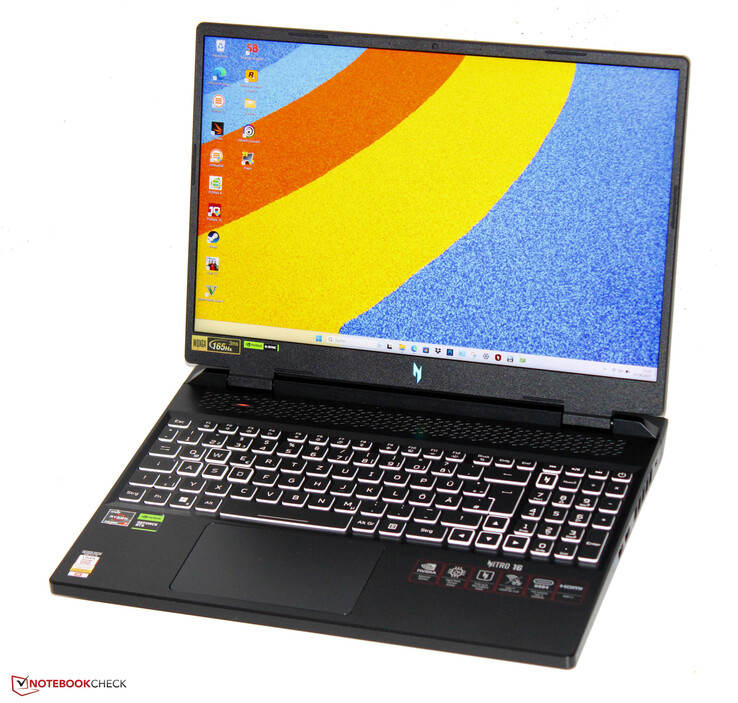
Recenzja Acer Nitro 16 AN16-41: Niedrogi laptop do gier z RTX 4050 i długim czasem pracy
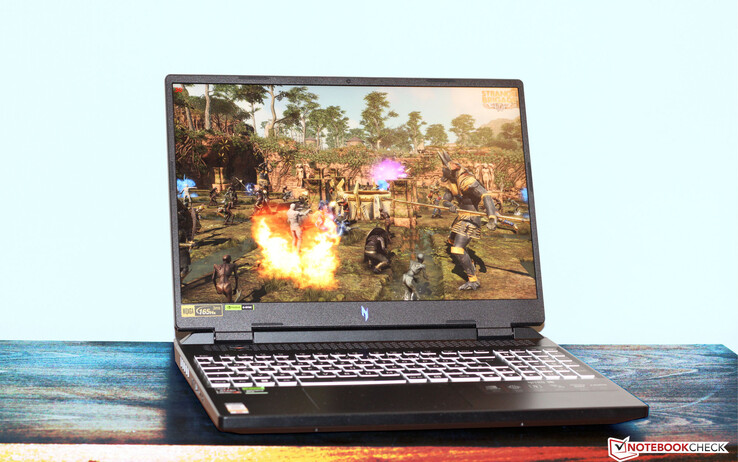
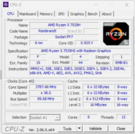
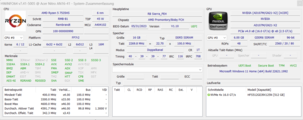
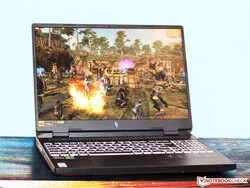
Przy cenie nieco poniżej 1250 euro, obecna konfiguracja Acer Nitro 16 należy do laptopów gamingowych z niższego segmentu cenowego. Nasza jednostka Nitro 16 jest zasilana przez AMD Ryzen 5 7535HS APU i procesor Nvidia GeForce RTX 4050 Laptop GPU.
Konkurencja obejmuje urządzenia takie jak Asus TUF Gaming A16 FA617XS, Schenker XMG Focus 15 (E23), Gigabyte G7 KE, Asus TUF A15 FA507oraz Medion Erazer Scout E20.
Informacje o obudowie, wyposażeniu i urządzeniach wejściowych można znaleźć w naszej recenzji identycznie zbudowanego siostrzanego modeluktóry jest wyposażony w Ryzen 7 7735HS i kartę graficzną RTX 4070 GPU.
Potencjalni konkurenci w porównaniu
Ocena | Data | Model | Waga | Wysokość | Rozmiar | Rezolucja | Cena |
|---|---|---|---|---|---|---|---|
| 86.7 % v7 (old) | 08/2023 | Acer Nitro 16 AN16-41-R7YE R5 7535HS, GeForce RTX 4050 Laptop GPU | 2.6 kg | 27.9 mm | 16.00" | 1920x1200 | |
| 86.9 % v7 (old) | 06/2023 | Asus TUF Gaming A16 FA617XS R9 7940HS, Radeon RX 7600S | 2.2 kg | 22.1 mm | 16.00" | 1920x1200 | |
| 85.1 % v7 (old) | 07/2023 | Schenker XMG Focus 15 (E23) i9-13900HX, GeForce RTX 4050 Laptop GPU | 2.4 kg | 26.9 mm | 15.60" | 2569x1440 | |
| 83.3 % v7 (old) | 01/2023 | Gigabyte G7 KE i5-12500H, GeForce RTX 3060 Laptop GPU | 2.6 kg | 25 mm | 17.30" | 1920x1080 | |
| 86.3 % v7 (old) | 06/2023 | Asus TUF A15 FA507 R7 7735HS, GeForce RTX 4050 Laptop GPU | 2.2 kg | 24.9 mm | 15.60" | 1920x1080 | |
| 83 % v7 (old) | 05/2023 | Medion Erazer Scout E20 i7-13700H, GeForce RTX 4050 Laptop GPU | 2.8 kg | 29 mm | 17.30" | 1920x1080 |
| SD Card Reader | |
| average JPG Copy Test (av. of 3 runs) | |
| Średnia w klasie Gaming (20 - 210, n=63, ostatnie 2 lata) | |
| Acer Nitro 16 AN16-41-R7YE (AV PRO microSD 128 GB V60) | |
| Acer Nitro 16 AN16-41 (AV Pro SD microSD 128 GB V60) | |
| maximum AS SSD Seq Read Test (1GB) | |
| Średnia w klasie Gaming (25.5 - 261, n=60, ostatnie 2 lata) | |
| Schenker XMG Focus 15 (E23) | |
| Gigabyte G7 KE (AV PRO microSD 128 GB V60) | |
| Acer Nitro 16 AN16-41 (AV Pro SD microSD 128 GB V60) | |
| Acer Nitro 16 AN16-41-R7YE (AV PRO microSD 128 GB V60) | |
Wyświetlacz - panel 16:10 z pokryciem sRGB
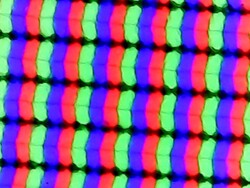
Do zalet matowego, 16-calowego ekranu IPS o rozdzielczości 1920 x 1200 pikseli i formacie 16:10 należy obsługa technologii G-Sync, brak migotania PWM oraz krótki czas reakcji. Jasność i kontrast panelu 165 Hz spełniają odpowiednie cele (odpowiednio > 300 cd/m² i 1000:1).
Nie ma zbyt wielu różnic w porównaniu z panelem WQXGA (2560 x 1600 pikseli) siostrzanego modelu siostrzanego modeluchoć ten ostatni oferuje wyższą maksymalną jasność (prawie 500 cd/m²).
| |||||||||||||||||||||||||
rozświetlenie: 84 %
na akumulatorze: 415 cd/m²
kontrast: 1153:1 (czerń: 0.36 cd/m²)
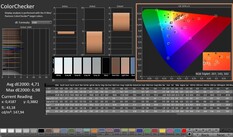
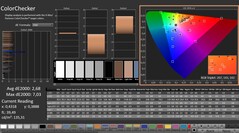
ΔE ColorChecker Calman: 4.71 | ∀{0.5-29.43 Ø4.76}
calibrated: 2.68
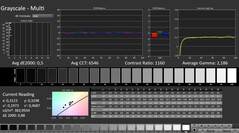
ΔE Greyscale Calman: 3.6 | ∀{0.09-98 Ø5}
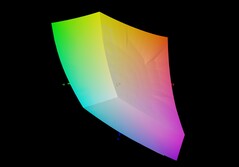
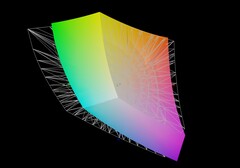
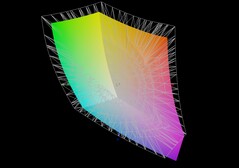
77.4% AdobeRGB 1998 (Argyll 3D)
99.4% sRGB (Argyll 3D)
80% Display P3 (Argyll 3D)
Gamma: 2.182
CCT: 7153 K
| Acer Nitro 16 AN16-41-R7YE AU Optronics B160UAN01.Q, IPS, 1920x1200, 16" | Asus TUF Gaming A16 FA617XS BOE NE160WUM-NX2, IPS, 1920x1200, 16" | Schenker XMG Focus 15 (E23) BOE0AD1, IPS, 2569x1440, 15.6" | Gigabyte G7 KE AU Optronics B173HAN05.1, IPS, 1920x1080, 17.3" | Asus TUF A15 FA507 N156HMA-GA1, IPS, 1920x1080, 15.6" | Medion Erazer Scout E20 LG Philips LGD0611, IPS, 1920x1080, 17.3" | Acer Nitro 16 AN16-41 BOE CQ NE16QDM-NY1, IPS, 2560x1600, 16" | |
|---|---|---|---|---|---|---|---|
| Display | -8% | 12% | -6% | -12% | -12% | -8% | |
| Display P3 Coverage (%) | 80 | 69.3 -13% | 98.6 23% | 70.4 -12% | 64.9 -19% | 65.1 -19% | 67.9 -15% |
| sRGB Coverage (%) | 99.4 | 97.3 -2% | 99.9 1% | 99.8 0% | 96.5 -3% | 96.7 -3% | 99.1 0% |
| AdobeRGB 1998 Coverage (%) | 77.4 | 70.7 -9% | 86.3 11% | 71.7 -7% | 66.6 -14% | 66.5 -14% | 69.9 -10% |
| Response Times | -66% | -81% | -3% | -236% | -66% | 3% | |
| Response Time Grey 50% / Grey 80% * (ms) | 11.2 ? | 15.6 ? -39% | 15.6 ? -39% | 5 ? 55% | 30.4 ? -171% | 14.8 ? -32% | 11 ? 2% |
| Response Time Black / White * (ms) | 5.2 ? | 10 ? -92% | 11.6 ? -123% | 8.3 ? -60% | 20.8 ? -300% | 10.4 ? -100% | 5 ? 4% |
| PWM Frequency (Hz) | |||||||
| Screen | 25% | -2% | 28% | 28% | 14% | 27% | |
| Brightness middle (cd/m²) | 415 | 301 -27% | 302 -27% | 307 -26% | 288 -31% | 312 -25% | 520 25% |
| Brightness (cd/m²) | 380 | 294 -23% | 278 -27% | 301 -21% | 271 -29% | 303 -20% | 494 30% |
| Brightness Distribution (%) | 84 | 94 12% | 85 1% | 93 11% | 91 8% | 91 8% | 91 8% |
| Black Level * (cd/m²) | 0.36 | 0.21 42% | 0.36 -0% | 0.2 44% | 0.17 53% | 0.25 31% | 0.39 -8% |
| Contrast (:1) | 1153 | 1433 24% | 839 -27% | 1535 33% | 1694 47% | 1248 8% | 1333 16% |
| Colorchecker dE 2000 * | 4.71 | 1.79 62% | 2.24 52% | 1.32 72% | 1.9 60% | 2.65 44% | 1.94 59% |
| Colorchecker dE 2000 max. * | 6.98 | 3.48 50% | 5.52 21% | 4.6 34% | 3.3 53% | 6.44 8% | 5.62 19% |
| Colorchecker dE 2000 calibrated * | 2.68 | 1.2 55% | 1.03 62% | 0.9 66% | 0.96 64% | 0.74 72% | |
| Greyscale dE 2000 * | 3.6 | 2.5 31% | 3.87 -8% | 2.1 42% | 2.7 25% | 3.2 11% | 2.94 18% |
| Gamma | 2.182 101% | 2.265 97% | 2.42 91% | 2.247 98% | 2.32 95% | 2.246 98% | 2.37 93% |
| CCT | 7153 91% | 6157 106% | 6936 94% | 6815 95% | 6535 99% | 7258 90% | 6443 101% |
| Całkowita średnia (program / ustawienia) | -16% /
5% | -24% /
-11% | 6% /
16% | -73% /
-18% | -21% /
-3% | 7% /
16% |
* ... im mniej tym lepiej
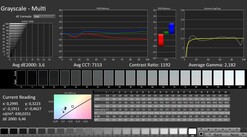
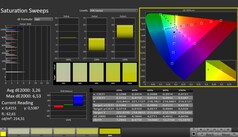
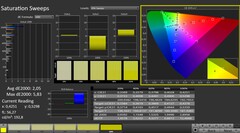
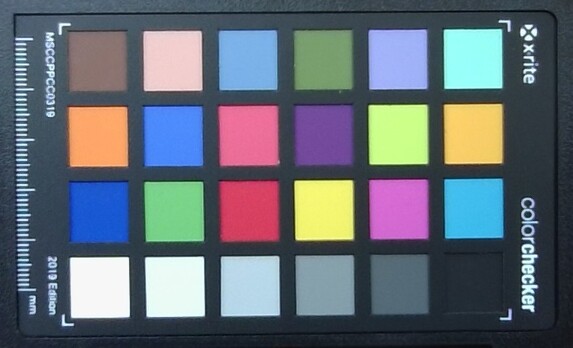
Ekran wykazuje przyzwoite odwzorowanie kolorów fabrycznie - z odchyleniem około 4,7, cel (DeltaE < 3) nie jest dokładnie dopasowany. Kalibracja zmniejsza odchylenie do 2,68 i zapewnia bardziej zrównoważone poziomy szarości. Panel może całkowicie odtworzyć gamę kolorów sRGB, ale nie przestrzenie kolorów Adobe RGB i Display P3.
Ma to miejsce w przypadku panelu WQXGA w konfiguracji oinnym wariancie Nitro 16, a także ekranów większości konkurentów. Tylko wyświetlacz XMG Focus 15 oferuje dobre pokrycie DCI-P3.
Wyświetl czasy reakcji
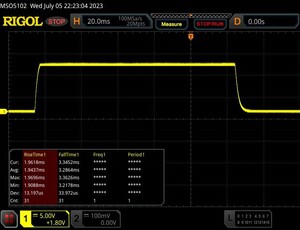
| ↔ Czas reakcji od czerni do bieli | ||
|---|---|---|
| 5.2 ms ... wzrost ↗ i spadek ↘ łącznie | ↗ 1.9 ms wzrost | |
| ↘ 3.3 ms upadek | ||
| W naszych testach ekran wykazuje bardzo szybką reakcję i powinien bardzo dobrze nadawać się do szybkich gier. Dla porównania, wszystkie testowane urządzenia wahają się od 0.1 (minimum) do 240 (maksimum) ms. » 17 % wszystkich urządzeń jest lepszych. Oznacza to, że zmierzony czas reakcji jest lepszy od średniej wszystkich testowanych urządzeń (20.1 ms). | ||
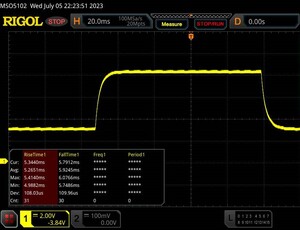
| ↔ Czas reakcji 50% szarości do 80% szarości | ||
| 11.2 ms ... wzrost ↗ i spadek ↘ łącznie | ↗ 5.3 ms wzrost | |
| ↘ 5.9 ms upadek | ||
| W naszych testach ekran wykazuje dobry współczynnik reakcji, ale może być zbyt wolny dla graczy rywalizujących ze sobą. Dla porównania, wszystkie testowane urządzenia wahają się od 0.165 (minimum) do 636 (maksimum) ms. » 24 % wszystkich urządzeń jest lepszych. Oznacza to, że zmierzony czas reakcji jest lepszy od średniej wszystkich testowanych urządzeń (31.4 ms). | ||
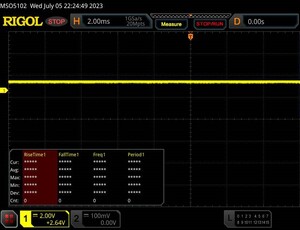
Migotanie ekranu / PWM (modulacja szerokości impulsu)
| Migotanie ekranu/nie wykryto PWM | |||
Dla porównania: 53 % wszystkich testowanych urządzeń nie używa PWM do przyciemniania wyświetlacza. Jeśli wykryto PWM, zmierzono średnio 8016 (minimum: 5 - maksimum: 343500) Hz. | |||
Wydajność: Acer skupia się na Rembrandcie i Adzie Lovelace
Seria Nitro 16 łączy układy GPU Ada-Lovelace z procesorami Intel lub AMD. Obecny model opiera się na AMD i jest dostępny za około 1250 euro (~ 1500 USD). Jest to więc obecnie najtańszy przedstawiciel tej serii.
Warunki testowe
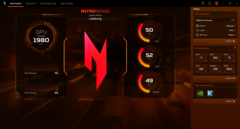
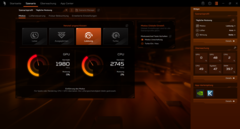
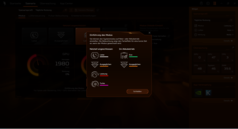
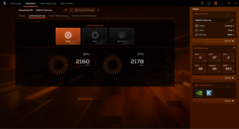
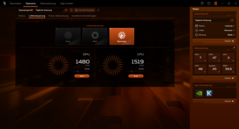
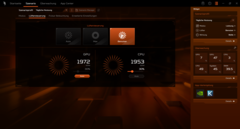
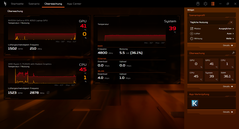
Spośród sześciu trybów wydajności specyficznych dla producenta (patrz tabela poniżej) wykorzystano tryby "Balanced" (do testów porównawczych) i "Eco" (do testów baterii). tryby "Turbo" i "Performance" są dostępne tylko przy zasilaniu sieciowym (poziom naładowania baterii > 30%). Przycisk nad klawiaturą umożliwia przełączanie między trybami. Alternatywnie można to zrobić za pomocą oprogramowania NitroSense (centrum sterowania laptopa). Dioda LED wskazuje aktywny tryb.
Uwaga: Podczas gdy model other Nitro 16 był testowany z aktywnym trybem Optimus, tryb dGPU (= iGPU jest wyłączone) jest używany na bieżącym urządzeniu testowym. Testy baterii są jednak wyjątkiem. Dlatego wyniki benchmarków nie zawsze są bezpośrednio porównywalne.
| Turbo | Power | Balanced | Quiet | Balanced (bateria) | Eco (bateria) | |
|---|---|---|---|---|---|---|
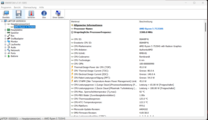
| PowerLimit 1 (HWInfo) | 95 Watt | 75 Watt | 65 Watt | 45 Watt | 25 Watt | 25 Watt |
| Limit mocy 2(HWInfo) | 100 Watt | 100 Watt | 100 Watt | 100 Watt | 25 Watt | 25 Watt |
| Wydajność (Witcher 3 ) | ~84 fps | ~83 fps | ~82 fps | ~74 fps | - | - |
| Hałas (Witcher 3 ) | 61 dB(A) | 56 dB(A) | 45 dB(A) | 35 dB(A) | - | - |
Procesor
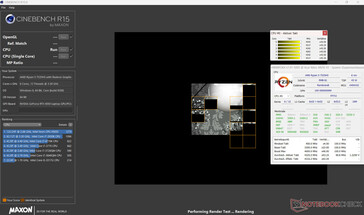
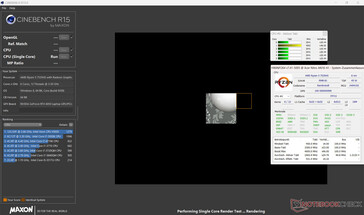
Ryzen Ryzen 5 7535HSaPU (Zen 3+, Rembrandt-R) oferuje sześć rdzeni CPU z łącznie 12 wątkami przy maksymalnym taktowaniu pojedynczego rdzenia wynoszącym 4,55 GHz. Procesor potwierdza stałe obciążenie wielowątkowe (CB15 Loop) ze stale wysokim taktowaniem Turbo - niezależnie od wybranego trybu pracy systemu. Różnice pomiędzy poszczególnymi trybami są niewielkie.
Nic dziwnego, że APU Ryzen 7 z siostrzanego modelu oferuje większą wydajność wielowątkową - w końcu ma 8 rdzeni CPU. Pod względem wydajności jednowątkowej, która jest bardziej istotna w codziennym użytkowaniu, APU są niemal na równi.
Cinebench R15 multi-core loop
* ... im mniej tym lepiej
AIDA64: FP32 Ray-Trace | FPU Julia | CPU SHA3 | CPU Queen | FPU SinJulia | FPU Mandel | CPU AES | CPU ZLib | FP64 Ray-Trace | CPU PhotoWorxx
| Performance rating | |
| Średnia w klasie Gaming | |
| Schenker XMG Focus 15 (E23) | |
| Asus TUF Gaming A16 FA617XS | |
| Acer Nitro 16 AN16-41 | |
| Asus TUF A15 FA507 | |
| Medion Erazer Scout E20 | |
| Acer Nitro 16 AN16-41-R7YE | |
| Gigabyte G7 KE | |
| Przeciętny AMD Ryzen 5 7535HS | |
| AIDA64 / FP32 Ray-Trace | |
| Średnia w klasie Gaming (7192 - 85542, n=133, ostatnie 2 lata) | |
| Asus TUF Gaming A16 FA617XS | |
| Schenker XMG Focus 15 (E23) | |
| Acer Nitro 16 AN16-41 | |
| Asus TUF A15 FA507 | |
| Medion Erazer Scout E20 | |
| Gigabyte G7 KE | |
| Acer Nitro 16 AN16-41-R7YE | |
| Przeciętny AMD Ryzen 5 7535HS (9617 - 12945, n=3) | |
| AIDA64 / FPU Julia | |
| Średnia w klasie Gaming (35040 - 238426, n=133, ostatnie 2 lata) | |
| Asus TUF Gaming A16 FA617XS | |
| Schenker XMG Focus 15 (E23) | |
| Acer Nitro 16 AN16-41 | |
| Asus TUF A15 FA507 | |
| Acer Nitro 16 AN16-41-R7YE | |
| Medion Erazer Scout E20 | |
| Przeciętny AMD Ryzen 5 7535HS (61244 - 79252, n=3) | |
| Gigabyte G7 KE | |
| AIDA64 / CPU SHA3 | |
| Średnia w klasie Gaming (1728 - 9817, n=133, ostatnie 2 lata) | |
| Schenker XMG Focus 15 (E23) | |
| Asus TUF Gaming A16 FA617XS | |
| Acer Nitro 16 AN16-41 | |
| Asus TUF A15 FA507 | |
| Gigabyte G7 KE | |
| Medion Erazer Scout E20 | |
| Acer Nitro 16 AN16-41-R7YE | |
| Przeciętny AMD Ryzen 5 7535HS (2075 - 2679, n=3) | |
| AIDA64 / CPU Queen | |
| Schenker XMG Focus 15 (E23) | |
| Asus TUF Gaming A16 FA617XS | |
| Średnia w klasie Gaming (49785 - 173351, n=133, ostatnie 2 lata) | |
| Acer Nitro 16 AN16-41 | |
| Medion Erazer Scout E20 | |
| Asus TUF A15 FA507 | |
| Acer Nitro 16 AN16-41-R7YE | |
| Gigabyte G7 KE | |
| Przeciętny AMD Ryzen 5 7535HS (73548 - 82540, n=3) | |
| AIDA64 / FPU SinJulia | |
| Asus TUF Gaming A16 FA617XS | |
| Średnia w klasie Gaming (4424 - 33636, n=133, ostatnie 2 lata) | |
| Schenker XMG Focus 15 (E23) | |
| Acer Nitro 16 AN16-41 | |
| Asus TUF A15 FA507 | |
| Acer Nitro 16 AN16-41-R7YE | |
| Medion Erazer Scout E20 | |
| Przeciętny AMD Ryzen 5 7535HS (8792 - 9786, n=3) | |
| Gigabyte G7 KE | |
| AIDA64 / FPU Mandel | |
| Średnia w klasie Gaming (17585 - 128721, n=133, ostatnie 2 lata) | |
| Asus TUF Gaming A16 FA617XS | |
| Acer Nitro 16 AN16-41 | |
| Asus TUF A15 FA507 | |
| Schenker XMG Focus 15 (E23) | |
| Acer Nitro 16 AN16-41-R7YE | |
| Przeciętny AMD Ryzen 5 7535HS (34054 - 43495, n=3) | |
| Medion Erazer Scout E20 | |
| Gigabyte G7 KE | |
| AIDA64 / CPU AES | |
| Gigabyte G7 KE | |
| Średnia w klasie Gaming (19065 - 247074, n=133, ostatnie 2 lata) | |
| Acer Nitro 16 AN16-41-R7YE | |
| Schenker XMG Focus 15 (E23) | |
| Asus TUF Gaming A16 FA617XS | |
| Medion Erazer Scout E20 | |
| Asus TUF A15 FA507 | |
| Przeciętny AMD Ryzen 5 7535HS (35651 - 105083, n=3) | |
| Acer Nitro 16 AN16-41 | |
| AIDA64 / CPU ZLib | |
| Schenker XMG Focus 15 (E23) | |
| Średnia w klasie Gaming (373 - 2531, n=133, ostatnie 2 lata) | |
| Asus TUF Gaming A16 FA617XS | |
| Medion Erazer Scout E20 | |
| Gigabyte G7 KE | |
| Acer Nitro 16 AN16-41 | |
| Acer Nitro 16 AN16-41-R7YE | |
| Asus TUF A15 FA507 | |
| Przeciętny AMD Ryzen 5 7535HS (545 - 665, n=3) | |
| AIDA64 / FP64 Ray-Trace | |
| Średnia w klasie Gaming (3856 - 45446, n=133, ostatnie 2 lata) | |
| Asus TUF Gaming A16 FA617XS | |
| Schenker XMG Focus 15 (E23) | |
| Acer Nitro 16 AN16-41 | |
| Asus TUF A15 FA507 | |
| Medion Erazer Scout E20 | |
| Gigabyte G7 KE | |
| Acer Nitro 16 AN16-41-R7YE | |
| Przeciętny AMD Ryzen 5 7535HS (5170 - 6899, n=3) | |
| AIDA64 / CPU PhotoWorxx | |
| Schenker XMG Focus 15 (E23) | |
| Średnia w klasie Gaming (10805 - 62916, n=133, ostatnie 2 lata) | |
| Medion Erazer Scout E20 | |
| Asus TUF Gaming A16 FA617XS | |
| Gigabyte G7 KE | |
| Acer Nitro 16 AN16-41-R7YE | |
| Asus TUF A15 FA507 | |
| Acer Nitro 16 AN16-41 | |
| Przeciętny AMD Ryzen 5 7535HS (24728 - 28865, n=3) | |
Wydajność systemu
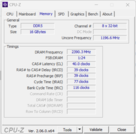
Płynnie działający system zapewnia wystarczającą moc obliczeniową dla wymagających aplikacji, takich jak rendering, edycja wideo i gry. Prędkości transferów pamięci roboczej (DDR5-4800) pozostają poniżej potencjału, gdyż porównanie z wartościami z modelu Asus TUF Gaming A16 pokazuje.
CrossMark: Overall | Productivity | Creativity | Responsiveness
| PCMark 10 / Score | |
| Średnia w klasie Gaming (5776 - 10060, n=113, ostatnie 2 lata) | |
| Asus TUF Gaming A16 FA617XS | |
| Medion Erazer Scout E20 | |
| Acer Nitro 16 AN16-41 | |
| Asus TUF A15 FA507 | |
| Schenker XMG Focus 15 (E23) | |
| Acer Nitro 16 AN16-41-R7YE | |
| Przeciętny AMD Ryzen 5 7535HS, NVIDIA GeForce RTX 4050 Laptop GPU (n=1) | |
| Gigabyte G7 KE | |
| PCMark 10 / Essentials | |
| Medion Erazer Scout E20 | |
| Asus TUF Gaming A16 FA617XS | |
| Średnia w klasie Gaming (8810 - 12600, n=117, ostatnie 2 lata) | |
| Acer Nitro 16 AN16-41 | |
| Asus TUF A15 FA507 | |
| Gigabyte G7 KE | |
| Acer Nitro 16 AN16-41-R7YE | |
| Przeciętny AMD Ryzen 5 7535HS, NVIDIA GeForce RTX 4050 Laptop GPU (n=1) | |
| Schenker XMG Focus 15 (E23) | |
| PCMark 10 / Productivity | |
| Asus TUF Gaming A16 FA617XS | |
| Średnia w klasie Gaming (6662 - 16716, n=115, ostatnie 2 lata) | |
| Medion Erazer Scout E20 | |
| Schenker XMG Focus 15 (E23) | |
| Asus TUF A15 FA507 | |
| Acer Nitro 16 AN16-41 | |
| Gigabyte G7 KE | |
| Acer Nitro 16 AN16-41-R7YE | |
| Przeciętny AMD Ryzen 5 7535HS, NVIDIA GeForce RTX 4050 Laptop GPU (n=1) | |
| PCMark 10 / Digital Content Creation | |
| Średnia w klasie Gaming (7440 - 19351, n=115, ostatnie 2 lata) | |
| Asus TUF Gaming A16 FA617XS | |
| Medion Erazer Scout E20 | |
| Acer Nitro 16 AN16-41 | |
| Asus TUF A15 FA507 | |
| Acer Nitro 16 AN16-41-R7YE | |
| Przeciętny AMD Ryzen 5 7535HS, NVIDIA GeForce RTX 4050 Laptop GPU (n=1) | |
| Schenker XMG Focus 15 (E23) | |
| Gigabyte G7 KE | |
| CrossMark / Overall | |
| Schenker XMG Focus 15 (E23) | |
| Średnia w klasie Gaming (1247 - 2344, n=113, ostatnie 2 lata) | |
| Medion Erazer Scout E20 | |
| Gigabyte G7 KE | |
| Asus TUF Gaming A16 FA617XS | |
| Asus TUF A15 FA507 | |
| Acer Nitro 16 AN16-41 | |
| Acer Nitro 16 AN16-41-R7YE | |
| Przeciętny AMD Ryzen 5 7535HS, NVIDIA GeForce RTX 4050 Laptop GPU (n=1) | |
| CrossMark / Productivity | |
| Schenker XMG Focus 15 (E23) | |
| Medion Erazer Scout E20 | |
| Średnia w klasie Gaming (1299 - 2211, n=113, ostatnie 2 lata) | |
| Gigabyte G7 KE | |
| Asus TUF Gaming A16 FA617XS | |
| Asus TUF A15 FA507 | |
| Acer Nitro 16 AN16-41 | |
| Acer Nitro 16 AN16-41-R7YE | |
| Przeciętny AMD Ryzen 5 7535HS, NVIDIA GeForce RTX 4050 Laptop GPU (n=1) | |
| CrossMark / Creativity | |
| Schenker XMG Focus 15 (E23) | |
| Średnia w klasie Gaming (1275 - 2729, n=113, ostatnie 2 lata) | |
| Medion Erazer Scout E20 | |
| Asus TUF Gaming A16 FA617XS | |
| Gigabyte G7 KE | |
| Asus TUF A15 FA507 | |
| Acer Nitro 16 AN16-41 | |
| Acer Nitro 16 AN16-41-R7YE | |
| Przeciętny AMD Ryzen 5 7535HS, NVIDIA GeForce RTX 4050 Laptop GPU (n=1) | |
| CrossMark / Responsiveness | |
| Gigabyte G7 KE | |
| Medion Erazer Scout E20 | |
| Schenker XMG Focus 15 (E23) | |
| Średnia w klasie Gaming (1030 - 2330, n=113, ostatnie 2 lata) | |
| Asus TUF Gaming A16 FA617XS | |
| Acer Nitro 16 AN16-41-R7YE | |
| Przeciętny AMD Ryzen 5 7535HS, NVIDIA GeForce RTX 4050 Laptop GPU (n=1) | |
| Acer Nitro 16 AN16-41 | |
| Asus TUF A15 FA507 | |
| PCMark 8 Home Score Accelerated v2 | 5548 pkt. | |
| PCMark 8 Work Score Accelerated v2 | 5810 pkt. | |
| PCMark 10 Score | 6690 pkt. | |
Pomoc | ||
| AIDA64 / Memory Copy | |
| Schenker XMG Focus 15 (E23) | |
| Średnia w klasie Gaming (21750 - 108104, n=133, ostatnie 2 lata) | |
| Asus TUF Gaming A16 FA617XS | |
| Medion Erazer Scout E20 | |
| Przeciętny AMD Ryzen 5 7535HS (48040 - 49119, n=3) | |
| Acer Nitro 16 AN16-41-R7YE | |
| Asus TUF A15 FA507 | |
| Acer Nitro 16 AN16-41 | |
| Gigabyte G7 KE | |
| AIDA64 / Memory Read | |
| Schenker XMG Focus 15 (E23) | |
| Średnia w klasie Gaming (22956 - 104349, n=133, ostatnie 2 lata) | |
| Medion Erazer Scout E20 | |
| Asus TUF Gaming A16 FA617XS | |
| Acer Nitro 16 AN16-41-R7YE | |
| Acer Nitro 16 AN16-41 | |
| Asus TUF A15 FA507 | |
| Gigabyte G7 KE | |
| Przeciętny AMD Ryzen 5 7535HS (40044 - 50259, n=3) | |
| AIDA64 / Memory Write | |
| Schenker XMG Focus 15 (E23) | |
| Średnia w klasie Gaming (22297 - 133486, n=133, ostatnie 2 lata) | |
| Asus TUF Gaming A16 FA617XS | |
| Medion Erazer Scout E20 | |
| Asus TUF A15 FA507 | |
| Acer Nitro 16 AN16-41-R7YE | |
| Acer Nitro 16 AN16-41 | |
| Przeciętny AMD Ryzen 5 7535HS (48854 - 54982, n=3) | |
| Gigabyte G7 KE | |
| AIDA64 / Memory Latency | |
| Średnia w klasie Gaming (59.5 - 259, n=133, ostatnie 2 lata) | |
| Przeciętny AMD Ryzen 5 7535HS (87.7 - 110.3, n=3) | |
| Medion Erazer Scout E20 | |
| Acer Nitro 16 AN16-41 | |
| Asus TUF Gaming A16 FA617XS | |
| Gigabyte G7 KE | |
| Acer Nitro 16 AN16-41-R7YE | |
| Schenker XMG Focus 15 (E23) | |
| Asus TUF A15 FA507 | |
* ... im mniej tym lepiej
Opóźnienie DPC
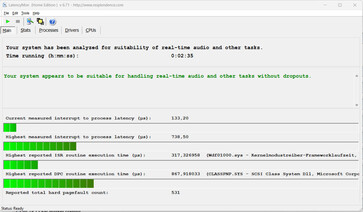
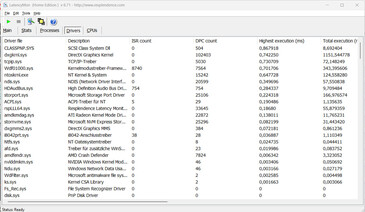
Standardowy test monitora opóźnień (surfowanie po Internecie, odtwarzanie wideo 4k, duże FFT w Prime95) nie wykazał żadnych nieprawidłowości. System wydaje się być odpowiedni do edycji wideo i audio w czasie rzeczywistym. Przyszłe aktualizacje oprogramowania mogą doprowadzić do poprawy lub nawet pogorszenia wydajności.
| DPC Latencies / LatencyMon - interrupt to process latency (max), Web, Youtube, Prime95 | |
| Schenker XMG Focus 15 (E23) | |
| Medion Erazer Scout E20 | |
| Gigabyte G7 KE | |
| Acer Nitro 16 AN16-41 | |
| Asus TUF Gaming A16 FA617XS | |
| Acer Nitro 16 AN16-41-R7YE | |
* ... im mniej tym lepiej
Pamięć masowa
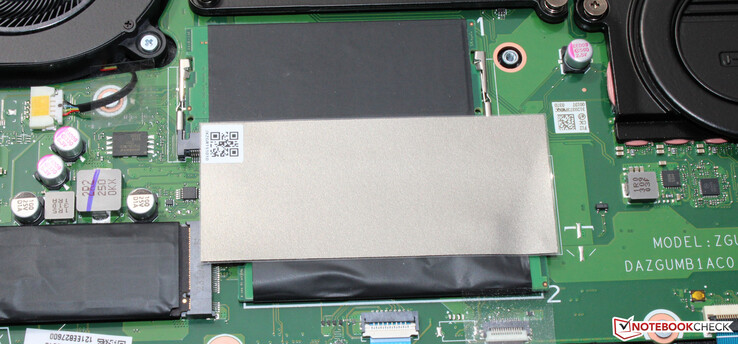
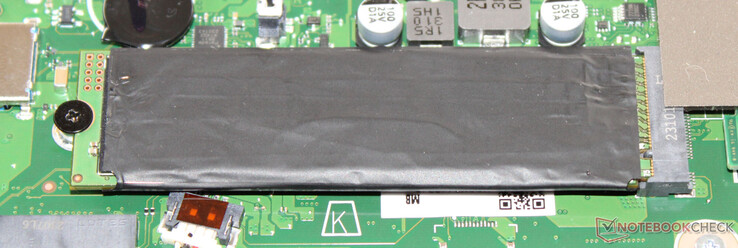
Acer wyposaża Nitro 16 w dysk SSD o pojemności 512 GB (PCIe 4, M.2-2280) firmy SK Hynix. Zapewnia on dobrą szybkość transmisji danych, ale nie należy do najbardziej wydajnych modeli SSD. Negatywnym aspektem jest to, że spadki wydajności występują z powodu dławienia termicznego. Notebook posiada miejsce na drugi dysk SSD PCIe Gen 4.
* ... im mniej tym lepiej
Drive throttling: DiskSpd Read Loop, Queue Depth 8
Karta graficzna
Wyniki testów porównawczych GeForce RTX 4050 są powyżej średnich wyników dla RTX 4050 ("Balanced"). tryby "Performance" i "Turbo" skutkują w najlepszym przypadku minimalnym wzrostem wydajności.
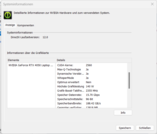
Acer ustawił maksymalne TGP na 140 W - wyższa moc nie jest możliwa. Według testu The Witcher 3 nie jest nawet bliski wyczerpania. Przełączanie między dGPU a Optimusem nie wymaga restartu, ponieważ Advanced Optimus jest obsługiwany.
| 3DMark 06 Standard Score | 43233 pkt. | |
| 3DMark 11 Performance | 24596 pkt. | |
| 3DMark Cloud Gate Standard Score | 47710 pkt. | |
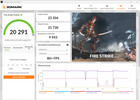
| 3DMark Fire Strike Score | 20291 pkt. | |
| 3DMark Time Spy Score | 8227 pkt. | |
Pomoc | ||
* ... im mniej tym lepiej
Wydajność w grach
Sprzęt został zaprojektowany do grania w rozdzielczości FHD przy wysokich i maksymalnych ustawieniach. W ten sposób można w pełni wykorzystać wysoką liczbę klatek na sekundę w rozdzielczości FHD ekranu i osiągnąć liczbę klatek na sekundę powyżej określonej średniej RTX 4050.
Technologia DLSS firmy Nvidia może zapewnić wzrost liczby klatek na sekundę. Jeśli jest ona aktywna, procesor graficzny oblicza grę w niższej rozdzielczości, a następnie skaluje ją do żądanej rozdzielczości za pomocą sztucznej inteligencji. DLSS musi być wyraźnie obsługiwany przez grę. Przetestowaliśmy kilka odpowiednich tytułów na zasadzie próbnej.
| Raytracing (FHD, Ultra) | Raytracing (FHD, Ultra) + DLSS (Jakość) | Raytracing (FHD, Ultra) + DLSS (Zrównoważony) | Raytracing (FHD, Ultra) + DLSS (Wydajność) | |
|---|---|---|---|---|
| Cyberpunk 2077 V1.6 | ||||
| Spider-Man: Miles Morales | ||||
| The Witcher 3 V4.00 | ||||
| Hogwarts Legacy | ||||
| Returnal | 66 fps |
| The Witcher 3 - 1920x1080 Ultra Graphics & Postprocessing (HBAO+) | |
| Średnia w klasie Gaming (80.2 - 240, n=35, ostatnie 2 lata) | |
| Acer Nitro 16 AN16-41 | |
| Asus TUF Gaming A16 FA617XS | |
| Acer Nitro 16 AN16-41-R7YE | |
| Medion Erazer Scout E20 | |
| Gigabyte G7 KE | |
| Asus TUF A15 FA507 | |
| Przeciętny NVIDIA GeForce RTX 4050 Laptop GPU (18.5 - 94.7, n=40) | |
| Schenker XMG Focus 15 (E23) | |
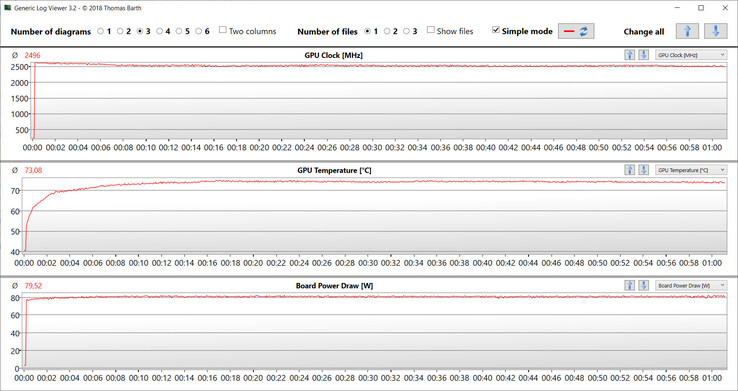
Aby sprawdzić, czy liczba klatek na sekundę pozostaje w dużej mierze stała przez dłuższy czas, uruchomiliśmy grę The Witcher 3 na około 60 minut w rozdzielczości Full HD i maksymalnych ustawieniach jakości. Postać w grze nie jest poruszana. Spadek liczby klatek na sekundę nie jest zauważalny.
The Witcher 3 FPS Chart
| low | med. | high | ultra | |
|---|---|---|---|---|
| The Witcher 3 (2015) | 307.8 | 262.4 | 156.2 | 83.9 |
| Dota 2 Reborn (2015) | 151 | 136.5 | 132.1 | 125.2 |
| Final Fantasy XV Benchmark (2018) | 187.4 | 116.2 | 83.5 | |
| X-Plane 11.11 (2018) | 115.3 | 101.6 | 81.4 | |
| Far Cry 5 (2018) | 131 | 114 | 108 | 102 |
| Strange Brigade (2018) | 355 | 209 | 169.3 | 146.8 |
| F1 22 (2022) | 207 | 198.1 | 166.8 | 52.9 |
Emisje: Acer Nitro 16 znacznie się nagrzewa
Emisja hałasu
Pomimo stale aktywnego dGPU, notebook jest cichy w codziennym użytkowaniu (biuro, Internet itp.). Zgodnie z oczekiwaniami inaczej wygląda to w trybie gamingowym.
Poziomy ciśnienia akustycznego dochodzące do 61 dB(A) ("Turbo") lub 56 dB(A) ("Performance") wymagają użycia słuchawek. Używany przez nas tryb "Zrównoważony" wychodzi na poziomie 45 dB(A). Ogólnie niższy poziom hałasu można uzyskać, korzystając z trybu "Quiet", ale oczywiście kosztem wydajności obliczeniowej.
Hałas
| luz |
| 25 / 26 / 27 dB |
| obciążenie |
| 42 / 45 dB |
 | ||
30 dB cichy 40 dB(A) słyszalny 50 dB(A) irytujący |
||
min: | ||
| Acer Nitro 16 AN16-41-R7YE R5 7535HS, GeForce RTX 4050 Laptop GPU | Asus TUF Gaming A16 FA617XS R9 7940HS, Radeon RX 7600S | Schenker XMG Focus 15 (E23) i9-13900HX, GeForce RTX 4050 Laptop GPU | Gigabyte G7 KE i5-12500H, GeForce RTX 3060 Laptop GPU | Asus TUF A15 FA507 R7 7735HS, GeForce RTX 4050 Laptop GPU | Medion Erazer Scout E20 i7-13700H, GeForce RTX 4050 Laptop GPU | Acer Nitro 16 AN16-41 R7 7735HS, GeForce RTX 4070 Laptop GPU | |
|---|---|---|---|---|---|---|---|
| Noise | -7% | -15% | -26% | 10% | -16% | -4% | |
| wyłączone / środowisko * (dB) | 24 | 25 -4% | 24 -0% | 27 -13% | 23.3 3% | 25 -4% | 25.7 -7% |
| Idle Minimum * (dB) | 25 | 25 -0% | 24 4% | 27 -8% | 23.3 7% | 26 -4% | 25.7 -3% |
| Idle Average * (dB) | 26 | 26 -0% | 25.14 3% | 35 -35% | 23.3 10% | 27 -4% | 25.7 1% |
| Idle Maximum * (dB) | 27 | 28 -4% | 35.14 -30% | 38 -41% | 23.3 14% | 32 -19% | 26.3 3% |
| Load Average * (dB) | 42 | 43 -2% | 55.93 -33% | 52 -24% | 29.6 30% | 57 -36% | 33.9 19% |
| Witcher 3 ultra * (dB) | 43 | 51 -19% | 54.62 -27% | 56 -30% | 43 -0% | 50 -16% | |
| Load Maximum * (dB) | 45 | 53 -18% | 56.34 -25% | 59 -31% | 43 4% | 57 -27% | 62 -38% |
* ... im mniej tym lepiej
Temperatura
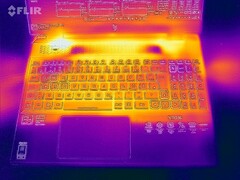
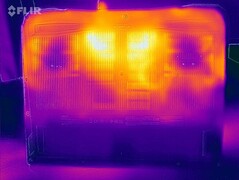
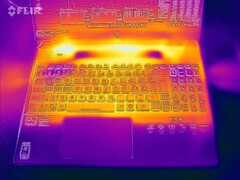
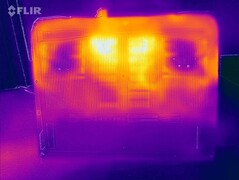
Nitro 16 wyraźnie nagrzewa się pod obciążeniem. W jednym z punktów pomiarowych osiągnięto temperaturę ponad 60°C.
W codziennym użytkowaniu temperatury mieszczą się w zielonej strefie, ale są wyższe niż w siostrzanym modelu ze względu na aktywny tryb dGPU.
(-) Maksymalna temperatura w górnej części wynosi 51 °C / 124 F, w porównaniu do średniej 40.4 °C / 105 F , począwszy od 21.2 do 68.8 °C dla klasy Gaming.
(-) Dno nagrzewa się maksymalnie do 63 °C / 145 F, w porównaniu do średniej 43.3 °C / 110 F
(+) W stanie bezczynności średnia temperatura górnej części wynosi 31.6 °C / 89 F, w porównaniu ze średnią temperaturą urządzenia wynoszącą 33.9 °C / ### class_avg_f### F.
(-) Podczas gry w Wiedźmina 3 średnia temperatura górnej części wynosi 42.8 °C / 109 F, w porównaniu do średniej temperatury urządzenia wynoszącej 33.9 °C / ## #class_avg_f### F.
(-) Podpórki pod nadgarstki i touchpad mogą się bardzo nagrzać w dotyku, maksymalnie do 42 °C / 107.6 F.
(-) Średnia temperatura obszaru podparcia dłoni w podobnych urządzeniach wynosiła 28.8 °C / 83.8 F (-13.2 °C / -23.8 F).
| Acer Nitro 16 AN16-41-R7YE AMD Ryzen 5 7535HS, NVIDIA GeForce RTX 4050 Laptop GPU | Asus TUF Gaming A16 FA617XS AMD Ryzen 9 7940HS, AMD Radeon RX 7600S | Schenker XMG Focus 15 (E23) Intel Core i9-13900HX, NVIDIA GeForce RTX 4050 Laptop GPU | Gigabyte G7 KE Intel Core i5-12500H, NVIDIA GeForce RTX 3060 Laptop GPU | Asus TUF A15 FA507 AMD Ryzen 7 7735HS, NVIDIA GeForce RTX 4050 Laptop GPU | Medion Erazer Scout E20 Intel Core i7-13700H, NVIDIA GeForce RTX 4050 Laptop GPU | Acer Nitro 16 AN16-41 AMD Ryzen 7 7735HS, NVIDIA GeForce RTX 4070 Laptop GPU | |
|---|---|---|---|---|---|---|---|
| Heat | 10% | 9% | 8% | 17% | 19% | 9% | |
| Maximum Upper Side * (°C) | 51 | 53 -4% | 51 -0% | 52 -2% | 48.9 4% | 41 20% | 41.5 19% |
| Maximum Bottom * (°C) | 63 | 48 24% | 53 16% | 54 14% | 44.6 29% | 39 38% | 51.8 18% |
| Idle Upper Side * (°C) | 34 | 30 12% | 29 15% | 28 18% | 27.1 20% | 31 9% | 31.6 7% |
| Idle Bottom * (°C) | 32 | 30 6% | 30 6% | 32 -0% | 27.5 14% | 29 9% | 34.5 -8% |
* ... im mniej tym lepiej
Test warunków skrajnych
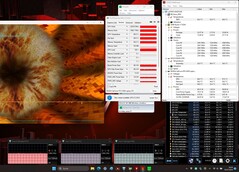
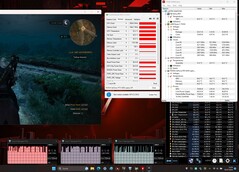
Test obciążeniowy (Prime95 i Furmark w trybie ciągłym) to ekstremalny scenariusz testowania stabilności systemu pod pełnym obciążeniem. Procesor rozpoczyna test obciążeniowy z taktowaniem od 4,1 do 4,2 GHz, a rdzeń graficzny pracuje z częstotliwością od 2,3 do 2,4 GHz. W dalszej części testu taktowanie spada do 2,6 GHz (procesor) i 2,2 GHz (rdzeń graficzny).
Głośnik
Głośniki stereo generują przyzwoity, w dużej mierze pozbawiony basów dźwięk. Lepsze wrażenia dźwiękowe można uzyskać przy użyciu słuchawek lub głośników zewnętrznych.
Acer Nitro 16 AN16-41-R7YE analiza dźwięku
(+) | głośniki mogą odtwarzać stosunkowo głośno (82 dB)
Bas 100 - 315 Hz
(-) | prawie brak basu - średnio 28.2% niższa od mediany
(±) | liniowość basu jest średnia (12.9% delta do poprzedniej częstotliwości)
Średnie 400 - 2000 Hz
(+) | zbalansowane środki średnie - tylko 2.2% od mediany
(+) | średnie są liniowe (3.8% delta do poprzedniej częstotliwości)
Wysokie 2–16 kHz
(+) | zrównoważone maksima - tylko 3.5% od mediany
(+) | wzloty są liniowe (4.6% delta do poprzedniej częstotliwości)
Ogólnie 100 - 16.000 Hz
(±) | liniowość ogólnego dźwięku jest średnia (17.3% różnicy w stosunku do mediany)
W porównaniu do tej samej klasy
» 47% wszystkich testowanych urządzeń w tej klasie było lepszych, 12% podobnych, 41% gorszych
» Najlepszy miał deltę 6%, średnia wynosiła ###średnia###%, najgorsza wynosiła 132%
W porównaniu do wszystkich testowanych urządzeń
» 32% wszystkich testowanych urządzeń było lepszych, 8% podobnych, 60% gorszych
» Najlepszy miał deltę 4%, średnia wynosiła ###średnia###%, najgorsza wynosiła 134%
Asus TUF Gaming A16 FA617XS analiza dźwięku
(±) | głośność głośnika jest średnia, ale dobra (79 dB)
Bas 100 - 315 Hz
(±) | zredukowany bas - średnio 11.6% niższy od mediany
(±) | liniowość basu jest średnia (7% delta do poprzedniej częstotliwości)
Średnie 400 - 2000 Hz
(±) | wyższe średnie - średnio 5.7% wyższe niż mediana
(+) | średnie są liniowe (3.8% delta do poprzedniej częstotliwości)
Wysokie 2–16 kHz
(+) | zrównoważone maksima - tylko 2.6% od mediany
(+) | wzloty są liniowe (6.5% delta do poprzedniej częstotliwości)
Ogólnie 100 - 16.000 Hz
(±) | liniowość ogólnego dźwięku jest średnia (15.4% różnicy w stosunku do mediany)
W porównaniu do tej samej klasy
» 34% wszystkich testowanych urządzeń w tej klasie było lepszych, 7% podobnych, 60% gorszych
» Najlepszy miał deltę 6%, średnia wynosiła ###średnia###%, najgorsza wynosiła 132%
W porównaniu do wszystkich testowanych urządzeń
» 22% wszystkich testowanych urządzeń było lepszych, 4% podobnych, 74% gorszych
» Najlepszy miał deltę 4%, średnia wynosiła ###średnia###%, najgorsza wynosiła 134%
Zarządzanie energią: Nitro 16 może osiągnąć bardzo dobre czasy pracy
Zużycie energii
Zużycie energii jest na normalnym poziomie dla zainstalowanego sprzętu. Tryb dGPU jest odpowiedzialny za wyższe zużycie energii w trybie bezczynności w porównaniu do siostrzanego modelu. Test warunków skrajnych i test Witcher 3 są uruchamiane przy stałym zużyciu energii. Dostarczony zasilacz (230 W) może w pełni zasilić laptopa pod obciążeniem.
| wyłączony / stan wstrzymania | |
| luz | |
| obciążenie |
|
Legenda:
min: | |
| Acer Nitro 16 AN16-41-R7YE R5 7535HS, GeForce RTX 4050 Laptop GPU | Asus TUF Gaming A16 FA617XS R9 7940HS, Radeon RX 7600S | Schenker XMG Focus 15 (E23) i9-13900HX, GeForce RTX 4050 Laptop GPU | Gigabyte G7 KE i5-12500H, GeForce RTX 3060 Laptop GPU | Asus TUF A15 FA507 R7 7735HS, GeForce RTX 4050 Laptop GPU | Medion Erazer Scout E20 i7-13700H, GeForce RTX 4050 Laptop GPU | Acer Nitro 16 AN16-41 R7 7735HS, GeForce RTX 4070 Laptop GPU | Średnia w klasie Gaming | |
|---|---|---|---|---|---|---|---|---|
| Power Consumption | 20% | -32% | -10% | 23% | 13% | -7% | -12% | |
| Idle Minimum * (Watt) | 19 | 7 63% | 11.4 40% | 15 21% | 8 58% | 5 74% | 11.6 39% | 13.8 ? 27% |
| Idle Average * (Watt) | 20 | 10 50% | 16.7 16% | 17 15% | 12.1 39% | 11 45% | 15.6 22% | 19.5 ? 2% |
| Idle Maximum * (Watt) | 23 | 15 35% | 25.8 -12% | 24 -4% | 12.5 46% | 22 4% | 16.5 28% | 25.5 ? -11% |
| Load Average * (Watt) | 80 | 86 -8% | 139 -74% | 111 -39% | 74.9 6% | 96 -20% | 155 -94% | 110.6 ? -38% |
| Witcher 3 ultra * (Watt) | 125.8 | 160.6 -28% | 265 -111% | 174.1 -38% | 136.6 -9% | 145.2 -15% | 154.8 -23% | |
| Load Maximum * (Watt) | 184 | 172 7% | 280 -52% | 208 -13% | 185 -1% | 201 -9% | 205 -11% | 257 ? -40% |
* ... im mniej tym lepiej
Power consumption: The Witcher 3 / Stress test
Power consumption: External monitor
Żywotność baterii
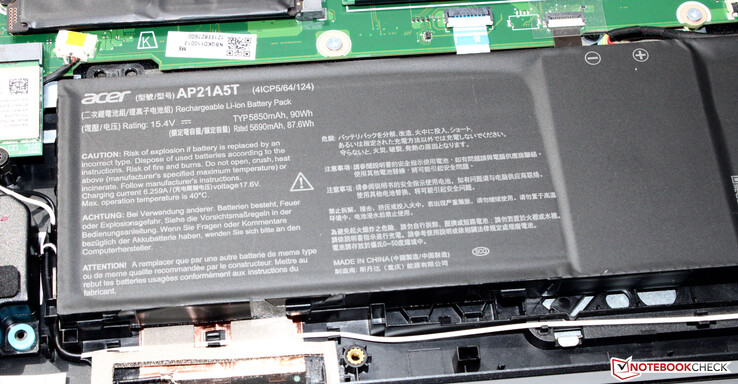
Nitro 16 osiąga czasy pracy wynoszące odpowiednio 11:00 h i 10:50 h w teście WLAN (wywoływanie stron internetowych za pomocą skryptu) i teście wideo (krótki film Big Buck Bunny FHD H.264 kodowany w pętli). Podczas obu testów funkcje oszczędzania energii notebooka są wyłączone, a jasność wyświetlacza jest ustawiona na około 150 cd/m². Moduły bezprzewodowe są również wyłączone na czas testu wideo.
Uwaga: Nitro wykazuje zwiększone zużycie energii w trybie bateryjnym w systemie Windows 11 (instalacja Acer, instalacja własna). W związku z tym czasy pracy są niższe niż w przypadku siostrzanego modelu Recenzja Acer Nitro 16 AN16-41: Laptop do gier z RTX 4070 i długim czasem pracy na baterii (WLAN: 5,5 vs. 9 h) przy tej samej pojemności baterii. Dlatego czasy pracy zostały określone pod Windows 10. Tutaj problem nie występuje.
Nie potrafimy wskazać przyczyny zwiększonego zużycia energii. Może to być problem naszego urządzenia testowego.
| Acer Nitro 16 AN16-41-R7YE R5 7535HS, GeForce RTX 4050 Laptop GPU, 90 Wh | Asus TUF Gaming A16 FA617XS R9 7940HS, Radeon RX 7600S, 90 Wh | Schenker XMG Focus 15 (E23) i9-13900HX, GeForce RTX 4050 Laptop GPU, 73 Wh | Gigabyte G7 KE i5-12500H, GeForce RTX 3060 Laptop GPU, 54 Wh | Asus TUF A15 FA507 R7 7735HS, GeForce RTX 4050 Laptop GPU, 90 Wh | Medion Erazer Scout E20 i7-13700H, GeForce RTX 4050 Laptop GPU, 53.35 Wh | Acer Nitro 16 AN16-41 R7 7735HS, GeForce RTX 4070 Laptop GPU, 90 Wh | Średnia w klasie Gaming | |
|---|---|---|---|---|---|---|---|---|
| Czasy pracy | 10% | -44% | -54% | -11% | -48% | -10% | -31% | |
| Reader / Idle (h) | 12 | 20.3 69% | 7.1 -41% | 6.7 -44% | 12.2 2% | 9.06 ? -24% | ||
| H.264 (h) | 10.8 | 12.4 15% | 2.2 -80% | 12.5 16% | 4.6 -57% | 10.2 -6% | 7.93 ? -27% | |
| WiFi v1.3 (h) | 11 | 12.4 13% | 5.9 -46% | 5.3 -52% | 11.7 6% | 4.7 -57% | 9 -18% | 6.68 ? -39% |
| Load (h) | 2.2 | 0.9 -59% | 1.3 -41% | 1.3 -41% | 1 -55% | 1.5 -32% | 1.8 -18% | 1.483 ? -33% |
Za
Przeciw
Werdykt: Niedrogie wejście do świata gier
Acer Nitro 16 został zaprojektowany z myślą o grach w rozdzielczości FHD przy wysokich i maksymalnych ustawieniach, ale sprawdza się również w innych obszarach (edycja wideo, renderowanie). ProcesorRyzen 5 7535HS i GeForce RTX 4050zapewniają niezbędną wydajność, a CPU i GPU mogą pracować ze stale wysokimi częstotliwościami taktowania.
Acer prezentuje dobrze zaokrąglony laptop do gier w segmencie podstawowym z Nitro 16.
Co zaskakujące, laptop nagrzewa się bardziej pod obciążeniem niż jego siostrzany model wyposażony w mocniejszy sprzęt. Modele Nitro nie mają ze sobą wiele wspólnego pod względem generowanego hałasu. Tryb "Zrównoważony" zapewnia umiarkowany hałas w tle.
16-calowy wyświetlacz (WUXGA) niewiele ustępuje panelowi (WQXGA) siostrzanego modelu. Ten drugi oferuje wyższą maksymalną jasność (400 nitów vs. 500 nitów). I tak już dobre czasy pracy Ryzen 7 Nitro są przewyższane przez obecny model, nawet jeśli tylko w systemie Windows 10. Pojemność pamięci masowej (512 GB) jest skromna jak na notebooka do gier.
Alternatywę można znaleźć w Asus TUF A15 FA507. Oferuje on większą wydajność procesora przy nieco lepszym czasie pracy na baterii. Płyta główna Gigabyte G7 KE byłby budżetową alternatywą, w której niższy poziom wydajności byłby równoważony niższą ceną zakupu (1050 euro). Jednak system operacyjny Windows nie jest objęty zakresem dostawy.
Cena i dostępność
W USA użytkownicy mogą zamówić niektóre warianty Acer Nitro 16 AN16-41 na Amazon, które mają mocniejsze konfiguracje niż ta, którą recenzowaliśmy.
Acer Nitro 16 AN16-41-R7YE
- 01/08/2023 v7 (old)
Sascha Mölck
Przezroczystość
Wyboru urządzeń do recenzji dokonuje nasza redakcja. Próbka testowa została udostępniona autorowi jako pożyczka od producenta lub sprzedawcy detalicznego na potrzeby tej recenzji. Pożyczkodawca nie miał wpływu na tę recenzję, producent nie otrzymał też kopii tej recenzji przed publikacją. Nie było obowiązku publikowania tej recenzji. Jako niezależna firma medialna, Notebookcheck nie podlega władzy producentów, sprzedawców detalicznych ani wydawców.
Tak testuje Notebookcheck
Każdego roku Notebookcheck niezależnie sprawdza setki laptopów i smartfonów, stosując standardowe procedury, aby zapewnić porównywalność wszystkich wyników. Od około 20 lat stale rozwijamy nasze metody badawcze, ustanawiając przy tym standardy branżowe. W naszych laboratoriach testowych doświadczeni technicy i redaktorzy korzystają z wysokiej jakości sprzętu pomiarowego. Testy te obejmują wieloetapowy proces walidacji. Nasz kompleksowy system ocen opiera się na setkach uzasadnionych pomiarów i benchmarków, co pozwala zachować obiektywizm.

