
Werdykt
Erazer Deputy 15 P1 pozostawił po sobie pozytywne wrażenie w teście. Podczas gdy niektóre inne laptopy do gier RTX 5060, takie jak niedawno testowany MSI Cyborg 15cierpią z powodu niskiego TGP, układ Blackwell jest w stanie zapewnić tutaj solidną wydajność, nawet jeśli wciąż jest miejsce na poprawę w porównaniu do konkurentów Lenovo (np LOQ 15 i Legion 5 15). Zainstalowany Core 7 250H również nie jest flagowym modelem, ale nadal wypada przekonująco w porównaniu z rywalami w przedziale cenowym poniżej 1500 euro. Dość solidna obudowa, w połączeniu z dobrymi urządzeniami wejściowymi i przyzwoitym wyborem portów, dodatkowo zwiększa jego atrakcyjność.
Jakość wyświetlania jest jednak nieco słaba. W szczególności panel IPS 144 Hz oferuje jedynie ograniczoną gamę kolorów. Niektórzy konkurenci, tacy jak XMG Core 15 M25wypadają pod tym względem lepiej. Ten 15-calowy laptop ma również pewne problemy z jakością dźwięku i poziomem hałasu. Ogólnie rzecz biorąc, Deputy 15 P1 nie może ubiegać się o tytuł "najlepszego laptopa do gier RTX 5060"
Za
Przeciw
Cena i dostępność
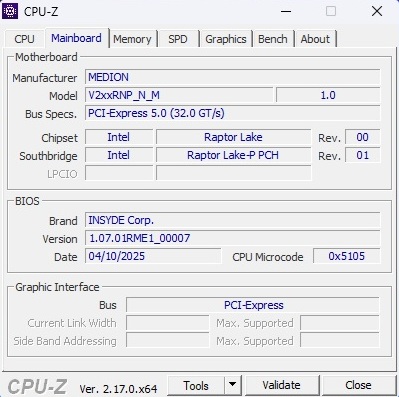
Testowany Medion Erazer Deputy 15 P1 MD62761, wyposażony w Core 7 250H i GeForce RTX 5060, jest dostępny za niecałe 1300 euro (ok. 1531 USD) u różnych sprzedawców internetowych (np. CoolBlue).
Uwaga tłumacza: Laptopy Medion nie są oficjalnie sprzedawane w Ameryce Północnej.
Specyfikacje
Przypadek
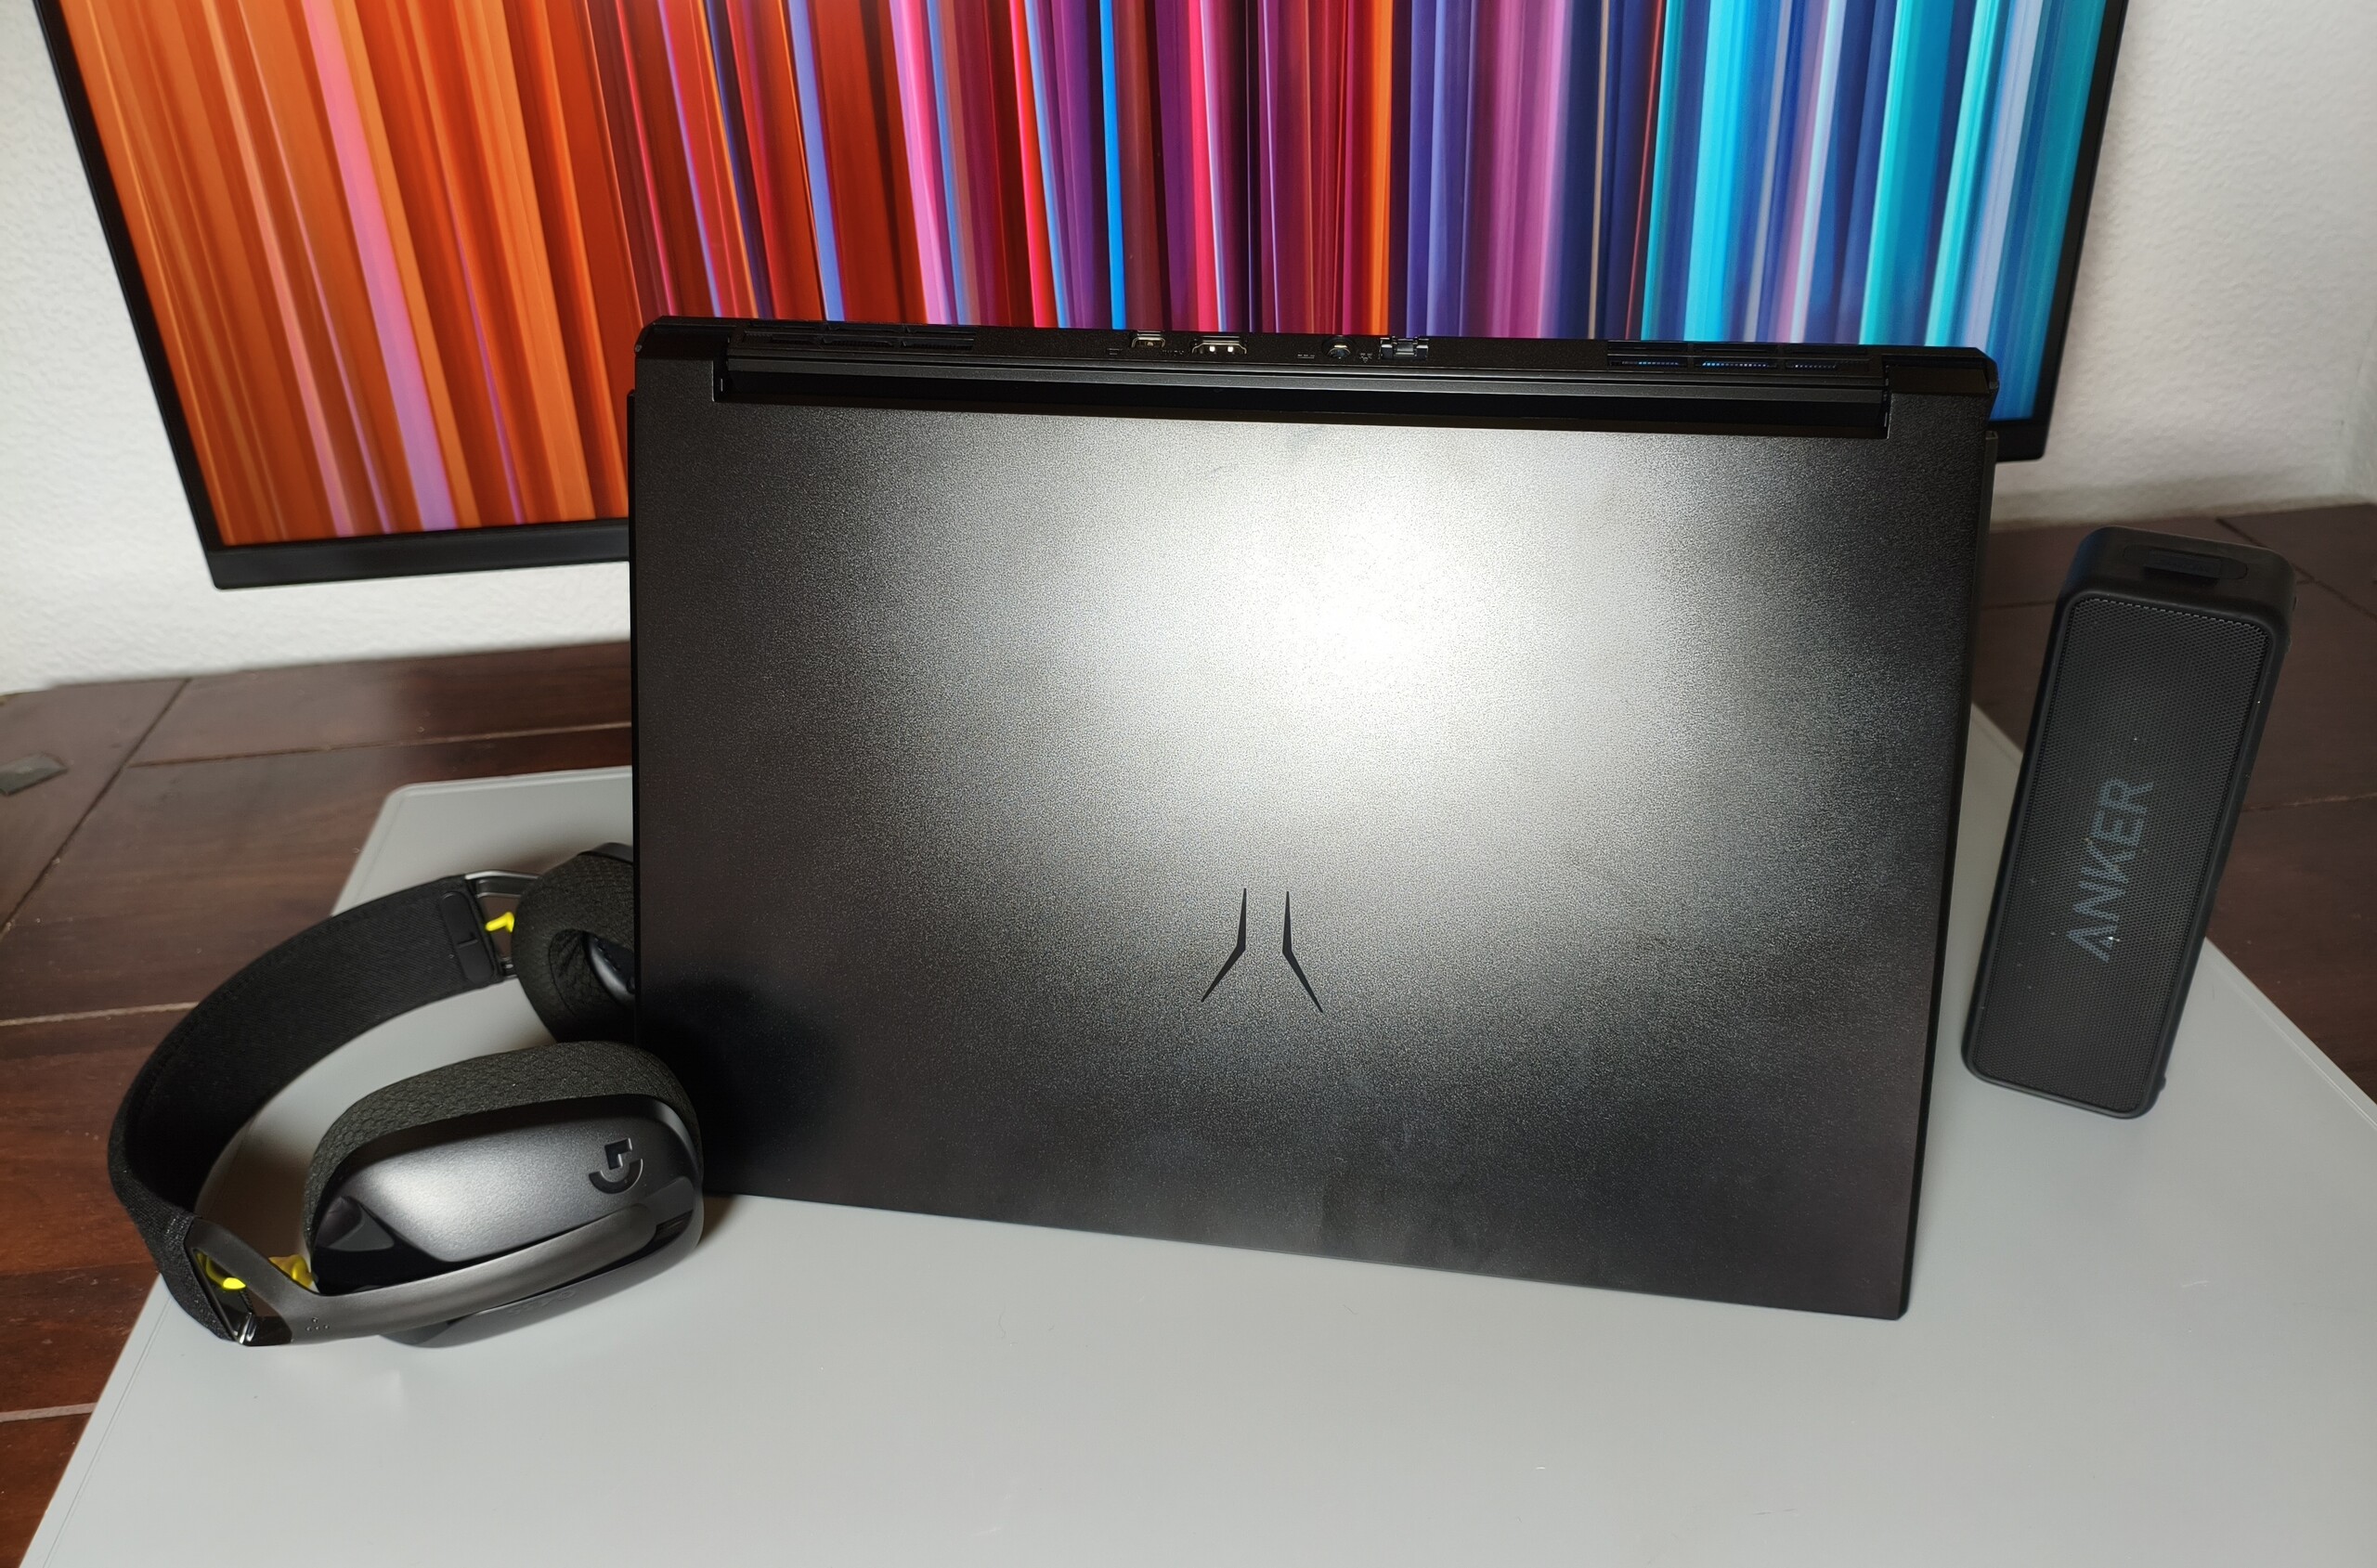
Podobnie jak XMG, Medion również opiera się na barebones i obudowach odpowiednio od Tongfang i Clevo. Erazer Deputy 15 P1 bazuje na tej ostatniej i waży około 2,2 kg, co plasuje go mniej więcej pośrodku konkurencyjnych modeli o wadze 1,9-2,4 kg. Podczas gdy pokrywa jest wykonana z metalu, dość solidna jednostka bazowa jest plastikowa. Nie ma nic do zarzucenia jakości wykonania, choć maksymalny kąt otwarcia wynoszący zaledwie 130° mógłby być lepszy.
Sprzęt
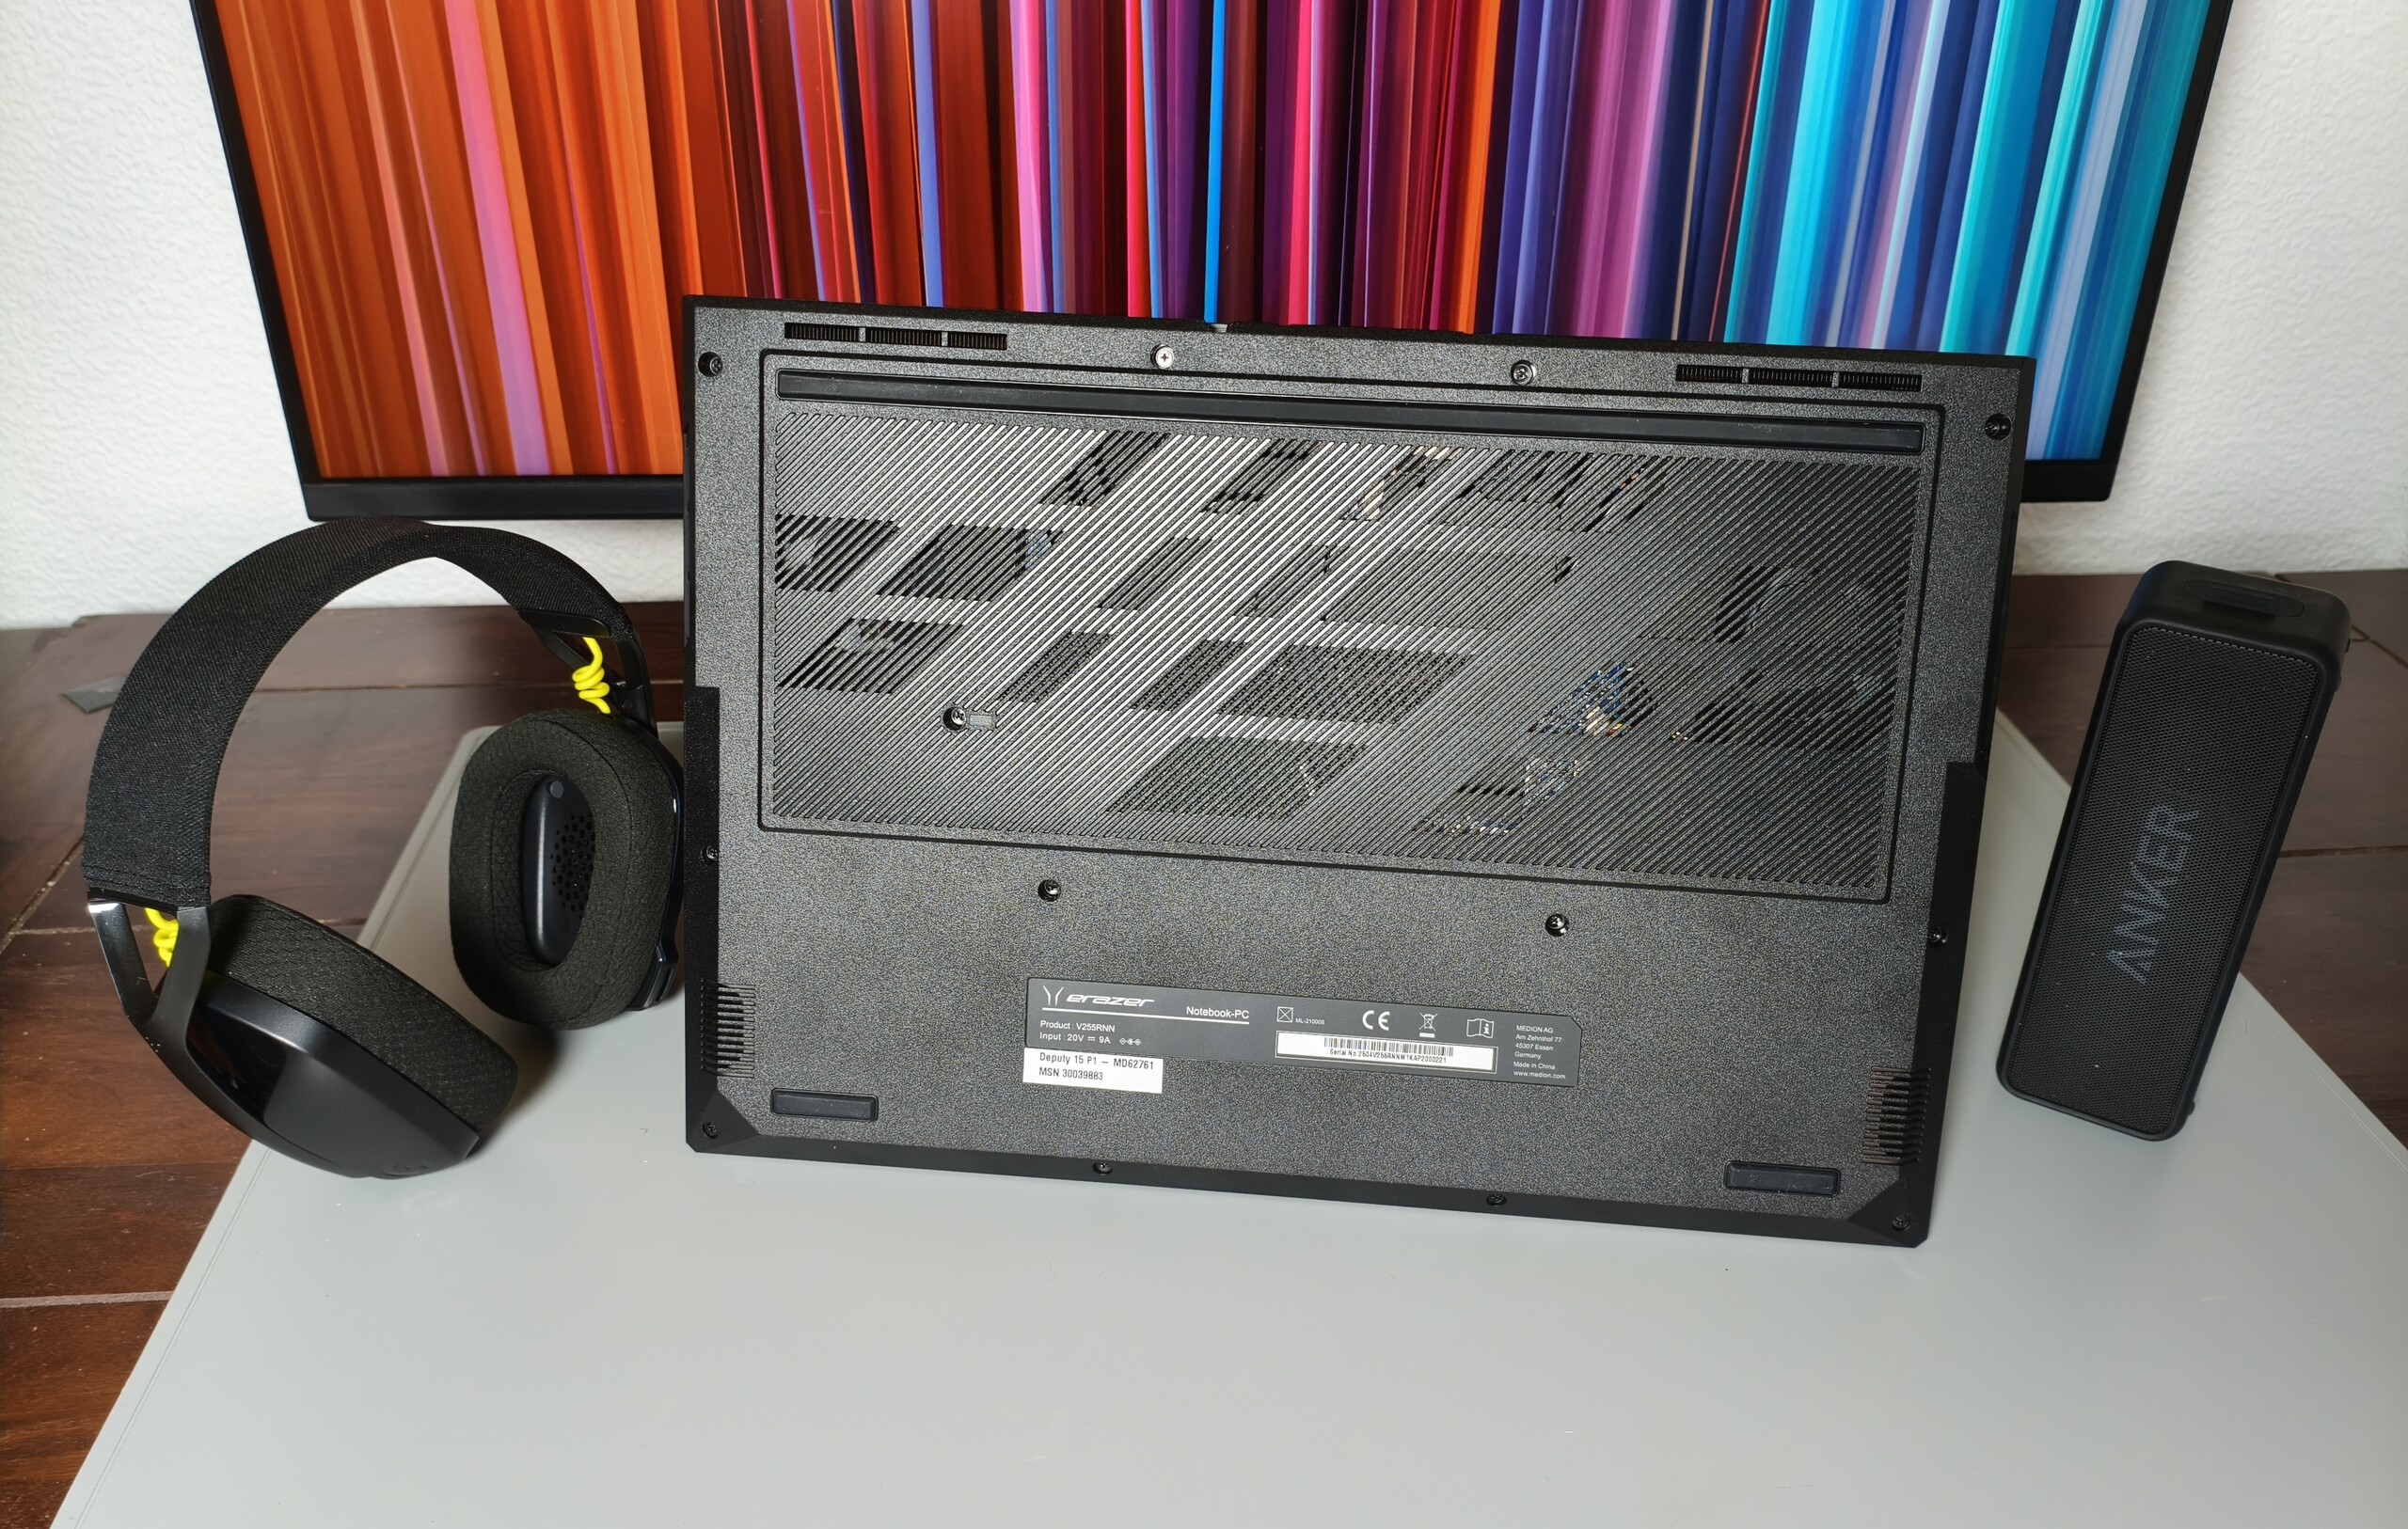
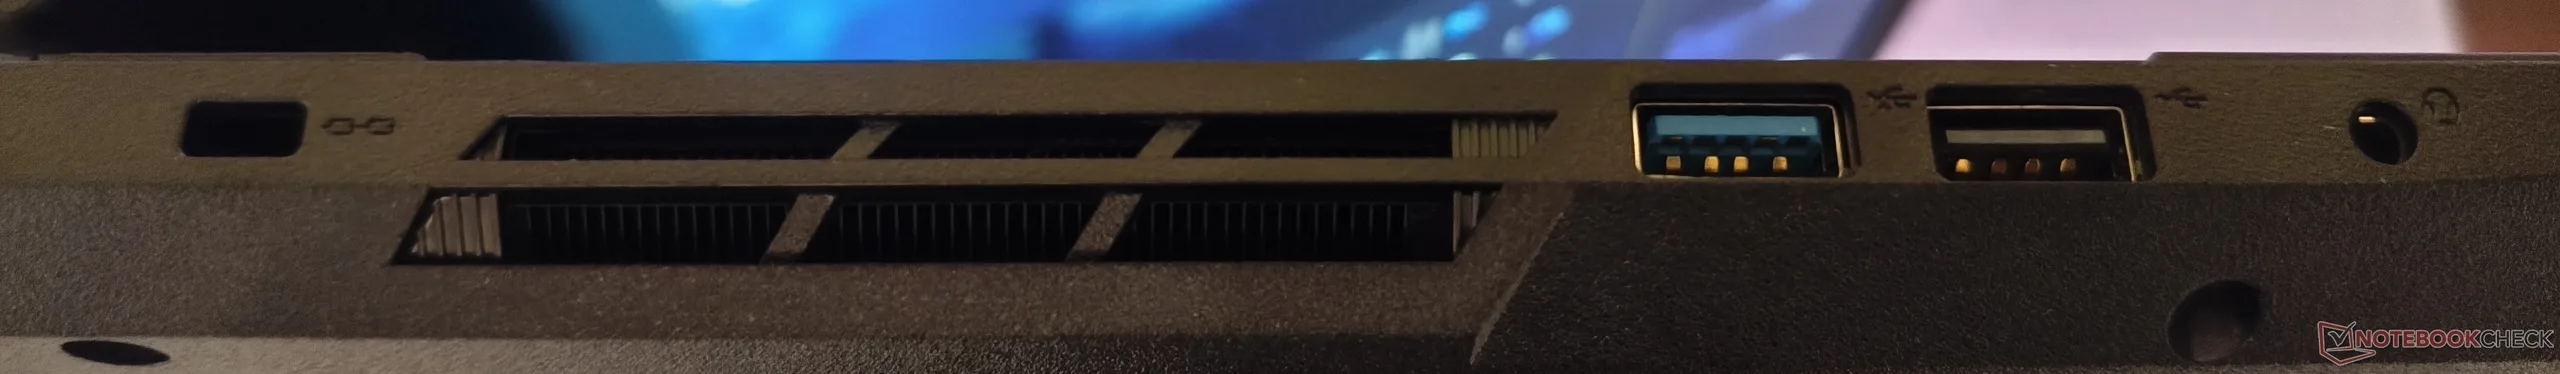
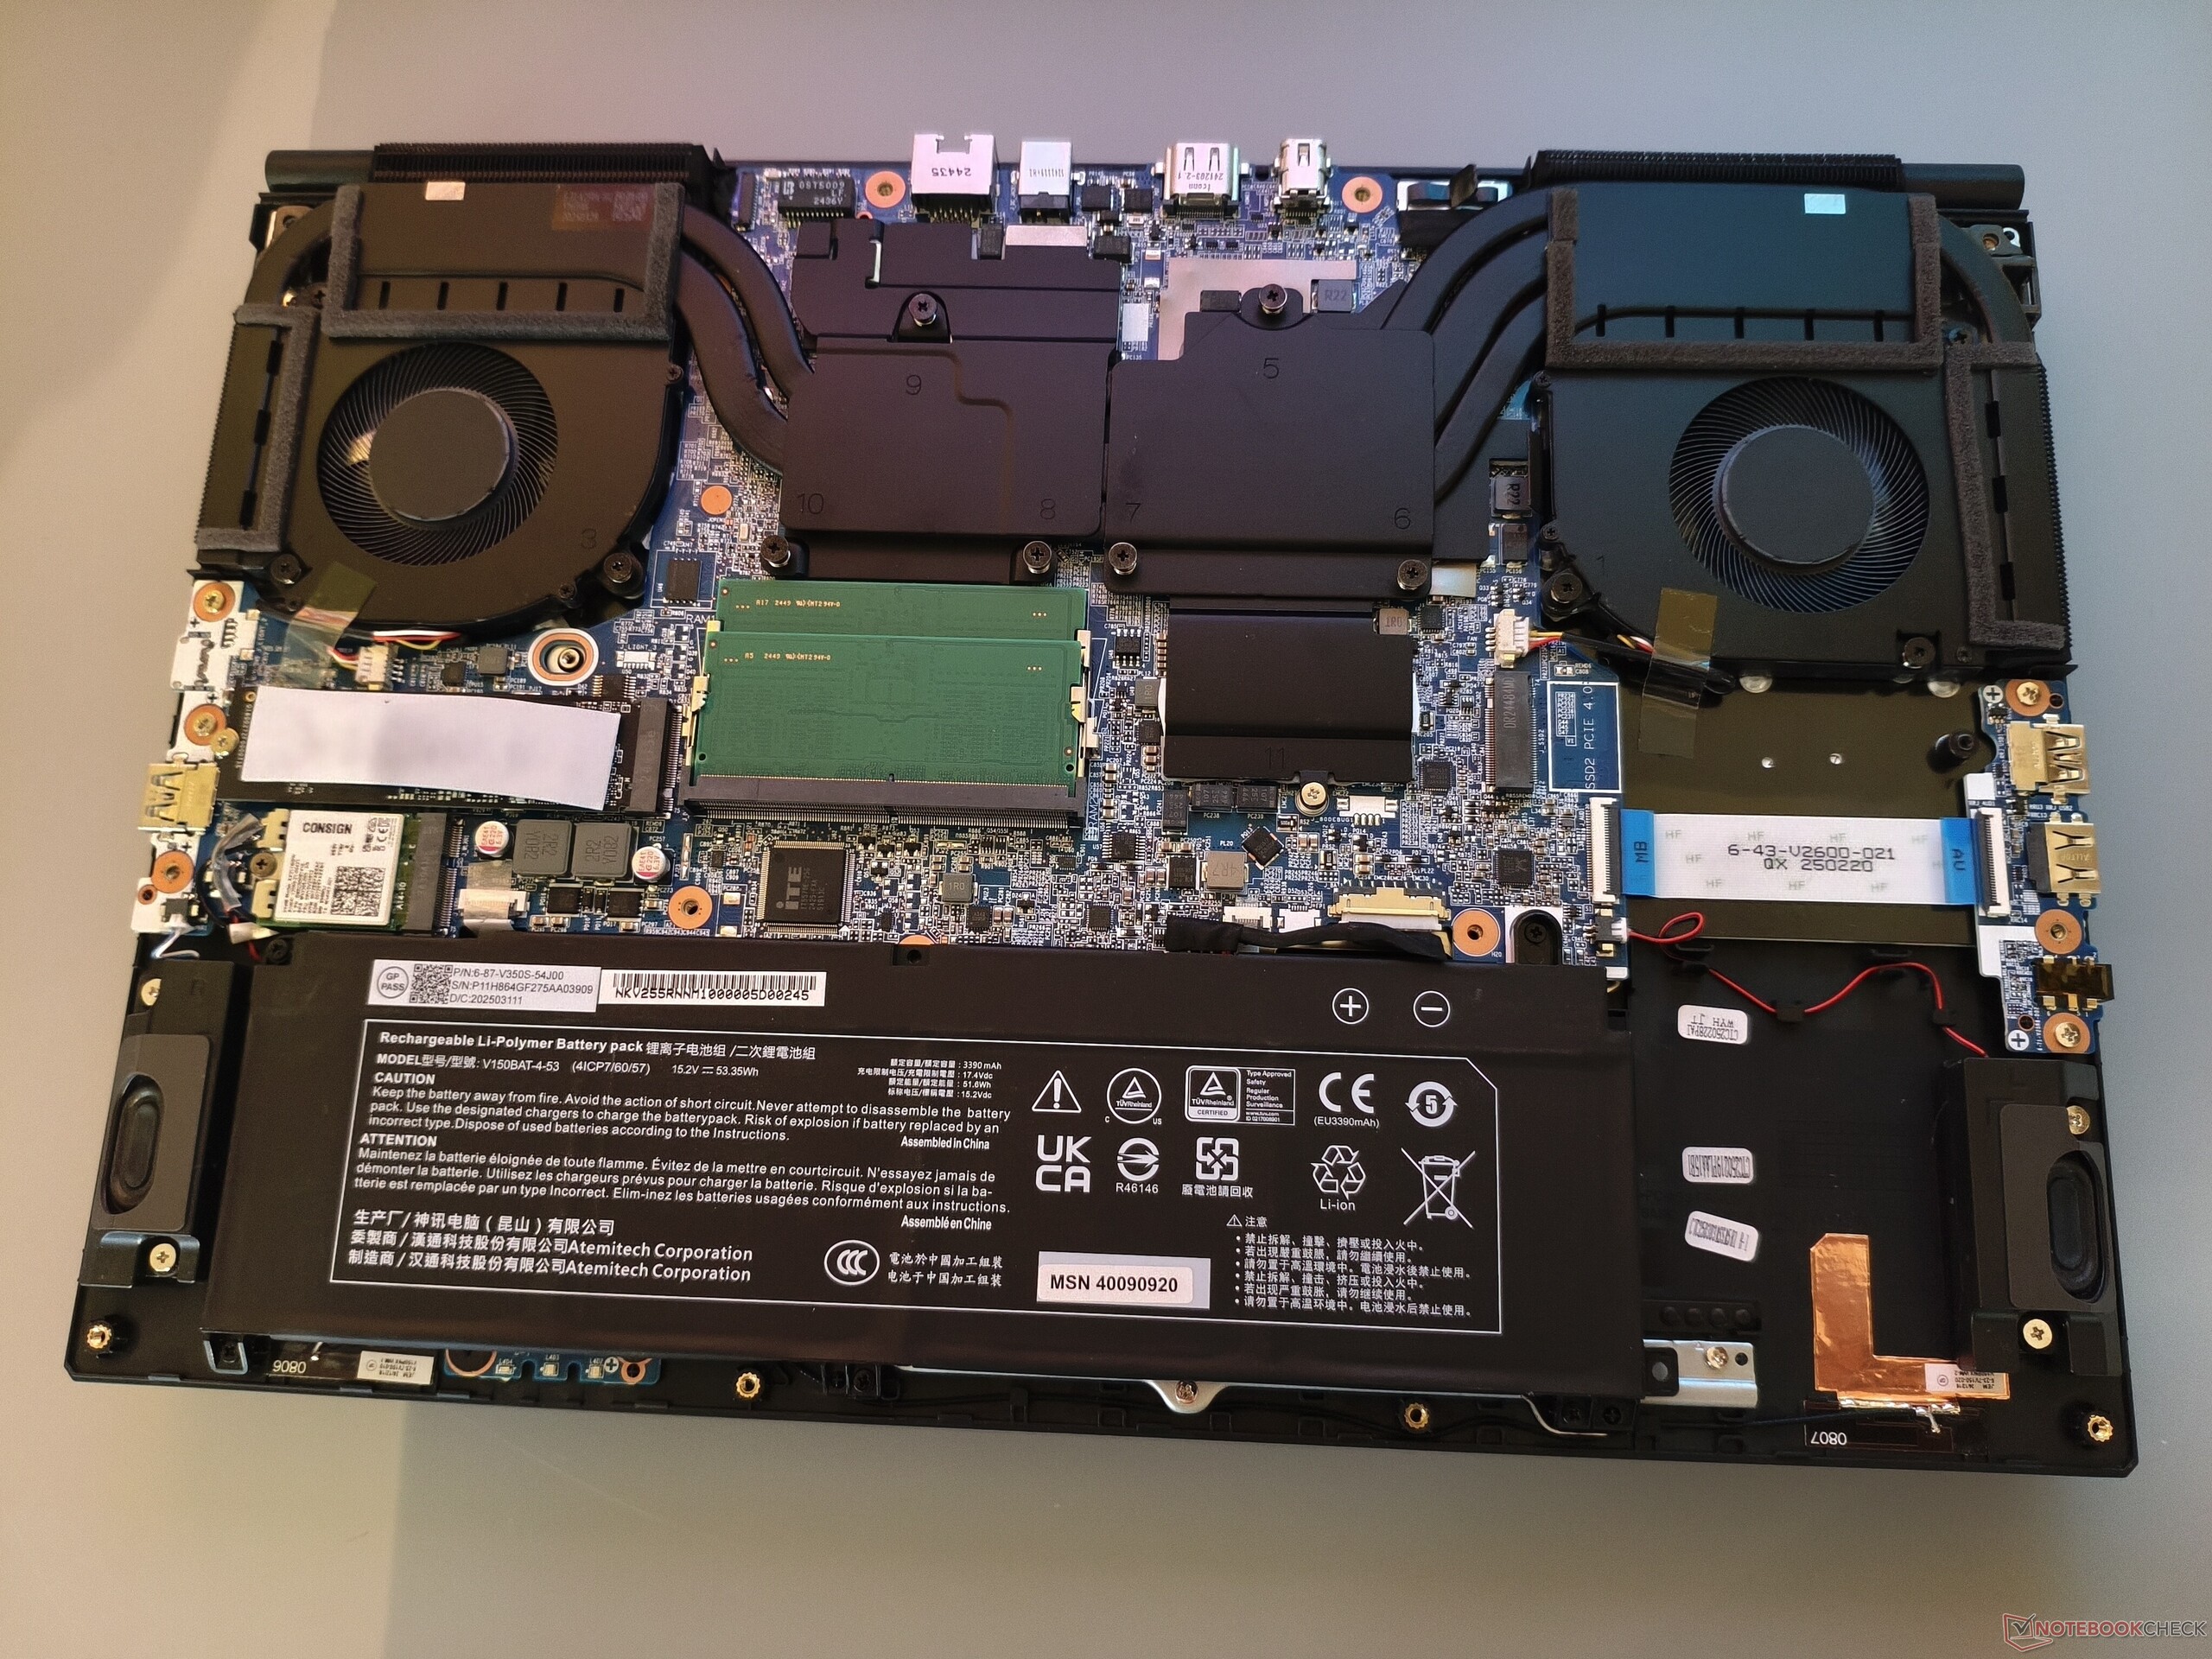
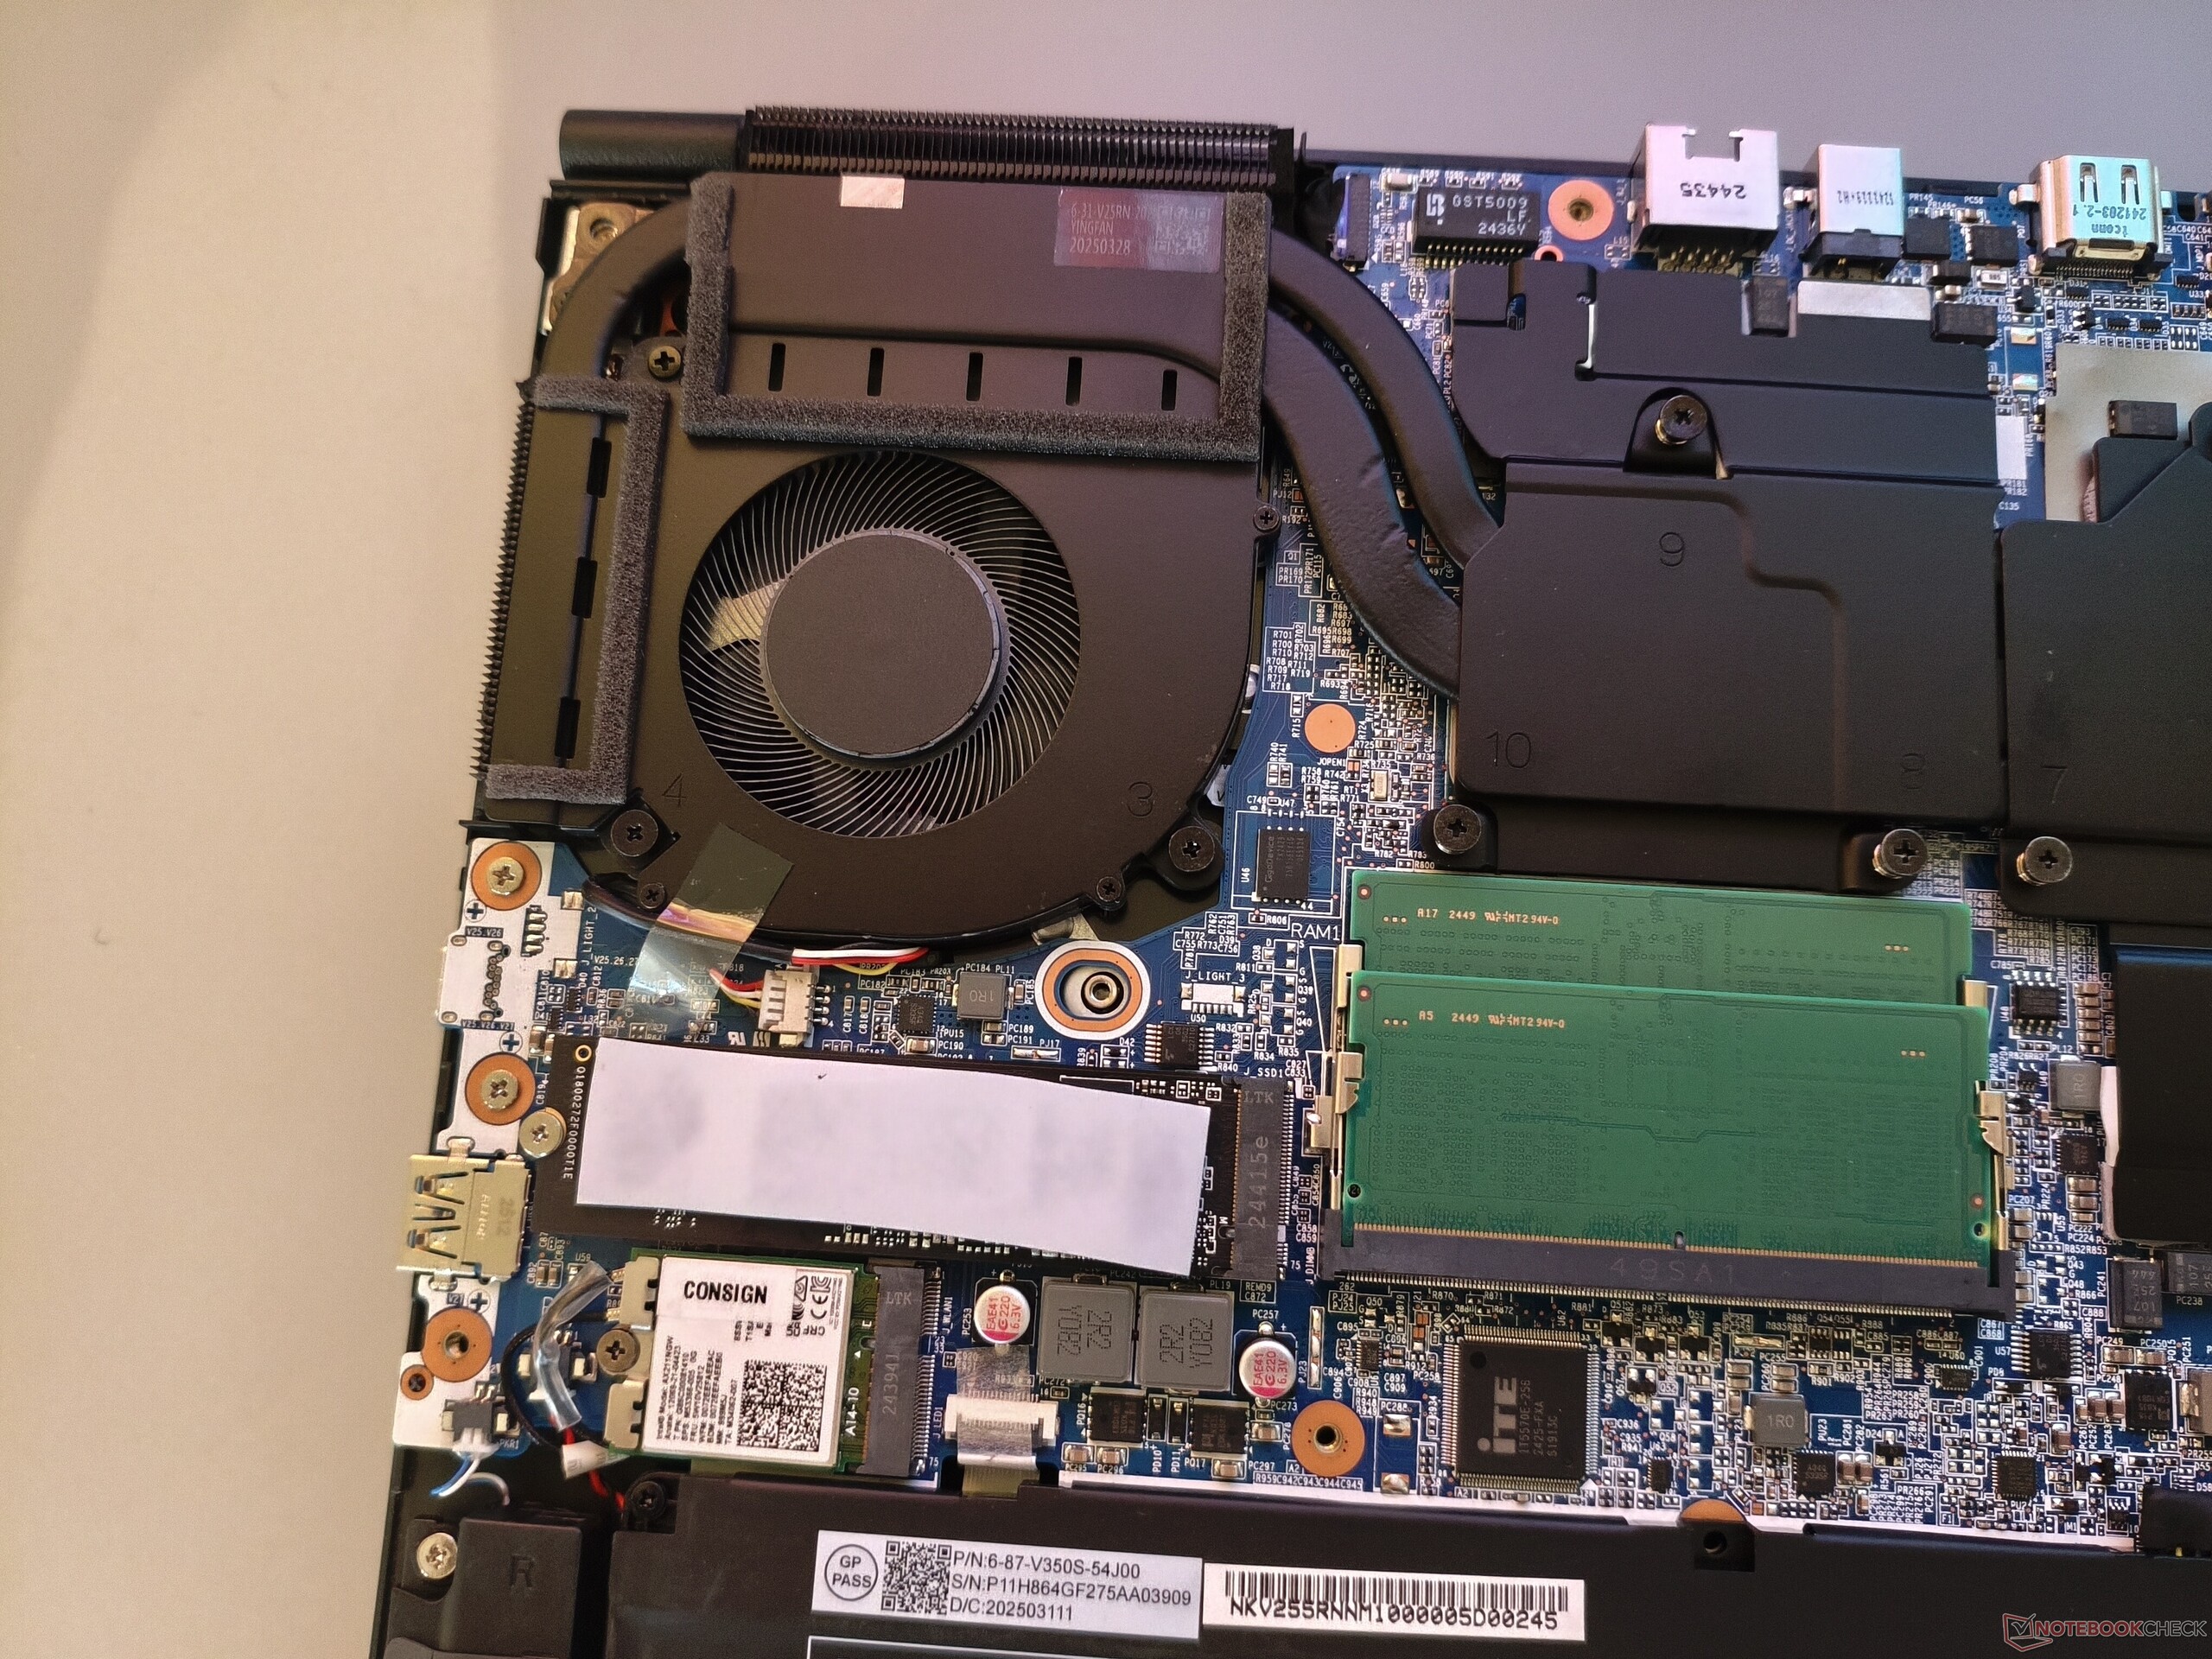
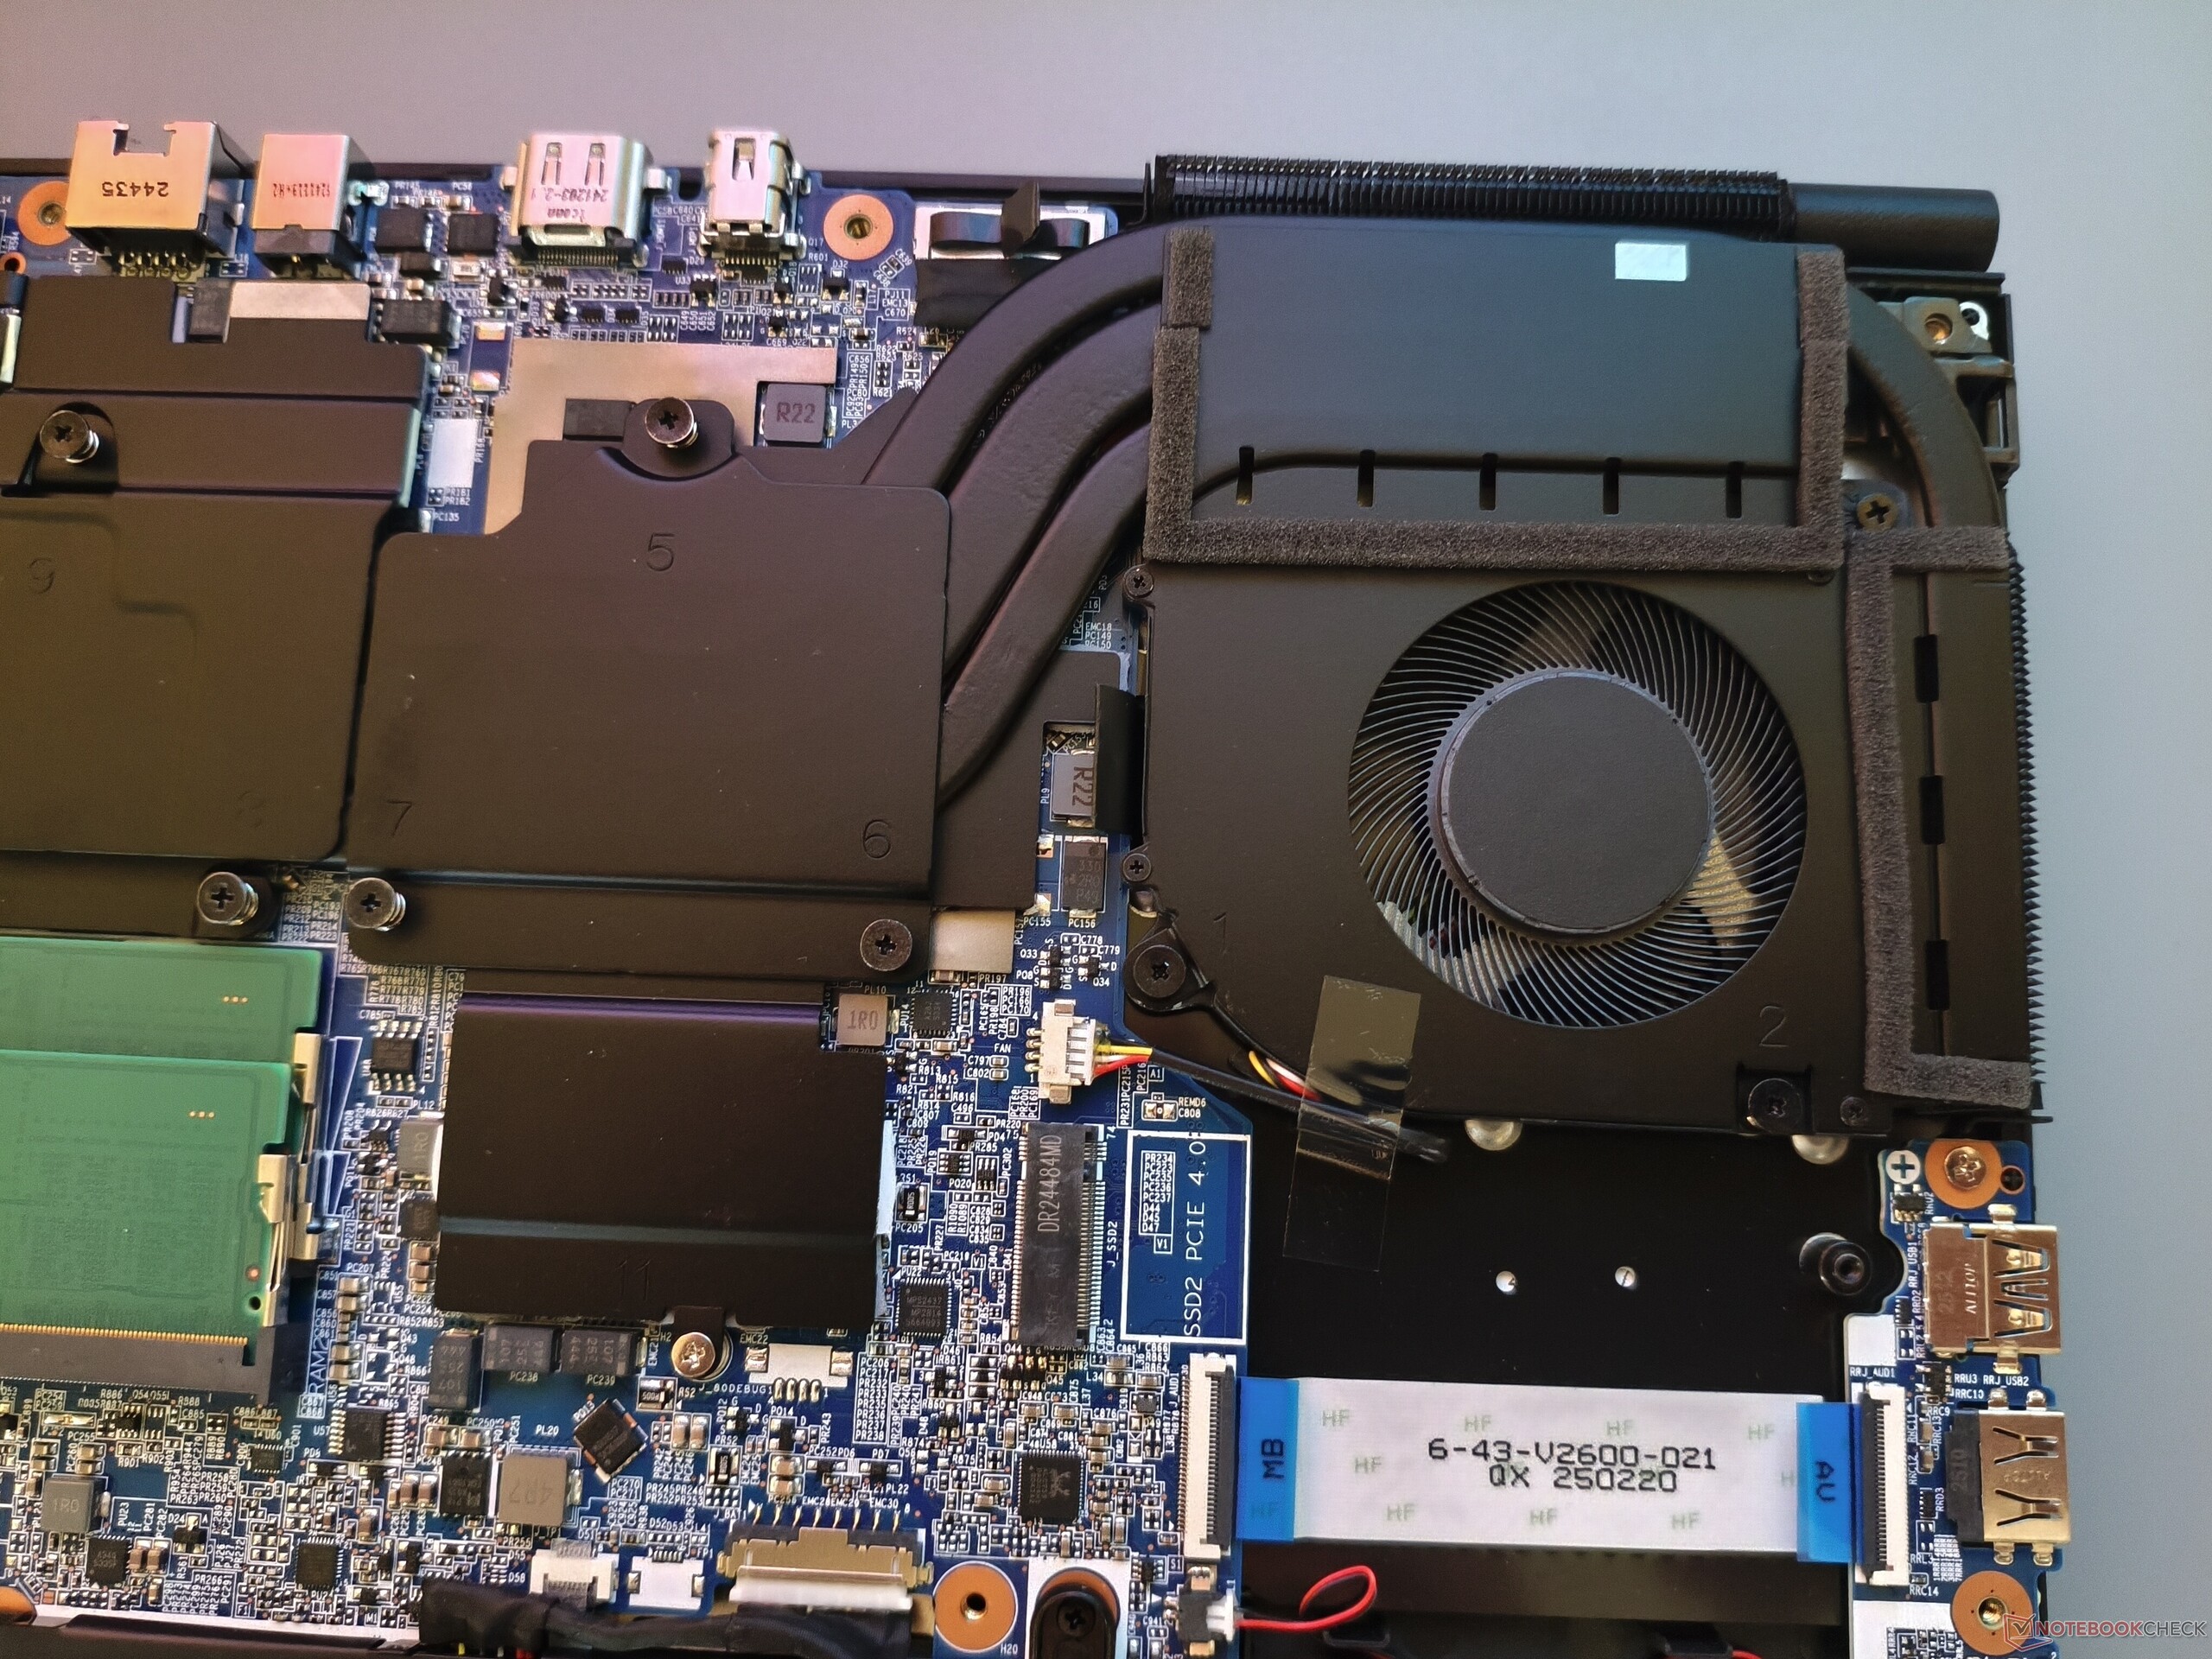
Pomijając brak obsługi USB 4/Thunderbolt i czytnika kart, łączność jest więcej niż solidna. 15-calowy model posiada trzy porty USB-A, jeden port typu C, gniazdo audio, port RJ45 i gniazdo blokady Kensington. Zewnętrzne wyświetlacze można podłączyć bezpośrednio przez HDMI lub Mini DisplayPort. Moduł bezprzewodowy Intela (AX211) działa dobrze lub bardzo dobrze, natomiast ostrość obrazu z kamery internetowej jest słaba. Dolny panel można zdjąć po odkręceniu 13 śrubek krzyżakowych. Jak widać na poniższych zdjęciach, Deputy 15 P1 oferuje dwa sloty na pamięć RAM i dwa sloty na dyski SSD, co zasługuje na pochwałę.


Komunikacja
Kamera internetowa


Konserwacja
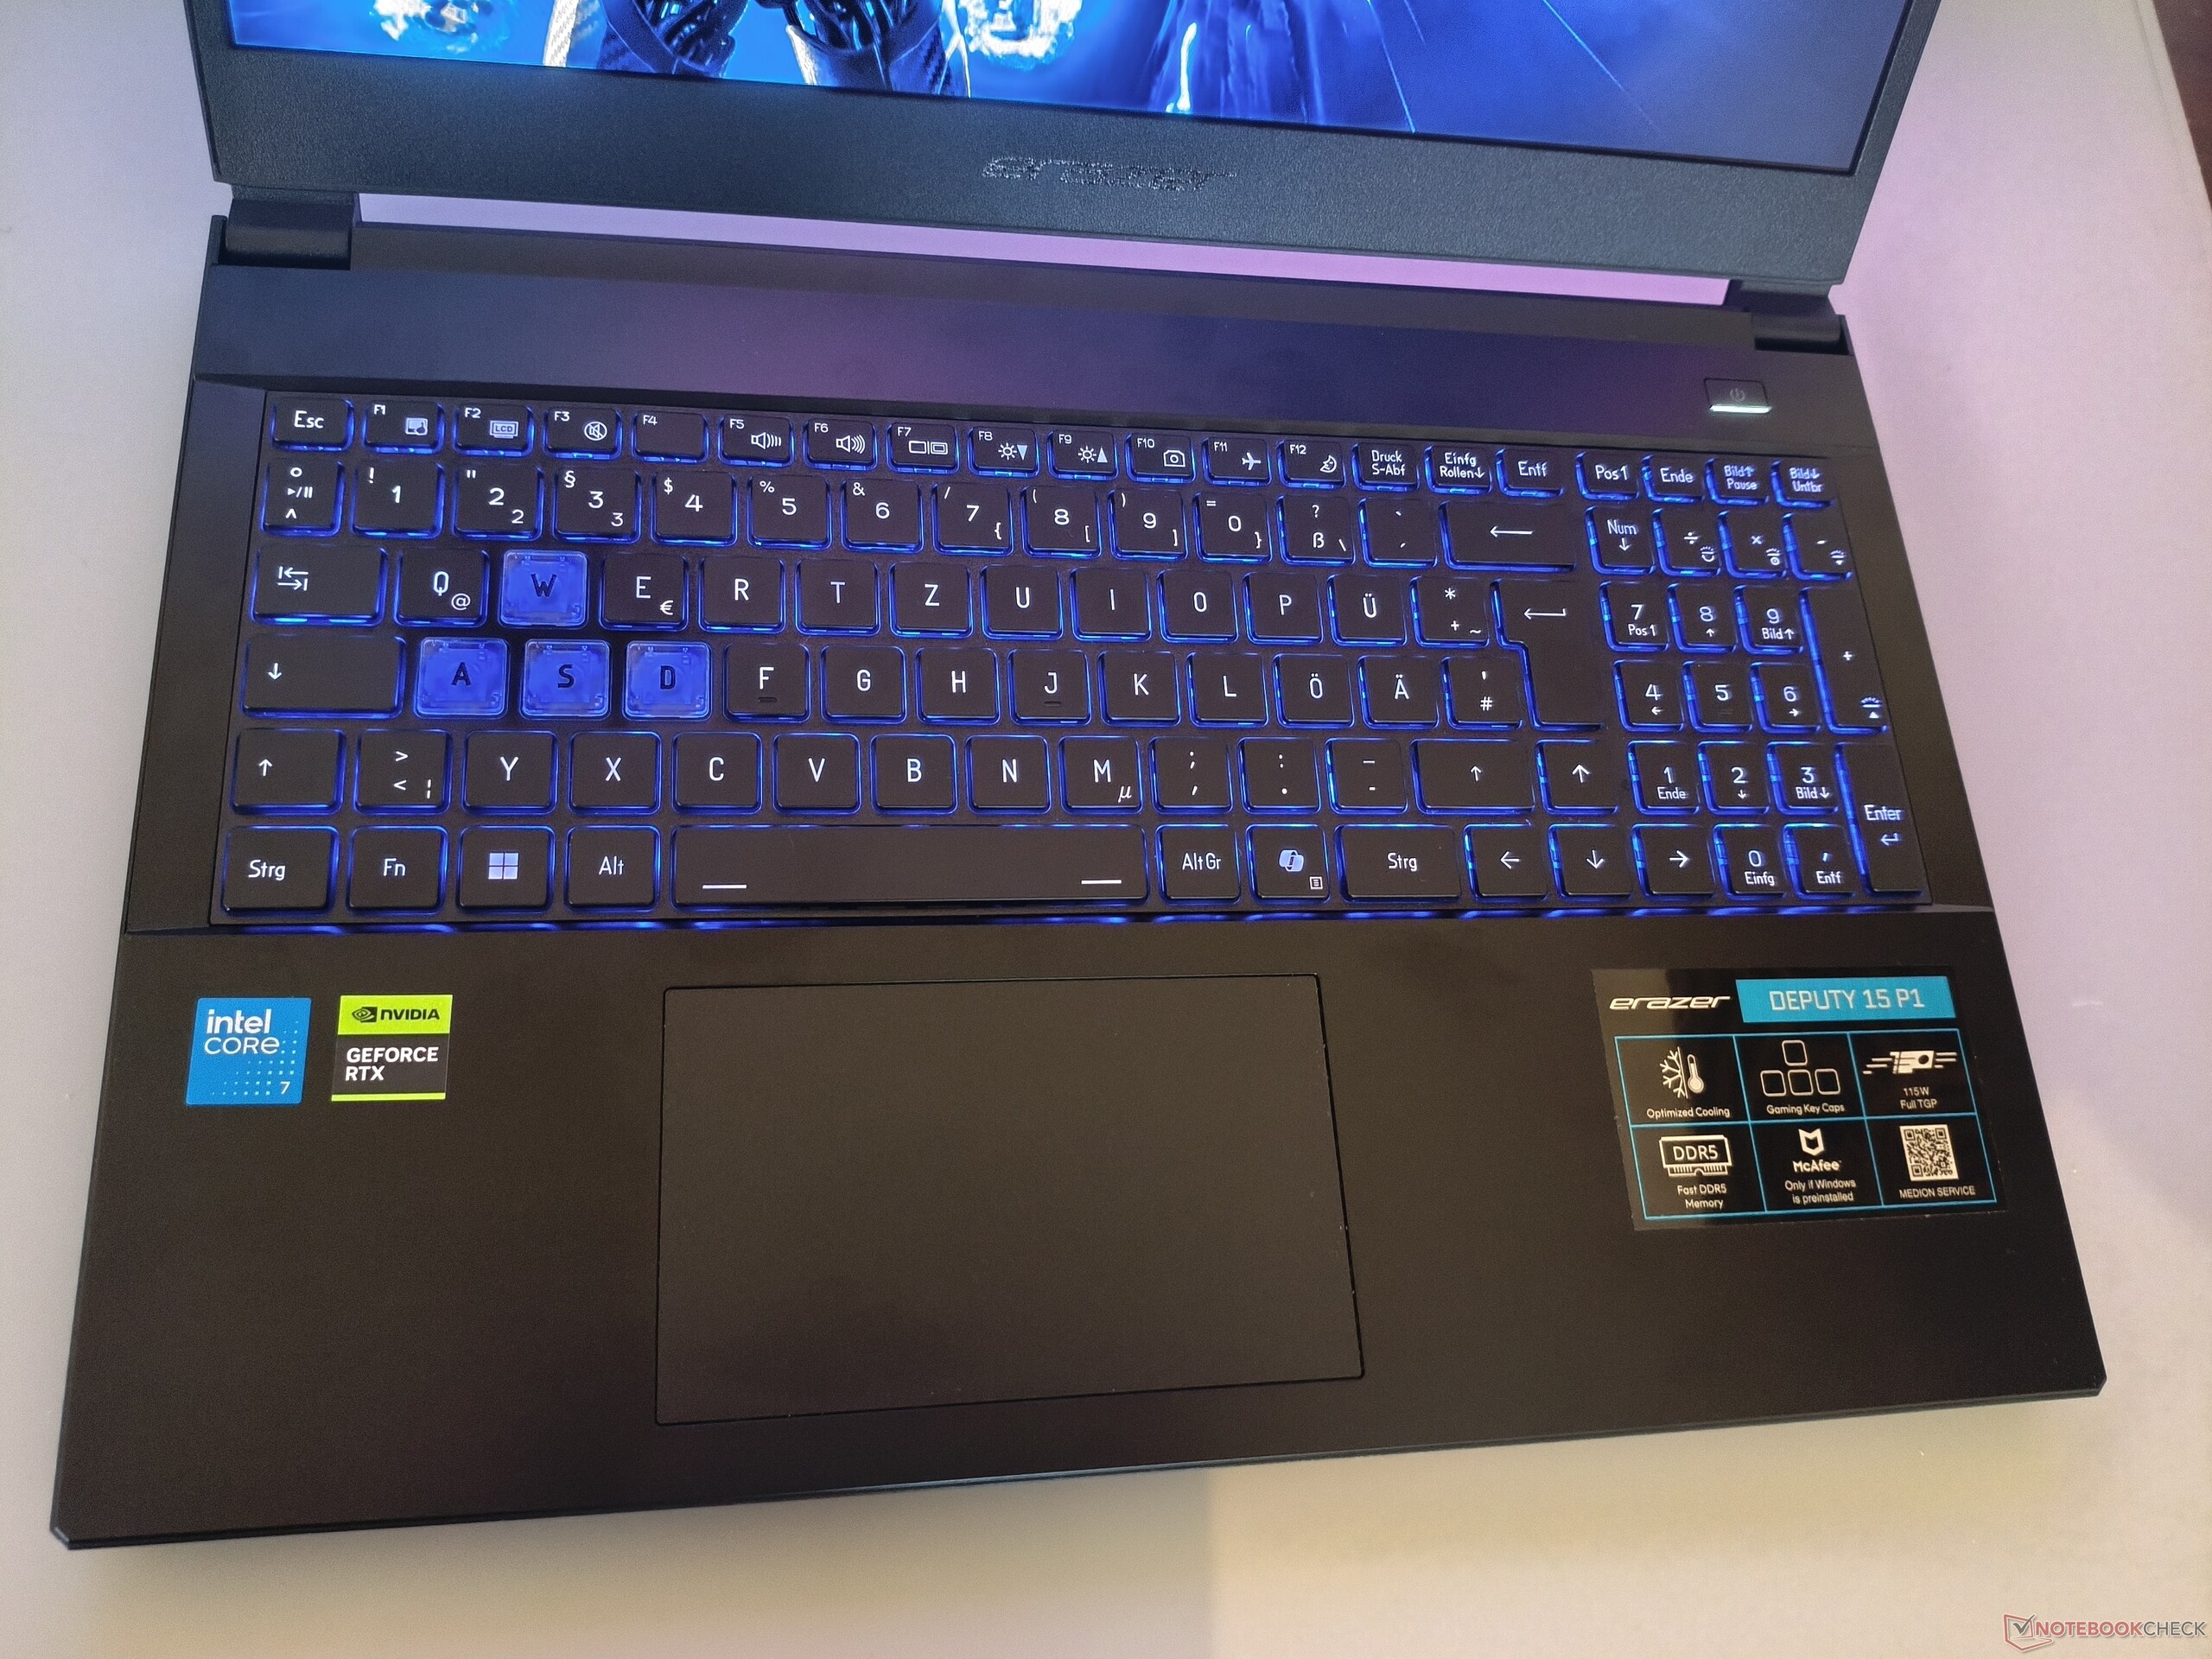
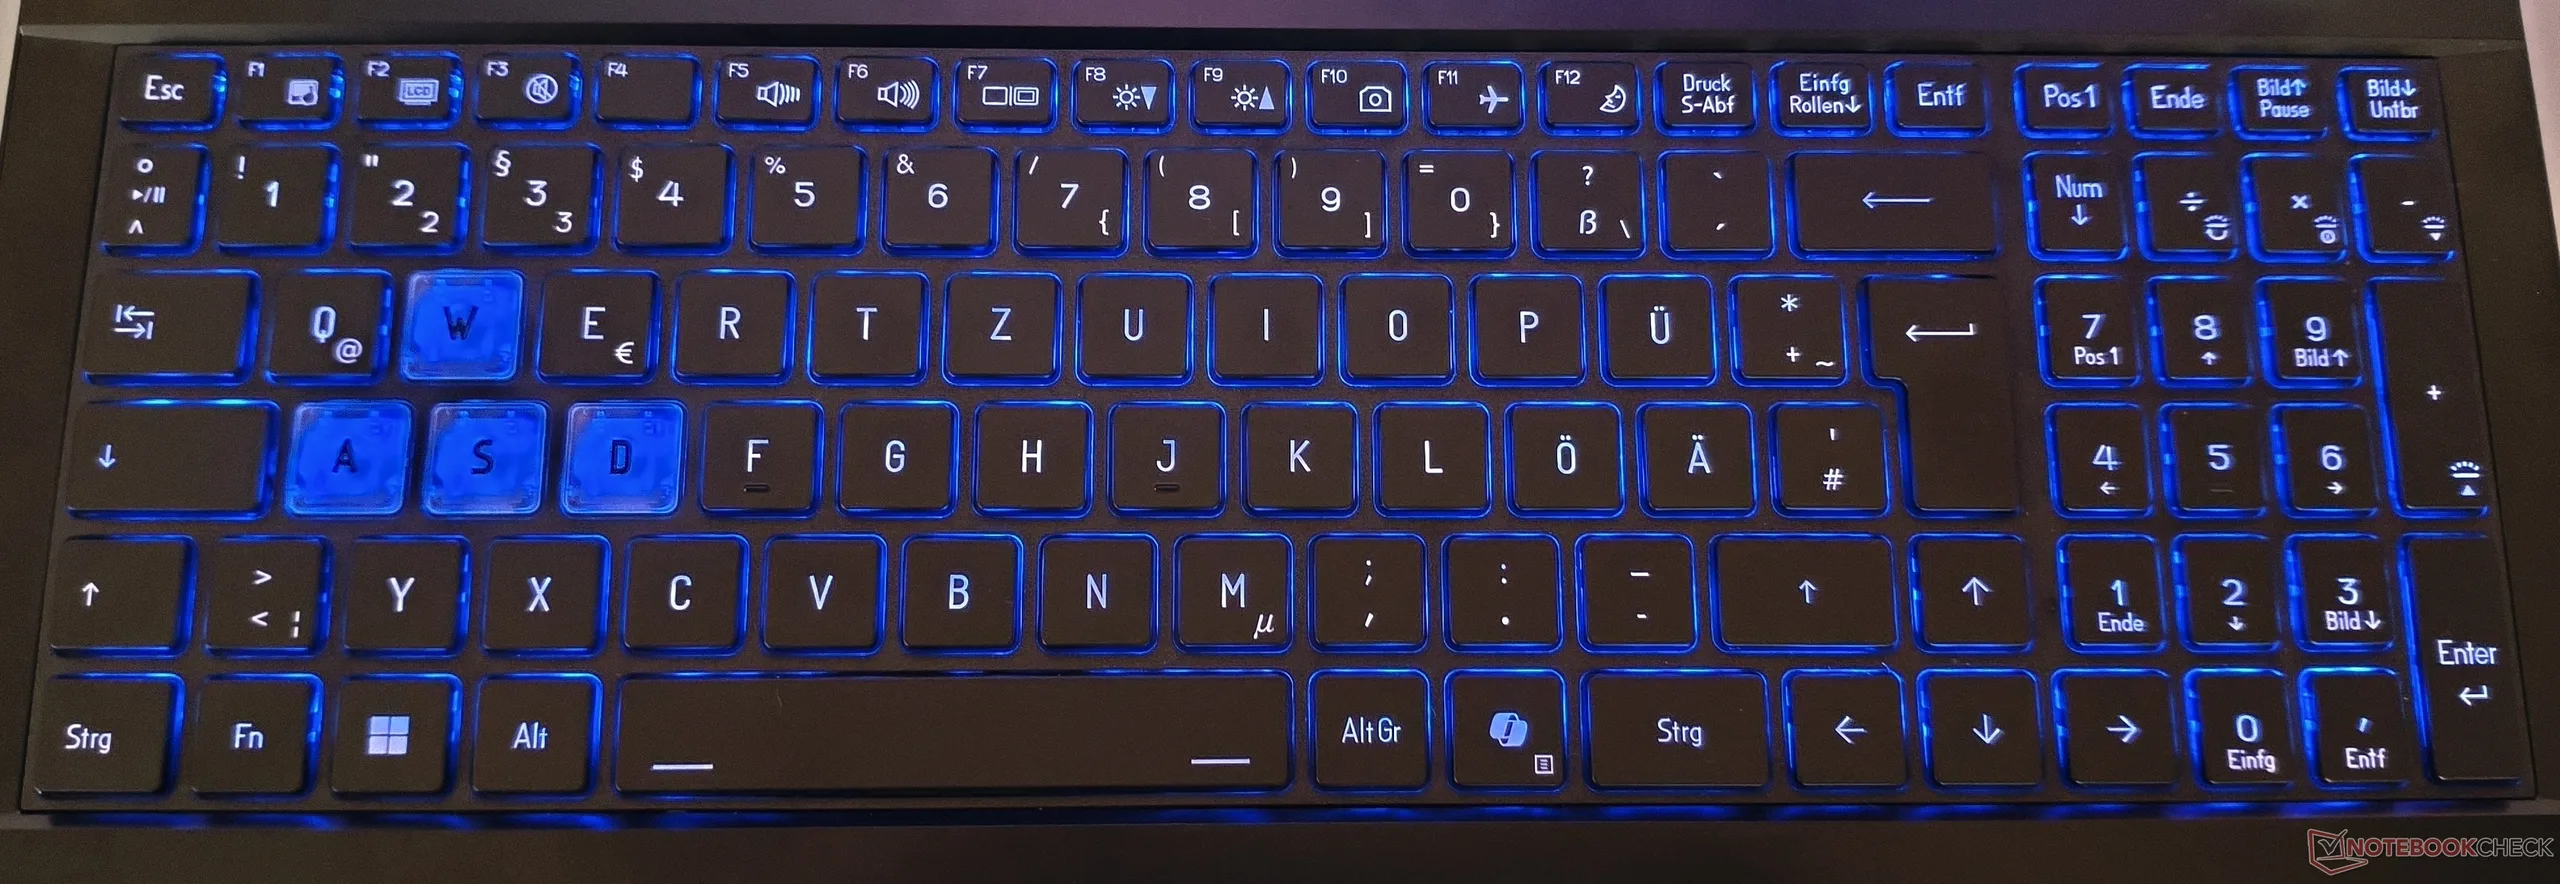
Urządzenia wejściowe
Jak na standardy gumowych kopułek, klawiatura robi stosunkowo dobre wrażenie. Skok klawiszy jest więcej niż przyzwoity, choć sprzężenie zwrotne mogłoby być nieco twardsze, jak na nasz gust. Szczególnie przypadł nam do gustu układ klawiszy, z którego inni producenci mogliby brać przykład. Klawisze strzałek są odpowiedniej wielkości, a prawie cała szerokość notebooka jest wykorzystana. Touchpad, mierzący około 12,1 × 7,3 cm, generalnie oferuje dobrą precyzję i akceptowalne właściwości ślizgowe. Jednak, podobnie jak w przypadku wielu laptopów, kliknięcia brzmią nieco grzechotliwie.
Wyświetlacz
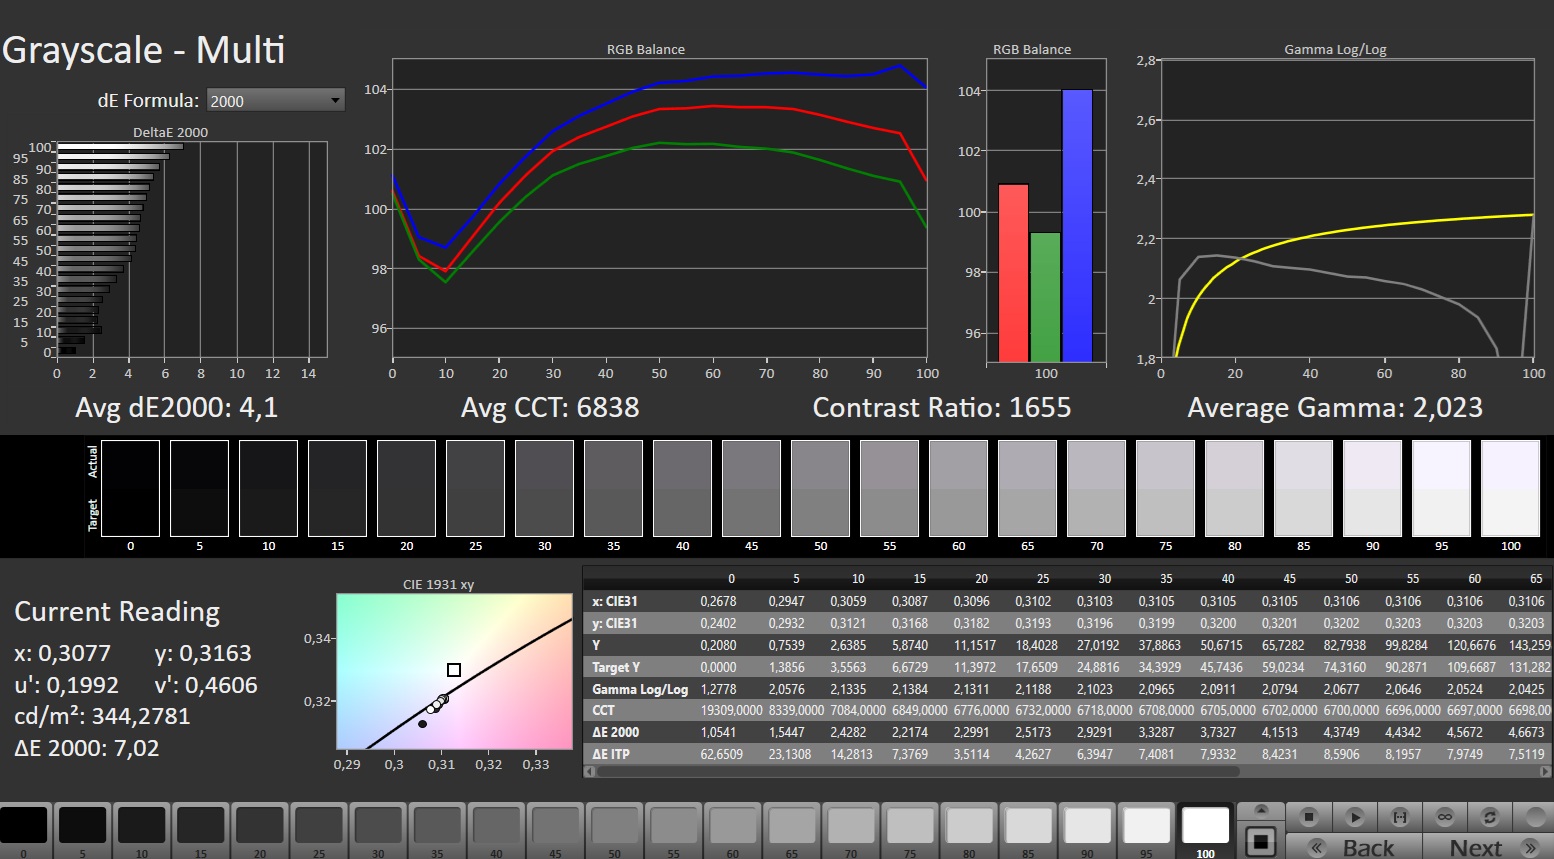
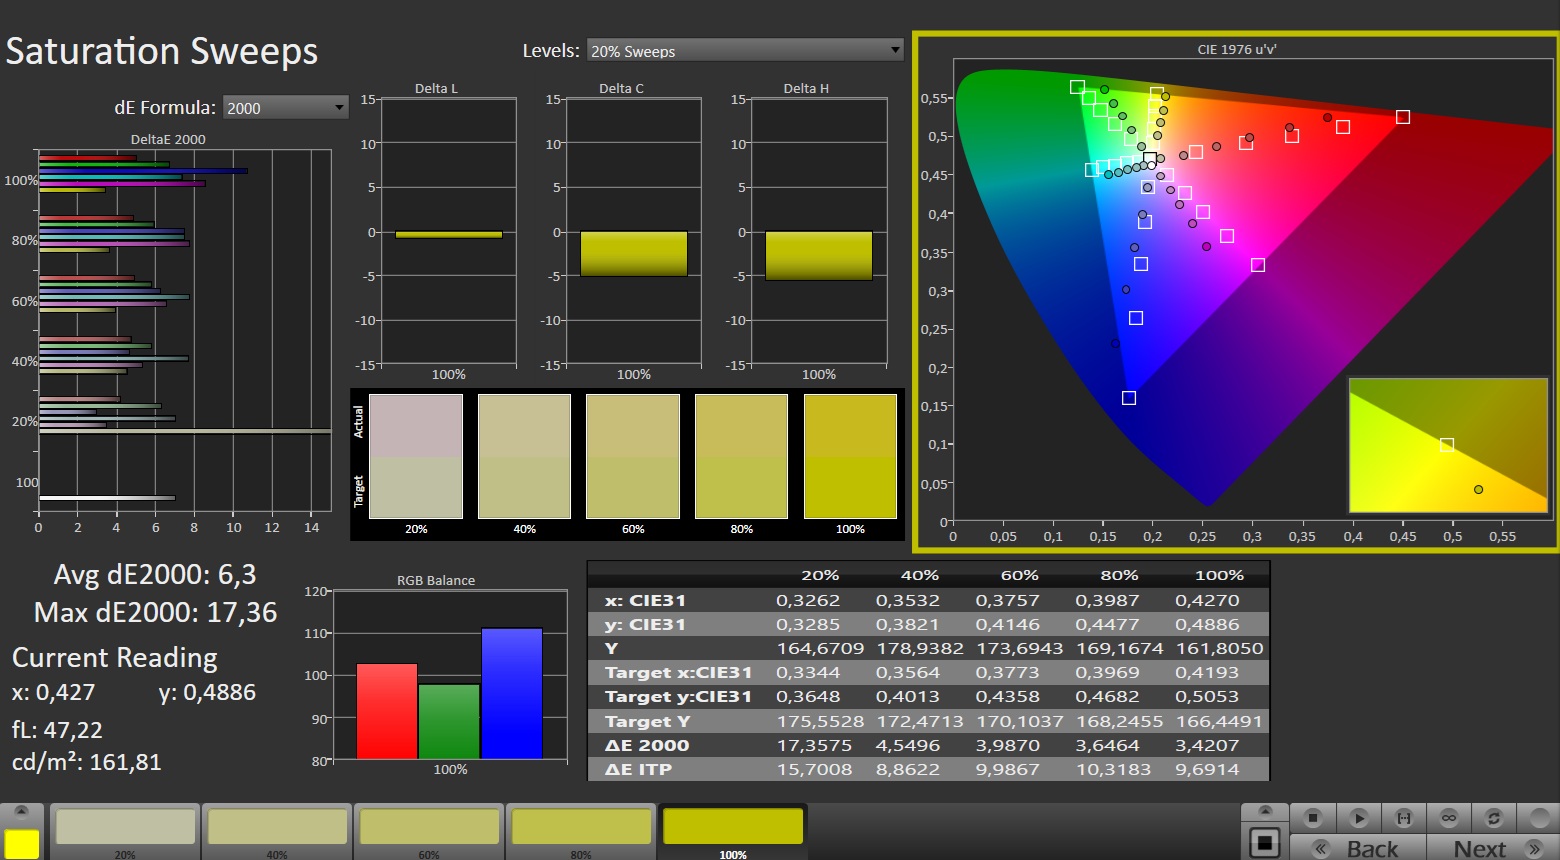
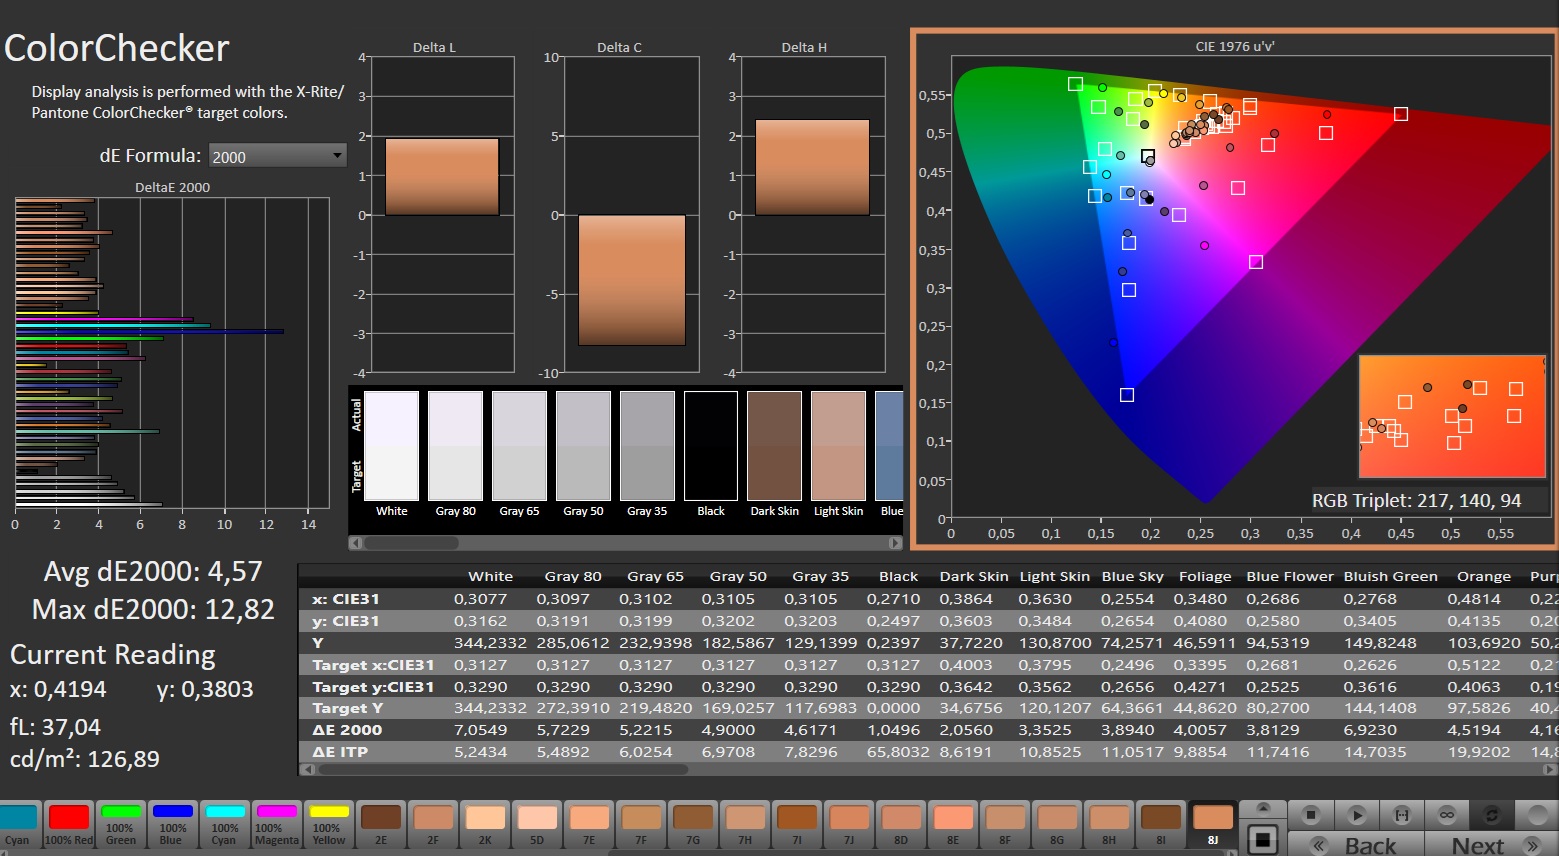
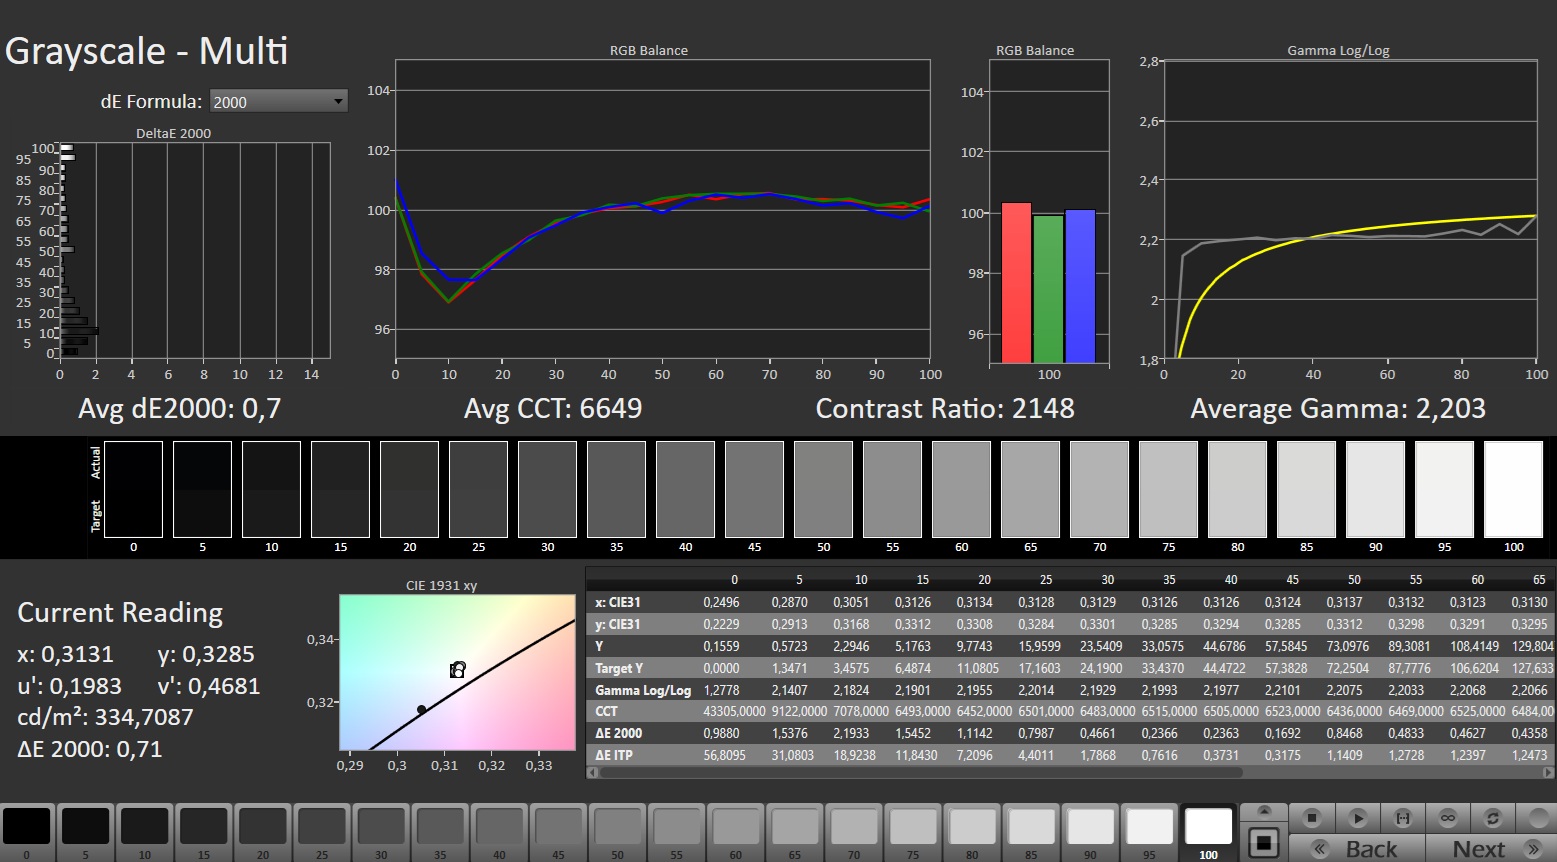
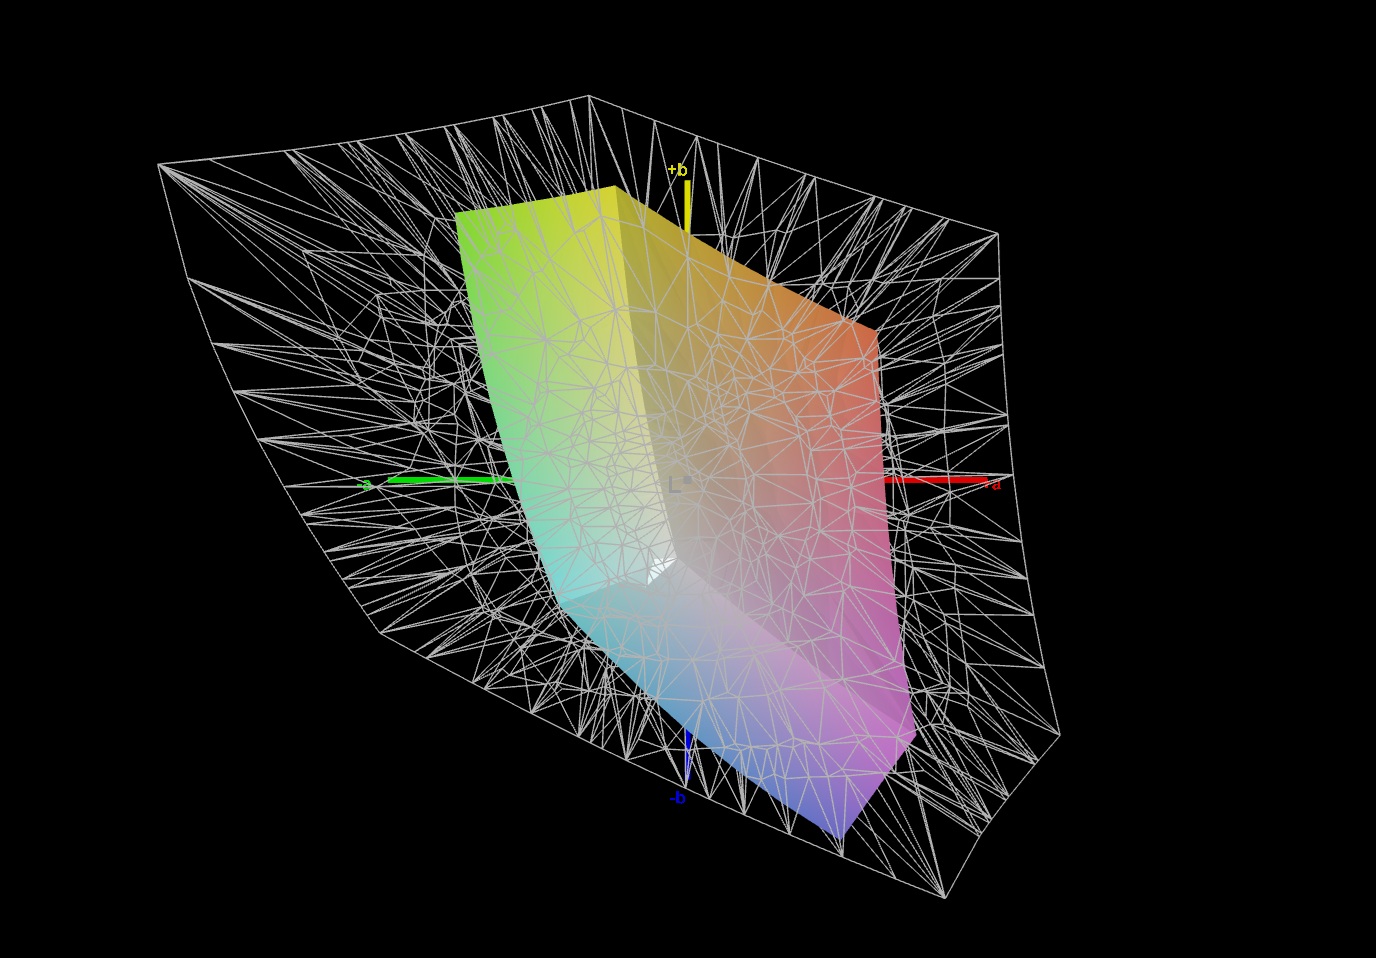
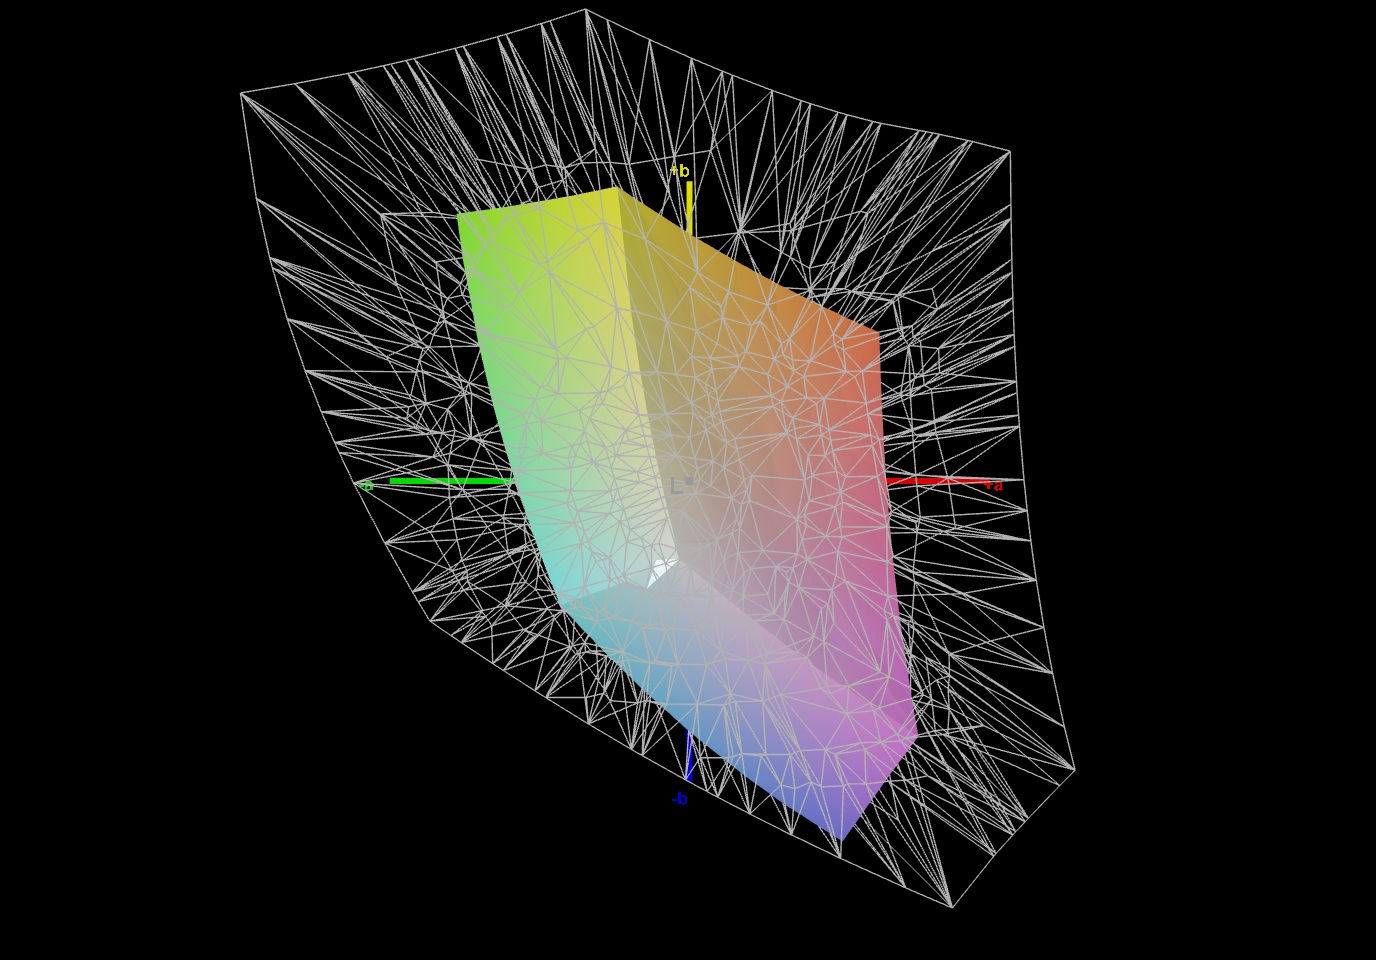
Mierna jakość obrazu kosztuje Deputy 15 P1 kilka punktów rankingowych. W przeciwieństwie do niektórych konkurentów, którzy w pełni pokrywają sRGB, model Medion osiąga tylko około 58% sRGB, co jest raczej skromne. Producent mógłby również poprawić jasność. Podczas gdy średnia 314 cd/m² jest wystarczająca dla większości środowisk wewnętrznych, wyższa jasność byłaby pożądana najpóźniej do użytku na zewnątrz. W pozostałych obszarach panel Full HD wypada jednak całkiem nieźle. Stosunkowo niski poziom czerni wynoszący 0,2 cd/m² dla panelu IPS skutkuje przyzwoitym współczynnikiem kontrastu wynoszącym ponad 1600:1. Czasy reakcji są również akceptowalne.
| |||||||||||||||||||||||||
rozświetlenie: 82 %
na akumulatorze: 332 cd/m²
kontrast: 1660:1 (czerń: 0.2 cd/m²)
ΔE ColorChecker Calman: 4.57 | ∀{0.5-29.43 Ø4.72}
calibrated: 3.95
ΔE Greyscale Calman: 4.1 | ∀{0.09-98 Ø4.97}
40.1% AdobeRGB 1998 (Argyll 3D)
58.4% sRGB (Argyll 3D)
38.8% Display P3 (Argyll 3D)
Gamma: 2.023
CCT: 6838 K
| Medion Erazer Deputy 15 P1 MD62761 CMN N156HRA-EA1, IPS, 1920x1080, 15.6", 144 Hz | Acer Nitro V 15 ANV15-52-50S2 BOEhydis NE156FHM-NXA, IPS, 1920x1080, 15.6", 165 Hz | Lenovo LOQ 15AHP10 CSOT MNF601BA1-4, IPS, 1920x1080, 15.6", 144 Hz | Lenovo Legion 5 15AHP G10 LEN151WQXGA, OLED, 2560x1600, 15.1", 165 Hz | Schenker XMG Core 15 (M25) NE153QDM-NZ2 (BOE0D5F), IPS, 2560x1600, 15.3", 300 Hz | Gigabyte Gaming A16 GA6H NE160QDM-NYJ (BOE0C80), IPS, 2560x1600, 16", 165 Hz | |
|---|---|---|---|---|---|---|
| Display | 4% | 72% | 124% | 80% | 76% | |
| Display P3 Coverage (%) | 38.8 | 40.3 4% | 67.3 73% | 99.9 157% | 71.7 85% | 69.4 79% |
| sRGB Coverage (%) | 58.4 | 60.3 3% | 99.2 70% | 100 71% | 99.9 71% | 99.5 70% |
| AdobeRGB 1998 Coverage (%) | 40.1 | 41.6 4% | 69.1 72% | 98.3 145% | 73.6 84% | 71.6 79% |
| Response Times | -20% | -13% | 99% | 66% | 58% | |
| Response Time Grey 50% / Grey 80% * (ms) | 29.3 ? | 39 ? -33% | 33.9 ? -16% | 0.42 ? 99% | 12.4 ? 58% | 14.3 ? 51% |
| Response Time Black / White * (ms) | 19.4 ? | 20.8 ? -7% | 21.2 ? -9% | 0.4 ? 98% | 5 ? 74% | 7 ? 64% |
| PWM Frequency (Hz) | 1152 ? | |||||
| PWM Amplitude * (%) | 11 | |||||
| Screen | -5% | 29% | 59% | 15% | 1% | |
| Brightness middle (cd/m²) | 332 | 382 15% | 318 -4% | 492 48% | 545 64% | 432 30% |
| Brightness (cd/m²) | 314 | 347 11% | 300 -4% | 495 58% | 530 69% | 425 35% |
| Brightness Distribution (%) | 82 | 86 5% | 89 9% | 92 12% | 94 15% | 91 11% |
| Black Level * (cd/m²) | 0.2 | 0.31 -55% | 0.2 -0% | 0.54 -170% | 0.37 -85% | |
| Contrast (:1) | 1660 | 1232 -26% | 1590 -4% | 1009 -39% | 1168 -30% | |
| Colorchecker dE 2000 * | 4.57 | 4.34 5% | 1.33 71% | 0.9 80% | 2.29 50% | 4.76 -4% |
| Colorchecker dE 2000 max. * | 12.82 | 19.19 -50% | 4.42 66% | 1.8 86% | 5.42 58% | 8.59 33% |
| Colorchecker dE 2000 calibrated * | 3.95 | 3.56 10% | 0.94 76% | 1.05 73% | 1.18 70% | |
| Greyscale dE 2000 * | 4.1 | 2.4 41% | 1.9 54% | 1.2 71% | 3.5 15% | 6.2 -51% |
| Gamma | 2.023 109% | 2.165 102% | 2.187 101% | 2.16 102% | 2.317 95% | 2.079 106% |
| CCT | 6838 95% | 7024 93% | 6678 97% | 6291 103% | 6957 93% | 6690 97% |
| Całkowita średnia (program / ustawienia) | -7% /
-5% | 29% /
32% | 94% /
84% | 54% /
36% | 45% /
25% |
* ... im mniej tym lepiej
Wyświetl czasy reakcji
| ↔ Czas reakcji od czerni do bieli | ||
|---|---|---|
| 19.4 ms ... wzrost ↗ i spadek ↘ łącznie | ↗ 10.1 ms wzrost | 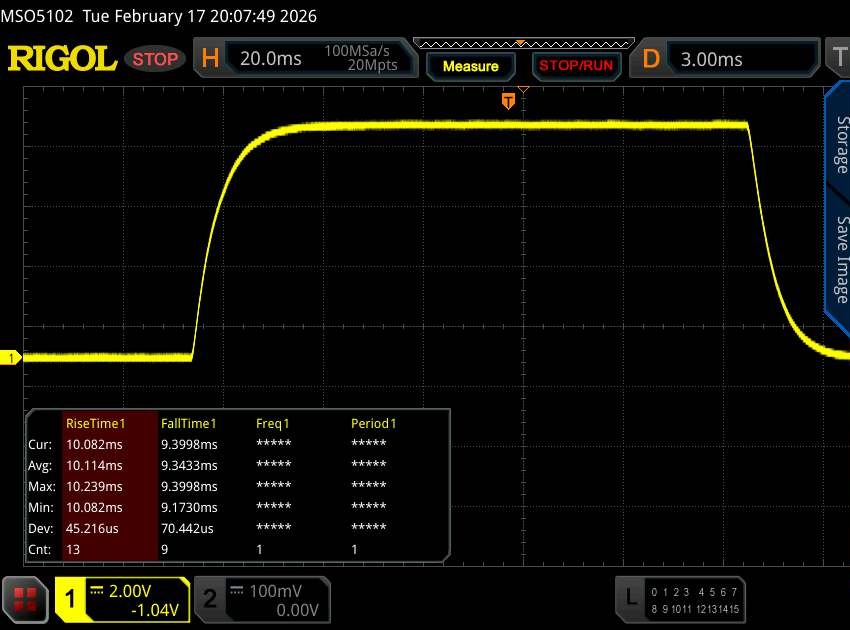 |
| ↘ 9.3 ms upadek | ||
| W naszych testach ekran wykazuje dobry współczynnik reakcji, ale może być zbyt wolny dla graczy rywalizujących ze sobą. Dla porównania, wszystkie testowane urządzenia wahają się od 0.1 (minimum) do 240 (maksimum) ms. » 43 % wszystkich urządzeń jest lepszych. Oznacza to, że zmierzony czas reakcji jest zbliżony do średniej wszystkich testowanych urządzeń (19.8 ms). | ||
| ↔ Czas reakcji 50% szarości do 80% szarości | ||
| 29.3 ms ... wzrost ↗ i spadek ↘ łącznie | ↗ 13.2 ms wzrost | 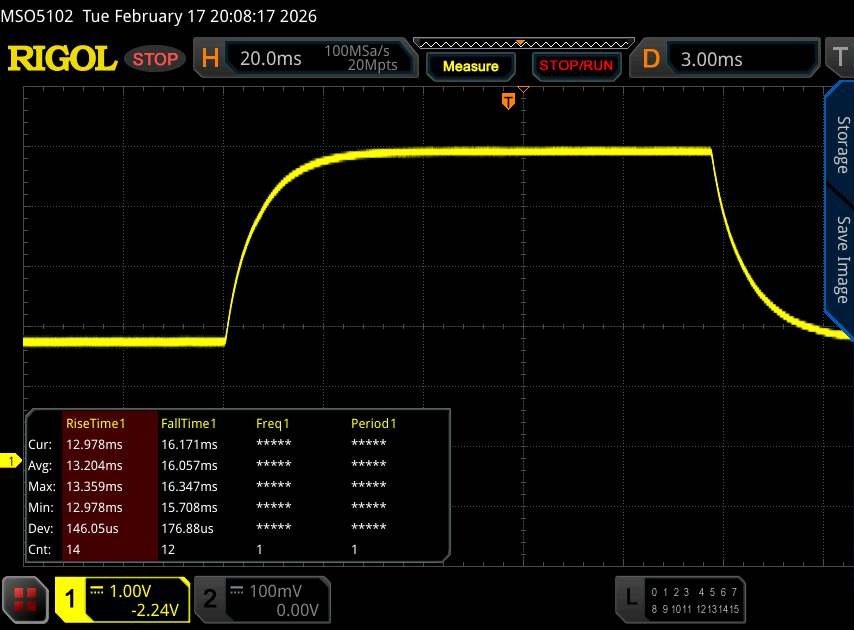 |
| ↘ 16.1 ms upadek | ||
| W naszych testach ekran wykazuje stosunkowo powolne tempo reakcji i może być zbyt wolny dla graczy. Dla porównania, wszystkie testowane urządzenia wahają się od 0.165 (minimum) do 636 (maksimum) ms. » 40 % wszystkich urządzeń jest lepszych. Oznacza to, że zmierzony czas reakcji jest zbliżony do średniej wszystkich testowanych urządzeń (31 ms). | ||
Migotanie ekranu / PWM (modulacja szerokości impulsu)
| Migotanie ekranu/nie wykryto PWM |  | ||
Dla porównania: 52 % wszystkich testowanych urządzeń nie używa PWM do przyciemniania wyświetlacza. Jeśli wykryto PWM, zmierzono średnio 7763 (minimum: 5 - maksimum: 343500) Hz. | |||
Wydajność
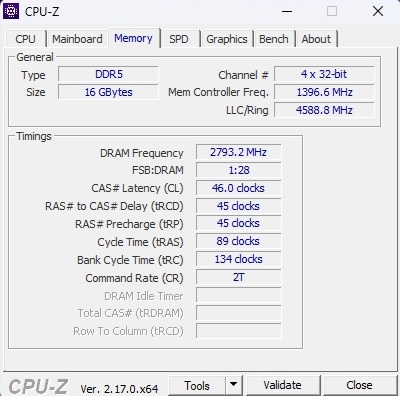
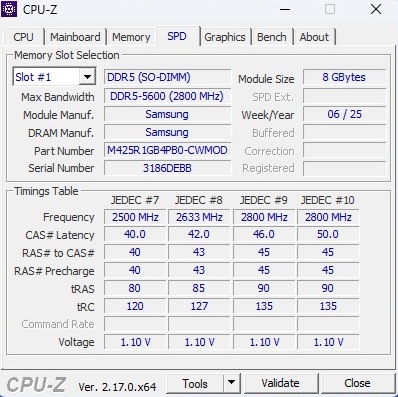
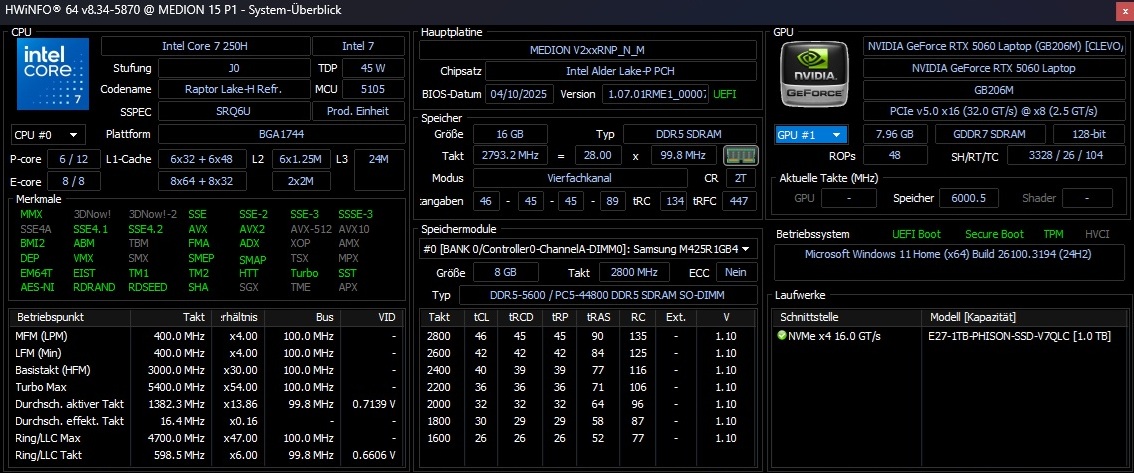
Zastępca 15 P1 jest wygodny nie tylko pod względem ceny, ale także pod względem wydajności w niższym średnim zakresie. Pamięć RAM 2×8 GB DDR5-5600 i dysk SSD 1 TB w naszej konfiguracji testowej są nadal godne szacunku w 2026 roku.
Warunki testu
Centrum sterowania Erazer zapewnia dostęp do trzech trybów pracy, przy czym w naszych testach korzystaliśmy z trybu gamingowego. Do codziennego użytku wolelibyśmy jednak tryb rozrywkowy, ponieważ tylko wydajność procesora nieznacznie spada, a urządzenie pozostaje znacznie cichsze pod obciążeniem (patrz tabela).
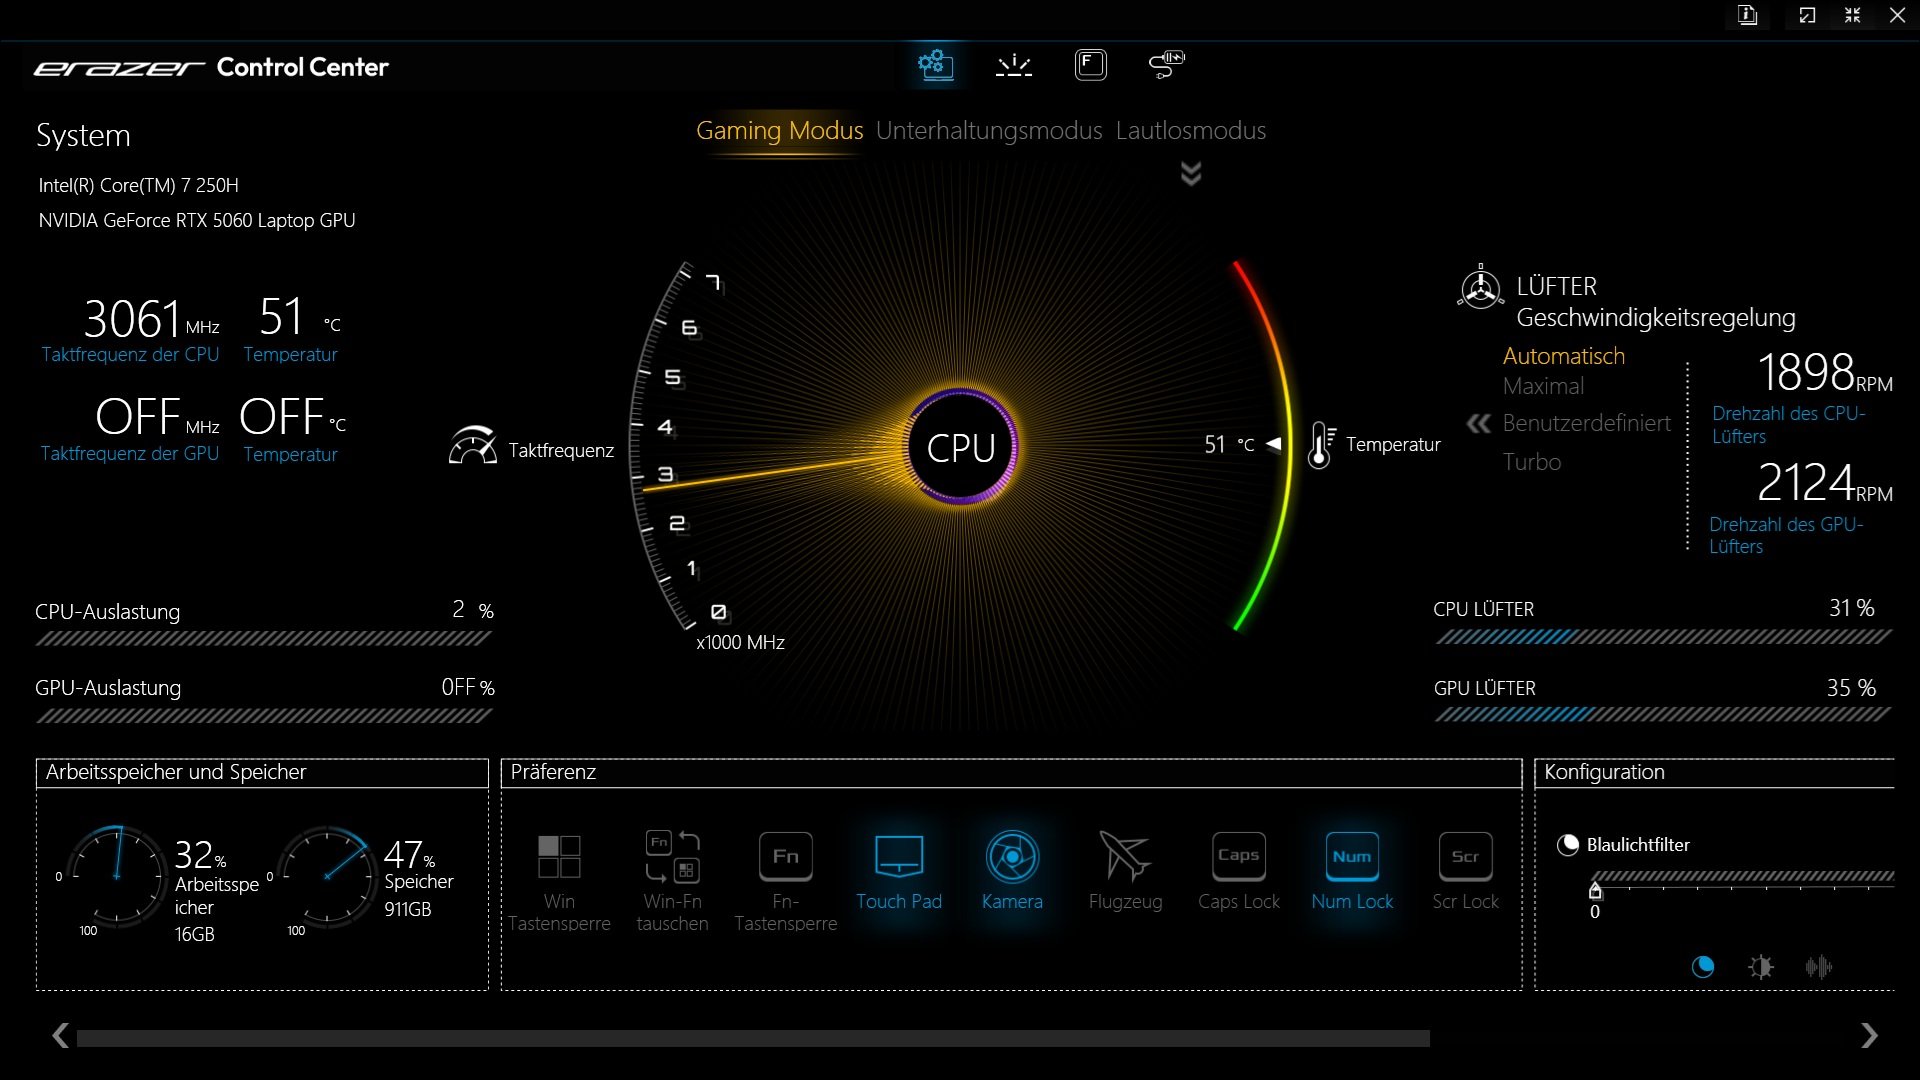
| Tryb | Gaming | Rozrywka | Cichy |
| Cyberpunk 2077 Hałas | 55 dB(A) | 47 dB(A) | 34 dB(A) |
| Liczba klatek na sekundę w grze Cyberpunk 2077 (FHD/Ultra) | 83,3 fps | 83,1 fps | 34,1 fps |
| Pobór mocy GPU | ~80 W | ~80 W | ~55 W |
| CPU PL1 | 110 W | 38 W | 15 W |
| CPU PL2 | 115 W | 115 W | 30 W |
| Cinebench R15 Multi Score | 3049 punktów | 2650 punktów | 749 punktów |
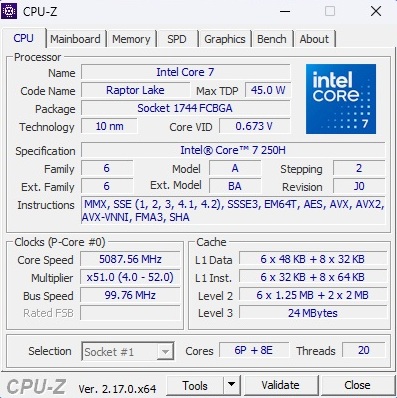
Procesor
Intel Core 7 250H pojawia się po raz pierwszy w modelu Deputy 15 P1. Procesor 10 nm z generacji Raptor Lake nie jest już w pełni aktualny, ale dzięki sześciu rdzeniom wydajnościowym i ośmiu rdzeniom wydajnościowym nadal zapewnia solidny poziom wydajności. Po zimnym starcie, Core 7 250H początkowo wyprzedza konkurencyjne urządzenia, ale po pewnym czasie wydajność ustabilizuje się na poziomie Ryzen 7 260 lub Ryzen AI 7 350 .
Test wytrzymałości Cinebench R15 Multi
* ... im mniej tym lepiej
AIDA64: FP32 Ray-Trace | FPU Julia | CPU SHA3 | CPU Queen | FPU SinJulia | FPU Mandel | CPU AES | CPU ZLib | FP64 Ray-Trace | CPU PhotoWorxx
| Performance rating | |
| Średnia w klasie Gaming | |
| Lenovo Legion 5 15AHP G10 | |
| Schenker XMG Core 15 (M25) | |
| Lenovo LOQ 15AHP10 | |
| Medion Erazer Deputy 15 P1 MD62761 | |
| Przeciętny Intel Core 7 250H | |
| Gigabyte Gaming A16 GA6H | |
| Acer Nitro V 15 ANV15-52-50S2 | |
| AIDA64 / FP32 Ray-Trace | |
| Średnia w klasie Gaming (10227 - 85542, n=107, ostatnie 2 lata) | |
| Lenovo Legion 5 15AHP G10 (v6.92.6600) | |
| Schenker XMG Core 15 (M25) (v6.92.6600) | |
| Lenovo LOQ 15AHP10 (v6.92.6600) | |
| Medion Erazer Deputy 15 P1 MD62761 (v6.92.6600) | |
| Przeciętny Intel Core 7 250H (n=1) | |
| Gigabyte Gaming A16 GA6H (v6.92.6600) | |
| Acer Nitro V 15 ANV15-52-50S2 (v6.92.6600) | |
| AIDA64 / FPU Julia | |
| Średnia w klasie Gaming (51376 - 238426, n=107, ostatnie 2 lata) | |
| Lenovo Legion 5 15AHP G10 (v6.92.6600) | |
| Schenker XMG Core 15 (M25) (v6.92.6600) | |
| Lenovo LOQ 15AHP10 (v6.92.6600) | |
| Medion Erazer Deputy 15 P1 MD62761 (v6.92.6600) | |
| Przeciętny Intel Core 7 250H (n=1) | |
| Gigabyte Gaming A16 GA6H (v6.92.6600) | |
| Acer Nitro V 15 ANV15-52-50S2 (v6.92.6600) | |
| AIDA64 / CPU SHA3 | |
| Średnia w klasie Gaming (2180 - 9817, n=107, ostatnie 2 lata) | |
| Lenovo Legion 5 15AHP G10 (v6.92.6600) | |
| Lenovo LOQ 15AHP10 (v6.92.6600) | |
| Schenker XMG Core 15 (M25) (v6.92.6600) | |
| Medion Erazer Deputy 15 P1 MD62761 (v6.92.6600) | |
| Przeciętny Intel Core 7 250H (n=1) | |
| Gigabyte Gaming A16 GA6H (v6.92.6600) | |
| Acer Nitro V 15 ANV15-52-50S2 (v6.92.6600) | |
| AIDA64 / CPU Queen | |
| Lenovo Legion 5 15AHP G10 (v6.92.6600) | |
| Średnia w klasie Gaming (49785 - 173351, n=94, ostatnie 2 lata) | |
| Lenovo LOQ 15AHP10 (v6.92.6600) | |
| Medion Erazer Deputy 15 P1 MD62761 (v6.92.6600) | |
| Przeciętny Intel Core 7 250H (n=1) | |
| Gigabyte Gaming A16 GA6H (v6.92.6600) | |
| Schenker XMG Core 15 (M25) (v6.92.6600) | |
| Acer Nitro V 15 ANV15-52-50S2 (v6.92.6600) | |
| AIDA64 / FPU SinJulia | |
| Lenovo Legion 5 15AHP G10 (v6.92.6600) | |
| Lenovo LOQ 15AHP10 (v6.92.6600) | |
| Średnia w klasie Gaming (4424 - 33636, n=107, ostatnie 2 lata) | |
| Schenker XMG Core 15 (M25) (v6.92.6600) | |
| Medion Erazer Deputy 15 P1 MD62761 (v6.92.6600) | |
| Przeciętny Intel Core 7 250H (n=1) | |
| Gigabyte Gaming A16 GA6H (v6.92.6600) | |
| Acer Nitro V 15 ANV15-52-50S2 (v6.92.6600) | |
| AIDA64 / FPU Mandel | |
| Średnia w klasie Gaming (25115 - 128721, n=107, ostatnie 2 lata) | |
| Lenovo Legion 5 15AHP G10 (v6.92.6600) | |
| Schenker XMG Core 15 (M25) (v6.92.6600) | |
| Lenovo LOQ 15AHP10 (v6.92.6600) | |
| Medion Erazer Deputy 15 P1 MD62761 (v6.92.6600) | |
| Przeciętny Intel Core 7 250H (n=1) | |
| Gigabyte Gaming A16 GA6H (v6.92.6600) | |
| Acer Nitro V 15 ANV15-52-50S2 (v6.92.6600) | |
| AIDA64 / CPU AES | |
| Średnia w klasie Gaming (39258 - 247074, n=107, ostatnie 2 lata) | |
| Schenker XMG Core 15 (M25) (v6.92.6600) | |
| Medion Erazer Deputy 15 P1 MD62761 (v6.92.6600) | |
| Przeciętny Intel Core 7 250H (n=1) | |
| Lenovo Legion 5 15AHP G10 (v6.92.6600) | |
| Lenovo LOQ 15AHP10 (v6.92.6600) | |
| Gigabyte Gaming A16 GA6H (v6.92.6600) | |
| Acer Nitro V 15 ANV15-52-50S2 (v6.92.6600) | |
| AIDA64 / CPU ZLib | |
| Średnia w klasie Gaming (574 - 2531, n=107, ostatnie 2 lata) | |
| Medion Erazer Deputy 15 P1 MD62761 (v6.92.6600) | |
| Przeciętny Intel Core 7 250H (n=1) | |
| Schenker XMG Core 15 (M25) (v6.92.6600) | |
| Lenovo Legion 5 15AHP G10 (v6.92.6600) | |
| Lenovo LOQ 15AHP10 (v6.92.6600) | |
| Gigabyte Gaming A16 GA6H (v6.92.6600) | |
| Acer Nitro V 15 ANV15-52-50S2 (v6.92.6600) | |
| AIDA64 / FP64 Ray-Trace | |
| Średnia w klasie Gaming (5509 - 45446, n=107, ostatnie 2 lata) | |
| Lenovo Legion 5 15AHP G10 (v6.92.6600) | |
| Schenker XMG Core 15 (M25) (v6.92.6600) | |
| Lenovo LOQ 15AHP10 (v6.92.6600) | |
| Medion Erazer Deputy 15 P1 MD62761 (v6.92.6600) | |
| Przeciętny Intel Core 7 250H (n=1) | |
| Gigabyte Gaming A16 GA6H (v6.92.6600) | |
| Acer Nitro V 15 ANV15-52-50S2 (v6.92.6600) | |
| AIDA64 / CPU PhotoWorxx | |
| Schenker XMG Core 15 (M25) (v6.92.6600) | |
| Średnia w klasie Gaming (12271 - 89891, n=107, ostatnie 2 lata) | |
| Lenovo Legion 5 15AHP G10 (v6.92.6600) | |
| Medion Erazer Deputy 15 P1 MD62761 (v6.92.6600) | |
| Przeciętny Intel Core 7 250H (n=1) | |
| Lenovo LOQ 15AHP10 (v6.92.6600) | |
| Gigabyte Gaming A16 GA6H (v6.92.6600) | |
| Acer Nitro V 15 ANV15-52-50S2 (v6.92.6600) | |
Wydajność systemu
Pod względem wydajności systemu, Deputy 15 P1 również zajmuje pierwsze miejsce wśród porównywanych urządzeń. System reaguje przyjemnie szybko w większości sytuacji.
PCMark 10: Score | Essentials | Productivity | Digital Content Creation
CrossMark: Overall | Productivity | Creativity | Responsiveness
WebXPRT 3: Overall
WebXPRT 4: Overall
Mozilla Kraken 1.1: Total
| Performance rating | |
| Medion Erazer Deputy 15 P1 MD62761 | |
| Przeciętny Intel Core 7 250H, NVIDIA GeForce RTX 5060 Laptop | |
| Średnia w klasie Gaming | |
| Lenovo Legion 5 15AHP G10 | |
| Gigabyte Gaming A16 GA6H | |
| Schenker XMG Core 15 (M25) -3! | |
| Lenovo LOQ 15AHP10 -2! | |
| Acer Nitro V 15 ANV15-52-50S2 -2! | |
| PCMark 10 / Score | |
| Medion Erazer Deputy 15 P1 MD62761 | |
| Przeciętny Intel Core 7 250H, NVIDIA GeForce RTX 5060 Laptop (n=1) | |
| Średnia w klasie Gaming (5828 - 11574, n=95, ostatnie 2 lata) | |
| Lenovo Legion 5 15AHP G10 | |
| Lenovo LOQ 15AHP10 | |
| Gigabyte Gaming A16 GA6H | |
| PCMark 10 / Essentials | |
| Lenovo Legion 5 15AHP G10 | |
| Schenker XMG Core 15 (M25) | |
| Średnia w klasie Gaming (8810 - 12600, n=99, ostatnie 2 lata) | |
| Lenovo LOQ 15AHP10 | |
| Gigabyte Gaming A16 GA6H | |
| Medion Erazer Deputy 15 P1 MD62761 | |
| Przeciętny Intel Core 7 250H, NVIDIA GeForce RTX 5060 Laptop (n=1) | |
| PCMark 10 / Productivity | |
| Medion Erazer Deputy 15 P1 MD62761 | |
| Przeciętny Intel Core 7 250H, NVIDIA GeForce RTX 5060 Laptop (n=1) | |
| Acer Nitro V 15 ANV15-52-50S2 | |
| Średnia w klasie Gaming (6845 - 21327, n=97, ostatnie 2 lata) | |
| Lenovo Legion 5 15AHP G10 | |
| Lenovo LOQ 15AHP10 | |
| Gigabyte Gaming A16 GA6H | |
| PCMark 10 / Digital Content Creation | |
| Średnia w klasie Gaming (7602 - 19657, n=97, ostatnie 2 lata) | |
| Lenovo Legion 5 15AHP G10 | |
| Medion Erazer Deputy 15 P1 MD62761 | |
| Przeciętny Intel Core 7 250H, NVIDIA GeForce RTX 5060 Laptop (n=1) | |
| Gigabyte Gaming A16 GA6H | |
| Lenovo LOQ 15AHP10 | |
| Acer Nitro V 15 ANV15-52-50S2 | |
| CrossMark / Overall | |
| Medion Erazer Deputy 15 P1 MD62761 | |
| Przeciętny Intel Core 7 250H, NVIDIA GeForce RTX 5060 Laptop (n=1) | |
| Średnia w klasie Gaming (1366 - 2409, n=96, ostatnie 2 lata) | |
| Gigabyte Gaming A16 GA6H | |
| Lenovo Legion 5 15AHP G10 | |
| Lenovo LOQ 15AHP10 | |
| Schenker XMG Core 15 (M25) | |
| Acer Nitro V 15 ANV15-52-50S2 | |
| CrossMark / Productivity | |
| Medion Erazer Deputy 15 P1 MD62761 | |
| Przeciętny Intel Core 7 250H, NVIDIA GeForce RTX 5060 Laptop (n=1) | |
| Średnia w klasie Gaming (1386 - 2254, n=96, ostatnie 2 lata) | |
| Gigabyte Gaming A16 GA6H | |
| Lenovo LOQ 15AHP10 | |
| Lenovo Legion 5 15AHP G10 | |
| Schenker XMG Core 15 (M25) | |
| Acer Nitro V 15 ANV15-52-50S2 | |
| CrossMark / Creativity | |
| Średnia w klasie Gaming (1343 - 2729, n=96, ostatnie 2 lata) | |
| Medion Erazer Deputy 15 P1 MD62761 | |
| Przeciętny Intel Core 7 250H, NVIDIA GeForce RTX 5060 Laptop (n=1) | |
| Lenovo Legion 5 15AHP G10 | |
| Schenker XMG Core 15 (M25) | |
| Gigabyte Gaming A16 GA6H | |
| Lenovo LOQ 15AHP10 | |
| Acer Nitro V 15 ANV15-52-50S2 | |
| CrossMark / Responsiveness | |
| Gigabyte Gaming A16 GA6H | |
| Medion Erazer Deputy 15 P1 MD62761 | |
| Przeciętny Intel Core 7 250H, NVIDIA GeForce RTX 5060 Laptop (n=1) | |
| Średnia w klasie Gaming (1226 - 2334, n=96, ostatnie 2 lata) | |
| Lenovo LOQ 15AHP10 | |
| Lenovo Legion 5 15AHP G10 | |
| Schenker XMG Core 15 (M25) | |
| Acer Nitro V 15 ANV15-52-50S2 | |
| WebXPRT 3 / Overall | |
| Medion Erazer Deputy 15 P1 MD62761 | |
| Przeciętny Intel Core 7 250H, NVIDIA GeForce RTX 5060 Laptop (n=1) | |
| Średnia w klasie Gaming (220 - 532, n=100, ostatnie 2 lata) | |
| Lenovo Legion 5 15AHP G10 | |
| Gigabyte Gaming A16 GA6H | |
| Schenker XMG Core 15 (M25) | |
| Acer Nitro V 15 ANV15-52-50S2 | |
| WebXPRT 4 / Overall | |
| Średnia w klasie Gaming (165 - 354, n=101, ostatnie 2 lata) | |
| Medion Erazer Deputy 15 P1 MD62761 | |
| Przeciętny Intel Core 7 250H, NVIDIA GeForce RTX 5060 Laptop (n=1) | |
| Lenovo Legion 5 15AHP G10 | |
| Gigabyte Gaming A16 GA6H | |
| Acer Nitro V 15 ANV15-52-50S2 | |
| Schenker XMG Core 15 (M25) | |
| Mozilla Kraken 1.1 / Total | |
| Acer Nitro V 15 ANV15-52-50S2 | |
| Lenovo LOQ 15AHP10 | |
| Gigabyte Gaming A16 GA6H | |
| Lenovo Legion 5 15AHP G10 | |
| Medion Erazer Deputy 15 P1 MD62761 | |
| Przeciętny Intel Core 7 250H, NVIDIA GeForce RTX 5060 Laptop (n=1) | |
| Średnia w klasie Gaming (391 - 590, n=104, ostatnie 2 lata) | |
| Schenker XMG Core 15 (M25) | |
* ... im mniej tym lepiej
| PCMark 10 Score | 8844 pkt. | |
Pomoc | ||
| AIDA64 / Memory Copy | |
| Schenker XMG Core 15 (M25) | |
| Średnia w klasie Gaming (21750 - 129946, n=107, ostatnie 2 lata) | |
| Lenovo Legion 5 15AHP G10 | |
| Medion Erazer Deputy 15 P1 MD62761 | |
| Przeciętny Intel Core 7 250H (n=1) | |
| Lenovo LOQ 15AHP10 | |
| Gigabyte Gaming A16 GA6H | |
| Acer Nitro V 15 ANV15-52-50S2 | |
| AIDA64 / Memory Read | |
| Medion Erazer Deputy 15 P1 MD62761 | |
| Przeciętny Intel Core 7 250H (n=1) | |
| Średnia w klasie Gaming (22956 - 118858, n=107, ostatnie 2 lata) | |
| Schenker XMG Core 15 (M25) | |
| Lenovo Legion 5 15AHP G10 | |
| Gigabyte Gaming A16 GA6H | |
| Lenovo LOQ 15AHP10 | |
| Acer Nitro V 15 ANV15-52-50S2 | |
| AIDA64 / Memory Write | |
| Lenovo Legion 5 15AHP G10 | |
| Schenker XMG Core 15 (M25) | |
| Średnia w klasie Gaming (22297 - 135096, n=107, ostatnie 2 lata) | |
| Medion Erazer Deputy 15 P1 MD62761 | |
| Przeciętny Intel Core 7 250H (n=1) | |
| Lenovo LOQ 15AHP10 | |
| Gigabyte Gaming A16 GA6H | |
| Acer Nitro V 15 ANV15-52-50S2 | |
| AIDA64 / Memory Latency | |
| Średnia w klasie Gaming (75.3 - 259, n=107, ostatnie 2 lata) | |
| Gigabyte Gaming A16 GA6H | |
| Acer Nitro V 15 ANV15-52-50S2 | |
| Medion Erazer Deputy 15 P1 MD62761 | |
| Przeciętny Intel Core 7 250H (n=1) | |
| Lenovo LOQ 15AHP10 | |
| Lenovo Legion 5 15AHP G10 | |
| Schenker XMG Core 15 (M25) | |
* ... im mniej tym lepiej
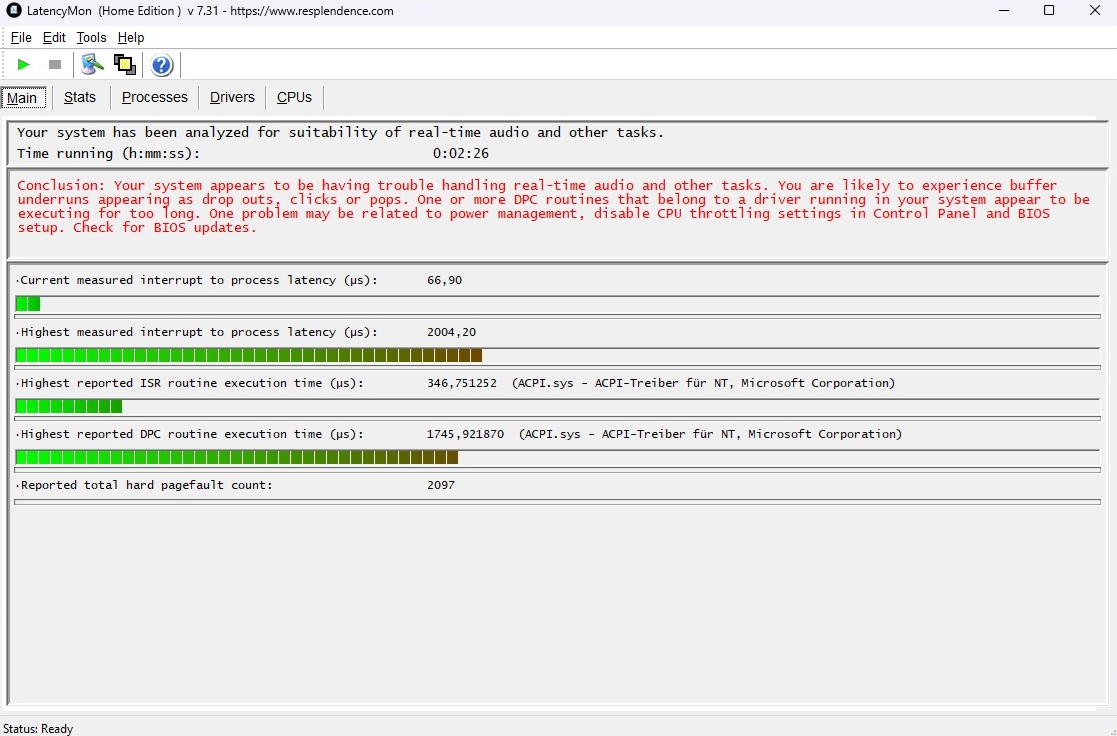
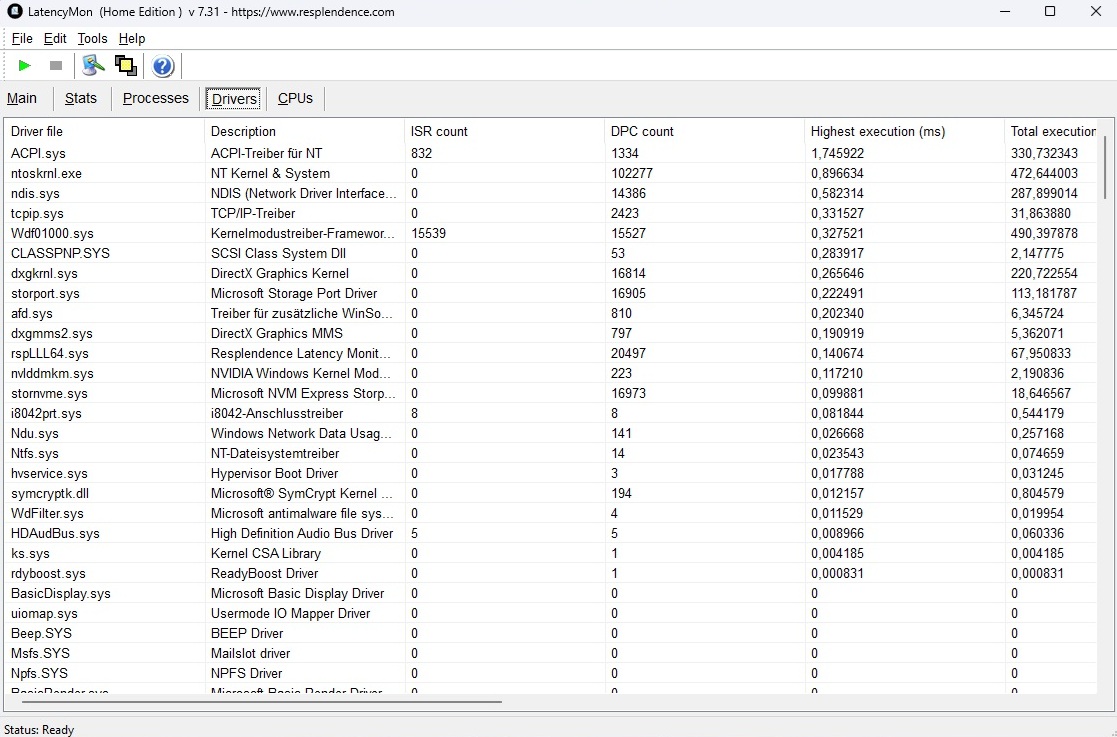
Opóźnienia DPC
Jeśli chodzi o opóźnienia, 15-calowy model plasuje się w połowie stawki, więc nie wypada ani szczególnie dobrze, ani szczególnie słabo.
| DPC Latencies / LatencyMon - interrupt to process latency (max), Web, Youtube, Prime95 | |
| Gigabyte Gaming A16 GA6H | |
| Acer Nitro V 15 ANV15-52-50S2 | |
| Lenovo Legion 5 15AHP G10 | |
| Medion Erazer Deputy 15 P1 MD62761 | |
| Lenovo LOQ 15AHP10 | |
| Schenker XMG Core 15 (M25) | |
* ... im mniej tym lepiej
Przechowywanie
Stała wydajność pamięci masowej zasługuje na pochwałę. Wielu innych konkurentów wykazywało czasami poważny throttling SSD w naszym teście pętli, co wskazuje na nieoptymalne chłodzenie.

* ... im mniej tym lepiej
Ciągła wydajność odczytu: Pętla odczytu DiskSpd, głębokość kolejki 8
Wydajność GPU
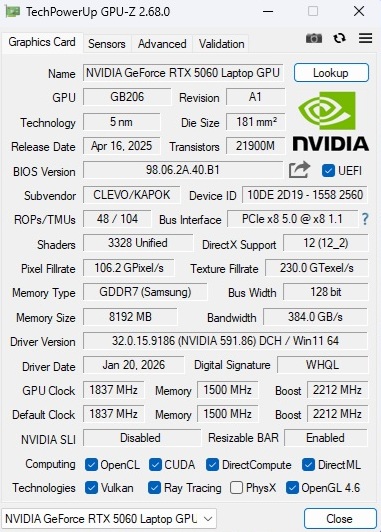
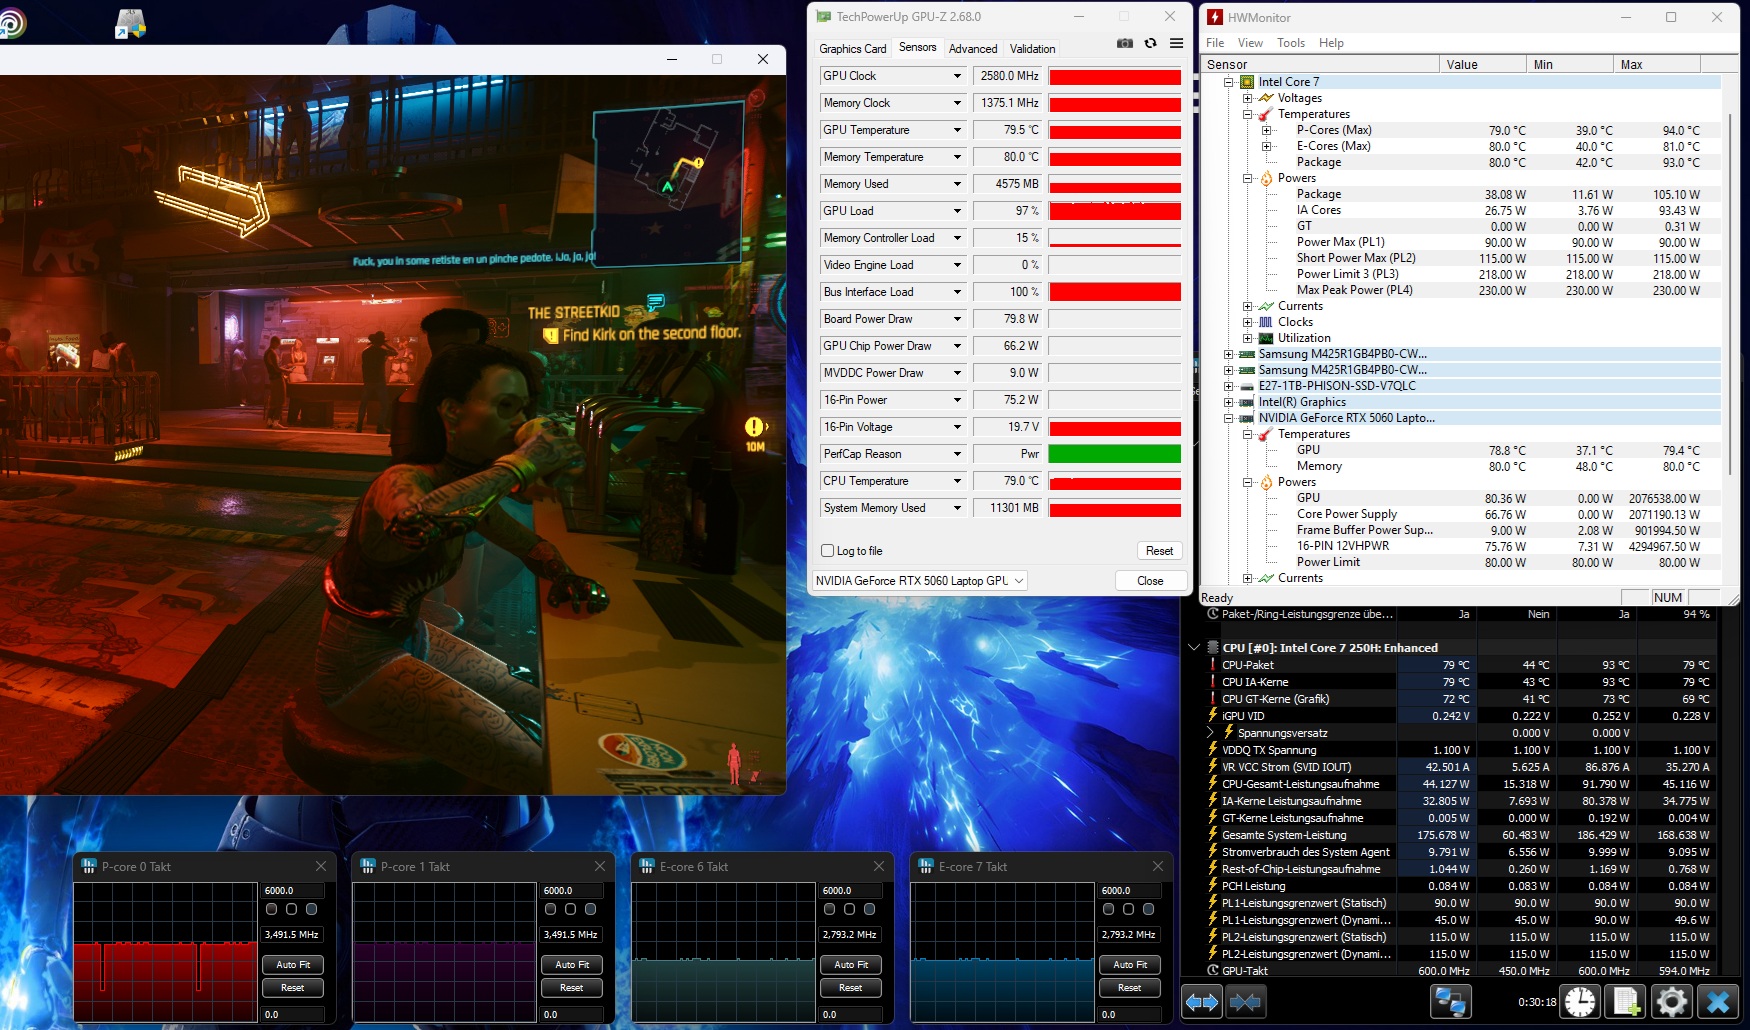
Chociaż GeForce RTX 5060 w modelu Deputy 15 P1 ma na papierze moc do 115 watów, byliśmy w stanie pobrać tylko około 80 watów z układu Blackwell nawet w trybie gamingowym. W rezultacie, jego wydajność GPU w testach 3DMark plasuje się mniej więcej na poziomie średniej RTX 5060 zmierzonej do tej pory, bez wysuwania się na prowadzenie w sposób, w jaki robią to niektórzy konkurenci.
| 3DMark 11 Performance | 33272 pkt. | |
| 3DMark Cloud Gate Standard Score | 69740 pkt. | |
| 3DMark Fire Strike Score | 27295 pkt. | |
| 3DMark Time Spy Score | 11526 pkt. | |
Pomoc | ||
* ... im mniej tym lepiej
Wydajność w grach
Testy porównawcze w grach pokazują typowy obraz dla RTX 5060. Tak długo, jak trzymają się Państwo rozdzielczości 1920 × 1080, większość gier działa płynnie nawet przy (bardzo) wysokich ustawieniach. Jeśli liczba klatek na sekundę staje się ograniczona, funkcje takie jak skalowanie w górę mogą pomóc. Na przykład, dzięki DLSS Balanced (Transformer) zwiększyliśmy Black Ops 7 z 36 fps do 55 fps (ustawienie Ultra z pełnym ray tracingiem). Po włączeniu 4× generowania klatek osiągnęliśmy nawet 161 fps, choć subiektywne wrażenia mogą się różnić w zależności od użytkownika.
| low | med. | high | ultra | |
|---|---|---|---|---|
| GTA V (2015) | 183.8 | 179.6 | 128.5 | |
| Dota 2 Reborn (2015) | 182 | 133.9 | 141.7 | 139.4 |
| X-Plane 11.11 (2018) | 117.9 | 108.9 | 97.3 | |
| Baldur's Gate 3 (2023) | 119.2 | 97.5 | 95.6 | |
| Cyberpunk 2077 (2023) | 110.6 | 93.9 | 83.3 | |
| Until Dawn (2024) | 88.6 | 62 | 45.4 | |
| Stalker 2 (2024) | 63.4 | 56.3 | 41.1 | |
| Borderlands 4 (2025) | 48.9 | 39.3 | 24.8 | |
| The Outer Worlds 2 (2025) | 83.4 | 66.3 | 37.1 | |
| ARC Raiders (2025) | 110.1 | 88.6 | 61.9 | |
| Anno 117: Pax Romana (2025) | 80.7 | 59.4 | 30.5 | |
| Call of Duty Black Ops 7 (2025) | 130 | 96 | 36 |
| Call of Duty Black Ops 7 | |
| 1920x1080 Extreme Preset + Raytracing | |
| Średnia w klasie Gaming (24 - 60, n=11, ostatnie 2 lata) | |
| Medion Erazer Deputy 15 P1 MD62761 | |
| Przeciętny NVIDIA GeForce RTX 5060 Laptop (32 - 38, n=4) | |
| Tulpar T6 V3.5 | |
| MSI Cyborg 15 B2RWEKG | |
| 1920x1080 Ultra Preset | |
| Średnia w klasie Gaming (70 - 157, n=11, ostatnie 2 lata) | |
| Przeciętny NVIDIA GeForce RTX 5060 Laptop (95 - 103, n=4) | |
| Medion Erazer Deputy 15 P1 MD62761 | |
| Tulpar T6 V3.5 | |
| MSI Cyborg 15 B2RWEKG | |
| ARC Raiders | |
| 1920x1080 Epic Preset + Epic Raytracing AA:TSR | |
| Średnia w klasie Gaming (43.5 - 98.6, n=11, ostatnie 2 lata) | |
| Medion Erazer Deputy 15 P1 MD62761 | |
| Przeciętny NVIDIA GeForce RTX 5060 Laptop (55 - 70.2, n=4) | |
| Tulpar T6 V3.5 | |
| MSI Cyborg 15 B2RWEKG | |
| 1920x1080 High Preset AA:TSR | |
| Średnia w klasie Gaming (64.5 - 144.4, n=11, ostatnie 2 lata) | |
| Tulpar T6 V3.5 | |
| Przeciętny NVIDIA GeForce RTX 5060 Laptop (79.9 - 104.9, n=4) | |
| Medion Erazer Deputy 15 P1 MD62761 | |
| MSI Cyborg 15 B2RWEKG | |
| Borderlands 4 | |
| 1920x1080 Badass Preset AA:FX | |
| Średnia w klasie Gaming (16 - 54, n=13, ostatnie 2 lata) | |
| Medion Erazer Deputy 15 P1 MD62761 | |
| Przeciętny NVIDIA GeForce RTX 5060 Laptop (16.3 - 24.8, n=4) | |
| Tulpar T6 V3.5 | |
| 1920x1080 High Preset AA:FX | |
| Średnia w klasie Gaming (28.7 - 76.6, n=13, ostatnie 2 lata) | |
| Medion Erazer Deputy 15 P1 MD62761 | |
| Przeciętny NVIDIA GeForce RTX 5060 Laptop (28.7 - 39.3, n=4) | |
| Tulpar T6 V3.5 | |
Cyberpunk 2077 - wykres ultra FPS
Emisje
Emisja hałasu
W trybie gamingowym, Deputy 15 P1 jest głośniejszy od swoich konkurentów. W Cyberpunk 2077 zmierzyliśmy 55 dB(A), w porównaniu do 49-54 dB(A) dla innych modeli - irytująco głośny poziom, który zasadniczo wymaga zestawu słuchawkowego (47 dB(A) w trybie rozrywki).
Hałas
| luz |
| 27 / 29 / 32 dB |
| obciążenie |
| 50 / 56 dB |
 | ||
30 dB cichy 40 dB(A) słyszalny 50 dB(A) irytujący |
||
min: | ||
| Medion Erazer Deputy 15 P1 MD62761 Core 7 250H, GeForce RTX 5060 Laptop | Acer Nitro V 15 ANV15-52-50S2 i5-13420H, GeForce RTX 5050 Laptop | Lenovo LOQ 15AHP10 R7 250, GeForce RTX 5060 Laptop | Schenker XMG Core 15 (M25) Ryzen AI 7 350, GeForce RTX 5060 Laptop | Lenovo Legion 5 15AHP G10 R7 260, GeForce RTX 5060 Laptop | Gigabyte Gaming A16 GA6H i7-13620H, GeForce RTX 5070 Laptop | |
|---|---|---|---|---|---|---|
| Noise | 1% | -23% | 8% | 12% | 5% | |
| wyłączone / środowisko * (dB) | 25 | 24 4% | 25 -0% | 24 4% | 25.5 -2% | 24 4% |
| Idle Minimum * (dB) | 27 | 28 -4% | 43 -59% | 25 7% | 25.5 6% | 25 7% |
| Idle Average * (dB) | 29 | 29 -0% | 45 -55% | 27 7% | 25.5 12% | 26 10% |
| Idle Maximum * (dB) | 32 | 33 -3% | 48 -50% | 29 9% | 26.9 16% | 27 16% |
| Load Average * (dB) | 50 | 48 4% | 53 -6% | 48 4% | 34.6 31% | 54 -8% |
| Cyberpunk 2077 ultra * (dB) | 55 | 52 5% | 51 7% | 49 11% | 50.1 9% | 54 2% |
| Load Maximum * (dB) | 56 | 54 4% | 53 5% | 50 11% | 50.1 11% | 55 2% |
* ... im mniej tym lepiej
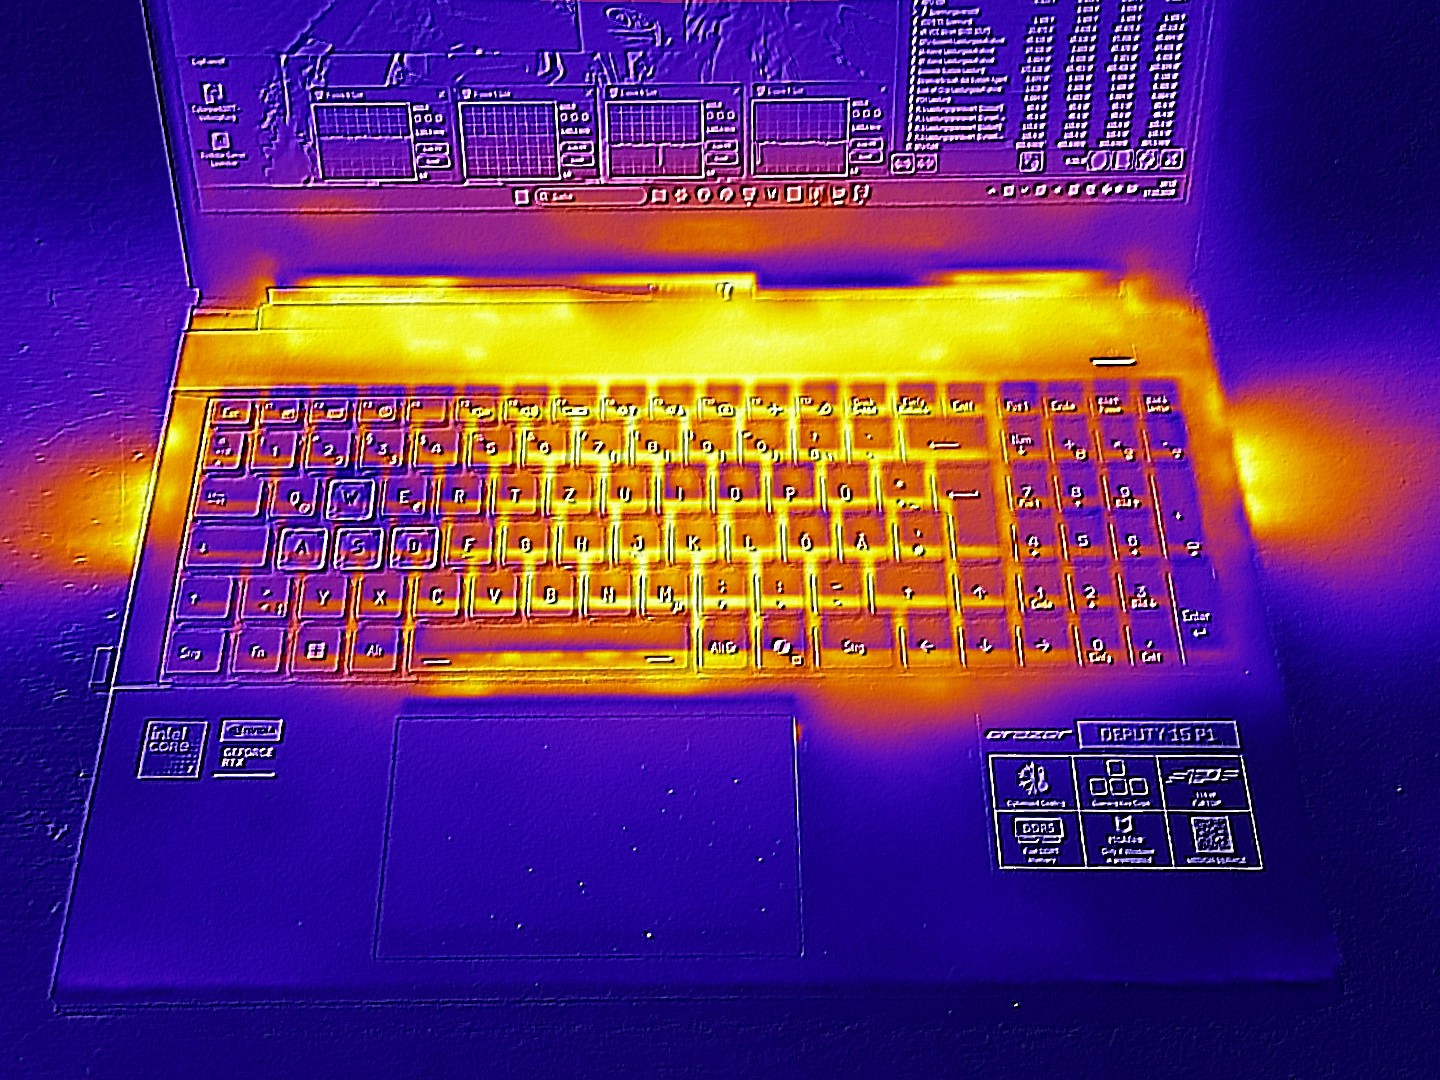
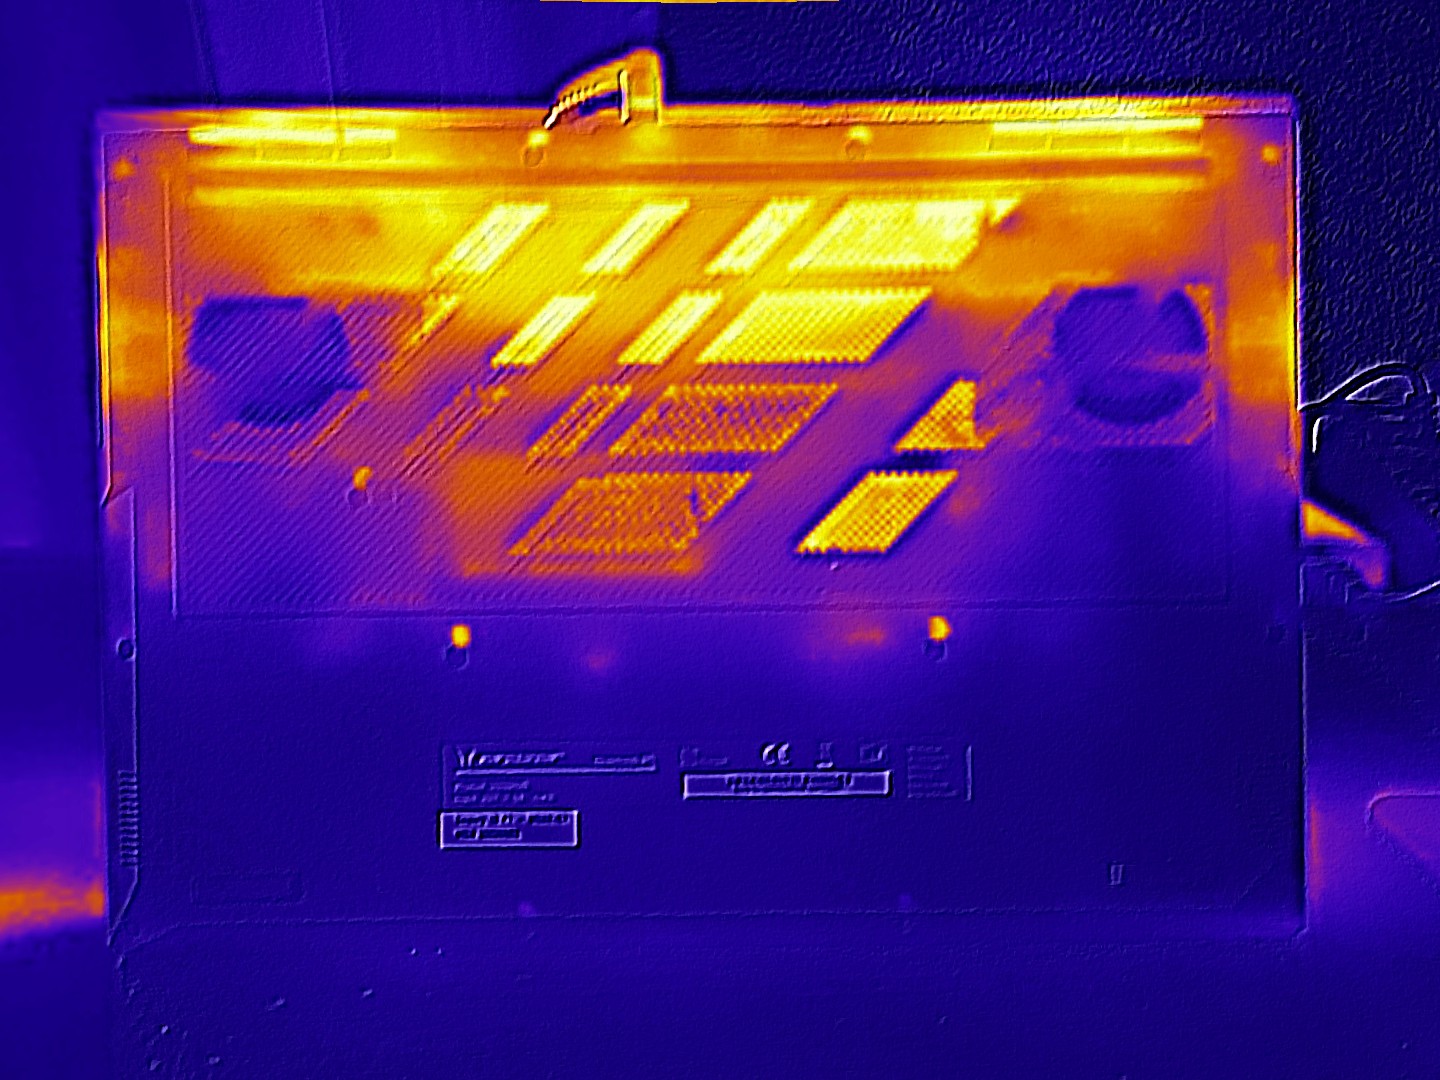
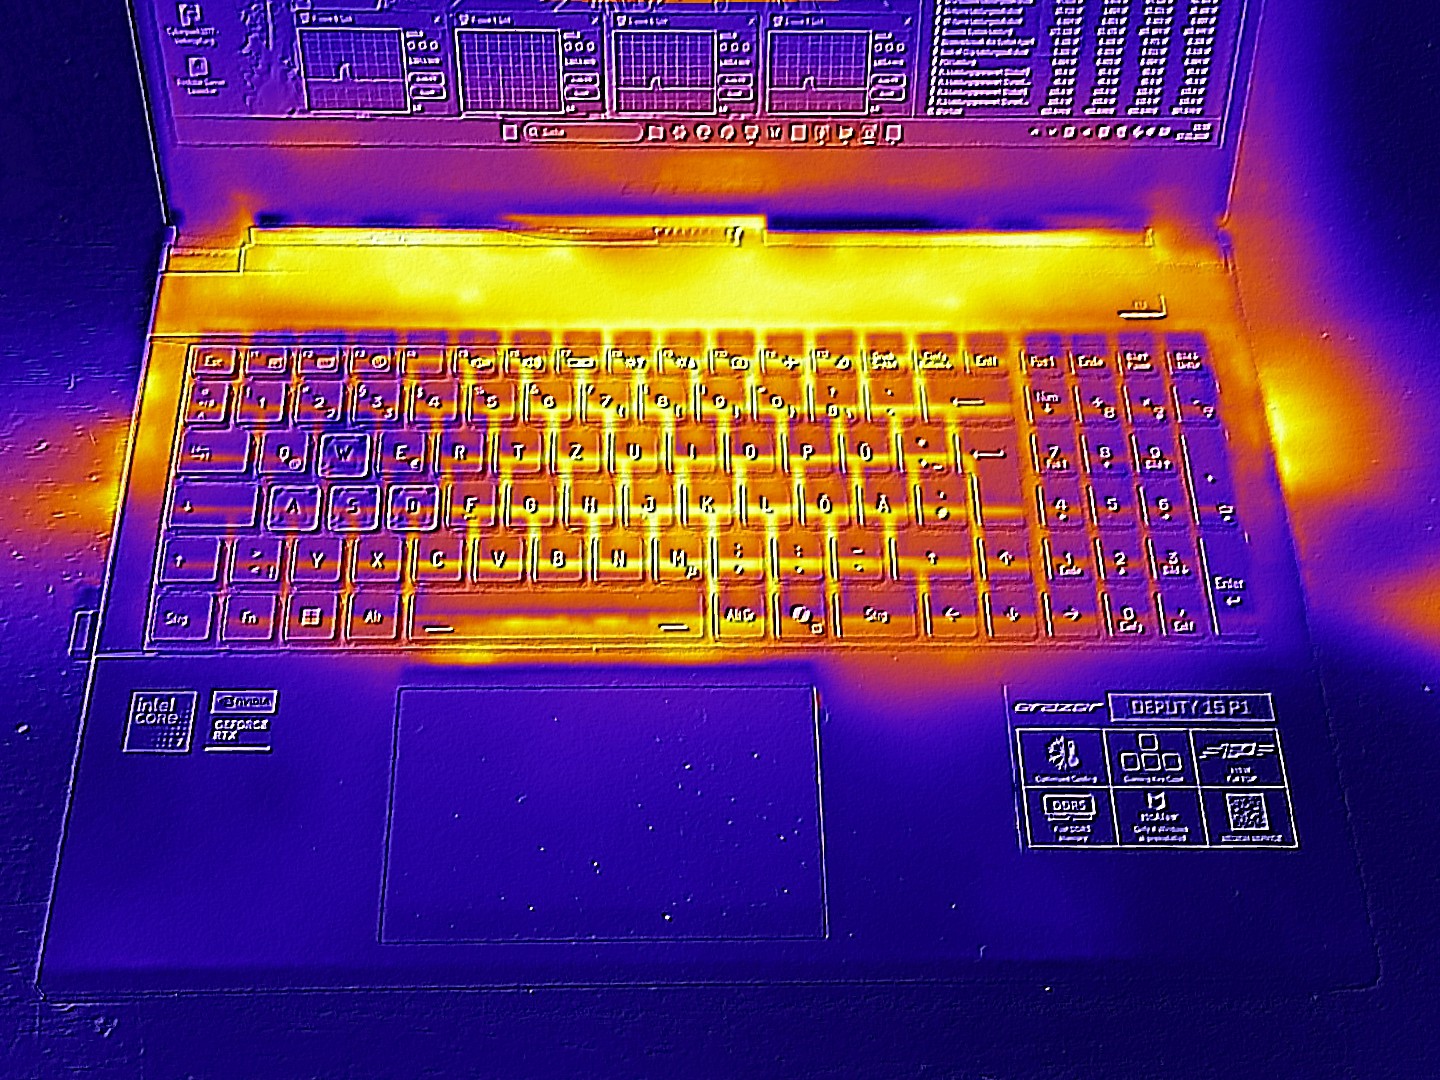
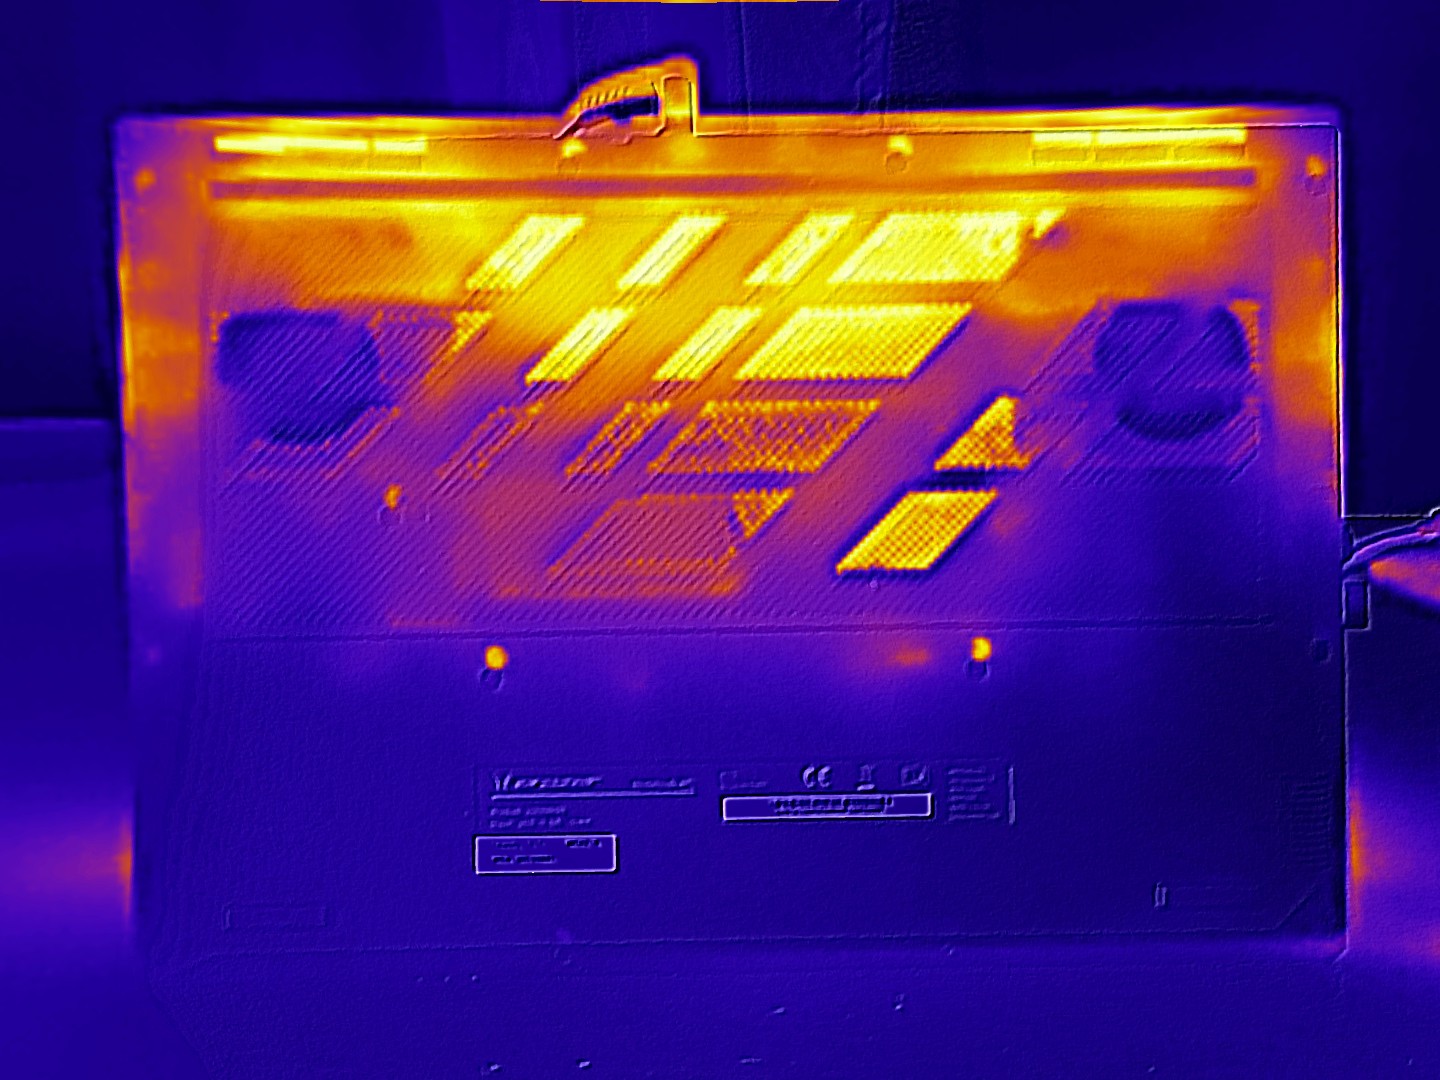
Temperatura
Temperatury mieszczą się w oczekiwanym zakresie. Ze szczytowymi wartościami 43 °C na górze i 52 °C na dole, Deputy 15 P1 jest porównywalny do Lenovo Legion 5 15. W trybie bezczynności obudowa pozostaje komfortowa, średnio 28 °C.
(±) Maksymalna temperatura w górnej części wynosi 43 °C / 109 F, w porównaniu do średniej 40.4 °C / 105 F , począwszy od 21.2 do 68.8 °C dla klasy Gaming.
(-) Dno nagrzewa się maksymalnie do 52 °C / 126 F, w porównaniu do średniej 43.2 °C / 110 F
(+) W stanie bezczynności średnia temperatura górnej części wynosi 27.9 °C / 82 F, w porównaniu ze średnią temperaturą urządzenia wynoszącą 33.9 °C / ### class_avg_f### F.
(±) 3: The average temperature for the upper side is 36.6 °C / 98 F, compared to the average of 33.9 °C / 93 F for the class Gaming.
(+) Podpórki pod nadgarstki i touchpad są chłodniejsze niż temperatura skóry i maksymalnie 31 °C / 87.8 F i dlatego są chłodne w dotyku.
(-) Średnia temperatura obszaru podparcia dłoni w podobnych urządzeniach wynosiła 28.8 °C / 83.8 F (-2.2 °C / -4 F).
| Medion Erazer Deputy 15 P1 MD62761 Core 7 250H, GeForce RTX 5060 Laptop | Acer Nitro V 15 ANV15-52-50S2 i5-13420H, GeForce RTX 5050 Laptop | Lenovo LOQ 15AHP10 R7 250, GeForce RTX 5060 Laptop | Schenker XMG Core 15 (M25) Ryzen AI 7 350, GeForce RTX 5060 Laptop | Lenovo Legion 5 15AHP G10 R7 260, GeForce RTX 5060 Laptop | Gigabyte Gaming A16 GA6H i7-13620H, GeForce RTX 5070 Laptop | |
|---|---|---|---|---|---|---|
| Heat | 4% | -5% | -4% | 5% | -7% | |
| Maximum Upper Side * (°C) | 43 | 46 -7% | 49 -14% | 49 -14% | 42.2 2% | 50 -16% |
| Maximum Bottom * (°C) | 52 | 49 6% | 58 -12% | 59 -13% | 51.7 1% | 49 6% |
| Idle Upper Side * (°C) | 31 | 28 10% | 32 -3% | 28 10% | 28.5 8% | 35 -13% |
| Idle Bottom * (°C) | 32 | 30 6% | 29 9% | 31 3% | 29.2 9% | 34 -6% |
* ... im mniej tym lepiej
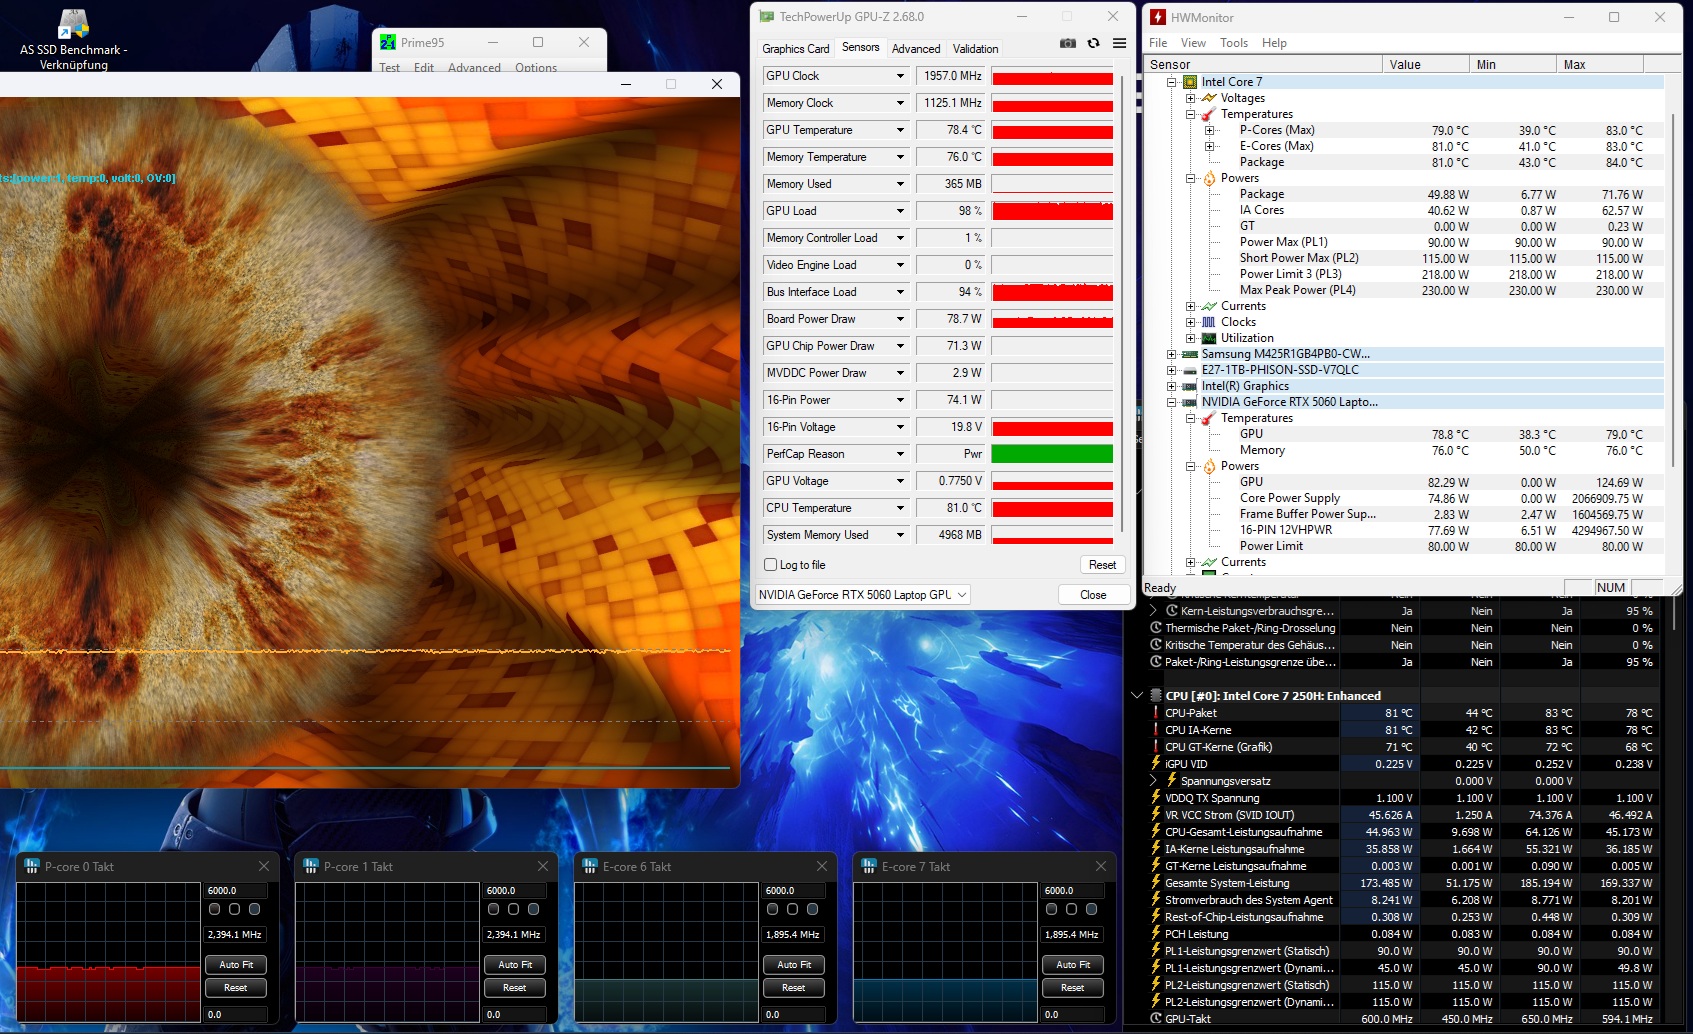
Test warunków skrajnych
Komponenty nie nagrzewają się nadmiernie pod obciążeniem. W naszym teście obciążeniowym przy użyciu FurMark i Prime95, Core 7 250H i GeForce RTX 5060 osiągnęły nieco poniżej 80 °C.
Głośniki
Obok jakości wyświetlacza, jakość głośników jest jedną z największych wad Deputy 15 P1. Większość notebooków do gier wypada lepiej w naszej analizie audio.
Medion Erazer Deputy 15 P1 MD62761 analiza dźwięku
(±) | głośność głośnika jest średnia, ale dobra (80 dB)
Bas 100 - 315 Hz
(-) | prawie brak basu - średnio 23.6% niższa od mediany
(-) | bas nie jest liniowy (17.8% delta do poprzedniej częstotliwości)
Średnie 400 - 2000 Hz
(±) | wyższe średnie - średnio 6.6% wyższe niż mediana
(±) | liniowość środka jest średnia (7.6% delta do poprzedniej częstotliwości)
Wysokie 2–16 kHz
(+) | zrównoważone maksima - tylko 3.2% od mediany
(±) | liniowość wysokich wartości jest średnia (7.5% delta do poprzedniej częstotliwości)
Ogólnie 100 - 16.000 Hz
(±) | liniowość ogólnego dźwięku jest średnia (22.3% różnicy w stosunku do mediany)
W porównaniu do tej samej klasy
» 80% wszystkich testowanych urządzeń w tej klasie było lepszych, 6% podobnych, 14% gorszych
» Najlepszy miał deltę 6%, średnia wynosiła ###średnia###%, najgorsza wynosiła 132%
W porównaniu do wszystkich testowanych urządzeń
» 65% wszystkich testowanych urządzeń było lepszych, 6% podobnych, 29% gorszych
» Najlepszy miał deltę 4%, średnia wynosiła ###średnia###%, najgorsza wynosiła 134%
Schenker XMG Core 15 (M25) analiza dźwięku
(+) | głośniki mogą odtwarzać stosunkowo głośno (82 dB)
Bas 100 - 315 Hz
(-) | prawie brak basu - średnio 18.3% niższa od mediany
(±) | liniowość basu jest średnia (9.8% delta do poprzedniej częstotliwości)
Średnie 400 - 2000 Hz
(+) | zbalansowane środki średnie - tylko 3.4% od mediany
(+) | średnie są liniowe (5.9% delta do poprzedniej częstotliwości)
Wysokie 2–16 kHz
(+) | zrównoważone maksima - tylko 3.2% od mediany
(+) | wzloty są liniowe (4.1% delta do poprzedniej częstotliwości)
Ogólnie 100 - 16.000 Hz
(+) | ogólny dźwięk jest liniowy (14.3% różnicy w stosunku do mediany)
W porównaniu do tej samej klasy
» 26% wszystkich testowanych urządzeń w tej klasie było lepszych, 7% podobnych, 67% gorszych
» Najlepszy miał deltę 6%, średnia wynosiła ###średnia###%, najgorsza wynosiła 132%
W porównaniu do wszystkich testowanych urządzeń
» 17% wszystkich testowanych urządzeń było lepszych, 4% podobnych, 78% gorszych
» Najlepszy miał deltę 4%, średnia wynosiła ###średnia###%, najgorsza wynosiła 134%
Zarządzanie energią
Zużycie energii
Interesujące: Choć niektórzy konkurenci są szybsi, notebook Medion często pobiera najwięcej energii w trybie 3D. Na biegu jałowym sytuacja wygląda jednak lepiej.
| wyłączony / stan wstrzymania | |
| luz | |
| obciążenie |
|
Legenda:
min: | |
| Medion Erazer Deputy 15 P1 MD62761 Core 7 250H, GeForce RTX 5060 Laptop | Acer Nitro V 15 ANV15-52-50S2 i5-13420H, GeForce RTX 5050 Laptop | Lenovo LOQ 15AHP10 R7 250, GeForce RTX 5060 Laptop | Schenker XMG Core 15 (M25) Ryzen AI 7 350, GeForce RTX 5060 Laptop | Lenovo Legion 5 15AHP G10 R7 260, GeForce RTX 5060 Laptop | Gigabyte Gaming A16 GA6H i7-13620H, GeForce RTX 5070 Laptop | Średnia w klasie Gaming | |
|---|---|---|---|---|---|---|---|
| Power Consumption | 15% | -6% | 11% | 21% | 17% | -18% | |
| Idle Minimum * (Watt) | 13.7 | 16.8 -23% | 20 -46% | 10.6 23% | 6.9 50% | 9 34% | 13 ? 5% |
| Idle Average * (Watt) | 14.7 | 17.6 -20% | 20.7 -41% | 12.1 18% | 10.7 27% | 11 25% | 18.7 ? -27% |
| Idle Maximum * (Watt) | 17.9 | 19.8 -11% | 22.7 -27% | 15.9 11% | 11.3 37% | 23 -28% | 24.3 ? -36% |
| Load Average * (Watt) | 110 | 66 40% | 71 35% | 95 14% | 69.7 37% | 91 17% | 108.2 ? 2% |
| Cyberpunk 2077 ultra external monitor * (Watt) | 177.2 | 105 41% | 151.1 15% | 165 7% | 165 7% | 130 27% | |
| Cyberpunk 2077 ultra * (Watt) | 177.9 | 106.5 40% | 153.1 14% | 169 5% | 162.6 9% | 132.5 26% | |
| Load Maximum * (Watt) | 191 | 119 38% | 172 10% | 192 -1% | 233.6 -22% | 155 19% | 254 ? -33% |
* ... im mniej tym lepiej
zużycie energii Cyberpunk / Stress test
zużycie energii z zewnętrznym monitorem
Żywotność baterii
W porównaniu do swoich konkurentów, Deputy 15 P1 ma najmniejszą baterię. Zamiast od 60 do 99,8 Wh, notebook Medion oferuje tylko 53 Wh, a mimo to udało mu się wytrzymać 5 godzin w naszym teście Wi-Fi (jasność zredukowana do 150 cd/m²).
| Medion Erazer Deputy 15 P1 MD62761 Core 7 250H, GeForce RTX 5060 Laptop, 53 Wh | Acer Nitro V 15 ANV15-52-50S2 i5-13420H, GeForce RTX 5050 Laptop, 76 Wh | Lenovo LOQ 15AHP10 R7 250, GeForce RTX 5060 Laptop, 60 Wh | Schenker XMG Core 15 (M25) Ryzen AI 7 350, GeForce RTX 5060 Laptop, 99.8 Wh | Lenovo Legion 5 15AHP G10 R7 260, GeForce RTX 5060 Laptop, 80 Wh | Gigabyte Gaming A16 GA6H i7-13620H, GeForce RTX 5070 Laptop, 76 Wh | Średnia w klasie Gaming | |
|---|---|---|---|---|---|---|---|
| Czasy pracy | 6% | -13% | 90% | 87% | 48% | 36% | |
| WiFi v1.3 (h) | 5.2 | 5.5 6% | 4.5 -13% | 9.9 90% | 9.7 87% | 7.7 48% | 7.06 ? 36% |
| Reader / Idle (h) | 6.9 | 8.71 ? | |||||
| Load (h) | 1.3 | 1.2 | 1.51 ? | ||||
| H.264 (h) | 11.5 | 8.9 ? | |||||
| Cyberpunk 2077 ultra 150cd (h) | 0.9 |
Ogólna ocena Notebookcheck
Erazer Deputy 15 P1 okazuje się być dobrym notebookiem do gier, ale kilka niedociągnięć (gama kolorów wyświetlacza, jakość głośników itp.) sprawia, że nieco trudniej jest mu konkurować z rywalami - niektórzy z nich oferują więcej za mniej niż 1500 euro (około 1765 USD).
Medion Erazer Deputy 15 P1 MD62761
- 18/02/2026 v8
Florian Glaser
 Total Sustainability Score:
 Możliwe alternatywy w porównaniu
Obraz | Model / recenzja | Cena | Waga | Wysokość | Ekran |
|---|---|---|---|---|---|
1. 78.6%  | Medion Erazer Deputy 15 P1 MD62761 Intel Core 7 250H ⎘ NVIDIA GeForce RTX 5060 Laptop ⎘ 16 GB Pamięć, 1024 GB | Amazon: Cena katalogowa: 1300 EUR | 2.2 kg | 29 mm | 15.60" 1920x1080 141 PPI IPS |
2. 73.7%  | Acer Nitro V 15 ANV15-52-50S2 Intel Core i5-13420H ⎘ NVIDIA GeForce RTX 5050 Laptop ⎘ 16 GB Pamięć, 1024 GB SSD | Amazon: Cena katalogowa: 1049 EUR | 2.1 kg | 23.5 mm | 15.60" 1920x1080 141 PPI IPS |
3. 77.5%  | Lenovo LOQ 15AHP10 AMD Ryzen 7 250 ⎘ NVIDIA GeForce RTX 5060 Laptop ⎘ 16 GB Pamięć, 1024 GB SSD | Amazon: | 2.4 kg | 24 mm | 15.60" 1920x1080 141 PPI IPS |
4. 84.7%  | Schenker XMG Core 15 (M25) AMD Ryzen AI 7 350 ⎘ NVIDIA GeForce RTX 5060 Laptop ⎘ 64 GB Pamięć, 2048 GB SSD | Amazon: Cena katalogowa: 1840 EUR | 1.9 kg | 22 mm | 15.30" 2560x1600 197 PPI IPS |
5. 87.2%  | Lenovo Legion 5 15AHP G10 AMD Ryzen 7 260 ⎘ NVIDIA GeForce RTX 5060 Laptop ⎘ 32 GB Pamięć, 1024 GB SSD | Amazon: Cena katalogowa: 1449€ | 1.9 kg | 21.5 mm | 15.10" 2560x1600 200 PPI OLED |
6. 80.1%  | Gigabyte Gaming A16 GA6H Intel Core i7-13620H ⎘ NVIDIA GeForce RTX 5070 Laptop ⎘ 16 GB Pamięć, 1024 GB SSD | Amazon: 1. $1,598.77 GIGABYTE - Gaming A16 Gaming... 2. $1,224.02 GIGABYTE - Gaming A16 Gaming... 3. $1,085.33 GIGABYTE - Gaming A16 Gaming... Cena katalogowa: 1700 EUR | 2.3 kg | 23 mm | 16.00" 2560x1600 189 PPI IPS |
Przezroczystość
Wyboru urządzeń do recenzji dokonuje nasza redakcja. Próbka testowa została udostępniona autorowi jako pożyczka od producenta lub sprzedawcy detalicznego na potrzeby tej recenzji. Pożyczkodawca nie miał wpływu na tę recenzję, producent nie otrzymał też kopii tej recenzji przed publikacją. Nie było obowiązku publikowania tej recenzji. Jako niezależna firma medialna, Notebookcheck nie podlega władzy producentów, sprzedawców detalicznych ani wydawców.
Tak testuje Notebookcheck
Każdego roku Notebookcheck niezależnie sprawdza setki laptopów i smartfonów, stosując standardowe procedury, aby zapewnić porównywalność wszystkich wyników. Od około 20 lat stale rozwijamy nasze metody badawcze, ustanawiając przy tym standardy branżowe. W naszych laboratoriach testowych doświadczeni technicy i redaktorzy korzystają z wysokiej jakości sprzętu pomiarowego. Testy te obejmują wieloetapowy proces walidacji. Nasz kompleksowy system ocen opiera się na setkach uzasadnionych pomiarów i benchmarków, co pozwala zachować obiektywizm.