

Notebookcheck Logo
Teaser

Potężny komputer do gier z wyświetlaczem 4K Mini-LED, kartą graficzną RTX 5090 i 128 GB pamięci RAM – recenzja modelu Asus ROG Strix SCAR 18 G835LXG

Gry klasy premium z bezkompromisową wydajnością.

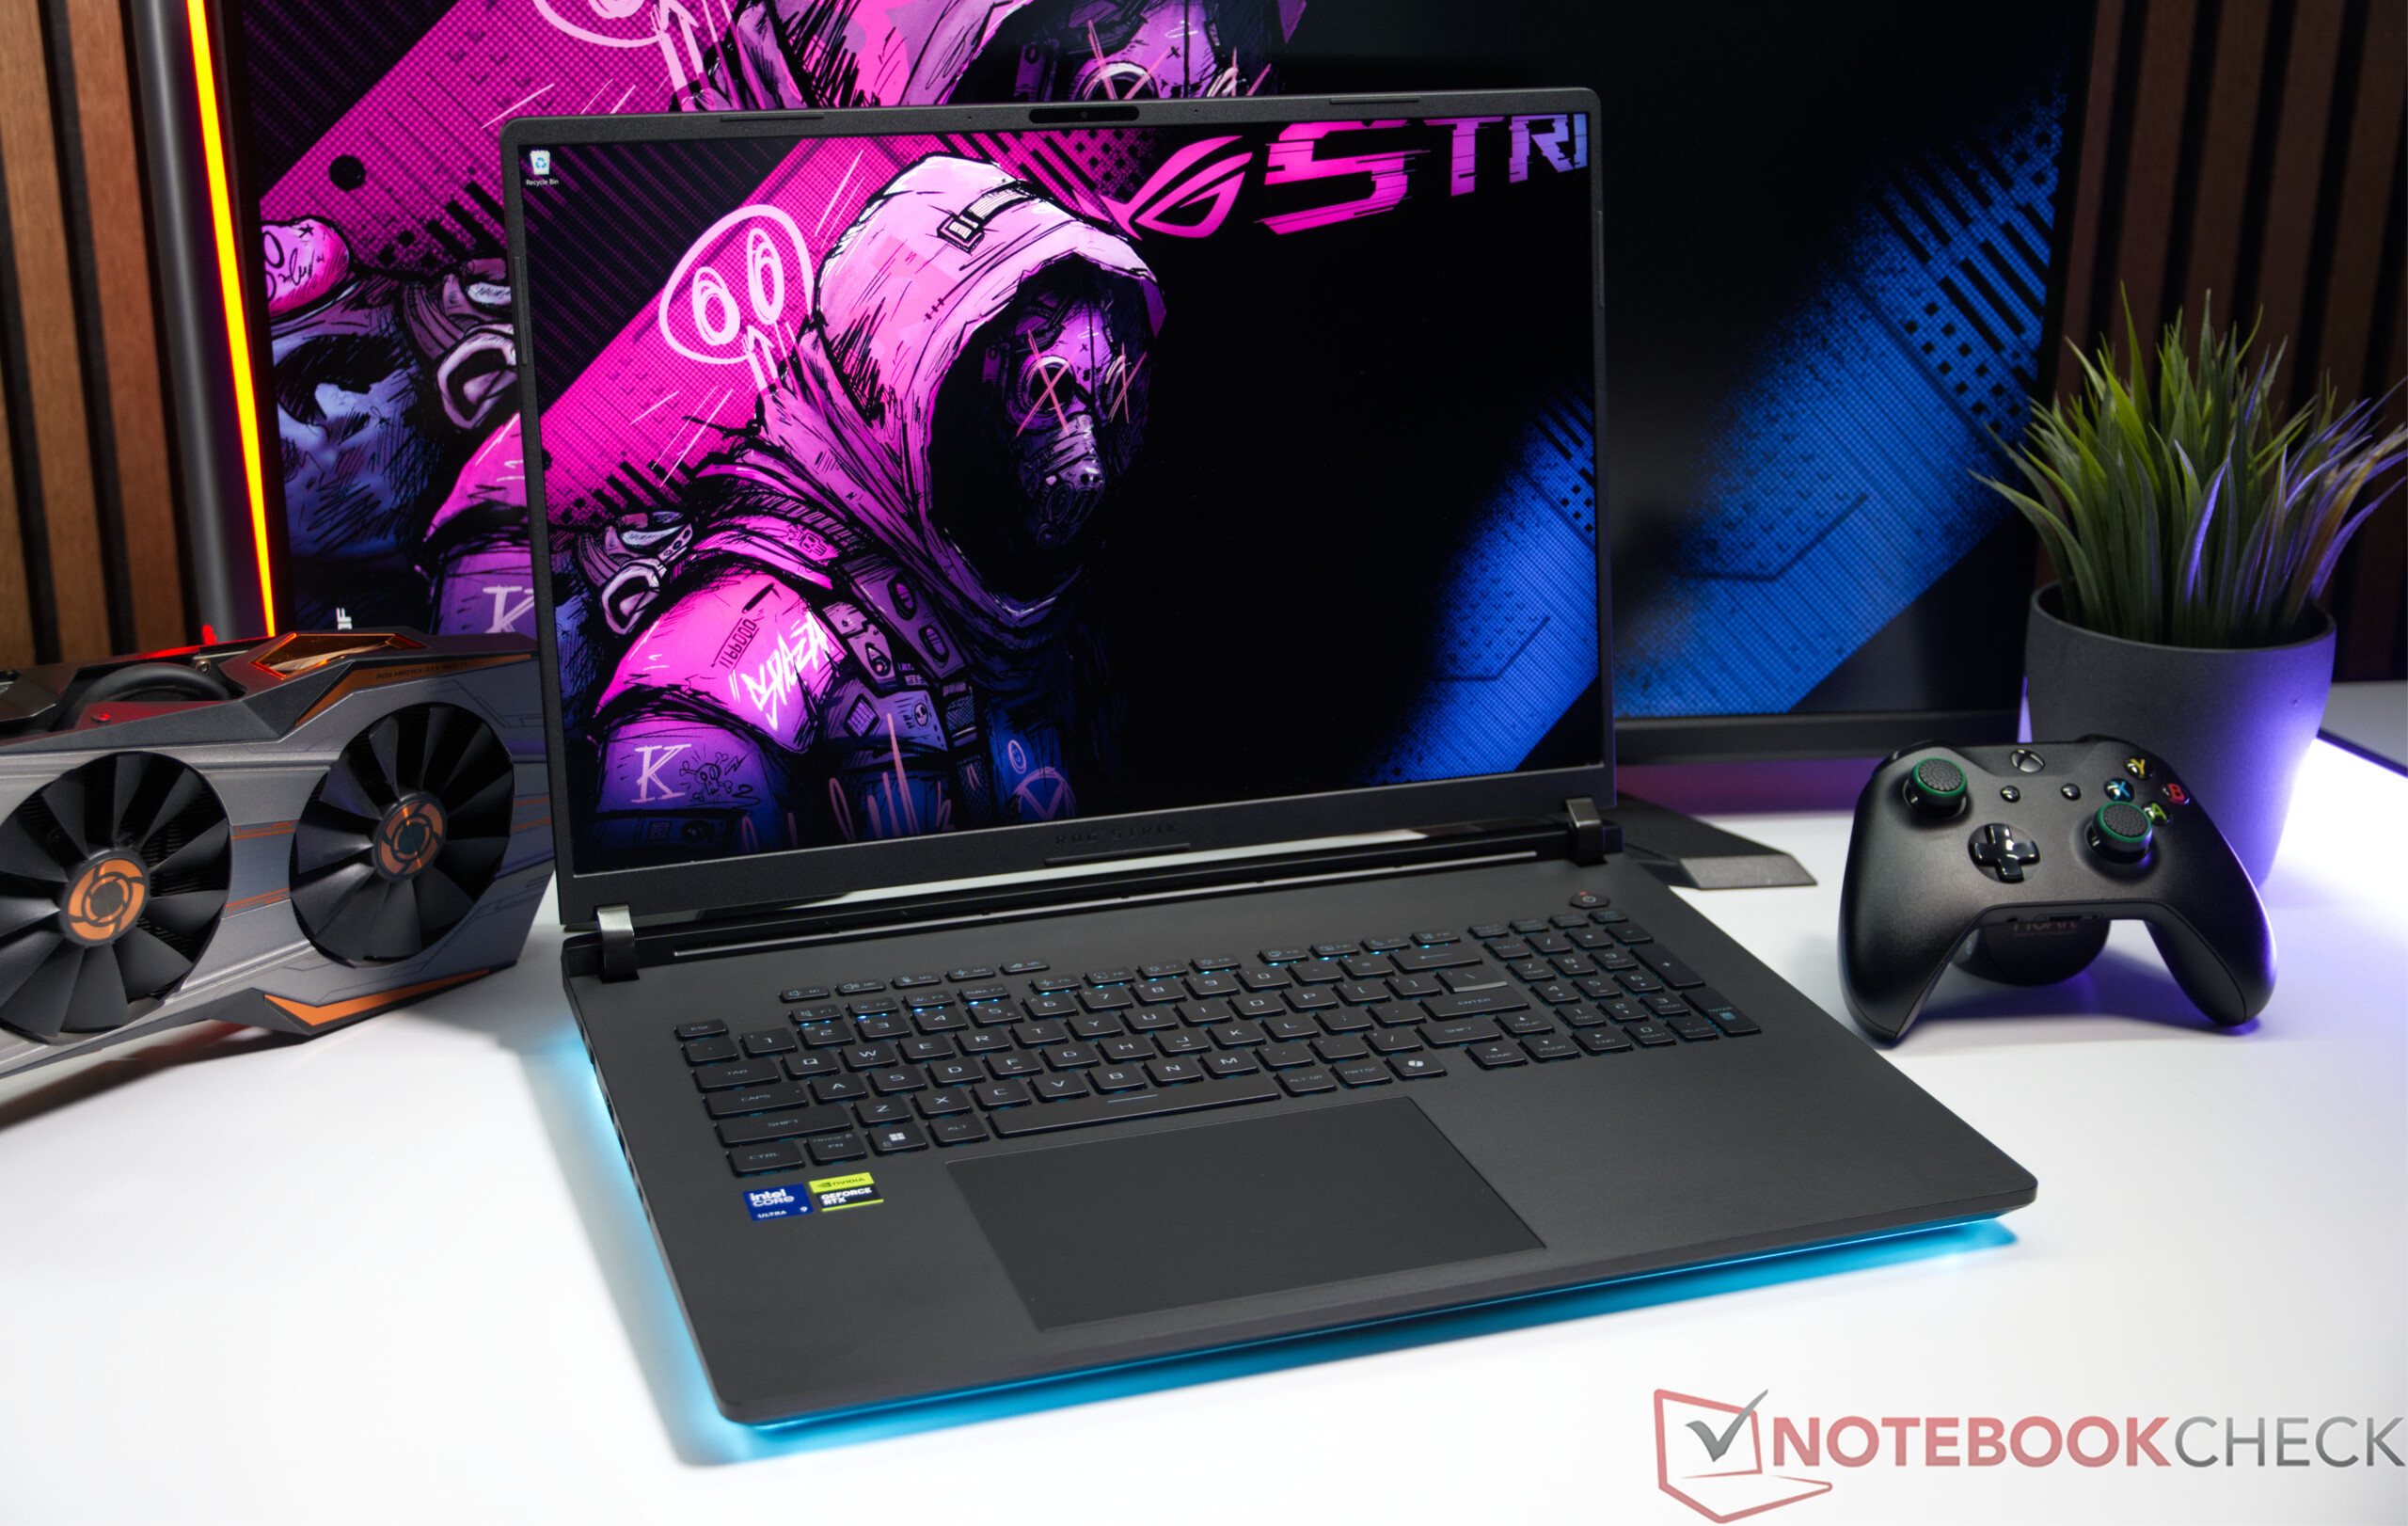
Firma Asus aktualizuje swój model ROG Strix SCAR 18 G835LXG, wyposażając go w procesor Intel Core Ultra 9 290HX, procesor graficzny NVIDIA GeForce RTX 5090 przeznaczony do laptopów oraz 18-calowy wyświetlacz 4K z technologią Mini-LED, częstotliwością odświeżania 240 Hz i 2 000 strefami przyciemniania. Urządzenie charakteryzuje się również doskonałą łatwością serwisowania dzięki uproszczonemu dostępowi do podzespołów oraz szerokim możliwościom personalizacji za pomocą oprogramowania AniME Vision i wszechstronnego oświetlenia RGB.
Sebastian Bade, 👁 Sebastian Bade (tłumaczenie DeepL / Ninh Duy) Opublikowany 🇺🇸 🇩🇪 ...
AI Blackwell RTX 5000 Nvidia Arrow Lake Intel Laptop / Notebook Windows Gaming Wi-Fi 7 Thunderbolt

Werdykt – Maksymalna wydajność w grach przy niewielkiej liczbie niedociągnięć

Asus ROG Strix SCAR 18 G835LXG jest jednym z najpotężniejszych laptopów do gier dostępnych obecnie na rynku. Wyposażony w procesor Intel Core Ultra 9 290HX, kartę graficzną NVIDIA GeForce RTX 5090 Laptop o TGP wynoszącym 175 watów oraz 128 GB pamięci RAM, testowany egzemplarz oferuje ogromne rezerwy wydajnościowe do obsługi najnowszych gier klasy AAA, profesjonalnego tworzenia treści oraz wymagających zadań związanych ze sztuczną inteligencją. Wydajność procesora i karty graficznej pozostaje stabilna nawet przy długotrwałym obciążeniu.

Jednym z największych atutów laptopa jest 18-calowy wyświetlacz Mini-LED o rozdzielczości 4K, 2000 strefach przyciemniania oraz częstotliwości odświeżania 240 Hz. Urządzenie zachwyca wysoką ostrością obrazu, doskonałymi możliwościami HDR oraz wysoką maksymalną jasnością. Jedyne ograniczenia dotyczą fabrycznej kalibracji kolorów, którą można jednak znacznie poprawić poprzez kalibrację. Ponadto częstotliwość odświeżania 240 Hz jest dostępna wyłącznie w trybie GPU Ultimate Mode — we wszystkich pozostałych trybach graficznych nadal możliwa jest częstotliwość 120 Hz.

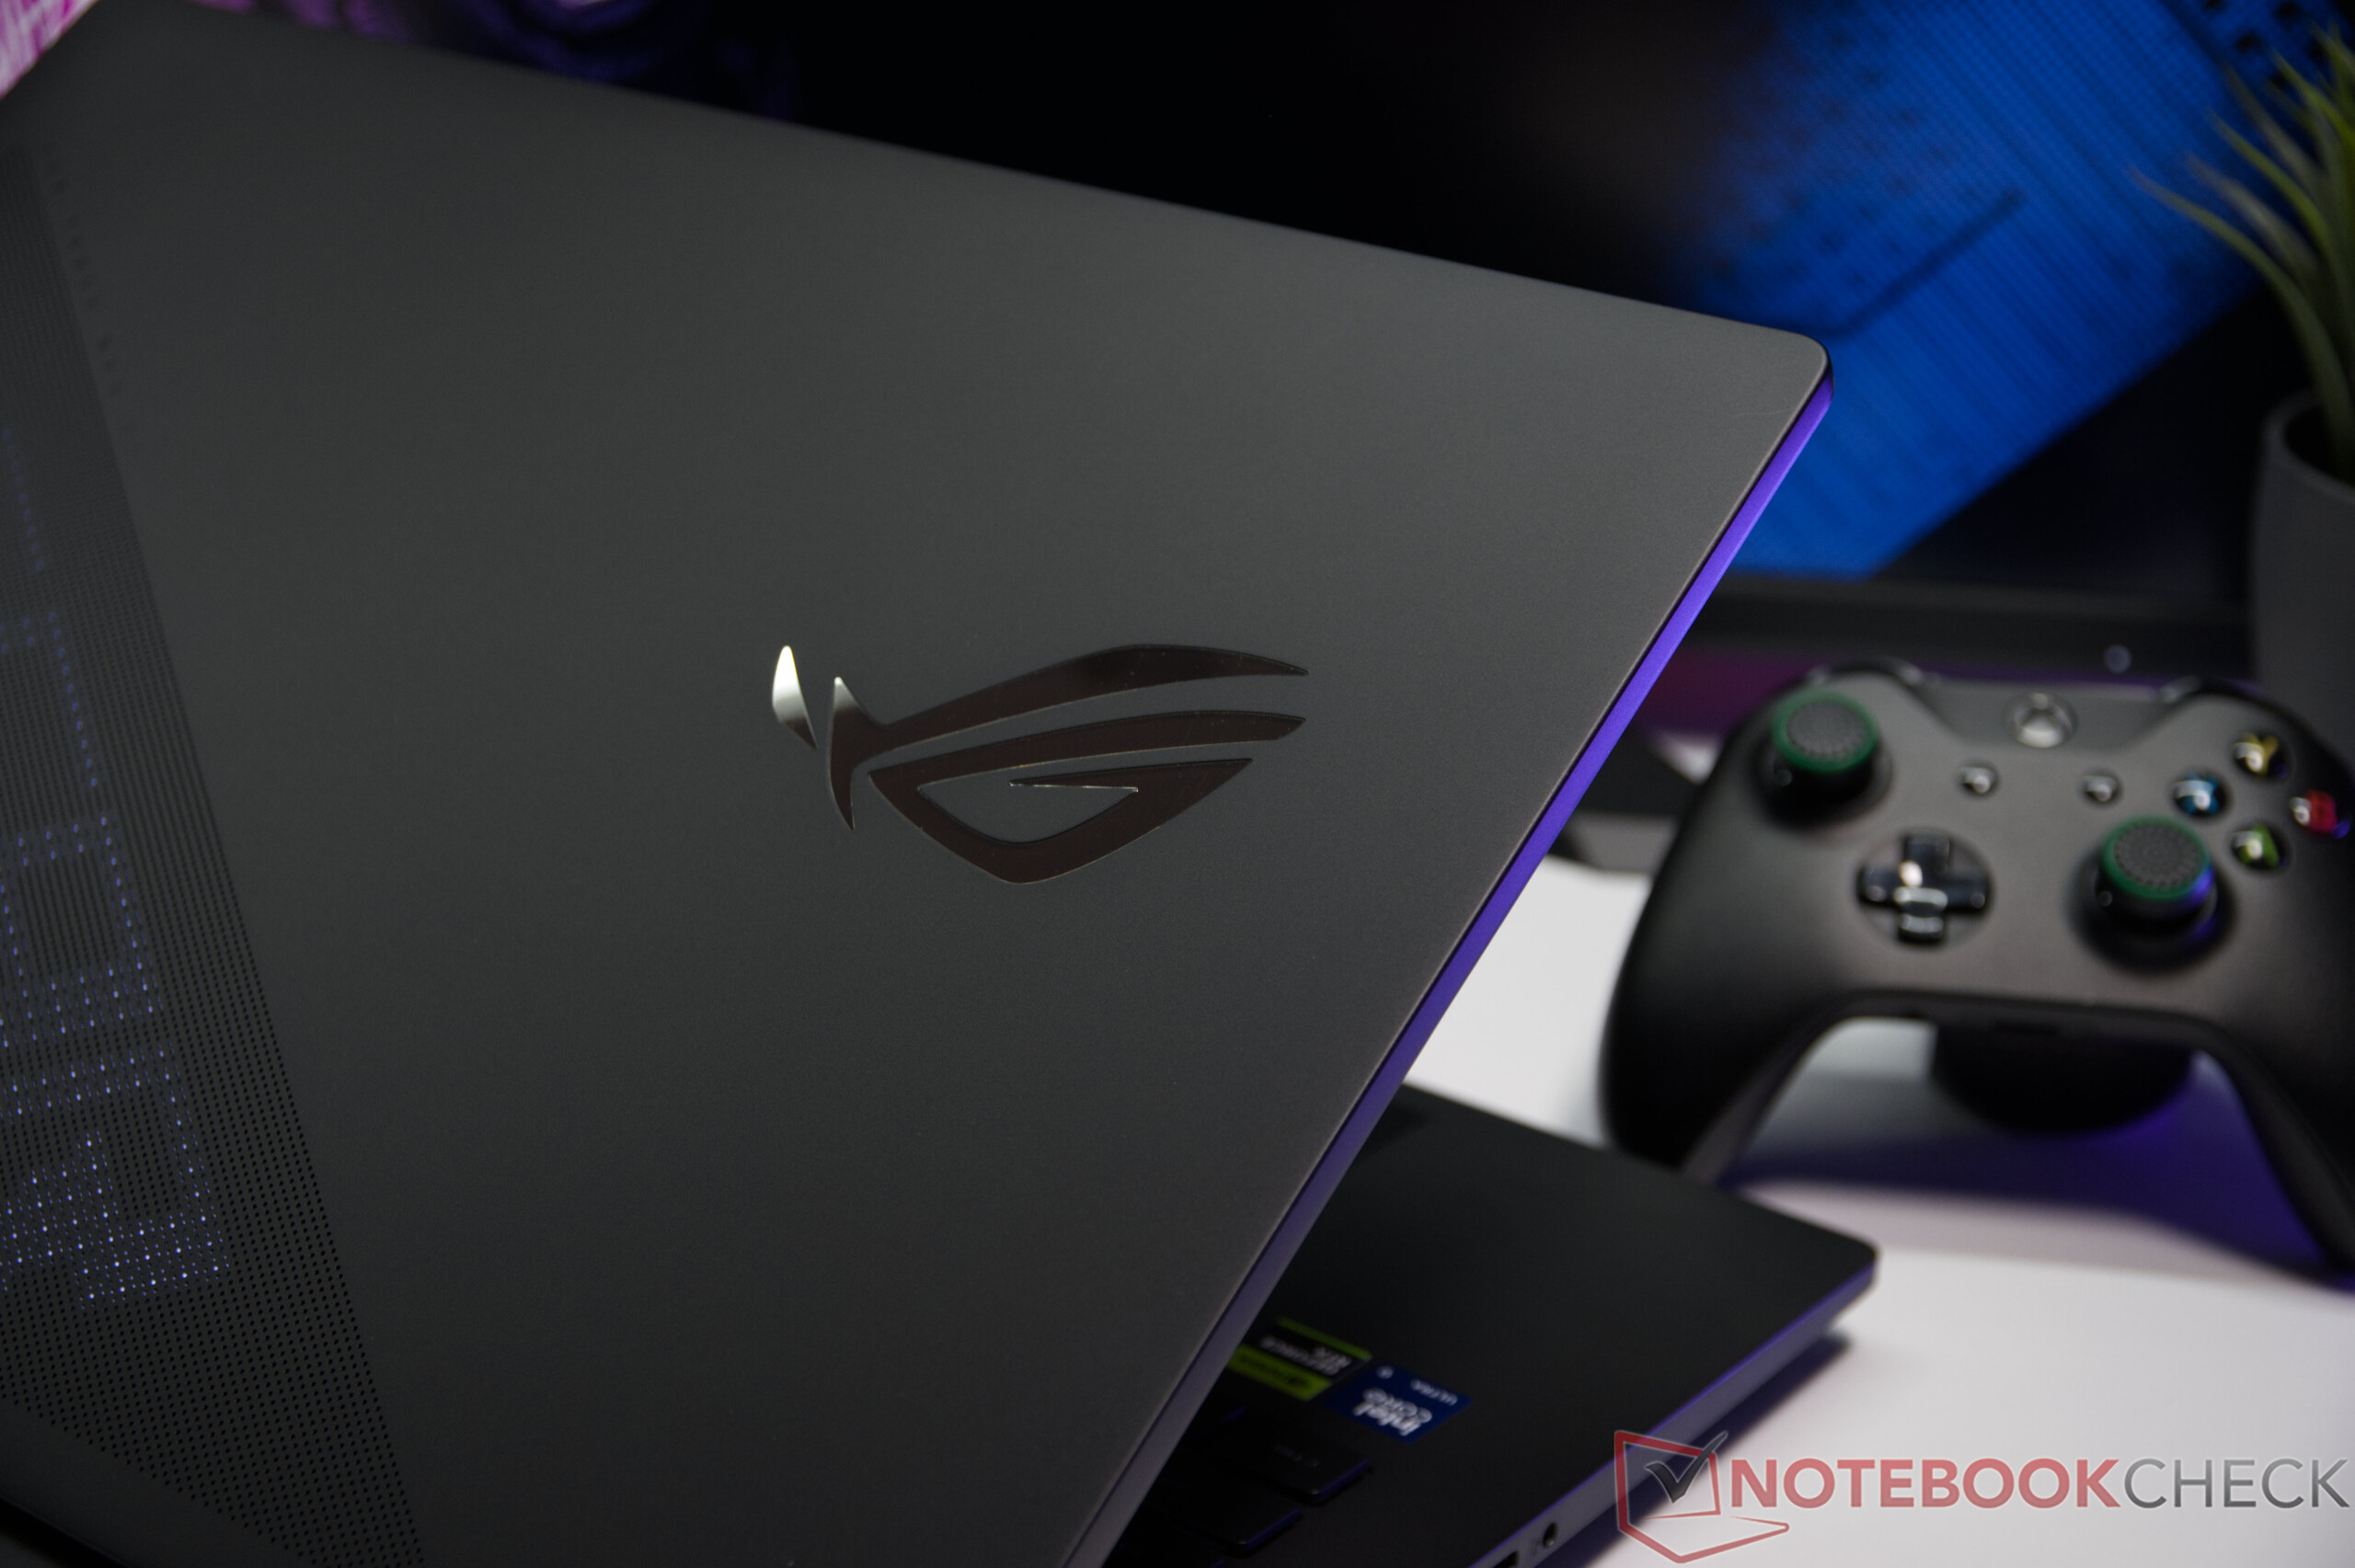
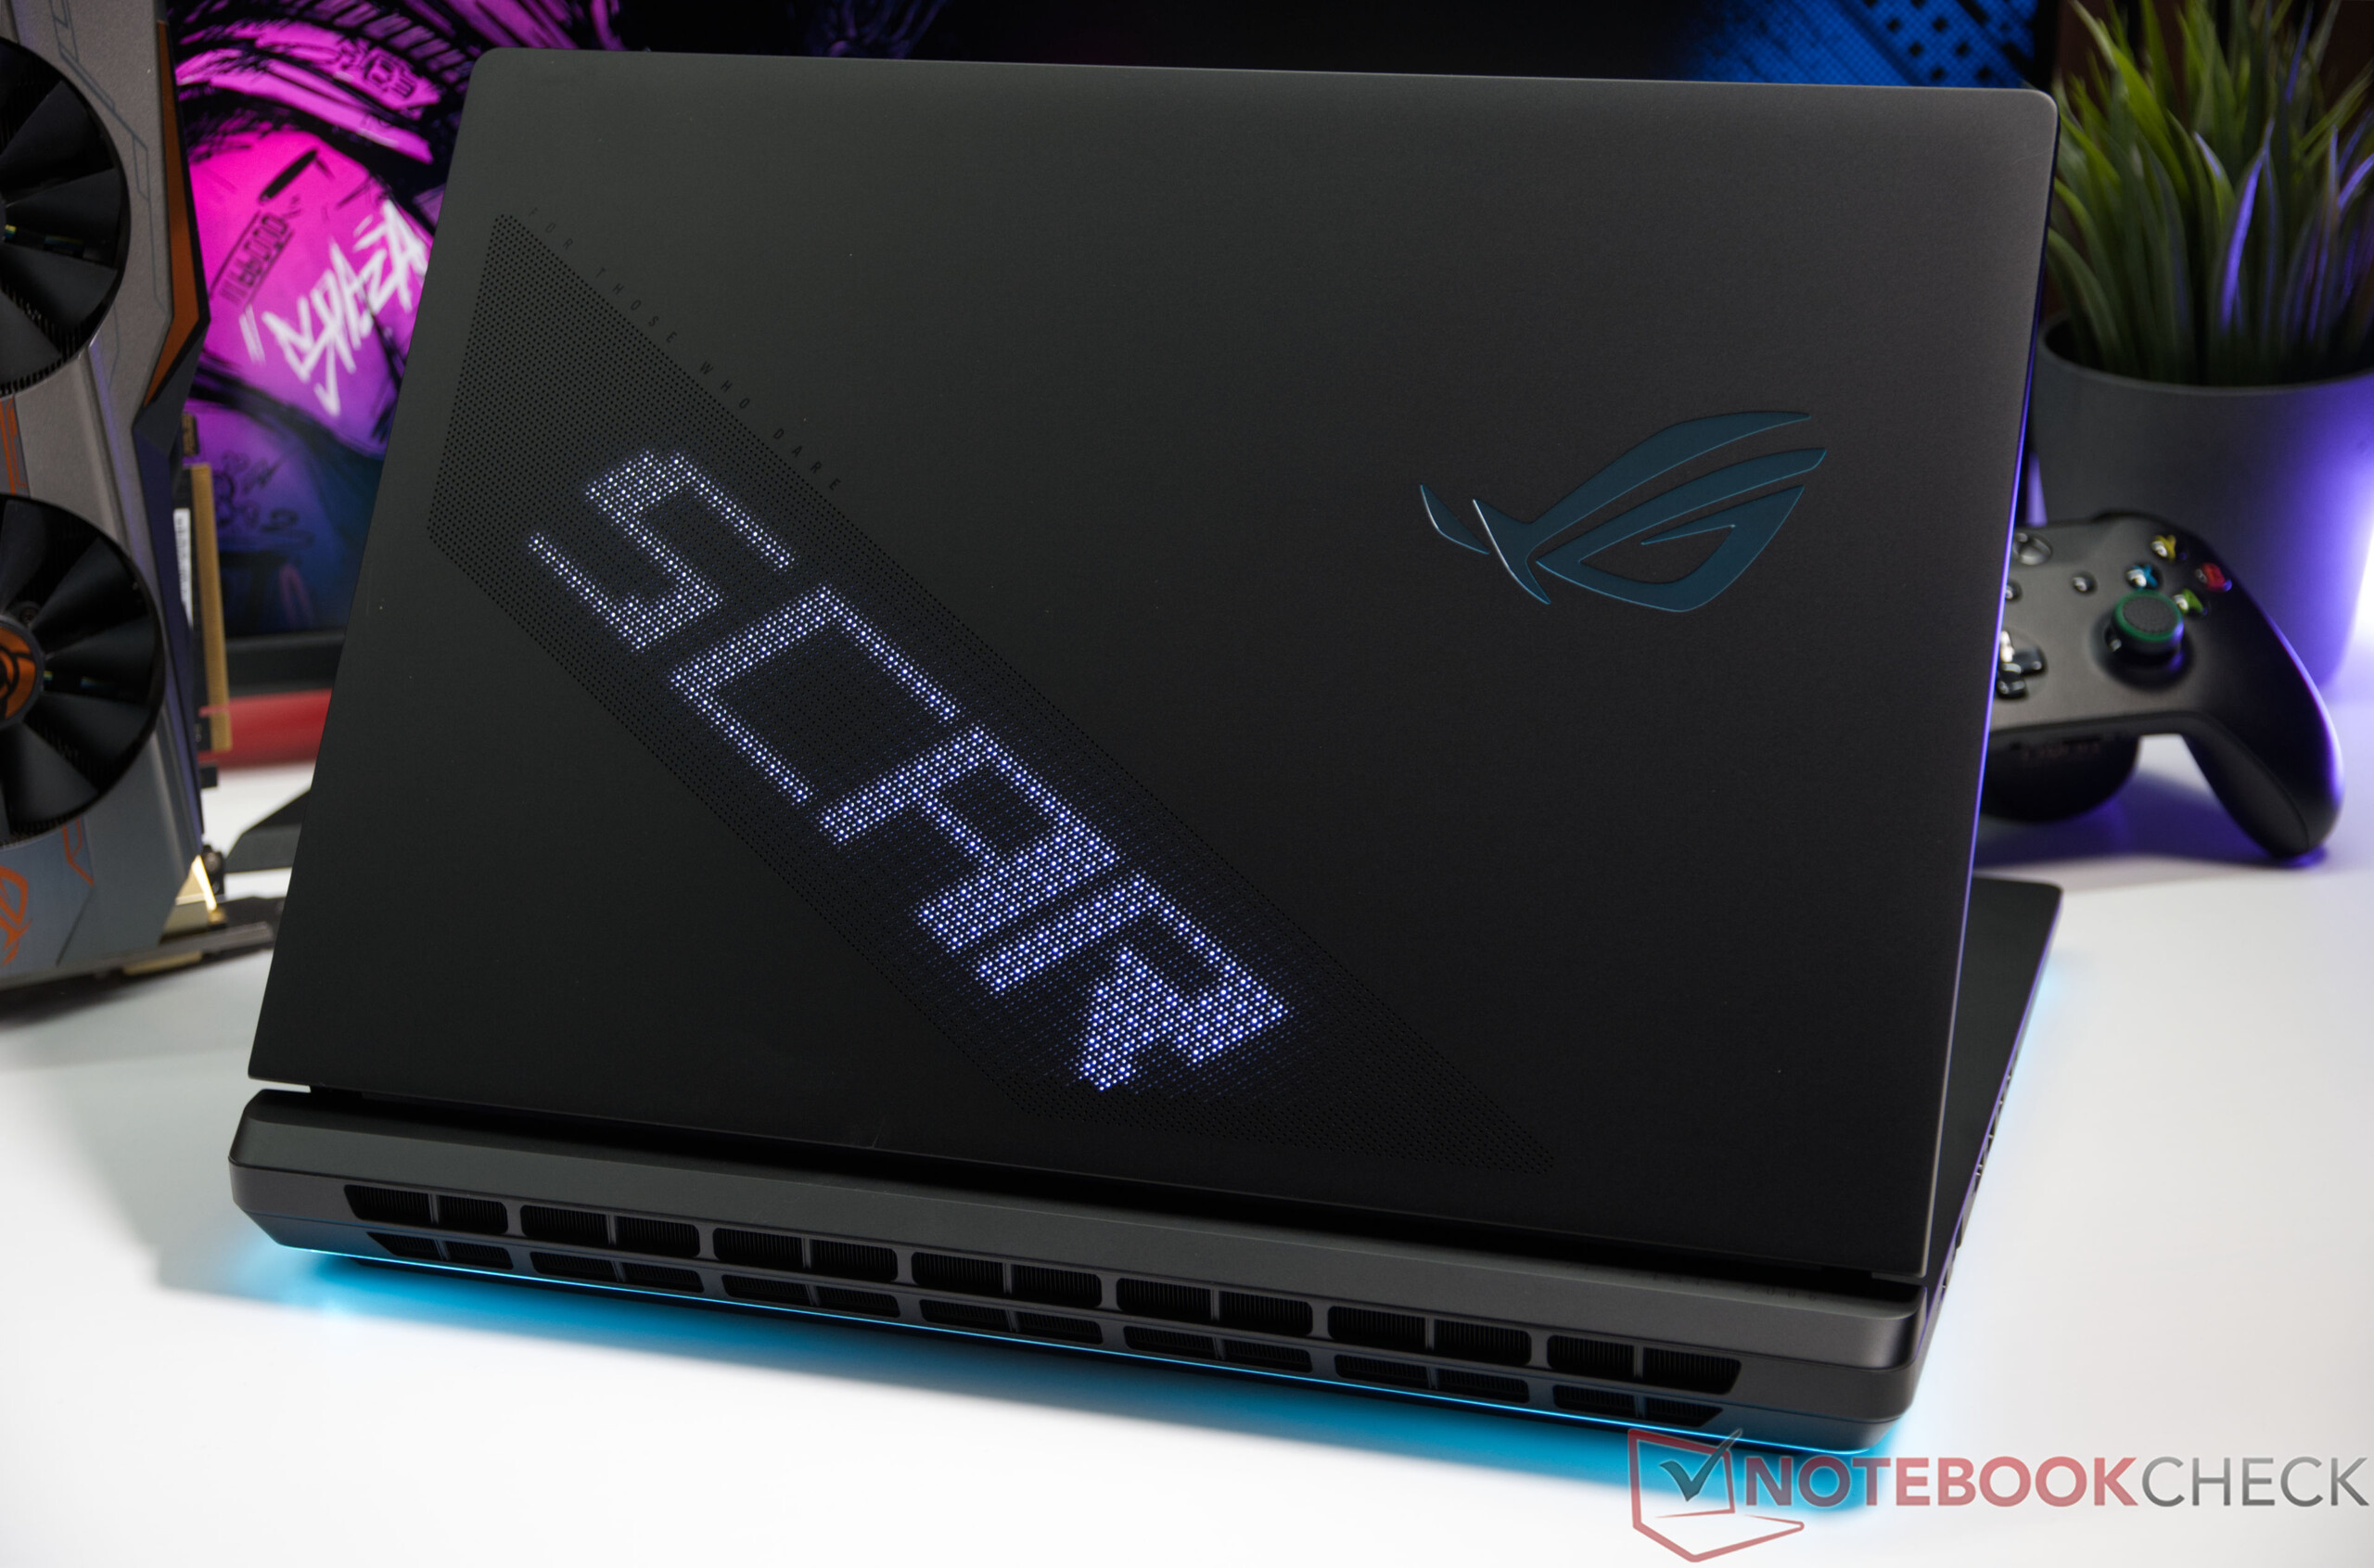
Obudowa sprawia również wrażenie wysokiej jakości. Bogate podświetlenie RGB, w tym funkcja AniME Vision, a także łatwość konserwacji podkreślają jej ekskluzywny charakter. Mniej imponująca jest delikatna plastikowa powierzchnia obudowy, na której szybko pozostają odciski palców, oraz system chłodzenia, który jest wyraźnie słyszalny pod obciążeniem. Do tego dochodzi wysokie zużycie energii oraz czas pracy na baterii, który w tej klasie wydajności jest jedynie przeciętny.

Jeśli poszukują Państwo bezkompromisowego zamiennika komputera stacjonarnego, zapewniającego maksymalną wydajność w grach i aplikacjach, model Asus ROG Strix SCAR 18 G835LXG jest jednym z najpotężniejszych 18-calowych laptopów do gier dostępnych obecnie na rynku. Wiąże się to jednak z bardzo wysoką ceną zakupu, a także wysokim poziomem hałasu i zużyciem energii – co stanowi typowe kompromisy w tej klasie wydajności.

Za

+ Znakomita wydajność w grach i pracy systemu
+ Laptop z kartą graficzną GeForce RTX 5090 o TGP wynoszącym 175 W
+ 128 GB pamięci RAM DDR5
+ Łącznie 8 TB pamięci masowej (2 x 4 TB w konfiguracji RAID 0)
+ Doskonały 18-calowy wyświetlacz Mini-LED
+ Dwa porty Thunderbolt 5
+ Znakomite możliwości konserwacji i rozbudowy
+ Wszechstronne, konfigurowalne podświetlenie RGB i AniME Vision
+ Wygodna klawiatura zapewniająca precyzyjne naciśnięcia klawiszy

Przeciw

- Wysoki poziom hałasu podczas pracy pod obciążeniem związanym z grami
- Plastikowa obudowa bardzo łatwo ulega zabrudzeniom od odcisków palców
- Wysokie zużycie energii podczas pracy pod obciążeniem
- Brak portów z tyłu obudowy

Cena i dostępność

Nowy model Asus ROG Strix SCAR 18 ma wkrótce pojawić się w sklepach.

Amazon Logo
  • $7,439.00
    HIDevolution [2026] ASUS ROG Strix Scar 18 G835LXG 18" 4K 240Hz Mini LED, 2.7 GHz Ultra 9-290HX Plus, RTX 5090, 128 GB DDR5 RAM, 4 TB PCIe SSD, Windows 11 Pro
  • $6,284.00
    HIDevolution [2026] ASUS ROG Strix Scar 18 G835LXG 18" 4K 240Hz Mini LED, 2.7 GHz Ultra 9-290HX Plus, RTX 5090, 64 GB DDR5 RAM, 2 TB PCIe SSD, Windows 11 Home
  • $6,019.00
    HIDevolution [2026] ASUS ROG Strix Scar 18 G835LXG 18" 4K 240Hz Mini LED, 2.7 GHz Ultra 9-290HX Plus, RTX 5090, 64 GB DDR5 RAM, 1 TB PCIe SSD, Windows 11 Home

Asus ROG Strix SCAR 18 G835LXG to flagowy laptop gamingowy firmy Asus, zaprojektowany z myślą o użytkownikach o najwyższych wymaganiach dotyczących wydajności. Testowany przez nas egzemplarz łączy procesor Intel Core Ultra 9 290HX z kartą graficzną Nvidia GeForce RTX 5090 przeznaczoną do laptopów, a ponadto jest wyposażony w 128 GB pamięci RAM, dwa szybkie dyski SSD o pojemności 4 TB w macierzy RAID 0 oraz 18-calowy wyświetlacz Mini-LED o częstotliwości odświeżania 240 Hz. Dzięki temu ten laptop z najwyższej półki doskonale sprawdza się zarówno w wymagających grach, jak i podczas profesjonalnego tworzenia treści.

Specyfikacje

Asus ROG Strix Scar 18 G835LXG (Strix Scar 18 Rodzina)
Procesor
Intel Core Ultra 9 290HX Plus 24c/24t, 8 x 5.5 GHz Intel Lion Cove P-Core, 16 x 4.7 GHz Intel Skymont E-Core, 200 W PL2 / Short Burst, 180 W PL1 / Sustained, Arrow Lake-HX
Karta grafiki
NVIDIA GeForce RTX 5090 Laptop - 24 GB VRAM, rdzeń: 1597 MHz, pamięć: 1750 MHz, 175 W TDP ( w tym 25 W Dynamic Boost), GDDR7, Nvidia 610.62, Advanced Optimus
Pamięć
128 GB 
, DDR5-6400, 2x SO-DIMM, Dual-Channel
Matryca
18.00 cali 16:10, 3840 x 2400 pikseli 252 PPI, NE180QA1-MM0, Mini LED, refleksująca: nie, HDR, 240 Hz, Adaptive Sync
Chipset
Intel HM870 (Arrow Lake-HX PCH)
Dysk twardy
2x Samsung PM9E1 MZVLC4T0HBL1 (RAID 0), 8192 GB 
, M.2 PCIe, RAID 0, 7280 GB wolne miejsce
Karta dźwiękowa
Intel Arrow Lake-S PCH - ACE (Audio Context Engine)
Złącza
3 USB 3.1 Gen2, 2 Thunderbolt 5, USB-C Power Delivery (PD), 1 HDMI, 2 DisplayPort, 1 złącze stacji dokującej, gniazda audio: 3.5 mm Stereo
Łączność
Realtek RTL8125 2.5GBe Family Ethernet Controller (10/100/1000/2500MBit/s), Intel Wi-Fi 7 BE200 320MHz (a/b/g/n = Wi-Fi 4/ac = Wi-Fi 5/ax = Wi-Fi 6/ Wi-Fi 6E 6 GHz be = Wi-Fi 7), Bluetooth 5.4
Gabaryty
wysokość x szerokość x głębokość (mm): 35 x 399 x 298
Akumulator
90 Wh litowo-polimerowy, 4-cell
System operacyjny
Microsoft Windows 11 Home
Kamera
kamerka: 1080P FHD IR Camera for Windows Hello
Główny aparat: 2 MPix
Inne
głośniki: 4-speaker system, klawiatura: Chiclet, podświetlanie klawiatury: tak, 450W PSU, Armoury Crate, 24 miesiące(y) gwarancji
Waga
3.605 kg, zasilacz: 821 g
Cena
8999 PLN
Uwaga: Producent może używać komponentów pochodzących od różnych dostawców, w tym paneli wyświetlaczy, napędów lub kart pamięci o podobnych specyfikacjach.


Obudowa, funkcje i urządzenia wejściowe

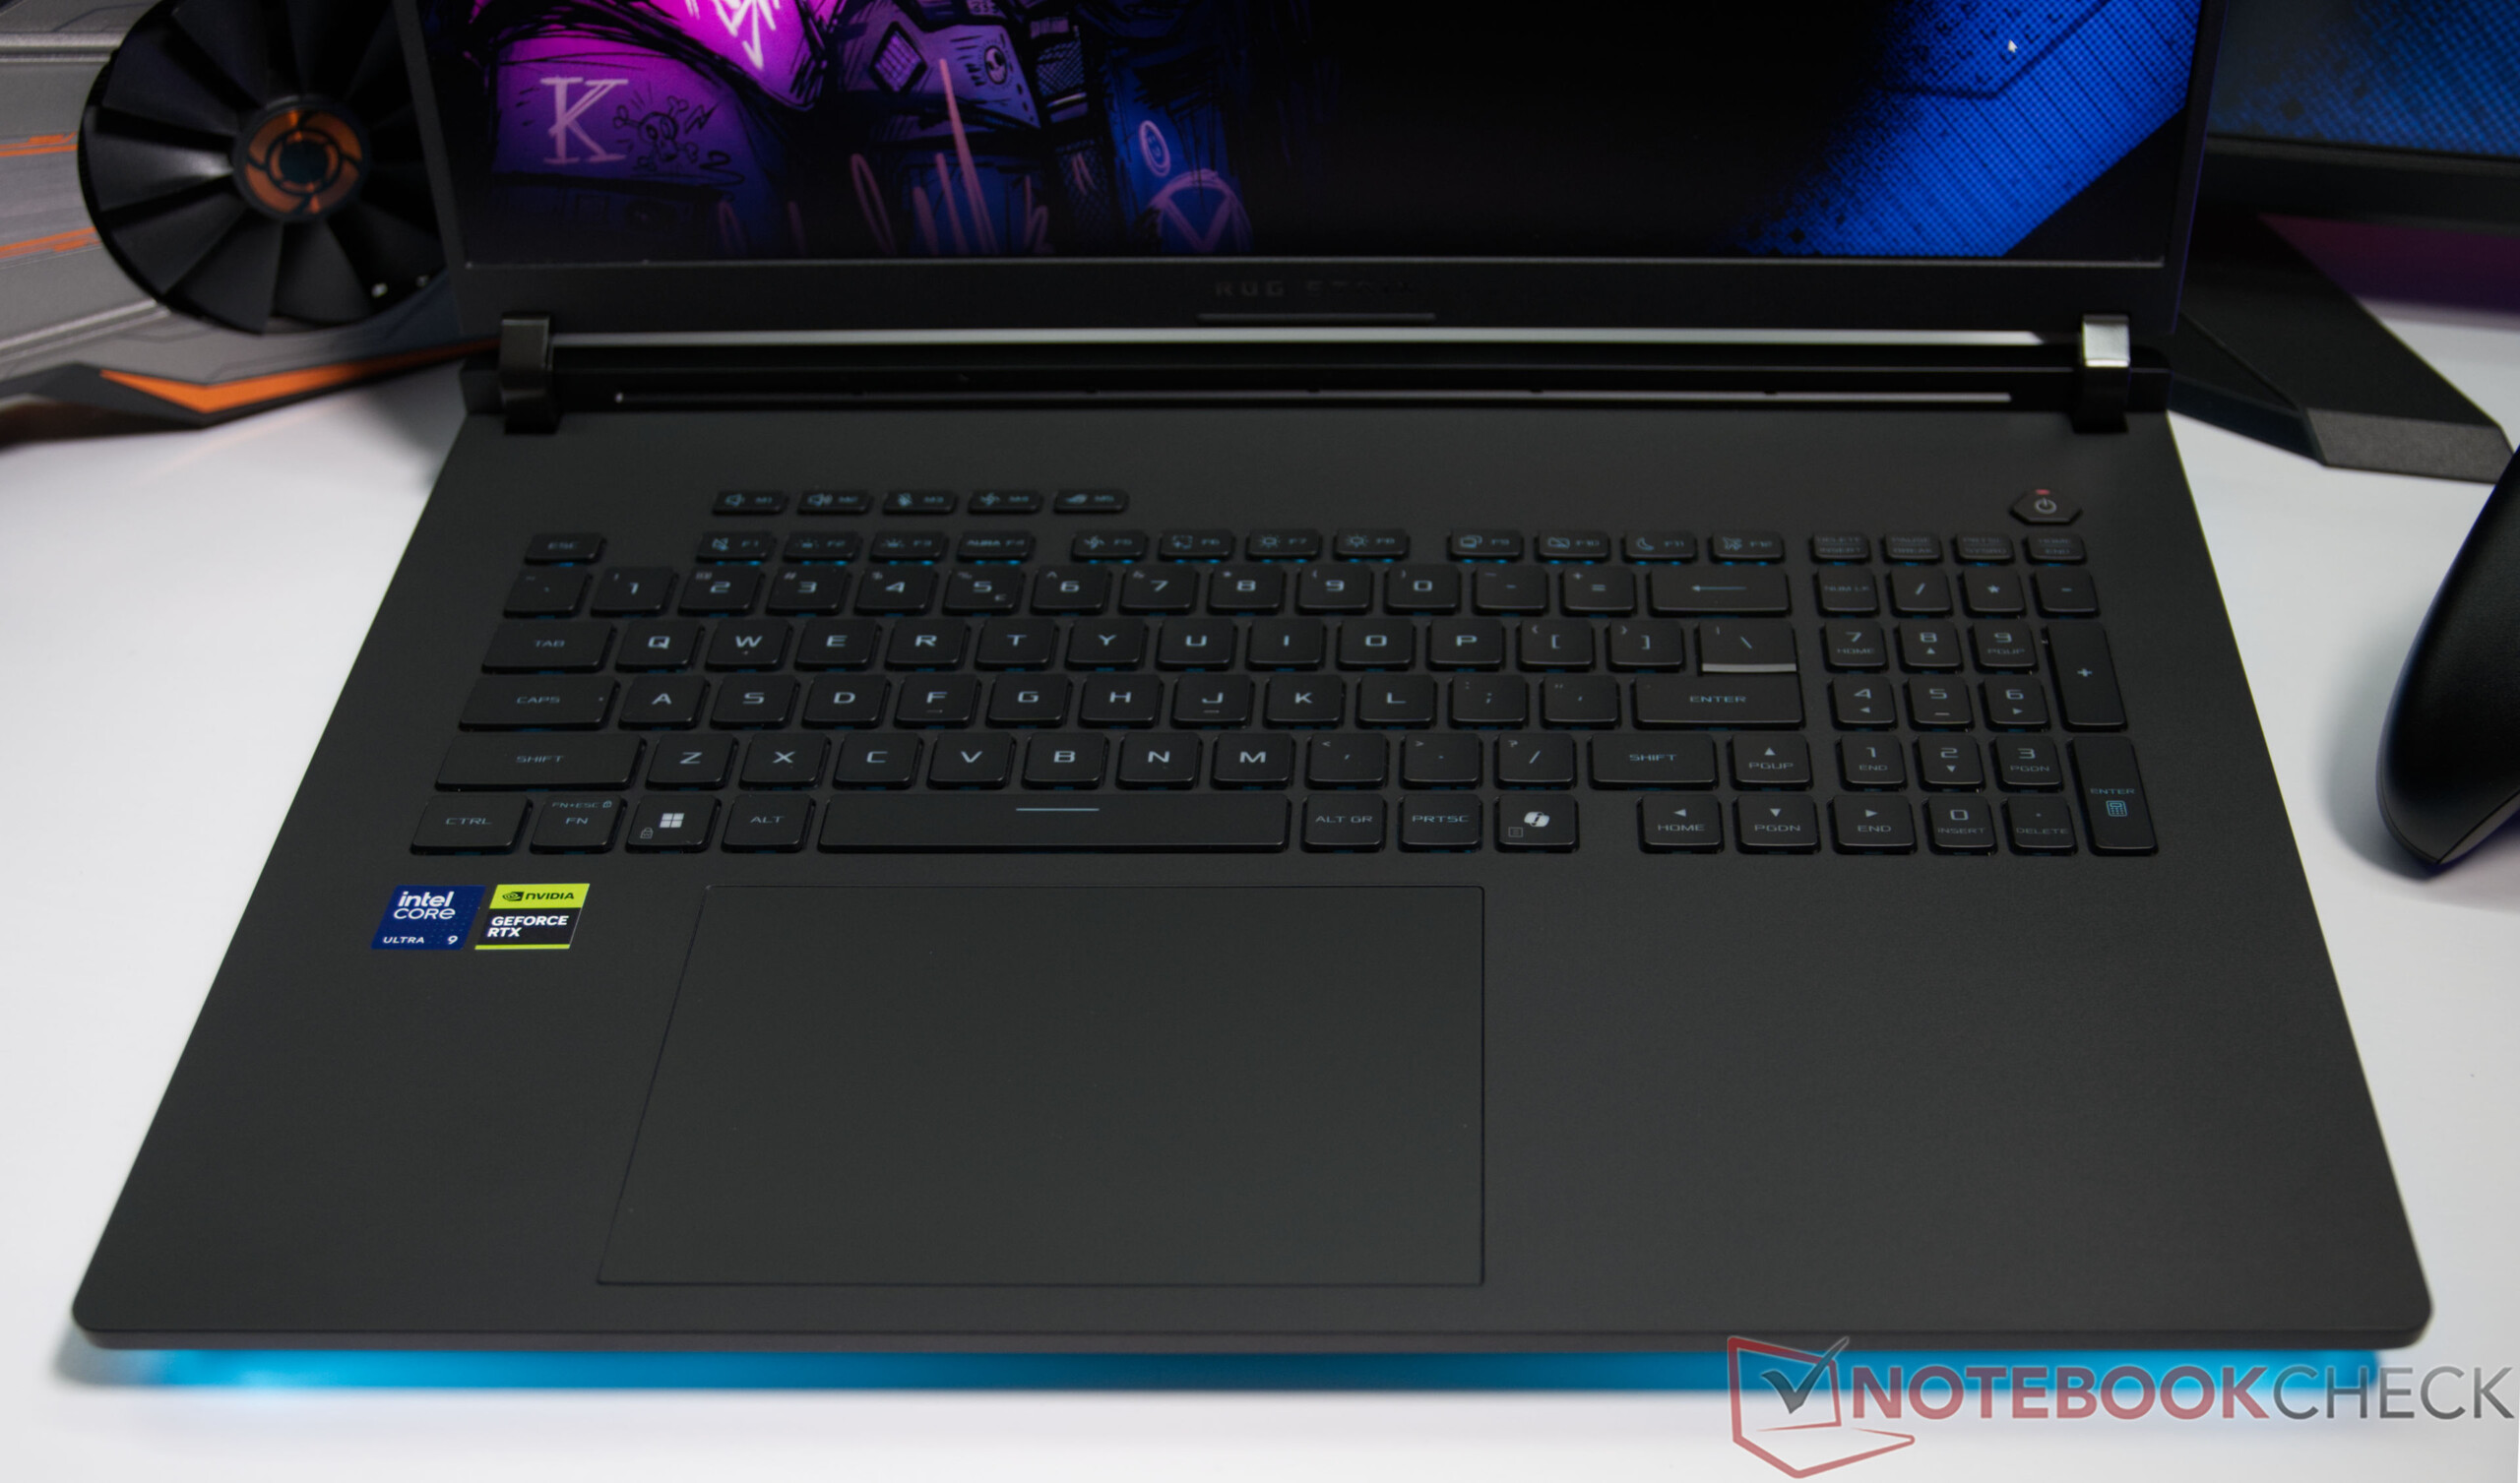
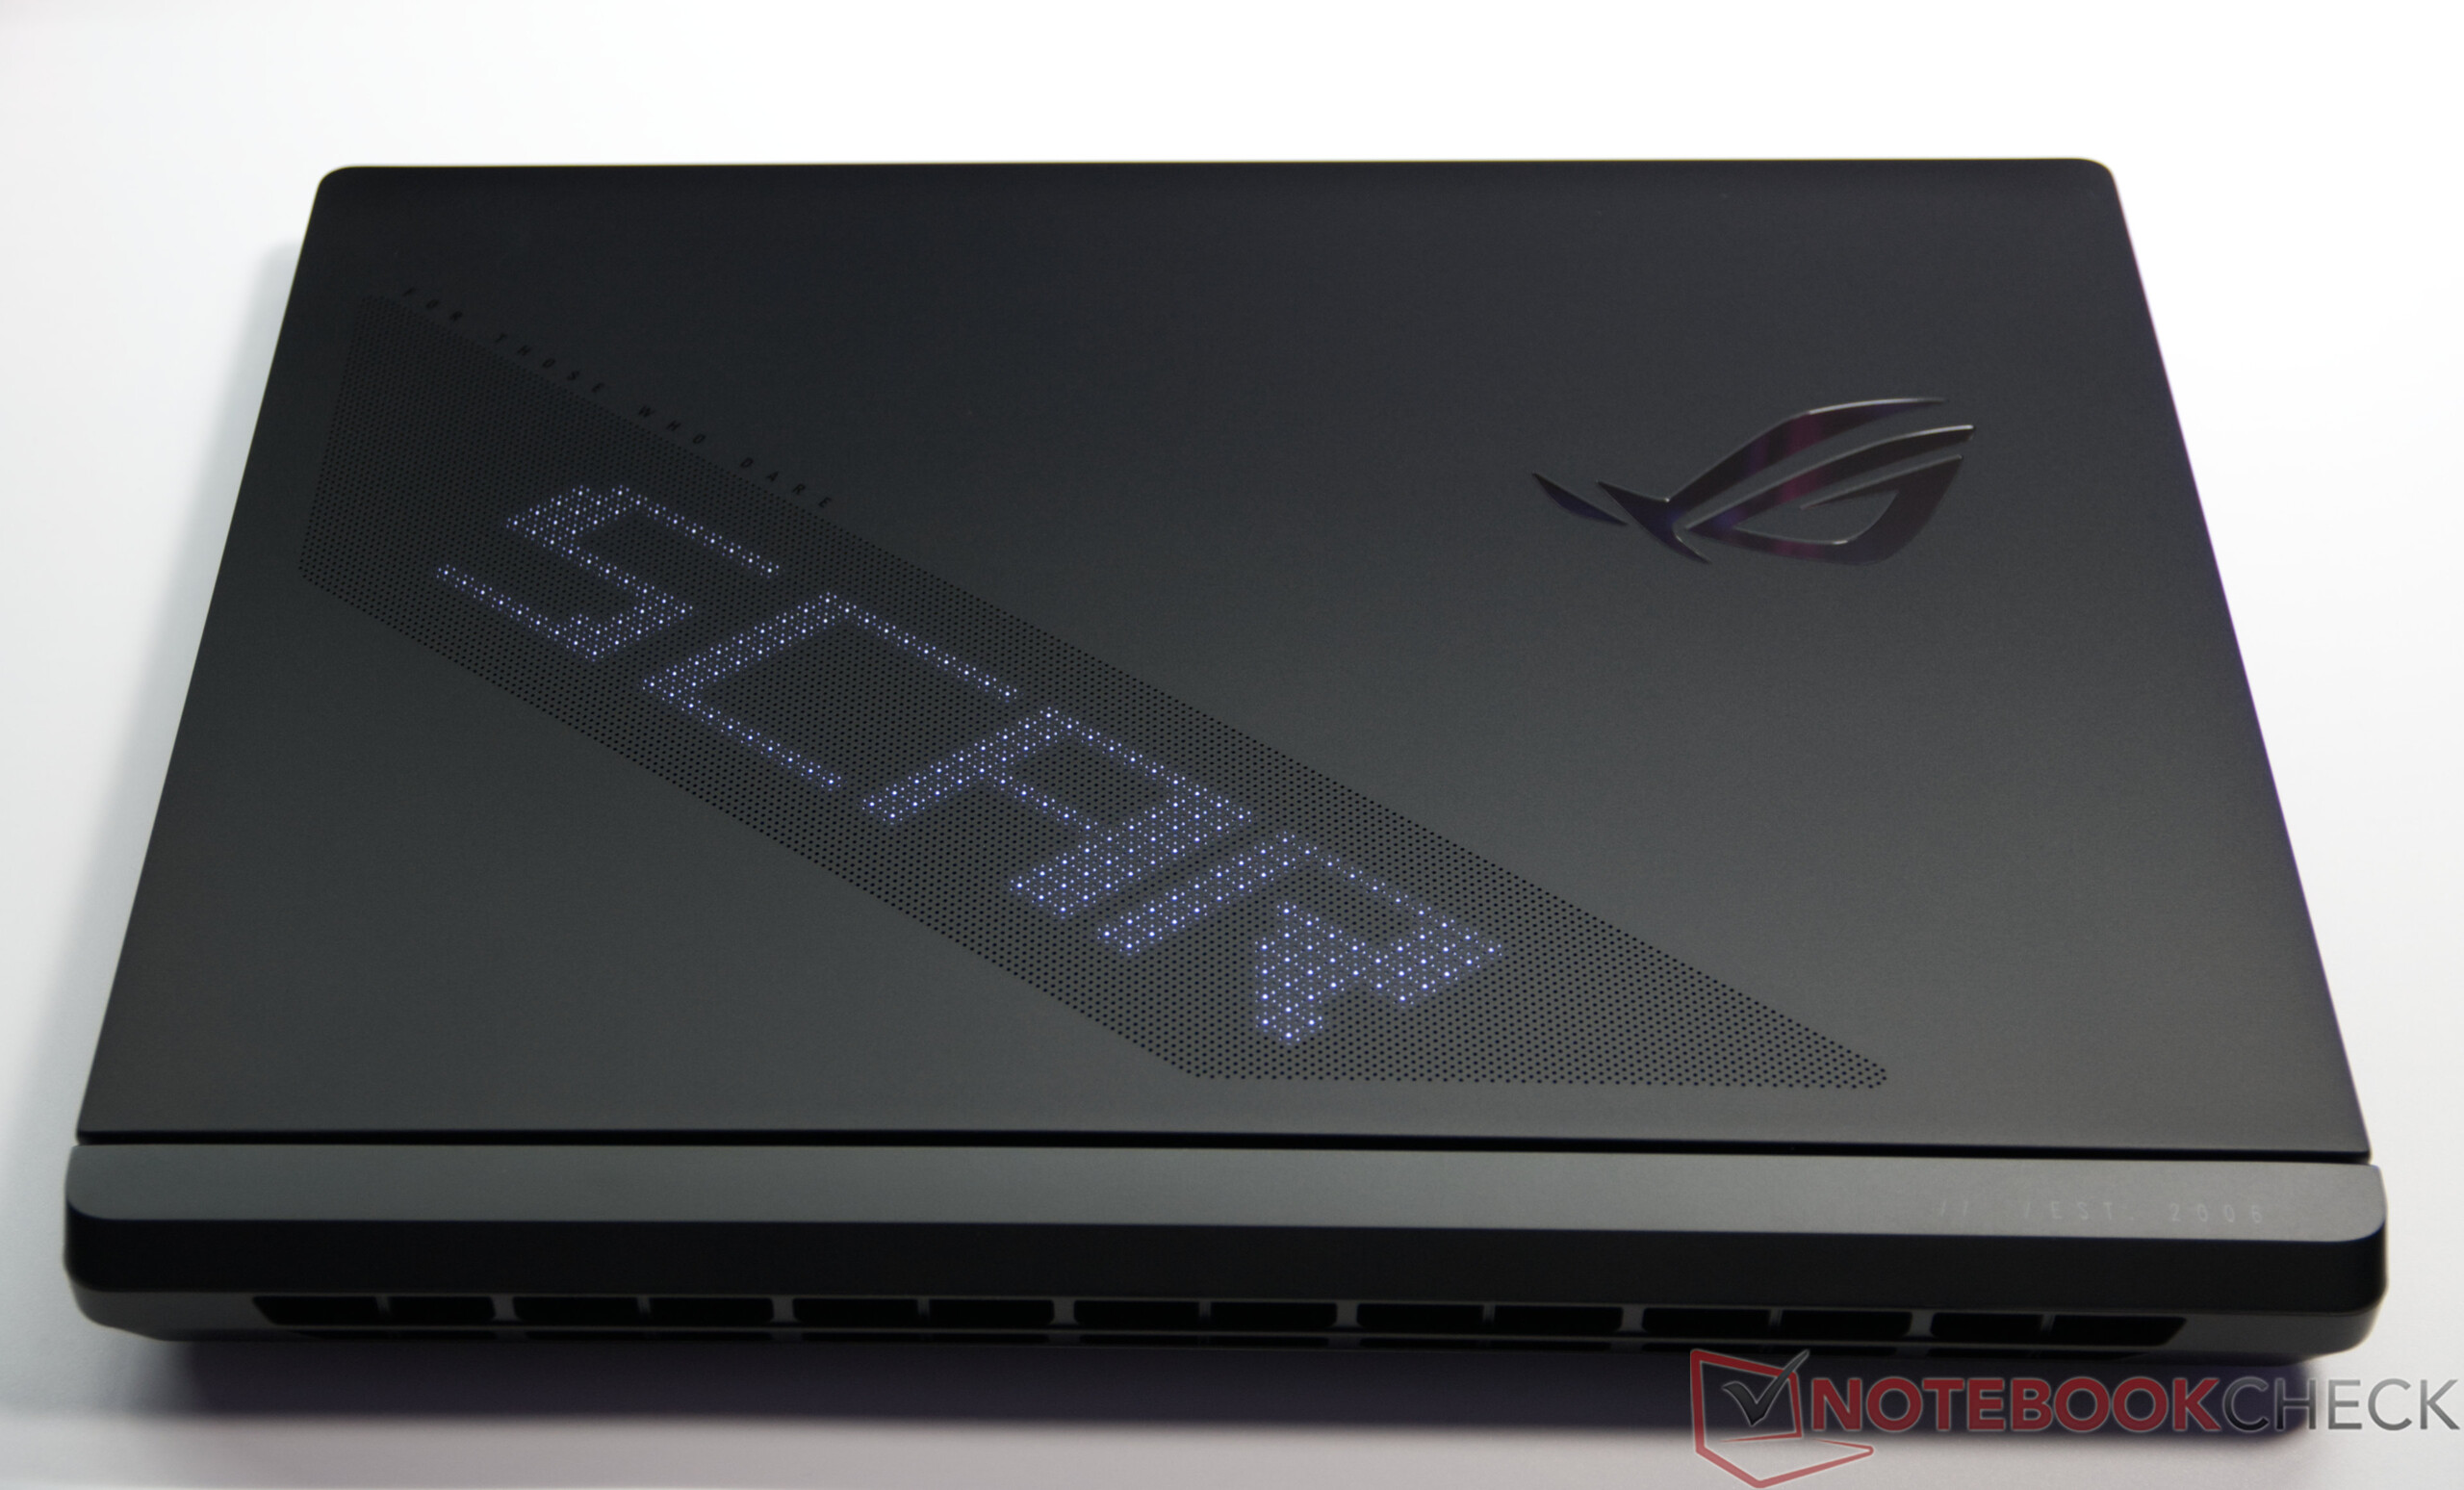
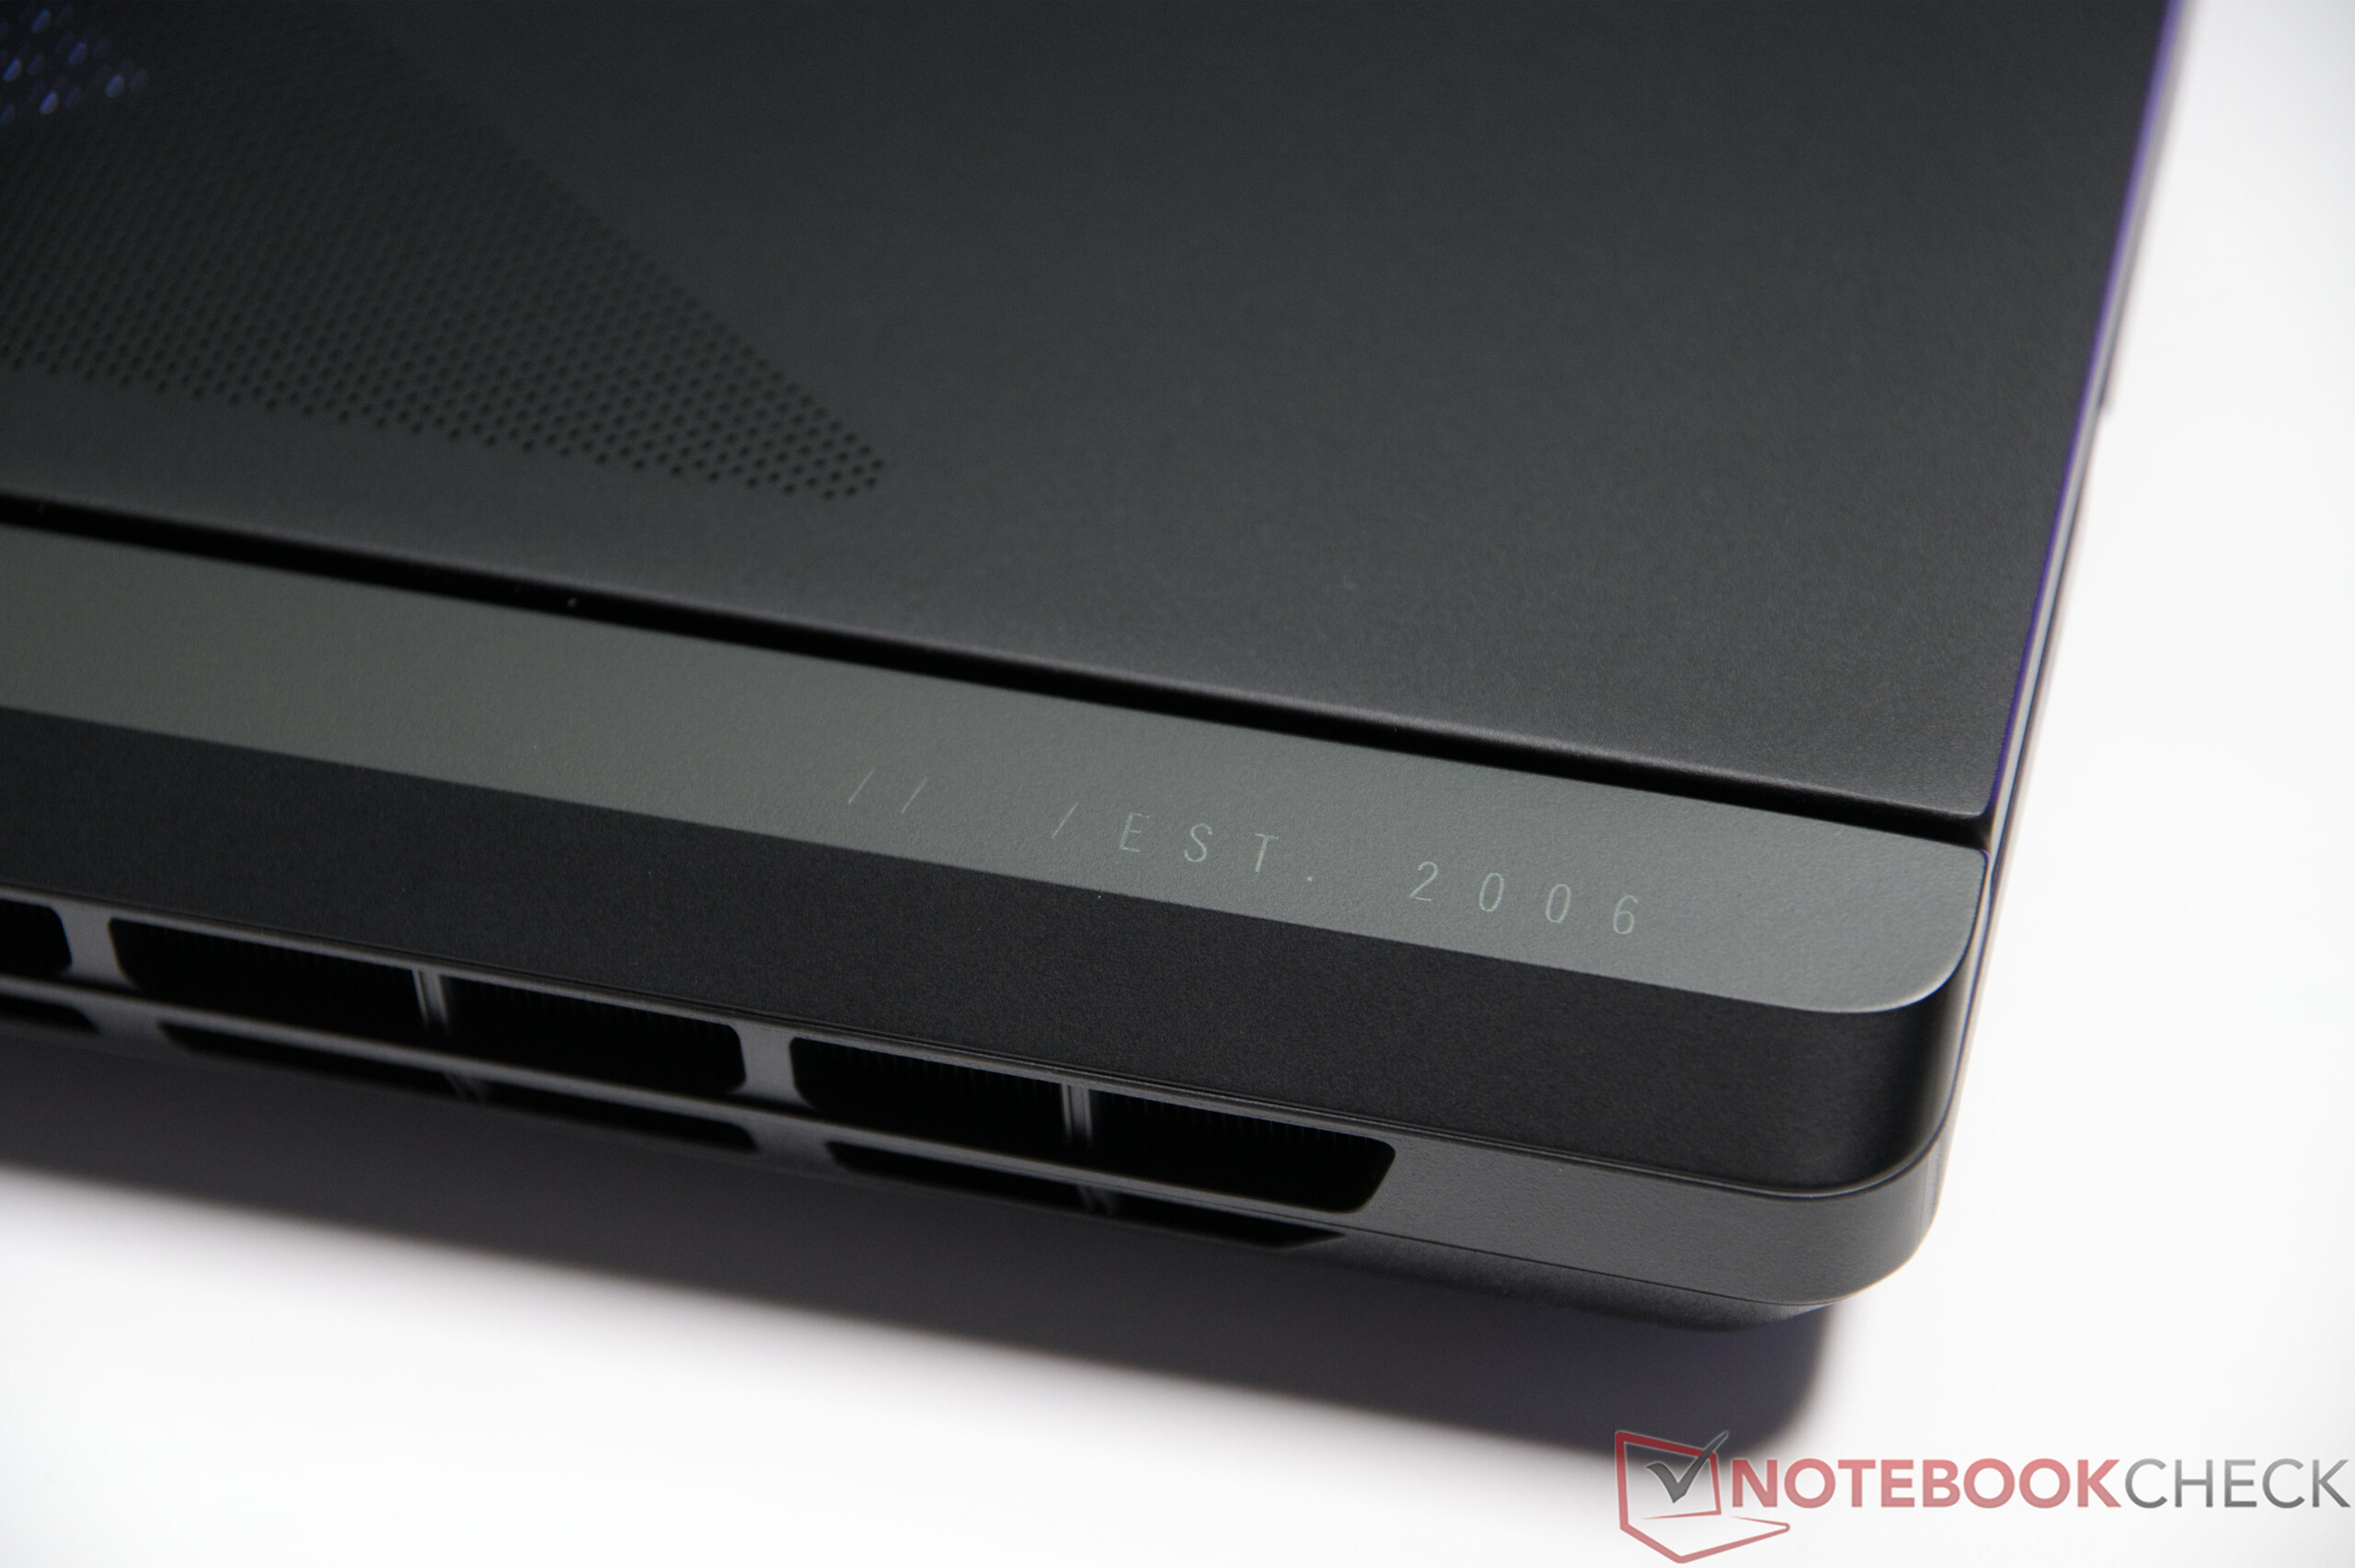
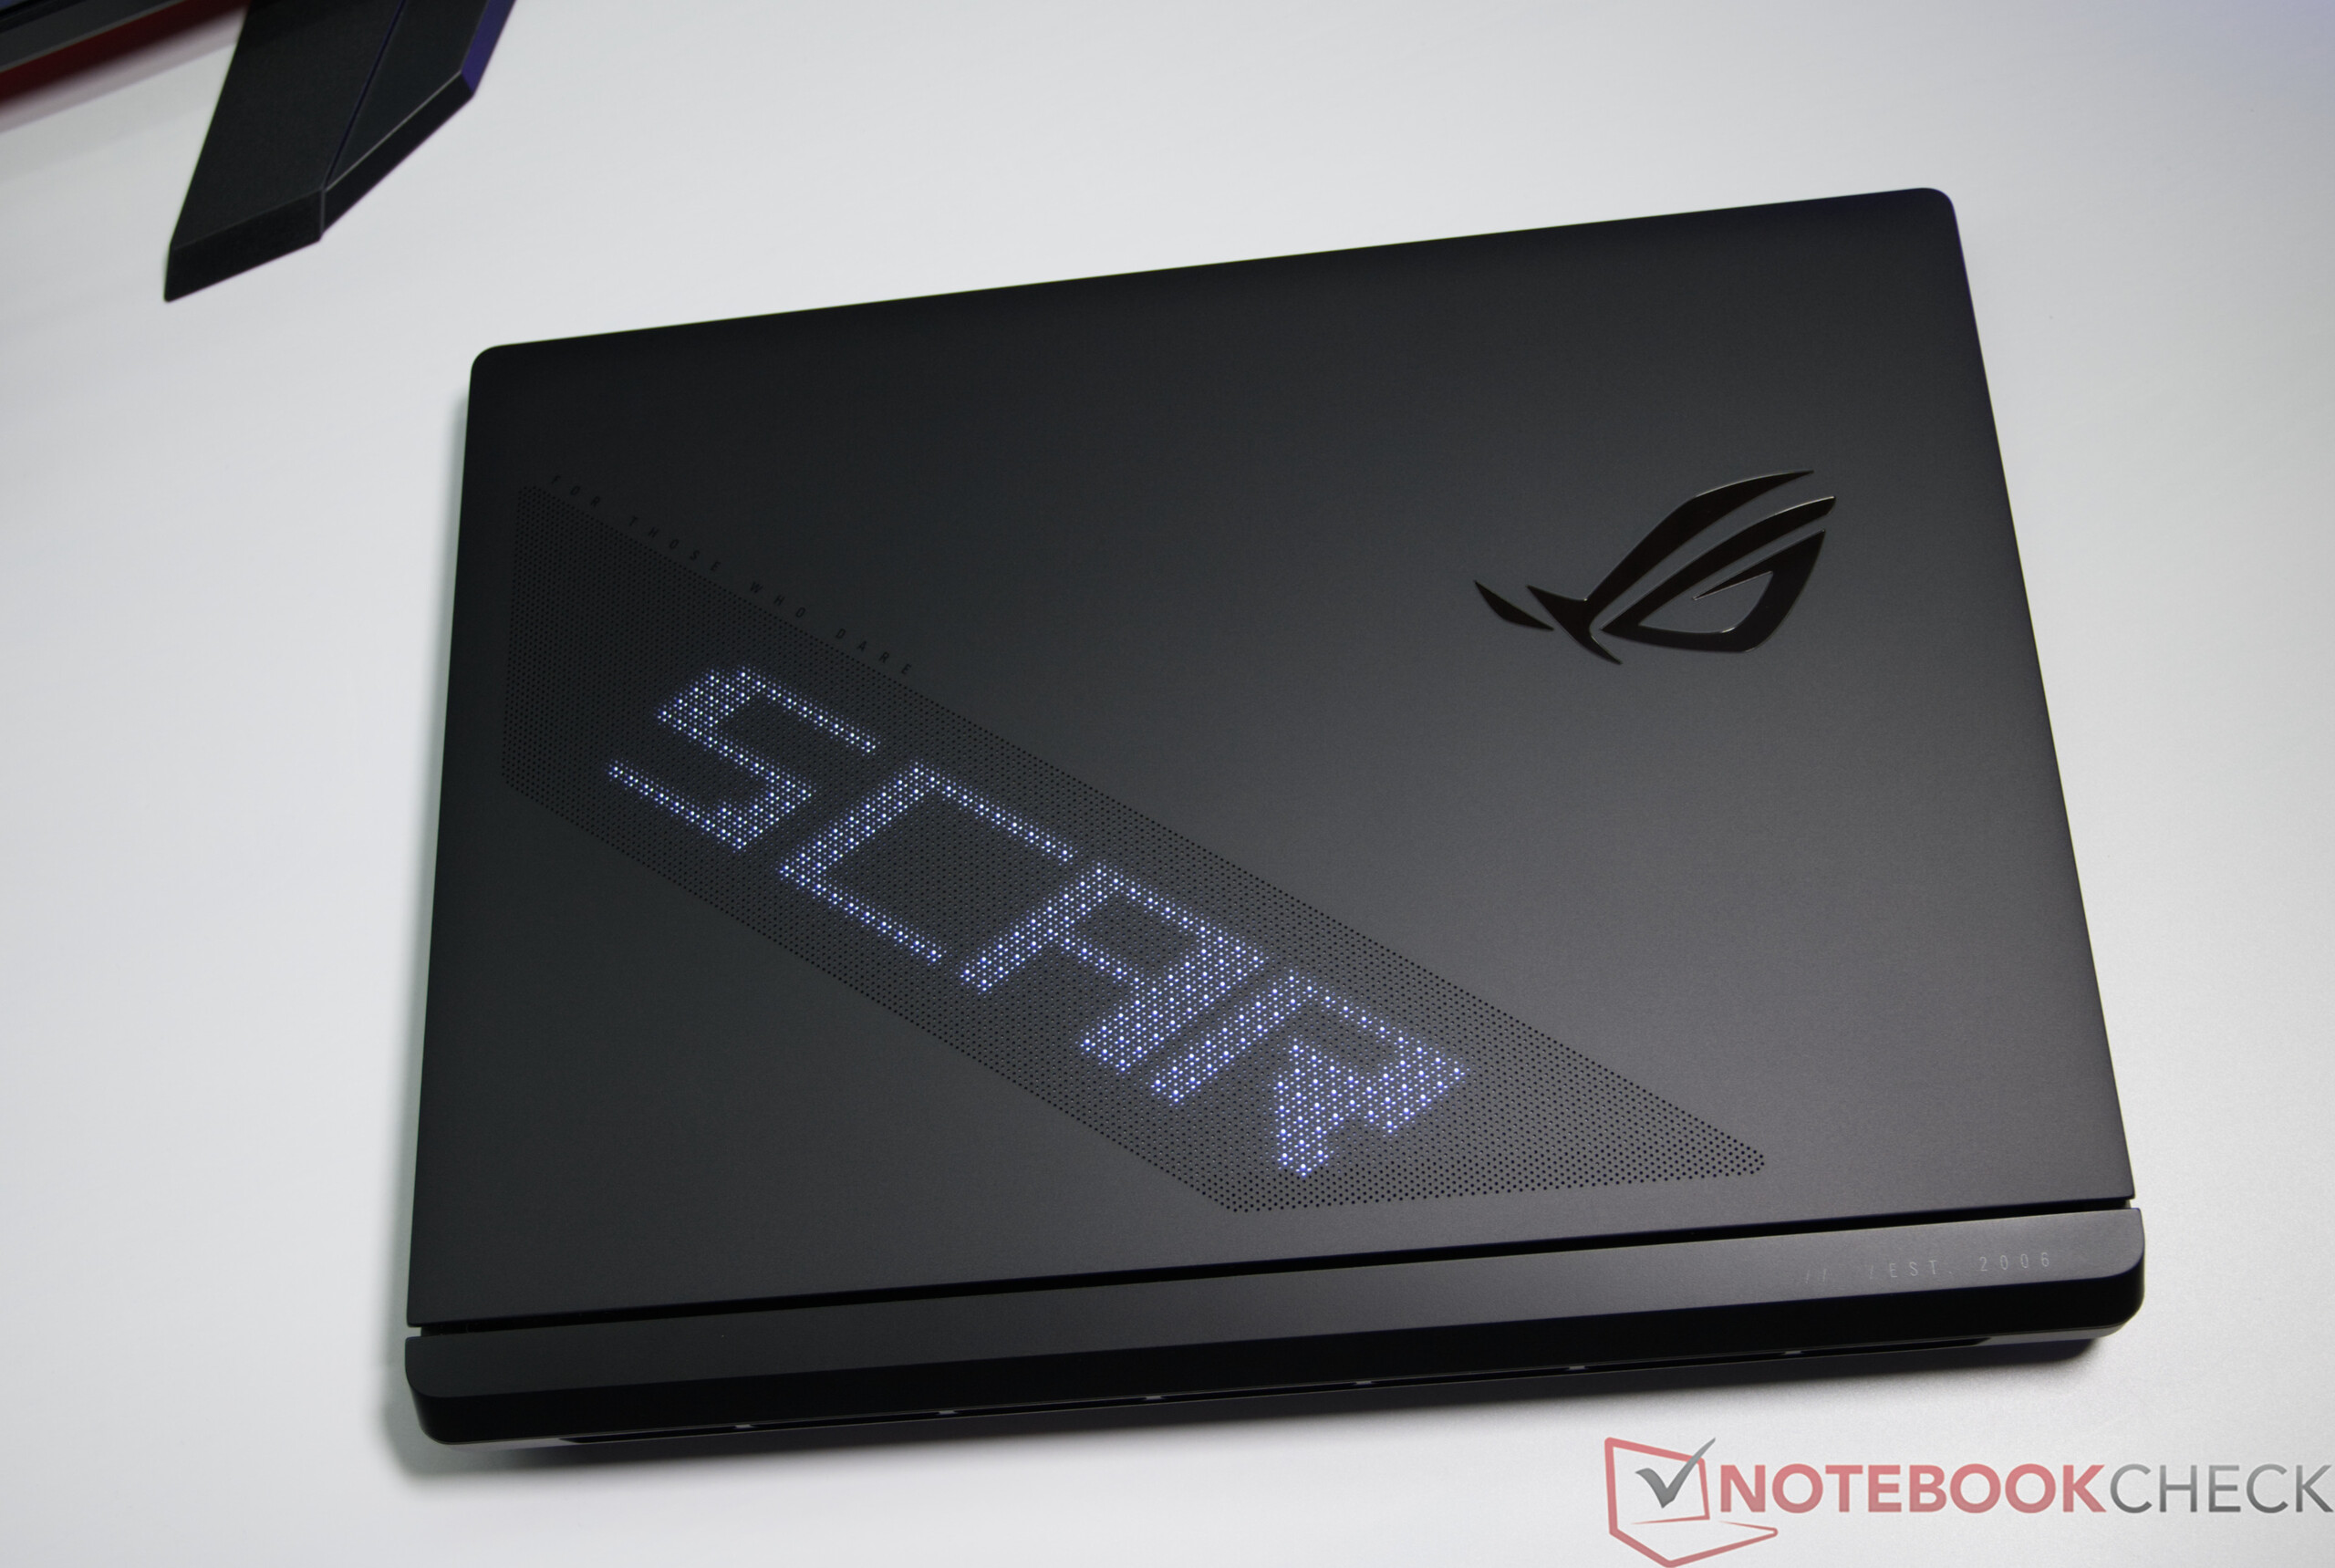
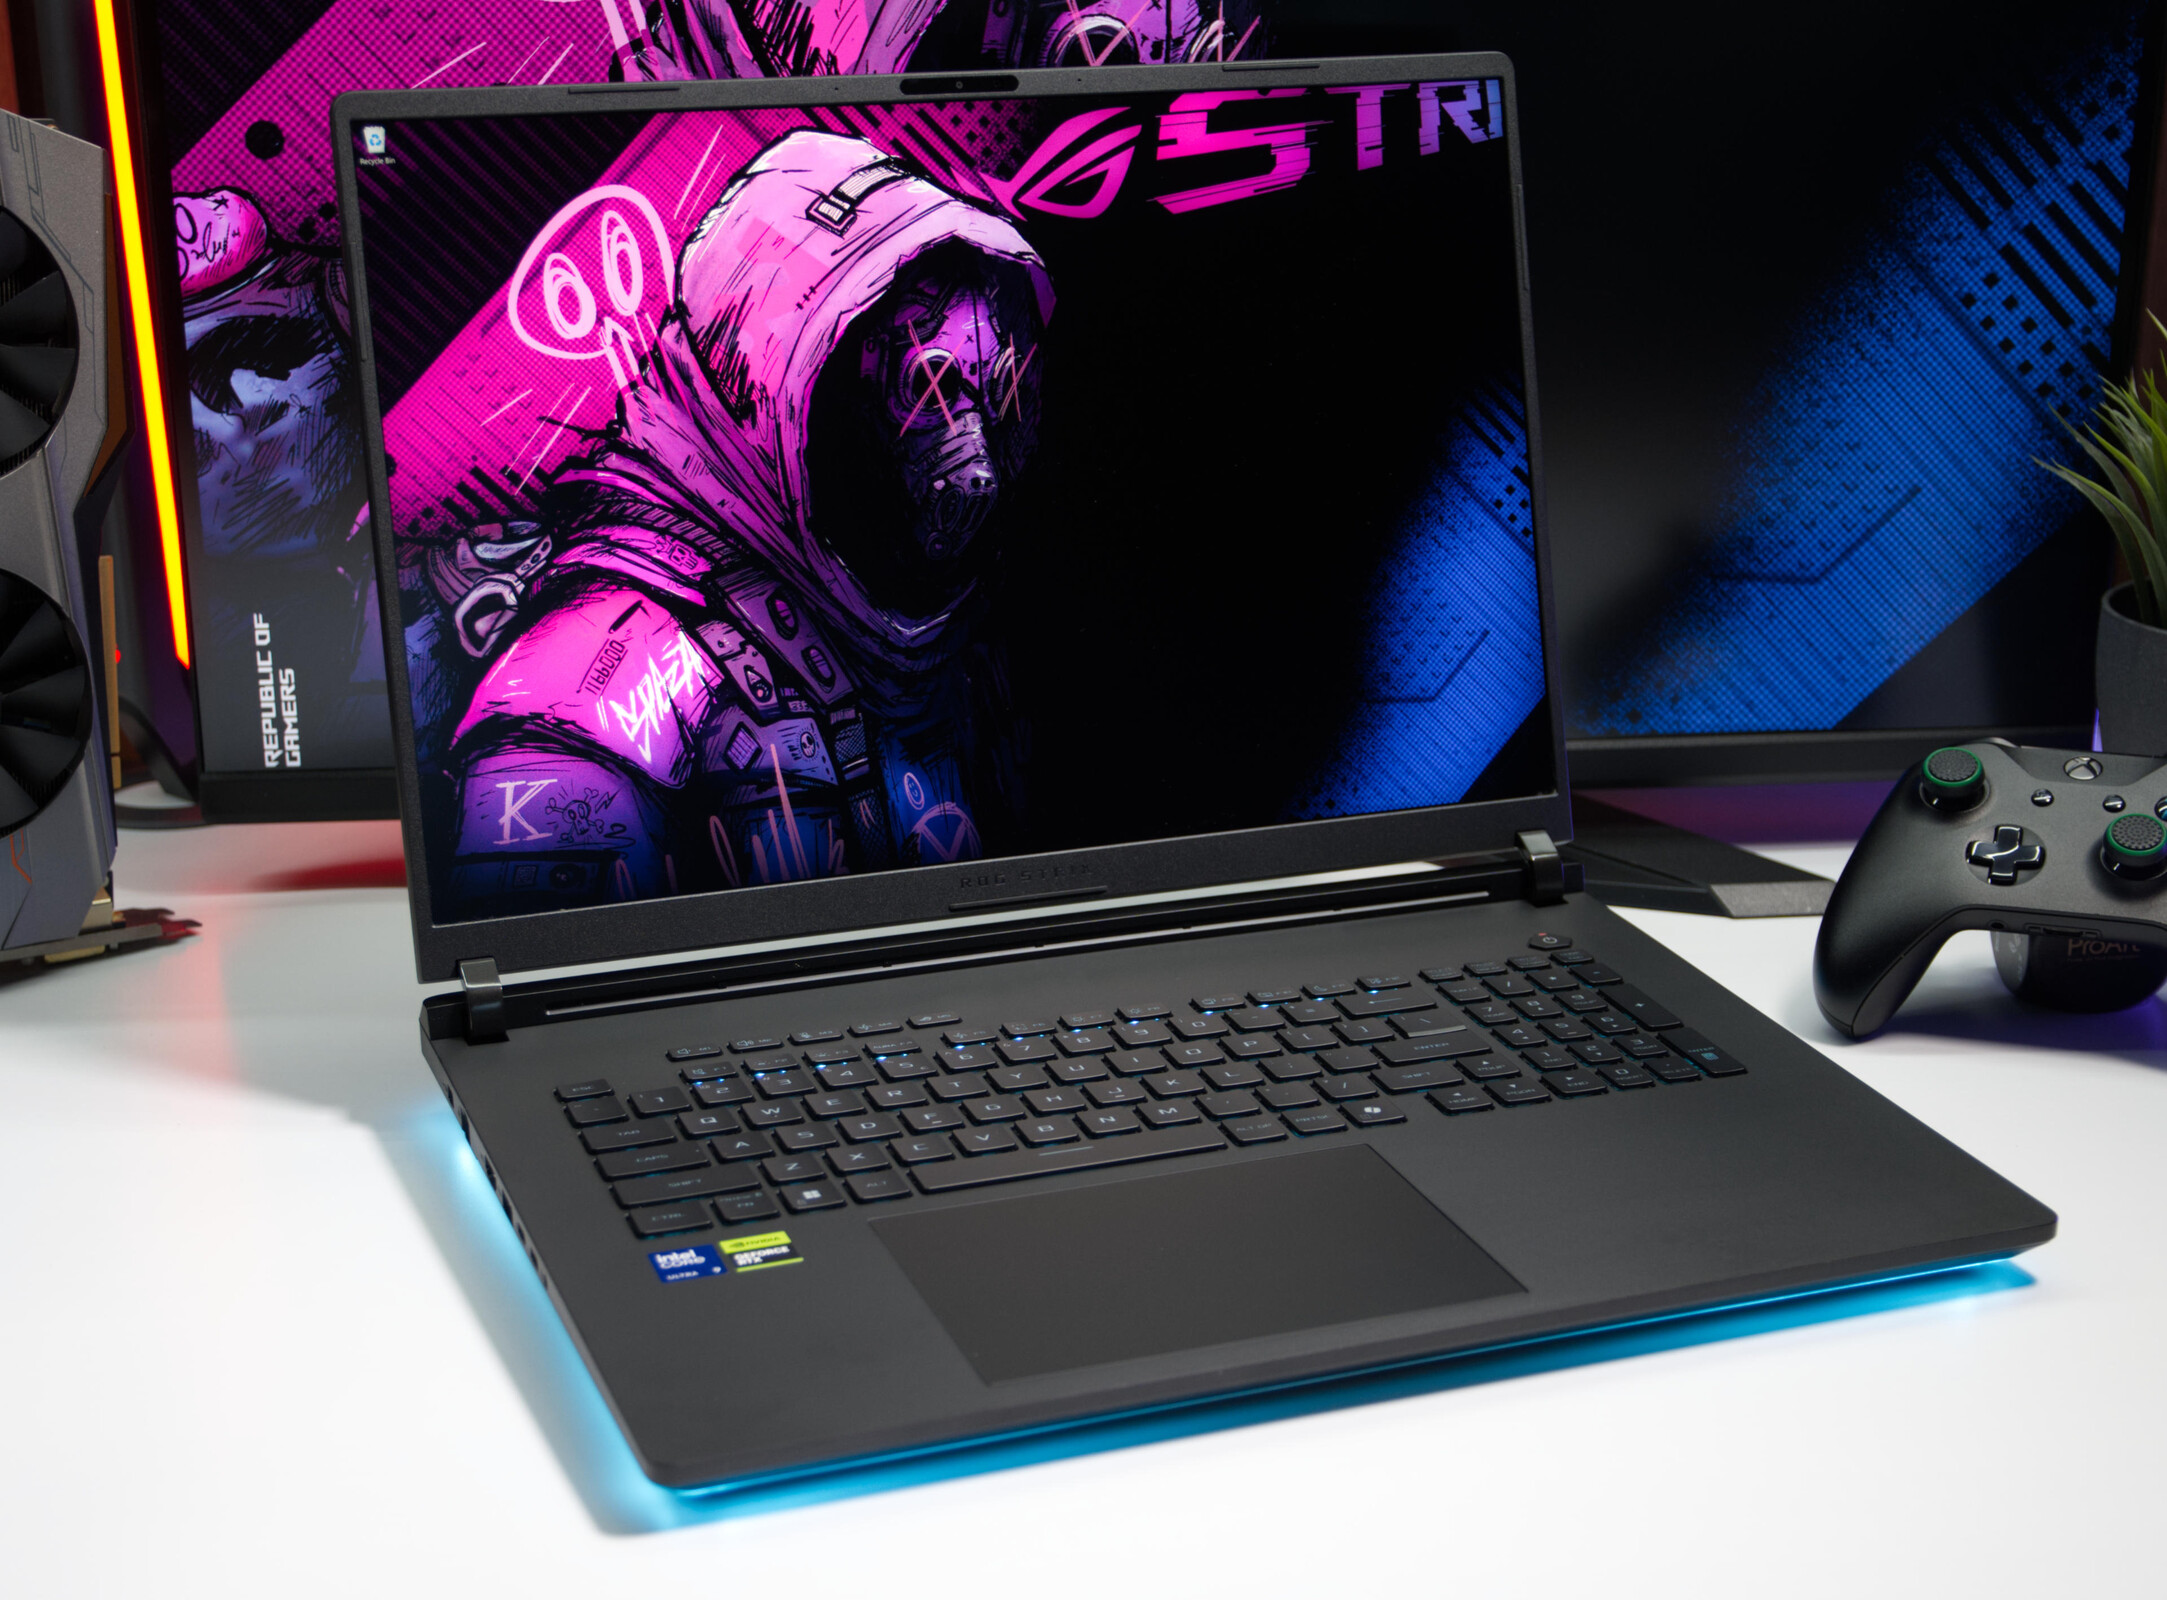
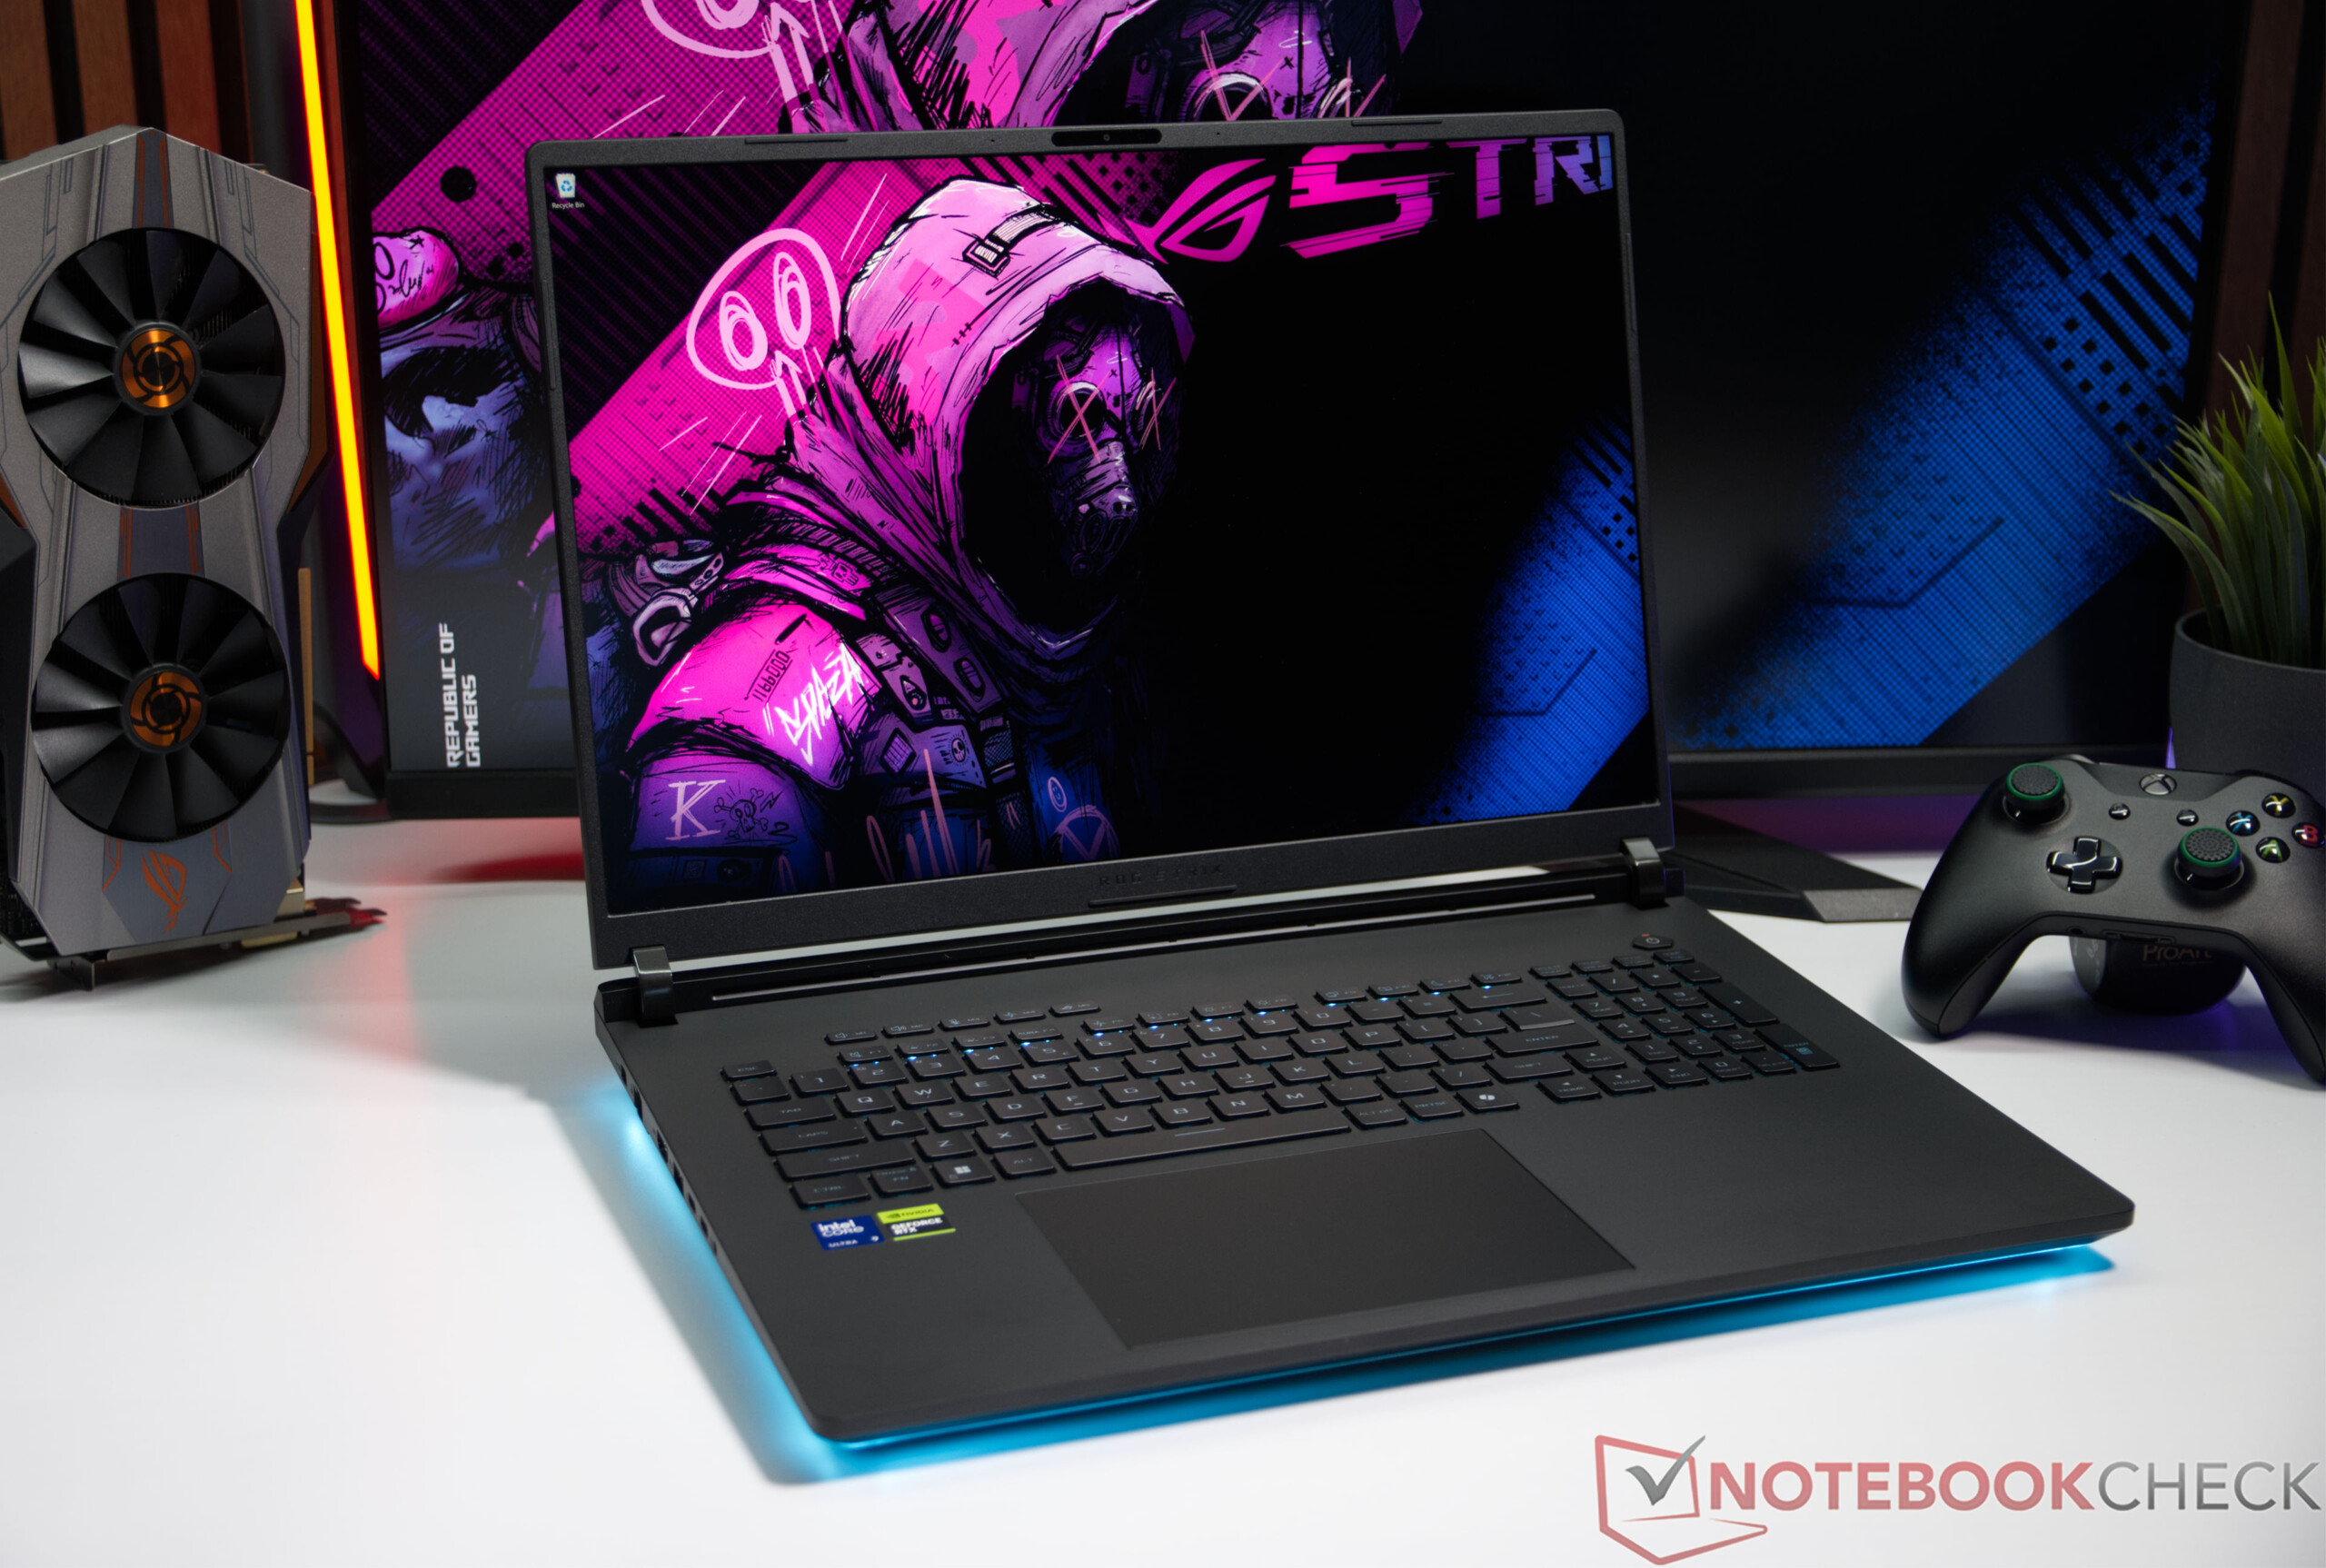
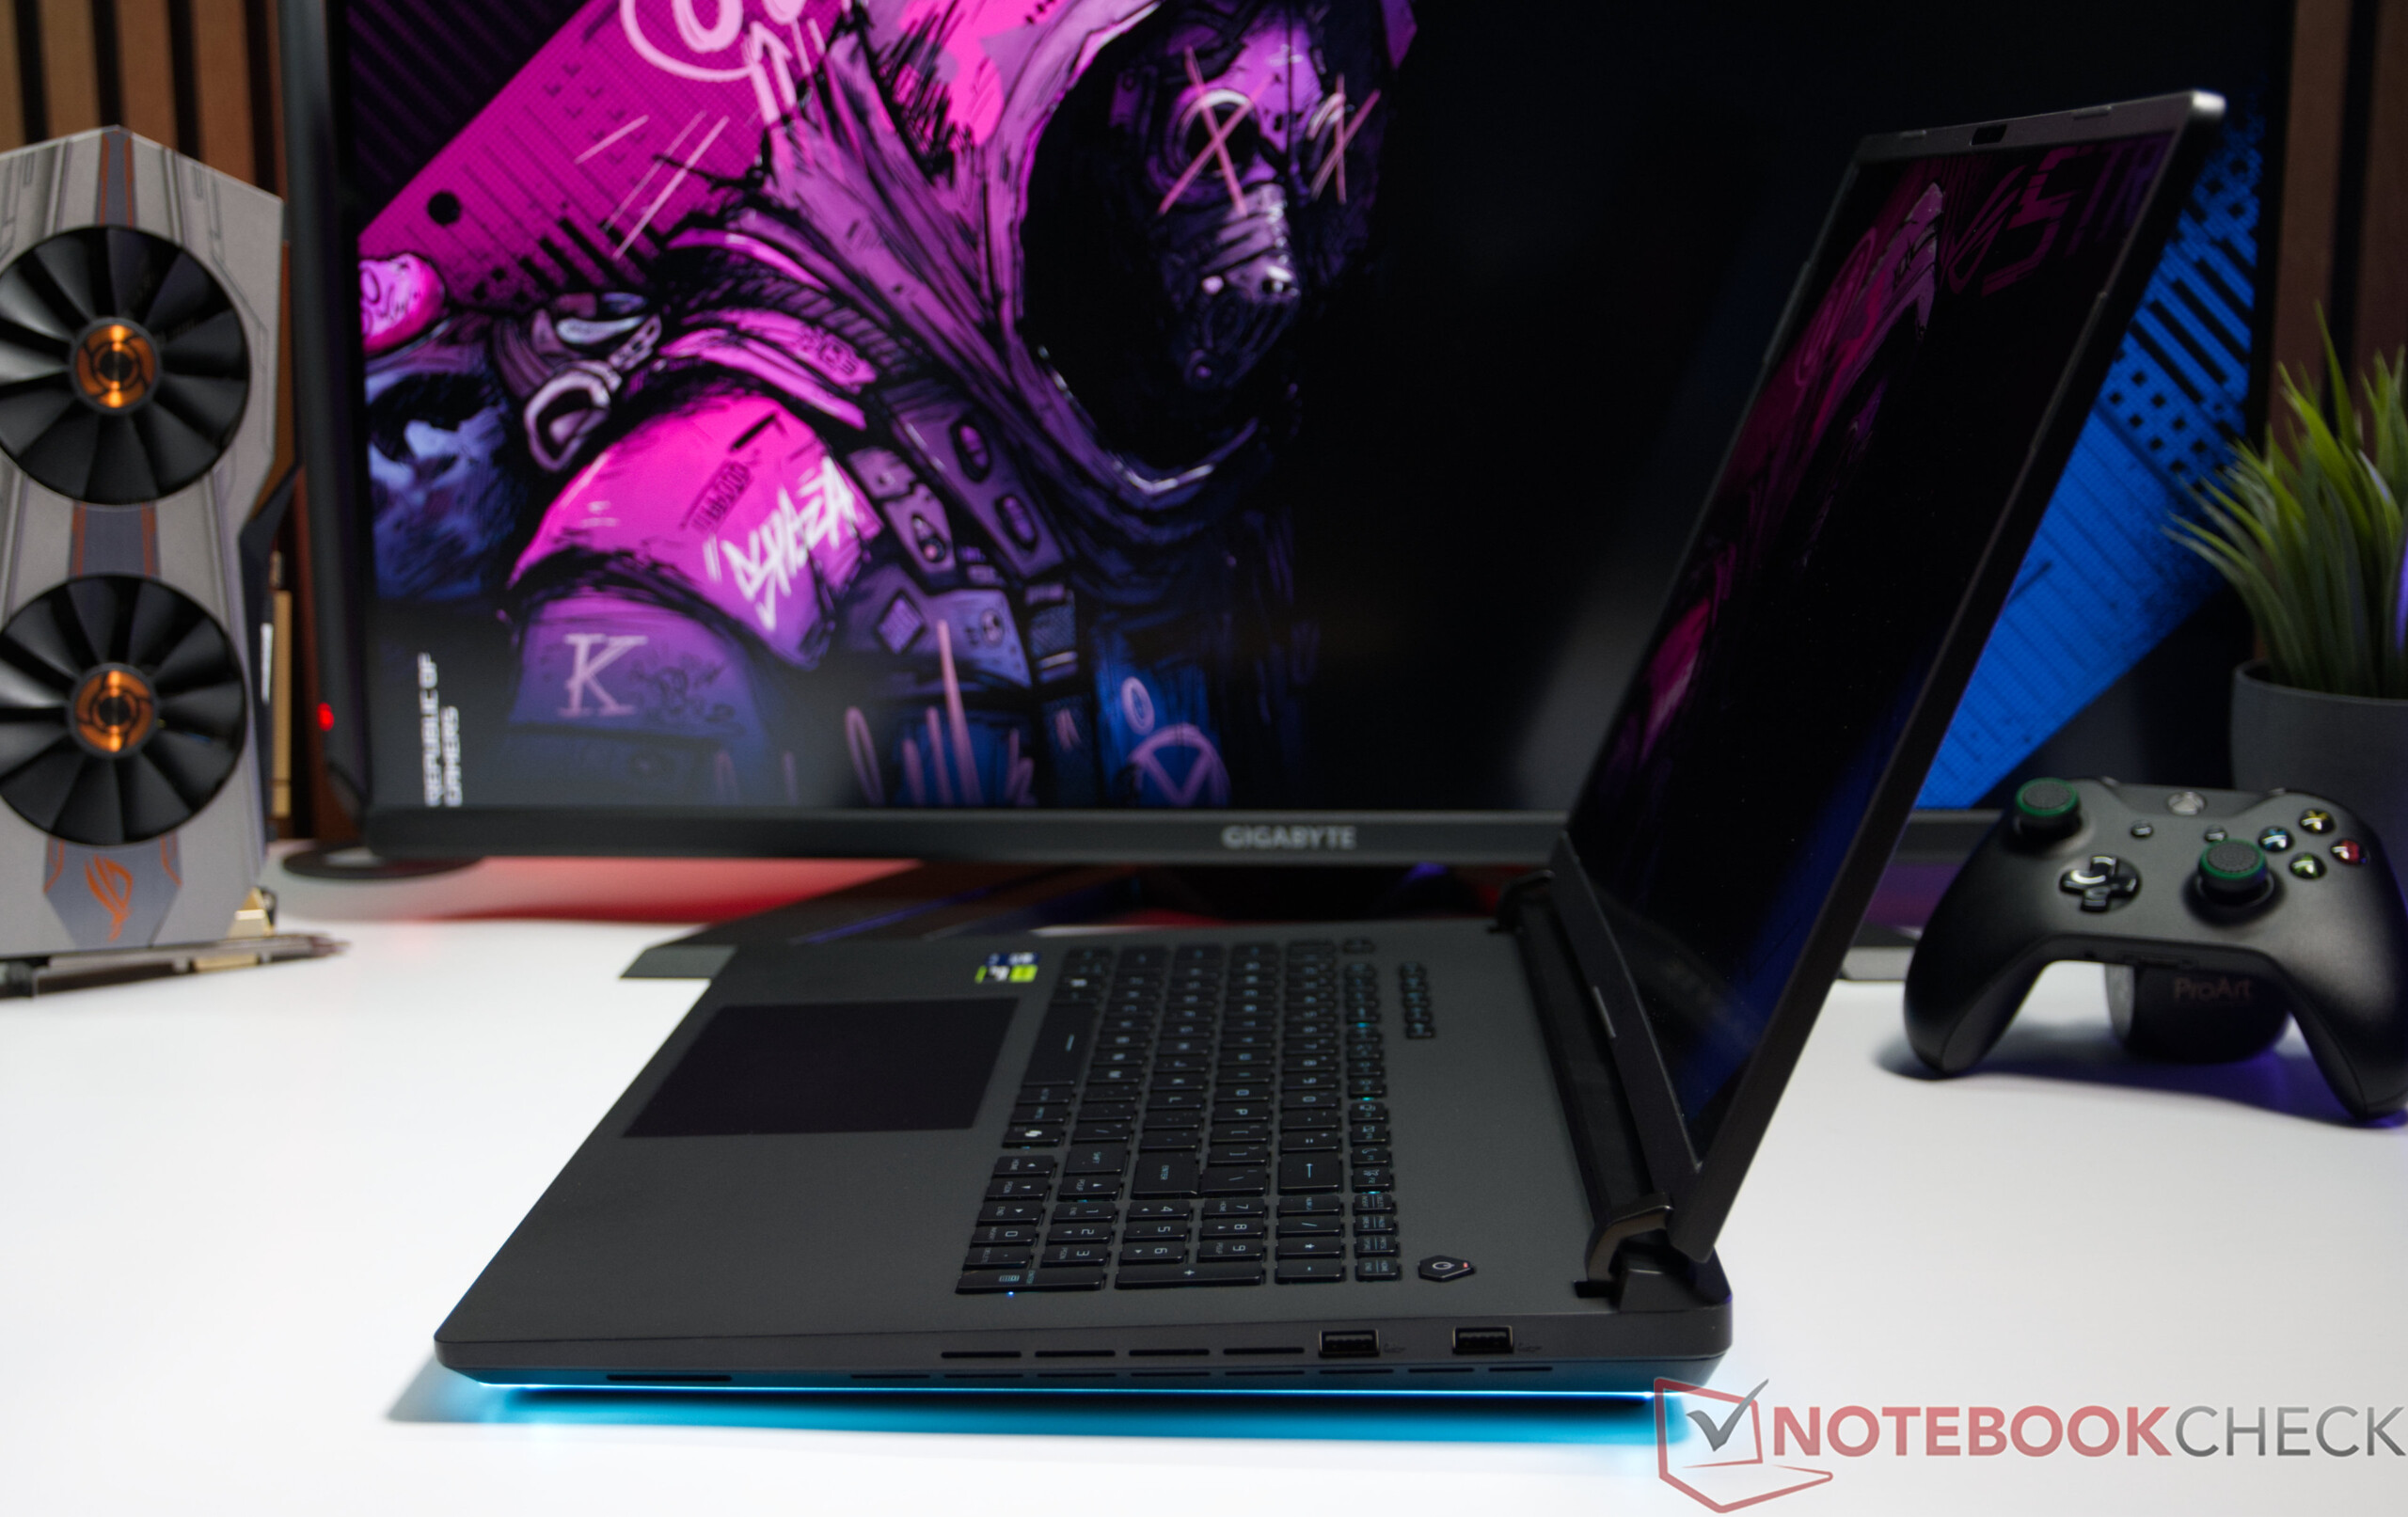
Ponieważ model Asus ROG Strix SCAR 18 G835LXG opiera się na tej samej obudowie, co recenzowany wcześniej model ROG Strix SCAR 18 G835LX, jakość wykonania i konstrukcja pozostają niezmienione. Szczegółowe informacje na temat obudowy, portów i urządzeń wejściowych można znaleźć w naszej osobnej recenzji modelu siostrzanego.
Porównanie rozmiarów

410.3 mm 319.9 mm 26.7 mm 4 kg404 mm 307.5 mm 32.1 mm 3.6 kg405 mm 312 mm 29.5 mm 3.3 kg399 mm 298 mm 35 mm 3.6 kg399 mm 298 mm 32 mm 3.3 kg399.9 mm 275.4 mm 21.9 mm 3.1 kg396 mm 278 mm 24.9 mm 3.4 kg297 mm 210 mm 1 mm 5.7 g
Po lewej: zasilacz, LAN 2,5G, HDMI 2.1, USB-A 3.2 Gen. 2 (10 Gbit/s), 2x Thunderbolt 5 (DisplayPort, zasilanie, G-SYNC (prędkość transmisji danych do 120 Gbps), gniazdo audio 3,5 mm
Poprawnie: 2x USB-A 3.2 Gen. 2 (10 Gbit/s)
Networking
iperf3 transmit Wi-Fi6/7 RT-BE96U
Przeciętny Intel Wi-Fi 7 BE200 320MHz
  (3270 - 3587, n=2)
3429 MBit/s +5%
Asus ROG Strix Scar 18 G835LXG
Intel Wi-Fi 7 BE200 320MHz
3270 (3115min - 3471max) MBit/s
Średnia w klasie Gaming
  (872 - 4473, n=6, ostatnie 2 lata)
2376 MBit/s -27%
iperf3 receive Wi-Fi6/7 RT-BE96U
Przeciętny Intel Wi-Fi 7 BE200 320MHz
  (3047 - 3487, n=2)
3267 MBit/s +7%
Asus ROG Strix Scar 18 G835LXG
Intel Wi-Fi 7 BE200 320MHz
3047 (2765min - 3114max) MBit/s
Średnia w klasie Gaming
  (788 - 3208, n=6, ostatnie 2 lata)
2082 MBit/s -32%
iperf3 receive AXE11000 6GHz
Schenker Key 17 Pro (M24)
Intel Wi-Fi 7 BE200 320MHz
1714 (853min - 1741max) MBit/s
Średnia w klasie Gaming
  (975 - 1775, n=35, ostatnie 2 lata)
1556 MBit/s
Przeciętny Intel Wi-Fi 7 BE200 320MHz
  (725 - 1770, n=29)
1483 MBit/s
MSI Titan 18 HX A14VIG
Intel Killer Wi-Fi 7 BE1750x BE200NGW
1379 (709min - 1426max) MBit/s
Razer Blade 18 2024 RZ09-0509
Intel Wi-Fi 7 BE200 320MHz
1315 (1269min - 1369max) MBit/s
Alienware m18 R2
Intel Killer Wi-Fi 7 BE1750x BE200NGW
1292 (1215min - 1327max) MBit/s
iperf3 transmit AXE11000 6GHz
Schenker Key 17 Pro (M24)
Intel Wi-Fi 7 BE200 320MHz
1634 (812min - 1725max) MBit/s
Średnia w klasie Gaming
  (723 - 1868, n=36, ostatnie 2 lata)
1449 MBit/s
Przeciętny Intel Wi-Fi 7 BE200 320MHz
  (693 - 1653, n=29)
1293 MBit/s
Razer Blade 18 2024 RZ09-0509
Intel Wi-Fi 7 BE200 320MHz
1199 (1057min - 1319max) MBit/s
MSI Titan 18 HX A14VIG
Intel Killer Wi-Fi 7 BE1750x BE200NGW
1096 (900min - 1242max) MBit/s
Alienware m18 R2
Intel Killer Wi-Fi 7 BE1750x BE200NGW
648 (595min - 759max) MBit/s
01002003004005006007008009001000110012001300140015001600170018001900200021002200230024002500260027002800290030003100320033003400Tooltip
Asus ROG Strix Scar 18 G835LXG; iperf3 transmit Wi-Fi6/7 RT-BE96U; iperf 3.1.3: Ø3270 (3115-3471) MBit/s
Asus ROG Strix Scar 18 G835LXG; iperf3 receive Wi-Fi6/7 RT-BE96U; iperf 3.1.3: Ø3046 (2765-3114) MBit/s
ColorChecker
7.7 ∆E
3.5 ∆E
9.6 ∆E
12.7 ∆E
7.5 ∆E
7.8 ∆E
5.1 ∆E
10.1 ∆E
3.8 ∆E
2.6 ∆E
8.5 ∆E
6.4 ∆E
3.1 ∆E
13.4 ∆E
10.5 ∆E
3.1 ∆E
2.6 ∆E
14.3 ∆E
6.7 ∆E
2.4 ∆E
3.1 ∆E
5.2 ∆E
2.1 ∆E
5.9 ∆E
ColorChecker Asus ROG Strix Scar 18 G835LXG: 6.57 ∆E min: 2.09 - max: 14.27 ∆E

Wyświetlanie

Struktura subpikselowa
Brak widocznych aureoli

18-calowy wyświetlacz Mini-LED w laptopie Asus ROG Strix SCAR 18 G835LXG charakteryzuje się rozdzielczością 3840 x 2400 pikseli w formacie 16:10 oraz 2 000 stref przyciemniania, a także częstotliwość odświeżania wynoszącą 240 Hz. Jakość obrazu zachwyca wysoką ostrością, żywą kolorystyką oraz równomiernym podświetleniem. Dzięki wysokiej częstotliwości odświeżania ruch jest renderowany niezwykle płynnie, co stanowi szczególną zaletę podczas grania. Maksymalna częstotliwość odświeżania wynosząca 240 Hz jest dostępna wyłącznie w trybie GPU Ultimate Mode, który można włączyć za pomocą oprogramowania Armoury Crate. We wszystkich pozostałych trybach GPU częstotliwość odświeżania wyświetlacza jest ograniczona do 120 Hz.

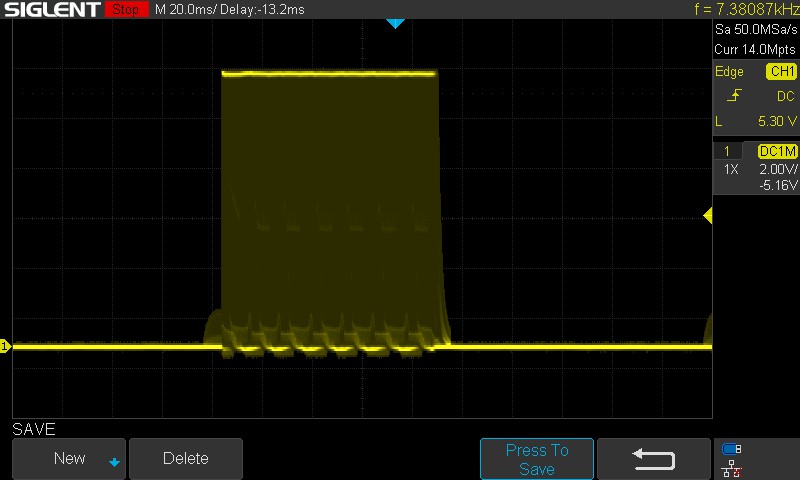
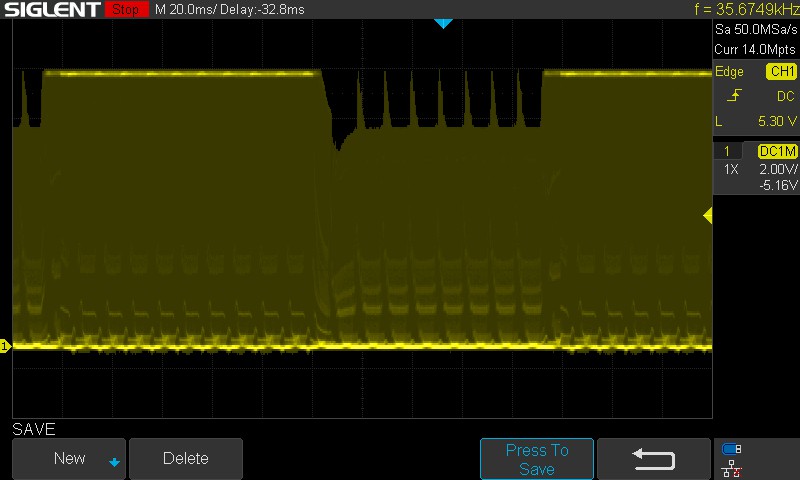
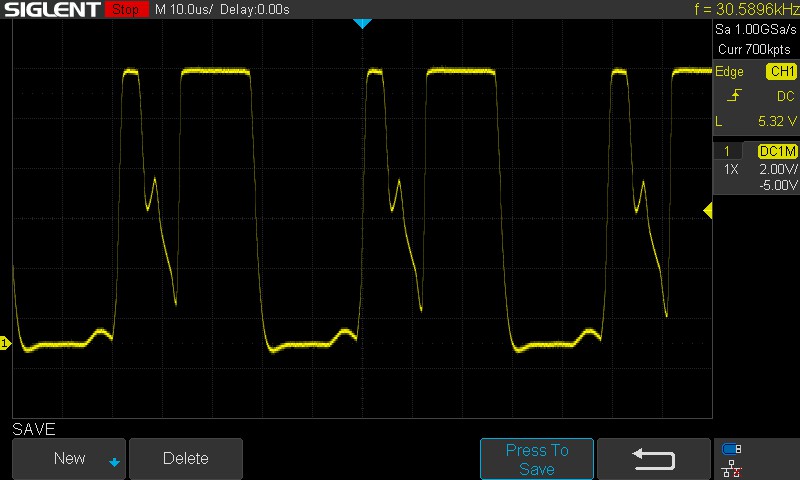
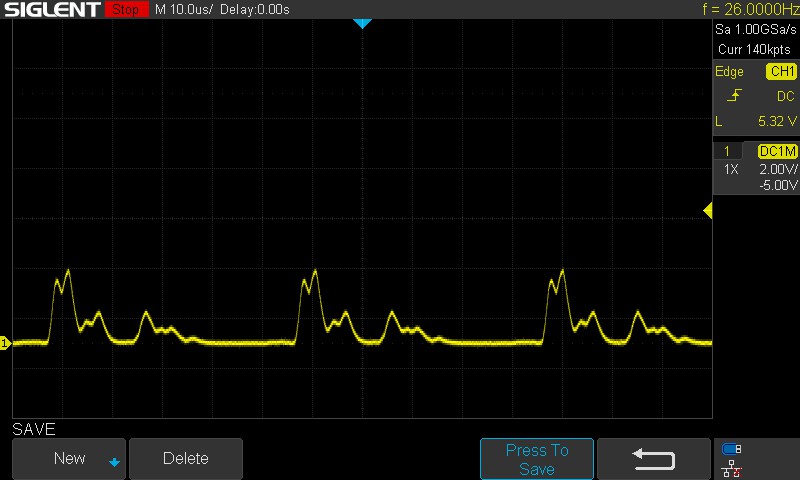
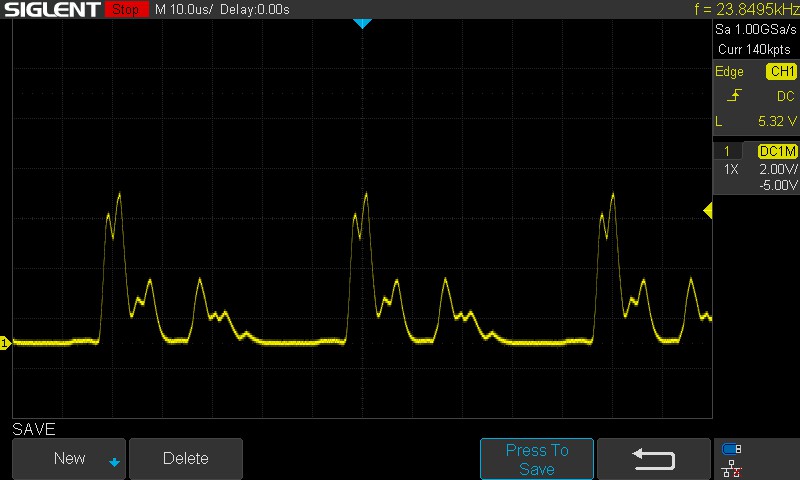
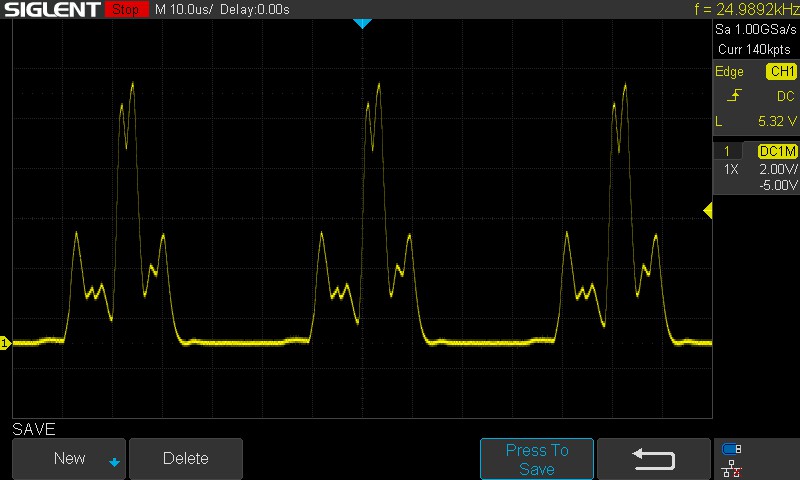
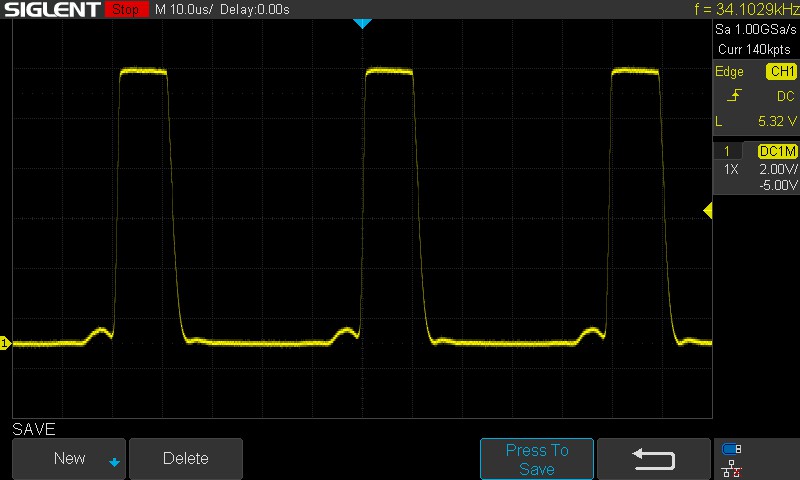
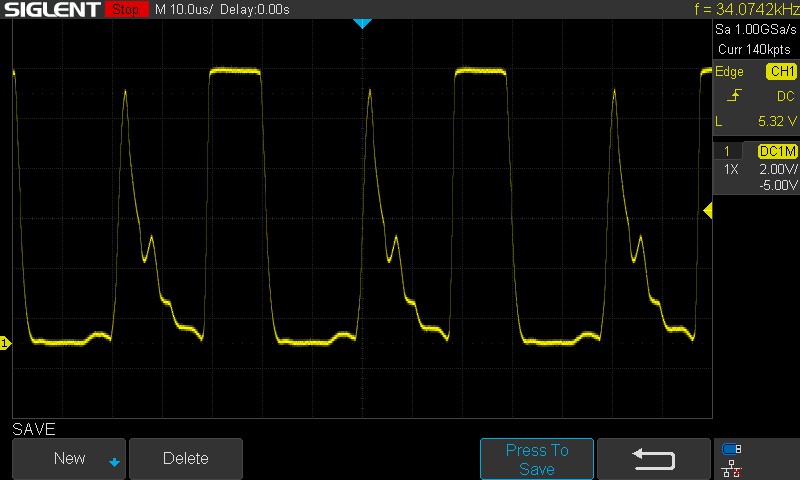
Firma ASUS oferuje różne profile wyświetlania z lokalnym przyciemnianiem lub bez niego, co pozwala dostosować panel zarówno do gier, jak i do edycji obrazu. W trybie HDR wyświetlacz osiąga bardzo wysoką jasność szczytową i charakteryzuje się doskonałym kontrastem z głęboką czernią. Dzięki maksymalnej jasności SDR wynoszącej około 600 cd/m² panel pozostaje jednym z najjaśniejszych w swojej klasie i doskonale sprawdza się w jasnym otoczeniu. Pełna jasność jest dostępna również podczas pracy na zasilaniu bateryjnym. Jak to zwykle bywa w przypadku paneli Mini-LED, podświetlenie wykorzystuje modulację PWM; jednak bardzo wysoka częstotliwość wynosząca około 30 kHz prawdopodobnie nie spowoduje żadnych problemów w praktyce, nawet u wrażliwych użytkowników.

662
cd/m²
624
cd/m²
595
cd/m²
613
cd/m²
600
cd/m²
581
cd/m²
618
cd/m²
588
cd/m²
559
cd/m²
podświetlenie ekranu
NE180QA1-MM0 testowany z X-Rite i1Pro 3
maksimum: 662 cd/m² (Nits) średnia: 604.4 cd/m² Minimum: 44.1 cd/m²
rozświetlenie: 84 %
na akumulatorze: 589 cd/m²
kontrast: ∞:1 (czerń: 0 cd/m²)
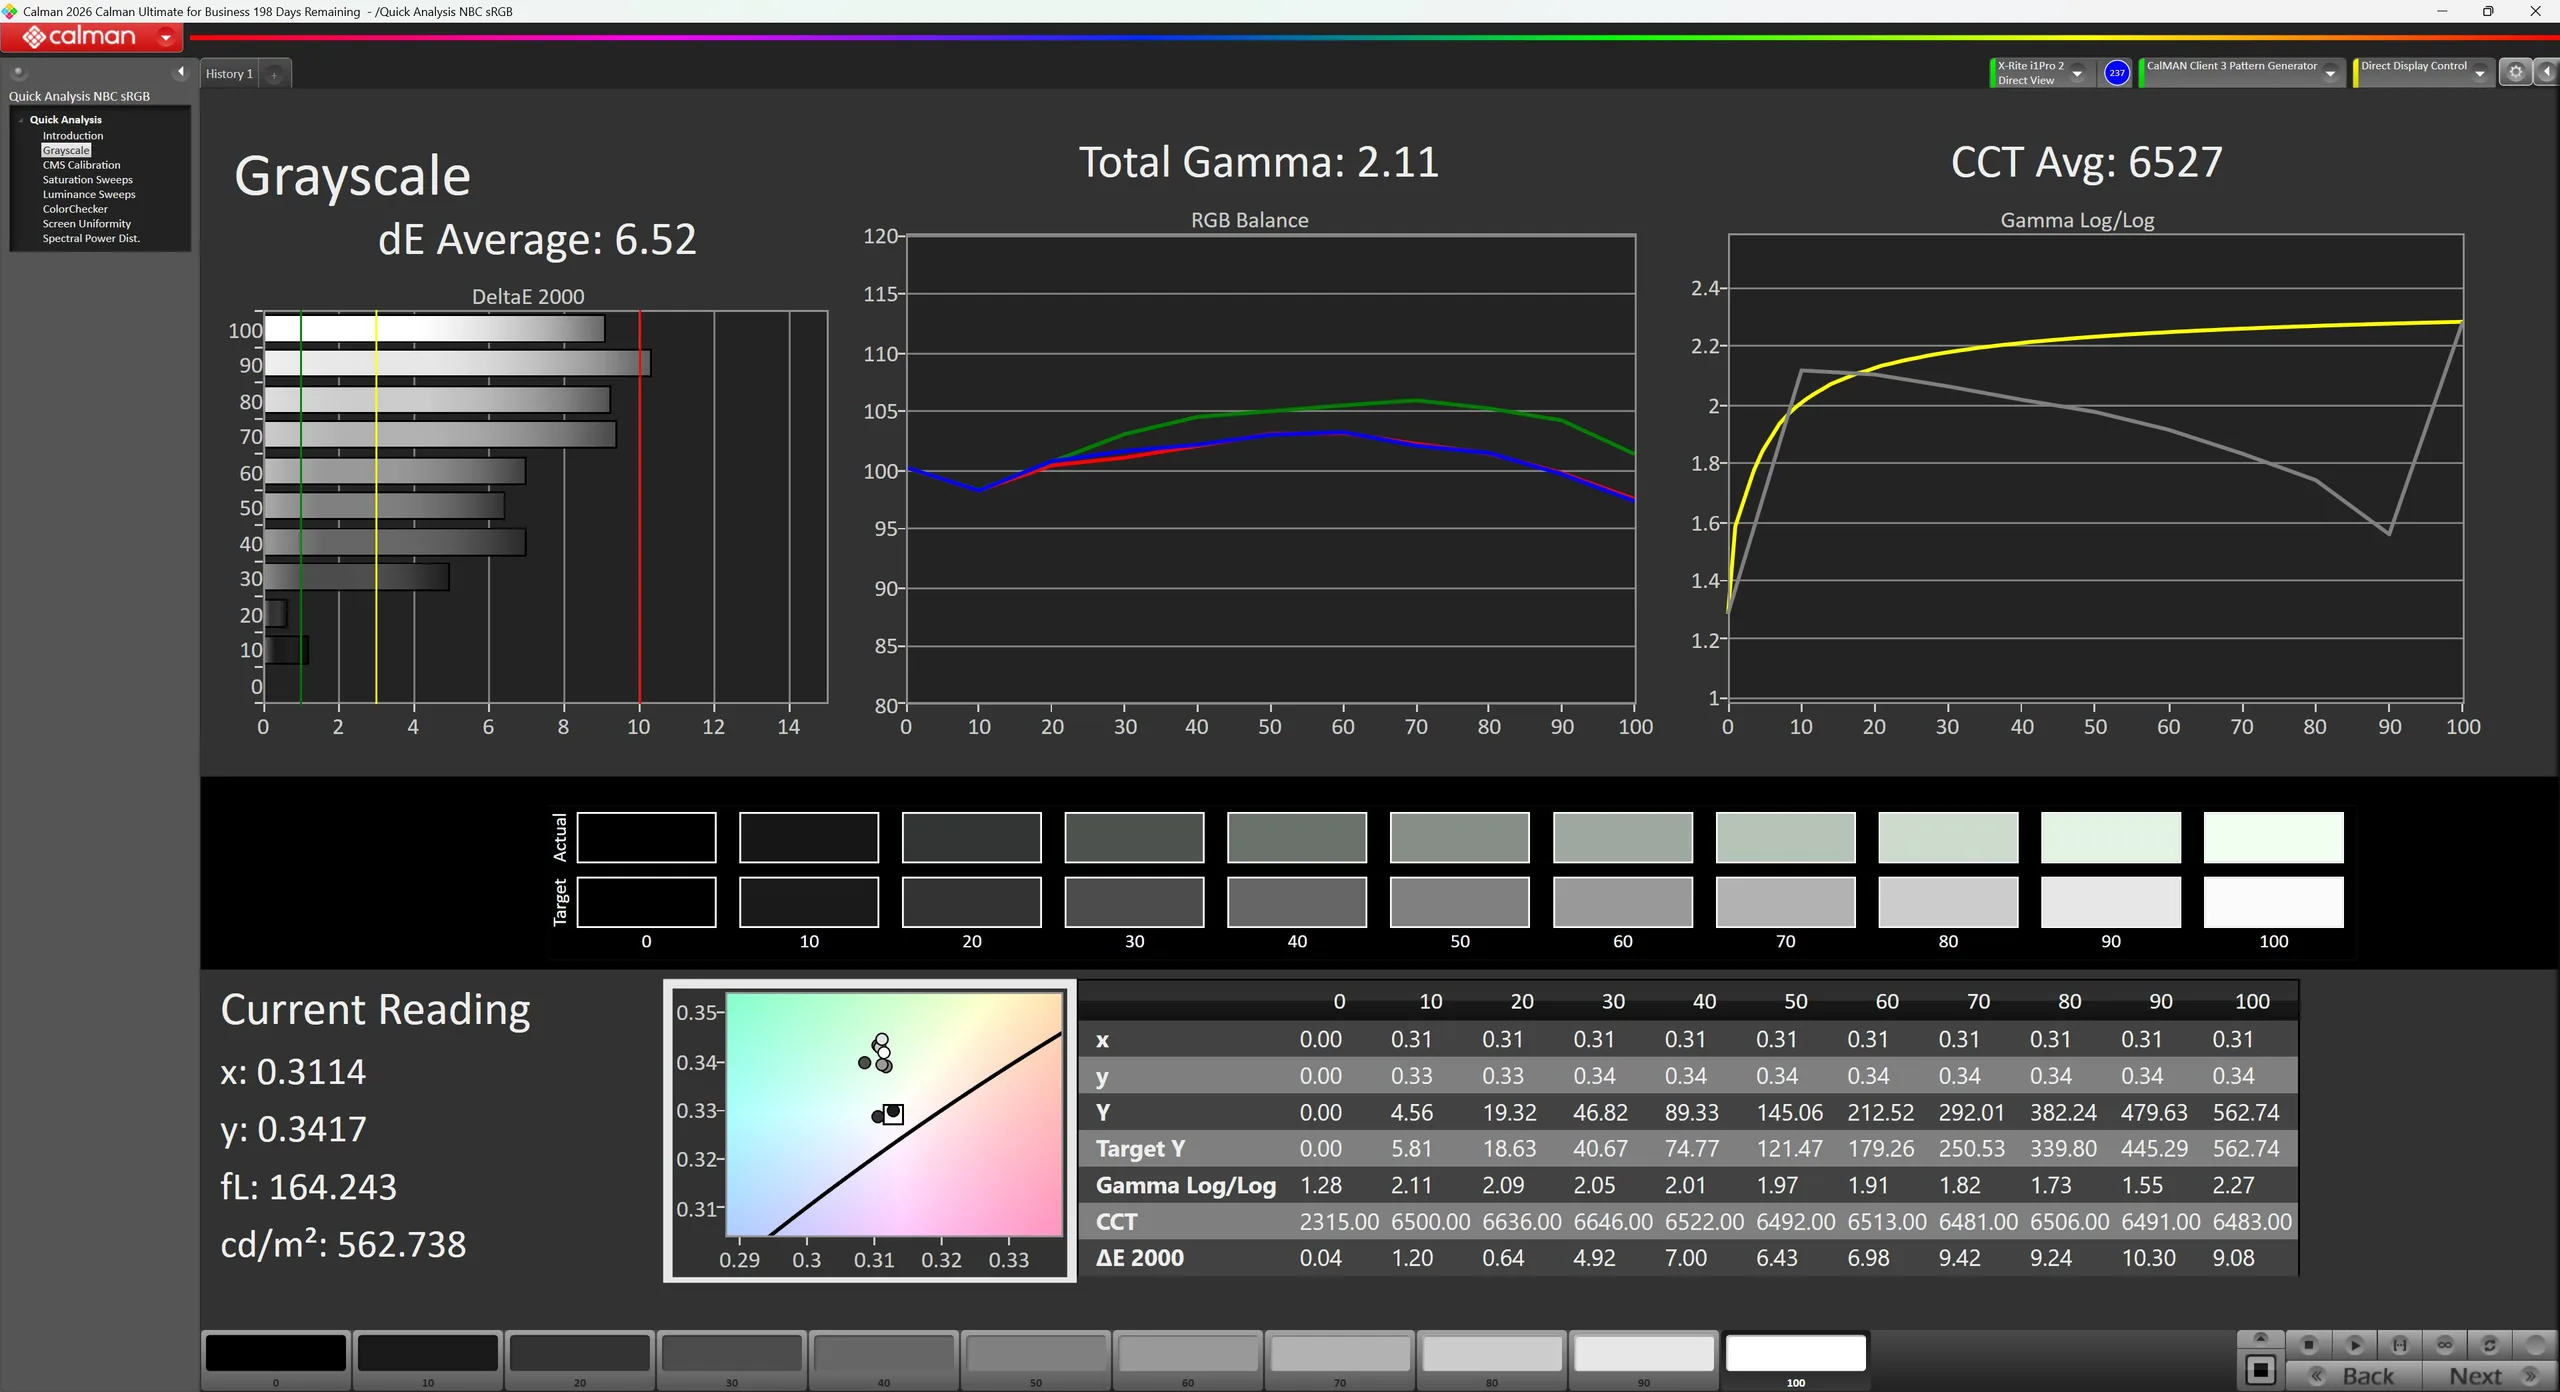
ΔE ColorChecker Calman: 7.12 | ∀{0.5-29.43 Ø4.71}
calibrated: 4.92
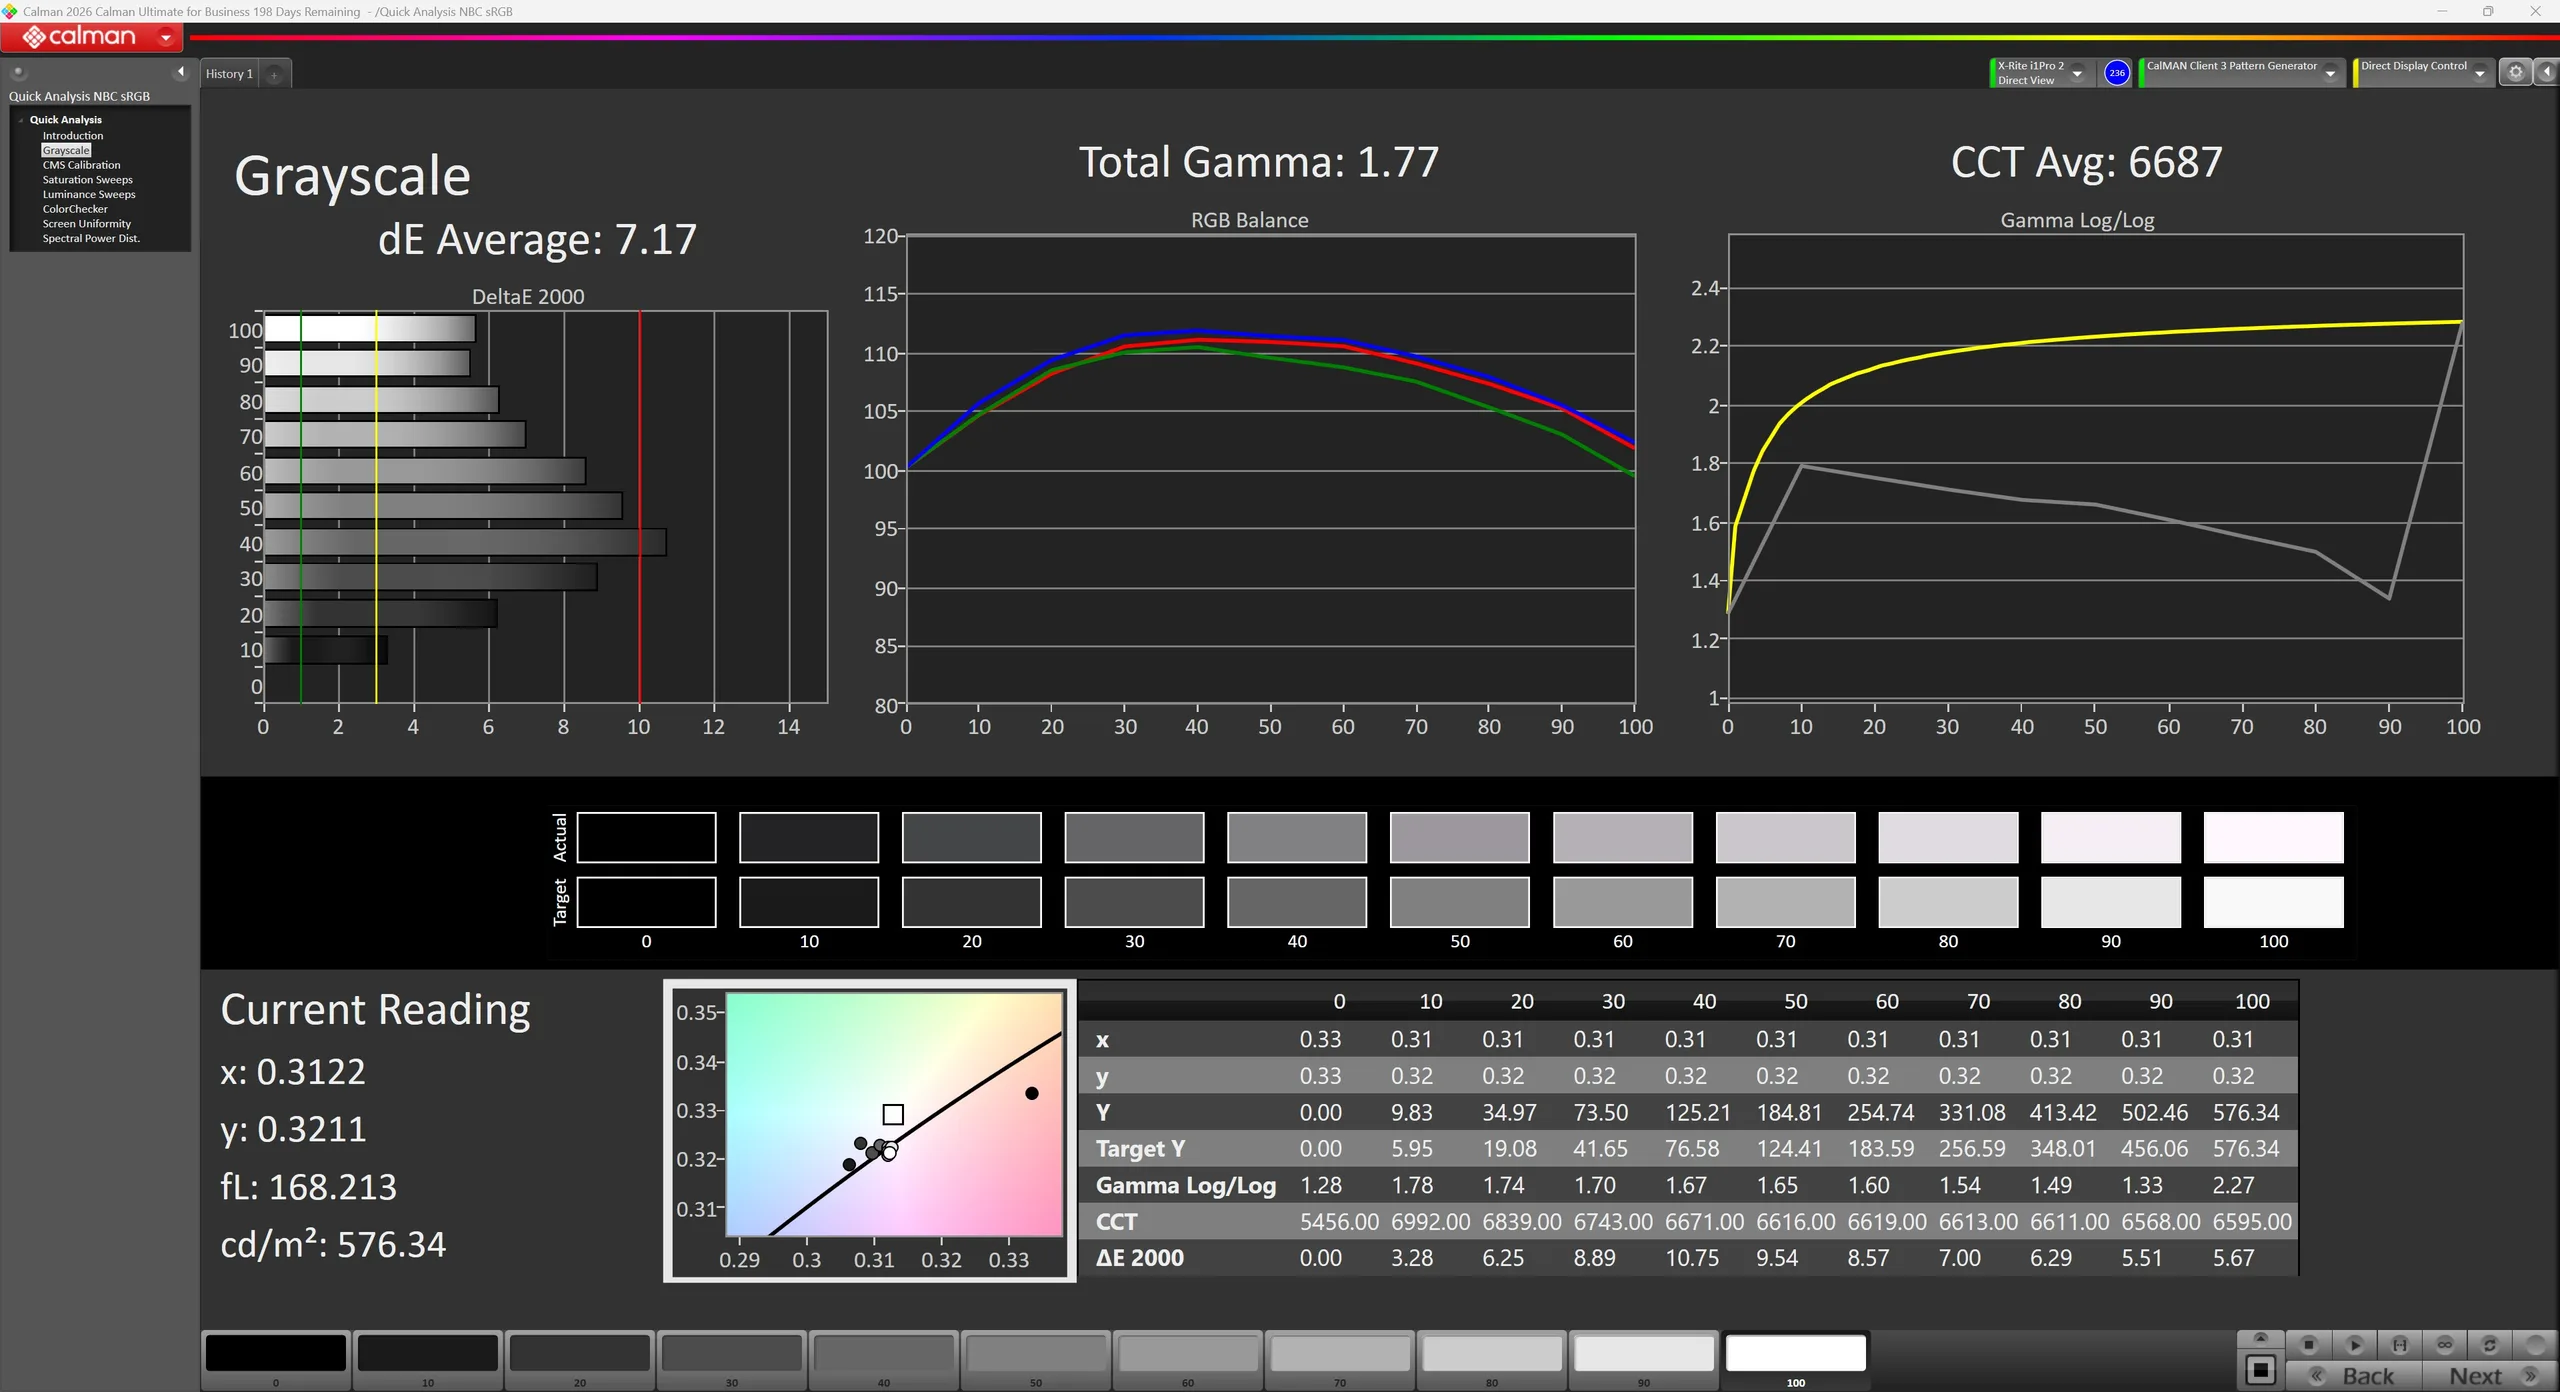
ΔE Greyscale Calman: 7.17 | ∀{0.09-98 Ø4.96}
92.8% AdobeRGB 1998 (Argyll 3D)
99.9% sRGB (Argyll 3D)
99.9% Display P3 (Argyll 3D)
Gamma: 1.77
CCT: 6687 K
Asus ROG Strix Scar 18 G835LXG
NE180QA1-MM0, Mini LED, 3840x2400, 18", 240 Hz
Asus Strix Scar 18 G835LX
N180QDM-NM2, Mini-LED, 2560x1600, 18", 240 Hz
Razer Blade 18 2024 RZ09-0509
BOE NE180QDM-NM1, Mini-LED, 2560x1600, 18", 300 Hz
Alienware m18 R2
BOE NE18NZ1, IPS, 2560x1600, 18", 165 Hz
Acer Predator Helios 18 PH18-72-98MW
B180QAN01.2 (AUO45A8), Mini-LED, 2560x1600, 18", 250 Hz
MSI Titan 18 HX A14VIG
AU Optronics B180ZAN01.0, Mini-LED, 3840x2400, 18", 120 Hz
Schenker Key 17 Pro (M24)
BOE, IPS, 3840x2160, 17.3", 144 Hz
Display
-2%
-2%
-2%
-0%
-3%
-5%
HDR Peak Brightness (cd/m²)
1264
Display P3 Coverage (%)
99.9
99
-1%
99
-1%
97.8
-2%
99.7
0%
98.1
-2%
93.51
-6%
sRGB Coverage (%)
99.9
100
0%
100
0%
99.5
0%
100
0%
99.8
0%
99.86
0%
AdobeRGB 1998 Coverage (%)
92.8
87.2
-6%
86.9
-6%
88.9
-4%
91.6
-1%
86.2
-7%
84.33
-9%
Response Times
-19%
-53%
-11%
-79%
-486%
-38%
Response Time Grey 50% / Grey 80% * (ms)
5.8 ?(2.1, 3.7)
7.4 ?(2.4, 5)
-28%
7.6 ?(3.6, 4)
-31%
5.3 ?(2.2, 3.1)
9%
8 ?(4.9, 3.1)
-38%
8.6 ?(4.2, 4.4)
-48%
11.593 ?(5.307, 6.286)
-100%
Response Time Black / White * (ms)
8 ?(4, 4)
10.4 ?(0.6, 9.8)
-30%
14 ?(6.6, 7.4)
-75%
10.4 ?(4.8, 5.6)
-30%
17.6 ?(15.2, 2.4)
-120%
81.8 ?(76, 5.8)
-923%
6 ?(1.5, 4.5)
25%
PWM Frequency (Hz)
30589
20610 ?(100)
26444 ?(100)
4832 ?(100)
2592 ?(100)
PWM Amplitude * (%)
100
100
-0%
Screen
50%
36%
19%
38%
21%
17%
Brightness middle (cd/m²)
600
764
27%
605.4
1%
271.8
-55%
722
20%
467.5
-22%
548
-9%
Brightness (cd/m²)
604
747
24%
600
-1%
275
-54%
724
20%
459
-24%
505
-16%
Brightness Distribution (%)
84
93
11%
97
15%
78
-7%
93
11%
90
7%
86
2%
Black Level * (cd/m²)
0.1
0.62
0.27
0.04
0.54
Colorchecker dE 2000 *
7.12
1.2
83%
1.53
79%
2.48
65%
3.4
52%
3.77
47%
3.81
46%
Colorchecker dE 2000 max. *
10.42
2.8
73%
4.15
60%
5.59
46%
5.32
49%
6.12
41%
7.9
24%
Colorchecker dE 2000 calibrated *
4.92
0.56
89%
1.6
67%
2.94
40%
2.54
48%
Greyscale dE 2000 *
7.17
1.5
79%
2.6
64%
3.7
48%
3.8
47%
3.2
55%
5.4
25%
Gamma
1.77 124%
2.17 101%
2.22 99%
2.2 100%
2.383 92%
2.43 91%
2.062 107%
CCT
6687 97%
6556 99%
6843 95%
6355 102%
7051 92%
6478 100%
7224 90%
Contrast (:1)
7640
976
1007
18050
1015
Całkowita średnia (program / ustawienia)
10% / 19%
-6% / 10%
2% / 9%
-14% / 9%
-156% / -70%
-9% / 3%

* ... im mniej tym lepiej

Skala szarości CalMAN (profil: Display P3)
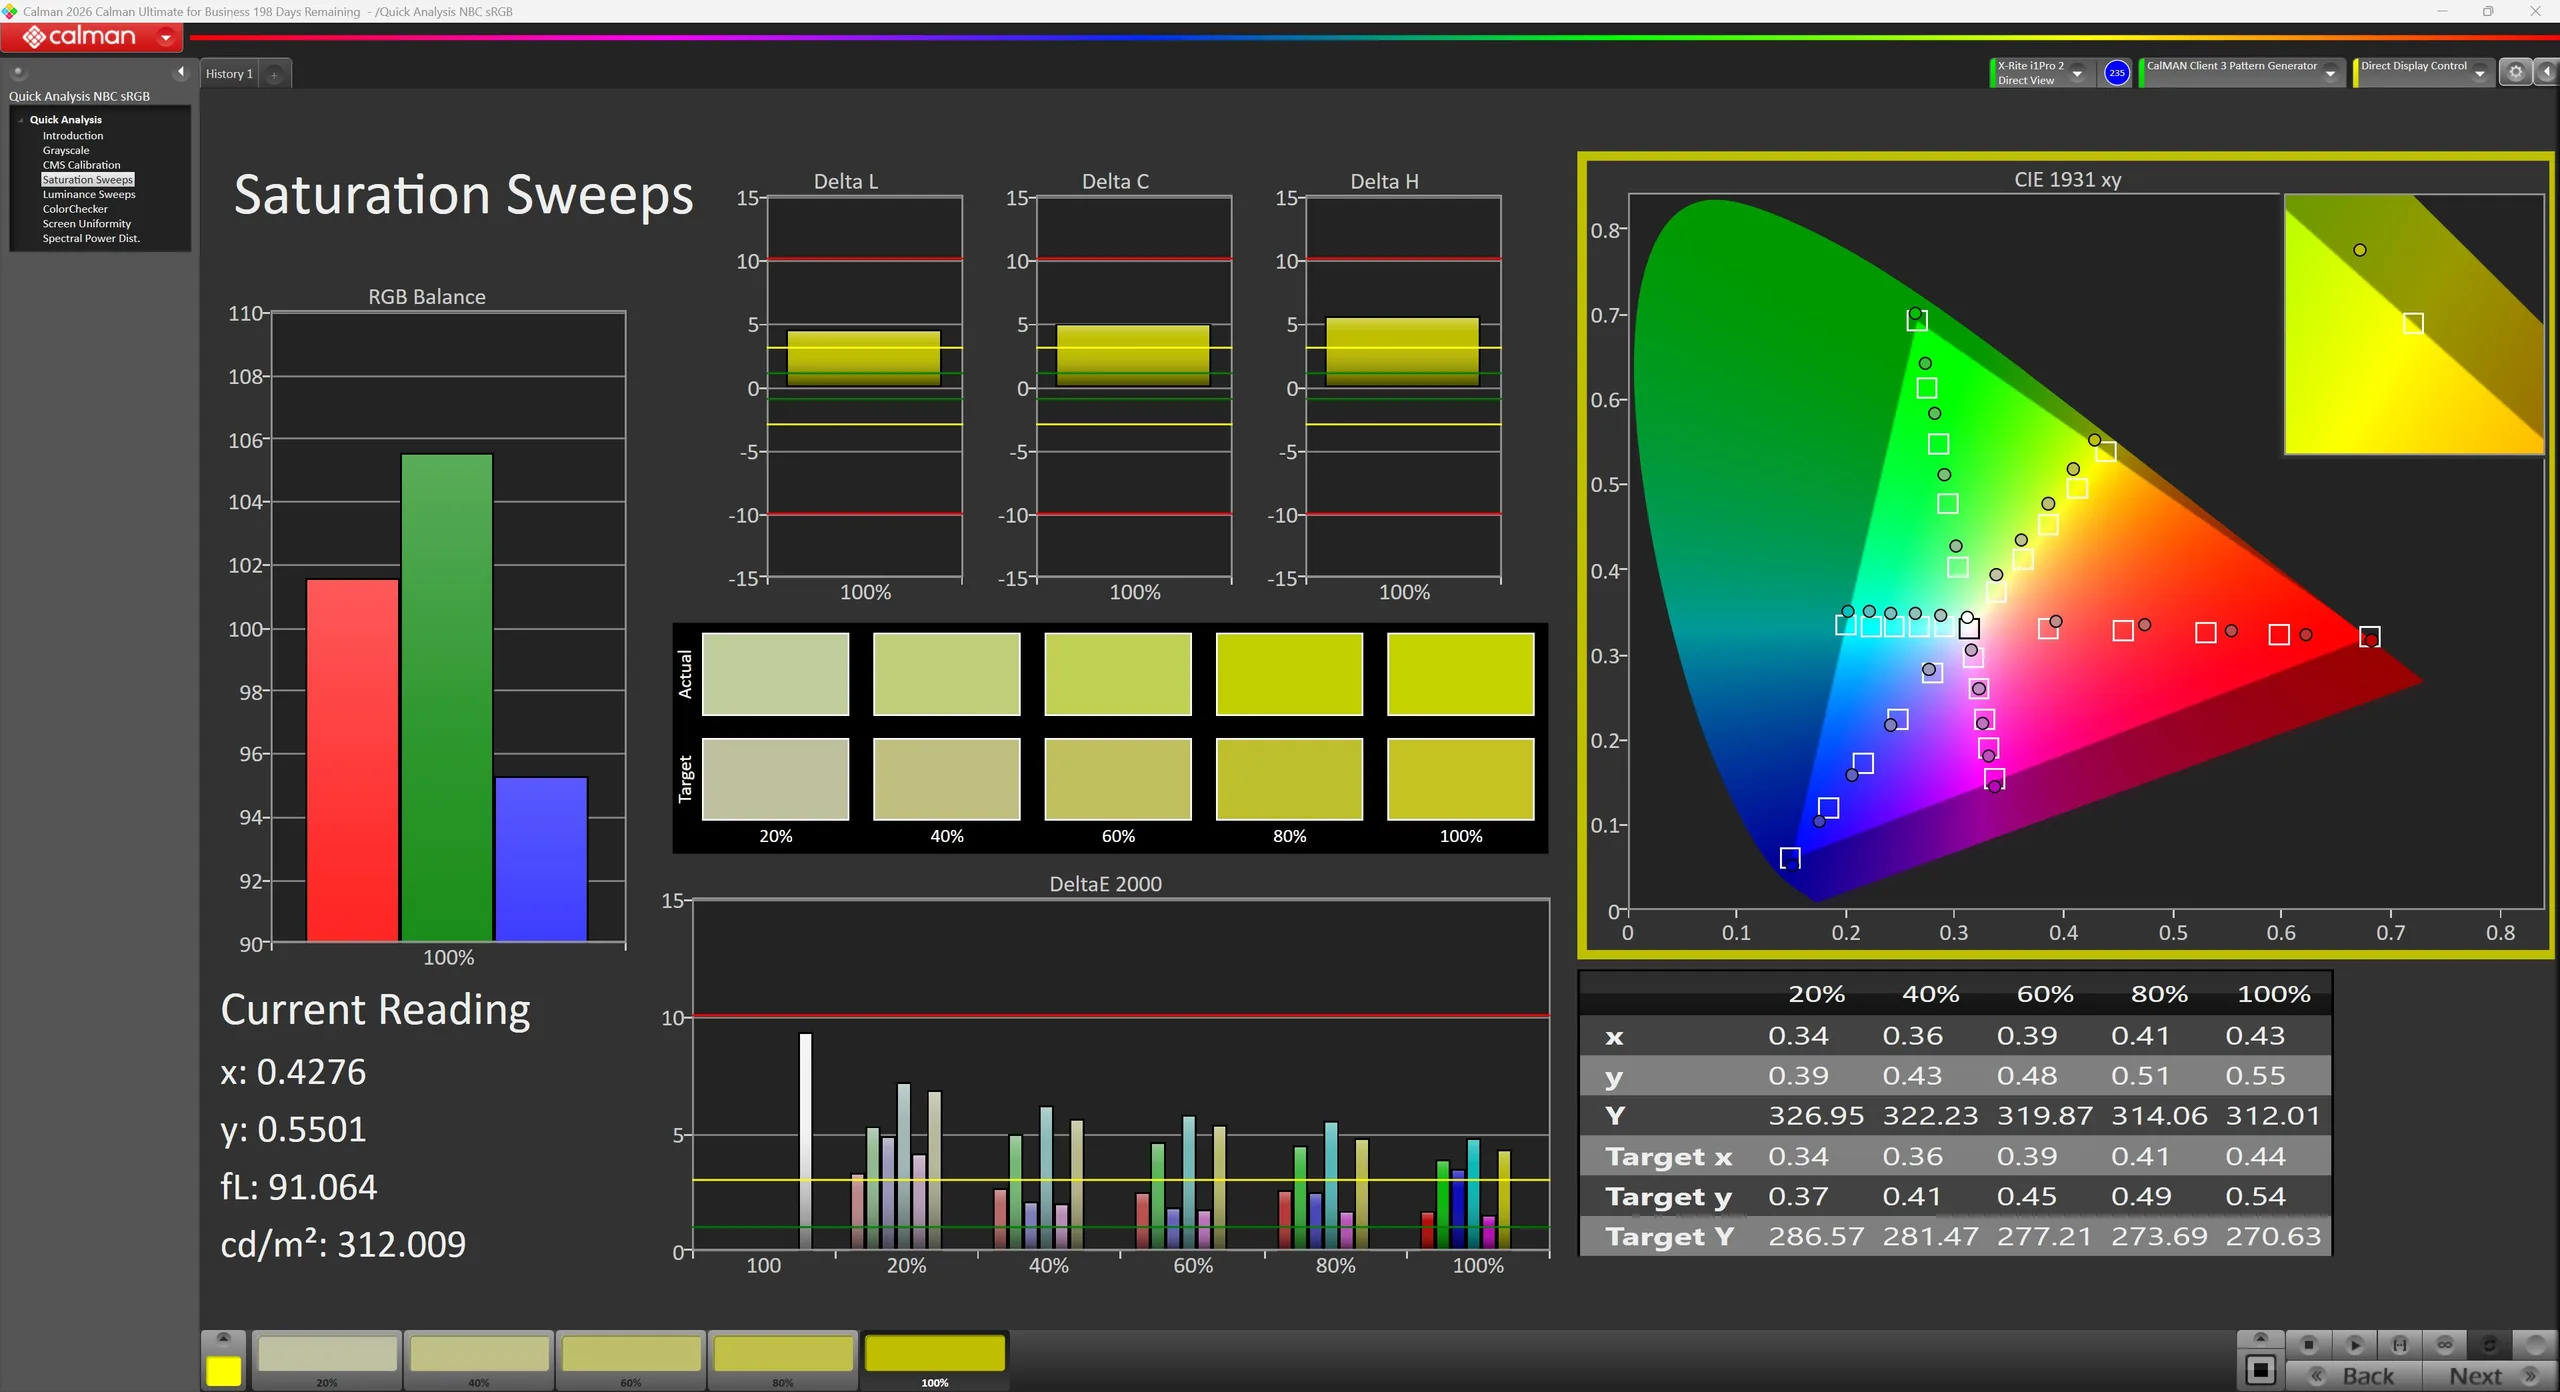
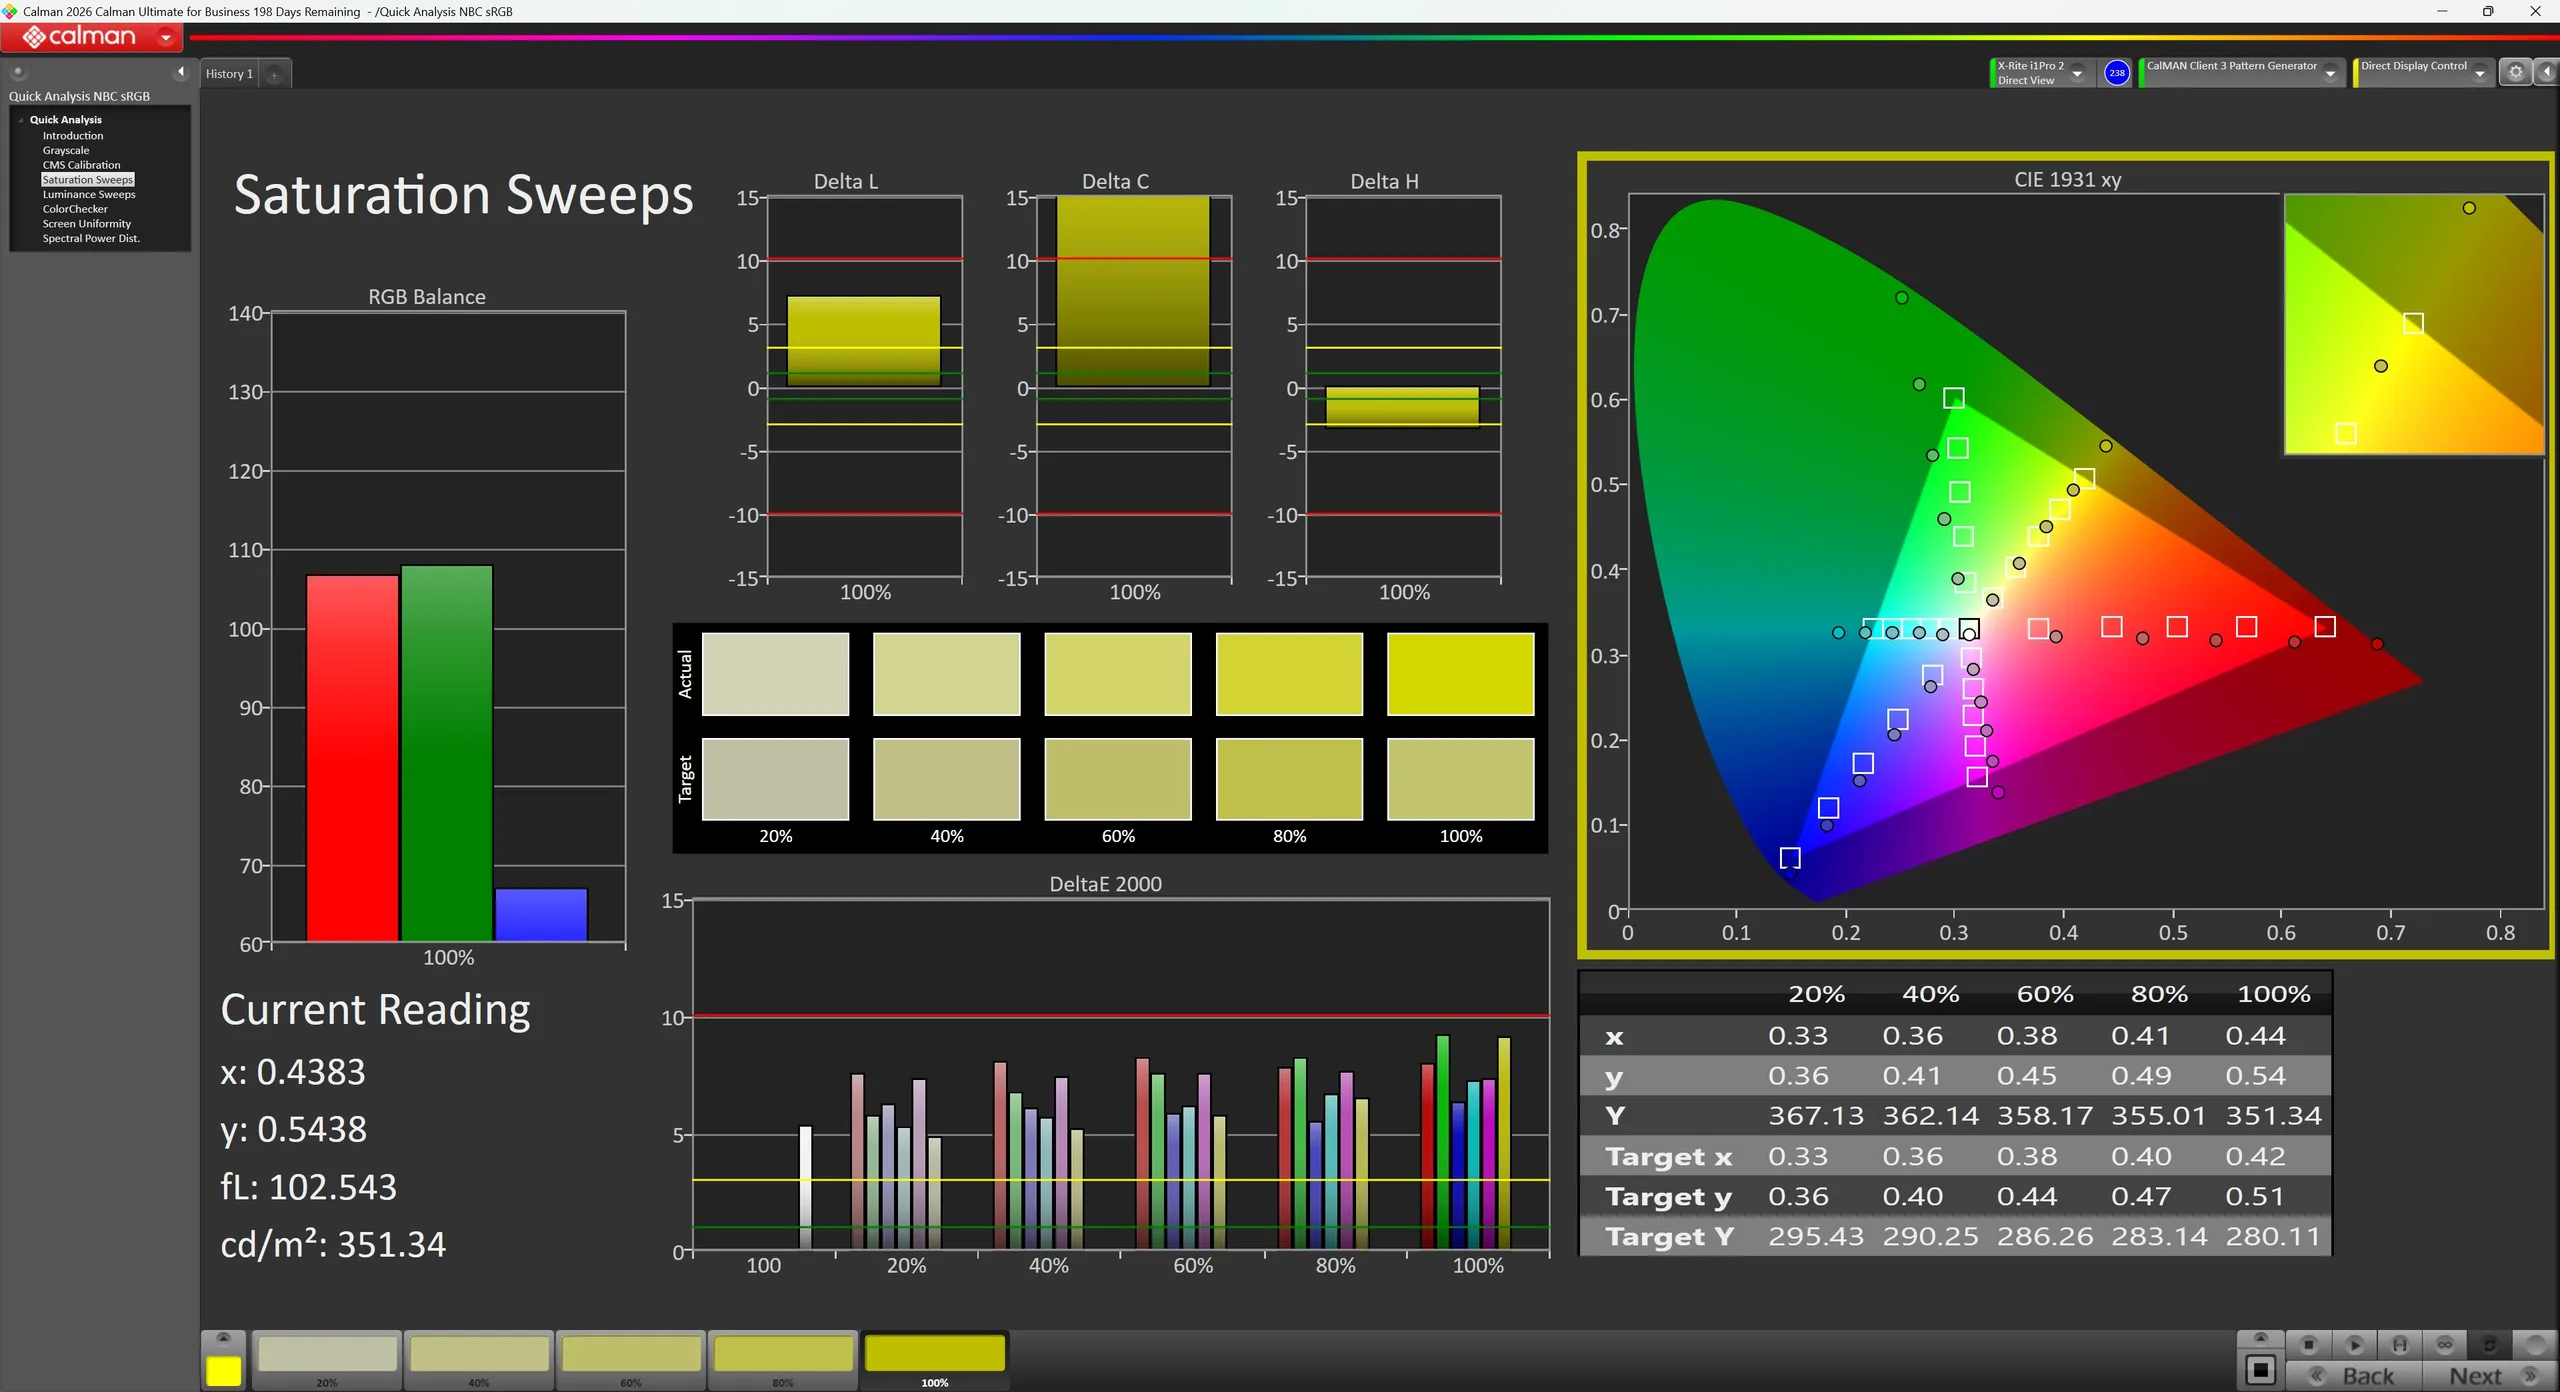
Nasycenie CalMAN (profil: Display P3)
CalMAN ColorChecker (profil: Display P3)
Skala szarości CalMAN (profil: Native)
Nasycenie CalMAN (profil: Native)
CalMAN ColorChecker (profil: natywny)

Zakres przestrzeni barwnej

sRGB
sRGB
AdobeRGB
AdobeRGB
DCI-P3
DCI-P3

Firma Asus oferuje również 18 różnych profili kolorystycznych dla modelu ROG Strix SCAR. Jednak w stanie fabrycznym nasz egzemplarz testowy wykazuje stosunkowo duże odchylenia kolorystyczne, co oznacza, że dokładność odwzorowania kolorów nie spełnia oczekiwań stawianych laptopom z najwyższej półki. Dopiero po kalibracji jakość wyświetlacza ulega znacznej poprawie, a odchylenia kolorystyczne zostają zauważalnie zredukowane, dzięki czemu panel znacznie lepiej nadaje się do zastosowań, w których kolory mają kluczowe znaczenie.

Wyświetl czasy reakcji

Czasy reakcji wyświetlacza pokazują, jak szybko ekran może zmieniać kolor z jednego koloru na drugi. Długi czas reakcji może powodować powstawanie powidoków i sprawiać, że poruszające się obiekty będą niewyraźne (duchy). Gracze szybkich tytułów 3D powinni zwrócić szczególną uwagę na szybki czas reakcji.
       Czas reakcji od czerni do bieli
8 ms ... wzrost ↗ i spadek ↘ łącznie↗ 4 ms wzrost
↘ 4 ms upadek
W naszych testach ekran wykazuje szybki czas reakcji i powinien nadawać się do gier.
Dla porównania, wszystkie testowane urządzenia wahają się od 0.1 (minimum) do 240 (maksimum) ms. » 22 % wszystkich urządzeń jest lepszych.
Oznacza to, że zmierzony czas reakcji jest lepszy od średniej wszystkich testowanych urządzeń (19.8 ms).
       Czas reakcji 50% szarości do 80% szarości
5.8 ms ... wzrost ↗ i spadek ↘ łącznie↗ 2.1 ms wzrost
↘ 3.7 ms upadek
W naszych testach ekran wykazuje bardzo szybką reakcję i powinien bardzo dobrze nadawać się do szybkich gier.
Dla porównania, wszystkie testowane urządzenia wahają się od 0.165 (minimum) do 636 (maksimum) ms. » 19 % wszystkich urządzeń jest lepszych.
Oznacza to, że zmierzony czas reakcji jest lepszy od średniej wszystkich testowanych urządzeń (31 ms).

Migotanie ekranu / PWM (modulacja szerokości impulsu)

Aby przyciemnić ekran, niektóre notebooki po prostu w krótkich odstępach czasu włączają i wyłączają podświetlenie — jest to metoda zwana modulacją szerokości impulsu (PWM). W idealnym przypadku ta częstotliwość cykli powinna być niewykrywalna dla ludzkiego oka. Jeśli wspomniana częstotliwość jest zbyt niska, użytkownicy o wrażliwych oczach mogą odczuwać zmęczenie lub bóle głowy, a nawet całkowicie zauważyć migotanie.
Wykryto migotanie ekranu/wykryto PWM 30589 Hz
Amplitude: 100 %

Podświetlenie wyświetlacza miga z częstotliwością 30589 Hz (najgorszy przypadek, np. przy użyciu PWM) .

Częstotliwość 30589 Hz jest dość wysoka, więc większość użytkowników wrażliwych na PWM nie powinna zauważyć żadnego migotania.

Dla porównania: 52 % wszystkich testowanych urządzeń nie używa PWM do przyciemniania wyświetlacza. Jeśli wykryto PWM, zmierzono średnio 7754 (minimum: 5 - maksimum: 343500) Hz.

Migotanie PWM (jasność 0%)
Migotanie PWM (jasność 20%)
Migotanie PWM (jasność 40%)
Migotanie PWM (jasność 60%)
Migotanie PWM (jasność 80%)
Migotanie PWM (jasność 100%)
Pod zachmurzonym niebem
W promieniach słońca
Stabilność kąta widzenia

Wydajność

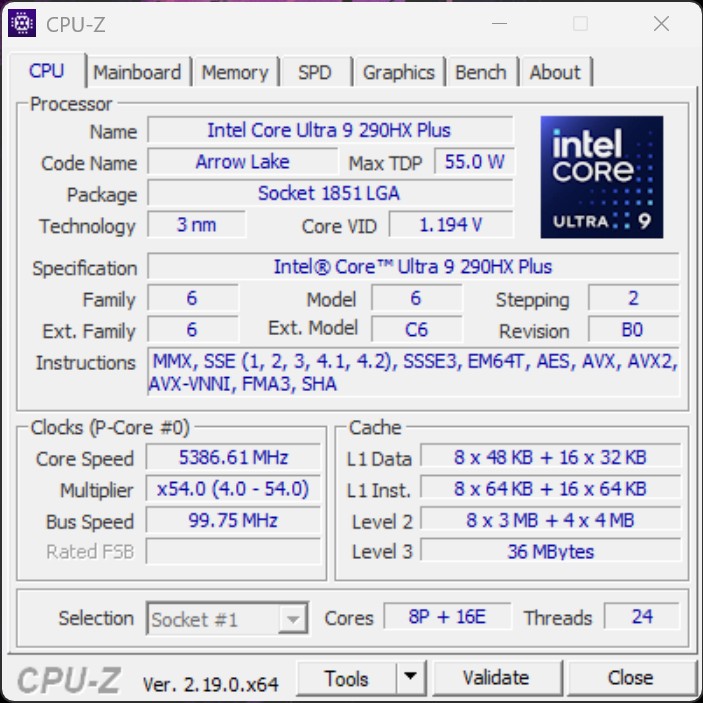
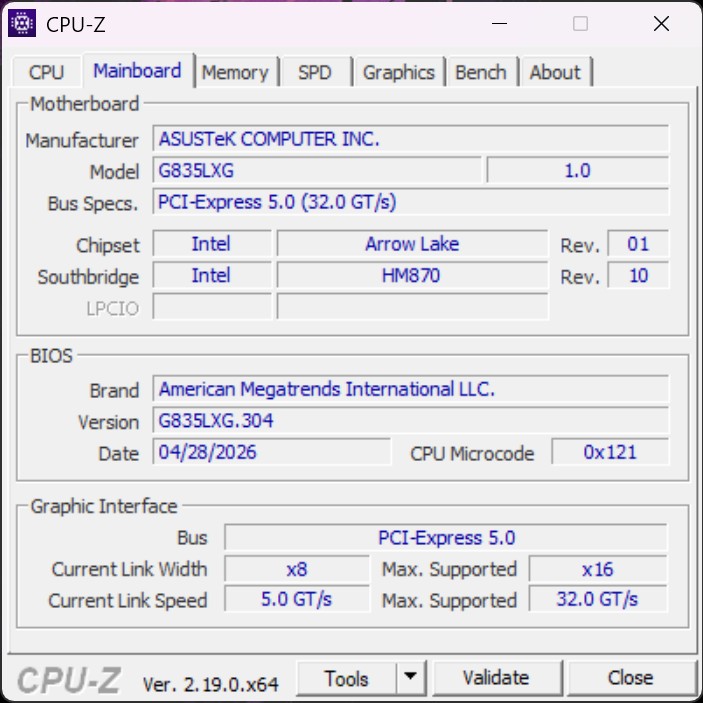
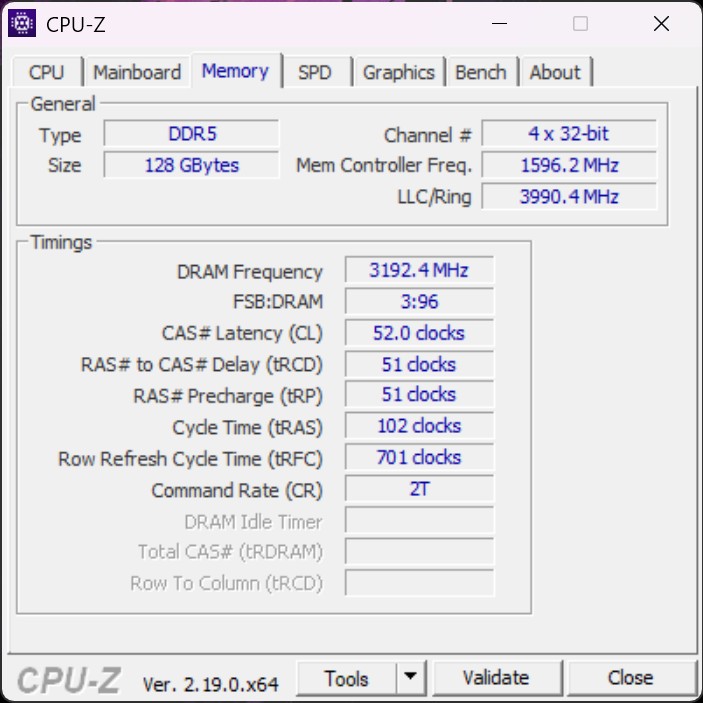
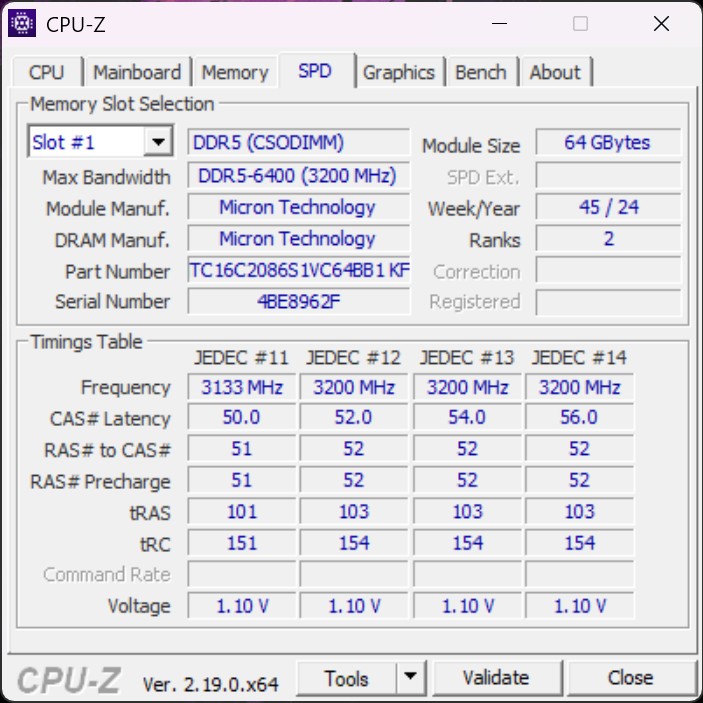
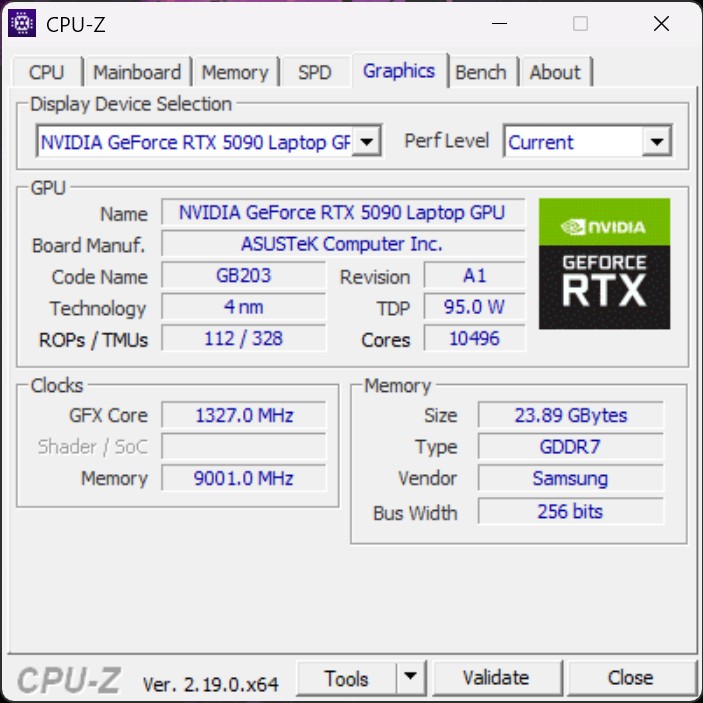
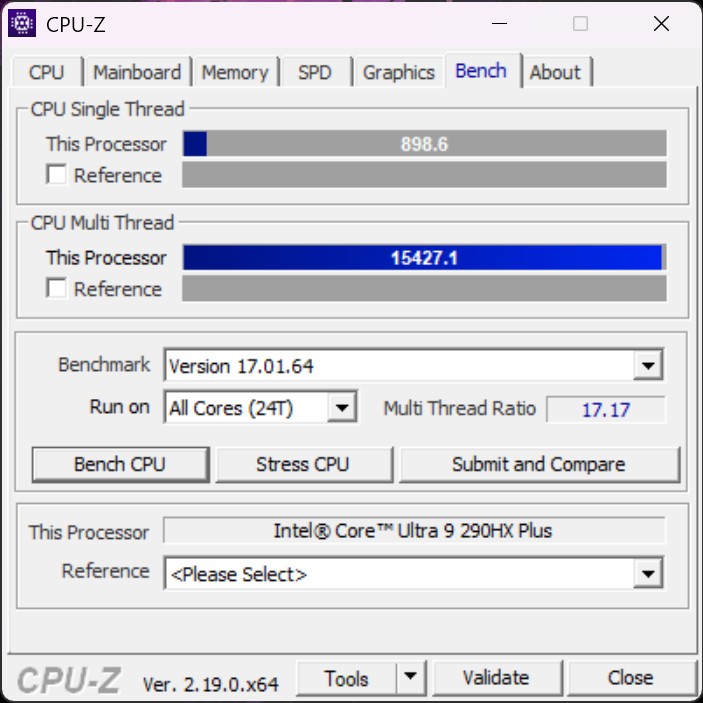
CPU-Z
CPU-Z
CPU-Z
CPU-Z
CPU-Z
CPU-Z
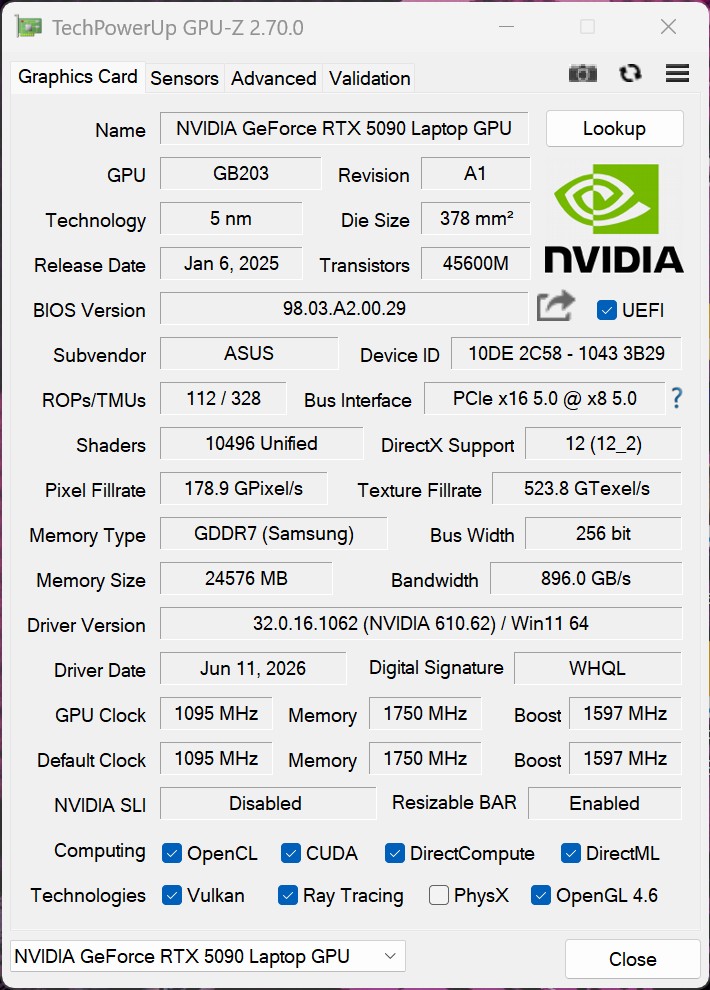
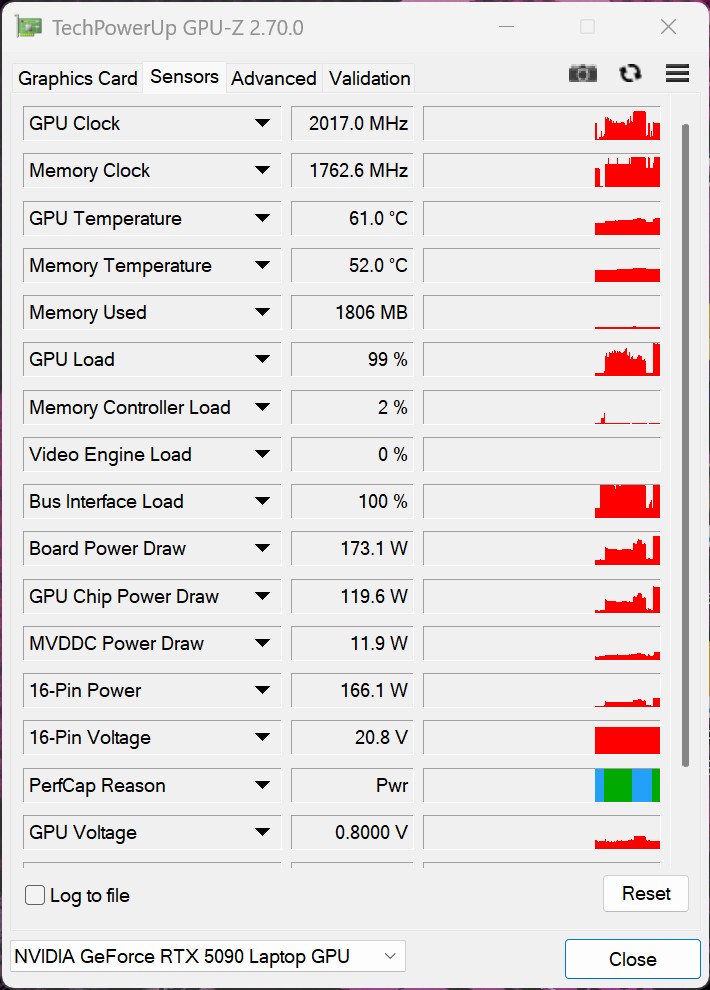
GPU-Z
GPU-Z
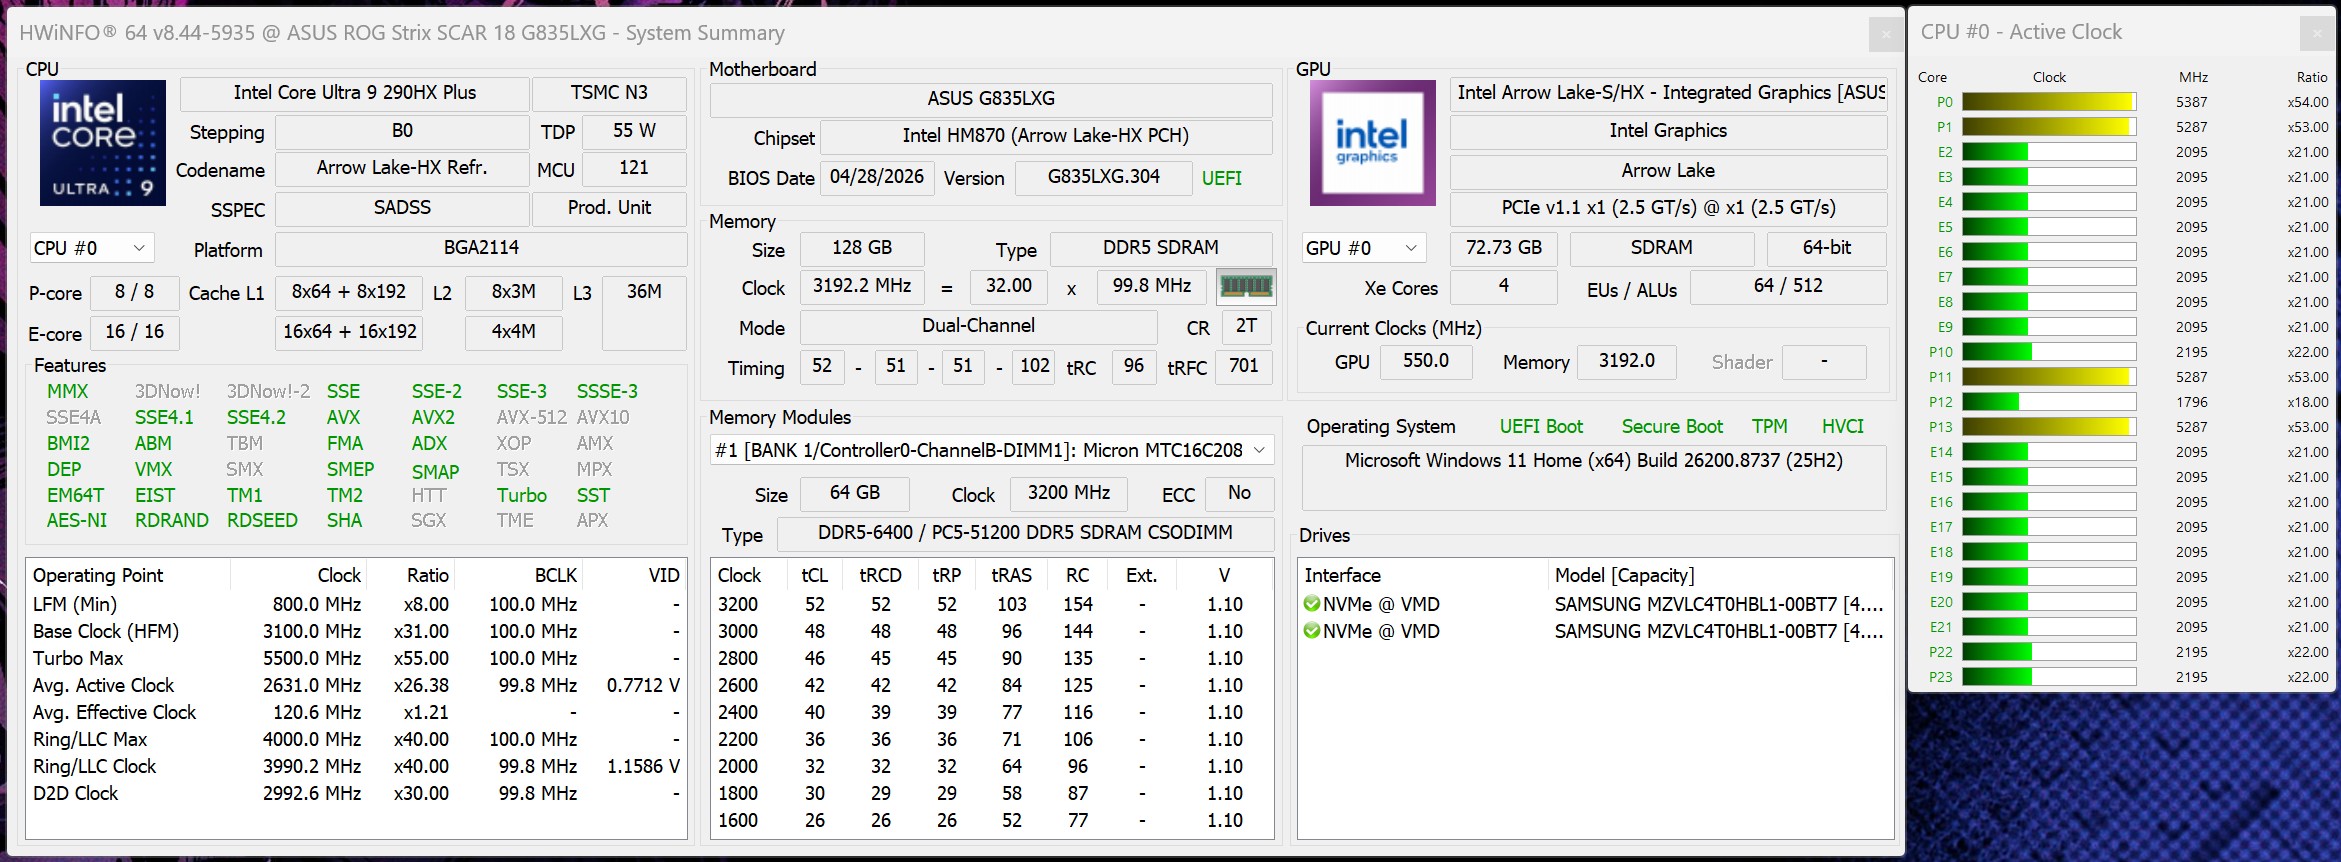
HWiNFO

Warunki testowe

Komputer Asus ROG Strix SCAR 18 oferuje trzy znane profile zasilania: Cichy, Wydajność i Turbo. We wszystkich testach porównawczych i pomiarach wykorzystano tryb Turbo, który zapewnia maksymalną wydajność. Ponadto dostępny jest tryb ręczny, w którym można między innymi dostosować częstotliwości taktowania procesora graficznego oraz sterowanie wentylatorami. Tryb Turbo nie jest jednak dostępny podczas pracy na zasilaniu bateryjnym.

Profil zasilania TDP procesora CBR24 Multi TGP karty graficznej TimeSpy Graphics CP2077 QHD Maks. hałas wentylatora
Cichy 100/80 watów 1953 punktów 95 watów 16321 punktów 80,2 klatek na sekundę 34,8 dB(A)
Wydajność 125/100 watów 2133 punktów 150 watów 23177 punktów 110,0 klatek na sekundę 49 dB(A)
Tryb Turbo 200/180 watów 2318 punktów 175 watów 25256 punktów 118,7 klatek na sekundę 53,7 dB(A)

Procesor – Core Ultra 9 290HX Plus

Procesor Intel Core Ultra 9 290HX jest jednym z najszybszych procesorów mobilnych w obecnej generacji Arrow Lake-HX i został zaprojektowany z myślą o wysokiej klasy laptopach do gier oraz mobilnych stacjach roboczych. Dzięki wysokiej wydajności wielordzeniowej radzi sobie z wymagającymi aplikacjami, takimi jak renderowanie, edycja wideo czy tworzenie oprogramowania, równie płynnie jak z najnowszymi grami. W testach procesor ten zapewnia niezmiennie wysoką wydajność i plasuje się wśród najlepszych obecnie dostępnych procesorów do notebooków. W modelu Asus ROG Strix SCAR 18 producent oferuje trzy wstępnie zdefiniowane tryby wydajnościowe o mocy szczytowej do 200 watów. Użytkownicy, którzy chcą ręcznie dostosować ustawienia, mogą nawet przydzielić procesorowi mobilnemu moc do 240 watów.

Cinebench R15 Multi Loop

0125250375500625750875100011251250137515001625175018752000212522502375250026252750287530003125325033753500362537503875400041254250437545004625475048755000512552505375550056255750587560006125Tooltip
Asus ROG Strix Scar 18 G835LXG Intel Core Ultra 9 290HX Plus: Ø6190 (6119.95-6230.53) Points
Asus Strix Scar 18 G835LX Intel Core Ultra 9 275HX: Ø5942 (5879.76-6059.69) Points
Razer Blade 18 2024 RZ09-0509 Intel Core i9-14900HX: Ø4163 (3956.09-4227.88) Points
Alienware m18 R2 Intel Core i9-14900HX: Ø4743 (4458.81-4807.11) Points
Acer Predator Helios 18 PH18-72-98MW Intel Core i9-14900HX: Ø4064 (3787.52-4673.44) Points
MSI Titan 18 HX A14VIG Intel Core i9-14900HX: Ø4753 (4700.35-4782.4) Points
Schenker Key 17 Pro (M24) Intel Core i9-14900HX: Ø3786 (3488.57-4363) Points
CPU Performance rating: Percent
Cinebench R23: Multi Core | Single Core
Cinebench R20: CPU (Multi Core) | CPU (Single Core)
Cinebench R15: CPU Multi 64Bit | CPU Single 64Bit
Blender: v2.79 BMW27 CPU
7-Zip 18.03: 7z b 4 | 7z b 4 -mmt1
Geekbench 6.7: Multi-Core | Single-Core
Geekbench 5.5: Multi-Core | Single-Core
HWBOT x265 Benchmark v2.2: 4k Preset
LibreOffice : 20 Documents To PDF
R Benchmark 2.5: Overall mean
CPU Performance rating
Asus ROG Strix Scar 18 G835LXG
Intel Core Ultra 9 290HX Plus
86 pt
Asus Strix Scar 18 G835LX
Intel Core Ultra 9 275HX
83.4 pt
Przeciętny Intel Core Ultra 9 290HX Plus
 
83.3 pt
Alienware m18 R2
Intel Core i9-14900HX
74.8 pt
MSI Titan 18 HX A14VIG
Intel Core i9-14900HX
71.6 pt
Razer Blade 18 2024 RZ09-0509
Intel Core i9-14900HX
67.9 pt
Schenker Key 17 Pro (M24)
Intel Core i9-14900HX
66.1 pt
Acer Predator Helios 18 PH18-72-98MW
Intel Core i9-14900HX
65.2 pt
Średnia w klasie Gaming
 
63.4 pt
Cinebench R23 / Multi Core
Asus ROG Strix Scar 18 G835LXG
Intel Core Ultra 9 290HX Plus
42661 Points
Przeciętny Intel Core Ultra 9 290HX Plus
  (37038 - 42661, n=5)
39891 Points -6%
Asus Strix Scar 18 G835LX
Intel Core Ultra 9 275HX
39001 Points -9%
MSI Titan 18 HX A14VIG
Intel Core i9-14900HX
32428 (29693.8min - 32428.3max) Points -24%
Alienware m18 R2
Intel Core i9-14900HX
31391 (28656min - 31390.7max) Points -26%
Razer Blade 18 2024 RZ09-0509
Intel Core i9-14900HX
27657 (23328.1min - 27657.5max) Points -35%
Schenker Key 17 Pro (M24)
Intel Core i9-14900HX
27338 Points -36%
Średnia w klasie Gaming
  (10488 - 42661, n=107, ostatnie 2 lata)
26304 Points -38%
Acer Predator Helios 18 PH18-72-98MW
Intel Core i9-14900HX
26171 Points -39%
Cinebench R23 / Single Core
Asus ROG Strix Scar 18 G835LXG
Intel Core Ultra 9 290HX Plus
2415 Points
Przeciętny Intel Core Ultra 9 290HX Plus
  (2319 - 2415, n=5)
2361 Points -2%
Asus Strix Scar 18 G835LX
Intel Core Ultra 9 275HX
2252 Points -7%
Alienware m18 R2
Intel Core i9-14900HX
2235 Points -7%
Acer Predator Helios 18 PH18-72-98MW
Intel Core i9-14900HX
2176 Points -10%
MSI Titan 18 HX A14VIG
Intel Core i9-14900HX
2143 Points -11%
Razer Blade 18 2024 RZ09-0509
Intel Core i9-14900HX
2088 Points -14%
Schenker Key 17 Pro (M24)
Intel Core i9-14900HX
2028 Points -16%
Średnia w klasie Gaming
  (1166 - 2415, n=107, ostatnie 2 lata)
2015 Points -17%
Cinebench R20 / CPU (Multi Core)
Asus ROG Strix Scar 18 G835LXG
Intel Core Ultra 9 290HX Plus
16433 Points
Asus Strix Scar 18 G835LX
Intel Core Ultra 9 275HX
15517 Points -6%
Przeciętny Intel Core Ultra 9 290HX Plus
  (14397 - 16433, n=5)
15445 Points -6%
MSI Titan 18 HX A14VIG
Intel Core i9-14900HX
12103 Points -26%
Alienware m18 R2
Intel Core i9-14900HX
11816 Points -28%
Razer Blade 18 2024 RZ09-0509
Intel Core i9-14900HX
10871 Points -34%
Schenker Key 17 Pro (M24)
Intel Core i9-14900HX
10276 Points -37%
Średnia w klasie Gaming
  (4029 - 16433, n=106, ostatnie 2 lata)
10226 Points -38%
Acer Predator Helios 18 PH18-72-98MW
Intel Core i9-14900HX
9881 Points -40%
Cinebench R20 / CPU (Single Core)
Asus ROG Strix Scar 18 G835LXG
Intel Core Ultra 9 290HX Plus
913 Points
Przeciętny Intel Core Ultra 9 290HX Plus
  (864 - 913, n=5)
891 Points -2%
Asus Strix Scar 18 G835LX
Intel Core Ultra 9 275HX
866 Points -5%
Alienware m18 R2
Intel Core i9-14900HX
853 Points -7%
Acer Predator Helios 18 PH18-72-98MW
Intel Core i9-14900HX
832 Points -9%
MSI Titan 18 HX A14VIG
Intel Core i9-14900HX
823 Points -10%
Razer Blade 18 2024 RZ09-0509
Intel Core i9-14900HX
814 Points -11%
Średnia w klasie Gaming
  (442 - 913, n=106, ostatnie 2 lata)
780 Points -15%
Schenker Key 17 Pro (M24)
Intel Core i9-14900HX
779 Points -15%
Cinebench R15 / CPU Multi 64Bit
Asus ROG Strix Scar 18 G835LXG
Intel Core Ultra 9 290HX Plus
6330 Points
Asus Strix Scar 18 G835LX
Intel Core Ultra 9 275HX
6060 (5879.76min - 6059.69max) Points -4%
Przeciętny Intel Core Ultra 9 290HX Plus
  (5617 - 6330, n=5)
6002 Points -5%
Alienware m18 R2
Intel Core i9-14900HX
4807 (4458.81min - 4807.11max) Points -24%
MSI Titan 18 HX A14VIG
Intel Core i9-14900HX
4782 (4700.35min - 4782.4max) Points -24%
Acer Predator Helios 18 PH18-72-98MW
Intel Core i9-14900HX
4673 (3787.52min - 4673.44max) Points -26%
Schenker Key 17 Pro (M24)
Intel Core i9-14900HX
4363 (3488.57min - 4363max) Points -31%
Razer Blade 18 2024 RZ09-0509
Intel Core i9-14900HX
4228 (3956.09min - 4227.88max) Points -33%
Średnia w klasie Gaming
  (1578 - 6330, n=105, ostatnie 2 lata)
4079 Points -36%
Cinebench R15 / CPU Single 64Bit
Asus ROG Strix Scar 18 G835LXG
Intel Core Ultra 9 290HX Plus
350 Points
Asus Strix Scar 18 G835LX
Intel Core Ultra 9 275HX
343 Points -2%
Przeciętny Intel Core Ultra 9 290HX Plus
  (324 - 350, n=5)
339 Points -3%
Alienware m18 R2
Intel Core i9-14900HX
318 Points -9%
Acer Predator Helios 18 PH18-72-98MW
Intel Core i9-14900HX
312 Points -11%
Razer Blade 18 2024 RZ09-0509
Intel Core i9-14900HX
304 Points -13%
MSI Titan 18 HX A14VIG
Intel Core i9-14900HX
300 Points -14%
Średnia w klasie Gaming
  (188.8 - 350, n=106, ostatnie 2 lata)
297 Points -15%
Schenker Key 17 Pro (M24)
Intel Core i9-14900HX
288 Points -18%
Blender / v2.79 BMW27 CPU
Średnia w klasie Gaming
  (79 - 330, n=104, ostatnie 2 lata)
149.9 Seconds * -90%
Acer Predator Helios 18 PH18-72-98MW
Intel Core i9-14900HX
125 Seconds * -58%
Schenker Key 17 Pro (M24)
Intel Core i9-14900HX
121 Seconds * -53%
Razer Blade 18 2024 RZ09-0509
Intel Core i9-14900HX
117 Seconds * -48%
MSI Titan 18 HX A14VIG
Intel Core i9-14900HX
104 Seconds * -32%
Alienware m18 R2
Intel Core i9-14900HX
102 Seconds * -29%
Asus Strix Scar 18 G835LX
Intel Core Ultra 9 275HX
87 Seconds * -10%
Przeciętny Intel Core Ultra 9 290HX Plus
  (79 - 94, n=5)
86.2 Seconds * -9%
Asus ROG Strix Scar 18 G835LXG
Intel Core Ultra 9 290HX Plus
79 Seconds *
7-Zip 18.03 / 7z b 4
Asus ROG Strix Scar 18 G835LXG
Intel Core Ultra 9 290HX Plus
131933 MIPS
Asus Strix Scar 18 G835LX
Intel Core Ultra 9 275HX
122818 MIPS -7%
Alienware m18 R2
Intel Core i9-14900HX
122772 MIPS -7%
MSI Titan 18 HX A14VIG
Intel Core i9-14900HX
121266 MIPS -8%
Przeciętny Intel Core Ultra 9 290HX Plus
  (103986 - 131933, n=5)
119559 MIPS -9%
Schenker Key 17 Pro (M24)
Intel Core i9-14900HX
109204 MIPS -17%
Razer Blade 18 2024 RZ09-0509
Intel Core i9-14900HX
107527 MIPS -18%
Acer Predator Helios 18 PH18-72-98MW
Intel Core i9-14900HX
106977 MIPS -19%
Średnia w klasie Gaming
  (33491 - 148086, n=105, ostatnie 2 lata)
90547 MIPS -31%
7-Zip 18.03 / 7z b 4 -mmt1
Asus ROG Strix Scar 18 G835LXG
Intel Core Ultra 9 290HX Plus
7143 MIPS
Alienware m18 R2
Intel Core i9-14900HX
7103 MIPS -1%
Asus Strix Scar 18 G835LX
Intel Core Ultra 9 275HX
7027 MIPS -2%
Schenker Key 17 Pro (M24)
Intel Core i9-14900HX
6858 MIPS -4%
Przeciętny Intel Core Ultra 9 290HX Plus
  (6562 - 7143, n=5)
6850 MIPS -4%
MSI Titan 18 HX A14VIG
Intel Core i9-14900HX
6504 MIPS -9%
Razer Blade 18 2024 RZ09-0509
Intel Core i9-14900HX
6497 MIPS -9%
Średnia w klasie Gaming
  (4199 - 7436, n=105, ostatnie 2 lata)
6417 MIPS -10%
Acer Predator Helios 18 PH18-72-98MW
Intel Core i9-14900HX
6206 MIPS -13%
Geekbench 6.7 / Multi-Core
Asus ROG Strix Scar 18 G835LXG
Intel Core Ultra 9 290HX Plus
22850 Points
Asus Strix Scar 18 G835LX
Intel Core Ultra 9 275HX
21668 Points -5%
Przeciętny Intel Core Ultra 9 290HX Plus
  (19855 - 22850, n=6)
21145 Points -7%
Alienware m18 R2
Intel Core i9-14900HX
18233 Points -20%
Acer Predator Helios 18 PH18-72-98MW
Intel Core i9-14900HX
17403 Points -24%
Razer Blade 18 2024 RZ09-0509
Intel Core i9-14900HX
17231 Points -25%
MSI Titan 18 HX A14VIG
Intel Core i9-14900HX
16652 Points -27%
Schenker Key 17 Pro (M24)
Intel Core i9-14900HX
16482 Points -28%
Średnia w klasie Gaming
  (6625 - 22850, n=106, ostatnie 2 lata)
16010 Points -30%
Geekbench 6.7 / Single-Core
Asus ROG Strix Scar 18 G835LXG
Intel Core Ultra 9 290HX Plus
3228 Points
Przeciętny Intel Core Ultra 9 290HX Plus
  (3147 - 3228, n=6)
3186 Points -1%
Asus Strix Scar 18 G835LX
Intel Core Ultra 9 275HX
3158 Points -2%
Alienware m18 R2
Intel Core i9-14900HX
3057 Points -5%
Acer Predator Helios 18 PH18-72-98MW
Intel Core i9-14900HX
2965 Points -8%
Średnia w klasie Gaming
  (1490 - 3259, n=106, ostatnie 2 lata)
2848 Points -12%
MSI Titan 18 HX A14VIG
Intel Core i9-14900HX
2843 Points -12%
Razer Blade 18 2024 RZ09-0509
Intel Core i9-14900HX
2842 Points -12%
Schenker Key 17 Pro (M24)
Intel Core i9-14900HX
2611 Points -19%
Geekbench 5.5 / Multi-Core
Asus ROG Strix Scar 18 G835LXG
Intel Core Ultra 9 290HX Plus
28263 Points
Asus Strix Scar 18 G835LX
Intel Core Ultra 9 275HX
25855 Points -9%
Przeciętny Intel Core Ultra 9 290HX Plus
  (23839 - 28263, n=5)
25396 Points -10%
Alienware m18 R2
Intel Core i9-14900HX
21284 Points -25%
Acer Predator Helios 18 PH18-72-98MW
Intel Core i9-14900HX
20029 Points -29%
Schenker Key 17 Pro (M24)
Intel Core i9-14900HX
19316 Points -32%
Razer Blade 18 2024 RZ09-0509
Intel Core i9-14900HX
19310 Points -32%
MSI Titan 18 HX A14VIG
Intel Core i9-14900HX
19137 Points -32%
Średnia w klasie Gaming
  (6460 - 28263, n=105, ostatnie 2 lata)
17266 Points -39%
Geekbench 5.5 / Single-Core
Asus ROG Strix Scar 18 G835LXG
Intel Core Ultra 9 290HX Plus
2350 Points
Przeciętny Intel Core Ultra 9 290HX Plus
  (2282 - 2357, n=5)
2318 Points -1%
Asus Strix Scar 18 G835LX
Intel Core Ultra 9 275HX
2292 Points -2%
Alienware m18 R2
Intel Core i9-14900HX
2193 Points -7%
MSI Titan 18 HX A14VIG
Intel Core i9-14900HX
2098 Points -11%
Średnia w klasie Gaming
  (986 - 2474, n=105, ostatnie 2 lata)
2060 Points -12%
Razer Blade 18 2024 RZ09-0509
Intel Core i9-14900HX
2015 Points -14%
Acer Predator Helios 18 PH18-72-98MW
Intel Core i9-14900HX
2009 Points -15%
Schenker Key 17 Pro (M24)
Intel Core i9-14900HX
1924 Points -18%
HWBOT x265 Benchmark v2.2 / 4k Preset
Asus ROG Strix Scar 18 G835LXG
Intel Core Ultra 9 290HX Plus
44.4 fps
Przeciętny Intel Core Ultra 9 290HX Plus
  (38.2 - 44.4, n=5)
41.4 fps -7%
Asus Strix Scar 18 G835LX
Intel Core Ultra 9 275HX
41.2 fps -7%
Alienware m18 R2
Intel Core i9-14900HX
32.1 fps -28%
MSI Titan 18 HX A14VIG
Intel Core i9-14900HX
30.9 fps -30%
Acer Predator Helios 18 PH18-72-98MW
Intel Core i9-14900HX
29.5 fps -34%
Średnia w klasie Gaming
  (11.5 - 44.4, n=105, ostatnie 2 lata)
28.8 fps -35%
Razer Blade 18 2024 RZ09-0509
Intel Core i9-14900HX
27.7 fps -38%
Schenker Key 17 Pro (M24)
Intel Core i9-14900HX
27.1 fps -39%
LibreOffice / 20 Documents To PDF
Acer Predator Helios 18 PH18-72-98MW
Intel Core i9-14900HX
85.1 s * -25%
Asus ROG Strix Scar 18 G835LXG
Intel Core Ultra 9 290HX Plus
68.2 s *
Średnia w klasie Gaming
  (33.2 - 88.8, n=105, ostatnie 2 lata)
49.7 s * +27%
Razer Blade 18 2024 RZ09-0509
Intel Core i9-14900HX
48.5 s * +29%
Schenker Key 17 Pro (M24)
Intel Core i9-14900HX
46.6 s * +32%
MSI Titan 18 HX A14VIG
Intel Core i9-14900HX
46.2 s * +32%
Przeciętny Intel Core Ultra 9 290HX Plus
  (38.9 - 68.2, n=5)
45.5 s * +33%
Alienware m18 R2
Intel Core i9-14900HX
44.8 s * +34%
Asus Strix Scar 18 G835LX
Intel Core Ultra 9 275HX
41.3 s * +39%
R Benchmark 2.5 / Overall mean
Średnia w klasie Gaming
  (0.3439 - 0.759, n=106, ostatnie 2 lata)
0.4284 sec * -10%
Acer Predator Helios 18 PH18-72-98MW
Intel Core i9-14900HX
0.4225 sec * -8%
Schenker Key 17 Pro (M24)
Intel Core i9-14900HX
0.4143 sec * -6%
Asus Strix Scar 18 G835LX
Intel Core Ultra 9 275HX
0.3943 sec * -1%
Razer Blade 18 2024 RZ09-0509
Intel Core i9-14900HX
0.3937 sec * -1%
MSI Titan 18 HX A14VIG
Intel Core i9-14900HX
0.3919 sec * -1%
Asus ROG Strix Scar 18 G835LXG
Intel Core Ultra 9 290HX Plus
0.3899 sec *
Przeciętny Intel Core Ultra 9 290HX Plus
  (0.3788 - 0.3951, n=5)
0.3887 sec * -0%
Alienware m18 R2
Intel Core i9-14900HX
0.3767 sec * +3%

* ... im mniej tym lepiej

Cinebench R10 Rendering Single 32Bit
12575
Cinebench R10 Shading 64Bit
13665 Points
Cinebench R10 Rendering Multiple CPUs 64Bit
165835 Points
Cinebench R10 Rendering Single CPUs 64Bit
19487 Points
Cinebench R10 Shading 32Bit
13696
Cinebench R10 Rendering Multiple CPUs 32Bit
102066
Cinebench R11.5 CPU Single 32Bit
3.66 Points
Cinebench R11.5 CPU Multi 32Bit
67.85 Points
Cinebench R11.5 OpenGL 32Bit
199.32 fps
Cinebench R11.5 CPU Single 64Bit
4.16 Points
Cinebench R11.5 CPU Multi 64Bit
76.69 Points
Cinebench R11.5 OpenGL 64Bit
220.23 fps
Cinebench R15 CPU Single 64Bit
350 Points
Cinebench R15 CPU Multi 64Bit
6330 Points
Cinebench R15 Ref. Match 64Bit
99.6 %
Cinebench R15 OpenGL 64Bit
321.54 fps
Cinebench R20 CPU (Single Core)
913 Points
Cinebench R20 CPU (Multi Core)
16433 Points
Cinebench R23 Multi Core
42661 Points
Cinebench R23 Single Core
2415 Points
Cinebench 2024 CPU Single Core
141 Points
Cinebench 2024 CPU Multi Core
2327 Points
Cinebench 2026 CPU Multi
9542 Points
Cinebench 2026 CPU Single Thread
581 Points
Pomoc
Performance rating
Asus ROG Strix Scar 18 G835LXG
Intel Core Ultra 9 290HX Plus, GeForce RTX 5090 Laptop
97.5 pt
Przeciętny Intel Core Ultra 9 290HX Plus
 
91.7 pt
Asus Strix Scar 18 G835LX -1!
Intel Core Ultra 9 275HX, GeForce RTX 5090 Laptop
90.1 pt
MSI Titan 18 HX A14VIG -1!
Intel Core i9-14900HX, GeForce RTX 4090 Laptop GPU
77.8 pt
Alienware m18 R2 -1!
Intel Core i9-14900HX, GeForce RTX 4090 Laptop GPU
77.4 pt
Średnia w klasie Gaming
 
71.2 pt
Razer Blade 18 2024 RZ09-0509 -1!
Intel Core i9-14900HX, GeForce RTX 4090 Laptop GPU
69.8 pt
Acer Predator Helios 18 PH18-72-98MW -1!
Intel Core i9-14900HX, GeForce RTX 4090 Laptop GPU
67 pt
Schenker Key 17 Pro (M24) -1!
Intel Core i9-14900HX, GeForce RTX 4090 Laptop GPU
64.8 pt
AIDA64 / FP32 Ray-Trace
Asus ROG Strix Scar 18 G835LXG
Intel Core Ultra 9 290HX Plus, GeForce RTX 5090 Laptop (v6.92.6600)
43239 KRay/s
Asus ROG Strix Scar 18 G835LXG
Intel Core Ultra 9 290HX Plus, GeForce RTX 5090 Laptop (v8.20.8100)
43116 KRay/s 0%
Przeciętny Intel Core Ultra 9 290HX Plus
  (34761 - 43239, n=6)
40296 KRay/s -7%
Asus Strix Scar 18 G835LX
Intel Core Ultra 9 275HX, GeForce RTX 5090 Laptop (v6.92.6600)
39458 KRay/s -9%
Średnia w klasie Gaming
  (10227 - 85542, n=105, ostatnie 2 lata)
32356 KRay/s -25%
MSI Titan 18 HX A14VIG
Intel Core i9-14900HX, GeForce RTX 4090 Laptop GPU (v6.92.6600)
29351 KRay/s -32%
Alienware m18 R2
Intel Core i9-14900HX, GeForce RTX 4090 Laptop GPU (v6.92.6600)
29280 KRay/s -32%
Razer Blade 18 2024 RZ09-0509
Intel Core i9-14900HX, GeForce RTX 4090 Laptop GPU (v6.85.6300)
25098 KRay/s -42%
Acer Predator Helios 18 PH18-72-98MW
Intel Core i9-14900HX, GeForce RTX 4090 Laptop GPU (v6.92.6600)
23862 KRay/s -45%
Schenker Key 17 Pro (M24)
Intel Core i9-14900HX, GeForce RTX 4090 Laptop GPU (v6.92.6600)
21858 KRay/s -49%
AIDA64 / FPU Julia
Asus ROG Strix Scar 18 G835LXG
Intel Core Ultra 9 290HX Plus, GeForce RTX 5090 Laptop (v8.20.8100)
218895 Points
Asus ROG Strix Scar 18 G835LXG
Intel Core Ultra 9 290HX Plus, GeForce RTX 5090 Laptop (v6.92.6600)
217175 Points -1%
Przeciętny Intel Core Ultra 9 290HX Plus
  (174665 - 218895, n=6)
204722 Points -6%
Asus Strix Scar 18 G835LX
Intel Core Ultra 9 275HX, GeForce RTX 5090 Laptop (v6.92.6600)
194867 Points -11%
MSI Titan 18 HX A14VIG
Intel Core i9-14900HX, GeForce RTX 4090 Laptop GPU (v6.92.6600)
148888 Points -32%
Alienware m18 R2
Intel Core i9-14900HX, GeForce RTX 4090 Laptop GPU (v6.92.6600)
142791 Points -35%
Średnia w klasie Gaming
  (51376 - 238426, n=105, ostatnie 2 lata)
140193 Points -36%
Razer Blade 18 2024 RZ09-0509
Intel Core i9-14900HX, GeForce RTX 4090 Laptop GPU (v6.85.6300)
128369 Points -41%
Acer Predator Helios 18 PH18-72-98MW
Intel Core i9-14900HX, GeForce RTX 4090 Laptop GPU (v6.92.6600)
118469 Points -46%
Schenker Key 17 Pro (M24)
Intel Core i9-14900HX, GeForce RTX 4090 Laptop GPU (v6.92.6600)
113270 Points -48%
AIDA64 / CPU SHA3
Asus ROG Strix Scar 18 G835LXG
Intel Core Ultra 9 290HX Plus, GeForce RTX 5090 Laptop (v8.20.8100)
10115 MB/s
Asus ROG Strix Scar 18 G835LXG
Intel Core Ultra 9 290HX Plus, GeForce RTX 5090 Laptop (v6.92.6600)
10055 MB/s -1%
Przeciętny Intel Core Ultra 9 290HX Plus
  (8352 - 10115, n=6)
9565 MB/s -5%
Asus Strix Scar 18 G835LX
Intel Core Ultra 9 275HX, GeForce RTX 5090 Laptop (v6.92.6600)
9482 MB/s -6%
MSI Titan 18 HX A14VIG
Intel Core i9-14900HX, GeForce RTX 4090 Laptop GPU (v6.92.6600)
7229 MB/s -29%
Alienware m18 R2
Intel Core i9-14900HX, GeForce RTX 4090 Laptop GPU (v6.92.6600)
7095 MB/s -30%
Średnia w klasie Gaming
  (2180 - 10115, n=105, ostatnie 2 lata)
6367 MB/s -37%
Razer Blade 18 2024 RZ09-0509
Intel Core i9-14900HX, GeForce RTX 4090 Laptop GPU (v6.85.6300)
6159 MB/s -39%
Acer Predator Helios 18 PH18-72-98MW
Intel Core i9-14900HX, GeForce RTX 4090 Laptop GPU (v6.92.6600)
5804 MB/s -43%
Schenker Key 17 Pro (M24)
Intel Core i9-14900HX, GeForce RTX 4090 Laptop GPU (v6.92.6600)
5598 MB/s -45%
AIDA64 / CPU Queen
MSI Titan 18 HX A14VIG
Intel Core i9-14900HX, GeForce RTX 4090 Laptop GPU (v6.92.6600)
148773 Points +5%
Asus ROG Strix Scar 18 G835LXG
Intel Core Ultra 9 290HX Plus, GeForce RTX 5090 Laptop (v6.92.6600)
141622 Points
Przeciętny Intel Core Ultra 9 290HX Plus
  (n=1)
141622 Points 0%
Asus Strix Scar 18 G835LX
Intel Core Ultra 9 275HX, GeForce RTX 5090 Laptop (v6.92.6600)
139608 Points -1%
Alienware m18 R2
Intel Core i9-14900HX, GeForce RTX 4090 Laptop GPU (v6.92.6600)
139323 Points -2%
Acer Predator Helios 18 PH18-72-98MW
Intel Core i9-14900HX, GeForce RTX 4090 Laptop GPU (v6.92.6600)
139146 Points -2%
Schenker Key 17 Pro (M24)
Intel Core i9-14900HX, GeForce RTX 4090 Laptop GPU (v6.92.6600)
138708 Points -2%
Razer Blade 18 2024 RZ09-0509
Intel Core i9-14900HX, GeForce RTX 4090 Laptop GPU (v6.85.6300)
136621 Points -4%
Średnia w klasie Gaming
  (49785 - 173351, n=90, ostatnie 2 lata)
116544 Points -18%
AIDA64 / FPU SinJulia
MSI Titan 18 HX A14VIG
Intel Core i9-14900HX, GeForce RTX 4090 Laptop GPU (v6.92.6600)
18256 Points +23%
Alienware m18 R2
Intel Core i9-14900HX, GeForce RTX 4090 Laptop GPU (v6.92.6600)
16279 Points +9%
Razer Blade 18 2024 RZ09-0509
Intel Core i9-14900HX, GeForce RTX 4090 Laptop GPU (v6.85.6300)
15500 Points +4%
Acer Predator Helios 18 PH18-72-98MW
Intel Core i9-14900HX, GeForce RTX 4090 Laptop GPU (v6.92.6600)
15099 Points +2%
Asus ROG Strix Scar 18 G835LXG
Intel Core Ultra 9 290HX Plus, GeForce RTX 5090 Laptop (v8.20.8100)
14874 Points
Asus ROG Strix Scar 18 G835LXG
Intel Core Ultra 9 290HX Plus, GeForce RTX 5090 Laptop (v6.92.6600)
14857 Points 0%
Średnia w klasie Gaming
  (4424 - 33636, n=105, ostatnie 2 lata)
14619 Points -2%
Przeciętny Intel Core Ultra 9 290HX Plus
  (13612 - 14874, n=6)
14247 Points -4%
Asus Strix Scar 18 G835LX
Intel Core Ultra 9 275HX, GeForce RTX 5090 Laptop (v6.92.6600)
14112 Points -5%
Schenker Key 17 Pro (M24)
Intel Core i9-14900HX, GeForce RTX 4090 Laptop GPU (v6.92.6600)
13903 Points -7%
AIDA64 / FPU Mandel
Asus ROG Strix Scar 18 G835LXG
Intel Core Ultra 9 290HX Plus, GeForce RTX 5090 Laptop (v6.92.6600)
115371 Points
Asus ROG Strix Scar 18 G835LXG
Intel Core Ultra 9 290HX Plus, GeForce RTX 5090 Laptop (v8.20.8100)
115355 Points 0%
Przeciętny Intel Core Ultra 9 290HX Plus
  (91215 - 115371, n=6)
107382 Points -7%
Asus Strix Scar 18 G835LX
Intel Core Ultra 9 275HX, GeForce RTX 5090 Laptop (v6.92.6600)
104057 Points -10%
Średnia w klasie Gaming
  (25115 - 128721, n=105, ostatnie 2 lata)
73608 Points -36%
Alienware m18 R2
Intel Core i9-14900HX, GeForce RTX 4090 Laptop GPU (v6.92.6600)
72594 Points -37%
MSI Titan 18 HX A14VIG
Intel Core i9-14900HX, GeForce RTX 4090 Laptop GPU (v6.92.6600)
72355 Points -37%
Razer Blade 18 2024 RZ09-0509
Intel Core i9-14900HX, GeForce RTX 4090 Laptop GPU (v6.85.6300)
62867 Points -46%
Acer Predator Helios 18 PH18-72-98MW
Intel Core i9-14900HX, GeForce RTX 4090 Laptop GPU (v6.92.6600)
59005 Points -49%
Schenker Key 17 Pro (M24)
Intel Core i9-14900HX, GeForce RTX 4090 Laptop GPU (v6.92.6600)
54428 Points -53%
AIDA64 / CPU AES
Asus ROG Strix Scar 18 G835LXG
Intel Core Ultra 9 290HX Plus, GeForce RTX 5090 Laptop (v6.92.6600)
143205 MB/s
Asus ROG Strix Scar 18 G835LXG
Intel Core Ultra 9 290HX Plus, GeForce RTX 5090 Laptop (v8.20.8100)
143046 MB/s 0%
MSI Titan 18 HX A14VIG
Intel Core i9-14900HX, GeForce RTX 4090 Laptop GPU (v6.92.6600)
138830 MB/s -3%
Przeciętny Intel Core Ultra 9 290HX Plus
  (127585 - 143205, n=6)
136036 MB/s -5%
Asus Strix Scar 18 G835LX
Intel Core Ultra 9 275HX, GeForce RTX 5090 Laptop (v6.92.6600)
134920 MB/s -6%
Alienware m18 R2
Intel Core i9-14900HX, GeForce RTX 4090 Laptop GPU (v6.92.6600)
134675 MB/s -6%
Razer Blade 18 2024 RZ09-0509
Intel Core i9-14900HX, GeForce RTX 4090 Laptop GPU (v6.85.6300)
117887 MB/s -18%
Acer Predator Helios 18 PH18-72-98MW
Intel Core i9-14900HX, GeForce RTX 4090 Laptop GPU (v6.92.6600)
112197 MB/s -22%
Średnia w klasie Gaming
  (39258 - 247074, n=105, ostatnie 2 lata)
108017 MB/s -25%
Schenker Key 17 Pro (M24)
Intel Core i9-14900HX, GeForce RTX 4090 Laptop GPU (v6.92.6600)
106371 MB/s -26%
AIDA64 / CPU ZLib
Asus ROG Strix Scar 18 G835LXG
Intel Core Ultra 9 290HX Plus, GeForce RTX 5090 Laptop (v6.92.6600)
2340 MB/s
Asus ROG Strix Scar 18 G835LXG
Intel Core Ultra 9 290HX Plus, GeForce RTX 5090 Laptop (v8.20.8100)
2334 MB/s 0%
Asus Strix Scar 18 G835LX
Intel Core Ultra 9 275HX, GeForce RTX 5090 Laptop (v6.92.6600)
2220 MB/s -5%
Przeciętny Intel Core Ultra 9 290HX Plus
  (1967 - 2340, n=6)
2202 MB/s -6%
MSI Titan 18 HX A14VIG
Intel Core i9-14900HX, GeForce RTX 4090 Laptop GPU (v6.92.6600)
2149 MB/s -8%
Alienware m18 R2
Intel Core i9-14900HX, GeForce RTX 4090 Laptop GPU (v6.92.6600)
2053 MB/s -12%
Razer Blade 18 2024 RZ09-0509
Intel Core i9-14900HX, GeForce RTX 4090 Laptop GPU (v6.85.6300)
1794 MB/s -23%
Acer Predator Helios 18 PH18-72-98MW
Intel Core i9-14900HX, GeForce RTX 4090 Laptop GPU (v6.92.6600)
1696 MB/s -28%
Schenker Key 17 Pro (M24)
Intel Core i9-14900HX, GeForce RTX 4090 Laptop GPU (v6.92.6600)
1691 MB/s -28%
Średnia w klasie Gaming
  (574 - 2531, n=105, ostatnie 2 lata)
1569 MB/s -33%
AIDA64 / FP64 Ray-Trace
Asus ROG Strix Scar 18 G835LXG
Intel Core Ultra 9 290HX Plus, GeForce RTX 5090 Laptop (v6.92.6600)
23843 KRay/s
Asus ROG Strix Scar 18 G835LXG
Intel Core Ultra 9 290HX Plus, GeForce RTX 5090 Laptop (v8.20.8100)
23227 KRay/s -3%
Przeciętny Intel Core Ultra 9 290HX Plus
  (18611 - 23843, n=6)
21823 KRay/s -8%
Asus Strix Scar 18 G835LX
Intel Core Ultra 9 275HX, GeForce RTX 5090 Laptop (v6.92.6600)
21372 KRay/s -10%
Średnia w klasie Gaming
  (5509 - 45446, n=105, ostatnie 2 lata)
17303 KRay/s -27%
Alienware m18 R2
Intel Core i9-14900HX, GeForce RTX 4090 Laptop GPU (v6.92.6600)
16128 KRay/s -32%
MSI Titan 18 HX A14VIG
Intel Core i9-14900HX, GeForce RTX 4090 Laptop GPU (v6.92.6600)
16104 KRay/s -32%
Razer Blade 18 2024 RZ09-0509
Intel Core i9-14900HX, GeForce RTX 4090 Laptop GPU (v6.85.6300)
13680 KRay/s -43%
Acer Predator Helios 18 PH18-72-98MW
Intel Core i9-14900HX, GeForce RTX 4090 Laptop GPU (v6.92.6600)
12565 KRay/s -47%
Schenker Key 17 Pro (M24)
Intel Core i9-14900HX, GeForce RTX 4090 Laptop GPU (v6.92.6600)
11838 KRay/s -50%
AIDA64 / CPU PhotoWorxx
Asus ROG Strix Scar 18 G835LXG
Intel Core Ultra 9 290HX Plus, GeForce RTX 5090 Laptop (v8.20.8100)
65272 MPixel/s
Asus ROG Strix Scar 18 G835LXG
Intel Core Ultra 9 290HX Plus, GeForce RTX 5090 Laptop (v6.92.6600)
62686 MPixel/s -4%
Przeciętny Intel Core Ultra 9 290HX Plus
  (51134 - 65272, n=6)
56956 MPixel/s -13%
Asus Strix Scar 18 G835LX
Intel Core Ultra 9 275HX, GeForce RTX 5090 Laptop (v6.92.6600)
56601 MPixel/s -13%
Schenker Key 17 Pro (M24)
Intel Core i9-14900HX, GeForce RTX 4090 Laptop GPU (v6.92.6600)
50465 MPixel/s -23%
Alienware m18 R2
Intel Core i9-14900HX, GeForce RTX 4090 Laptop GPU (v6.92.6600)
49716 MPixel/s -24%
Razer Blade 18 2024 RZ09-0509
Intel Core i9-14900HX, GeForce RTX 4090 Laptop GPU (v6.85.6300)
47472 MPixel/s -27%
Acer Predator Helios 18 PH18-72-98MW
Intel Core i9-14900HX, GeForce RTX 4090 Laptop GPU (v6.92.6600)
47343 MPixel/s -27%
Średnia w klasie Gaming
  (12271 - 89891, n=105, ostatnie 2 lata)
44630 MPixel/s -32%
MSI Titan 18 HX A14VIG
Intel Core i9-14900HX, GeForce RTX 4090 Laptop GPU (v6.92.6600)
33960 MPixel/s -48%
AIDA64 / CPU CheckMate
Asus ROG Strix Scar 18 G835LXG
Intel Core Ultra 9 290HX Plus, GeForce RTX 5090 Laptop (v8.20.8100)
8765 MP/s
Przeciętny Intel Core Ultra 9 290HX Plus
  (7624 - 8765, n=5)
8207 MP/s -6%
Średnia w klasie Gaming
  (2930 - 11788, n=14, ostatnie 2 lata)
6635 MP/s -24%

Wydajność systemu i pamięci masowej

Laptop Asus ROG Strix SCAR 18 zachwyca w codziennym użytkowaniu bardzo wysoką wydajnością systemu i krótkim czasem ładowania. Aplikacje i gry uruchamiają się szybko, dzięki czemu laptop zawsze działa niezwykle płynnie. Przełączanie trybów graficznych za pomocą technologii Nvidia Advanced Optimus powoduje krótkie opóźnienie podczas uruchamiania niektórych gier; wynika to z ograniczeń technicznych i nie powoduje żadnych dalszych utrudnień podczas pracy.

Performance rating: Percent
PCMark 10: Score | Essentials | Productivity | Digital Content Creation
CrossMark: Overall | Productivity | Creativity | Responsiveness
WebXPRT 3: Overall
WebXPRT 4: Overall
Mozilla Kraken 1.1: Total
Performance rating
Asus ROG Strix Scar 18 G835LXG
GeForce RTX 5090 Laptop, Ultra 9 290HX Plus, 2x Samsung PM9E1 MZVLC4T0HBL1 (RAID 0)
91.6 pt
Przeciętny Intel Core Ultra 9 290HX Plus, NVIDIA GeForce RTX 5090 Laptop
 
89.1 pt
Asus Strix Scar 18 G835LX
GeForce RTX 5090 Laptop, Ultra 9 275HX, WD PC SN8000S 2TB
79.4 pt
Alienware m18 R2
GeForce RTX 4090 Laptop GPU, i9-14900HX, SK Hynix PC811 HFS002TEM9X152N
77.2 pt
Razer Blade 18 2024 RZ09-0509 -1!
GeForce RTX 4090 Laptop GPU, i9-14900HX
74.1 pt
MSI Titan 18 HX A14VIG
GeForce RTX 4090 Laptop GPU, i9-14900HX, 2x Samsung PM9A1a MZVL22T0HDLB (RAID 0)
72.3 pt
Średnia w klasie Gaming
 
72.1 pt
Schenker Key 17 Pro (M24) -4!
GeForce RTX 4090 Laptop GPU, i9-14900HX, Samsung 990 Pro 1 TB
63 pt
Acer Predator Helios 18 PH18-72-98MW -6!
GeForce RTX 4090 Laptop GPU, i9-14900HX, 2x SK Hynix HFS001TEJ9X115N (RAID 0)
56.2 pt
PCMark 10 / Score
Asus ROG Strix Scar 18 G835LXG
GeForce RTX 5090 Laptop, Ultra 9 290HX Plus, 2x Samsung PM9E1 MZVLC4T0HBL1 (RAID 0)
12414 Points
Przeciętny Intel Core Ultra 9 290HX Plus, NVIDIA GeForce RTX 5090 Laptop
  (11015 - 12414, n=3)
11720 Points -6%
Alienware m18 R2
GeForce RTX 4090 Laptop GPU, i9-14900HX, SK Hynix PC811 HFS002TEM9X152N
9234 Points -26%
MSI Titan 18 HX A14VIG
GeForce RTX 4090 Laptop GPU, i9-14900HX, 2x Samsung PM9A1a MZVL22T0HDLB (RAID 0)
8968 Points -28%
Razer Blade 18 2024 RZ09-0509
GeForce RTX 4090 Laptop GPU, i9-14900HX
8805 Points -29%
Asus Strix Scar 18 G835LX
GeForce RTX 5090 Laptop, Ultra 9 275HX, WD PC SN8000S 2TB
8623 Points -31%
Średnia w klasie Gaming
  (5828 - 12414, n=93, ostatnie 2 lata)
8463 Points -32%
Schenker Key 17 Pro (M24)
GeForce RTX 4090 Laptop GPU, i9-14900HX, Samsung 990 Pro 1 TB
8277 Points -33%
Acer Predator Helios 18 PH18-72-98MW
GeForce RTX 4090 Laptop GPU, i9-14900HX, 2x SK Hynix HFS001TEJ9X115N (RAID 0)
8230 Points -34%
PCMark 10 / Essentials
MSI Titan 18 HX A14VIG
GeForce RTX 4090 Laptop GPU, i9-14900HX, 2x Samsung PM9A1a MZVL22T0HDLB (RAID 0)
11628 Points 0%
Asus ROG Strix Scar 18 G835LXG
GeForce RTX 5090 Laptop, Ultra 9 290HX Plus, 2x Samsung PM9E1 MZVLC4T0HBL1 (RAID 0)
11604 Points
Przeciętny Intel Core Ultra 9 290HX Plus, NVIDIA GeForce RTX 5090 Laptop
  (11316 - 11604, n=3)
11468 Points -1%
Alienware m18 R2
GeForce RTX 4090 Laptop GPU, i9-14900HX, SK Hynix PC811 HFS002TEM9X152N
11415 Points -2%
Razer Blade 18 2024 RZ09-0509
GeForce RTX 4090 Laptop GPU, i9-14900HX
11378 Points -2%
Acer Predator Helios 18 PH18-72-98MW
GeForce RTX 4090 Laptop GPU, i9-14900HX, 2x SK Hynix HFS001TEJ9X115N (RAID 0)
11032 Points -5%
Asus Strix Scar 18 G835LX
GeForce RTX 5090 Laptop, Ultra 9 275HX, WD PC SN8000S 2TB
10966 Points -5%
Schenker Key 17 Pro (M24)
GeForce RTX 4090 Laptop GPU, i9-14900HX, Samsung 990 Pro 1 TB
10778 Points -7%
Średnia w klasie Gaming
  (8810 - 11935, n=97, ostatnie 2 lata)
10660 Points -8%
PCMark 10 / Productivity
Asus ROG Strix Scar 18 G835LXG
GeForce RTX 5090 Laptop, Ultra 9 290HX Plus, 2x Samsung PM9E1 MZVLC4T0HBL1 (RAID 0)
25323 Points
Przeciętny Intel Core Ultra 9 290HX Plus, NVIDIA GeForce RTX 5090 Laptop
  (16305 - 25323, n=3)
20246 Points -20%
Alienware m18 R2
GeForce RTX 4090 Laptop GPU, i9-14900HX, SK Hynix PC811 HFS002TEM9X152N
11415 Points -55%
Średnia w klasie Gaming
  (6845 - 25323, n=95, ostatnie 2 lata)
11222 Points -56%
MSI Titan 18 HX A14VIG
GeForce RTX 4090 Laptop GPU, i9-14900HX, 2x Samsung PM9A1a MZVL22T0HDLB (RAID 0)
10225 Points -60%
Razer Blade 18 2024 RZ09-0509
GeForce RTX 4090 Laptop GPU, i9-14900HX
10186 Points -60%
Acer Predator Helios 18 PH18-72-98MW
GeForce RTX 4090 Laptop GPU, i9-14900HX, 2x SK Hynix HFS001TEJ9X115N (RAID 0)
9951 Points -61%
Schenker Key 17 Pro (M24)
GeForce RTX 4090 Laptop GPU, i9-14900HX, Samsung 990 Pro 1 TB
9458 Points -63%
Asus Strix Scar 18 G835LX
GeForce RTX 5090 Laptop, Ultra 9 275HX, WD PC SN8000S 2TB
9444 Points -63%
PCMark 10 / Digital Content Creation
Przeciętny Intel Core Ultra 9 290HX Plus, NVIDIA GeForce RTX 5090 Laptop
  (17665 - 19954, n=3)
19092 Points +8%
Asus ROG Strix Scar 18 G835LXG
GeForce RTX 5090 Laptop, Ultra 9 290HX Plus, 2x Samsung PM9E1 MZVLC4T0HBL1 (RAID 0)
17665 Points
Asus Strix Scar 18 G835LX
GeForce RTX 5090 Laptop, Ultra 9 275HX, WD PC SN8000S 2TB
16802 Points -5%
MSI Titan 18 HX A14VIG
GeForce RTX 4090 Laptop GPU, i9-14900HX, 2x Samsung PM9A1a MZVL22T0HDLB (RAID 0)
16462 Points -7%
Alienware m18 R2
GeForce RTX 4090 Laptop GPU, i9-14900HX, SK Hynix PC811 HFS002TEM9X152N
16398 Points -7%
Razer Blade 18 2024 RZ09-0509
GeForce RTX 4090 Laptop GPU, i9-14900HX
15985 Points -10%
Schenker Key 17 Pro (M24)
GeForce RTX 4090 Laptop GPU, i9-14900HX, Samsung 990 Pro 1 TB
15093 Points -15%
Średnia w klasie Gaming
  (7602 - 19954, n=95, ostatnie 2 lata)
14060 Points -20%
Acer Predator Helios 18 PH18-72-98MW
GeForce RTX 4090 Laptop GPU, i9-14900HX, 2x SK Hynix HFS001TEJ9X115N (RAID 0)
13779 Points -22%
CrossMark / Overall
Asus ROG Strix Scar 18 G835LXG
GeForce RTX 5090 Laptop, Ultra 9 290HX Plus, 2x Samsung PM9E1 MZVLC4T0HBL1 (RAID 0)
2345 Points
Przeciętny Intel Core Ultra 9 290HX Plus, NVIDIA GeForce RTX 5090 Laptop
  (2177 - 2401, n=3)
2308 Points -2%
Asus Strix Scar 18 G835LX
GeForce RTX 5090 Laptop, Ultra 9 275HX, WD PC SN8000S 2TB
2221 Points -5%
Alienware m18 R2
GeForce RTX 4090 Laptop GPU, i9-14900HX, SK Hynix PC811 HFS002TEM9X152N
2073 Points -12%
Razer Blade 18 2024 RZ09-0509
GeForce RTX 4090 Laptop GPU, i9-14900HX
2048 Points -13%
Średnia w klasie Gaming
  (1366 - 2409, n=94, ostatnie 2 lata)
1986 Points -15%
MSI Titan 18 HX A14VIG
GeForce RTX 4090 Laptop GPU, i9-14900HX, 2x Samsung PM9A1a MZVL22T0HDLB (RAID 0)
1877 Points -20%
CrossMark / Productivity
Asus ROG Strix Scar 18 G835LXG
GeForce RTX 5090 Laptop, Ultra 9 290HX Plus, 2x Samsung PM9E1 MZVLC4T0HBL1 (RAID 0)
2110 Points
Przeciętny Intel Core Ultra 9 290HX Plus, NVIDIA GeForce RTX 5090 Laptop
  (1994 - 2213, n=3)
2106 Points 0%
Asus Strix Scar 18 G835LX
GeForce RTX 5090 Laptop, Ultra 9 275HX, WD PC SN8000S 2TB
2025 Points -4%
Razer Blade 18 2024 RZ09-0509
GeForce RTX 4090 Laptop GPU, i9-14900HX
1902 Points -10%
Alienware m18 R2
GeForce RTX 4090 Laptop GPU, i9-14900HX, SK Hynix PC811 HFS002TEM9X152N
1881 Points -11%
Średnia w klasie Gaming
  (1386 - 2254, n=94, ostatnie 2 lata)
1856 Points -12%
MSI Titan 18 HX A14VIG
GeForce RTX 4090 Laptop GPU, i9-14900HX, 2x Samsung PM9A1a MZVL22T0HDLB (RAID 0)
1738 Points -18%
CrossMark / Creativity
Asus ROG Strix Scar 18 G835LXG
GeForce RTX 5090 Laptop, Ultra 9 290HX Plus, 2x Samsung PM9E1 MZVLC4T0HBL1 (RAID 0)
2786 Points
Przeciętny Intel Core Ultra 9 290HX Plus, NVIDIA GeForce RTX 5090 Laptop
  (2548 - 2786, n=3)
2665 Points -4%
Asus Strix Scar 18 G835LX
GeForce RTX 5090 Laptop, Ultra 9 275HX, WD PC SN8000S 2TB
2606 Points -6%
Alienware m18 R2
GeForce RTX 4090 Laptop GPU, i9-14900HX, SK Hynix PC811 HFS002TEM9X152N
2393 Points -14%
Razer Blade 18 2024 RZ09-0509
GeForce RTX 4090 Laptop GPU, i9-14900HX
2316 Points -17%
Średnia w klasie Gaming
  (1343 - 2786, n=94, ostatnie 2 lata)
2241 Points -20%
MSI Titan 18 HX A14VIG
GeForce RTX 4090 Laptop GPU, i9-14900HX, 2x Samsung PM9A1a MZVL22T0HDLB (RAID 0)
2195 Points -21%
CrossMark / Responsiveness
Przeciętny Intel Core Ultra 9 290HX Plus, NVIDIA GeForce RTX 5090 Laptop
  (1766 - 2249, n=3)
1979 Points +3%
Asus ROG Strix Scar 18 G835LXG
GeForce RTX 5090 Laptop, Ultra 9 290HX Plus, 2x Samsung PM9E1 MZVLC4T0HBL1 (RAID 0)
1922 Points
Asus Strix Scar 18 G835LX
GeForce RTX 5090 Laptop, Ultra 9 275HX, WD PC SN8000S 2TB
1813 Points -6%
Alienware m18 R2
GeForce RTX 4090 Laptop GPU, i9-14900HX, SK Hynix PC811 HFS002TEM9X152N
1806 Points -6%
Razer Blade 18 2024 RZ09-0509
GeForce RTX 4090 Laptop GPU, i9-14900HX
1765 Points -8%
Średnia w klasie Gaming
  (1226 - 2334, n=94, ostatnie 2 lata)
1705 Points -11%
MSI Titan 18 HX A14VIG
GeForce RTX 4090 Laptop GPU, i9-14900HX, 2x Samsung PM9A1a MZVL22T0HDLB (RAID 0)
1478 Points -23%
WebXPRT 3 / Overall
Asus ROG Strix Scar 18 G835LXG
GeForce RTX 5090 Laptop, Ultra 9 290HX Plus, 2x Samsung PM9E1 MZVLC4T0HBL1 (RAID 0)
369 Points
Przeciętny Intel Core Ultra 9 290HX Plus, NVIDIA GeForce RTX 5090 Laptop
  (354 - 369, n=3)
361 Points -2%
Asus Strix Scar 18 G835LX
GeForce RTX 5090 Laptop, Ultra 9 275HX, WD PC SN8000S 2TB
346 Points -6%
Razer Blade 18 2024 RZ09-0509
GeForce RTX 4090 Laptop GPU, i9-14900HX
339 Points -8%
MSI Titan 18 HX A14VIG
GeForce RTX 4090 Laptop GPU, i9-14900HX, 2x Samsung PM9A1a MZVL22T0HDLB (RAID 0)
327 Points -11%
Alienware m18 R2
GeForce RTX 4090 Laptop GPU, i9-14900HX, SK Hynix PC811 HFS002TEM9X152N
326 Points -12%
Średnia w klasie Gaming
  (220 - 532, n=98, ostatnie 2 lata)
318 Points -14%
Schenker Key 17 Pro (M24)
GeForce RTX 4090 Laptop GPU, i9-14900HX, Samsung 990 Pro 1 TB
308 Points -17%
WebXPRT 4 / Overall
Asus ROG Strix Scar 18 G835LXG
GeForce RTX 5090 Laptop, Ultra 9 290HX Plus, 2x Samsung PM9E1 MZVLC4T0HBL1 (RAID 0)
336 Points
Asus Strix Scar 18 G835LX
GeForce RTX 5090 Laptop, Ultra 9 275HX, WD PC SN8000S 2TB
335 Points 0%
Przeciętny Intel Core Ultra 9 290HX Plus, NVIDIA GeForce RTX 5090 Laptop
  (310 - 336, n=3)
327 Points -3%
Alienware m18 R2
GeForce RTX 4090 Laptop GPU, i9-14900HX, SK Hynix PC811 HFS002TEM9X152N
309 Points -8%
MSI Titan 18 HX A14VIG
GeForce RTX 4090 Laptop GPU, i9-14900HX, 2x Samsung PM9A1a MZVL22T0HDLB (RAID 0)
287 Points -15%
Średnia w klasie Gaming
  (165 - 354, n=98, ostatnie 2 lata)
285 Points -15%
Schenker Key 17 Pro (M24)
GeForce RTX 4090 Laptop GPU, i9-14900HX, Samsung 990 Pro 1 TB
275 Points -18%
Mozilla Kraken 1.1 / Total
Schenker Key 17 Pro (M24)
GeForce RTX 4090 Laptop GPU, i9-14900HX, Samsung 990 Pro 1 TB
481 ms * -22%
Średnia w klasie Gaming
  (391 - 590, n=100, ostatnie 2 lata)
459 ms * -17%
MSI Titan 18 HX A14VIG
GeForce RTX 4090 Laptop GPU, i9-14900HX, 2x Samsung PM9A1a MZVL22T0HDLB (RAID 0)
452 ms * -15%
Razer Blade 18 2024 RZ09-0509
GeForce RTX 4090 Laptop GPU, i9-14900HX
449 ms * -14%
Acer Predator Helios 18 PH18-72-98MW
GeForce RTX 4090 Laptop GPU, i9-14900HX, 2x SK Hynix HFS001TEJ9X115N (RAID 0)
441 ms * -12%
Alienware m18 R2
GeForce RTX 4090 Laptop GPU, i9-14900HX, SK Hynix PC811 HFS002TEM9X152N
430 ms * -9%
Asus Strix Scar 18 G835LX
GeForce RTX 5090 Laptop, Ultra 9 275HX, WD PC SN8000S 2TB
409 ms * -4%
Przeciętny Intel Core Ultra 9 290HX Plus, NVIDIA GeForce RTX 5090 Laptop
  (393 - 399, n=3)
395 ms * -1%
Asus ROG Strix Scar 18 G835LXG
GeForce RTX 5090 Laptop, Ultra 9 290HX Plus, 2x Samsung PM9E1 MZVLC4T0HBL1 (RAID 0)
393 ms *

* ... im mniej tym lepiej

PCMark 10 Score
12414 pkt.
Pomoc
AIDA64 / Memory Copy
Asus ROG Strix Scar 18 G835LXG
Intel Core Ultra 9 290HX Plus, GeForce RTX 5090 Laptop (v8.20.8100)
93930 MB/s
Asus ROG Strix Scar 18 G835LXG
Intel Core Ultra 9 290HX Plus, GeForce RTX 5090 Laptop (v6.92.6600)
93592 MB/s 0%
Przeciętny Intel Core Ultra 9 290HX Plus
  (76912 - 93930, n=6)
85886 MB/s -9%
Asus Strix Scar 18 G835LX
Intel Core Ultra 9 275HX, GeForce RTX 5090 Laptop (v6.92.6600)
84432 MB/s -10%
Alienware m18 R2
Intel Core i9-14900HX, GeForce RTX 4090 Laptop GPU (v6.92.6600)
79243 MB/s -16%
Schenker Key 17 Pro (M24)
Intel Core i9-14900HX, GeForce RTX 4090 Laptop GPU (v6.92.6600)
78820 MB/s -16%
Acer Predator Helios 18 PH18-72-98MW
Intel Core i9-14900HX, GeForce RTX 4090 Laptop GPU (v6.92.6600)
78016 MB/s -17%
Razer Blade 18 2024 RZ09-0509
Intel Core i9-14900HX, GeForce RTX 4090 Laptop GPU (v6.85.6300)
76268 MB/s -19%
Średnia w klasie Gaming
  (21750 - 129946, n=105, ostatnie 2 lata)
72521 MB/s -23%
MSI Titan 18 HX A14VIG
Intel Core i9-14900HX, GeForce RTX 4090 Laptop GPU (v6.92.6600)
56992 MB/s -39%
AIDA64 / Memory Read
Asus ROG Strix Scar 18 G835LXG
Intel Core Ultra 9 290HX Plus, GeForce RTX 5090 Laptop (v8.20.8100)
98574 MB/s
Asus ROG Strix Scar 18 G835LXG
Intel Core Ultra 9 290HX Plus, GeForce RTX 5090 Laptop (v6.92.6600)
98471 MB/s 0%
Przeciętny Intel Core Ultra 9 290HX Plus
  (84638 - 98574, n=6)
92870 MB/s -6%
Asus Strix Scar 18 G835LX
Intel Core Ultra 9 275HX, GeForce RTX 5090 Laptop (v6.92.6600)
86194 MB/s -13%
Alienware m18 R2
Intel Core i9-14900HX, GeForce RTX 4090 Laptop GPU (v6.92.6600)
85791 MB/s -13%
Schenker Key 17 Pro (M24)
Intel Core i9-14900HX, GeForce RTX 4090 Laptop GPU (v6.92.6600)
85763 MB/s -13%
Acer Predator Helios 18 PH18-72-98MW
Intel Core i9-14900HX, GeForce RTX 4090 Laptop GPU (v6.92.6600)
85323 MB/s -13%
Razer Blade 18 2024 RZ09-0509
Intel Core i9-14900HX, GeForce RTX 4090 Laptop GPU (v6.85.6300)
82992 MB/s -16%
Średnia w klasie Gaming
  (22956 - 118858, n=105, ostatnie 2 lata)
74162 MB/s -25%
MSI Titan 18 HX A14VIG
Intel Core i9-14900HX, GeForce RTX 4090 Laptop GPU (v6.92.6600)
54443 MB/s -45%
AIDA64 / Memory Write
Asus ROG Strix Scar 18 G835LXG
Intel Core Ultra 9 290HX Plus, GeForce RTX 5090 Laptop (v6.92.6600)
100988 MB/s
Asus ROG Strix Scar 18 G835LXG
Intel Core Ultra 9 290HX Plus, GeForce RTX 5090 Laptop (v8.20.8100)
89856 MB/s -11%
Przeciętny Intel Core Ultra 9 290HX Plus
  (76094 - 100988, n=6)
85213 MB/s -16%
Asus Strix Scar 18 G835LX
Intel Core Ultra 9 275HX, GeForce RTX 5090 Laptop (v6.92.6600)
82198 MB/s -19%
Schenker Key 17 Pro (M24)
Intel Core i9-14900HX, GeForce RTX 4090 Laptop GPU (v6.92.6600)
77439 MB/s -23%
Alienware m18 R2
Intel Core i9-14900HX, GeForce RTX 4090 Laptop GPU (v6.92.6600)
77089 MB/s -24%
Średnia w klasie Gaming
  (22297 - 135096, n=105, ostatnie 2 lata)
76303 MB/s -24%
Acer Predator Helios 18 PH18-72-98MW
Intel Core i9-14900HX, GeForce RTX 4090 Laptop GPU (v6.92.6600)
70089 MB/s -31%
Razer Blade 18 2024 RZ09-0509
Intel Core i9-14900HX, GeForce RTX 4090 Laptop GPU (v6.85.6300)
67801 MB/s -33%
MSI Titan 18 HX A14VIG
Intel Core i9-14900HX, GeForce RTX 4090 Laptop GPU (v6.92.6600)
51387 MB/s -49%
AIDA64 / Memory Latency
Asus Strix Scar 18 G835LX
Intel Core Ultra 9 275HX, GeForce RTX 5090 Laptop (v6.92.6600)
108.9 ns * -4%
Średnia w klasie Gaming
  (75.3 - 259, n=105, ostatnie 2 lata)
107 ns * -2%
Asus ROG Strix Scar 18 G835LXG
Intel Core Ultra 9 290HX Plus, GeForce RTX 5090 Laptop (v6.92.6600)
105.2 ns *
Asus ROG Strix Scar 18 G835LXG
Intel Core Ultra 9 290HX Plus, GeForce RTX 5090 Laptop (v8.20.8100)
104.8 ns * -0%
MSI Titan 18 HX A14VIG
Intel Core i9-14900HX, GeForce RTX 4090 Laptop GPU (v6.92.6600)
105 ns * -0%
Przeciętny Intel Core Ultra 9 290HX Plus
  (100.7 - 108.4, n=6)
105 ns * -0%
Razer Blade 18 2024 RZ09-0509
Intel Core i9-14900HX, GeForce RTX 4090 Laptop GPU (v6.85.6300)
87.6 ns * +17%
Alienware m18 R2
Intel Core i9-14900HX, GeForce RTX 4090 Laptop GPU (v6.92.6600)
86.4 ns * +18%
Schenker Key 17 Pro (M24)
Intel Core i9-14900HX, GeForce RTX 4090 Laptop GPU (v6.92.6600)
84.5 ns * +20%
Acer Predator Helios 18 PH18-72-98MW
Intel Core i9-14900HX, GeForce RTX 4090 Laptop GPU (v6.92.6600)
83 ns * +21%

* ... im mniej tym lepiej

Opóźnienia DPC

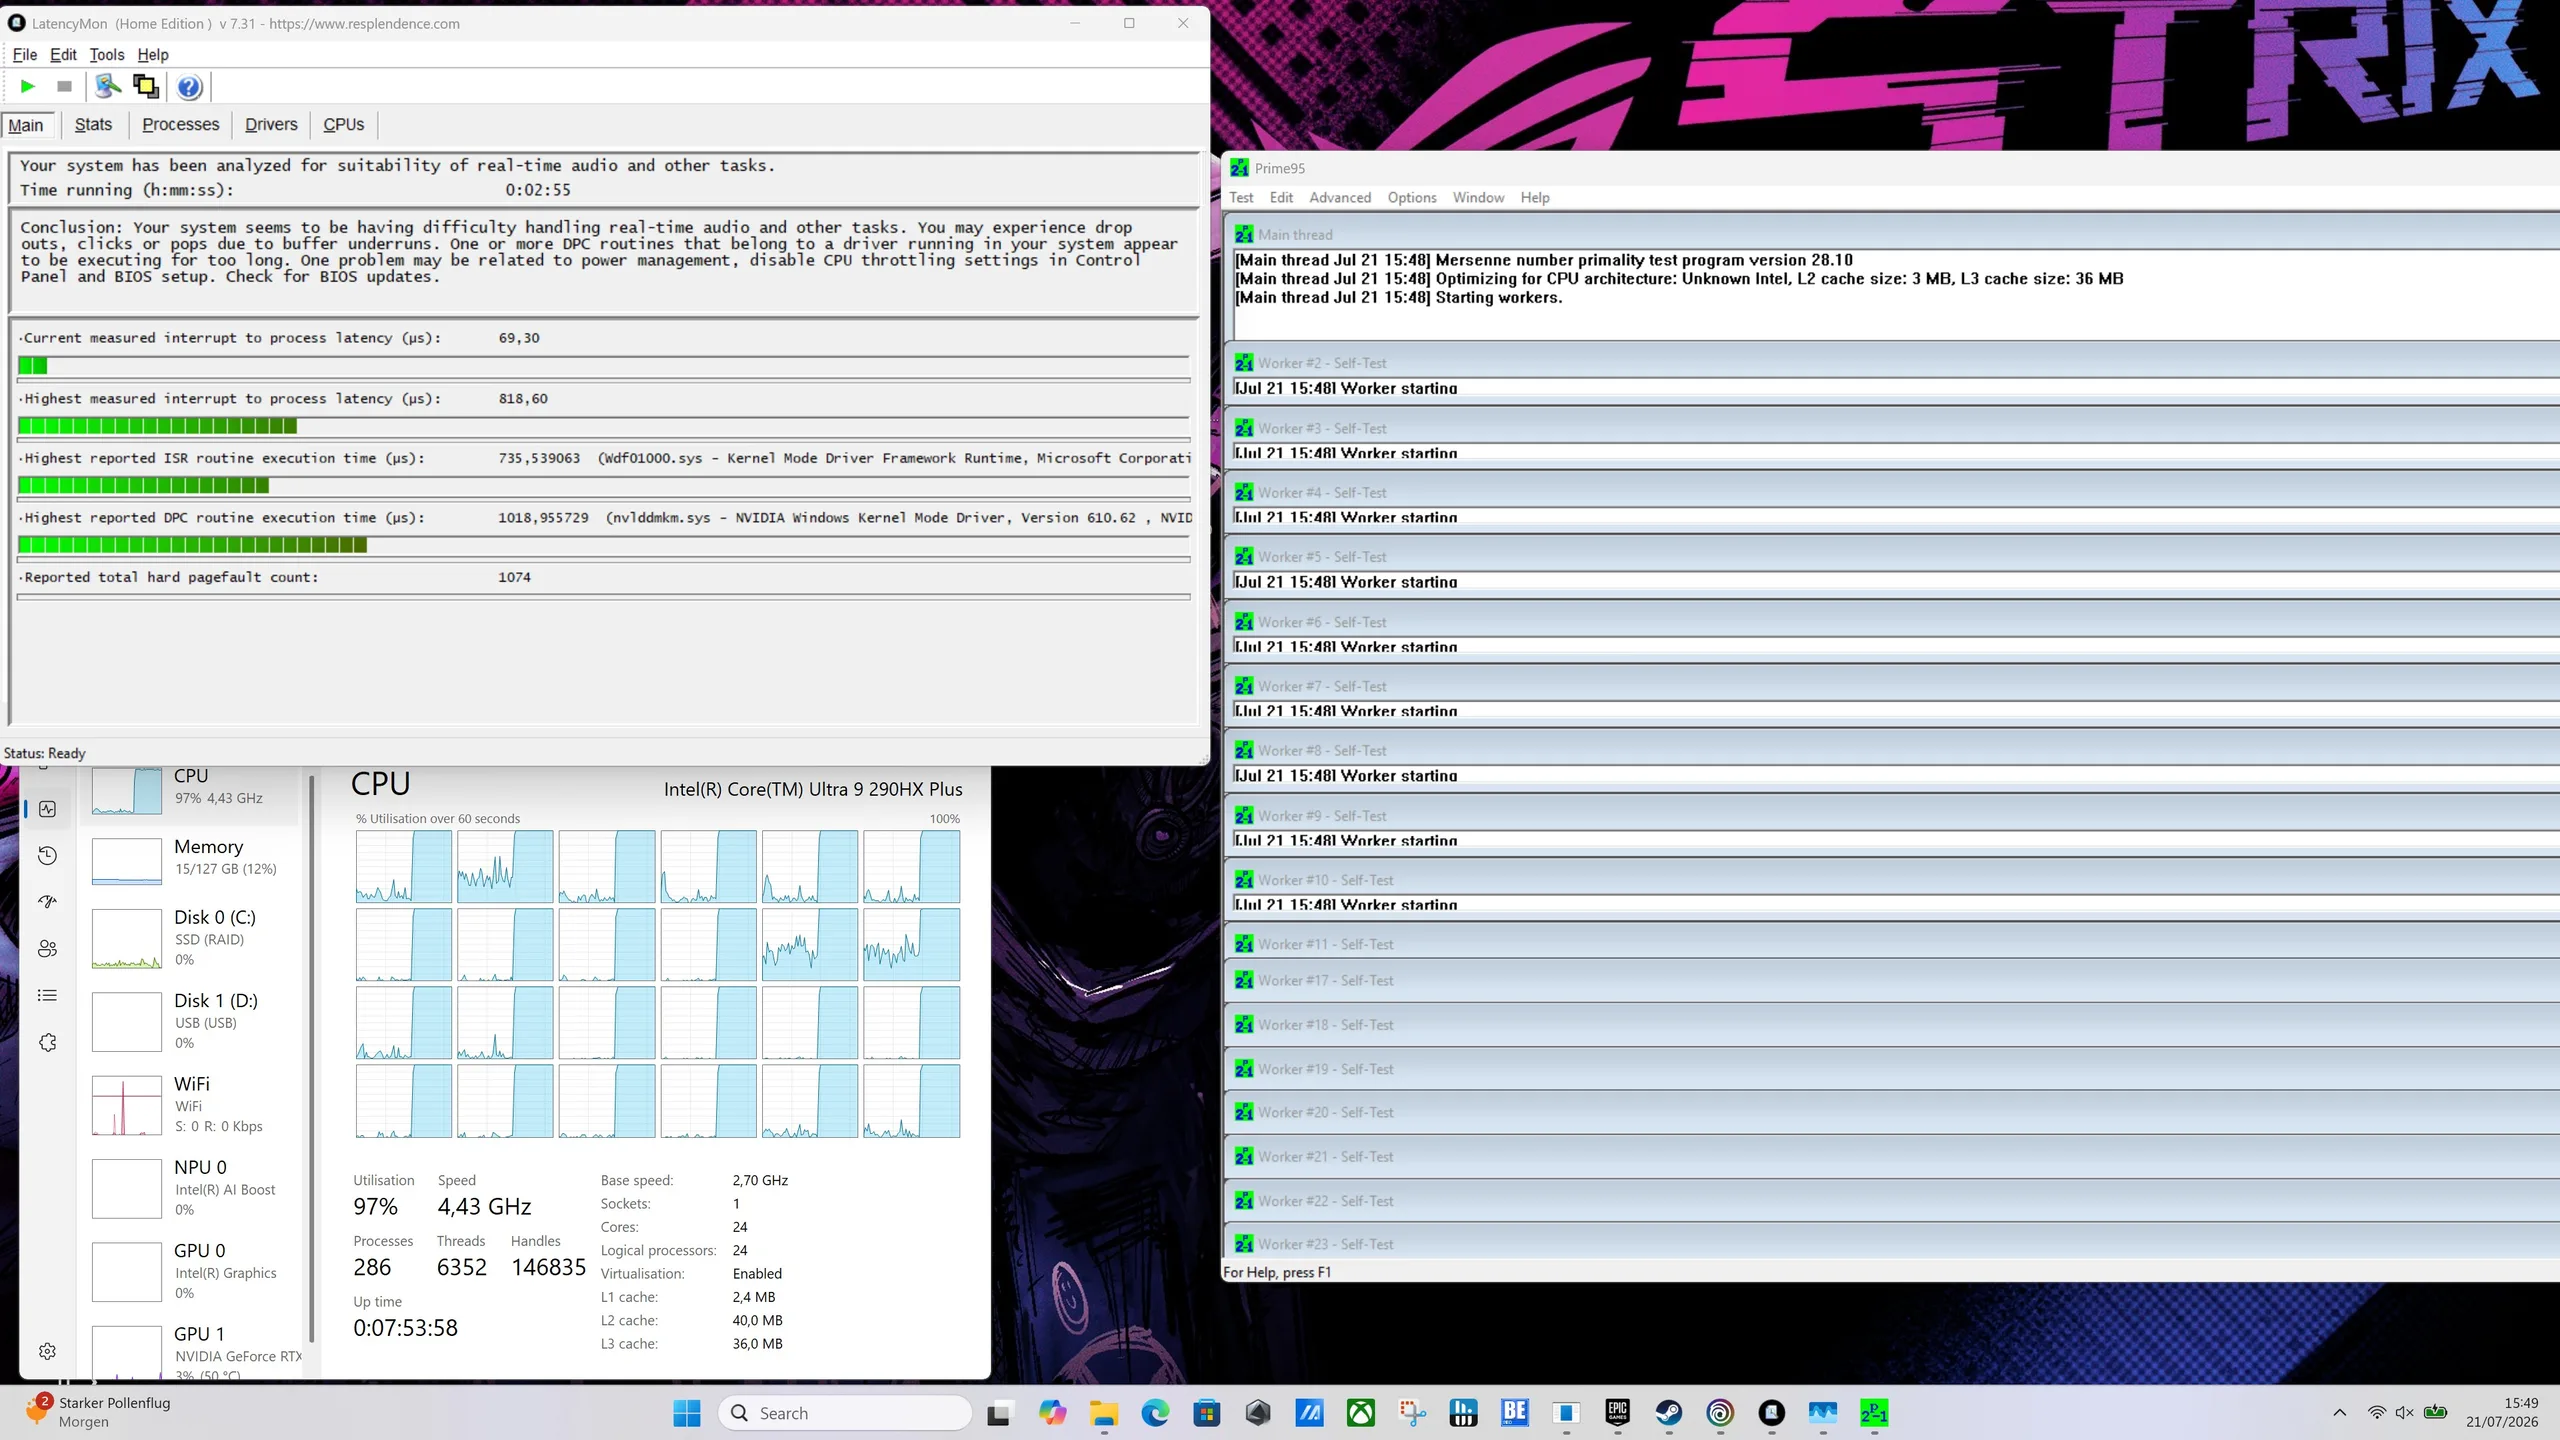
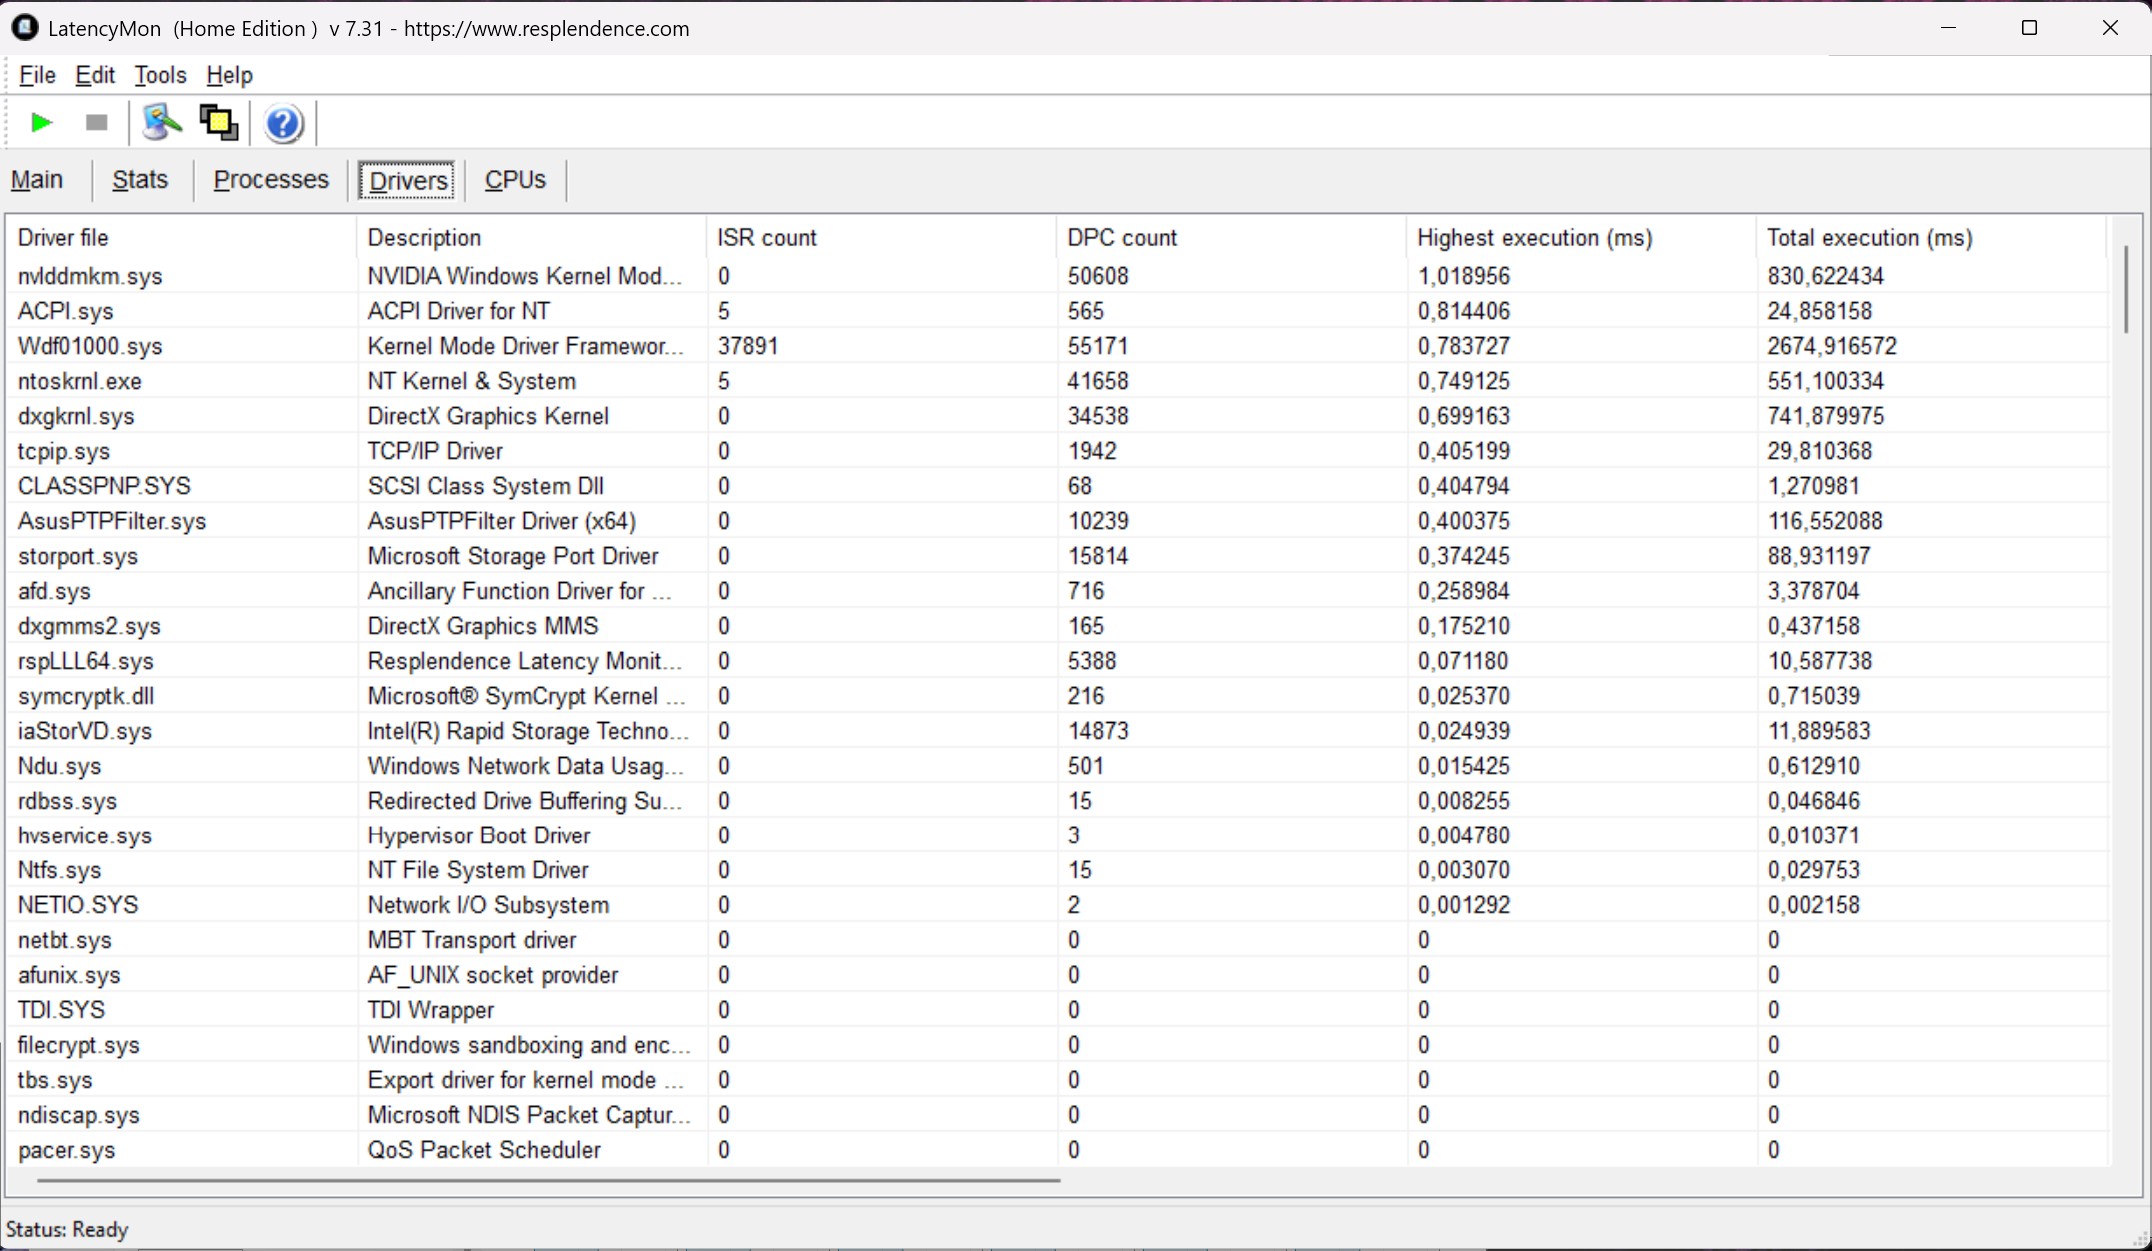
W standardowym teście LatencyMon (przeglądanie stron internetowych, odtwarzanie filmów w rozdzielczości 4K na YouTube oraz obciążenie procesora) laptop Asus ROG Strix SCAR 18 G835LXG wykazuje dobrą ogólną wydajność. Jedynie sterownik karty graficznej NVIDIA (nvlddmkm.sys) powoduje zwiększone opóźnienia podczas odtwarzania wideo.
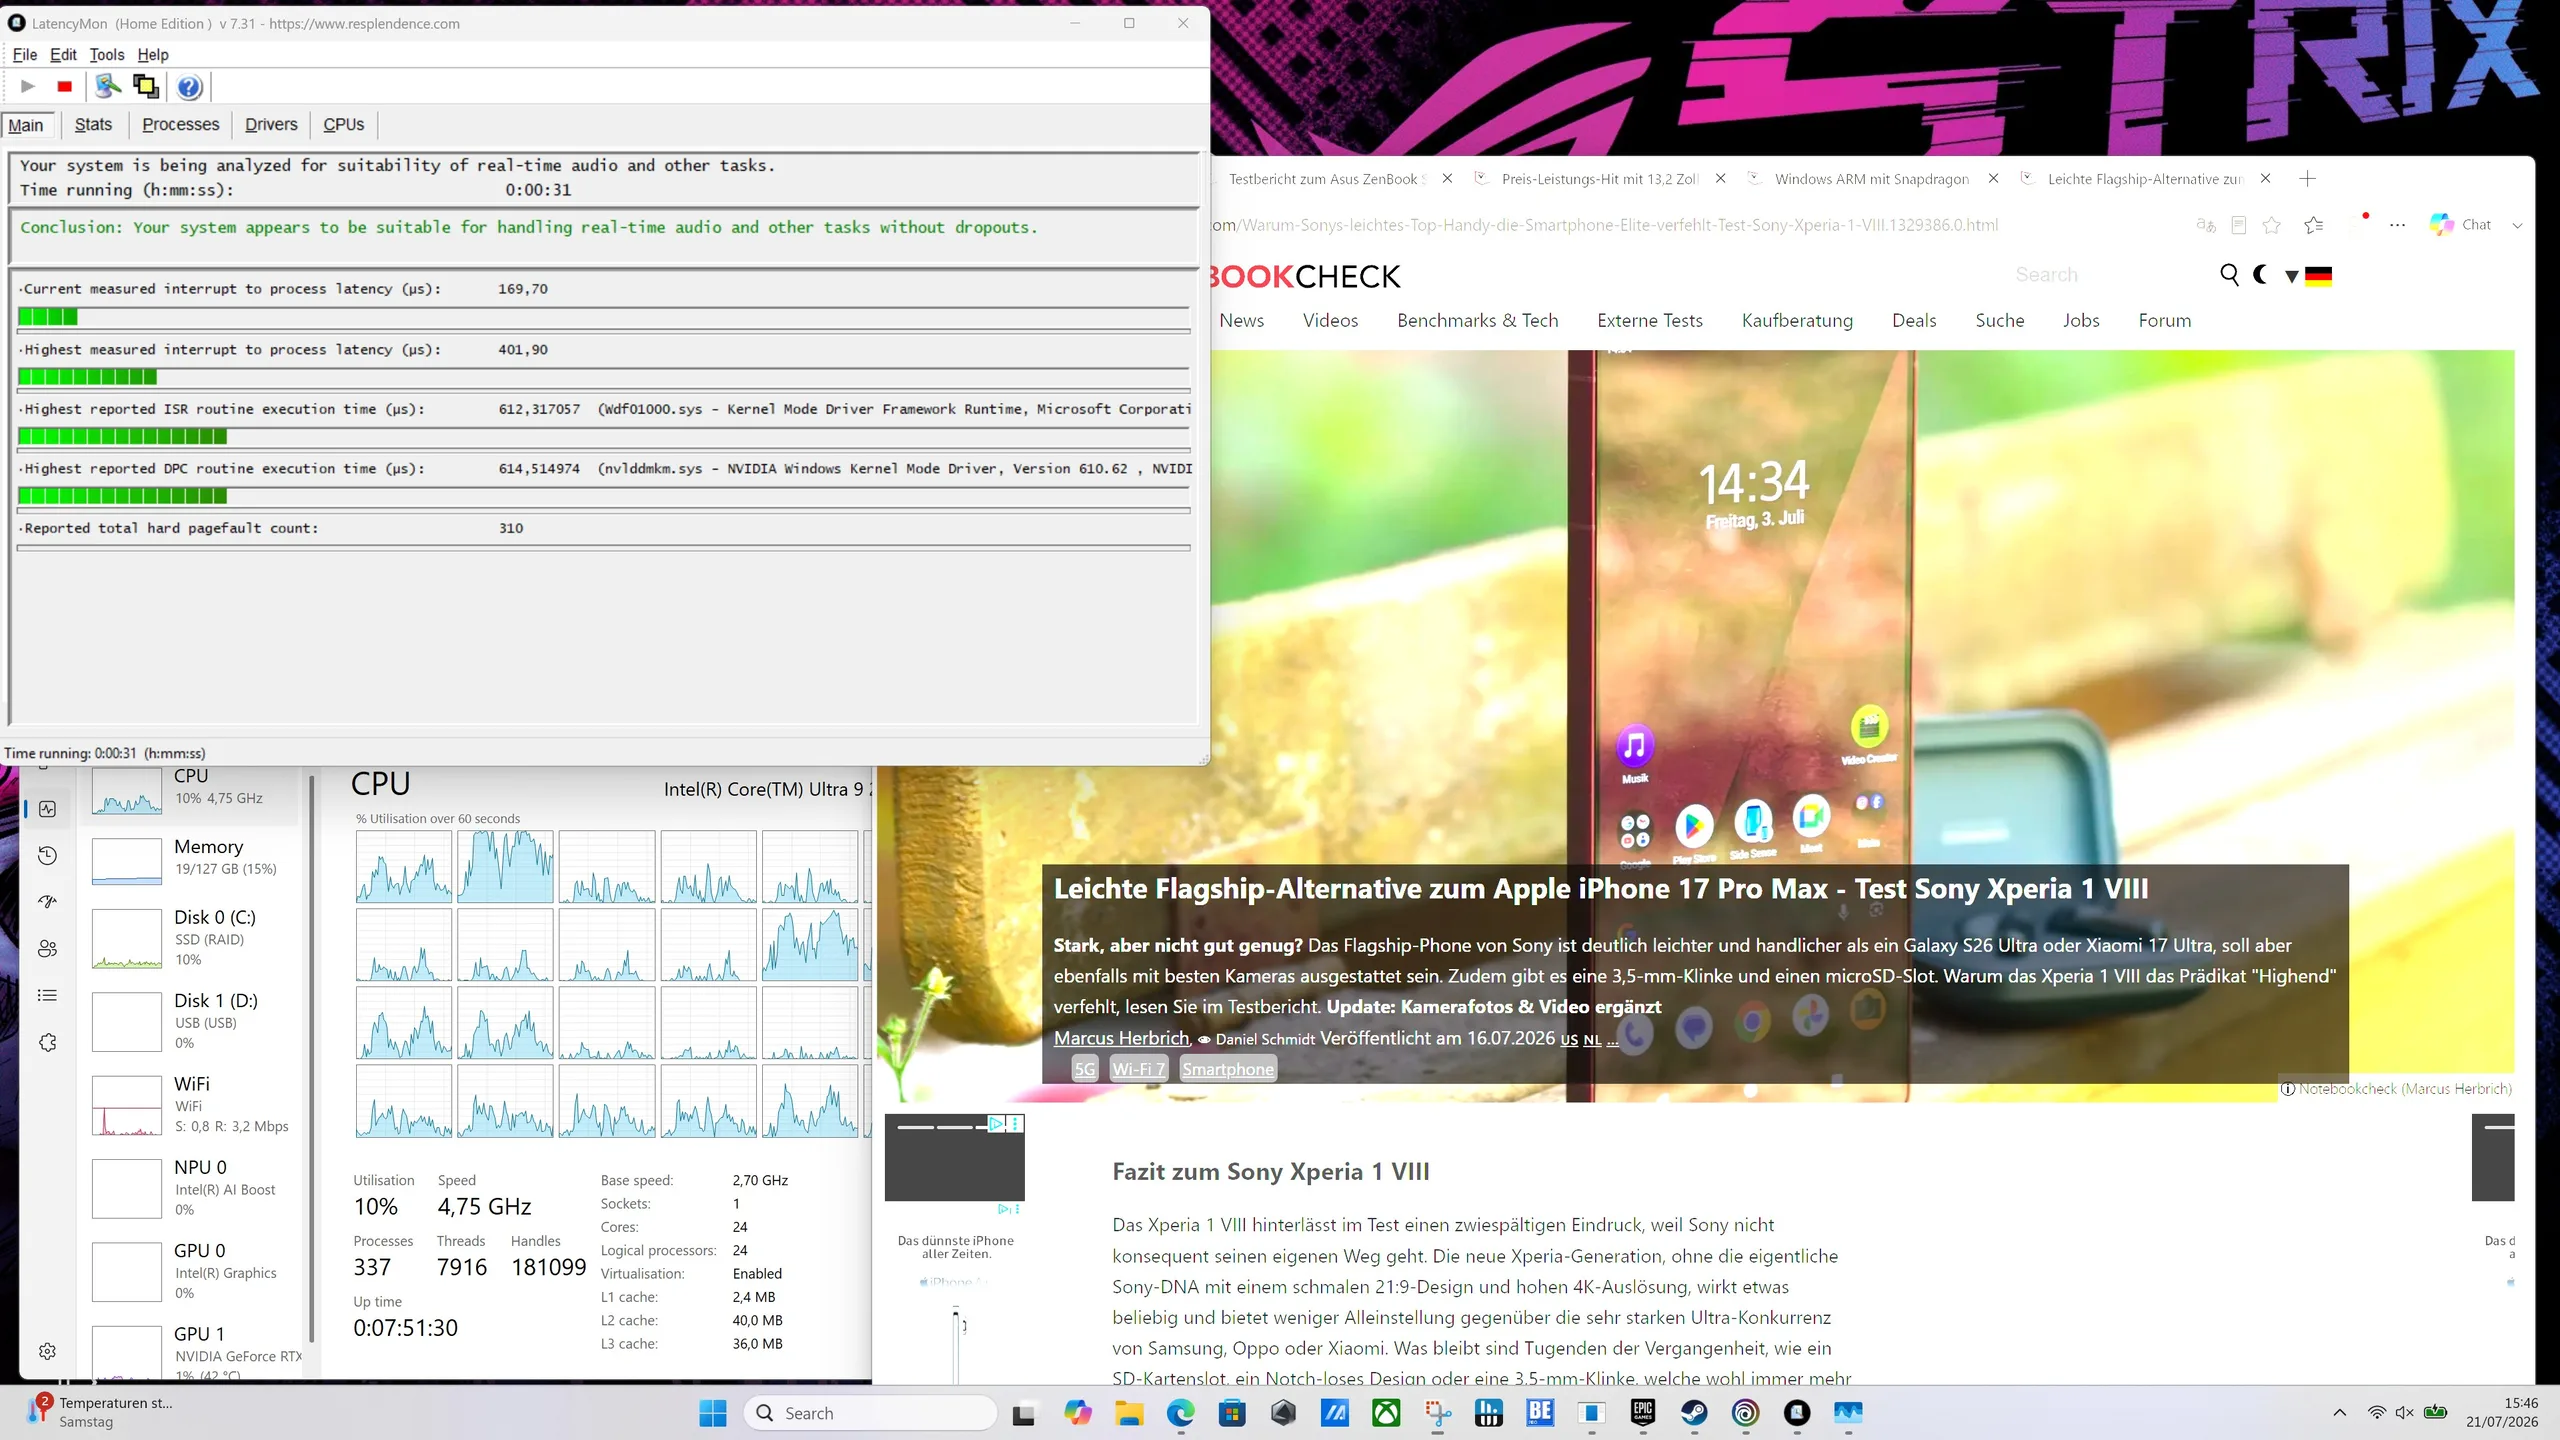
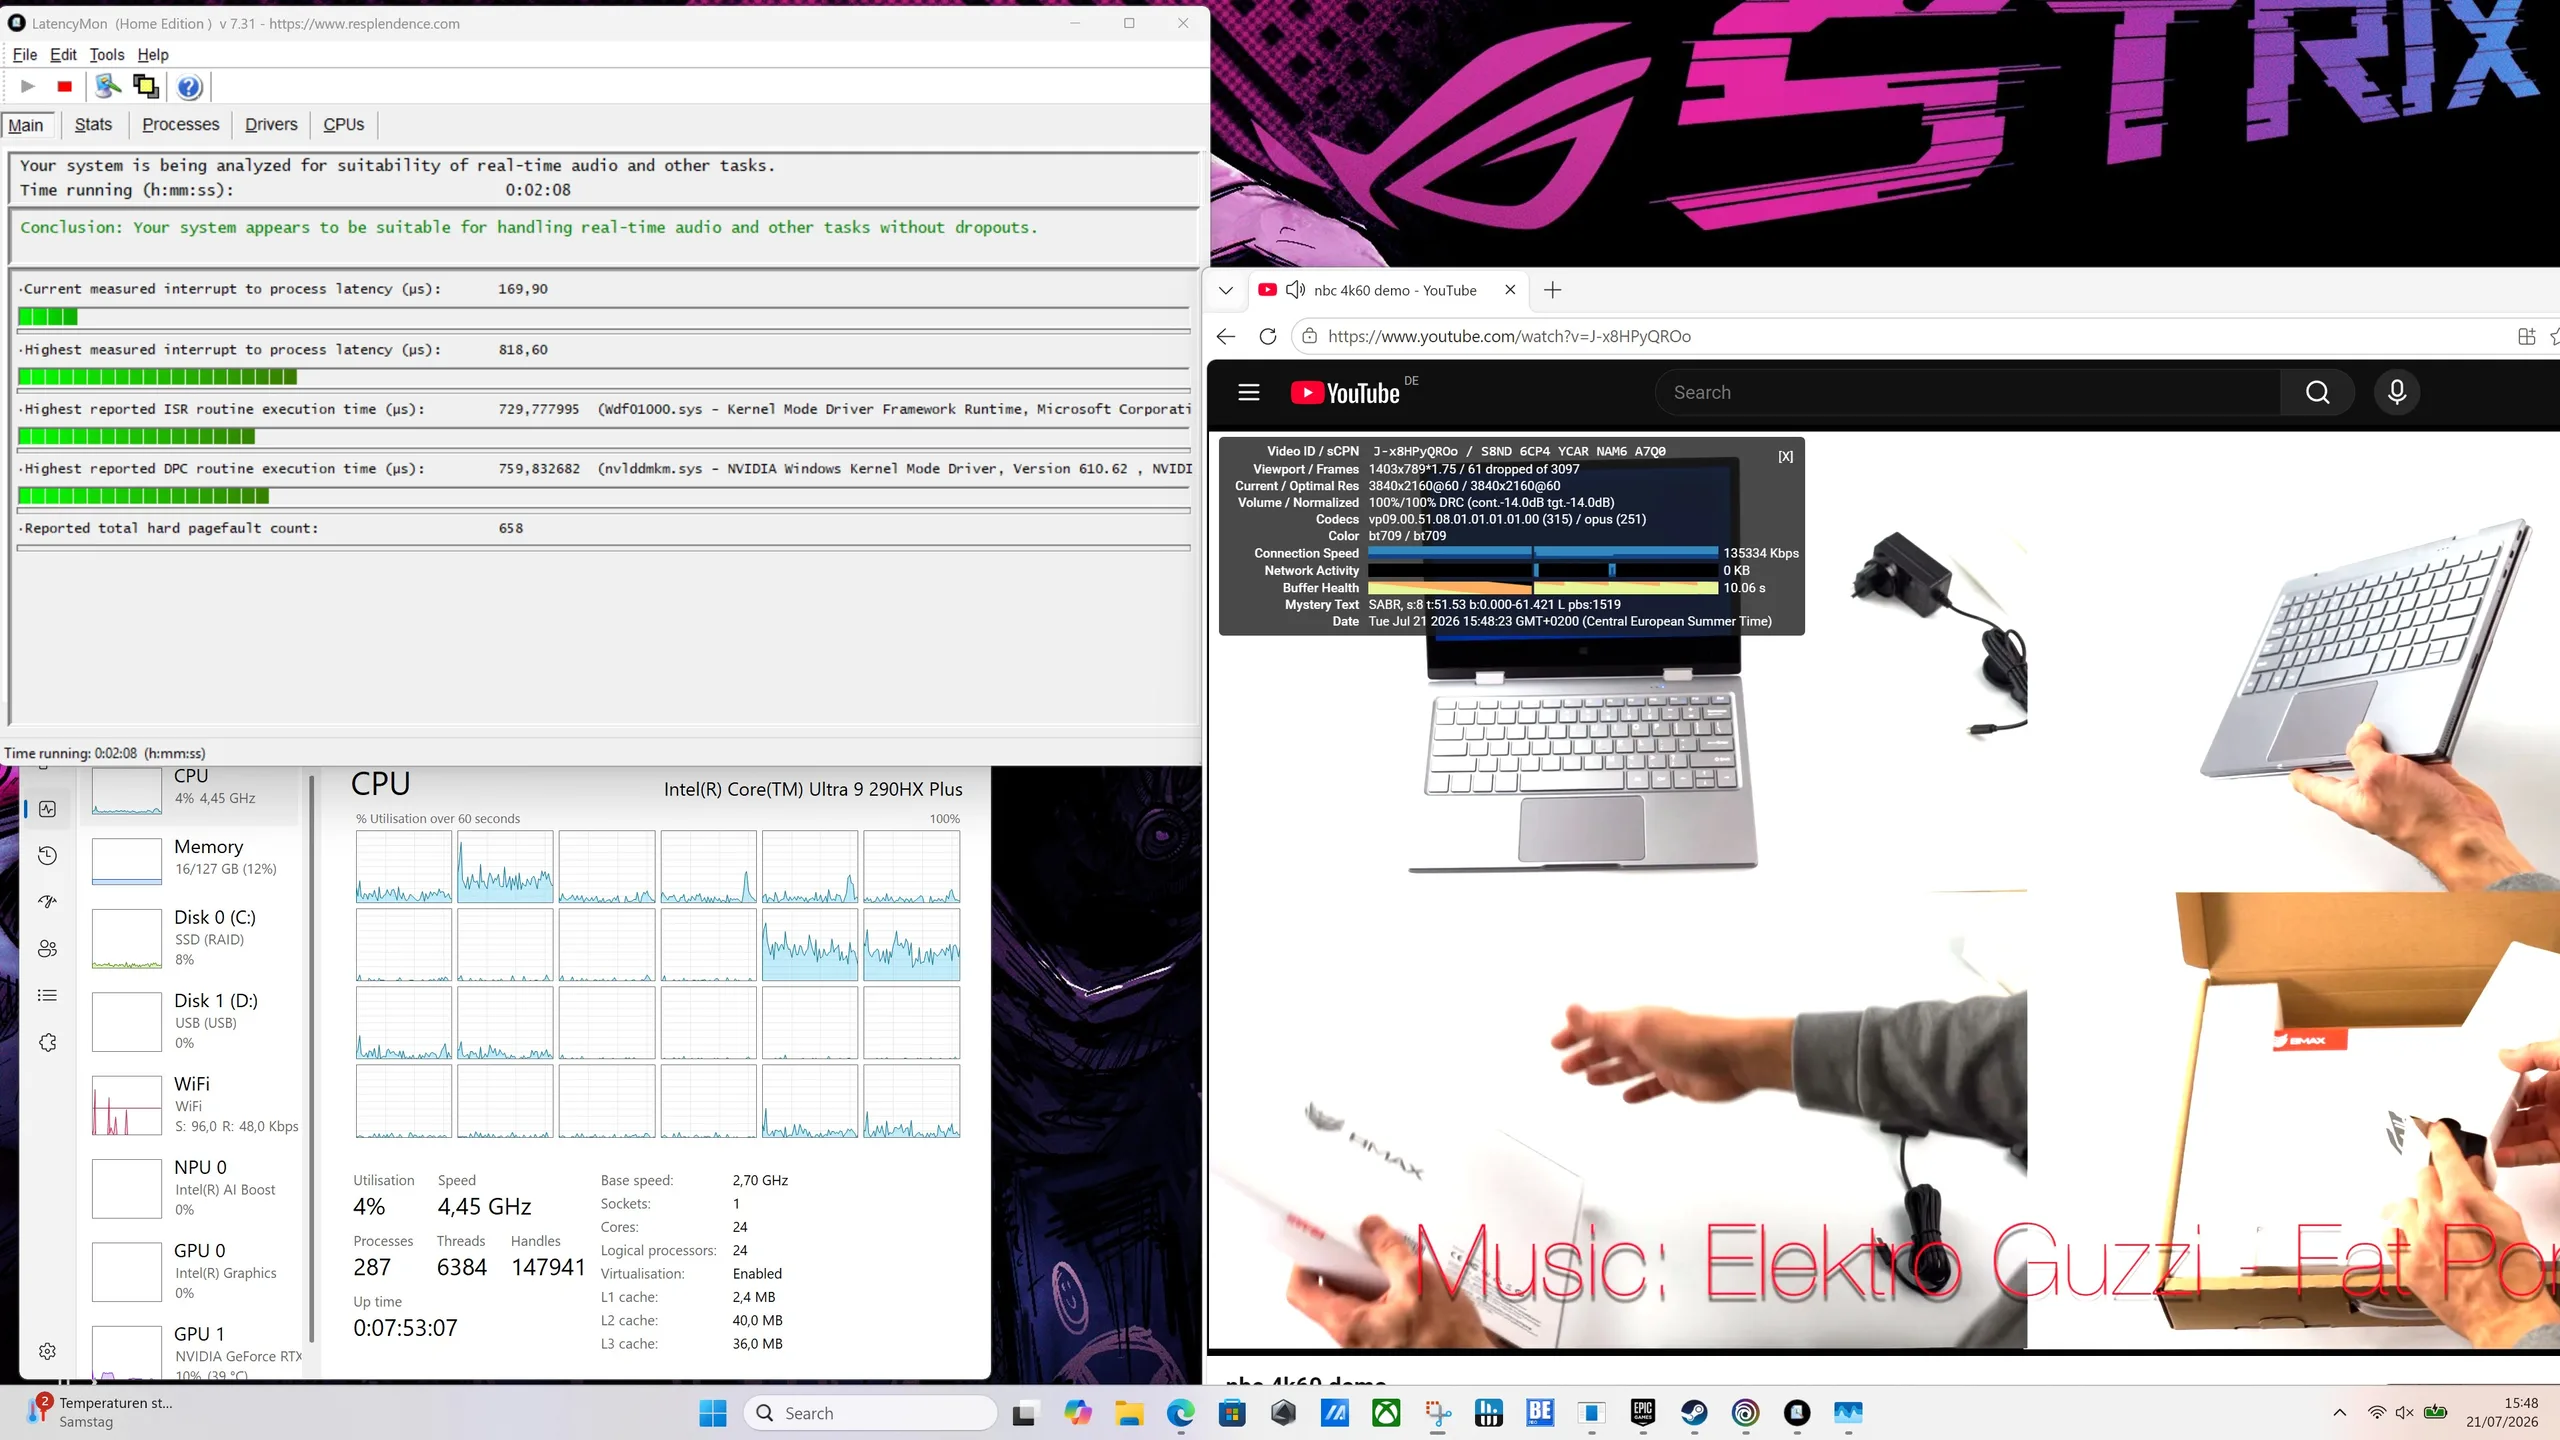
Maksymalne opóźnienie podczas otwierania wielu kart przeglądarki
Maksymalne opóźnienie podczas odtwarzania materiału wideo w rozdzielczości 4K
Maksymalne opóźnienie po upływie dziesięciu sekund od uruchomienia programu Prime95
Sterowniki uszeregowane według najdłuższego czasu działania
DPC Latencies / LatencyMon - interrupt to process latency (max), Web, Youtube, Prime95
Acer Predator Helios 18 PH18-72-98MW
GeForce RTX 4090 Laptop GPU, i9-14900HX, 2x SK Hynix HFS001TEJ9X115N (RAID 0)
3388 μs * -233%
Alienware m18 R2
GeForce RTX 4090 Laptop GPU, i9-14900HX, SK Hynix PC811 HFS002TEM9X152N
2815.1 μs * -177%
Średnia w klasie Gaming
  (410 - 11799, n=93, ostatnie 2 lata)
2500 μs * -146%
MSI Titan 18 HX A14VIG
GeForce RTX 4090 Laptop GPU, i9-14900HX, 2x Samsung PM9A1a MZVL22T0HDLB (RAID 0)
2384.5 μs * -134%
Schenker Key 17 Pro (M24)
GeForce RTX 4090 Laptop GPU, i9-14900HX, Samsung 990 Pro 1 TB
1955.8 μs * -92%
Razer Blade 18 2024 RZ09-0509
GeForce RTX 4090 Laptop GPU, i9-14900HX
1479.7 μs * -45%
Asus ROG Strix Scar 18 G835LXG
GeForce RTX 5090 Laptop, Ultra 9 290HX Plus, 2x Samsung PM9E1 MZVLC4T0HBL1 (RAID 0)
1018 μs *
Asus Strix Scar 18 G835LX
GeForce RTX 5090 Laptop, Ultra 9 275HX, WD PC SN8000S 2TB
810 μs * +20%

* ... im mniej tym lepiej

Urządzenia pamięci masowej

Nasza konfiguracja testowa wyposażona jest w dwa dyski SSD PCIe 5.0 o pojemności 4 TB (Samsung PM9E1), zapewniające łącznie 8 TB szybkiej pamięci masowej. Dyski te wyróżniają się bardzo wysoką prędkością transferu oraz krótkim czasem dostępu, co pozwala na wyjątkowo szybkie ładowanie programów, gier i dużych plików. Jednak przy długotrwałym obciążeniu wydajność po pewnym czasie spada, dlatego podczas dłuższych procesów kopiowania lub instalacji należy spodziewać się zauważalnego spadku wydajności.
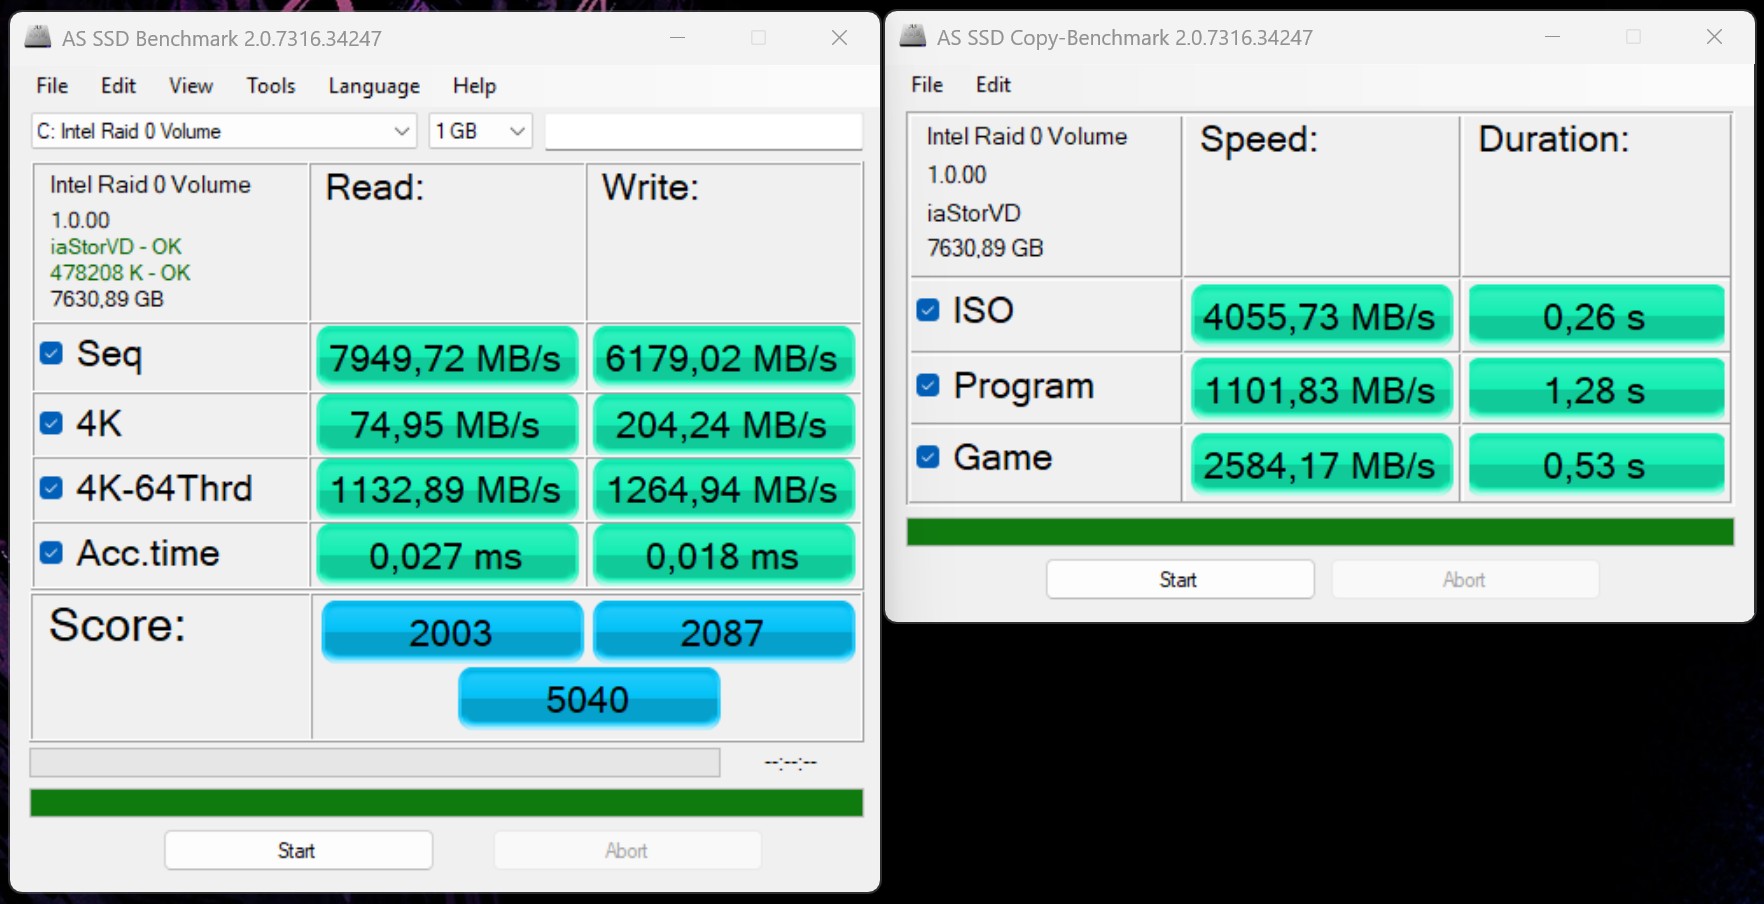
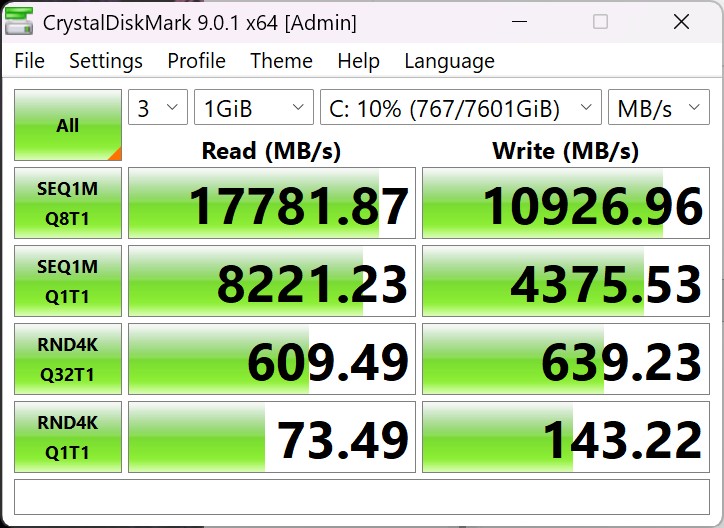
AS SSD
AS SSD
CDM9
CDM9
Konfiguracja dysku SSD
2x Samsung PM9E1 MZVLC4T0HBL1 (RAID 0)
Sequential Read: 7949MB/s
Sequential Write: 6179MB/s
4K Read: 75MB/s
4K Write: 204MB/s
4K-64 Read: 1133MB/s
4K-64 Write: 1265MB/s
Access Time Read: 0.027ms
Access Time Write: 0.018ms
Copy ISO: 4055.73MB/s
Copy Program: 1101.83MB/s
Copy Game: 2584.17MB/s
Score Read: 2003Points
Score Write: 2087Points
Score Total: 5040Points
Drive Performance rating - Percent
Alienware m18 R2
SK Hynix PC811 HFS002TEM9X152N
78.1 pt
Schenker Key 17 Pro (M24)
Samsung 990 Pro 1 TB
78 pt
Acer Predator Helios 18 PH18-72-98MW
2x SK Hynix HFS001TEJ9X115N (RAID 0)
64.2 pt
Asus ROG Strix Scar 18 G835LXG
2x Samsung PM9E1 MZVLC4T0HBL1 (RAID 0)
63.2 pt
Przeciętny 2x Samsung PM9E1 MZVLC4T0HBL1 (RAID 0)
 
63.2 pt
MSI Titan 18 HX A14VIG
2x Samsung PM9A1a MZVL22T0HDLB (RAID 0)
56.8 pt
Średnia w klasie Gaming
 
54.9 pt
Asus Strix Scar 18 G835LX
WD PC SN8000S 2TB
48.3 pt
Razer Blade 18 2024 RZ09-0509
 
46.1 pt
DiskSpd
seq read
Asus ROG Strix Scar 18 G835LXG
2x Samsung PM9E1 MZVLC4T0HBL1 (RAID 0)
7917 (7533.6min - 7917.48max) MB/s
Przeciętny 2x Samsung PM9E1 MZVLC4T0HBL1 (RAID 0)
  (n=1)
7917 MB/s 0%
Acer Predator Helios 18 PH18-72-98MW
2x SK Hynix HFS001TEJ9X115N (RAID 0)
7045 (6975.86min - 7044.54max) MB/s -11%
Alienware m18 R2
SK Hynix PC811 HFS002TEM9X152N
5588 (5540.05min - 5587.65max) MB/s -29%
MSI Titan 18 HX A14VIG
2x Samsung PM9A1a MZVL22T0HDLB (RAID 0)
5424 (5395.57min - 5423.86max) MB/s -31%
Asus Strix Scar 18 G835LX
WD PC SN8000S 2TB
3799 (23.02min - 3799.36max) MB/s -52%
Razer Blade 18 2024 RZ09-0509
 
3560 (3002.28min - 3559.93max) MB/s -55%
Średnia w klasie Gaming
  (281 - 9494, n=99, ostatnie 2 lata)
3556 MB/s -55%
Schenker Key 17 Pro (M24)
Samsung 990 Pro 1 TB
3142 (3005.43min - 3141.53max) MB/s -60%
seq write
Acer Predator Helios 18 PH18-72-98MW
2x SK Hynix HFS001TEJ9X115N (RAID 0)
8992 (8801.75min - 8992.01max) MB/s +53%
MSI Titan 18 HX A14VIG
2x Samsung PM9A1a MZVL22T0HDLB (RAID 0)
7291 (7191.64min - 7291.38max) MB/s +24%
Asus ROG Strix Scar 18 G835LXG
2x Samsung PM9E1 MZVLC4T0HBL1 (RAID 0)
5867 (5141.17min - 5866.57max) MB/s
Przeciętny 2x Samsung PM9E1 MZVLC4T0HBL1 (RAID 0)
  (n=1)
5867 MB/s 0%
Alienware m18 R2
SK Hynix PC811 HFS002TEM9X152N
5153 (5139.7min - 5152.91max) MB/s -12%
Schenker Key 17 Pro (M24)
Samsung 990 Pro 1 TB
4891 (4759.07min - 4890.56max) MB/s -17%
Asus Strix Scar 18 G835LX
WD PC SN8000S 2TB
4437 (4373.88min - 4437.36max) MB/s -24%
Średnia w klasie Gaming
  (1057 - 9832, n=99, ostatnie 2 lata)
3957 MB/s -33%
Razer Blade 18 2024 RZ09-0509
 
3367 (3255.82min - 3366.95max) MB/s -43%
seq q8 t1 read
Asus ROG Strix Scar 18 G835LXG
2x Samsung PM9E1 MZVLC4T0HBL1 (RAID 0)
17459 (12476.6min - 17459.1max) MB/s
Przeciętny 2x Samsung PM9E1 MZVLC4T0HBL1 (RAID 0)
  (n=1)
17459 MB/s 0%
MSI Titan 18 HX A14VIG
2x Samsung PM9A1a MZVL22T0HDLB (RAID 0)
13588 (10727.3min - 13588.3max) MB/s -22%
Asus Strix Scar 18 G835LX
WD PC SN8000S 2TB
12470 (11207.2min - 12469.7max) MB/s -29%
Acer Predator Helios 18 PH18-72-98MW
2x SK Hynix HFS001TEJ9X115N (RAID 0)
11019 (9854.1min - 11018.8max) MB/s -37%
Średnia w klasie Gaming
  (3772 - 17459, n=99, ostatnie 2 lata)
7552 MB/s -57%
Alienware m18 R2
SK Hynix PC811 HFS002TEM9X152N
7110 (6256.85min - 7110.18max) MB/s -59%
Schenker Key 17 Pro (M24)
Samsung 990 Pro 1 TB
7033 (6025.44min - 7033.01max) MB/s -60%
Razer Blade 18 2024 RZ09-0509
 
6797 (5573.18min - 6797.33max) MB/s -61%
seq q8 t1 write
Acer Predator Helios 18 PH18-72-98MW
2x SK Hynix HFS001TEJ9X115N (RAID 0)
11472 (11391min - 11471.6max) MB/s 0%
Asus ROG Strix Scar 18 G835LXG
2x Samsung PM9E1 MZVLC4T0HBL1 (RAID 0)
11431 (10787.1min - 11430.9max) MB/s
Przeciętny 2x Samsung PM9E1 MZVLC4T0HBL1 (RAID 0)
  (n=1)
11431 MB/s 0%
MSI Titan 18 HX A14VIG
2x Samsung PM9A1a MZVL22T0HDLB (RAID 0)
10571 (10519.3min - 10571.3max) MB/s -8%
Asus Strix Scar 18 G835LX
WD PC SN8000S 2TB
8696 (8611.54min - 8696.26max) MB/s -24%
Alienware m18 R2
SK Hynix PC811 HFS002TEM9X152N
6779 (6710.47min - 6778.83max) MB/s -41%
Schenker Key 17 Pro (M24)
Samsung 990 Pro 1 TB
6620 (6576.94min - 6620.29max) MB/s -42%
Średnia w klasie Gaming
  (1218 - 13519, n=99, ostatnie 2 lata)
5961 MB/s -48%
Razer Blade 18 2024 RZ09-0509
 
4902 (4309.42min - 4901.73max) MB/s -57%
4k q1 t1 read
Schenker Key 17 Pro (M24)
Samsung 990 Pro 1 TB
99 (97.84min - 99.01max) MB/s +21%
Acer Predator Helios 18 PH18-72-98MW
2x SK Hynix HFS001TEJ9X115N (RAID 0)
81.6 (81.02min - 81.62max) MB/s 0%
Asus ROG Strix Scar 18 G835LXG
2x Samsung PM9E1 MZVLC4T0HBL1 (RAID 0)
81.6 (80.95min - 81.61max) MB/s
Przeciętny 2x Samsung PM9E1 MZVLC4T0HBL1 (RAID 0)
  (n=1)
81.6 MB/s 0%
Alienware m18 R2
SK Hynix PC811 HFS002TEM9X152N
75.4 (73.49min - 75.43max) MB/s -8%
Średnia w klasie Gaming
  (32.2 - 111.2, n=99, ostatnie 2 lata)
70.3 MB/s -14%
MSI Titan 18 HX A14VIG
2x Samsung PM9A1a MZVL22T0HDLB (RAID 0)
69.6 (68.6min - 69.57max) MB/s -15%
Asus Strix Scar 18 G835LX
WD PC SN8000S 2TB
63.4 (62.2min - 63.4max) MB/s -22%
Razer Blade 18 2024 RZ09-0509
 
61.8 (61.2min - 61.81max) MB/s -24%
4k q1 t1 write
Schenker Key 17 Pro (M24)
Samsung 990 Pro 1 TB
316 (303.92min - 316.48max) MB/s +61%
Alienware m18 R2
SK Hynix PC811 HFS002TEM9X152N
300 (297.27min - 299.6max) MB/s +53%
Acer Predator Helios 18 PH18-72-98MW
2x SK Hynix HFS001TEJ9X115N (RAID 0)
259 (250.68min - 258.82max) MB/s +32%
Średnia w klasie Gaming
  (78 - 345, n=99, ostatnie 2 lata)
195.9 MB/s 0%
Asus ROG Strix Scar 18 G835LXG
2x Samsung PM9E1 MZVLC4T0HBL1 (RAID 0)
195.8 (125.81min - 195.77max) MB/s
Przeciętny 2x Samsung PM9E1 MZVLC4T0HBL1 (RAID 0)
  (n=1)
195.8 MB/s 0%
Razer Blade 18 2024 RZ09-0509
 
164 (110.95min - 164max) MB/s -16%
MSI Titan 18 HX A14VIG
2x Samsung PM9A1a MZVL22T0HDLB (RAID 0)
152.1 (149.74min - 152.09max) MB/s -22%
Asus Strix Scar 18 G835LX
WD PC SN8000S 2TB
136.4 (134.95min - 136.4max) MB/s -30%
4k q32 t16 read
Alienware m18 R2
SK Hynix PC811 HFS002TEM9X152N
6067 (5596.15min - 6066.73max) MB/s +626%
Schenker Key 17 Pro (M24)
Samsung 990 Pro 1 TB
4926 (4895.9min - 4926.27max) MB/s +489%
Średnia w klasie Gaming
  (539 - 8067, n=99, ostatnie 2 lata)
2264 MB/s +171%
MSI Titan 18 HX A14VIG
2x Samsung PM9A1a MZVL22T0HDLB (RAID 0)
1623 (1464.8min - 1623.24max) MB/s +94%
Acer Predator Helios 18 PH18-72-98MW
2x SK Hynix HFS001TEJ9X115N (RAID 0)
1385 (1275.7min - 1385.11max) MB/s +66%
Razer Blade 18 2024 RZ09-0509
 
1005 (964.75min - 1004.59max) MB/s +20%
Asus ROG Strix Scar 18 G835LXG
2x Samsung PM9E1 MZVLC4T0HBL1 (RAID 0)
836 (795.8min - 835.68max) MB/s
Przeciętny 2x Samsung PM9E1 MZVLC4T0HBL1 (RAID 0)
  (n=1)
836 MB/s 0%
Asus Strix Scar 18 G835LX
WD PC SN8000S 2TB
746 (519.37min - 746.01max) MB/s -11%
4k q32 t16 write
Alienware m18 R2
SK Hynix PC811 HFS002TEM9X152N
4176 (3805.57min - 4175.9max) MB/s +551%
Schenker Key 17 Pro (M24)
Samsung 990 Pro 1 TB
3579 (3433.86min - 3579.4max) MB/s +458%
Średnia w klasie Gaming
  (227 - 5653, n=99, ostatnie 2 lata)
1832 MB/s +186%
MSI Titan 18 HX A14VIG
2x Samsung PM9A1a MZVL22T0HDLB (RAID 0)
1377 (1306.51min - 1377.05max) MB/s +115%
Acer Predator Helios 18 PH18-72-98MW
2x SK Hynix HFS001TEJ9X115N (RAID 0)
1330 (1184.45min - 1330.4max) MB/s +107%
Asus ROG Strix Scar 18 G835LXG
2x Samsung PM9E1 MZVLC4T0HBL1 (RAID 0)
641 (632.54min - 640.8max) MB/s
Przeciętny 2x Samsung PM9E1 MZVLC4T0HBL1 (RAID 0)
  (n=1)
641 MB/s 0%
Razer Blade 18 2024 RZ09-0509
 
442 (336.87min - 441.83max) MB/s -31%
Asus Strix Scar 18 G835LX
WD PC SN8000S 2TB
284 (254.39min - 283.58max) MB/s -56%
AS SSD
Score Total
Alienware m18 R2
SK Hynix PC811 HFS002TEM9X152N
10655 Points +111%
Schenker Key 17 Pro (M24)
Samsung 990 Pro 1 TB
10591 Points +110%
Średnia w klasie Gaming
  (2912 - 14159, n=97, ostatnie 2 lata)
6872 Points +36%
MSI Titan 18 HX A14VIG
2x Samsung PM9A1a MZVL22T0HDLB (RAID 0)
5369 Points +7%
Acer Predator Helios 18 PH18-72-98MW
2x SK Hynix HFS001TEJ9X115N (RAID 0)
5102 Points +1%
Asus ROG Strix Scar 18 G835LXG
2x Samsung PM9E1 MZVLC4T0HBL1 (RAID 0)
5040 Points
Przeciętny 2x Samsung PM9E1 MZVLC4T0HBL1 (RAID 0)
  (n=1)
5040 Points 0%
Razer Blade 18 2024 RZ09-0509
 
4927 Points -2%
Asus Strix Scar 18 G835LX
WD PC SN8000S 2TB
4764 Points -5%
Score Read
Schenker Key 17 Pro (M24)
Samsung 990 Pro 1 TB
3807 Points +90%
Alienware m18 R2
SK Hynix PC811 HFS002TEM9X152N
3753 Points +87%
Średnia w klasie Gaming
  (953 - 5082, n=97, ostatnie 2 lata)
2248 Points +12%
MSI Titan 18 HX A14VIG
2x Samsung PM9A1a MZVL22T0HDLB (RAID 0)
2194 Points +10%
Acer Predator Helios 18 PH18-72-98MW
2x SK Hynix HFS001TEJ9X115N (RAID 0)
2049 Points +2%
Asus ROG Strix Scar 18 G835LXG
2x Samsung PM9E1 MZVLC4T0HBL1 (RAID 0)
2003 Points
Przeciętny 2x Samsung PM9E1 MZVLC4T0HBL1 (RAID 0)
  (n=1)
2003 Points 0%
Razer Blade 18 2024 RZ09-0509
 
1667 Points -17%
Asus Strix Scar 18 G835LX
WD PC SN8000S 2TB
1653 Points -17%
Score Write
Alienware m18 R2
SK Hynix PC811 HFS002TEM9X152N
4993 Points +139%
Schenker Key 17 Pro (M24)
Samsung 990 Pro 1 TB
4852 Points +132%
Średnia w klasie Gaming
  (1136 - 6457, n=97, ostatnie 2 lata)
3547 Points +70%
Razer Blade 18 2024 RZ09-0509
 
2518 Points +21%
Asus Strix Scar 18 G835LX
WD PC SN8000S 2TB
2267 Points +9%
MSI Titan 18 HX A14VIG
2x Samsung PM9A1a MZVL22T0HDLB (RAID 0)
2092 Points 0%
Asus ROG Strix Scar 18 G835LXG
2x Samsung PM9E1 MZVLC4T0HBL1 (RAID 0)
2087 Points
Przeciętny 2x Samsung PM9E1 MZVLC4T0HBL1 (RAID 0)
  (n=1)
2087 Points 0%
Acer Predator Helios 18 PH18-72-98MW
2x SK Hynix HFS001TEJ9X115N (RAID 0)
2038 Points -2%
Seq Read
MSI Titan 18 HX A14VIG
2x Samsung PM9A1a MZVL22T0HDLB (RAID 0)
9576.8 MB/s +20%
Acer Predator Helios 18 PH18-72-98MW
2x SK Hynix HFS001TEJ9X115N (RAID 0)
8496.25 MB/s +7%
Asus ROG Strix Scar 18 G835LXG
2x Samsung PM9E1 MZVLC4T0HBL1 (RAID 0)
7949 MB/s
Przeciętny 2x Samsung PM9E1 MZVLC4T0HBL1 (RAID 0)
  (n=1)
7949 MB/s 0%
Alienware m18 R2
SK Hynix PC811 HFS002TEM9X152N
5916.27 MB/s -26%
Asus Strix Scar 18 G835LX
WD PC SN8000S 2TB
5595 MB/s -30%
Średnia w klasie Gaming
  (2346 - 10091, n=97, ostatnie 2 lata)
5591 MB/s -30%
Razer Blade 18 2024 RZ09-0509
 
5476.6 MB/s -31%
Schenker Key 17 Pro (M24)
Samsung 990 Pro 1 TB
5346 MB/s -33%
Seq Write
MSI Titan 18 HX A14VIG
2x Samsung PM9A1a MZVL22T0HDLB (RAID 0)
8685.54 MB/s +41%
Acer Predator Helios 18 PH18-72-98MW
2x SK Hynix HFS001TEJ9X115N (RAID 0)
7597.23 MB/s +23%
Asus ROG Strix Scar 18 G835LXG
2x Samsung PM9E1 MZVLC4T0HBL1 (RAID 0)
6179 MB/s
Przeciętny 2x Samsung PM9E1 MZVLC4T0HBL1 (RAID 0)
  (n=1)
6179 MB/s 0%
Alienware m18 R2
SK Hynix PC811 HFS002TEM9X152N
5929.42 MB/s -4%
Asus Strix Scar 18 G835LX
WD PC SN8000S 2TB
5305 MB/s -14%
Schenker Key 17 Pro (M24)
Samsung 990 Pro 1 TB
5012 MB/s -19%
Średnia w klasie Gaming
  (114.5 - 10726, n=97, ostatnie 2 lata)
3972 MB/s -36%
Razer Blade 18 2024 RZ09-0509
 
2995.22 MB/s -52%
4K Read
Schenker Key 17 Pro (M24)
Samsung 990 Pro 1 TB
90.9 MB/s +21%
Asus ROG Strix Scar 18 G835LXG
2x Samsung PM9E1 MZVLC4T0HBL1 (RAID 0)
75 MB/s
Przeciętny 2x Samsung PM9E1 MZVLC4T0HBL1 (RAID 0)
  (n=1)
75 MB/s 0%
Średnia w klasie Gaming
  (36.4 - 108.4, n=97, ostatnie 2 lata)
71.1 MB/s -5%
Acer Predator Helios 18 PH18-72-98MW
2x SK Hynix HFS001TEJ9X115N (RAID 0)
69.86 MB/s -7%
Razer Blade 18 2024 RZ09-0509
 
65.49 MB/s -13%
Asus Strix Scar 18 G835LX
WD PC SN8000S 2TB
65.1 MB/s -13%
Alienware m18 R2
SK Hynix PC811 HFS002TEM9X152N
64.97 MB/s -13%
MSI Titan 18 HX A14VIG
2x Samsung PM9A1a MZVL22T0HDLB (RAID 0)
63.69 MB/s -15%
4K Write
Schenker Key 17 Pro (M24)
Samsung 990 Pro 1 TB
260 MB/s +27%
Alienware m18 R2
SK Hynix PC811 HFS002TEM9X152N
238.28 MB/s +17%
Razer Blade 18 2024 RZ09-0509
 
219.58 MB/s +8%
Średnia w klasie Gaming
  (75.6 - 307, n=97, ostatnie 2 lata)
215 MB/s +5%
Asus ROG Strix Scar 18 G835LXG
2x Samsung PM9E1 MZVLC4T0HBL1 (RAID 0)
204 MB/s
Przeciętny 2x Samsung PM9E1 MZVLC4T0HBL1 (RAID 0)
  (n=1)
204 MB/s 0%
Acer Predator Helios 18 PH18-72-98MW
2x SK Hynix HFS001TEJ9X115N (RAID 0)
200.92 MB/s -2%
Asus Strix Scar 18 G835LX
WD PC SN8000S 2TB
189.8 MB/s -7%
MSI Titan 18 HX A14VIG
2x Samsung PM9A1a MZVL22T0HDLB (RAID 0)
134.66 MB/s -34%
4K-64 Read
Schenker Key 17 Pro (M24)
Samsung 990 Pro 1 TB
3182 MB/s +181%
Alienware m18 R2
SK Hynix PC811 HFS002TEM9X152N
3096 MB/s +173%
Średnia w klasie Gaming
  (517 - 3977, n=97, ostatnie 2 lata)
1618 MB/s +43%
MSI Titan 18 HX A14VIG
2x Samsung PM9A1a MZVL22T0HDLB (RAID 0)
1172.14 MB/s +3%
Asus ROG Strix Scar 18 G835LXG
2x Samsung PM9E1 MZVLC4T0HBL1 (RAID 0)
1133 MB/s
Przeciętny 2x Samsung PM9E1 MZVLC4T0HBL1 (RAID 0)
  (n=1)
1133 MB/s 0%
Acer Predator Helios 18 PH18-72-98MW
2x SK Hynix HFS001TEJ9X115N (RAID 0)
1129.76 MB/s 0%
Razer Blade 18 2024 RZ09-0509
 
1053.83 MB/s -7%
Asus Strix Scar 18 G835LX
WD PC SN8000S 2TB
1029 MB/s -9%
4K-64 Write
Alienware m18 R2
SK Hynix PC811 HFS002TEM9X152N
4161.9 MB/s +229%
Schenker Key 17 Pro (M24)
Samsung 990 Pro 1 TB
4090 MB/s +223%
Średnia w klasie Gaming
  (850 - 5356, n=97, ostatnie 2 lata)
2935 MB/s +132%
Razer Blade 18 2024 RZ09-0509
 
1998.53 MB/s +58%
Asus Strix Scar 18 G835LX
WD PC SN8000S 2TB
1546 MB/s +22%
Asus ROG Strix Scar 18 G835LXG
2x Samsung PM9E1 MZVLC4T0HBL1 (RAID 0)
1265 MB/s
Przeciętny 2x Samsung PM9E1 MZVLC4T0HBL1 (RAID 0)
  (n=1)
1265 MB/s 0%
MSI Titan 18 HX A14VIG
2x Samsung PM9A1a MZVL22T0HDLB (RAID 0)
1088.59 MB/s -14%
Acer Predator Helios 18 PH18-72-98MW
2x SK Hynix HFS001TEJ9X115N (RAID 0)
1077.68 MB/s -15%
Access Time Read
Asus Strix Scar 18 G835LX
WD PC SN8000S 2TB
0.067 ms * -148%
Średnia w klasie Gaming
  (0.017 - 0.623, n=97, ostatnie 2 lata)
0.06364 ms * -136%
Schenker Key 17 Pro (M24)
Samsung 990 Pro 1 TB
0.046 ms * -70%
Acer Predator Helios 18 PH18-72-98MW
2x SK Hynix HFS001TEJ9X115N (RAID 0)
0.044 ms * -63%
MSI Titan 18 HX A14VIG
2x Samsung PM9A1a MZVL22T0HDLB (RAID 0)
0.036 ms * -33%
Alienware m18 R2
SK Hynix PC811 HFS002TEM9X152N
0.029 ms * -7%
Asus ROG Strix Scar 18 G835LXG
2x Samsung PM9E1 MZVLC4T0HBL1 (RAID 0)
0.027 ms *
Przeciętny 2x Samsung PM9E1 MZVLC4T0HBL1 (RAID 0)
  (n=1)
0.027 ms * -0%
Razer Blade 18 2024 RZ09-0509
 
0.025 ms * +7%
Access Time Write
MSI Titan 18 HX A14VIG
2x Samsung PM9A1a MZVL22T0HDLB (RAID 0)
0.091 ms * -406%
Razer Blade 18 2024 RZ09-0509
 
0.057 ms * -217%
Alienware m18 R2
SK Hynix PC811 HFS002TEM9X152N
0.055 ms * -206%
Średnia w klasie Gaming
  (0.012 - 0.277, n=97, ostatnie 2 lata)
0.03794 ms * -111%
Acer Predator Helios 18 PH18-72-98MW
2x SK Hynix HFS001TEJ9X115N (RAID 0)
0.019 ms * -6%
Asus Strix Scar 18 G835LX
WD PC SN8000S 2TB
0.019 ms * -6%
Asus ROG Strix Scar 18 G835LXG
2x Samsung PM9E1 MZVLC4T0HBL1 (RAID 0)
0.018 ms *
Przeciętny 2x Samsung PM9E1 MZVLC4T0HBL1 (RAID 0)
  (n=1)
0.018 ms * -0%
Schenker Key 17 Pro (M24)
Samsung 990 Pro 1 TB
0.015 ms * +17%

* ... im mniej tym lepiej

Ograniczanie przepustowości dysku: pętla odczytu DiskSpd, głębokość kolejki 8

035571010651420177521302485284031953550390542604615497053255680603563906745710074557810816585208875923095859940102951065011005113601171512070124251278013135134901384514200145551491015265156201597516330166851704017395Tooltip
Asus ROG Strix Scar 18 G835LXG; diskspd 2.0.17 f: Ø17083 (13259.78-17590.28) MB/s

Wydajność procesorów graficznych i gier

Komputer Asus ROG Strix SCAR 18 jest wyposażony w procesor graficzny Nvidia GeForce RTX 5090 do laptopów z 24 GB pamięci VRAM typu GDDR7. W naszym teście karta graficzna działała przy maksymalnym TGP wynoszącym 175 watów (150 watów + 25 watów w trybie Dynamic Boost), co czyni ją najszybszą dostępną konfiguracją. Wydajność w grach i aplikacjach jest odpowiednio bardzo wysoka, zapewniając znaczne rezerwy mocy nawet w przypadku wymagających tytułów przy wysokich rozdzielczościach.

W trybie ręcznym częstotliwości taktowania procesora graficznego i pamięci można dodatkowo zwiększyć, co pozwala na niewielki wzrost wydajności graficznej. Kolejnym pozytywnym aspektem jest to, że wydajność karty graficznej RTX 5090 Laptop pozostaje stabilna nawet przy długotrwałym obciążeniu i nie wykazuje znaczących spadków. W trybie pracy na baterii dostępny jest jednak znacznie niższy budżet mocy, dlatego wydajność karty graficznej zauważalnie spada.

3DMark Performance rating - Percent
Asus ROG Strix Scar 18 G835LXG
NVIDIA GeForce RTX 5090 Laptop, Intel Core Ultra 9 290HX Plus
100 pt
Przeciętny NVIDIA GeForce RTX 5090 Laptop
 
91.3 pt
Asus Strix Scar 18 G835LX
NVIDIA GeForce RTX 5090 Laptop, Intel Core Ultra 9 275HX
90.4 pt
MSI Titan 18 HX A14VIG
NVIDIA GeForce RTX 4090 Laptop GPU, Intel Core i9-14900HX
87.4 pt
Alienware m18 R2
NVIDIA GeForce RTX 4090 Laptop GPU, Intel Core i9-14900HX
86 pt
Razer Blade 18 2024 RZ09-0509
NVIDIA GeForce RTX 4090 Laptop GPU, Intel Core i9-14900HX
82.9 pt
Schenker Key 17 Pro (M24)
NVIDIA GeForce RTX 4090 Laptop GPU, Intel Core i9-14900HX
79.2 pt
Acer Predator Helios 18 PH18-72-98MW
NVIDIA GeForce RTX 4090 Laptop GPU, Intel Core i9-14900HX
76.6 pt
Średnia w klasie Gaming
 
65.8 pt
3DMark 11 - 1280x720 Performance GPU
Asus ROG Strix Scar 18 G835LXG
NVIDIA GeForce RTX 5090 Laptop, Intel Core Ultra 9 290HX Plus
77229 Points
Alienware m18 R2
NVIDIA GeForce RTX 4090 Laptop GPU, Intel Core i9-14900HX
69254 Points -10%
Przeciętny NVIDIA GeForce RTX 5090 Laptop
  (26378 - 80022, n=24)
66542 Points -14%
Asus Strix Scar 18 G835LX
NVIDIA GeForce RTX 5090 Laptop, Intel Core Ultra 9 275HX
66337 Points -14%
Razer Blade 18 2024 RZ09-0509
NVIDIA GeForce RTX 4090 Laptop GPU, Intel Core i9-14900HX
64952 Points -16%
MSI Titan 18 HX A14VIG
NVIDIA GeForce RTX 4090 Laptop GPU, Intel Core i9-14900HX
63978 Points -17%
Acer Predator Helios 18 PH18-72-98MW
NVIDIA GeForce RTX 4090 Laptop GPU, Intel Core i9-14900HX
59871 Points -22%
Schenker Key 17 Pro (M24)
NVIDIA GeForce RTX 4090 Laptop GPU, Intel Core i9-14900HX
59715 Points -23%
Średnia w klasie Gaming
  (21841 - 80022, n=104, ostatnie 2 lata)
50006 Points -35%
3DMark
2560x1440 Time Spy Graphics
Asus ROG Strix Scar 18 G835LXG
NVIDIA GeForce RTX 5090 Laptop, Intel Core Ultra 9 290HX Plus
25562 Points
Asus Strix Scar 18 G835LX
NVIDIA GeForce RTX 5090 Laptop, Intel Core Ultra 9 275HX
24599 Points -4%
Przeciętny NVIDIA GeForce RTX 5090 Laptop
  (19216 - 26212, n=27)
23833 Points -7%
Alienware m18 R2
NVIDIA GeForce RTX 4090 Laptop GPU, Intel Core i9-14900HX
22290 Points -13%
MSI Titan 18 HX A14VIG
NVIDIA GeForce RTX 4090 Laptop GPU, Intel Core i9-14900HX
22256 Points -13%
Razer Blade 18 2024 RZ09-0509
NVIDIA GeForce RTX 4090 Laptop GPU, Intel Core i9-14900HX
21246 Points -17%
Schenker Key 17 Pro (M24)
NVIDIA GeForce RTX 4090 Laptop GPU, Intel Core i9-14900HX
19741 Points -23%
Acer Predator Helios 18 PH18-72-98MW
NVIDIA GeForce RTX 4090 Laptop GPU, Intel Core i9-14900HX
18814 Points -26%
Średnia w klasie Gaming
  (5012 - 26212, n=115, ostatnie 2 lata)
15813 Points -38%
1920x1080 Fire Strike Graphics
Asus ROG Strix Scar 18 G835LXG
NVIDIA GeForce RTX 5090 Laptop, Intel Core Ultra 9 290HX Plus
54821 Points
Przeciętny NVIDIA GeForce RTX 5090 Laptop
  (42175 - 62849, n=29)
51817 Points -5%
MSI Titan 18 HX A14VIG
NVIDIA GeForce RTX 4090 Laptop GPU, Intel Core i9-14900HX
50532 Points -8%
Asus Strix Scar 18 G835LX
NVIDIA GeForce RTX 5090 Laptop, Intel Core Ultra 9 275HX
48863 Points -11%
Schenker Key 17 Pro (M24)
NVIDIA GeForce RTX 4090 Laptop GPU, Intel Core i9-14900HX
45600 Points -17%
Razer Blade 18 2024 RZ09-0509
NVIDIA GeForce RTX 4090 Laptop GPU, Intel Core i9-14900HX
44702 Points -18%
Alienware m18 R2
NVIDIA GeForce RTX 4090 Laptop GPU, Intel Core i9-14900HX
44492 Points -19%
Acer Predator Helios 18 PH18-72-98MW
NVIDIA GeForce RTX 4090 Laptop GPU, Intel Core i9-14900HX
43140 Points -21%
Średnia w klasie Gaming
  (12242 - 62849, n=115, ostatnie 2 lata)
38781 Points -29%
3DMark 06 Standard Score
69318 pkt.
3DMark Vantage P Result
145142 pkt.
3DMark 11 Performance
54427 pkt.
3DMark Ice Storm Standard Score
328157 pkt.
3DMark Cloud Gate Standard Score
79173 pkt.
3DMark Fire Strike Score
42509 pkt.
3DMark Fire Strike Extreme Score
30184 pkt.
3DMark Time Spy Score
24092 pkt.
3DMark Steel Nomad Score
6277 pkt.
Pomoc
Blender
v3.3 Classroom OPTIX/RTX
Średnia w klasie Gaming
  (9 - 32, n=106, ostatnie 2 lata)
18.3 Seconds * -31%
Razer Blade 18 2024 RZ09-0509
NVIDIA GeForce RTX 4090 Laptop GPU, Intel Core i9-14900HX
14 Seconds * -0%
Asus ROG Strix Scar 18 G835LXG
NVIDIA GeForce RTX 5090 Laptop, Intel Core Ultra 9 290HX Plus
14 Seconds *
Acer Predator Helios 18 PH18-72-98MW
NVIDIA GeForce RTX 4090 Laptop GPU, Intel Core i9-14900HX
13 Seconds * +7%
Schenker Key 17 Pro (M24)
NVIDIA GeForce RTX 4090 Laptop GPU, Intel Core i9-14900HX
13 Seconds * +7%
Alienware m18 R2
NVIDIA GeForce RTX 4090 Laptop GPU, Intel Core i9-14900HX
12 Seconds * +14%
Przeciętny NVIDIA GeForce RTX 5090 Laptop
  (9 - 18, n=23)
11.8 Seconds * +16%
MSI Titan 18 HX A14VIG
NVIDIA GeForce RTX 4090 Laptop GPU, Intel Core i9-14900HX
10 Seconds * +29%
Asus Strix Scar 18 G835LX
NVIDIA GeForce RTX 5090 Laptop, Intel Core Ultra 9 275HX
10 Seconds * +29%
v3.3 Classroom CUDA
Średnia w klasie Gaming
  (15 - 228, n=106, ostatnie 2 lata)
32.4 Seconds * -91%
Razer Blade 18 2024 RZ09-0509
NVIDIA GeForce RTX 4090 Laptop GPU, Intel Core i9-14900HX
19 Seconds * -12%
MSI Titan 18 HX A14VIG
NVIDIA GeForce RTX 4090 Laptop GPU, Intel Core i9-14900HX
18 Seconds * -6%
Acer Predator Helios 18 PH18-72-98MW
NVIDIA GeForce RTX 4090 Laptop GPU, Intel Core i9-14900HX
18 Seconds * -6%
Alienware m18 R2
NVIDIA GeForce RTX 4090 Laptop GPU, Intel Core i9-14900HX
18 Seconds * -6%
Schenker Key 17 Pro (M24)
NVIDIA GeForce RTX 4090 Laptop GPU, Intel Core i9-14900HX
18 Seconds * -6%
Przeciętny NVIDIA GeForce RTX 5090 Laptop
  (15 - 37, n=22)
17.6 Seconds * -4%
Asus ROG Strix Scar 18 G835LXG
NVIDIA GeForce RTX 5090 Laptop, Intel Core Ultra 9 290HX Plus
17 Seconds *
Asus Strix Scar 18 G835LX
NVIDIA GeForce RTX 5090 Laptop, Intel Core Ultra 9 275HX
16 Seconds * +6%
v3.3 Classroom CPU
Średnia w klasie Gaming
  (122 - 565, n=102, ostatnie 2 lata)
247 Seconds * -96%
Acer Predator Helios 18 PH18-72-98MW
NVIDIA GeForce RTX 4090 Laptop GPU, Intel Core i9-14900HX
225 Seconds * -79%
Schenker Key 17 Pro (M24)
NVIDIA GeForce RTX 4090 Laptop GPU, Intel Core i9-14900HX
218 Seconds * -73%
Razer Blade 18 2024 RZ09-0509
NVIDIA GeForce RTX 4090 Laptop GPU, Intel Core i9-14900HX
207 Seconds * -64%
Alienware m18 R2
NVIDIA GeForce RTX 4090 Laptop GPU, Intel Core i9-14900HX
180 Seconds * -43%
MSI Titan 18 HX A14VIG
NVIDIA GeForce RTX 4090 Laptop GPU, Intel Core i9-14900HX
179 Seconds * -42%
Przeciętny NVIDIA GeForce RTX 5090 Laptop
  (123 - 282, n=23)
164.3 Seconds * -30%
Asus Strix Scar 18 G835LX
NVIDIA GeForce RTX 5090 Laptop, Intel Core Ultra 9 275HX
137 Seconds * -9%
Asus ROG Strix Scar 18 G835LXG
NVIDIA GeForce RTX 5090 Laptop, Intel Core Ultra 9 290HX Plus
126 Seconds *

* ... im mniej tym lepiej

Performance rating - Percent
Asus ROG Strix Scar 18 G835LXG
Intel Core Ultra 9 290HX Plus, NVIDIA GeForce RTX 5090 Laptop
98 pt
Asus Strix Scar 18 G835LX
Intel Core Ultra 9 275HX, NVIDIA GeForce RTX 5090 Laptop
91.6 pt
Alienware m18 R2
Intel Core i9-14900HX, NVIDIA GeForce RTX 4090 Laptop GPU
87.8 pt
MSI Titan 18 HX A14VIG
Intel Core i9-14900HX, NVIDIA GeForce RTX 4090 Laptop GPU
86.6 pt
Schenker Key 17 Pro (M24)
Intel Core i9-14900HX, NVIDIA GeForce RTX 4090 Laptop GPU
82.4 pt
Acer Predator Helios 18 PH18-72-98MW -2!
Intel Core i9-14900HX, NVIDIA GeForce RTX 4090 Laptop GPU
78.1 pt
Razer Blade 18 2024 RZ09-0509
Intel Core i9-14900HX, NVIDIA GeForce RTX 4090 Laptop GPU
75.9 pt
Średnia w klasie Gaming
 
70 pt
Cyberpunk 2077 - 1920x1080 Ultra Preset (FSR off)
Asus ROG Strix Scar 18 G835LXG
Intel Core Ultra 9 290HX Plus, NVIDIA GeForce RTX 5090 Laptop
169.4 (133.9min) fps
Asus Strix Scar 18 G835LX
Intel Core Ultra 9 275HX, NVIDIA GeForce RTX 5090 Laptop
154.9 (126.3min) fps -9%
Alienware m18 R2
Intel Core i9-14900HX, NVIDIA GeForce RTX 4090 Laptop GPU
133.9 (67.5min) fps -21%
MSI Titan 18 HX A14VIG
Intel Core i9-14900HX, NVIDIA GeForce RTX 4090 Laptop GPU
129.8 (26.2min) fps -23%
Schenker Key 17 Pro (M24)
Intel Core i9-14900HX, NVIDIA GeForce RTX 4090 Laptop GPU
113.5 (84.3min) fps -33%
Średnia w klasie Gaming
  (17.7 - 169.9, n=115, ostatnie 2 lata)
108.4 fps -36%
Razer Blade 18 2024 RZ09-0509
Intel Core i9-14900HX, NVIDIA GeForce RTX 4090 Laptop GPU
101.25 (77.2min) fps -40%
Baldur's Gate 3 - 1920x1080 Ultra Preset AA:T
MSI Titan 18 HX A14VIG
Intel Core i9-14900HX, NVIDIA GeForce RTX 4090 Laptop GPU
207.7 fps 0%
Asus ROG Strix Scar 18 G835LXG
Intel Core Ultra 9 290HX Plus, NVIDIA GeForce RTX 5090 Laptop
207 (90.2min, 154.6P0.1, 186.9P1) fps
Alienware m18 R2
Intel Core i9-14900HX, NVIDIA GeForce RTX 4090 Laptop GPU
202 fps -2%
Asus Strix Scar 18 G835LX
Intel Core Ultra 9 275HX, NVIDIA GeForce RTX 5090 Laptop
193.7 fps -6%
Schenker Key 17 Pro (M24)
Intel Core i9-14900HX, NVIDIA GeForce RTX 4090 Laptop GPU
177 fps -14%
Razer Blade 18 2024 RZ09-0509
Intel Core i9-14900HX, NVIDIA GeForce RTX 4090 Laptop GPU
160.5 (65P0.1, 99.5P1) fps -22%
Średnia w klasie Gaming
  (59.4 - 246, n=104, ostatnie 2 lata)
139.9 fps -32%
GTA V - 1920x1080 Highest AA:4xMSAA + FX AF:16x
Asus ROG Strix Scar 18 G835LXG
Intel Core Ultra 9 290HX Plus, NVIDIA GeForce RTX 5090 Laptop
173 (3.12min, 125P1) fps
Asus Strix Scar 18 G835LX
Intel Core Ultra 9 275HX, NVIDIA GeForce RTX 5090 Laptop
161.9 (2.78min, 111.1P1) fps -6%
MSI Titan 18 HX A14VIG
Intel Core i9-14900HX, NVIDIA GeForce RTX 4090 Laptop GPU
139.2 (3.73min, 90.9P1) fps -20%
Alienware m18 R2
Intel Core i9-14900HX, NVIDIA GeForce RTX 4090 Laptop GPU
137 (7.81min, 83.3P1) fps -21%
Acer Predator Helios 18 PH18-72-98MW
Intel Core i9-14900HX, NVIDIA GeForce RTX 4090 Laptop GPU
134 (22.7min, 90.9P1) fps -23%
Średnia w klasie Gaming
  (48.3 - 186.9, n=94, ostatnie 2 lata)
132.3 fps -24%
Razer Blade 18 2024 RZ09-0509
Intel Core i9-14900HX, NVIDIA GeForce RTX 4090 Laptop GPU
129.8 (16.1min, 90.9P1) fps -25%
Schenker Key 17 Pro (M24)
Intel Core i9-14900HX, NVIDIA GeForce RTX 4090 Laptop GPU
126.7 (8.43min, 83.3P1) fps -27%
Final Fantasy XV Benchmark - 1920x1080 High Quality
Asus ROG Strix Scar 18 G835LXG
Intel Core Ultra 9 290HX Plus, NVIDIA GeForce RTX 5090 Laptop
214 fps
Asus Strix Scar 18 G835LX
Intel Core Ultra 9 275HX, NVIDIA GeForce RTX 5090 Laptop
199.3 fps -7%
Alienware m18 R2
Intel Core i9-14900HX, NVIDIA GeForce RTX 4090 Laptop GPU
193.2 fps -10%
MSI Titan 18 HX A14VIG
Intel Core i9-14900HX, NVIDIA GeForce RTX 4090 Laptop GPU
184 fps -14%
Schenker Key 17 Pro (M24)
Intel Core i9-14900HX, NVIDIA GeForce RTX 4090 Laptop GPU
174.6 fps -18%
Acer Predator Helios 18 PH18-72-98MW
Intel Core i9-14900HX, NVIDIA GeForce RTX 4090 Laptop GPU
157.1 fps -27%
Razer Blade 18 2024 RZ09-0509
Intel Core i9-14900HX, NVIDIA GeForce RTX 4090 Laptop GPU
156.9 fps -27%
Średnia w klasie Gaming
  (41 - 215, n=95, ostatnie 2 lata)
150.1 fps -30%
Strange Brigade - 1920x1080 ultra AA:ultra AF:16
Asus ROG Strix Scar 18 G835LXG
Intel Core Ultra 9 290HX Plus, NVIDIA GeForce RTX 5090 Laptop
458 (143.1min, 329P1) fps
Asus Strix Scar 18 G835LX
Intel Core Ultra 9 275HX, NVIDIA GeForce RTX 5090 Laptop
401 (103.4min, 236P1) fps -12%
MSI Titan 18 HX A14VIG
Intel Core i9-14900HX, NVIDIA GeForce RTX 4090 Laptop GPU
385 (27.2min, 274P1) fps -16%
Alienware m18 R2
Intel Core i9-14900HX, NVIDIA GeForce RTX 4090 Laptop GPU
369 (31.4min, 266P1) fps -19%
Schenker Key 17 Pro (M24)
Intel Core i9-14900HX, NVIDIA GeForce RTX 4090 Laptop GPU
360 (22.5min, 268P1) fps -21%
Razer Blade 18 2024 RZ09-0509
Intel Core i9-14900HX, NVIDIA GeForce RTX 4090 Laptop GPU
325 (49.1min, 213P1) fps -29%
Acer Predator Helios 18 PH18-72-98MW
Intel Core i9-14900HX, NVIDIA GeForce RTX 4090 Laptop GPU
305 (14.5min, 223P1) fps -33%
Średnia w klasie Gaming
  (76.3 - 458, n=87, ostatnie 2 lata)
288 fps -37%
Dota 2 Reborn - 1920x1080 ultra (3/3) best looking
Asus ROG Strix Scar 18 G835LXG
Intel Core Ultra 9 290HX Plus, NVIDIA GeForce RTX 5090 Laptop
194.7 (163.7min) fps
Asus Strix Scar 18 G835LX
Intel Core Ultra 9 275HX, NVIDIA GeForce RTX 5090 Laptop
186.6 (157.4min) fps -4%
Schenker Key 17 Pro (M24)
Intel Core i9-14900HX, NVIDIA GeForce RTX 4090 Laptop GPU
178.4 (149.2min) fps -8%
Acer Predator Helios 18 PH18-72-98MW
Intel Core i9-14900HX, NVIDIA GeForce RTX 4090 Laptop GPU
178.3 (150.2min) fps -8%
MSI Titan 18 HX A14VIG
Intel Core i9-14900HX, NVIDIA GeForce RTX 4090 Laptop GPU
174.5 (151.1min) fps -10%
Alienware m18 R2
Intel Core i9-14900HX, NVIDIA GeForce RTX 4090 Laptop GPU
171.8 (143.6min) fps -12%
Razer Blade 18 2024 RZ09-0509
Intel Core i9-14900HX, NVIDIA GeForce RTX 4090 Laptop GPU
164 (140min) fps -16%
Średnia w klasie Gaming
  (84.8 - 248, n=107, ostatnie 2 lata)
153.7 fps -21%
X-Plane 11.11 - 1920x1080 high (fps_test=3)
Alienware m18 R2
Intel Core i9-14900HX, NVIDIA GeForce RTX 4090 Laptop GPU
140.6 fps +15%
Schenker Key 17 Pro (M24)
Intel Core i9-14900HX, NVIDIA GeForce RTX 4090 Laptop GPU
139.7 fps +15%
Razer Blade 18 2024 RZ09-0509
Intel Core i9-14900HX, NVIDIA GeForce RTX 4090 Laptop GPU
127.2 fps +4%
MSI Titan 18 HX A14VIG
Intel Core i9-14900HX, NVIDIA GeForce RTX 4090 Laptop GPU
126.1 fps +4%
Asus ROG Strix Scar 18 G835LXG
Intel Core Ultra 9 290HX Plus, NVIDIA GeForce RTX 5090 Laptop
121.8 fps
Asus Strix Scar 18 G835LX
Intel Core Ultra 9 275HX, NVIDIA GeForce RTX 5090 Laptop
121.7 fps 0%
Acer Predator Helios 18 PH18-72-98MW
Intel Core i9-14900HX, NVIDIA GeForce RTX 4090 Laptop GPU
114.5 fps -6%
Średnia w klasie Gaming
  (55.5 - 143.5, n=109, ostatnie 2 lata)
98.7 fps -19%
The Witcher 3
1024x768 Low Graphics & Postprocessing
MSI Titan 18 HX A14VIG
Intel Core i9-14900HX, NVIDIA GeForce RTX 4090 Laptop GPU
595.3 (554min) fps +33%
Alienware m18 R2
Intel Core i9-14900HX, NVIDIA GeForce RTX 4090 Laptop GPU
585.5 (526min) fps +31%
Średnia w klasie Gaming
  (447 - 686, n=2, ostatnie 2 lata)
567 fps +27%
Asus ROG Strix Scar 18 G835LXG
Intel Core Ultra 9 290HX Plus, NVIDIA GeForce RTX 5090 Laptop
447 (29.3min, 93.2P0.1, 271P1) fps
Przeciętny NVIDIA GeForce RTX 5090 Laptop
  (n=1)
447 fps 0%
1366x768 Medium Graphics & Postprocessing
Alienware m18 R2
Intel Core i9-14900HX, NVIDIA GeForce RTX 4090 Laptop GPU
525.8 (493min) fps +23%
MSI Titan 18 HX A14VIG
Intel Core i9-14900HX, NVIDIA GeForce RTX 4090 Laptop GPU
506.6 (447min) fps +18%
Średnia w klasie Gaming
  (428 - 517, n=2, ostatnie 2 lata)
473 fps +11%
Asus ROG Strix Scar 18 G835LXG
Intel Core Ultra 9 290HX Plus, NVIDIA GeForce RTX 5090 Laptop
428 (15.6min, 153P0.1, 268P1) fps
Przeciętny NVIDIA GeForce RTX 5090 Laptop
  (n=1)
428 fps 0%
1920x1080 High Graphics & Postprocessing (Nvidia HairWorks Off)
MSI Titan 18 HX A14VIG
Intel Core i9-14900HX, NVIDIA GeForce RTX 4090 Laptop GPU
412.2 (387min) fps +2%
Alienware m18 R2
Intel Core i9-14900HX, NVIDIA GeForce RTX 4090 Laptop GPU
405.6 (374min) fps 0%
Asus ROG Strix Scar 18 G835LXG
Intel Core Ultra 9 290HX Plus, NVIDIA GeForce RTX 5090 Laptop
404 (88.1min, 153.9P0.1, 264P1) fps
Przeciętny NVIDIA GeForce RTX 5090 Laptop
  (n=1)
404 fps 0%
Średnia w klasie Gaming
  (341 - 404, n=2, ostatnie 2 lata)
373 fps -8%
1920x1080 Ultra Graphics & Postprocessing (HBAO+)
Asus ROG Strix Scar 18 G835LXG
Intel Core Ultra 9 290HX Plus, NVIDIA GeForce RTX 5090 Laptop
234 (14.7min, 99.6P0.1, 147.5P1) fps
Przeciętny NVIDIA GeForce RTX 5090 Laptop
  (192 - 240, n=5)
222 fps -5%
MSI Titan 18 HX A14VIG
Intel Core i9-14900HX, NVIDIA GeForce RTX 4090 Laptop GPU
211.2 (165min) fps -10%
Alienware m18 R2
Intel Core i9-14900HX, NVIDIA GeForce RTX 4090 Laptop GPU
205.7 (193min) fps -12%
Średnia w klasie Gaming
  (104.7 - 240, n=7, ostatnie 2 lata)
196.3 fps -16%
Razer Blade 18 2024 RZ09-0509
Intel Core i9-14900HX, NVIDIA GeForce RTX 4090 Laptop GPU
193 (53.6P0.1, 119.7P1) fps -18%
Acer Predator Helios 18 PH18-72-98MW
Intel Core i9-14900HX, NVIDIA GeForce RTX 4090 Laptop GPU
180 fps -23%

Wykres FPS – 30 min, Cyberpunk 2077, rozdzielczość 1920 x 1080, ustawienia „Ultra” (FSR wyłączone)
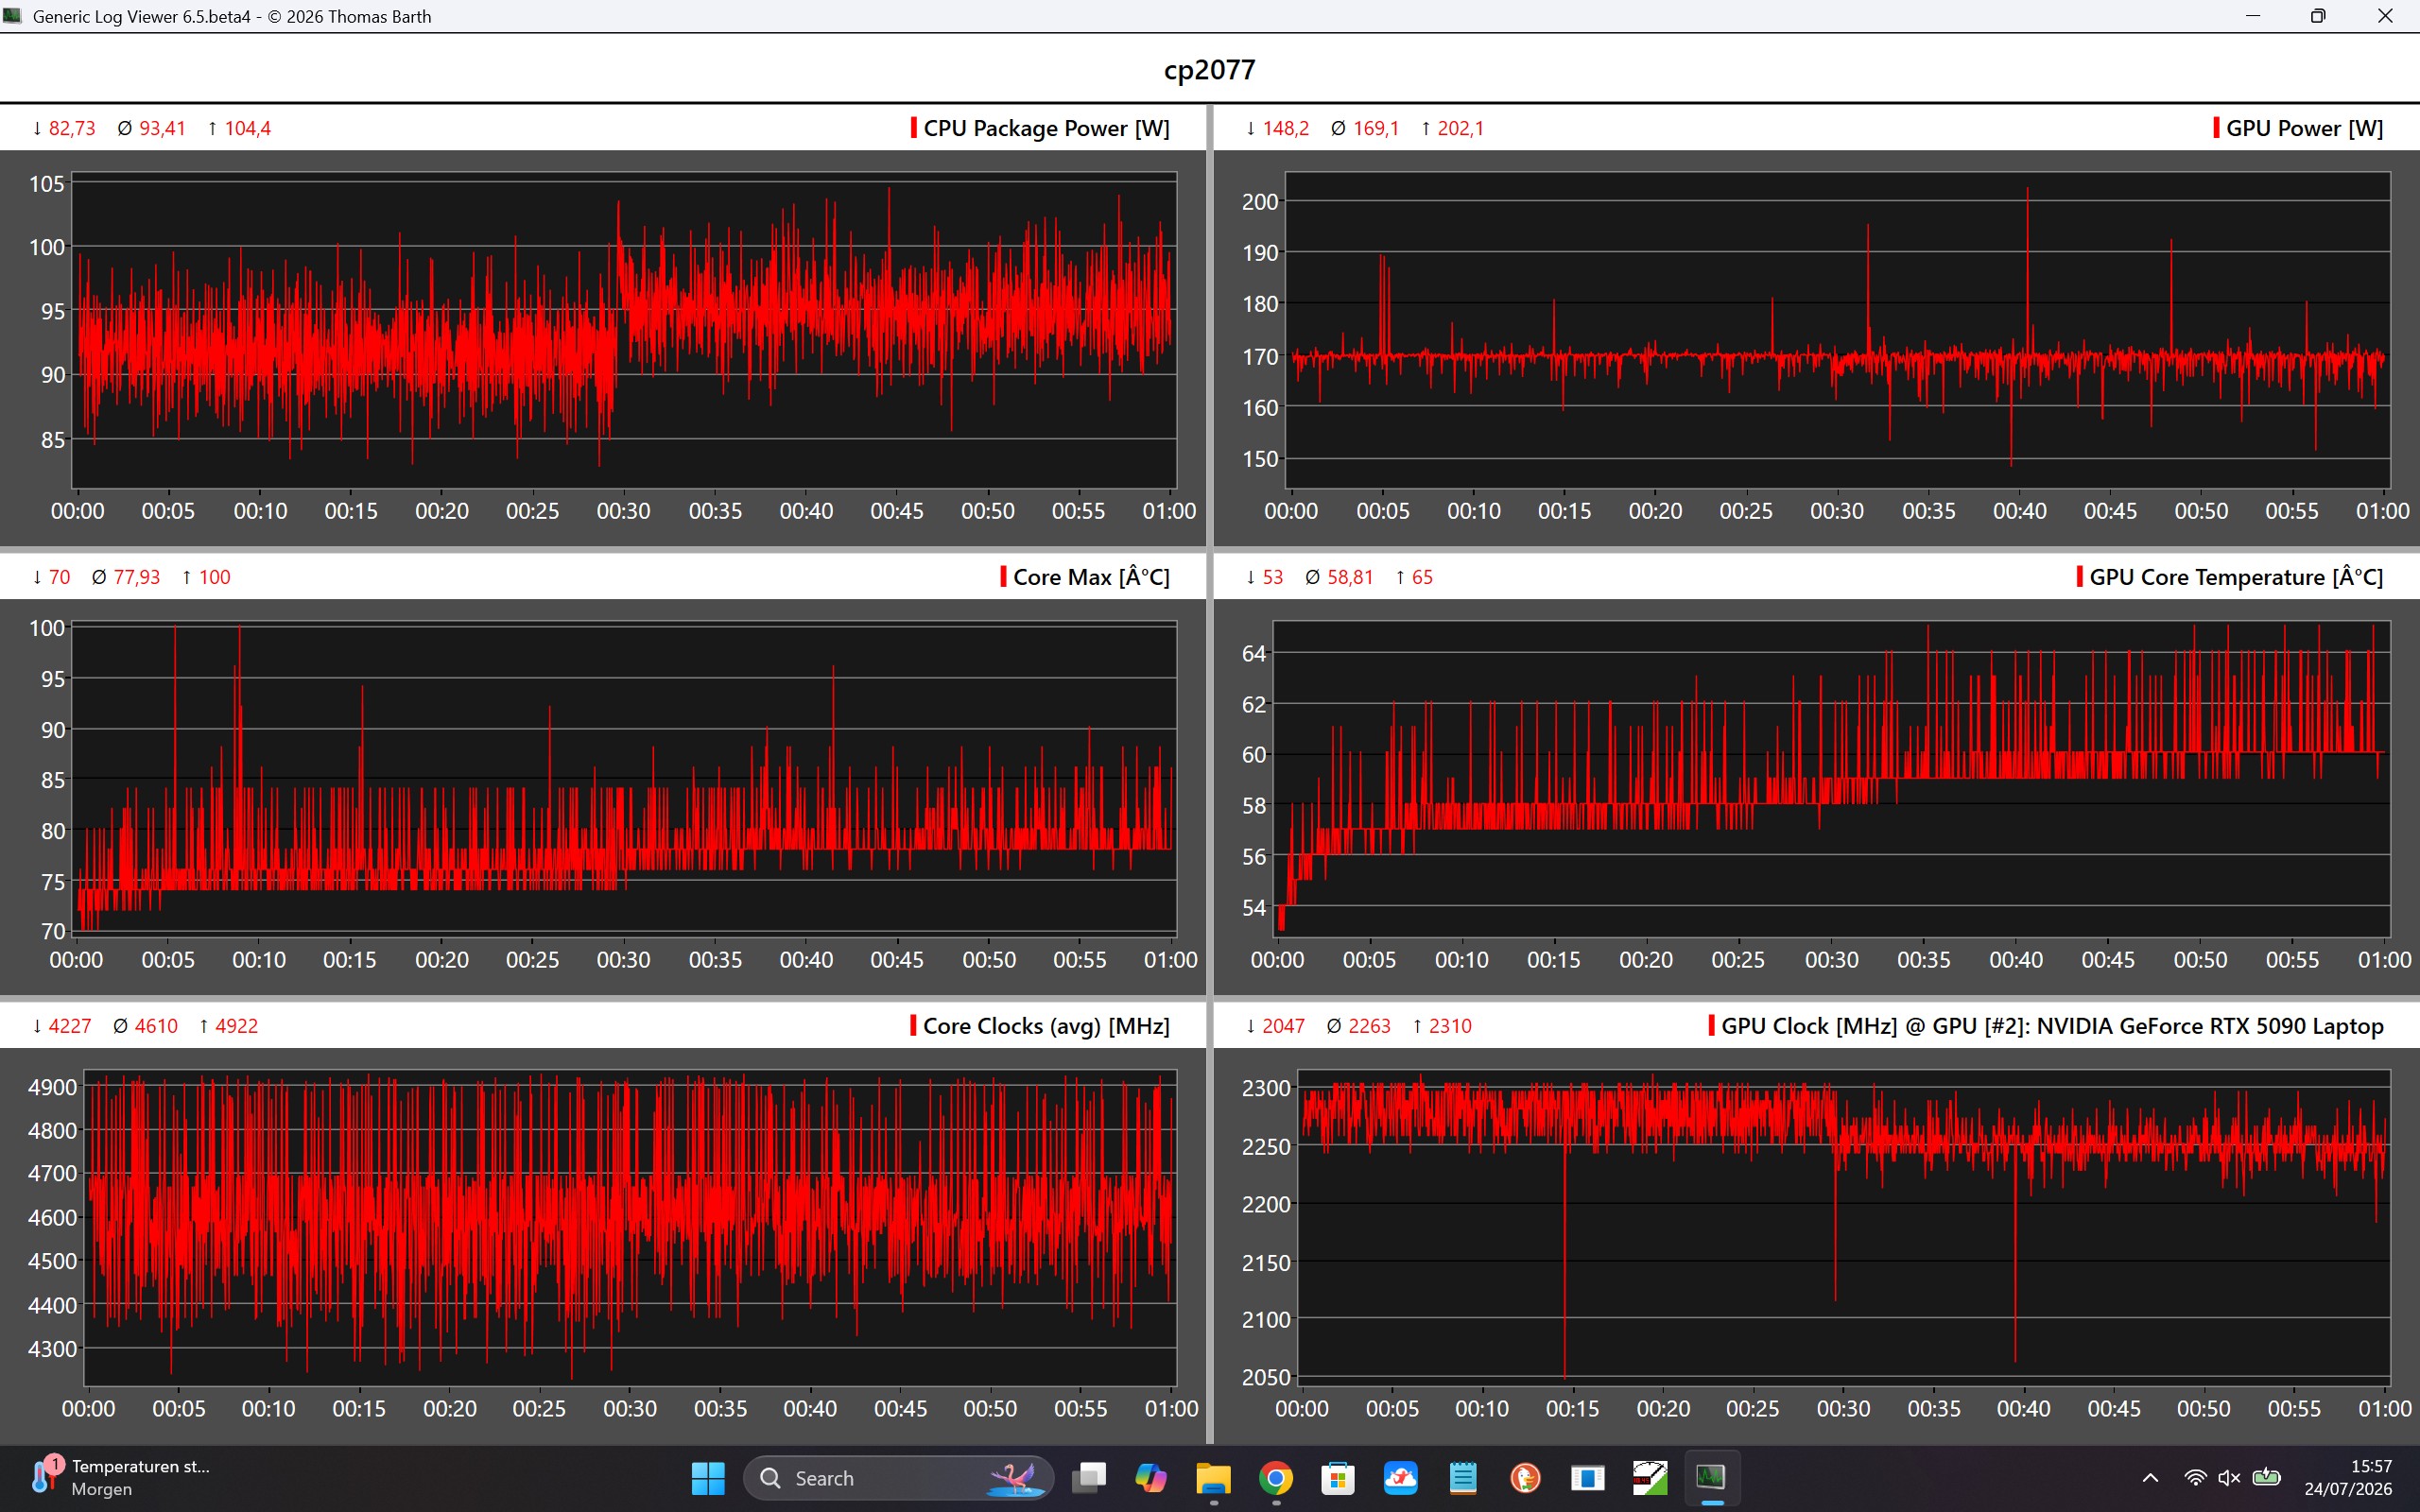
05101520253035404550556065707580859095100105110115120125130135140145150155160165Tooltip
Asus ROG Strix Scar 18 G835LXG Ultra 9 290HX Plus, GeForce RTX 5090 Laptop: Ø163.1 (152.9-166.7) fps
Asus Strix Scar 18 G835LX Ultra 9 275HX, GeForce RTX 5090 Laptop: Ø144.2 (124.3-147.1) fps
Specyfikacje procesora i karty graficznej dla gry Cyberpunk 2077
lowmed.highultraQHD4K
GTA V (2015) 187.7 187.1 186.8 173 173.7 186.6
The Witcher 3 (2015) 447 428 404 234 193.5 170.9
Dota 2 Reborn (2015) 238.8 217.9 207.9 194.7 193.1
Final Fantasy XV Benchmark (2018) 234 231 214 174 107
X-Plane 11.11 (2018) 149.3 150.3 121.8 97.6
Strange Brigade (2018) 654 500 494 458 354 184.5
Baldur's Gate 3 (2023) 229 240 212 207 152.8 87.4
Cyberpunk 2077 (2023) 209 194.8 173.3 169.4 118.7 56.1
Alan Wake 2 (2023) 145.3 143.5 132.7 88.3 46
F1 24 (2024) 363 391 372 163.6 109.4 54.3
Black Myth: Wukong (2024) 182 135 107 65 49 29
Indiana Jones and the Great Circle (2024) 217 183.2 164.5 152.5 122.8 75
Kingdom Come Deliverance 2 (2025) 252 206 177.7 126.8 94.4 54.7
Assassin's Creed Shadows (2025) 113 111 96 75 64 46
F1 25 (2025) 286 266 255 65.3 39.1 18.8
Anno 117: Pax Romana (2025) 191.3 149.4 121.6 69.8 49.5 28.2
Call of Duty Black Ops 7 (2025) 216 208 170 69 47 31
Pragmata (2026) 257 199.9 164.9 125 71.4
007 First Light (2026) 135 128 111.8 108.2 78.6 45.9

Emisje i energia

Szumy systemowe

Poziom hałasu laptopa Asus ROG Strix SCAR 18 zależy w dużym stopniu od wybranego profilu zasilania. Do codziennego użytku zaleca się tryb cichy (Quiet Mode), ponieważ wentylatory często zatrzymują się przy niewielkim obciążeniu, a laptop pracuje przy przyjemnie niskim poziomie hałasu. W tym profilu można grać nawet w mniej wymagające gry, przy umiarkowanym hałasie w tle.

W trybie Turbo wentylatory pracują jednak nieprzerwanie i osiągają poziom hałasu do 55,1 dB(A) przy dużym obciążeniu lub podczas grania. Dlatego podczas dłuższych sesji gamingowych zaleca się korzystanie ze słuchawek. Pozytywnym aspektem jest to, że wydajność chłodzenia pozostaje na stałym poziomie nawet przy tak wysokim poziomie hałasu. Nieznaczny elektroniczny szum w tle występował jedynie w kilku syntetycznych testach wydajności procesora graficznego i nie był odczuwalny podczas normalnej pracy ani podczas grania.

Hałas

luz
30.9 / 31 / 31.1 dB
obciążenie
47.8 / 55.1 dB
  red to green bar
 
 
30 dB
cichy
40 dB(A)
słyszalny
50 dB(A)
irytujący
 
min: dark, med: mid, max: light   Earthworks M23R (odległość 15 cm)   hałas otoczenia: 25 dB(A)
dB(A) 0102030405060708090Deep BassMiddle BassHigh BassLower RangeMidsHigher MidsLower HighsMid HighsUpper HighsSuper Highs2032.634.834.632.728.344.72529.728.528.624.828.833.43131.926.428.1263035.94022.922.119.92223.532.15022.525.219.919.218.933.36321.219.216.817.915.732.98023.617.515.314.511.431.710022.616.416.315.512.334.212526.516.316.316.111.432.116026.416.717.517.51332.72002817.418.518.110.431.72503018.419.418.31038.531530.819.218.218.89.236.140035.124.624.223.610.142.650032.520.120.420.110.644.363036.322.922.822.81038.180036.621.421.621.910.437.2100036.82120.620.611.939.3125037.520.319.919.61242.5160038.120.720.420.411.942.8200039.220.1202011.938.2250037.518.718.218.212.437.531503516.516.616.313.236.44000341514.91513.838.150003314.714.614.614.134.3630031.215.114.914.914.533.8800026151514.914.732.81000024.815.715.715.61534.51250025.415.11515.114.630.41600025.516.416.516.214.224.7SPL47.831.13130.92551N5.91.41.41.40.68median 32.5median 17.4median 18.2median 18.1median 12median 36.4Delta5.32.32.42.41.83.2hearing rangehide median Fan NoiseAsus ROG Strix Scar 18 G835LXG
Asus ROG Strix Scar 18 G835LXG
Ultra 9 290HX Plus, GeForce RTX 5090 Laptop
Asus Strix Scar 18 G835LX
Ultra 9 275HX, GeForce RTX 5090 Laptop
Razer Blade 18 2024 RZ09-0509
i9-14900HX, GeForce RTX 4090 Laptop GPU
Alienware m18 R2
i9-14900HX, GeForce RTX 4090 Laptop GPU
Acer Predator Helios 18 PH18-72-98MW
i9-14900HX, GeForce RTX 4090 Laptop GPU
MSI Titan 18 HX A14VIG
i9-14900HX, GeForce RTX 4090 Laptop GPU
Schenker Key 17 Pro (M24)
i9-14900HX, GeForce RTX 4090 Laptop GPU
Noise
5%
8%
12%
-5%
10%
9%
wyłączone / środowisko * (dB)
25
23.3
7%
23.4
6%
23.6
6%
25
-0%
22.8
9%
23.41
6%
Idle Minimum * (dB)
30.9
29.8
4%
23.9
23%
23.8
23%
30
3%
23.8
23%
25.33
18%
Idle Average * (dB)
31
29.8
4%
28.2
9%
26.1
16%
36
-16%
23.8
23%
25.33
18%
Idle Maximum * (dB)
31.1
29.8
4%
29
7%
31.5
-1%
44
-41%
28
10%
25.33
19%
Load Average * (dB)
47.8
42.9
10%
36.8
23%
31.5
34%
48
-0%
38
21%
33.57
30%
Witcher 3 ultra * (dB)
55.2
54.1
2%
52.1
6%
49
11%
57.3
-4%
Cyberpunk 2077 ultra * (dB)
55.1
53.7
3%
61.97
-12%
Load Maximum * (dB)
55.1
53.7
3%
61.1
-11%
56.6
-3%
51
7%
62.8
-14%
62.14
-13%

* ... im mniej tym lepiej

Temperatura

Temperatury powierzchniowe laptopa Asus ROG Strix SCAR 18 pozostają pod dobrą kontrolą nawet przy dużym obciążeniu. W odizolowanych obszarach na spodzie urządzenia zmierzyliśmy temperatury sięgające jedynie 45 °C. Z kolei klawiatura nagrzewa się jedynie nieznacznie, dzięki czemu zwłaszcza obszar klawiszy WASD pozostaje przyjemnie chłodny nawet podczas dłuższych sesji grania.

W teście obciążeniowym układ chłodzenia nadaje priorytet karcie graficznej GeForce RTX 5090 Laptop, której TGP ustabilizowało się po krótkim czasie na poziomie około 175 watów. Procesor Intel Core Ultra 9 290HX pracuje równolegle przy mocy około 95 watów. Pomimo wysokiego zużycia energii temperatury procesora i karty graficznej przez cały czas utrzymują się w bezpiecznym zakresie.
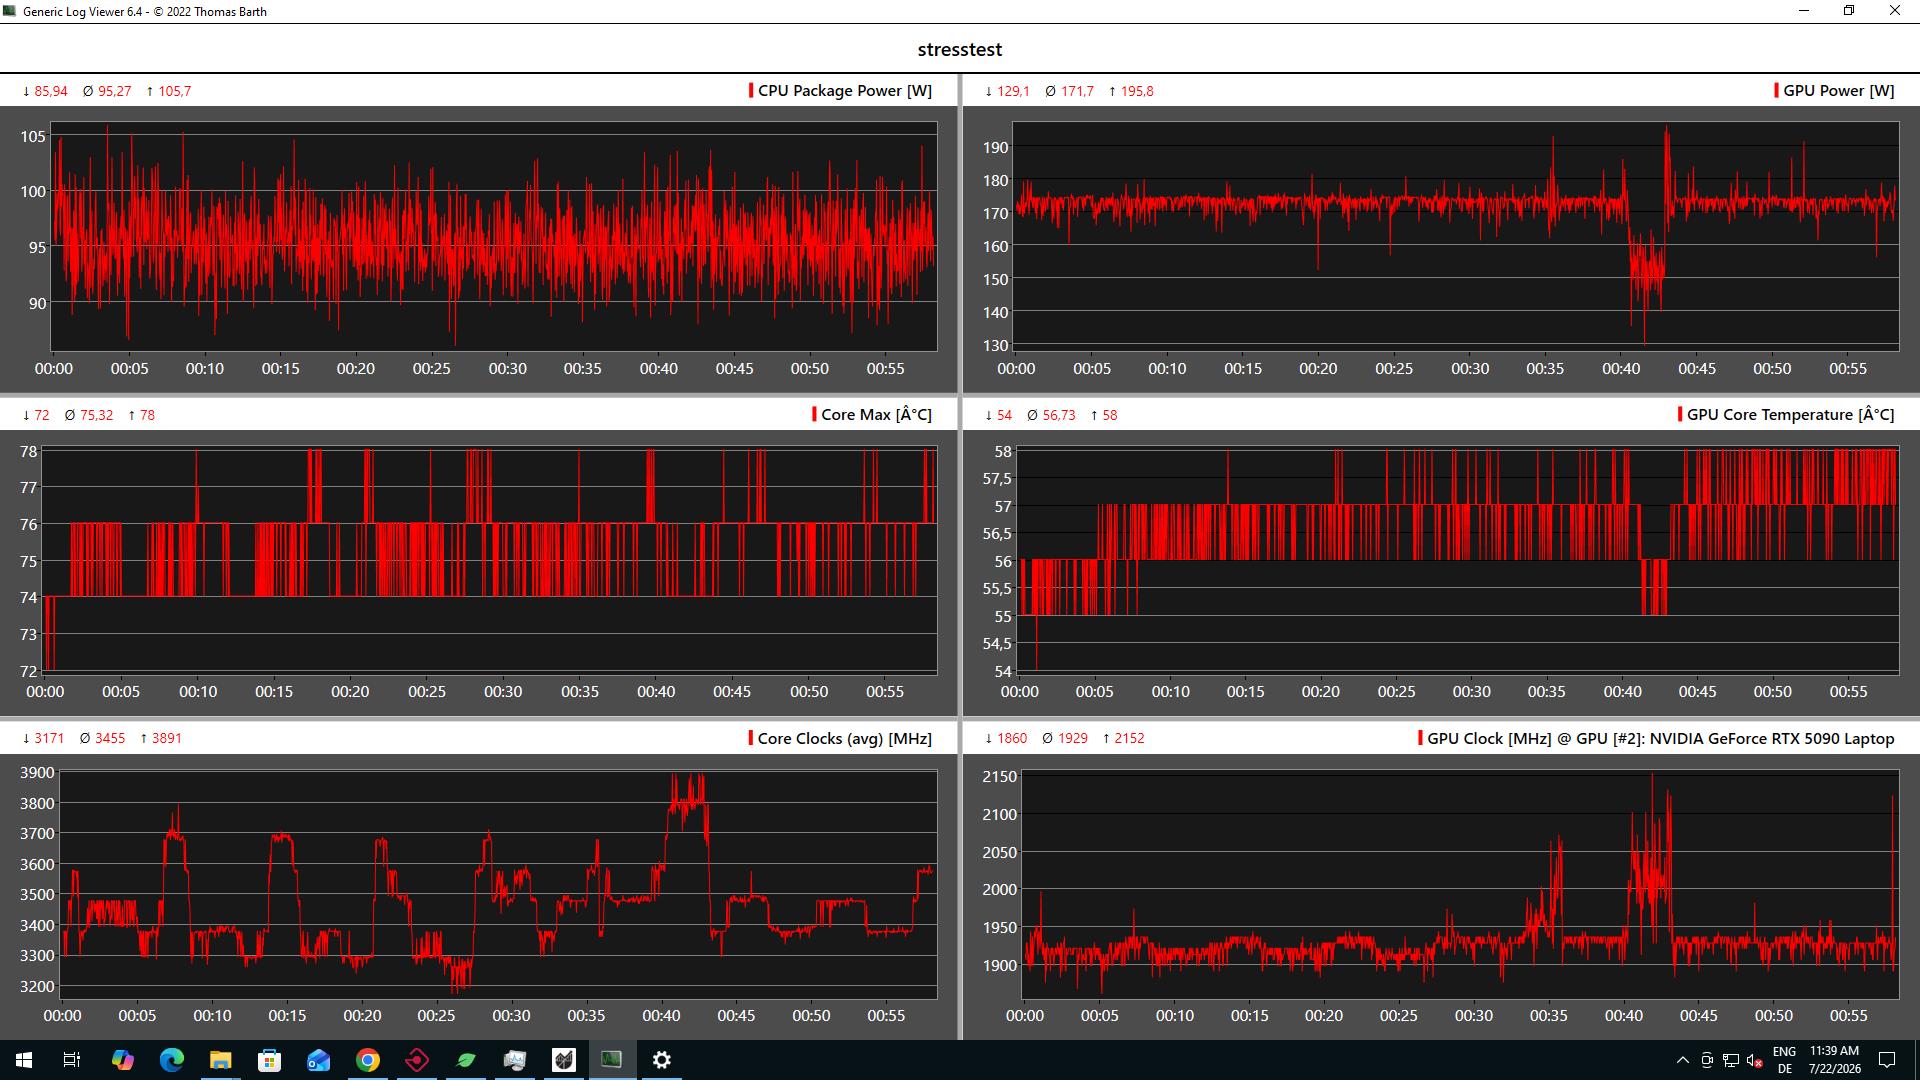
Test obciążeniowy procesora i karty graficznej
 34.3 °C37.5 °C32.6 °C 
 29.2 °C34.6 °C27.7 °C 
 26.8 °C28.6 °C27.3 °C 
maks. w ogóle: 37.5 °C
średnia: 31 °C
25.8 °C40.9 °C28.5 °C
25.7 °C26.1 °C26.4 °C
26.3 °C27.5 °C27.4 °C
maks. w ogóle: 40.9 °C
średnia: 28.3 °C
zasilacz  53.9 °C | temperatura otoczenia 22.7 °C | Fluke t3000FC (calibrated)
(+) Średnia temperatura górnej części przy maksymalnym obciążeniu wynosi 31 °C / 88 F, w porównaniu do średniej 33.9 °C / ###class_avg_f# ## F dla urządzeń w klasie Gaming.
(+) Maksymalna temperatura w górnej części wynosi 37.5 °C / 100 F, w porównaniu do średniej 40.4 °C / 105 F , począwszy od 21.2 do 68.8 °C dla klasy Gaming.
(±) Dno nagrzewa się maksymalnie do 40.9 °C / 106 F, w porównaniu do średniej 43.2 °C / 110 F
(+) W stanie bezczynności średnia temperatura górnej części wynosi 28 °C / 82 F, w porównaniu ze średnią temperaturą urządzenia wynoszącą 33.9 °C / ### class_avg_f### F.
(±) 3: The average temperature for the upper side is 32.7 °C / 91 F, compared to the average of 33.9 °C / 93 F for the class Gaming.
(+) Podpórki pod nadgarstki i touchpad są chłodniejsze niż temperatura skóry i maksymalnie 30.7 °C / 87.3 F i dlatego są chłodne w dotyku.
(±) Średnia temperatura obszaru podparcia dłoni w podobnych urządzeniach wynosiła 28.8 °C / 83.8 F (-1.9 °C / -3.5 F).
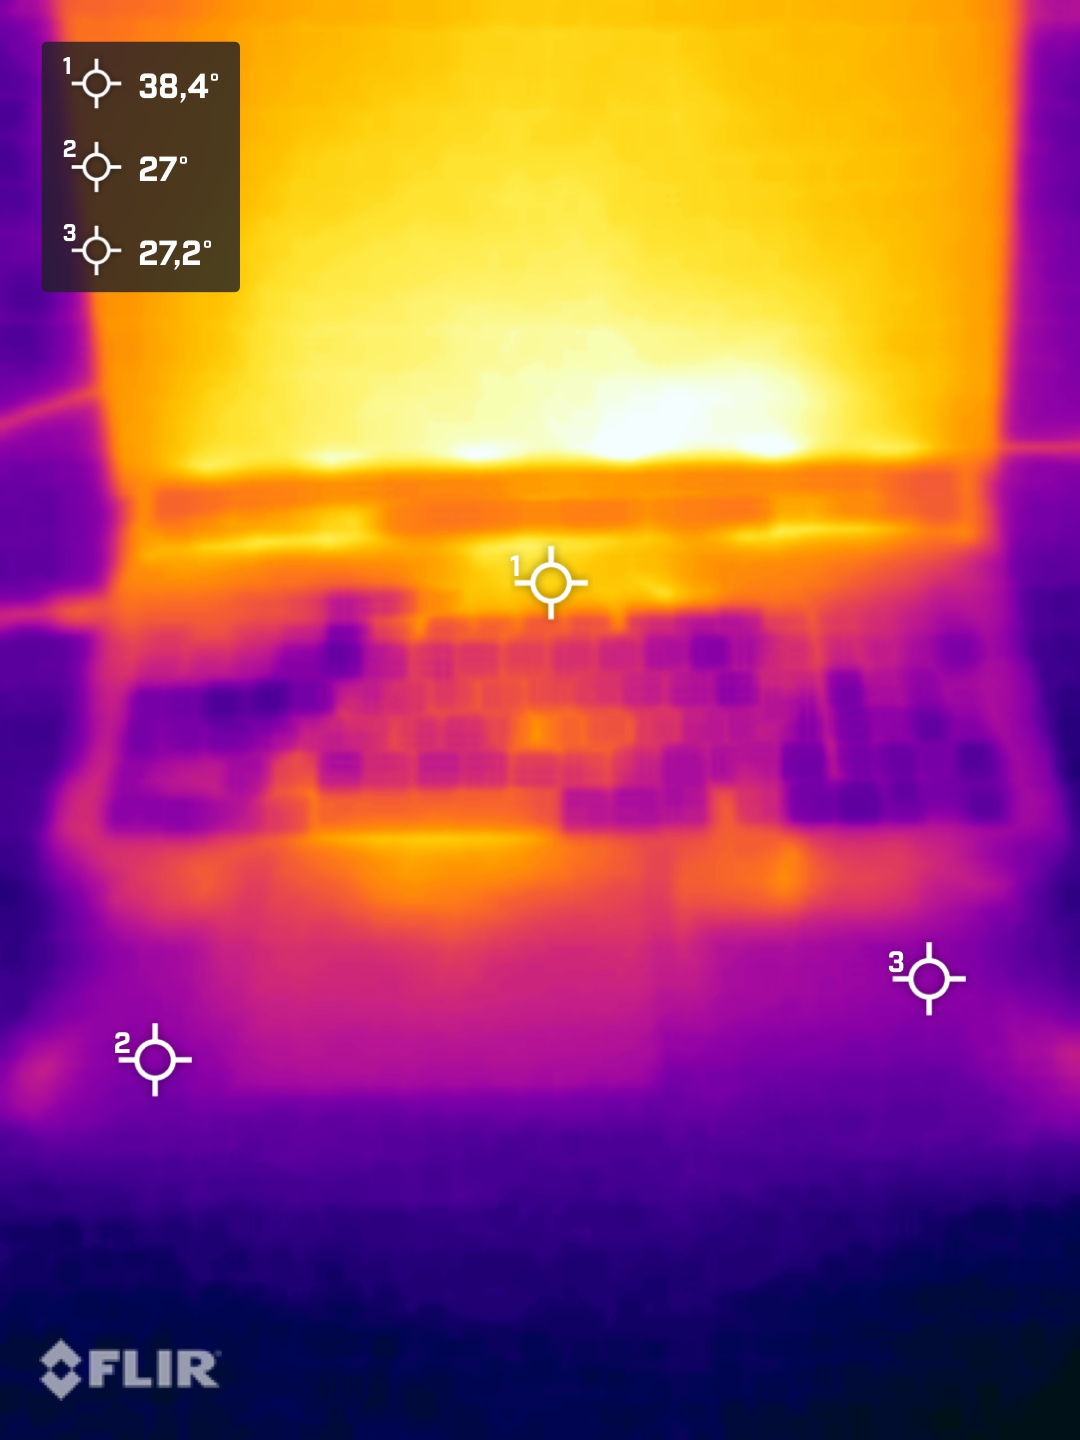
Test wytrzymałościowy temperatury powierzchni (strona górna)
Test wytrzymałościowy temperatury powierzchni (strona dolna)
Test obciążeniowy zasilacza
Asus ROG Strix Scar 18 G835LXG
Ultra 9 290HX Plus, GeForce RTX 5090 Laptop
Asus Strix Scar 18 G835LX
Ultra 9 275HX, GeForce RTX 5090 Laptop
Razer Blade 18 2024 RZ09-0509
i9-14900HX, GeForce RTX 4090 Laptop GPU
Alienware m18 R2
i9-14900HX, GeForce RTX 4090 Laptop GPU
Acer Predator Helios 18 PH18-72-98MW
i9-14900HX, GeForce RTX 4090 Laptop GPU
MSI Titan 18 HX A14VIG
i9-14900HX, GeForce RTX 4090 Laptop GPU
Schenker Key 17 Pro (M24)
i9-14900HX, GeForce RTX 4090 Laptop GPU
Heat
-6%
-14%
-19%
-19%
-6%
-45%
Maximum Upper Side * (°C)
37.5
45.6
-22%
43.2
-15%
41.2
-10%
43
-15%
37.8
-1%
51
-36%
Maximum Bottom * (°C)
40.9
46
-12%
42.6
-4%
34.6
15%
59
-44%
37.6
8%
64
-56%
Idle Upper Side * (°C)
31.1
28.9
7%
36
-16%
42.8
-38%
32
-3%
34.8
-12%
42.3
-36%
Idle Bottom * (°C)
30.2
29.2
3%
36.4
-21%
43.6
-44%
34
-13%
36
-19%
46
-52%

* ... im mniej tym lepiej

Prelegenci

Model Asus ROG Strix SCAR 18 wyposażony jest w system czterech głośników, który zapewnia ogólnie dobrą jakość dźwięku. Głosy są odtwarzane wyraźnie, a muzyka i filmy również zyskują dzięki dobrze zbalansowanemu profilowi dźwiękowemu. W bezpośrednim porównaniu z niektórymi konkurencyjnymi modelami z najwyższej półki istnieją jednak systemy o jeszcze potężniejszym brzmieniu i głębszym basie. Do grania zalecamy jednak korzystanie ze słuchawek, ponieważ przy dużym obciążeniu wyraźnie słychać pracę wentylatorów.

dB(A) 0102030405060708090Deep BassMiddle BassHigh BassLower RangeMidsHigher MidsLower HighsMid HighsUpper HighsSuper Highs2028.333.42528.828.63130294023.522.65018.933.56315.722.88011.434.710012.342.812511.446.61601351.620010.455.825010603159.263.440010.165.950010.668.66301073.980010.476.1100011.973.712501275.5160011.974.1200011.967250012.464.6315013.262.6400013.858500014.153.6630014.553.4800014.759.5100001573.41250014.667.91600014.259.9SPL2582.6N0.651.8median 12median 63.4Delta1.89.426.325.821.422.12624.925.127.622.532.523.448.72655.818.860.922.167.2267019.372.317.674.217.774.319.575.31571.711.871.311.27410.574.21072.710.17210.67210.97511.374.811.671.71269.71269.612.371.112.669.61270.111.269.824.784.70.666.6median 12median 71.73.42.2hearing rangehide median Pink NoiseAsus ROG Strix Scar 18 G835LXGApple MacBook Pro 16 2021 M1 Pro
Wykres częstotliwości (pola wyboru można zaznaczyć i odznaczyć, aby porównać urządzenia)
Asus ROG Strix Scar 18 G835LXG analiza dźwięku

(+) | głośniki mogą odtwarzać stosunkowo głośno (82.6 dB)
Bas 100 - 315 Hz
(±) | zredukowany bas - średnio 10% niższy od mediany
(±) | liniowość basu jest średnia (9.3% delta do poprzedniej częstotliwości)
Średnie 400 - 2000 Hz
(±) | wyższe średnie - średnio 8.5% wyższe niż mediana
(+) | średnie są liniowe (6.2% delta do poprzedniej częstotliwości)
Wysokie 2–16 kHz
(±) | obniżone maksima - średnio 5.8% niższe od mediany
(±) | liniowość wysokich wartości jest średnia (9.4% delta do poprzedniej częstotliwości)
Ogólnie 100 - 16.000 Hz
(±) | liniowość ogólnego dźwięku jest średnia (16.2% różnicy w stosunku do mediany)
W porównaniu do tej samej klasy
» 40% wszystkich testowanych urządzeń w tej klasie było lepszych, 7% podobnych, 53% gorszych
» Najlepszy miał deltę 6%, średnia wynosiła ###średnia###%, najgorsza wynosiła 132%
W porównaniu do wszystkich testowanych urządzeń
» 26% wszystkich testowanych urządzeń było lepszych, 6% podobnych, 68% gorszych
» Najlepszy miał deltę 4%, średnia wynosiła ###średnia###%, najgorsza wynosiła 134%

Apple MacBook Pro 16 2021 M1 Pro analiza dźwięku

(+) | głośniki mogą odtwarzać stosunkowo głośno (84.7 dB)
Bas 100 - 315 Hz
(+) | dobry bas - tylko 3.8% od mediany
(+) | bas jest liniowy (5.2% delta do poprzedniej częstotliwości)
Średnie 400 - 2000 Hz
(+) | zbalansowane środki średnie - tylko 1.3% od mediany
(+) | średnie są liniowe (2.1% delta do poprzedniej częstotliwości)
Wysokie 2–16 kHz
(+) | zrównoważone maksima - tylko 1.9% od mediany
(+) | wzloty są liniowe (2.7% delta do poprzedniej częstotliwości)
Ogólnie 100 - 16.000 Hz
(+) | ogólny dźwięk jest liniowy (4.6% różnicy w stosunku do mediany)
W porównaniu do tej samej klasy
» 0% wszystkich testowanych urządzeń w tej klasie było lepszych, 0% podobnych, 100% gorszych
» Najlepszy miał deltę 5%, średnia wynosiła ###średnia###%, najgorsza wynosiła 45%
W porównaniu do wszystkich testowanych urządzeń
» 0% wszystkich testowanych urządzeń było lepszych, 0% podobnych, 100% gorszych
» Najlepszy miał deltę 4%, średnia wynosiła ###średnia###%, najgorsza wynosiła 134%

Zarządzanie energią

Laptop Asus ROG Strix SCAR 18 nie należy do najbardziej energooszczędnych laptopów do gier. Nawet w stanie spoczynku jego zużycie energii jest stosunkowo wysokie ze względu na wydajny sprzęt i jasny wyświetlacz Mini-LED. Pod pełnym obciążeniem system na krótko osiąga pobór mocy wynoszący nawet 354 watów, po czym stabilizuje się na poziomie około 230 watów. Dołączony zasilacz o mocy 450 watów zapewnia zatem wystarczający zapas mocy. Pobór mocy w trybie czuwania jest niepotrzebnie wysoki i wynosi 19 watów.

Asus ROG Strix SCAR 18 z zasilaczem o mocy 450 W
Zasilacz o mocy 450 W

Zużycie energii i żywotność baterii

Oczywiście bateria o pojemności 90 Wh w laptopie Asus ROG Strix SCAR 18 może zrekompensować wysokie zużycie energii przez system jedynie w ograniczonym stopniu. W praktycznym teście z wykorzystaniem sieci Wi-Fi ten laptop do gier osiągnął czas pracy wynoszący zaledwie 4 godziny. Niektórzy konkurenci oferują pod tym względem lepsze wyniki.

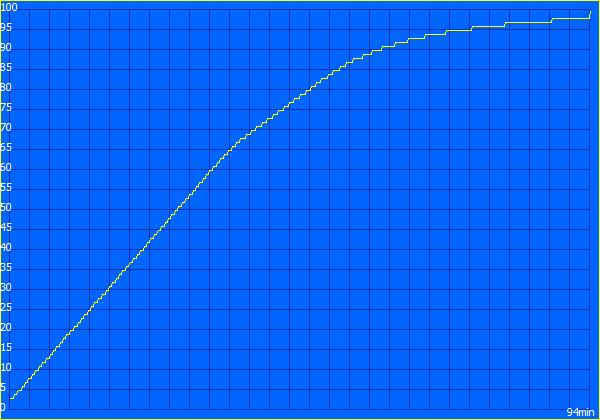
Informacje dotyczące baterii
Proces ładowania
Proces ładowania
Pobór mocy
wyłączony / stan wstrzymaniadarklight 0.8 / 19.4 W
luzdarkmidlight 15.5 / 43.2 / 47.6 W
obciążenie midlight 163.9 / 354 W
 color bar
Legenda: min: dark, med: mid, max: light        Metrahit Energy

Zużycie energii: Cyberpunk / Test obciążeniowy

0102030405060708090100110120130140150160170180190200210220230240250260270280290300310320330340350Tooltip
Asus ROG Strix Scar 18 G835LXG; 1280x720 Prime95 28.10 and Furmark 1.25: Ø229 (160.4-354) Watt
Asus ROG Strix Scar 18 G835LXG; Idle 150cd/m2: Ø37.3 (22.4-50.4) Watt
Asus ROG Strix Scar 18 G835LXG; Cyberpunk 2077 FHD ultra no FSR 150cd: Ø254 (249-269) Watt

Pobór mocy przy podłączeniu monitora zewnętrznego

05101520253035404550556065707580859095100105110115120125130135140145150155160165170175180185190195200205210215220225230235240245Tooltip
Asus ROG Strix Scar 18 G835LXG; Prime95 V2810 Stress (external Monitor): Ø190.3 (177.2-205) Watt
Asus ROG Strix Scar 18 G835LXG; Cinebench R15 Multi (external Monitor): Ø190.3 (189.5-191.1) Watt
Asus ROG Strix Scar 18 G835LXG; Cinebench R23 Single (external Monitor): Ø73.8 (69.2-99.1) Watt
Asus ROG Strix Scar 18 G835LXG; Cinebench R23 Multi (external Monitor): Ø189 (187.4-190.8) Watt
Asus ROG Strix Scar 18 G835LXG; 1280x720 FurMark 1.19 GPU Stress Test (external Monitor): Ø209 (192.1-223) Watt
Asus ROG Strix Scar 18 G835LXG; Idle 1min (external Monitor): Ø33.4 (17.6-51.5) Watt
Asus ROG Strix Scar 18 G835LXG; Cyberpunk 2077 FHD ultra no FSR (external Monitor): Ø241 (237-249) Watt
Wydajność akumulatora
luz
2h 58min
WiFi Websurfing
4h 00min
WiFi Websurfing max. Brightness
2h 16min
Big Buck Bunny H.264 1080p
2h 08min
obciążenie
1h 31min
Asus ROG Strix Scar 18 G835LXG
Ultra 9 290HX Plus, GeForce RTX 5090 Laptop, 90 Wh
Asus Strix Scar 18 G835LX
Ultra 9 275HX, GeForce RTX 5090 Laptop, 90 Wh
Razer Blade 18 2024 RZ09-0509
i9-14900HX, GeForce RTX 4090 Laptop GPU, 91.7 Wh
Alienware m18 R2
i9-14900HX, GeForce RTX 4090 Laptop GPU, 97 Wh
Acer Predator Helios 18 PH18-72-98MW
i9-14900HX, GeForce RTX 4090 Laptop GPU, 90 Wh
MSI Titan 18 HX A14VIG
i9-14900HX, GeForce RTX 4090 Laptop GPU, 99.9 Wh
Schenker Key 17 Pro (M24)
i9-14900HX, GeForce RTX 4090 Laptop GPU, 99 Wh
Średnia w klasie Gaming
 
Czasy pracy
65%
32%
20%
-24%
27%
-21%
138%
Reader / Idle (h)
3
6.6
120%
5.9
97%
H.264 (h)
2.1
5.8
176%
WiFi v1.3 (h)
4
5.5
38%
4.4
10%
4.8
20%
3.2
-20%
4.2
5%
3.4
-15%
Load (h)
1.5
1.2
-20%
1
-33%
1.1
-27%
1.2
-20%
1.1
-27%
Cyberpunk 2077 ultra 150cd (h)
0.7
1.1

Ogólna ocena serwisu Notebookcheck

Asus ROG Strix Scar 18 G835LXG - 24/07/2026 v8
Sebastian Bade

Wykonanie
85 / 98 → 86%
Klawiatura
91%
Myszka
86%
Komunikacja
75 / 80 → 94%
Waga
53 / 10-68 → 73%
Akumulator
55 / 95 → 58%
Wyświetlacz
87%
Wydajność w grach
96%
Wydajność w programach użytkowych
97%
Workstation
81%
Temperatura
93 / 95 → 97%
Hałas
59 / 90 → 65%
Głośniki
78%
Kamerka
33 / 75 → 43%
Średnio
59%
87%
Gaming - Ważona średnia
CO2 Emissions
No Data
Materials
0%
Packaging
50%
Power Use
41.8%
Repairability
40%
Software Updates
22.3%
Recycle Logo Total Sustainability Score: 25.7%

Porównanie możliwych alternatyw

Obraz
Model / recenzja
Cena
Waga
Wysokość
Ekran
1.
87.4%
Asus ROG Strix Scar 18 G835LXG
Intel Core Ultra 9 290HX Plus ⎘
NVIDIA GeForce RTX 5090 Laptop ⎘
128 GB Pamięć, 8192 GB SSD
Amazon:
1. $7,439.00
HIDevolution [2026] ASUS ROG...
2. $6,284.00
HIDevolution [2026] ASUS ROG...
3. $6,019.00
HIDevolution [2026] ASUS ROG...
Cena katalogowa: 8999€
3.6 kg35 mm18.00"
3840x2400
252 PPI
Mini LED
2.
88%
Asus Strix Scar 18 G835LX
Intel Core Ultra 9 275HX ⎘
NVIDIA GeForce RTX 5090 Laptop ⎘
64 GB Pamięć, 2048 GB SSD
Amazon: Cena katalogowa: 5799€3.3 kg32 mm18.00"
2560x1600
168 PPI
Mini-LED
3.
90.5% v7 (old)
Razer Blade 18 2024 RZ09-0509
Intel Core i9-14900HX ⎘
NVIDIA GeForce RTX 4090 Laptop GPU ⎘
32 GB Pamięć
Amazon: Cena katalogowa: 4500 USD3.1 kg21.9 mm18.00"
2560x1600
168 PPI
Mini-LED
4.
89.5% v7 (old)
Alienware m18 R2
Alienware m18 R2
Intel Core i9-14900HX ⎘
NVIDIA GeForce RTX 4090 Laptop GPU ⎘
32 GB Pamięć, 2048 GB SSD
Amazon:
1. $3,499.99
Dell Alienware m18 R2 Gaming...
2. $2,799.00
Alienware M18 Gaming Laptop ...
3. $3,699.00
Dell Alienware 18 Area-51 Ga...
Cena katalogowa: 3300 USD
4 kg26.7 mm18.00"
2560x1600
168 PPI
IPS
5.
87.1% v7 (old)
Acer Predator Helios 18 PH18-72-98MW
Intel Core i9-14900HX ⎘
NVIDIA GeForce RTX 4090 Laptop GPU ⎘
32 GB Pamięć, 2048 GB SSD
Amazon:
1. $23.99
HSSDTECH DC in Power Jack Ch...
2. $84.99
330W Charger for Acer Predat...
3. $899.99
Acer Predator Helios 300 PH3...
3.3 kg29.5 mm18.00"
2560x1600
168 PPI
Mini-LED
6.
88.8% v7 (old)
MSI Titan 18 HX A14VIG
Intel Core i9-14900HX ⎘
NVIDIA GeForce RTX 4090 Laptop GPU ⎘
128 GB Pamięć, 4096 GB SSD
Amazon:
1. $6,699.99
msi Titan 18 HX AI 18" 240Hz...
2. $5,699.99
msi Titan 18 HX AI 18" 120Hz...
3. $2,699.99
msi Vector A18 HX 18” 240H...
Cena katalogowa: 5000 USD
3.6 kg32.1 mm18.00"
3840x2400
252 PPI
Mini-LED
7.
85.1%
Schenker Key 17 Pro (M24)
Intel Core i9-14900HX ⎘
NVIDIA GeForce RTX 4090 Laptop GPU ⎘
32 GB Pamięć, 1024 GB SSD
Amazon:
Cena katalogowa: 4273€
3.4 kg24.9 mm17.30"
3840x2160
255 PPI
IPS

Przezroczystość

Wyboru urządzeń do recenzji dokonuje nasza redakcja. Próbka testowa została udostępniona autorowi jako pożyczka od producenta lub sprzedawcy detalicznego na potrzeby tej recenzji. Pożyczkodawca nie miał wpływu na tę recenzję, producent nie otrzymał też kopii tej recenzji przed publikacją. Nie było obowiązku publikowania tej recenzji. Jako niezależna firma medialna, Notebookcheck nie podlega władzy producentów, sprzedawców detalicznych ani wydawców.

Tak testuje Notebookcheck

Każdego roku Notebookcheck niezależnie sprawdza setki laptopów i smartfonów, stosując standardowe procedury, aby zapewnić porównywalność wszystkich wyników. Od około 20 lat stale rozwijamy nasze metody badawcze, ustanawiając przy tym standardy branżowe. W naszych laboratoriach testowych doświadczeni technicy i redaktorzy korzystają z wysokiej jakości sprzętu pomiarowego. Testy te obejmują wieloetapowy proces walidacji. Nasz kompleksowy system ocen opiera się na setkach uzasadnionych pomiarów i benchmarków, co pozwala zachować obiektywizm.
Google LogoAdd as a preferred source on Google
Mail Logo
> laptopy testy i recenzje notebooki > Laptopy > Potężny komputer do gier z wyświetlaczem 4K Mini-LED, kartą graficzną RTX 5090 i 128 GB pamięci RAM – recenzja modelu Asus ROG Strix SCAR 18 G835LXG
Sebastian Bade, 2026-07-26 (Update: 2026-07-26)