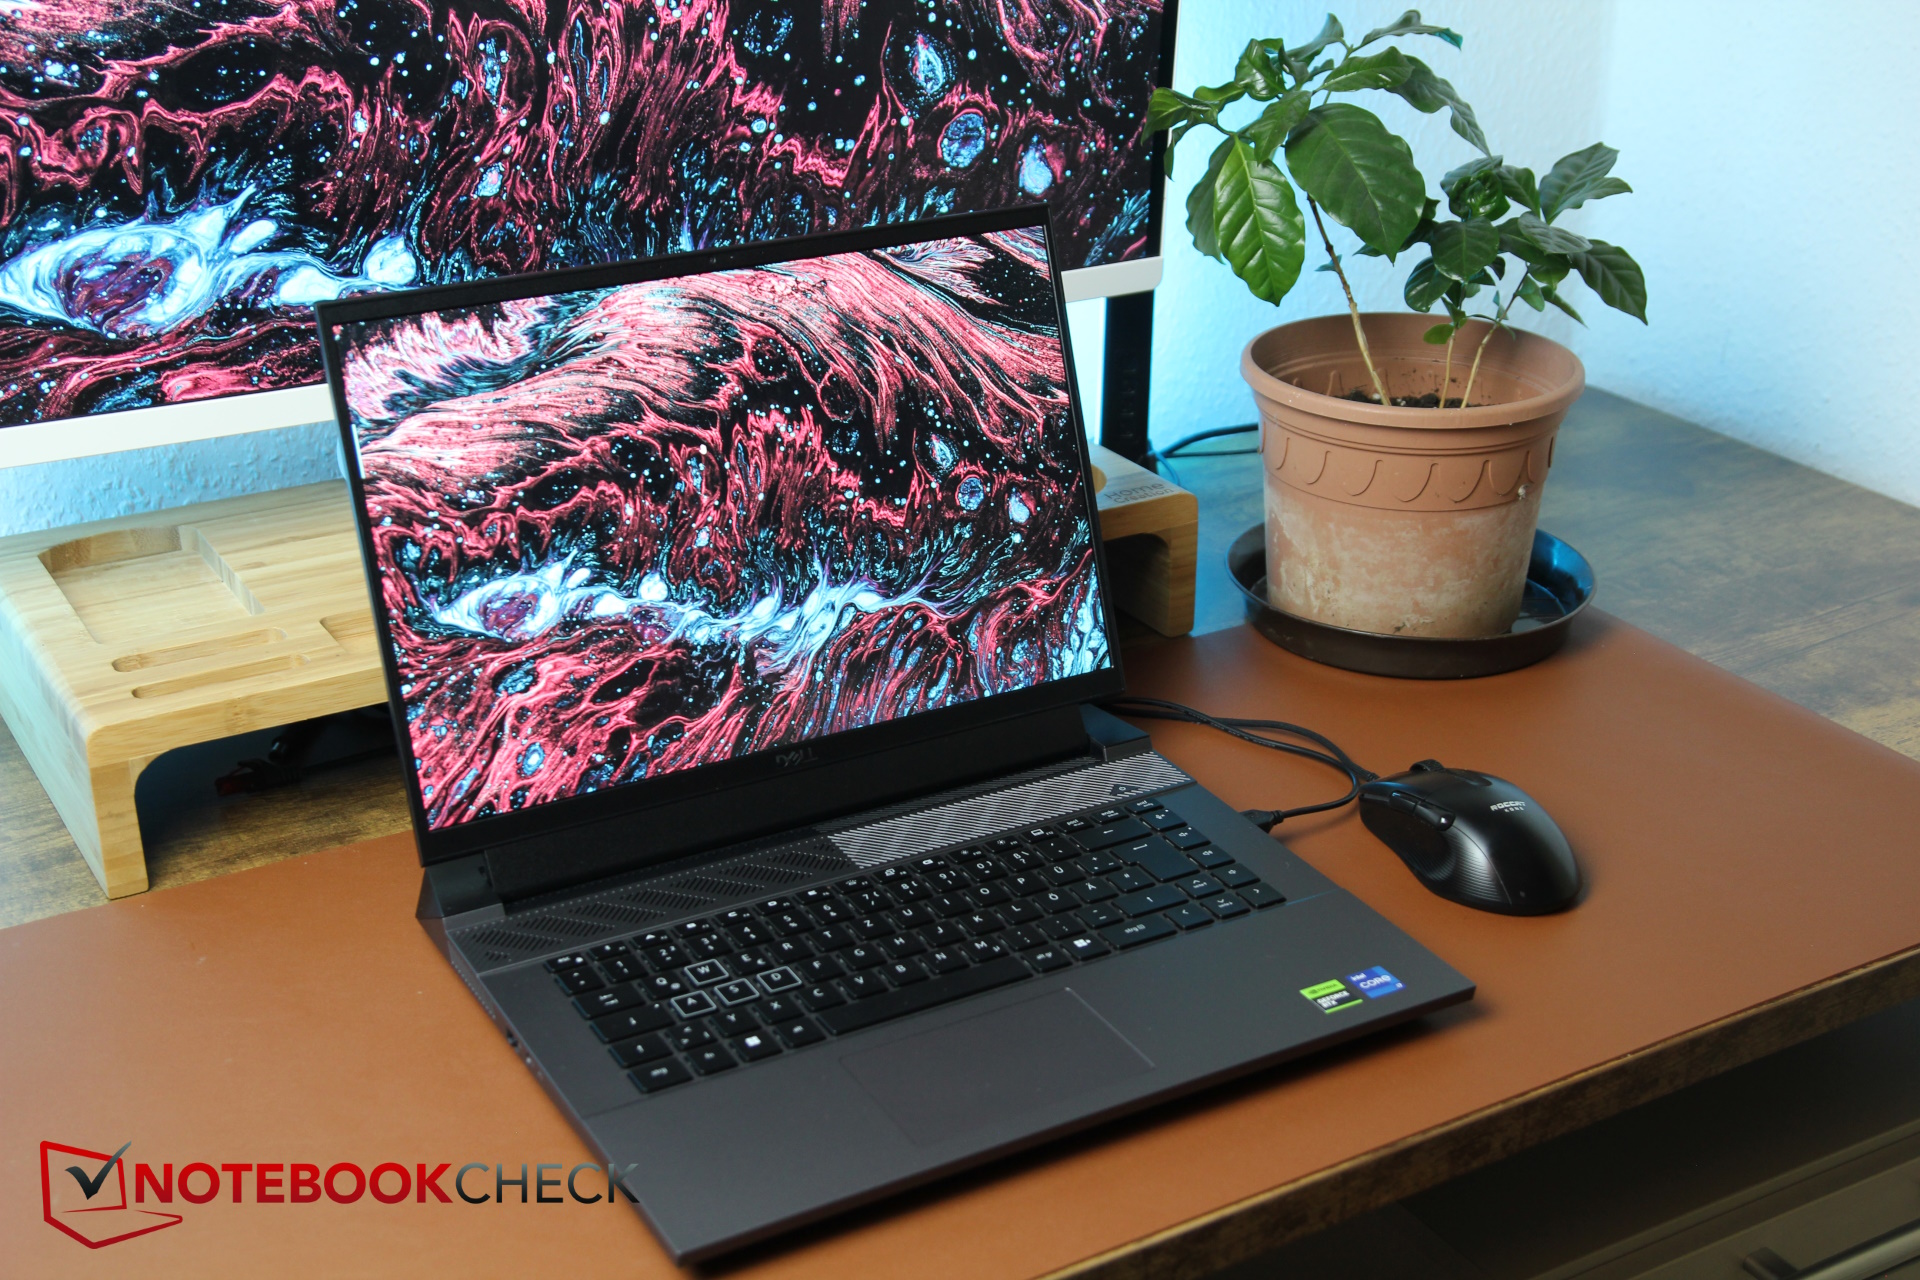
Recenzja laptopa Dell G16 (2024): Niedroga alternatywa Alienware od tego samego producenta?
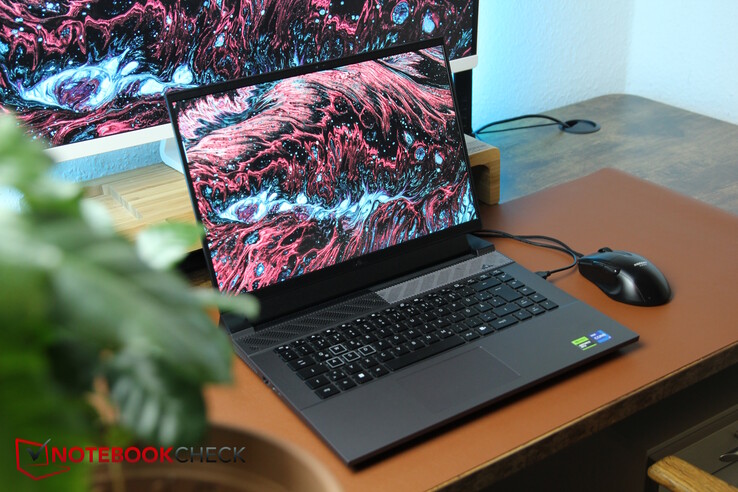
Pod koniec 2022 roku po raz ostatni (i przypadkowo po raz pierwszy) przyjrzeliśmy się 16-calowemu modelowi stosunkowo nowej serii G, budżetowych i średniej klasy laptopów do gier firmy Dell. W tamtym czasie Dell G16 był wyposażony w procesor Intel Gen-12 i kartę graficzną RTX 3060. W modelu 2024 producent dokonał przejścia na Intel Gen 13 i procesor RTX 4060 (dostępne są dalsze opcje GPU). Wyświetlacz otrzymał nieco mocniejszy wariant jako opcję.
Przyjrzymy się również, czy Dell zdołał jeszcze bardziej odchudzić stosunkowo grubą obudowę laptopa. Co więcej, G16 musi oczywiście konkurować z innymi budżetowymi i średniej klasy urządzeniami dla graczy, takimi jak MSI Raider GE68 HX 13VF, Lenovo Lenovo Legion Slim 5 16APH8 i Lenovo LOQ 16-plus, będziemy oczywiście porównywać go do jego poprzednika, a także do nieco droższego Alienware m16 R1.
Potencjalni konkurenci w porównaniu
Ocena | Data | Model | Waga | Wysokość | Rozmiar | Rezolucja | Cena |
|---|---|---|---|---|---|---|---|
| 85.5 % v7 (old) | 02/2024 | Dell G16, i7-13650HX, RTX 4060 i7-13650HX, GeForce RTX 4060 Laptop GPU | 2.8 kg | 25.65 mm | 16.00" | 2560x1600 | |
| 86.1 % v7 (old) | 10/2022 | Dell G16 7620 i7-12700H, GeForce RTX 3060 Laptop GPU | 2.6 kg | 26.9 mm | 16.00" | 2560x1600 | |
| 86.9 % v7 (old) | 10/2023 | MSI Raider GE68HX 13VF i9-13950HX, GeForce RTX 4060 Laptop GPU | 2.7 kg | 27.9 mm | 16.00" | 1900x1200 | |
| 87.7 % v7 (old) | 08/2023 | Lenovo Legion Slim 5 16APH8 R7 7840HS, GeForce RTX 4060 Laptop GPU | 2.4 kg | 25.2 mm | 16.00" | 2560x1600 | |
| 88.3 % v7 (old) | 09/2023 | Alienware m16 R1 Intel i7-13700HX, GeForce RTX 4060 Laptop GPU | 3 kg | 25.4 mm | 16.00" | 2560x1600 | |
| 87.3 % v7 (old) | 09/2023 | Lenovo LOQ 16IRH8 i7-13620H, GeForce RTX 4060 Laptop GPU | 2.7 kg | 25.9 mm | 16.00" | 2560x1600 |
Obudowa - Aluminiowa pokrywa i reszta z szarego plastiku
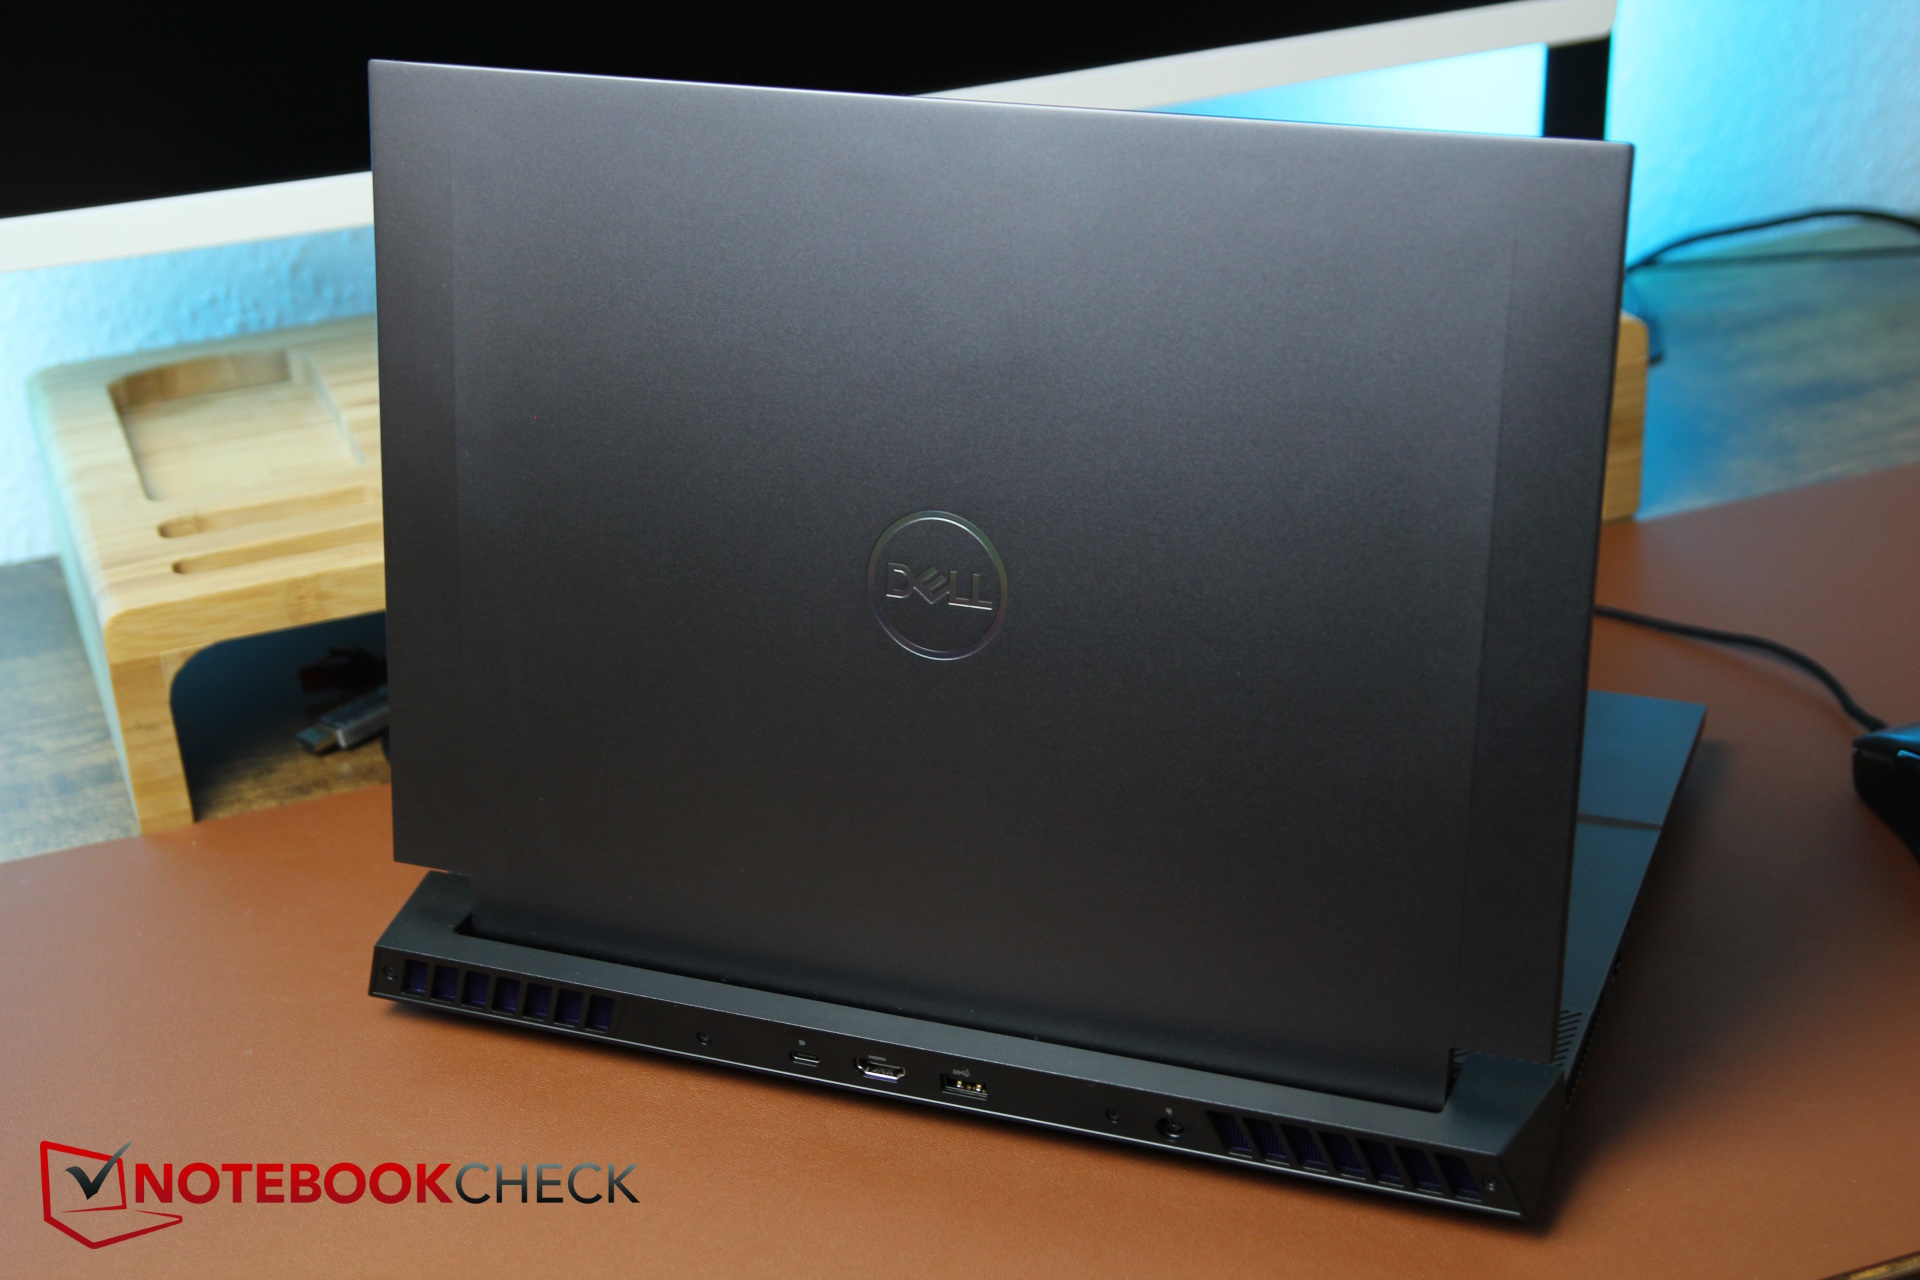
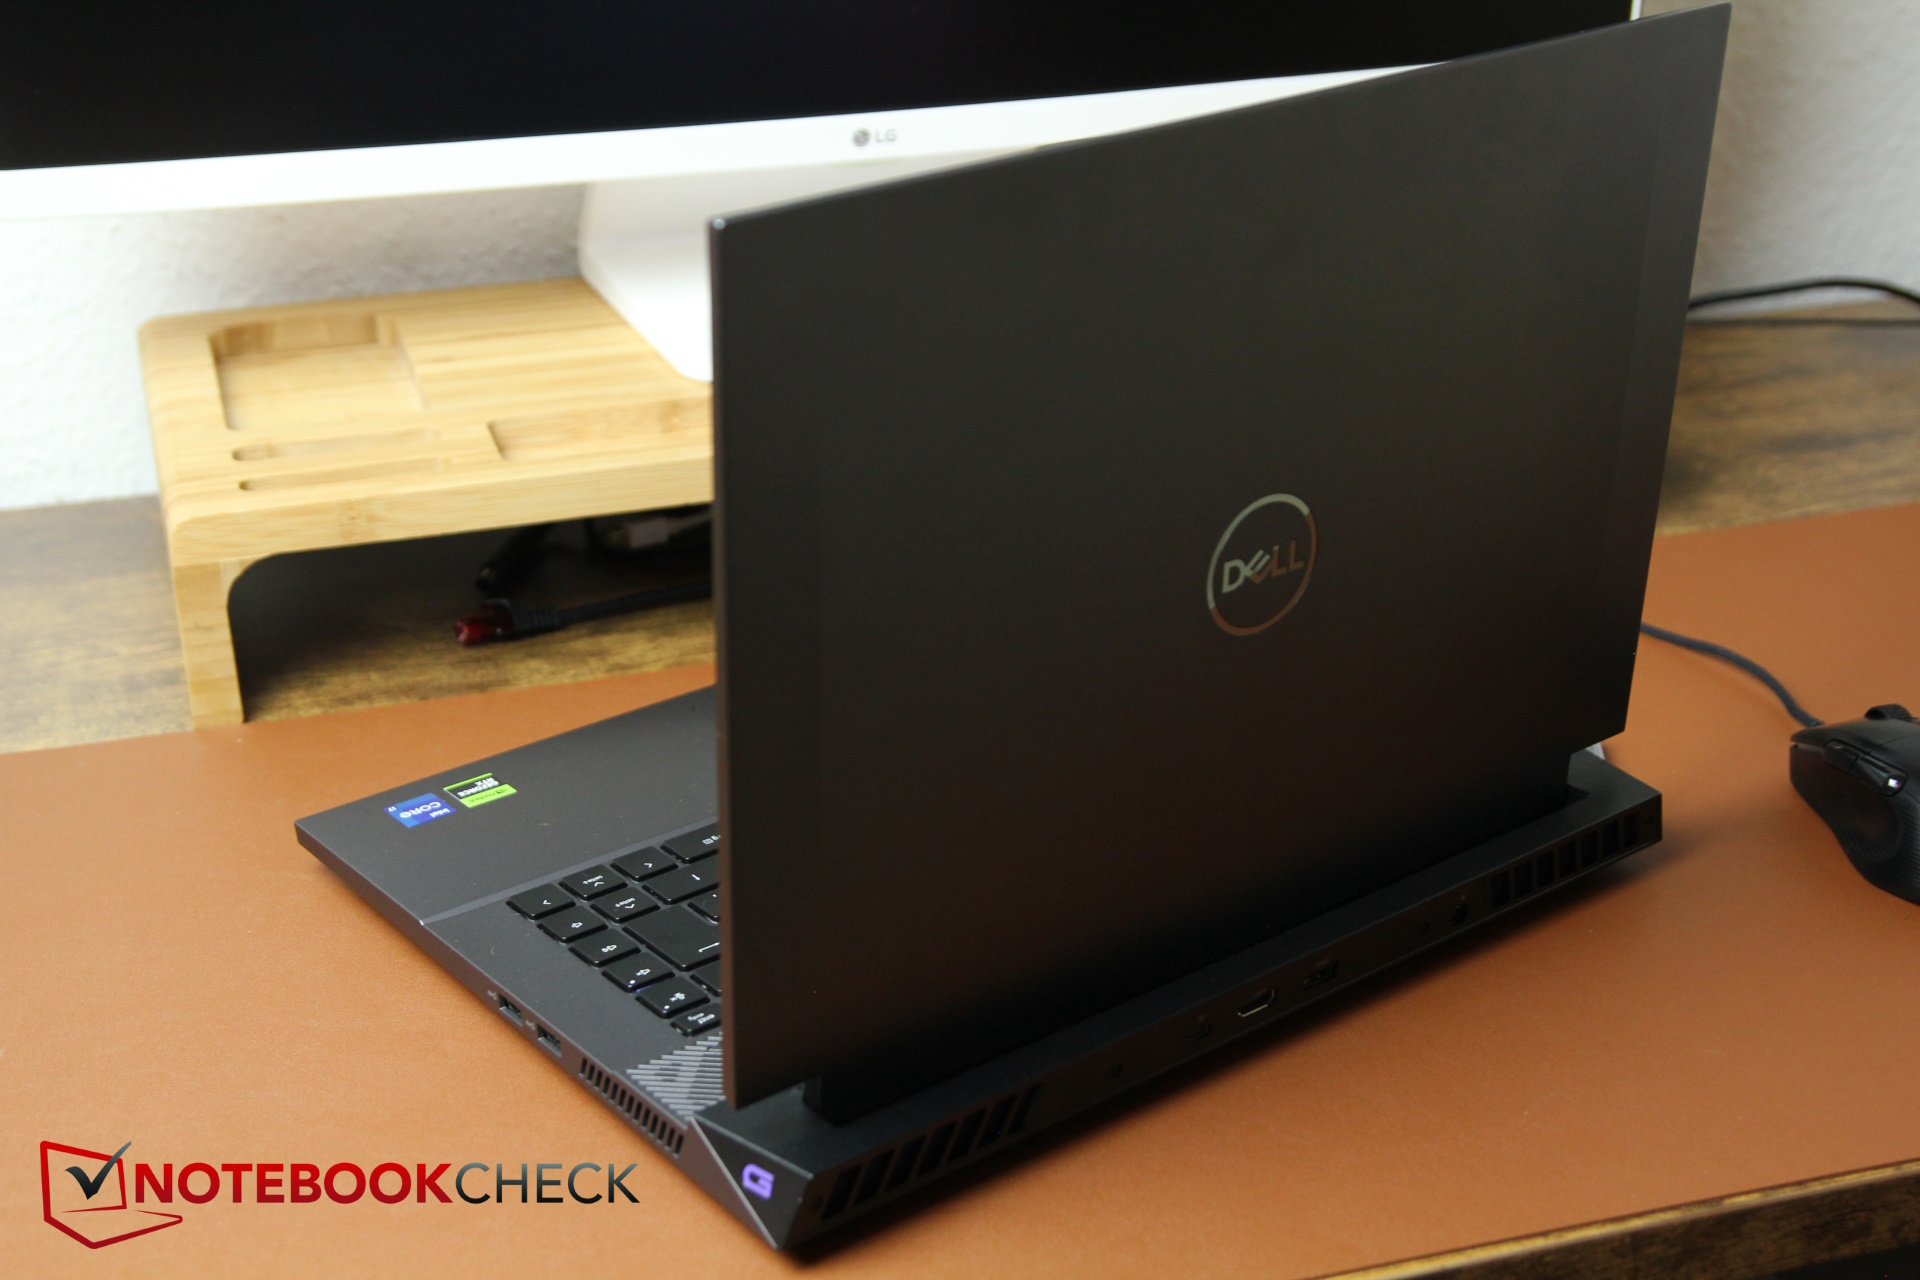
Obudowa laptopa, która różni się od obudowy poprzednika, jest w większości wykonana z szarego plastiku - tylko pokrywa jest aluminiowa, co zapewnia jej dobrą stabilność. Podstawa również jest stabilna i ledwo można ją przekręcić. Długi zawias dobrze utrzymuje wyświetlacz w miejscu, jednak zauważyliśmy lekkie odgłosy tarcia i skrzypienie podczas otwierania i zamykania. Miejmy nadzieję, że nie wpłynie to na żywotność urządzenia. Jego konstrukcja jest przyzwoita, ale nie sprawia wrażenia tak wysokiej jakości, jak droższe modele Dell i Alienware.
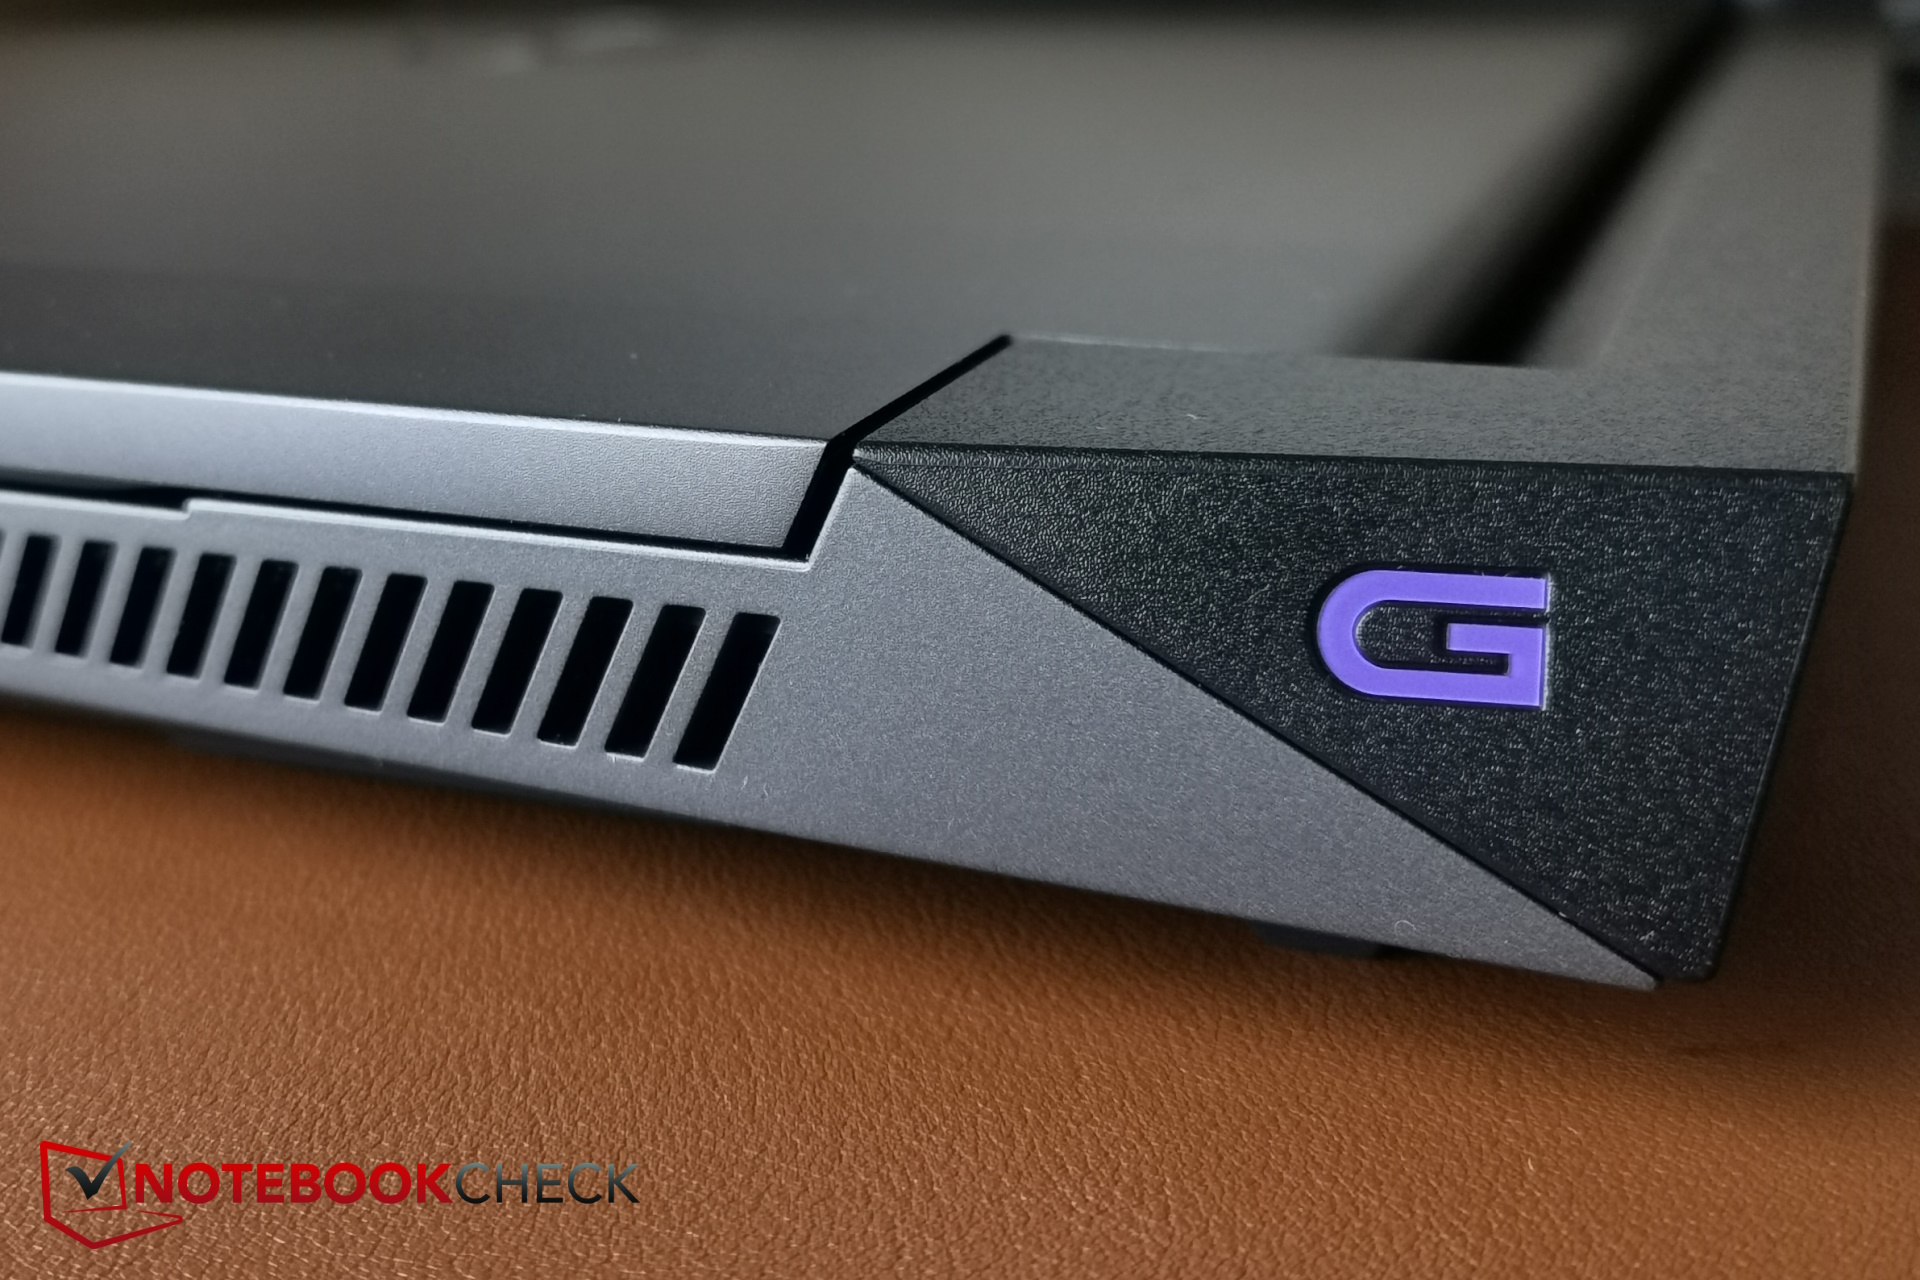
Logo Dell wyróżnia się na górze laptopa i poza tym nie ma żadnych dodatkowych akcentów kolorystycznych. Niemniej jednak, ten oczywisty gracz również nie wygląda zbyt elegancko, co wynika głównie z jednostki chłodzącej wystającej z tyłu. Ogólnie rzecz biorąc, G16 nie wygląda zbyt elegancko, ale raczej niezgrabnie i ciężko.
Droższy Alienware m16 R1 jest w rzeczywistości nieco szerszy niż nasz G16 i podobnie gruby. The MSI Raider GE68HX jest jeszcze nieco grubszy, podczas gdy pozostałe wymiary są niemal identyczne. Nawet Lenovo Legion Slim 5 nie jest dużo szczuplejszy, chociaż G16 wydaje się dość gruby, ale ten pierwszy jest nieco mniejszy.
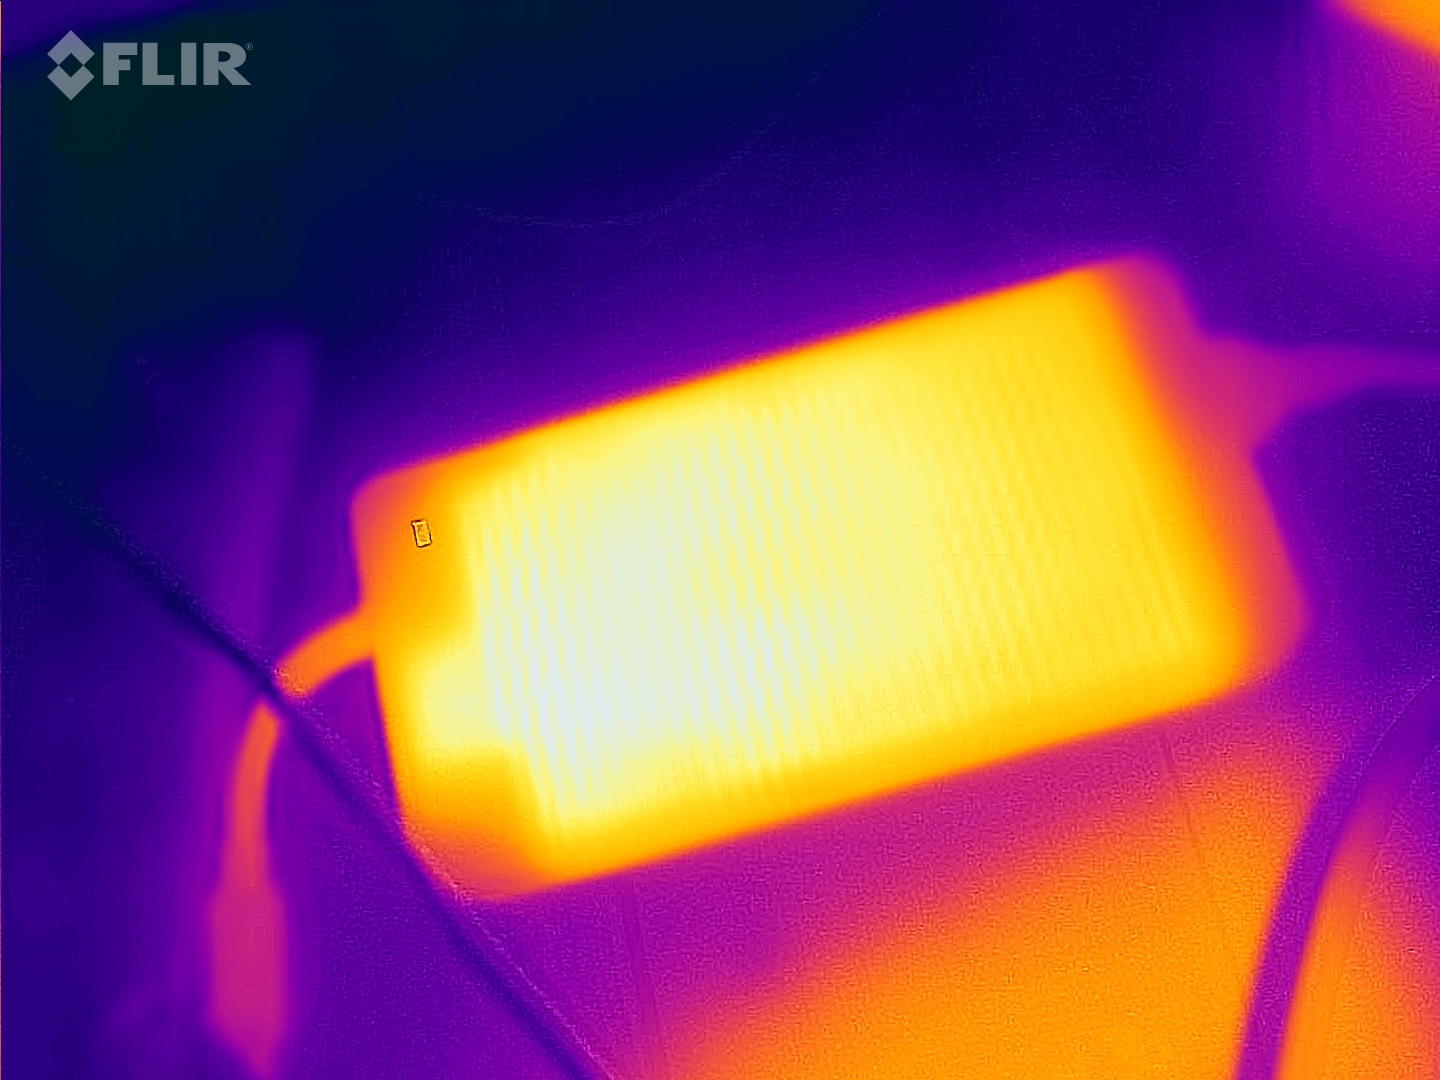
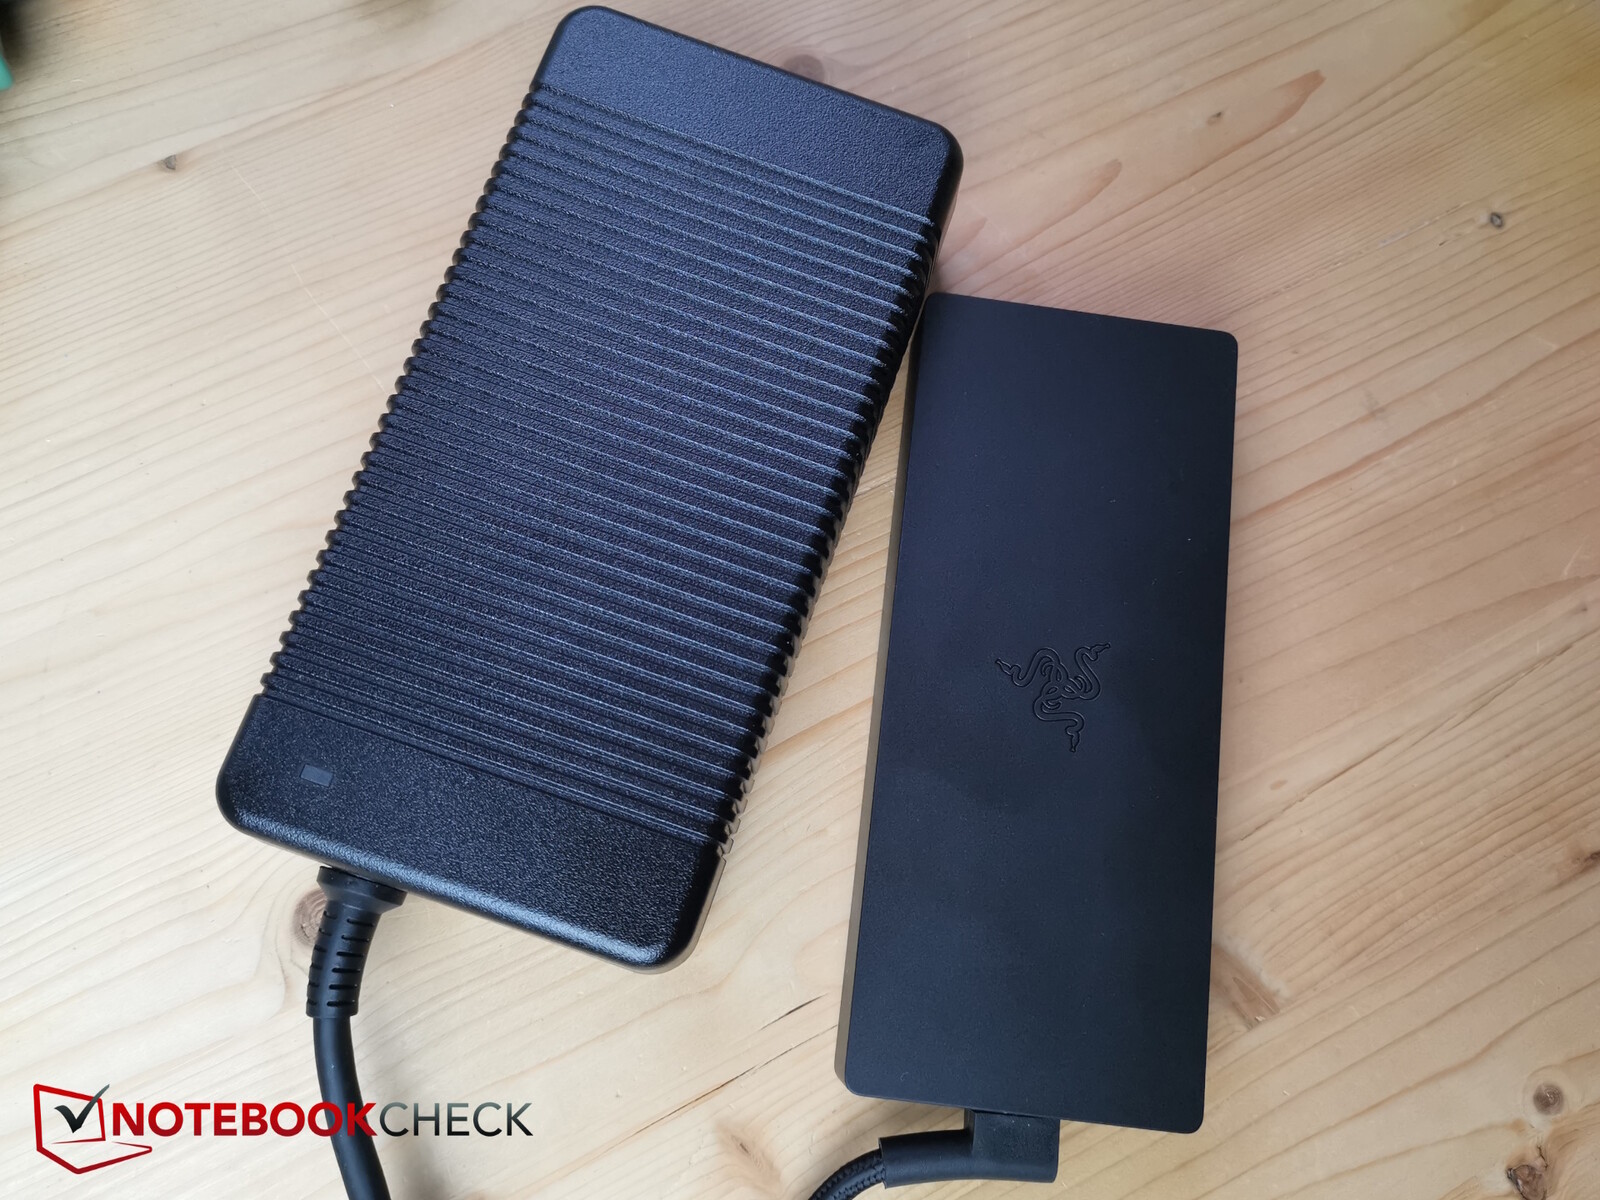
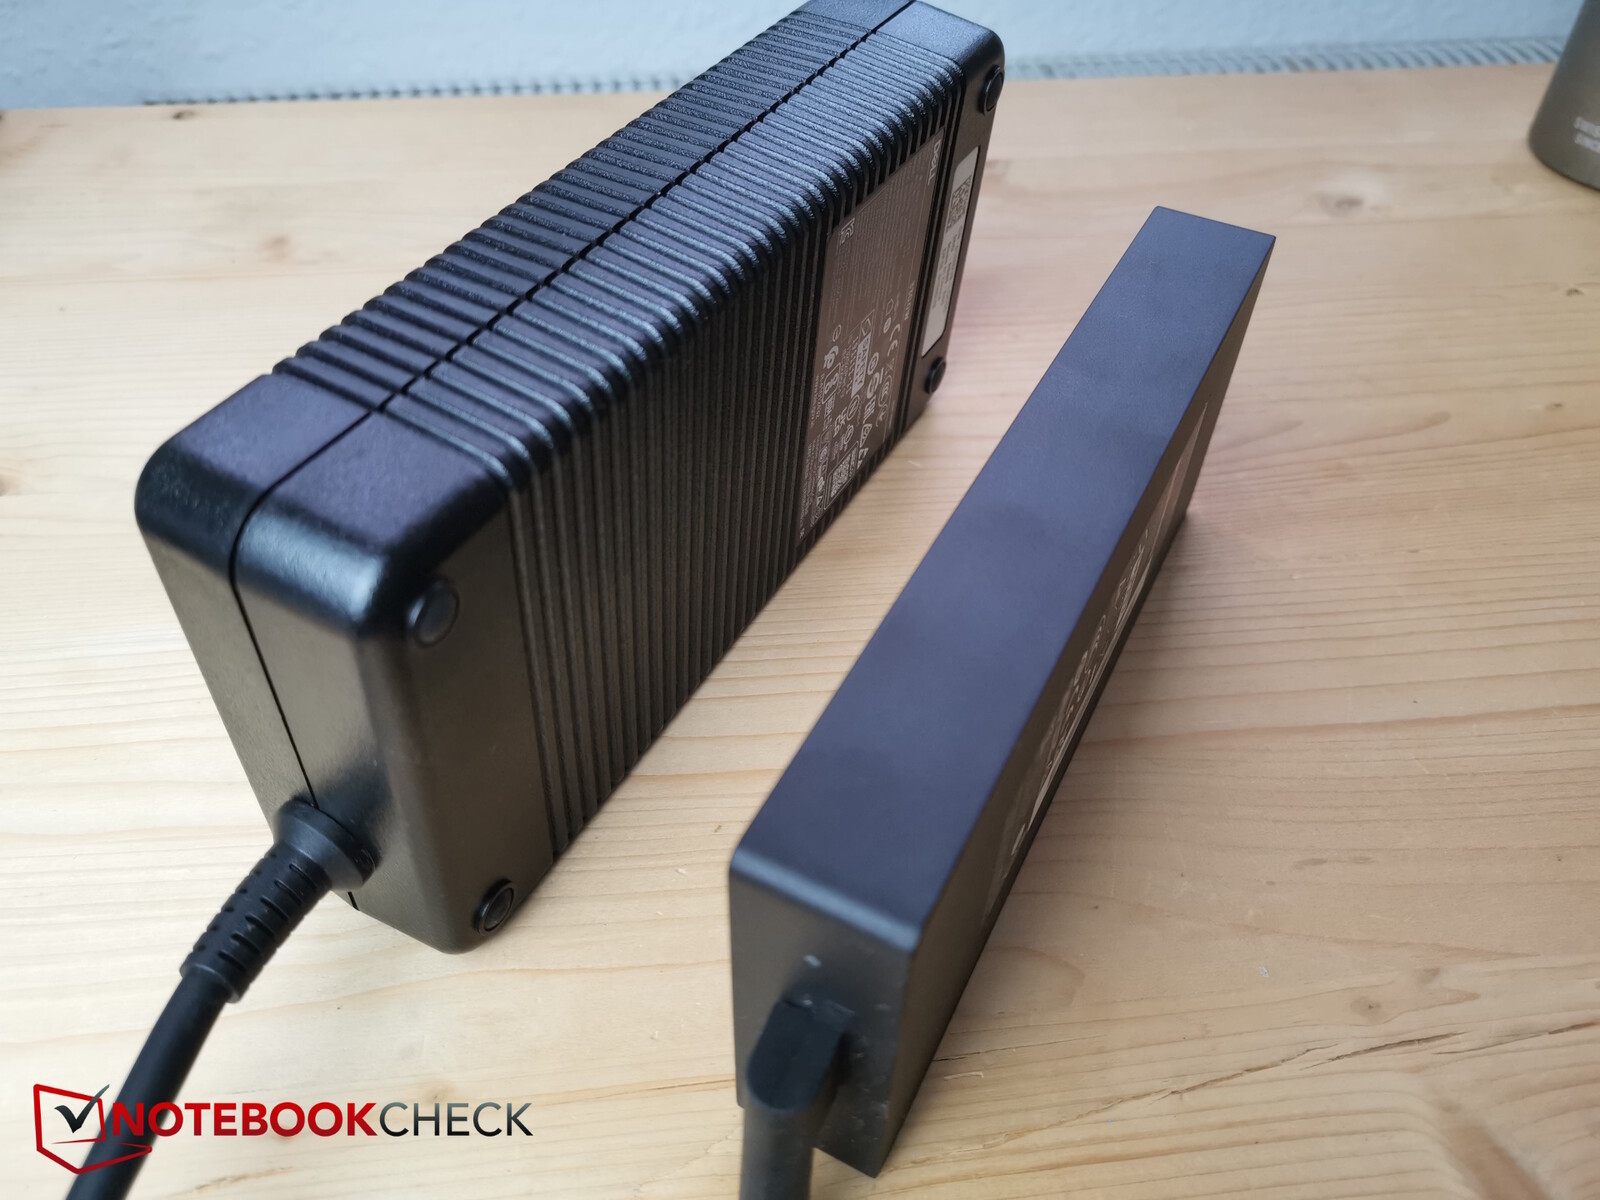
W porównaniu do swojego poprzednika, ten model faktycznie stał się nieco szczuplejszy, ale jednocześnie zwiększył swoją głębokość. Jest też cięższy (+200 g), co oznacza, że G16 jest obecnie drugim najcięższym 16-calowym gamerem z RTX 4060, po Alienware od tego samego producenta. Co więcej, Dell dostarcza nawet wersję z RTX 4060 z ogromnym i ciężkim 330-watowym zasilaczem - sam zasilacz waży ponad 1,5 kg.
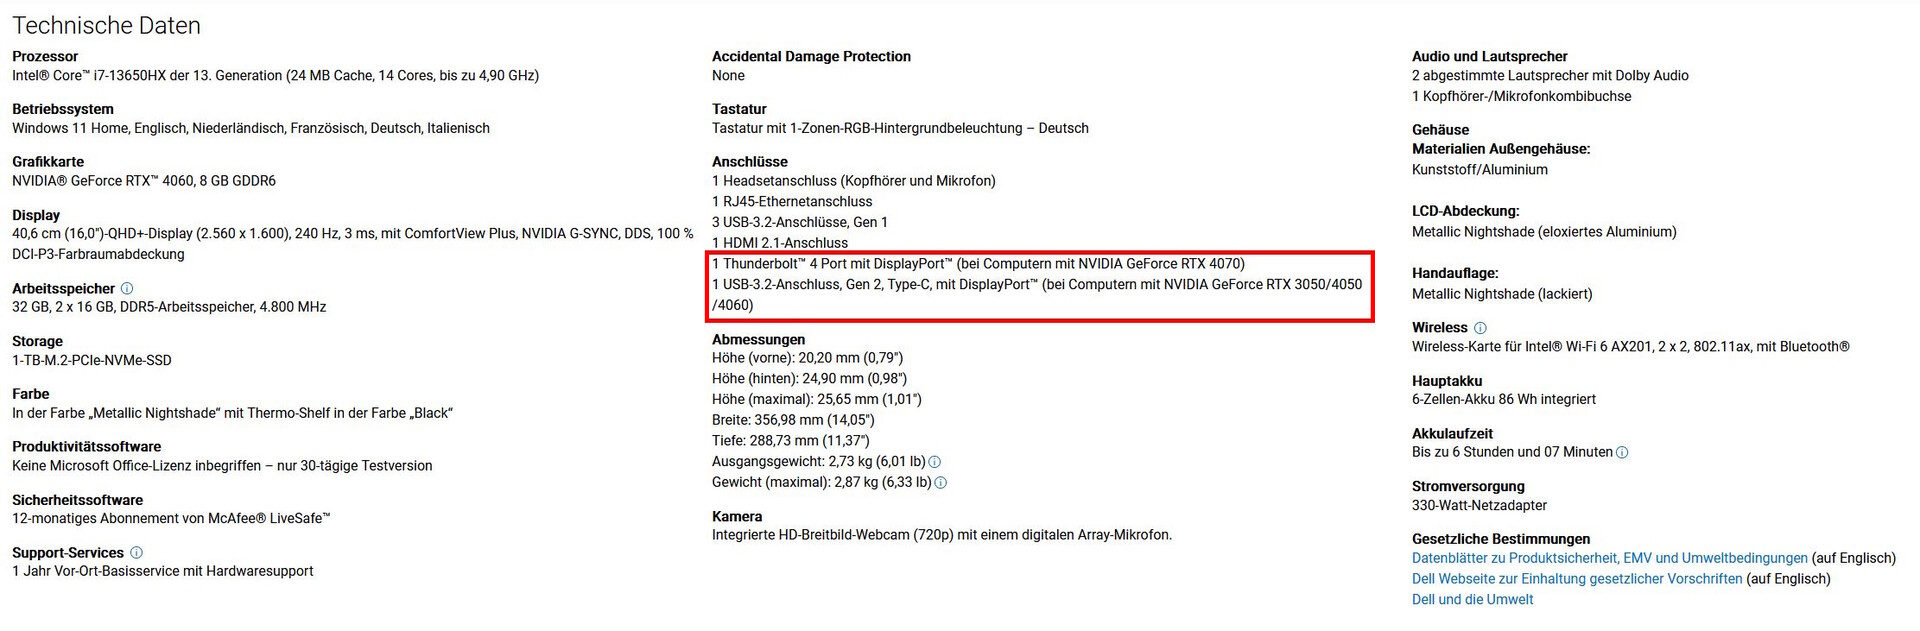
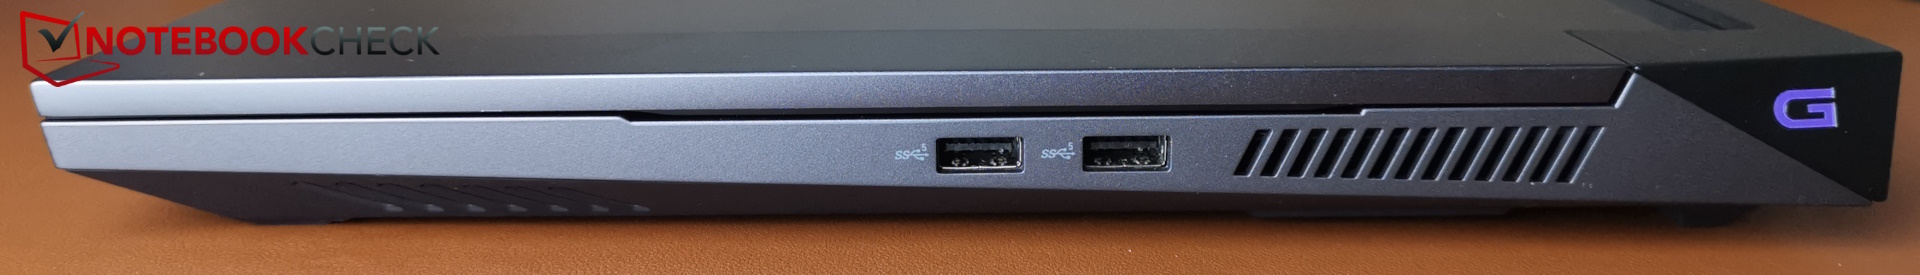
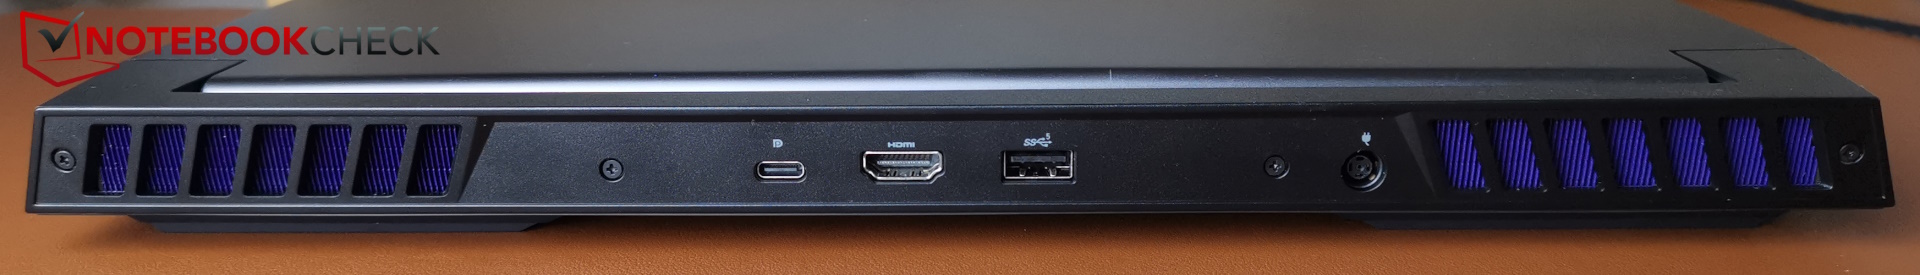
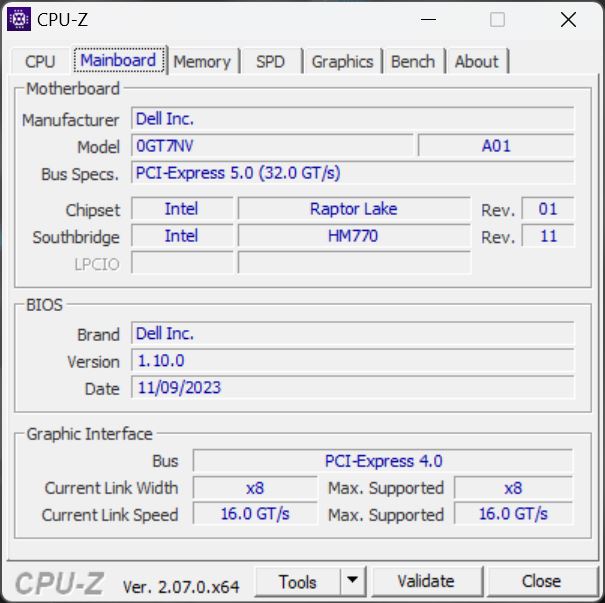
Łączność - Thunderbolt nie we wszystkich modelach G16
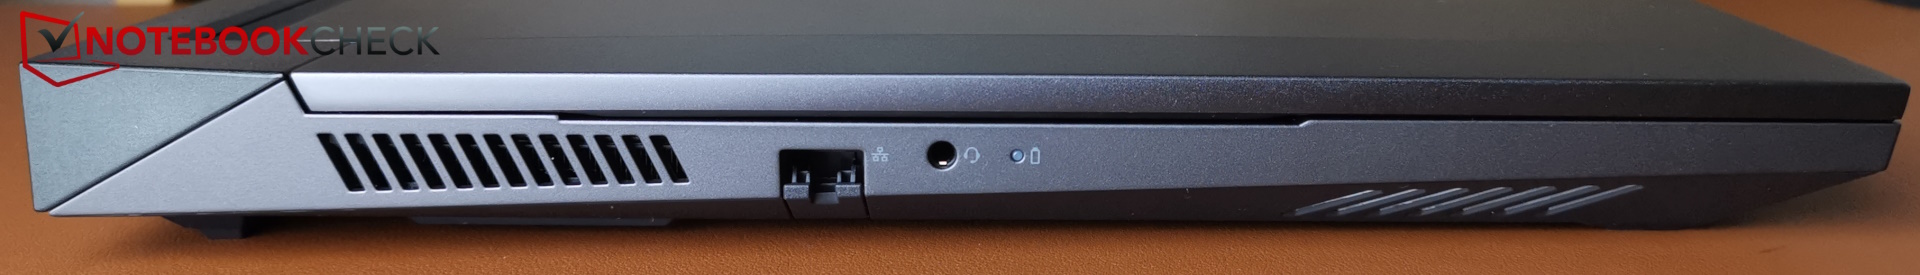
Układ portów laptopa pozostał taki sam, z jednym wyjątkiem: Z tyłu złącza zostały nieco przetasowane. Podczas gdy port HDMI miał dużo miejsca w poprzednim modelu, teraz znajduje się bezpośrednio między portem USB-A a portem USB-C - ten pierwszy może prowadzić do pewnych problemów z przestrzenią, gdy jest używany z większymi wtyczkami. Ta decyzja firmy Dell jest raczej wątpliwa.
Uwaga: Wtyczka zasilania nie siedzi zbyt mocno i gdy laptop jest przenoszony, dość łatwo się wyślizguje. Ciężki zasilacz dodatkowo przyczynia się do tego problemu.
Równie wątpliwa jest obsługa Thunderbolt (4), która była dostępna w poprzedniku. Teraz najwyraźniej zależy to od zainstalowanej karty graficznej. Według firmy Dell, Thunderbolt nie jest obsługiwany w modelach wykorzystujących do RTX 4060, podczas gdy RTX 4070 lub nowsze są w niego wyposażone. Jest to nietypowe i dla klientów kupujących mniejsze konfiguracje jest to frustrujące. Port nie obsługuje funkcji PowerDelivery.
Komunikacja
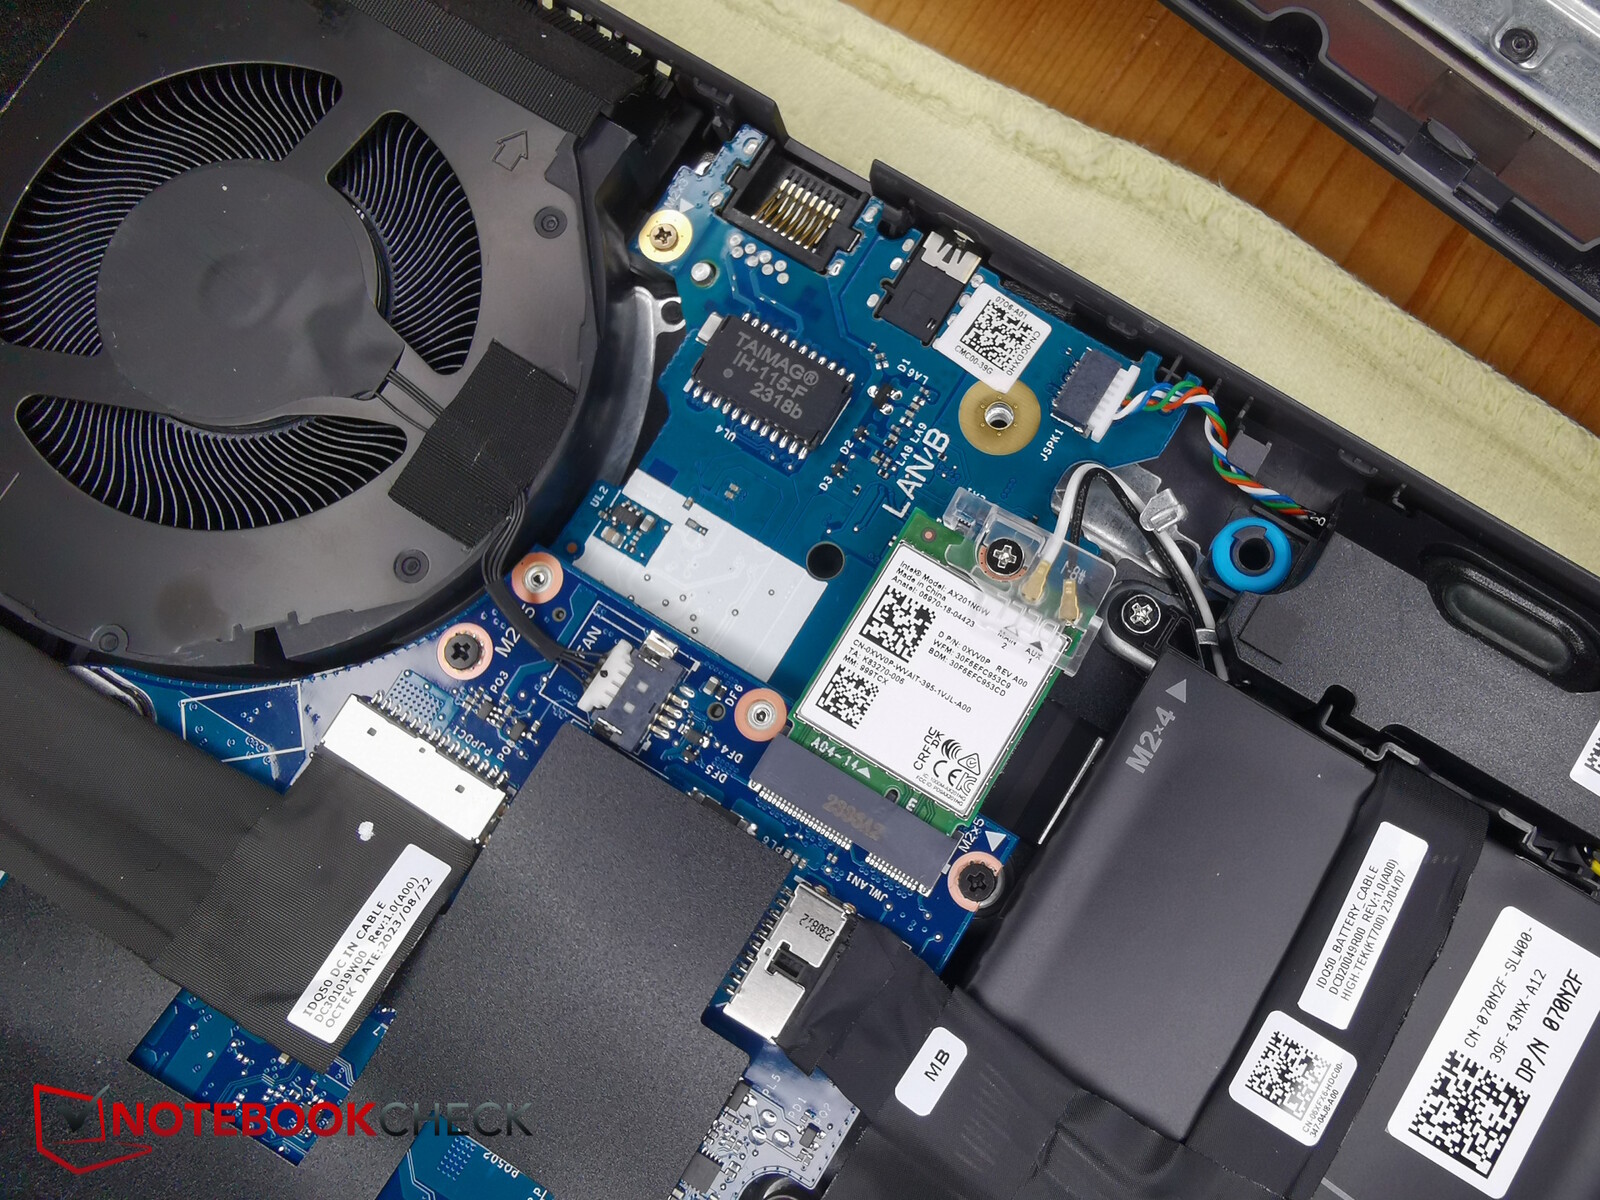
Moduł WiFi Intel AX201 obsługuje WiFi 6, ale jeszcze nie WiFi 6E.
Szybkość transferu w paśmie 5 GHz jest wyjątkowa, podczas gdy szybkość 2,4 GHz wynosząca 210 Mb/s jest rozczarowująca.
Kamera internetowa
Najpóźniej jego skromna kamera internetowa 720p pokazuje, gdzie Dell poczynił oszczędności. Wielu konkurentów posiada już kamerę Full-HD lub lepszą. Są też lepsze modele, jeśli chodzi o odchylenia kolorów i ostrość obrazu.


Bezpieczeństwo
G16 nie posiada żadnych fizycznych funkcji bezpieczeństwa, ponieważ nie ma ani czujnika odcisków palców, ani blokady Kensington. TPM jest oczywiście zintegrowany z procesorem.
Akcesoria i gwarancja
Opakowanie nie zawiera żadnych dodatków. Dell daje temu urządzeniu standardową 12-miesięczną gwarancję z podstawowym serwisem na miejscu i wsparciem sprzętowym, a specjalne warunki można zobaczyć na poniższym zrzucie ekranu.

Konserwacja
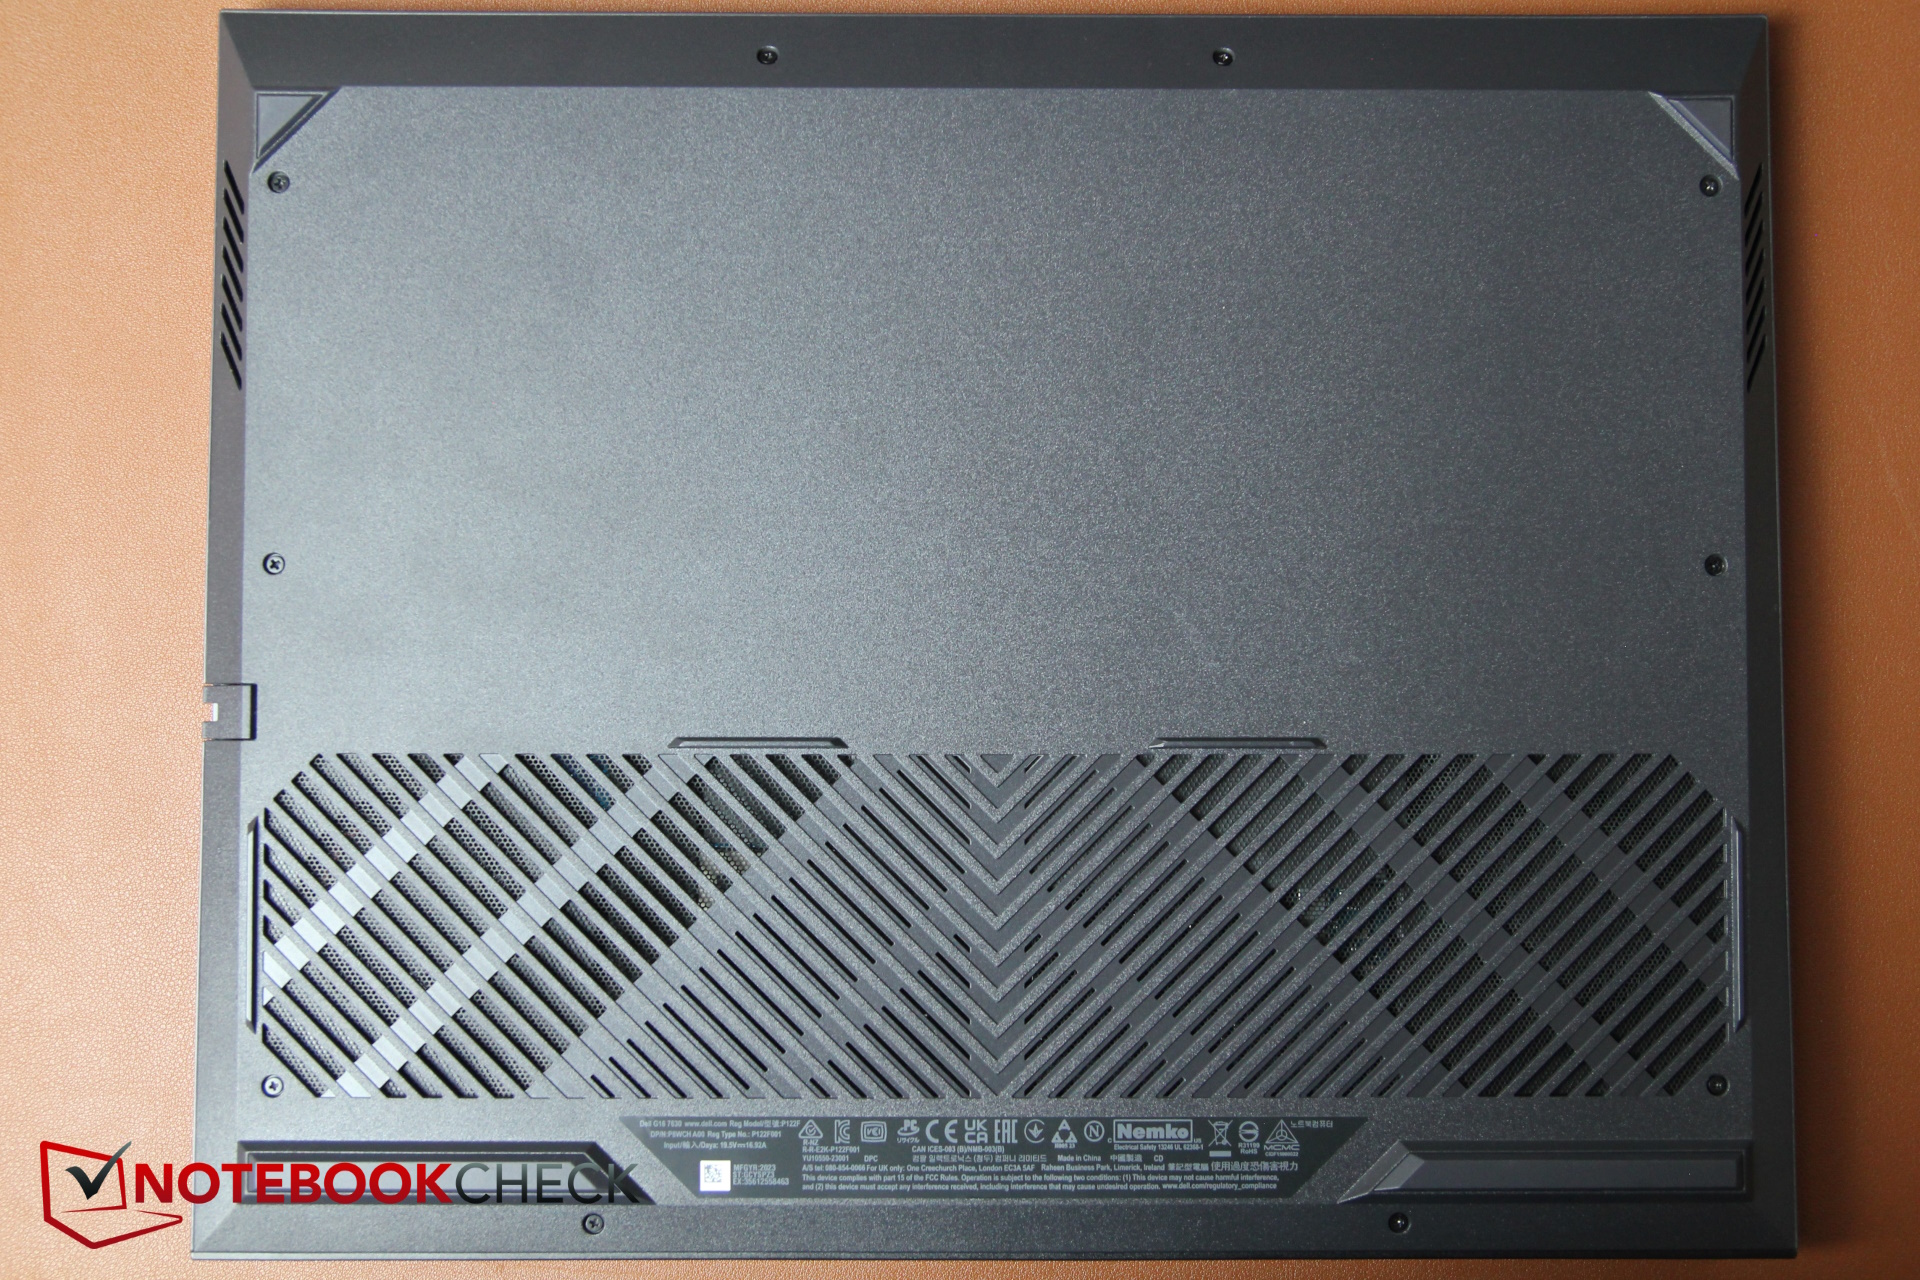
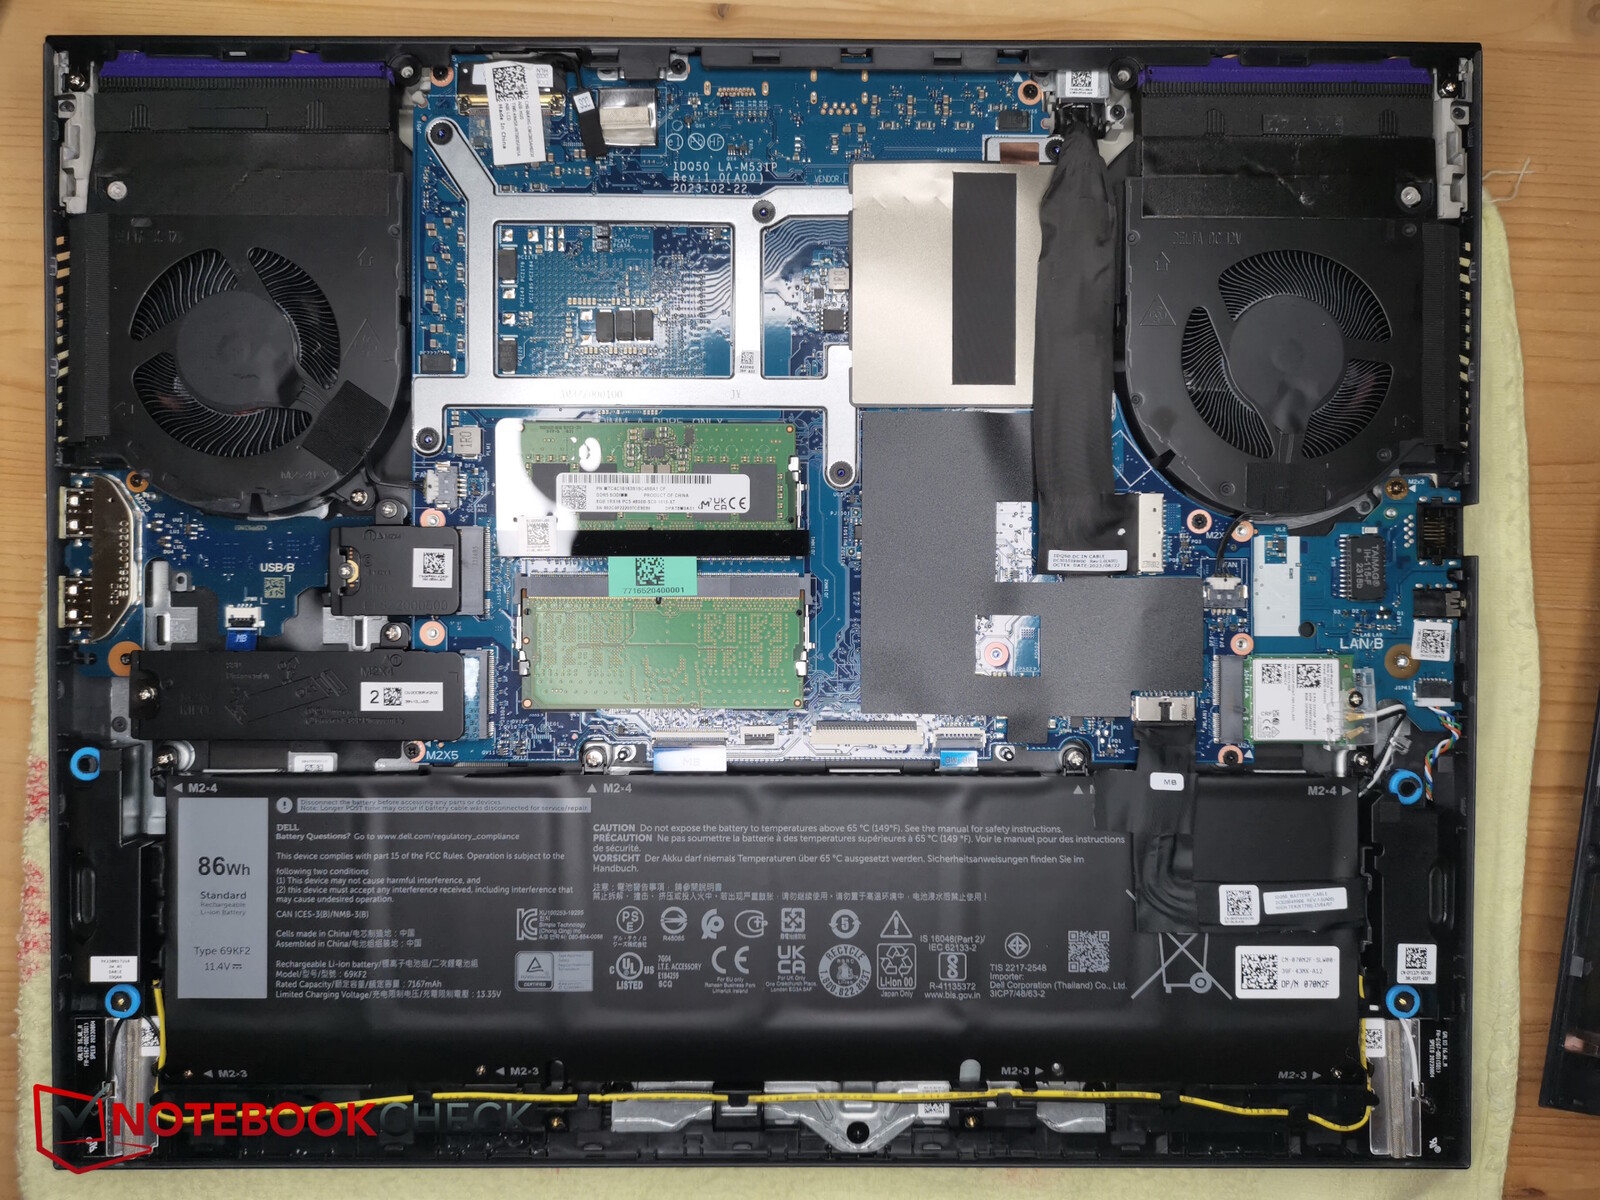
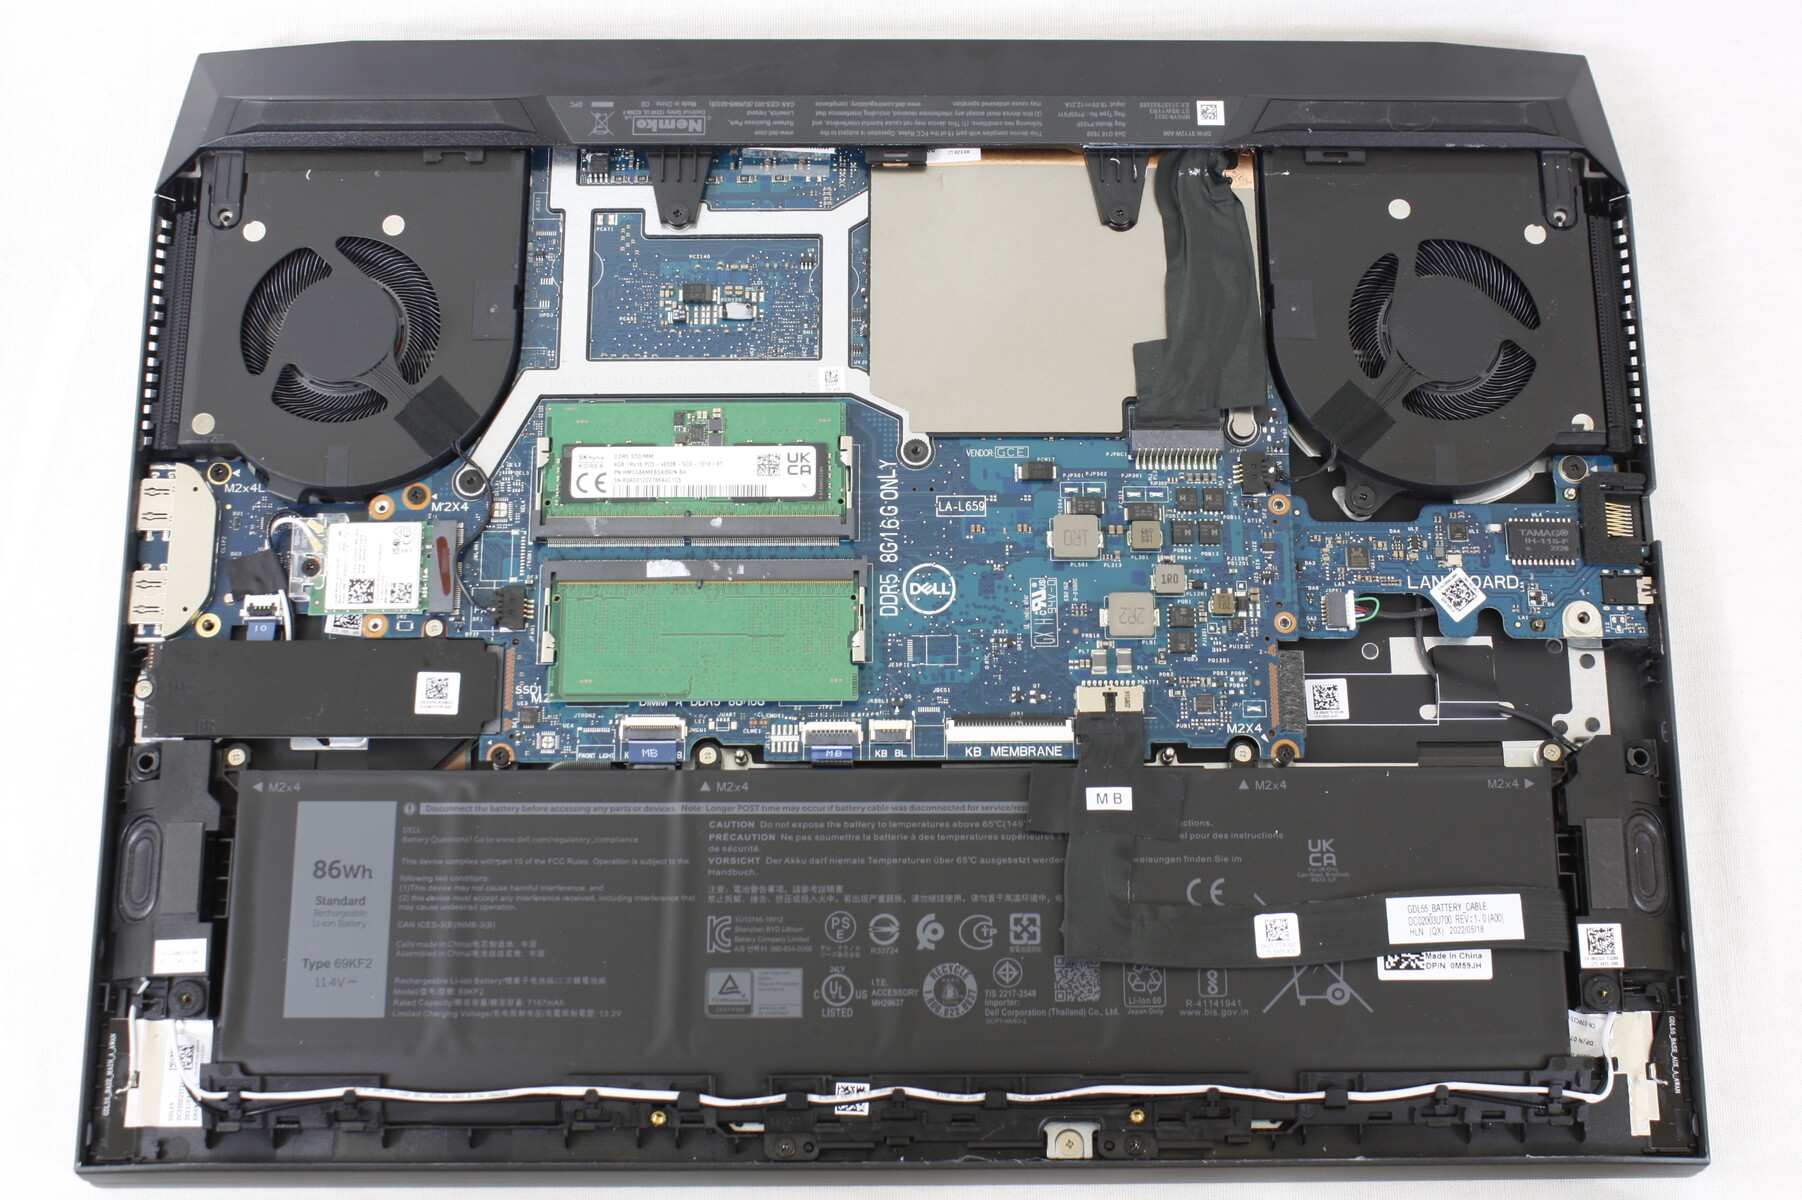
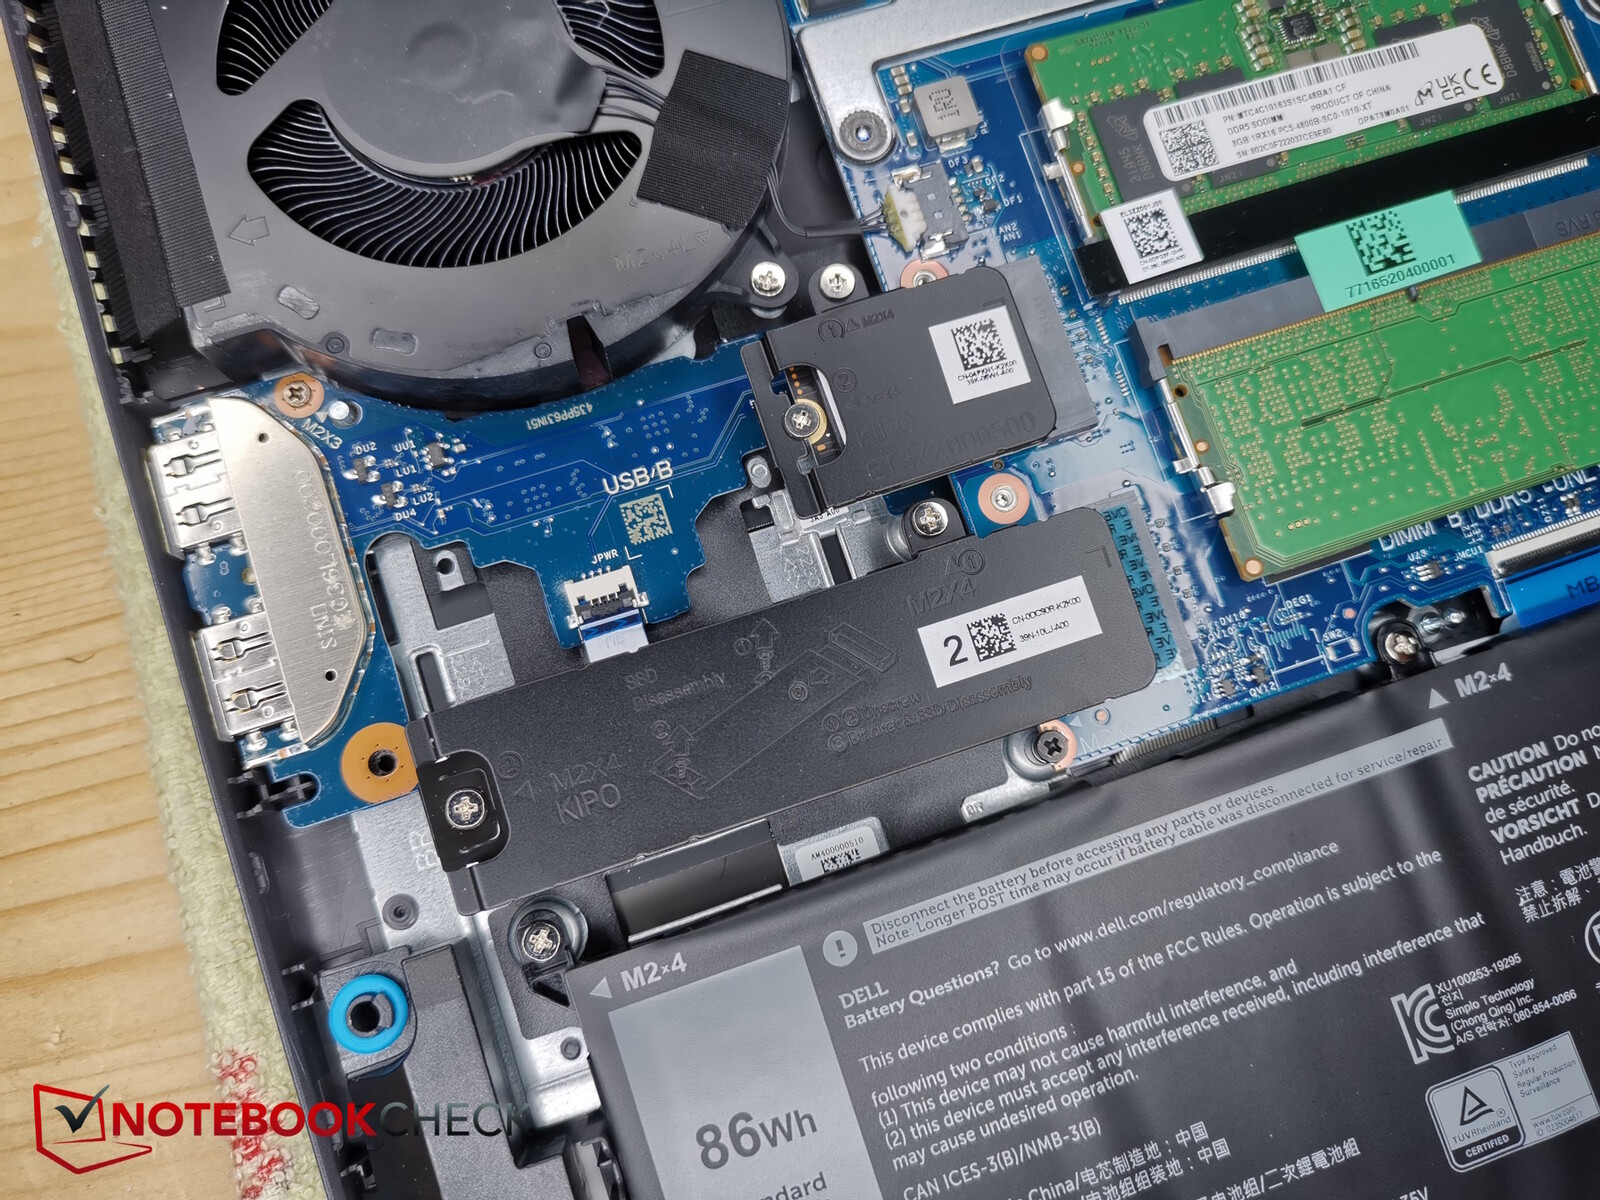
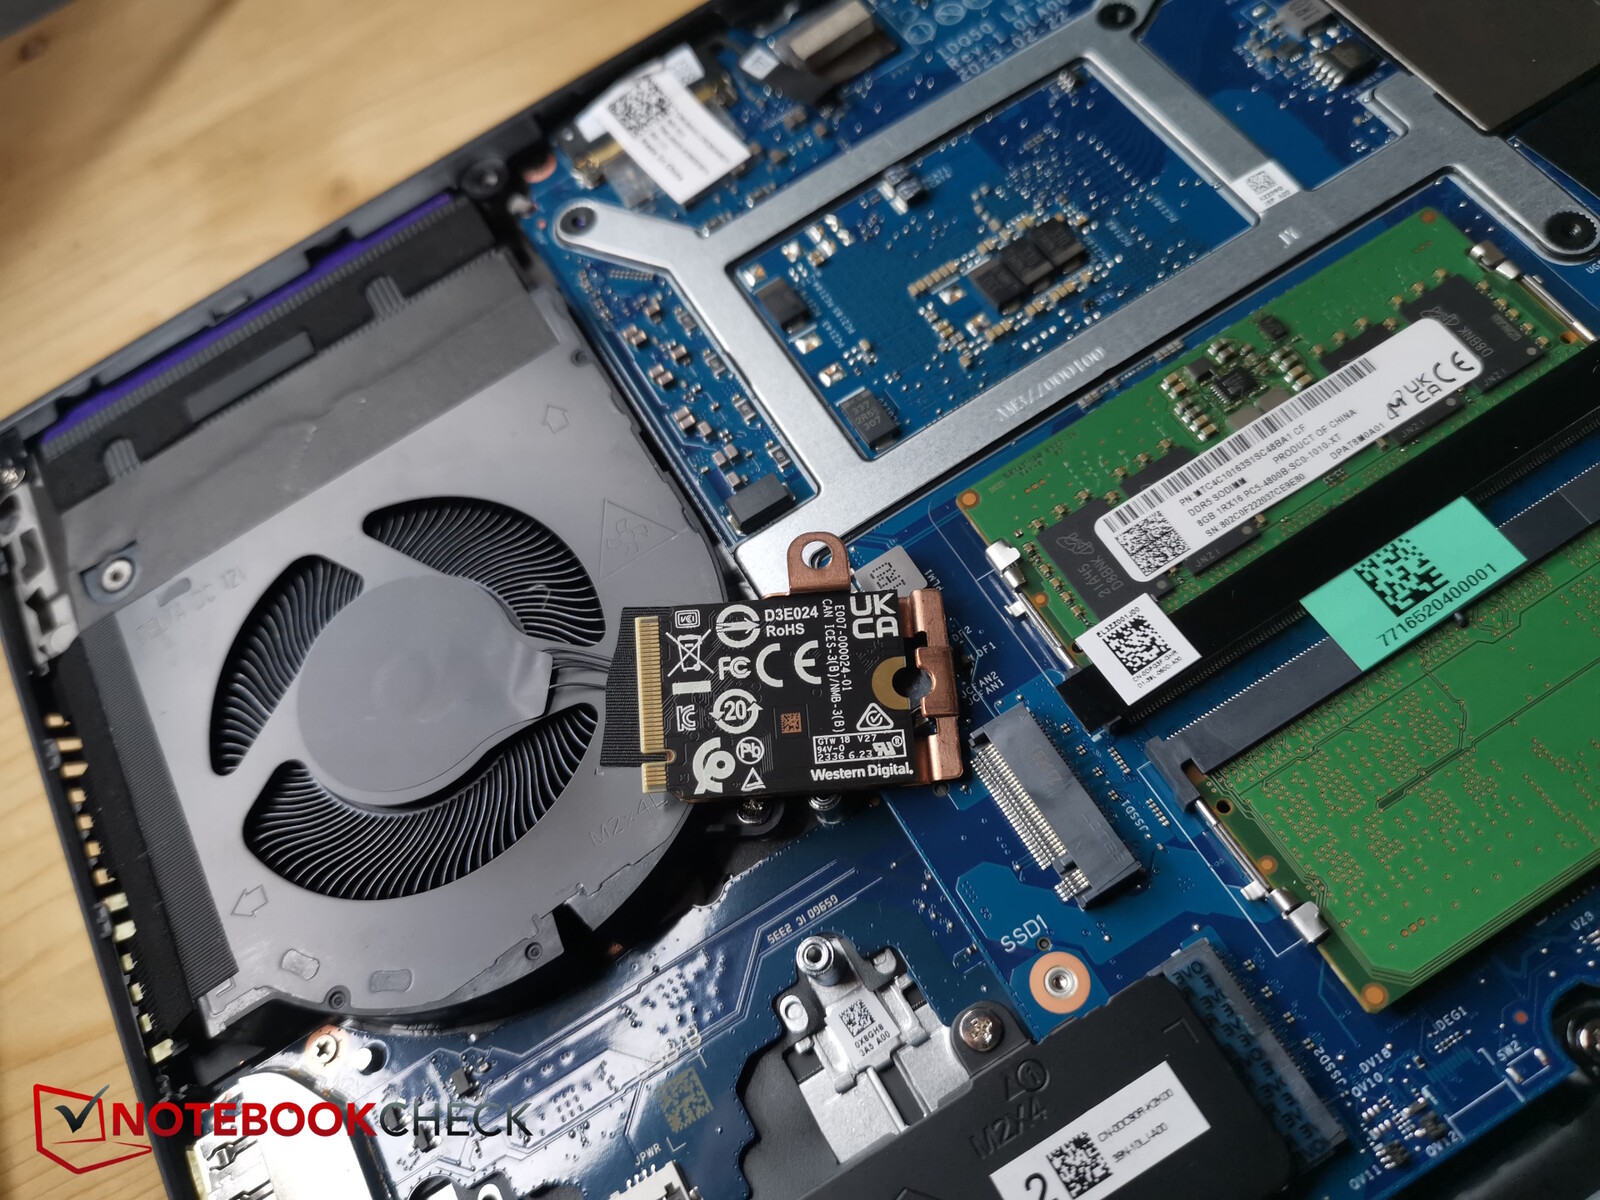
10 śrub z łbem krzyżowym utrzymuje dolną płytę na miejscu. Cztery z nich są dłuższe od pozostałych, ale nie wypadają z otworów, więc nie ma obaw, że się pomieszają. Po odkręceniu śrubek, dolna część obudowy niemal sama się odczepia, więc nie będą potrzebne żadne dodatkowe narzędzia.
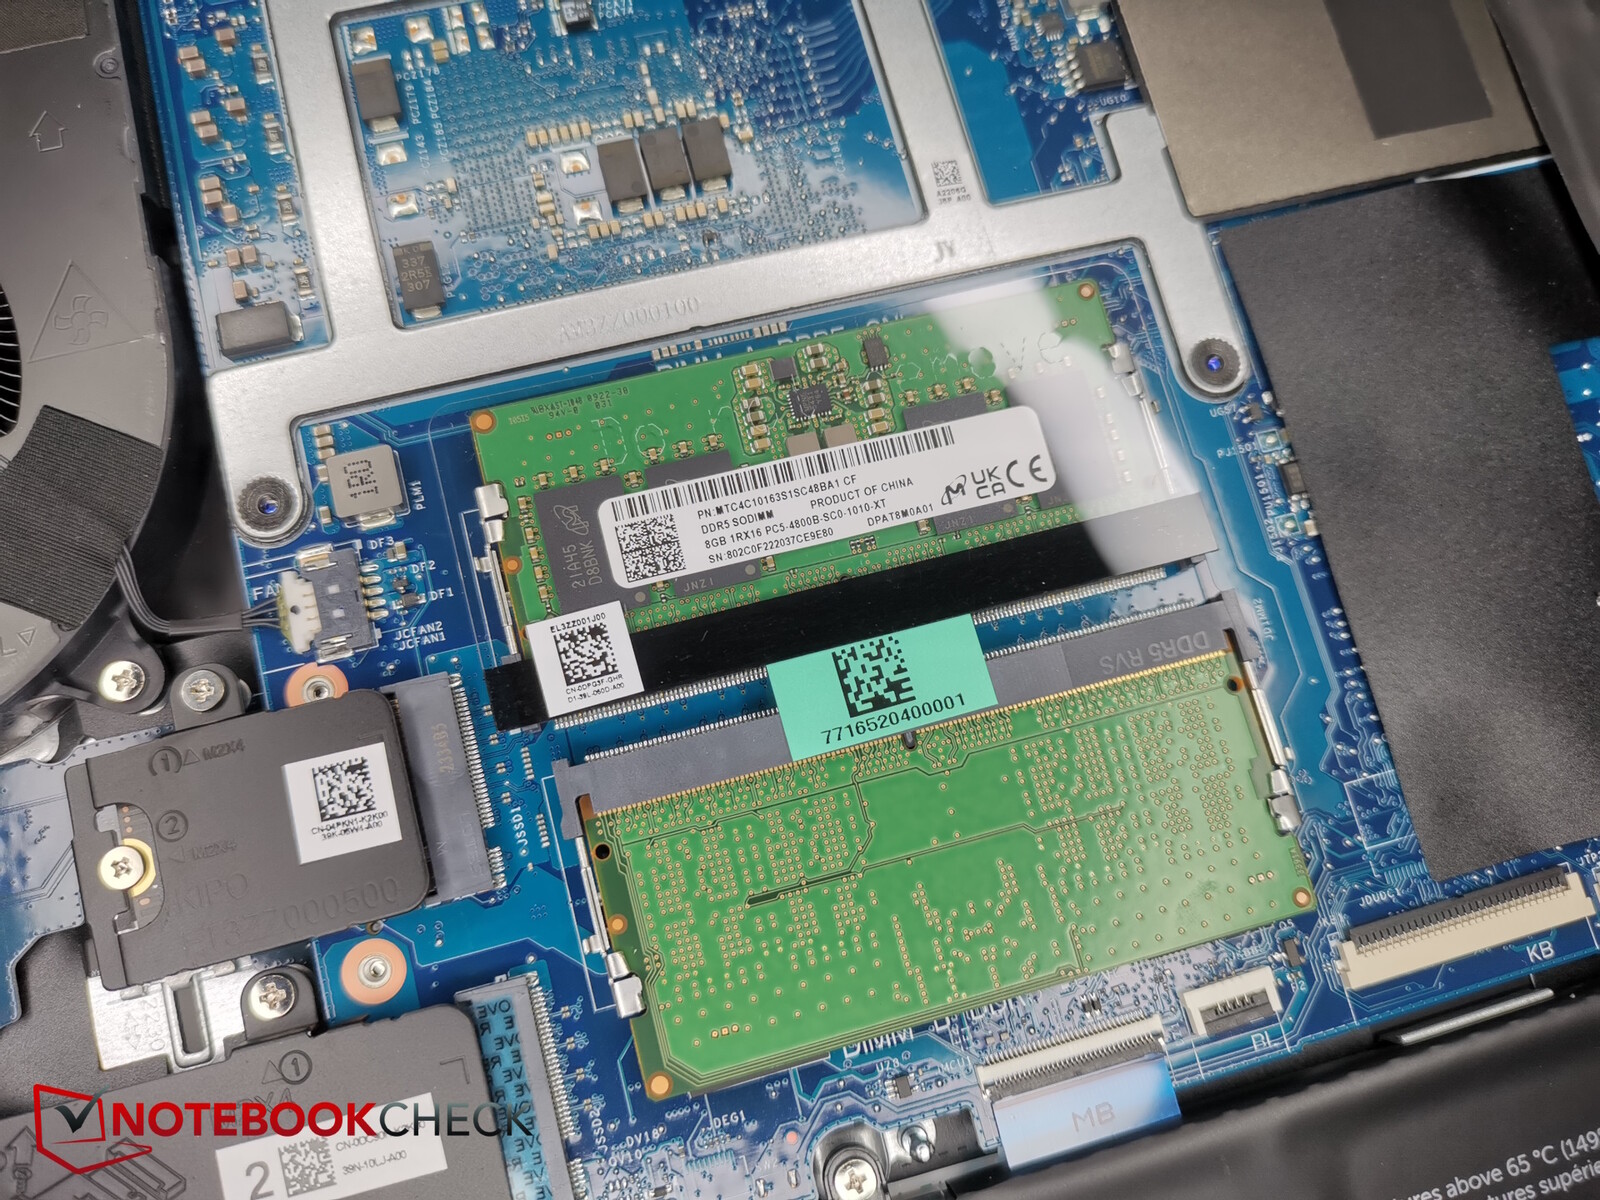
Wewnątrz nie ma zauważalnych miedzianych rurek cieplnych, które można zobaczyć u większości konkurentów do gier. Można uzyskać dostęp do wentylatorów, obu gniazd pamięci RAM, modułu WiFi, baterii i obu gniazd M.2-SSD, z których tylko mniejszy format 2230 jest zajęty.

Urządzenia wejściowe - 5 konfigurowalnych klawiszy specjalnych
Klawiatura
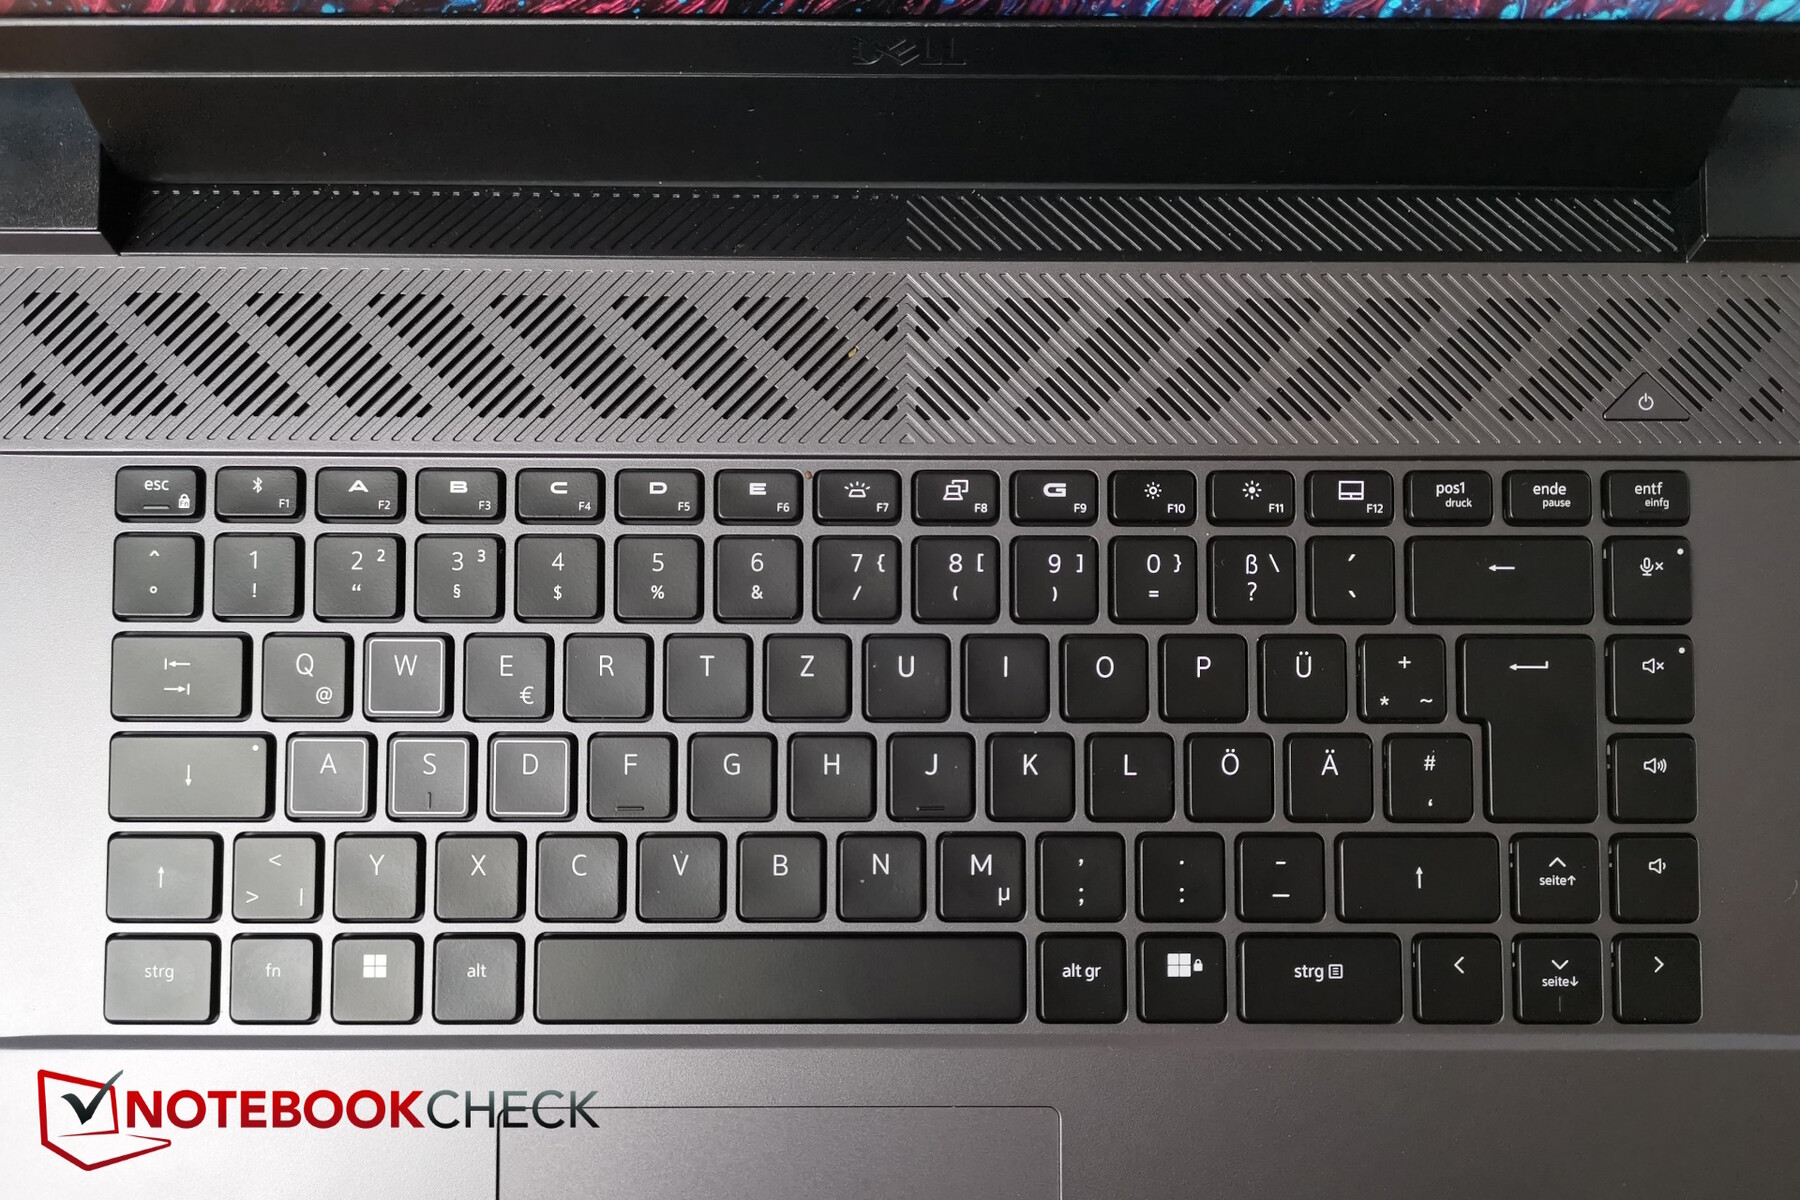
G16 nie posiada klawiatury numerycznej, ale oznacza to, że wszystkie klawisze mają wystarczająco dużo miejsca - dotyczy to również klawiszy strzałek o normalnym rozmiarze. Po prawej stronie znajduje się kilka klawiszy specjalnych (głośność, przycisk wyciszania mikrofonu). Normalne klawisze mają rozmiar około 1,6 x 1,6 cm, a klawisze F są o połowę mniejsze. Klawisze WASD mają biały kontur.
Ponieważ niektóre klawisze specjalne znajdują się po prawej stronie, F2 do F6 można skonfigurować ręcznie, np. za pomocą makr.
Podniesienie klawiszy nie jest zbyt duże, ale ich sprzężenie zwrotne jest w porządku i można na nich wygodnie i szybko pisać. Wynikające z tego odgłosy są bardzo umiarkowane. Lewy klawisz strzałki na naszym urządzeniu testowym brzmi nieco inaczej niż pozostałe klawisze (strzałki) - lekko wydrążony, jakby coś rezonowało w środku. Może to być błąd produkcyjny, który miejmy nadzieję dotyczy tylko naszego urządzenia.
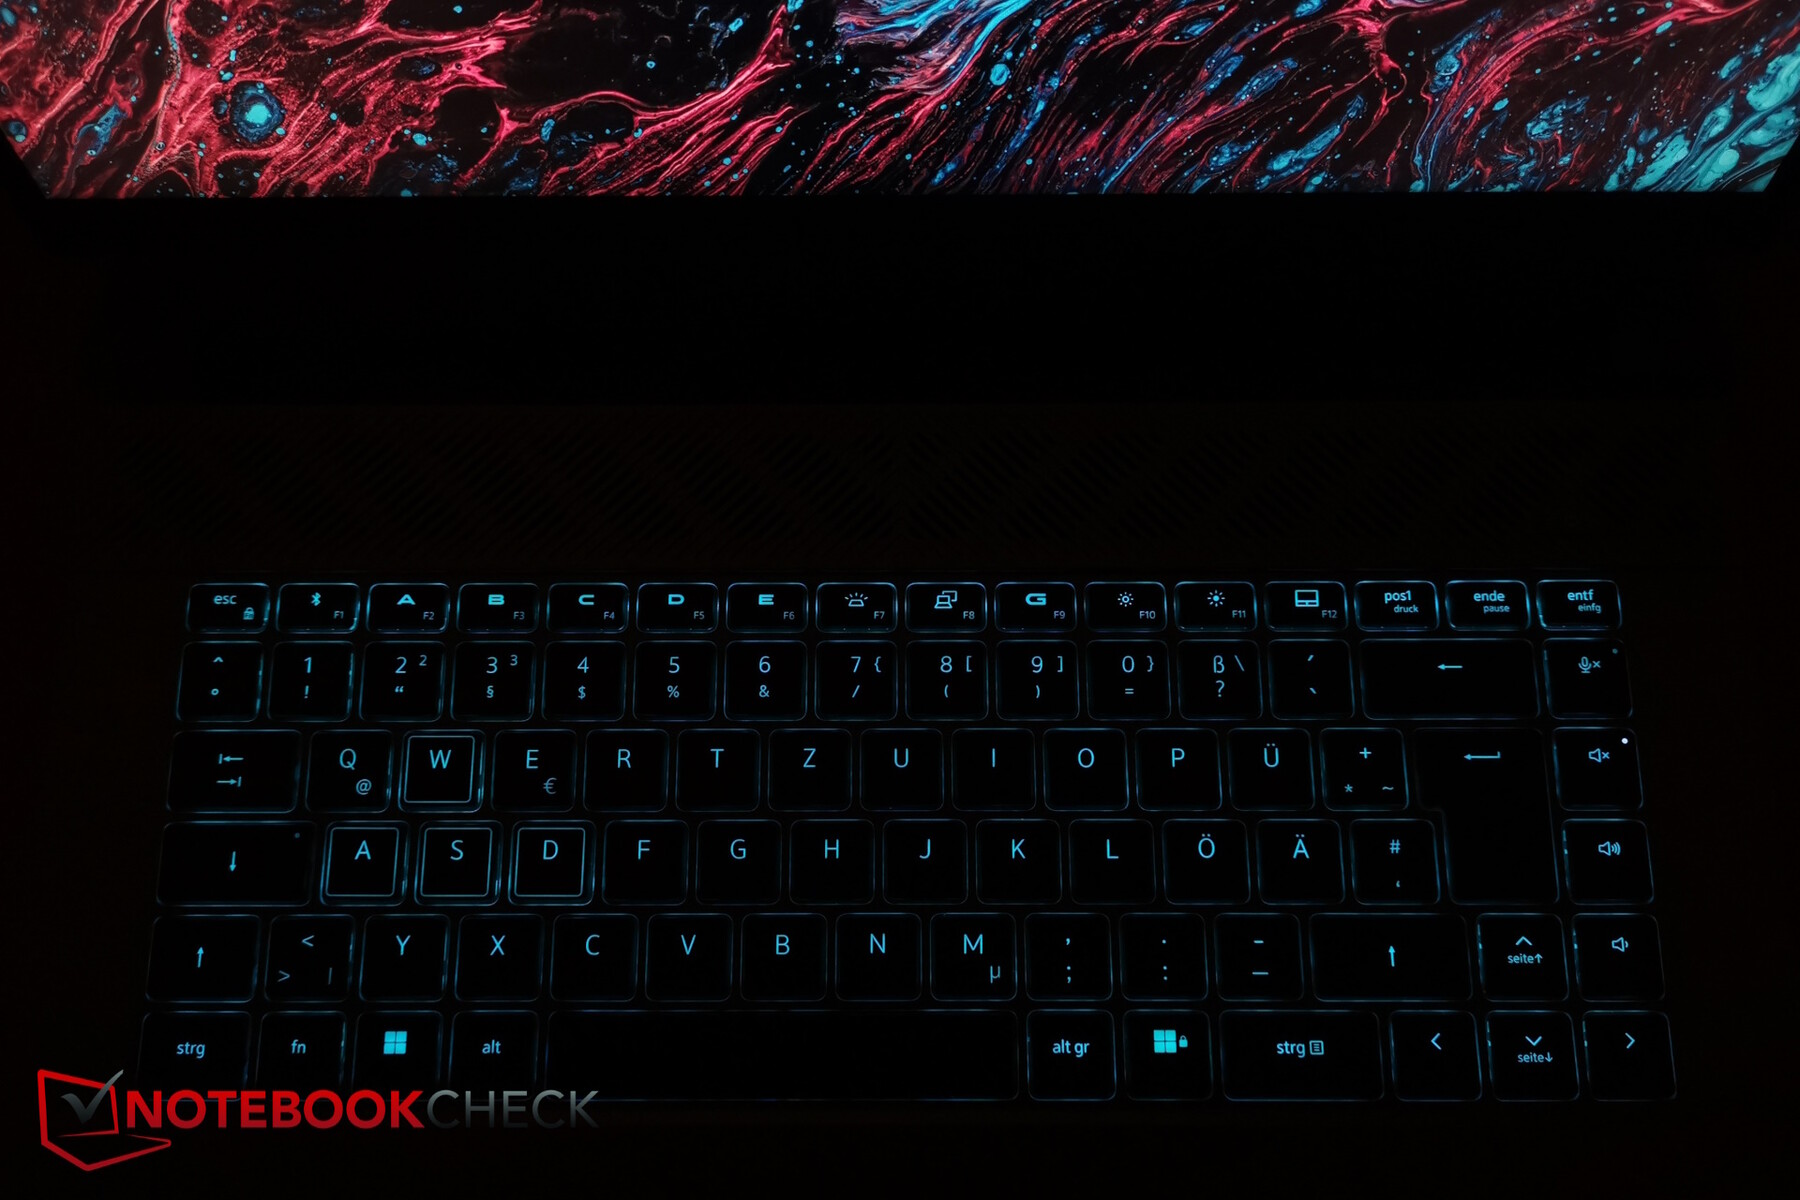
Klawiatura posiada podświetlenie tła o dwóch poziomach intensywności. Ma tylko jedną strefę, ale można wybrać szereg efektów RGB za pośrednictwem Centrum poleceń (krople deszczu, pulsowanie itp.).


Panel dotykowy
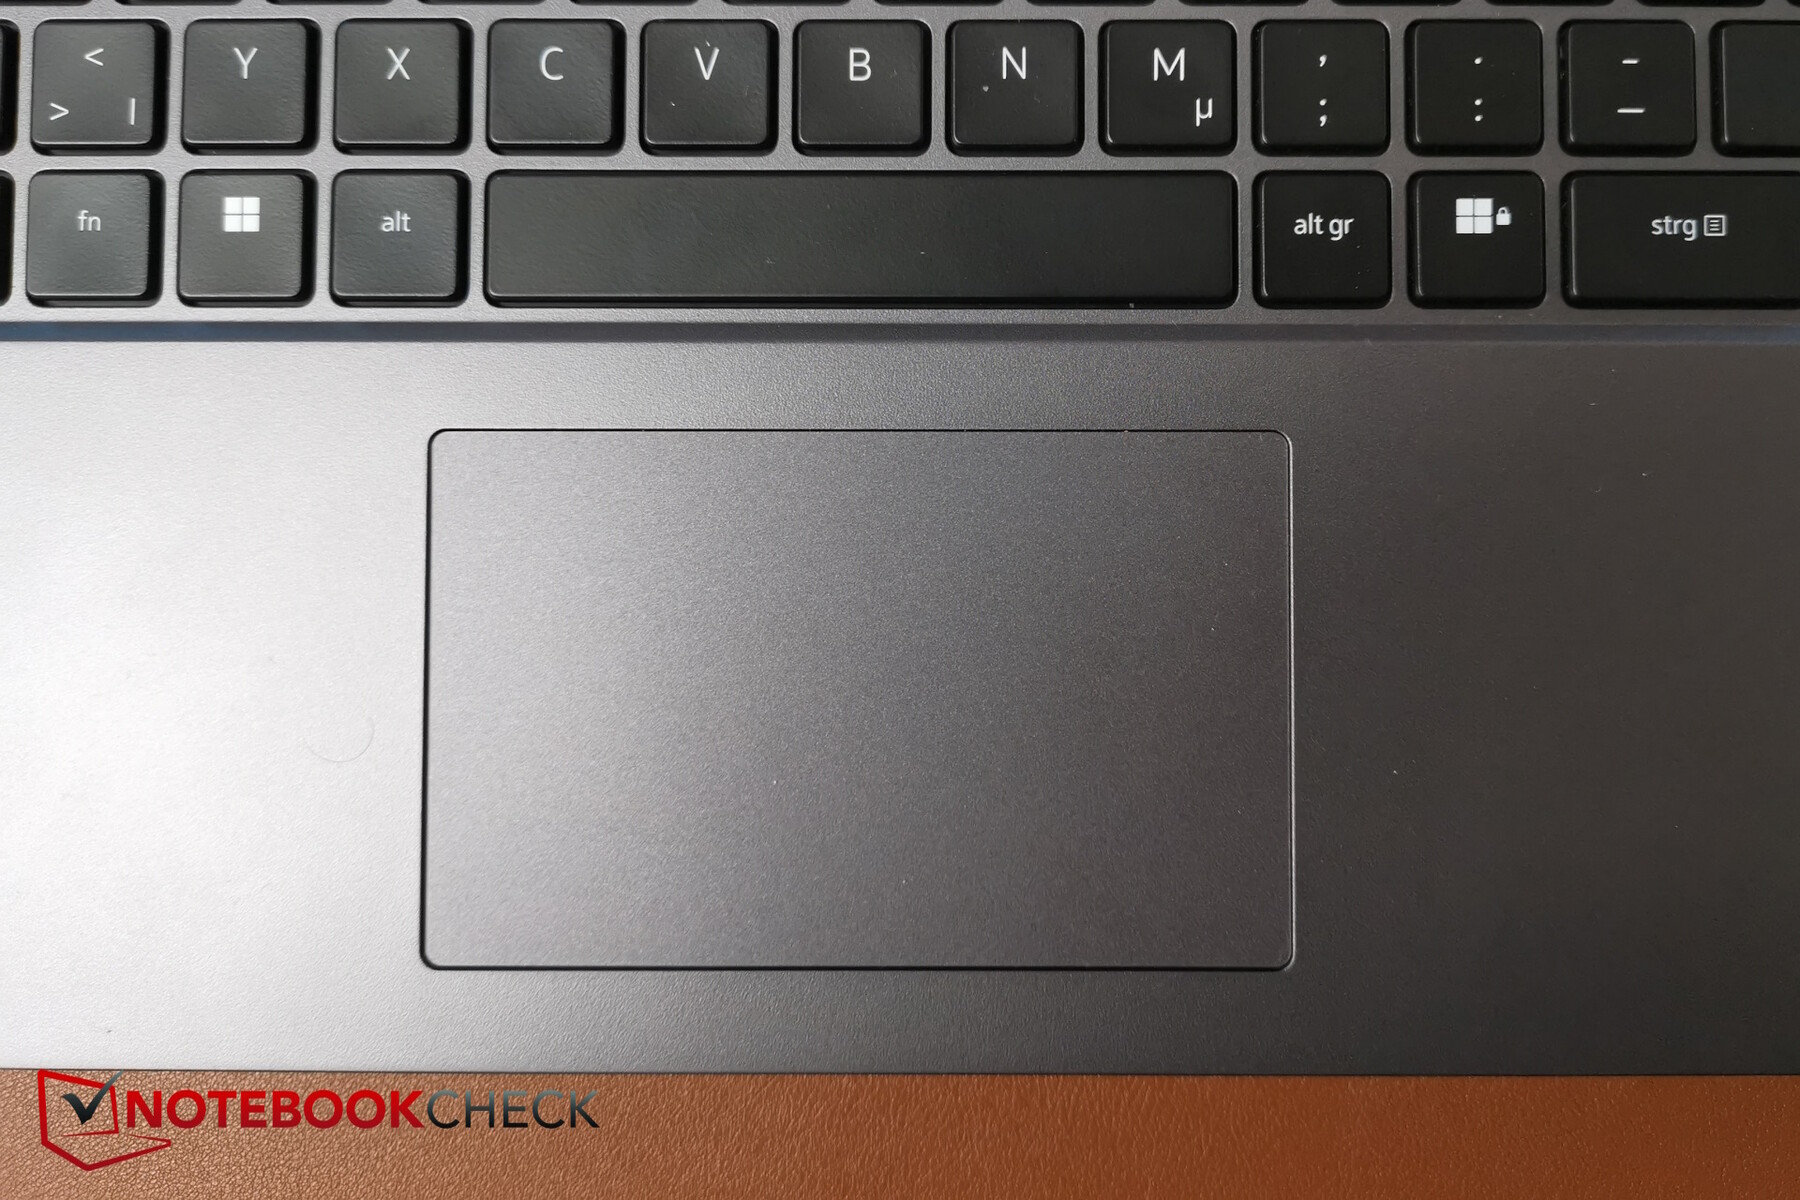
Touchpad jest nieco mały (około 10,5 x 6,5 cm), ale większość graczy prawdopodobnie będzie używać myszy, Dell może założyć. Jego powierzchnia jest przyjemna i gładka, ale podczas bardzo powolnych ruchów lub gdy palce są wilgotne, może się trochę kleić.
Zintegrowane przyciski uruchamiają się niezawodnie - odgłos kliknięcia jest nieco głośniejszy niż odgłos przycisków, ale w żadnym wypadku nie jest irytujący.
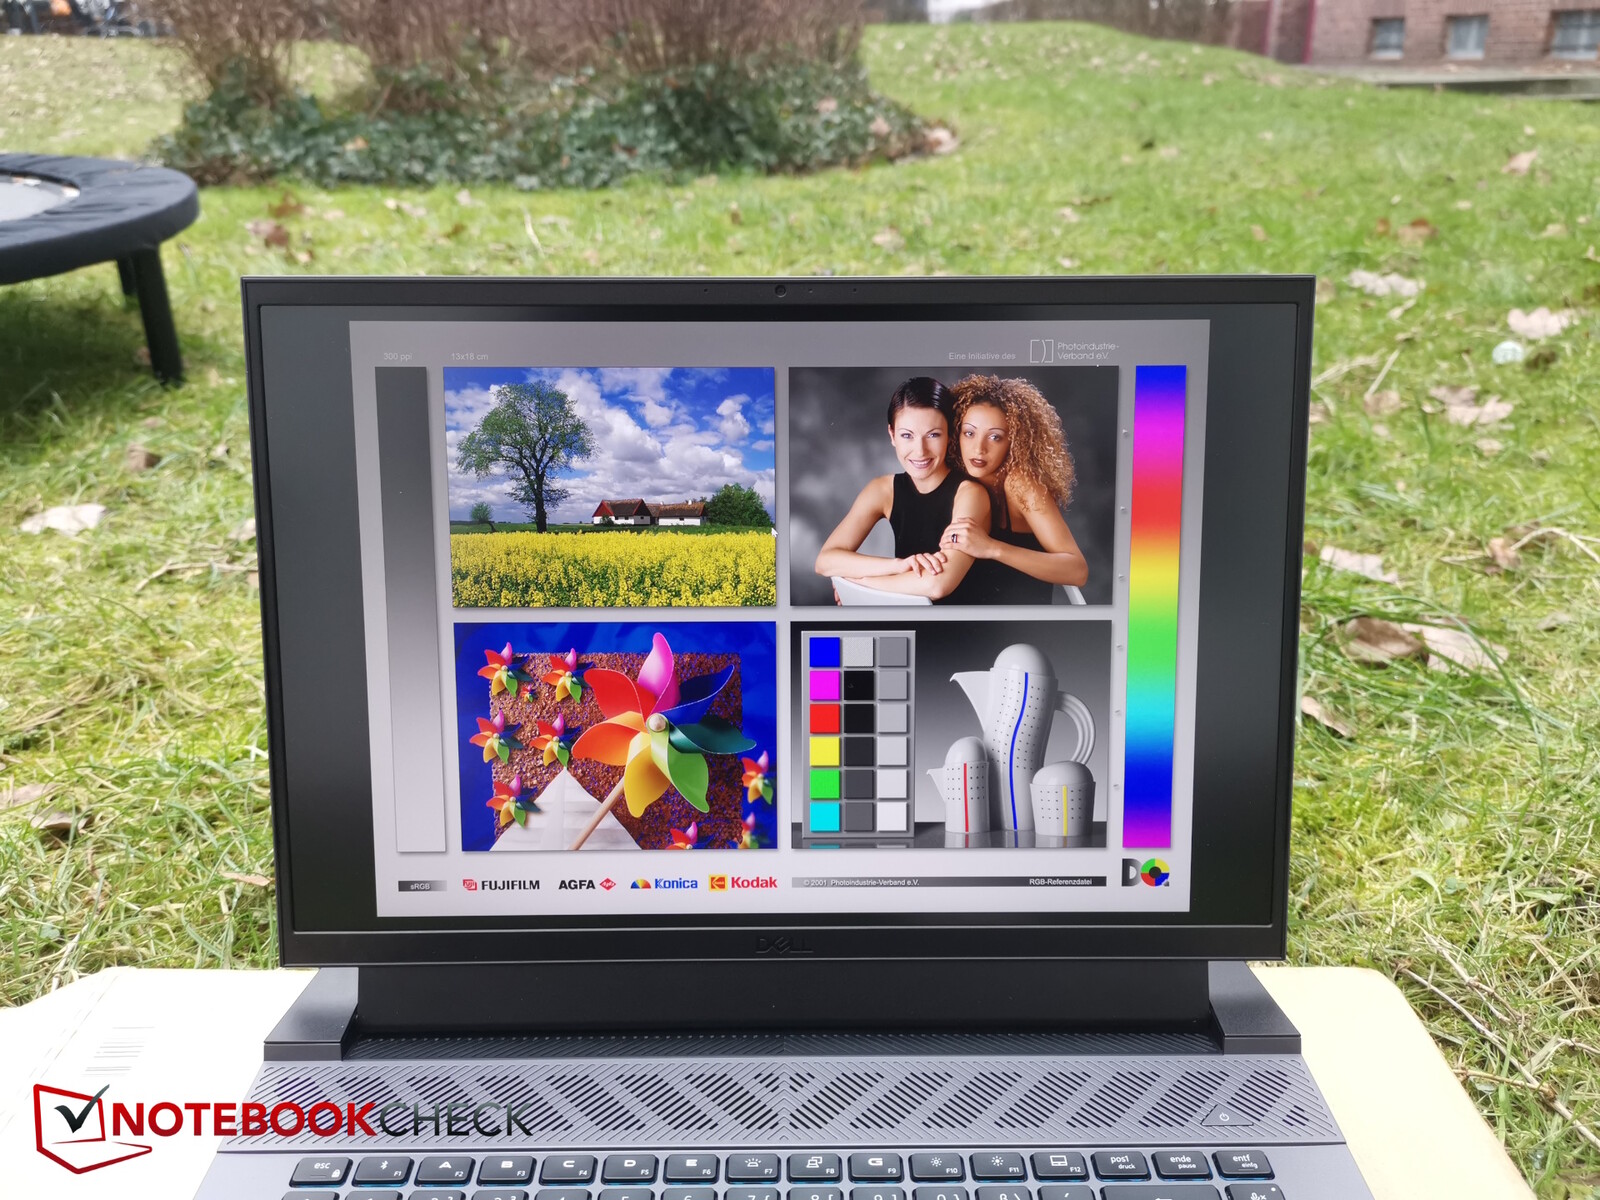
Wyświetlacz - DCI-P3 czy po prostu sRGB?


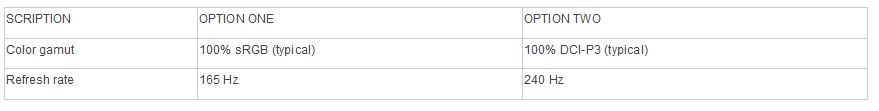
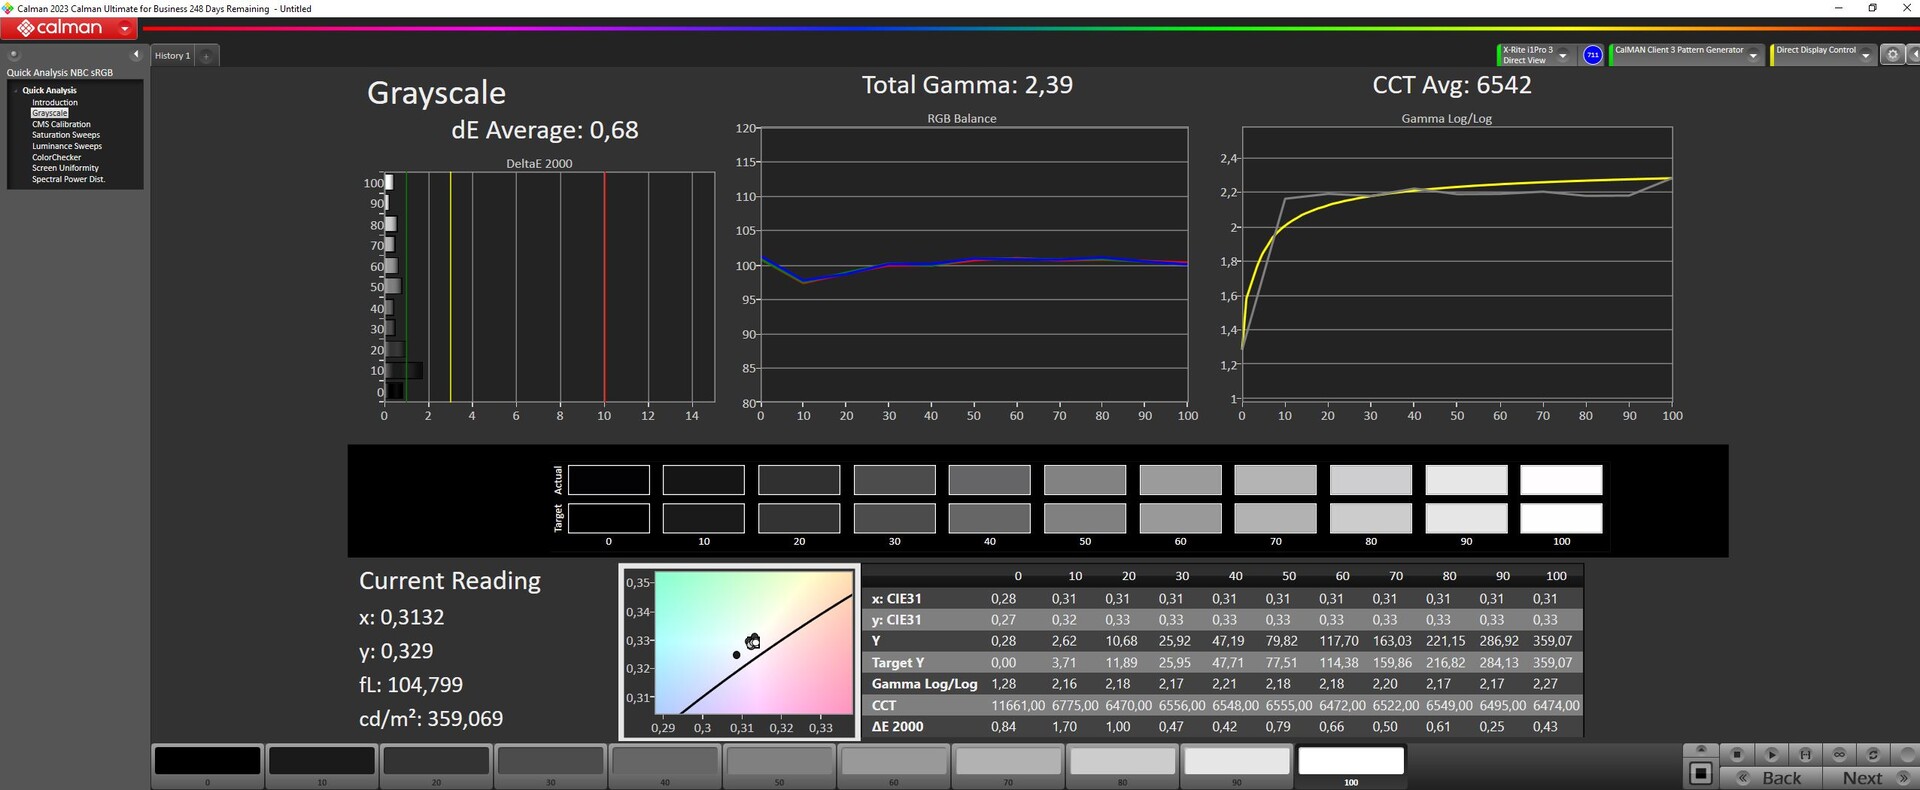
Pomimo tej samej rozdzielczości, Dell zmienił BOE na Chi Mei. Matowy wyświetlacz IPS ma rozdzielczość 2560 x 1600 pikseli. Proszę jednak uważać: Chociaż strona internetowa oferuje obecnie tylko jeden wyświetlacz dla G16 - mianowicie wyświetlacz QHD+ (2560 x 1600) z częstotliwością odświeżania 240 Hz, 3 ms, NVIDIA G-SYNC i 100% pokryciem DCI-P3) - nasza próbka testowa jest wyposażona w panel o tej samej rozdzielczości, ale częstotliwości odświeżania "tylko" 165 Hz i, co ważniejsze, tylko pokrycie sRGB, a nie DCI-P3! Proszę spojrzeć na instrukcję obsługi urządzenia https://www.dell.com/support/manuals/de-de/g-series-16-7630-laptop/dell-g16-7630-owners-manual/display?guid=guid-2bdf1814-06d3-4b69-967b-c48432875f91&lang=en-us aby poznać oba warianty.
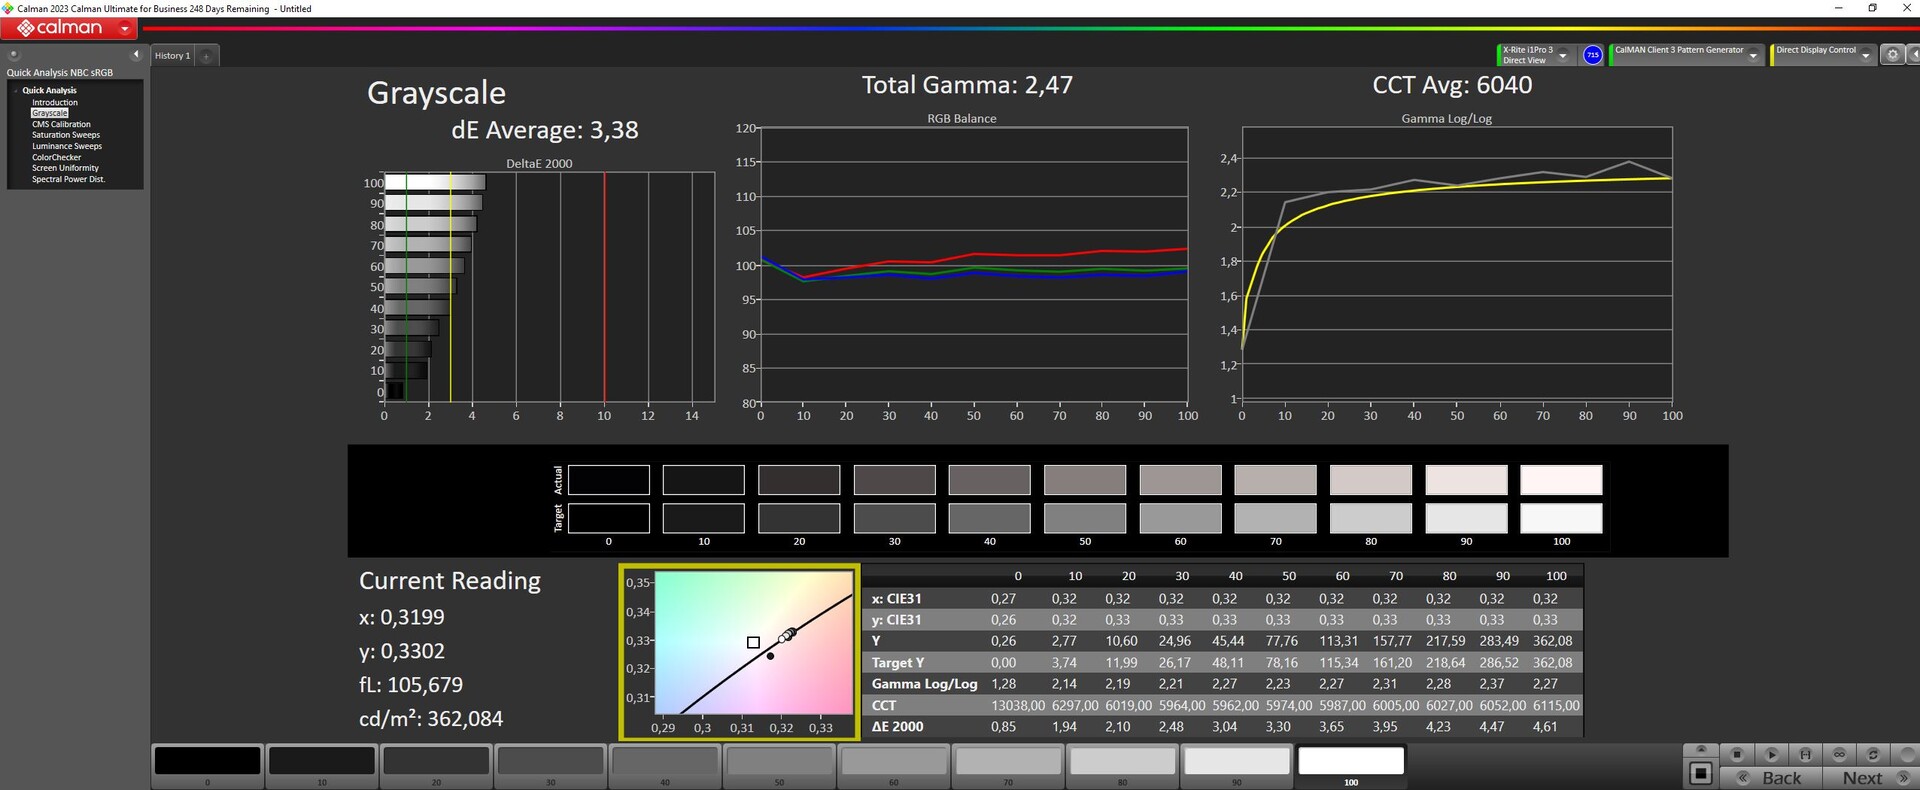
Zmierzyliśmy średnią jasność 344 nitów przy dobrym 89-procentowym podświetleniu. Jednak podczas przedstawiania ciemnych scen zauważyliśmy subtelne krwawienie podświetlenia praktycznie wzdłuż każdej krawędzi.
Pomimo tej samej jasności, ekran wykazuje lepszą wartość czerni, co również wpływa korzystnie na jego kontrast. Podsumowując, jest to całkiem dobry wyświetlacz sRGB, a jego czasy reakcji są również wystarczająco szybkie.
| |||||||||||||||||||||||||
rozświetlenie: 89 %
na akumulatorze: 369 cd/m²
kontrast: 1419:1 (czerń: 0.26 cd/m²)
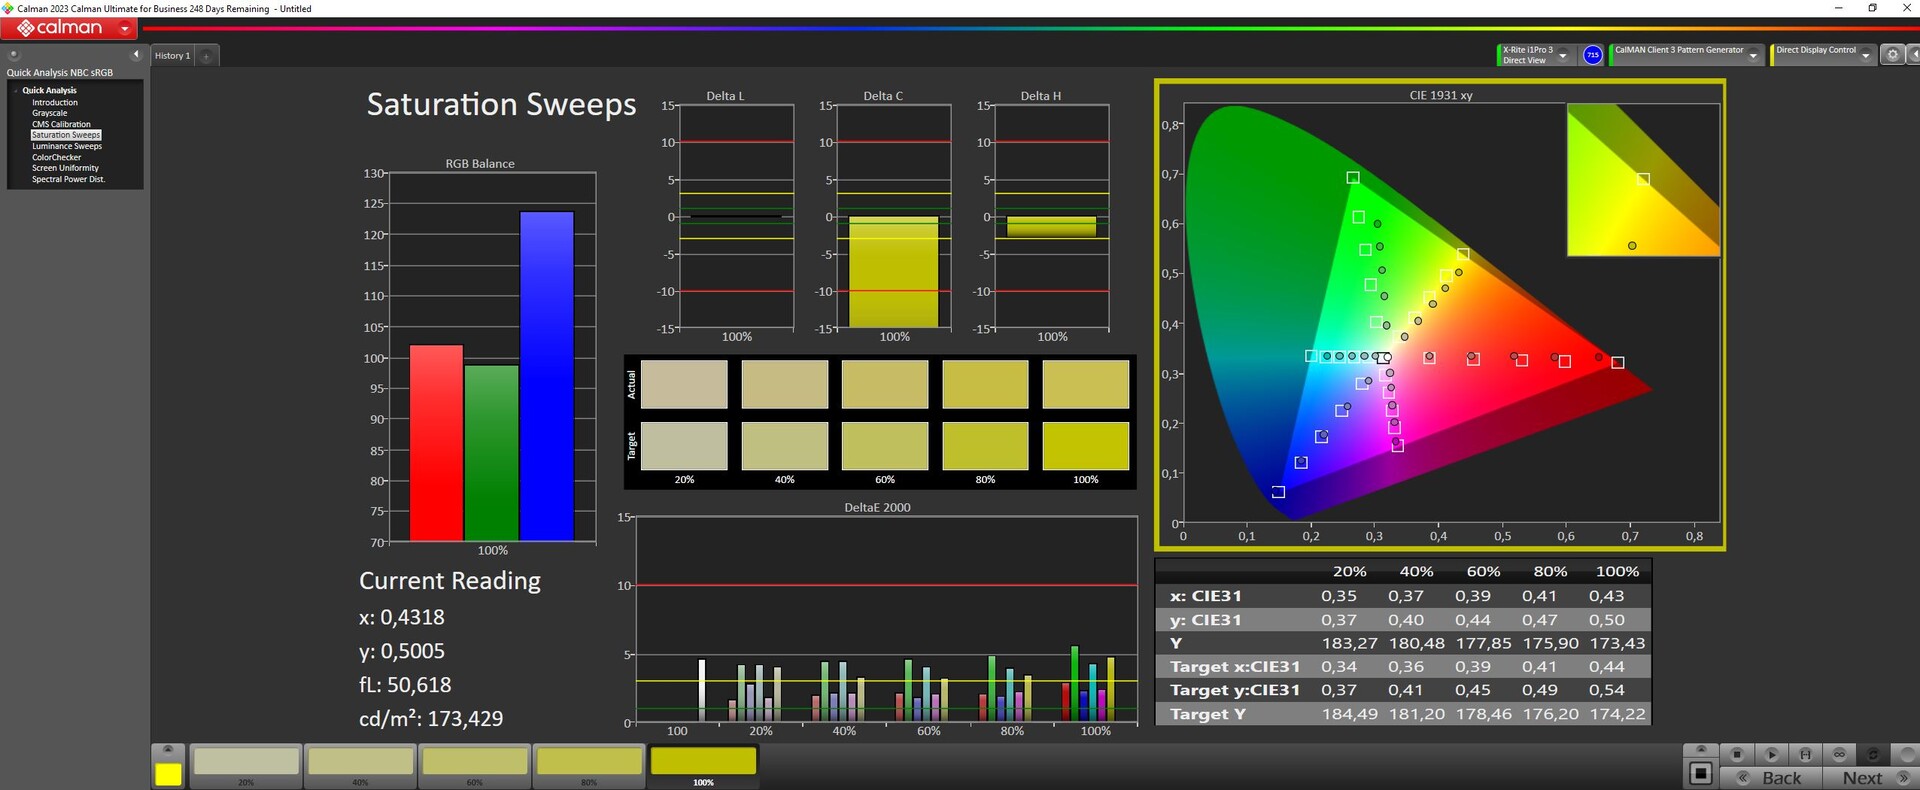
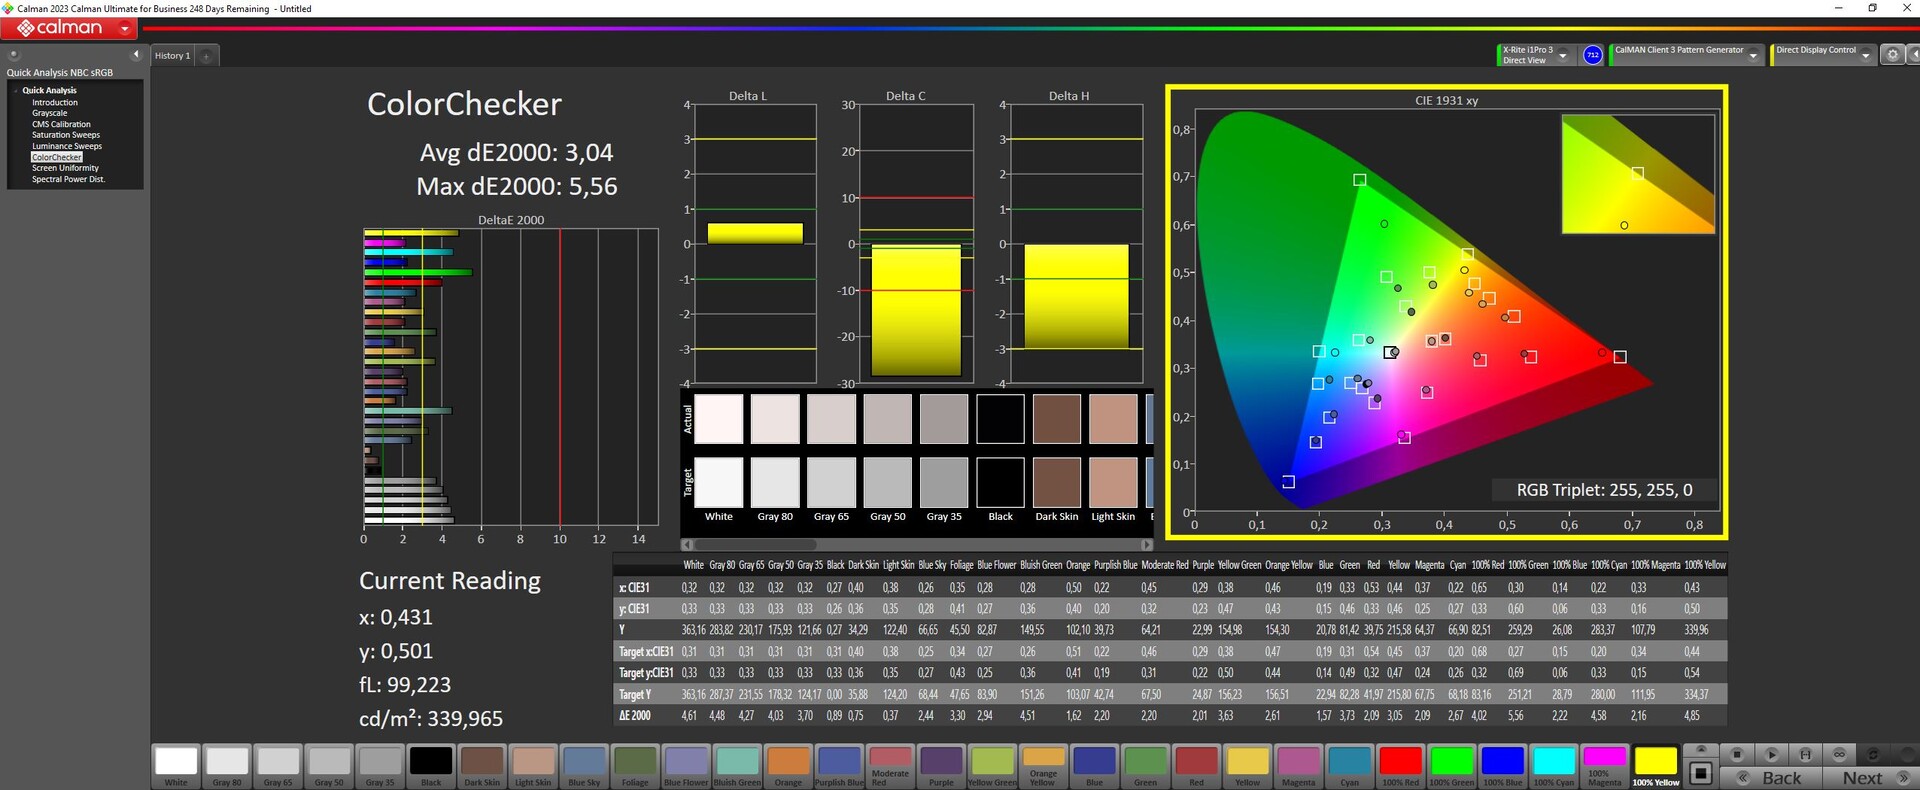
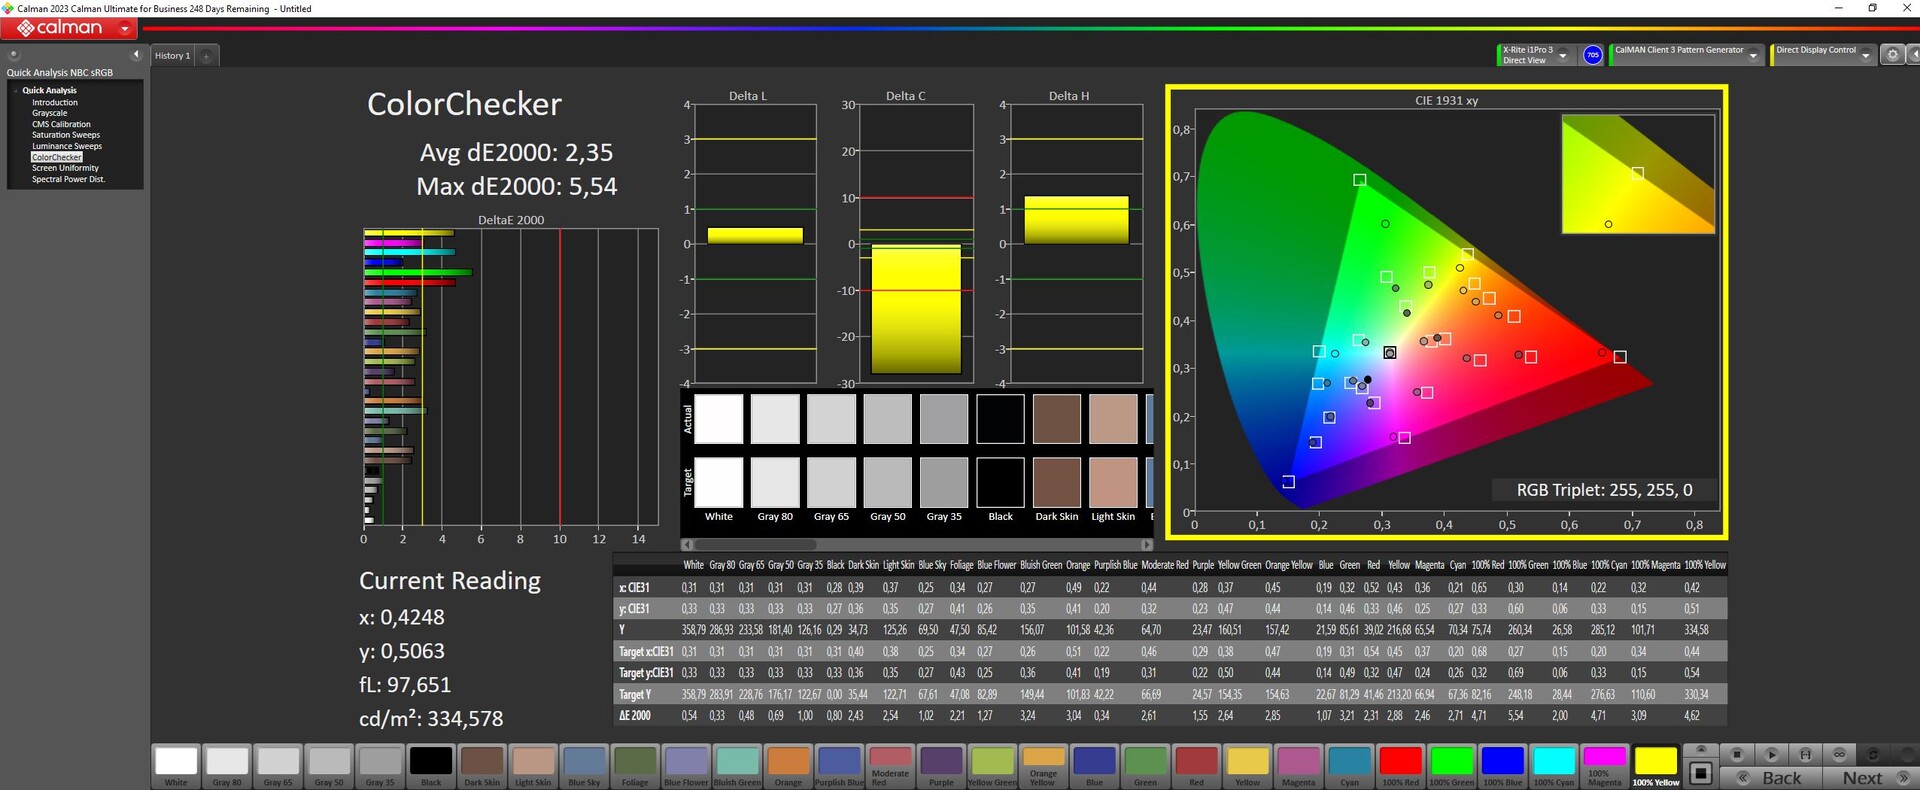
ΔE ColorChecker Calman: 3.04 | ∀{0.5-29.43 Ø4.72}
calibrated: 2.35
ΔE Greyscale Calman: 3.38 | ∀{0.09-98 Ø4.97}
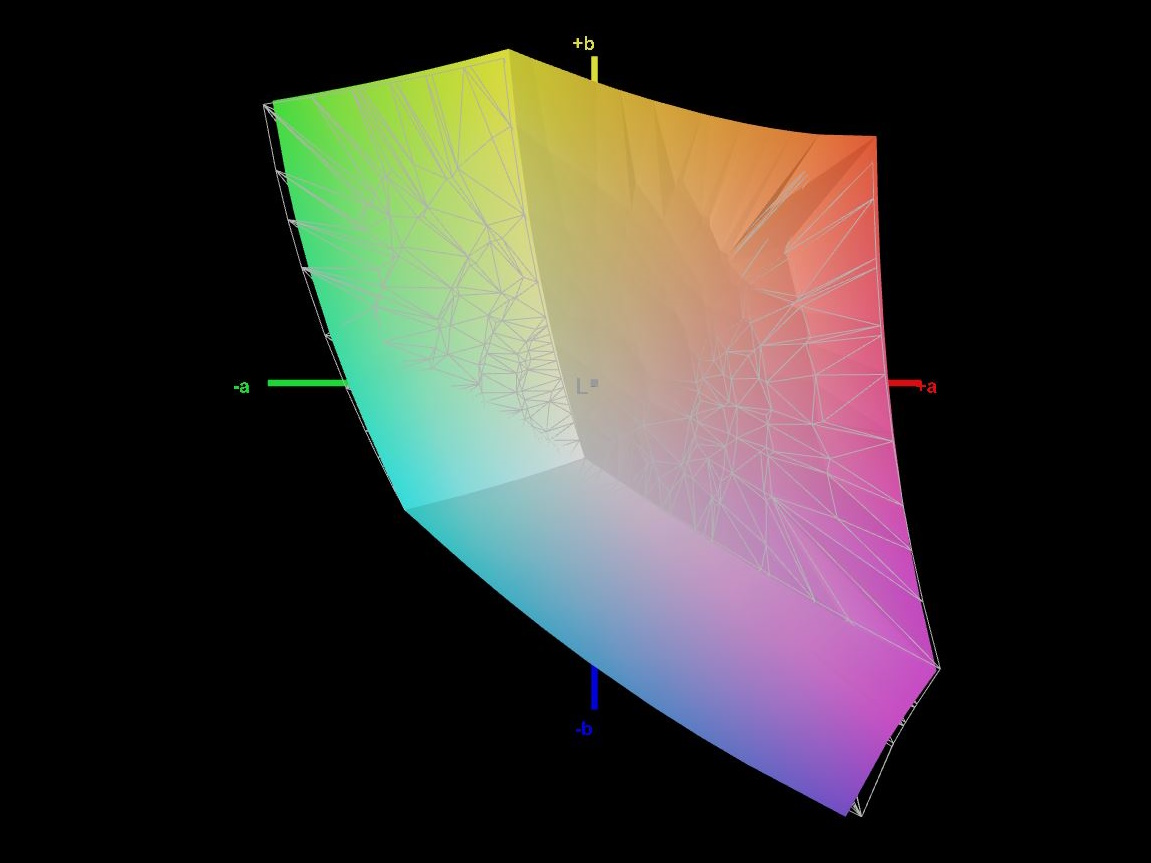
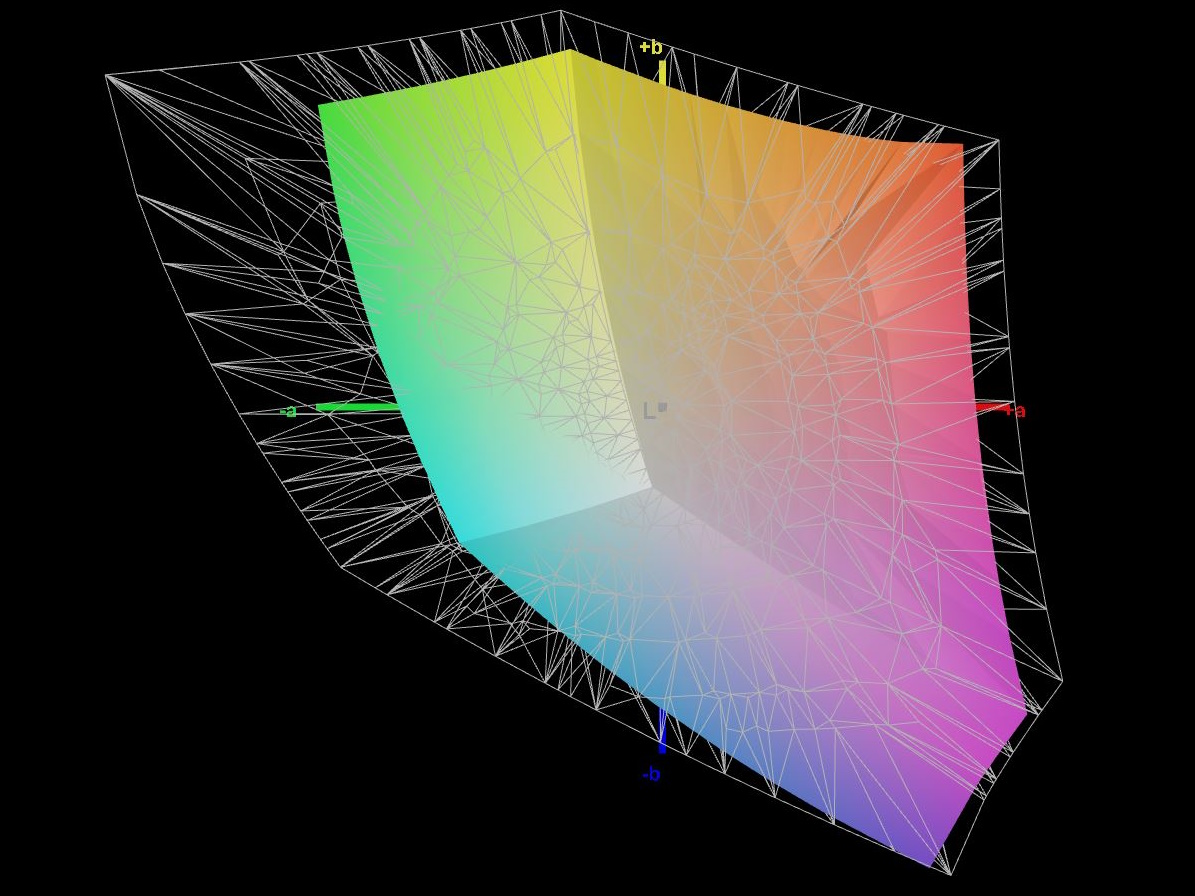
69.3% AdobeRGB 1998 (Argyll 3D)
98.5% sRGB (Argyll 3D)
67.5% Display P3 (Argyll 3D)
Gamma: 2.47
CCT: 6040 K
| Dell G16, i7-13650HX, RTX 4060 Chi Mei CMN161D (160GME), IPS, 2560x1600, 16" | Dell G16 7620 BOE NE16QDM, IPS, 2560x1600, 16" | MSI Raider GE68HX 13VF Chi Mei N160JME-GTK, IPS, 1900x1200, 16" | Lenovo Legion Slim 5 16APH8 BOE NJ NE160QDM-NYC, IPS, 2560x1600, 16" | Alienware m16 R1 Intel BOE NE16NYB, IPS, 2560x1600, 16" | Lenovo LOQ 16IRH8 AUOC1A5 (B160QAN03.L), IPS, 2560x1600, 16" | |
|---|---|---|---|---|---|---|
| Display | 1% | -38% | 2% | 0% | 3% | |
| Display P3 Coverage (%) | 67.5 | 68.3 1% | 41.6 -38% | 69.3 3% | 67.7 0% | 70.5 4% |
| sRGB Coverage (%) | 98.5 | 98 -1% | 62.2 -37% | 100 2% | 97.2 -1% | 98.9 0% |
| AdobeRGB 1998 Coverage (%) | 69.3 | 70.5 2% | 43 -38% | 70 1% | 70 1% | 72.6 5% |
| Response Times | -7% | -131% | -8% | 39% | 17% | |
| Response Time Grey 50% / Grey 80% * (ms) | 7.6 ? | 8.6 ? -13% | 17.3 ? -128% | 10.7 ? -41% | 4 ? 47% | 7.2 ? 5% |
| Response Time Black / White * (ms) | 10.4 ? | 10.4 ? -0% | 24.2 ? -133% | 7.8 ? 25% | 7.3 ? 30% | 7.4 ? 29% |
| PWM Frequency (Hz) | ||||||
| Screen | 7% | -37% | 15% | 4% | 13% | |
| Brightness middle (cd/m²) | 369 | 369.4 0% | 300.9 -18% | 371.6 1% | 306 -17% | 407 10% |
| Brightness (cd/m²) | 344 | 348 1% | 302 -12% | 343 0% | 302 -12% | 369 7% |
| Brightness Distribution (%) | 89 | 83 -7% | 93 4% | 84 -6% | 89 0% | 85 -4% |
| Black Level * (cd/m²) | 0.26 | 0.32 -23% | 0.31 -19% | 0.44 -69% | 0.3 -15% | 0.45 -73% |
| Contrast (:1) | 1419 | 1154 -19% | 971 -32% | 845 -40% | 1020 -28% | 904 -36% |
| Colorchecker dE 2000 * | 3.04 | 1.78 41% | 4.6 -51% | 1.52 50% | 2.57 15% | 1.43 53% |
| Colorchecker dE 2000 max. * | 5.56 | 4.41 21% | 17.6 -217% | 2.68 52% | 4.26 23% | 3.58 36% |
| Colorchecker dE 2000 calibrated * | 2.35 | 1.22 48% | 2.04 13% | 0.33 86% | 0.85 64% | 1.07 54% |
| Greyscale dE 2000 * | 3.38 | 3.2 5% | 3.3 2% | 1.2 64% | 3.3 2% | 1.13 67% |
| Gamma | 2.47 89% | 2.2 100% | 2.09 105% | 2.1 105% | 1.997 110% | 2.5 88% |
| CCT | 6040 108% | 6750 96% | 7151 91% | 6503 100% | 6895 94% | 6526 100% |
| Całkowita średnia (program / ustawienia) | 0% /
4% | -69% /
-50% | 3% /
9% | 14% /
8% | 11% /
11% |
* ... im mniej tym lepiej
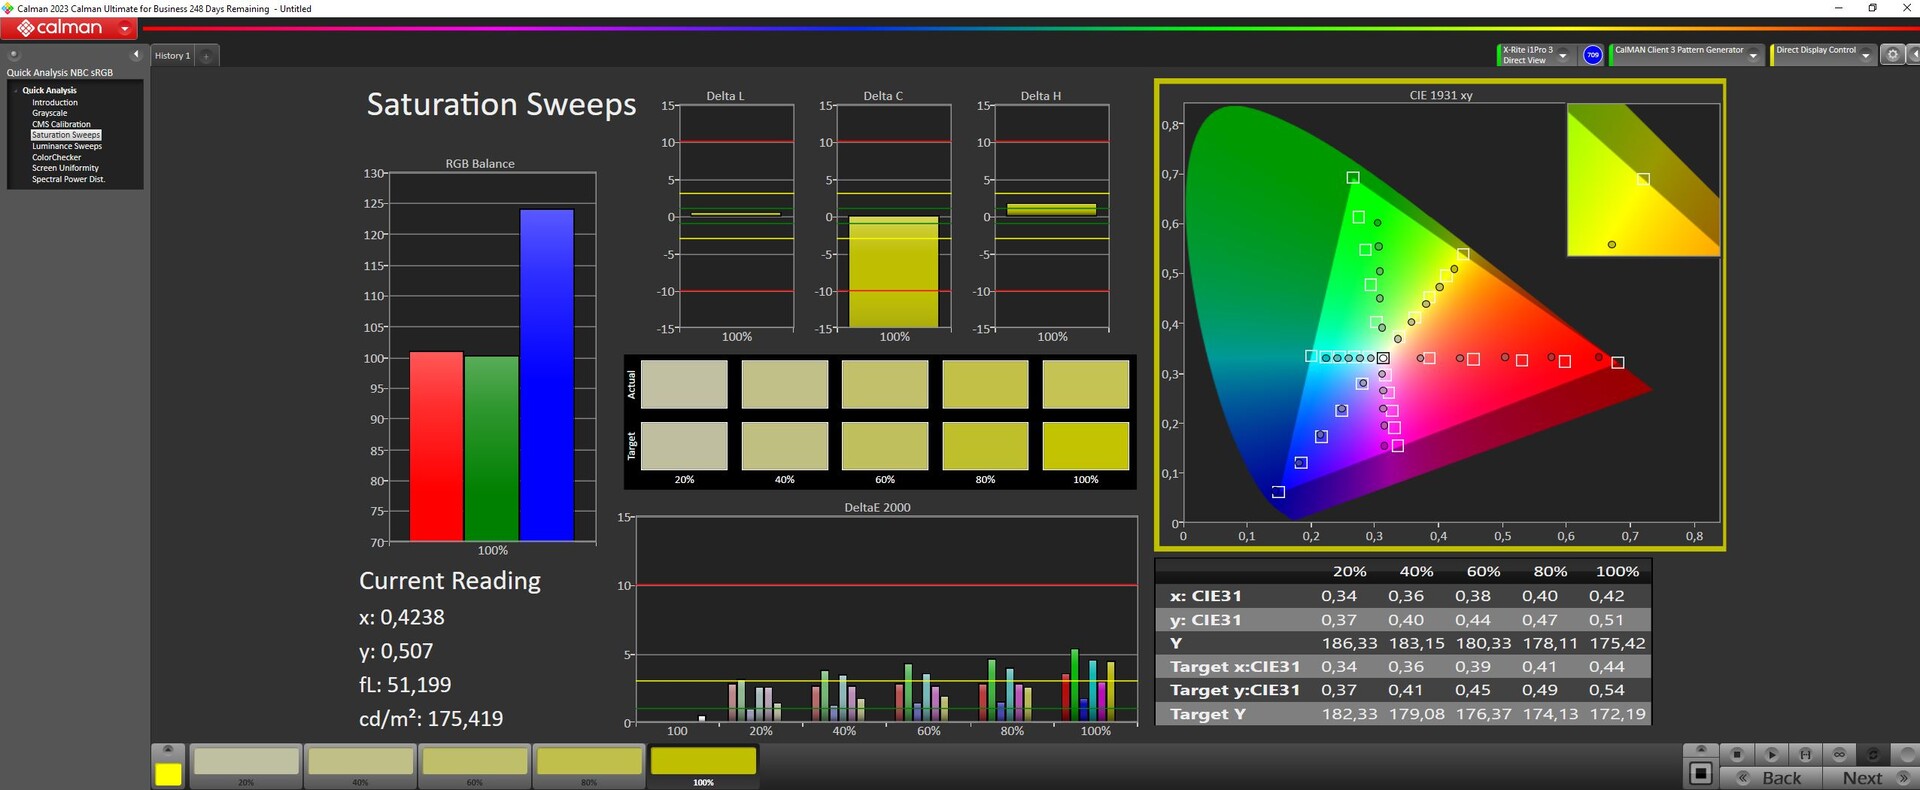
Zmierzyliśmy około 70% pokrycia DisplayP3 i AdobeRGB, podczas gdy sRGB jest prawie całkowicie pokryte. Stary wyświetlacz osiągnął podobne wartości; wersja oferowana na stronie internetowej ma pokrywać 100% DCI-P3.
Zaraz po wyjęciu z pudełka, wyświetlacz nie jest optymalnie skalibrowany. Nasza kalibracja przy użyciu urządzenia pomiarowego X-Rite i oprogramowania Calman znacznie poprawiła odchylenia w skali szarości, podczas gdy kolory nie zostały poprawione tak dobrze.
Wyświetl czasy reakcji
| ↔ Czas reakcji od czerni do bieli | ||
|---|---|---|
| 10.4 ms ... wzrost ↗ i spadek ↘ łącznie | ↗ 5.8 ms wzrost |  |
| ↘ 4.6 ms upadek | ||
| W naszych testach ekran wykazuje dobry współczynnik reakcji, ale może być zbyt wolny dla graczy rywalizujących ze sobą. Dla porównania, wszystkie testowane urządzenia wahają się od 0.1 (minimum) do 240 (maksimum) ms. » 28 % wszystkich urządzeń jest lepszych. Oznacza to, że zmierzony czas reakcji jest lepszy od średniej wszystkich testowanych urządzeń (19.8 ms). | ||
| ↔ Czas reakcji 50% szarości do 80% szarości | ||
| 7.6 ms ... wzrost ↗ i spadek ↘ łącznie | ↗ 3.8 ms wzrost | 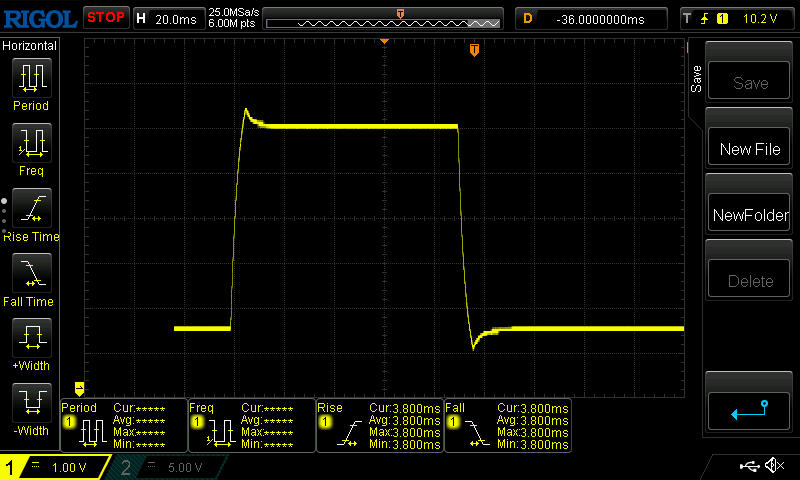 |
| ↘ 3.8 ms upadek | ||
| W naszych testach ekran wykazuje bardzo szybką reakcję i powinien bardzo dobrze nadawać się do szybkich gier. Dla porównania, wszystkie testowane urządzenia wahają się od 0.165 (minimum) do 636 (maksimum) ms. » 20 % wszystkich urządzeń jest lepszych. Oznacza to, że zmierzony czas reakcji jest lepszy od średniej wszystkich testowanych urządzeń (31 ms). | ||
Migotanie ekranu / PWM (modulacja szerokości impulsu)
| Migotanie ekranu/nie wykryto PWM | 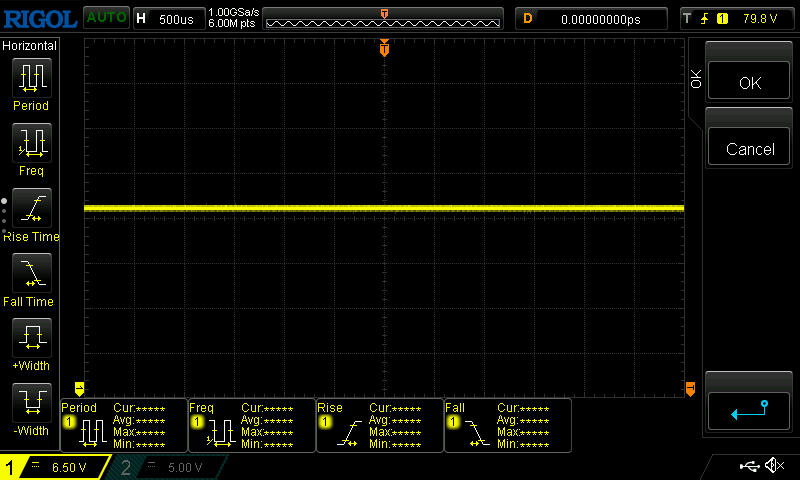 | ||
Dla porównania: 52 % wszystkich testowanych urządzeń nie używa PWM do przyciemniania wyświetlacza. Jeśli wykryto PWM, zmierzono średnio 7763 (minimum: 5 - maksimum: 343500) Hz. | |||
Wyświetlacz jest wystarczająco jasny, aby używać go na zewnątrz - przynajmniej w zacienionym otoczeniu - a jego matowa powierzchnia eliminuje większość dużych odbić.


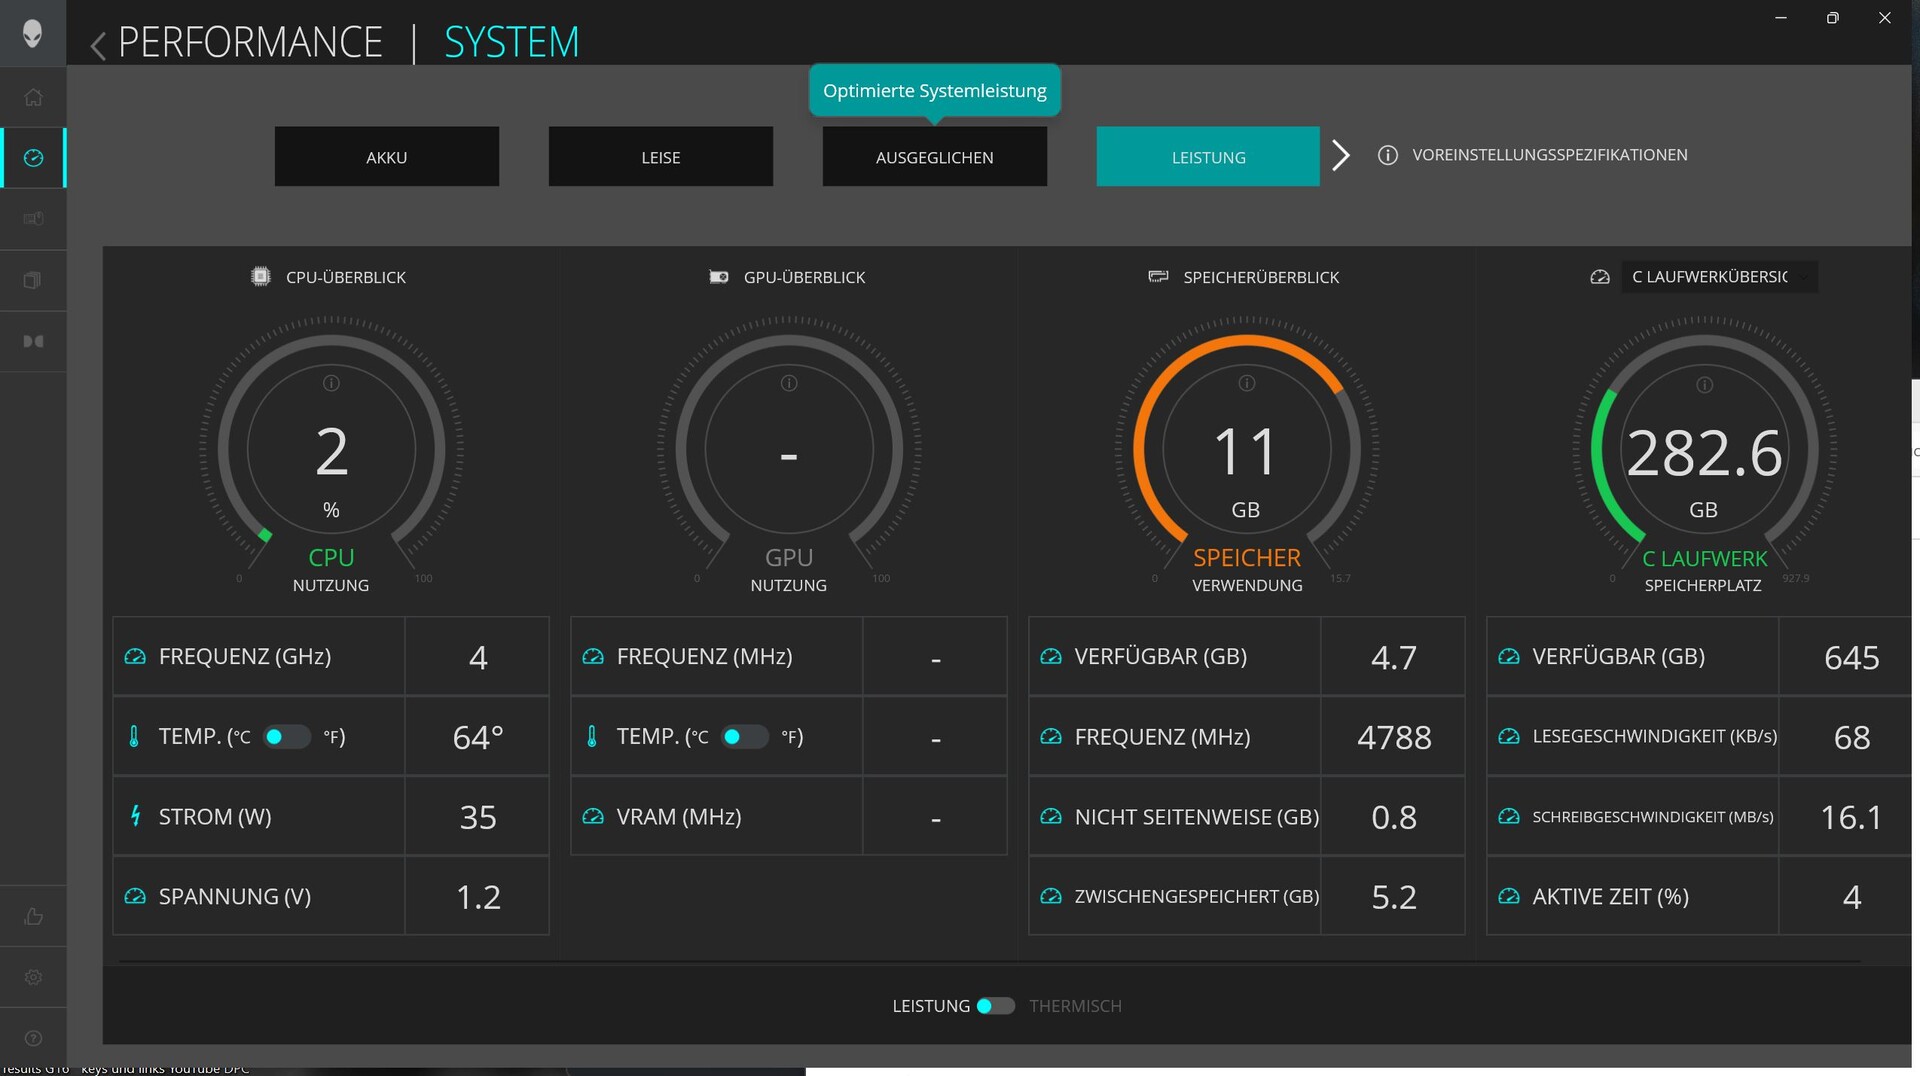
Wydajność - G16 działa zgodnie z oczekiwaniami
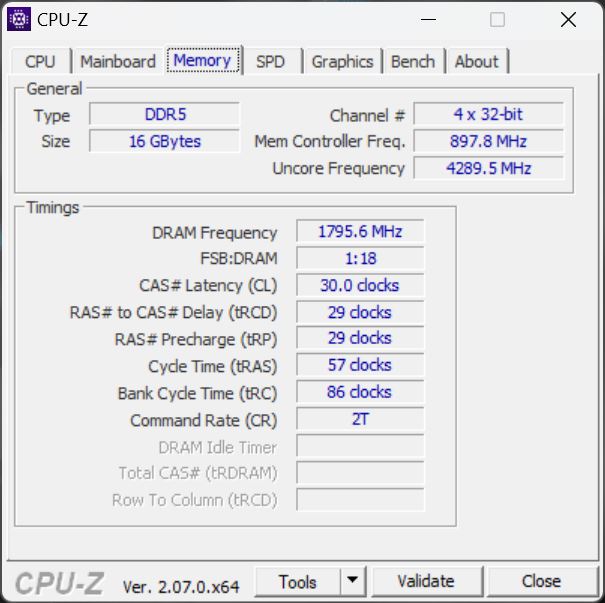
Dell G16 to typowy budżetowy laptop do gier ze średniej półki. Jego procesor to Intel Core i7-13650HX a do tego dochodzi karta graficzna RTX 4060 o mocy 140 W, 16 GB pamięci RAM i dysk SSD NVMe o pojemności 1 TB. W rezultacie większość aktualnych gier powinna być grywalna w rozdzielczości Full HD. Przyzwoity do dobrego wyświetlacz 16:10 uzupełnia konfigurację sprzętową laptopa.
Warunki testowania
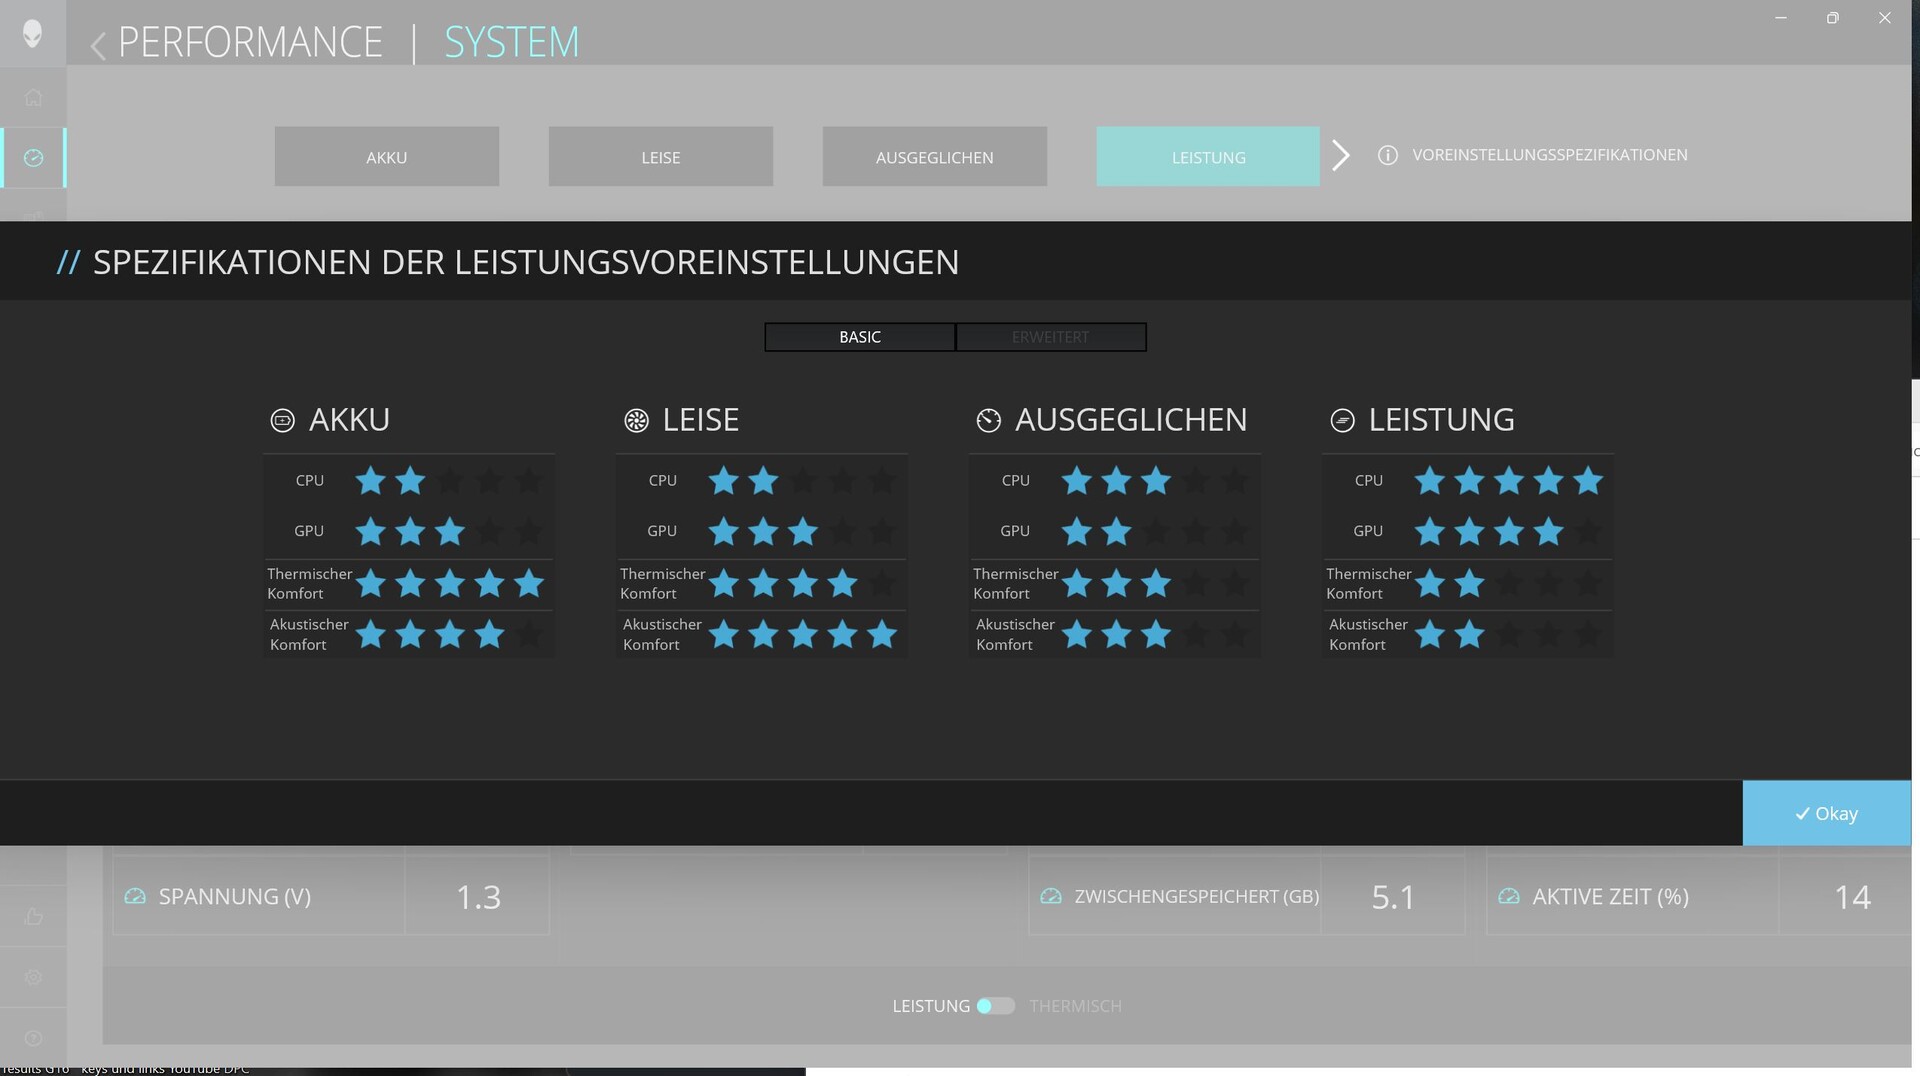
Dell preinstalował co najmniej dwie aplikacje (patrz McAffee) na G16. Jedną z nich jest My Dell, która jest również preinstalowana na komputerach innych producentów, a drugą jest Alienware Command Center na modelach Alienware. My Dell obejmuje serwis, aktualizacje itp., podczas gdy Command Center pozwala ustawić różne tryby wydajności(bateria, cichy, zrównoważony, wydajność, ręczny), kluczowe oświetlenie i inne opcje.
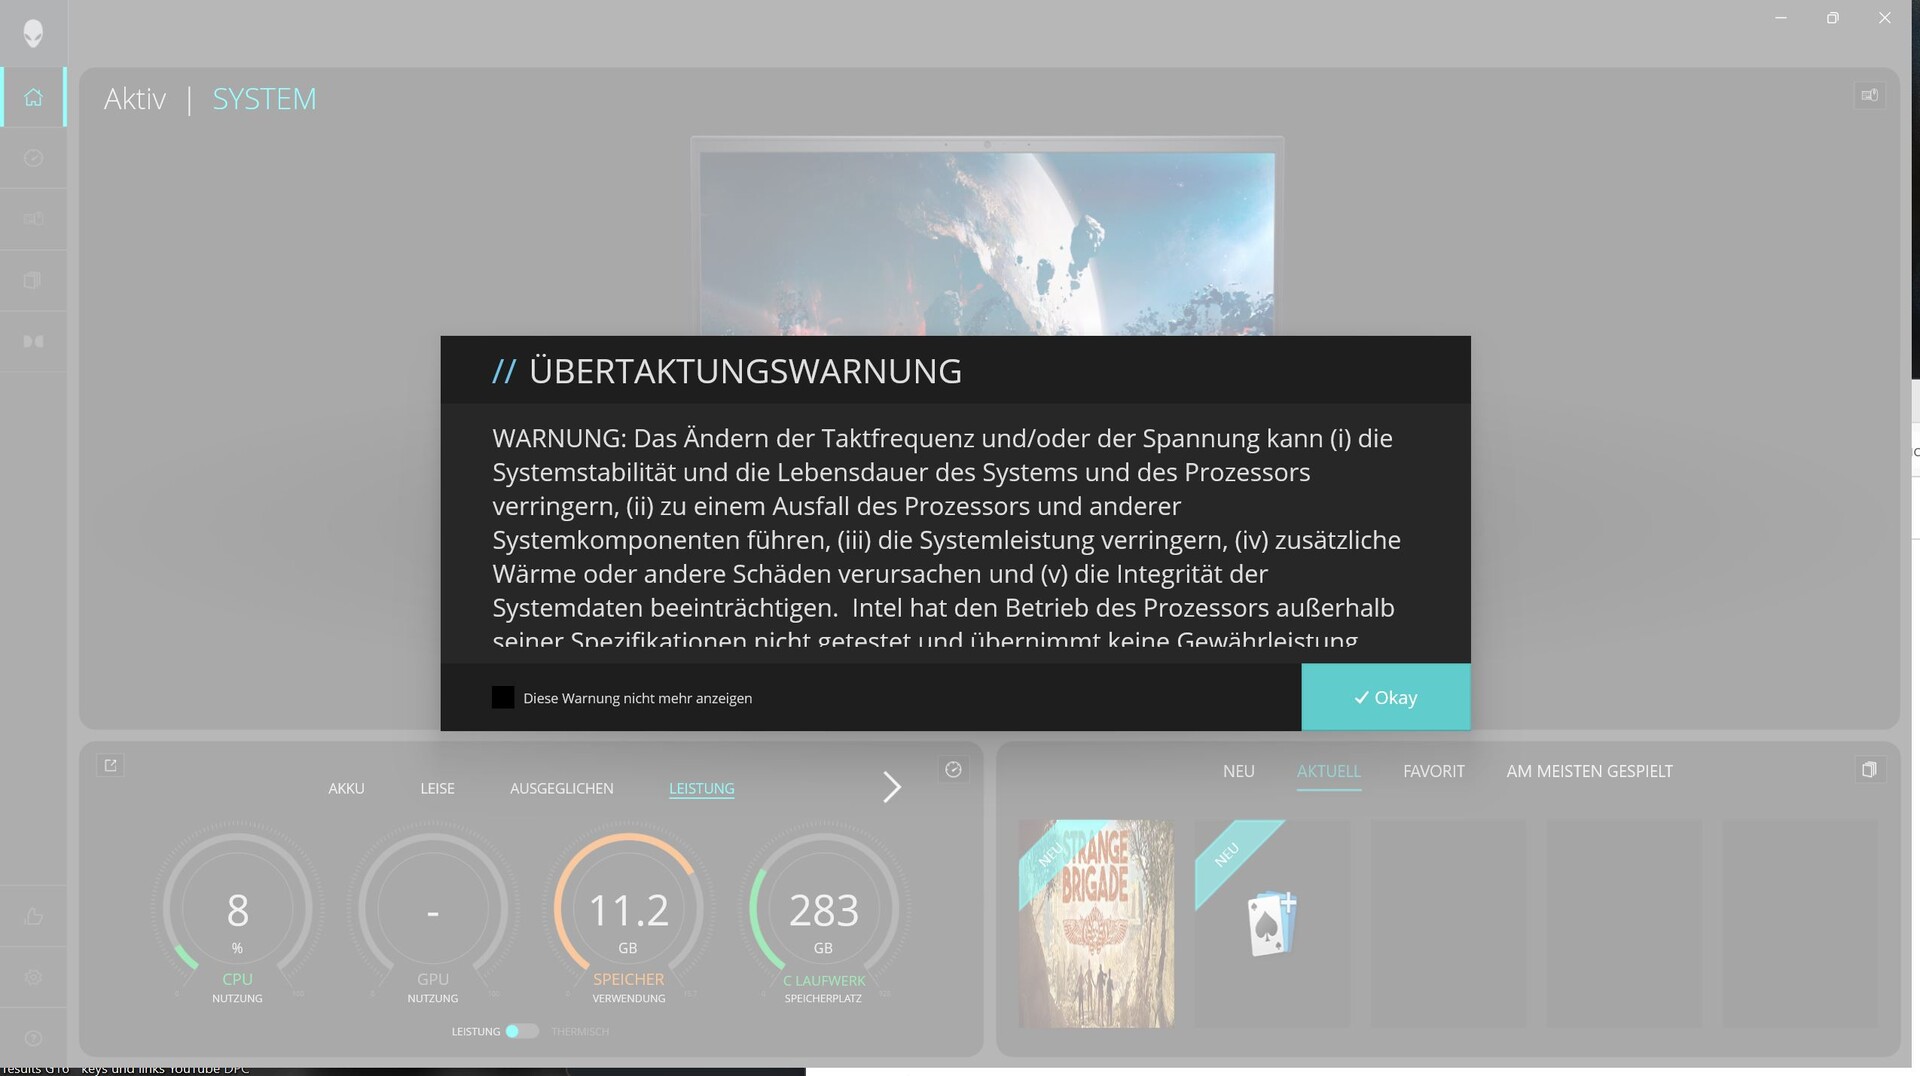
Pomimo wielu lat rozwoju, Centrum poleceń nadal nie jest w pełni rozwinięte. Na przykład, okno nie może być poprawnie zmaksymalizowane; nadal można zobaczyć pulpit na dole.
Prawdopodobnie kolejnym błędem jest to, że otrzymujemy ostrzeżenie, gdy tylko przełączymy się na tryb wydajności. Jest to bardzo niepokojące, ponieważ sugeruje, że gwarancja może zostać unieważniona, jeśli sprzęt będzie działał poza zalecanymi specyfikacjami. Podejrzewamy jednak, że ostrzeżenie odnosi się do trybu ręcznego, a nie trybu wydajności określonego przez samą firmę Dell - bardzo mylące!
Irytujące jest jednak to, że McAffee jest nie tylko preinstalowany, ale Dell regularnie wysyła nam wiadomość z prośbą o skorzystanie z tej usługi (odinstalowaliśmy ją), a wiadomość ta powraca najpóźniej każdego dnia.


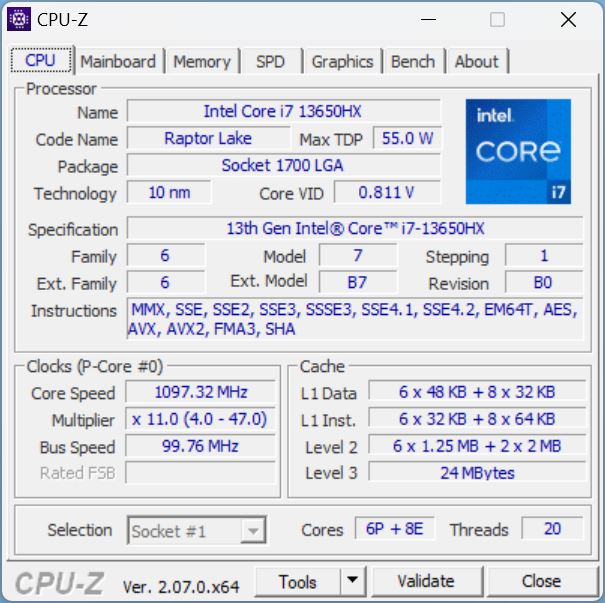
Procesor
Laptop Dell jest wyposażony w procesor Raptor-Lake, Intel Core i7-13650HX z 14 rdzeniami (6 P, 8 E) i 20 wątkami. Rdzenie P mogą indywidualnie taktować z częstotliwością do 4,9 GHz, a podstawowa częstotliwość taktowania rdzeni wydajnościowych wynosi 1,9 GHz. Mogą Państwo nabyć tylko mocniejszy i9-13900HX w połączeniu z kartą graficzną RTX 4070która kosztuje nieco więcej.
Podczas pętli Cinebench-R15, G16 działał na stałym, wysokim poziomie wydajności, bez żadnych spadków wydajności po kilku pierwszych uruchomieniach.
We wszystkich naszych testach porównawczych procesora, i7-13650HX działał na mniej więcej oczekiwanym poziomie i około 15 do 19% szybciej niż i7-12700H w poprzedniku urządzenia.
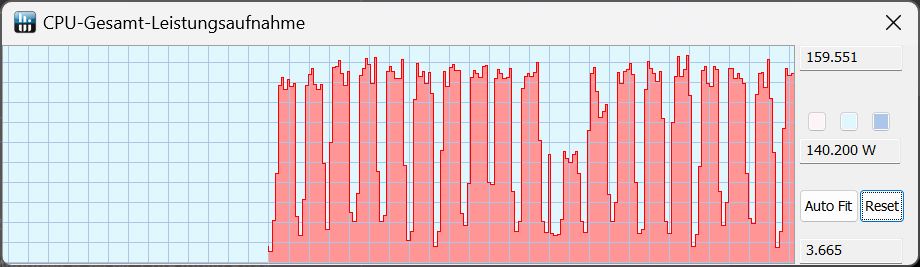
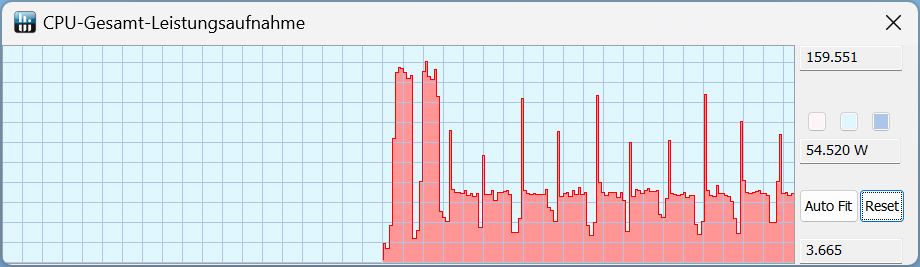
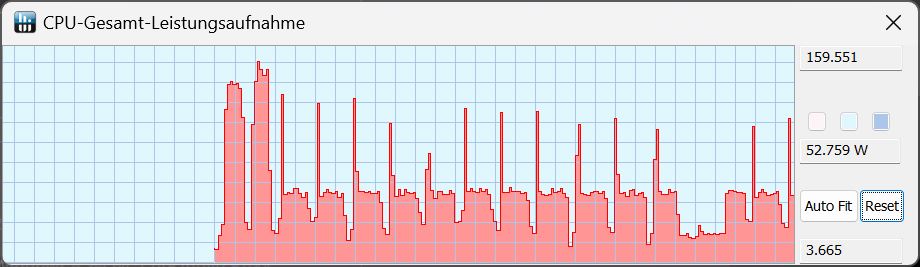
Korzystając z trybów wydajności, zrównoważonego i cichego, laptop osiągnął wartości zużycia energii na poziomie 159 watów na początku uruchomienia Cinebench, co dało taki sam wynik przy użyciu wszystkich trybów przy pomiarze jednorazowym. W trakcie dalszej pracy, TDP pozostawało na stałym poziomie jedynie w trybie wydajności. We wszystkich innych trybach TDP spadło do około 50 watów od drugiego uruchomienia.
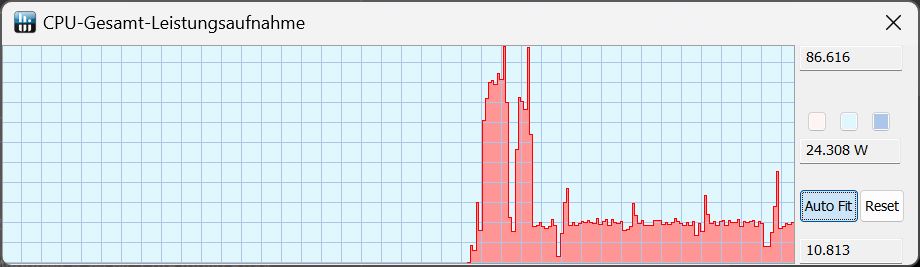
Po odłączeniu laptopa od zasilania, system automatycznie przełącza się w tryb bateryjny. W Cinebench R15 Multi osiągnął TDP na poziomie 86 W, a po pierwszym uruchomieniu TDP spadło do zaledwie 24 W.
Cinebench R15 Multi continuous test
Cinebench R23: Multi Core | Single Core
Cinebench R20: CPU (Multi Core) | CPU (Single Core)
Cinebench R15: CPU Multi 64Bit | CPU Single 64Bit
Blender: v2.79 BMW27 CPU
7-Zip 18.03: 7z b 4 | 7z b 4 -mmt1
Geekbench 6.7: Multi-Core | Single-Core
Geekbench 5.5: Multi-Core | Single-Core
HWBOT x265 Benchmark v2.2: 4k Preset
LibreOffice : 20 Documents To PDF
R Benchmark 2.5: Overall mean
| CPU Performance rating | |
| MSI Raider GE68HX 13VF | |
| Średnia w klasie Gaming | |
| Alienware m16 R1 Intel | |
| Przeciętny Intel Core i7-13650HX | |
| Dell G16, i7-13650HX, RTX 4060 | |
| Lenovo Legion Slim 5 16APH8 -2! | |
| Lenovo LOQ 16IRH8 | |
| Dell G16 7620 -2! | |
| Cinebench R23 / Multi Core | |
| MSI Raider GE68HX 13VF | |
| Średnia w klasie Gaming (10488 - 40970, n=110, ostatnie 2 lata) | |
| Alienware m16 R1 Intel | |
| Dell G16, i7-13650HX, RTX 4060 | |
| Przeciętny Intel Core i7-13650HX (18744 - 21006, n=6) | |
| Dell G16 7620 | |
| Lenovo Legion Slim 5 16APH8 | |
| Lenovo LOQ 16IRH8 | |
| Cinebench R23 / Single Core | |
| MSI Raider GE68HX 13VF | |
| Średnia w klasie Gaming (1166 - 2356, n=110, ostatnie 2 lata) | |
| Alienware m16 R1 Intel | |
| Dell G16, i7-13650HX, RTX 4060 | |
| Lenovo LOQ 16IRH8 | |
| Przeciętny Intel Core i7-13650HX (1693 - 1903, n=6) | |
| Lenovo Legion Slim 5 16APH8 | |
| Dell G16 7620 | |
| Cinebench R20 / CPU (Multi Core) | |
| MSI Raider GE68HX 13VF | |
| Średnia w klasie Gaming (4029 - 16108, n=109, ostatnie 2 lata) | |
| Alienware m16 R1 Intel | |
| Dell G16, i7-13650HX, RTX 4060 | |
| Przeciętny Intel Core i7-13650HX (7197 - 8021, n=5) | |
| Lenovo Legion Slim 5 16APH8 | |
| Dell G16 7620 | |
| Lenovo LOQ 16IRH8 | |
| Cinebench R20 / CPU (Single Core) | |
| MSI Raider GE68HX 13VF | |
| Średnia w klasie Gaming (442 - 895, n=109, ostatnie 2 lata) | |
| Alienware m16 R1 Intel | |
| Dell G16, i7-13650HX, RTX 4060 | |
| Przeciętny Intel Core i7-13650HX (700 - 728, n=5) | |
| Lenovo LOQ 16IRH8 | |
| Lenovo Legion Slim 5 16APH8 | |
| Dell G16 7620 | |
| Cinebench R15 / CPU Multi 64Bit | |
| MSI Raider GE68HX 13VF | |
| Średnia w klasie Gaming (1578 - 6271, n=108, ostatnie 2 lata) | |
| Alienware m16 R1 Intel | |
| Przeciętny Intel Core i7-13650HX (2864 - 3147, n=5) | |
| Dell G16, i7-13650HX, RTX 4060 | |
| Lenovo Legion Slim 5 16APH8 | |
| Dell G16 7620 | |
| Lenovo LOQ 16IRH8 | |
| Cinebench R15 / CPU Single 64Bit | |
| MSI Raider GE68HX 13VF | |
| Średnia w klasie Gaming (188.8 - 343, n=109, ostatnie 2 lata) | |
| Lenovo Legion Slim 5 16APH8 | |
| Alienware m16 R1 Intel | |
| Dell G16, i7-13650HX, RTX 4060 | |
| Przeciętny Intel Core i7-13650HX (256 - 275, n=5) | |
| Lenovo LOQ 16IRH8 | |
| Dell G16 7620 | |
| Blender / v2.79 BMW27 CPU | |
| Lenovo LOQ 16IRH8 | |
| Lenovo Legion Slim 5 16APH8 | |
| Dell G16 7620 | |
| Przeciętny Intel Core i7-13650HX (158 - 226, n=5) | |
| Dell G16, i7-13650HX, RTX 4060 | |
| Alienware m16 R1 Intel | |
| Średnia w klasie Gaming (80 - 330, n=107, ostatnie 2 lata) | |
| MSI Raider GE68HX 13VF | |
| 7-Zip 18.03 / 7z b 4 | |
| MSI Raider GE68HX 13VF | |
| Średnia w klasie Gaming (33491 - 148086, n=108, ostatnie 2 lata) | |
| Alienware m16 R1 Intel | |
| Przeciętny Intel Core i7-13650HX (73927 - 80057, n=5) | |
| Dell G16, i7-13650HX, RTX 4060 | |
| Lenovo Legion Slim 5 16APH8 | |
| Dell G16 7620 | |
| Lenovo LOQ 16IRH8 | |
| 7-Zip 18.03 / 7z b 4 -mmt1 | |
| MSI Raider GE68HX 13VF | |
| Lenovo Legion Slim 5 16APH8 | |
| Alienware m16 R1 Intel | |
| Średnia w klasie Gaming (4199 - 7436, n=108, ostatnie 2 lata) | |
| Przeciętny Intel Core i7-13650HX (5828 - 6125, n=5) | |
| Dell G16, i7-13650HX, RTX 4060 | |
| Lenovo LOQ 16IRH8 | |
| Dell G16 7620 | |
| Geekbench 6.7 / Multi-Core | |
| MSI Raider GE68HX 13VF | |
| Średnia w klasie Gaming (6625 - 22104, n=109, ostatnie 2 lata) | |
| Alienware m16 R1 Intel | |
| Przeciętny Intel Core i7-13650HX (13554 - 14378, n=3) | |
| Dell G16, i7-13650HX, RTX 4060 | |
| Lenovo LOQ 16IRH8 | |
| Geekbench 6.7 / Single-Core | |
| MSI Raider GE68HX 13VF | |
| Średnia w klasie Gaming (1490 - 3259, n=109, ostatnie 2 lata) | |
| Alienware m16 R1 Intel | |
| Lenovo LOQ 16IRH8 | |
| Dell G16, i7-13650HX, RTX 4060 | |
| Przeciętny Intel Core i7-13650HX (2505 - 2595, n=3) | |
| Geekbench 5.5 / Multi-Core | |
| MSI Raider GE68HX 13VF | |
| Średnia w klasie Gaming (6460 - 27010, n=108, ostatnie 2 lata) | |
| Alienware m16 R1 Intel | |
| Przeciętny Intel Core i7-13650HX (12509 - 14778, n=5) | |
| Dell G16, i7-13650HX, RTX 4060 | |
| Lenovo LOQ 16IRH8 | |
| Dell G16 7620 | |
| Lenovo Legion Slim 5 16APH8 | |
| Geekbench 5.5 / Single-Core | |
| MSI Raider GE68HX 13VF | |
| Średnia w klasie Gaming (986 - 2474, n=108, ostatnie 2 lata) | |
| Lenovo Legion Slim 5 16APH8 | |
| Dell G16, i7-13650HX, RTX 4060 | |
| Alienware m16 R1 Intel | |
| Przeciętny Intel Core i7-13650HX (1810 - 1866, n=5) | |
| Lenovo LOQ 16IRH8 | |
| Dell G16 7620 | |
| HWBOT x265 Benchmark v2.2 / 4k Preset | |
| MSI Raider GE68HX 13VF | |
| Średnia w klasie Gaming (11.5 - 44.3, n=108, ostatnie 2 lata) | |
| Alienware m16 R1 Intel | |
| Lenovo Legion Slim 5 16APH8 | |
| Przeciętny Intel Core i7-13650HX (18.9 - 23.6, n=5) | |
| Dell G16, i7-13650HX, RTX 4060 | |
| Dell G16 7620 | |
| Lenovo LOQ 16IRH8 | |
| LibreOffice / 20 Documents To PDF | |
| Dell G16 7620 | |
| Dell G16, i7-13650HX, RTX 4060 | |
| Średnia w klasie Gaming (19 - 88.8, n=108, ostatnie 2 lata) | |
| Przeciętny Intel Core i7-13650HX (38.9 - 58.8, n=5) | |
| Lenovo LOQ 16IRH8 | |
| Alienware m16 R1 Intel | |
| Lenovo Legion Slim 5 16APH8 | |
| MSI Raider GE68HX 13VF | |
| R Benchmark 2.5 / Overall mean | |
| Dell G16 7620 | |
| Lenovo LOQ 16IRH8 | |
| Alienware m16 R1 Intel | |
| Lenovo Legion Slim 5 16APH8 | |
| Przeciętny Intel Core i7-13650HX (0.4217 - 0.4461, n=6) | |
| Średnia w klasie Gaming (0.3439 - 0.759, n=109, ostatnie 2 lata) | |
| Dell G16, i7-13650HX, RTX 4060 | |
| Dell G16, i7-13650HX, RTX 4060 | |
| MSI Raider GE68HX 13VF | |
* ... im mniej tym lepiej
AIDA64: FP32 Ray-Trace | FPU Julia | CPU SHA3 | CPU Queen | FPU SinJulia | FPU Mandel | CPU AES | CPU ZLib | FP64 Ray-Trace | CPU PhotoWorxx
| Performance rating | |
| MSI Raider GE68HX 13VF | |
| Średnia w klasie Gaming | |
| Lenovo Legion Slim 5 16APH8 | |
| Alienware m16 R1 Intel | |
| Dell G16, i7-13650HX, RTX 4060 | |
| Przeciętny Intel Core i7-13650HX | |
| Dell G16 7620 | |
| Lenovo LOQ 16IRH8 | |
| AIDA64 / FP32 Ray-Trace | |
| Średnia w klasie Gaming (10227 - 85542, n=107, ostatnie 2 lata) | |
| Lenovo Legion Slim 5 16APH8 | |
| MSI Raider GE68HX 13VF | |
| Alienware m16 R1 Intel | |
| Dell G16, i7-13650HX, RTX 4060 | |
| Przeciętny Intel Core i7-13650HX (13404 - 20012, n=5) | |
| Dell G16 7620 | |
| Lenovo LOQ 16IRH8 | |
| AIDA64 / FPU Julia | |
| Średnia w klasie Gaming (51376 - 238426, n=107, ostatnie 2 lata) | |
| MSI Raider GE68HX 13VF | |
| Lenovo Legion Slim 5 16APH8 | |
| Alienware m16 R1 Intel | |
| Dell G16, i7-13650HX, RTX 4060 | |
| Przeciętny Intel Core i7-13650HX (68241 - 97317, n=5) | |
| Dell G16 7620 | |
| Lenovo LOQ 16IRH8 | |
| AIDA64 / CPU SHA3 | |
| MSI Raider GE68HX 13VF | |
| Średnia w klasie Gaming (2180 - 9817, n=107, ostatnie 2 lata) | |
| Lenovo Legion Slim 5 16APH8 | |
| Alienware m16 R1 Intel | |
| Dell G16, i7-13650HX, RTX 4060 | |
| Przeciętny Intel Core i7-13650HX (3127 - 4487, n=5) | |
| Dell G16 7620 | |
| Lenovo LOQ 16IRH8 | |
| AIDA64 / CPU Queen | |
| MSI Raider GE68HX 13VF | |
| Lenovo Legion Slim 5 16APH8 | |
| Średnia w klasie Gaming (49785 - 173351, n=94, ostatnie 2 lata) | |
| Alienware m16 R1 Intel | |
| Przeciętny Intel Core i7-13650HX (108627 - 110589, n=5) | |
| Dell G16, i7-13650HX, RTX 4060 | |
| Dell G16 7620 | |
| Lenovo LOQ 16IRH8 | |
| AIDA64 / FPU SinJulia | |
| MSI Raider GE68HX 13VF | |
| Lenovo Legion Slim 5 16APH8 | |
| Średnia w klasie Gaming (4424 - 33636, n=107, ostatnie 2 lata) | |
| Alienware m16 R1 Intel | |
| Dell G16, i7-13650HX, RTX 4060 | |
| Przeciętny Intel Core i7-13650HX (9134 - 10887, n=5) | |
| Dell G16 7620 | |
| Lenovo LOQ 16IRH8 | |
| AIDA64 / FPU Mandel | |
| Średnia w klasie Gaming (25115 - 128721, n=107, ostatnie 2 lata) | |
| MSI Raider GE68HX 13VF | |
| Lenovo Legion Slim 5 16APH8 | |
| Alienware m16 R1 Intel | |
| Dell G16, i7-13650HX, RTX 4060 | |
| Przeciętny Intel Core i7-13650HX (33391 - 48323, n=5) | |
| Dell G16 7620 | |
| Lenovo LOQ 16IRH8 | |
| AIDA64 / CPU AES | |
| Alienware m16 R1 Intel | |
| MSI Raider GE68HX 13VF | |
| Średnia w klasie Gaming (39258 - 247074, n=107, ostatnie 2 lata) | |
| Dell G16, i7-13650HX, RTX 4060 | |
| Przeciętny Intel Core i7-13650HX (64436 - 85343, n=5) | |
| Dell G16 7620 | |
| Lenovo Legion Slim 5 16APH8 | |
| Lenovo LOQ 16IRH8 | |
| AIDA64 / CPU ZLib | |
| MSI Raider GE68HX 13VF | |
| Średnia w klasie Gaming (574 - 2531, n=107, ostatnie 2 lata) | |
| Alienware m16 R1 Intel | |
| Dell G16, i7-13650HX, RTX 4060 | |
| Przeciętny Intel Core i7-13650HX (1136 - 1285, n=5) | |
| Lenovo Legion Slim 5 16APH8 | |
| Dell G16 7620 | |
| Lenovo LOQ 16IRH8 | |
| AIDA64 / FP64 Ray-Trace | |
| Średnia w klasie Gaming (5509 - 45446, n=107, ostatnie 2 lata) | |
| Lenovo Legion Slim 5 16APH8 | |
| MSI Raider GE68HX 13VF | |
| Alienware m16 R1 Intel | |
| Dell G16, i7-13650HX, RTX 4060 | |
| Przeciętny Intel Core i7-13650HX (7270 - 10900, n=5) | |
| Dell G16 7620 | |
| Lenovo LOQ 16IRH8 | |
| AIDA64 / CPU PhotoWorxx | |
| MSI Raider GE68HX 13VF | |
| Średnia w klasie Gaming (12271 - 89891, n=107, ostatnie 2 lata) | |
| Przeciętny Intel Core i7-13650HX (36170 - 43289, n=5) | |
| Dell G16, i7-13650HX, RTX 4060 | |
| Alienware m16 R1 Intel | |
| Dell G16 7620 | |
| Lenovo LOQ 16IRH8 | |
| Lenovo Legion Slim 5 16APH8 | |
Wydajność systemu
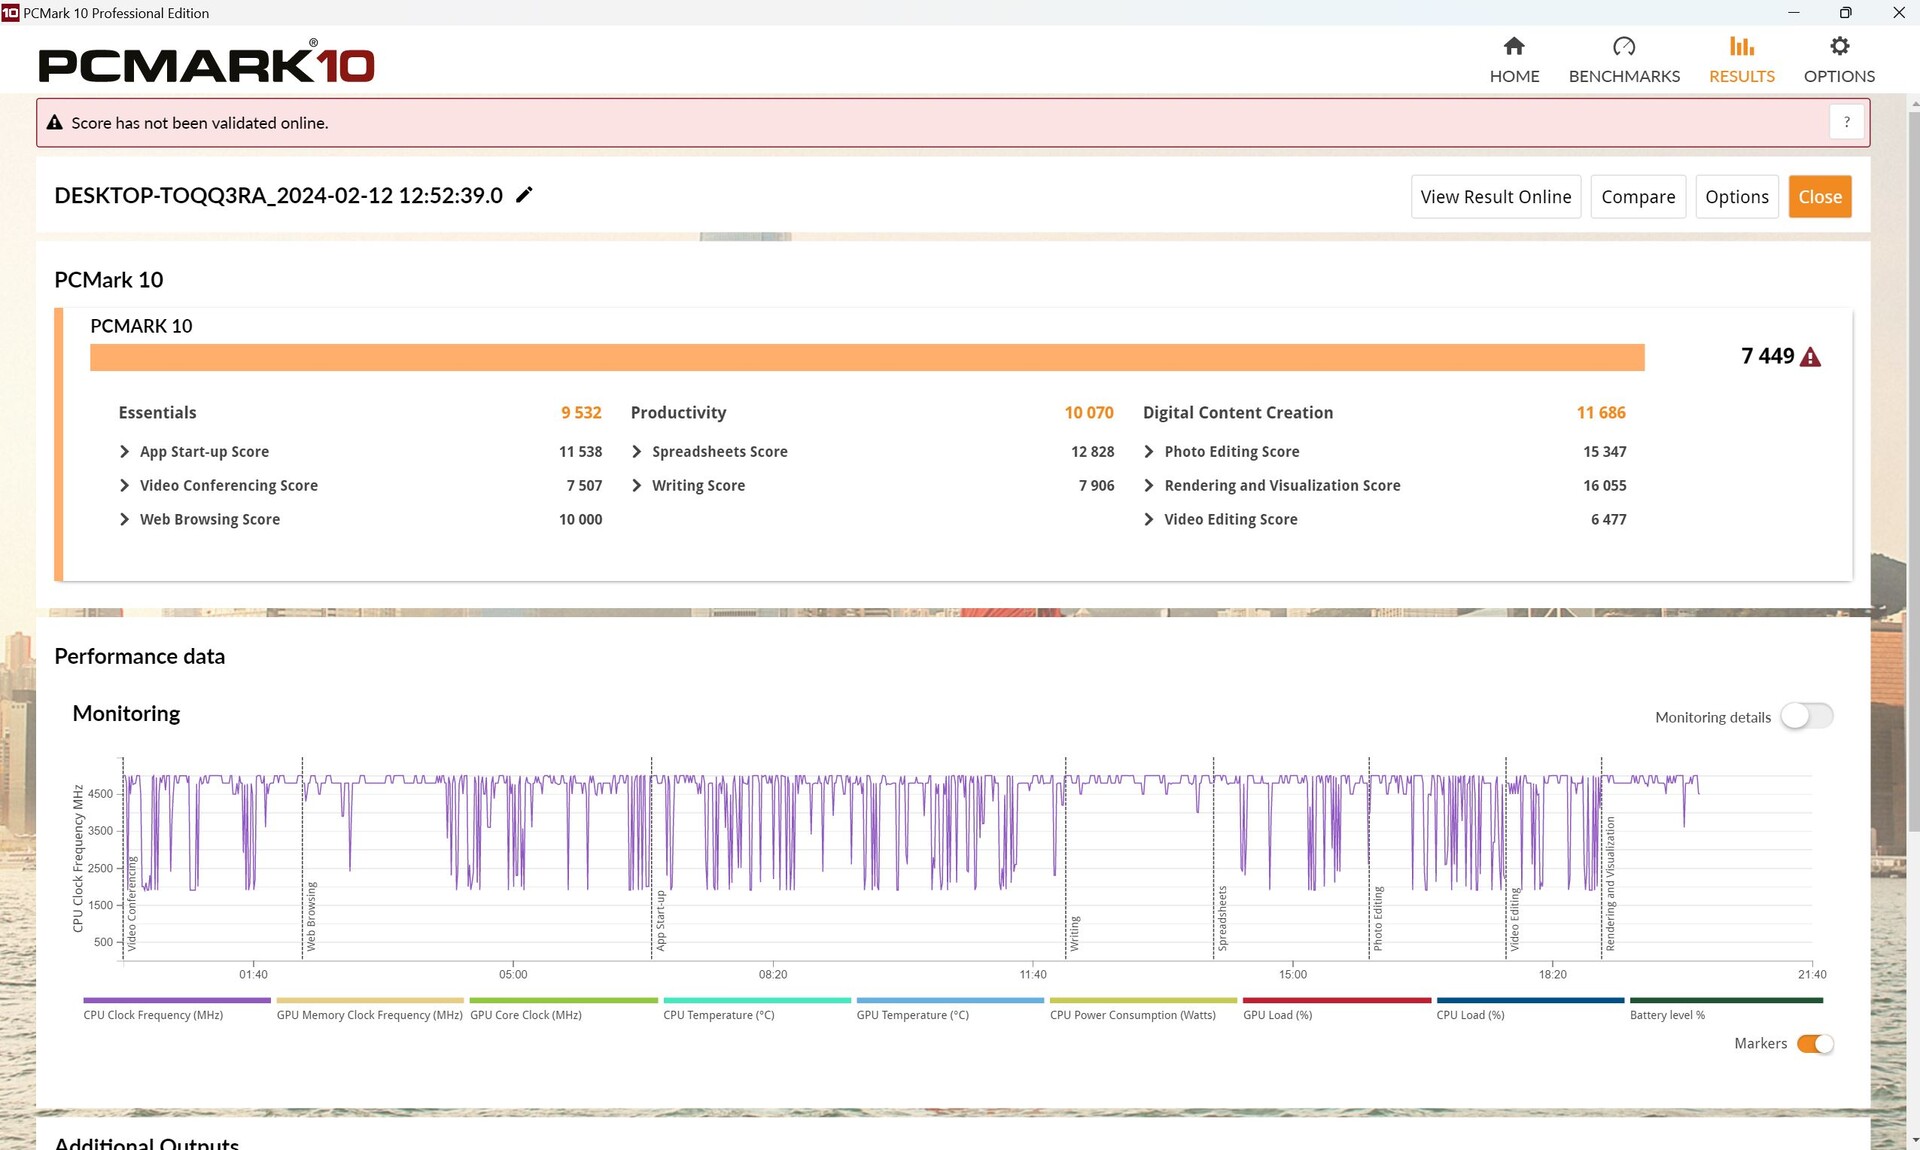
G16 poradził sobie ogólnie dobrze w PCMark 10, ale wykazał pewne słabości w podteście Essentials. To samo można powiedzieć o teście produktywności CrossMark. We wszystkich testach nasz model testowy zdołał nieznacznie przewyższyć wszystkie laptopy w naszej bazie danych, które mają tę samą konfigurację CPU / GPU, więc te wartości odstające nie są zbyt znaczące.
CrossMark: Overall | Productivity | Creativity | Responsiveness
WebXPRT 3: Overall
WebXPRT 4: Overall
Mozilla Kraken 1.1: Total
| PCMark 10 / Score | |
| Średnia w klasie Gaming (5828 - 11574, n=95, ostatnie 2 lata) | |
| MSI Raider GE68HX 13VF | |
| Lenovo Legion Slim 5 16APH8 | |
| Dell G16, i7-13650HX, RTX 4060 | |
| Przeciętny Intel Core i7-13650HX, NVIDIA GeForce RTX 4060 Laptop GPU (6984 - 7613, n=3) | |
| Alienware m16 R1 Intel | |
| Dell G16 7620 | |
| Lenovo LOQ 16IRH8 | |
| PCMark 10 / Essentials | |
| MSI Raider GE68HX 13VF | |
| Lenovo Legion Slim 5 16APH8 | |
| Alienware m16 R1 Intel | |
| Średnia w klasie Gaming (8810 - 12600, n=99, ostatnie 2 lata) | |
| Przeciętny Intel Core i7-13650HX, NVIDIA GeForce RTX 4060 Laptop GPU (9532 - 11151, n=3) | |
| Dell G16 7620 | |
| Lenovo LOQ 16IRH8 | |
| Dell G16, i7-13650HX, RTX 4060 | |
| PCMark 10 / Productivity | |
| Średnia w klasie Gaming (6845 - 21327, n=97, ostatnie 2 lata) | |
| Lenovo Legion Slim 5 16APH8 | |
| Przeciętny Intel Core i7-13650HX, NVIDIA GeForce RTX 4060 Laptop GPU (9961 - 10204, n=3) | |
| Dell G16, i7-13650HX, RTX 4060 | |
| MSI Raider GE68HX 13VF | |
| Alienware m16 R1 Intel | |
| Dell G16 7620 | |
| Lenovo LOQ 16IRH8 | |
| PCMark 10 / Digital Content Creation | |
| Średnia w klasie Gaming (7602 - 19657, n=97, ostatnie 2 lata) | |
| MSI Raider GE68HX 13VF | |
| Lenovo Legion Slim 5 16APH8 | |
| Dell G16, i7-13650HX, RTX 4060 | |
| Dell G16 7620 | |
| Przeciętny Intel Core i7-13650HX, NVIDIA GeForce RTX 4060 Laptop GPU (8323 - 11686, n=3) | |
| Alienware m16 R1 Intel | |
| Lenovo LOQ 16IRH8 | |
| CrossMark / Overall | |
| Alienware m16 R1 Intel | |
| Średnia w klasie Gaming (1366 - 2409, n=96, ostatnie 2 lata) | |
| MSI Raider GE68HX 13VF | |
| Lenovo LOQ 16IRH8 | |
| Przeciętny Intel Core i7-13650HX, NVIDIA GeForce RTX 4060 Laptop GPU (1839 - 1951, n=3) | |
| Dell G16, i7-13650HX, RTX 4060 | |
| Lenovo Legion Slim 5 16APH8 | |
| Dell G16 7620 | |
| CrossMark / Productivity | |
| Alienware m16 R1 Intel | |
| Lenovo LOQ 16IRH8 | |
| Średnia w klasie Gaming (1386 - 2254, n=96, ostatnie 2 lata) | |
| MSI Raider GE68HX 13VF | |
| Przeciętny Intel Core i7-13650HX, NVIDIA GeForce RTX 4060 Laptop GPU (1730 - 1864, n=3) | |
| Lenovo Legion Slim 5 16APH8 | |
| Dell G16, i7-13650HX, RTX 4060 | |
| Dell G16 7620 | |
| CrossMark / Creativity | |
| MSI Raider GE68HX 13VF | |
| Alienware m16 R1 Intel | |
| Średnia w klasie Gaming (1343 - 2729, n=96, ostatnie 2 lata) | |
| Przeciętny Intel Core i7-13650HX, NVIDIA GeForce RTX 4060 Laptop GPU (2020 - 2063, n=3) | |
| Lenovo LOQ 16IRH8 | |
| Dell G16, i7-13650HX, RTX 4060 | |
| Lenovo Legion Slim 5 16APH8 | |
| Dell G16 7620 | |
| CrossMark / Responsiveness | |
| Alienware m16 R1 Intel | |
| Lenovo LOQ 16IRH8 | |
| Przeciętny Intel Core i7-13650HX, NVIDIA GeForce RTX 4060 Laptop GPU (1544 - 1907, n=3) | |
| Średnia w klasie Gaming (1226 - 2334, n=96, ostatnie 2 lata) | |
| Dell G16, i7-13650HX, RTX 4060 | |
| MSI Raider GE68HX 13VF | |
| Dell G16 7620 | |
| Lenovo Legion Slim 5 16APH8 | |
| WebXPRT 3 / Overall | |
| MSI Raider GE68HX 13VF | |
| Lenovo Legion Slim 5 16APH8 | |
| Lenovo LOQ 16IRH8 | |
| Lenovo LOQ 16IRH8 | |
| Średnia w klasie Gaming (220 - 532, n=100, ostatnie 2 lata) | |
| Alienware m16 R1 Intel | |
| Przeciętny Intel Core i7-13650HX, NVIDIA GeForce RTX 4060 Laptop GPU (268 - 302, n=3) | |
| Dell G16 7620 | |
| Dell G16, i7-13650HX, RTX 4060 | |
| WebXPRT 4 / Overall | |
| MSI Raider GE68HX 13VF | |
| Średnia w klasie Gaming (165 - 354, n=101, ostatnie 2 lata) | |
| Alienware m16 R1 Intel | |
| Przeciętny Intel Core i7-13650HX, NVIDIA GeForce RTX 4060 Laptop GPU (260 - 276, n=2) | |
| Lenovo Legion Slim 5 16APH8 | |
| Dell G16 7620 | |
| Mozilla Kraken 1.1 / Total | |
| Dell G16 7620 | |
| Przeciętny Intel Core i7-13650HX, NVIDIA GeForce RTX 4060 Laptop GPU (507 - 511, n=3) | |
| Lenovo LOQ 16IRH8 | |
| Lenovo LOQ 16IRH8 | |
| Dell G16, i7-13650HX, RTX 4060 | |
| Alienware m16 R1 Intel | |
| Lenovo Legion Slim 5 16APH8 | |
| Średnia w klasie Gaming (391 - 590, n=104, ostatnie 2 lata) | |
| MSI Raider GE68HX 13VF | |
* ... im mniej tym lepiej
| PCMark 10 Score | 7449 pkt. | |
Pomoc | ||
| AIDA64 / Memory Copy | |
| MSI Raider GE68HX 13VF | |
| Średnia w klasie Gaming (21750 - 129946, n=107, ostatnie 2 lata) | |
| Lenovo Legion Slim 5 16APH8 | |
| Przeciętny Intel Core i7-13650HX (59266 - 66372, n=5) | |
| Dell G16, i7-13650HX, RTX 4060 | |
| Alienware m16 R1 Intel | |
| Dell G16 7620 | |
| Lenovo LOQ 16IRH8 | |
| AIDA64 / Memory Read | |
| MSI Raider GE68HX 13VF | |
| Średnia w klasie Gaming (22956 - 118858, n=107, ostatnie 2 lata) | |
| Przeciętny Intel Core i7-13650HX (67305 - 71022, n=5) | |
| Alienware m16 R1 Intel | |
| Dell G16, i7-13650HX, RTX 4060 | |
| Dell G16 7620 | |
| Lenovo LOQ 16IRH8 | |
| Lenovo Legion Slim 5 16APH8 | |
| AIDA64 / Memory Write | |
| Lenovo Legion Slim 5 16APH8 | |
| MSI Raider GE68HX 13VF | |
| Średnia w klasie Gaming (22297 - 135096, n=107, ostatnie 2 lata) | |
| Przeciętny Intel Core i7-13650HX (58028 - 68225, n=5) | |
| Alienware m16 R1 Intel | |
| Dell G16, i7-13650HX, RTX 4060 | |
| Dell G16 7620 | |
| Lenovo LOQ 16IRH8 | |
| AIDA64 / Memory Latency | |
| Lenovo LOQ 16IRH8 | |
| Średnia w klasie Gaming (75.3 - 259, n=107, ostatnie 2 lata) | |
| Dell G16 7620 | |
| Lenovo Legion Slim 5 16APH8 | |
| Dell G16, i7-13650HX, RTX 4060 | |
| Przeciętny Intel Core i7-13650HX (83.7 - 90.8, n=5) | |
| Alienware m16 R1 Intel | |
| MSI Raider GE68HX 13VF | |
* ... im mniej tym lepiej
Opóźnienie DPC
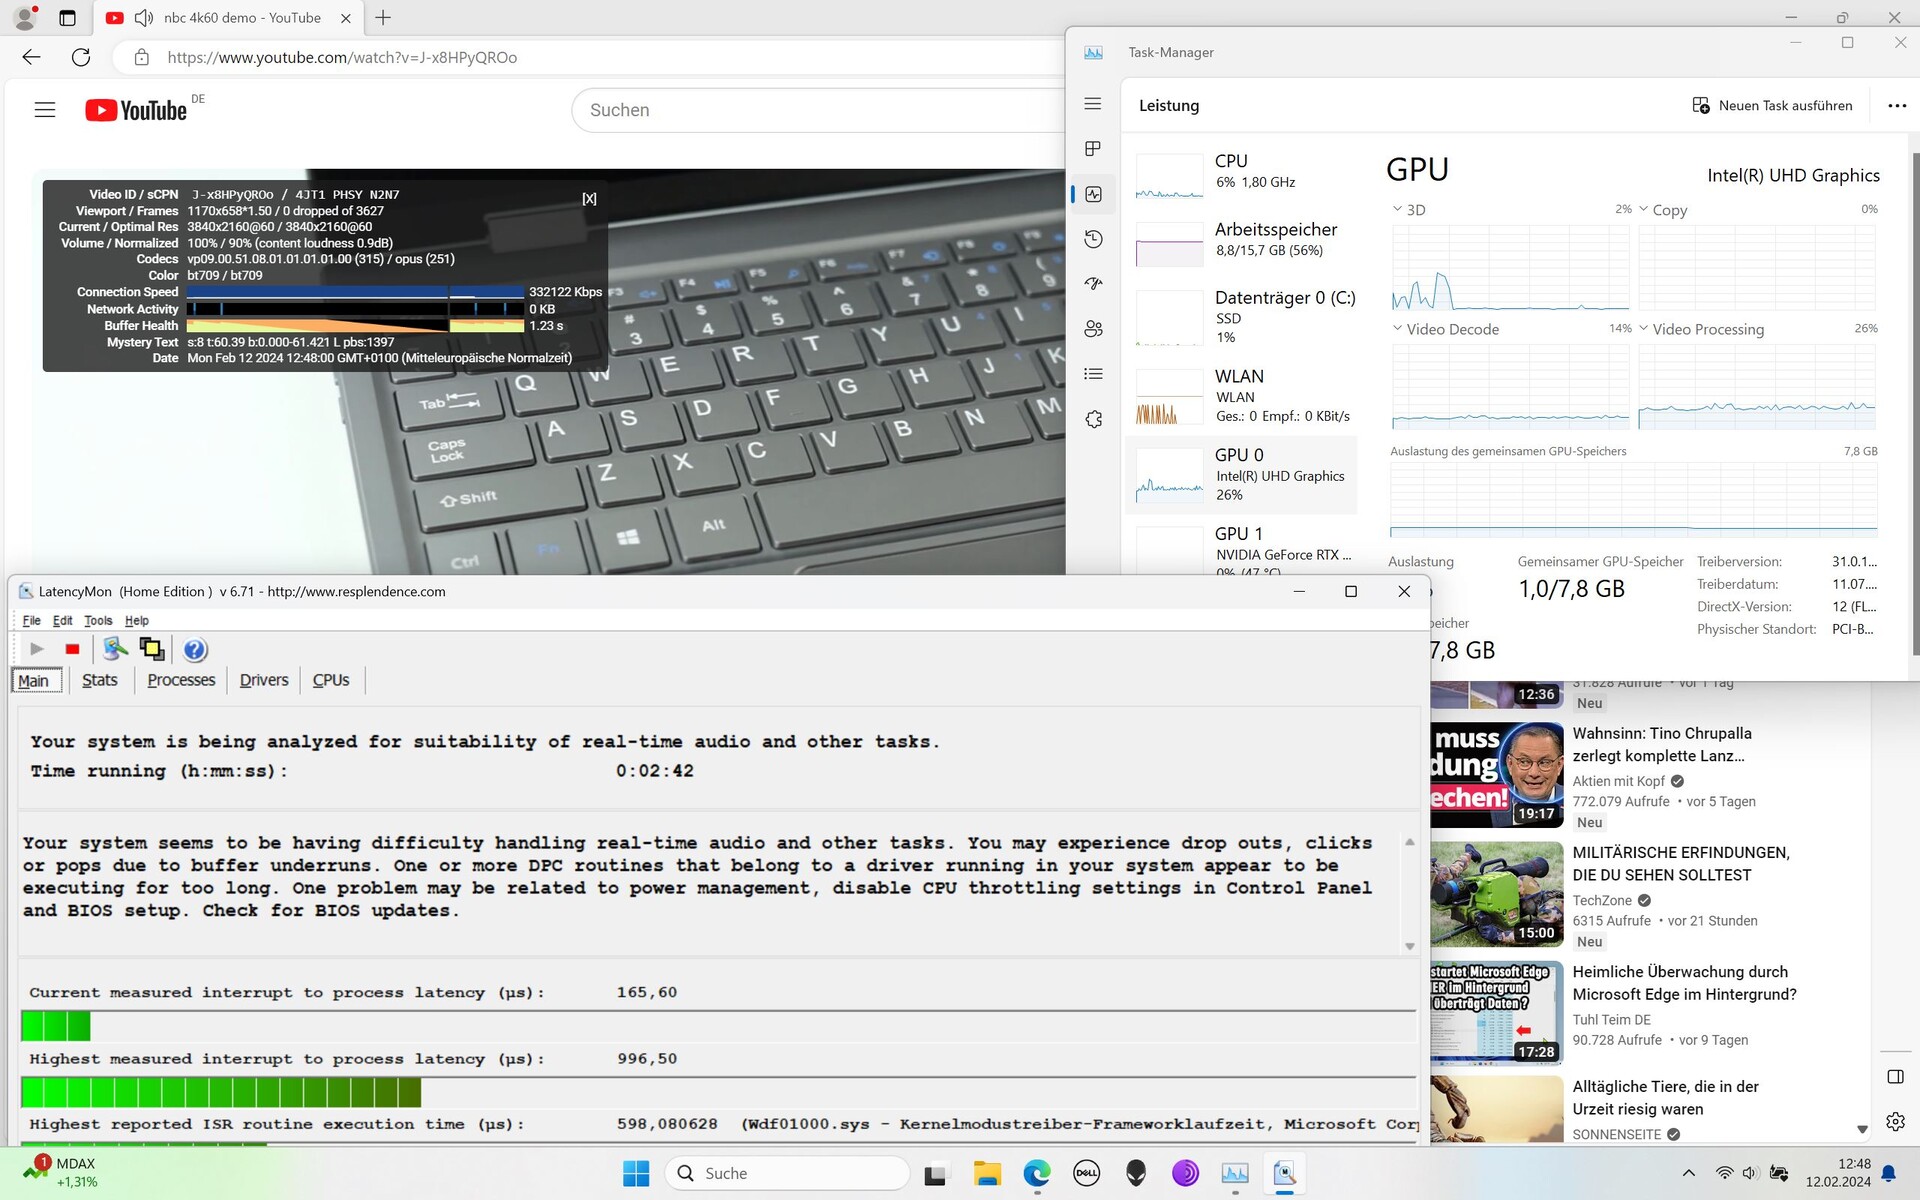
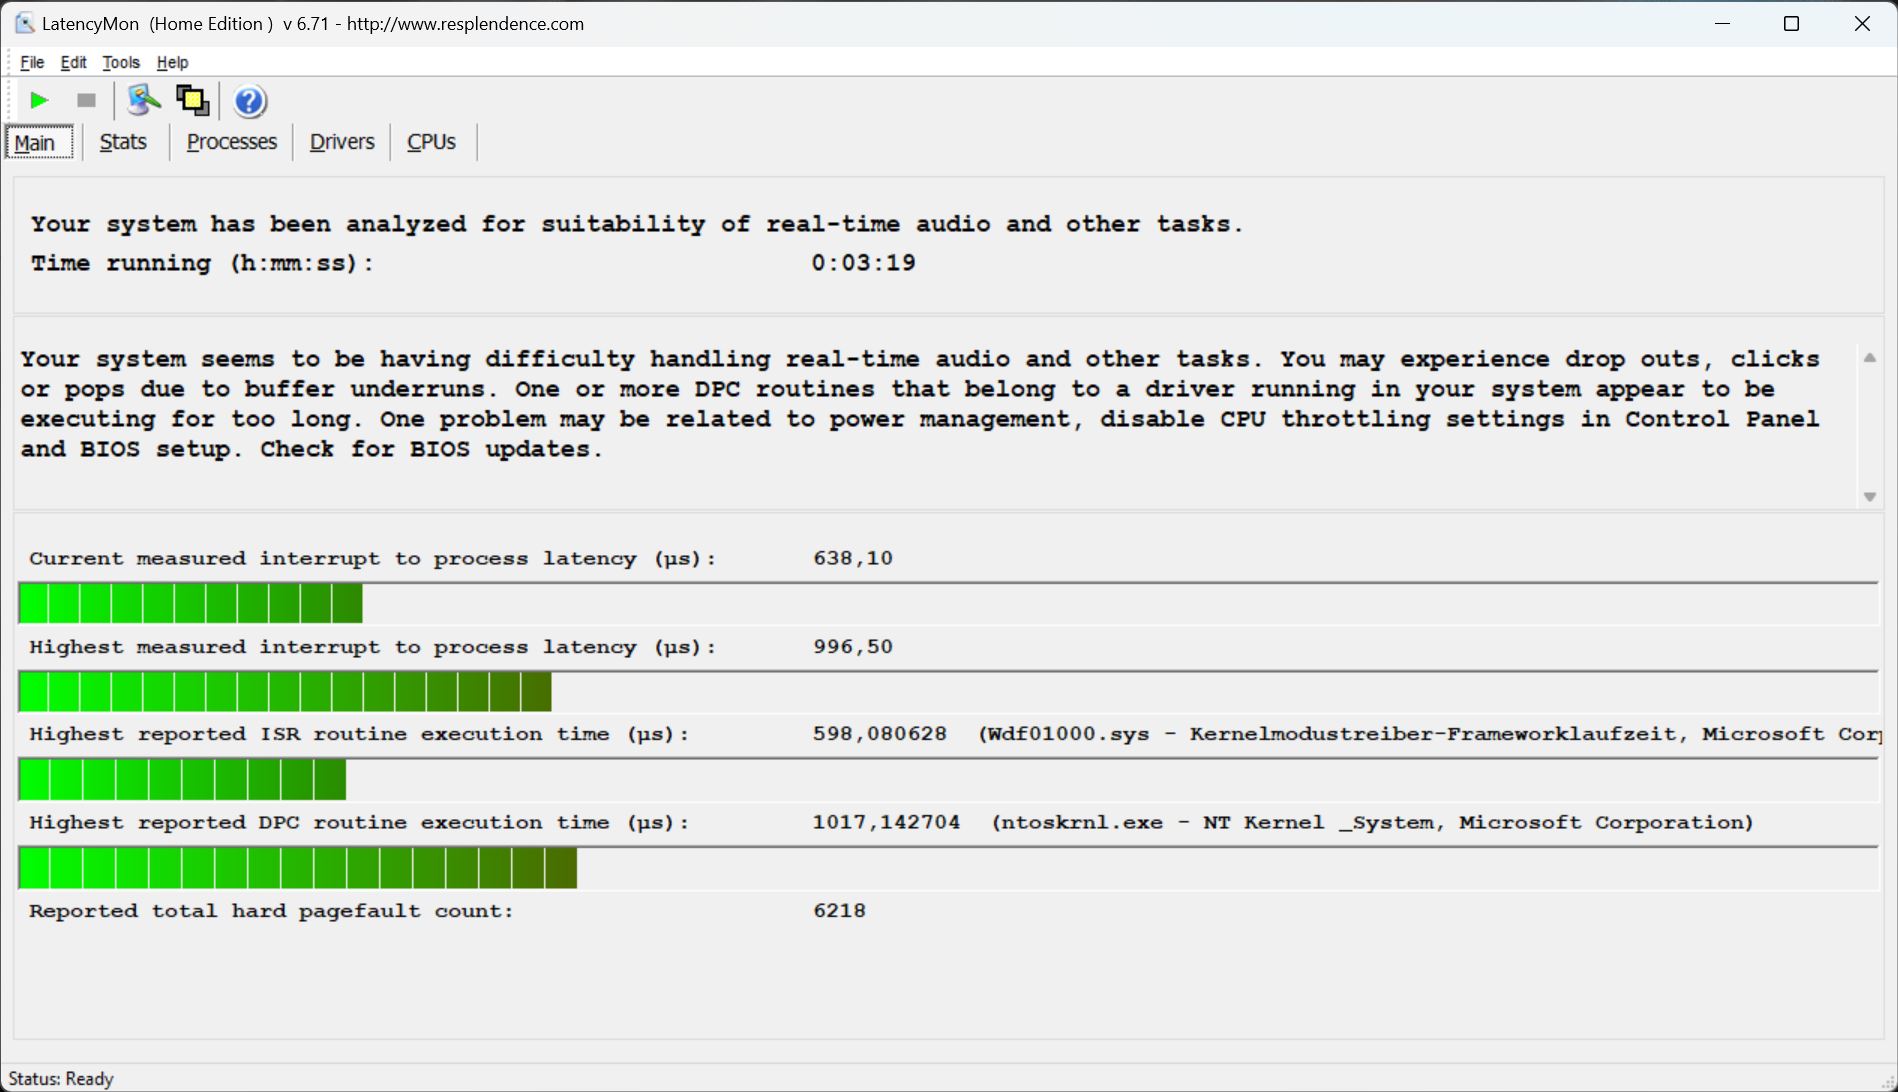
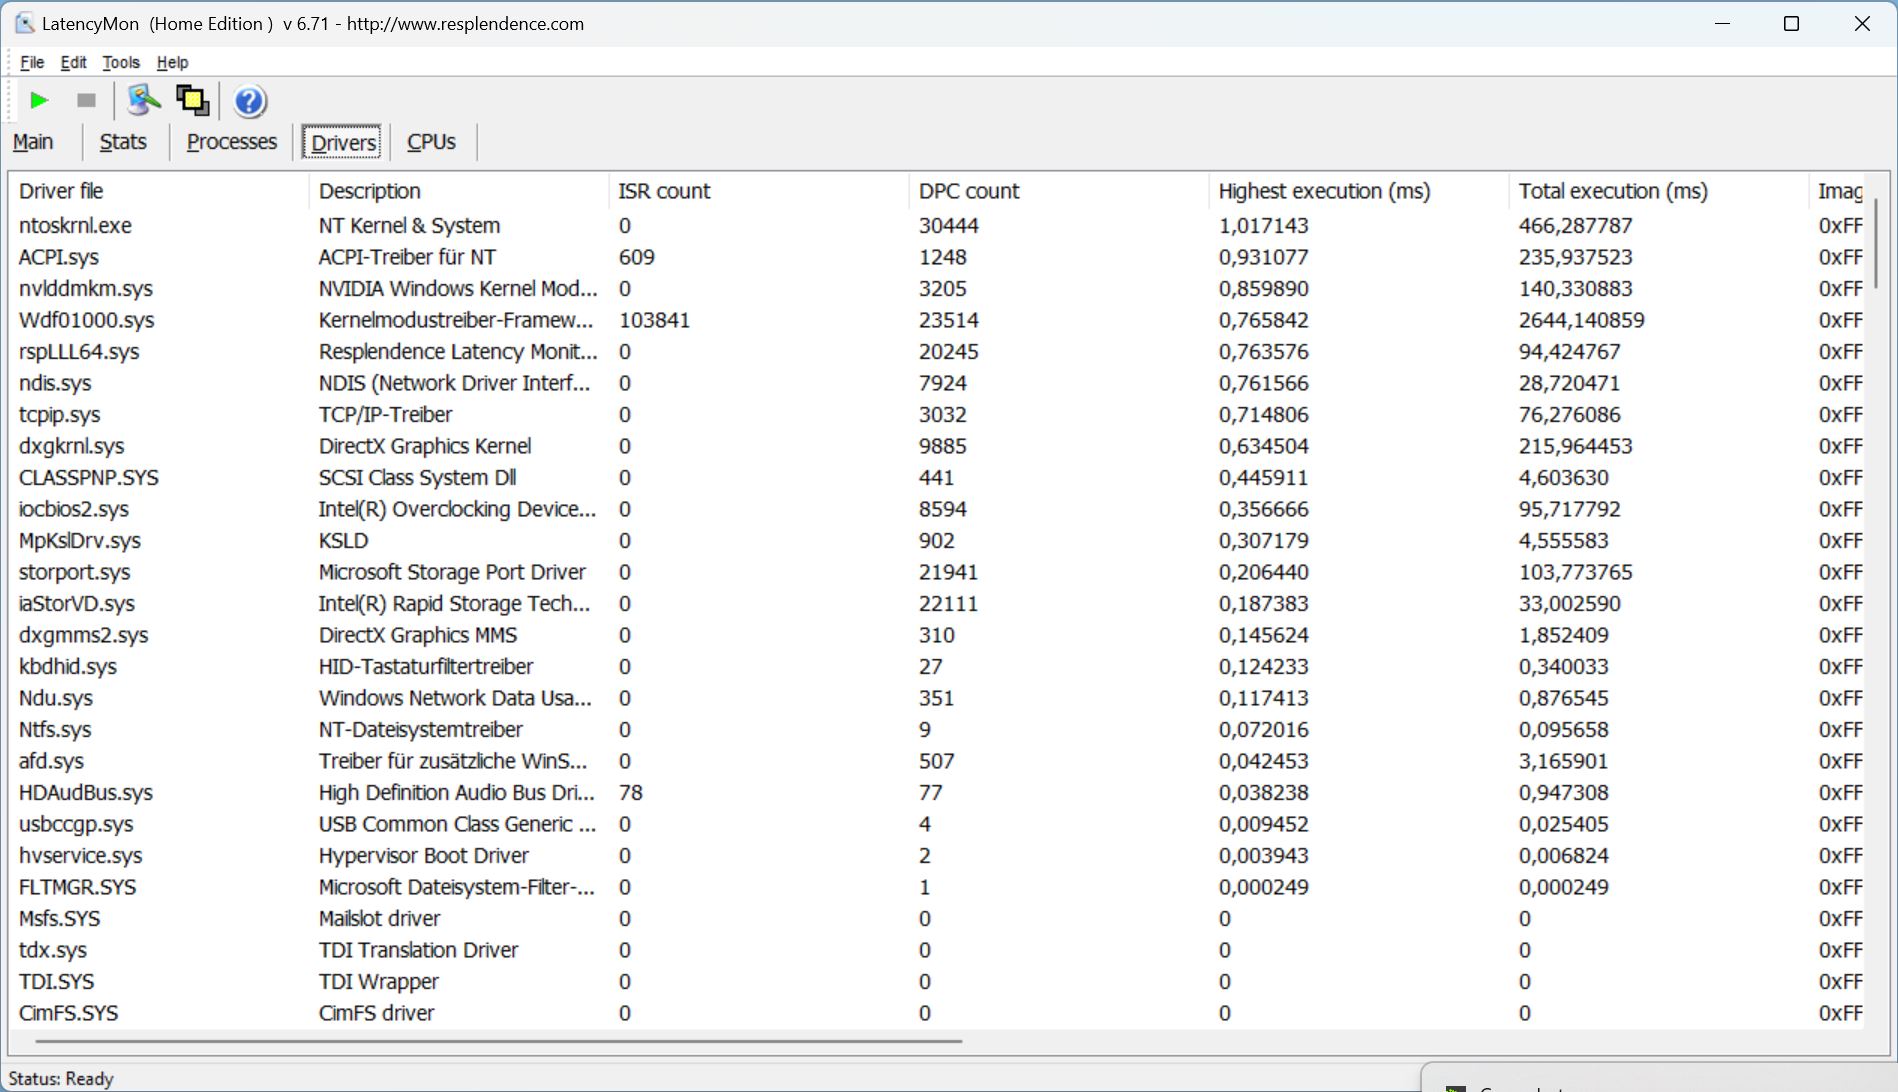
Podczas otwierania naszej strony internetowej laptop wykazywał niewielkie opóźnienia, ale oprogramowanie LatencyMon nie oznaczyło ich jako krytyczne. Nie zmieniło się to przy otwieraniu wielu kart. Opóźnienia wzrosły nieznacznie podczas odtwarzania naszego filmu 4K/60 klatek na sekundę na YouTube, co doprowadziło nasze narzędzie pomiarowe do wskazania pewnych problemów. Dla porównania, opóźnienia te są jednak dość niskie, a testowe wideo zostało odtworzone bez żadnych spadków klatek.
| DPC Latencies / LatencyMon - interrupt to process latency (max), Web, Youtube, Prime95 | |
| Alienware m16 R1 Intel | |
| MSI Raider GE68HX 13VF | |
| Lenovo LOQ 16IRH8 | |
| Lenovo Legion Slim 5 16APH8 | |
| Dell G16, i7-13650HX, RTX 4060 | |
| Dell G16 7620 | |
* ... im mniej tym lepiej
Urządzenia pamięci masowej
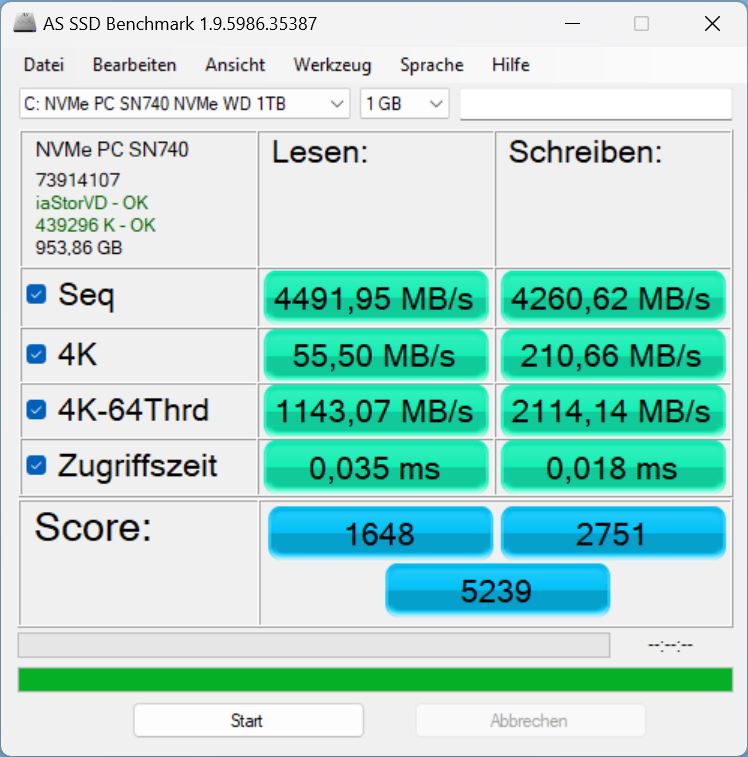
Firma Dell zainstalowała dysk SN740 firmy Western Digital w niewielkim formacie M.2 2230. Drugi, większy slot M.2-2280 jest również wolny. PCIe-4-NVMe zajmuje pozycję 142 w naszym zestawieniu najlepszych Liście najlepszych dysków SSD. Jego wydajność wyjściowa jest w rzeczywistości lepsza niż w przypadku dysków SSD w MSI Raider lub Lenovo LOQ 16. Jednak w przeciwieństwie do tych i innych konkurentów, nośnik pamięci w G16 jest dławiony termicznie po bardzo krótkim czasie.
Szybkość transferu spada wtedy o ponad połowę. Nawiasem mówiąc, jego poprzednik miał zainstalowany szybszy model - nawet jeśli również dotykały go problemy z dławieniem. Zaczęły się one jednak znacznie później.

* ... im mniej tym lepiej
Reading continuous performance: DiskSpd Read Loop, Queue Depth 8
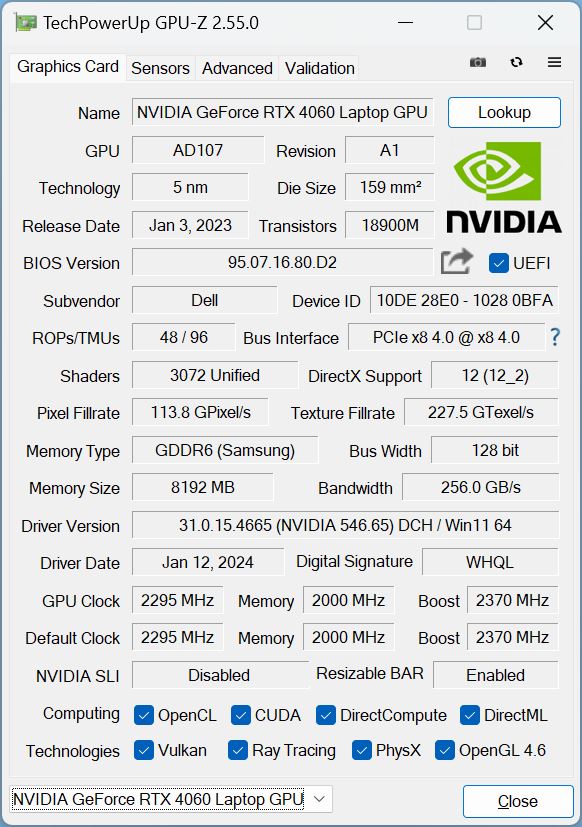
Karta graficzna
Dell wyposażył G16 w RTX 4060 o mocy 140 W. Obsługiwane są tryby Whisper Mode, Max-Q, Dynamic Boost, a nawet Advanced Optimus. Jednak ten ostatni staje się irytujący dość regularnie, ponieważ proces przełączania grafiki zajmuje dobre kilka sekund podczas każdej aplikacji 3D (uruchamianie i zamykanie), podczas której ekran zawiesza się.
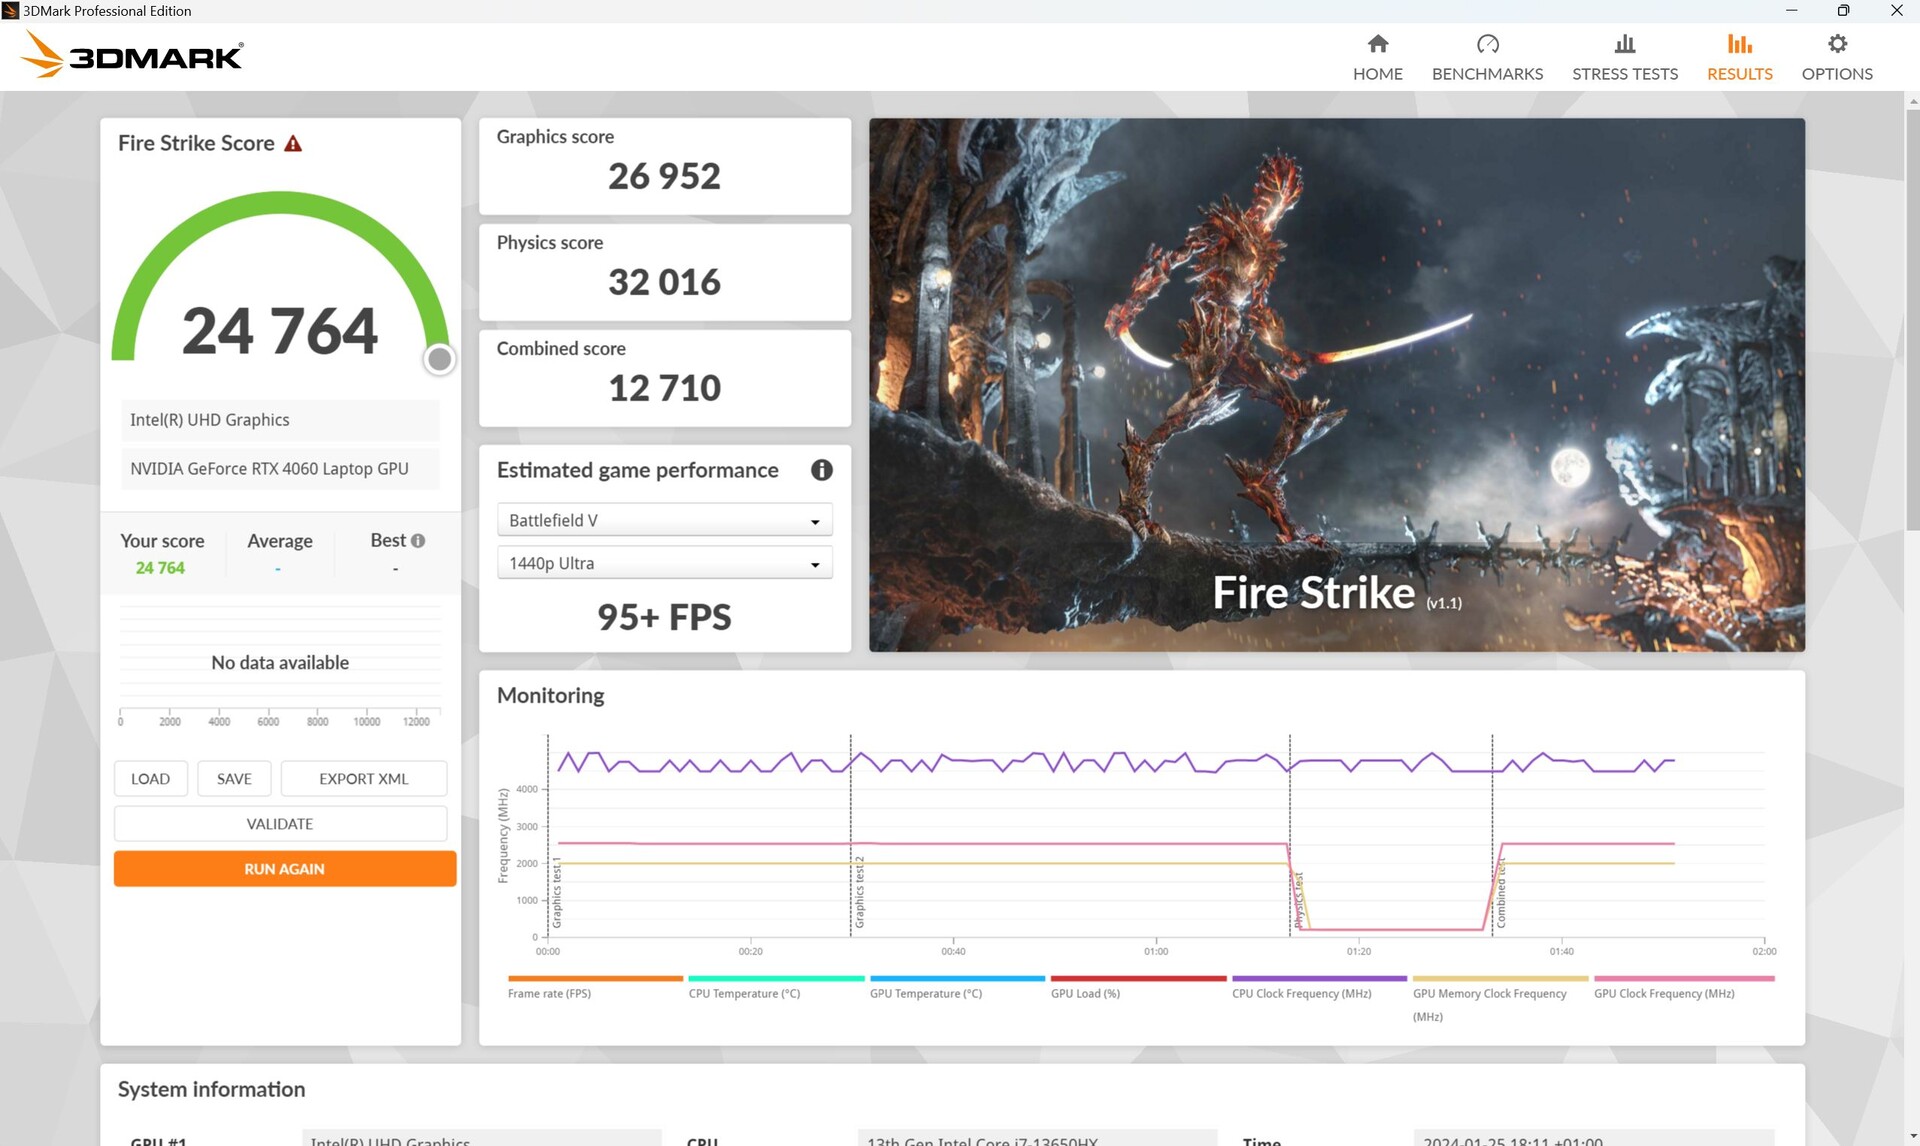
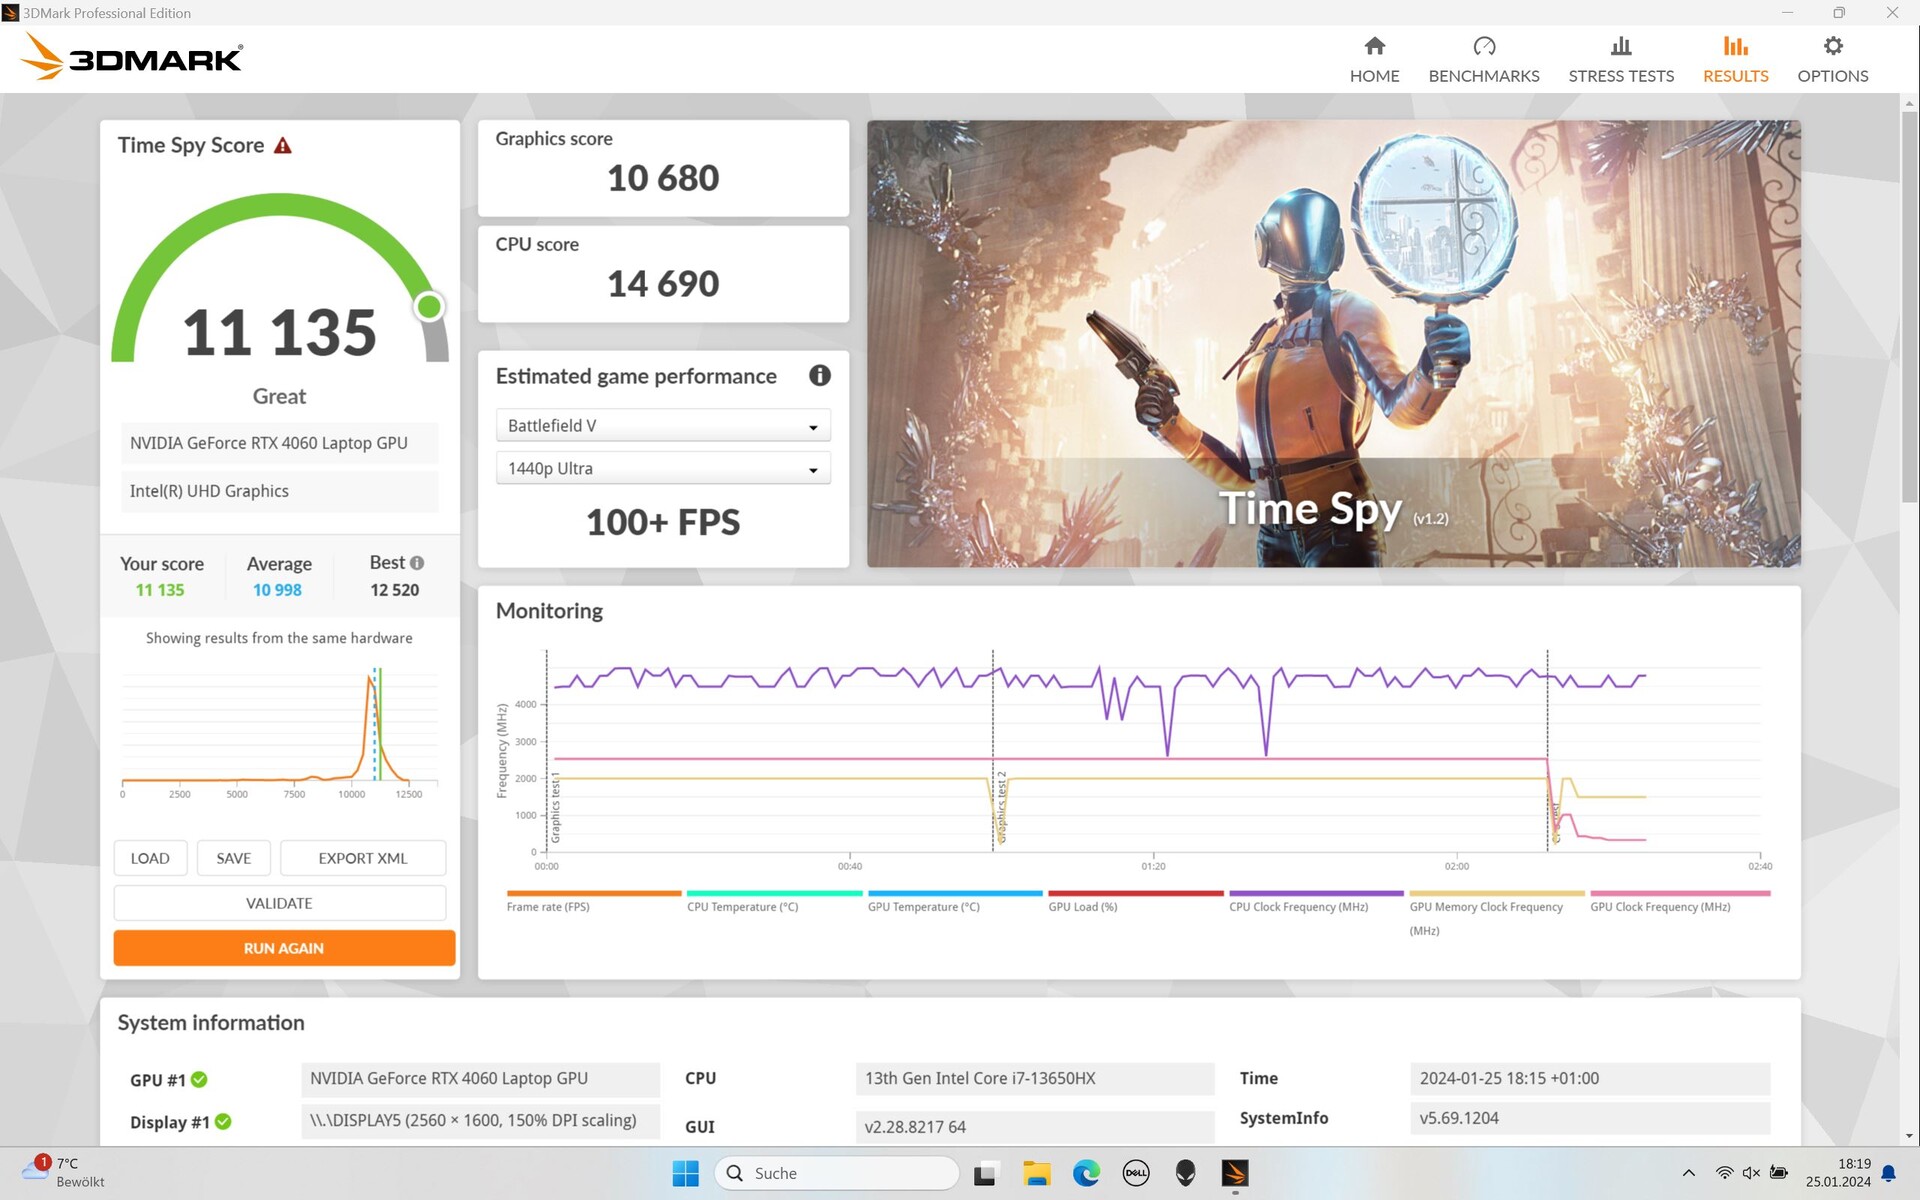
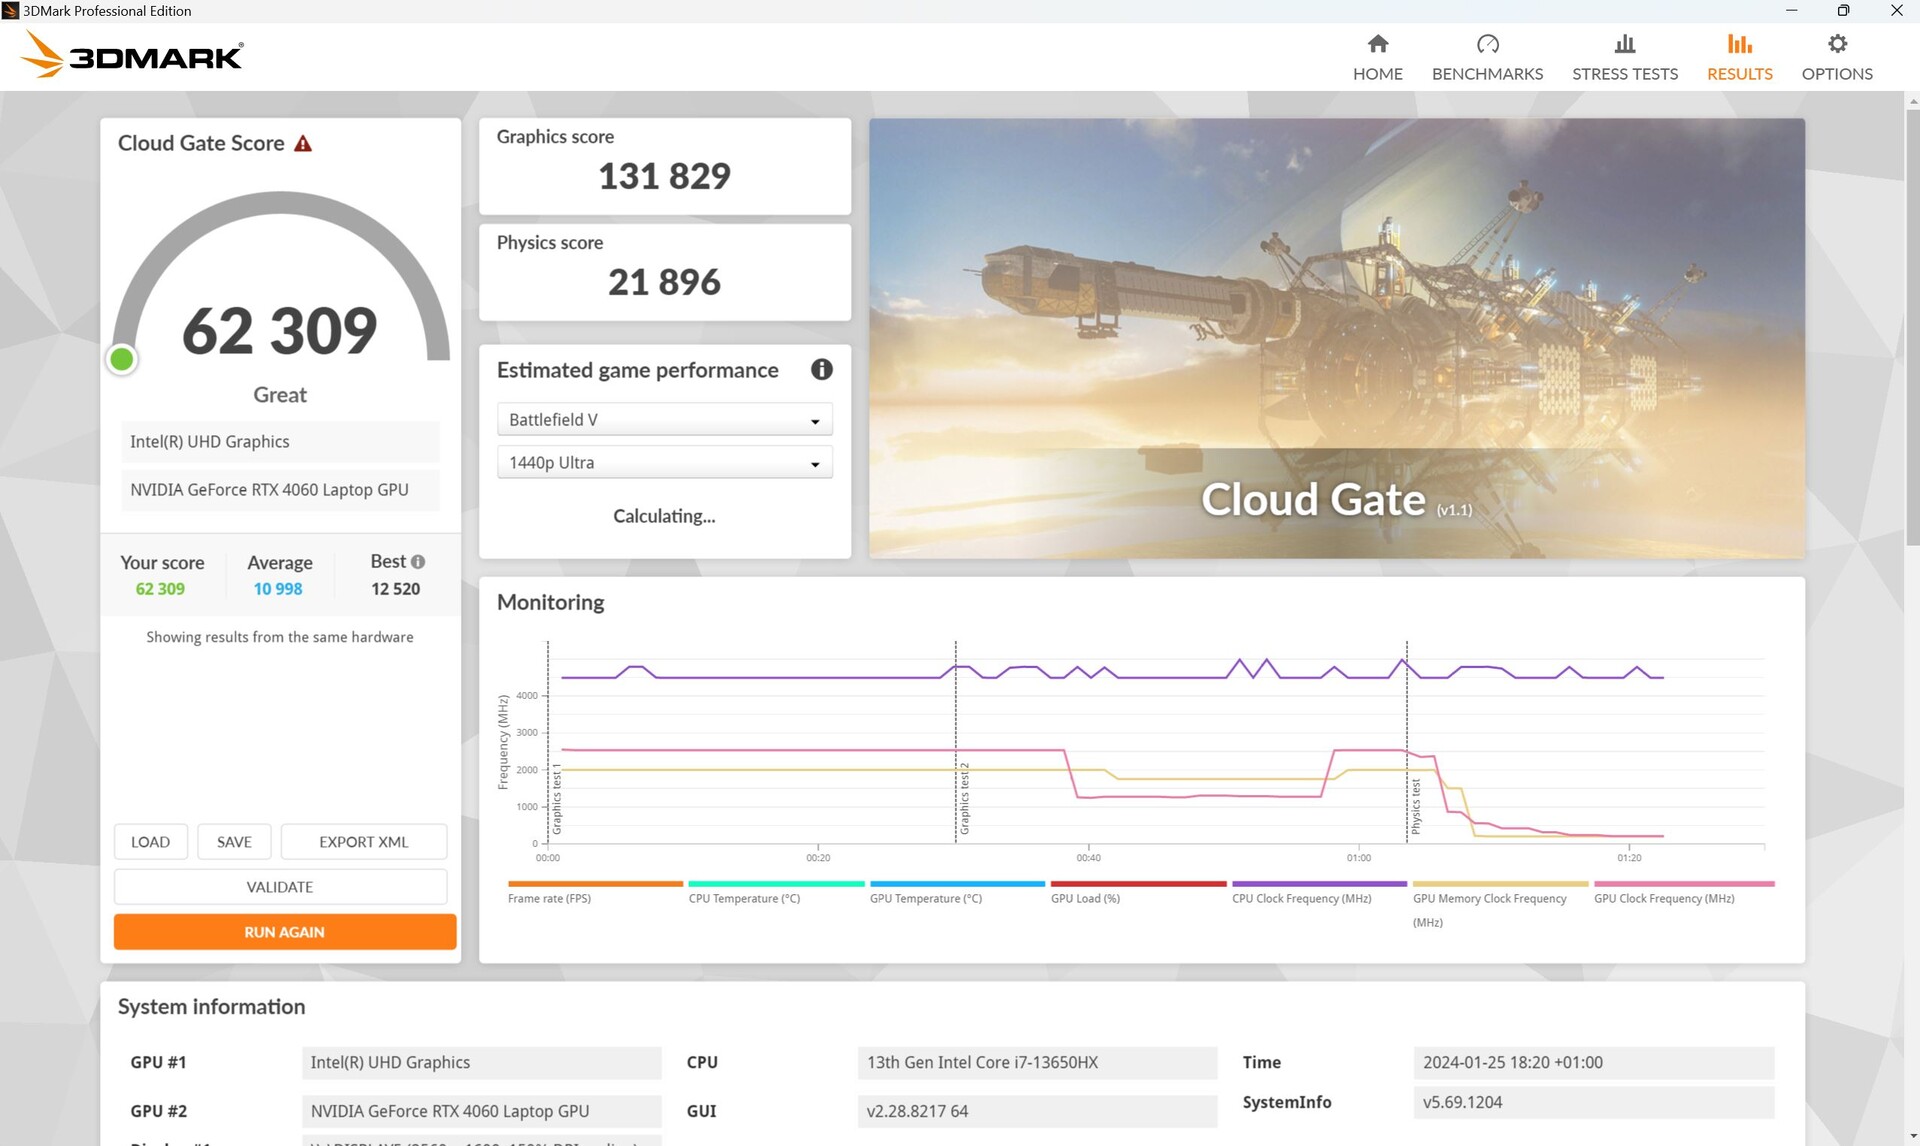
Mimo to, jego wydajność podczas syntetycznego 3DMarks była taka, jakiej się spodziewaliśmy, jeśli nie nieco lepsza. Jego przewaga nad poprzednikiem laptopa z kartą RTX 3060 i i7-12700H wynosi około 22%.
Po odłączeniu od zasilania, wydajność 3D spadła mniej drastycznie niż oczekiwano. W innym uruchomieniu Fire Strike zmierzyliśmy spadek o około 20%.
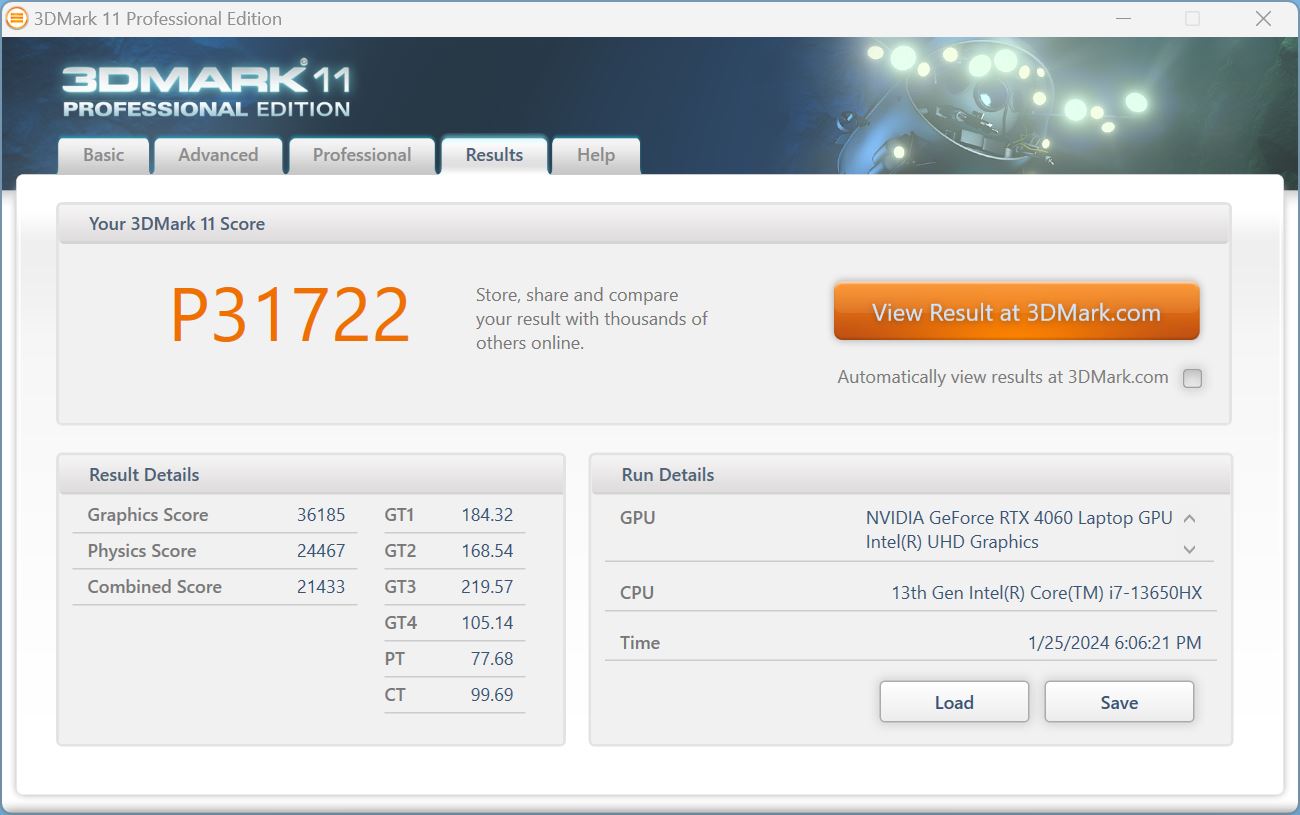
| 3DMark 11 Performance | 31722 pkt. | |
| 3DMark Cloud Gate Standard Score | 62309 pkt. | |
| 3DMark Fire Strike Score | 24764 pkt. | |
| 3DMark Time Spy Score | 11135 pkt. | |
Pomoc | ||
* ... im mniej tym lepiej
Wydajność w grach
Kiedy włączyliśmy tryb tylko Nvidia-GPU dla naszych testów porównawczych gier za pośrednictwem panelu sterowania, zauważyliśmy, że niektóre ustawienia (np. Witcher 3 Full HD Ultra, Strange Brigade QHD) skutkowały znacznie niższą liczbą klatek na sekundę niż w trybie Optimus lub automatycznym. Jest to dość nietypowe i może prowadzić do pewnej frustracji.
W przeciwnym razie nie możemy narzekać na wydajność laptopa w grach. Dla porównania, nasz G16 uplasował się pięć procent za MSI Raider z procesorem i9-13950HX i kartą RTX 4060ale Alienware i Lenovo LOQ pozostały tuż za nimi.
Ostatecznie we wszystkie obecne gry można grać w rozdzielczości FHD przy ustawieniach Ultra z prędkością ponad 60 klatek na sekundę. Korzystając z natywnej rozdzielczości 1600p, często nie będzie można osiągnąć niczego powyżej 60 klatek na sekundę, ale gry nadal działają płynnie z prędkością ponad 40 klatek na sekundę.
| Performance rating - Percent | |
| Średnia w klasie Gaming | |
| MSI Raider GE68HX 13VF -1! | |
| Dell G16, i7-13650HX, RTX 4060 | |
| Lenovo LOQ 16IRH8 | |
| Alienware m16 R1 Intel -1! | |
| Dell G16 7620 | |
| Lenovo Legion Slim 5 16APH8 | |
| The Witcher 3 - 1920x1080 Ultra Graphics & Postprocessing (HBAO+) | |
| Średnia w klasie Gaming (95 - 240, n=7, ostatnie 2 lata) | |
| Dell G16, i7-13650HX, RTX 4060 | |
| Alienware m16 R1 Intel | |
| Lenovo LOQ 16IRH8 | |
| MSI Raider GE68HX 13VF | |
| Lenovo Legion Slim 5 16APH8 | |
| Dell G16 7620 | |
| GTA V - 1920x1080 Highest AA:4xMSAA + FX AF:16x | |
| Średnia w klasie Gaming (48.3 - 186.9, n=97, ostatnie 2 lata) | |
| Dell G16, i7-13650HX, RTX 4060 | |
| Lenovo LOQ 16IRH8 | |
| Dell G16 7620 | |
| Lenovo Legion Slim 5 16APH8 | |
| Final Fantasy XV Benchmark - 1920x1080 High Quality | |
| Średnia w klasie Gaming (41 - 215, n=98, ostatnie 2 lata) | |
| Alienware m16 R1 Intel | |
| Dell G16, i7-13650HX, RTX 4060 | |
| MSI Raider GE68HX 13VF | |
| Lenovo LOQ 16IRH8 | |
| Lenovo Legion Slim 5 16APH8 | |
| Dell G16 7620 | |
| Strange Brigade - 1920x1080 ultra AA:ultra AF:16 | |
| Średnia w klasie Gaming (76.3 - 456, n=88, ostatnie 2 lata) | |
| Dell G16, i7-13650HX, RTX 4060 | |
| MSI Raider GE68HX 13VF | |
| Alienware m16 R1 Intel | |
| Lenovo LOQ 16IRH8 | |
| Lenovo Legion Slim 5 16APH8 | |
| Dell G16 7620 | |
| Dota 2 Reborn - 1920x1080 ultra (3/3) best looking | |
| MSI Raider GE68HX 13VF | |
| Alienware m16 R1 Intel | |
| Lenovo LOQ 16IRH8 | |
| Średnia w klasie Gaming (84.8 - 248, n=110, ostatnie 2 lata) | |
| Dell G16, i7-13650HX, RTX 4060 | |
| Dell G16 7620 | |
| Lenovo Legion Slim 5 16APH8 | |
W The Witcher 3 Ultra, nasz G16 osiągnął najlepszą wydajność i przewyższył konkurencję pod względem liczby klatek na sekundę od nieznacznie (Alienware) do znacznie (Legion Slim 5, GPU automatic).
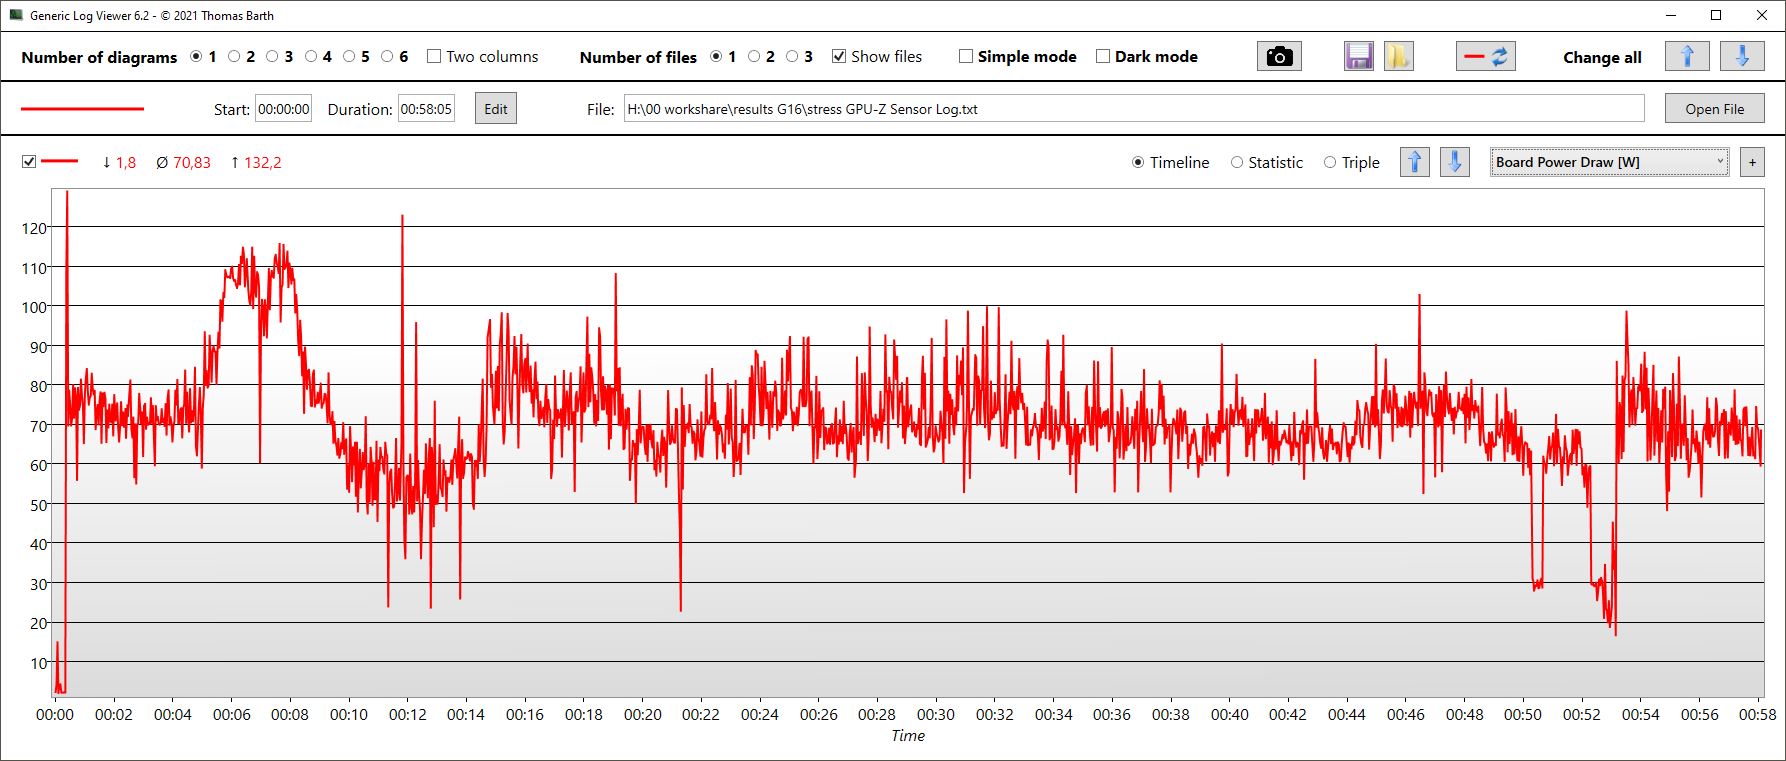
Poniższa tabela zawiera wartości klatek na sekundę dla Witcher 3 (FHD Ultra), a także nasze pomiary emisji hałasu i zużycia energii w zależności od trzech trybów wydajności.
| Wydajność tryb/wartość | fps początek | fps średnia | emisja hałasu | zużycie energii |
|---|---|---|---|---|
| Wydajność | 108 | 105,6 | 47,89 dB | 185 watów |
| Zrównoważony | 100 | 97,6 | 39 - 43 dB | 178 watów |
| Cichy | 99 | 97,6 | 35,52 dB | 168 watów |
Witcher 3 FPS diagram
| low | med. | high | ultra | QHD | 4K | |
|---|---|---|---|---|---|---|
| GTA V (2015) | 185.8 | 183.2 | 176.2 | 117.4 | 50.8 | |
| The Witcher 3 (2015) | 340.4 | 193.1 | 110 | 108 | 42.4 | |
| Dota 2 Reborn (2015) | 177 | 168.7 | 160.8 | 149 | 126.2 | |
| Final Fantasy XV Benchmark (2018) | 219 | 150.1 | 103.7 | 75.9 | ||
| X-Plane 11.11 (2018) | 160.4 | 144.6 | 114.9 | 119.6 | ||
| Far Cry 5 (2018) | 176 | 148 | 141 | 135 | 105 | |
| Strange Brigade (2018) | 478 | 291 | 228 | 194.9 | 129 | |
| Cyberpunk 2077 (2023) | 131.1 | 75.6 | 69.8 | 45.6 |
Emisje - dość ciche, nawet podczas grania
Emisja hałasu
W trybie bezczynności wentylatory są wyłączone podczas korzystania ze wszystkich trybów z wyjątkiem wydajności. W 3DMark06, naszym scenariuszu średniego obciążenia, laptop ma taką samą emisję hałasu jak w trybie bezczynności( tryb wydajności, około 28 dB), więc wentylatory nie obracają się szybciej.
Nawet podczas grania i pod pełnym obciążeniem, Dell G16 pozostaje zauważalnie cichszy niż konkurencja na poziomie znacznie poniżej 50 dB, co wydaje się być miejscem, w którym opłaca się jego masywny system chłodzenia.
Hałas
| luz |
| 23 / 23 / 27.96 dB |
| obciążenie |
| 27.96 / 47.89 dB |
 | ||
30 dB cichy 40 dB(A) słyszalny 50 dB(A) irytujący |
||
min: | ||
| Dell G16, i7-13650HX, RTX 4060 GeForce RTX 4060 Laptop GPU, i7-13650HX, WD PC SN740 SDDPNQD-1T00 | Dell G16 7620 GeForce RTX 3060 Laptop GPU, i7-12700H, WDC PC SN810 512GB | MSI Raider GE68HX 13VF GeForce RTX 4060 Laptop GPU, i9-13950HX, Samsung PM9B1 1024GB MZVL41T0HBLB | Lenovo Legion Slim 5 16APH8 GeForce RTX 4060 Laptop GPU, R7 7840HS, SK hynix PC801 HFS512GEJ9X115N | Alienware m16 R1 Intel GeForce RTX 4060 Laptop GPU, i7-13700HX, Kioxia KXG70ZNV512G | Lenovo LOQ 16IRH8 GeForce RTX 4060 Laptop GPU, i7-13620H, Solidigm SSDPFINW512GZL | |
|---|---|---|---|---|---|---|
| Noise | -10% | -26% | -6% | -19% | -16% | |
| wyłączone / środowisko * (dB) | 23 | 23.2 -1% | 23.3 -1% | 22.9 -0% | 25 -9% | 23 -0% |
| Idle Minimum * (dB) | 23 | 28.3 -23% | 25 -9% | 23.1 -0% | 25 -9% | 23 -0% |
| Idle Average * (dB) | 23 | 28.8 -25% | 31.3 -36% | 23.1 -0% | 26 -13% | 23 -0% |
| Idle Maximum * (dB) | 27.96 | 28.9 -3% | 37.5 -34% | 27.7 1% | 27 3% | 27.66 1% |
| Load Average * (dB) | 27.96 | 32.4 -16% | 44 -57% | 33.3 -19% | 52 -86% | 53.62 -92% |
| Witcher 3 ultra * (dB) | 47.89 | 48.3 -1% | 57 -19% | 54 -13% | 51 -6% | 53.5 -12% |
| Load Maximum * (dB) | 47.89 | 48.1 -0% | 60.1 -25% | 54 -13% | 53 -11% | 53.5 -12% |
* ... im mniej tym lepiej
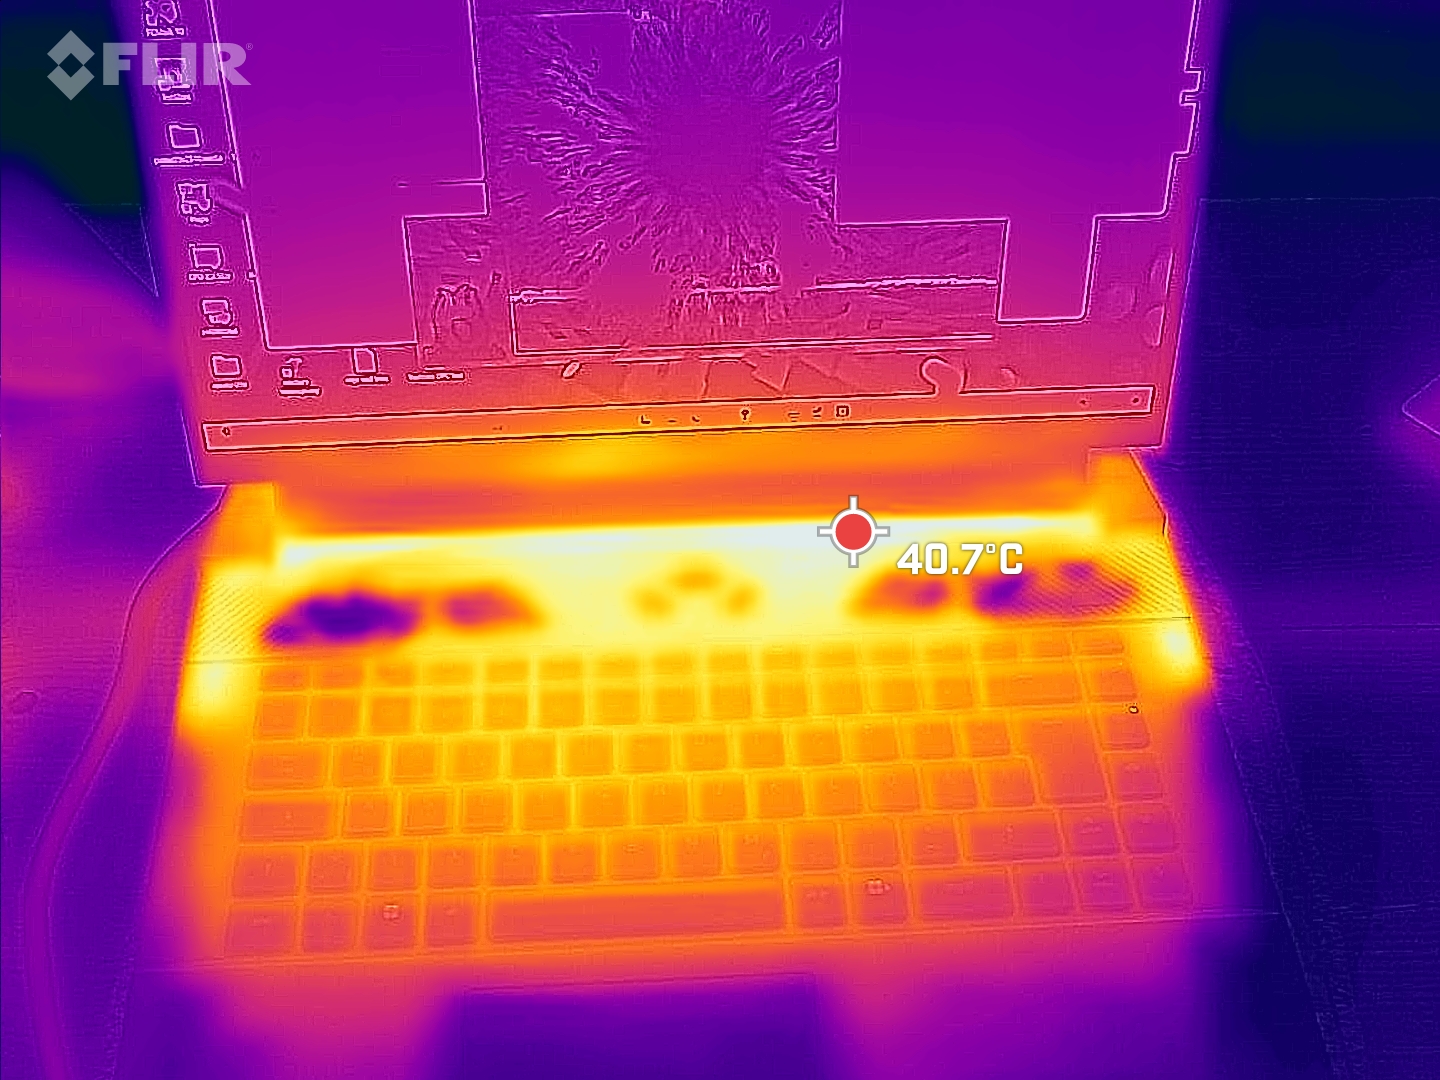
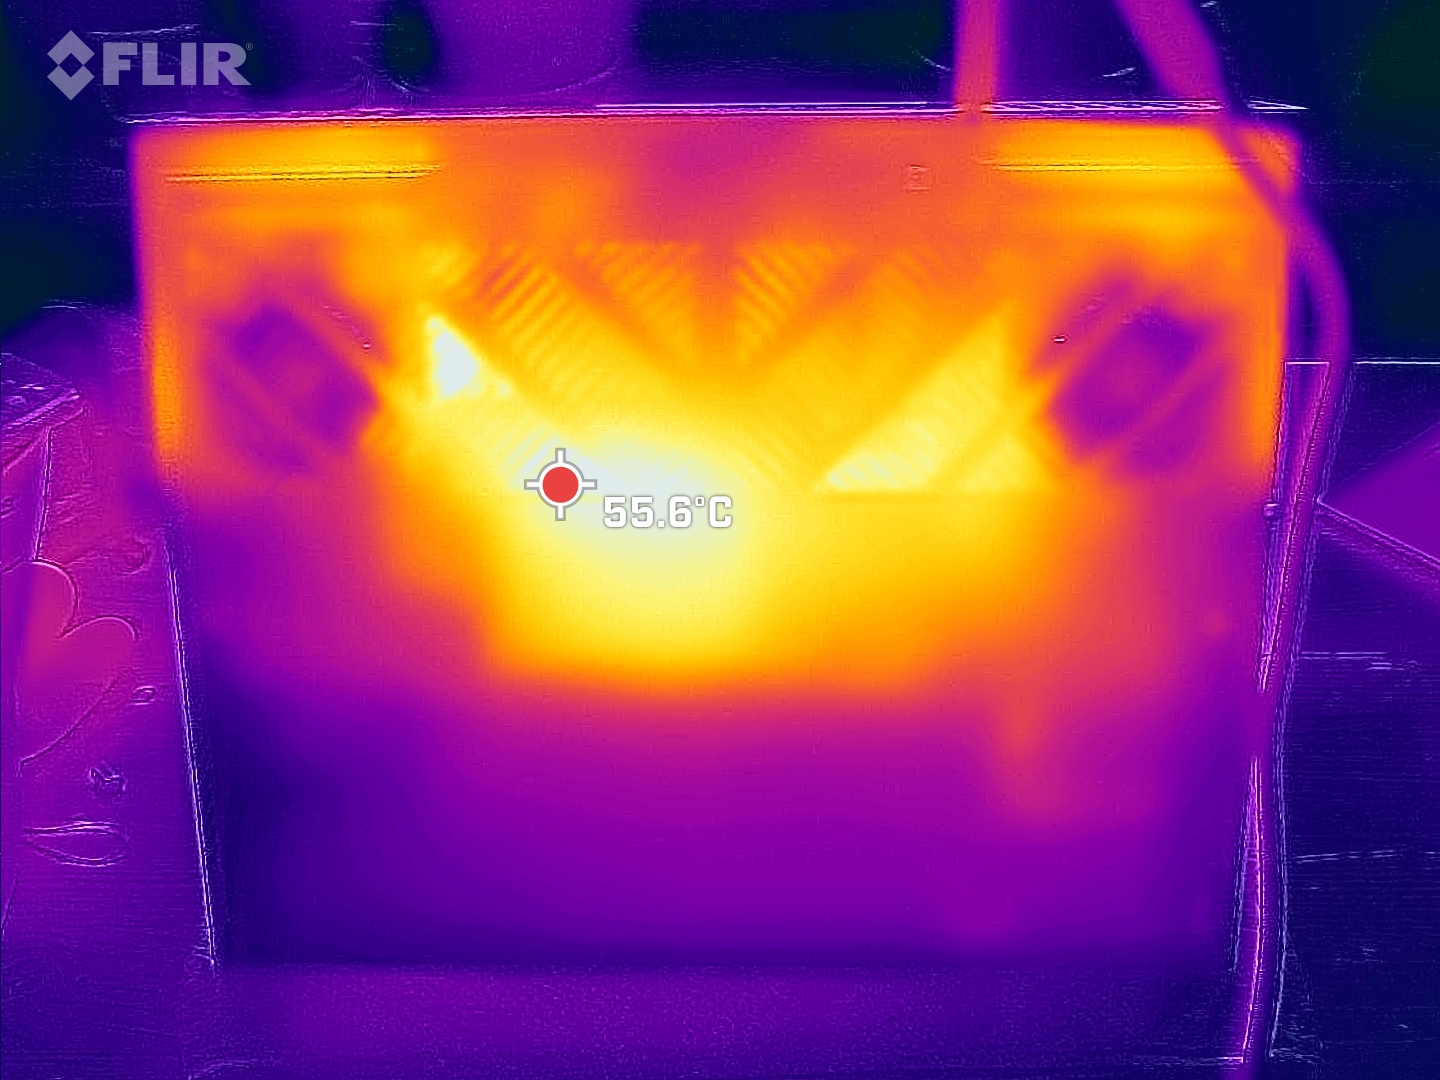
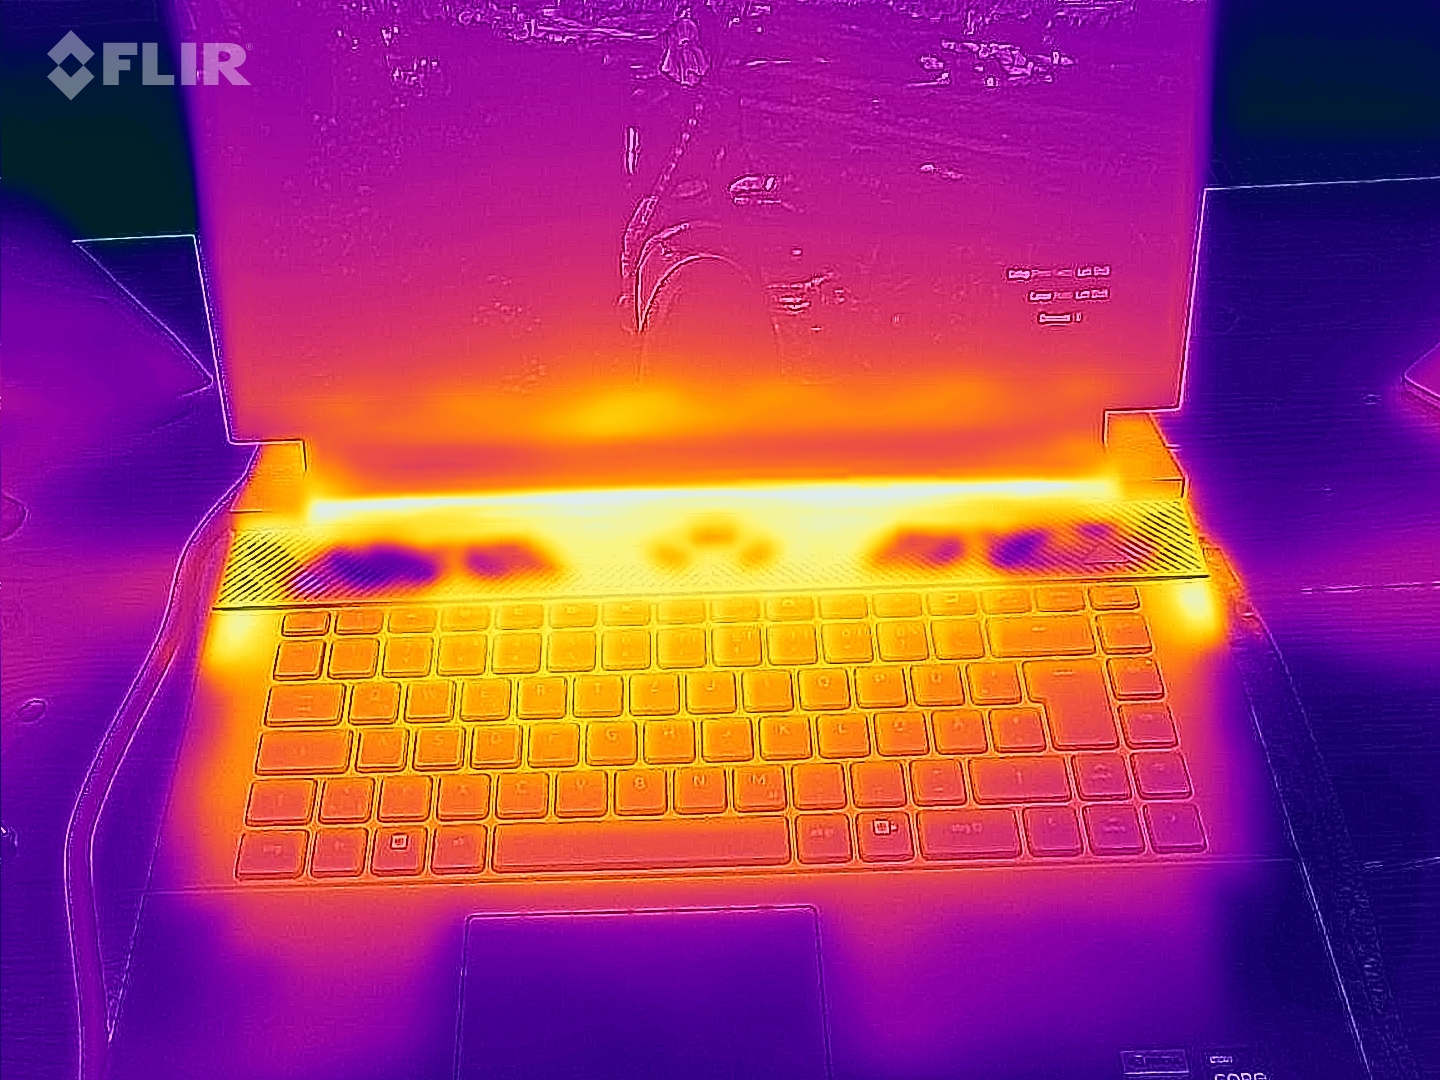
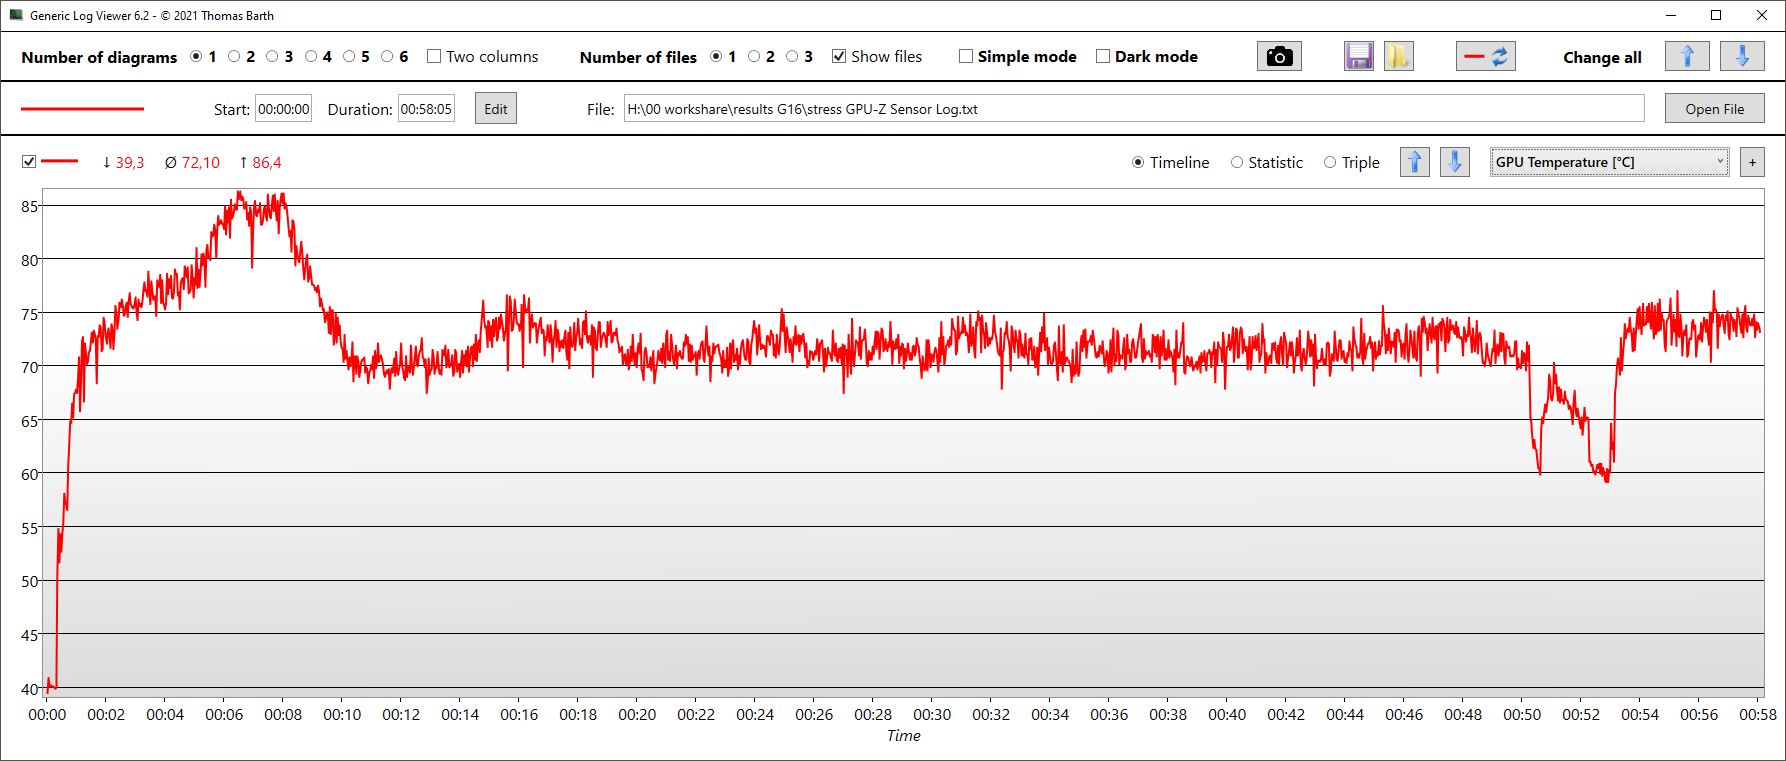
Temperatura
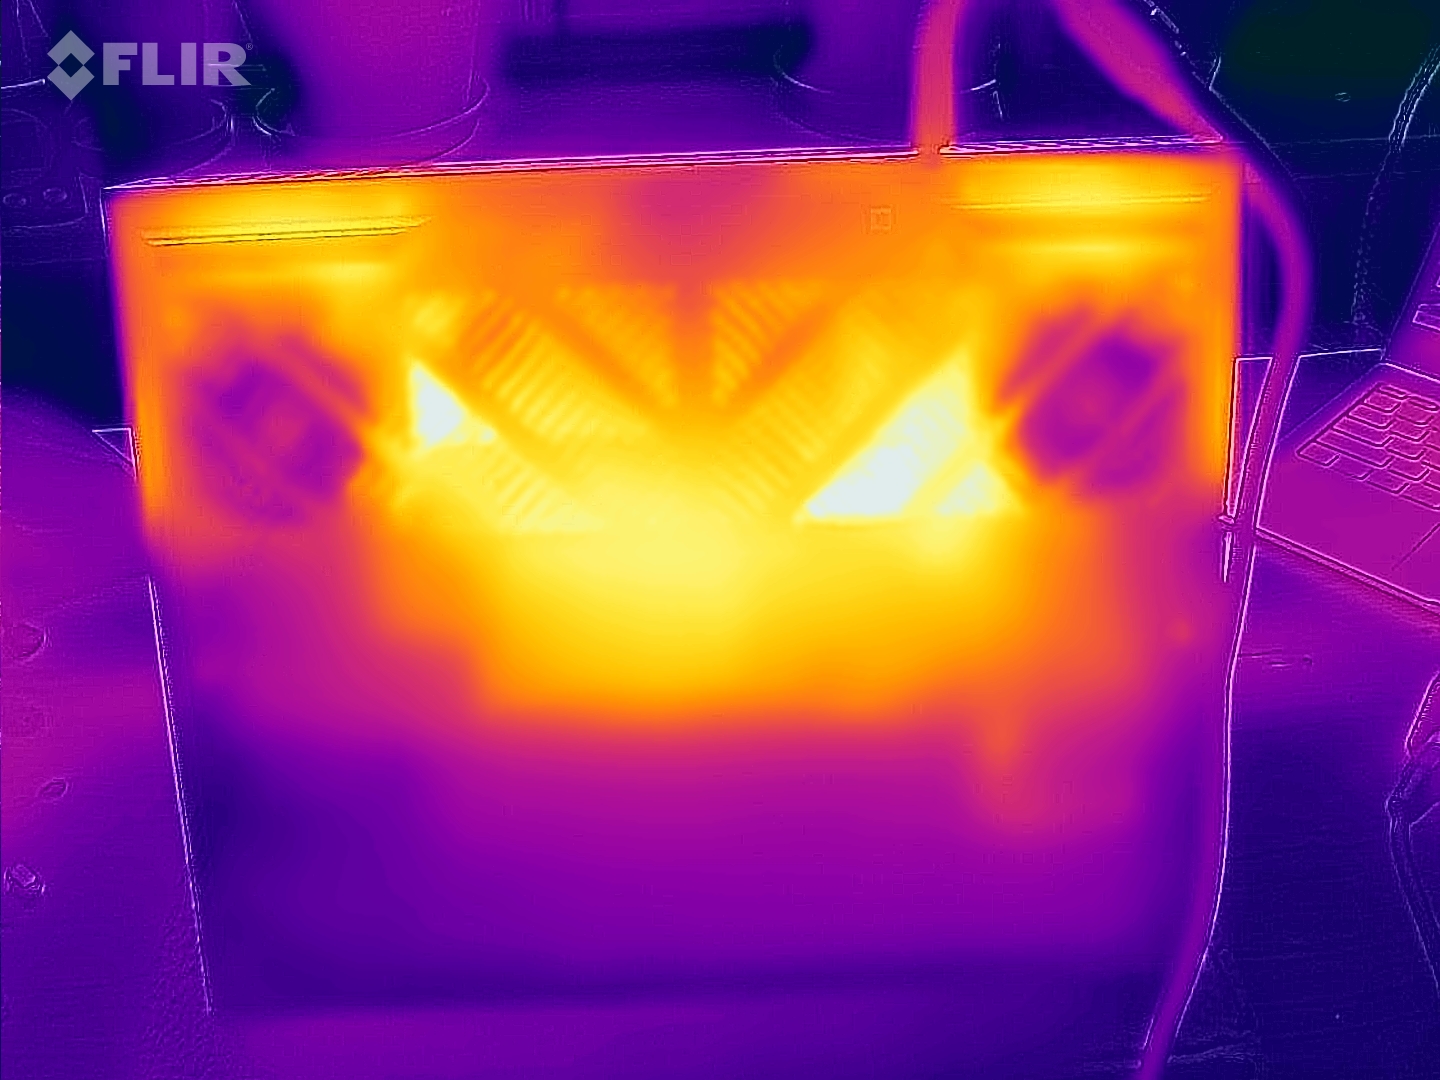
Jednak stosunkowo niska emisja hałasu przez urządzenie ma również pewne niewielkie wady. Powierzchnia G16 nagrzewa się bardziej niż u konkurentów. Zmierzyliśmy gorące punkty do 58 °C na spodzie pod maksymalnym obciążeniem! Tylko Lenovo LOQ 16 i poprzednik G16 nagrzewają się podobnie, podczas gdy pozostałe urządzenia porównawcze utrzymują się nieco poniżej 50 °C. Przynajmniej podpórki pod nadgarstki są zawsze chłodne, a obszar otaczający klawisze WASD również pozostaje w akceptowalnym zakresie.
(-) Maksymalna temperatura w górnej części wynosi 49 °C / 120 F, w porównaniu do średniej 40.4 °C / 105 F , począwszy od 21.2 do 68.8 °C dla klasy Gaming.
(-) Dno nagrzewa się maksymalnie do 58 °C / 136 F, w porównaniu do średniej 43.2 °C / 110 F
(+) W stanie bezczynności średnia temperatura górnej części wynosi 30 °C / 86 F, w porównaniu ze średnią temperaturą urządzenia wynoszącą 33.9 °C / ### class_avg_f### F.
(±) Podczas gry w Wiedźmina 3 średnia temperatura górnej części wynosi 34.4 °C / 94 F, w porównaniu do średniej temperatury urządzenia wynoszącej 33.9 °C / ## #class_avg_f### F.
(+) Podpórki pod nadgarstki i touchpad są chłodniejsze niż temperatura skóry i maksymalnie 25 °C / 77 F i dlatego są chłodne w dotyku.
(+) Średnia temperatura obszaru podparcia dłoni w podobnych urządzeniach wynosiła 28.8 °C / 83.8 F (+3.8 °C / 6.8 F).
| Dell G16, i7-13650HX, RTX 4060 Intel Core i7-13650HX, NVIDIA GeForce RTX 4060 Laptop GPU | Dell G16 7620 Intel Core i7-12700H, NVIDIA GeForce RTX 3060 Laptop GPU | MSI Raider GE68HX 13VF Intel Core i9-13950HX, NVIDIA GeForce RTX 4060 Laptop GPU | Lenovo Legion Slim 5 16APH8 AMD Ryzen 7 7840HS, NVIDIA GeForce RTX 4060 Laptop GPU | Alienware m16 R1 Intel Intel Core i7-13700HX, NVIDIA GeForce RTX 4060 Laptop GPU | Lenovo LOQ 16IRH8 Intel Core i7-13620H, NVIDIA GeForce RTX 4060 Laptop GPU | |
|---|---|---|---|---|---|---|
| Heat | 19% | 16% | 23% | -2% | 10% | |
| Maximum Upper Side * (°C) | 49 | 47.6 3% | 41.4 16% | 40.6 17% | 49 -0% | 48 2% |
| Maximum Bottom * (°C) | 58 | 54 7% | 45.4 22% | 42 28% | 48 17% | 59 -2% |
| Idle Upper Side * (°C) | 35 | 23 34% | 29.8 15% | 27.8 21% | 40 -14% | 28 20% |
| Idle Bottom * (°C) | 35 | 24.6 30% | 31.4 10% | 26.6 24% | 39 -11% | 28 20% |
* ... im mniej tym lepiej
Test warunków skrajnych
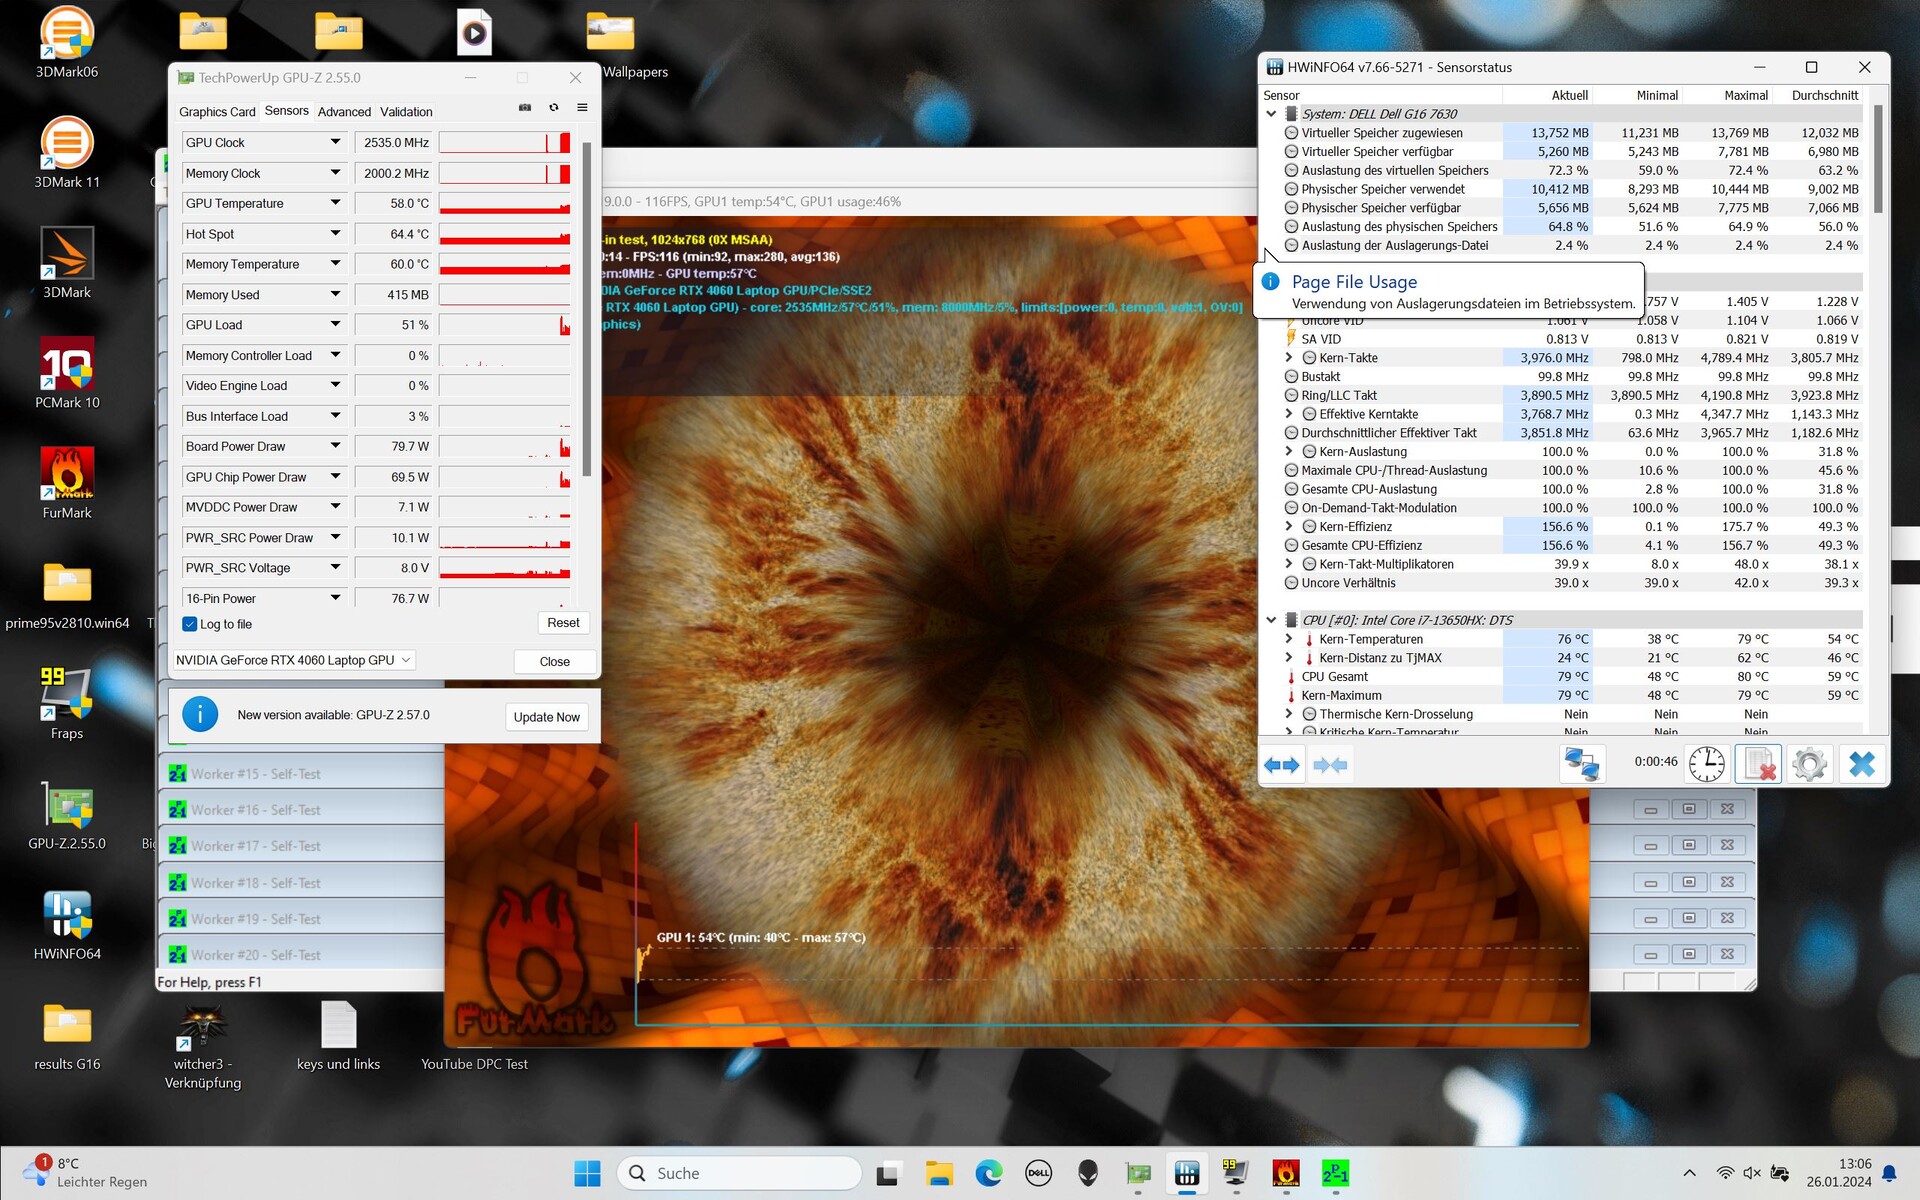
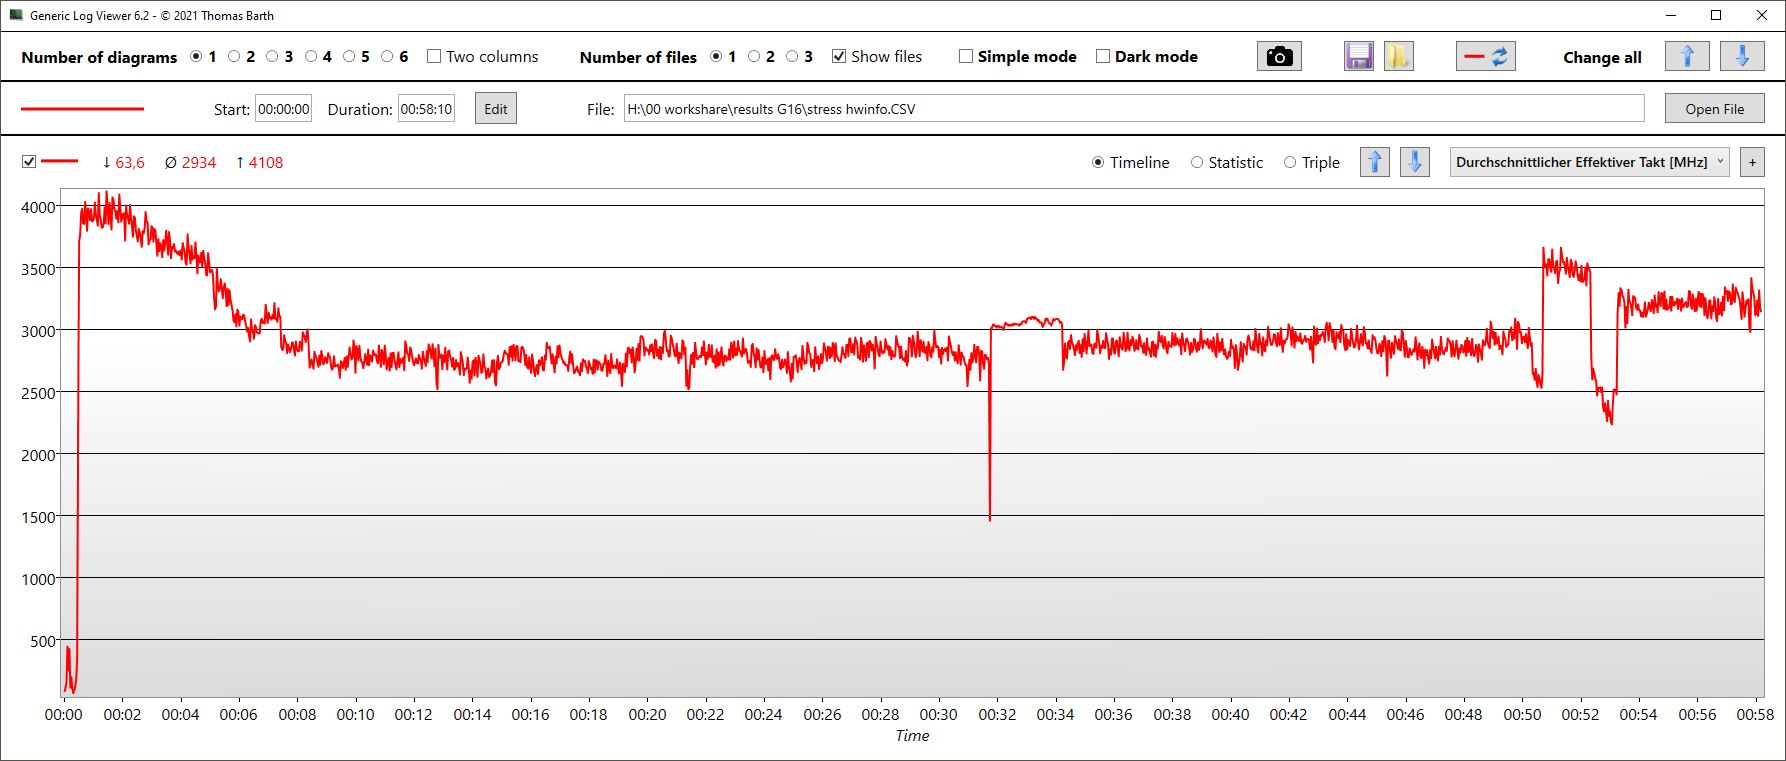
Podczas testu obciążeniowego, taktowanie rdzeni na krótko osiągnęło 4,1 GHz. Niestety spowodowało to nagrzanie się procesora do 100 °C, po czym pobór mocy urządzenia spadł z pierwotnych 128 watów i ustabilizował się na poziomie około 70 watów. Częstotliwość taktowania CPU ustabilizowała się na poziomie około 2,9 GHz, a temperatura na poziomie około 85 °C.
Z kolei częstotliwość taktowania GPU pozostała dość stabilna na poziomie około 2,4 do 2,5 GHz przez cały czas pracy. To samo dotyczy taktowania pamięci (2 GHz). Temperatura chipa ustabilizowała się na poziomie około 72 °C, a średni pobór mocy wyniósł 71 watów.
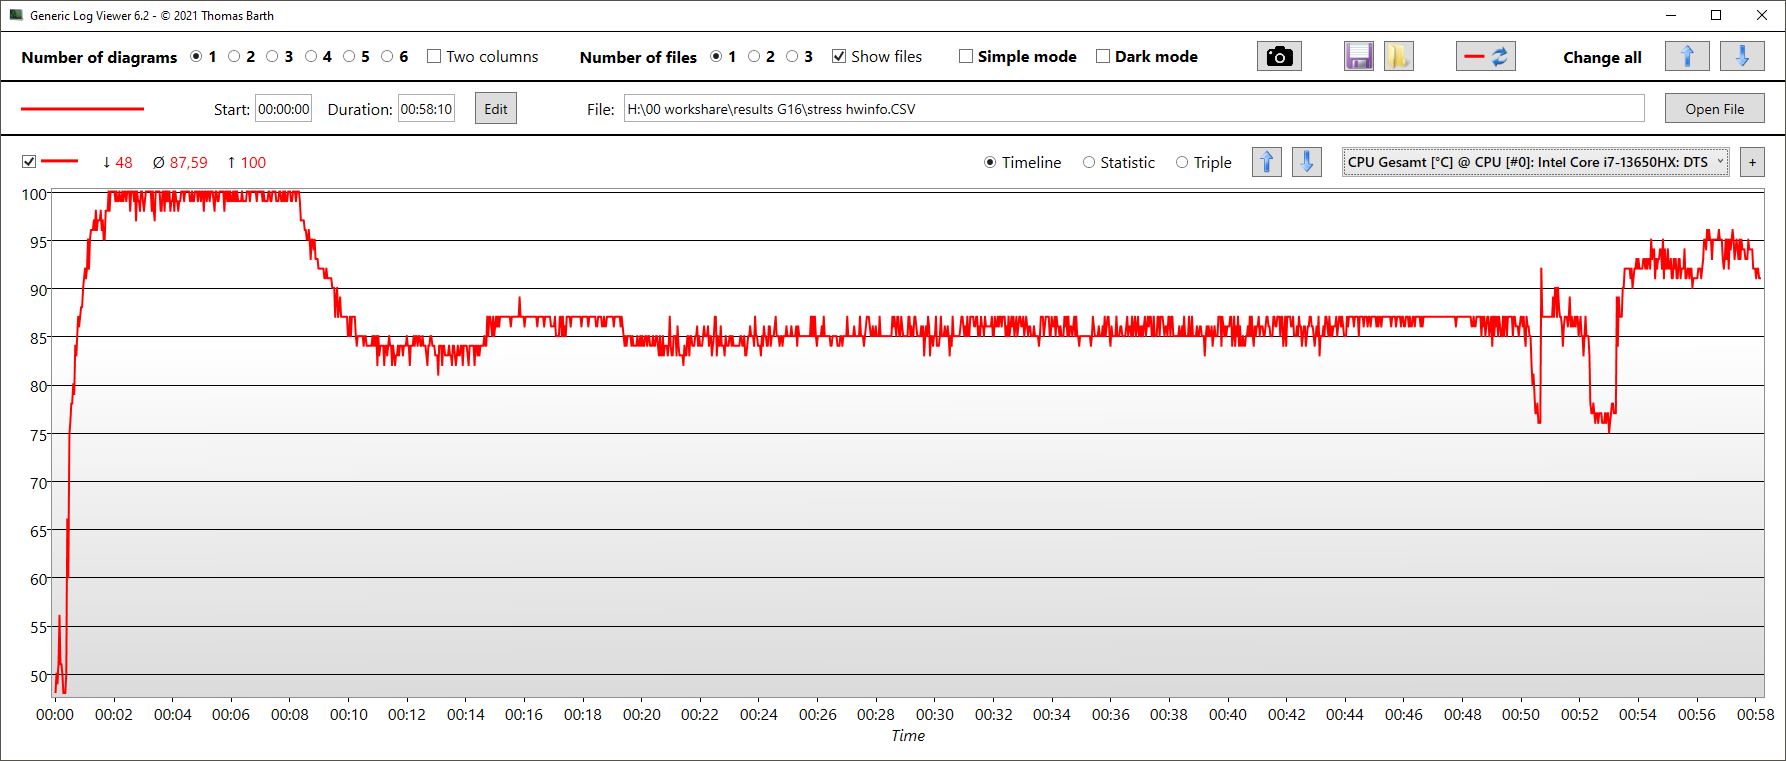
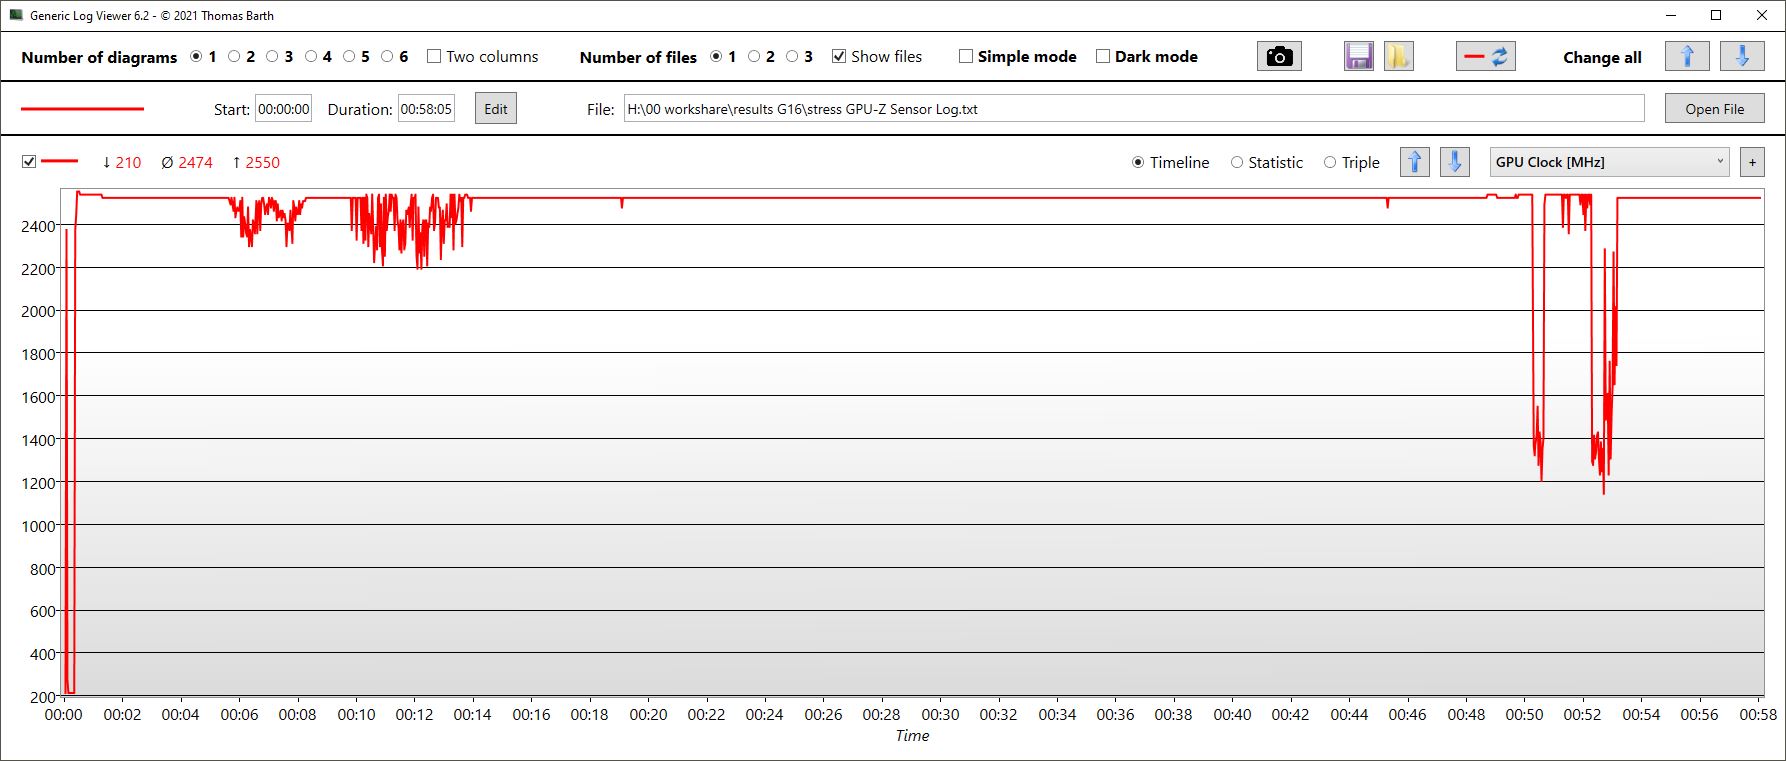
| Taktowanie CPU (GHz) | Taktowanie GPU (MHz) | Średnia temperatura CPU (°C) | Średnia temperatura GPU (°C) | |
| Prime95 + FurMark Stress | 2.9 | 2,490 | 85 | 72 |
| Witcher 3 Obciążenie | 0.538 | 2,500 | 81 | 73 |
Głośniki
Głośniki stereo laptopa nie są najlepsze: Nie ma prawie żadnego basu, są zbyt ciche, a nawet średnie i wysokie tony nie są zbyt zrównoważone ani liniowe. Jako analogowe złącze audio dostępne jest tylko złącze słuchawkowe 3,5 mm.
Dell G16, i7-13650HX, RTX 4060 analiza dźwięku
(±) | głośność głośnika jest średnia, ale dobra (80.55 dB)
Bas 100 - 315 Hz
(-) | prawie brak basu - średnio 25.1% niższa od mediany
(-) | bas nie jest liniowy (18.9% delta do poprzedniej częstotliwości)
Średnie 400 - 2000 Hz
(±) | wyższe średnie - średnio 8% wyższe niż mediana
(+) | średnie są liniowe (5.9% delta do poprzedniej częstotliwości)
Wysokie 2–16 kHz
(+) | zrównoważone maksima - tylko 3.5% od mediany
(±) | liniowość wysokich wartości jest średnia (8.6% delta do poprzedniej częstotliwości)
Ogólnie 100 - 16.000 Hz
(±) | liniowość ogólnego dźwięku jest średnia (23.4% różnicy w stosunku do mediany)
W porównaniu do tej samej klasy
» 85% wszystkich testowanych urządzeń w tej klasie było lepszych, 5% podobnych, 11% gorszych
» Najlepszy miał deltę 6%, średnia wynosiła ###średnia###%, najgorsza wynosiła 132%
W porównaniu do wszystkich testowanych urządzeń
» 70% wszystkich testowanych urządzeń było lepszych, 6% podobnych, 24% gorszych
» Najlepszy miał deltę 4%, średnia wynosiła ###średnia###%, najgorsza wynosiła 134%
Apple MacBook Pro 16 2021 M1 Pro analiza dźwięku
(+) | głośniki mogą odtwarzać stosunkowo głośno (84.7 dB)
Bas 100 - 315 Hz
(+) | dobry bas - tylko 3.8% od mediany
(+) | bas jest liniowy (5.2% delta do poprzedniej częstotliwości)
Średnie 400 - 2000 Hz
(+) | zbalansowane środki średnie - tylko 1.3% od mediany
(+) | średnie są liniowe (2.1% delta do poprzedniej częstotliwości)
Wysokie 2–16 kHz
(+) | zrównoważone maksima - tylko 1.9% od mediany
(+) | wzloty są liniowe (2.7% delta do poprzedniej częstotliwości)
Ogólnie 100 - 16.000 Hz
(+) | ogólny dźwięk jest liniowy (4.6% różnicy w stosunku do mediany)
W porównaniu do tej samej klasy
» 0% wszystkich testowanych urządzeń w tej klasie było lepszych, 0% podobnych, 100% gorszych
» Najlepszy miał deltę 5%, średnia wynosiła ###średnia###%, najgorsza wynosiła 45%
W porównaniu do wszystkich testowanych urządzeń
» 0% wszystkich testowanych urządzeń było lepszych, 0% podobnych, 100% gorszych
» Najlepszy miał deltę 4%, średnia wynosiła ###średnia###%, najgorsza wynosiła 134%
Zarządzanie energią - Dell G16 osiąga przeciętne wyniki w swojej klasie
Zużycie energii
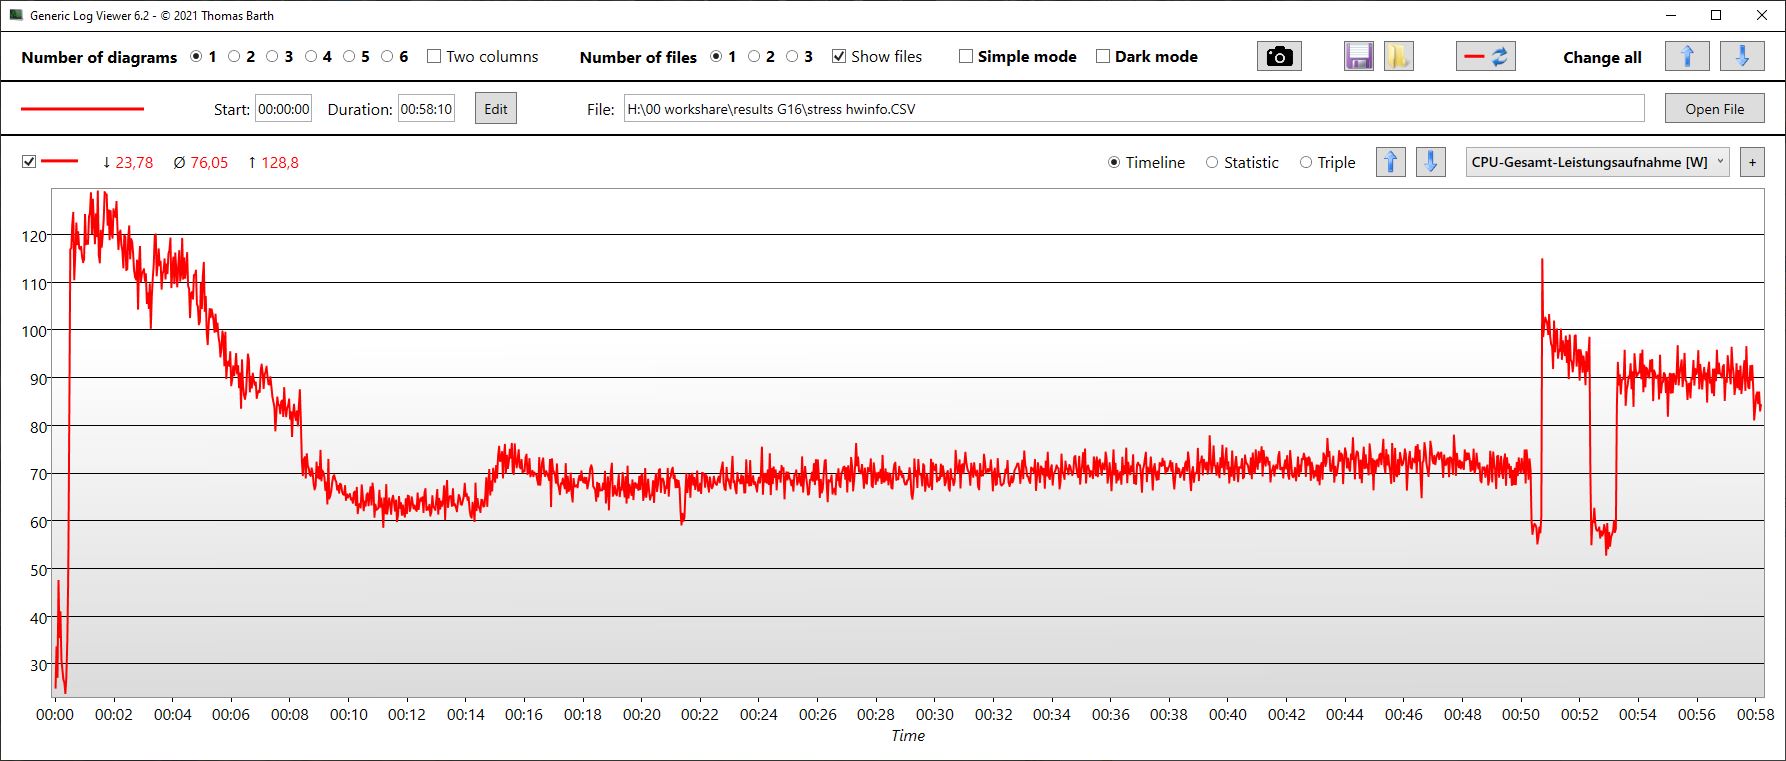
Biorąc pod uwagę wydajność, zużycie energii przez G16 jest więcej niż w porządku. Ogólnie rzecz biorąc, urządzenie stało się nawet bardziej wydajne. Zużywa teraz mniej energii niż jego poprzednik, zwłaszcza w stanie bezczynności. Podczas grania zużywa tylko około 5% więcej przy jednoczesnym wzroście wydajności o około 14%.
Podczas grania, podobnie szybkie Alienware i MSI Raider zużywają prawie tyle samo, a mianowicie średnio 185 watów podczas grania w The Witcher 3. Jego krótkoterminowe maksymalne zużycie wynosi 255 watów.
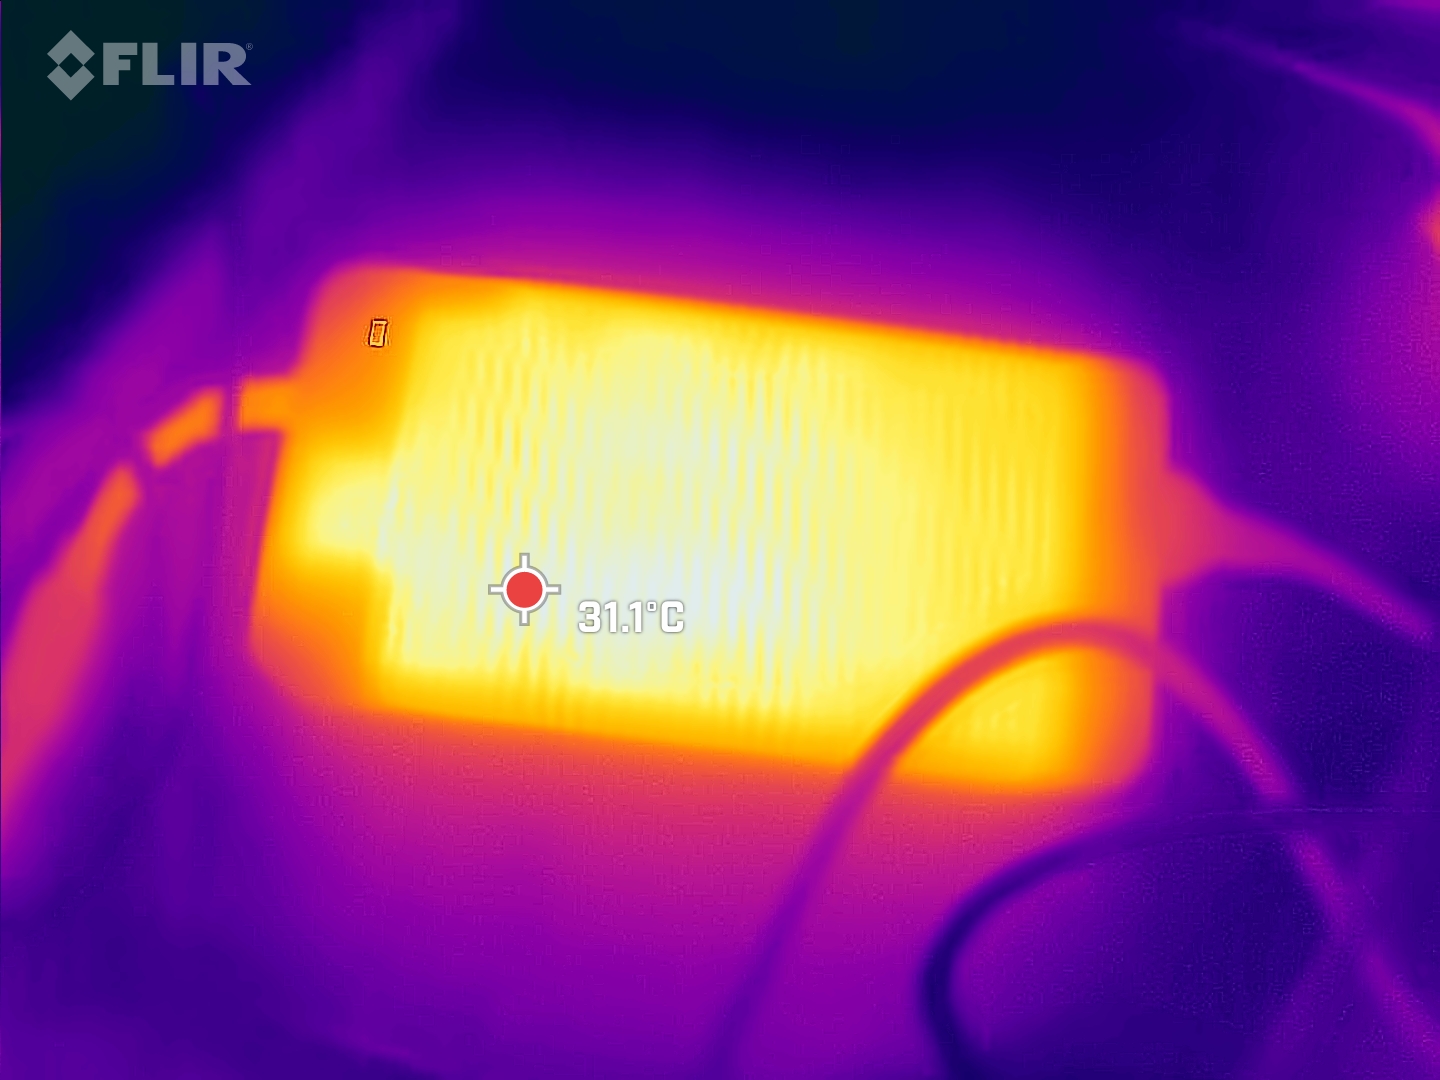
Mając to na uwadze, bardzo zaskakujące jest to, że Dell dołączył ogromny, niezgrabny i ciężki 330-watowy zasilacz do G16 z RTX 4060. Jest on całkowicie przewymiarowany dla zainstalowanego sprzętu. Przypuszczalnie Dell po prostu dostarcza ten sam zasilacz ze wszystkimi konfiguracjami, aby był również wyposażony w i9-13900HX i RTX 4070. Mniejszy, lżejszy zasilacz byłby wygodniejszy dla klientów kupujących ten model.
| wyłączony / stan wstrzymania | |
| luz | |
| obciążenie |
|
Legenda:
min: | |
| Dell G16, i7-13650HX, RTX 4060 i7-13650HX, GeForce RTX 4060 Laptop GPU, WD PC SN740 SDDPNQD-1T00, IPS, 2560x1600, 16" | Dell G16 7620 i7-12700H, GeForce RTX 3060 Laptop GPU, WDC PC SN810 512GB, IPS, 2560x1600, 16" | MSI Raider GE68HX 13VF i9-13950HX, GeForce RTX 4060 Laptop GPU, Samsung PM9B1 1024GB MZVL41T0HBLB, IPS, 1900x1200, 16" | Lenovo Legion Slim 5 16APH8 R7 7840HS, GeForce RTX 4060 Laptop GPU, SK hynix PC801 HFS512GEJ9X115N, IPS, 2560x1600, 16" | Alienware m16 R1 Intel i7-13700HX, GeForce RTX 4060 Laptop GPU, Kioxia KXG70ZNV512G, IPS, 2560x1600, 16" | Lenovo LOQ 16IRH8 i7-13620H, GeForce RTX 4060 Laptop GPU, Solidigm SSDPFINW512GZL, IPS, 2560x1600, 16" | Przeciętny NVIDIA GeForce RTX 4060 Laptop GPU | Średnia w klasie Gaming | |
|---|---|---|---|---|---|---|---|---|
| Power Consumption | -21% | -32% | 9% | -9% | -12% | -1% | -19% | |
| Idle Minimum * (Watt) | 11 | 14.4 -31% | 15.8 -44% | 9.4 15% | 10 9% | 17.2 -56% | 11.5 ? -5% | 13 ? -18% |
| Idle Average * (Watt) | 14.8 | 17.8 -20% | 19.4 -31% | 15.5 -5% | 14 5% | 19.3 -30% | 16 ? -8% | 18.7 ? -26% |
| Idle Maximum * (Watt) | 16.8 | 31.5 -88% | 27.3 -63% | 24.4 -45% | 21 -25% | 21.2 -26% | 20.3 ? -21% | 24.3 ? -45% |
| Load Average * (Watt) | 103.7 | 101.2 2% | 114.7 -11% | 74.1 29% | 119 -15% | 90 13% | 92.9 ? 10% | 108.2 ? -4% |
| Witcher 3 ultra * (Watt) | 185 | 176.9 4% | 185.5 -0% | 112.9 39% | 186.7 -1% | 168 9% | ||
| Load Maximum * (Watt) | 255 | 242.9 5% | 364.2 -43% | 206.5 19% | 323 -27% | 211 17% | 210 ? 18% | 254 ? -0% |
* ... im mniej tym lepiej
Power consumption Witcher 3 / stress test
Power consumption with external monitor
Czas trwania
Dell zainstalował w laptopie baterię o pojemności 86 Wh. Konkurencja jest podobnie wyposażona. To wystarczy, by G16 osiągał czasy pracy od około 5,5 godziny (maksymalna jasność) do prawie 6,5 godziny (150 nitów) podczas surfowania po sieci lub oglądania filmów. To sprawia, że Dell Gamer jest mniej więcej średniej klasy.
| Dell G16, i7-13650HX, RTX 4060 i7-13650HX, GeForce RTX 4060 Laptop GPU, 86 Wh | Dell G16 7620 i7-12700H, GeForce RTX 3060 Laptop GPU, 84 Wh | MSI Raider GE68HX 13VF i9-13950HX, GeForce RTX 4060 Laptop GPU, 99.9 Wh | Lenovo Legion Slim 5 16APH8 R7 7840HS, GeForce RTX 4060 Laptop GPU, 80 Wh | Alienware m16 R1 Intel i7-13700HX, GeForce RTX 4060 Laptop GPU, 86 Wh | Lenovo LOQ 16IRH8 i7-13620H, GeForce RTX 4060 Laptop GPU, 80 Wh | Średnia w klasie Gaming | |
|---|---|---|---|---|---|---|---|
| Czasy pracy | -34% | 23% | 3% | -20% | 5% | 22% | |
| H.264 (h) | 6.4 | 5.6 -13% | 6.4 0% | 8.9 ? 39% | |||
| WiFi v1.3 (h) | 6.3 | 5 -21% | 6.8 8% | 7.1 13% | 4.8 -24% | 6.3 0% | 7 ? 11% |
| Load (h) | 1.3 | 0.7 -46% | 1.8 38% | 1.2 -8% | 1 -23% | 1.5 15% | 1.51 ? 16% |
| Reader / Idle (h) | 7.1 | 8.8 | 11.7 | 6.4 | 8.71 ? |
Za
Przeciw
Werdykt - przystępna cenowo alternatywa dla Alienware z kilkoma drobnymi wadami
Dell G16 7630 wydaje się nieco bardziej elegancki i przystępny cenowo niż seria Alienware firmy Dell. Jego wydajność jest nadal dobra, a jednym z bardzo pozytywnych aspektów jest to, jak cichy pozostaje gracz podczas grania w gry w porównaniu do wielu konkurentów.
Dell poczynił pewne oszczędności, jeśli chodzi o kamerę internetową i budowę, co jest najprawdopodobniej znośne dla klientów o napiętym budżecie, ale czasami irytujące: Przykłady obejmują złącze zasilania laptopa, które wysuwa się kawałek po kawałku, gdy urządzenie się porusza, jego nieporęczny i ciężki zasilacz lub fakt, że tylko wersja z procesorem i9-13900HX i RTX 4070 obsługuje Thunderbolt. Nasza próbka testowa z procesorem i7-13650H i RTX 4060i RTX 4060, z drugiej strony, nie obsługuje, a ten ostatni nie jest tak przejrzysty dla klientów, jak dwa różne typy wyświetlaczy, które są wymienione tylko w instrukcji i różnią się jedynie przestrzeniami kolorów i częstotliwościami odświeżania.
Dell G16 7630 to dość duży i ciężki laptop do gier średniej klasy, który korzysta z dobrej wydajności i cichej pracy. Jeśli chodzi o łączność i konstrukcję, Dell mógłby być bardziej hojny.
Jeśli lubią Państwo jeszcze bardziej eleganckie i wydajne urządzenia, to warto przyjrzeć się nieco słabszemu modelowi Dell Inspiron 16 Plus 7630. Kolejną alternatywą może być Lenovo Legion Slim 5 a jeśli nie dysponują Państwo tak ograniczonym budżetem, model Legion Pro 5 16.
Cena i dostępność
Dell G16 7630 jest obecnie oferowany na Amazon za 1 401,84 USD. Ta wersja jest wyposażona w procesor Intel Core i9-13900HX, kartę graficzną RTX 4070, 16 GB pamięci RAM i dysk SSD o pojemności 1 TB.
Dell G16, i7-13650HX, RTX 4060
- 13/02/2024 v7 (old)
Christian Hintze
Przezroczystość
Wyboru urządzeń do recenzji dokonuje nasza redakcja. Próbka testowa została udostępniona autorowi jako pożyczka od producenta lub sprzedawcy detalicznego na potrzeby tej recenzji. Pożyczkodawca nie miał wpływu na tę recenzję, producent nie otrzymał też kopii tej recenzji przed publikacją. Nie było obowiązku publikowania tej recenzji. Jako niezależna firma medialna, Notebookcheck nie podlega władzy producentów, sprzedawców detalicznych ani wydawców.
Tak testuje Notebookcheck
Każdego roku Notebookcheck niezależnie sprawdza setki laptopów i smartfonów, stosując standardowe procedury, aby zapewnić porównywalność wszystkich wyników. Od około 20 lat stale rozwijamy nasze metody badawcze, ustanawiając przy tym standardy branżowe. W naszych laboratoriach testowych doświadczeni technicy i redaktorzy korzystają z wysokiej jakości sprzętu pomiarowego. Testy te obejmują wieloetapowy proces walidacji. Nasz kompleksowy system ocen opiera się na setkach uzasadnionych pomiarów i benchmarków, co pozwala zachować obiektywizm.Price comparison

