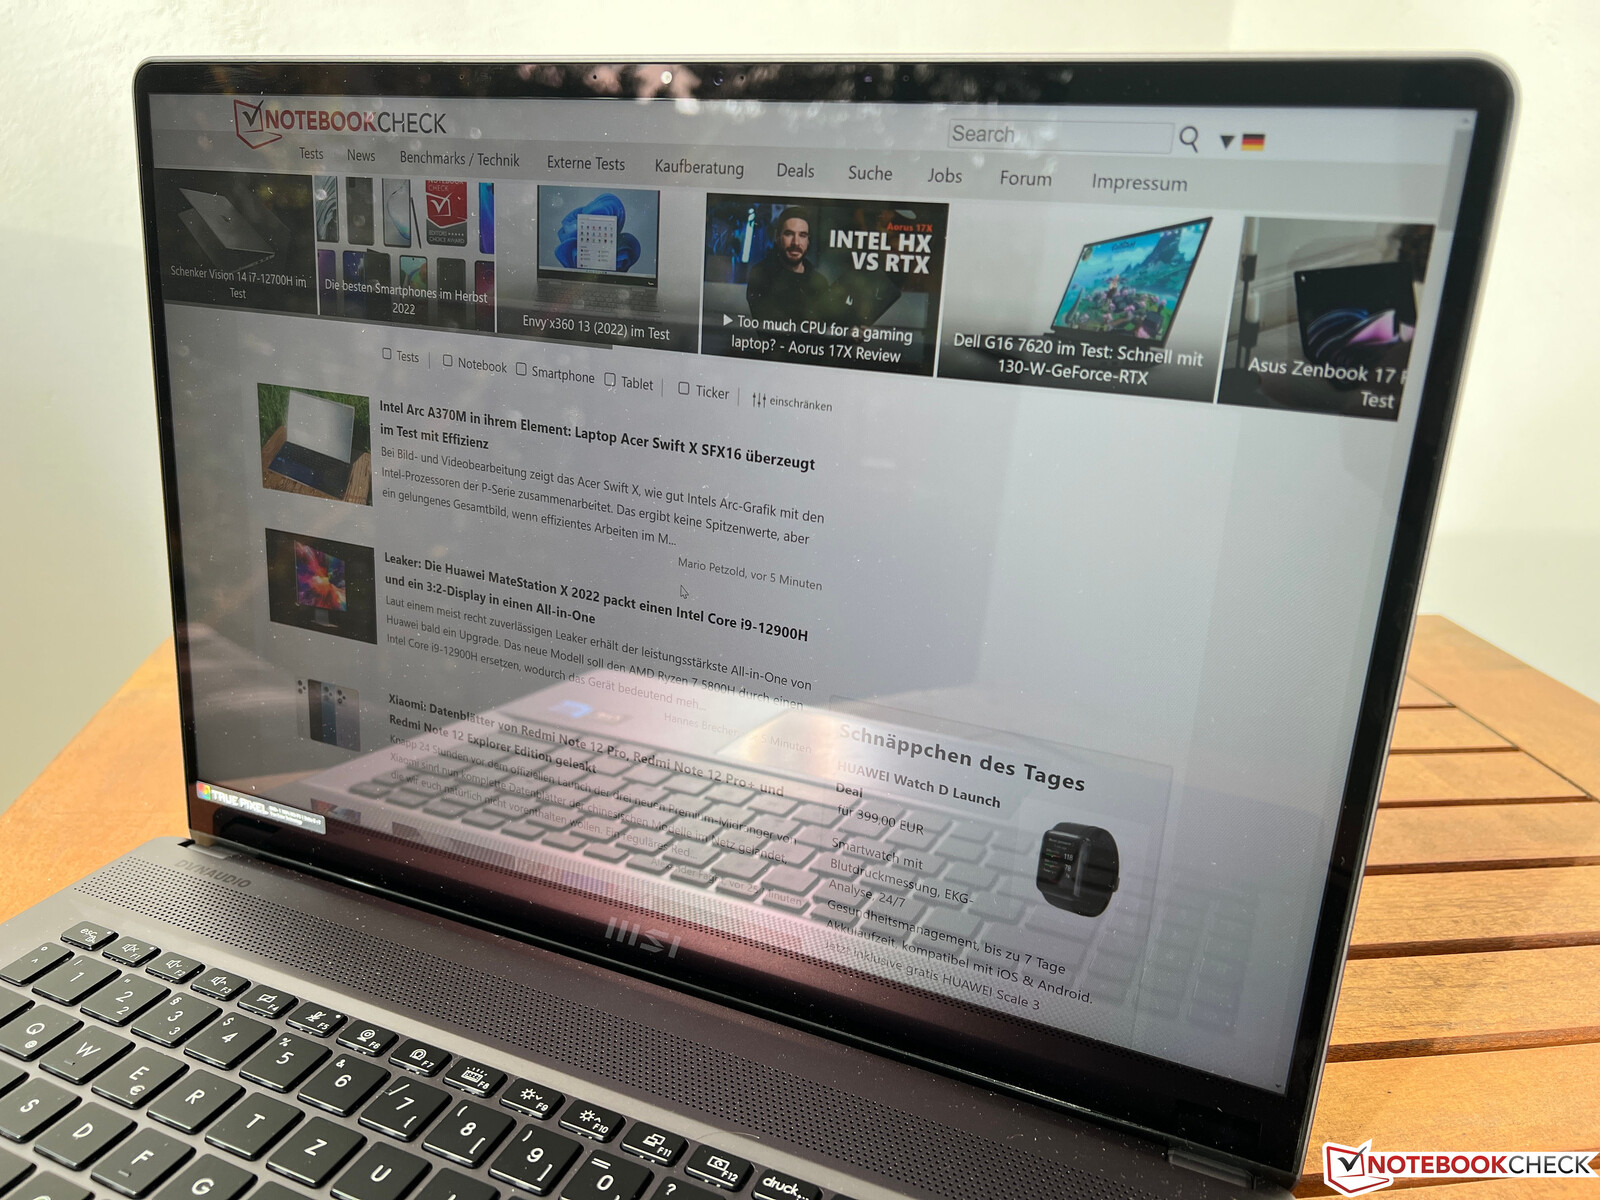
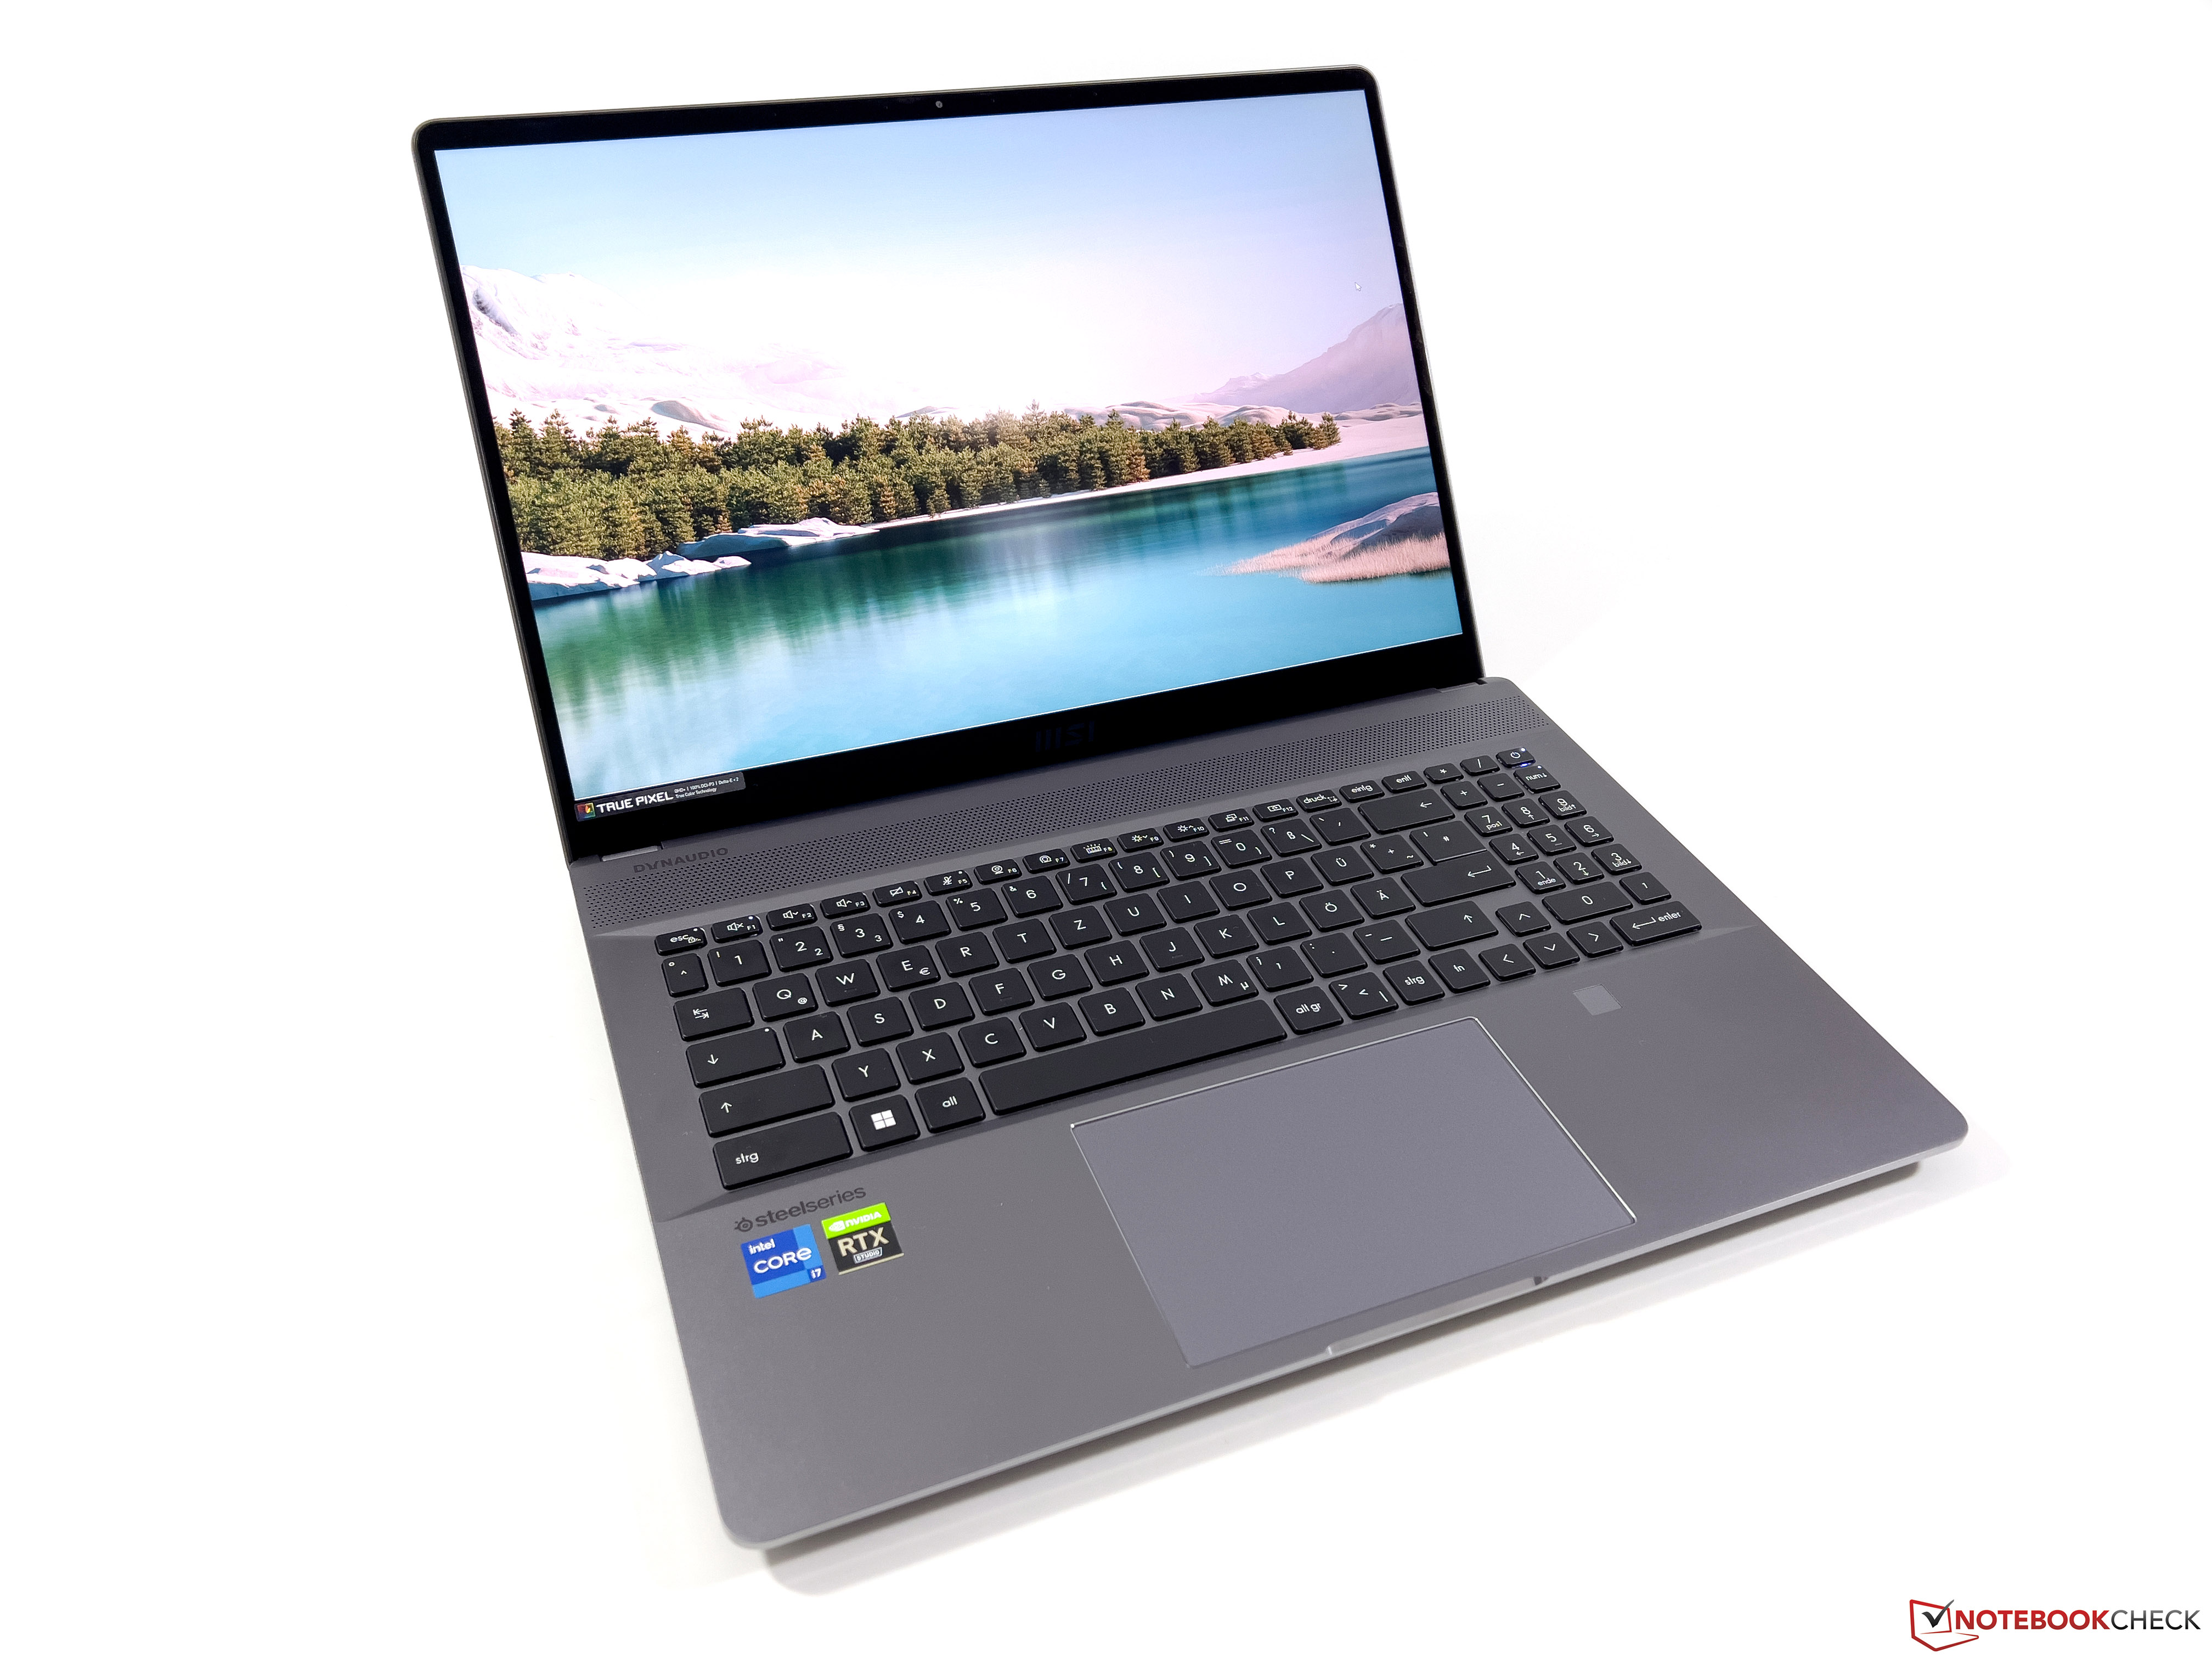
Recenzja laptopa MSI CreatorPro Z16P - mobilna stacja robocza z problemami z temperaturą
Testowaliśmy już m.in.Creator Z16P od MSIobszernie, który jest smukłym 16-calowym laptopem dla twórców treści. Producent oferuje jednak urządzenie także z profesjonalnymi układami graficznymi od Nvidii używając nazwy "CreatorPro Z16P", które dziś badamy. Testujemy konfigurację oznaczoną jako "B12UKST-078" za 3499 euro (~3 620 dolarów), która łączy w sobie m.in Intel Core i7-12700HzNvidia RTX A3000. Do tego dochodzi 32 GB pamięci RAM i duży, 1-TB dysk SSD, a także 16-calowy wyświetlacz IPS o rozdzielczości WQHD i częstotliwości odświeżania 165 Hz. W tym teście skupiamy się głównie na wydajności. Szczegółowe informacje na temat obudowy, wyposażenia, urządzeń wejściowych i głośników znajdziecie w naszym teście Creatora Z16P:
Potencjalni konkurenci w porównaniu
Ocena | Data | Model | Waga | Wysokość | Rozmiar | Rezolucja | Cena |
|---|---|---|---|---|---|---|---|
| 84.3 % v7 (old) | 11/2022 | MSI CreatorPro Z16P B12UKST i7-12700H, RTX A3000 Laptop GPU | 2.4 kg | 19 mm | 16.00" | 2560x1600 | |
| 90.1 % v7 (old) | 11/2022 | HP ZBook Studio 16 G9 62U04EA i7-12800H, RTX A2000 Laptop GPU | 1.8 kg | 19 mm | 16.00" | 3840x2400 | |
| 89.8 % v7 (old) | Lenovo ThinkPad P1 G4-20Y4S0KS00 i7-11850H, GeForce RTX 3070 Laptop GPU | 2 kg | 17.7 mm | 16.00" | 3840x2400 | ||
| 88.3 % v7 (old) | Dell Precision 5000 5560 i7-11850H, RTX A2000 Laptop GPU | 2 kg | 18 mm | 15.60" | 3840x2400 | ||
| 83.7 % v7 (old) | MSI Creator Z16P B12UHST i9-12900H, GeForce RTX 3080 Ti Laptop GPU | 2.4 kg | 20.4 mm | 16.00" | 2560x1600 |
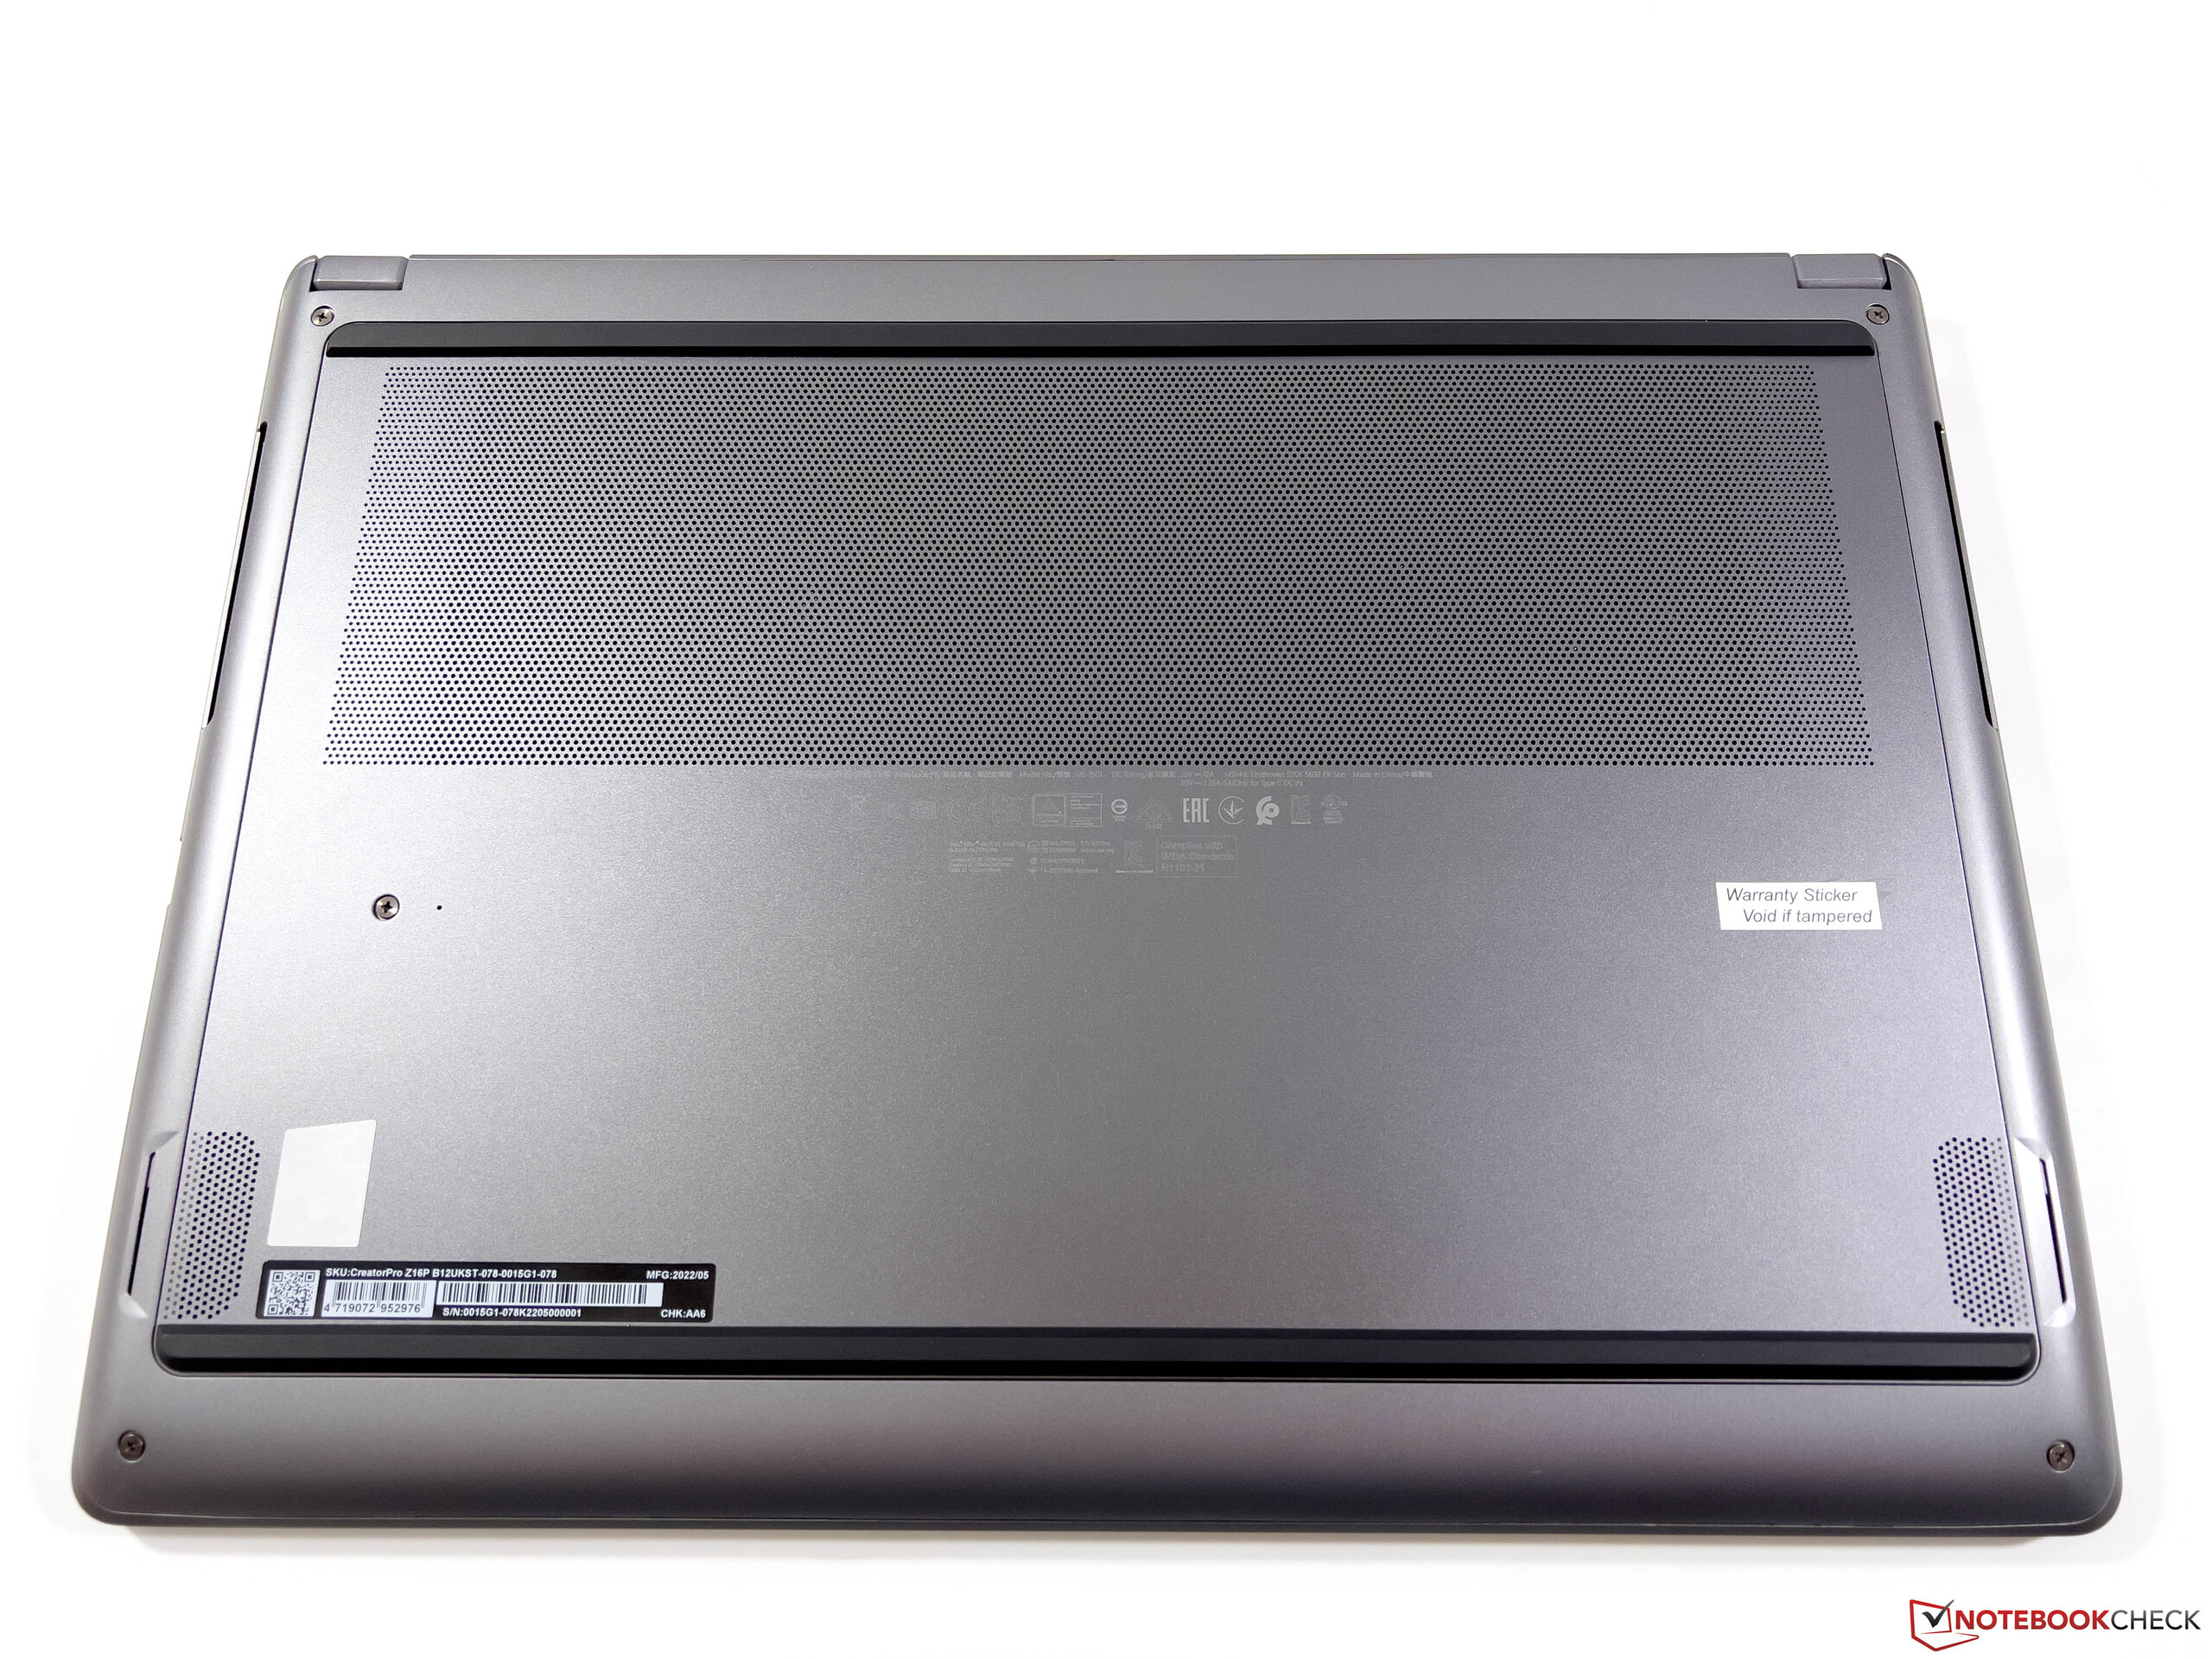
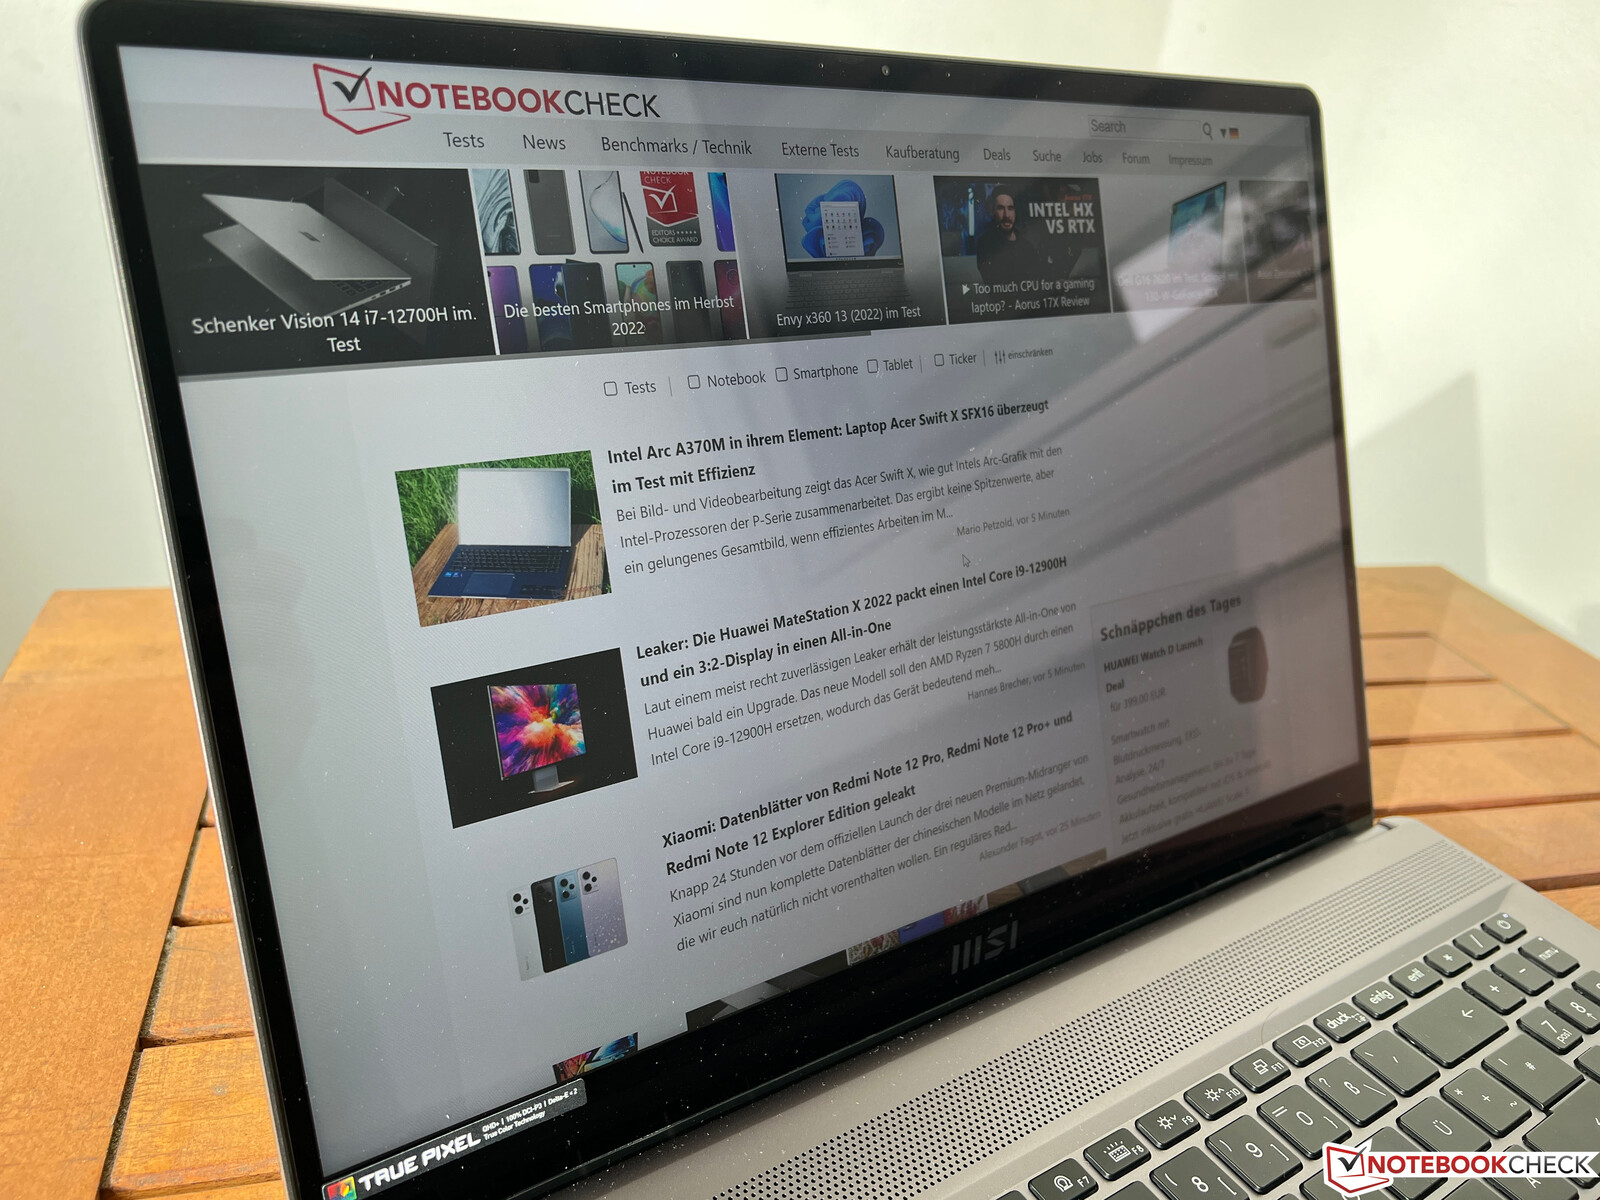
Obudowa, sprzęt i urządzenia wejściowe
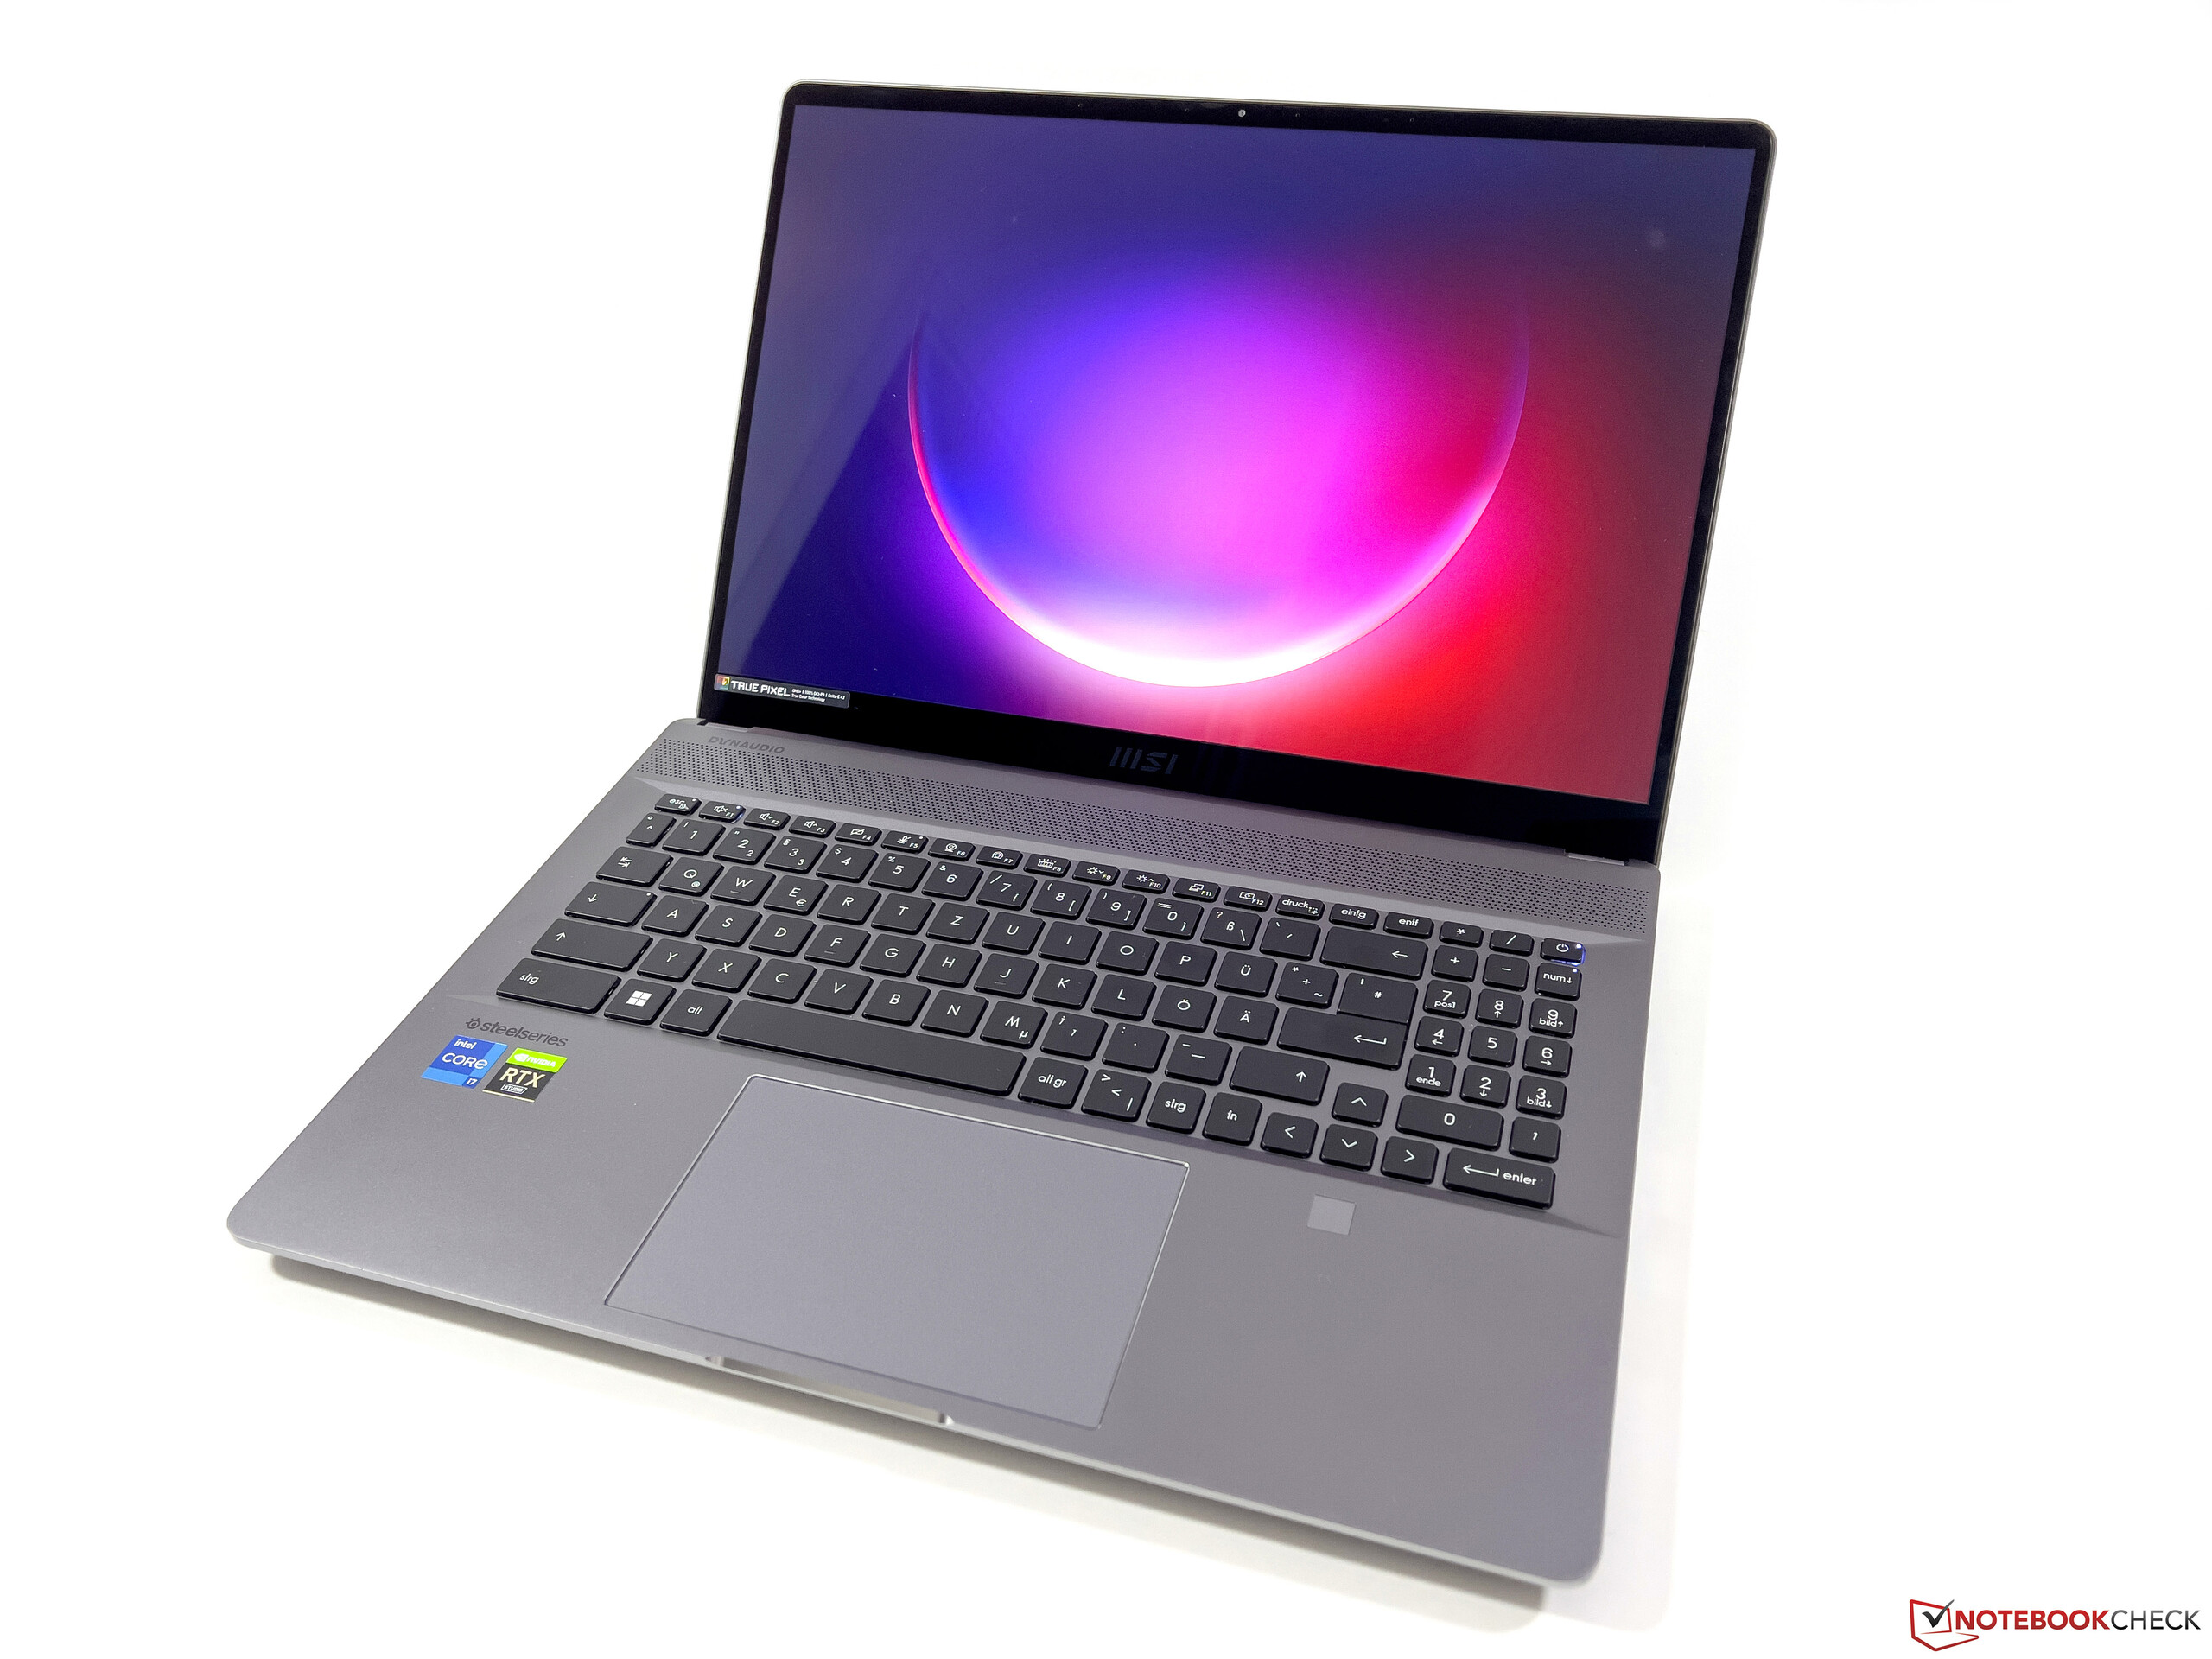
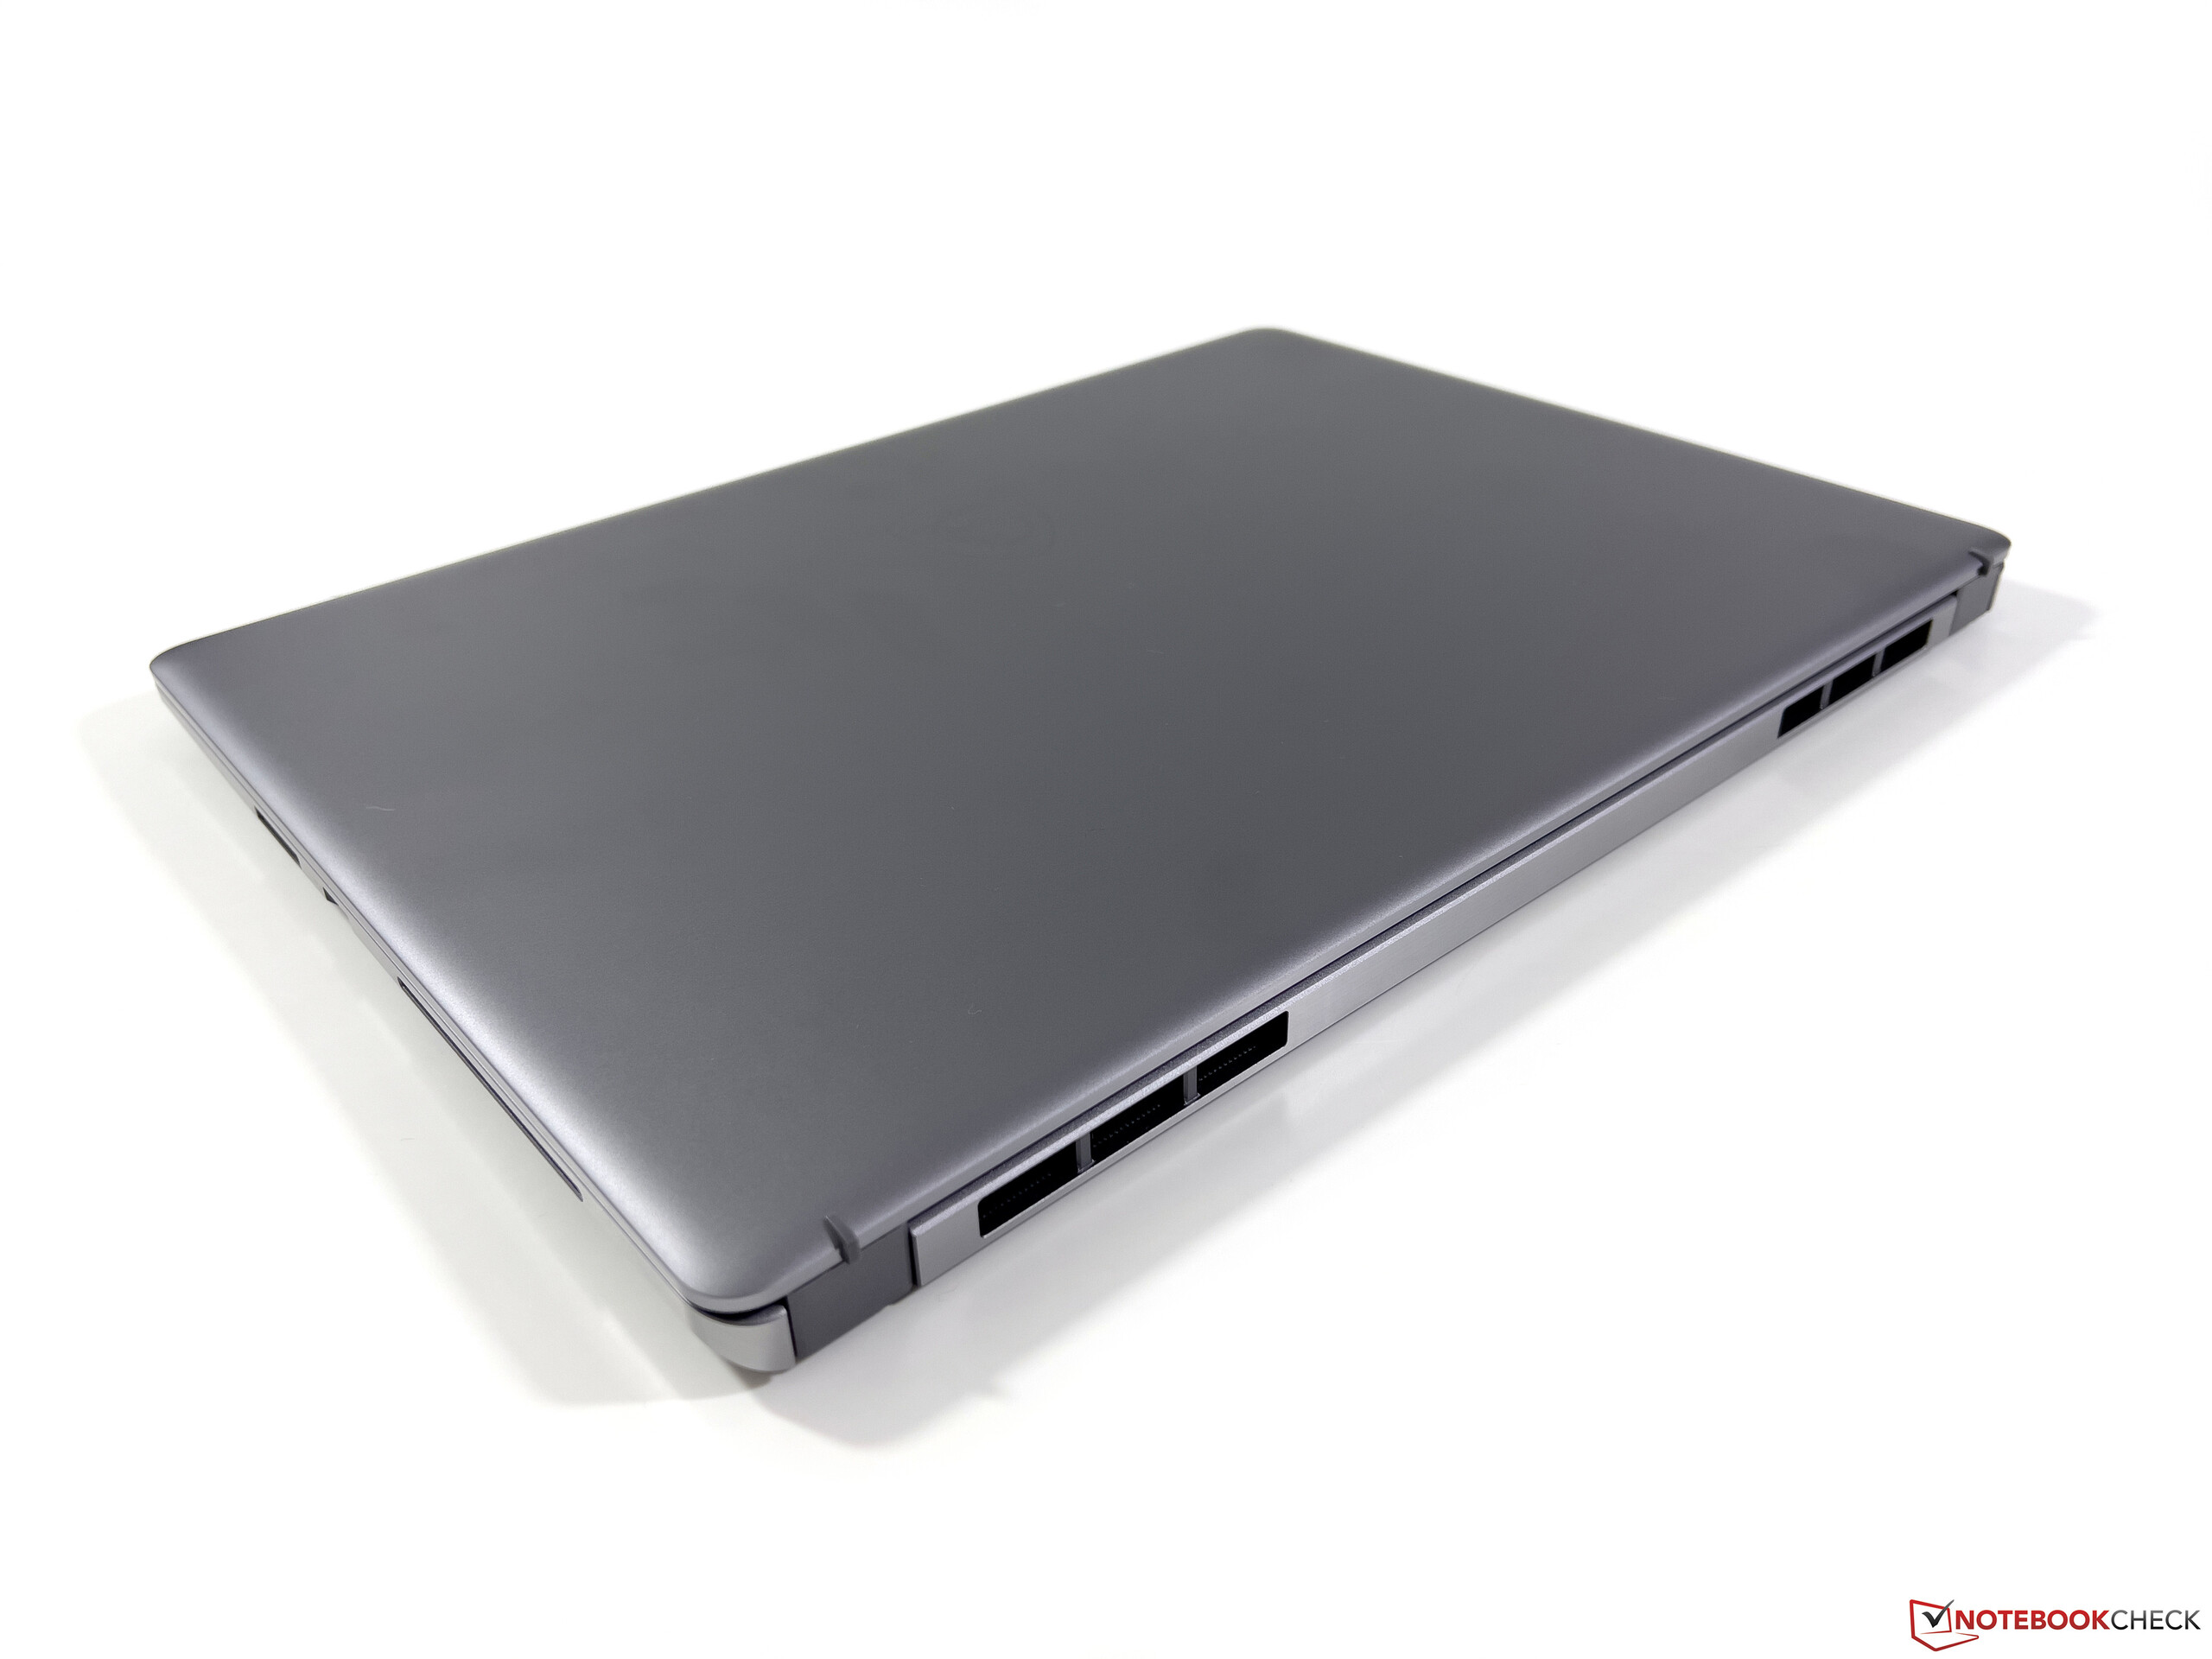
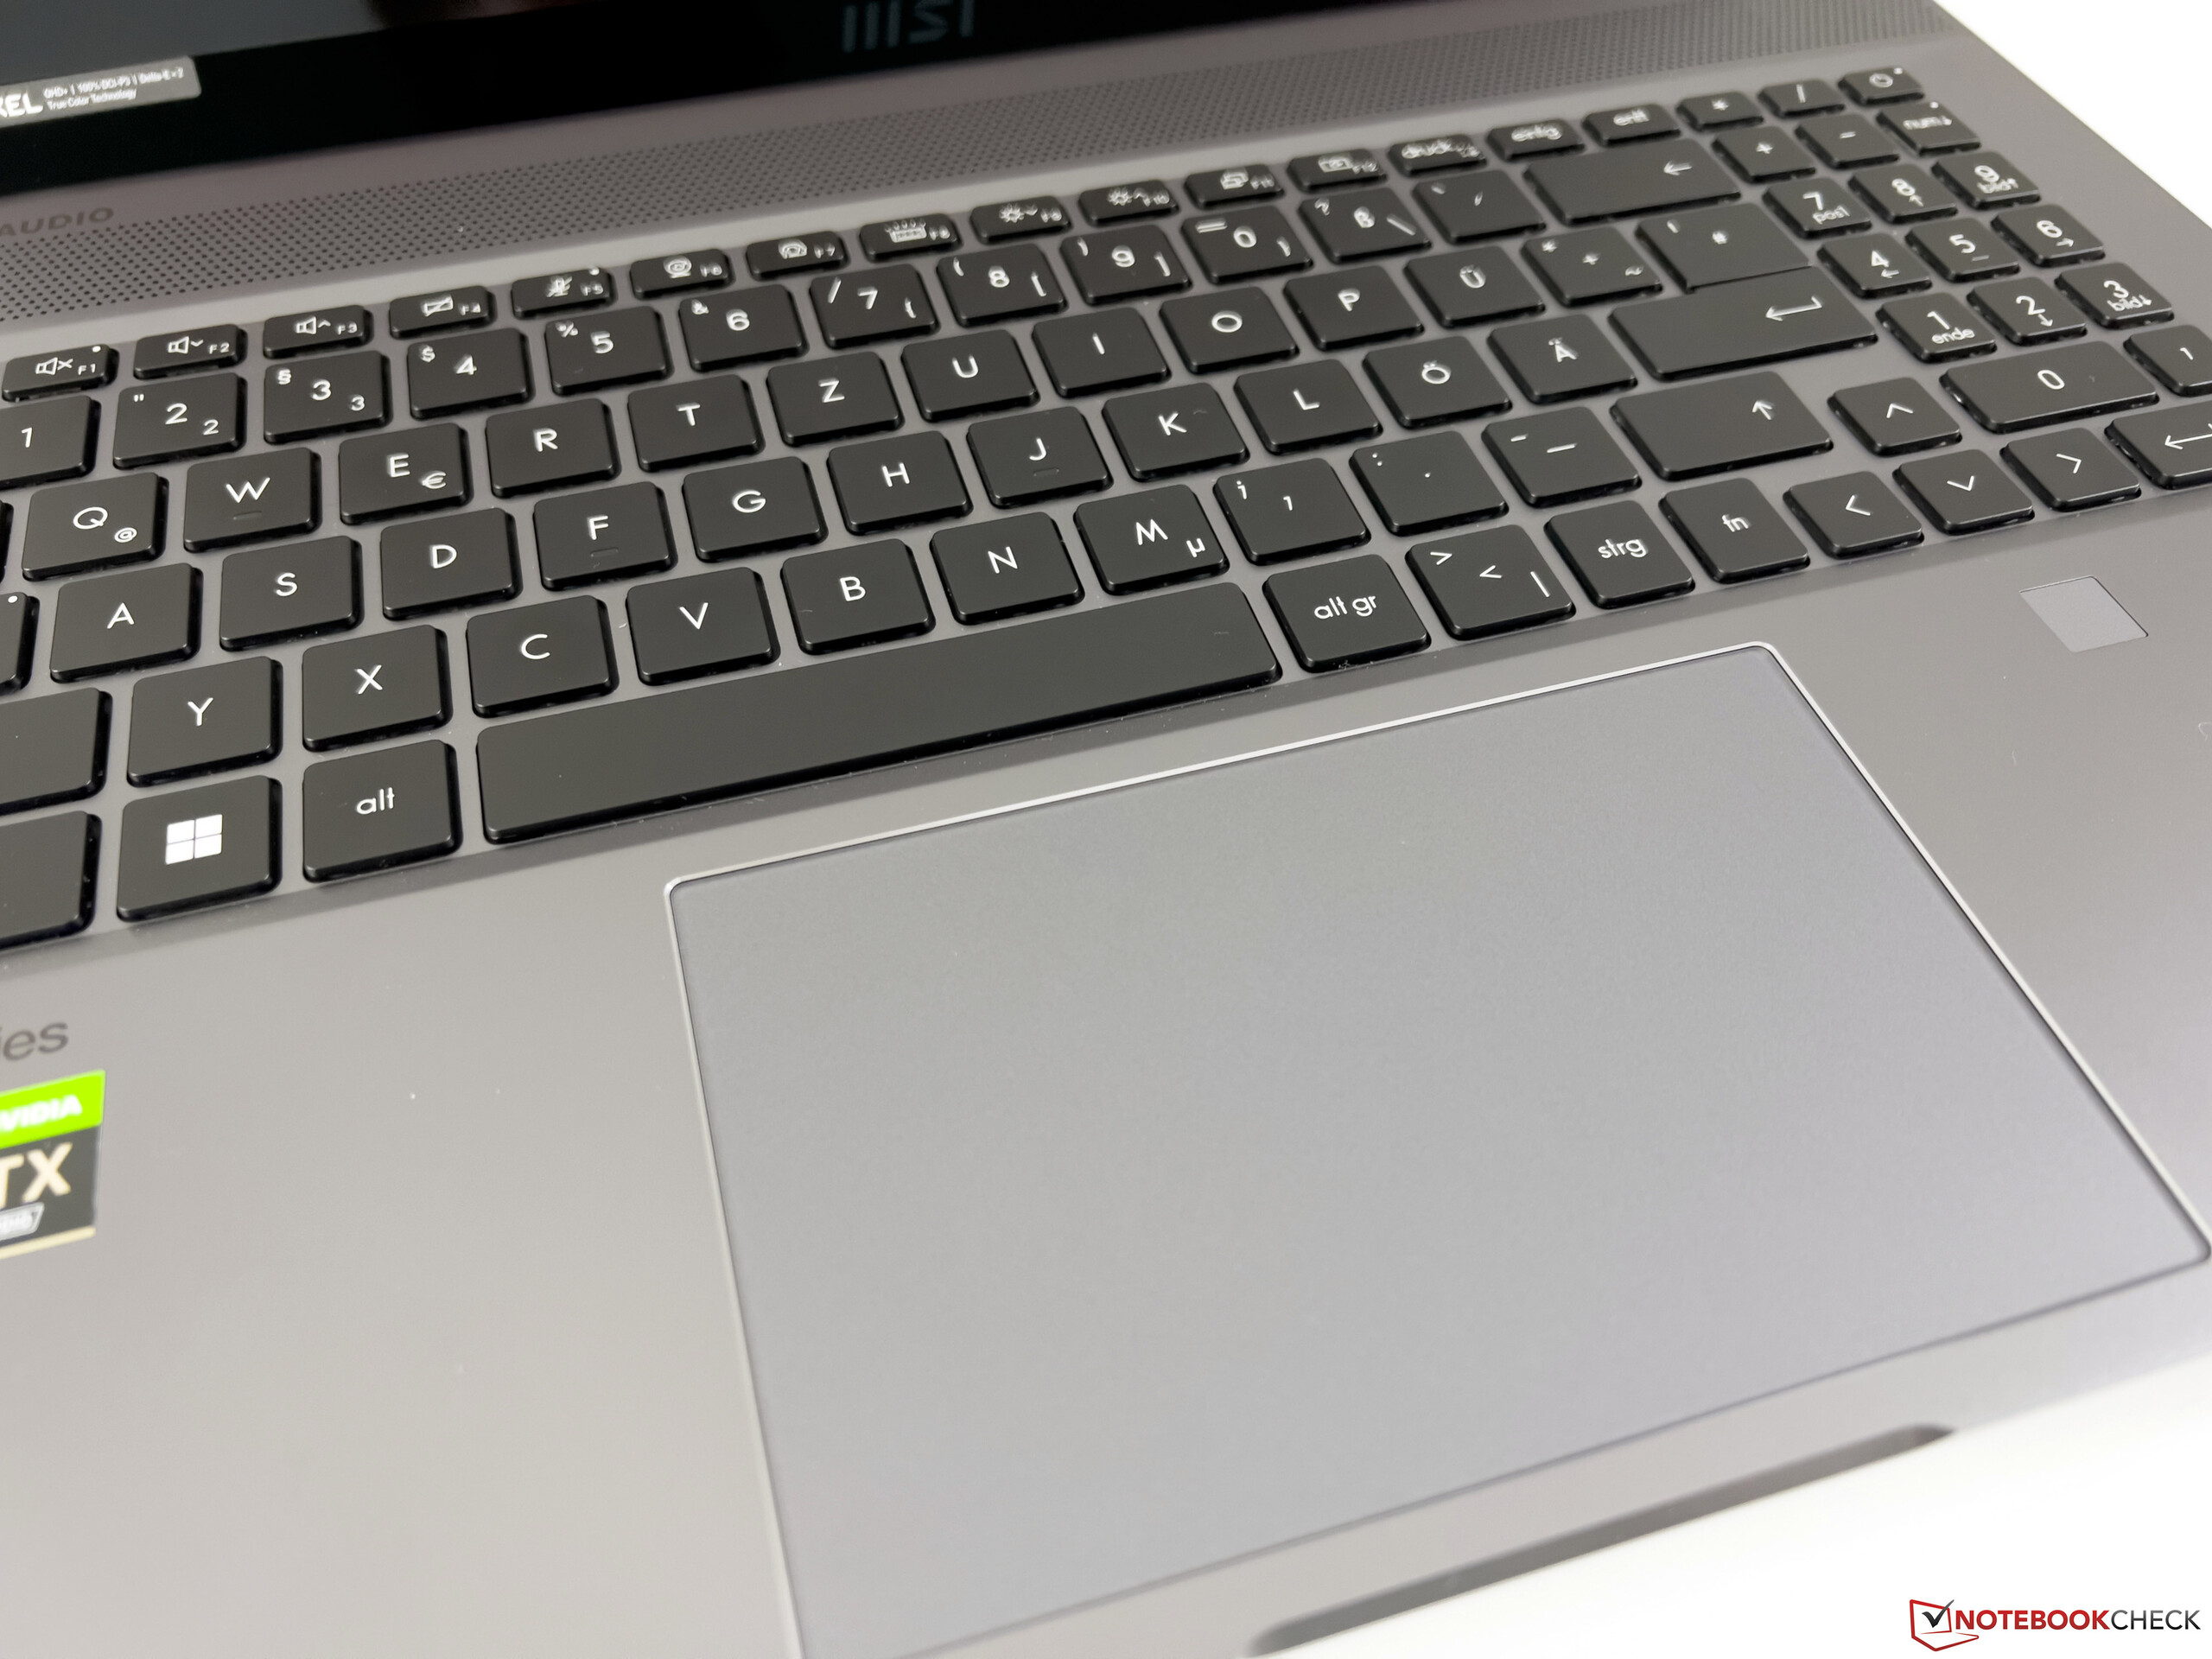
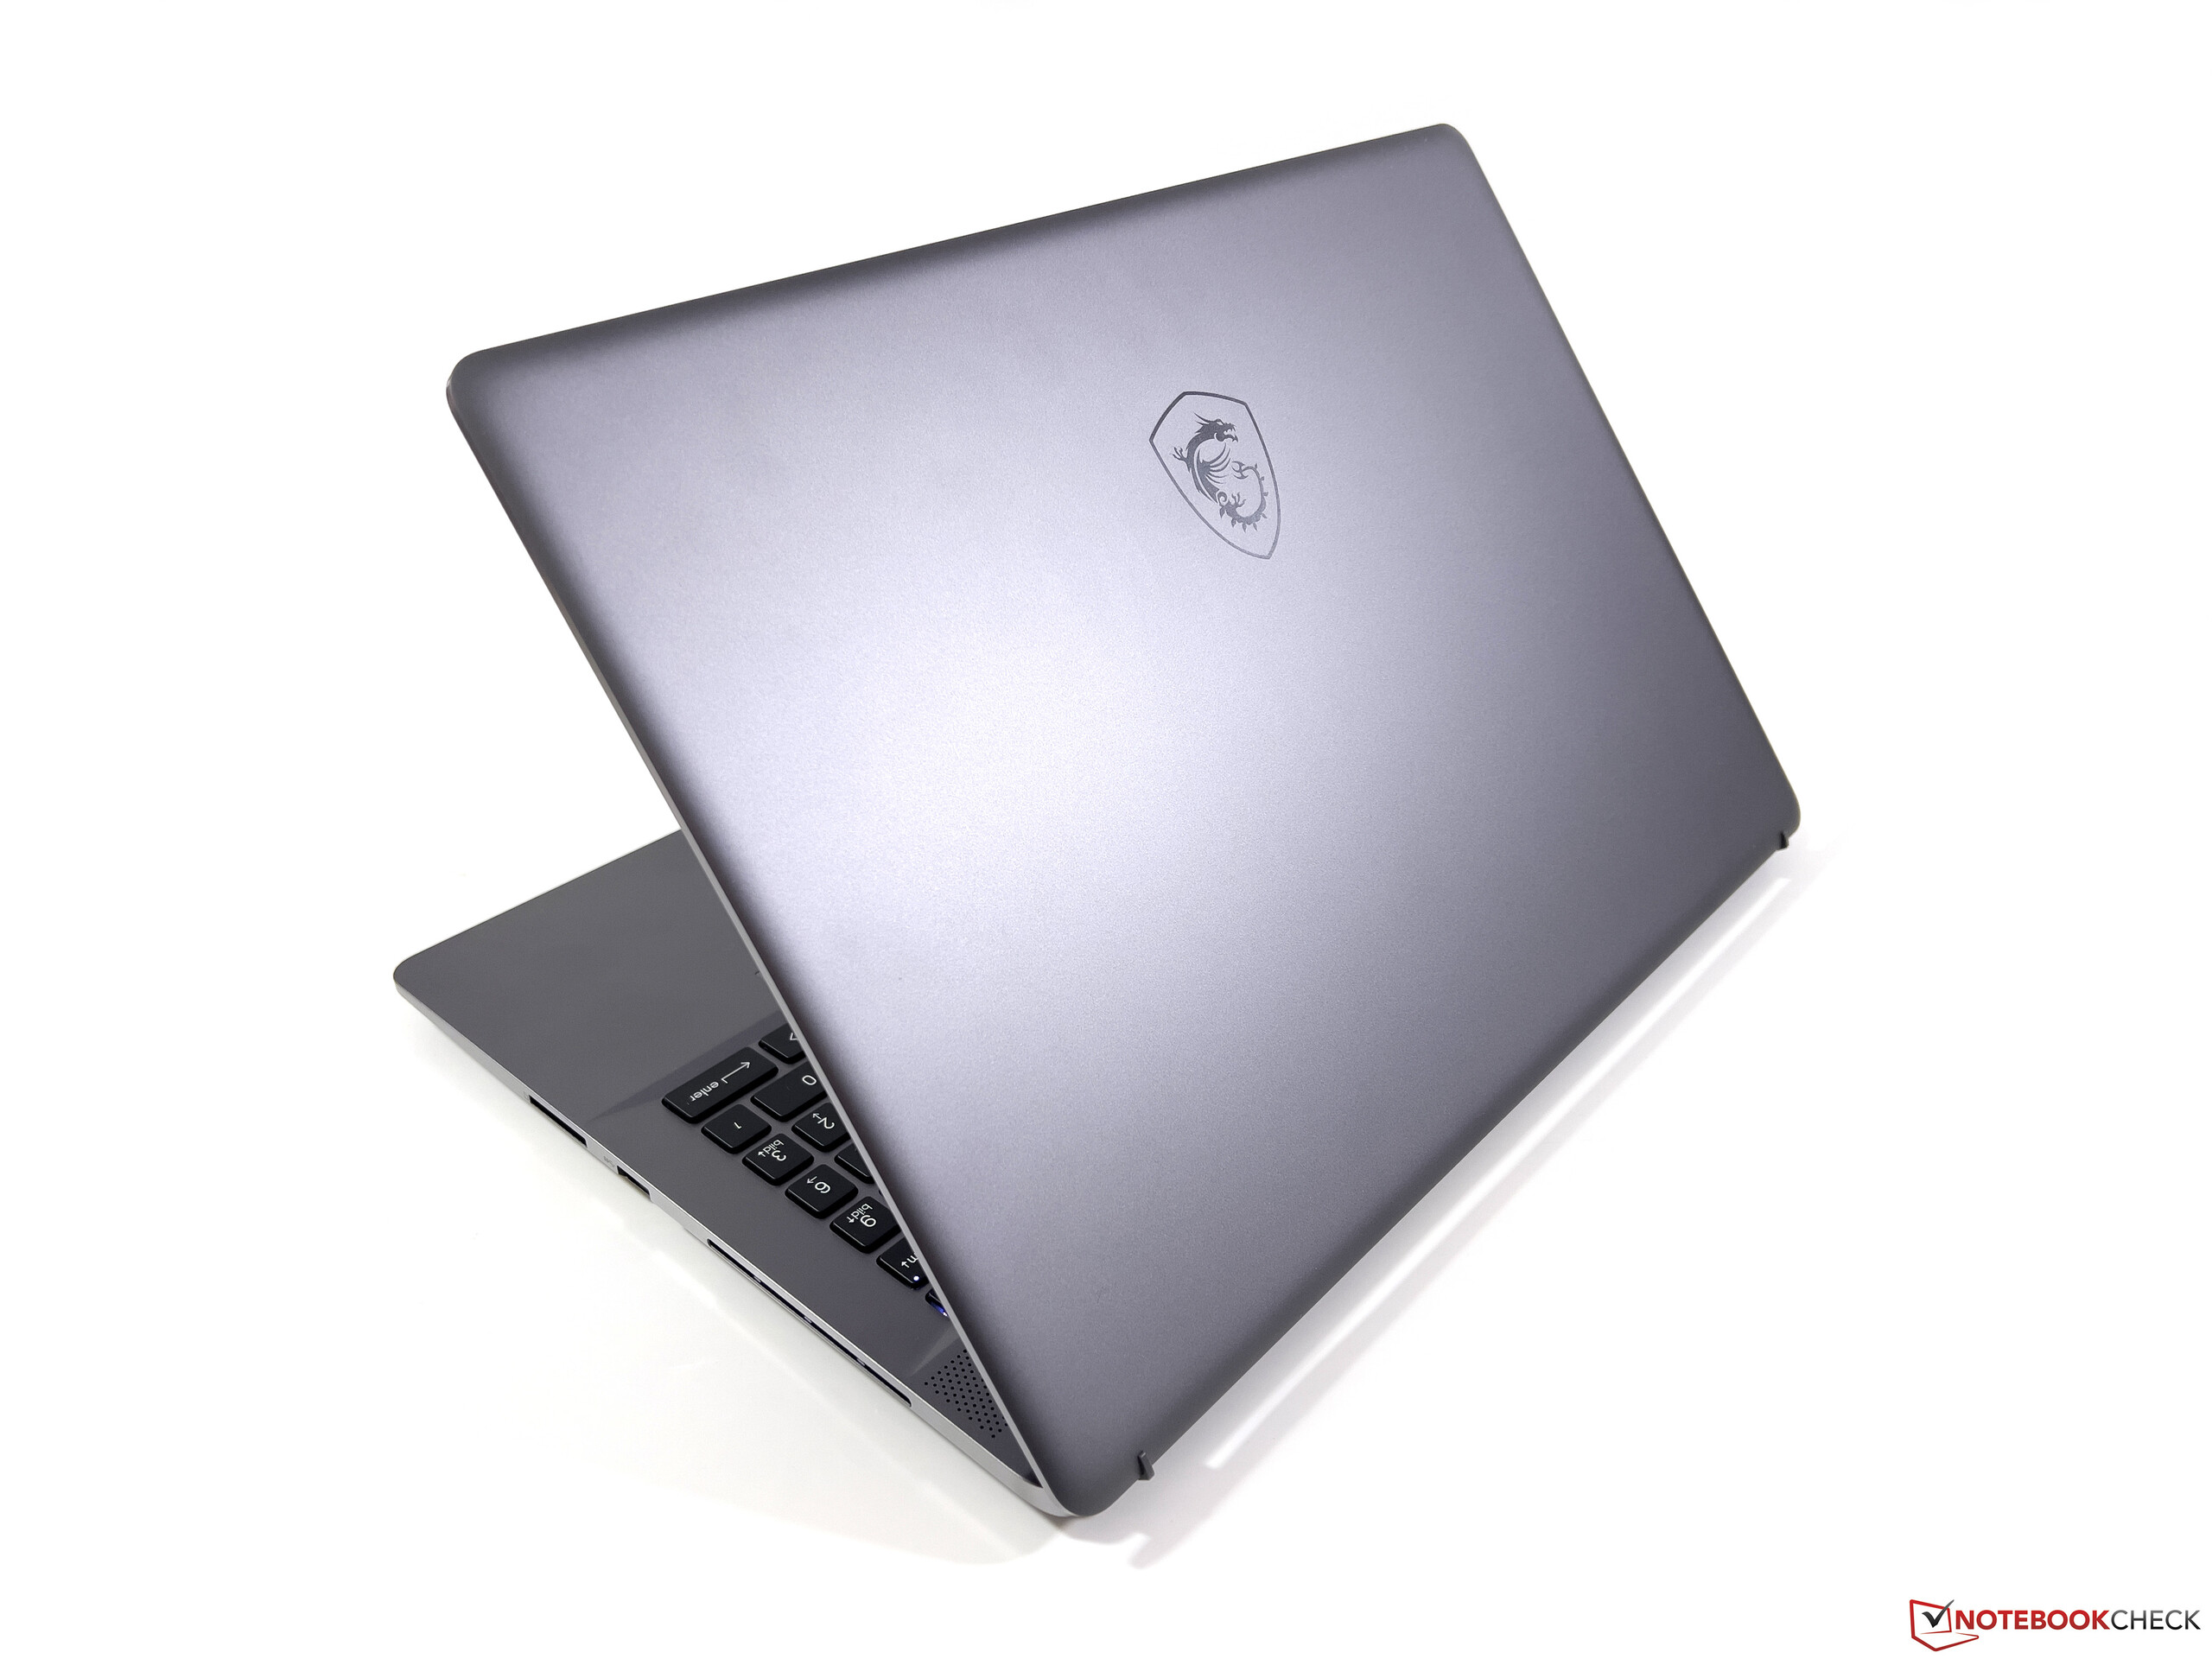
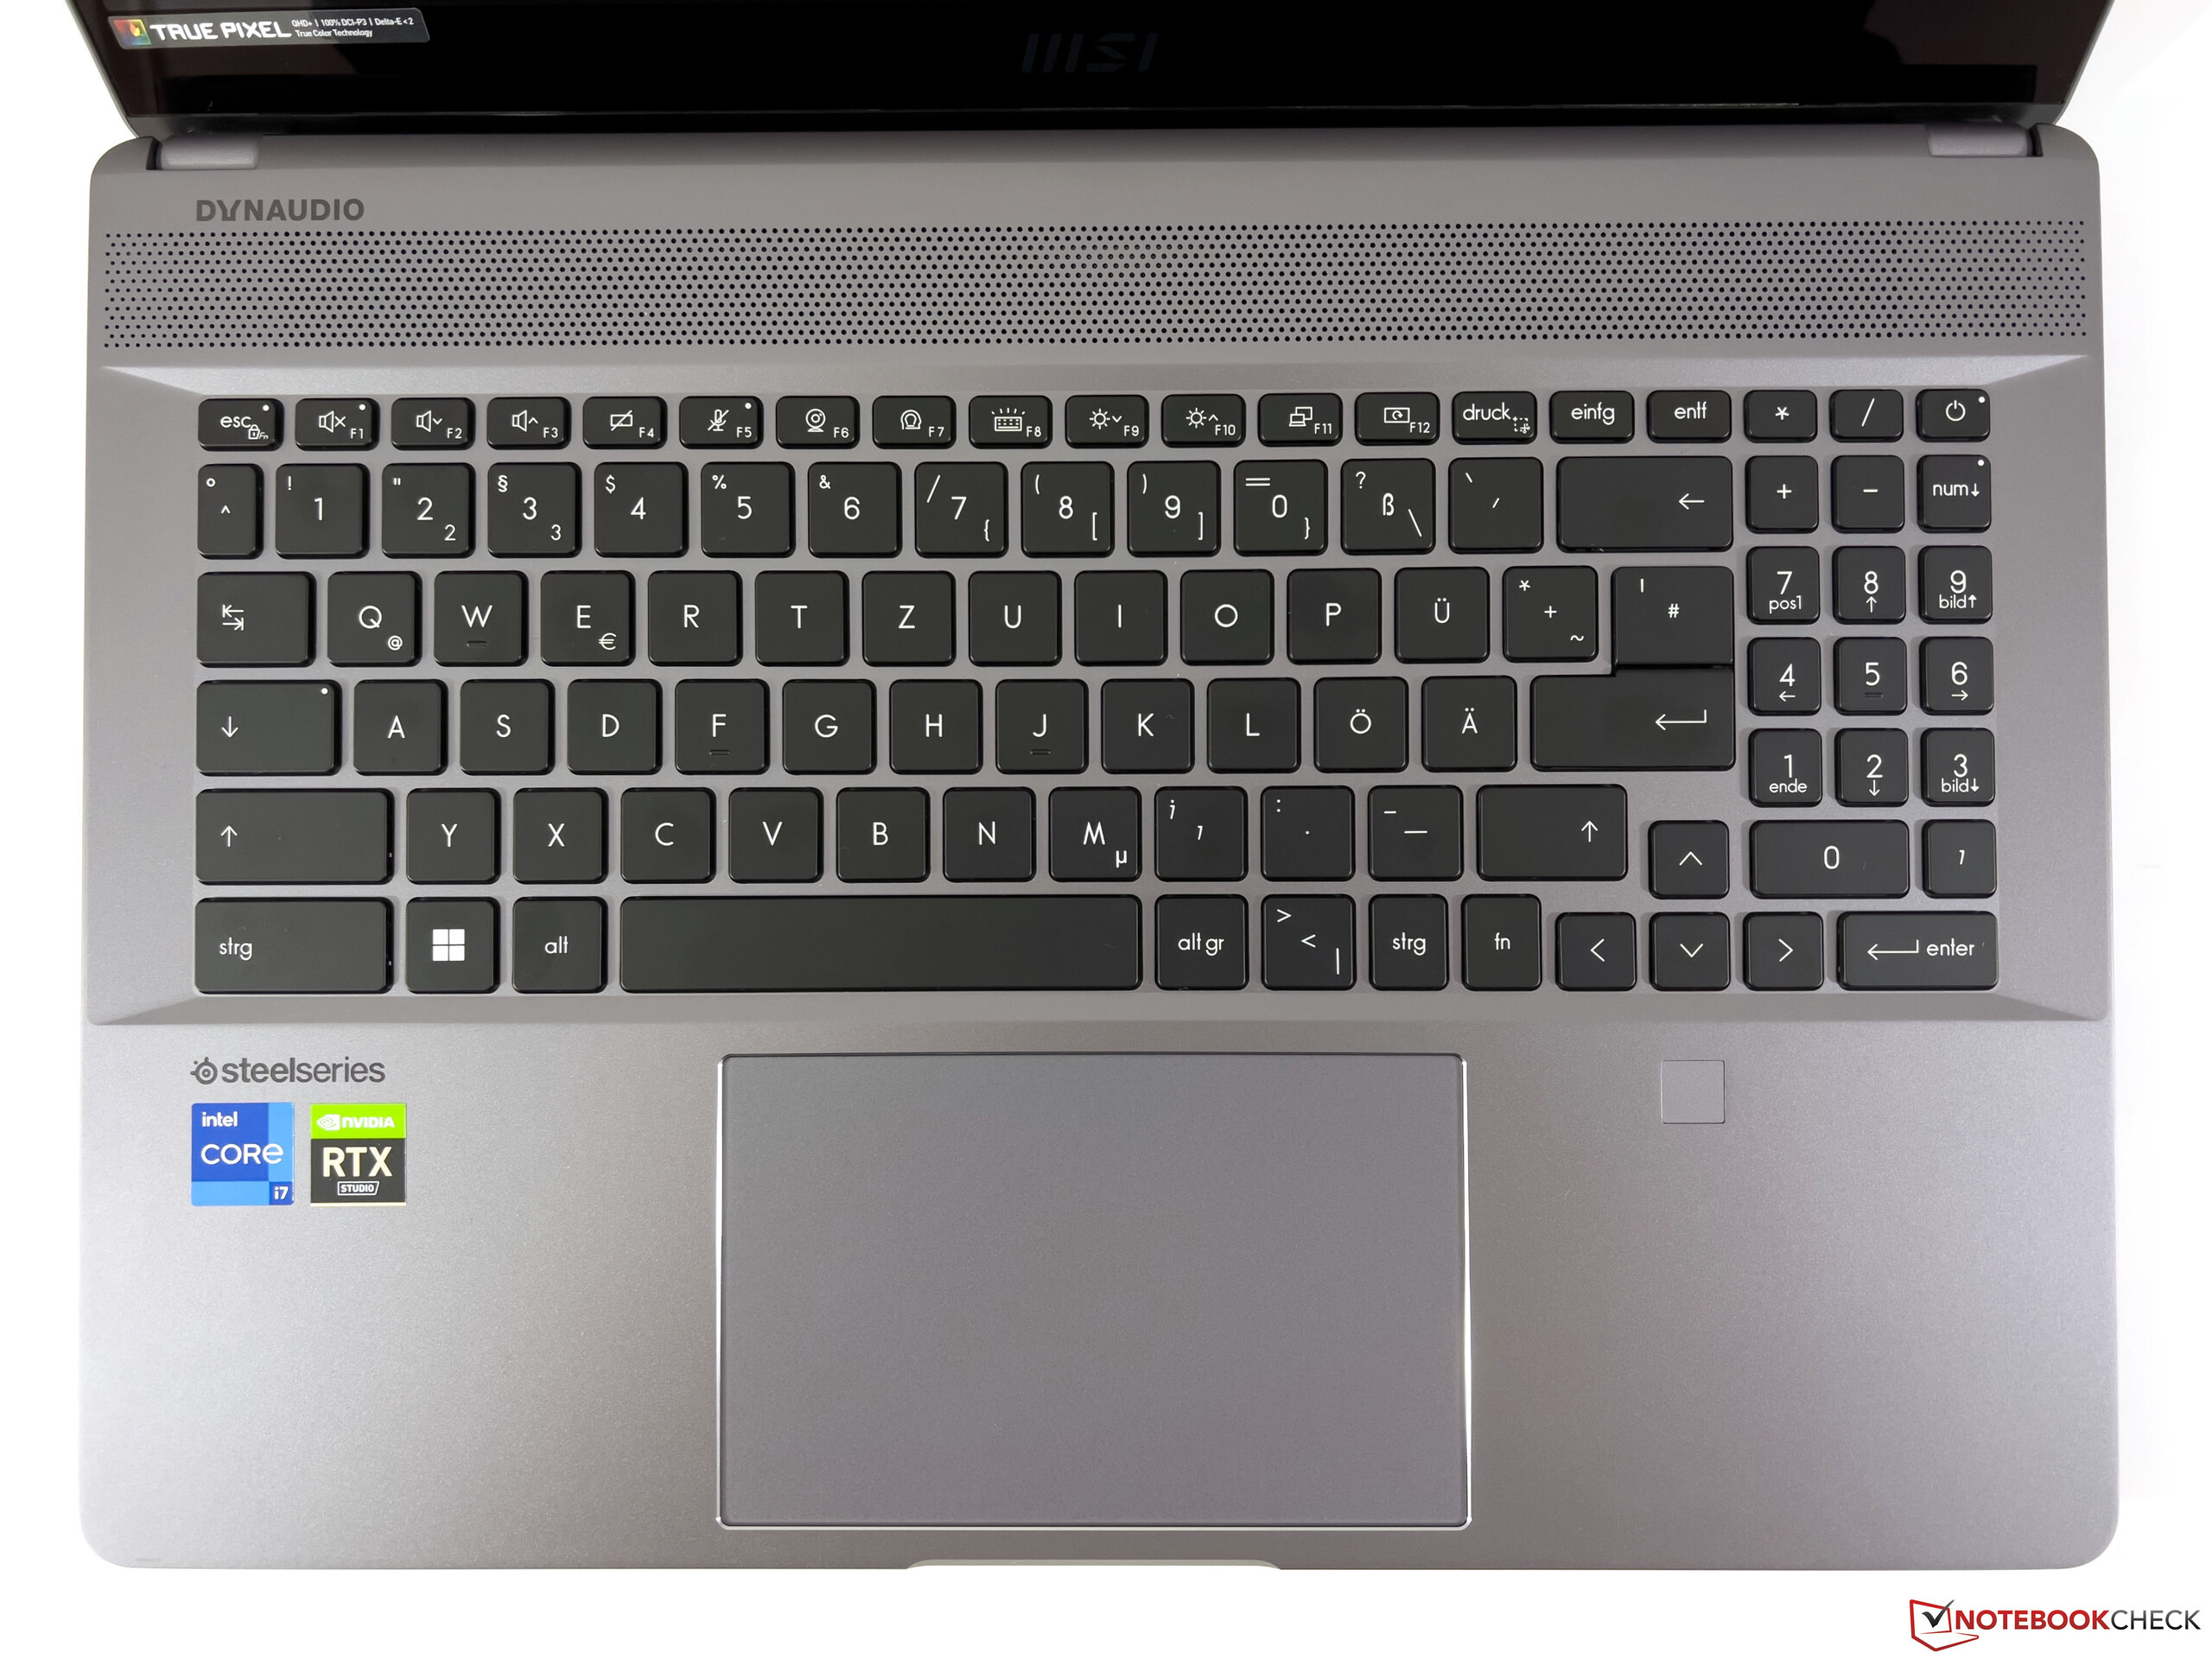
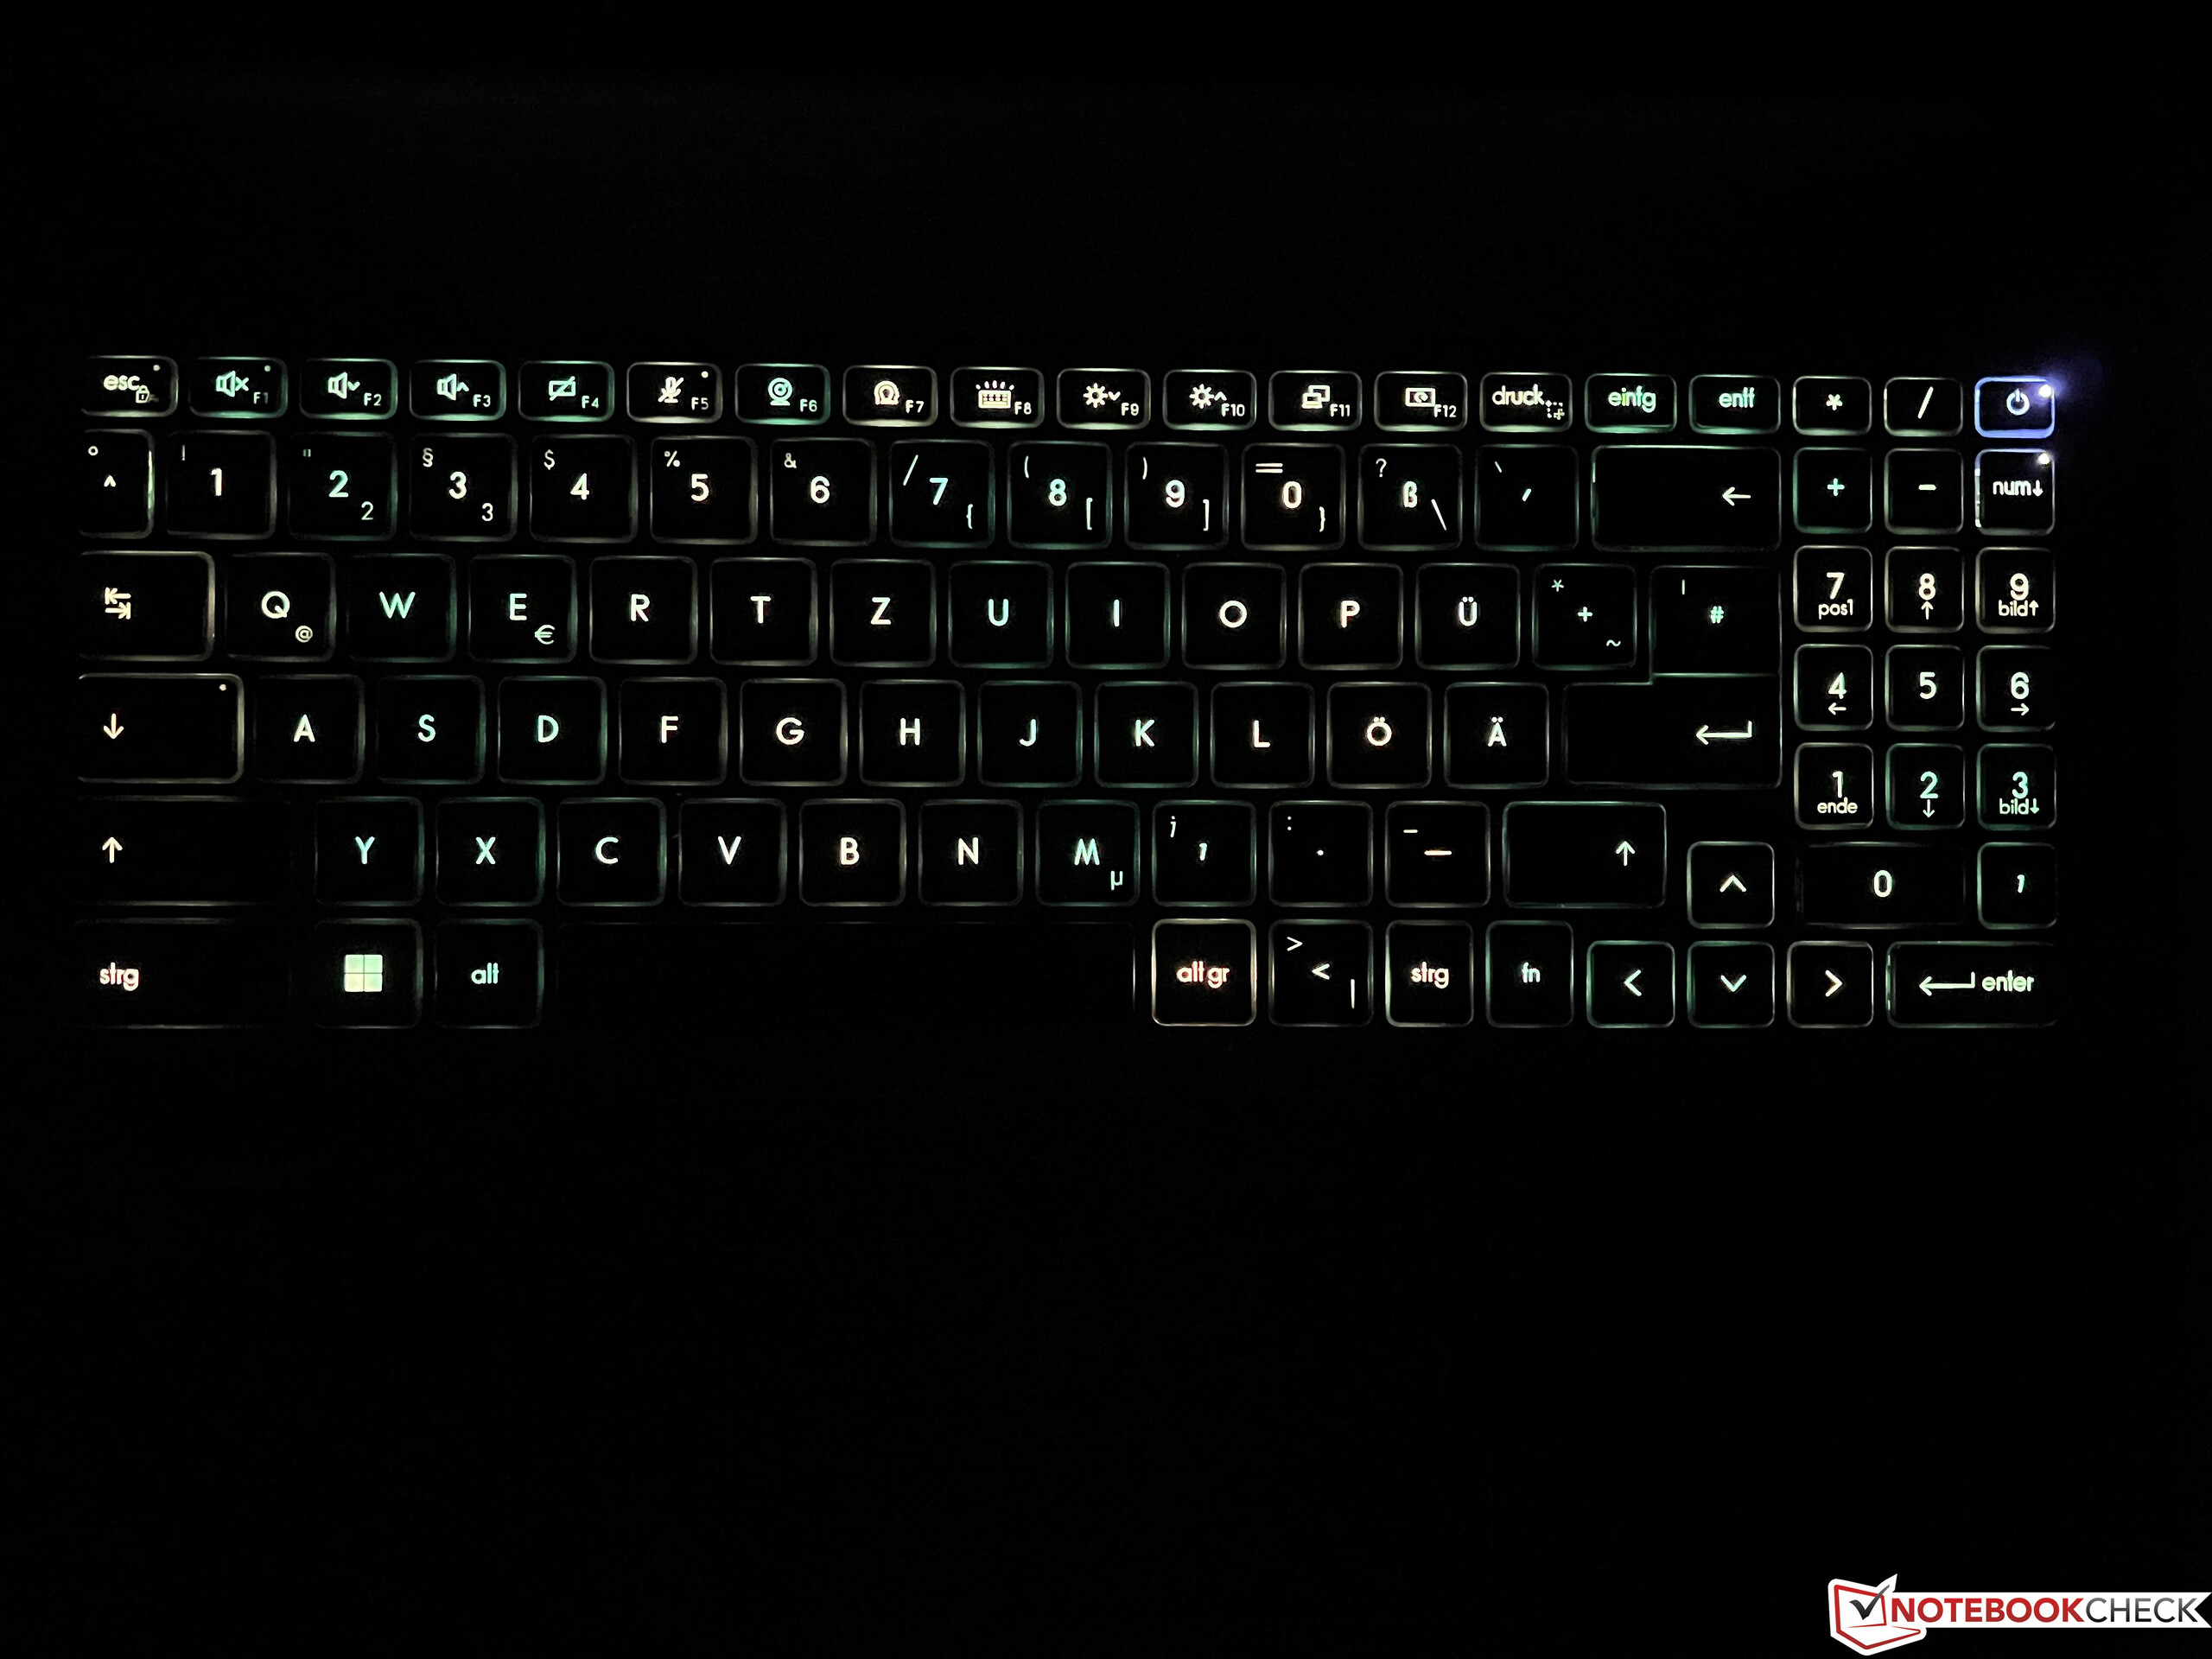
Obudowa CreatorPro Z16P nie różni się od obudowy zwykłego Creatora Z16Pco oczywiście obejmuje również złącza i urządzenia wejściowe. Z ciemnoszarą obudową (Lunar Gray) nie powinno być problemów nawet w biurze, o ile powstrzymamy się z podświetleniem klawiatury, gdzie kolor można skonfigurować indywidualnie dla każdego klawisza. Sama klawiatura oferuje bardzo wygodne pisanie i korzysta z długiego skoku klawiszy. Pod tym względem CreatorPro może dotrzymać kroku nawet dobrym laptopom biznesowym. ClickPad również działa bez zarzutu.
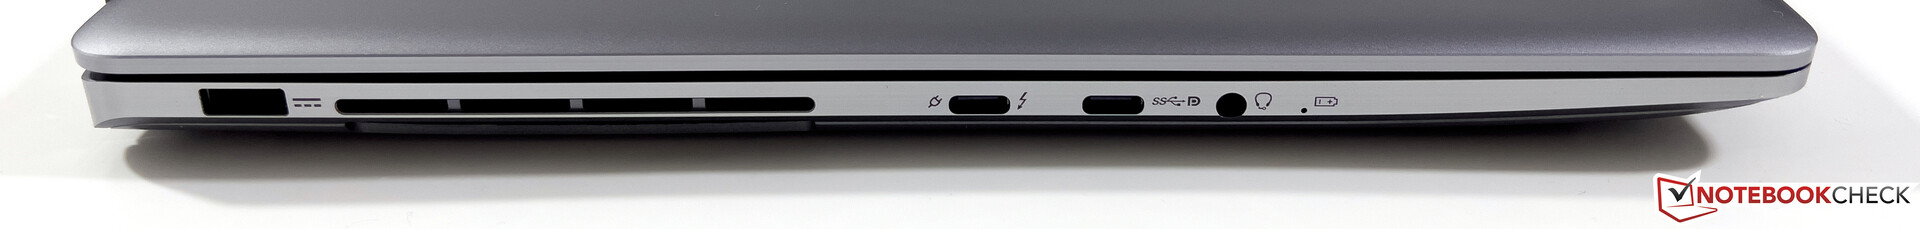
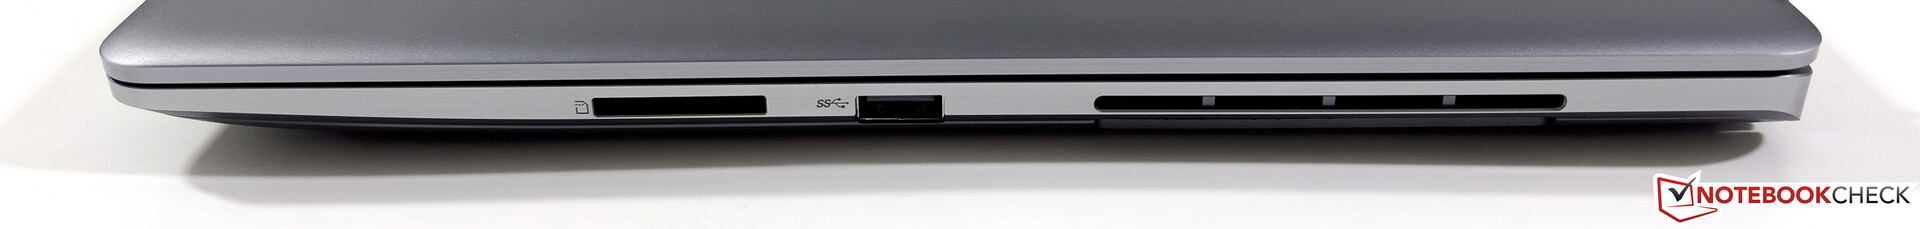
Jeśli chodzi o złącza, otrzymujemy w sumie trzy porty USB, w tym jeden z Thunderbolt 4, oraz pełnowymiarowy czytnik kart SD. Z drugiej strony trzeba się obejść bez dedykowanego wyjścia graficznego. Ze względu na chłodzenie, wszystkie złącza poza portem zasilania znajdują się w przednich częściach obu boków, co w codziennej eksploatacji nie jest optymalne.
| SD Card Reader | |
| average JPG Copy Test (av. of 3 runs) | |
| Dell Precision 5000 5560 (AV Pro V60) | |
| Średnia w klasie Workstation (49.6 - 681, n=14, ostatnie 2 lata) | |
| MSI CreatorPro Z16P B12UKST (AV Pro V60) | |
| MSI Creator Z16P B12UHST (AV PRO microSD 128 GB V60) | |
| HP ZBook Studio 16 G9 62U04EA (Angelbird AV PRO V60) | |
| maximum AS SSD Seq Read Test (1GB) | |
| Średnia w klasie Workstation (87.6 - 1455, n=14, ostatnie 2 lata) | |
| Dell Precision 5000 5560 (AV Pro V60) | |
| MSI CreatorPro Z16P B12UKST (AV Pro V60) | |
| HP ZBook Studio 16 G9 62U04EA (Angelbird AV PRO V60) | |
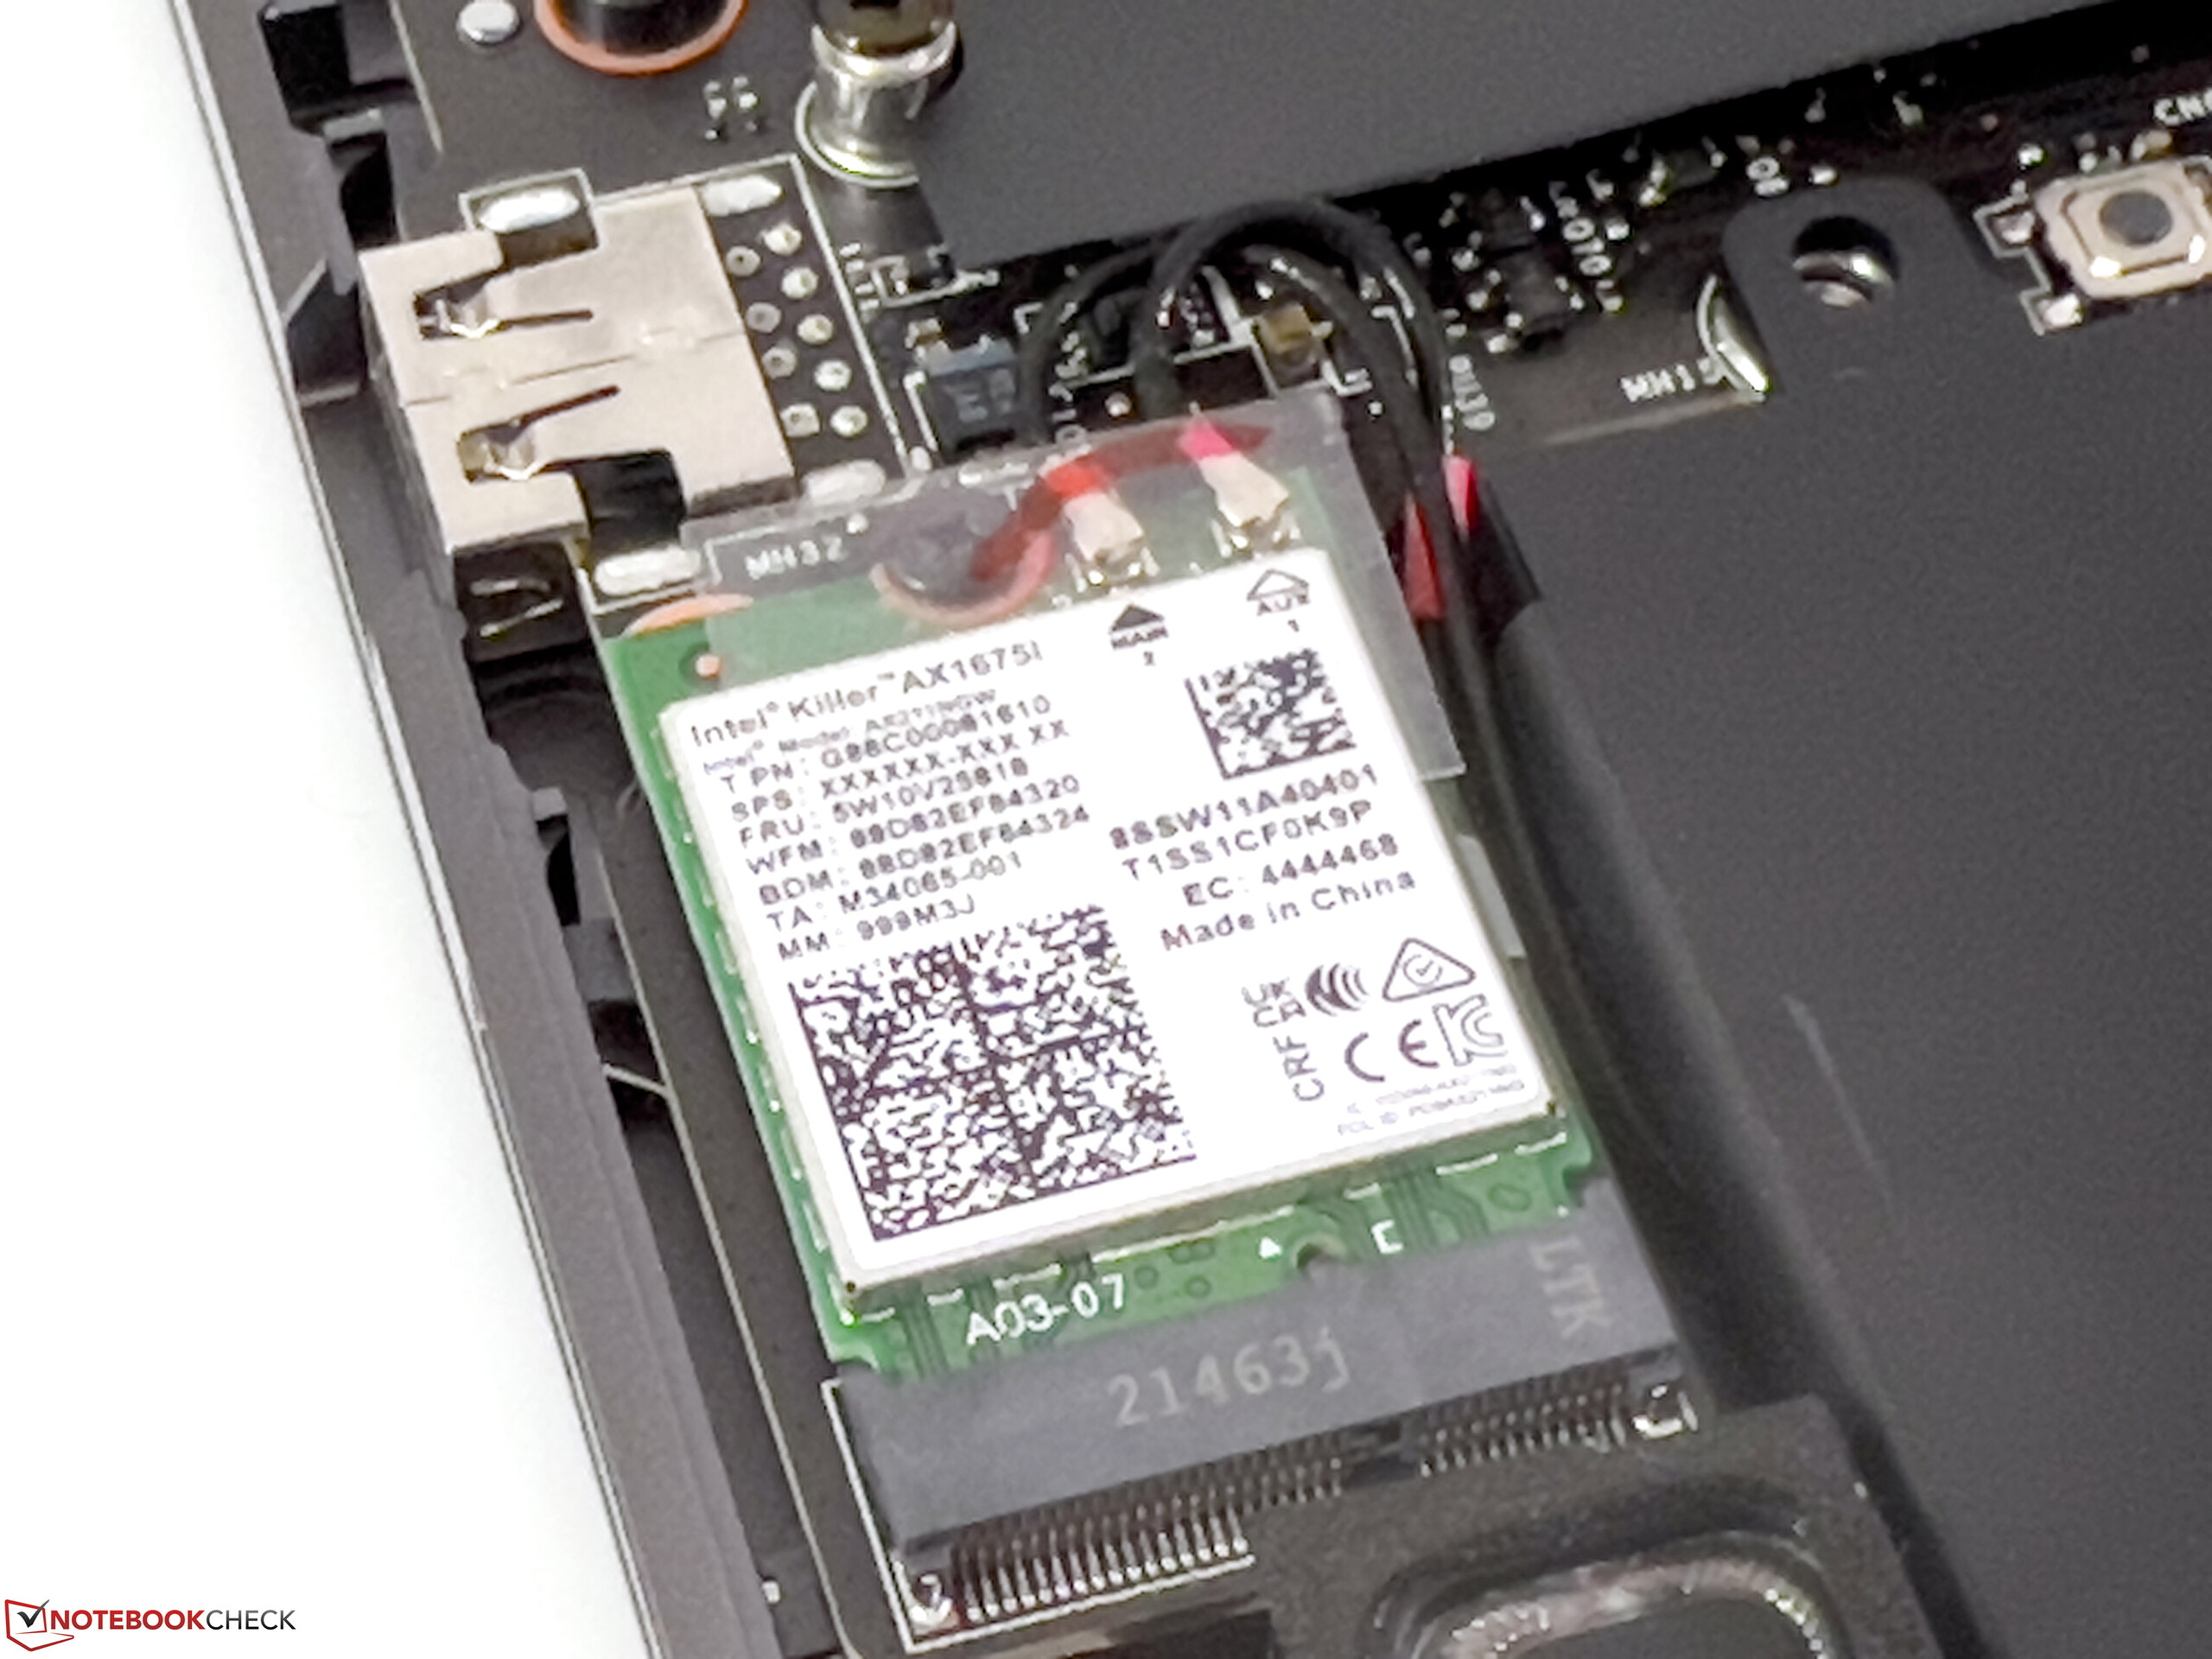
| Networking | |
| MSI CreatorPro Z16P B12UKST | |
| iperf3 receive AXE11000 6GHz | |
| iperf3 transmit AXE11000 6GHz | |
| HP ZBook Studio 16 G9 62U04EA | |
| iperf3 receive AXE11000 6GHz | |
| iperf3 transmit AXE11000 6GHz | |
| Dell Precision 5000 5560 | |
| iperf3 transmit AX12 | |
| iperf3 receive AX12 | |
| MSI Creator Z16P B12UHST | |
| iperf3 receive AXE11000 | |
| Lenovo ThinkPad P1 G4-20Y4Z9DVUS | |
| iperf3 transmit AX12 | |
| iperf3 receive AX12 | |


Wyświetlacz - TrueColor z częstotliwością 165 Hz
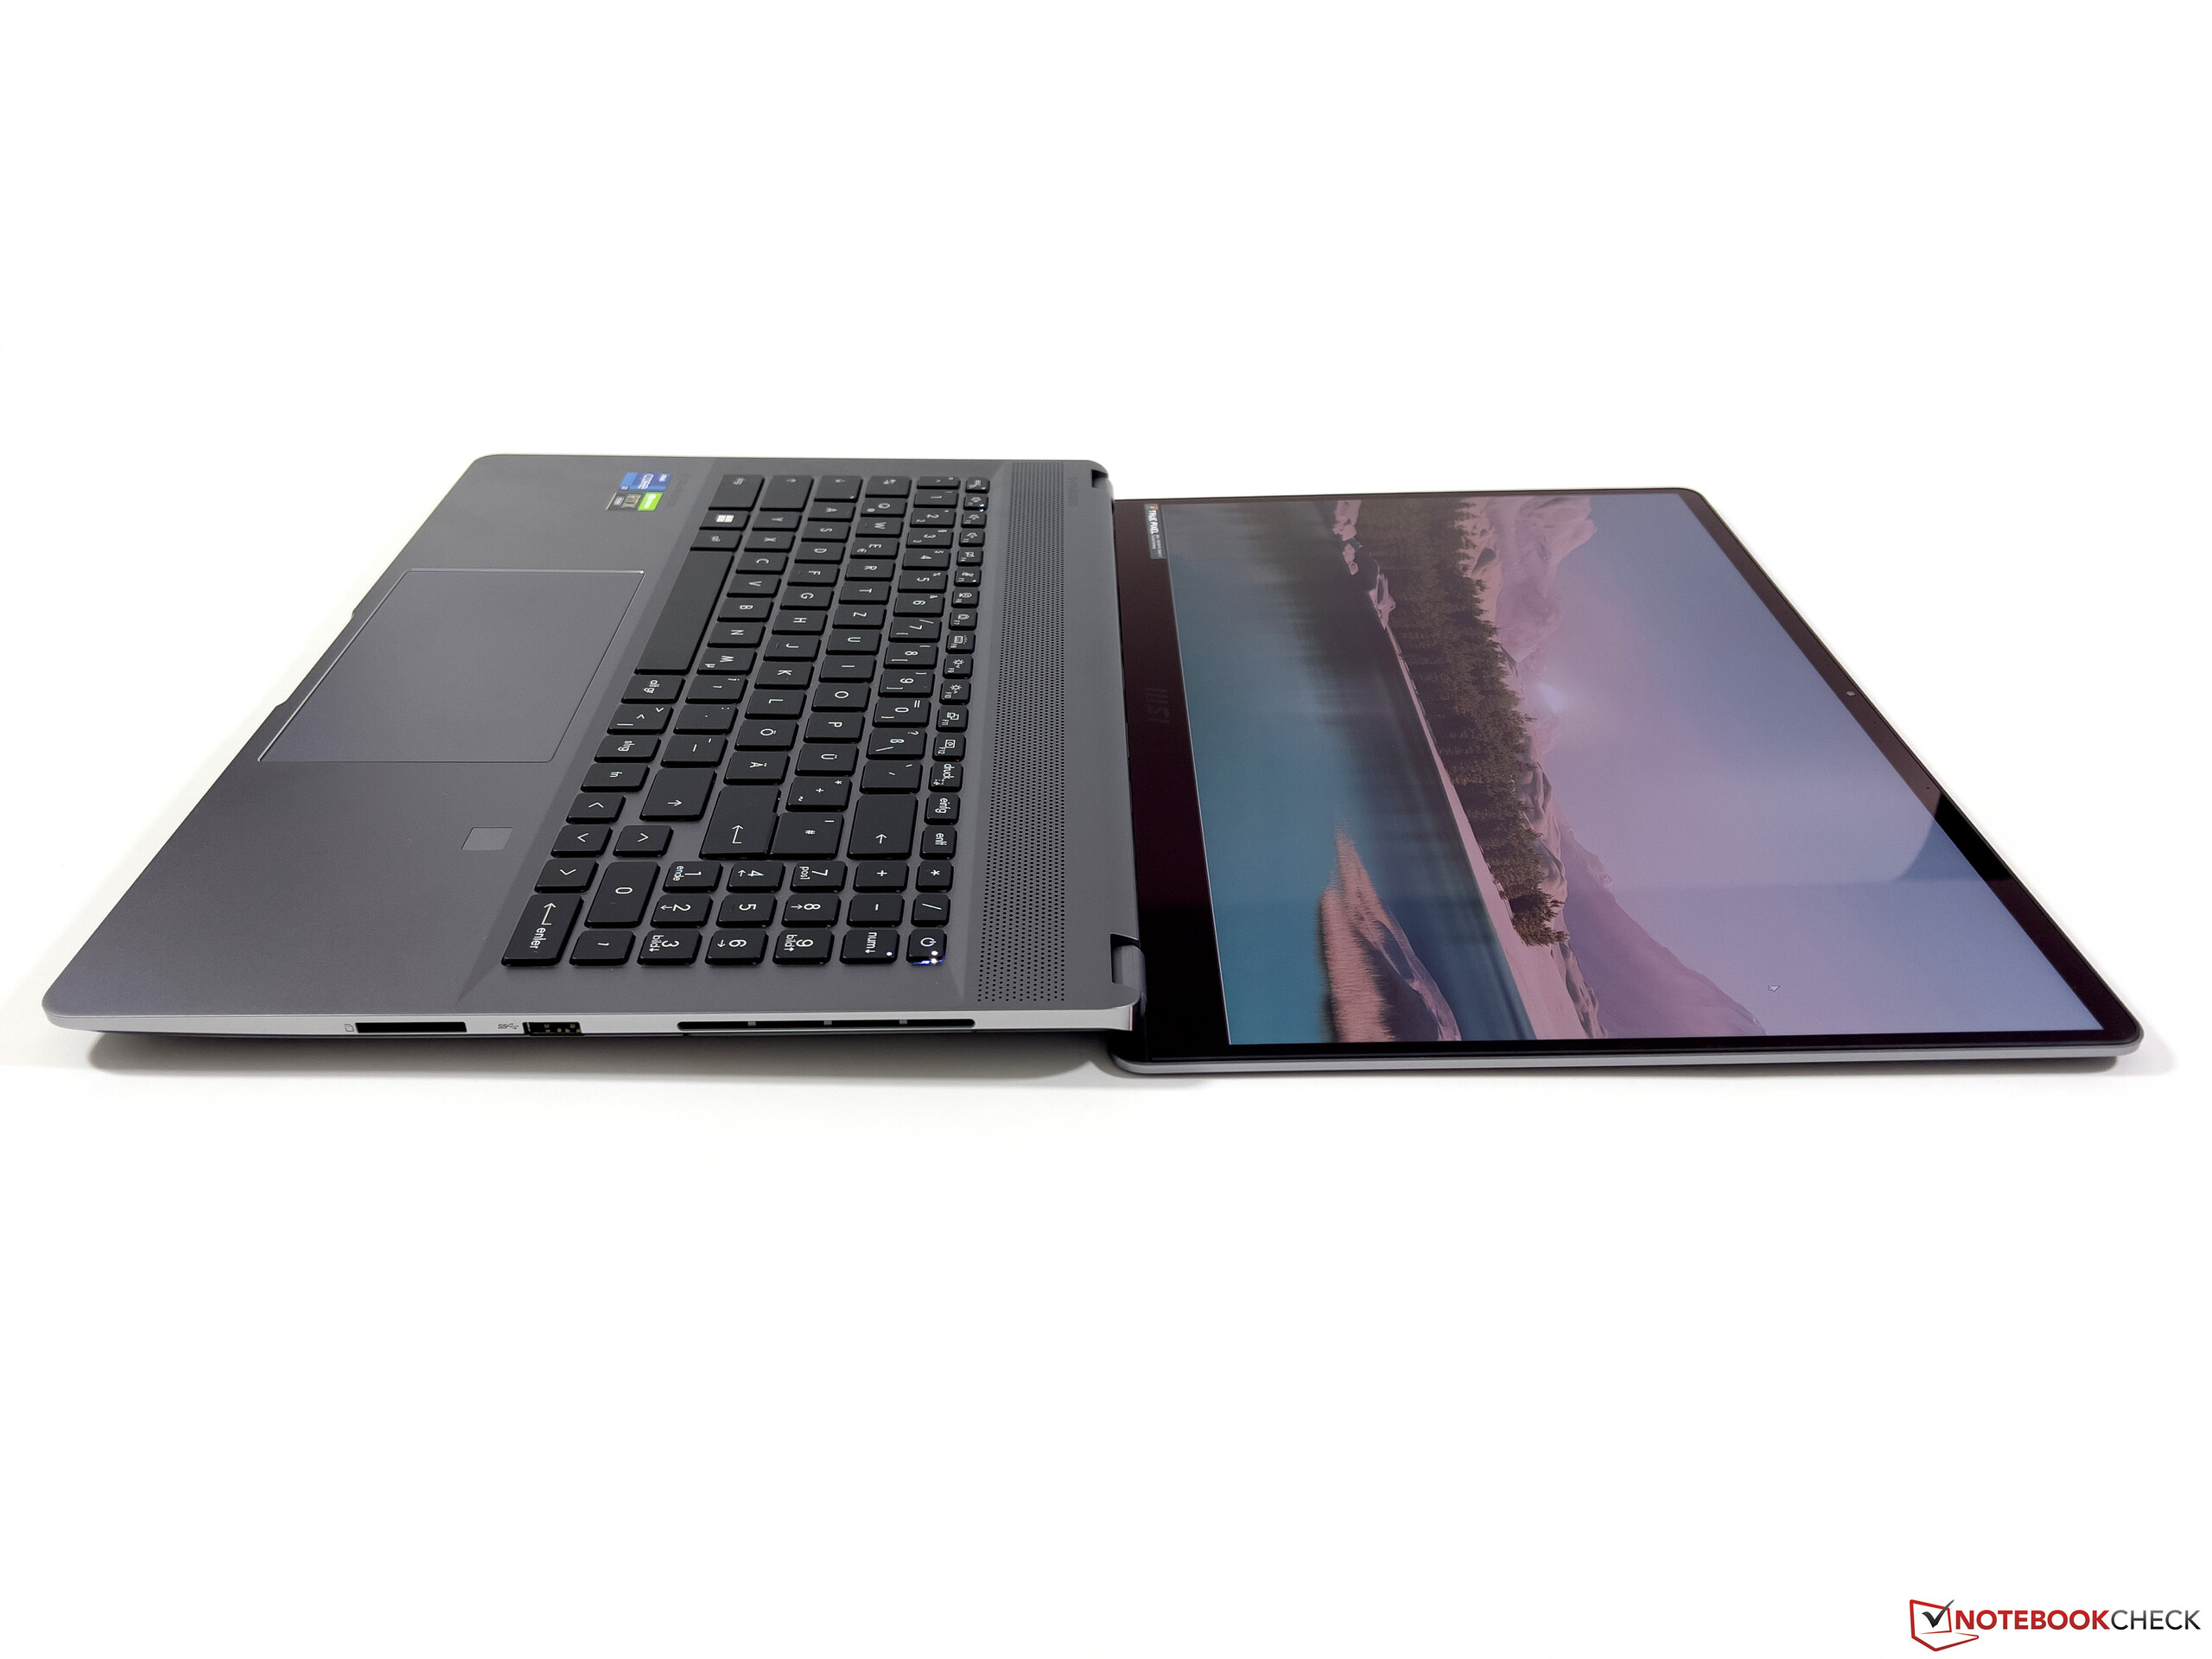
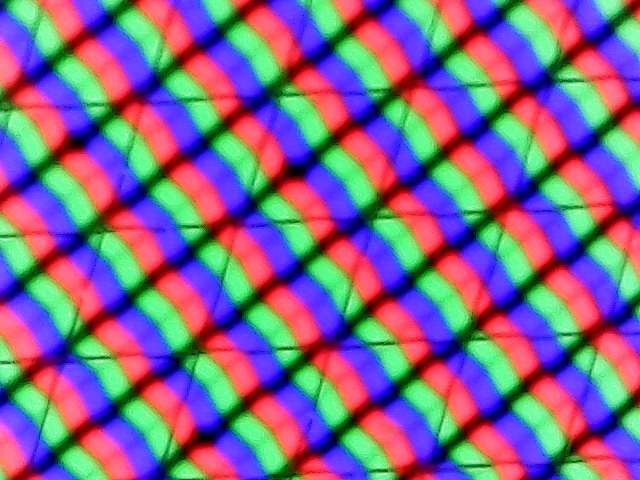
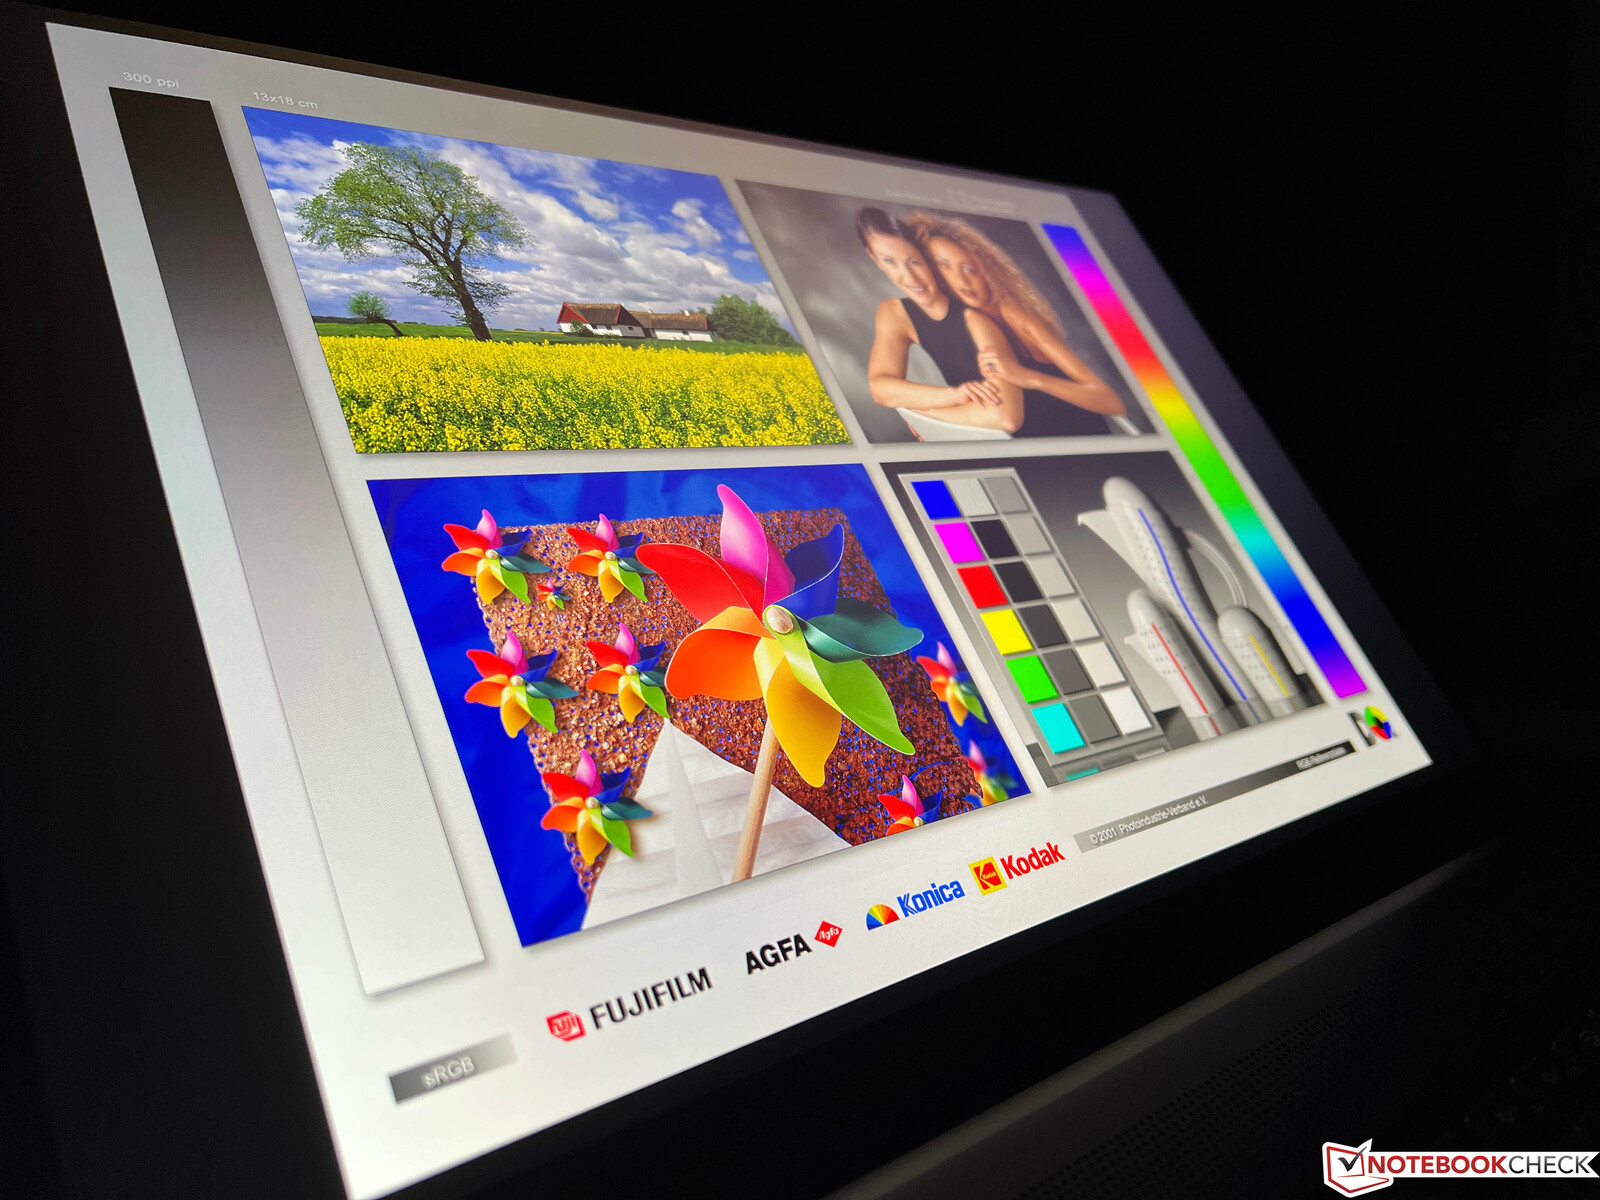
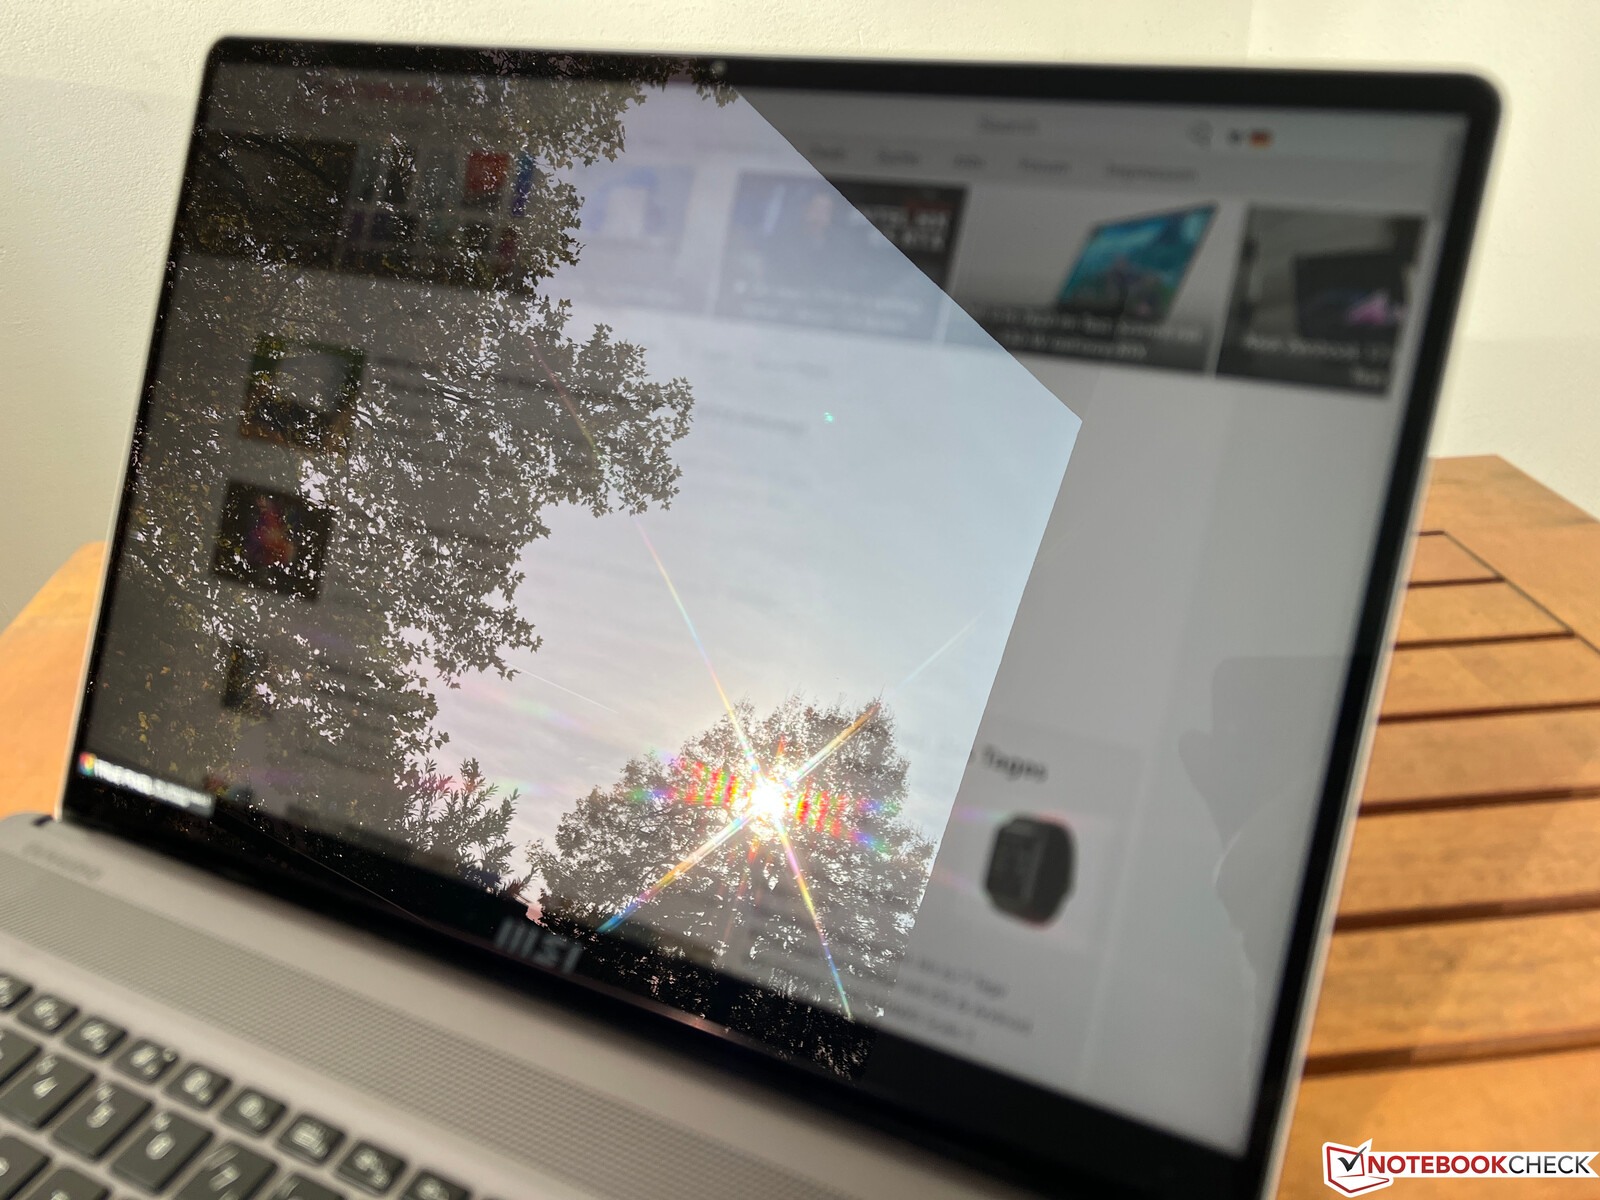
W sekcji wyświetlaczy również możemy być krótcy, ponieważ nie ma żadnych różnic w stosunku do zwykłego Creator Z16Ptutaj. Choć konstrukcja refleksyjnego panelu TrueColor WQHD (2560 x 1600 pikseli, IPS) w formacie 16:10 skierowana jest bardziej do odbiorców tworzących treści, to subiektywna jakość obrazu jest po prostu bardzo dobra i innym użytkownikom również bardzo się spodoba.
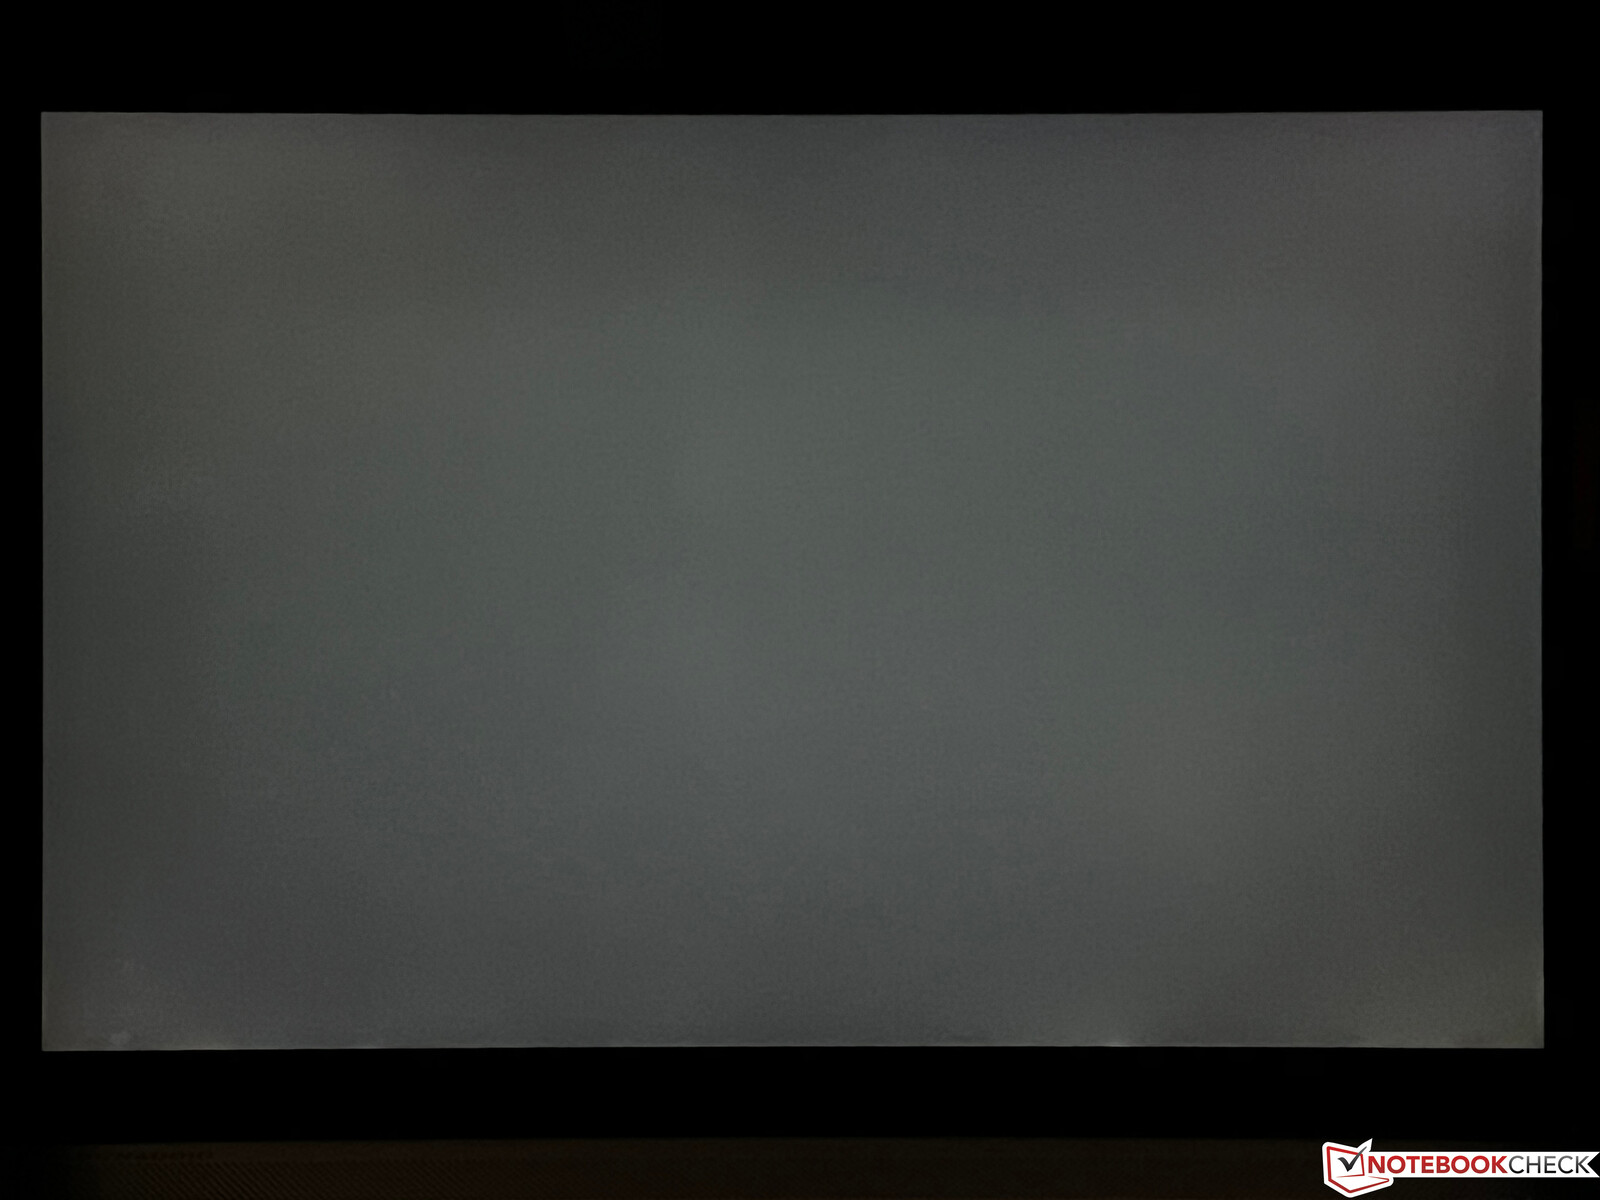
W naszych pomiarach panel dostarcza przyzwoitych wartości (średnia jasność ~390 cd/m²), choć kontrast na poziomie ~1.100:1 mógłby być jeszcze nieco lepszy, a wartość czerni mogłaby być niższa. Czasy reakcji panelu 165 Hz są znakomite, to samo dotyczy stabilności kątów widzenia. Lekkie halo nie będzie stanowiło większego problemu, a PWM również nie jest wykorzystywane.
| |||||||||||||||||||||||||
rozświetlenie: 88 %
na akumulatorze: 408 cd/m²
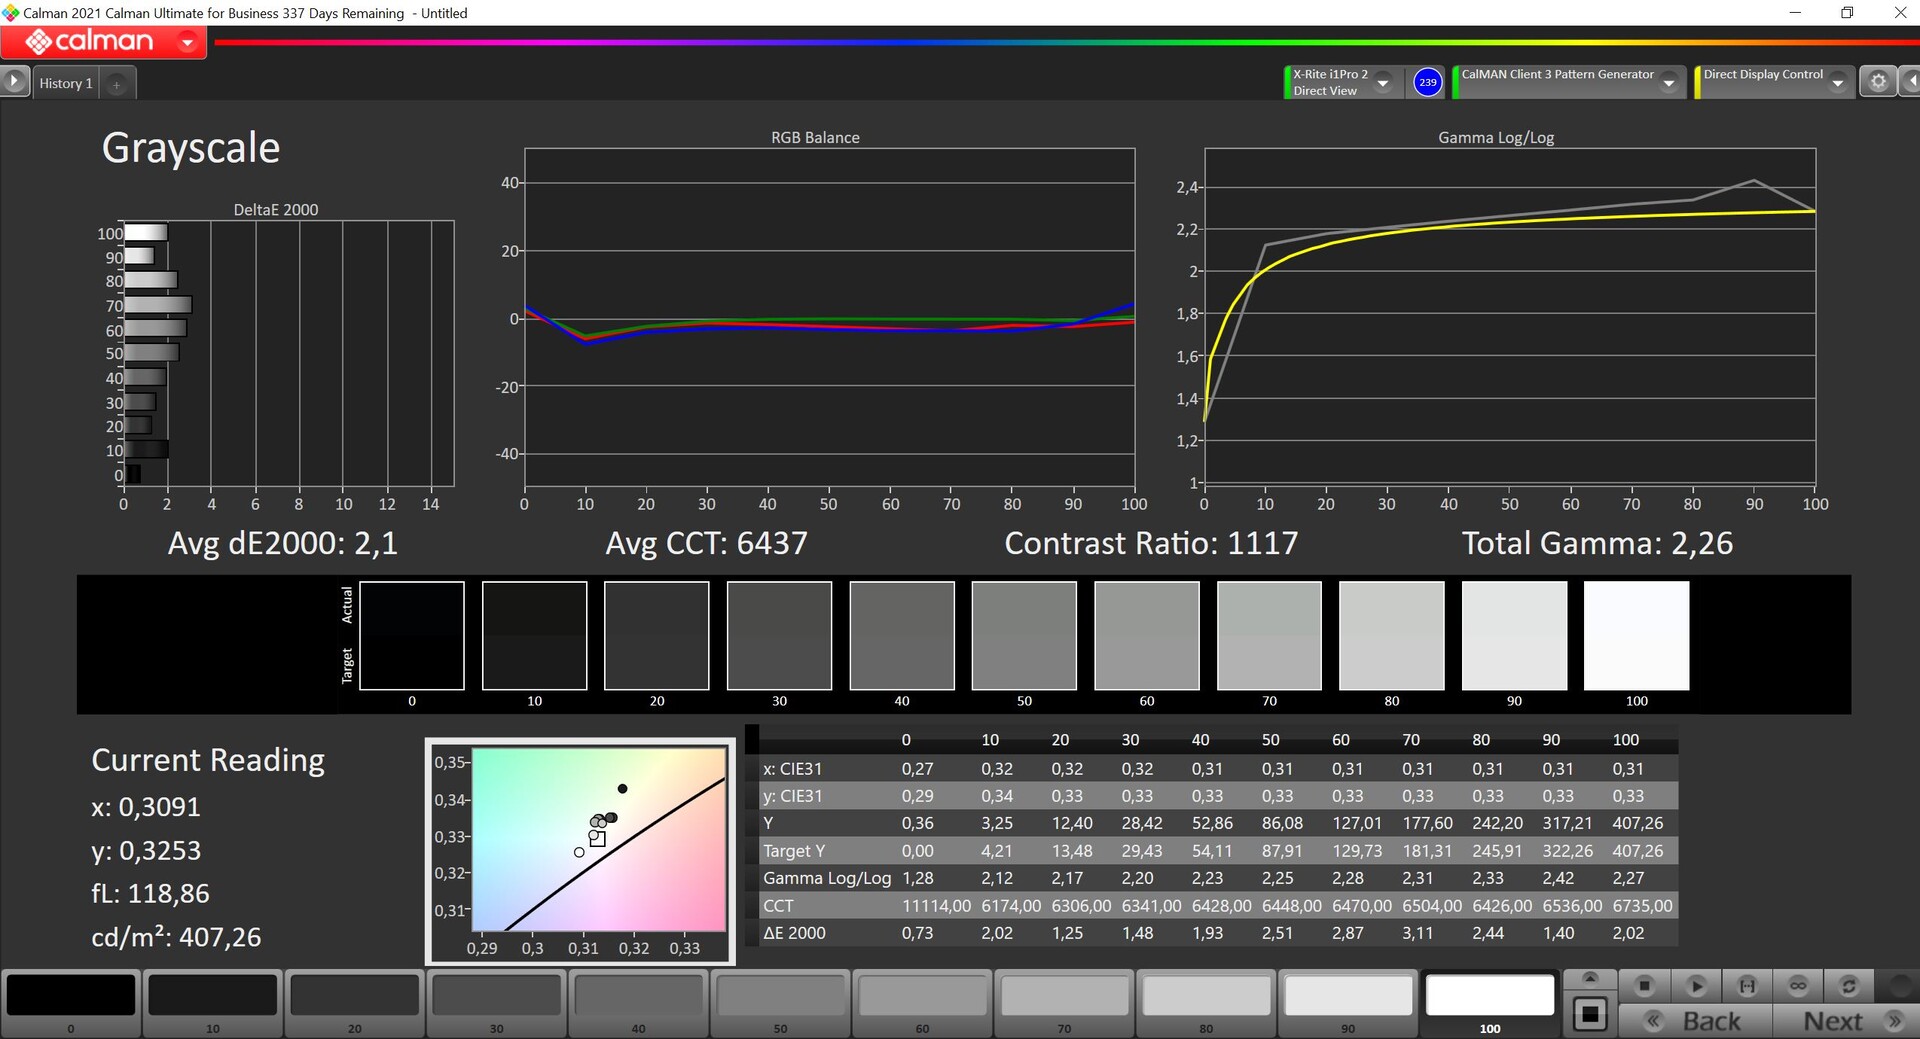
kontrast: 1131:1 (czerń: 0.36 cd/m²)
ΔE ColorChecker Calman: 1.3 | ∀{0.5-29.43 Ø4.73}
calibrated: 0.7
ΔE Greyscale Calman: 2.1 | ∀{0.09-98 Ø4.97}
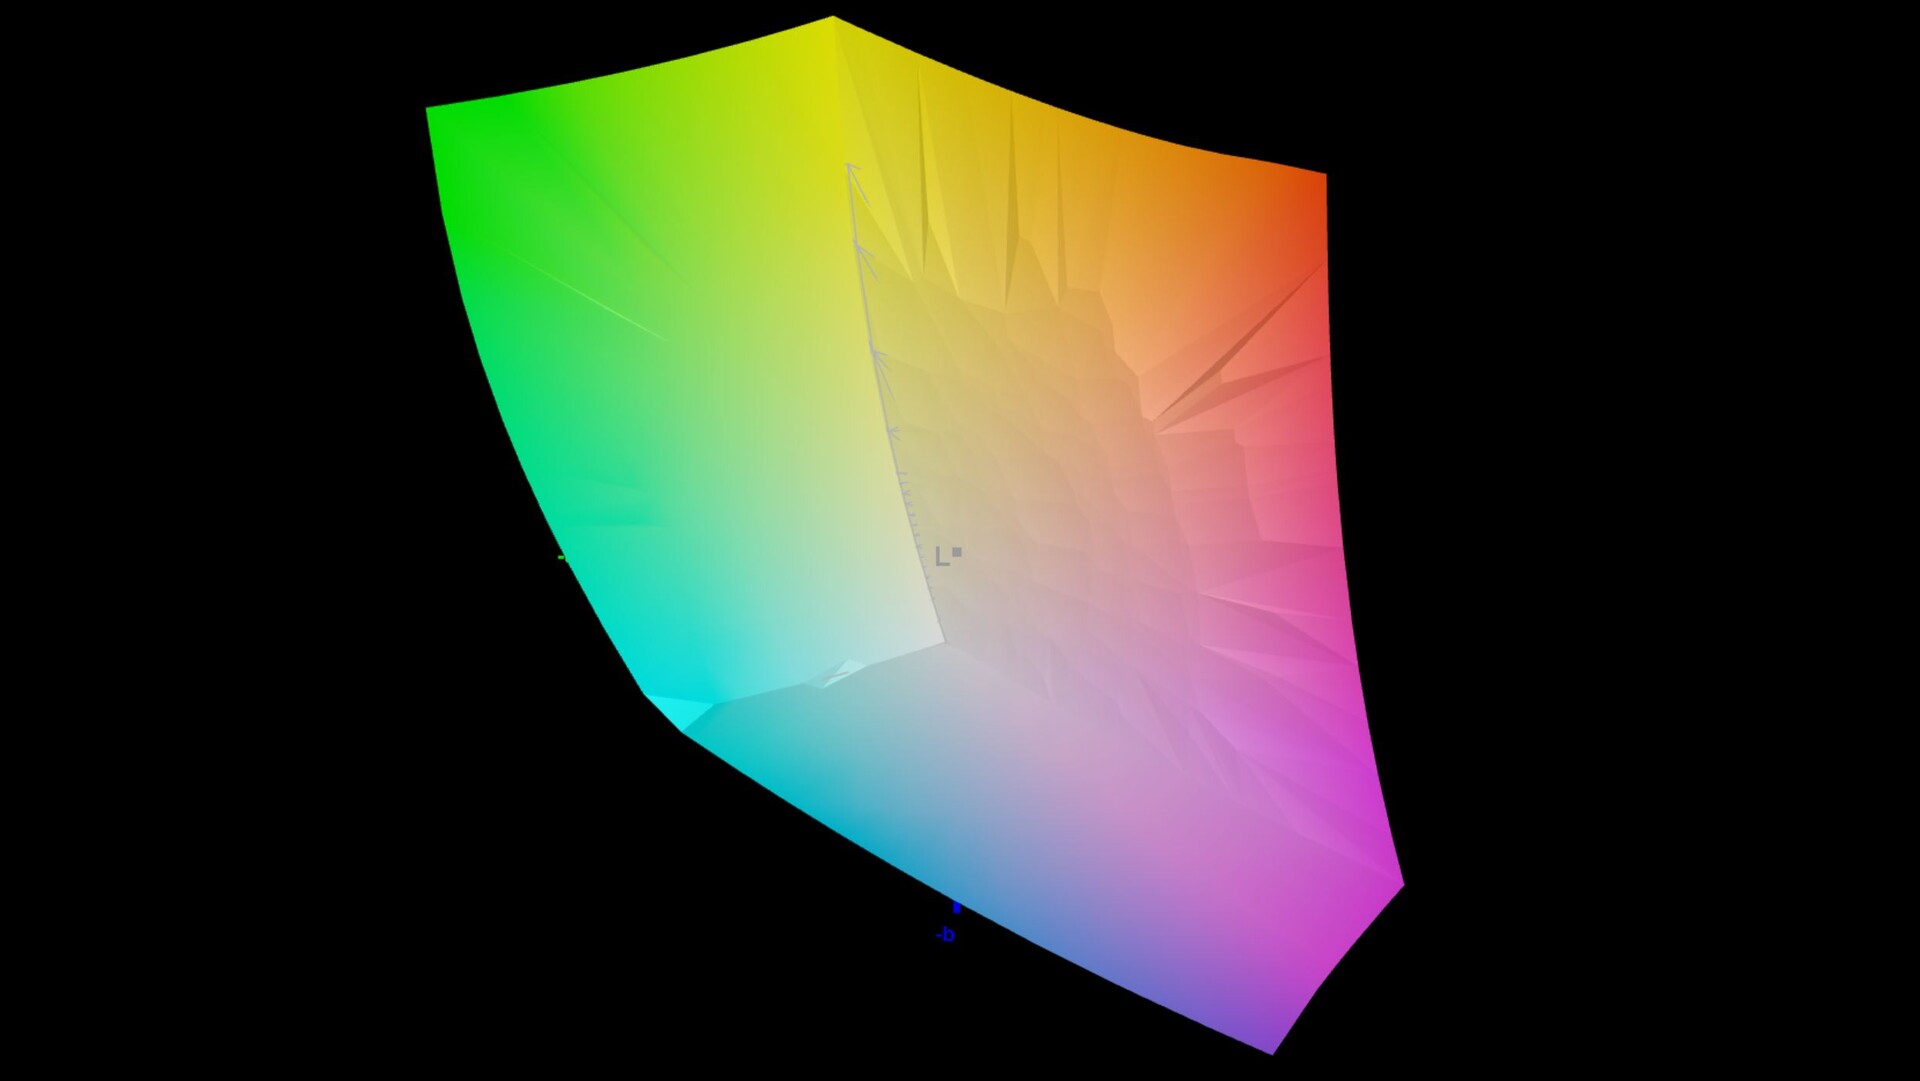
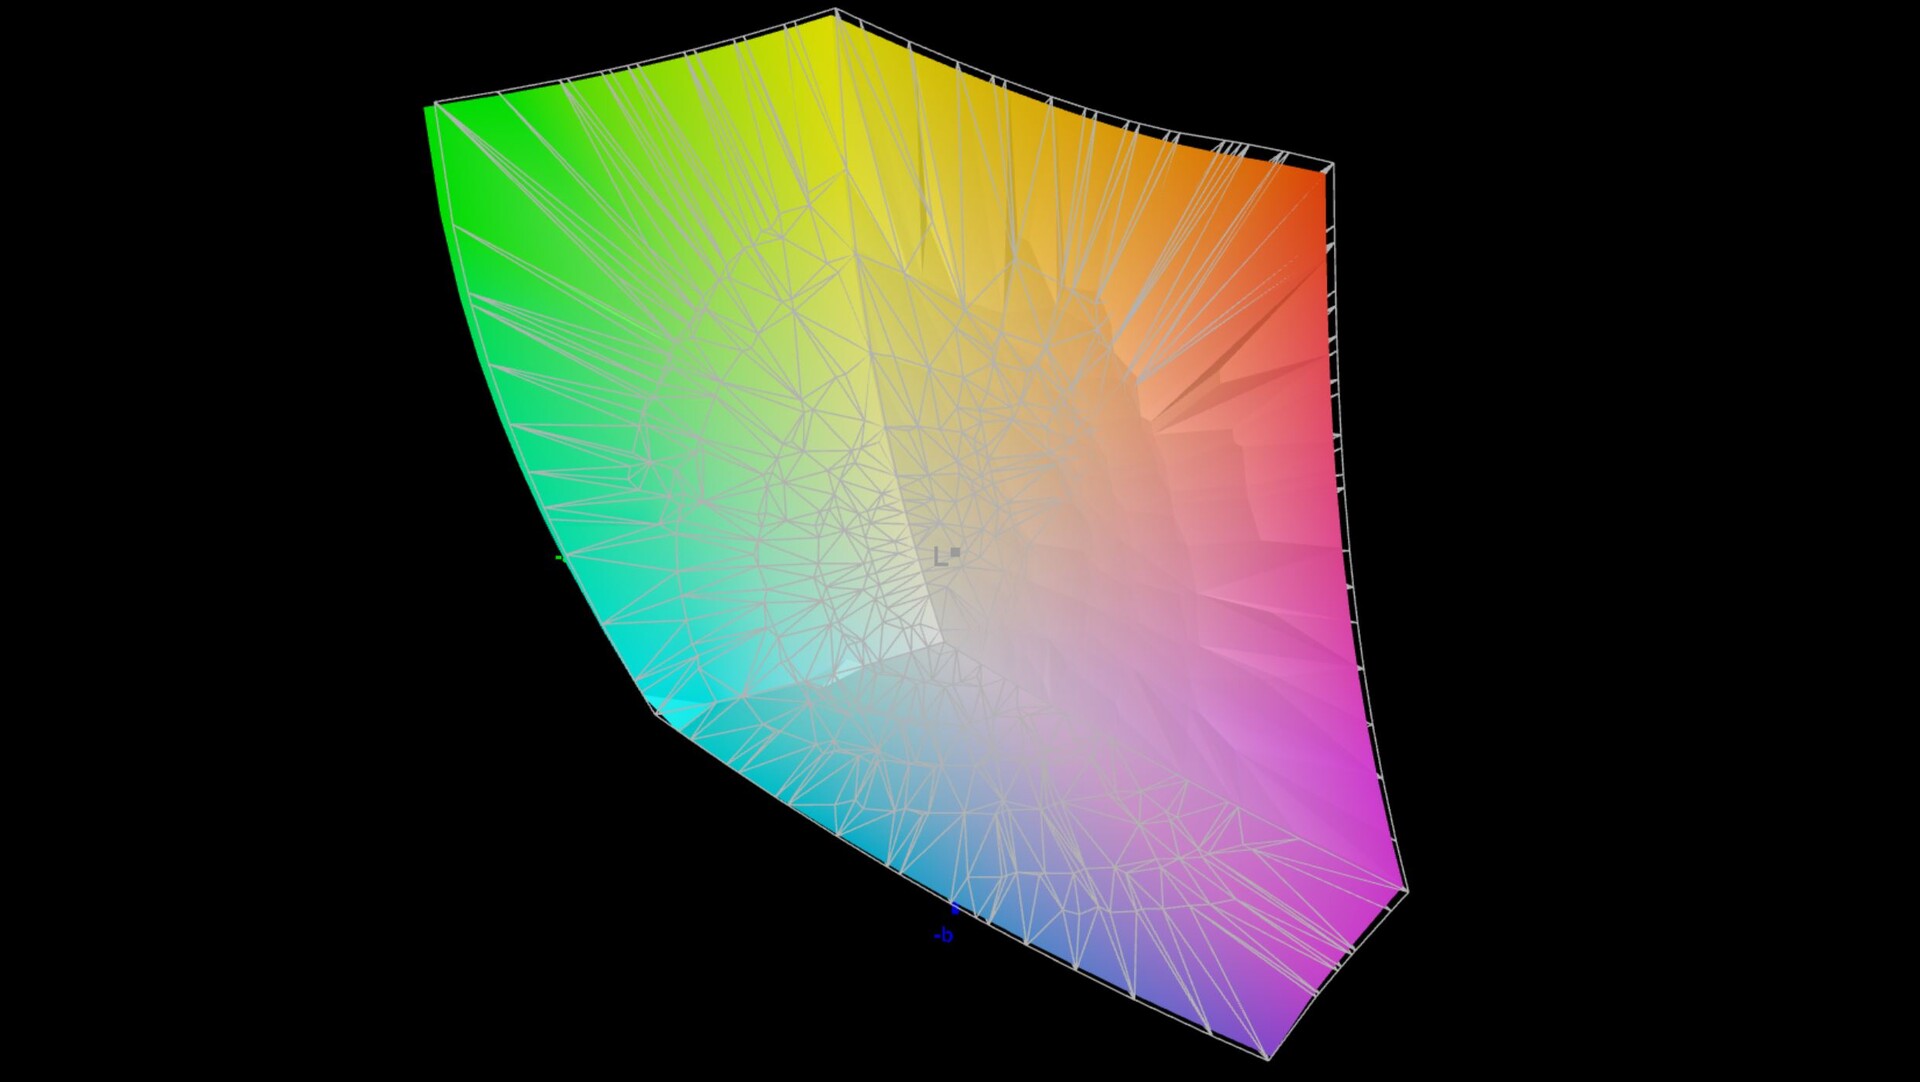
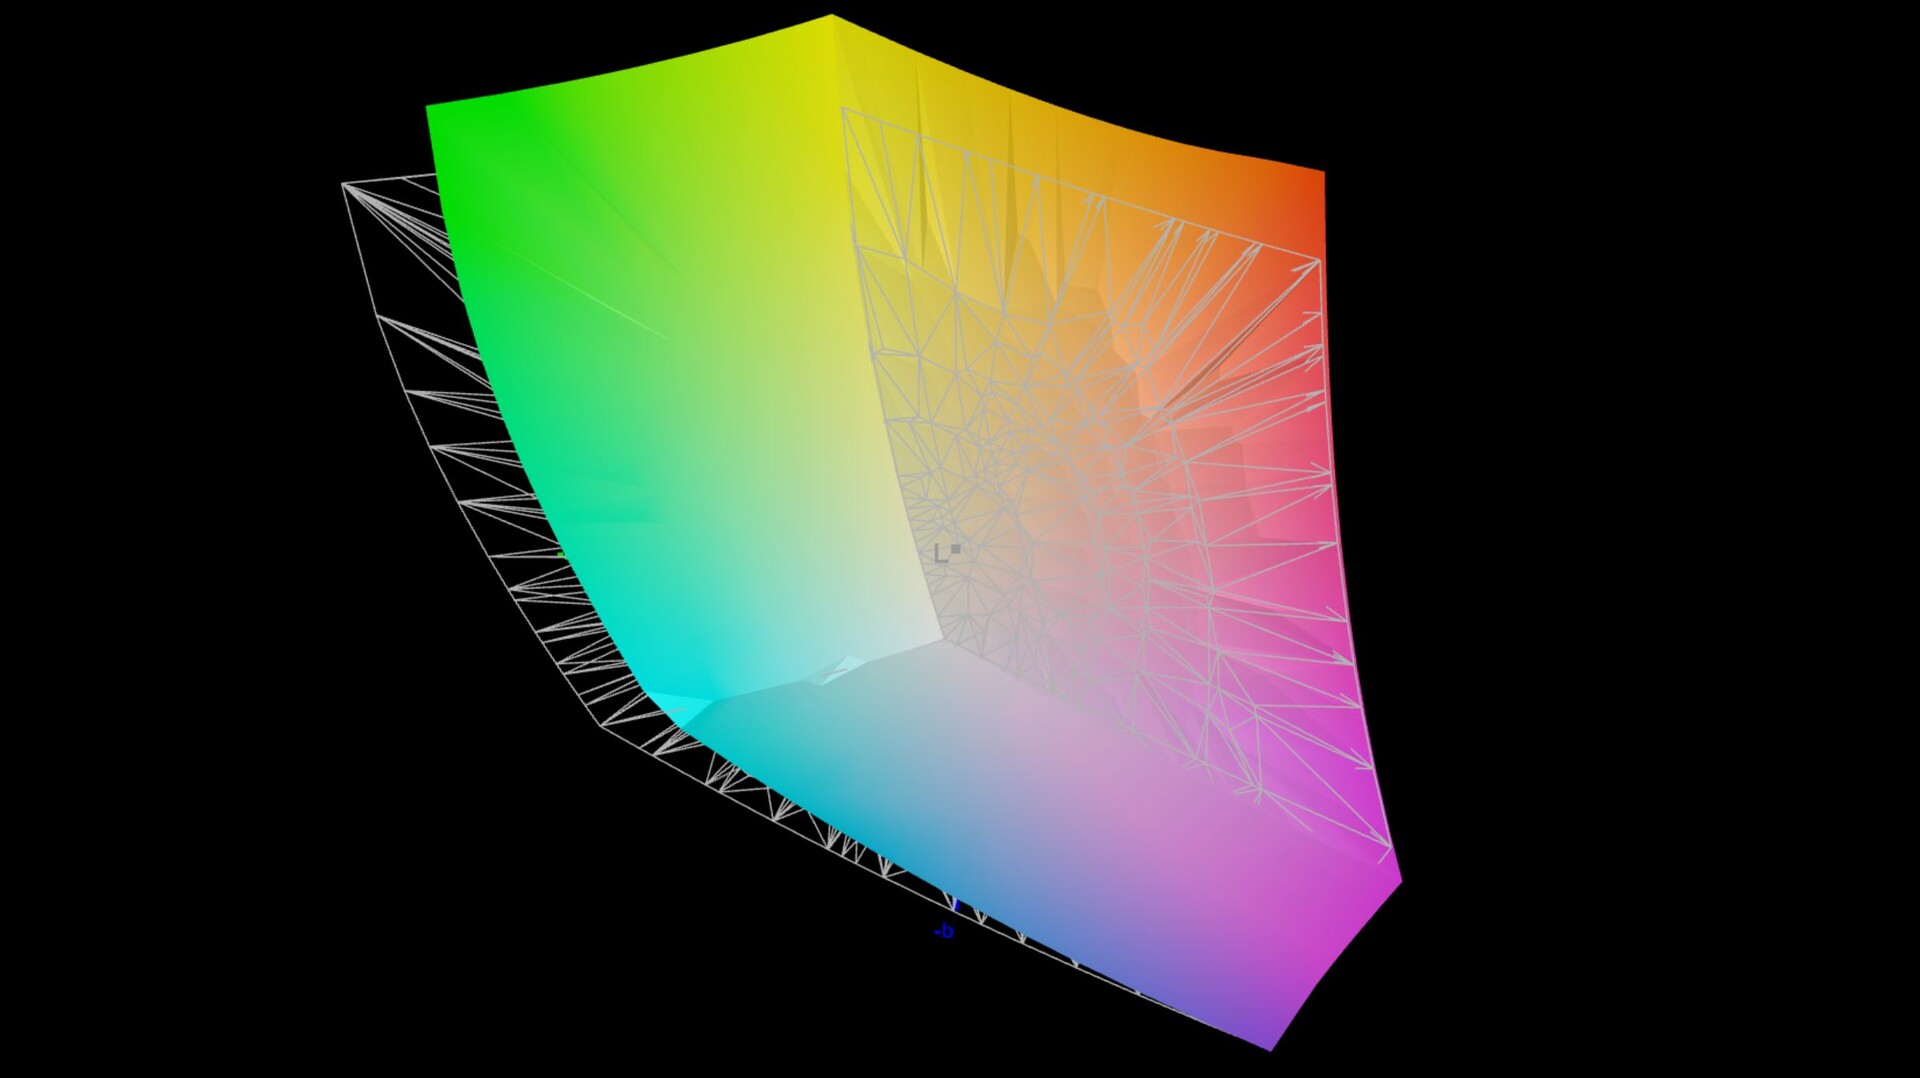
87.4% AdobeRGB 1998 (Argyll 3D)
99.9% sRGB (Argyll 3D)
97.6% Display P3 (Argyll 3D)
Gamma: 2.26
CCT: 6437 K
| MSI CreatorPro Z16P B12UKST B160QAN02.N, IPS, 2560x1600, 16" | HP ZBook Studio 16 G9 62U04EA BOE0A52, IPS, 3840x2400, 16" | Lenovo ThinkPad P1 G4-20Y4S0KS00 LP160UQ1-SPB1, IPS LED, 3840x2400, 16" | Dell Precision 5000 5560 Sharp LQ156R1, IPS, 3840x2400, 15.6" | MSI Creator Z16P B12UHST AUOD298, IPS True Pixel (~100% DCI-P3), 2560x1600, 16" | |
|---|---|---|---|---|---|
| Display | -0% | 0% | 4% | -0% | |
| Display P3 Coverage (%) | 97.6 | 97.5 0% | 85.7 -12% | 94.9 -3% | 97.6 0% |
| sRGB Coverage (%) | 99.9 | 99.9 0% | 99.4 -1% | 100 0% | 99.9 0% |
| AdobeRGB 1998 Coverage (%) | 87.4 | 86.3 -1% | 98.9 13% | 100 14% | 86.8 -1% |
| Response Times | -1% | -327% | -290% | 7% | |
| Response Time Grey 50% / Grey 80% * (ms) | 12.8 ? | 15.3 ? -20% | 55.2 ? -331% | 47.2 ? -269% | 12.9 ? -1% |
| Response Time Black / White * (ms) | 7.4 ? | 6.1 ? 18% | 31.2 ? -322% | 30.4 ? -311% | 6.4 ? 14% |
| PWM Frequency (Hz) | |||||
| Screen | 11% | -11% | -59% | -25% | |
| Brightness middle (cd/m²) | 407 | 554 36% | 630 55% | 501.5 23% | 428 5% |
| Brightness (cd/m²) | 388 | 516 33% | 622 60% | 467 20% | 394 2% |
| Brightness Distribution (%) | 88 | 84 -5% | 90 2% | 83 -6% | 86 -2% |
| Black Level * (cd/m²) | 0.36 | 0.47 -31% | 0.41 -14% | 0.44 -22% | 0.42 -17% |
| Contrast (:1) | 1131 | 1179 4% | 1537 36% | 1140 1% | 1019 -10% |
| Colorchecker dE 2000 * | 1.3 | 1 23% | 2.2 -69% | 4.73 -264% | 1.67 -28% |
| Colorchecker dE 2000 max. * | 2.5 | 2.4 4% | 5 -100% | 8.45 -238% | 5.71 -128% |
| Colorchecker dE 2000 calibrated * | 0.7 | 0.6 14% | 1 -43% | 0.51 27% | 0.71 -1% |
| Greyscale dE 2000 * | 2.1 | 1.6 24% | 2.7 -29% | 3.6 -71% | 3.1 -48% |
| Gamma | 2.26 97% | 2.29 96% | 2.26 97% | 2.08 106% | 2.195 100% |
| CCT | 6437 101% | 6458 101% | 6886 94% | 6447 101% | 6498 100% |
| Całkowita średnia (program / ustawienia) | 3% /
7% | -113% /
-54% | -115% /
-79% | -6% /
-15% |
* ... im mniej tym lepiej
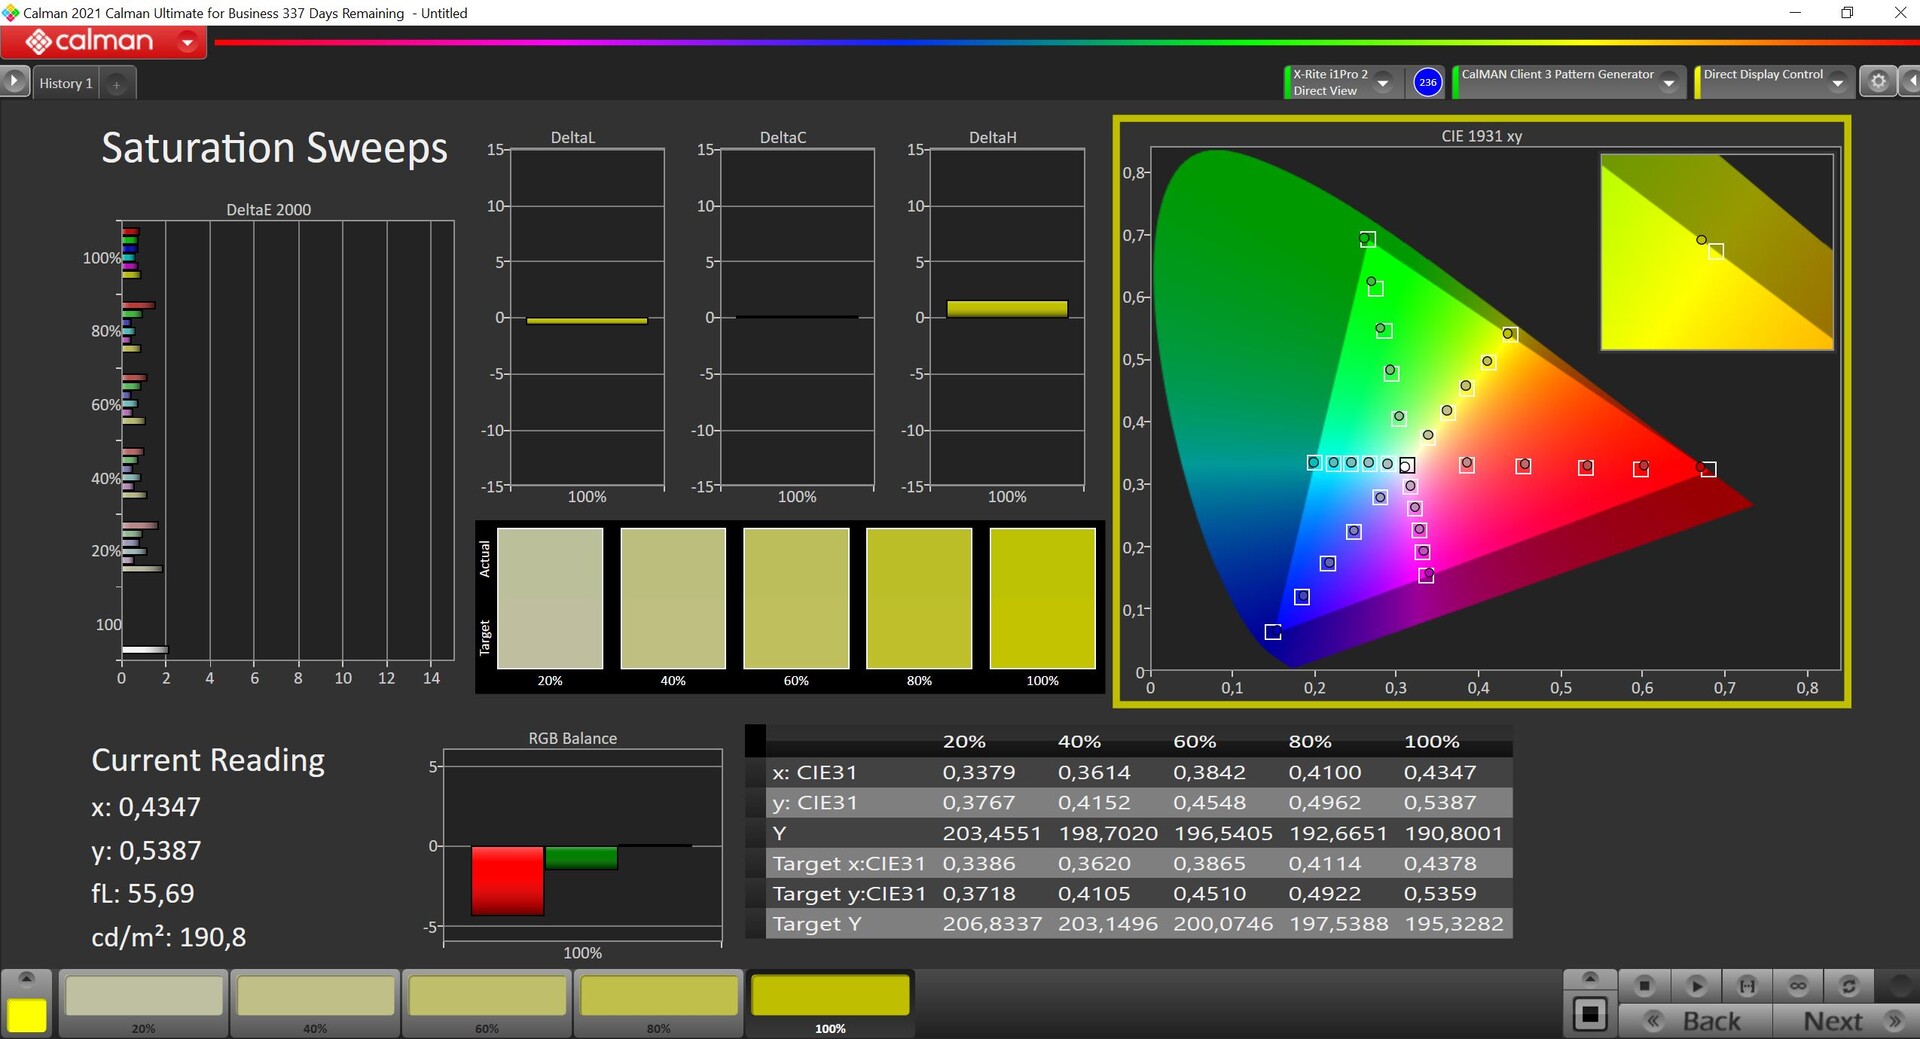
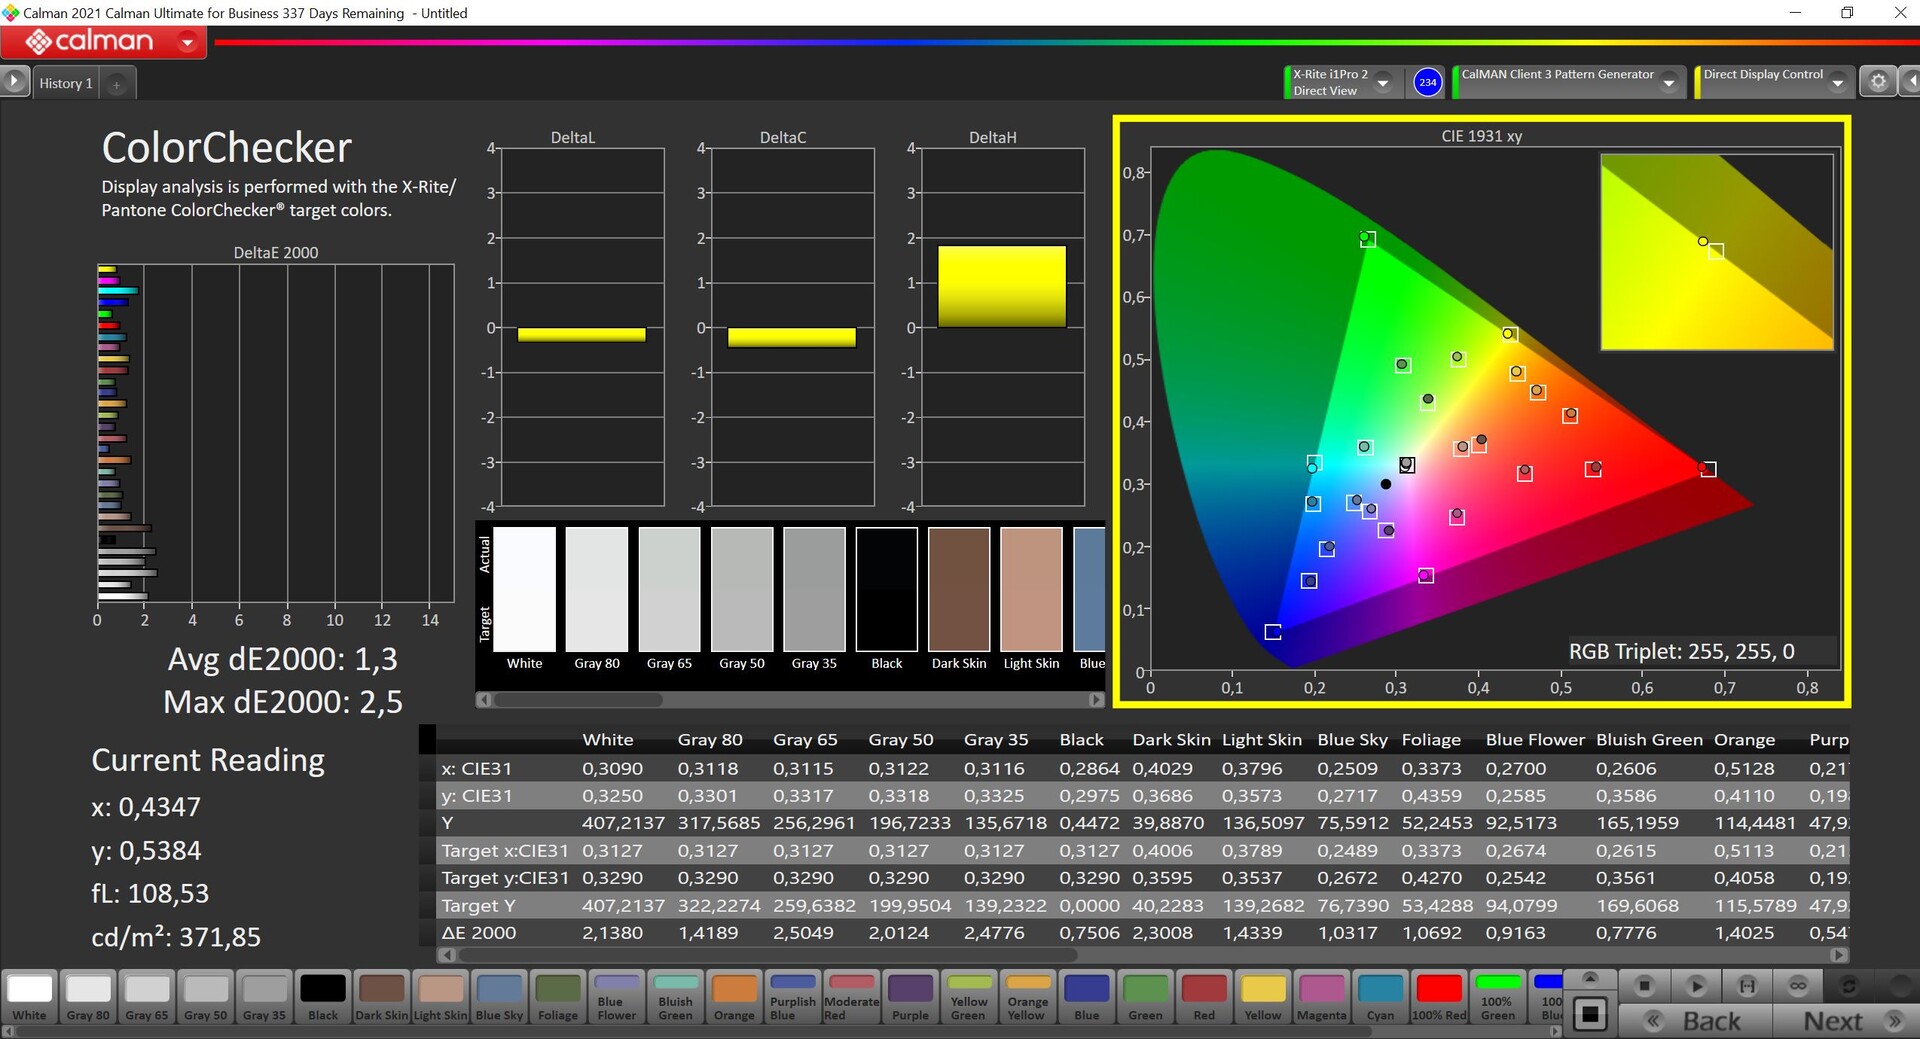
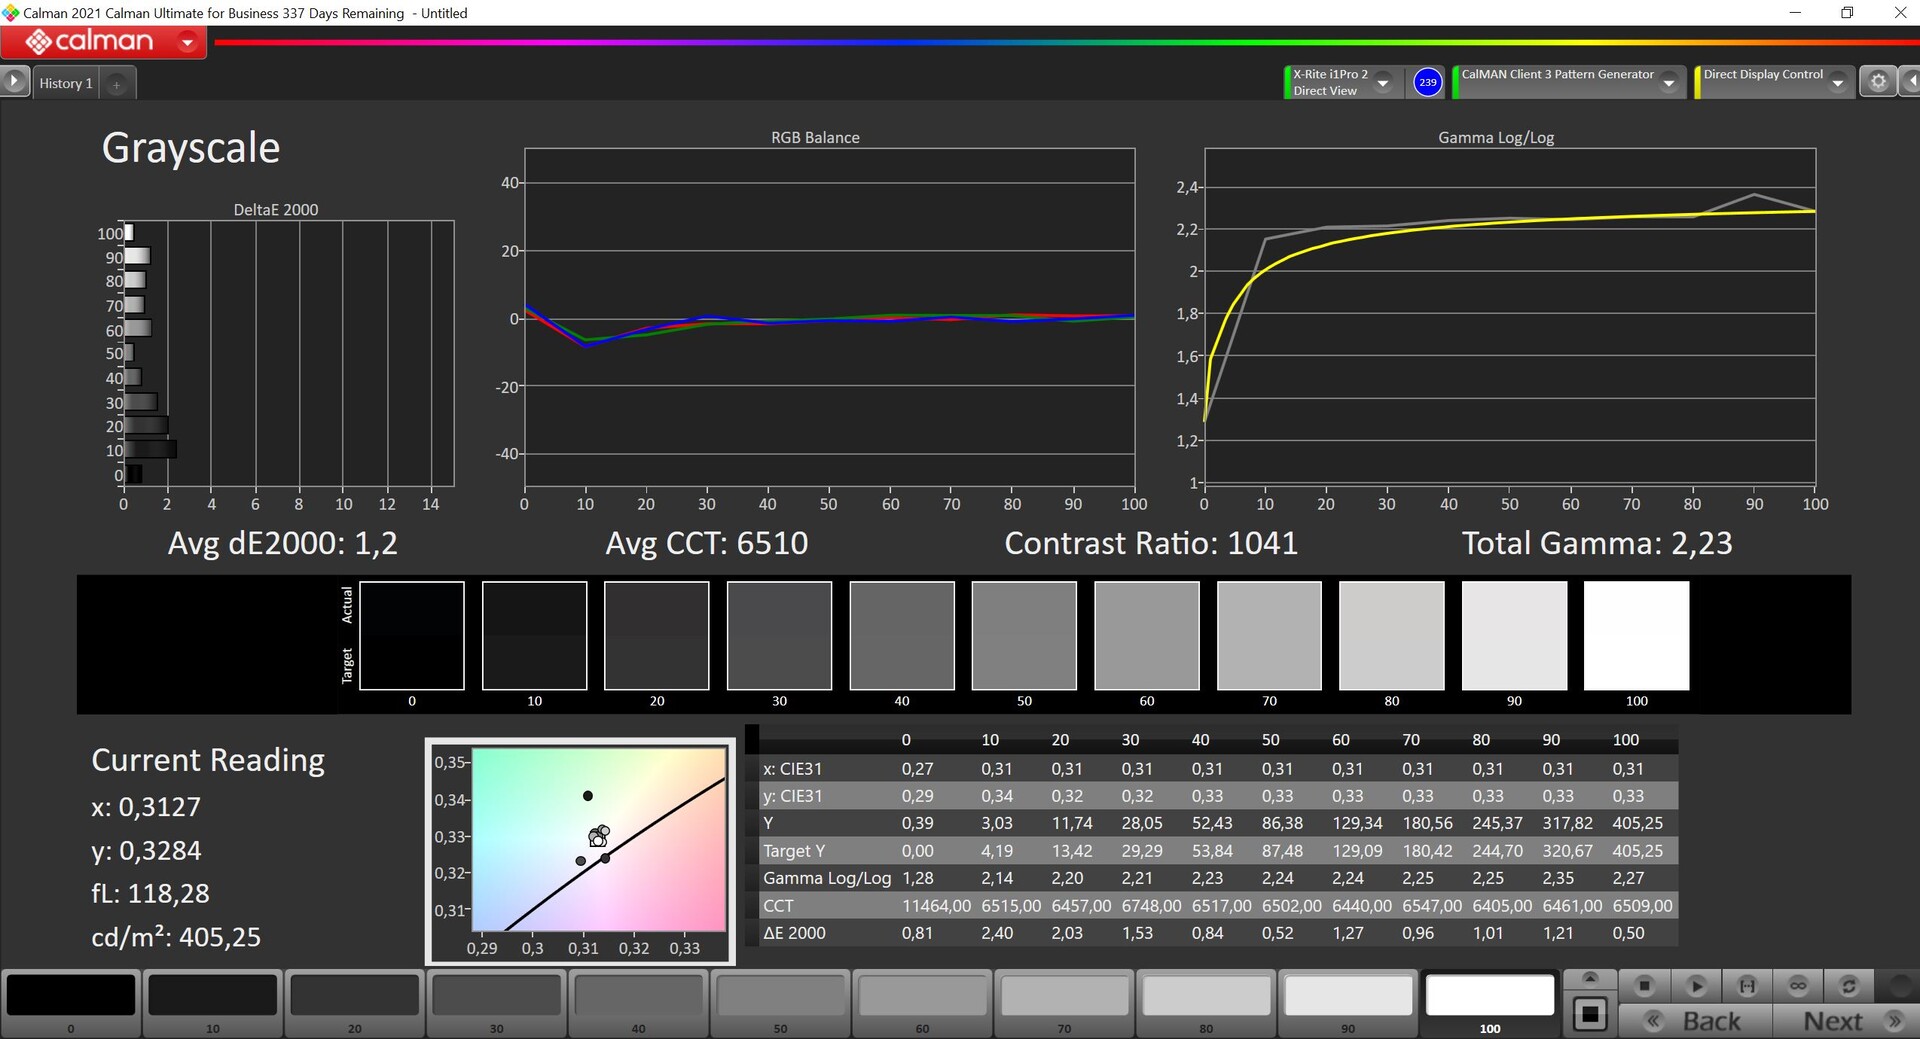
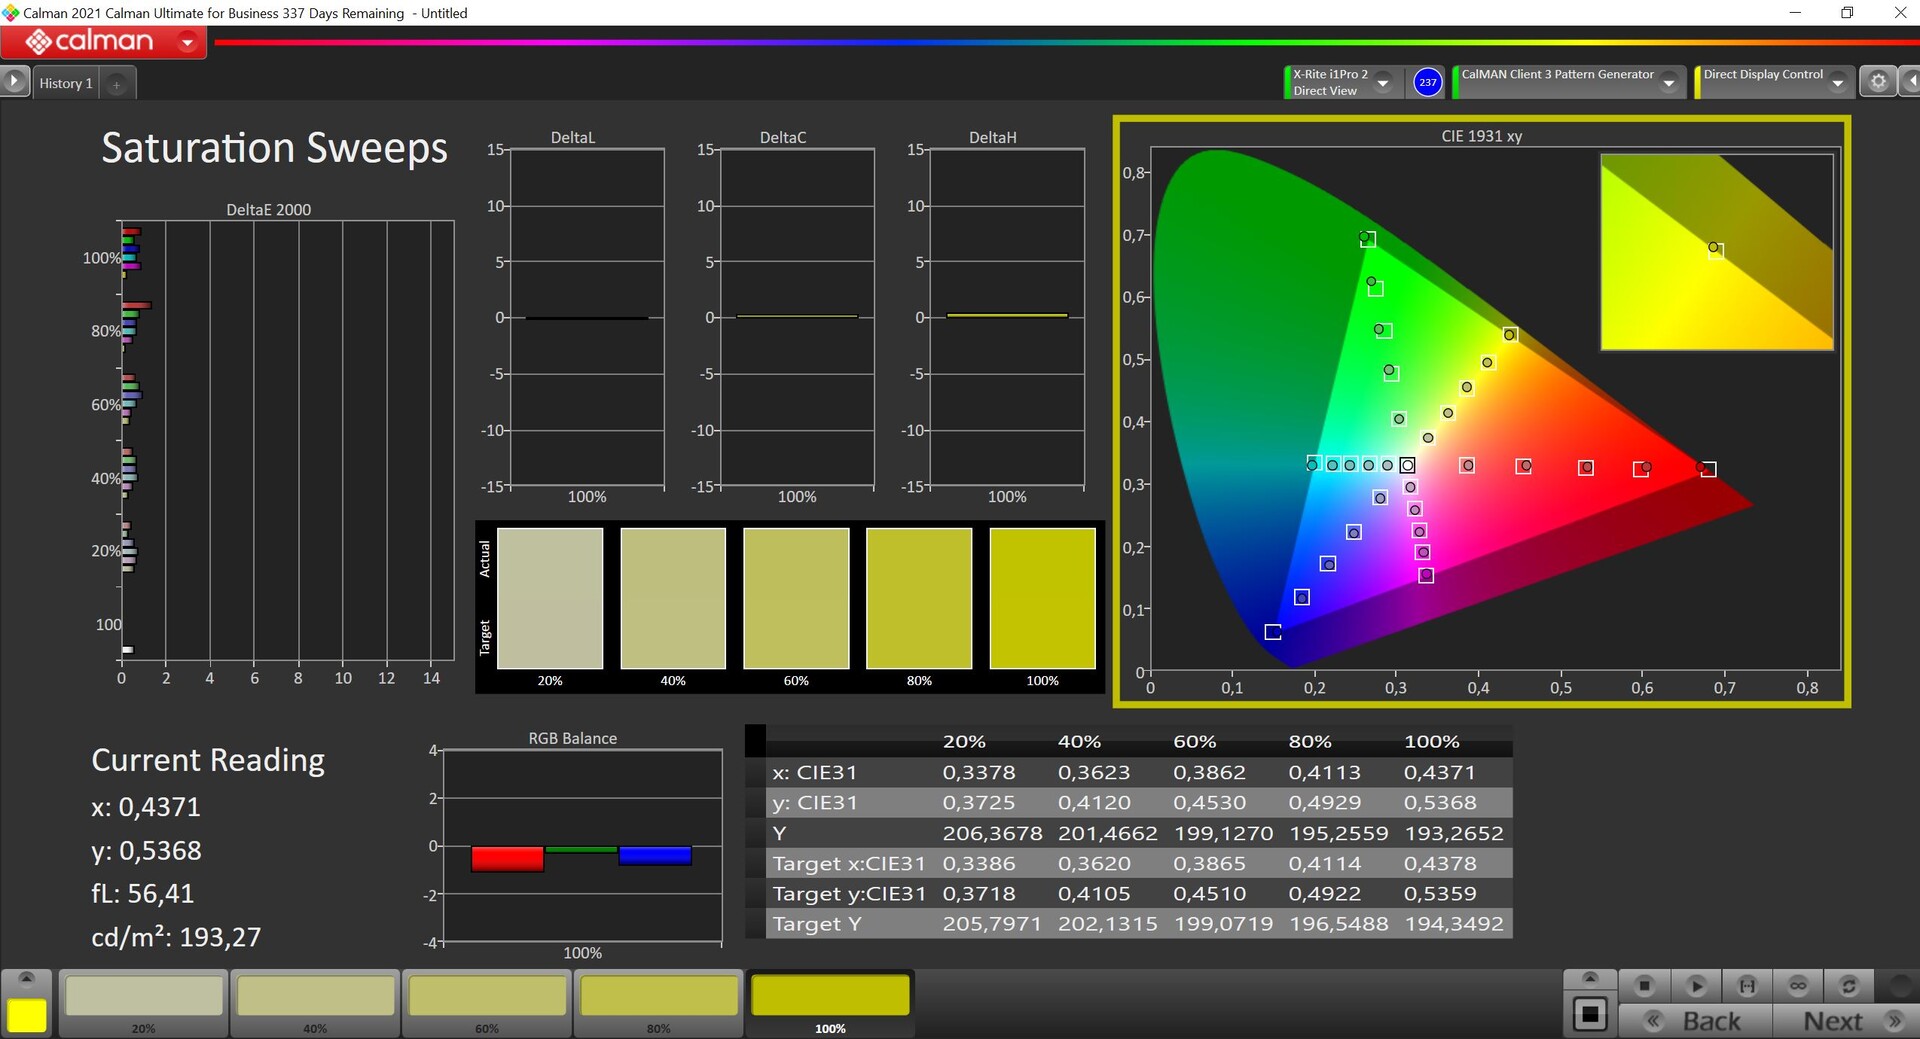
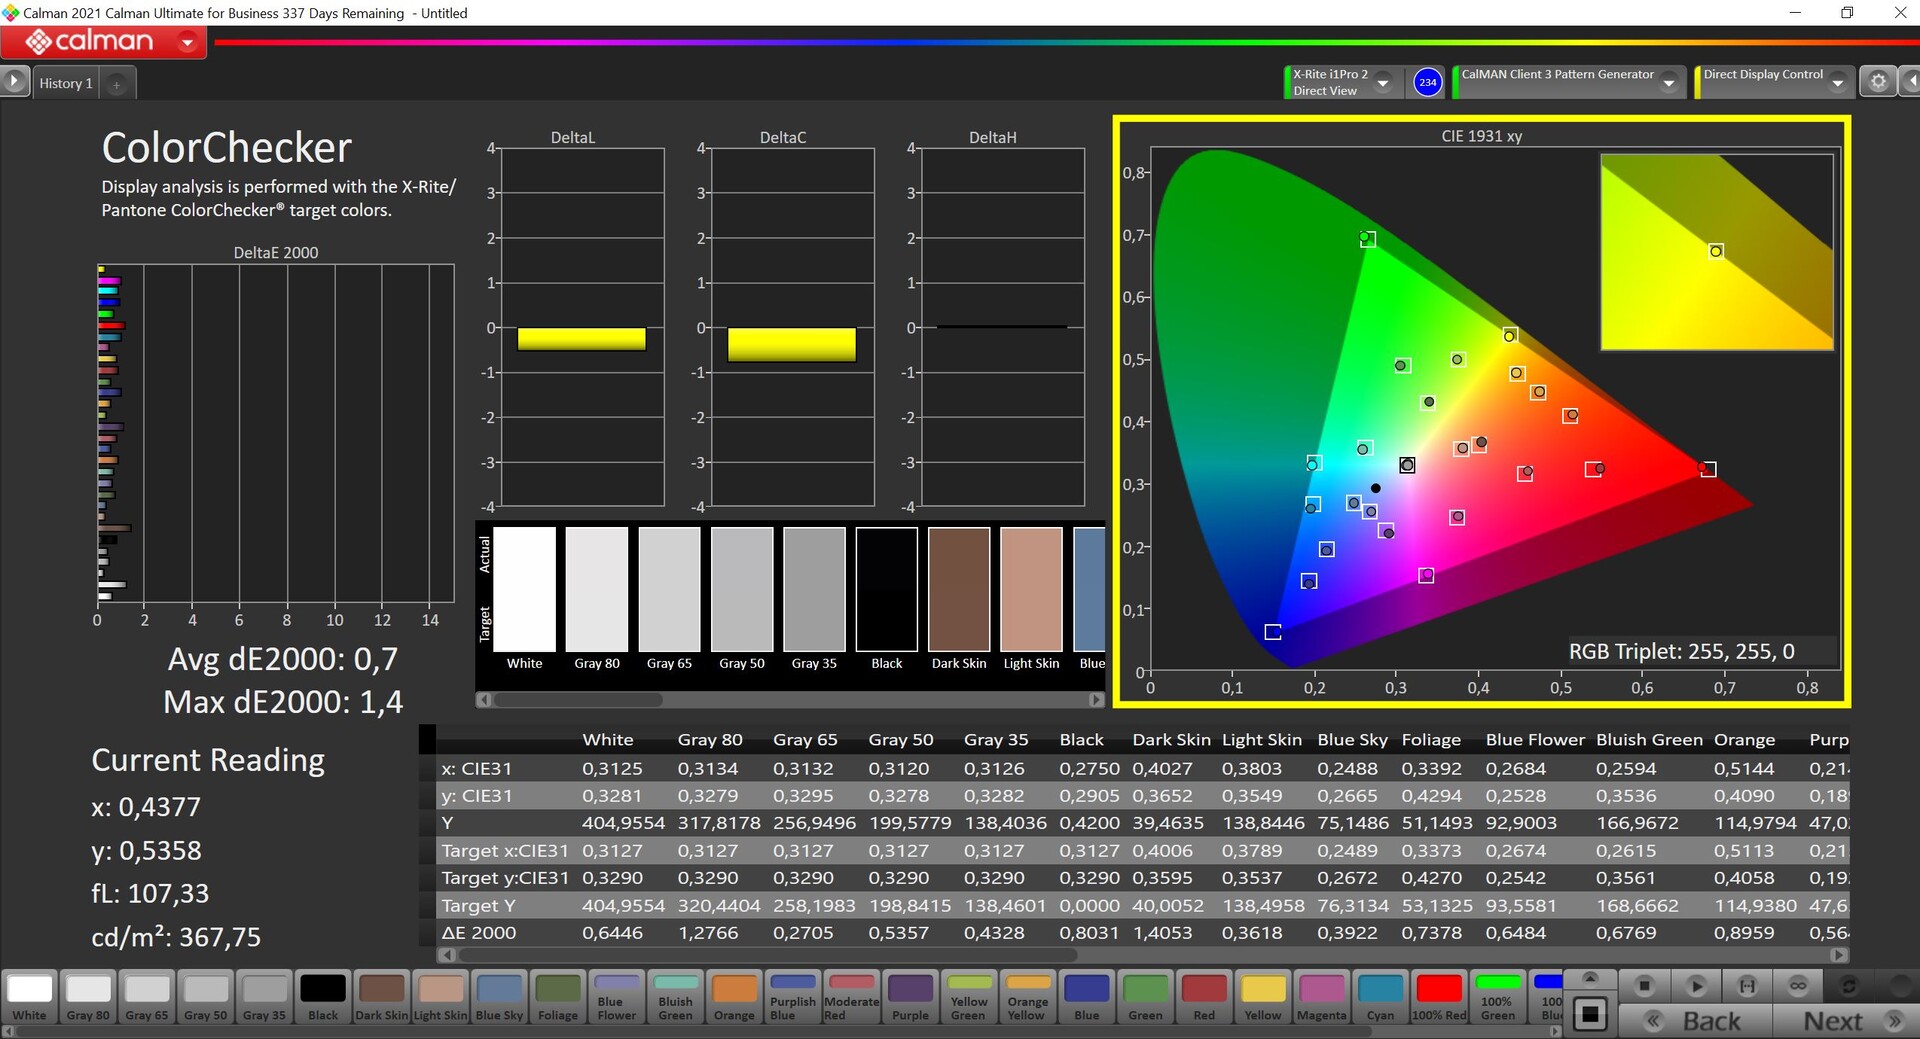
Nasza analiza z użyciem profesjonalnego oprogramowania CalMAN (X-Rite i1 Pro 2) wykazała, że panel jest już w stanie dostawy bardzo dobrze skalibrowany, a reklamowane przez MSI odchylenie DeltaE poniżej 2 w stosunku do referencyjnej przestrzeni barw DCI-P3 jest prawidłowe. W skali szarości odchylenie jest również bardzo małe i nie ma żadnego zabarwienia kolorów. Jesteśmy w stanie jeszcze bardziej poprawić odchylenia za pomocą własnej kalibracji (dostępnej do pobrania za darmo z linku dalej), ale tak naprawdę nie jest to konieczne.
Oprogramowanie TrueColor pozwala również na przełączanie przestrzeni barwnej, jeśli chcemy pracować np. w przestrzeni barwnej sRGB. Ponadto oprogramowanie pozwala także na kalibrację wyświetlacza i pod tym względem CreatorPro Z16P oferuje nawet pewne zalety w porównaniu z niektórymi stacjami roboczymi (np Modele HP ZBook z panelami DreamColorktóre w tym momencie nie oferują już żadnego oprogramowania do obsługi wyświetlacza).
Wyświetl czasy reakcji
| ↔ Czas reakcji od czerni do bieli | ||
|---|---|---|
| 7.4 ms ... wzrost ↗ i spadek ↘ łącznie | ↗ 3.4 ms wzrost | 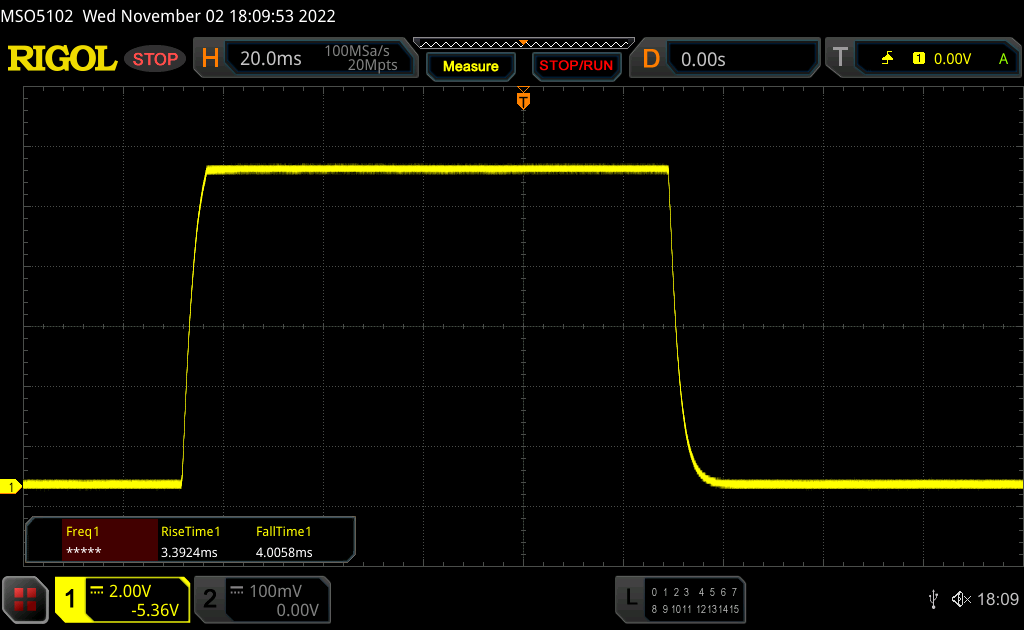 |
| ↘ 4 ms upadek | ||
| W naszych testach ekran wykazuje bardzo szybką reakcję i powinien bardzo dobrze nadawać się do szybkich gier. Dla porównania, wszystkie testowane urządzenia wahają się od 0.1 (minimum) do 240 (maksimum) ms. » 22 % wszystkich urządzeń jest lepszych. Oznacza to, że zmierzony czas reakcji jest lepszy od średniej wszystkich testowanych urządzeń (19.9 ms). | ||
| ↔ Czas reakcji 50% szarości do 80% szarości | ||
| 12.8 ms ... wzrost ↗ i spadek ↘ łącznie | ↗ 6.2 ms wzrost | 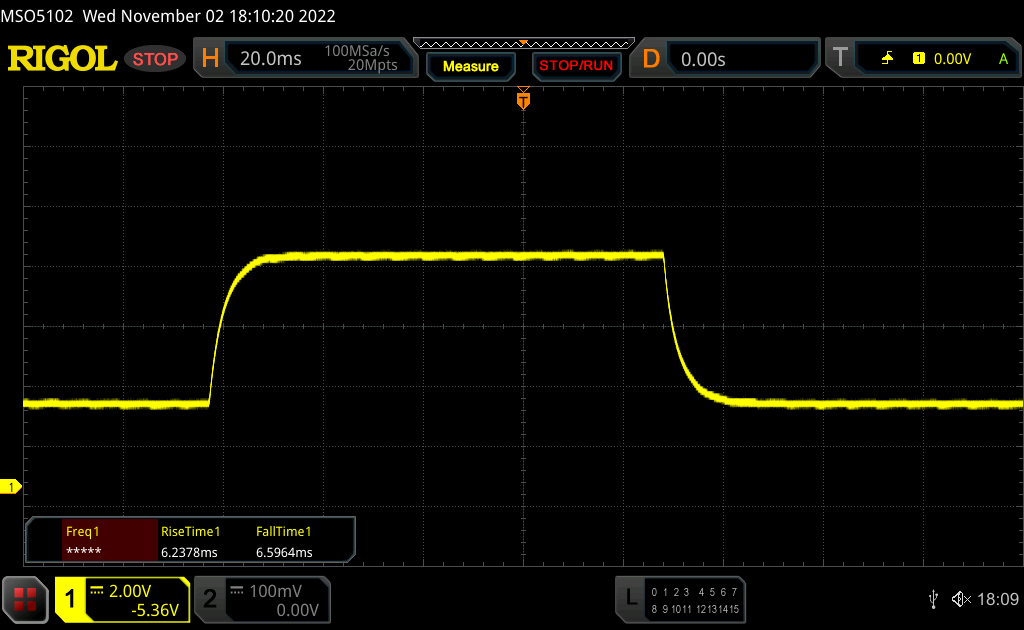 |
| ↘ 6.6 ms upadek | ||
| W naszych testach ekran wykazuje dobry współczynnik reakcji, ale może być zbyt wolny dla graczy rywalizujących ze sobą. Dla porównania, wszystkie testowane urządzenia wahają się od 0.165 (minimum) do 636 (maksimum) ms. » 26 % wszystkich urządzeń jest lepszych. Oznacza to, że zmierzony czas reakcji jest lepszy od średniej wszystkich testowanych urządzeń (31.1 ms). | ||
Migotanie ekranu / PWM (modulacja szerokości impulsu)
| Migotanie ekranu/nie wykryto PWM | 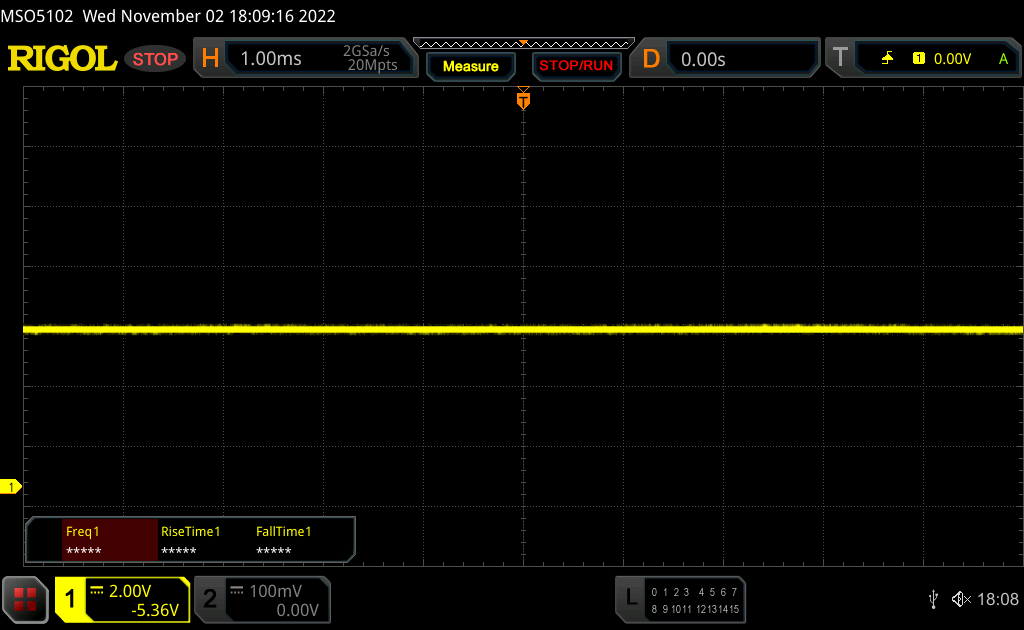 | ||
Dla porównania: 52 % wszystkich testowanych urządzeń nie używa PWM do przyciemniania wyświetlacza. Jeśli wykryto PWM, zmierzono średnio 7797 (minimum: 5 - maksimum: 343500) Hz. | |||
Nawet jeśli odblaskowa powierzchnia wyświetlacza pomaga w jakości obrazu, to oczywiście utrudnia też pracę na zewnątrz. Jeśli tylko uda się uniknąć odbić od źródeł światła lub jasnych obszarów, treść można jeszcze dość łatwo rozpoznać, ale osoby, które od czasu do czasu lubią wykonywać pracę mobilną lub pracują w zmiennych warunkach oświetleniowych, lepiej skorzystałyby z matowego wyświetlacza.
Wydajność - MSI wykorzystuje Intel Alder Lake i Nvidia Studio
Warunki badania
Oprócz ustawień Windows, MSI oferuje także własne profile zasilania w preinstalowanym oprogramowaniu CenterPro, a także tryb Smart Auto AI, który kontroluje wydajność niezależnie od obciążenia. Podczas naszych testów otrzymaliśmy wyniki, które różniły się w części w zależności od profili zasilania. Najlepsze wyniki otrzymaliśmy z trybem Performance, choć i tutaj zdarzały się wahania.
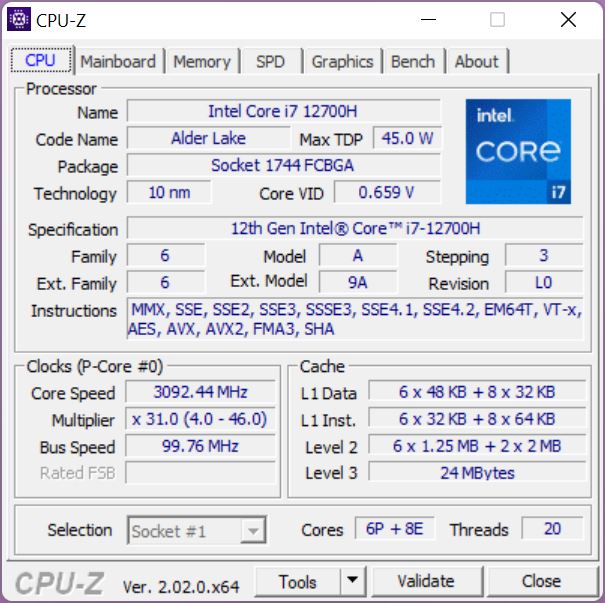
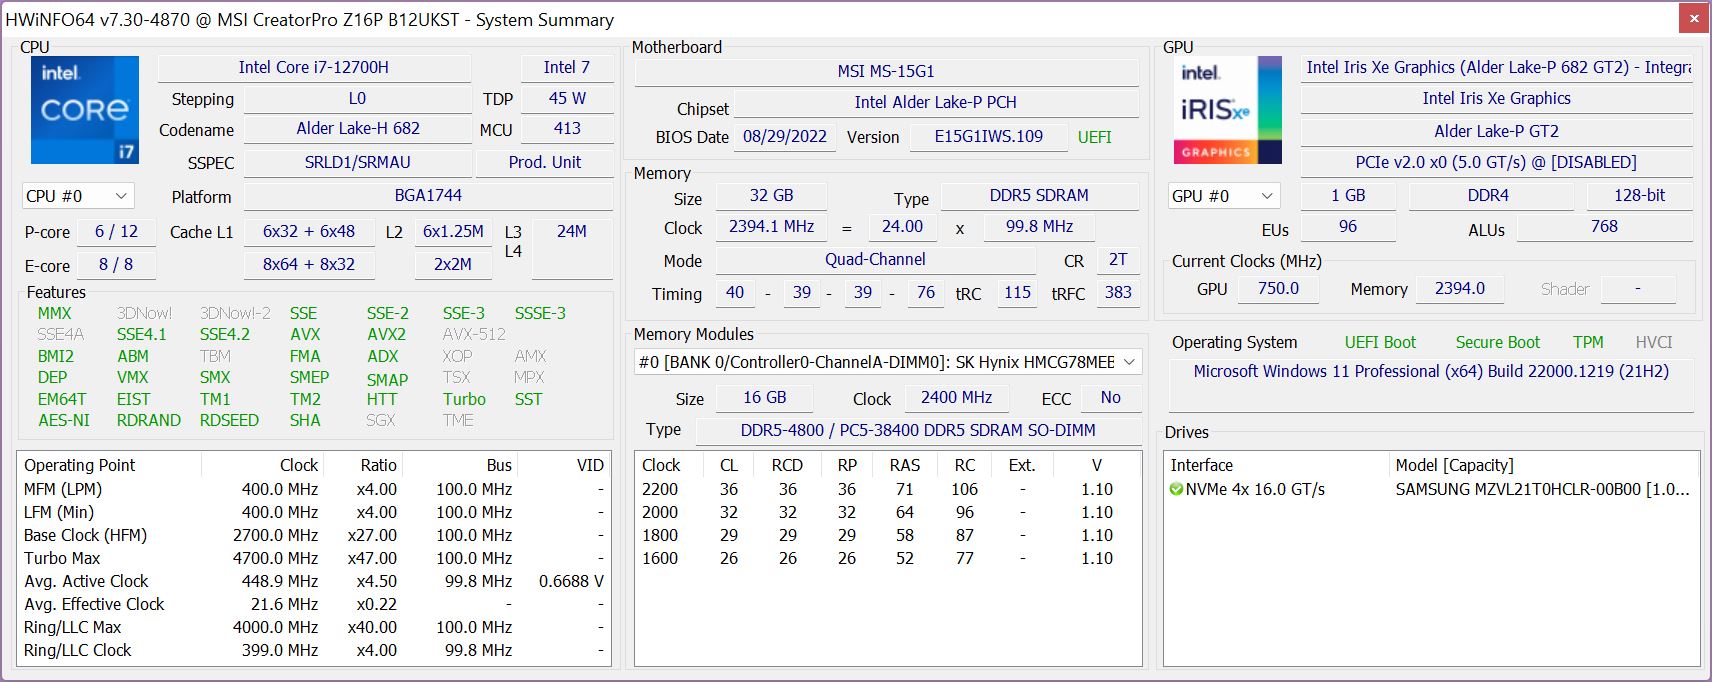
Procesor - Core i7-12700H
StronaIntel Core i7-12700Hjest obecnie stosowany w wielu laptopach, oferując bardzo dobre wartości wydajności dzięki 6 rdzeniom Performance i 8 Efficiency, ale w zależności od konfiguracji TDP mogą występować ogromne różnice. W CreatorPro Z16P wartości te są dobrane dość konserwatywnie i nie zawsze są stabilne. Czasami procesor może pobierać nawet 76 W, ale w pętli Cinebench jest to już tylko 55-60 W. MSI powinno wziąć się za to jeszcze raz i pozwolić na uzyskanie powtarzalnych wyników.
We wszystkich benchmarkach CPU wydajność jest jednak ogólnie bardzo dobra, plasując się minimalnie za HP ZBook Studio 16 G9z Core i7-12800H. Zwykły Creator Z16P w konfiguracji z Core i9-12900H jest średnio o około 9% szybszy. Podczas pracy na akumulatorze pobór mocy przez procesor jest ograniczony do 45 W, co powoduje spadek wydajności o około 25% w testach wielordzeniowych. Dodatkowe benchmarki CPU można znaleźć w naszej sekcji poświęconej procesorom mobilnym.
Cinebench R15 Multi Constant Load Test
Cinebench R23: Multi Core | Single Core
Cinebench R20: CPU (Multi Core) | CPU (Single Core)
Cinebench R15: CPU Multi 64Bit | CPU Single 64Bit
Blender: v2.79 BMW27 CPU
7-Zip 18.03: 7z b 4 | 7z b 4 -mmt1
Geekbench 5.5: Multi-Core | Single-Core
HWBOT x265 Benchmark v2.2: 4k Preset
LibreOffice : 20 Documents To PDF
R Benchmark 2.5: Overall mean
| CPU Performance rating | |
| Średnia w klasie Workstation | |
| MSI Creator Z16P B12UHST | |
| HP ZBook Studio 16 G9 62U04EA | |
| MSI CreatorPro Z16P B12UKST | |
| Przeciętny Intel Core i7-12700H | |
| Lenovo ThinkPad P1 G4-20Y4S0KS00 | |
| Dell Precision 5000 5560 -2! | |
| Cinebench R23 / Multi Core | |
| Średnia w klasie Workstation (14055 - 38520, n=25, ostatnie 2 lata) | |
| MSI Creator Z16P B12UHST | |
| MSI CreatorPro Z16P B12UKST | |
| HP ZBook Studio 16 G9 62U04EA | |
| Przeciętny Intel Core i7-12700H (4032 - 19330, n=64) | |
| Lenovo ThinkPad P1 G4-20Y4S0KS00 | |
| Dell Precision 5000 5560 | |
| Cinebench R23 / Single Core | |
| Średnia w klasie Workstation (1712 - 2228, n=25, ostatnie 2 lata) | |
| MSI Creator Z16P B12UHST | |
| HP ZBook Studio 16 G9 62U04EA | |
| Przeciętny Intel Core i7-12700H (778 - 1826, n=63) | |
| MSI CreatorPro Z16P B12UKST | |
| Lenovo ThinkPad P1 G4-20Y4S0KS00 | |
| Dell Precision 5000 5560 | |
| Cinebench R20 / CPU (Multi Core) | |
| Średnia w klasie Workstation (5471 - 15043, n=25, ostatnie 2 lata) | |
| MSI Creator Z16P B12UHST | |
| MSI CreatorPro Z16P B12UKST | |
| HP ZBook Studio 16 G9 62U04EA | |
| Przeciętny Intel Core i7-12700H (1576 - 7407, n=64) | |
| Lenovo ThinkPad P1 G4-20Y4S0KS00 | |
| Dell Precision 5000 5560 | |
| Cinebench R20 / CPU (Single Core) | |
| Średnia w klasie Workstation (671 - 857, n=25, ostatnie 2 lata) | |
| MSI Creator Z16P B12UHST | |
| HP ZBook Studio 16 G9 62U04EA | |
| Przeciętny Intel Core i7-12700H (300 - 704, n=64) | |
| MSI CreatorPro Z16P B12UKST | |
| Lenovo ThinkPad P1 G4-20Y4S0KS00 | |
| Dell Precision 5000 5560 | |
| Cinebench R15 / CPU Multi 64Bit | |
| Średnia w klasie Workstation (2489 - 5810, n=25, ostatnie 2 lata) | |
| MSI Creator Z16P B12UHST | |
| HP ZBook Studio 16 G9 62U04EA | |
| Przeciętny Intel Core i7-12700H (1379 - 2916, n=70) | |
| MSI CreatorPro Z16P B12UKST | |
| Lenovo ThinkPad P1 G4-20Y4S0KS00 | |
| Dell Precision 5000 5560 | |
| Cinebench R15 / CPU Single 64Bit | |
| Średnia w klasie Workstation (191.4 - 328, n=25, ostatnie 2 lata) | |
| MSI Creator Z16P B12UHST | |
| HP ZBook Studio 16 G9 62U04EA | |
| Przeciętny Intel Core i7-12700H (113 - 263, n=65) | |
| MSI CreatorPro Z16P B12UKST | |
| Lenovo ThinkPad P1 G4-20Y4S0KS00 | |
| Dell Precision 5000 5560 | |
| Blender / v2.79 BMW27 CPU | |
| Dell Precision 5000 5560 | |
| Lenovo ThinkPad P1 G4-20Y4S0KS00 | |
| Przeciętny Intel Core i7-12700H (168 - 732, n=63) | |
| MSI CreatorPro Z16P B12UKST | |
| HP ZBook Studio 16 G9 62U04EA | |
| MSI Creator Z16P B12UHST | |
| Średnia w klasie Workstation (91 - 261, n=25, ostatnie 2 lata) | |
| 7-Zip 18.03 / 7z b 4 | |
| Średnia w klasie Workstation (54741 - 116969, n=25, ostatnie 2 lata) | |
| MSI Creator Z16P B12UHST | |
| HP ZBook Studio 16 G9 62U04EA | |
| MSI CreatorPro Z16P B12UKST | |
| Przeciętny Intel Core i7-12700H (22844 - 73067, n=63) | |
| Lenovo ThinkPad P1 G4-20Y4S0KS00 | |
| Dell Precision 5000 5560 | |
| 7-Zip 18.03 / 7z b 4 -mmt1 | |
| Średnia w klasie Workstation (5126 - 6960, n=25, ostatnie 2 lata) | |
| MSI Creator Z16P B12UHST | |
| HP ZBook Studio 16 G9 62U04EA | |
| MSI CreatorPro Z16P B12UKST | |
| Lenovo ThinkPad P1 G4-20Y4S0KS00 | |
| Dell Precision 5000 5560 | |
| Przeciętny Intel Core i7-12700H (2743 - 5972, n=63) | |
| Geekbench 5.5 / Multi-Core | |
| Średnia w klasie Workstation (11542 - 25554, n=25, ostatnie 2 lata) | |
| MSI Creator Z16P B12UHST | |
| HP ZBook Studio 16 G9 62U04EA | |
| MSI CreatorPro Z16P B12UKST | |
| Przeciętny Intel Core i7-12700H (5144 - 13745, n=64) | |
| Lenovo ThinkPad P1 G4-20Y4S0KS00 | |
| Geekbench 5.5 / Single-Core | |
| Średnia w klasie Workstation (1781 - 2183, n=25, ostatnie 2 lata) | |
| MSI Creator Z16P B12UHST | |
| HP ZBook Studio 16 G9 62U04EA | |
| MSI CreatorPro Z16P B12UKST | |
| Przeciętny Intel Core i7-12700H (803 - 1851, n=64) | |
| Lenovo ThinkPad P1 G4-20Y4S0KS00 | |
| HWBOT x265 Benchmark v2.2 / 4k Preset | |
| Średnia w klasie Workstation (14.4 - 40.5, n=25, ostatnie 2 lata) | |
| HP ZBook Studio 16 G9 62U04EA | |
| MSI CreatorPro Z16P B12UKST | |
| MSI Creator Z16P B12UHST | |
| Przeciętny Intel Core i7-12700H (4.67 - 21.8, n=64) | |
| Lenovo ThinkPad P1 G4-20Y4S0KS00 | |
| Dell Precision 5000 5560 | |
| LibreOffice / 20 Documents To PDF | |
| Dell Precision 5000 5560 | |
| Średnia w klasie Workstation (37.1 - 74.7, n=25, ostatnie 2 lata) | |
| Przeciętny Intel Core i7-12700H (34.2 - 95.3, n=63) | |
| Lenovo ThinkPad P1 G4-20Y4S0KS00 | |
| HP ZBook Studio 16 G9 62U04EA | |
| MSI Creator Z16P B12UHST | |
| MSI CreatorPro Z16P B12UKST | |
| R Benchmark 2.5 / Overall mean | |
| Dell Precision 5000 5560 | |
| Lenovo ThinkPad P1 G4-20Y4S0KS00 | |
| Przeciętny Intel Core i7-12700H (0.4441 - 1.052, n=63) | |
| MSI CreatorPro Z16P B12UKST | |
| HP ZBook Studio 16 G9 62U04EA | |
| Średnia w klasie Workstation (0.3825 - 0.603, n=25, ostatnie 2 lata) | |
| MSI Creator Z16P B12UHST | |
* ... im mniej tym lepiej
AIDA64: FP32 Ray-Trace | FPU Julia | CPU SHA3 | CPU Queen | FPU SinJulia | FPU Mandel | CPU AES | CPU ZLib | FP64 Ray-Trace | CPU PhotoWorxx
| Performance rating | |
| Średnia w klasie Workstation | |
| MSI CreatorPro Z16P B12UKST | |
| HP ZBook Studio 16 G9 62U04EA | |
| Lenovo ThinkPad P1 G4-20Y4Z9DVUS | |
| MSI Creator Z16P B12UHST | |
| Przeciętny Intel Core i7-12700H | |
| AIDA64 / FP32 Ray-Trace | |
| Średnia w klasie Workstation (10658 - 61611, n=25, ostatnie 2 lata) | |
| Lenovo ThinkPad P1 G4-20Y4Z9DVUS | |
| HP ZBook Studio 16 G9 62U04EA | |
| MSI CreatorPro Z16P B12UKST | |
| Przeciętny Intel Core i7-12700H (2585 - 17957, n=64) | |
| MSI Creator Z16P B12UHST | |
| AIDA64 / FPU Julia | |
| Średnia w klasie Workstation (56664 - 186971, n=25, ostatnie 2 lata) | |
| HP ZBook Studio 16 G9 62U04EA | |
| MSI CreatorPro Z16P B12UKST | |
| Lenovo ThinkPad P1 G4-20Y4Z9DVUS | |
| Przeciętny Intel Core i7-12700H (12439 - 90760, n=64) | |
| MSI Creator Z16P B12UHST | |
| AIDA64 / CPU SHA3 | |
| Średnia w klasie Workstation (2608 - 8975, n=25, ostatnie 2 lata) | |
| Lenovo ThinkPad P1 G4-20Y4Z9DVUS | |
| HP ZBook Studio 16 G9 62U04EA | |
| MSI CreatorPro Z16P B12UKST | |
| Przeciętny Intel Core i7-12700H (833 - 4242, n=64) | |
| MSI Creator Z16P B12UHST | |
| AIDA64 / CPU Queen | |
| HP ZBook Studio 16 G9 62U04EA | |
| Średnia w klasie Workstation (60778 - 144411, n=25, ostatnie 2 lata) | |
| MSI Creator Z16P B12UHST | |
| MSI CreatorPro Z16P B12UKST | |
| Przeciętny Intel Core i7-12700H (57923 - 103202, n=63) | |
| Lenovo ThinkPad P1 G4-20Y4Z9DVUS | |
| AIDA64 / FPU SinJulia | |
| Średnia w klasie Workstation (8165 - 29343, n=25, ostatnie 2 lata) | |
| MSI Creator Z16P B12UHST | |
| Lenovo ThinkPad P1 G4-20Y4Z9DVUS | |
| HP ZBook Studio 16 G9 62U04EA | |
| MSI CreatorPro Z16P B12UKST | |
| Przeciętny Intel Core i7-12700H (3249 - 9939, n=64) | |
| AIDA64 / FPU Mandel | |
| Średnia w klasie Workstation (27301 - 98153, n=25, ostatnie 2 lata) | |
| HP ZBook Studio 16 G9 62U04EA | |
| Lenovo ThinkPad P1 G4-20Y4Z9DVUS | |
| MSI CreatorPro Z16P B12UKST | |
| Przeciętny Intel Core i7-12700H (7135 - 44760, n=64) | |
| MSI Creator Z16P B12UHST | |
| AIDA64 / CPU AES | |
| MSI CreatorPro Z16P B12UKST | |
| Średnia w klasie Workstation (56077 - 187841, n=25, ostatnie 2 lata) | |
| MSI Creator Z16P B12UHST | |
| Lenovo ThinkPad P1 G4-20Y4Z9DVUS | |
| Przeciętny Intel Core i7-12700H (31839 - 144360, n=64) | |
| HP ZBook Studio 16 G9 62U04EA | |
| AIDA64 / CPU ZLib | |
| Średnia w klasie Workstation (742 - 2148, n=25, ostatnie 2 lata) | |
| MSI Creator Z16P B12UHST | |
| HP ZBook Studio 16 G9 62U04EA | |
| MSI CreatorPro Z16P B12UKST | |
| Przeciętny Intel Core i7-12700H (305 - 1171, n=64) | |
| Lenovo ThinkPad P1 G4-20Y4Z9DVUS | |
| AIDA64 / FP64 Ray-Trace | |
| Średnia w klasie Workstation (5580 - 32891, n=25, ostatnie 2 lata) | |
| HP ZBook Studio 16 G9 62U04EA | |
| Lenovo ThinkPad P1 G4-20Y4Z9DVUS | |
| MSI CreatorPro Z16P B12UKST | |
| Przeciętny Intel Core i7-12700H (1437 - 9692, n=64) | |
| MSI Creator Z16P B12UHST | |
| AIDA64 / CPU PhotoWorxx | |
| Średnia w klasie Workstation (37151 - 93684, n=25, ostatnie 2 lata) | |
| MSI CreatorPro Z16P B12UKST | |
| MSI Creator Z16P B12UHST | |
| HP ZBook Studio 16 G9 62U04EA | |
| Przeciętny Intel Core i7-12700H (12863 - 52207, n=64) | |
| Lenovo ThinkPad P1 G4-20Y4Z9DVUS | |
Wydajność systemu
Niezbyt zaskakujące jest to, że w podstawowej wydajności systemu nie ma żadnych problemów. W naszych testach laptop jest zawsze bardzo responsywny, a wyniki benchmarków również okazują się bardzo dobre.
CrossMark: Overall | Productivity | Creativity | Responsiveness
| PCMark 10 / Score | |
| MSI Creator Z16P B12UHST | |
| Średnia w klasie Workstation (6436 - 10409, n=21, ostatnie 2 lata) | |
| Lenovo ThinkPad P1 G4-20Y4S0KS00 | |
| MSI CreatorPro Z16P B12UKST | |
| Przeciętny Intel Core i7-12700H, NVIDIA RTX A3000 Laptop GPU (n=1) | |
| Dell Precision 5000 5560 | |
| HP ZBook Studio 16 G9 62U04EA | |
| PCMark 10 / Essentials | |
| MSI Creator Z16P B12UHST | |
| Lenovo ThinkPad P1 G4-20Y4S0KS00 | |
| Dell Precision 5000 5560 | |
| MSI CreatorPro Z16P B12UKST | |
| Przeciętny Intel Core i7-12700H, NVIDIA RTX A3000 Laptop GPU (n=1) | |
| Średnia w klasie Workstation (9622 - 11157, n=21, ostatnie 2 lata) | |
| HP ZBook Studio 16 G9 62U04EA | |
| PCMark 10 / Productivity | |
| Średnia w klasie Workstation (8789 - 20616, n=21, ostatnie 2 lata) | |
| MSI Creator Z16P B12UHST | |
| MSI CreatorPro Z16P B12UKST | |
| Przeciętny Intel Core i7-12700H, NVIDIA RTX A3000 Laptop GPU (n=1) | |
| Dell Precision 5000 5560 | |
| Lenovo ThinkPad P1 G4-20Y4S0KS00 | |
| HP ZBook Studio 16 G9 62U04EA | |
| PCMark 10 / Digital Content Creation | |
| Średnia w klasie Workstation (7744 - 15631, n=21, ostatnie 2 lata) | |
| MSI Creator Z16P B12UHST | |
| Lenovo ThinkPad P1 G4-20Y4S0KS00 | |
| MSI CreatorPro Z16P B12UKST | |
| Przeciętny Intel Core i7-12700H, NVIDIA RTX A3000 Laptop GPU (n=1) | |
| HP ZBook Studio 16 G9 62U04EA | |
| Dell Precision 5000 5560 | |
| CrossMark / Overall | |
| MSI CreatorPro Z16P B12UKST | |
| Przeciętny Intel Core i7-12700H, NVIDIA RTX A3000 Laptop GPU (n=1) | |
| Średnia w klasie Workstation (1307 - 2267, n=24, ostatnie 2 lata) | |
| HP ZBook Studio 16 G9 62U04EA | |
| Lenovo ThinkPad P1 G4-20Y4S0KS00 | |
| CrossMark / Productivity | |
| MSI CreatorPro Z16P B12UKST | |
| Przeciętny Intel Core i7-12700H, NVIDIA RTX A3000 Laptop GPU (n=1) | |
| Średnia w klasie Workstation (1130 - 2122, n=24, ostatnie 2 lata) | |
| HP ZBook Studio 16 G9 62U04EA | |
| Lenovo ThinkPad P1 G4-20Y4S0KS00 | |
| CrossMark / Creativity | |
| Średnia w klasie Workstation (1657 - 2725, n=24, ostatnie 2 lata) | |
| HP ZBook Studio 16 G9 62U04EA | |
| MSI CreatorPro Z16P B12UKST | |
| Przeciętny Intel Core i7-12700H, NVIDIA RTX A3000 Laptop GPU (n=1) | |
| Lenovo ThinkPad P1 G4-20Y4S0KS00 | |
| CrossMark / Responsiveness | |
| MSI CreatorPro Z16P B12UKST | |
| Przeciętny Intel Core i7-12700H, NVIDIA RTX A3000 Laptop GPU (n=1) | |
| Średnia w klasie Workstation (993 - 2096, n=24, ostatnie 2 lata) | |
| HP ZBook Studio 16 G9 62U04EA | |
| Lenovo ThinkPad P1 G4-20Y4S0KS00 | |
| PCMark 10 Score | 7086 pkt. | |
Pomoc | ||
| AIDA64 / Memory Copy | |
| Średnia w klasie Workstation (56003 - 164795, n=25, ostatnie 2 lata) | |
| MSI Creator Z16P B12UHST | |
| MSI CreatorPro Z16P B12UKST | |
| HP ZBook Studio 16 G9 62U04EA | |
| Przeciętny Intel Core i7-12700H (25615 - 80511, n=64) | |
| Lenovo ThinkPad P1 G4-20Y4Z9DVUS | |
| AIDA64 / Memory Read | |
| Średnia w klasie Workstation (55795 - 121563, n=25, ostatnie 2 lata) | |
| MSI Creator Z16P B12UHST | |
| MSI CreatorPro Z16P B12UKST | |
| HP ZBook Studio 16 G9 62U04EA | |
| Przeciętny Intel Core i7-12700H (25586 - 79442, n=64) | |
| Lenovo ThinkPad P1 G4-20Y4Z9DVUS | |
| AIDA64 / Memory Write | |
| Średnia w klasie Workstation (55663 - 214520, n=25, ostatnie 2 lata) | |
| MSI CreatorPro Z16P B12UKST | |
| MSI Creator Z16P B12UHST | |
| HP ZBook Studio 16 G9 62U04EA | |
| Przeciętny Intel Core i7-12700H (23679 - 88660, n=64) | |
| Lenovo ThinkPad P1 G4-20Y4Z9DVUS | |
| AIDA64 / Memory Latency | |
| Średnia w klasie Workstation (84.5 - 165.2, n=25, ostatnie 2 lata) | |
| MSI CreatorPro Z16P B12UKST | |
| MSI Creator Z16P B12UHST | |
| HP ZBook Studio 16 G9 62U04EA | |
| Lenovo ThinkPad P1 G4-20Y4Z9DVUS | |
| Przeciętny Intel Core i7-12700H (76.2 - 133.9, n=62) | |
* ... im mniej tym lepiej
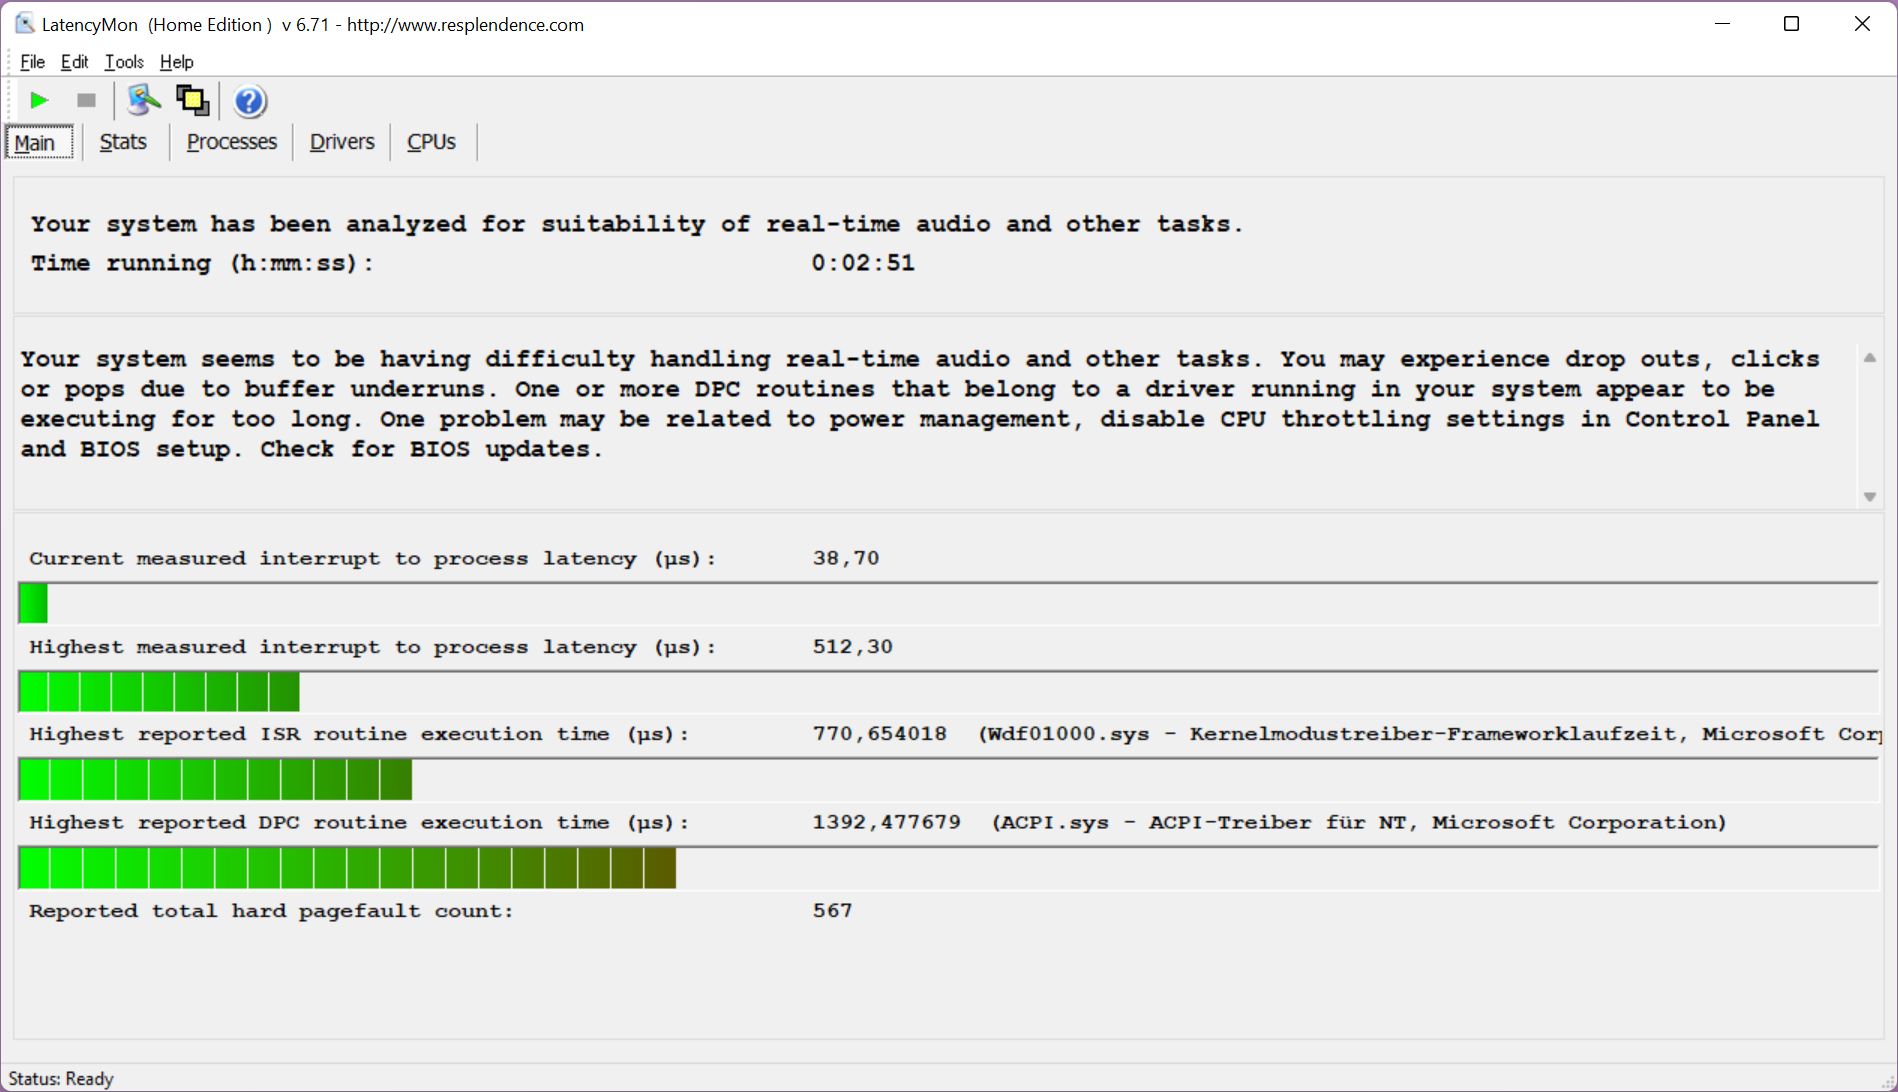
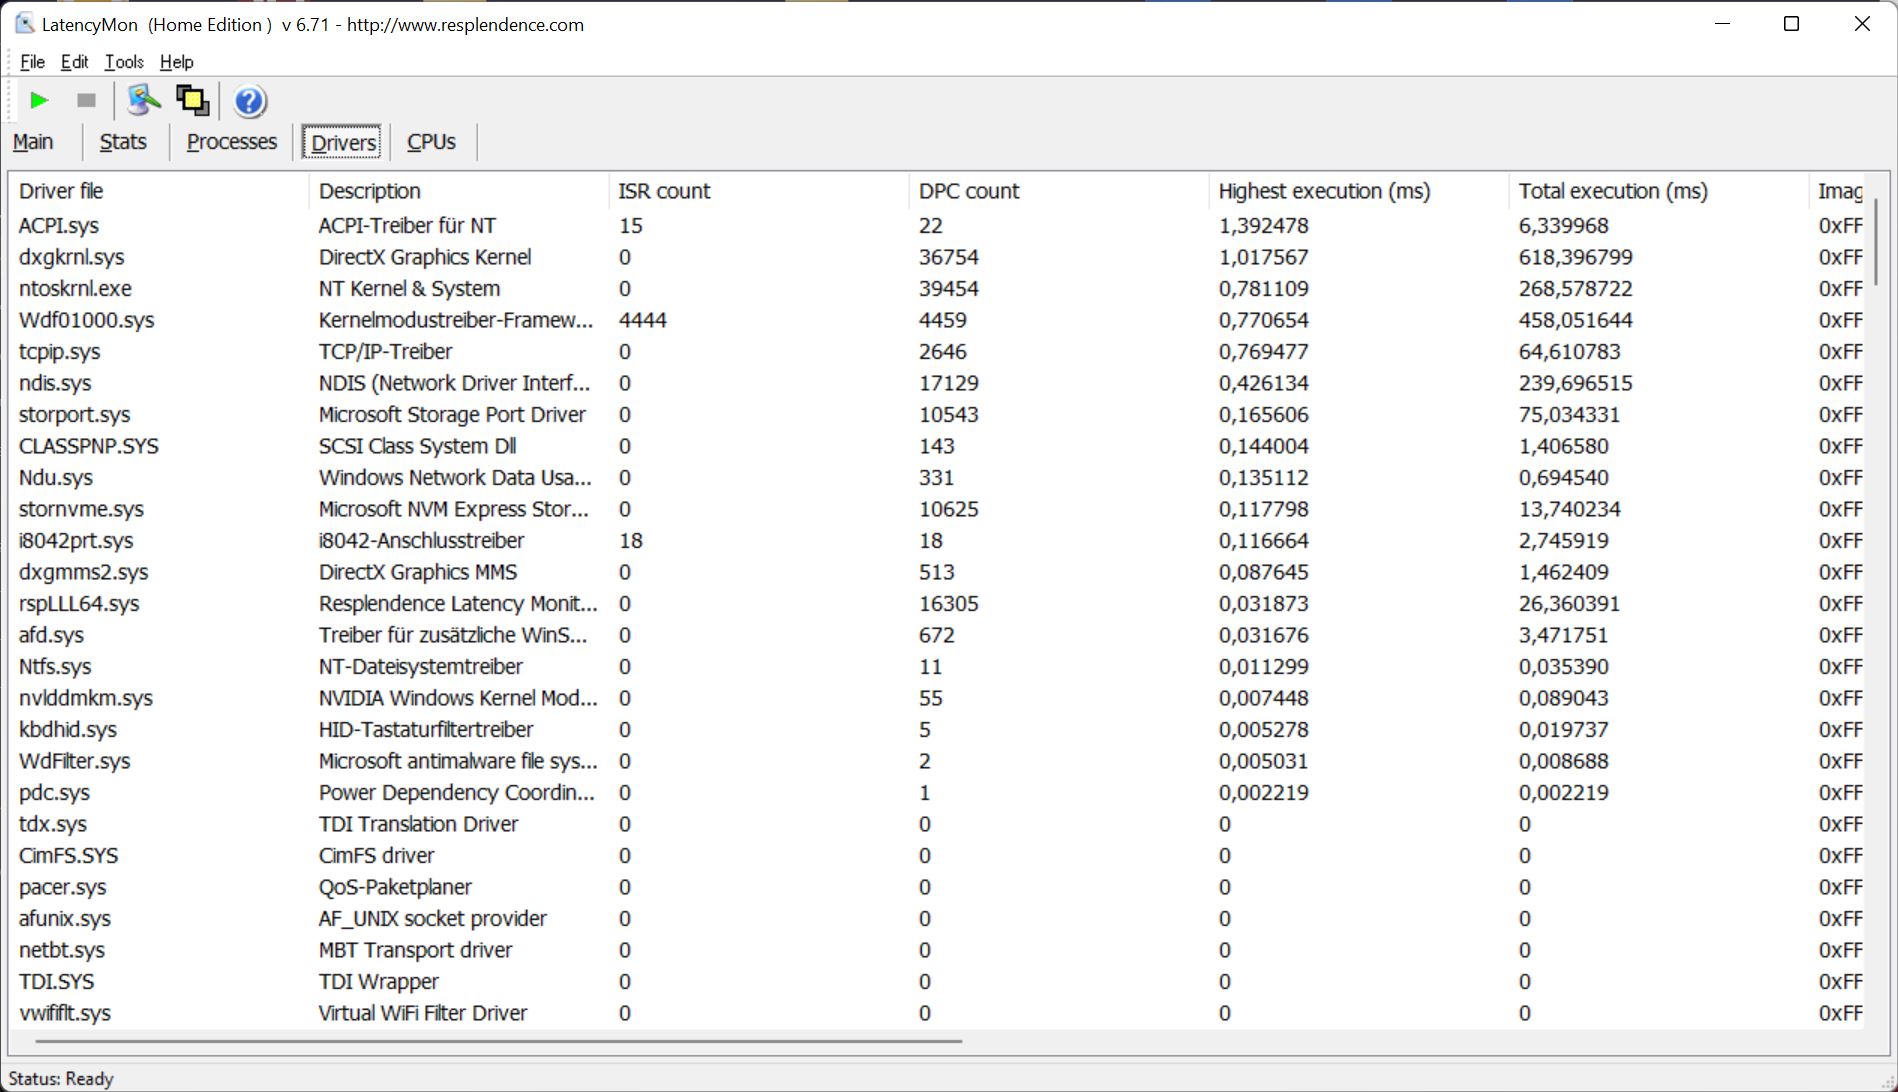
Opóźnienia DPC
Z BIOS-em na czas naszych testów jednostka testowa nie wykazuje żadnych ograniczeń w naszym teście opóźnień (surfowanie po internecie, odtwarzanie YouTube w 4K, obciążenie procesora). Nawet jeśli jeden ze sterowników powoduje lekkie odchylenia, nie powinno być problemów z korzystaniem z aplikacji audio działających w czasie rzeczywistym.
| DPC Latencies / LatencyMon - interrupt to process latency (max), Web, Youtube, Prime95 | |
| HP ZBook Studio 16 G9 62U04EA | |
| MSI Creator Z16P B12UHST | |
| Dell Precision 5000 5560 | |
| Lenovo ThinkPad P1 G4-20Y4S0KS00 | |
| MSI CreatorPro Z16P B12UKST | |
* ... im mniej tym lepiej
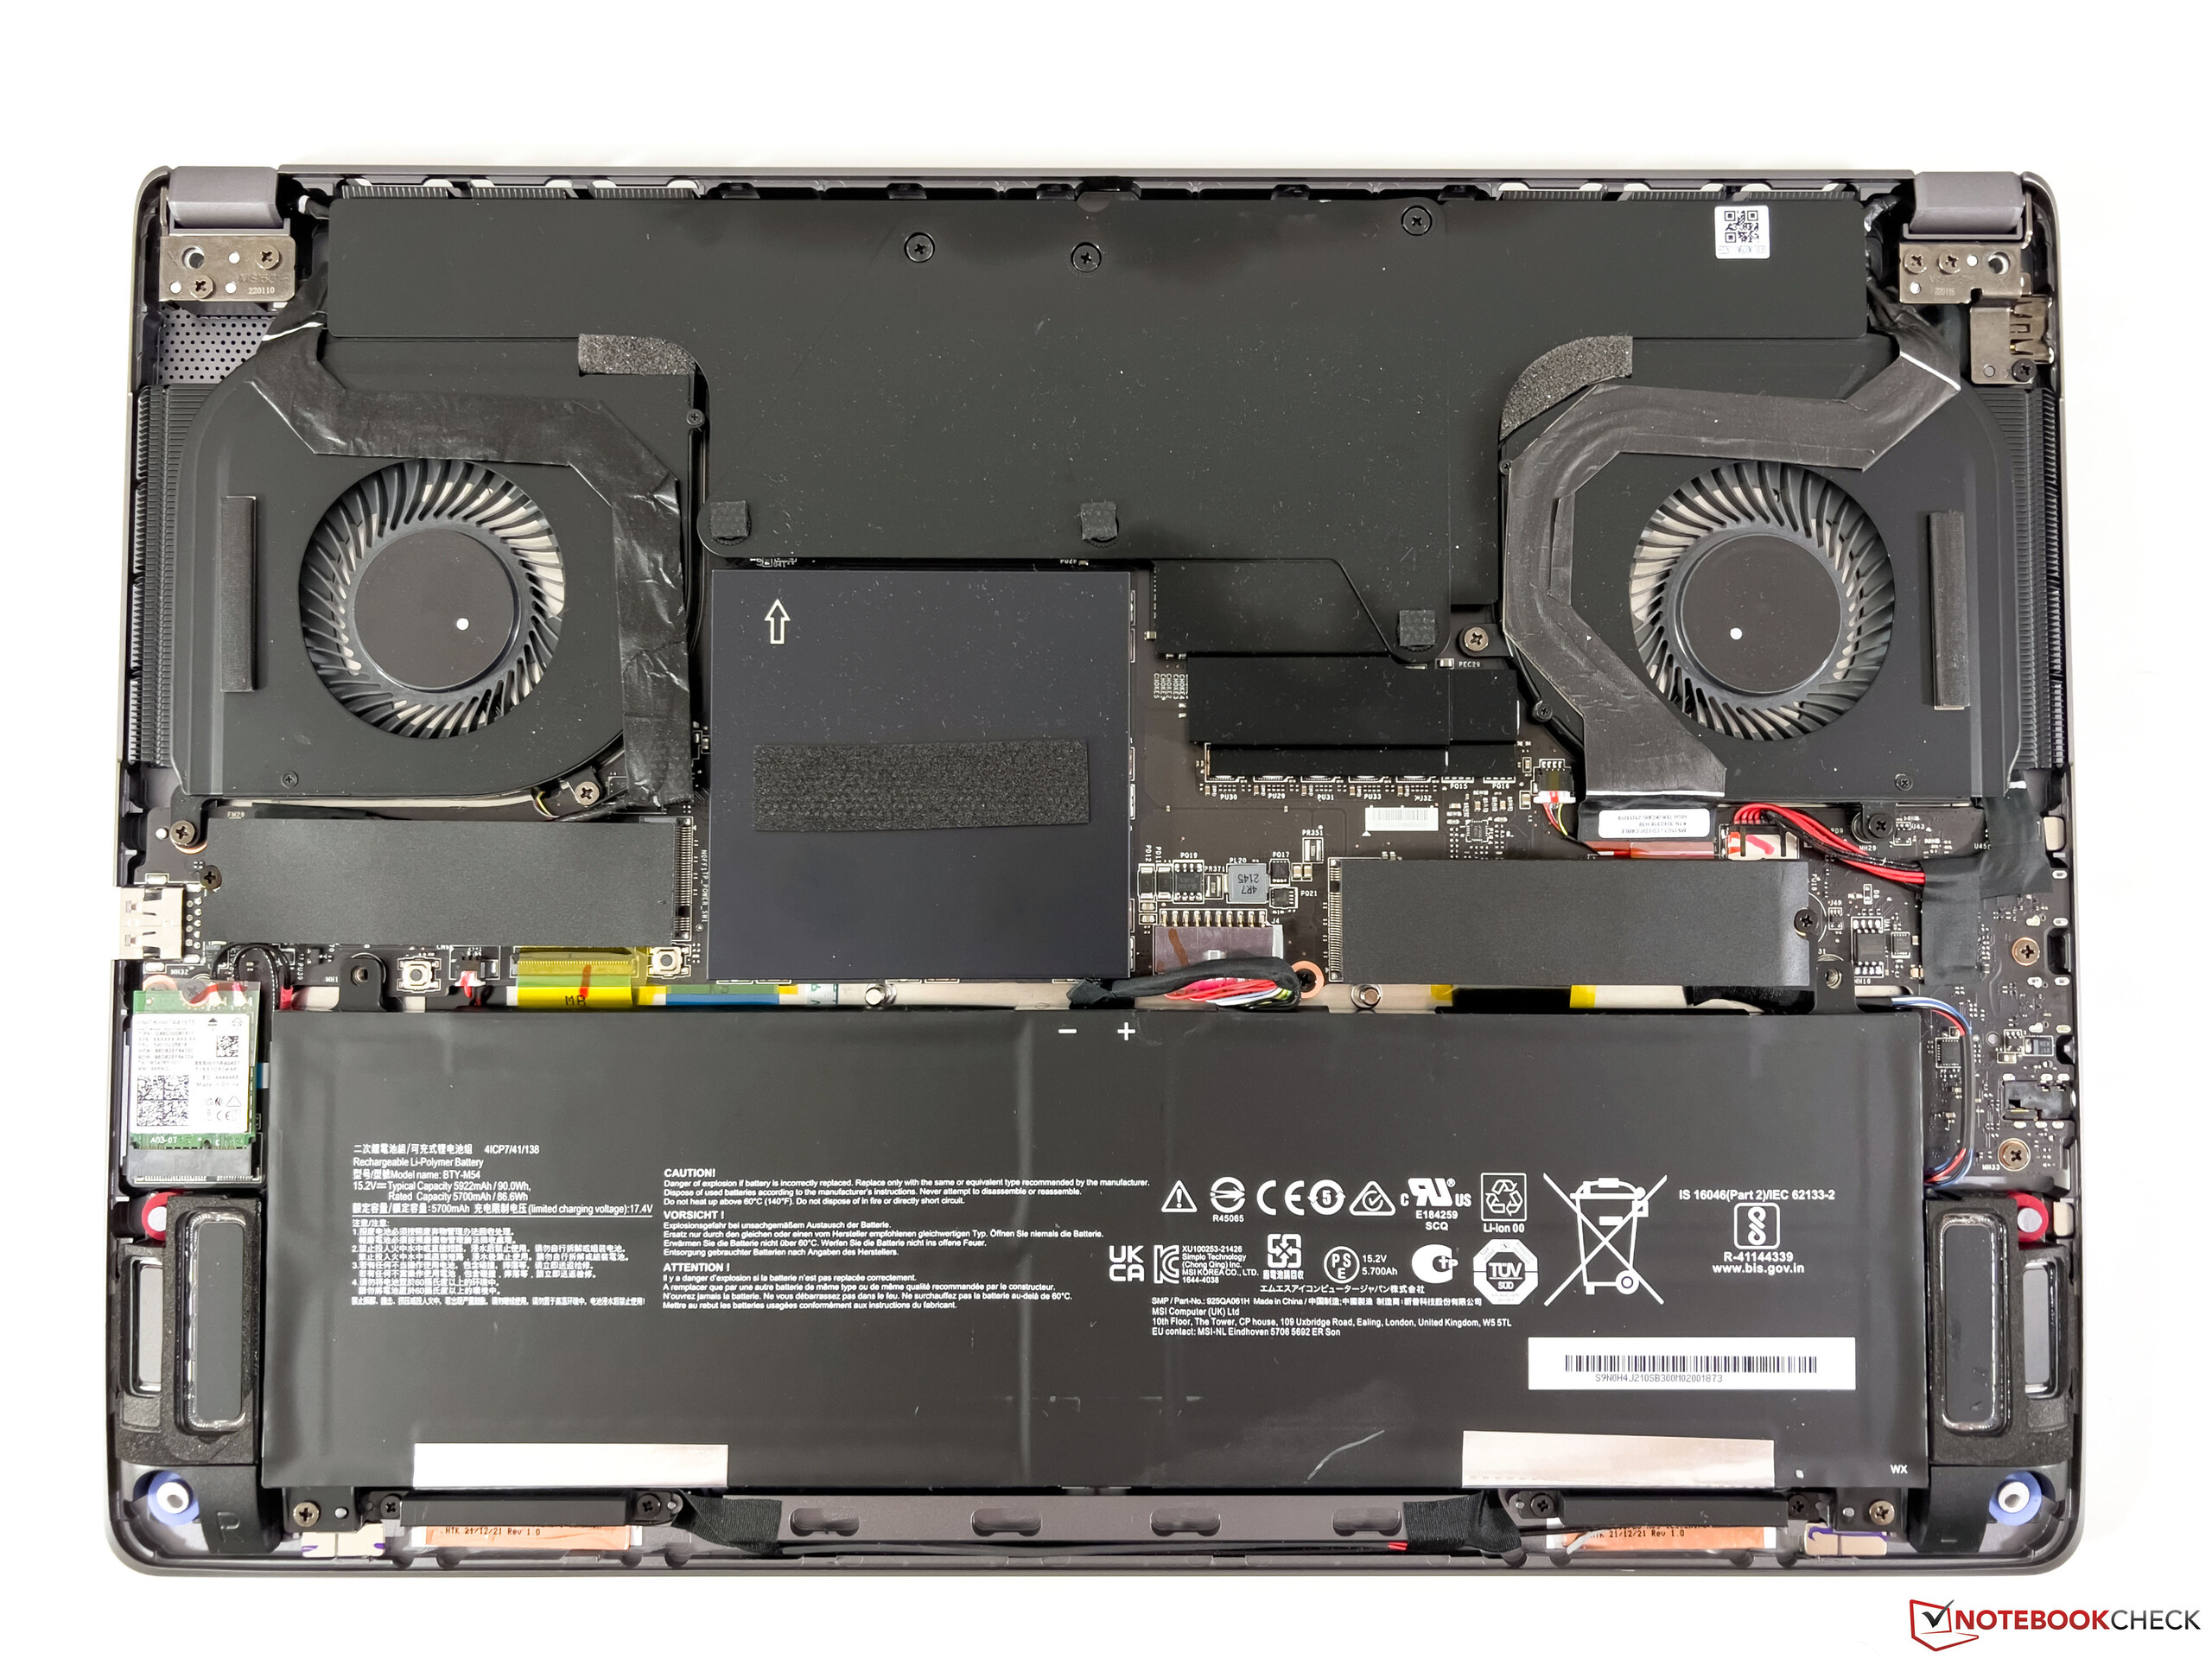
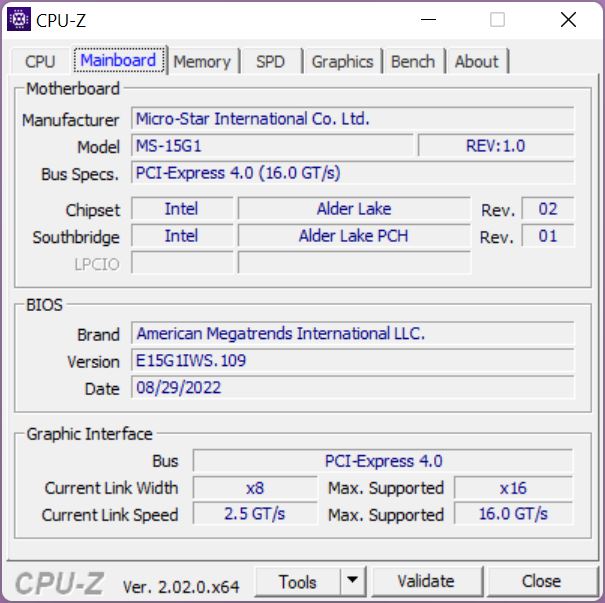
Rozwiązanie w zakresie przechowywania
MSI CreatorPro Z16P zawiera dwa sloty na dyski SSD M.2-2280 z szybkim interfejsem PCIe 4.0. Nasz testowy egzemplarz został wyposażony w szybki dysk PM9A1 od Samsunga (wersja OEM z 980 Pro). Jego pojemność wynosi 1 TB, z czego 870 GB jest dostępne dla użytkownika po pierwszym uruchomieniu. Transfery są bardzo wysokie, ale z powodu problemów z temperaturą wydajność nie pozostaje stabilna, spadając po kilku minutach z ponad 6 do około 4 GB/s. Jest to jednak nadal szybkość i w praktyce nie powinno być żadnych ograniczeń. Dodatkowe benchmarki dysków SSD można znaleźć m.in tutaj.

| Drive Performance rating - Percent | |
| MSI CreatorPro Z16P B12UKST -8! | |
| Lenovo ThinkPad P1 G4-20Y4S0KS00 | |
| MSI Creator Z16P B12UHST | |
| Średnia w klasie Workstation | |
| Przeciętny Samsung PM9A1 MZVL21T0HCLR | |
| Dell Precision 5000 5560 | |
| HP ZBook Studio 16 G9 62U04EA | |
* ... im mniej tym lepiej
Disk Throttling: DiskSpd Read Loop, Queue Depth 8
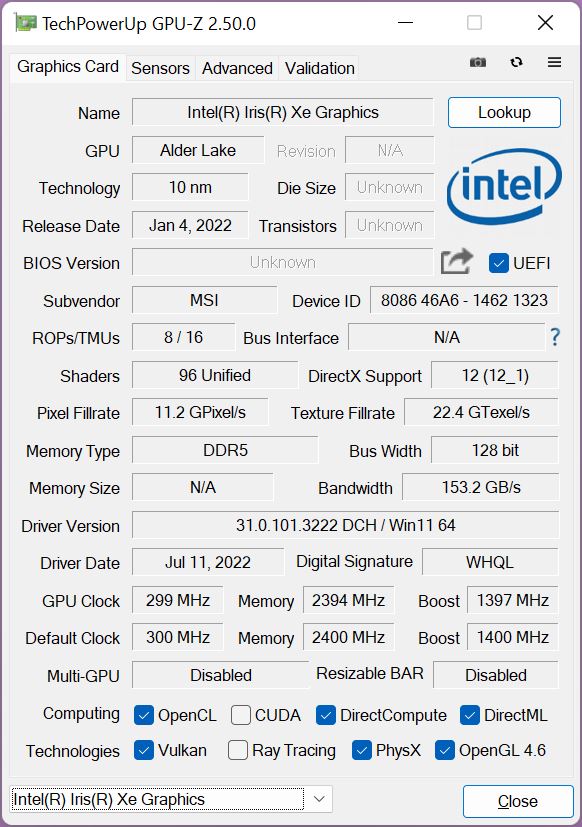
Karta graficzna - Nvidia RTX A3000
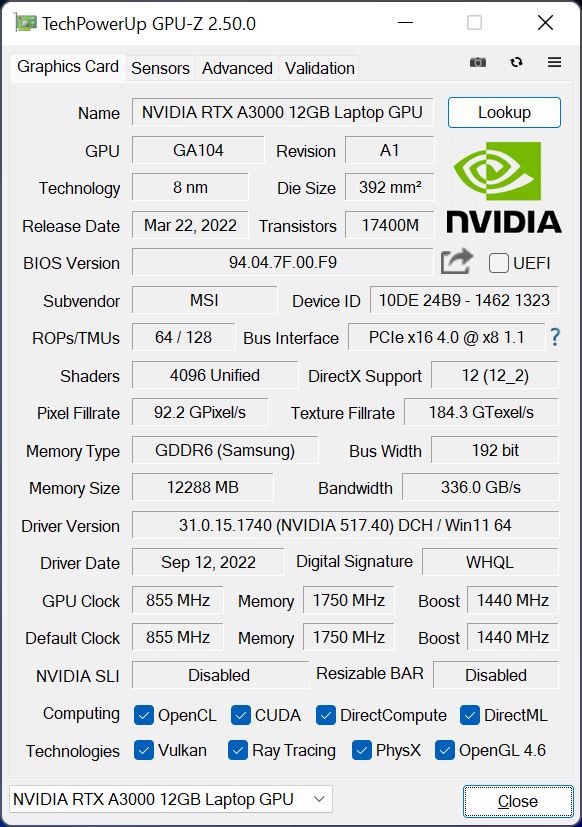
Nasza jednostka testowa wyposażona jest w profesjonalną Nvidia RTX A3000która w 2022 roku otrzymała upgrade z 6 do 12 GB pamięci GDDR6-VRAM. Istnieje wiele podobieństw technicznych z konsumenckim GeForce RTX 3060, ale RTX A3000 oferuje dodatkowe 256 rdzeni CUDA. Jest to wersja z TGP na poziomie 80 W, z dodatkowymi 10 W dynamicznego podbicia, które może być wykorzystane przez procesor
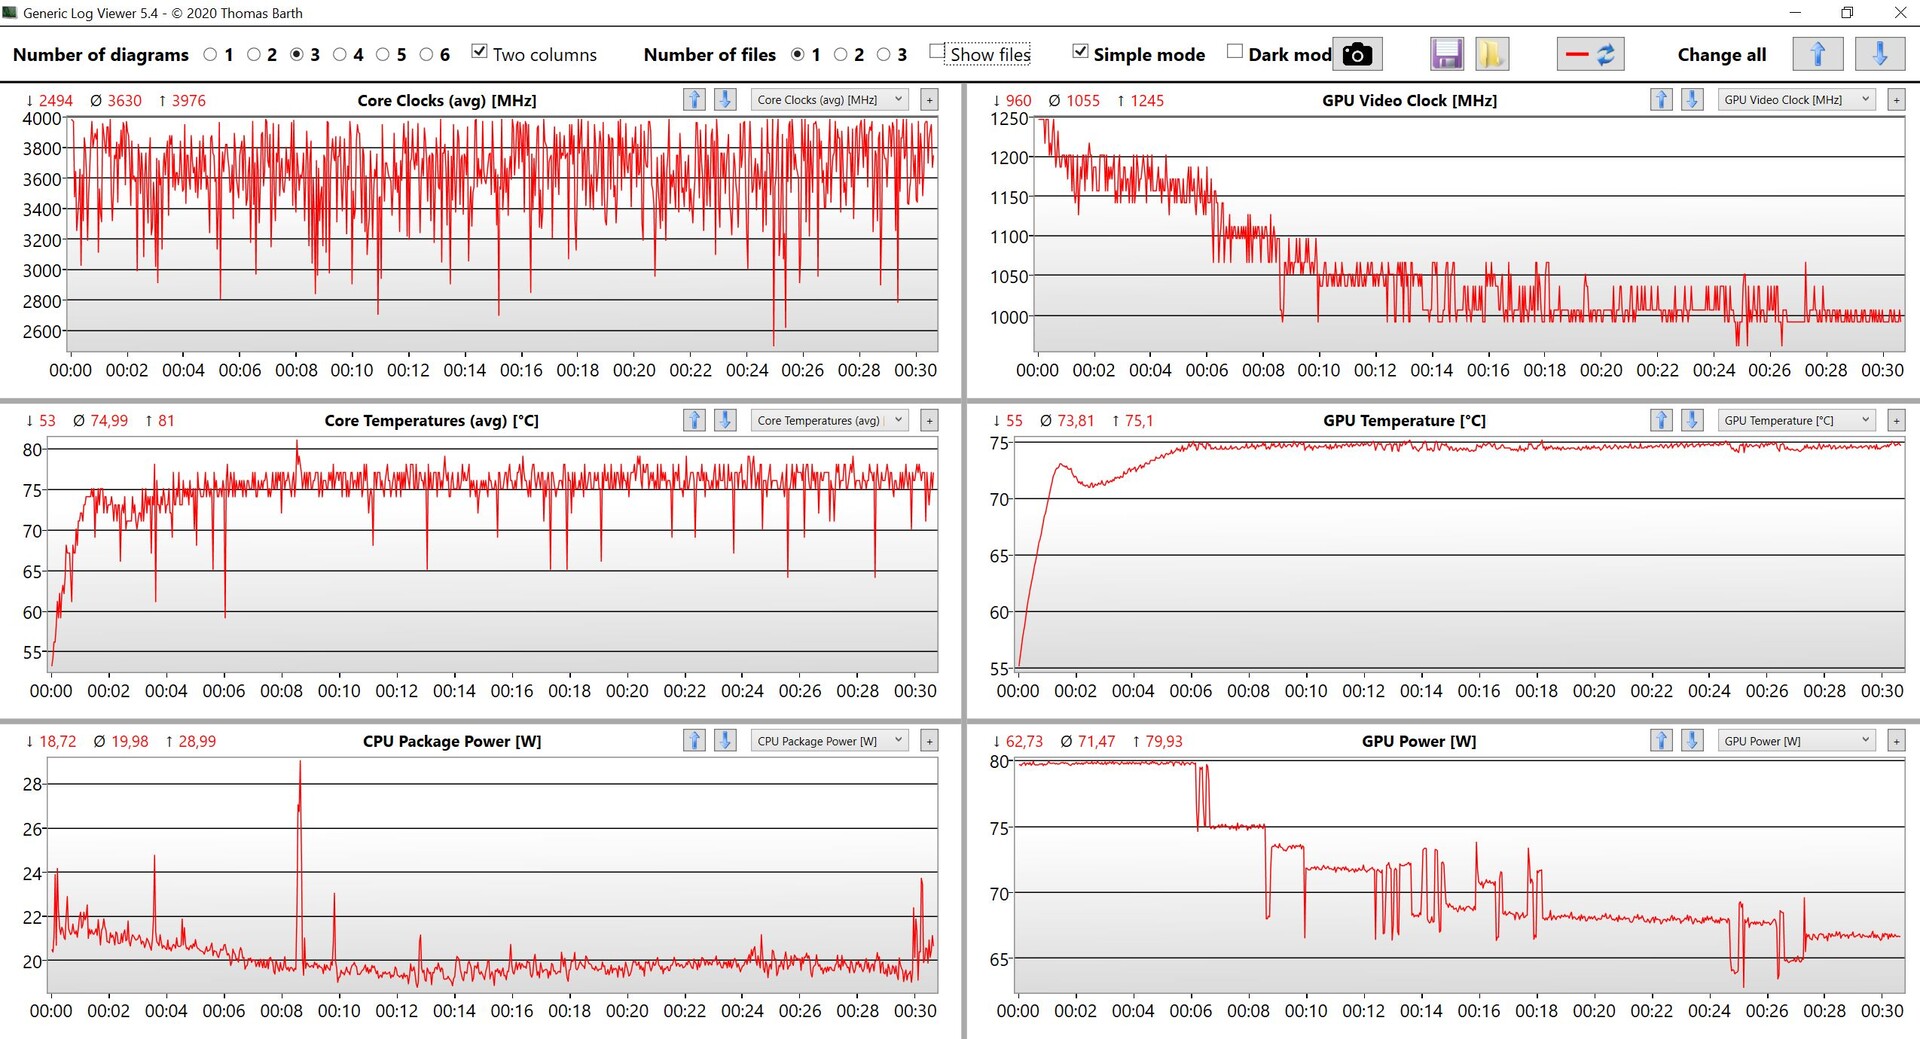
Wydajność graficzna mieści się w pełni w założeniach dla RTX A3000, widzimy też znaczną przewagę nad mniejszym RTX A2000 w ZBook Studio 16 G9. Pod względem czystej wydajności, tj RTX 3070 lub 3080 Tikonsumenckie GPU są oczywiście szybsze, ale testy profesjonalne również pokazują przewagę certyfikacji sterowników. MSI przechodzi test obciążeniowy 3DMark Time Spy z wynikiem 97,9%.
Z drugiej strony benchmarki gamingowe pokazują nieco inny obraz, ponieważ tutaj wydajność spada po kilku minutach, co widać też wyraźnie w naszym teście The Witcher 3. Podobne zachowanie mogliśmy zaobserwować w Creator Z16Pz RTX 3080 Ti, choć nie ma ku temu prawdziwego technicznego powodu i ponownie podejrzewamy tutaj jakieś problemy z profilami wydajności jako winowajców
W trybie pracy na baterii RTX A3000 może pobierać maksymalnie 40 W, co prowadzi do znacznego spadku wydajności o 75%. Dodatkowe benchmarki GPU znajdziecie m.in tutaj.
| 3DMark 11 - 1280x720 Performance GPU | |
| Średnia w klasie Workstation (10888 - 69594, n=25, ostatnie 2 lata) | |
| Lenovo ThinkPad P1 G4-20Y4S0KS00 | |
| MSI CreatorPro Z16P B12UKST | |
| Przeciętny NVIDIA RTX A3000 Laptop GPU (23699 - 27523, n=3) | |
| HP ZBook Studio 16 G9 62U04EA | |
| Dell Precision 5000 5560 | |
| MSI Creator Z16P B12UHST | |
| 3DMark | |
| 1920x1080 Fire Strike Graphics | |
| MSI Creator Z16P B12UHST | |
| Średnia w klasie Workstation (7578 - 52560, n=25, ostatnie 2 lata) | |
| Lenovo ThinkPad P1 G4-20Y4S0KS00 | |
| MSI CreatorPro Z16P B12UKST | |
| Przeciętny NVIDIA RTX A3000 Laptop GPU (17034 - 20417, n=3) | |
| HP ZBook Studio 16 G9 62U04EA | |
| Dell Precision 5000 5560 | |
| 2560x1440 Time Spy Graphics | |
| Średnia w klasie Workstation (2725 - 24806, n=25, ostatnie 2 lata) | |
| MSI Creator Z16P B12UHST | |
| Lenovo ThinkPad P1 G4-20Y4S0KS00 | |
| MSI CreatorPro Z16P B12UKST | |
| Przeciętny NVIDIA RTX A3000 Laptop GPU (6530 - 7536, n=3) | |
| HP ZBook Studio 16 G9 62U04EA | |
| Dell Precision 5000 5560 | |
| V-Ray Benchmark Next 4.10 - GPU | |
| Średnia w klasie Workstation (82 - 1362, n=24, ostatnie 2 lata) | |
| Lenovo ThinkPad P1 G4-20Y4S0KS00 | |
| MSI CreatorPro Z16P B12UKST | |
| MSI Creator Z16P B12UHST | |
| Przeciętny NVIDIA RTX A3000 Laptop GPU (242 - 362, n=3) | |
| HP ZBook Studio 16 G9 62U04EA | |
| Geekbench 5.5 - OpenCL Score | |
| Średnia w klasie Workstation (33651 - 272866, n=25, ostatnie 2 lata) | |
| Lenovo ThinkPad P1 G4-20Y4S0KS00 | |
| MSI Creator Z16P B12UHST | |
| MSI CreatorPro Z16P B12UKST | |
| Przeciętny NVIDIA RTX A3000 Laptop GPU (87630 - 93937, n=3) | |
| HP ZBook Studio 16 G9 62U04EA | |
| 3DMark 11 Performance | 24865 pkt. | |
| 3DMark Fire Strike Score | 18097 pkt. | |
| 3DMark Time Spy Score | 7703 pkt. | |
Pomoc | ||
| Blender / v3.3 Classroom OPTIX/RTX | |
| HP ZBook Firefly 14 G9-6B8A2EA | |
| Dell Precision 5000 5470 | |
| HP Envy 16 h0112nr | |
| HP ZBook Studio 16 G9 62U04EA | |
| Dell Precision 7670 | |
| MSI CreatorPro Z16P B12UKST | |
| Przeciętny NVIDIA RTX A3000 Laptop GPU (n=1) | |
| Średnia w klasie Workstation (10 - 95, n=19, ostatnie 2 lata) | |
| Blender / v3.3 Classroom CUDA | |
| HP ZBook Firefly 14 G9-6B8A2EA | |
| Dell Precision 5000 5470 | |
| HP ZBook Studio 16 G9 62U04EA | |
| HP Envy 16 h0112nr | |
| Dell Precision 7670 | |
| MSI CreatorPro Z16P B12UKST | |
| Przeciętny NVIDIA RTX A3000 Laptop GPU (n=1) | |
| Średnia w klasie Workstation (16 - 142, n=19, ostatnie 2 lata) | |
| Blender / v3.3 Classroom CPU | |
| HP ZBook Firefly 14 G9-6B8A2EA | |
| HP Envy 16 h0112nr | |
| Dell Precision 5000 5470 | |
| Dell Precision 7670 | |
| MSI CreatorPro Z16P B12UKST | |
| Przeciętny NVIDIA RTX A3000 Laptop GPU (n=1) | |
| HP ZBook Studio 16 G9 62U04EA | |
| Średnia w klasie Workstation (148 - 464, n=25, ostatnie 2 lata) | |
* ... im mniej tym lepiej
The Witcher 3 FPS Chart
| low | med. | high | ultra | QHD | |
|---|---|---|---|---|---|
| GTA V (2015) | 185.8 | 182.5 | 168.5 | 95.3 | 71.3 |
| The Witcher 3 (2015) | 381 | 262 | 151 | 59.6 | |
| Dota 2 Reborn (2015) | 182 | 166.8 | 155.8 | 147.1 | |
| Final Fantasy XV Benchmark (2018) | 176 | 83.8 | 64.3 | 45.6 | |
| X-Plane 11.11 (2018) | 142.1 | 120.7 | 97.5 | ||
| Far Cry 5 (2018) | 170 | 128 | 117 | 108 | 76 |
| Strange Brigade (2018) | 344 | 152 | 121 | 108 | 85 |
| F1 2021 (2021) | 334 | 187 | 151.1 | 77.5 | 56.3 |
| Cyberpunk 2077 1.6 (2022) | 77 | 66 | 53 | 43 | 27 |
| F1 22 (2022) | 181 | 167.5 | 120.9 | 39 | 26.2 |
Emisje i zarządzanie energią
Poziomy hałasu
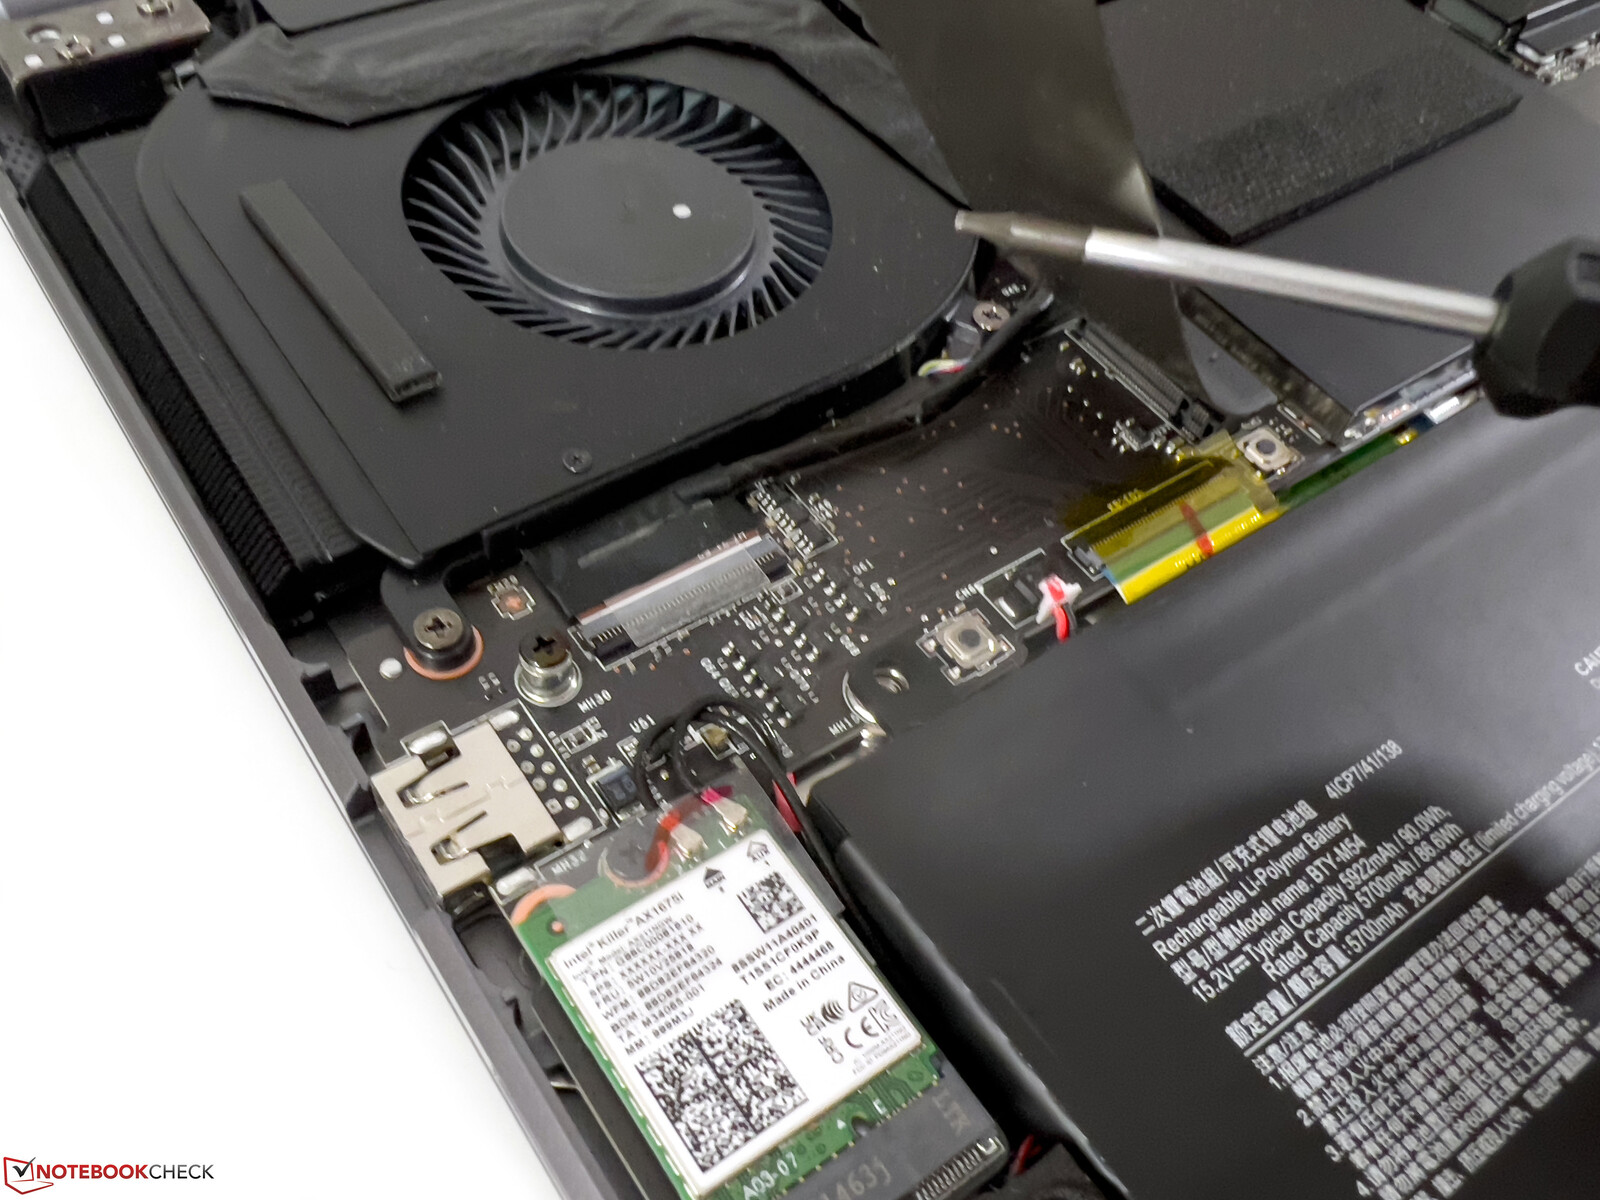
Dwa wentylatory CreatorPro Z16P są zawsze uruchomione, ale ich warkot można usłyszeć tylko trzymając ucho bezpośrednio przy obudowie w cichym pomieszczeniu. W codziennej pracy również korzystasz z defensywnej krzywej wentylatorów, ponieważ nawet pod pełnym obciążeniem mija około 30 sekund, zanim staną się one głośniejsze. Podczas grania mierzymy wtedy około 44, a pod pełnym obciążeniem 47 dB(A), przy czym warkot jest wyraźnie słyszalny, nie będąc przy tym obraźliwym. Nie słychać żadnych innych elektronicznych odgłosów, jak np. wycie cewek.
Hałas
| luz |
| 27.1 / 27.1 / 27.1 dB |
| obciążenie |
| 42.9 / 47 dB |
 | ||
30 dB cichy 40 dB(A) słyszalny 50 dB(A) irytujący |
||
min: | ||
| MSI CreatorPro Z16P B12UKST RTX A3000 Laptop GPU, i7-12700H, Samsung PM9A1 MZVL21T0HCLR | HP ZBook Studio 16 G9 62U04EA RTX A2000 Laptop GPU, i7-12800H, Micron 3400 1TB MTFDKBA1T0TFH | Lenovo ThinkPad P1 G4-20Y4S0KS00 GeForce RTX 3070 Laptop GPU, i7-11850H, Samsung PM9A1 MZVL21T0HCLR | Dell Precision 5000 5560 RTX A2000 Laptop GPU, i7-11850H, Samsung PM9A1 MZVL22T0HBLB | MSI Creator Z16P B12UHST GeForce RTX 3080 Ti Laptop GPU, i9-12900H, Samsung PM9A1 MZVL22T0HBLB | |
|---|---|---|---|---|---|
| Noise | 2% | 3% | 15% | -4% | |
| wyłączone / środowisko * (dB) | 24.1 | 24 -0% | 23.8 1% | 23.4 3% | 26 -8% |
| Idle Minimum * (dB) | 27.1 | 24 11% | 23.8 12% | 23.6 13% | 27 -0% |
| Idle Average * (dB) | 27.1 | 27.7 -2% | 23.8 12% | 23.6 13% | 29 -7% |
| Idle Maximum * (dB) | 27.1 | 27.7 -2% | 28.3 -4% | 23.6 13% | 31 -14% |
| Load Average * (dB) | 42.9 | 39.8 7% | 38.6 10% | 25.8 40% | 43 -0% |
| Witcher 3 ultra * (dB) | 44 | 44.3 -1% | 47.4 -8% | 40.1 9% | 43 2% |
| Load Maximum * (dB) | 47 | 47.7 -1% | 47.4 -1% | 41.4 12% | 46 2% |
* ... im mniej tym lepiej
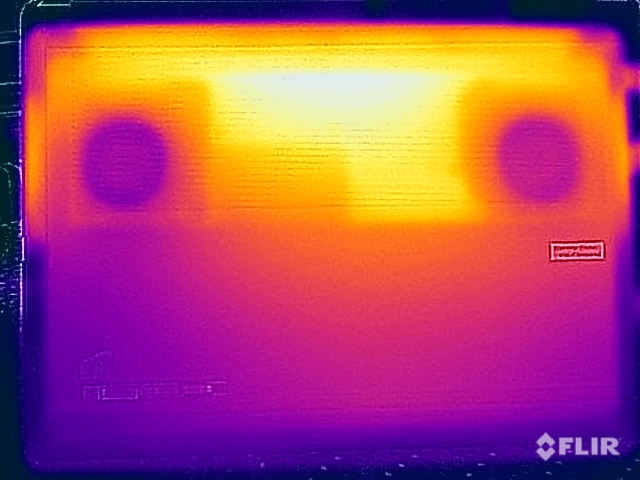
Temperatury
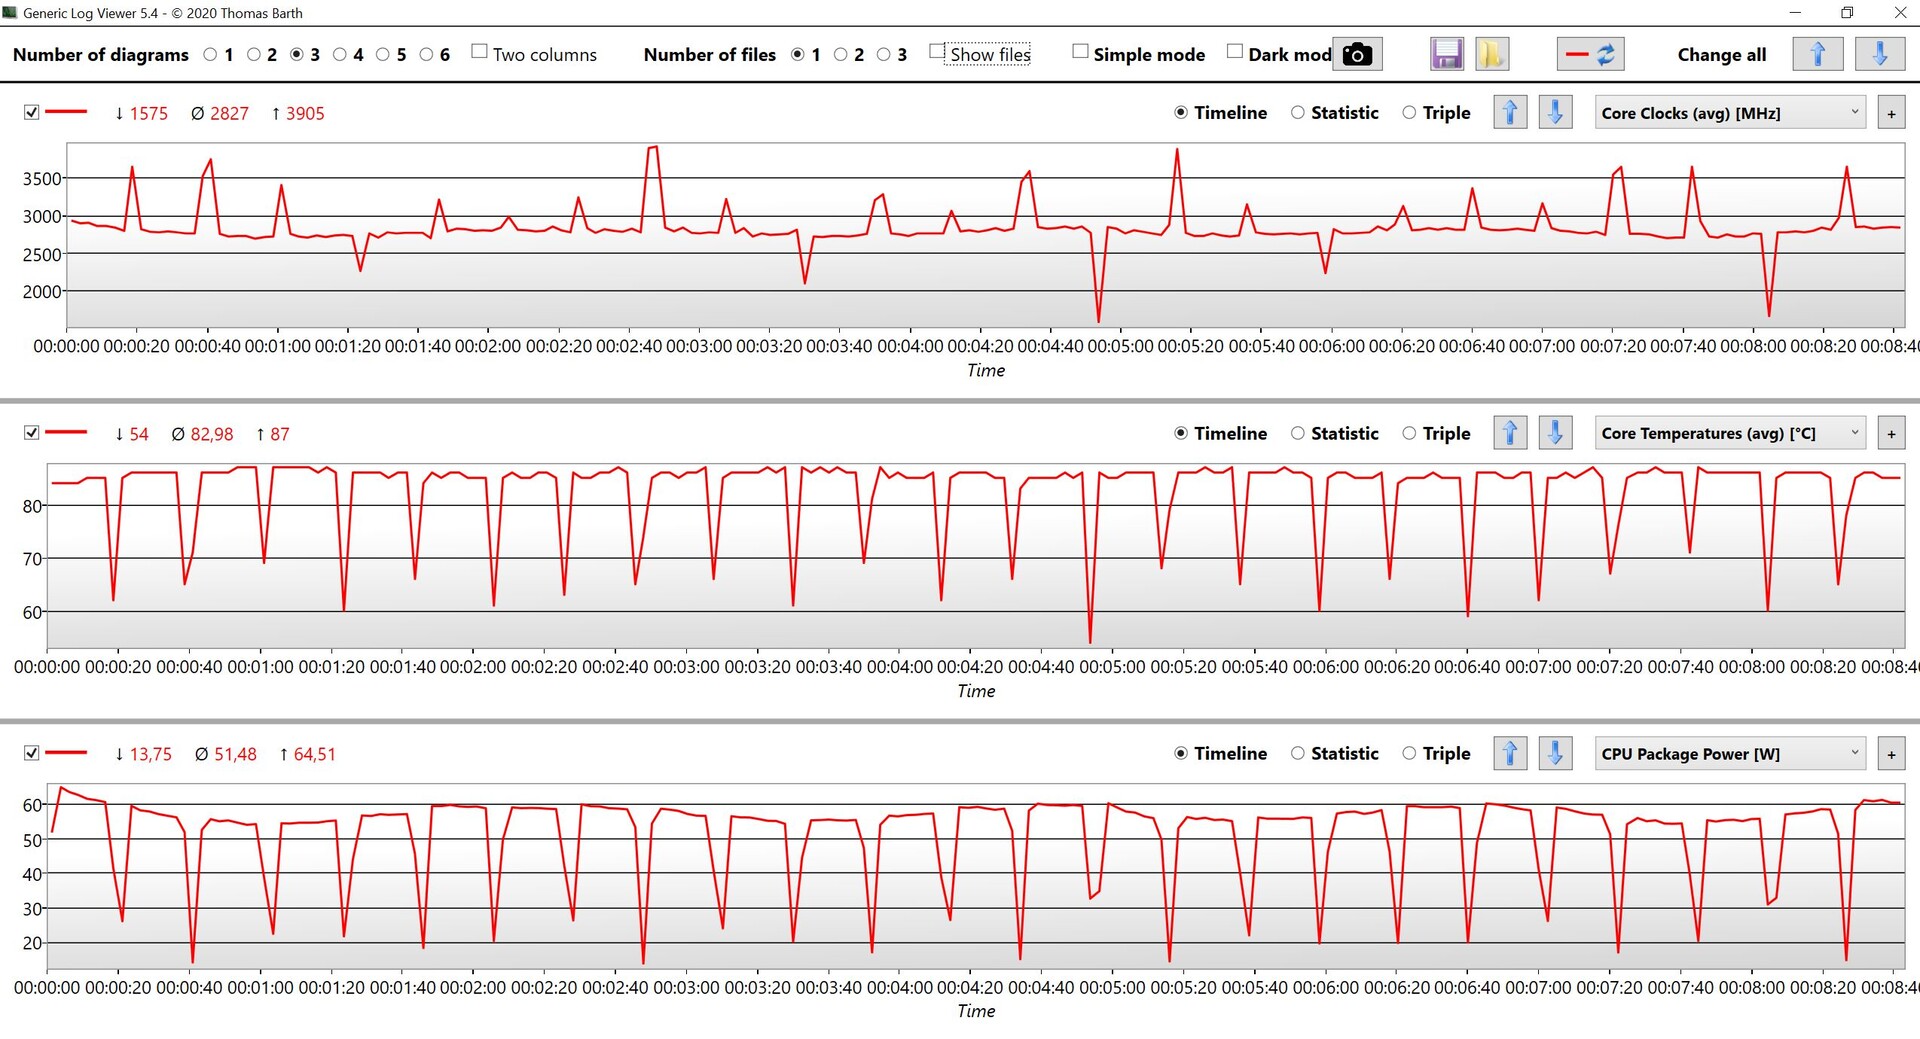
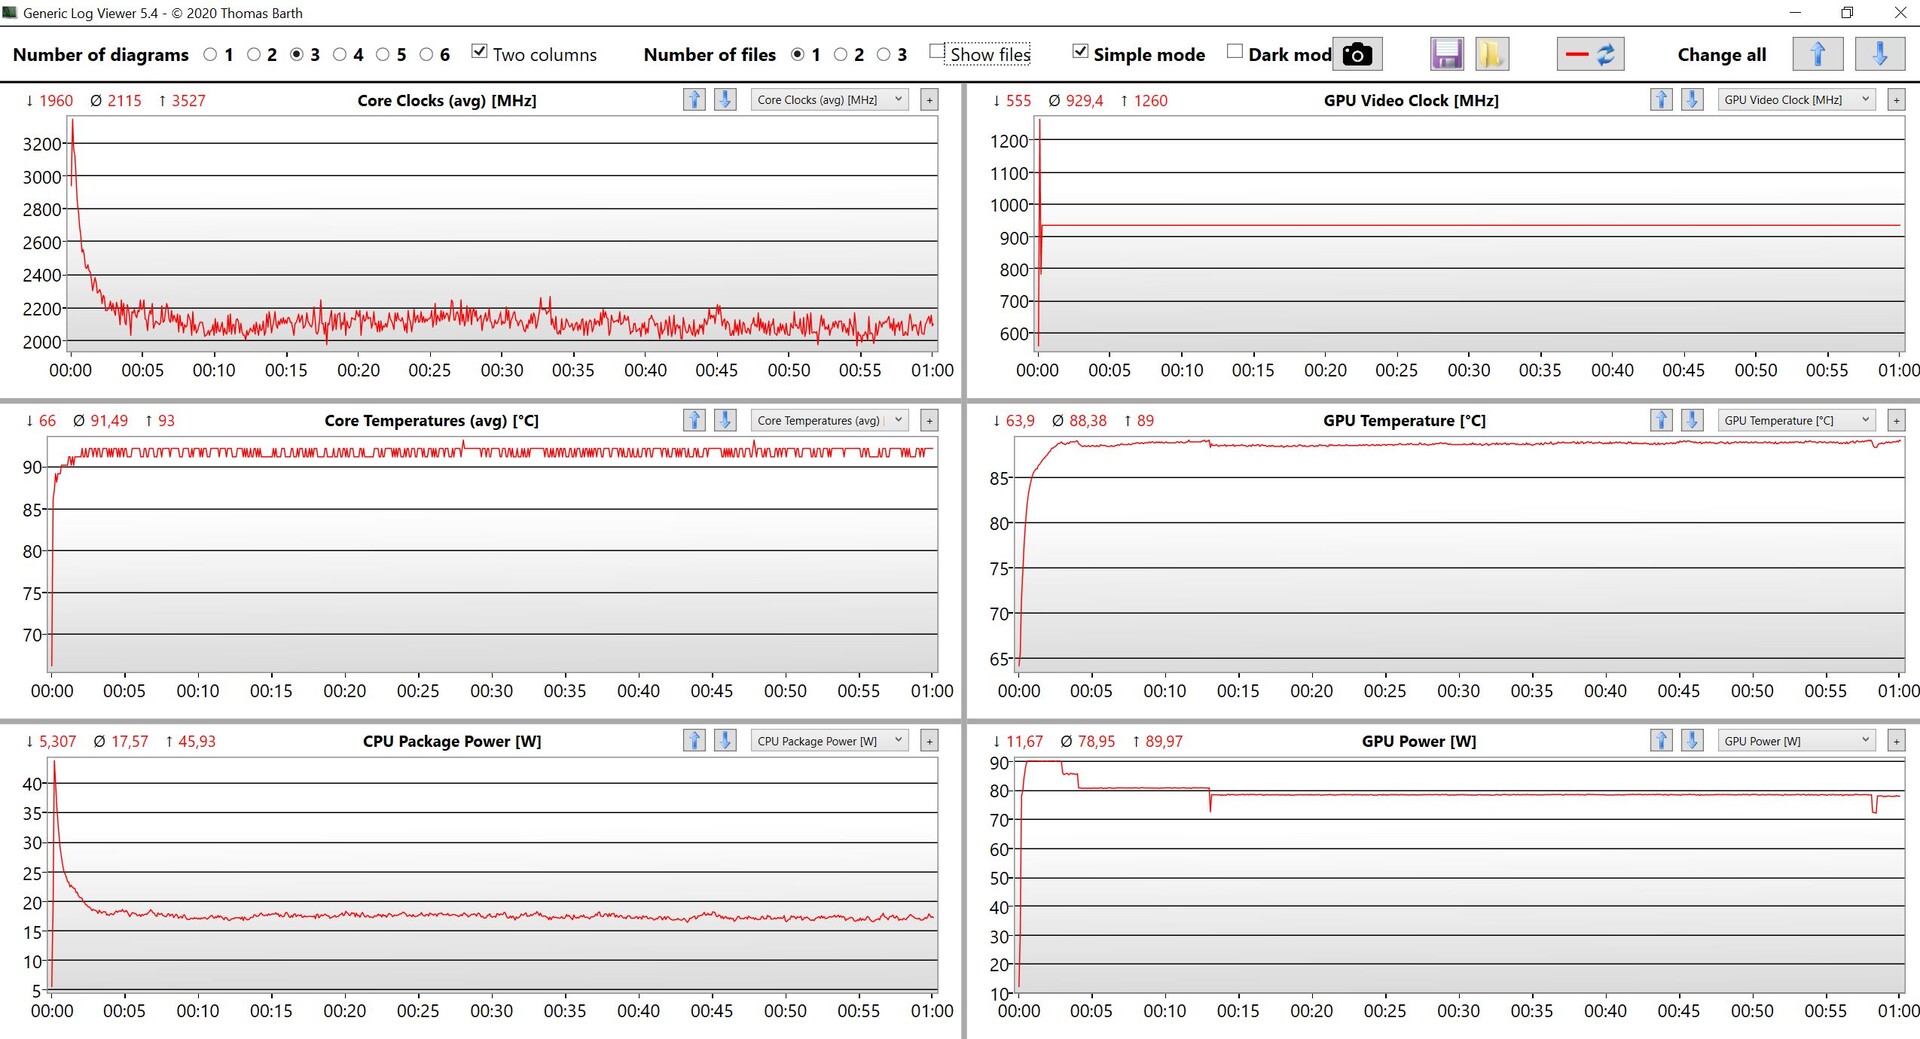
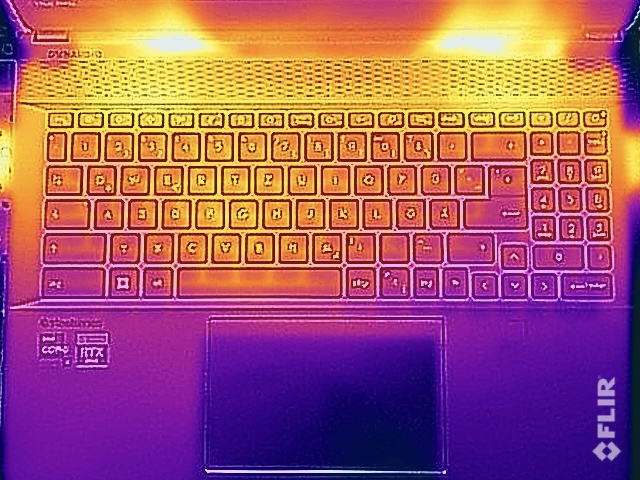
Rozwój temperatury był już dużym problemem w naszym jednostce testowej Creator Z16Pz Core i9 i RTX 3080 Ti. CreatorPro ze słabszym Core i7 i RTX A3000 radzi sobie nieco lepiej, ale nadal pozostaje problematyczny, mimo że również korzysta z systemu chłodzenia z komorą parową. Subiektywnie problem zwiększa też metalowa obudowa. Przy mniej wymagających zadaniach nie ma ograniczeń, ale już po kilku krótkich, trwających zaledwie kilka minut fazach obciążenia, wierzch jednostki zasadniczej nagrzewa się bardzo mocno i korzystanie z klawiatury faktycznie staje się niekomfortowe. Ponadto w żadnym wypadku nie należy uruchamiać urządzenia na kolanach pod obciążeniem, gdyż na spodzie obudowy mierzymy prawie 70°C (158°F). System chłodzenia jest po prostu ogólnie zbyt słaby, nawet dla wolniejszych komponentów.
W teście obciążeniowym widać, że system daje pierwszeństwo GPU, które pozostaje dość stabilne przy około 80 W, podczas gdy CPU spada poniżej 20 W. Po teście obciążeniowym nie ma żadnej reprodukcji wydajności.
(-) Maksymalna temperatura w górnej części wynosi 56.3 °C / 133 F, w porównaniu do średniej 38.2 °C / 101 F , począwszy od 22.2 do 69.8 °C dla klasy Workstation.
(-) Dno nagrzewa się maksymalnie do 68.3 °C / 155 F, w porównaniu do średniej 41.1 °C / 106 F
(+) W stanie bezczynności średnia temperatura górnej części wynosi 24.1 °C / 75 F, w porównaniu ze średnią temperaturą urządzenia wynoszącą 32 °C / ### class_avg_f### F.
(-) Podczas gry w Wiedźmina 3 średnia temperatura górnej części wynosi 44 °C / 111 F, w porównaniu do średniej temperatury urządzenia wynoszącej 32 °C / ## #class_avg_f### F.
(±) Podpórki pod nadgarstki i touchpad mogą się bardzo nagrzać w dotyku, maksymalnie do 38.2 °C / 100.8 F.
(-) Średnia temperatura obszaru podparcia dłoni w podobnych urządzeniach wynosiła 27.8 °C / 82 F (-10.4 °C / -18.8 F).
| MSI CreatorPro Z16P B12UKST Intel Core i7-12700H, NVIDIA RTX A3000 Laptop GPU | HP ZBook Studio 16 G9 62U04EA Intel Core i7-12800H, NVIDIA RTX A2000 Laptop GPU | Lenovo ThinkPad P1 G4-20Y4S0KS00 Intel Core i7-11850H, NVIDIA GeForce RTX 3070 Laptop GPU | Dell Precision 5000 5560 Intel Core i7-11850H, NVIDIA RTX A2000 Laptop GPU | MSI Creator Z16P B12UHST Intel Core i9-12900H, NVIDIA GeForce RTX 3080 Ti Laptop GPU | |
|---|---|---|---|---|---|
| Heat | 6% | 1% | -6% | -12% | |
| Maximum Upper Side * (°C) | 56.3 | 38.7 31% | 51 9% | 48.2 14% | 67 -19% |
| Maximum Bottom * (°C) | 68.3 | 53.4 22% | 53.5 22% | 42.6 38% | 69 -1% |
| Idle Upper Side * (°C) | 25.2 | 27.3 -8% | 28.8 -14% | 34.8 -38% | 29 -15% |
| Idle Bottom * (°C) | 25.9 | 31.6 -22% | 29.3 -13% | 35.2 -36% | 29 -12% |
* ... im mniej tym lepiej
Mówcy
MSI CreatorPro Z16P B12UKST analiza dźwięku
(+) | głośniki mogą odtwarzać stosunkowo głośno (83.3 dB)
Bas 100 - 315 Hz
(-) | prawie brak basu - średnio 18.7% niższa od mediany
(±) | liniowość basu jest średnia (7% delta do poprzedniej częstotliwości)
Średnie 400 - 2000 Hz
(+) | zbalansowane środki średnie - tylko 3% od mediany
(+) | średnie są liniowe (6.8% delta do poprzedniej częstotliwości)
Wysokie 2–16 kHz
(+) | zrównoważone maksima - tylko 4.6% od mediany
(+) | wzloty są liniowe (6.4% delta do poprzedniej częstotliwości)
Ogólnie 100 - 16.000 Hz
(±) | liniowość ogólnego dźwięku jest średnia (15.2% różnicy w stosunku do mediany)
W porównaniu do tej samej klasy
» 33% wszystkich testowanych urządzeń w tej klasie było lepszych, 10% podobnych, 57% gorszych
» Najlepszy miał deltę 7%, średnia wynosiła ###średnia###%, najgorsza wynosiła 35%
W porównaniu do wszystkich testowanych urządzeń
» 21% wszystkich testowanych urządzeń było lepszych, 4% podobnych, 74% gorszych
» Najlepszy miał deltę 4%, średnia wynosiła ###średnia###%, najgorsza wynosiła 134%
HP ZBook Studio 16 G9 62U04EA analiza dźwięku
(±) | głośność głośnika jest średnia, ale dobra (81.6 dB)
Bas 100 - 315 Hz
(±) | zredukowany bas - średnio 8.7% niższy od mediany
(±) | liniowość basu jest średnia (10.4% delta do poprzedniej częstotliwości)
Średnie 400 - 2000 Hz
(+) | zbalansowane środki średnie - tylko 3.7% od mediany
(+) | średnie są liniowe (4.6% delta do poprzedniej częstotliwości)
Wysokie 2–16 kHz
(+) | zrównoważone maksima - tylko 2.7% od mediany
(+) | wzloty są liniowe (3.5% delta do poprzedniej częstotliwości)
Ogólnie 100 - 16.000 Hz
(+) | ogólny dźwięk jest liniowy (10.6% różnicy w stosunku do mediany)
W porównaniu do tej samej klasy
» 9% wszystkich testowanych urządzeń w tej klasie było lepszych, 5% podobnych, 87% gorszych
» Najlepszy miał deltę 7%, średnia wynosiła ###średnia###%, najgorsza wynosiła 35%
W porównaniu do wszystkich testowanych urządzeń
» 6% wszystkich testowanych urządzeń było lepszych, 1% podobnych, 93% gorszych
» Najlepszy miał deltę 4%, średnia wynosiła ###średnia###%, najgorsza wynosiła 134%
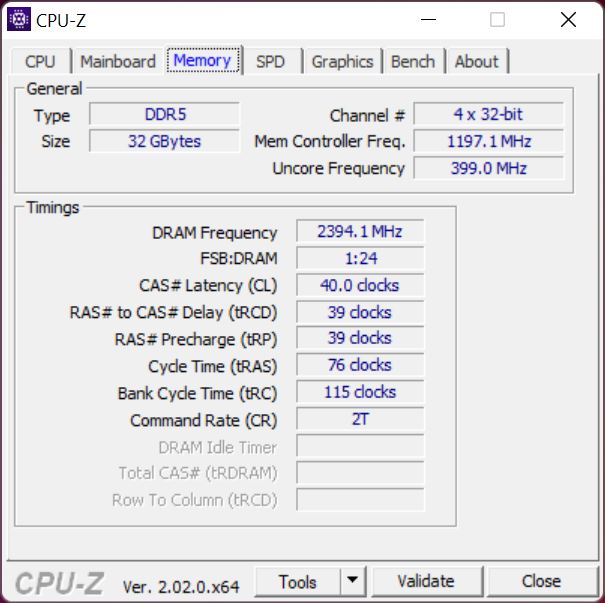
Pobór mocy
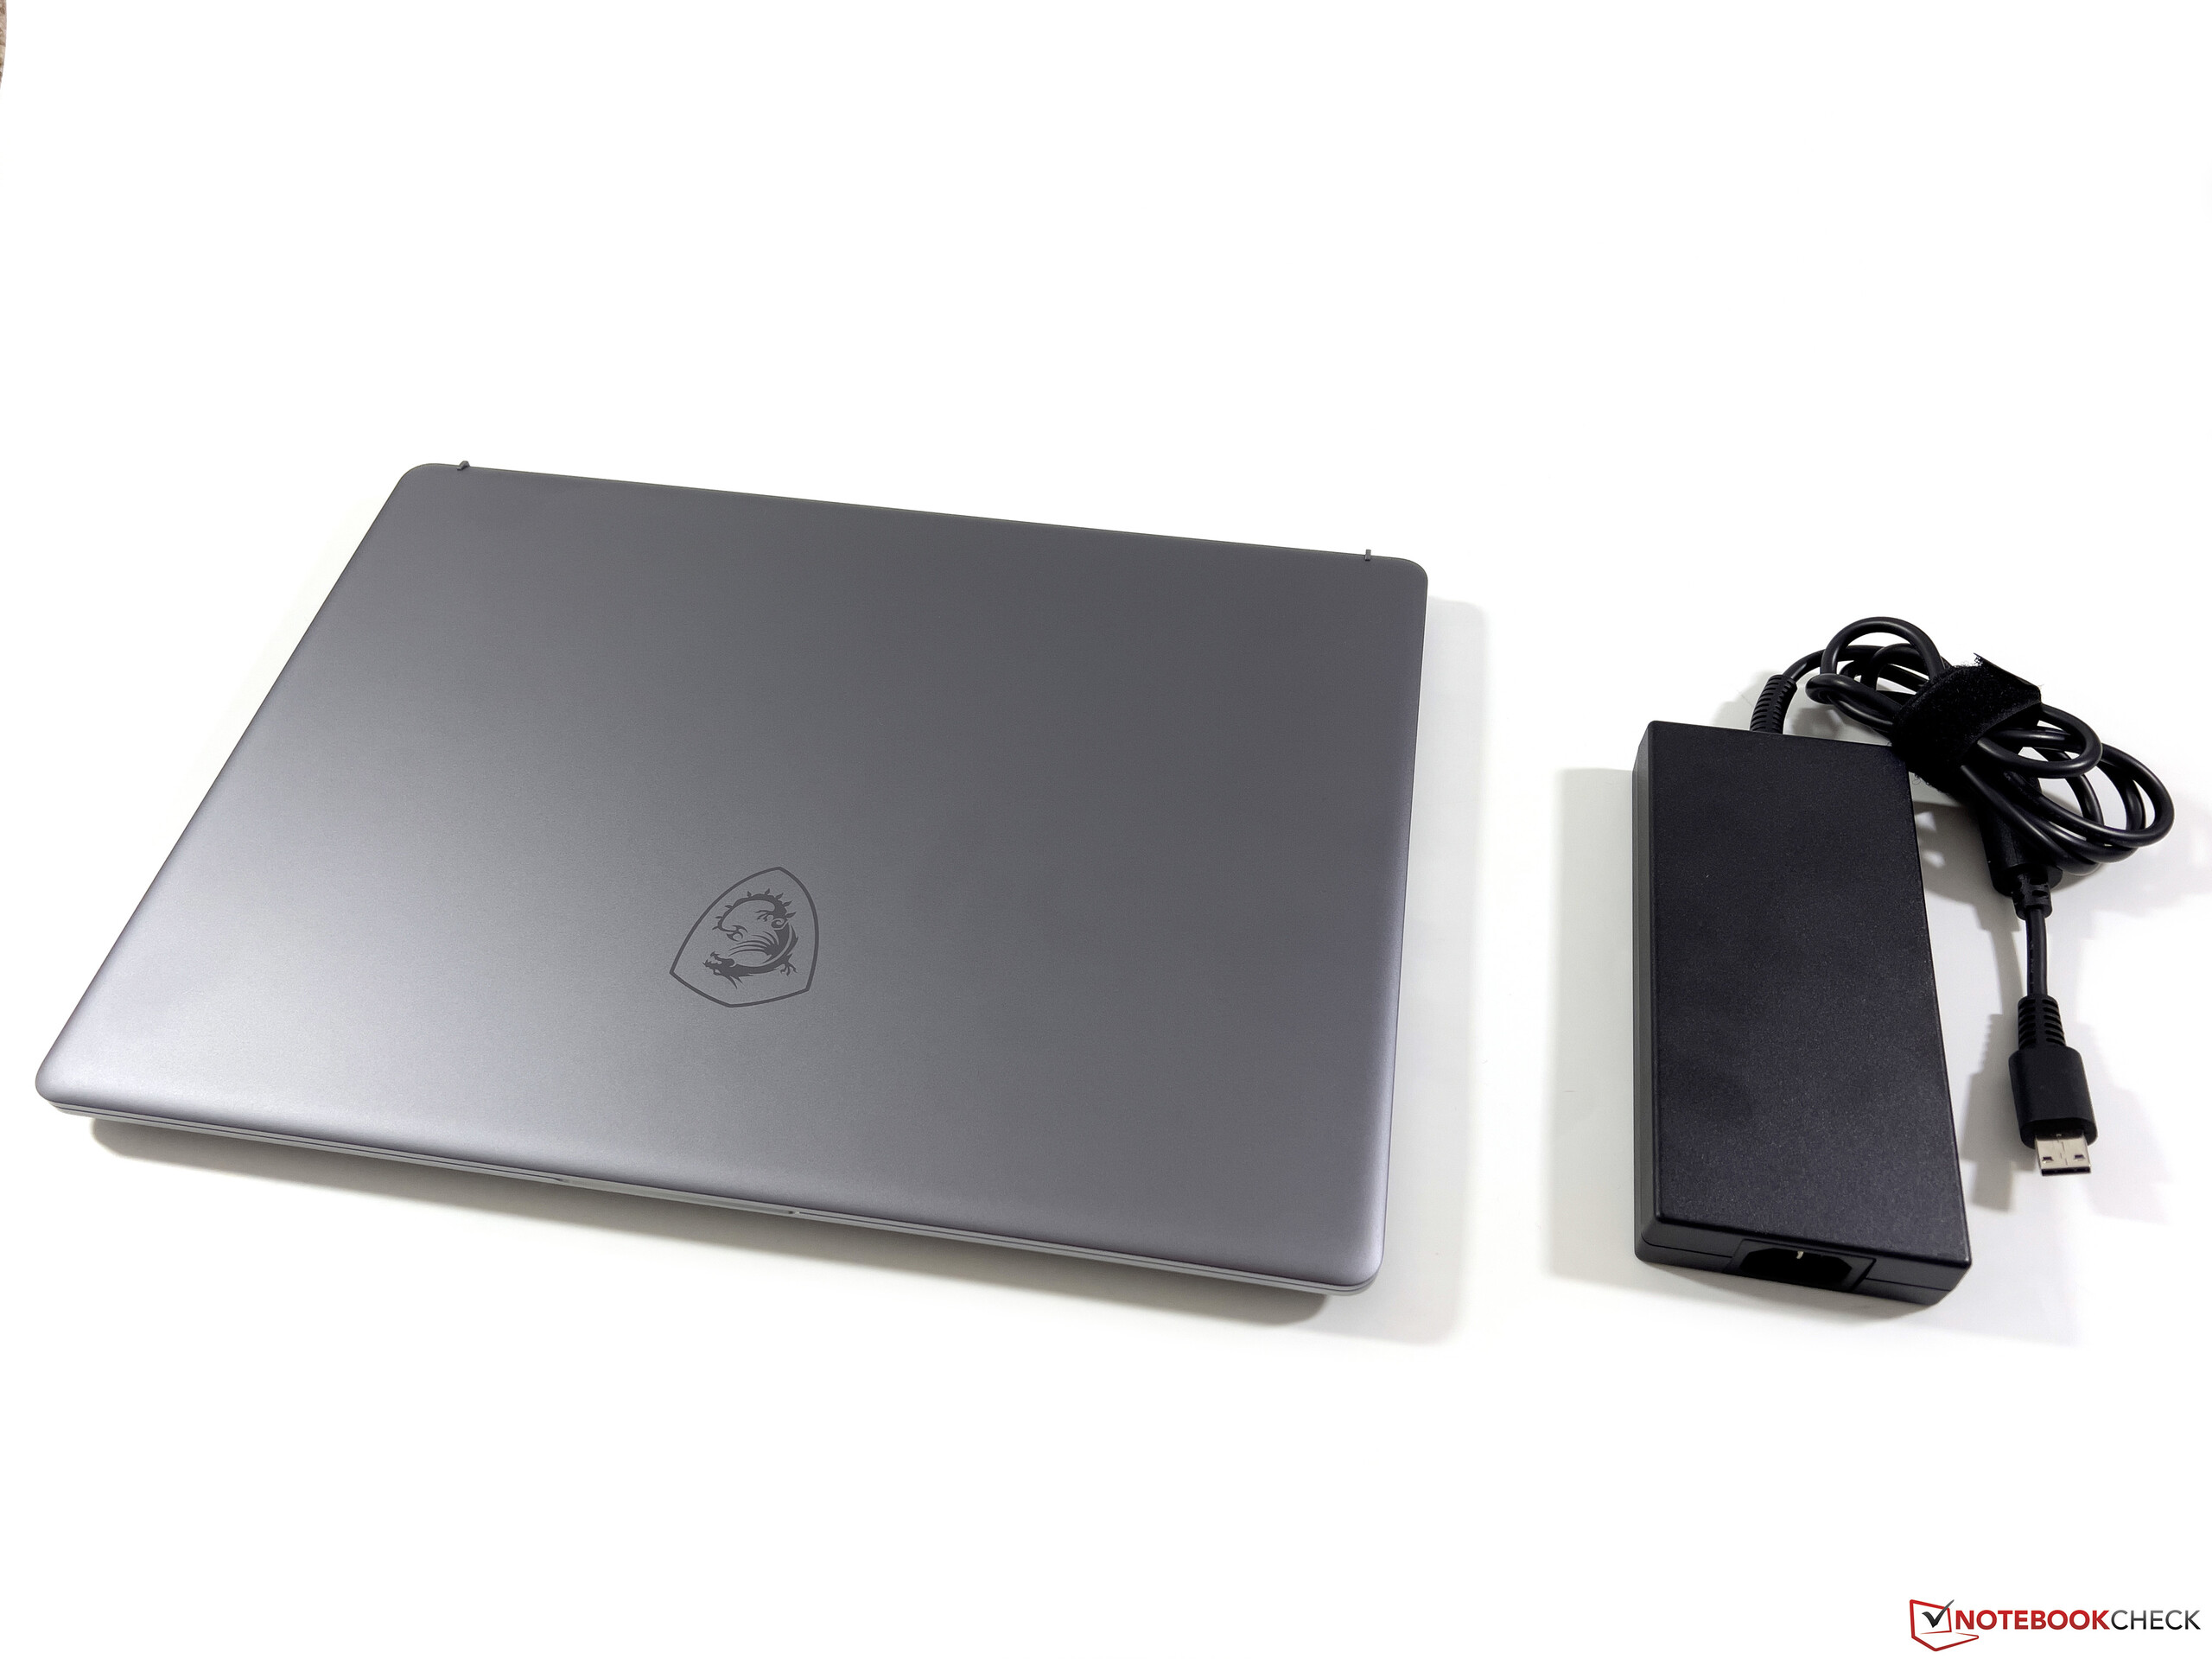
Nasze pomiary zużycia prądu pokazują teraz niespodzianki. Potężne podzespoły, w tym panel WQHD, po prostu potrzebują mocy i już podczas pracy jałowej mierzymy prawie 17 watów przy pełnej jasności wyświetlacza. Pod obciążeniem wartości te rosną potem znacznie wyżej i podczas grania mierzymy około 150 watów. Podczas testu stresu występuje krótki szczyt obciążenia na poziomie prawie 180 W, ale i tutaj wartość szybko się wyrównuje do około 157 W. Jak już w przypadku np Creator Z16PmSI dołącza do CreatoraPro solidny 240-watowy zasilacz, chociaż w naszej konfiguracji w zupełności wystarczyłby bardziej kompaktowy 200-watowy (lub nawet tylko 180-watowy).
| wyłączony / stan wstrzymania | |
| luz | |
| obciążenie |
|
Legenda:
min: | |
Power Consumption The Witcher 3 / Stress Test
Power Consumption With External Monitor
Czas pracy na baterii
Mobilne stacje robocze rzadko kiedy mogą pochwalić się długim czasem pracy na akumulatorze, zwłaszcza konfiguracje z wyświetlaczami o wysokiej rozdzielczości. Choć 90-woltowy akumulator CreatorPro Z16P jest bardzo pojemny, w naszym teście WLAN przy 150 cd/m², co odpowiada 39% maksymalnej jasności, zmierzyliśmy zaledwie 6 godzin. Przy pełnej jasności wytrzymuje on nawet tylko około 4,5 h
Przy włączonym laptopie pełny proces ładowania trwa 142 minuty, ale 65% pojemności jest już osiągane po prawie 37 minutach a około 80% po 54 minutach. Dopiero po tym czasie krzywa ładowania znacznie się spłaszcza.
| Battery Runtime | |
| WiFi Websurfing | |
| Średnia w klasie Workstation (2.47 - 14.2, n=25, ostatnie 2 lata) | |
| Lenovo ThinkPad P1 G4-20Y4S0KS00 | |
| Dell Precision 5000 5560 | |
| HP ZBook Studio 16 G9 62U04EA | |
| MSI CreatorPro Z16P B12UKST | |
| MSI Creator Z16P B12UHST | |
| WiFi Websurfing max. Brightness | |
| Średnia w klasie Workstation (4.55 - 8.98, n=7, ostatnie 2 lata) | |
| MSI Creator Z16P B12UHST | |
| MSI CreatorPro Z16P B12UKST | |
| HP ZBook Studio 16 G9 62U04EA | |
| Lenovo ThinkPad P1 G4-20Y4S0KS00 | |
Za
Przeciw
Werdykt - Chłodzenie CreatorPro Z16P jest przytłaczające
Wprawdzie profesjonalna karta graficzna zmienia MSI Creator Z16P w CreatorPro Z16P, ale innych różnic nie ma. Nie dziwi więc fakt, że urządzenia te mają również wspólne zalety i wady. Do zalet na pewno należy zaliczyć dobrą obudowę, świetny wyświetlacz, a także dobrą klawiaturę. Ale są też pewne problemy, bo wydajność podzespołów nie zawsze była miarodajna (nawet jeśli korzystaliśmy z profilu Highest Performance). Ogromnym problemem pozostaje również rozwijanie się temperatur. Korzystanie z klawiatury staje się niekomfortowe już po krótkich fazach obciążenia, a pod dłuższym obciążeniem udało nam się zmierzyć temperatury powierzchni wyższe niż 65°C (149°F)
Wydajność MSI CreatorPro Z16P nie zawsze pozostaje stabilna, a temperatury powierzchni stają się zbyt wysokie pod obciążeniem. Korzystanie z klawiatury staje się niewygodne już po kilku minutach.
Ogólnie rzecz biorąc, mamy pewne trudności z poleceniem MSI CreatorPro Z16P jako stacji roboczej. Choć jest kilka pozytywnych aspektów, problemy z wydajnością i ekstremalne temperatury powierzchni nie są dobrymi kwalifikacjami dla stacji roboczej. Testowany ostatnio m.in HP ZBook Studio 16 G9był w stanie pozostawić ogólnie znacznie lepsze wrażenie i jest również dostępny z mocniejszymi procesorami graficznymi. W najbliższych tygodniach przetestujemy również inne aktualne modele stacji roboczych od konkurencji.
Cena i dostępność
Topowa konfiguracja MSI CreatorPro Z16P z procesorem Intel Core i9-12900H, kartą graficzną RTX A5500, 64 GB RAM, 1 TB SSD i wyświetlaczem QHD+ jest dostępna w sklepie Amazon w cenie 4862 dolarów.
MSI CreatorPro Z16P B12UKST
- 14/11/2022 v7 (old)
Andreas Osthoff
Price comparison

