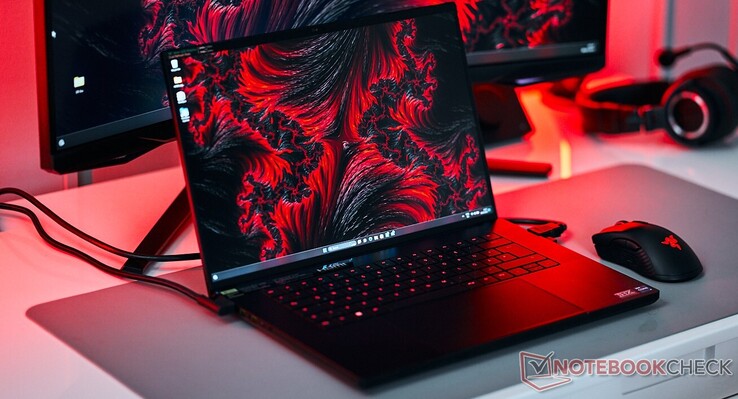
Razer Blade 16 Early 2023 RTX 4090 Review: Bestia Core i9-13950HX z pierwszym na świecie dwutrybowym wyświetlaczem mini-LED UHD+
Nowy Razer Blade 16dołącza do rosnącej listy gamingowych laptopów z serii Raptor Lake-HX i RTX 40, które upychają w sobie wszystko oprócz kuchennego zlewu i kosztują tyle, co używany samochód.
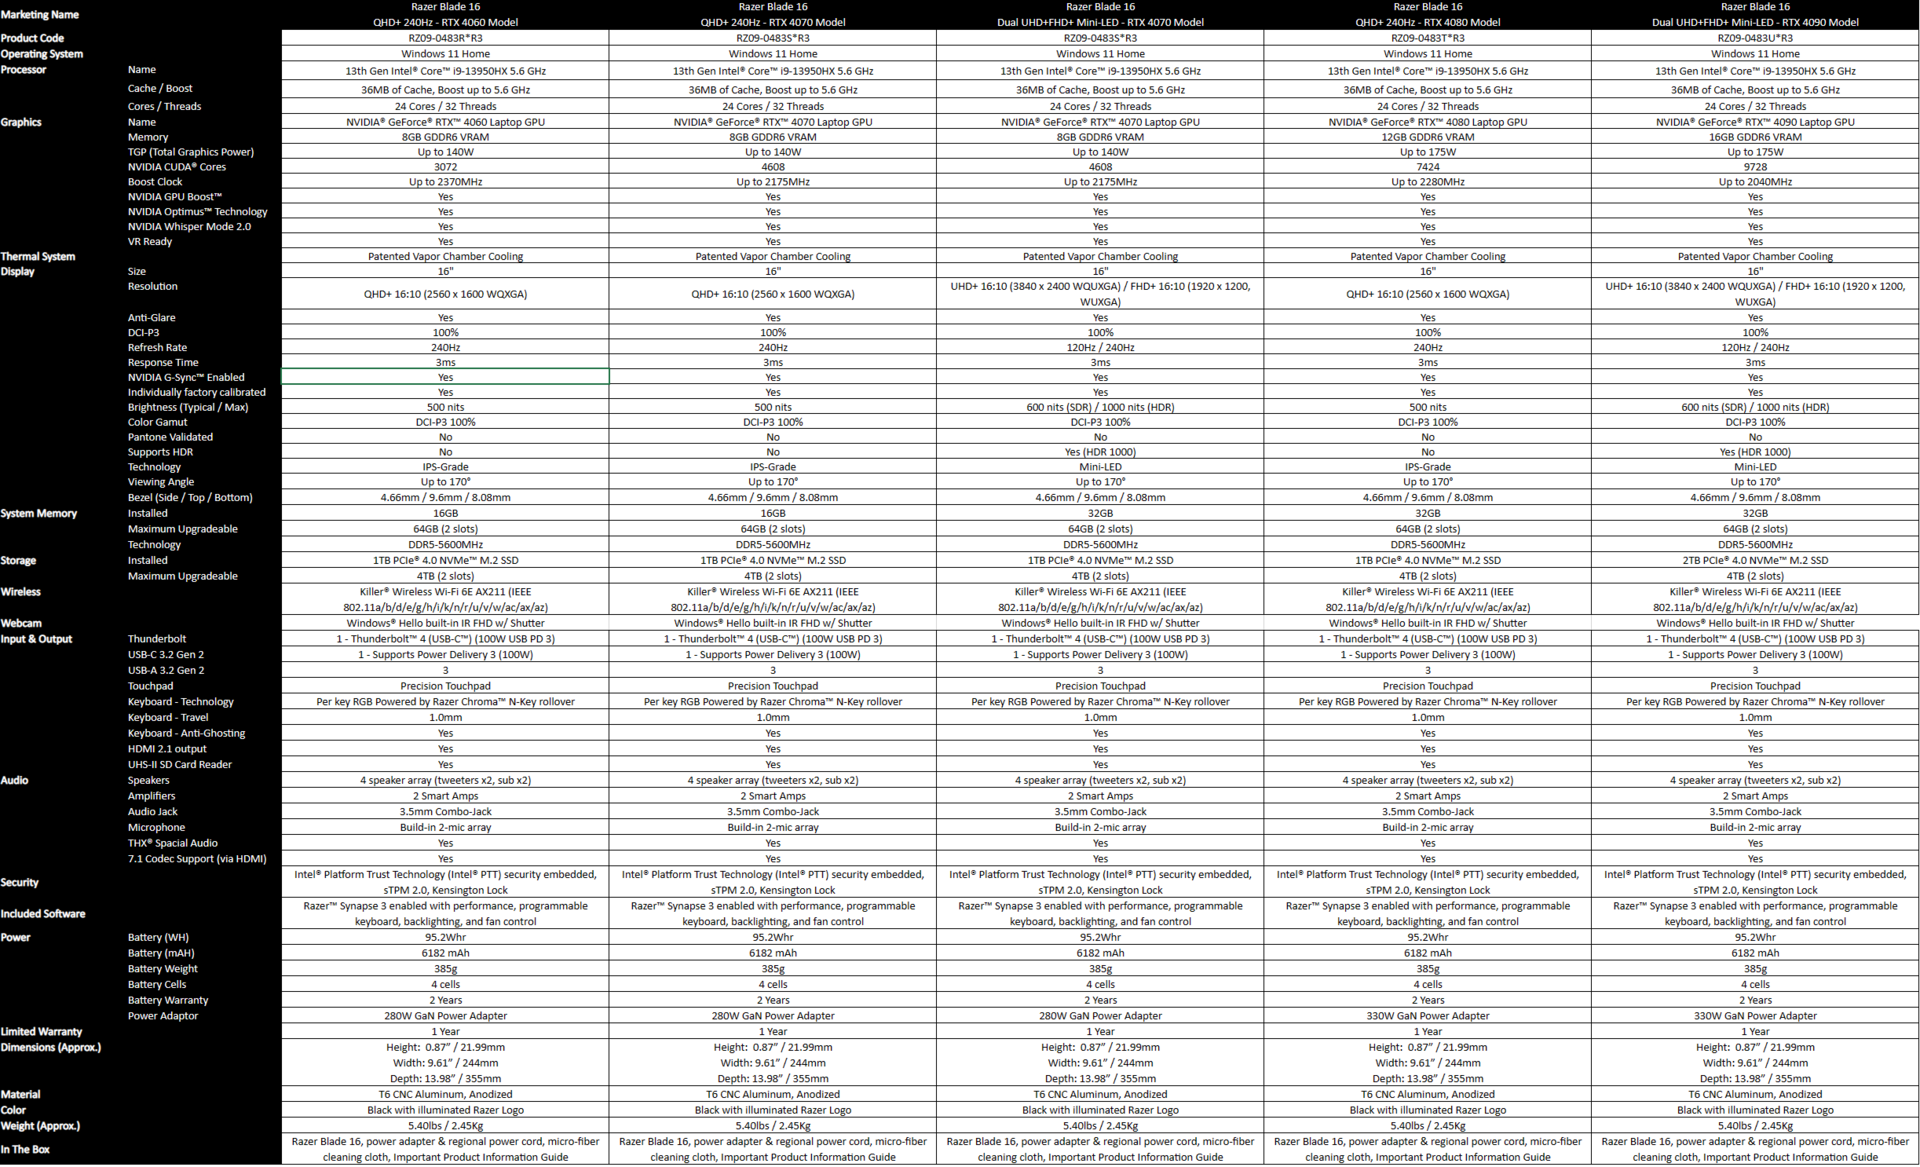
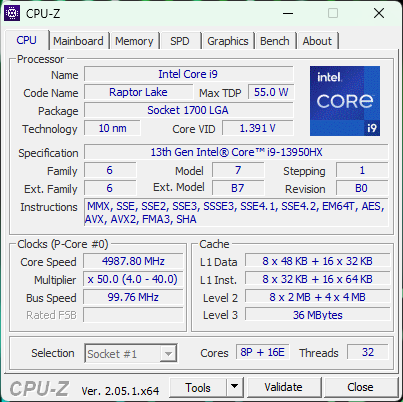
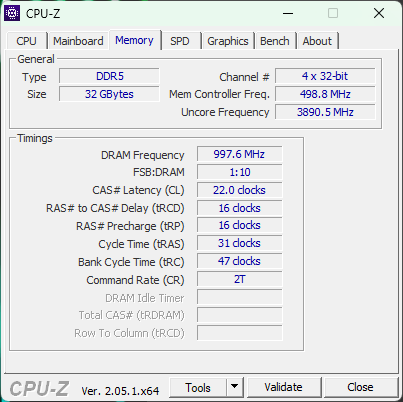
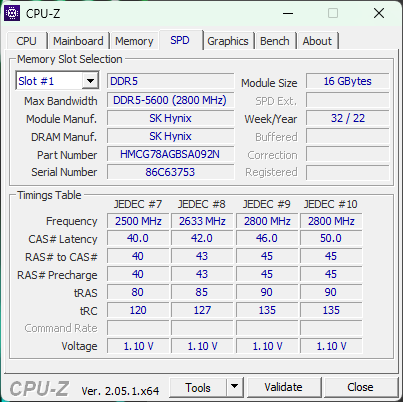
Nasz egzemplarz testowy dostarczony przez Nvidia India jest napędzany przez Core i9-13950HX, RTX 4090 "Laptop GPU, 16-calowy dwumodowy wyświetlacz mini-LED UHD, 32 GB pamięci RAM DDR5-5600, 2x 1 TB NVMe SSD oraz baterię o pojemności 95,2 WHr. Razer nie sprzedaje swoich produktów w Indiach, ale ta konfiguracja ustawi Cię o 4,300 USD lub 5,000 euro.
Wcześniej recenzowaliśmy m.in.Razer Blade 16 "Early 2023napędzany przez Intel Core i9-13950HX iNvidia GeForce RTX 4080 Laptop GPUa także Blade 18 wyposażony w ten sam procesor iRTX 4070 Laptop GPU.
W tej recenzji testujemy wariant Blade 16 Early 2023 z procesorem graficznym RTX 4090 Laptop GPU, porównujemy go z najnowszymi urządzeniami z tego roku i sprawdzamy, czy istnieje jakakolwiek realna korzyść z wydawania dodatkowych 700 USD na to, co jest już dość dużą konfiguracją.
Obudowa, urządzenia wejściowe i inne elementy wewnętrzne są identyczne jak w przypadku wersji RTX 4080 Blade 16, więc poruszymy je tutaj tylko pokrótce.
Potencjalni konkurenci w porównaniu
Ocena | Data | Model | Waga | Wysokość | Rozmiar | Rezolucja | Cena |
|---|---|---|---|---|---|---|---|
| 89.8 % v7 (old) | 03/2023 | Razer Blade 16 Early 2023 RTX 4090 i9-13950HX, GeForce RTX 4090 Laptop GPU | 2.5 kg | 21.99 mm | 16.00" | 3840x2400 | |
| 89.9 % v7 (old) | 03/2023 | Eluktronics Mech-17 GP2 i9-13900HX, GeForce RTX 4090 Laptop GPU | 2.9 kg | 27 mm | 17.00" | 2560x1600 | |
| 88 % v7 (old) | 04/2023 | Asus Zephyrus Duo 16 GX650PY-NM006W R9 7945HX, GeForce RTX 4090 Laptop GPU | 2.7 kg | 29.7 mm | 16.00" | 2560x1600 | |
| 89 % v7 (old) | 02/2023 | MSI Titan GT77 HX 13VI i9-13950HX, GeForce RTX 4090 Laptop GPU | 3.5 kg | 23 mm | 17.30" | 3840x2160 | |
| 86.6 % v7 (old) | 02/2023 | Asus ROG Strix Scar 18 2023 G834JY-N6005W i9-13980HX, GeForce RTX 4090 Laptop GPU | 3.1 kg | 30.8 mm | 18.00" | 2560x1600 | |
| 89.4 % v7 (old) | 03/2023 | Asus ROG Zephyrus M16 GU604VY-NM042X i9-13900H, GeForce RTX 4090 Laptop GPU | 2.3 kg | 22.9 mm | 16.00" | 2560x1600 | |
| 88.4 % v7 (old) | 03/2023 | Asus ROG Strix G16 G614JZ i9-13980HX, GeForce RTX 4080 Laptop GPU | 2.4 kg | 30.4 mm | 16.00" | 2560x1600 | |
| 91.2 % v7 (old) | 02/2023 | Razer Blade 16 Early 2023 i9-13950HX, GeForce RTX 4080 Laptop GPU | 2.4 kg | 21.99 mm | 16.00" | 2560x1600 | |
| 89.4 % v7 (old) | 02/2023 | Lenovo Legion Pro 7 16IRX8H i9-13900HX, GeForce RTX 4080 Laptop GPU | 2.7 kg | 26 mm | 16.00" | 2560x1600 | |
| 91.4 % v7 (old) | 02/2023 | Razer Blade 18 RTX 4070 i9-13950HX, GeForce RTX 4070 Laptop GPU | 3 kg | 21.9 mm | 18.00" | 2560x1600 |
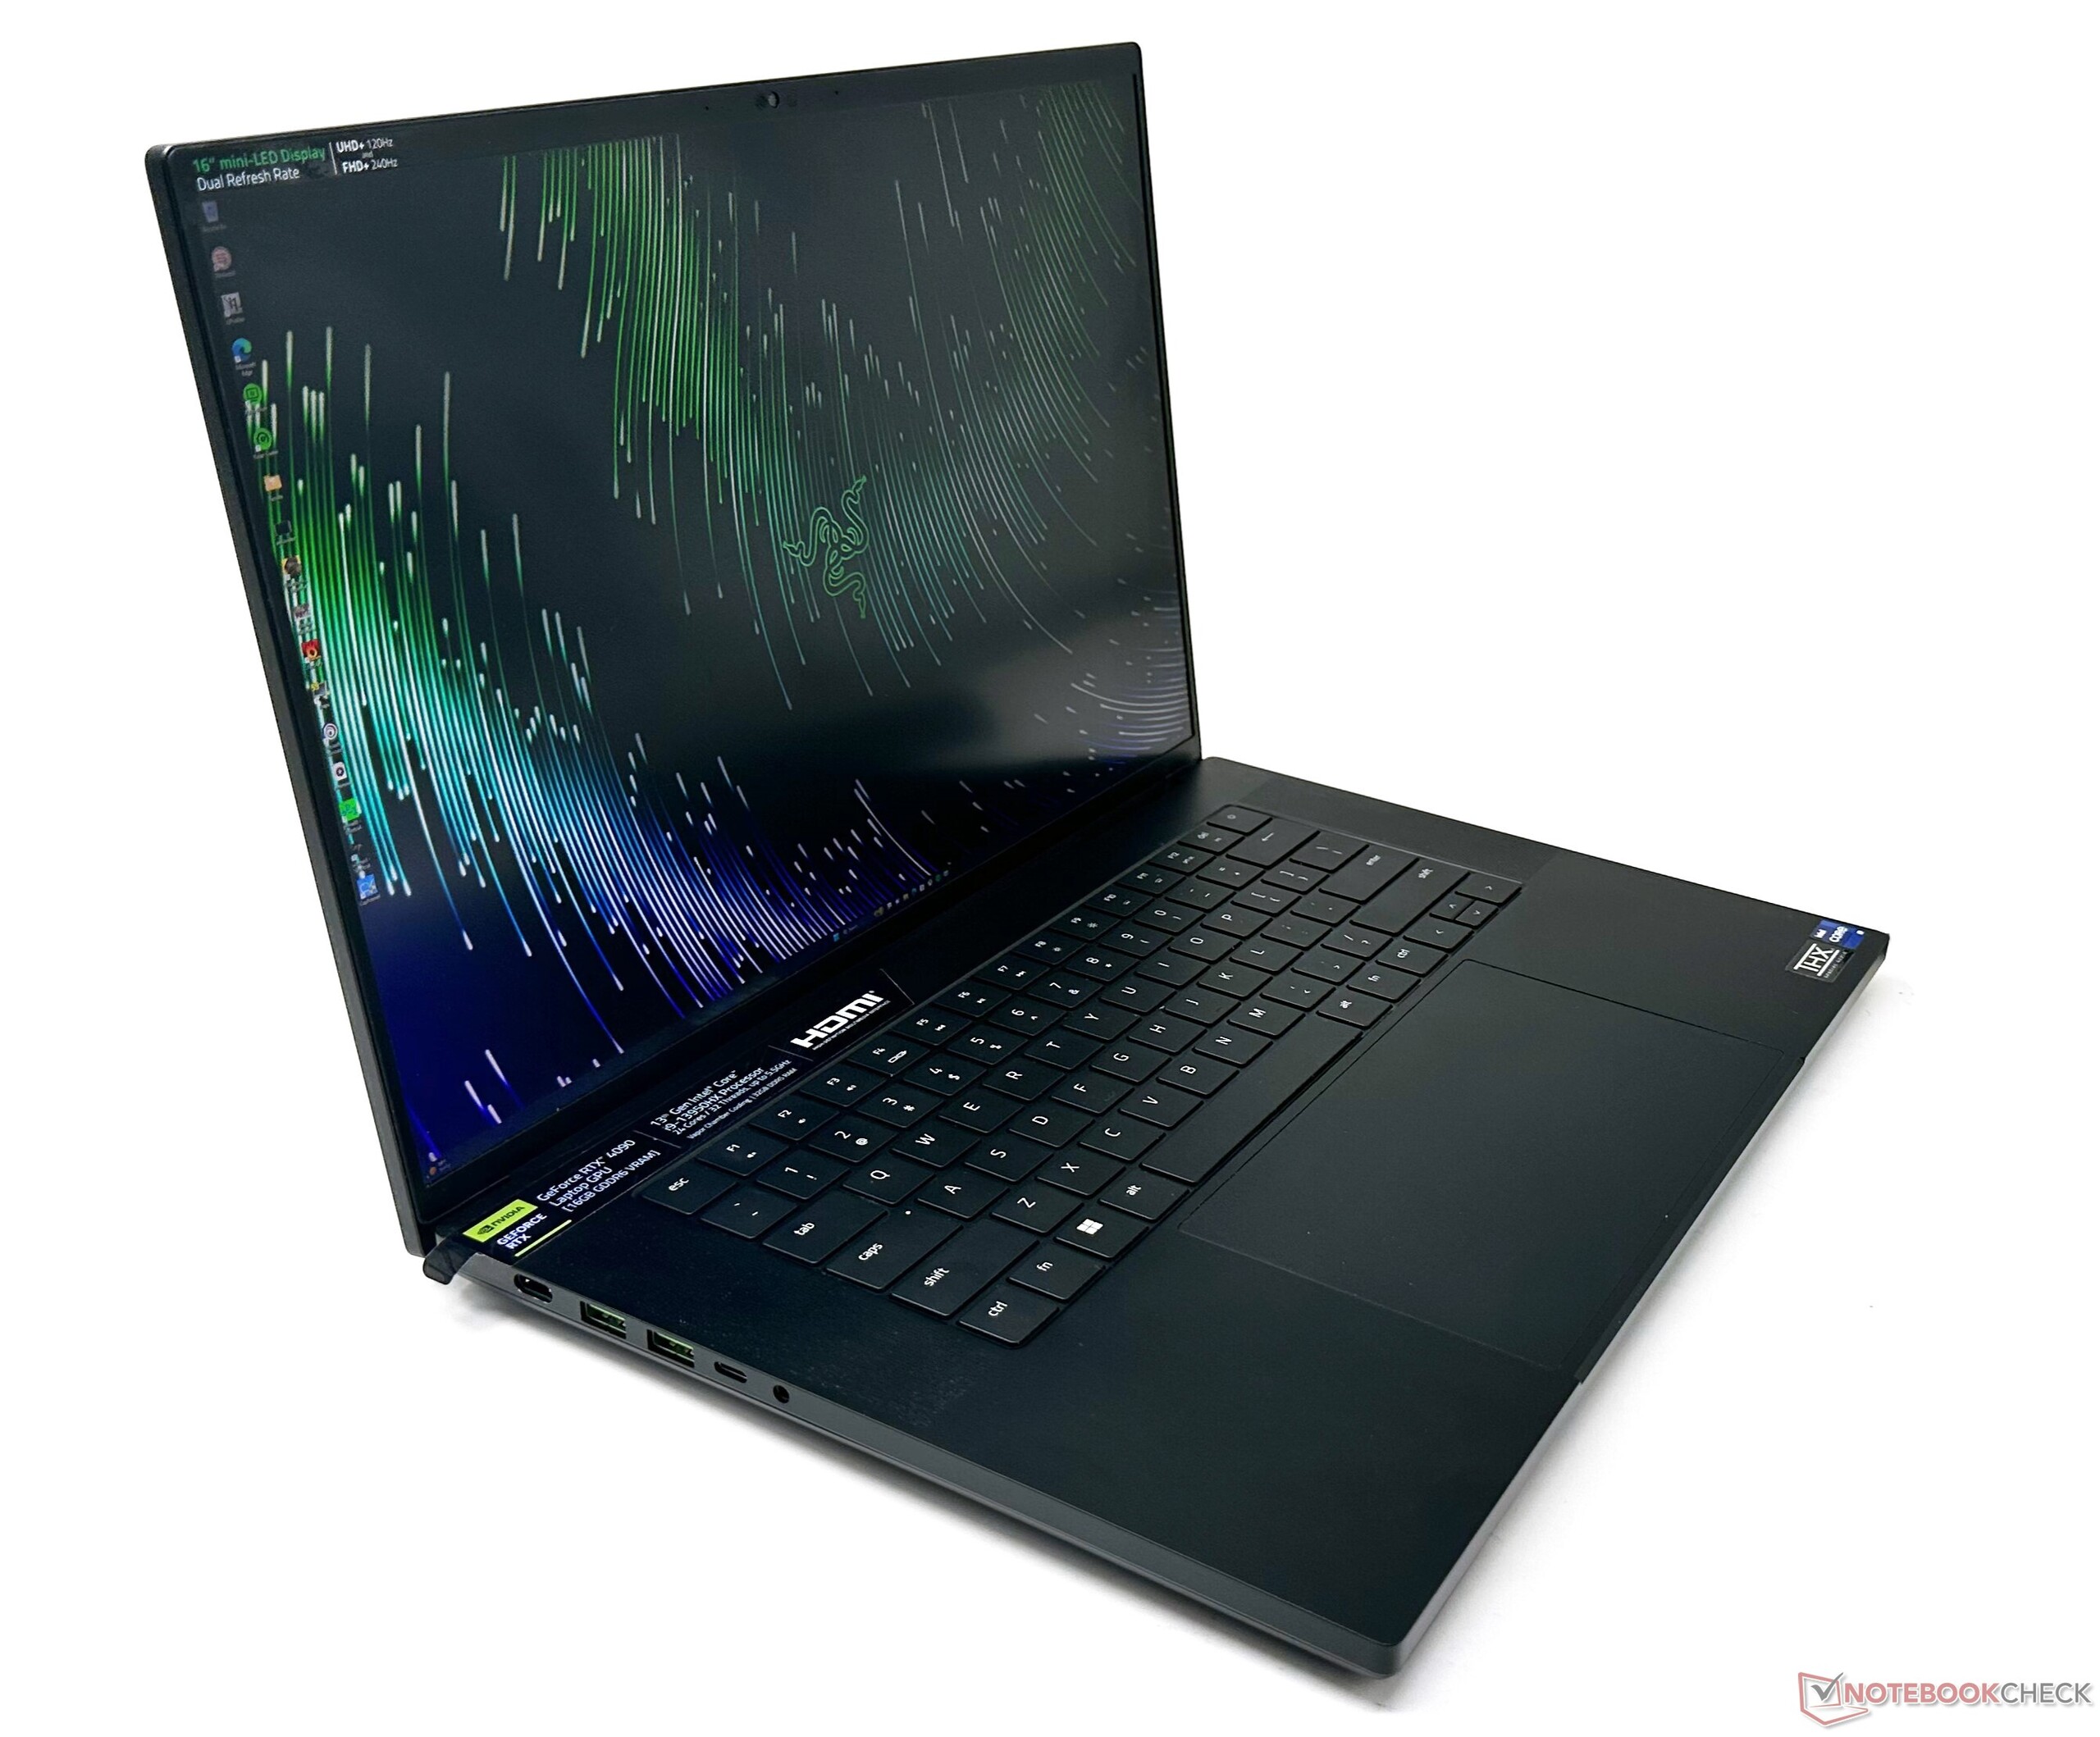
Obudowa: Premium i wytrzymałe w prawdziwej modzie Razera
Blade 16 posiada wykończenie z anodyzowanego aluminium, które przypomina MacBooka Pro, podobnie jak wiele poprzednich Razerów, które testowaliśmy. Obudowa premium jest niezwykle solidna, a jej ugięcia są minimalne, i to tylko przy świadomym wywieraniu dużego nacisku.
Razer Blade 16 jest smuklejszy niż Asus ROG Zephyrus Duo 16 i zdecydowanie bardziej smukły niż Lenovo Legion Pro 7 oraz MSI Titan GT77 HX 13VI. Na stronie Asus ROG Zephyrus M16 jest niemal identyczny z Blade 16 Early 2023 pod względem ogólnych wymiarów.
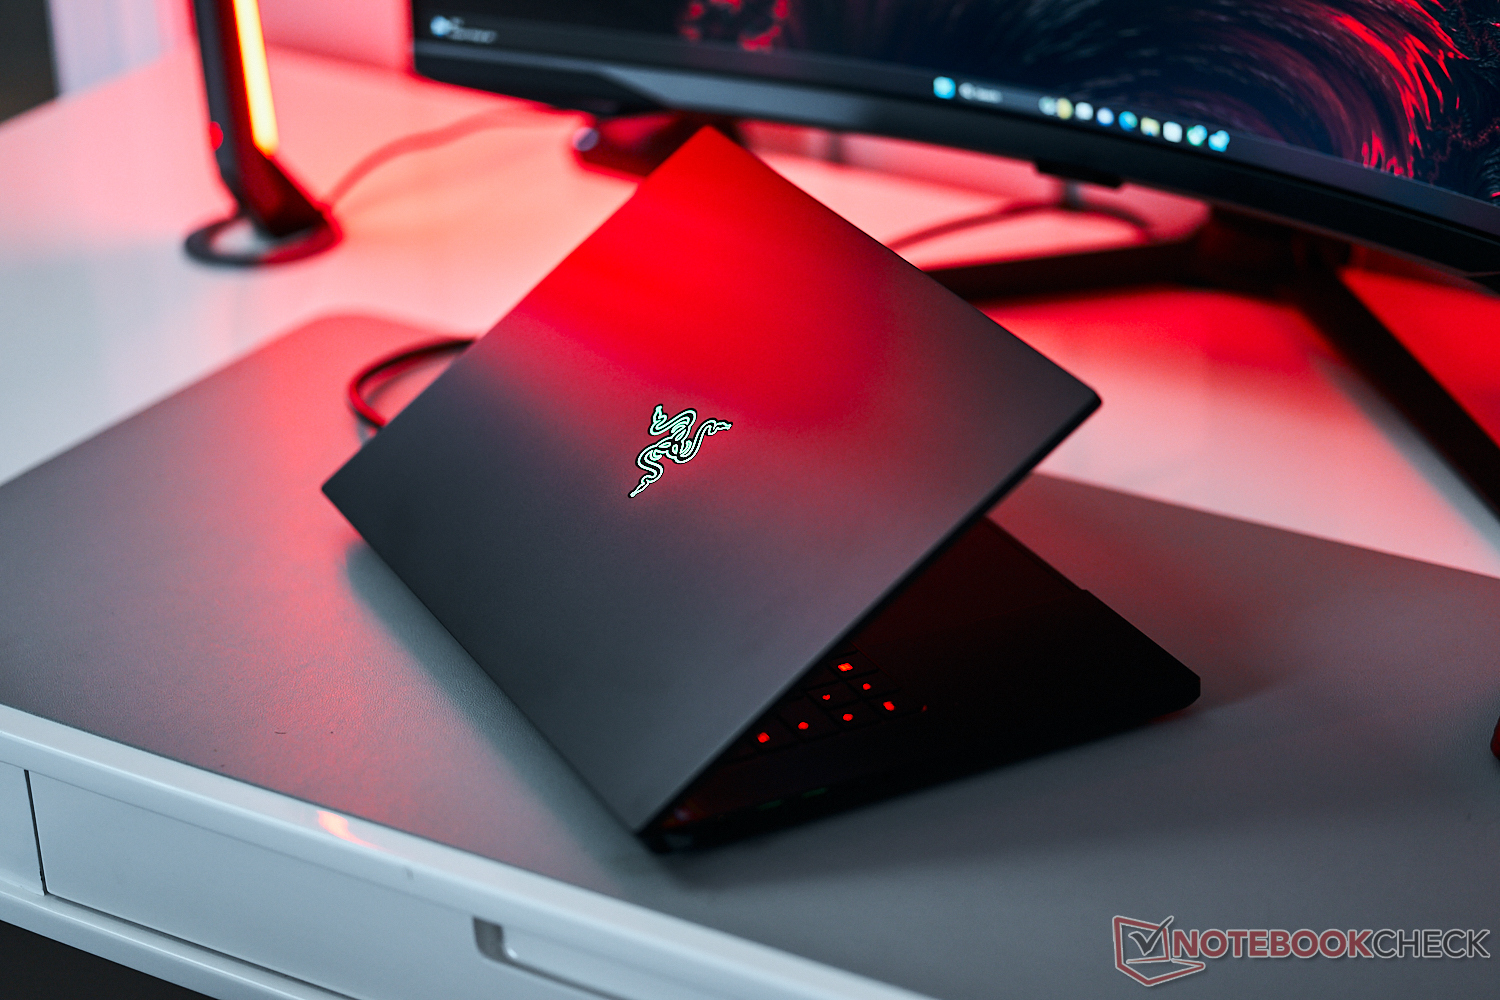
Obudowa sportuje minimalistyczny design, a jedynym efektem świetlnym jest charakterystyczne logo węża Razera na tylnej części pokrywy. Pokrywa jest jednak magnesem na brud i odciski palców, a utrzymanie jej w czystości jest uciążliwe. Pokrywę można łatwo otworzyć jednym palcem bez problemów ze stabilnością.
Łączność: Karta SD o dużej przepustowości i Wi-Fi
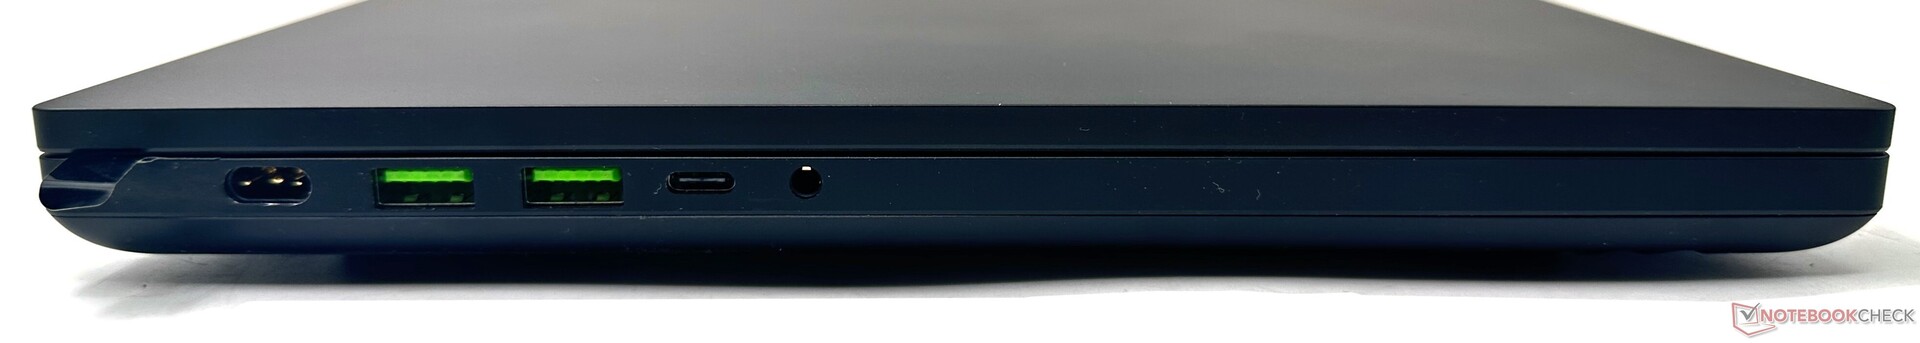
Blade 16 oferuje odpowiedni wybór portów. Razer używa autorskiego portu ładowania, który jest wstecznie kompatybilny z zeszłorocznym Blade 15 oraz Blade 17. Złącze nie jest umieszczone w jednej płaszczyźnie z obudową, co może być problemem dla niektórych.
Dostarczanie mocy do 100 W jest możliwe na obu portach USB Type-C. Mówiąc o Type-C, Blade 16 oferuje tylko jeden Thunderbolt 4, podczas gdy drugi to USB 3.2 Gen2 Type-C.
Razer mógł zamiast tego wyposażyć Blade 16 w dwa porty Thunderbolt 4. Ponadto porty Type-C nie są oznaczone, więc trzeba będzie zwrócić uwagę, że Thunderbolt 4 to tak naprawdę ten po prawej, a nie po lewej stronie.
Obecny jest slot na blokadę Kensington. Brak portu RJ-45 Gigabit Ethernet jest jednak kłopotliwy, biorąc pod uwagę, że laptop nie aspiruje do miana słabego.
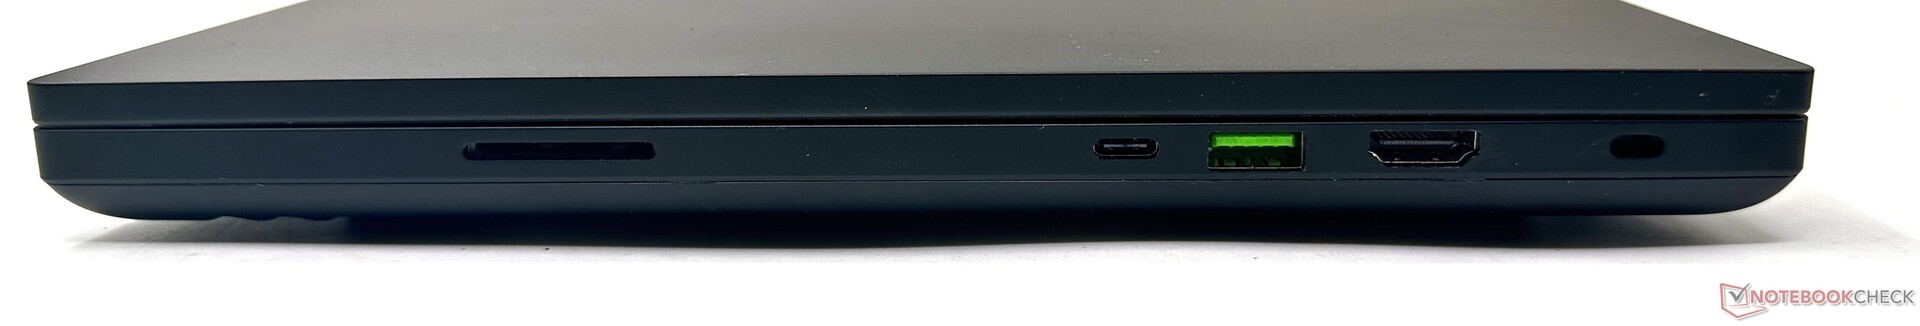
Czytnik kart SD
Razer nadal stosuje jedne z najszybszych czytników kart SD w laptopach dla graczy i Blade 16 nie jest pod tym względem inny. Chociaż czytnik kart Blade 16 Early 2023 pozostaje w tyle za Asusem ROG Zephyrus Duo 16 w testach sekwencyjnych, jest w stanie wyprzedzić go w testach kopiowania plików JPG.
| SD Card Reader | |
| average JPG Copy Test (av. of 3 runs) | |
| Razer Blade 18 RTX 4070 (Angelibird AV Pro V60) | |
| Razer Blade 16 Early 2023 RTX 4090 (Angelbird AV PRO 128 GB V60) | |
| Asus ROG Zephyrus M16 GU604VY-NM042X | |
| Asus Zephyrus Duo 16 GX650PY-NM006W (Angelbird AV Pro V60) | |
| Średnia w klasie Gaming (20.9 - 210, n=54, ostatnie 2 lata) | |
| Razer Blade 16 Early 2023 (AV PRO microSD 128 GB V60) | |
| MSI Titan GT77 HX 13VI (Angelibird AV Pro V60) | |
| Eluktronics Mech-17 GP2 (Angelibird AV Pro V60) | |
| maximum AS SSD Seq Read Test (1GB) | |
| Asus Zephyrus Duo 16 GX650PY-NM006W (Angelbird AV Pro V60) | |
| Razer Blade 18 RTX 4070 (Angelibird AV Pro V60) | |
| Razer Blade 16 Early 2023 (AV PRO microSD 128 GB V60) | |
| Razer Blade 16 Early 2023 RTX 4090 (Angelbird AV PRO 128 GB V60) | |
| Asus ROG Zephyrus M16 GU604VY-NM042X | |
| Średnia w klasie Gaming (25.5 - 261, n=51, ostatnie 2 lata) | |
| Eluktronics Mech-17 GP2 (Angelibird AV Pro V60) | |
| MSI Titan GT77 HX 13VI (Angelibird AV Pro V60) | |
Komunikacja
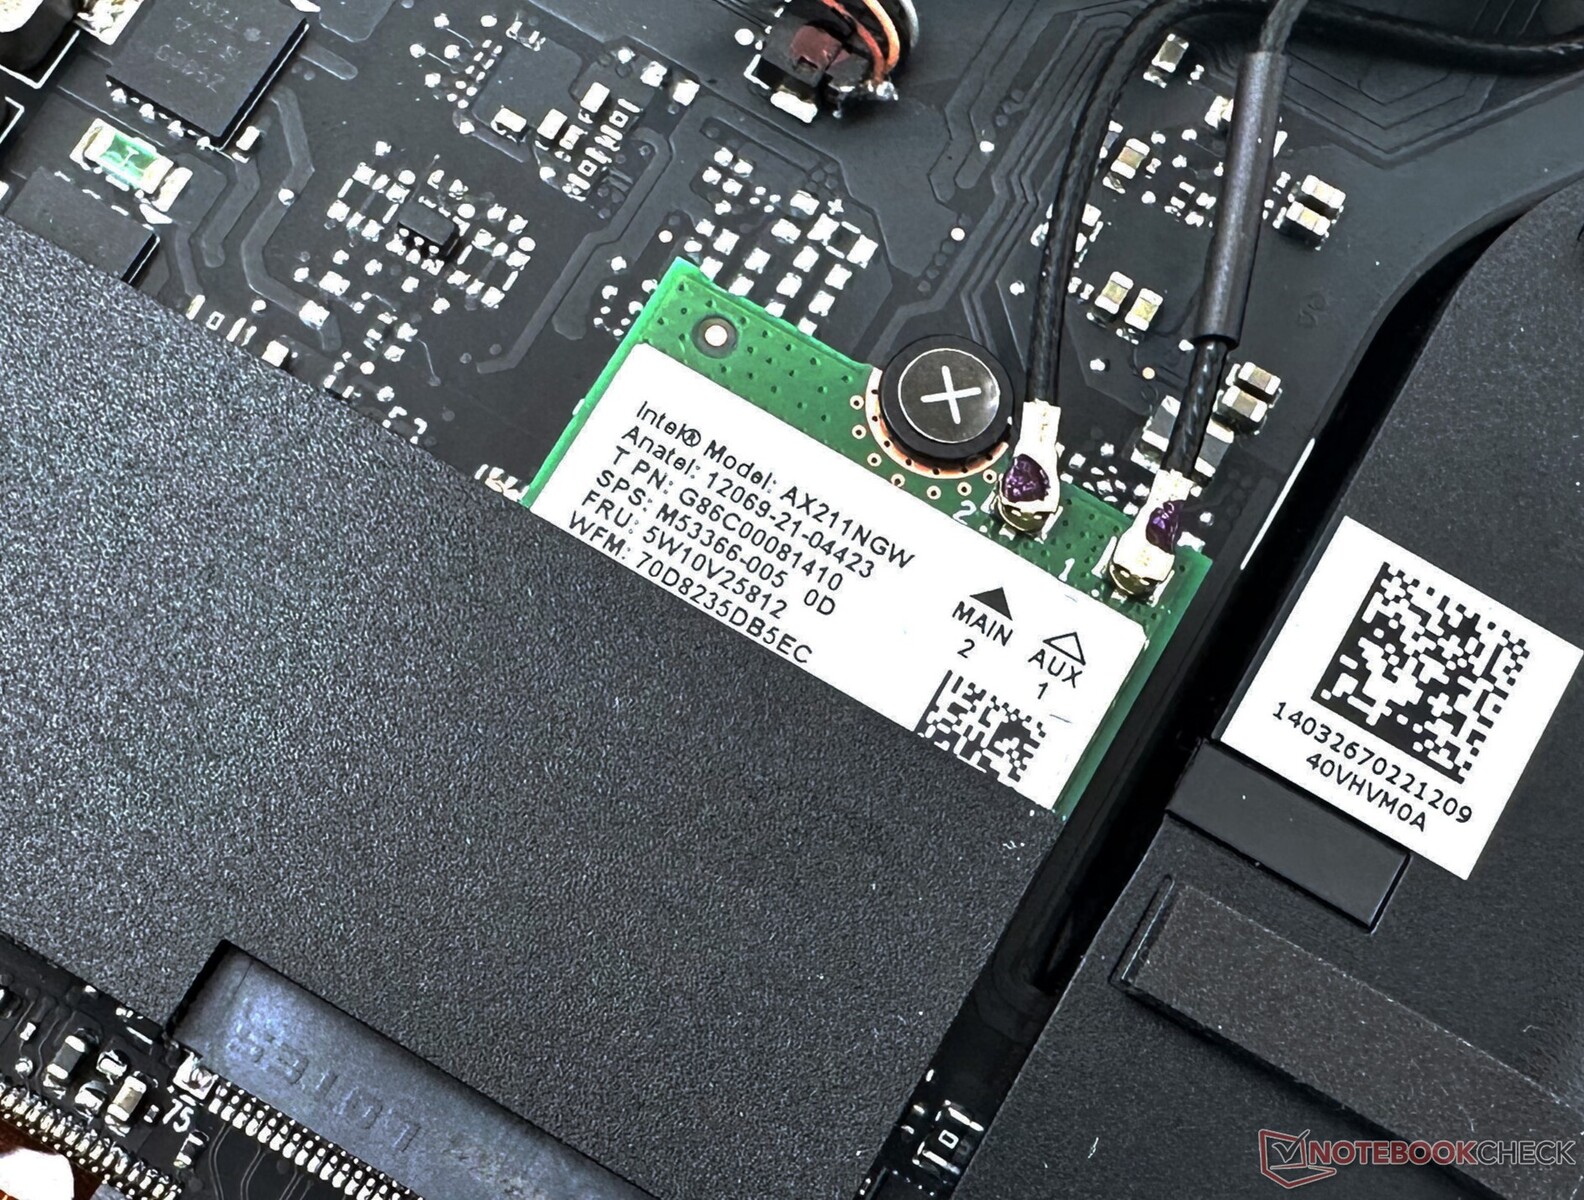
Blade 16 jest wyposażony w moduł WLAN Intel Wi-Fi 6E AX211. Wydajność Wi-Fi została sprawdzona przy użyciu naszego referencyjnego routera Asus ROG Rapture GT-AXE11000 w odległości 1 m od laptopa w czystej linii wzroku, bez innych podłączonych urządzeń i zakłóceń zewnętrznych.
Wydajność sieci jest dość stabilna zarówno w paśmie 5 GHz, jak i 6 GHz. Nie ma żadnej realnej korzyści w zakresie przepustowości przy korzystaniu z pasma 6 GHz w porównaniu z 5 GHz, ponieważ szybkość transferu jest w dużej mierze identyczna w obu przypadkach.
W związku z tym opcja 6 GHz jest nadal przydatna, jeśli masz kompatybilny router i chcesz zmniejszyć zakłócenia od mnóstwa innych klientów 5 GHz.
Kamera internetowa
Kamera internetowa 1080p wykazuje nieco większe odchylenia kolorów, zwłaszcza w przypadku odcieni niebieskiego. Ostrość jest zadowalająca, ale z zauważalną ilością szumów. Ogólnie rzecz biorąc, wydajność jest przyzwoita - wystarczająca do prowadzenia rozmów wideo i innych prac.


Bezpieczeństwo
Blade 16 obsługuje logowanie oparte na Windows Hello poprzez czujnik IR. Rozpoznawanie twarzy jest szybkie i działa bez większych problemów. W przeciwieństwie do Blade 18, dla kamerki internetowej przewidziano fizyczną migawkę. Obecny jest moduł TPM 2.0.
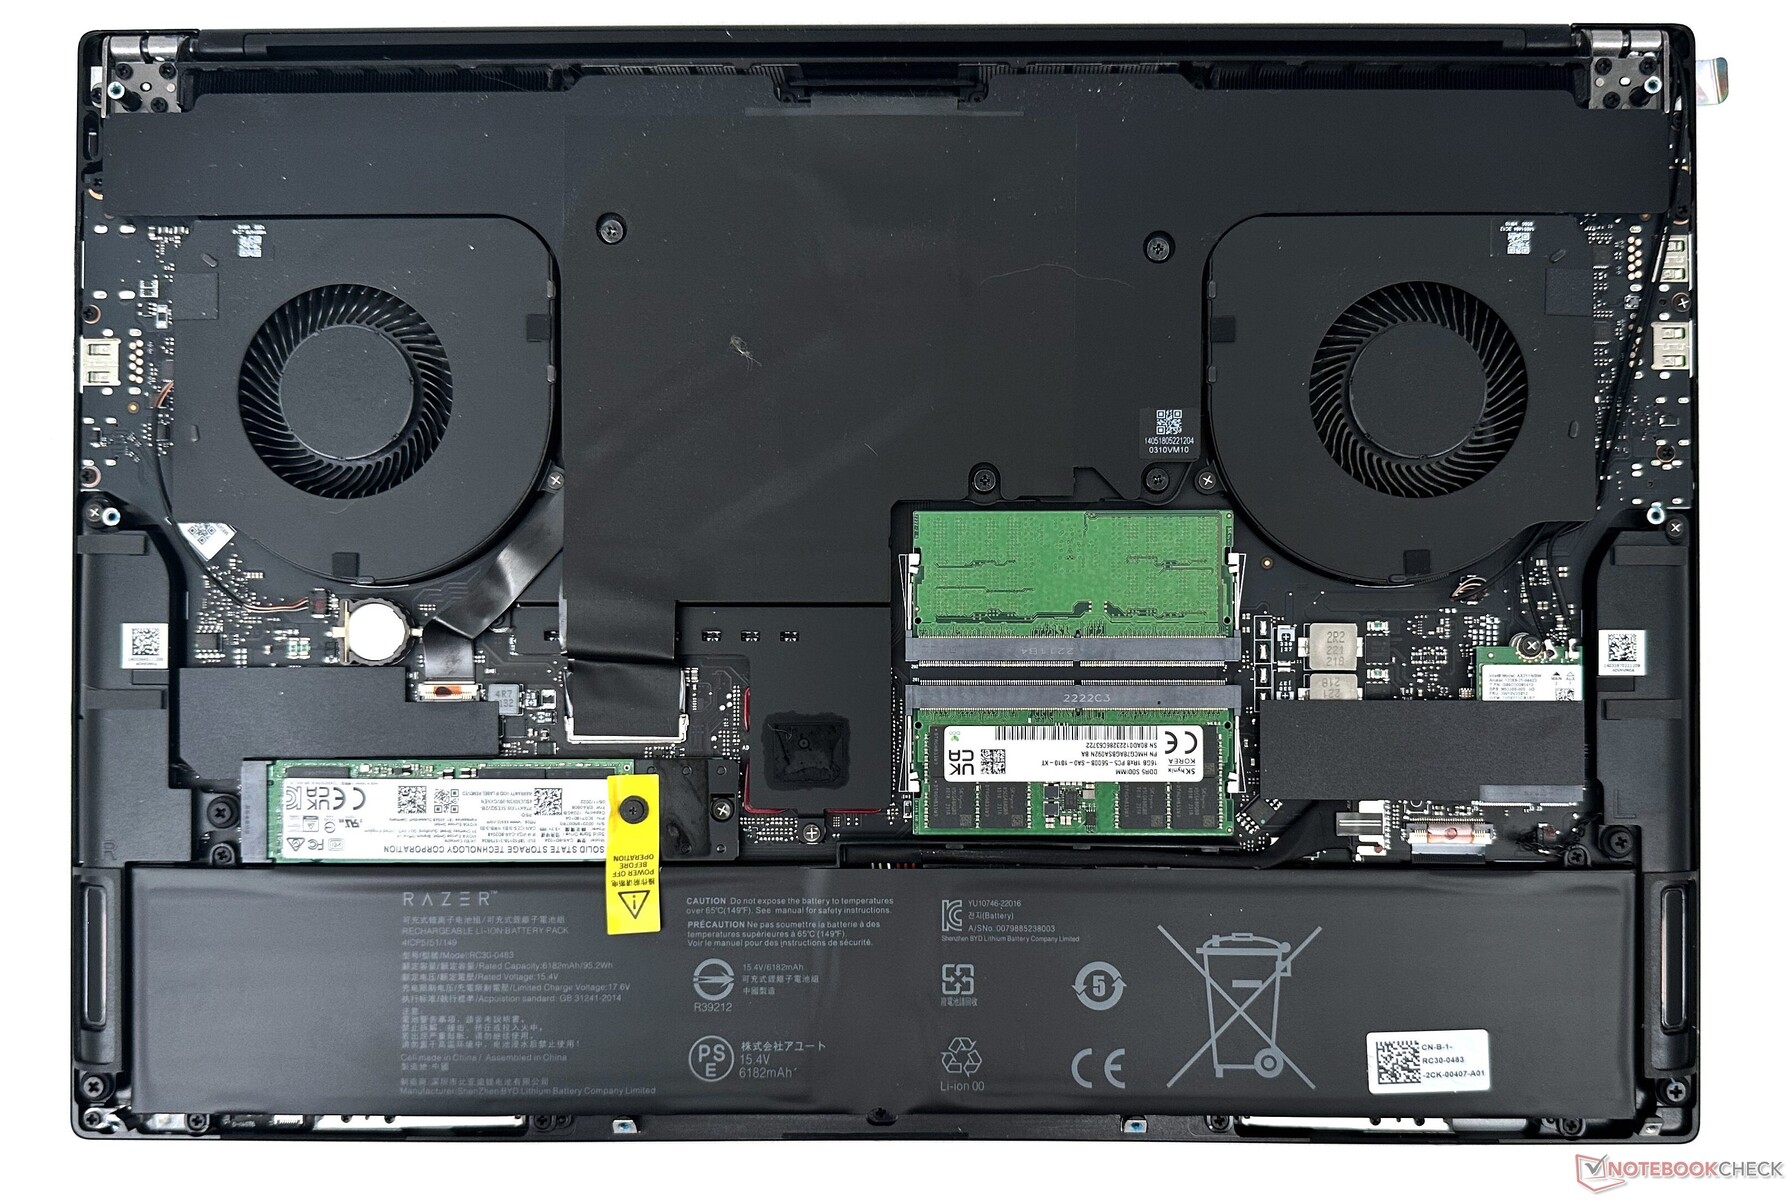
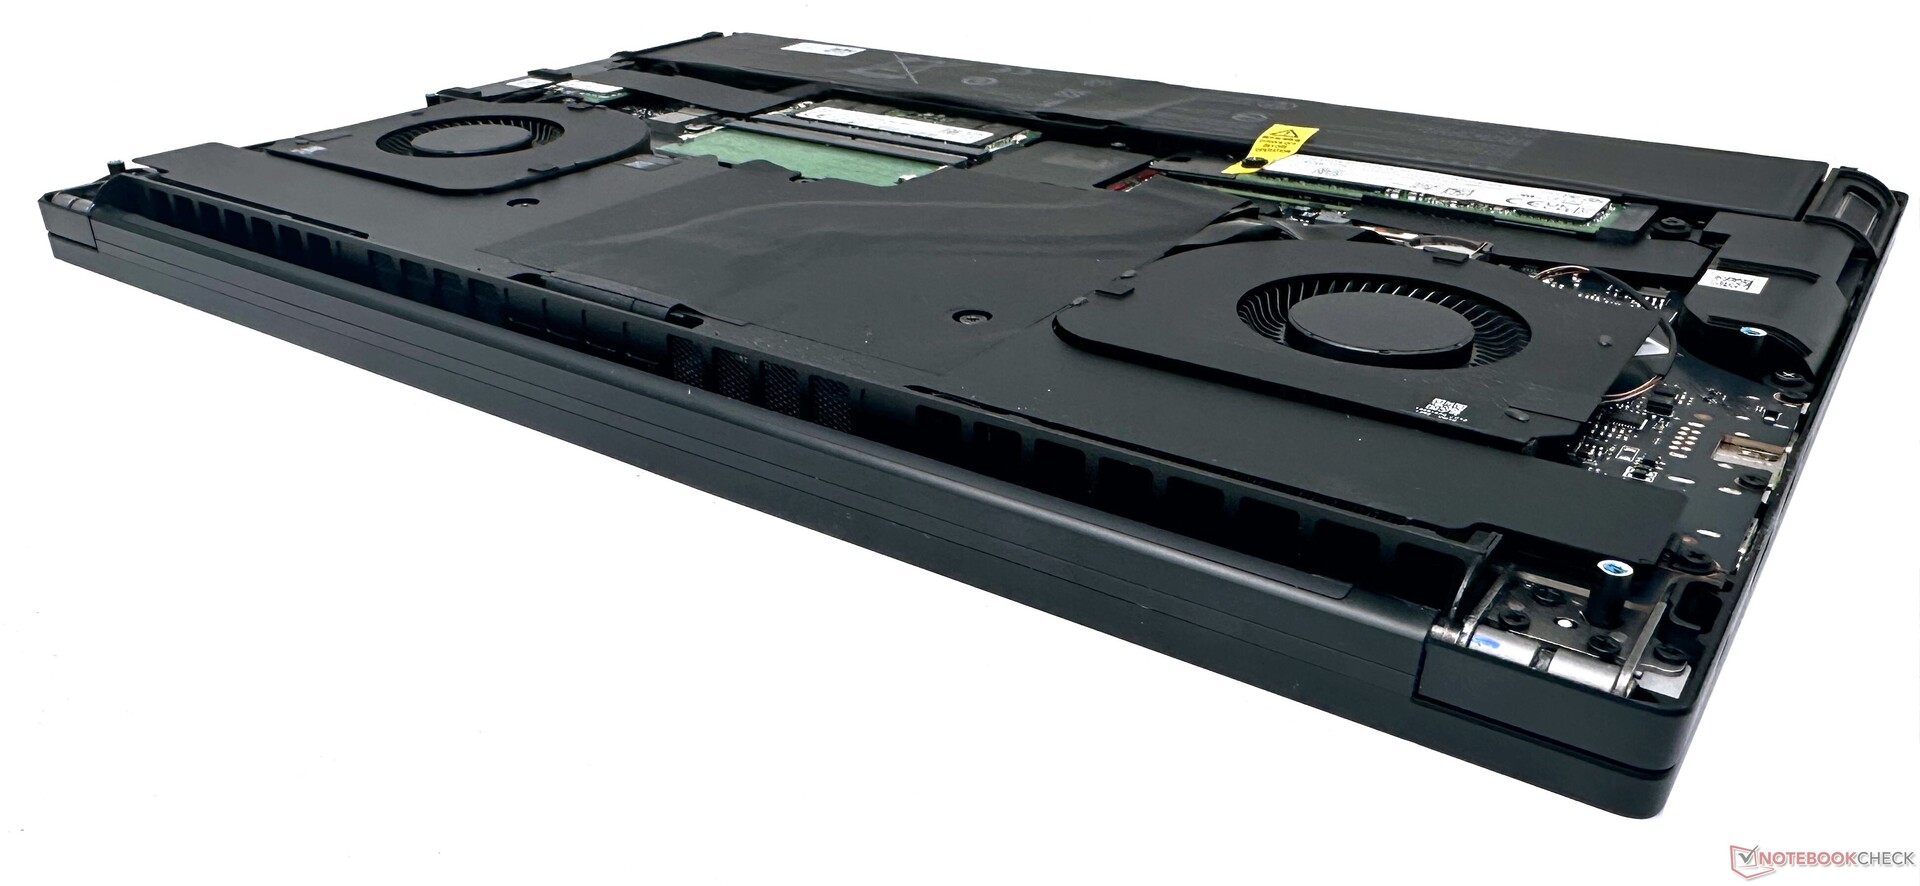
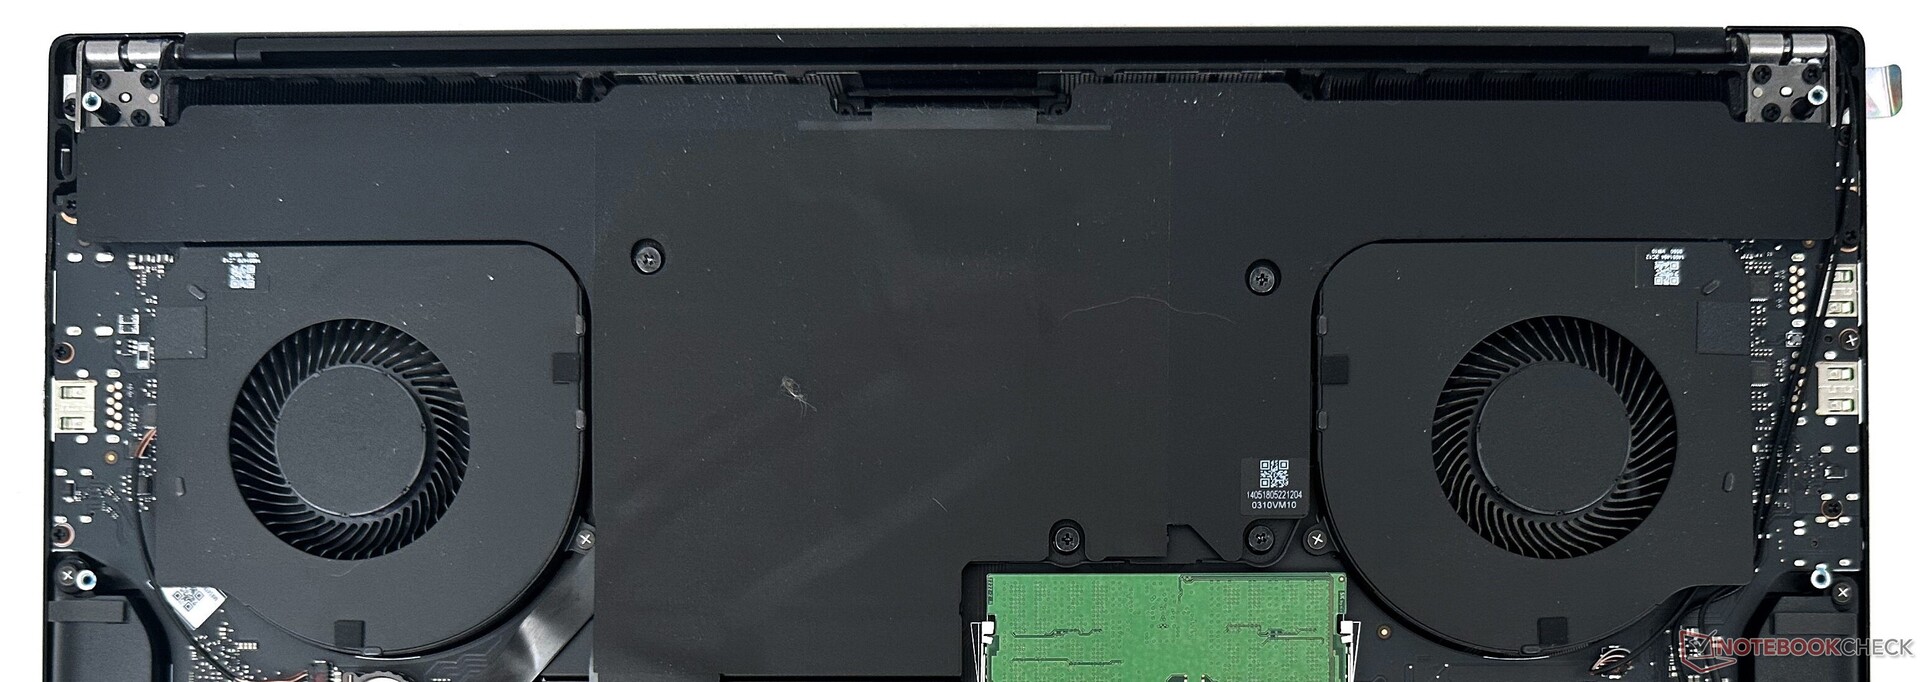
Konserwacja
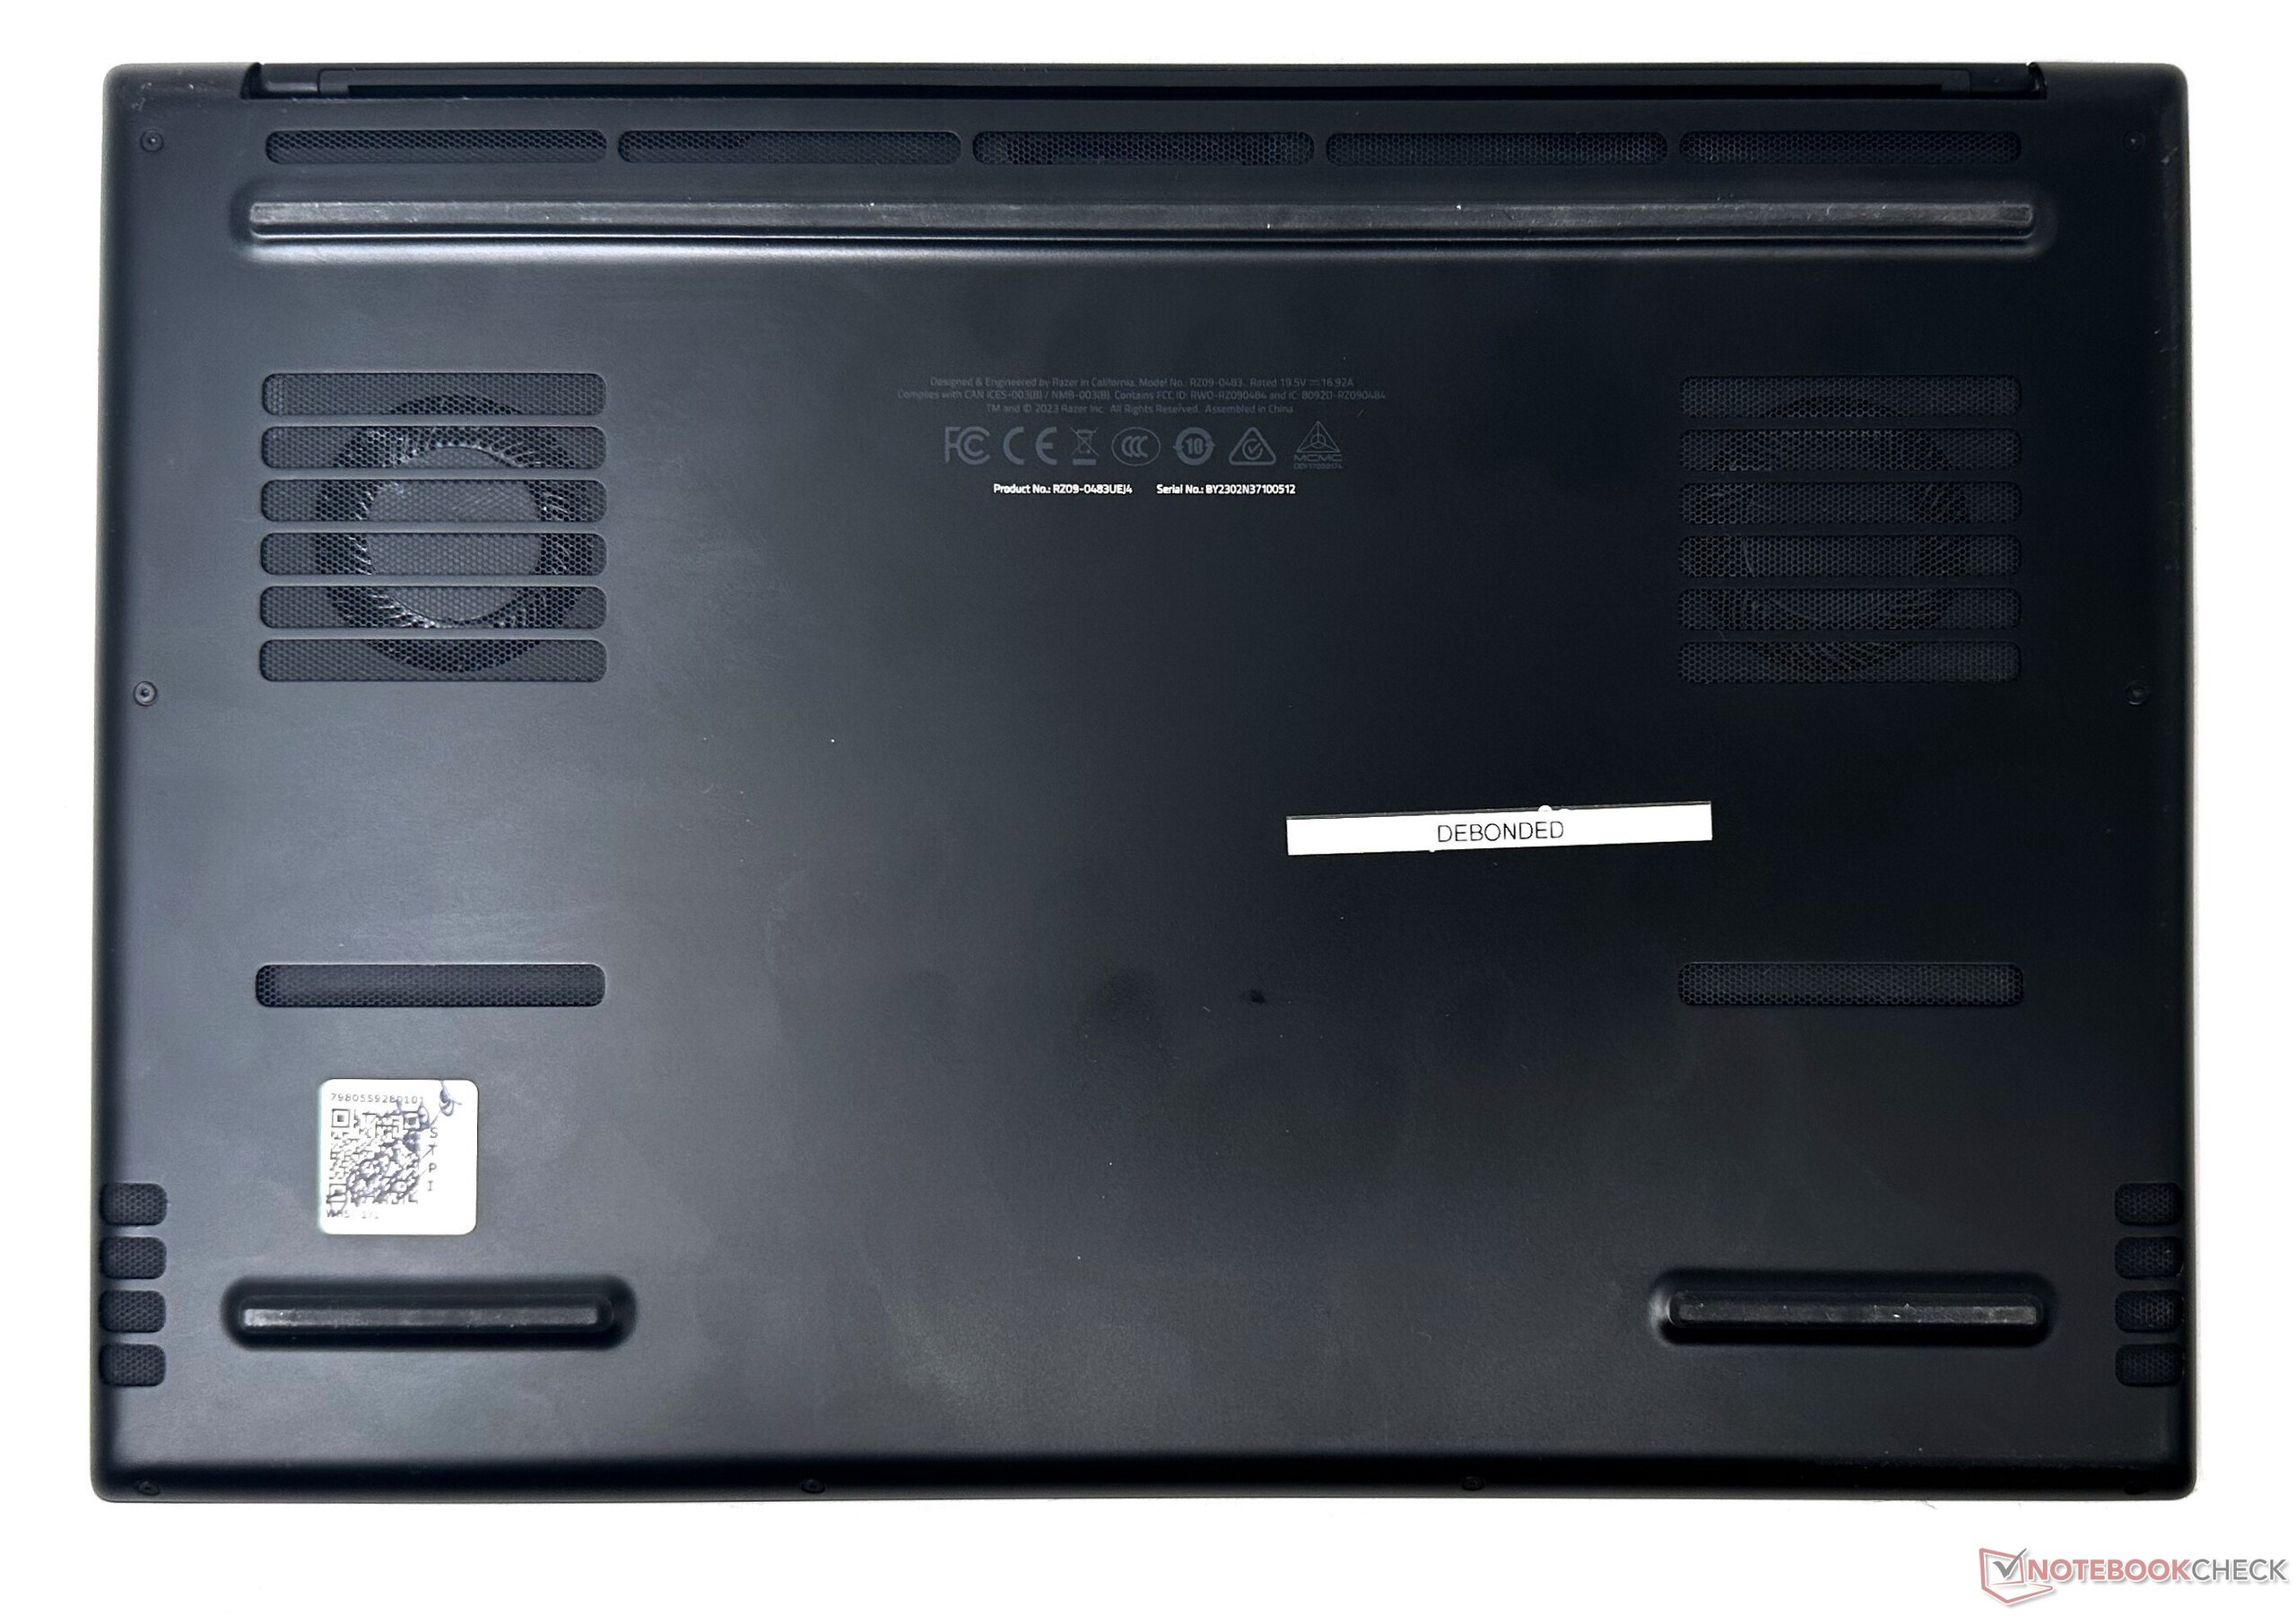
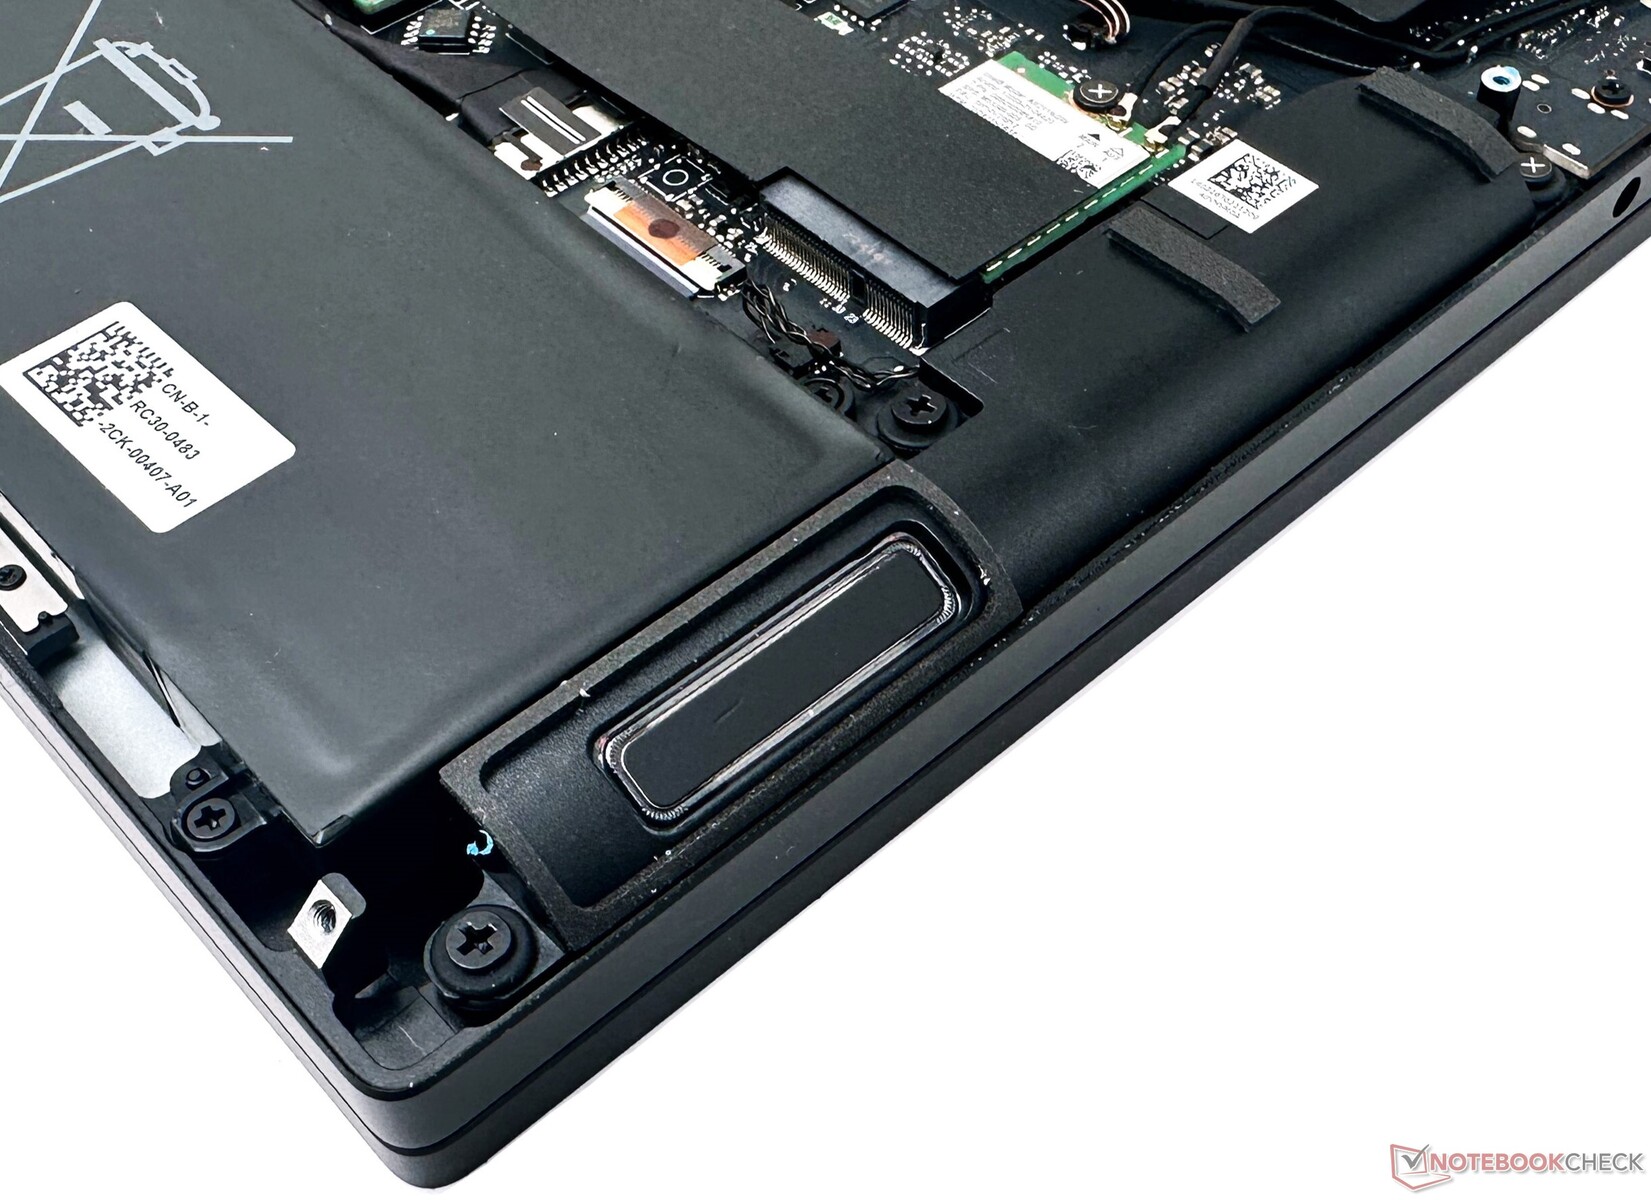
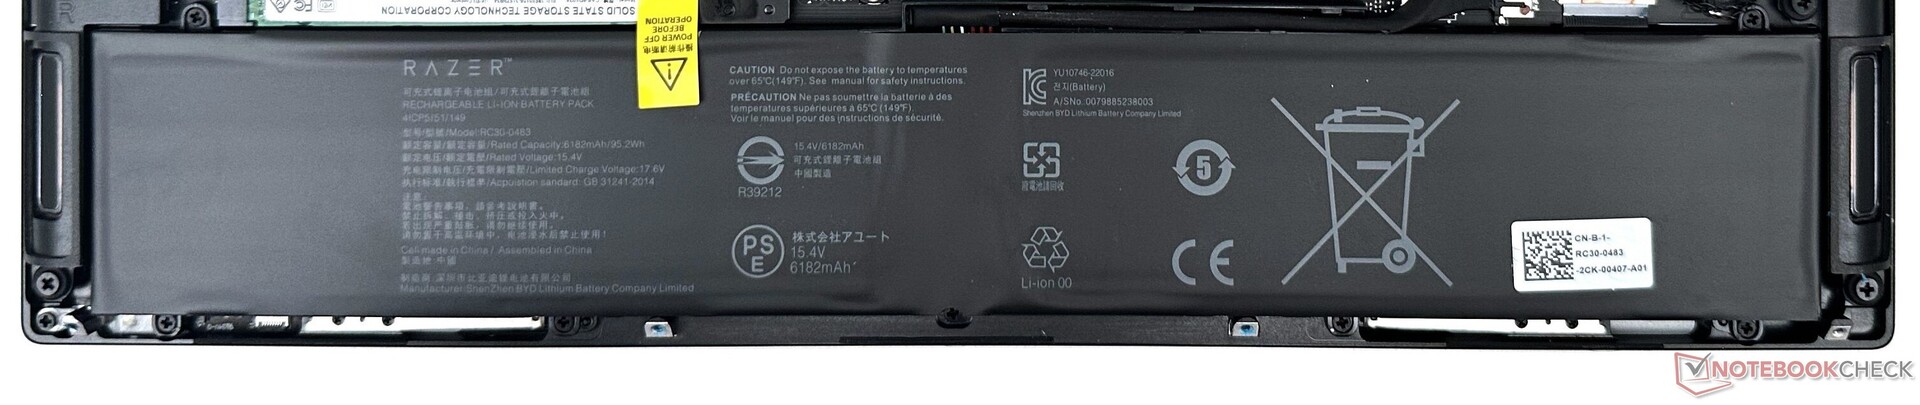
Odkręcenie ośmiu śrub T5 otwiera dolny panel, odsłaniając ogromny system chłodzenia z komorą parową. Pamięć RAM DDR5-5600, dyski SSD NVMe i karta Wi-Fi mogą być w razie potrzeby wymieniane. Podwójny pakiet baterii można również odkręcić i wymienić.
Warto zwrócić uwagę na to, że Razer oferuje aktualizacje BIOS-u i firmware'u tylko na swojej stronie wsparcia https://mysupport.razer.com/app/answers/detail/a_id/9668. W większości przypadków oficjalne generyczne sterowniki od Intela i Nvidii dla WLAN i grafiki działają bez problemów.
Ale jeśli musisz wymazać lub wymienić cały dysk z jakiegoś powodu, upewnij się, że masz kopię obrazu odzyskiwania fabrycznego https://mysupport.razer.com/app/answers/detail/a_id/6300 wcześniej. Pobranie obrazu odzyskiwania wymaga zalogowania się na konto Razera i podania numeru seryjnego urządzenia.
Akcesoria i gwarancja
Nasz egzemplarz Blade 16 przyszedł z zasilaczem GaN o mocy 330 W oraz standardowo z papierami.
Razer oferuje roczną standardową gwarancję na Blade 16 i dwuletnią na baterię. Osobno można dokupić rozszerzoną gwarancję na kolejny rok, ale nie dotyczy ona baterii.
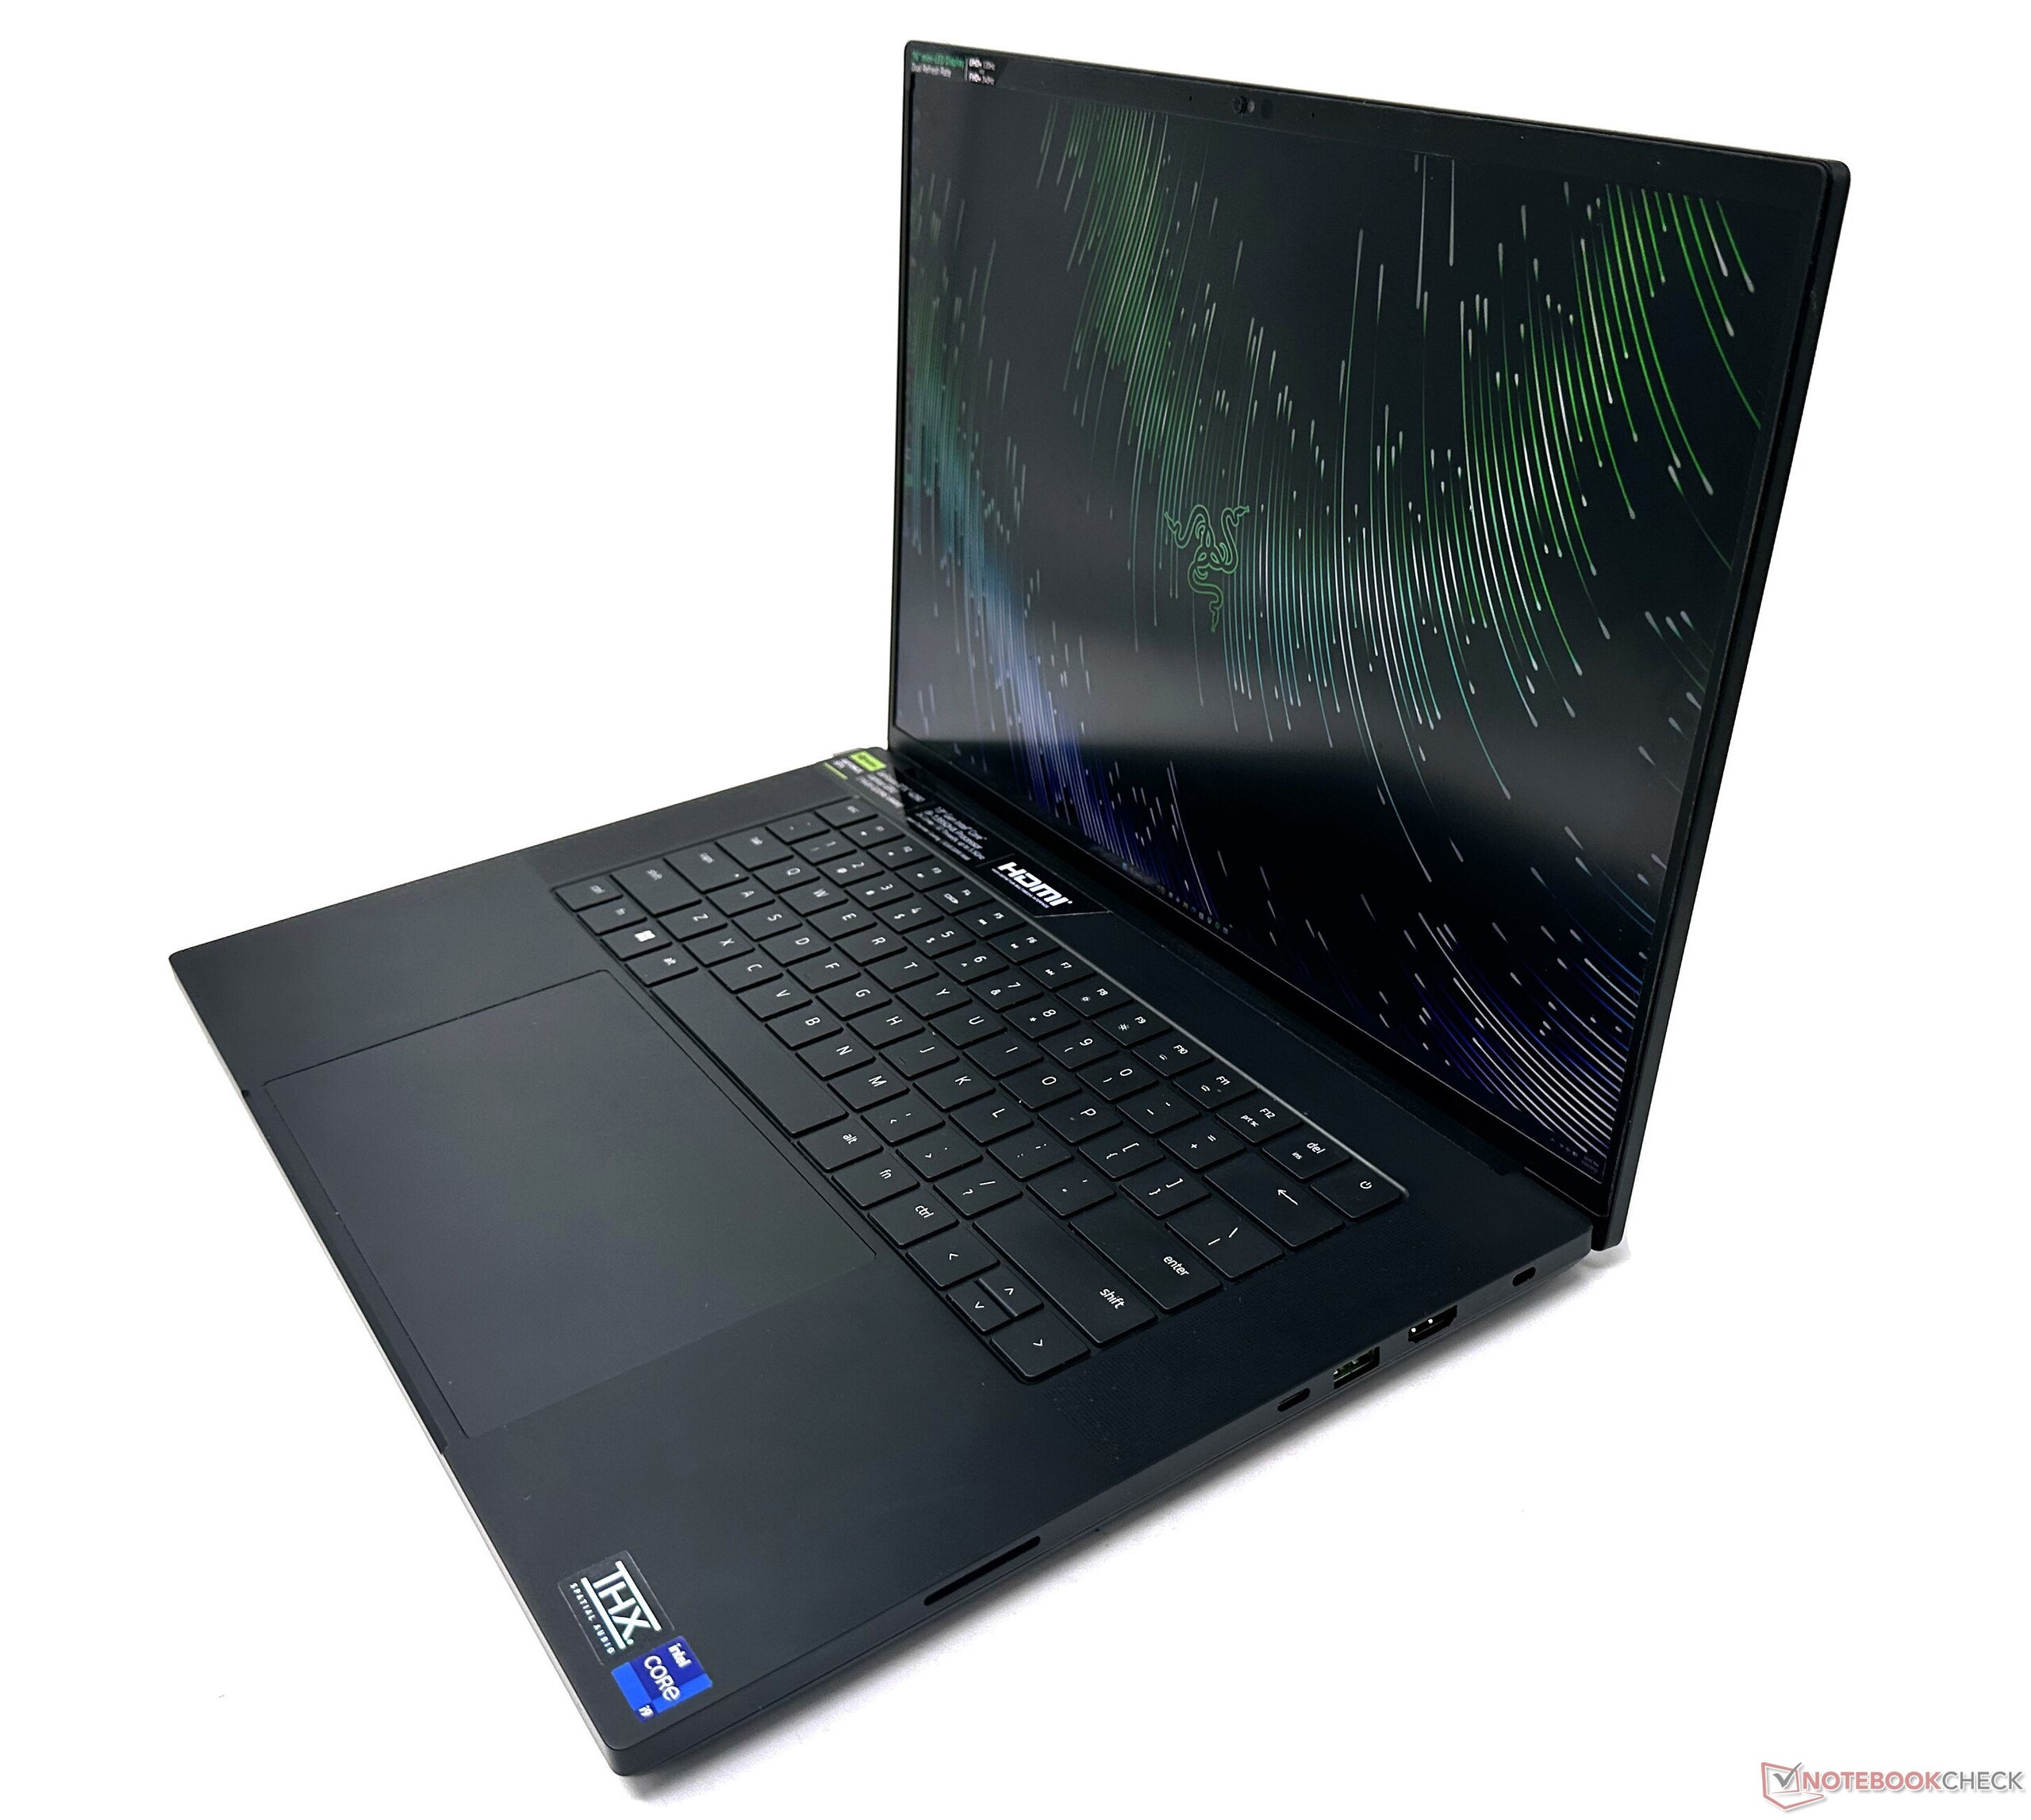
Urządzenia wejściowe: Nie różni się zbytnio od wcześniejszych Blade'ów
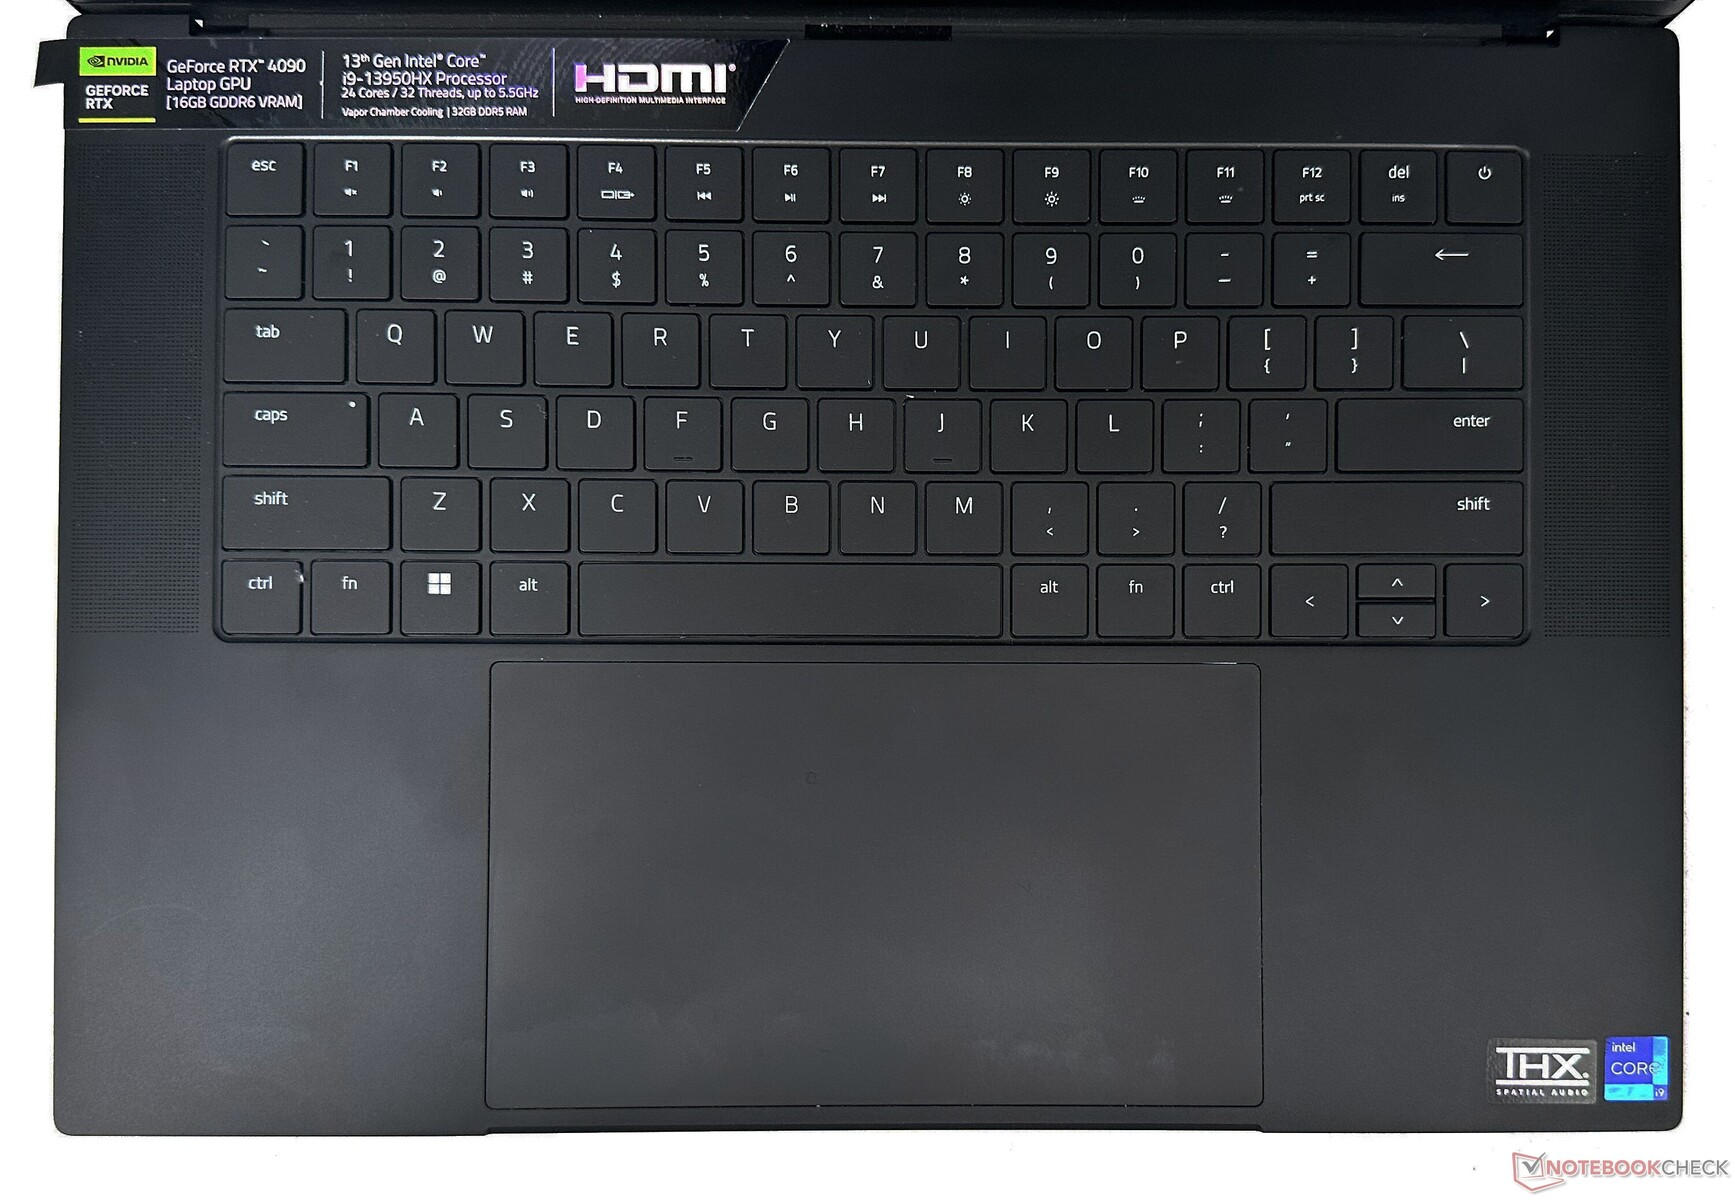
Klawiatura
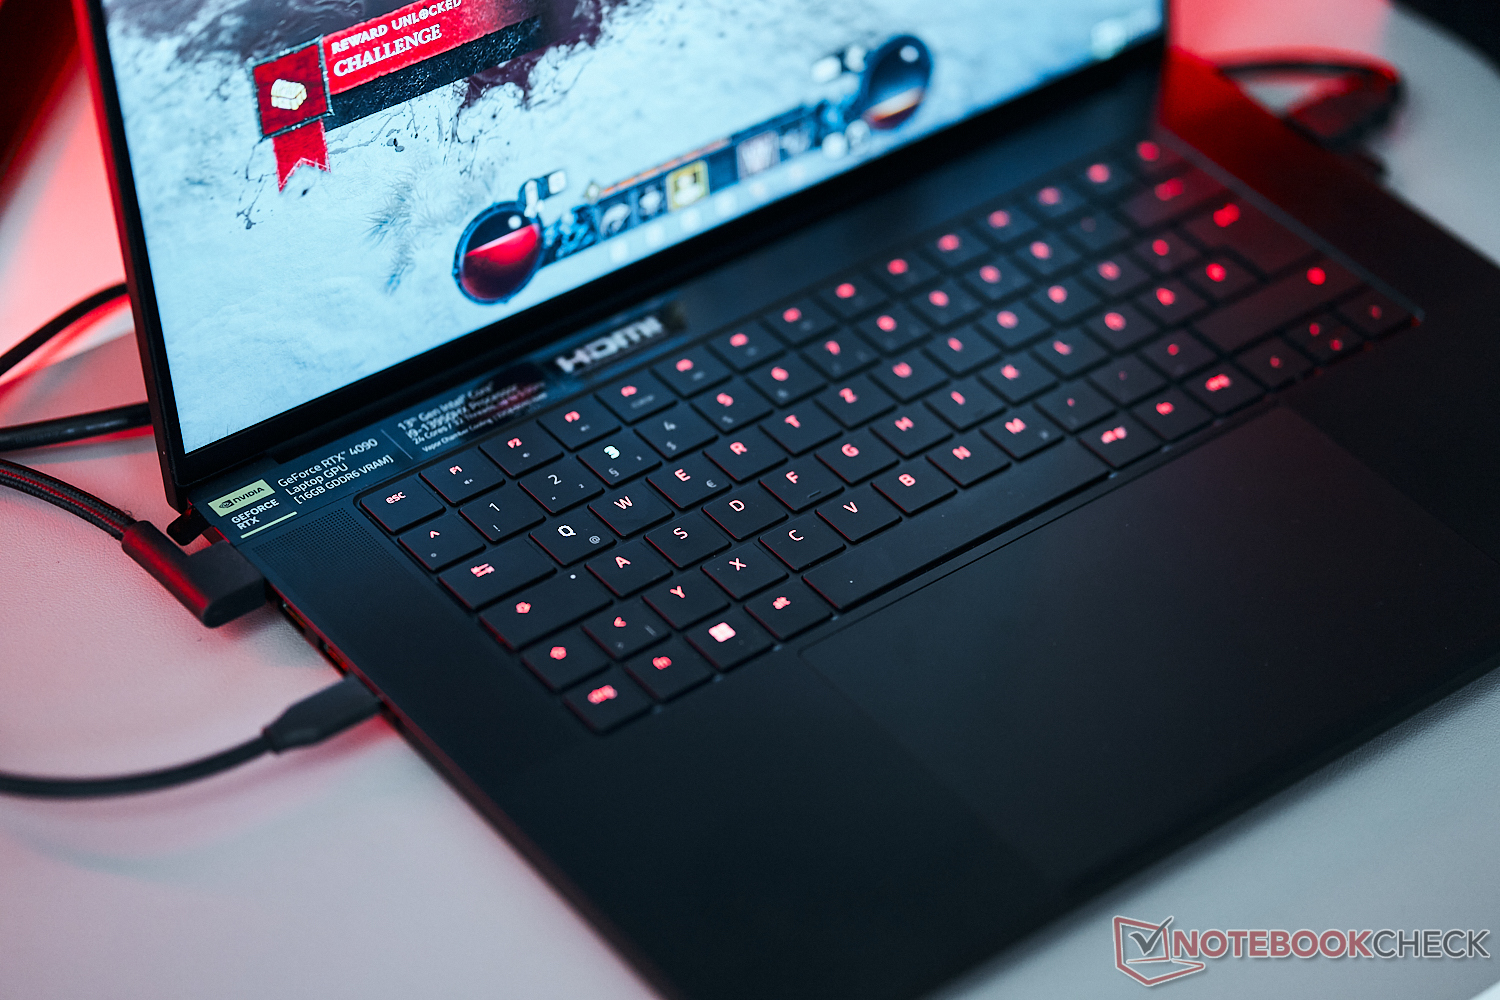
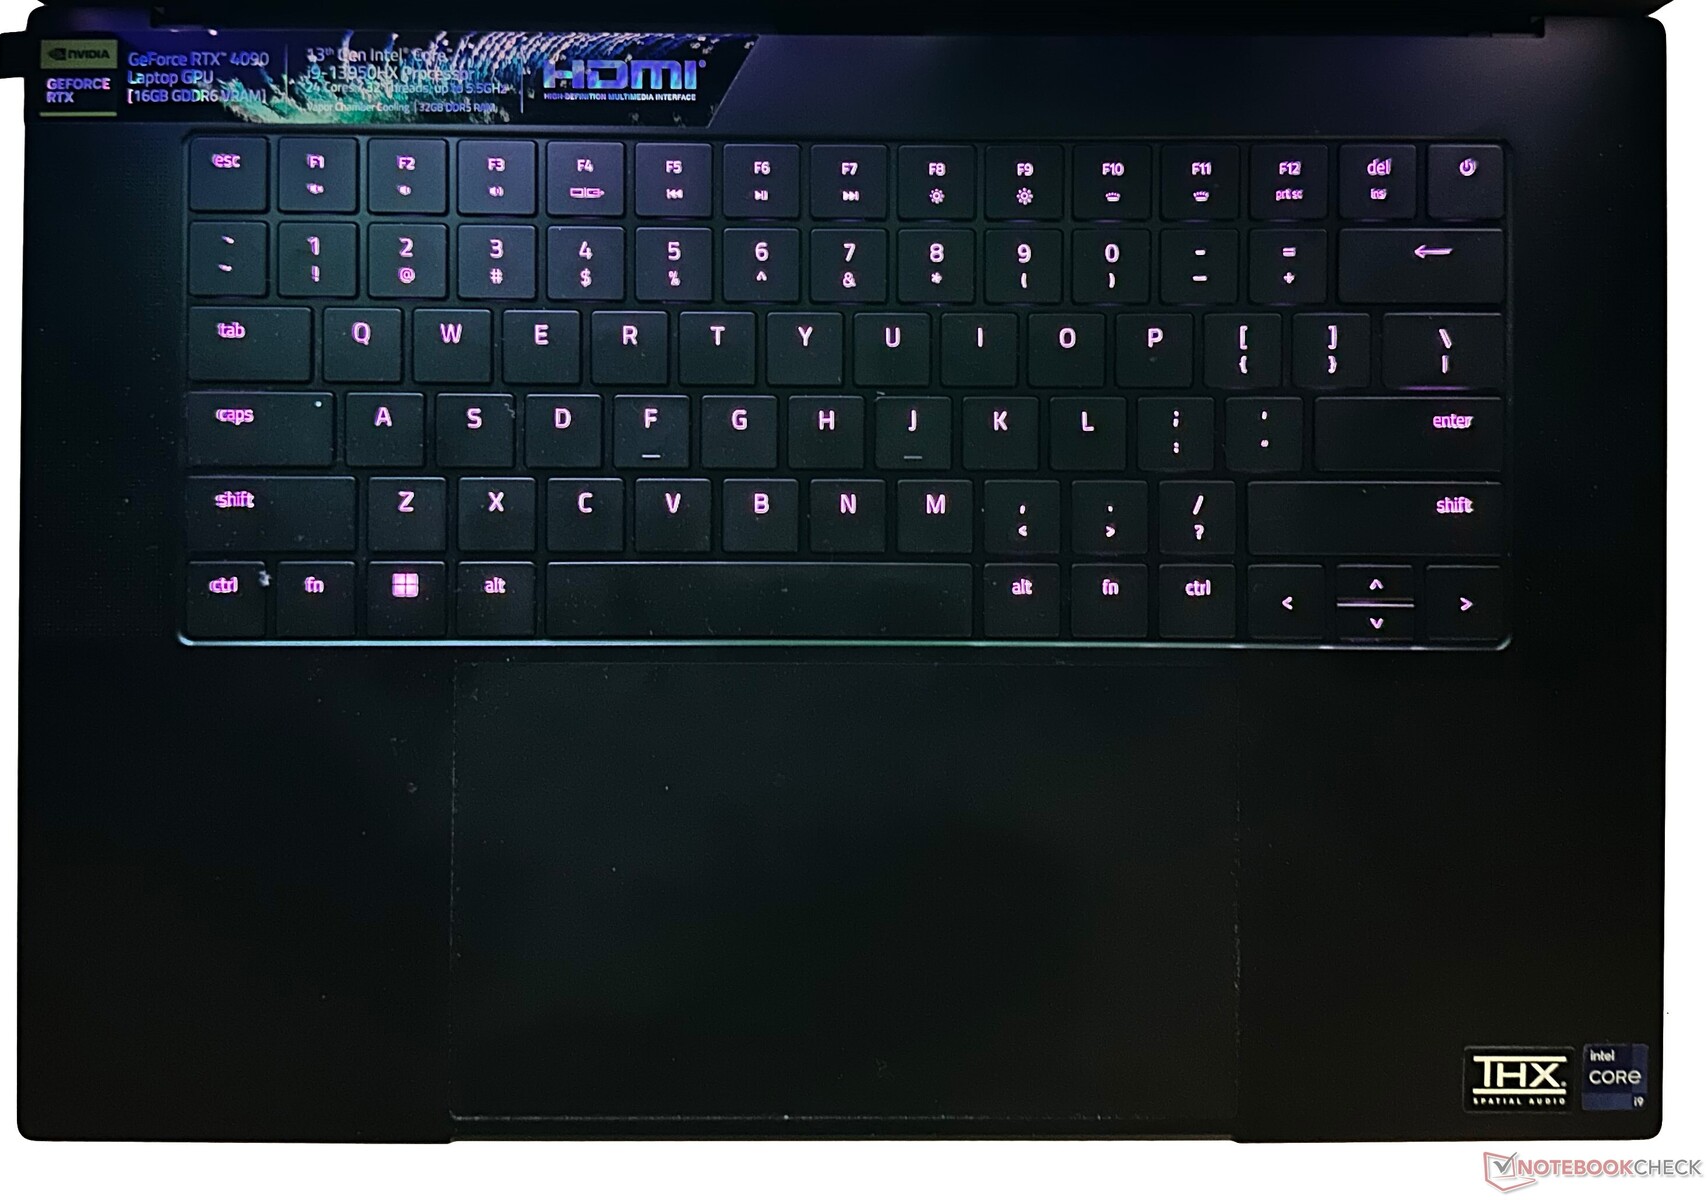
Razer postawił w klawiaturze na tradycyjne, membranowe przełączniki klawiszowe. Klawisze są płaskie z przyzwoitą aktywacją i wyczuwalnością, ale oferują krótki, 1-milimetrowy skok. Klawiatura obsługuje efekty Razer Chroma RGB oraz N-key rollover. Intensywność podświetlenia można regulować w 15 krokach.
Wyśrodkowane pozycjonowanie spodoba się osobom, którym nie przeszkadza brak klawiatury numerycznej. Przyzwyczajenie się do dłuższego prawego klawisza Shift oraz krótkich klawiszy strzałek góra i dół może jednak wydawać się uciążliwe.
Klawiatura Blade 16 nie może równać się z takimi modelami jak MSI Titan GT77 czy Schenker XMG Neo 17 M22które oferują mechaniczne przełączniki. Choć implementacja Razera sprawdza się w większości przypadków, pisanie długich dokumentów wydaje się na tej klawiaturze nieco uciążliwe.
Touchpad
Przestronny szklany touchpad o wymiarach 9,5 cm x 17 cm to nowa propozycja dla Blade'ów 2023 z dużym obszarem ślizgowym i obsługą gestów Windows Precision. Cała powierzchnia jest klikalna i bardzo responsywna, ale haptyka sprawia wrażenie nieco muskularnej.
Wyświetlacz: Jasny, prawie-OLED jakości dual-mode mini-LED z wysokim PWM
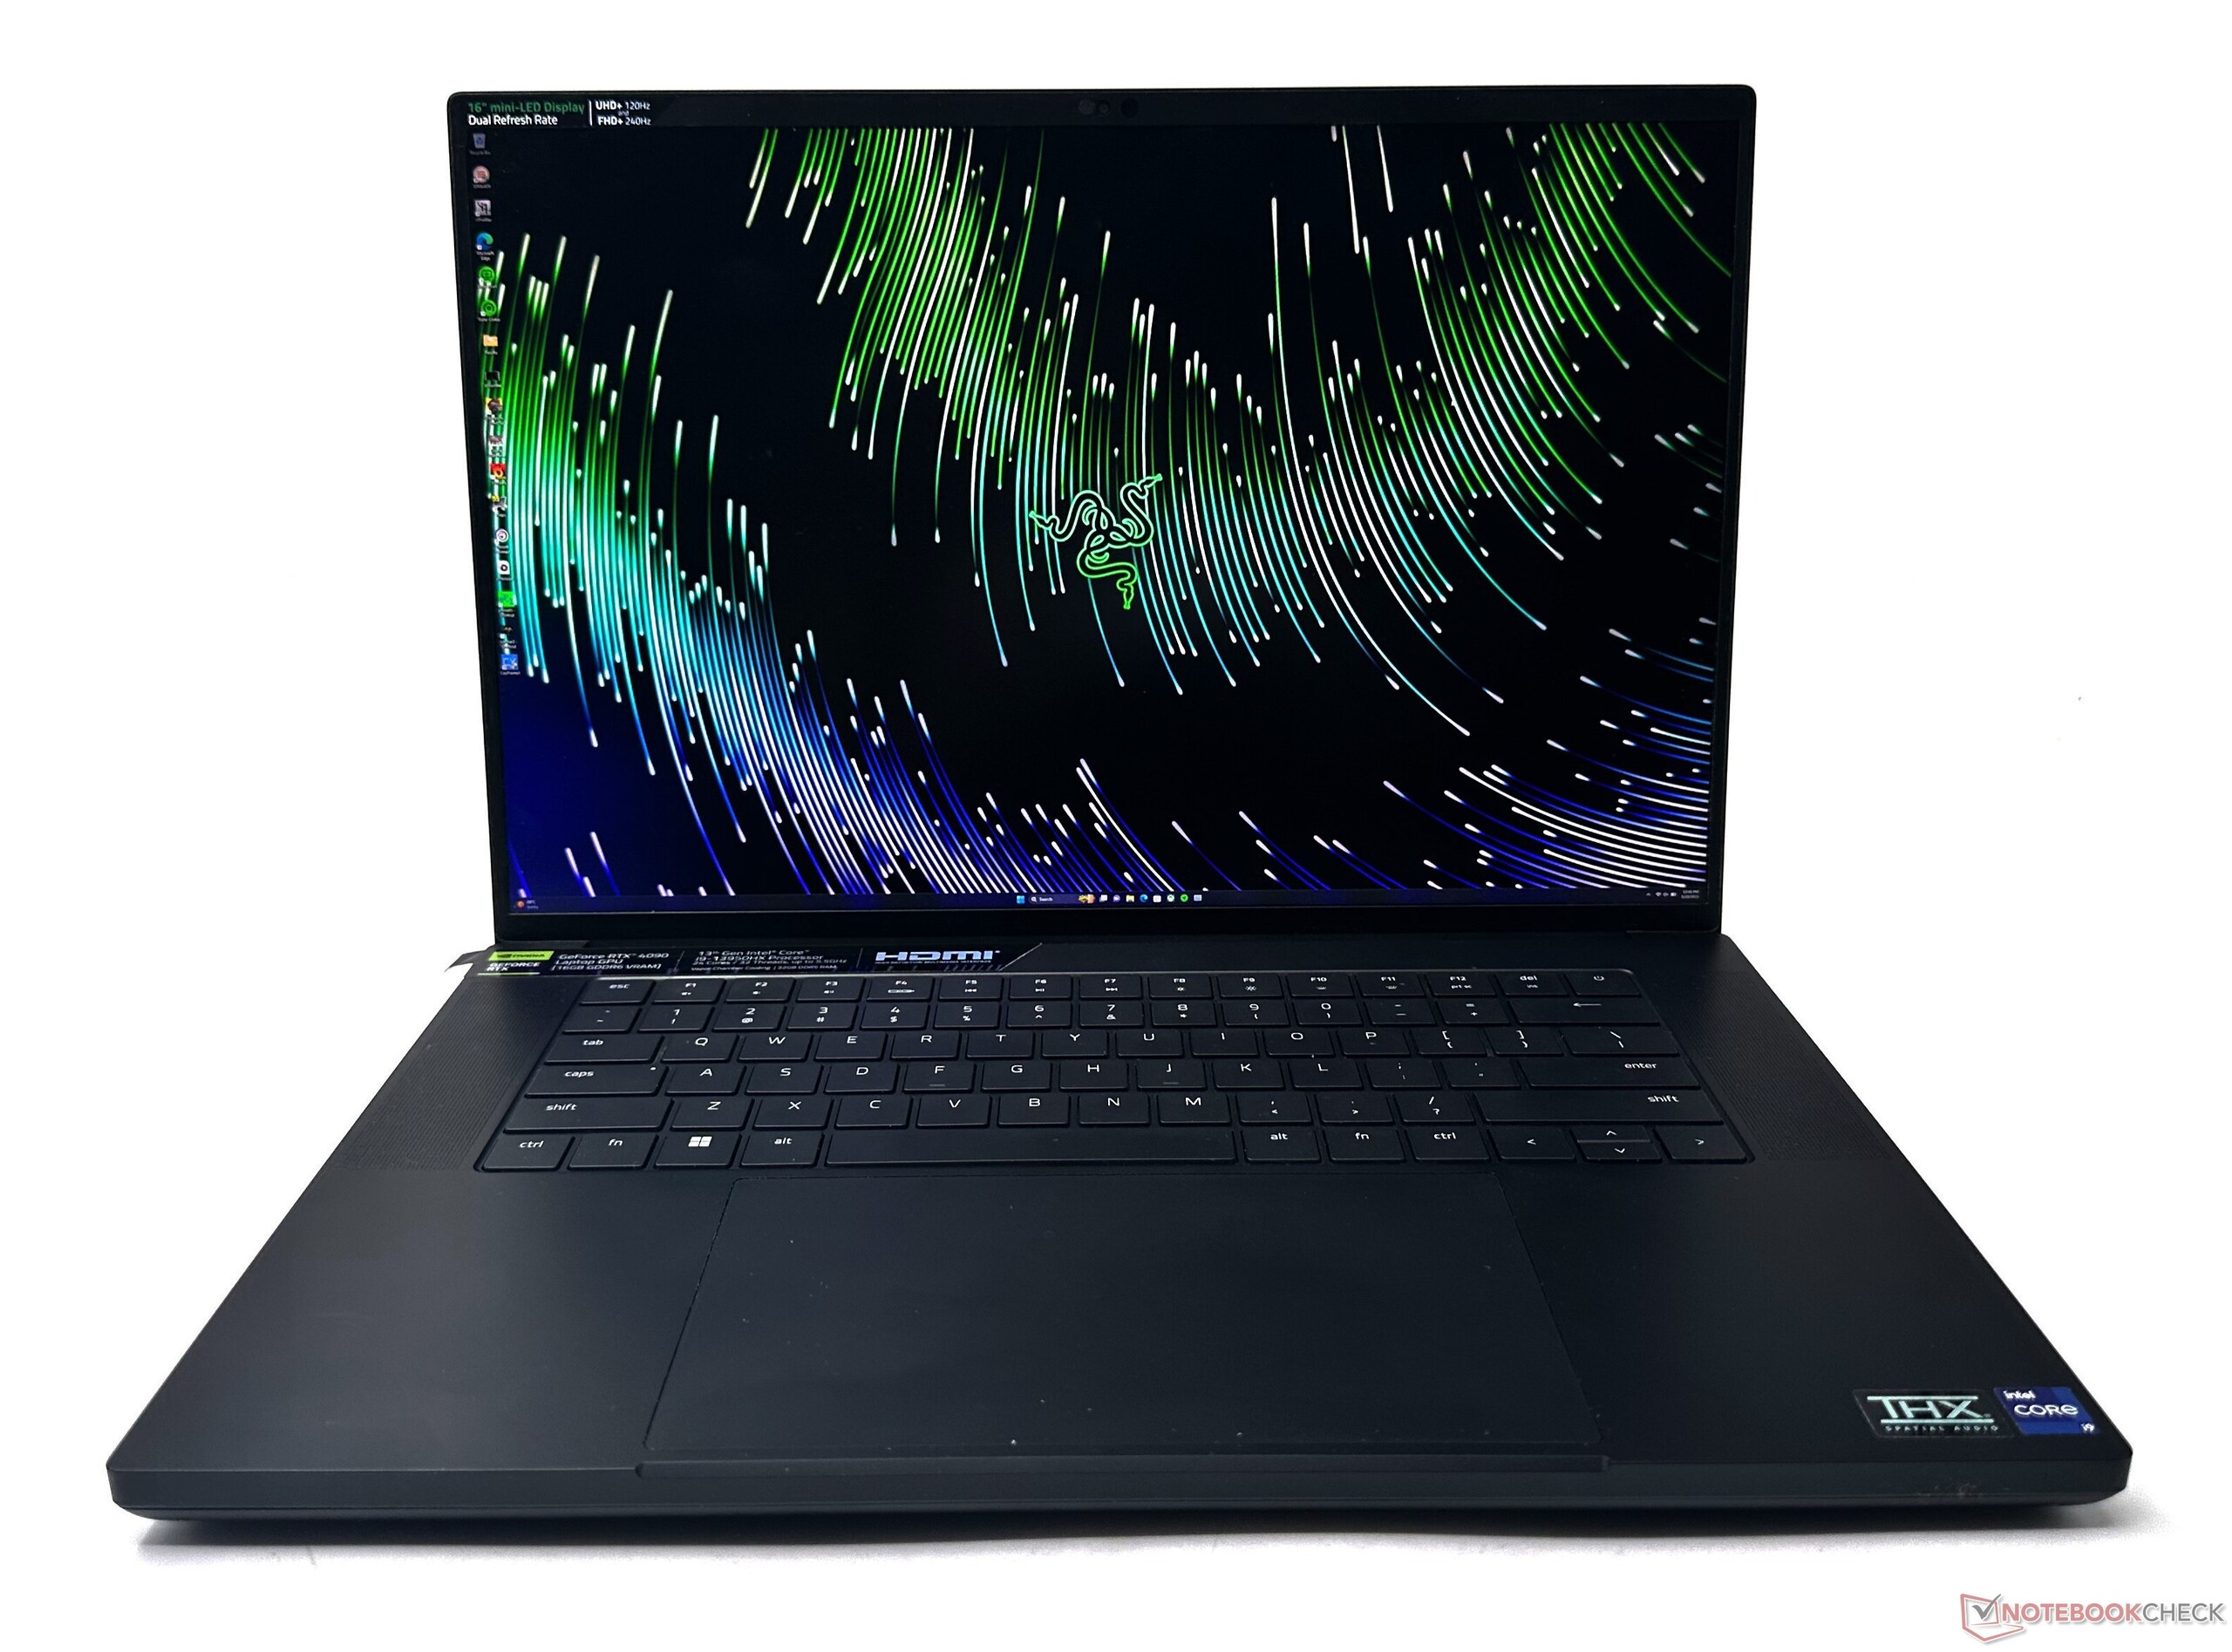
Blade 16 Early 2023 oferuje pierwszy w swoim rodzaju dwutrybowy wyświetlacz mini-LED. W trakcie naszego testowego egzemplarza zaprezentował kilka intrygujących spostrzeżeń.
Panel AUO naszego egzemplarza początkowo cierpiał z powodu błędu retencji obrazu, który wyrył części tapety na stałe na wyświetlaczu (z wyjątkiem wyłączenia), co było irytującym doświadczeniem. Jednak Razer wydał teraz łatkę do firmware'u, która w pełni naprawia ten problem.
Blade 16 Early 2023 to pierwszy laptop, który oferuje opcję wyświetlania obrazu w dwóch trybach 16:10. Użytkownicy mogą przełączać się pomiędzy trybami natywnego panelu UHD+ (3840 x 2400) 120 Hz i FHD+ (1920 x 1200) 240 Hz, co stanowi doskonałe skalowanie integry. Wyższa rozdzielczość może pomóc w kreatywnych przepływach pracy, podczas gdy FHD+ przy 240 Hz przydaje się podczas konkurencyjnych gier.
Razer nie podaje dokładnej liczby stref przyciemniania, ale spodziewamy się, że będzie ich ponad 1000 podobnie jak w MSI Titan GT77 HX 13VI. Nvidia G-Sync jest wspierana, ale tylko w trybie dGPU.
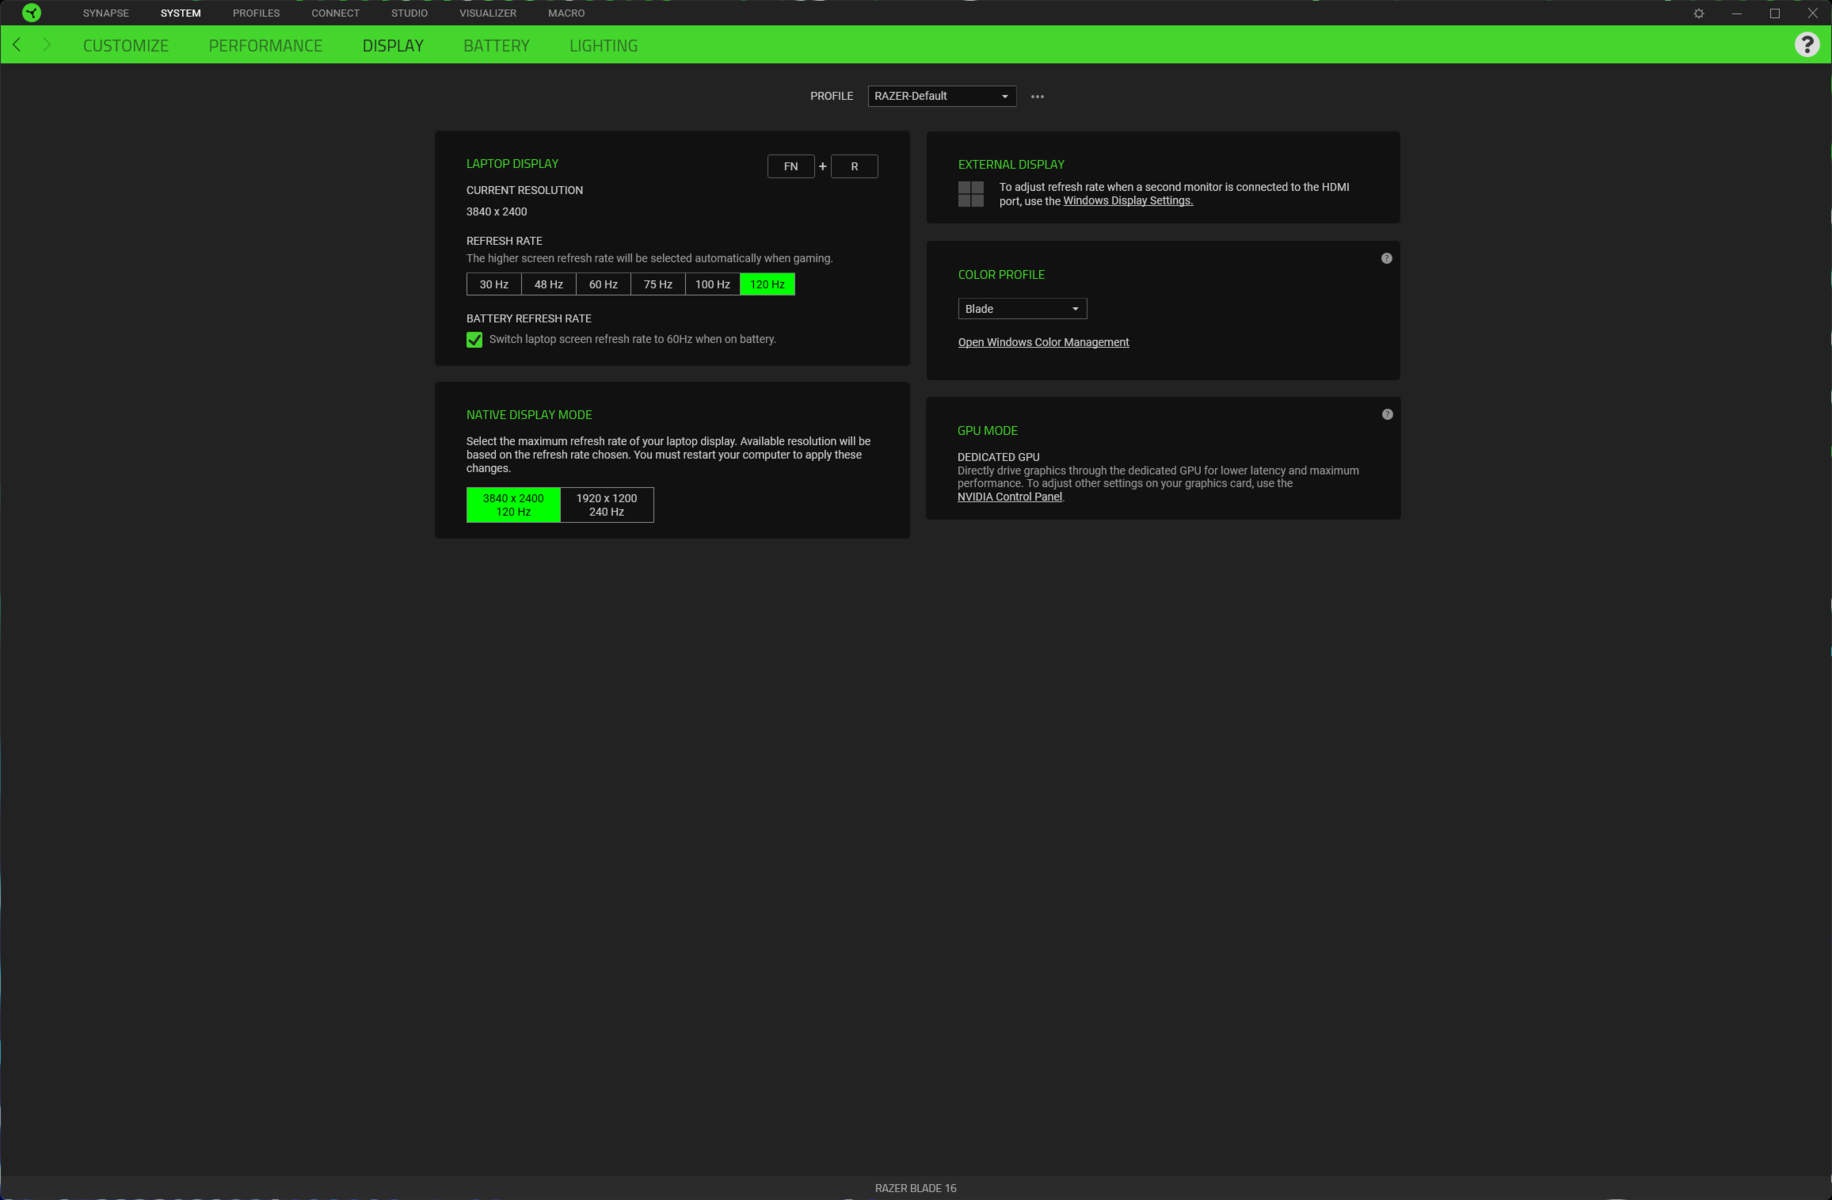
Tryb wyświetlania możemy zmienić albo poprzez Razer Synapse (wymaga restartu), albo z poziomu BIOS-u. Tutaj napotykamy pierwszą z kilku osobliwości. Jeśli zmienisz rozdzielczość na FHD+ w BIOS-ie, nie możesz zmienić jej z powrotem na UHD+ z poziomu interfejsu UEFI. Raczej będziesz musiał polegać na Synapse, aby przełączyć się na UHD+. Nie jest to jasno opisane i może zmylić pierwszych użytkowników.
Wszystkie testy przeprowadziliśmy w trybie UHD+ 120 Hz, gdyż jest to logiczny wybór dla każdego, kto wydaje ponad cztery tysiące na laptop.
Matryca subpikselowa wygląda nieco ziarniście przy oglądaniu z bliska. Co ciekawe, widzimy, że matryca w trybie UHD+ wygląda dość ostro i dobrze zdefiniowana. Można by się spodziewać większego rozmiaru pikseli po przejściu do trybu FHD+, ale widzimy tu identycznej wielkości piksele.
Dostrzegamy też rozmycie i artefakty aliasingu w matrycy subpikselowej - nie jest ona tak ostra jak w trybie UHD+ i zdecydowanie nie jest tak ostra w porównaniu do natywnego panelu FHD. Wygląda to tak, jakby Razer po prostu skalował w dół rozdzielczość 4K i stosował temporalny dithering.
Może to nie stanowić większego problemu podczas grania w szybką strzelankę, ale zalecamy trzymanie się natywnej rozdzielczości UHD+ w większości przypadków. Nie zaobserwowano krwawienia podświetlenia pod wysoką ekspozycją.


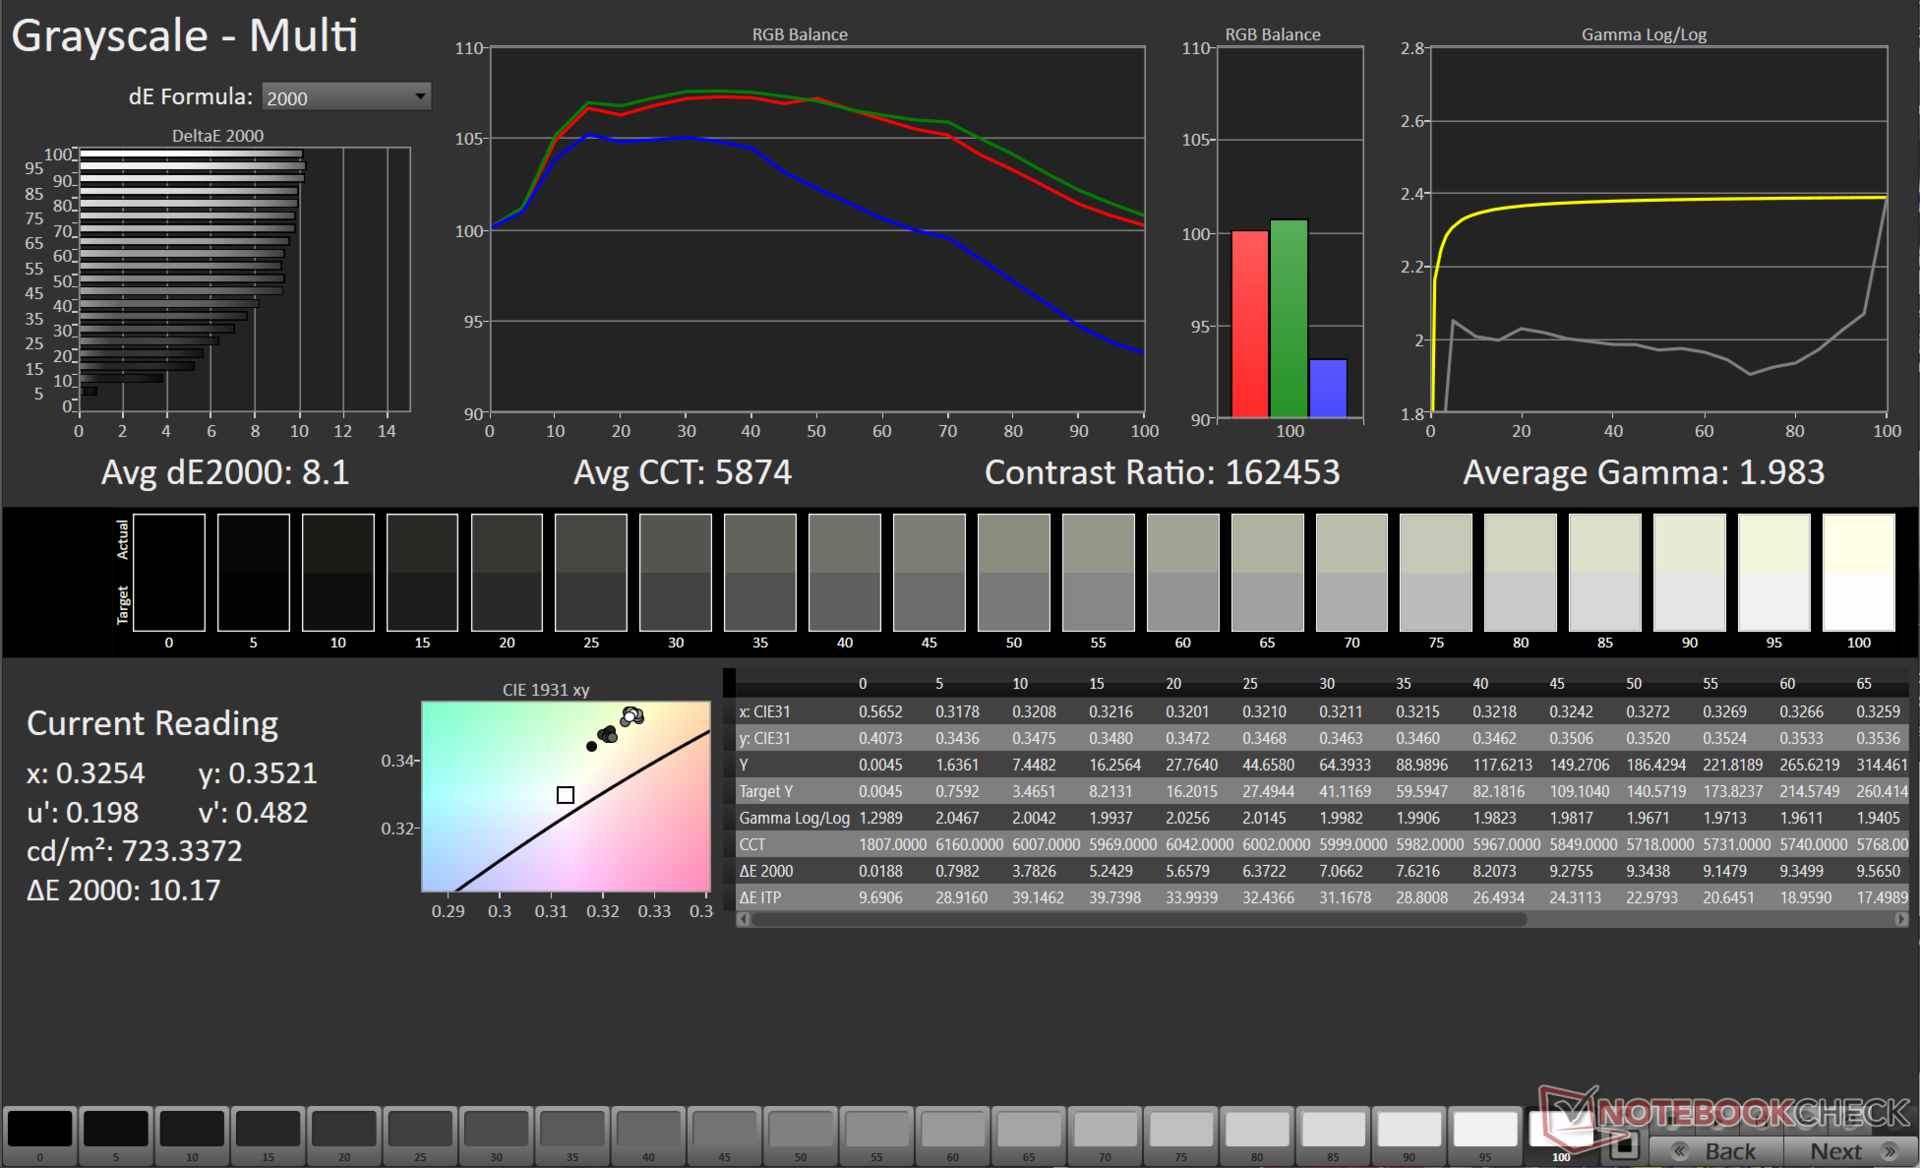
Panel 2023 Razer Blade 16 jest oficjalnie oceniany jako oferujący jasność szczytową na poziomie 1000 nitów. Zaobserwowaliśmy doskonały rozkład jasności na poziomie 94% przy szczytowej wartości 752 nitów w trybie SDR.
Z jakiegoś powodu wartości te uzyskujemy tylko przy korzystaniu z domyślnego profilu kolorów Windows, który jest podstawą naszych poniższych pomiarów. Blade 16 jest fabrycznie skalibrowany, ale użycie tego profilu ICC obniża poziom jasności o dobre 100 nitów.
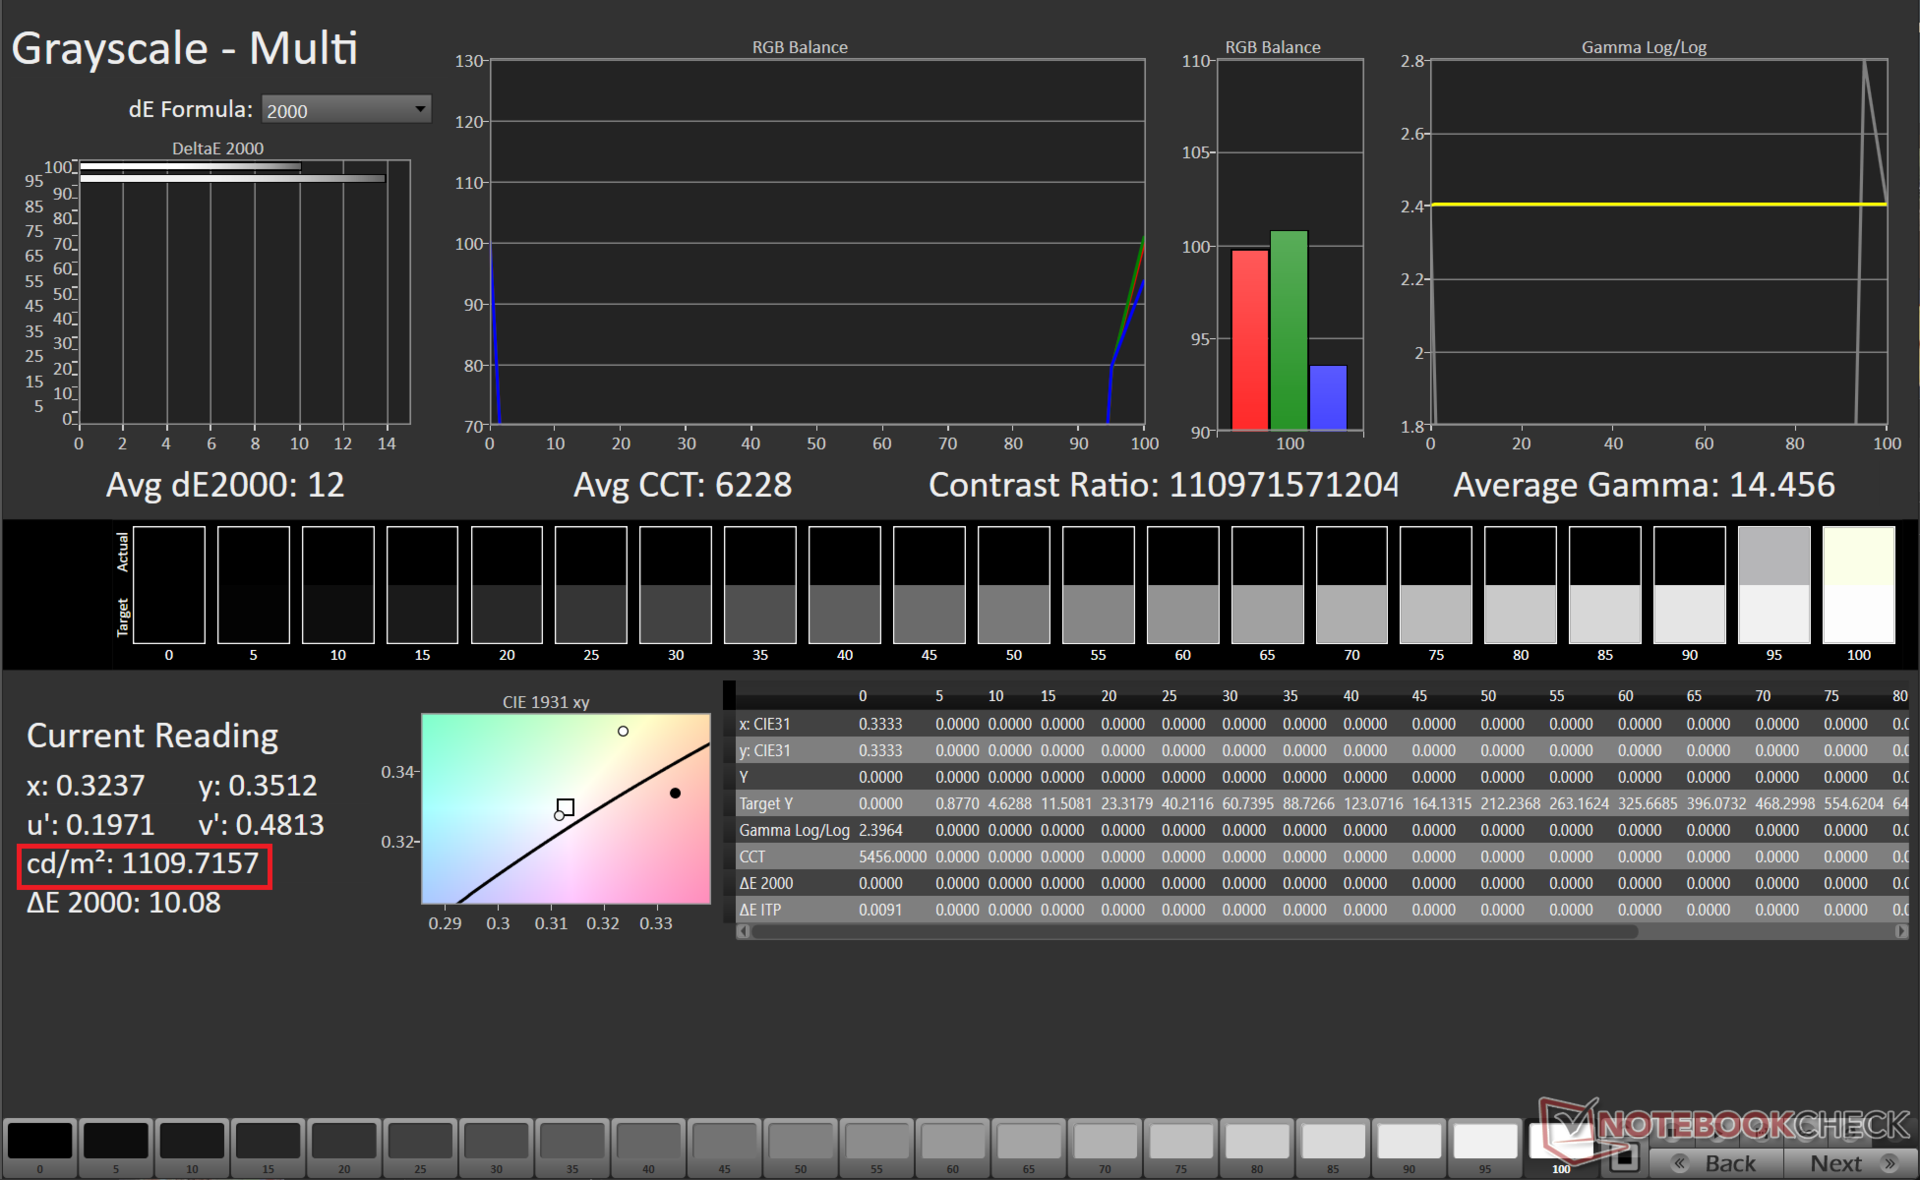
Zmierzyliśmy blisko 1110 nitów w trybie HDR przy 100% białym obrazie. Nie jest to dokładnie Apple MacBook Pro 16 ale mimo wszystko jest to doskonała luminancja.
Nie ma żadnych predefiniowanych profili kolorów poza jednym fabrycznie skalibrowanym plikiem ICC. W trybie UHD+ użytkownicy mogą wybrać pożądany profil bezpośrednio z ustawień wyświetlania systemu Windows lub Razer Synapse. Opcje te są jednak niedostępne w trybie FHD+.
| |||||||||||||||||||||||||
rozświetlenie: 94 %
na akumulatorze: 723 cd/m²
kontrast: 162222:1 (czerń: 0.0045 cd/m²)
ΔE ColorChecker Calman: 5.65 | ∀{0.5-29.43 Ø4.71}
calibrated: 1.85
ΔE Greyscale Calman: 8.1 | ∀{0.09-98 Ø4.96}
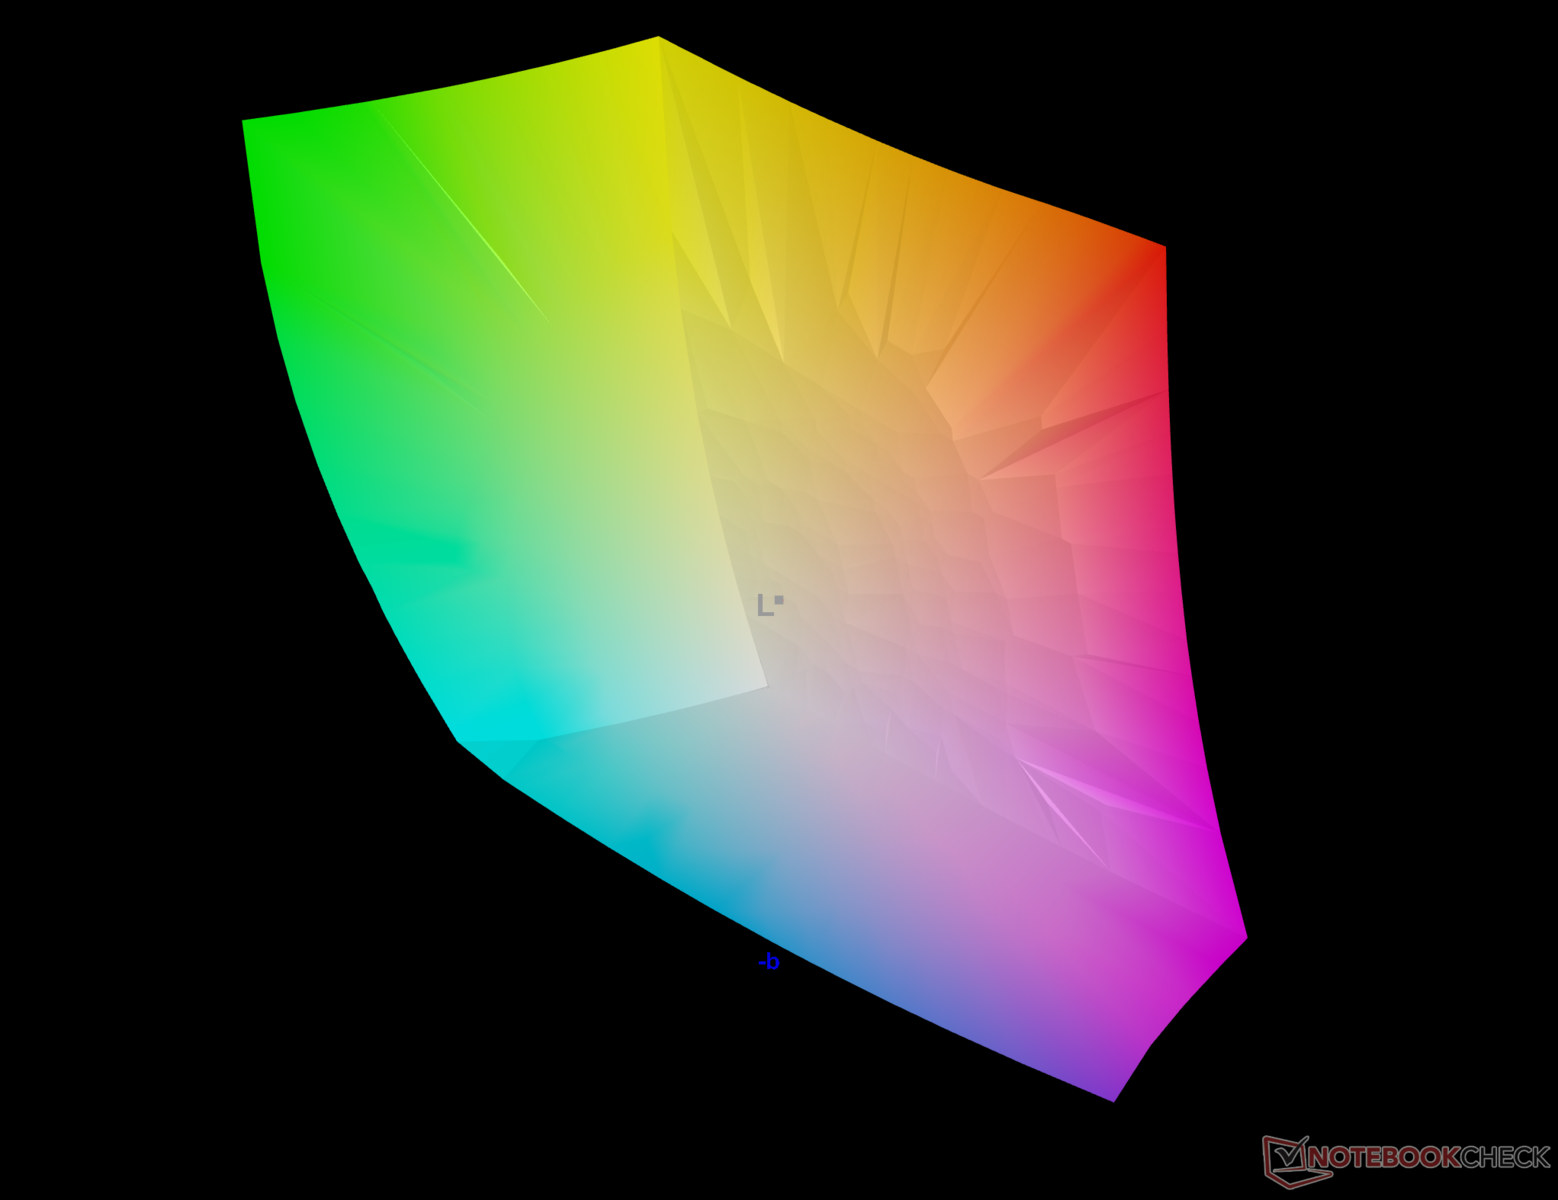
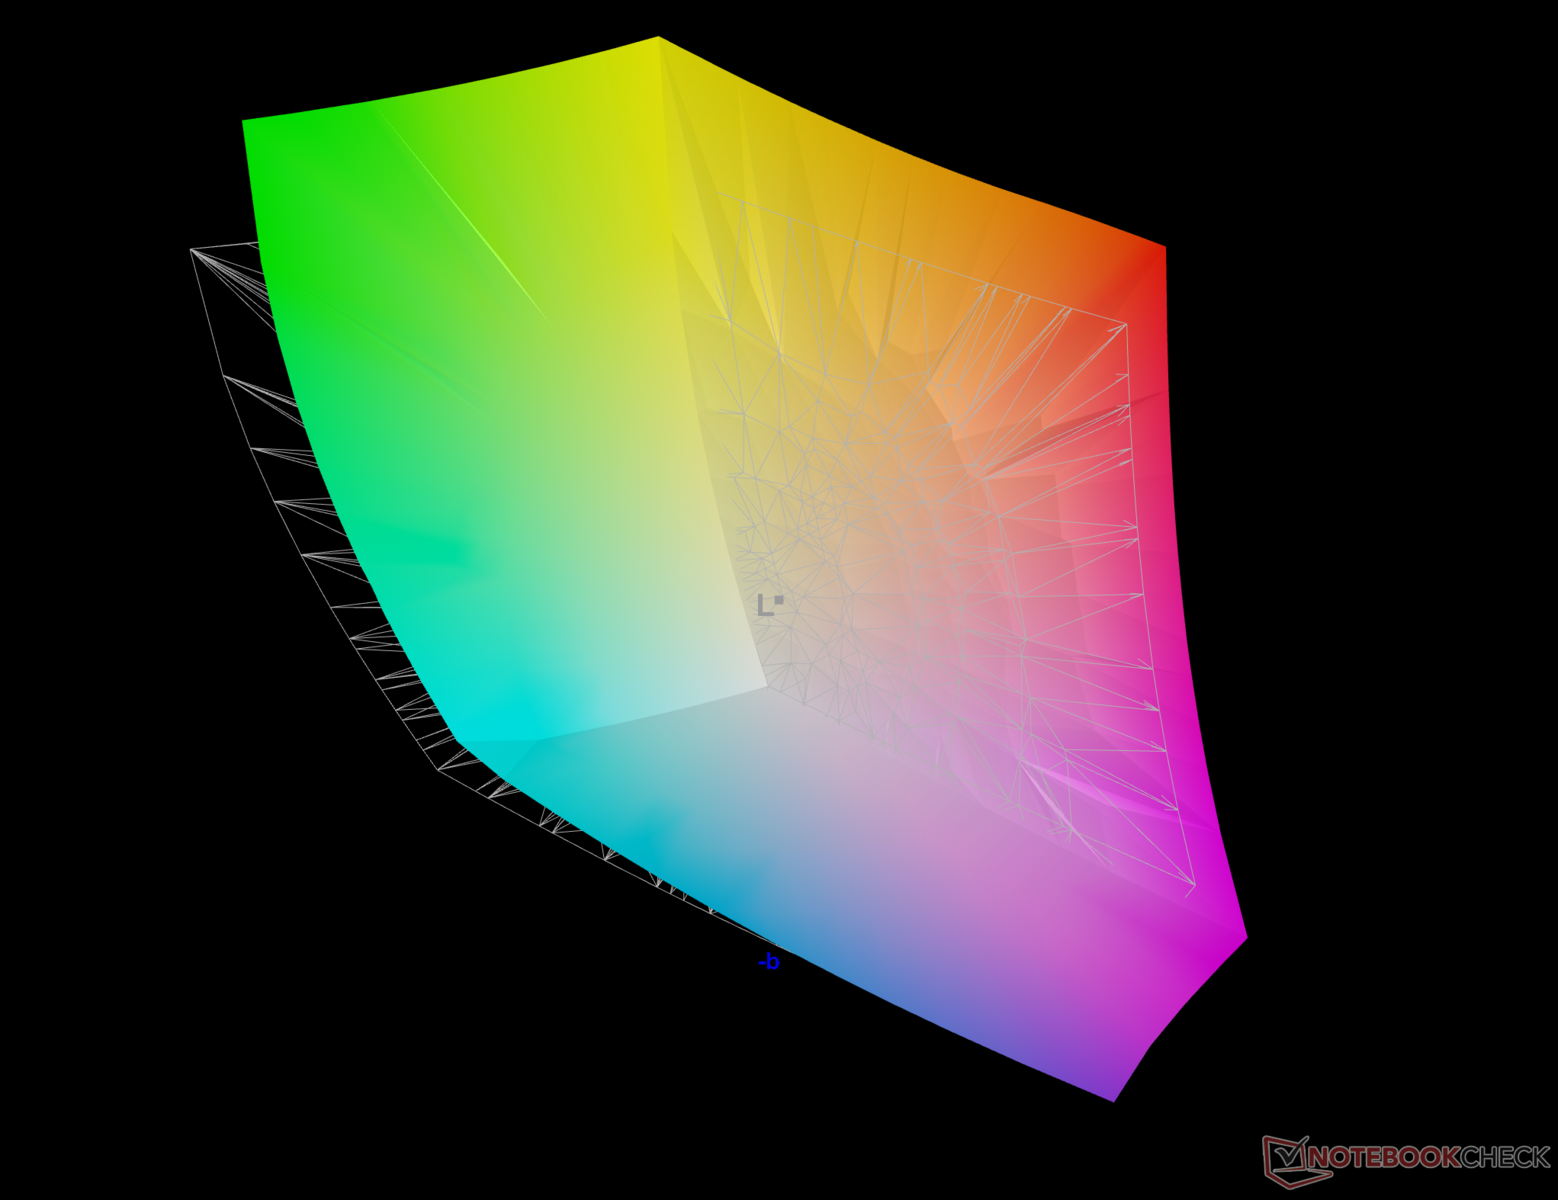
90.9% AdobeRGB 1998 (Argyll 3D)
100% sRGB (Argyll 3D)
99.9% Display P3 (Argyll 3D)
Gamma: 1.98
CCT: 5874 K
| Razer Blade 16 Early 2023 RTX 4090 AUO B160ZAN01.U, mini-LED, 3840x2400, 16" | Asus Zephyrus Duo 16 GX650PY-NM006W NE160QDM-NM4, MiniLED, 2560x1600, 16" | MSI Titan GT77 HX 13VI B173ZAN06.C, Mini-LED, 3840x2160, 17.3" | Asus ROG Strix G16 G614JZ TL160ADMP03-0, IPS, 2560x1600, 16" | Lenovo Legion Pro 7 16IRX8H MNG007DA2-3 (CSO1628), IPS, 2560x1600, 16" | Razer Blade 18 RTX 4070 AU Optronics B180QAN01.0, IPS, 2560x1600, 18" | |
|---|---|---|---|---|---|---|
| Display | -0% | -1% | -3% | -18% | -3% | |
| Display P3 Coverage (%) | 99.9 | 99.4 -1% | 94.9 -5% | 97 -3% | 69.1 -31% | 96.9 -3% |
| sRGB Coverage (%) | 100 | 100 0% | 99.9 0% | 99.9 0% | 99.7 0% | 99.8 0% |
| AdobeRGB 1998 Coverage (%) | 90.9 | 90.8 0% | 92.4 2% | 84.9 -7% | 71.2 -22% | 85.3 -6% |
| Response Times | 10% | -110% | 70% | 35% | 73% | |
| Response Time Grey 50% / Grey 80% * (ms) | 10.2 ? | 15.2 ? -49% | 38.4 ? -276% | 5.1 ? 50% | 12.3 ? -21% | 4.2 ? 59% |
| Response Time Black / White * (ms) | 62.04 ? | 19 ? 69% | 26.6 ? 57% | 6.6 ? 89% | 5.9 ? 90% | 8 ? 87% |
| PWM Frequency (Hz) | 2420 ? | 12000 ? | 2380 ? | |||
| Screen | -147% | 417% | -1018% | -962% | -1303% | |
| Brightness middle (cd/m²) | 730 | 712 -2% | 606 -17% | 470 -36% | 511 -30% | 549.6 -25% |
| Brightness (cd/m²) | 729 | 703 -4% | 602 -17% | 459 -37% | 469 -36% | 524 -28% |
| Brightness Distribution (%) | 94 | 95 1% | 93 -1% | 93 -1% | 86 -9% | 89 -5% |
| Black Level * (cd/m²) | 0.0045 | 0.07 -1456% | 0.0001 98% | 0.42 -9233% | 0.4 -8789% | 0.53 -11678% |
| Contrast (:1) | 162222 | 10171 -94% | 6060000 3636% | 1119 -99% | 1278 -99% | 1037 -99% |
| Colorchecker dE 2000 * | 5.65 | 1.7 70% | 4.8 15% | 1.86 67% | 0.95 83% | 3.32 41% |
| Colorchecker dE 2000 max. * | 10.11 | 4 60% | 8.2 19% | 3.87 62% | 2.07 80% | 6.63 34% |
| Colorchecker dE 2000 calibrated * | 1.85 | 1.2 35% | 1.8 3% | 0.93 50% | 0.91 51% | 2.7 -46% |
| Greyscale dE 2000 * | 8.1 | 2.8 65% | 6.5 20% | 2.7 67% | 0.6 93% | 2 75% |
| Gamma | 1.98 111% | 2.21 100% | 2.63 84% | 2.246 98% | 2.176 101% | 2.29 96% |
| CCT | 5874 111% | 6978 93% | 6596 99% | 6711 97% | 6545 99% | 6319 103% |
| Całkowita średnia (program / ustawienia) | -46% /
-93% | 102% /
252% | -317% /
-645% | -315% /
-617% | -411% /
-828% |
* ... im mniej tym lepiej
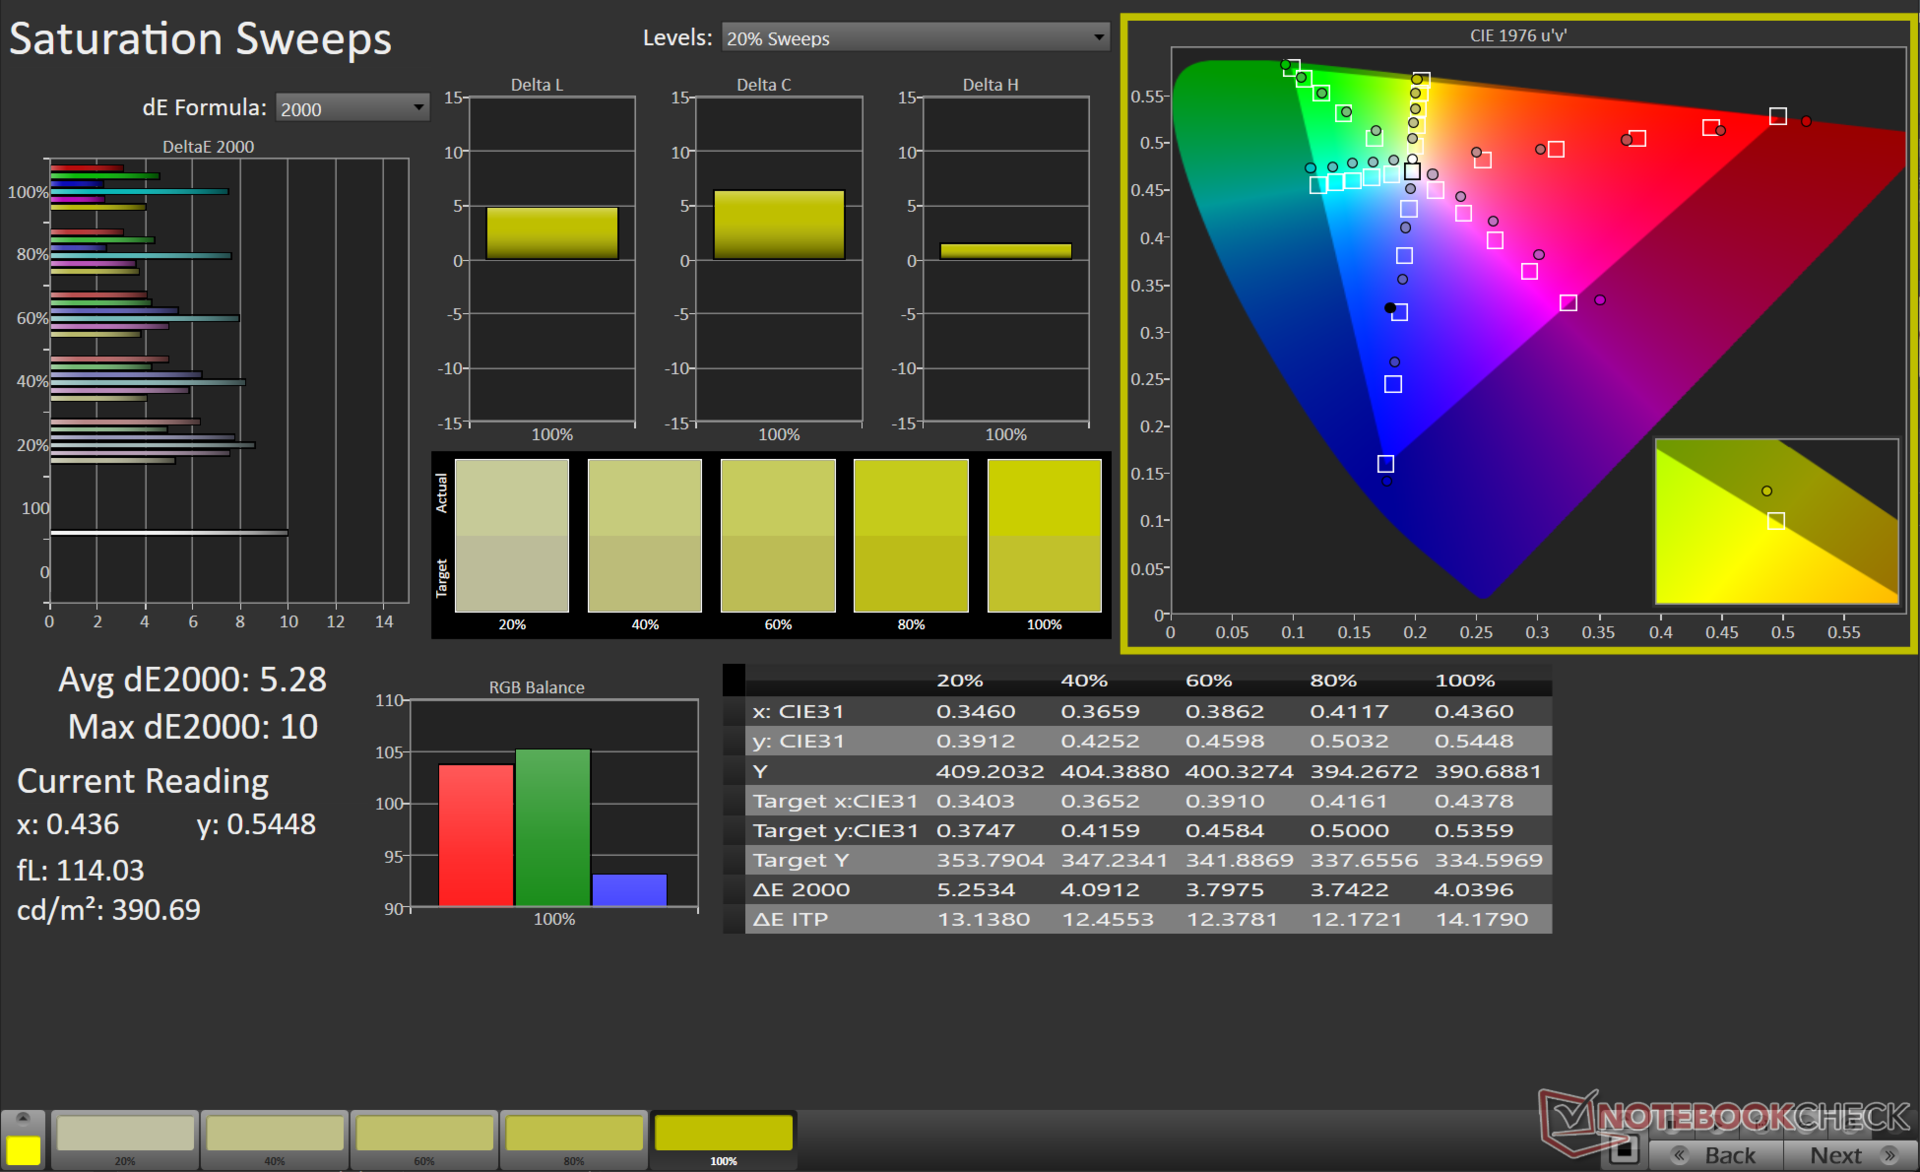
Razer reklamuje 100% pokrycie DCI-P3 dla tego panelu i nasze pomiary również to potwierdzają. Obserwujemy również pełne pokrycie gamy kolorów sRGB i doskonałe 91% pokrycie Adobe RGB, co oznacza, że wyświetlacz Blade 16 jest przyjazny zarówno dla graczy, jak i twórców treści.
Subiektywnie rzecz biorąc, wyświetlacz mini-LED jest wizualną ucztą z niemal nieskończoną czernią i wyrazistymi kolorami. Z bliska można zaobserwować pewne przekwitanie, ale nie jest ono rozpraszające i nie przeszkadza w oglądaniu.
Jest to najbliższa jakość, jaką można uzyskać w OLED, a jednocześnie czerpać korzyści z wysokiego poziomu luminancji.

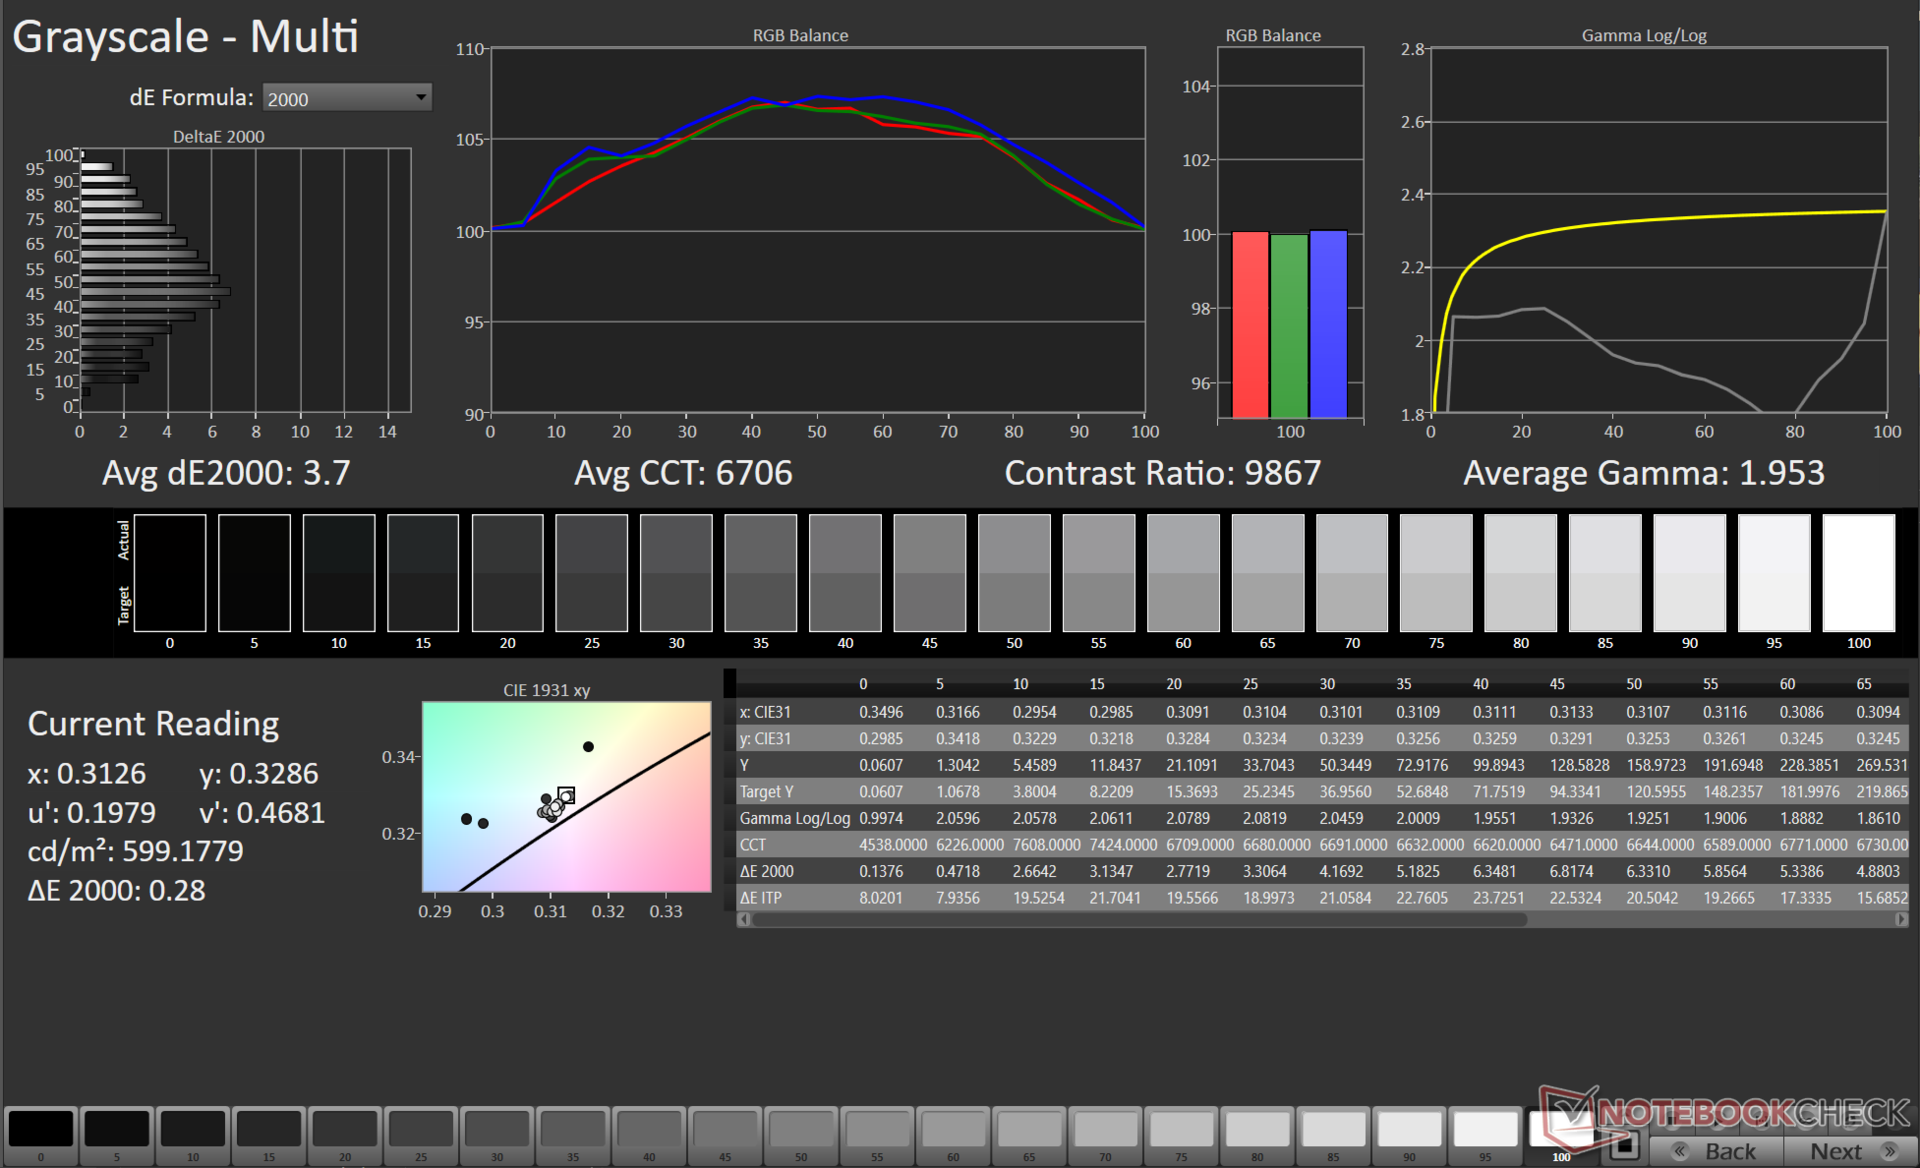
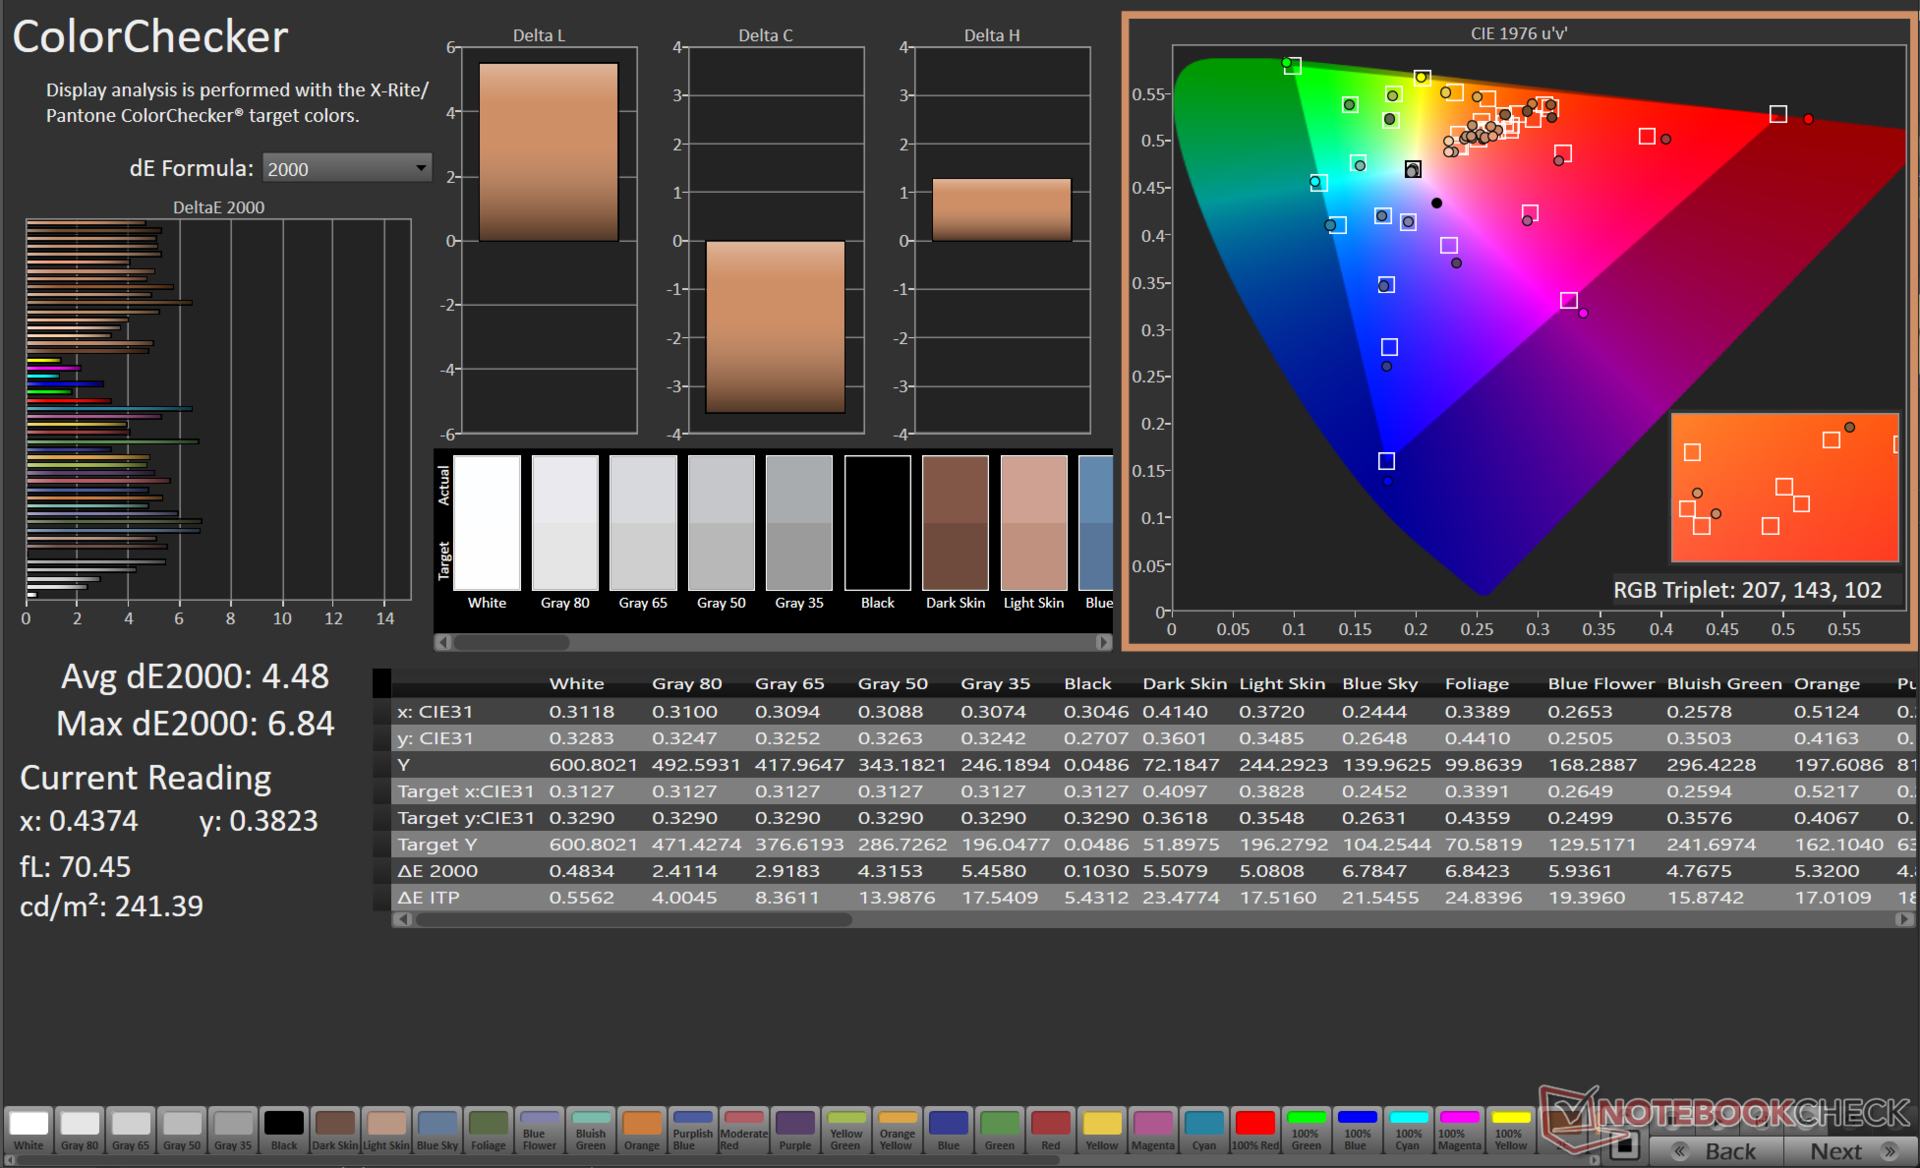
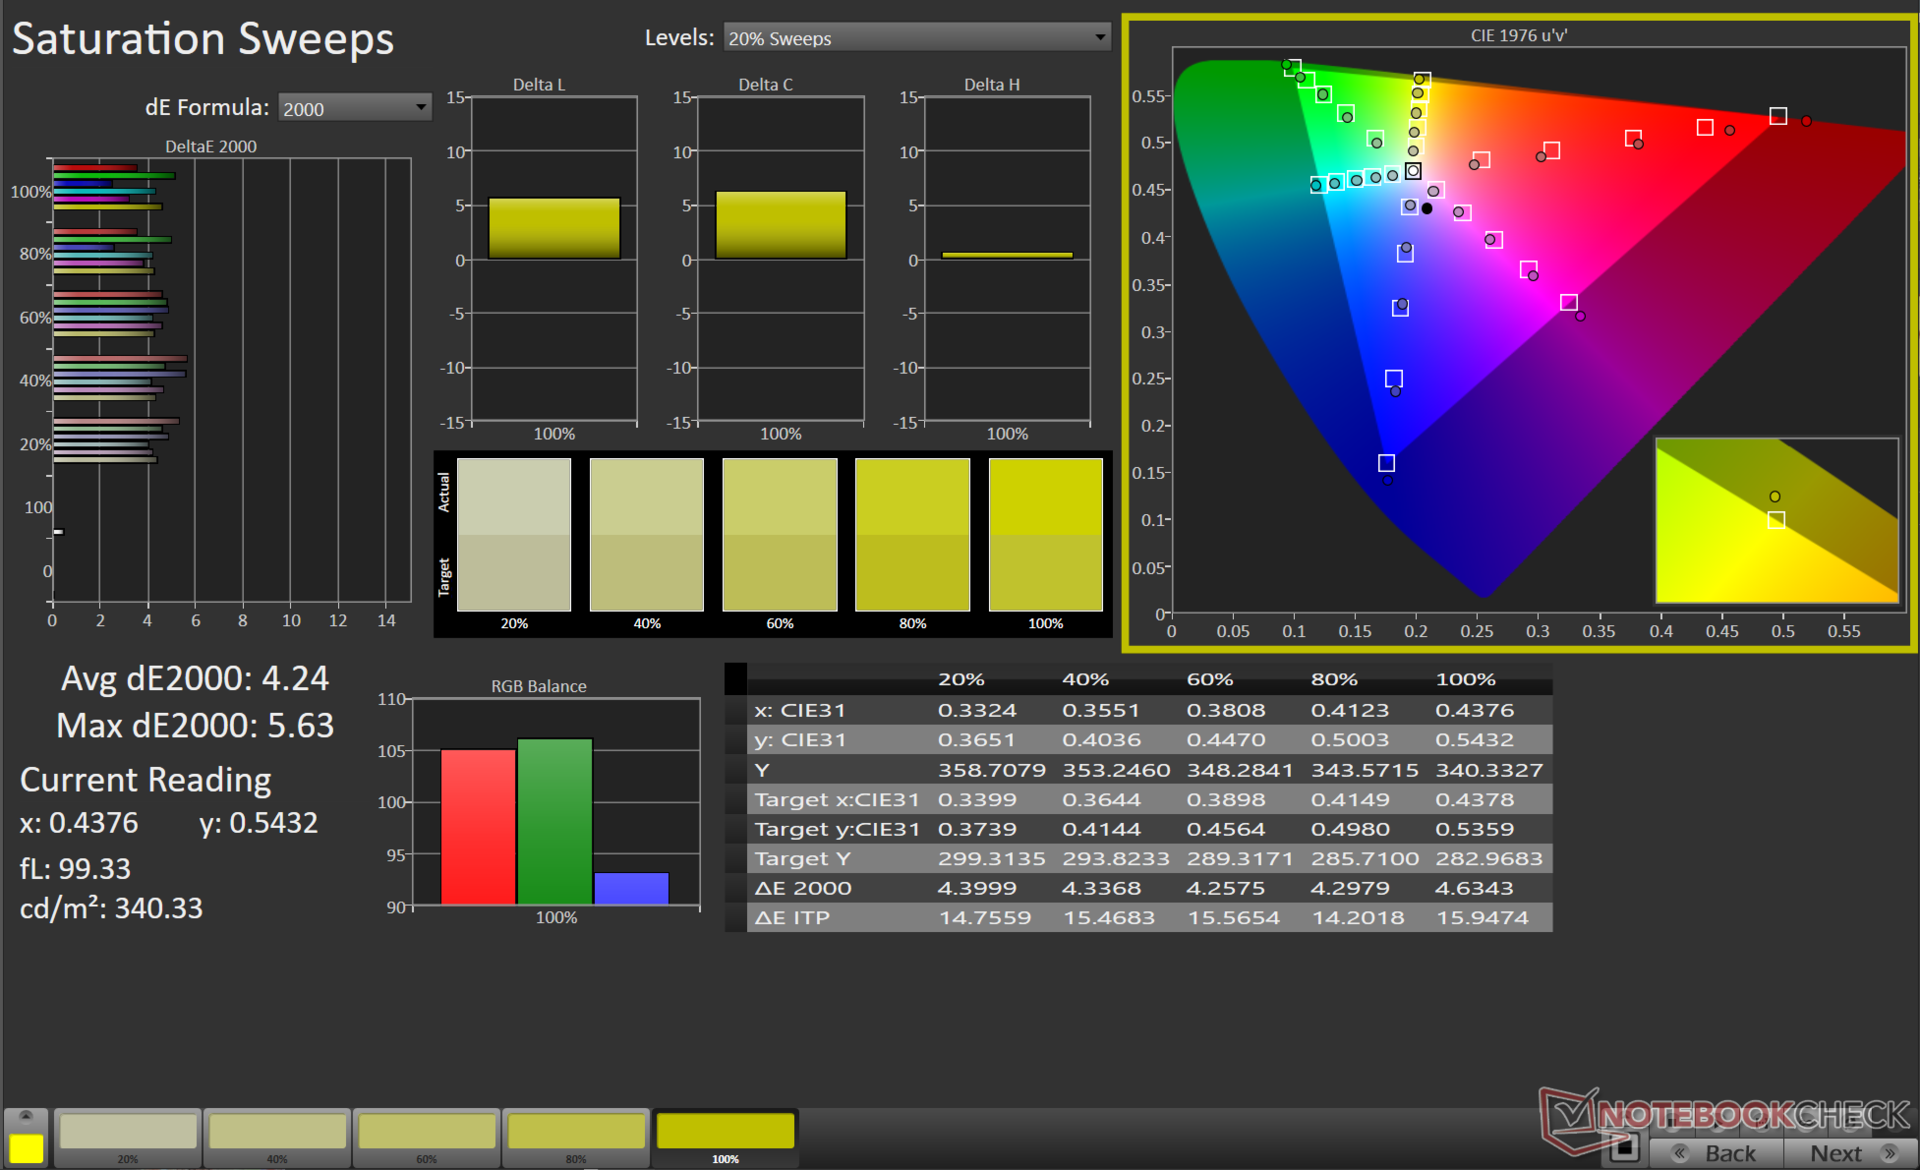
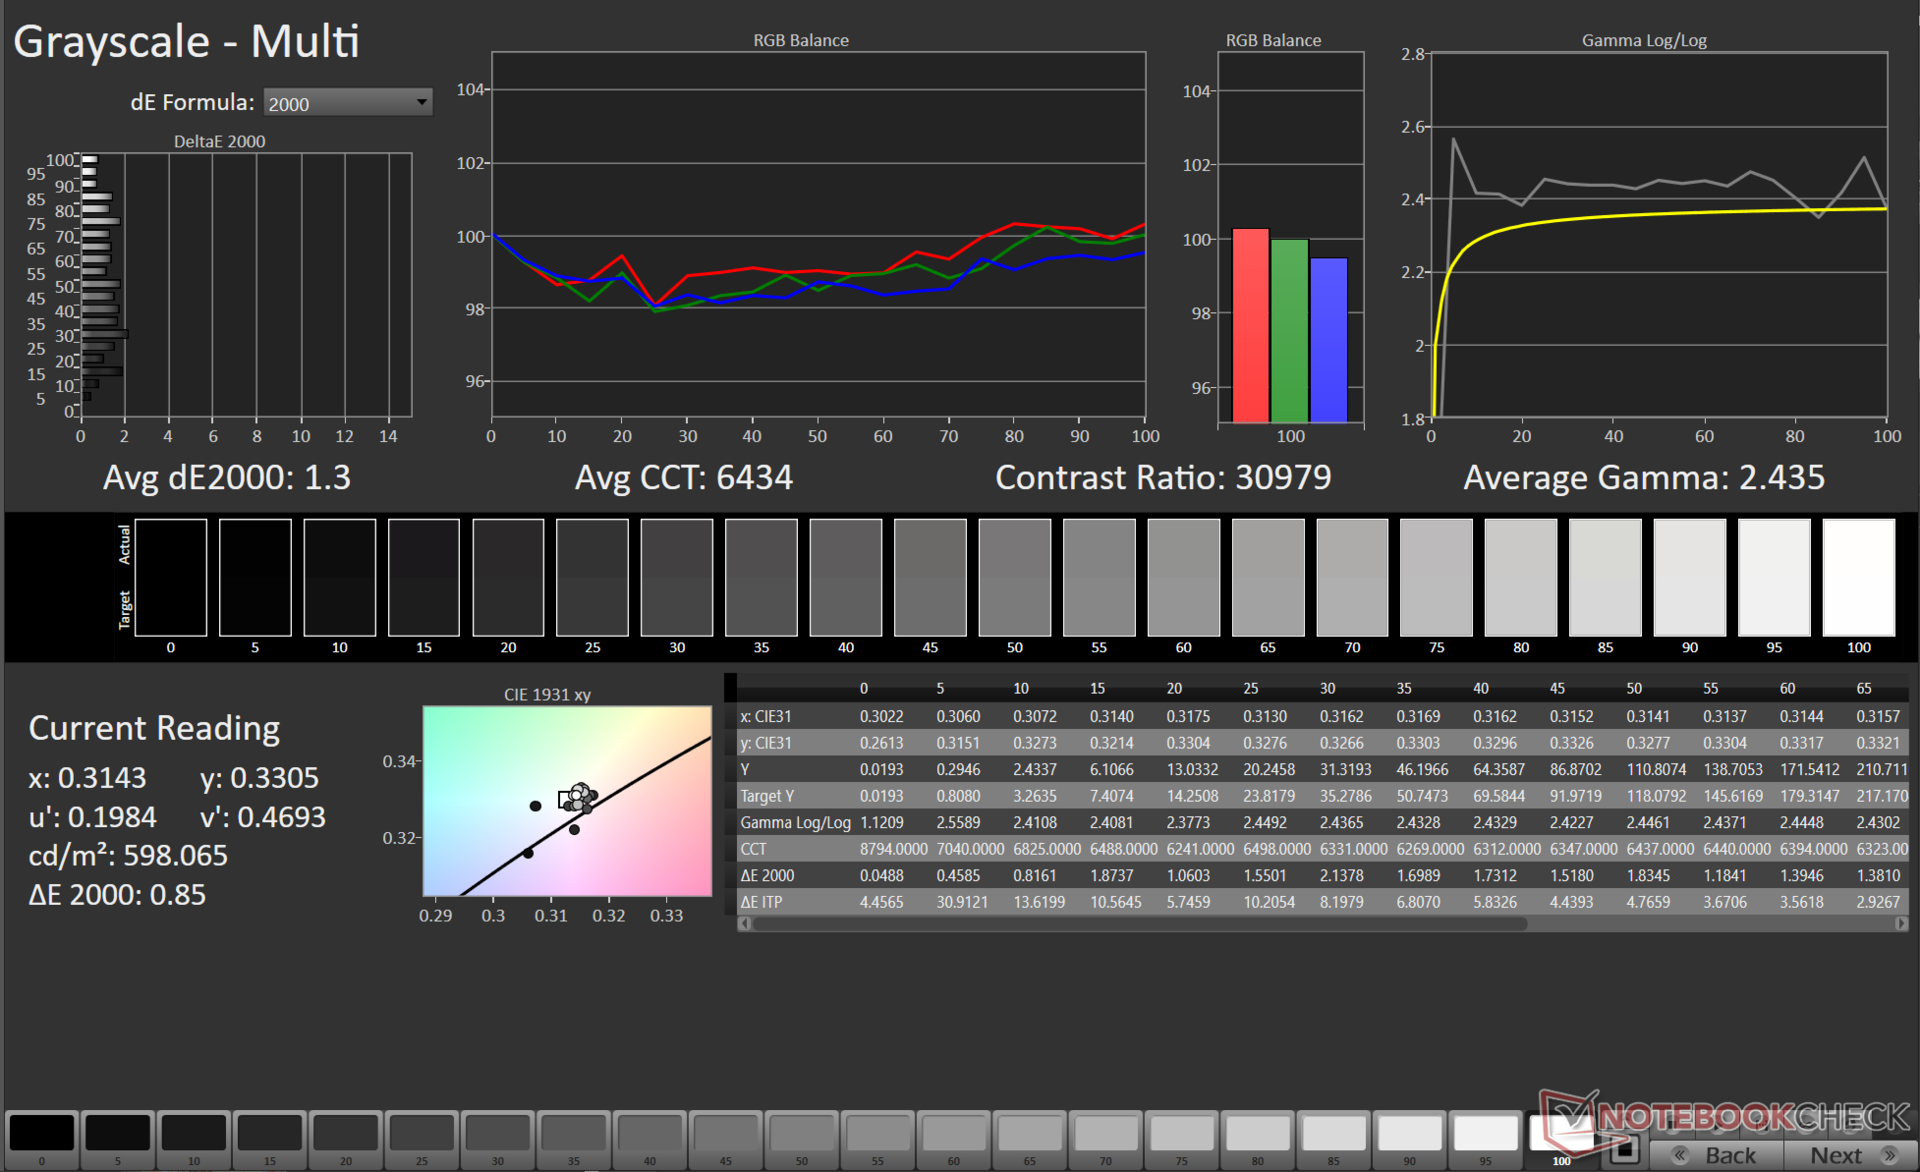
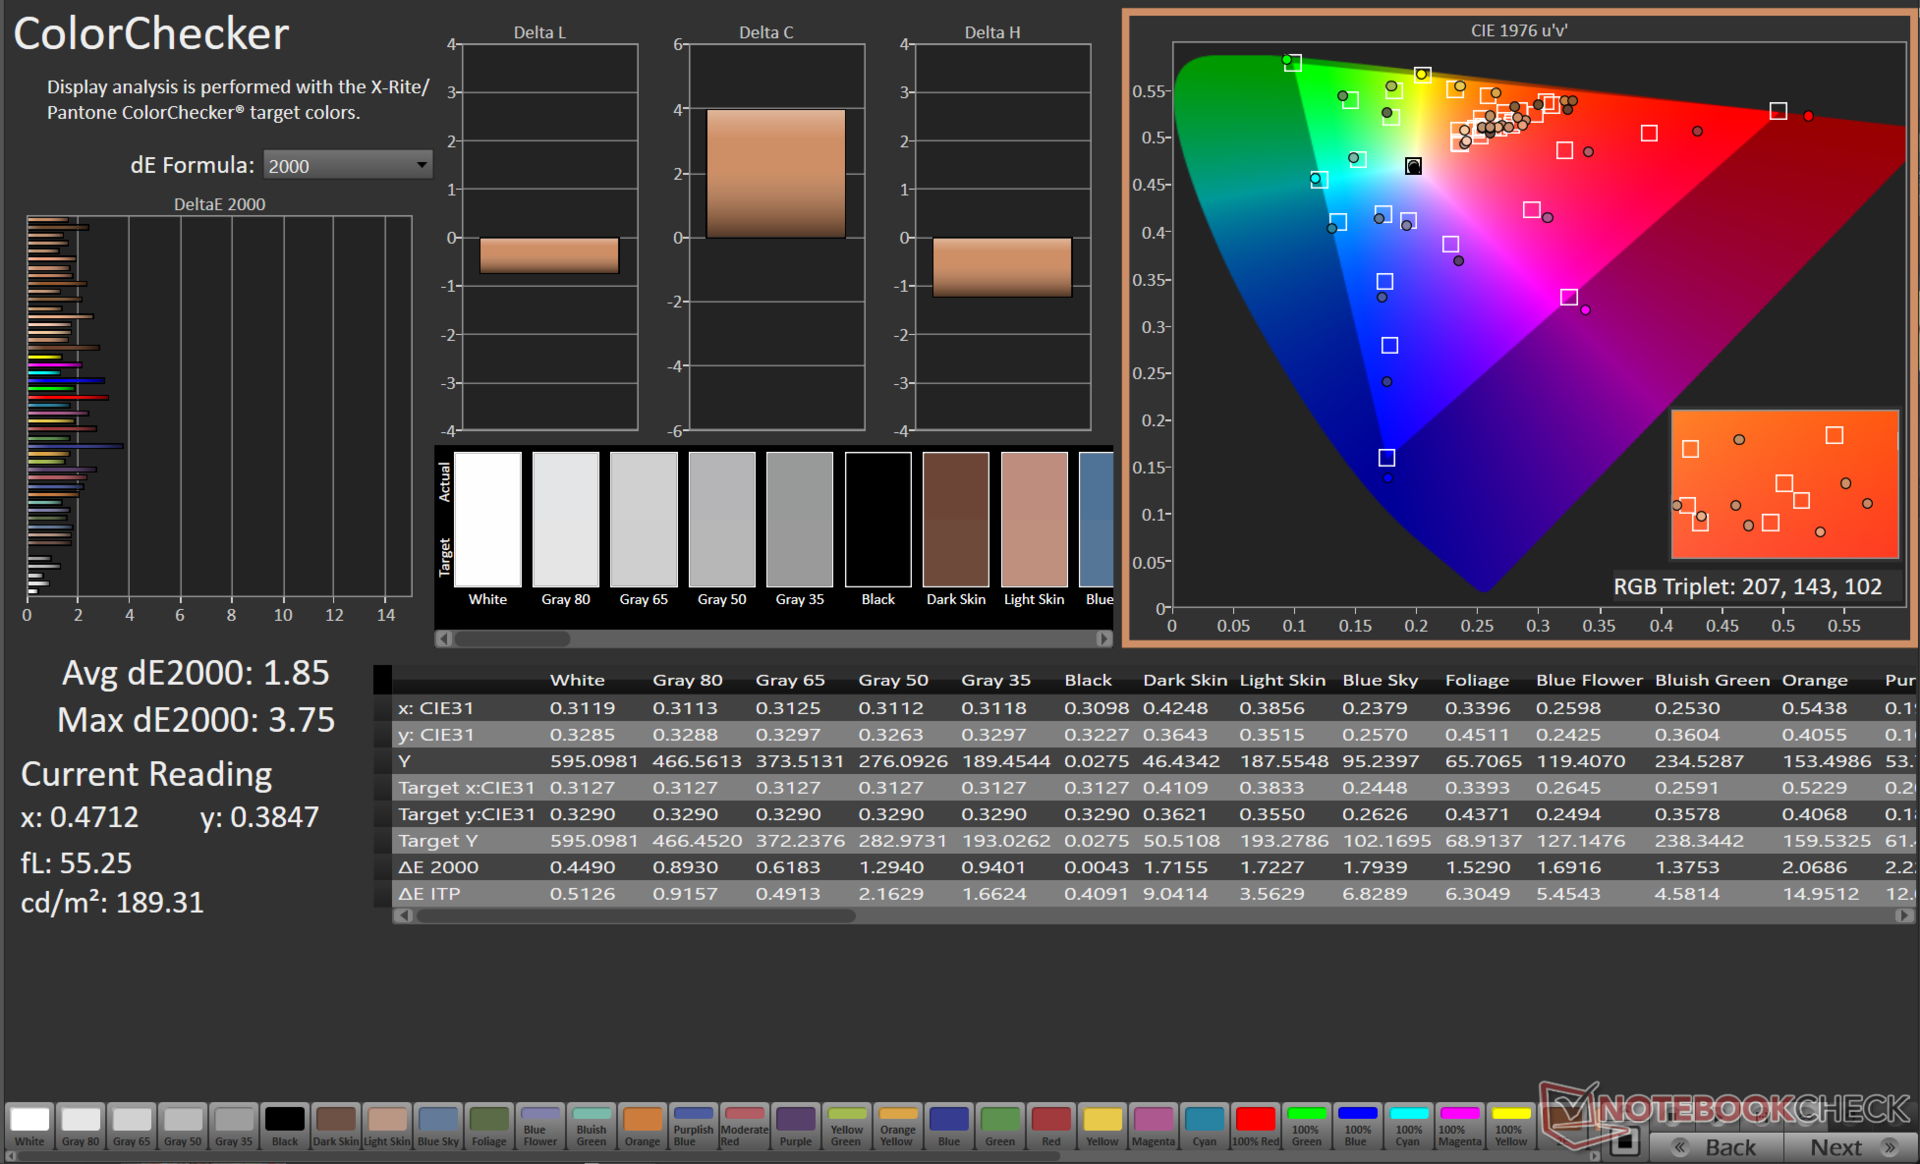
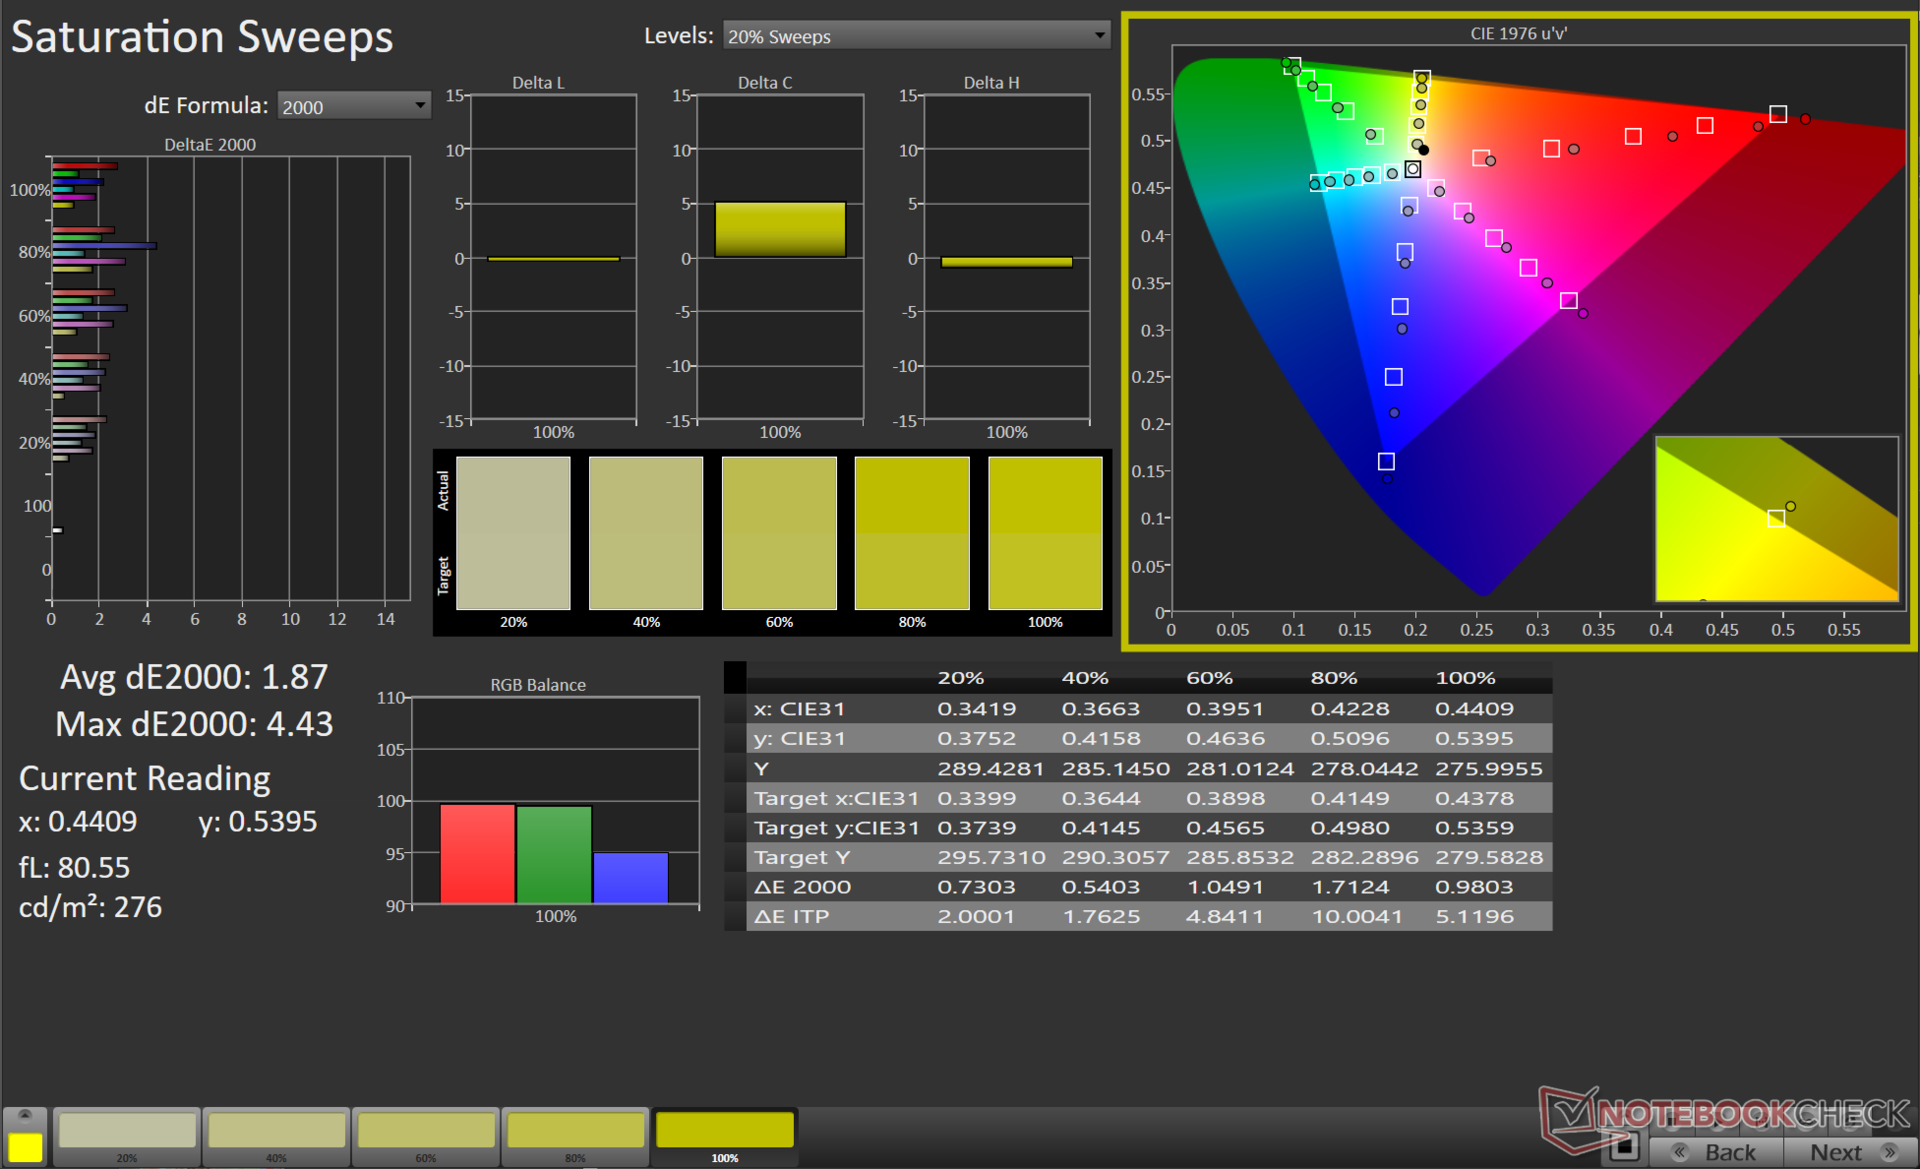
Choć fabryczna kalibracja wydaje się zmniejszać ogólną jasność SDR, to jednak wartości Delta E są znacznie lepsze w porównaniu do tych z domyślnego profilu ICC systemu Windows. Mimo to fabryczna kalibracja kolorów nie jest doskonała i można ją jeszcze poprawić.
Skalibrowaliśmy wyświetlacz Blade 16 przy użyciu spektrofotometru X-Rite i1Basic Pro 3 i oprogramowania do kalibracji kolorów Calman Ultimate firmy Portrait Displays w przestrzeni kolorów DCI-P3.
Nasza rutyna kalibracyjna pozwoliła uzyskać znacznie lepsze średnie wartości Delta E, wynoszące odpowiednio 1,3 i 1,85 w pomiarach Grayscale i ColorChecker. Czerwony i 100% niebieski wykazują najwyższe odchylenia, ale maksymalna wartość Delta E wynosząca 3,75 jest wciąż całkiem użyteczna dla większości kreatywnych przepływów pracy. Warto zauważyć, że po kalibracji ponownie spadają poziomy jasności.
Skalibrowany plik ICC można pobrać z powyższego linku.

Wyświetl czasy reakcji
| ↔ Czas reakcji od czerni do bieli | ||
|---|---|---|
| 62.04 ms ... wzrost ↗ i spadek ↘ łącznie | ↗ 58.04 ms wzrost | 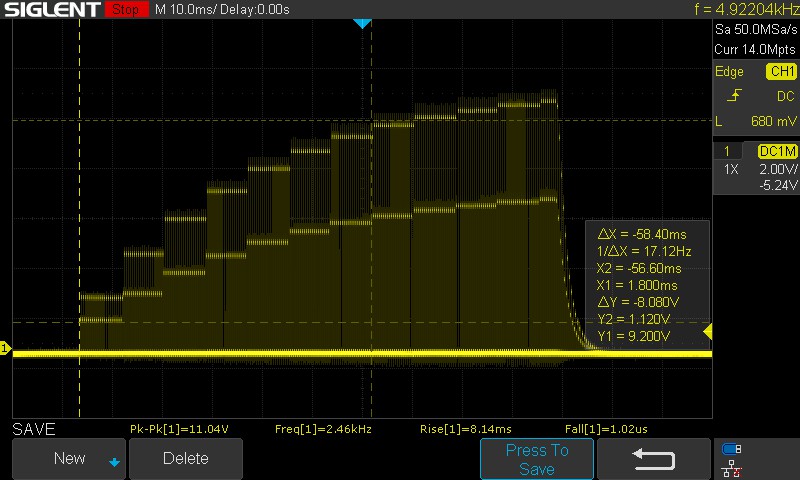  |
| ↘ 4 ms upadek | ||
| W naszych testach ekran wykazuje powolne tempo reakcji, co będzie niezadowalające dla graczy. Dla porównania, wszystkie testowane urządzenia wahają się od 0.1 (minimum) do 240 (maksimum) ms. » 100 % wszystkich urządzeń jest lepszych. Oznacza to, że zmierzony czas reakcji jest gorszy od średniej wszystkich testowanych urządzeń (19.8 ms). | ||
| ↔ Czas reakcji 50% szarości do 80% szarości | ||
| 10.2 ms ... wzrost ↗ i spadek ↘ łącznie | ↗ 5.8 ms wzrost |  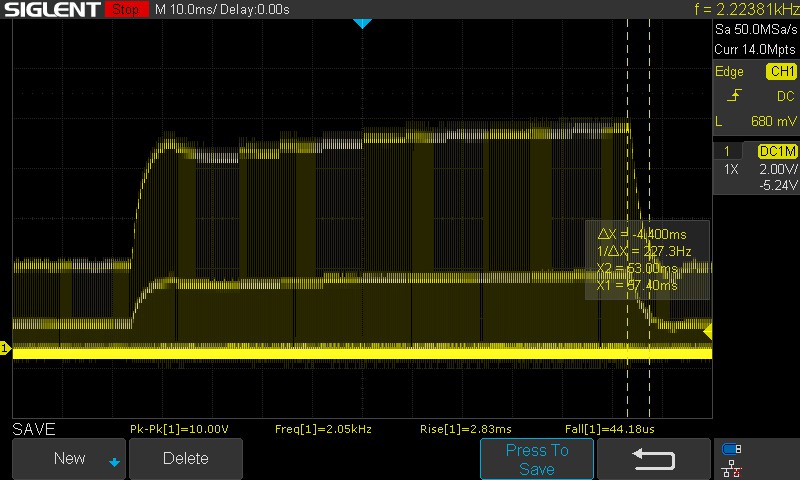 |
| ↘ 4.4 ms upadek | ||
| W naszych testach ekran wykazuje dobry współczynnik reakcji, ale może być zbyt wolny dla graczy rywalizujących ze sobą. Dla porównania, wszystkie testowane urządzenia wahają się od 0.165 (minimum) do 636 (maksimum) ms. » 24 % wszystkich urządzeń jest lepszych. Oznacza to, że zmierzony czas reakcji jest lepszy od średniej wszystkich testowanych urządzeń (30.9 ms). | ||
Matryca mini-LED sprawia, że dokładny pomiar czasów reakcji jest nieco skomplikowany. Silne migotanie oznaczało, że musieliśmy próbkować dane w całym zakresie pulsowania i ręcznie określać czasy narastania i opadania. Wartości odnotowane powyżej wydają się więc wyższe niż normalnie dla laptopa do gier, zwłaszcza przy przejściu od 100% czerni do 100%.
Razer reklamuje czas reakcji na poziomie 3 ms, ale nie jest jasne, w jakich warunkach uzyskano tę wartość. Użyliśmy ustawienia jasności SDR na 100%, ale możliwe, że Razer mógł wybrać dużo niższą jasność. Mimo to, częstotliwość odświeżania 120 Hz nie wydaje się powodować żadnych zauważalnych problemów ze smużeniem.
Migotanie ekranu / PWM (modulacja szerokości impulsu)
| Wykryto migotanie ekranu/wykryto PWM | 2420 Hz | ≤ 100 % ustawienia jasności | 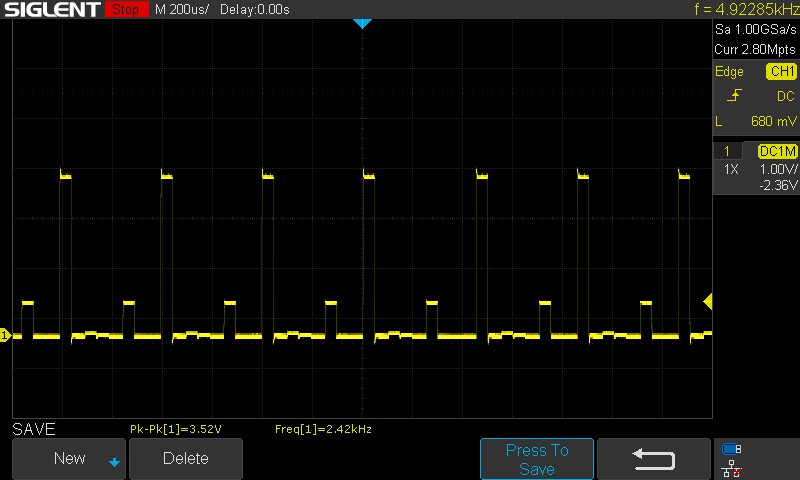 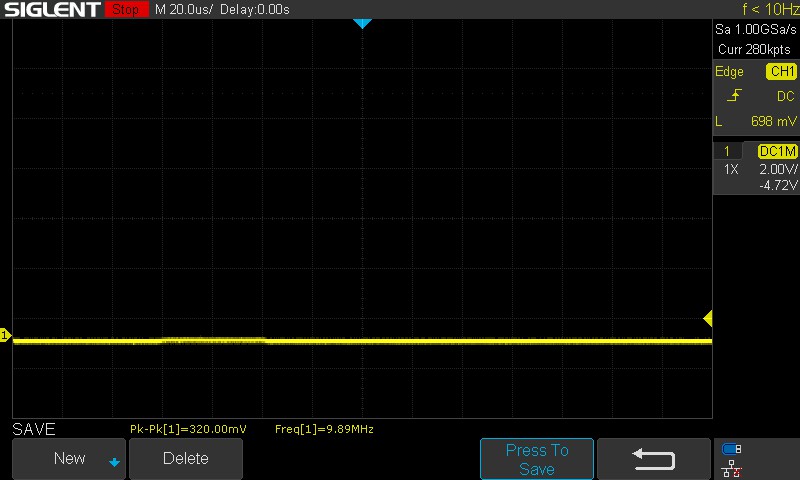 |
Podświetlenie wyświetlacza miga z częstotliwością 2420 Hz (najgorszy przypadek, np. przy użyciu PWM) Wykryto migotanie przy ustawieniu jasności 100 % i poniżej. Powyżej tego ustawienia jasności nie powinno być żadnego migotania ani PWM. Częstotliwość 2420 Hz jest dość wysoka, więc większość użytkowników wrażliwych na PWM nie powinna zauważyć żadnego migotania. Dla porównania: 52 % wszystkich testowanych urządzeń nie używa PWM do przyciemniania wyświetlacza. Jeśli wykryto PWM, zmierzono średnio 7744 (minimum: 5 - maksimum: 343500) Hz. | |||
We wszystkich testowanych poziomach jasności zaobserwowaliśmy PWM o częstotliwości 2,420 Hz, co jest wartością wystarczająco wysoką. PWM wzrasta do 9,89 MHz przy jasności 0%, co jest równie dobre jak brak migotania.
Wysoki poziom jasności zapewnia dobre wrażenia z oglądania na zewnątrz, nawet w bezpośrednim świetle słonecznym. Kąty widzenia są bardzo stabilne, z minimalną tylko utratą jasności na krańcach.


Wydajność: Core i9-13950HX i RTX 4090 combo zostają w tyle za konkurencją
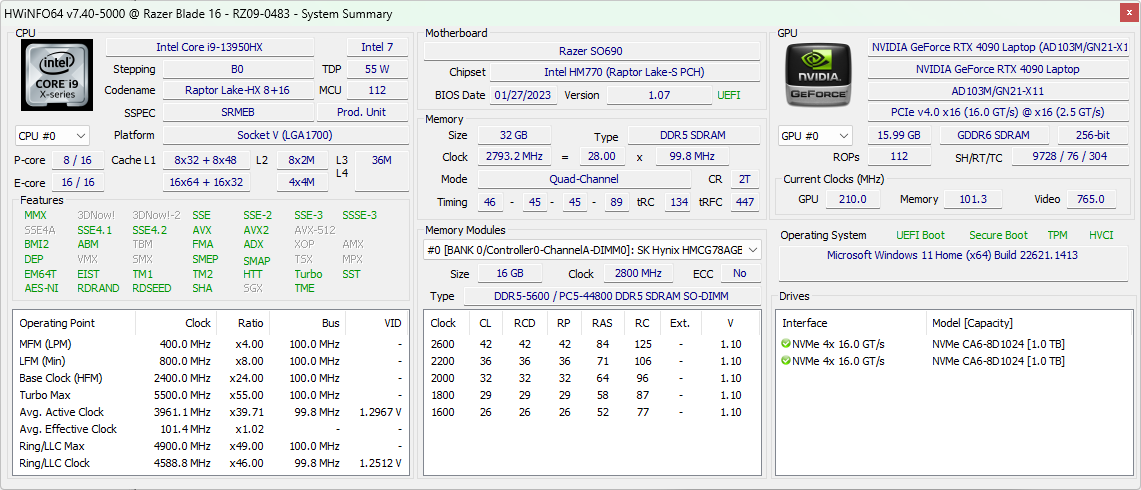
Nasz egzemplarz Razer Blade 16 Early 2023 jest napędzany przez Intel Core i9-13950HX oraz Nvidia GeForce RTX 4090 Laptop GPU. Kupujący mają również możliwość wyboru spośród kilku innych konfiguracji Blade 16, jak wskazano we wstępie.
Należy pamiętać, że dwutrybowe wyświetlacze mini-LED są dostępne tylko w konfiguracjach wyposażonych w układy GPU RTX 4070 Laptop i RTX 4090 Laptop.
Warunki badania
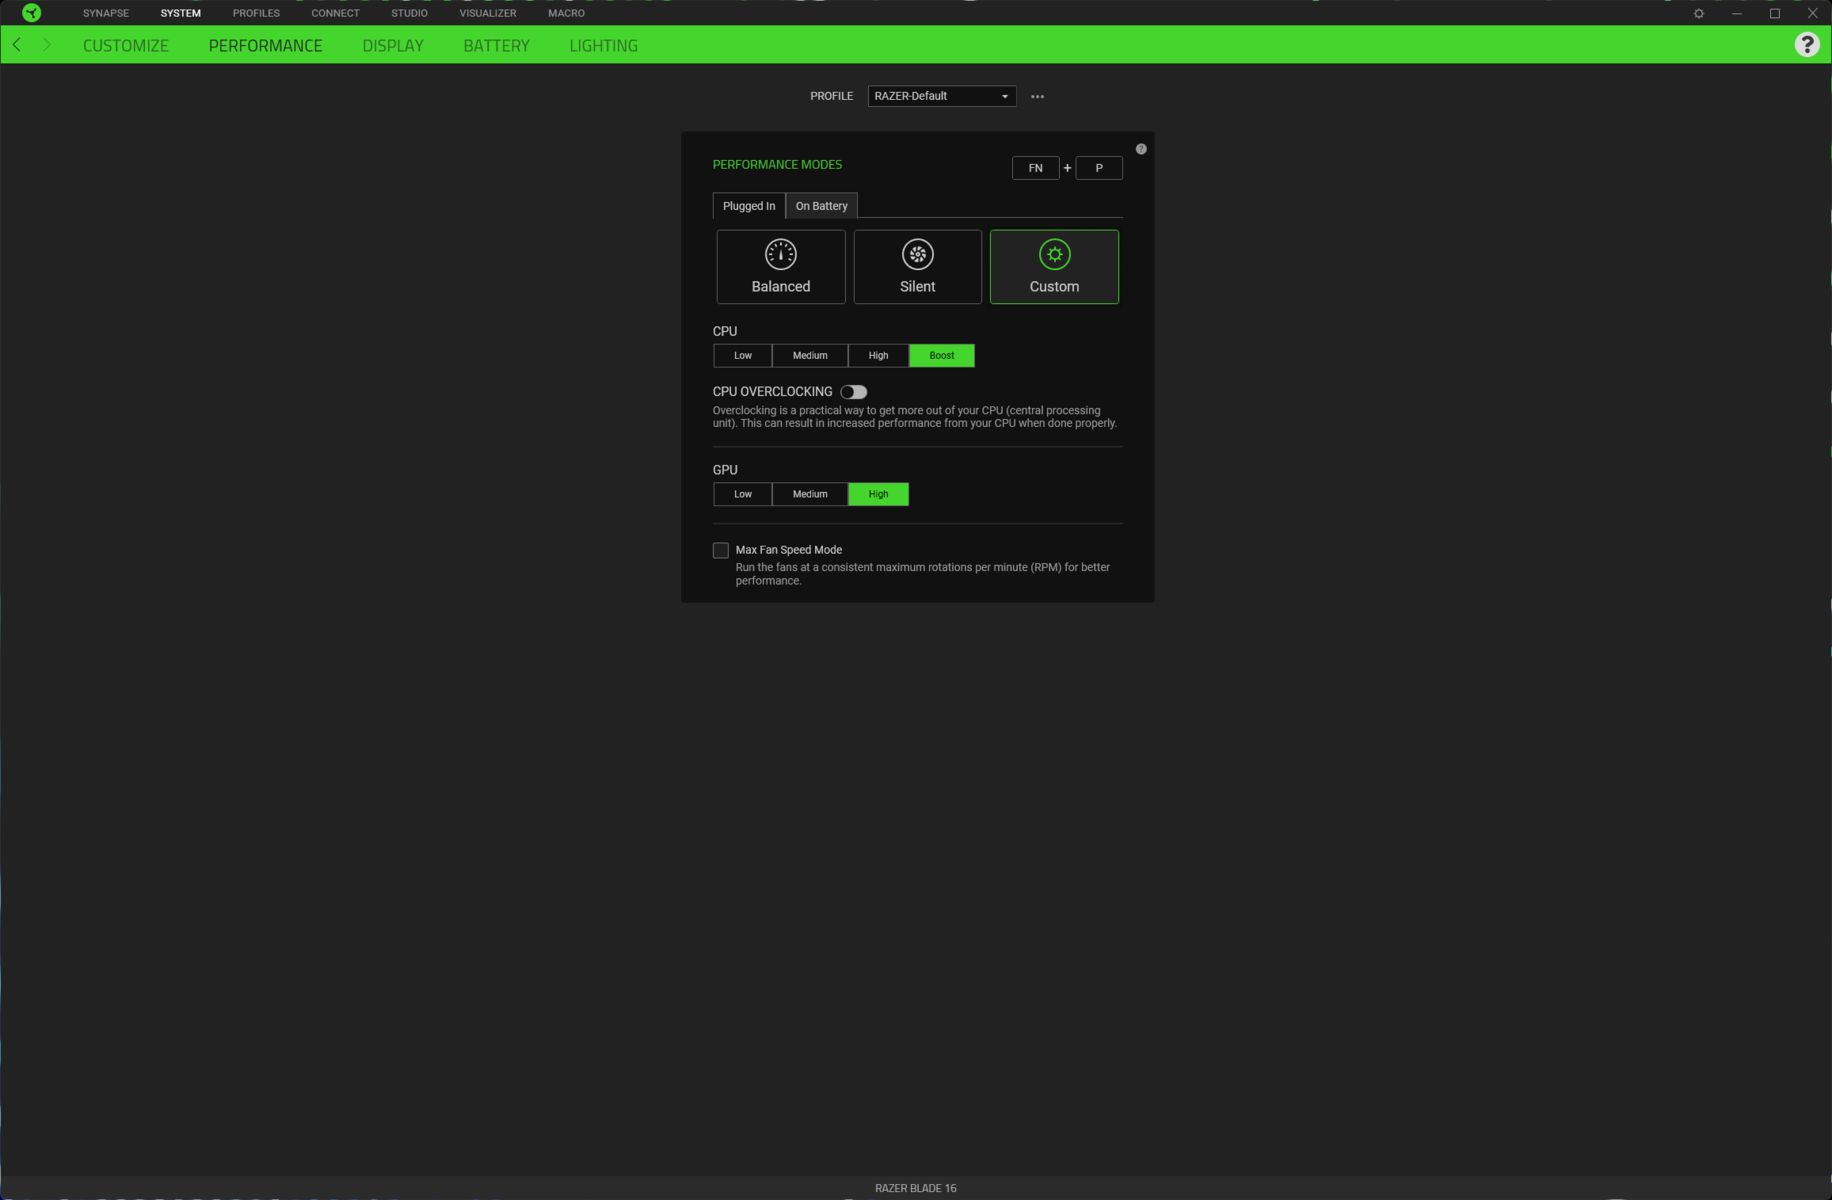
Razer Synapse umożliwia zmianę różnych trybów wydajności w zależności od potrzeb. Aby pozwolić Core i9-13950HX i RTX 4090 w pełni naprężyć swoje mięśnie, użyliśmy trybu Custom z opcjami CPU Boost i GPU High. W ten sposób uzyskaliśmy zrównoważone PL1 o mocy 110 W i krótkie podbicie o mocy 130 W.
Do przeprowadzenia testów graficznych wykorzystaliśmy tryb dGPU. Omawiany laptop obsługuje Advanced Optimus, więc można łatwo przełączać się między MSHybrid i dGPU bezpośrednio z panelu sterowania Nvidii bez konieczności restartowania komputera. G-Sync był podczas testów wyłączony.
Wybór trybów wydajności może mieć wpływ na emisję ciepła i hałasu. Poniższa tabela ilustruje, jak PL1 i PL2 zmieniają się przy poszczególnych ustawieniach wydajności.
Na zasilaniu akumulatorowym oferowany jest tylko profil Zrównoważony. Użyliśmy tego trybu do naszych testów bateryjnych i włączyliśmy opcję automatycznego przełączania na częstotliwość odświeżania 60 Hz.
| Tryb Performance | PL1 (PBP) / Tau | PL2 (MTP) / Tau |
|---|---|---|
| Silent | 32,5 W / 56 s | 37 W / 2,44 ms |
| Zrównoważony | 54 W / 56 s | 55 W / 2,44 ms |
| Niestandardowe (CPU Boost / GPU High) | 110 W / 56 s | 130 W / 2,44 ms |
Procesor
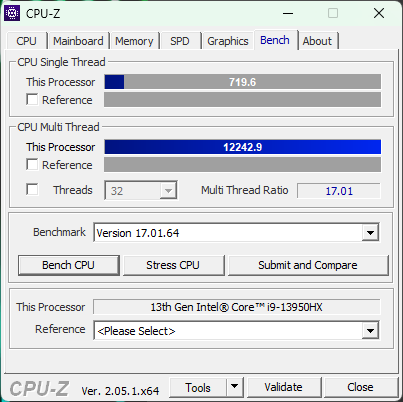
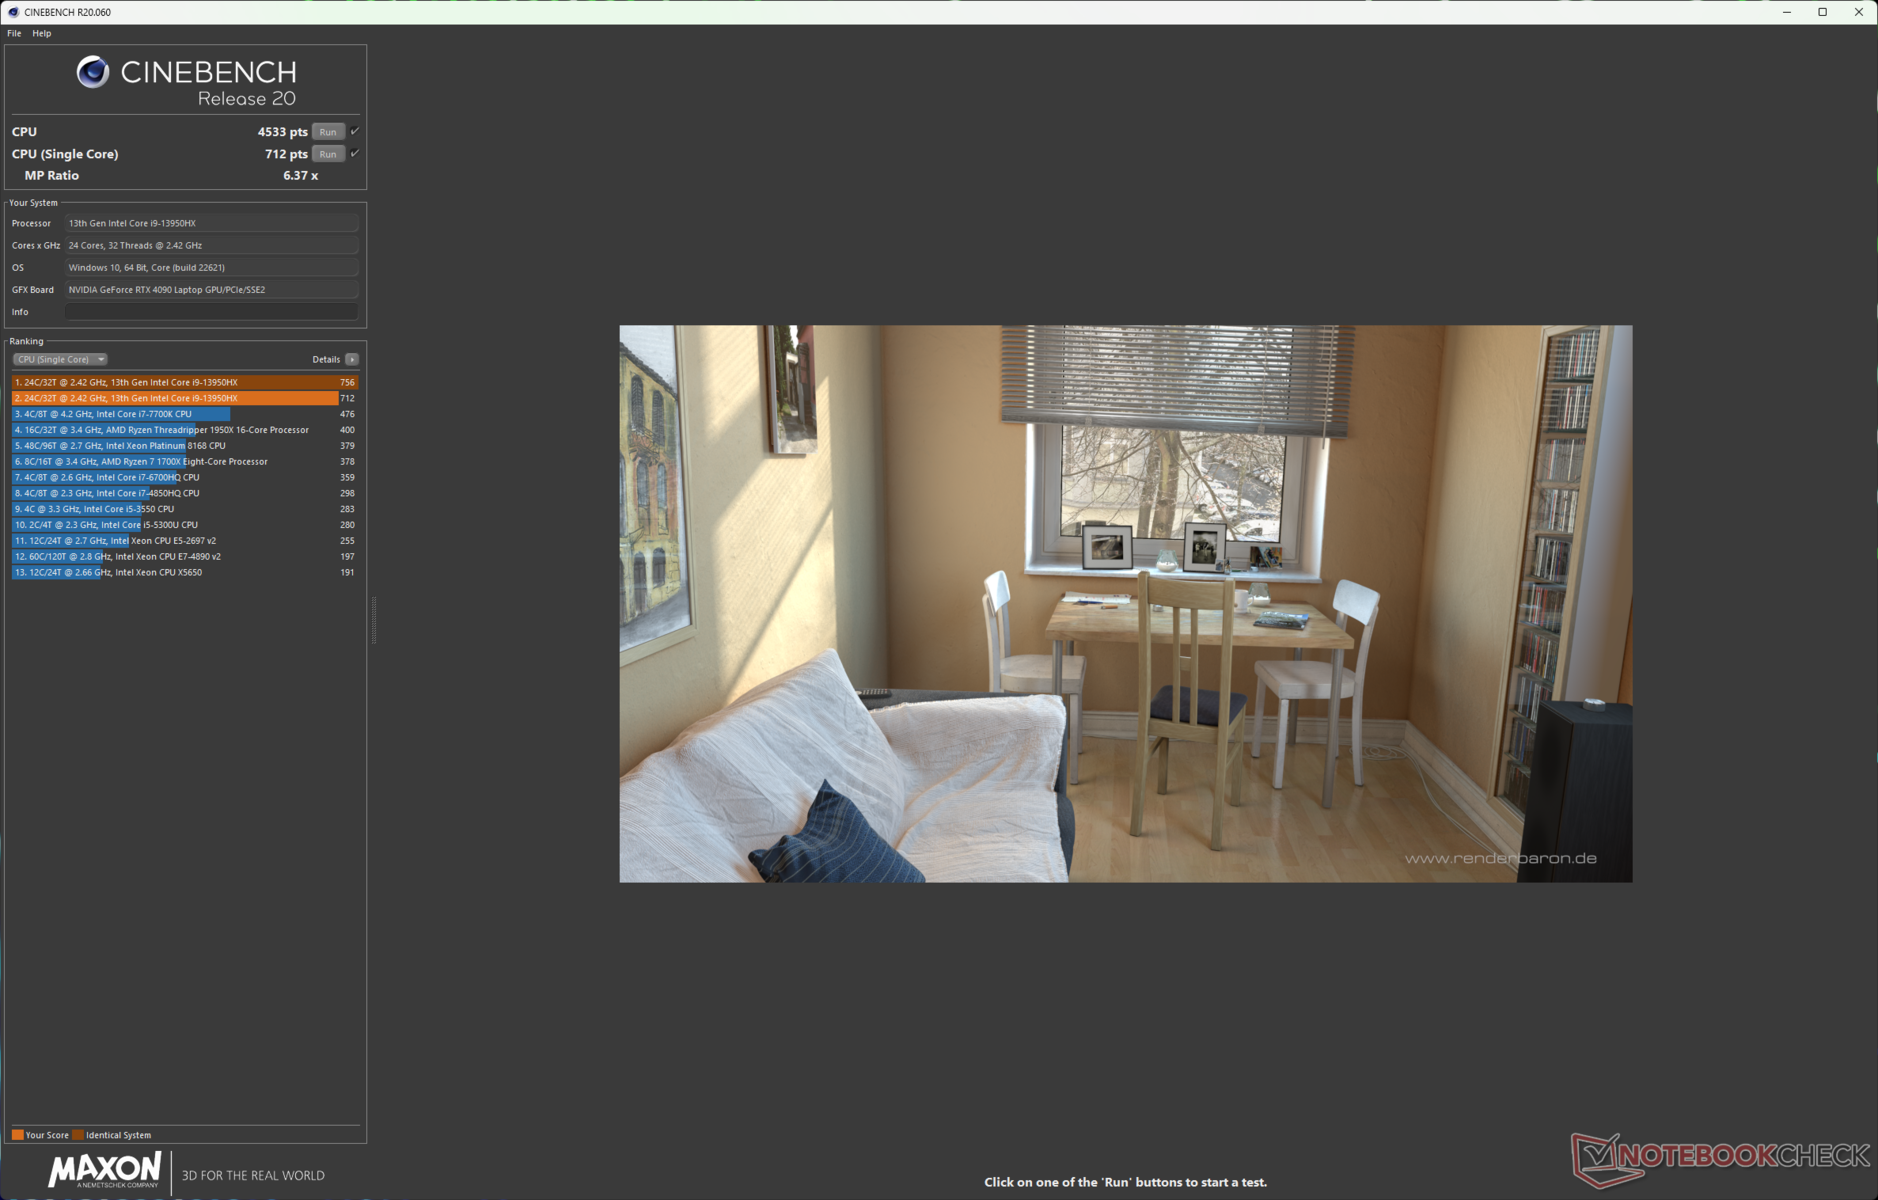
Intel Core i9-13950HX to część Raptor Lake-HX z 24 rdzeniami i 32 wątkami, która może osiągnąć podbicie jednordzeniowe na poziomie 5,5 GHz.
Gdy recenzowaliśmy Razer Blade 16 z RTX 4080, konkurencję stanowiły głównie urządzenia napędzane układami Intel Alder Lake i AMD Ryzen serii 6000.
W ciągu ostatnich kilkunastu miesięcy nastąpił stały napływ notebooków z 13. gen. Intela i AMD Ryzen serii 7000. Dzięki temu możemy dokonać bardziej współczesnego porównania i niestety oba Blade 16s 2023 zmagają się z najnowszą konkurencją.
Pomimo zastosowania wydajnego chłodzenia komorowego, Blade 16 z RTX 4090 nie radzi sobie dobrze w teście pętli wielordzeniowej Cinebench R15. Widzimy nawet 29% spadek w 19. biegu, a następnie przyspieszenie w 21. pętli. Jest to różnica w porównaniu z Blade 16 z RTX 4080, który wykazuje dobrze utrzymaną wydajność.
Cinebench R15 Multi Loop
Łączna wydajność to przyzwoity wzrost o 17% w stosunku do przeciętnego Core i9-12950HX. Na stronie Core i9-13900HXw Lenovo Legion Pro 7 łatwo przewyższa Core i9-13950HX z Blade 16 dzięki wysokim wartościom 130 W/185 W PL1/PL2.
Podobnie MSI Titan GT77 HX 13VI z tym samym procesorem co Blade 16 jest w stanie uzyskać wyższe wyniki w benchmarkach CPU dzięki wartościom 150 W PL1 i 220 W PL2.
Na stronie AMD Ryzen 9 7945HX w Asusie ROG Zephyrus Duo 16 plasuje się na komfortowej, 12-procentowej przewadze ogólnej nad Core i9-13950HX w Blade 16.
Cinebench R23: Multi Core | Single Core
Cinebench R20: CPU (Multi Core) | CPU (Single Core)
Cinebench R15: CPU Multi 64Bit | CPU Single 64Bit
Blender: v2.79 BMW27 CPU
7-Zip 18.03: 7z b 4 | 7z b 4 -mmt1
Geekbench 5.5: Multi-Core | Single-Core
HWBOT x265 Benchmark v2.2: 4k Preset
LibreOffice : 20 Documents To PDF
R Benchmark 2.5: Overall mean
| CPU Performance rating | |
| Przeciętny Intel Core i9-13900K | |
| Eluktronics Mech-17 GP2 | |
| Asus ROG Strix Scar 18 2023 G834JY-N6005W | |
| Asus Zephyrus Duo 16 GX650PY-NM006W | |
| MSI Titan GT77 HX 13VI | |
| Lenovo Legion Pro 7 16IRX8H | |
| Asus ROG Strix G16 G614JZ | |
| Razer Blade 18 RTX 4070 | |
| Razer Blade 16 Early 2023 RTX 4090 | |
| Razer Blade 16 Early 2023 | |
| Średnia w klasie Gaming | |
| Asus ROG Zephyrus M16 GU604VY-NM042X | |
| Przeciętny Intel Core i9-12950HX | |
| Cinebench R23 / Multi Core | |
| Przeciętny Intel Core i9-13900K (32592 - 40103, n=4) | |
| Asus Zephyrus Duo 16 GX650PY-NM006W | |
| MSI Titan GT77 HX 13VI | |
| Eluktronics Mech-17 GP2 | |
| Asus ROG Strix Scar 18 2023 G834JY-N6005W | |
| Lenovo Legion Pro 7 16IRX8H | |
| Asus ROG Strix G16 G614JZ | |
| Razer Blade 18 RTX 4070 | |
| Razer Blade 16 Early 2023 RTX 4090 | |
| Średnia w klasie Gaming (10488 - 42661, n=104, ostatnie 2 lata) | |
| Razer Blade 16 Early 2023 | |
| Przeciętny Intel Core i9-12950HX (16277 - 23113, n=7) | |
| Asus ROG Zephyrus M16 GU604VY-NM042X | |
| Cinebench R23 / Single Core | |
| Przeciętny Intel Core i9-13900K (2203 - 2272, n=4) | |
| Asus ROG Strix Scar 18 2023 G834JY-N6005W | |
| Asus ROG Strix G16 G614JZ | |
| MSI Titan GT77 HX 13VI | |
| Eluktronics Mech-17 GP2 | |
| Razer Blade 18 RTX 4070 | |
| Lenovo Legion Pro 7 16IRX8H | |
| Razer Blade 16 Early 2023 | |
| Średnia w klasie Gaming (1601 - 2415, n=104, ostatnie 2 lata) | |
| Asus ROG Zephyrus M16 GU604VY-NM042X | |
| Razer Blade 16 Early 2023 RTX 4090 | |
| Asus Zephyrus Duo 16 GX650PY-NM006W | |
| Przeciętny Intel Core i9-12950HX (1465 - 1922, n=7) | |
| Cinebench R20 / CPU (Multi Core) | |
| Przeciętny Intel Core i9-13900K (13415 - 15181, n=4) | |
| Asus Zephyrus Duo 16 GX650PY-NM006W | |
| MSI Titan GT77 HX 13VI | |
| Eluktronics Mech-17 GP2 | |
| Asus ROG Strix Scar 18 2023 G834JY-N6005W | |
| Asus ROG Strix G16 G614JZ | |
| Lenovo Legion Pro 7 16IRX8H | |
| Razer Blade 18 RTX 4070 | |
| Razer Blade 16 Early 2023 RTX 4090 | |
| Średnia w klasie Gaming (4029 - 16433, n=103, ostatnie 2 lata) | |
| Razer Blade 16 Early 2023 | |
| Przeciętny Intel Core i9-12950HX (6625 - 8777, n=7) | |
| Asus ROG Zephyrus M16 GU604VY-NM042X | |
| Cinebench R20 / CPU (Single Core) | |
| Przeciętny Intel Core i9-13900K (828 - 870, n=4) | |
| Asus ROG Strix Scar 18 2023 G834JY-N6005W | |
| Asus ROG Strix G16 G614JZ | |
| MSI Titan GT77 HX 13VI | |
| Eluktronics Mech-17 GP2 | |
| Razer Blade 18 RTX 4070 | |
| Lenovo Legion Pro 7 16IRX8H | |
| Średnia w klasie Gaming (622 - 913, n=103, ostatnie 2 lata) | |
| Asus Zephyrus Duo 16 GX650PY-NM006W | |
| Razer Blade 16 Early 2023 RTX 4090 | |
| Asus ROG Zephyrus M16 GU604VY-NM042X | |
| Razer Blade 16 Early 2023 | |
| Przeciętny Intel Core i9-12950HX (703 - 741, n=7) | |
| Cinebench R15 / CPU Multi 64Bit | |
| Przeciętny Intel Core i9-13900K (5321 - 6191, n=8) | |
| Asus Zephyrus Duo 16 GX650PY-NM006W | |
| MSI Titan GT77 HX 13VI | |
| Eluktronics Mech-17 GP2 | |
| Lenovo Legion Pro 7 16IRX8H | |
| Asus ROG Strix Scar 18 2023 G834JY-N6005W | |
| Asus ROG Strix G16 G614JZ | |
| Asus ROG Strix G16 G614JZ | |
| Razer Blade 16 Early 2023 | |
| Razer Blade 18 RTX 4070 | |
| Razer Blade 16 Early 2023 RTX 4090 | |
| Średnia w klasie Gaming (1578 - 6330, n=102, ostatnie 2 lata) | |
| Przeciętny Intel Core i9-12950HX (2464 - 3530, n=7) | |
| Asus ROG Zephyrus M16 GU604VY-NM042X | |
| Cinebench R15 / CPU Single 64Bit | |
| Przeciętny Intel Core i9-13900K (299 - 328, n=8) | |
| Asus ROG Strix Scar 18 2023 G834JY-N6005W | |
| Asus Zephyrus Duo 16 GX650PY-NM006W | |
| Asus ROG Strix G16 G614JZ | |
| Asus ROG Strix G16 G614JZ | |
| Lenovo Legion Pro 7 16IRX8H | |
| MSI Titan GT77 HX 13VI | |
| Eluktronics Mech-17 GP2 | |
| Średnia w klasie Gaming (188.8 - 350, n=103, ostatnie 2 lata) | |
| Razer Blade 18 RTX 4070 | |
| Asus ROG Zephyrus M16 GU604VY-NM042X | |
| Razer Blade 16 Early 2023 RTX 4090 | |
| Razer Blade 16 Early 2023 | |
| Przeciętny Intel Core i9-12950HX (167 - 276, n=7) | |
| Blender / v2.79 BMW27 CPU | |
| Przeciętny Intel Core i9-12950HX (138 - 193, n=7) | |
| Asus ROG Zephyrus M16 GU604VY-NM042X | |
| Średnia w klasie Gaming (79 - 330, n=101, ostatnie 2 lata) | |
| Razer Blade 16 Early 2023 RTX 4090 | |
| Razer Blade 16 Early 2023 | |
| Razer Blade 18 RTX 4070 | |
| Asus ROG Strix G16 G614JZ | |
| Lenovo Legion Pro 7 16IRX8H | |
| Asus ROG Strix Scar 18 2023 G834JY-N6005W | |
| Eluktronics Mech-17 GP2 | |
| MSI Titan GT77 HX 13VI | |
| Asus Zephyrus Duo 16 GX650PY-NM006W | |
| Przeciętny Intel Core i9-13900K (80 - 101, n=7) | |
| 7-Zip 18.03 / 7z b 4 | |
| Przeciętny Intel Core i9-13900K (127201 - 148053, n=5) | |
| Asus Zephyrus Duo 16 GX650PY-NM006W | |
| MSI Titan GT77 HX 13VI | |
| Eluktronics Mech-17 GP2 | |
| Asus ROG Strix Scar 18 2023 G834JY-N6005W | |
| Lenovo Legion Pro 7 16IRX8H | |
| Razer Blade 18 RTX 4070 | |
| Asus ROG Strix G16 G614JZ | |
| Razer Blade 16 Early 2023 | |
| Razer Blade 16 Early 2023 RTX 4090 | |
| Średnia w klasie Gaming (33491 - 148086, n=102, ostatnie 2 lata) | |
| Asus ROG Zephyrus M16 GU604VY-NM042X | |
| Przeciętny Intel Core i9-12950HX (65637 - 85019, n=7) | |
| 7-Zip 18.03 / 7z b 4 -mmt1 | |
| Przeciętny Intel Core i9-13900K (7176 - 7539, n=5) | |
| Asus Zephyrus Duo 16 GX650PY-NM006W | |
| Asus ROG Strix Scar 18 2023 G834JY-N6005W | |
| Lenovo Legion Pro 7 16IRX8H | |
| Eluktronics Mech-17 GP2 | |
| Asus ROG Strix G16 G614JZ | |
| MSI Titan GT77 HX 13VI | |
| Razer Blade 18 RTX 4070 | |
| Razer Blade 16 Early 2023 RTX 4090 | |
| Średnia w klasie Gaming (4824 - 7436, n=102, ostatnie 2 lata) | |
| Razer Blade 16 Early 2023 | |
| Asus ROG Zephyrus M16 GU604VY-NM042X | |
| Przeciętny Intel Core i9-12950HX (6022 - 6318, n=7) | |
| Geekbench 5.5 / Multi-Core | |
| Przeciętny Intel Core i9-13900K (22448 - 24157, n=5) | |
| Lenovo Legion Pro 7 16IRX8H | |
| Asus ROG Strix Scar 18 2023 G834JY-N6005W | |
| Eluktronics Mech-17 GP2 | |
| MSI Titan GT77 HX 13VI | |
| Razer Blade 18 RTX 4070 | |
| Asus Zephyrus Duo 16 GX650PY-NM006W | |
| Asus ROG Strix G16 G614JZ | |
| Razer Blade 16 Early 2023 | |
| Średnia w klasie Gaming (6460 - 28263, n=102, ostatnie 2 lata) | |
| Razer Blade 16 Early 2023 RTX 4090 | |
| Asus ROG Zephyrus M16 GU604VY-NM042X | |
| Przeciętny Intel Core i9-12950HX (14028 - 16009, n=7) | |
| Geekbench 5.5 / Single-Core | |
| Przeciętny Intel Core i9-13900K (2106 - 2290, n=5) | |
| Asus Zephyrus Duo 16 GX650PY-NM006W | |
| Asus ROG Strix Scar 18 2023 G834JY-N6005W | |
| Eluktronics Mech-17 GP2 | |
| Średnia w klasie Gaming (1403 - 2474, n=102, ostatnie 2 lata) | |
| Asus ROG Strix G16 G614JZ | |
| MSI Titan GT77 HX 13VI | |
| Razer Blade 18 RTX 4070 | |
| Lenovo Legion Pro 7 16IRX8H | |
| Asus ROG Zephyrus M16 GU604VY-NM042X | |
| Razer Blade 16 Early 2023 RTX 4090 | |
| Przeciętny Intel Core i9-12950HX (1847 - 1945, n=7) | |
| Razer Blade 16 Early 2023 | |
| HWBOT x265 Benchmark v2.2 / 4k Preset | |
| Przeciętny Intel Core i9-13900K (34.5 - 42.6, n=5) | |
| Asus Zephyrus Duo 16 GX650PY-NM006W | |
| Eluktronics Mech-17 GP2 | |
| Asus ROG Strix Scar 18 2023 G834JY-N6005W | |
| MSI Titan GT77 HX 13VI | |
| Lenovo Legion Pro 7 16IRX8H | |
| Razer Blade 18 RTX 4070 | |
| Razer Blade 16 Early 2023 RTX 4090 | |
| Asus ROG Strix G16 G614JZ | |
| Średnia w klasie Gaming (11.5 - 44.4, n=102, ostatnie 2 lata) | |
| Razer Blade 16 Early 2023 | |
| Przeciętny Intel Core i9-12950HX (18.6 - 26.5, n=7) | |
| Asus ROG Zephyrus M16 GU604VY-NM042X | |
| LibreOffice / 20 Documents To PDF | |
| Asus Zephyrus Duo 16 GX650PY-NM006W | |
| Razer Blade 16 Early 2023 RTX 4090 | |
| Asus ROG Zephyrus M16 GU604VY-NM042X | |
| Średnia w klasie Gaming (33.2 - 88.8, n=102, ostatnie 2 lata) | |
| Asus ROG Strix G16 G614JZ | |
| Razer Blade 16 Early 2023 | |
| MSI Titan GT77 HX 13VI | |
| Lenovo Legion Pro 7 16IRX8H | |
| Razer Blade 18 RTX 4070 | |
| Przeciętny Intel Core i9-12950HX (34.7 - 45.4, n=7) | |
| Asus ROG Strix Scar 18 2023 G834JY-N6005W | |
| Przeciętny Intel Core i9-13900K (30.3 - 41.6, n=5) | |
| Eluktronics Mech-17 GP2 | |
| R Benchmark 2.5 / Overall mean | |
| Przeciętny Intel Core i9-12950HX (0.4251 - 0.4515, n=7) | |
| Średnia w klasie Gaming (0.3439 - 0.59, n=102, ostatnie 2 lata) | |
| Razer Blade 16 Early 2023 | |
| Asus ROG Zephyrus M16 GU604VY-NM042X | |
| MSI Titan GT77 HX 13VI | |
| Asus Zephyrus Duo 16 GX650PY-NM006W | |
| Lenovo Legion Pro 7 16IRX8H | |
| Razer Blade 16 Early 2023 RTX 4090 | |
| Razer Blade 18 RTX 4070 | |
| Asus ROG Strix G16 G614JZ | |
| Eluktronics Mech-17 GP2 | |
| Asus ROG Strix Scar 18 2023 G834JY-N6005W | |
| Przeciętny Intel Core i9-13900K (0.3468 - 0.3911, n=5) | |
* ... im mniej tym lepiej
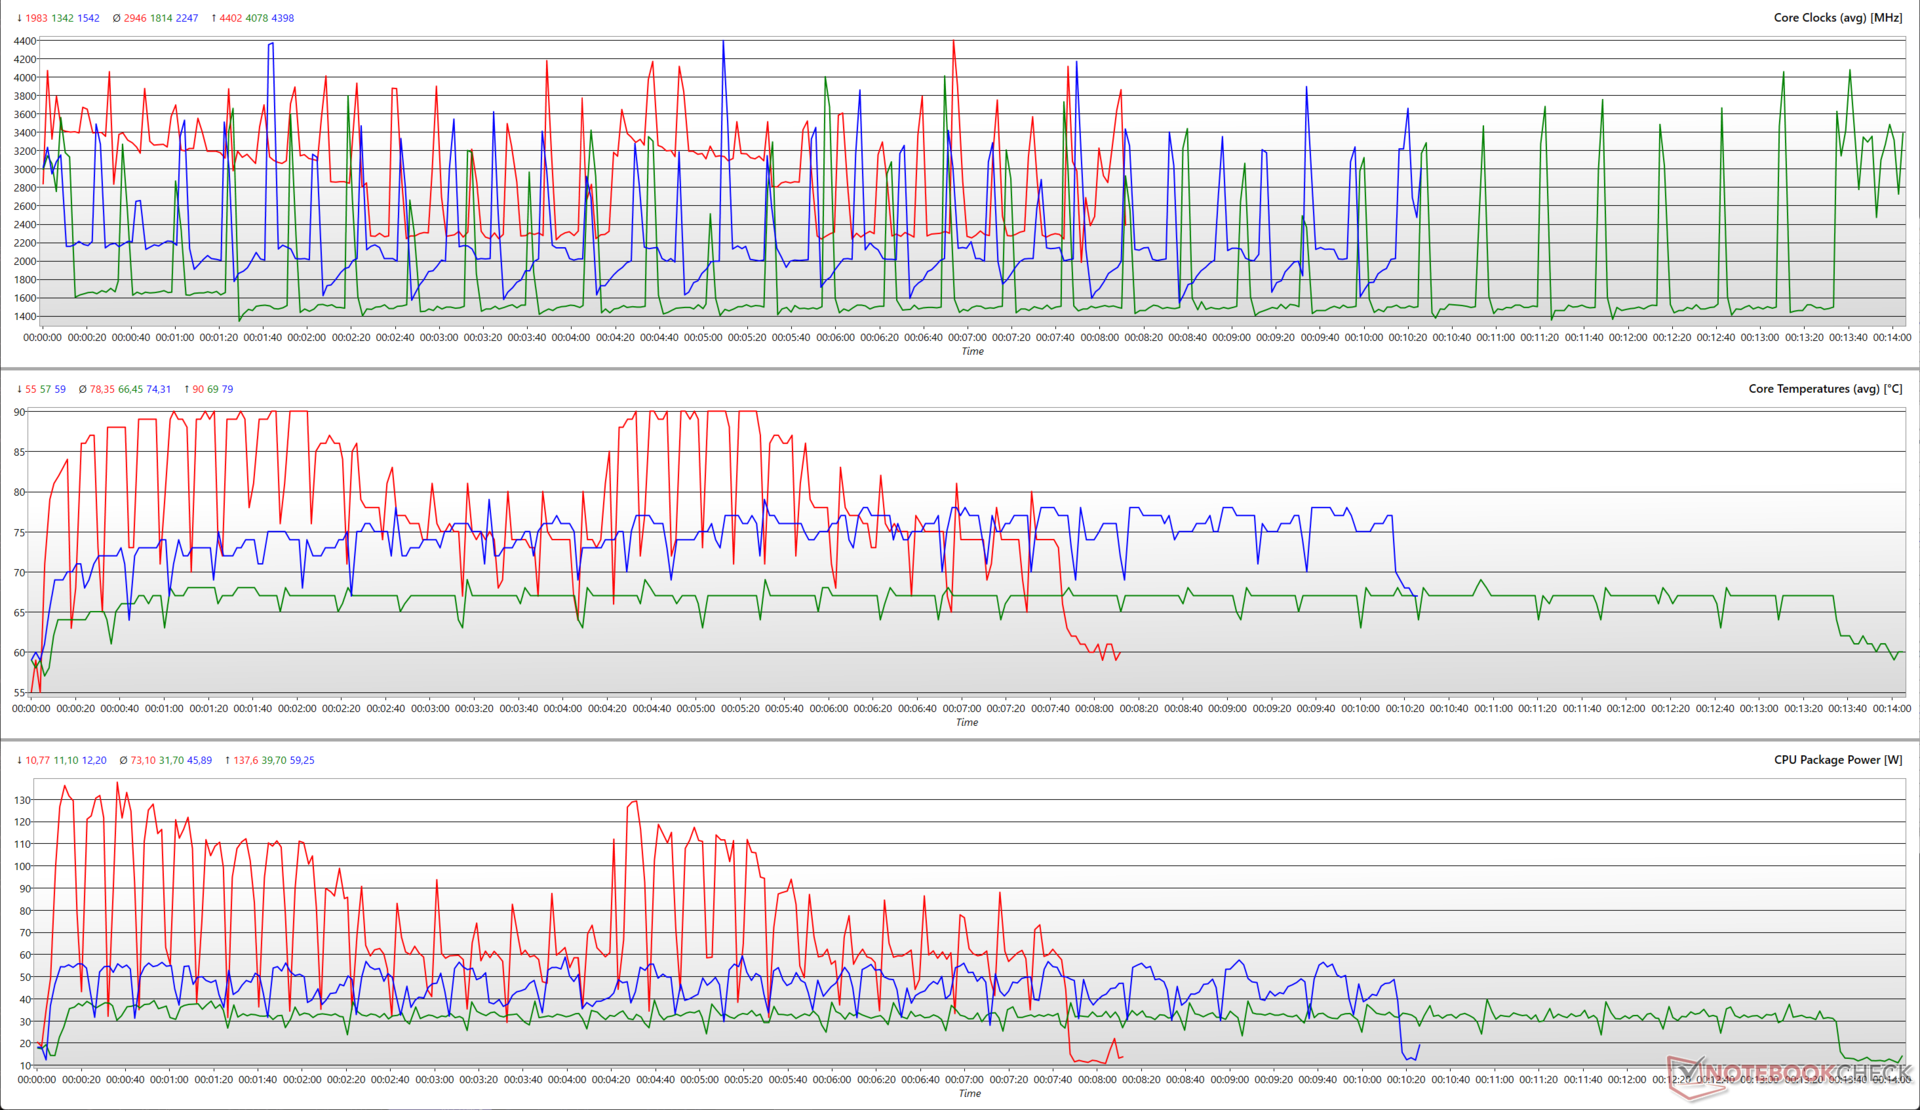
Nietypowy wykres widoczny powyżej w pętli Cinebench R15 ma swoje odzwierciedlenie również podczas oceny różnych parametrów procesora w dostępnych trybach wydajności. Taki wzór nie jest widoczny podczas uruchamiania testu pętli w profilach Balanced i Silent.
W ustawieniu Custom widzimy, że moc pakietu dobija do maksymalnej wartości 137,6 W, co skutkuje maksymalnym podbiciem do 4,4 GHz i temperaturą rdzenia sięgającą 90 °C. Możliwe, że Razer zaimplementował surową tolerancję temperaturową, gdy tylko temperatura rdzenia przekroczy 90 °C. W wyniku tego moc pakietu spada do 74 W, po czym ponownie wzrasta do 130 W i cykl się powtarza.
Tryb zrównoważony wydaje się być w tym przypadku nieco wyrozumiały. Widzimy zegary zbliżone do 4,4 GHz przy szczytowej mocy pakietu 59 W i maksymalnej temperaturze rdzenia 79 °C. Ten tryb powinien być wystarczający dla większości przypadków użycia.
W trybie cichym zegary spadają, ale temperatura rdzenia wynosi 69°C przy maksymalnym poborze mocy 39,7 W.
Na baterii Blade 16 działa w profilu zrównoważonym. Podczas gdy wydajność jednordzeniowa spadła tylko o 5%, wyniki wielordzeniowe spadły o 57% w Cinebench R20. Mimo to, zmniejszona wydajność powinna wystarczyć do wykonania kilku zadań w podróży.
Razer Blade 16 Early 2023 oferuje ogólnie dobrą wydajność procesora, ale relatywnie niższe limity mocy stawiają go w niekorzystnej sytuacji w stosunku do konkurencji.
AIDA64: FP32 Ray-Trace | FPU Julia | CPU SHA3 | CPU Queen | FPU SinJulia | FPU Mandel | CPU AES | CPU ZLib | FP64 Ray-Trace | CPU PhotoWorxx
| Performance rating | |
| Eluktronics Mech-17 GP2 | |
| MSI Titan GT77 HX 13VI | |
| Asus ROG Strix Scar 18 2023 G834JY-N6005W | |
| Średnia w klasie Gaming | |
| Lenovo Legion Pro 7 16IRX8H | |
| Asus ROG Strix G16 G614JZ | |
| Razer Blade 18 RTX 4070 | |
| Przeciętny Intel Core i9-13950HX | |
| Razer Blade 16 Early 2023 RTX 4090 | |
| Razer Blade 16 Early 2023 | |
| Asus ROG Zephyrus M16 GU604VY-NM042X | |
Sprawdź nasze dedykowane Intel Core i9-13950HX aby uzyskać więcej informacji i porównać wydajność.
Wydajność systemu
W punktacji łącznej PCMark 10 Razer Blade 16 ustępuje napędzanemu przez Ryzen 9 7945HX modelowi Zephyrus Duo 16 o 17%, ale urządzenia te wykazują mniej więcej identyczne osiągi w ogólnych wynikach CrossMark.
W codziennym użytkowaniu nie napotkaliśmy żadnych problemów z wydajnością i szybkością reakcji systemu.
CrossMark: Overall | Productivity | Creativity | Responsiveness
| PCMark 10 / Score | |
| Asus Zephyrus Duo 16 GX650PY-NM006W | |
| Eluktronics Mech-17 GP2 | |
| MSI Titan GT77 HX 13VI | |
| Asus ROG Strix Scar 18 2023 G834JY-N6005W | |
| Średnia w klasie Gaming (5828 - 12414, n=93, ostatnie 2 lata) | |
| Asus ROG Zephyrus M16 GU604VY-NM042X | |
| Przeciętny Intel Core i9-13950HX, NVIDIA GeForce RTX 4090 Laptop GPU (7597 - 8884, n=2) | |
| Razer Blade 16 Early 2023 | |
| Lenovo Legion Pro 7 16IRX8H | |
| Razer Blade 18 RTX 4070 | |
| Razer Blade 16 Early 2023 RTX 4090 | |
| Asus ROG Strix G16 G614JZ | |
| PCMark 10 / Essentials | |
| Asus Zephyrus Duo 16 GX650PY-NM006W | |
| Asus ROG Strix G16 G614JZ | |
| Eluktronics Mech-17 GP2 | |
| MSI Titan GT77 HX 13VI | |
| Lenovo Legion Pro 7 16IRX8H | |
| Razer Blade 18 RTX 4070 | |
| Asus ROG Zephyrus M16 GU604VY-NM042X | |
| Przeciętny Intel Core i9-13950HX, NVIDIA GeForce RTX 4090 Laptop GPU (10903 - 11761, n=2) | |
| Razer Blade 16 Early 2023 | |
| Razer Blade 16 Early 2023 RTX 4090 | |
| Średnia w klasie Gaming (8810 - 11935, n=97, ostatnie 2 lata) | |
| PCMark 10 / Productivity | |
| Asus Zephyrus Duo 16 GX650PY-NM006W | |
| Średnia w klasie Gaming (6845 - 25323, n=95, ostatnie 2 lata) | |
| Asus ROG Zephyrus M16 GU604VY-NM042X | |
| Lenovo Legion Pro 7 16IRX8H | |
| Eluktronics Mech-17 GP2 | |
| MSI Titan GT77 HX 13VI | |
| Razer Blade 18 RTX 4070 | |
| Przeciętny Intel Core i9-13950HX, NVIDIA GeForce RTX 4090 Laptop GPU (8330 - 9851, n=2) | |
| Razer Blade 16 Early 2023 RTX 4090 | |
| Razer Blade 16 Early 2023 | |
| Asus ROG Strix G16 G614JZ | |
| PCMark 10 / Digital Content Creation | |
| MSI Titan GT77 HX 13VI | |
| Eluktronics Mech-17 GP2 | |
| Przeciętny Intel Core i9-13950HX, NVIDIA GeForce RTX 4090 Laptop GPU (13099 - 16424, n=2) | |
| Razer Blade 16 Early 2023 | |
| Asus Zephyrus Duo 16 GX650PY-NM006W | |
| Średnia w klasie Gaming (7602 - 19954, n=95, ostatnie 2 lata) | |
| Razer Blade 16 Early 2023 RTX 4090 | |
| Asus ROG Zephyrus M16 GU604VY-NM042X | |
| Asus ROG Strix G16 G614JZ | |
| Razer Blade 18 RTX 4070 | |
| Lenovo Legion Pro 7 16IRX8H | |
| CrossMark / Overall | |
| Eluktronics Mech-17 GP2 | |
| Asus ROG Strix G16 G614JZ | |
| MSI Titan GT77 HX 13VI | |
| Razer Blade 18 RTX 4070 | |
| Asus ROG Strix Scar 18 2023 G834JY-N6005W | |
| Przeciętny Intel Core i9-13950HX, NVIDIA GeForce RTX 4090 Laptop GPU (2019 - 2139, n=2) | |
| Asus Zephyrus Duo 16 GX650PY-NM006W | |
| Razer Blade 16 Early 2023 RTX 4090 | |
| Średnia w klasie Gaming (1366 - 2409, n=94, ostatnie 2 lata) | |
| Asus ROG Zephyrus M16 GU604VY-NM042X | |
| Razer Blade 16 Early 2023 | |
| CrossMark / Productivity | |
| Asus ROG Strix G16 G614JZ | |
| Eluktronics Mech-17 GP2 | |
| MSI Titan GT77 HX 13VI | |
| Razer Blade 18 RTX 4070 | |
| Asus Zephyrus Duo 16 GX650PY-NM006W | |
| Przeciętny Intel Core i9-13950HX, NVIDIA GeForce RTX 4090 Laptop GPU (1909 - 1977, n=2) | |
| Asus ROG Strix Scar 18 2023 G834JY-N6005W | |
| Razer Blade 16 Early 2023 RTX 4090 | |
| Średnia w klasie Gaming (1386 - 2254, n=94, ostatnie 2 lata) | |
| Asus ROG Zephyrus M16 GU604VY-NM042X | |
| Razer Blade 16 Early 2023 | |
| CrossMark / Creativity | |
| Eluktronics Mech-17 GP2 | |
| Asus ROG Strix Scar 18 2023 G834JY-N6005W | |
| MSI Titan GT77 HX 13VI | |
| Asus ROG Strix G16 G614JZ | |
| Razer Blade 18 RTX 4070 | |
| Asus Zephyrus Duo 16 GX650PY-NM006W | |
| Przeciętny Intel Core i9-13950HX, NVIDIA GeForce RTX 4090 Laptop GPU (2222 - 2423, n=2) | |
| Średnia w klasie Gaming (1343 - 2786, n=94, ostatnie 2 lata) | |
| Asus ROG Zephyrus M16 GU604VY-NM042X | |
| Razer Blade 16 Early 2023 RTX 4090 | |
| Razer Blade 16 Early 2023 | |
| CrossMark / Responsiveness | |
| Asus ROG Strix G16 G614JZ | |
| Razer Blade 18 RTX 4070 | |
| MSI Titan GT77 HX 13VI | |
| Eluktronics Mech-17 GP2 | |
| Przeciętny Intel Core i9-13950HX, NVIDIA GeForce RTX 4090 Laptop GPU (1792 - 1861, n=2) | |
| Razer Blade 16 Early 2023 RTX 4090 | |
| Średnia w klasie Gaming (1226 - 2334, n=94, ostatnie 2 lata) | |
| Asus Zephyrus Duo 16 GX650PY-NM006W | |
| Asus ROG Zephyrus M16 GU604VY-NM042X | |
| Asus ROG Strix Scar 18 2023 G834JY-N6005W | |
| Razer Blade 16 Early 2023 | |
| PCMark 8 Home Score Accelerated v2 | 4861 pkt. | |
| PCMark 8 Creative Score Accelerated v2 | 5206 pkt. | |
| PCMark 10 Score | 7597 pkt. | |
Pomoc | ||
* ... im mniej tym lepiej
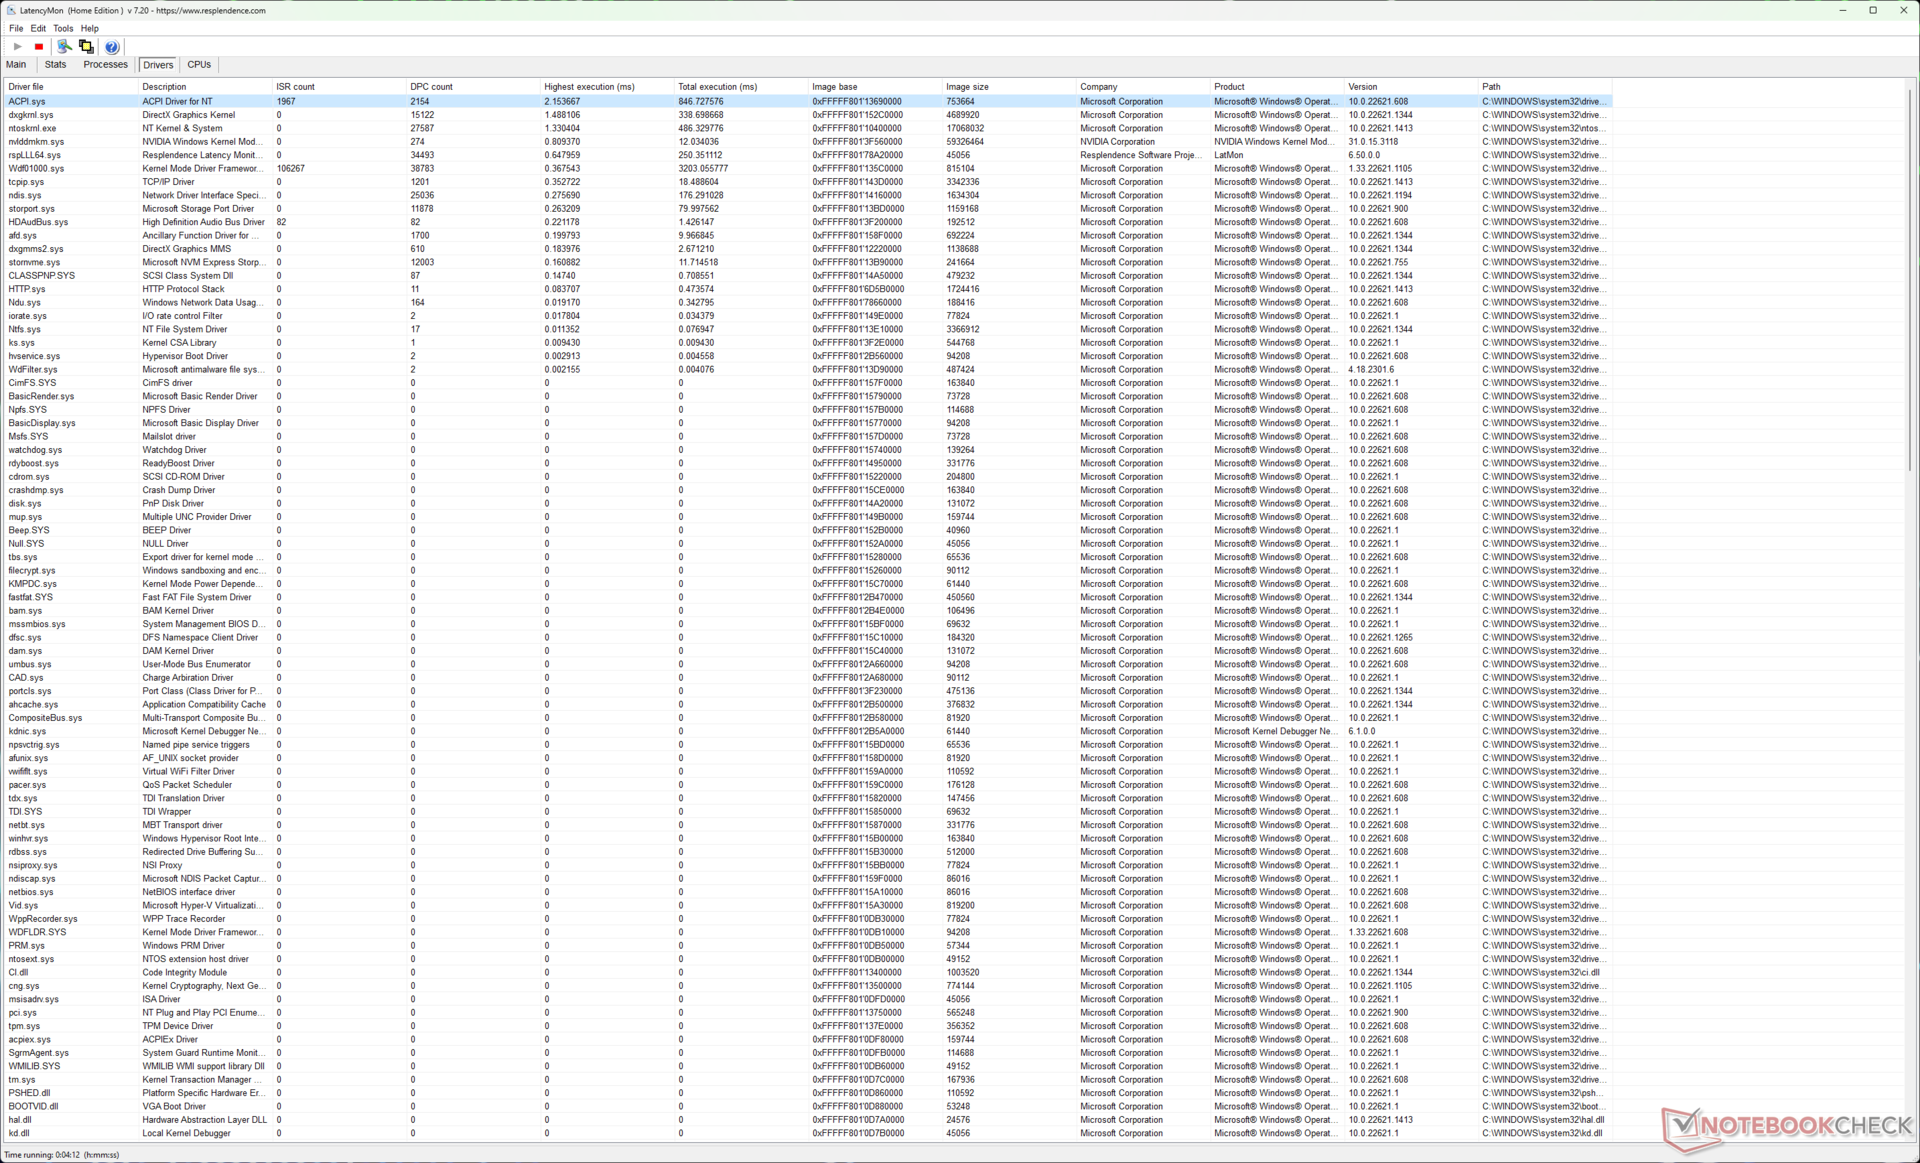
Opóźnienie DPC
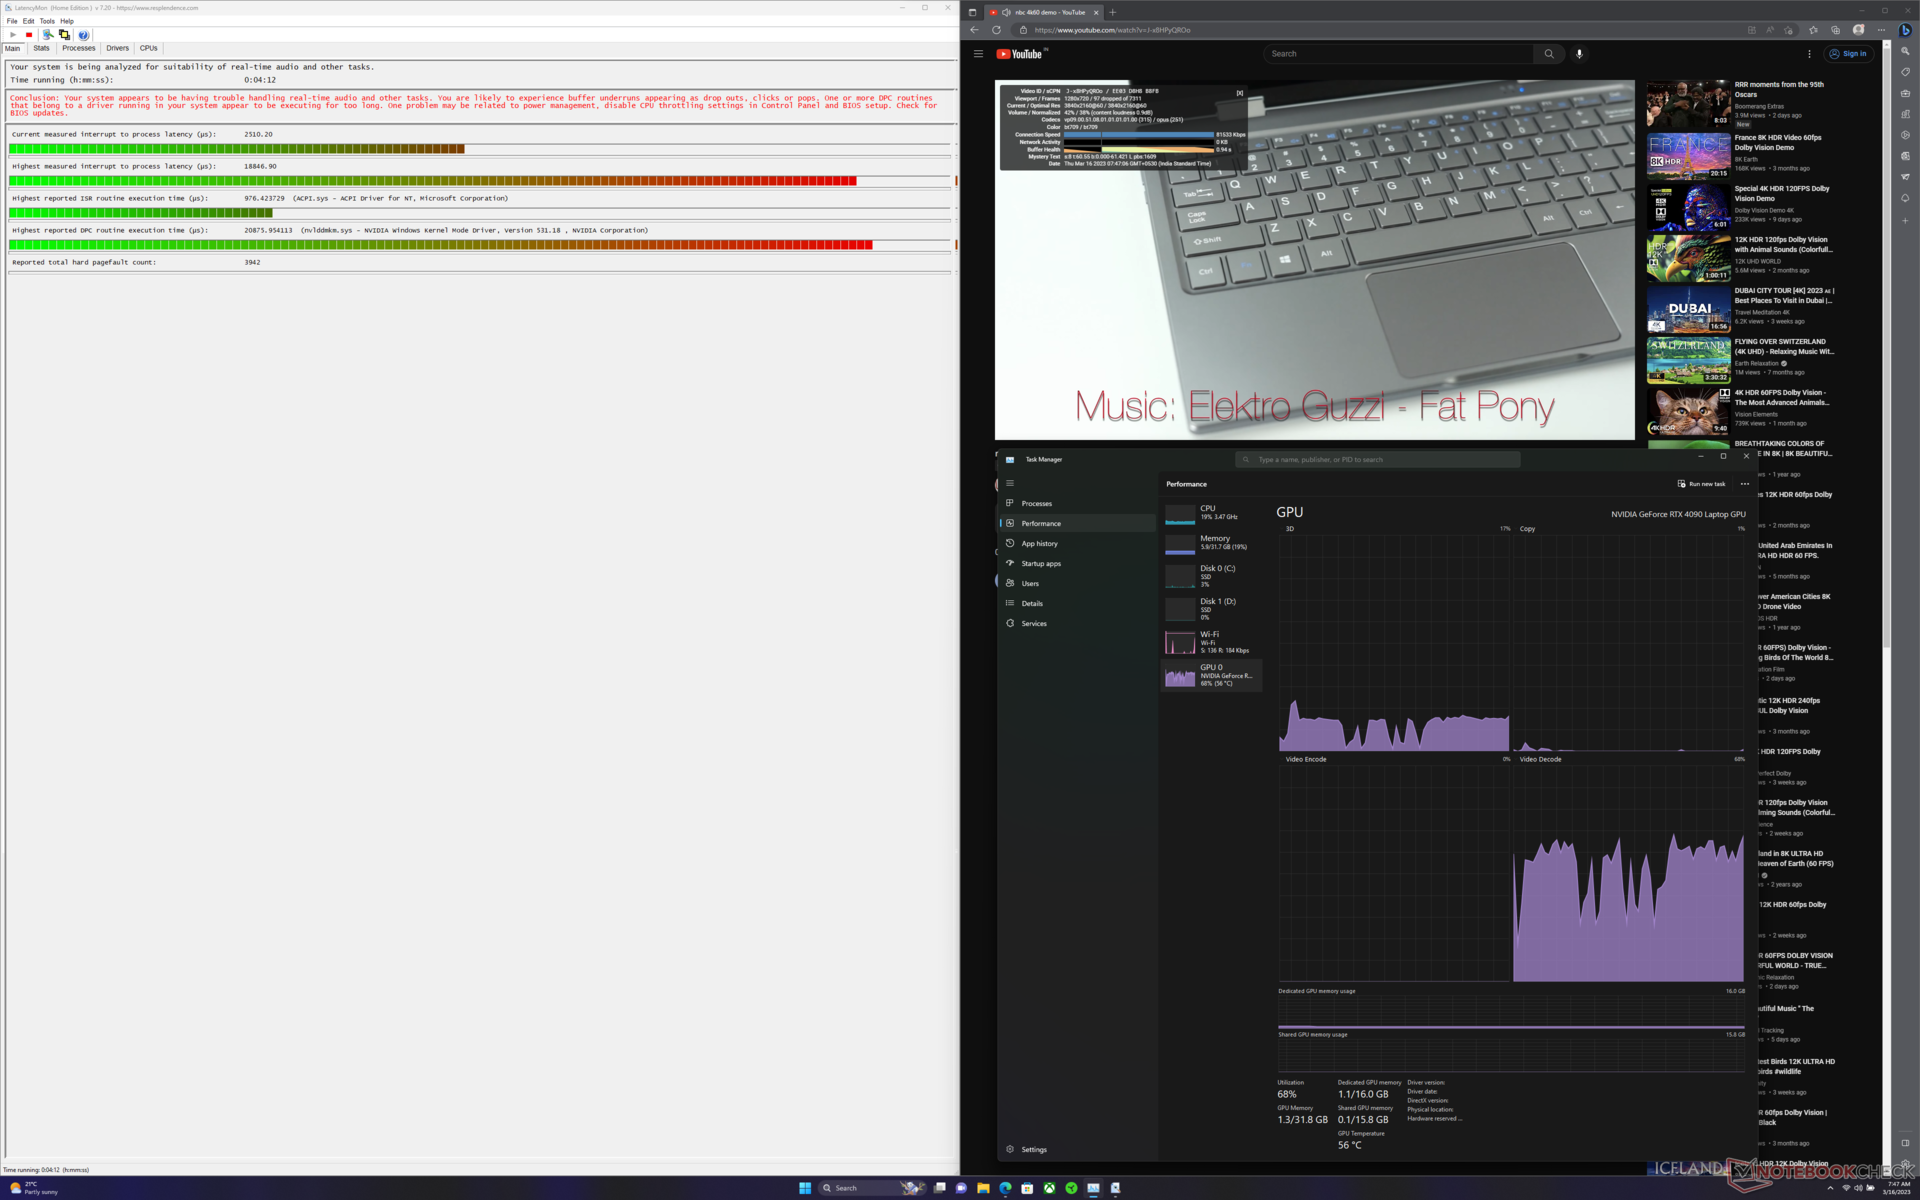
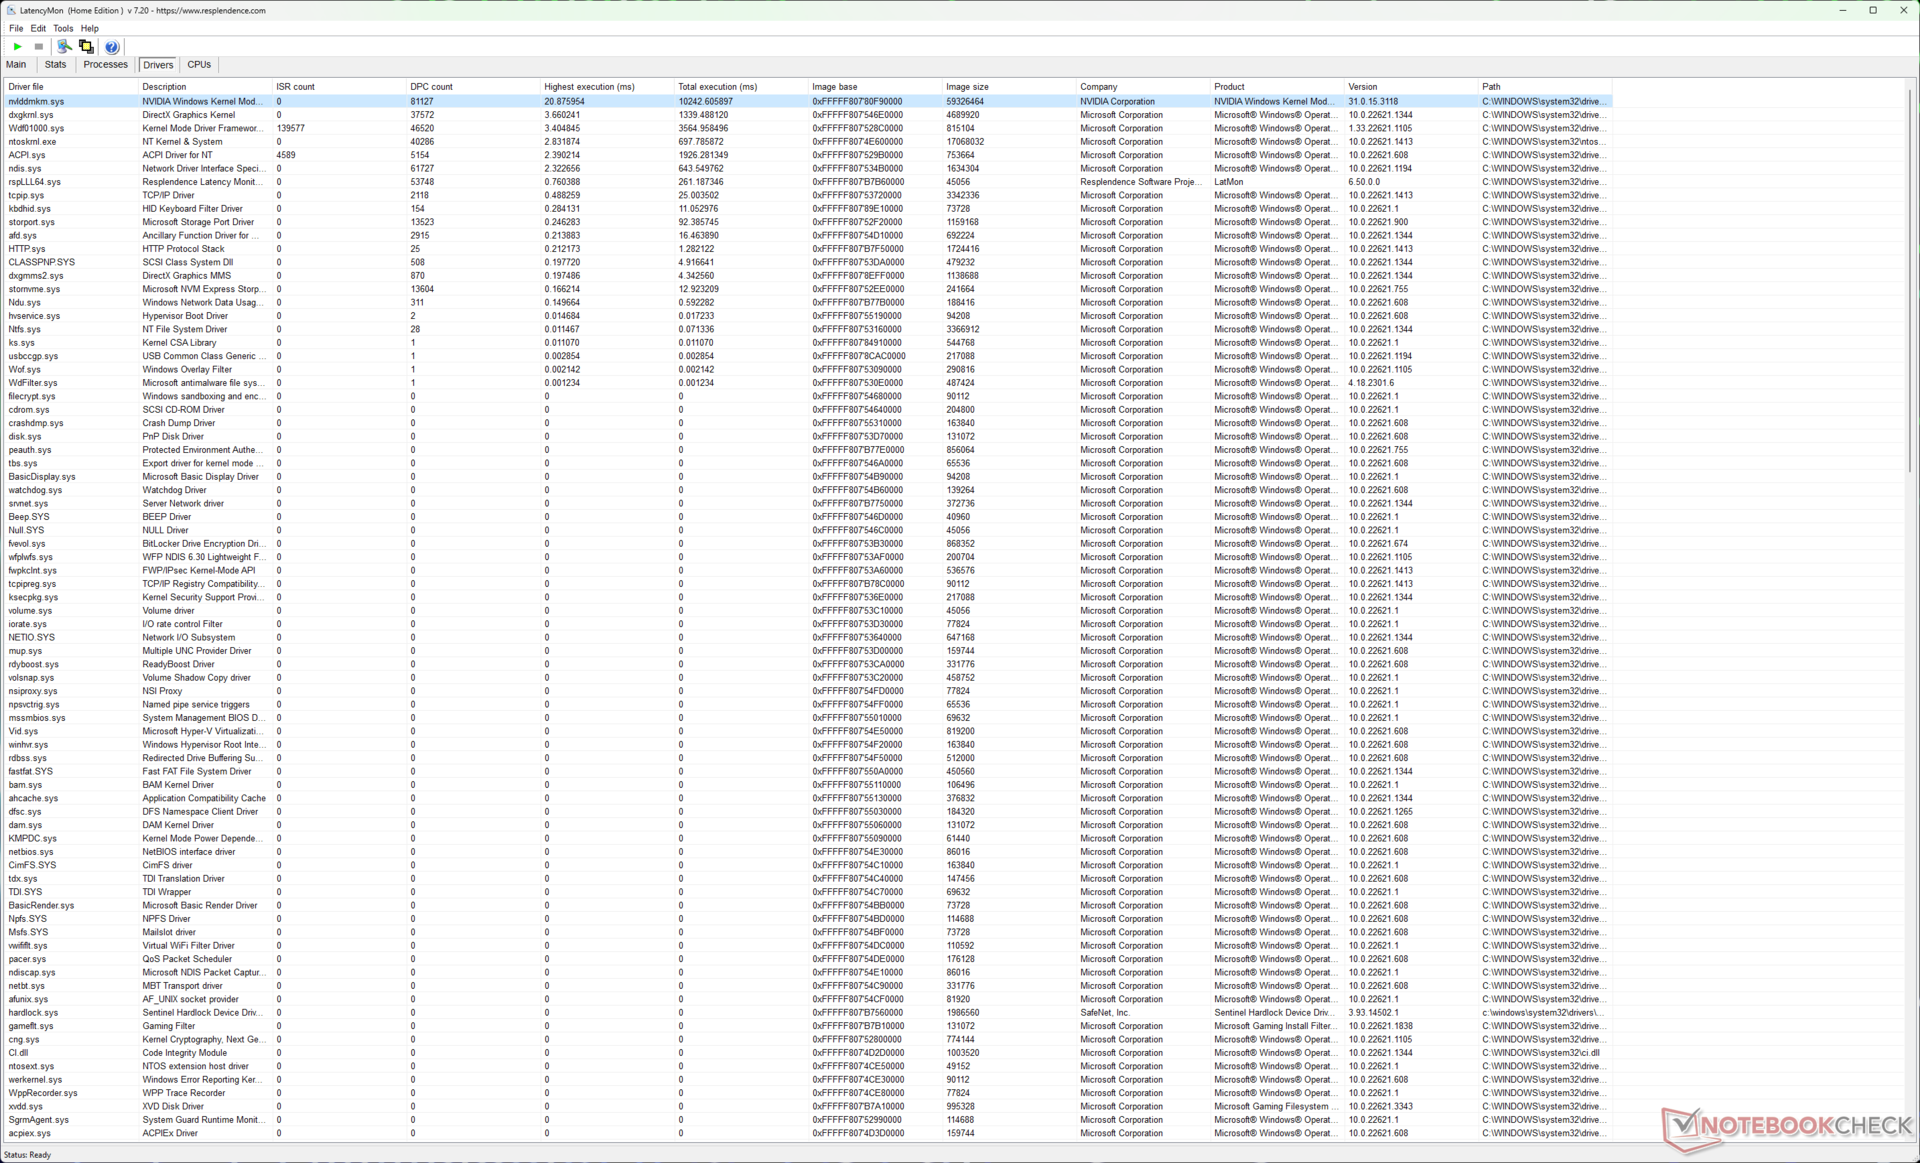
GeForce Istnieje znany błąd w sterownikach https://forums.developer.nvidia.com/t/driver-version-516-94-introduces-high-dpc-latency-and-serious-audio-problems/238290 który powoduje wysokie opóźnienie DPC. Firma Nvidia przyznała również https://us.download.nvidia.com/Windows/531.29/531.29-win11-win10-release-notes.pdf że sterownik Release 530 dla systemu Windows powoduje zwiększone opóźnienie DPC podczas pomiaru za pomocą LatencyMon.
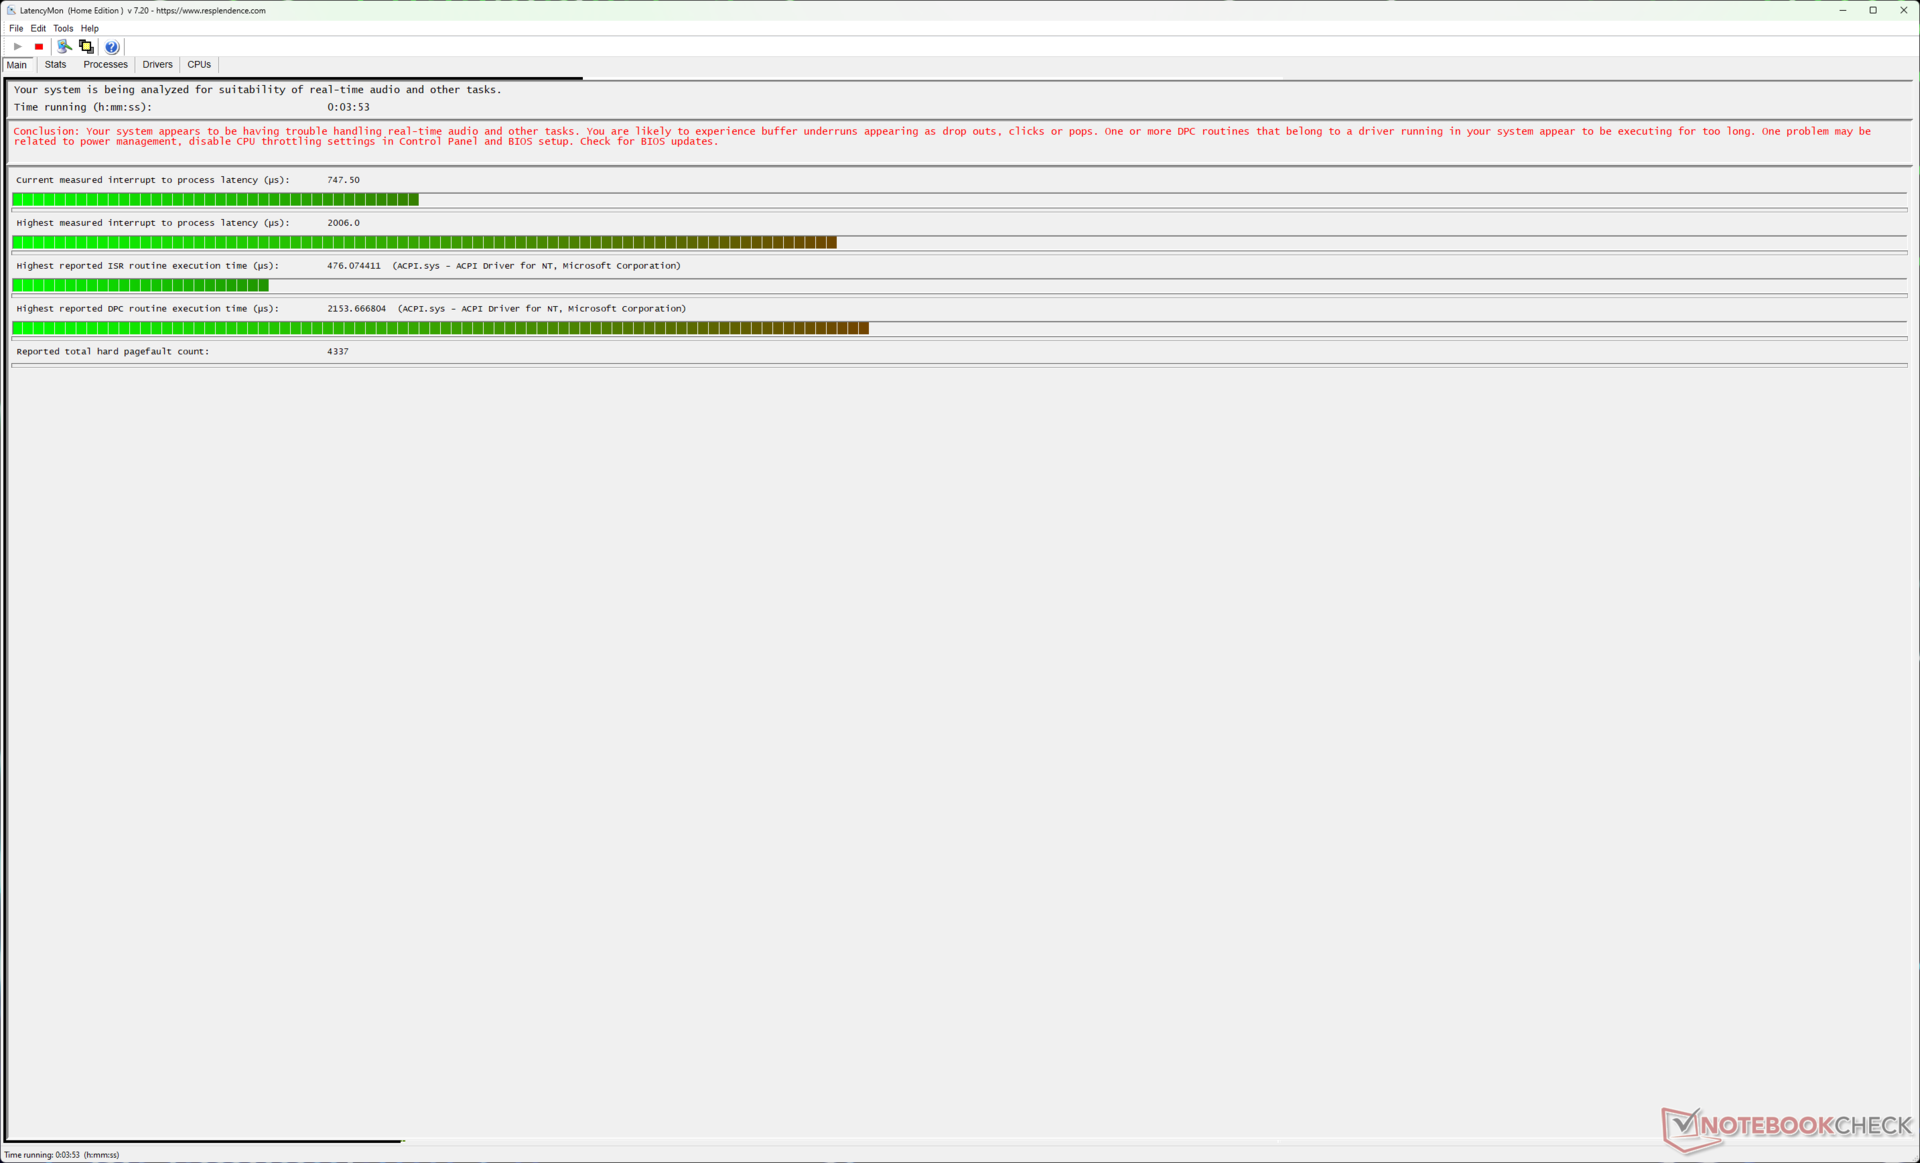
W związku z tym zaobserwowaliśmy bardzo wysokie opóźnienie między przerwaniami a procesami, wynoszące 18 846,9 µs w trybie dGPU, a także wysokie wykorzystanie GPU. Można to przypisać wysokiemu czasowi wykonania 20,87 ms dla sterownika Nvidia Kernel Mode.
Najwyższa wartość opóźnienia pomiędzy przerwaniami spada do bardziej rozsądnego, ale wciąż wysokiego poziomu 2 006 µs w trybie MSHybrid.
Tak wysoka latencja DPC może stwarzać problemy z przepływem pracy w czasie rzeczywistym przy edycji audio i wideo, co nie jest idealnym rozwiązaniem w tej konfiguracji i cenie.
| DPC Latencies / LatencyMon - interrupt to process latency (max), Web, Youtube, Prime95 | |
| Razer Blade 16 Early 2023 RTX 4090 (dGPU) | |
| Razer Blade 16 Early 2023 RTX 4090 (MSHybrid) | |
| Asus Zephyrus Duo 16 GX650PY-NM006W | |
| MSI Titan GT77 HX 13VI | |
| Asus ROG Zephyrus M16 GU604VY-NM042X | |
| Asus ROG Strix G16 G614JZ | |
| Razer Blade 16 Early 2023 (Edge 109.0.1518.70) | |
| Razer Blade 18 RTX 4070 (Edge 110.0.1587.46) | |
| Asus ROG Strix Scar 18 2023 G834JY-N6005W | |
| Eluktronics Mech-17 GP2 (Edge 110.0.1587.57) | |
| Lenovo Legion Pro 7 16IRX8H | |
* ... im mniej tym lepiej
Więcej porównań LatencyMon można zobaczyć w naszym Ranking Latencji DPC strona.
Urządzenia do przechowywania danych
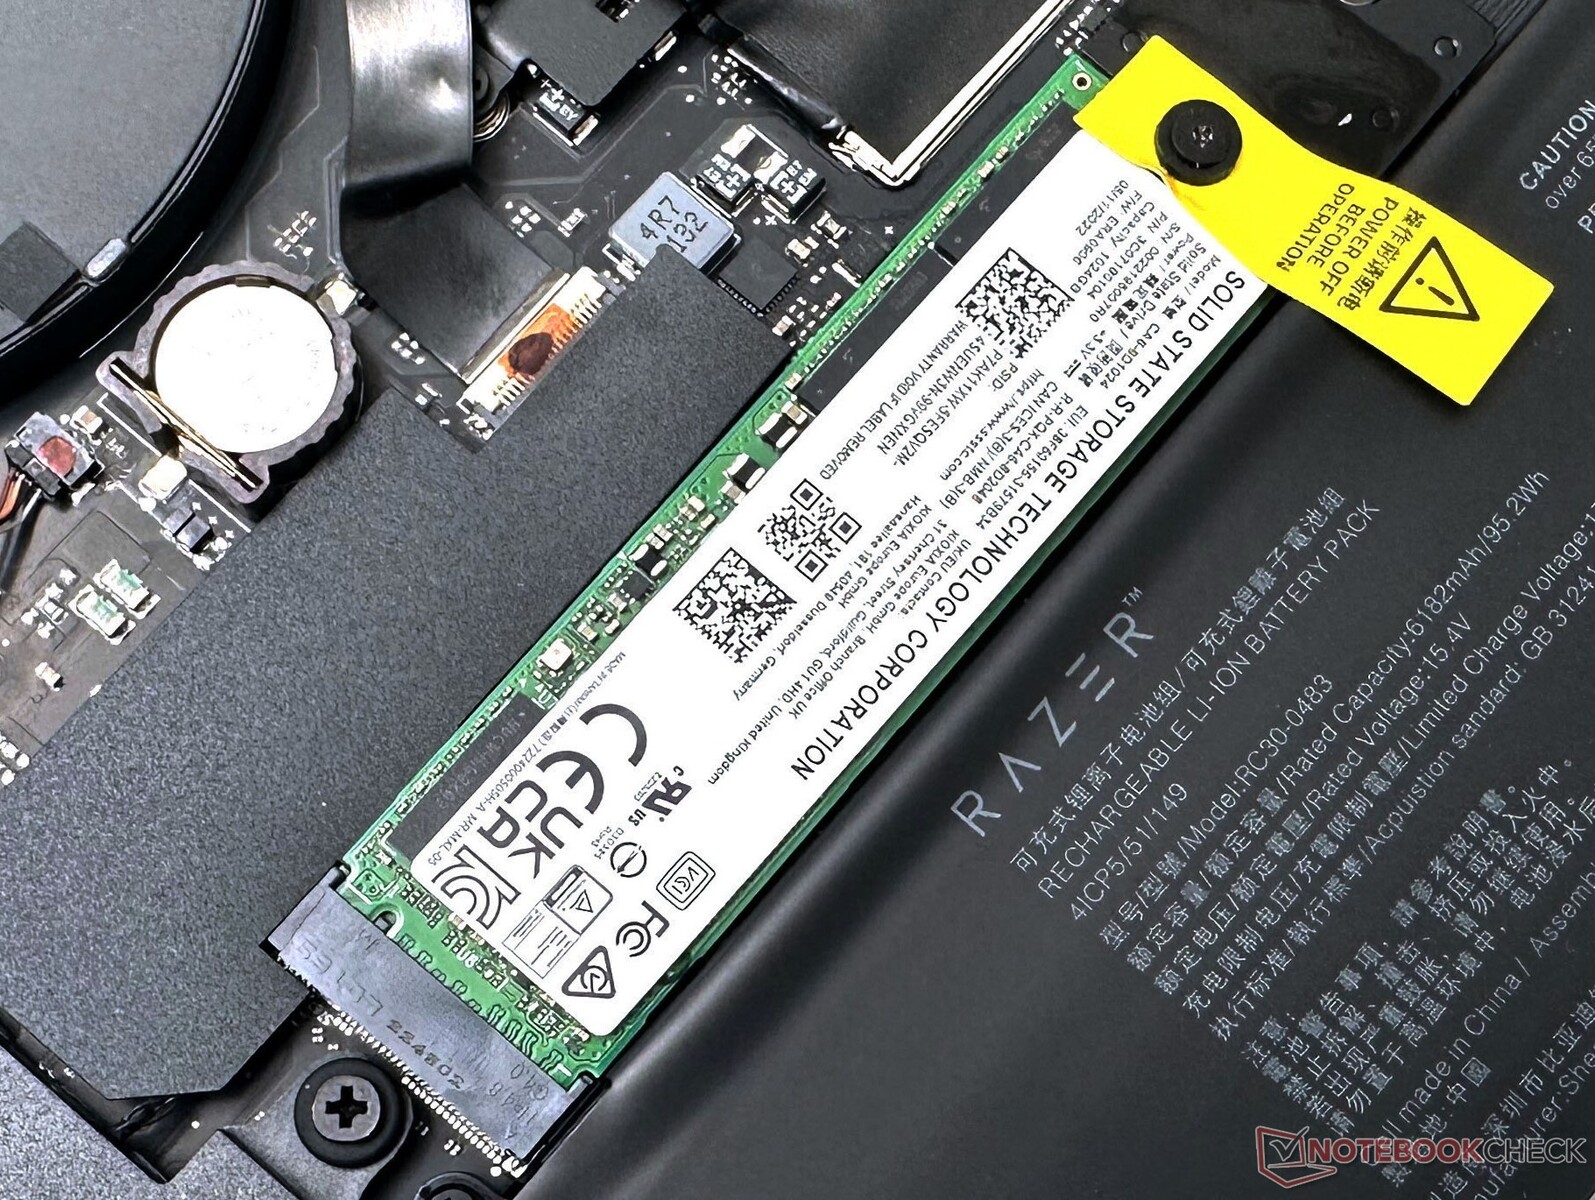
Nasza jednostka Blade 16 Early 2023 została wyposażona w dwa dyski SSD NVMe o pojemności 1 TB firmy Solid State Storage Technology Corporation (SSSTC). Dyski NVMe są ułożone jeden na drugim, z podstawowym dyskiem poniżej, w celu efektywnego wykorzystania przestrzeni płyty głównej.
Ogólna wydajność dysku jest na oczekiwanych liniach, ale nie może się równać z konfiguracjami opartymi na Samsungu PM9A1. wydajność zapisu 4K jest jednak lepsza od większości konkurencji.
Dysk jest w stanie utrzymać się dość dobrze w początkowej części naszego testu pętli odczytu DiskSpd przy głębokości kolejki 8, po czym zaczyna dławić się od pętli 31.
Nie ma możliwości dodania 2,5-calowego dysku SATA.

* ... im mniej tym lepiej
Disk Throttling: DiskSpd Read Loop, Queue Depth 8
Zapoznaj się z naszymi Benchmarki SSD i HDD więcej porównań urządzeń pamięci masowej.
Wydajność GPU
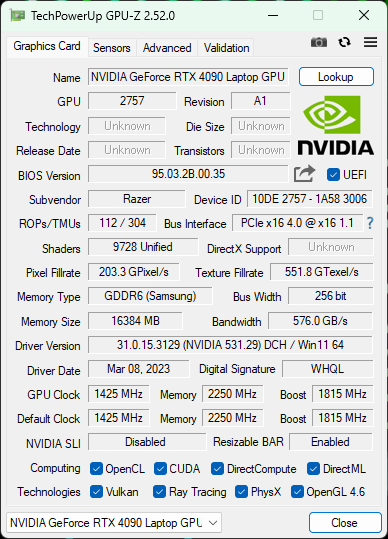
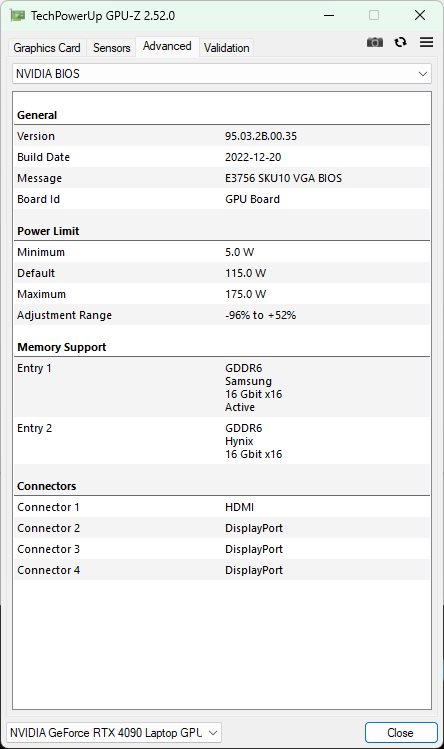
Nasz egzemplarz Blade 16 został wyposażony w GPU Nvidia GeForce RTX 4090 Laptop który jest oceniany jako wydajny przy 175 W TGP. Razer nie podaje wartości Dynamic Boost, ale zakładamy, że wynosi ona 25 W, biorąc pod uwagę, że procesor graficzny RTX 4090 Laptop osiąga maksymalny poziom 150 W TGP.
RTX 4090 w Blade 16 nie jest tak naprawdę na szczycie listy przebojów w ogólnej wydajności 3DMark. Blade 16 Early 2023 RTX 4090 prowadzi w ogólnym rozrachunku o 8% w stosunku do RTX 4080 SKU, ale pozostaje w tyle za innymi ciężkimi kartami RTX 4090, takimi jak MSI Titan GT77 HX 13VI, Asus ROG Strix Scar 18, Eluktronics Mech-17 GP2oraz Asus ROG Zephyrus Duo 16.
Na stronie Asus ROG Strix G16 z RTX 4080 o włos wyprzedza Blade 16.
| 3DMark 11 Performance | 41433 pkt. | |
| 3DMark Ice Storm Standard Score | 244104 pkt. | |
| 3DMark Cloud Gate Standard Score | 52227 pkt. | |
| 3DMark Fire Strike Score | 31174 pkt. | |
| 3DMark Fire Strike Extreme Score | 22713 pkt. | |
| 3DMark Time Spy Score | 18599 pkt. | |
Pomoc | ||
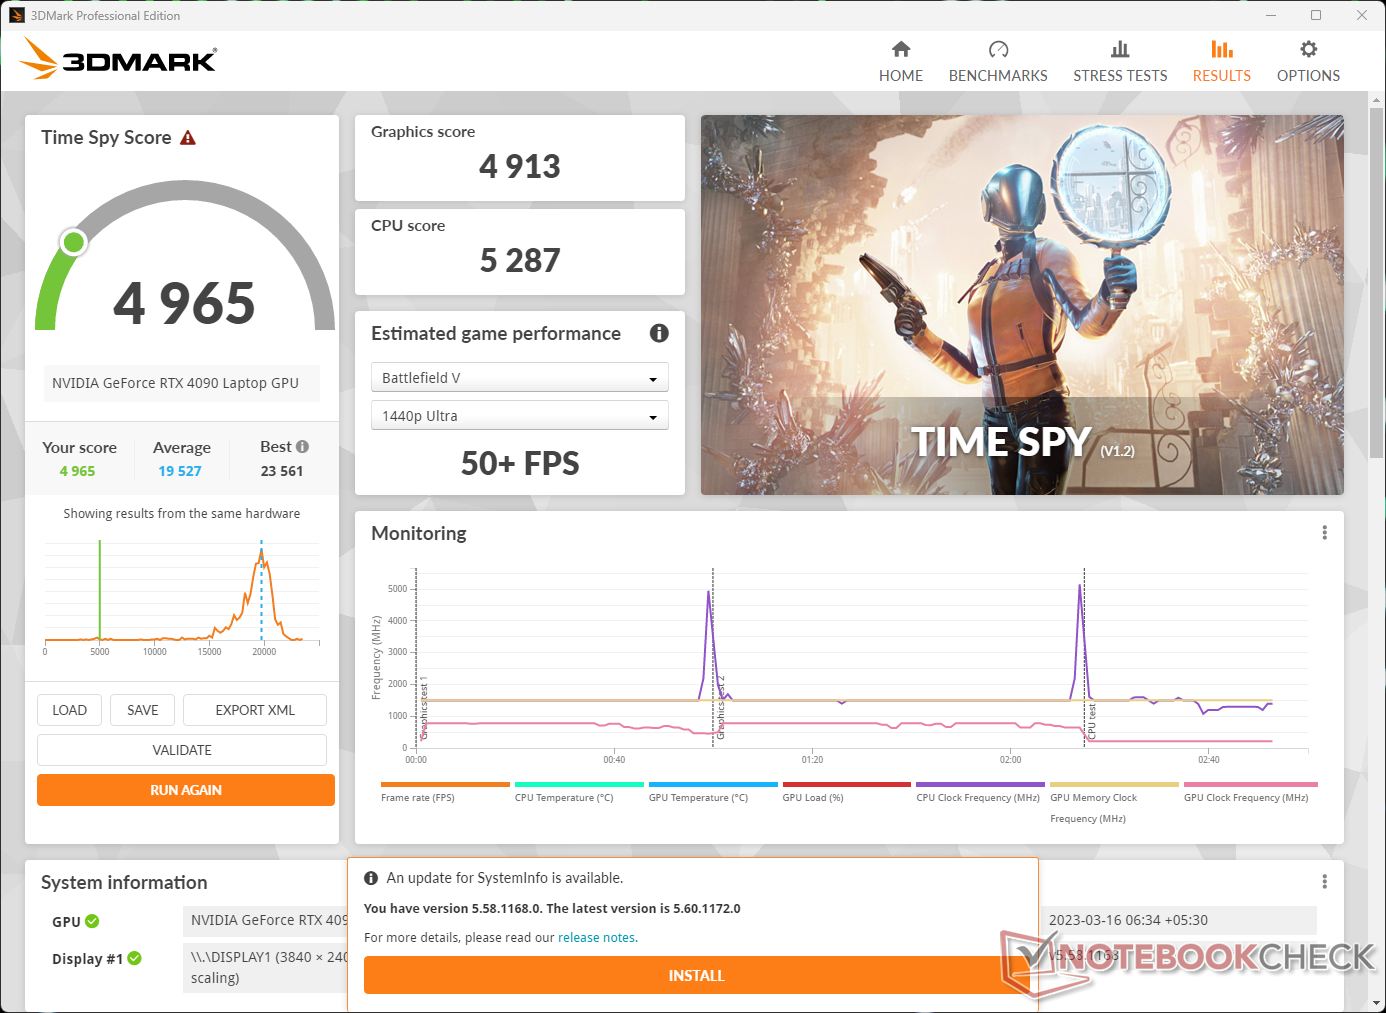
Wydajność procesora graficznego na zasilaniu bateryjnym może nieźle dać się we znaki. wyniki 3DMark Time Spy spadają o 75% na zasilaniu bateryjnym. Według benchmarku, wydajność powinna być wystarczająca do zagrania w Battlefield V przy 50 klatkach na sekundę w rozdzielczości 1440p Ultra.
W Blenderze 3.3 RTX 4090 w Blade 16 wypada tak samo jak inne podobnie skonfigurowane laptopy w testach Optix i Classroom CUDA, ale laptop jest o dobre 52% wolniejszy w porównaniu z napędzanym Ryzenem 9 7945HX procesorem Zephyrus Duo 16 w Classroom.
| Blender / v3.3 Classroom OPTIX/RTX | |
| Razer Blade 18 RTX 4070 | |
| Średnia w klasie Gaming (9 - 32, n=103, ostatnie 2 lata) | |
| Razer Blade 16 Early 2023 | |
| Asus ROG Zephyrus M16 GU604VY-NM042X | |
| Lenovo Legion Pro 7 16IRX8H | |
| Asus ROG Strix G16 G614JZ | |
| Asus Zephyrus Duo 16 GX650PY-NM006W | |
| Przeciętny NVIDIA GeForce RTX 4090 Laptop GPU (9 - 19, n=39) | |
| MSI Titan GT77 HX 13VI | |
| Razer Blade 16 Early 2023 RTX 4090 | |
| Asus ROG Strix Scar 18 2023 G834JY-N6005W | |
| Eluktronics Mech-17 GP2 | |
| Blender / v3.3 Classroom CUDA | |
| Razer Blade 18 RTX 4070 | |
| Średnia w klasie Gaming (15 - 228, n=103, ostatnie 2 lata) | |
| Lenovo Legion Pro 7 16IRX8H | |
| Razer Blade 16 Early 2023 | |
| Asus ROG Strix G16 G614JZ | |
| Asus Zephyrus Duo 16 GX650PY-NM006W | |
| Przeciętny NVIDIA GeForce RTX 4090 Laptop GPU (16 - 24, n=39) | |
| Asus ROG Strix Scar 18 2023 G834JY-N6005W | |
| Asus ROG Strix Scar 18 2023 G834JY-N6005W | |
| Asus ROG Zephyrus M16 GU604VY-NM042X | |
| MSI Titan GT77 HX 13VI | |
| Razer Blade 16 Early 2023 RTX 4090 | |
| Eluktronics Mech-17 GP2 | |
| Blender / v3.3 Classroom CPU | |
| Asus ROG Zephyrus M16 GU604VY-NM042X | |
| Średnia w klasie Gaming (122 - 565, n=99, ostatnie 2 lata) | |
| Razer Blade 16 Early 2023 RTX 4090 | |
| Razer Blade 16 Early 2023 | |
| Przeciętny NVIDIA GeForce RTX 4090 Laptop GPU (144 - 305, n=39) | |
| Razer Blade 18 RTX 4070 | |
| Lenovo Legion Pro 7 16IRX8H | |
| Asus ROG Strix G16 G614JZ | |
| Asus ROG Strix Scar 18 2023 G834JY-N6005W | |
| MSI Titan GT77 HX 13VI | |
| Eluktronics Mech-17 GP2 | |
| Asus Zephyrus Duo 16 GX650PY-NM006W | |
* ... im mniej tym lepiej
Wydajność w grach
Skumulowana wydajność Blade 16 RTX 4090 w grach w rozdzielczości 1080p Ultra jest nieco niższa niż w przypadku Zephyrus Duo 16, ale wykazuje przyzwoity 15% wzrost w stosunku do Blade 18 z procesorem graficznym RTX 4070 do laptopa. Zarówno MSI Titan GT77 jak i ROG Strix Scar 18 prowadzą w naszym teście o 13%, podczas gdy Eluktronics Mech-17 GP2 plasuje się na szczycie listy przebojów.
Laptopy te mają wyższy PL2, co może się przydać w rozdzielczościach ograniczonych przez procesor, takich jak 1080p.
Podobny trend w wyższych rozdzielczościach widzimy także w większości gier. Ray tracing w natywnym 4K Ultra z grywalną liczbą klatek na sekundę nie jest przyjemnym doświadczeniem. Gracze mogą jednak skorzystać z DLSS 3 Frame Generation w obsługiwanych tytułach, aby uzyskać znaczny wzrost fps.
| F1 2021 | |
| 1920x1080 Ultra High Preset + Raytracing AA:T AF:16x | |
| MSI Titan GT77 HX 13VI | |
| Przeciętny NVIDIA GeForce RTX 4090 Laptop GPU (151.6 - 271, n=7) | |
| Asus Zephyrus Duo 16 GX650PY-NM006W | |
| Razer Blade 16 Early 2023 RTX 4090 | |
| 2560x1440 Ultra High Preset + Raytracing AA:T AF:16x | |
| MSI Titan GT77 HX 13VI | |
| Przeciętny NVIDIA GeForce RTX 4090 Laptop GPU (140 - 204, n=7) | |
| Asus Zephyrus Duo 16 GX650PY-NM006W | |
| Razer Blade 16 Early 2023 RTX 4090 | |
| 3840x2160 Ultra High Preset + Raytracing AA:T AF:16x | |
| MSI Titan GT77 HX 13VI | |
| Przeciętny NVIDIA GeForce RTX 4090 Laptop GPU (89.9 - 115.1, n=5) | |
| Razer Blade 16 Early 2023 RTX 4090 | |
Wykres Witcher 3 FPS
Blade 16 pozostaje stosunkowo stabilny, gdy jest obciążany przez The Witcher 3 w 1080p Ultra, ale widzimy sporadyczne spadki klatek.
| low | med. | high | ultra | QHD | 4K DLSS | 4K | |
|---|---|---|---|---|---|---|---|
| GTA V (2015) | 186.6 | 187.3 | 181.6 | 128.7 | 120.5 | 153.5 | |
| The Witcher 3 (2015) | 452 | 408 | 322 | 174.8 | 130 | ||
| Dota 2 Reborn (2015) | 234.8 | 209.9 | 200.2 | 183.5 | 170.8 | ||
| Final Fantasy XV Benchmark (2018) | 194.5 | 155.9 | 122.2 | 115.7 | 83.9 | ||
| X-Plane 11.11 (2018) | 197.3 | 172.1 | 135.6 | 113.1 | |||
| Far Cry 5 (2018) | 162 | 167 | 144 | 146 | 100 | ||
| Strange Brigade (2018) | 432 | 380 | 350 | 328 | 256 | 129.5 | |
| F1 2021 (2021) | 433 | 341 | 299 | 151.6 | 151.5 | 103.6 | |
| Cyberpunk 2077 1.6 (2022) | 100.7 | 97.5 | 96.6 | 86.7 | 45.4 | ||
| F1 22 (2022) | 254 | 264 | 223 | 114.3 | 79.7 | 44 | |
| Call of Duty Modern Warfare 2 2022 (2022) | 177 | 169 | 160 | 154 | 122 | 112 | 75 |
| The Witcher 3 v4 (2023) | 220 | 154.1 | 137.5 | 120.4 | 83.3 | 41.6 |
Więcej informacji można znaleźć w naszym dedykowanym GPU Nvidia GeForce RTX 4090 Laptop page. Koniecznie sprawdźcie też naszą dogłębną analizę nt RTX 4080 i RTX 4090oraz RTX 4050, RTX 4060 i RTX 4070 - procesorów graficznych dla laptopów aby uzyskać szczegółowe porównanie wydajności.
Emisje: Wysoki poziom hałasu i wydzielanego ciepła
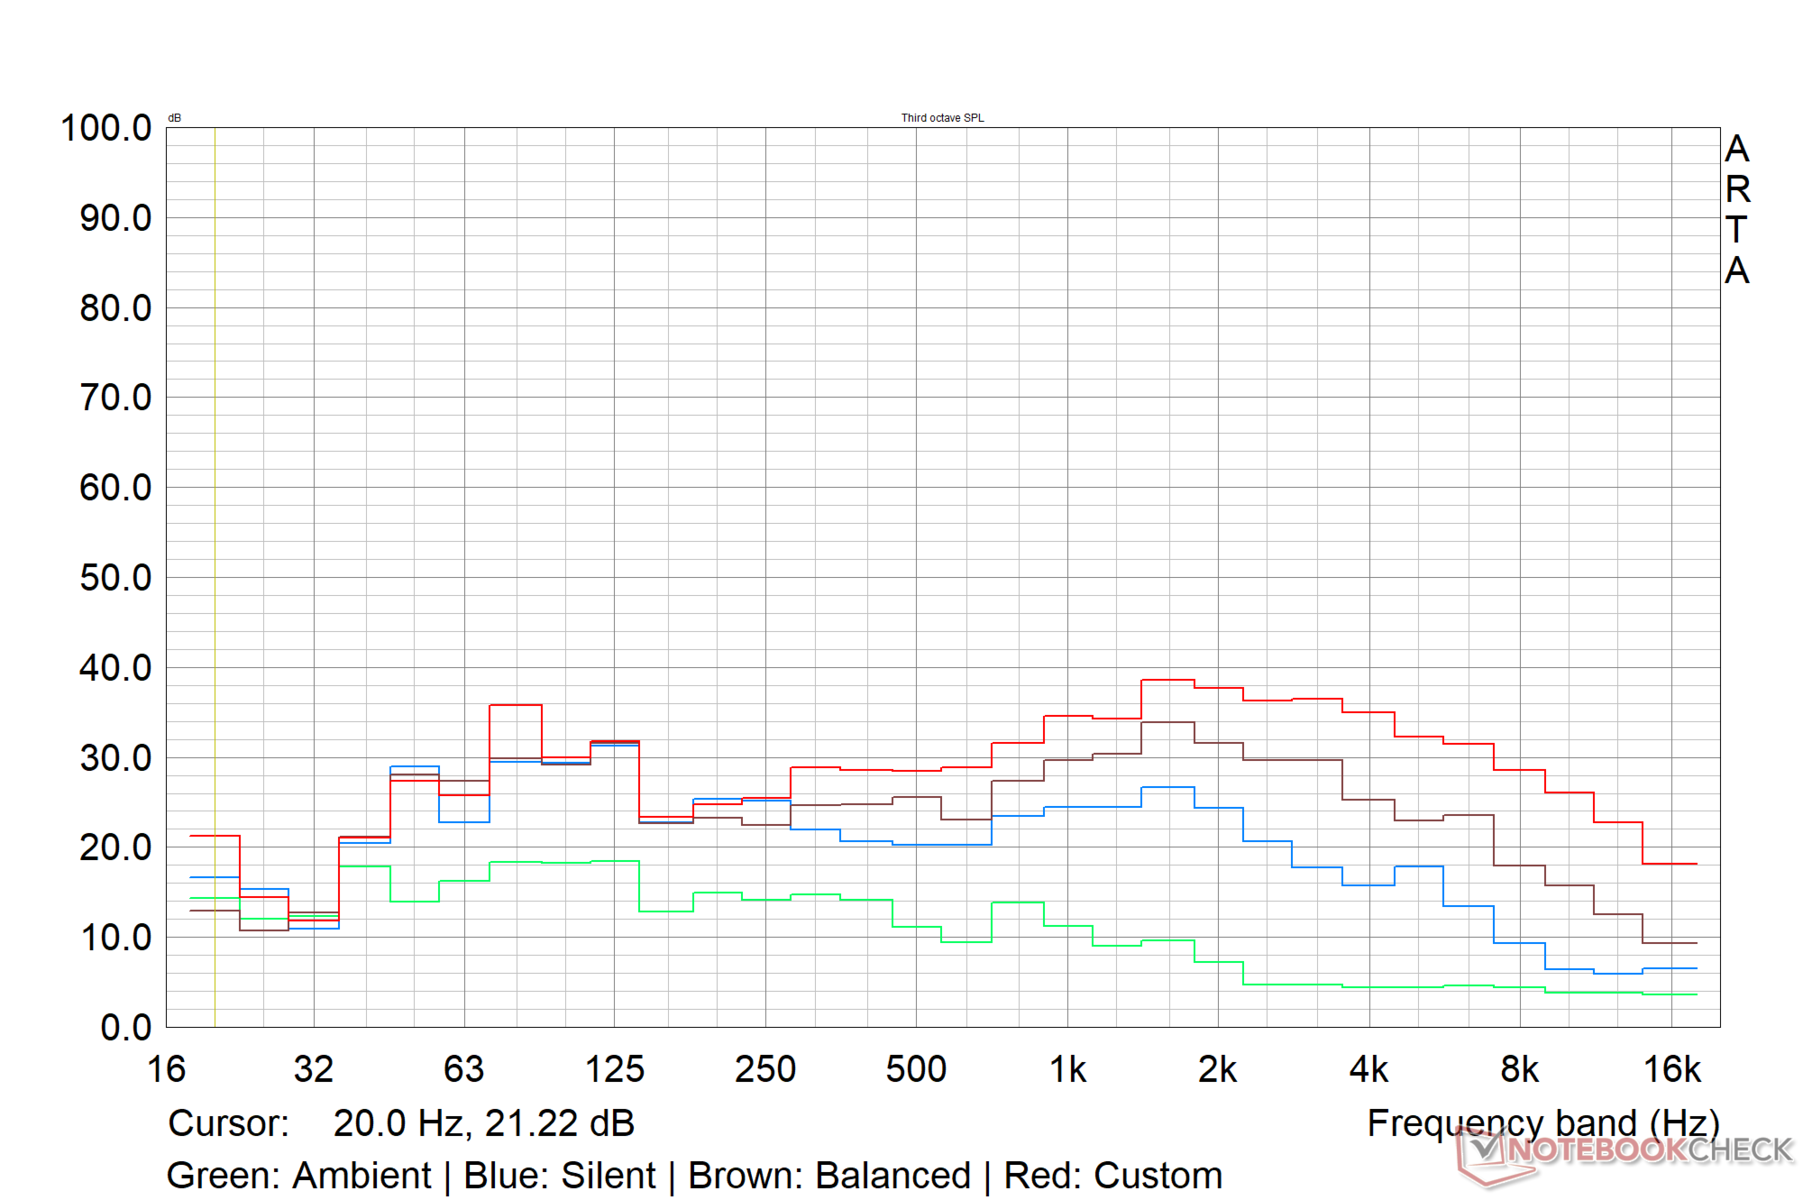
Szum systemu
W stresie Blade 16 potrafi znacznie głośniej rozpędzić swoje wentylatory. Zanotowaliśmy maksymalny poziom ciśnienia akustycznego (SPL) 46,7 db(A) pod połączonym obciążeniem Prime95 i FurMark, a także w The Witcher 3 przy 1080p Ultra w testowanym profilu Custom.
Szum wentylatora w profilu Balanced jest znacznie bardziej znośny, a maksymalna emisja unosi się tuż obok granicy 41 dB(A). W trybie Silent szum wentylatora zawsze pozostaje poniżej 35 db(A) bez względu na obciążenie.
| Ustawienie wydajności | Idle dB(A) | Load average dB(A) | Load maximum dB(A) | The Witcher 3 dB(A) |
|---|---|---|---|---|
| Cichy | 23,65 | 33,12 | 31,03 | 33,90 |
| Zrównoważony | 23,65 | 30,03 | 38,20 | 40,69 |
| Niestandardowy (CPU Boost / GPU High) | 23,65 | 43,35 | 46,72 | 46,65 |
Hałas
| luz |
| 23.65 / 23.65 / 23.65 dB |
| obciążenie |
| 43.35 / 46.72 dB |
 | ||
30 dB cichy 40 dB(A) słyszalny 50 dB(A) irytujący |
||
min: | ||
| Razer Blade 16 Early 2023 RTX 4090 i9-13950HX, GeForce RTX 4090 Laptop GPU | Eluktronics Mech-17 GP2 i9-13900HX, GeForce RTX 4090 Laptop GPU | Asus Zephyrus Duo 16 GX650PY-NM006W R9 7945HX, GeForce RTX 4090 Laptop GPU | MSI Titan GT77 HX 13VI i9-13950HX, GeForce RTX 4090 Laptop GPU | Razer Blade 16 Early 2023 i9-13950HX, GeForce RTX 4080 Laptop GPU | Lenovo Legion Pro 7 16IRX8H i9-13900HX, GeForce RTX 4080 Laptop GPU | Razer Blade 18 RTX 4070 i9-13950HX, GeForce RTX 4070 Laptop GPU | |
|---|---|---|---|---|---|---|---|
| Noise | -15% | -20% | -21% | -2% | -19% | -5% | |
| wyłączone / środowisko * (dB) | 20.84 | 25.2 -21% | 23.9 -15% | 24.6 -18% | 23 -10% | 24 -15% | 23.5 -13% |
| Idle Minimum * (dB) | 23.65 | 28 -18% | 23.9 -1% | 29.2 -23% | 23 3% | 26 -10% | 23.8 -1% |
| Idle Average * (dB) | 23.65 | 28 -18% | 32.9 -39% | 29.2 -23% | 23 3% | 28 -18% | 23.8 -1% |
| Idle Maximum * (dB) | 23.65 | 30.4 -29% | 36.5 -54% | 29.2 -23% | 23.6 -0% | 34 -44% | 26.8 -13% |
| Load Average * (dB) | 43.35 | 41 5% | 42.9 1% | 50.7 -17% | 39 10% | 47 -8% | 37.3 14% |
| Witcher 3 ultra * (dB) | 46.7 | 50.7 -9% | 51.2 -10% | 53.3 -14% | 51.6 -10% | 55 -18% | 48 -3% |
| Load Maximum * (dB) | 46.72 | 52.6 -13% | 56 -20% | 61 -31% | 51.3 -10% | 56 -20% | 53.5 -15% |
* ... im mniej tym lepiej
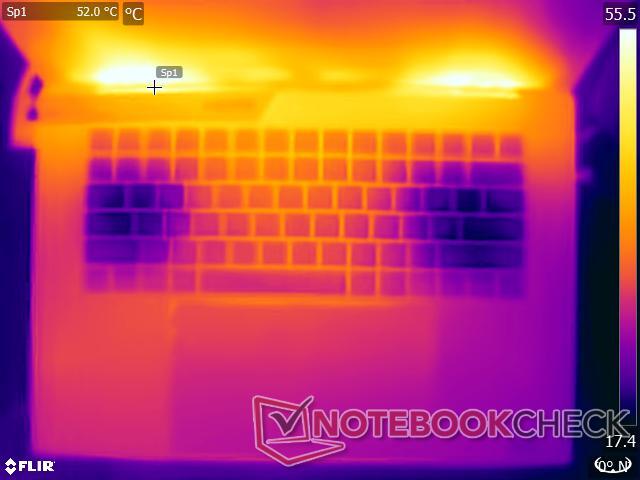
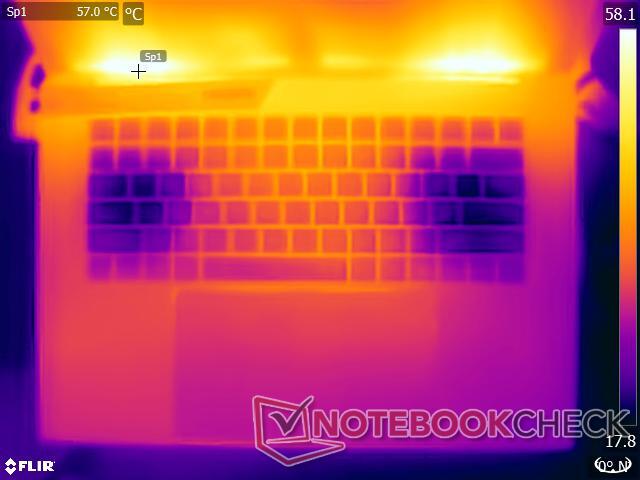
Temperatura
Razer Blade 16 nie jest raczej chłodnym klientem, jeśli chodzi o temperatury powierzchni pod obciążeniem. Zanotowaliśmy maksymalnie 54,2 °C podczas stresu z The Witcher 3 w 1080p Ultra, podczas gdy połączone obciążenie Prime95 i FurMark skutkuje hotspotem 52 °C w górnym środku obudowy.
Większość ciepła koncentruje się w górnym rzędzie. Spód laptopa może się znacznie nagrzać, więc nie zalecamy używania urządzenia na kolanach podczas pracy pod dużym obciążeniem. W takich przypadkach lepiej sprawdza się profil Balanced lub Silent.
Miejsca oparcia dłoni nie nagrzewają się nadmiernie, ale na lewym i prawym miejscu oparcia dłoni oraz na touchpadzie zanotowaliśmy gorące punkty o temperaturze około 40°C.
(-) Maksymalna temperatura w górnej części wynosi 52 °C / 126 F, w porównaniu do średniej 40.4 °C / 105 F , począwszy od 21.2 do 68.8 °C dla klasy Gaming.
(-) Dno nagrzewa się maksymalnie do 47.6 °C / 118 F, w porównaniu do średniej 43.2 °C / 110 F
(+) W stanie bezczynności średnia temperatura górnej części wynosi 30.6 °C / 87 F, w porównaniu ze średnią temperaturą urządzenia wynoszącą 33.9 °C / ### class_avg_f### F.
(-) Podczas gry w Wiedźmina 3 średnia temperatura górnej części wynosi 44.9 °C / 113 F, w porównaniu do średniej temperatury urządzenia wynoszącej 33.9 °C / ## #class_avg_f### F.
(-) Podpórki pod nadgarstki i touchpad mogą się bardzo nagrzać w dotyku, maksymalnie do 40.6 °C / 105.1 F.
(-) Średnia temperatura obszaru podparcia dłoni w podobnych urządzeniach wynosiła 28.8 °C / 83.8 F (-11.8 °C / -21.3 F).
Wyświetlacz częściowo blokuje wyloty powietrza, co prowadzi do nadmiernego nagrzewania się tego obszaru. W wyniku tego również podstawa wyświetlacza nagrzewa się dość znacznie.
Idealnie byłoby, gdyby Razer zaoferował większy odstęp pomiędzy podstawą wyświetlacza a otworami wylotowymi.


| Razer Blade 16 Early 2023 RTX 4090 i9-13950HX, GeForce RTX 4090 Laptop GPU | Eluktronics Mech-17 GP2 i9-13900HX, GeForce RTX 4090 Laptop GPU | Asus Zephyrus Duo 16 GX650PY-NM006W R9 7945HX, GeForce RTX 4090 Laptop GPU | MSI Titan GT77 HX 13VI i9-13950HX, GeForce RTX 4090 Laptop GPU | Razer Blade 16 Early 2023 i9-13950HX, GeForce RTX 4080 Laptop GPU | Lenovo Legion Pro 7 16IRX8H i9-13900HX, GeForce RTX 4080 Laptop GPU | Razer Blade 18 RTX 4070 i9-13950HX, GeForce RTX 4070 Laptop GPU | |
|---|---|---|---|---|---|---|---|
| Heat | 11% | 8% | 15% | 11% | -6% | 12% | |
| Maximum Upper Side * (°C) | 52 | 39 25% | 44.2 15% | 40.6 22% | 40 23% | 48 8% | 39.2 25% |
| Maximum Bottom * (°C) | 47.6 | 44 8% | 46.8 2% | 41.1 14% | 37.6 21% | 49 -3% | 35.6 25% |
| Idle Upper Side * (°C) | 33 | 31 6% | 29.2 12% | 26.2 21% | 32.4 2% | 40 -21% | 31.8 4% |
| Idle Bottom * (°C) | 30.6 | 29.8 3% | 30.2 1% | 30.3 1% | 31.4 -3% | 33 -8% | 33.2 -8% |
* ... im mniej tym lepiej
Stress Test
Blade 16 wykorzystuje system chłodzenia z komorą parową, aby utrzymać w chłodzie swoje potężne komponenty. Komora parowa spisuje się przyzwoicie, zapobiegając nadmiernemu dławieniu, o czym świadczą nasze testy obciążeniowe.
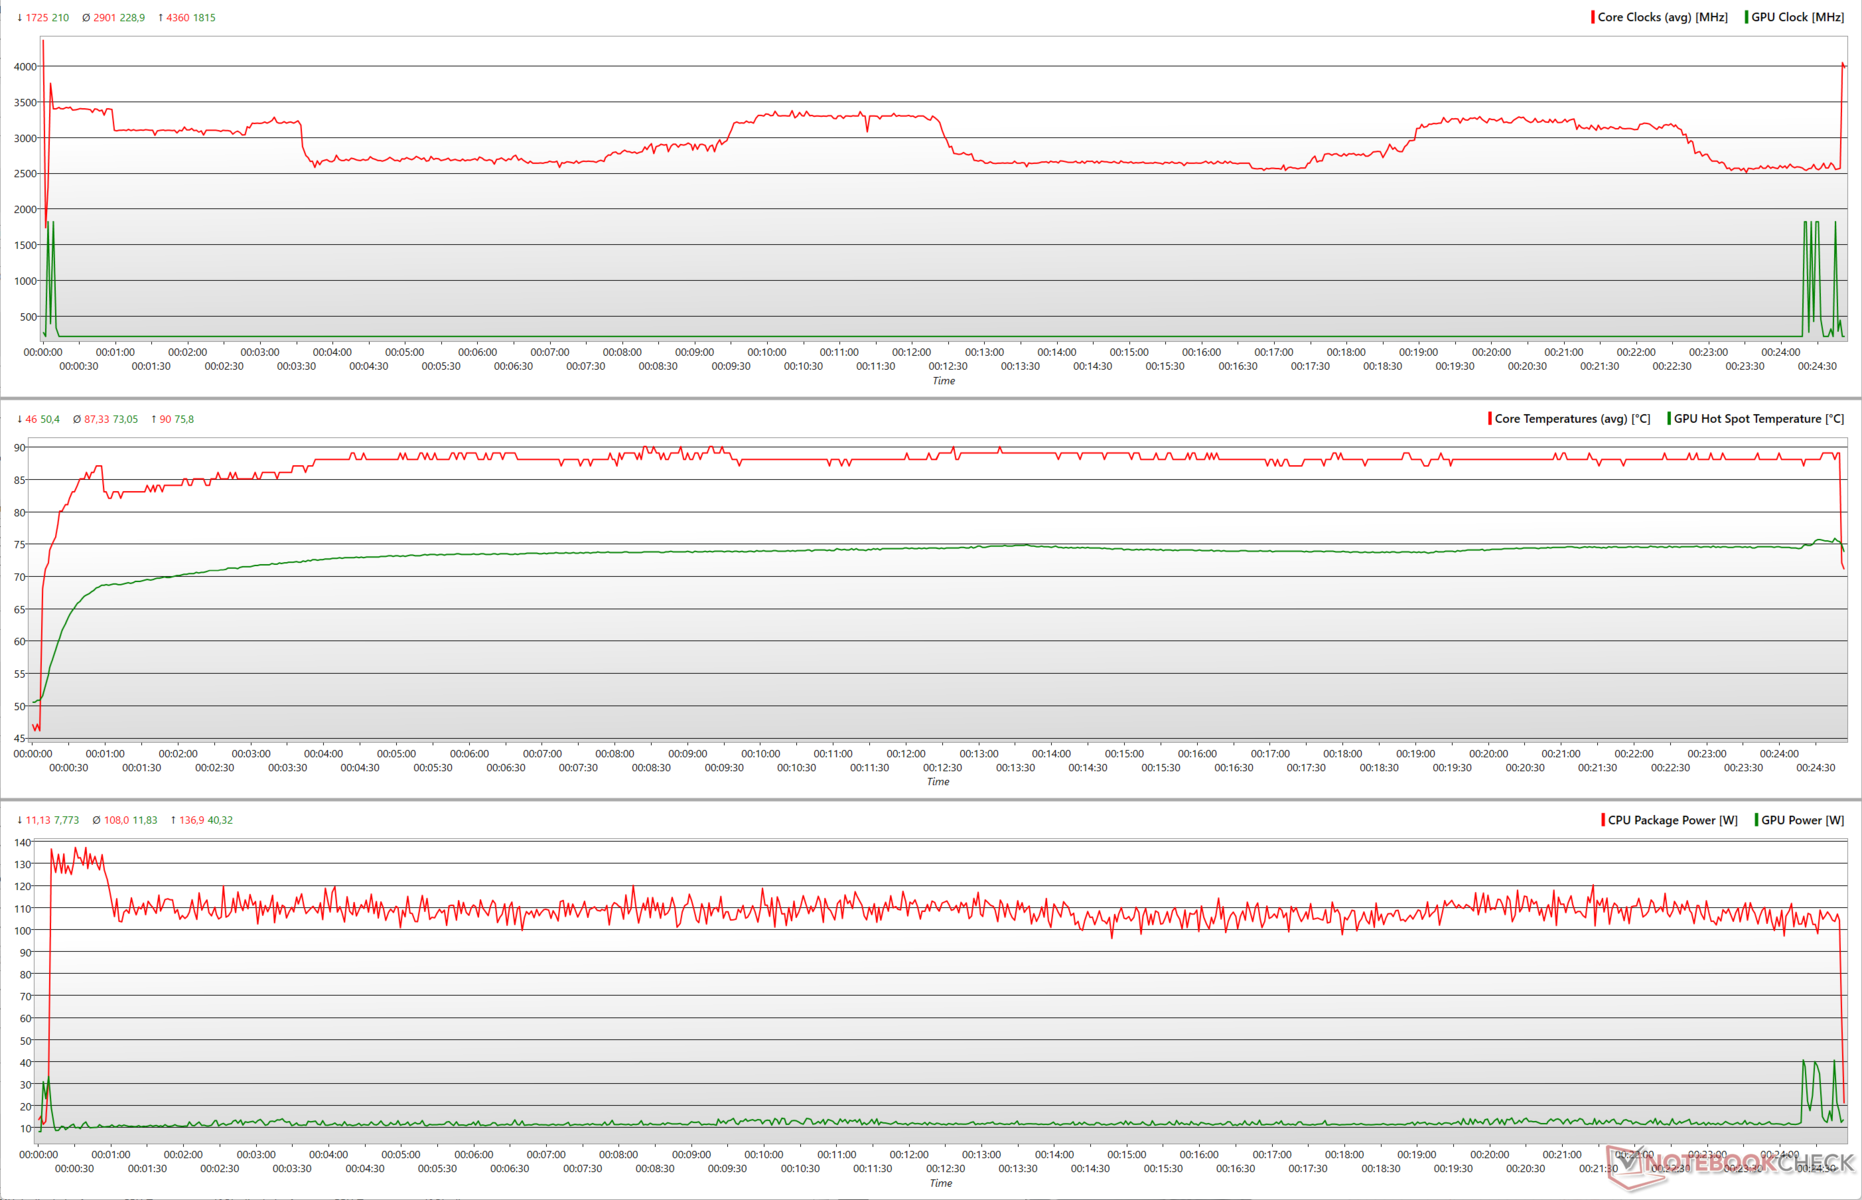
Podczas stresu z Prime95 w miejscu dużych FFTs pokazał Core i9-13950HX zwiększając do 4,36 GHz, podczas gdy temperatury rdzenia uderzyły w granicę 90 ° C. Procesor może chwilowo pobierać do 137 W, po czym spada do około 100 W w dalszej części testu.
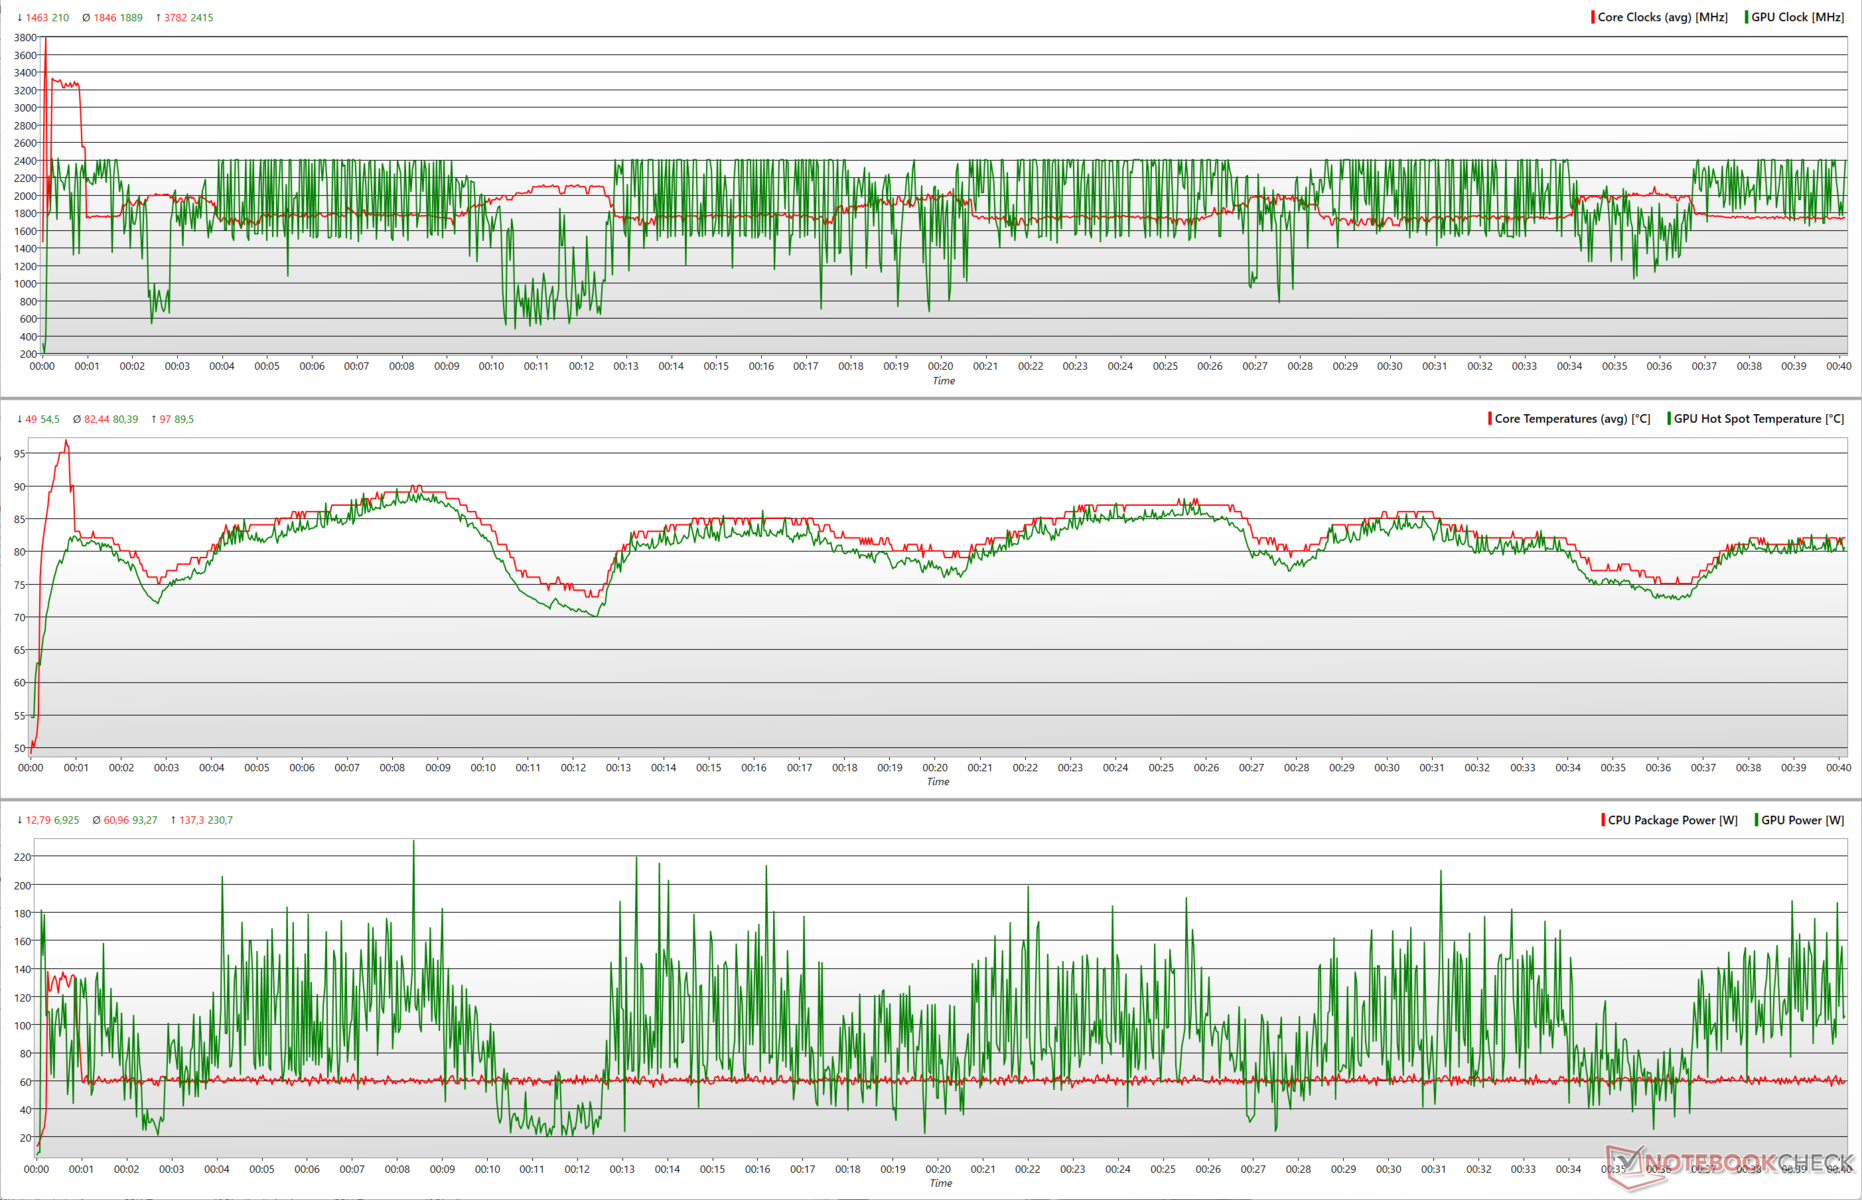
Po dodaniu do mieszanki FurMark w rozdzielczości 1280 x 720 bez AA, Blade 16 poświęca część mocy CPU, by zapewnić trochę miejsca dla układu graficznego RTX 4090 Laptop. Zegary procesora graficznego spadają jednak znacząco, gdy tylko CPU próbuje zwiększyć częstotliwość taktowania z 1,8 GHz do około 2,2 GHz.
W porównaniu do samego stresu Prime95, średnia moc pakietu CPU w połączonym obciążeniu spada ze 108 W do 61 W. Dzięki temu RTX 4090 jest w stanie wykorzystać tę dodatkową moc w chwilowych skokach do 231 W, co skutkuje szczytowymi zegarami o częstotliwości 2 415 MHz.
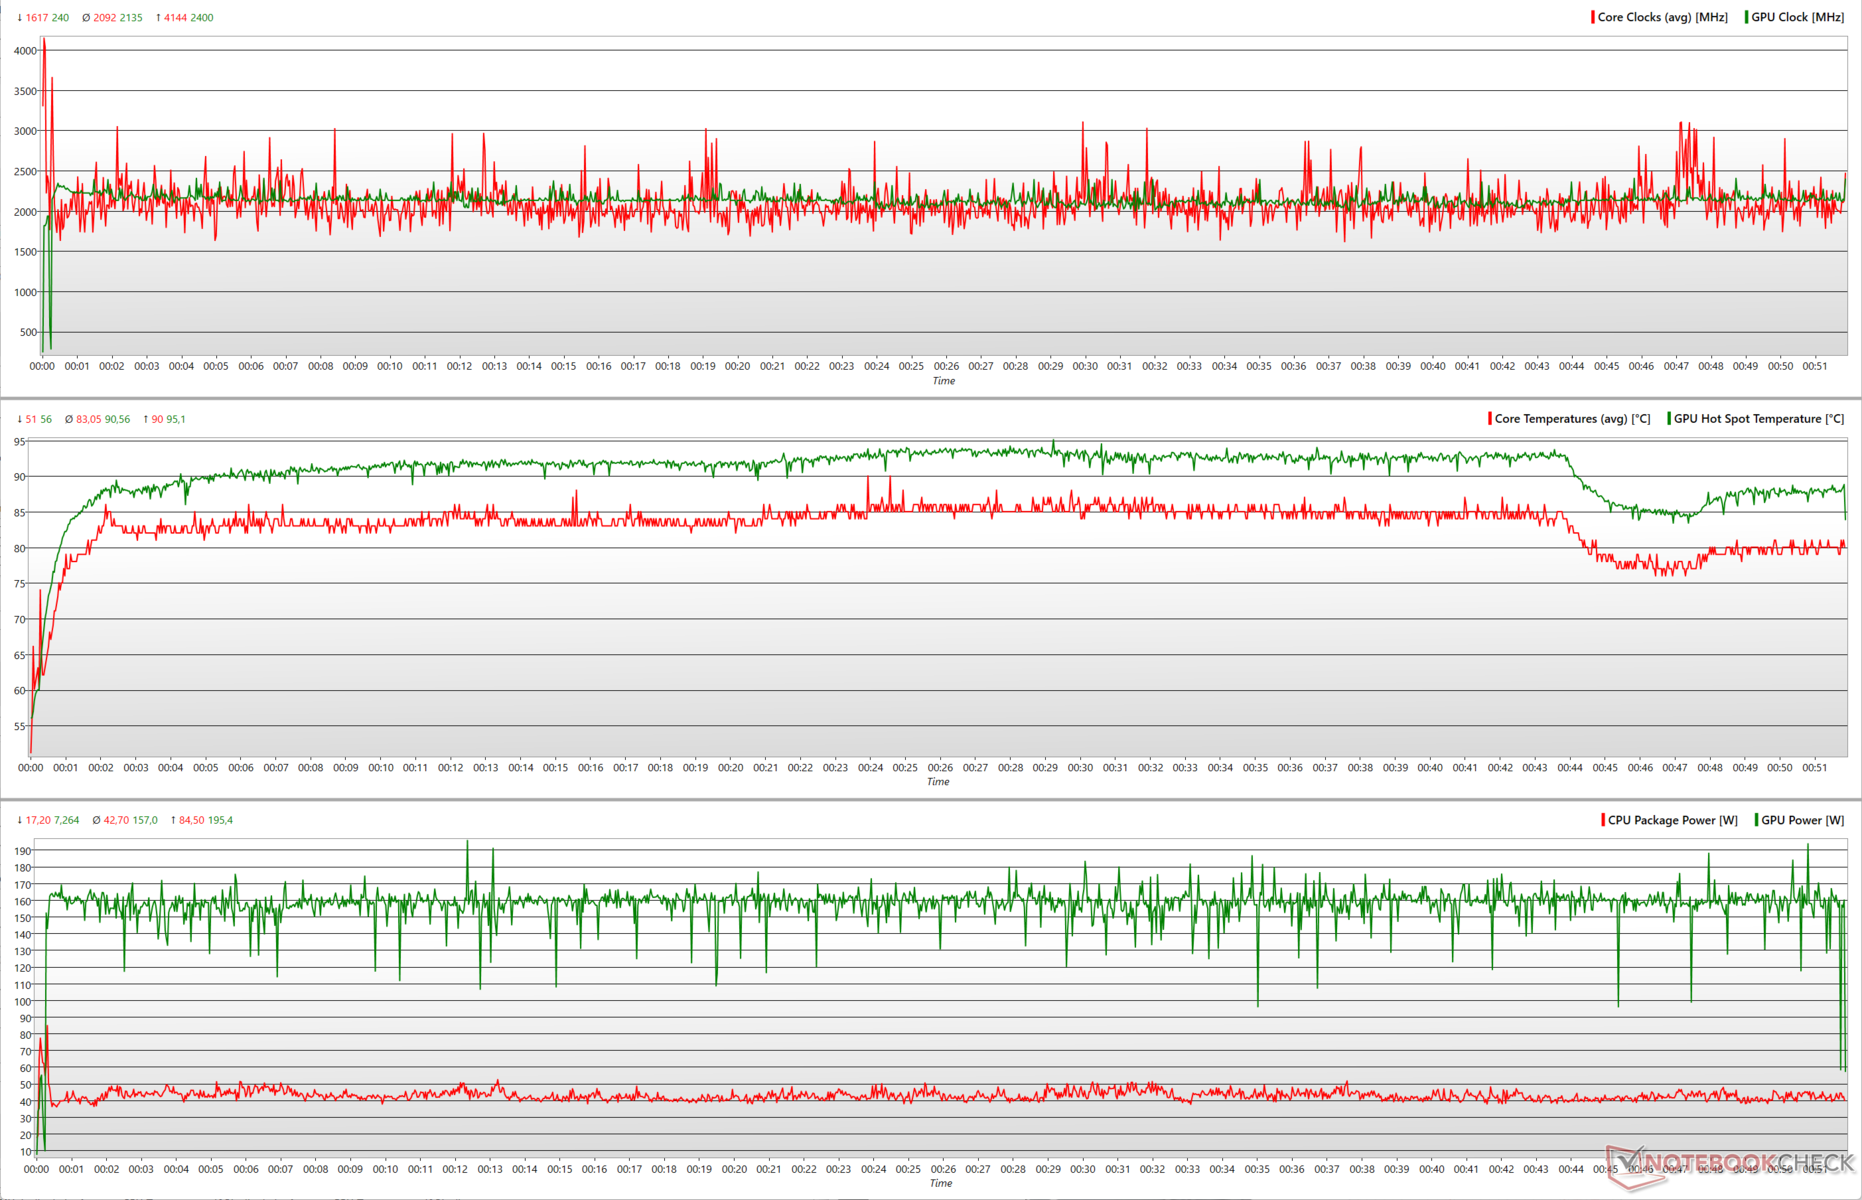
Zegary i moc procesora graficznego pozostają względnie stabilne podczas stresu w grze The Witcher 3 w rozdzielczości 1080p Ultra. Średnia moc pakietu CPU zostaje jeszcze bardziej zredukowana do 42,7 W, dzięki czemu RTX 4090 może komfortowo poruszać się wokół średniej wartości 157 W. Zarówno Core i9-13950HX jak i RTX 4090 taktowane są średnio zegarem bliskim 2,1 GHz.
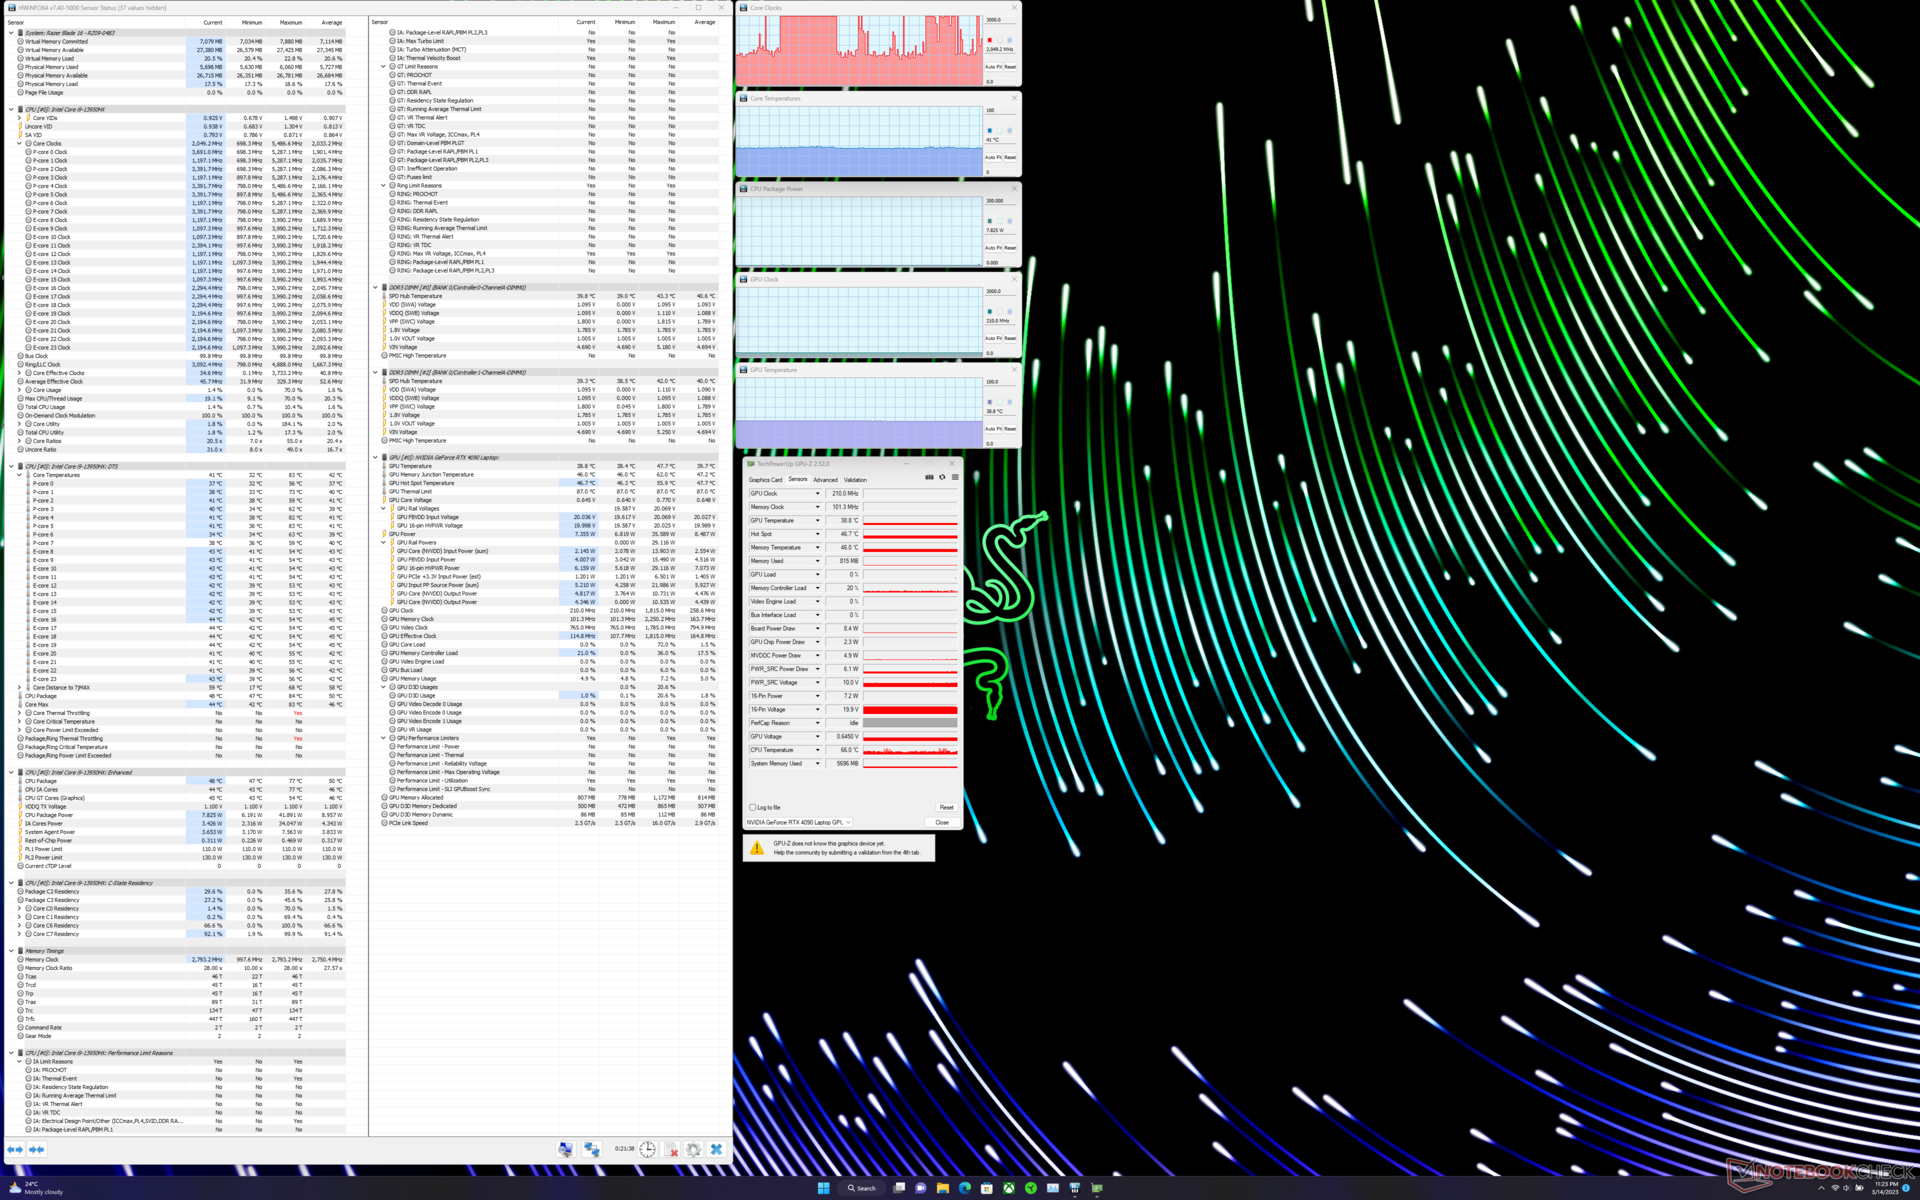
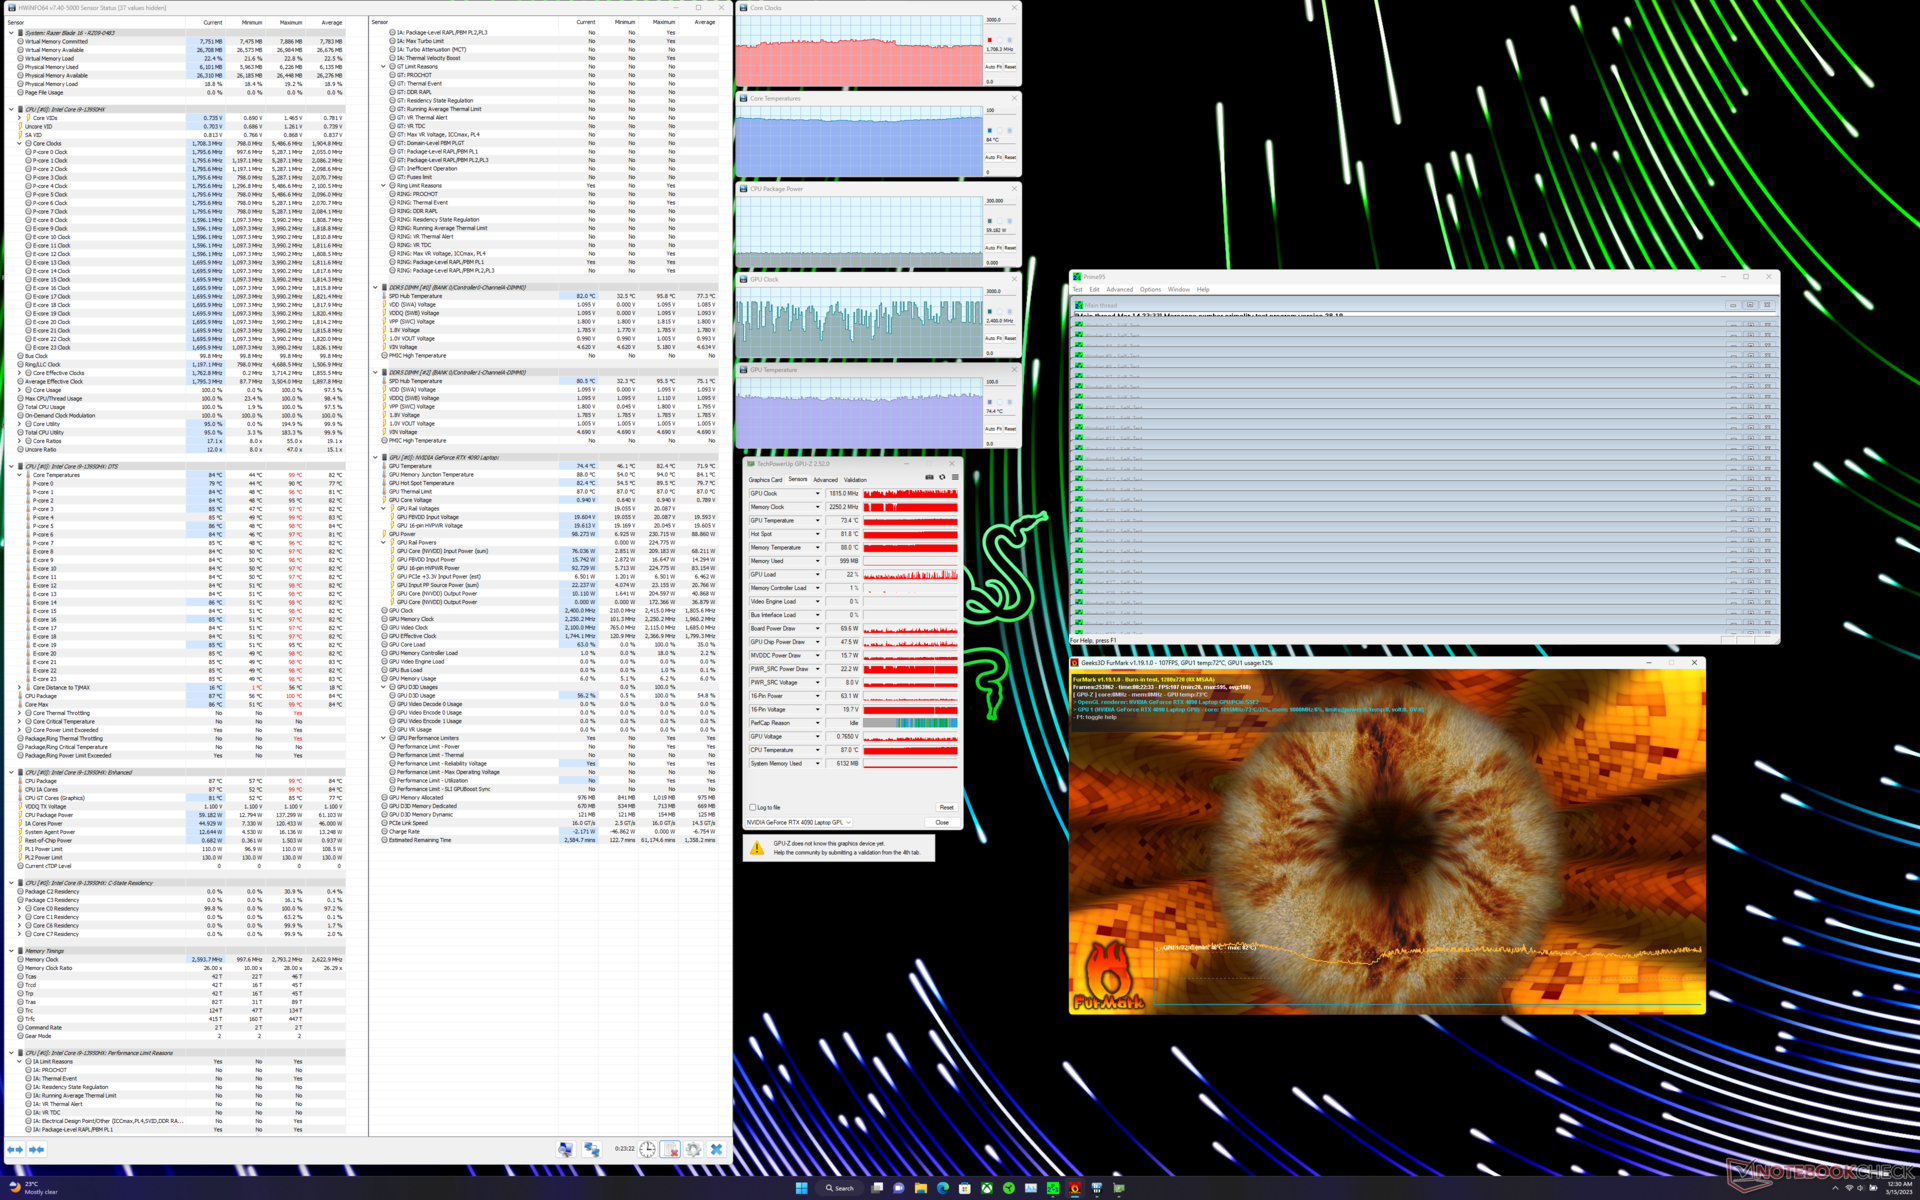
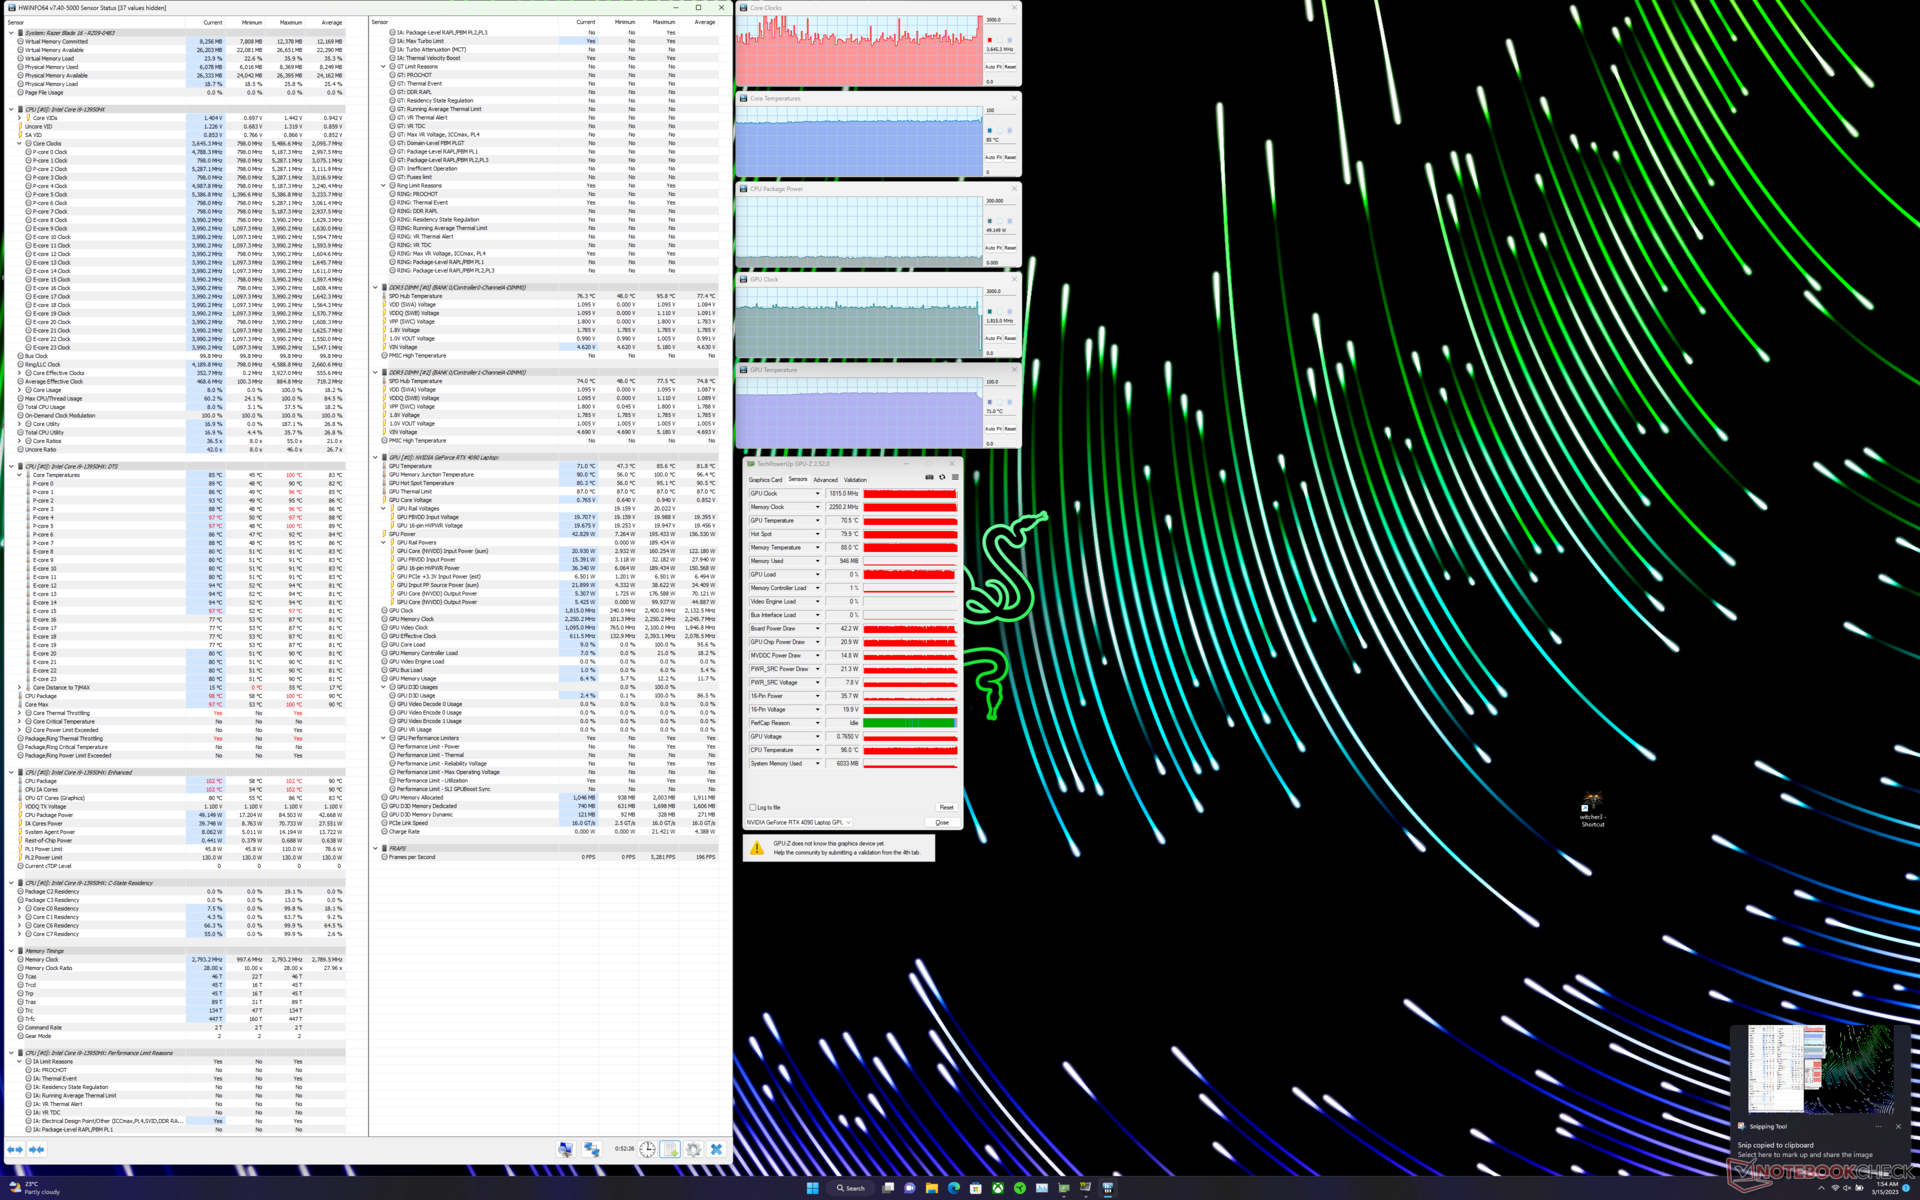
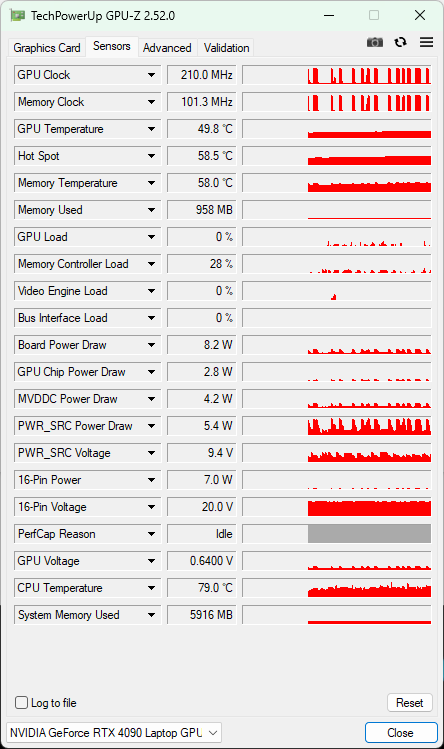
| Test obciążeniowy | Zegar CPU (GHz) | Zegar GPU (MHz) | Średnia temperatura CPU (°C) | Średnia temperatura GPU (°C) |
| System Idle | 2.05 | 210 | 42 | 39.7 |
| Prime95 | 2,56 | 210 | 87 | 63,1 |
| Prime95 + FurMark | 1.70 | 1,815 | 82 | 72 |
| The Witcher 3 | 3.64 | 1.815 | 83 | 81.8 |
Mówcy
Razer jest znany z wyposażania swoich Blade'ów w przyzwoite głośniki pokładowe i Blade 16 nie jest inny. Blade 16 wyposażony jest w dwa głośniki i dwa woofery zasilane przez dwa wzmacniacze Smart Amps.
Szczytowy SPL na poziomie 75 dB(A) wydaje się być nieco niższy od tego, co widzieliśmy wcześniej w Blade 16 RTX 4080 i Blade 18, ale jest wystarczająco głośny, aby wypełnić średniej wielkości pokój.
Odpowiedź basowa jest przyzwoita, ale mogłaby być zdecydowanie lepsza, biorąc pod uwagę obecność dedykowanych głośników niskotonowych. Średnie i wysokie tony są dobrze zdefiniowane, co powinno być wystarczające do swobodnego słuchania. Pozostałe opcje łączności audio to combo audio jack 3,5 mm oraz Bluetooth 5.3.
Razer oferuje funkcję THX Spatial Audio, ale niestety nie udało nam się uruchomić aplikacji nawet po aktualizacji sterowników audio.
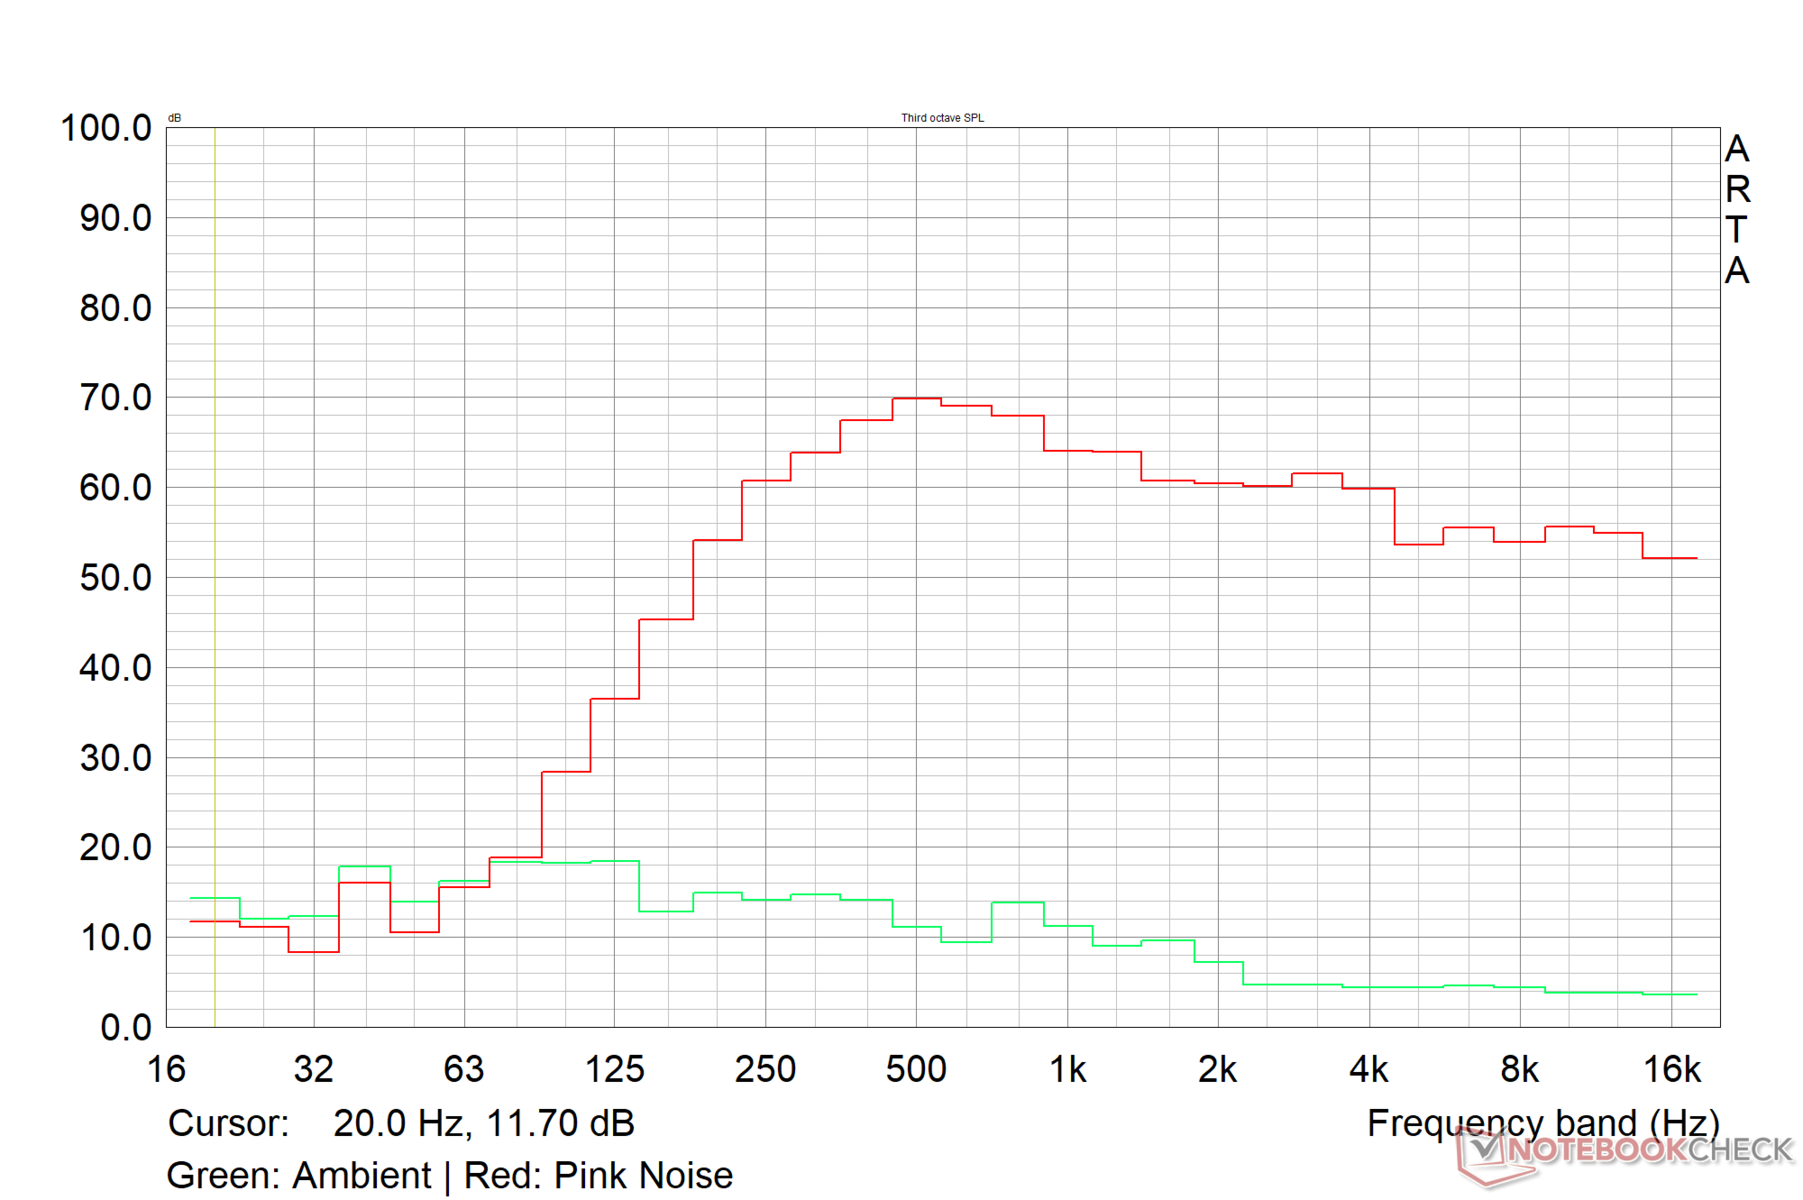
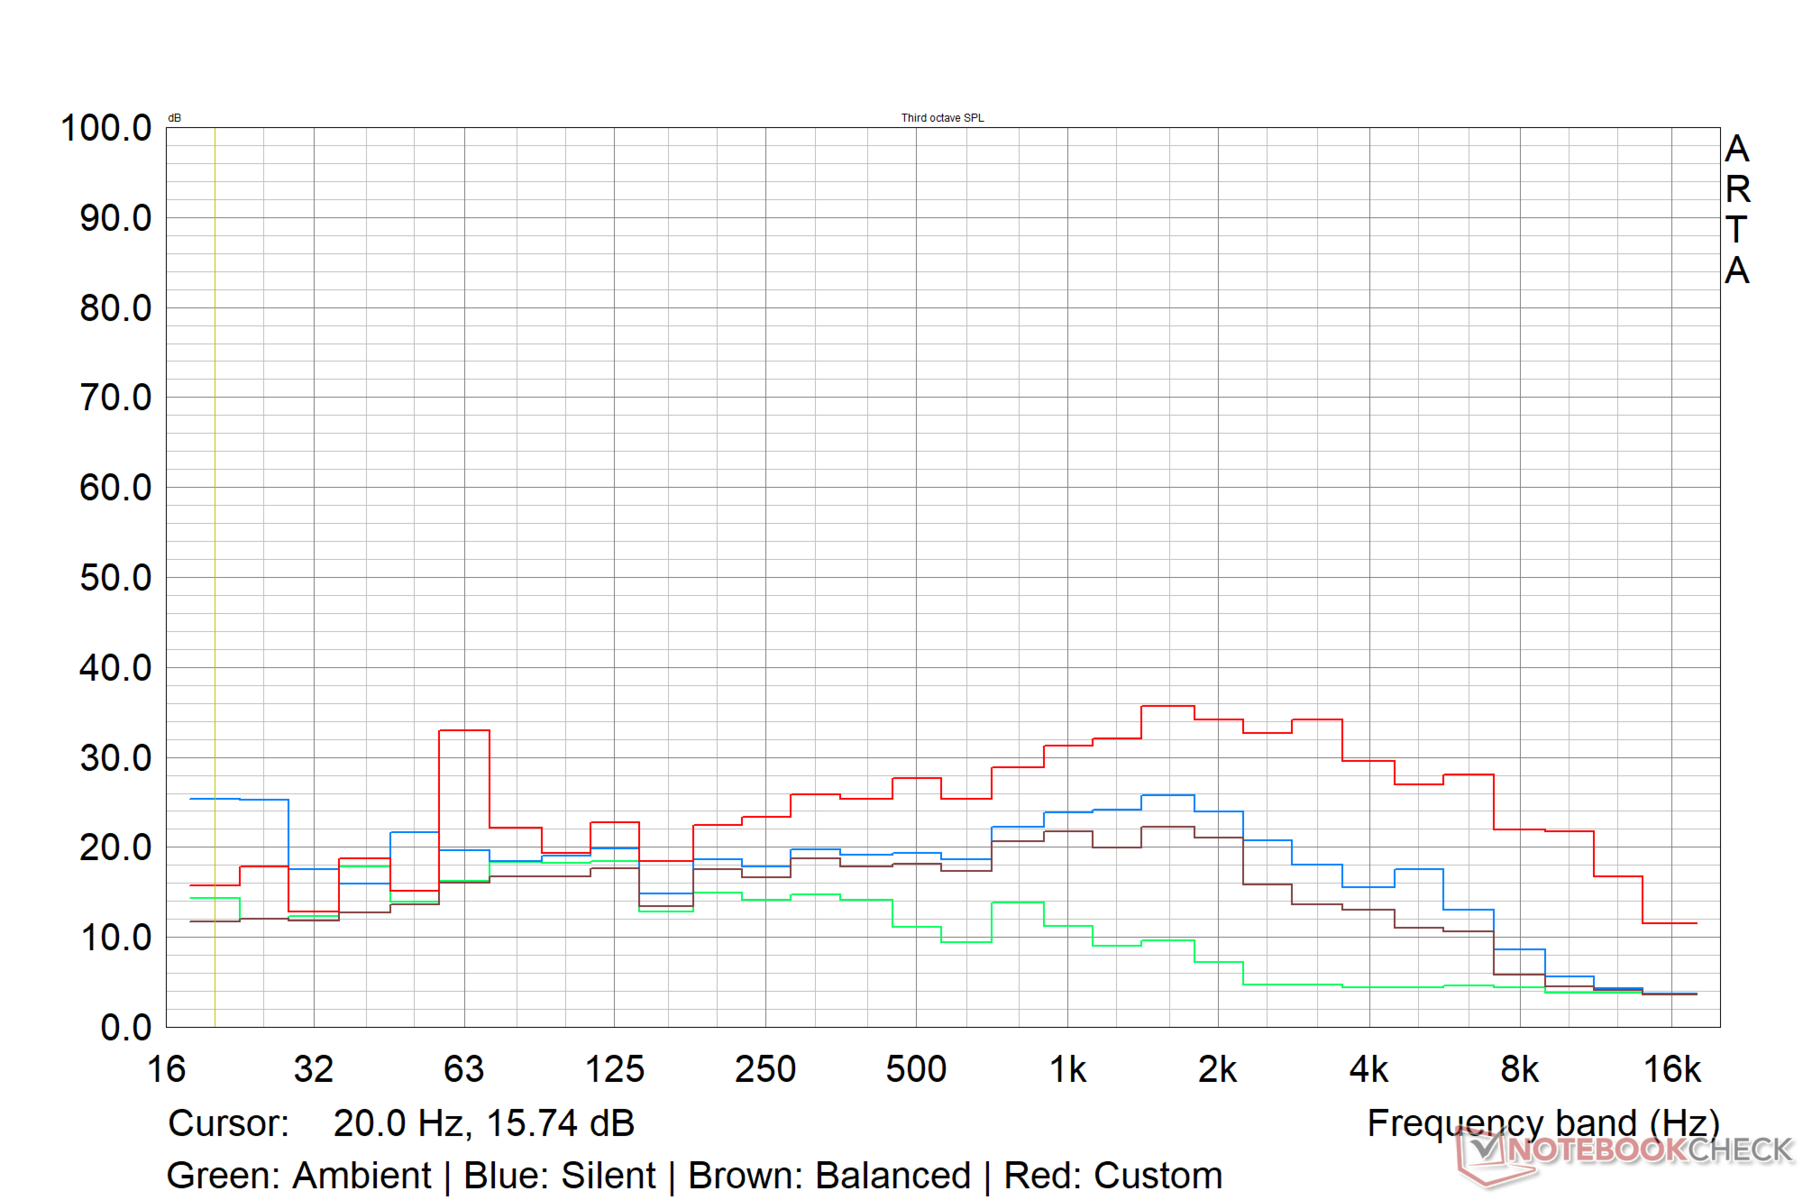
Razer Blade 16 Early 2023 RTX 4090 analiza dźwięku
(±) | głośność głośnika jest średnia, ale dobra (75 dB)
Bas 100 - 315 Hz
(±) | zredukowany bas - średnio 13.4% niższy od mediany
(±) | liniowość basu jest średnia (14.8% delta do poprzedniej częstotliwości)
Średnie 400 - 2000 Hz
(±) | wyższe średnie - średnio 5.3% wyższe niż mediana
(+) | średnie są liniowe (3.8% delta do poprzedniej częstotliwości)
Wysokie 2–16 kHz
(+) | zrównoważone maksima - tylko 3.4% od mediany
(+) | wzloty są liniowe (4.2% delta do poprzedniej częstotliwości)
Ogólnie 100 - 16.000 Hz
(±) | liniowość ogólnego dźwięku jest średnia (15.6% różnicy w stosunku do mediany)
W porównaniu do tej samej klasy
» 36% wszystkich testowanych urządzeń w tej klasie było lepszych, 6% podobnych, 58% gorszych
» Najlepszy miał deltę 6%, średnia wynosiła ###średnia###%, najgorsza wynosiła 132%
W porównaniu do wszystkich testowanych urządzeń
» 24% wszystkich testowanych urządzeń było lepszych, 5% podobnych, 72% gorszych
» Najlepszy miał deltę 4%, średnia wynosiła ###średnia###%, najgorsza wynosiła 134%
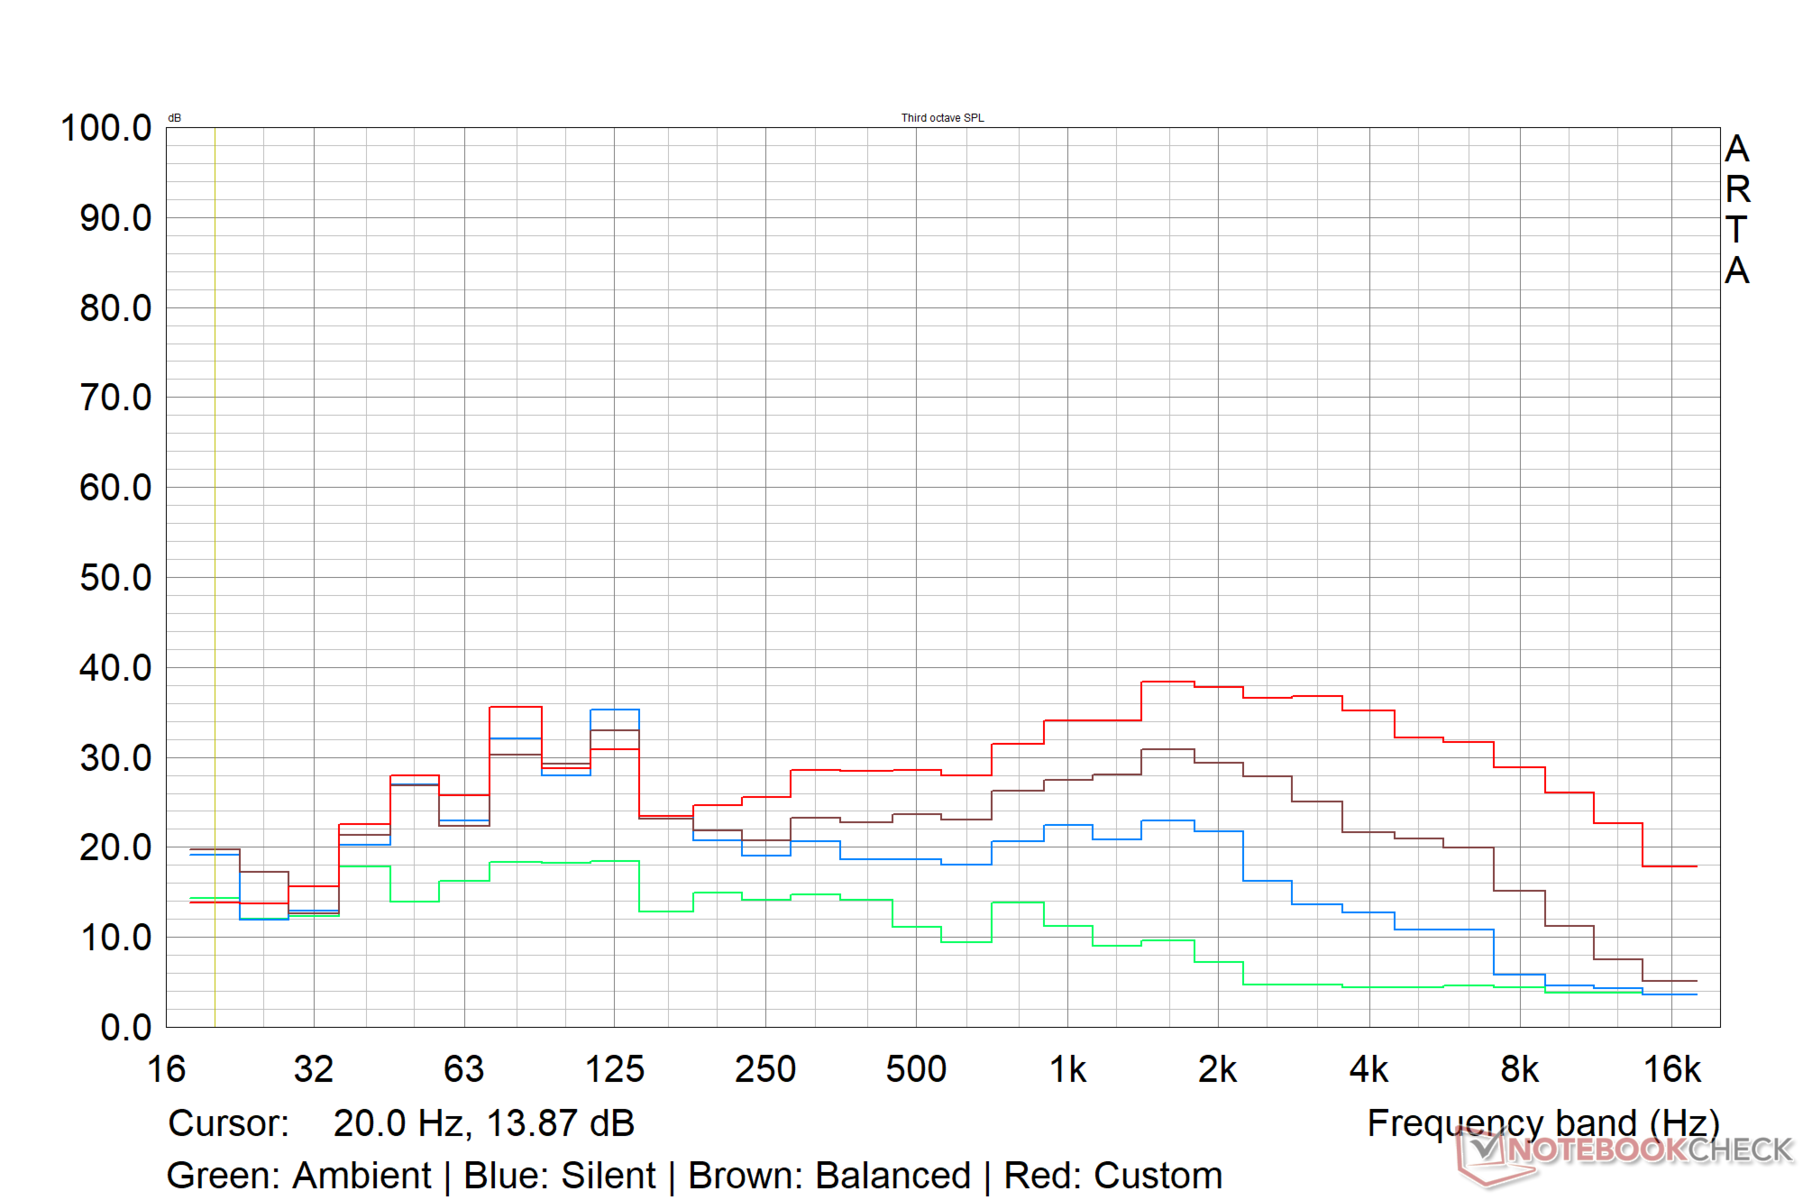
Apple MacBook Pro 16 2021 M1 Pro analiza dźwięku
(+) | głośniki mogą odtwarzać stosunkowo głośno (84.7 dB)
Bas 100 - 315 Hz
(+) | dobry bas - tylko 3.8% od mediany
(+) | bas jest liniowy (5.2% delta do poprzedniej częstotliwości)
Średnie 400 - 2000 Hz
(+) | zbalansowane środki średnie - tylko 1.3% od mediany
(+) | średnie są liniowe (2.1% delta do poprzedniej częstotliwości)
Wysokie 2–16 kHz
(+) | zrównoważone maksima - tylko 1.9% od mediany
(+) | wzloty są liniowe (2.7% delta do poprzedniej częstotliwości)
Ogólnie 100 - 16.000 Hz
(+) | ogólny dźwięk jest liniowy (4.6% różnicy w stosunku do mediany)
W porównaniu do tej samej klasy
» 0% wszystkich testowanych urządzeń w tej klasie było lepszych, 0% podobnych, 100% gorszych
» Najlepszy miał deltę 5%, średnia wynosiła ###średnia###%, najgorsza wynosiła 45%
W porównaniu do wszystkich testowanych urządzeń
» 0% wszystkich testowanych urządzeń było lepszych, 0% podobnych, 100% gorszych
» Najlepszy miał deltę 4%, średnia wynosiła ###średnia###%, najgorsza wynosiła 134%
Zarządzanie energią: Ekonomiczny pobór mocy dla danej konfiguracji
Pobór mocy
Pobór mocy Blade 16 RTX 4090 w spoczynku jest wyższy, ale pobór mocy pod obciążeniem wydaje się dość ekonomiczny dla danej konfiguracji. Wzorzec zużycia energii w dużej mierze pokrywa się z naszymi obserwacjami podczas powyższego testu obciążeniowego.
W profilu niestandardowym pod maksymalnym obciążeniem odnotowaliśmy szczytowy pobór mocy bliski 287 W, więc dostarczony adapter GaN o mocy 330 W powinien być więcej niż wystarczający dla potrzeb energetycznych Blade 16. W porównaniu z podobnie ocenianymi adapterami u konkurencji, cegła zasilająca GaN Razera jest bardziej kompaktowa i przenośna.
| wyłączony / stan wstrzymania | |
| luz | |
| obciążenie |
|
Legenda:
min: | |
| Razer Blade 16 Early 2023 RTX 4090 i9-13950HX, GeForce RTX 4090 Laptop GPU, mini-LED, 3840x2400, 16" | Eluktronics Mech-17 GP2 i9-13900HX, GeForce RTX 4090 Laptop GPU, IPS, 2560x1600, 17" | Asus Zephyrus Duo 16 GX650PY-NM006W R9 7945HX, GeForce RTX 4090 Laptop GPU, MiniLED, 2560x1600, 16" | MSI Titan GT77 HX 13VI i9-13950HX, GeForce RTX 4090 Laptop GPU, Mini-LED, 3840x2160, 17.3" | Razer Blade 16 Early 2023 i9-13950HX, GeForce RTX 4080 Laptop GPU, IPS, 2560x1600, 16" | Lenovo Legion Pro 7 16IRX8H i9-13900HX, GeForce RTX 4080 Laptop GPU, IPS, 2560x1600, 16" | Razer Blade 18 RTX 4070 i9-13950HX, GeForce RTX 4070 Laptop GPU, IPS, 2560x1600, 18" | Przeciętny NVIDIA GeForce RTX 4090 Laptop GPU | Średnia w klasie Gaming | |
|---|---|---|---|---|---|---|---|---|---|
| Power Consumption | 12% | 9% | 14% | 11% | 12% | 2% | 15% | 32% | |
| Idle Minimum * (Watt) | 27.5 | 14 49% | 19.2 30% | 14 49% | 15.2 45% | 18 35% | 24.5 11% | 16.2 ? 41% | 13.1 ? 52% |
| Idle Average * (Watt) | 34.4 | 19.3 44% | 29.7 14% | 21.6 37% | 22.8 34% | 24 30% | 34.1 1% | 23.1 ? 33% | 19 ? 45% |
| Idle Maximum * (Watt) | 35.4 | 36.8 -4% | 30.8 13% | 24.8 30% | 49.8 -41% | 32 10% | 47.7 -35% | 34.2 ? 3% | 24.6 ? 31% |
| Load Average * (Watt) | 147.8 | 117.2 21% | 126 15% | 122.5 17% | 121.2 18% | 130 12% | 140 5% | 130.5 ? 12% | 111.3 ? 25% |
| Witcher 3 ultra * (Watt) | 256 | 304 -19% | 258 -1% | 265 -4% | 242 5% | 260 -2% | 202 21% | ||
| Load Maximum * (Watt) | 286.7 | 342.5 -19% | 330 -15% | 418 -46% | 273.7 5% | 320 -12% | 261 9% | 324 ? -13% | 260 ? 9% |
* ... im mniej tym lepiej
Power Consumption: The Witcher 3 / Stress test
Power Consumption: External monitor
Czas pracy na baterii
Dołączony do zestawu podwójny akumulator 95,2 WHr osiąga 5,45 godziny pracy w naszym standardowym teście przeglądania stron internetowych przez Wi-Fi przy 150 nitach. Wynik ten jest tylko nieznacznie lepszy od Razer Blade 16 RTX 4080.
Czas odtwarzania wideo w rozdzielczości 150 nitów jest znacznie lepszy od konkurencji i wynosi blisko 8,5 godziny.
Biorąc pod uwagę potężne wnętrze, akumulator wytrzymuje pod obciążeniem tylko około 1,5 godziny. Lenovo Legion Pro 7 z RTX 4080 i akumulatorem o pojemności 99,9 WHr wytrzymuje 53% dłużej
.
| Razer Blade 16 Early 2023 RTX 4090 i9-13950HX, GeForce RTX 4090 Laptop GPU, 95.2 Wh | Eluktronics Mech-17 GP2 i9-13900HX, GeForce RTX 4090 Laptop GPU, 99 Wh | Asus Zephyrus Duo 16 GX650PY-NM006W R9 7945HX, GeForce RTX 4090 Laptop GPU, 90 Wh | MSI Titan GT77 HX 13VI i9-13950HX, GeForce RTX 4090 Laptop GPU, 99.9 Wh | Razer Blade 16 Early 2023 i9-13950HX, GeForce RTX 4080 Laptop GPU, 95.2 Wh | Lenovo Legion Pro 7 16IRX8H i9-13900HX, GeForce RTX 4080 Laptop GPU, 99.9 Wh | Razer Blade 18 RTX 4070 i9-13950HX, GeForce RTX 4070 Laptop GPU, 91.7 Wh | Średnia w klasie Gaming | |
|---|---|---|---|---|---|---|---|---|
| Czasy pracy | -12% | -38% | -13% | 3% | 19% | -19% | 9% | |
| H.264 (h) | 8.4 | 3.8 -55% | 6 -29% | 8.27 ? -2% | ||||
| WiFi v1.3 (h) | 5.8 | 5.1 -12% | 4 -31% | 5.3 -9% | 6.1 5% | 5.1 -12% | 4 -31% | 7.08 ? 22% |
| Witcher 3 ultra (h) | 1.6 | |||||||
| Load (h) | 1.4 | 1 -29% | 1.4 0% | 1.4 0% | 2.1 50% | 1.3 -7% | 1.496 ? 7% | |
| Reader / Idle (h) | 8.9 | 6.4 | 7 | 7.84 ? |
Za
Przeciw
Werdykt: Blade 16 dla entuzjastów, nie tak bardzo dla koneserów wydajności
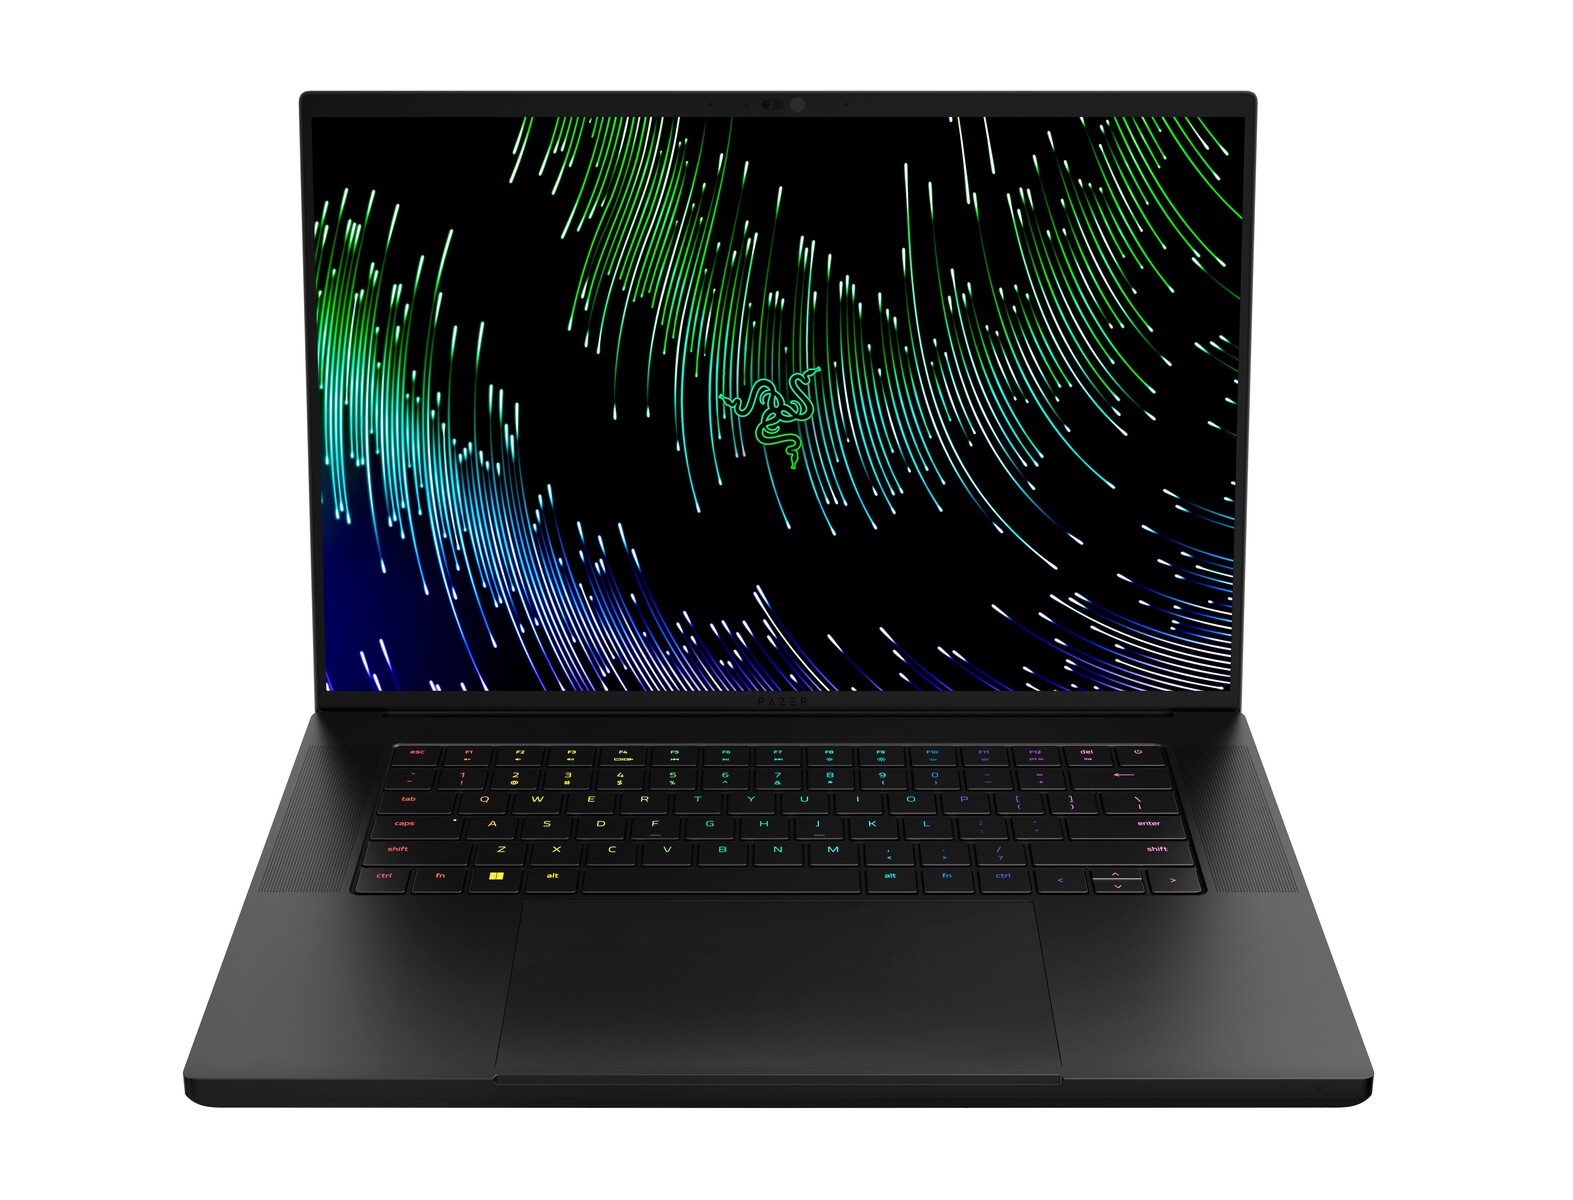
Razer Blade 16 Early 2023 z procesorem graficznym RTX 4090 Laptop wywołuje emocje już na pierwszy rzut oka. Smukła, 16-calowa obudowa wygląda i sprawia wrażenie wysokiej jakości, a Razer musi być pochwalony za osiągnięcie odpowiedniej równowagi między minimalizmem a estetyką gier. Choć solidna, może szybko stać się oczkiem w głowie dzięki wszystkim smugom.
Razer ma wiele rzeczy w porządku z 2023 Blade 16. Wydajny czytnik kart SD, stabilne Wi-Fi 6E, przyzwoita kamera internetowa 1080p, odpowiednie I/O oraz zwiększona powierzchnia touchpada dobrze wróżą Blade 16. Klawiatura jest dobra z jasnym podświetleniem, ale Razer mógł zaimplementować dłuższy skok i/lub włączyć klawisze optyczne.
Dwutrybowy wyświetlacz mini-LED to główna USP Blade 16 Early 2023 i jest to pierwszy na świecie laptop wyposażony w taki wyświetlacz. Możliwość przełączania się między trybami UHD+ 120 Hz i FHD+ 240 Hz może być przydatna dla twórców, którzy również grają.
Poza całym szumem jest jednak fakt, że implementacja dwóch trybów nie jest idealna. Przełączanie nie jest dynamiczne, wymagając za każdym razem restartu. Ponadto w trybie FHD+ obraz jest zauważalnie rozmyty, a do tego traci się możliwość zmiany profili kolorystycznych. W trybie UHD+ wyświetlacz Blade 16 wyróżnia się jednak wysoką luminancją i wspaniałymi wizualizacjami SDR/HDR, które są tak bliskie jakości OLED-ów, jak to tylko możliwe.
Razer Blade 16 Early 2023 to kusząca perspektywa w atrakcyjnej cenie. Wyposażony w procesor Core i9-13950HX, procesor graficzny RTX 4090 Laptop o mocy 175 W oraz żywy, dwutrybowy wyświetlacz UHD+ mini-LED, nowy Razer Blade 16 sprawdza większość pól dla high-endowego laptopa do gier w 2023 roku. Jednak za 4 300 USD można by oczekiwać laptopa niemal doskonałego we wszystkich aspektach, co w tym przypadku nie ma miejsca."
Blade 16 Early 2023 sportuje sprzęt z najwyższej półki, m.in Intel Core i9-13950HX oraz Nvidia GeForce RTX 4090 Laptop GPU. Podczas gdy ta kombinacja łatwo trąci zeszłoroczne top-end flagowych laptopów do gier bez łamania potu, rzeczy zaczęły się stać niezwykle konkurencyjne w 2023.
Blade 16 pozostaje w tyle za innymi high-endowymi laptopami do gier, np MSI Titan GT77 HX 13VI, Lenovo Legion Pro 7, oraz Asus ROG Zephyrus Duo 16 w wydajności procesora. Delty wydajnościowe zawężają się nieco, gdy chodzi o obciążenia grafiki.
Procesor graficzny RTX 4090 Laptop jest czasem przyćmiony przez RTX 4080 Laptop GPU w 1080p Ultra ze względu na wąskie gardła CPU, ale karta radzi sobie dobrze w QHD i 4K w zależności od tytułu. Wszelkie plany grania w 4K Ultra z ray tracingiem będą wymagały włączenia DLSS 2 lub DLSS 3 Frame Generation dla uzyskania grywalnej liczby klatek na sekundę.
Termika Blade 16 jest całkiem dobra, ale zdecydowanie można ją poprawić. Komora parowa wykonuje przyzwoitą pracę w zakresie chłodzenia podzespołów, ale nie jest w stanie w pełni okiełznać CPU i GPU w maksymalnym obciążeniu w niestandardowym profilu zasilania.
Wysokie temperatury powierzchni mogą być odstraszające. Poziomy hałasu wentylatora są na równi z kursem dla laptopa do gier tego kalibru. Jakość dźwięku na pokładzie jest serwisable dla większości.
Zużycie energii jest wysokie w stanie spoczynku, ale zaskakująco oszczędne pod obciążeniem, biorąc pod uwagę konfigurację. Nowy adapter zasilania GaN ma znacznie zmniejszony ślad i jest w stanie dostarczyć 330 W bez problemów. Czas pracy na baterii jest przyzwoity w przypadku prostego przeglądania stron internetowych i odtwarzania wideo przy niskich poziomach jasności. Każda ilość stresu spowoduje, że żywotność baterii spadnie.
Ogólnie rzecz biorąc, za cenę wywoławczą 4,300 USD, Razer Blade 16 Early 2023 jest mieszanką. Jeśli jesteś już fanem Razera, aktualizacja do najnowszej specyfikacji powinna zaoferować wymierne korzyści w zakresie wydajności wraz z wszystkimi dziwactwami, z których słyną laptopy Razera.
Możesz też zaoszczędzić 700 dolarów, decydując się na Blade 16 Early 2023 RTX 4080. Różnica w wydajności pomiędzy tymi dwoma SKU nie jest w tym momencie warta dodatkowej ceny wywoławczej.
Nowy Blade 16 spodoba się również tym, którzy przedkładają jakość wyświetlania nad inne aspekty. Jednak jeśli gonisz za samymi liczbami wydajności, Blade 16 ma poważnych rywali w tym roku, którzy kopią tyłki.
A my dopiero zaczynamy!
Cena i dostępność
Razer Blade 16 Early 2023 RTX 4090
- 23/03/2023 v7 (old)
Vaidyanathan Subramaniam
Przezroczystość
Wyboru urządzeń do recenzji dokonuje nasza redakcja. Próbka testowa została udostępniona autorowi jako pożyczka od producenta lub sprzedawcy detalicznego na potrzeby tej recenzji. Pożyczkodawca nie miał wpływu na tę recenzję, producent nie otrzymał też kopii tej recenzji przed publikacją. Nie było obowiązku publikowania tej recenzji. Jako niezależna firma medialna, Notebookcheck nie podlega władzy producentów, sprzedawców detalicznych ani wydawców.
Tak testuje Notebookcheck
Każdego roku Notebookcheck niezależnie sprawdza setki laptopów i smartfonów, stosując standardowe procedury, aby zapewnić porównywalność wszystkich wyników. Od około 20 lat stale rozwijamy nasze metody badawcze, ustanawiając przy tym standardy branżowe. W naszych laboratoriach testowych doświadczeni technicy i redaktorzy korzystają z wysokiej jakości sprzętu pomiarowego. Testy te obejmują wieloetapowy proces walidacji. Nasz kompleksowy system ocen opiera się na setkach uzasadnionych pomiarów i benchmarków, co pozwala zachować obiektywizm.Price comparison

