Werdykt — surowa wydajność przy zaledwie minimalnym komforcie
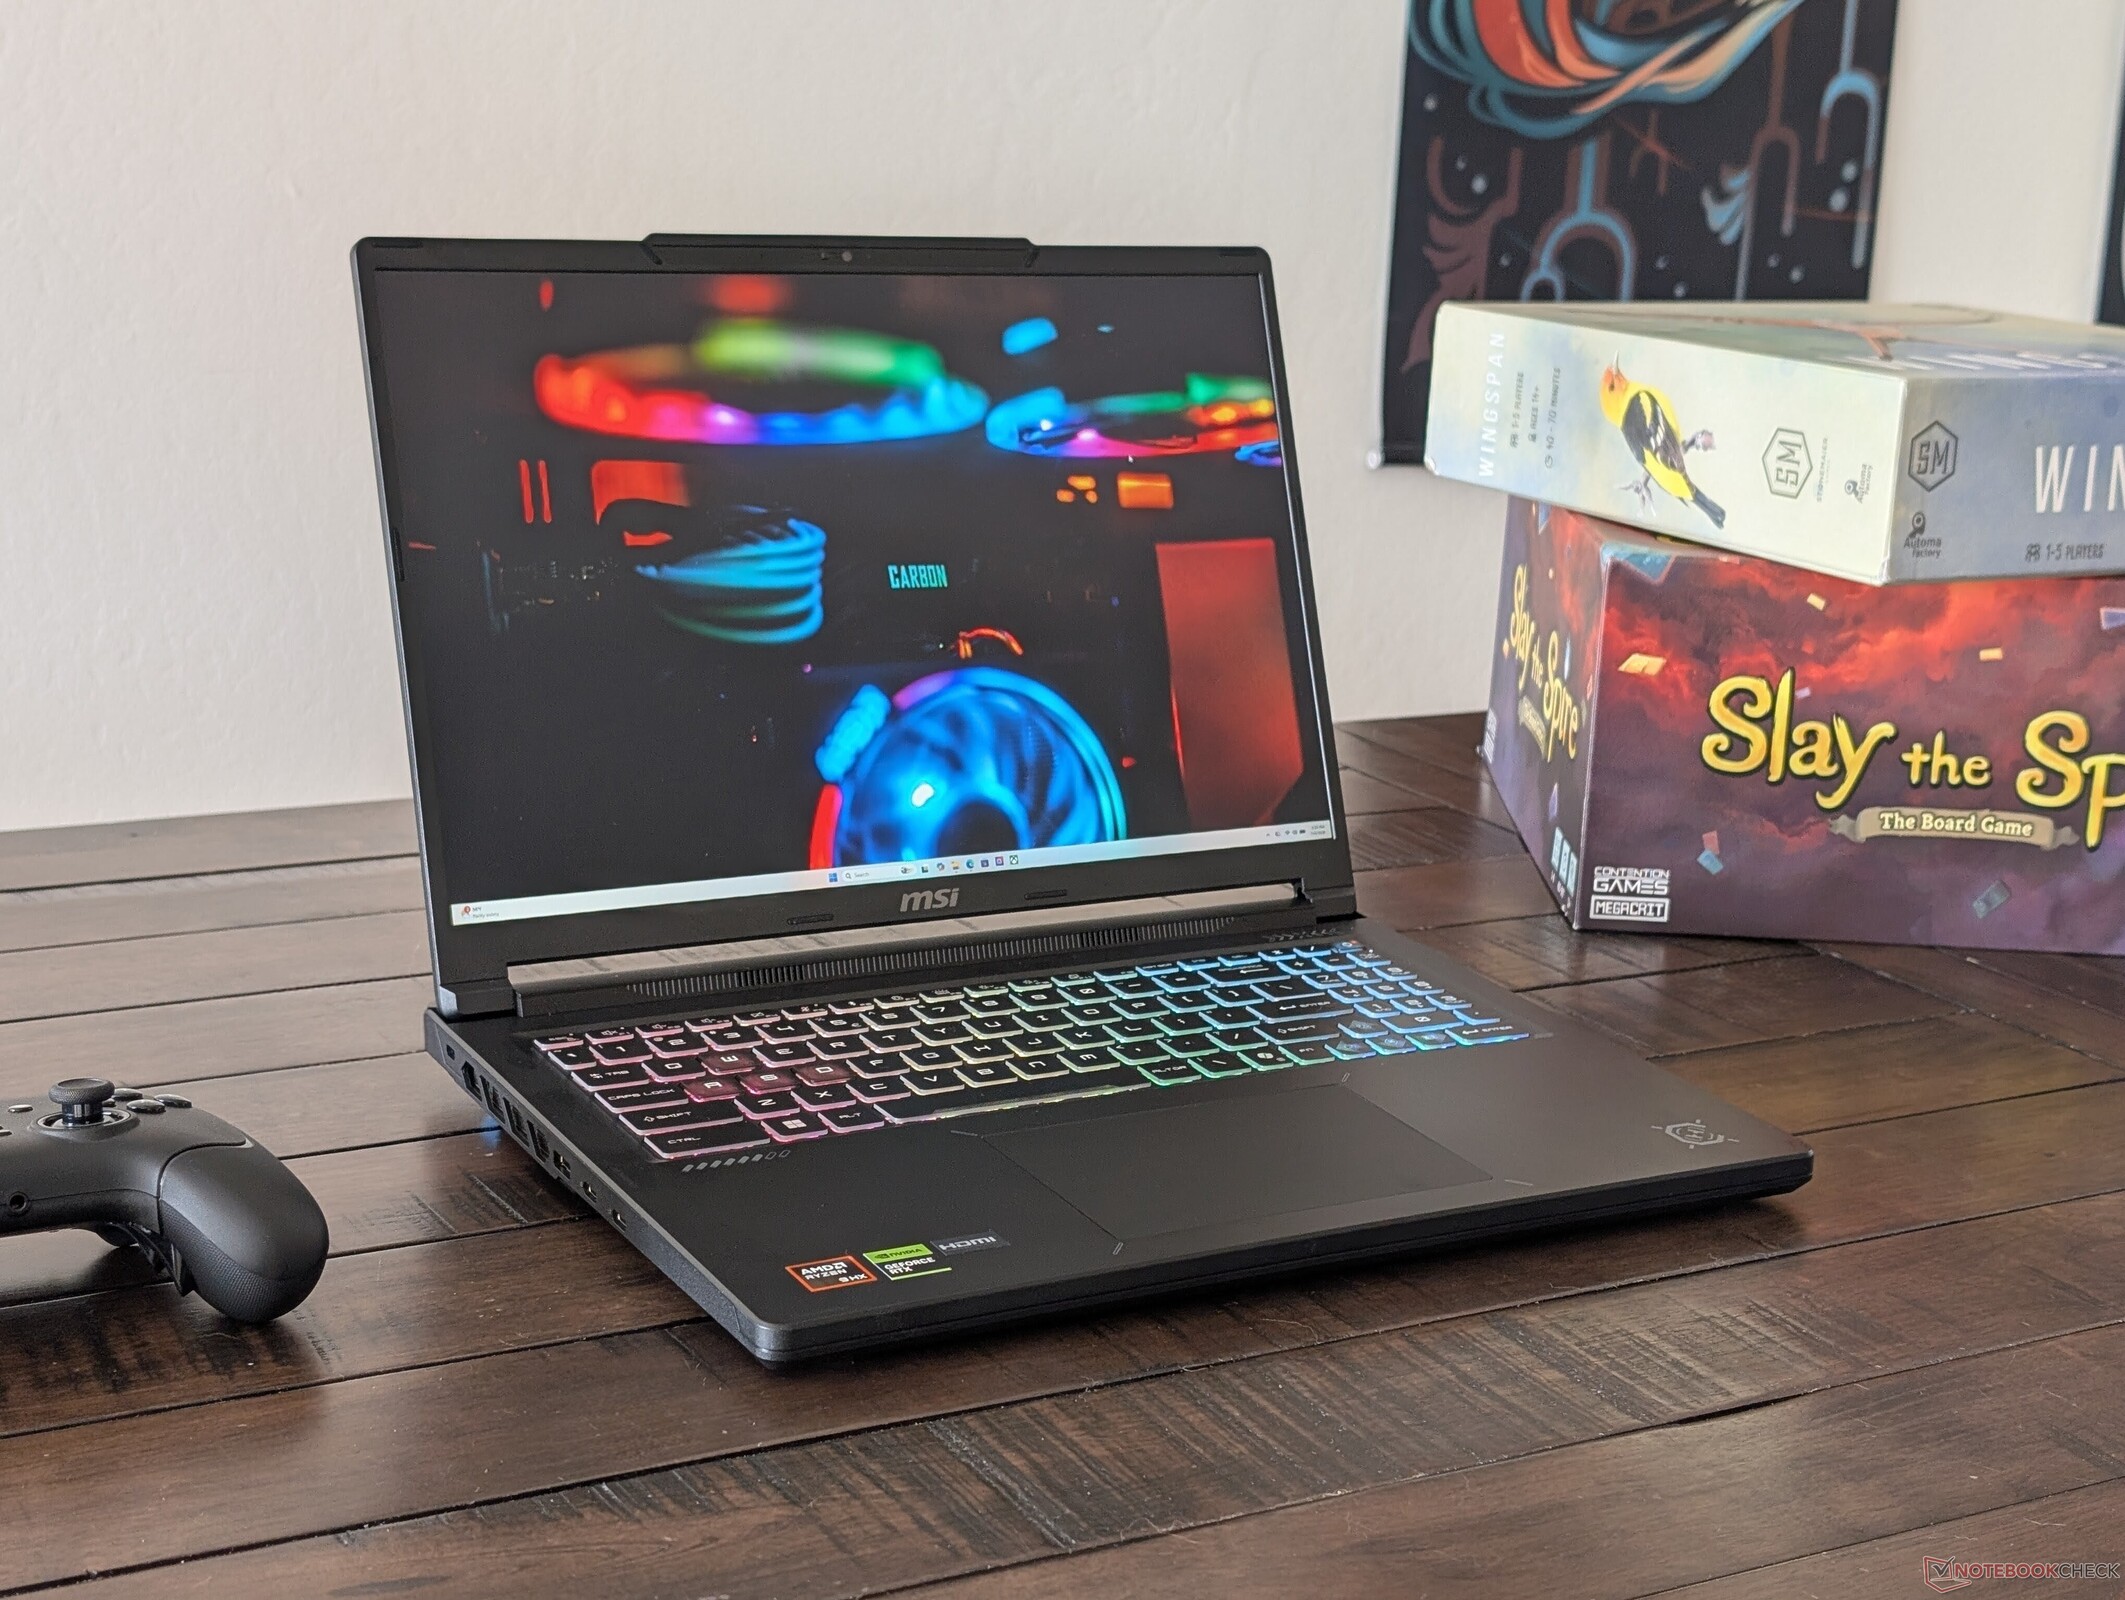
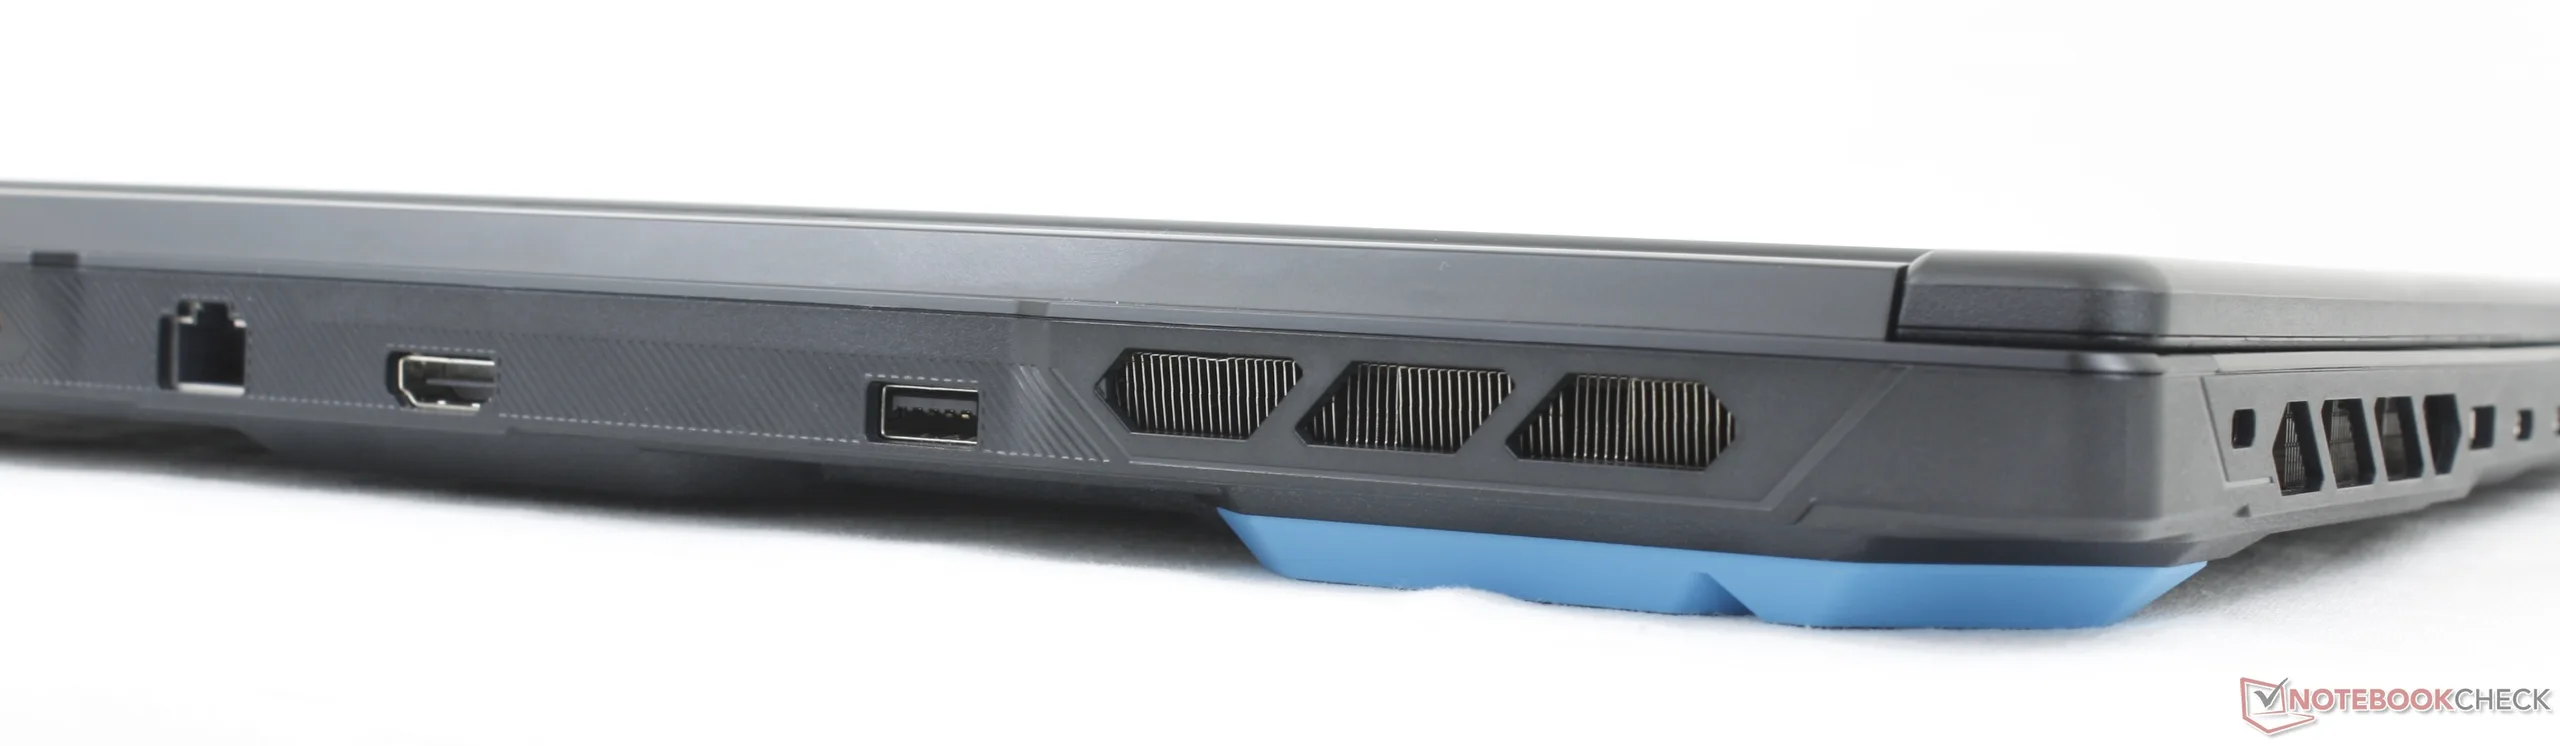
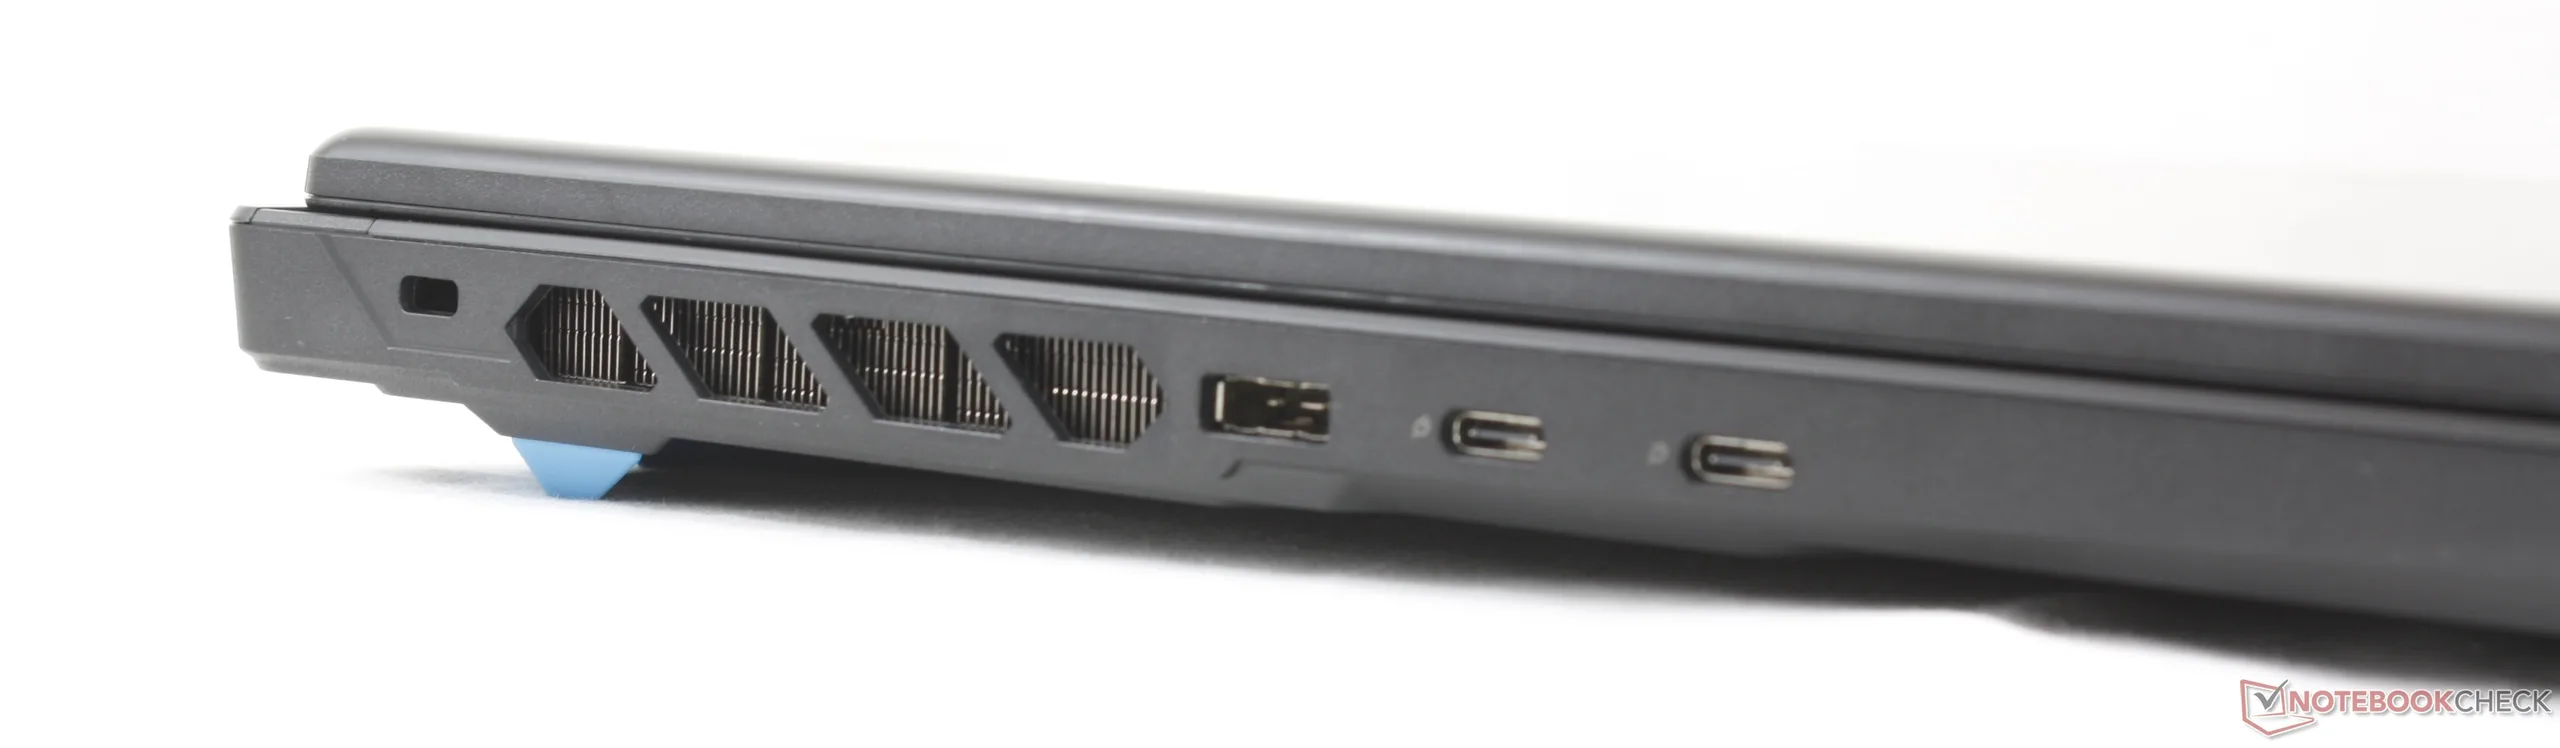
Crosshair A16 HX wyróżnia się wysoką wydajnością, zwłaszcza jak na laptop gamingowy klasy średniej z procesorem AMD lub kartą graficzną NVIDIA. Pomimo tego, że działa on na starszej platformie Zen 4, Ryzen 9 8940HX przewyższa wydajnością nowszy procesor Ryzen AI 9 470 oparty na architekturze Zen 5, a jednocześnie plasuje się w przedziale od 5 do 10 procent w stosunku do droższego procesora Intel Core Ultra 9 275HX. Zmiany konstrukcyjne obudowy również stanowią krok we właściwym kierunku, ponieważ system oferuje więcej portów, większy panel dotykowy oraz nieco cieńszą i lżejszą konstrukcję w porównaniu z modelem Crosshair 16 HX , co ułatwia jego transport.
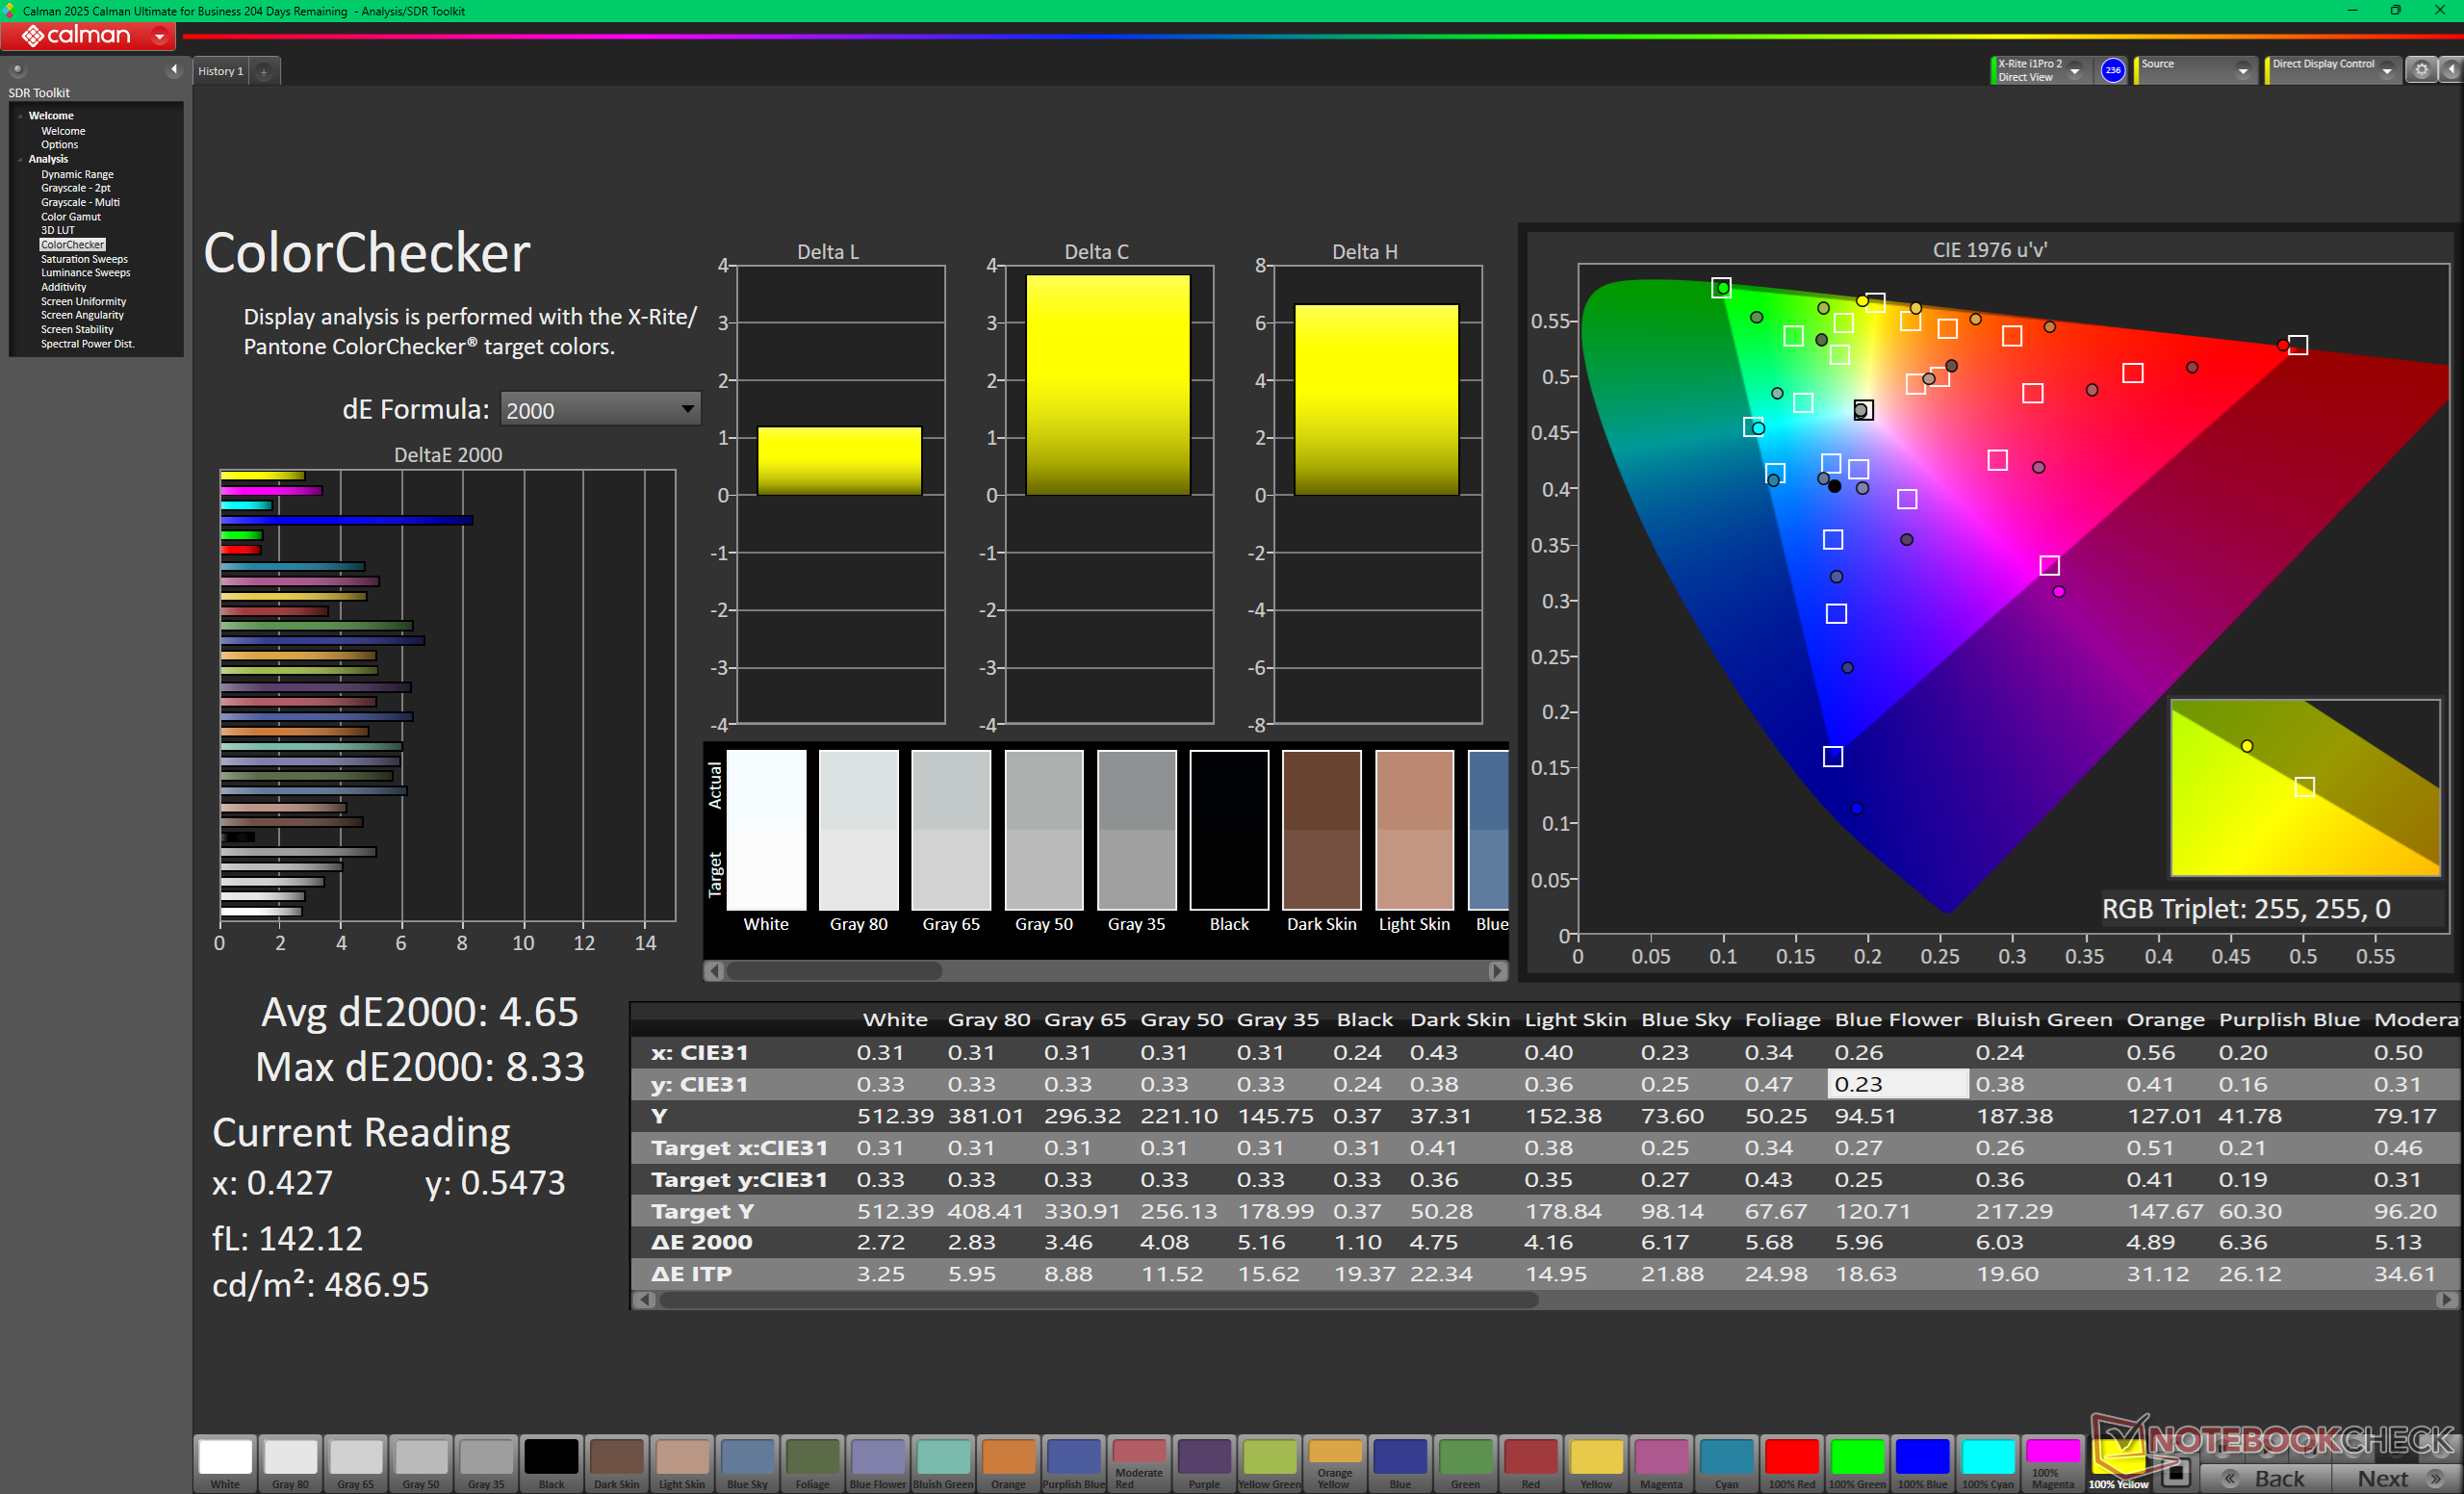
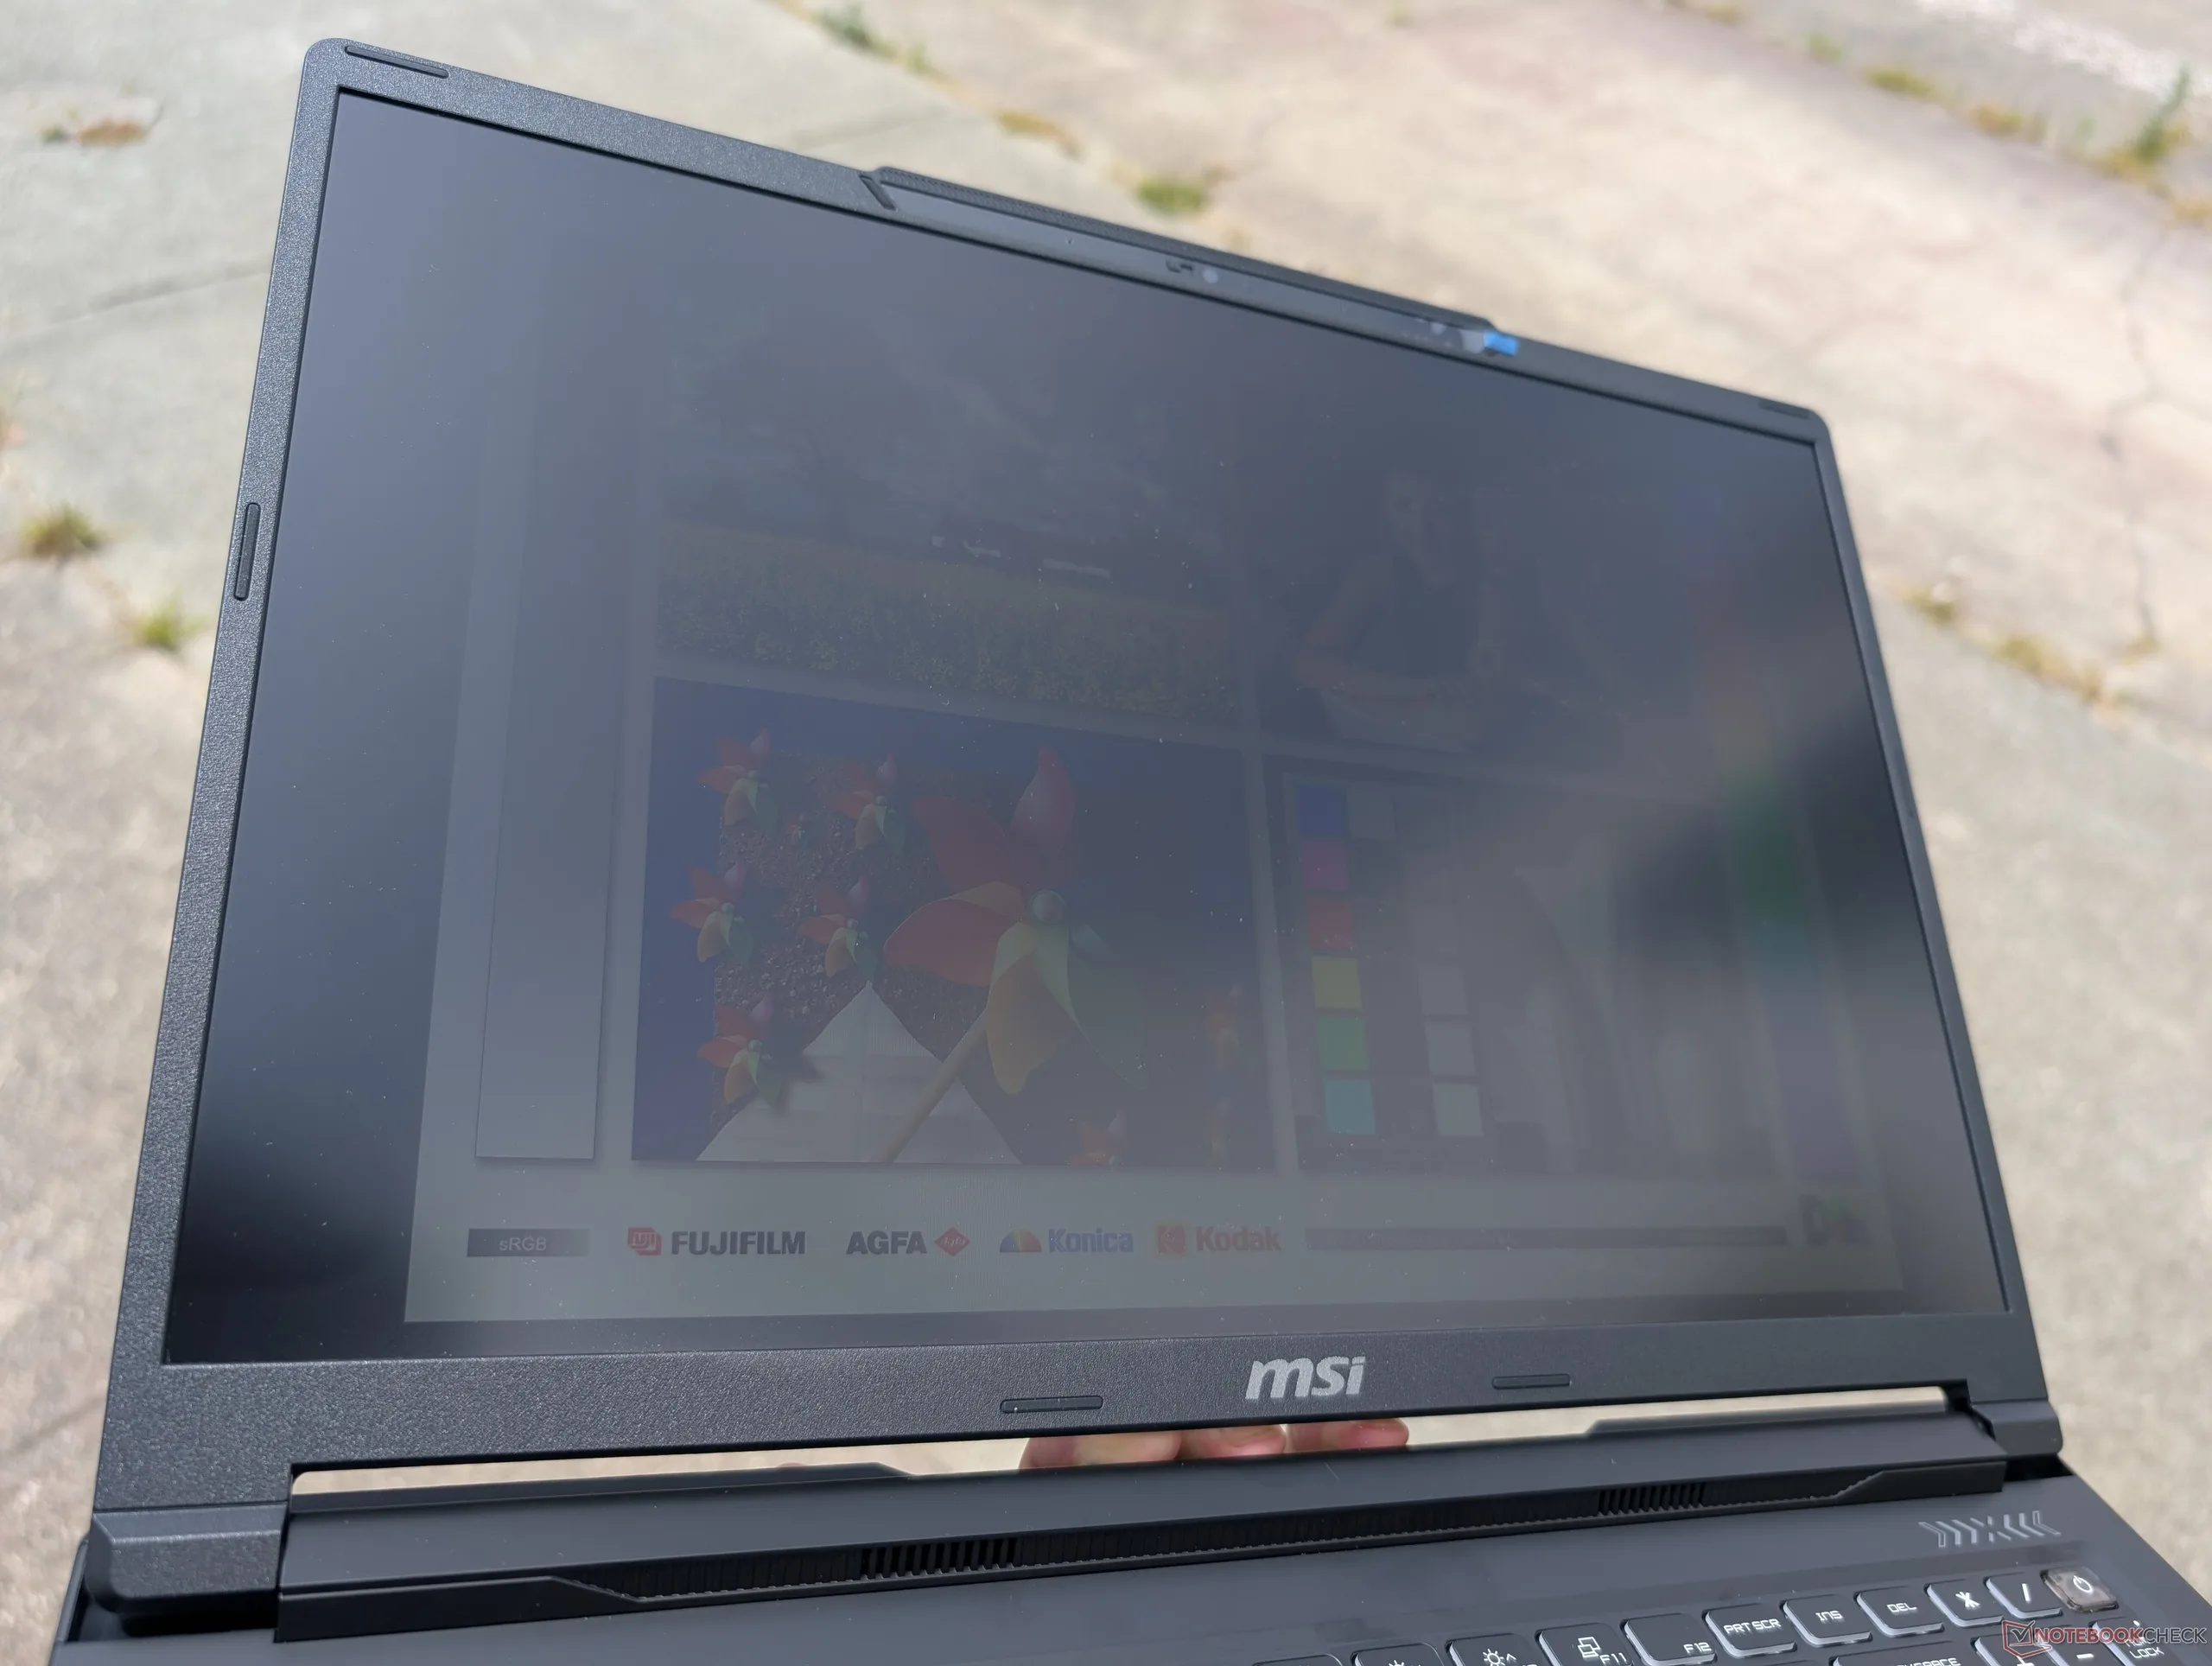
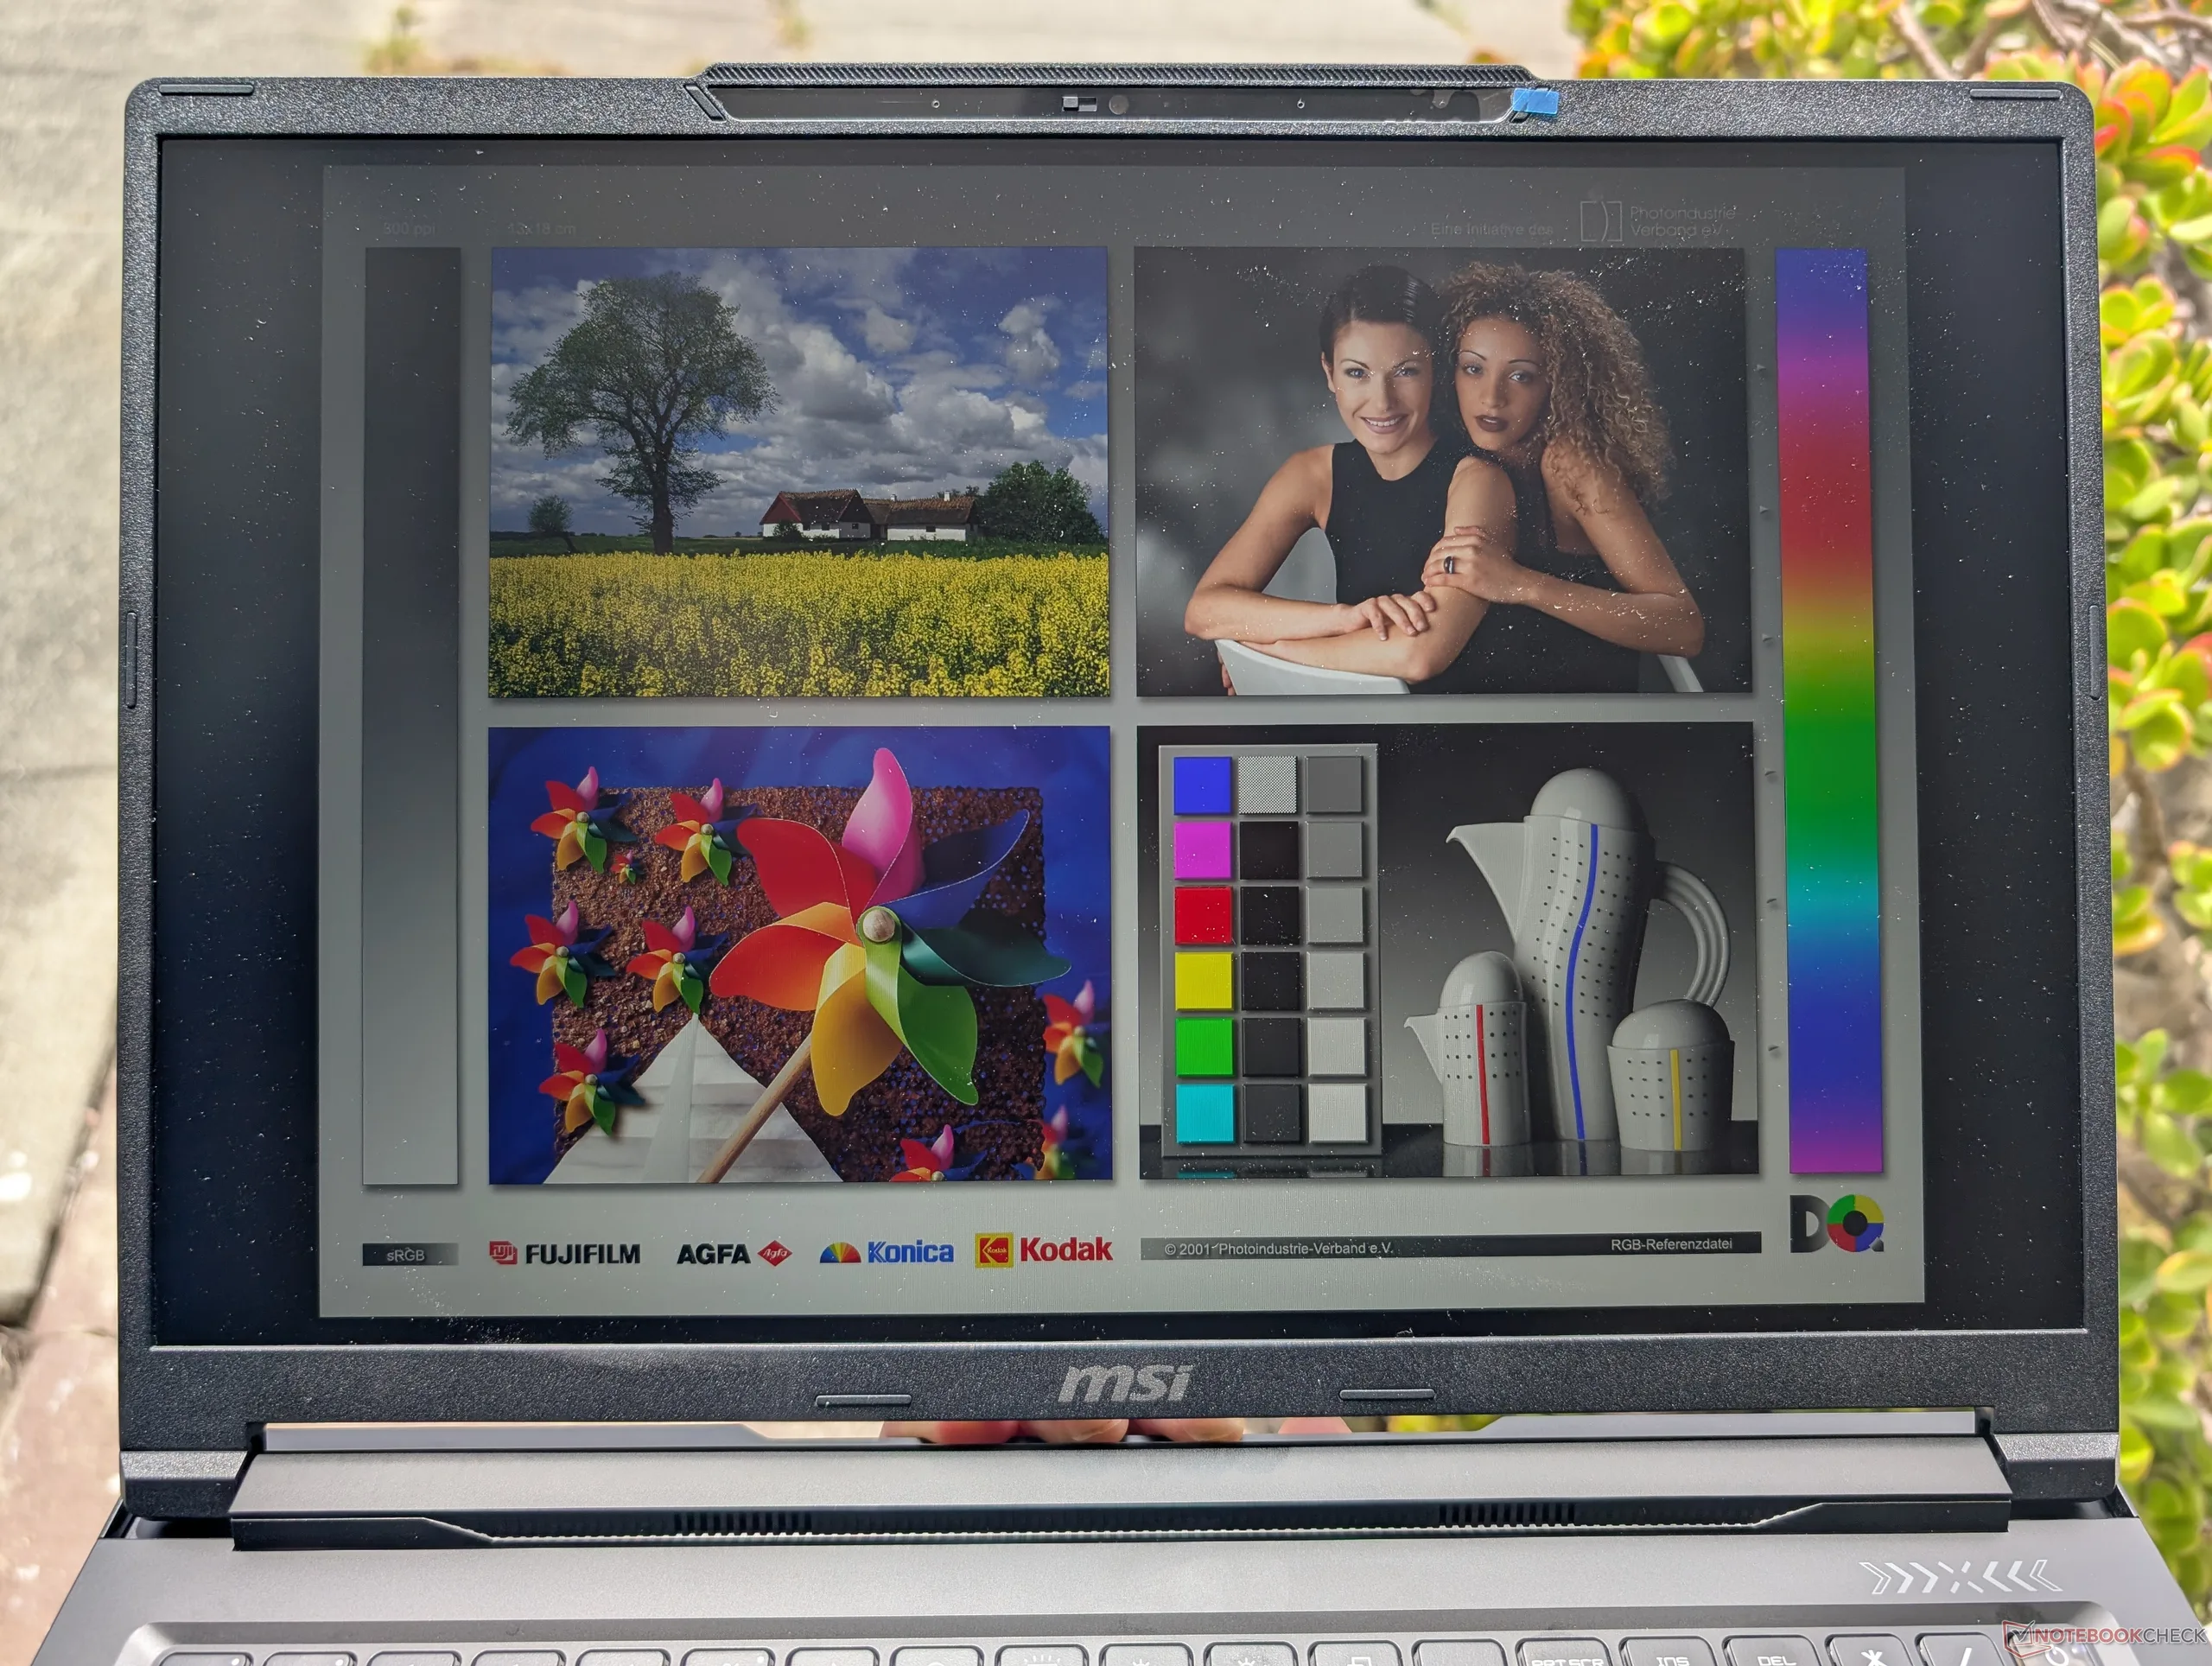
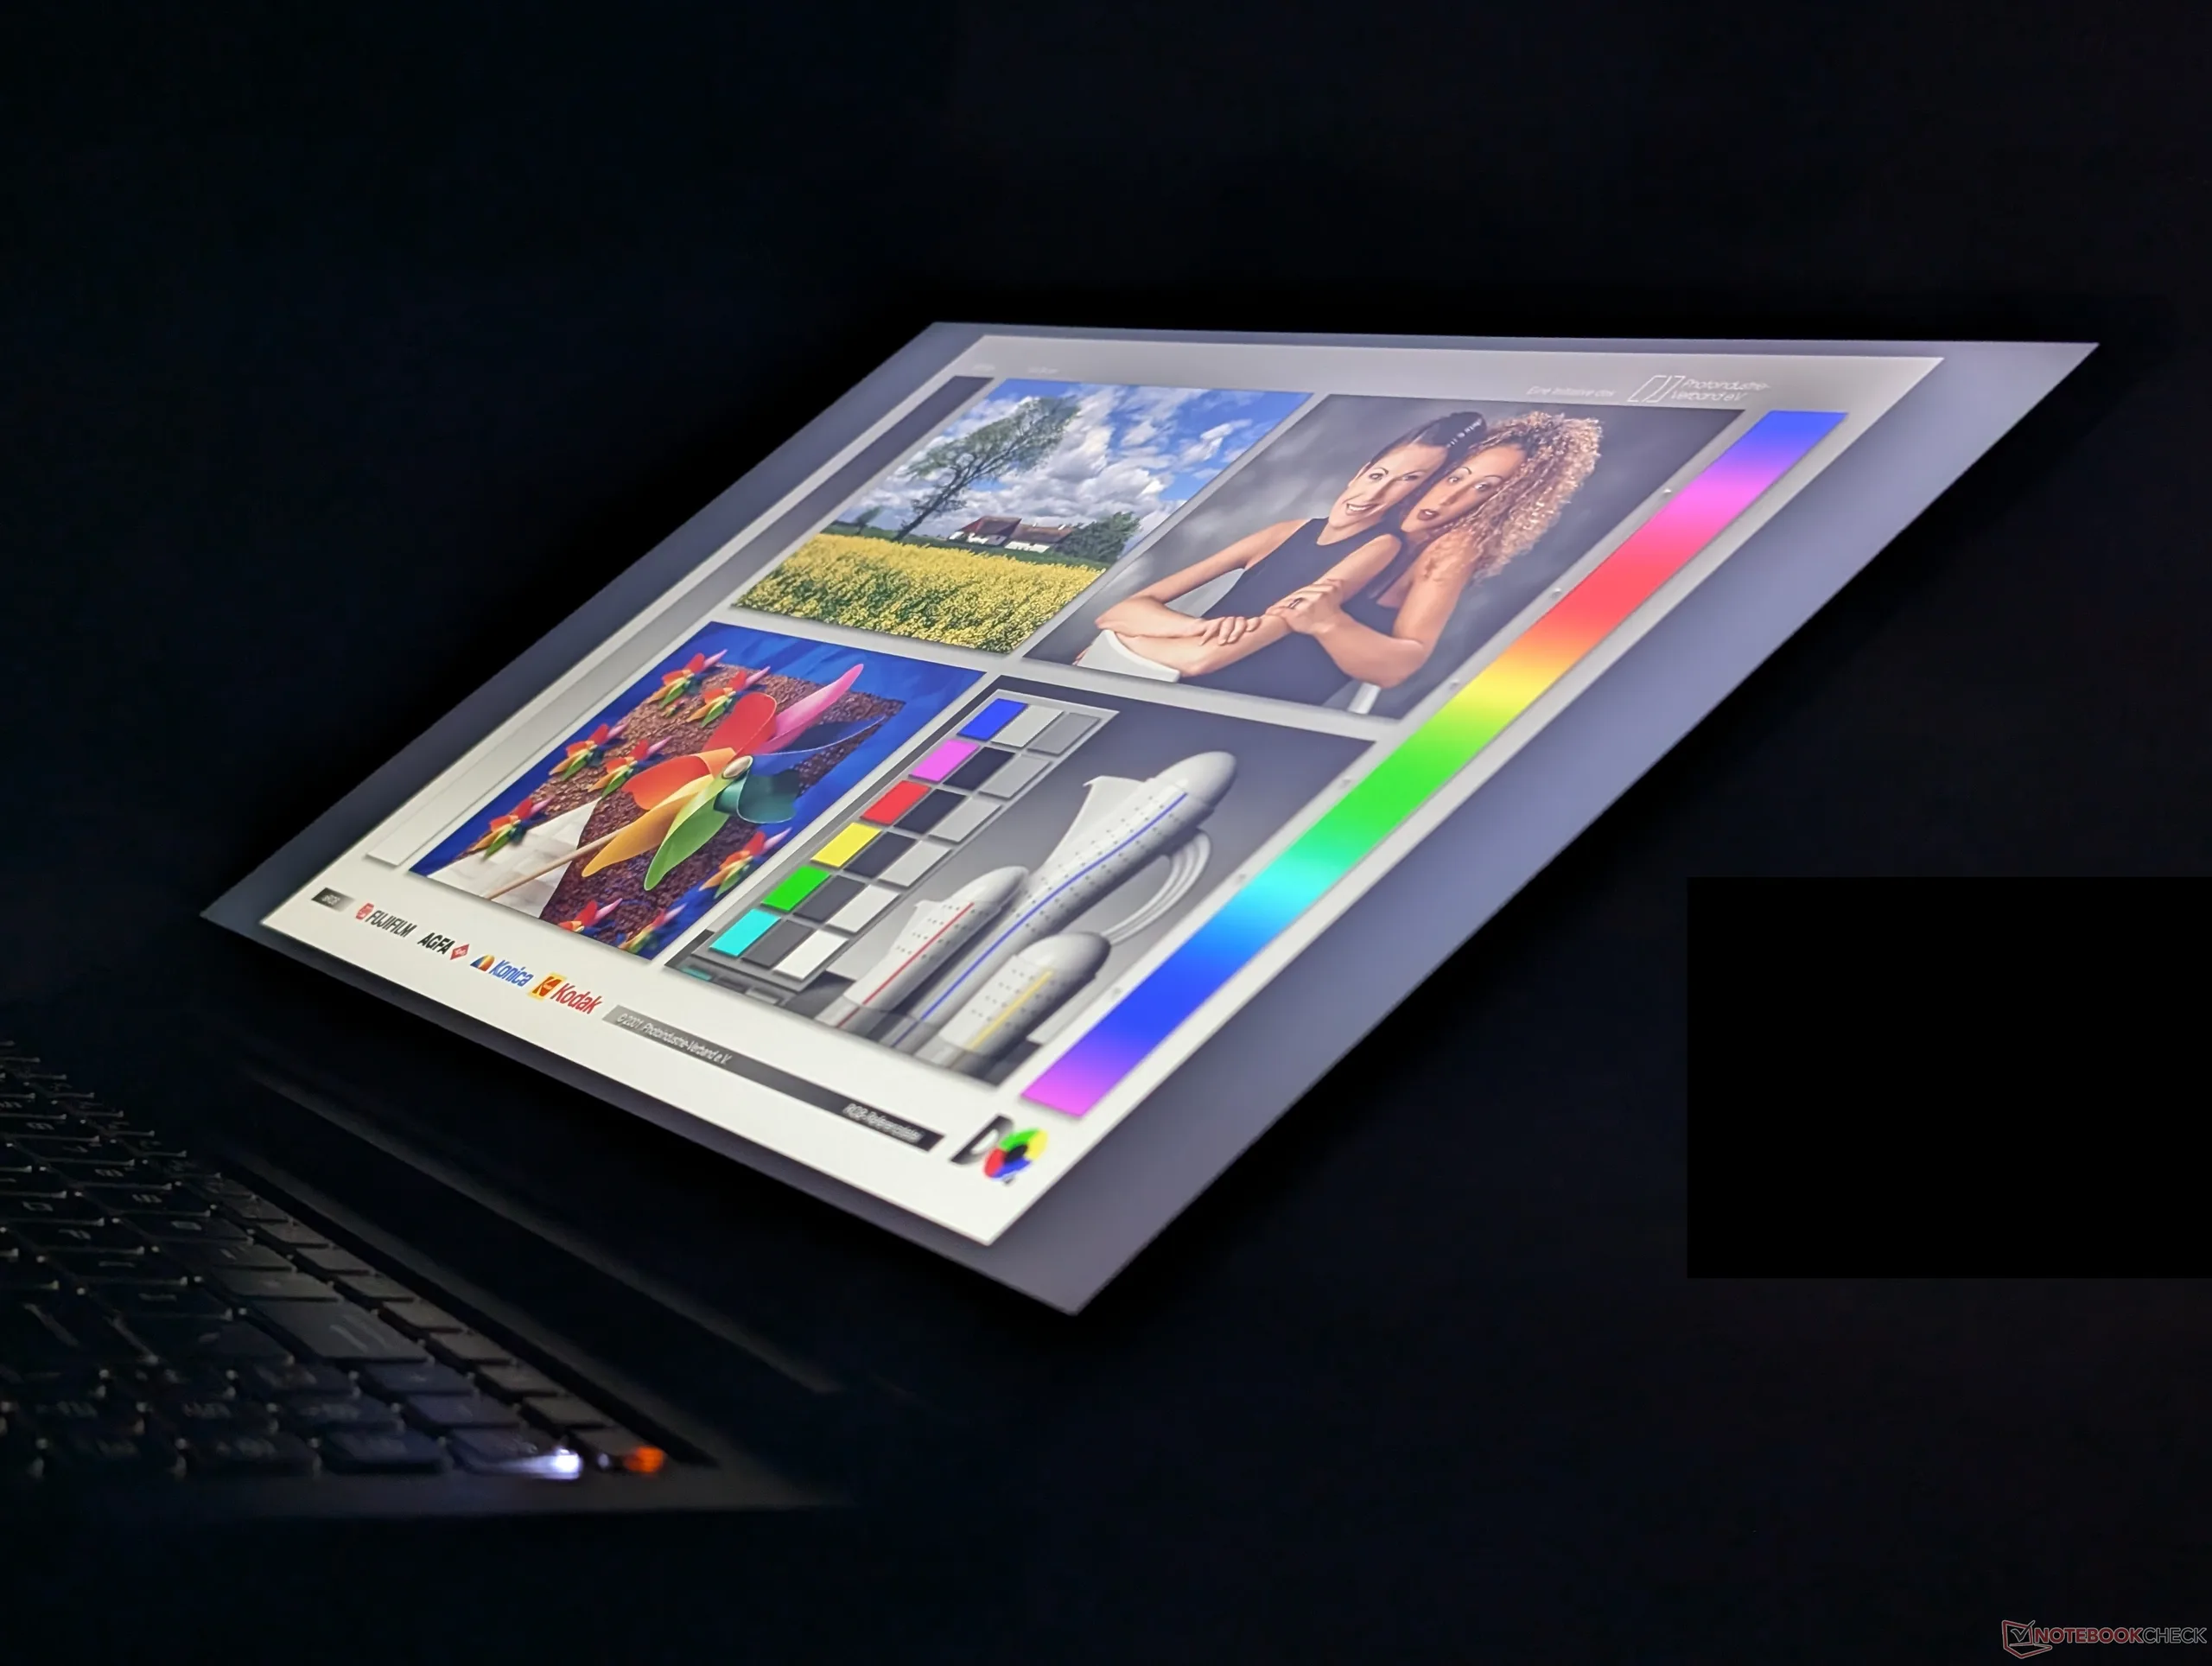
Na uwagę zasługuje również wyświetlacz IPS o rozdzielczości 1600p240 z pokryciem 95% przestrzeni barwnej P3. Doceniamy fakt, że wszystkie obecne konfiguracje są wyposażone w ten sam wysokiej jakości panel – nawet podstawowy model z kartą graficzną RTX 5060 – dzięki czemu nabywcy nie muszą obawiać się opcji o niskim pokryciu przestrzeni barwnej (zaledwie 45% NTSC).
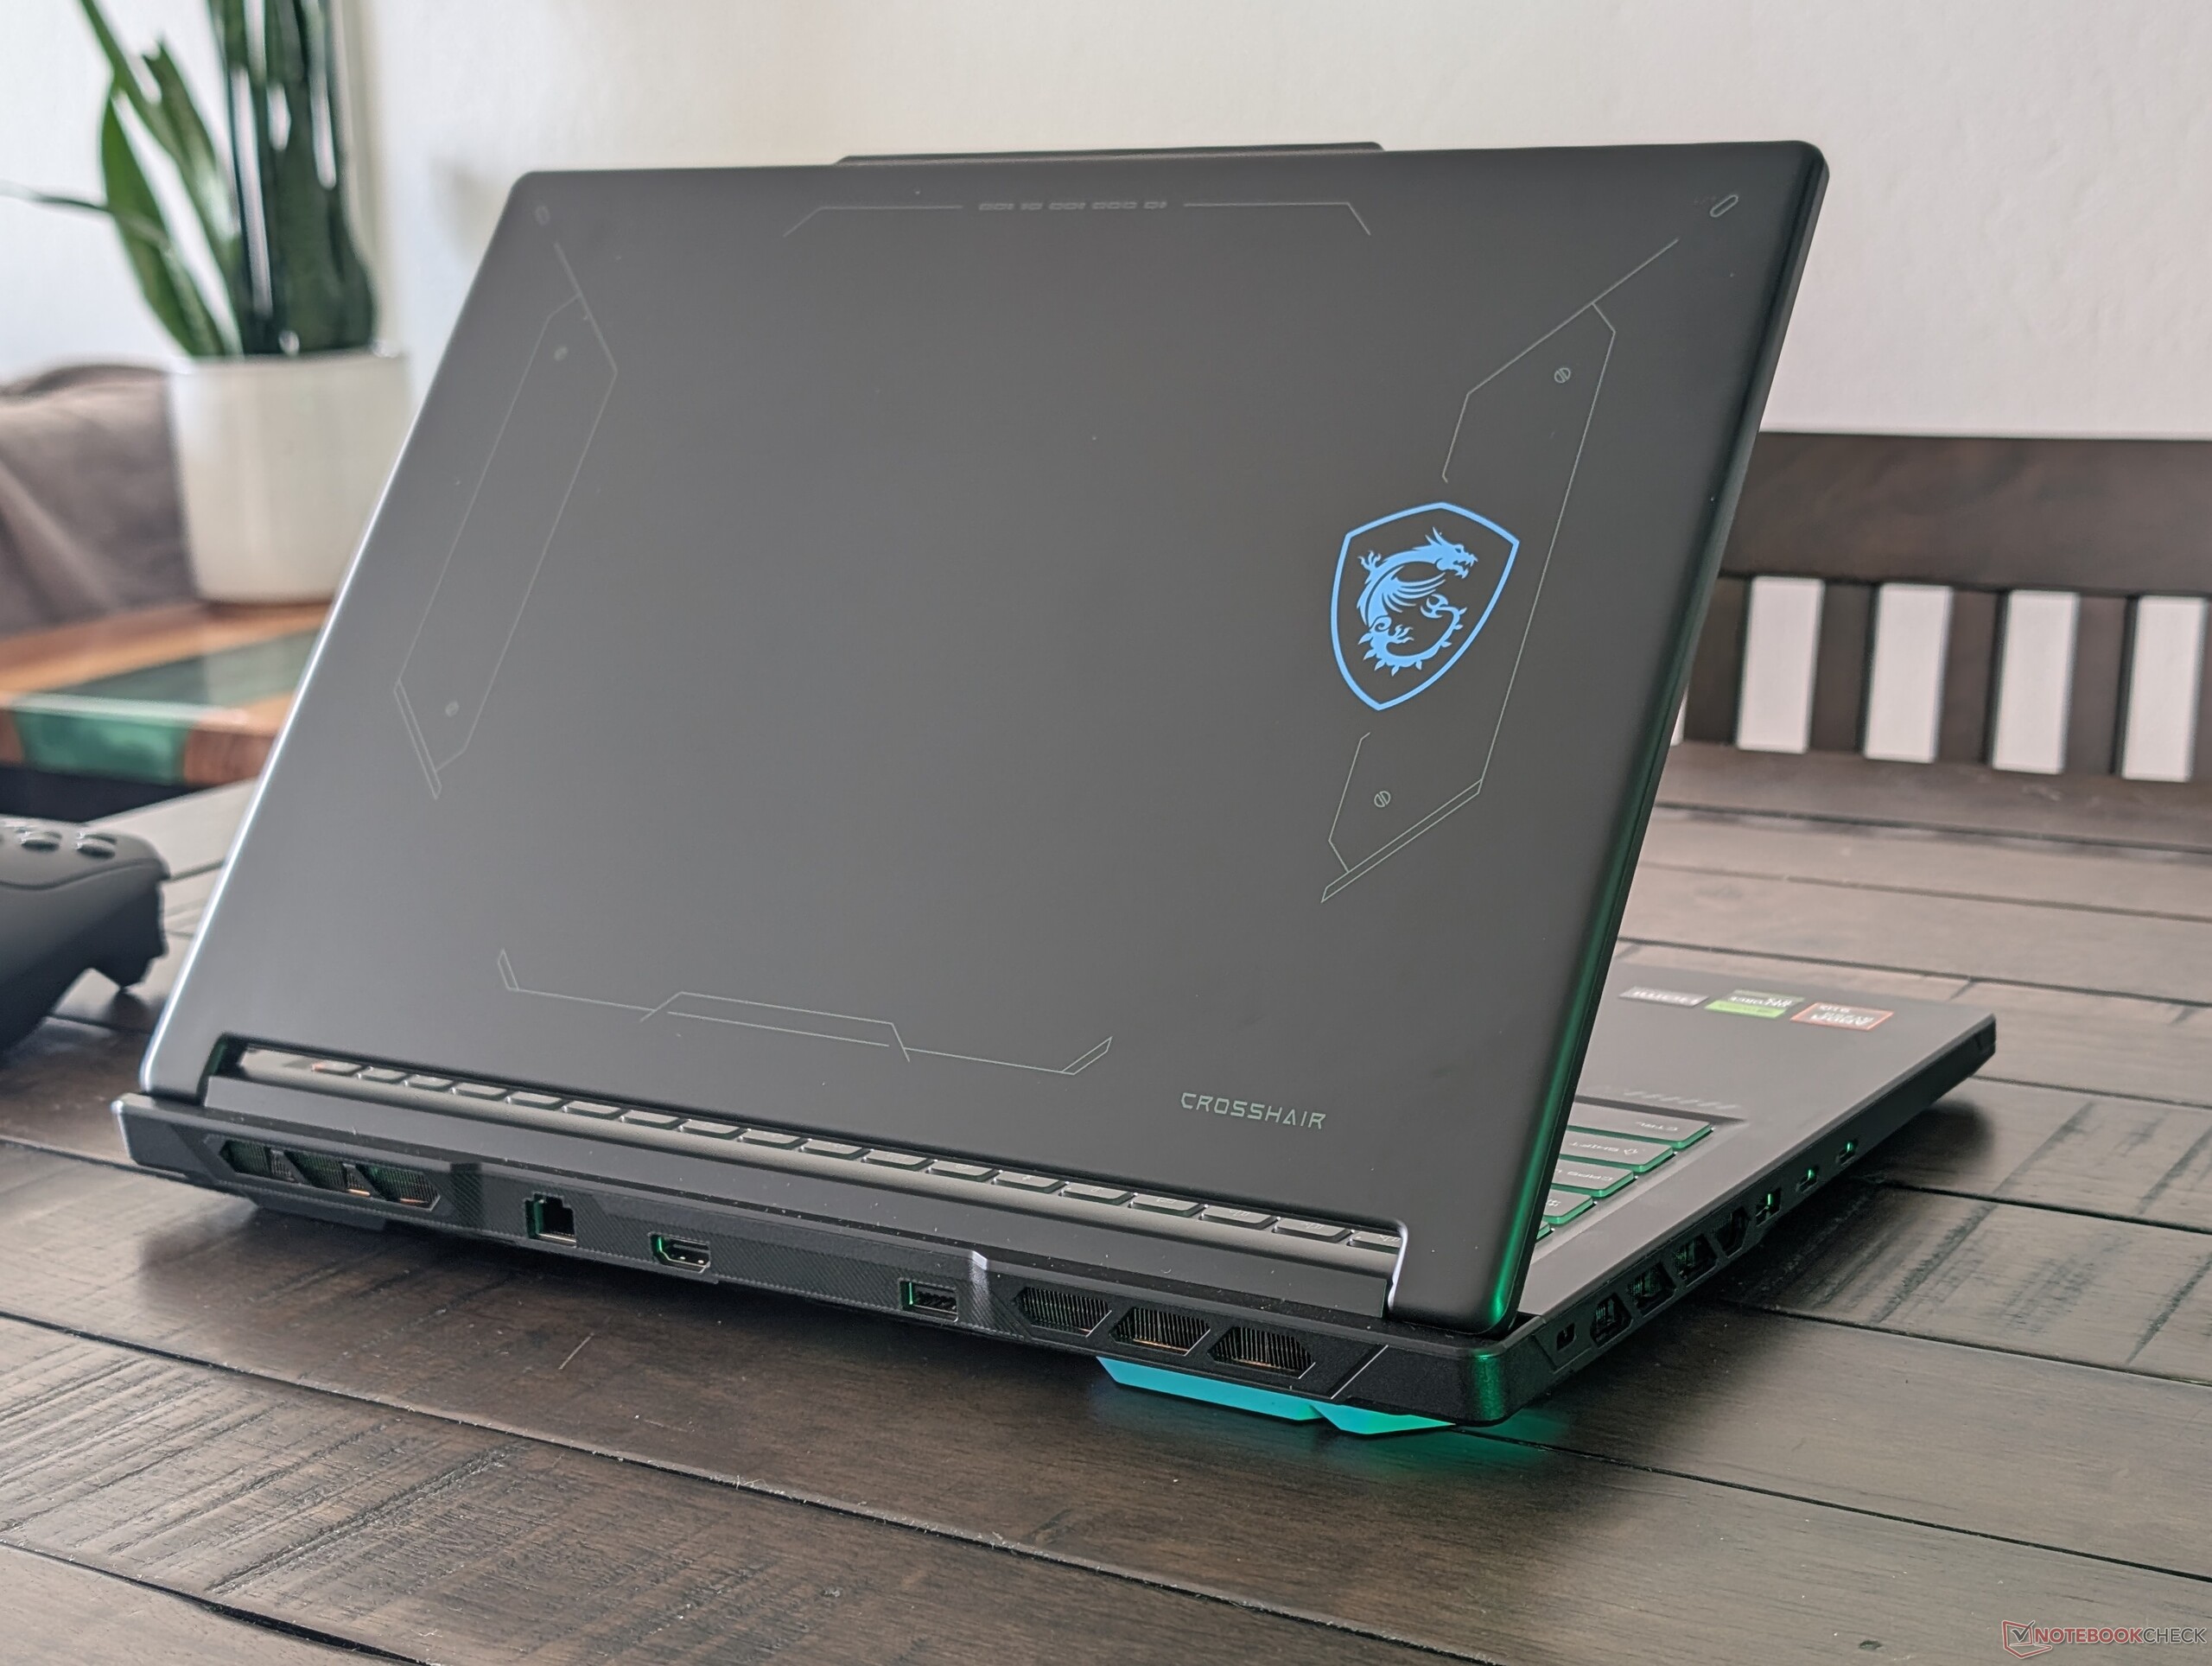
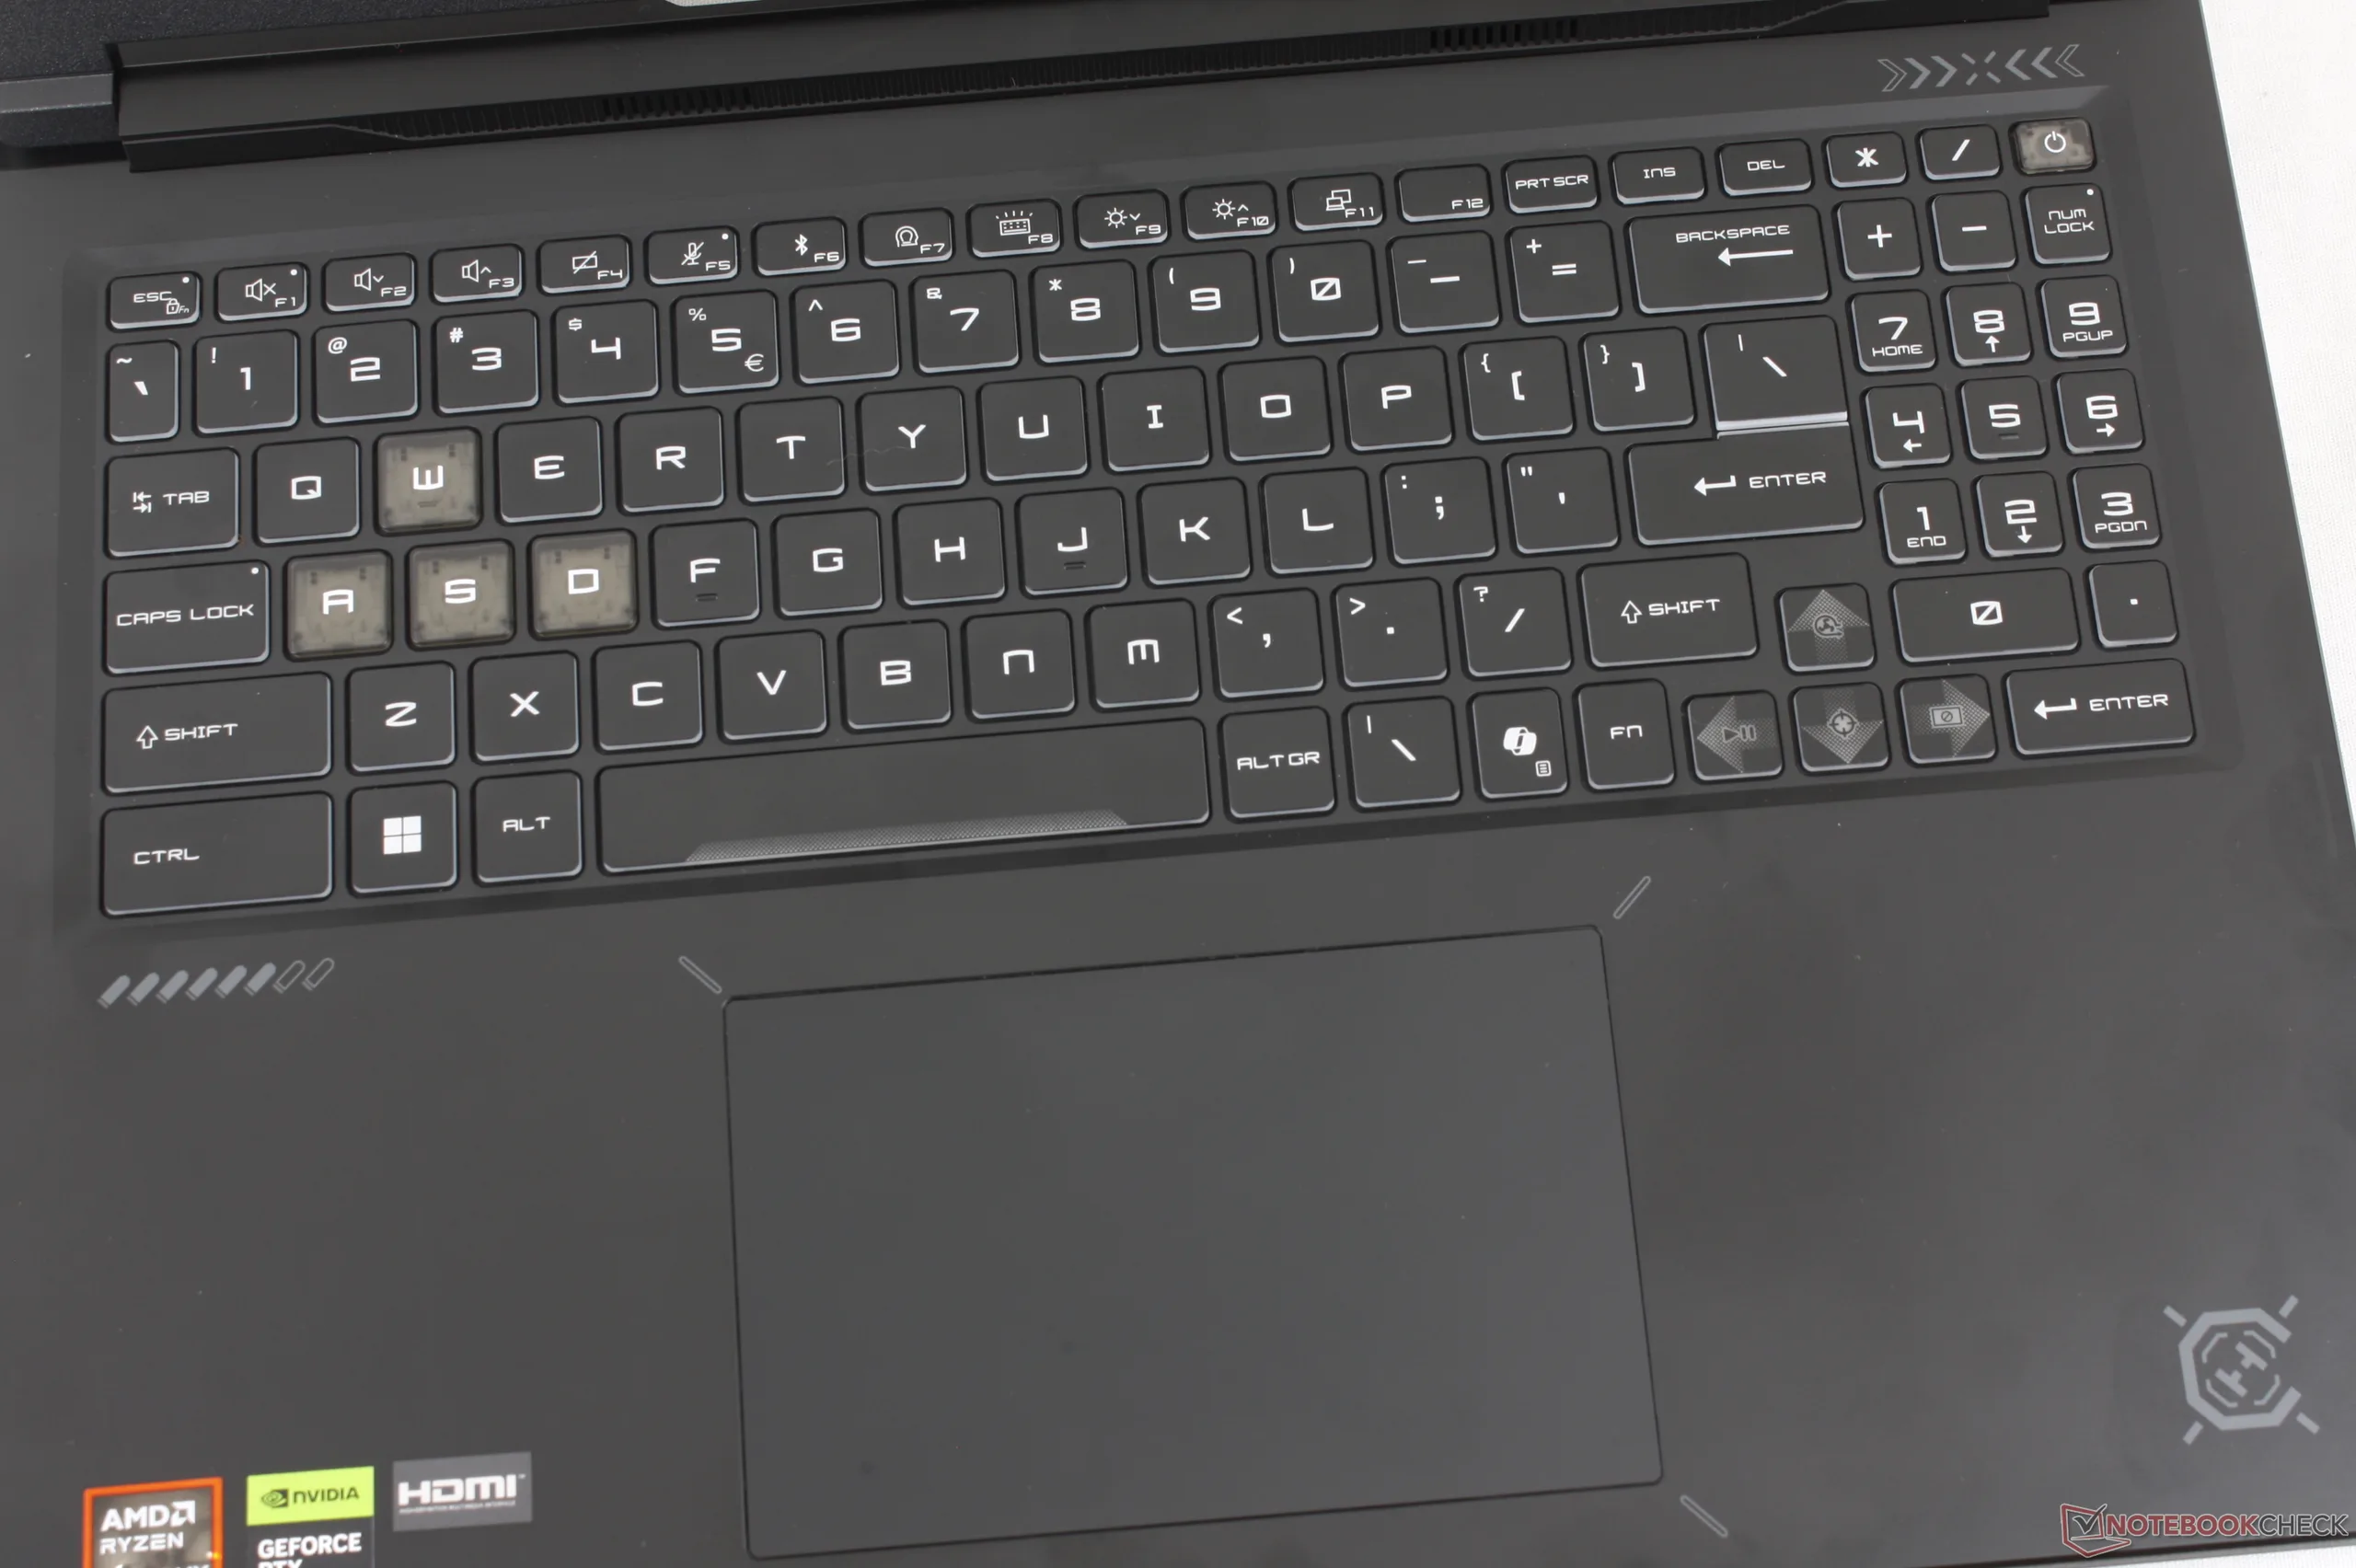
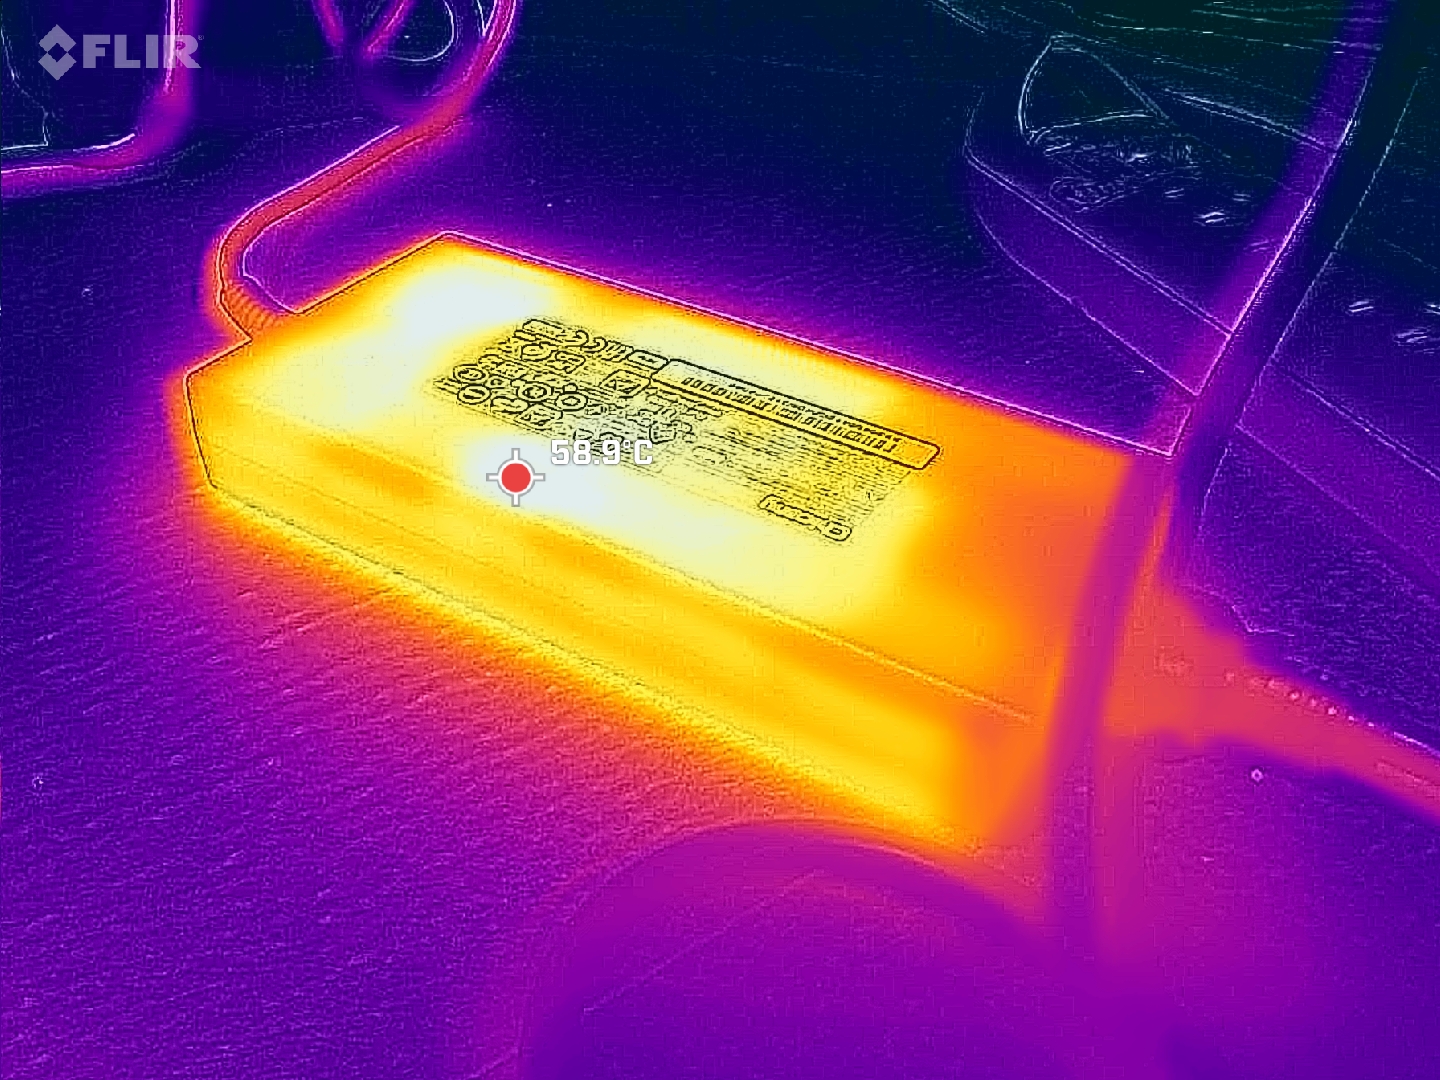
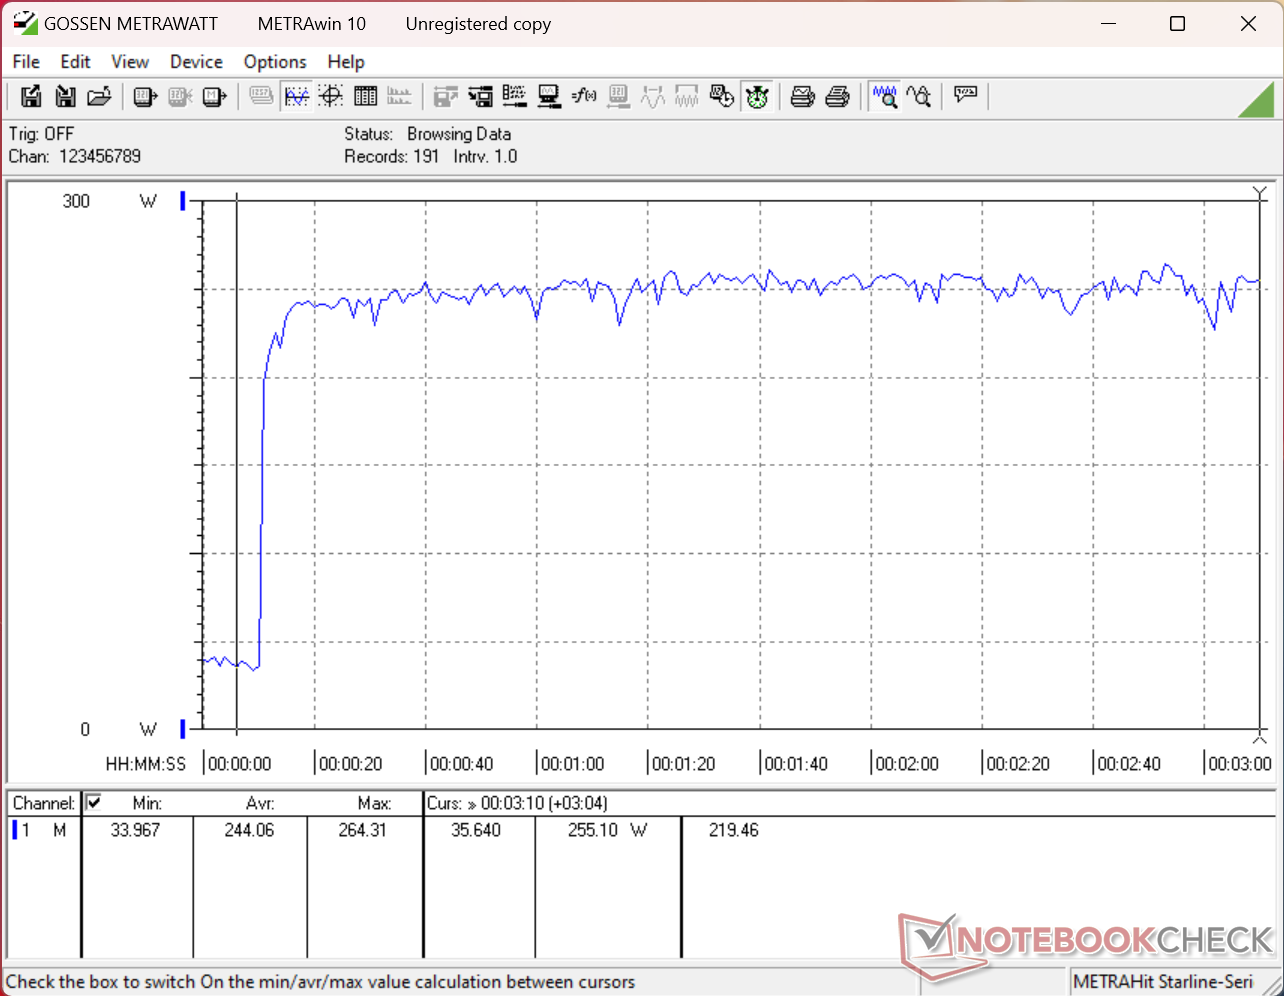
Chociaż ulepszenia w zakresie wydajności i obudowy są znakomite, Crosshair A16 HX pozostaje modelem z segmentu budżetowego, w związku z czym zauważalne są pewne oszczędności. W szczególności matowa, plastikowa obudowa jest bardzo podatna na odciski palców, a słaba jakość głośników, brak technologii G-Sync, Advanced Optimus, HDR oraz podświetlenia RGB poszczególnych klawiszy negatywnie wpływają na ogólne wrażenia z grania. Zasilacz o mocy 240 W wydaje się nieco za mały, ponieważ ten wymagający laptop zużywa średnio już prawie 250 W podczas grania, co prowadzi do bardzo wysokich temperatur zasilacza i ogólnie krótszego czasu pracy na baterii.
Za
Przeciw
Cena i dostępność
Testowana przez nas konfiguracja z kartą RTX 5070 jest obecnie dostępna w sprzedaży na Amazon za 2700 dolarów.
Crosshair A16 HX to wersja AMD opartego na procesorach Intel Crosshair 16 HX. Niemniej jednak między tymi modelami istnieje kilka różnic, zarówno pod względem wyglądu zewnętrznego, jak i konstrukcji wewnętrznej. Seria Crosshair obejmuje niektóre z bardziej przystępnych cenowo laptopów gamingowych firmy MSI, w przeciwieństwie do droższych serii Raider lub Titan.
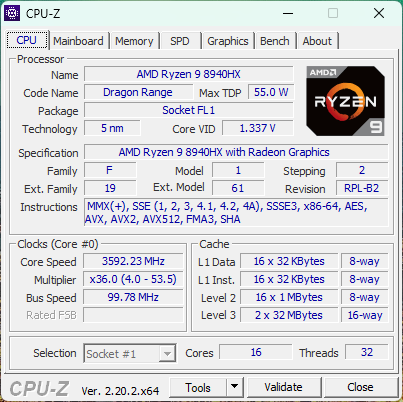
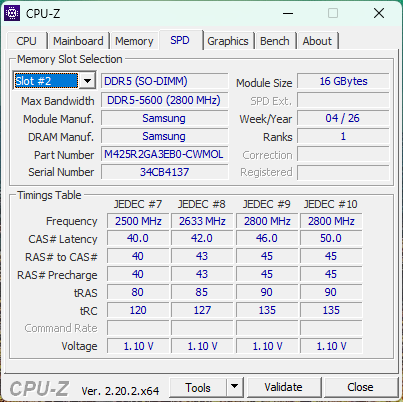
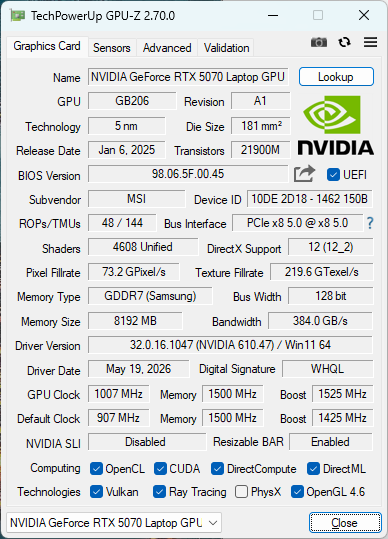
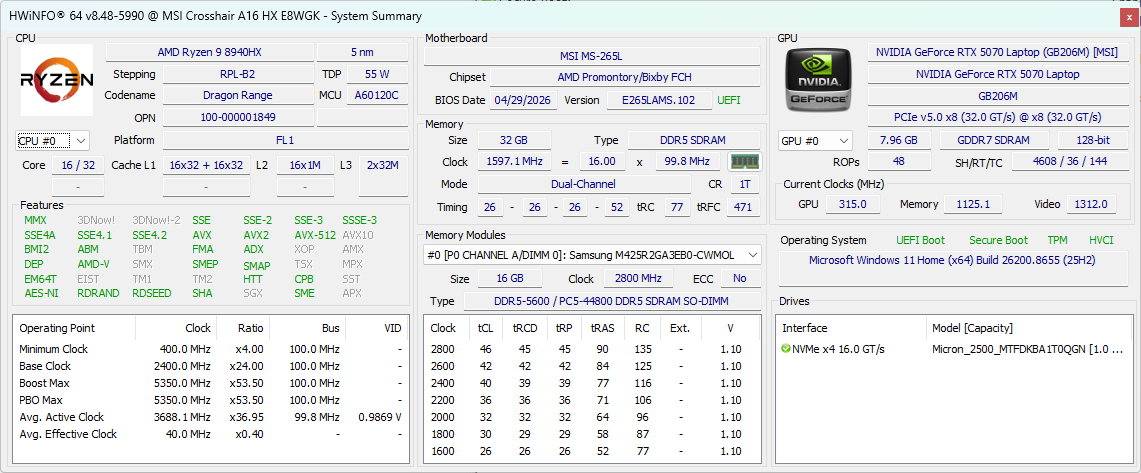
Nasz egzemplarz testowy to konfiguracja z wyższej półki, wyposażona w procesor Ryzen 9 8940HX Zen 4, kartę graficzną RTX 5070 z technologią GeForce o mocy 115 W oraz wyświetlacz IPS o rozdzielczości 1600p, dostępna za około 2700 USD. Tańsze modele są wyposażone w kartę graficzną RTX 5060, jednak wszystkie konfiguracje posiadają ten sam wyświetlacz IPS.
Alternatywami są inne niedrogie lub średniej klasy laptopy do gier, takie jak seria Asus TUF, Alienware 16 Auroralub Acer Nitro V 16.
Więcej recenzji produktów MSI:
Dane techniczne
Sprawa
Obudowa wykonana jest głównie z matowego czarnego tworzywa sztucznego i nie posiada zbędnych podświetleń RGB, co pozwala obniżyć koszty. Zawiasy ekranu umożliwiają otwarcie go maksymalnie pod kątem około 150 stopni.
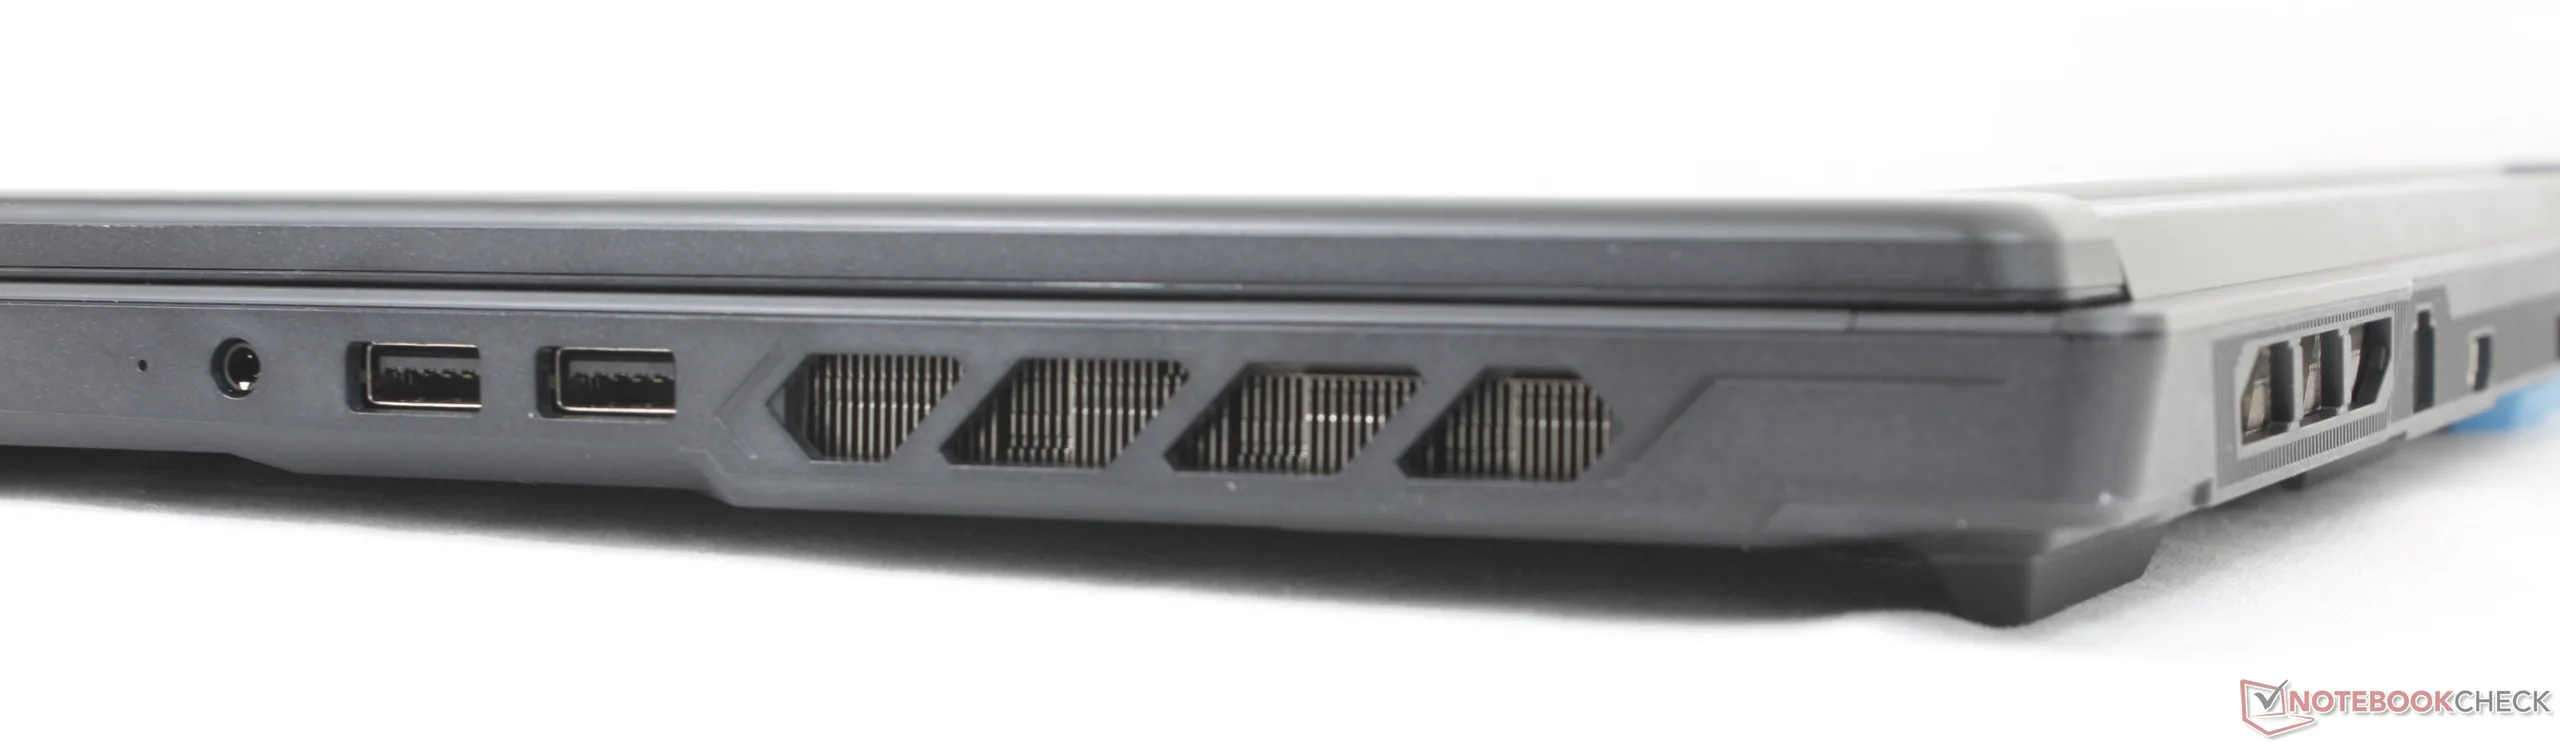
Łączność
Komunikacja
Kamera internetowa


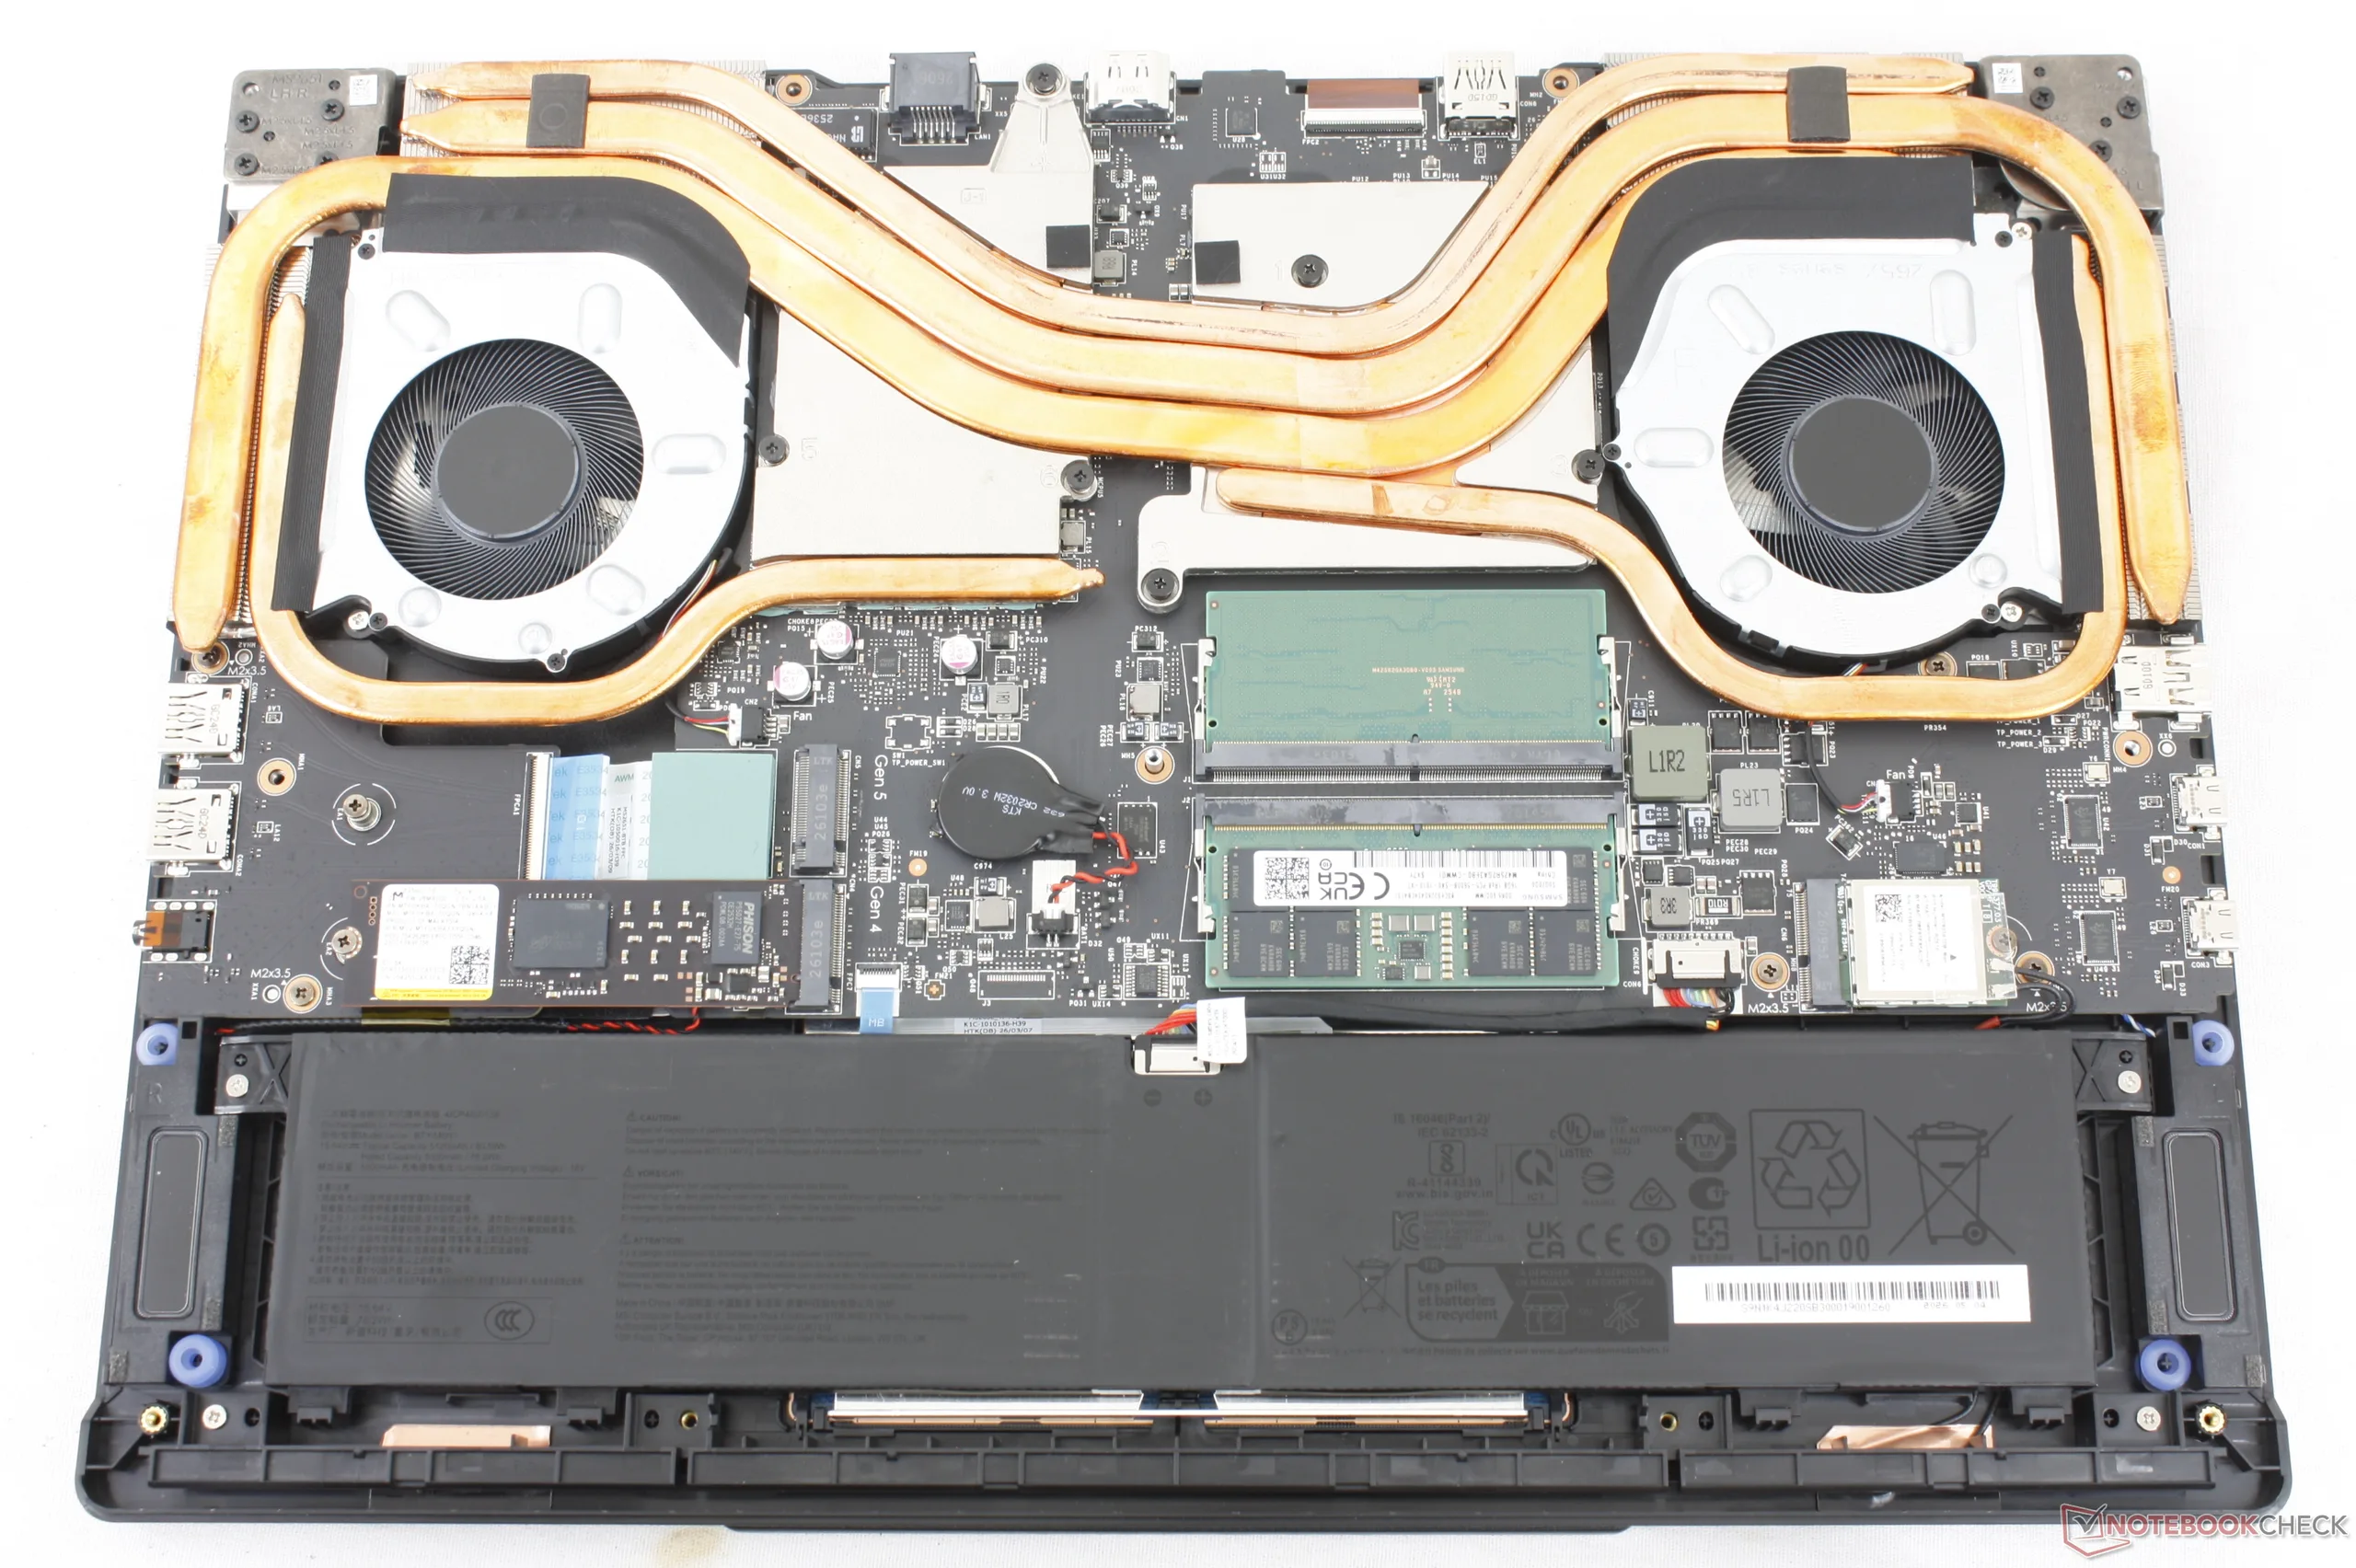
Konserwacja

Urządzenia wejściowe
Wyświetlacz
W tym modelu zastosowano ten sam panel IPS B160QAN02.3 firmy AU Optronics, co w modelu Crosshair 16 HX AI opartym na procesorze Intel.


| |||||||||||||||||||||||||
rozświetlenie: 89 %
na akumulatorze: 512.4 cd/m²
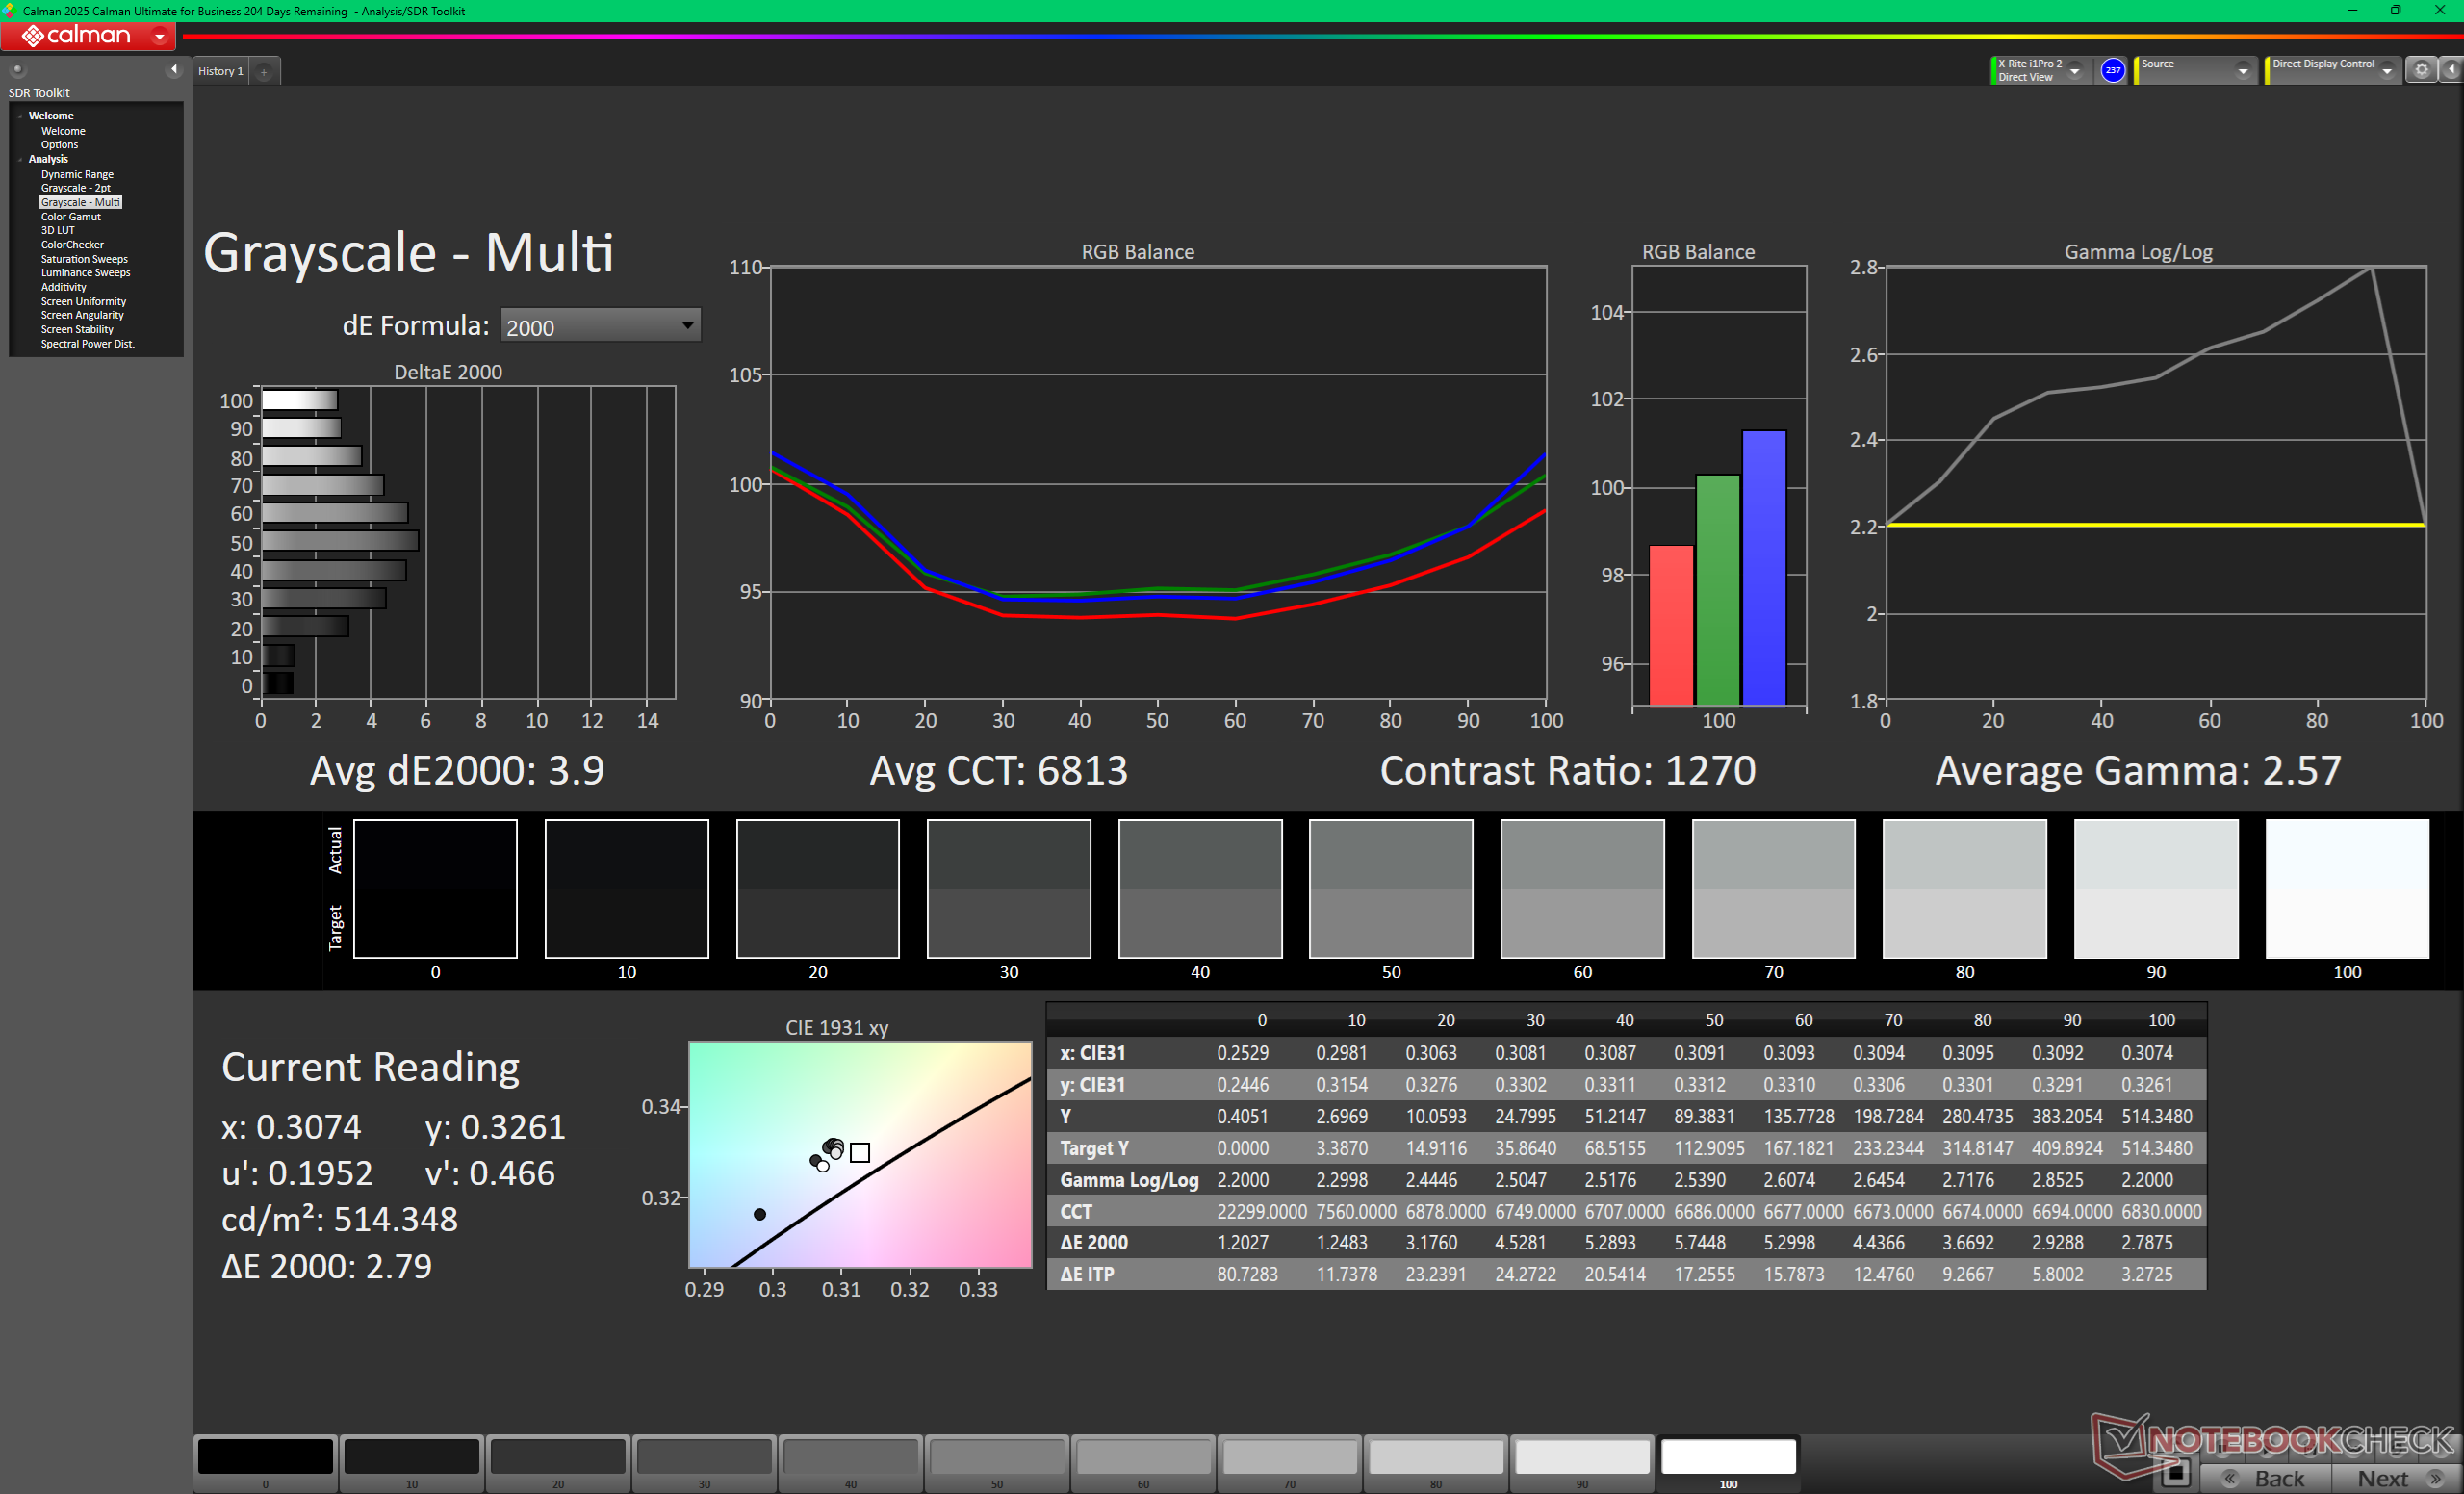
kontrast: 1314:1 (czerń: 0.39 cd/m²)
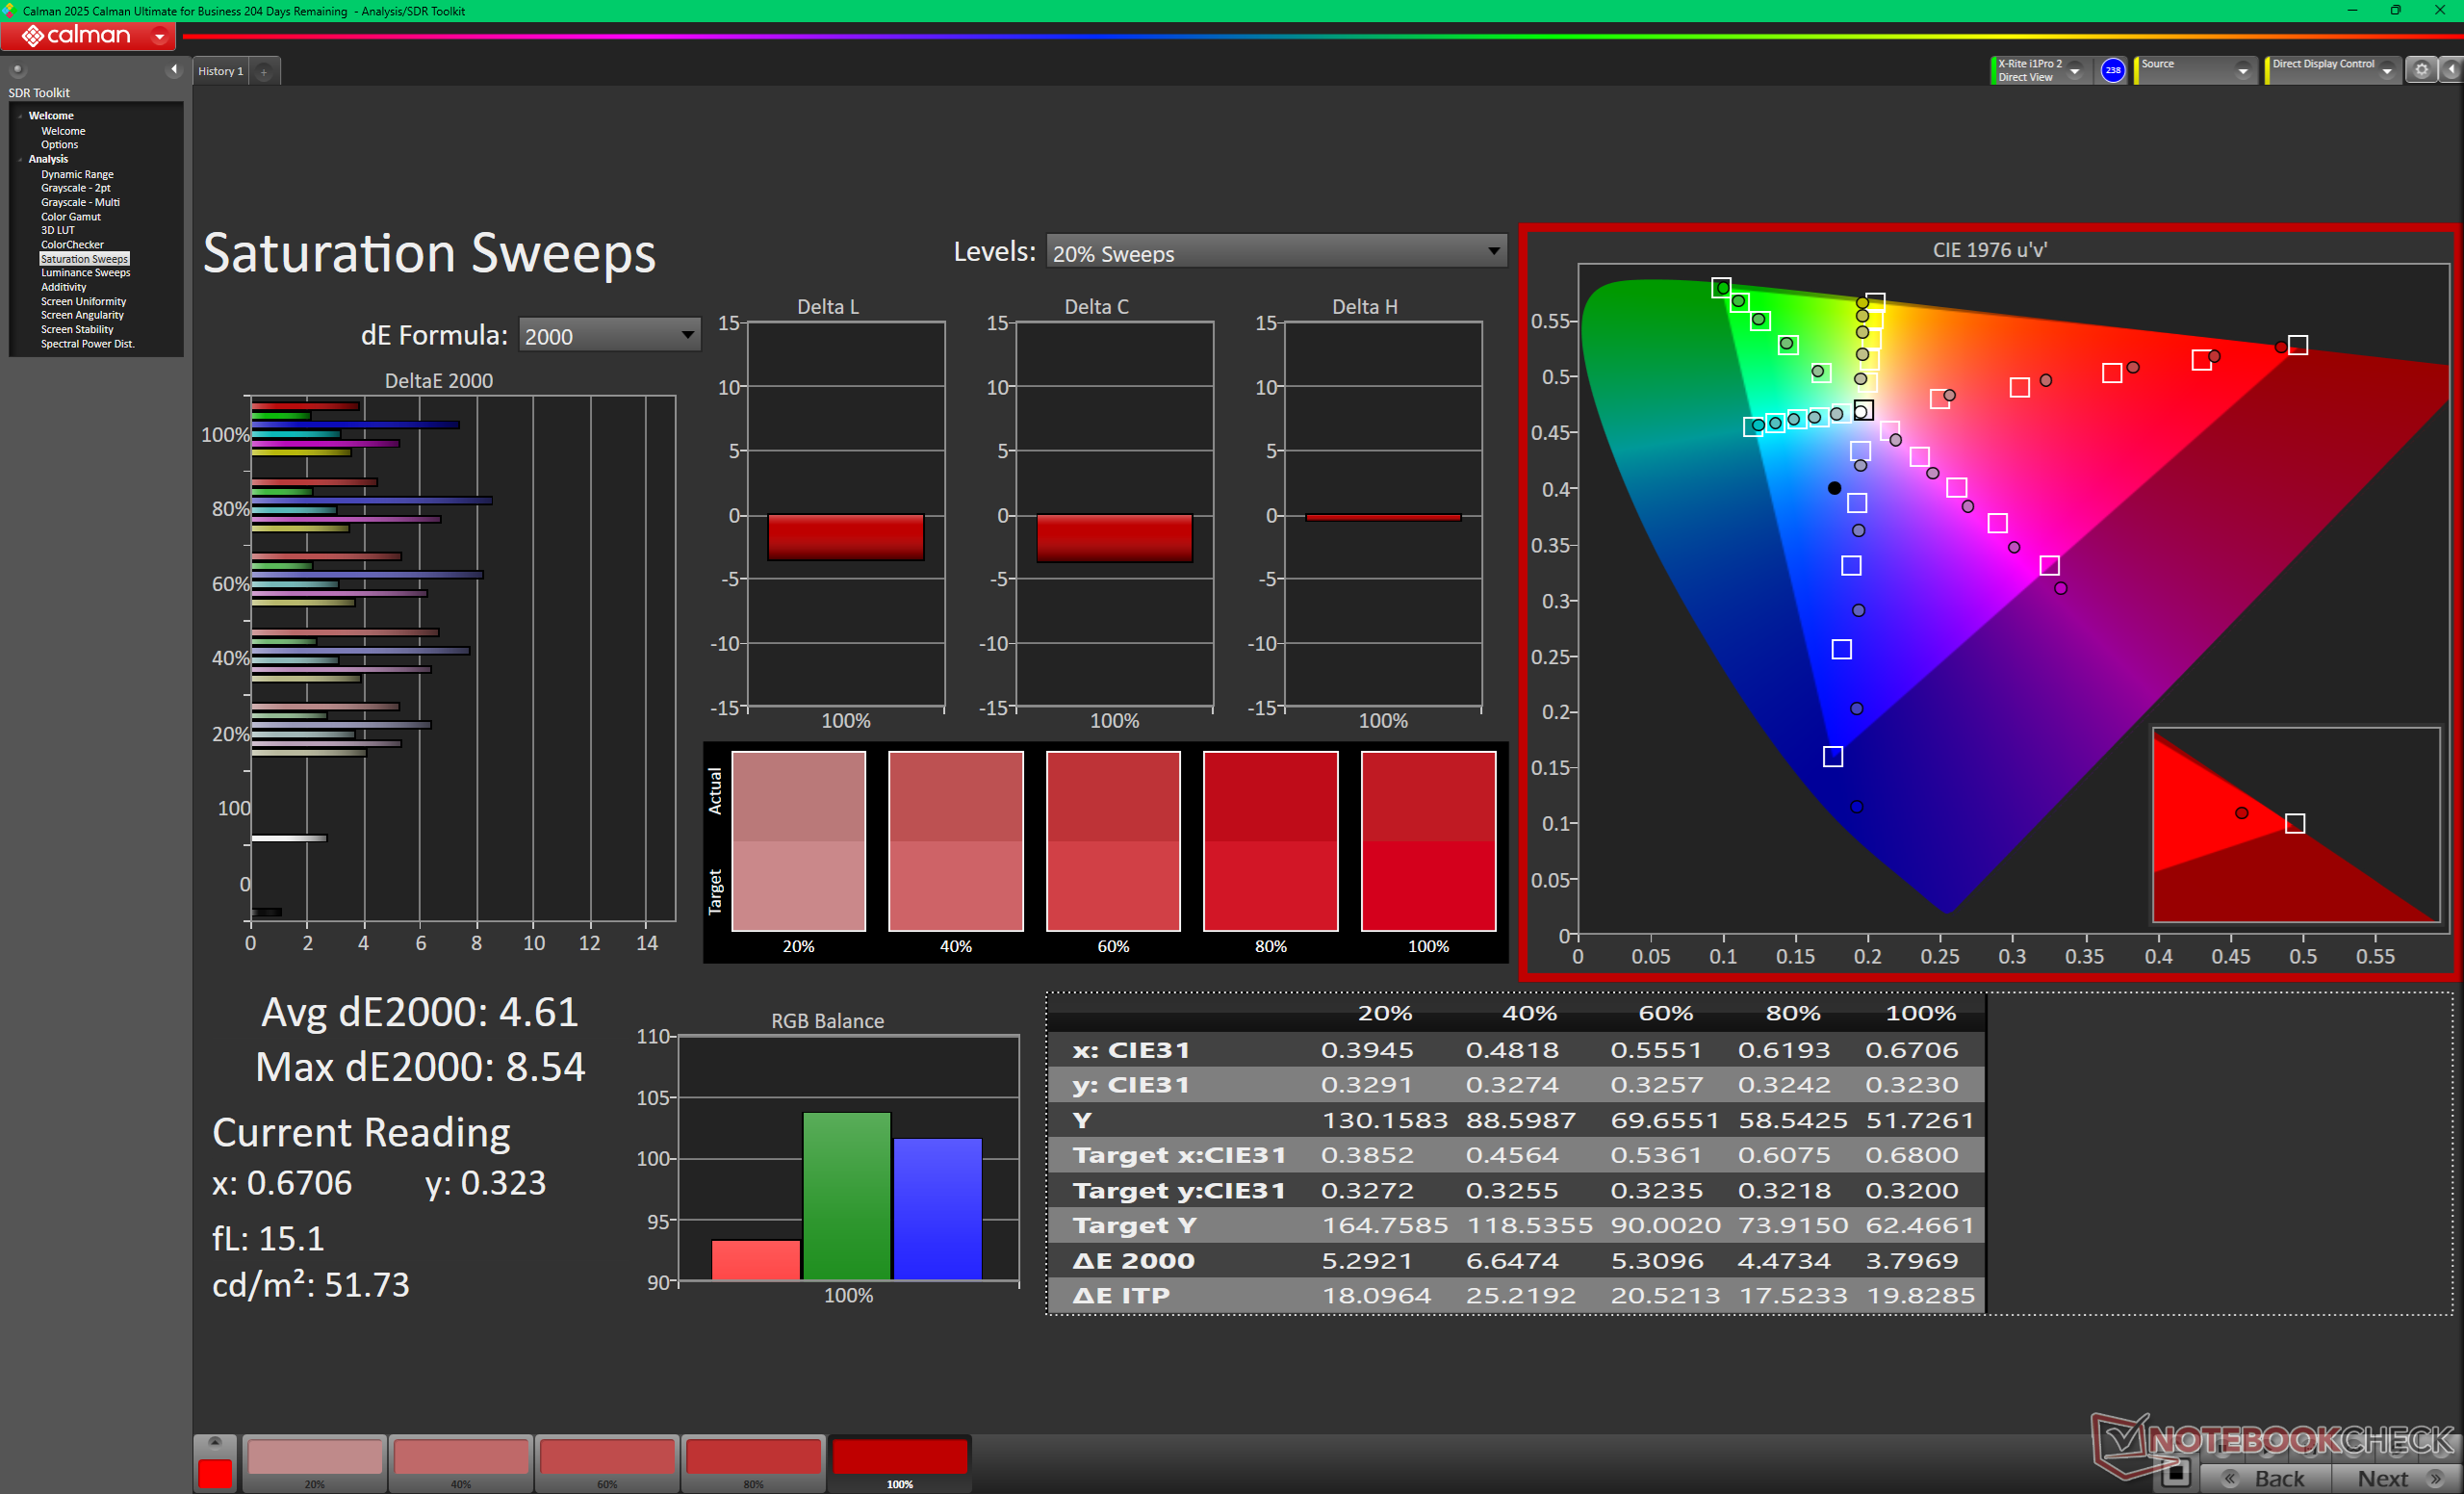
ΔE ColorChecker Calman: 4.65 | ∀{0.5-29.43 Ø4.72}
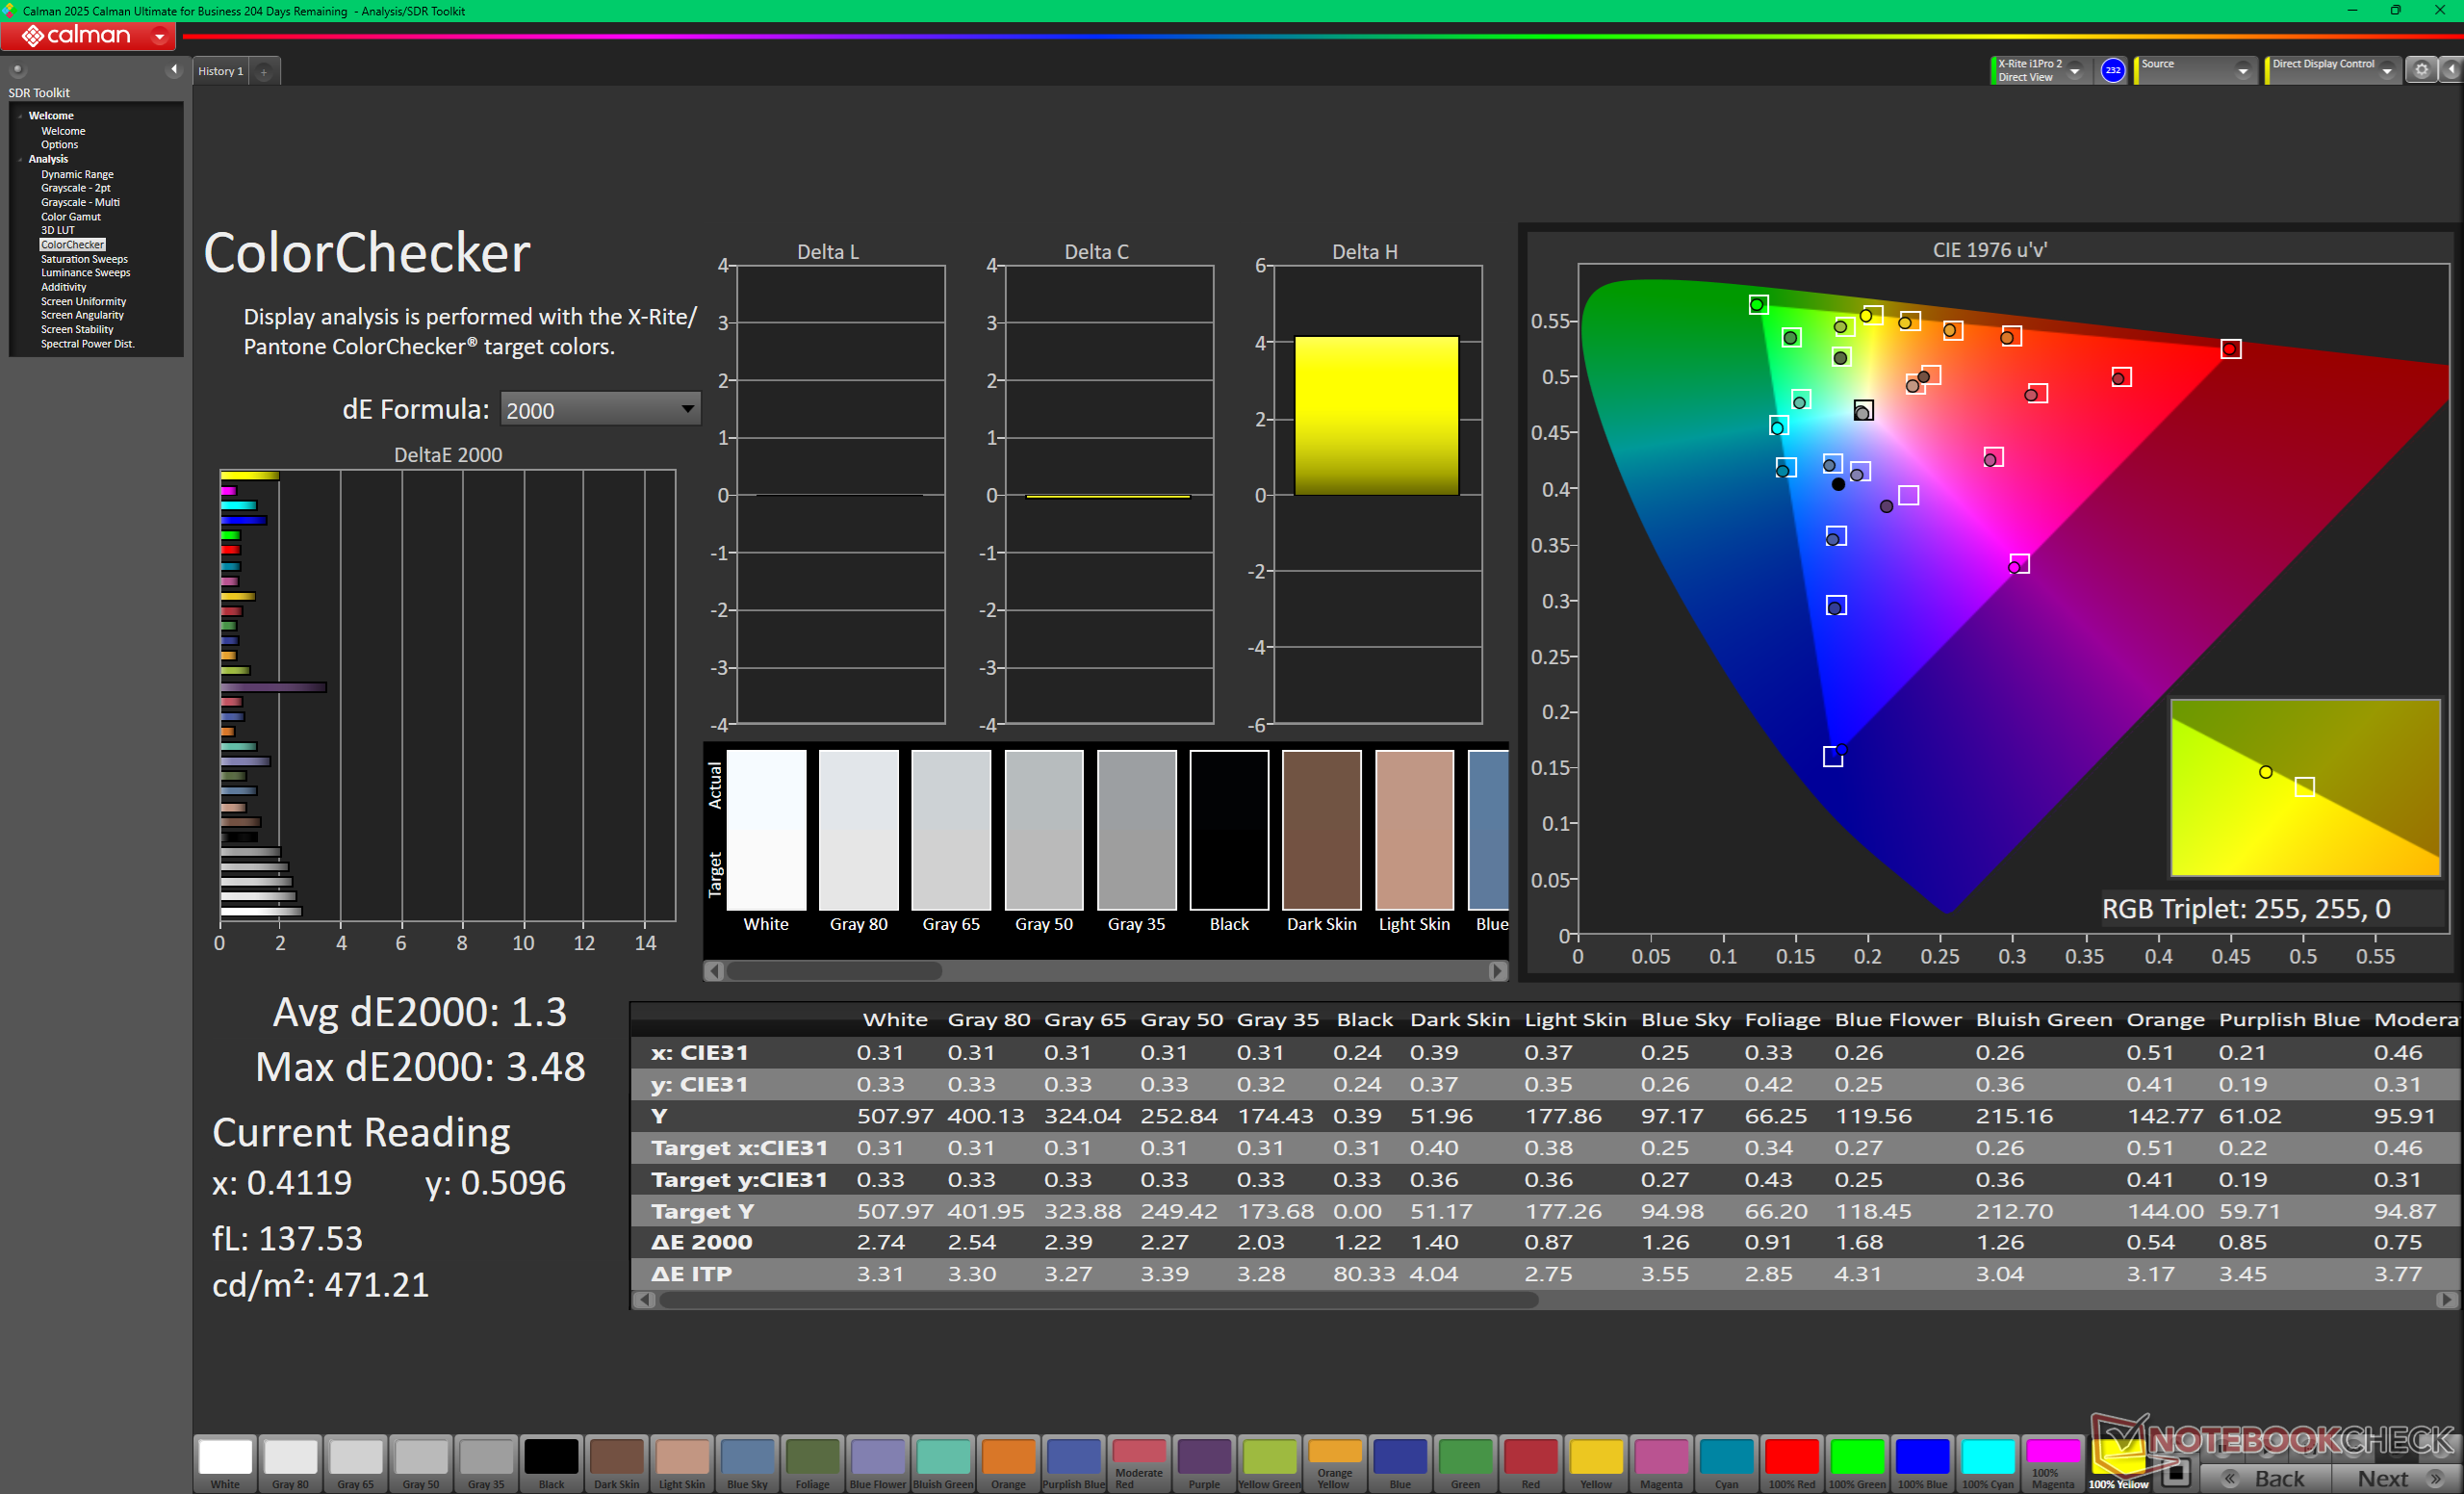
calibrated: 1.3
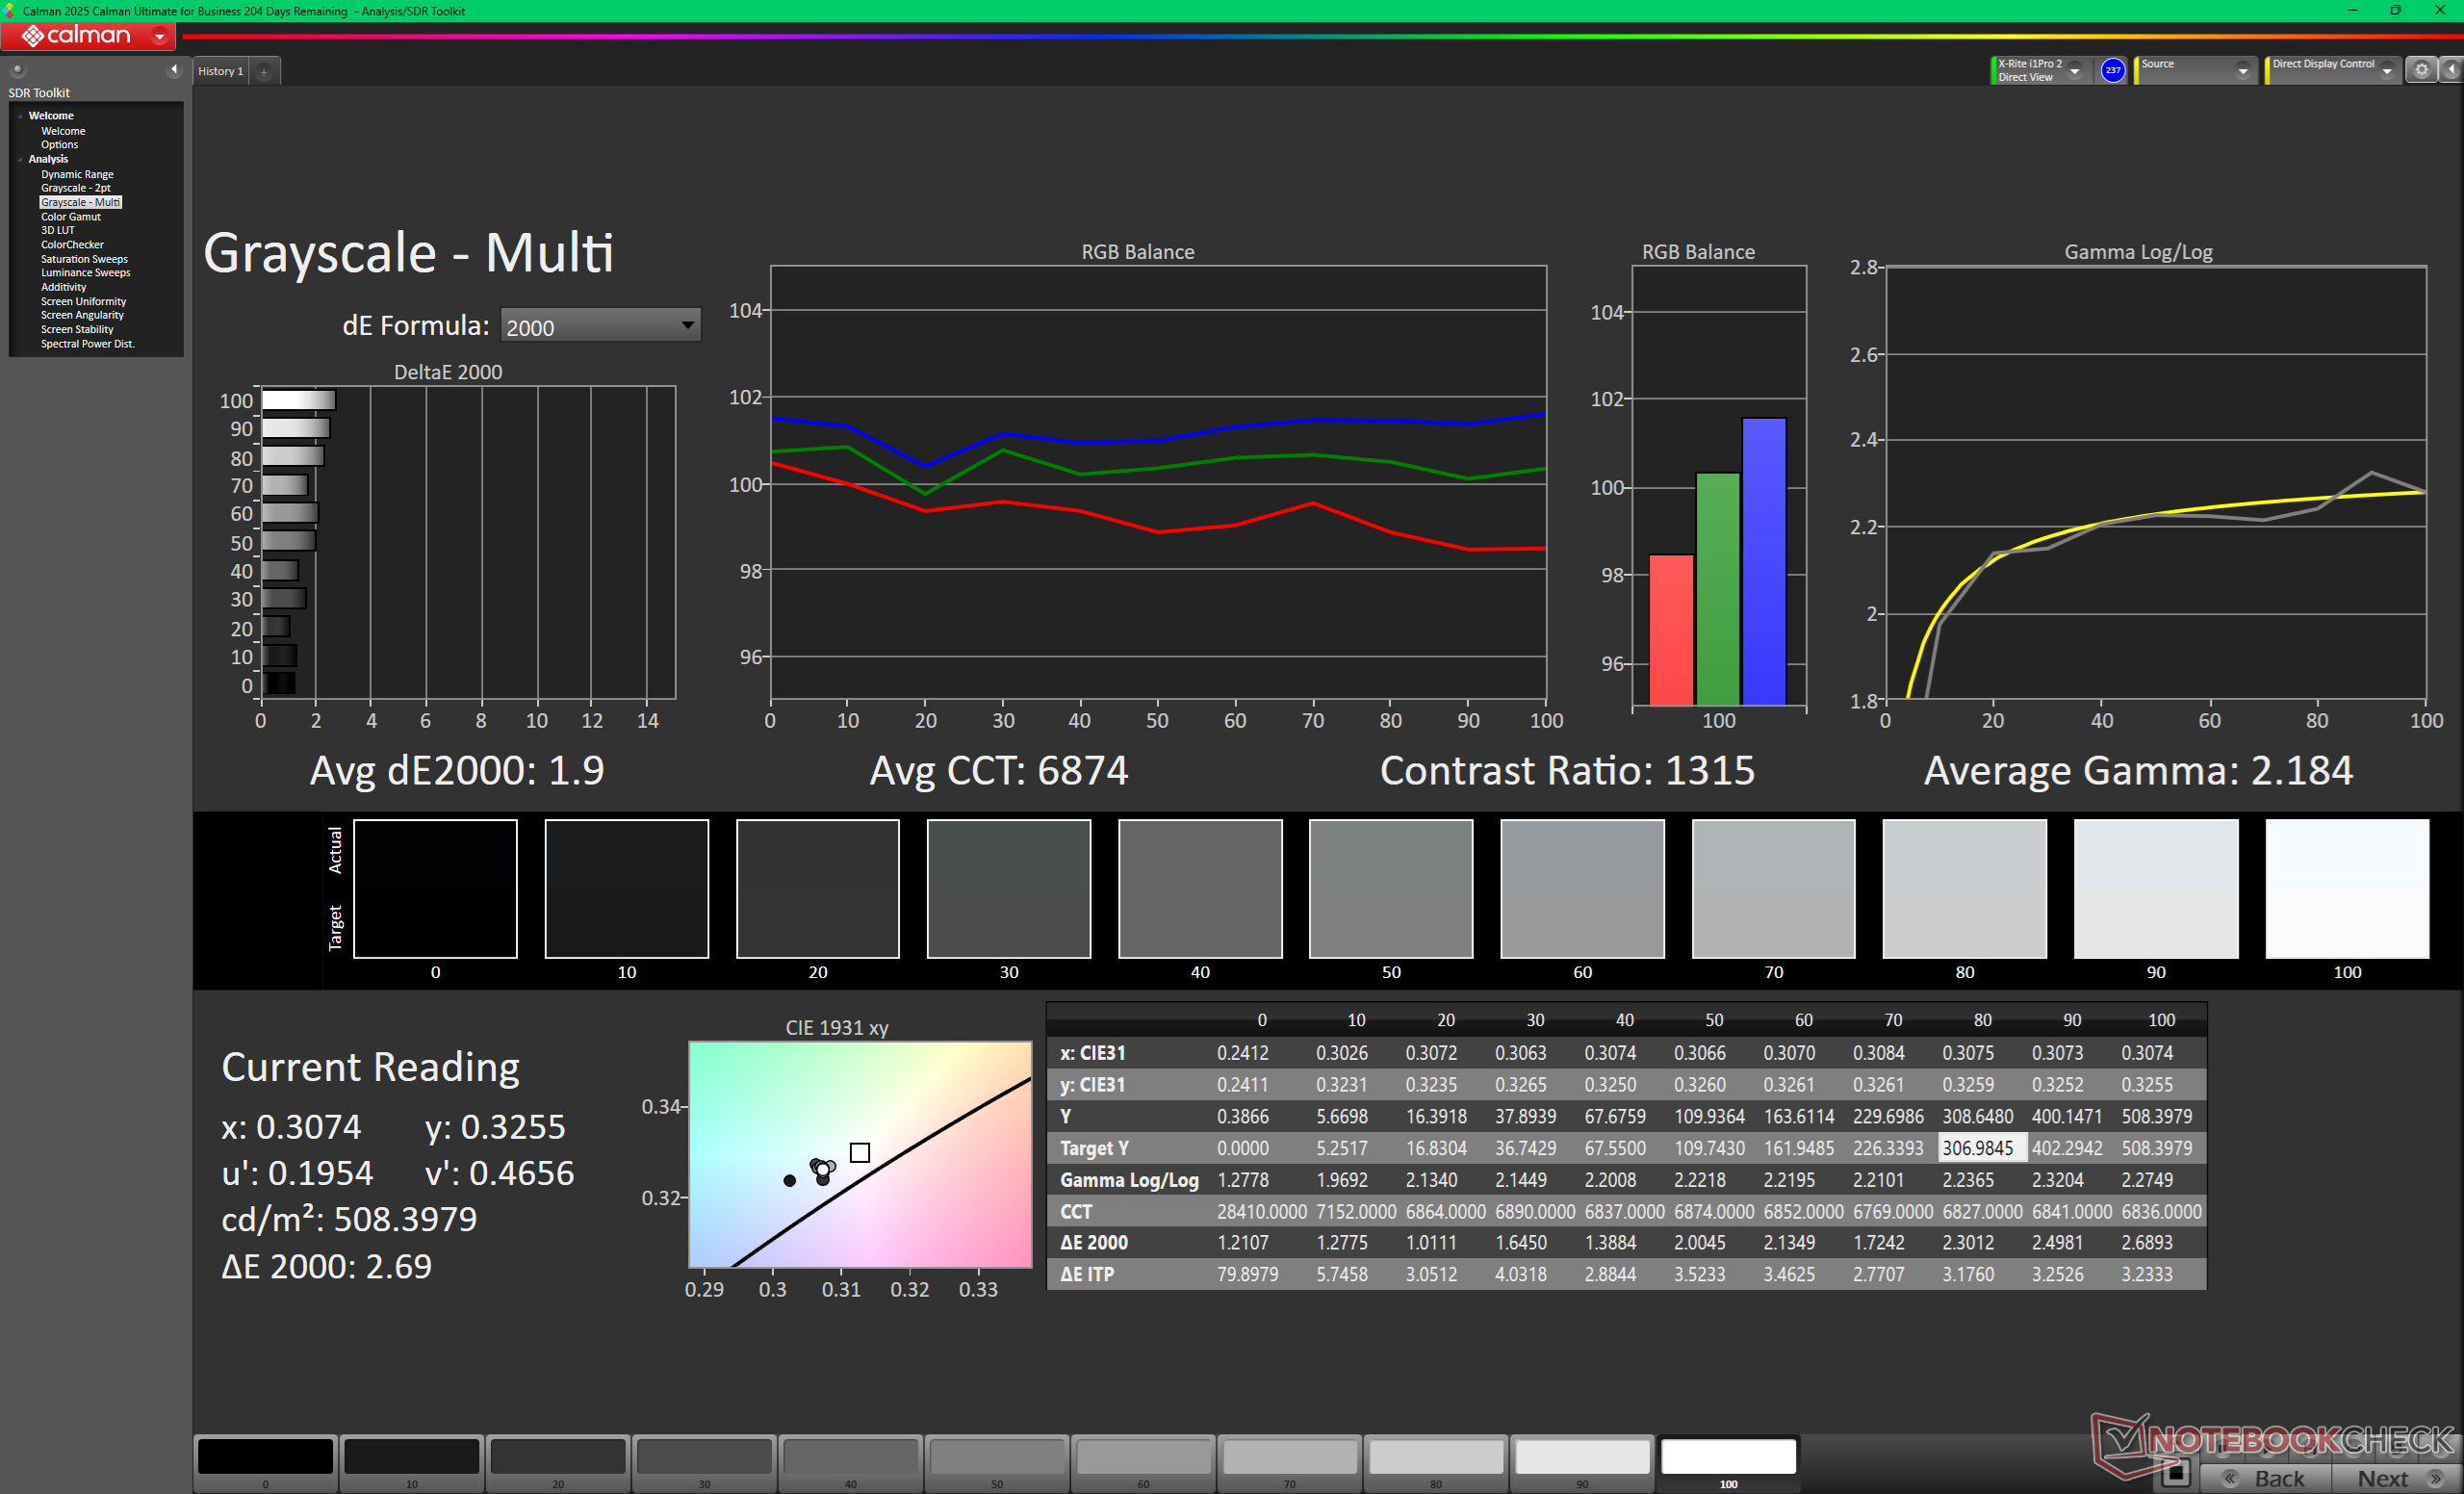
ΔE Greyscale Calman: 3.9 | ∀{0.09-98 Ø4.97}
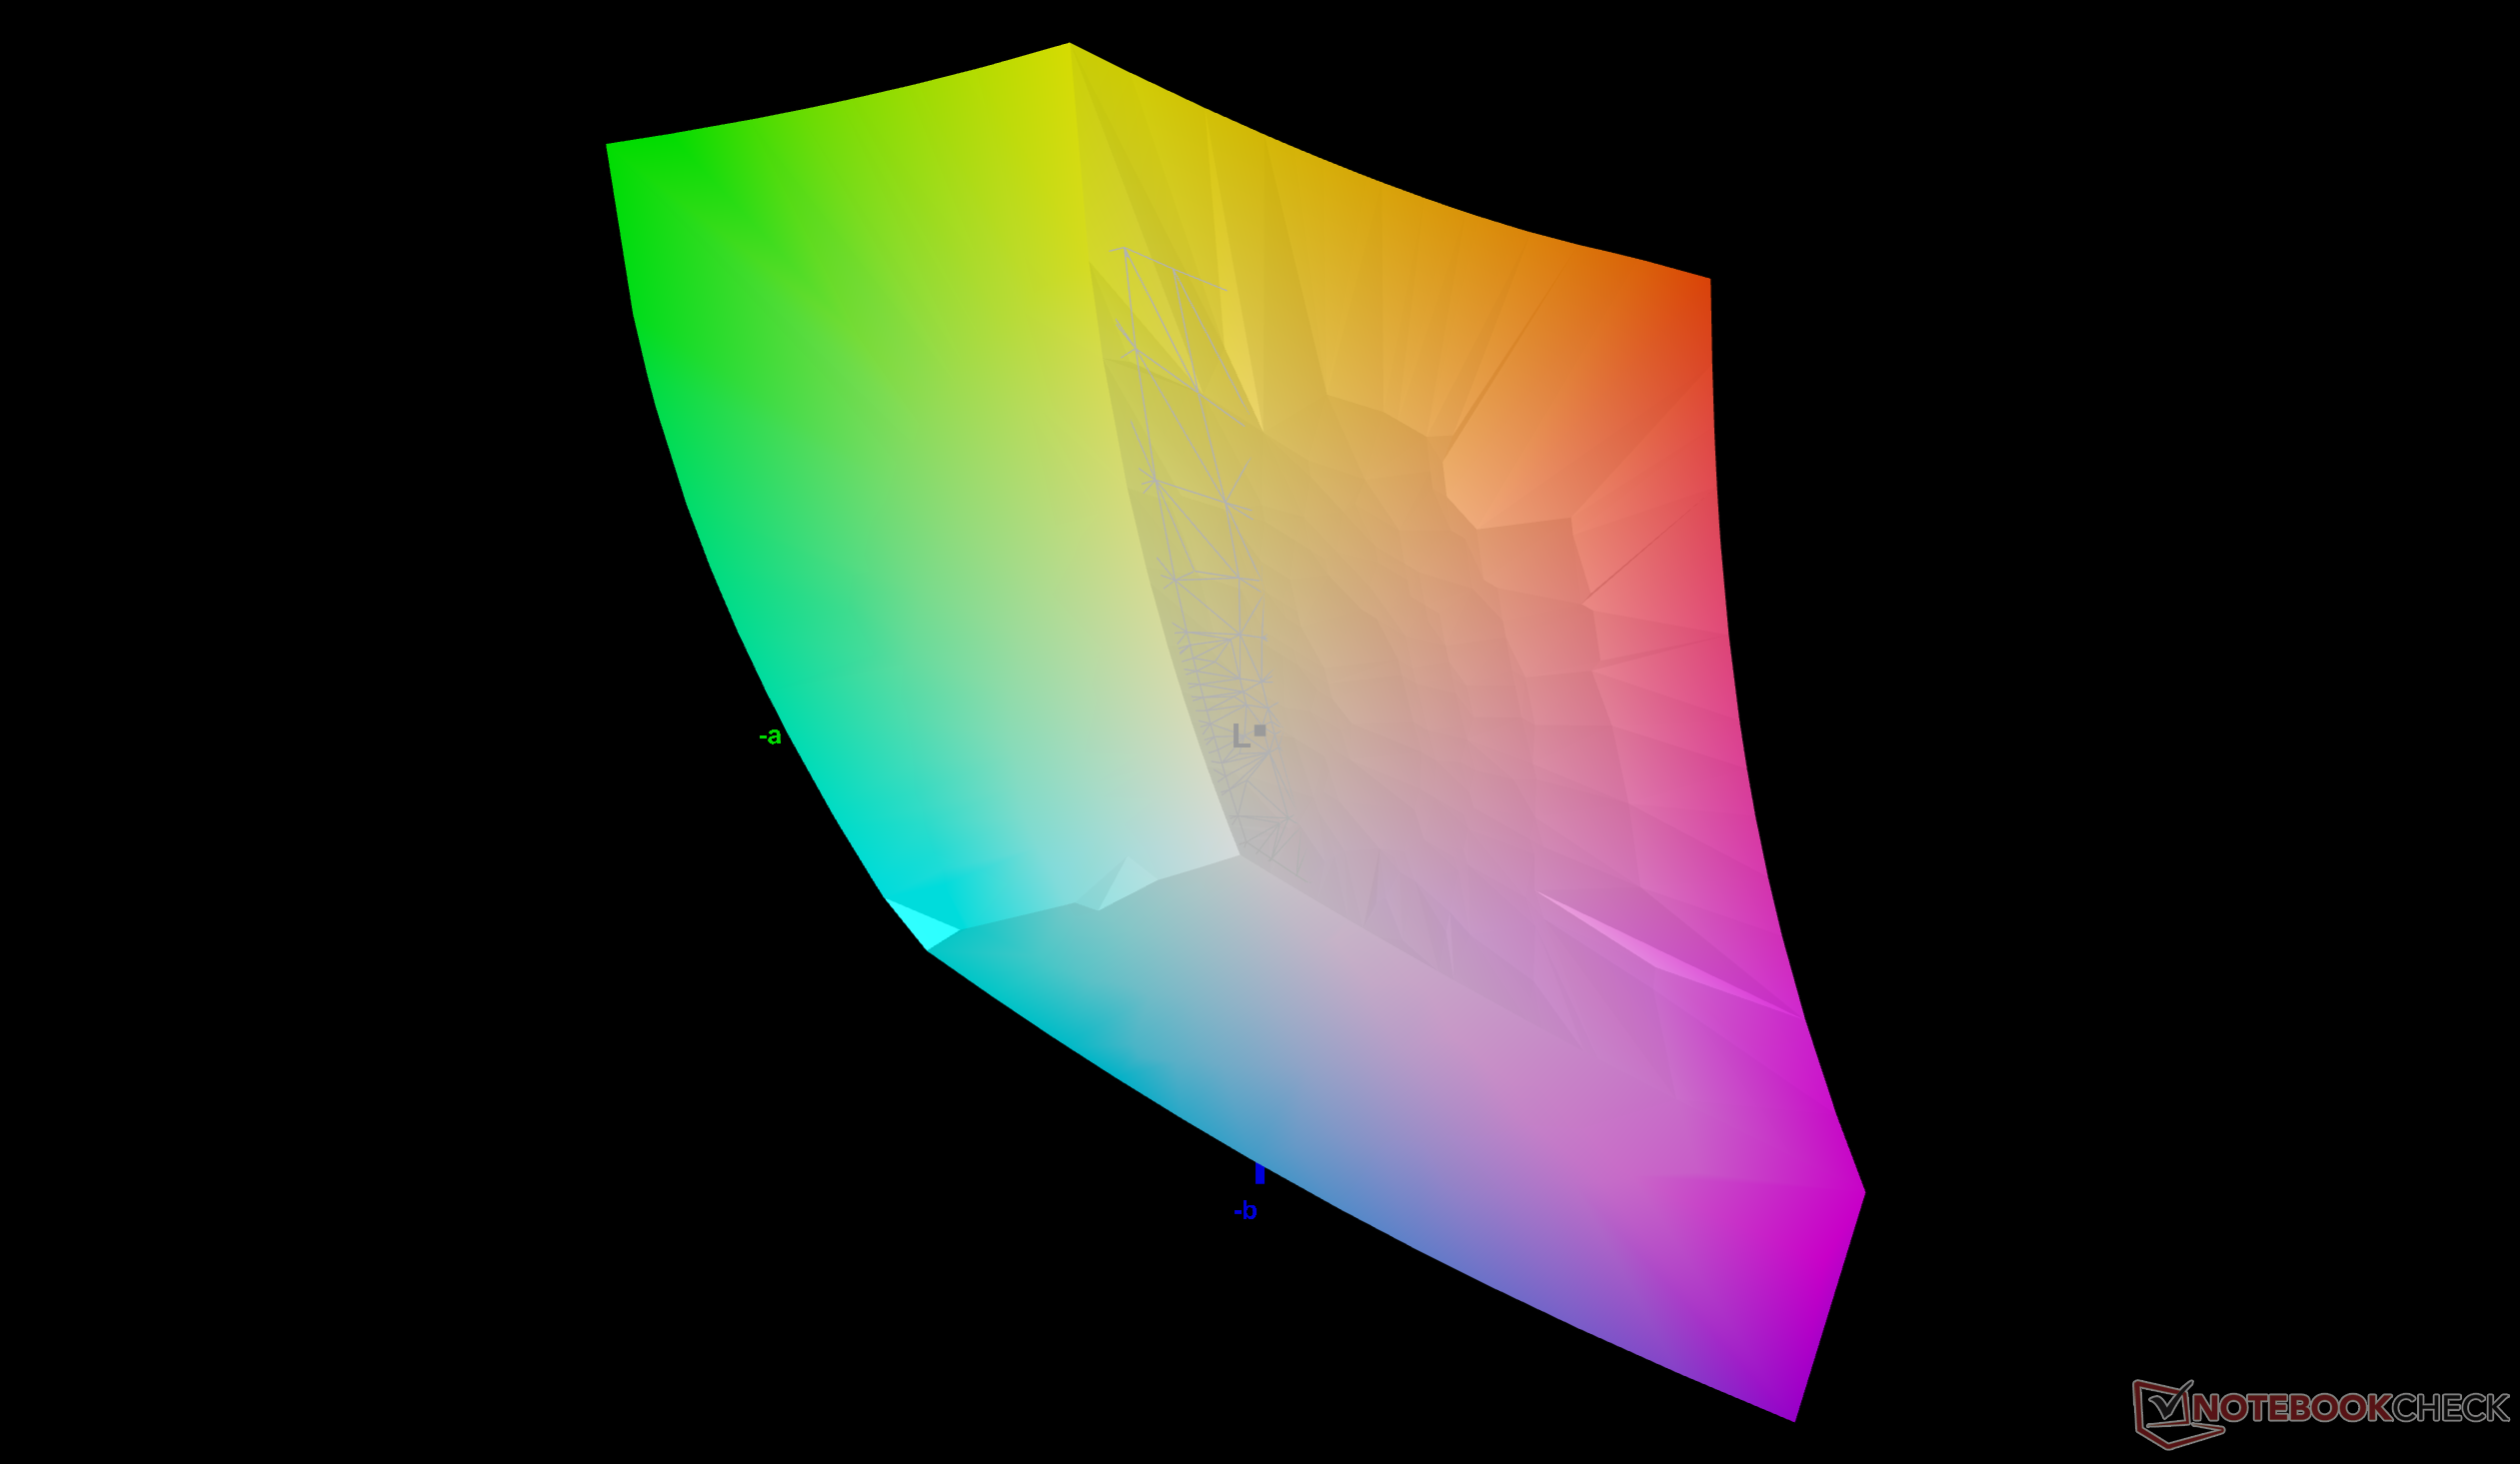
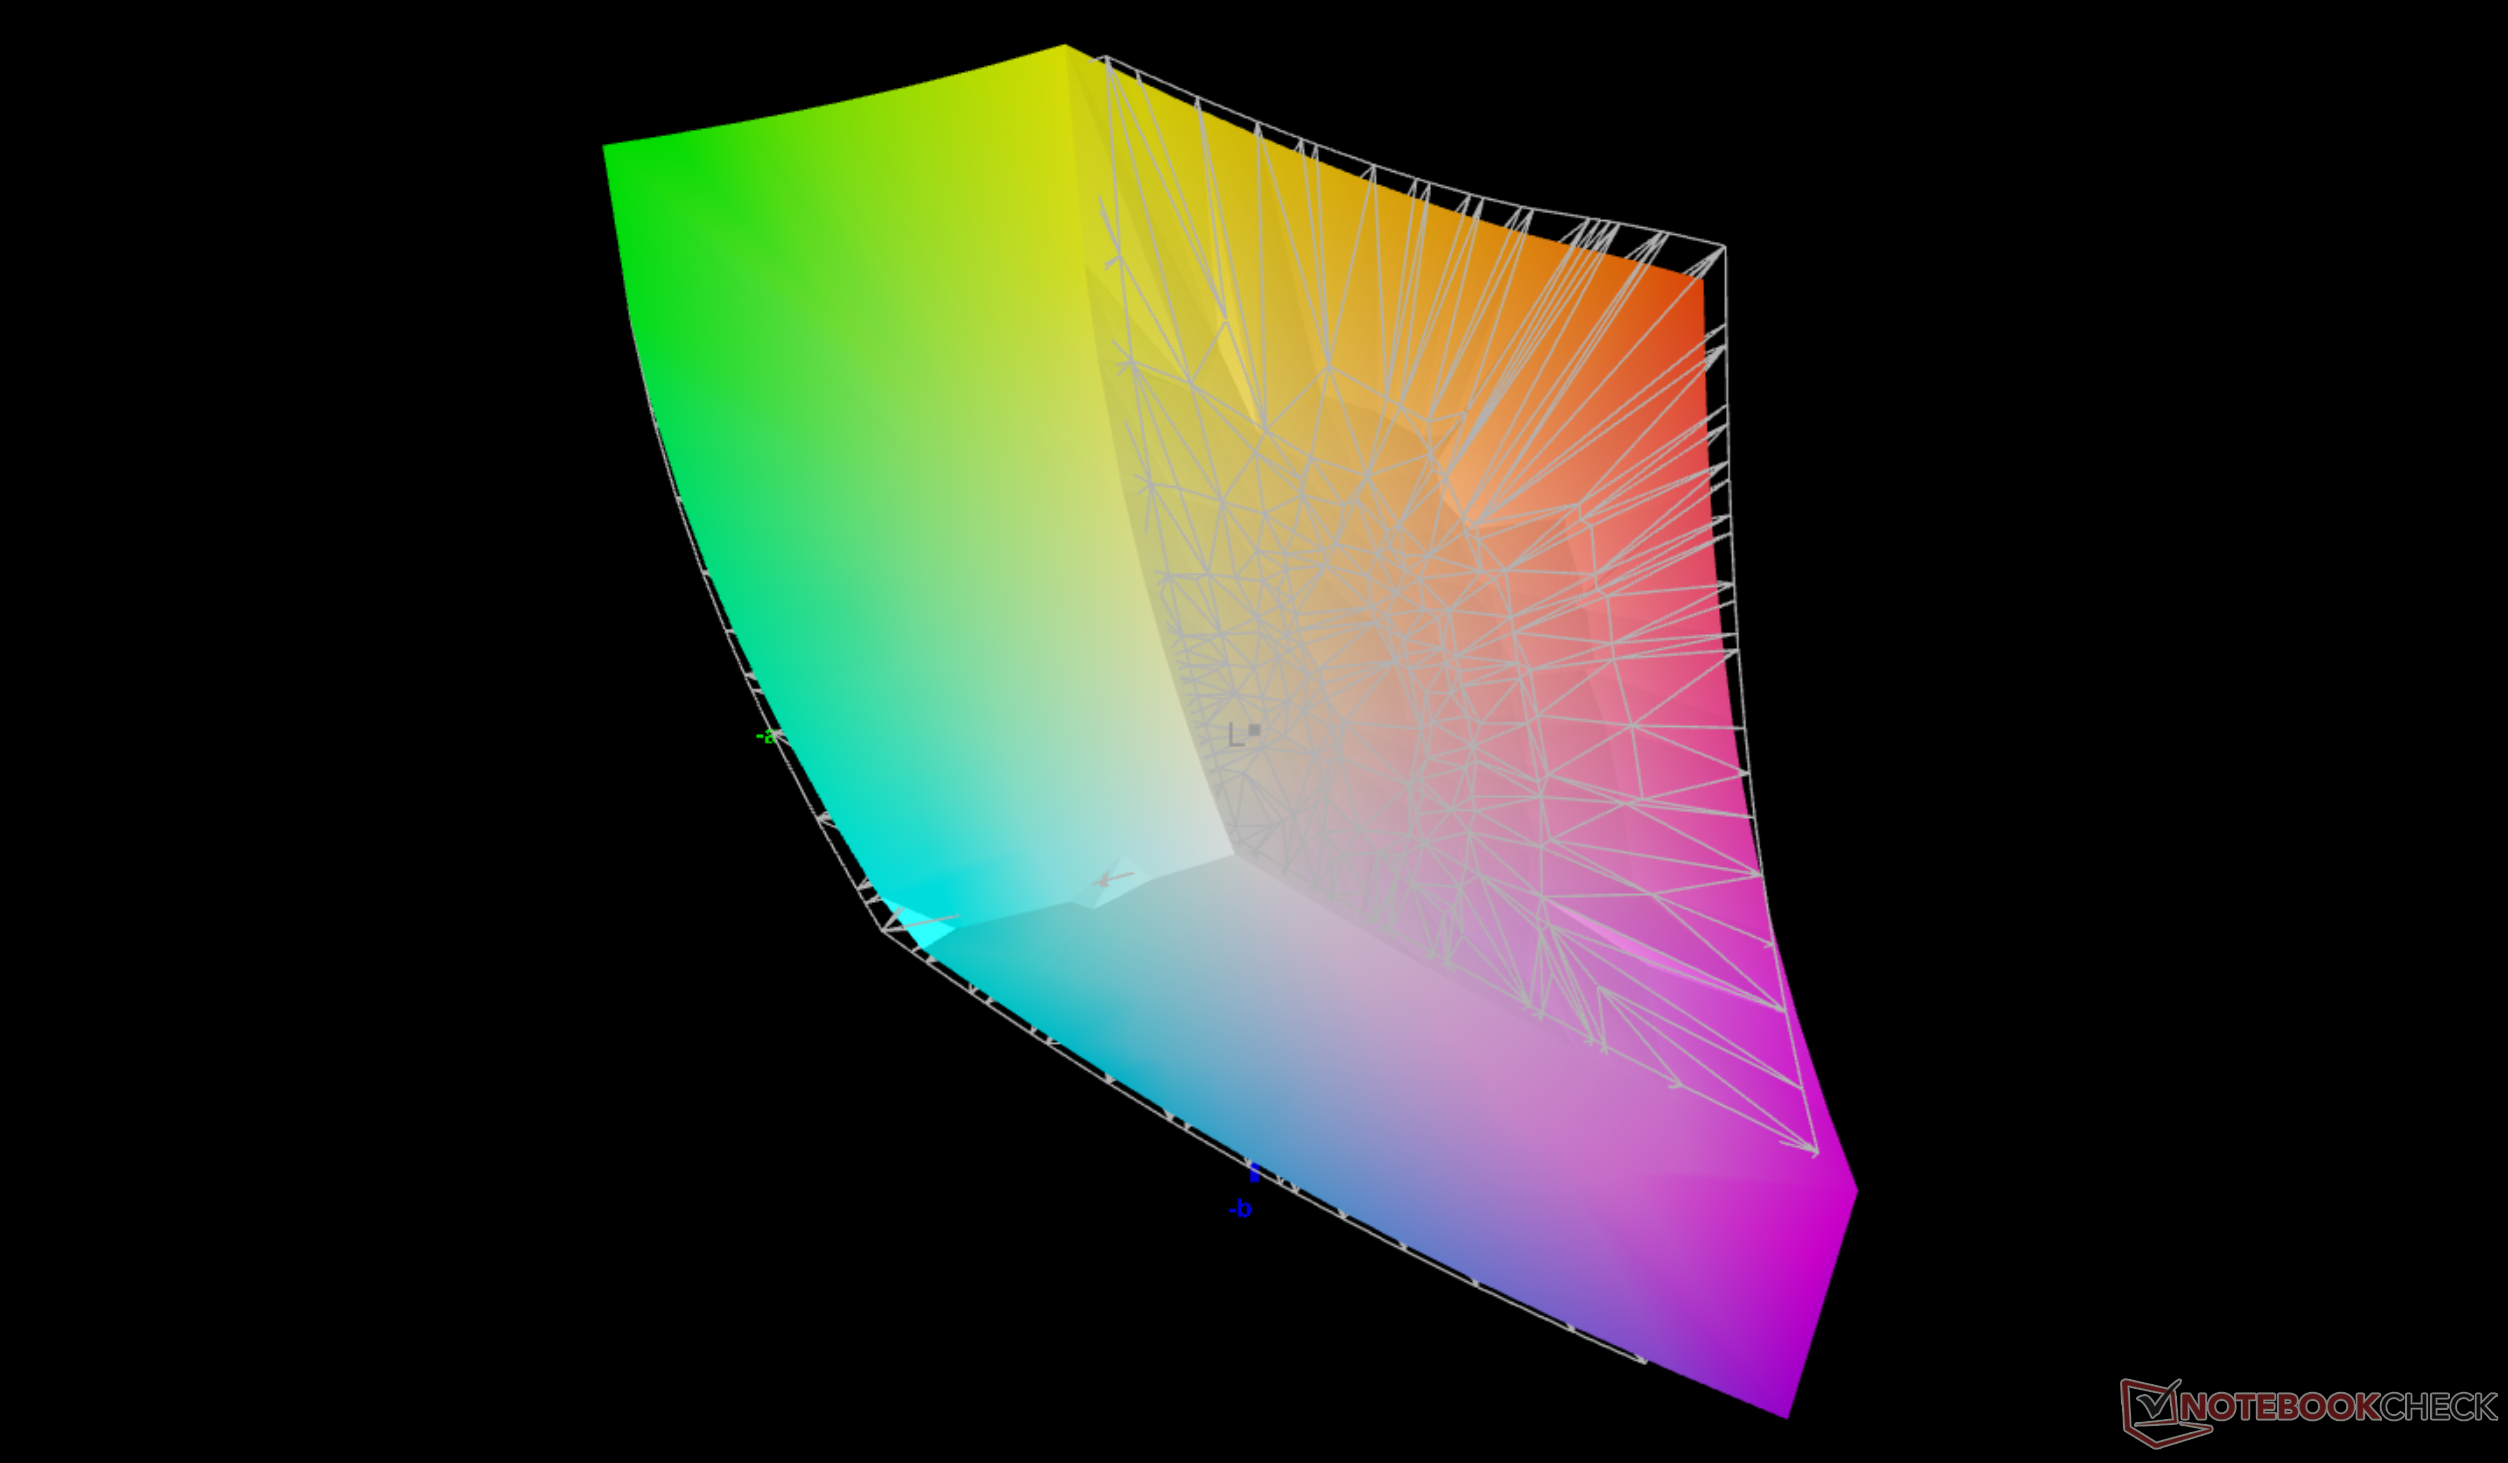
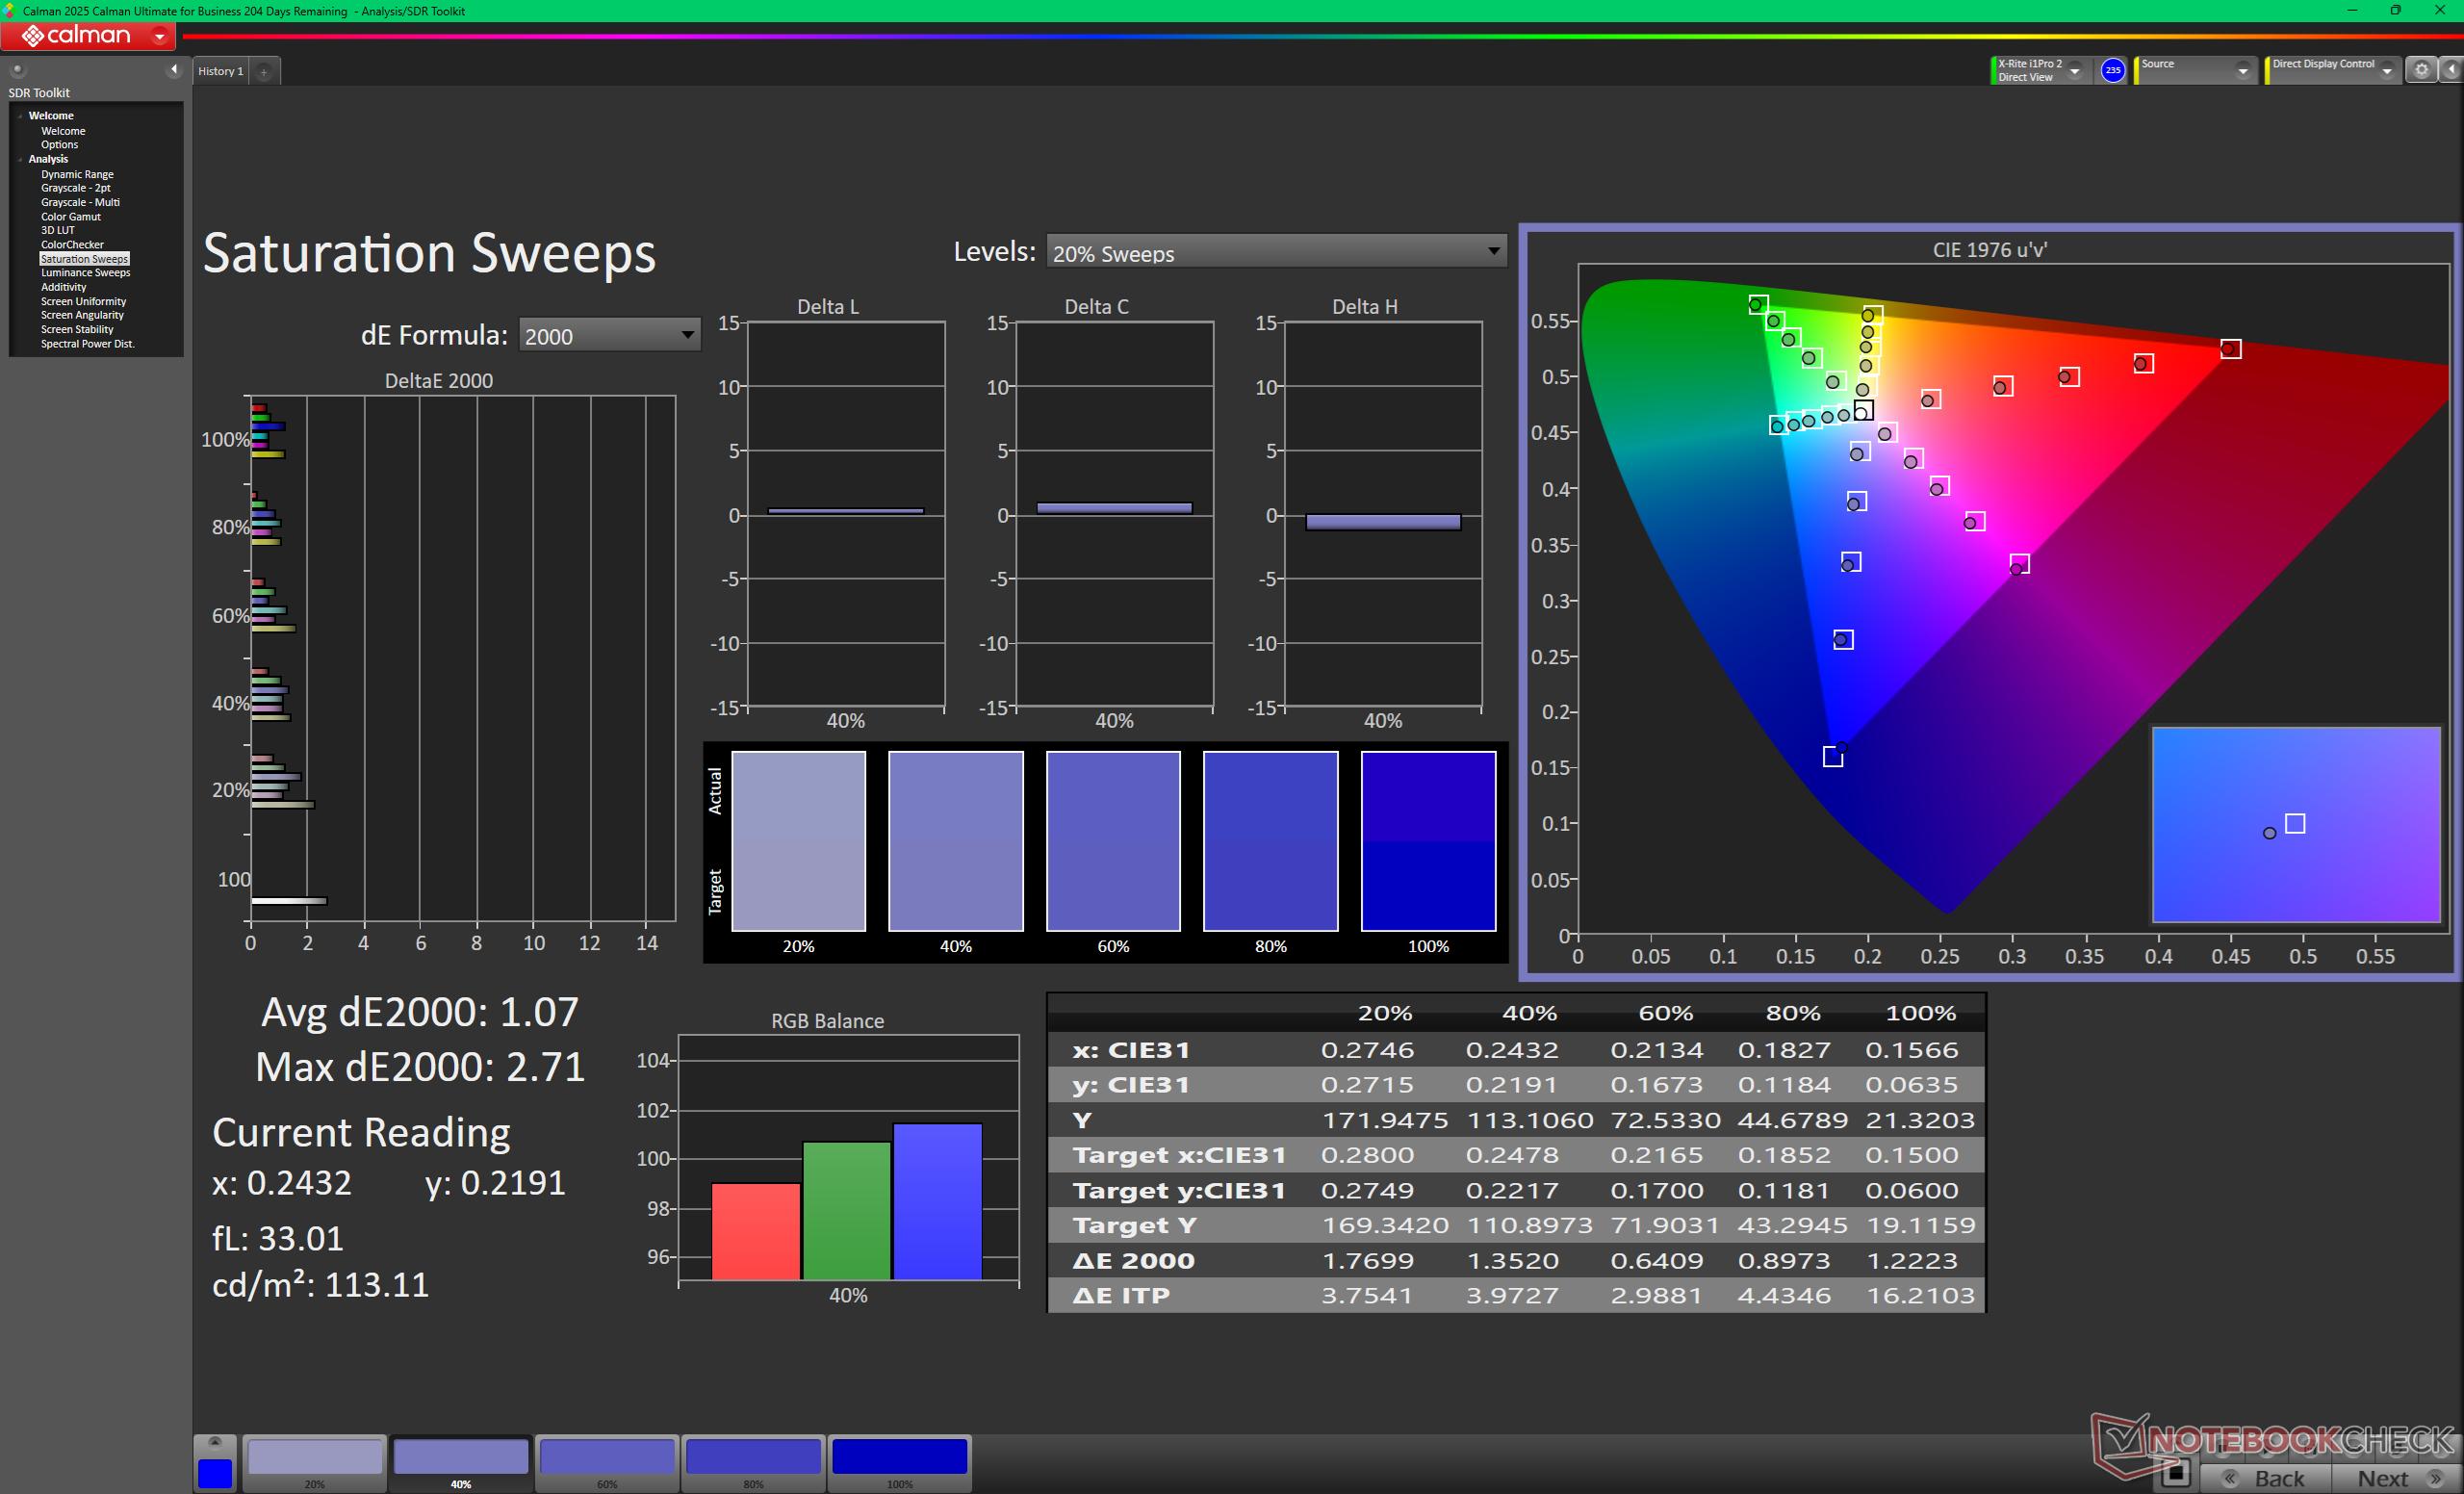
83.1% AdobeRGB 1998 (Argyll 3D)
99.6% sRGB (Argyll 3D)
94.9% Display P3 (Argyll 3D)
Gamma: 2.57
CCT: 6813 K
| MSI Crosshair A16 HX E8WGK AU Optronics B160QAN02.3, IPS, 2560x1600, 16", 240 Hz | MSI Crosshair 16 HX AI D2XWGKG AUO B160QAN02.3, IPS, 2560x1600, 16", 240 Hz | Alienware 16X Aurora Core Ultra 9 290HX Plus Samsung 160HU05, OLED, 2560x1600, 16", 240 Hz | Lenovo Legion 7 16 AGP11 ATNA60HU02-0, OLED, 2560x1600, 16", 240 Hz | Gigabyte Gaming A16 Pro GA6DH (Core 7 240H, RTX 5070 Ti) BOE0D86 (NS160QDM-NY3), IPS, 2560x1600, 16", 165 Hz | Acer Predator Helios Neo 16S AI PHN16S-71-94L9 Samsung ATNA60DL03-0, OLED, 2560x1600, 16", 240 Hz | |
|---|---|---|---|---|---|---|
| Display | 1% | 6% | 5% | -13% | 7% | |
| Display P3 Coverage (%) | 94.9 | 95.5 1% | 99.6 5% | 99.2 5% | 72.5 -24% | 99.9 5% |
| sRGB Coverage (%) | 99.6 | 99.7 0% | 100 0% | 100 0% | 99.3 0% | 100 0% |
| AdobeRGB 1998 Coverage (%) | 83.1 | 83.9 1% | 93.9 13% | 90.2 9% | 70.4 -15% | 96.5 16% |
| Response Times | 19% | 94% | 82% | -7% | 96% | |
| Response Time Grey 50% / Grey 80% * (ms) | 4.2 ? | 3.59 ? 15% | 0.29 ? 93% | 1.41 ? 66% | 6.8 ? -62% | 0.2 ? 95% |
| Response Time Black / White * (ms) | 9.2 ? | 7.09 ? 23% | 0.45 ? 95% | 0.25 ? 97% | 4.8 ? 48% | 0.25 ? 97% |
| PWM Frequency (Hz) | 1439.8 ? | 1440 ? | 960 | |||
| PWM Amplitude * (%) | 29 | 44 | 50 | |||
| Screen | -24% | 15% | 242% | 18% | 97% | |
| Brightness middle (cd/m²) | 512.4 | 472 -8% | 380.5 -26% | 499 -3% | 517 1% | 390 -24% |
| Brightness (cd/m²) | 476 | 438 -8% | 384 -19% | 502 5% | 490 3% | 394 -17% |
| Brightness Distribution (%) | 89 | 88 -1% | 98 10% | 98 10% | 92 3% | 98 10% |
| Black Level * (cd/m²) | 0.39 | 0.4 -3% | 0.02 95% | 0.39 -0% | 0.04 90% | |
| Contrast (:1) | 1314 | 1180 -10% | 24950 1799% | 1326 1% | 9750 642% | |
| Colorchecker dE 2000 * | 4.65 | 6.07 -31% | 3.27 30% | 2.5 46% | 1.62 65% | 1.61 65% |
| Colorchecker dE 2000 max. * | 8.33 | 9.76 -17% | 6.31 24% | 7.8 6% | 3.52 58% | 3.49 58% |
| Colorchecker dE 2000 calibrated * | 1.3 | 2.25 -73% | 1.1 15% | 1.62 -25% | 1.59 -22% | |
| Greyscale dE 2000 * | 3.9 | 6.4 -64% | 1 74% | 4.7 -21% | 1.85 53% | 1.2 69% |
| Gamma | 2.57 86% | 2.52 87% | 2.23 99% | 2.21 100% | 2.36 93% | 2.235 98% |
| CCT | 6813 95% | 7987 81% | 6410 101% | 6715 97% | 6596 99% | 6580 99% |
| Całkowita średnia (program / ustawienia) | -1% /
-13% | 38% /
26% | 110% /
163% | -1% /
8% | 67% /
77% |
* ... im mniej tym lepiej
Wyświetl czasy reakcji
| ↔ Czas reakcji od czerni do bieli | ||
|---|---|---|
| 9.2 ms ... wzrost ↗ i spadek ↘ łącznie | ↗ 4.9 ms wzrost | 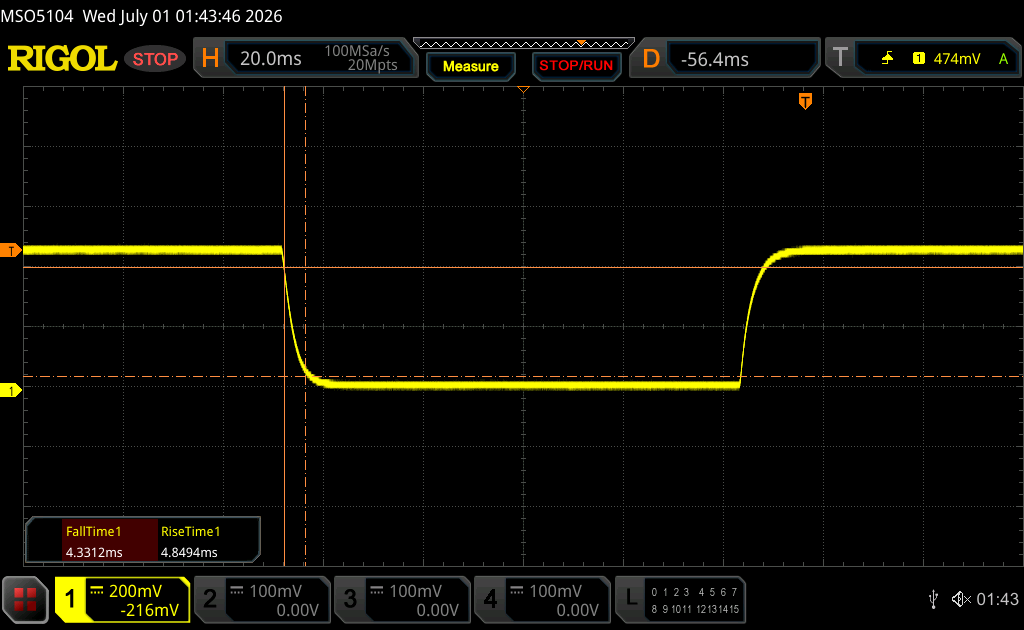 |
| ↘ 4.3 ms upadek | ||
| W naszych testach ekran wykazuje szybki czas reakcji i powinien nadawać się do gier. Dla porównania, wszystkie testowane urządzenia wahają się od 0.1 (minimum) do 240 (maksimum) ms. » 26 % wszystkich urządzeń jest lepszych. Oznacza to, że zmierzony czas reakcji jest lepszy od średniej wszystkich testowanych urządzeń (19.8 ms). | ||
| ↔ Czas reakcji 50% szarości do 80% szarości | ||
| 4.2 ms ... wzrost ↗ i spadek ↘ łącznie | ↗ 1.8 ms wzrost | 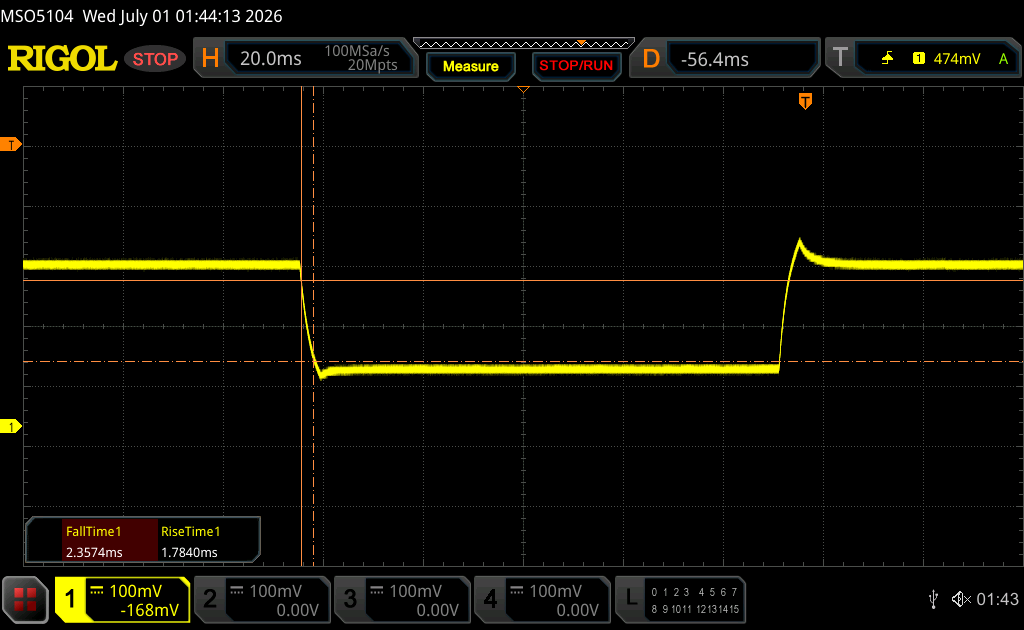 |
| ↘ 2.4 ms upadek | ||
| W naszych testach ekran wykazuje bardzo szybką reakcję i powinien bardzo dobrze nadawać się do szybkich gier. Dla porównania, wszystkie testowane urządzenia wahają się od 0.165 (minimum) do 636 (maksimum) ms. » 16 % wszystkich urządzeń jest lepszych. Oznacza to, że zmierzony czas reakcji jest lepszy od średniej wszystkich testowanych urządzeń (31 ms). | ||
Migotanie ekranu / PWM (modulacja szerokości impulsu)
| Migotanie ekranu/nie wykryto PWM | 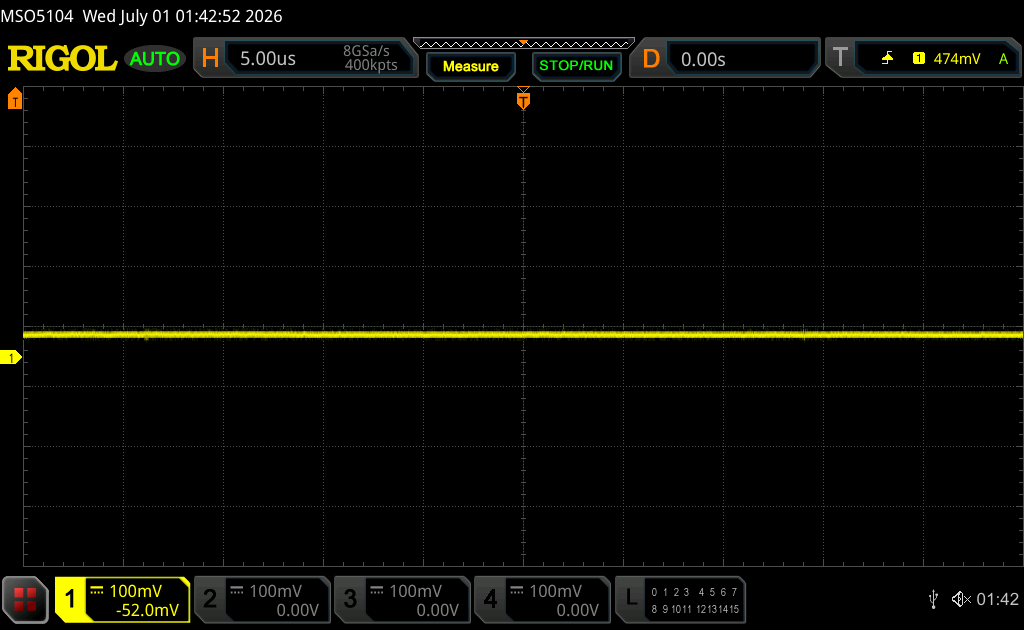 | ||
Dla porównania: 52 % wszystkich testowanych urządzeń nie używa PWM do przyciemniania wyświetlacza. Jeśli wykryto PWM, zmierzono średnio 7772 (minimum: 5 - maksimum: 343500) Hz. | |||
Wydajność
Warunki testowania
System jest fabrycznie ustawiony w trybie „Performance” z włączonym trybem „Apex”. Przed uruchomieniem poniższych testów porównawczych ustawiliśmy również system w trybie dGPU.
Wydajność procesora
Cinebench R15 – test wielopętlowy
Cinebench R23: Multi Core | Single Core
Cinebench R20: CPU (Multi Core) | CPU (Single Core)
Cinebench R15: CPU Multi 64Bit | CPU Single 64Bit
Blender: v2.79 BMW27 CPU
7-Zip 18.03: 7z b 4 | 7z b 4 -mmt1
Geekbench 6.7: Multi-Core | Single-Core
Geekbench 5.5: Multi-Core | Single-Core
HWBOT x265 Benchmark v2.2: 4k Preset
LibreOffice : 20 Documents To PDF
R Benchmark 2.5: Overall mean
* ... im mniej tym lepiej
AIDA64: FP32 Ray-Trace | FPU Julia | CPU SHA3 | CPU Queen | FPU SinJulia | FPU Mandel | CPU AES | CPU ZLib | FP64 Ray-Trace | CPU PhotoWorxx | CPU CheckMate
| Performance rating | |
| MSI Crosshair A16 HX E8WGK -1! | |
| Przeciętny AMD Ryzen 9 8940HX | |
| Alienware 16X Aurora Core Ultra 9 290HX Plus -1! | |
| MSI Crosshair 16 HX AI D2XWGKG -1! | |
| Lenovo Legion 7 16 AGP11 -1! | |
| Acer Predator Helios Neo 16S AI PHN16S-71-94L9 -1! | |
| Gigabyte Gaming A16 Pro GA6DH (Core 7 240H, RTX 5070 Ti) -1! | |
| AIDA64 / FP32 Ray-Trace | |
| MSI Crosshair A16 HX E8WGK (v8.20.8100) | |
| Przeciętny AMD Ryzen 9 8940HX (43311 - 53747, n=3) | |
| Lenovo Legion 7 16 AGP11 (v8.20.8100) | |
| MSI Crosshair 16 HX AI D2XWGKG (v6.92.6600) | |
| Alienware 16X Aurora Core Ultra 9 290HX Plus (v8.20.8100) | |
| Acer Predator Helios Neo 16S AI PHN16S-71-94L9 (v6.92.6600) | |
| Gigabyte Gaming A16 Pro GA6DH (Core 7 240H, RTX 5070 Ti) (v8.20.8100) | |
| AIDA64 / FPU Julia | |
| MSI Crosshair A16 HX E8WGK (v8.20.8100) | |
| Przeciętny AMD Ryzen 9 8940HX (171374 - 218716, n=3) | |
| MSI Crosshair 16 HX AI D2XWGKG (v6.92.6600) | |
| Alienware 16X Aurora Core Ultra 9 290HX Plus (v8.20.8100) | |
| Lenovo Legion 7 16 AGP11 (v8.20.8100) | |
| Acer Predator Helios Neo 16S AI PHN16S-71-94L9 (v6.92.6600) | |
| Gigabyte Gaming A16 Pro GA6DH (Core 7 240H, RTX 5070 Ti) (v8.20.8100) | |
| AIDA64 / CPU SHA3 | |
| MSI Crosshair A16 HX E8WGK (v8.20.8100) | |
| Przeciętny AMD Ryzen 9 8940HX (7988 - 9427, n=3) | |
| MSI Crosshair 16 HX AI D2XWGKG (v6.92.6600) | |
| Alienware 16X Aurora Core Ultra 9 290HX Plus (v8.20.8100) | |
| Acer Predator Helios Neo 16S AI PHN16S-71-94L9 (v6.92.6600) | |
| Lenovo Legion 7 16 AGP11 (v8.20.8100) | |
| Gigabyte Gaming A16 Pro GA6DH (Core 7 240H, RTX 5070 Ti) (v8.20.8100) | |
| AIDA64 / CPU Queen | |
| Przeciętny AMD Ryzen 9 8940HX (169334 - 172010, n=2) | |
| MSI Crosshair 16 HX AI D2XWGKG (v6.92.6600) | |
| Acer Predator Helios Neo 16S AI PHN16S-71-94L9 (v6.92.6600) | |
| AIDA64 / FPU SinJulia | |
| MSI Crosshair A16 HX E8WGK (v8.20.8100) | |
| Przeciętny AMD Ryzen 9 8940HX (26855 - 29886, n=3) | |
| Lenovo Legion 7 16 AGP11 (v8.20.8100) | |
| Alienware 16X Aurora Core Ultra 9 290HX Plus (v8.20.8100) | |
| MSI Crosshair 16 HX AI D2XWGKG (v6.92.6600) | |
| Acer Predator Helios Neo 16S AI PHN16S-71-94L9 (v6.92.6600) | |
| Gigabyte Gaming A16 Pro GA6DH (Core 7 240H, RTX 5070 Ti) (v8.20.8100) | |
| AIDA64 / FPU Mandel | |
| MSI Crosshair A16 HX E8WGK (v8.20.8100) | |
| Przeciętny AMD Ryzen 9 8940HX (90684 - 117231, n=3) | |
| MSI Crosshair 16 HX AI D2XWGKG (v6.92.6600) | |
| Alienware 16X Aurora Core Ultra 9 290HX Plus (v8.20.8100) | |
| Lenovo Legion 7 16 AGP11 (v8.20.8100) | |
| Acer Predator Helios Neo 16S AI PHN16S-71-94L9 (v6.92.6600) | |
| Gigabyte Gaming A16 Pro GA6DH (Core 7 240H, RTX 5070 Ti) (v8.20.8100) | |
| AIDA64 / CPU AES | |
| MSI Crosshair A16 HX E8WGK (v8.20.8100) | |
| Przeciętny AMD Ryzen 9 8940HX (150768 - 175214, n=3) | |
| Alienware 16X Aurora Core Ultra 9 290HX Plus (v8.20.8100) | |
| MSI Crosshair 16 HX AI D2XWGKG (v6.92.6600) | |
| Lenovo Legion 7 16 AGP11 (v8.20.8100) | |
| Acer Predator Helios Neo 16S AI PHN16S-71-94L9 (v6.92.6600) | |
| Gigabyte Gaming A16 Pro GA6DH (Core 7 240H, RTX 5070 Ti) (v8.20.8100) | |
| AIDA64 / CPU ZLib | |
| MSI Crosshair A16 HX E8WGK (v8.20.8100) | |
| Przeciętny AMD Ryzen 9 8940HX (1784 - 2122, n=3) | |
| MSI Crosshair 16 HX AI D2XWGKG (v6.92.6600) | |
| Alienware 16X Aurora Core Ultra 9 290HX Plus (v8.20.8100) | |
| Acer Predator Helios Neo 16S AI PHN16S-71-94L9 (v6.92.6600) | |
| Lenovo Legion 7 16 AGP11 (v8.20.8100) | |
| Gigabyte Gaming A16 Pro GA6DH (Core 7 240H, RTX 5070 Ti) (v8.20.8100) | |
| AIDA64 / FP64 Ray-Trace | |
| MSI Crosshair A16 HX E8WGK (v8.20.8100) | |
| Przeciętny AMD Ryzen 9 8940HX (23193 - 28773, n=3) | |
| Lenovo Legion 7 16 AGP11 (v8.20.8100) | |
| MSI Crosshair 16 HX AI D2XWGKG (v6.92.6600) | |
| Alienware 16X Aurora Core Ultra 9 290HX Plus (v8.20.8100) | |
| Acer Predator Helios Neo 16S AI PHN16S-71-94L9 (v6.92.6600) | |
| Gigabyte Gaming A16 Pro GA6DH (Core 7 240H, RTX 5070 Ti) (v8.20.8100) | |
| AIDA64 / CPU PhotoWorxx | |
| Lenovo Legion 7 16 AGP11 (v8.20.8100) | |
| Acer Predator Helios Neo 16S AI PHN16S-71-94L9 (v6.92.6600) | |
| Alienware 16X Aurora Core Ultra 9 290HX Plus (v8.20.8100) | |
| Gigabyte Gaming A16 Pro GA6DH (Core 7 240H, RTX 5070 Ti) (v8.20.8100) | |
| MSI Crosshair 16 HX AI D2XWGKG (v6.92.6600) | |
| MSI Crosshair A16 HX E8WGK (v8.20.8100) | |
| Przeciętny AMD Ryzen 9 8940HX (18283 - 35274, n=3) | |
| AIDA64 / CPU CheckMate | |
| MSI Crosshair A16 HX E8WGK (v8.20.8100) | |
| Przeciętny AMD Ryzen 9 8940HX (n=1) | |
| Lenovo Legion 7 16 AGP11 (v8.20.8100) | |
| Alienware 16X Aurora Core Ultra 9 290HX Plus (v8.20.8100) | |
| Gigabyte Gaming A16 Pro GA6DH (Core 7 240H, RTX 5070 Ti) (v8.20.8100) | |
Wydajność systemu
PCMark 10: Score | Essentials | Productivity | Digital Content Creation
CrossMark: Overall | Productivity | Creativity | Responsiveness
WebXPRT 3: Overall
WebXPRT 4: Overall
Mozilla Kraken 1.1: Total
Geekbench AI: Quantized GPU 1.7 | Half Precision GPU 1.7 | Single Precision GPU 1.7
| Performance rating | |
| Alienware 16X Aurora Core Ultra 9 290HX Plus | |
| MSI Crosshair A16 HX E8WGK | |
| Przeciętny AMD Ryzen 9 8940HX, NVIDIA GeForce RTX 5070 Laptop | |
| MSI Crosshair 16 HX AI D2XWGKG | |
| Acer Predator Helios Neo 16S AI PHN16S-71-94L9 -3! | |
| Lenovo Legion 7 16 AGP11 -3! | |
| Gigabyte Gaming A16 Pro GA6DH (Core 7 240H, RTX 5070 Ti) | |
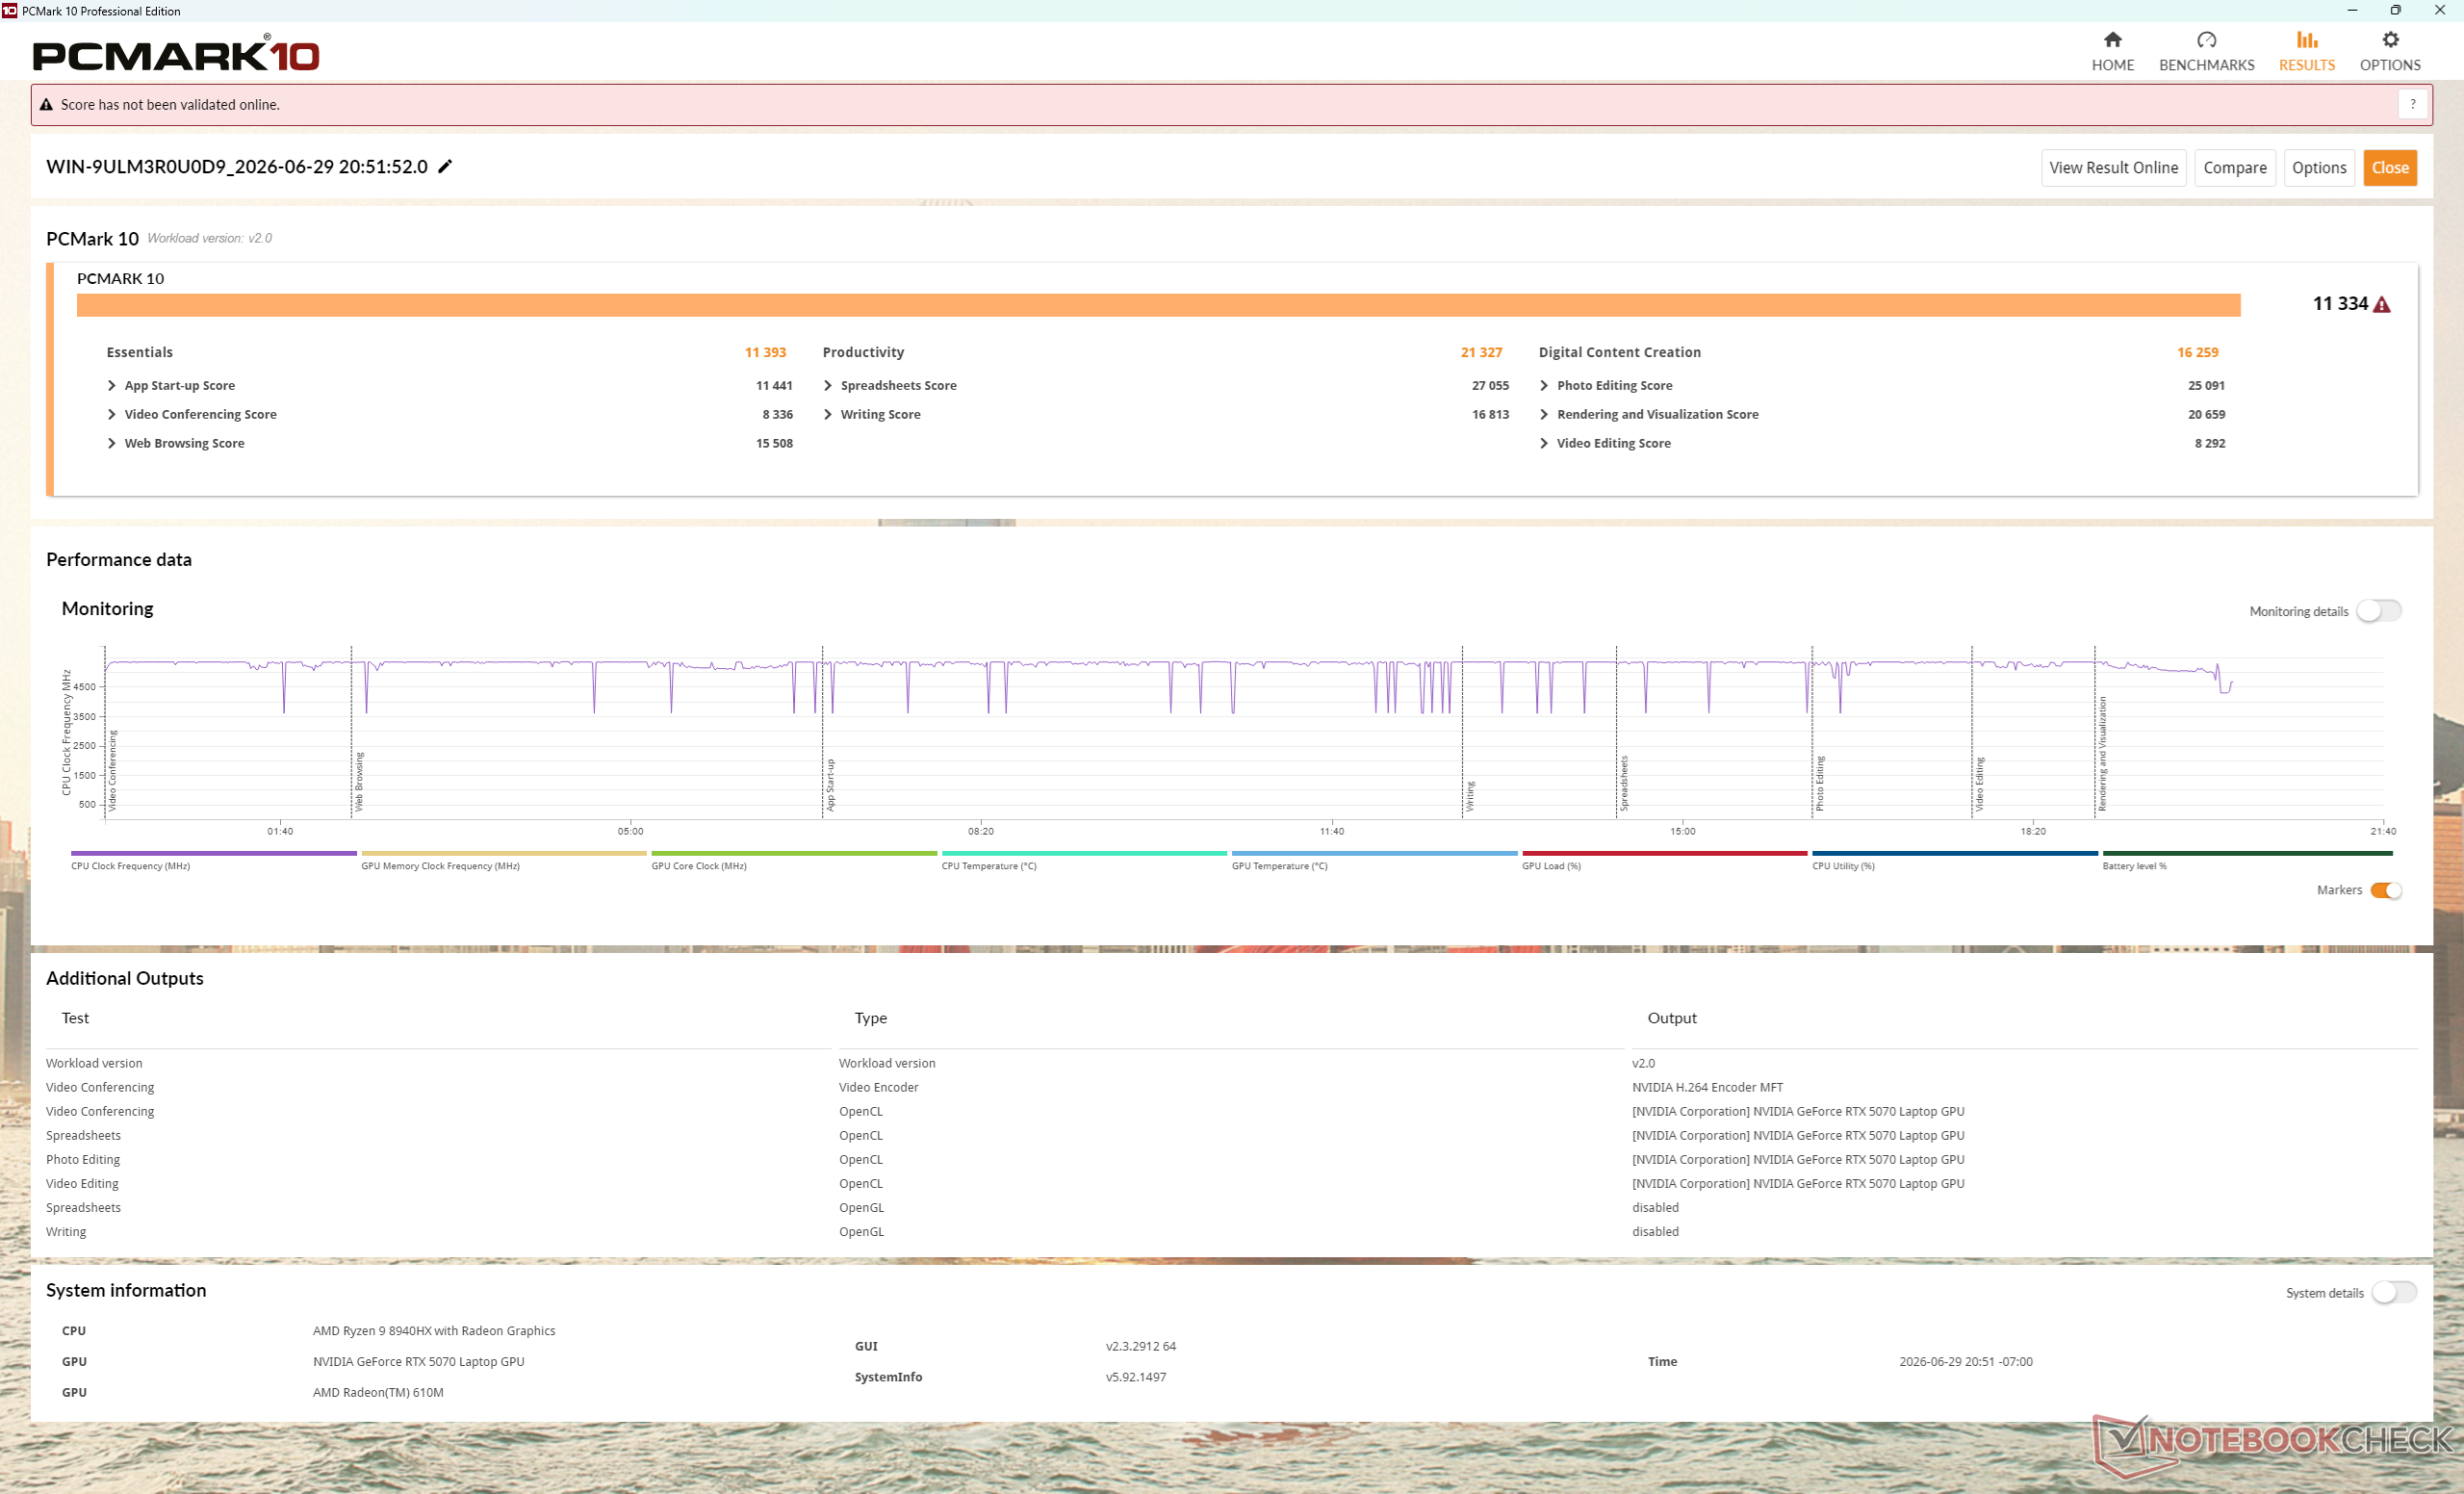
| PCMark 10 / Score | |
| MSI Crosshair A16 HX E8WGK | |
| Alienware 16X Aurora Core Ultra 9 290HX Plus | |
| Przeciętny AMD Ryzen 9 8940HX, NVIDIA GeForce RTX 5070 Laptop (8106 - 11334, n=2) | |
| Lenovo Legion 7 16 AGP11 | |
| Gigabyte Gaming A16 Pro GA6DH (Core 7 240H, RTX 5070 Ti) | |
| Acer Predator Helios Neo 16S AI PHN16S-71-94L9 | |
| MSI Crosshair 16 HX AI D2XWGKG | |
| PCMark 10 / Essentials | |
| Alienware 16X Aurora Core Ultra 9 290HX Plus | |
| MSI Crosshair A16 HX E8WGK | |
| Przeciętny AMD Ryzen 9 8940HX, NVIDIA GeForce RTX 5070 Laptop (11371 - 11393, n=2) | |
| Acer Predator Helios Neo 16S AI PHN16S-71-94L9 | |
| MSI Crosshair 16 HX AI D2XWGKG | |
| Lenovo Legion 7 16 AGP11 | |
| Gigabyte Gaming A16 Pro GA6DH (Core 7 240H, RTX 5070 Ti) | |
| PCMark 10 / Productivity | |
| MSI Crosshair A16 HX E8WGK | |
| Alienware 16X Aurora Core Ultra 9 290HX Plus | |
| Lenovo Legion 7 16 AGP11 | |
| Przeciętny AMD Ryzen 9 8940HX, NVIDIA GeForce RTX 5070 Laptop (9492 - 21327, n=2) | |
| Gigabyte Gaming A16 Pro GA6DH (Core 7 240H, RTX 5070 Ti) | |
| Acer Predator Helios Neo 16S AI PHN16S-71-94L9 | |
| MSI Crosshair 16 HX AI D2XWGKG | |
| PCMark 10 / Digital Content Creation | |
| Alienware 16X Aurora Core Ultra 9 290HX Plus | |
| MSI Crosshair 16 HX AI D2XWGKG | |
| MSI Crosshair A16 HX E8WGK | |
| Przeciętny AMD Ryzen 9 8940HX, NVIDIA GeForce RTX 5070 Laptop (13392 - 16259, n=2) | |
| Acer Predator Helios Neo 16S AI PHN16S-71-94L9 | |
| Lenovo Legion 7 16 AGP11 | |
| Gigabyte Gaming A16 Pro GA6DH (Core 7 240H, RTX 5070 Ti) | |
| CrossMark / Overall | |
| Alienware 16X Aurora Core Ultra 9 290HX Plus | |
| Acer Predator Helios Neo 16S AI PHN16S-71-94L9 | |
| MSI Crosshair 16 HX AI D2XWGKG | |
| MSI Crosshair A16 HX E8WGK | |
| Przeciętny AMD Ryzen 9 8940HX, NVIDIA GeForce RTX 5070 Laptop (1977 - 2011, n=2) | |
| Gigabyte Gaming A16 Pro GA6DH (Core 7 240H, RTX 5070 Ti) | |
| Lenovo Legion 7 16 AGP11 | |
| CrossMark / Productivity | |
| Alienware 16X Aurora Core Ultra 9 290HX Plus | |
| MSI Crosshair 16 HX AI D2XWGKG | |
| Acer Predator Helios Neo 16S AI PHN16S-71-94L9 | |
| MSI Crosshair A16 HX E8WGK | |
| Przeciętny AMD Ryzen 9 8940HX, NVIDIA GeForce RTX 5070 Laptop (1844 - 1869, n=2) | |
| Gigabyte Gaming A16 Pro GA6DH (Core 7 240H, RTX 5070 Ti) | |
| Lenovo Legion 7 16 AGP11 | |
| CrossMark / Creativity | |
| Alienware 16X Aurora Core Ultra 9 290HX Plus | |
| Acer Predator Helios Neo 16S AI PHN16S-71-94L9 | |
| MSI Crosshair 16 HX AI D2XWGKG | |
| MSI Crosshair A16 HX E8WGK | |
| Przeciętny AMD Ryzen 9 8940HX, NVIDIA GeForce RTX 5070 Laptop (2225 - 2298, n=2) | |
| Gigabyte Gaming A16 Pro GA6DH (Core 7 240H, RTX 5070 Ti) | |
| Lenovo Legion 7 16 AGP11 | |
| CrossMark / Responsiveness | |
| Alienware 16X Aurora Core Ultra 9 290HX Plus | |
| MSI Crosshair 16 HX AI D2XWGKG | |
| Acer Predator Helios Neo 16S AI PHN16S-71-94L9 | |
| Przeciętny AMD Ryzen 9 8940HX, NVIDIA GeForce RTX 5070 Laptop (1680 - 1709, n=2) | |
| MSI Crosshair A16 HX E8WGK | |
| Gigabyte Gaming A16 Pro GA6DH (Core 7 240H, RTX 5070 Ti) | |
| Lenovo Legion 7 16 AGP11 | |
| WebXPRT 3 / Overall | |
| Alienware 16X Aurora Core Ultra 9 290HX Plus | |
| MSI Crosshair 16 HX AI D2XWGKG | |
| Lenovo Legion 7 16 AGP11 | |
| Acer Predator Helios Neo 16S AI PHN16S-71-94L9 | |
| MSI Crosshair A16 HX E8WGK | |
| Przeciętny AMD Ryzen 9 8940HX, NVIDIA GeForce RTX 5070 Laptop (274 - 322, n=2) | |
| Gigabyte Gaming A16 Pro GA6DH (Core 7 240H, RTX 5070 Ti) | |
| WebXPRT 4 / Overall | |
| Alienware 16X Aurora Core Ultra 9 290HX Plus | |
| MSI Crosshair 16 HX AI D2XWGKG | |
| Acer Predator Helios Neo 16S AI PHN16S-71-94L9 | |
| MSI Crosshair A16 HX E8WGK | |
| Lenovo Legion 7 16 AGP11 | |
| Przeciętny AMD Ryzen 9 8940HX, NVIDIA GeForce RTX 5070 Laptop (230 - 283, n=2) | |
| Gigabyte Gaming A16 Pro GA6DH (Core 7 240H, RTX 5070 Ti) | |
| Mozilla Kraken 1.1 / Total | |
| Gigabyte Gaming A16 Pro GA6DH (Core 7 240H, RTX 5070 Ti) | |
| Przeciętny AMD Ryzen 9 8940HX, NVIDIA GeForce RTX 5070 Laptop (474 - 507, n=2) | |
| MSI Crosshair A16 HX E8WGK | |
| Lenovo Legion 7 16 AGP11 | |
| Acer Predator Helios Neo 16S AI PHN16S-71-94L9 | |
| MSI Crosshair 16 HX AI D2XWGKG | |
| Alienware 16X Aurora Core Ultra 9 290HX Plus | |
| Geekbench AI / Quantized GPU 1.7 | |
| Alienware 16X Aurora Core Ultra 9 290HX Plus | |
| MSI Crosshair A16 HX E8WGK | |
| Przeciętny AMD Ryzen 9 8940HX, NVIDIA GeForce RTX 5070 Laptop (n=1) | |
| MSI Crosshair 16 HX AI D2XWGKG | |
| Gigabyte Gaming A16 Pro GA6DH (Core 7 240H, RTX 5070 Ti) | |
| Geekbench AI / Half Precision GPU 1.7 | |
| MSI Crosshair A16 HX E8WGK | |
| Przeciętny AMD Ryzen 9 8940HX, NVIDIA GeForce RTX 5070 Laptop (n=1) | |
| Alienware 16X Aurora Core Ultra 9 290HX Plus | |
| MSI Crosshair 16 HX AI D2XWGKG | |
| Gigabyte Gaming A16 Pro GA6DH (Core 7 240H, RTX 5070 Ti) | |
| Geekbench AI / Single Precision GPU 1.7 | |
| Alienware 16X Aurora Core Ultra 9 290HX Plus | |
| MSI Crosshair A16 HX E8WGK | |
| Przeciętny AMD Ryzen 9 8940HX, NVIDIA GeForce RTX 5070 Laptop (n=1) | |
| MSI Crosshair 16 HX AI D2XWGKG | |
| Gigabyte Gaming A16 Pro GA6DH (Core 7 240H, RTX 5070 Ti) | |
* ... im mniej tym lepiej
| PCMark 10 Score | 11334 pkt. | |
Pomoc | ||
* ... im mniej tym lepiej
Opóźnienie DPC
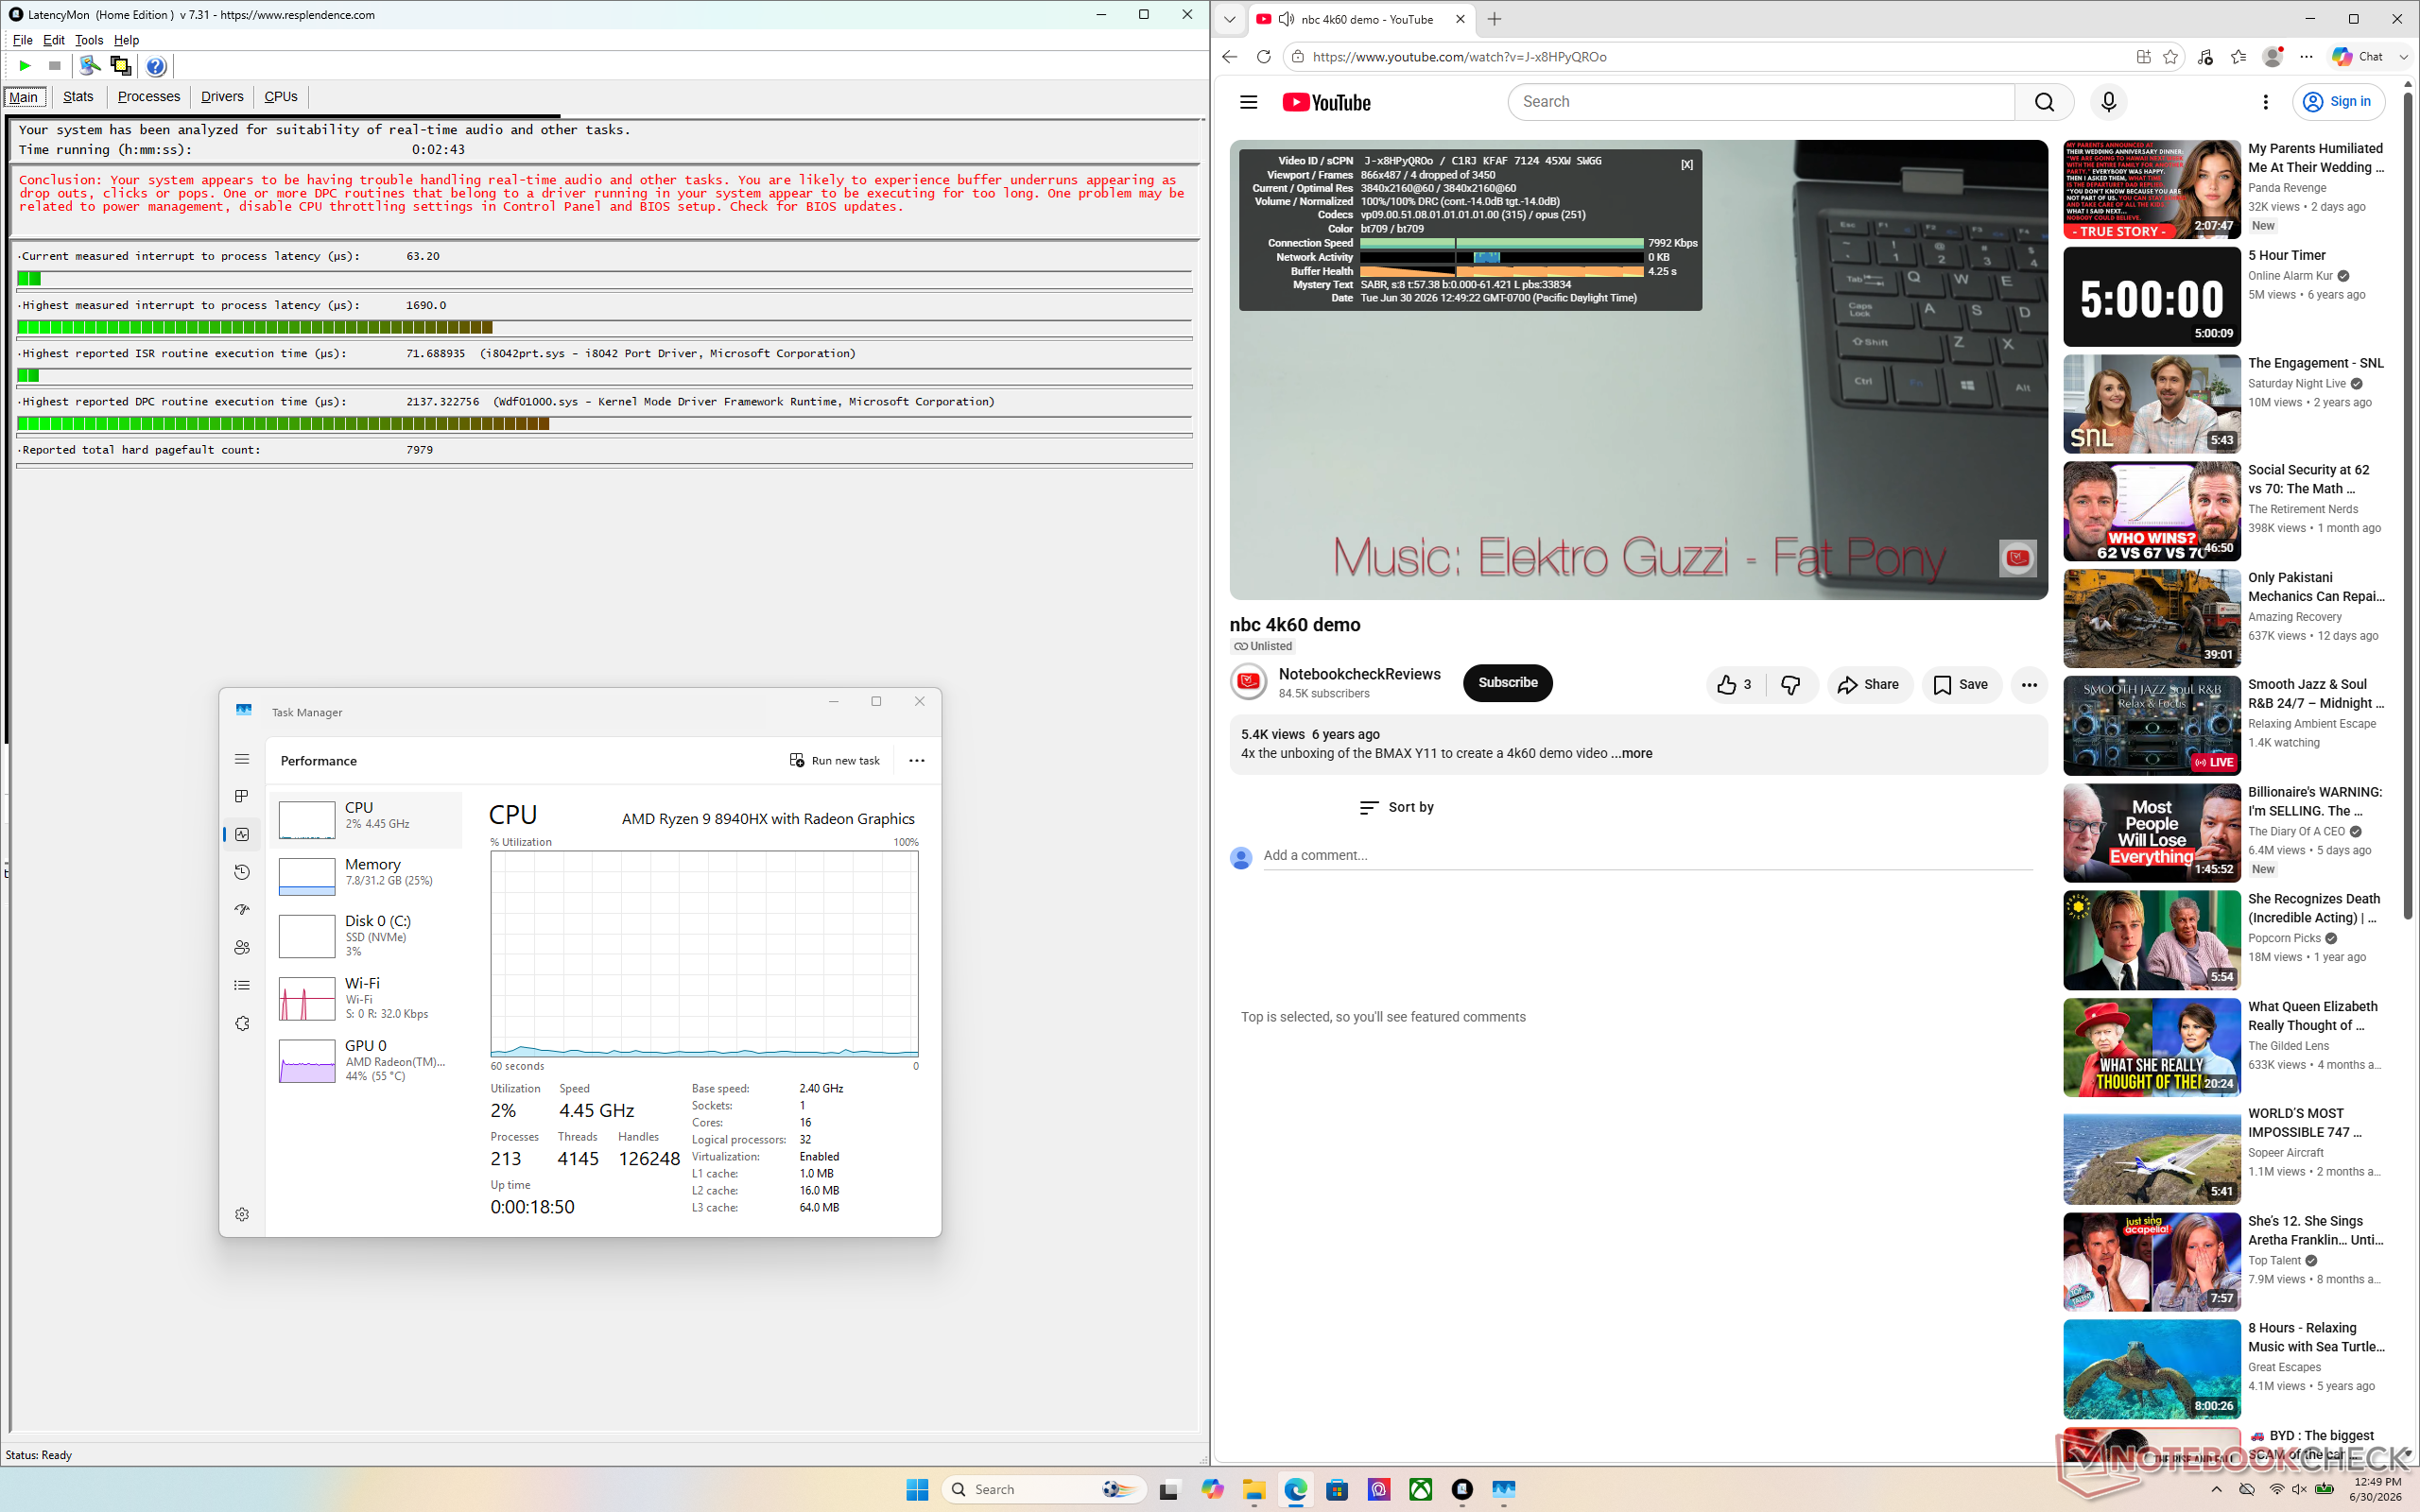
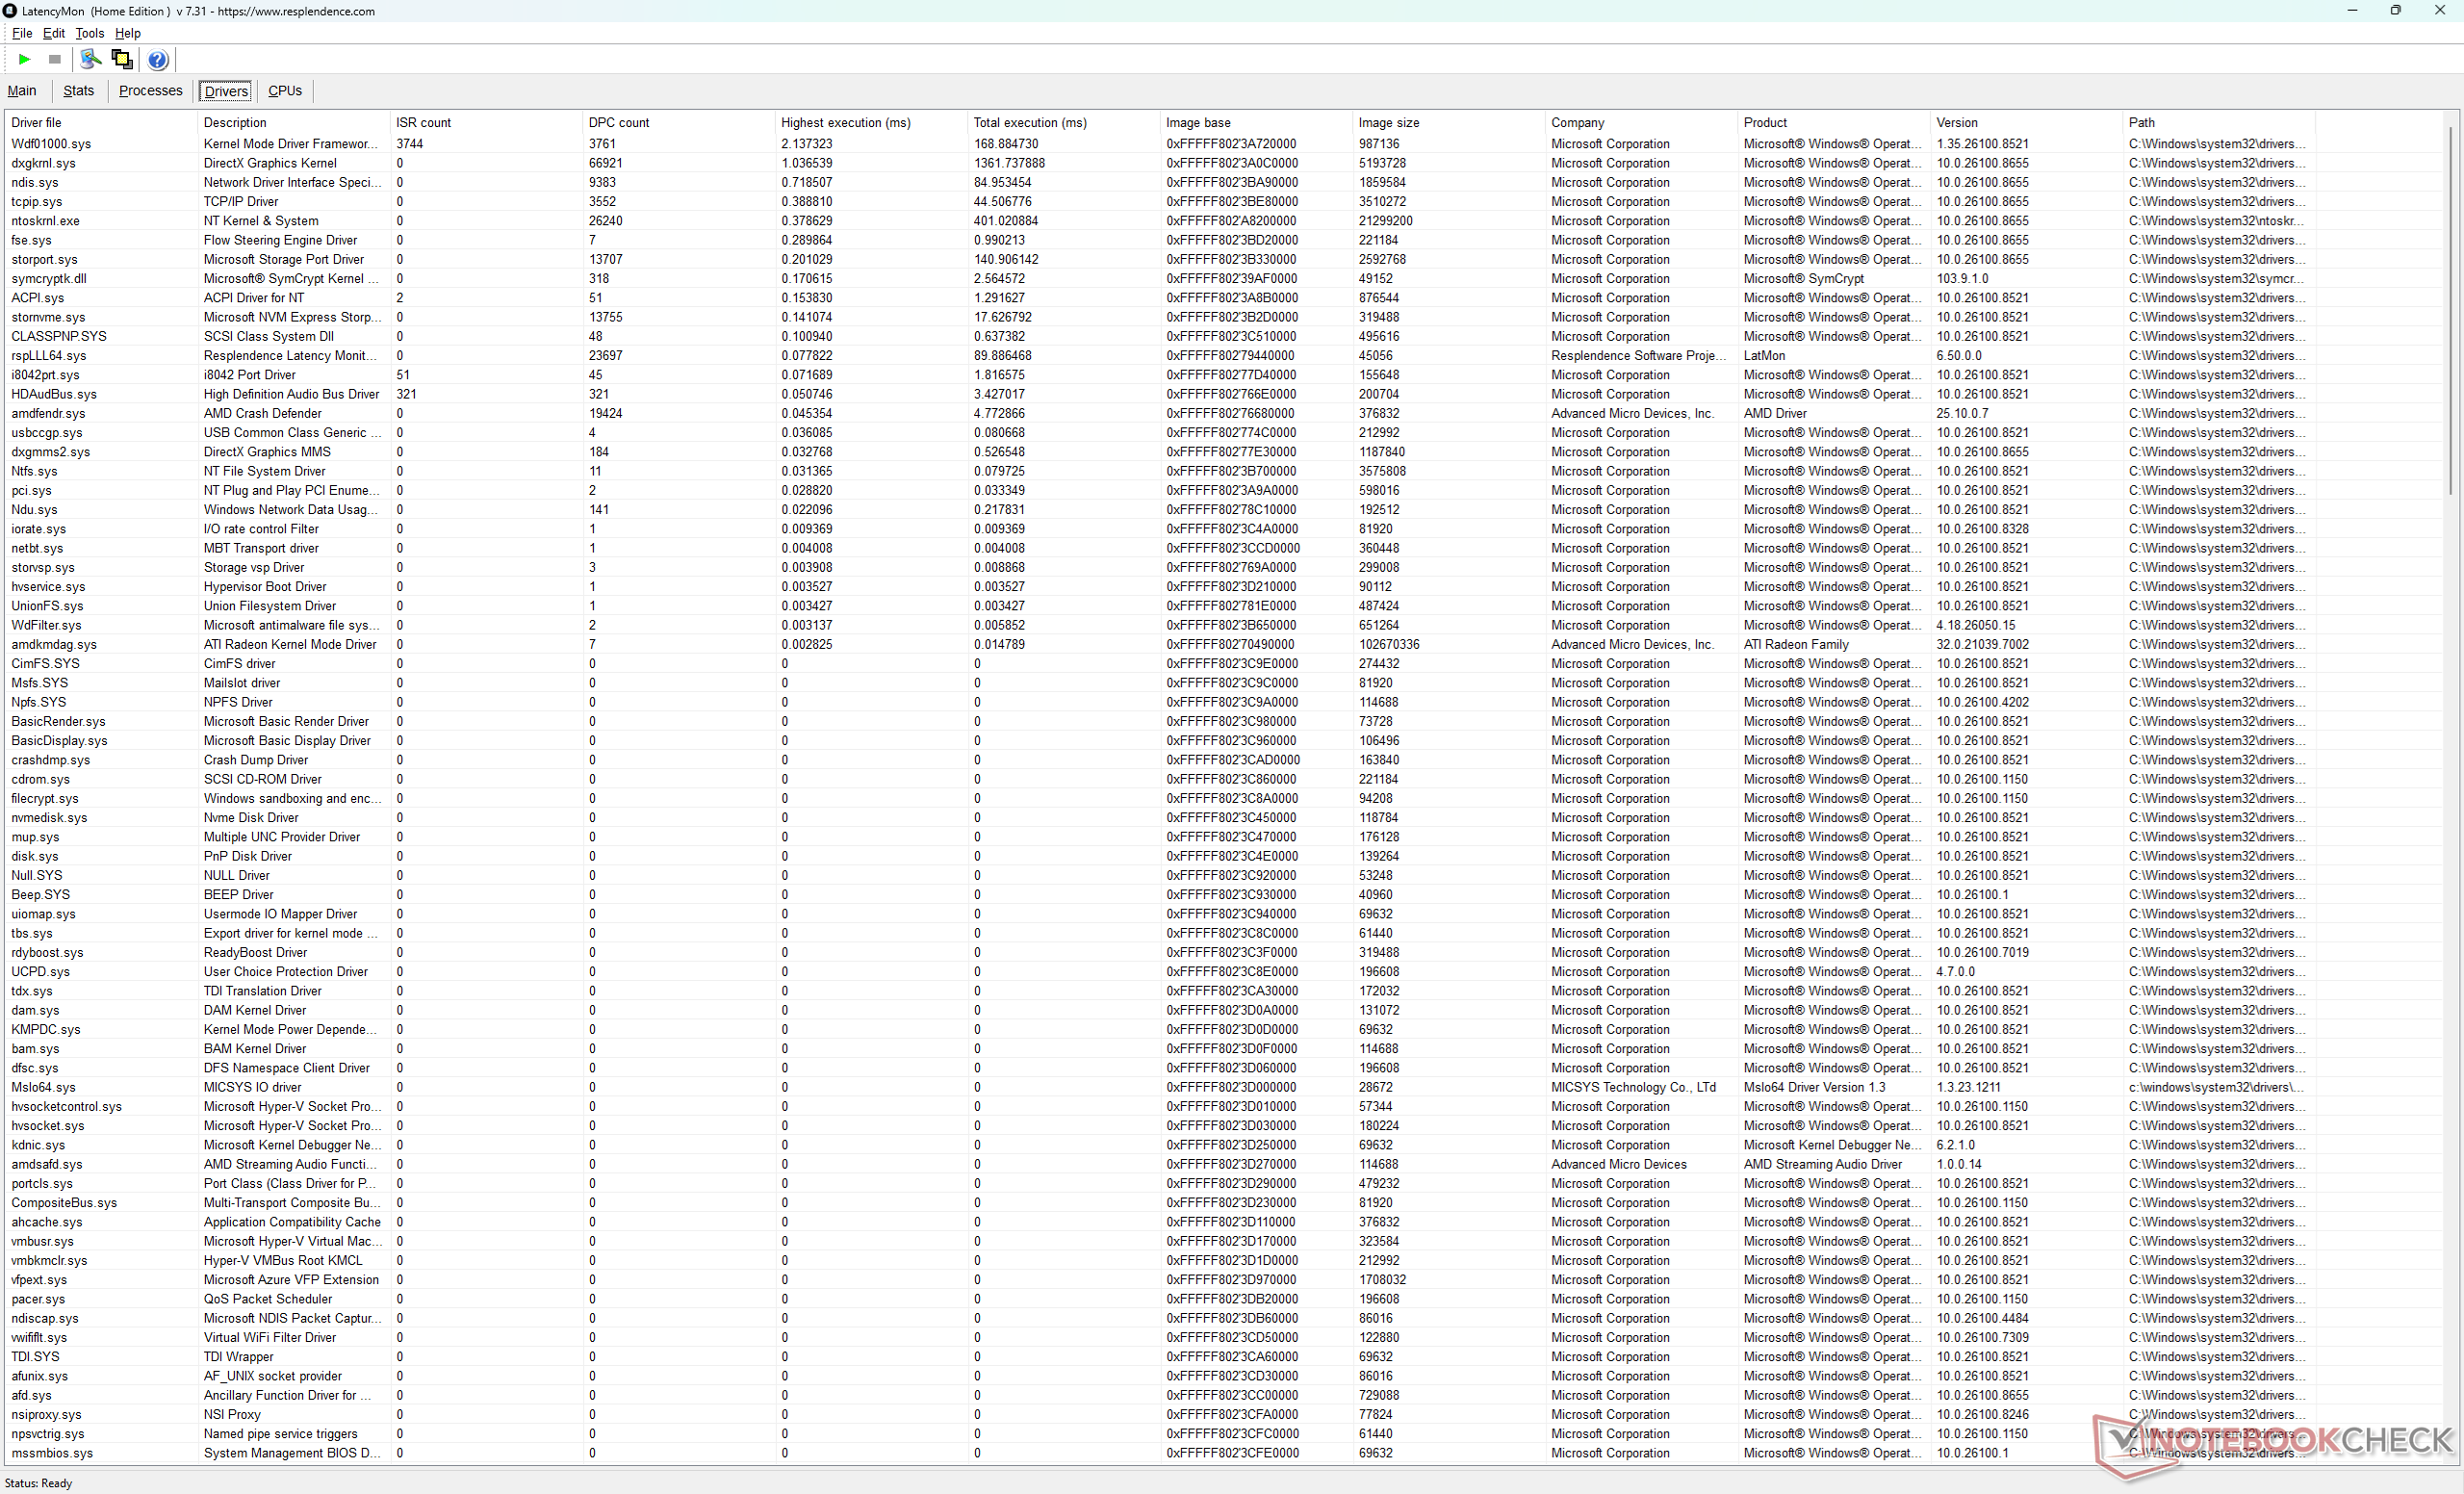
| DPC Latencies / LatencyMon - interrupt to process latency (max), Web, Youtube, Prime95 | |
| Lenovo Legion 7 16 AGP11 | |
| Gigabyte Gaming A16 Pro GA6DH (Core 7 240H, RTX 5070 Ti) | |
| Alienware 16X Aurora Core Ultra 9 290HX Plus | |
| Acer Predator Helios Neo 16S AI PHN16S-71-94L9 | |
| MSI Crosshair A16 HX E8WGK | |
| MSI Crosshair 16 HX AI D2XWGKG | |
* ... im mniej tym lepiej
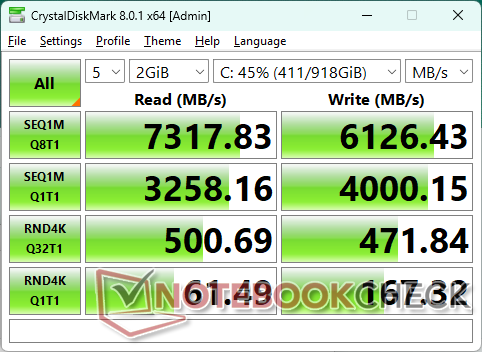
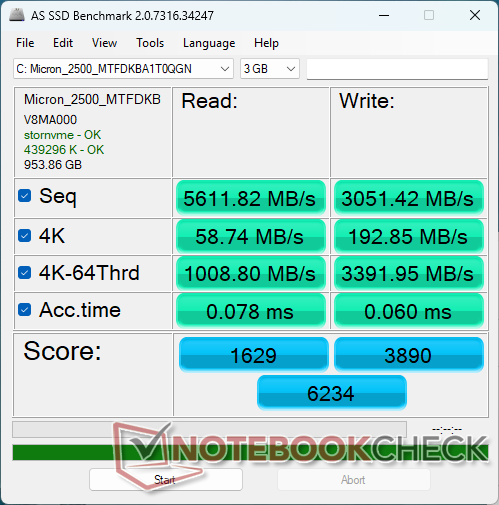
Urządzenia pamięci masowej

* ... im mniej tym lepiej
Ograniczanie wydajności dysku: pętla odczytu DiskSpd, głębokość kolejki 8
Wydajność procesora graficznego
| Profil zasilania | Wynik w kategorii grafiki | Wynik w zakresie fizyki | Wynik łączny |
| Tryb wydajności, funkcja Cooler Boost włączona, funkcja Apex włączona | 14087 | 13 104 | 13 930 |
| Tryb wydajnościowy, funkcja Cooler Boost wyłączona, Apex włączony | 14118 (-0%) | 13154 (-0%) | 13964 (-0%) |
| Tryb wydajności, funkcja Cooler Boost wyłączona, funkcja Apex wyłączona | 13 991 (-1%) | 13109 (-0%) | 13851 (-0%) |
| Tryb zrównoważony | 13 451 (-5 %) | 12 174 (-7 %) | 13 242 (-5 %) |
| Zasilanie akumulatorowe | 4400 (-69%) | 6518 (-50%) | 4625 (-67%) |
| 3DMark 11 Performance | 37786 pkt. | |
| 3DMark Cloud Gate Standard Score | 71413 pkt. | |
| 3DMark Fire Strike Score | 35205 pkt. | |
| 3DMark Time Spy Score | 13964 pkt. | |
| 3DMark Steel Nomad Score | 3087 pkt. | |
Pomoc | ||
* ... im mniej tym lepiej
| Final Fantasy XV Benchmark - 1920x1080 High Quality | |
| Alienware 16X Aurora Core Ultra 9 290HX Plus | |
| MSI Crosshair 16 HX AI D2XWGKG | |
| MSI Crosshair A16 HX E8WGK | |
| Lenovo Legion 7 16 AGP11 | |
| Gigabyte Gaming A16 Pro GA6DH (Core 7 240H, RTX 5070 Ti) | |
| Strange Brigade - 1920x1080 ultra AA:ultra AF:16 | |
| Alienware 16X Aurora Core Ultra 9 290HX Plus | |
| Gigabyte Gaming A16 Pro GA6DH (Core 7 240H, RTX 5070 Ti) | |
| MSI Crosshair 16 HX AI D2XWGKG | |
| MSI Crosshair A16 HX E8WGK | |
| Lenovo Legion 7 16 AGP11 | |
Wykres liczby klatek na sekundę w trybie Ultra w grze „Cyberpunk 2077”
| low | med. | high | ultra | QHD DLSS | QHD | |
|---|---|---|---|---|---|---|
| GTA V (2015) | 187.6 | 186.6 | 184.6 | 152.6 | 129.7 | |
| Dota 2 Reborn (2015) | 240 | 208 | 199.1 | 183.3 | ||
| Final Fantasy XV Benchmark (2018) | 229 | 187.8 | 140 | 102 | ||
| X-Plane 11.11 (2018) | 141.9 | 131.5 | 104.8 | |||
| Strange Brigade (2018) | 502 | 369 | 305 | 258 | 170.4 | |
| Baldur's Gate 3 (2023) | 239 | 183.9 | 154.6 | 133.2 | 129.6 | 90.3 |
| Cyberpunk 2077 (2023) | 173.8 | 149 | 124.8 | 112.1 | 81.9 | 68.8 |
| F1 24 (2024) | 345 | 336 | 269 | 94.7 | 93.1 | 59.3 |
Emisje
Hałas systemowy
Hałas
| luz |
| 29.1 / 29.1 / 29.1 dB |
| obciążenie |
| 41.7 / 59 dB |
 | ||
30 dB cichy 40 dB(A) słyszalny 50 dB(A) irytujący |
||
min: | ||
| MSI Crosshair A16 HX E8WGK R9 8940HX, GeForce RTX 5070 Laptop | MSI Crosshair 16 HX AI D2XWGKG Ultra 9 275HX, GeForce RTX 5070 Laptop | Alienware 16X Aurora Core Ultra 9 290HX Plus Ultra 9 290HX Plus, GeForce RTX 5070 Ti Laptop | Lenovo Legion 7 16 AGP11 Ryzen AI 9 HX 470, GeForce RTX 5060 Laptop | Gigabyte Gaming A16 Pro GA6DH (Core 7 240H, RTX 5070 Ti) Core 7 240H, GeForce RTX 5070 Ti Laptop | Acer Predator Helios Neo 16S AI PHN16S-71-94L9 Ultra 9 275HX, GeForce RTX 5070 Ti Laptop | |
|---|---|---|---|---|---|---|
| Noise | -2% | 3% | 10% | 11% | -2% | |
| wyłączone / środowisko * (dB) | 23.4 | 25.56 -9% | 23.4 -0% | 24.5 -5% | 23 2% | 24 -3% |
| Idle Minimum * (dB) | 29.1 | 28.3 3% | 23.8 18% | 24.5 16% | 23 21% | 24 18% |
| Idle Average * (dB) | 29.1 | 28.3 3% | 23.8 18% | 24.5 16% | 24.35 16% | 30 -3% |
| Idle Maximum * (dB) | 29.1 | 28.3 3% | 31.4 -8% | 27.1 7% | 24.35 16% | 35 -20% |
| Load Average * (dB) | 41.7 | 50.26 -21% | 48.7 -17% | 34.6 17% | 34.77 17% | 53 -27% |
| Cyberpunk 2077 ultra * (dB) | 58.7 | 57.8 2% | 51.5 12% | 53 10% | 56.18 4% | 52 11% |
| Load Maximum * (dB) | 59 | 57.95 2% | 59.8 -1% | 53 10% | 56.43 4% | 54 8% |
* ... im mniej tym lepiej
Temperatura
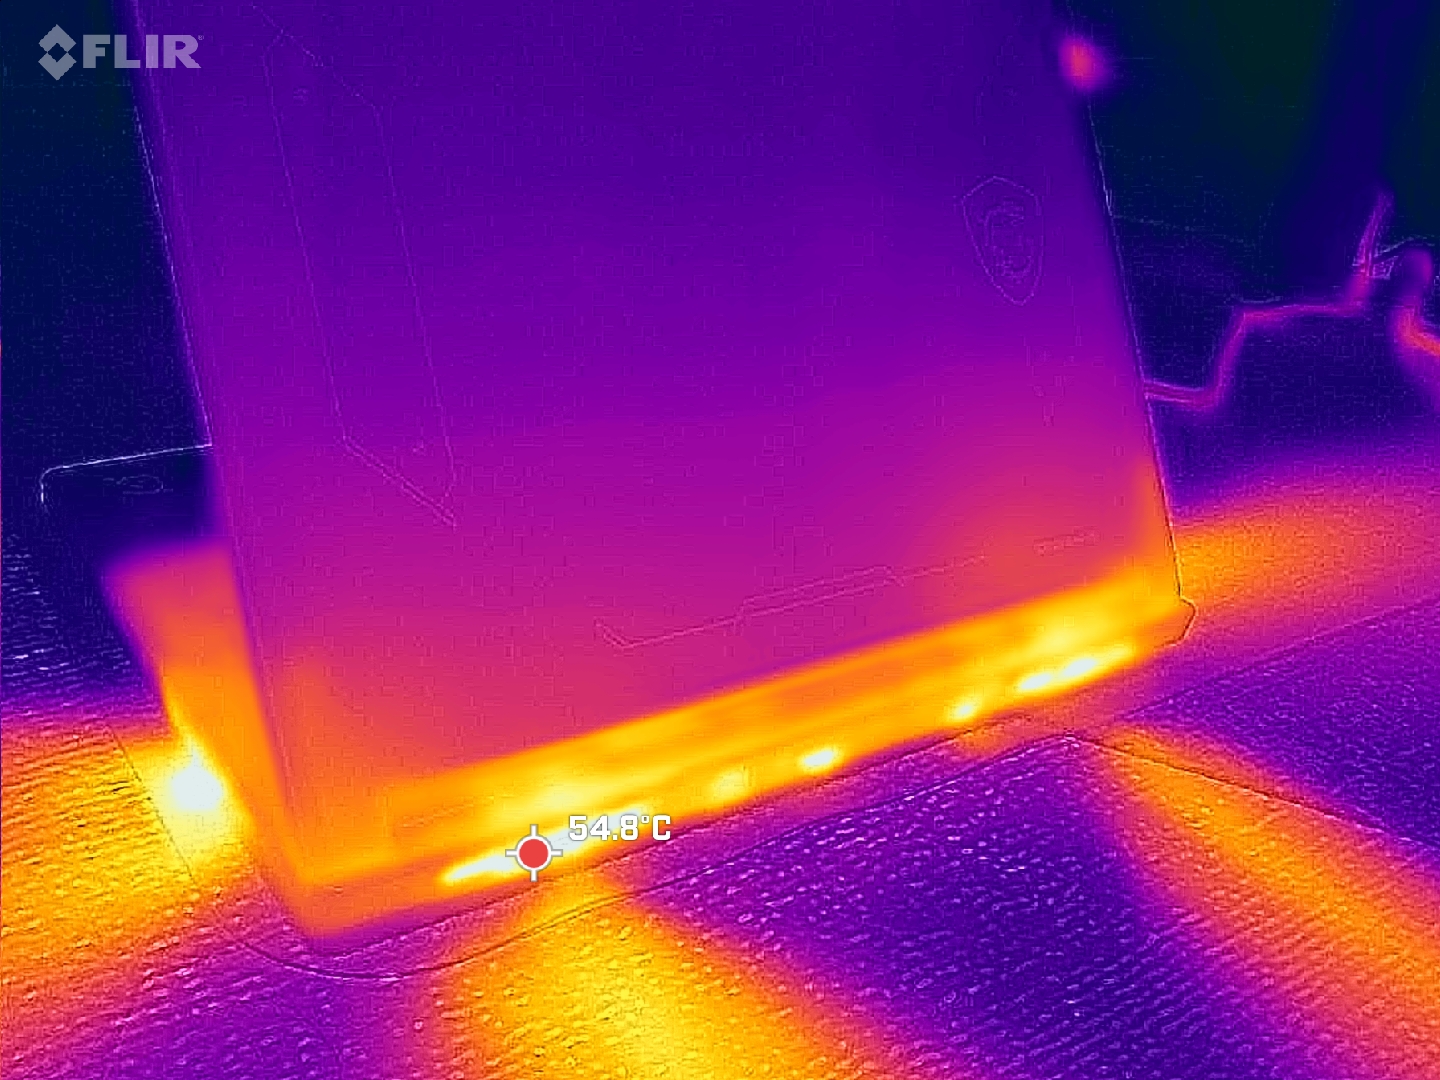
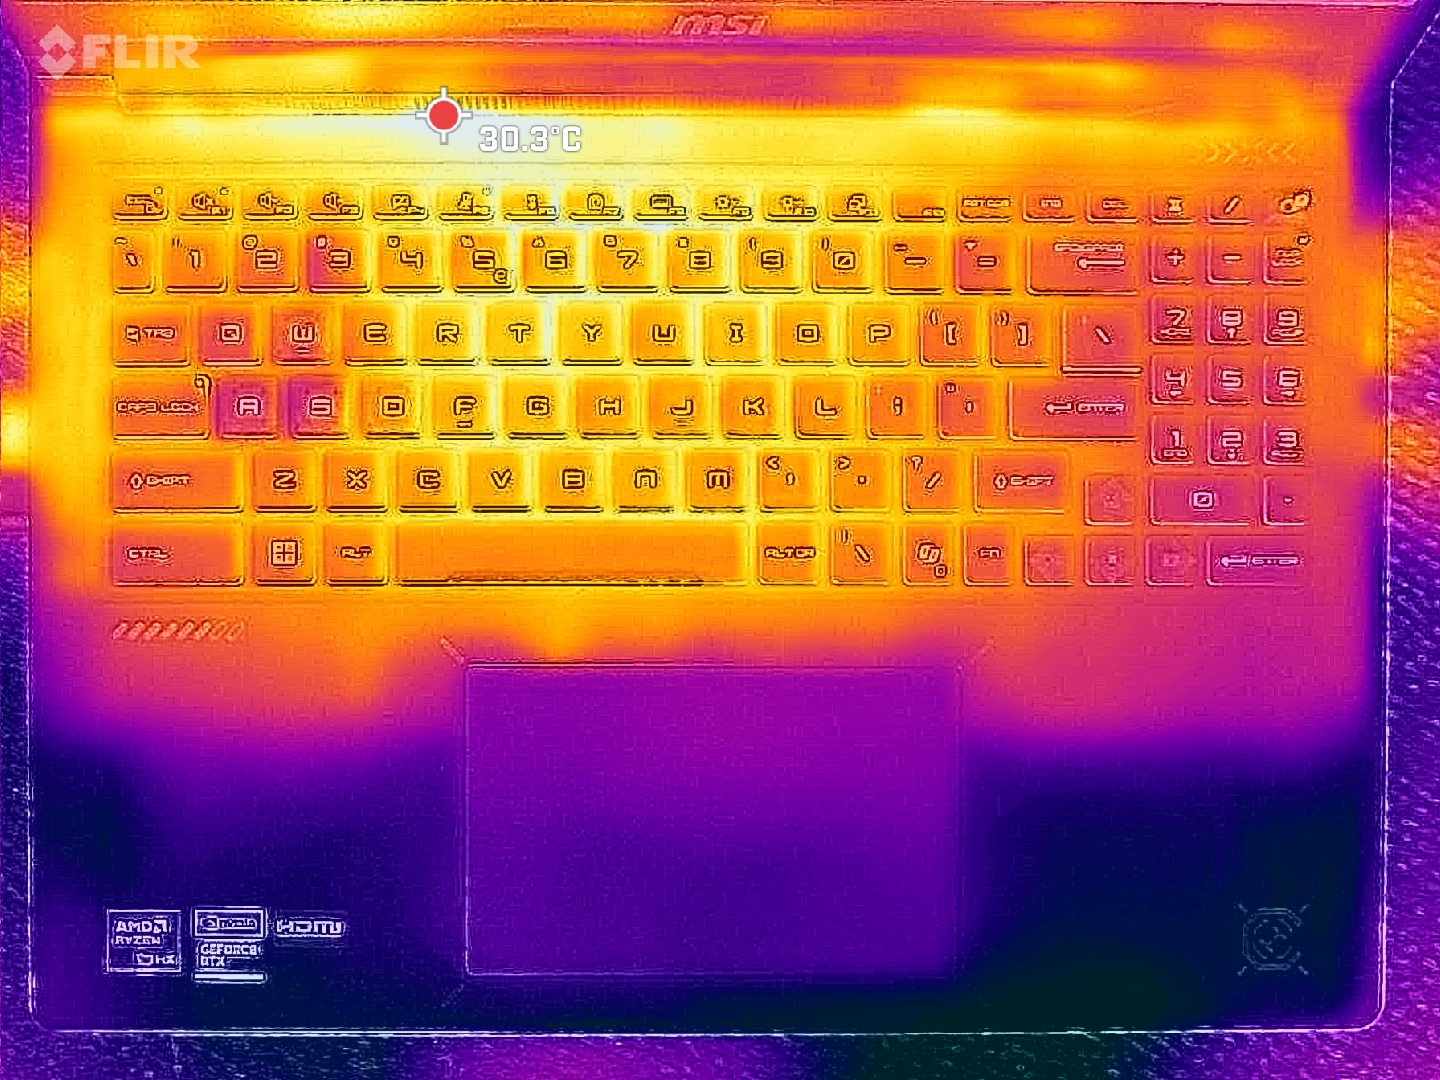
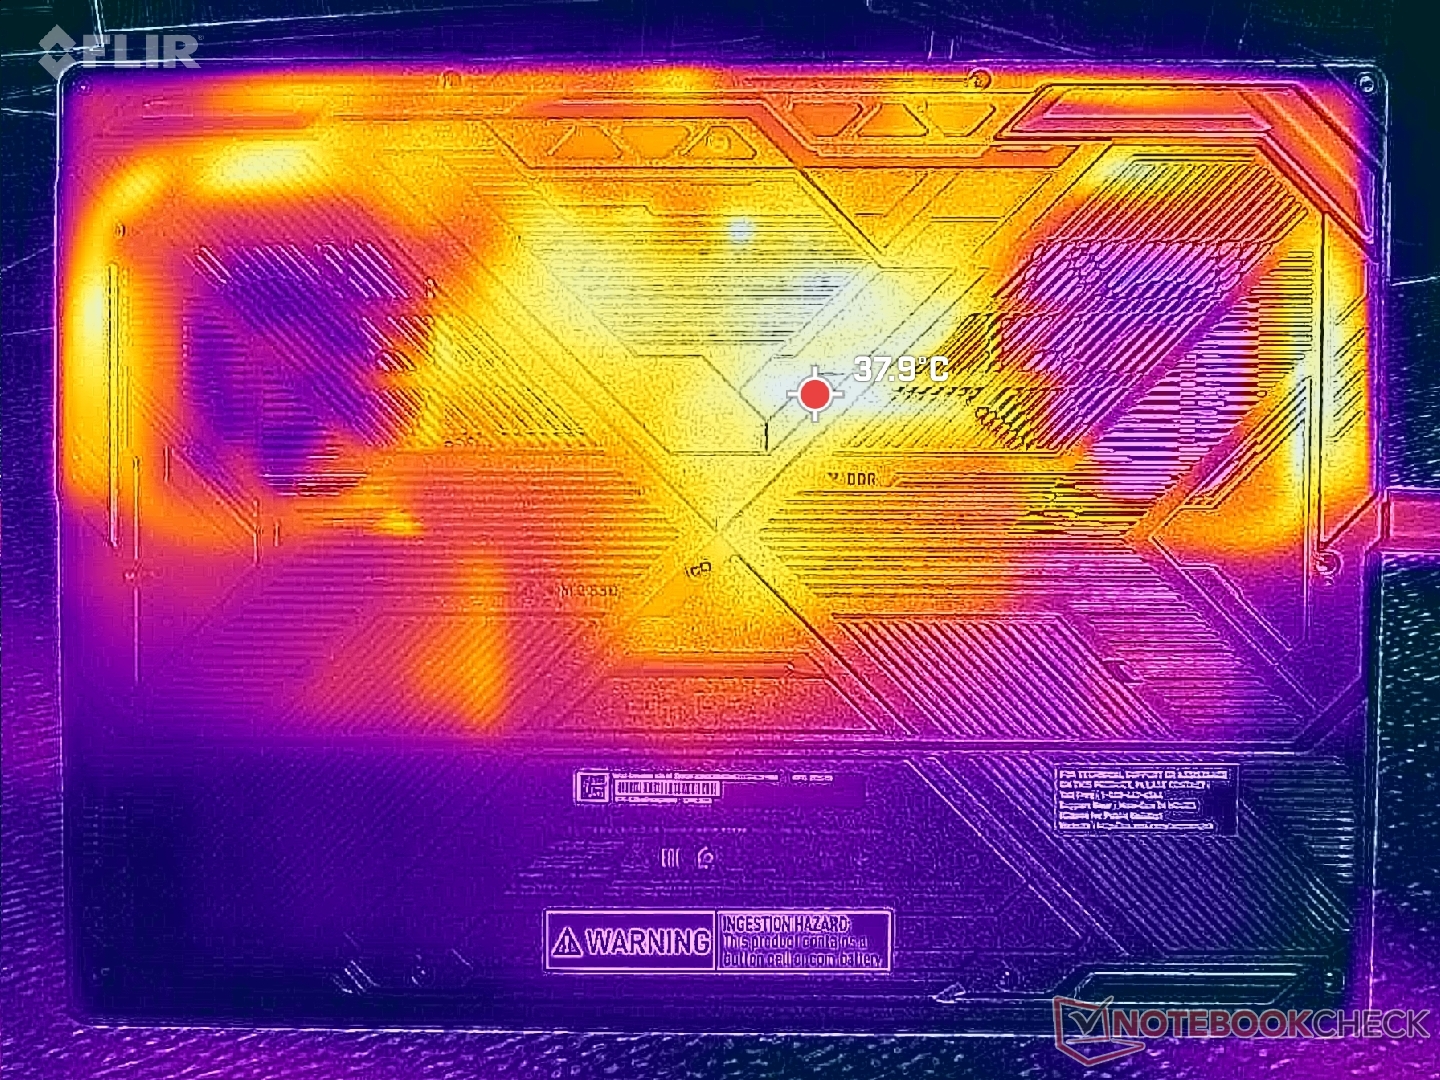
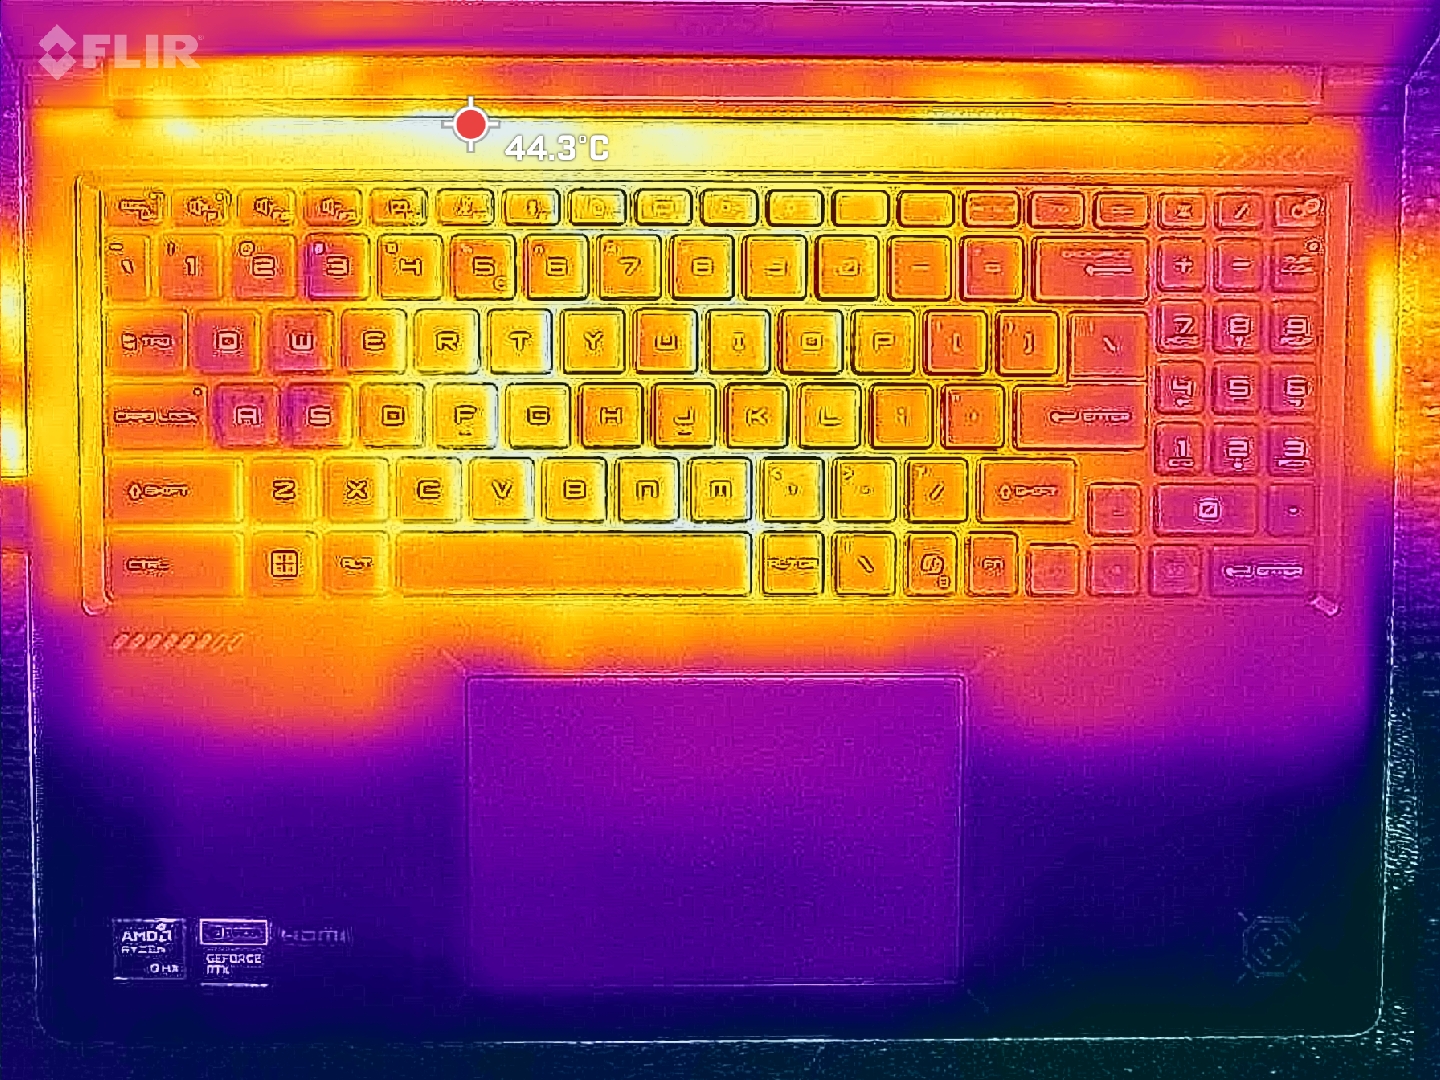
(±) Maksymalna temperatura w górnej części wynosi 41.8 °C / 107 F, w porównaniu do średniej 40.4 °C / 105 F , począwszy od 21.2 do 68.8 °C dla klasy Gaming.
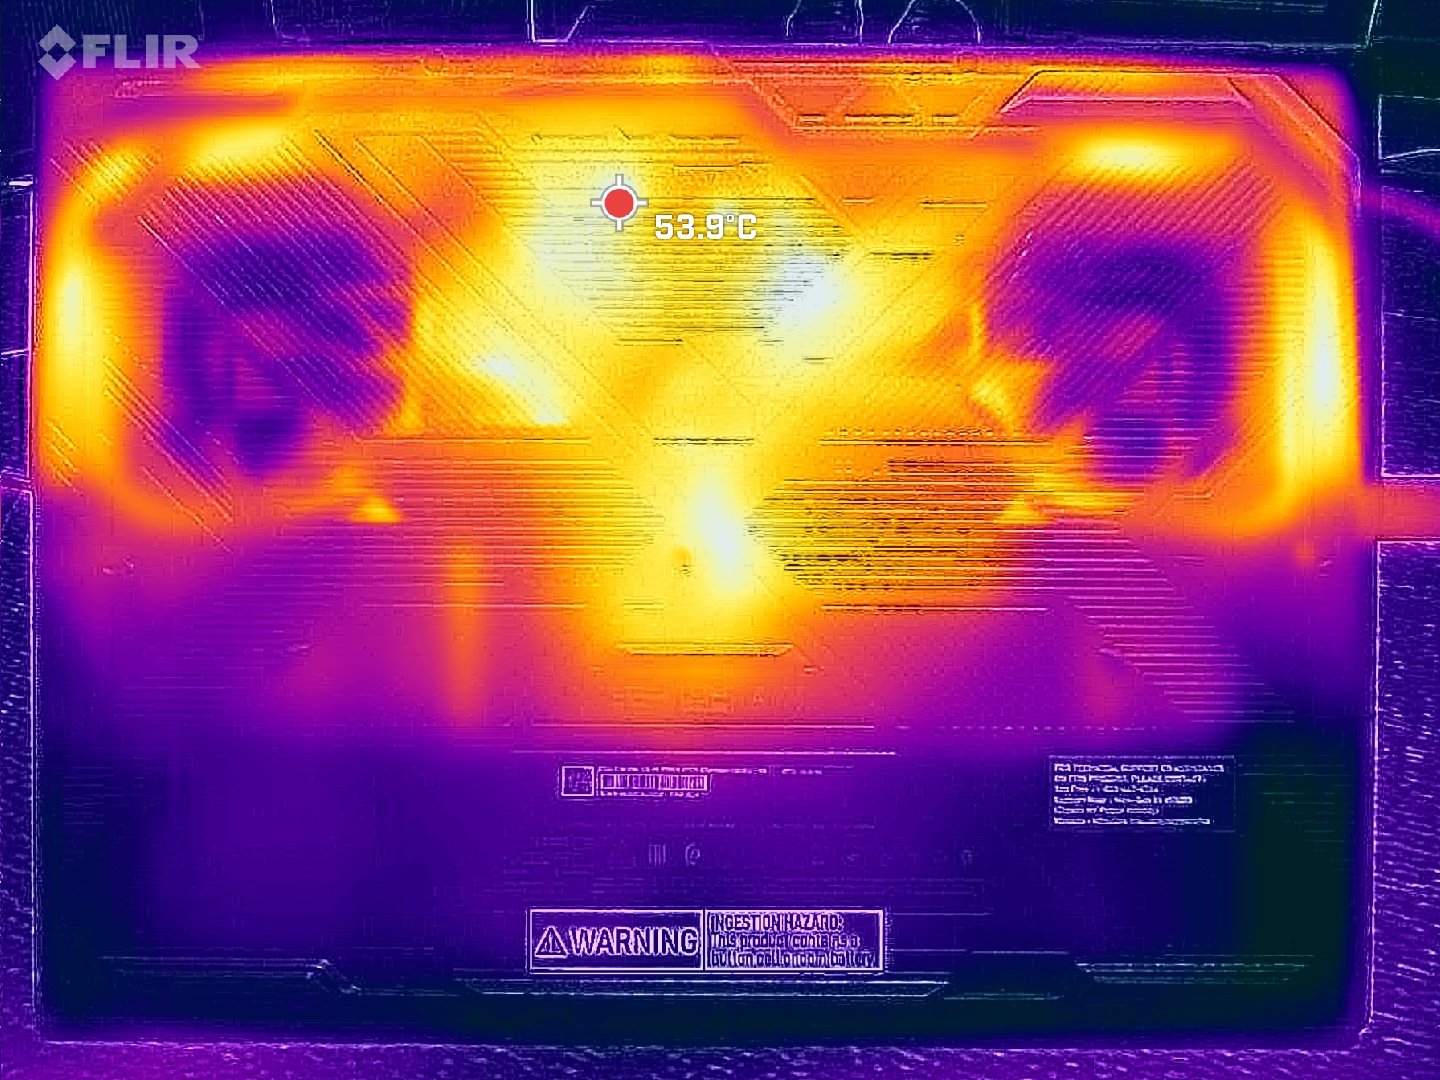
(-) Dno nagrzewa się maksymalnie do 50.6 °C / 123 F, w porównaniu do średniej 43.2 °C / 110 F
(+) W stanie bezczynności średnia temperatura górnej części wynosi 26.2 °C / 79 F, w porównaniu ze średnią temperaturą urządzenia wynoszącą 33.9 °C / ### class_avg_f### F.
(+) Podpórki pod nadgarstki i touchpad są chłodniejsze niż temperatura skóry i maksymalnie 31.6 °C / 88.9 F i dlatego są chłodne w dotyku.
(-) Średnia temperatura obszaru podparcia dłoni w podobnych urządzeniach wynosiła 28.8 °C / 83.8 F (-2.8 °C / -5.1 F).
| MSI Crosshair A16 HX E8WGK R9 8940HX, GeForce RTX 5070 Laptop | MSI Crosshair 16 HX AI D2XWGKG Ultra 9 275HX, GeForce RTX 5070 Laptop | Alienware 16X Aurora Core Ultra 9 290HX Plus Ultra 9 290HX Plus, GeForce RTX 5070 Ti Laptop | Lenovo Legion 7 16 AGP11 Ryzen AI 9 HX 470, GeForce RTX 5060 Laptop | Gigabyte Gaming A16 Pro GA6DH (Core 7 240H, RTX 5070 Ti) Core 7 240H, GeForce RTX 5070 Ti Laptop | Acer Predator Helios Neo 16S AI PHN16S-71-94L9 Ultra 9 275HX, GeForce RTX 5070 Ti Laptop | |
|---|---|---|---|---|---|---|
| Heat | 7% | 10% | 7% | -2% | 2% | |
| Maximum Upper Side * (°C) | 41.8 | 44.8 -7% | 48.2 -15% | 44.9 -7% | 42 -0% | 47 -12% |
| Maximum Bottom * (°C) | 50.6 | 43.4 14% | 41 19% | 50.5 -0% | 49 3% | 55 -9% |
| Idle Upper Side * (°C) | 30.8 | 31.2 -1% | 28.2 8% | 27.3 11% | 34 -10% | 28 9% |
| Idle Bottom * (°C) | 36 | 28.8 20% | 26.2 27% | 27.5 24% | 36 -0% | 29 19% |
* ... im mniej tym lepiej
Test warunków skrajnych
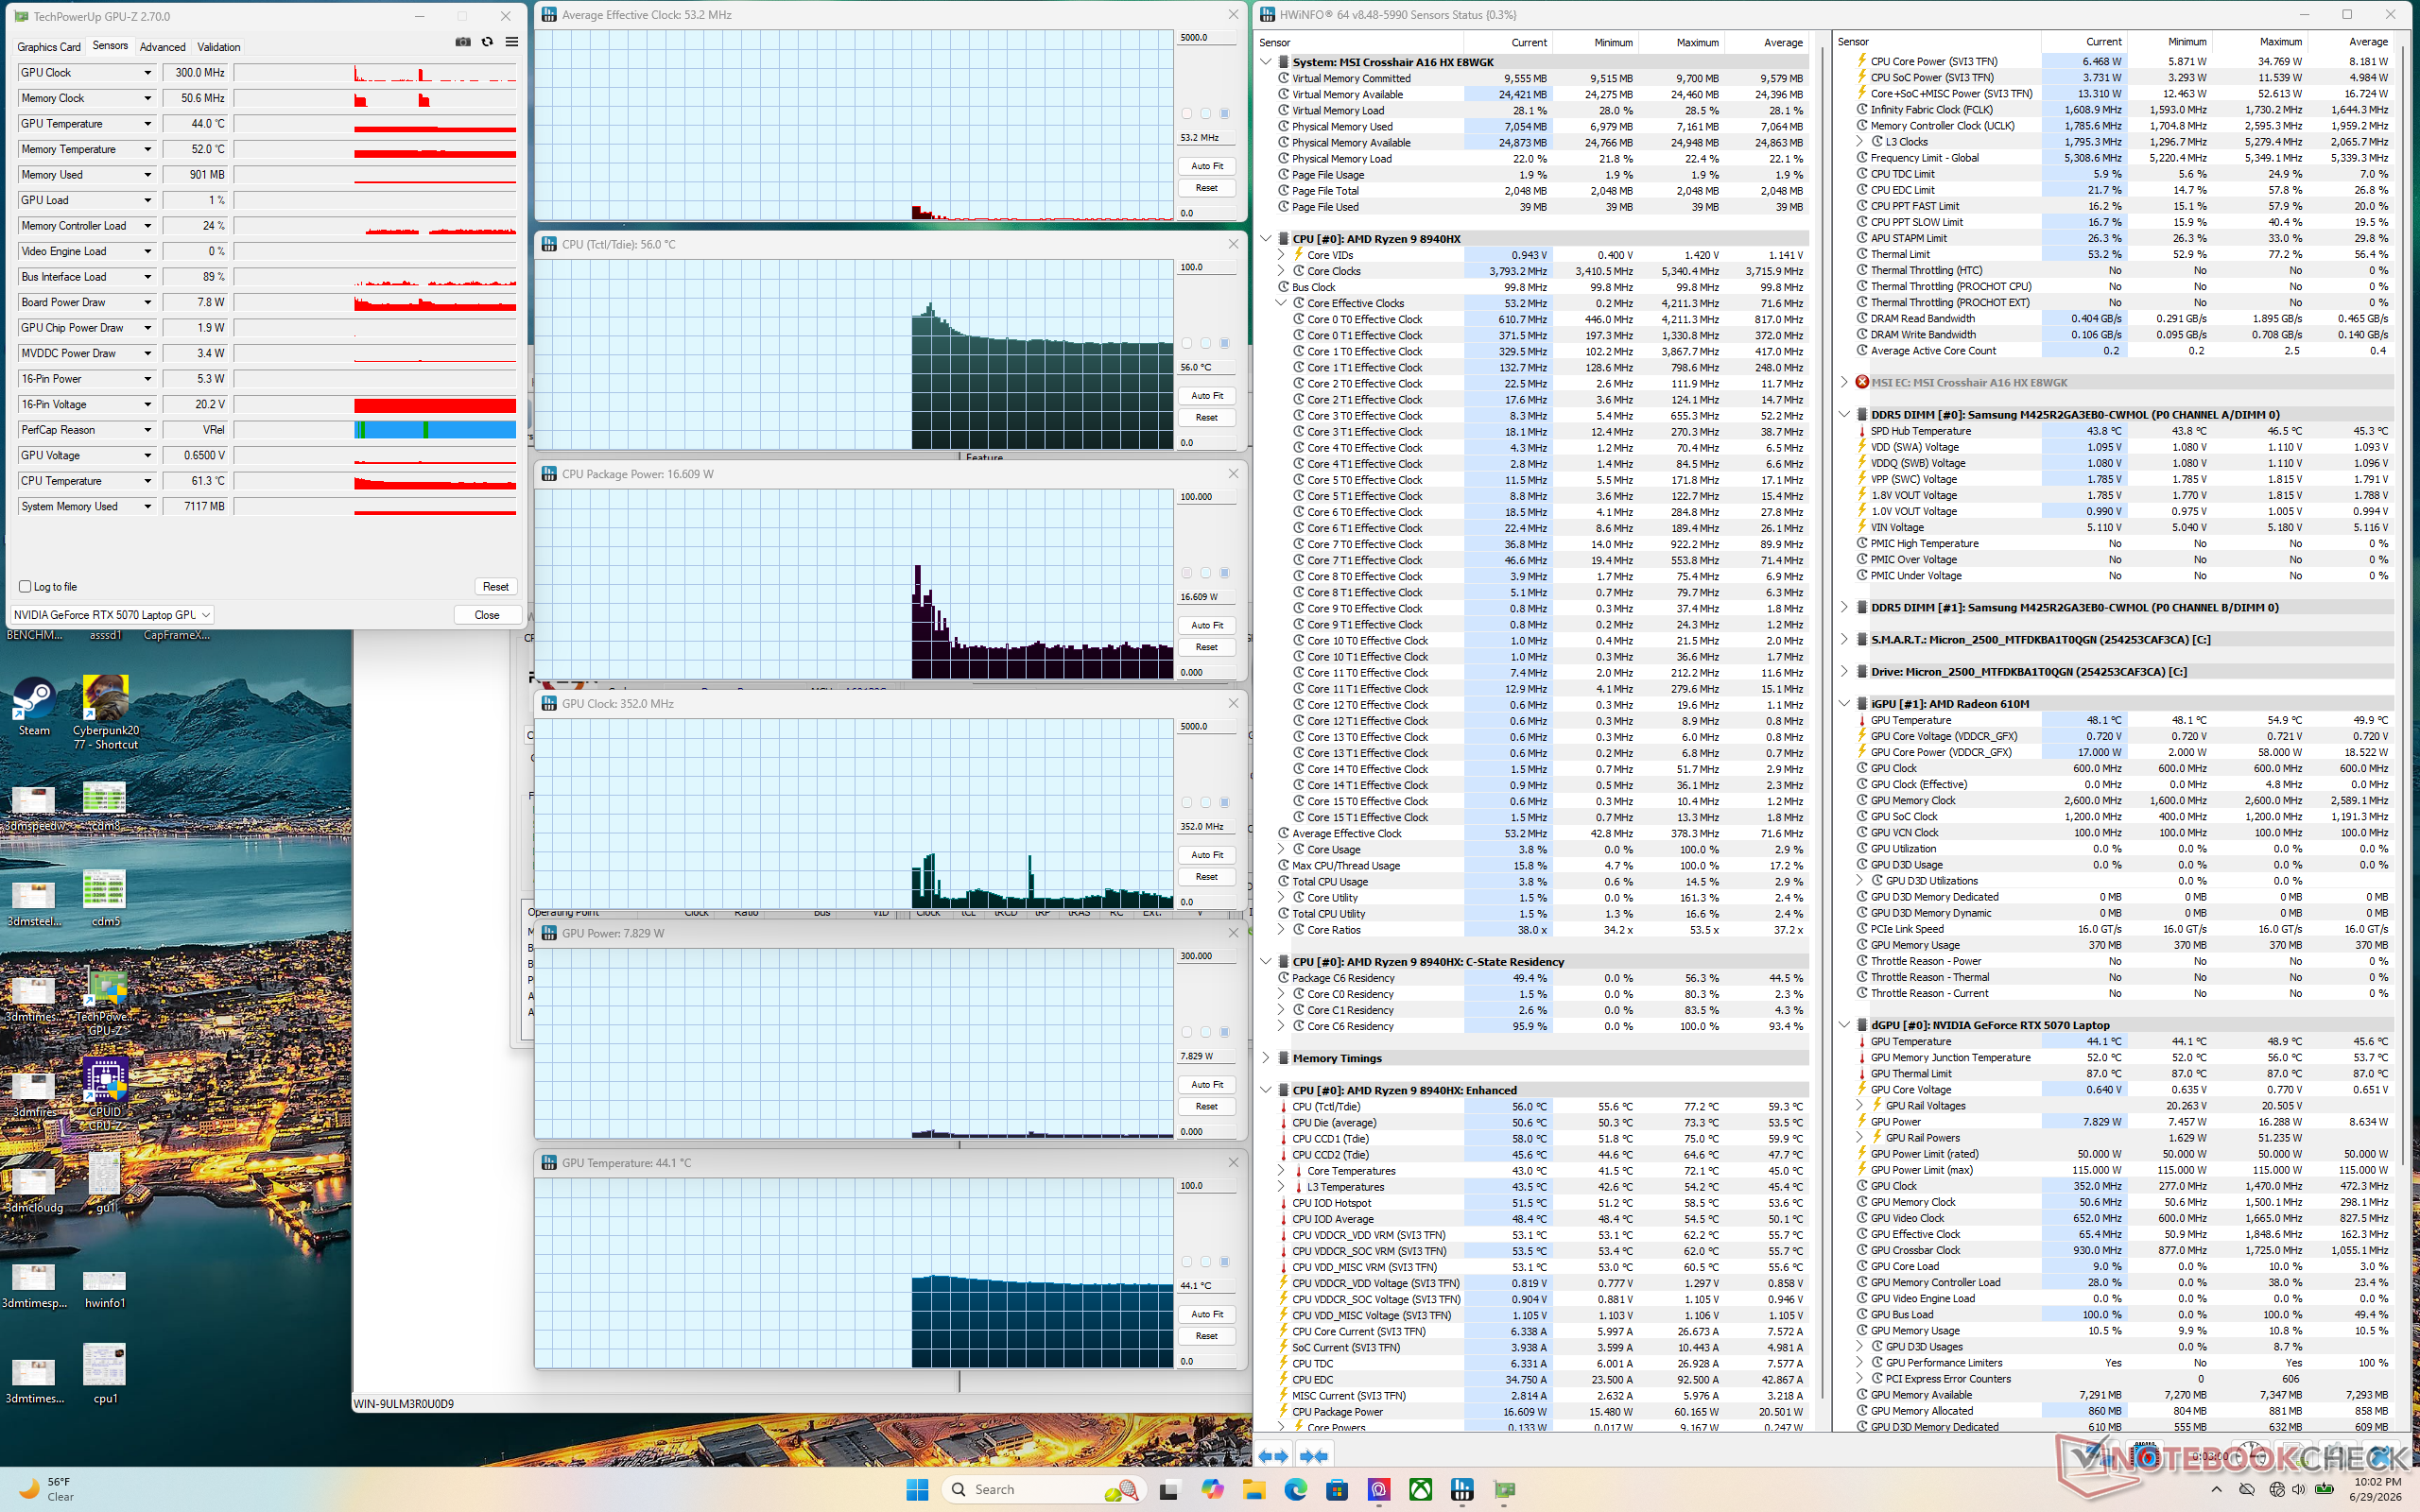
Temperatury procesora i karty graficznej podczas grania w trybie wydajnościowym wynosiły średnio odpowiednio w połowie i na początku przedziału 80s. Temperatury rdzeni byłyby o kilka stopni C niższe w przypadku pracy w trybie zrównoważonym, jednak średni TGP spadłby ze 113 W do 99 W przy niższej wydajności grafiki.
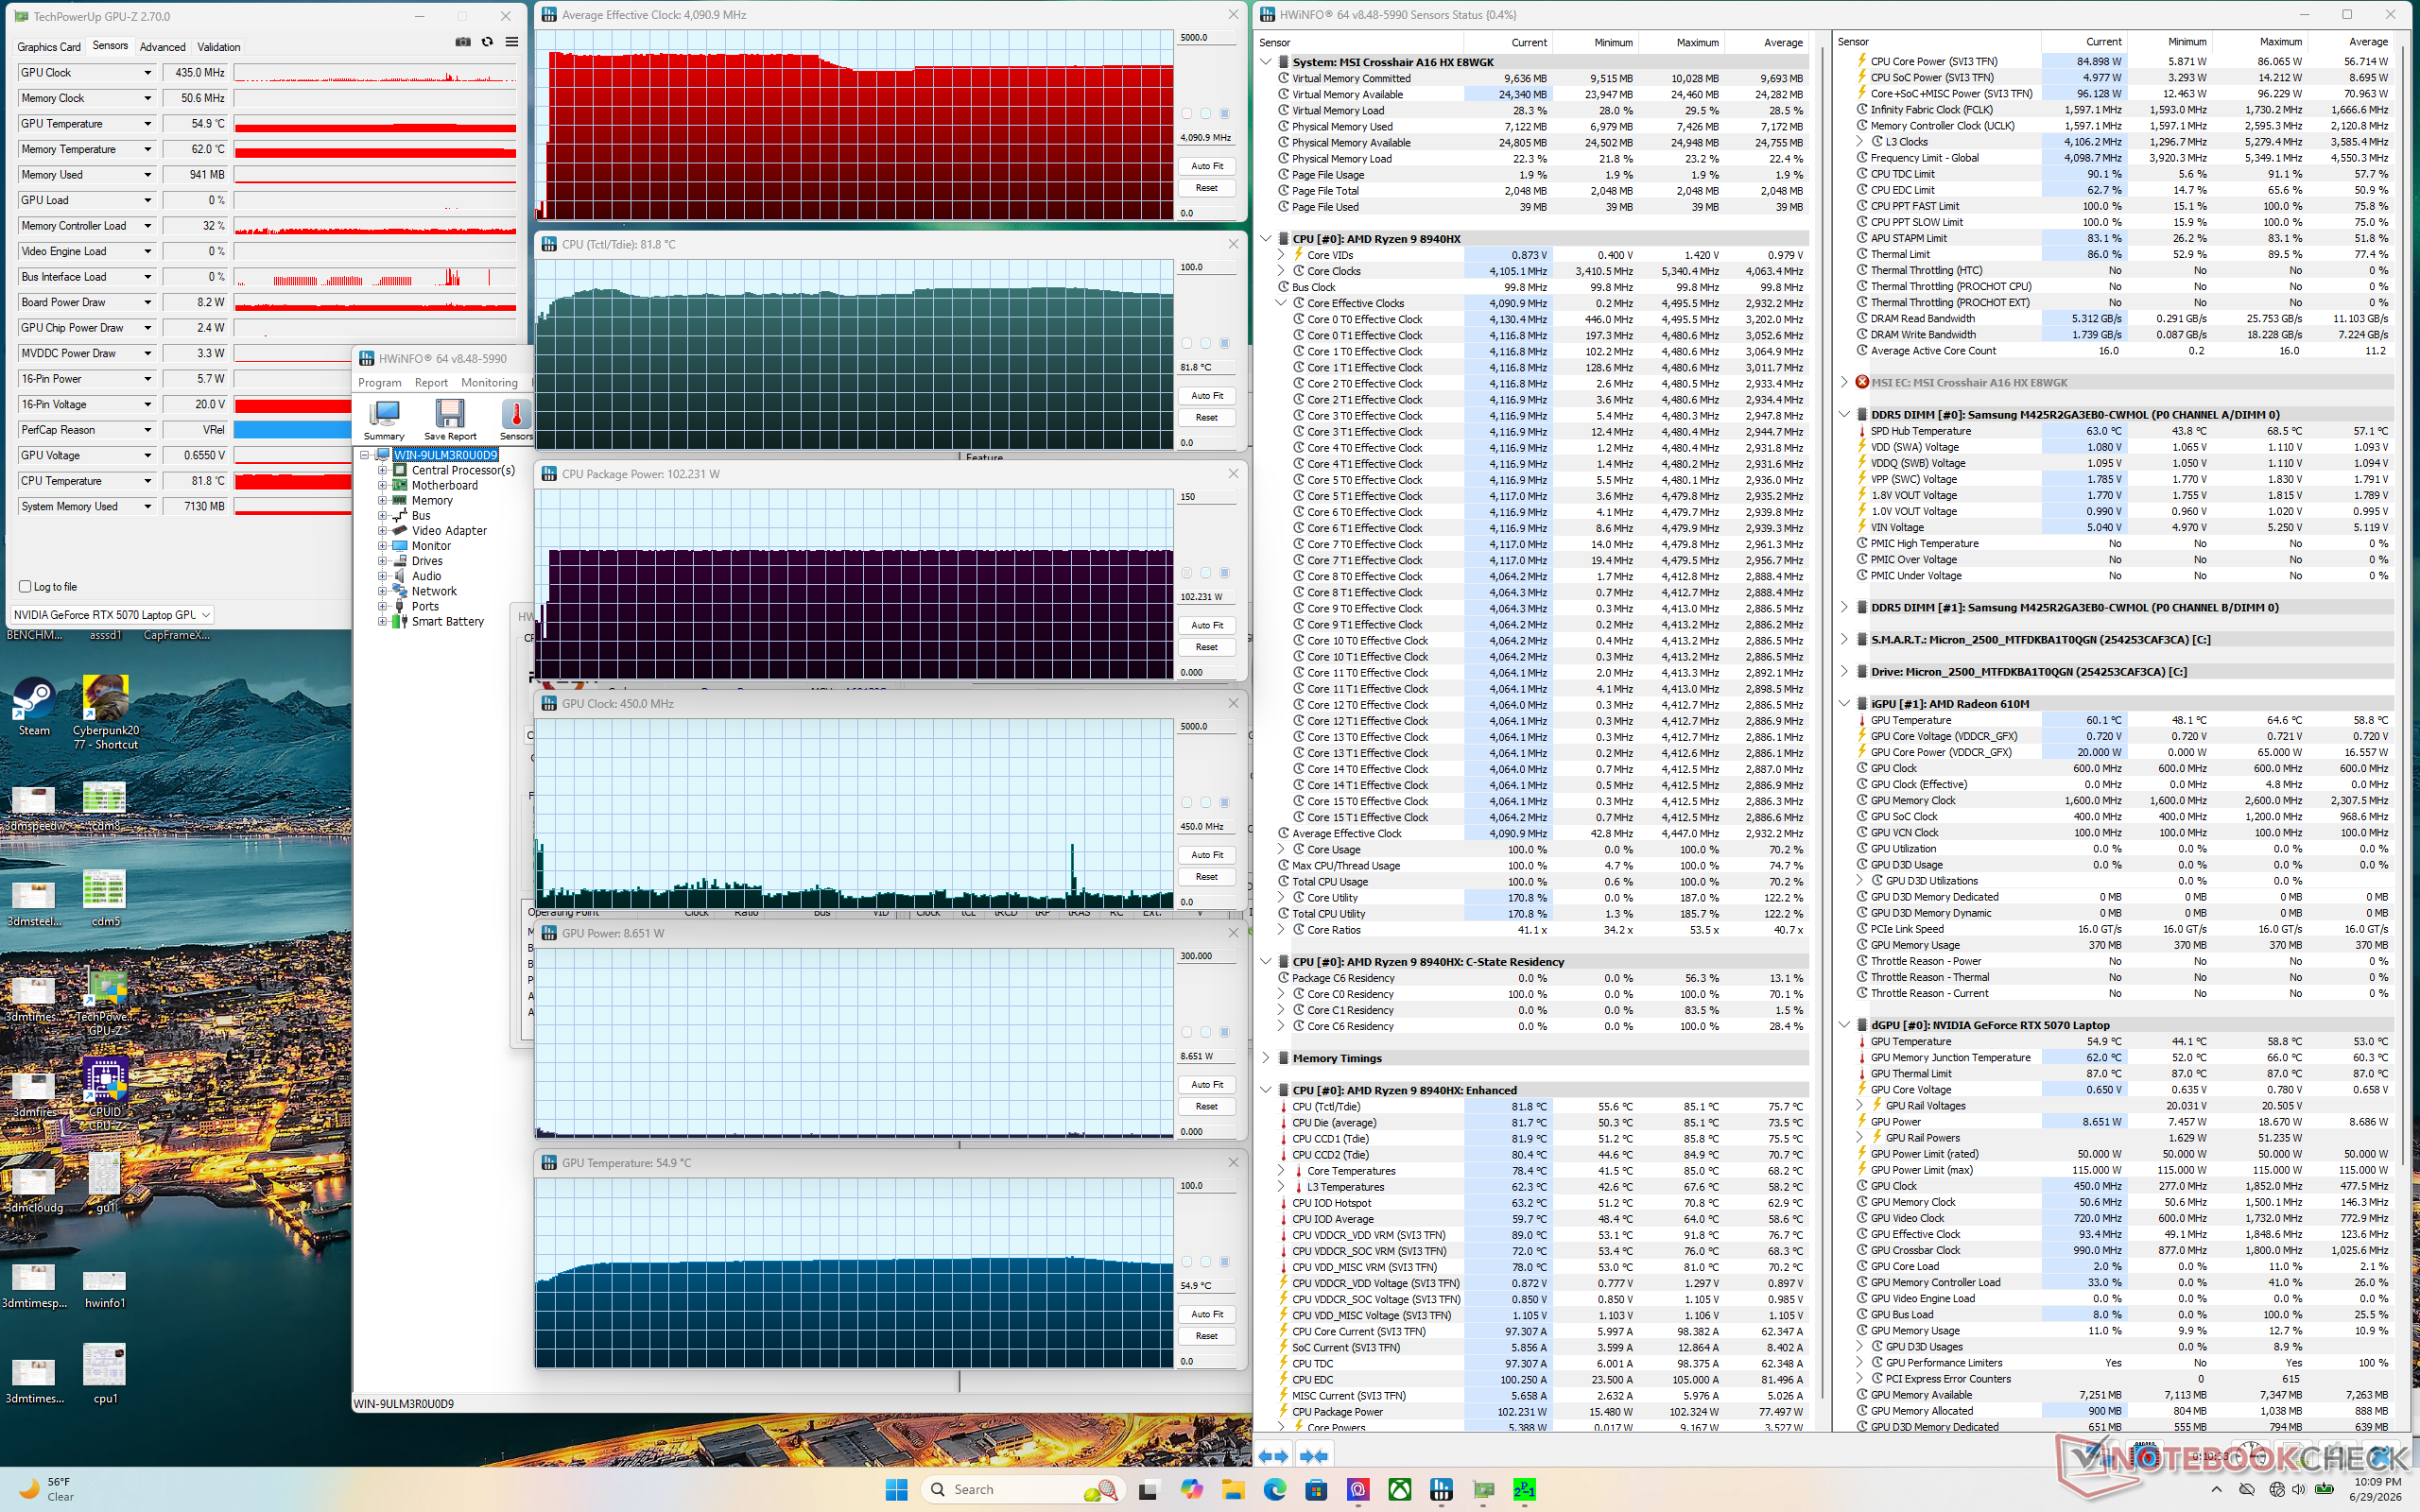
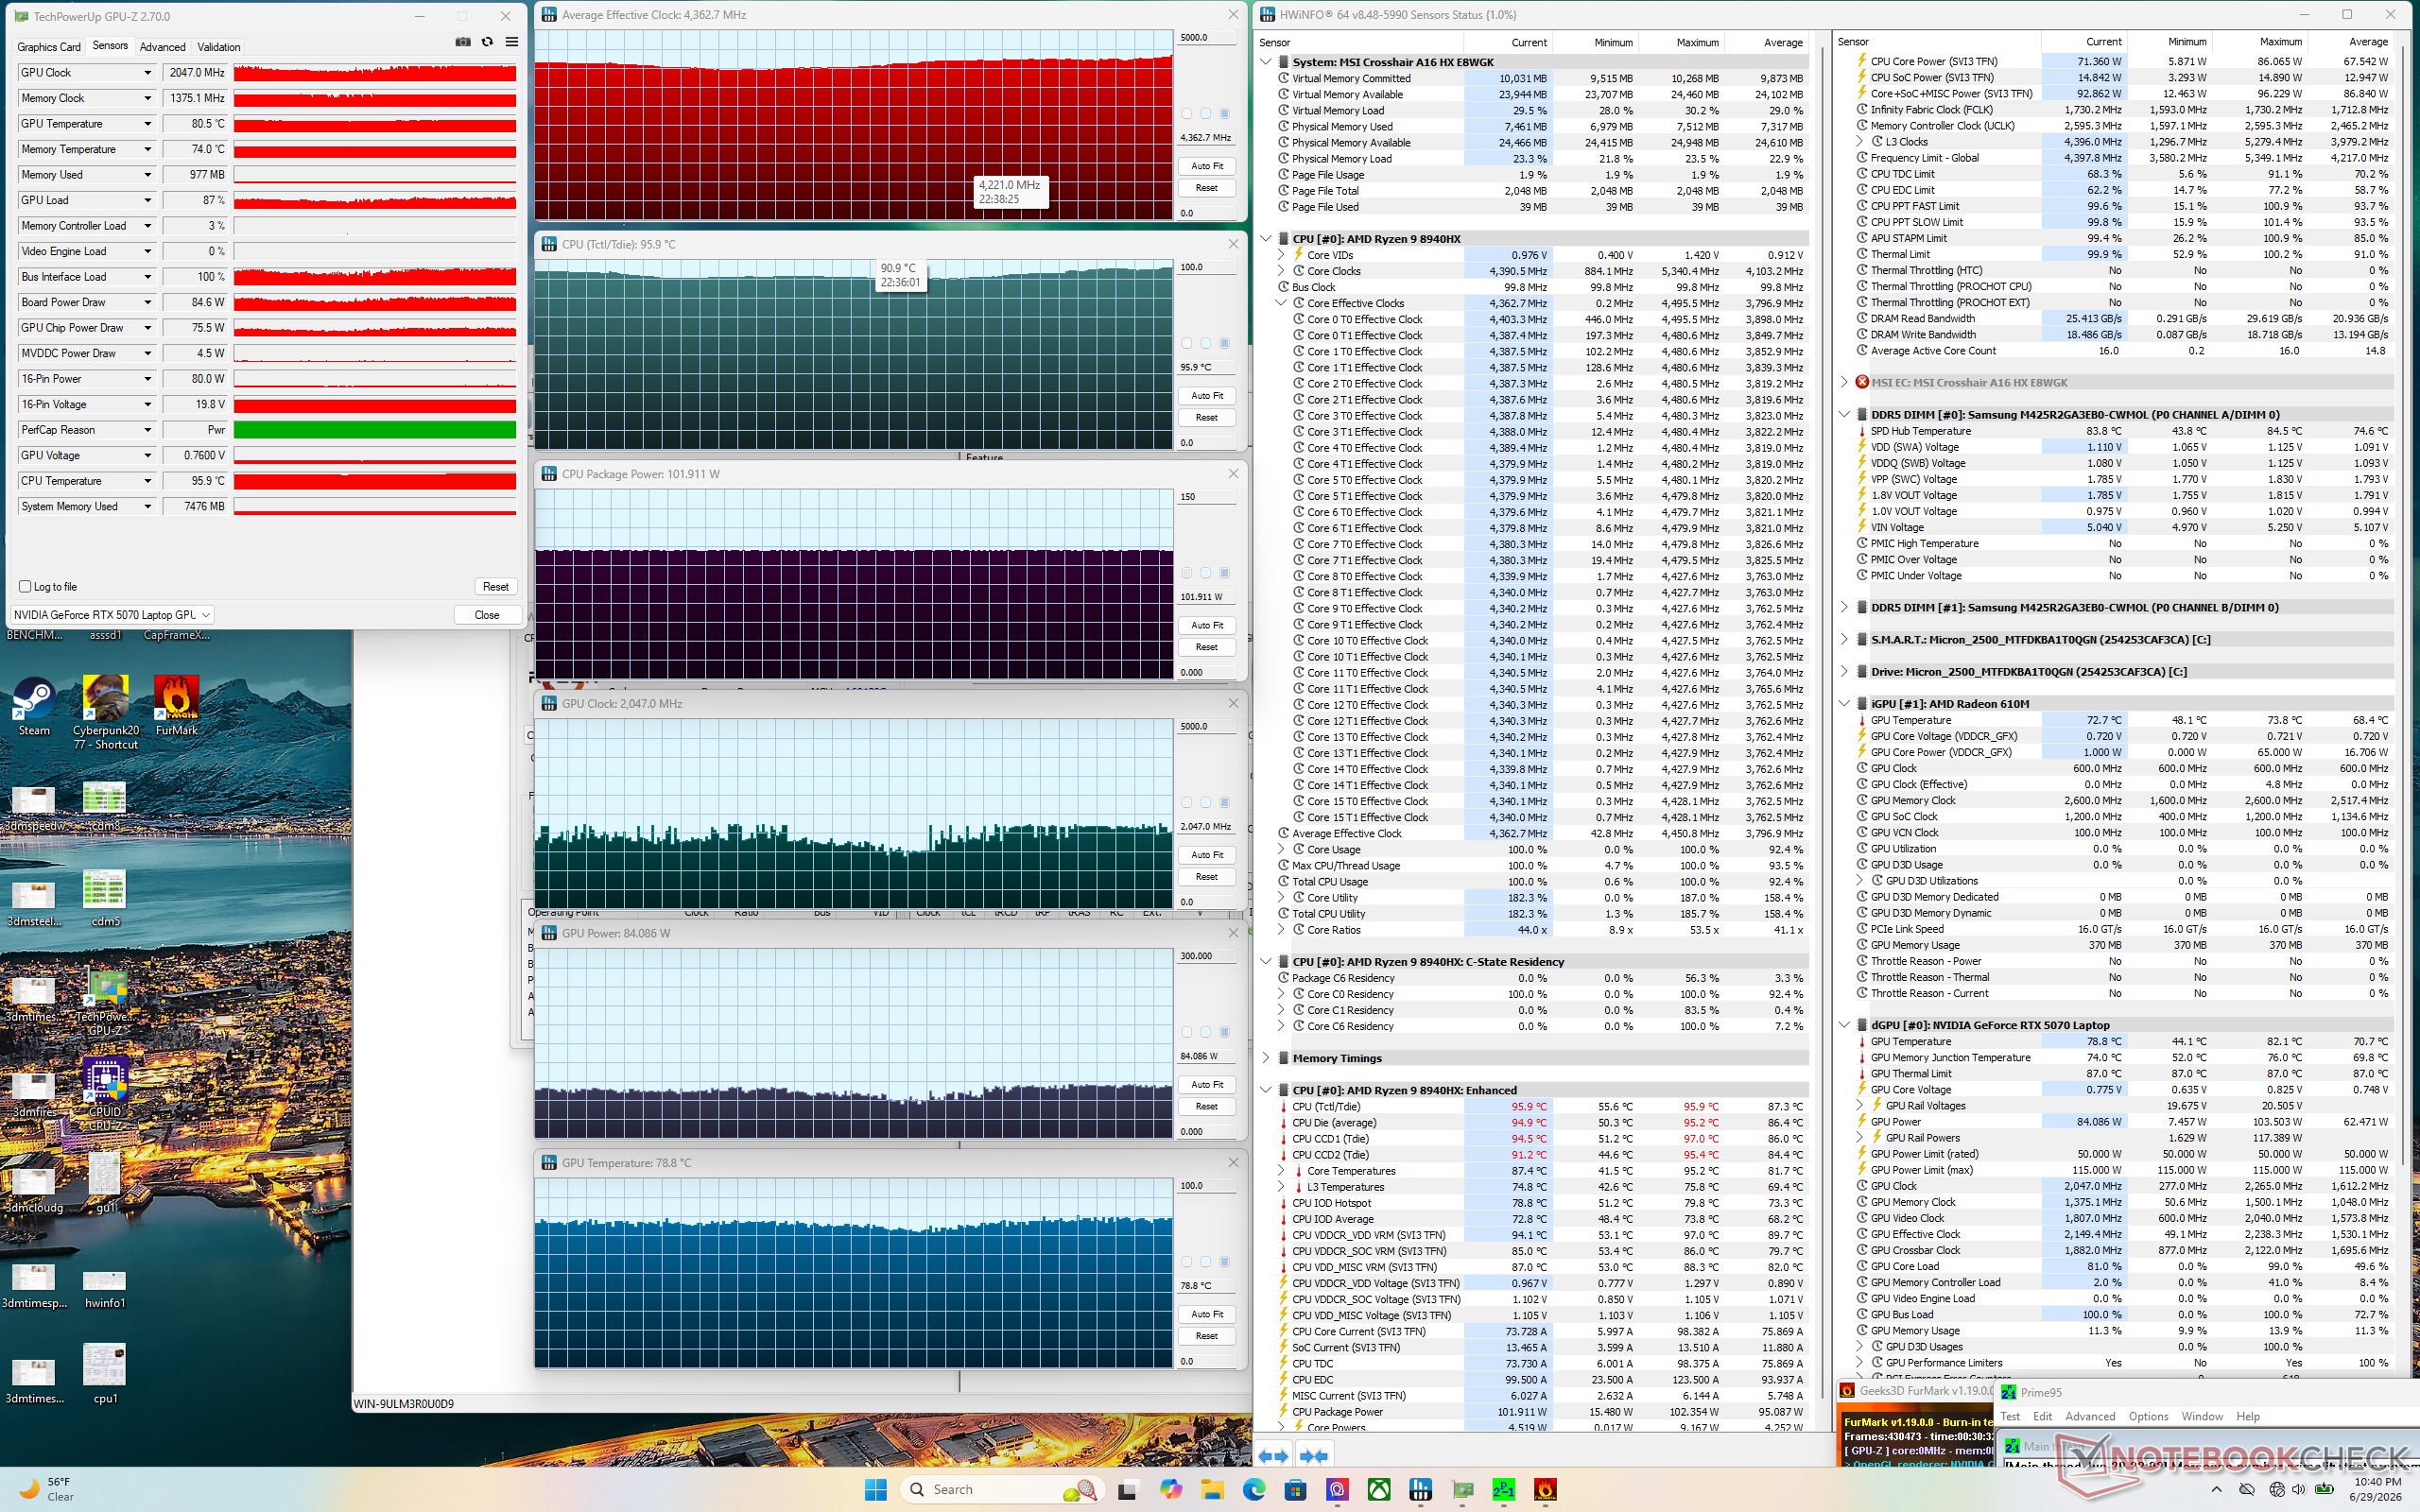
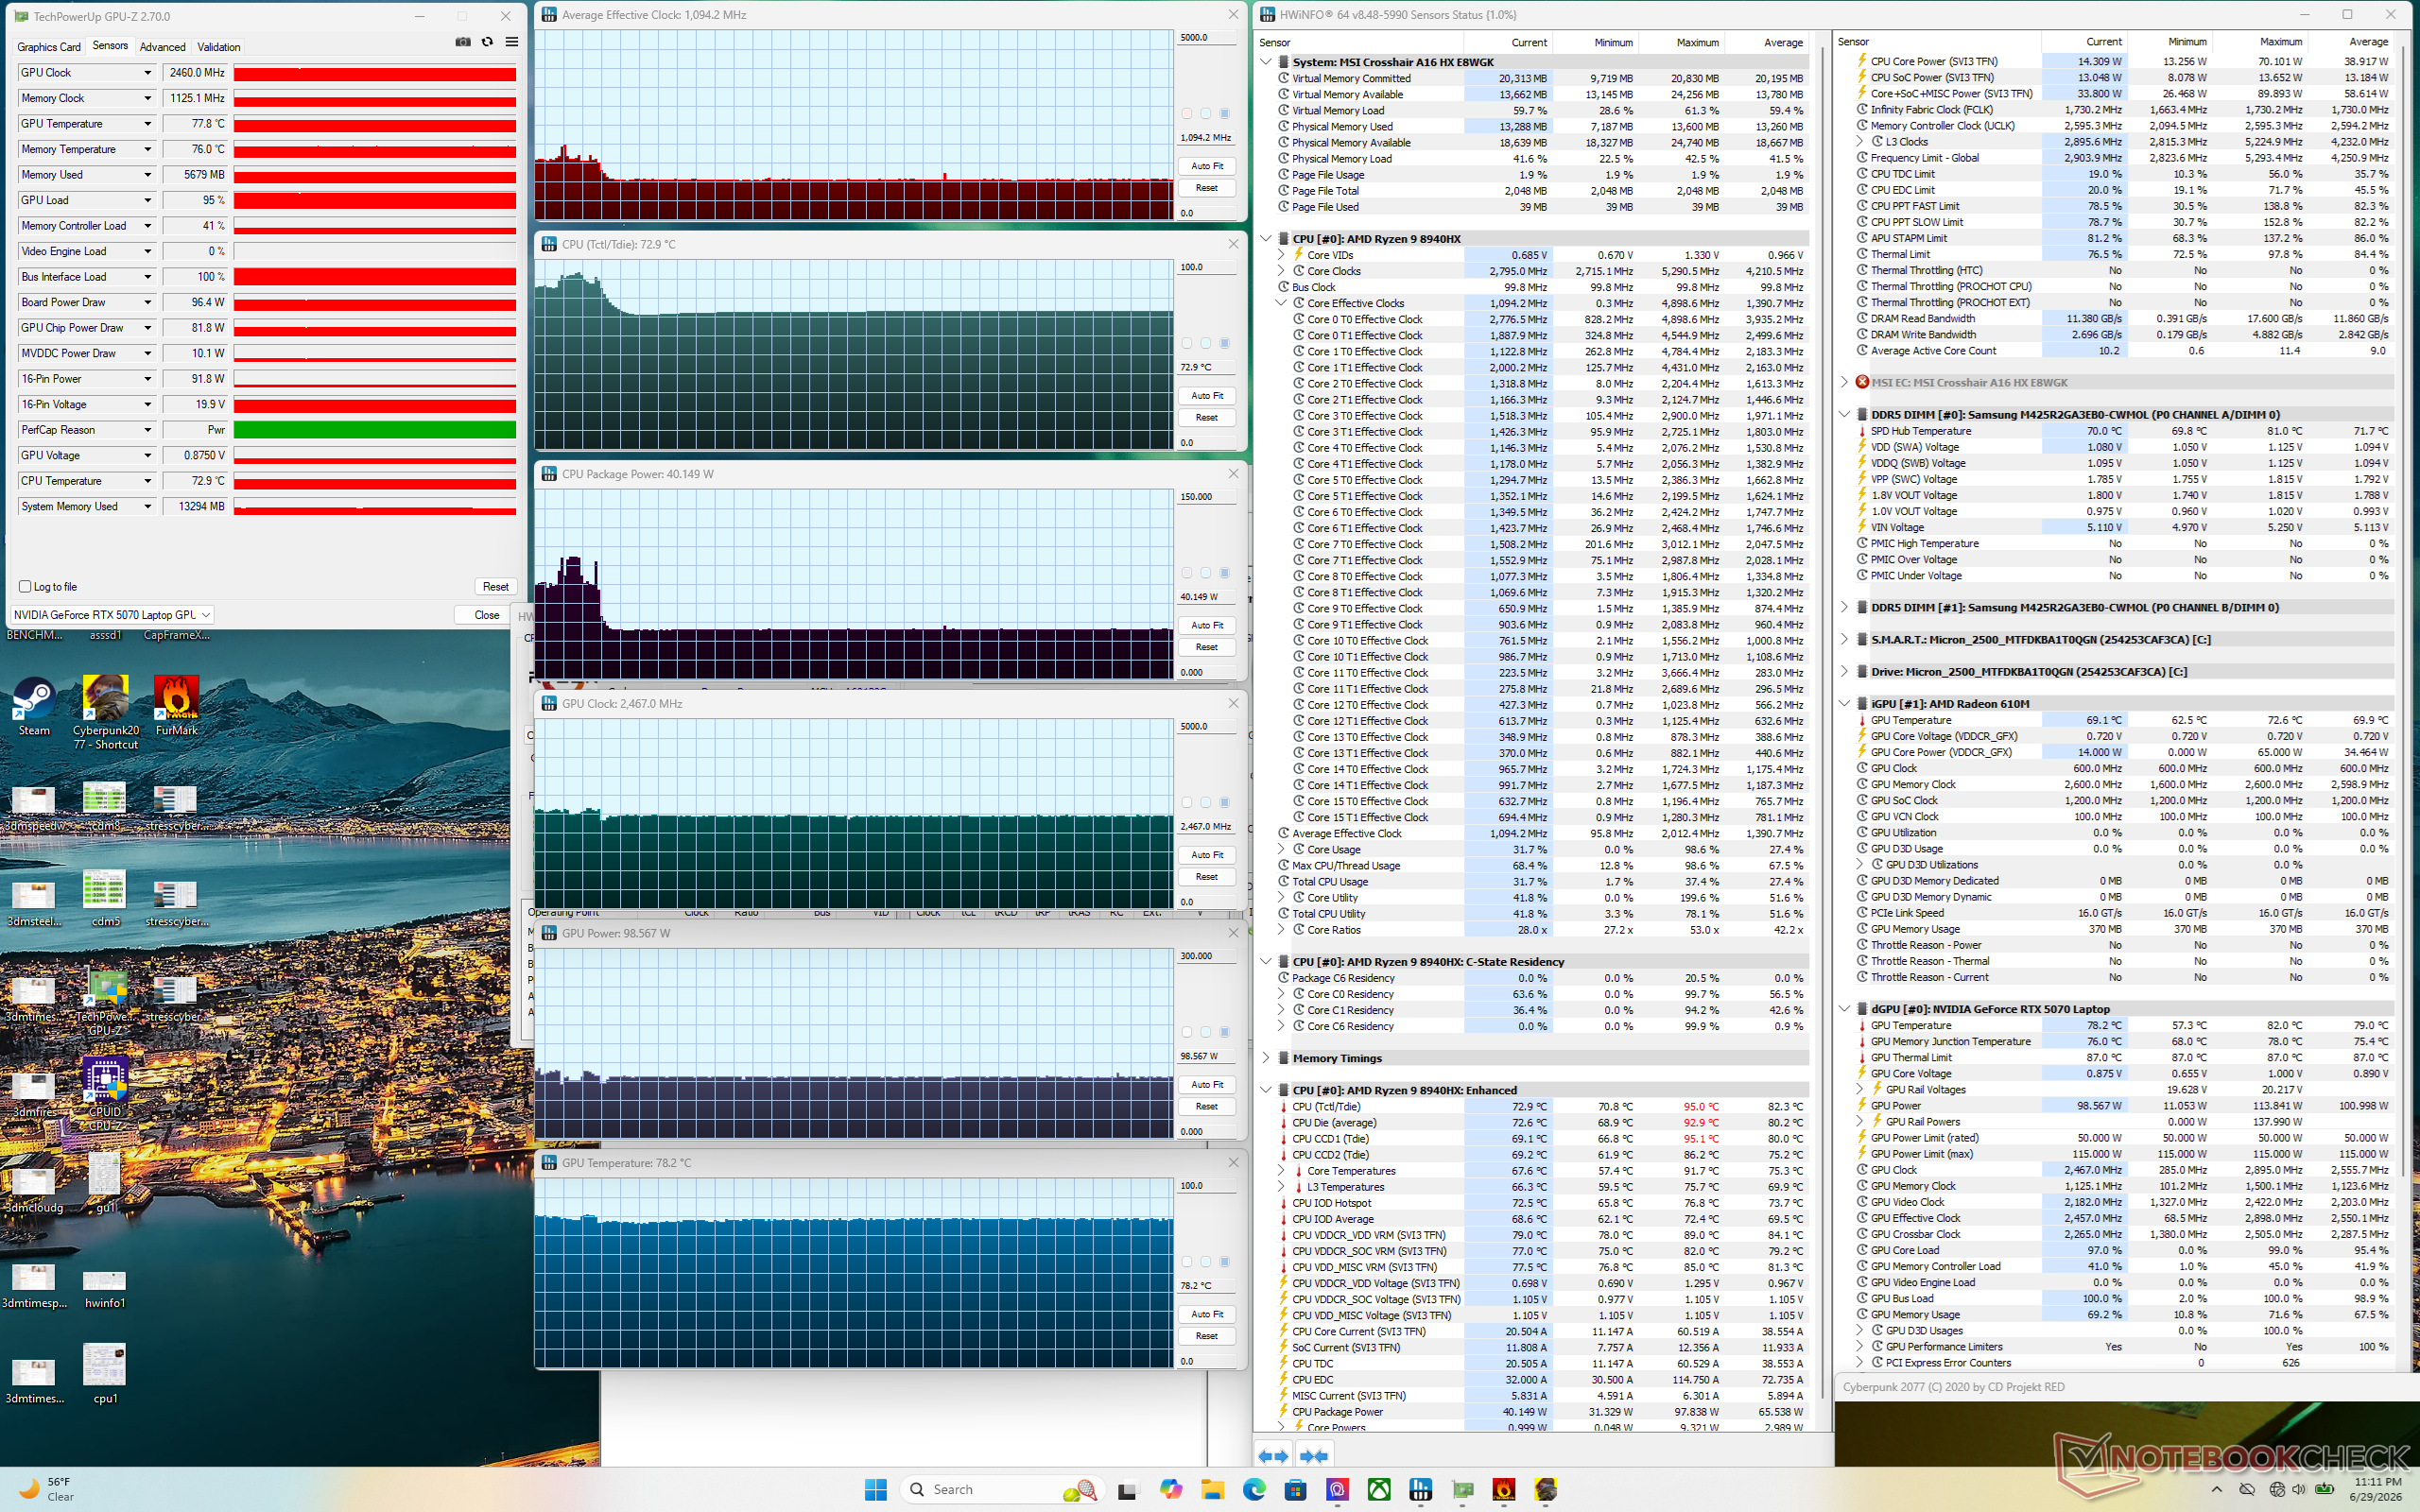
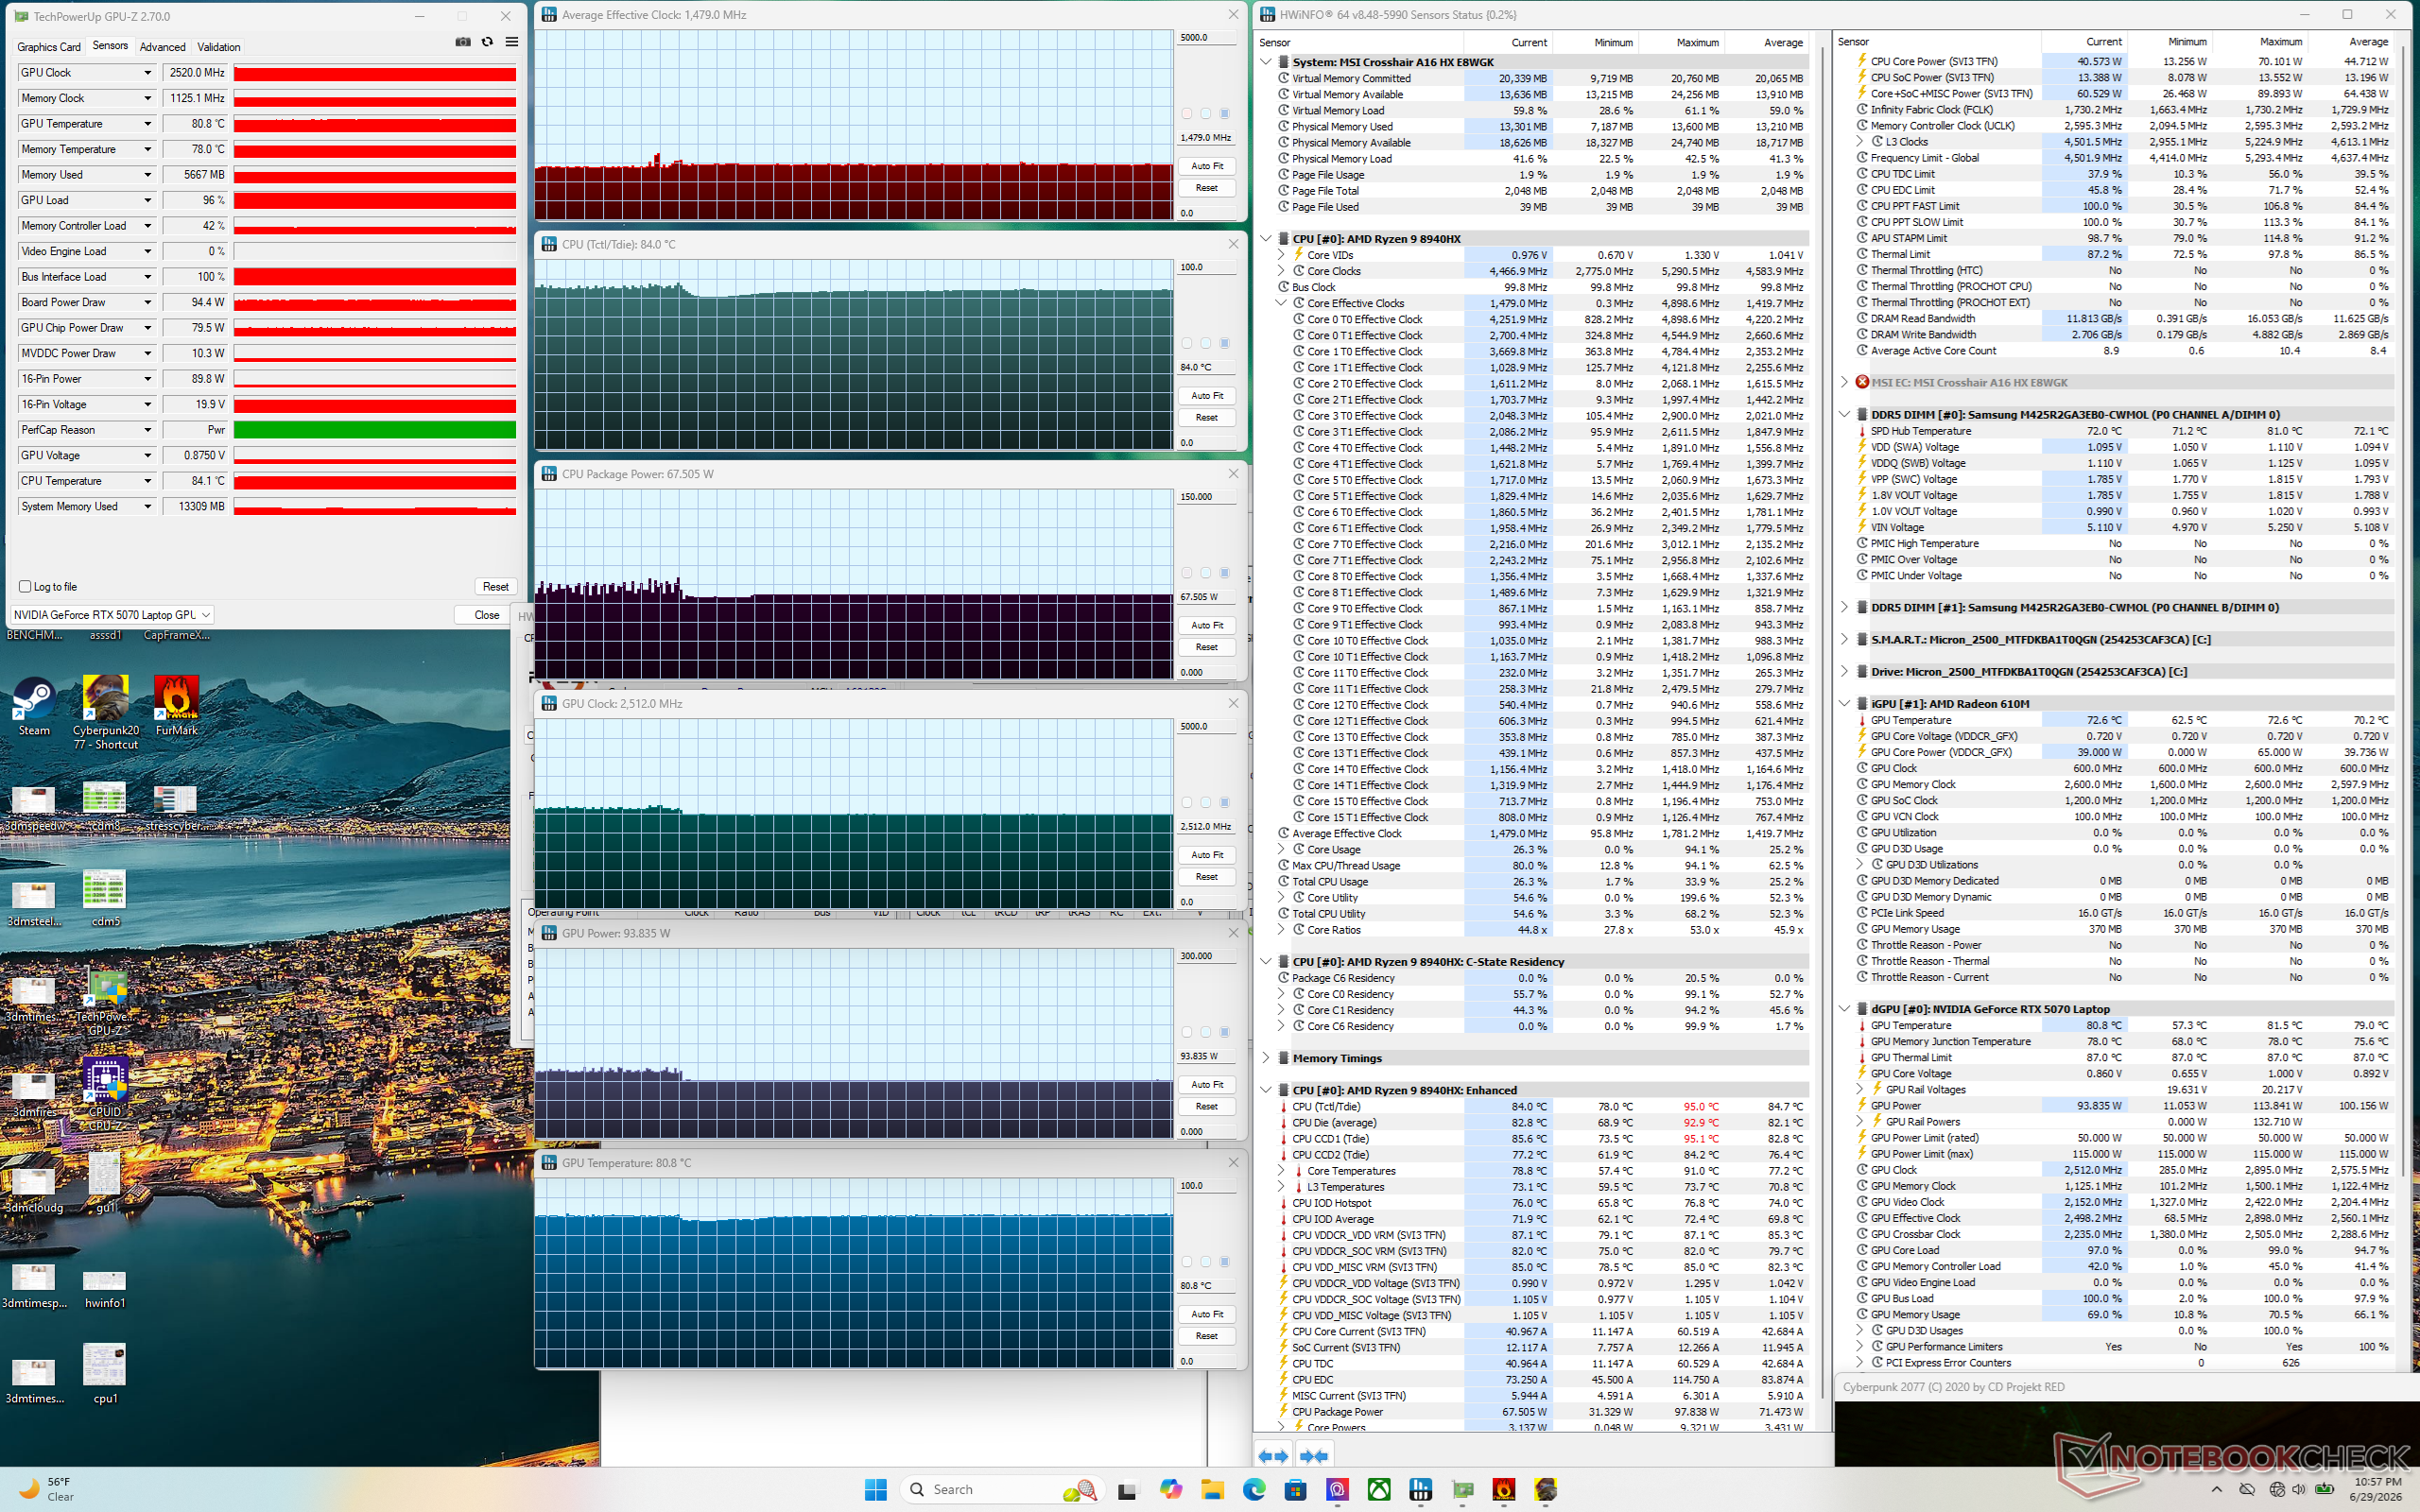
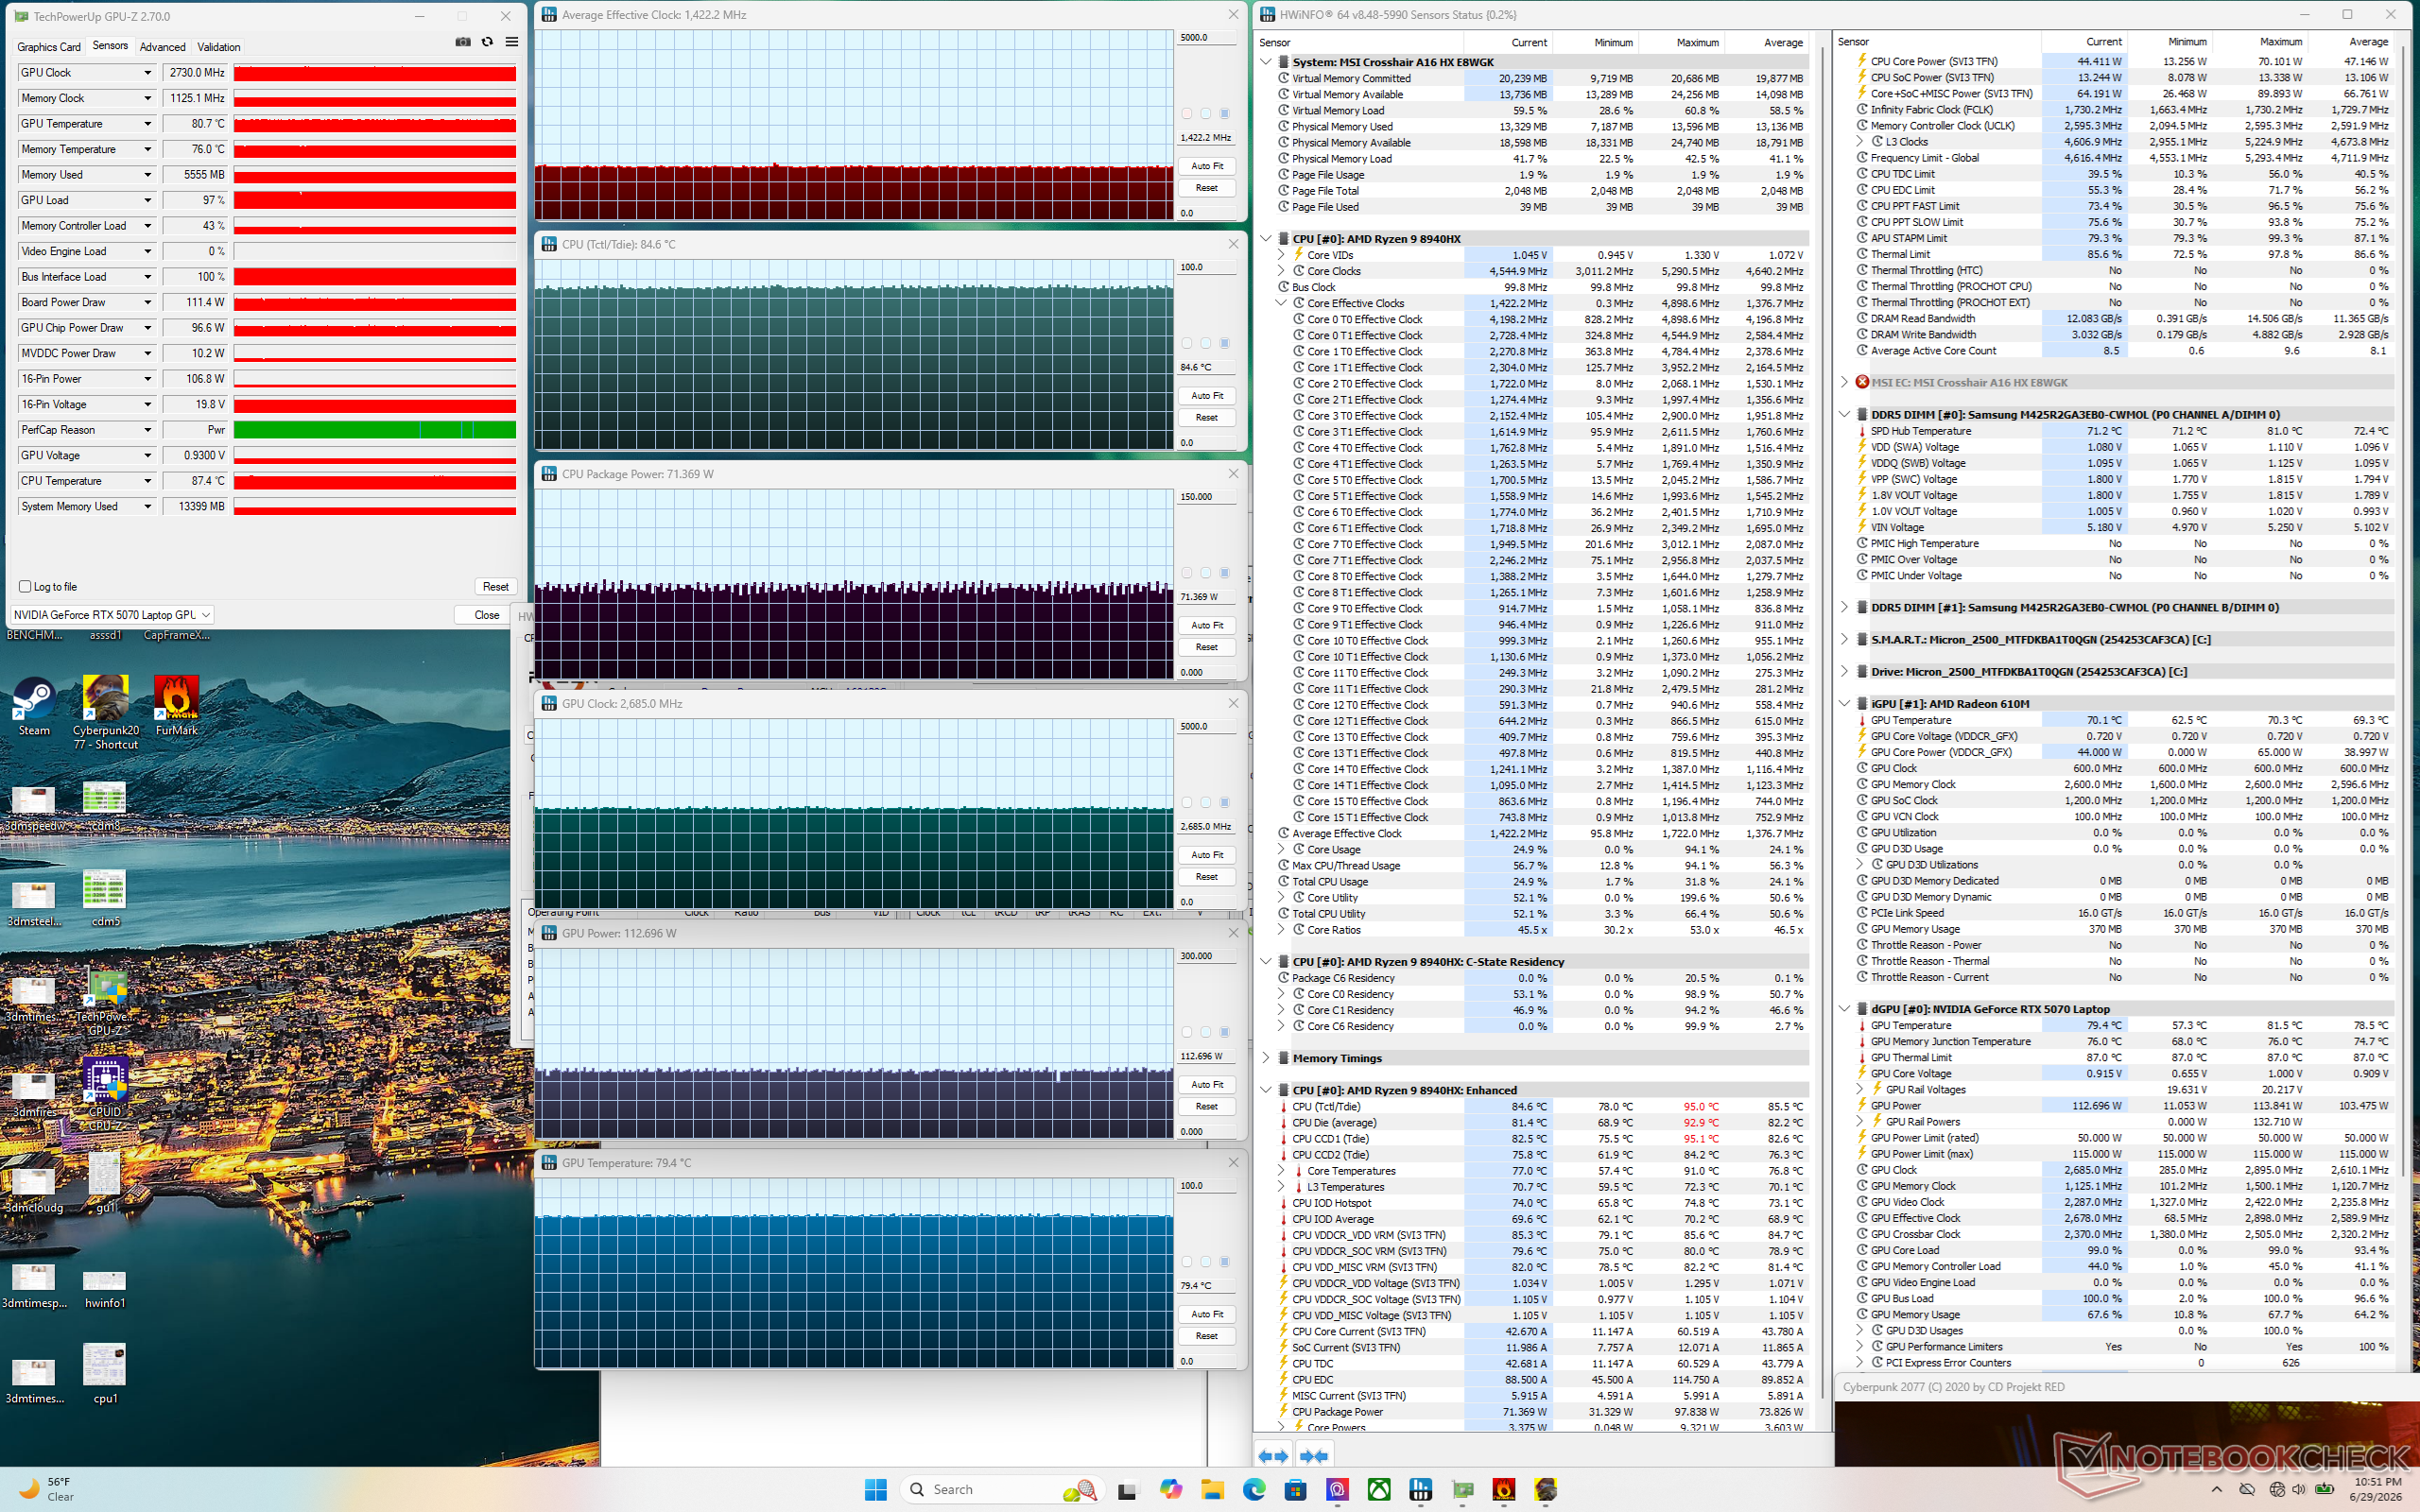

| Średnia częstotliwość taktowania procesora (GHz) | Częstotliwość taktowania karty graficznej (MHz) | Średnia temperatura procesora (°C) | Średnia temperatura karty graficznej (°C) | |
| Tryb bezczynności systemu | -- | -- | 56 | 44 |
| Obciążenie Prime95 | 4,1 | -- | 82 | 55 |
| Obciążenie Prime95 + FurMark | 4,4 | ~2047 | 96 | 79 |
| Obciążenie Cyberpunk 2077 (tryb zrównoważony) | 1,1 | 2467 | 73 | 78 |
| Cyberpunk 2077 – test obciążeniowy (funkcja Apex wyłączona, tryb wydajności) | 1,5 | 2512 | 84 | 81 |
| Cyberpunk 2077 – test obciążeniowy (funkcja Apex włączona, tryb wydajności) | 1,4 | 2685 | 85 | 79 |
| Cyberpunk 2077 – test obciążeniowy (włączona gra Apex, tryb Cooler Boost) | 1,6 | 2625 | 85 | 80 |
Prelegenci
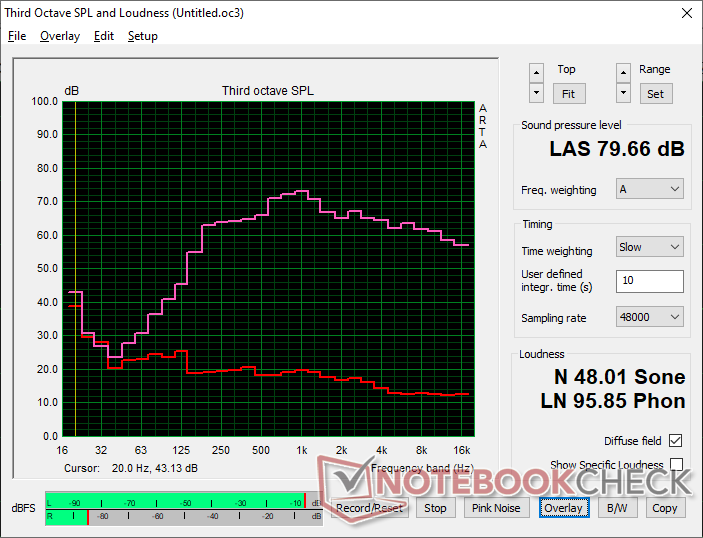
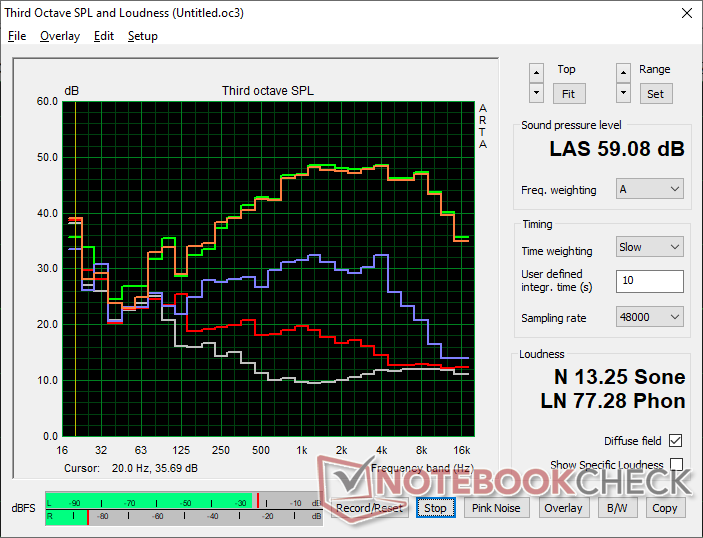
MSI Crosshair A16 HX E8WGK analiza dźwięku
(±) | głośność głośnika jest średnia, ale dobra (79.7 dB)
Bas 100 - 315 Hz
(±) | zredukowany bas - średnio 8.8% niższy od mediany
(±) | liniowość basu jest średnia (10% delta do poprzedniej częstotliwości)
Średnie 400 - 2000 Hz
(+) | zbalansowane środki średnie - tylko 4.5% od mediany
(+) | średnie są liniowe (4.6% delta do poprzedniej częstotliwości)
Wysokie 2–16 kHz
(+) | zrównoważone maksima - tylko 1.7% od mediany
(+) | wzloty są liniowe (3.6% delta do poprzedniej częstotliwości)
Ogólnie 100 - 16.000 Hz
(+) | ogólny dźwięk jest liniowy (12.7% różnicy w stosunku do mediany)
W porównaniu do tej samej klasy
» 16% wszystkich testowanych urządzeń w tej klasie było lepszych, 4% podobnych, 80% gorszych
» Najlepszy miał deltę 6%, średnia wynosiła ###średnia###%, najgorsza wynosiła 132%
W porównaniu do wszystkich testowanych urządzeń
» 12% wszystkich testowanych urządzeń było lepszych, 3% podobnych, 86% gorszych
» Najlepszy miał deltę 4%, średnia wynosiła ###średnia###%, najgorsza wynosiła 134%
Apple MacBook Pro 16 2021 M1 Pro analiza dźwięku
(+) | głośniki mogą odtwarzać stosunkowo głośno (84.7 dB)
Bas 100 - 315 Hz
(+) | dobry bas - tylko 3.8% od mediany
(+) | bas jest liniowy (5.2% delta do poprzedniej częstotliwości)
Średnie 400 - 2000 Hz
(+) | zbalansowane środki średnie - tylko 1.3% od mediany
(+) | średnie są liniowe (2.1% delta do poprzedniej częstotliwości)
Wysokie 2–16 kHz
(+) | zrównoważone maksima - tylko 1.9% od mediany
(+) | wzloty są liniowe (2.7% delta do poprzedniej częstotliwości)
Ogólnie 100 - 16.000 Hz
(+) | ogólny dźwięk jest liniowy (4.6% różnicy w stosunku do mediany)
W porównaniu do tej samej klasy
» 0% wszystkich testowanych urządzeń w tej klasie było lepszych, 0% podobnych, 100% gorszych
» Najlepszy miał deltę 5%, średnia wynosiła ###średnia###%, najgorsza wynosiła 45%
W porównaniu do wszystkich testowanych urządzeń
» 0% wszystkich testowanych urządzeń było lepszych, 0% podobnych, 100% gorszych
» Najlepszy miał deltę 4%, średnia wynosiła ###średnia###%, najgorsza wynosiła 134%
Zarządzanie energią
Zużycie energii
| wyłączony / stan wstrzymania | |
| luz | |
| obciążenie |
|
Legenda:
min: | |
| MSI Crosshair A16 HX E8WGK R9 8940HX, GeForce RTX 5070 Laptop, Micron 2500 1TB MTFDKBA1T0QGN, IPS, 2560x1600, 16" | MSI Crosshair 16 HX AI D2XWGKG Ultra 9 275HX, GeForce RTX 5070 Laptop, Micron 2500 1TB MTFDKBA1T0QGN, IPS, 2560x1600, 16" | Alienware 16X Aurora Core Ultra 9 290HX Plus Ultra 9 290HX Plus, GeForce RTX 5070 Ti Laptop, , OLED, 2560x1600, 16" | Lenovo Legion 7 16 AGP11 Ryzen AI 9 HX 470, GeForce RTX 5060 Laptop, Lenovo UMIS AM541 1TB, OLED, 2560x1600, 16" | Gigabyte Gaming A16 Pro GA6DH (Core 7 240H, RTX 5070 Ti) Core 7 240H, GeForce RTX 5070 Ti Laptop, Samsung PM9C1b MZVL81T0HFLB-00BTW, IPS, 2560x1600, 16" | Acer Predator Helios Neo 16S AI PHN16S-71-94L9 Ultra 9 275HX, GeForce RTX 5070 Ti Laptop, Micron 3500 1TB MTFDKBA1T0TGD, OLED, 2560x1600, 16" | |
|---|---|---|---|---|---|---|
| Power Consumption | -25% | 22% | 42% | 3% | 37% | |
| Idle Minimum * (Watt) | 12.3 | 26.2 -113% | 6.9 44% | 5.7 54% | 21.5 -75% | 3.9 68% |
| Idle Average * (Watt) | 17.1 | 33.8 -98% | 8.1 53% | 8.7 49% | 28.3 -65% | 11 36% |
| Idle Maximum * (Watt) | 42.4 | 34 20% | 31 27% | 9.1 79% | 26.3 38% | 16.9 60% |
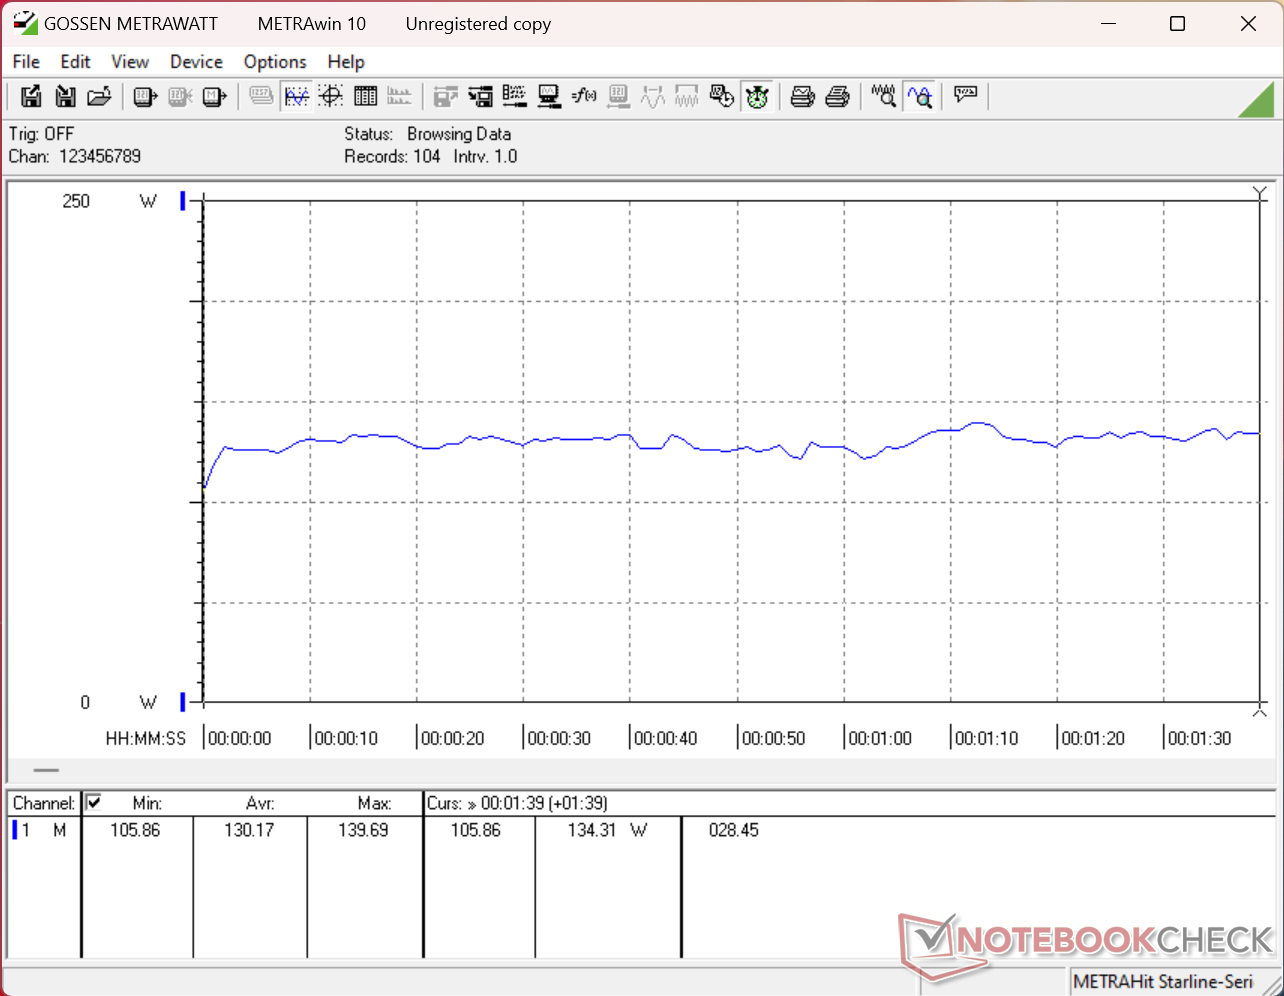
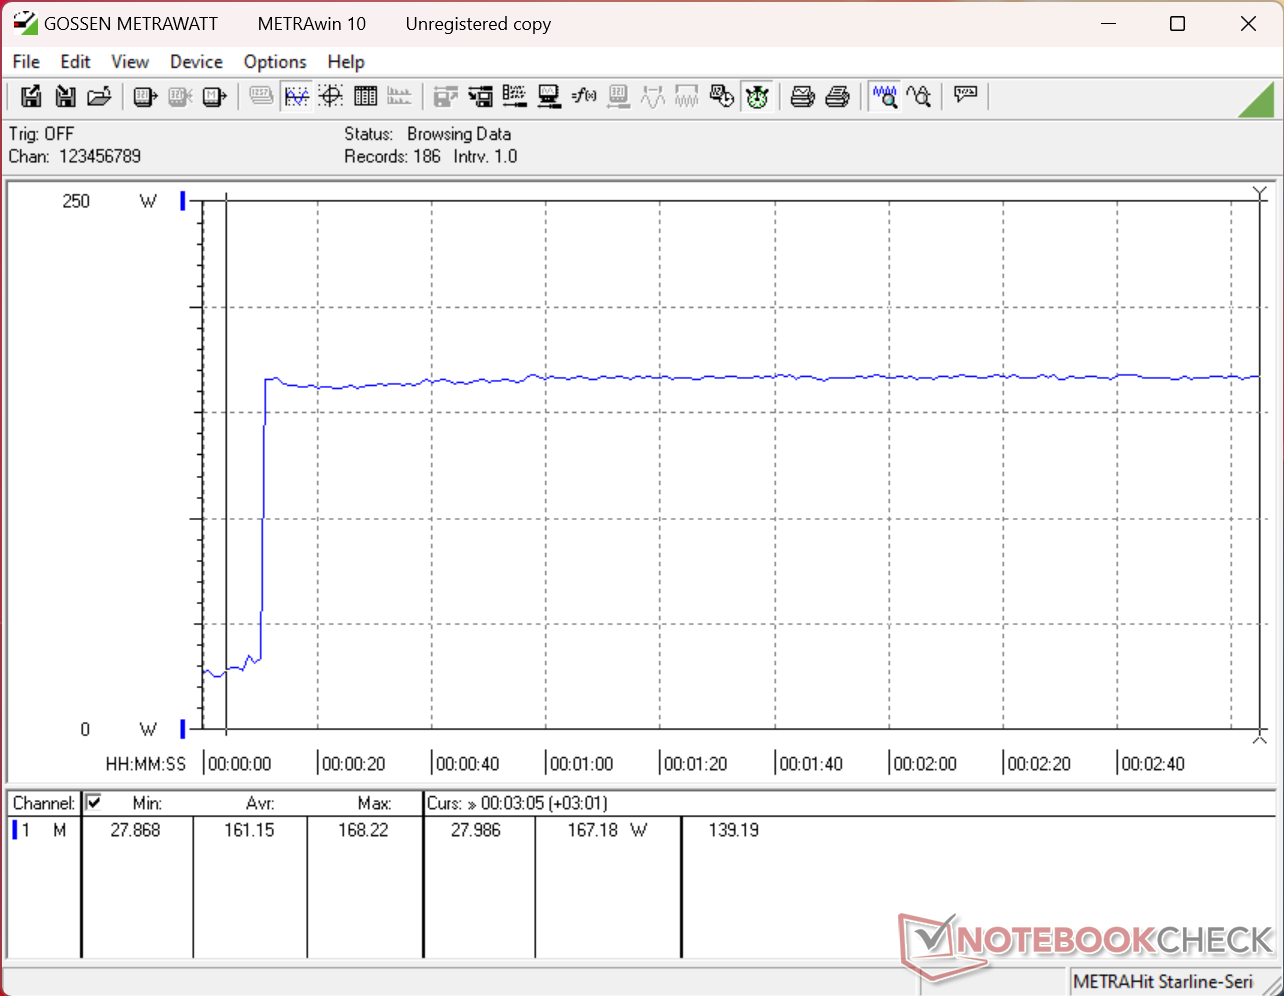
| Load Average * (Watt) | 130.2 | 112 14% | 131.6 -1% | 88.7 32% | 92.5 29% | 123 6% |
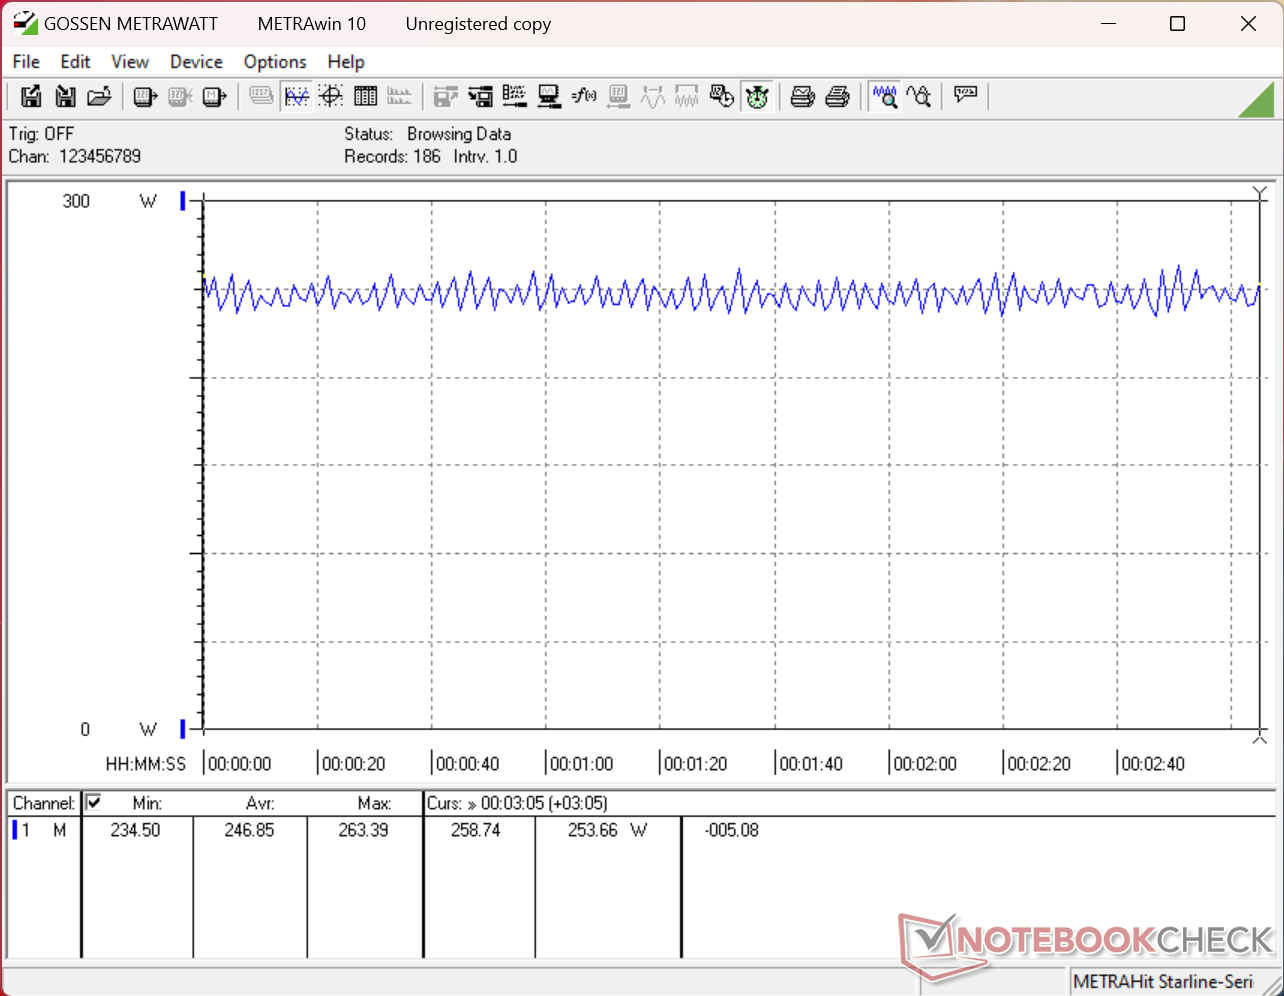
| Cyberpunk 2077 ultra * (Watt) | 246 | 224 9% | 198.3 19% | 160.3 35% | 165 33% | 152.7 38% |
| Cyberpunk 2077 ultra external monitor * (Watt) | 242 | 220 9% | 172.1 29% | 156.9 35% | 158 35% | 144.9 40% |
| Load Maximum * (Watt) | 264.3 | 315 -19% | 300.1 -14% | 234.9 11% | 195 26% | 229 13% |
* ... im mniej tym lepiej
Zużycie energii w grze „Cyberpunk” / Test obciążeniowy
Pobór mocy przez monitor zewnętrzny
Żywotność baterii
| MSI Crosshair A16 HX E8WGK R9 8940HX, GeForce RTX 5070 Laptop, 80 Wh | MSI Crosshair 16 HX AI D2XWGKG Ultra 9 275HX, GeForce RTX 5070 Laptop, 90 Wh | Alienware 16X Aurora Core Ultra 9 290HX Plus Ultra 9 290HX Plus, GeForce RTX 5070 Ti Laptop, 96 Wh | Lenovo Legion 7 16 AGP11 Ryzen AI 9 HX 470, GeForce RTX 5060 Laptop, 84 Wh | Gigabyte Gaming A16 Pro GA6DH (Core 7 240H, RTX 5070 Ti) Core 7 240H, GeForce RTX 5070 Ti Laptop, 76 Wh | Acer Predator Helios Neo 16S AI PHN16S-71-94L9 Ultra 9 275HX, GeForce RTX 5070 Ti Laptop, 76 Wh | |
|---|---|---|---|---|---|---|
| Czasy pracy | 102% | 35% | 67% | 51% | -9% | |
| WiFi v1.3 (h) | 5.5 | 11.1 102% | 7.4 35% | 9.2 67% | 8.3 51% | 5 -9% |
| H.264 (h) | 14.2 |
Ocena serwisu Notebookcheck
Crosshair A16 to jeden z bardziej przystępnych cenowo laptopów gamingowych firmy MSI, w którym priorytetem jest wydajność i jakość wyświetlacza, a nie funkcje dodatkowe czy luksusowe elementy wyposażenia, co pozwala obniżyć koszty.
MSI Crosshair A16 HX E8WGK
- 03/07/2026 v8
Allen Ngo
 Total Sustainability Score:
 Porównanie potencjalnych konkurentów
Obraz | Model / recenzja | Cena | Waga | Wysokość | Ekran |
|---|---|---|---|---|---|
1. 82.5%  | MSI Crosshair A16 HX E8WGK AMD Ryzen 9 8940HX ⎘ NVIDIA GeForce RTX 5070 Laptop ⎘ 32 GB Pamięć, 1024 GB SSD | Amazon: $2,629.00 Cena katalogowa: 2700 USD | 2.3 kg | 25.55 mm | 16.00" 2560x1600 189 PPI IPS |
2. 81.9%  | MSI Crosshair 16 HX AI D2XWGKG Intel Core Ultra 9 275HX ⎘ NVIDIA GeForce RTX 5070 Laptop ⎘ 16 GB Pamięć, 1024 GB SSD | Amazon: Cena katalogowa: 2500 EUR | 2.5 kg | 27.9 mm | 16.00" 2560x1600 189 PPI IPS |
3. 85.9%  | Alienware 16X Aurora Core Ultra 9 290HX Plus Intel Core Ultra 9 290HX Plus ⎘ NVIDIA GeForce RTX 5070 Ti Laptop ⎘ 32 GB Pamięć | Amazon: Cena katalogowa: 3000 USD | 2.6 kg | 23.4 mm | 16.00" 2560x1600 189 PPI OLED |
4. 86.4%  | Lenovo Legion 7 16 AGP11 AMD Ryzen AI 9 HX 470 ⎘ NVIDIA GeForce RTX 5060 Laptop ⎘ 32 GB Pamięć, 1024 GB SSD | Amazon: Cena katalogowa: 2500€ | 1.8 kg | 16.9 mm | 16.00" 2560x1600 189 PPI OLED |
5. 81%  | Gigabyte Gaming A16 Pro GA6DH (Core 7 240H, RTX 5070 Ti) Intel Core 7 240H ⎘ NVIDIA GeForce RTX 5070 Ti Laptop ⎘ 32 GB Pamięć, 1000 GB SSD | Amazon: Cena katalogowa: 2300 Euro | 2.4 kg | 22.99 mm | 16.00" 2560x1600 189 PPI IPS |
6. 82%  | Acer Predator Helios Neo 16S AI PHN16S-71-94L9 Intel Core Ultra 9 275HX ⎘ NVIDIA GeForce RTX 5070 Ti Laptop ⎘ 32 GB Pamięć, 1024 GB SSD | Amazon: Cena katalogowa: 2400 EUR | 2.2 kg | 19.9 mm | 16.00" 2560x1600 189 PPI OLED |
Przezroczystość
Wyboru urządzeń do recenzji dokonuje nasza redakcja. Próbka testowa została udostępniona autorowi jako pożyczka od producenta lub sprzedawcy detalicznego na potrzeby tej recenzji. Pożyczkodawca nie miał wpływu na tę recenzję, producent nie otrzymał też kopii tej recenzji przed publikacją. Nie było obowiązku publikowania tej recenzji. Jako niezależna firma medialna, Notebookcheck nie podlega władzy producentów, sprzedawców detalicznych ani wydawców.
Tak testuje Notebookcheck
Każdego roku Notebookcheck niezależnie sprawdza setki laptopów i smartfonów, stosując standardowe procedury, aby zapewnić porównywalność wszystkich wyników. Od około 20 lat stale rozwijamy nasze metody badawcze, ustanawiając przy tym standardy branżowe. W naszych laboratoriach testowych doświadczeni technicy i redaktorzy korzystają z wysokiej jakości sprzętu pomiarowego. Testy te obejmują wieloetapowy proces walidacji. Nasz kompleksowy system ocen opiera się na setkach uzasadnionych pomiarów i benchmarków, co pozwala zachować obiektywizm.
