Werdykt - Większe funkcje za wyższą cenę
Jedną z naszych głównych skarg na Alienware 16X Aurora 2025 był brak OLED, obsługi HDR i opcji GeForce RTX 5070 Ti. Teraz, rok później, 2026 16X Aurora można skonfigurować ze wszystkimi tymi brakującymi funkcjami oraz zupełnie nowym Core Ultra 9 290HX Plus jako opcją procesora wyższego poziomu w stosunku do istniejącego Core Ultra 9 275HX.
Po pierwsze, nowy procesor wnosi bardzo niewiele, zwłaszcza dla graczy, więc jest to prawdopodobnie najgorszy powód, dla którego warto wybrać Aurorę 2026 16X zamiast modelu 2025. Zamiast tego, nowa opcja RTX 5070 Ti jest głównym punktem sprzedaży, ponieważ działa rozsądnie szybciej niż zeszłoroczny RTX 5070.
Tymczasem matowy panel OLED jest unikalny w tej przestrzeni, ponieważ większość innych jest błyszcząca. Jakość obrazu jest lepsza niż w i tak już świetnej podstawowej opcji IPS, ale matowa powłoka wprowadza nieco ziarnistości w celu zmniejszenia odblasków. Jasność jest również tylko przeciętna dla OLED; konkurencyjne Lenovo Legion Pro 5 wyposażony jest w błyszczący i jaśniejszy panel OLED.
Poza tym wrażenia użytkownika są takie same jak w zeszłym roku. Waga pozostaje wyższa niż u większości konkurentów, ale przyzwoite możliwości rozbudowy i bardzo sztywna konstrukcja częściowo rekompensują tę wadę. Być może najbardziej irytującym aspektem zaktualizowanego modelu jest to, że nowa opcja RTX 5070 Ti jest powiązana z Core Ultra 9 290HX Plus, mimo że procesor nie dodaje prawie nic do wrażeń z gry w porównaniu z istniejącym Core Ultra 9 275HX. Przy tak wysokich cenach laptopów jak obecnie, większa swoboda w konfiguracjach sprawiłaby, że Alienware byłby łatwiejszym zakupem dla wielu osób.
Za
Przeciw
Cena i dostępność
Dell dostarcza obecnie Alienware 16X Aurora w konfiguracji przedstawionej w niniejszej recenzji za 3000 USD.
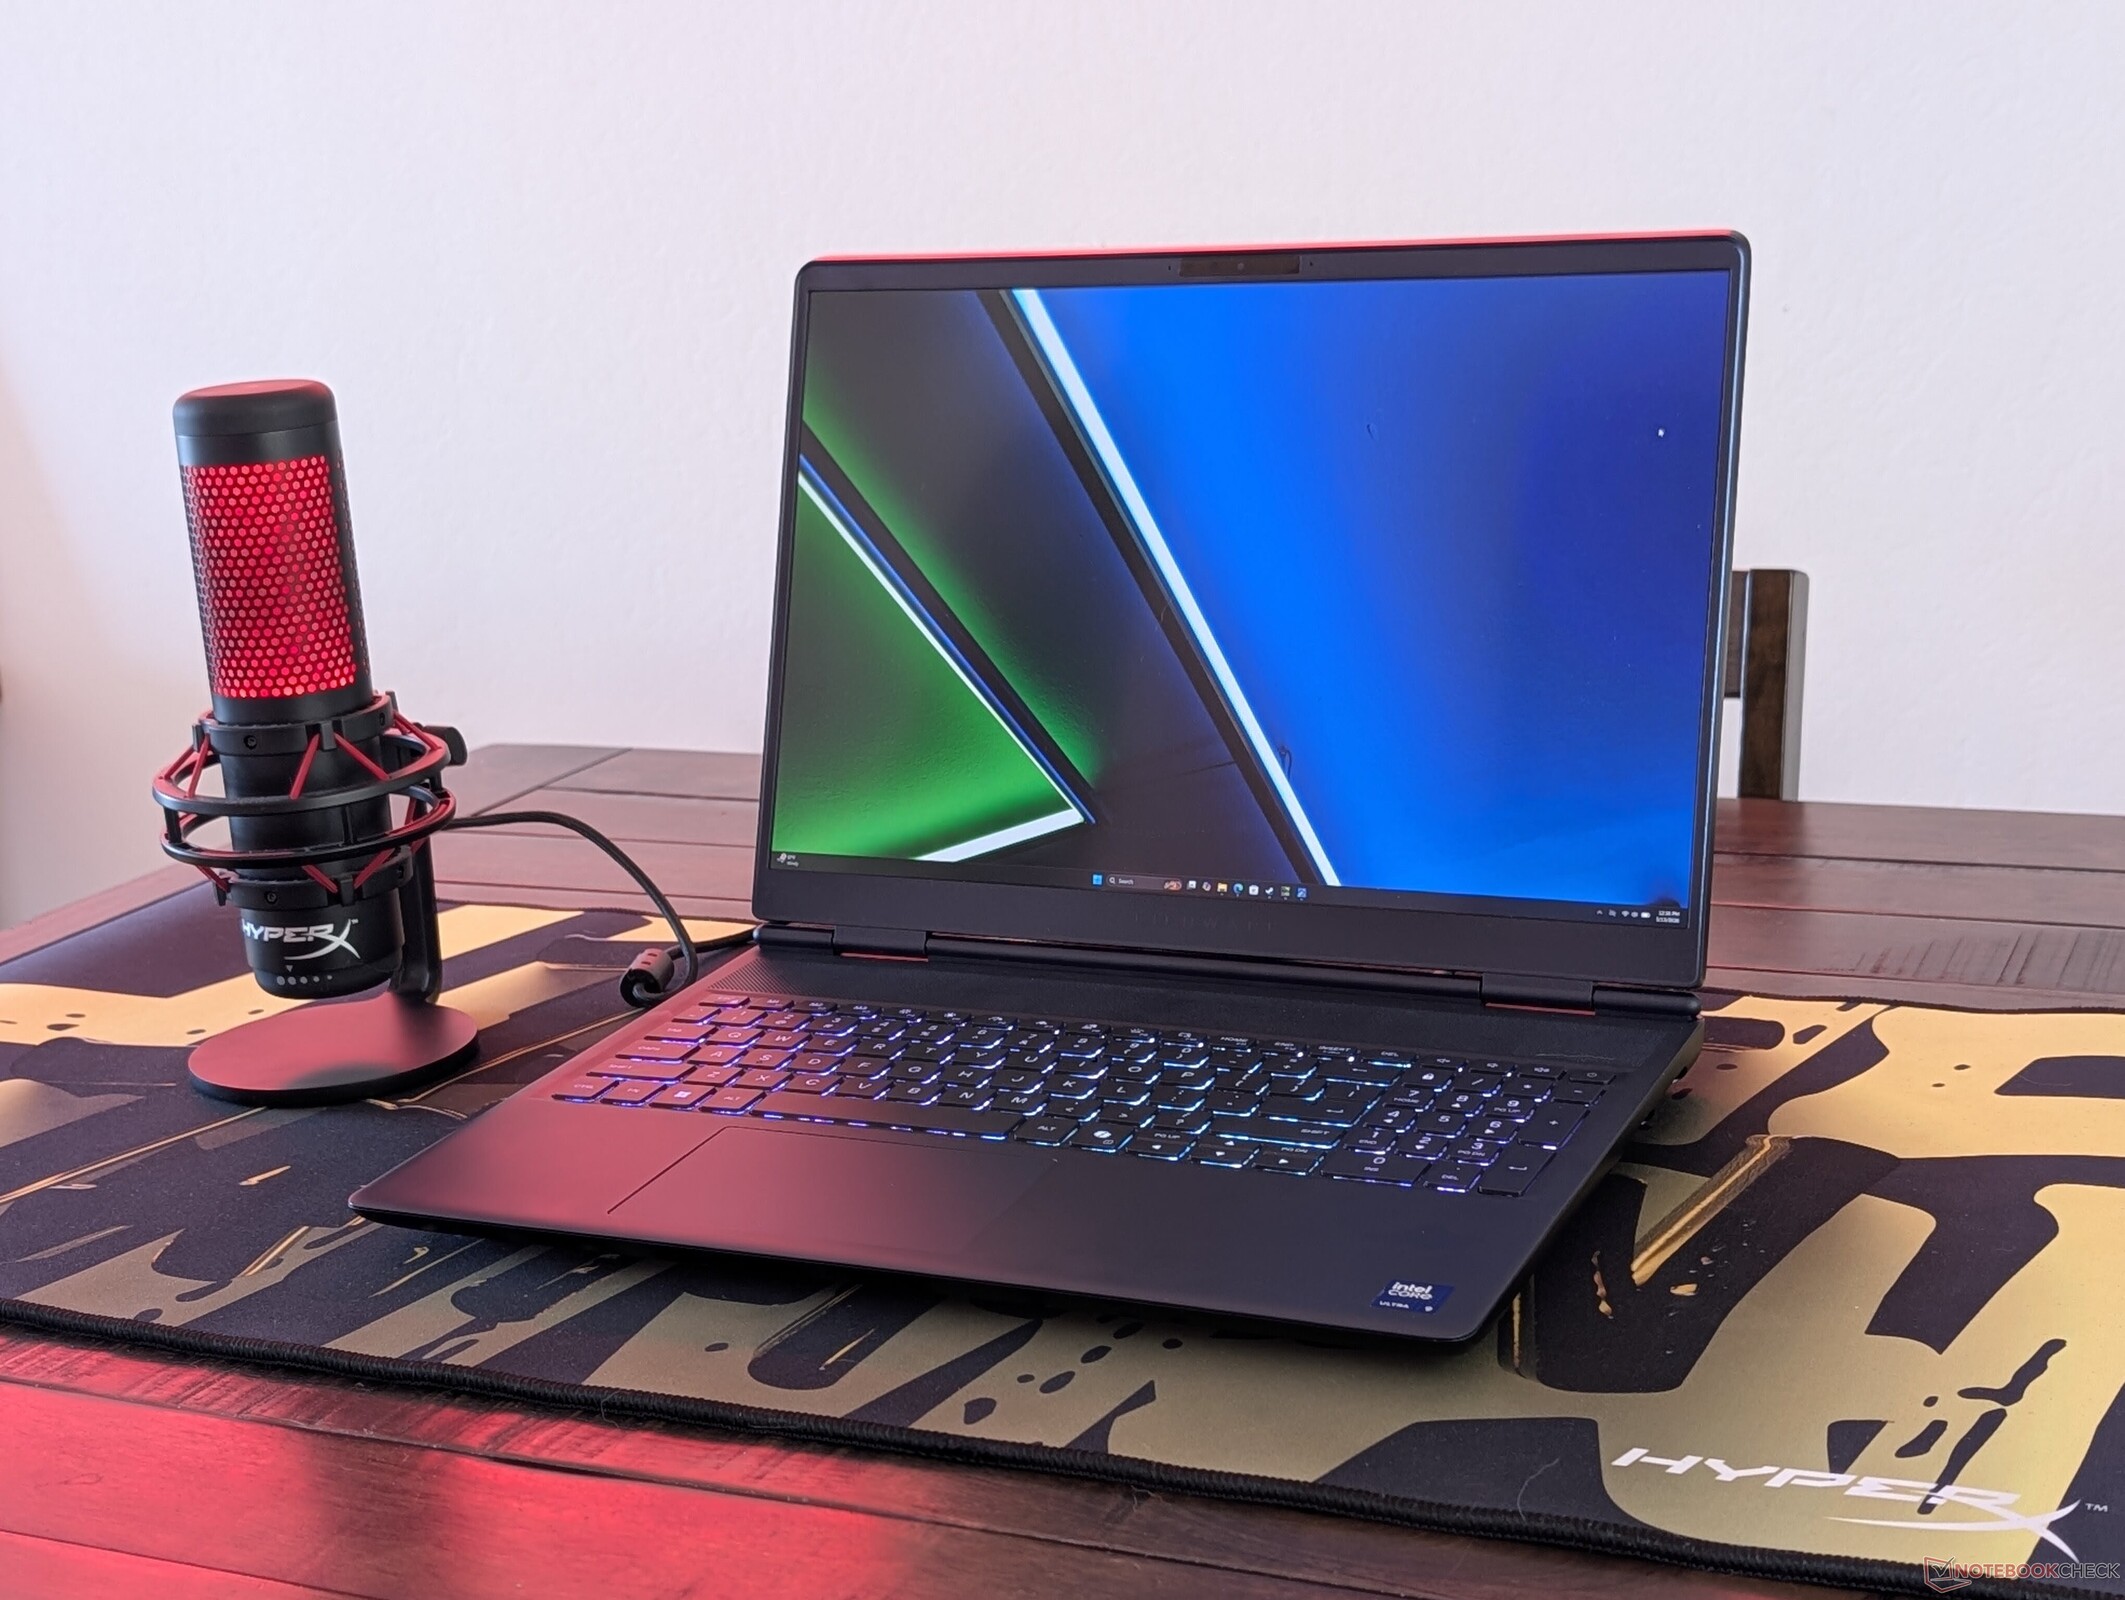
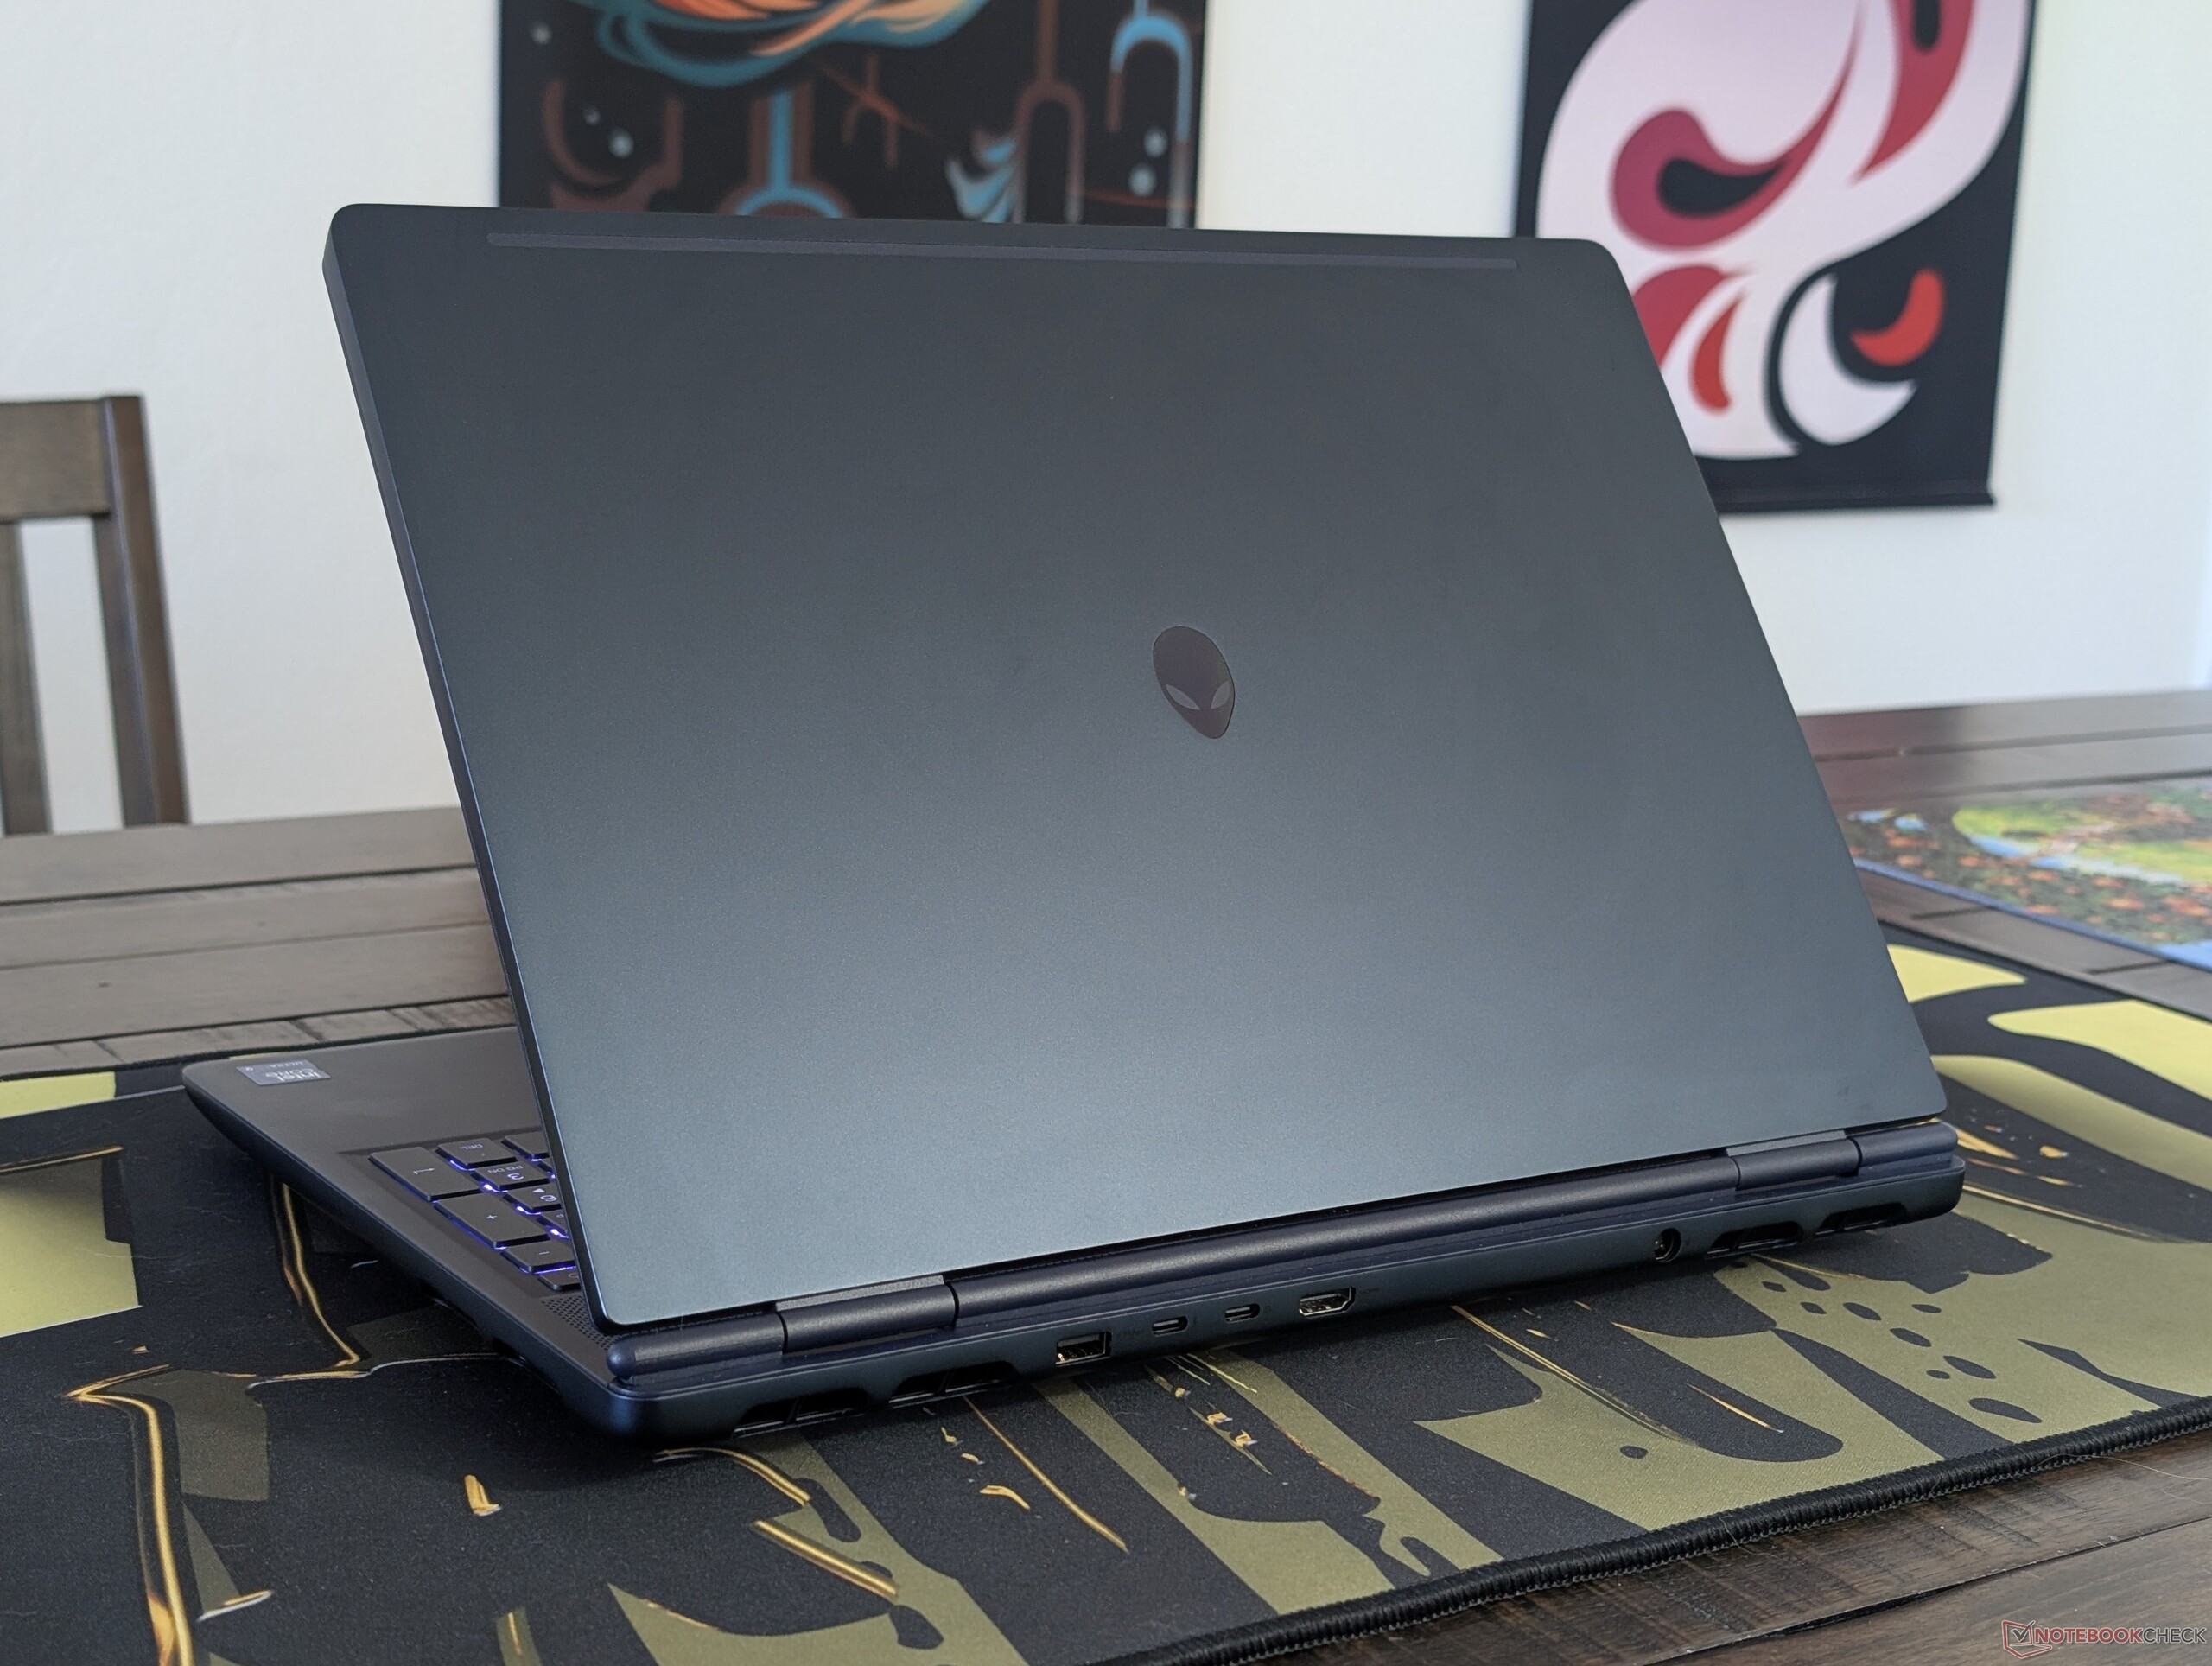
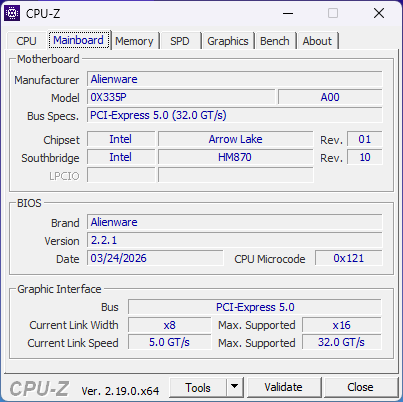
Alienware 16X Aurora powraca w tym roku z nowymi opcjami procesora, karty graficznej i wyświetlacza, aby uzupełnić istniejące opcje w modelu 2025. Poza tym obudowa jest wizualnie identyczna z modelem 2025, więc więcej szczegółów można znaleźć w naszej istniejącej recenzji tutaj.
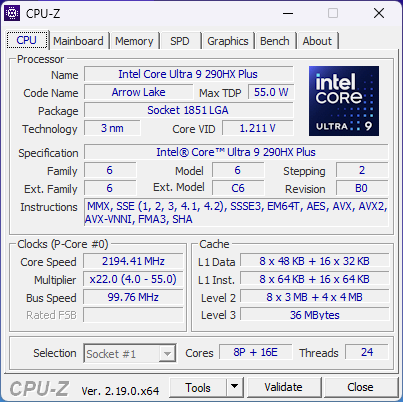
Nasza jednostka testowa to najwyższa konfiguracja z procesorem Arrow Lake Core Ultra 9 290HX Plus, GeForce RTX 5070 Ti i wyświetlaczem OLED 1600p za około 3000 USD. Wcześniej 16X Aurora była ograniczona do Core Ultra 9 275HX, RTX 5070 i wyświetlacza IPS 1600p.
Konkurenci w tej dziedzinie obejmują inne 16-calowe laptopy do gier z wyższej półki, takie jak Asus ROG Zephyrus G16, Acer Predator Helios Neolub MSI Vector 16 HX.
Więcej recenzji Alienware:
Specyfikacje
Przypadek
Łączność


Komunikacja
Kamera internetowa


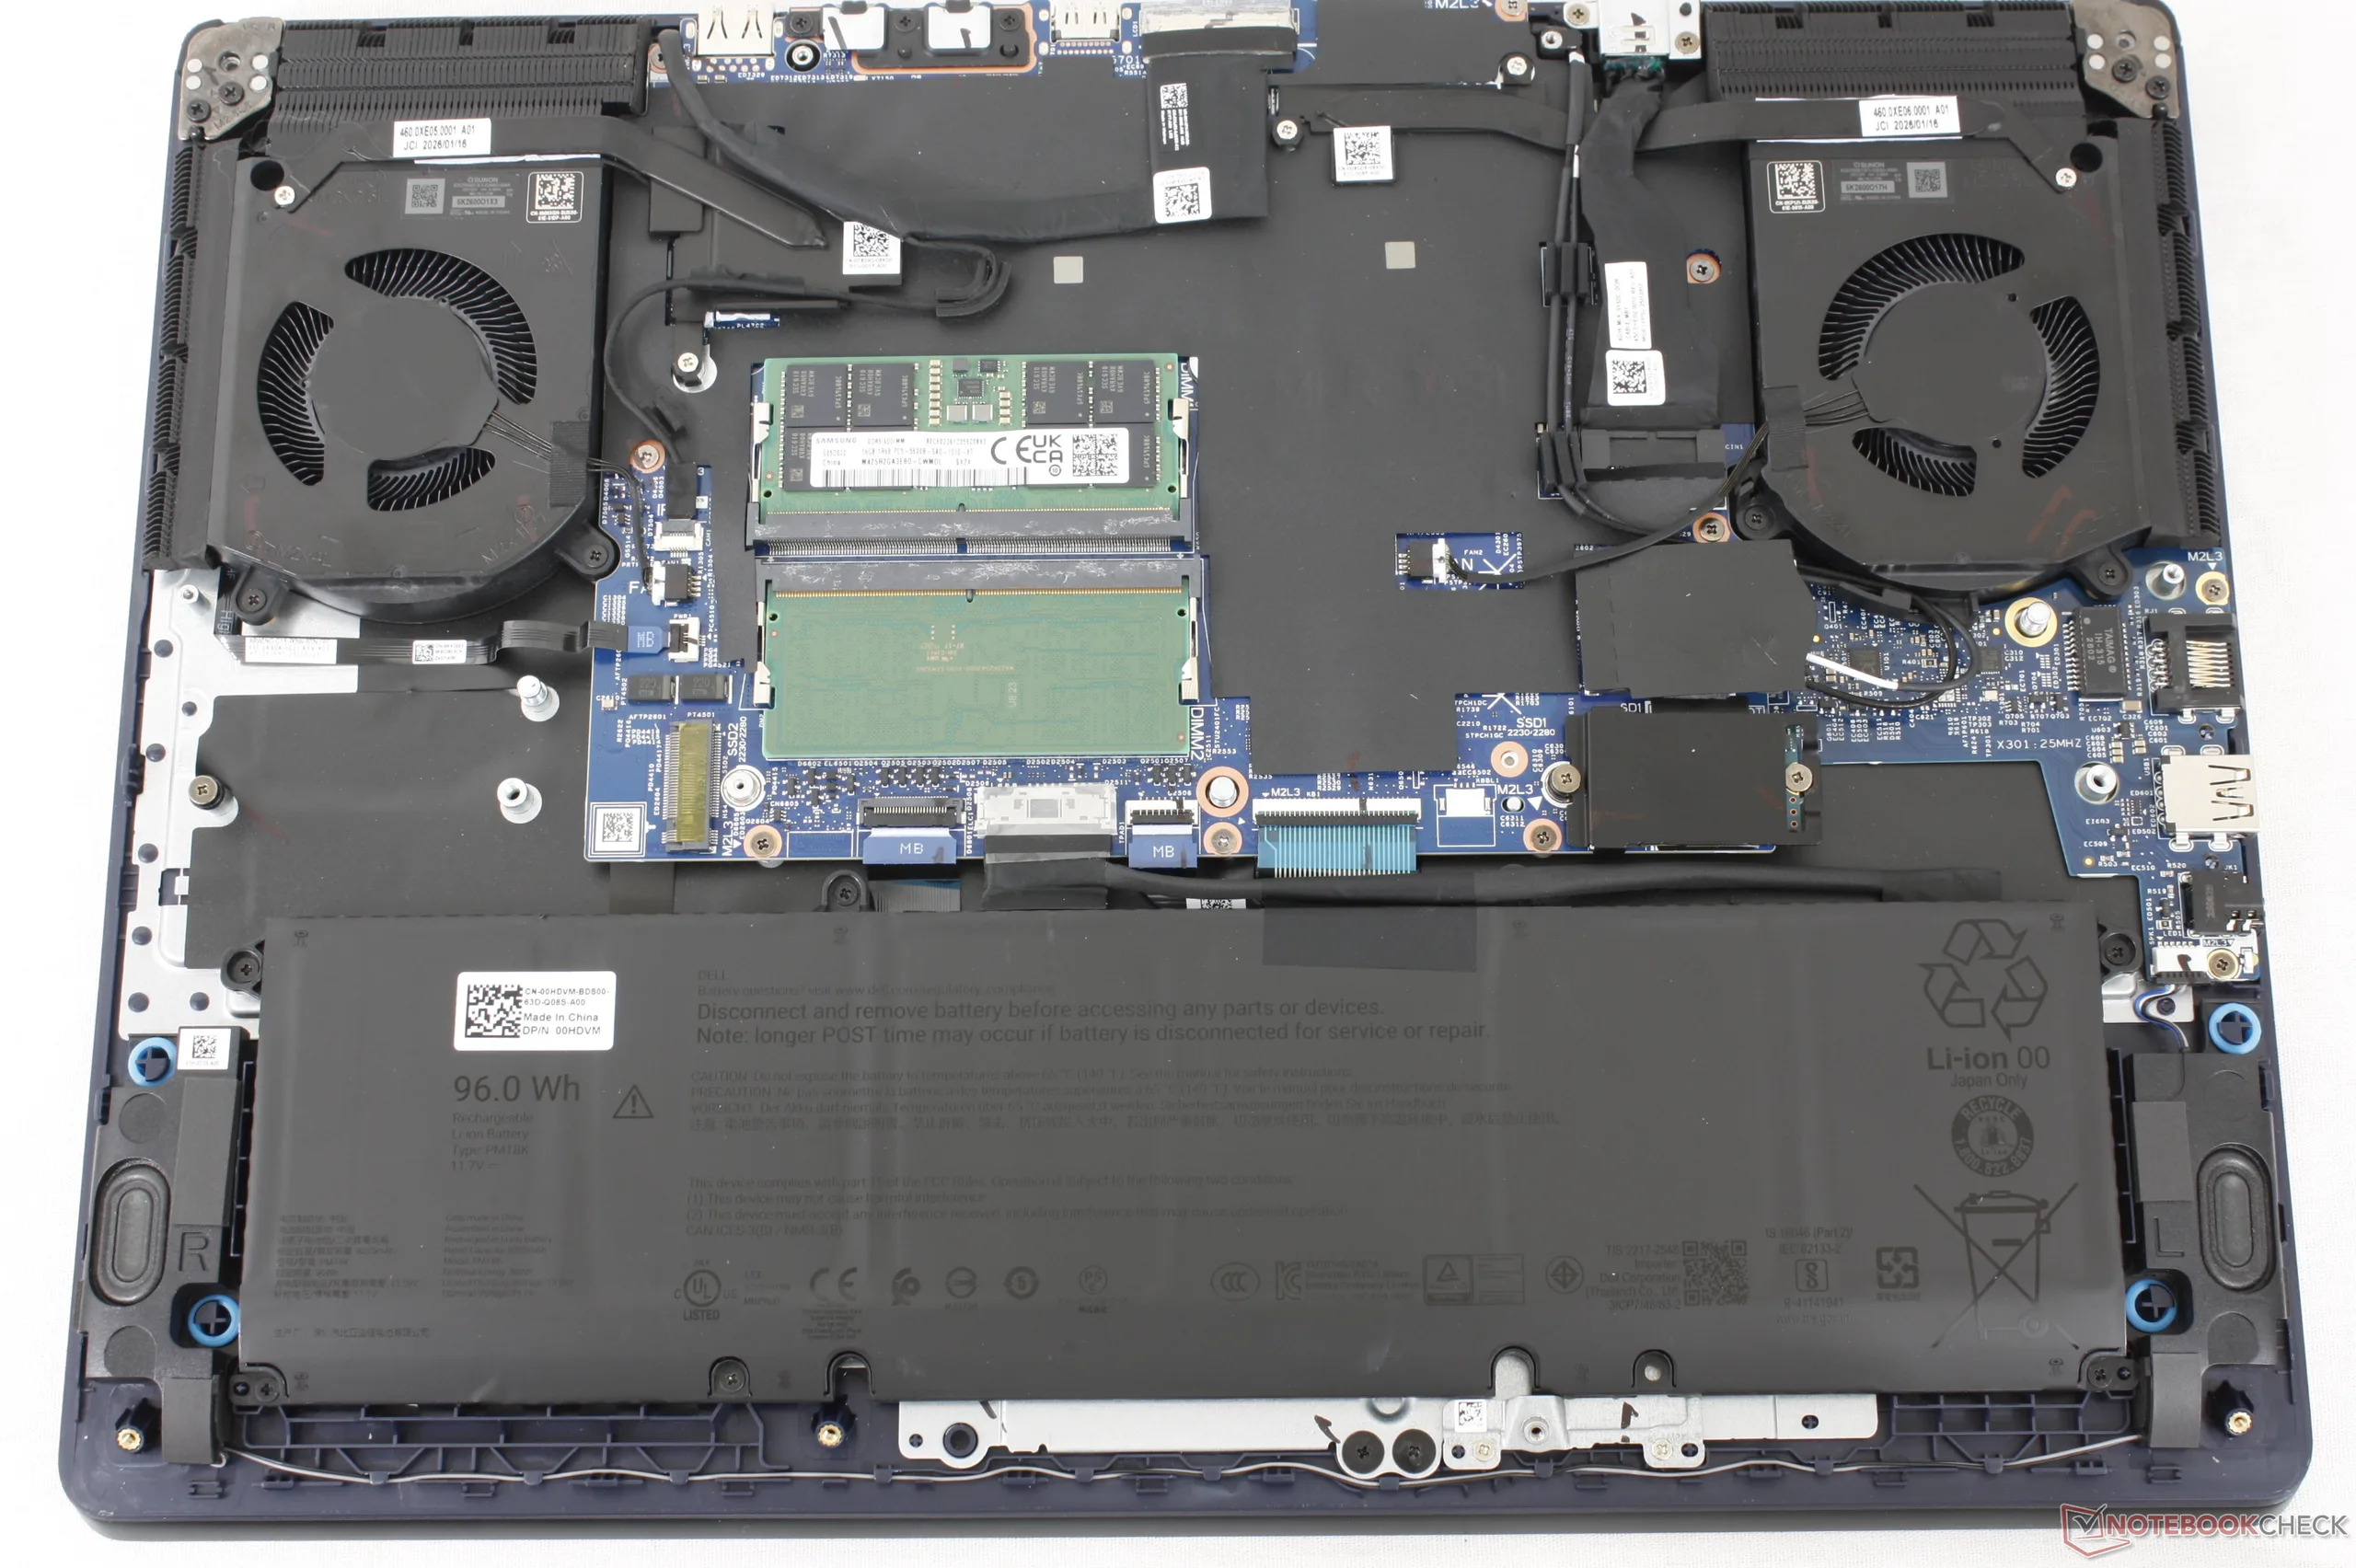
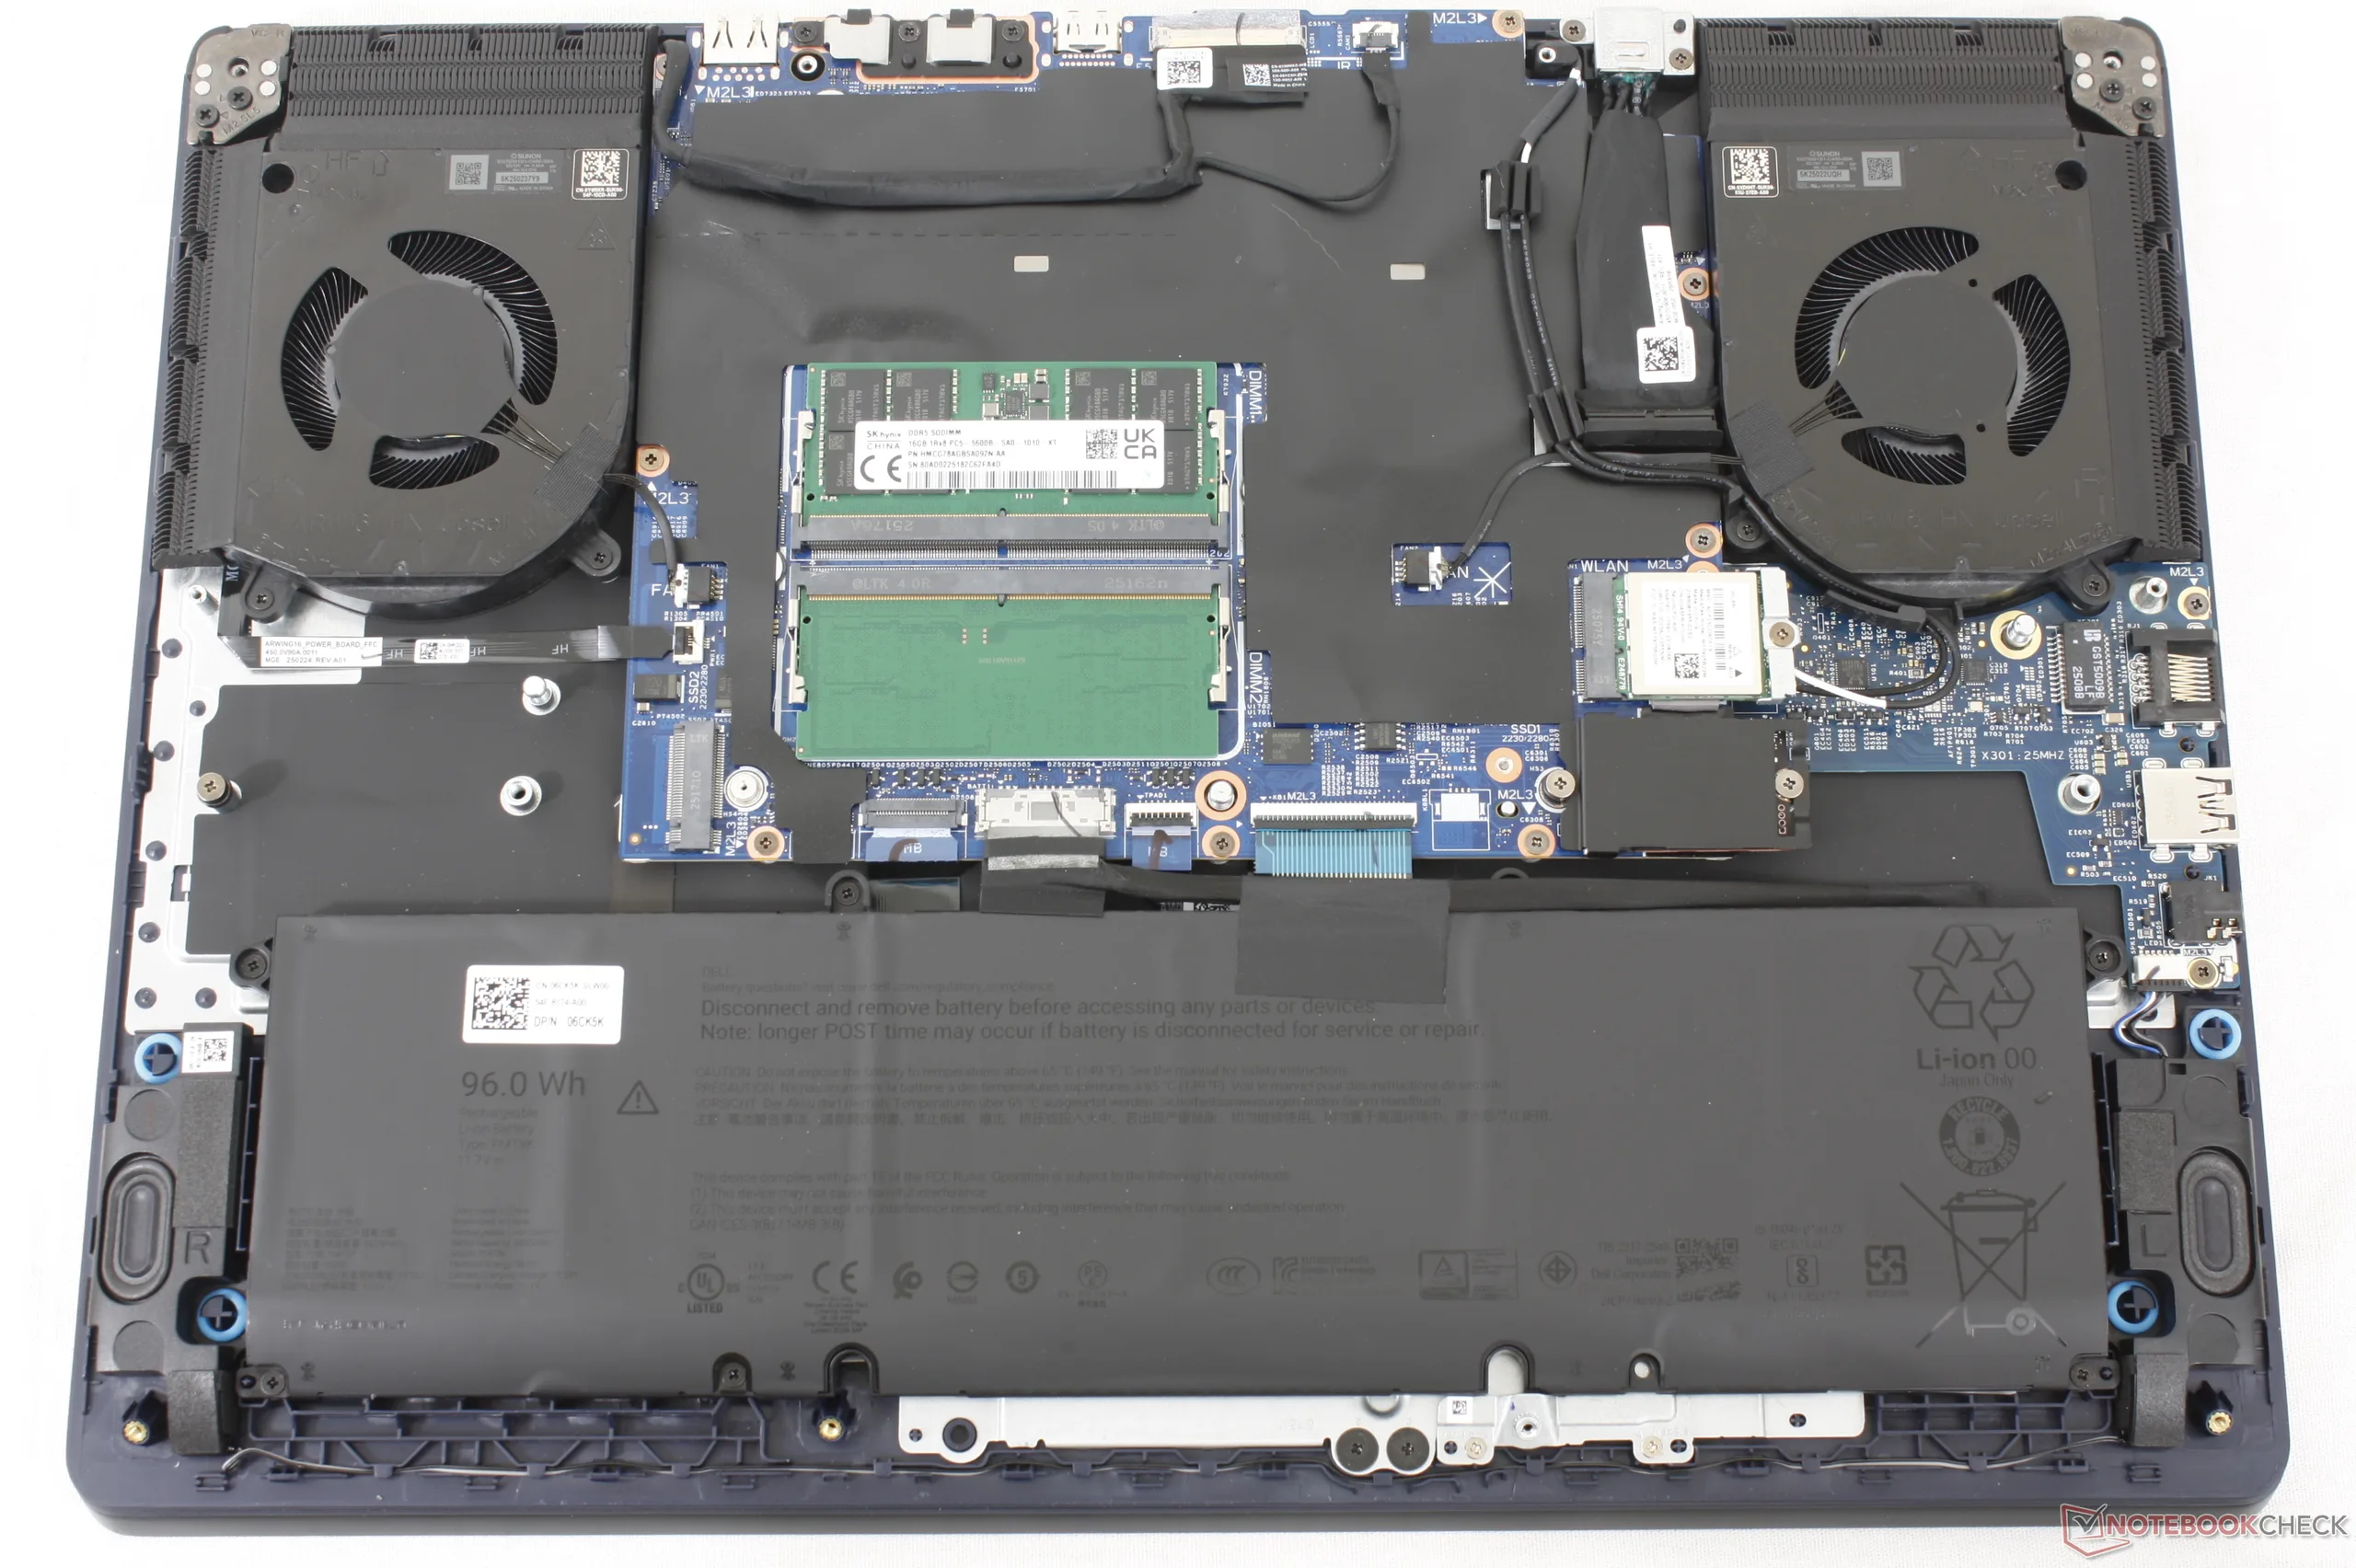
Konserwacja
Urządzenia wejściowe
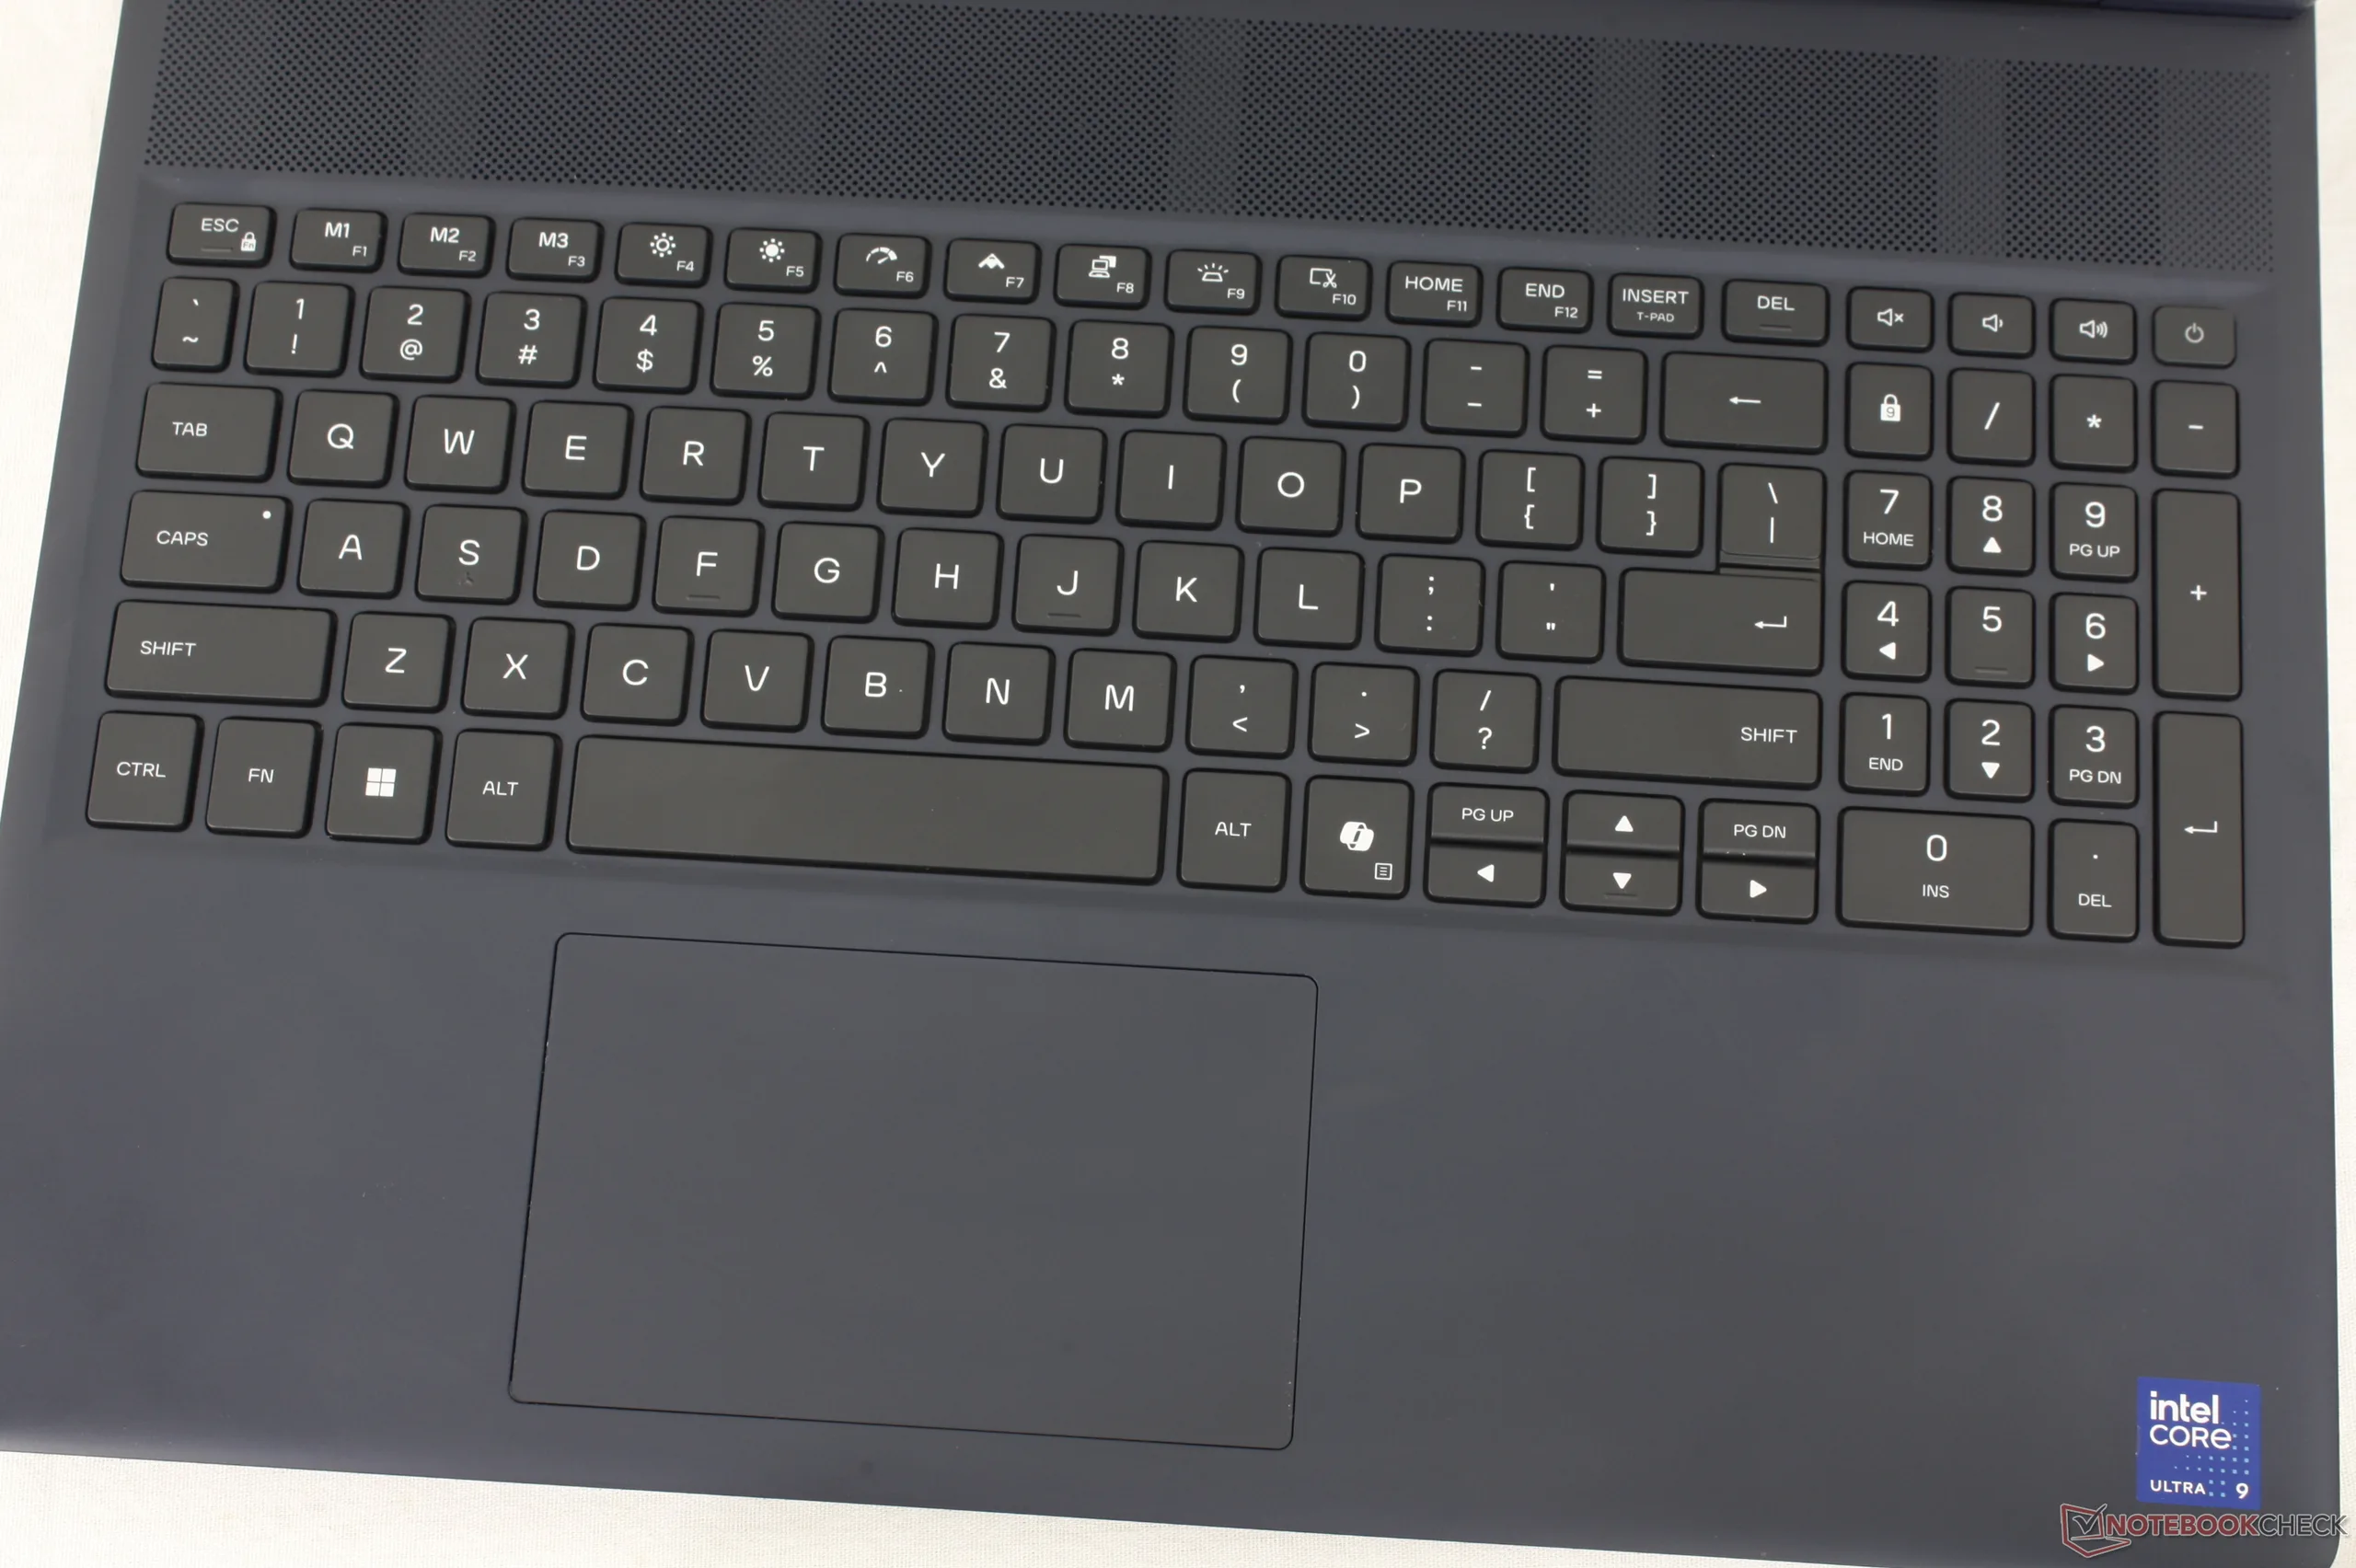
Wyświetlacz

Nowością w tym roku w serii Aurora 16X jest matowy panel OLED, który oferuje tę samą natywną częstotliwość odświeżania 240 Hz, rozdzielczość 2560 x 1600 i obsługę G-Sync, co istniejąca opcja IPS, ale ze wszystkimi zaletami OLED, w tym szybszym czasem reakcji, głębszymi poziomami czerni i odpowiednią obsługą HDR.
Zauważalną wadą panelu OLED jest to, że jest on ciemniejszy niż panel IPS o około 100 nitów w trybie SDR, jak pokazuje nasza tabela porównawcza poniżej. Maksymalna jasność osiąga 390 nitów w trybie SDR lub do 621 nitów w trybie HDR, co odpowiada reklamie producenta 620 nitów.
Niestety, matowy panel OLED nadal wykazuje podobny poziom ziarnistości, który zauważyliśmy na zeszłorocznym panelu IPS. Choć nie jest to szczególnie rozpraszające, z pewnością nie jest tak ostry ani czysty, jak błyszczący panel OLED w nowym XPS 16.
| |||||||||||||||||||||||||
rozświetlenie: 98 %
na akumulatorze: 380.5 cd/m²
kontrast: ∞:1 (czerń: 0 cd/m²)
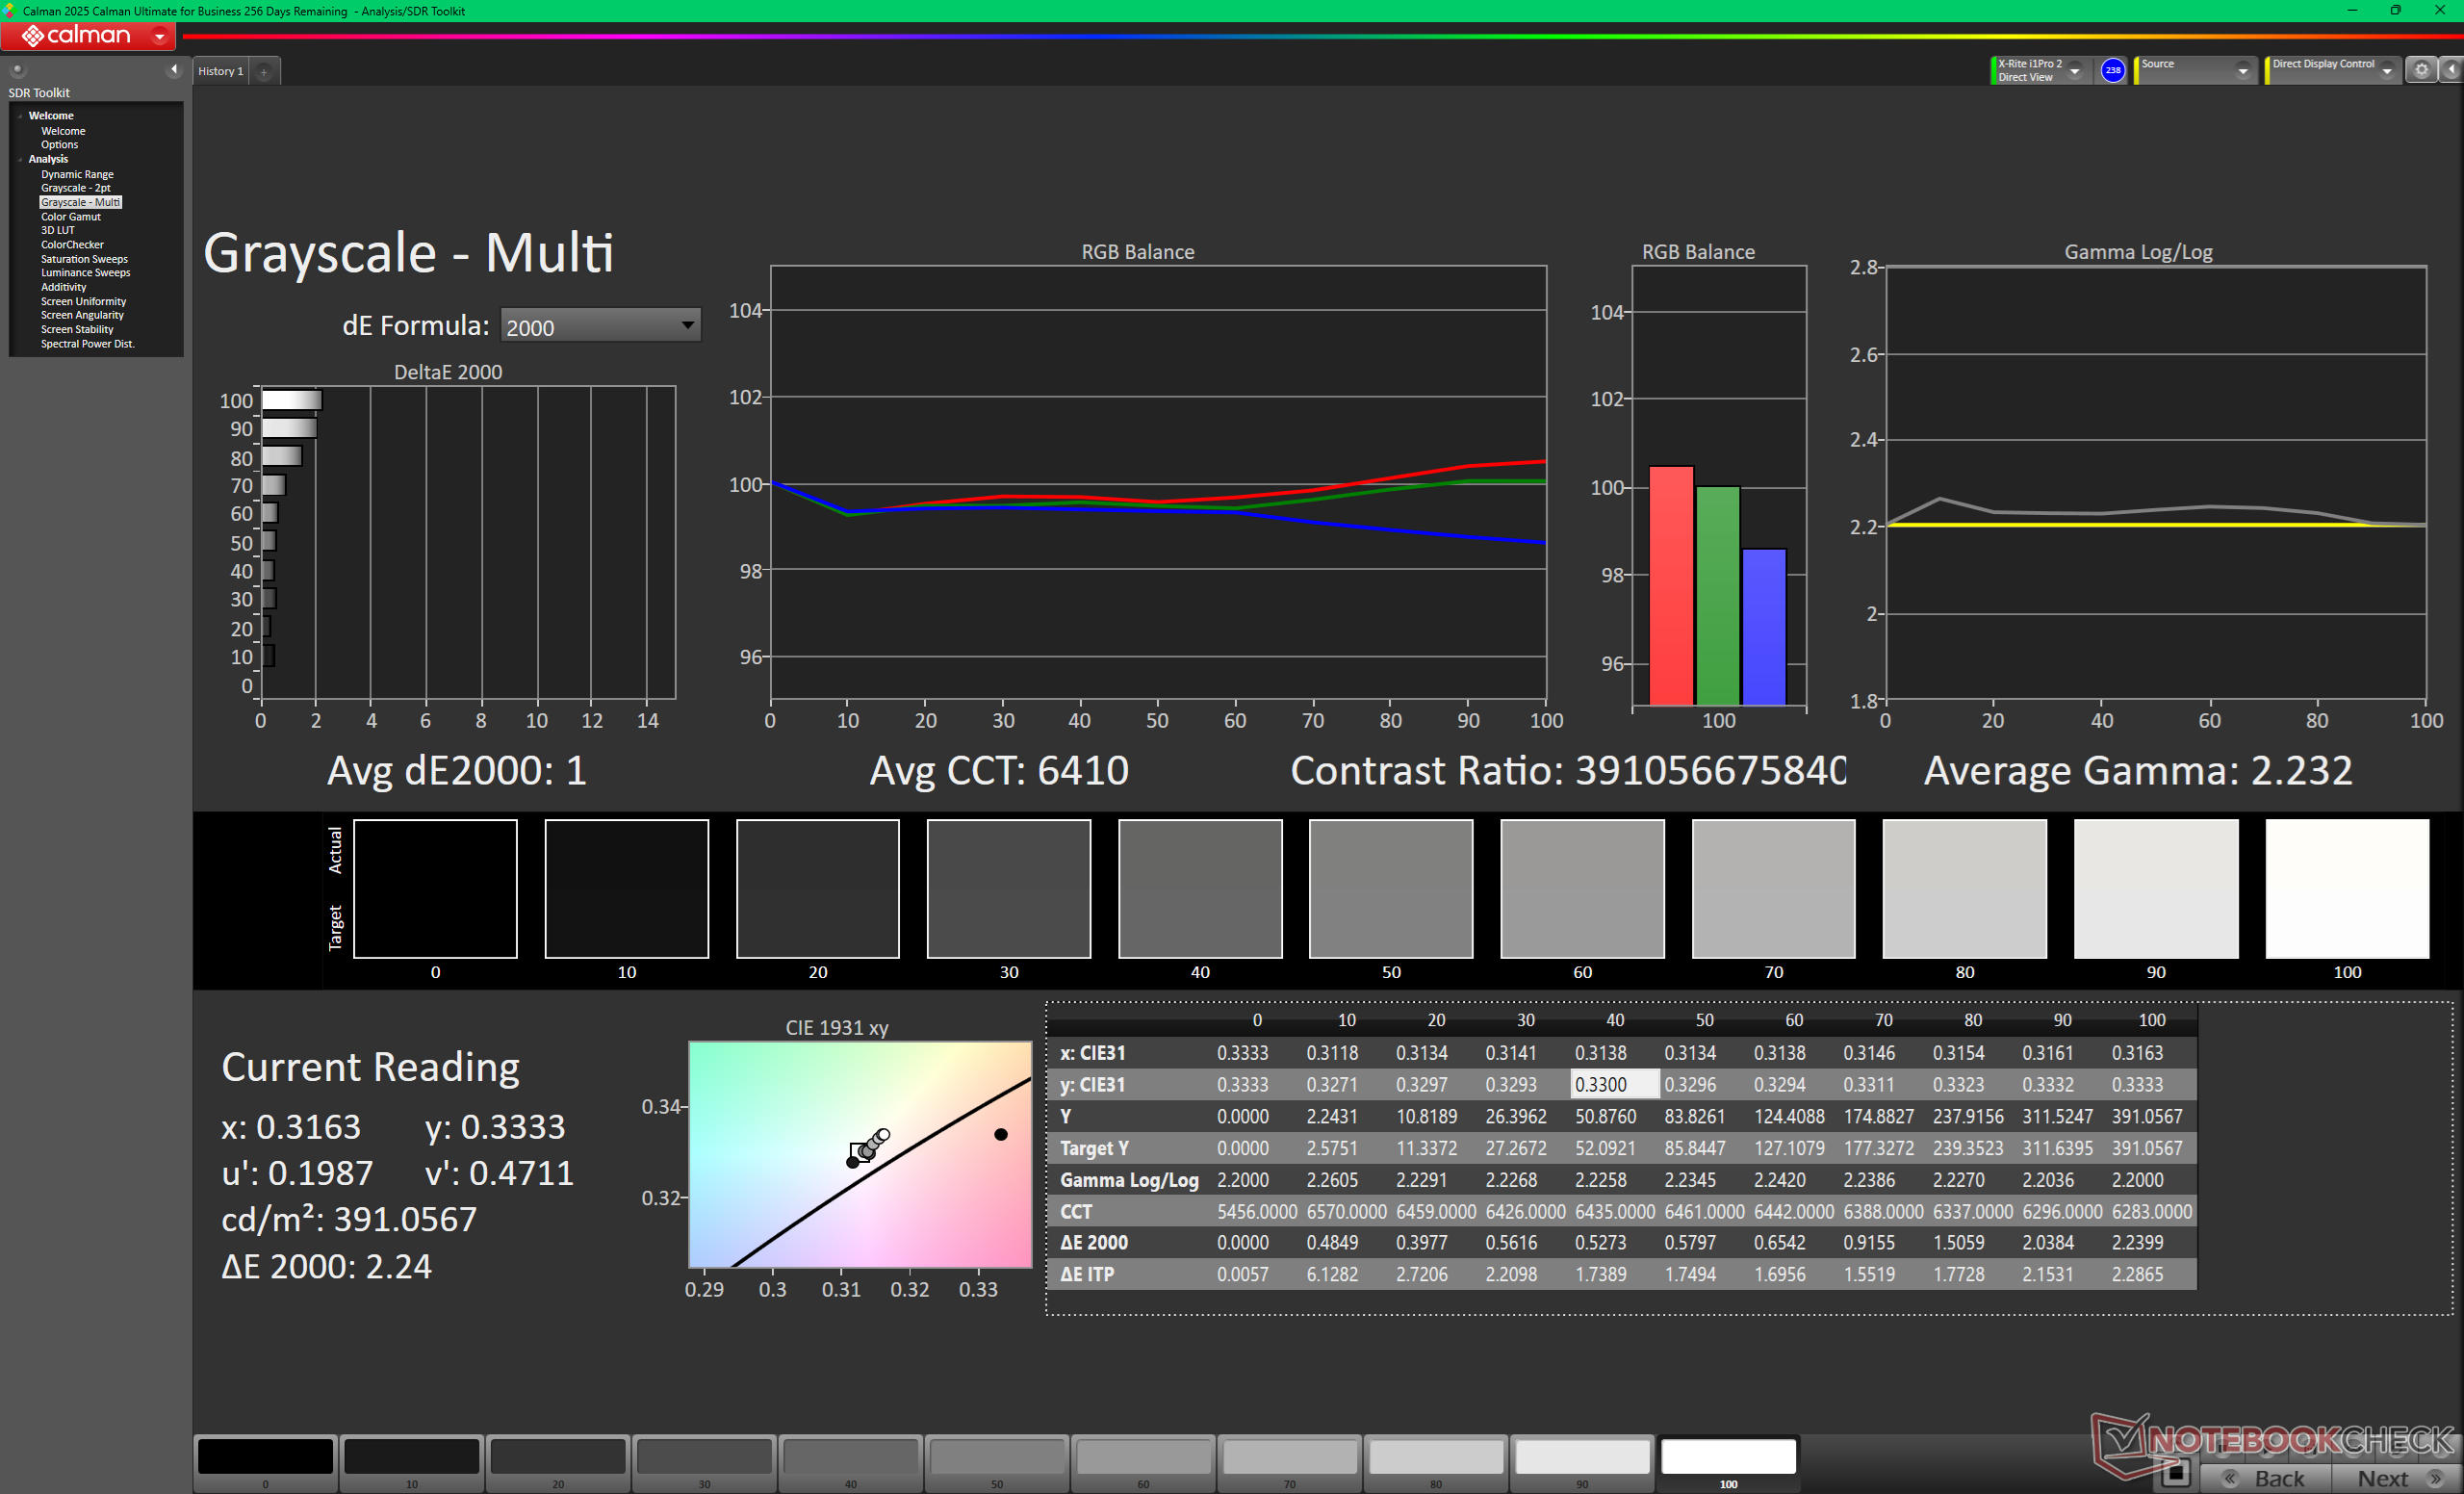
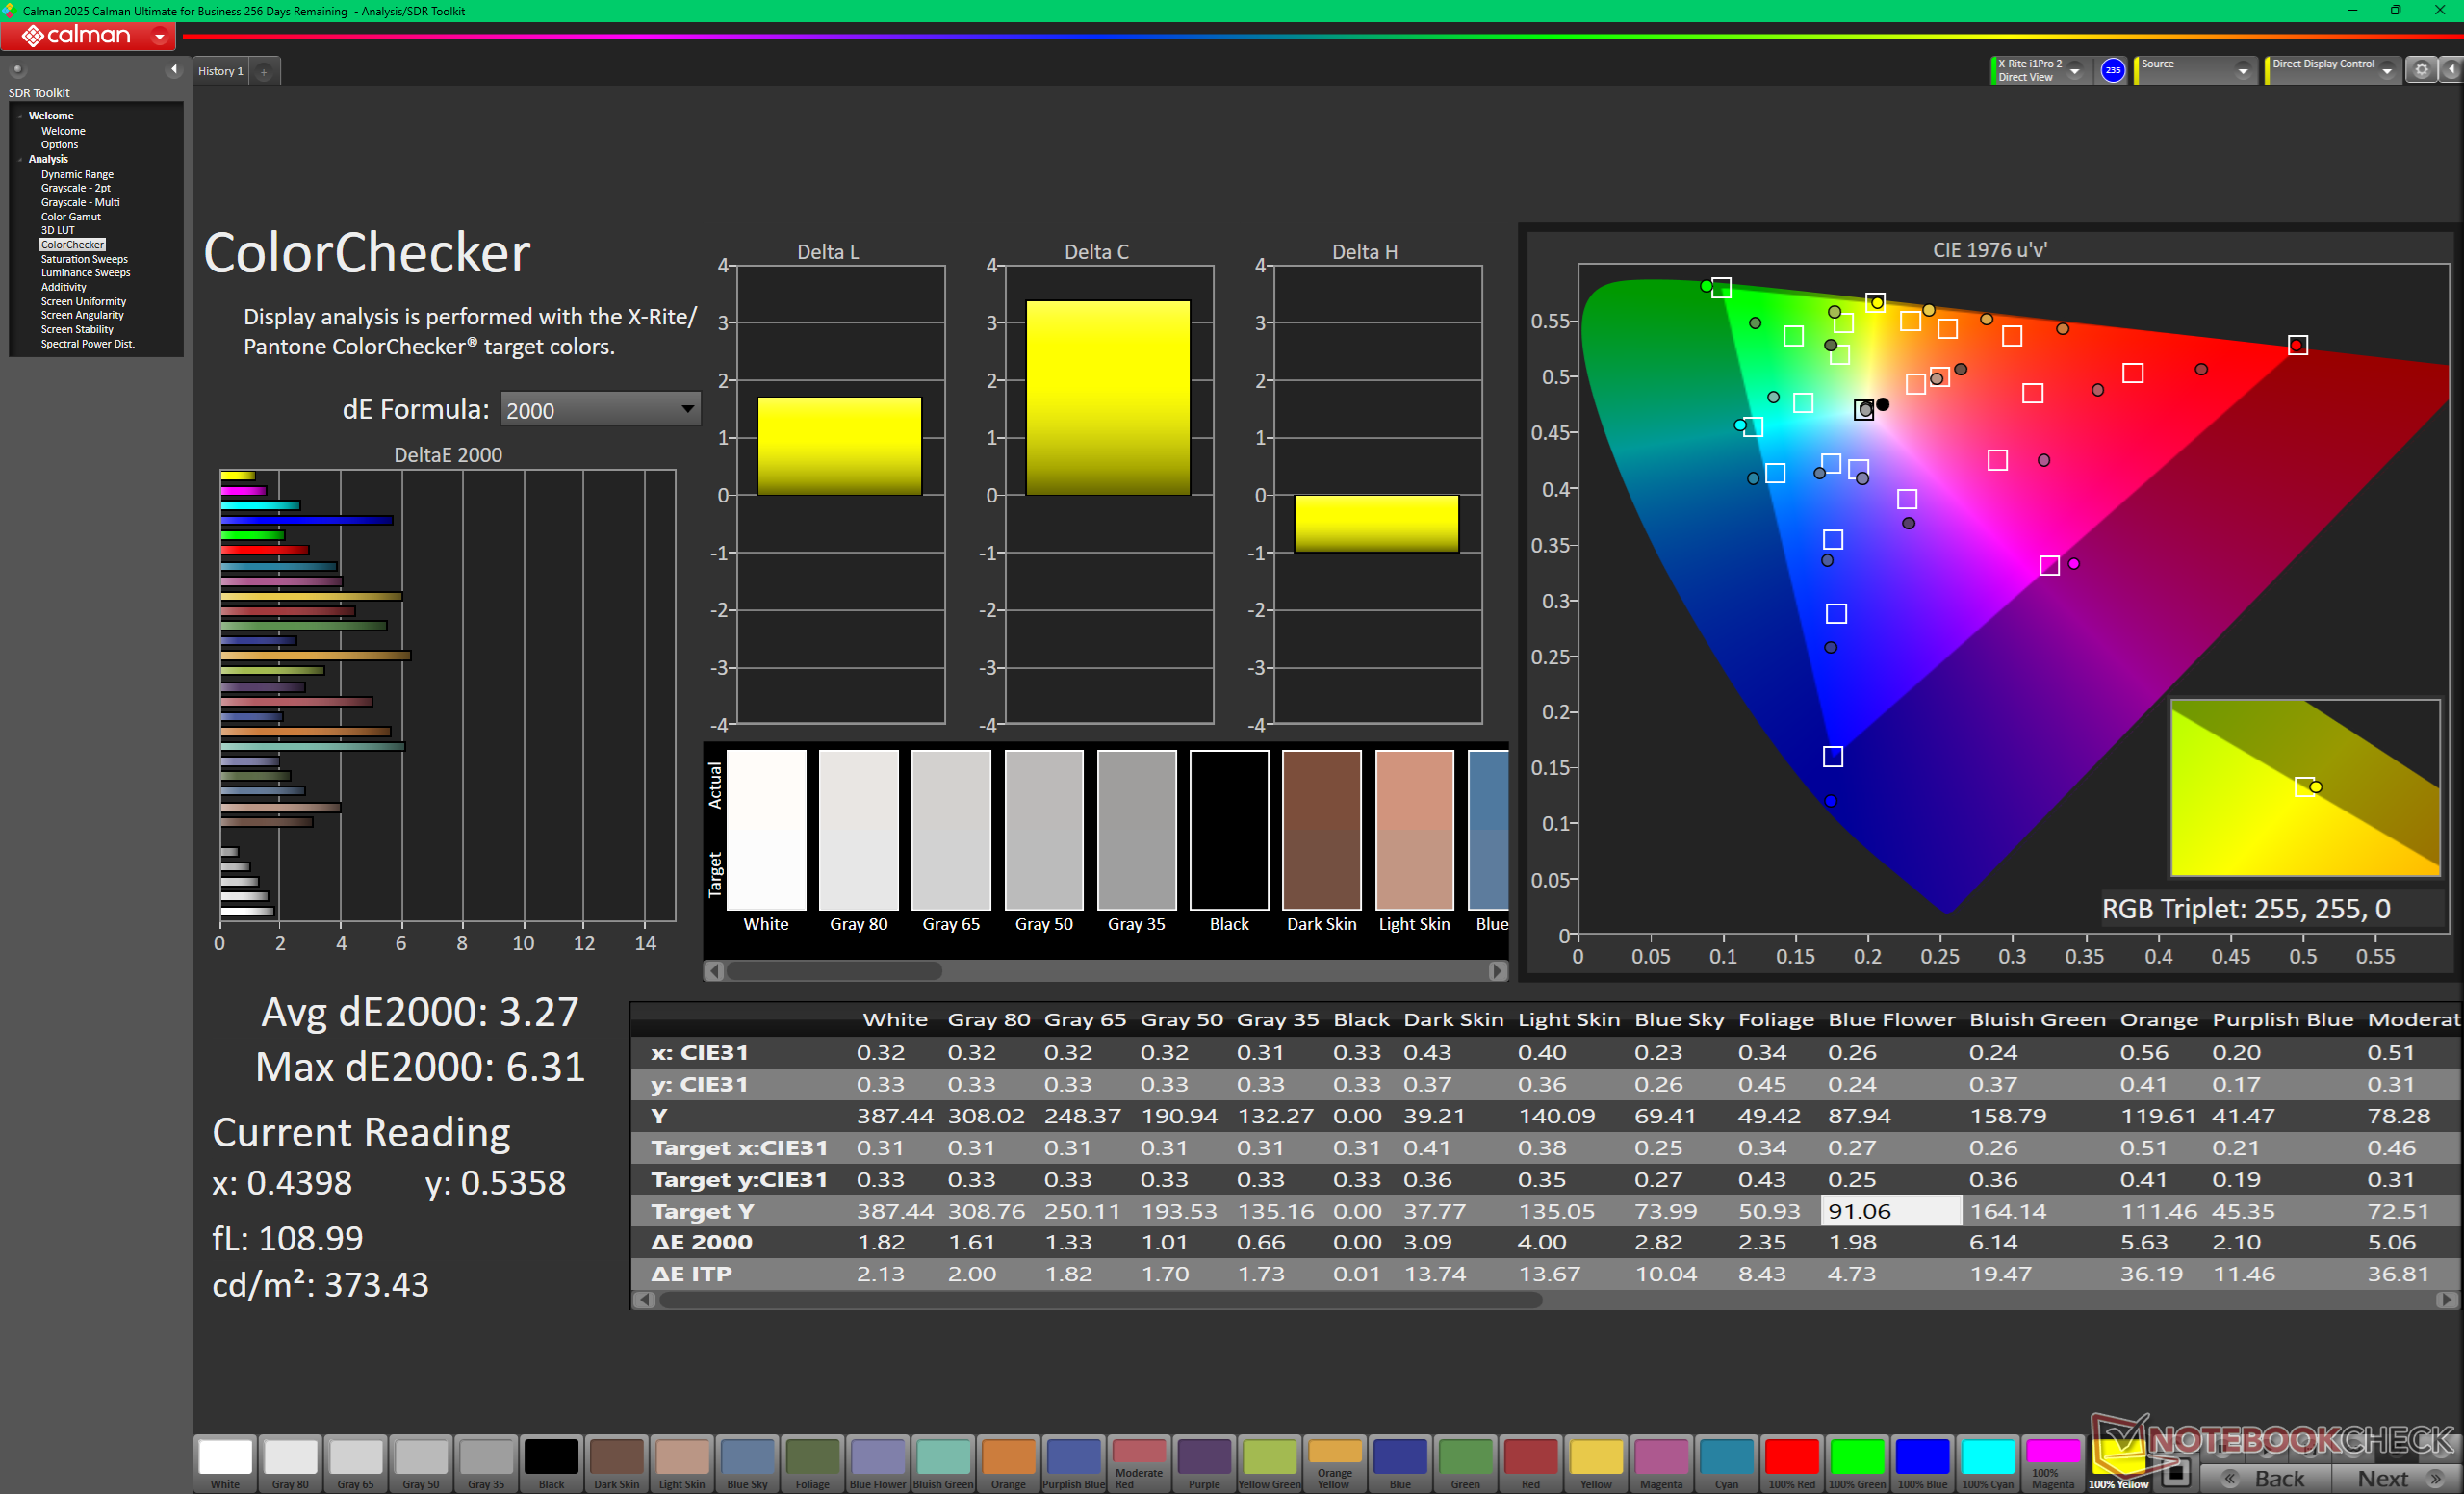
ΔE ColorChecker Calman: 3.27 | ∀{0.5-29.43 Ø4.73}
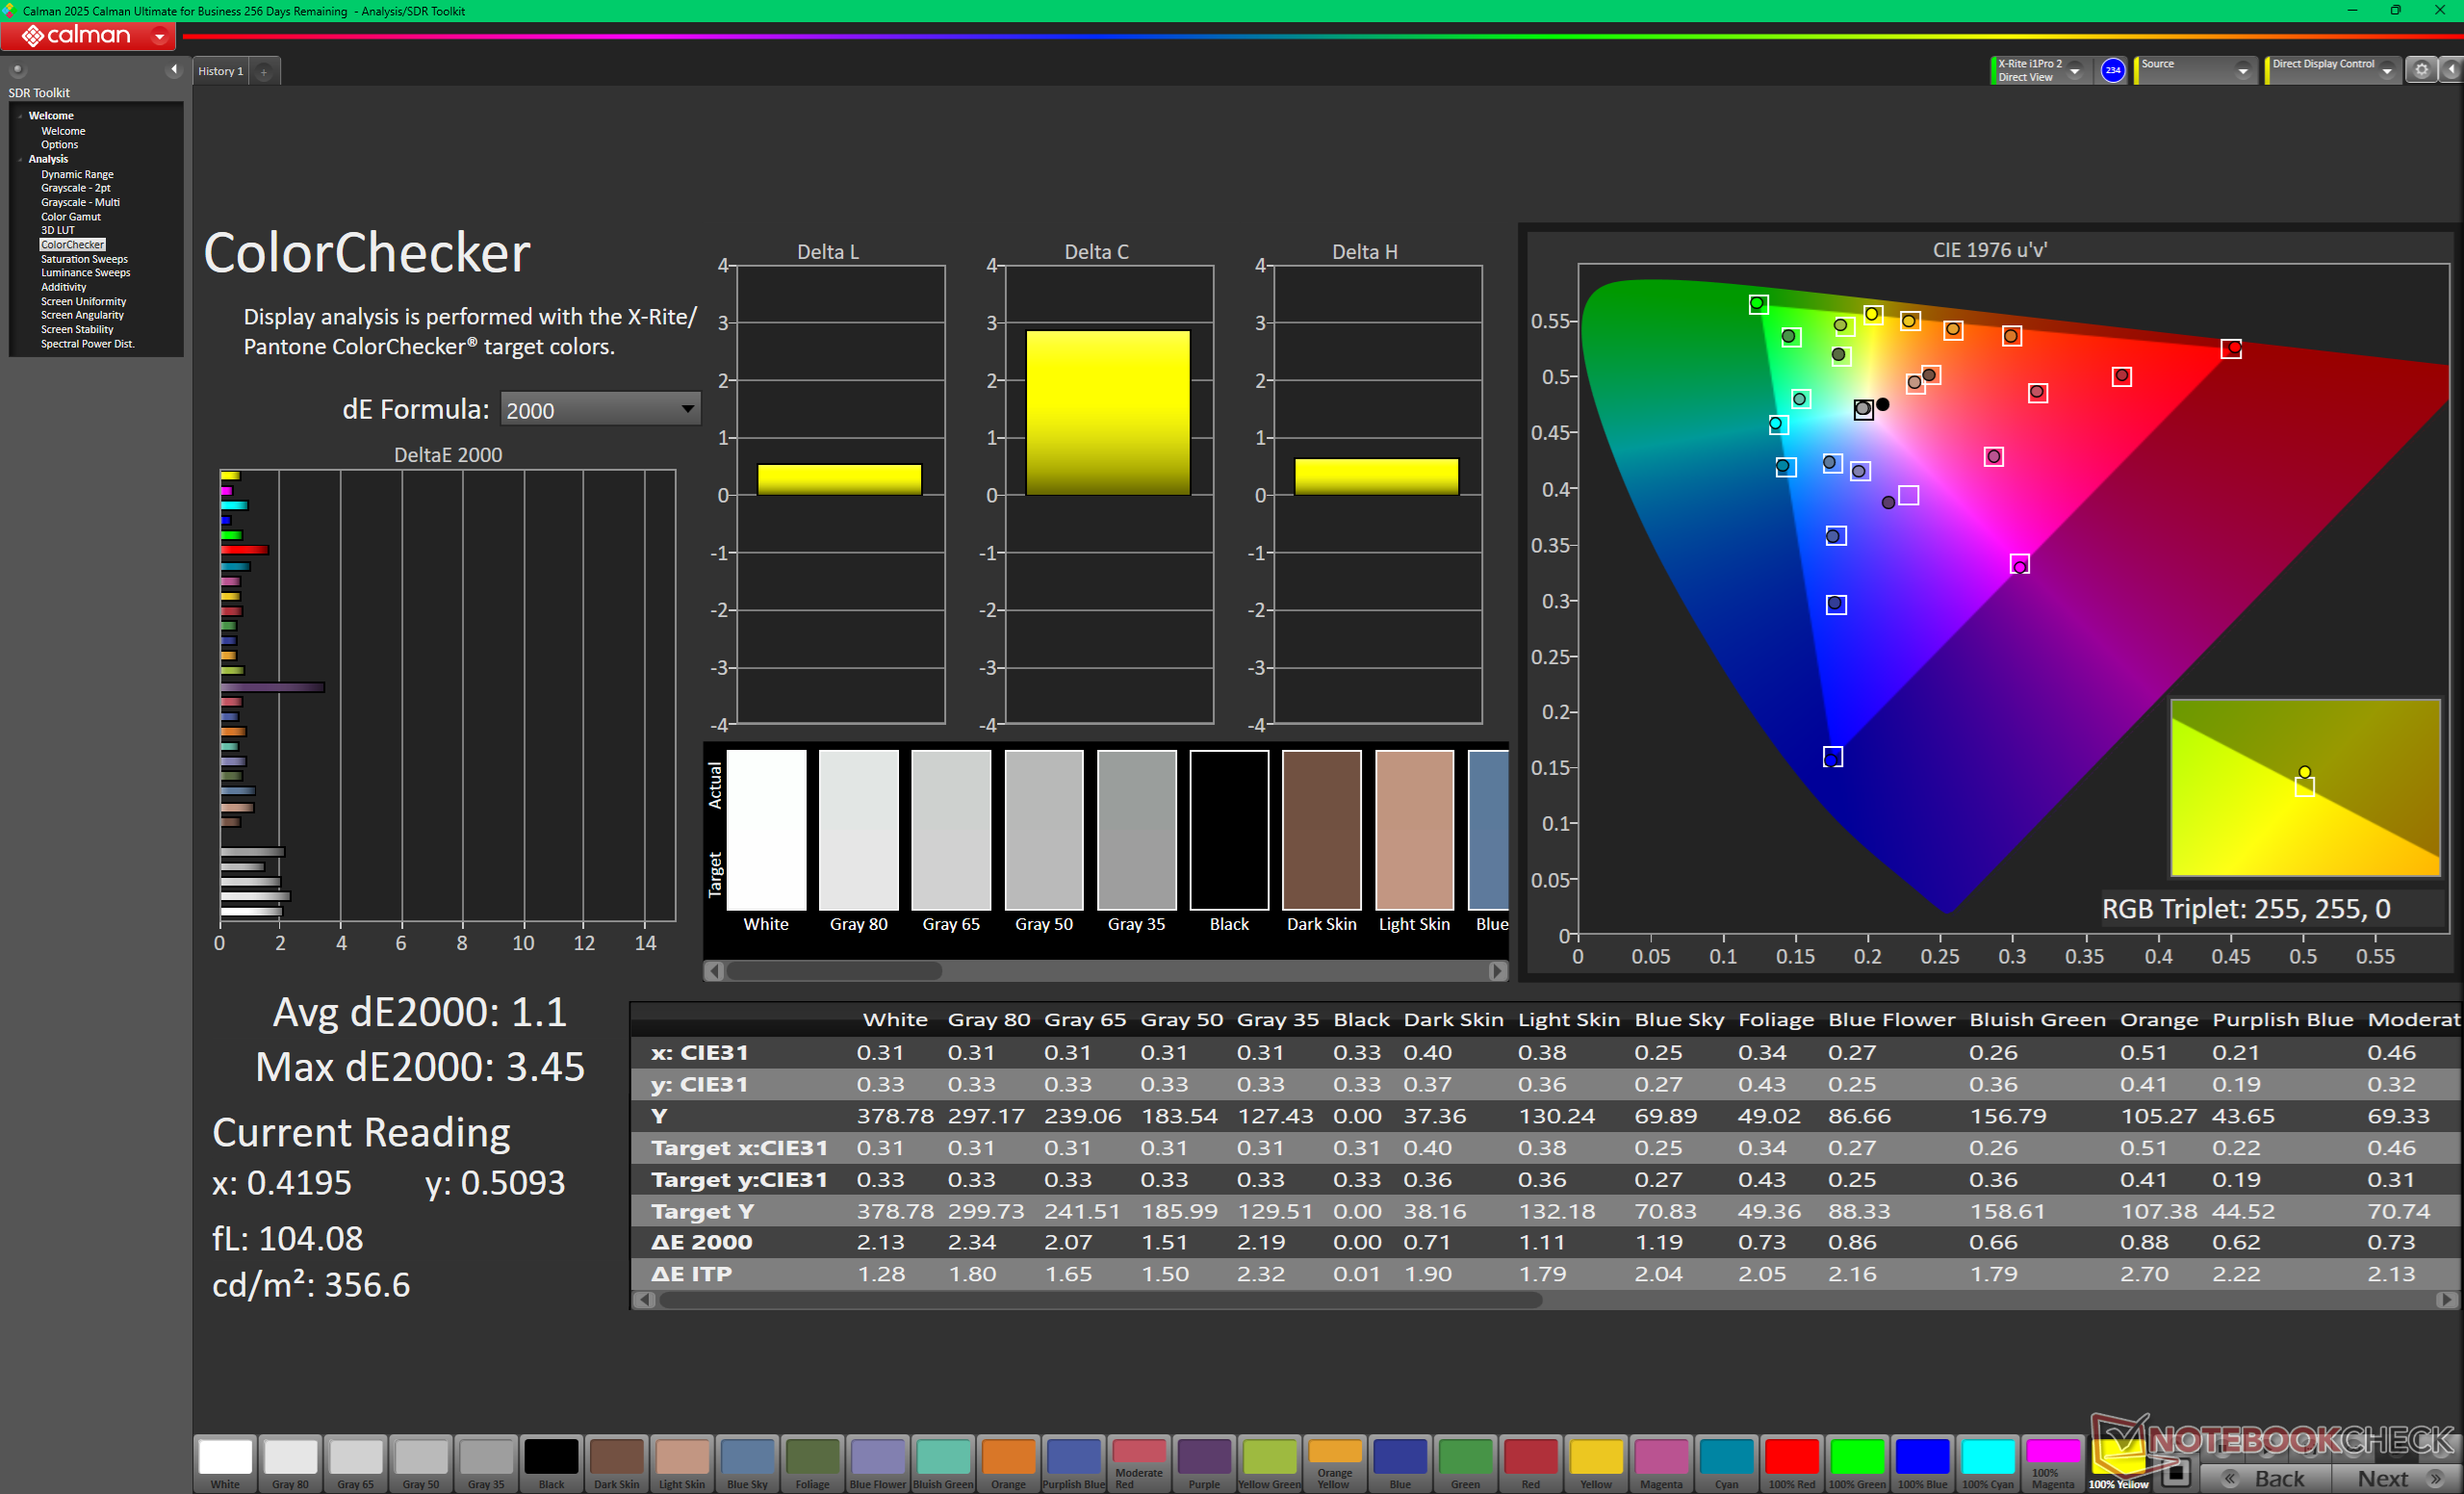
calibrated: 1.1
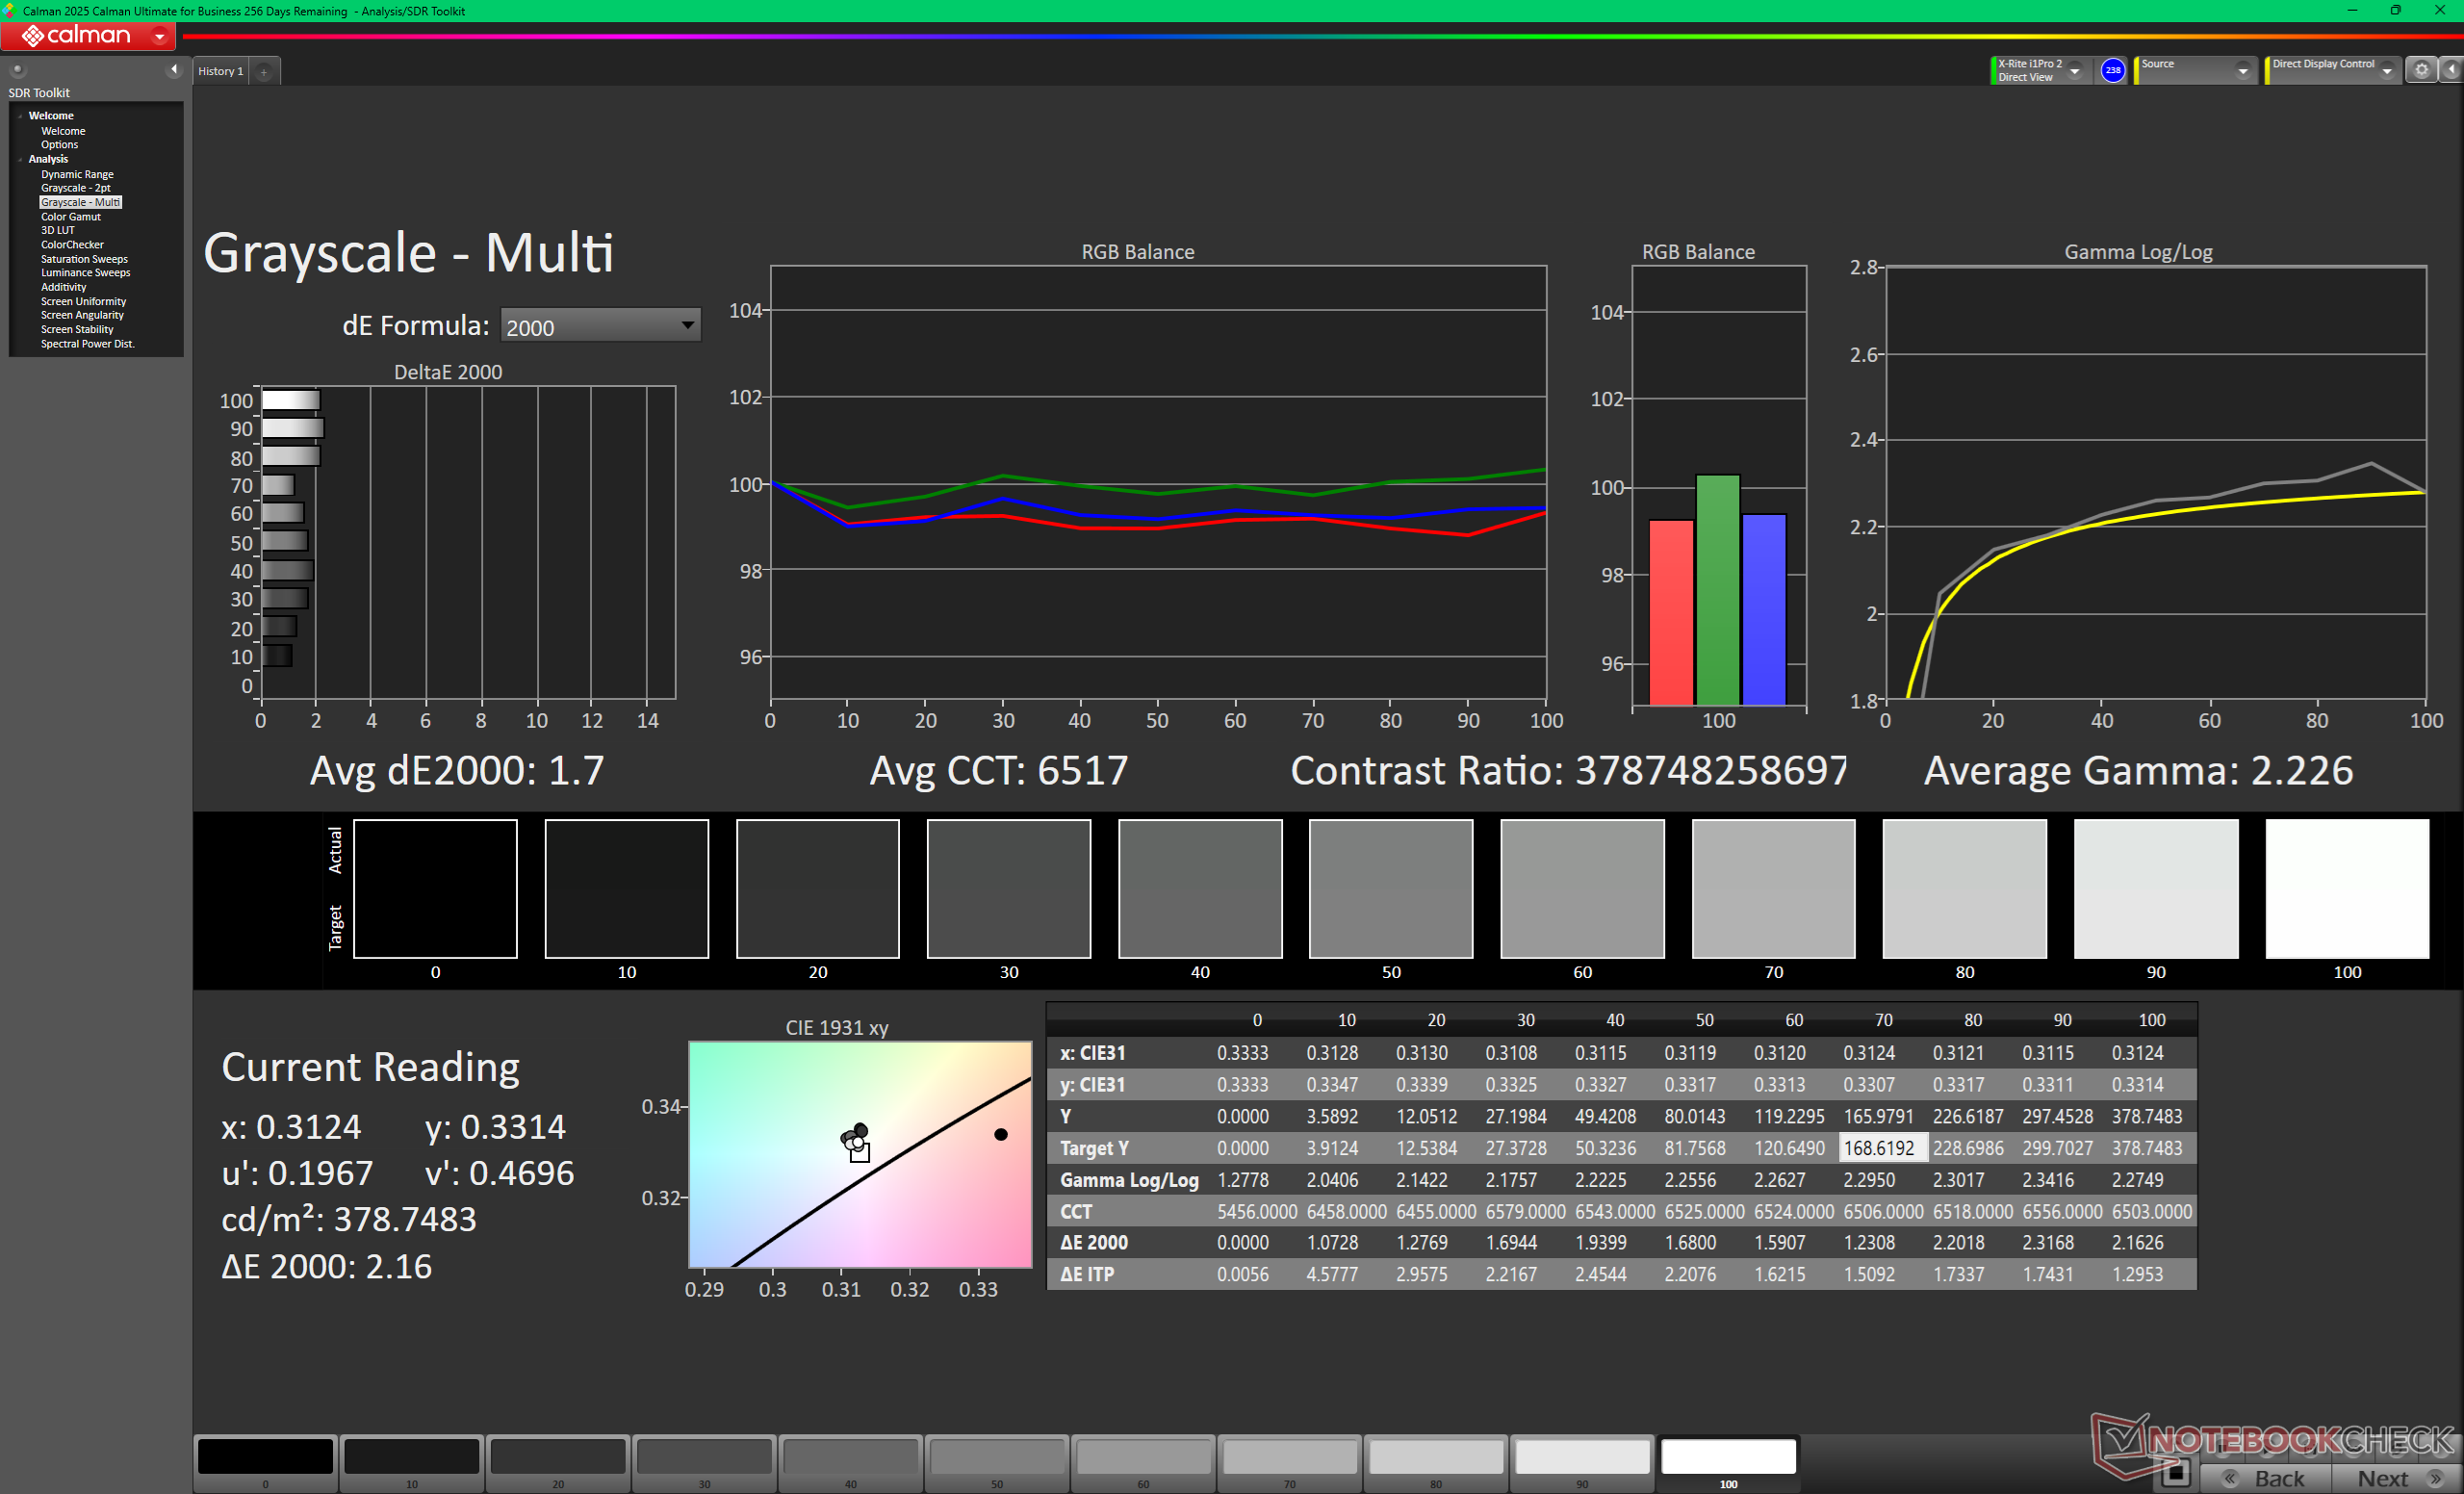
ΔE Greyscale Calman: 1 | ∀{0.09-98 Ø4.97}
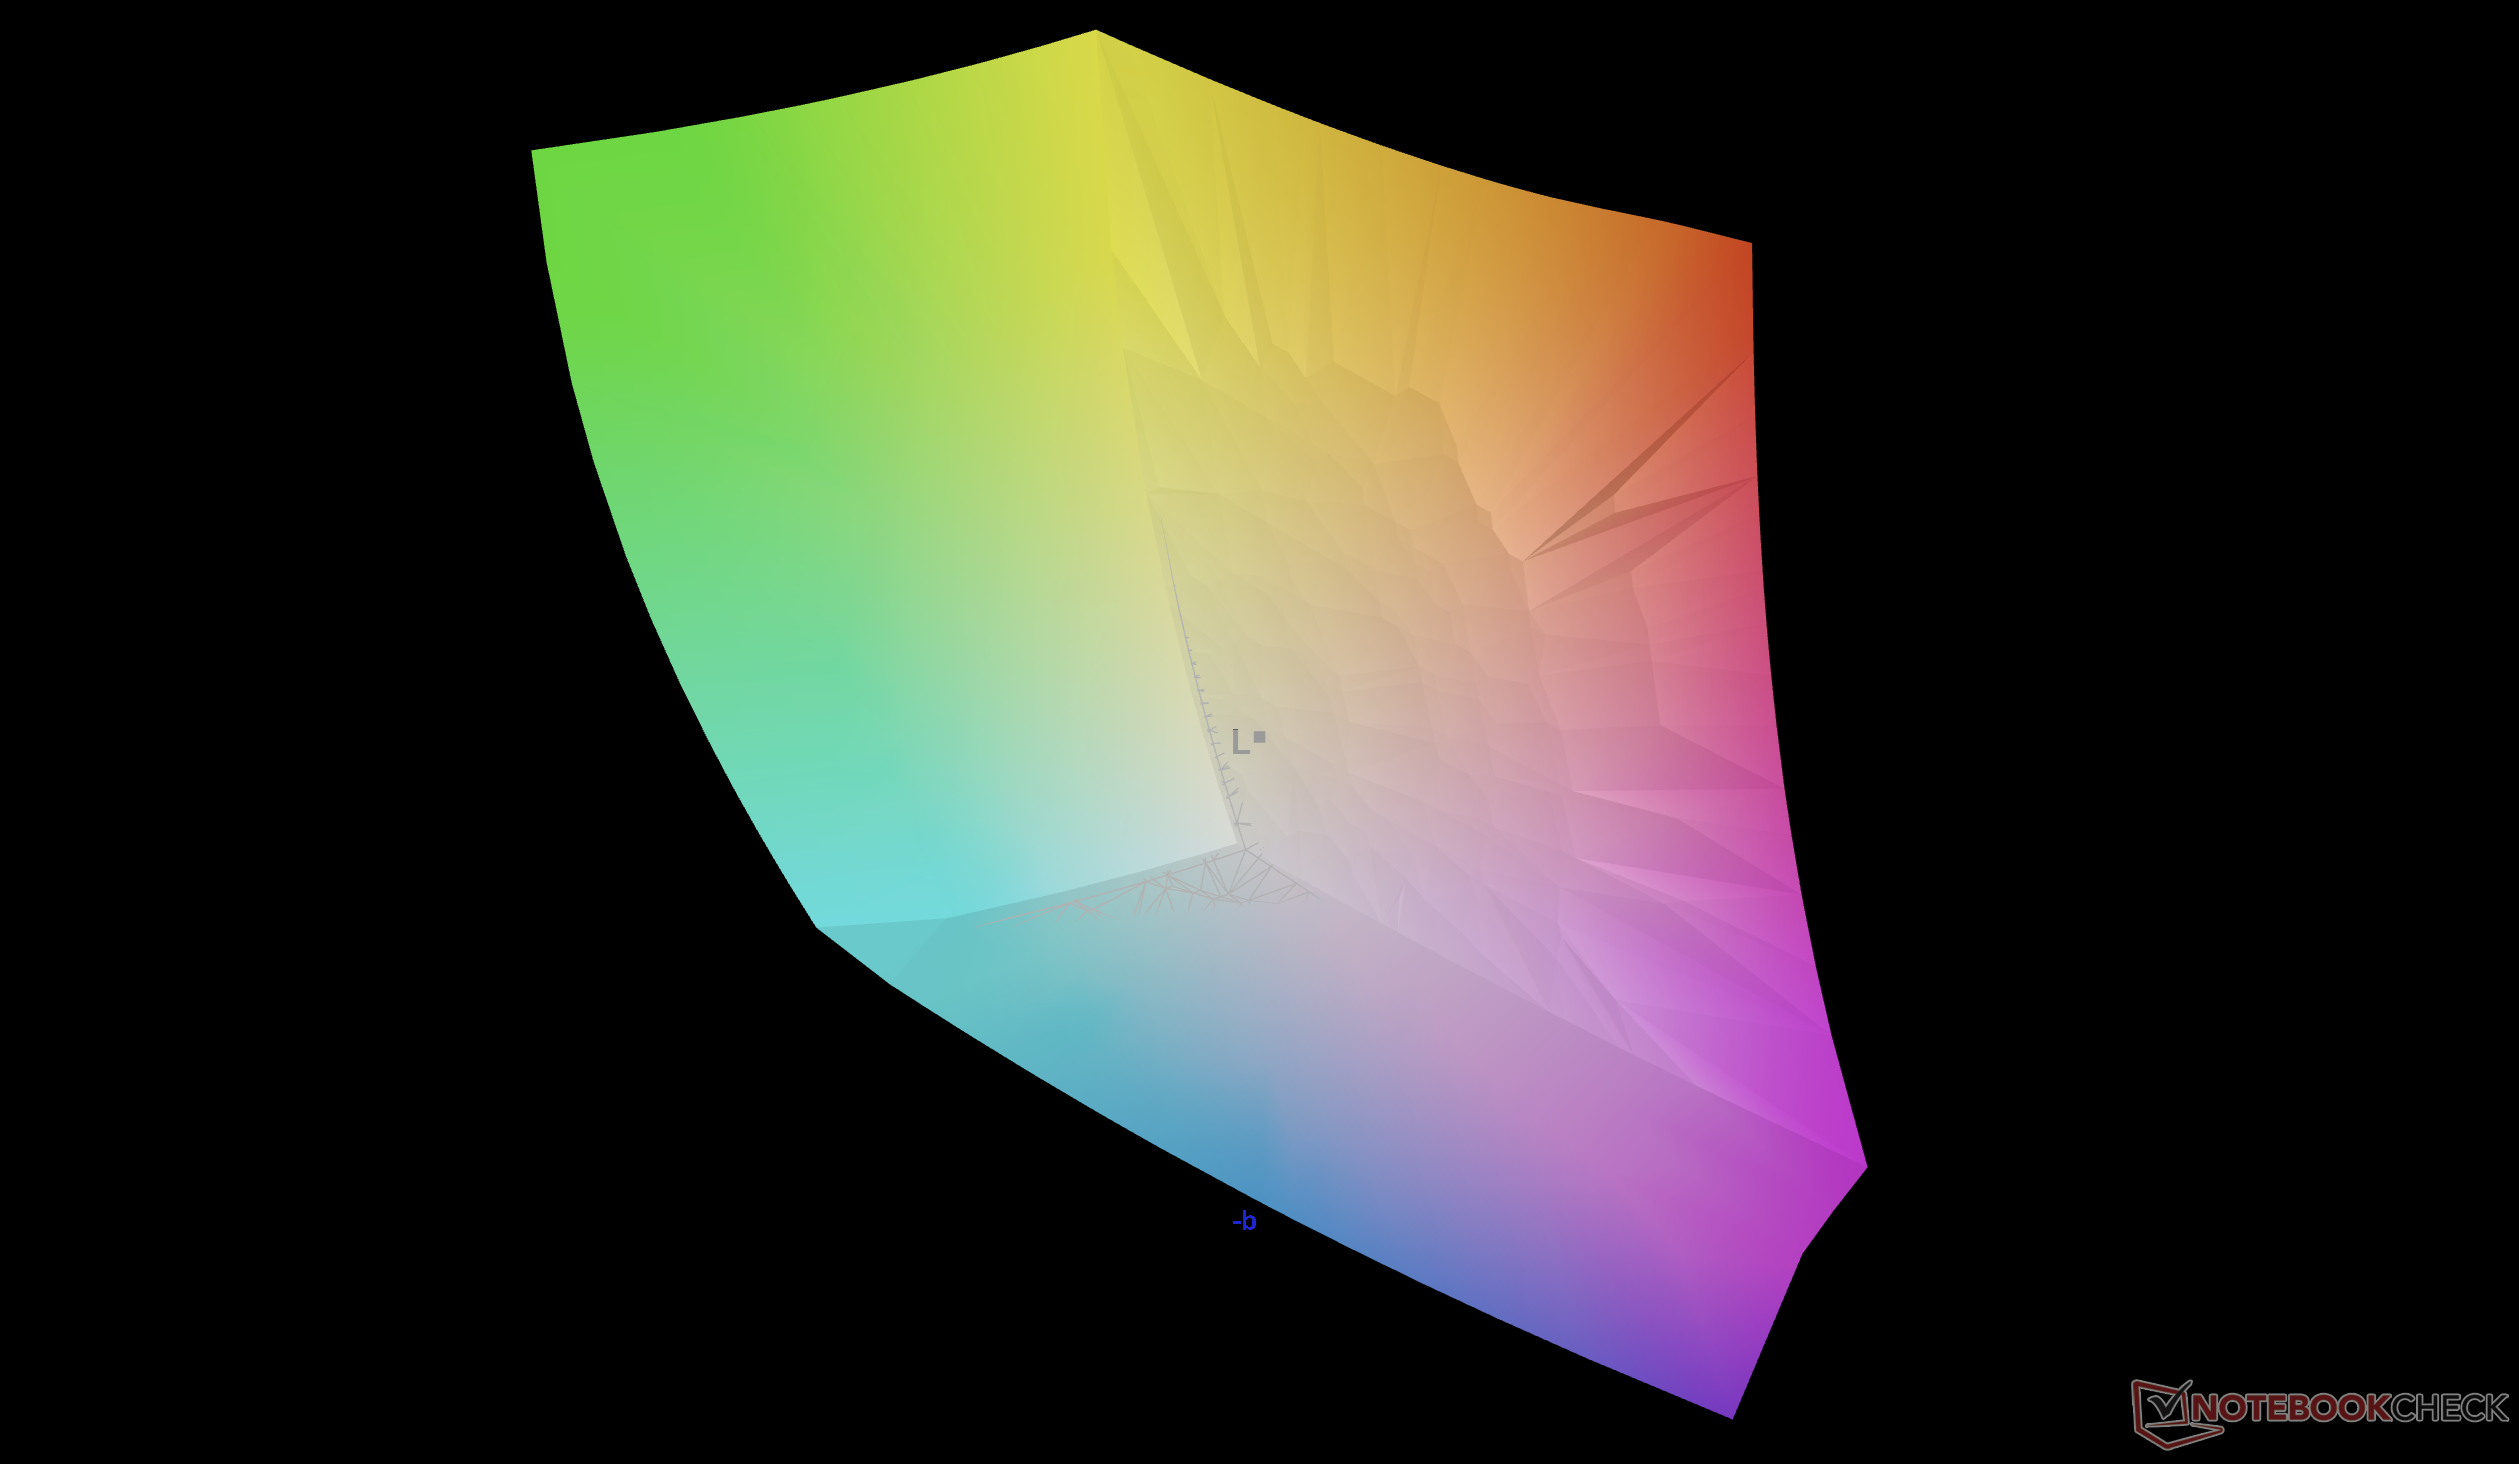
93.9% AdobeRGB 1998 (Argyll 3D)
100% sRGB (Argyll 3D)
99.6% Display P3 (Argyll 3D)
Gamma: 2.23
CCT: 6410 K
| Alienware 16X Aurora Core Ultra 9 290HX Plus Samsung 160HU05, OLED, 2560x1600, 16", 240 Hz | Alienware 16X Aurora, RTX 5070 LG Philips 160WQG, IPS, 2560x1600, 16", 240 Hz | Acer Predator Helios Neo 16S AI PHN16S-71-94L9 Samsung ATNA60DL03-0, OLED, 2560x1600, 16", 240 Hz | Lenovo Legion Pro 5 16IAX10, RTX 5070 ATNA60HS01-0 (Samsung SDC420A), OLED, 2650x1600, 16", 165 Hz | MSI Vector 16 HX AI A2XWHG B160QAN02.3 (AUO7DB2), IPS, 2560x1600, 16", 240 Hz | Asus ROG Zephyrus G16 GU605CW Samsung ATNA60DL01-0, OLED, 2560x1600, 16", 240 Hz | |
|---|---|---|---|---|---|---|
| Display | -2% | 1% | 0% | -4% | -1% | |
| APL18 Peak Brightness (cd/m²) | 609 | |||||
| HDR Peak Brightness (cd/m²) | 609 | |||||
| Display P3 Coverage (%) | 99.6 | 96.9 -3% | 99.9 0% | 99.3 0% | 96.6 -3% | 96.5 -3% |
| sRGB Coverage (%) | 100 | 99.8 0% | 100 0% | 100 0% | 99.8 0% | 99.2 -1% |
| AdobeRGB 1998 Coverage (%) | 93.9 | 89.7 -4% | 96.5 3% | 93.9 0% | 84.4 -10% | 94.5 1% |
| Response Times | -1608% | 1% | -253% | -1308% | -404% | |
| Response Time Grey 50% / Grey 80% * (ms) | 0.29 ? | 4.3 ? -1383% | 0.2 ? 31% | 2 ? -590% | 4.3 ? -1383% | 0.32 ? -10% |
| Response Time Black / White * (ms) | 0.45 ? | 8.7 ? -1833% | 0.25 ? 44% | 1.4 ? -211% | 6 ? -1233% | 6 ? -1233% |
| PWM Frequency (Hz) | 1439.8 ? | 960 | 1300 | 960 | ||
| PWM Amplitude * (%) | 29 | 50 -72% | 16.7 42% | 20 31% | ||
| Screen | -29% | 5% | -32% | -33% | -14% | |
| Brightness middle (cd/m²) | 380.5 | 493.2 30% | 390 2% | 521 37% | 473 24% | 394 4% |
| Brightness (cd/m²) | 384 | 477 24% | 394 3% | 519 35% | 426 11% | 398 4% |
| Brightness Distribution (%) | 98 | 93 -5% | 98 0% | 98 0% | 85 -13% | 98 0% |
| Black Level * (cd/m²) | 0.5 | 0.04 | 0.075 | 0.42 | 0.0084 | |
| Colorchecker dE 2000 * | 3.27 | 3.57 -9% | 1.61 51% | 2.5 24% | 3.47 -6% | 2.41 26% |
| Colorchecker dE 2000 max. * | 6.31 | 7.03 -11% | 3.49 45% | 4.85 23% | 7.24 -15% | 3.82 39% |
| Colorchecker dE 2000 calibrated * | 1.1 | 0.68 38% | 1.59 -45% | 2.5 -127% | 1.36 -24% | 1.41 -28% |
| Greyscale dE 2000 * | 1 | 3.7 -270% | 1.2 -20% | 3.17 -217% | 3.1 -210% | 2.4 -140% |
| Gamma | 2.23 99% | 2.16 102% | 2.235 98% | 2.35 94% | 2.486 88% | 2.16 102% |
| CCT | 6410 101% | 5876 111% | 6580 99% | 6454 101% | 6832 95% | 6544 99% |
| Contrast (:1) | 986 | 9750 | 6947 | 1126 | 46905 | |
| Całkowita średnia (program / ustawienia) | -546% /
-286% | 2% /
3% | -95% /
-76% | -448% /
-239% | -140% /
-101% |
* ... im mniej tym lepiej


Wyświetl czasy reakcji
| ↔ Czas reakcji od czerni do bieli | ||
|---|---|---|
| 0.45 ms ... wzrost ↗ i spadek ↘ łącznie | ↗ 0.23 ms wzrost | 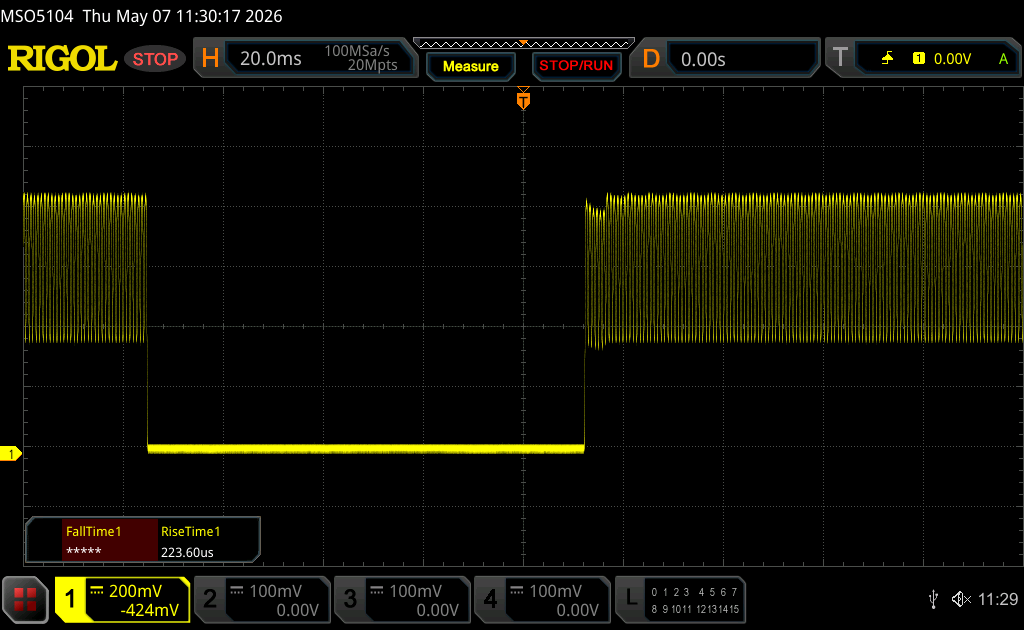 |
| ↘ 0.22 ms upadek | ||
| W naszych testach ekran wykazuje bardzo szybką reakcję i powinien bardzo dobrze nadawać się do szybkich gier. Dla porównania, wszystkie testowane urządzenia wahają się od 0.1 (minimum) do 240 (maksimum) ms. » 1 % wszystkich urządzeń jest lepszych. Oznacza to, że zmierzony czas reakcji jest lepszy od średniej wszystkich testowanych urządzeń (19.9 ms). | ||
| ↔ Czas reakcji 50% szarości do 80% szarości | ||
| 0.29 ms ... wzrost ↗ i spadek ↘ łącznie | ↗ 0.15 ms wzrost | 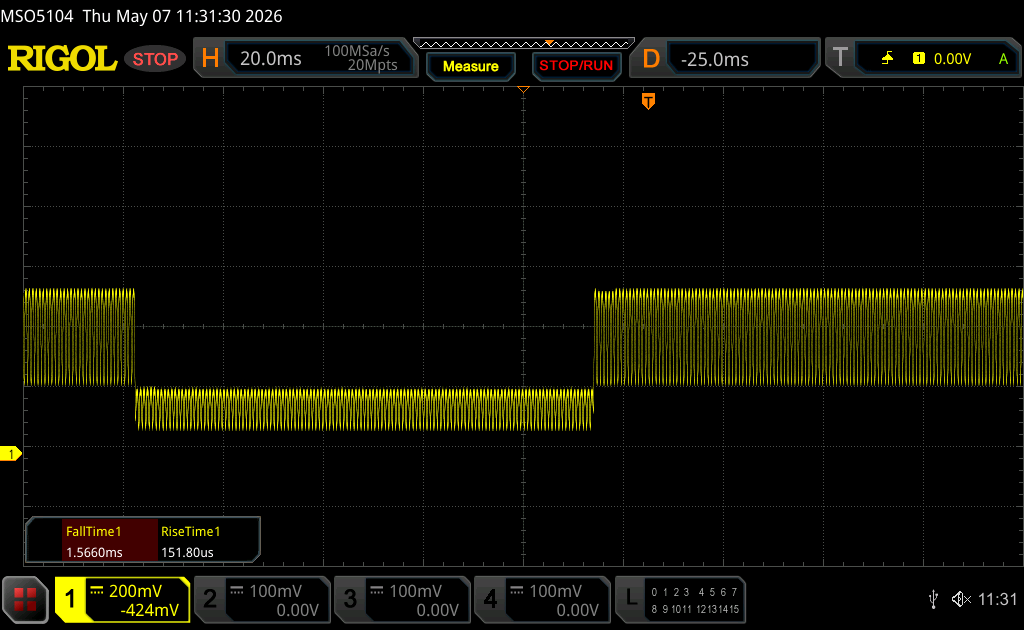 |
| ↘ 0.14 ms upadek | ||
| W naszych testach ekran wykazuje bardzo szybką reakcję i powinien bardzo dobrze nadawać się do szybkich gier. Dla porównania, wszystkie testowane urządzenia wahają się od 0.165 (minimum) do 636 (maksimum) ms. » 0 % wszystkich urządzeń jest lepszych. Oznacza to, że zmierzony czas reakcji jest lepszy od średniej wszystkich testowanych urządzeń (31.1 ms). | ||
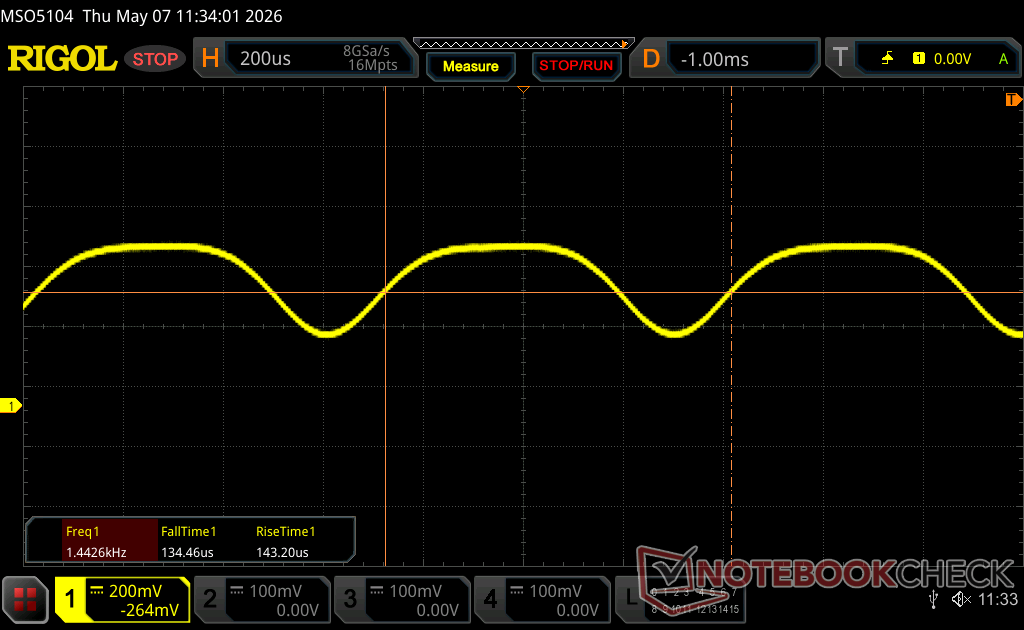
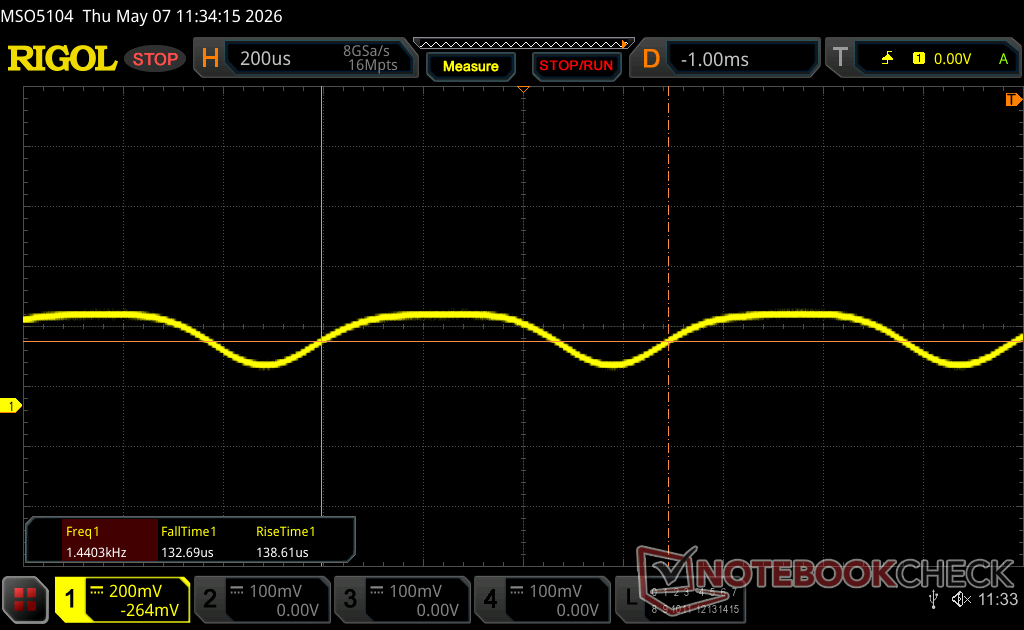
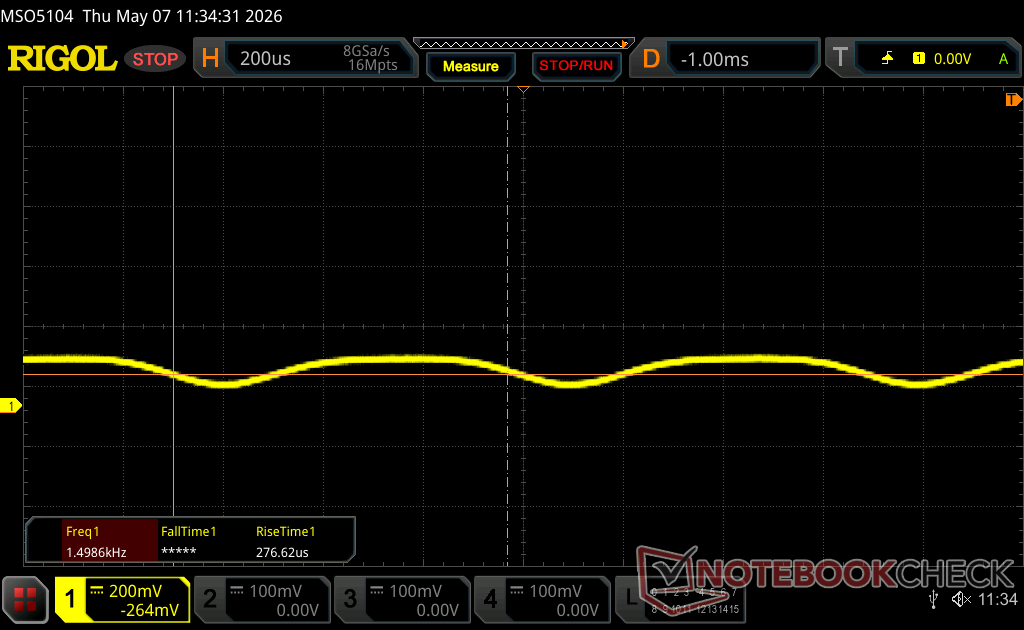
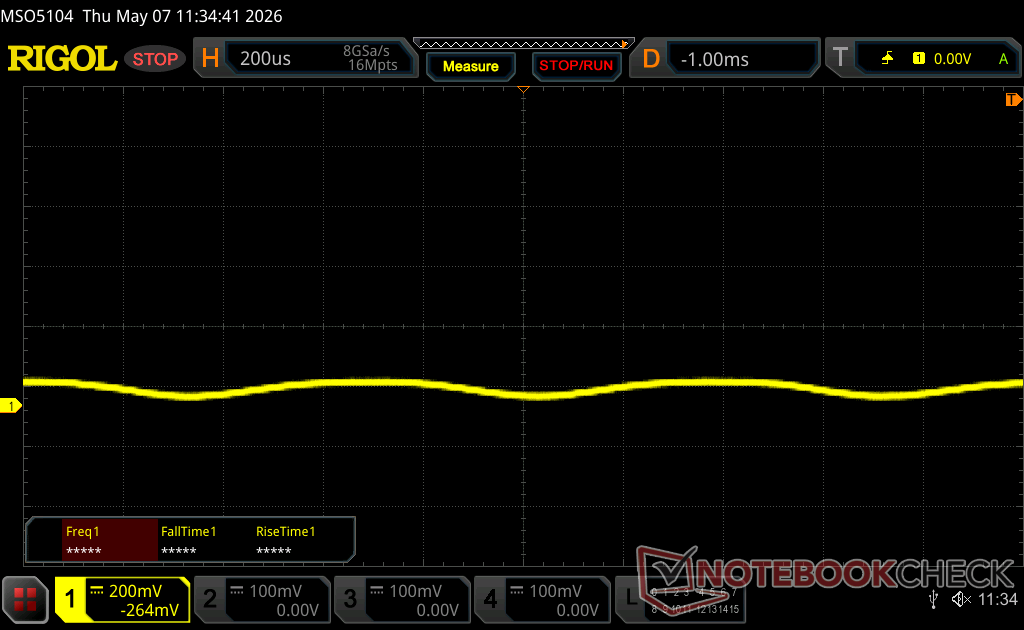
Migotanie ekranu / PWM (modulacja szerokości impulsu)
| Wykryto migotanie ekranu/wykryto PWM | 1439.8 Hz Amplitude: 29 % | ≤ 100 % ustawienia jasności | 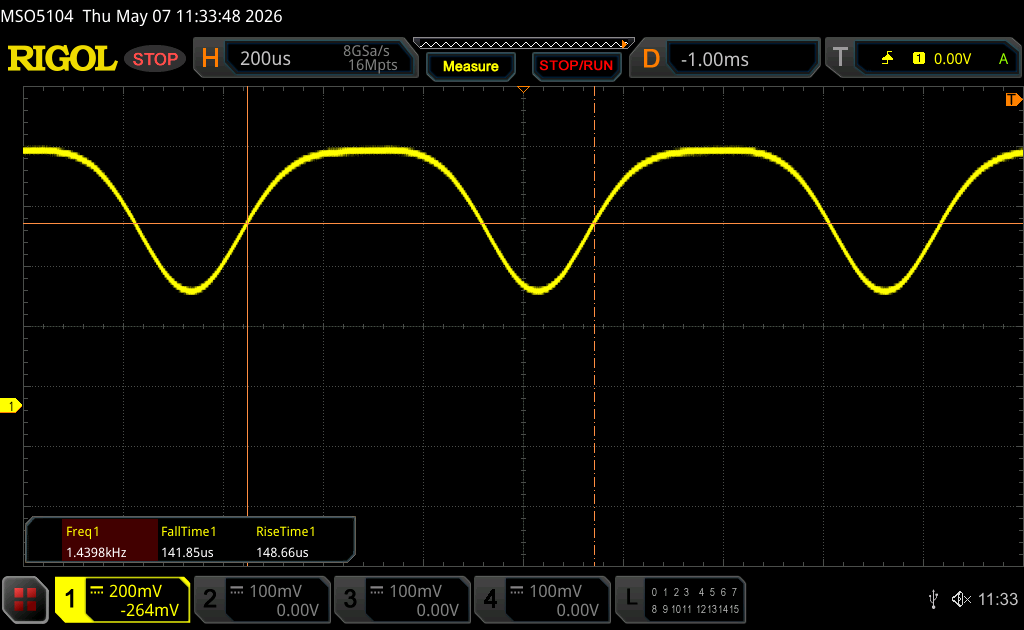 |
Podświetlenie wyświetlacza miga z częstotliwością 1439.8 Hz (najgorszy przypadek, np. przy użyciu PWM) Wykryto migotanie przy ustawieniu jasności 100 % i poniżej. Powyżej tego ustawienia jasności nie powinno być żadnego migotania ani PWM. Częstotliwość 1439.8 Hz jest dość wysoka, więc większość użytkowników wrażliwych na PWM nie powinna zauważyć żadnego migotania. Dla porównania: 52 % wszystkich testowanych urządzeń nie używa PWM do przyciemniania wyświetlacza. Jeśli wykryto PWM, zmierzono średnio 7794 (minimum: 5 - maksimum: 343500) Hz. | |||


Wydajność
Warunki testowania
Przed uruchomieniem poniższych testów porównawczych ustawiliśmy Alienware Command Center na tryb Performance. Dostępny jest również tryb "Overdrive", który zwiększa obroty wentylatora do maksimum, ale wszelkie korzyści w stosunku do trybu wydajności są niewielkie.
Procesor
Procesor Core Ultra 9 290HX Plus jest tylko do 5 punktów procentowych szybszy niż Core Ultra 9 275HX w zeszłorocznym modelu. Praca w trybie Overdrive nie poprawiłaby znacząco wyników.
Cinebench R15 Multi Loop
Cinebench R23: Multi Core | Single Core
Cinebench R20: CPU (Multi Core) | CPU (Single Core)
Cinebench R15: CPU Multi 64Bit | CPU Single 64Bit
Blender: v2.79 BMW27 CPU
7-Zip 18.03: 7z b 4 | 7z b 4 -mmt1
Geekbench 6.7: Multi-Core | Single-Core
Geekbench 5.5: Multi-Core | Single-Core
HWBOT x265 Benchmark v2.2: 4k Preset
LibreOffice : 20 Documents To PDF
R Benchmark 2.5: Overall mean
| CPU Performance rating | |
| Schenker XMG Neo 16 A25 5090 | |
| Przeciętny Intel Core Ultra 9 290HX Plus | |
| Alienware 16X Aurora Core Ultra 9 290HX Plus | |
| Alienware 16X Aurora, RTX 5070 | |
| Lenovo Legion Pro 5 16IAX10, RTX 5070 | |
| Lenovo Legion 7 16 IRX G9 | |
| Lenovo Legion 7 16 AGP11 | |
| Asus ROG Zephyrus G16 GA605WV | |
| Asus TUF Gaming A16 FA608UP | |
| Alienware 16 Aurora | |
| Asus ROG Zephyrus G16 GU605CW | |
| HP Omen 16-b1090ng -2! | |
| HP Omen 16-c0077ng -3! | |
| Cinebench R23 / Multi Core | |
| Schenker XMG Neo 16 A25 5090 | |
| Przeciętny Intel Core Ultra 9 290HX Plus (37038 - 40560, n=3) | |
| Alienware 16X Aurora Core Ultra 9 290HX Plus | |
| Alienware 16X Aurora, RTX 5070 | |
| Lenovo Legion Pro 5 16IAX10, RTX 5070 | |
| Lenovo Legion 7 16 IRX G9 | |
| Lenovo Legion 7 16 AGP11 | |
| Asus ROG Zephyrus G16 GA605WV | |
| Asus TUF Gaming A16 FA608UP | |
| Alienware 16 Aurora | |
| HP Omen 16-b1090ng | |
| Asus ROG Zephyrus G16 GU605CW | |
| HP Omen 16-c0077ng | |
| Cinebench R23 / Single Core | |
| Przeciętny Intel Core Ultra 9 290HX Plus (2319 - 2356, n=3) | |
| Alienware 16X Aurora Core Ultra 9 290HX Plus | |
| Lenovo Legion 7 16 IRX G9 | |
| Alienware 16X Aurora, RTX 5070 | |
| Schenker XMG Neo 16 A25 5090 | |
| Lenovo Legion Pro 5 16IAX10, RTX 5070 | |
| Lenovo Legion 7 16 AGP11 | |
| Asus ROG Zephyrus G16 GU605CW | |
| Asus ROG Zephyrus G16 GA605WV | |
| Alienware 16 Aurora | |
| HP Omen 16-b1090ng | |
| Asus TUF Gaming A16 FA608UP | |
| HP Omen 16-c0077ng | |
| Cinebench R20 / CPU (Multi Core) | |
| Schenker XMG Neo 16 A25 5090 | |
| Przeciętny Intel Core Ultra 9 290HX Plus (14397 - 15732, n=3) | |
| Alienware 16X Aurora Core Ultra 9 290HX Plus | |
| Alienware 16X Aurora, RTX 5070 | |
| Lenovo Legion Pro 5 16IAX10, RTX 5070 | |
| Lenovo Legion 7 16 IRX G9 | |
| Lenovo Legion 7 16 AGP11 | |
| Asus ROG Zephyrus G16 GA605WV | |
| Asus TUF Gaming A16 FA608UP | |
| Alienware 16 Aurora | |
| HP Omen 16-b1090ng | |
| Asus ROG Zephyrus G16 GU605CW | |
| HP Omen 16-c0077ng | |
| Cinebench R20 / CPU (Single Core) | |
| Przeciętny Intel Core Ultra 9 290HX Plus (864 - 895, n=3) | |
| Alienware 16X Aurora Core Ultra 9 290HX Plus | |
| Schenker XMG Neo 16 A25 5090 | |
| Alienware 16X Aurora, RTX 5070 | |
| Lenovo Legion 7 16 IRX G9 | |
| Lenovo Legion Pro 5 16IAX10, RTX 5070 | |
| Lenovo Legion 7 16 AGP11 | |
| Asus ROG Zephyrus G16 GA605WV | |
| Asus ROG Zephyrus G16 GU605CW | |
| Alienware 16 Aurora | |
| HP Omen 16-b1090ng | |
| Asus TUF Gaming A16 FA608UP | |
| HP Omen 16-c0077ng | |
| Cinebench R15 / CPU Multi 64Bit | |
| Schenker XMG Neo 16 A25 5090 | |
| Przeciętny Intel Core Ultra 9 290HX Plus (5617 - 6162, n=3) | |
| Alienware 16X Aurora Core Ultra 9 290HX Plus | |
| Alienware 16X Aurora, RTX 5070 | |
| Lenovo Legion Pro 5 16IAX10, RTX 5070 | |
| Lenovo Legion 7 16 IRX G9 | |
| Lenovo Legion 7 16 AGP11 | |
| Asus ROG Zephyrus G16 GA605WV | |
| HP Omen 16-b1090ng | |
| Asus TUF Gaming A16 FA608UP | |
| Alienware 16 Aurora | |
| Asus ROG Zephyrus G16 GU605CW | |
| HP Omen 16-c0077ng | |
| Cinebench R15 / CPU Single 64Bit | |
| Alienware 16X Aurora Core Ultra 9 290HX Plus | |
| Przeciętny Intel Core Ultra 9 290HX Plus (324 - 340, n=3) | |
| Schenker XMG Neo 16 A25 5090 | |
| Alienware 16X Aurora, RTX 5070 | |
| Lenovo Legion Pro 5 16IAX10, RTX 5070 | |
| Lenovo Legion 7 16 IRX G9 | |
| Asus ROG Zephyrus G16 GA605WV | |
| Asus ROG Zephyrus G16 GU605CW | |
| Asus TUF Gaming A16 FA608UP | |
| Alienware 16 Aurora | |
| HP Omen 16-b1090ng | |
| HP Omen 16-c0077ng | |
| Lenovo Legion 7 16 AGP11 | |
| Blender / v2.79 BMW27 CPU | |
| HP Omen 16-c0077ng | |
| Asus ROG Zephyrus G16 GU605CW | |
| Alienware 16 Aurora | |
| HP Omen 16-b1090ng | |
| Asus TUF Gaming A16 FA608UP | |
| Asus ROG Zephyrus G16 GA605WV | |
| Lenovo Legion 7 16 AGP11 | |
| Lenovo Legion 7 16 IRX G9 | |
| Lenovo Legion Pro 5 16IAX10, RTX 5070 | |
| Alienware 16X Aurora, RTX 5070 | |
| Alienware 16X Aurora Core Ultra 9 290HX Plus | |
| Przeciętny Intel Core Ultra 9 290HX Plus (84 - 94, n=3) | |
| Schenker XMG Neo 16 A25 5090 | |
| 7-Zip 18.03 / 7z b 4 | |
| Schenker XMG Neo 16 A25 5090 | |
| Przeciętny Intel Core Ultra 9 290HX Plus (103986 - 121987, n=3) | |
| Lenovo Legion 7 16 IRX G9 | |
| Alienware 16X Aurora, RTX 5070 | |
| Lenovo Legion Pro 5 16IAX10, RTX 5070 | |
| Alienware 16X Aurora Core Ultra 9 290HX Plus | |
| Lenovo Legion 7 16 AGP11 | |
| Asus ROG Zephyrus G16 GA605WV | |
| HP Omen 16-b1090ng | |
| Asus TUF Gaming A16 FA608UP | |
| Alienware 16 Aurora | |
| Asus ROG Zephyrus G16 GU605CW | |
| 7-Zip 18.03 / 7z b 4 -mmt1 | |
| Schenker XMG Neo 16 A25 5090 | |
| Lenovo Legion 7 16 IRX G9 | |
| Przeciętny Intel Core Ultra 9 290HX Plus (6562 - 6748, n=3) | |
| Alienware 16X Aurora, RTX 5070 | |
| Lenovo Legion Pro 5 16IAX10, RTX 5070 | |
| Alienware 16X Aurora Core Ultra 9 290HX Plus | |
| Lenovo Legion 7 16 AGP11 | |
| Asus ROG Zephyrus G16 GA605WV | |
| Asus TUF Gaming A16 FA608UP | |
| HP Omen 16-b1090ng | |
| Alienware 16 Aurora | |
| HP Omen 16-c0077ng | |
| Asus ROG Zephyrus G16 GU605CW | |
| Geekbench 5.5 / Multi-Core | |
| Przeciętny Intel Core Ultra 9 290HX Plus (23839 - 24959, n=3) | |
| Alienware 16X Aurora Core Ultra 9 290HX Plus | |
| Schenker XMG Neo 16 A25 5090 | |
| Alienware 16X Aurora, RTX 5070 | |
| Lenovo Legion 7 16 IRX G9 | |
| Lenovo Legion Pro 5 16IAX10, RTX 5070 | |
| Lenovo Legion 7 16 AGP11 | |
| Asus ROG Zephyrus G16 GA605WV | |
| HP Omen 16-b1090ng | |
| Asus ROG Zephyrus G16 GU605CW | |
| Alienware 16 Aurora | |
| Asus TUF Gaming A16 FA608UP | |
| HP Omen 16-c0077ng | |
| Geekbench 5.5 / Single-Core | |
| Schenker XMG Neo 16 A25 5090 | |
| Przeciętny Intel Core Ultra 9 290HX Plus (2282 - 2311, n=3) | |
| Alienware 16X Aurora Core Ultra 9 290HX Plus | |
| Alienware 16X Aurora, RTX 5070 | |
| Lenovo Legion Pro 5 16IAX10, RTX 5070 | |
| Lenovo Legion 7 16 AGP11 | |
| Asus ROG Zephyrus G16 GA605WV | |
| Lenovo Legion 7 16 IRX G9 | |
| Asus TUF Gaming A16 FA608UP | |
| Asus ROG Zephyrus G16 GU605CW | |
| Alienware 16 Aurora | |
| HP Omen 16-b1090ng | |
| HP Omen 16-c0077ng | |
| HWBOT x265 Benchmark v2.2 / 4k Preset | |
| Schenker XMG Neo 16 A25 5090 | |
| Przeciętny Intel Core Ultra 9 290HX Plus (38.2 - 42.3, n=3) | |
| Alienware 16X Aurora Core Ultra 9 290HX Plus | |
| Alienware 16X Aurora, RTX 5070 | |
| Lenovo Legion Pro 5 16IAX10, RTX 5070 | |
| Lenovo Legion 7 16 IRX G9 | |
| Lenovo Legion 7 16 AGP11 | |
| Asus ROG Zephyrus G16 GA605WV | |
| Asus TUF Gaming A16 FA608UP | |
| HP Omen 16-b1090ng | |
| Alienware 16 Aurora | |
| Asus ROG Zephyrus G16 GU605CW | |
| HP Omen 16-c0077ng | |
| LibreOffice / 20 Documents To PDF | |
| HP Omen 16-c0077ng | |
| Asus TUF Gaming A16 FA608UP | |
| Asus ROG Zephyrus G16 GA605WV | |
| Lenovo Legion 7 16 AGP11 | |
| Alienware 16 Aurora | |
| Asus ROG Zephyrus G16 GU605CW | |
| Schenker XMG Neo 16 A25 5090 | |
| Lenovo Legion Pro 5 16IAX10, RTX 5070 | |
| Lenovo Legion 7 16 IRX G9 | |
| HP Omen 16-b1090ng | |
| Alienware 16X Aurora Core Ultra 9 290HX Plus | |
| Przeciętny Intel Core Ultra 9 290HX Plus (38.9 - 39.5, n=3) | |
| Alienware 16X Aurora, RTX 5070 | |
| R Benchmark 2.5 / Overall mean | |
| HP Omen 16-c0077ng | |
| Alienware 16 Aurora | |
| Asus ROG Zephyrus G16 GU605CW | |
| HP Omen 16-b1090ng | |
| Asus TUF Gaming A16 FA608UP | |
| Lenovo Legion Pro 5 16IAX10, RTX 5070 | |
| Alienware 16X Aurora, RTX 5070 | |
| Lenovo Legion 7 16 AGP11 | |
| Asus ROG Zephyrus G16 GA605WV | |
| Lenovo Legion 7 16 IRX G9 | |
| Przeciętny Intel Core Ultra 9 290HX Plus (0.3889 - 0.3951, n=3) | |
| Alienware 16X Aurora Core Ultra 9 290HX Plus | |
| Schenker XMG Neo 16 A25 5090 | |
Cinebench R23: Multi Core | Single Core
Cinebench R20: CPU (Multi Core) | CPU (Single Core)
Cinebench R15: CPU Multi 64Bit | CPU Single 64Bit
Blender: v2.79 BMW27 CPU
7-Zip 18.03: 7z b 4 | 7z b 4 -mmt1
Geekbench 6.7: Multi-Core | Single-Core
Geekbench 5.5: Multi-Core | Single-Core
HWBOT x265 Benchmark v2.2: 4k Preset
LibreOffice : 20 Documents To PDF
R Benchmark 2.5: Overall mean
* ... im mniej tym lepiej
AIDA64: FP32 Ray-Trace | FPU Julia | CPU SHA3 | CPU Queen | FPU SinJulia | FPU Mandel | CPU AES | CPU ZLib | FP64 Ray-Trace | CPU PhotoWorxx | CPU CheckMate
| Performance rating | |
| Przeciętny Intel Core Ultra 9 290HX Plus -1! | |
| Alienware 16X Aurora Core Ultra 9 290HX Plus -1! | |
| Lenovo Legion Pro 5 16IAX10, RTX 5070 -1! | |
| Alienware 16X Aurora, RTX 5070 -1! | |
| Acer Predator Helios Neo 16S AI PHN16S-71-94L9 -1! | |
| MSI Vector 16 HX AI A2XWHG -1! | |
| Asus ROG Zephyrus G16 GU605CW -1! | |
| AIDA64 / FP32 Ray-Trace | |
| Przeciętny Intel Core Ultra 9 290HX Plus (34761 - 40761, n=3) | |
| Alienware 16X Aurora Core Ultra 9 290HX Plus (v8.20.8100) | |
| Lenovo Legion Pro 5 16IAX10, RTX 5070 (v6.92.6600) | |
| Alienware 16X Aurora, RTX 5070 (v6.92.6600) | |
| Acer Predator Helios Neo 16S AI PHN16S-71-94L9 (v6.92.6600) | |
| MSI Vector 16 HX AI A2XWHG (v6.92.6600) | |
| Asus ROG Zephyrus G16 GU605CW (v6.92.6600) | |
| AIDA64 / FPU Julia | |
| Przeciętny Intel Core Ultra 9 290HX Plus (174665 - 208083, n=3) | |
| Alienware 16X Aurora Core Ultra 9 290HX Plus (v8.20.8100) | |
| Lenovo Legion Pro 5 16IAX10, RTX 5070 (v6.92.6600) | |
| Alienware 16X Aurora, RTX 5070 (v6.92.6600) | |
| Acer Predator Helios Neo 16S AI PHN16S-71-94L9 (v6.92.6600) | |
| MSI Vector 16 HX AI A2XWHG (v6.92.6600) | |
| Asus ROG Zephyrus G16 GU605CW (v6.92.6600) | |
| AIDA64 / CPU SHA3 | |
| Przeciętny Intel Core Ultra 9 290HX Plus (8352 - 9784, n=3) | |
| Alienware 16X Aurora Core Ultra 9 290HX Plus (v8.20.8100) | |
| Alienware 16X Aurora, RTX 5070 (v6.92.6600) | |
| Lenovo Legion Pro 5 16IAX10, RTX 5070 (v6.92.6600) | |
| Acer Predator Helios Neo 16S AI PHN16S-71-94L9 (v6.92.6600) | |
| MSI Vector 16 HX AI A2XWHG (v6.92.6600) | |
| Asus ROG Zephyrus G16 GU605CW (v6.92.6600) | |
| AIDA64 / CPU Queen | |
| Lenovo Legion Pro 5 16IAX10, RTX 5070 (v6.92.6600) | |
| Alienware 16X Aurora, RTX 5070 (v6.92.6600) | |
| Acer Predator Helios Neo 16S AI PHN16S-71-94L9 (v6.92.6600) | |
| MSI Vector 16 HX AI A2XWHG (v6.92.6600) | |
| Asus ROG Zephyrus G16 GU605CW (v6.92.6600) | |
| AIDA64 / FPU SinJulia | |
| Przeciętny Intel Core Ultra 9 290HX Plus (13612 - 14461, n=3) | |
| Alienware 16X Aurora Core Ultra 9 290HX Plus (v8.20.8100) | |
| Alienware 16X Aurora, RTX 5070 (v6.92.6600) | |
| Lenovo Legion Pro 5 16IAX10, RTX 5070 (v6.92.6600) | |
| Acer Predator Helios Neo 16S AI PHN16S-71-94L9 (v6.92.6600) | |
| MSI Vector 16 HX AI A2XWHG (v6.92.6600) | |
| Asus ROG Zephyrus G16 GU605CW (v6.92.6600) | |
| AIDA64 / FPU Mandel | |
| Przeciętny Intel Core Ultra 9 290HX Plus (91215 - 108275, n=3) | |
| Alienware 16X Aurora Core Ultra 9 290HX Plus (v8.20.8100) | |
| Lenovo Legion Pro 5 16IAX10, RTX 5070 (v6.92.6600) | |
| Alienware 16X Aurora, RTX 5070 (v6.92.6600) | |
| Acer Predator Helios Neo 16S AI PHN16S-71-94L9 (v6.92.6600) | |
| MSI Vector 16 HX AI A2XWHG (v6.92.6600) | |
| Asus ROG Zephyrus G16 GU605CW (v6.92.6600) | |
| AIDA64 / CPU AES | |
| Przeciętny Intel Core Ultra 9 290HX Plus (127585 - 136781, n=3) | |
| Alienware 16X Aurora Core Ultra 9 290HX Plus (v8.20.8100) | |
| Alienware 16X Aurora, RTX 5070 (v6.92.6600) | |
| Lenovo Legion Pro 5 16IAX10, RTX 5070 (v6.92.6600) | |
| Acer Predator Helios Neo 16S AI PHN16S-71-94L9 (v6.92.6600) | |
| MSI Vector 16 HX AI A2XWHG (v6.92.6600) | |
| Asus ROG Zephyrus G16 GU605CW (v6.92.6600) | |
| AIDA64 / CPU ZLib | |
| Przeciętny Intel Core Ultra 9 290HX Plus (1967 - 2206, n=3) | |
| Alienware 16X Aurora Core Ultra 9 290HX Plus (v8.20.8100) | |
| Alienware 16X Aurora, RTX 5070 (v6.92.6600) | |
| Lenovo Legion Pro 5 16IAX10, RTX 5070 (v6.92.6600) | |
| Acer Predator Helios Neo 16S AI PHN16S-71-94L9 (v6.92.6600) | |
| MSI Vector 16 HX AI A2XWHG (v6.92.6600) | |
| Asus ROG Zephyrus G16 GU605CW (v6.92.6600) | |
| AIDA64 / FP64 Ray-Trace | |
| Przeciętny Intel Core Ultra 9 290HX Plus (18611 - 21949, n=3) | |
| Alienware 16X Aurora Core Ultra 9 290HX Plus (v8.20.8100) | |
| Lenovo Legion Pro 5 16IAX10, RTX 5070 (v6.92.6600) | |
| Alienware 16X Aurora, RTX 5070 (v6.92.6600) | |
| Acer Predator Helios Neo 16S AI PHN16S-71-94L9 (v6.92.6600) | |
| MSI Vector 16 HX AI A2XWHG (v6.92.6600) | |
| Asus ROG Zephyrus G16 GU605CW (v6.92.6600) | |
| AIDA64 / CPU PhotoWorxx | |
| Asus ROG Zephyrus G16 GU605CW (v6.92.6600) | |
| Lenovo Legion Pro 5 16IAX10, RTX 5070 (v6.92.6600) | |
| Acer Predator Helios Neo 16S AI PHN16S-71-94L9 (v6.92.6600) | |
| Przeciętny Intel Core Ultra 9 290HX Plus (51134 - 55731, n=3) | |
| Alienware 16X Aurora Core Ultra 9 290HX Plus (v8.20.8100) | |
| Alienware 16X Aurora, RTX 5070 (v6.92.6600) | |
| MSI Vector 16 HX AI A2XWHG (v6.92.6600) | |
| AIDA64 / CPU CheckMate | |
| Przeciętny Intel Core Ultra 9 290HX Plus (7624 - 8322, n=3) | |
| Alienware 16X Aurora Core Ultra 9 290HX Plus (v8.20.8100) | |
Wydajność systemu
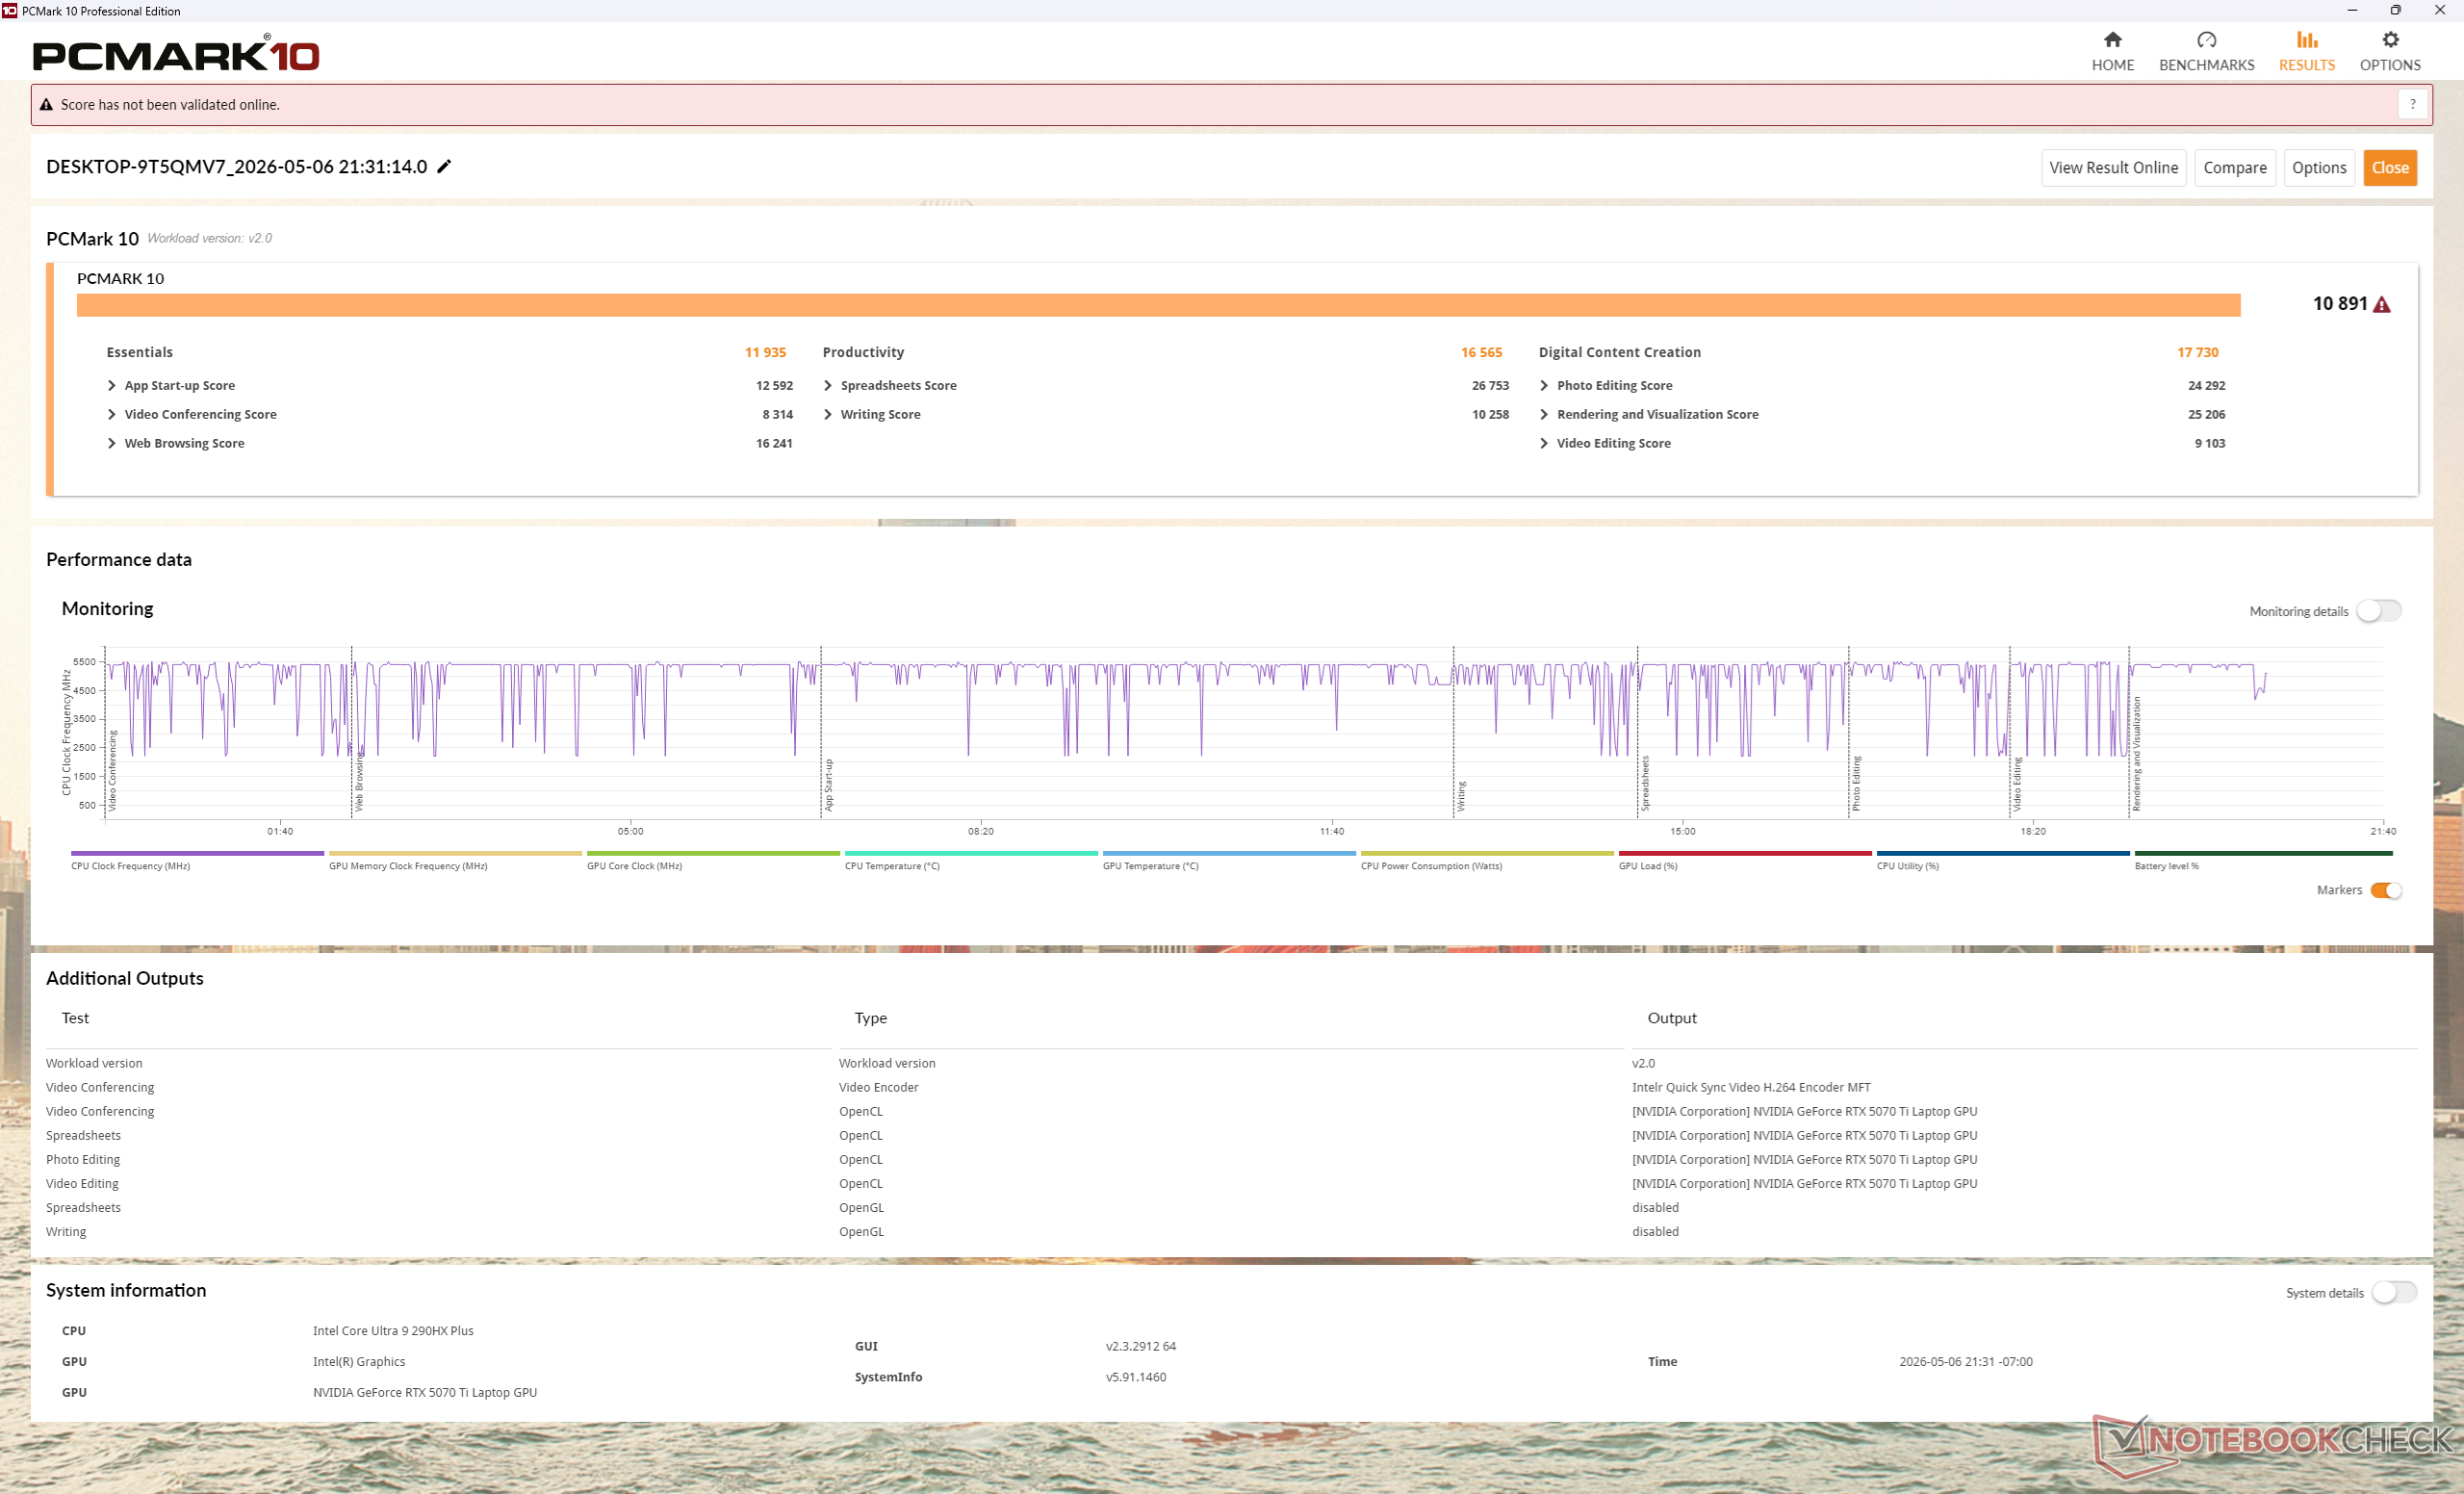
PCMark 10: Score | Essentials | Productivity | Digital Content Creation
CrossMark: Overall | Productivity | Creativity | Responsiveness
WebXPRT 3: Overall
WebXPRT 4: Overall
Mozilla Kraken 1.1: Total
Geekbench AI: Quantized GPU 1.7 | Half Precision GPU 1.7 | Single Precision GPU 1.7
| Performance rating | |
| Alienware 16X Aurora Core Ultra 9 290HX Plus | |
| Przeciętny Intel Core Ultra 9 290HX Plus, NVIDIA GeForce RTX 5070 Ti Laptop | |
| Alienware 16X Aurora, RTX 5070 -4! | |
| Lenovo Legion Pro 5 16IAX10, RTX 5070 | |
| Acer Predator Helios Neo 16S AI PHN16S-71-94L9 -3! | |
| MSI Vector 16 HX AI A2XWHG -3! | |
| Asus ROG Zephyrus G16 GU605CW -3! | |
| PCMark 10 / Score | |
| Alienware 16X Aurora Core Ultra 9 290HX Plus | |
| Przeciętny Intel Core Ultra 9 290HX Plus, NVIDIA GeForce RTX 5070 Ti Laptop (n=1) | |
| Lenovo Legion Pro 5 16IAX10, RTX 5070 | |
| Acer Predator Helios Neo 16S AI PHN16S-71-94L9 | |
| MSI Vector 16 HX AI A2XWHG | |
| Asus ROG Zephyrus G16 GU605CW | |
| PCMark 10 / Essentials | |
| Alienware 16X Aurora Core Ultra 9 290HX Plus | |
| Przeciętny Intel Core Ultra 9 290HX Plus, NVIDIA GeForce RTX 5070 Ti Laptop (n=1) | |
| Lenovo Legion Pro 5 16IAX10, RTX 5070 | |
| Acer Predator Helios Neo 16S AI PHN16S-71-94L9 | |
| MSI Vector 16 HX AI A2XWHG | |
| Asus ROG Zephyrus G16 GU605CW | |
| PCMark 10 / Productivity | |
| Alienware 16X Aurora Core Ultra 9 290HX Plus | |
| Przeciętny Intel Core Ultra 9 290HX Plus, NVIDIA GeForce RTX 5070 Ti Laptop (n=1) | |
| Lenovo Legion Pro 5 16IAX10, RTX 5070 | |
| Acer Predator Helios Neo 16S AI PHN16S-71-94L9 | |
| MSI Vector 16 HX AI A2XWHG | |
| Asus ROG Zephyrus G16 GU605CW | |
| PCMark 10 / Digital Content Creation | |
| Alienware 16X Aurora Core Ultra 9 290HX Plus | |
| Przeciętny Intel Core Ultra 9 290HX Plus, NVIDIA GeForce RTX 5070 Ti Laptop (n=1) | |
| Lenovo Legion Pro 5 16IAX10, RTX 5070 | |
| Acer Predator Helios Neo 16S AI PHN16S-71-94L9 | |
| Asus ROG Zephyrus G16 GU605CW | |
| MSI Vector 16 HX AI A2XWHG | |
| CrossMark / Overall | |
| Alienware 16X Aurora Core Ultra 9 290HX Plus | |
| Przeciętny Intel Core Ultra 9 290HX Plus, NVIDIA GeForce RTX 5070 Ti Laptop (n=1) | |
| Alienware 16X Aurora, RTX 5070 | |
| Acer Predator Helios Neo 16S AI PHN16S-71-94L9 | |
| Lenovo Legion Pro 5 16IAX10, RTX 5070 | |
| MSI Vector 16 HX AI A2XWHG | |
| Asus ROG Zephyrus G16 GU605CW | |
| CrossMark / Productivity | |
| Alienware 16X Aurora Core Ultra 9 290HX Plus | |
| Przeciętny Intel Core Ultra 9 290HX Plus, NVIDIA GeForce RTX 5070 Ti Laptop (n=1) | |
| Alienware 16X Aurora, RTX 5070 | |
| Acer Predator Helios Neo 16S AI PHN16S-71-94L9 | |
| Lenovo Legion Pro 5 16IAX10, RTX 5070 | |
| MSI Vector 16 HX AI A2XWHG | |
| Asus ROG Zephyrus G16 GU605CW | |
| CrossMark / Creativity | |
| Alienware 16X Aurora Core Ultra 9 290HX Plus | |
| Przeciętny Intel Core Ultra 9 290HX Plus, NVIDIA GeForce RTX 5070 Ti Laptop (n=1) | |
| Acer Predator Helios Neo 16S AI PHN16S-71-94L9 | |
| Alienware 16X Aurora, RTX 5070 | |
| Lenovo Legion Pro 5 16IAX10, RTX 5070 | |
| MSI Vector 16 HX AI A2XWHG | |
| Asus ROG Zephyrus G16 GU605CW | |
| CrossMark / Responsiveness | |
| Alienware 16X Aurora Core Ultra 9 290HX Plus | |
| Przeciętny Intel Core Ultra 9 290HX Plus, NVIDIA GeForce RTX 5070 Ti Laptop (n=1) | |
| Alienware 16X Aurora, RTX 5070 | |
| Lenovo Legion Pro 5 16IAX10, RTX 5070 | |
| Acer Predator Helios Neo 16S AI PHN16S-71-94L9 | |
| MSI Vector 16 HX AI A2XWHG | |
| Asus ROG Zephyrus G16 GU605CW | |
| WebXPRT 3 / Overall | |
| Alienware 16X Aurora Core Ultra 9 290HX Plus | |
| Przeciętny Intel Core Ultra 9 290HX Plus, NVIDIA GeForce RTX 5070 Ti Laptop (n=1) | |
| Alienware 16X Aurora, RTX 5070 | |
| Lenovo Legion Pro 5 16IAX10, RTX 5070 | |
| Acer Predator Helios Neo 16S AI PHN16S-71-94L9 | |
| MSI Vector 16 HX AI A2XWHG | |
| Asus ROG Zephyrus G16 GU605CW | |
| WebXPRT 4 / Overall | |
| Alienware 16X Aurora Core Ultra 9 290HX Plus | |
| Przeciętny Intel Core Ultra 9 290HX Plus, NVIDIA GeForce RTX 5070 Ti Laptop (n=1) | |
| Alienware 16X Aurora, RTX 5070 | |
| Lenovo Legion Pro 5 16IAX10, RTX 5070 | |
| Acer Predator Helios Neo 16S AI PHN16S-71-94L9 | |
| MSI Vector 16 HX AI A2XWHG | |
| Asus ROG Zephyrus G16 GU605CW | |
| Mozilla Kraken 1.1 / Total | |
| Asus ROG Zephyrus G16 GU605CW | |
| Lenovo Legion Pro 5 16IAX10, RTX 5070 | |
| MSI Vector 16 HX AI A2XWHG | |
| Alienware 16X Aurora, RTX 5070 | |
| Acer Predator Helios Neo 16S AI PHN16S-71-94L9 | |
| Alienware 16X Aurora Core Ultra 9 290HX Plus | |
| Przeciętny Intel Core Ultra 9 290HX Plus, NVIDIA GeForce RTX 5070 Ti Laptop (n=1) | |
| Geekbench AI / Quantized GPU 1.7 | |
| Alienware 16X Aurora Core Ultra 9 290HX Plus | |
| Przeciętny Intel Core Ultra 9 290HX Plus, NVIDIA GeForce RTX 5070 Ti Laptop (n=1) | |
| Alienware 16X Aurora, RTX 5070 | |
| Lenovo Legion Pro 5 16IAX10, RTX 5070 | |
| Geekbench AI / Half Precision GPU 1.7 | |
| Alienware 16X Aurora Core Ultra 9 290HX Plus | |
| Przeciętny Intel Core Ultra 9 290HX Plus, NVIDIA GeForce RTX 5070 Ti Laptop (n=1) | |
| Alienware 16X Aurora, RTX 5070 | |
| Lenovo Legion Pro 5 16IAX10, RTX 5070 | |
| Geekbench AI / Single Precision GPU 1.7 | |
| Alienware 16X Aurora Core Ultra 9 290HX Plus | |
| Przeciętny Intel Core Ultra 9 290HX Plus, NVIDIA GeForce RTX 5070 Ti Laptop (n=1) | |
| Alienware 16X Aurora, RTX 5070 | |
| Lenovo Legion Pro 5 16IAX10, RTX 5070 | |
* ... im mniej tym lepiej
| PCMark 10 Score | 10891 pkt. | |
Pomoc | ||
| AIDA64 / Memory Copy | |
| Asus ROG Zephyrus G16 GU605CW | |
| Acer Predator Helios Neo 16S AI PHN16S-71-94L9 | |
| Lenovo Legion Pro 5 16IAX10, RTX 5070 | |
| Przeciętny Intel Core Ultra 9 290HX Plus (76912 - 85698, n=3) | |
| Alienware 16X Aurora, RTX 5070 | |
| Alienware 16X Aurora Core Ultra 9 290HX Plus | |
| MSI Vector 16 HX AI A2XWHG | |
| AIDA64 / Memory Read | |
| Acer Predator Helios Neo 16S AI PHN16S-71-94L9 | |
| Lenovo Legion Pro 5 16IAX10, RTX 5070 | |
| Przeciętny Intel Core Ultra 9 290HX Plus (84638 - 93496, n=3) | |
| Alienware 16X Aurora, RTX 5070 | |
| Alienware 16X Aurora Core Ultra 9 290HX Plus | |
| MSI Vector 16 HX AI A2XWHG | |
| Asus ROG Zephyrus G16 GU605CW | |
| AIDA64 / Memory Write | |
| Acer Predator Helios Neo 16S AI PHN16S-71-94L9 | |
| Lenovo Legion Pro 5 16IAX10, RTX 5070 | |
| Alienware 16X Aurora, RTX 5070 | |
| Przeciętny Intel Core Ultra 9 290HX Plus (76094 - 81688, n=3) | |
| Alienware 16X Aurora Core Ultra 9 290HX Plus | |
| Asus ROG Zephyrus G16 GU605CW | |
| MSI Vector 16 HX AI A2XWHG | |
| AIDA64 / Memory Latency | |
| Asus ROG Zephyrus G16 GU605CW | |
| Alienware 16X Aurora, RTX 5070 | |
| Acer Predator Helios Neo 16S AI PHN16S-71-94L9 | |
| Alienware 16X Aurora Core Ultra 9 290HX Plus | |
| MSI Vector 16 HX AI A2XWHG | |
| Przeciętny Intel Core Ultra 9 290HX Plus (105.3 - 108.4, n=3) | |
| Lenovo Legion Pro 5 16IAX10, RTX 5070 | |
* ... im mniej tym lepiej
Opóźnienie DPC
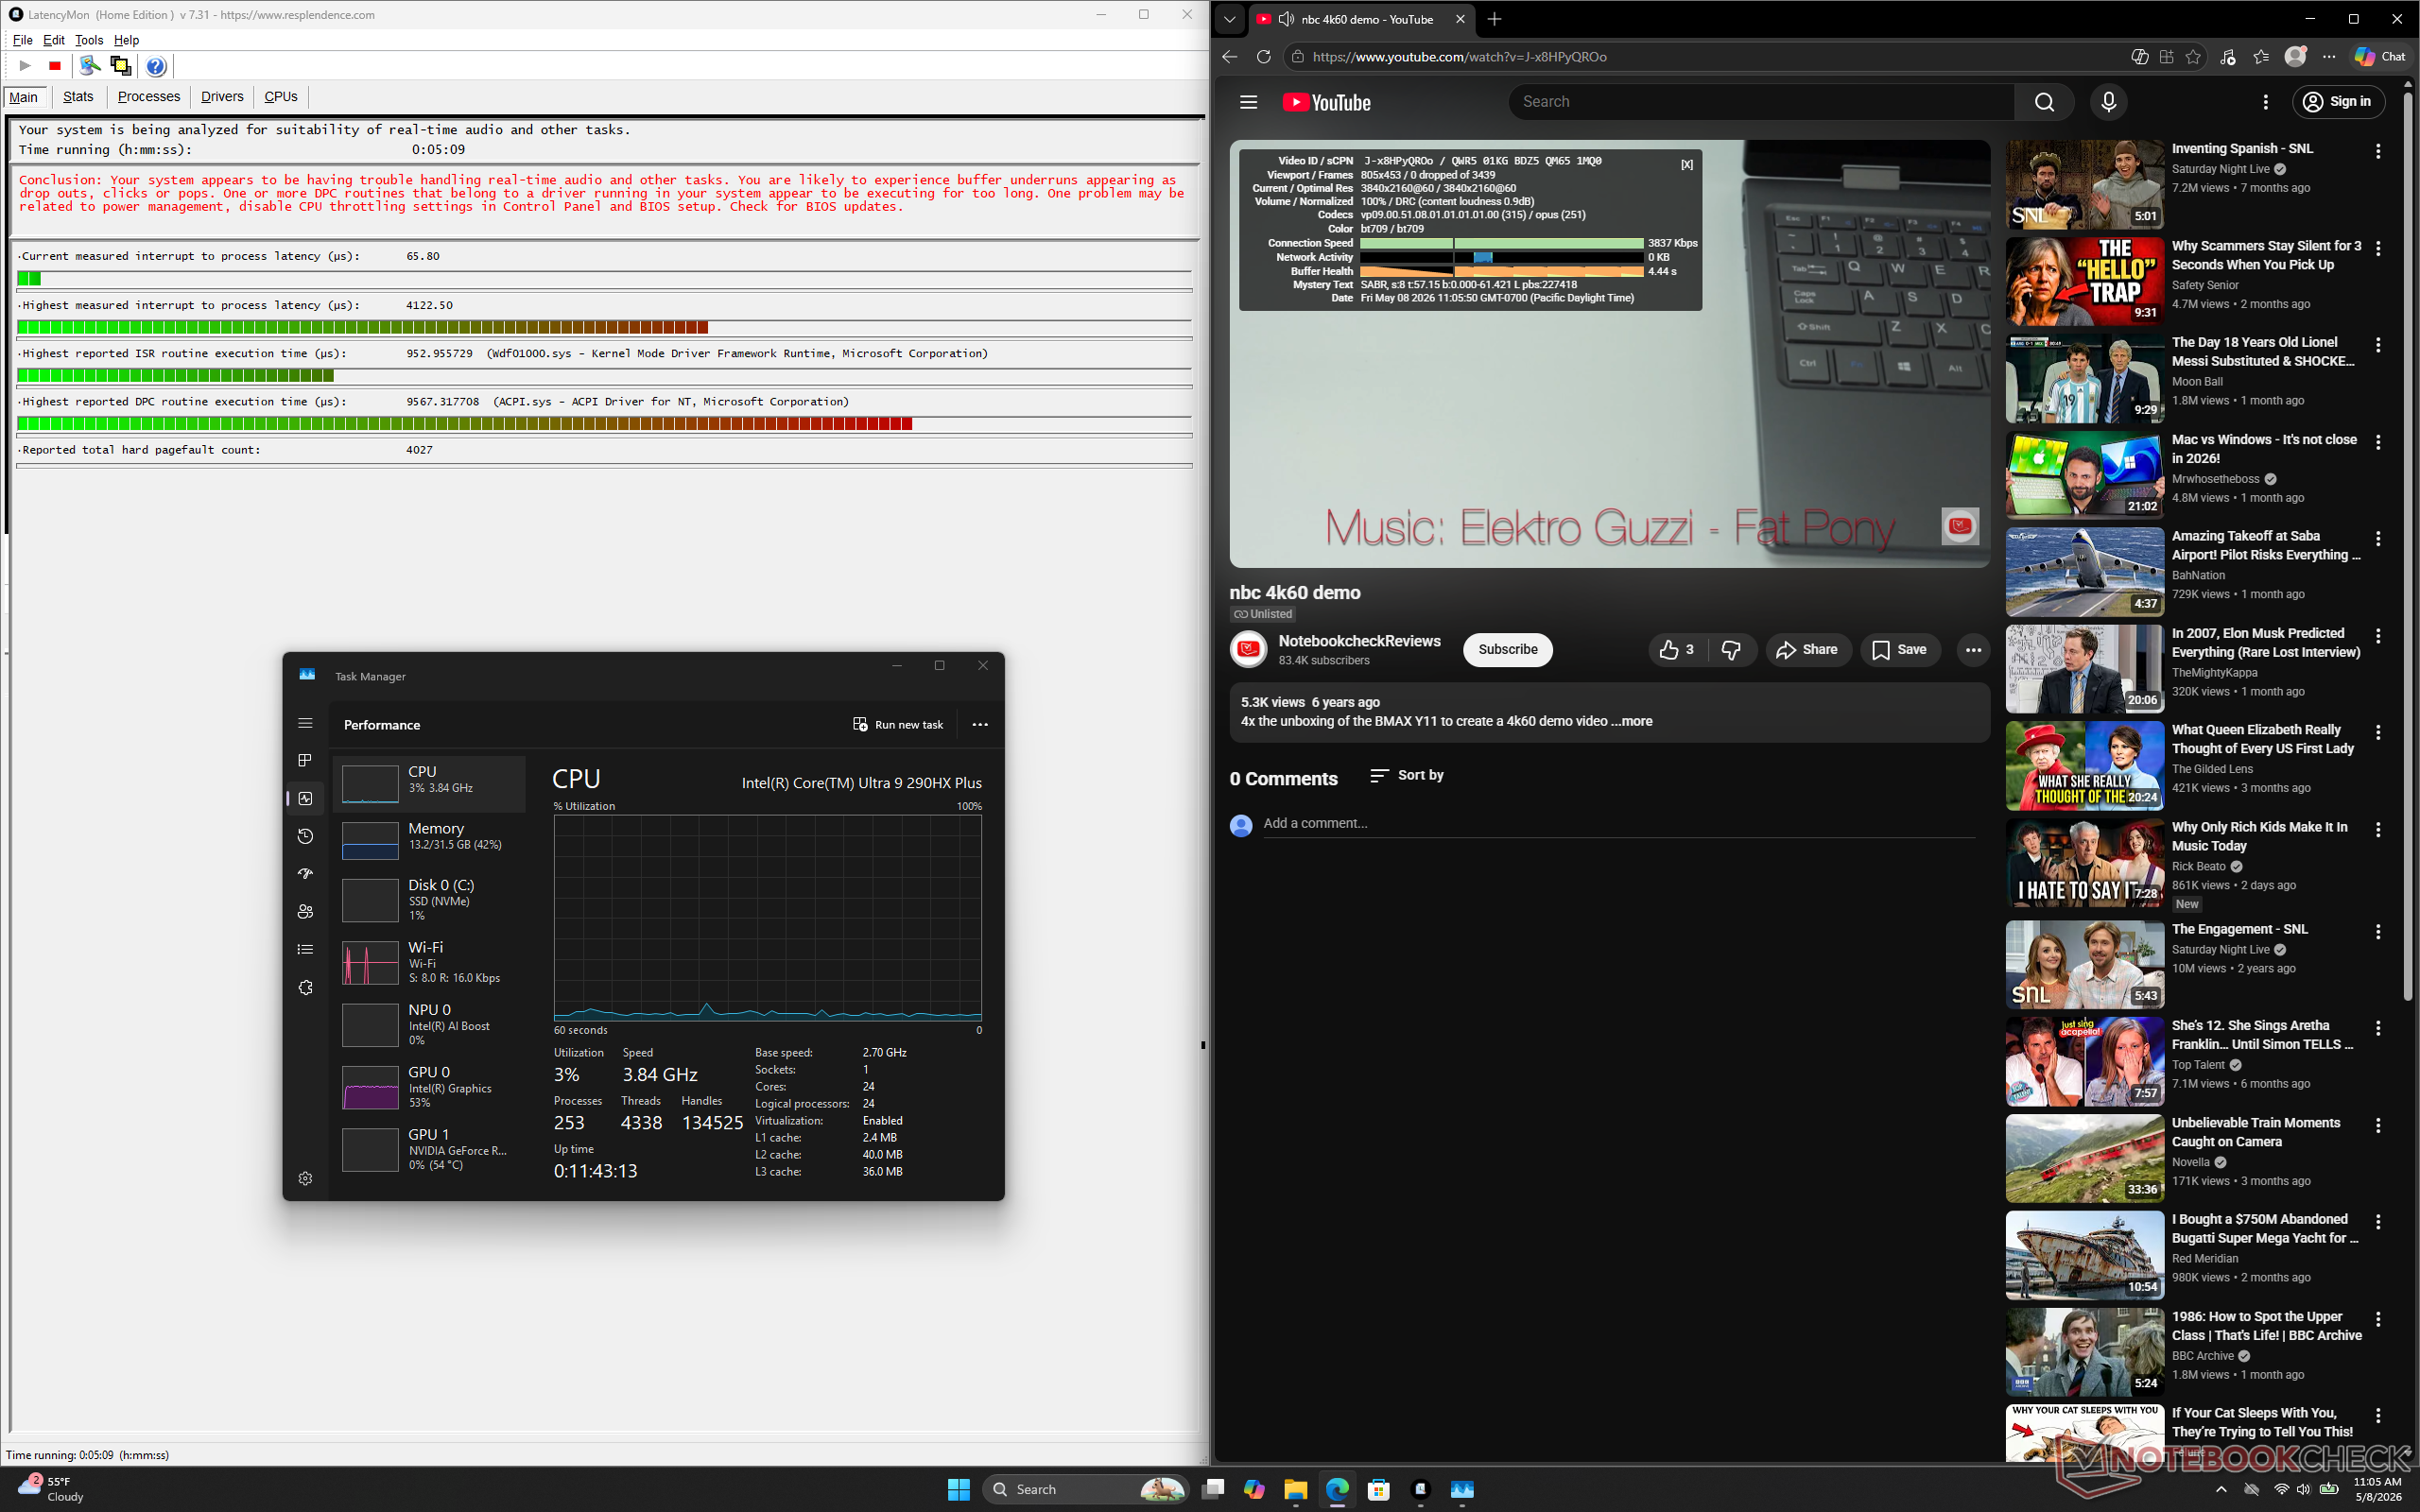
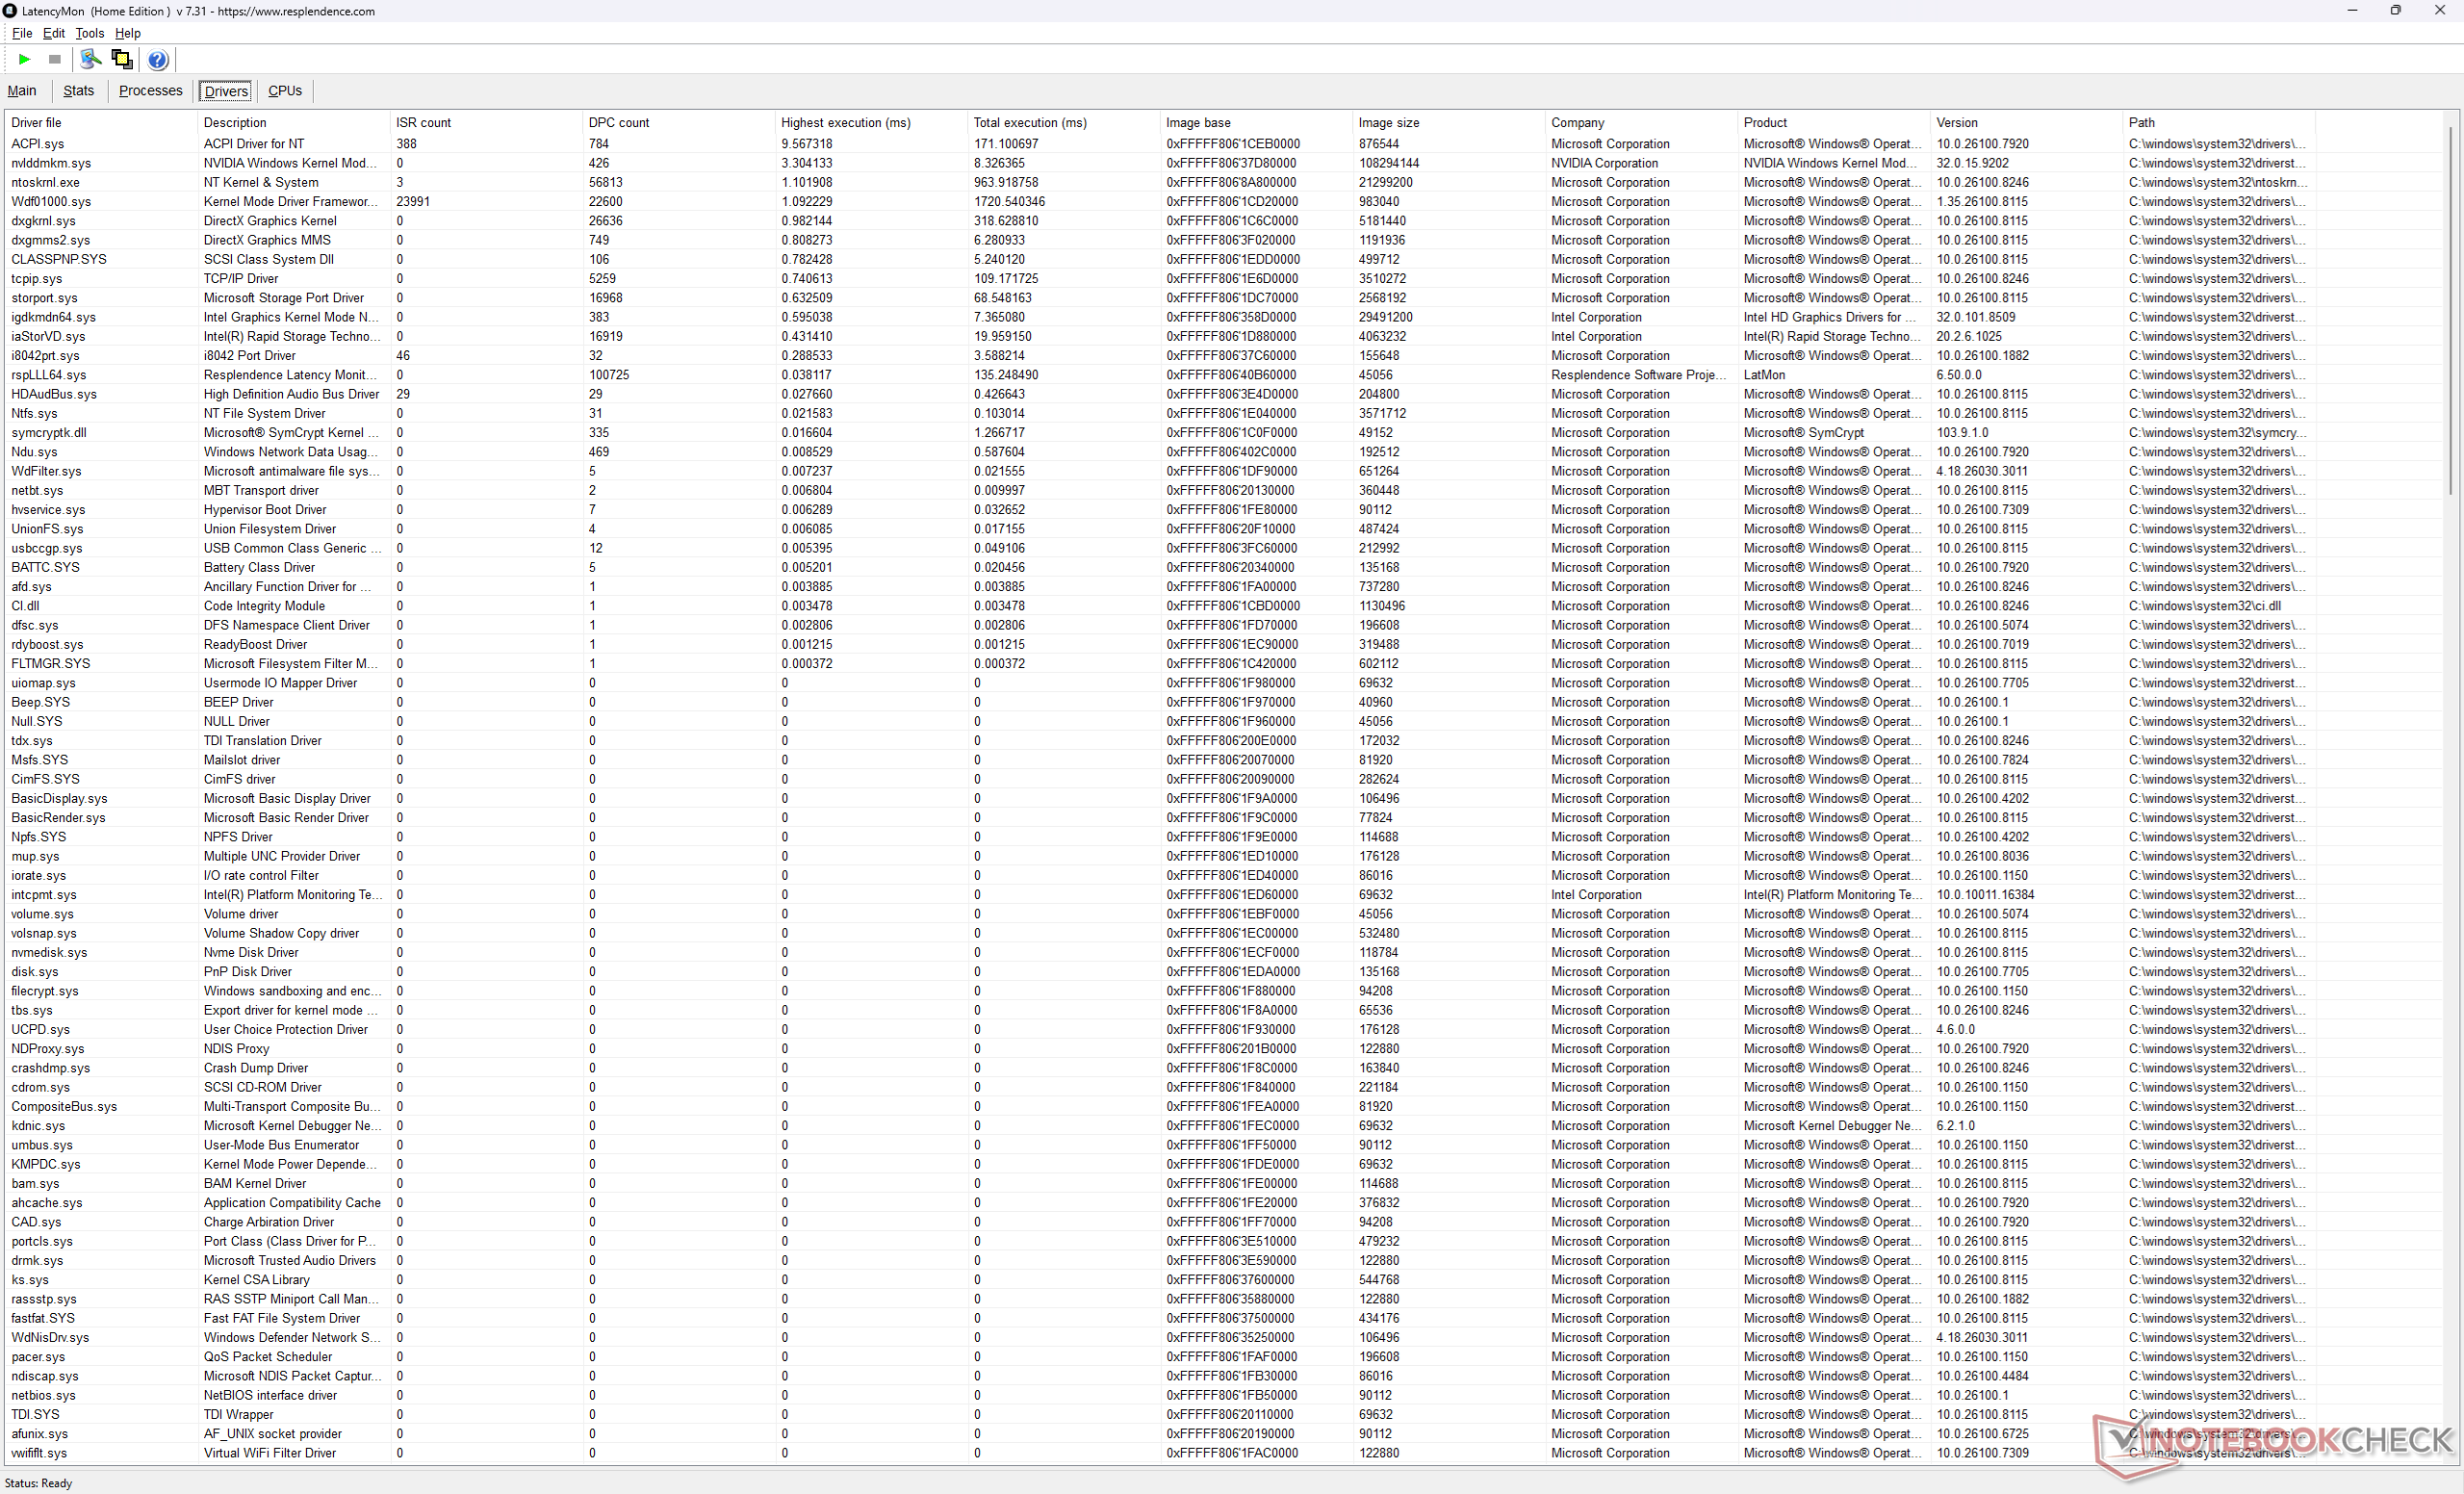
| DPC Latencies / LatencyMon - interrupt to process latency (max), Web, Youtube, Prime95 | |
| MSI Vector 16 HX AI A2XWHG | |
| Alienware 16X Aurora Core Ultra 9 290HX Plus | |
| Acer Predator Helios Neo 16S AI PHN16S-71-94L9 | |
| Alienware 16X Aurora, RTX 5070 | |
| Asus ROG Zephyrus G16 GU605CW | |
| Lenovo Legion Pro 5 16IAX10, RTX 5070 | |
* ... im mniej tym lepiej
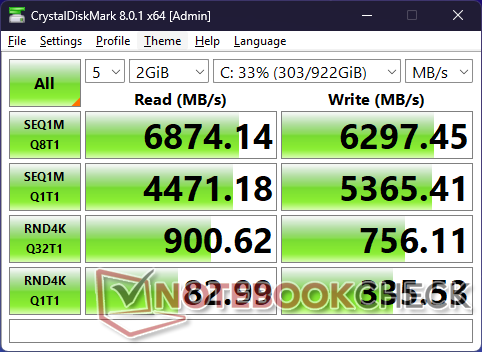
Urządzenia pamięci masowej
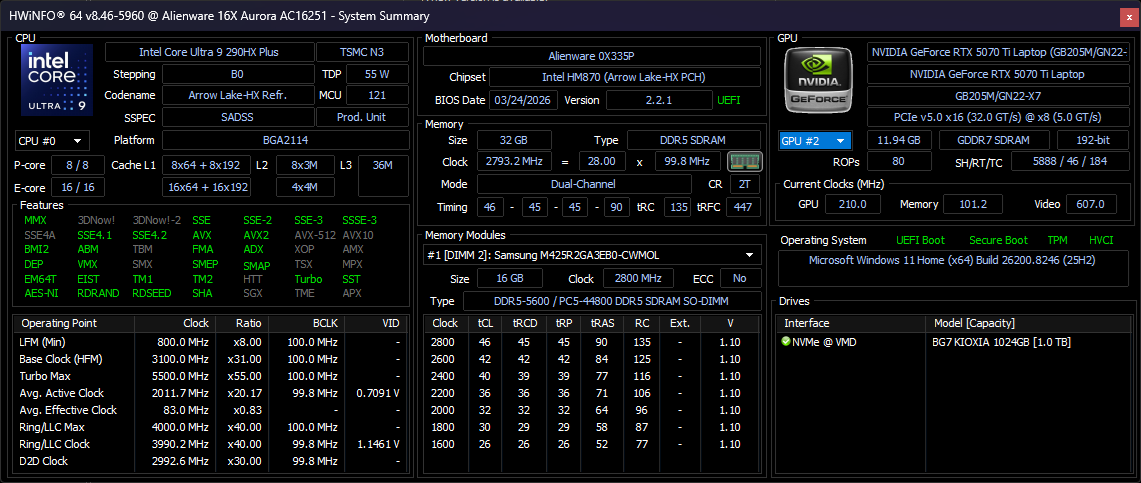
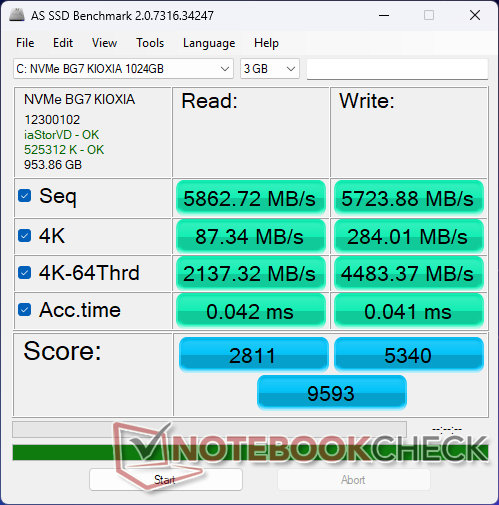
Podczas gdy zeszłoroczny model był dostarczany z Micron 2650, nasz model 2026 będzie dostarczany z Kioxia BG7 zamiast tego. Ten dysk SSD M.2 2242 PCIe4 x4 NVMe oferuje stabilne prędkości transferu na poziomie ~7000 MB/s bez problemów z dławieniem, co stanowi ulepszenie w stosunku do Microna.

* ... im mniej tym lepiej
Dławienie dysku: Pętla odczytu DiskSpd, głębokość kolejki 8
Wydajność GPU
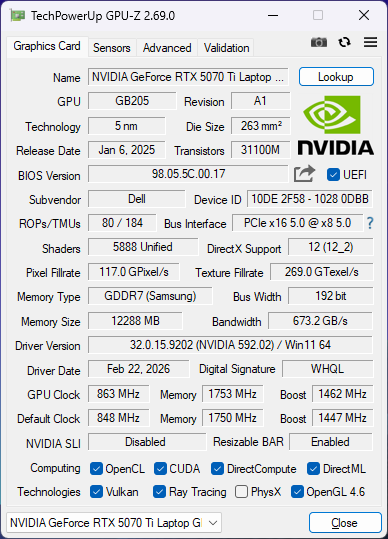
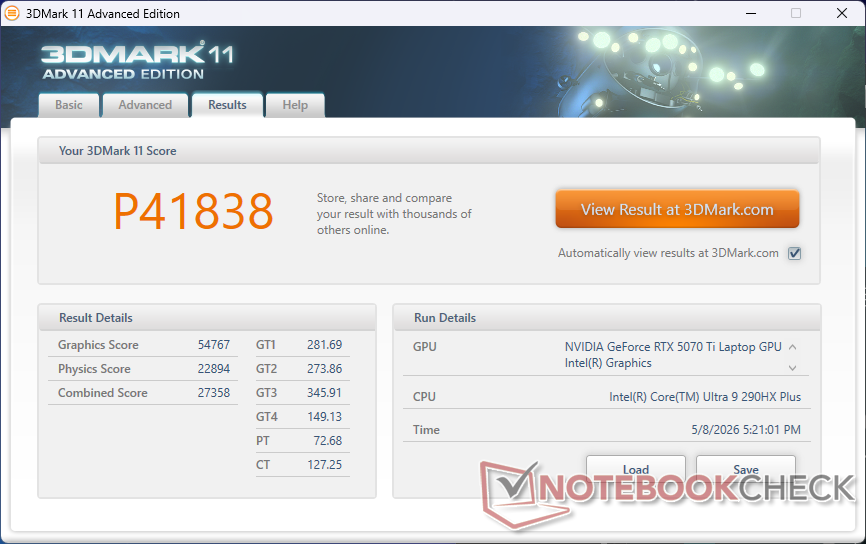
The mobilna GeForce RTX 5070 Ti jest o około 20 procent szybszy niż mobilny RTX 5070 w zeszłorocznej wersji 16X Aurora. Co najważniejsze, mobilny RTX 5070 Ti oferuje więcej pamięci VRAM niż mobilne RTX 5070 lub niższe.
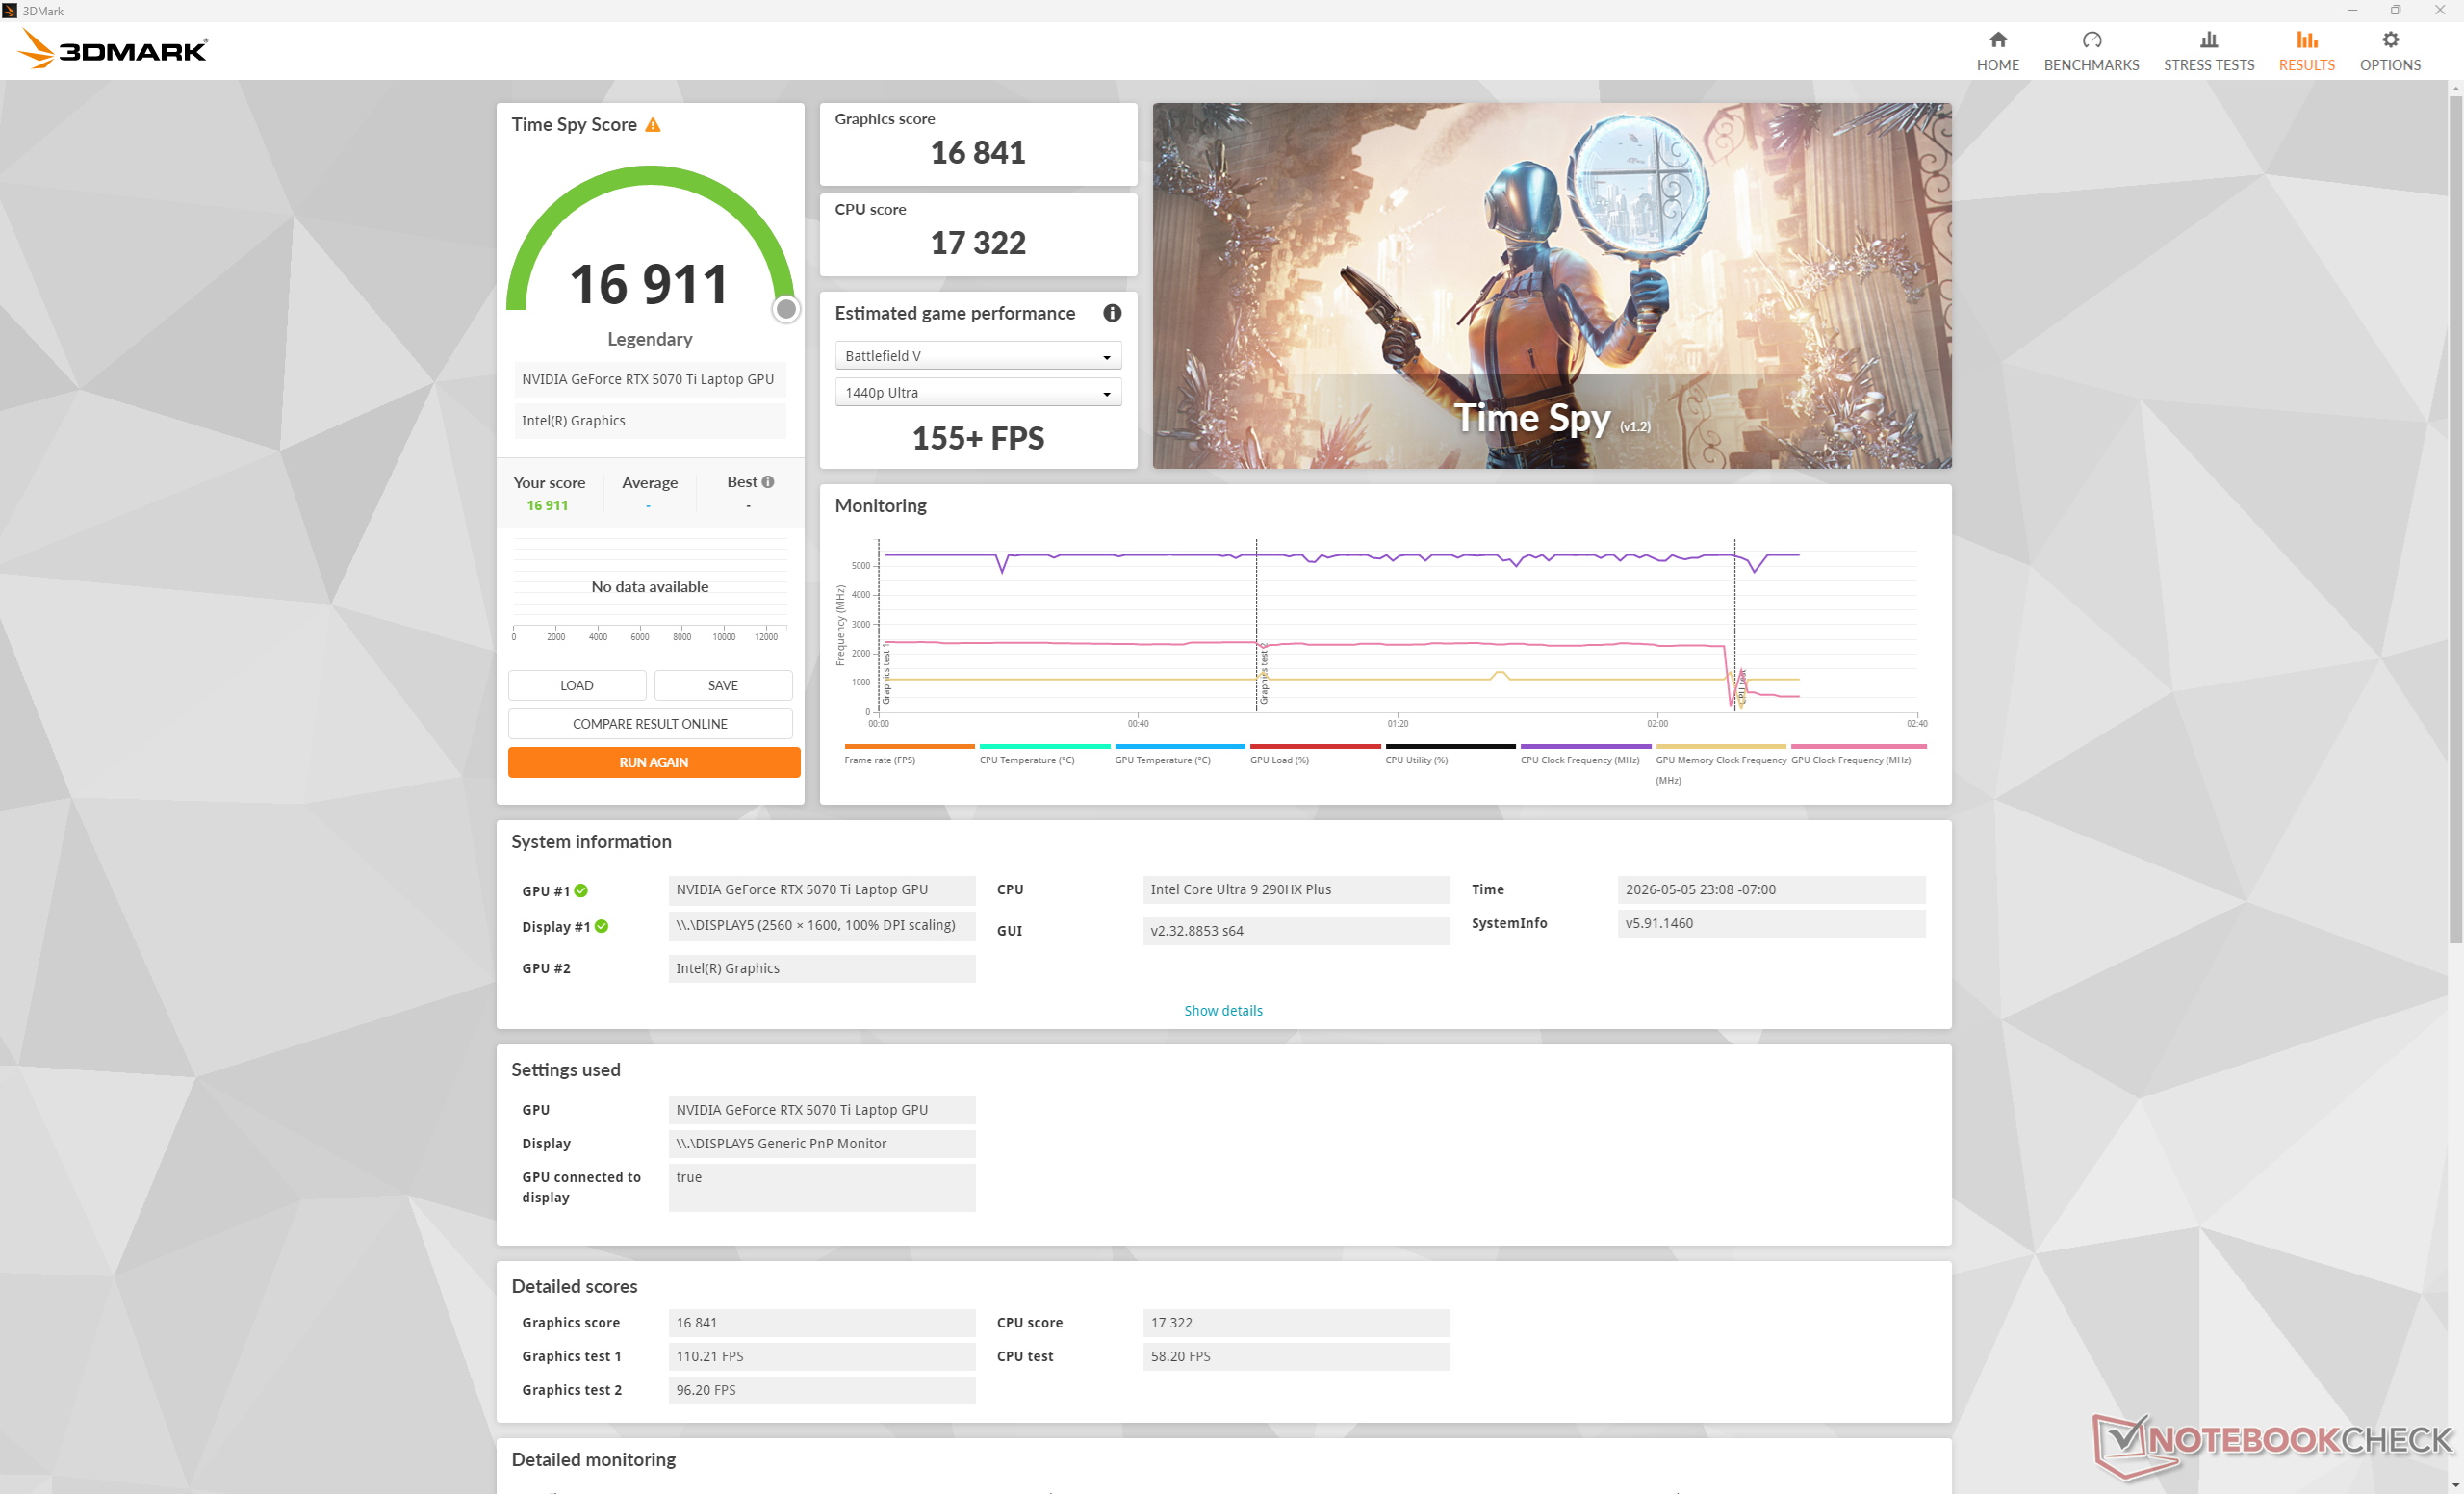
Proszę zauważyć, że uruchomienie trybu Performance zamiast Overdrive ledwo wpłynęłoby na wydajność, jak pokazują nasze wyniki Time Spy poniżej. Dopiero po zejściu do trybu Balanced, spadek wydajności w grach staje się zauważalny.
| Profil zasilania | Wynik grafiki | Wynik fizyki | Łączny wynik |
| Tryb Overdrive | 16841 | 17322 | 16911 |
| Tryb wydajności | 16458 (-2%) | 17318 (-0%) | 16581 (-2%) |
| Tryb zrównoważony | 15234 (-10%) | 17079 (-1%) | 15484 (-8%) |
| Zasilanie bateryjne | 11934 (-29%) | 14833 (-14%) | 12294 (-27%) |
| 3DMark Performance rating - Percent | |
| MSI GeForce RTX 5070 Ti 16G Ventus 3X OC -1! | |
| Schenker XMG Neo 16 A25 5090 -1! | |
| Przeciętny NVIDIA GeForce RTX 5070 Ti Laptop | |
| Alienware 16X Aurora Core Ultra 9 290HX Plus | |
| Asus TUF Gaming A16 FA608UP -1! | |
| Asus ROG Zephyrus G16 GU605CW -3! | |
| Alienware 16X Aurora, RTX 5070 | |
| Lenovo Legion 7 16 IRX G9 -1! | |
| Lenovo Legion 7 16 AGP11 | |
| Alienware 16 Aurora | |
| HP Omen 16-b1090ng -1! | |
| Asus ROG Zephyrus G16 GA605WV -1! | |
| HP Omen 16-c0077ng -1! | |
| 3DMark 11 Performance | 41838 pkt. | |
| 3DMark Cloud Gate Standard Score | 72346 pkt. | |
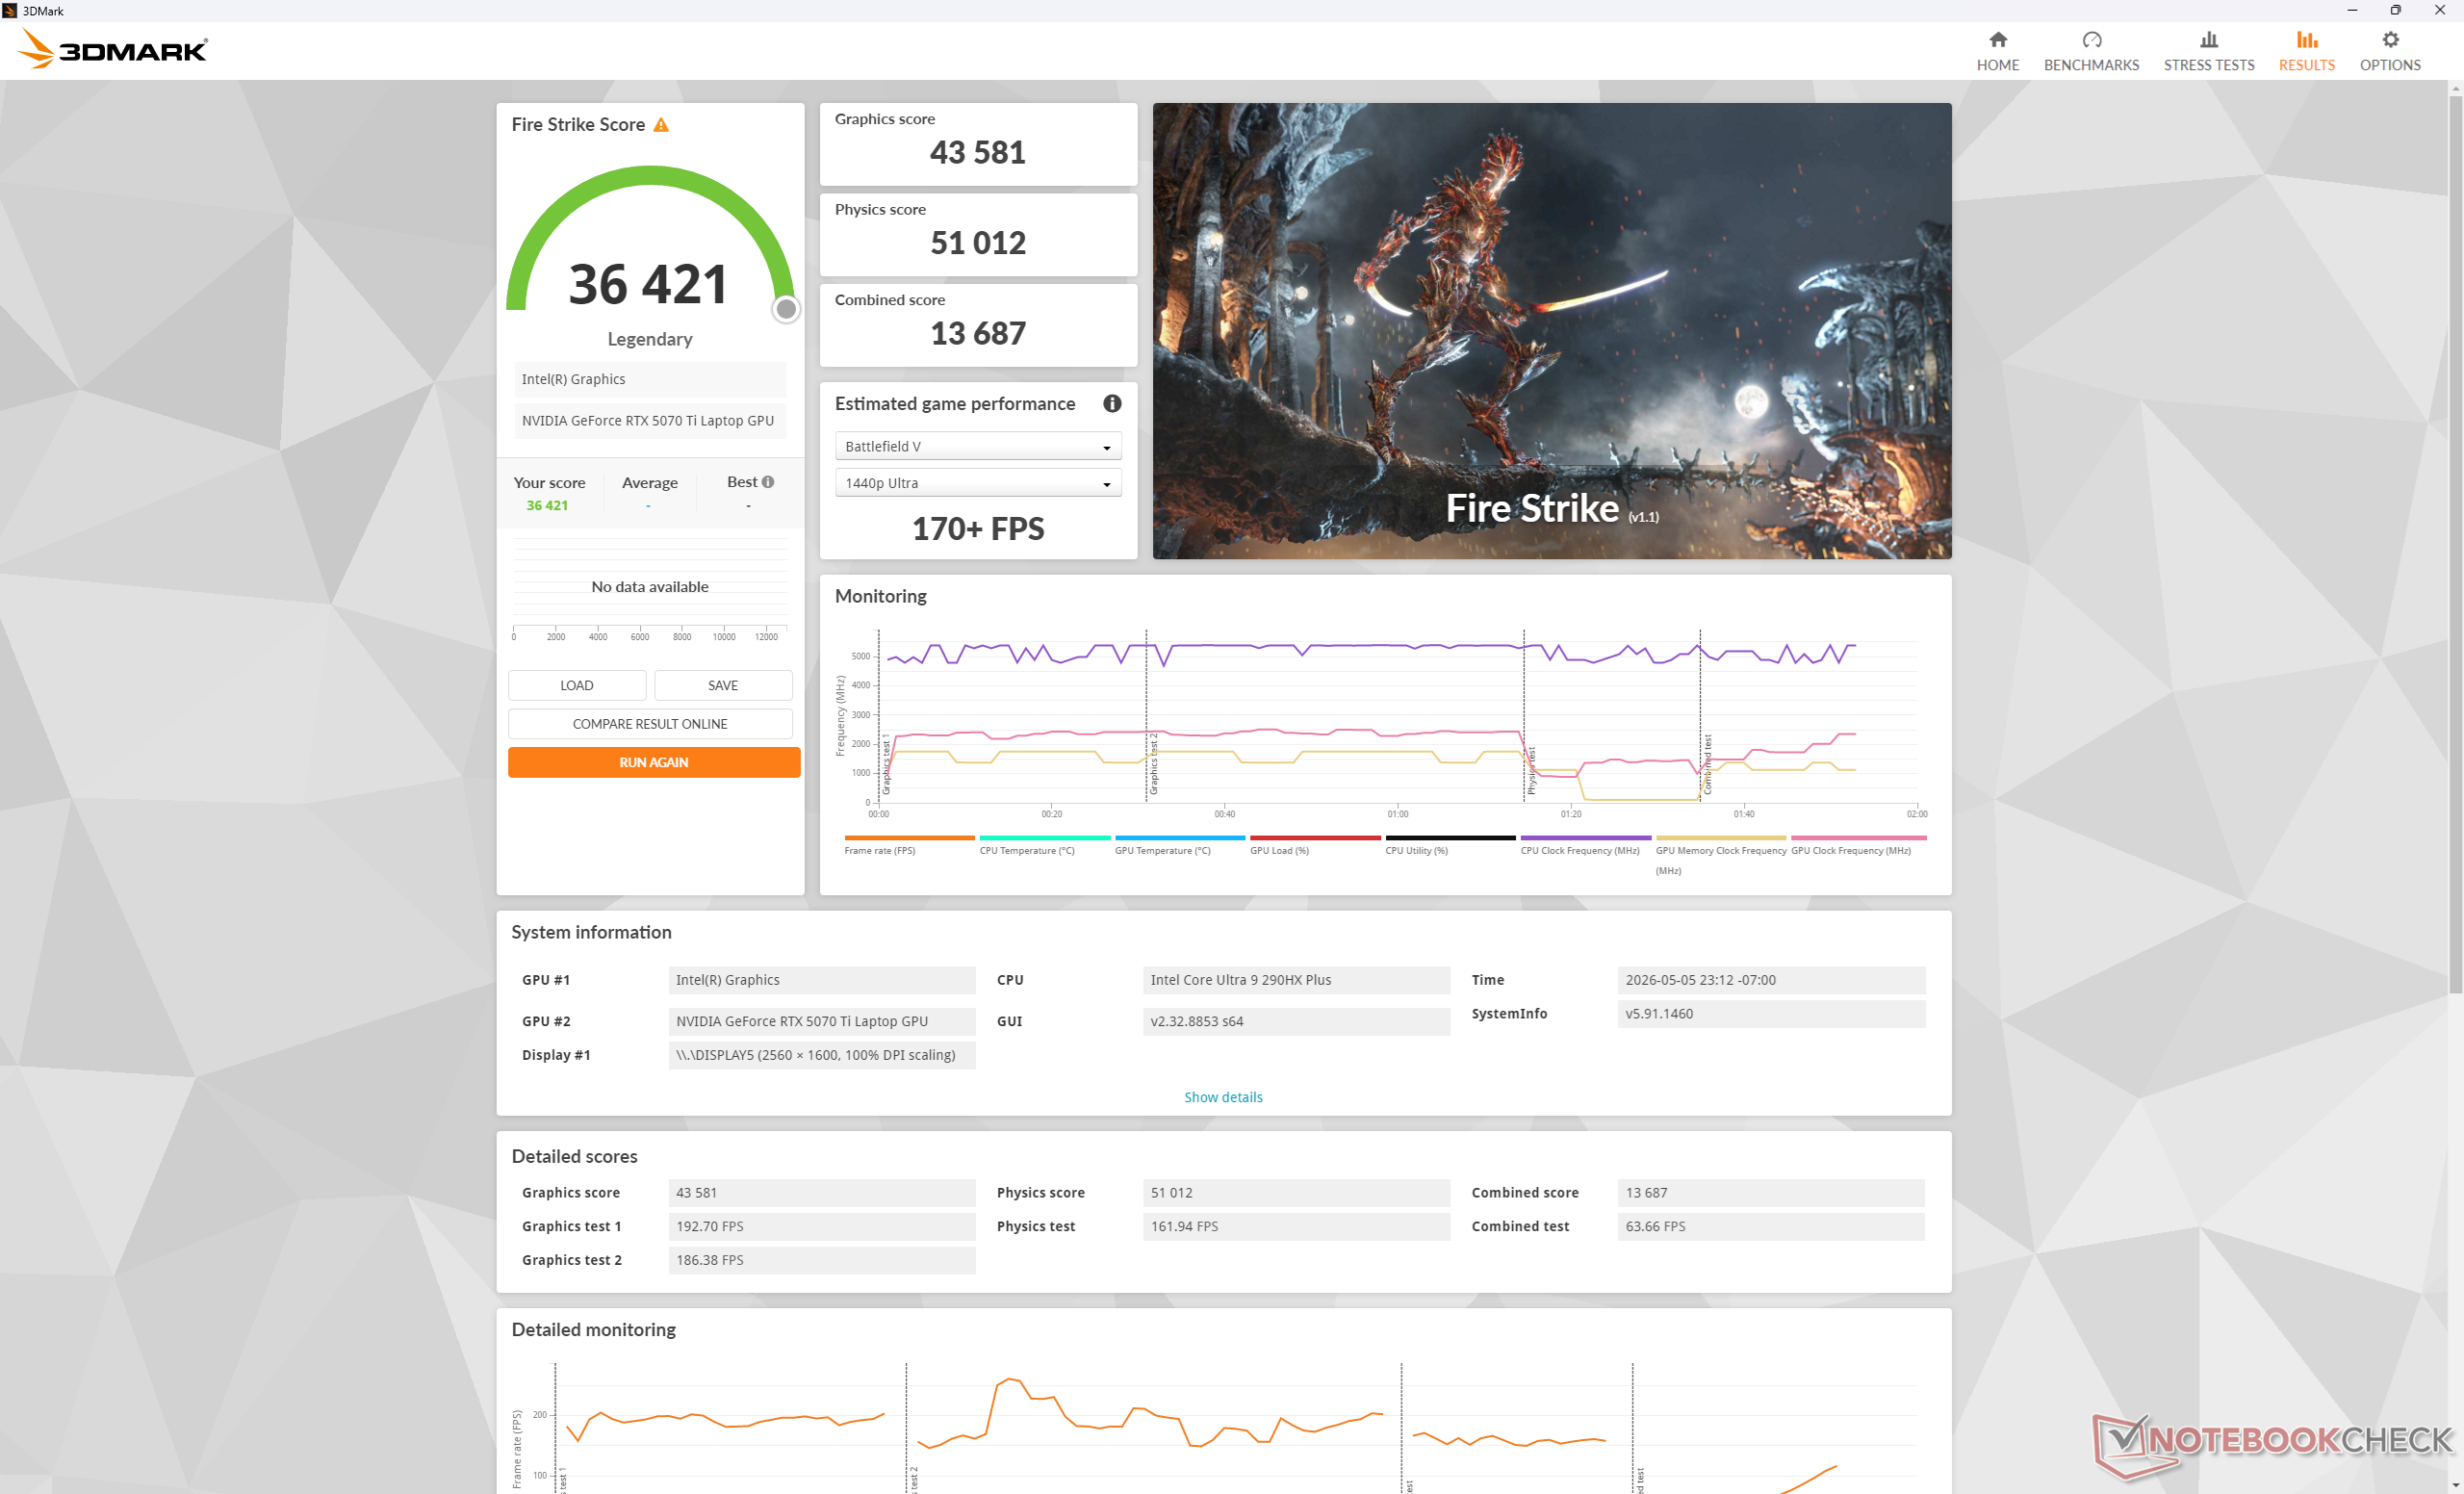
| 3DMark Fire Strike Score | 36421 pkt. | |
| 3DMark Time Spy Score | 16581 pkt. | |
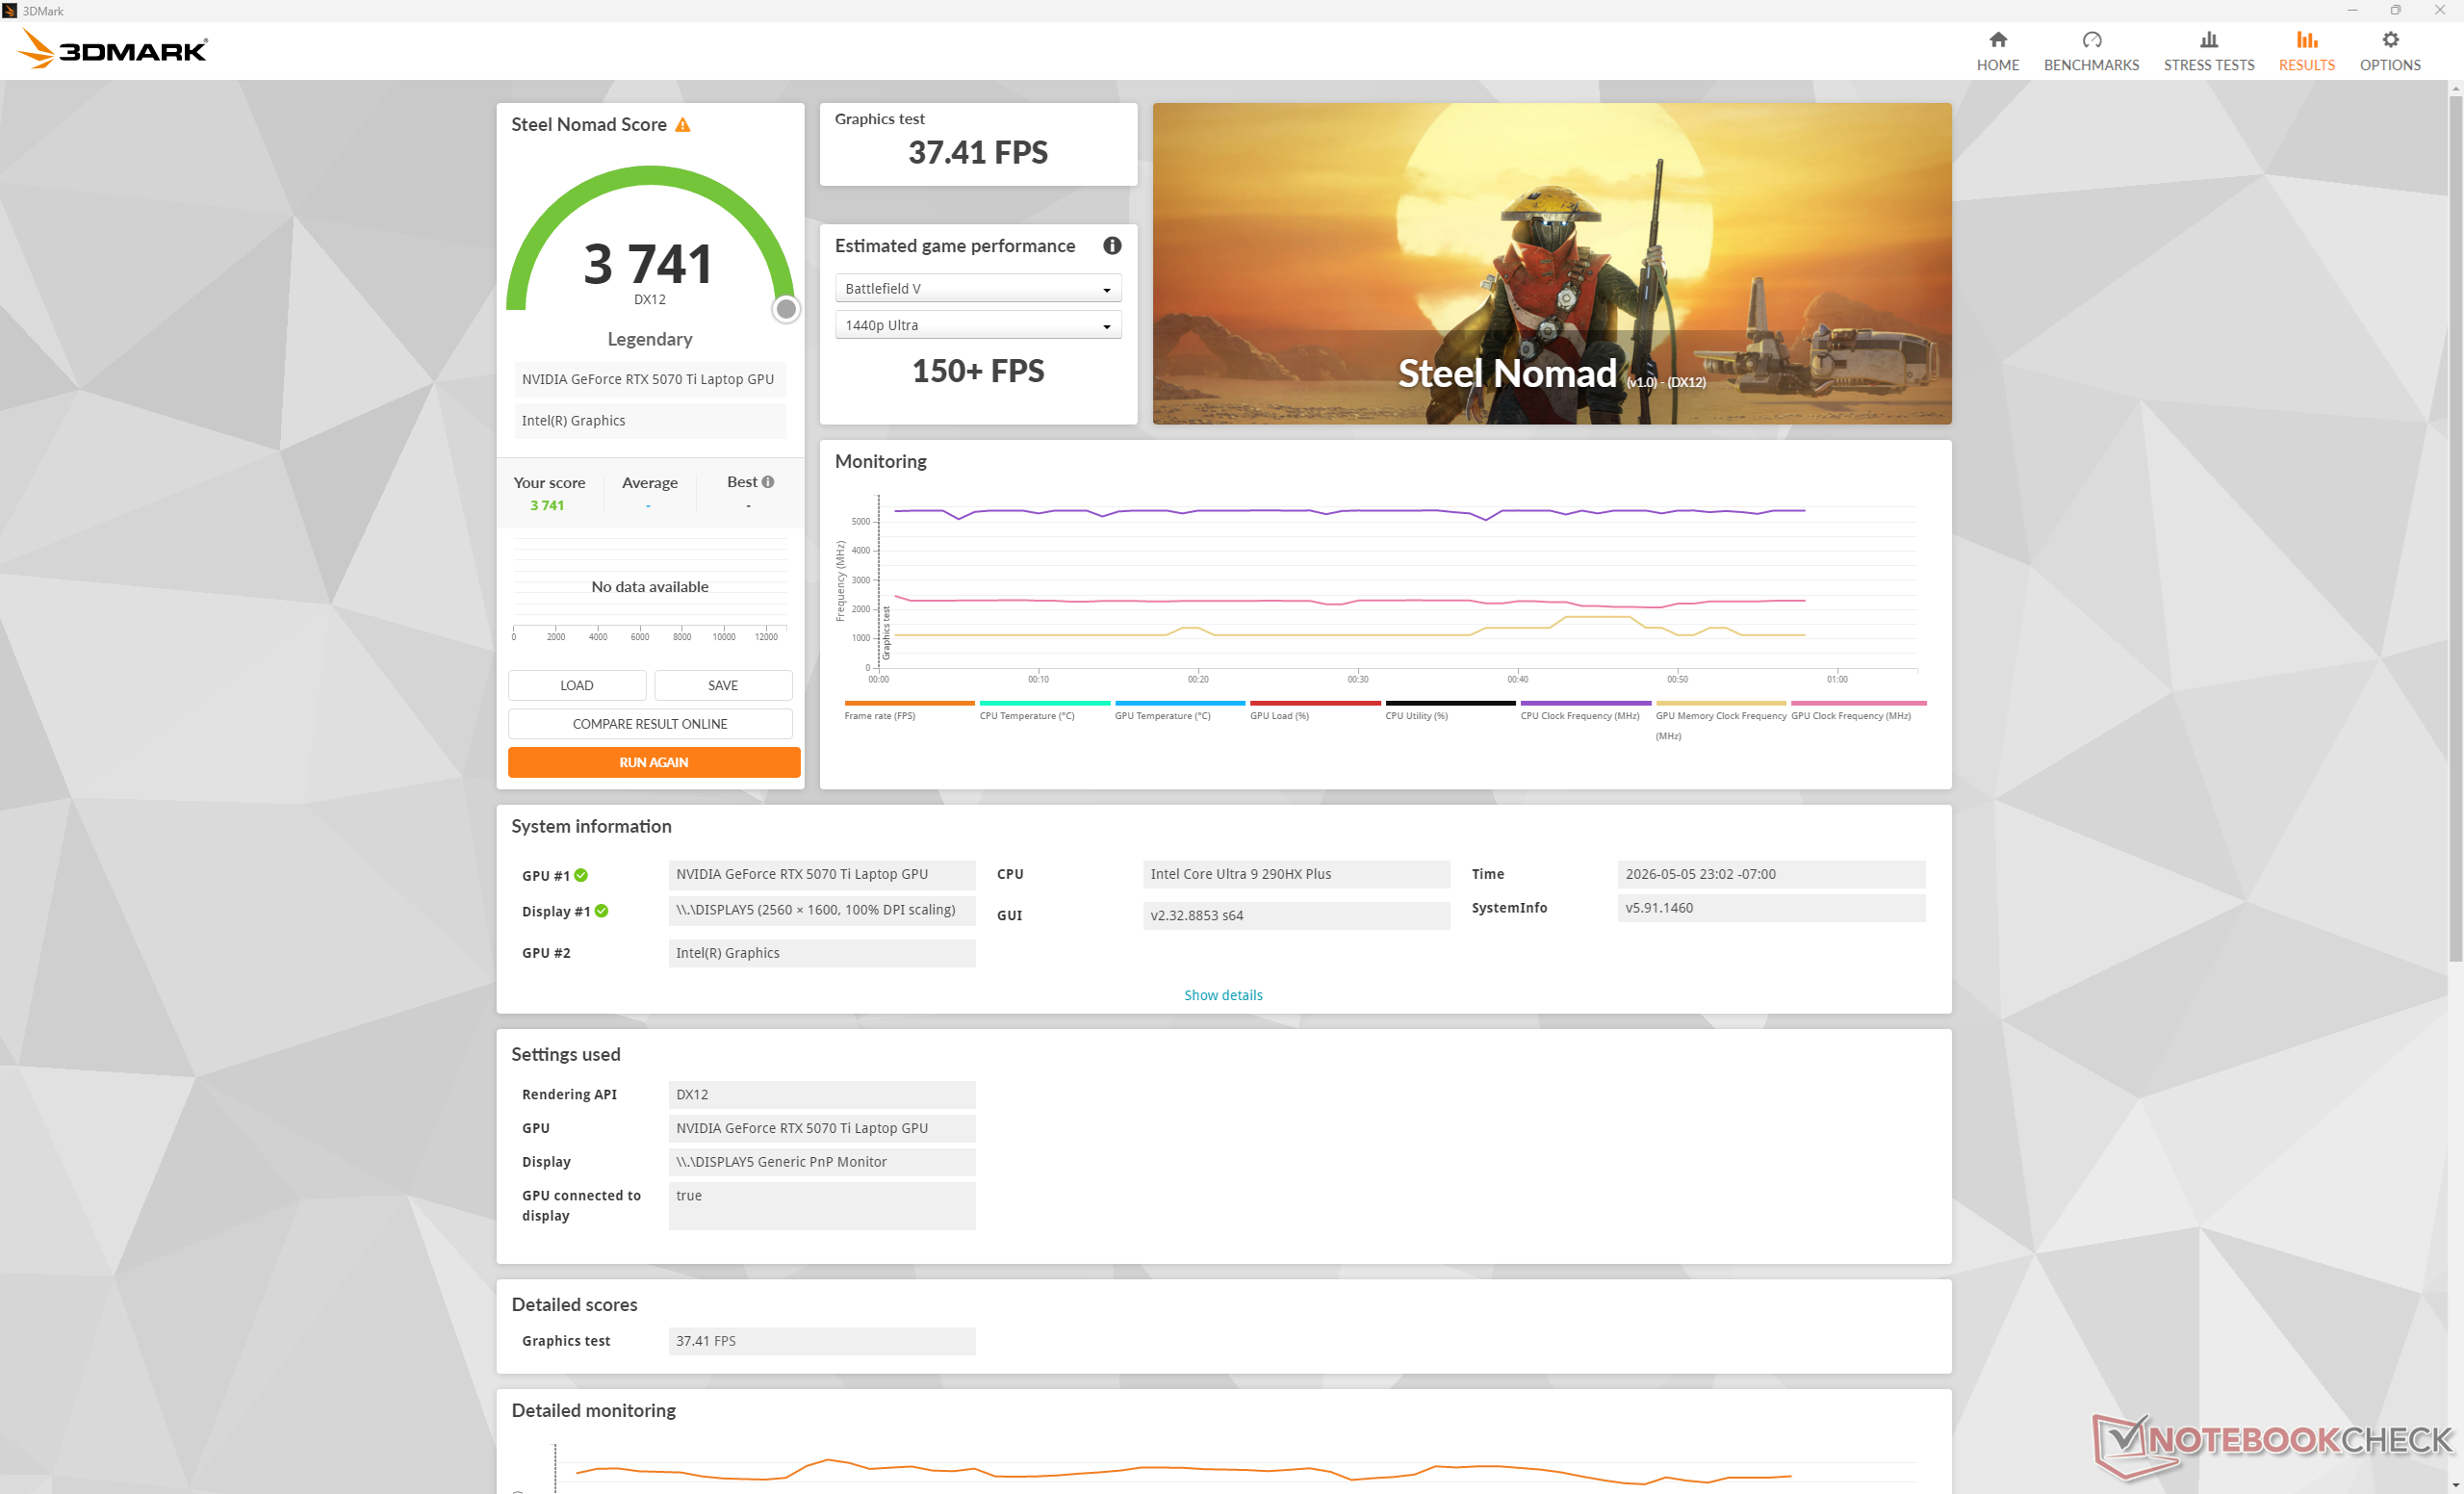
| 3DMark Steel Nomad Score | 3741 pkt. | |
Pomoc | ||
* ... im mniej tym lepiej
Wydajność w grach
Wydajność w grach jest średnio o około 15 procent wyższa niż w przypadku modelu 2025 16X Aurora z kartą GeForce RTX 5070.
| GTA V - 1920x1080 Highest AA:4xMSAA + FX AF:16x | |
| Alienware 16X Aurora Core Ultra 9 290HX Plus | |
| Alienware 16X Aurora, RTX 5070 | |
| Lenovo Legion Pro 5 16IAX10, RTX 5070 | |
| Acer Predator Helios Neo 16S AI PHN16S-71-94L9 | |
| MSI Vector 16 HX AI A2XWHG | |
| Final Fantasy XV Benchmark - 1920x1080 High Quality | |
| MSI Vector 16 HX AI A2XWHG | |
| Alienware 16X Aurora Core Ultra 9 290HX Plus | |
| Alienware 16X Aurora, RTX 5070 | |
| Lenovo Legion Pro 5 16IAX10, RTX 5070 | |
| Asus ROG Zephyrus G16 2025 5070 Ti | |
| Strange Brigade - 1920x1080 ultra AA:ultra AF:16 | |
| Alienware 16X Aurora Core Ultra 9 290HX Plus | |
| Asus ROG Zephyrus G16 2025 5070 Ti | |
| Alienware 16X Aurora, RTX 5070 | |
| Lenovo Legion Pro 5 16IAX10, RTX 5070 | |
| Dota 2 Reborn - 1920x1080 ultra (3/3) best looking | |
| Schenker XMG Neo 16 A25 5090 | |
| Alienware 16X Aurora Core Ultra 9 290HX Plus | |
| Alienware 16X Aurora, RTX 5070 | |
| Lenovo Legion 7 16 IRX G9 | |
| Przeciętny NVIDIA GeForce RTX 5070 Ti Laptop (115.5 - 193.9, n=15) | |
| Alienware 16 Aurora | |
| Lenovo Legion 7 16 AGP11 | |
| HP Omen 16-b1090ng | |
| Asus ROG Zephyrus G16 GA605WV | |
| Asus TUF Gaming A16 FA608UP | |
| Asus ROG Zephyrus G16 GU605CW | |
| HP Omen 16-c0077ng | |
Cyberpunk 2077 ultra FPS Chart
| low | med. | high | ultra | QHD DLSS | QHD | |
|---|---|---|---|---|---|---|
| GTA V (2015) | 187.6 | 187.2 | 184.9 | 159.2 | 134.4 | |
| Dota 2 Reborn (2015) | 236 | 207 | 199.9 | 184.7 | ||
| Final Fantasy XV Benchmark (2018) | 233 | 209 | 161.1 | 120.3 | ||
| X-Plane 11.11 (2018) | 154.1 | 137.3 | 110.4 | |||
| Strange Brigade (2018) | 572 | 337 | 281 | 314 | 210 | |
| Baldur's Gate 3 (2023) | 181.6 | 162.4 | 159.3 | 157.7 | 109.5 | |
| Cyberpunk 2077 (2023) | 171.3 | 146.5 | 126.1 | 114.9 | 86.9 | 75.1 |
| F1 24 (2024) | 324 | 318 | 268 | 97.7 | 99 | 62.8 |
| Black Myth: Wukong (2024) | 126 | 94 | 73 | 42 | 47 | 31 |
| Assassin's Creed Shadows (2025) | 89 | 83 | 71 | 52 | 54 | 44 |
Emisje
Hałas systemowy
Zmiany obrotów wentylatora są szybkie i nagłe, gdy wprowadzane są wyższe obciążenia, nawet przy ustawieniu Optimus i zrównoważonym profilu mocy. Odczyty pułapu hałasu wentylatora są poza tym niemal identyczne jak w modelu 2025, więc model 2026 nie jest ani głośniejszy, ani cichszy podczas grania.
Hałas wentylatorów podczas grania w Cyberpunk 2077 w trybach Balanced, Performance i Overdrive ustabilizował się odpowiednio na poziomie około 48,7 dB(A), 51,5 dB(A) i 59,8 dB(A). Ponieważ wzrost wydajności podczas grania w trybie Overdrive jest tak niewielki, zalecamy zamiast tego granie w trybie Performance ze względu na znacznie cichsze wentylatory.
Hałas
| luz |
| 23.8 / 23.8 / 31.4 dB |
| obciążenie |
| 48.7 / 59.8 dB |
 | ||
30 dB cichy 40 dB(A) słyszalny 50 dB(A) irytujący |
||
min: | ||
| Alienware 16X Aurora Core Ultra 9 290HX Plus Ultra 9 290HX Plus, GeForce RTX 5070 Ti Laptop | Alienware 16X Aurora, RTX 5070 Ultra 9 275HX, GeForce RTX 5070 Laptop | Acer Predator Helios Neo 16S AI PHN16S-71-94L9 Ultra 9 275HX, GeForce RTX 5070 Ti Laptop | Lenovo Legion Pro 5 16IAX10, RTX 5070 Ultra 7 255HX, GeForce RTX 5070 Laptop | MSI Vector 16 HX AI A2XWHG Ultra 7 255HX, GeForce RTX 5070 Ti Laptop | Asus ROG Zephyrus G16 GU605CW Ultra 9 285H, GeForce RTX 5080 Laptop | |
|---|---|---|---|---|---|---|
| Noise | 9% | -6% | 8% | -11% | -9% | |
| wyłączone / środowisko * (dB) | 23.4 | 23.7 -1% | 24 -3% | 23 2% | 25 -7% | 25.56 -9% |
| Idle Minimum * (dB) | 23.8 | 23.9 -0% | 24 -1% | 23 3% | 33 -39% | 30 -26% |
| Idle Average * (dB) | 23.8 | 23.9 -0% | 30 -26% | 23 3% | 34 -43% | 30 -26% |
| Idle Maximum * (dB) | 31.4 | 26.1 17% | 35 -11% | 23 27% | 38 -21% | 30 4% |
| Load Average * (dB) | 48.7 | 26.8 45% | 53 -9% | 43.85 10% | 46 6% | 53.55 -10% |
| Cyberpunk 2077 ultra * (dB) | 51.5 | 51.8 -1% | 52 -1% | 50.27 2% | 47 9% | 53.5 -4% |
| Load Maximum * (dB) | 59.8 | 58 3% | 54 10% | 52.9 12% | 49 18% | 54.02 10% |
* ... im mniej tym lepiej
Temperatura
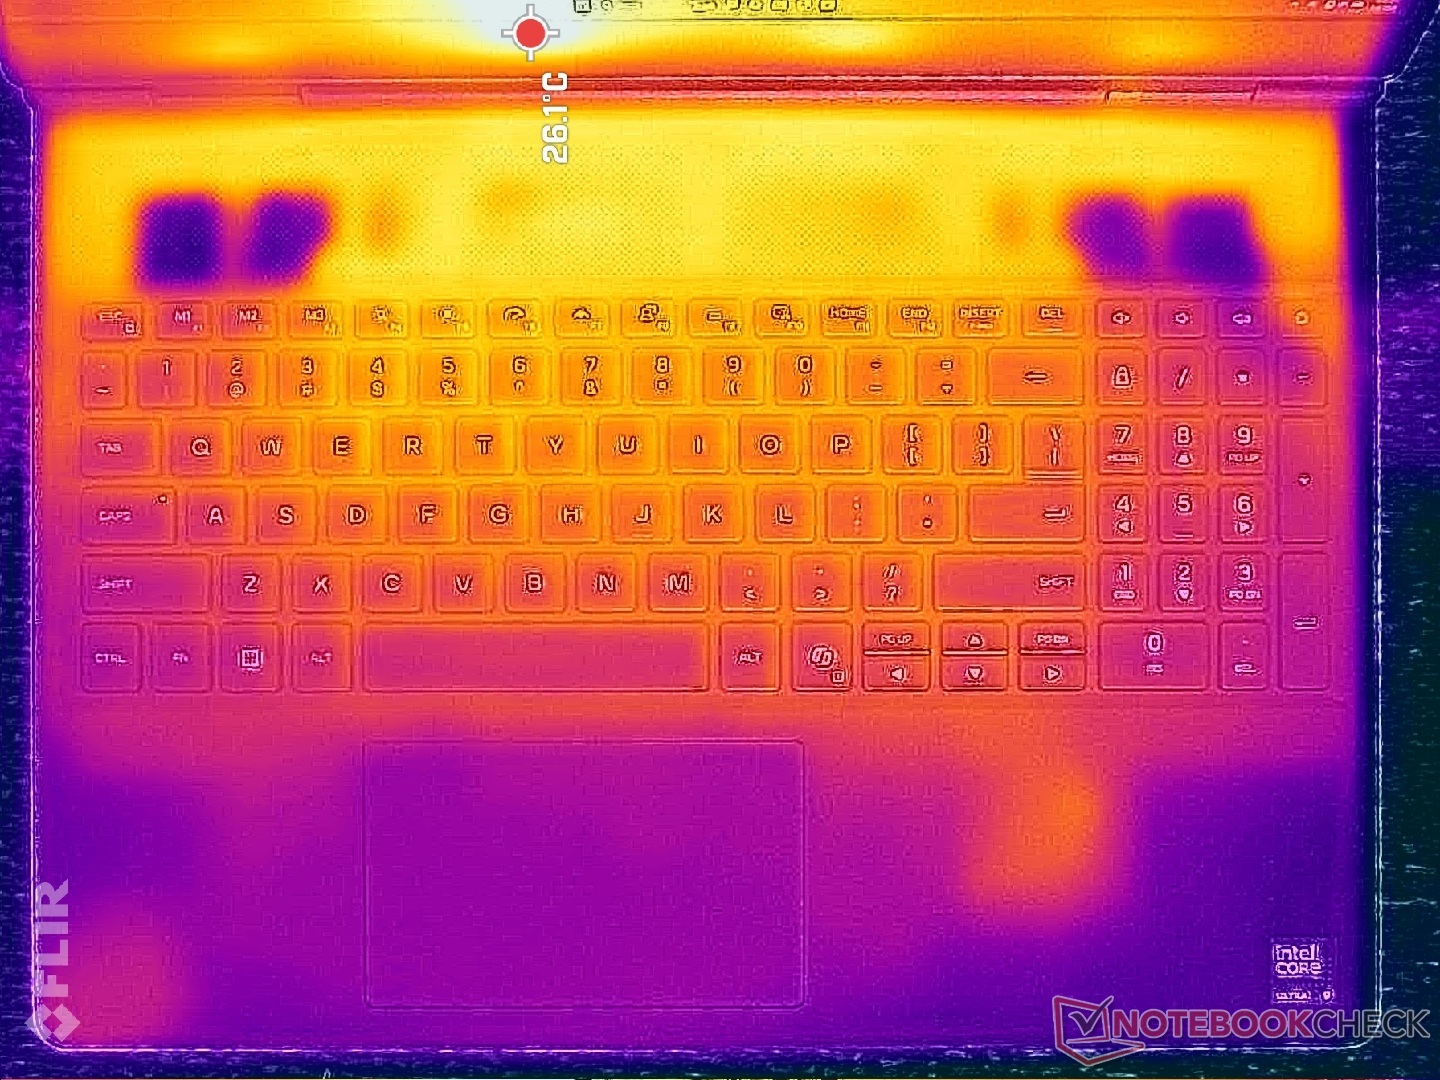
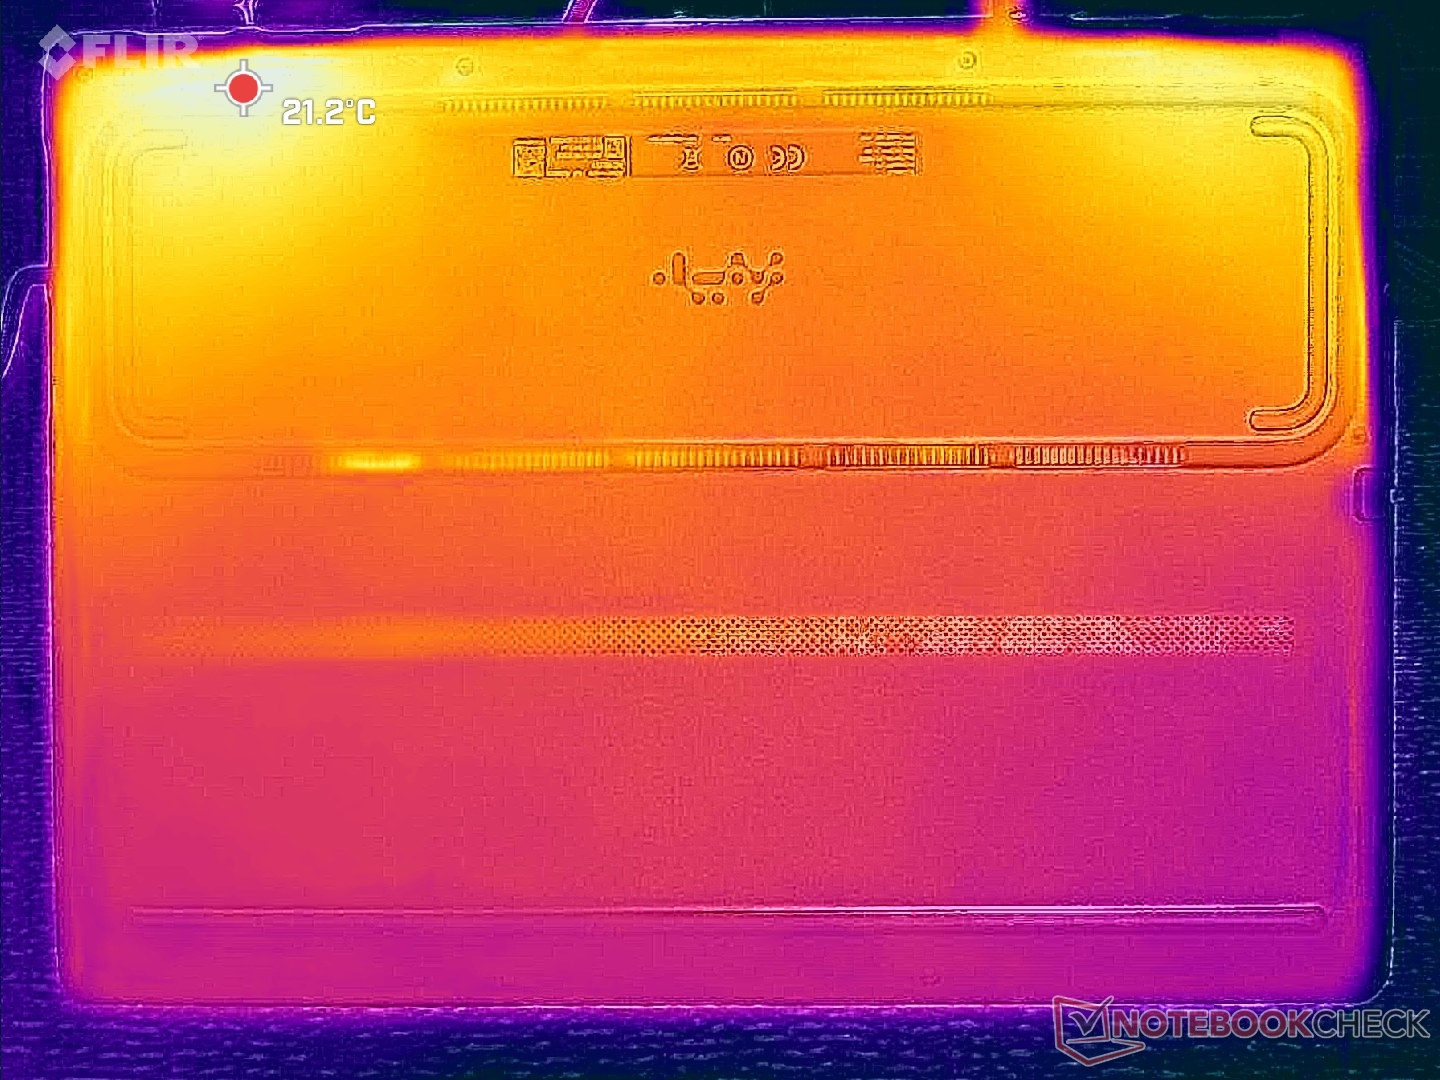
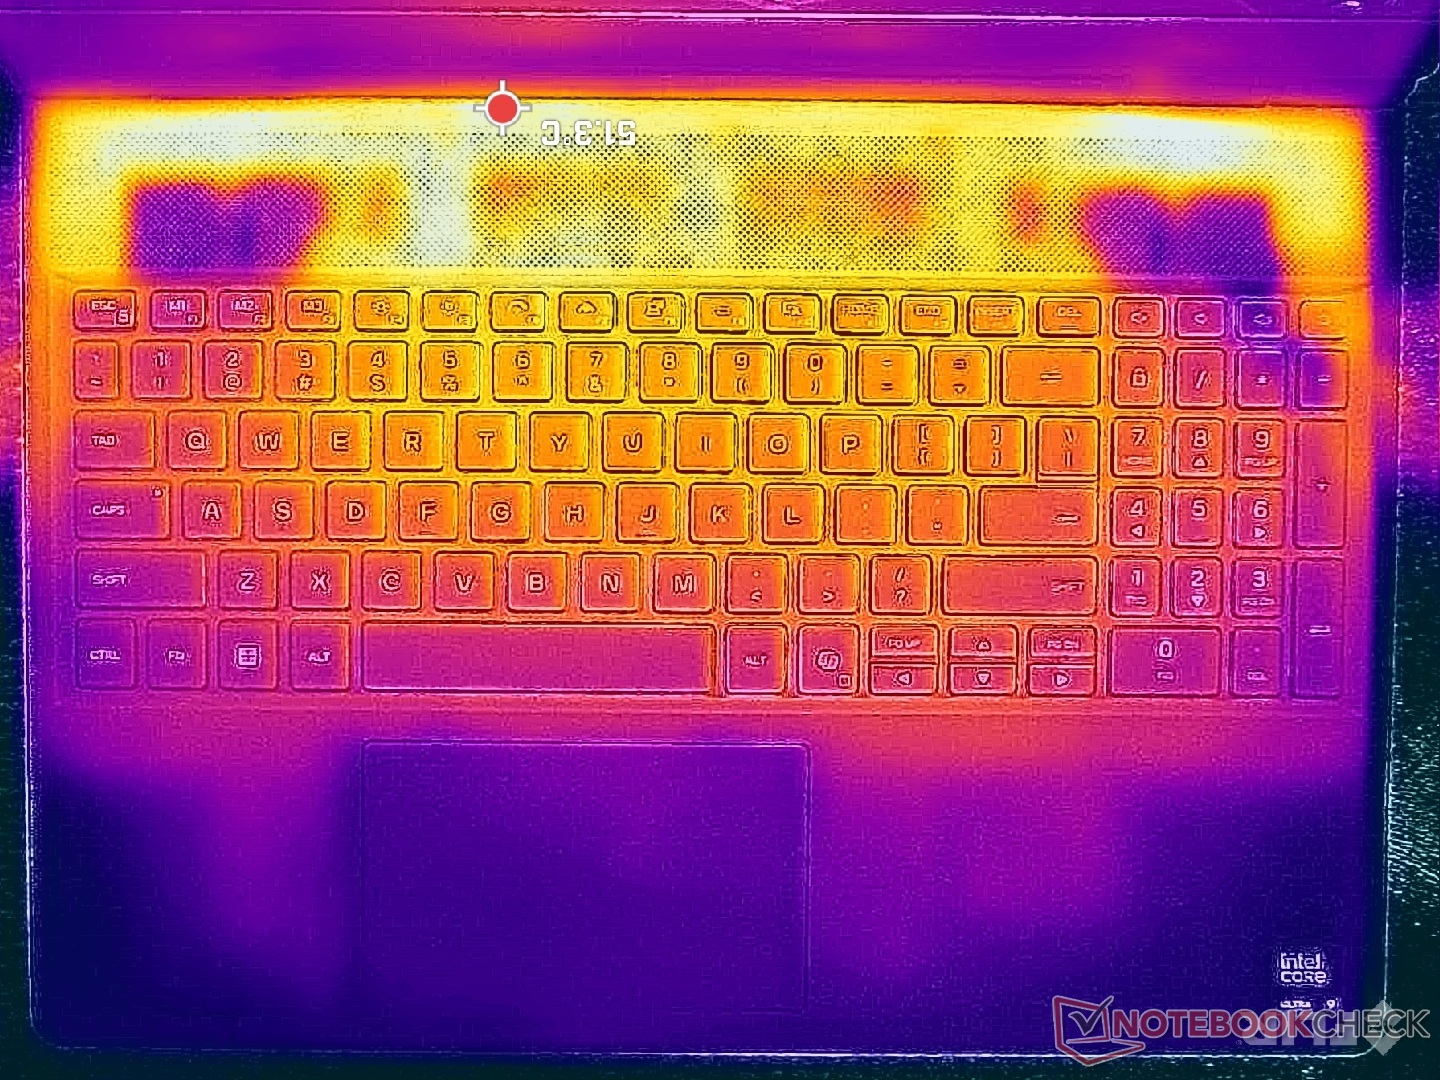
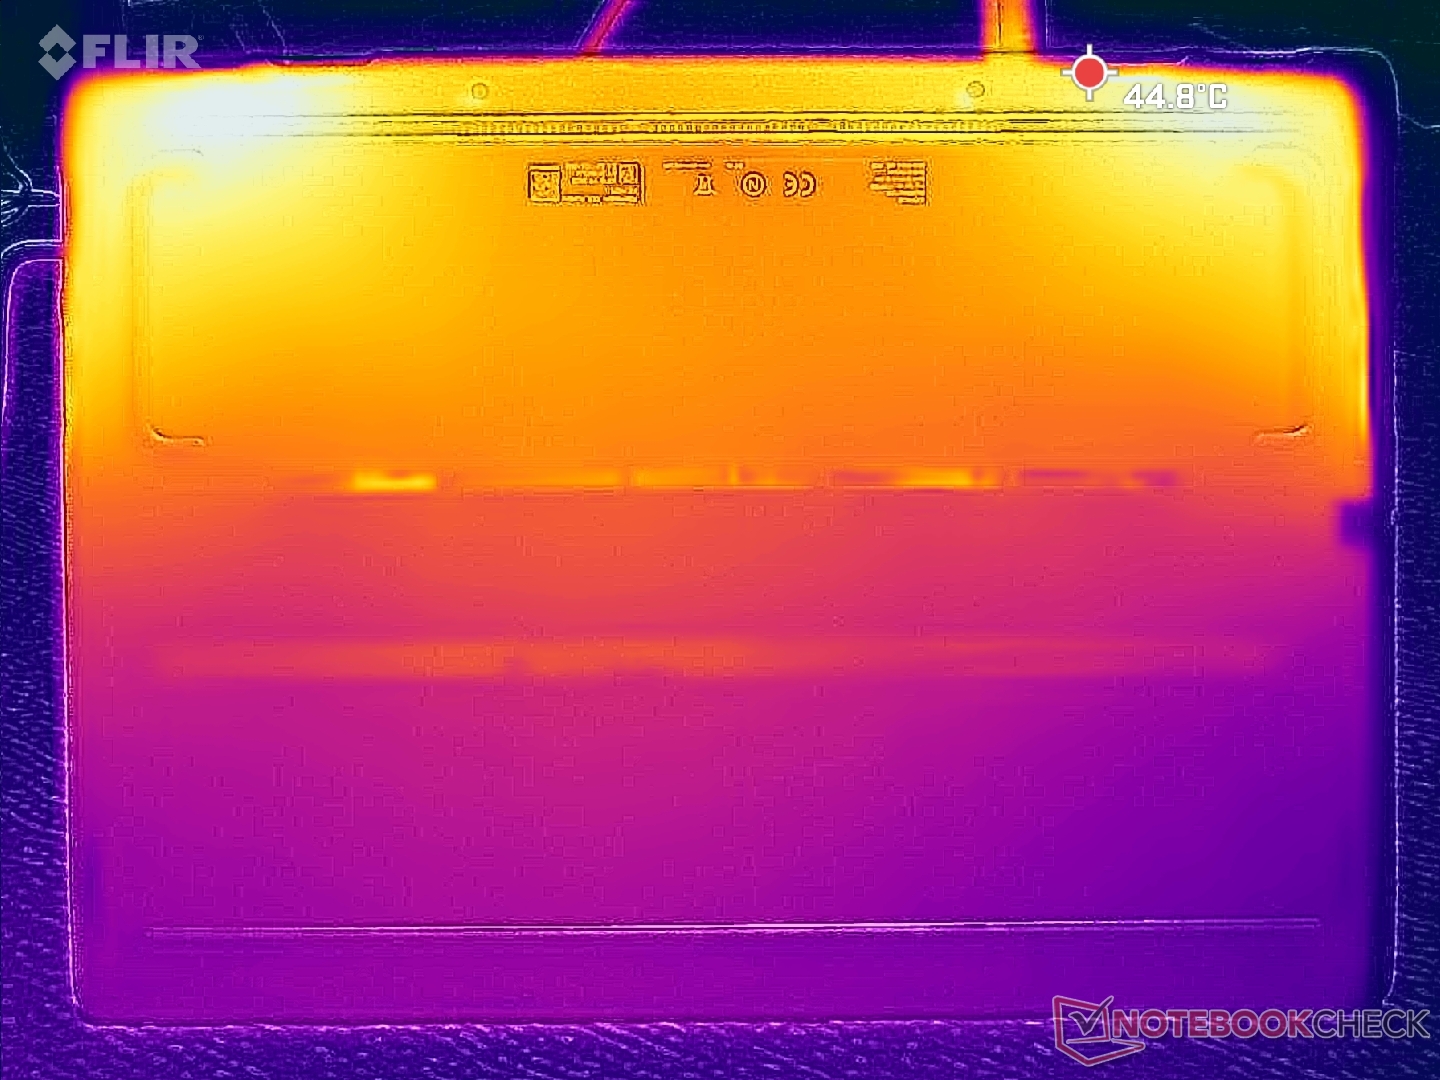
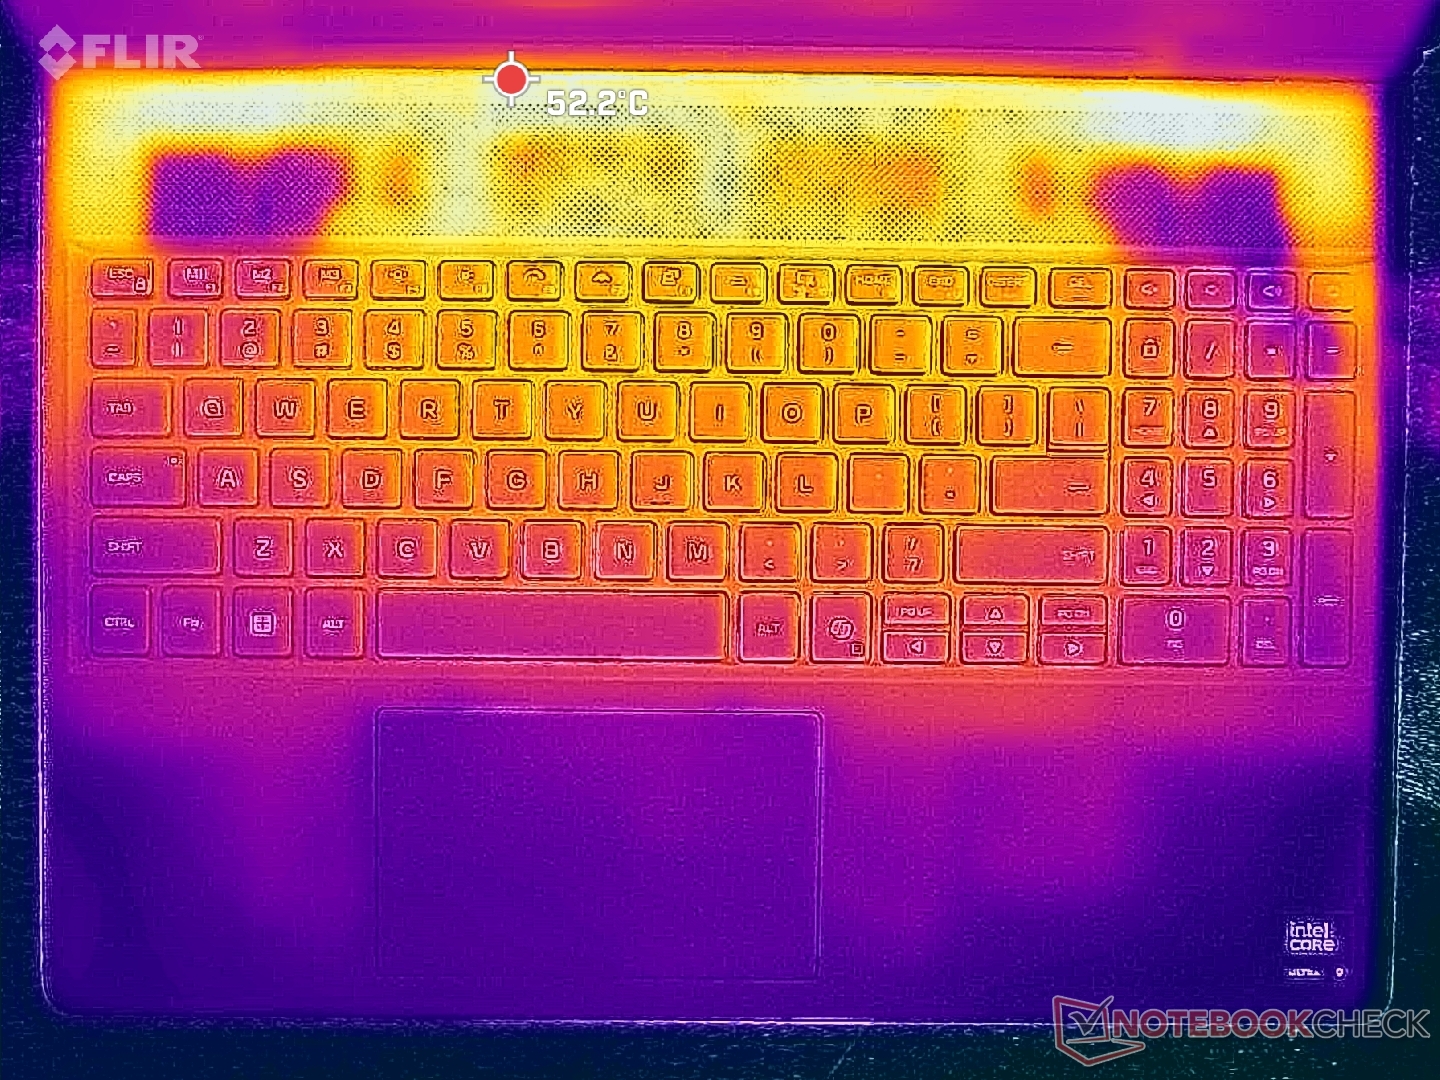
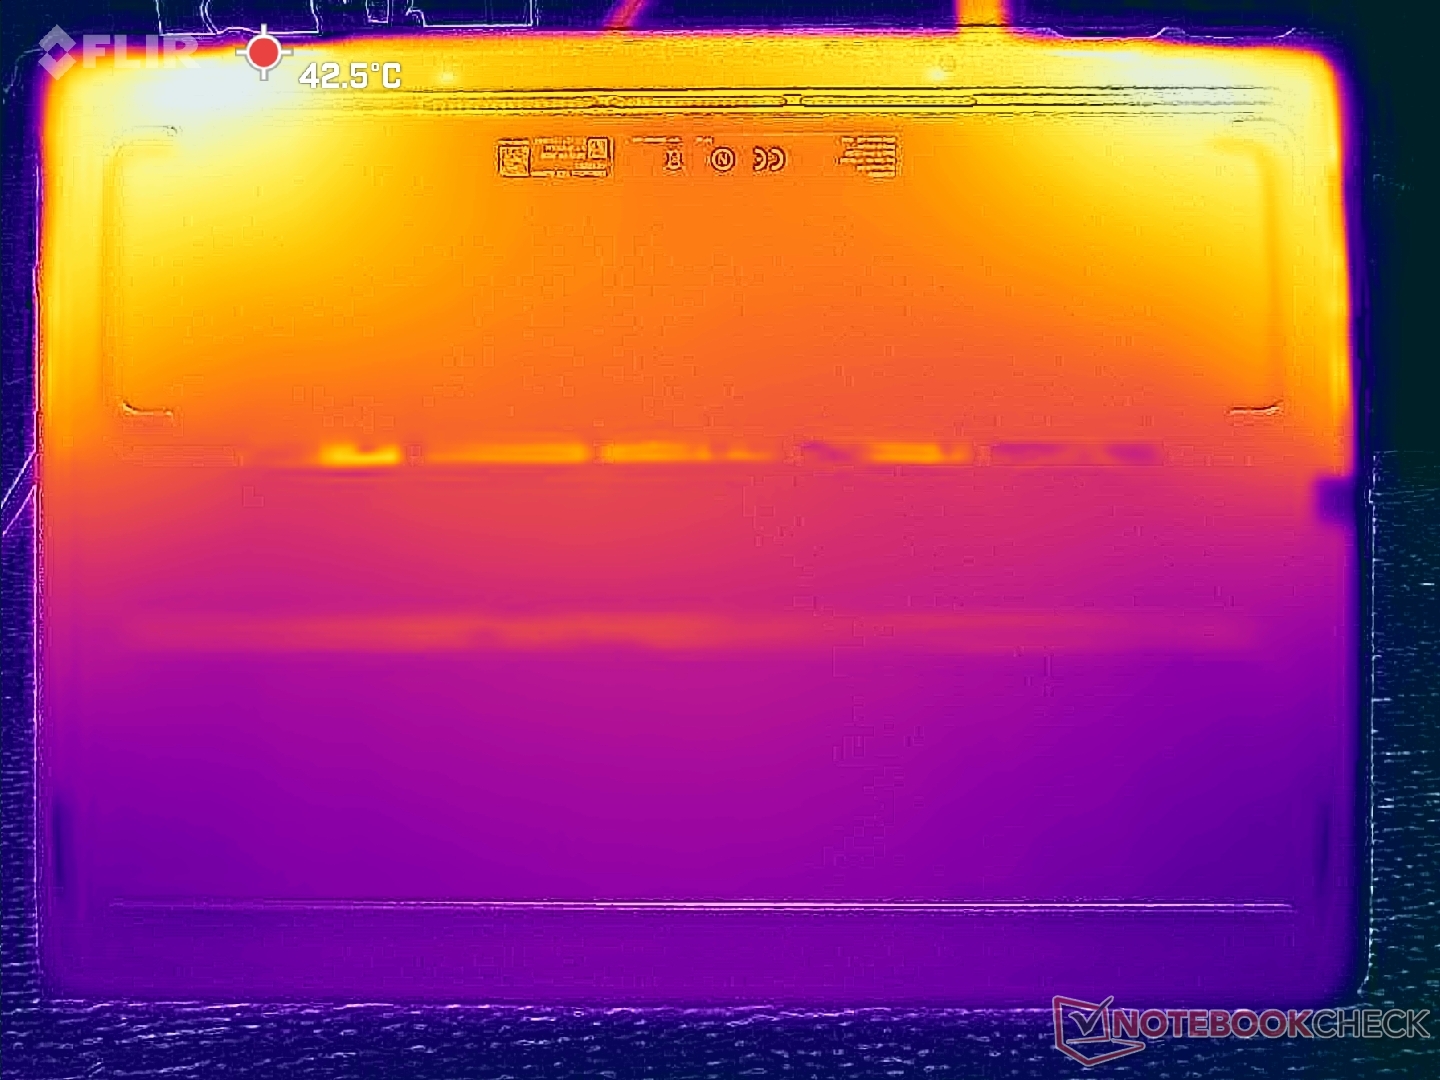
Temperatury powierzchniowe są średnio nieco niższe o kilka stopni C niż te, które odnotowaliśmy w zeszłorocznej konfiguracji. Wyniki korelują z naszymi analizami w sekcji Stress Test poniżej.
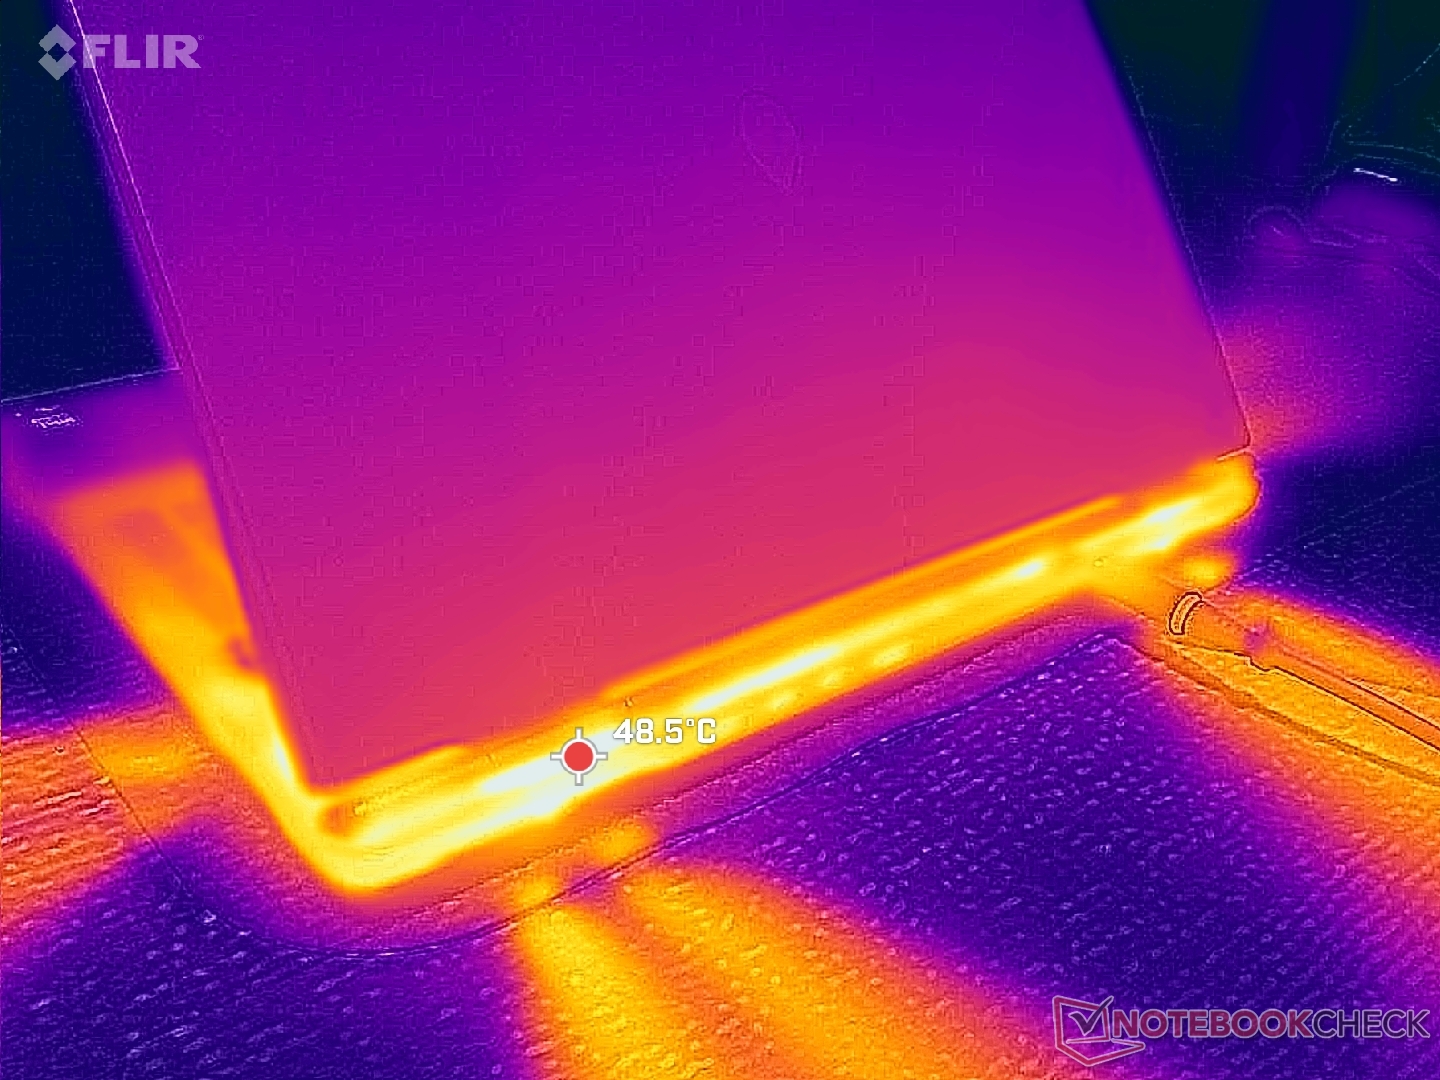
(-) Maksymalna temperatura w górnej części wynosi 48.2 °C / 119 F, w porównaniu do średniej 40.4 °C / 105 F , począwszy od 21.2 do 68.8 °C dla klasy Gaming.
(±) Dno nagrzewa się maksymalnie do 41 °C / 106 F, w porównaniu do średniej 43.2 °C / 110 F
(+) W stanie bezczynności średnia temperatura górnej części wynosi 26 °C / 79 F, w porównaniu ze średnią temperaturą urządzenia wynoszącą 33.9 °C / ### class_avg_f### F.
(-) 3: The average temperature for the upper side is 39.4 °C / 103 F, compared to the average of 33.9 °C / 93 F for the class Gaming.
(+) Podpórki pod nadgarstki i touchpad są chłodniejsze niż temperatura skóry i maksymalnie 31 °C / 87.8 F i dlatego są chłodne w dotyku.
(-) Średnia temperatura obszaru podparcia dłoni w podobnych urządzeniach wynosiła 28.8 °C / 83.8 F (-2.2 °C / -4 F).
| Alienware 16X Aurora Core Ultra 9 290HX Plus Ultra 9 290HX Plus, GeForce RTX 5070 Ti Laptop | Alienware 16X Aurora, RTX 5070 Ultra 9 275HX, GeForce RTX 5070 Laptop | Acer Predator Helios Neo 16S AI PHN16S-71-94L9 Ultra 9 275HX, GeForce RTX 5070 Ti Laptop | Lenovo Legion Pro 5 16IAX10, RTX 5070 Ultra 7 255HX, GeForce RTX 5070 Laptop | MSI Vector 16 HX AI A2XWHG Ultra 7 255HX, GeForce RTX 5070 Ti Laptop | Asus ROG Zephyrus G16 GU605CW Ultra 9 285H, GeForce RTX 5080 Laptop | |
|---|---|---|---|---|---|---|
| Heat | -7% | -11% | -10% | -16% | -25% | |
| Maximum Upper Side * (°C) | 48.2 | 51 -6% | 47 2% | 42 13% | 53 -10% | 49.2 -2% |
| Maximum Bottom * (°C) | 41 | 45.6 -11% | 55 -34% | 44 -7% | 52 -27% | 50.2 -22% |
| Idle Upper Side * (°C) | 28.2 | 29.8 -6% | 28 1% | 33 -17% | 33 -17% | 37.2 -32% |
| Idle Bottom * (°C) | 26.2 | 27.4 -5% | 29 -11% | 34 -30% | 29 -11% | 37.4 -43% |
* ... im mniej tym lepiej
Test warunków skrajnych
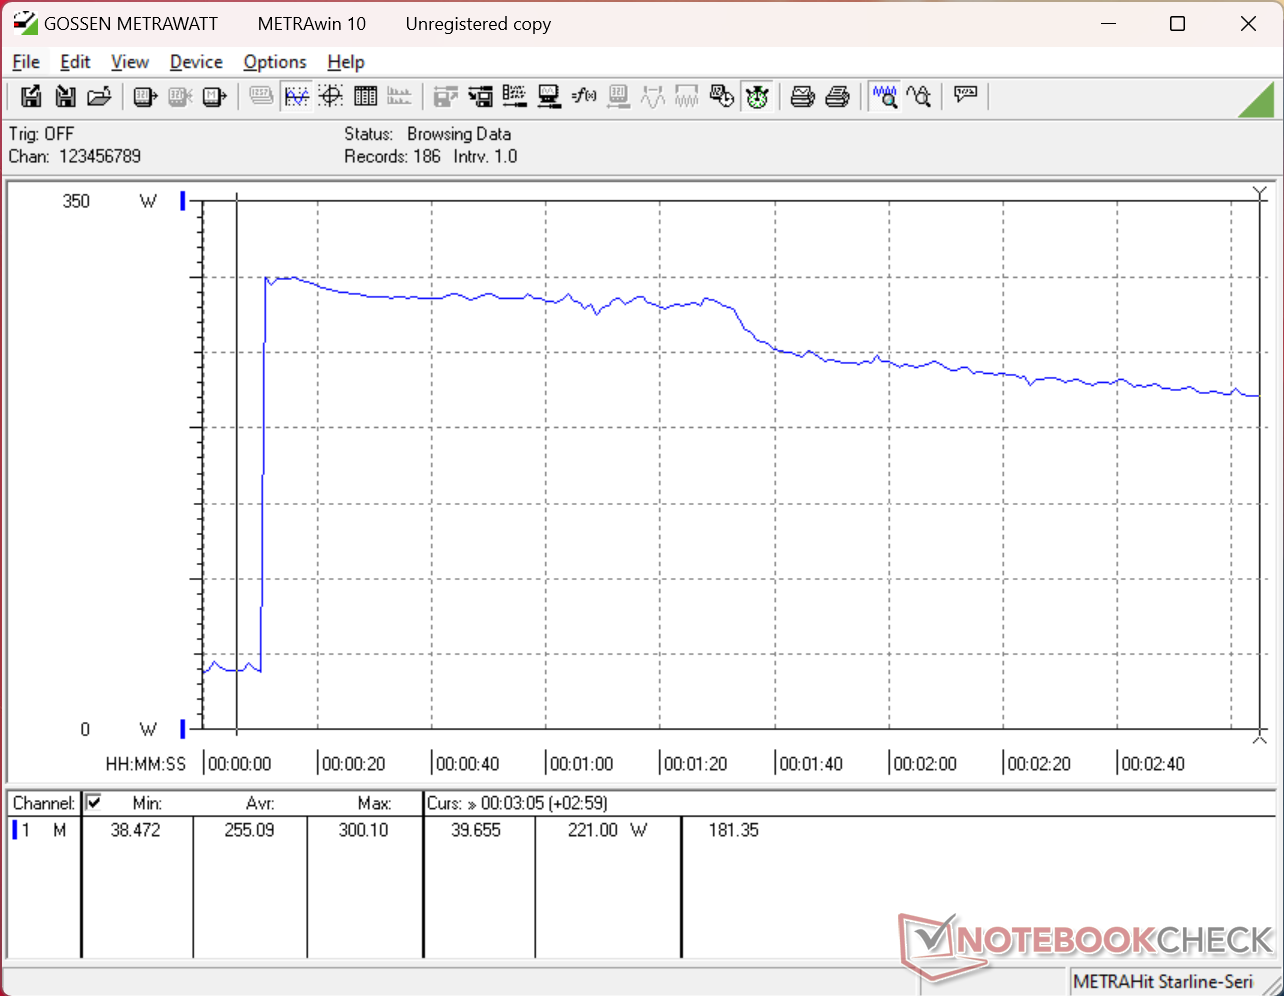
Temperatura rdzenia podczas uruchamiania Prime95 na zeszłorocznej 16X Aurora osiągnęłaby prawie 100 C. Core Ultra 9 290HX Plus w 2026 16X Aurora celuje w jeszcze wyższe częstotliwości taktowania, które, co nie jest zaskoczeniem, również osiągnęłyby prawie 100 C podczas uruchamiania Prime95. Procesor prawdopodobnie mógłby działać lepiej, gdyby chłodzenie laptopa było bardziej efektywne. Przykładowo, procesor zwiększał taktowanie do 4,3 GHz i 163 W przez zaledwie sekundę lub dwie, po czym stale spadał do 3,4 GHz i 97 W, wskazując na ograniczony potencjał Turbo Boost.
Temperatury rdzenia podczas grania są niższe w tegorocznym modelu w porównaniu do poprzedniego roku ze względu na różnice w konfiguracji. Mówiąc dokładniej, RTX 5070 Ti celuje w niższe częstotliwości taktowania niż RTX 5070, dzięki czemu temperatury pracy są o kilka stopni C niższe. Pobór mocy GPU w trybie Overdrive, Performance i Balanced ustabilizował się odpowiednio na poziomie 114 W, 97 W i 84 W.
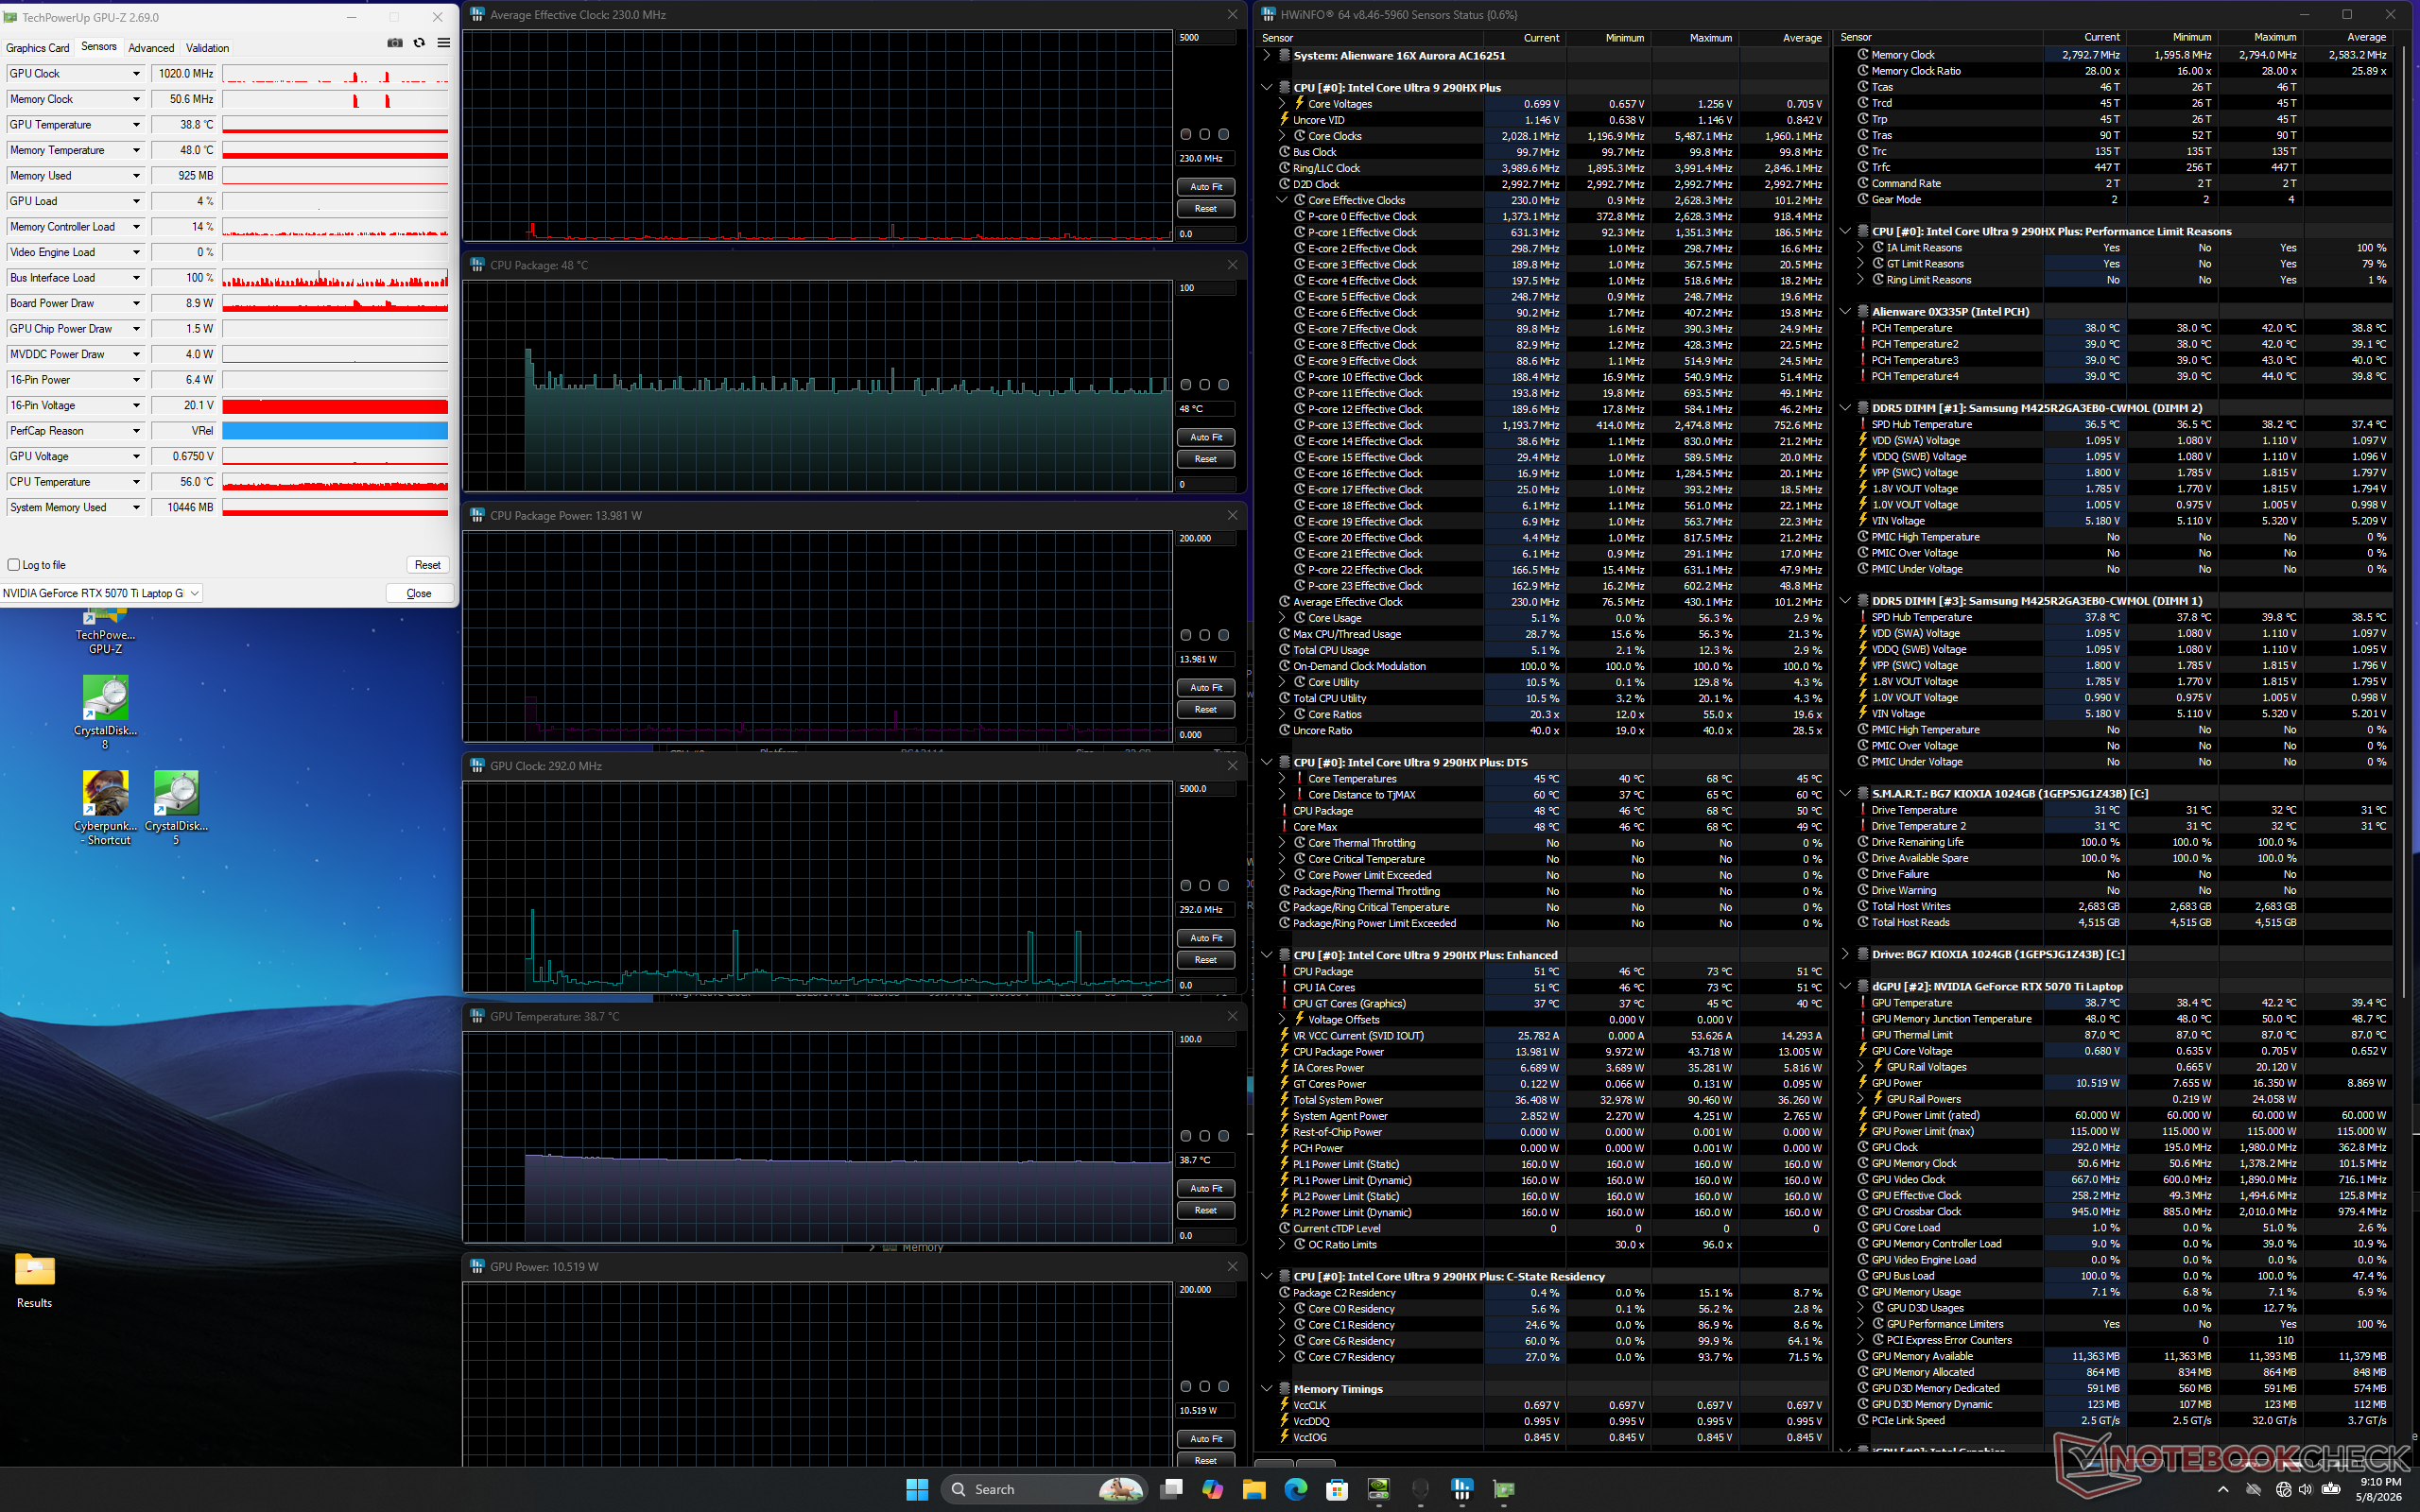
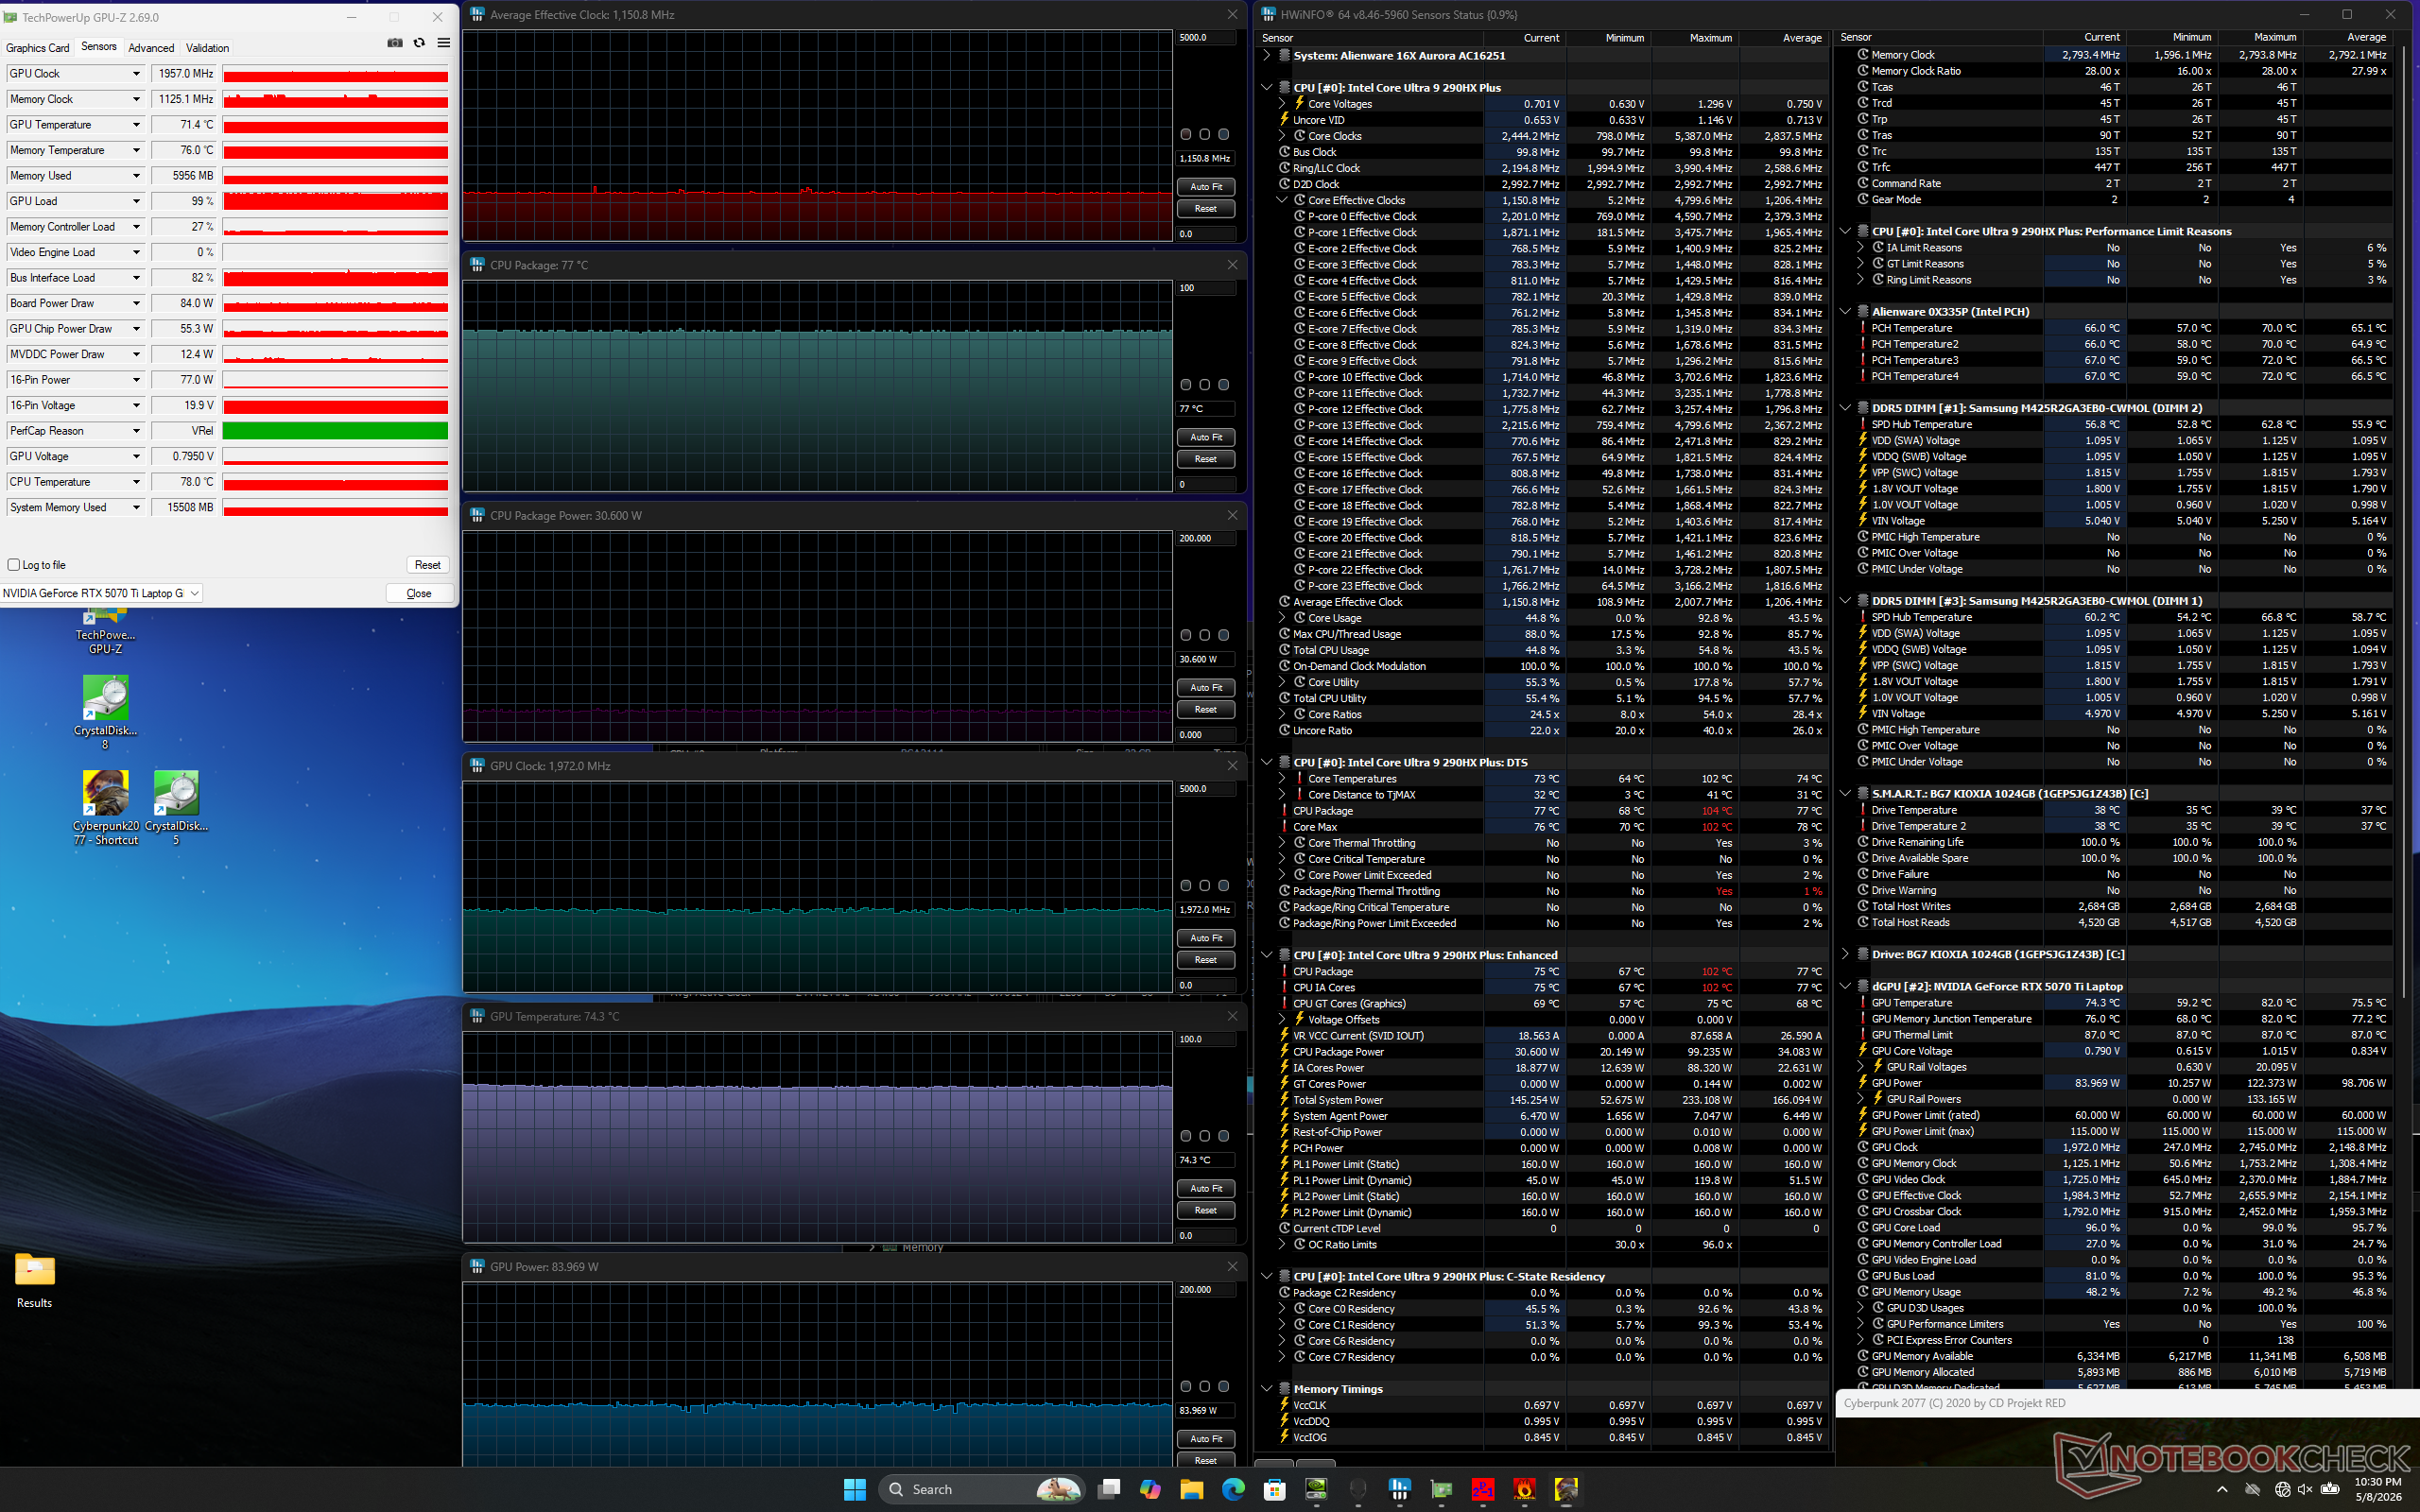
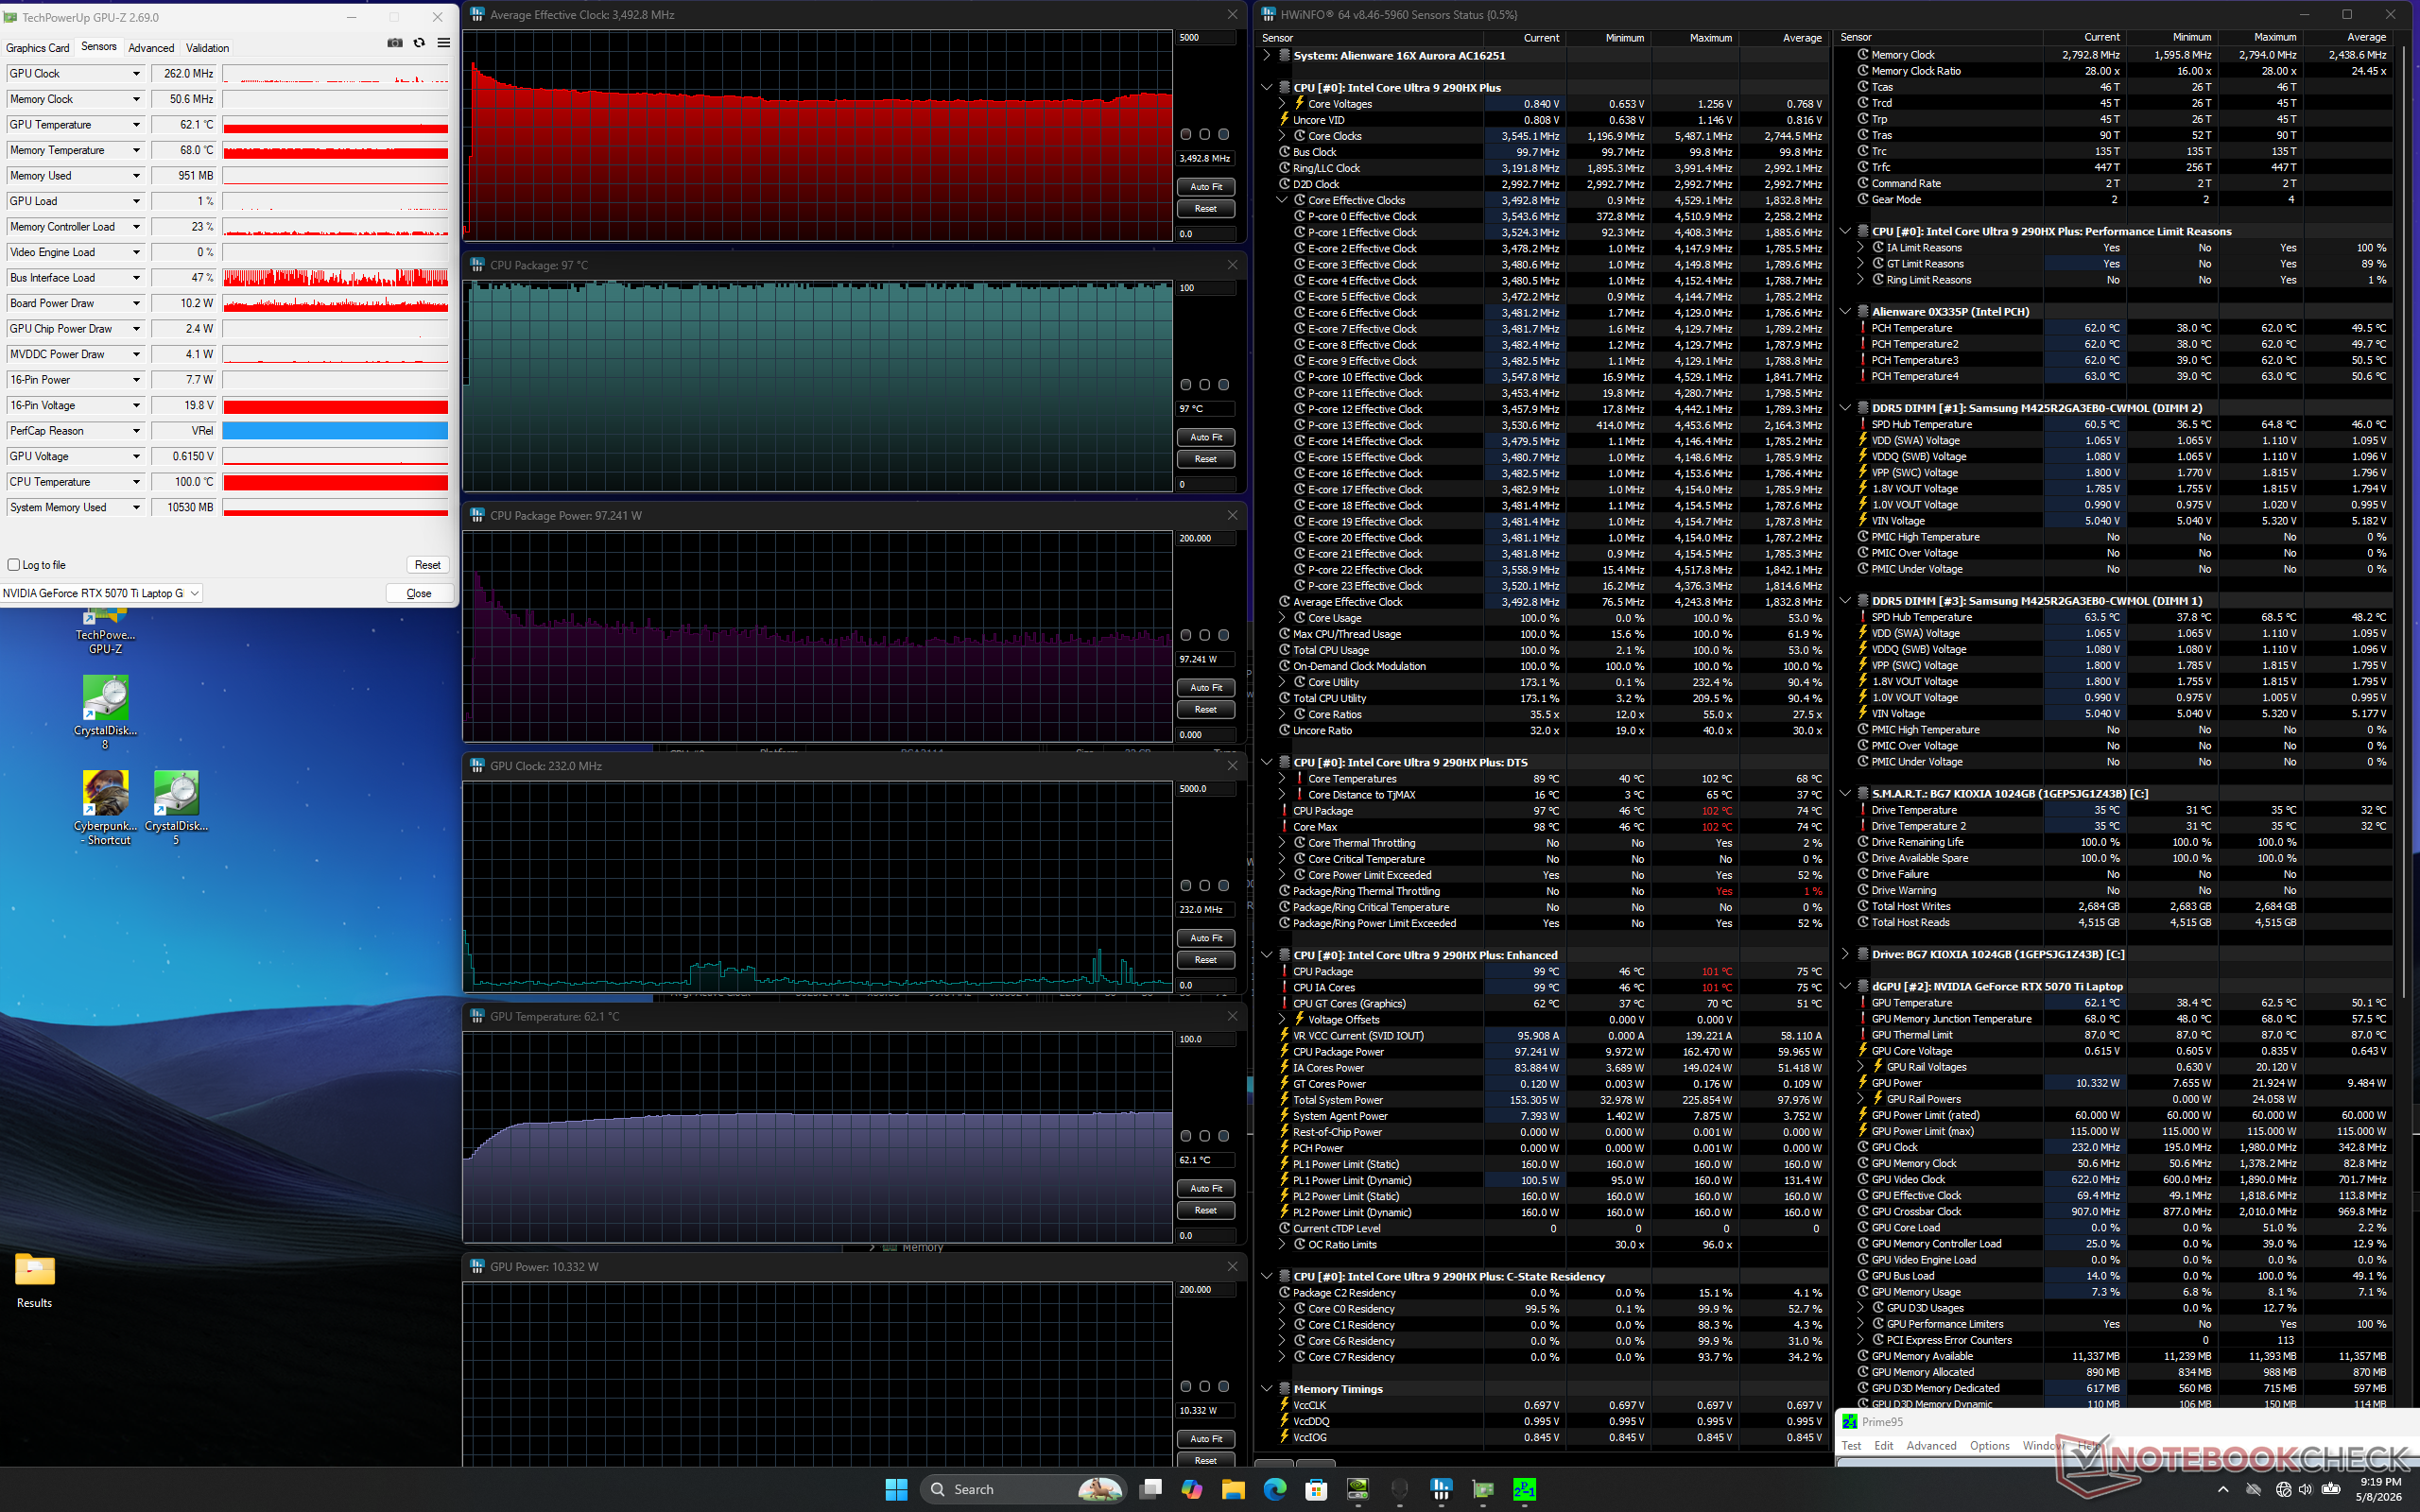
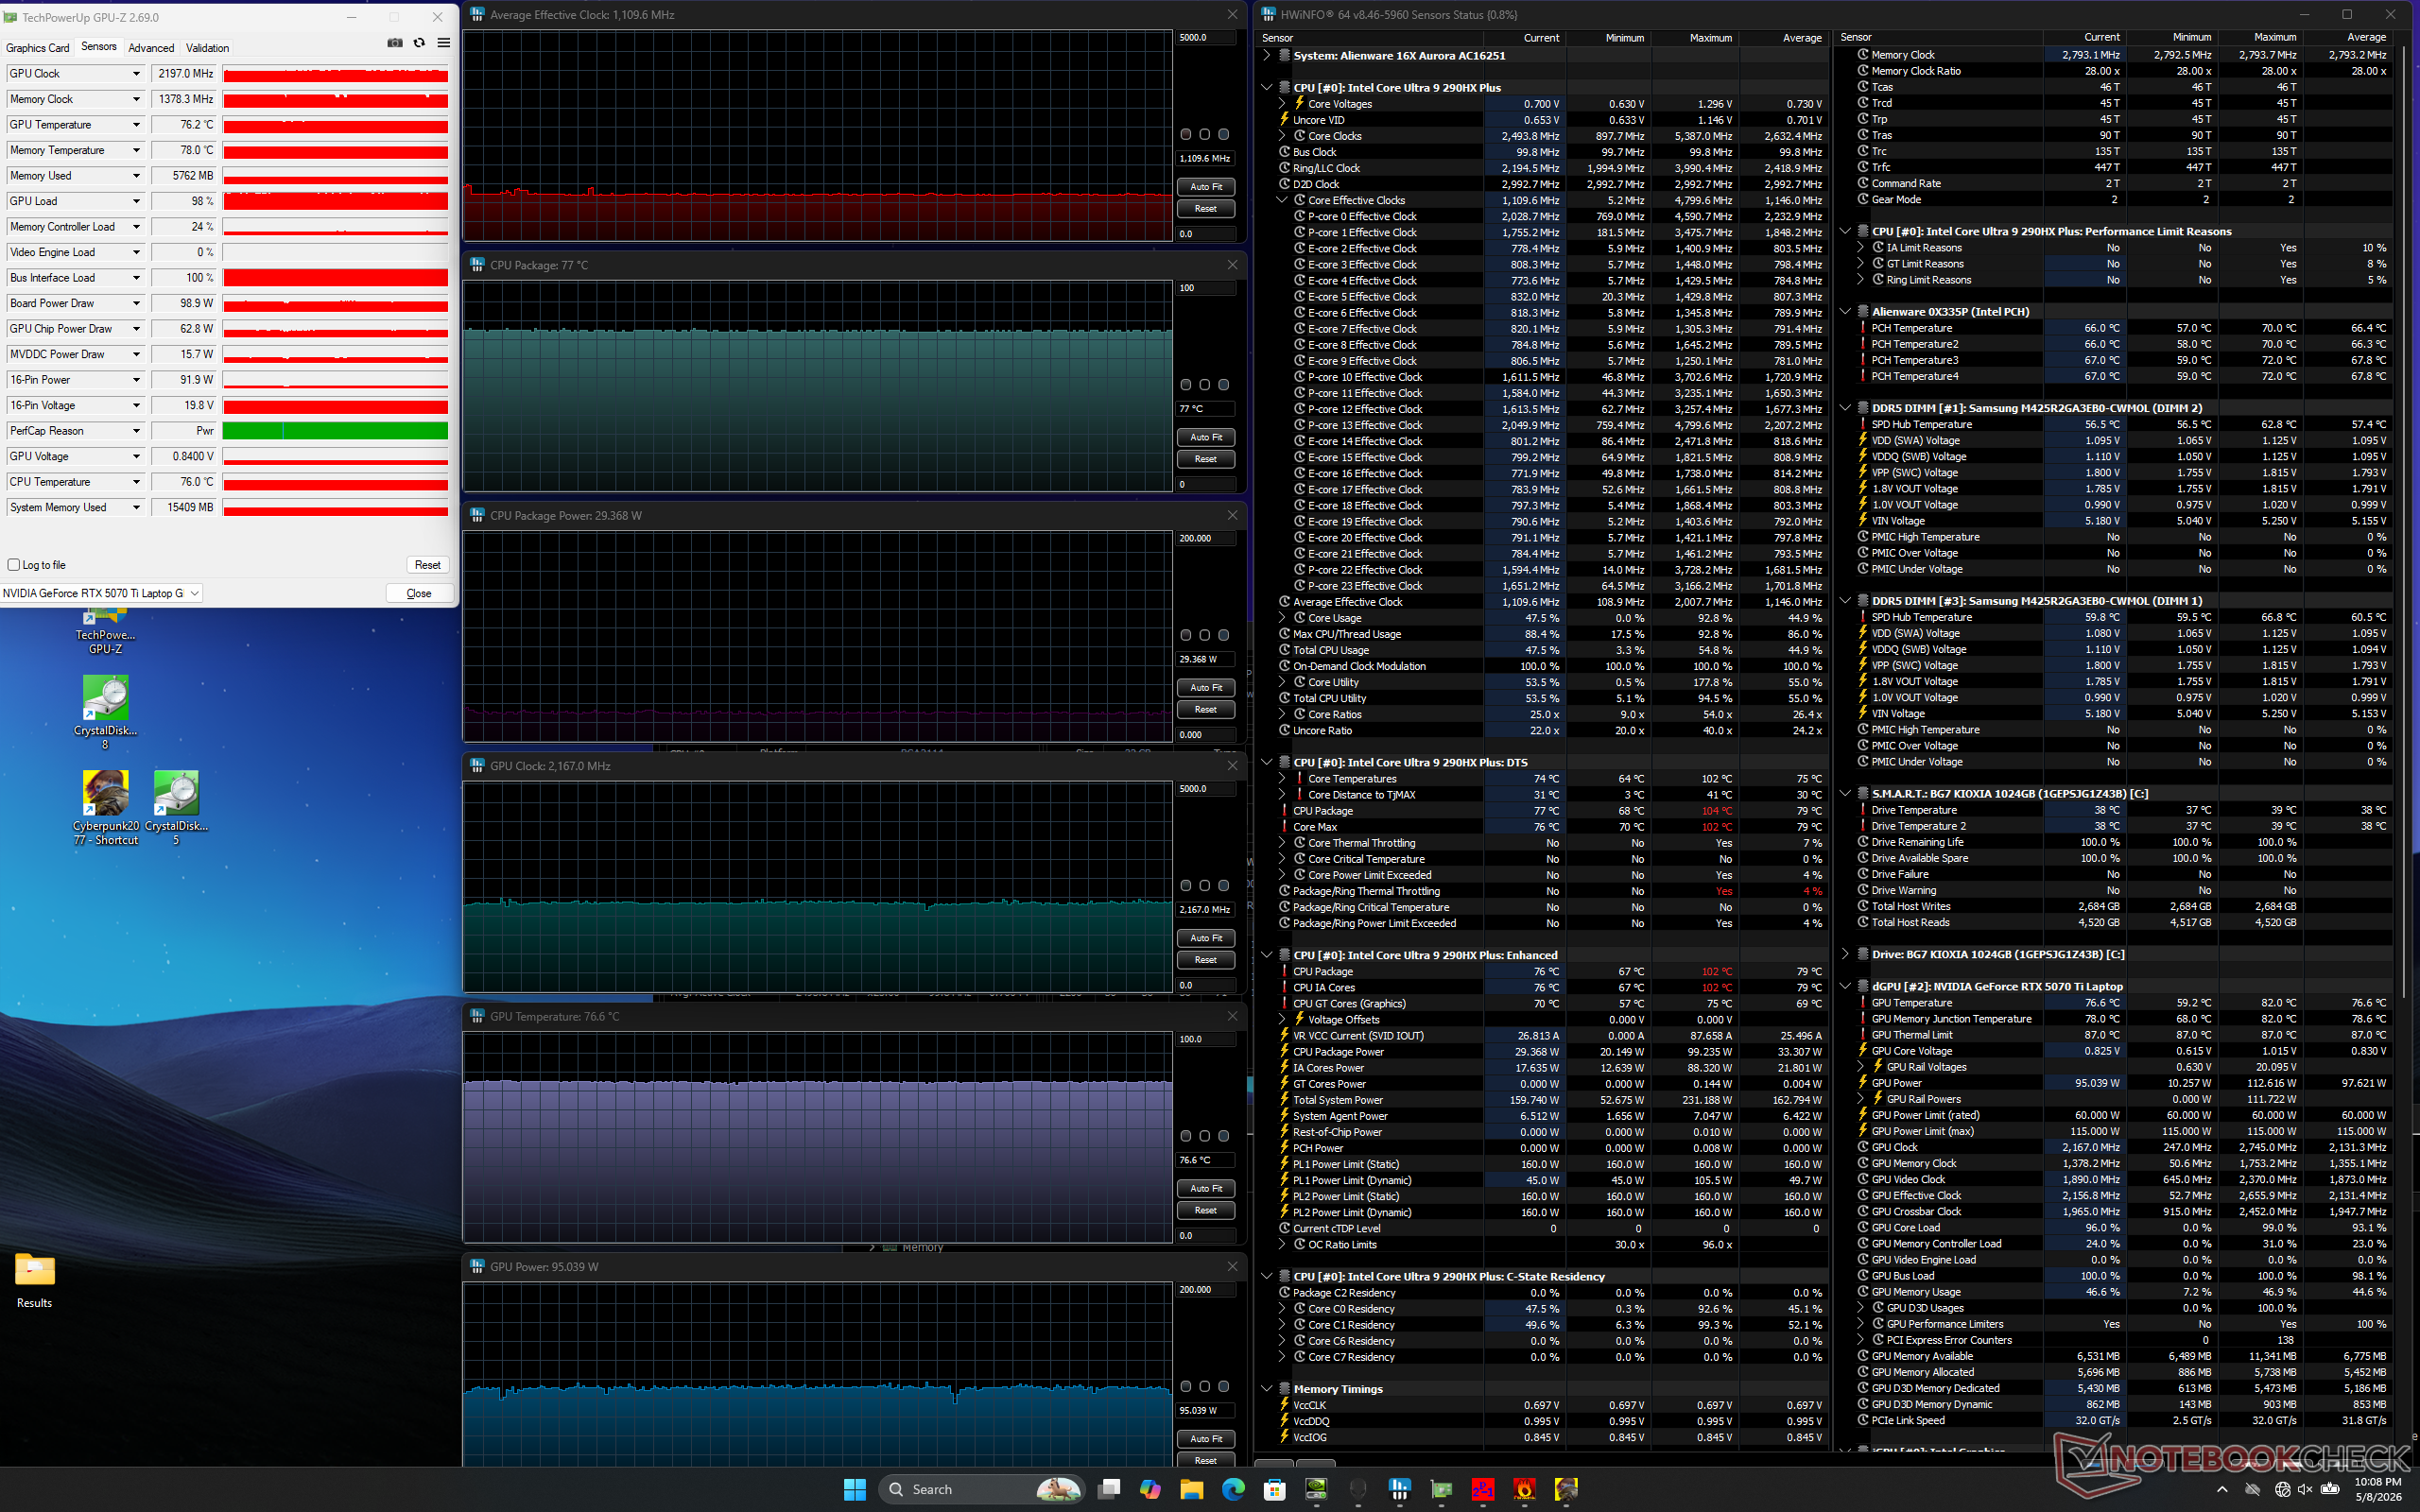
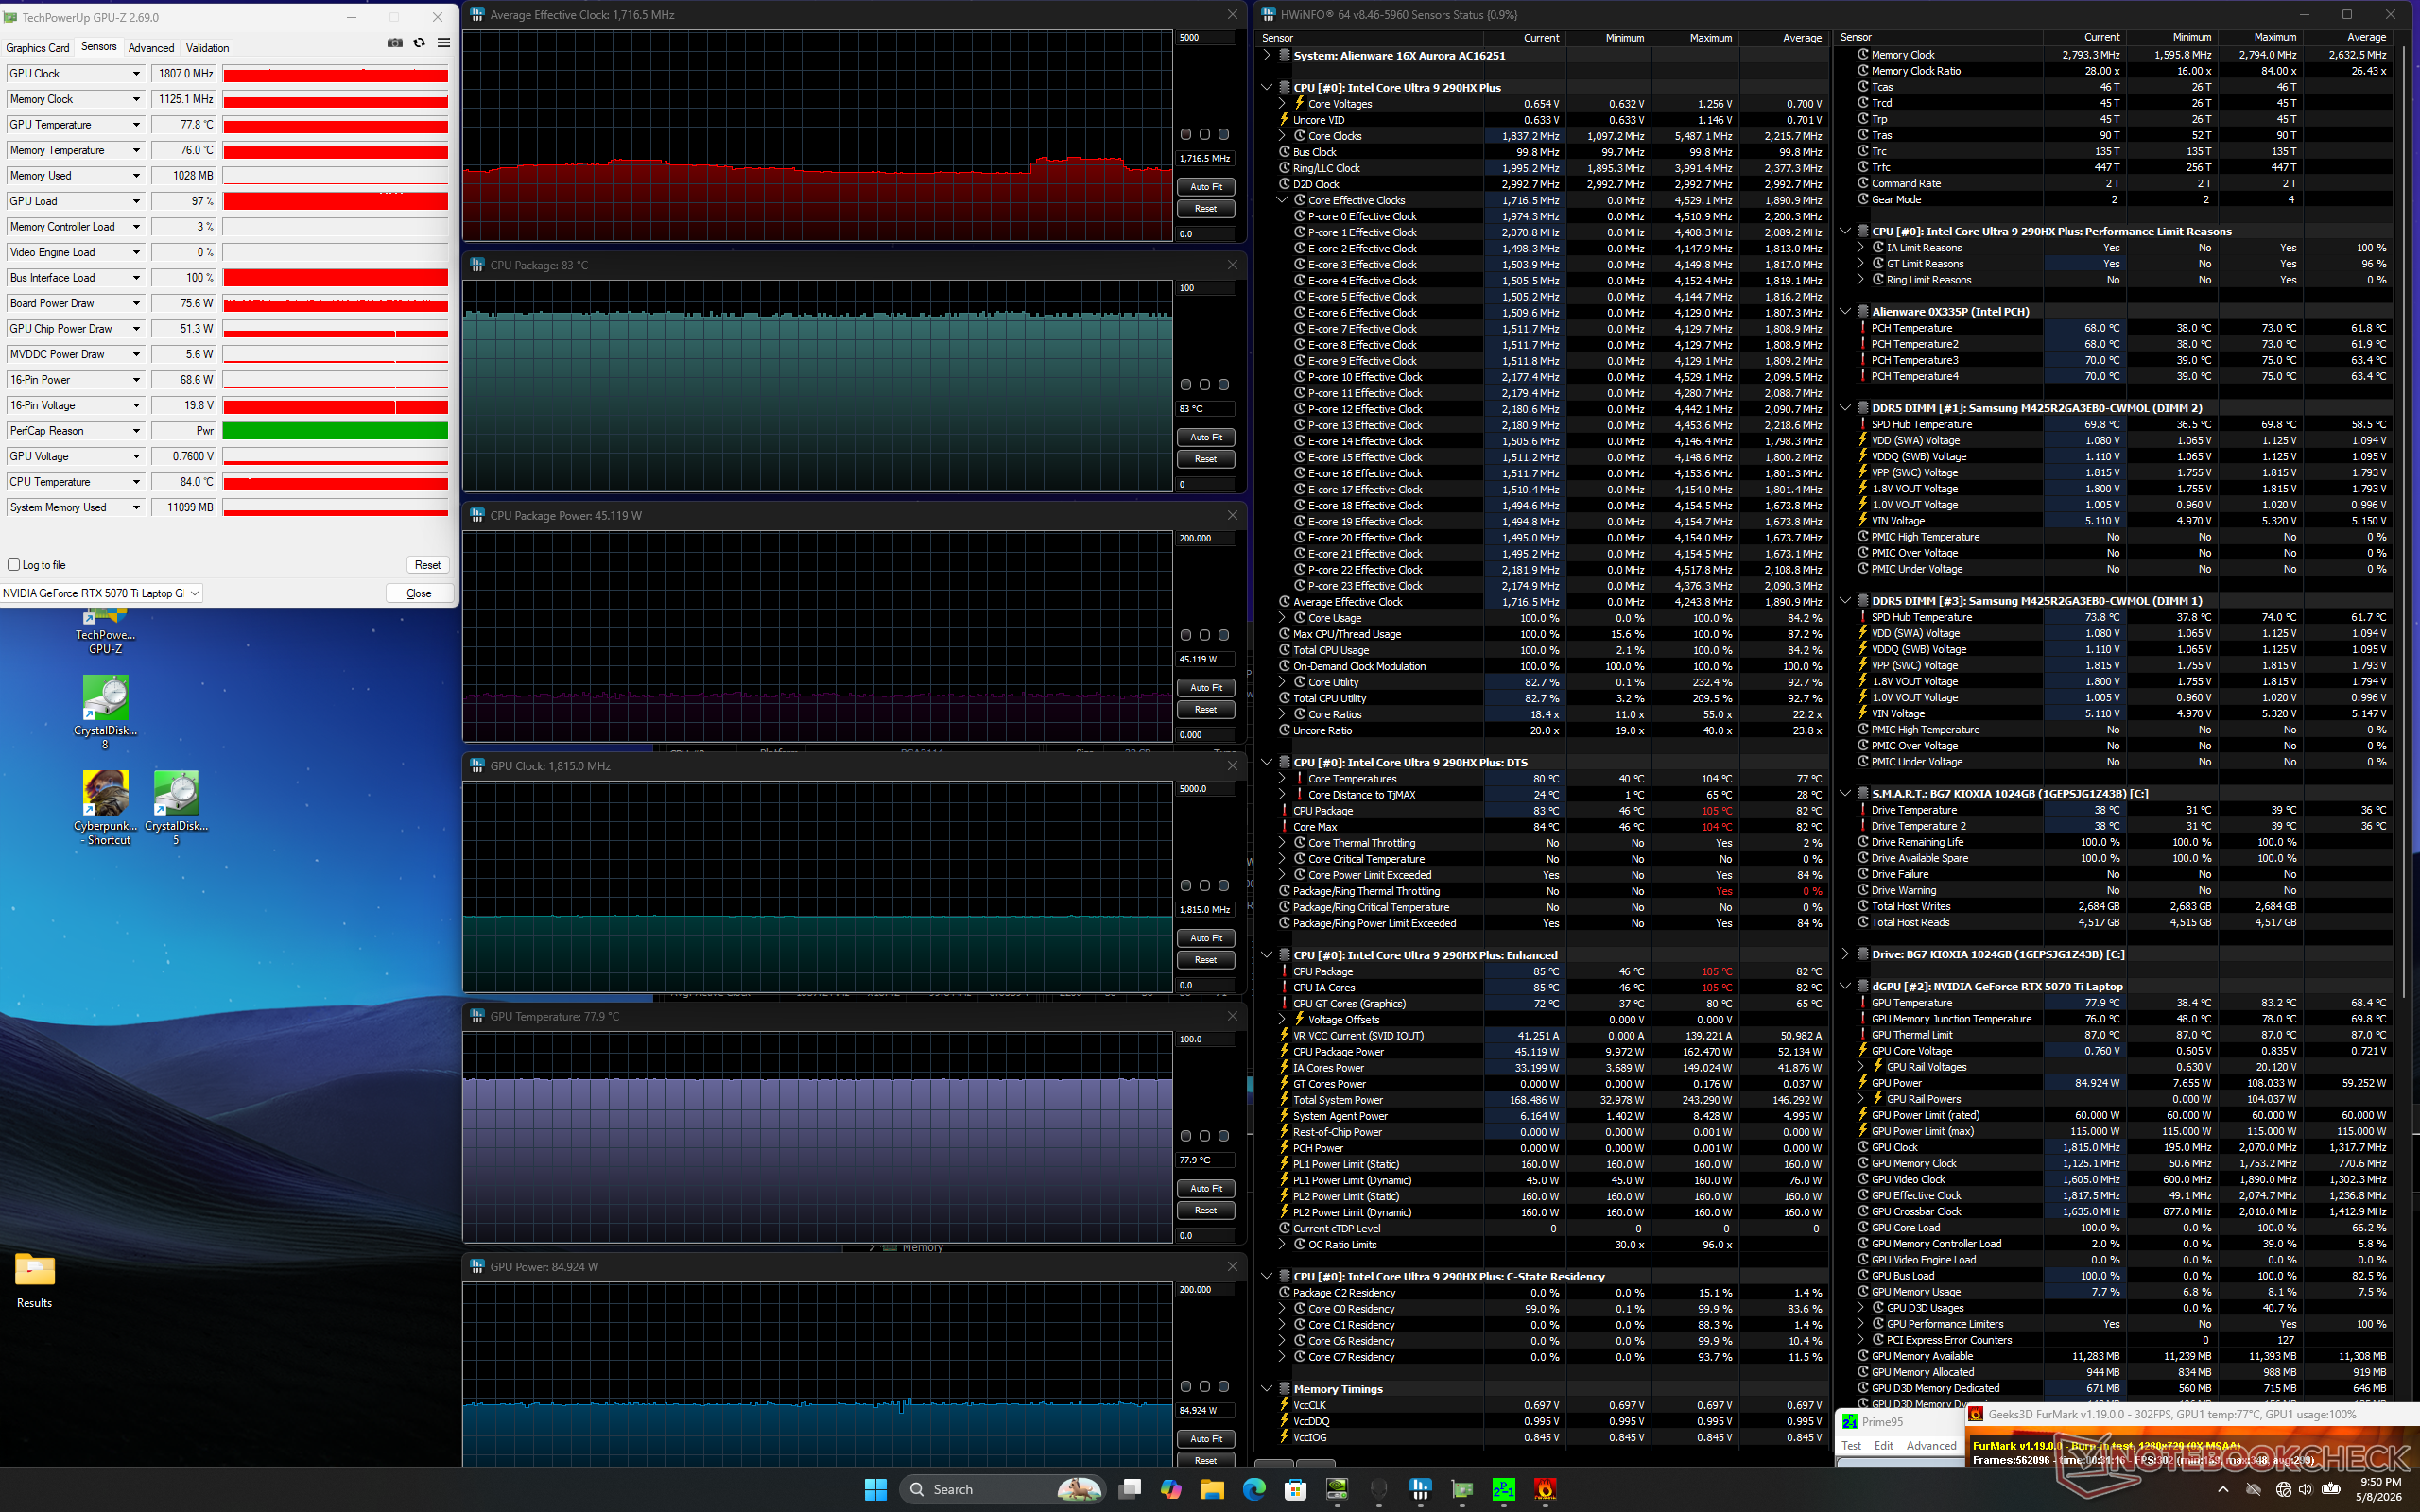
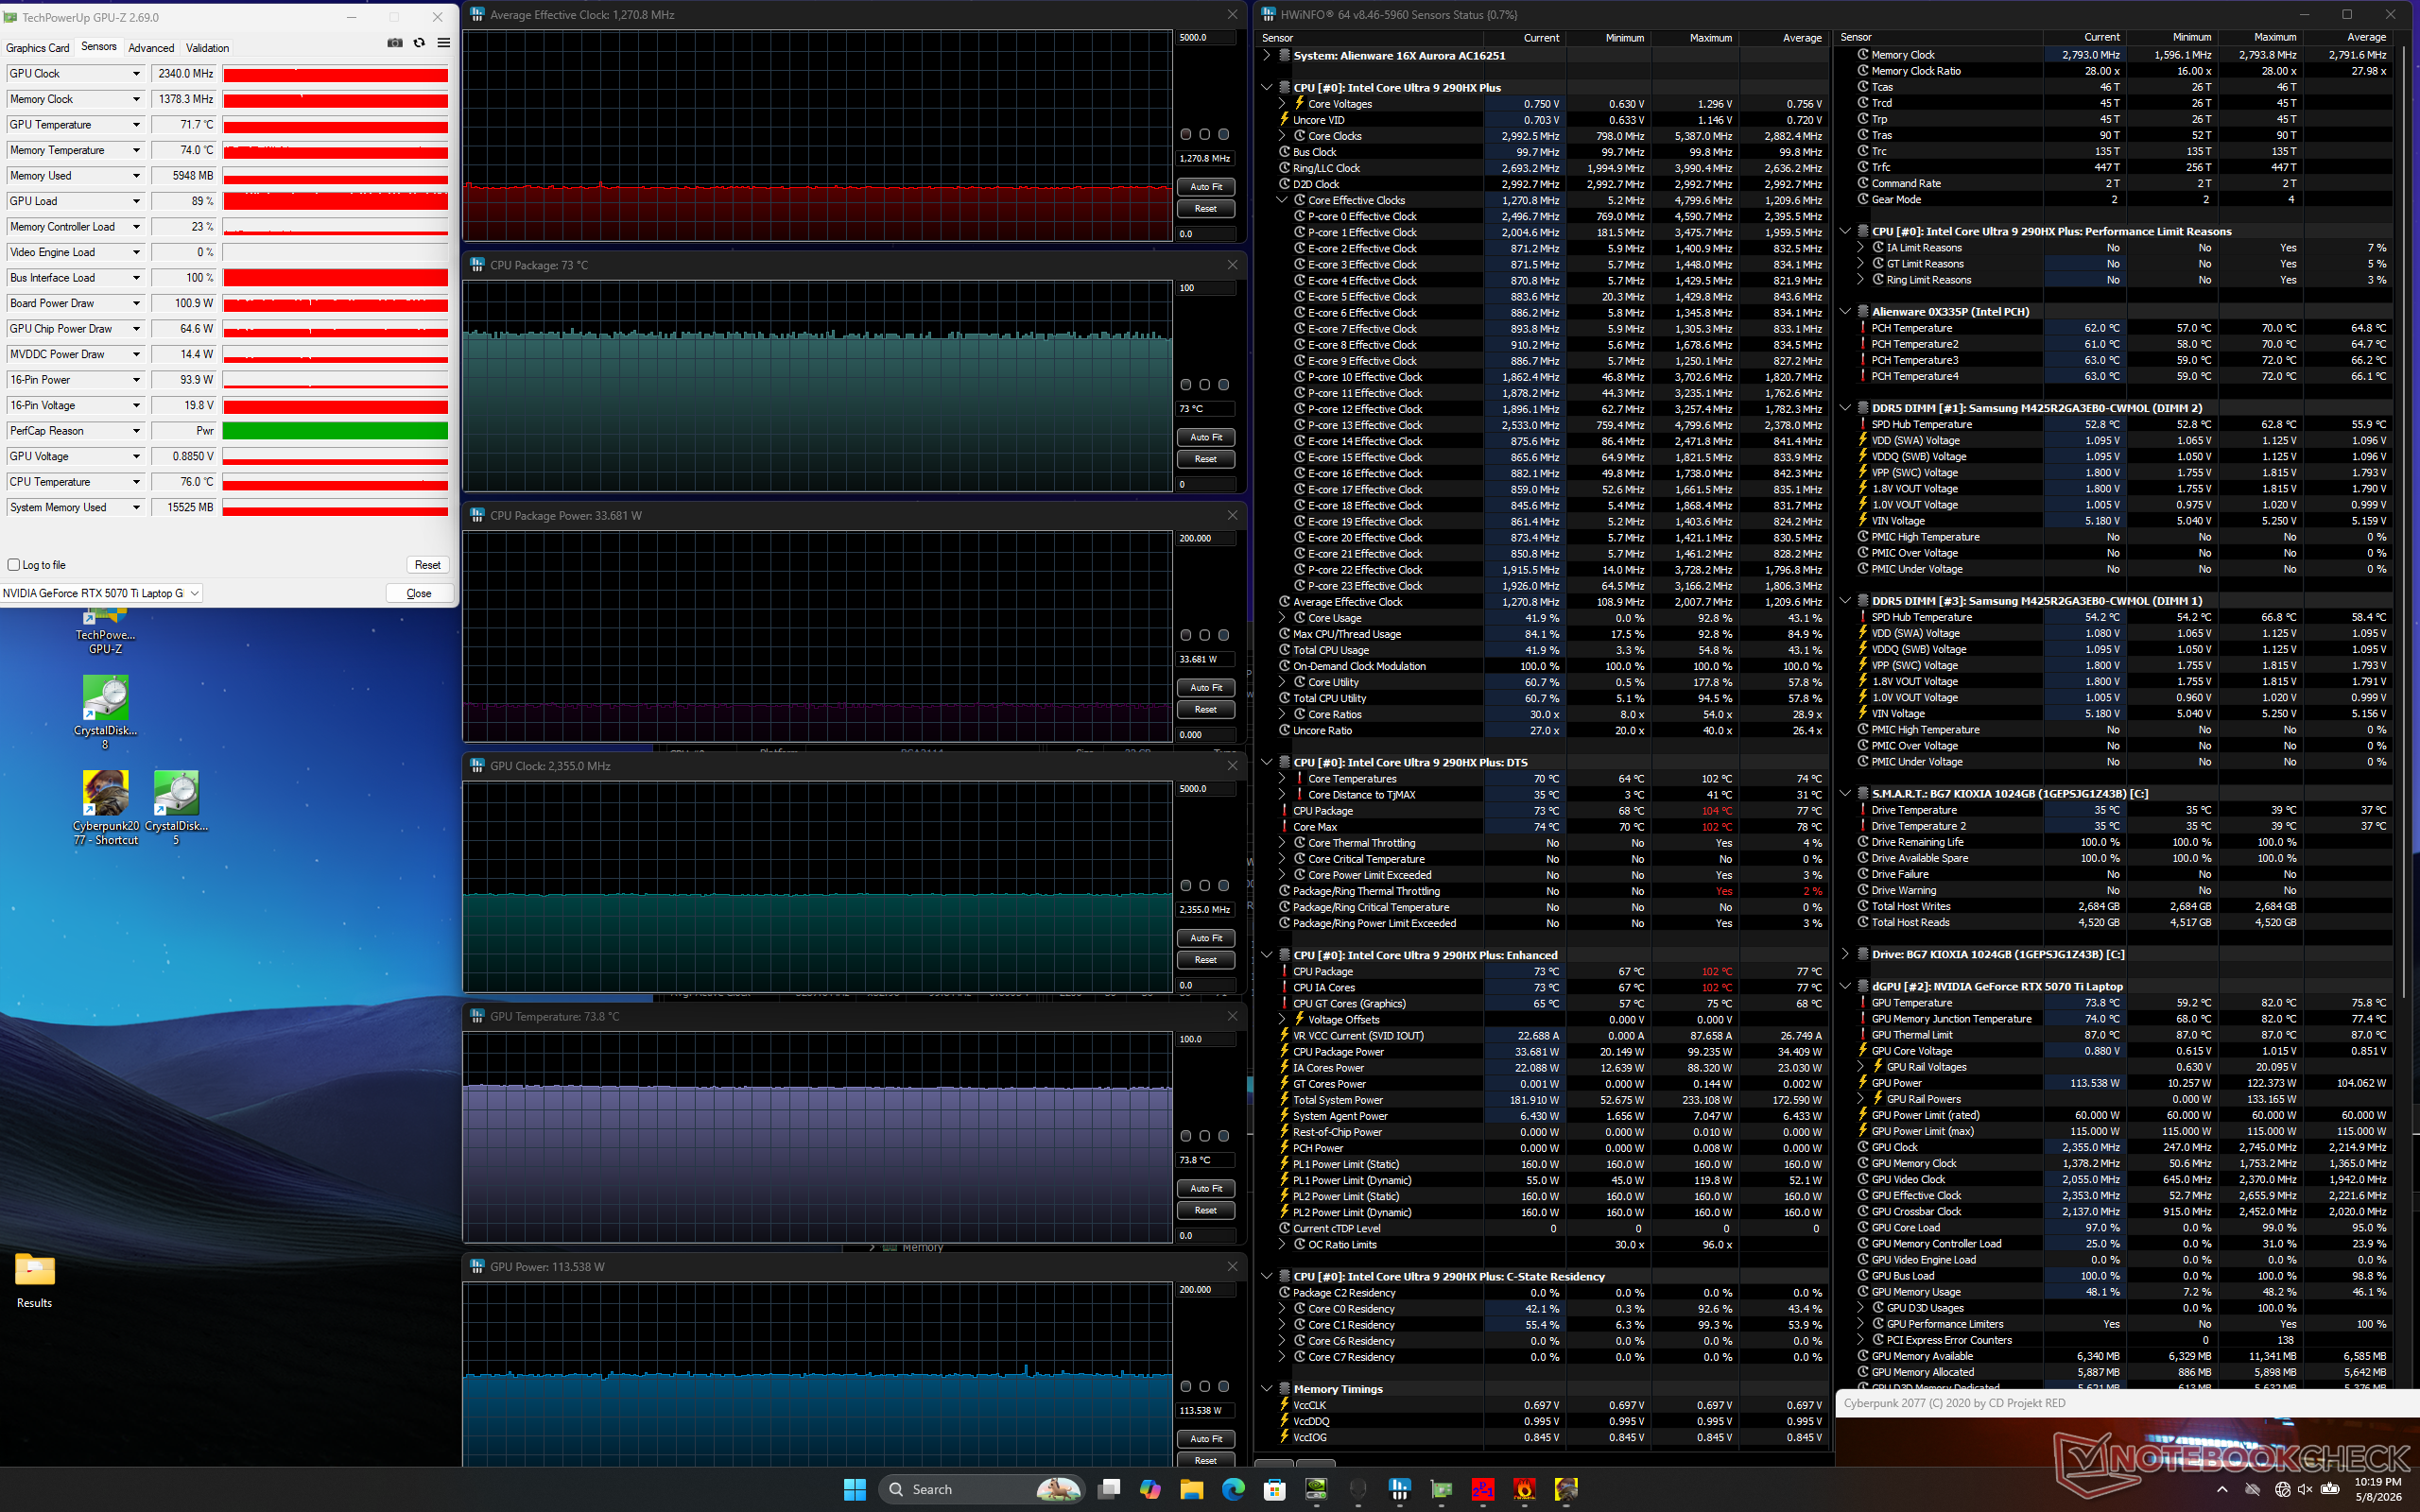
| Średnie taktowanieCPU (GHz) | Taktowanie GPU (MHz) | Średnia temperatura CPU (°C) | Średnia temperatura GPU (°C) | |
| System w stanie spoczynku | -- | -- | 48 | 39 |
| Prime95 Stress | 3.5 | -- | 97 | 62 |
| Prime95 + FurMark Stress | 1.7 | 1815 | 83 | 78 |
| Cyberpunk 2077 Stres (tryb zrównoważony) | 1.2 | 1972 | 77 | 74 |
| Cyberpunk 2077 Stress (tryb wydajności) | 1.1 | 2167 | 77 | 77 |
| Cyberpunk 2077 Stress (tryb Overdrive) | 1.3 | 2355 | 73 | 74 |
Głośniki
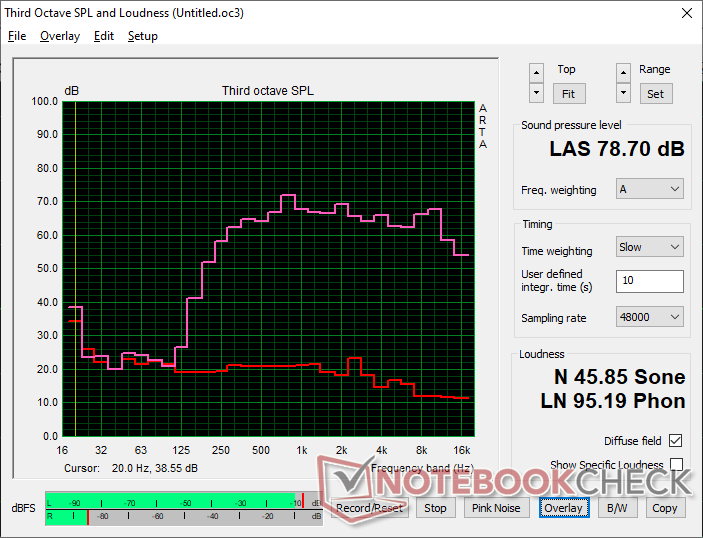
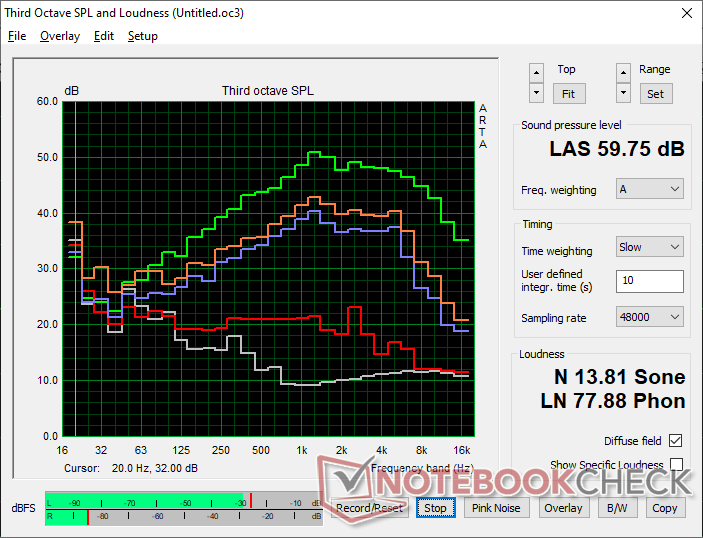
Alienware 16X Aurora Core Ultra 9 290HX Plus analiza dźwięku
(±) | głośność głośnika jest średnia, ale dobra (78.7 dB)
Bas 100 - 315 Hz
(-) | prawie brak basu - średnio 20.8% niższa od mediany
(-) | bas nie jest liniowy (16% delta do poprzedniej częstotliwości)
Średnie 400 - 2000 Hz
(+) | zbalansowane środki średnie - tylko 3% od mediany
(+) | średnie są liniowe (5.1% delta do poprzedniej częstotliwości)
Wysokie 2–16 kHz
(+) | zrównoważone maksima - tylko 1.7% od mediany
(+) | wzloty są liniowe (4.9% delta do poprzedniej częstotliwości)
Ogólnie 100 - 16.000 Hz
(±) | liniowość ogólnego dźwięku jest średnia (18.5% różnicy w stosunku do mediany)
W porównaniu do tej samej klasy
» 60% wszystkich testowanych urządzeń w tej klasie było lepszych, 8% podobnych, 32% gorszych
» Najlepszy miał deltę 6%, średnia wynosiła ###średnia###%, najgorsza wynosiła 132%
W porównaniu do wszystkich testowanych urządzeń
» 41% wszystkich testowanych urządzeń było lepszych, 8% podobnych, 51% gorszych
» Najlepszy miał deltę 4%, średnia wynosiła ###średnia###%, najgorsza wynosiła 134%
Apple MacBook Pro 16 2021 M1 Pro analiza dźwięku
(+) | głośniki mogą odtwarzać stosunkowo głośno (84.7 dB)
Bas 100 - 315 Hz
(+) | dobry bas - tylko 3.8% od mediany
(+) | bas jest liniowy (5.2% delta do poprzedniej częstotliwości)
Średnie 400 - 2000 Hz
(+) | zbalansowane środki średnie - tylko 1.3% od mediany
(+) | średnie są liniowe (2.1% delta do poprzedniej częstotliwości)
Wysokie 2–16 kHz
(+) | zrównoważone maksima - tylko 1.9% od mediany
(+) | wzloty są liniowe (2.7% delta do poprzedniej częstotliwości)
Ogólnie 100 - 16.000 Hz
(+) | ogólny dźwięk jest liniowy (4.6% różnicy w stosunku do mediany)
W porównaniu do tej samej klasy
» 0% wszystkich testowanych urządzeń w tej klasie było lepszych, 0% podobnych, 100% gorszych
» Najlepszy miał deltę 5%, średnia wynosiła ###średnia###%, najgorsza wynosiła 45%
W porównaniu do wszystkich testowanych urządzeń
» 0% wszystkich testowanych urządzeń było lepszych, 0% podobnych, 100% gorszych
» Najlepszy miał deltę 4%, średnia wynosiła ###średnia###%, najgorsza wynosiła 134%
Zarządzanie energią
Zużycie energii
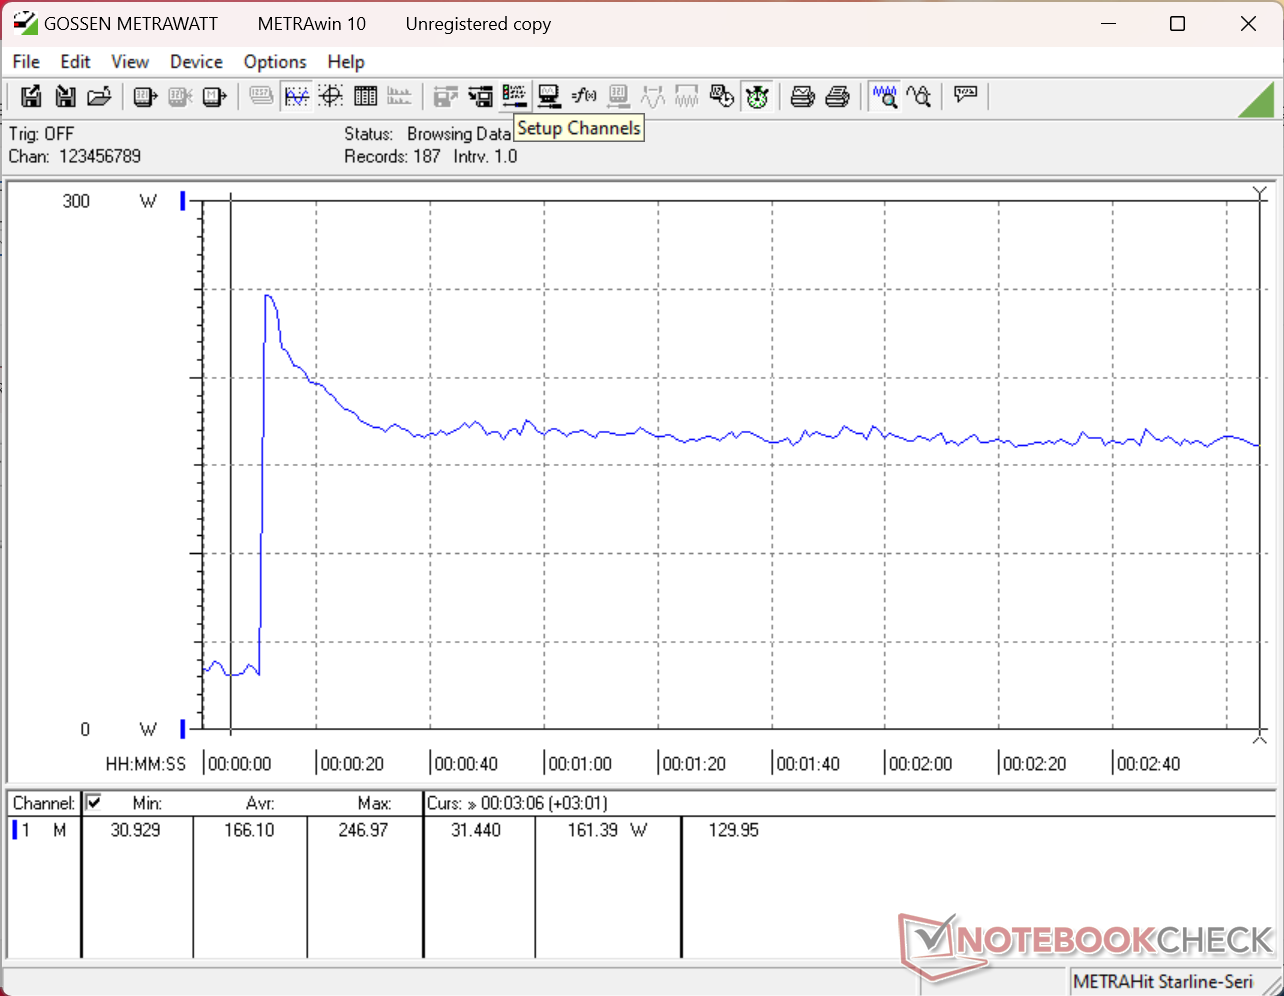
Zużycie na biegu jałowym może być jednocyfrowe, co jest znacznie niższe niż to, co odnotowaliśmy w modelu 2025. W przeciwnym razie wyniki są prawie identyczne między dwoma modelami, gdy wprowadzane są wyższe obciążenia, w tym nawet skok i stopniowe tempo spadku w Prime95 i / lub FurMark.
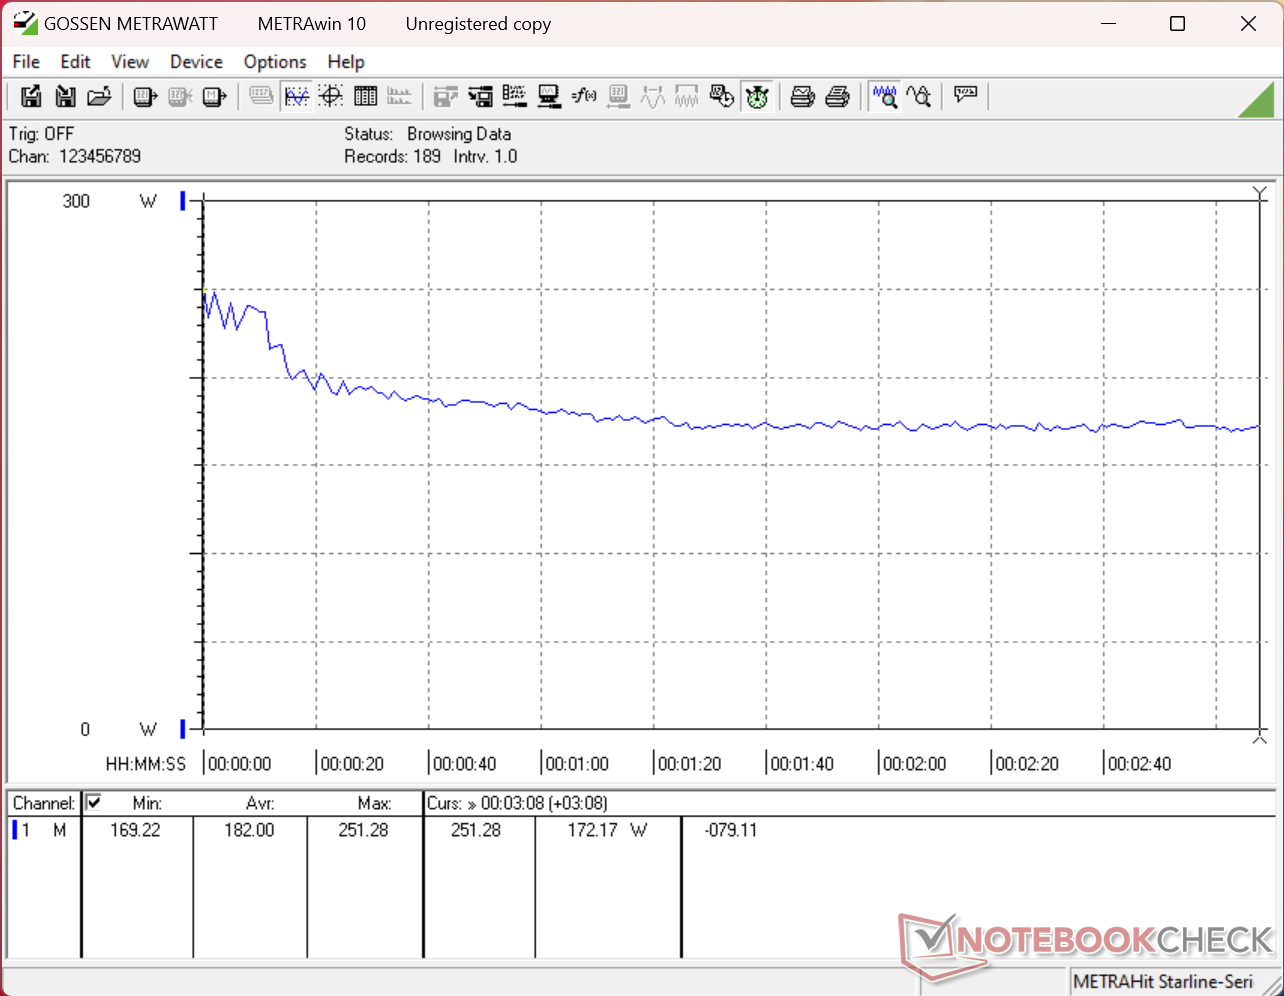
Zużycie energii podczas uruchamiania gry Cyberpunk 2077 wyniosłoby średnio 172 W i 199 W odpowiednio w trybie Performance i Overdrive, co byłoby o kilka watów więcej niż odnotowaliśmy w zeszłorocznym modelu. Jednak niewielki, 4-procentowy wzrost zużycia energii jest prawdopodobnie wart 20-procentowego wzrostu liczby klatek na sekundę.
| wyłączony / stan wstrzymania | |
| luz | |
| obciążenie |
|
Legenda:
min: | |
| Alienware 16X Aurora Core Ultra 9 290HX Plus Ultra 9 290HX Plus, GeForce RTX 5070 Ti Laptop, , OLED, 2560x1600, 16" | Alienware 16X Aurora, RTX 5070 Ultra 9 275HX, GeForce RTX 5070 Laptop, , IPS, 2560x1600, 16" | Acer Predator Helios Neo 16S AI PHN16S-71-94L9 Ultra 9 275HX, GeForce RTX 5070 Ti Laptop, Micron 3500 1TB MTFDKBA1T0TGD, OLED, 2560x1600, 16" | Lenovo Legion Pro 5 16IAX10, RTX 5070 Ultra 7 255HX, GeForce RTX 5070 Laptop, SK Hynix HFS001TEJ9X115N, OLED, 2650x1600, 16" | MSI Vector 16 HX AI A2XWHG Ultra 7 255HX, GeForce RTX 5070 Ti Laptop, Micron 2400 MTFDKBA512QFM, IPS, 2560x1600, 16" | Asus ROG Zephyrus G16 GU605CW Ultra 9 285H, GeForce RTX 5080 Laptop, Micron 2500 2TB MTFDKBA2T0QGN-1BN1AABGA, OLED, 2560x1600, 16" | |
|---|---|---|---|---|---|---|
| Power Consumption | -62% | 17% | -11% | -20% | -3% | |
| Idle Minimum * (Watt) | 6.9 | 20.1 -191% | 3.9 43% | 10.6 -54% | 7.1 -3% | 12.6 -83% |
| Idle Average * (Watt) | 8.1 | 27.6 -241% | 11 -36% | 12.3 -52% | 15.9 -96% | 13.4 -65% |
| Idle Maximum * (Watt) | 31 | 31.8 -3% | 16.9 45% | 18.6 40% | 29.5 5% | 15.1 51% |
| Load Average * (Watt) | 131.6 | 102.7 22% | 123 7% | 104 21% | 124 6% | 116.3 12% |
| Cyberpunk 2077 ultra * (Watt) | 198.3 | 217 -9% | 152.7 23% | 231 -16% | 222 -12% | 156.4 21% |
| Cyberpunk 2077 ultra external monitor * (Watt) | 172.1 | 192.3 -12% | 144.9 16% | 227 -32% | 217 -26% | 157.9 8% |
| Load Maximum * (Watt) | 300.1 | 292 3% | 229 24% | 248 17% | 336 -12% | 199 34% |
* ... im mniej tym lepiej
Pobór mocy Cyberpunk / Test warunków skrajnych
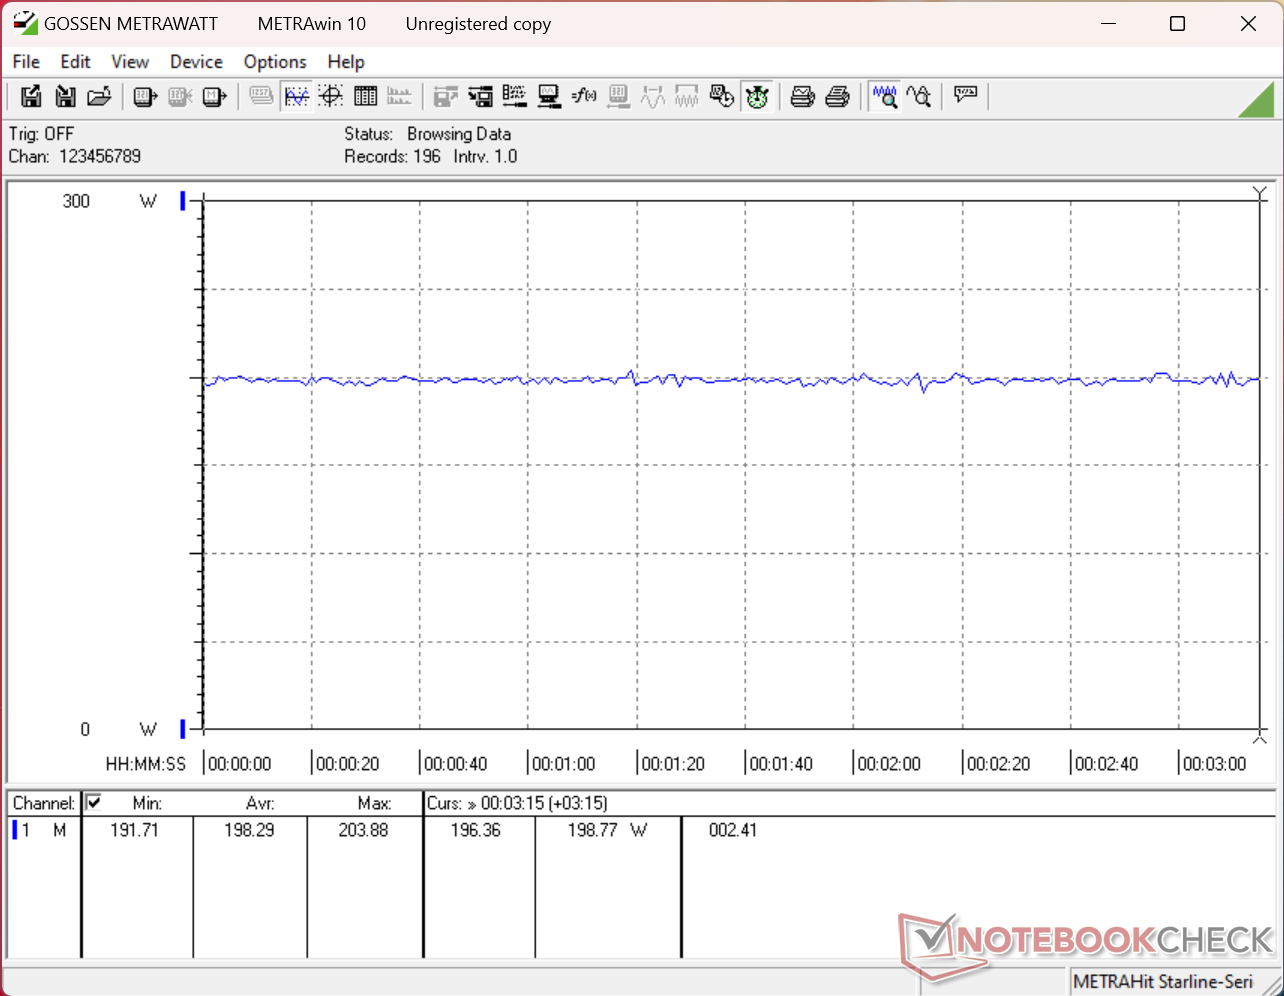
Zużycie energii przez monitor zewnętrzny
Żywotność baterii
Niższe zużycie energii na biegu jałowym, o którym mowa powyżej, doprowadziło do dłuższego czasu pracy na baterii w porównaniu z zeszłorocznym modelem, pomimo przejścia z IPS na OLED. Proszę jednak pamiętać, aby ustawić GPU na "Automatyczny", wyświetlacz na 60 Hz, a profil zasilania na "Zrównoważony" lub niższy, aby osiągnąć czas pracy WLAN powyżej 7 godzin.
| Alienware 16X Aurora Core Ultra 9 290HX Plus Ultra 9 290HX Plus, GeForce RTX 5070 Ti Laptop, 96 Wh | Alienware 16X Aurora, RTX 5070 Ultra 9 275HX, GeForce RTX 5070 Laptop, 96 Wh | Acer Predator Helios Neo 16S AI PHN16S-71-94L9 Ultra 9 275HX, GeForce RTX 5070 Ti Laptop, 76 Wh | Lenovo Legion Pro 5 16IAX10, RTX 5070 Ultra 7 255HX, GeForce RTX 5070 Laptop, 80 Wh | MSI Vector 16 HX AI A2XWHG Ultra 7 255HX, GeForce RTX 5070 Ti Laptop, 90 Wh | Asus ROG Zephyrus G16 GA605WV Ryzen AI 9 HX 370, GeForce RTX 4060 Laptop GPU, 90 Wh | |
|---|---|---|---|---|---|---|
| Czasy pracy | -42% | -32% | -16% | -5% | 8% | |
| WiFi v1.3 (h) | 7.4 | 4.3 -42% | 5 -32% | 6.2 -16% | 7 -5% | 8 8% |
| H.264 (h) | 6.1 | 13.7 | ||||
| Load (h) | 1.8 | 1.7 |
Ocena Notebookcheck
Alienware 16X Aurora 2026 oferuje bardziej zaawansowane konfiguracje niż w poprzednim roku, ale niektóre opcje są niestety powiązane lub dołączone do innych za zawyżone ceny.
Alienware 16X Aurora Core Ultra 9 290HX Plus
- 14/05/2026 v8
Allen Ngo
 Total Sustainability Score:
 Potencjalni konkurenci w porównaniu
Obraz | Model / recenzja | Cena | Waga | Wysokość | Ekran |
|---|---|---|---|---|---|
1. 85.9%  | Alienware 16X Aurora Core Ultra 9 290HX Plus Intel Core Ultra 9 290HX Plus ⎘ NVIDIA GeForce RTX 5070 Ti Laptop ⎘ 32 GB Pamięć | Amazon: Cena katalogowa: 3000 USD | 2.6 kg | 23.4 mm | 16.00" 2560x1600 189 PPI OLED |
2. 84.9%  | Alienware 16X Aurora, RTX 5070 Intel Core Ultra 9 275HX ⎘ NVIDIA GeForce RTX 5070 Laptop ⎘ 32 GB Pamięć | Amazon: Cena katalogowa: 1800 USD | 2.5 kg | 23.4 mm | 16.00" 2560x1600 189 PPI IPS |
3. 82%  | Acer Predator Helios Neo 16S AI PHN16S-71-94L9 Intel Core Ultra 9 275HX ⎘ NVIDIA GeForce RTX 5070 Ti Laptop ⎘ 32 GB Pamięć, 1024 GB SSD | Amazon: Cena katalogowa: 2400 EUR | 2.2 kg | 19.9 mm | 16.00" 2560x1600 189 PPI OLED |
4. 86.2%  | Lenovo Legion Pro 5 16IAX10, RTX 5070 Intel Core Ultra 7 255HX ⎘ NVIDIA GeForce RTX 5070 Laptop ⎘ 32 GB Pamięć, 1024 GB SSD | Amazon: Cena katalogowa: 1800 Euro | 2.3 kg | 25.95 mm | 16.00" 2650x1600 189 PPI OLED |
5. 84%  | MSI Vector 16 HX AI A2XWHG Intel Core Ultra 7 255HX ⎘ NVIDIA GeForce RTX 5070 Ti Laptop ⎘ 16 GB Pamięć, 512 GB SSD | Amazon: Cena katalogowa: 2000 EUR | 2.6 kg | 28.6 mm | 16.00" 2560x1600 189 PPI IPS |
6.  | Asus ROG Zephyrus G16 GU605CW Intel Core Ultra 9 285H ⎘ NVIDIA GeForce RTX 5080 Laptop ⎘ 32 GB Pamięć, 2048 GB SSD | Amazon: Cena katalogowa: 3800€ | 2 kg | 14.9 mm | 16.00" 2560x1600 189 PPI OLED |
Przezroczystość
Wyboru urządzeń do recenzji dokonuje nasza redakcja. Próbka testowa została udostępniona autorowi jako pożyczka od producenta lub sprzedawcy detalicznego na potrzeby tej recenzji. Pożyczkodawca nie miał wpływu na tę recenzję, producent nie otrzymał też kopii tej recenzji przed publikacją. Nie było obowiązku publikowania tej recenzji. Jako niezależna firma medialna, Notebookcheck nie podlega władzy producentów, sprzedawców detalicznych ani wydawców.
Tak testuje Notebookcheck
Każdego roku Notebookcheck niezależnie sprawdza setki laptopów i smartfonów, stosując standardowe procedury, aby zapewnić porównywalność wszystkich wyników. Od około 20 lat stale rozwijamy nasze metody badawcze, ustanawiając przy tym standardy branżowe. W naszych laboratoriach testowych doświadczeni technicy i redaktorzy korzystają z wysokiej jakości sprzętu pomiarowego. Testy te obejmują wieloetapowy proces walidacji. Nasz kompleksowy system ocen opiera się na setkach uzasadnionych pomiarów i benchmarków, co pozwala zachować obiektywizm.
