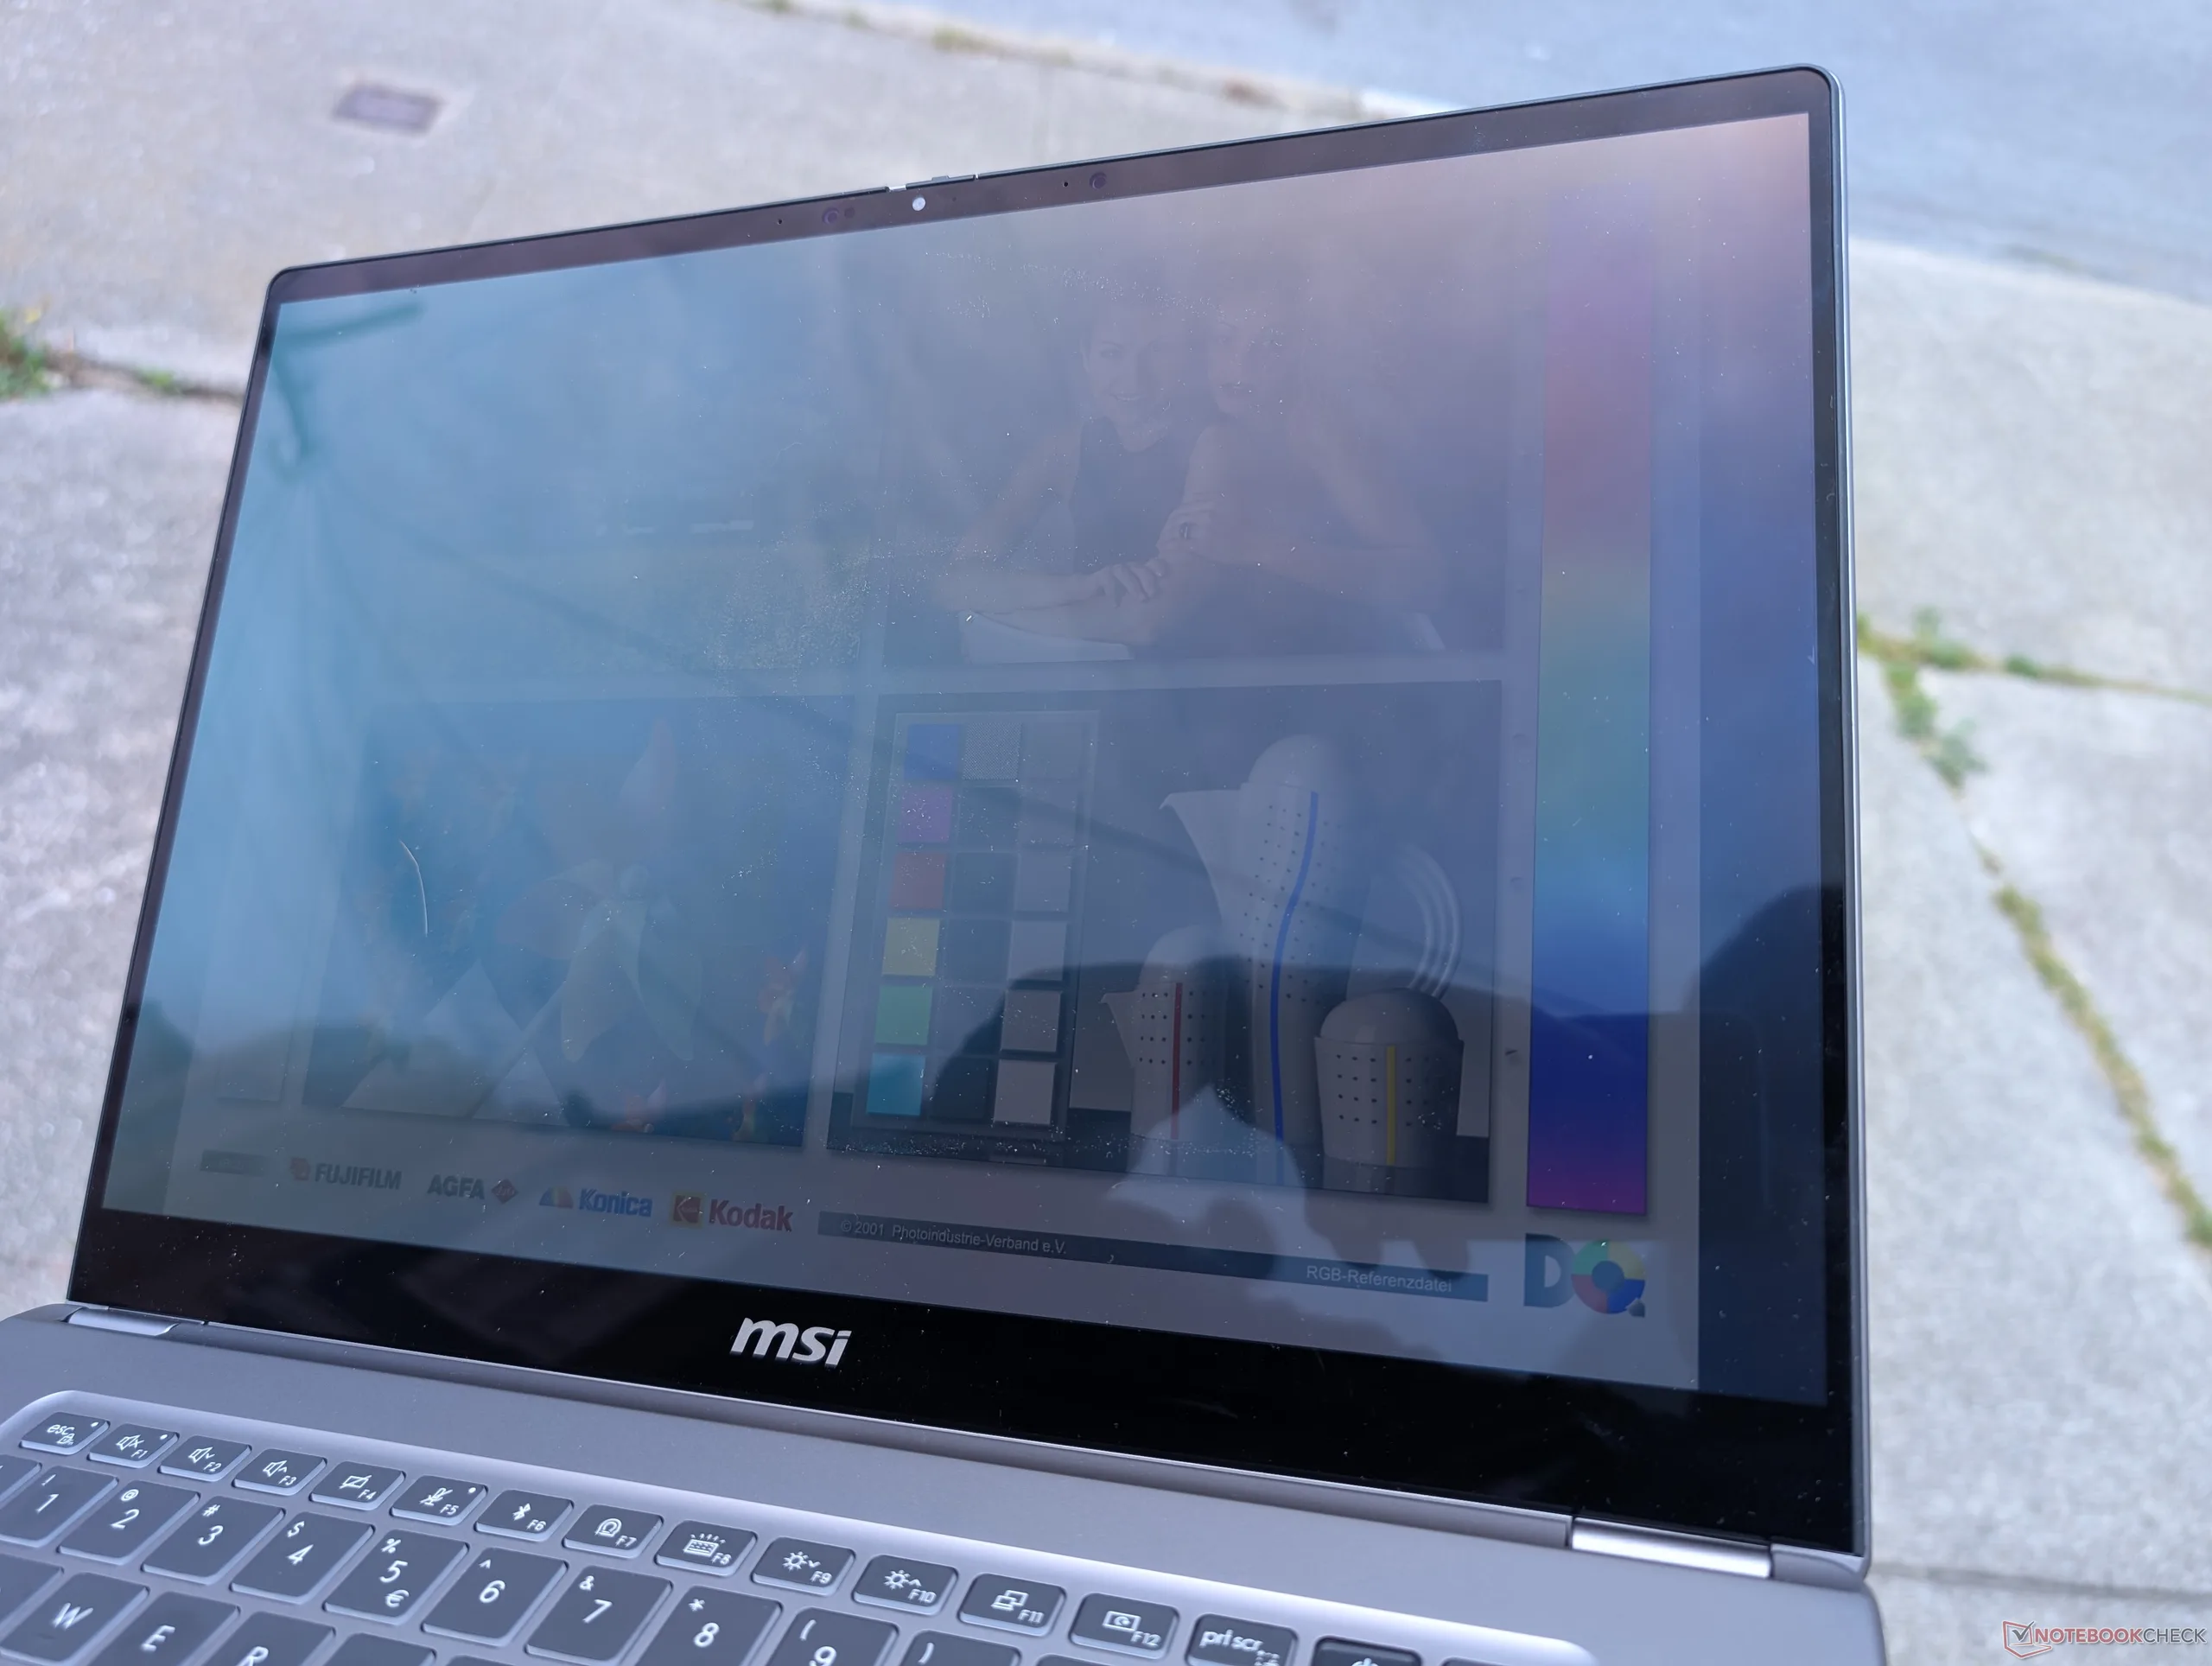
Werdykt - jak dotąd najsmuklejszy i najbardziej profesjonalny laptop MSI
Podobnie jak transformacja z 2025 Dell 16 Premium do 2026 XPS 16prestige 16 z 2026 roku jest szczuplejszą, bardziej elegancką i wydajniejszą maszyną niż 2025 Prestige 16. W dużej mierze wynika to z przejścia na procesor Intel Panther Lake X7, który oferuje znaczny wzrost wydajności na wat w porównaniu z poprzednią generacją. W szczególności wydajność GPU jest imponująca, biorąc pod uwagę, że MSI jest cieńszy niż większość innych 16-calowych laptopów z podobnymi opcjami procesorów.
Poza procesorem, MSI wprowadziło w tym roku znaczące zmiany, począwszy od portów, a skończywszy na wyświetlaczu. Większość z nich to skok naprzód, w tym panel OLED 120 Hz i bardziej profesjonalna estetyka, ale porzucone porty i mniejsza bateria to mieszana torba. Temperatura rdzenia jest wyższa niż u konkurentów, a zasilacz sieciowy USB-C o mocy 65 W ogranicza zarówno wydajność Turbo Boost, jak i szybkość ładowania w określonych warunkach.
Użytkownicy, którzy nie mają nic przeciwko nieco grubszemu i cięższemu systemowi, znajdą XPS 16 jako mocną alternatywę, ponieważ oferuje on ekran dotykowy o jeszcze wyższej rozdzielczości i kamerę internetową, aczkolwiek z mniejszą liczbą opcji portów i krótszą żywotnością baterii. W międzyczasie, zasilany przez AMD Asus Zenbook S16 jest jeszcze lżejszy i mniejszy z podobną wydajnością procesora i opcjami paneli, ale jego wentylatory są głośniejsze, a wydajność graficzna gorsza. Jeden model może być lepszy od drugiego w zależności od konkretnych potrzeb.
Za
Przeciw
Cena i dostępność
MSI Prestige 16 AI+ C3MTG clamshell nie jest jeszcze powszechnie dostępny w momencie publikacji. Jednak model Prestige 16 Flip AI+ C3MTG jest już dostępny w sprzedaży w cenie od 2150 USD.
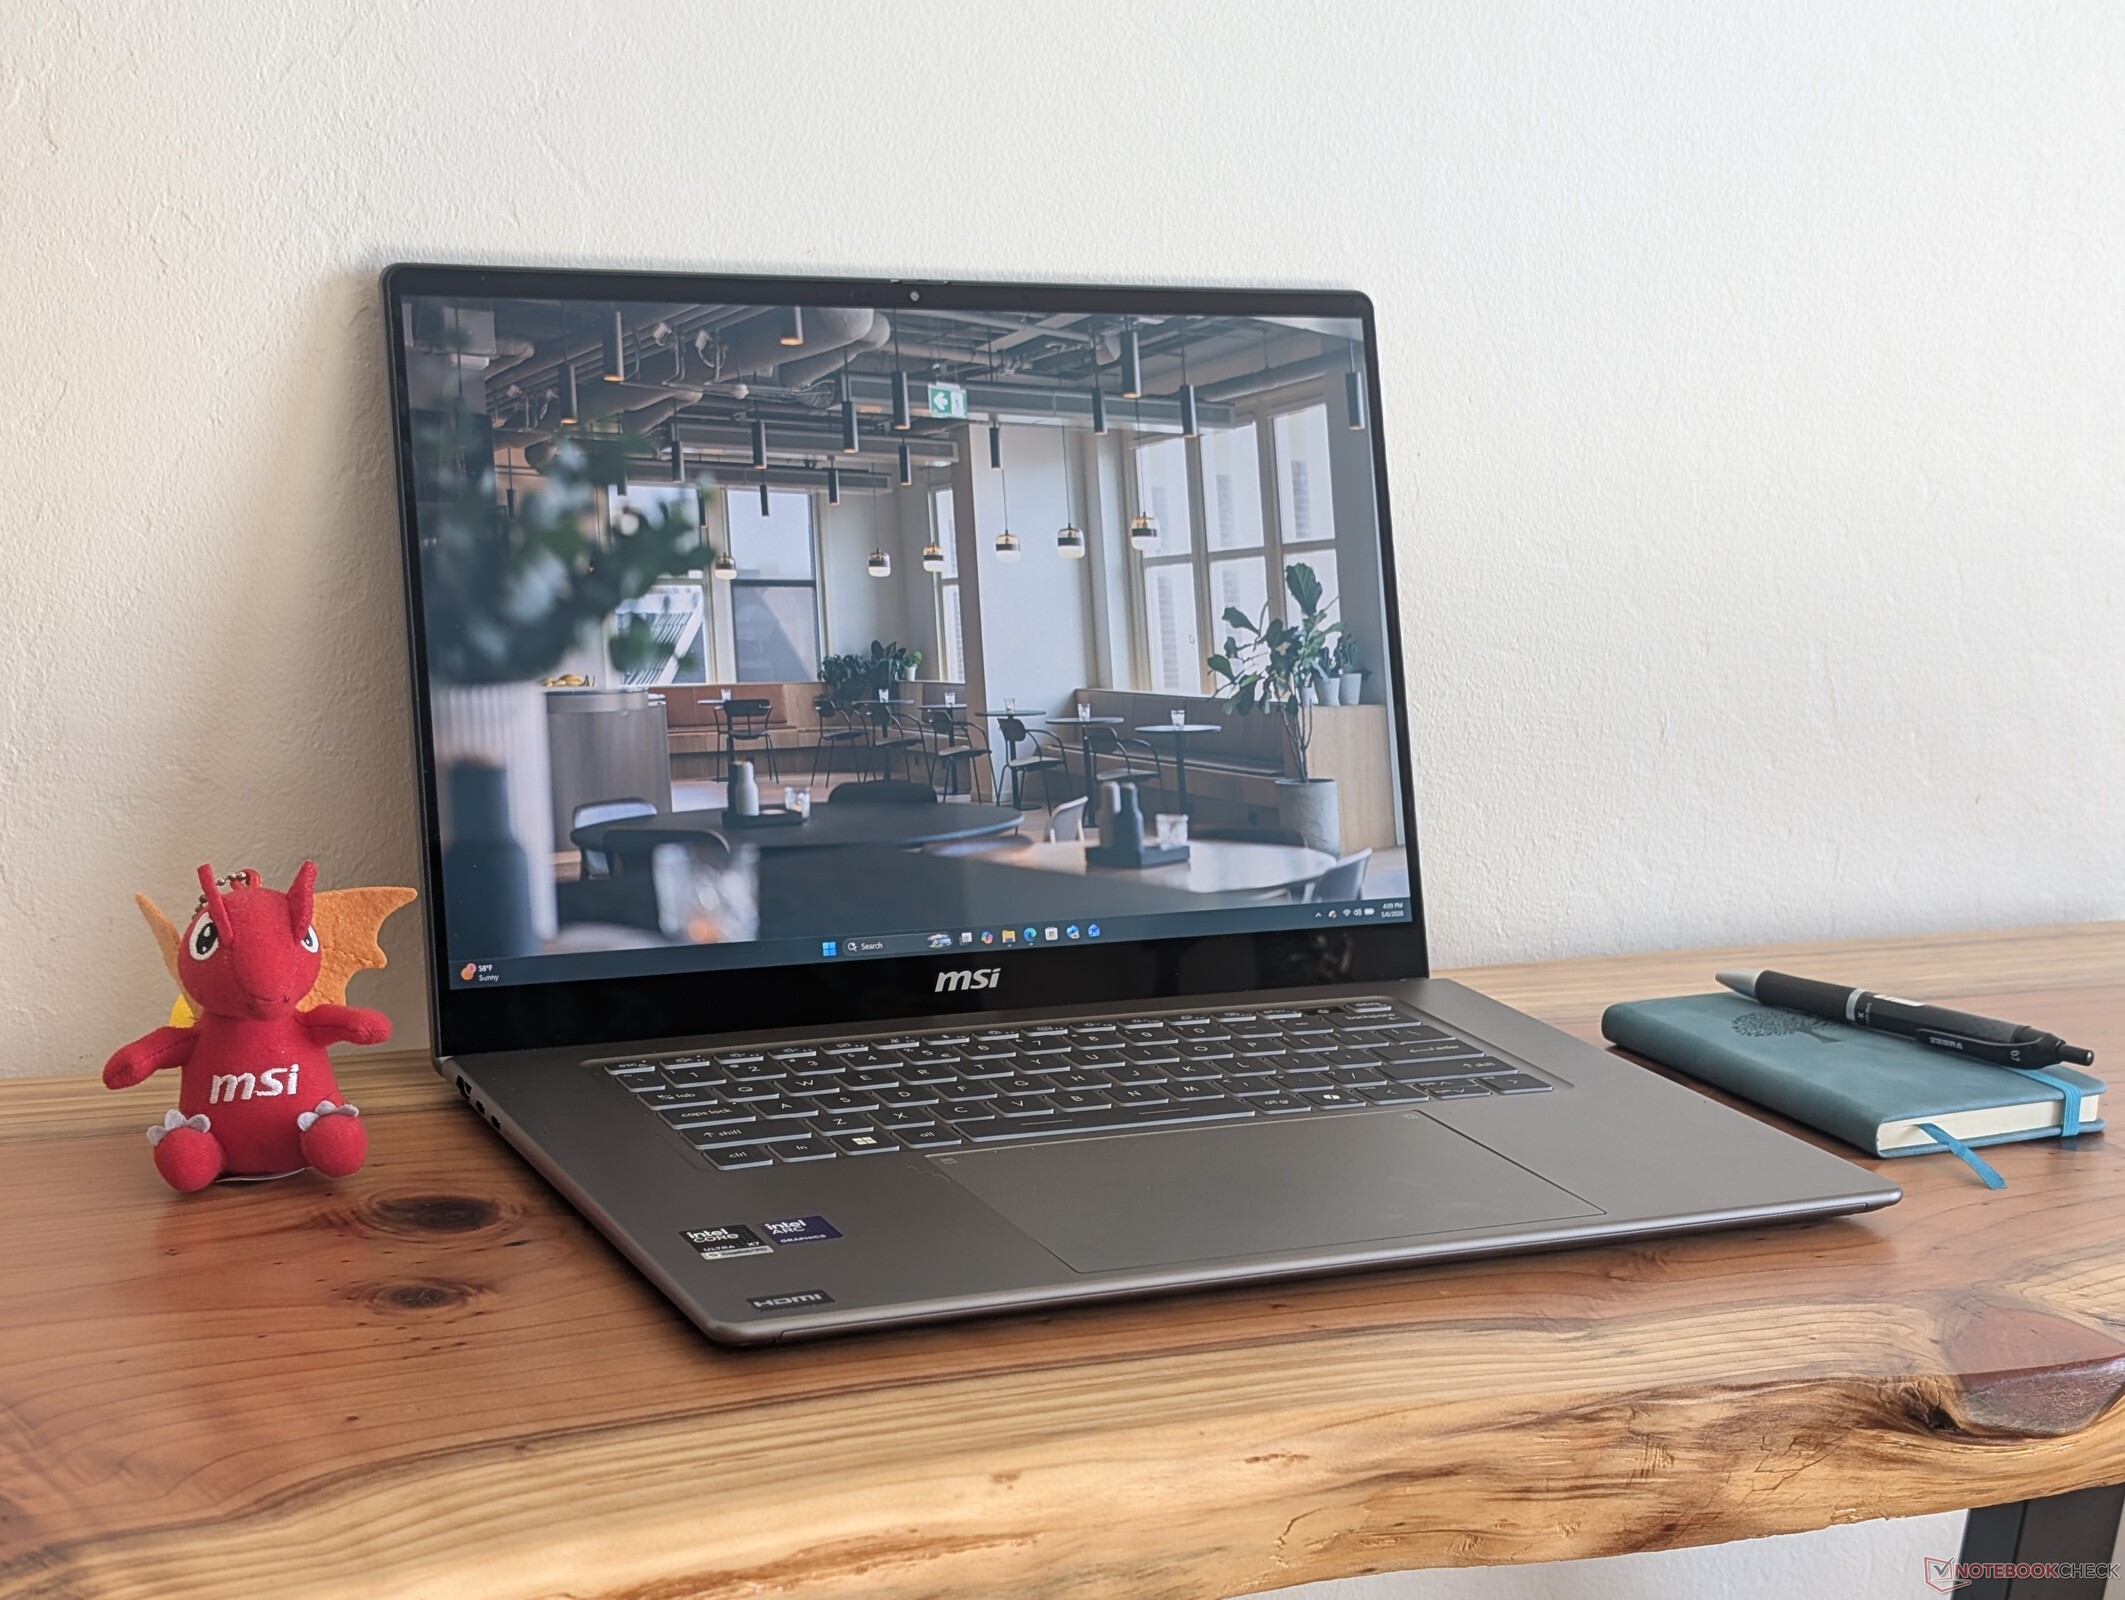
Klawiatura Prestige 16 AI+ C3MG została zaprezentowana na targach CES 2026 wraz z wieloma innymi modelami Prestige wyposażonymi w procesory Intel Panther Lake. Najnowszy Prestige 16 został w pełni przeprojektowany w porównaniu do zeszłorocznego modelu Arrow Lake, aby zapewnić odświeżone wrażenia użytkownika.
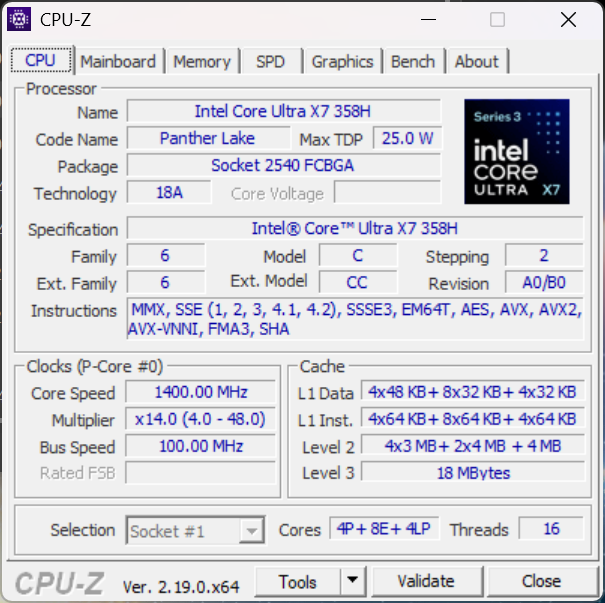
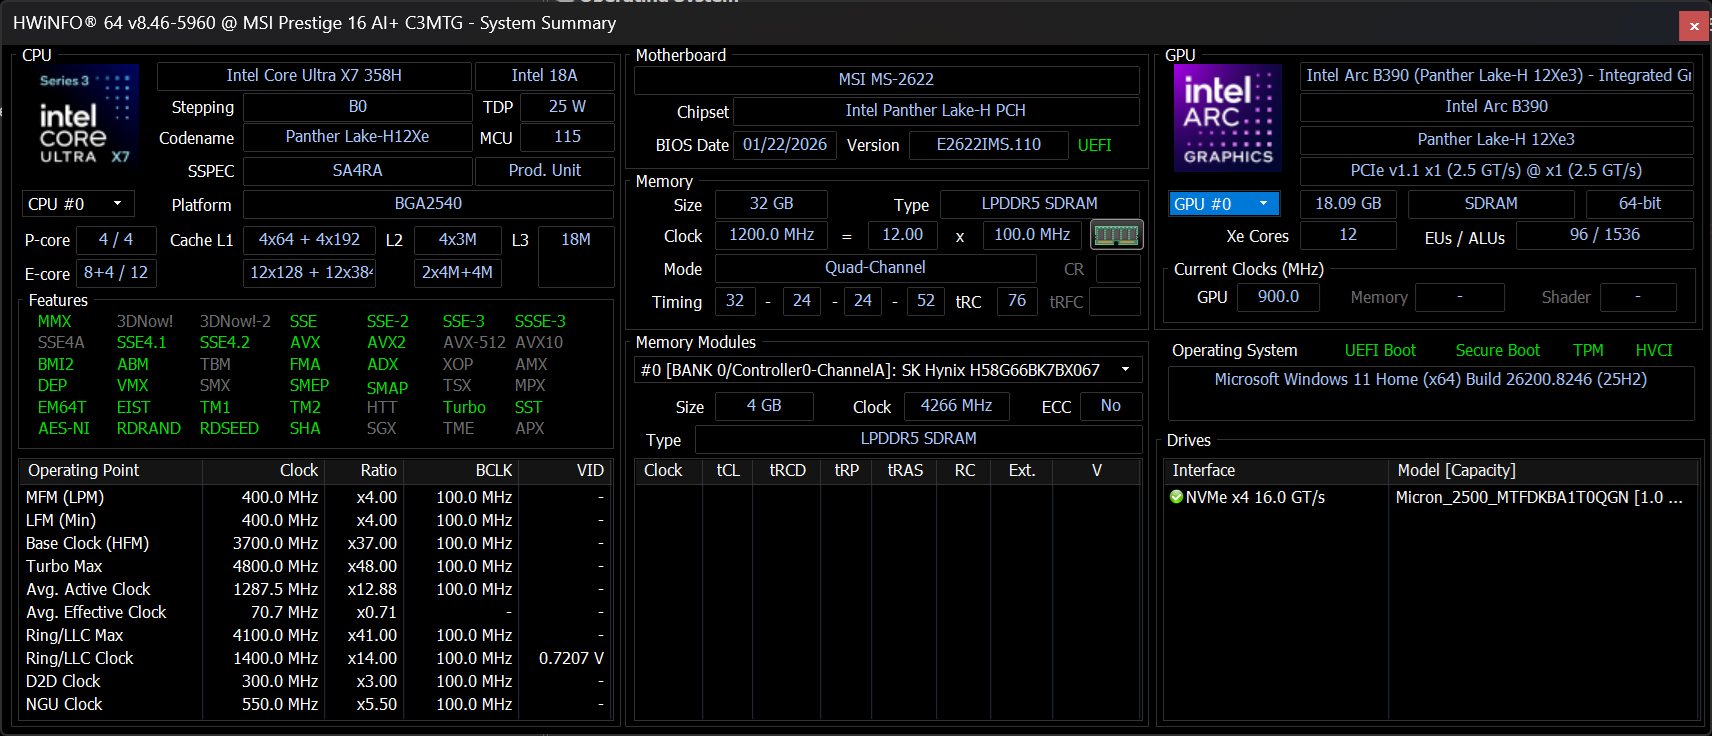
Nasza jednostka testowa została skonfigurowana z procesorem Core Ultra X7 358H, 32 GB pamięci RAM i ekranem dotykowym OLED 1800p za około 2100 USD. Inne jednostki SKU mogą być dostarczane z procesorem Core Ultra X9 388H, ale ekran OLED 1800p i procesor graficzny Arc B390 pozostają niezmienne.
Konkurencyjne modele obejmują inne wysokiej klasy laptopy prosumenckie, takie jak Dell XPS 16, Lenovo Pro 9i 16 Auralub Asus ZenBook S16 . Dostępna jest również wersja konwertowalna z zawiasami 360 stopni o nazwie Prestige 16 Flip AI+ C3MG.
Więcej recenzji MSI:
Specyfikacje
Przypadek
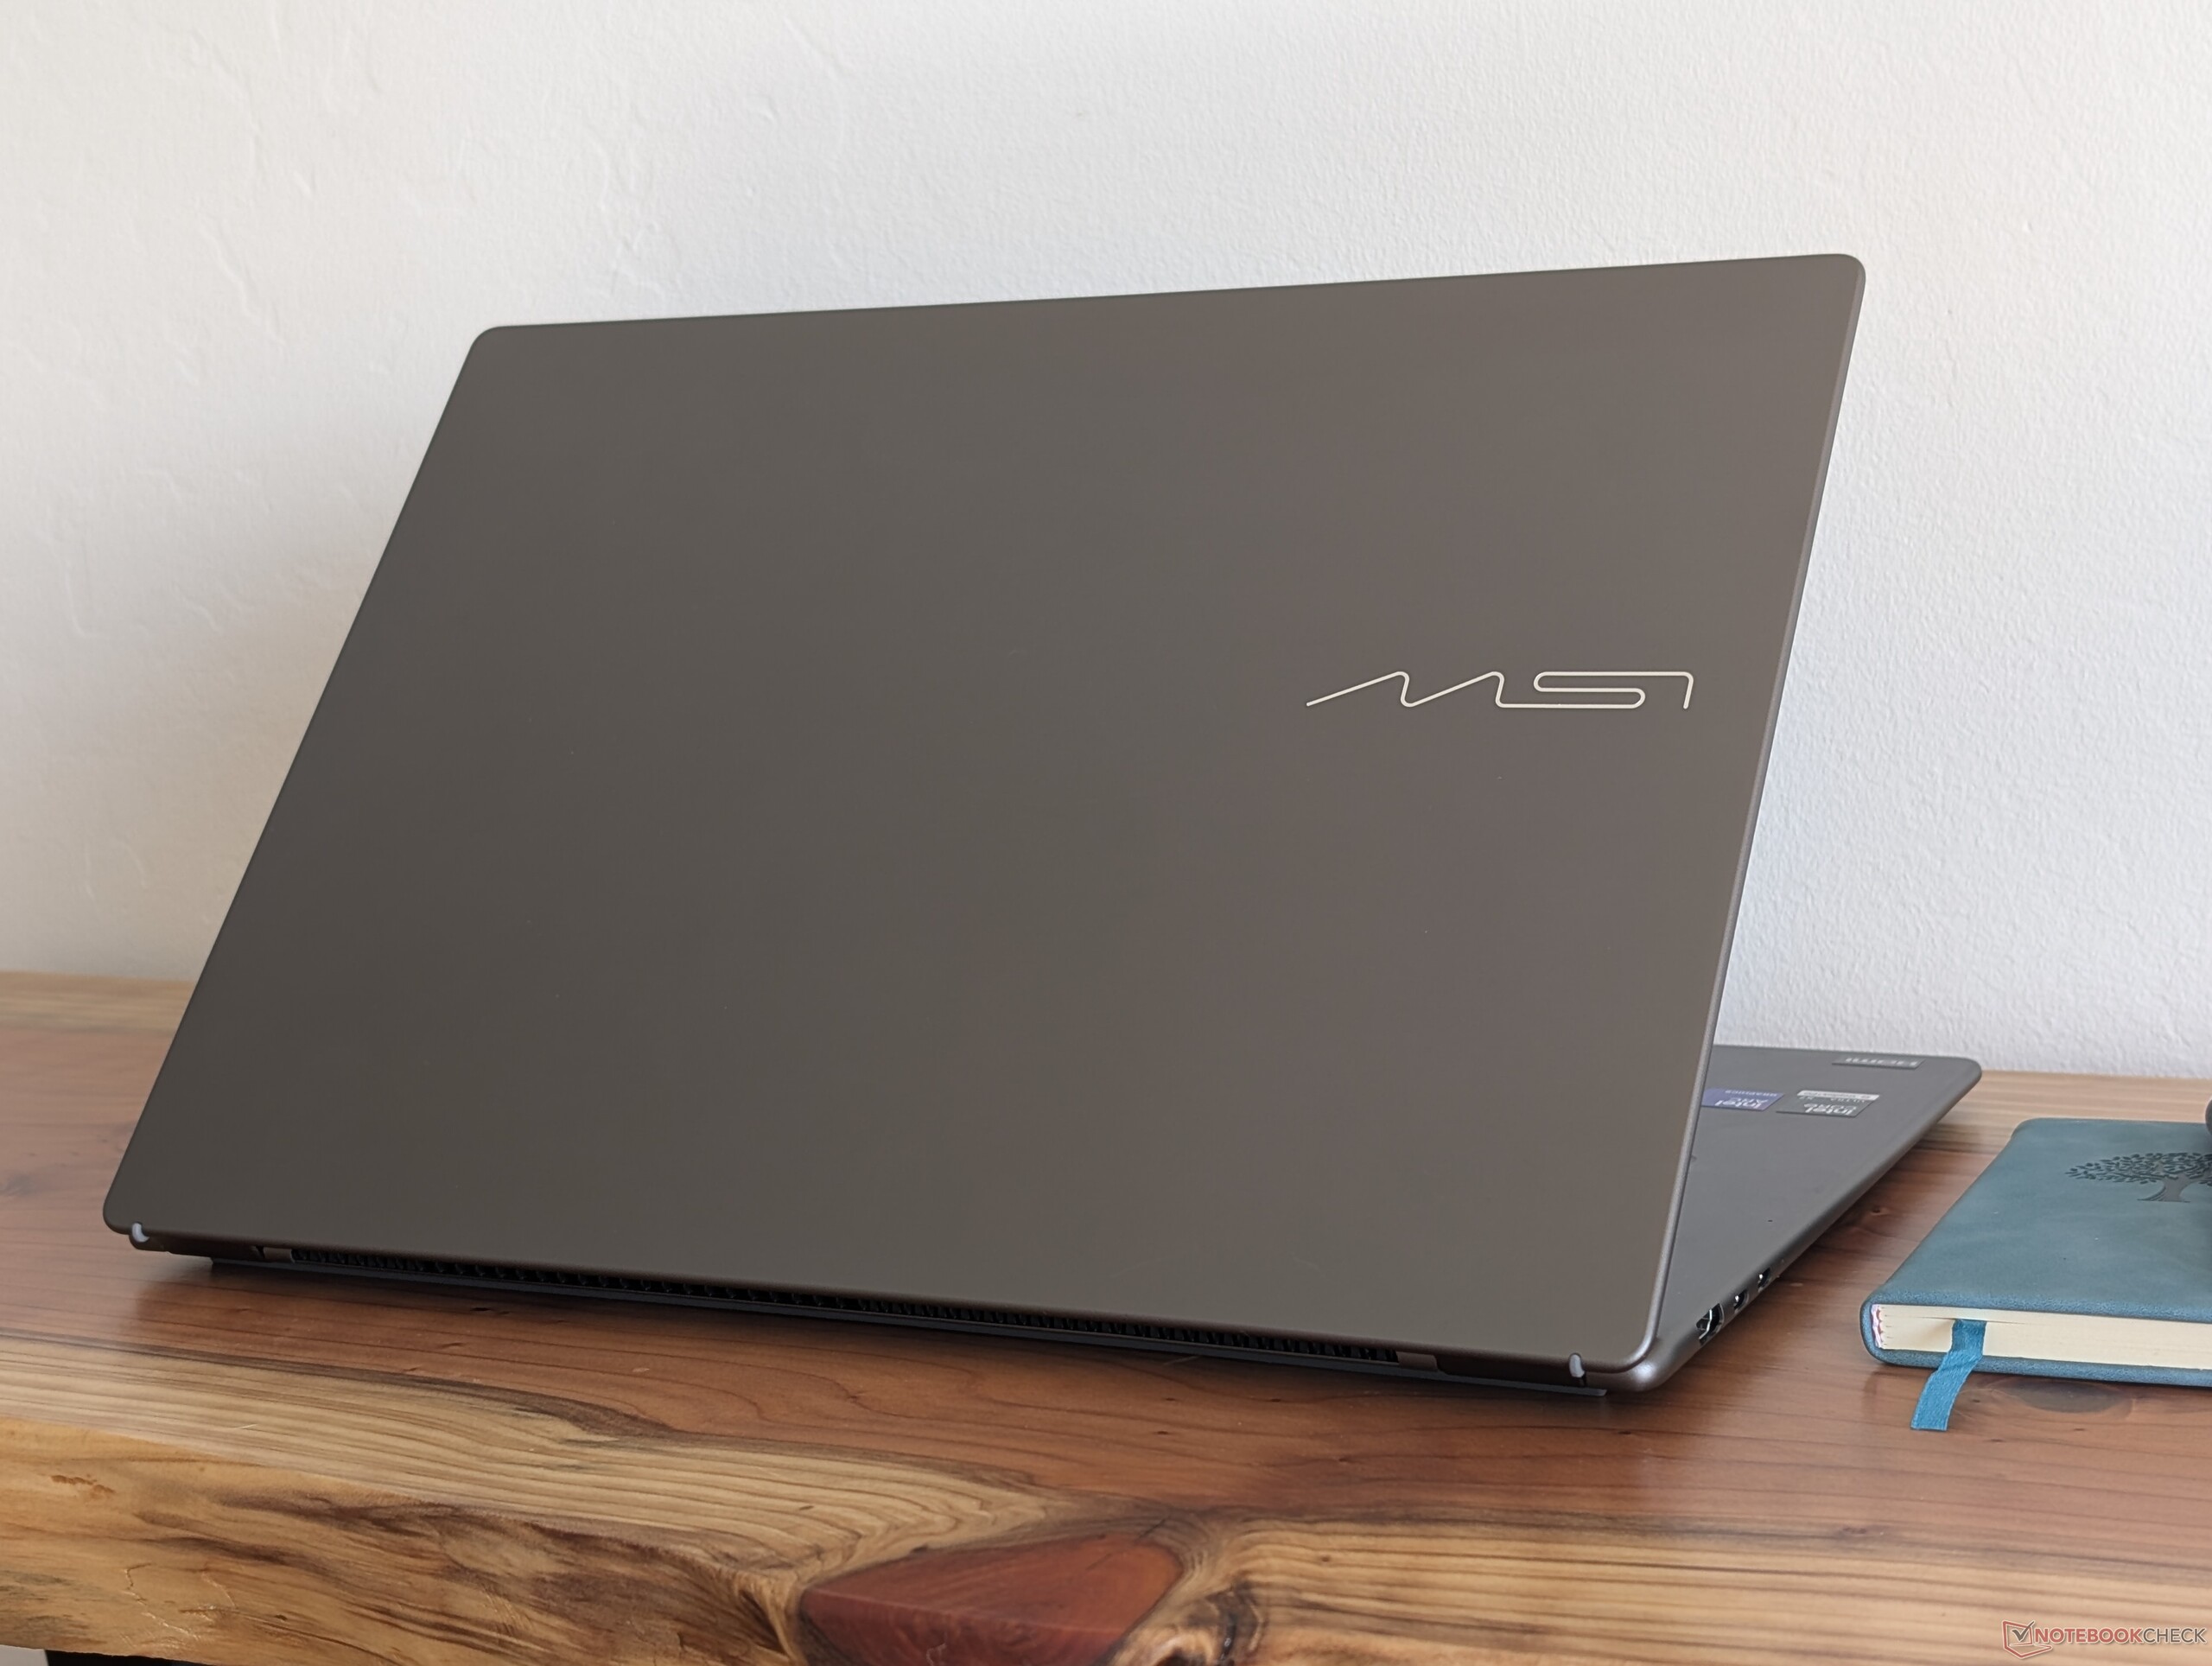
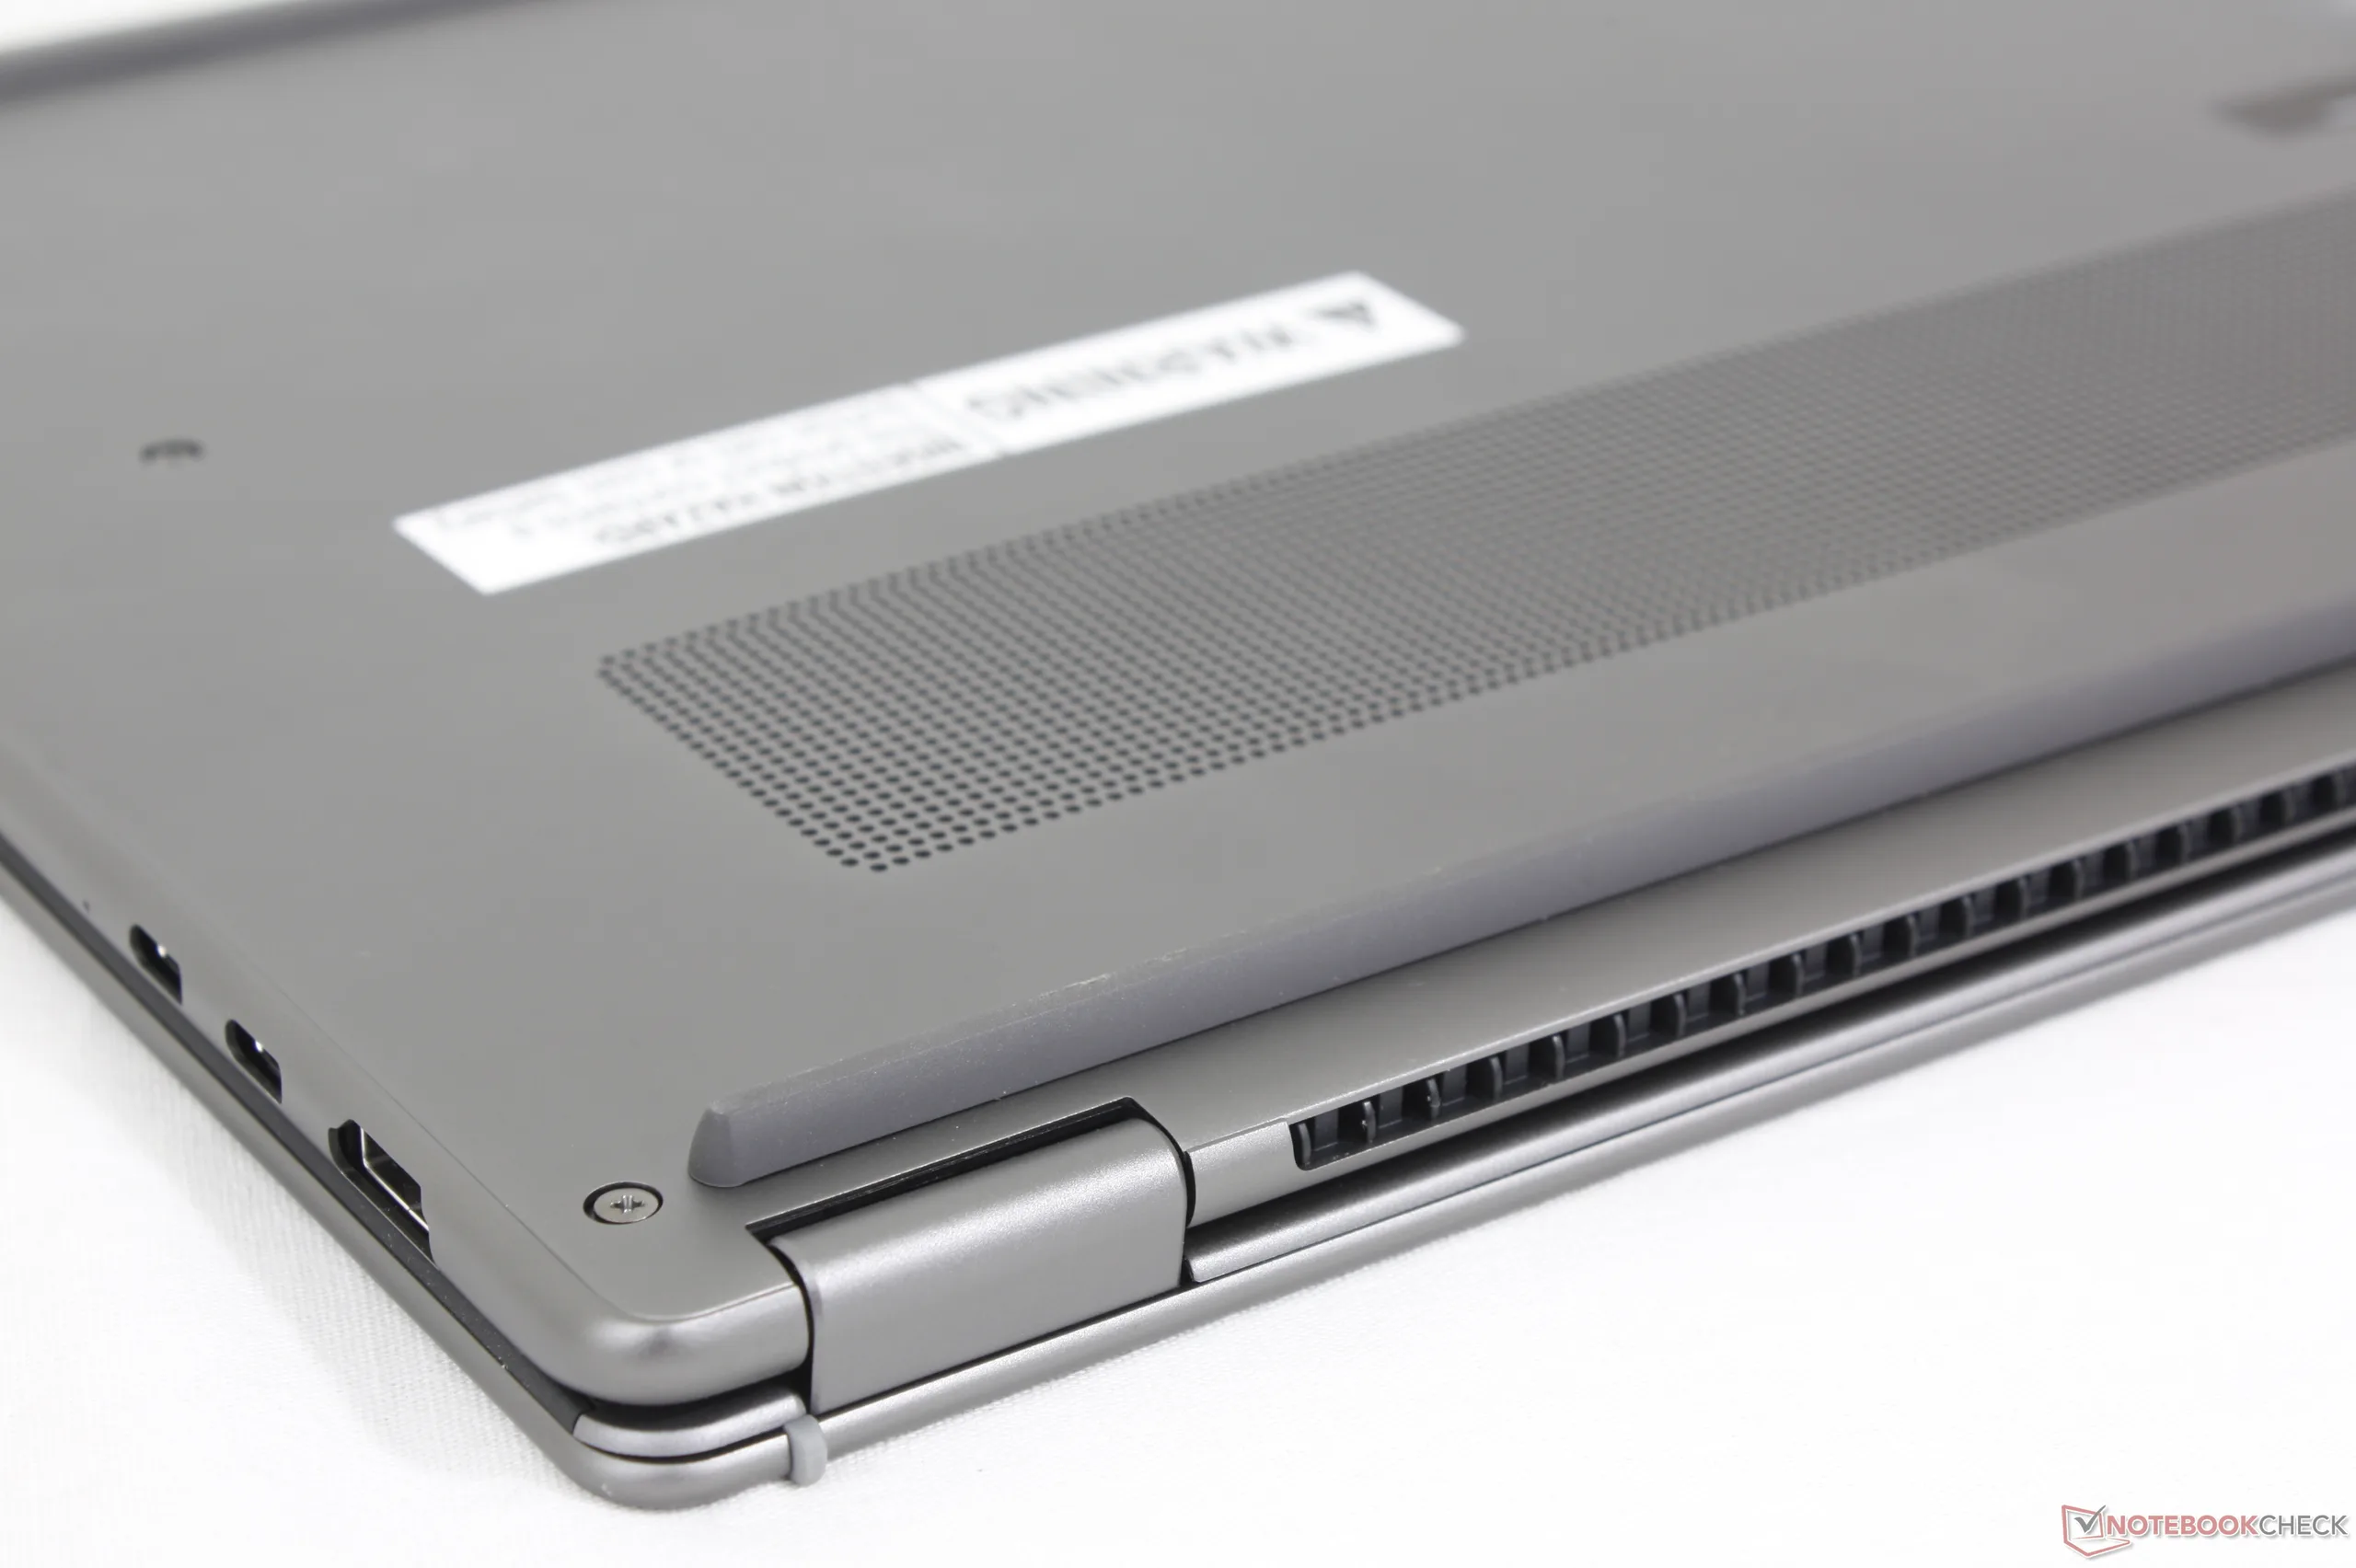
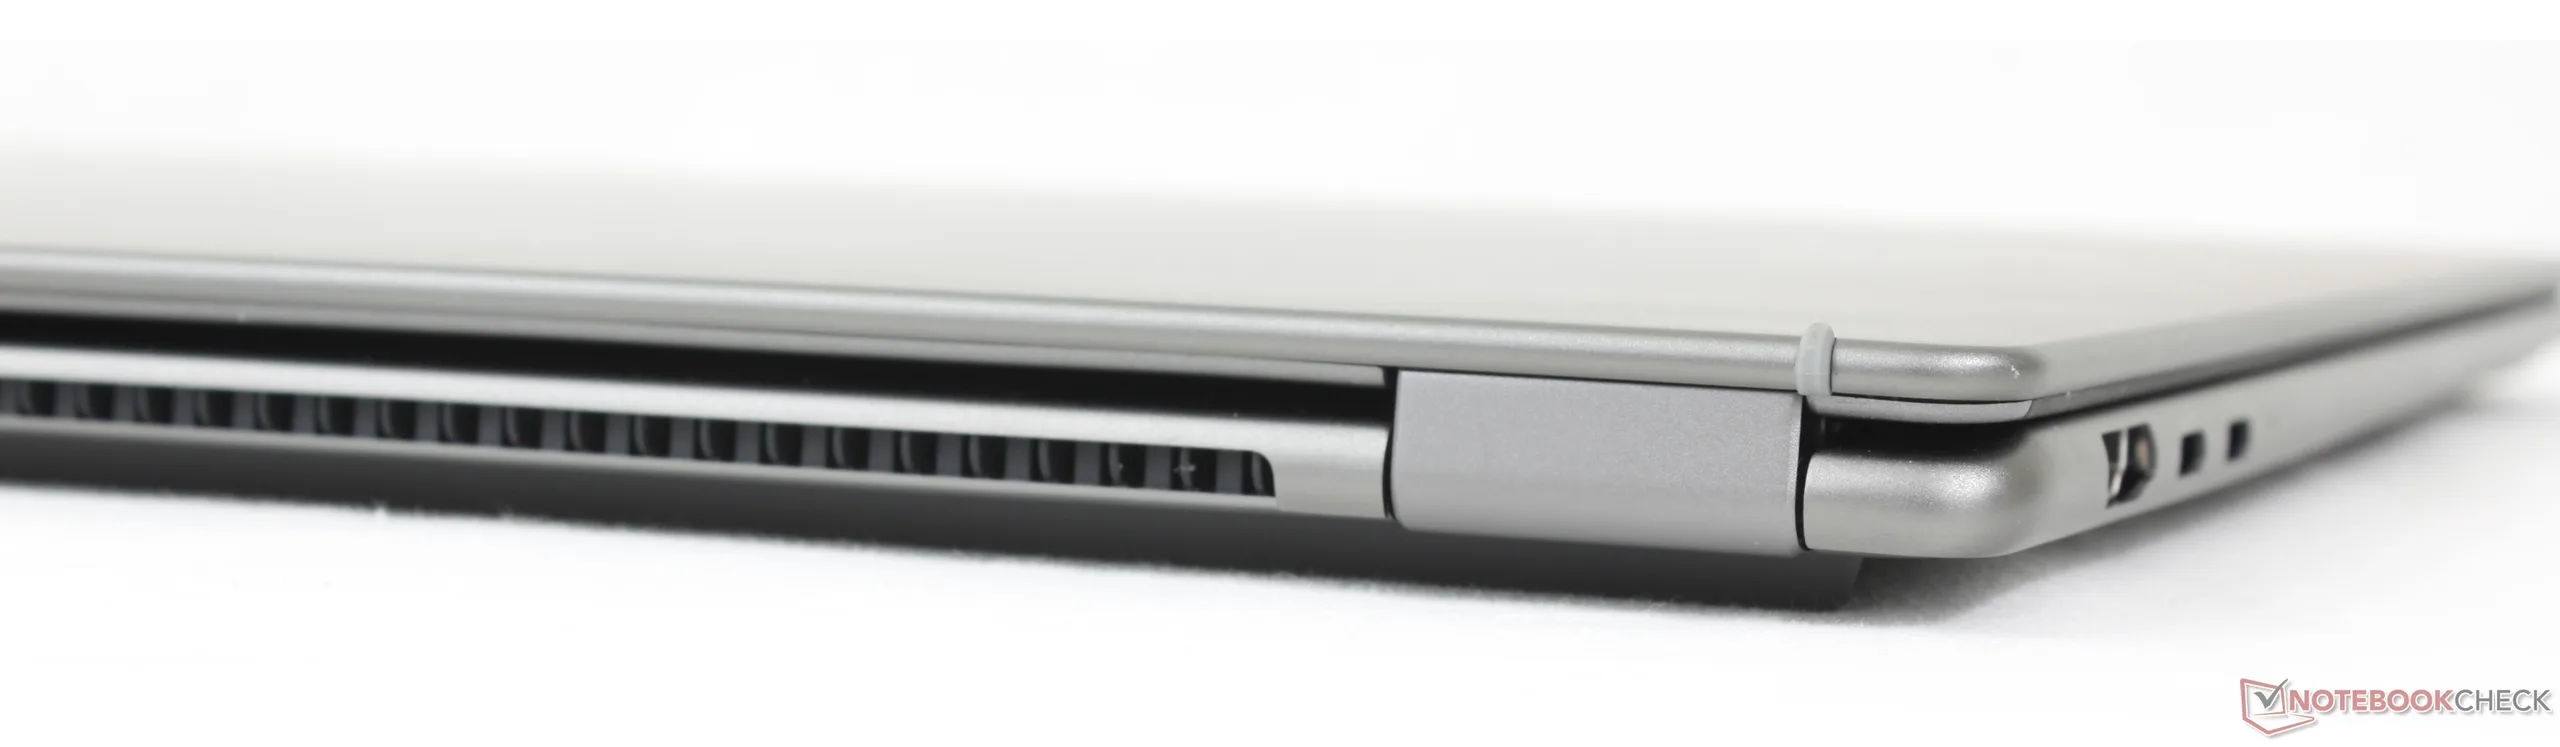
Obudowa ze stopu aluminium jest teraz cieńsza i ma mniej kątów i powierzchownych linii, co zapewnia bardziej profesjonalny wygląd. Rzeczywiście, w porównaniu do poprzedniego modelu, 2026 Prestige 16 jest prawdopodobnie bardziej klasyczny, ale nie wygląda zbyt nudno lub zbyt minimalistycznie.
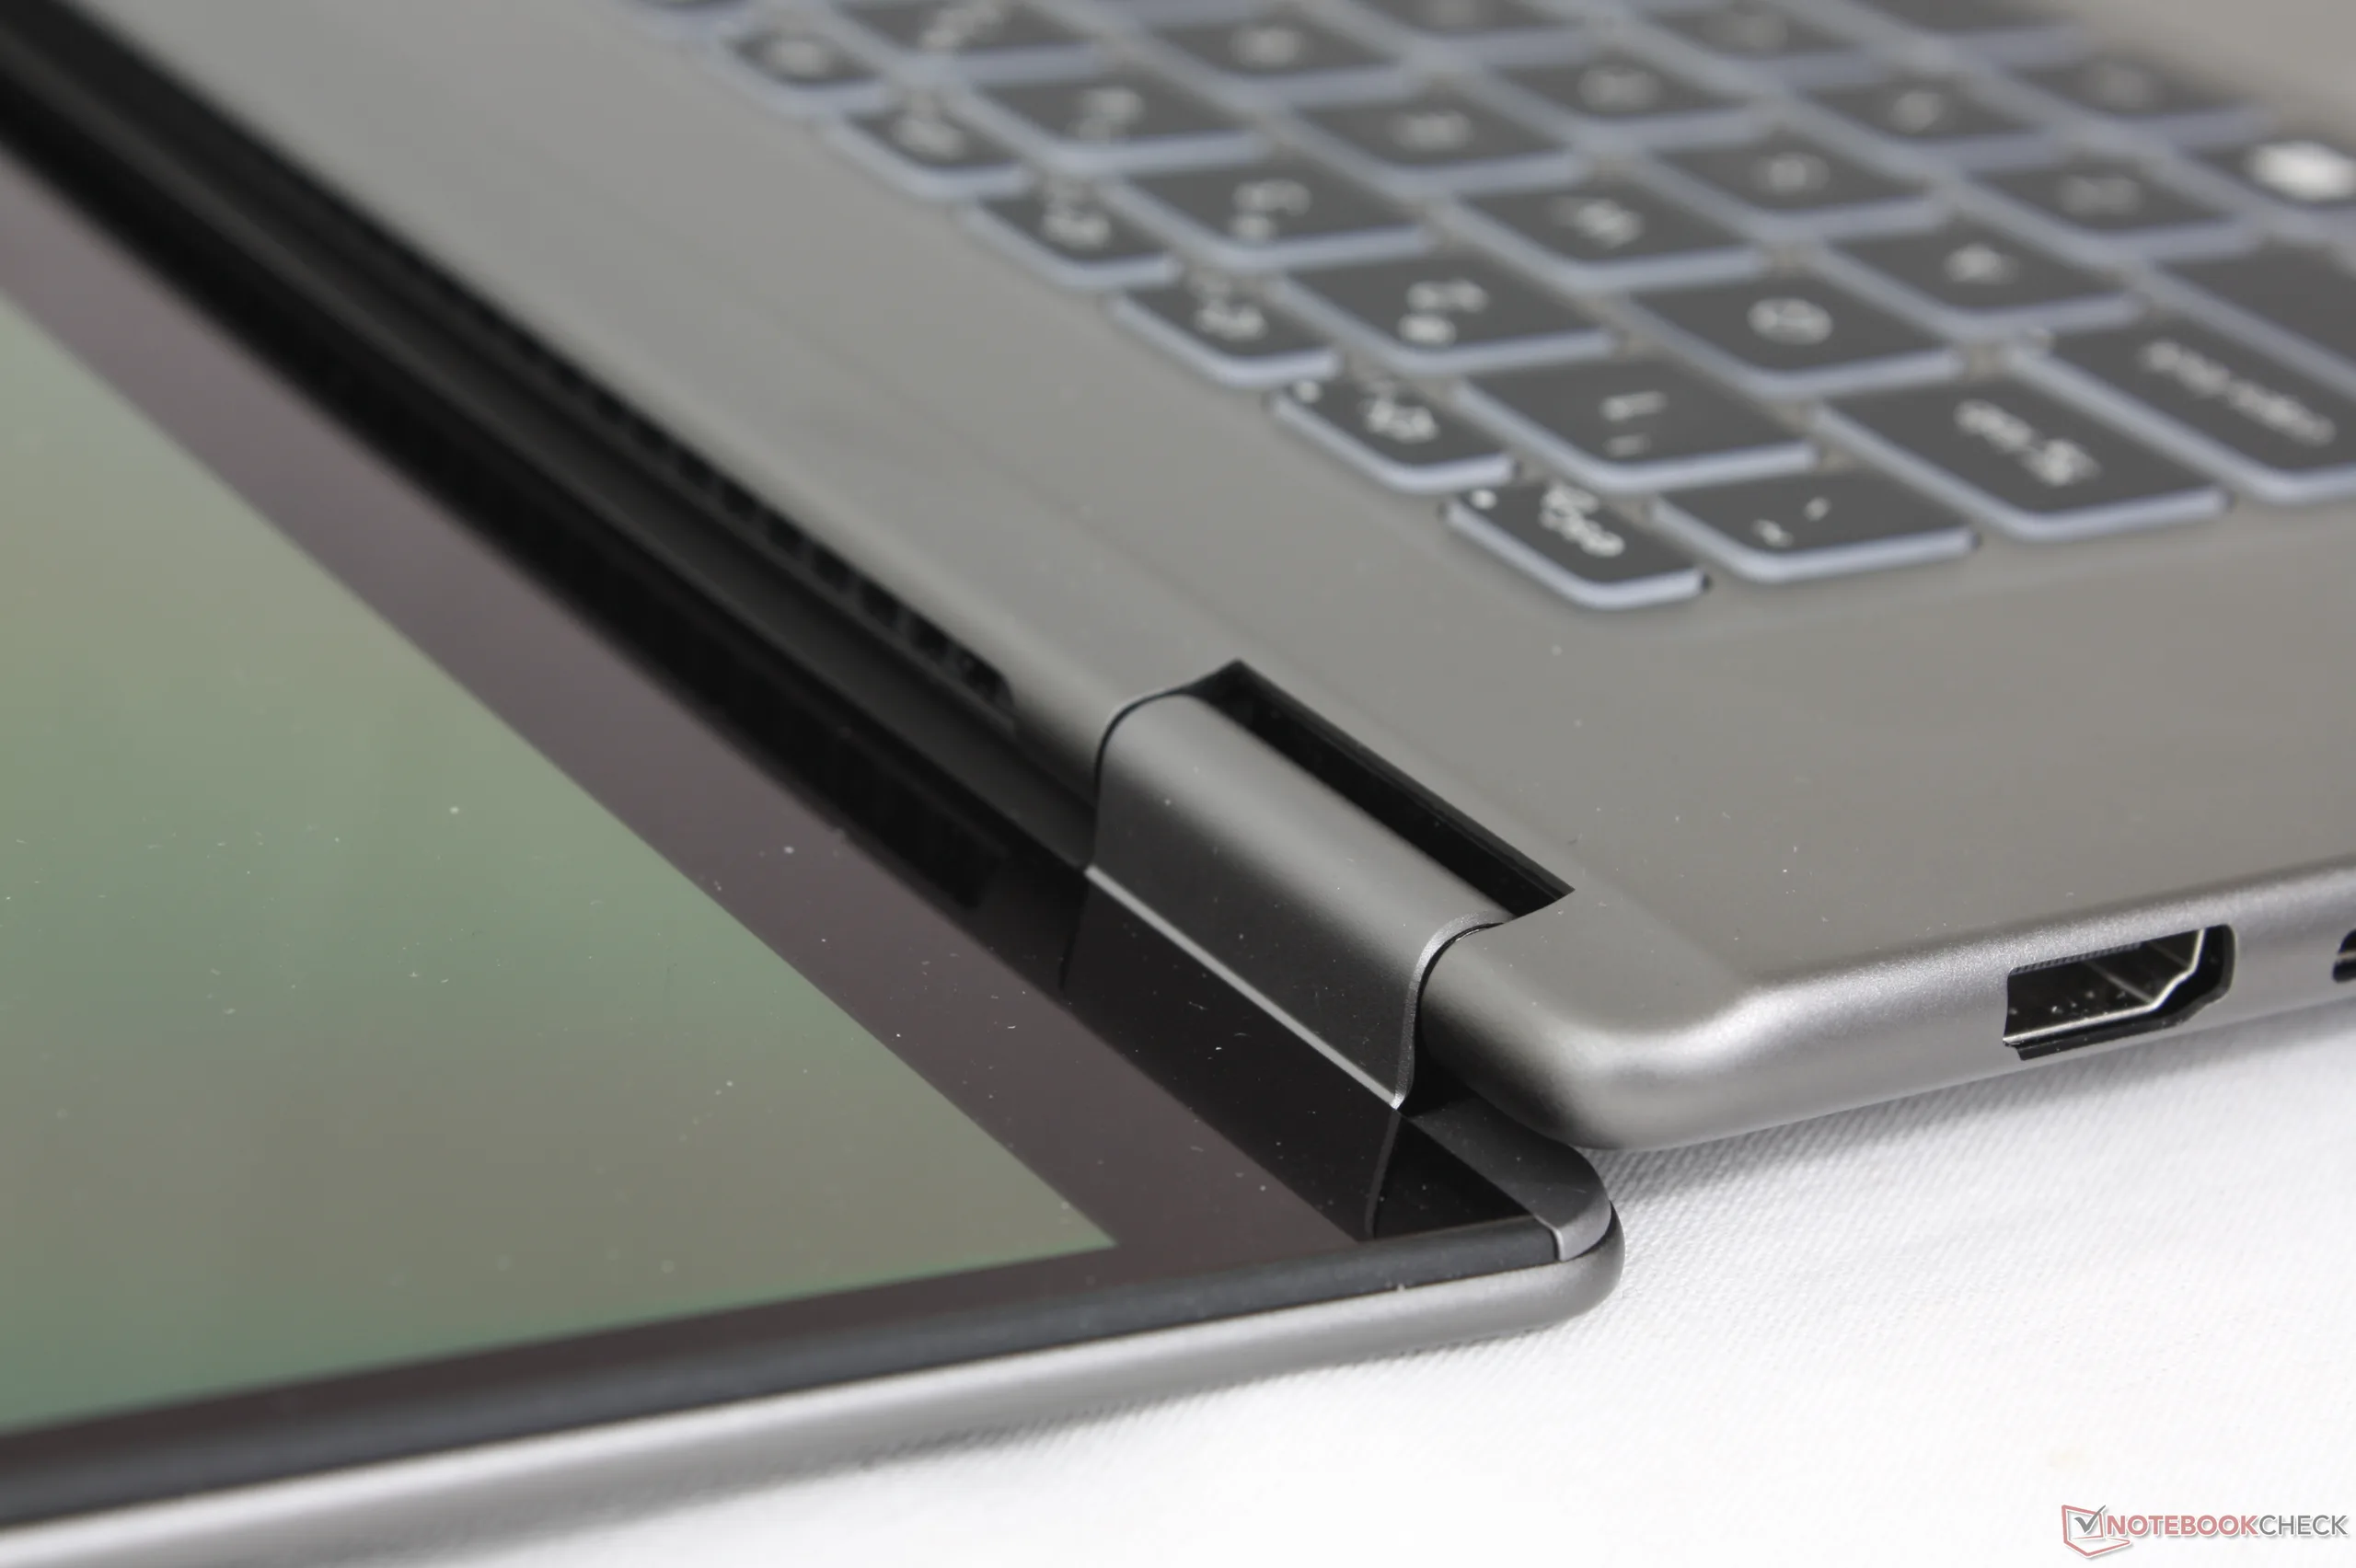
Sztywność obudowy jest solidna, choć z nieco większym ugięciem niż w przypadku grubszego XPS 16 lub Lenovo Pro 9i 16 Aura.
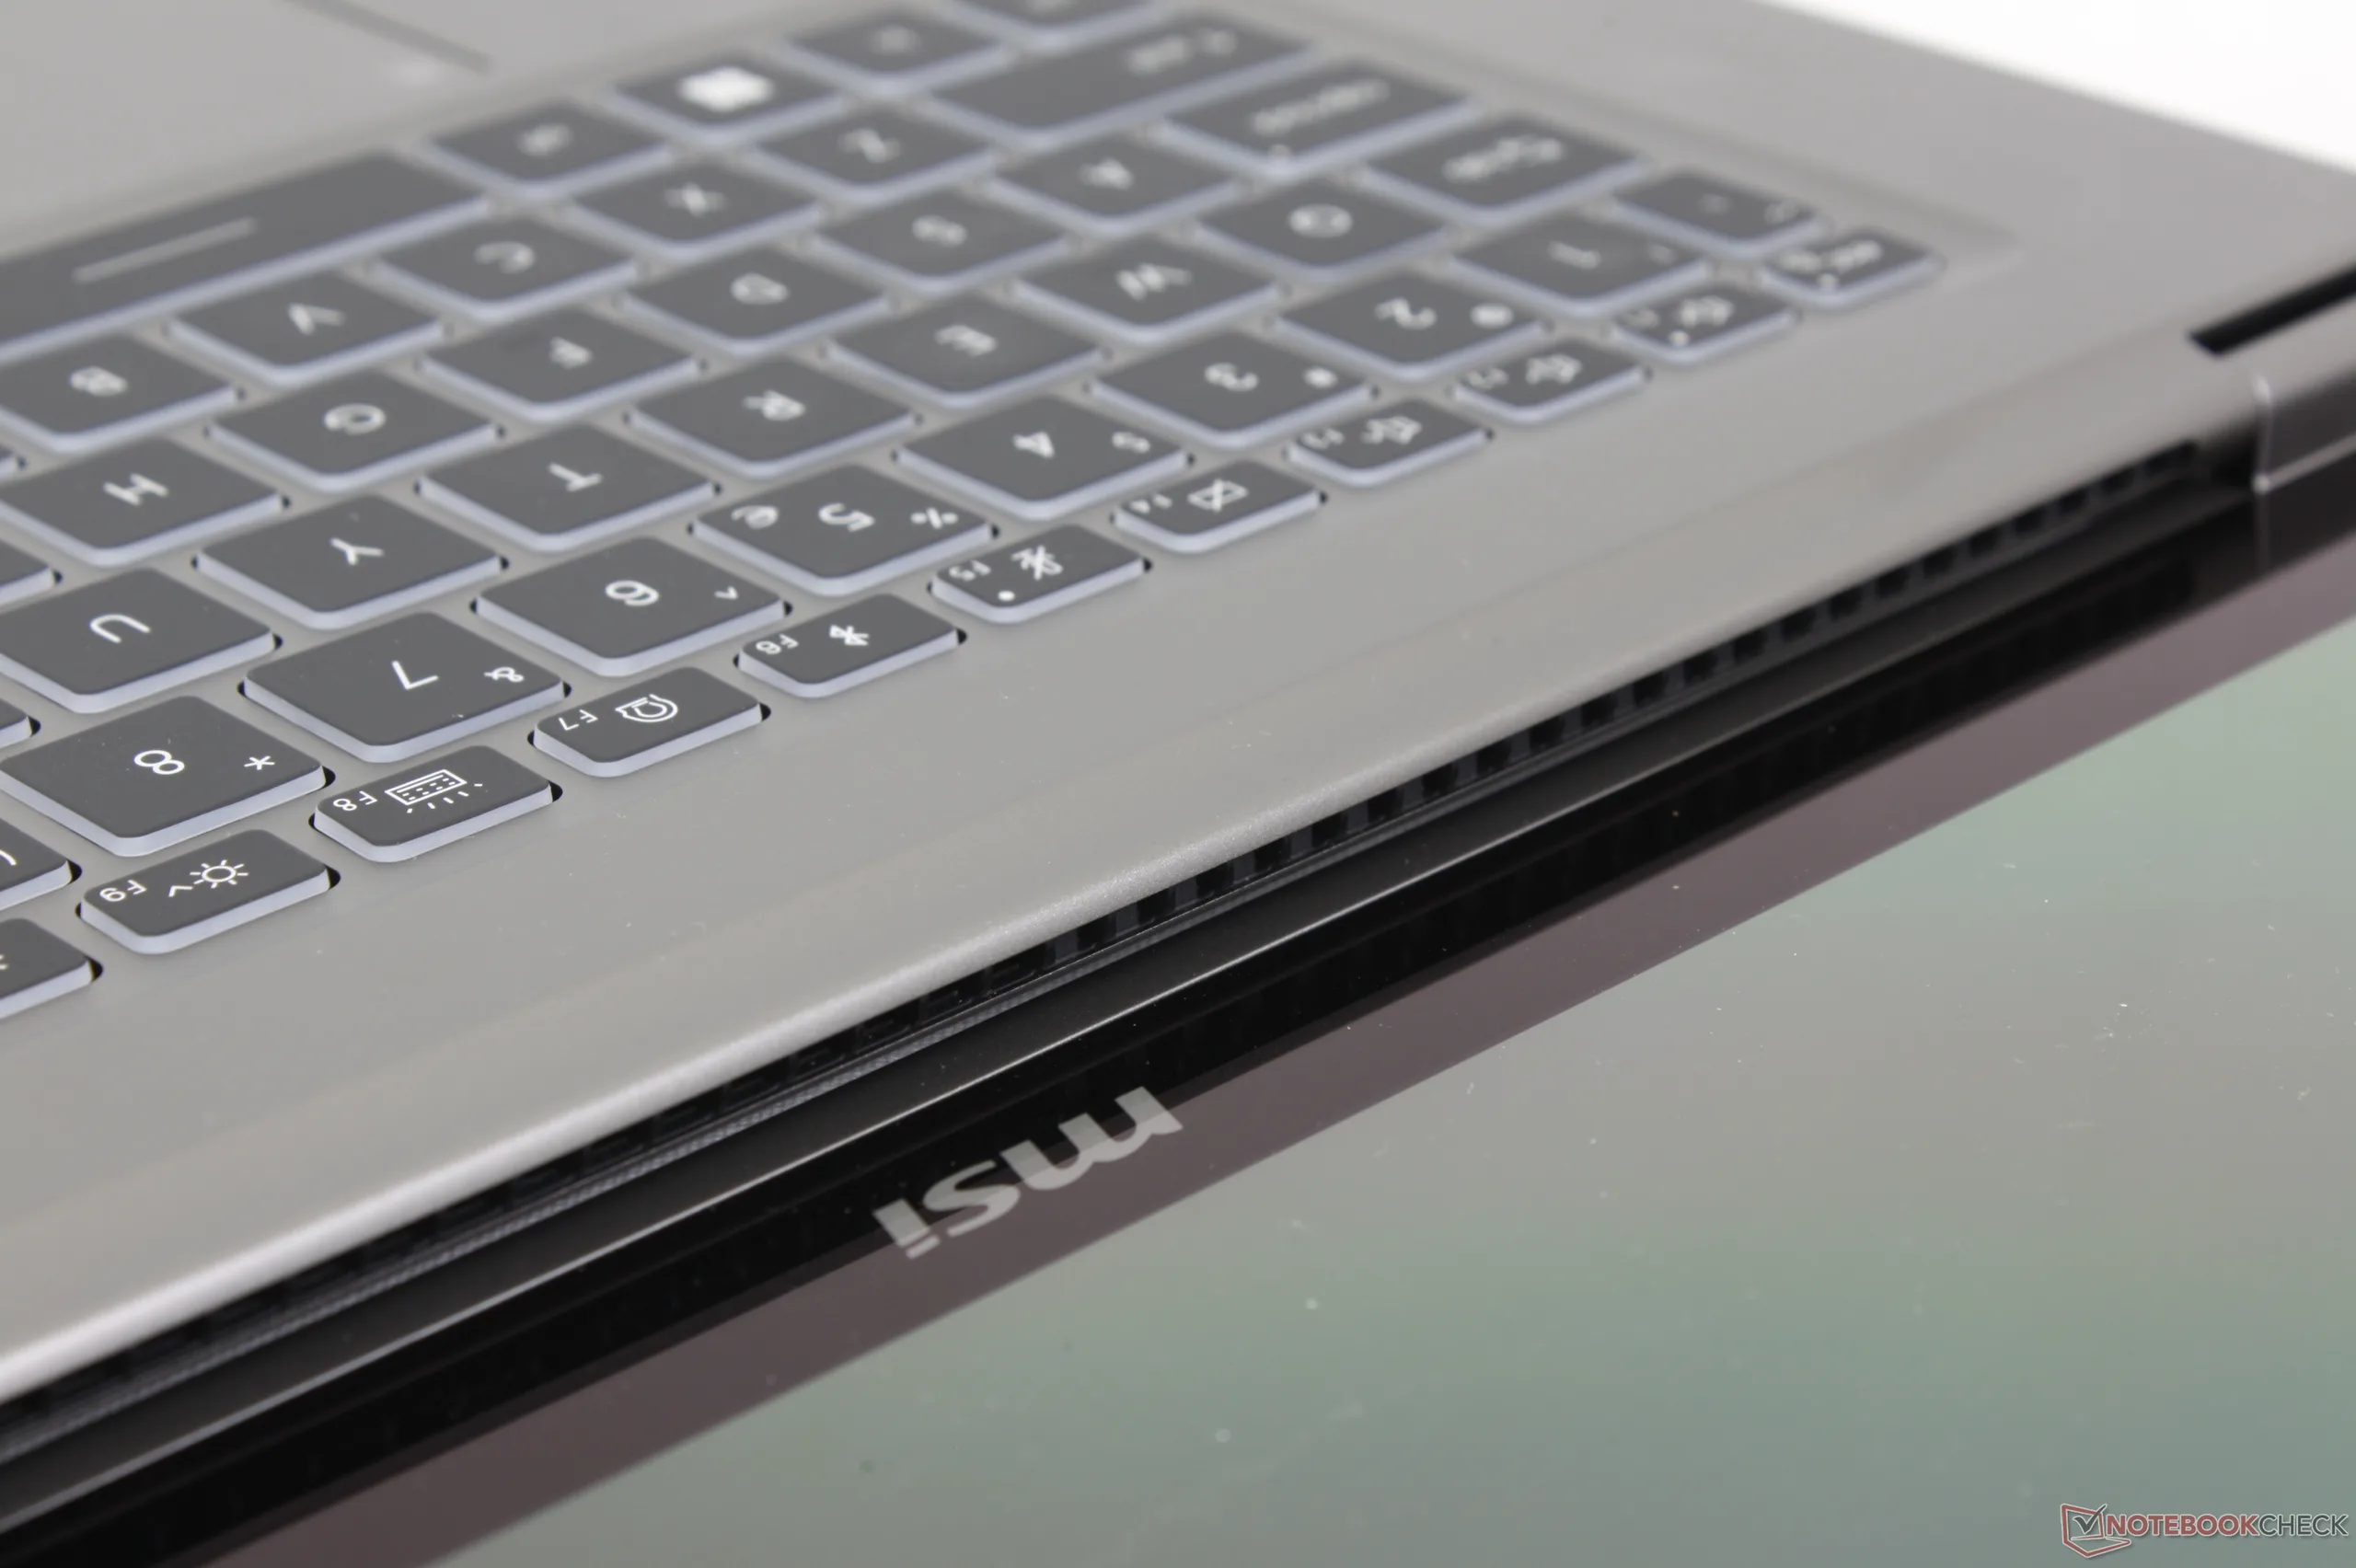
MSI wprowadza również w tym roku zaktualizowane logo na zewnętrznej pokrywie, począwszy od linii 2026 Prestige. Według producenta, fantazyjne grawerowanie laserowe może pojawić się na większej liczbie premierowych modeli biznesowych w najbliższej przyszłości, aby lepiej oddzielić je od rozwiązań MSI skoncentrowanych na grach.
System jest zauważalnie cieńszy niż zeszłoroczny projekt, ale prawie bez zmiany wagi, co zapewnia gęstsze odczucie. Pod względem wagi plasuje się wygodnie pomiędzy XPS 16 i ZenBook S16, będąc jednocześnie nieco większym od nich pod względem zajmowanej powierzchni.

Łączność
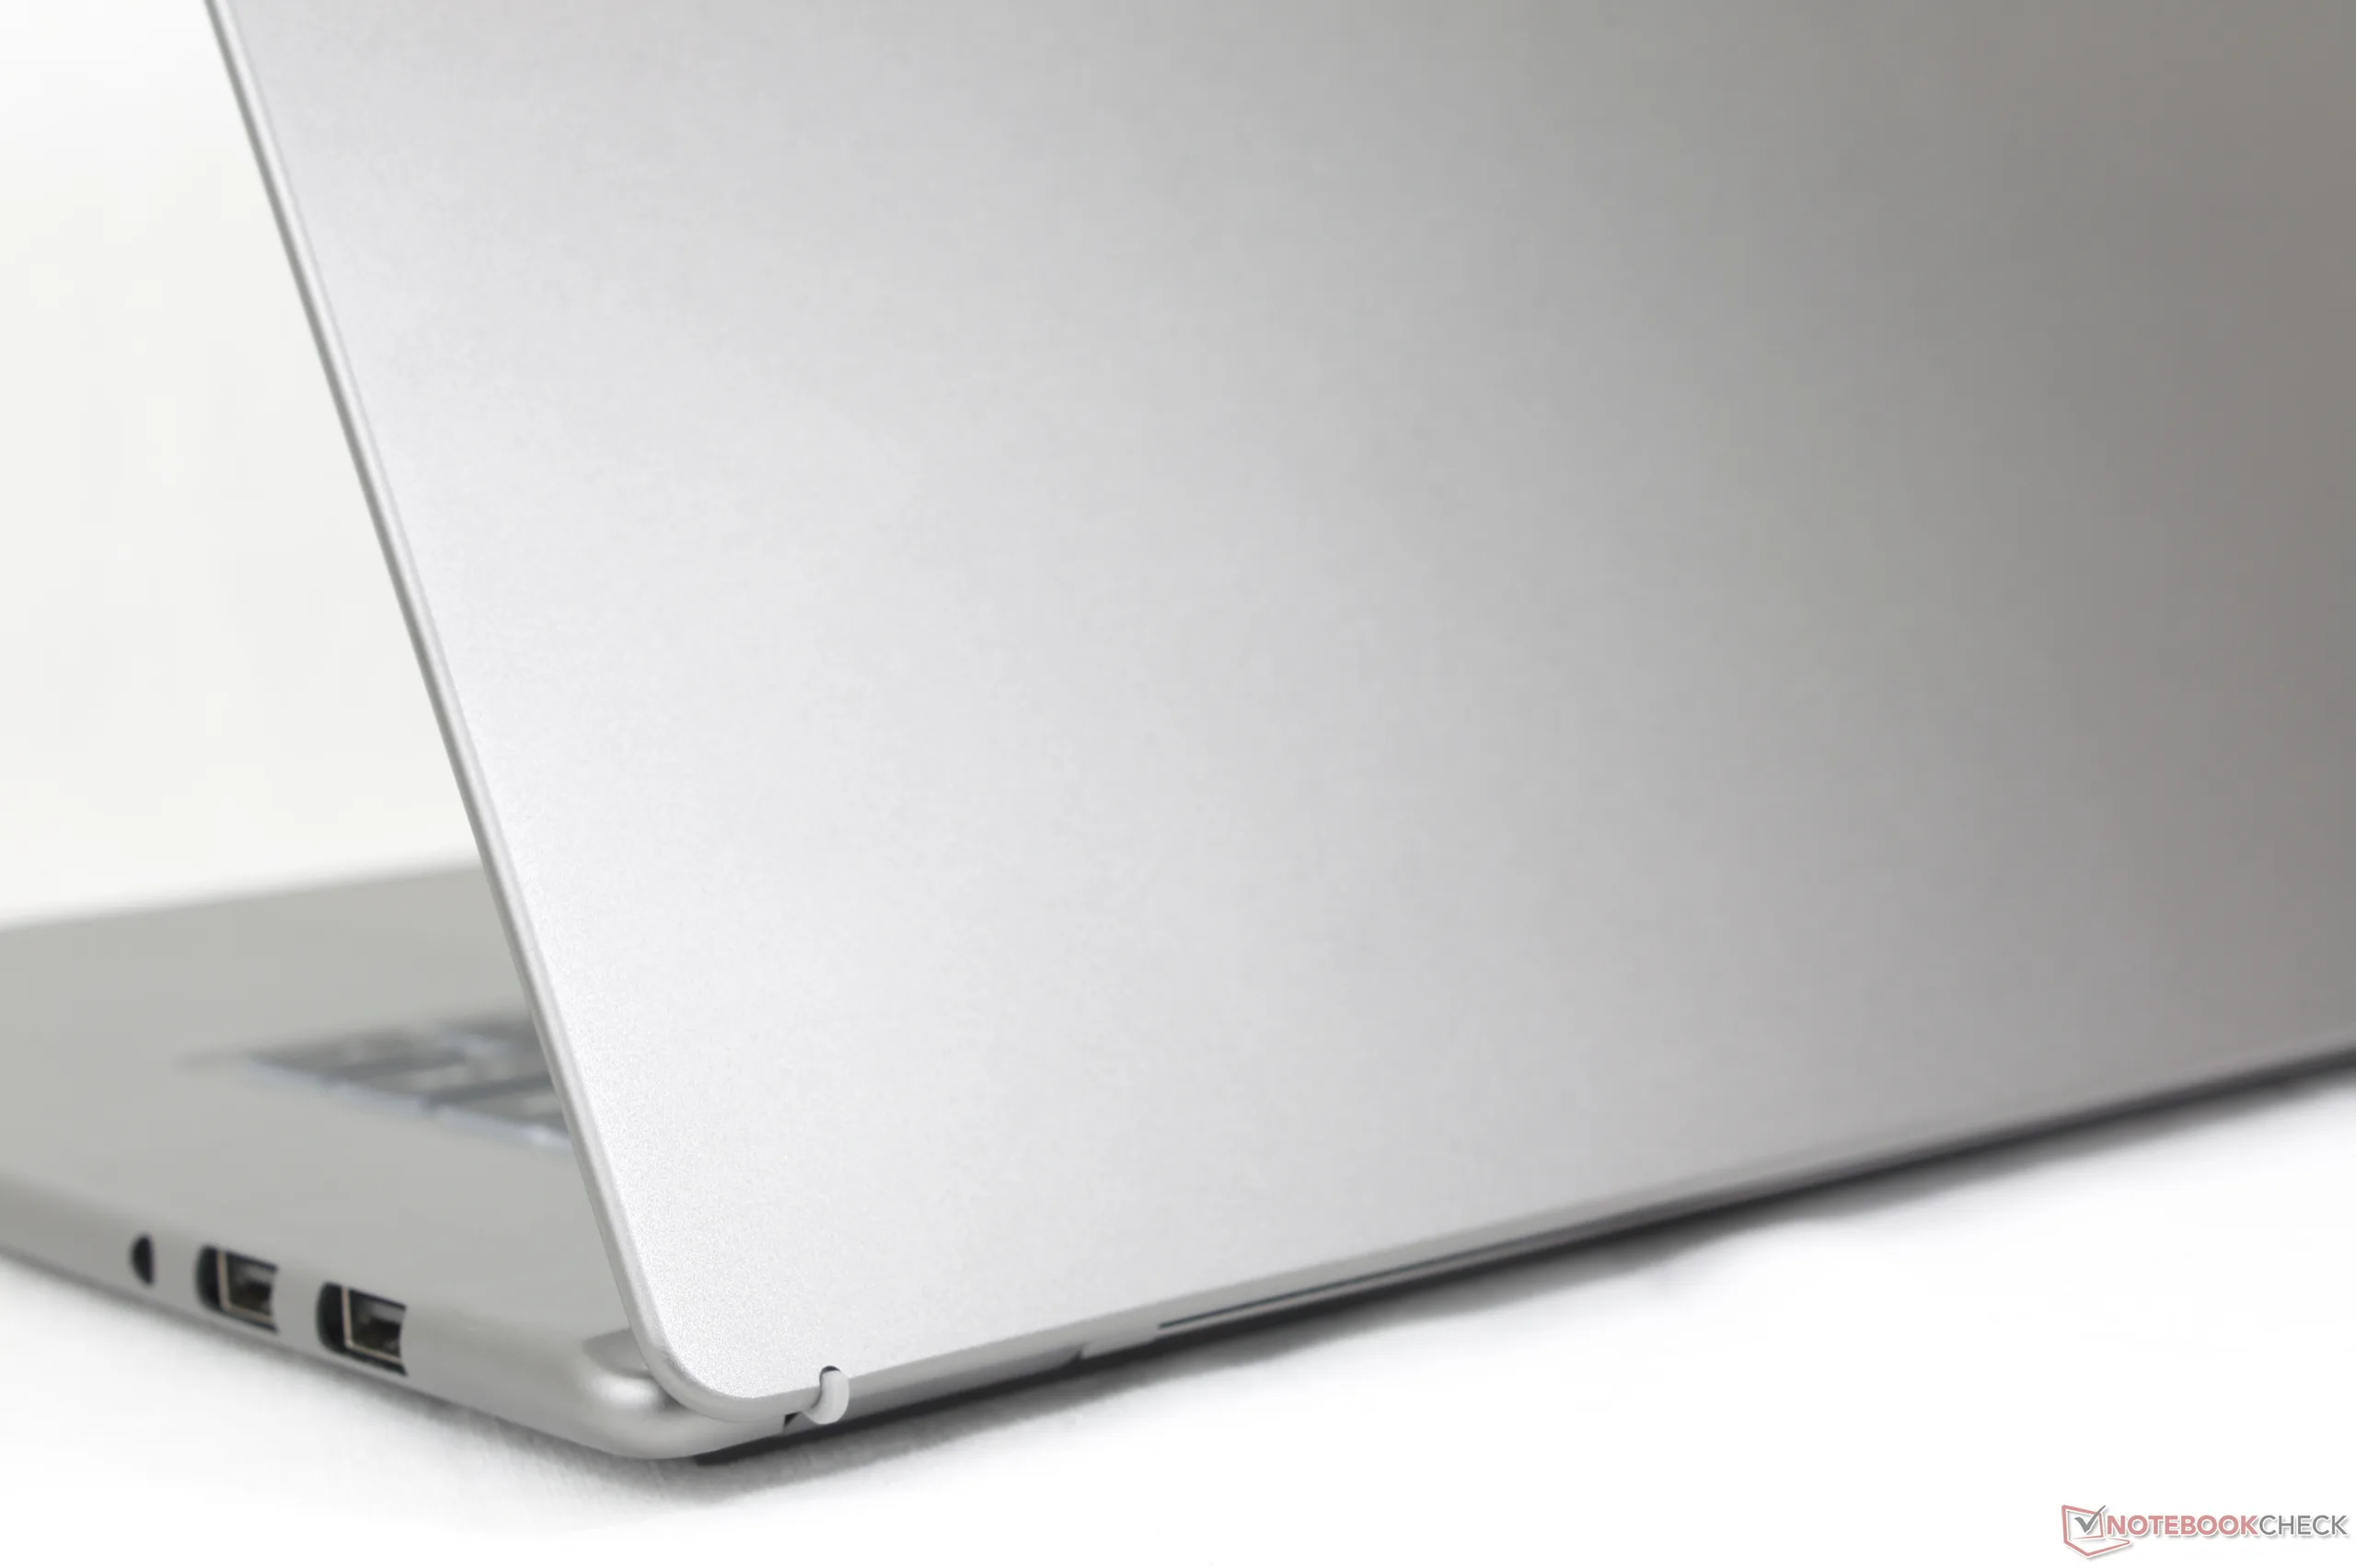
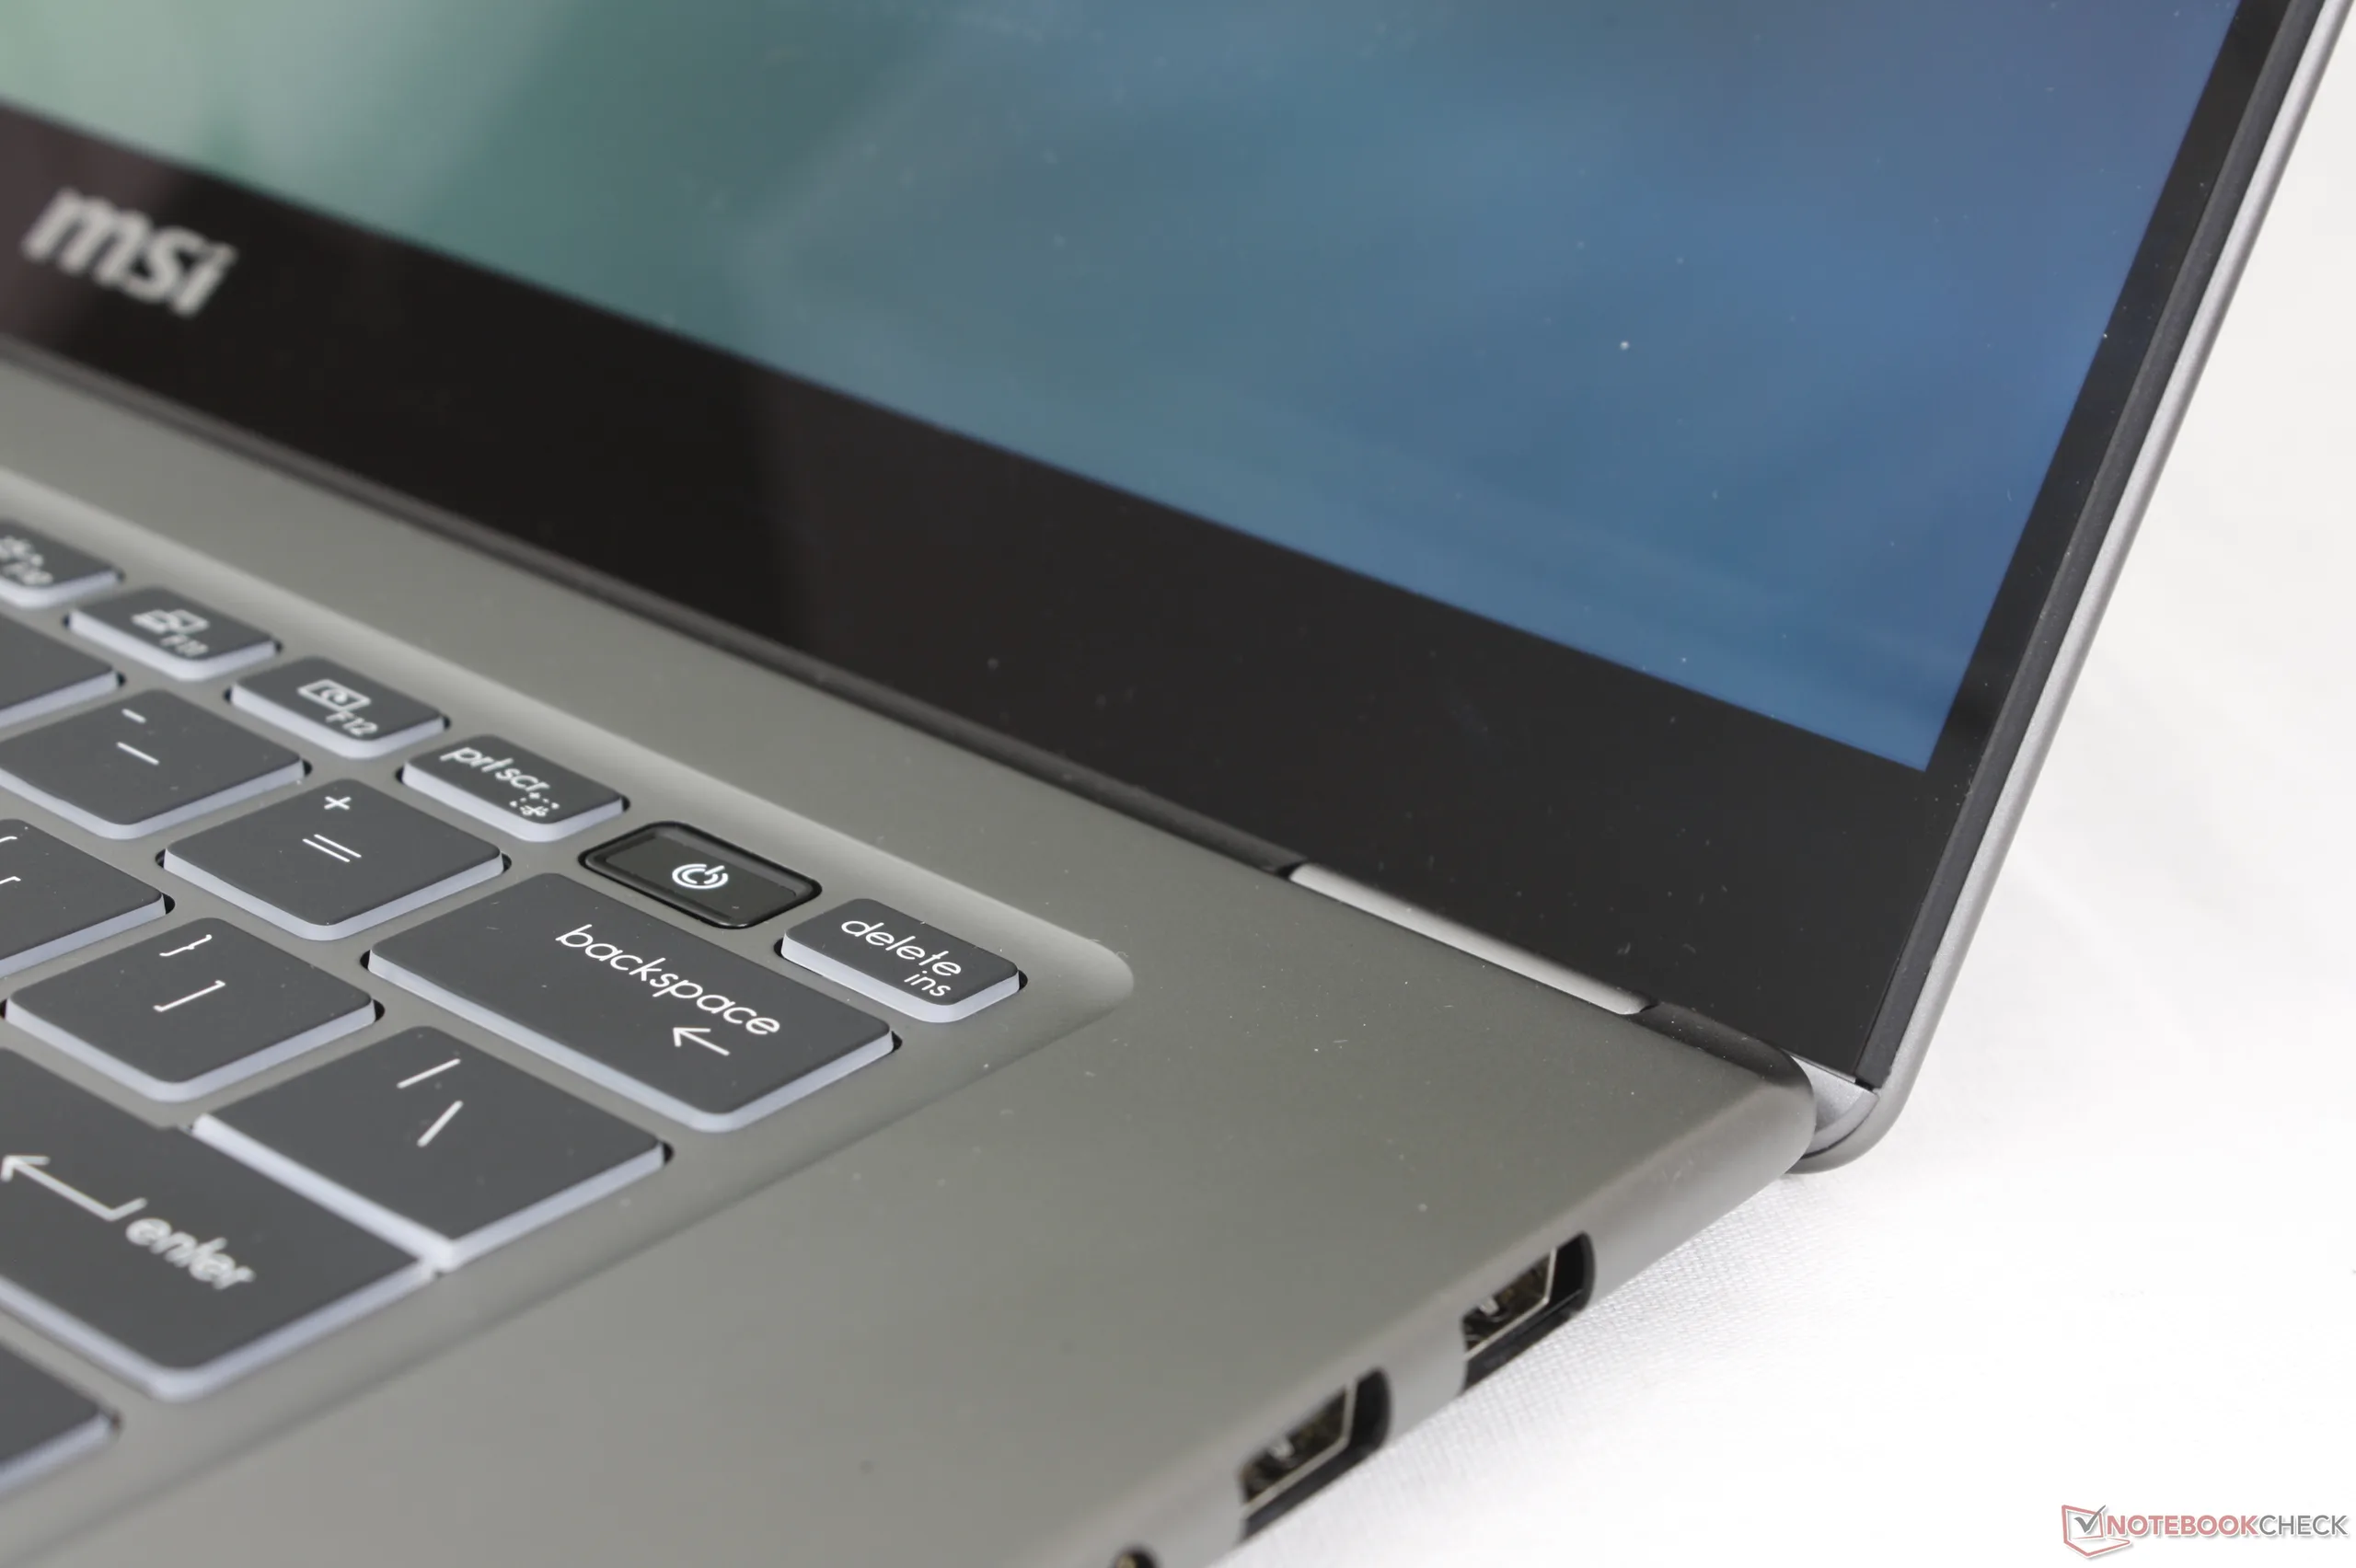
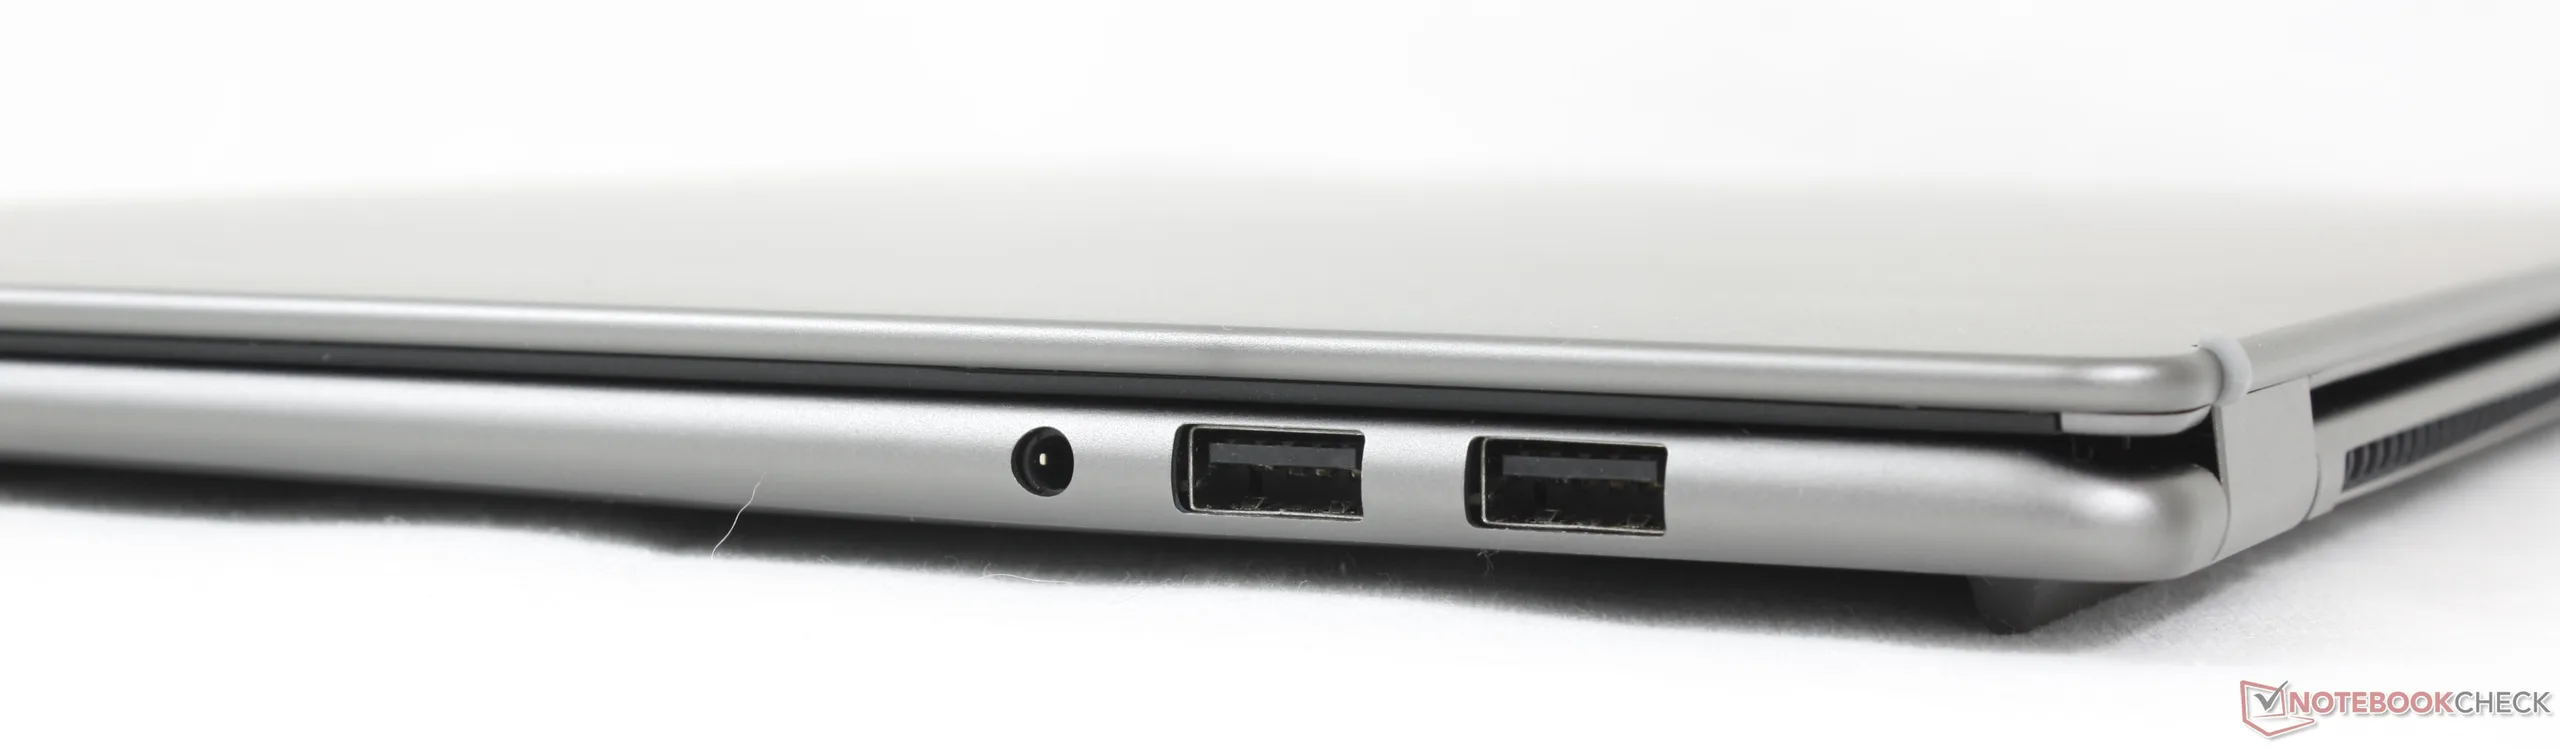
Opcje portów uległy zmianie w stosunku do modelu 2025. MSI zrezygnowało z portu RJ-45, czytnika kart SD i blokady Kensington, dodając jednocześnie drugi port USB-A. Zmiany są mieszane w zależności od preferencji użytkownika.
Rozmieszczenie portów również mogło być lepsze, ponieważ ładowanie USB-C jest ograniczone tylko do lewej strony systemu.


Komunikacja
Kamera internetowa
Kamera internetowa o rozdzielczości 2 MP jest standardowo wyposażona zarówno w podczerwień, jak i fizyczną przesłonę prywatności.


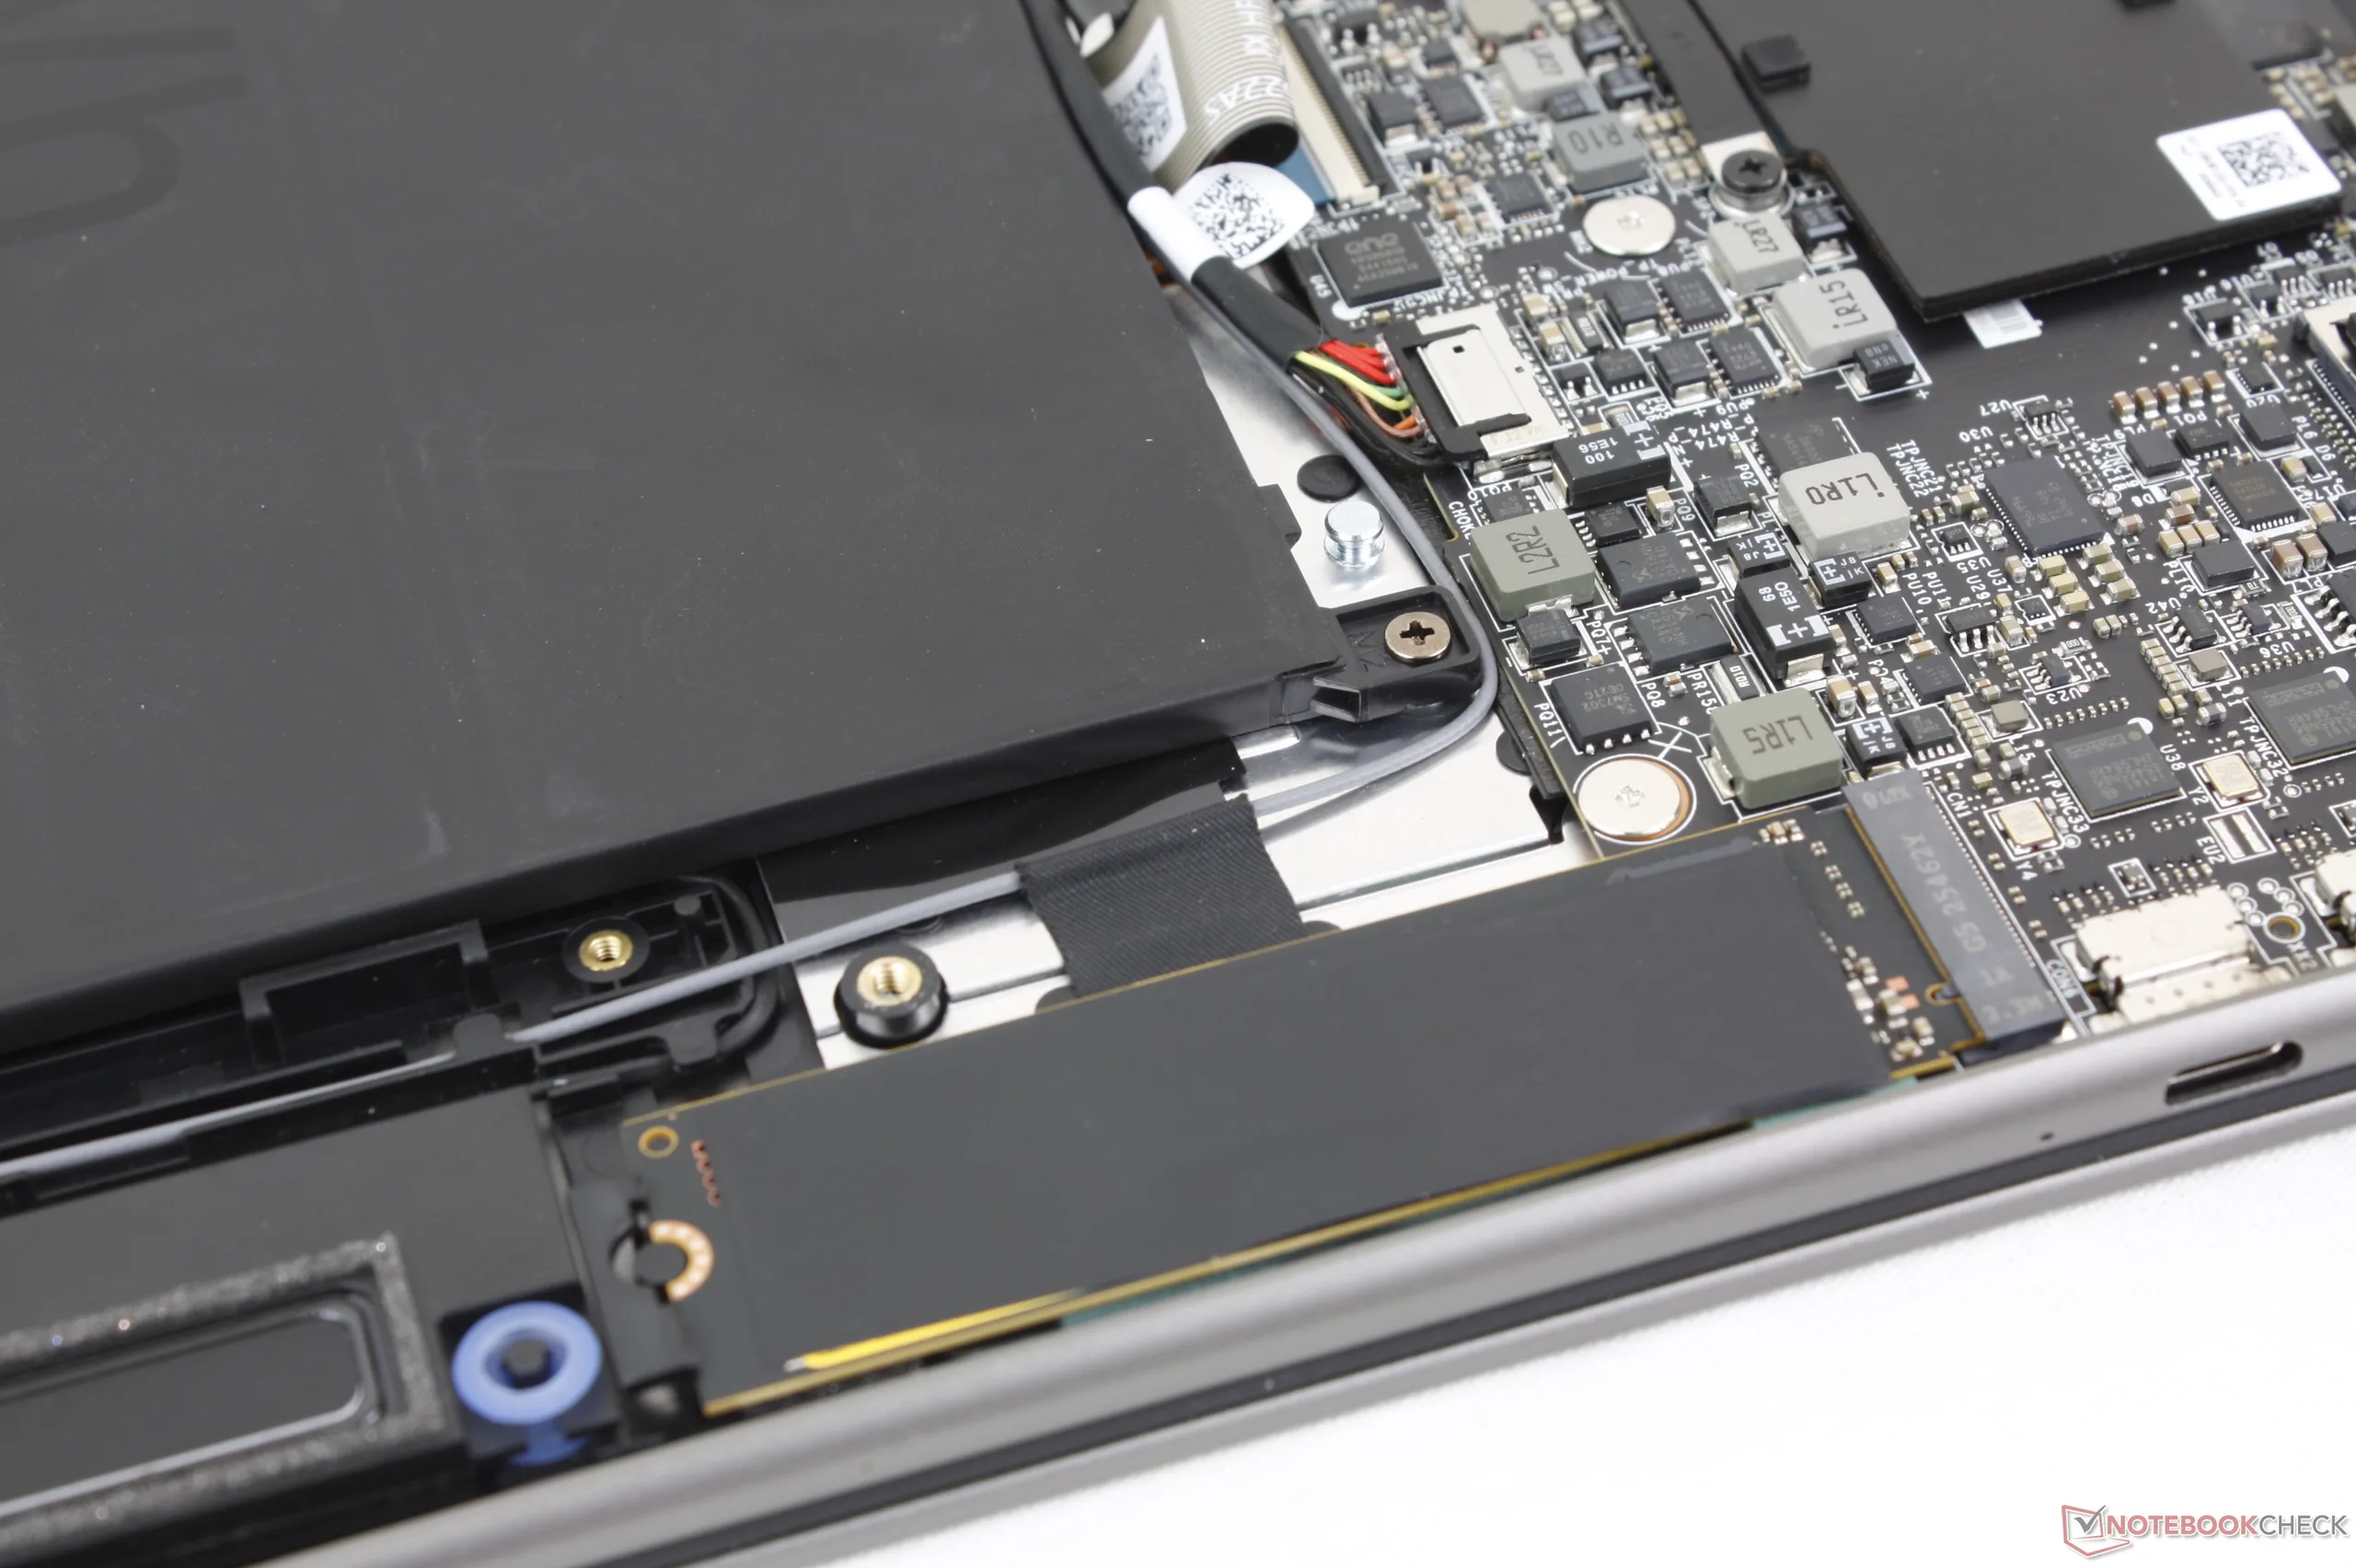
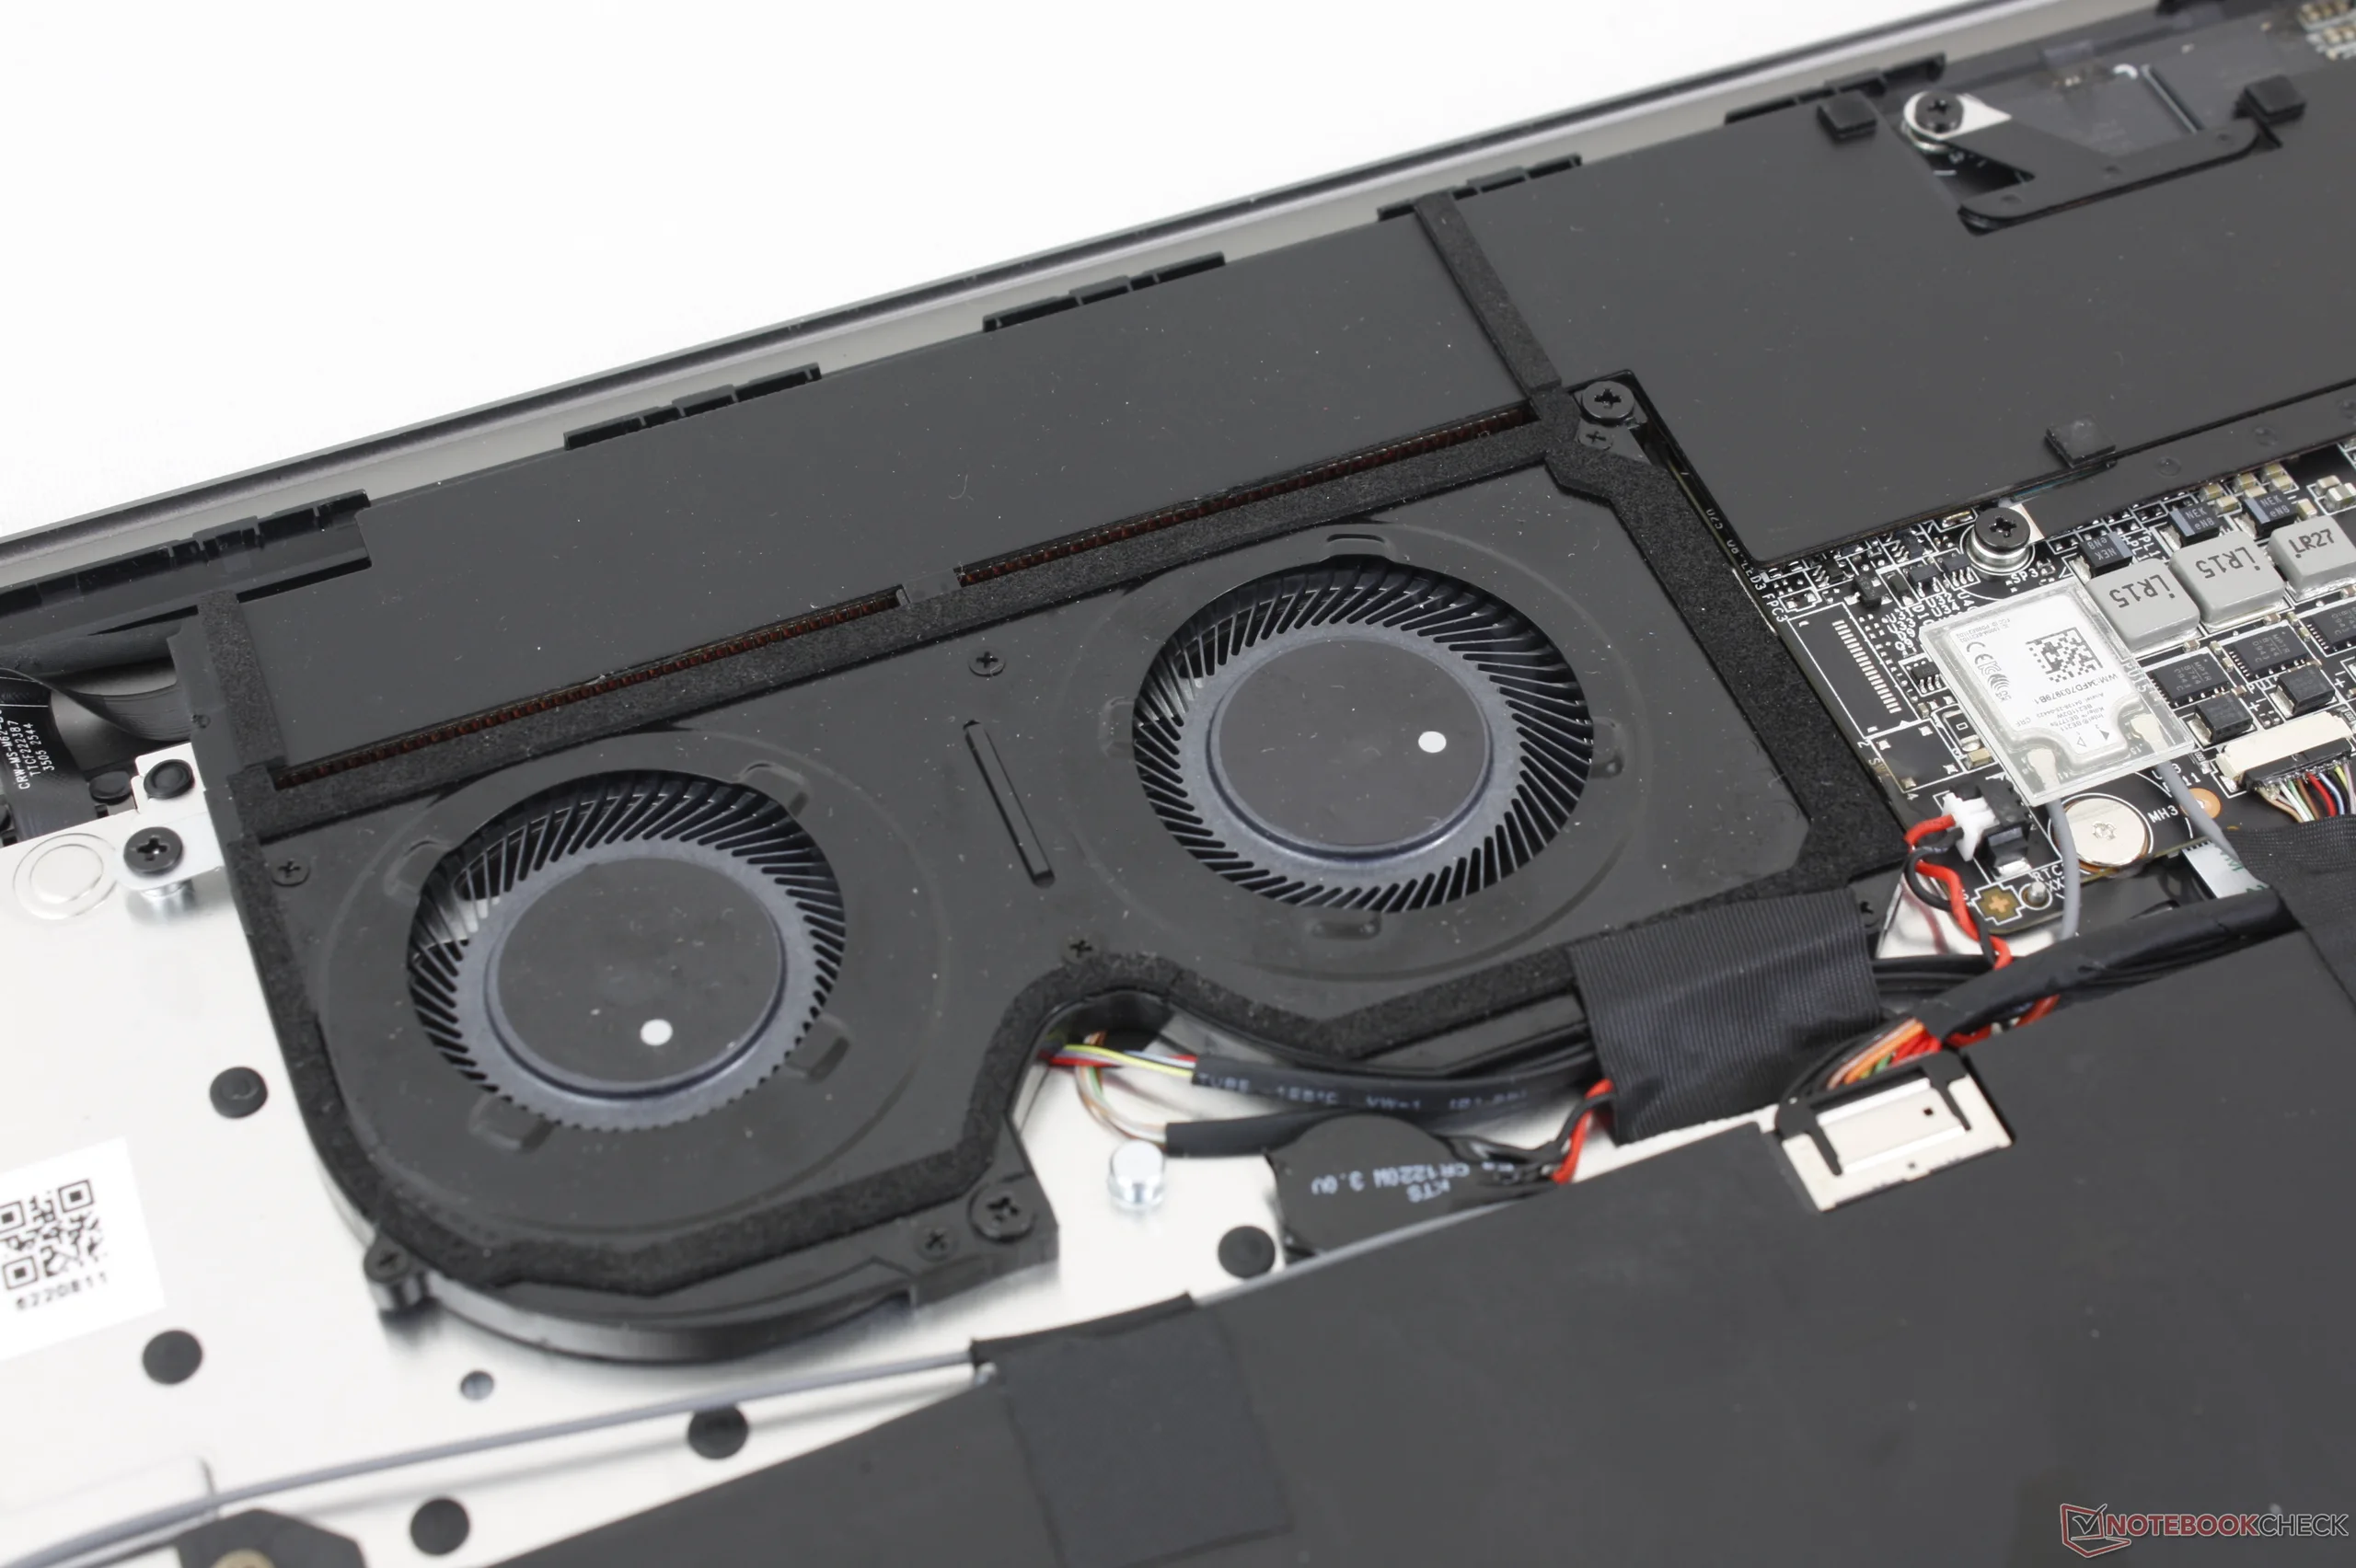
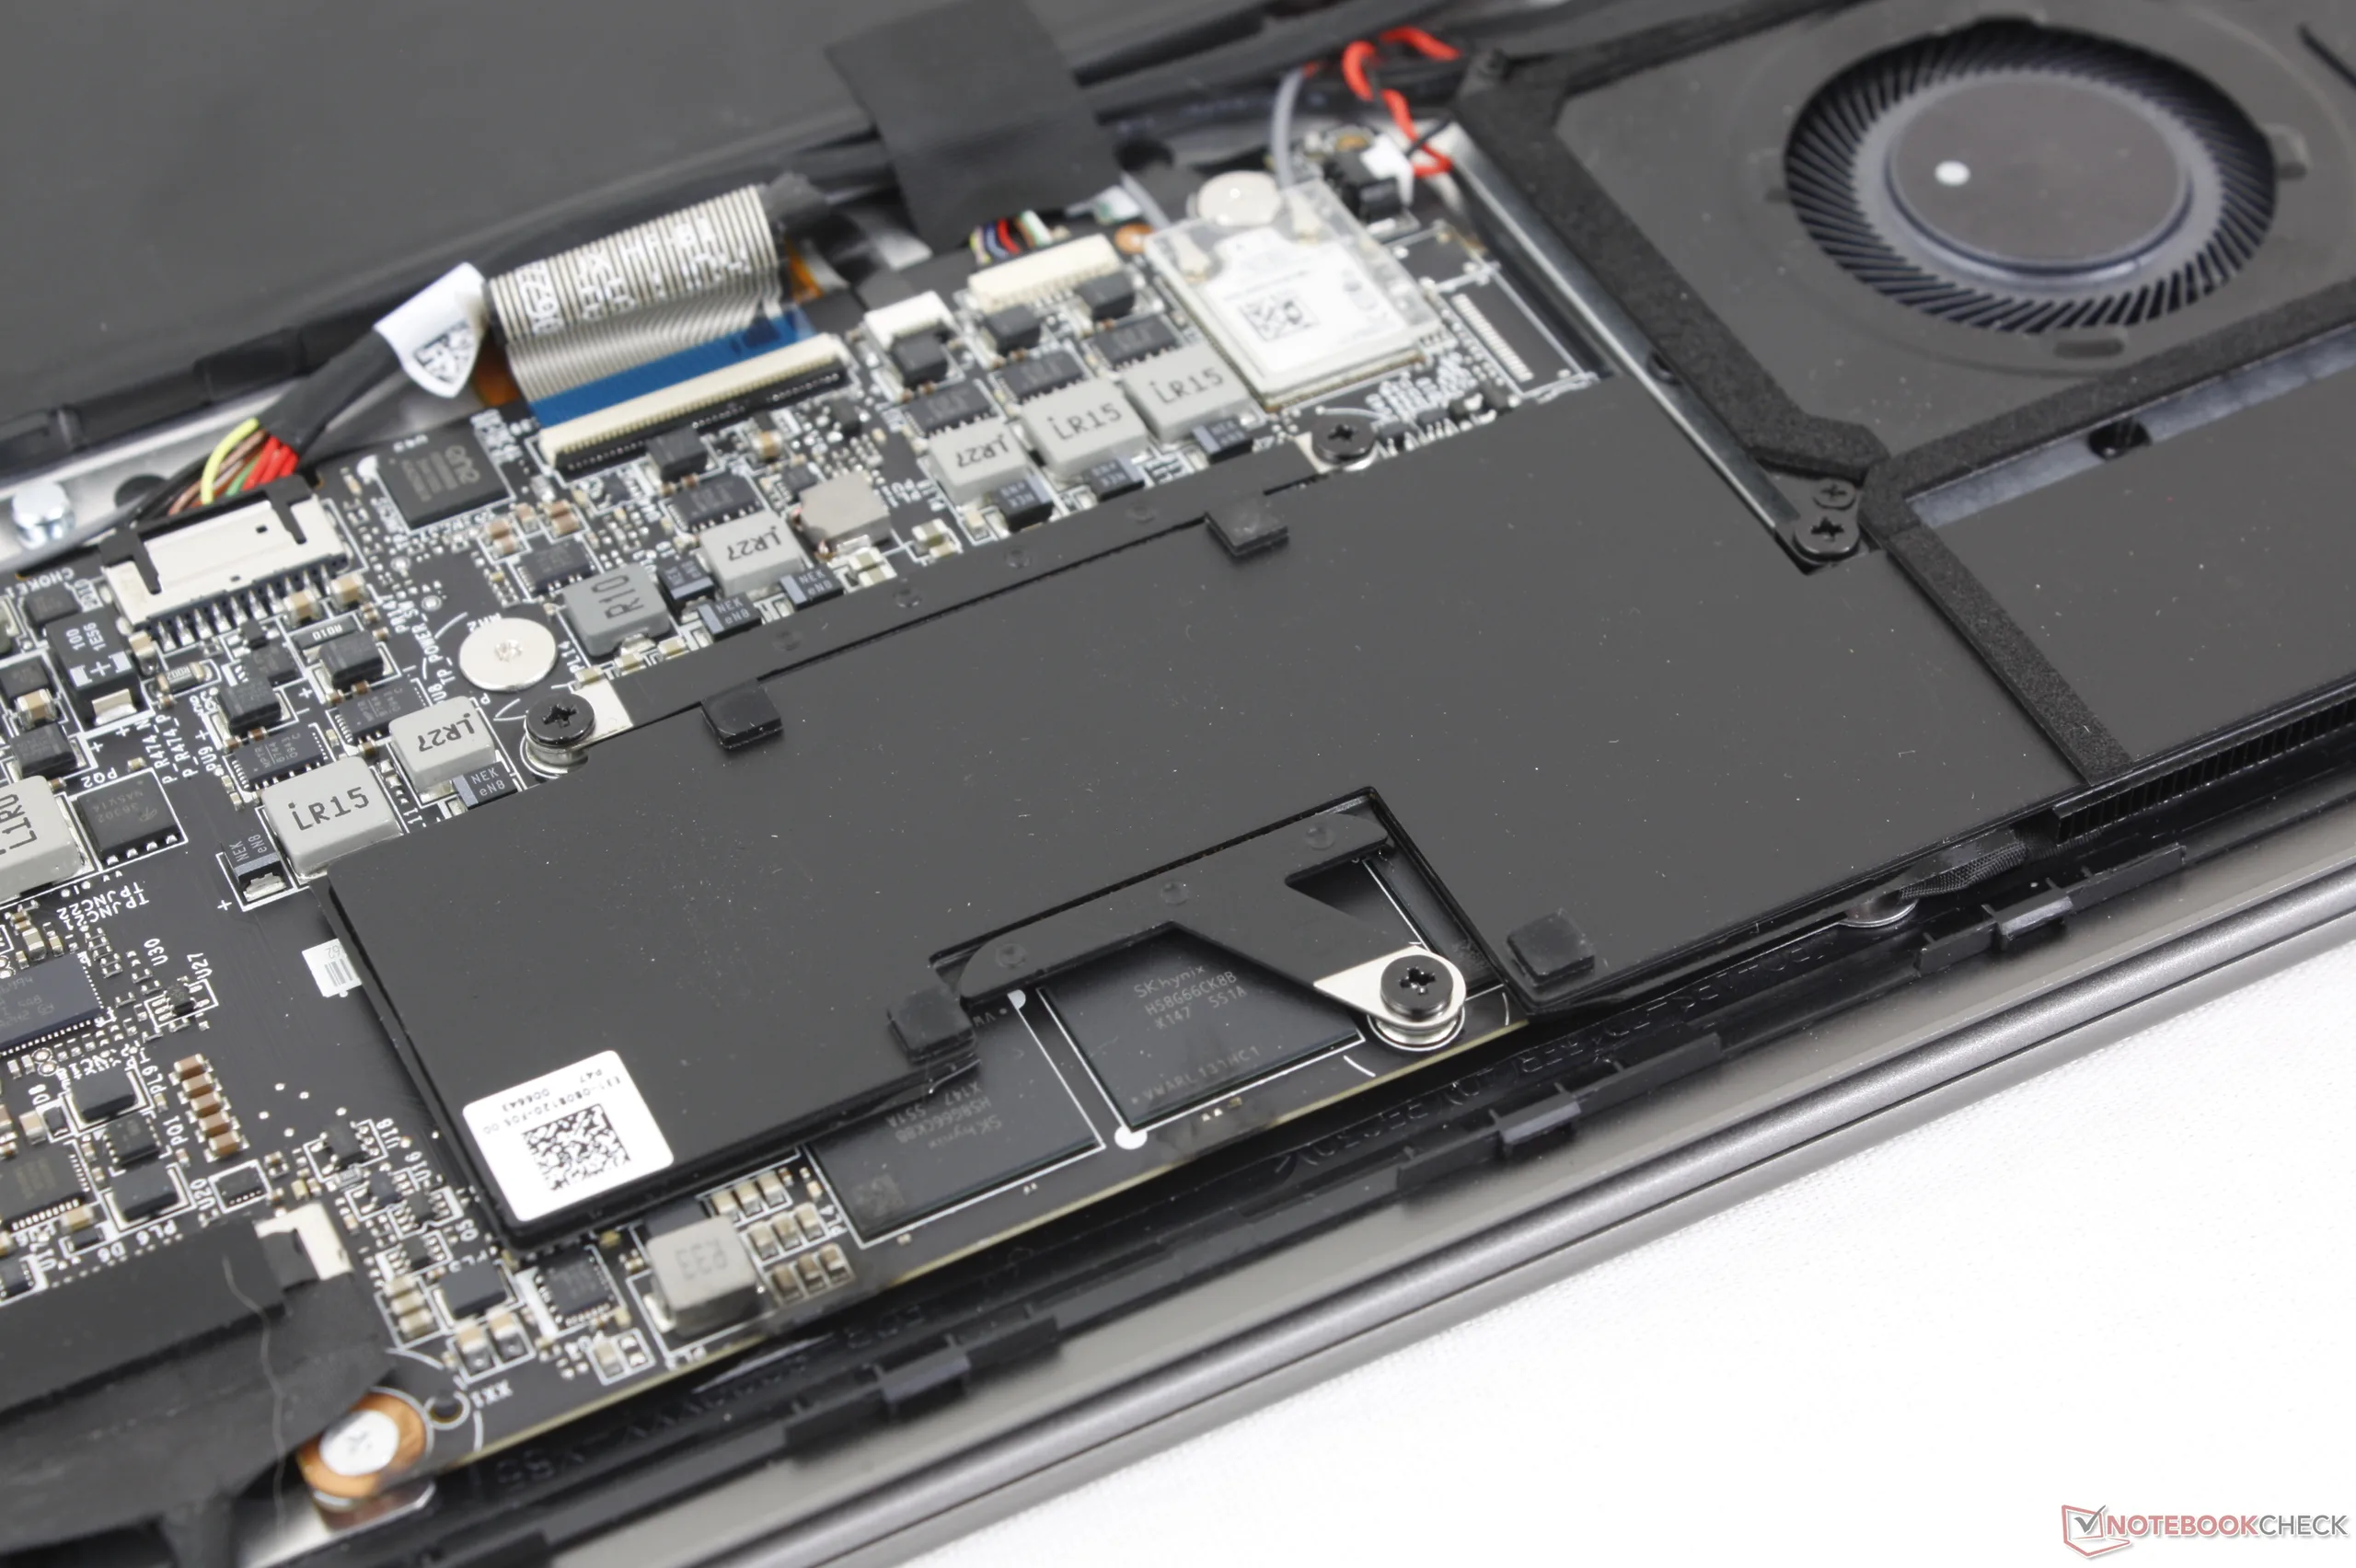
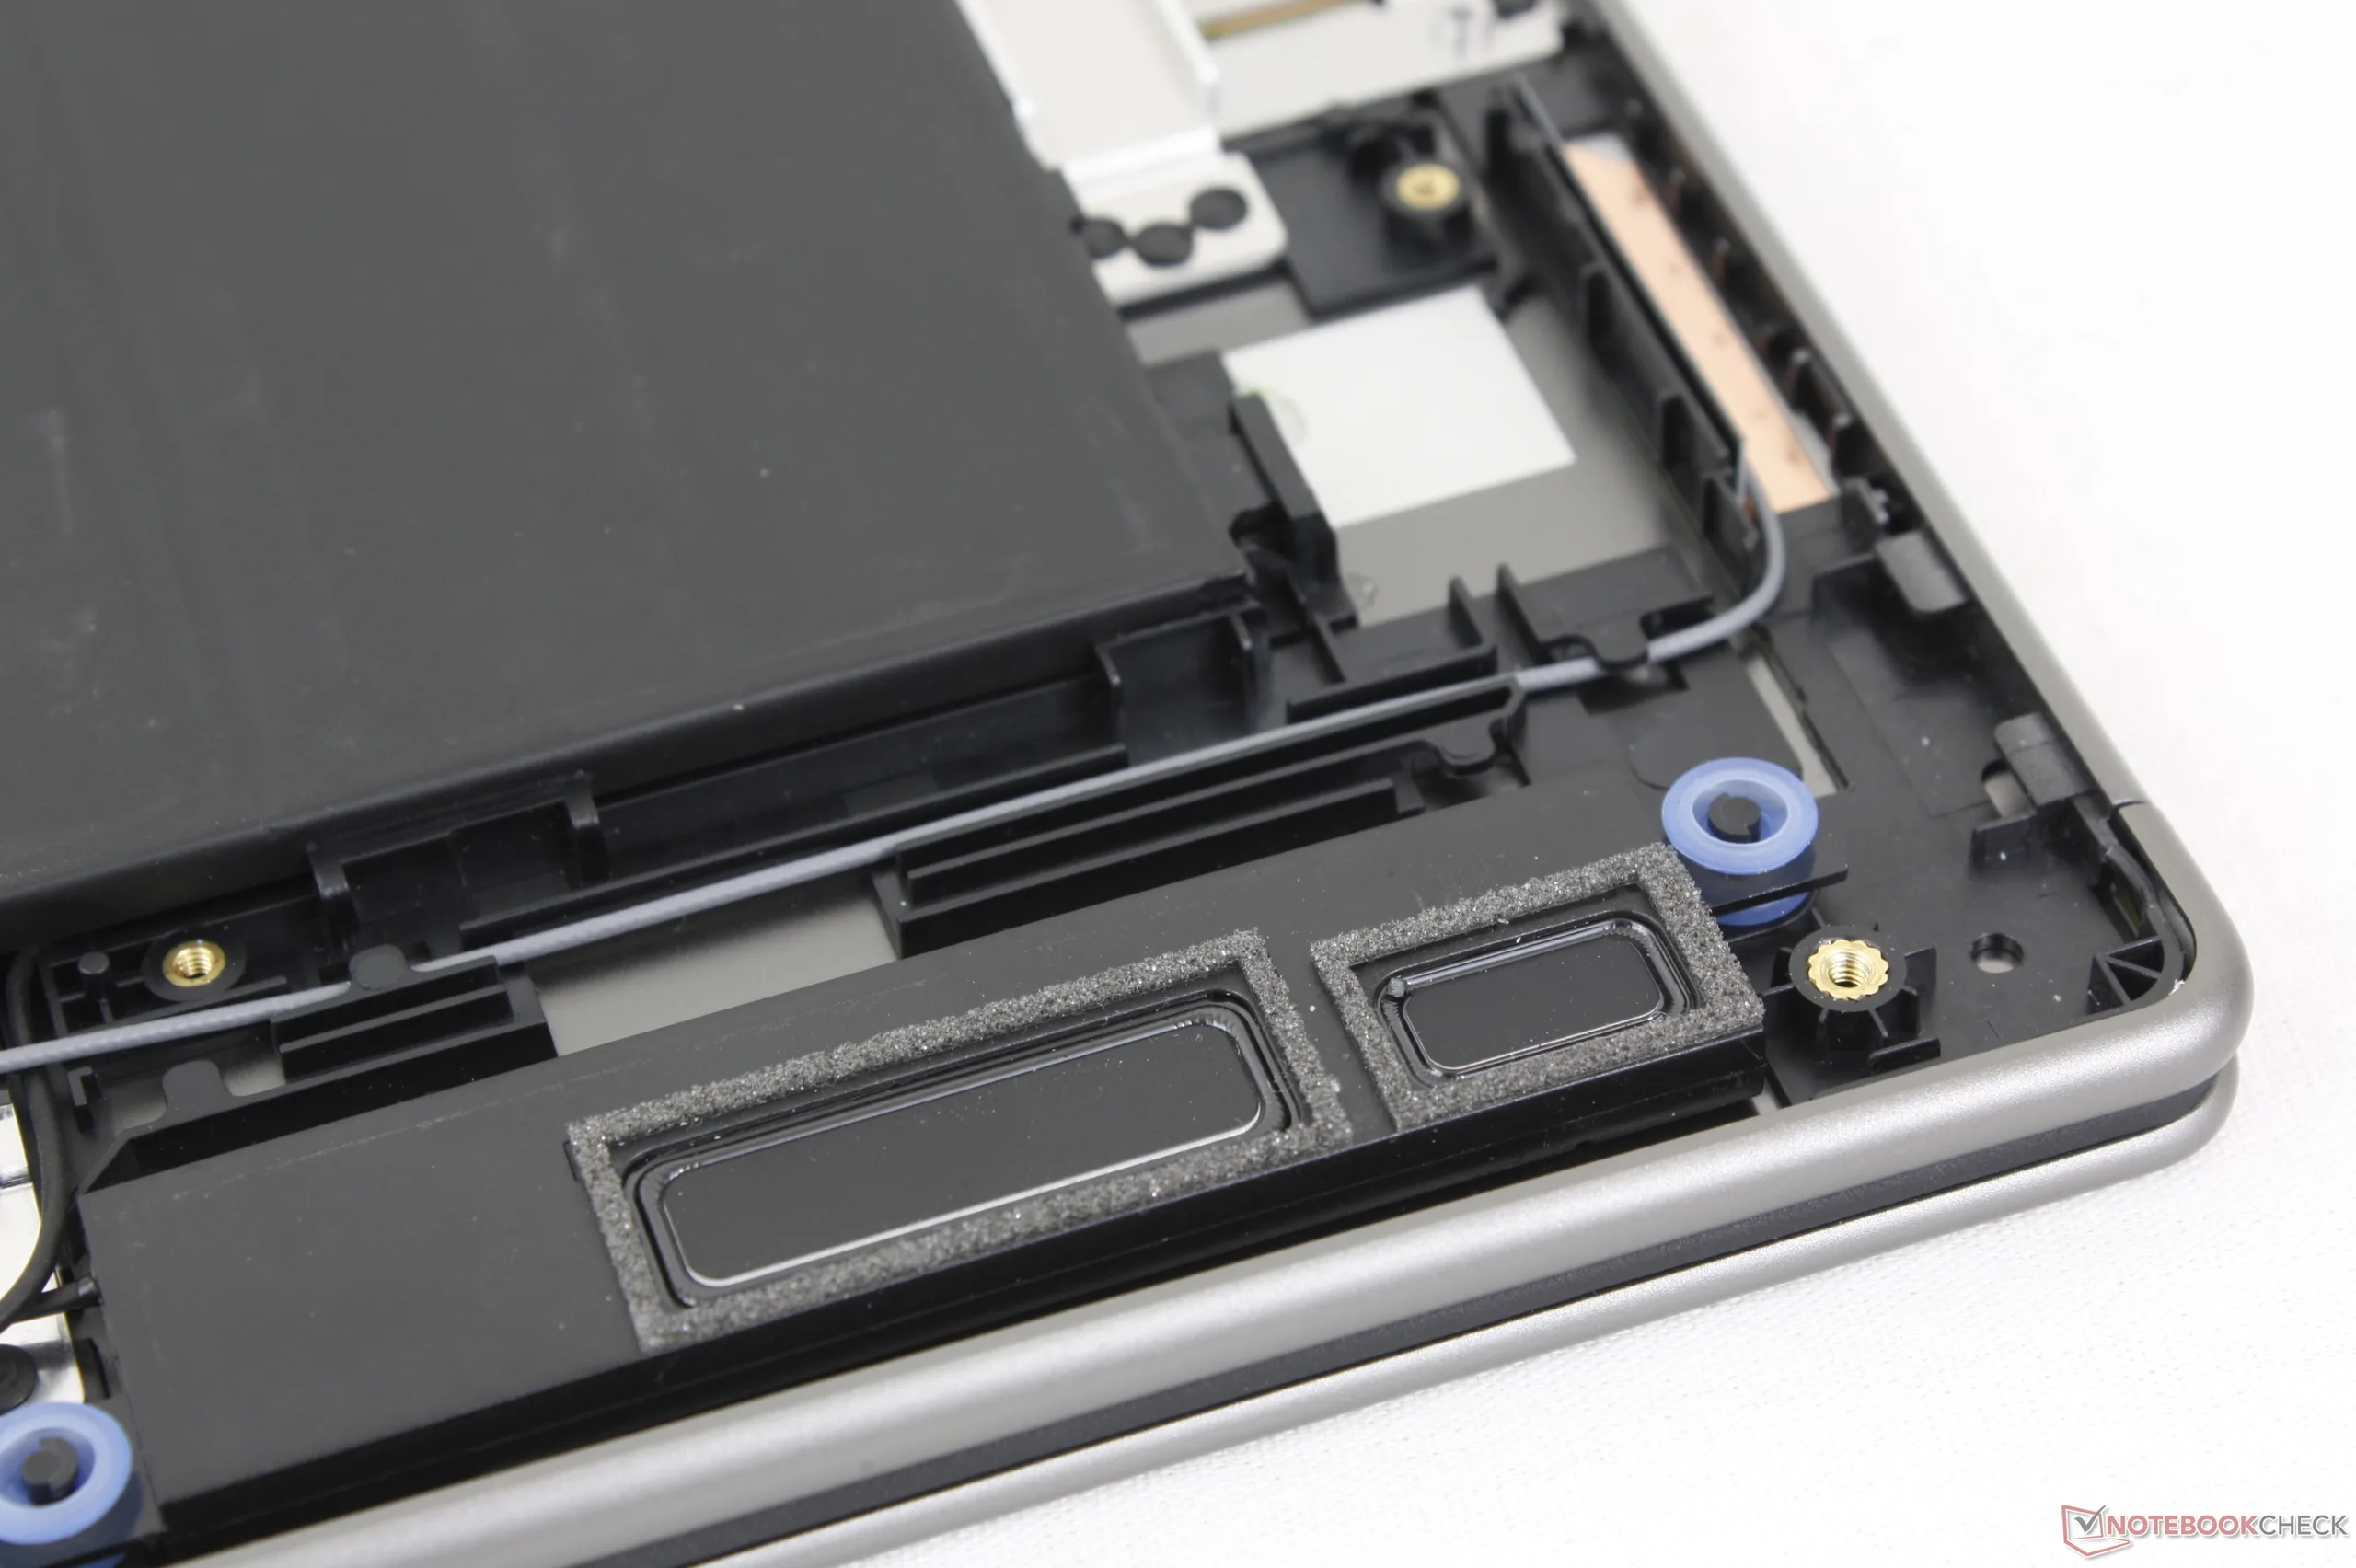
Konserwacja
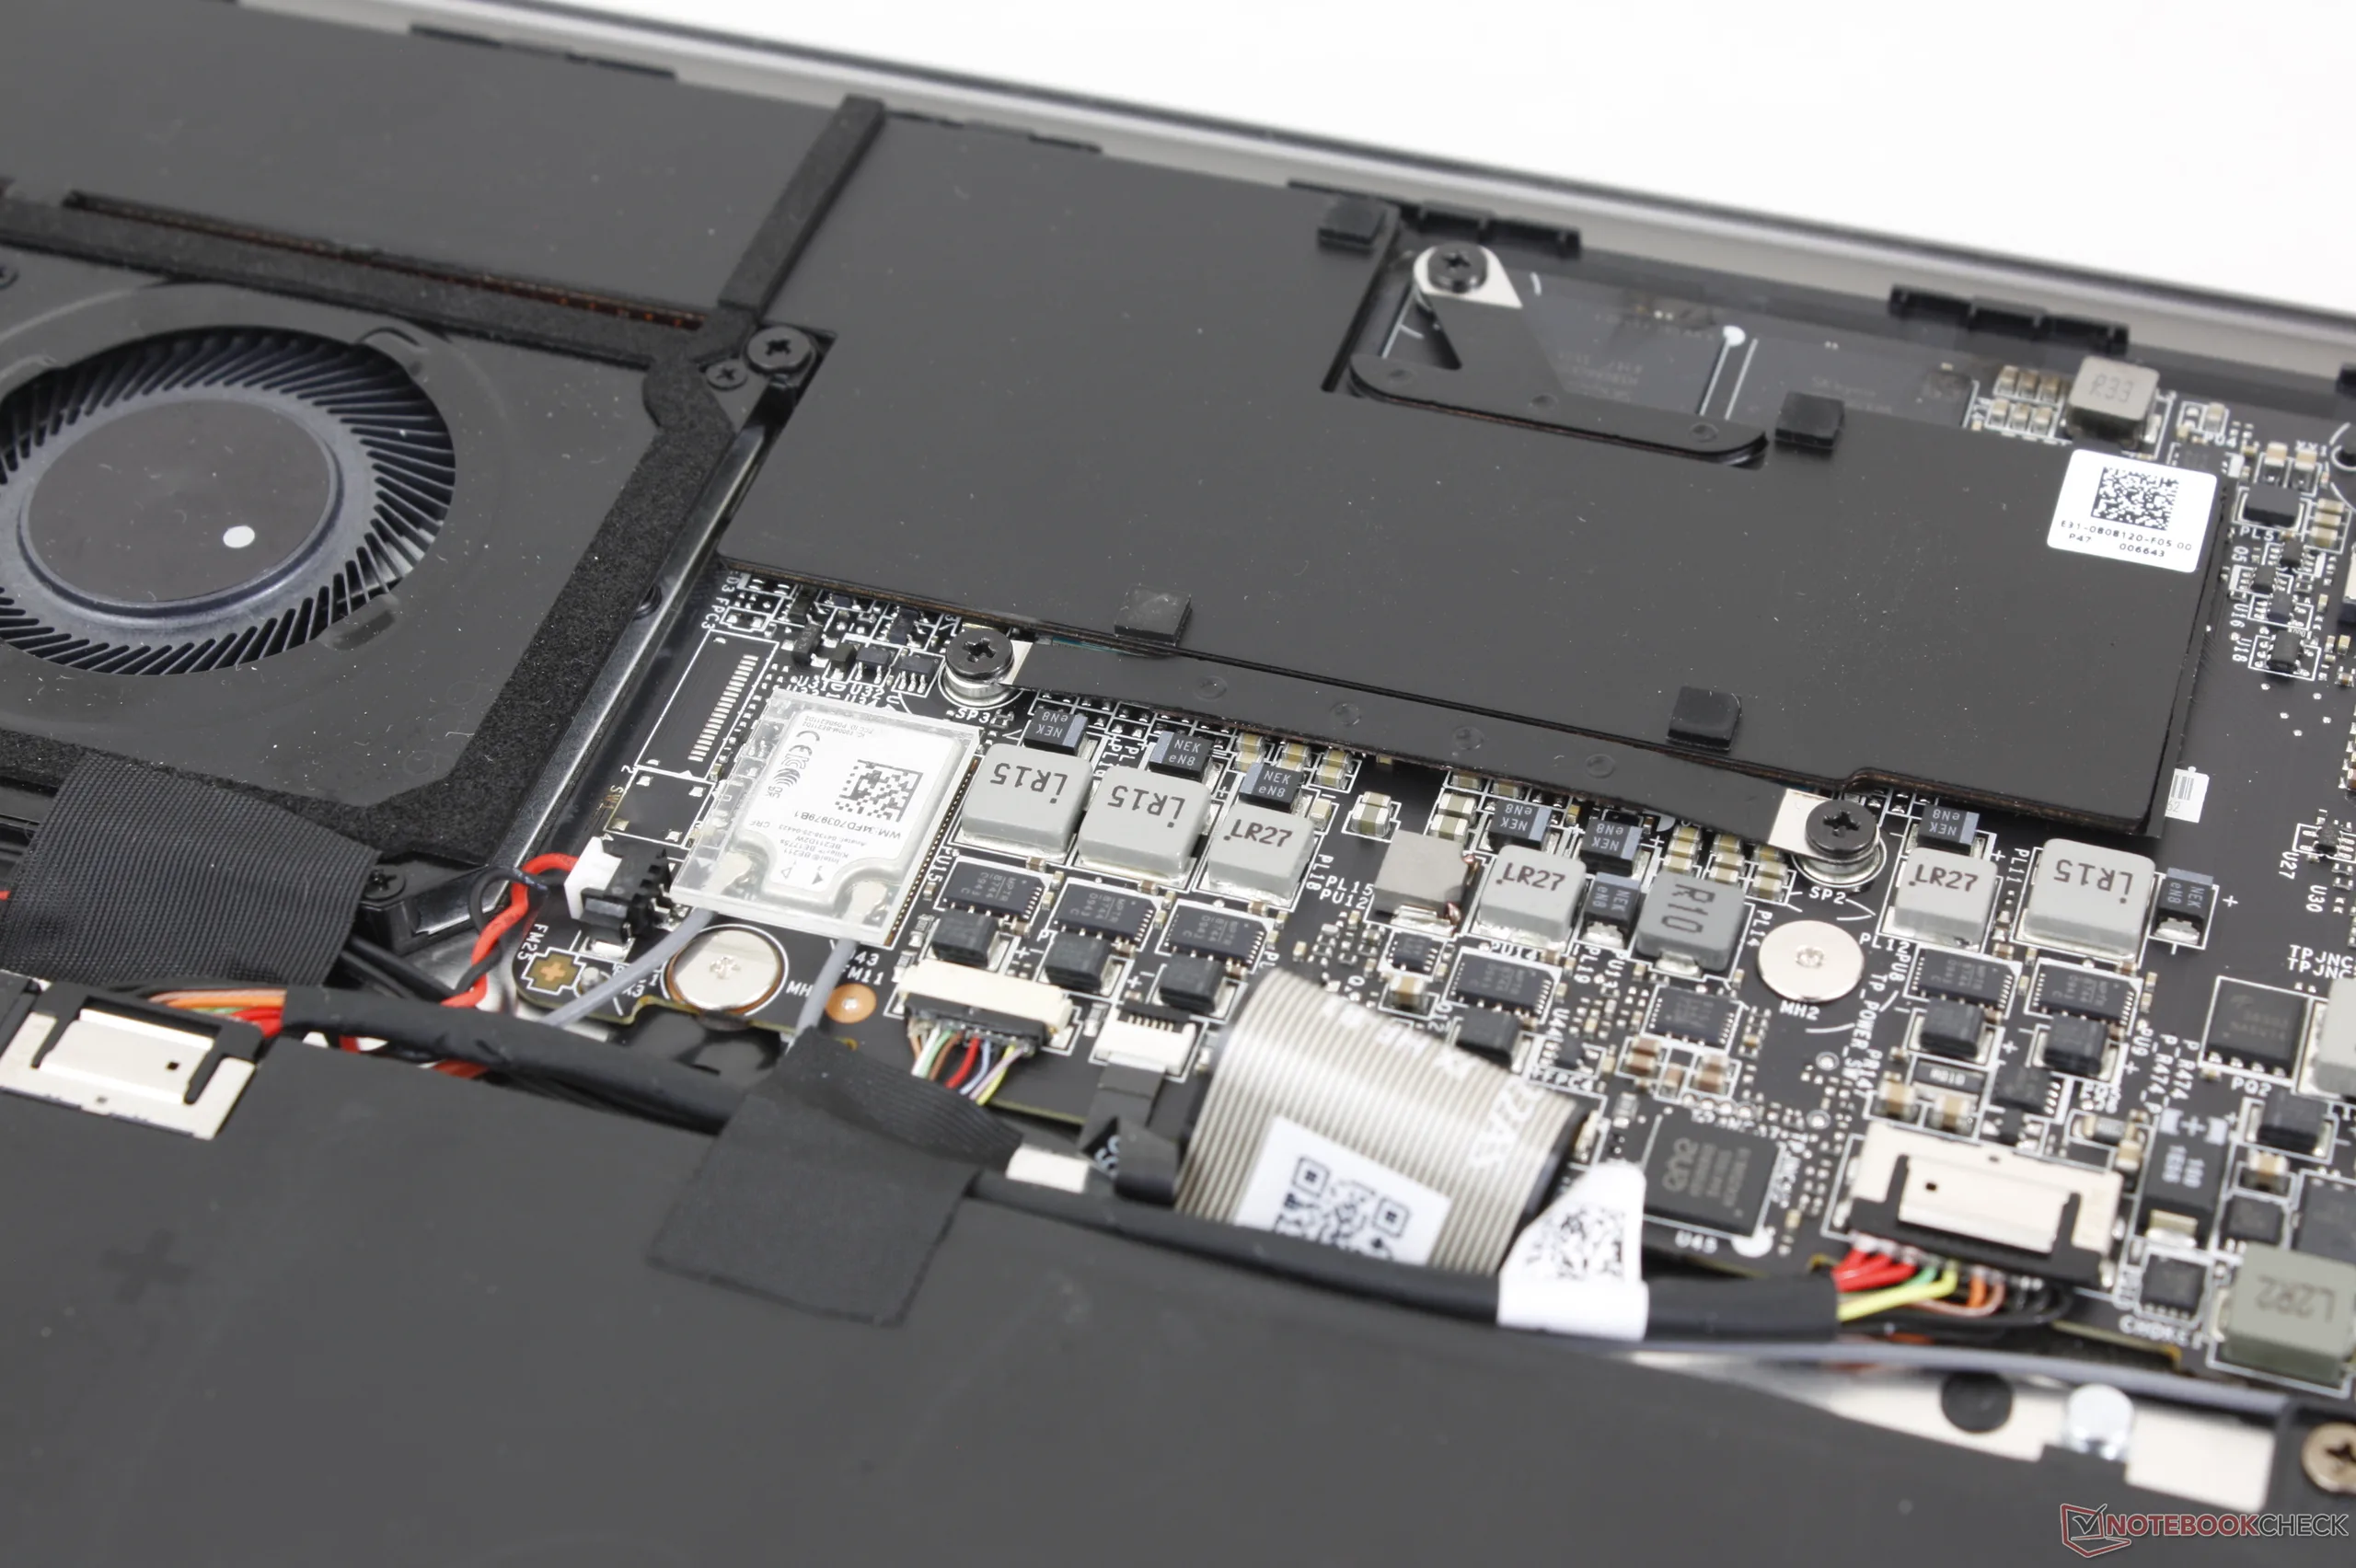
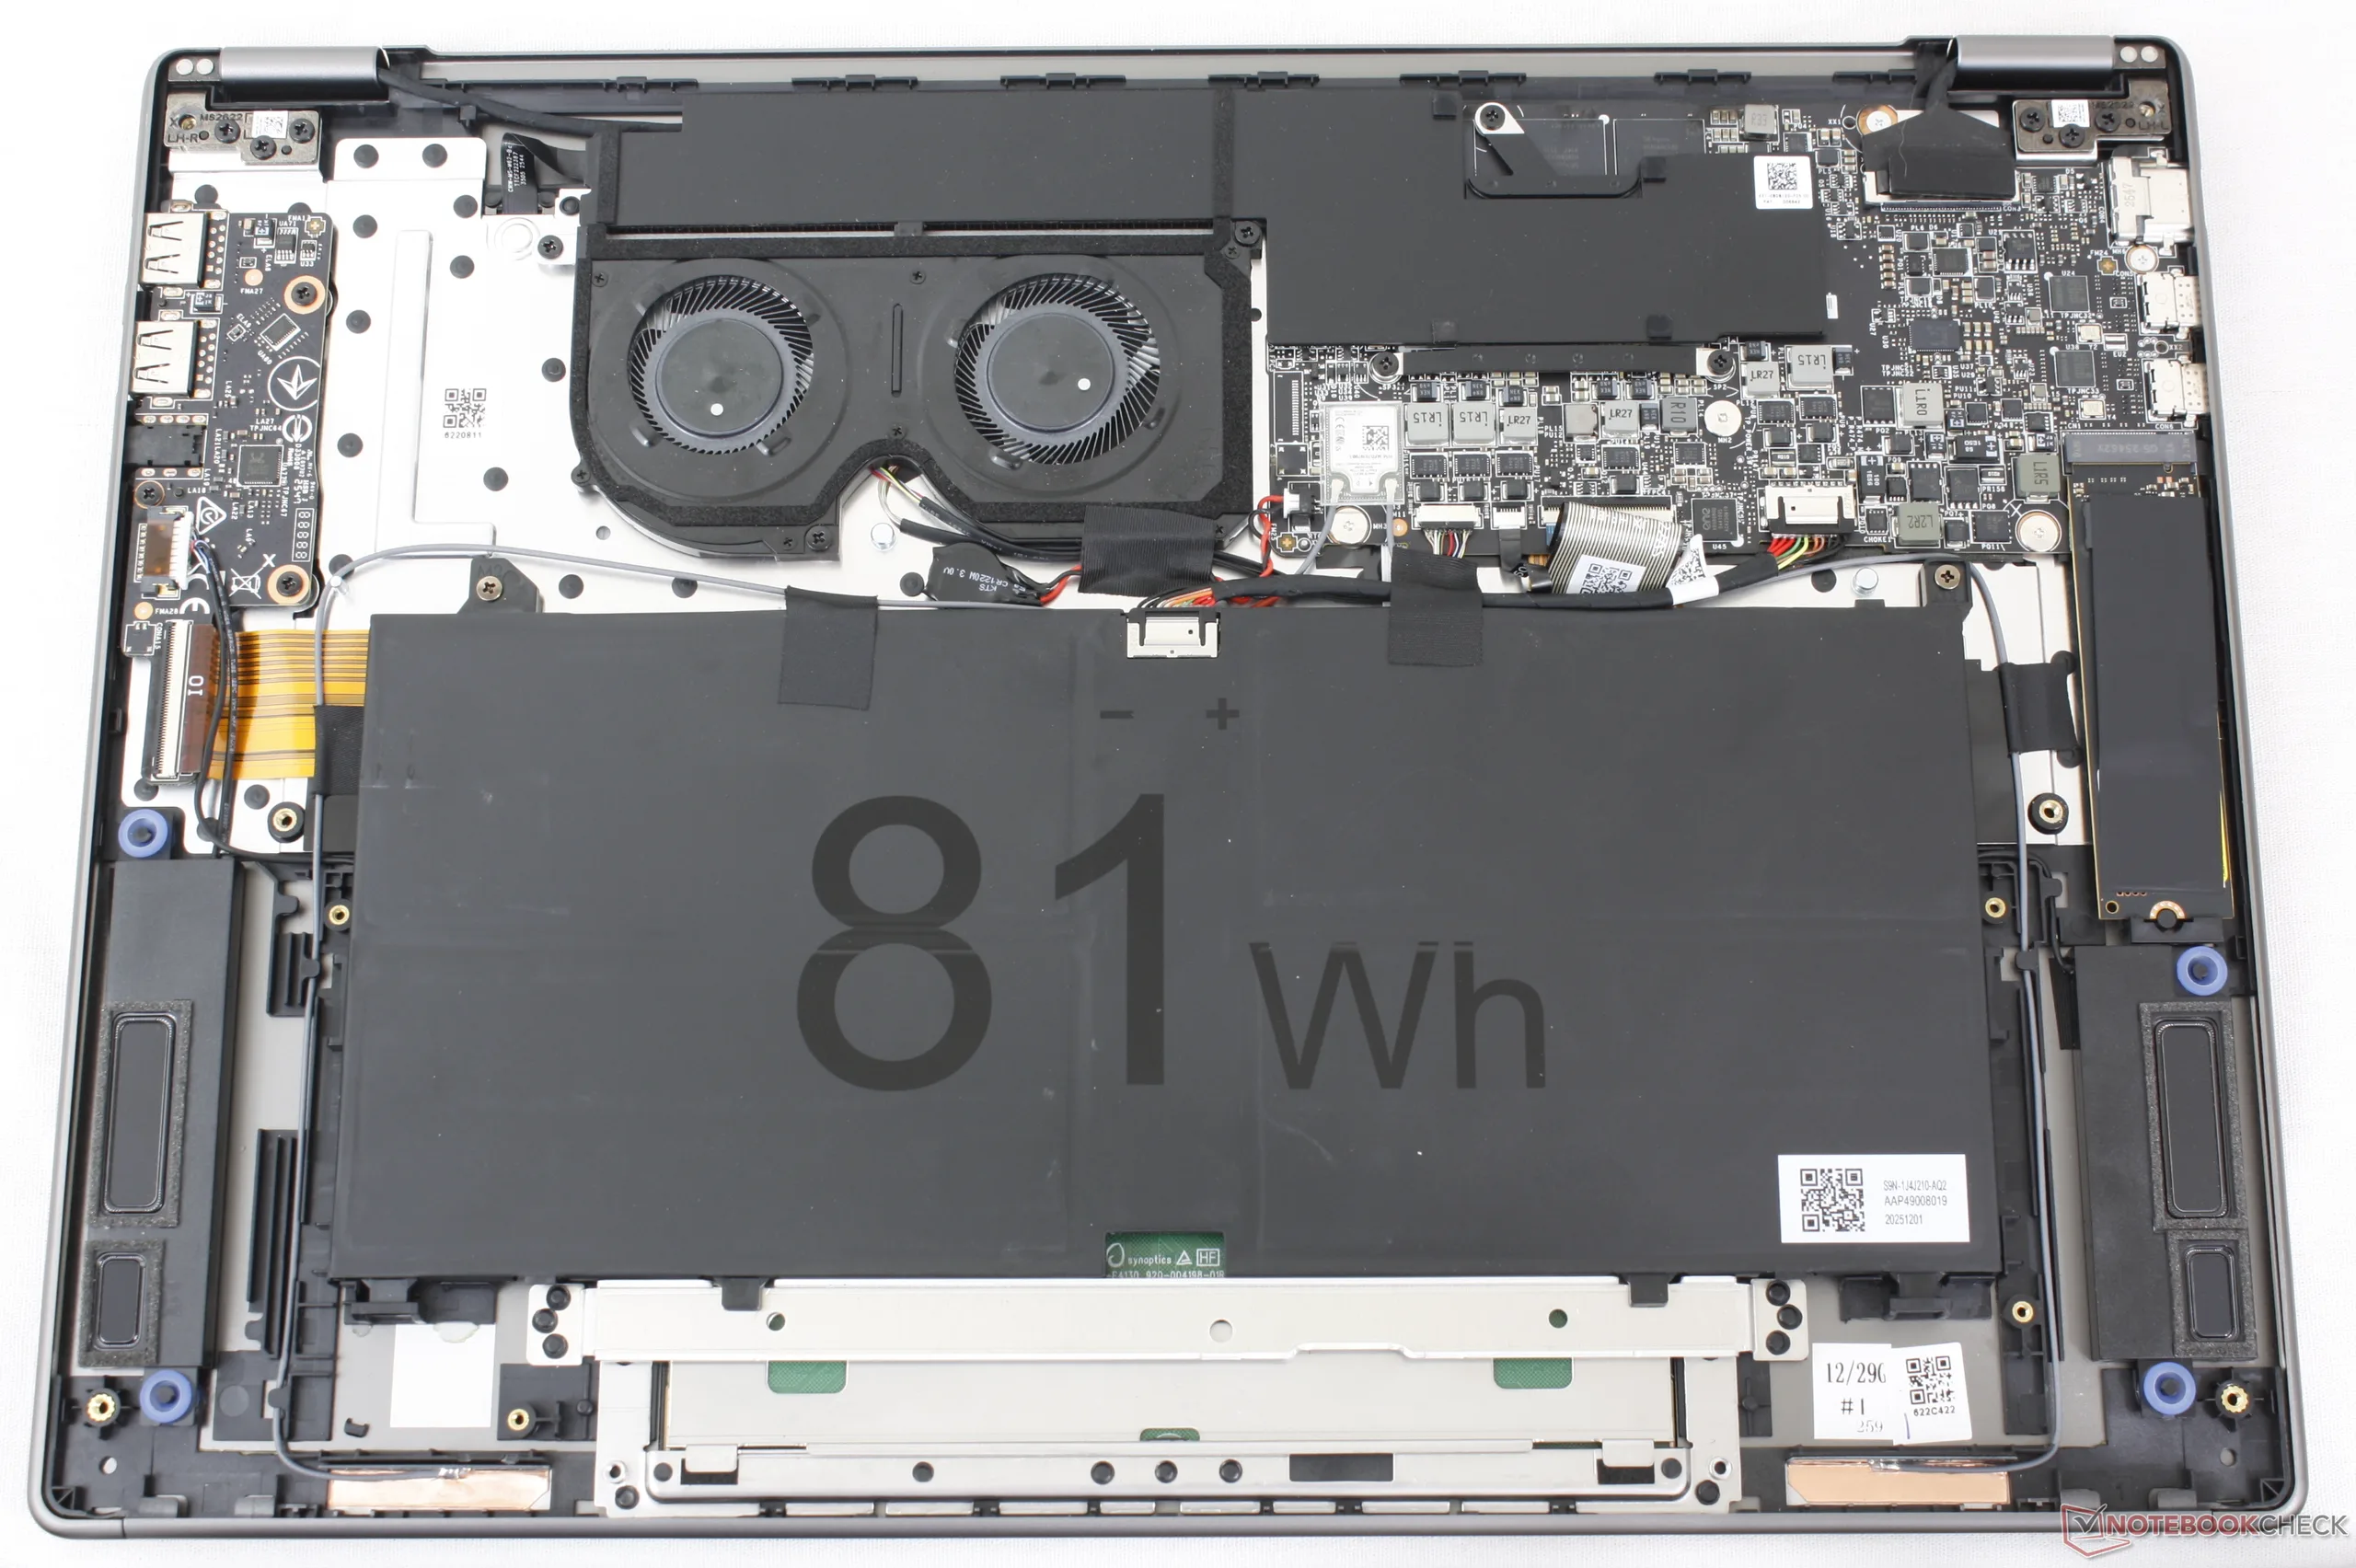
Dolny panel można łatwo zdemontować za pomocą śrubokręta krzyżakowego i ostrej krawędzi. Płyta główna została całkowicie zmieniona w stosunku do modelu z 2025 roku, jak pokazano poniżej. Przede wszystkim model ten obsługuje teraz tylko jeden dysk SSD M.2 zamiast dwóch, a pojemność baterii zmniejszyła się prawdopodobnie w celu zmniejszenia wagi.

Zrównoważony rozwój
Wykorzystanie materiałów pochodzących z recyklingu podczas produkcji nie jest wyraźnie określone przez producenta. Tymczasem opakowanie posiada certyfikat FSC i składa się zarówno z papieru, jak i plastiku.
Akcesoria i gwarancja
W pudełku nie ma żadnych dodatków poza zasilaczem sieciowym i dokumentacją. W przypadku zakupu w Stanach Zjednoczonych obowiązuje standardowa roczna ograniczona gwarancja producenta.
Urządzenia wejściowe
Klawiatura
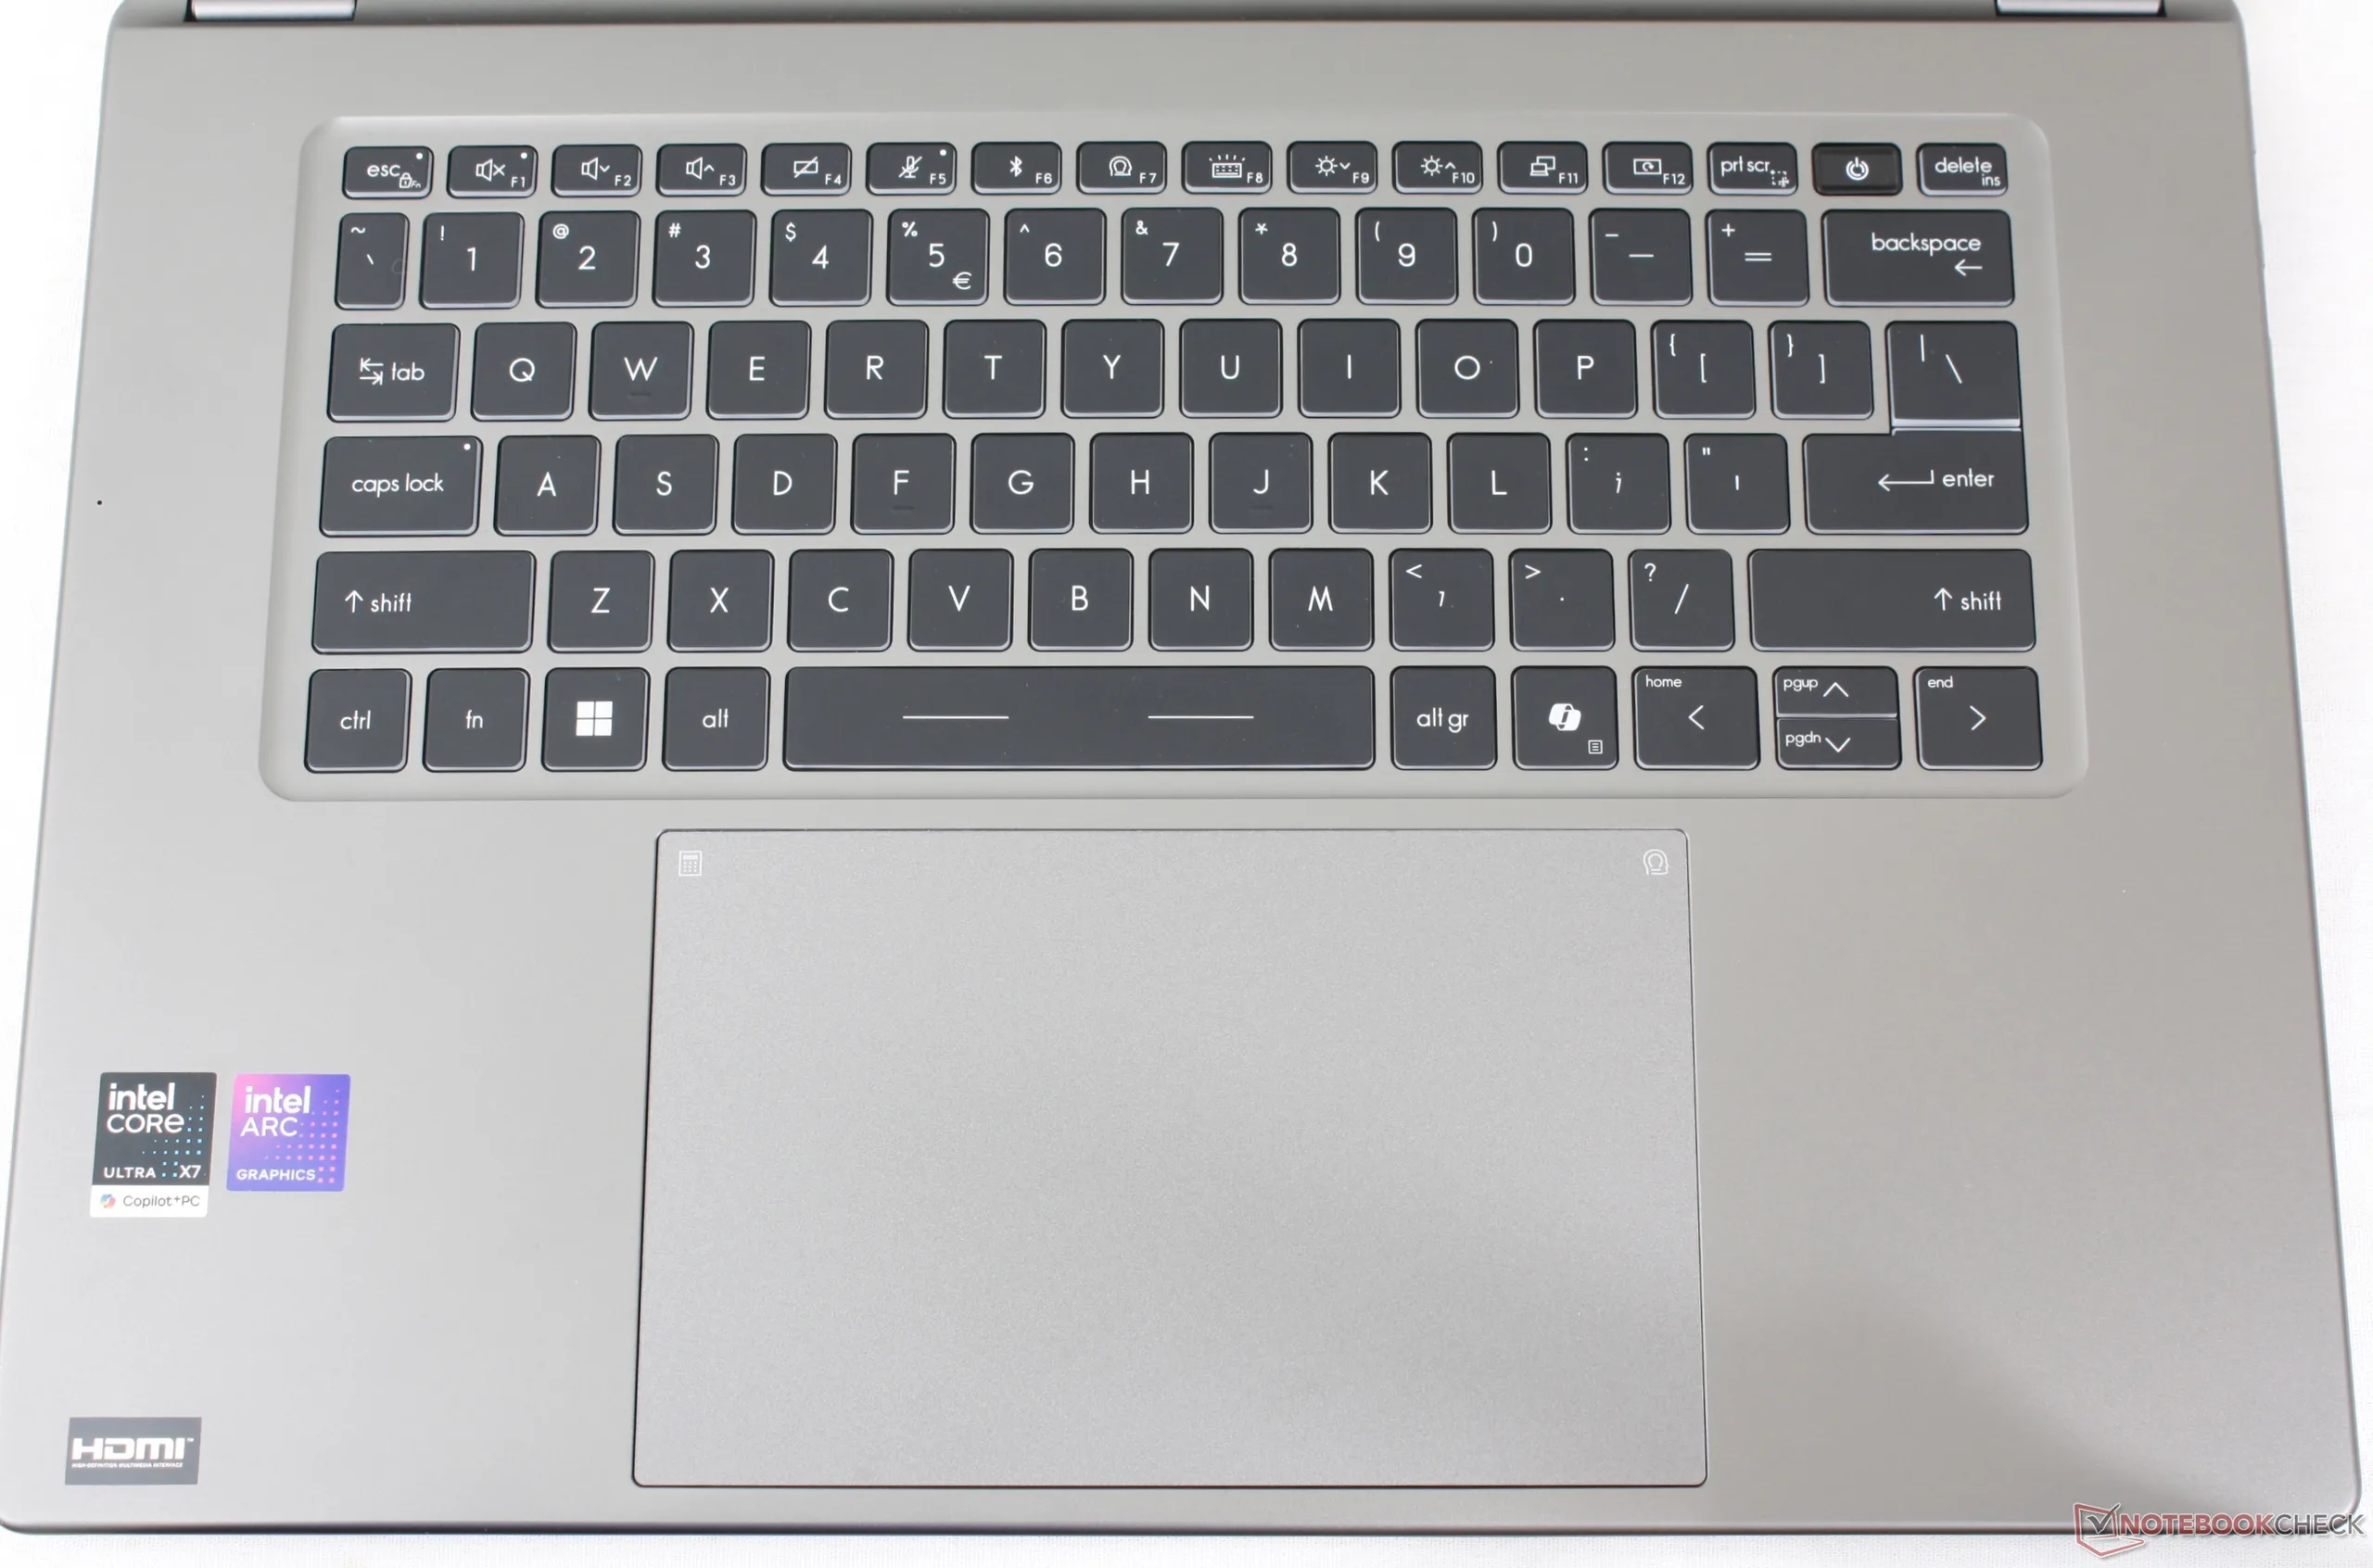
Klawiatura numeryczna zniknęła na dobre i na złe. Poza tym pisanie na klawiaturze jest lżejsze i ma płytszy skok niż w przypadku klasycznych laptopów biurowych z serii Thinkpad T lub EliteBook. Pisanie na znacznie tańszym Venture 16czuje się mniej więcej tak samo, jak na premierowej linii Prestige. Podczas gdy MSI dopracowało ogólną konstrukcję nowej obudowy Prestige, jej klawiatura nie nadąża.
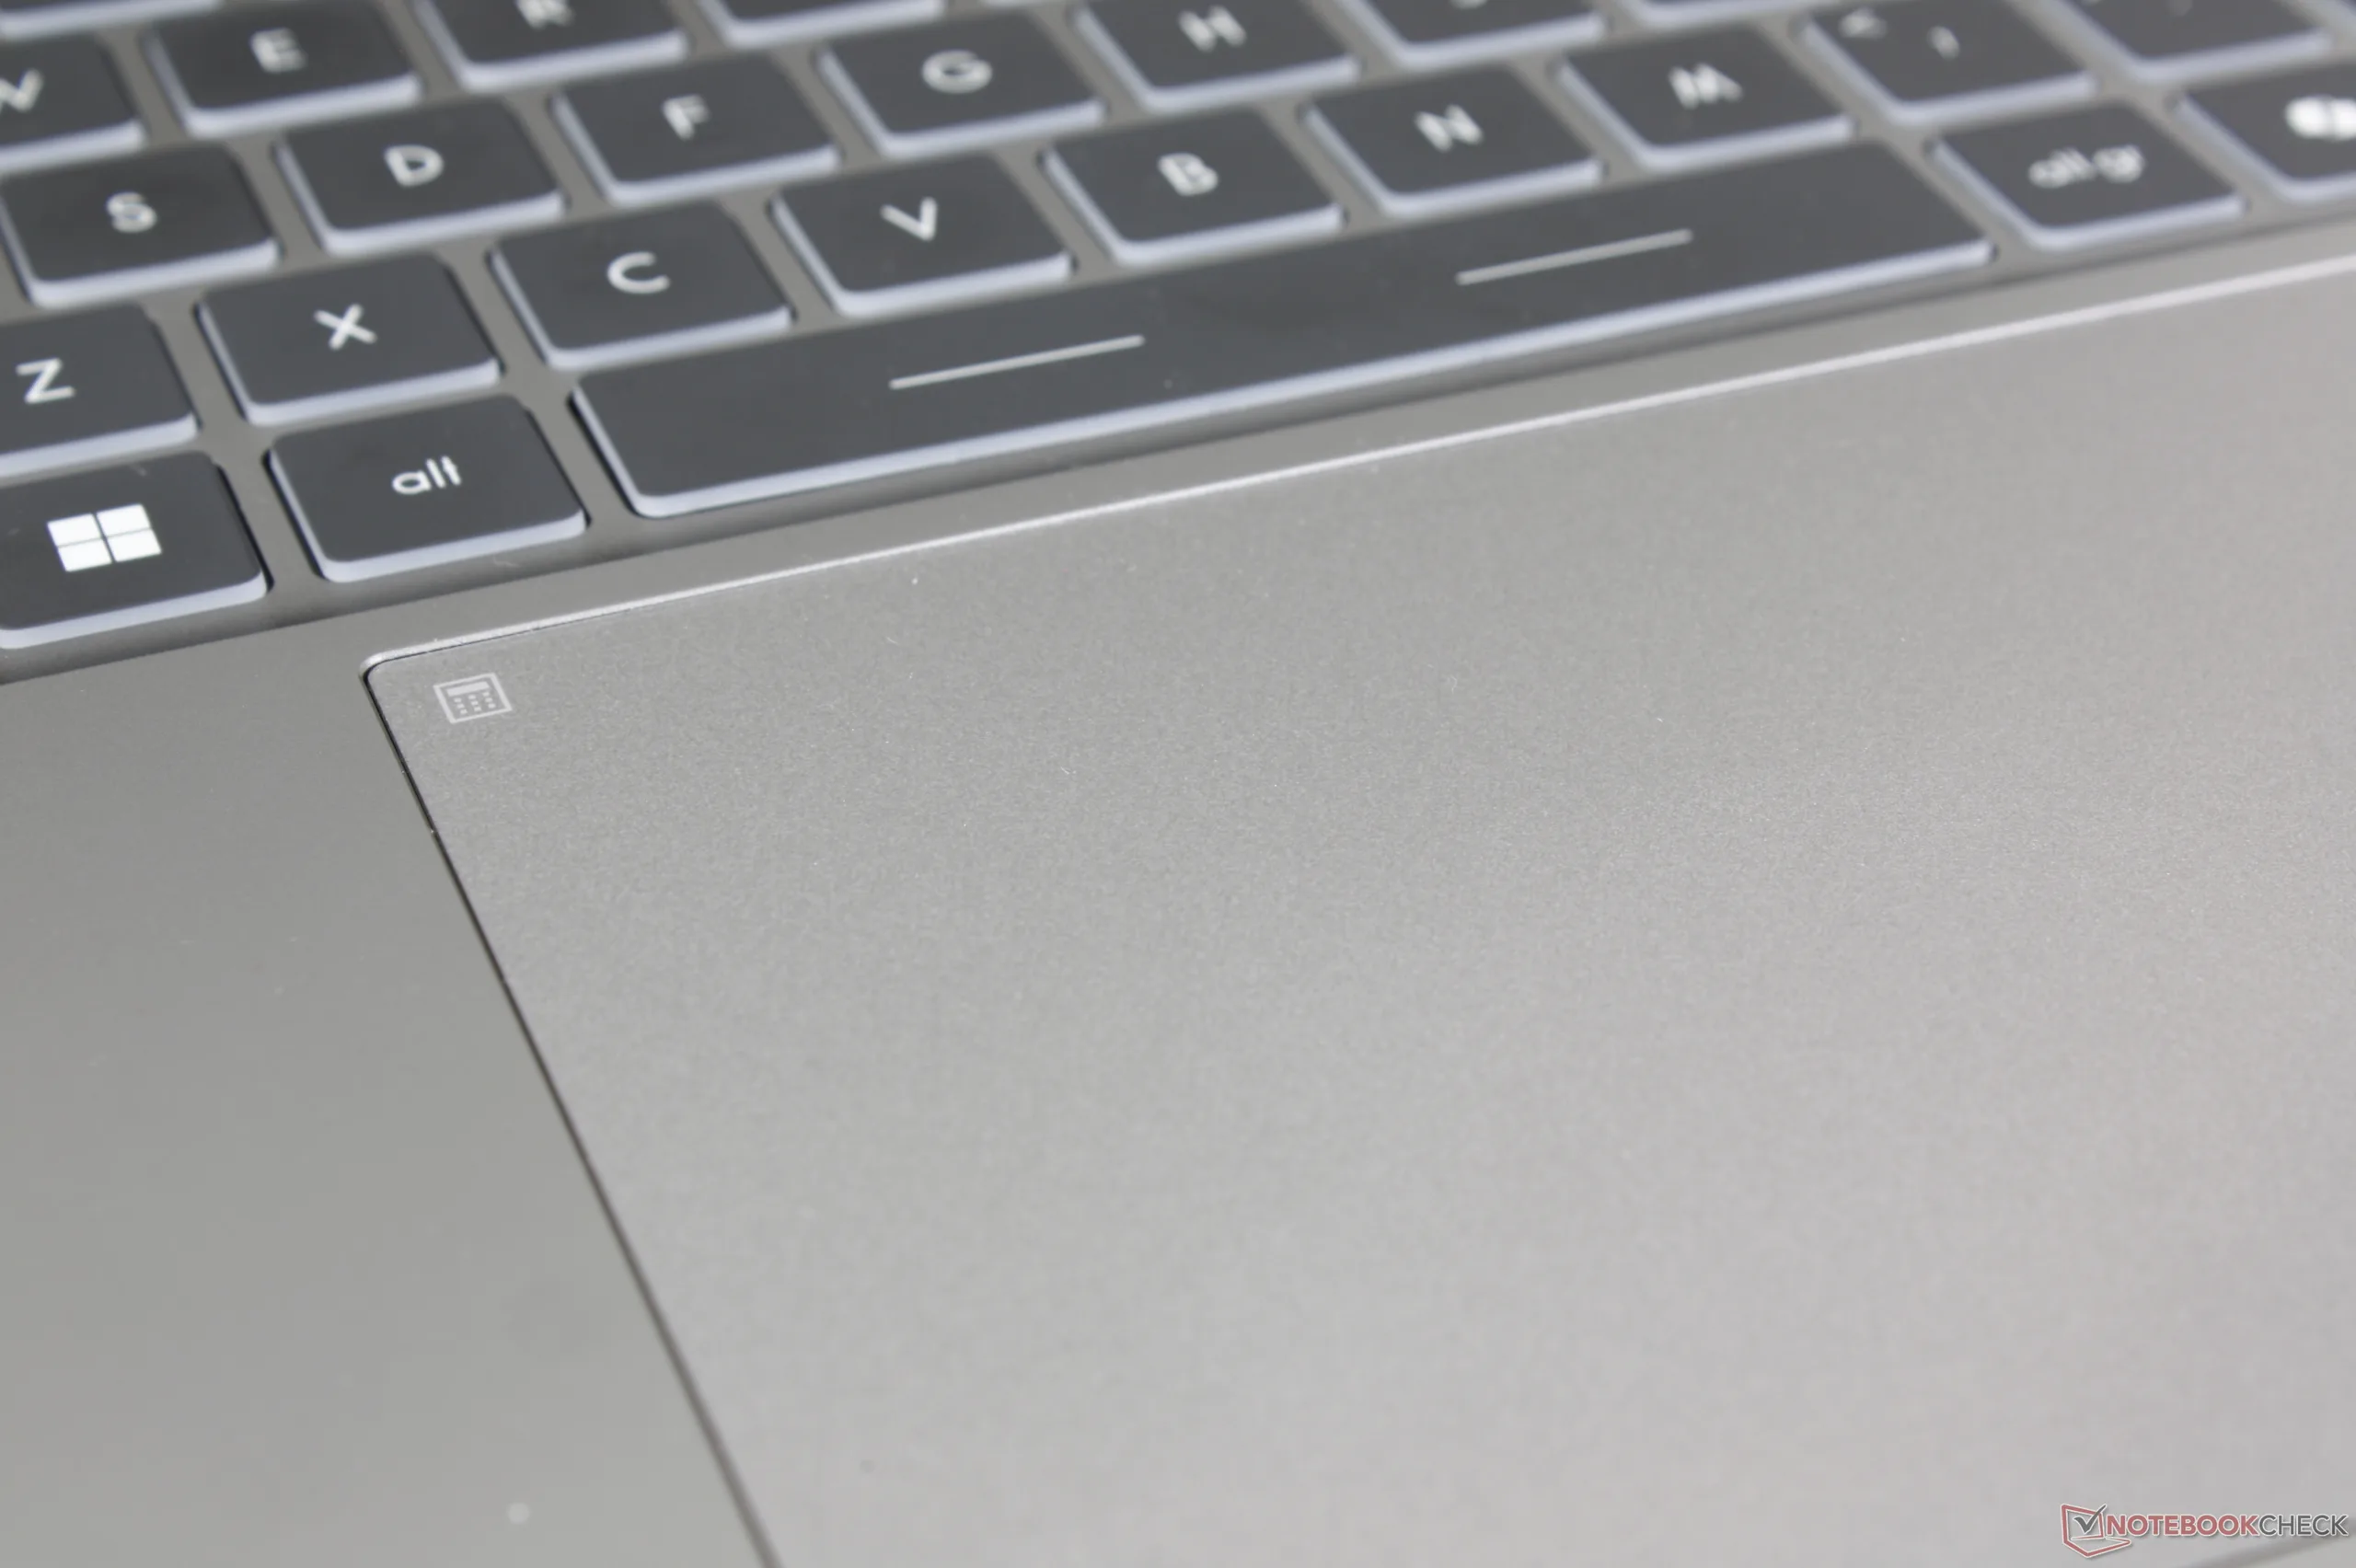
Panel dotykowy
Klawiatura jest jeszcze większa niż wcześniej, z 15 x 9 cm do 16 x 10 cm w nowszym modelu. Trakcja jest płynna i dokładna bez względu na prędkość przesuwania, ale sprzężenie zwrotne podczas klikania pozostaje stosunkowo słabe. Klikanie jest również wygodne tylko w pobliżu dwóch dolnych rogów, gdzie powierzchnia clickpada wciska się znacznie łatwiej.


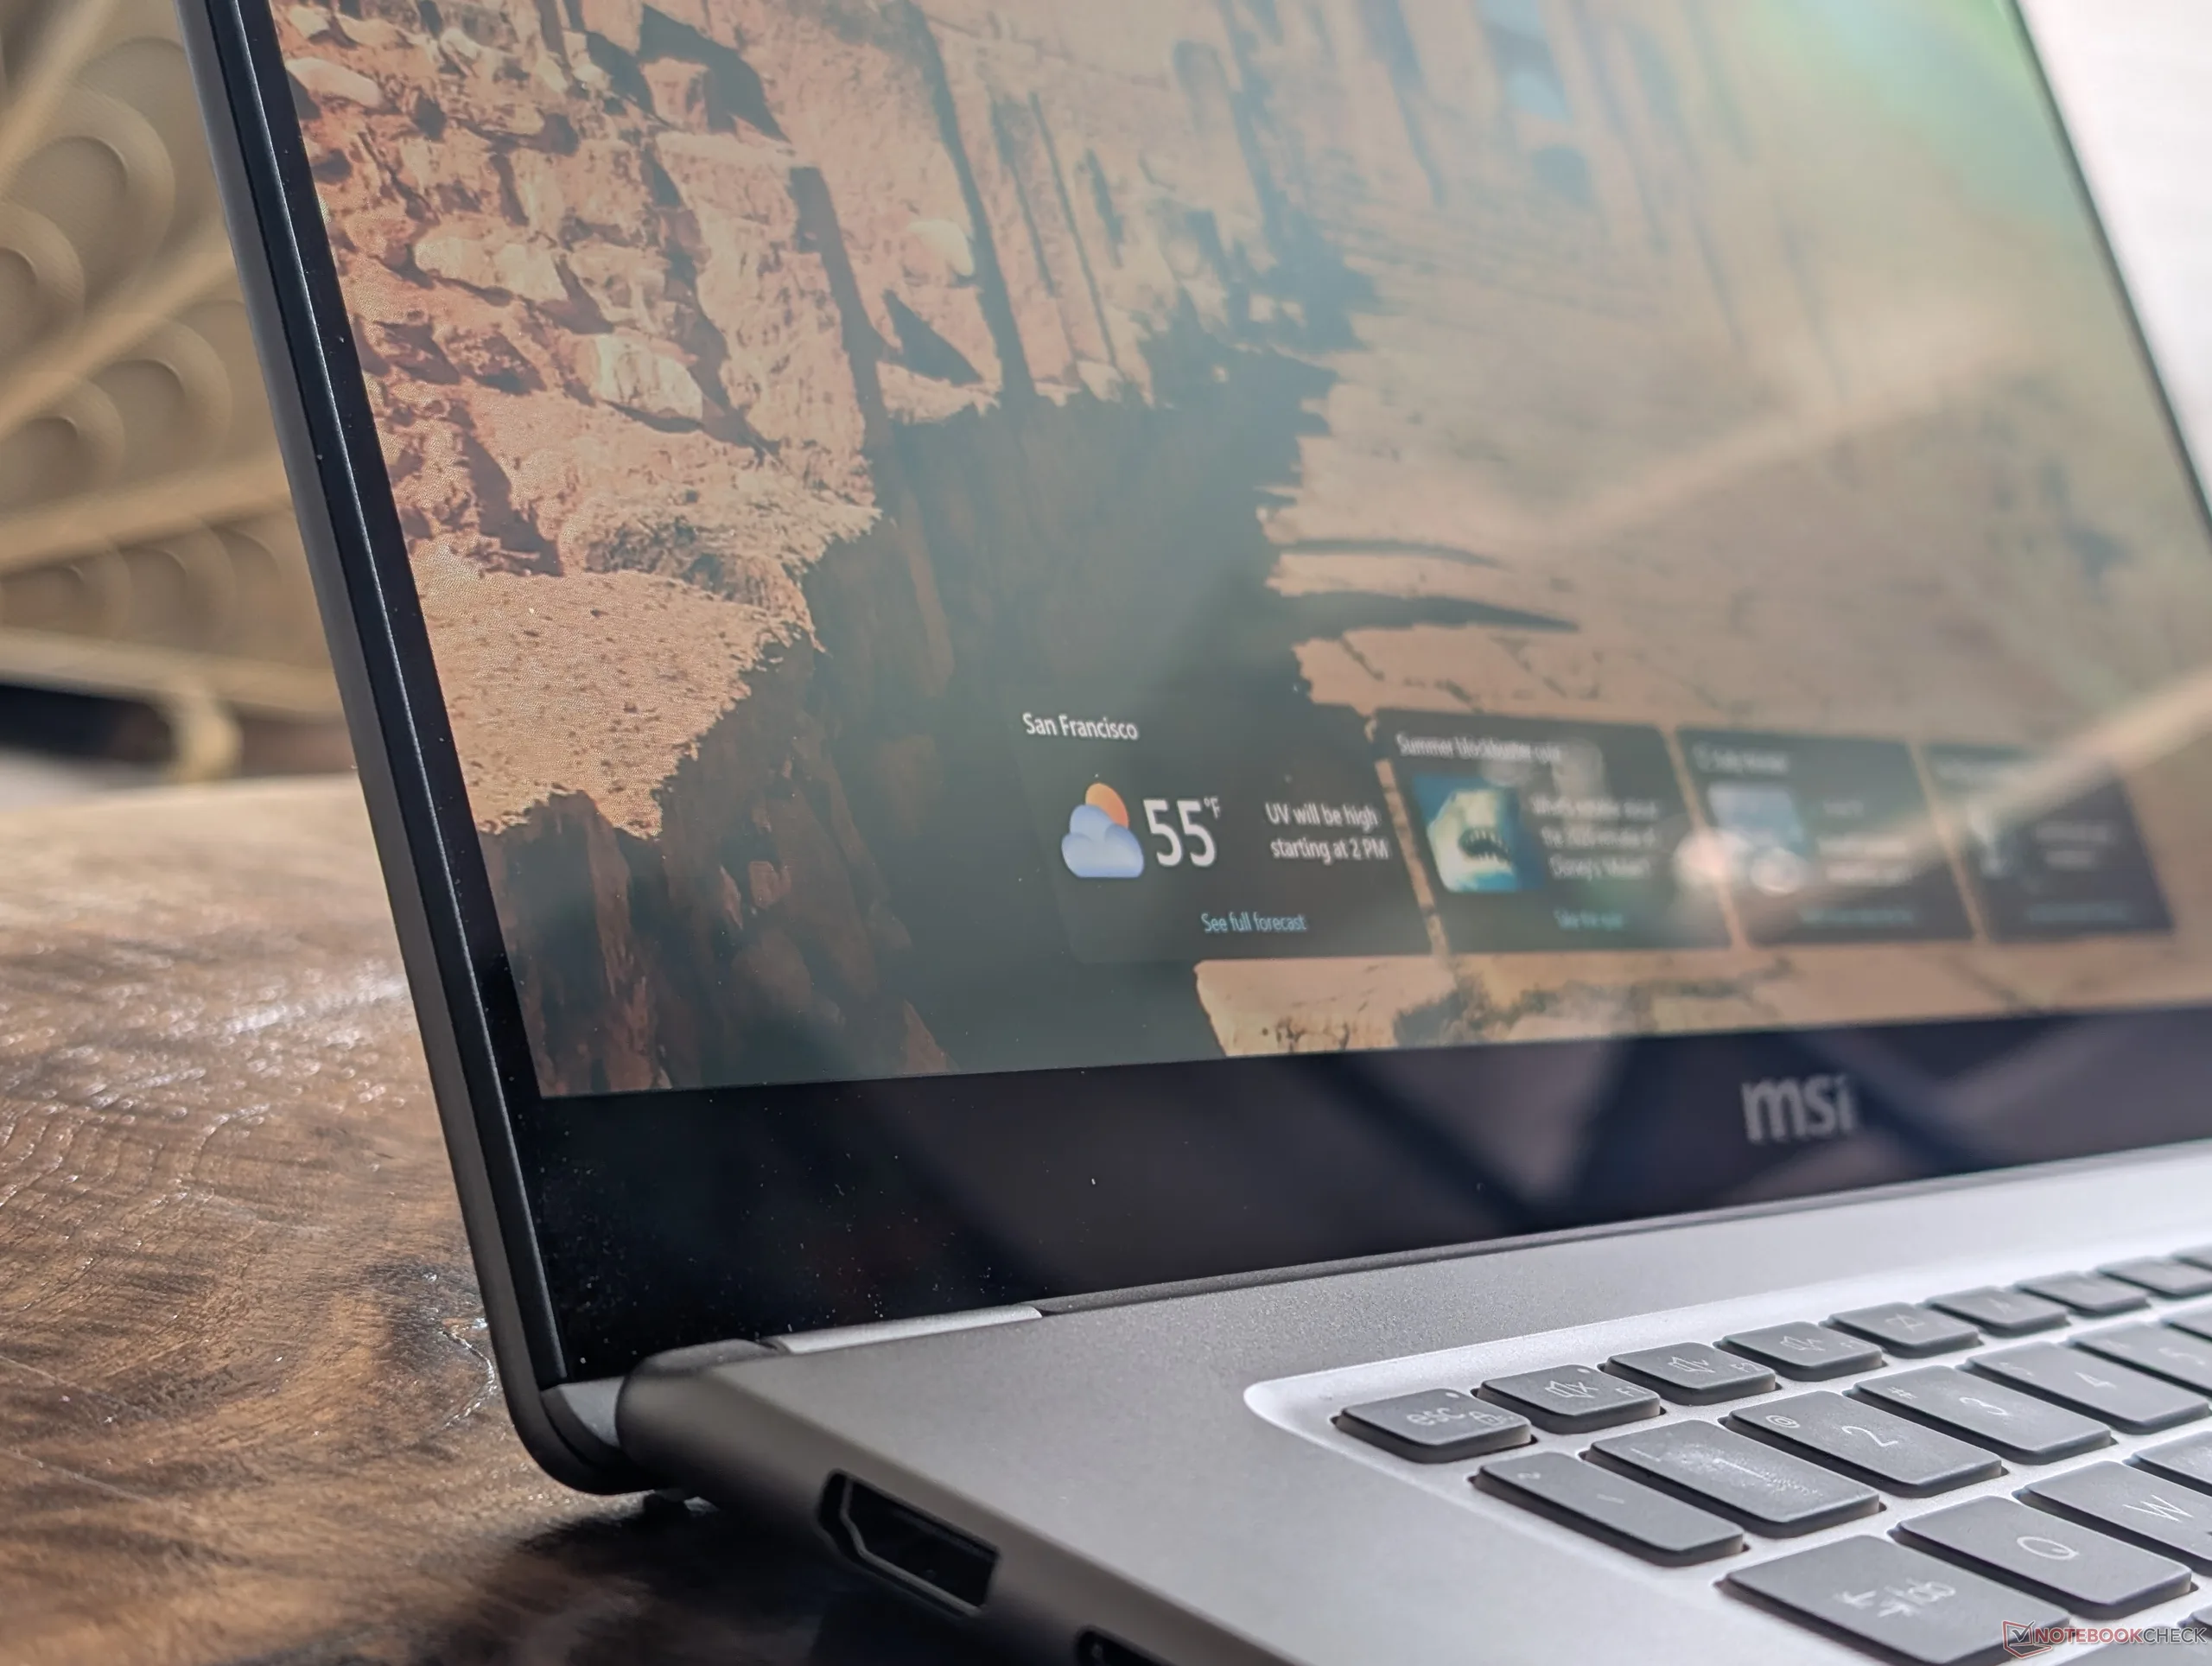
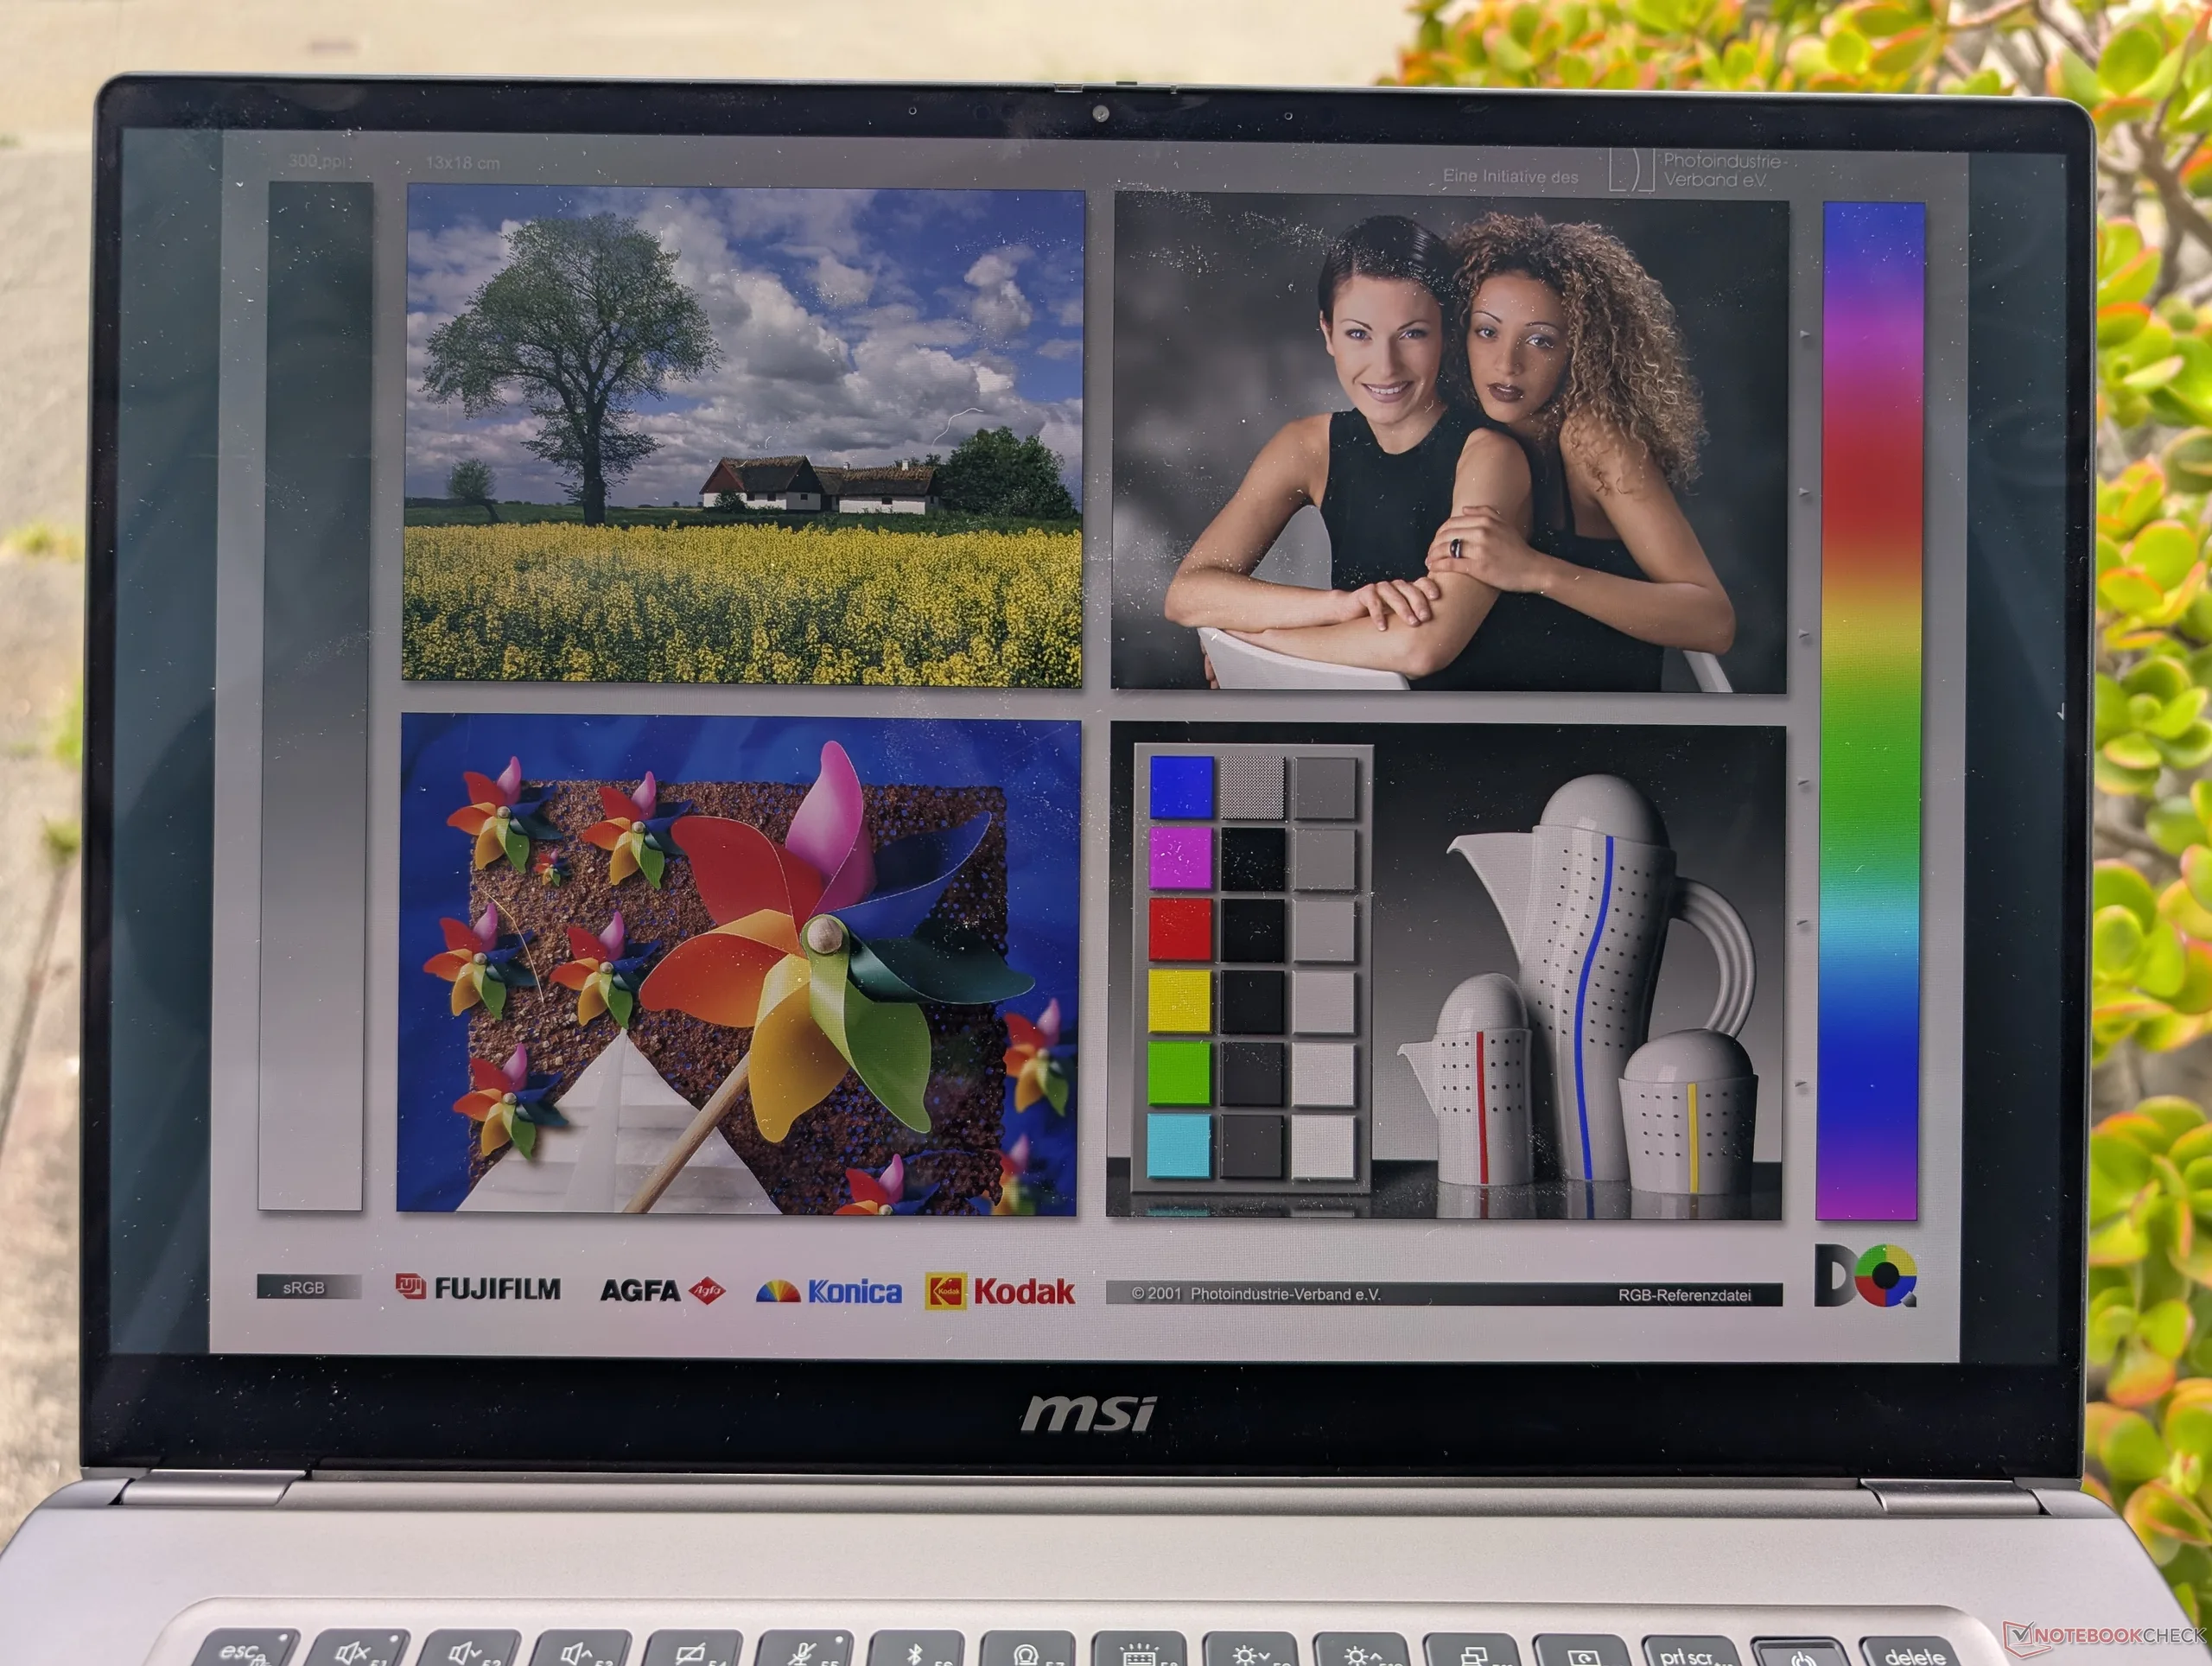
Wyświetlacz
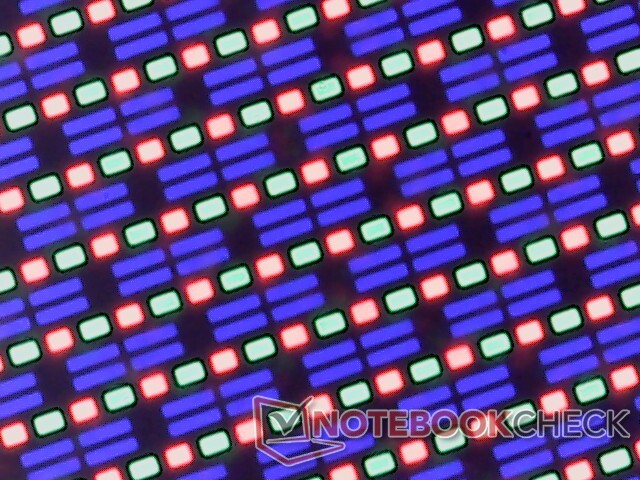
Panel OLED Samsung ATNA60CL11-0 jest bardzo podobny do panelu ATNA60CL10-0, który można znaleźć w ZenBook S16. Częstotliwość odświeżania 120 Hz i natywna rozdzielczość 1800p stanowią ulepszenie w stosunku do panelu IPS w zeszłorocznym modelu. W rzeczywistości nie ma już żadnych opcji IPS, o których można by mówić, co przenosi serię Prestige 16 prosto do kategorii entuzjastów.
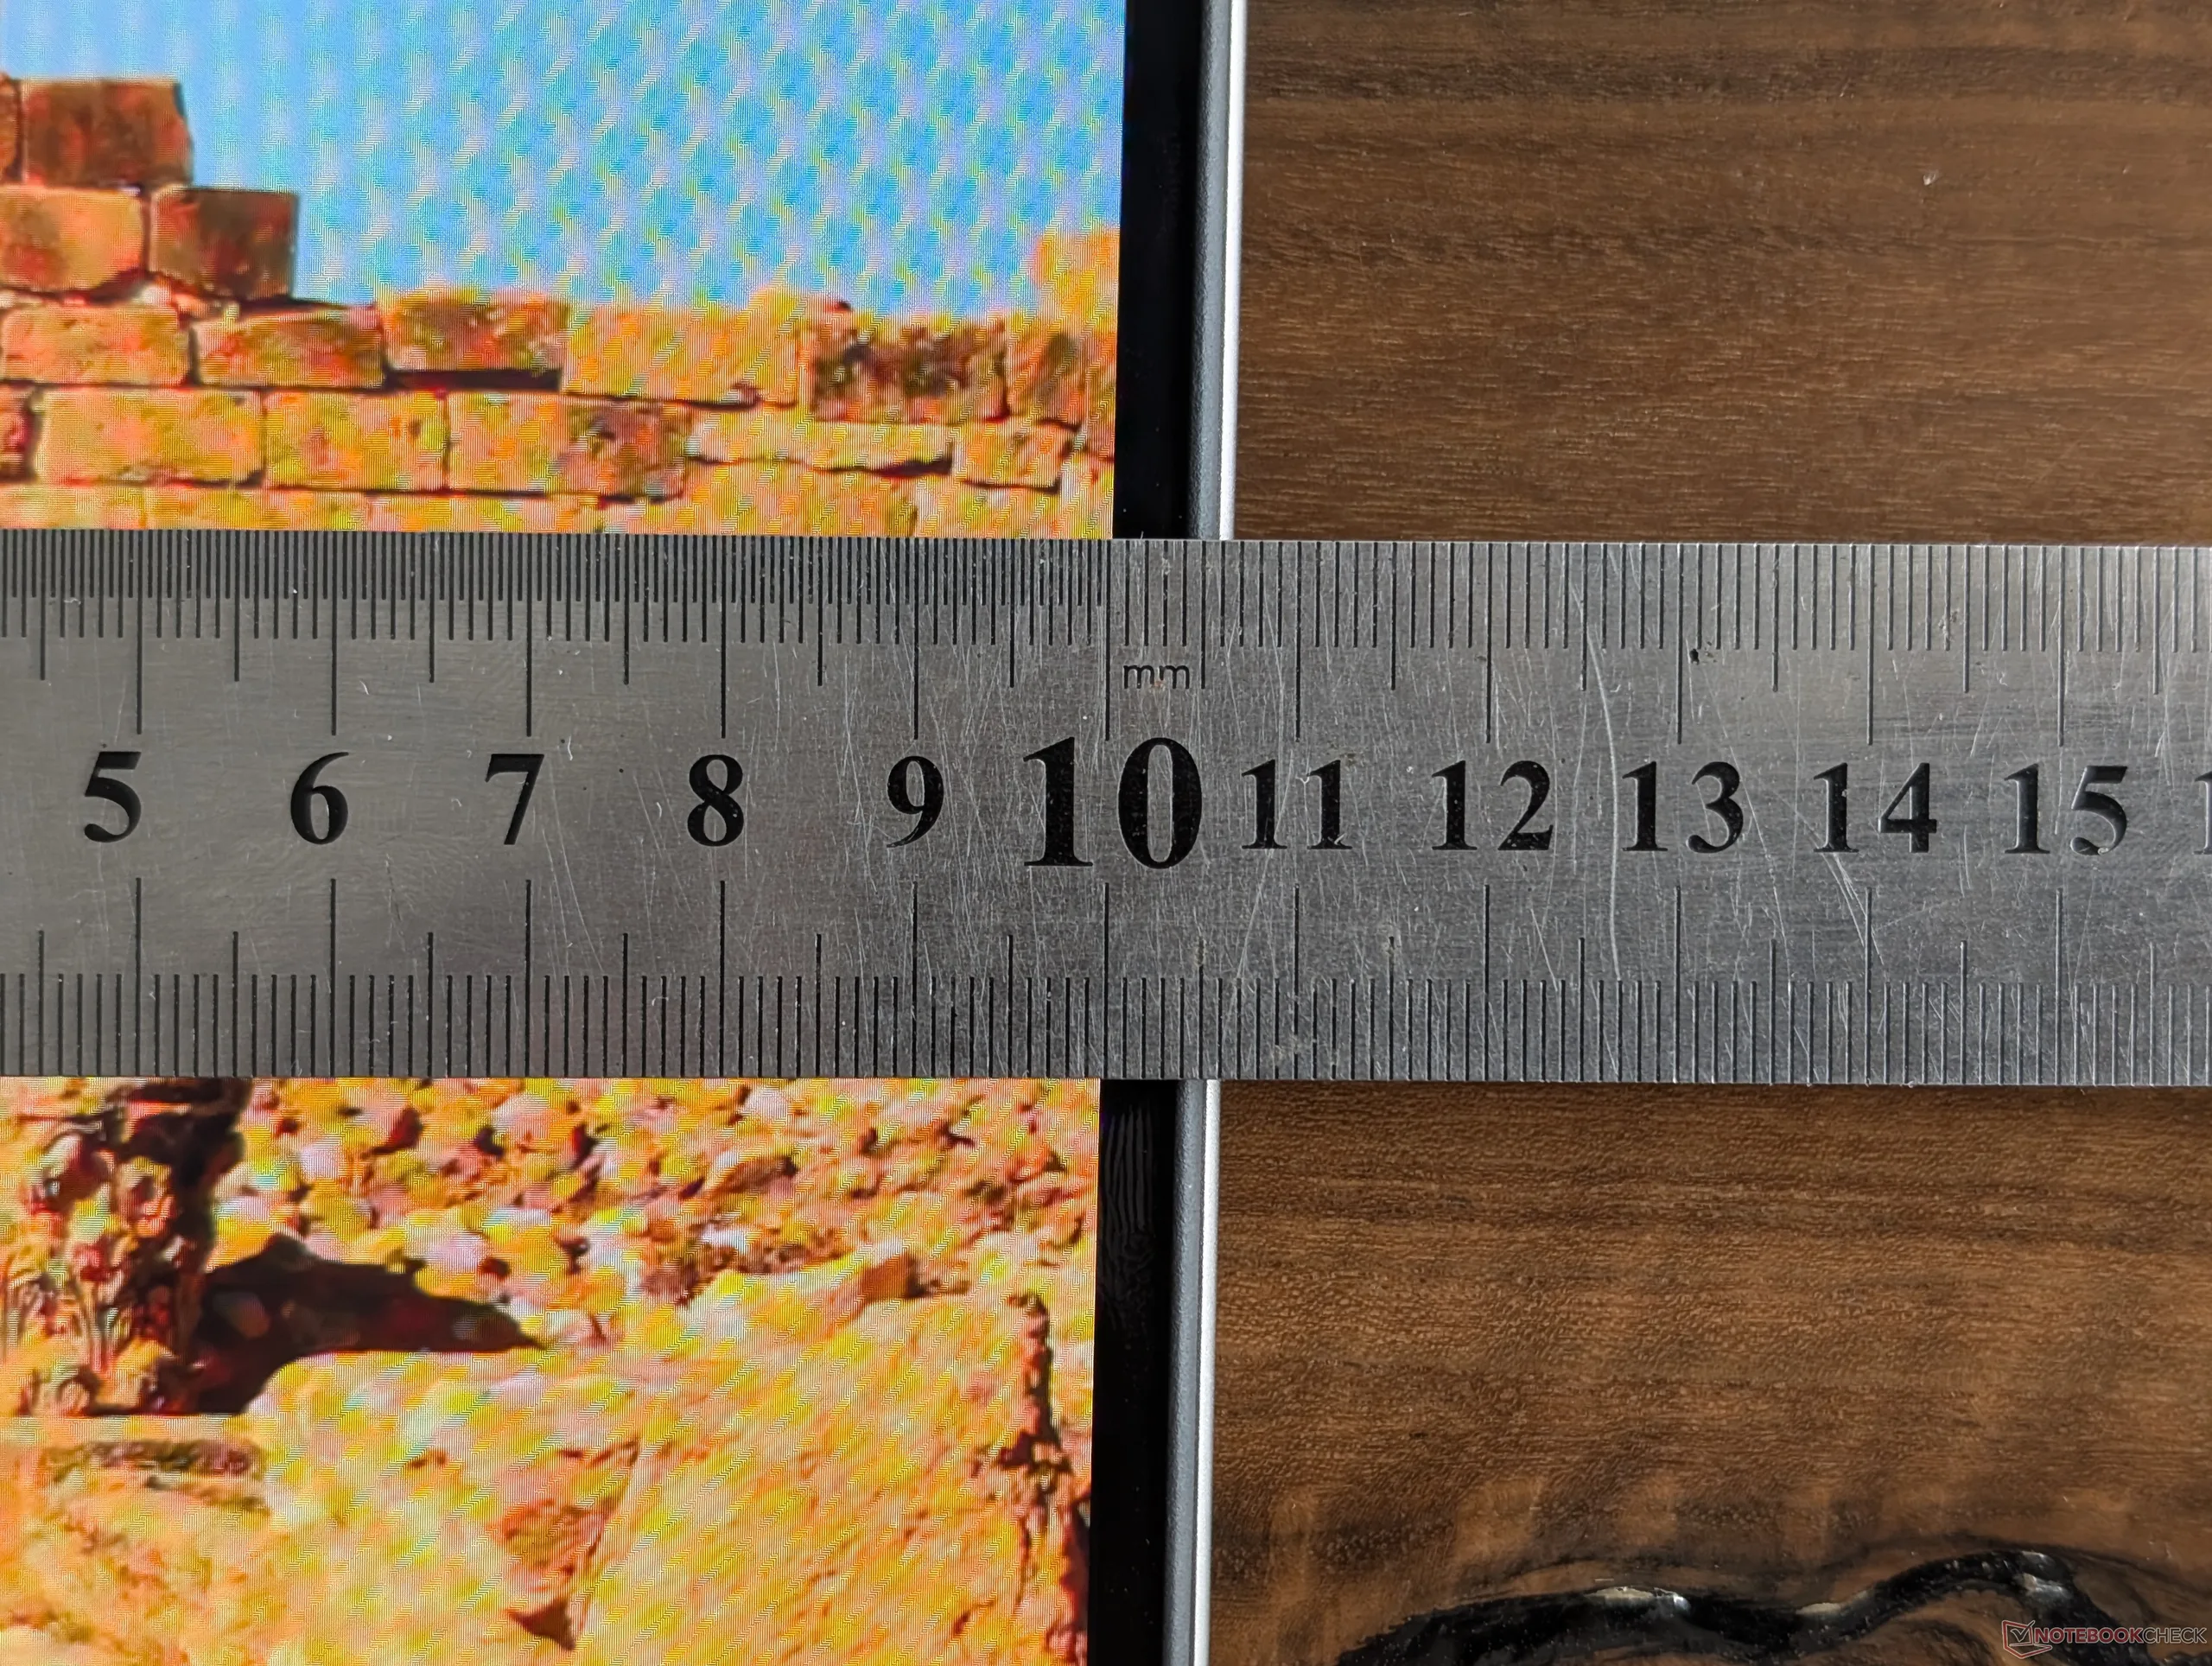
Jasność, choć nadal doskonała, jest słabsza niż w przypadku wyświetlacza IPS w Prestige 16 2025. Nasze testy wykazały maksymalną jasność wynoszącą zaledwie 383 nitów i 422 nitów odpowiednio w trybie SDR i HDR, w porównaniu do 471 nitów w zeszłorocznym modelu. Niektóre konfiguracje obsługują DisplayHDR1000 w celu uzyskania jaśniejszych wartości maksymalnych, ale nasza jednostka testowa nie jest jedną z nich.
| |||||||||||||||||||||||||
rozświetlenie: 98 %
na akumulatorze: 375 cd/m²
kontrast: ∞:1 (czerń: 0 cd/m²)
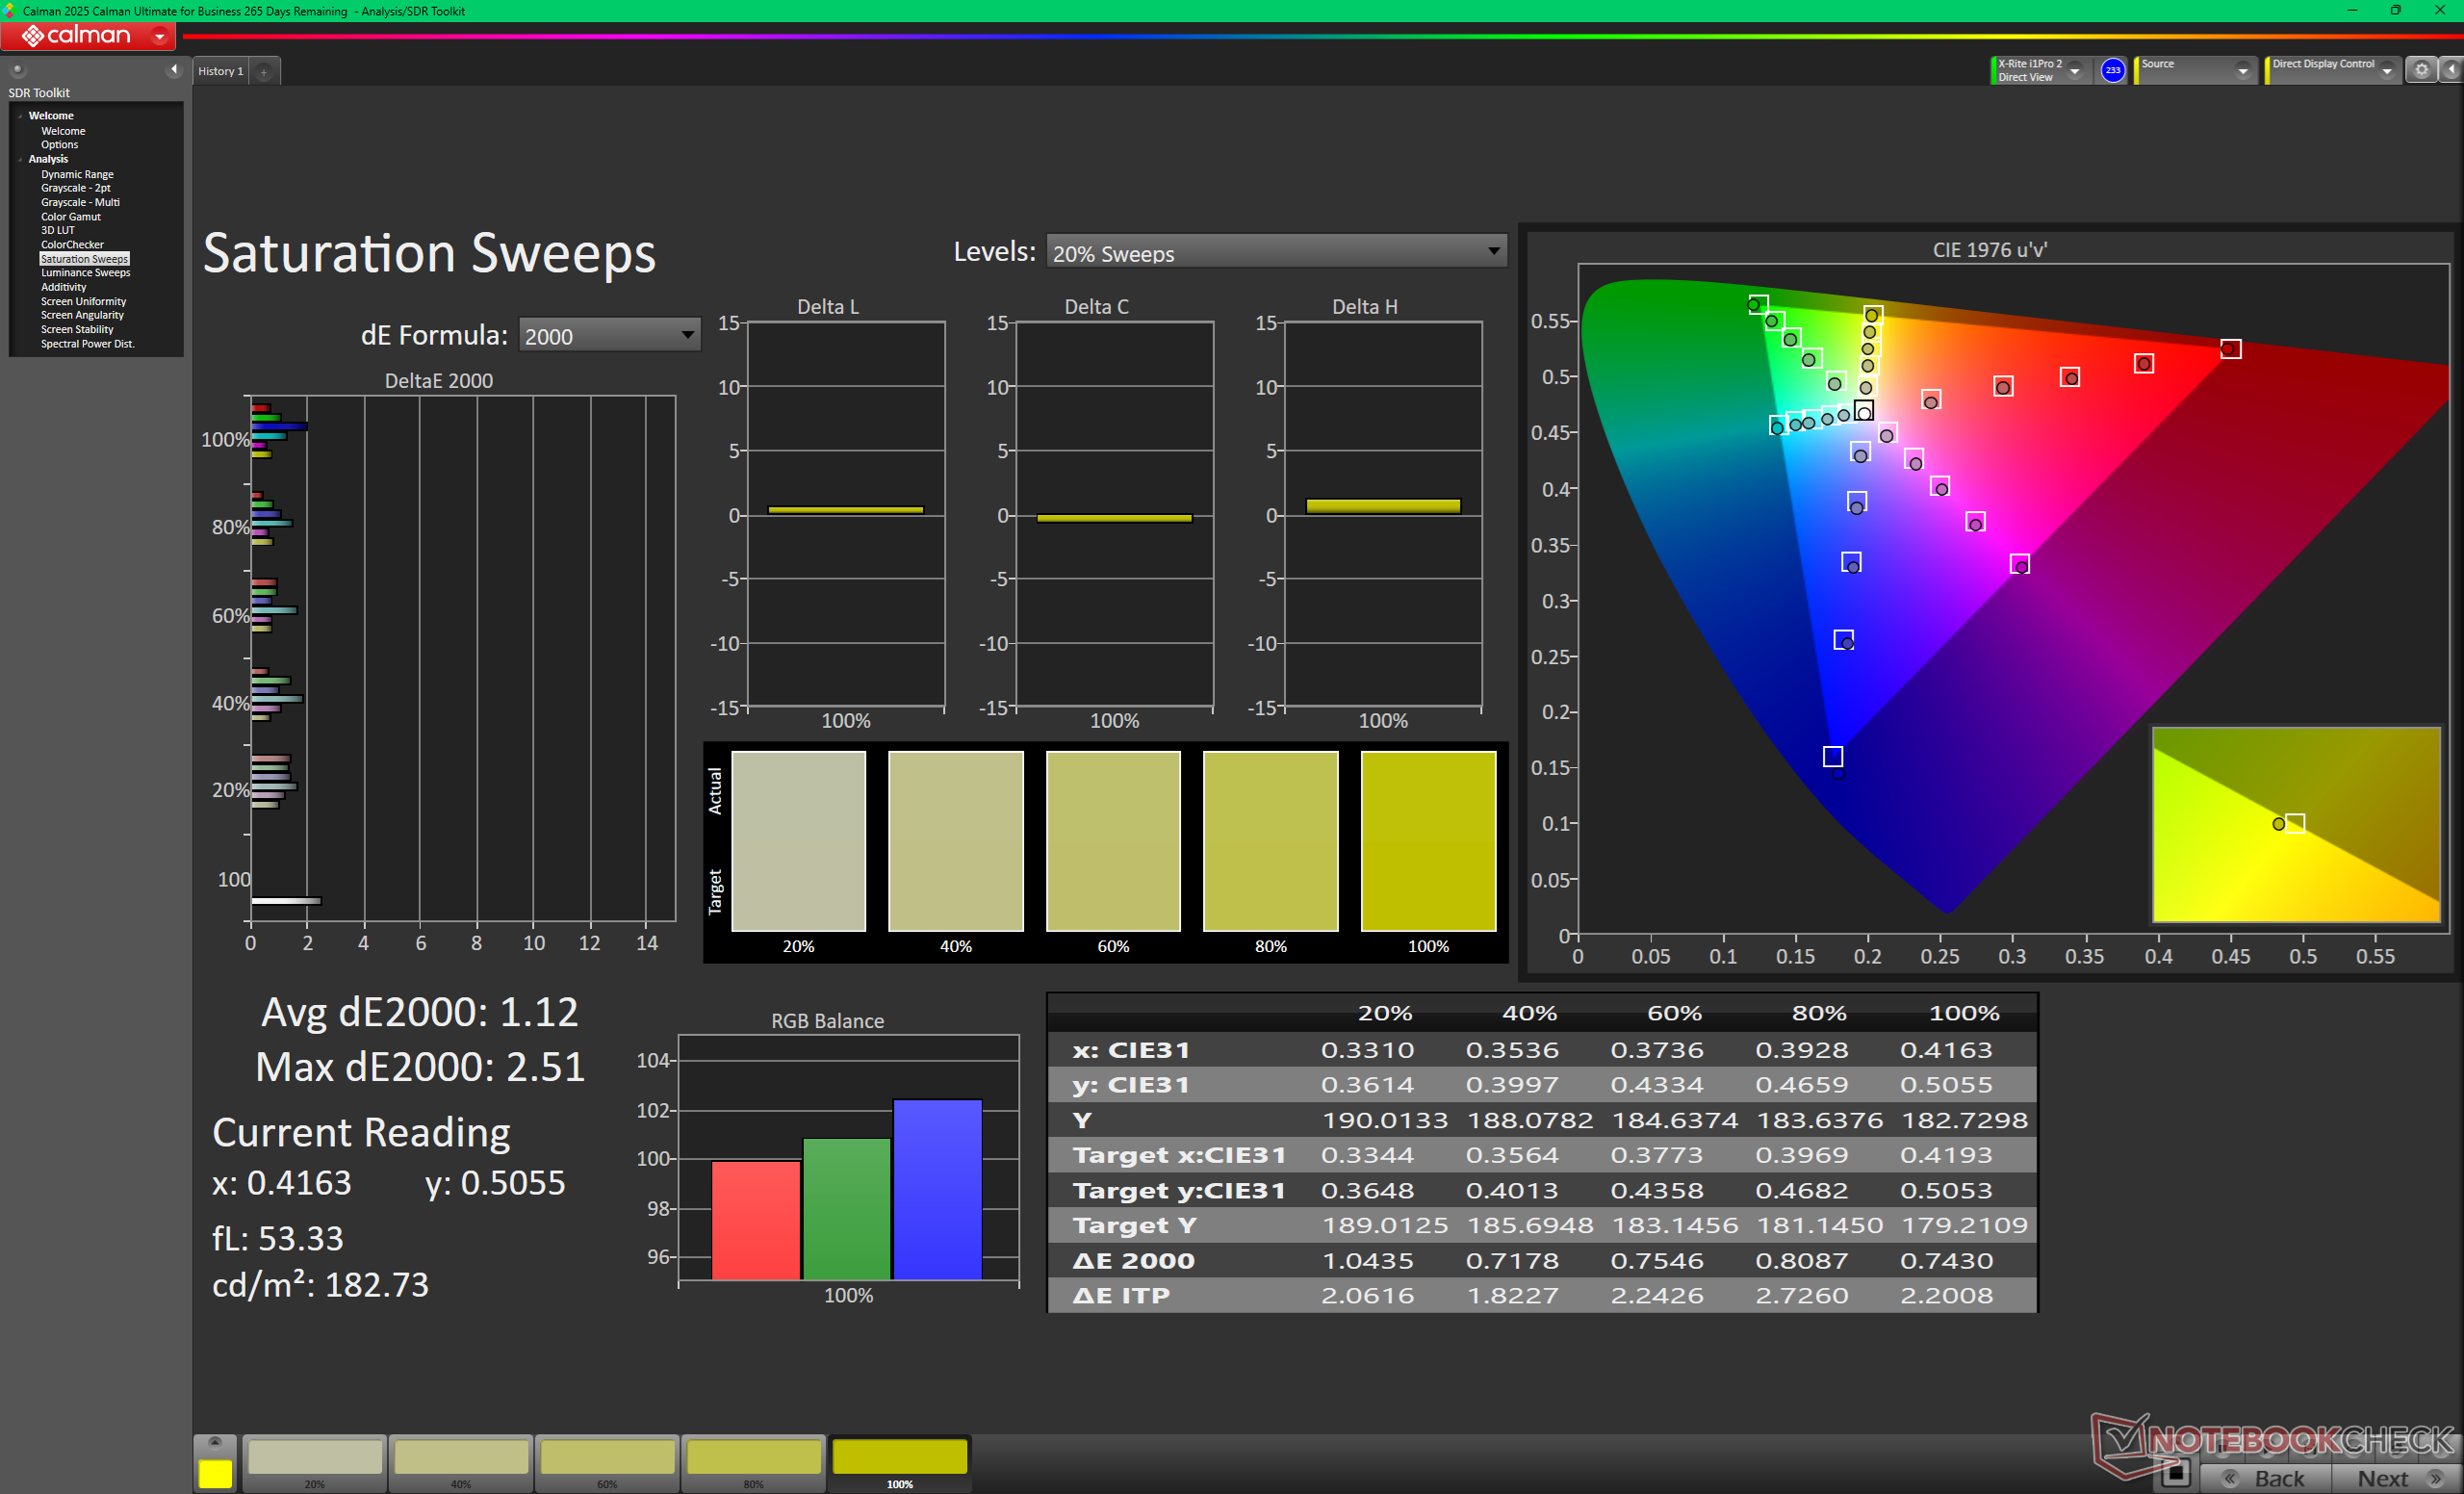
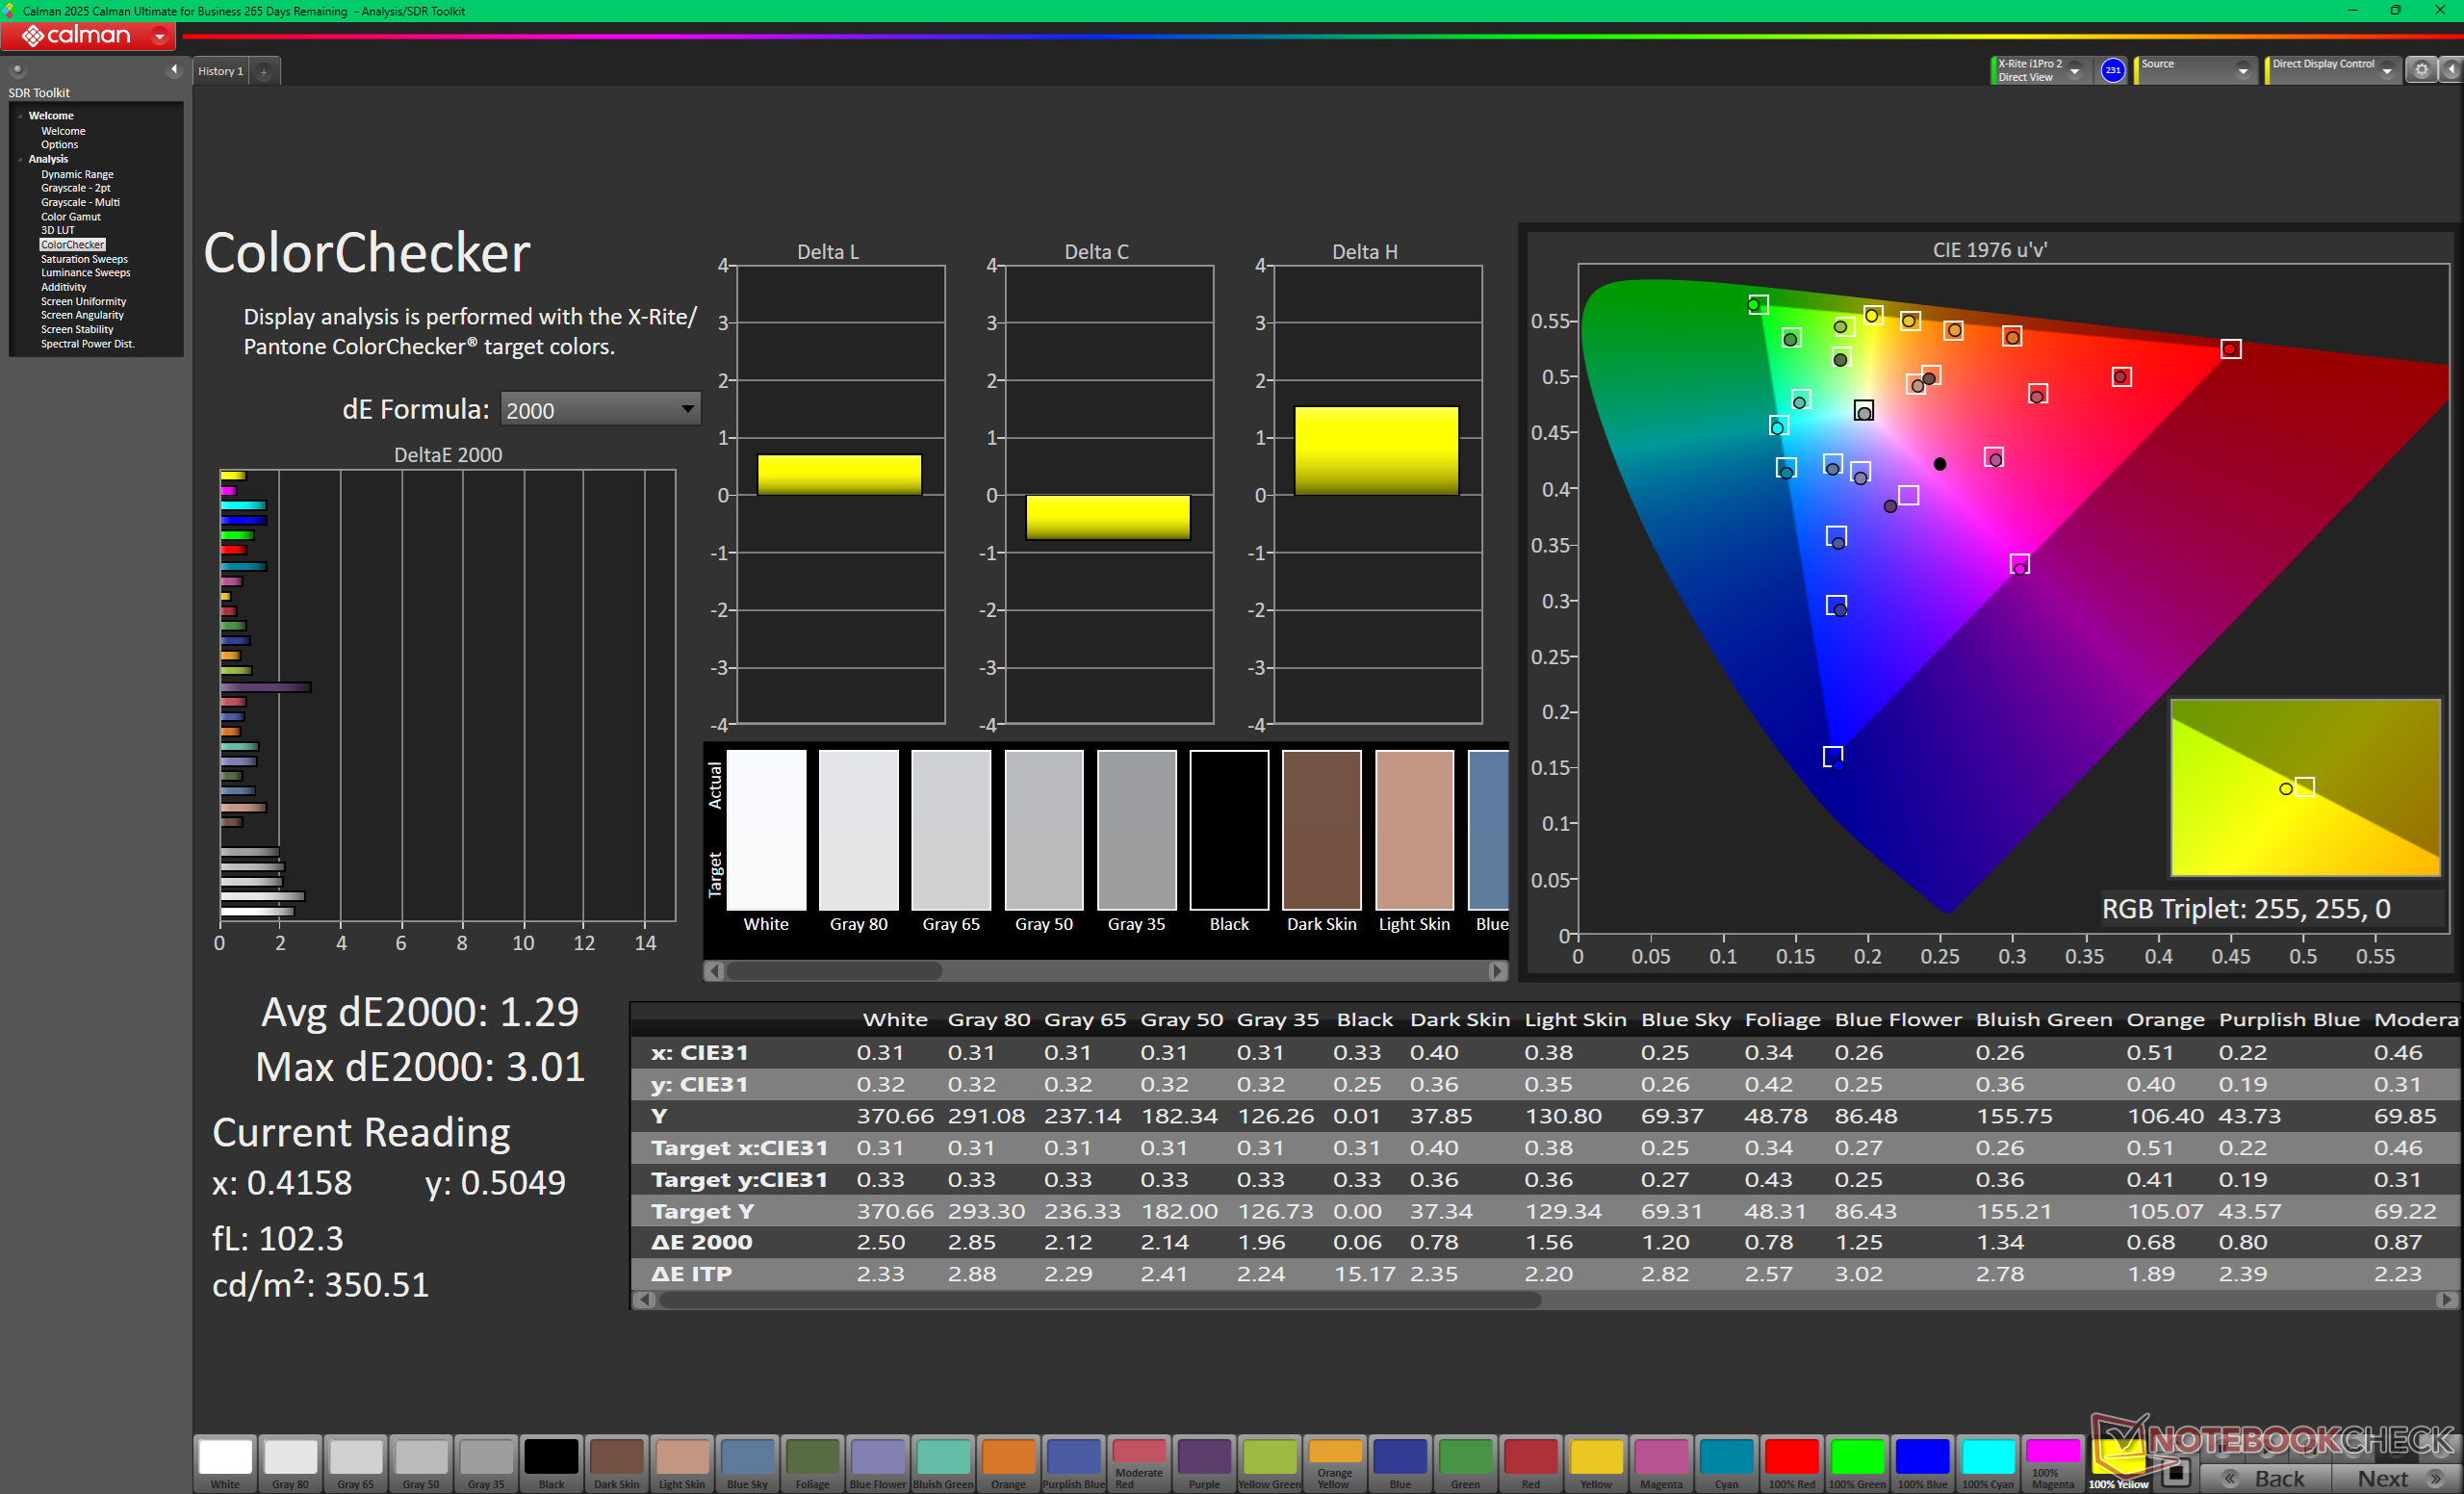
ΔE ColorChecker Calman: 1.29 | ∀{0.5-29.43 Ø4.73}
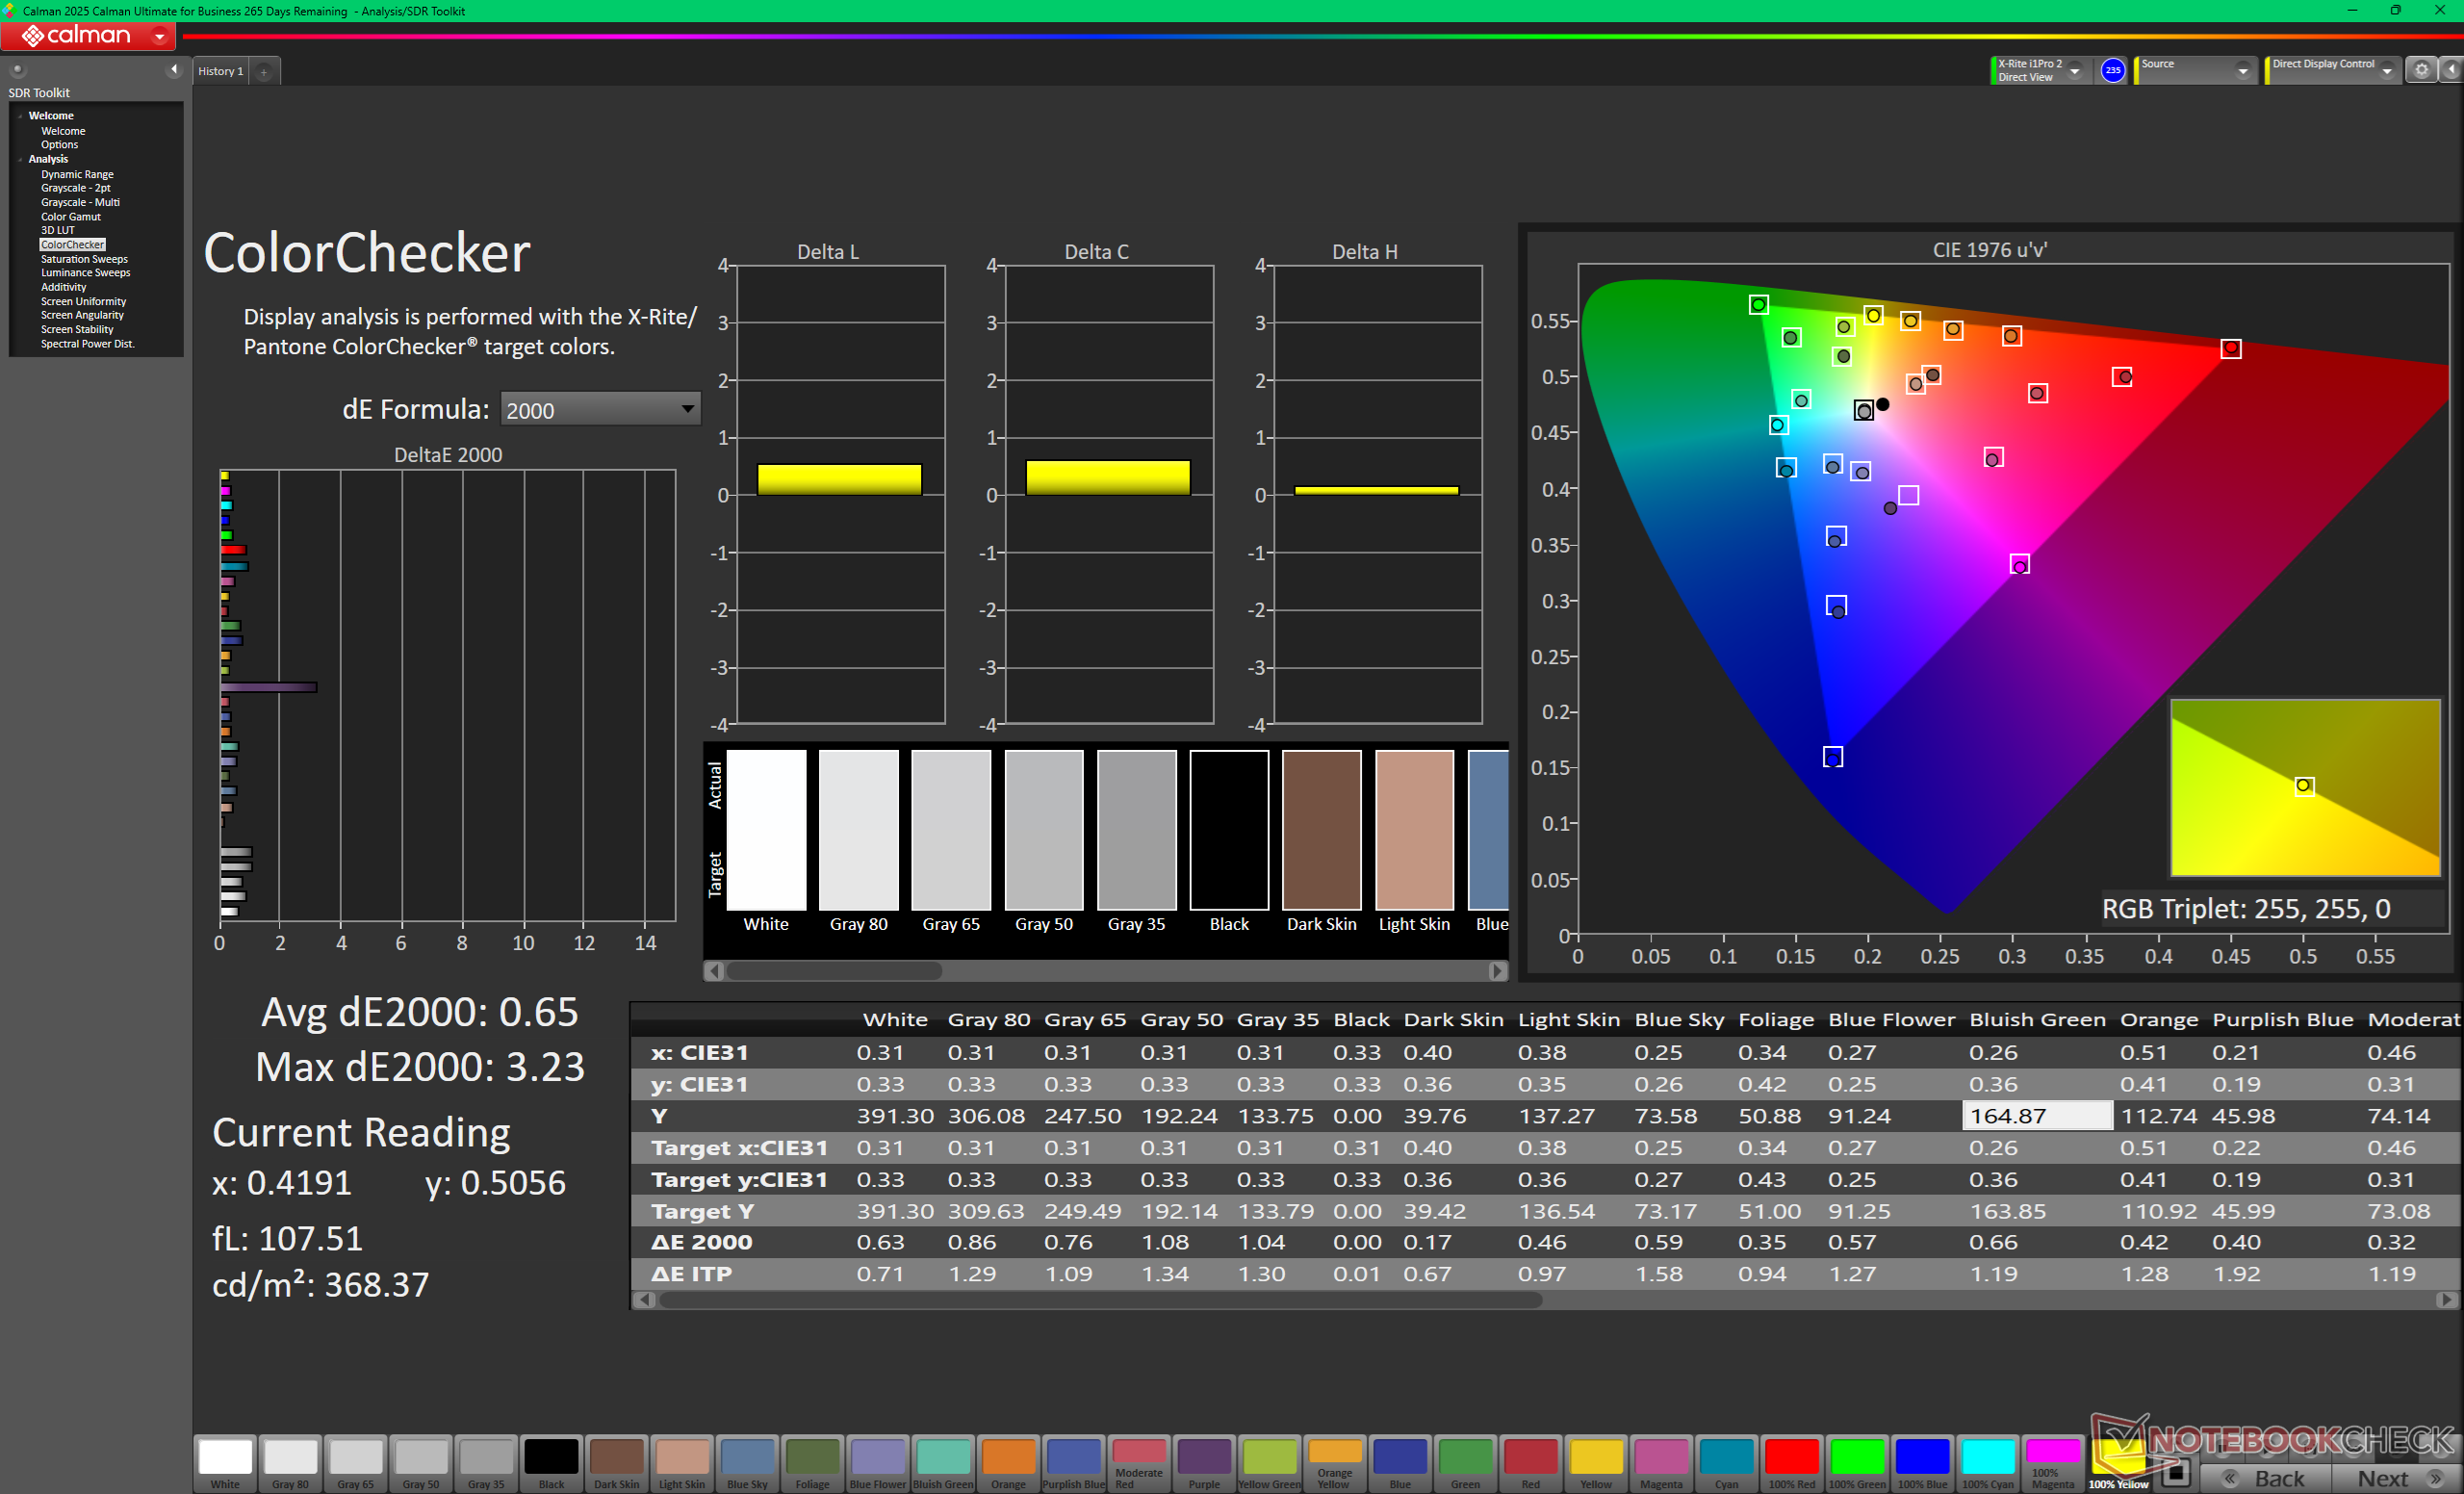
calibrated: 0.65
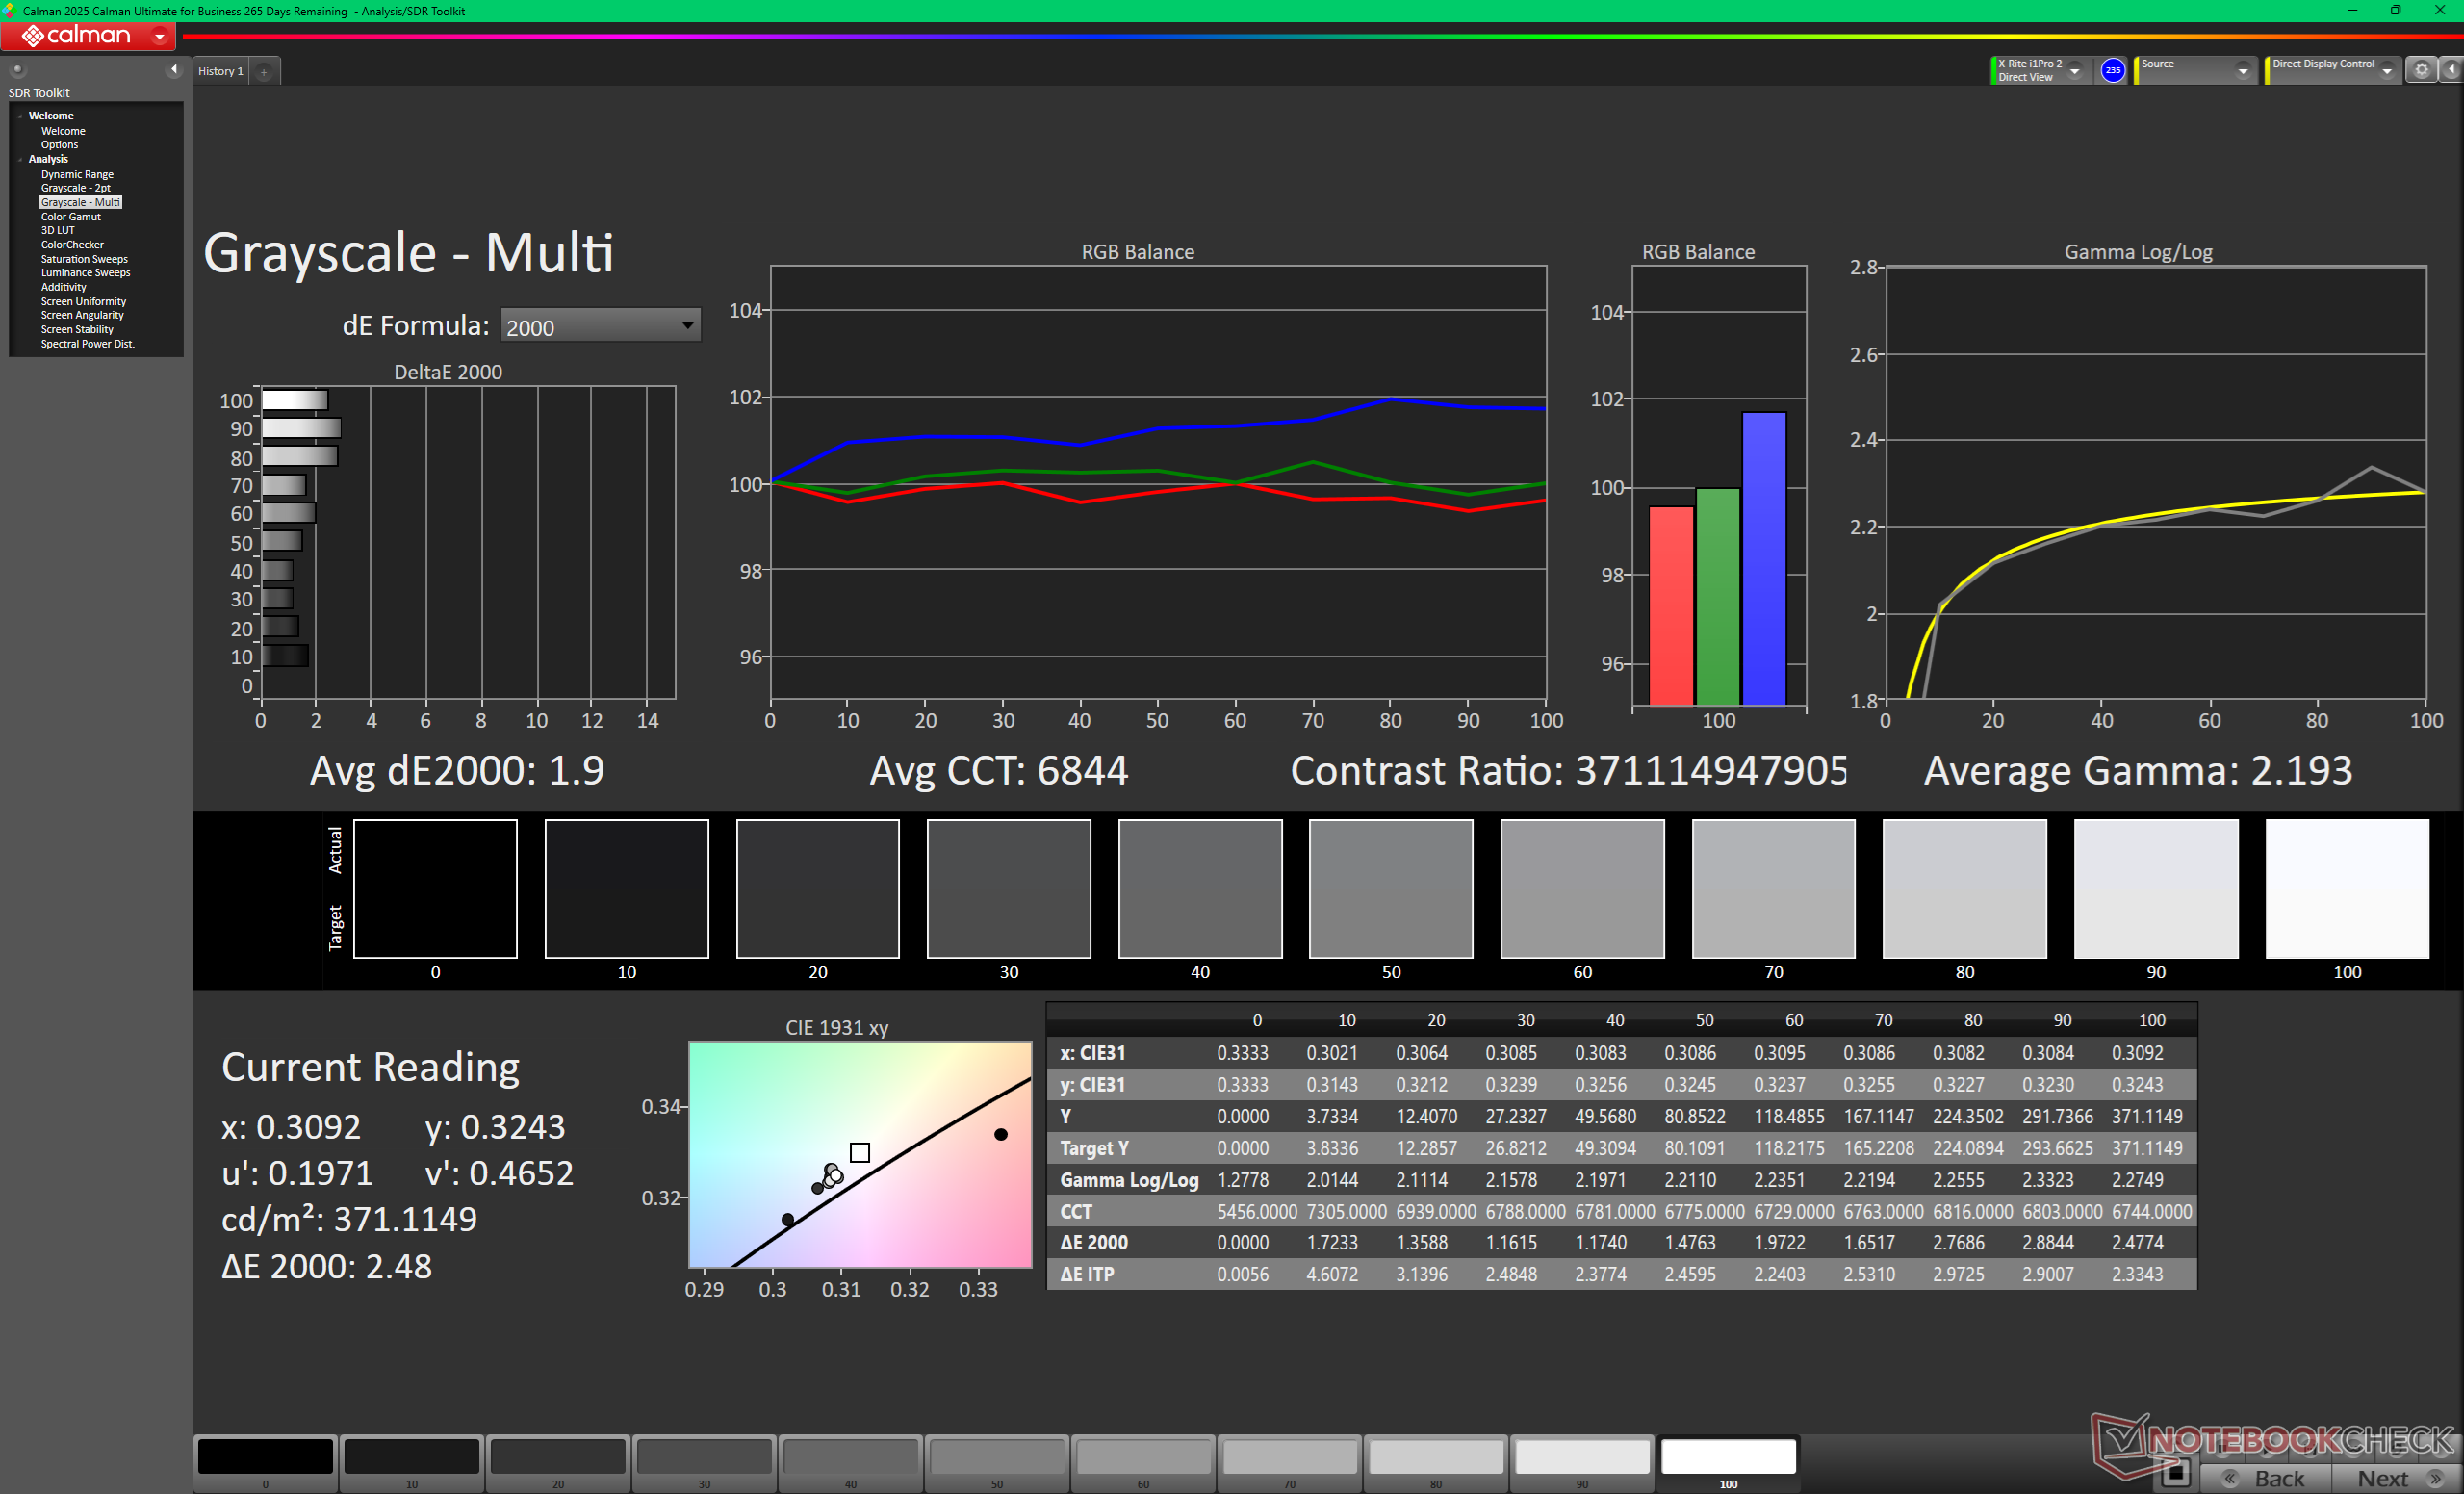
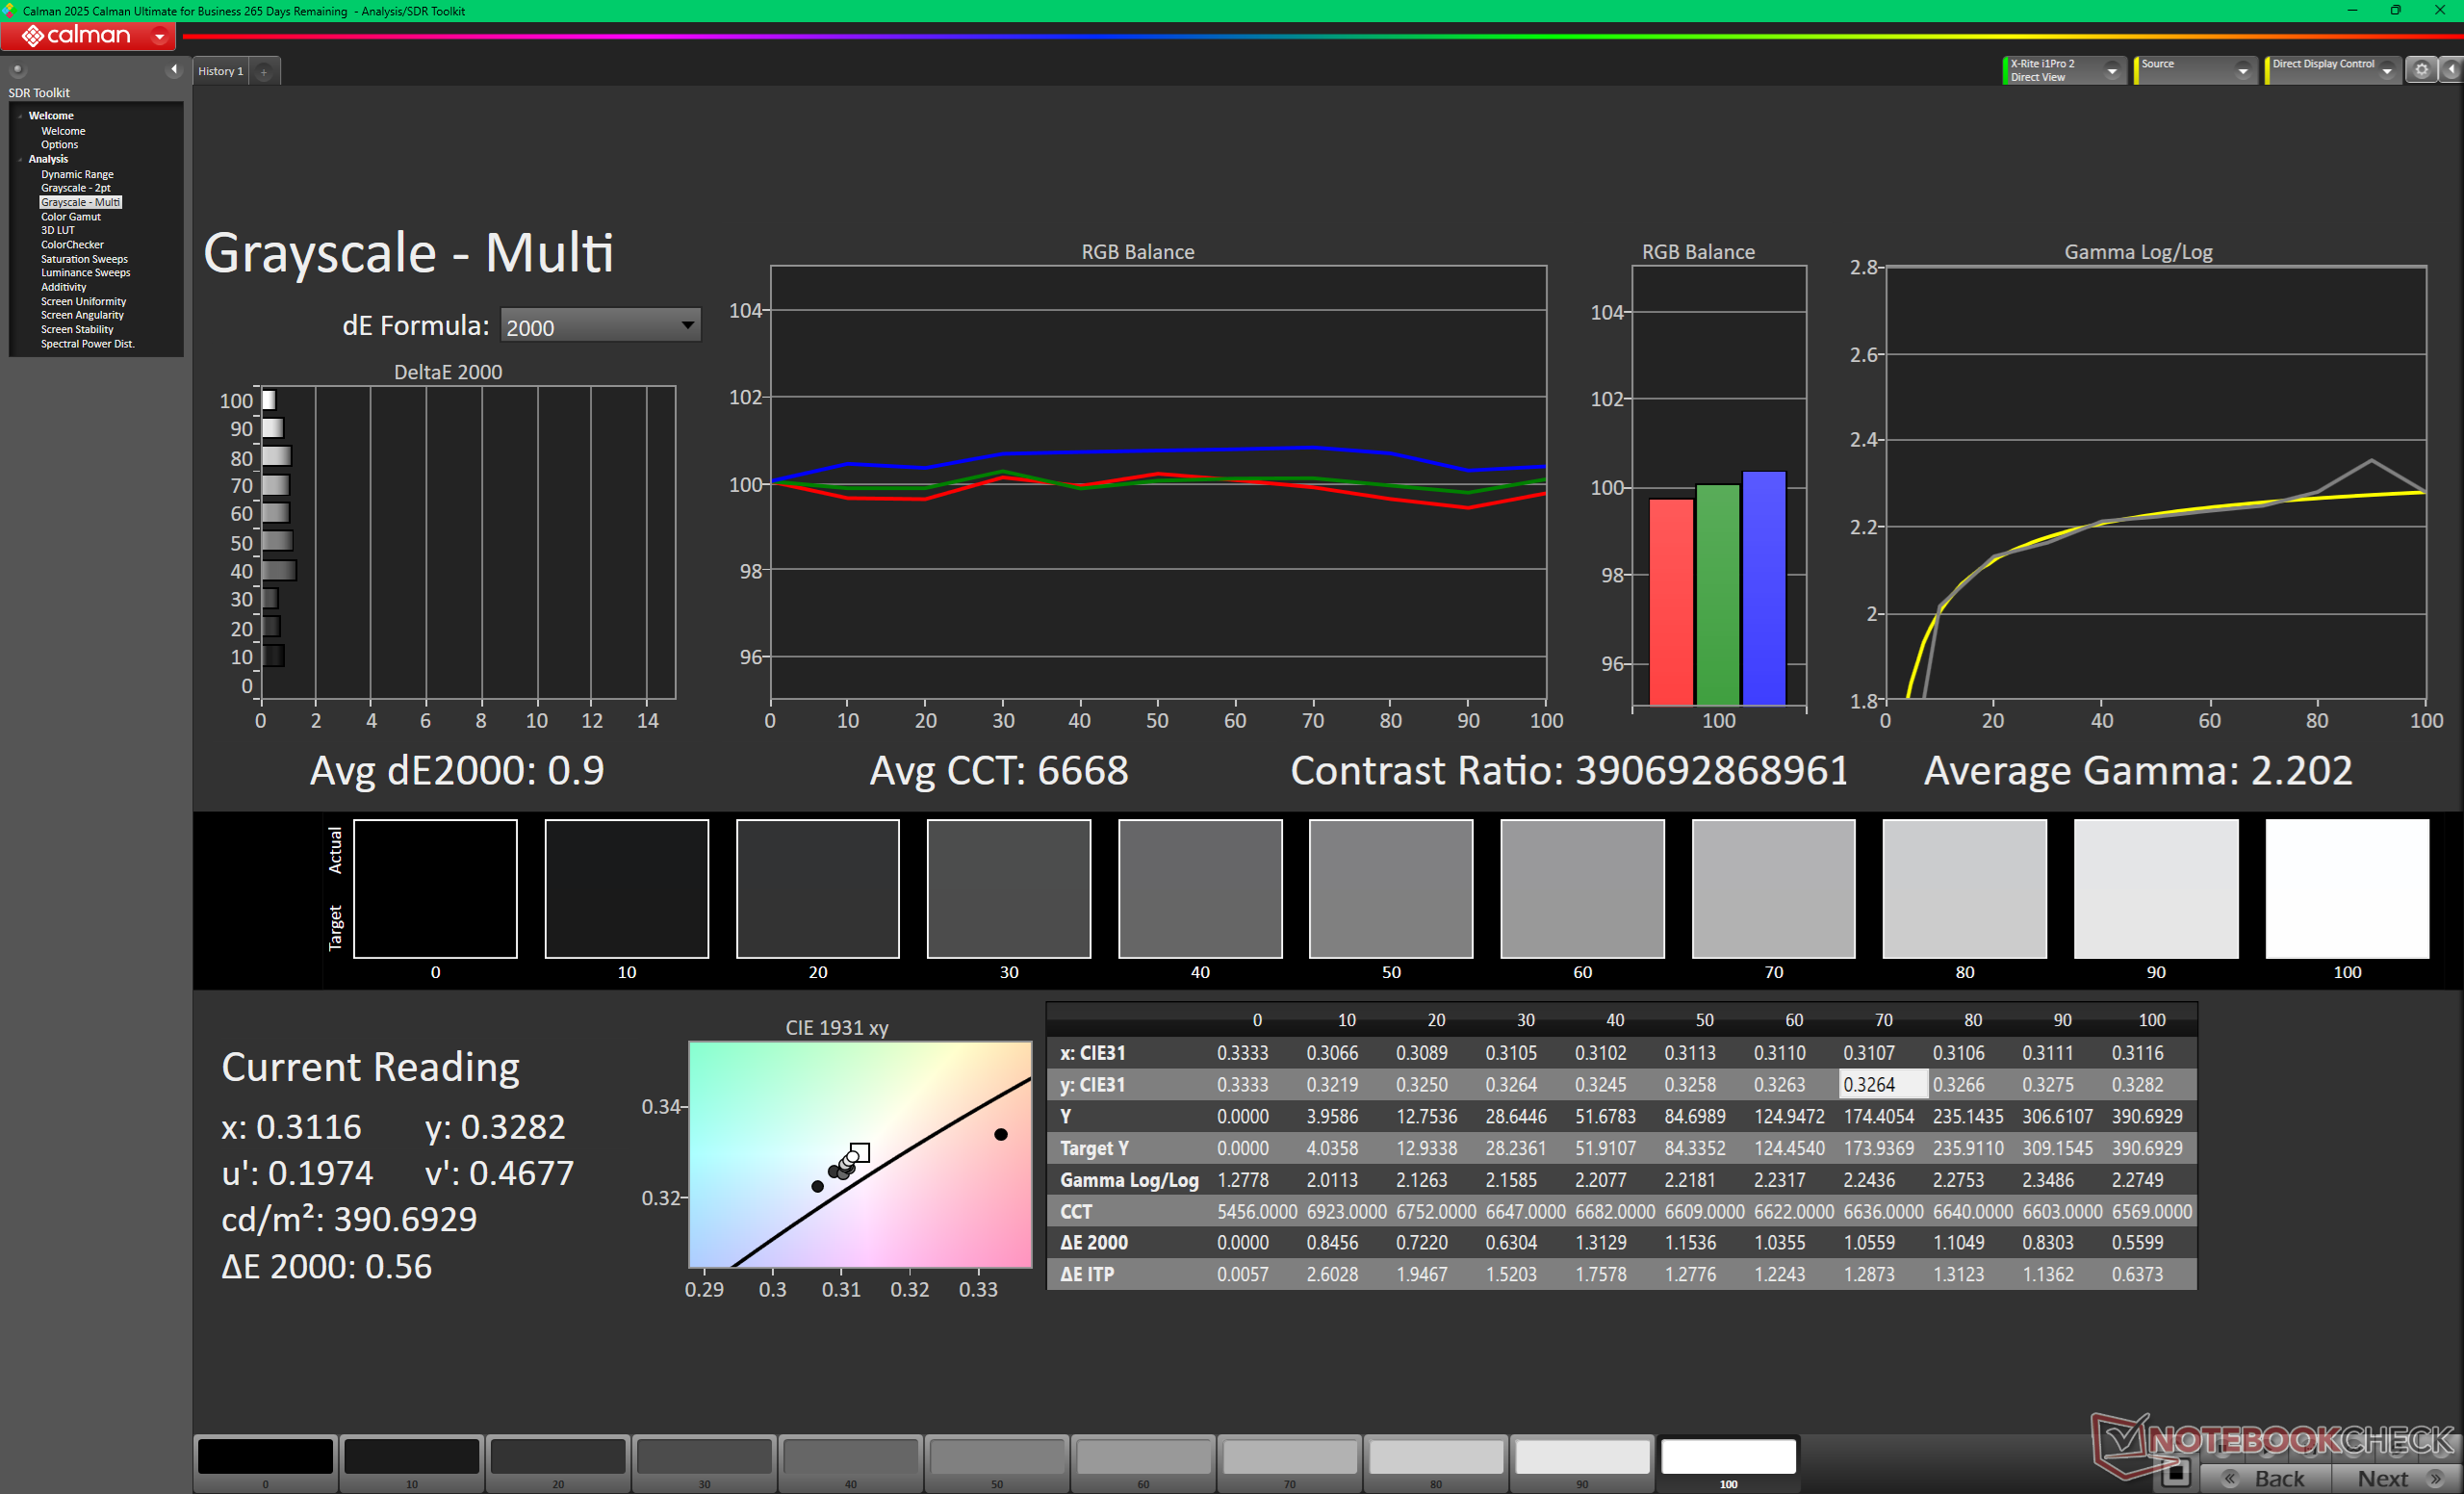
ΔE Greyscale Calman: 1.9 | ∀{0.09-98 Ø4.97}
98% AdobeRGB 1998 (Argyll 3D)
100% sRGB (Argyll 3D)
99.8% Display P3 (Argyll 3D)
Gamma: 2.19
CCT: 6844 K
| MSI Prestige 16 AI C3MTG Samsung ATNA60CL11-0, OLED, 2880x1800, 16", 120 Hz | MSI Prestige 16 AI Evo B2HMG B160QAN03_R, IPS, 2560x1600, 16", 60 Hz | Dell XPS 16 Core Ultra X7 358H LG Philips 160WV1, OLED, 3200x2000, 16", 120 Hz | Asus ZenBook S16 UM5606GA ATNA60HR07-0, OLED, 2880x1800, 16", 120 Hz | Lenovo ThinkBook 16 G7+ AMD LEN160-3.2K, IPS, 3200x2000, 16", 165 Hz | HP Envy x360 2-in-1 16-ad0097nr Samsung SDC41A6, OLED, 2880x1800, 16", 120 Hz | |
|---|---|---|---|---|---|---|
| Display | -6% | -1% | -1% | -5% | -1% | |
| Display P3 Coverage (%) | 99.8 | 96.4 -3% | 99.5 0% | 99.8 0% | 96.3 -4% | 99.6 0% |
| sRGB Coverage (%) | 100 | 99.7 0% | 100 0% | 100 0% | 100 0% | 100 0% |
| AdobeRGB 1998 Coverage (%) | 98 | 84.3 -14% | 96.5 -2% | 94 -4% | 86.9 -11% | 96.5 -2% |
| Response Times | -4924% | -21% | -80% | -1241% | -8% | |
| Response Time Grey 50% / Grey 80% * (ms) | 0.71 ? | 51.5 ? -7154% | 0.65 ? 8% | 1.27 ? -79% | 13.9 ? -1858% | 0.8 ? -13% |
| Response Time Black / White * (ms) | 0.87 ? | 24.3 ? -2693% | 0.87 ? -0% | 0.43 ? 51% | 6.3 ? -624% | 0.89 ? -2% |
| PWM Frequency (Hz) | 460.46 ? | 240.2 ? | 960 ? | 491.8 ? | ||
| PWM Amplitude * (%) | 18 | 31 -72% | 56 -211% | |||
| Screen | -153% | -50% | 12% | -9% | -48% | |
| Brightness middle (cd/m²) | 375 | 471 26% | 395.4 5% | 465 24% | 422 13% | 399.4 7% |
| Brightness (cd/m²) | 380 | 455 20% | 392 3% | 466 23% | 403 6% | 405 7% |
| Brightness Distribution (%) | 98 | 92 -6% | 95 -3% | 99 1% | 93 -5% | 98 0% |
| Black Level * (cd/m²) | 0.2 | 0.3 | ||||
| Colorchecker dE 2000 * | 1.29 | 5.8 -350% | 3.69 -186% | 1 22% | 1.7 -32% | 4.05 -214% |
| Colorchecker dE 2000 max. * | 3.01 | 10.8 -259% | 7.94 -164% | 3 -0% | 3.4 -13% | 6.69 -122% |
| Colorchecker dE 2000 calibrated * | 0.65 | 1.9 -192% | 0.68 -5% | 0.7 -8% | 1.02 -57% | |
| Greyscale dE 2000 * | 1.9 | 7.8 -311% | 1.9 -0% | 1.9 -0% | 2.4 -26% | 1.1 42% |
| Gamma | 2.19 100% | 2.07 106% | 2.28 96% | 2.19 100% | 2.19 100% | 2.27 97% |
| CCT | 6844 95% | 7262 90% | 6274 104% | 6458 101% | 6989 93% | 6419 101% |
| Contrast (:1) | 2355 | 1407 | ||||
| Całkowita średnia (program / ustawienia) | -1694% /
-911% | -24% /
-32% | -23% /
-14% | -418% /
-214% | -19% /
-30% |
* ... im mniej tym lepiej
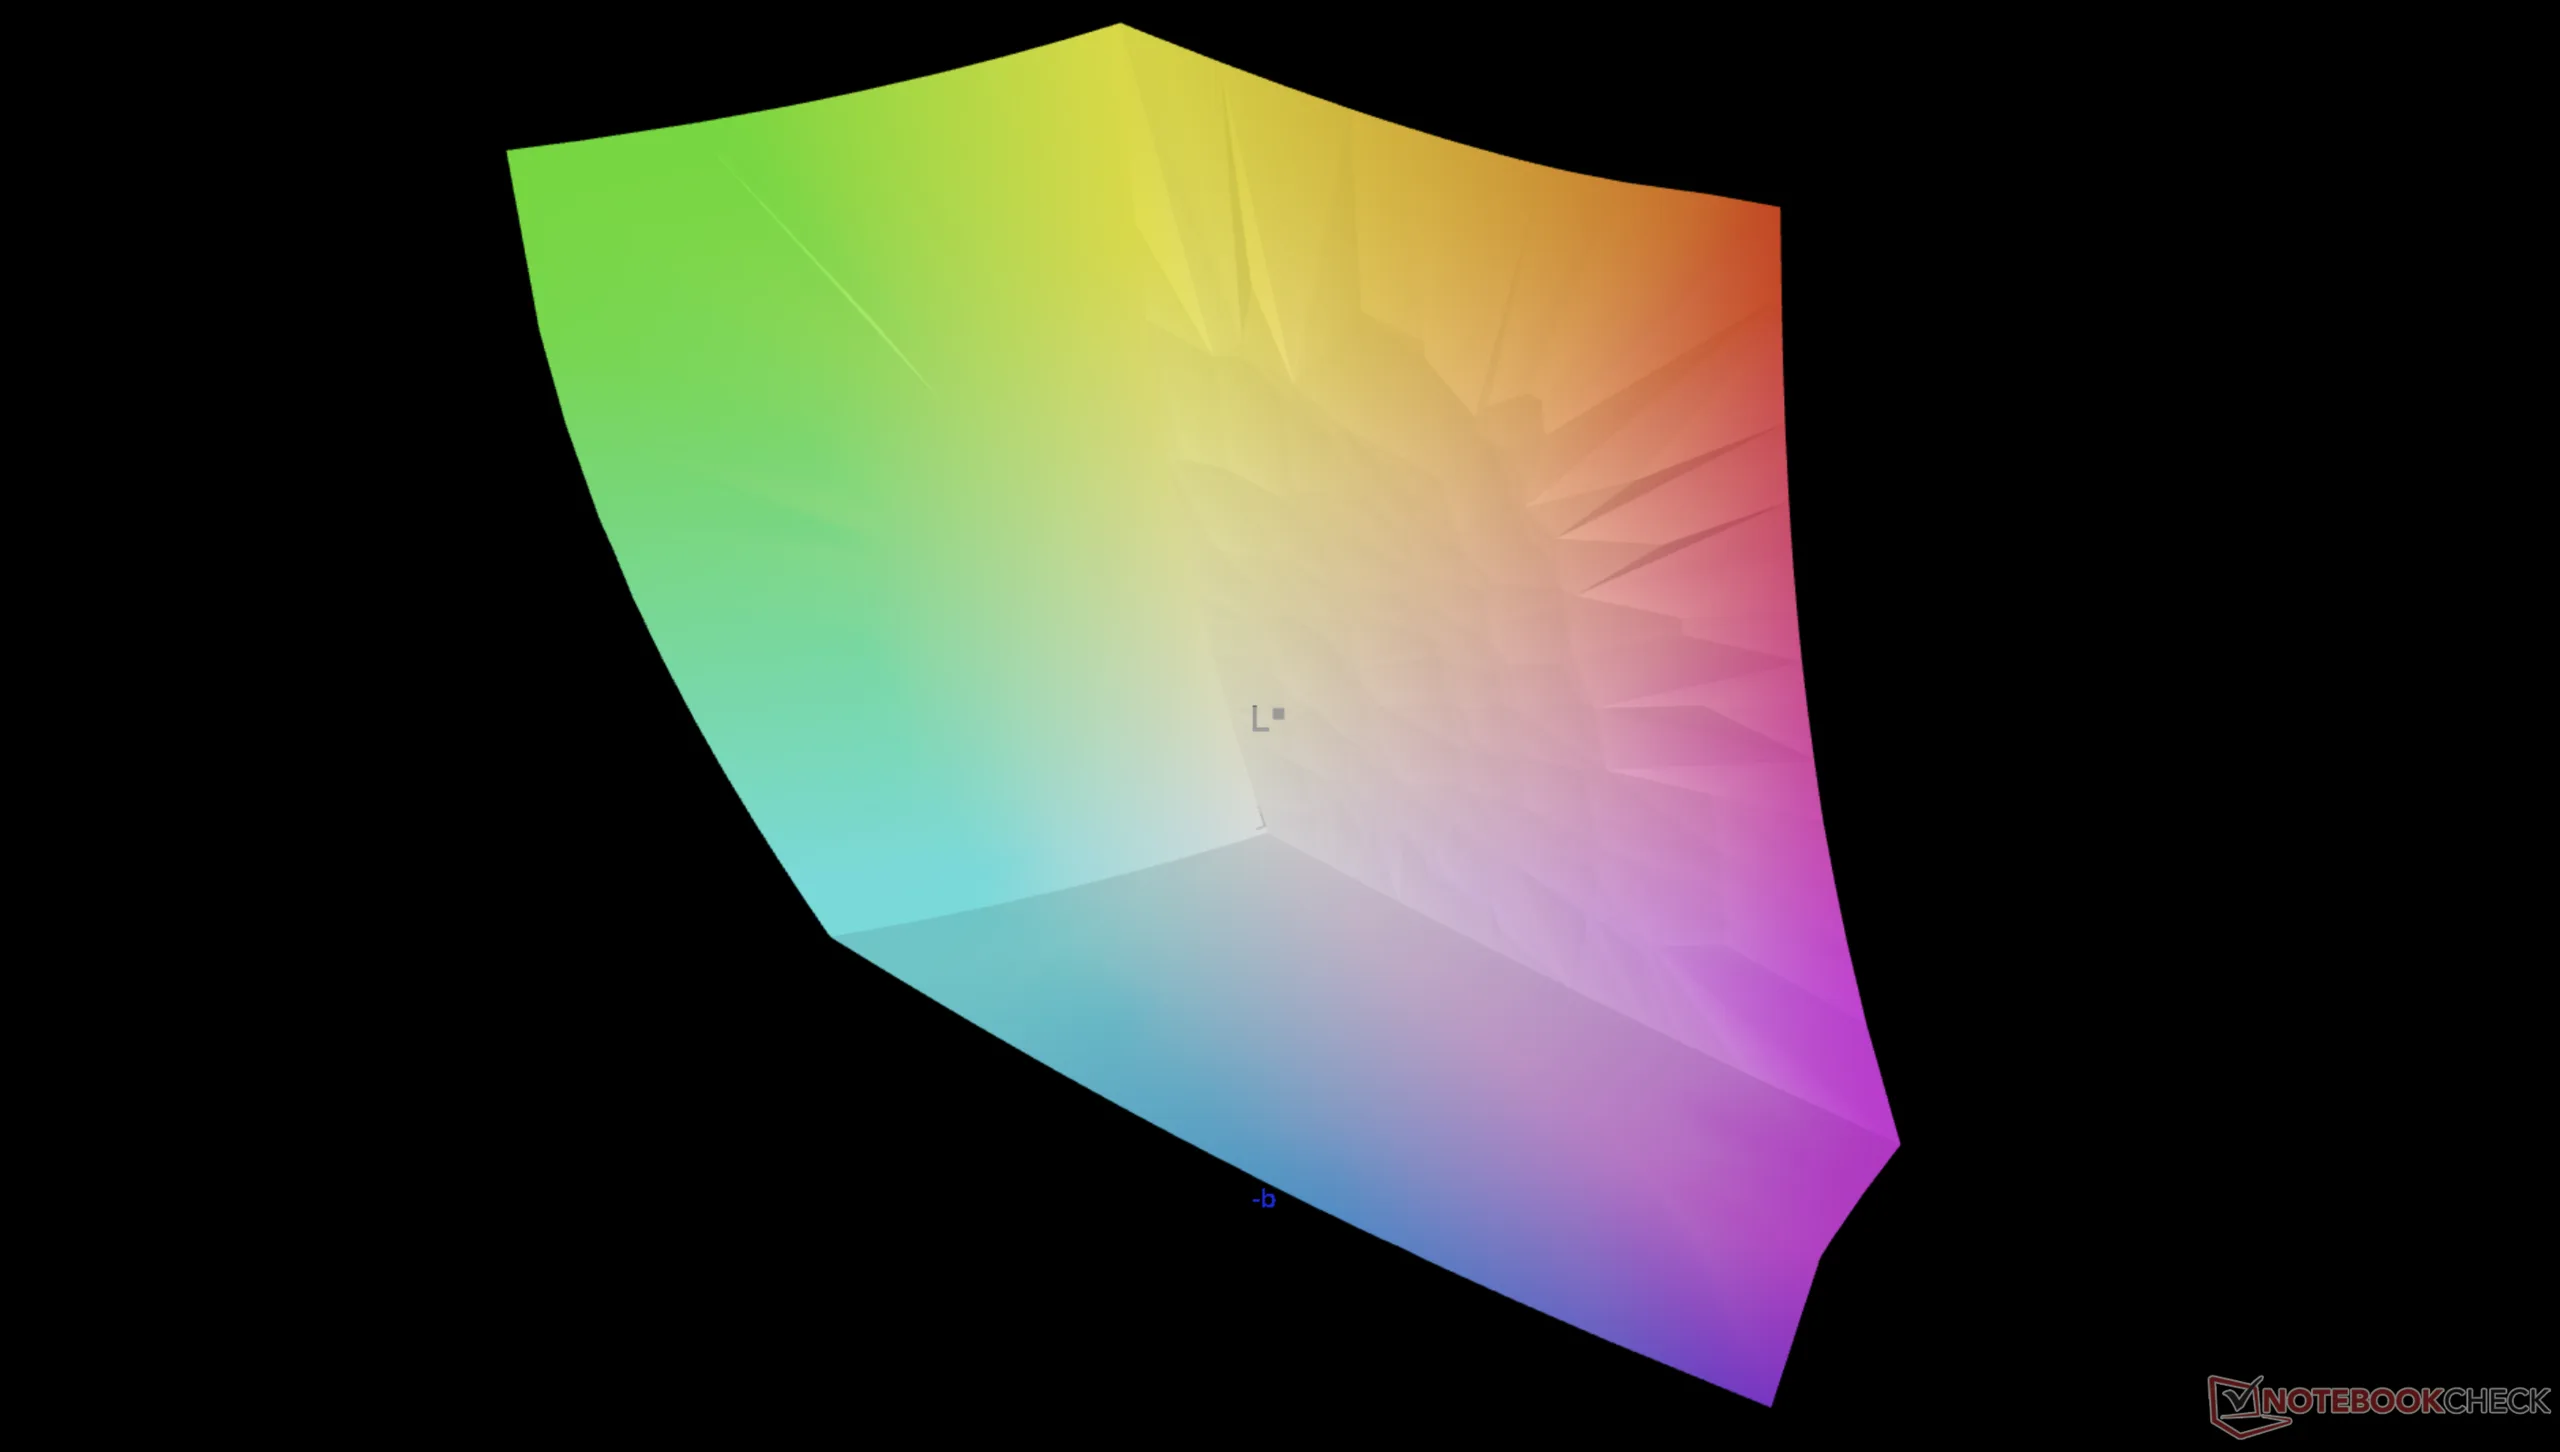
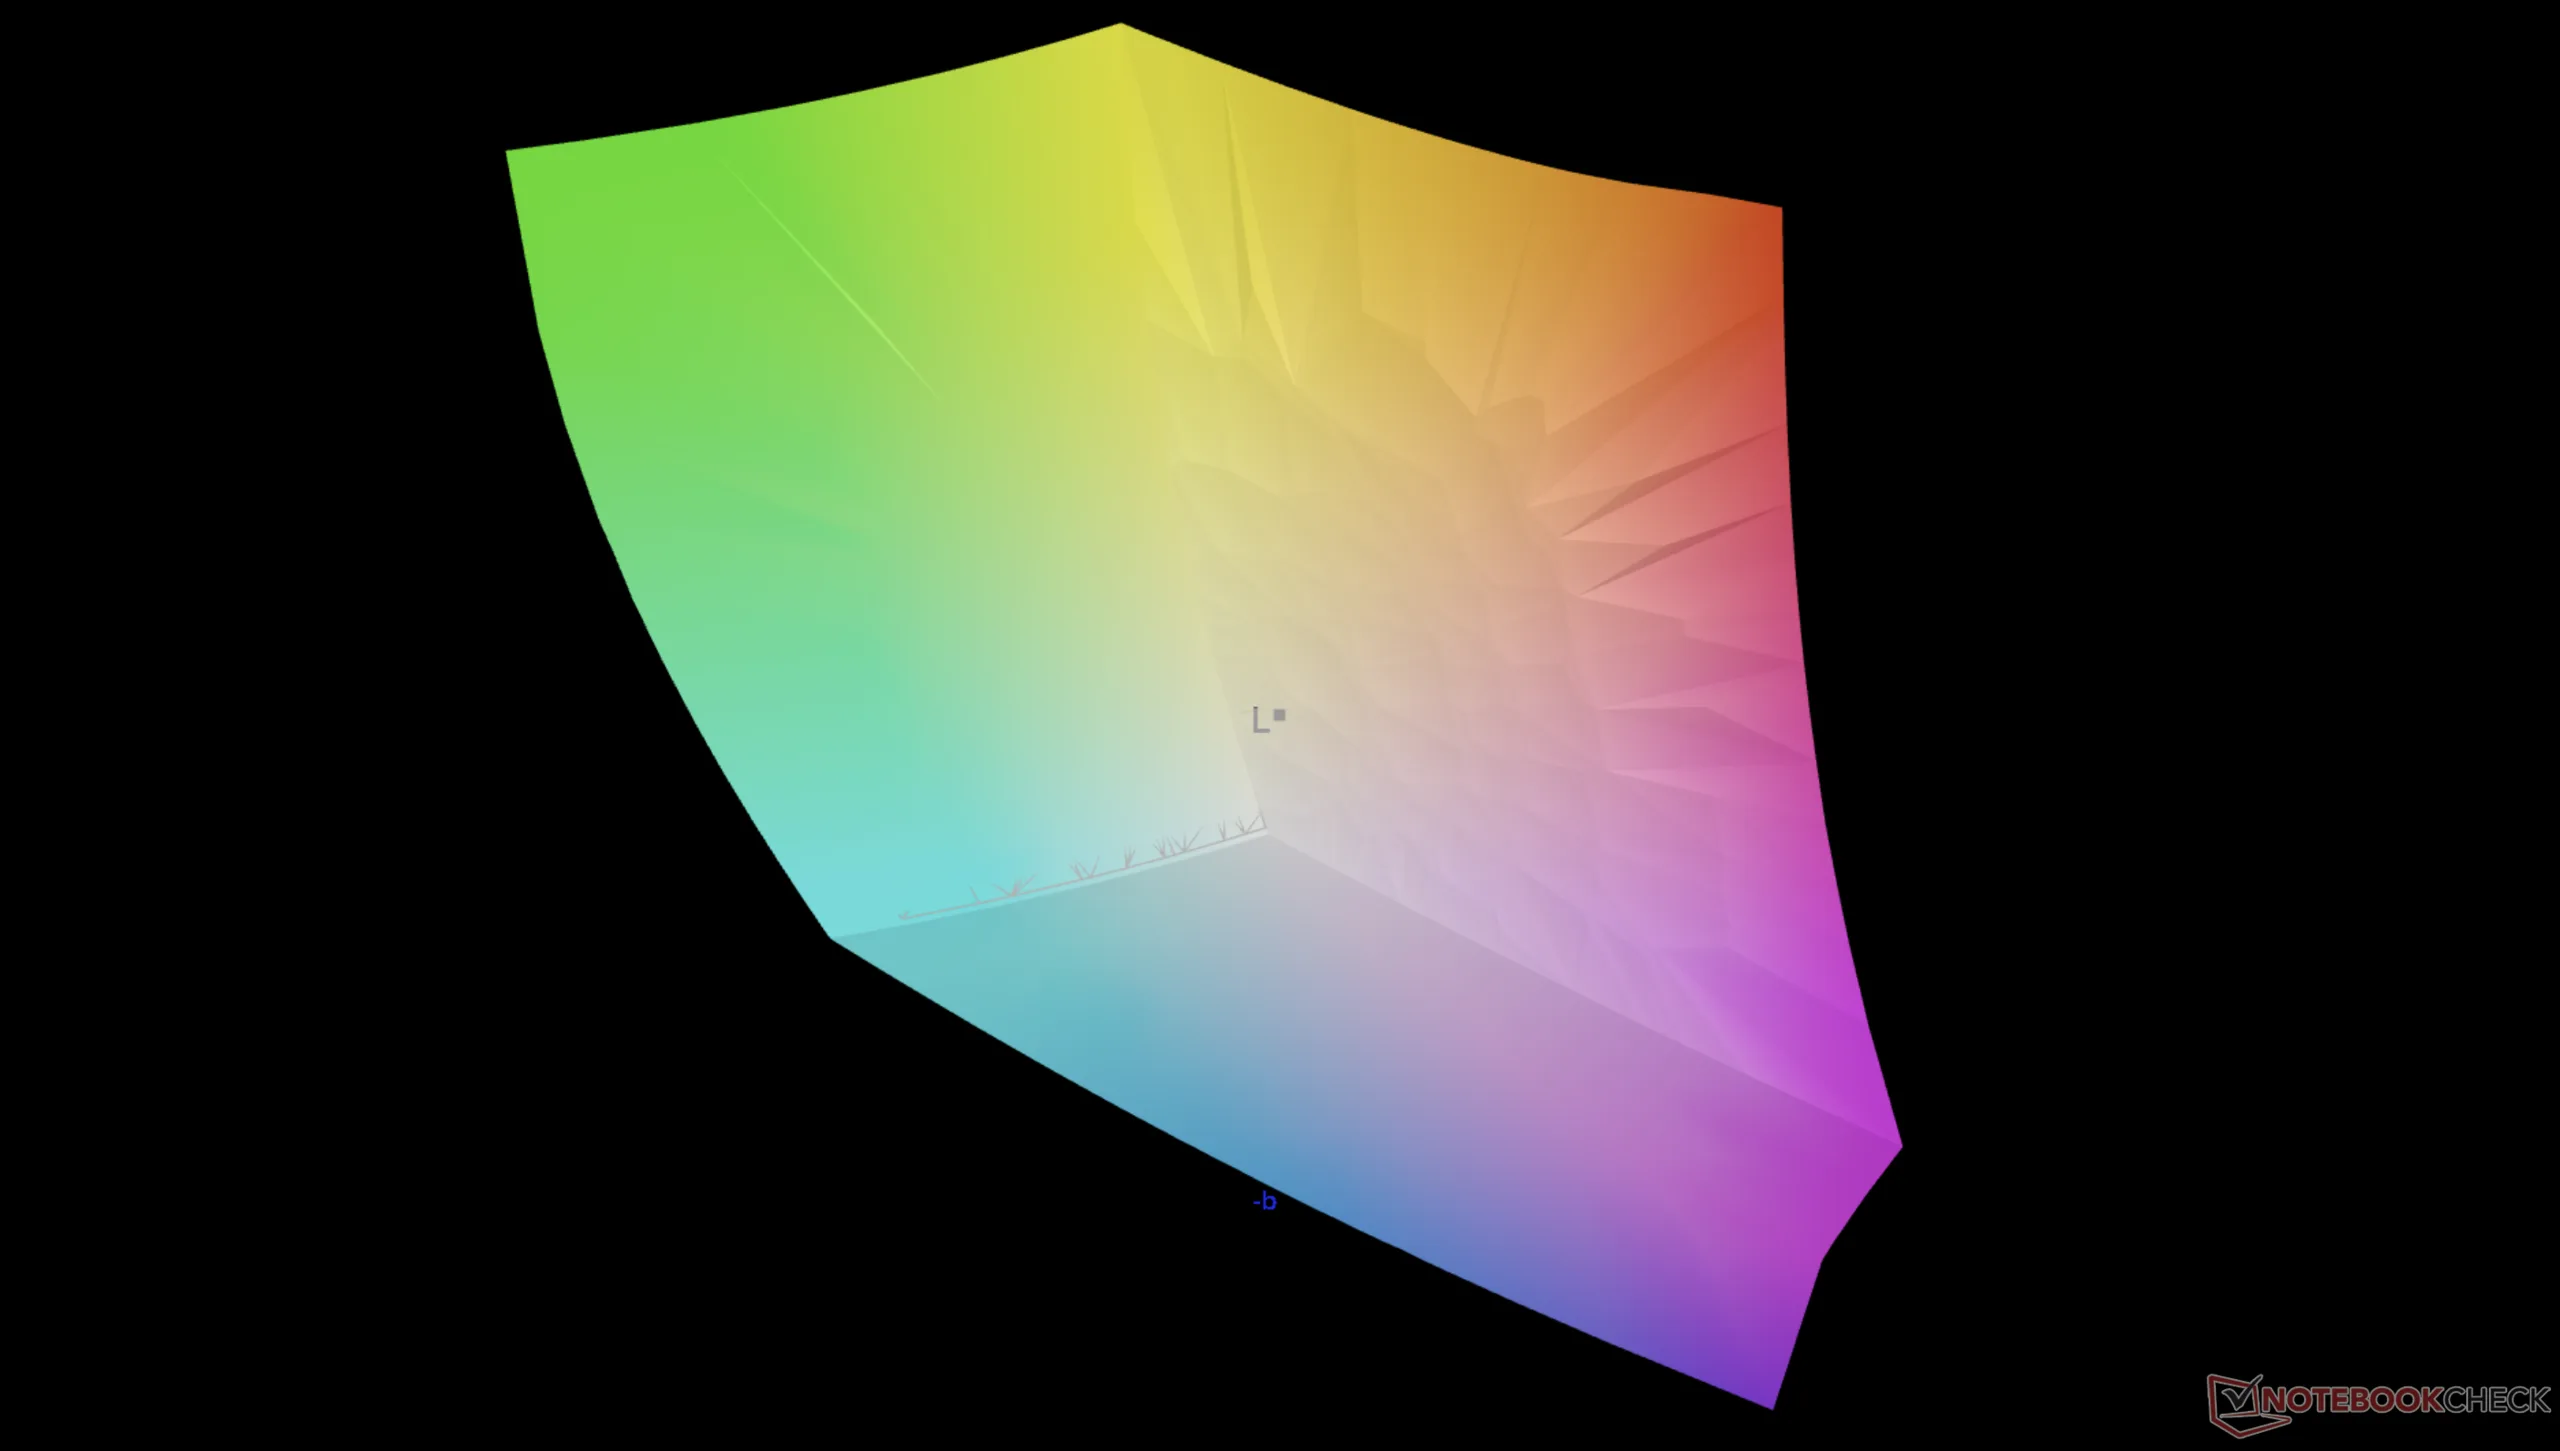
System jest wstępnie ustawiony i wstępnie skalibrowany do sRGB, mimo że wyświetlacz OLED obsługuje pełne kolory P3. Średnie wartości deltaE skali szarości i koloru są już bardzo dokładne i wynoszą odpowiednio tylko 1,9 i 1,29 przed jakimikolwiek wysiłkami kalibracyjnymi.
Wyświetl czasy reakcji
| ↔ Czas reakcji od czerni do bieli | ||
|---|---|---|
| 0.87 ms ... wzrost ↗ i spadek ↘ łącznie | ↗ 0.41 ms wzrost | 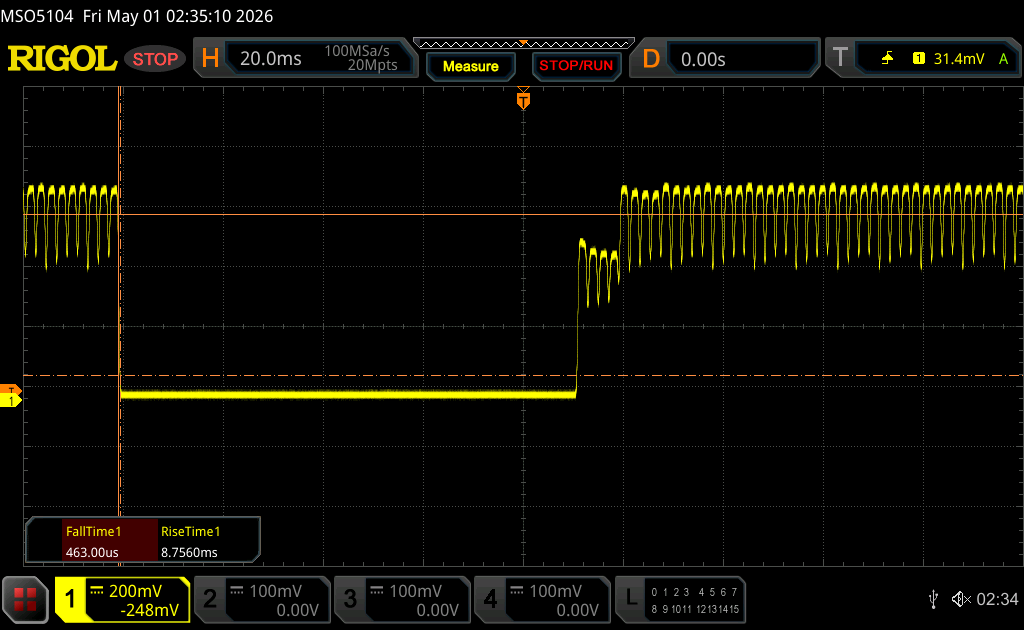 |
| ↘ 0.46 ms upadek | ||
| W naszych testach ekran wykazuje bardzo szybką reakcję i powinien bardzo dobrze nadawać się do szybkich gier. Dla porównania, wszystkie testowane urządzenia wahają się od 0.1 (minimum) do 240 (maksimum) ms. » 3 % wszystkich urządzeń jest lepszych. Oznacza to, że zmierzony czas reakcji jest lepszy od średniej wszystkich testowanych urządzeń (19.9 ms). | ||
| ↔ Czas reakcji 50% szarości do 80% szarości | ||
| 0.71 ms ... wzrost ↗ i spadek ↘ łącznie | ↗ 0.38 ms wzrost | 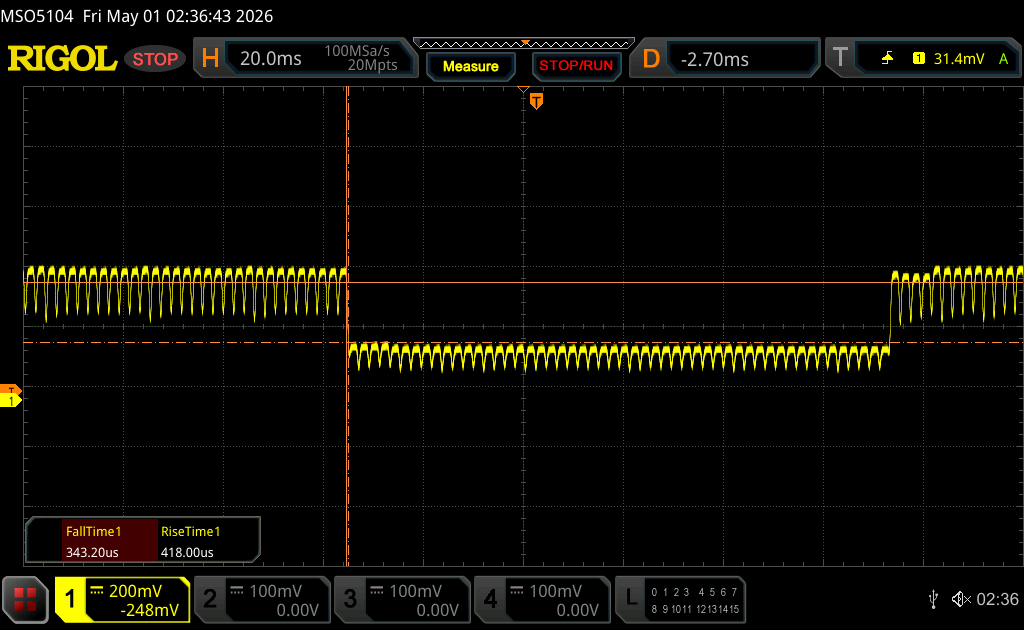 |
| ↘ 0.33 ms upadek | ||
| W naszych testach ekran wykazuje bardzo szybką reakcję i powinien bardzo dobrze nadawać się do szybkich gier. Dla porównania, wszystkie testowane urządzenia wahają się od 0.165 (minimum) do 636 (maksimum) ms. » 2 % wszystkich urządzeń jest lepszych. Oznacza to, że zmierzony czas reakcji jest lepszy od średniej wszystkich testowanych urządzeń (31.1 ms). | ||
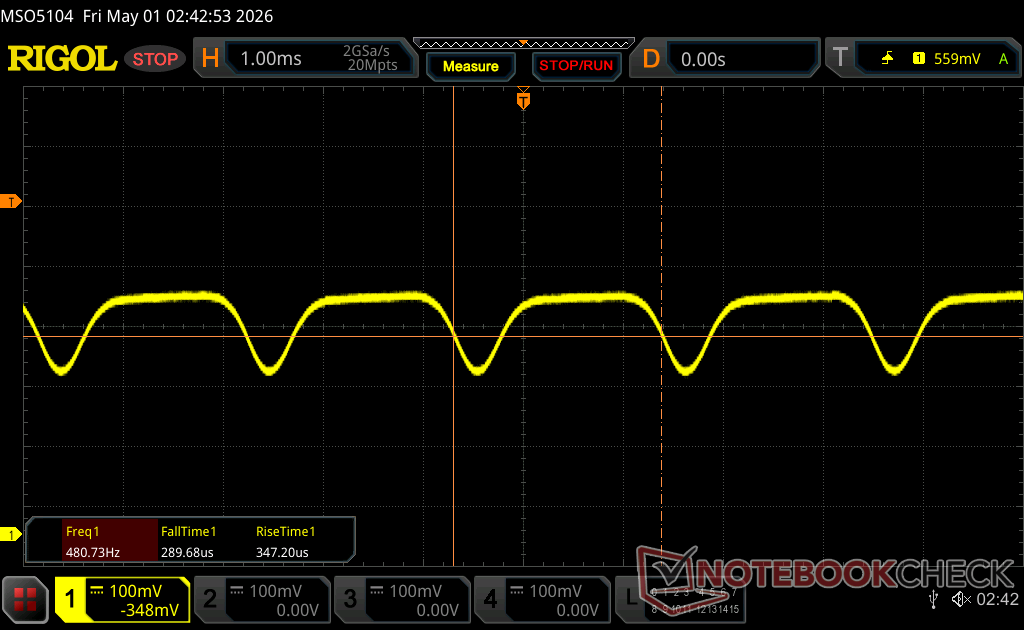
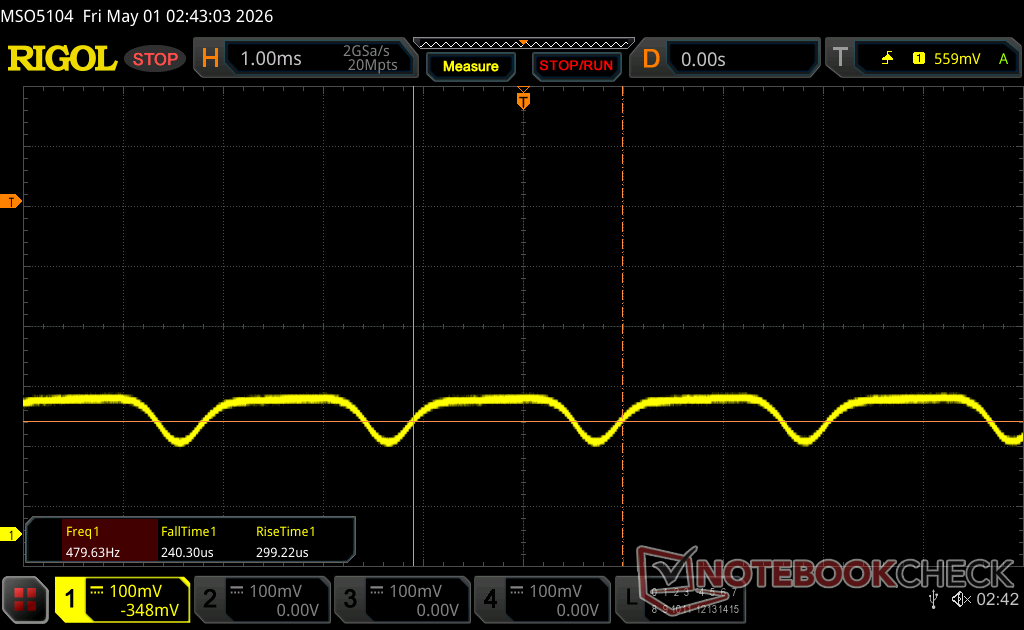
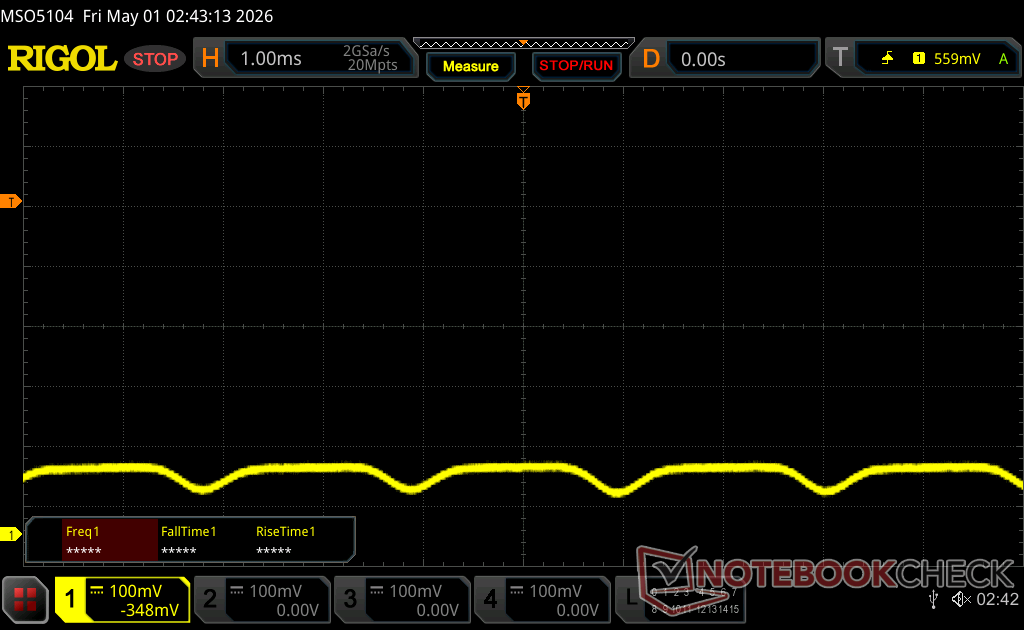
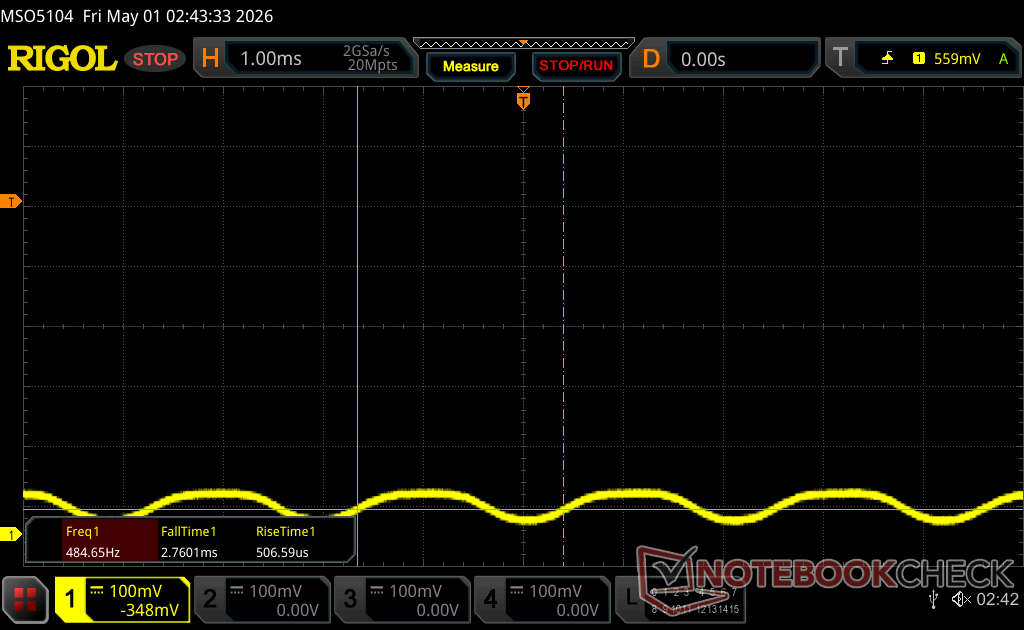
Migotanie ekranu / PWM (modulacja szerokości impulsu)
| Wykryto migotanie ekranu/wykryto PWM | 460.46 Hz Amplitude: 18 % | ≤ 100 % ustawienia jasności | 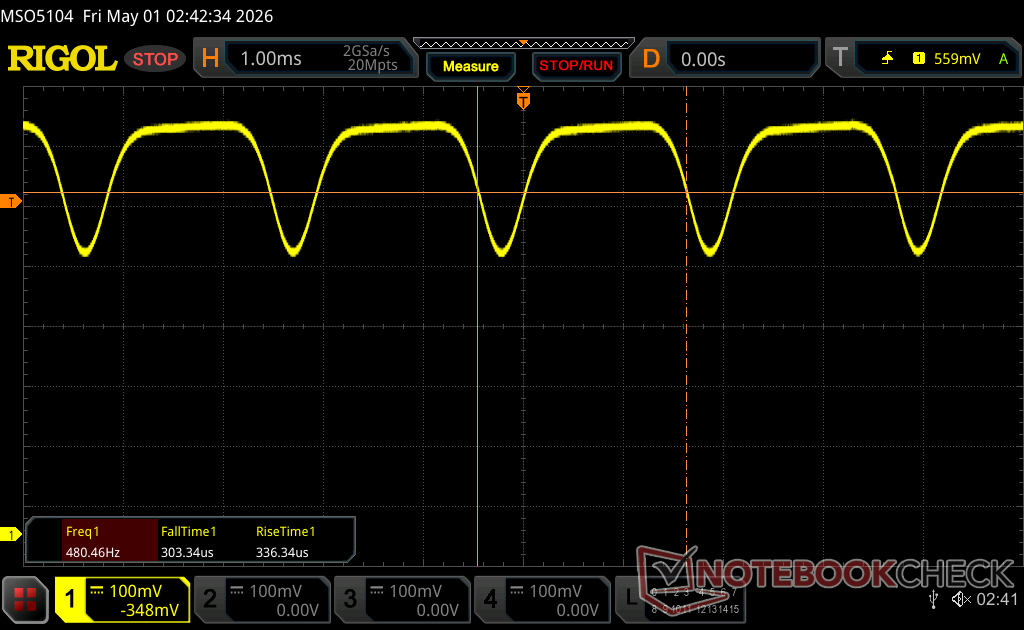 |
Podświetlenie wyświetlacza miga z częstotliwością 460.46 Hz (najgorszy przypadek, np. przy użyciu PWM) Wykryto migotanie przy ustawieniu jasności 100 % i poniżej. Powyżej tego ustawienia jasności nie powinno być żadnego migotania ani PWM. Częstotliwość 460.46 Hz jest stosunkowo wysoka, więc większość użytkowników wrażliwych na PWM nie powinna zauważyć żadnego migotania. Istnieją jednak doniesienia, że niektórzy użytkownicy są nadal wrażliwi na PWM przy częstotliwości 500 Hz i wyższej, więc należy zachować ostrożność. Dla porównania: 52 % wszystkich testowanych urządzeń nie używa PWM do przyciemniania wyświetlacza. Jeśli wykryto PWM, zmierzono średnio 7801 (minimum: 5 - maksimum: 343500) Hz. | |||


Wydajność
Warunki testowania
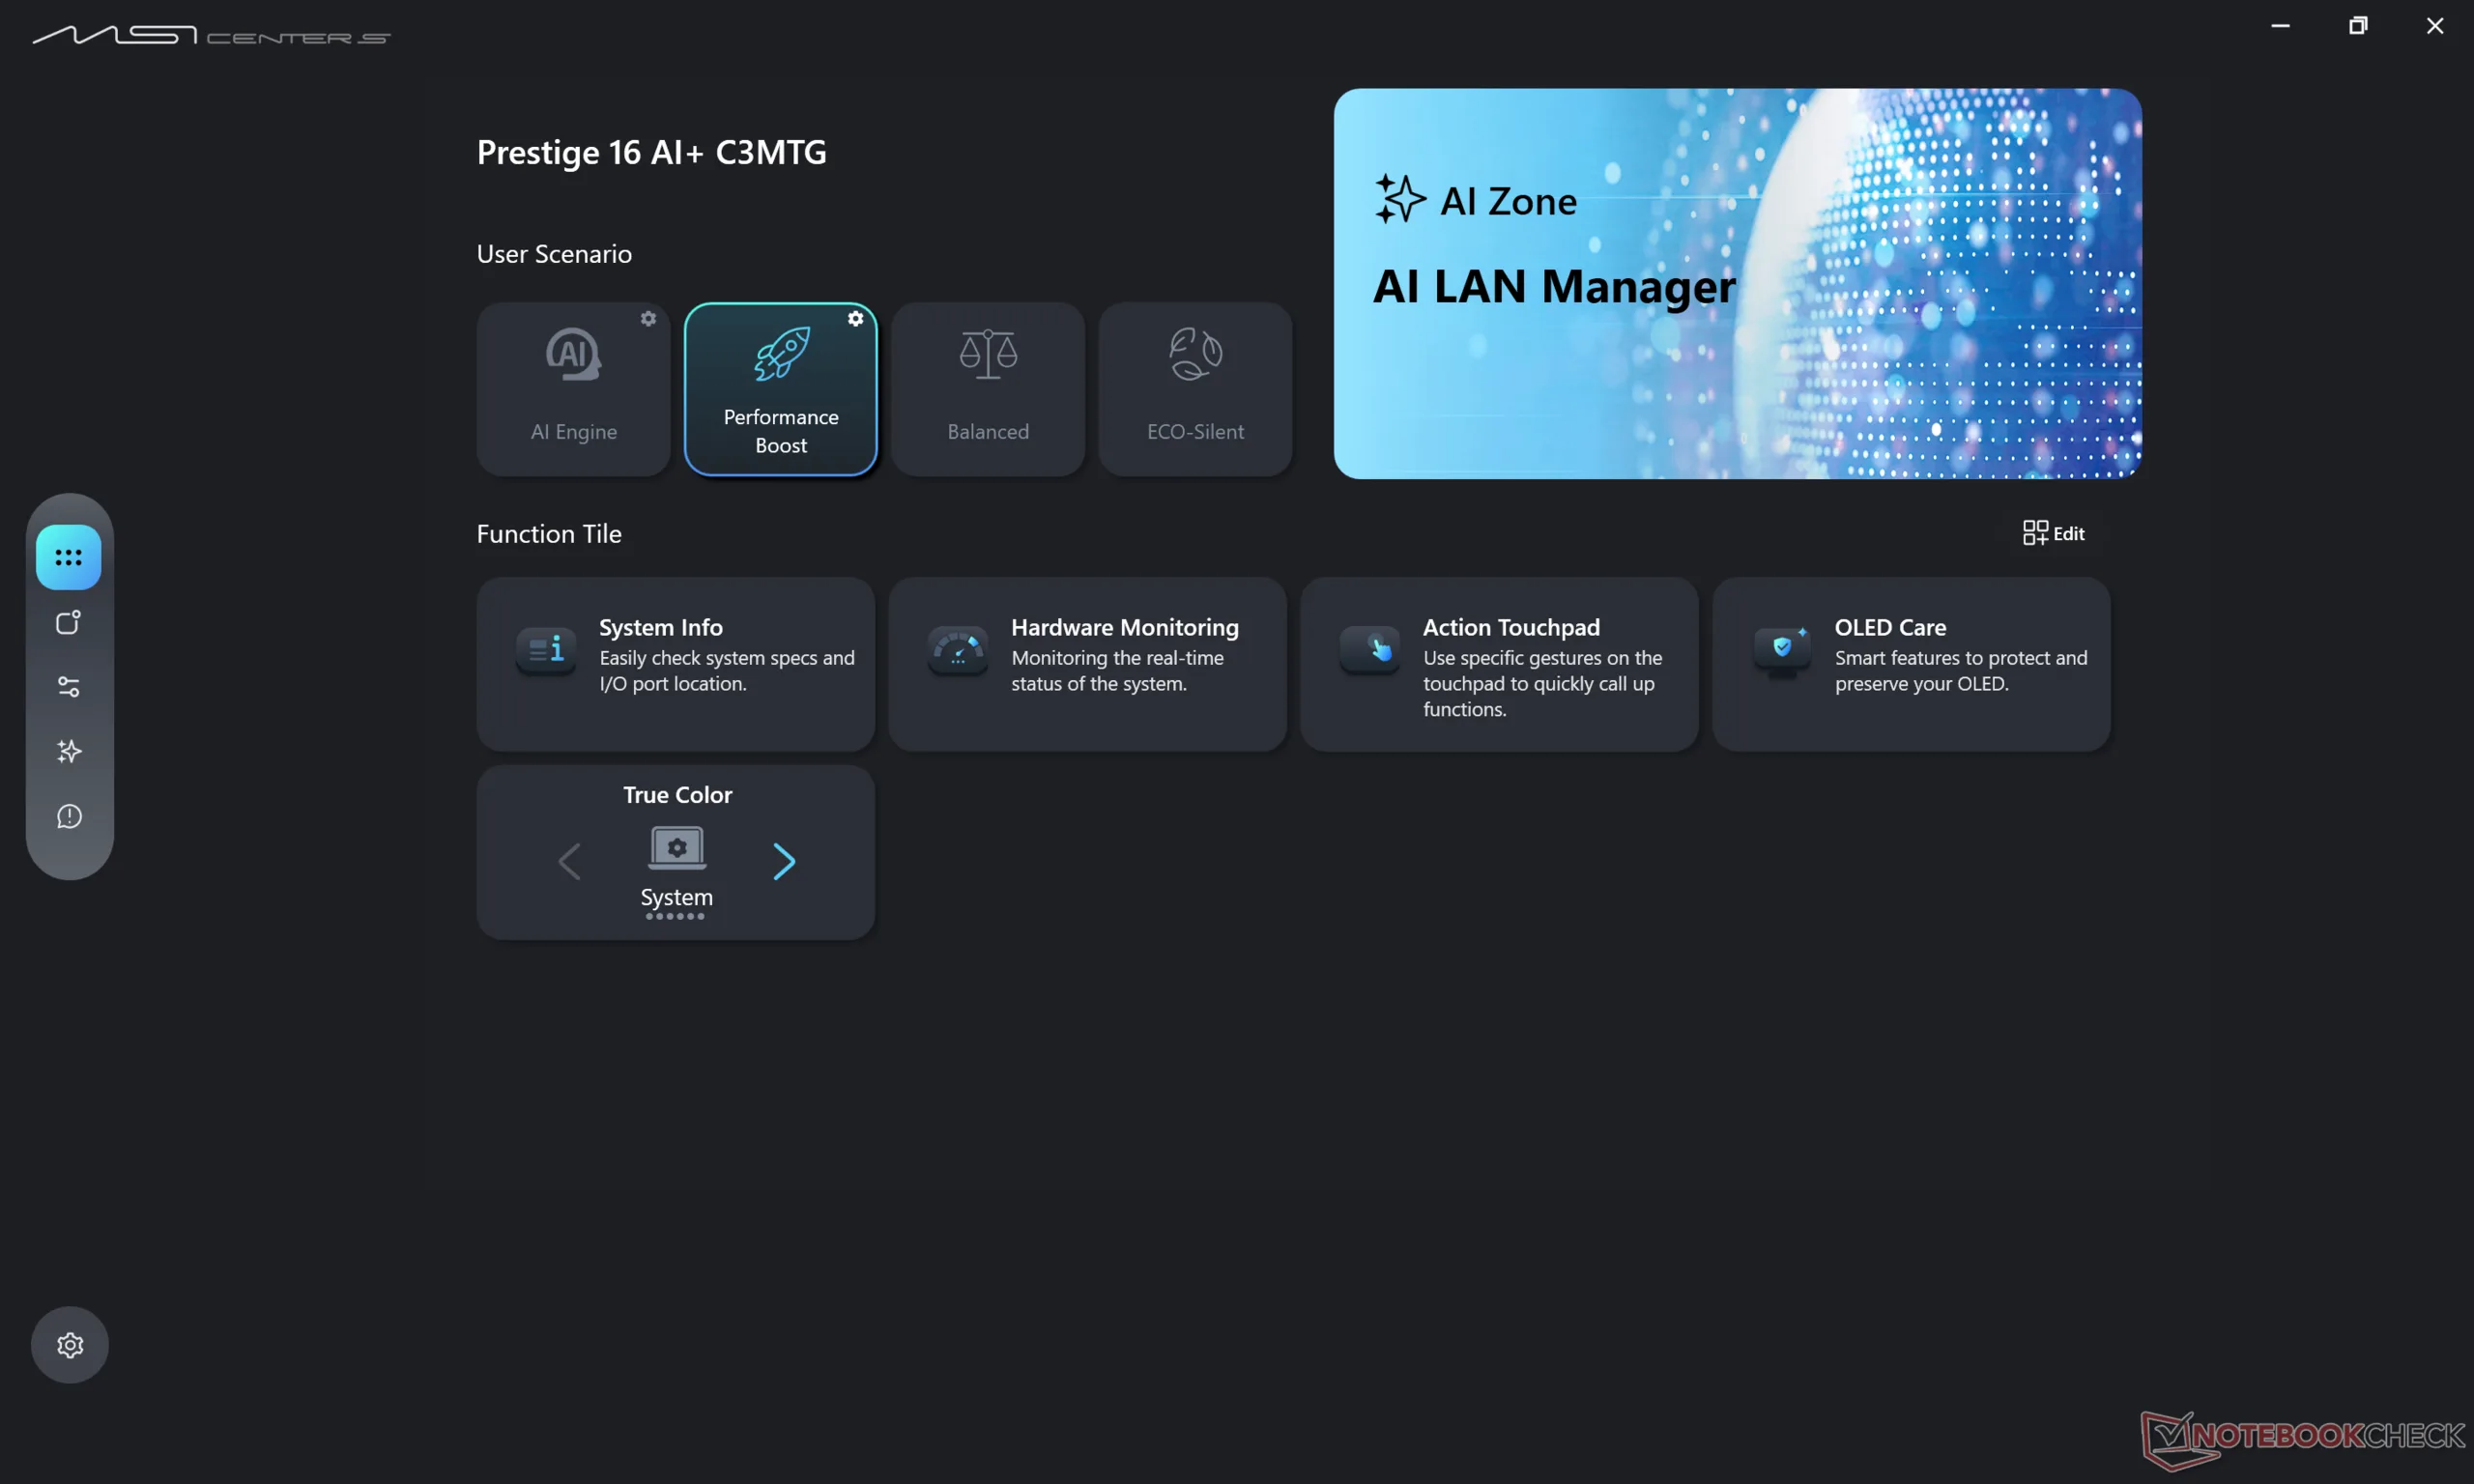
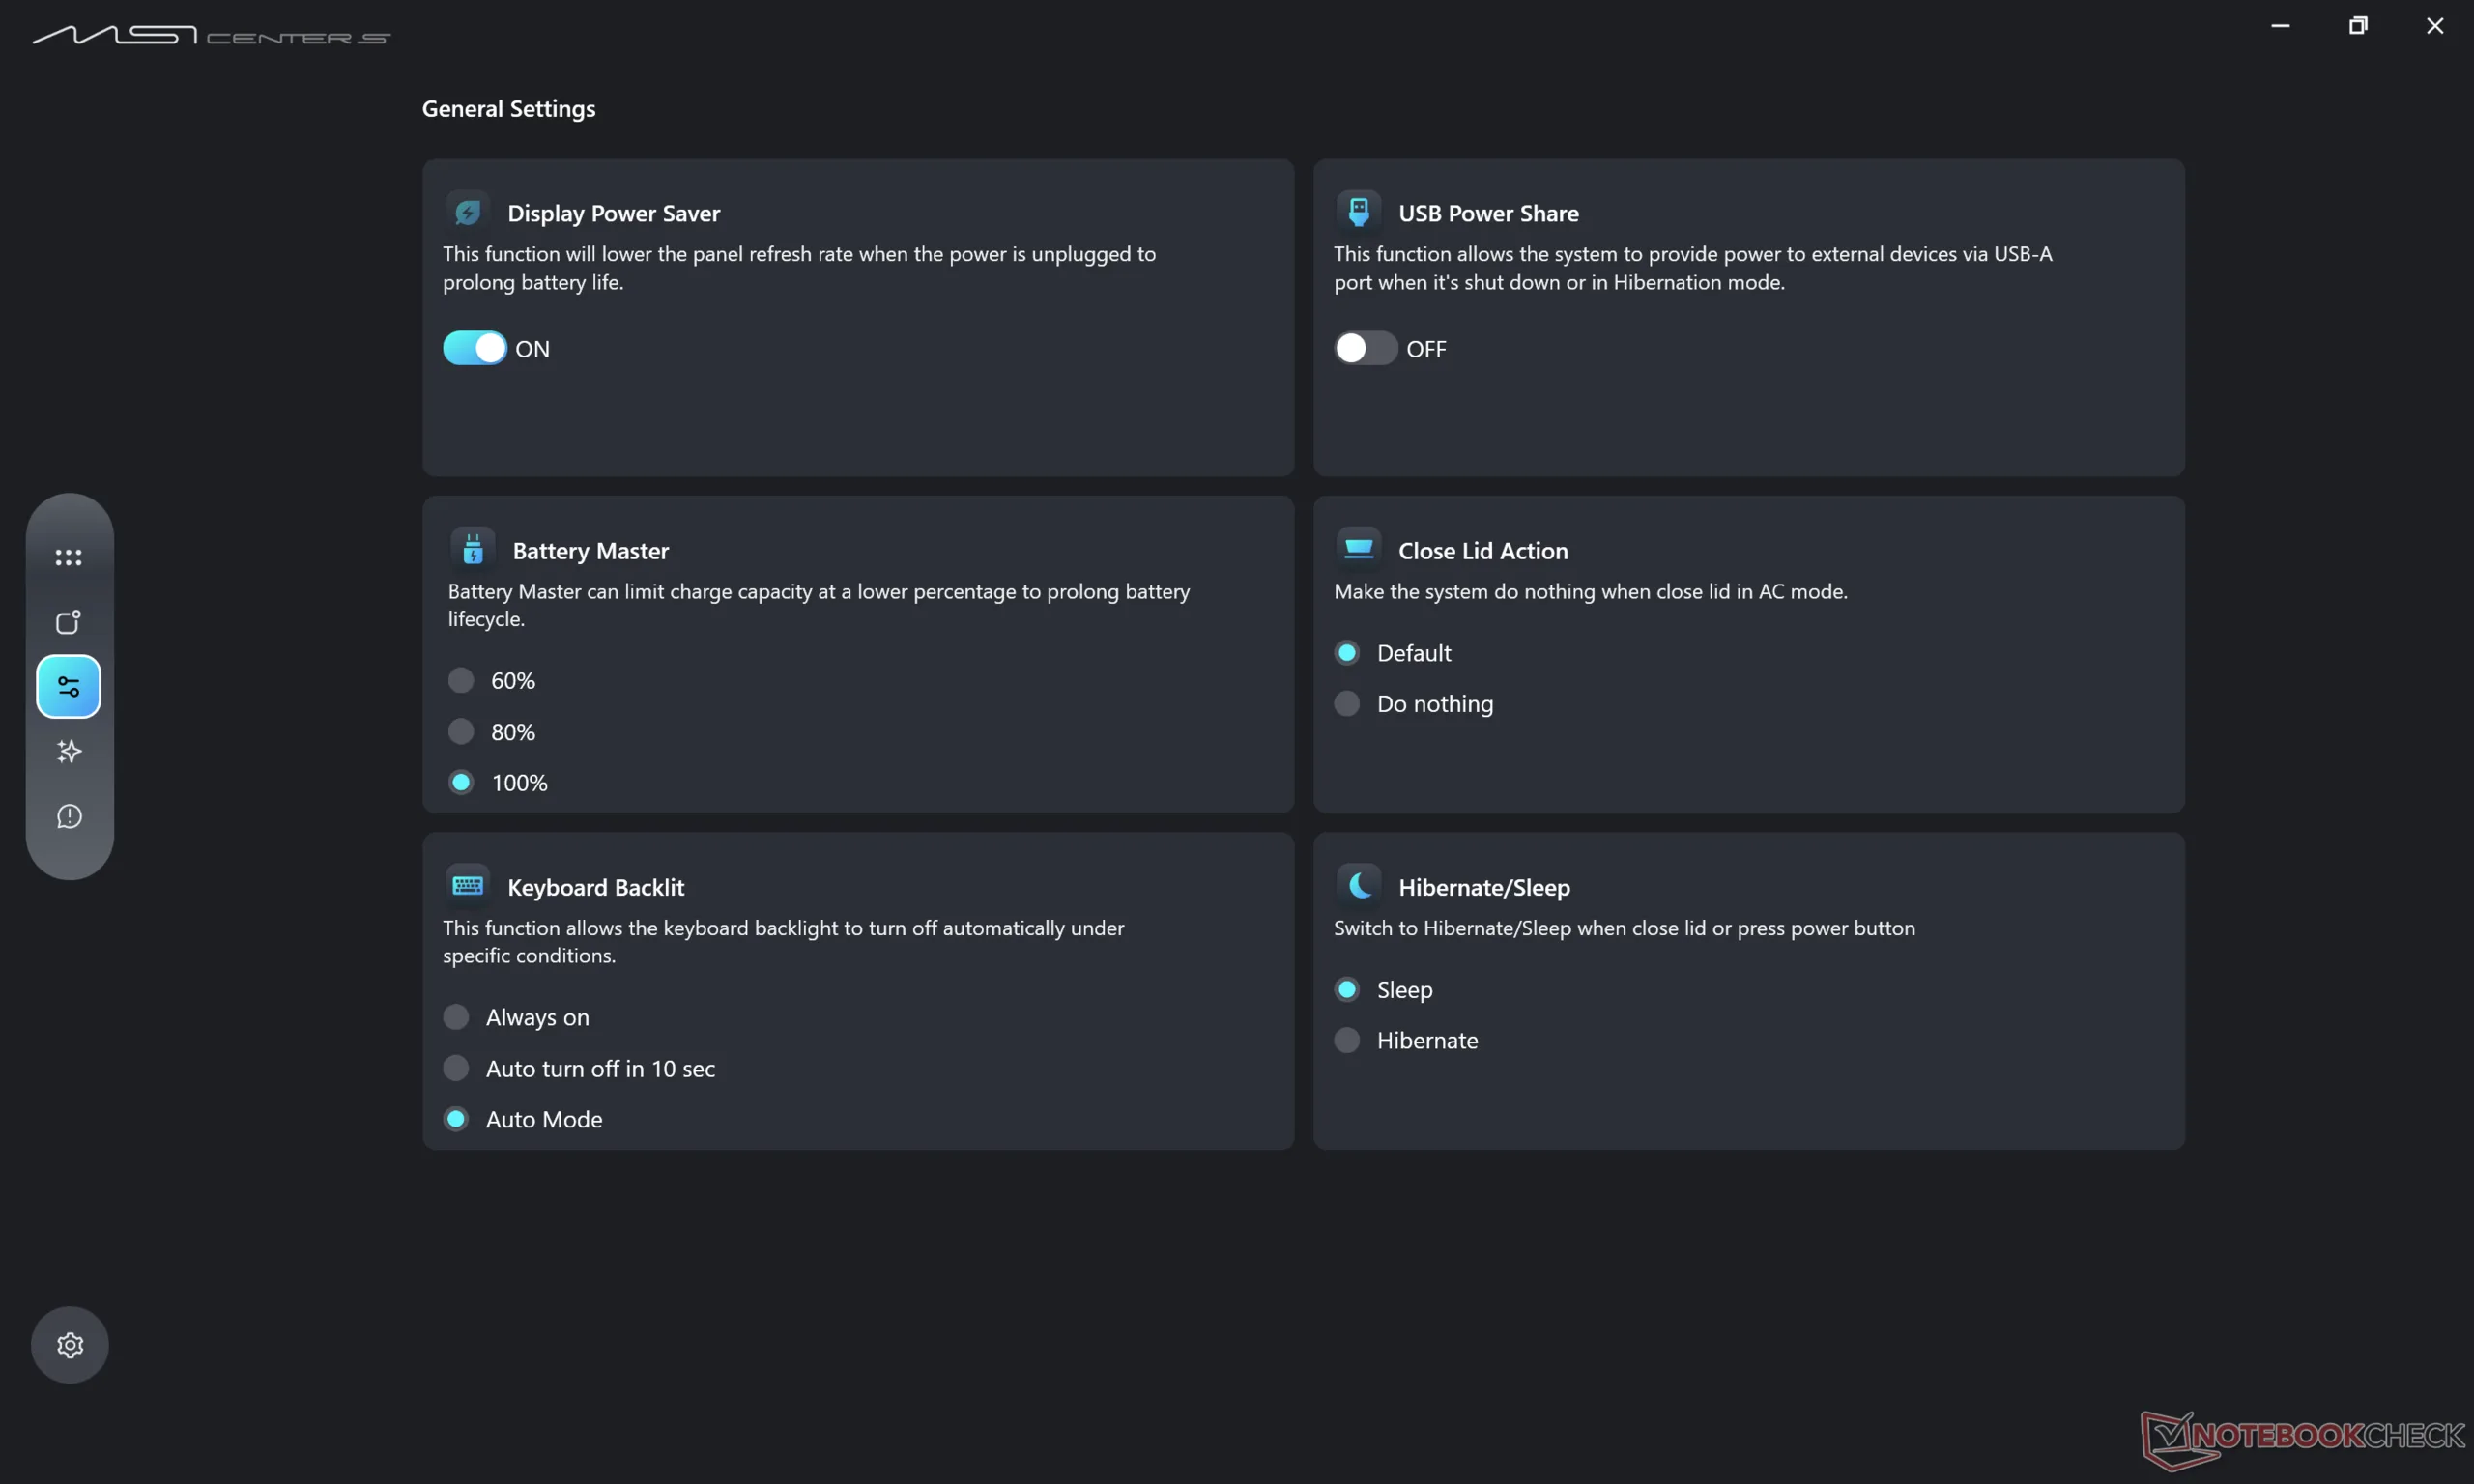
Przed uruchomieniem poniższych testów ustawiliśmy MSI Center S i Windows na tryb wydajności.
Procesor
Procesor Core Ultra X7 358H oferuje bardziej stałą wydajność niż Core Ultra 9 285H w 2025 Prestige 16. Podczas gdy ten drugi może być nawet o 10 procent szybszy, gdy Turbo Boost jest najbardziej efektywny, po ustabilizowaniu się Turbo Boost jest odwrotnie. Można to zaobserwować podczas uruchamiania CineBench R15 xT w pętli, gdzie 2025 Prestige 16 jest szybszą maszyną tylko przez około pierwszą minutę, zanim nasz 2026 Prestige 16 wyprzedzi go później.
Aktualizacja do Core Ultra X9 388H powinna zwiększyć wydajność wielowątkową nawet o 10 procent w oparciu o nasz czas spędzony z Asus ZenBook Duo UX8407AA.
Cinebench R15 Multi Loop
Cinebench R23: Multi Core | Single Core
Cinebench R20: CPU (Multi Core) | CPU (Single Core)
Cinebench R15: CPU Multi 64Bit | CPU Single 64Bit
Blender: v2.79 BMW27 CPU
7-Zip 18.03: 7z b 4 | 7z b 4 -mmt1
Geekbench 6.7: Multi-Core | Single-Core
Geekbench 5.5: Multi-Core | Single-Core
HWBOT x265 Benchmark v2.2: 4k Preset
LibreOffice : 20 Documents To PDF
R Benchmark 2.5: Overall mean
* ... im mniej tym lepiej
AIDA64: FP32 Ray-Trace | FPU Julia | CPU SHA3 | CPU Queen | FPU SinJulia | FPU Mandel | CPU AES | CPU ZLib | FP64 Ray-Trace | CPU PhotoWorxx | CPU CheckMate
| Performance rating | |
| Asus ZenBook S16 UM5606GA -1! | |
| Lenovo ThinkBook 16 G7+ AMD -1! | |
| Dell XPS 16 Core Ultra X7 358H -1! | |
| HP Envy x360 2-in-1 16-ad0097nr -1! | |
| MSI Prestige 16 AI C3MTG -1! | |
| MSI Prestige 16 AI Evo B2HMG -1! | |
| Przeciętny Intel Core Ultra X7 358H | |
| AIDA64 / FP32 Ray-Trace | |
| Lenovo ThinkBook 16 G7+ AMD (v6.92.6600) | |
| Asus ZenBook S16 UM5606GA (v6.92.6600) | |
| HP Envy x360 2-in-1 16-ad0097nr (v6.92.6600) | |
| MSI Prestige 16 AI Evo B2HMG (v6.92.6600) | |
| MSI Prestige 16 AI C3MTG (v8.20.8100) | |
| Dell XPS 16 Core Ultra X7 358H (v8.20.8100) | |
| Przeciętny Intel Core Ultra X7 358H (12221 - 17932, n=8) | |
| AIDA64 / FPU Julia | |
| Lenovo ThinkBook 16 G7+ AMD (v6.92.6600) | |
| Asus ZenBook S16 UM5606GA (v6.92.6600) | |
| MSI Prestige 16 AI Evo B2HMG (v6.92.6600) | |
| HP Envy x360 2-in-1 16-ad0097nr (v6.92.6600) | |
| MSI Prestige 16 AI C3MTG (v8.20.8100) | |
| Dell XPS 16 Core Ultra X7 358H (v8.20.8100) | |
| Przeciętny Intel Core Ultra X7 358H (29930 - 95525, n=8) | |
| AIDA64 / CPU SHA3 | |
| Lenovo ThinkBook 16 G7+ AMD (v6.92.6600) | |
| Asus ZenBook S16 UM5606GA (v6.92.6600) | |
| Przeciętny Intel Core Ultra X7 358H (3910 - 4911, n=8) | |
| MSI Prestige 16 AI Evo B2HMG (v6.92.6600) | |
| Dell XPS 16 Core Ultra X7 358H (v8.20.8100) | |
| MSI Prestige 16 AI C3MTG (v8.20.8100) | |
| HP Envy x360 2-in-1 16-ad0097nr (v6.92.6600) | |
| AIDA64 / CPU Queen | |
| HP Envy x360 2-in-1 16-ad0097nr (v6.92.6600) | |
| Asus ZenBook S16 UM5606GA (v6.92.6600) | |
| Lenovo ThinkBook 16 G7+ AMD (v6.92.6600) | |
| MSI Prestige 16 AI Evo B2HMG (v6.92.6600) | |
| Przeciętny Intel Core Ultra X7 358H (63425 - 63827, n=2) | |
| AIDA64 / FPU SinJulia | |
| Lenovo ThinkBook 16 G7+ AMD (v6.92.6600) | |
| Asus ZenBook S16 UM5606GA (v6.92.6600) | |
| HP Envy x360 2-in-1 16-ad0097nr (v6.92.6600) | |
| MSI Prestige 16 AI Evo B2HMG (v6.92.6600) | |
| Dell XPS 16 Core Ultra X7 358H (v8.20.8100) | |
| MSI Prestige 16 AI C3MTG (v8.20.8100) | |
| Przeciętny Intel Core Ultra X7 358H (4735 - 7038, n=8) | |
| AIDA64 / FPU Mandel | |
| Lenovo ThinkBook 16 G7+ AMD (v6.92.6600) | |
| Asus ZenBook S16 UM5606GA (v6.92.6600) | |
| MSI Prestige 16 AI Evo B2HMG (v6.92.6600) | |
| HP Envy x360 2-in-1 16-ad0097nr (v6.92.6600) | |
| Dell XPS 16 Core Ultra X7 358H (v8.20.8100) | |
| MSI Prestige 16 AI C3MTG (v8.20.8100) | |
| Przeciętny Intel Core Ultra X7 358H (14716 - 50734, n=8) | |
| AIDA64 / CPU AES | |
| Asus ZenBook S16 UM5606GA (v6.92.6600) | |
| HP Envy x360 2-in-1 16-ad0097nr (v6.92.6600) | |
| Lenovo ThinkBook 16 G7+ AMD (v6.92.6600) | |
| MSI Prestige 16 AI Evo B2HMG (v6.92.6600) | |
| MSI Prestige 16 AI C3MTG (v8.20.8100) | |
| Dell XPS 16 Core Ultra X7 358H (v8.20.8100) | |
| Przeciętny Intel Core Ultra X7 358H (5127 - 67510, n=8) | |
| AIDA64 / CPU ZLib | |
| Lenovo ThinkBook 16 G7+ AMD (v6.92.6600) | |
| Asus ZenBook S16 UM5606GA (v6.92.6600) | |
| Przeciętny Intel Core Ultra X7 358H (932 - 1179, n=8) | |
| MSI Prestige 16 AI Evo B2HMG (v6.92.6600) | |
| MSI Prestige 16 AI C3MTG (v8.20.8100) | |
| Dell XPS 16 Core Ultra X7 358H (v8.20.8100) | |
| HP Envy x360 2-in-1 16-ad0097nr (v6.92.6600) | |
| AIDA64 / FP64 Ray-Trace | |
| Lenovo ThinkBook 16 G7+ AMD (v6.92.6600) | |
| Asus ZenBook S16 UM5606GA (v6.92.6600) | |
| HP Envy x360 2-in-1 16-ad0097nr (v6.92.6600) | |
| MSI Prestige 16 AI Evo B2HMG (v6.92.6600) | |
| MSI Prestige 16 AI C3MTG (v8.20.8100) | |
| Dell XPS 16 Core Ultra X7 358H (v8.20.8100) | |
| Przeciętny Intel Core Ultra X7 358H (6506 - 9447, n=8) | |
| AIDA64 / CPU PhotoWorxx | |
| Dell XPS 16 Core Ultra X7 358H (v8.20.8100) | |
| MSI Prestige 16 AI C3MTG (v8.20.8100) | |
| Przeciętny Intel Core Ultra X7 358H (30538 - 88154, n=8) | |
| MSI Prestige 16 AI Evo B2HMG (v6.92.6600) | |
| Asus ZenBook S16 UM5606GA (v6.92.6600) | |
| Lenovo ThinkBook 16 G7+ AMD (v6.92.6600) | |
| HP Envy x360 2-in-1 16-ad0097nr (v6.92.6600) | |
| AIDA64 / CPU CheckMate | |
| Przeciętny Intel Core Ultra X7 358H (4187 - 4475, n=7) | |
| Dell XPS 16 Core Ultra X7 358H (v8.20.8100) | |
| MSI Prestige 16 AI C3MTG (v8.20.8100) | |
Wydajność systemu
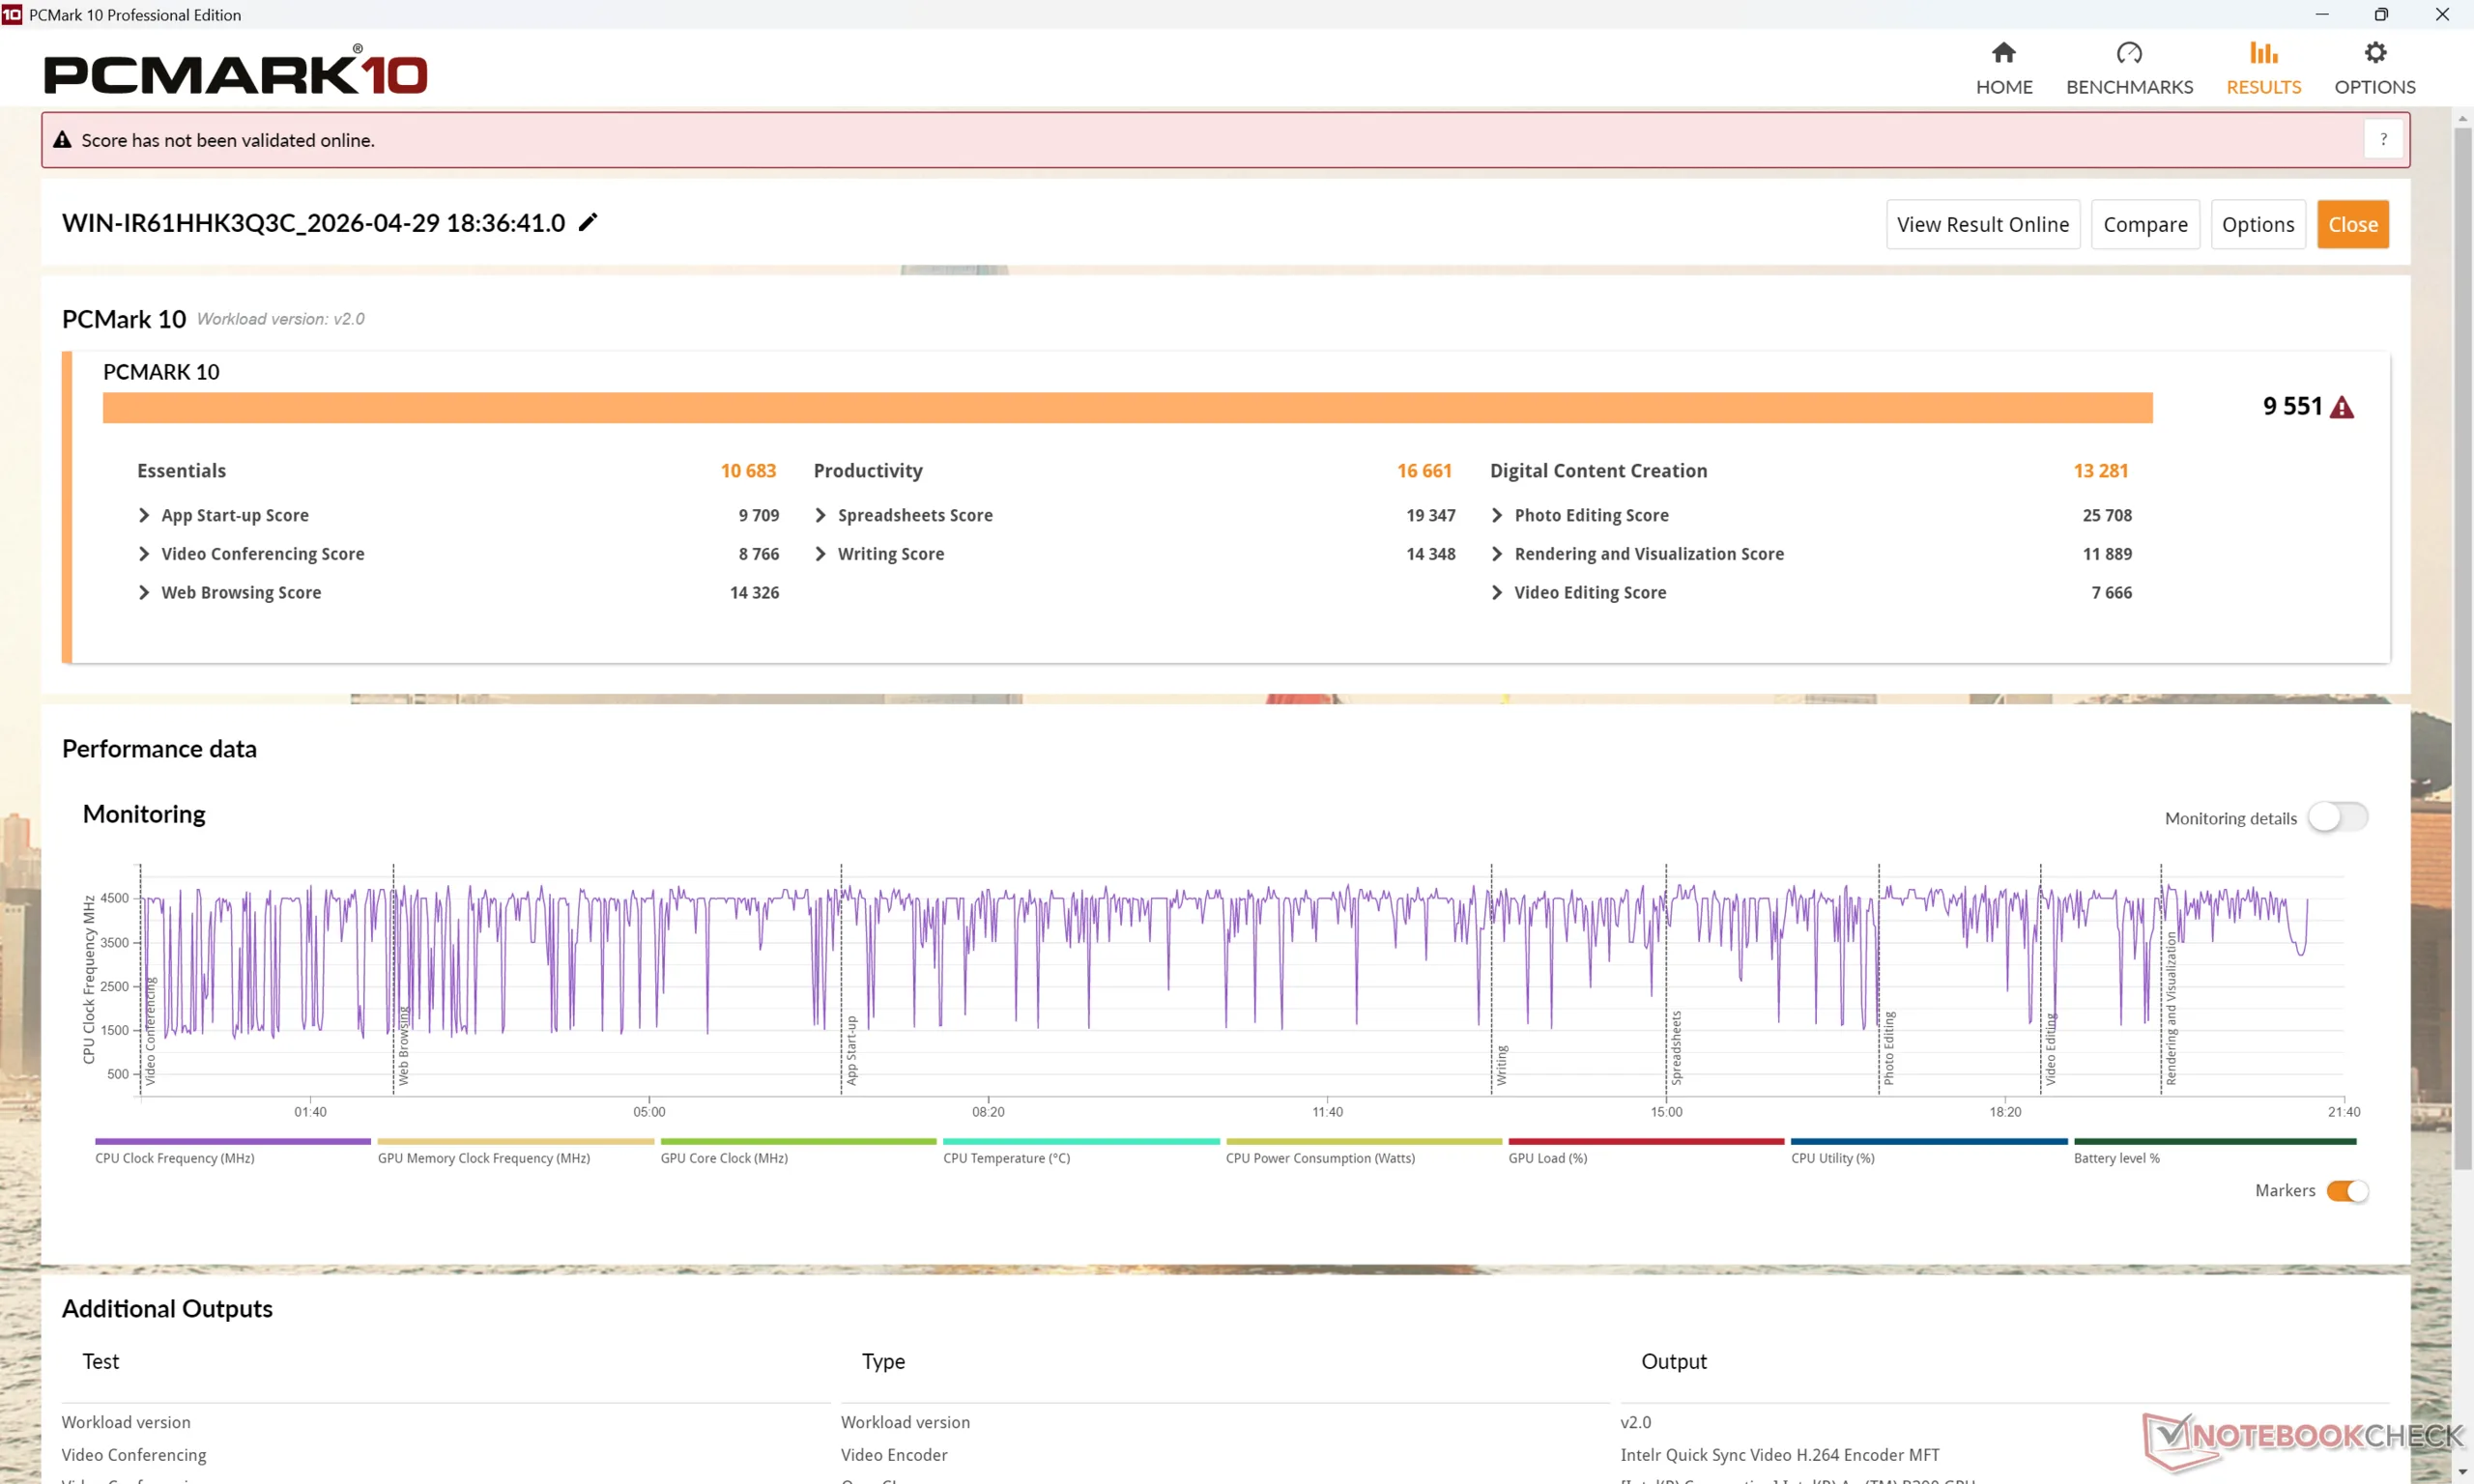
PCMark 10: Score | Essentials | Productivity | Digital Content Creation
CrossMark: Overall | Productivity | Creativity | Responsiveness
WebXPRT 3: Overall
WebXPRT 4: Overall
Mozilla Kraken 1.1: Total
Geekbench AI: Quantized GPU 1.7 | Half Precision GPU 1.7 | Single Precision GPU 1.7
| Performance rating | |
| Dell XPS 16 Core Ultra X7 358H | |
| MSI Prestige 16 AI C3MTG | |
| Przeciętny Intel Core Ultra X7 358H, Intel Arc B390 12 Xe3 Panther Lake iGPU | |
| MSI Prestige 16 AI Evo B2HMG -3! | |
| Asus ZenBook S16 UM5606GA -3! | |
| Lenovo ThinkBook 16 G7+ AMD -3! | |
| HP Envy x360 2-in-1 16-ad0097nr -3! | |
| PCMark 10 / Score | |
| Dell XPS 16 Core Ultra X7 358H | |
| MSI Prestige 16 AI C3MTG | |
| Przeciętny Intel Core Ultra X7 358H, Intel Arc B390 12 Xe3 Panther Lake iGPU (8834 - 9880, n=8) | |
| Asus ZenBook S16 UM5606GA | |
| MSI Prestige 16 AI Evo B2HMG | |
| Lenovo ThinkBook 16 G7+ AMD | |
| HP Envy x360 2-in-1 16-ad0097nr | |
| PCMark 10 / Essentials | |
| MSI Prestige 16 AI Evo B2HMG | |
| Dell XPS 16 Core Ultra X7 358H | |
| Przeciętny Intel Core Ultra X7 358H, Intel Arc B390 12 Xe3 Panther Lake iGPU (10282 - 11263, n=7) | |
| MSI Prestige 16 AI C3MTG | |
| Lenovo ThinkBook 16 G7+ AMD | |
| HP Envy x360 2-in-1 16-ad0097nr | |
| Asus ZenBook S16 UM5606GA | |
| PCMark 10 / Productivity | |
| MSI Prestige 16 AI C3MTG | |
| Dell XPS 16 Core Ultra X7 358H | |
| Asus ZenBook S16 UM5606GA | |
| Przeciętny Intel Core Ultra X7 358H, Intel Arc B390 12 Xe3 Panther Lake iGPU (13908 - 16780, n=7) | |
| Lenovo ThinkBook 16 G7+ AMD | |
| HP Envy x360 2-in-1 16-ad0097nr | |
| MSI Prestige 16 AI Evo B2HMG | |
| PCMark 10 / Digital Content Creation | |
| Dell XPS 16 Core Ultra X7 358H | |
| Przeciętny Intel Core Ultra X7 358H, Intel Arc B390 12 Xe3 Panther Lake iGPU (13082 - 13893, n=7) | |
| MSI Prestige 16 AI C3MTG | |
| MSI Prestige 16 AI Evo B2HMG | |
| Lenovo ThinkBook 16 G7+ AMD | |
| Asus ZenBook S16 UM5606GA | |
| HP Envy x360 2-in-1 16-ad0097nr | |
| CrossMark / Overall | |
| MSI Prestige 16 AI Evo B2HMG | |
| Dell XPS 16 Core Ultra X7 358H | |
| MSI Prestige 16 AI C3MTG | |
| Przeciętny Intel Core Ultra X7 358H, Intel Arc B390 12 Xe3 Panther Lake iGPU (1884 - 2119, n=8) | |
| Lenovo ThinkBook 16 G7+ AMD | |
| Asus ZenBook S16 UM5606GA | |
| HP Envy x360 2-in-1 16-ad0097nr | |
| CrossMark / Productivity | |
| MSI Prestige 16 AI Evo B2HMG | |
| Dell XPS 16 Core Ultra X7 358H | |
| MSI Prestige 16 AI C3MTG | |
| Przeciętny Intel Core Ultra X7 358H, Intel Arc B390 12 Xe3 Panther Lake iGPU (1678 - 1928, n=8) | |
| Asus ZenBook S16 UM5606GA | |
| HP Envy x360 2-in-1 16-ad0097nr | |
| Lenovo ThinkBook 16 G7+ AMD | |
| CrossMark / Creativity | |
| Dell XPS 16 Core Ultra X7 358H | |
| MSI Prestige 16 AI C3MTG | |
| Przeciętny Intel Core Ultra X7 358H, Intel Arc B390 12 Xe3 Panther Lake iGPU (2241 - 2529, n=8) | |
| MSI Prestige 16 AI Evo B2HMG | |
| Lenovo ThinkBook 16 G7+ AMD | |
| Asus ZenBook S16 UM5606GA | |
| HP Envy x360 2-in-1 16-ad0097nr | |
| CrossMark / Responsiveness | |
| MSI Prestige 16 AI Evo B2HMG | |
| Dell XPS 16 Core Ultra X7 358H | |
| Przeciętny Intel Core Ultra X7 358H, Intel Arc B390 12 Xe3 Panther Lake iGPU (1560 - 1837, n=8) | |
| MSI Prestige 16 AI C3MTG | |
| HP Envy x360 2-in-1 16-ad0097nr | |
| Lenovo ThinkBook 16 G7+ AMD | |
| Asus ZenBook S16 UM5606GA | |
| WebXPRT 3 / Overall | |
| MSI Prestige 16 AI Evo B2HMG | |
| MSI Prestige 16 AI C3MTG | |
| Przeciętny Intel Core Ultra X7 358H, Intel Arc B390 12 Xe3 Panther Lake iGPU (293 - 338, n=8) | |
| Lenovo ThinkBook 16 G7+ AMD | |
| Dell XPS 16 Core Ultra X7 358H | |
| HP Envy x360 2-in-1 16-ad0097nr | |
| Asus ZenBook S16 UM5606GA | |
| WebXPRT 4 / Overall | |
| MSI Prestige 16 AI Evo B2HMG | |
| MSI Prestige 16 AI C3MTG | |
| Dell XPS 16 Core Ultra X7 358H | |
| Przeciętny Intel Core Ultra X7 358H, Intel Arc B390 12 Xe3 Panther Lake iGPU (278 - 305, n=7) | |
| Lenovo ThinkBook 16 G7+ AMD | |
| HP Envy x360 2-in-1 16-ad0097nr | |
| Asus ZenBook S16 UM5606GA | |
| Mozilla Kraken 1.1 / Total | |
| HP Envy x360 2-in-1 16-ad0097nr | |
| Asus ZenBook S16 UM5606GA | |
| MSI Prestige 16 AI C3MTG | |
| Przeciętny Intel Core Ultra X7 358H, Intel Arc B390 12 Xe3 Panther Lake iGPU (445 - 460, n=8) | |
| Dell XPS 16 Core Ultra X7 358H | |
| Lenovo ThinkBook 16 G7+ AMD | |
| MSI Prestige 16 AI Evo B2HMG | |
| Geekbench AI / Quantized GPU 1.7 | |
| Dell XPS 16 Core Ultra X7 358H | |
| MSI Prestige 16 AI C3MTG | |
| Przeciętny Intel Core Ultra X7 358H, Intel Arc B390 12 Xe3 Panther Lake iGPU (6908 - 8011, n=6) | |
| Geekbench AI / Half Precision GPU 1.7 | |
| MSI Prestige 16 AI C3MTG | |
| Dell XPS 16 Core Ultra X7 358H | |
| Przeciętny Intel Core Ultra X7 358H, Intel Arc B390 12 Xe3 Panther Lake iGPU (16188 - 21963, n=6) | |
| Geekbench AI / Single Precision GPU 1.7 | |
| MSI Prestige 16 AI C3MTG | |
| Dell XPS 16 Core Ultra X7 358H | |
| Przeciętny Intel Core Ultra X7 358H, Intel Arc B390 12 Xe3 Panther Lake iGPU (9783 - 12255, n=6) | |
* ... im mniej tym lepiej
| PCMark 10 Score | 9551 pkt. | |
Pomoc | ||
| AIDA64 / Memory Copy | |
| Dell XPS 16 Core Ultra X7 358H | |
| MSI Prestige 16 AI C3MTG | |
| Przeciętny Intel Core Ultra X7 358H (102745 - 132135, n=7) | |
| MSI Prestige 16 AI Evo B2HMG | |
| Asus ZenBook S16 UM5606GA | |
| Lenovo ThinkBook 16 G7+ AMD | |
| HP Envy x360 2-in-1 16-ad0097nr | |
| AIDA64 / Memory Read | |
| Dell XPS 16 Core Ultra X7 358H | |
| Przeciętny Intel Core Ultra X7 358H (97755 - 118888, n=8) | |
| MSI Prestige 16 AI C3MTG | |
| Asus ZenBook S16 UM5606GA | |
| Lenovo ThinkBook 16 G7+ AMD | |
| MSI Prestige 16 AI Evo B2HMG | |
| HP Envy x360 2-in-1 16-ad0097nr | |
| AIDA64 / Memory Write | |
| Dell XPS 16 Core Ultra X7 358H | |
| Przeciętny Intel Core Ultra X7 358H (105984 - 134998, n=8) | |
| MSI Prestige 16 AI C3MTG | |
| Asus ZenBook S16 UM5606GA | |
| Lenovo ThinkBook 16 G7+ AMD | |
| HP Envy x360 2-in-1 16-ad0097nr | |
| MSI Prestige 16 AI Evo B2HMG | |
| AIDA64 / Memory Latency | |
| MSI Prestige 16 AI Evo B2HMG | |
| HP Envy x360 2-in-1 16-ad0097nr | |
| Lenovo ThinkBook 16 G7+ AMD | |
| Asus ZenBook S16 UM5606GA | |
| MSI Prestige 16 AI C3MTG | |
| Dell XPS 16 Core Ultra X7 358H | |
| Przeciętny Intel Core Ultra X7 358H (84.6 - 101.9, n=8) | |
* ... im mniej tym lepiej
Opóźnienie DPC
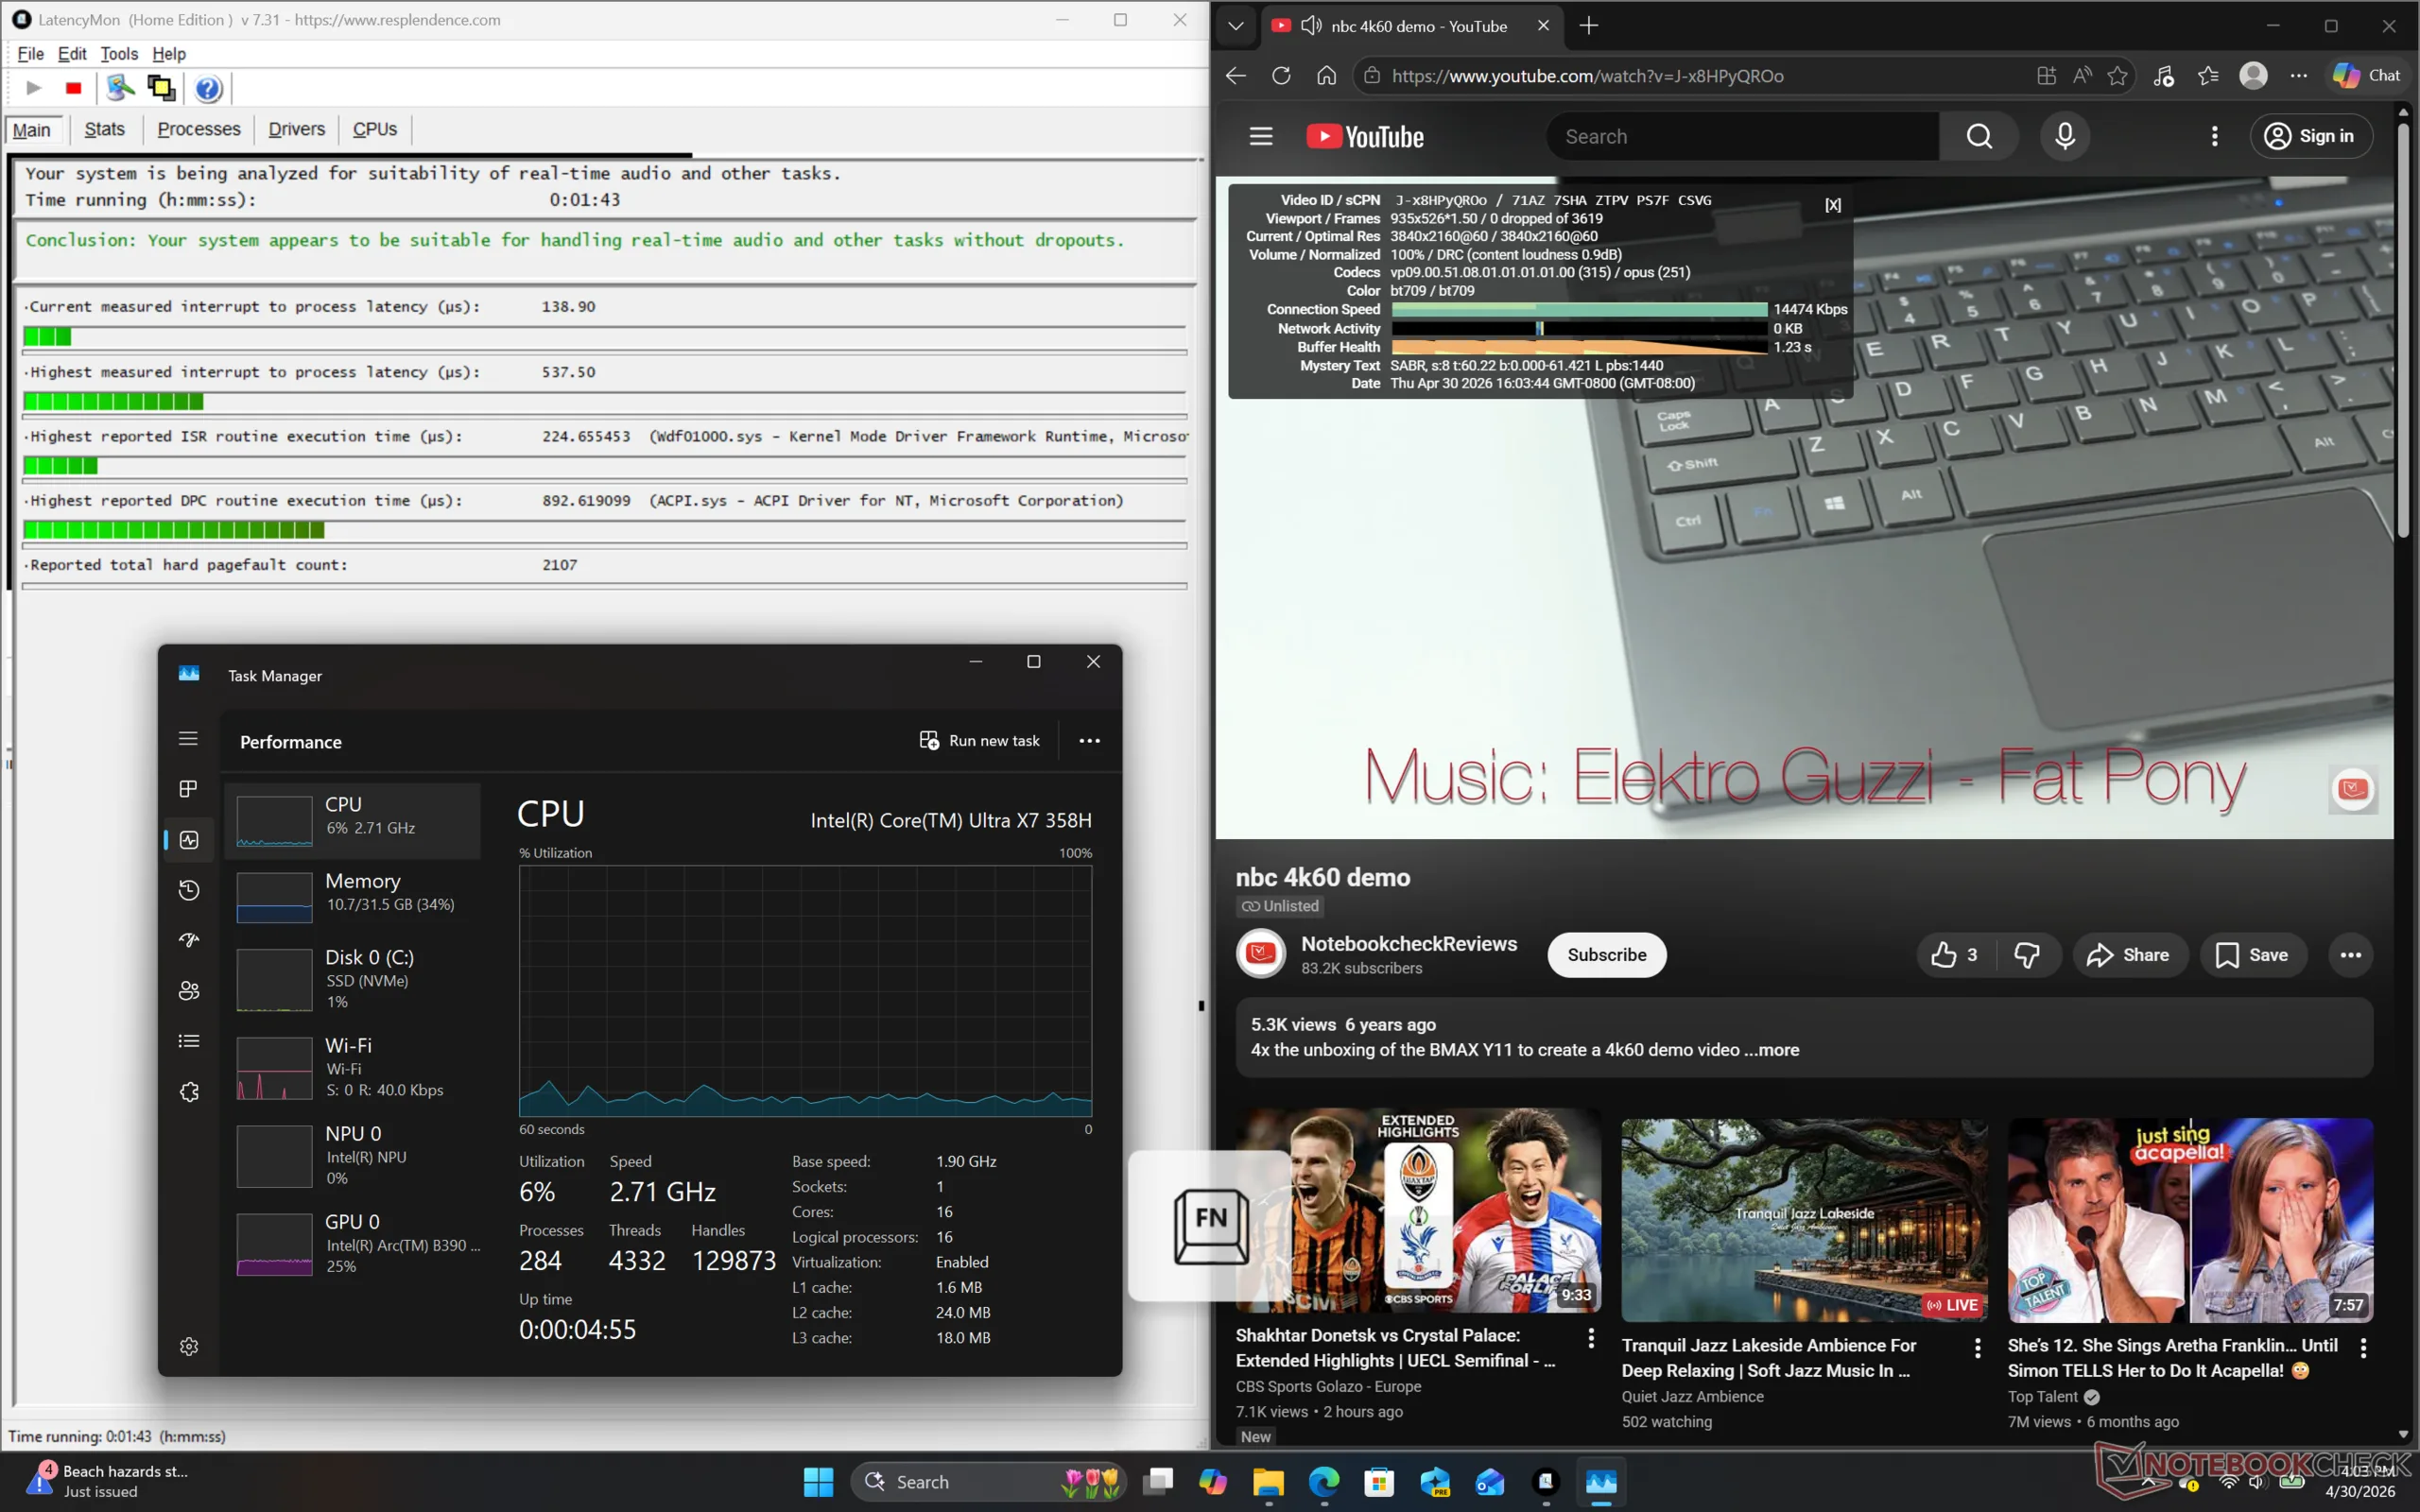
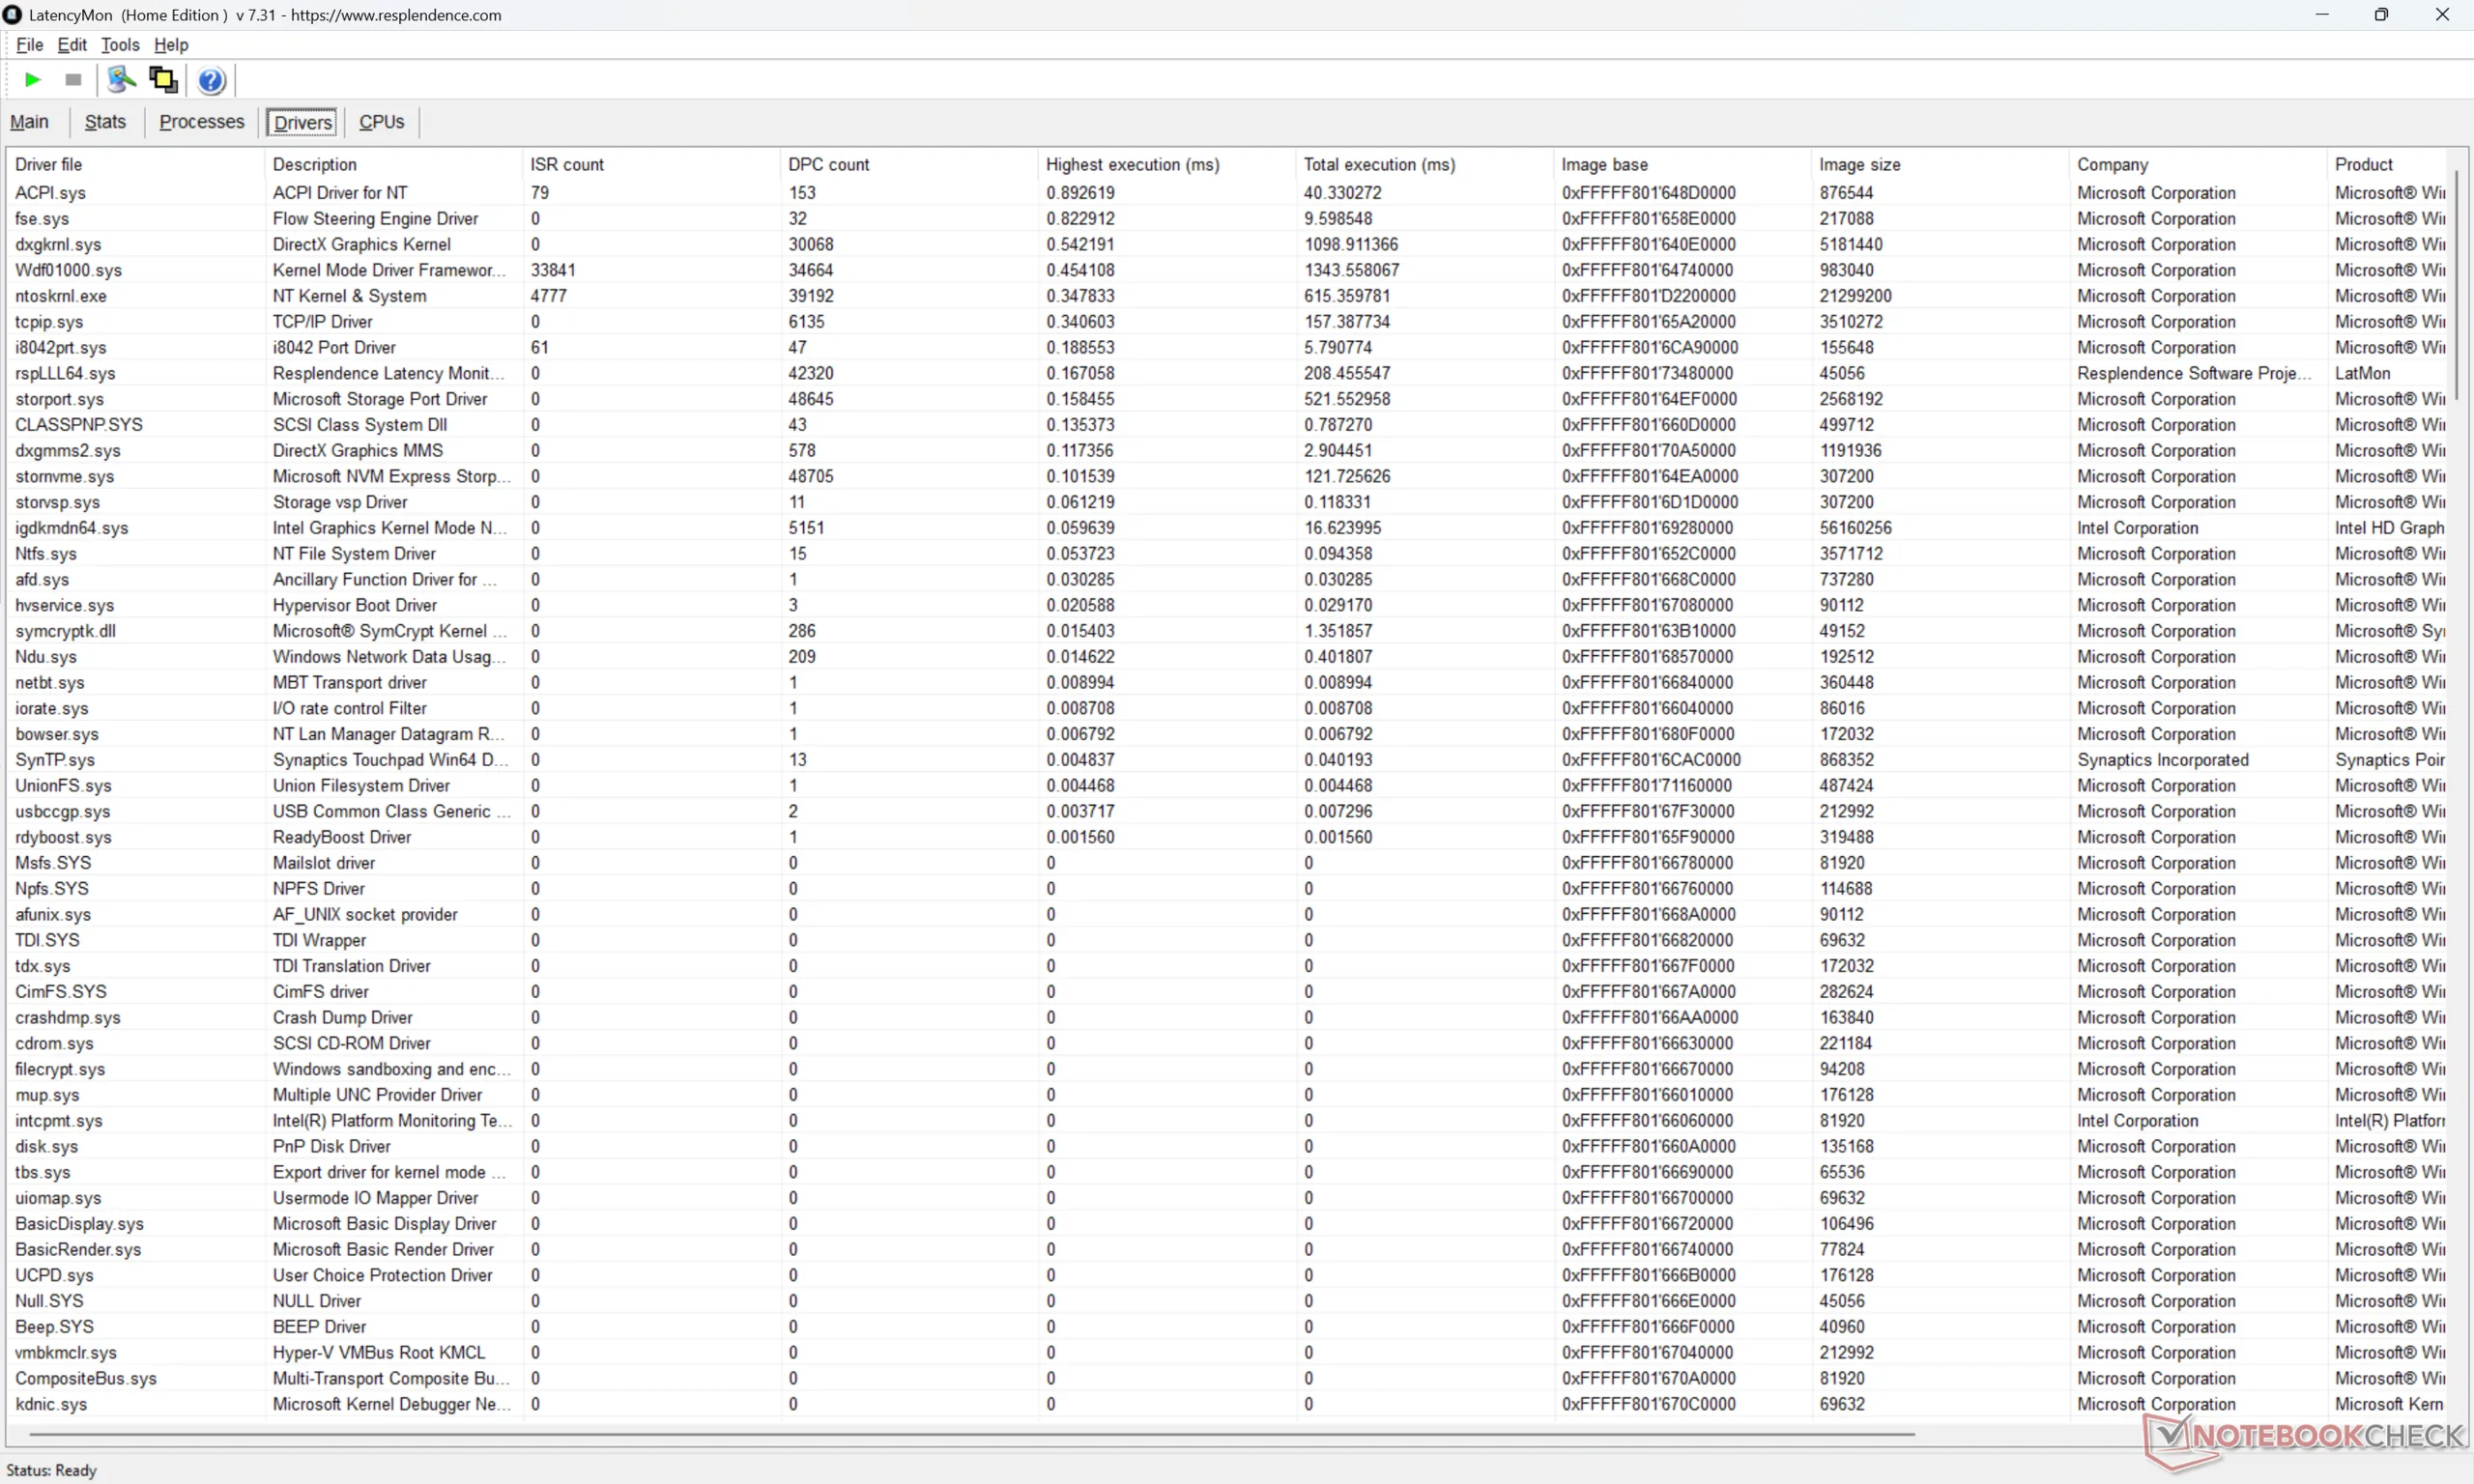
| DPC Latencies / LatencyMon - interrupt to process latency (max), Web, Youtube, Prime95 | |
| MSI Prestige 16 AI Evo B2HMG | |
| HP Envy x360 2-in-1 16-ad0097nr | |
| Lenovo ThinkBook 16 G7+ AMD | |
| Asus ZenBook S16 UM5606GA | |
| MSI Prestige 16 AI C3MTG | |
| Dell XPS 16 Core Ultra X7 358H | |
* ... im mniej tym lepiej
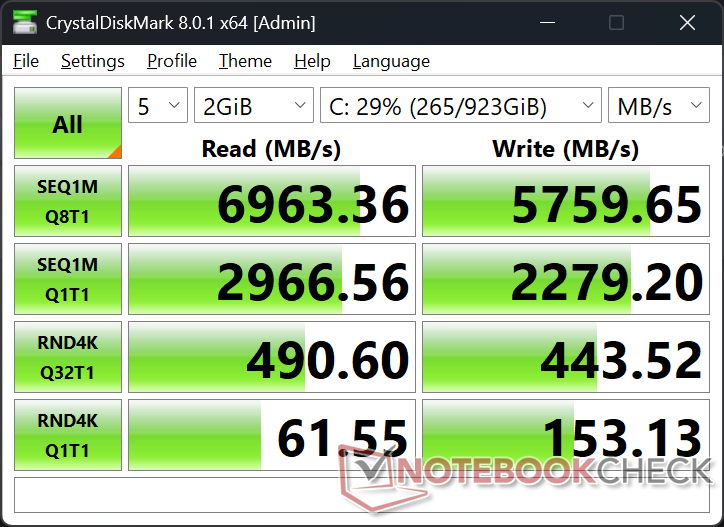
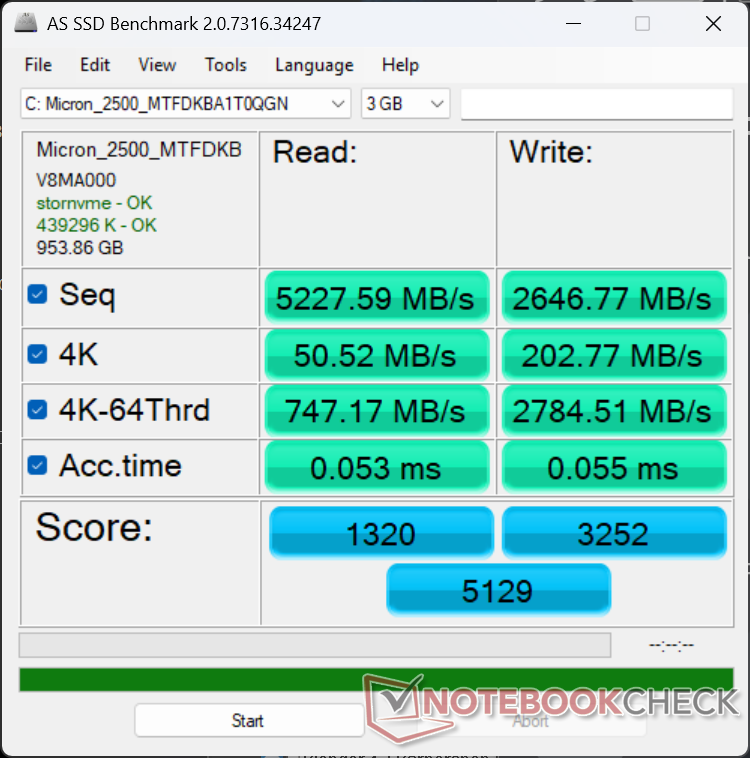
Urządzenia pamięci masowej
Nasza jednostka testowa jest dostarczana z tym samym dyskiem 1 TB Micron 2500 PCIe4 x4 NVMe SSD, jak w zeszłorocznym modelu, zapewniając podobny poziom wydajności i brak zauważalnego dławienia. Nie ma już wsparcia dla dodatkowych dysków SSD M.2, co wydaje się być trendem w nowszych 16-calowych laptopach, takich jak XPS 16 lub Asus Zenbook S16.

* ... im mniej tym lepiej
Dławienie dysku: Pętla odczytu DiskSpd, głębokość kolejki 8
Wydajność GPU
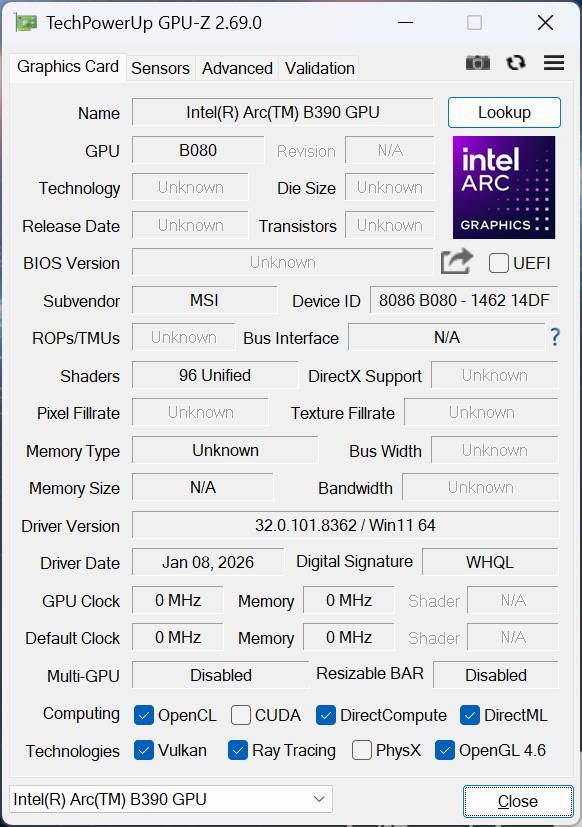
Wydajność graficzna jest taka, jakiej oczekujemy w porównaniu z innymi komputerami PC z tym samym Arc B390 GPU, jeśli nie nieco wolniejsza o kilka punktów procentowych. Arc B390 jest znacznie szybszy niż Arc 140T w zeszłorocznym Prestige 16 nawet o 50 do 80 procent i jest to jeden z największych powodów, dla których warto dokonać aktualizacji do Panther Lake.
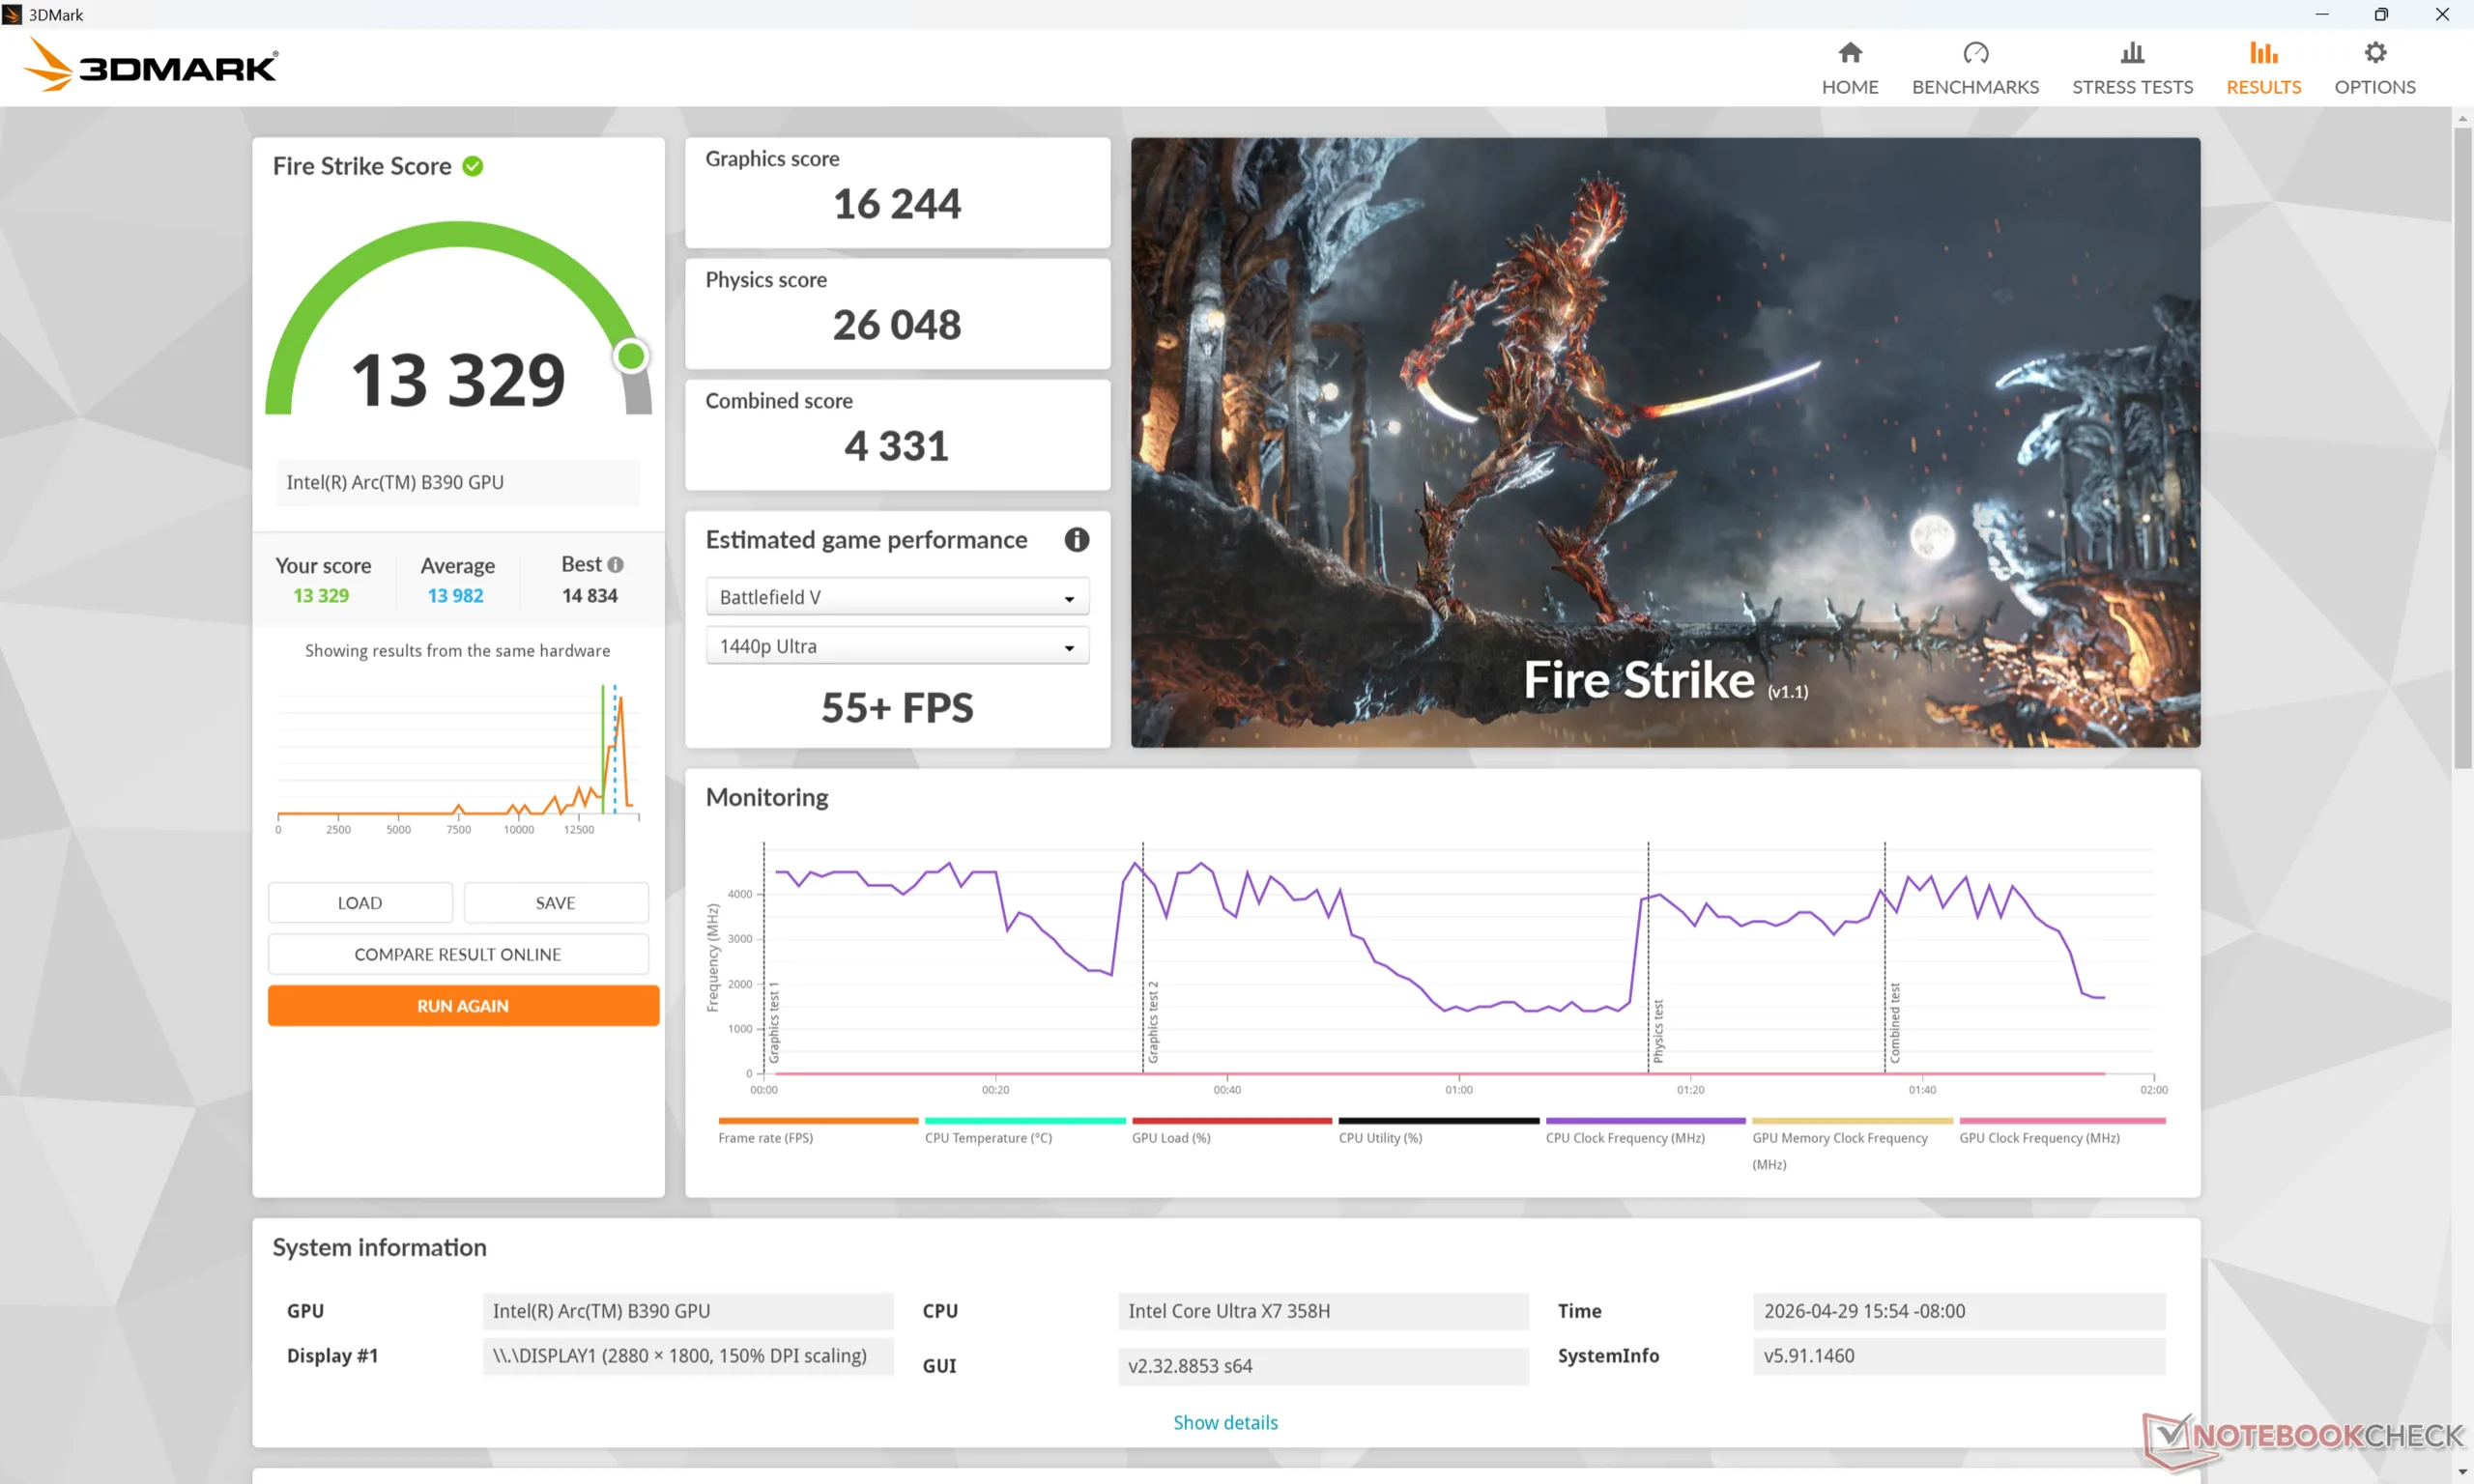
Uruchamianie w trybie zrównoważonym zamiast w trybie wydajności wpłynęłoby na wydajność bardziej niż oczekiwano, nawet o 25 procent, jak pokazuje nasza tabela wyników Fire Strike poniżej. Wpłynęłoby to następnie na hałas wentylatora i wydajność w grach, jak pokażą poniższe sekcje.
| Profil zasilania | Wynik grafiki | Wynik fizyki | Łączny wynik |
| Tryb wydajności | 16244 | 26048 | 4331 |
| Tryb zrównoważony | 15684 (-3%) | 19912 (-24%) | 4476 (-0%) |
| Zasilanie bateryjne | 16481 (-0%) | 20729 (-20%) | 4794 (-0%) |
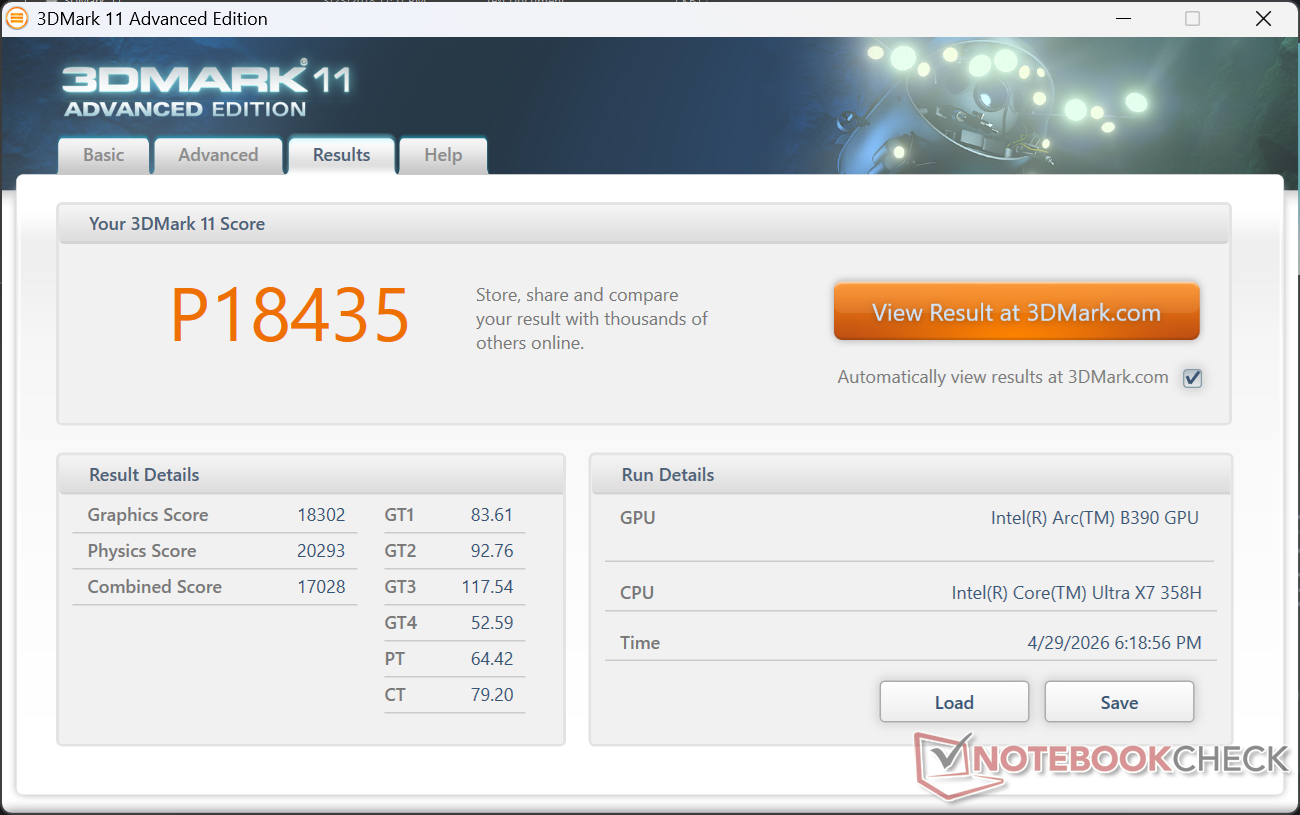
| 3DMark 11 Performance | 18435 pkt. | |
| 3DMark Cloud Gate Standard Score | 35193 pkt. | |
| 3DMark Fire Strike Score | 13329 pkt. | |
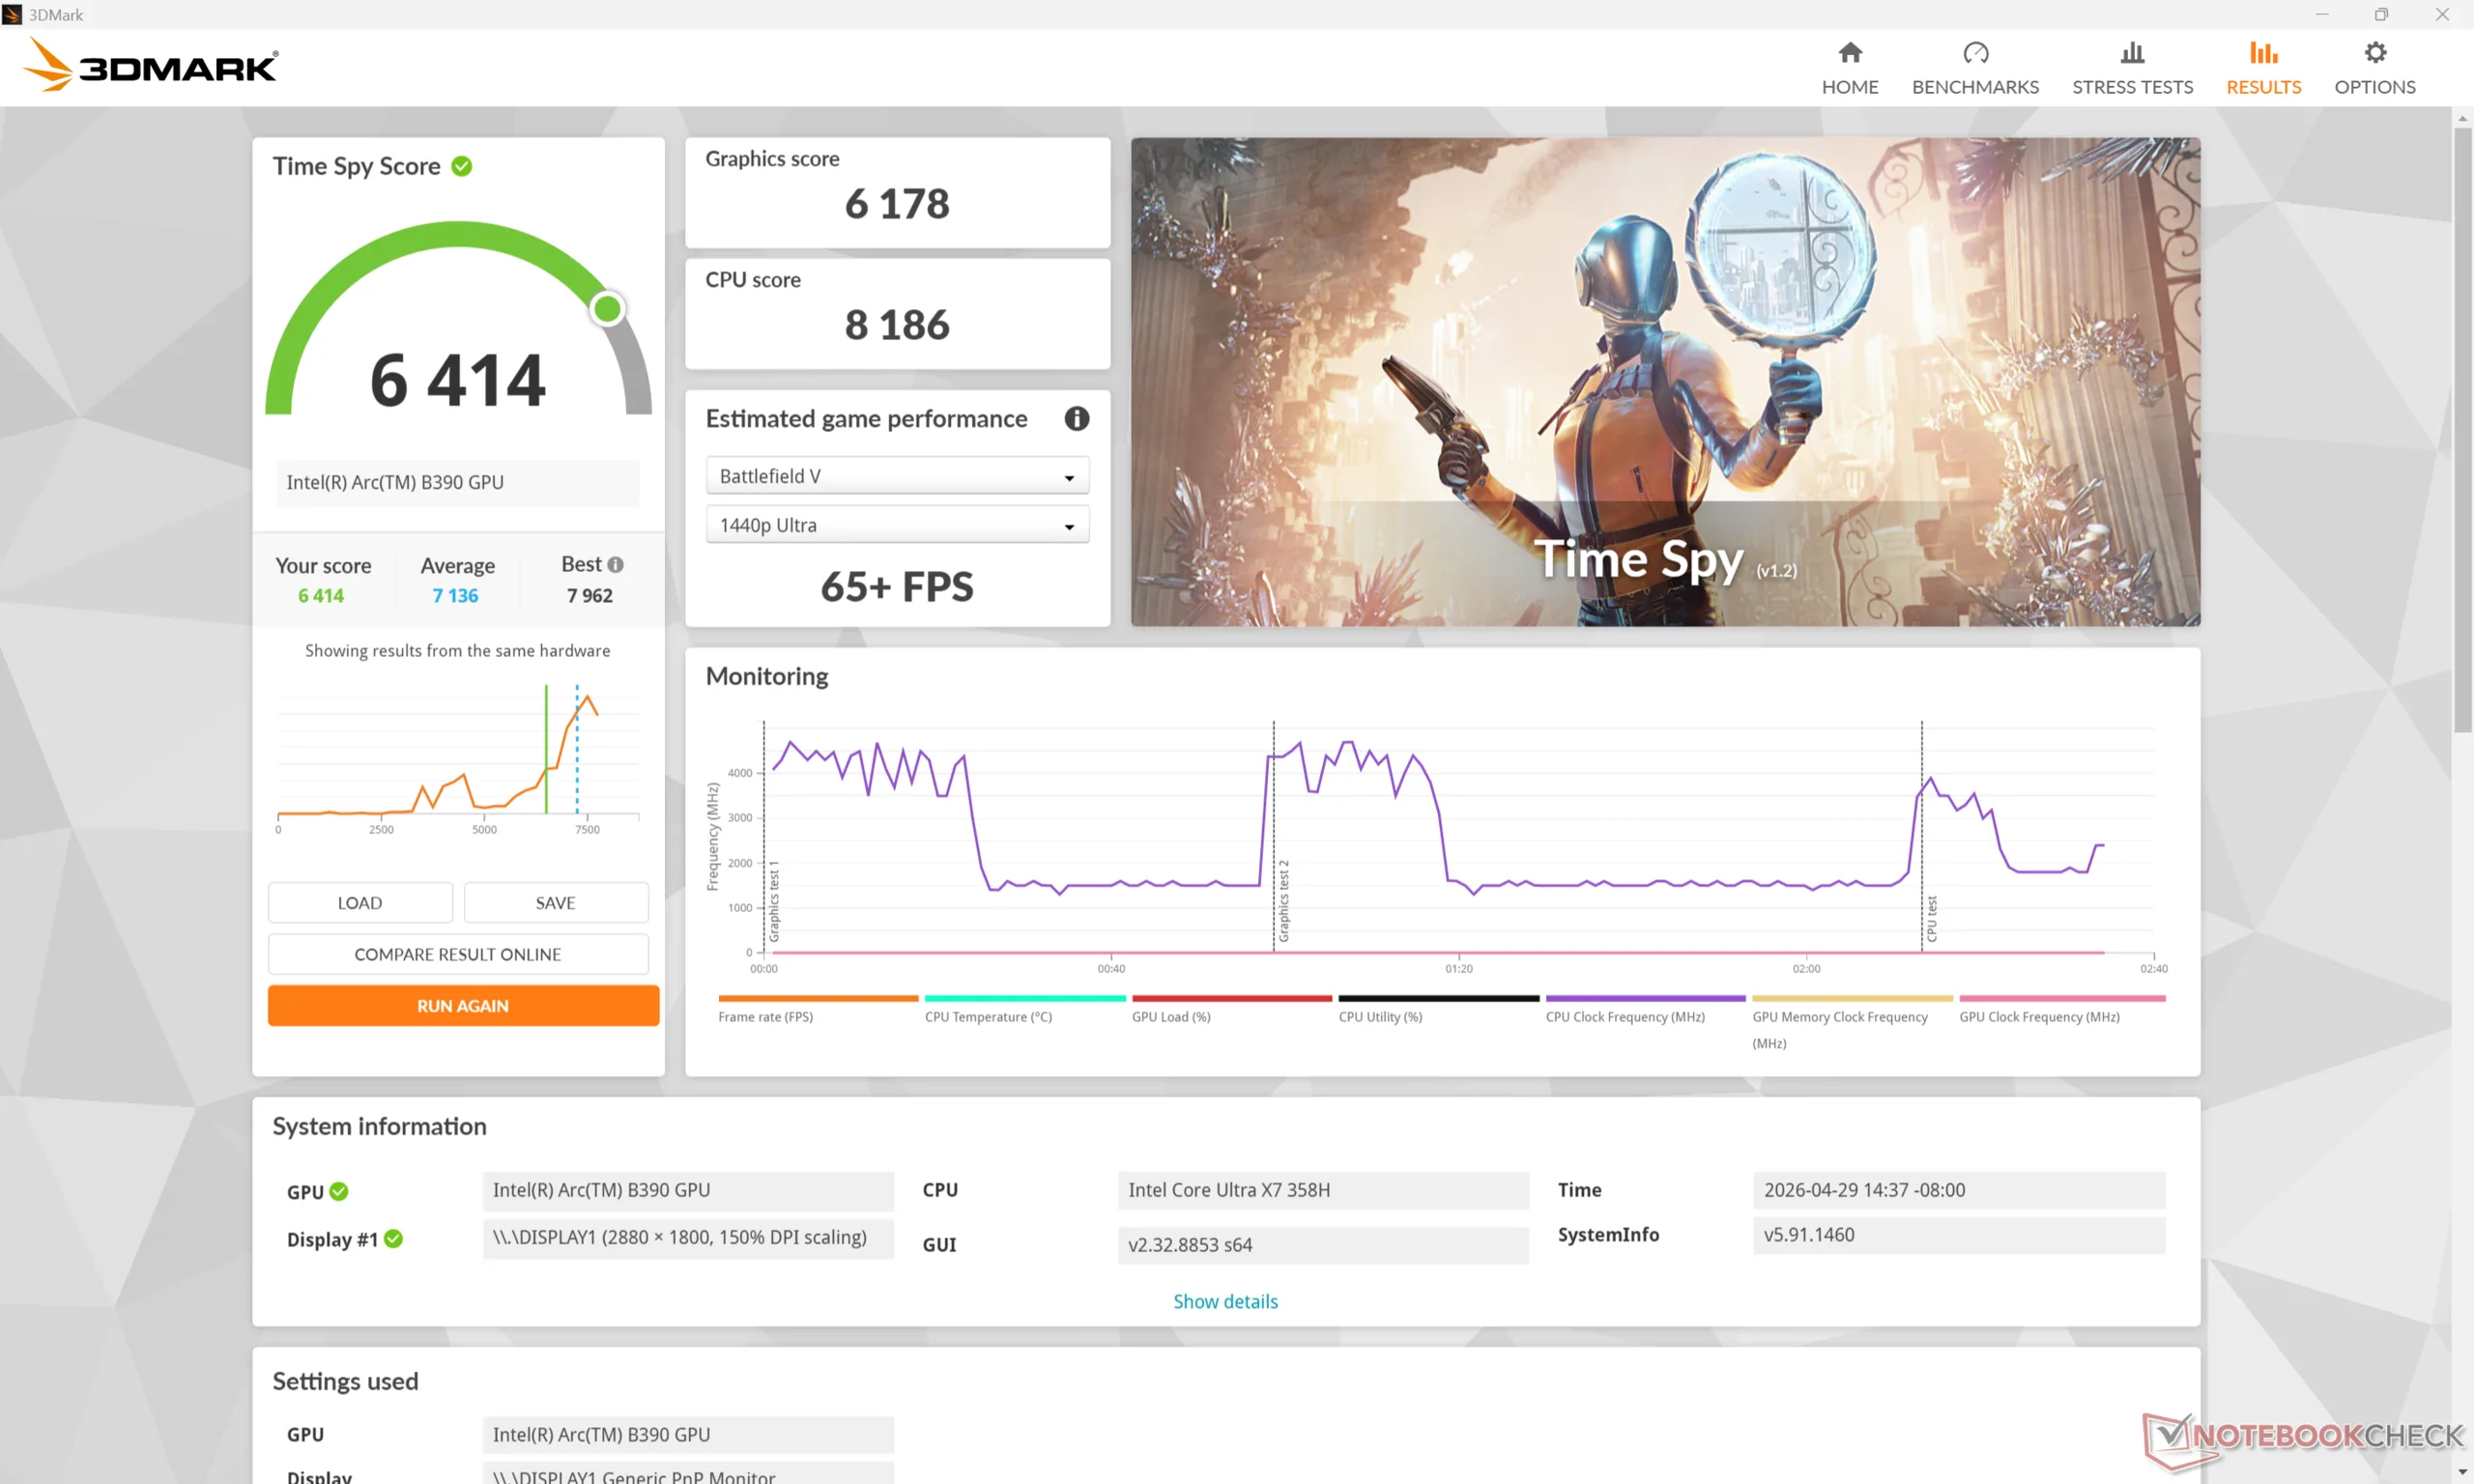
| 3DMark Time Spy Score | 6414 pkt. | |
Pomoc | ||
* ... im mniej tym lepiej
Wydajność w grach
Laptopy z Arc B390, choć nie są przede wszystkim maszynami do gier, są w pełni zdolne do uruchamiania nawet najbardziej wymagających tytułów przy przyzwoitych ustawieniach 1080p i liczbie klatek na sekundę. Cyberpunk 2077, na przykład, osiąga średnio 45 FPS na ustawieniach 1080p Ultra przed zastosowaniem jakiegokolwiek skalowania XeSS.
G-Sync nie jest obsługiwany na wewnętrznym wyświetlaczu.
| Performance rating - Percent | |
| MSI Prestige 16 AI C3MTG | |
| Dell XPS 16 Core Ultra X7 358H | |
| Lenovo ThinkBook 16 G7+ AMD | |
| Asus ZenBook S16 UM5606GA | |
| MSI Prestige 16 AI Evo B2HMG | |
| HP Envy x360 2-in-1 16-ad0097nr -1! | |
| Cyberpunk 2077 - 1920x1080 Ultra Preset (FSR off) | |
| Dell XPS 16 Core Ultra X7 358H | |
| MSI Prestige 16 AI C3MTG | |
| MSI Prestige 16 AI Evo B2HMG | |
| Lenovo ThinkBook 16 G7+ AMD | |
| Asus ZenBook S16 UM5606GA | |
| HP Envy x360 2-in-1 16-ad0097nr | |
| Baldur's Gate 3 - 1920x1080 Ultra Preset AA:T | |
| Dell XPS 16 Core Ultra X7 358H | |
| MSI Prestige 16 AI C3MTG | |
| Lenovo ThinkBook 16 G7+ AMD | |
| Asus ZenBook S16 UM5606GA | |
| MSI Prestige 16 AI Evo B2HMG | |
| HP Envy x360 2-in-1 16-ad0097nr | |
| GTA V - 1920x1080 Highest AA:4xMSAA + FX AF:16x | |
| Dell XPS 16 Core Ultra X7 358H | |
| MSI Prestige 16 AI C3MTG | |
| Lenovo ThinkBook 16 G7+ AMD | |
| Asus ZenBook S16 UM5606GA | |
| MSI Prestige 16 AI Evo B2HMG | |
| Final Fantasy XV Benchmark - 1920x1080 High Quality | |
| Dell XPS 16 Core Ultra X7 358H | |
| MSI Prestige 16 AI C3MTG | |
| Lenovo ThinkBook 16 G7+ AMD | |
| MSI Prestige 16 AI Evo B2HMG | |
| Asus ZenBook S16 UM5606GA | |
| HP Envy x360 2-in-1 16-ad0097nr | |
| Strange Brigade - 1920x1080 ultra AA:ultra AF:16 | |
| Dell XPS 16 Core Ultra X7 358H | |
| MSI Prestige 16 AI C3MTG | |
| MSI Prestige 16 AI Evo B2HMG | |
| Lenovo ThinkBook 16 G7+ AMD | |
| Asus ZenBook S16 UM5606GA | |
| HP Envy x360 2-in-1 16-ad0097nr | |
| Dota 2 Reborn - 1920x1080 ultra (3/3) best looking | |
| MSI Prestige 16 AI C3MTG | |
| Dell XPS 16 Core Ultra X7 358H | |
| Lenovo ThinkBook 16 G7+ AMD | |
| Asus ZenBook S16 UM5606GA | |
| MSI Prestige 16 AI Evo B2HMG | |
| HP Envy x360 2-in-1 16-ad0097nr | |
| X-Plane 11.11 - 1920x1080 high (fps_test=3) | |
| Lenovo ThinkBook 16 G7+ AMD | |
| Asus ZenBook S16 UM5606GA | |
| MSI Prestige 16 AI C3MTG | |
| Dell XPS 16 Core Ultra X7 358H | |
| MSI Prestige 16 AI Evo B2HMG | |
| HP Envy x360 2-in-1 16-ad0097nr | |
Cyberpunk 2077 ultra FPS Chart
| low | med. | high | ultra | |
|---|---|---|---|---|
| GTA V (2015) | 174.7 | 164.7 | 97.9 | 43 |
| Dota 2 Reborn (2015) | 122.1 | 98.4 | 104.3 | 111.8 |
| Final Fantasy XV Benchmark (2018) | 124.3 | 73.9 | 53.4 | |
| X-Plane 11.11 (2018) | 61.7 | 52.4 | 44.5 | |
| Strange Brigade (2018) | 304 | 118.7 | 98.5 | 88.5 |
| Baldur's Gate 3 (2023) | 69.4 | 58.5 | 52.6 | 51.7 |
| Cyberpunk 2077 (2023) | 77.2 | 62.3 | 53.8 | 44.8 |
| F1 24 (2024) | 144.9 | 135.3 | 104.3 | 37.4 |
Emisje
Hałas systemowy
Rozwiązanie chłodzące jest znacznie mniejsze niż w XPS 16, co przyczynia się do znacznych różnic w temperaturze rdzenia między tymi dwoma modelami. Podczas gdy wentylatory w MSI mogą pozostać cichsze przez dłuższy czas, zanim będą musiały się rozpędzić, to jednak po pewnym czasie osiągają podobne wartości maksymalne. Na przykład hałas wentylatora podczas uruchamiania gry Cyberpunk 2077 w trybie wydajności ustabilizowałby się na poziomie 41 dB(A) w porównaniu do 42 dB(A) na Dellu.
Proszę zauważyć, że hałas wentylatorów znacznie by się zmniejszył, gdybyśmy grali w trybie zrównoważonym zamiast w trybie wydajności. W tym przypadku wentylatory osiągnęłyby szczyt na poziomie nieco poniżej 30 dB(A), co może uzasadniać wspomniany powyżej 20-procentowy spadek wydajności, w zależności od preferencji użytkownika.
Hałas
| luz |
| 23.3 / 23.3 / 25.9 dB |
| obciążenie |
| 30.1 / 44.7 dB |
 | ||
30 dB cichy 40 dB(A) słyszalny 50 dB(A) irytujący |
||
min: | ||
| MSI Prestige 16 AI C3MTG Ultra X7 358H, Arc B390 Panther Lake iGPU | MSI Prestige 16 AI Evo B2HMG Ultra 9 285H, Arc 140T | Dell XPS 16 Core Ultra X7 358H Ultra X7 358H, Arc B390 Panther Lake iGPU | Asus ZenBook S16 UM5606GA Ryzen AI 9 465, Radeon 880M | Lenovo ThinkBook 16 G7+ AMD Ryzen AI 9 365, Radeon 880M | HP Envy x360 2-in-1 16-ad0097nr R7 8840HS, Radeon 780M | |
|---|---|---|---|---|---|---|
| Noise | -4% | -4% | -15% | -3% | 6% | |
| wyłączone / środowisko * (dB) | 23.1 | 23.6 -2% | 23.3 -1% | 24.9 -8% | 24.5 -6% | 22.9 1% |
| Idle Minimum * (dB) | 23.3 | 23.6 -1% | 23.4 -0% | 24.9 -7% | 24.5 -5% | 23 1% |
| Idle Average * (dB) | 23.3 | 23.6 -1% | 23.4 -0% | 24.9 -7% | 24.5 -5% | 23 1% |
| Idle Maximum * (dB) | 25.9 | 26.2 -1% | 25.8 -0% | 24.9 4% | 25.9 -0% | 23 11% |
| Load Average * (dB) | 30.1 | 37.1 -23% | 38 -26% | 45.7 -52% | 36.2 -20% | 23.8 21% |
| Cyberpunk 2077 ultra * (dB) | 40.8 | 42.1 -3% | 38.1 7% | 49 -20% | 40.1 2% | |
| Load Maximum * (dB) | 44.7 | 42.1 6% | 48.6 -9% | 50.4 -13% | 40.1 10% | 43.8 2% |
| Witcher 3 ultra * (dB) | 43.8 |
* ... im mniej tym lepiej
Temperatura
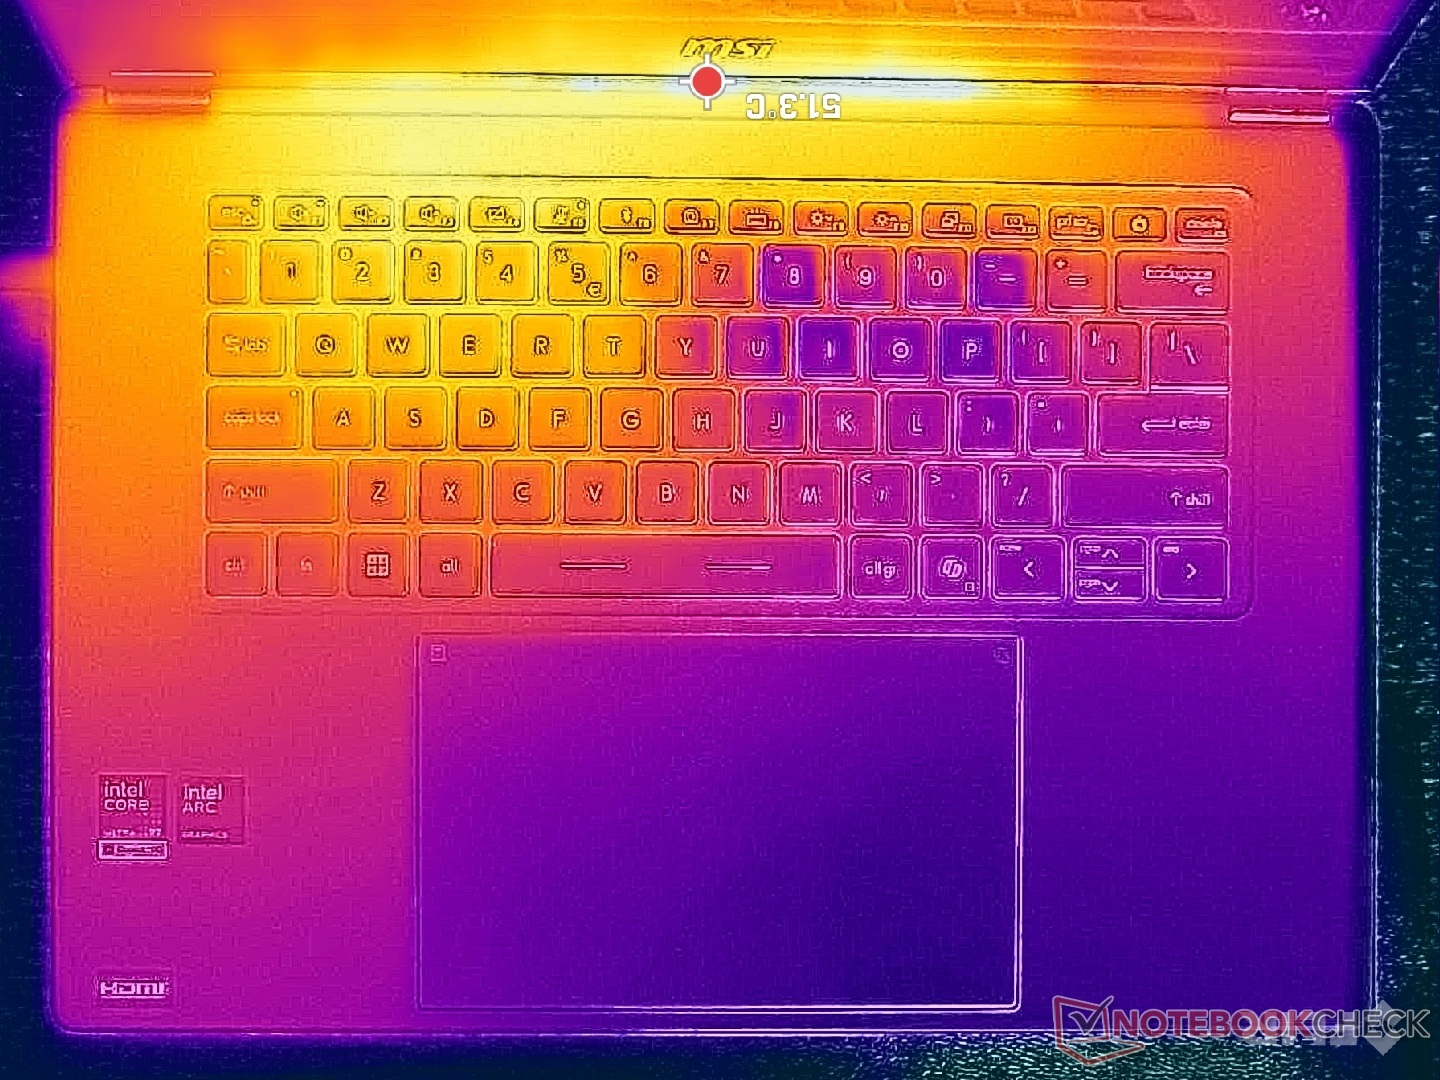
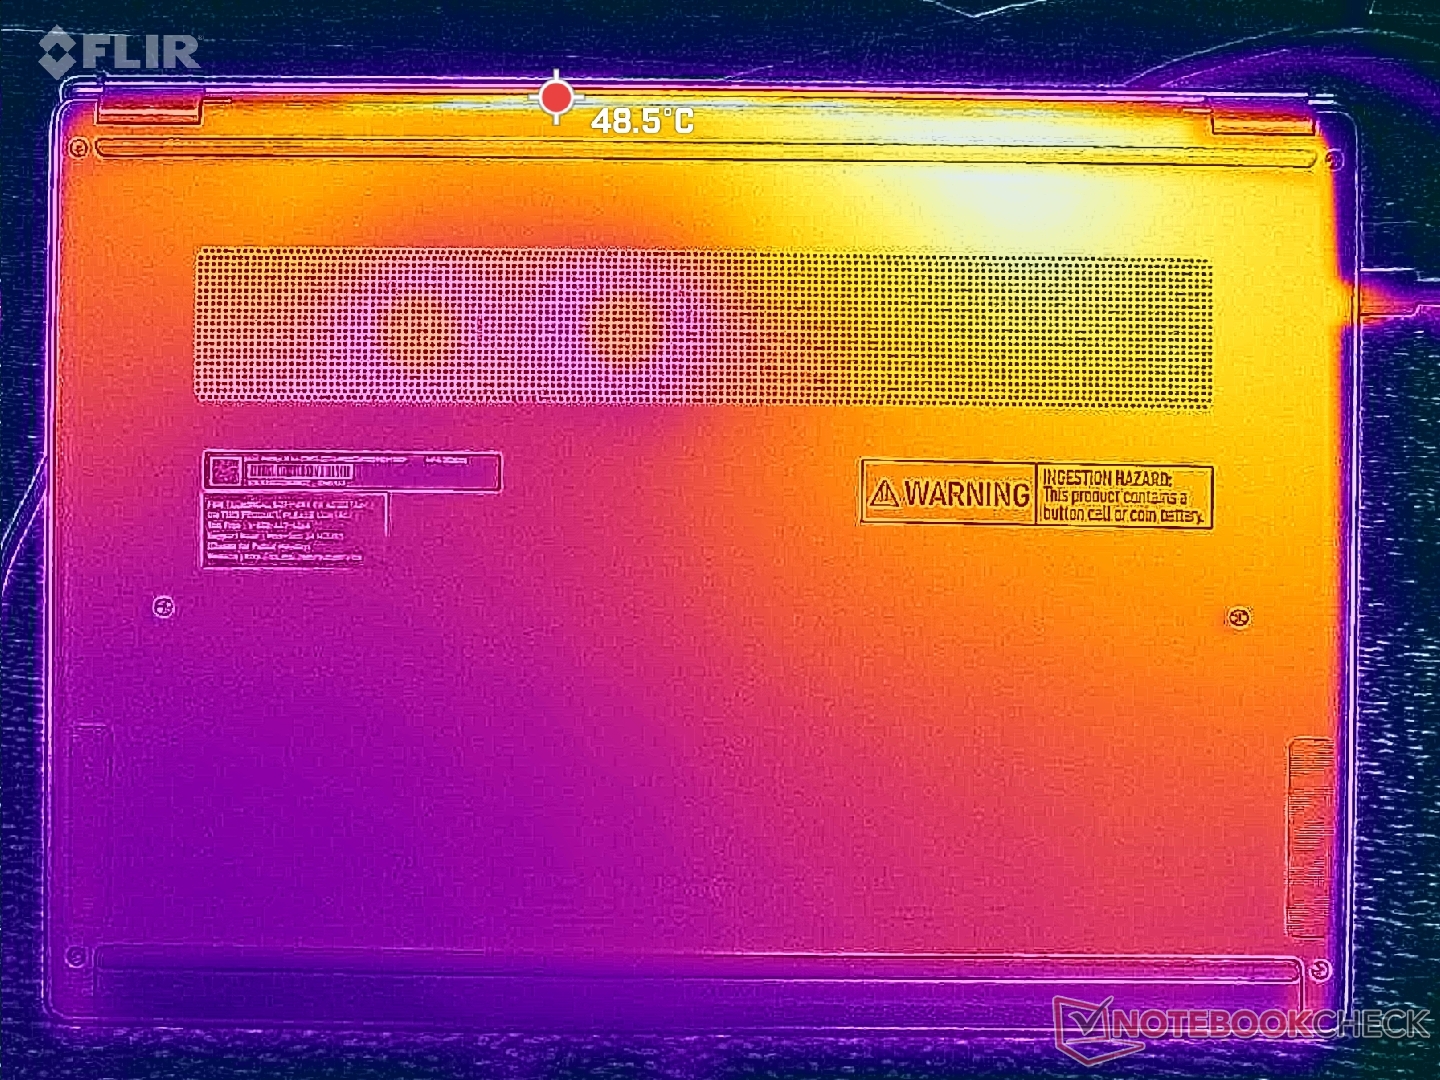
Temperatury powierzchni są lepsze niż w poprzedniej generacji. Podczas gdy Prestige 16 z 2025 roku osiągał temperatury od 47 C do 52 C, nowszy model osiągał od 40 C do 47 C. Gorące punkty znajdują się w pobliżu tylnego rogu obudowy, gdzie kontakt ze skórą jest zminimalizowany.
Mimo to temperatury powierzchni są nadal wyższe niż w konkurencyjnych modelach XPS 16 gdzie gorące punkty osiągnęłyby tylko 41 C bez względu na stronę, co daje chłodniejszą średnią.
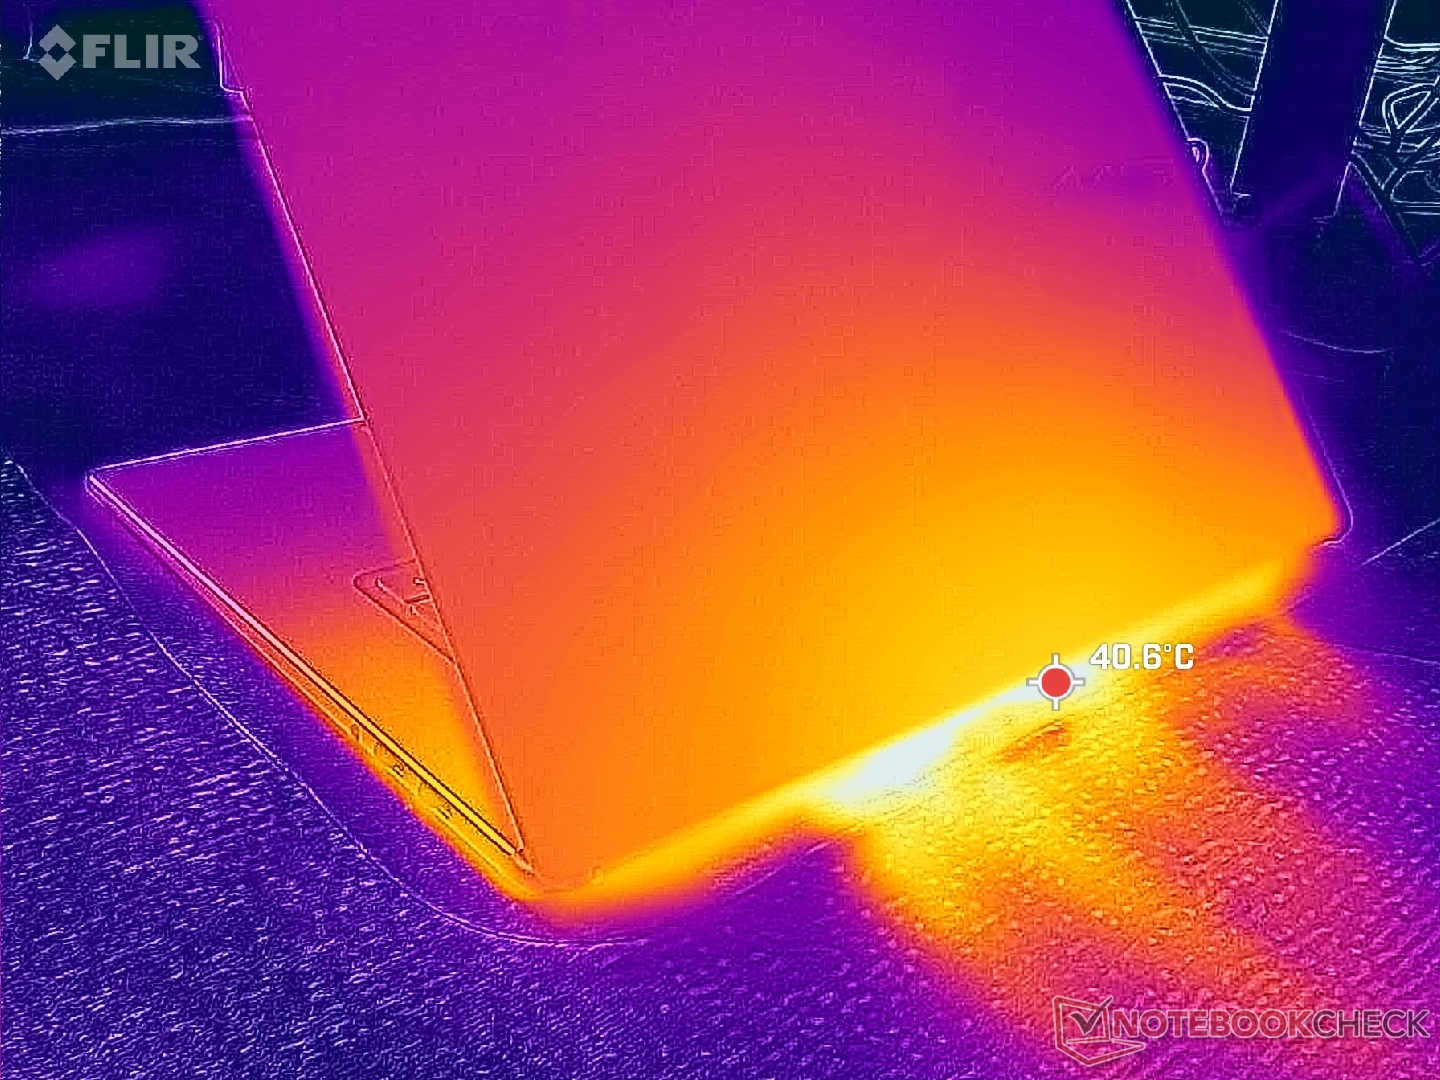
(-) Maksymalna temperatura w górnej części wynosi 47 °C / 117 F, w porównaniu do średniej 36.8 °C / 98 F , począwszy od 21 do 71 °C dla klasy Multimedia.
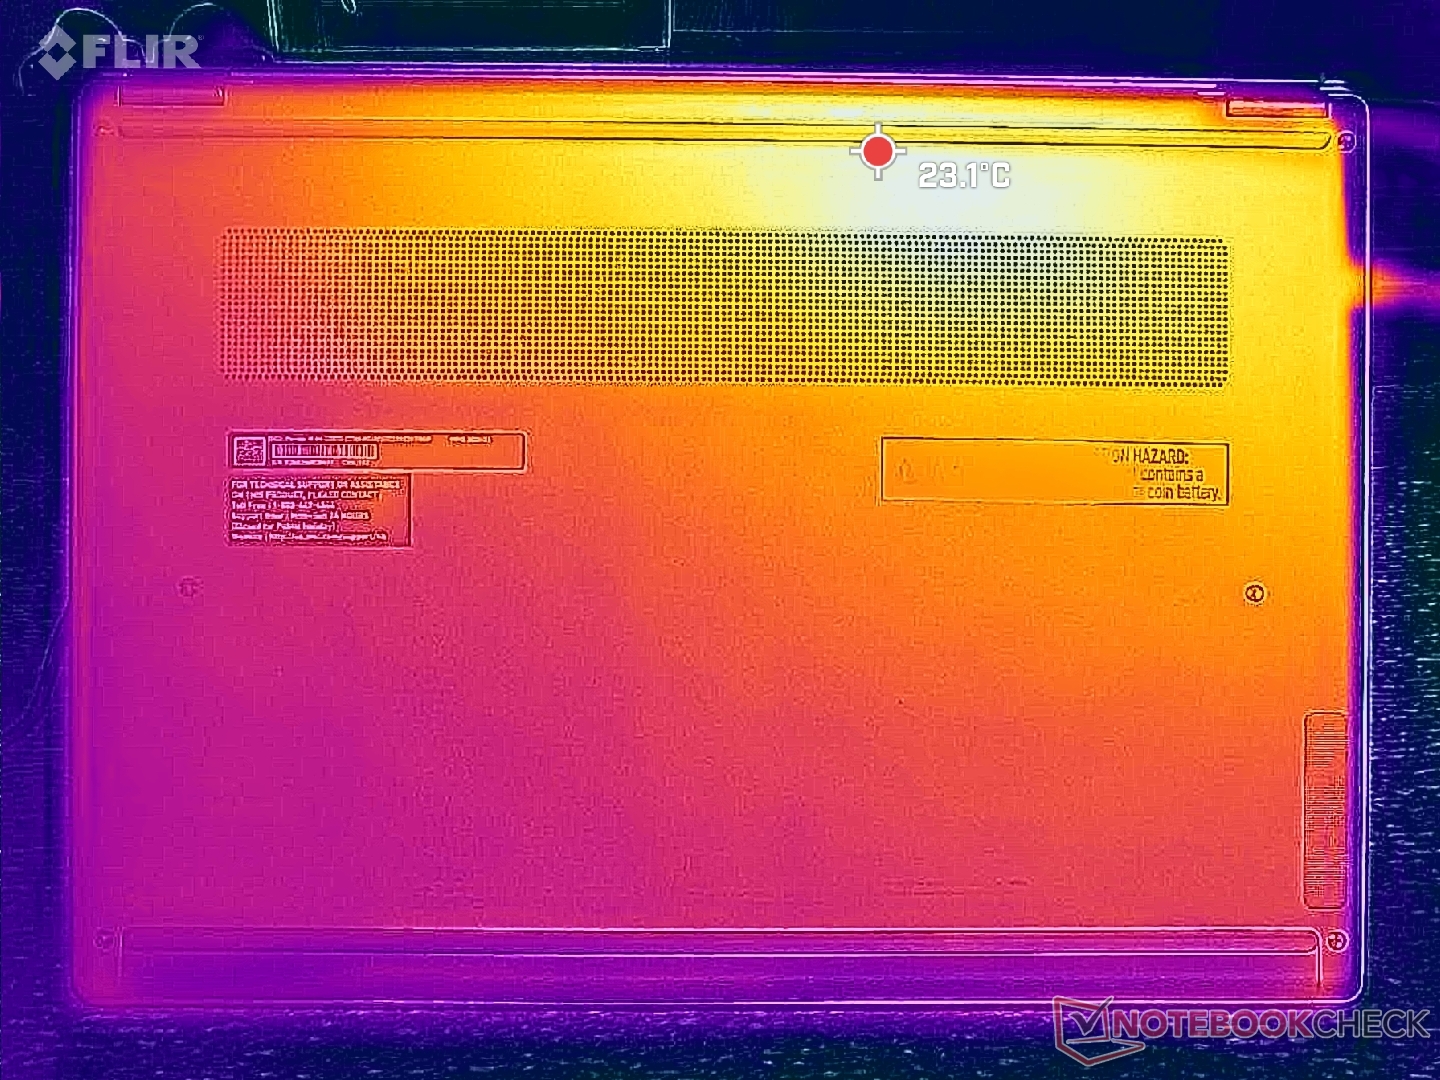
(±) Dno nagrzewa się maksymalnie do 40 °C / 104 F, w porównaniu do średniej 39.1 °C / 102 F
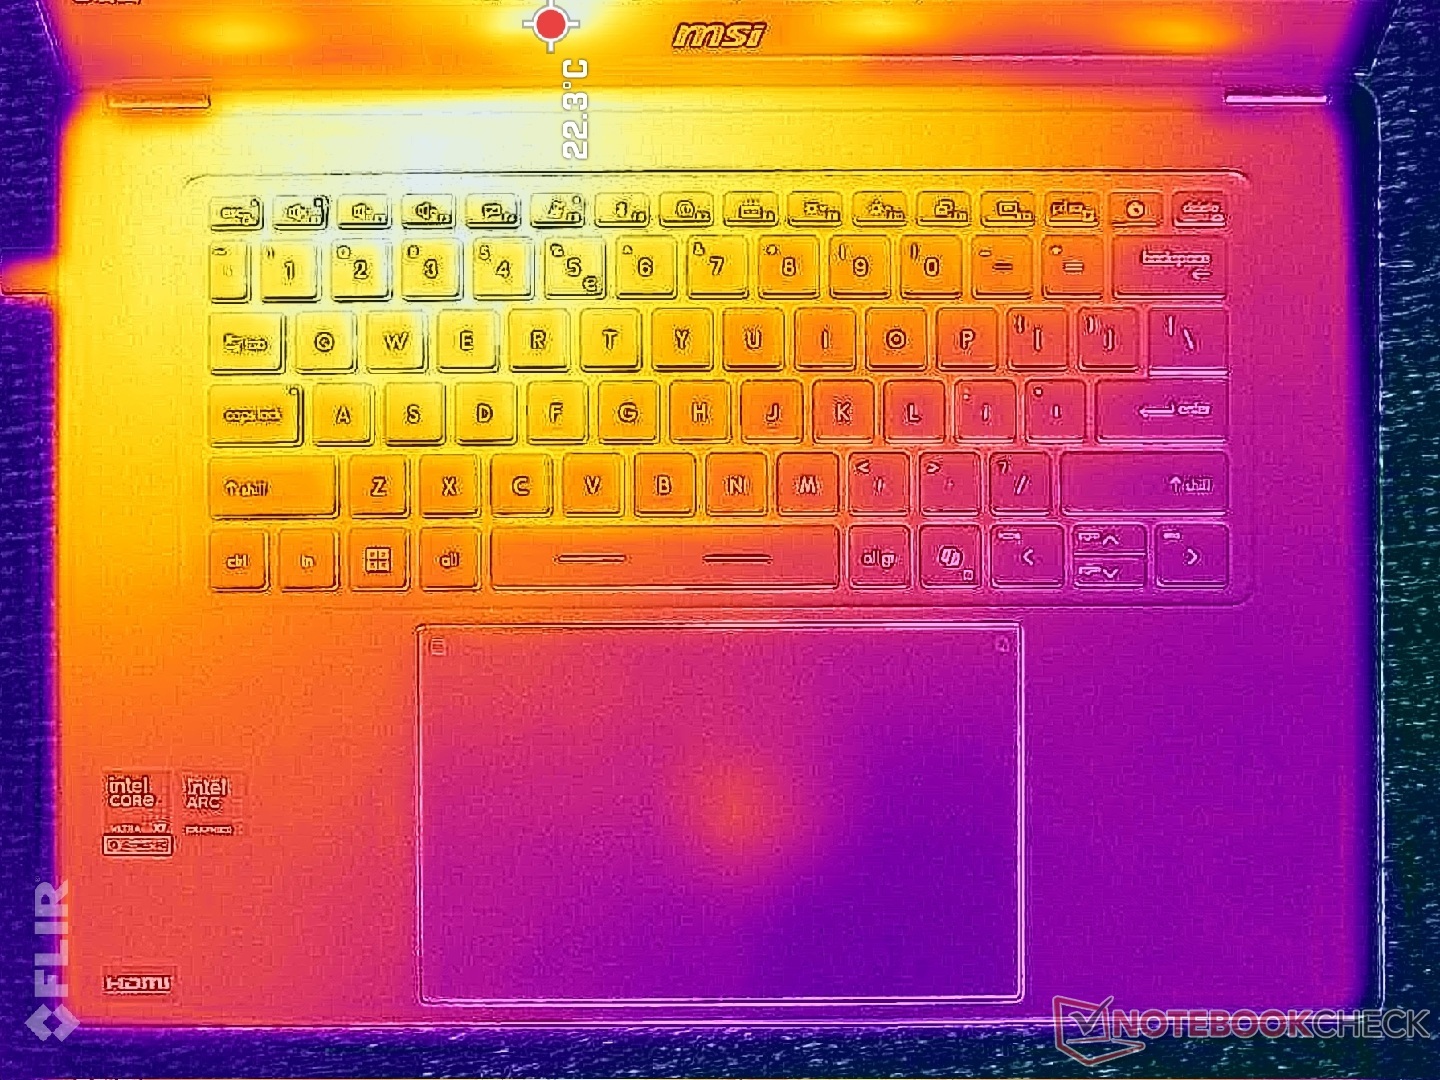
(+) W stanie bezczynności średnia temperatura górnej części wynosi 24.8 °C / 77 F, w porównaniu ze średnią temperaturą urządzenia wynoszącą 31.3 °C / ### class_avg_f### F.
(+) Podpórki pod nadgarstki i touchpad są chłodniejsze niż temperatura skóry i maksymalnie 30.4 °C / 86.7 F i dlatego są chłodne w dotyku.
(±) Średnia temperatura obszaru podparcia dłoni w podobnych urządzeniach wynosiła 28.7 °C / 83.7 F (-1.7 °C / -3 F).
| MSI Prestige 16 AI C3MTG Ultra X7 358H, Arc B390 Panther Lake iGPU | MSI Prestige 16 AI Evo B2HMG Ultra 9 285H, Arc 140T | Dell XPS 16 Core Ultra X7 358H Ultra X7 358H, Arc B390 Panther Lake iGPU | Asus ZenBook S16 UM5606GA Ryzen AI 9 465, Radeon 880M | Lenovo ThinkBook 16 G7+ AMD Ryzen AI 9 365, Radeon 880M | HP Envy x360 2-in-1 16-ad0097nr R7 8840HS, Radeon 780M | |
|---|---|---|---|---|---|---|
| Heat | -5% | 11% | -1% | 9% | -3% | |
| Maximum Upper Side * (°C) | 47 | 48.1 -2% | 40.6 14% | 43.4 8% | 38.2 19% | 42.6 9% |
| Maximum Bottom * (°C) | 40 | 51.6 -29% | 39.8 1% | 46.2 -16% | 37.9 5% | 47.8 -19% |
| Idle Upper Side * (°C) | 27.4 | 25.9 5% | 23.2 15% | 26.5 3% | 25.4 7% | 27.4 -0% |
| Idle Bottom * (°C) | 27.4 | 25.2 8% | 23.8 13% | 27 1% | 25.7 6% | 27.8 -1% |
* ... im mniej tym lepiej
Test warunków skrajnych
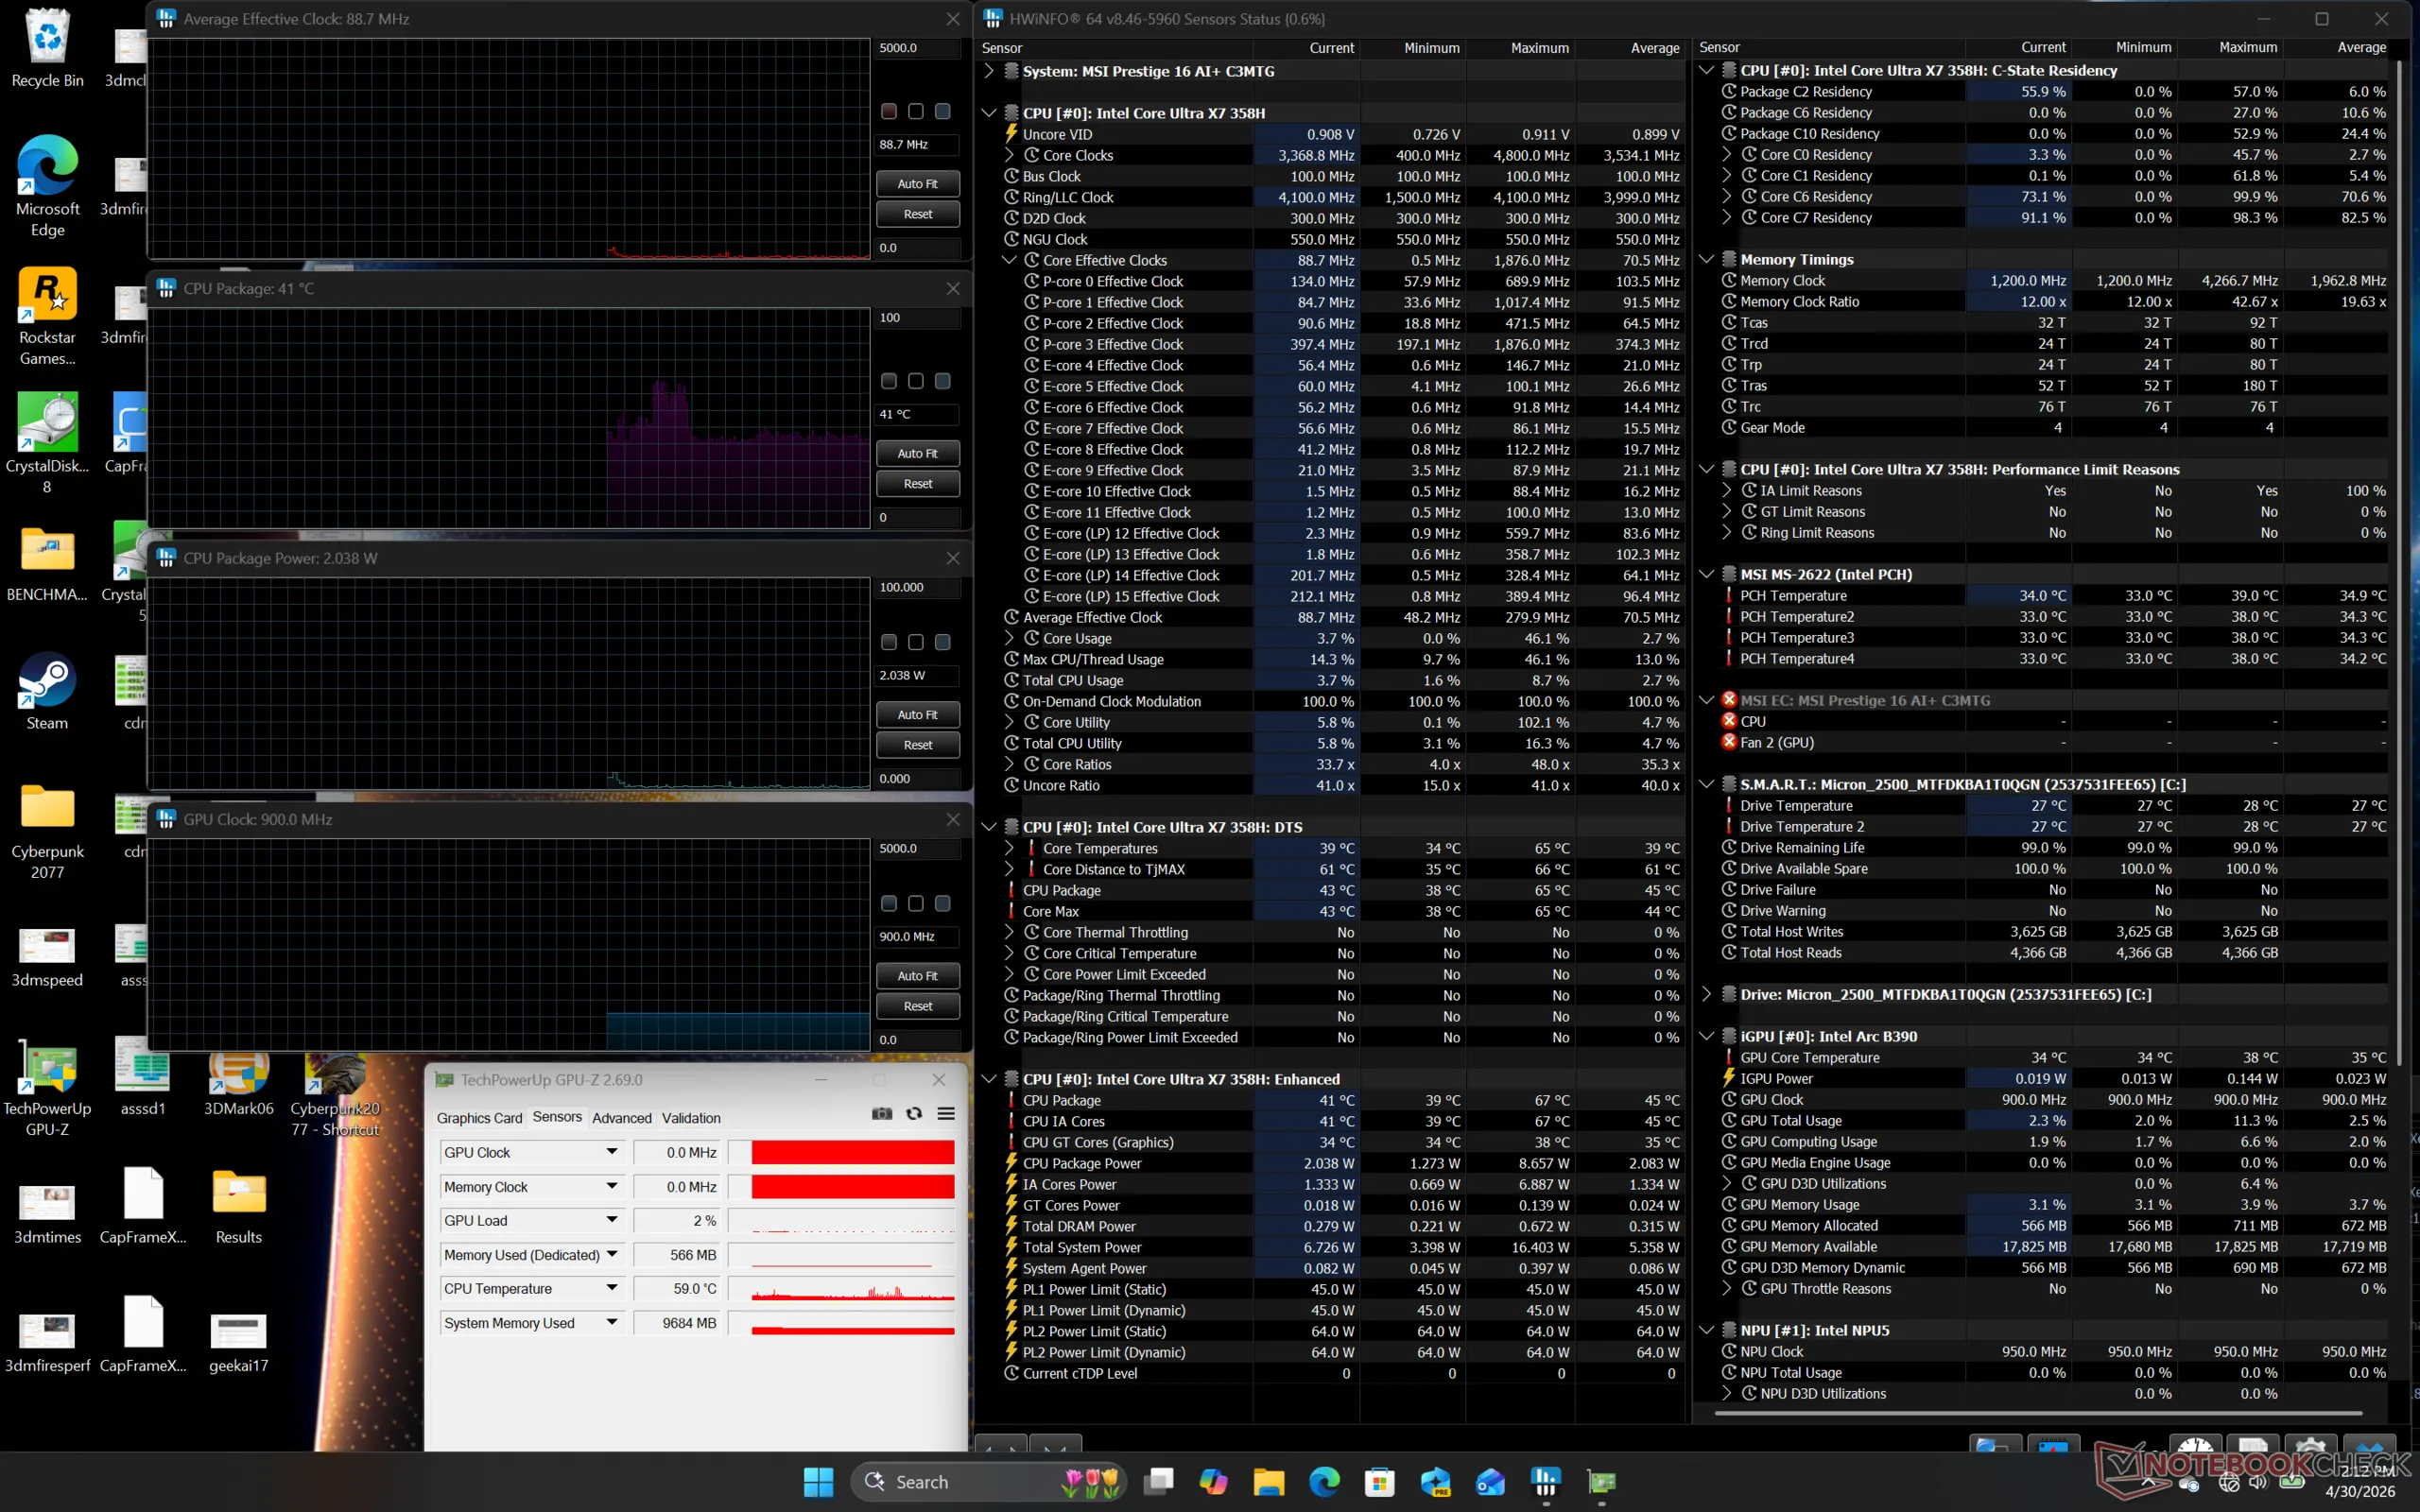
Podczas uruchamiania stresu Prime95, procesor zwiększał taktowanie do 3 GHz, 64 W i 97 C, po czym szybko spadał do 2,3 GHz i 39 W, aby utrzymać stabilną temperaturę rdzenia na poziomie 90 C. Wyniki są cieplejsze niż to, co zarejestrowaliśmy na XPS 16 z dokładnie tym samym procesorem, gdzie temperatura rdzenia ustabilizowała się na poziomie zaledwie 78 C.
Podczas uruchamiania Cyberpunk 2077 w trybie wydajności, aby reprezentować stres w grach, GPU ustabilizowałoby się na poziomie 2500 MHz, 38 W i 86 C, co ponownie jest znacznie cieplejsze niż wspomniany Dell o ponad 20 C. Dostrojenie systemu do trybu zrównoważonego spowodowałoby, że GPU pracowałoby cyklicznie od 1220 MHz do 1850 MHz i od 16 W do 26 W, co jest zgodne zarówno z wolniejszą wydajnością grafiki wspomnianą powyżej, jak i cichszym hałasem wentylatora.
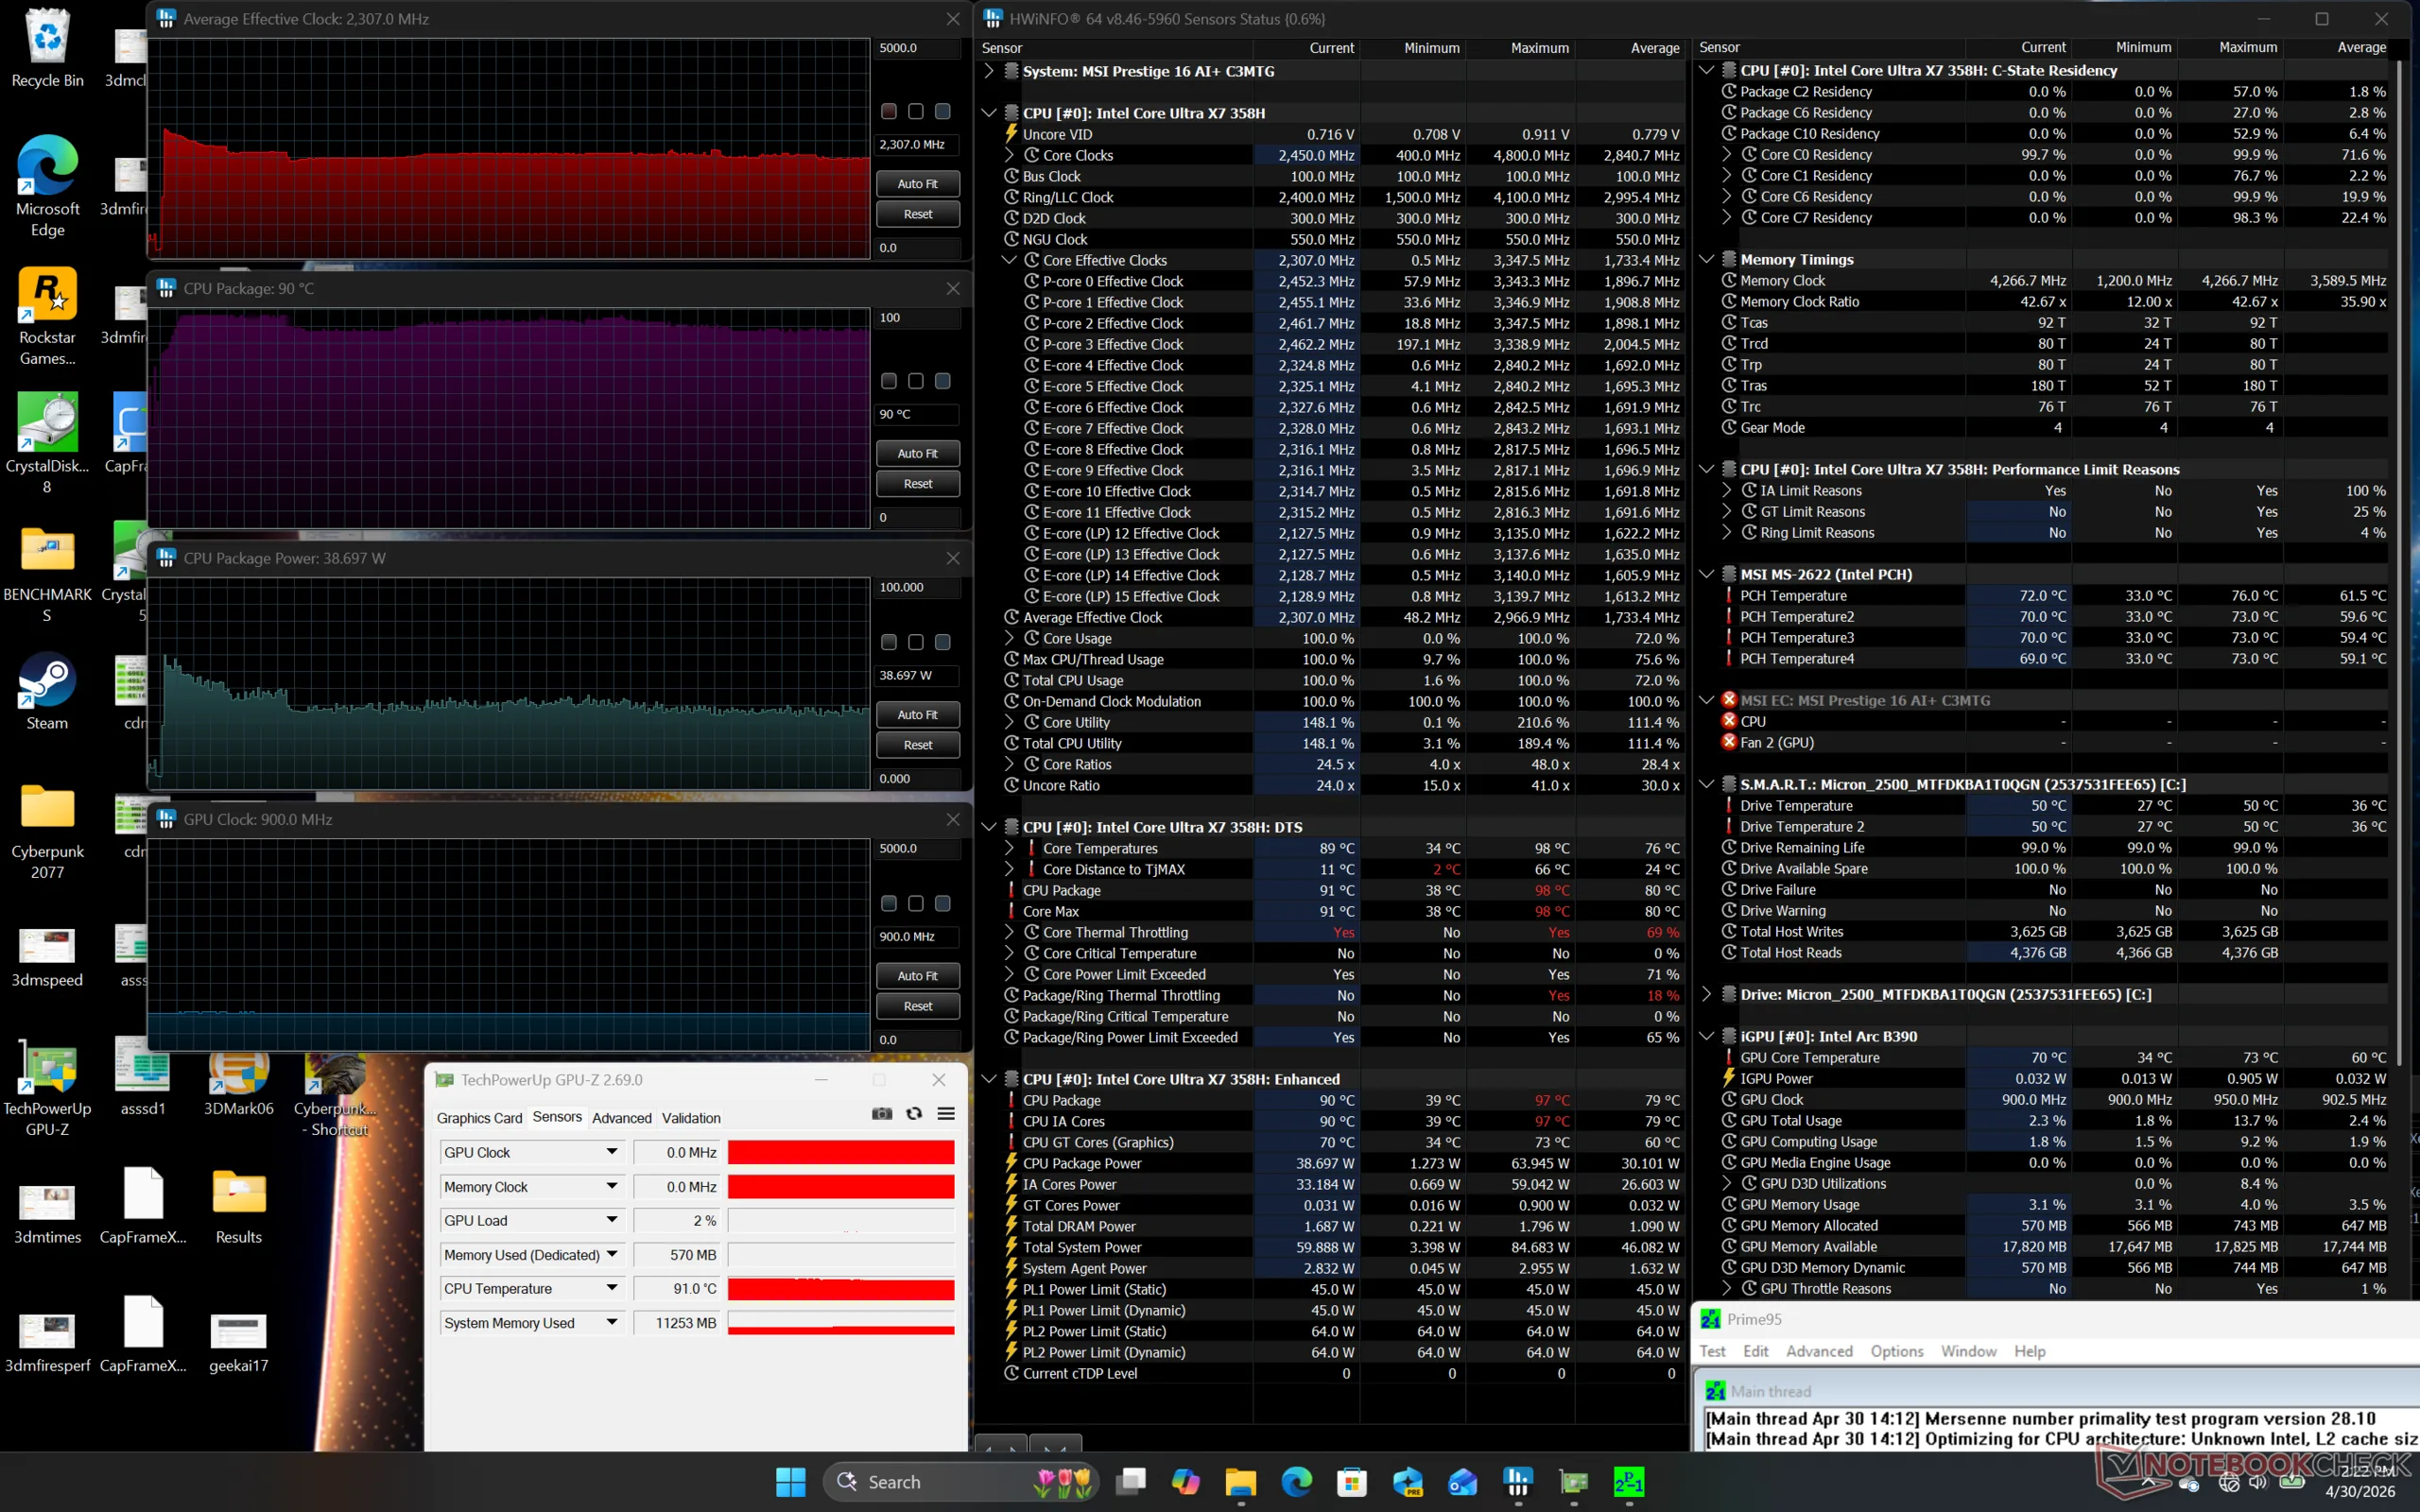
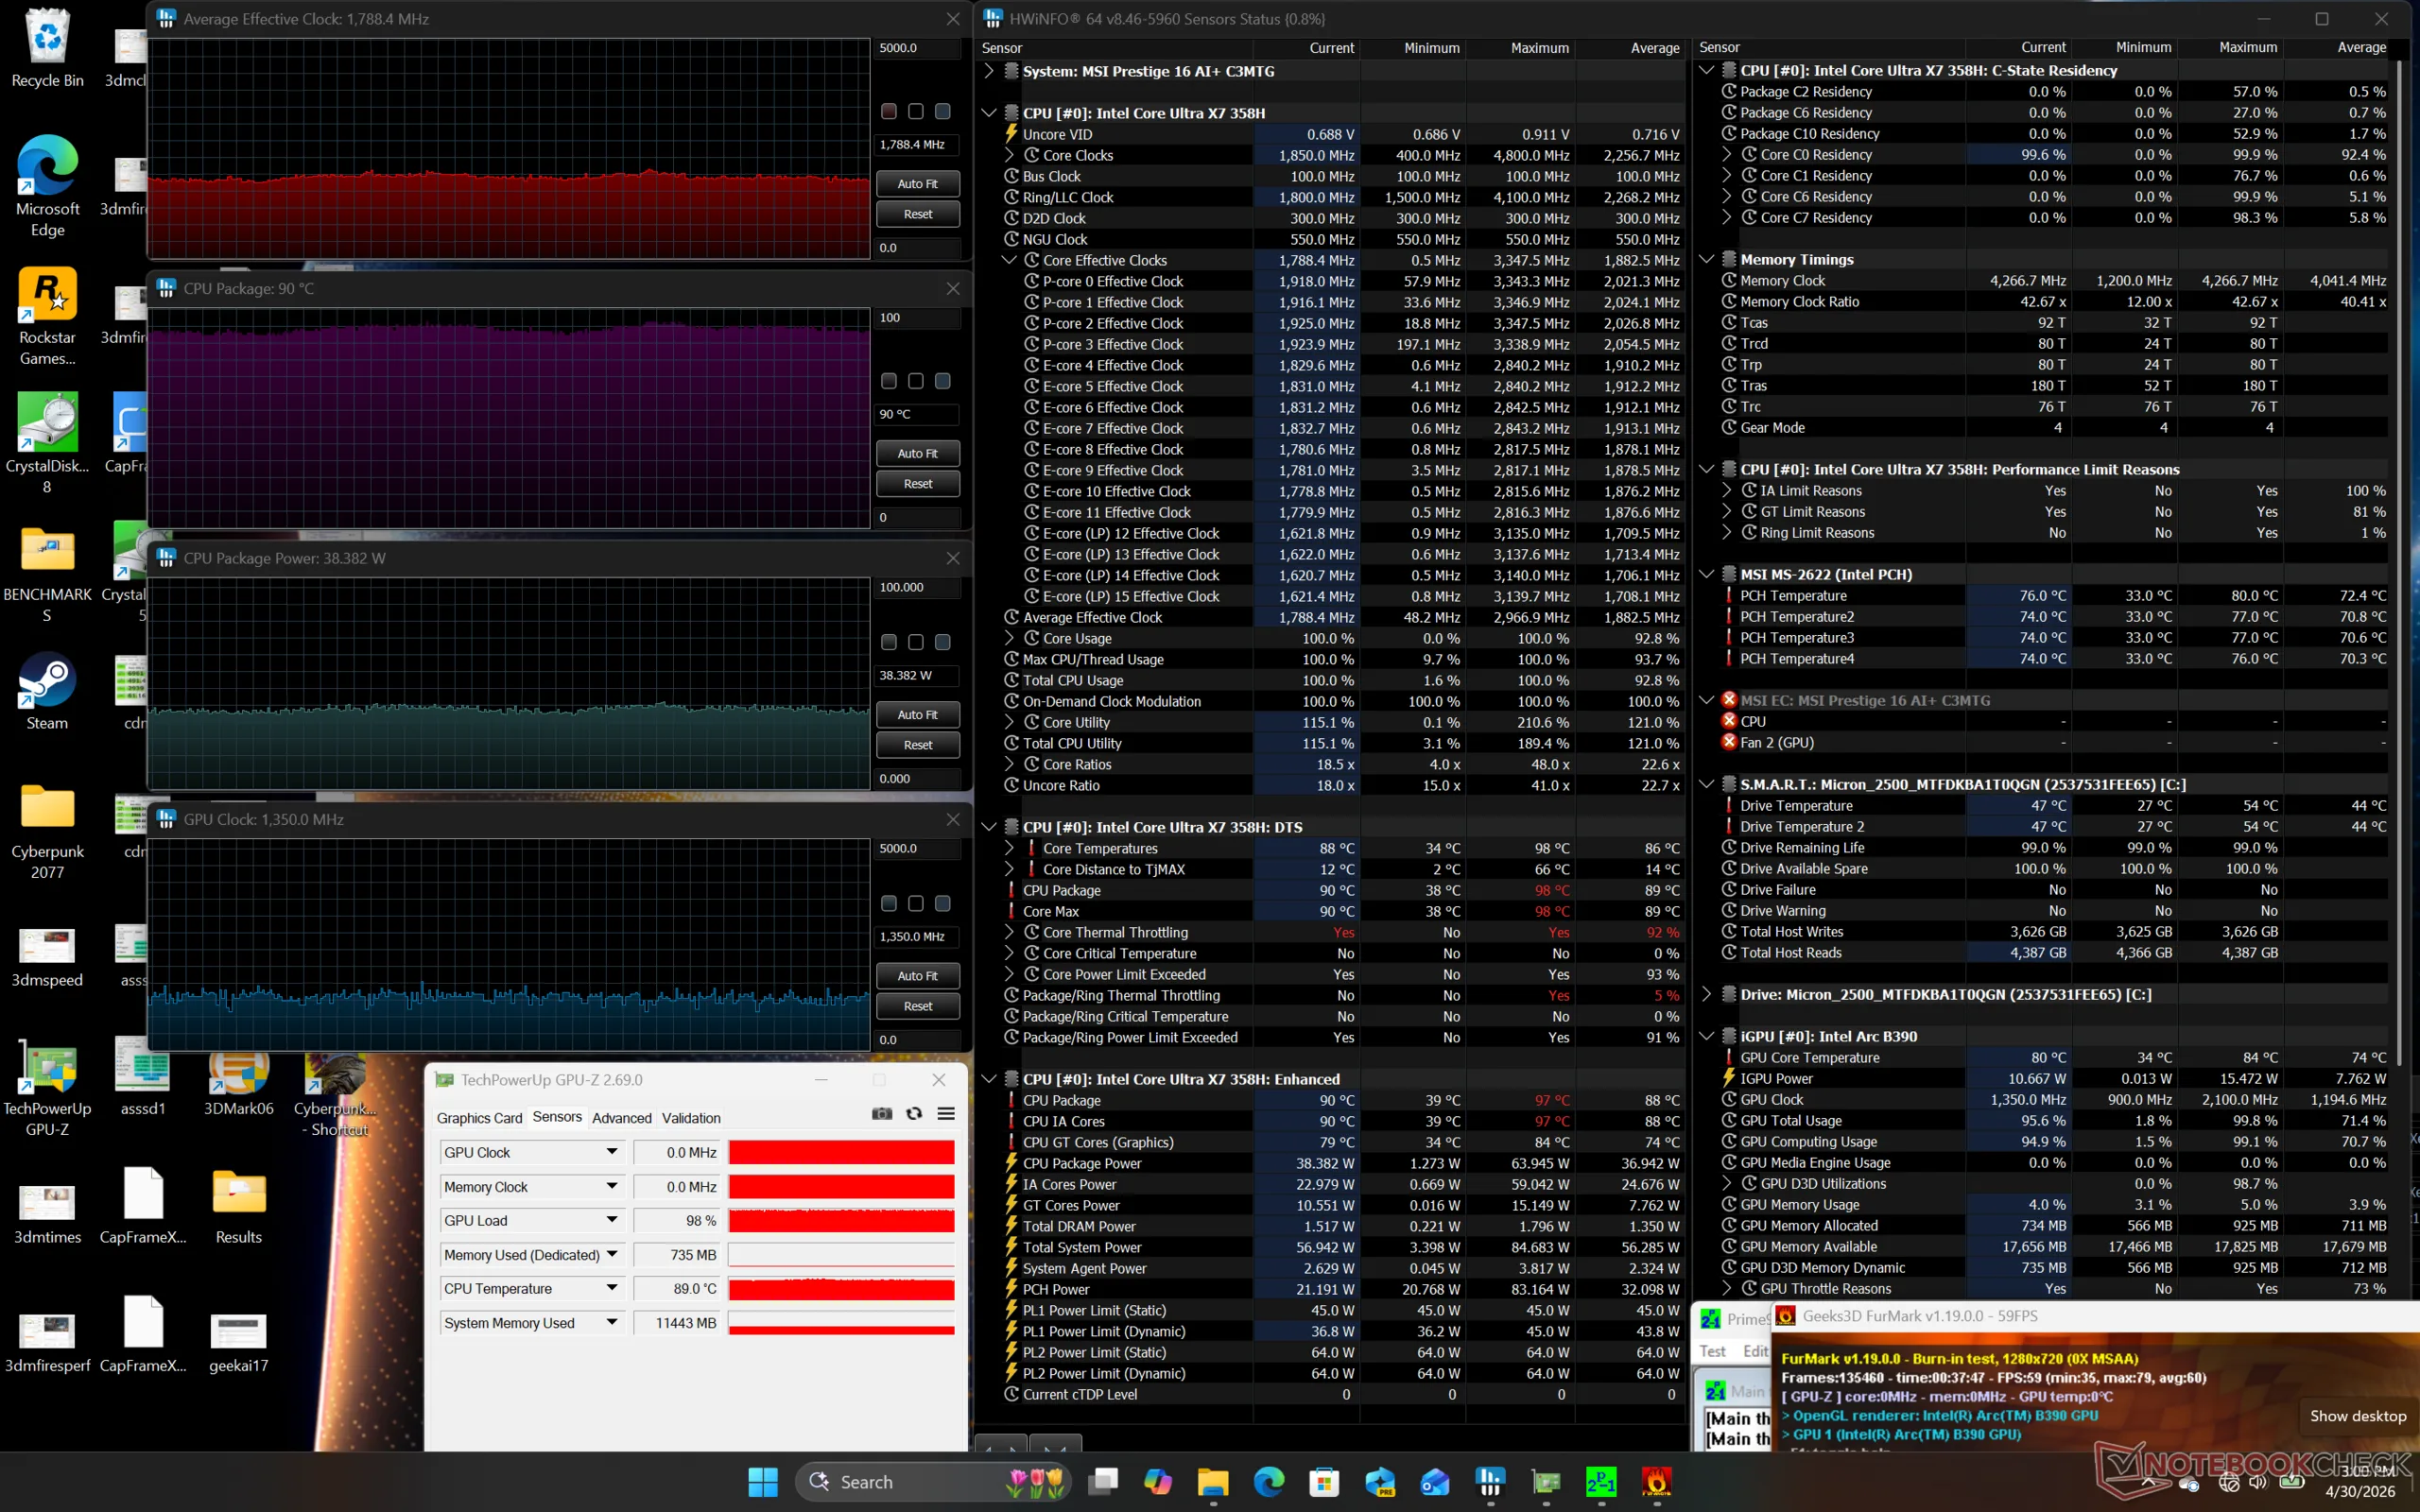
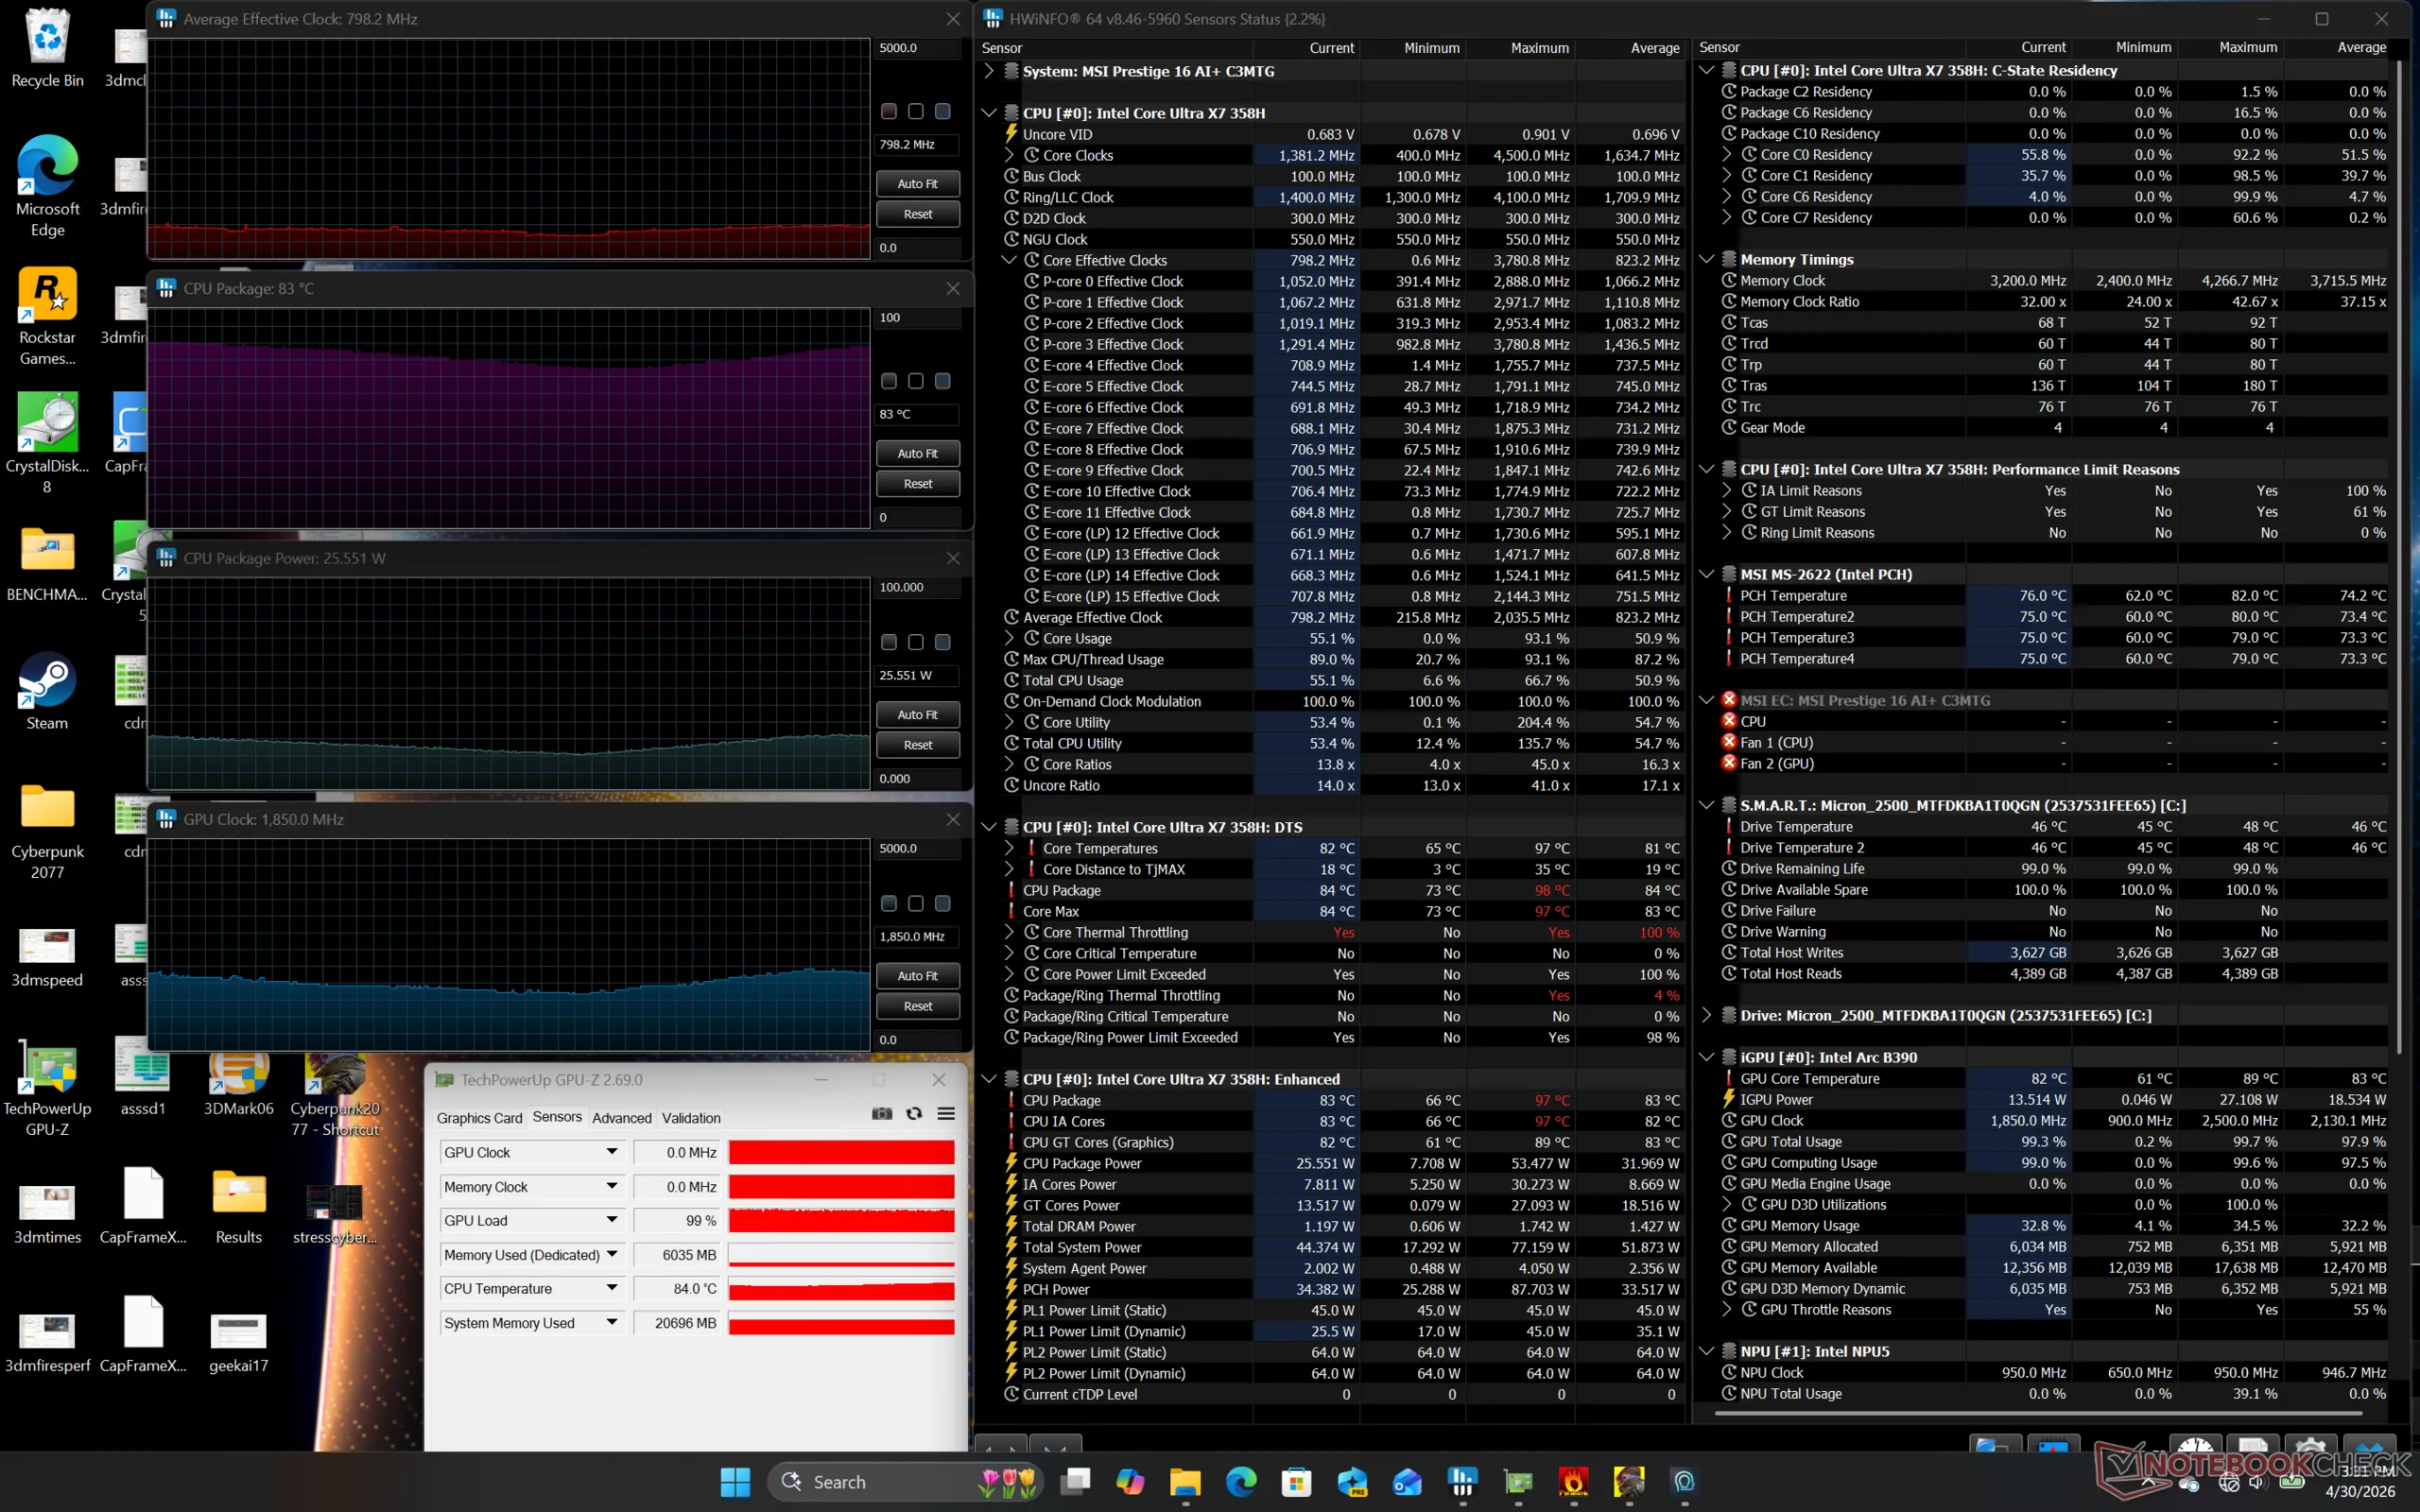
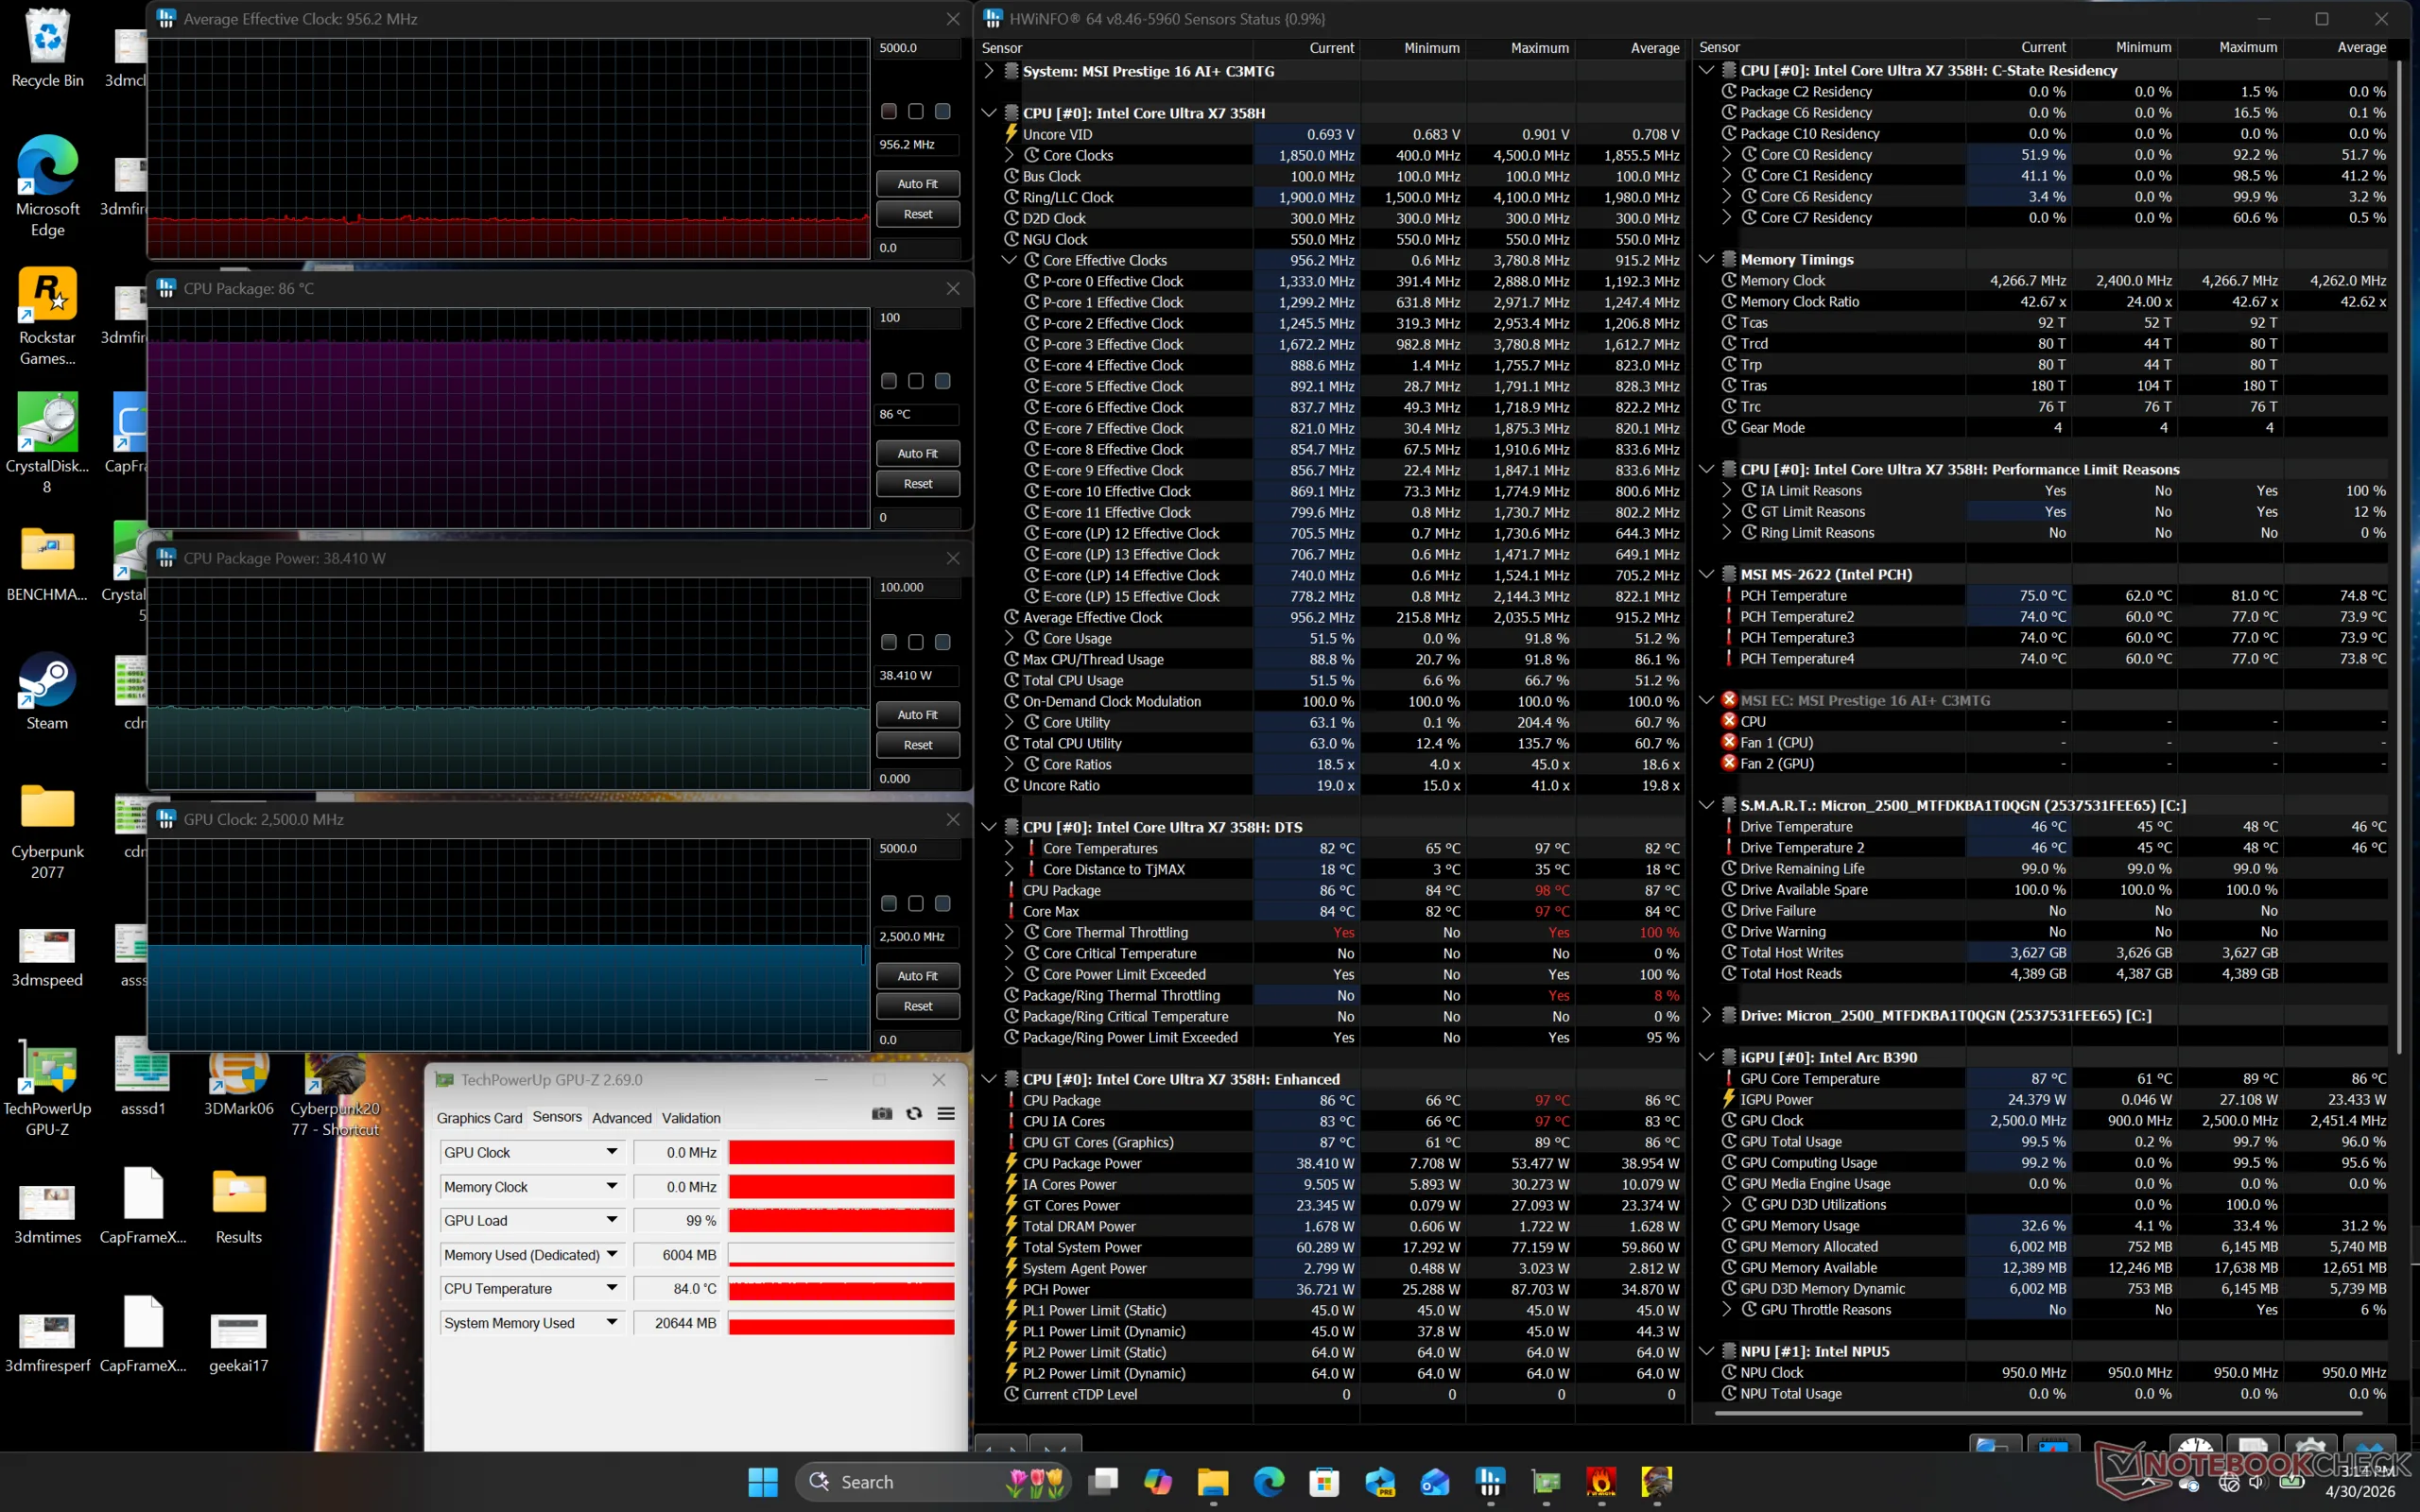
| Średnie taktowanie CPU (GHz) | Taktowanie GPU (MHz) | Średnia temperatura CPU (°C) | |
| System bezczynności | -- | 900 | 41 |
| Prime95 Stress | 2.3 | -- | 90 |
| Prime95 + FurMark Stress | 1.8 | ~1350 | 90 |
| Cyberpunk 2077 Stress (tryb zrównoważony) | 0.8 | 1220 - 1850 | 83 |
| Cyberpunk 2077 Stress (tryb wydajności) | 1.0 | 2500 | 86 |
Głośniki
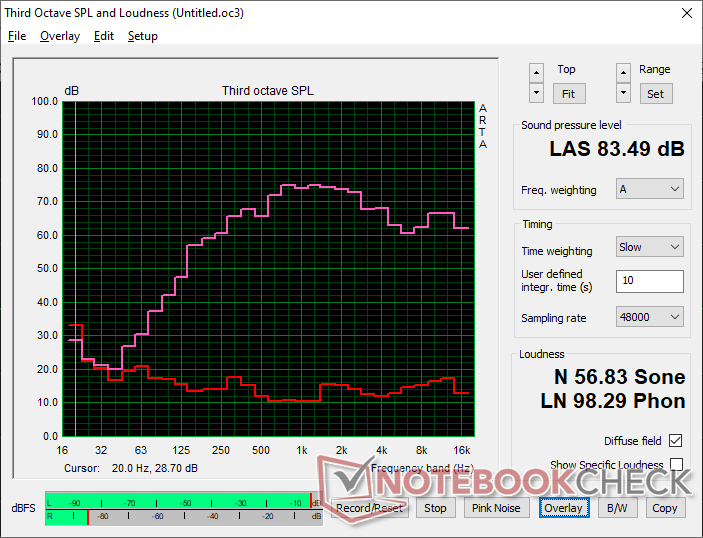
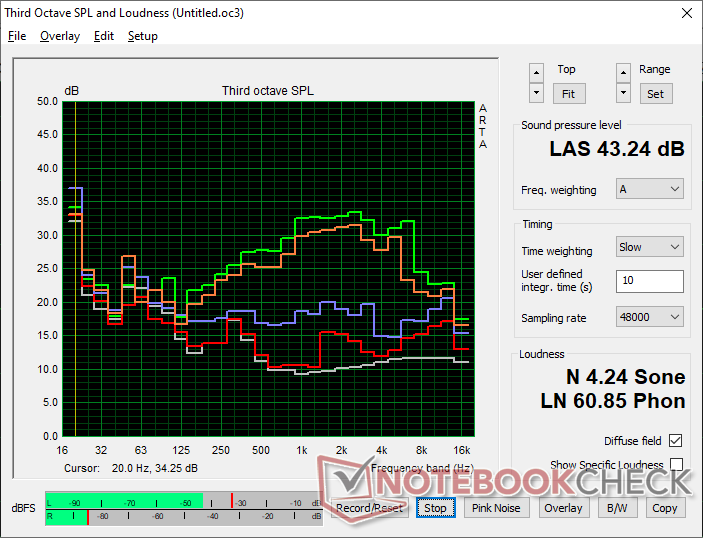
MSI Prestige 16 AI C3MTG analiza dźwięku
(+) | głośniki mogą odtwarzać stosunkowo głośno (83.5 dB)
Bas 100 - 315 Hz
(±) | zredukowany bas - średnio 11.2% niższy od mediany
(±) | liniowość basu jest średnia (9% delta do poprzedniej częstotliwości)
Średnie 400 - 2000 Hz
(±) | wyższe średnie - średnio 5.9% wyższe niż mediana
(+) | średnie są liniowe (4% delta do poprzedniej częstotliwości)
Wysokie 2–16 kHz
(+) | zrównoważone maksima - tylko 3.3% od mediany
(+) | wzloty są liniowe (5.4% delta do poprzedniej częstotliwości)
Ogólnie 100 - 16.000 Hz
(+) | ogólny dźwięk jest liniowy (12.8% różnicy w stosunku do mediany)
W porównaniu do tej samej klasy
» 24% wszystkich testowanych urządzeń w tej klasie było lepszych, 5% podobnych, 71% gorszych
» Najlepszy miał deltę 5%, średnia wynosiła ###średnia###%, najgorsza wynosiła 45%
W porównaniu do wszystkich testowanych urządzeń
» 12% wszystkich testowanych urządzeń było lepszych, 3% podobnych, 85% gorszych
» Najlepszy miał deltę 4%, średnia wynosiła ###średnia###%, najgorsza wynosiła 134%
Apple MacBook Pro 16 2021 M1 Pro analiza dźwięku
(+) | głośniki mogą odtwarzać stosunkowo głośno (84.7 dB)
Bas 100 - 315 Hz
(+) | dobry bas - tylko 3.8% od mediany
(+) | bas jest liniowy (5.2% delta do poprzedniej częstotliwości)
Średnie 400 - 2000 Hz
(+) | zbalansowane środki średnie - tylko 1.3% od mediany
(+) | średnie są liniowe (2.1% delta do poprzedniej częstotliwości)
Wysokie 2–16 kHz
(+) | zrównoważone maksima - tylko 1.9% od mediany
(+) | wzloty są liniowe (2.7% delta do poprzedniej częstotliwości)
Ogólnie 100 - 16.000 Hz
(+) | ogólny dźwięk jest liniowy (4.6% różnicy w stosunku do mediany)
W porównaniu do tej samej klasy
» 0% wszystkich testowanych urządzeń w tej klasie było lepszych, 0% podobnych, 100% gorszych
» Najlepszy miał deltę 5%, średnia wynosiła ###średnia###%, najgorsza wynosiła 45%
W porównaniu do wszystkich testowanych urządzeń
» 0% wszystkich testowanych urządzeń było lepszych, 0% podobnych, 100% gorszych
» Najlepszy miał deltę 4%, średnia wynosiła ###średnia###%, najgorsza wynosiła 134%
Zarządzanie energią
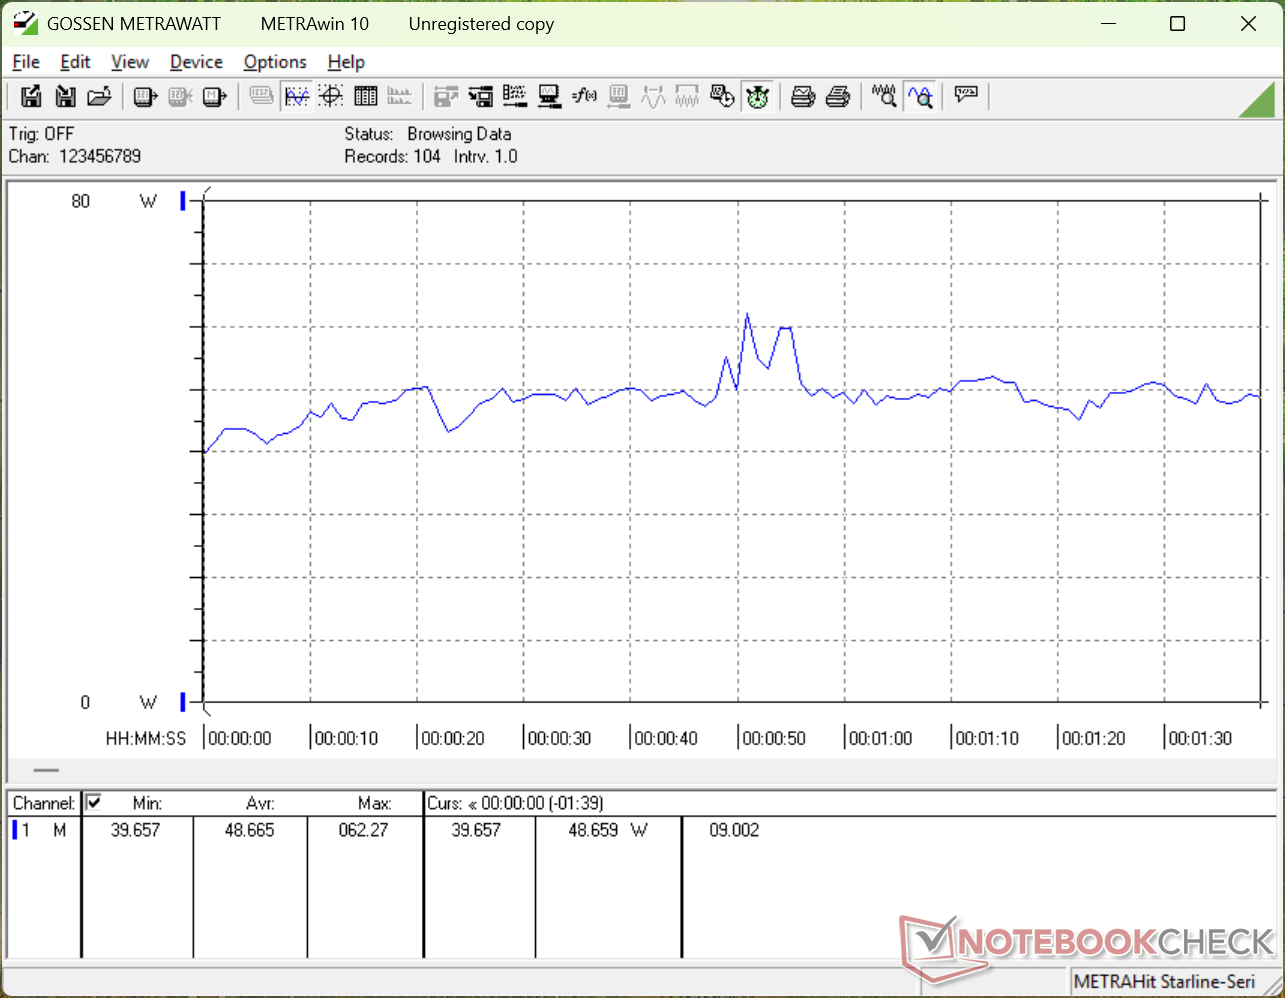
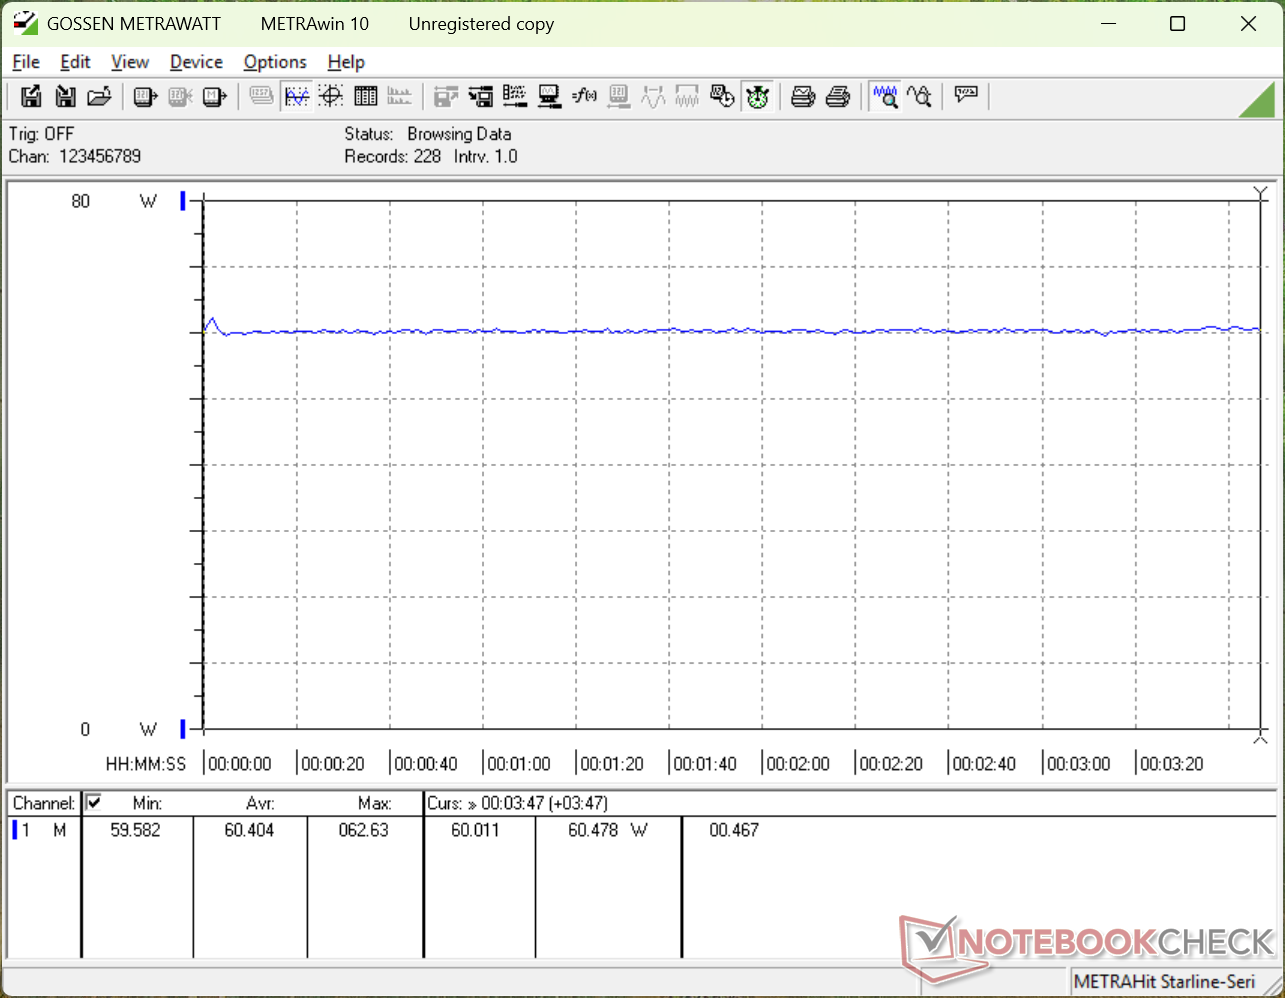
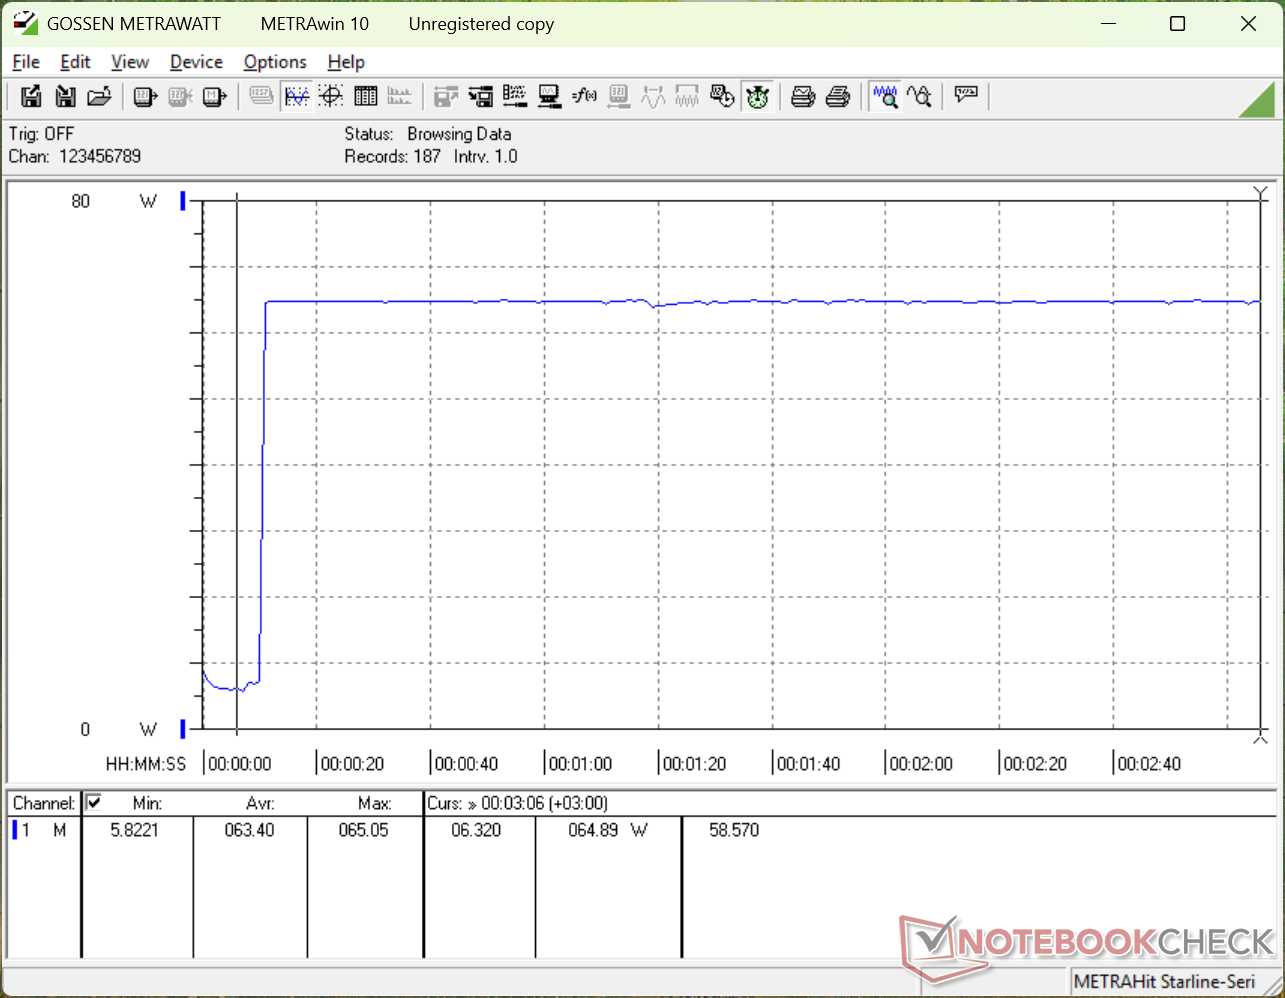
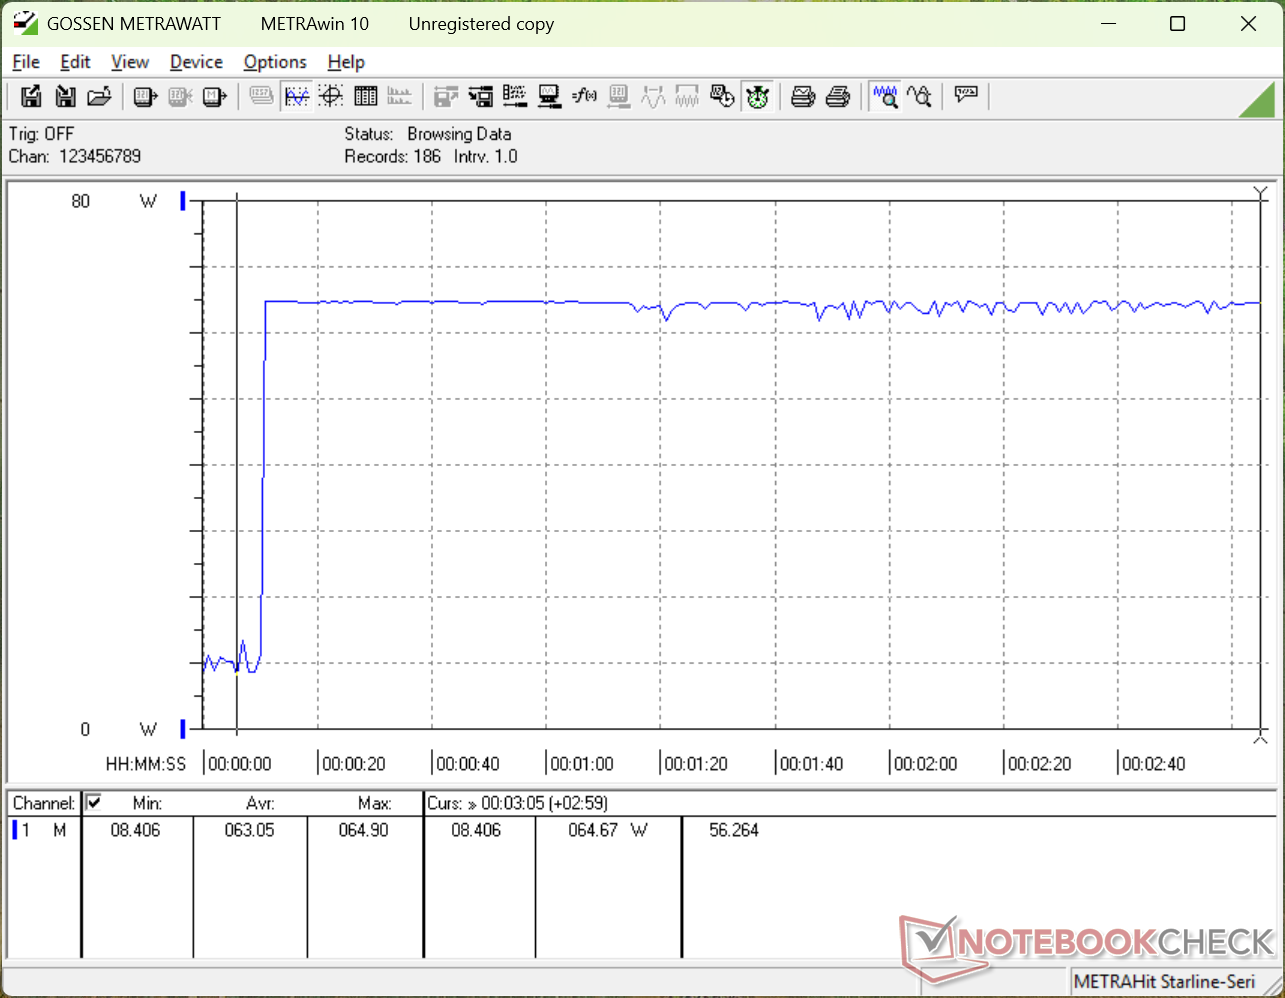
Zużycie energii
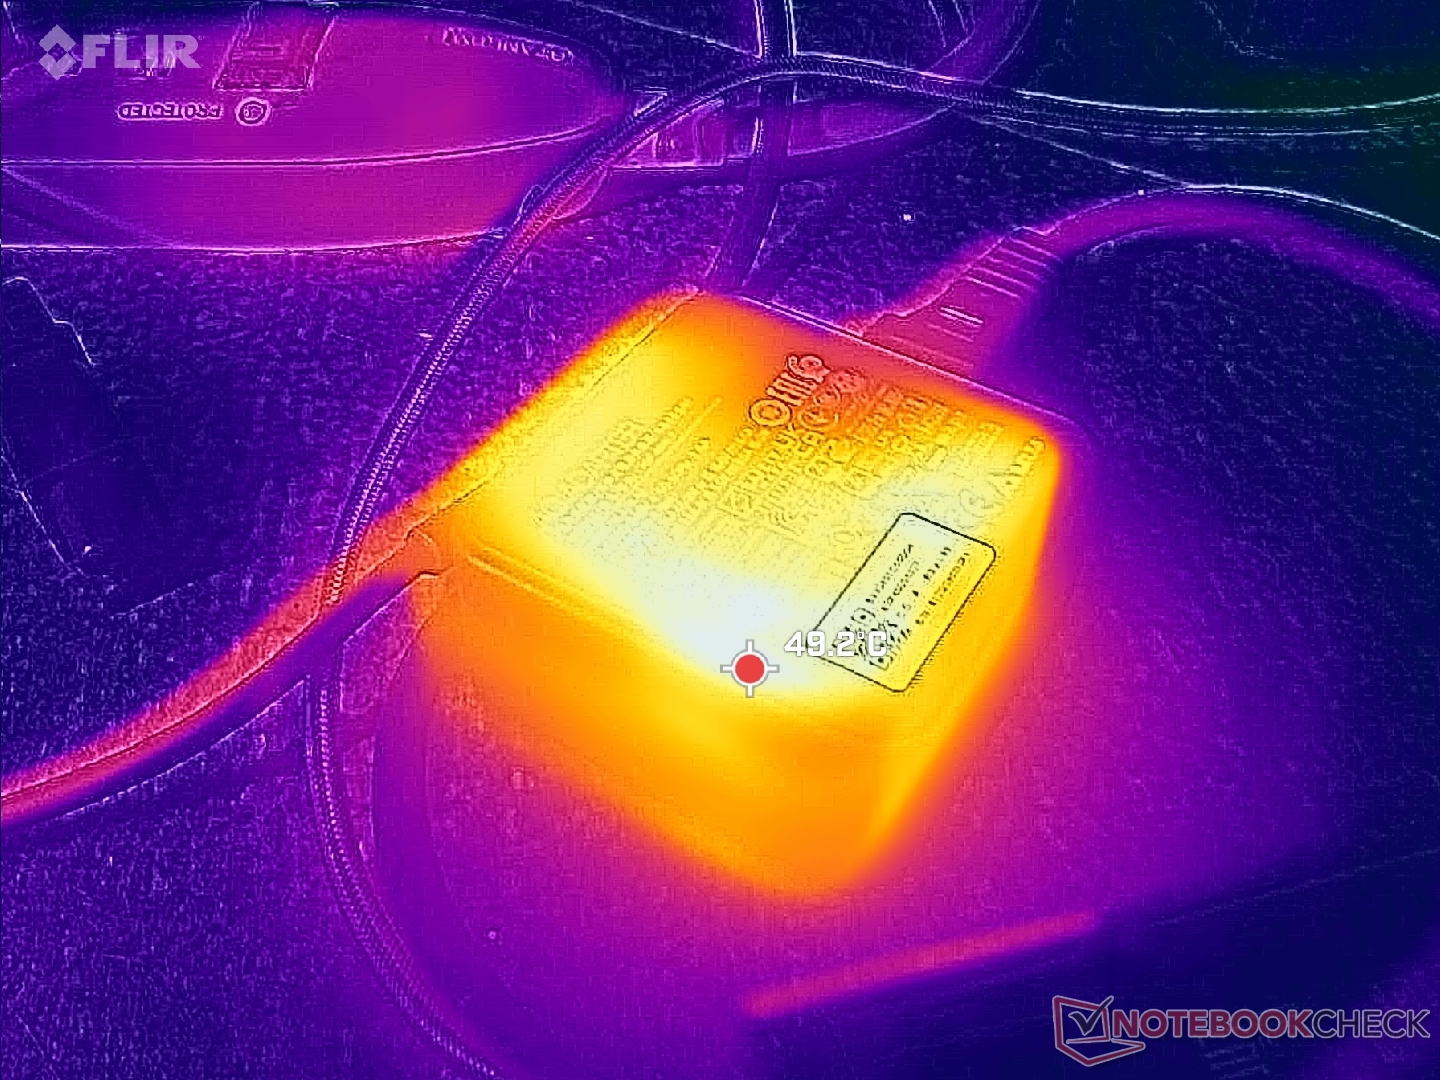
Model ten dostarczany jest z mniejszym zasilaczem sieciowym USB-C o mocy 65 W (~6,5 x 6,5 x 3,0 cm) zamiast zasilacza o mocy 100 W, który był dostarczany z modelem 2025. Pomimo tego, ogólne zużycie energii między tymi dwoma modelami jest dość podobne, co pokazują poniższe wykresy. Wydajność w przeliczeniu na wat znacznie wzrosła, jeśli chodzi o grafikę, ponieważ nowy Prestige 16 jest do 80 procent szybszy, pobierając prawie taką samą moc.
Konsekwencją mniejszego zasilacza 65 W jest niższa wydajność Turbo Boost. Dla przykładu, w stresie Prime95, 2025 Prestige 16 mógł pobierać tymczasowo nawet 103 W w porównaniu do zaledwie 66 W na naszym 2026 Prestige 16. Starszy model może zatem nieznacznie przewyższać nowszy model pod względem surowej wydajności procesora w ciągu około pierwszej minuty testu warunków skrajnych, kiedy Turbo Boost jest najbardziej efektywny.
Proszę pamiętać, że tempo ładowania znacznie spada w przypadku jednoczesnego uruchomienia wymagających obciążeń, ponieważ zasilacz sieciowy o mocy 65 W jest prawdopodobnie niewystarczający; samo uruchomienie Cyberpunk 2077 pobiera już ponad 60 W.
| wyłączony / stan wstrzymania | |
| luz | |
| obciążenie |
|
Legenda:
min: | |
| MSI Prestige 16 AI C3MTG Ultra X7 358H, Arc B390 Panther Lake iGPU, Micron 2500 1TB MTFDKBA1T0QGN, OLED, 2880x1800, 16" | MSI Prestige 16 AI Evo B2HMG Ultra 9 285H, Arc 140T, Micron 2500 1TB MTFDKBA1T0QGN, IPS, 2560x1600, 16" | Dell XPS 16 Core Ultra X7 358H Ultra X7 358H, Arc B390 Panther Lake iGPU, , OLED, 3200x2000, 16" | Asus ZenBook S16 UM5606GA Ryzen AI 9 465, Radeon 880M, SanDisk PC SN5100S, OLED, 2880x1800, 16" | Lenovo ThinkBook 16 G7+ AMD Ryzen AI 9 365, Radeon 880M, Samsung PM9C1a MZAL81T0HDLB, IPS, 3200x2000, 16" | HP Envy x360 2-in-1 16-ad0097nr R7 8840HS, Radeon 780M, KIOXIA BG5 KBG50ZNV1T02, OLED, 2880x1800, 16" | |
|---|---|---|---|---|---|---|
| Power Consumption | -22% | -0% | -2% | -55% | -10% | |
| Idle Minimum * (Watt) | 3.3 | 4.4 -33% | 4 -21% | 3.7 -12% | 6.4 -94% | 5 -52% |
| Idle Average * (Watt) | 7.4 | 9.2 -24% | 4.4 41% | 7.4 -0% | 14.1 -91% | 6.2 16% |
| Idle Maximum * (Watt) | 13 | 9.5 27% | 10.2 22% | 9.5 27% | 14.3 -10% | 14.7 -13% |
| Load Average * (Watt) | 48.7 | 66.9 -37% | 44.2 9% | 57.9 -19% | 83.4 -71% | 49.9 -2% |
| Cyberpunk 2077 ultra * (Watt) | 60.4 | 68.8 -14% | 62.6 -4% | 58.5 3% | 79.8 -32% | |
| Cyberpunk 2077 ultra external monitor * (Watt) | 60.4 | 67.4 -12% | 62.4 -3% | 57 6% | 77.5 -28% | |
| Load Maximum * (Watt) | 64.8 | 102.9 -59% | 94.6 -46% | 76.9 -19% | 102.9 -59% | 65 -0% |
| Witcher 3 ultra * (Watt) | 54.5 |
* ... im mniej tym lepiej
Pobór mocy Cyberpunk / Test warunków skrajnych
Zużycie energii przez monitor zewnętrzny
Żywotność baterii
W tym roku czas pracy jest krótszy, częściowo ze względu na mniejszy akumulator (99 Wh w porównaniu do 81 Wh) i przejście z IPS na OLED. Wpływ ten jest jednak nieco zrekompensowany przez wzrost wydajności osiągnięty w innych częściach systemu. Jesteśmy w stanie zarejestrować czas pracy WLAN wynoszący prawie 13 godzin, który jest o 3 do 4 godzin krótszy niż w modelu 2025.
| MSI Prestige 16 AI C3MTG Ultra X7 358H, Arc B390 Panther Lake iGPU, 81 Wh | MSI Prestige 16 AI Evo B2HMG Ultra 9 285H, Arc 140T, 99.9 Wh | Dell XPS 16 Core Ultra X7 358H Ultra X7 358H, Arc B390 Panther Lake iGPU, 70 Wh | Asus ZenBook S16 UM5606GA Ryzen AI 9 465, Radeon 880M, 83 Wh | Lenovo ThinkBook 16 G7+ AMD Ryzen AI 9 365, Radeon 880M, 85 Wh | HP Envy x360 2-in-1 16-ad0097nr R7 8840HS, Radeon 780M, 68 Wh | |
|---|---|---|---|---|---|---|
| Czasy pracy | 31% | -18% | 4% | -14% | -39% | |
| WiFi v1.3 (h) | 12.6 | 16.5 31% | 10.3 -18% | 13.1 4% | 10.8 -14% | 7.7 -39% |
| H.264 (h) | 20.8 | 13.9 | ||||
| Load (h) | 2.4 | 1.9 | ||||
| Reader / Idle (h) | 15.6 |
Ocena Notebookcheck
MSI Prestige 16 2026 to jeden z najcieńszych laptopów prosumenckich dostępnych z procesorem Intel Panther Lake, ale konkurencja jest ostra, jeśli chodzi o rozdzielczość kamery internetowej, opcje wyświetlania i zintegrowane porty.
MSI Prestige 16 AI C3MTG
- 07/05/2026 v8
Allen Ngo
 Total Sustainability Score:
 Potencjalni konkurenci w porównaniu
Obraz | Model / recenzja | Cena | Waga | Wysokość | Ekran |
|---|---|---|---|---|---|
1. 86.4%  | MSI Prestige 16 AI C3MTG Intel Core Ultra X7 358H ⎘ Intel Arc B390 12 Xe3 Panther Lake iGPU ⎘ 32 GB Pamięć, 1024 GB SSD | Amazon: Cena katalogowa: 2100 USD | 1.6 kg | 13.9 mm | 16.00" 2880x1800 212 PPI OLED |
2. 82.8%  | MSI Prestige 16 AI Evo B2HMG Intel Core Ultra 9 285H ⎘ Intel Arc Graphics 140T ⎘ 32 GB Pamięć, 1024 GB SSD | Amazon: 1. $1,479.00 MSI Prestige 16 AI+ Evo 16" ... 2. $1,397.87 MSI Prestige 14 AI+ EVO PRE1... 3. $1,199.00 msi Prestige A16 AI+ (2025) ... | 1.6 kg | 18.95 mm | 16.00" 2560x1600 189 PPI IPS |
3. 87.2%  | Dell XPS 16 Core Ultra X7 358H Intel Core Ultra X7 358H ⎘ Intel Arc B390 12 Xe3 Panther Lake iGPU ⎘ 32 GB Pamięć | Amazon: 1. $2,599.00 Dell Premium 16 (XPS 16 2025... 2. $1,977.99 Dell Premium 16 (Previously ... 3. $2,599.00 Dell Premium 16 (XPS 16 2025... Cena katalogowa: 2350 USD | 1.7 kg | 14.62 mm | 16.00" 3200x2000 236 PPI OLED |
4. 86.6%  | Asus ZenBook S16 UM5606GA AMD Ryzen AI 9 465 ⎘ AMD Radeon 880M ⎘ 32 GB Pamięć, 1024 GB SSD | Amazon: Cena katalogowa: 1799€ | 1.5 kg | 12.9 mm | 16.00" 2880x1800 212 PPI OLED |
5. 86.6%  | Lenovo ThinkBook 16 G7+ AMD AMD Ryzen AI 9 365 ⎘ AMD Radeon 880M ⎘ 32 GB Pamięć, 1024 GB SSD | Amazon: 1. $999.95 Lenovo ThinkBook 16 G7 Busin... 2. $1,199.99 Lenovo ThinkBook 16 G7 Busin... 3. $979.95 Oemgenuine Lenovo ThinkBook ... Cena katalogowa: 1399€ | 1.9 kg | 16.9 mm | 16.00" 3200x2000 236 PPI IPS |
6. 87.2% v7 (old)  | HP Envy x360 2-in-1 16-ad0097nr AMD Ryzen 7 8840HS ⎘ AMD Radeon 780M ⎘ 16 GB Pamięć, 1024 GB SSD | Amazon: 1. $149.99 Replacement for HP Envy x360... 2. $256.99 Replacement for HP Envy x360... 3. $695.00 HP Envy x360 2-in-1 Laptop, ... Cena katalogowa: 1300 USD | 1.8 kg | 18.3 mm | 16.00" 2880x1800 212 PPI OLED |
Przezroczystość
Wyboru urządzeń do recenzji dokonuje nasza redakcja. Próbka testowa została udostępniona autorowi jako pożyczka od producenta lub sprzedawcy detalicznego na potrzeby tej recenzji. Pożyczkodawca nie miał wpływu na tę recenzję, producent nie otrzymał też kopii tej recenzji przed publikacją. Nie było obowiązku publikowania tej recenzji. Jako niezależna firma medialna, Notebookcheck nie podlega władzy producentów, sprzedawców detalicznych ani wydawców.
Tak testuje Notebookcheck
Każdego roku Notebookcheck niezależnie sprawdza setki laptopów i smartfonów, stosując standardowe procedury, aby zapewnić porównywalność wszystkich wyników. Od około 20 lat stale rozwijamy nasze metody badawcze, ustanawiając przy tym standardy branżowe. W naszych laboratoriach testowych doświadczeni technicy i redaktorzy korzystają z wysokiej jakości sprzętu pomiarowego. Testy te obejmują wieloetapowy proces walidacji. Nasz kompleksowy system ocen opiera się na setkach uzasadnionych pomiarów i benchmarków, co pozwala zachować obiektywizm.
