Werdykt - wydajność 18-calowego laptopa do gier na 16-calowym ekranie
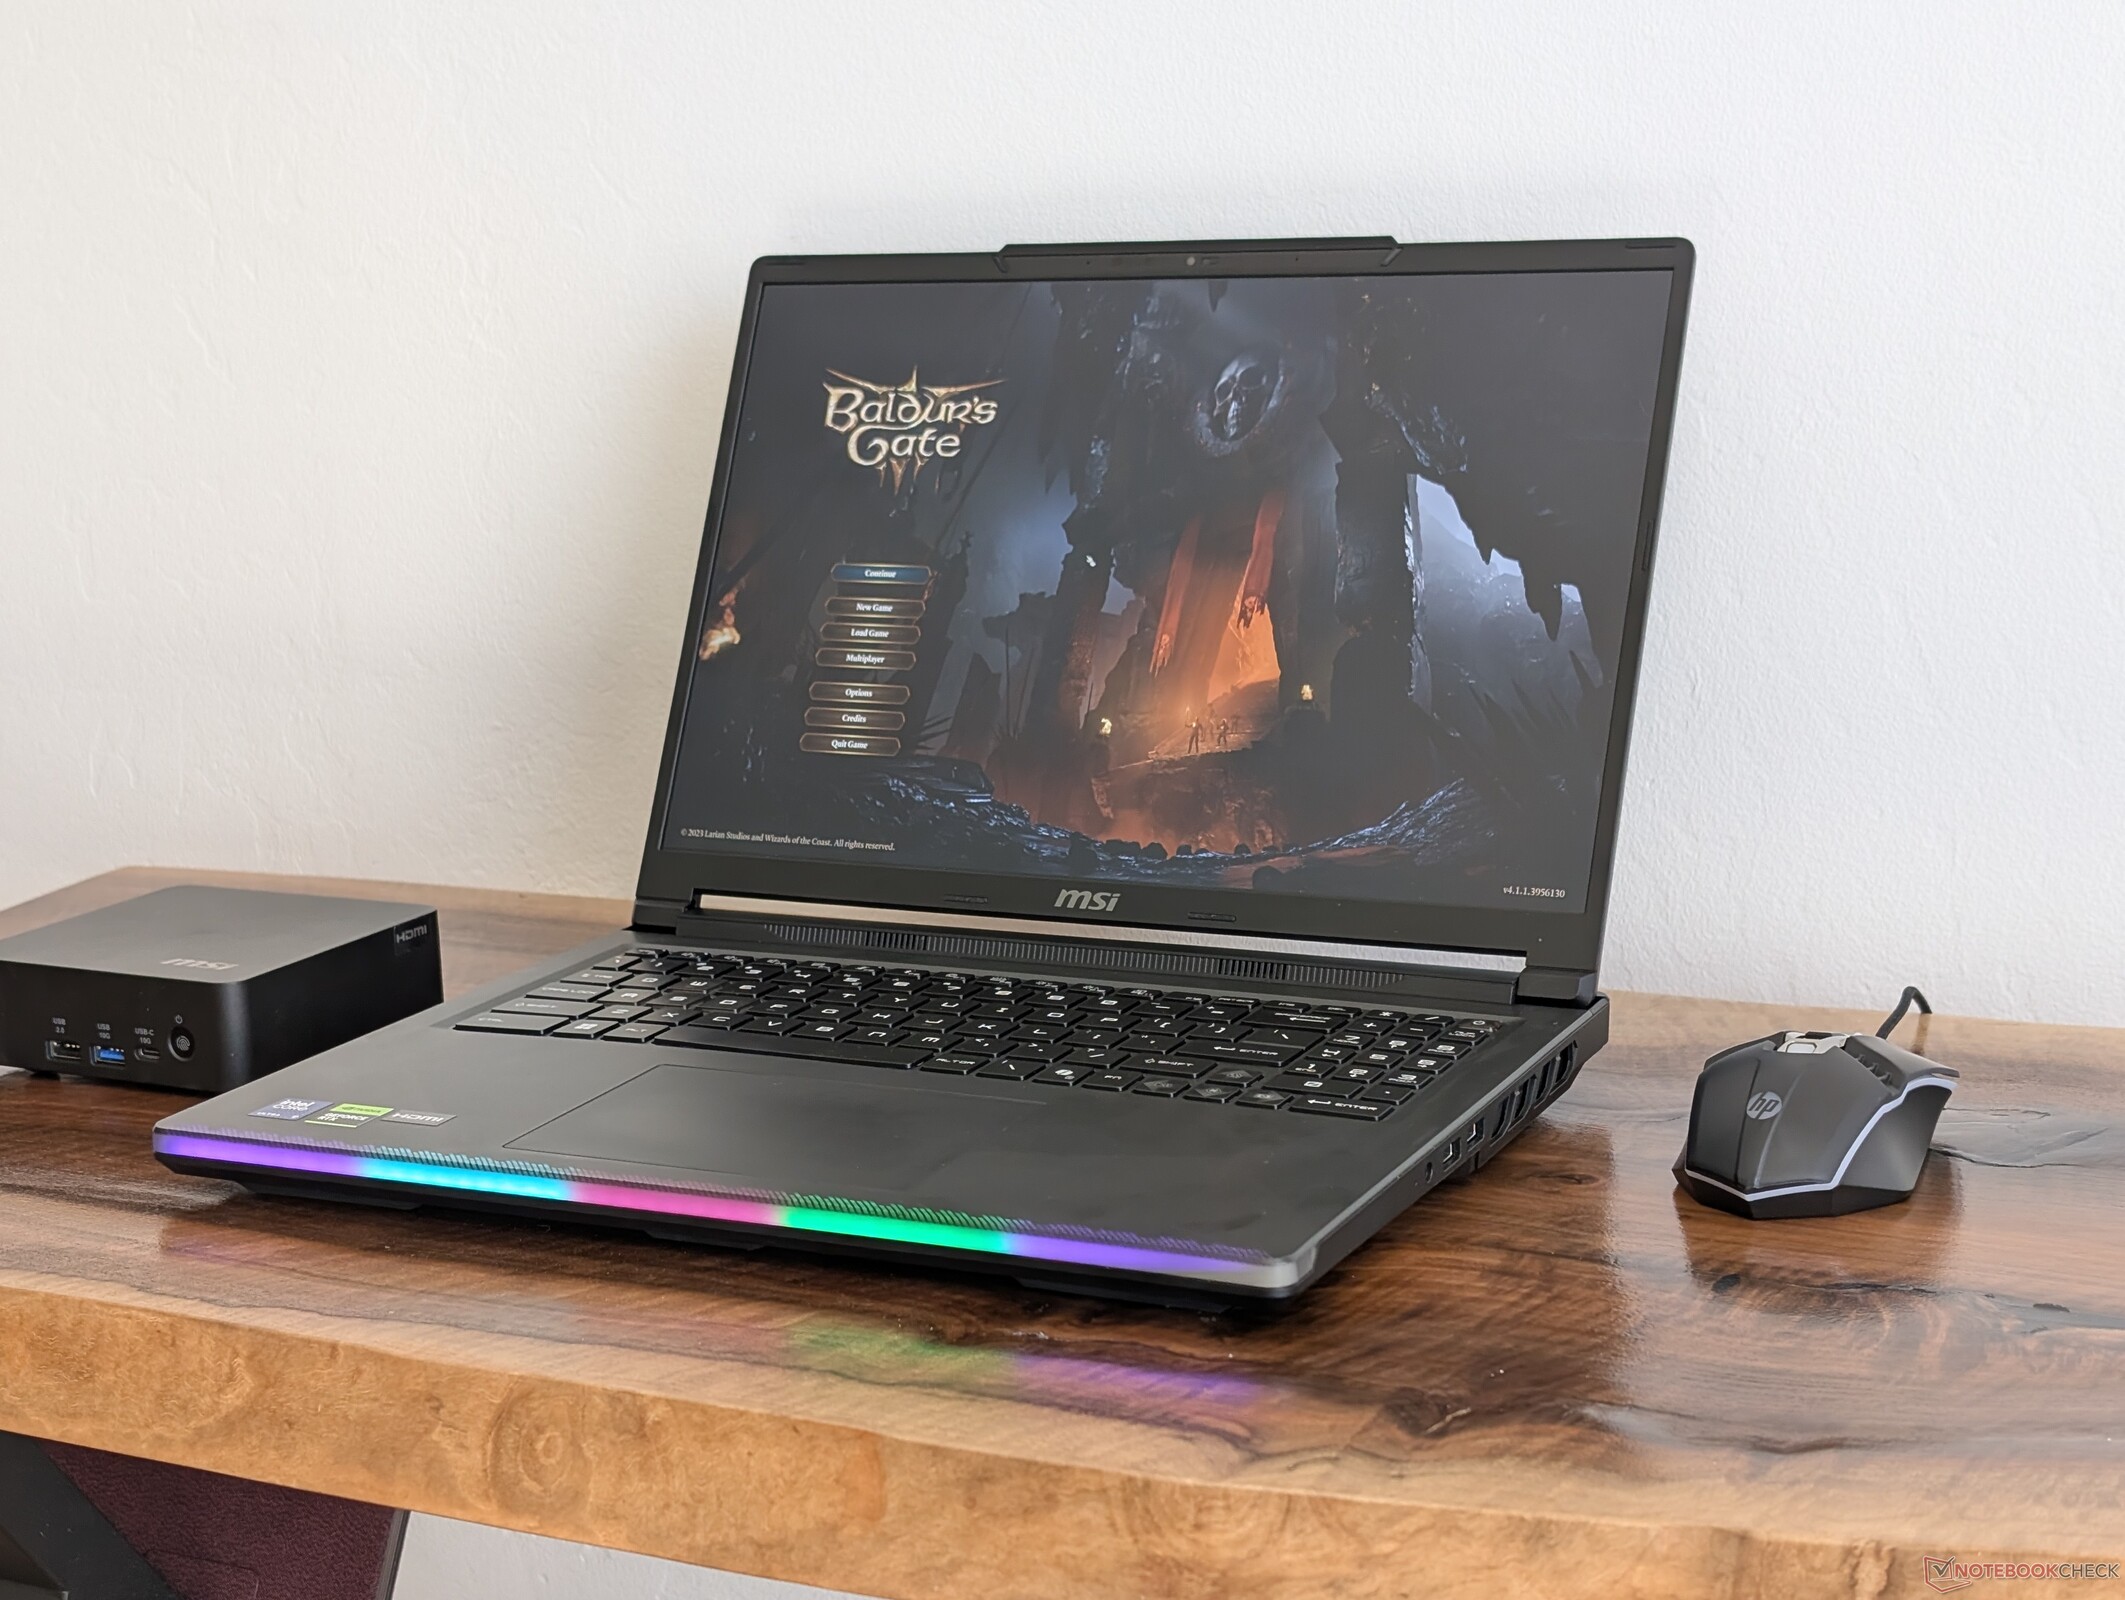
Raider 16 Max HX może być mniejszy niż masywny Raider 18 lub Titan 18ale nadal stawia wydajność na pierwszym miejscu. Procesor Arrow Lake-HX i 175 W GPU to jedne z najszybszych opcji dostępnych niezależnie od rozmiaru laptopa, dzięki czemu Raider 16 Max HX jest jednym z najszybszych rozwiązań do gier na rynku. Błyszczący wyświetlacz OLED jest równie imponujący, jeśli można złagodzić nieuniknione odblaski, podczas gdy subpanel jest praktyczną funkcją, którą chcielibyśmy zobaczyć we wszystkich laptopach do gier MSI w przyszłości.
Ekstremalna wydajność wiąże się z kosztami. Przede wszystkim Raider 16 Max HX jest bardziej masywny i cięższy niż wiele innych 16-calowych laptopów do gier, w tym już duże Alienware 16X Aurora. Plastikowa obudowa nie jest tak luksusowa jak w przypadku Alienware 16 Area-51 mimo że kosztują mniej więcej tyle samo, a brak G-Sync i Advanced Optimus jest trudny do wybaczenia w tym przedziale cenowym. Użytkownicy, którzy lubią podróżować i grać w ruchu, mogą znaleźć większą wartość w lżejszych i bardziej przenośnych 16-calowych rozwiązaniach, takich jak MSI Stealth 16 lub Razer Blade 16 które są wyposażone w podobną grafikę RTX 5090 działającą na nieco niższych poziomach wydajności.
Za
Przeciw
Cena i dostępność
MSI Raider 16 Max HX jest już dostępny w sprzedaży na Amazon w cenie do 4300 USD w konfiguracji z kartą graficzną GeForce RTX 5090.
Płyta główna MSI Raider 16 Max HX została zaprezentowany na targach CES 2026 jako pierwszy 16-calowy laptop z serii Raider. Jest to również jeden z pierwszych gamingowych laptopów MSI z wyświetlaczem OLED zamiast zwykłego IPS lub Mini-LED. Podobnie jak w przypadku serii Raider 18, Raider 16 Max HX jest jednym z najszybszych laptopów w ofercie MSI.
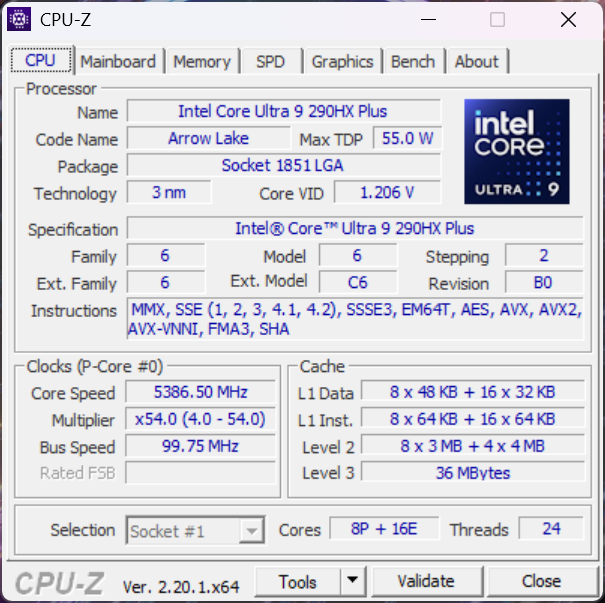
Nasza jednostka testowa to najwyższej klasy konfiguracja z procesorem Arrow Lake Core Ultra 9 290HX Plus i 175 W GeForce RTX 5090 GPU za około 4400 USD. Wszystkie jednostki SKU są obecnie dostarczane z tym samym procesorem i błyszczącym wyświetlaczem OLED QHD + 240 Hz, ale mogą zaczynać się od GeForce RTX 5070 Ti.
Konkurenci obejmują inne wysokiej klasy lub flagowe 16-calowe laptopy do gier, takie jak Dell Alienware 16 Area-51, Asus Zephyrus Duolub Razer Blade 16.
Więcej recenzji MSI:
Specyfikacje
Sprawa
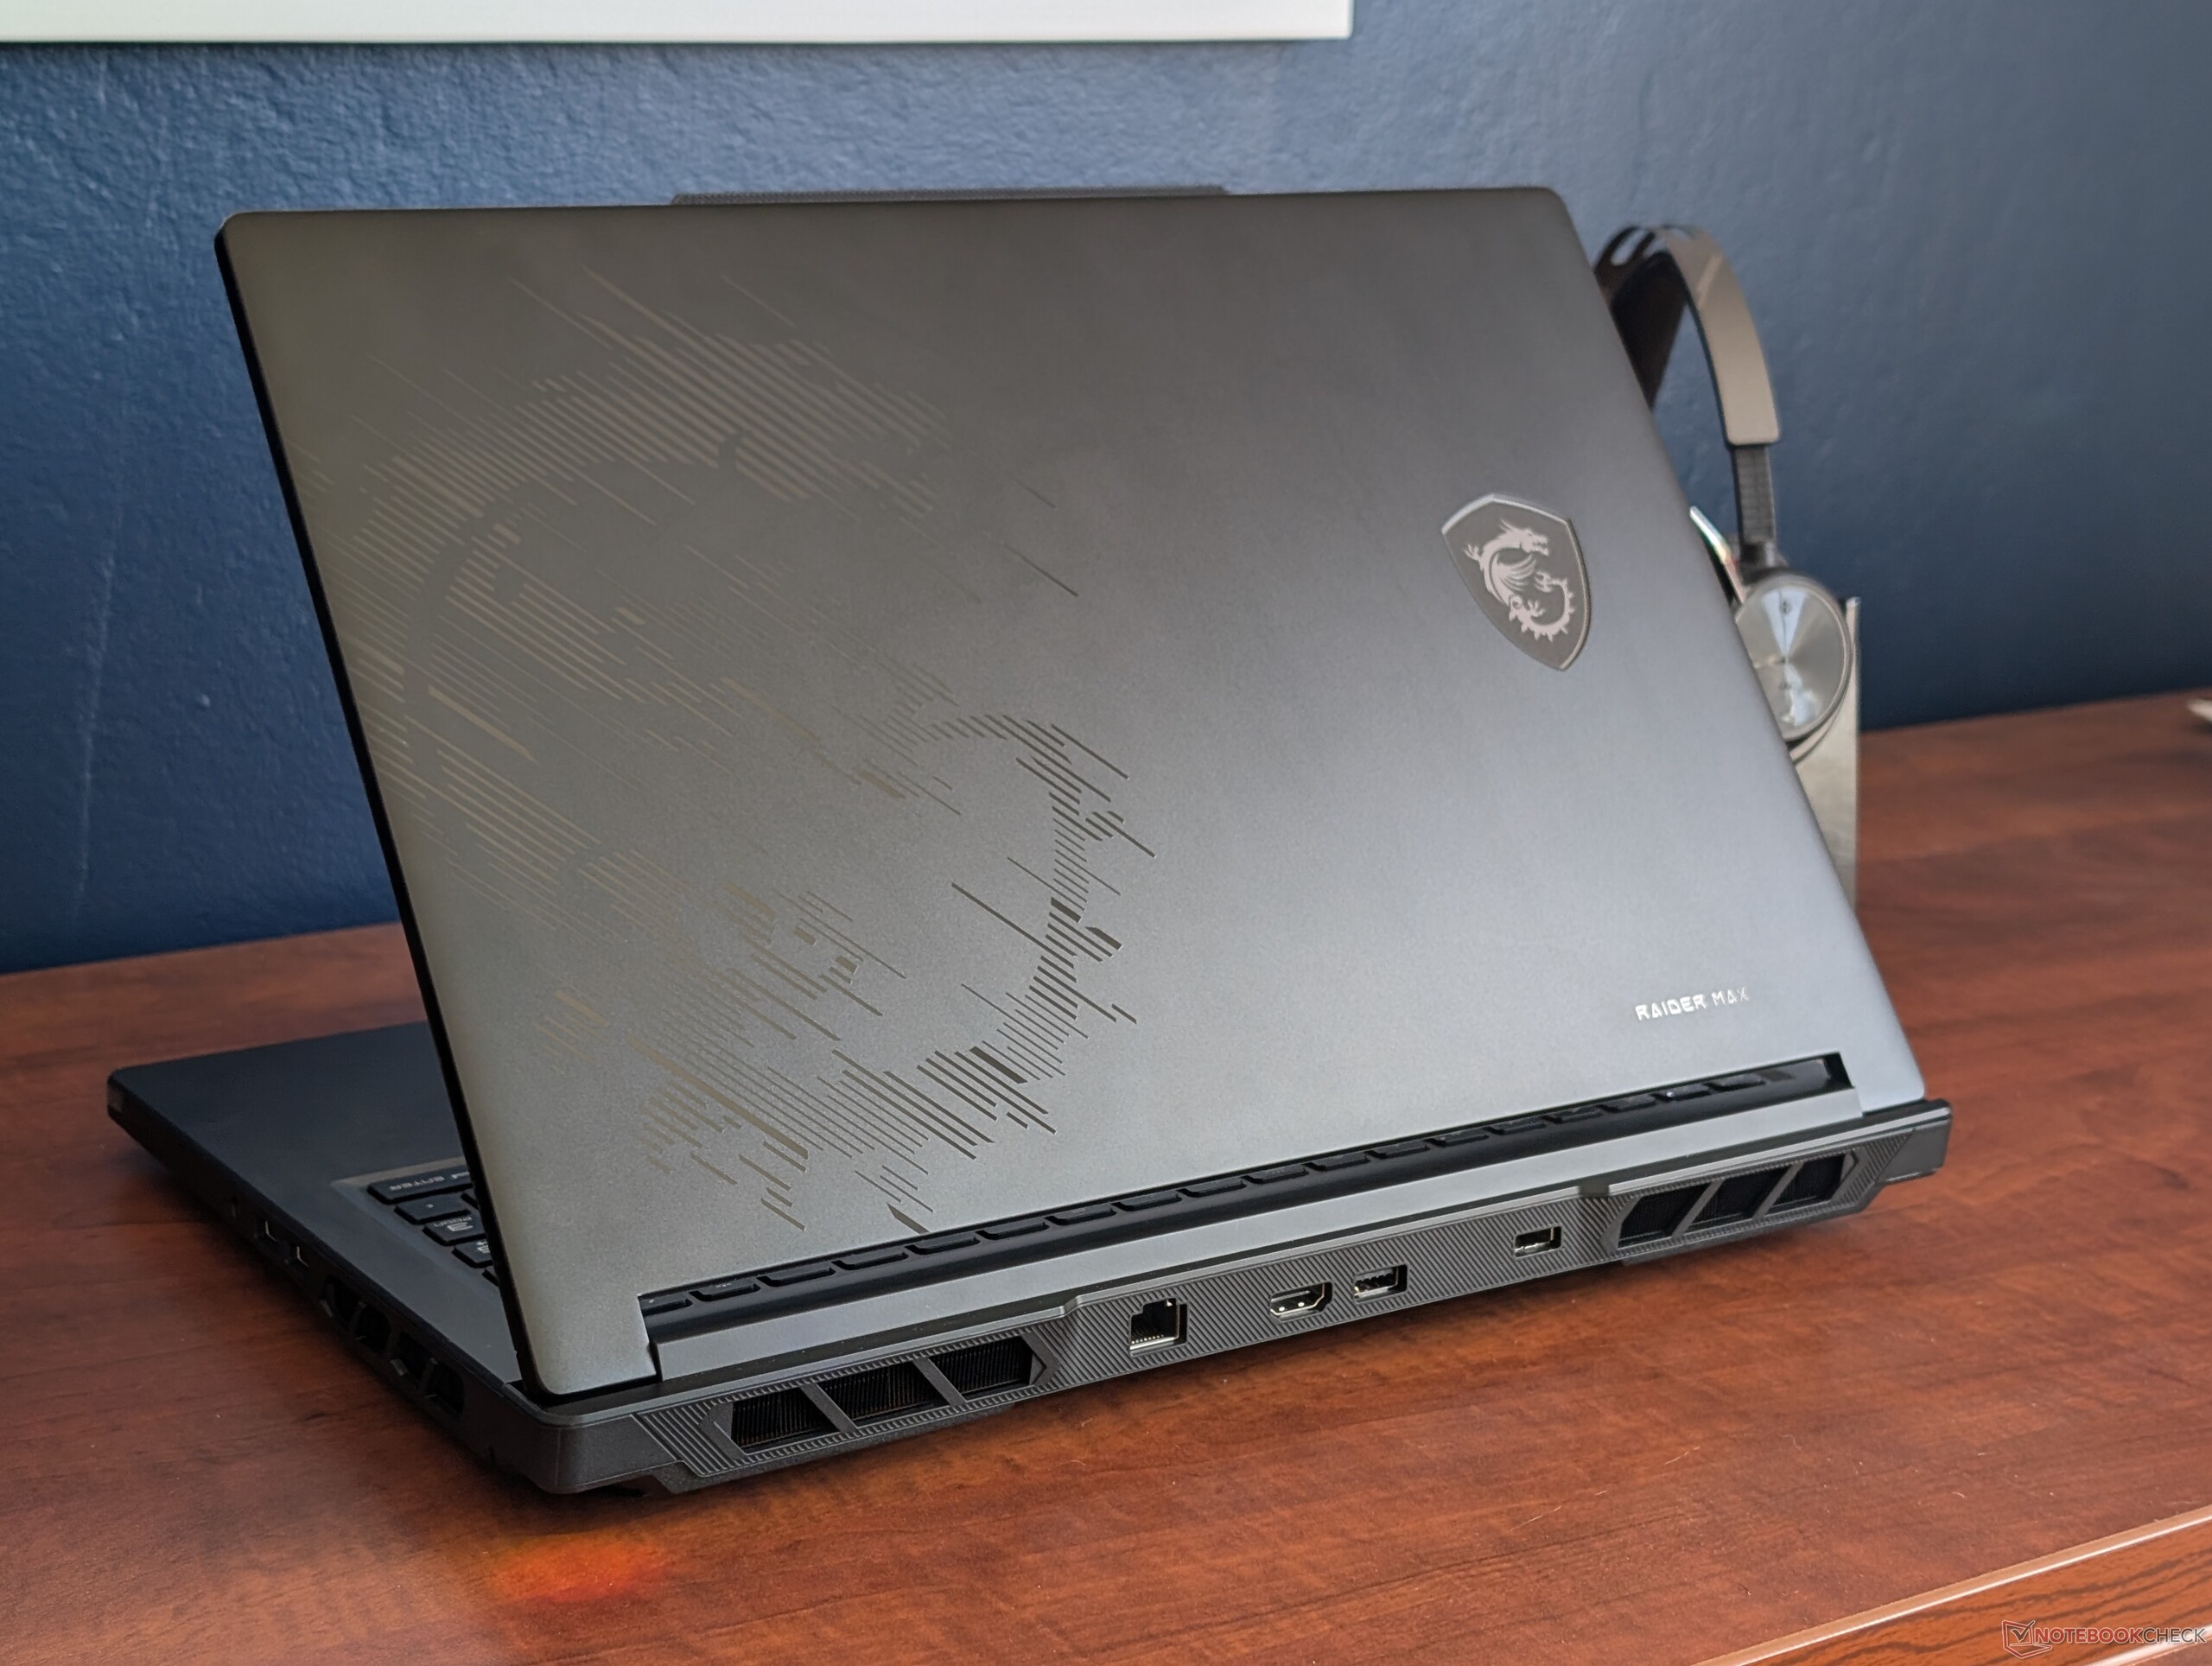
Zewnętrzna pokrywa to gładki, matowy metal, podczas gdy podstawa jest w dużej mierze plastikowa. Choć w żadnym wypadku nie jest to straszne, powierzchnie wyginają się i nie są tak sztywne, jak w przypadku konkurencyjnych modeli, takich jak Alienware 16 Area-51 lub Razer Blade 16. Spodziewaliśmy się mocniejszej lub bardziej premium konstrukcji obudowy, biorąc pod uwagę wysoką cenę wywoławczą.
Łączność
Opcje portów są identyczne jak w modelu Raider 18 HX, aczkolwiek zmieniono ich rozmieszczenie.


Czytnik kart SD
| SD Card Reader | |
| average JPG Copy Test (av. of 3 runs) | |
| MSI Raider 16 Max HX B2WJ (Toshiba Exceria Pro SDXC 64 GB UHS-II) | |
| Razer Blade 16 Core Ultra 9 386H (Toshiba Exceria Pro SDXC 64 GB UHS-II) | |
| Lenovo Legion 7 16IAX10 (Toshiba Exceria Pro SDXC 64 GB UHS-II) | |
| maximum AS SSD Seq Read Test (1GB) | |
| Lenovo Legion 7 16IAX10 (Toshiba Exceria Pro SDXC 64 GB UHS-II) | |
| Razer Blade 16 Core Ultra 9 386H (Toshiba Exceria Pro SDXC 64 GB UHS-II) | |
| MSI Raider 16 Max HX B2WJ (Toshiba Exceria Pro SDXC 64 GB UHS-II) | |
Komunikacja
Kamera internetowa
kamera internetowa 2 MP z podczerwienią i fizyczną migawką to standard.


Konserwacja
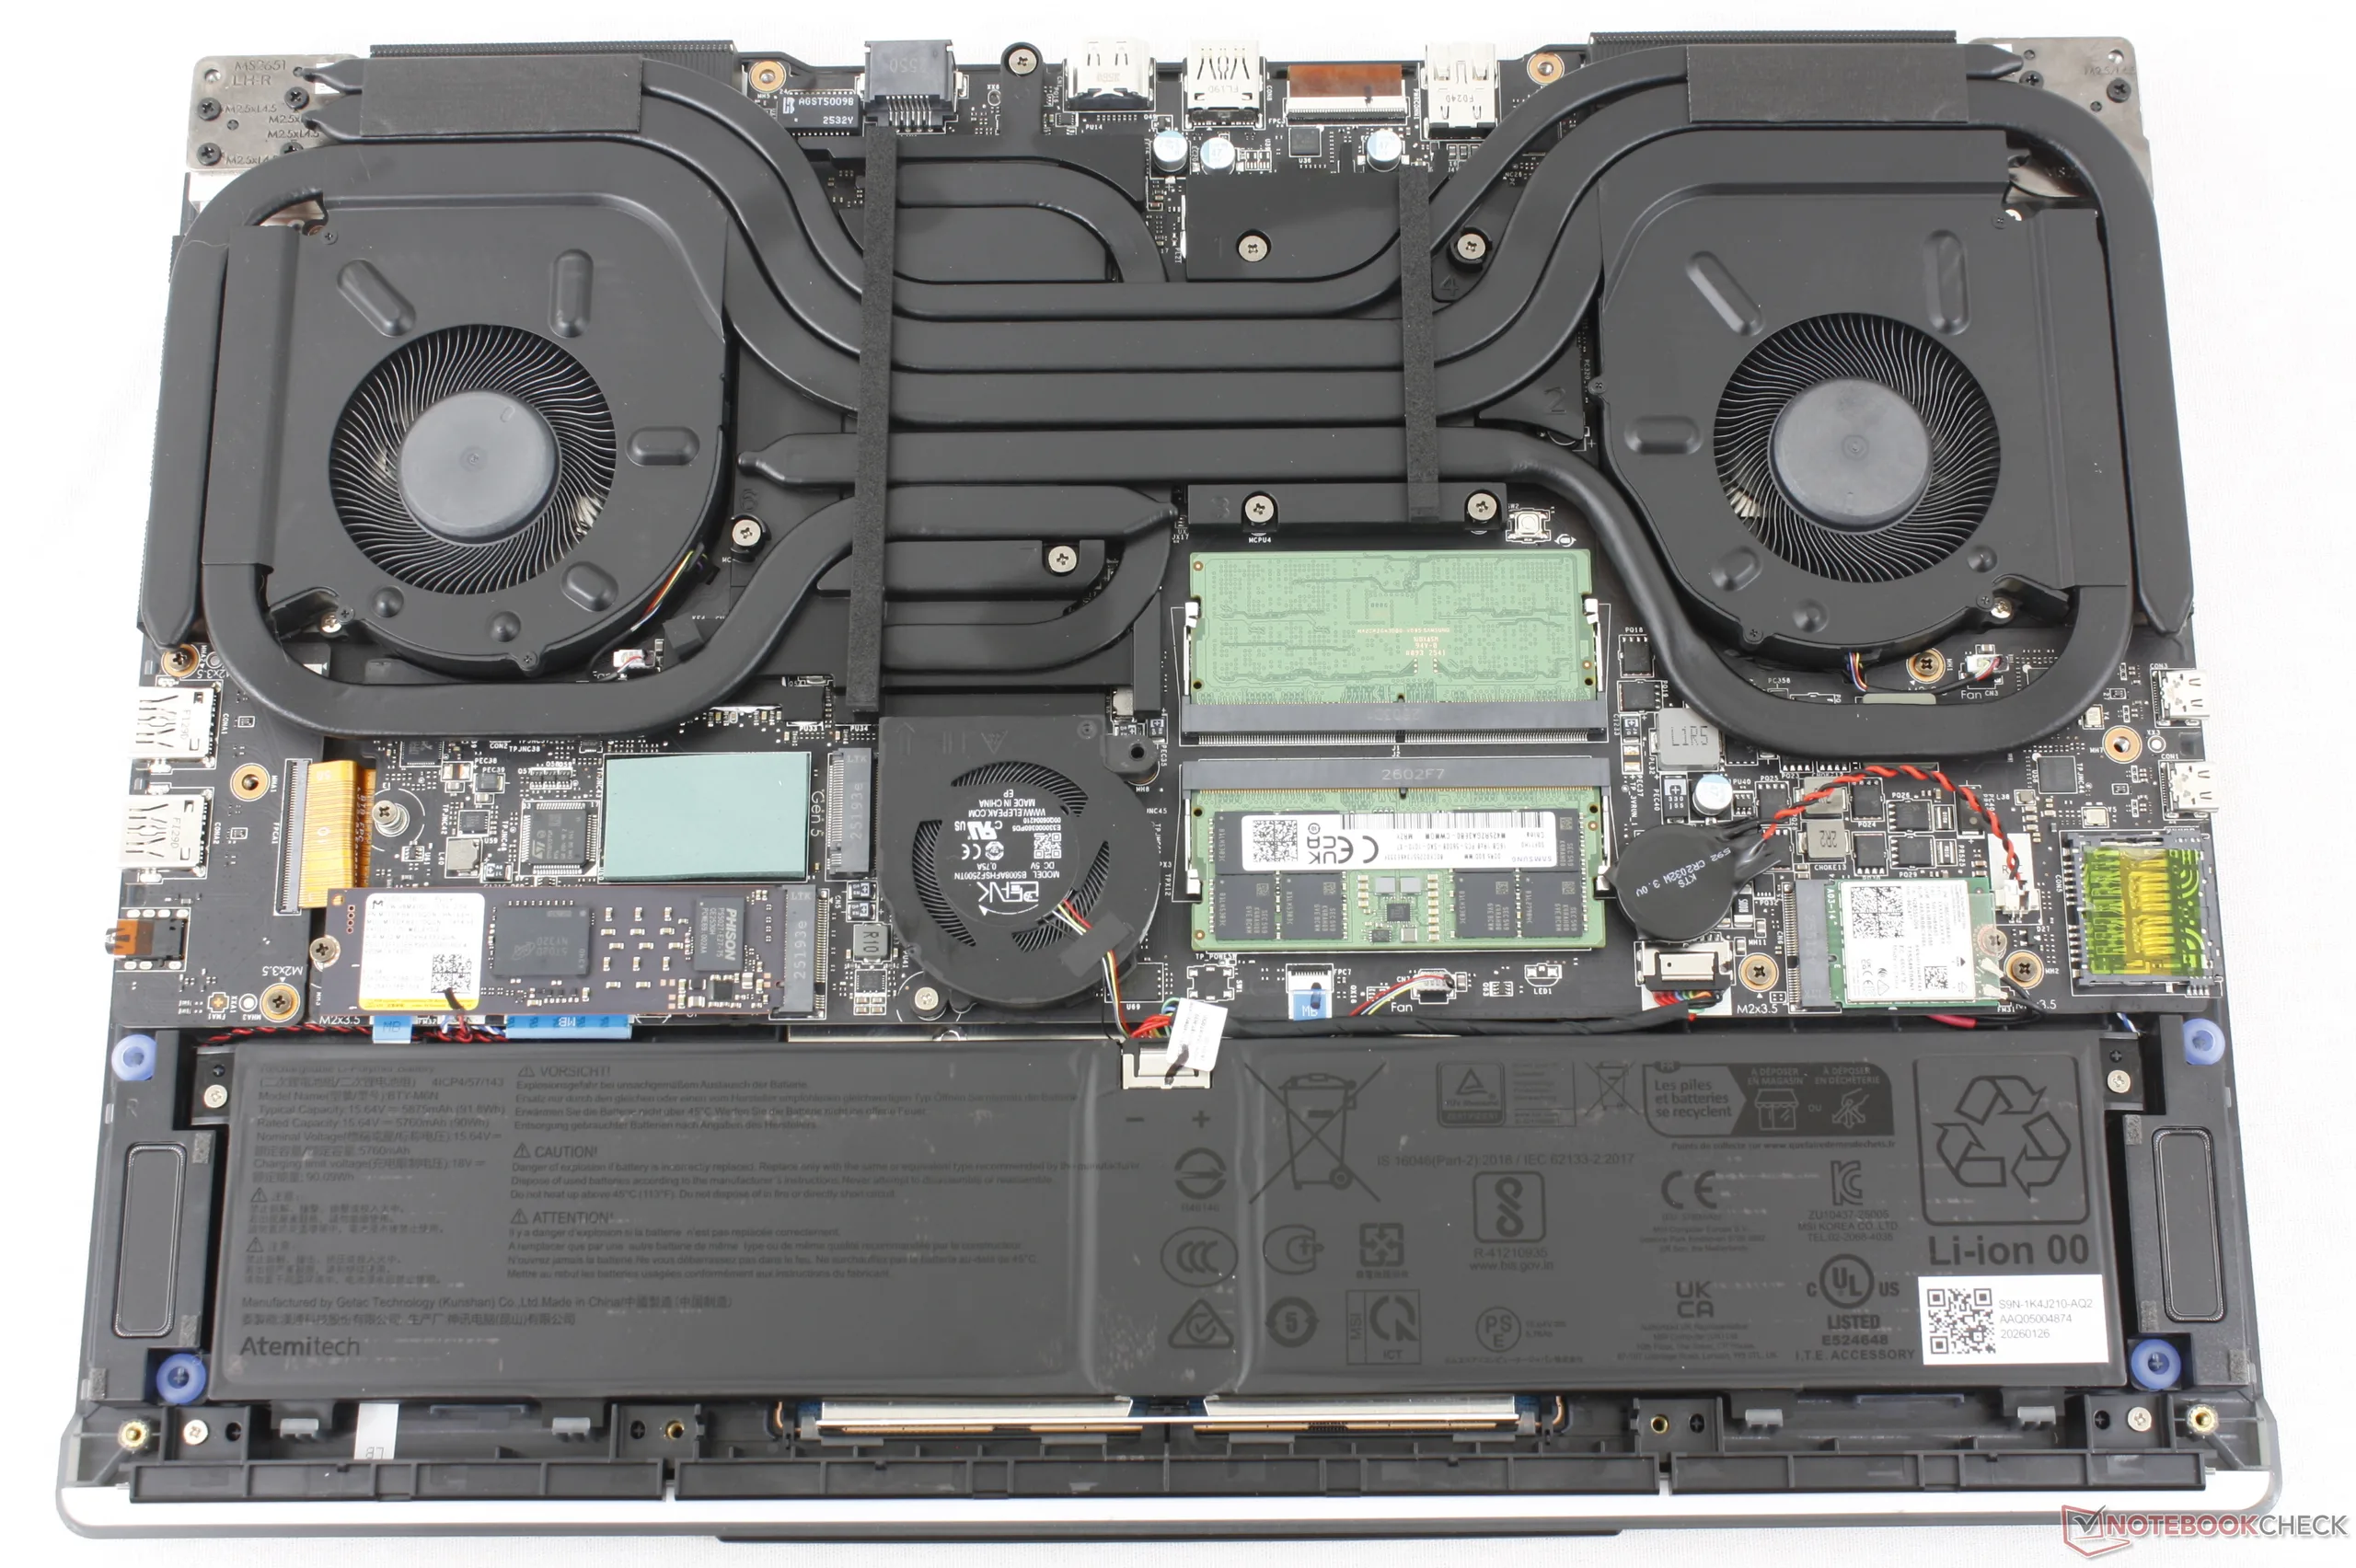
Dolny panel zawiera subpanel ułatwiający dostęp do dwóch slotów M.2 2280 SSD (jeden PCIe5 i jeden PCIe4) oraz dwóch slotów DDR5 SODIMM. Poza tym, cały dolny panel można stosunkowo łatwo zdemontować za pomocą standardowego śrubokręta krzyżakowego.
Zrównoważony rozwój
MSI nie wspomina o materiałach pochodzących z recyklingu użytych podczas produkcji Raider 16 Max HX. Opakowanie nie zawiera plastiku.
Akcesoria i gwarancja
W pudełku nie ma żadnych dodatków poza zasilaczem sieciowym i dokumentacją. W przypadku zakupu w Stanach Zjednoczonych obowiązuje zwykła roczna ograniczona gwarancja producenta.
Urządzenia wejściowe
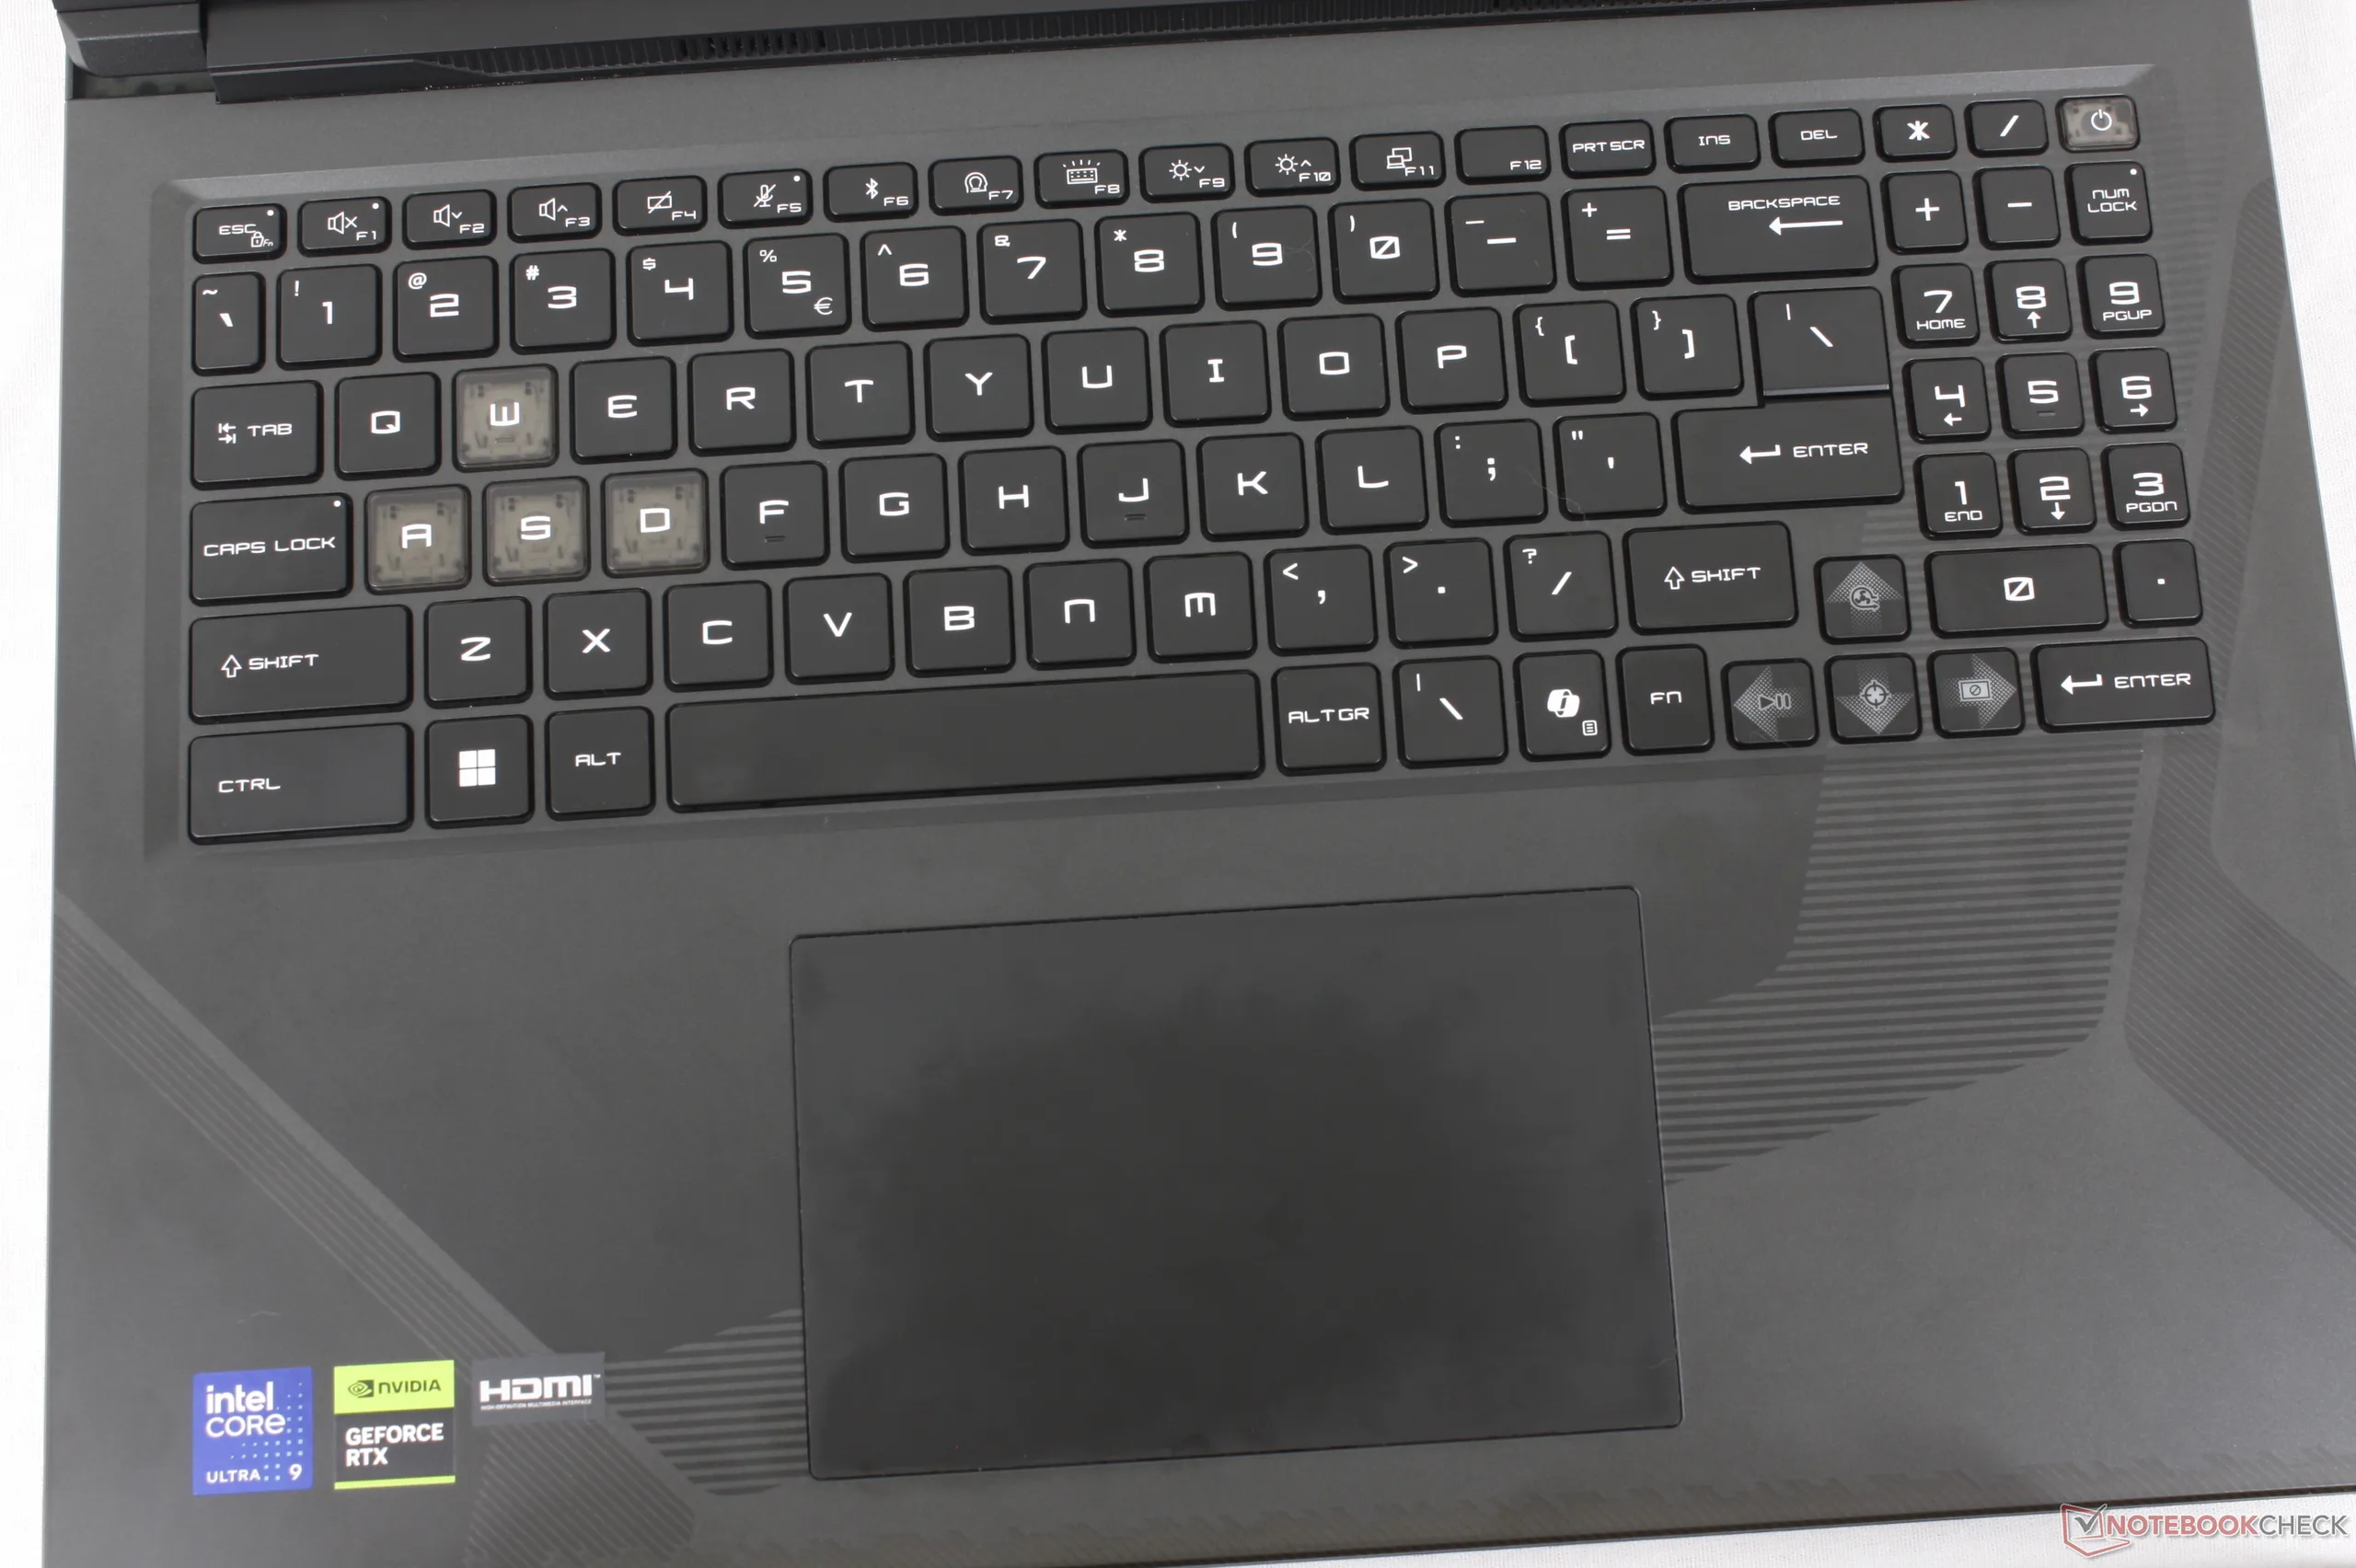
Klawiatura i clickpad w Raider 16 Max HX są identyczne z tym, co jest dostępne w Crosshair 16 HX, mimo że ten ostatni jest niższym modelem do gier od MSI. W Raiderze klawisze mają jednak podświetlenie RGB dla każdego klawisza, co pozwala na większą personalizację przez użytkownika, podczas gdy Crosshair ma bardziej ograniczone strefy RGB.
Wyświetlacz

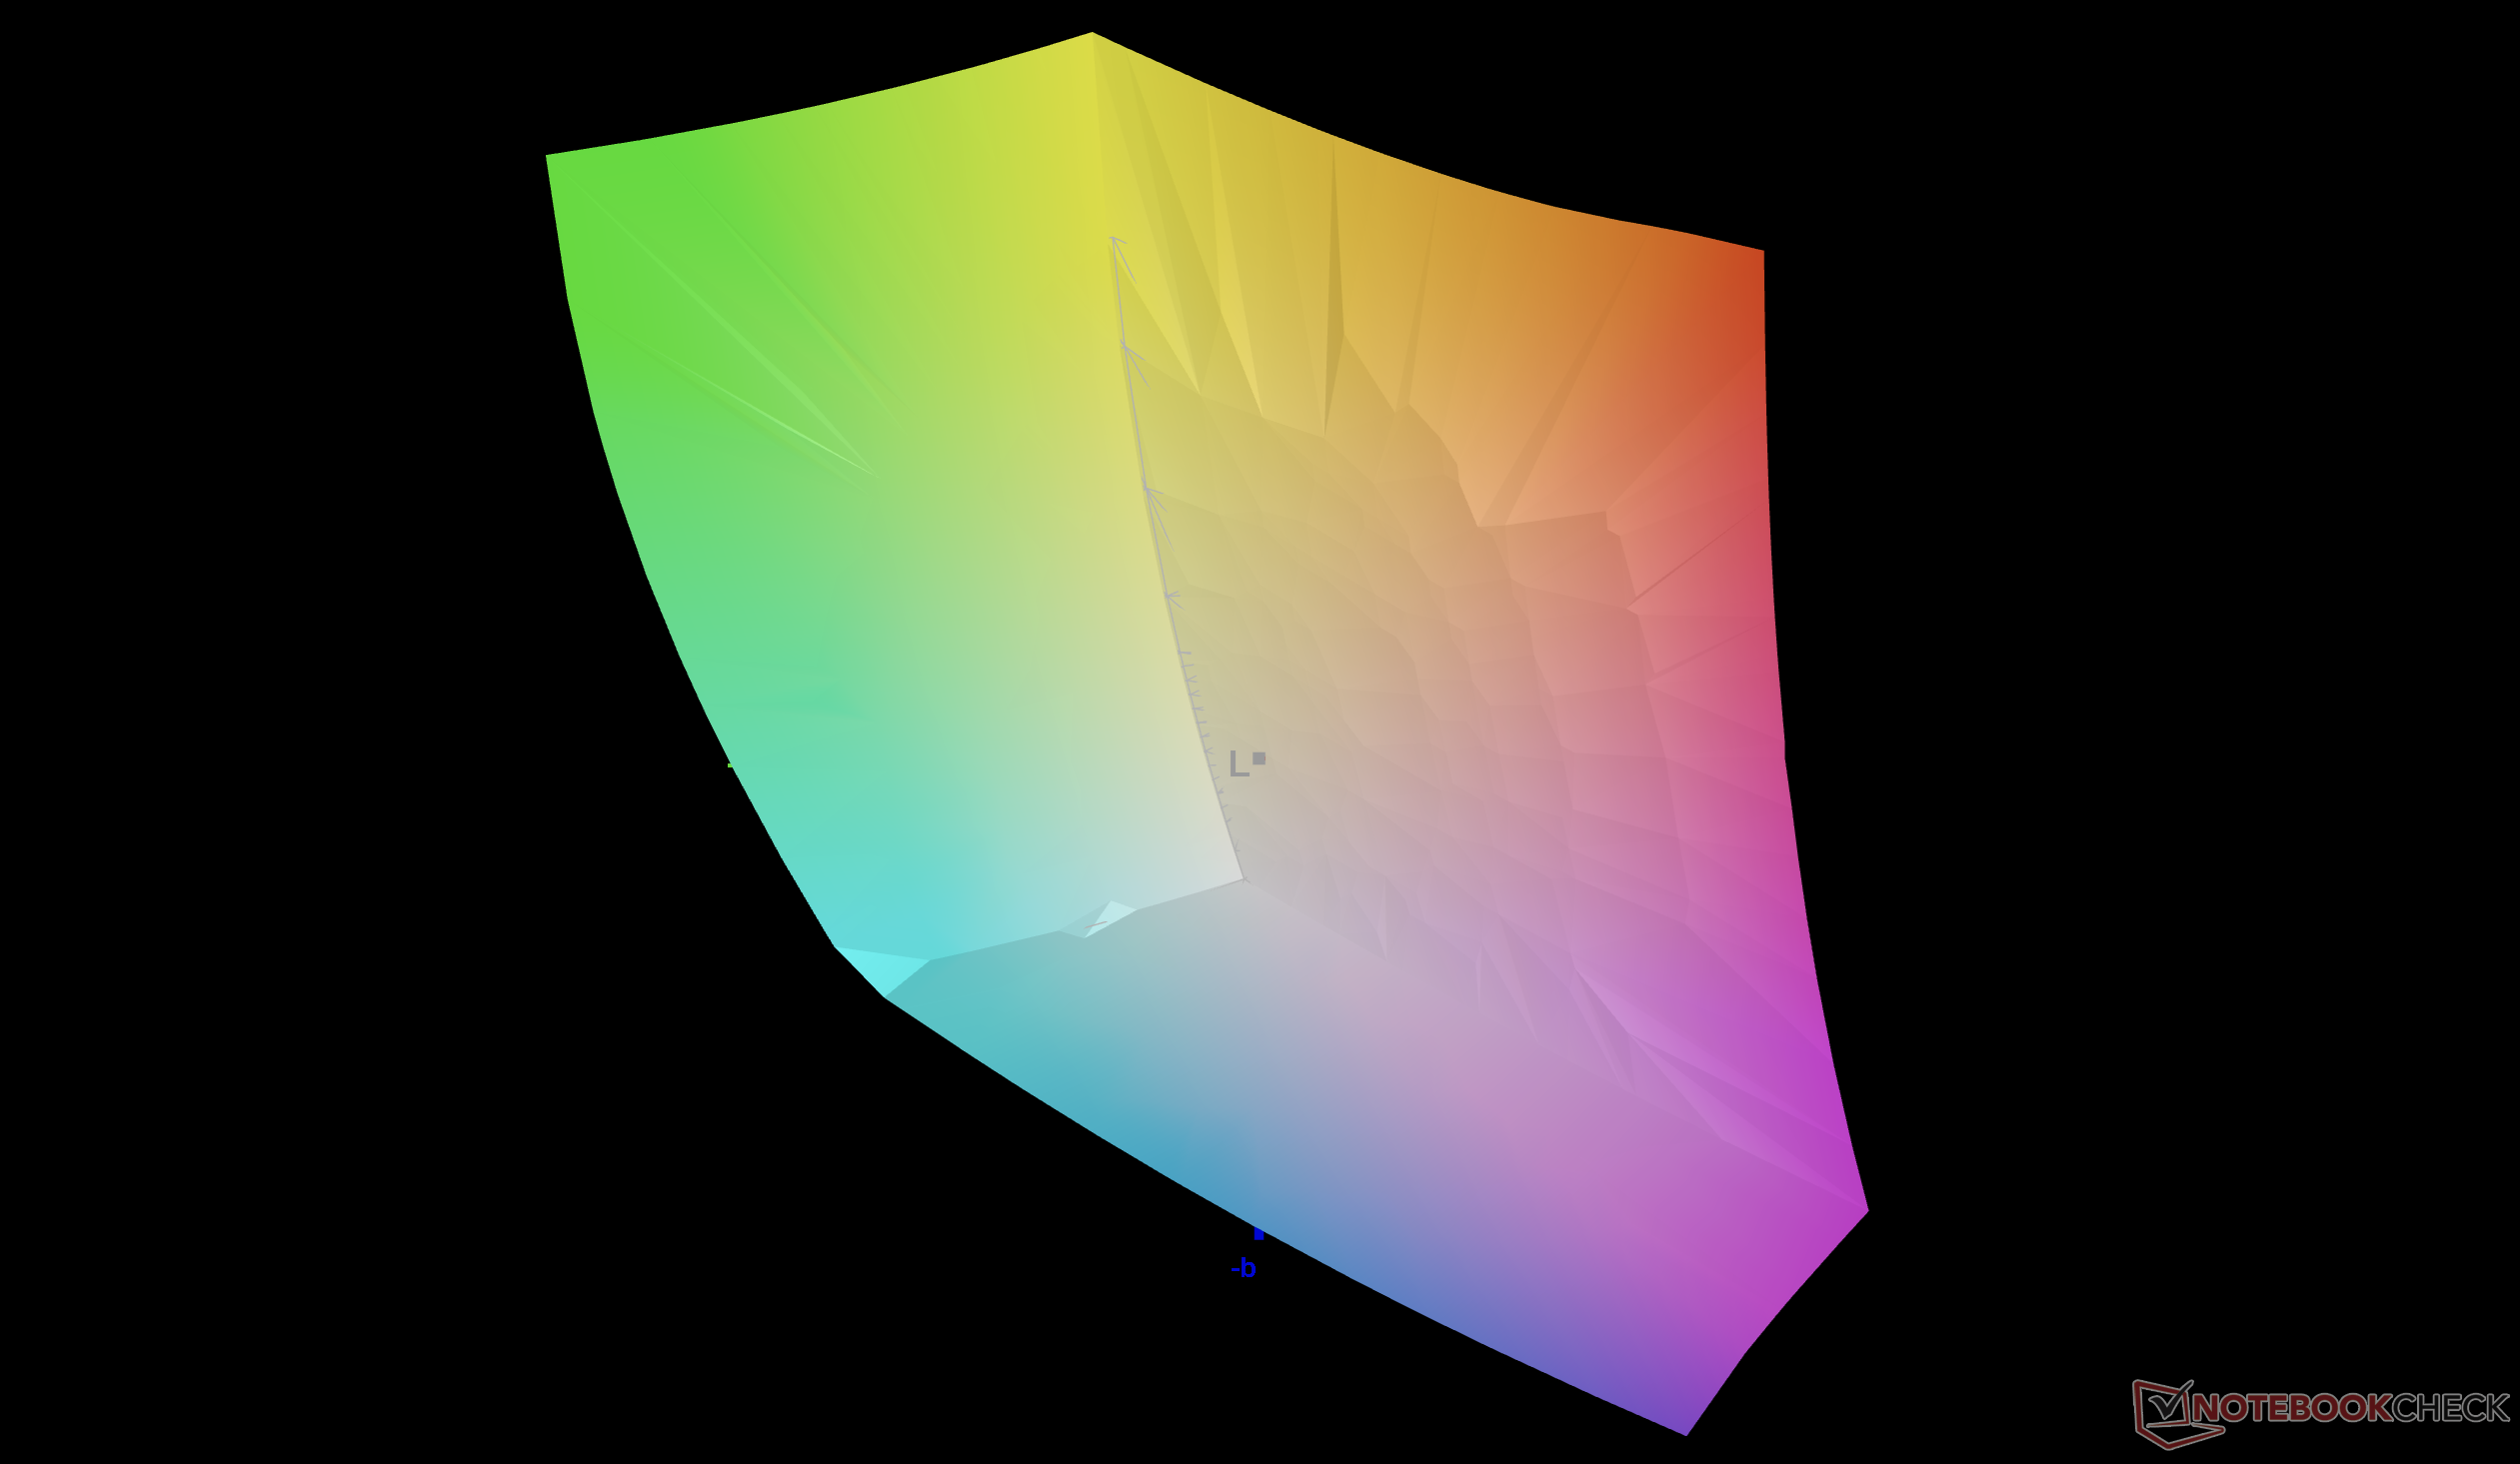
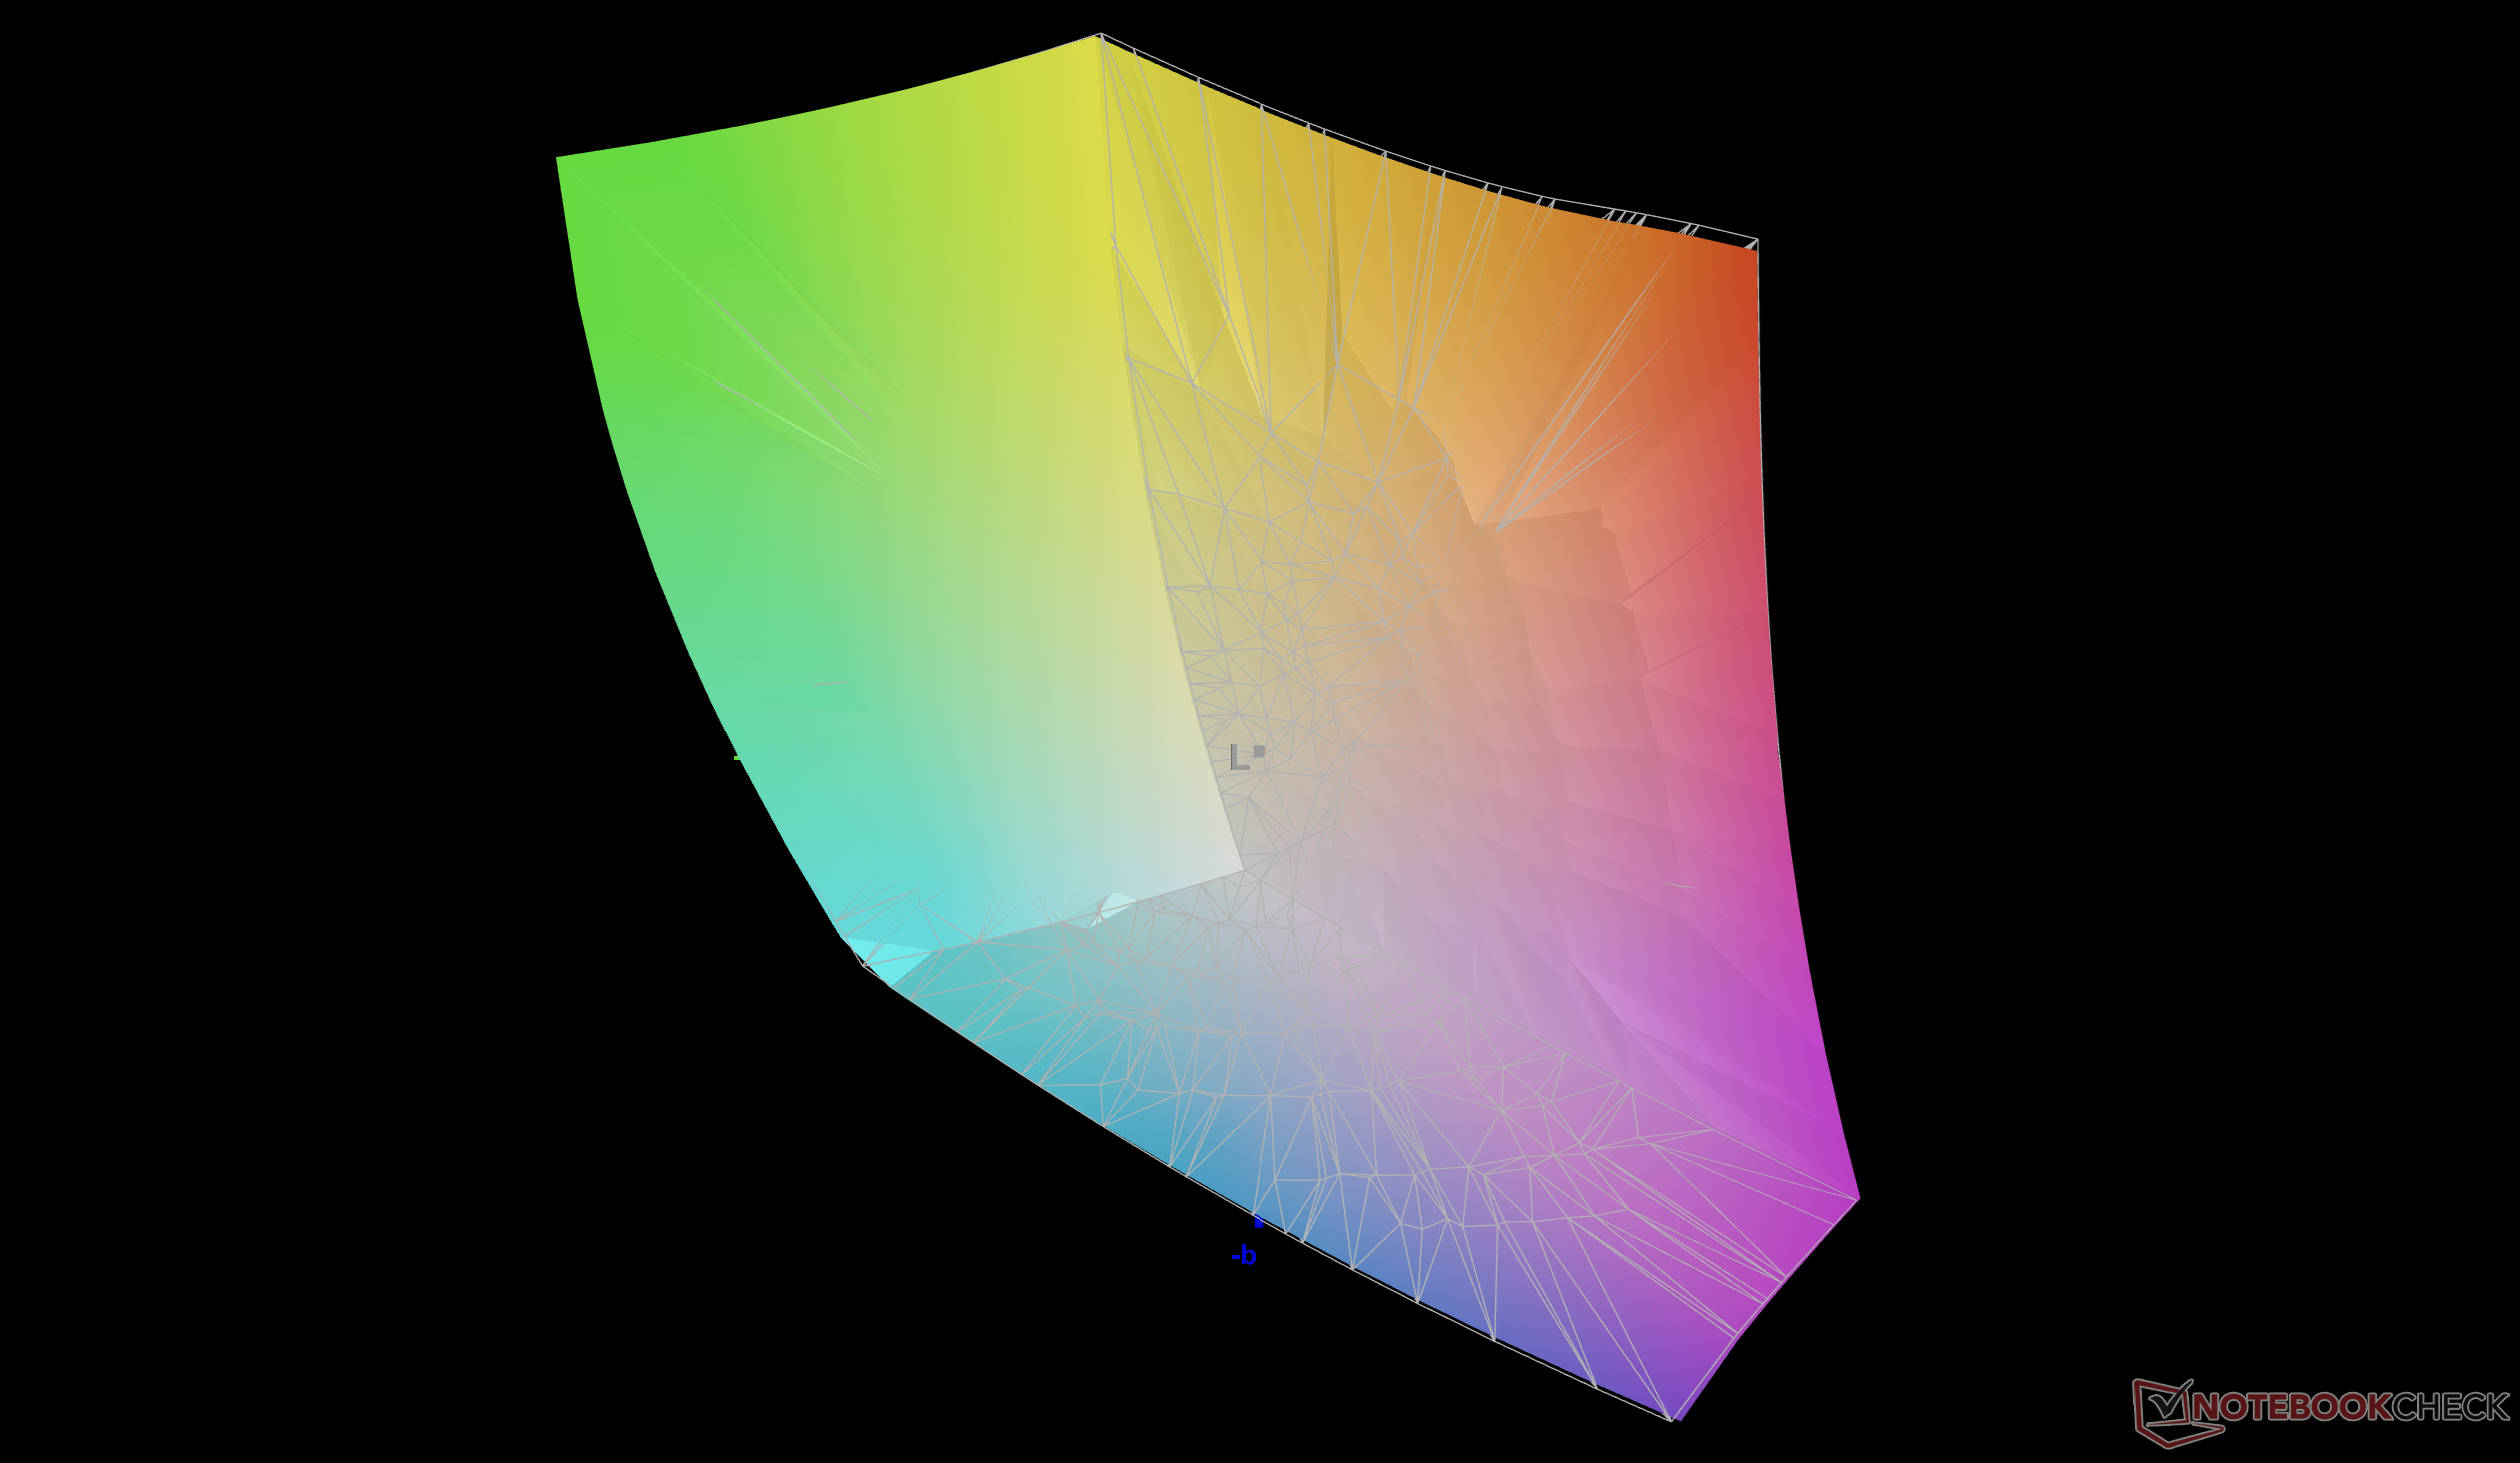
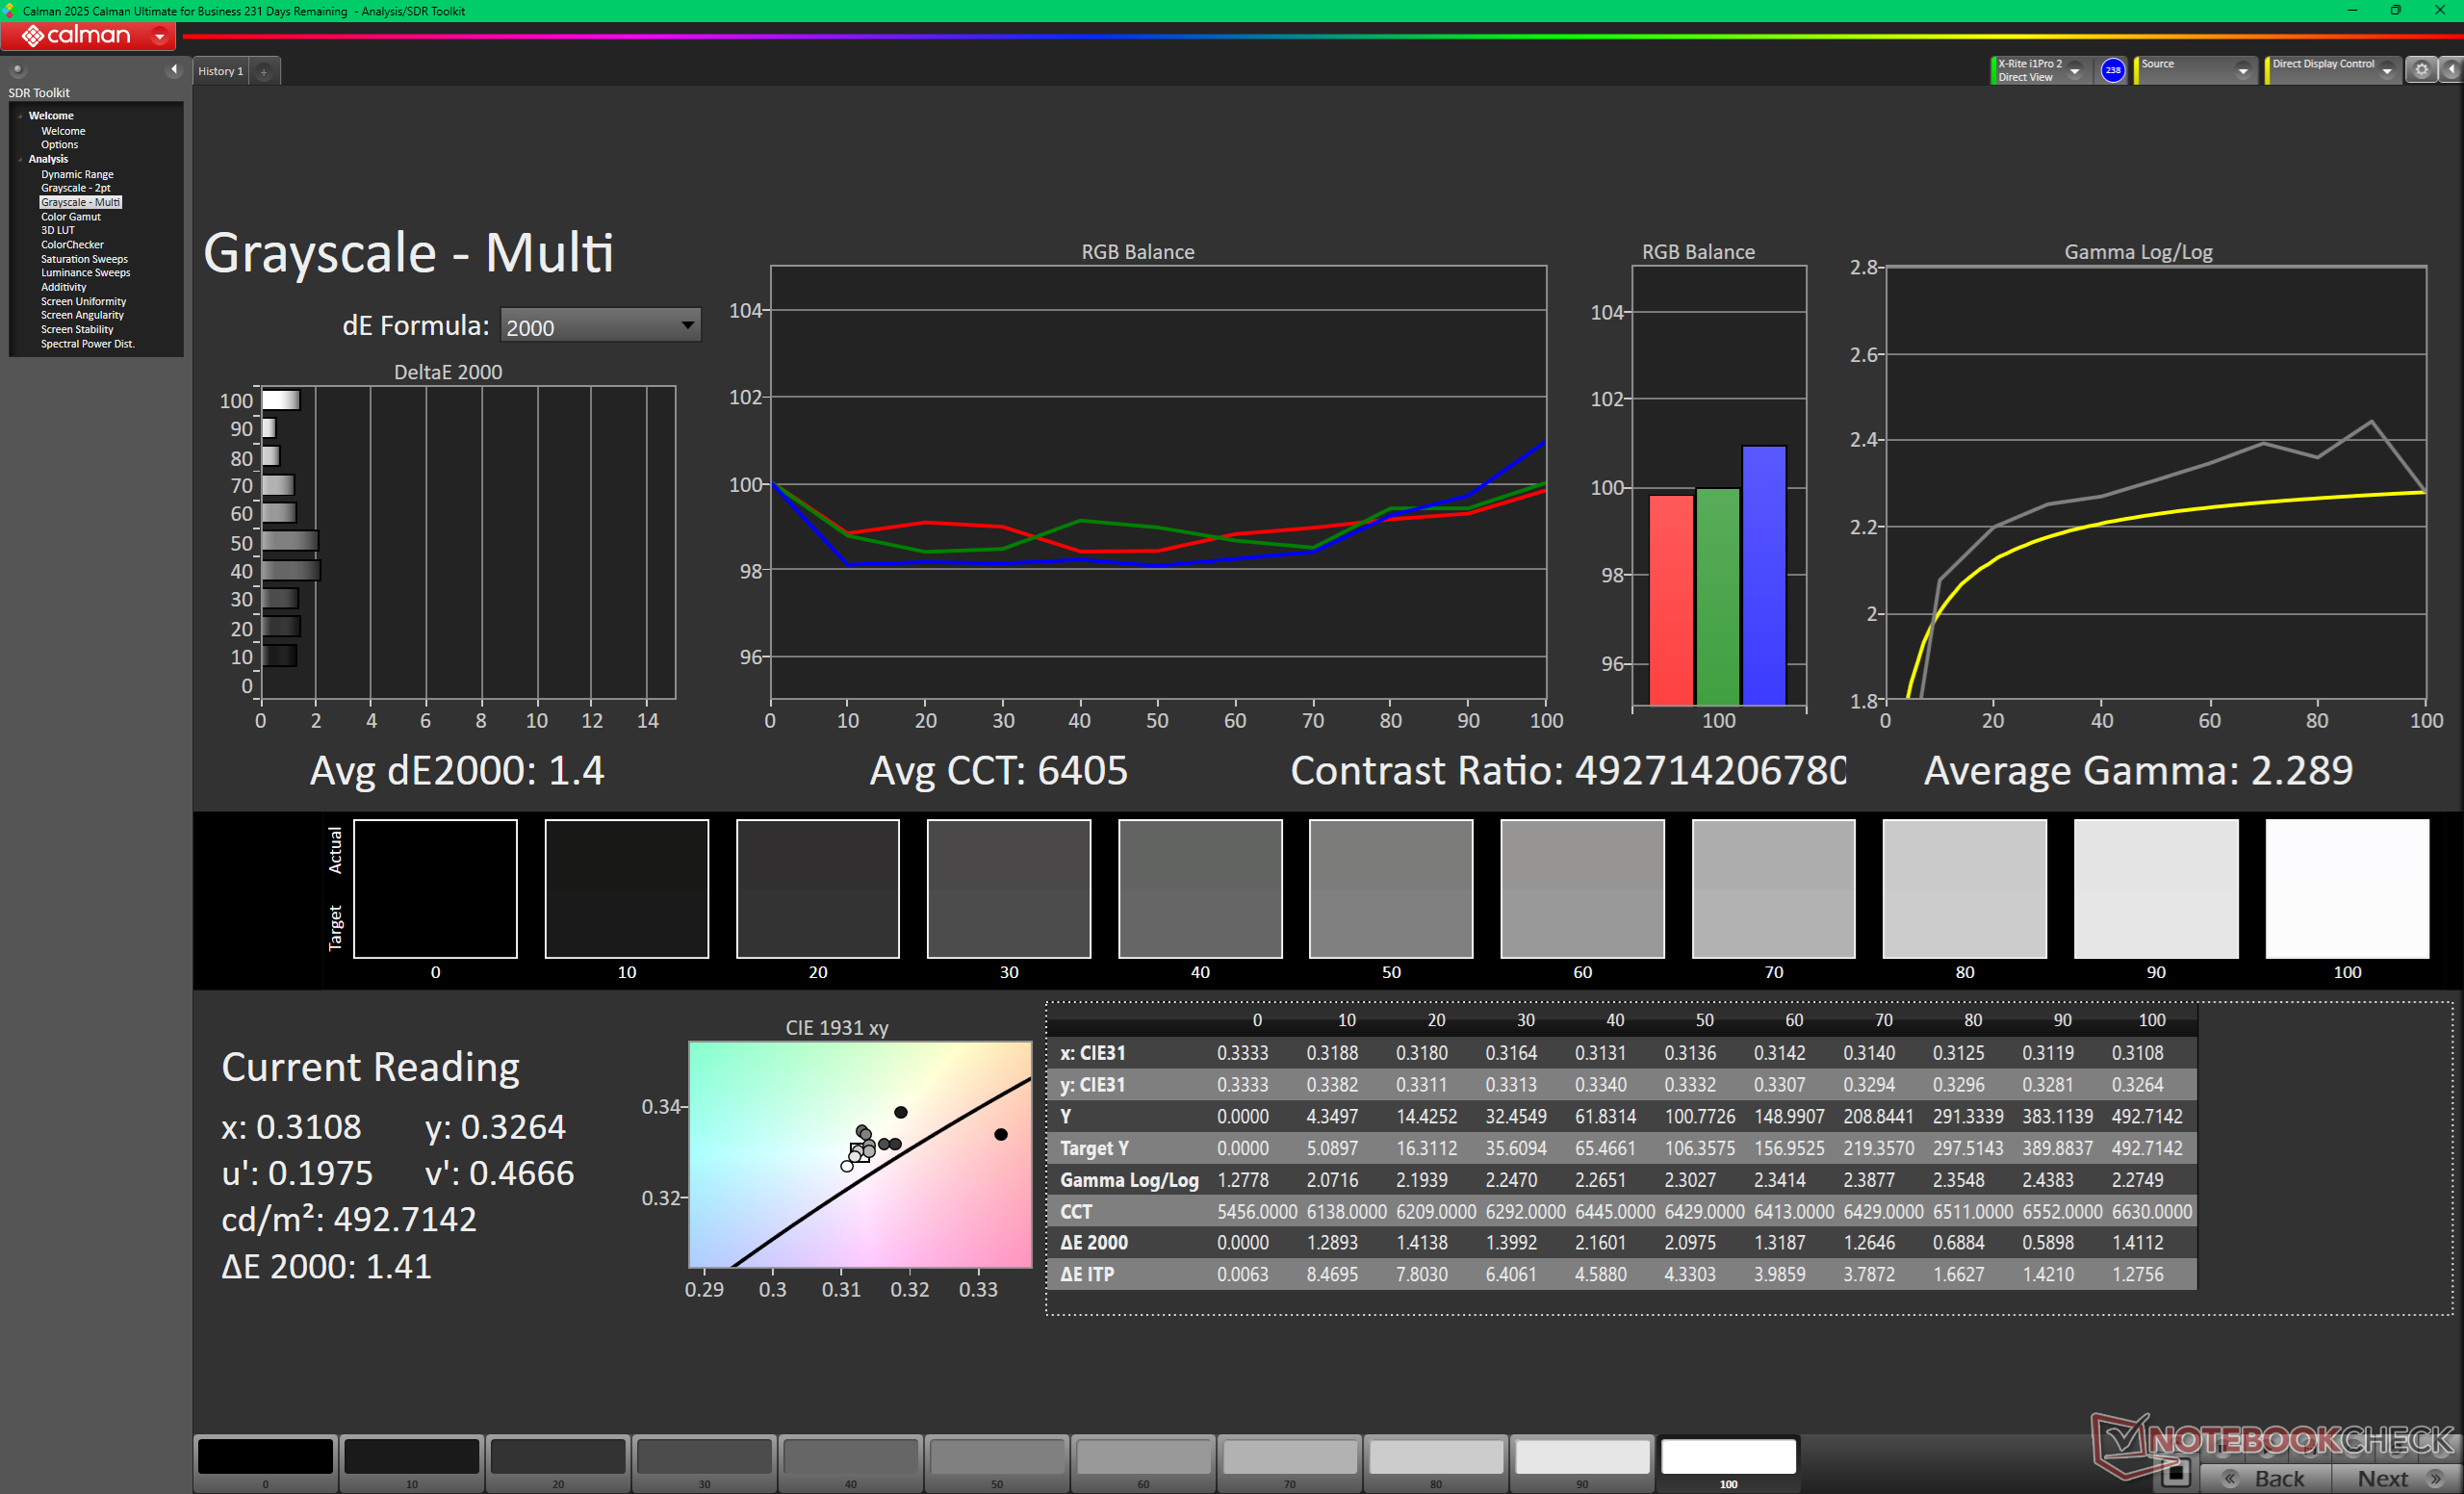
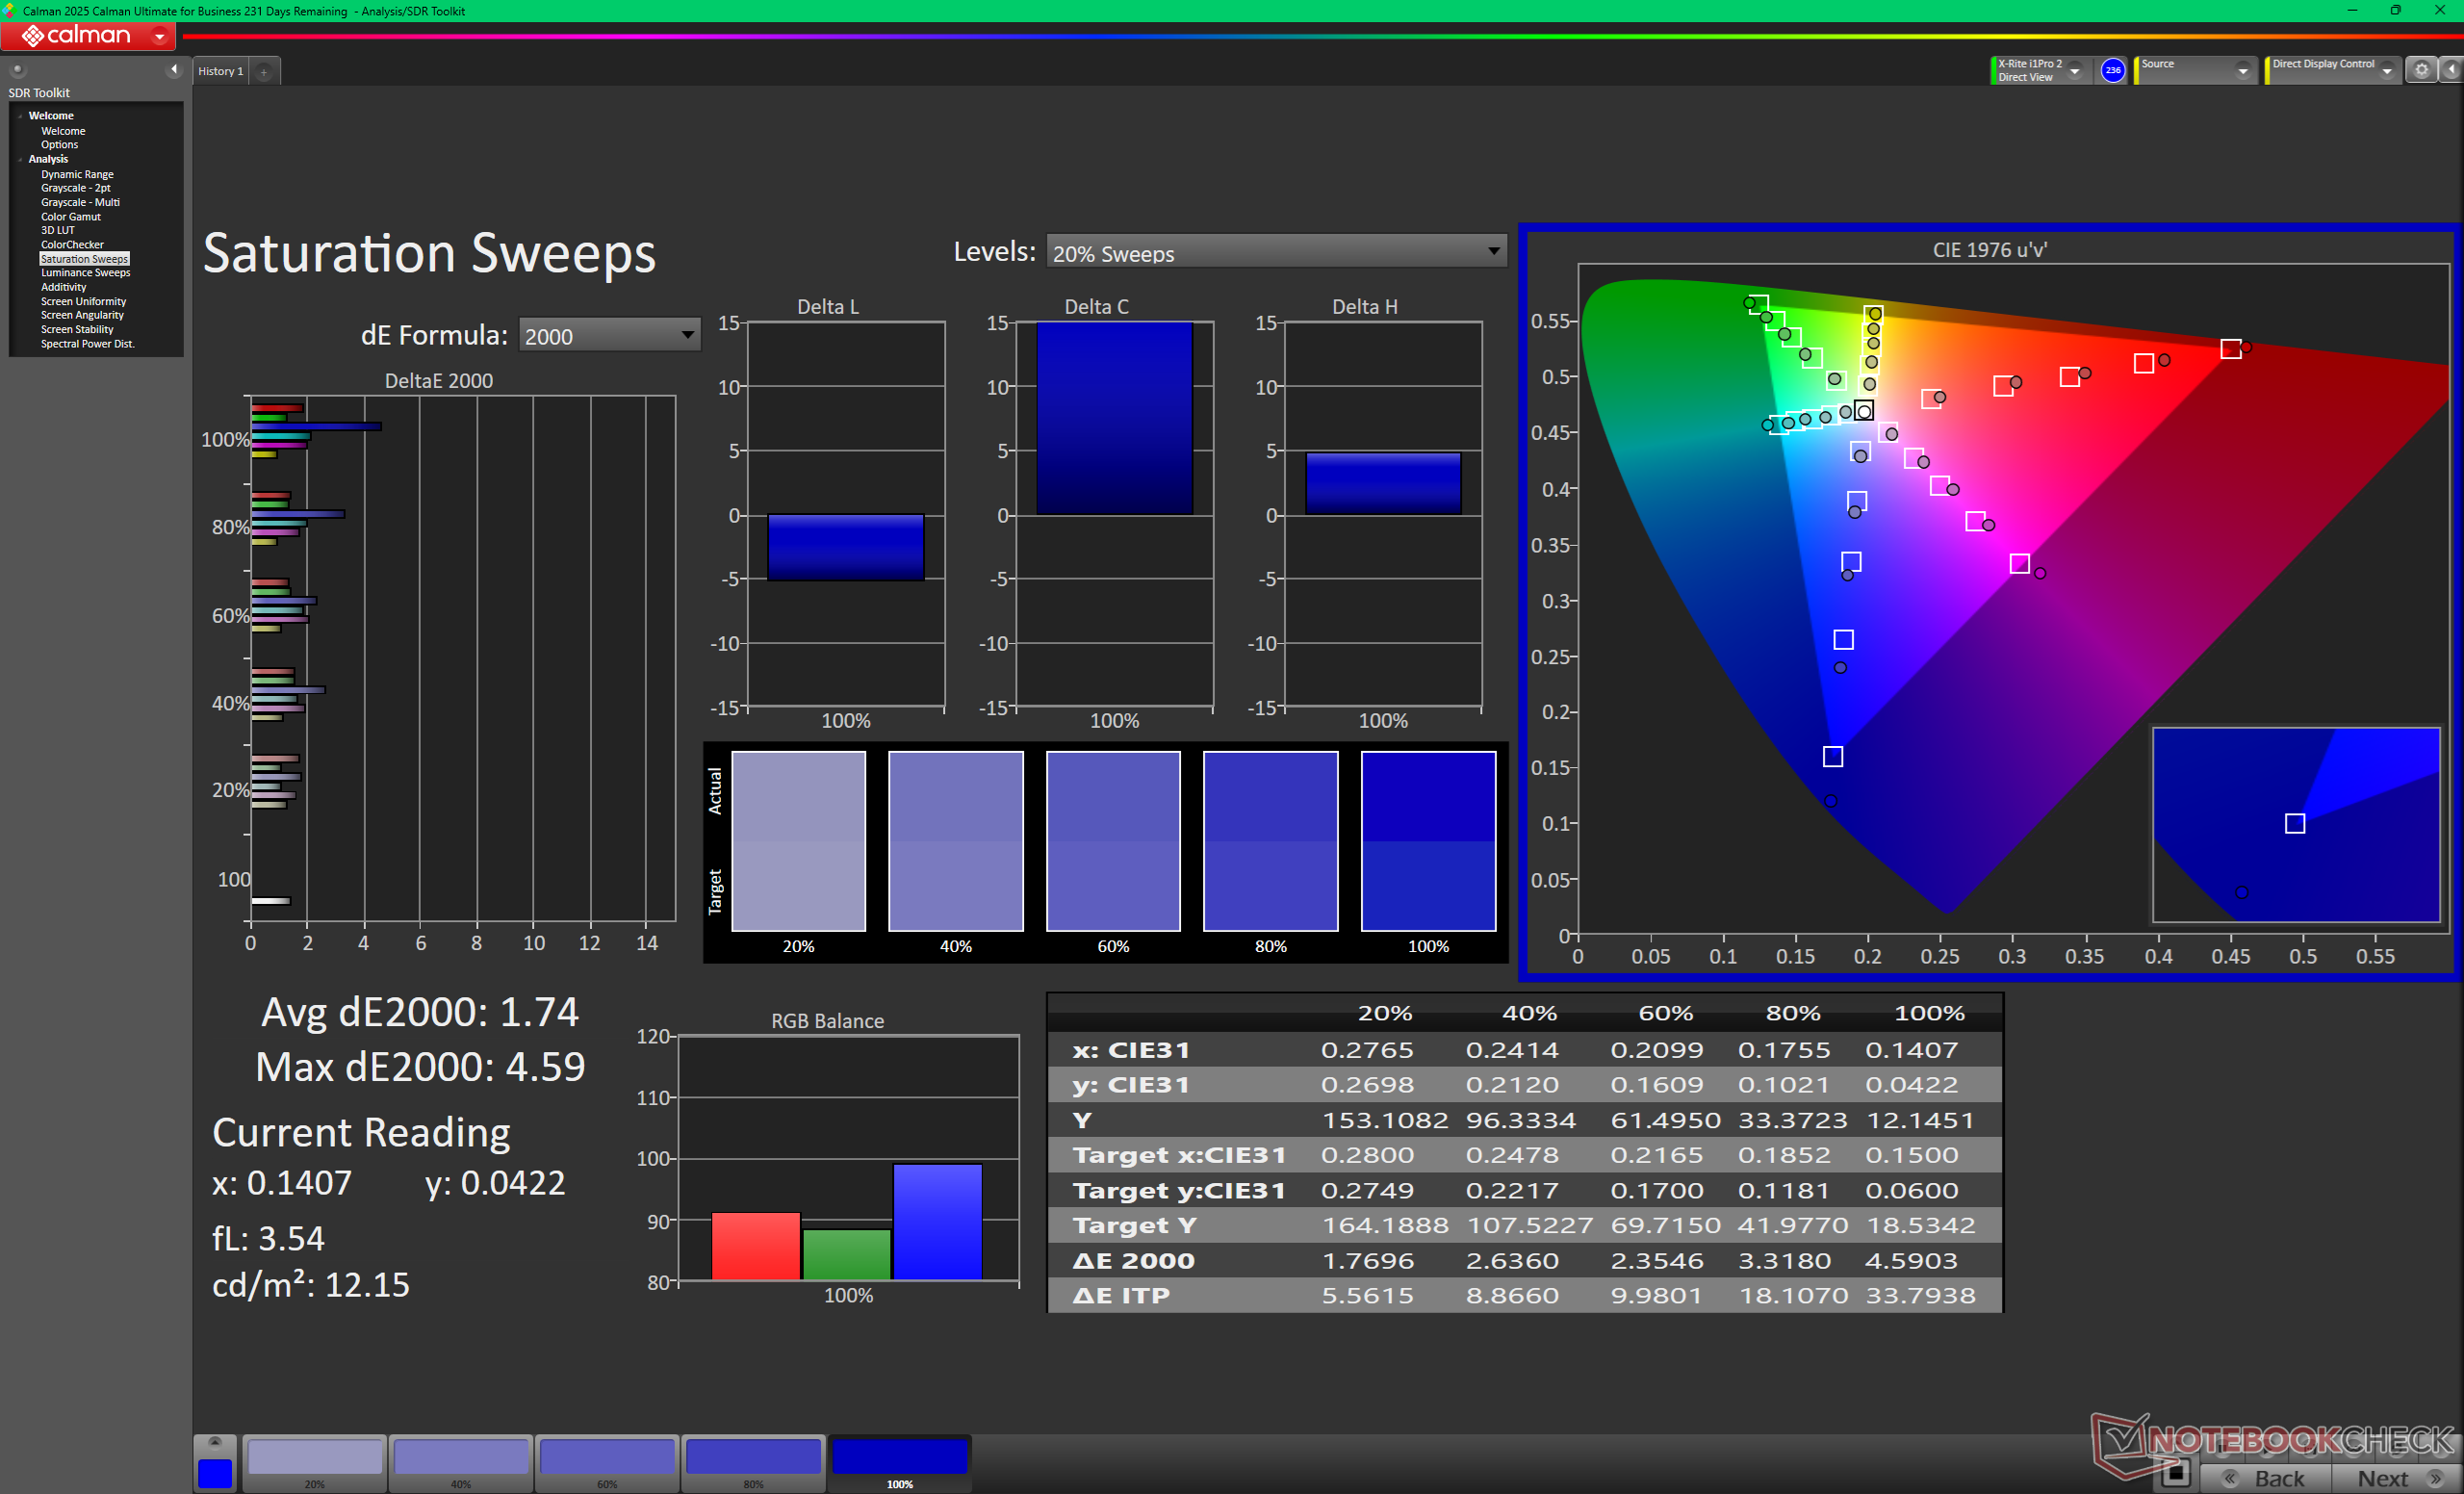
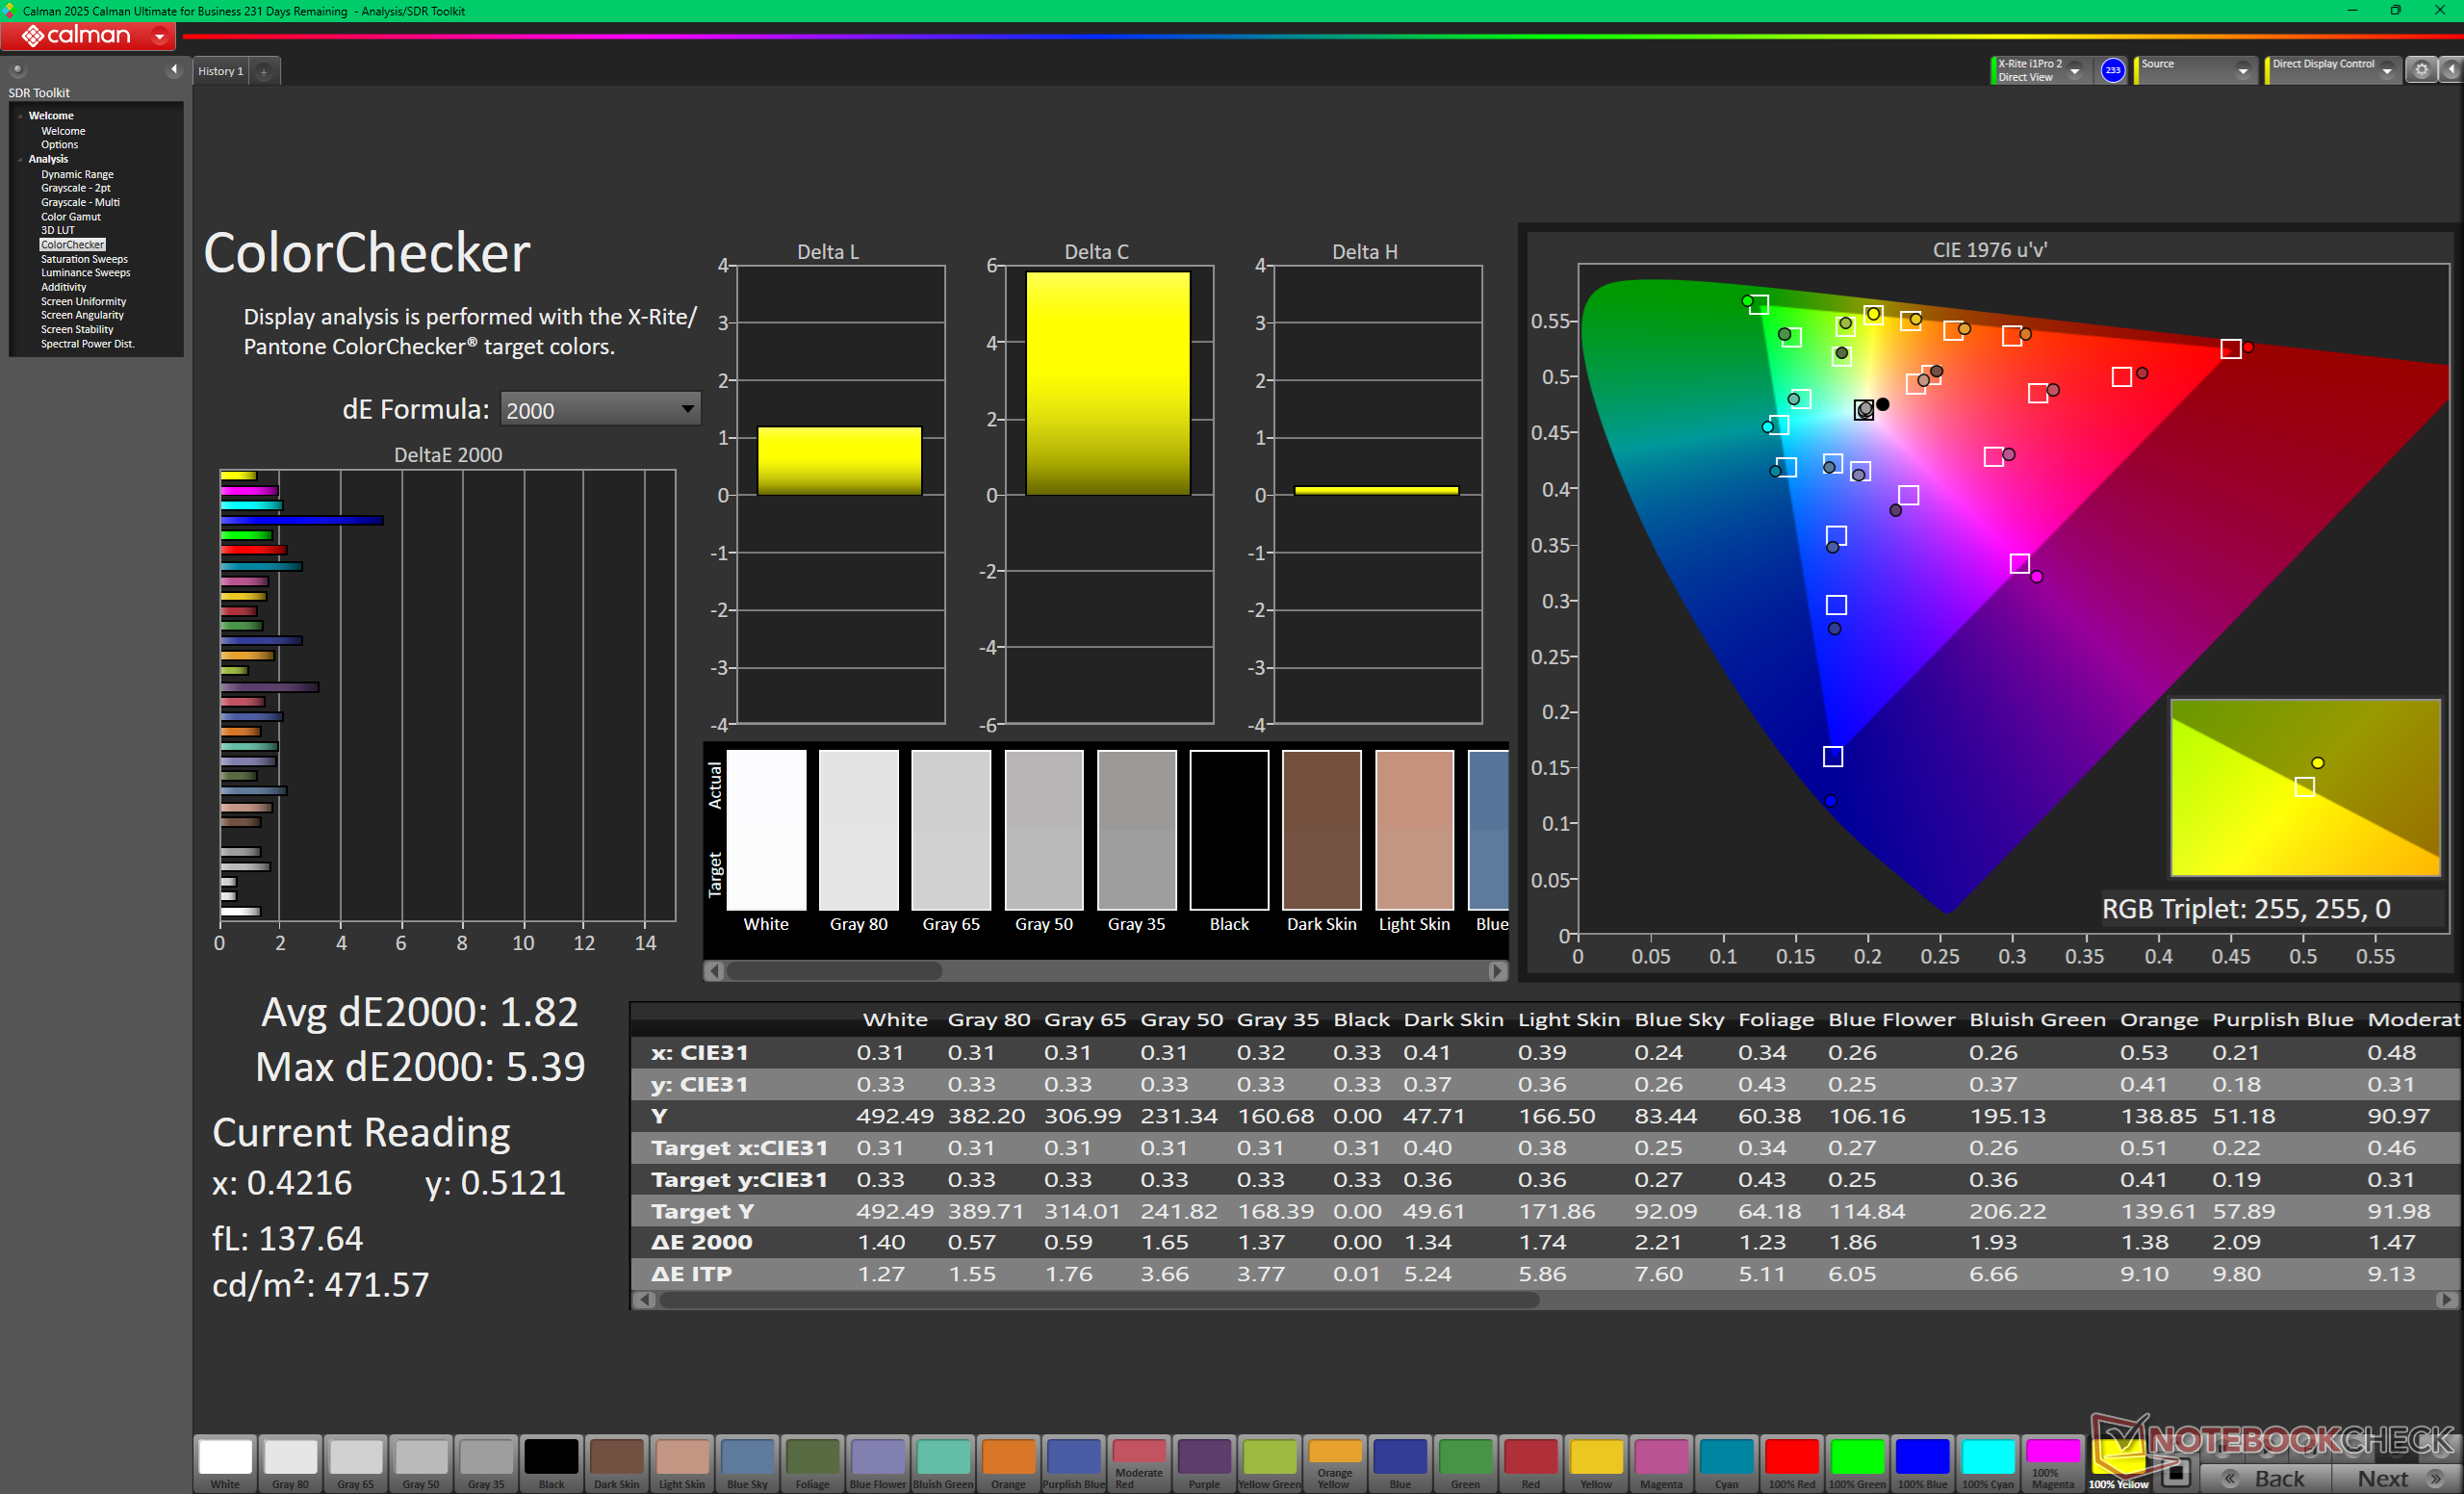
MSI zaczyna zwracać się w stronę OLED zamiast IPS lub Mini-LED w wielu swoich laptopach do gier. W przypadku Raider 16 Max HX, panel OLED 240 Hz QHD+ jest wyraźny z doskonałymi poziomami czerni, dokładnymi kolorami P3, obsługą DisplayHDR1000 i brakiem efektu "halo" powszechnie występującego w konkurencyjnych opcjach mini-LED.
Dwie najbardziej zauważalne wady wyświetlacza to bardzo błyszcząca nakładka i brak obsługi G-Sync, w przeciwieństwie do większości starszych laptopów MSI do gier, w których matowe panele były standardem. Proszę być przygotowanym na walkę z odblaskami podczas grania w jasnych pomieszczeniach.
| |||||||||||||||||||||||||
rozświetlenie: 98 %
na akumulatorze: 478.6 cd/m²
kontrast: ∞:1 (czerń: 0 cd/m²)
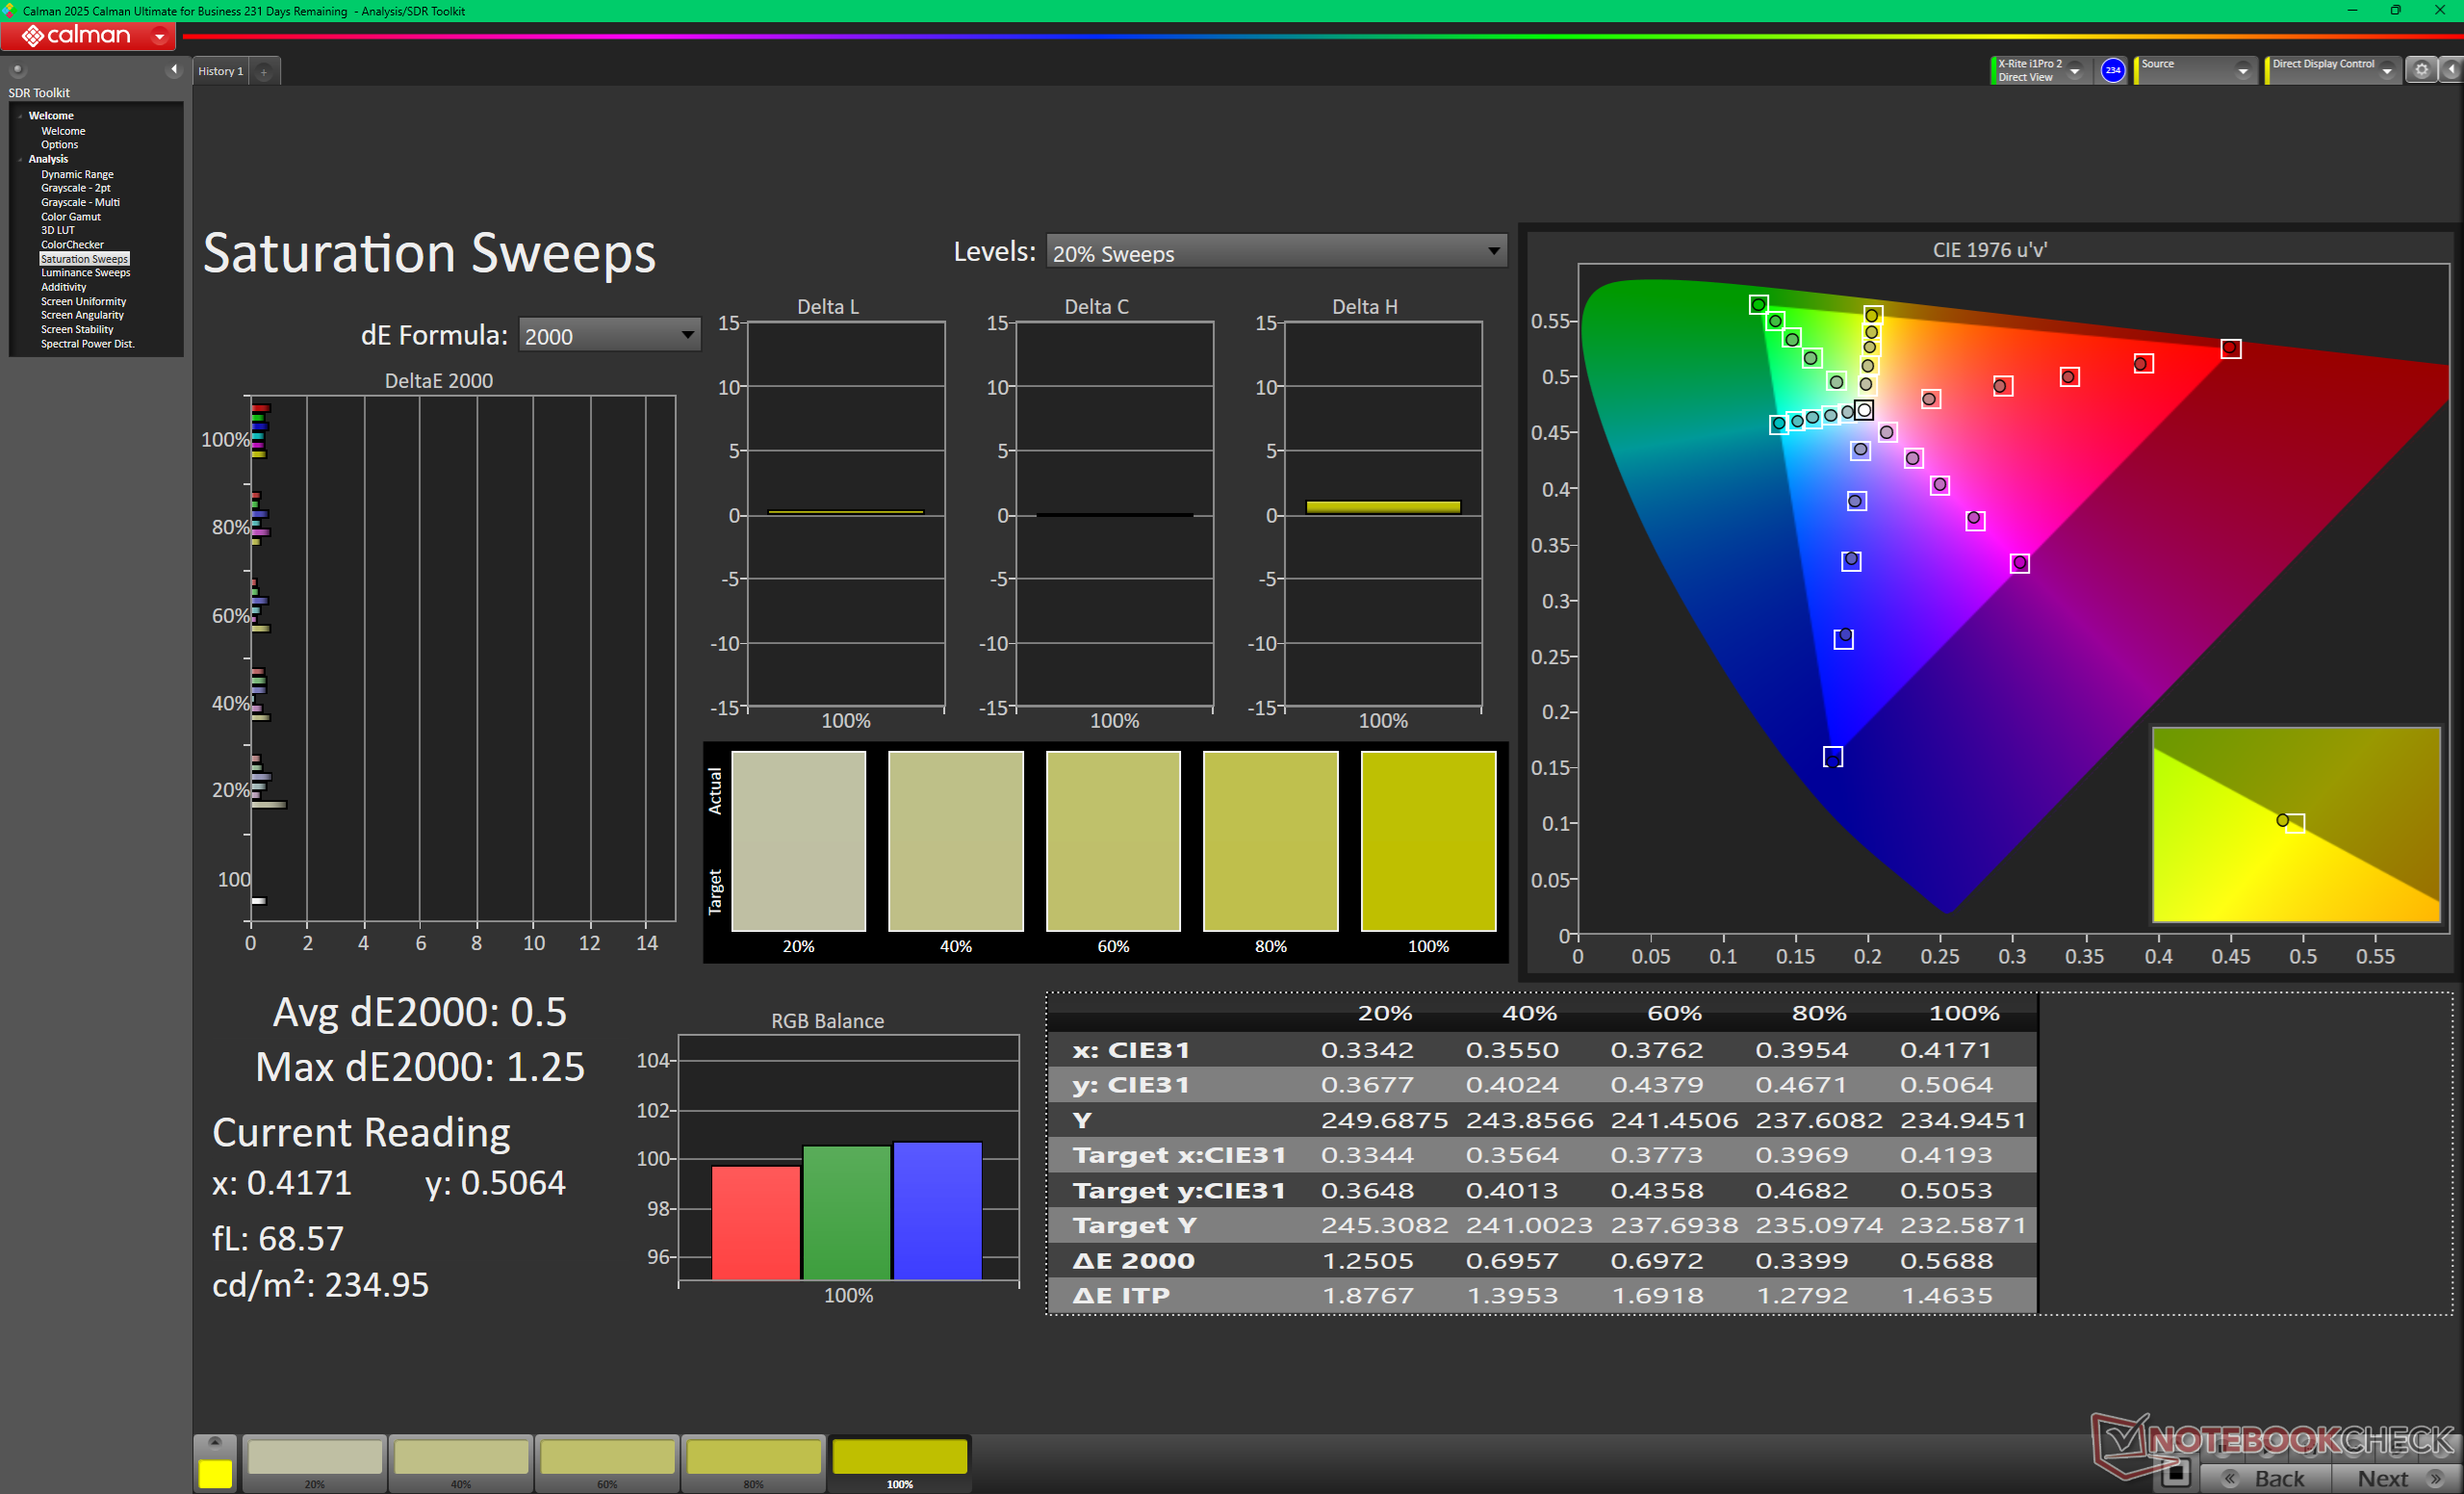
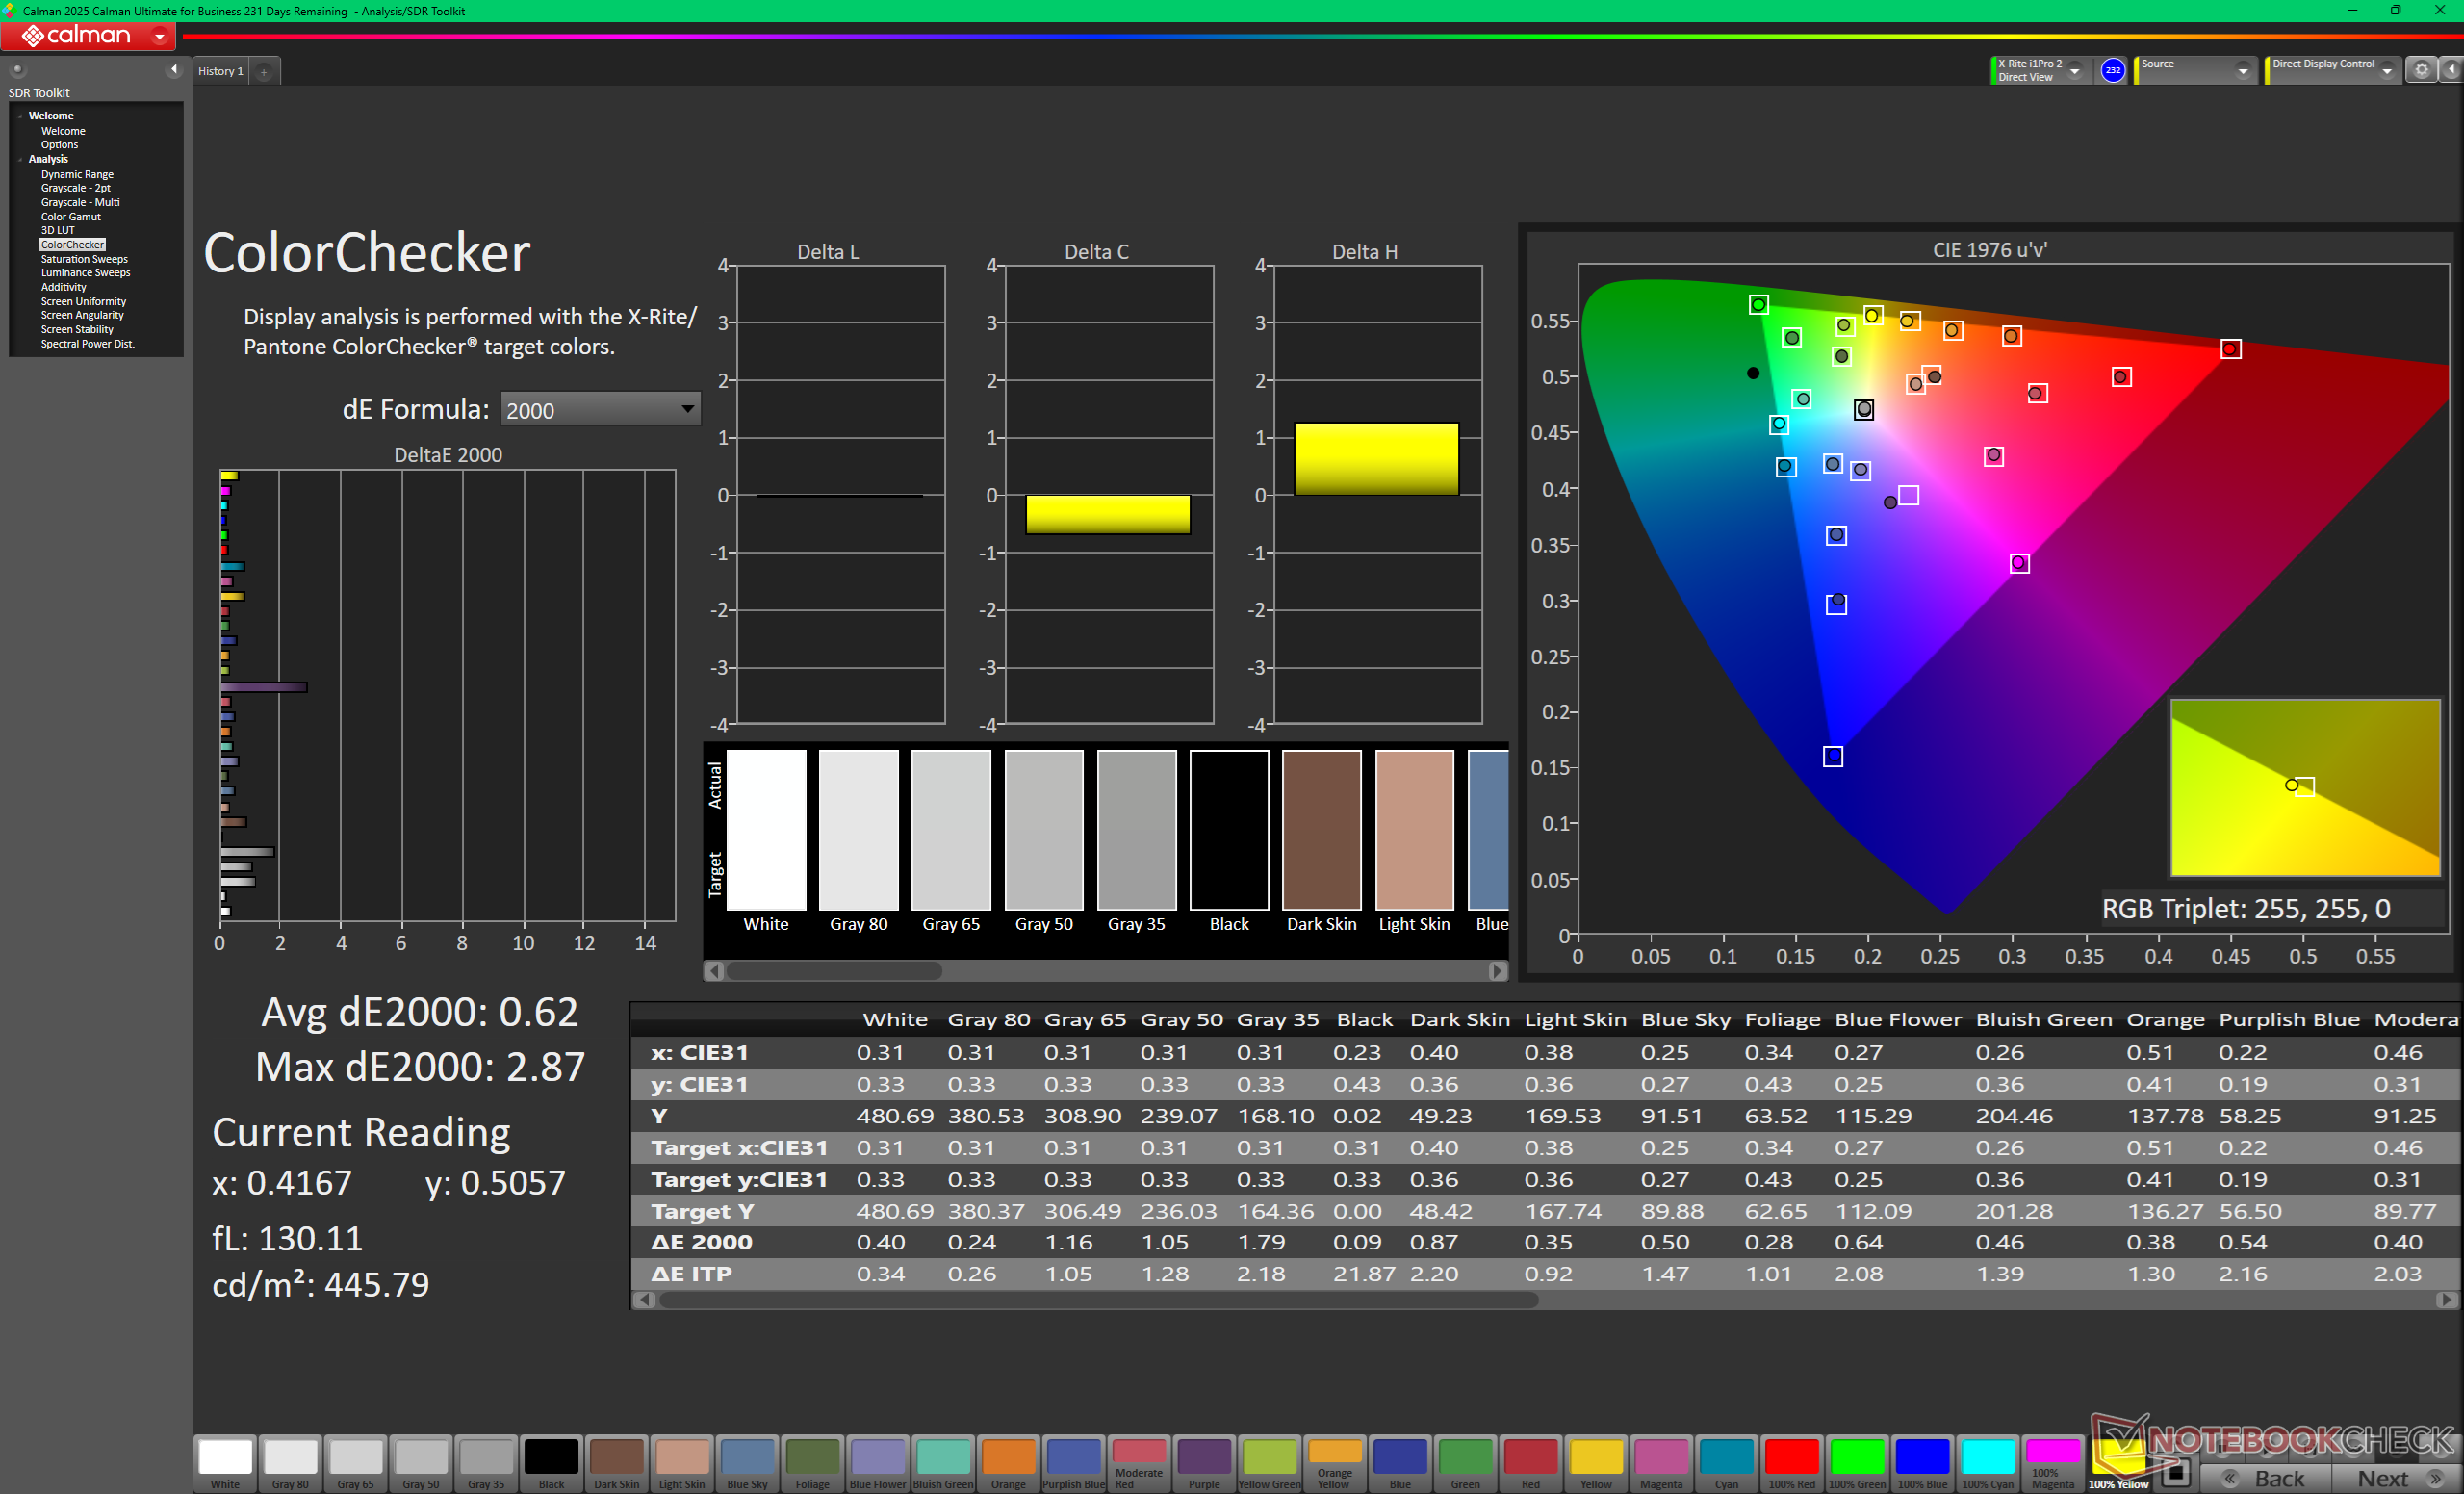
ΔE ColorChecker Calman: 0.62 | ∀{0.5-29.43 Ø4.71}
ΔE Greyscale Calman: 0.7 | ∀{0.09-98 Ø4.96}
87.5% AdobeRGB 1998 (Argyll 3D)
99.9% sRGB (Argyll 3D)
99.3% Display P3 (Argyll 3D)
Gamma: 2.16
CCT: 6535 K
| MSI Raider 16 Max HX B2WJ Samsung ATNA60HU01-0, OLED, 2560x1600, 16", 240 Hz | MSI Crosshair 16 HX AI D2XWGKG AUO B160QAN02.3, IPS, 2560x1600, 16", 240 Hz | Razer Blade 16 Core Ultra 9 386H Samsung ATNA60HU06-0, OLED, 2560x1600, 16", 240 Hz | Alienware 16X Aurora Core Ultra 9 290HX Plus Samsung 160HU05, OLED, 2560x1600, 16", 240 Hz | Asus TUF Gaming A16 FA608UP MNG007DA5-3, IPS, 2560x1600, 16", 165 Hz | Lenovo Legion 7 16IAX10 Samsung ATNA60HS01-0, OLED, 2560x1600, 16", 165 Hz | |
|---|---|---|---|---|---|---|
| Display | -3% | 2% | 2% | -17% | 2% | |
| Display P3 Coverage (%) | 99.3 | 95.5 -4% | 99.7 0% | 99.6 0% | 69.4 -30% | 99.6 0% |
| sRGB Coverage (%) | 99.9 | 99.7 0% | 100 0% | 100 0% | 97.2 -3% | 100 0% |
| AdobeRGB 1998 Coverage (%) | 87.5 | 83.9 -4% | 93.5 7% | 93.9 7% | 71.9 -18% | 93.5 7% |
| Response Times | -1450% | 2% | -1% | -1641% | -62% | |
| Response Time Grey 50% / Grey 80% * (ms) | 0.28 ? | 3.59 ? -1182% | 0.28 ? -0% | 0.29 ? -4% | 6.3 ? -2150% | 0.6 ? -114% |
| Response Time Black / White * (ms) | 0.39 ? | 7.09 ? -1718% | 0.4 ? -3% | 0.45 ? -15% | 4.8 ? -1131% | 0.8 ? -105% |
| PWM Frequency (Hz) | 1440 ? | 1441 | 1439.8 ? | 1317 ? | ||
| PWM Amplitude * (%) | 35 | 32 9% | 29 17% | 23 34% | ||
| Screen | -326% | -81% | -105% | -33% | -91% | |
| Brightness middle (cd/m²) | 478.6 | 472 -1% | 462.2 -3% | 380.5 -20% | 480 0% | 477.6 0% |
| Brightness (cd/m²) | 481 | 438 -9% | 465 -3% | 384 -20% | 456 -5% | 483 0% |
| Brightness Distribution (%) | 98 | 88 -10% | 97 -1% | 98 0% | 91 -7% | 95 -3% |
| Black Level * (cd/m²) | 0.4 | 0.32 | ||||
| Colorchecker dE 2000 * | 0.62 | 6.07 -879% | 3.03 -389% | 3.27 -427% | 1.4 -126% | 3.11 -402% |
| Colorchecker dE 2000 max. * | 2.87 | 9.76 -240% | 5.84 -103% | 6.31 -120% | 2.5 13% | 5.99 -109% |
| Greyscale dE 2000 * | 0.7 | 6.4 -814% | 0.6 14% | 1 -43% | 1.2 -71% | 0.9 -29% |
| Gamma | 2.16 102% | 2.52 87% | 2.2 100% | 2.23 99% | 2.16 102% | 2.18 101% |
| CCT | 6535 99% | 7987 81% | 6452 101% | 6410 101% | 6620 98% | 6405 101% |
| Contrast (:1) | 1180 | 1500 | ||||
| Colorchecker dE 2000 calibrated * | 2.25 | 0.6 | 1.1 | 1.3 | 0.79 | |
| Całkowita średnia (program / ustawienia) | -593% /
-442% | -26% /
-39% | -35% /
-52% | -564% /
-321% | -50% /
-60% |
* ... im mniej tym lepiej

Wyświetl czasy reakcji
| ↔ Czas reakcji od czerni do bieli | ||
|---|---|---|
| 0.39 ms ... wzrost ↗ i spadek ↘ łącznie | ↗ 0.21 ms wzrost | 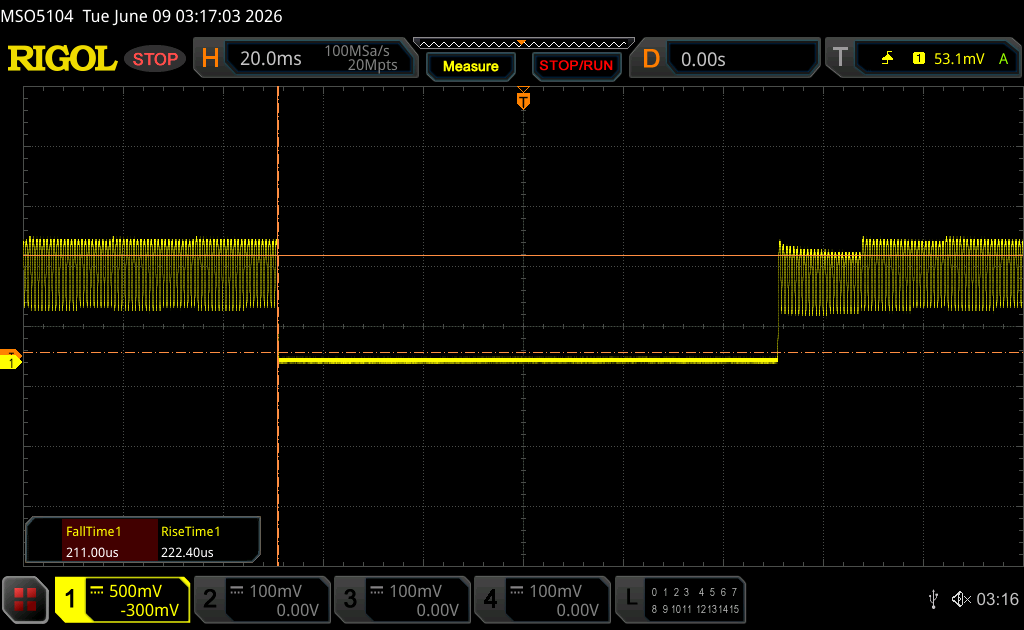 |
| ↘ 0.18 ms upadek | ||
| W naszych testach ekran wykazuje bardzo szybką reakcję i powinien bardzo dobrze nadawać się do szybkich gier. Dla porównania, wszystkie testowane urządzenia wahają się od 0.1 (minimum) do 240 (maksimum) ms. » 0 % wszystkich urządzeń jest lepszych. Oznacza to, że zmierzony czas reakcji jest lepszy od średniej wszystkich testowanych urządzeń (19.8 ms). | ||
| ↔ Czas reakcji 50% szarości do 80% szarości | ||
| 0.28 ms ... wzrost ↗ i spadek ↘ łącznie | ↗ 0.14 ms wzrost | 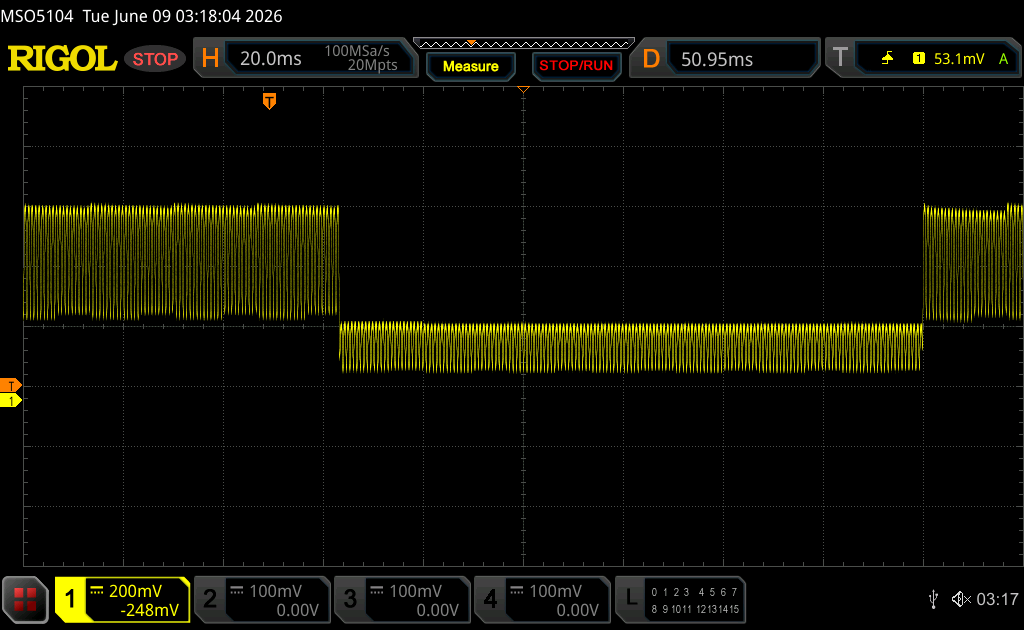 |
| ↘ 0.14 ms upadek | ||
| W naszych testach ekran wykazuje bardzo szybką reakcję i powinien bardzo dobrze nadawać się do szybkich gier. Dla porównania, wszystkie testowane urządzenia wahają się od 0.165 (minimum) do 636 (maksimum) ms. » 0 % wszystkich urządzeń jest lepszych. Oznacza to, że zmierzony czas reakcji jest lepszy od średniej wszystkich testowanych urządzeń (31 ms). | ||
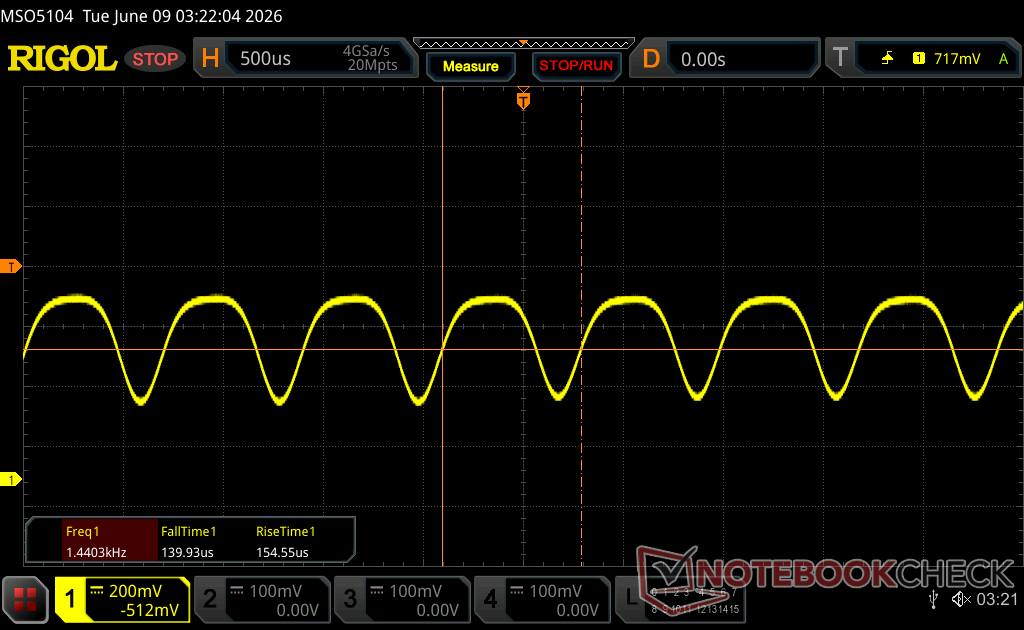
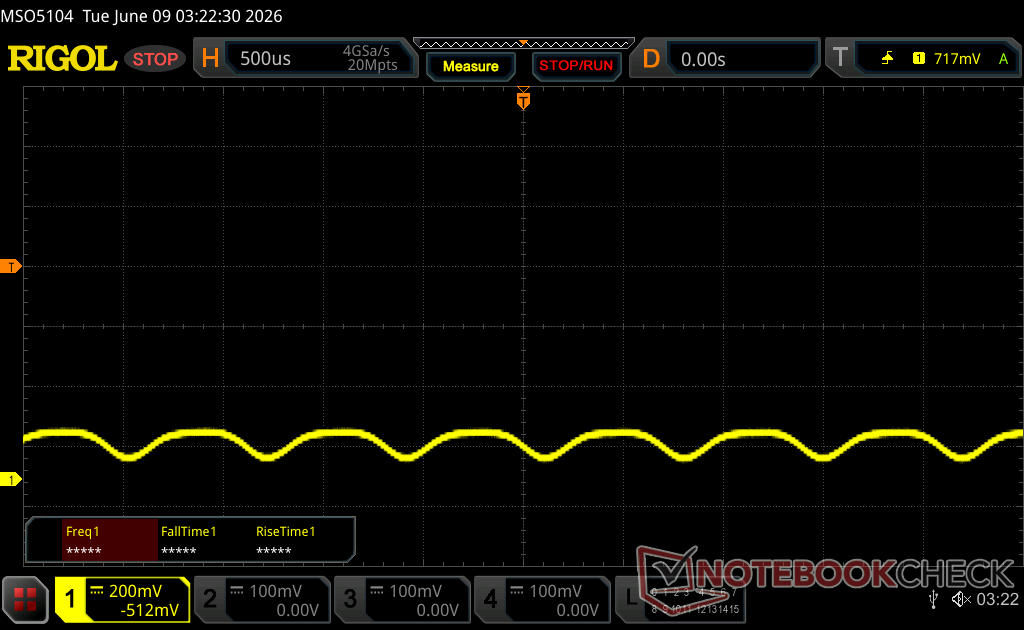
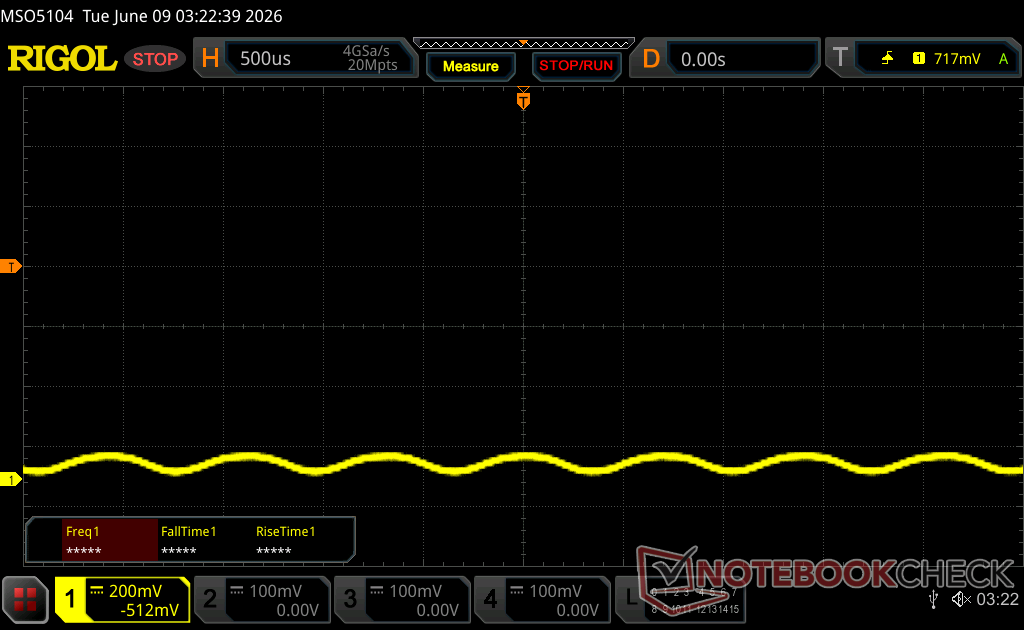
Migotanie ekranu / PWM (modulacja szerokości impulsu)
| Wykryto migotanie ekranu/wykryto PWM | 1440 Hz Amplitude: 35 % | ≤ 100 % ustawienia jasności | 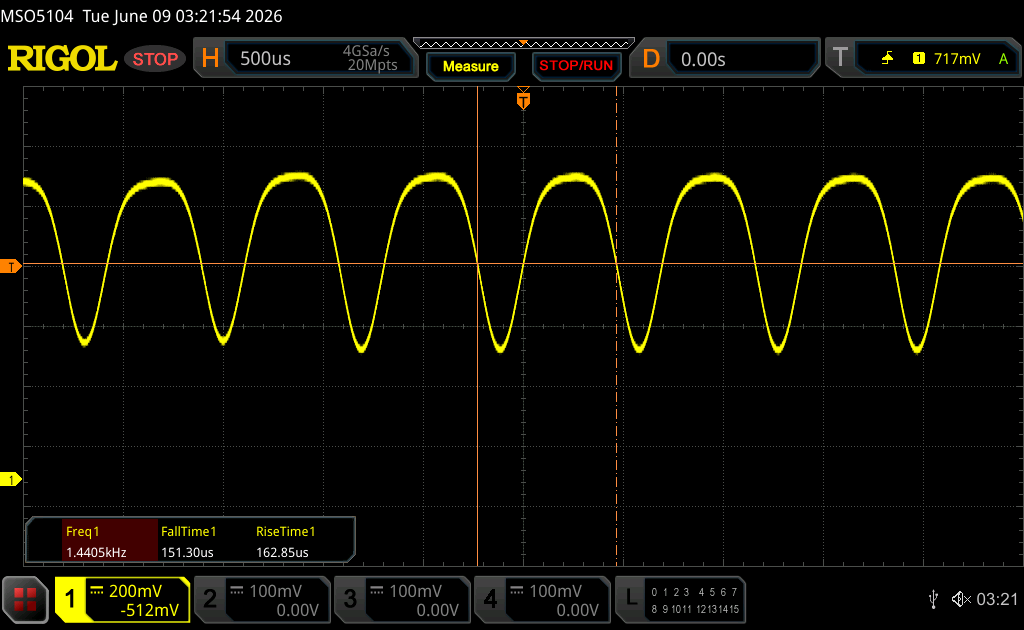 |
Podświetlenie wyświetlacza miga z częstotliwością 1440 Hz (najgorszy przypadek, np. przy użyciu PWM) Wykryto migotanie przy ustawieniu jasności 100 % i poniżej. Powyżej tego ustawienia jasności nie powinno być żadnego migotania ani PWM. Częstotliwość 1440 Hz jest dość wysoka, więc większość użytkowników wrażliwych na PWM nie powinna zauważyć żadnego migotania. Dla porównania: 52 % wszystkich testowanych urządzeń nie używa PWM do przyciemniania wyświetlacza. Jeśli wykryto PWM, zmierzono średnio 7757 (minimum: 5 - maksimum: 343500) Hz. | |||


Wydajność
Warunki testowania
Przed uruchomieniem poniższych testów ustawiliśmy MSI Center na tryb ekstremalnej wydajności i dyskretny tryb graficzny.
Procesor
Procesor Core Ultra 9 290HX Plus jest zasadniczo podkręconym Core Ultra 9 275HX z dokładnie takimi samymi rozmiarami pamięci podręcznej i liczbą rdzeni. Użytkownicy mogą spodziewać się o około 15 procent wyższej wydajności procesora w porównaniu do MSI Crosshair 16 HX. Co ciekawsze, nasz MSI działałby do 10 procent szybciej niż Dell Alienware 16X Aurora z dokładnie tym samym procesorem Core Ultra 9 290HX Plus, jak pokazują poniższe wykresy porównawcze.
Cinebench R15 Multi Loop
Cinebench R23: Multi Core | Single Core
Cinebench R20: CPU (Multi Core) | CPU (Single Core)
Cinebench R15: CPU Multi 64Bit | CPU Single 64Bit
Blender: v2.79 BMW27 CPU
7-Zip 18.03: 7z b 4 | 7z b 4 -mmt1
Geekbench 6.7: Multi-Core | Single-Core
Geekbench 5.5: Multi-Core | Single-Core
HWBOT x265 Benchmark v2.2: 4k Preset
LibreOffice : 20 Documents To PDF
R Benchmark 2.5: Overall mean
| CPU Performance rating | |
| MSI Raider 16 Max HX B2WJ | |
| Schenker XMG Neo 16 A25 5090 | |
| Przeciętny Intel Core Ultra 9 290HX Plus | |
| Schenker XMG APEX 16 MAX | |
| Alienware 16X Aurora Core Ultra 9 290HX Plus | |
| MSI Crosshair 16 HX AI D2XWGKG | |
| MSI Raider GE68HX 13VF | |
| Lenovo Legion 7 16IAX10 | |
| HP Omen Transcend 16 -2! | |
| Razer Blade 16 Core Ultra 9 386H | |
| Lenovo Legion 7 16 AGP11 | |
| Asus TUF Gaming A16 FA608UP | |
| Lenovo Legion 5 Pro 16 G7 i7 RTX 3070Ti -2! | |
| Cinebench R23 / Multi Core | |
| MSI Raider 16 Max HX B2WJ | |
| Przeciętny Intel Core Ultra 9 290HX Plus (37038 - 42661, n=5) | |
| Schenker XMG Neo 16 A25 5090 | |
| Alienware 16X Aurora Core Ultra 9 290HX Plus | |
| Schenker XMG APEX 16 MAX | |
| MSI Crosshair 16 HX AI D2XWGKG | |
| Lenovo Legion 7 16IAX10 | |
| MSI Raider GE68HX 13VF | |
| HP Omen Transcend 16 | |
| Lenovo Legion 7 16 AGP11 | |
| Razer Blade 16 Core Ultra 9 386H | |
| Lenovo Legion 5 Pro 16 G7 i7 RTX 3070Ti | |
| Asus TUF Gaming A16 FA608UP | |
| Cinebench R23 / Single Core | |
| Przeciętny Intel Core Ultra 9 290HX Plus (2319 - 2415, n=5) | |
| MSI Raider 16 Max HX B2WJ | |
| Alienware 16X Aurora Core Ultra 9 290HX Plus | |
| MSI Crosshair 16 HX AI D2XWGKG | |
| Schenker XMG Neo 16 A25 5090 | |
| Schenker XMG APEX 16 MAX | |
| Lenovo Legion 7 16IAX10 | |
| HP Omen Transcend 16 | |
| MSI Raider GE68HX 13VF | |
| Razer Blade 16 Core Ultra 9 386H | |
| Lenovo Legion 7 16 AGP11 | |
| Lenovo Legion 5 Pro 16 G7 i7 RTX 3070Ti | |
| Asus TUF Gaming A16 FA608UP | |
| Cinebench R20 / CPU (Multi Core) | |
| MSI Raider 16 Max HX B2WJ | |
| Przeciętny Intel Core Ultra 9 290HX Plus (14397 - 16433, n=5) | |
| Schenker XMG Neo 16 A25 5090 | |
| Alienware 16X Aurora Core Ultra 9 290HX Plus | |
| Schenker XMG APEX 16 MAX | |
| MSI Crosshair 16 HX AI D2XWGKG | |
| Lenovo Legion 7 16IAX10 | |
| MSI Raider GE68HX 13VF | |
| HP Omen Transcend 16 | |
| Lenovo Legion 7 16 AGP11 | |
| Razer Blade 16 Core Ultra 9 386H | |
| Lenovo Legion 5 Pro 16 G7 i7 RTX 3070Ti | |
| Asus TUF Gaming A16 FA608UP | |
| Cinebench R20 / CPU (Single Core) | |
| MSI Raider 16 Max HX B2WJ | |
| Przeciętny Intel Core Ultra 9 290HX Plus (864 - 913, n=5) | |
| Alienware 16X Aurora Core Ultra 9 290HX Plus | |
| Schenker XMG APEX 16 MAX | |
| MSI Crosshair 16 HX AI D2XWGKG | |
| Schenker XMG Neo 16 A25 5090 | |
| Lenovo Legion 7 16IAX10 | |
| Lenovo Legion 7 16 AGP11 | |
| HP Omen Transcend 16 | |
| MSI Raider GE68HX 13VF | |
| Razer Blade 16 Core Ultra 9 386H | |
| Lenovo Legion 5 Pro 16 G7 i7 RTX 3070Ti | |
| Asus TUF Gaming A16 FA608UP | |
| Cinebench R15 / CPU Multi 64Bit | |
| MSI Raider 16 Max HX B2WJ | |
| Schenker XMG Neo 16 A25 5090 | |
| Przeciętny Intel Core Ultra 9 290HX Plus (5617 - 6330, n=5) | |
| Schenker XMG APEX 16 MAX | |
| Alienware 16X Aurora Core Ultra 9 290HX Plus | |
| MSI Crosshair 16 HX AI D2XWGKG | |
| Lenovo Legion 7 16IAX10 | |
| MSI Raider GE68HX 13VF | |
| HP Omen Transcend 16 | |
| Lenovo Legion 7 16 AGP11 | |
| Razer Blade 16 Core Ultra 9 386H | |
| Lenovo Legion 5 Pro 16 G7 i7 RTX 3070Ti | |
| Asus TUF Gaming A16 FA608UP | |
| Cinebench R15 / CPU Single 64Bit | |
| Alienware 16X Aurora Core Ultra 9 290HX Plus | |
| Przeciętny Intel Core Ultra 9 290HX Plus (324 - 350, n=5) | |
| MSI Raider 16 Max HX B2WJ | |
| Schenker XMG APEX 16 MAX | |
| Schenker XMG Neo 16 A25 5090 | |
| MSI Crosshair 16 HX AI D2XWGKG | |
| Lenovo Legion 7 16IAX10 | |
| Razer Blade 16 Core Ultra 9 386H | |
| HP Omen Transcend 16 | |
| MSI Raider GE68HX 13VF | |
| Asus TUF Gaming A16 FA608UP | |
| Lenovo Legion 5 Pro 16 G7 i7 RTX 3070Ti | |
| Lenovo Legion 7 16 AGP11 | |
| Blender / v2.79 BMW27 CPU | |
| Asus TUF Gaming A16 FA608UP | |
| Lenovo Legion 5 Pro 16 G7 i7 RTX 3070Ti | |
| Razer Blade 16 Core Ultra 9 386H | |
| Lenovo Legion 7 16 AGP11 | |
| HP Omen Transcend 16 | |
| Lenovo Legion 7 16IAX10 | |
| MSI Raider GE68HX 13VF | |
| MSI Crosshair 16 HX AI D2XWGKG | |
| Alienware 16X Aurora Core Ultra 9 290HX Plus | |
| Przeciętny Intel Core Ultra 9 290HX Plus (79 - 94, n=5) | |
| Schenker XMG APEX 16 MAX | |
| MSI Raider 16 Max HX B2WJ | |
| Schenker XMG Neo 16 A25 5090 | |
| 7-Zip 18.03 / 7z b 4 | |
| Schenker XMG Neo 16 A25 5090 | |
| Schenker XMG APEX 16 MAX | |
| MSI Raider 16 Max HX B2WJ | |
| Przeciętny Intel Core Ultra 9 290HX Plus (103986 - 131933, n=5) | |
| MSI Raider GE68HX 13VF | |
| MSI Crosshair 16 HX AI D2XWGKG | |
| HP Omen Transcend 16 | |
| Alienware 16X Aurora Core Ultra 9 290HX Plus | |
| Lenovo Legion 7 16IAX10 | |
| Lenovo Legion 7 16 AGP11 | |
| Asus TUF Gaming A16 FA608UP | |
| Razer Blade 16 Core Ultra 9 386H | |
| Lenovo Legion 5 Pro 16 G7 i7 RTX 3070Ti | |
| 7-Zip 18.03 / 7z b 4 -mmt1 | |
| Schenker XMG APEX 16 MAX | |
| Schenker XMG Neo 16 A25 5090 | |
| HP Omen Transcend 16 | |
| Przeciętny Intel Core Ultra 9 290HX Plus (6562 - 7143, n=5) | |
| MSI Crosshair 16 HX AI D2XWGKG | |
| MSI Raider GE68HX 13VF | |
| MSI Raider 16 Max HX B2WJ | |
| Alienware 16X Aurora Core Ultra 9 290HX Plus | |
| Lenovo Legion 7 16IAX10 | |
| Razer Blade 16 Core Ultra 9 386H | |
| Lenovo Legion 7 16 AGP11 | |
| Asus TUF Gaming A16 FA608UP | |
| Lenovo Legion 5 Pro 16 G7 i7 RTX 3070Ti | |
| Geekbench 5.5 / Multi-Core | |
| Przeciętny Intel Core Ultra 9 290HX Plus (23839 - 28263, n=5) | |
| MSI Raider 16 Max HX B2WJ | |
| Alienware 16X Aurora Core Ultra 9 290HX Plus | |
| Schenker XMG Neo 16 A25 5090 | |
| Schenker XMG APEX 16 MAX | |
| MSI Crosshair 16 HX AI D2XWGKG | |
| MSI Raider GE68HX 13VF | |
| Lenovo Legion 7 16IAX10 | |
| HP Omen Transcend 16 | |
| Razer Blade 16 Core Ultra 9 386H | |
| Lenovo Legion 7 16 AGP11 | |
| Lenovo Legion 5 Pro 16 G7 i7 RTX 3070Ti | |
| Asus TUF Gaming A16 FA608UP | |
| Geekbench 5.5 / Single-Core | |
| Schenker XMG APEX 16 MAX | |
| Schenker XMG Neo 16 A25 5090 | |
| Przeciętny Intel Core Ultra 9 290HX Plus (2282 - 2357, n=5) | |
| MSI Raider 16 Max HX B2WJ | |
| Alienware 16X Aurora Core Ultra 9 290HX Plus | |
| MSI Crosshair 16 HX AI D2XWGKG | |
| Lenovo Legion 7 16 AGP11 | |
| Lenovo Legion 7 16IAX10 | |
| Razer Blade 16 Core Ultra 9 386H | |
| HP Omen Transcend 16 | |
| MSI Raider GE68HX 13VF | |
| Asus TUF Gaming A16 FA608UP | |
| Lenovo Legion 5 Pro 16 G7 i7 RTX 3070Ti | |
| HWBOT x265 Benchmark v2.2 / 4k Preset | |
| Schenker XMG Neo 16 A25 5090 | |
| MSI Raider 16 Max HX B2WJ | |
| Przeciętny Intel Core Ultra 9 290HX Plus (38.2 - 44.4, n=5) | |
| Schenker XMG APEX 16 MAX | |
| Alienware 16X Aurora Core Ultra 9 290HX Plus | |
| MSI Crosshair 16 HX AI D2XWGKG | |
| Lenovo Legion 7 16IAX10 | |
| MSI Raider GE68HX 13VF | |
| Lenovo Legion 7 16 AGP11 | |
| HP Omen Transcend 16 | |
| Razer Blade 16 Core Ultra 9 386H | |
| Lenovo Legion 5 Pro 16 G7 i7 RTX 3070Ti | |
| Asus TUF Gaming A16 FA608UP | |
| LibreOffice / 20 Documents To PDF | |
| Asus TUF Gaming A16 FA608UP | |
| Lenovo Legion 7 16 AGP11 | |
| Schenker XMG APEX 16 MAX | |
| Schenker XMG Neo 16 A25 5090 | |
| Przeciętny Intel Core Ultra 9 290HX Plus (38.9 - 68.2, n=5) | |
| HP Omen Transcend 16 | |
| Lenovo Legion 5 Pro 16 G7 i7 RTX 3070Ti | |
| MSI Crosshair 16 HX AI D2XWGKG | |
| MSI Raider 16 Max HX B2WJ | |
| Alienware 16X Aurora Core Ultra 9 290HX Plus | |
| Razer Blade 16 Core Ultra 9 386H | |
| Lenovo Legion 7 16IAX10 | |
| MSI Raider GE68HX 13VF | |
| R Benchmark 2.5 / Overall mean | |
| Lenovo Legion 5 Pro 16 G7 i7 RTX 3070Ti | |
| Asus TUF Gaming A16 FA608UP | |
| Lenovo Legion 7 16IAX10 | |
| Lenovo Legion 7 16 AGP11 | |
| Razer Blade 16 Core Ultra 9 386H | |
| HP Omen Transcend 16 | |
| MSI Crosshair 16 HX AI D2XWGKG | |
| MSI Raider GE68HX 13VF | |
| Alienware 16X Aurora Core Ultra 9 290HX Plus | |
| MSI Raider 16 Max HX B2WJ | |
| Przeciętny Intel Core Ultra 9 290HX Plus (0.3788 - 0.3951, n=5) | |
| Schenker XMG Neo 16 A25 5090 | |
| Schenker XMG APEX 16 MAX | |
Cinebench R23: Multi Core | Single Core
Cinebench R20: CPU (Multi Core) | CPU (Single Core)
Cinebench R15: CPU Multi 64Bit | CPU Single 64Bit
Blender: v2.79 BMW27 CPU
7-Zip 18.03: 7z b 4 | 7z b 4 -mmt1
Geekbench 6.7: Multi-Core | Single-Core
Geekbench 5.5: Multi-Core | Single-Core
HWBOT x265 Benchmark v2.2: 4k Preset
LibreOffice : 20 Documents To PDF
R Benchmark 2.5: Overall mean
* ... im mniej tym lepiej
AIDA64: FP32 Ray-Trace | FPU Julia | CPU SHA3 | CPU Queen | FPU SinJulia | FPU Mandel | CPU AES | CPU ZLib | FP64 Ray-Trace | CPU PhotoWorxx | CPU CheckMate
| Performance rating | |
| Przeciętny Intel Core Ultra 9 290HX Plus | |
| MSI Raider 16 Max HX B2WJ -1! | |
| Alienware 16X Aurora Core Ultra 9 290HX Plus -1! | |
| MSI Crosshair 16 HX AI D2XWGKG -1! | |
| Lenovo Legion 7 16IAX10 -1! | |
| Asus TUF Gaming A16 FA608UP -1! | |
| Razer Blade 16 Core Ultra 9 386H -1! | |
| AIDA64 / FP32 Ray-Trace | |
| MSI Raider 16 Max HX B2WJ (v8.20.8100) | |
| Przeciętny Intel Core Ultra 9 290HX Plus (34761 - 43239, n=6) | |
| MSI Crosshair 16 HX AI D2XWGKG (v6.92.6600) | |
| Alienware 16X Aurora Core Ultra 9 290HX Plus (v8.20.8100) | |
| Lenovo Legion 7 16IAX10 (v6.92.6600) | |
| Asus TUF Gaming A16 FA608UP (v6.92.6600) | |
| Razer Blade 16 Core Ultra 9 386H (v8.20.8100) | |
| AIDA64 / FPU Julia | |
| MSI Raider 16 Max HX B2WJ (v8.20.8100) | |
| Przeciętny Intel Core Ultra 9 290HX Plus (174665 - 218895, n=6) | |
| MSI Crosshair 16 HX AI D2XWGKG (v6.92.6600) | |
| Alienware 16X Aurora Core Ultra 9 290HX Plus (v8.20.8100) | |
| Lenovo Legion 7 16IAX10 (v6.92.6600) | |
| Asus TUF Gaming A16 FA608UP (v6.92.6600) | |
| Razer Blade 16 Core Ultra 9 386H (v8.20.8100) | |
| AIDA64 / CPU SHA3 | |
| MSI Raider 16 Max HX B2WJ (v8.20.8100) | |
| Przeciętny Intel Core Ultra 9 290HX Plus (8352 - 10115, n=6) | |
| MSI Crosshair 16 HX AI D2XWGKG (v6.92.6600) | |
| Alienware 16X Aurora Core Ultra 9 290HX Plus (v8.20.8100) | |
| Lenovo Legion 7 16IAX10 (v6.92.6600) | |
| Razer Blade 16 Core Ultra 9 386H (v8.20.8100) | |
| Asus TUF Gaming A16 FA608UP (v6.92.6600) | |
| AIDA64 / CPU Queen | |
| Przeciętny Intel Core Ultra 9 290HX Plus (n=1) | |
| Lenovo Legion 7 16IAX10 (v6.92.6600) | |
| MSI Crosshair 16 HX AI D2XWGKG (v6.92.6600) | |
| Asus TUF Gaming A16 FA608UP (v6.92.6600) | |
| AIDA64 / FPU SinJulia | |
| Asus TUF Gaming A16 FA608UP (v6.92.6600) | |
| MSI Raider 16 Max HX B2WJ (v8.20.8100) | |
| Przeciętny Intel Core Ultra 9 290HX Plus (13612 - 14874, n=6) | |
| Alienware 16X Aurora Core Ultra 9 290HX Plus (v8.20.8100) | |
| MSI Crosshair 16 HX AI D2XWGKG (v6.92.6600) | |
| Lenovo Legion 7 16IAX10 (v6.92.6600) | |
| Razer Blade 16 Core Ultra 9 386H (v8.20.8100) | |
| AIDA64 / FPU Mandel | |
| MSI Raider 16 Max HX B2WJ (v8.20.8100) | |
| Przeciętny Intel Core Ultra 9 290HX Plus (91215 - 115371, n=6) | |
| MSI Crosshair 16 HX AI D2XWGKG (v6.92.6600) | |
| Alienware 16X Aurora Core Ultra 9 290HX Plus (v8.20.8100) | |
| Lenovo Legion 7 16IAX10 (v6.92.6600) | |
| Asus TUF Gaming A16 FA608UP (v6.92.6600) | |
| Razer Blade 16 Core Ultra 9 386H (v8.20.8100) | |
| AIDA64 / CPU AES | |
| MSI Raider 16 Max HX B2WJ (v8.20.8100) | |
| Przeciętny Intel Core Ultra 9 290HX Plus (127585 - 143205, n=6) | |
| Alienware 16X Aurora Core Ultra 9 290HX Plus (v8.20.8100) | |
| MSI Crosshair 16 HX AI D2XWGKG (v6.92.6600) | |
| Lenovo Legion 7 16IAX10 (v6.92.6600) | |
| Asus TUF Gaming A16 FA608UP (v6.92.6600) | |
| Razer Blade 16 Core Ultra 9 386H (v8.20.8100) | |
| AIDA64 / CPU ZLib | |
| MSI Raider 16 Max HX B2WJ (v8.20.8100) | |
| Przeciętny Intel Core Ultra 9 290HX Plus (1967 - 2340, n=6) | |
| MSI Crosshair 16 HX AI D2XWGKG (v6.92.6600) | |
| Alienware 16X Aurora Core Ultra 9 290HX Plus (v8.20.8100) | |
| Lenovo Legion 7 16IAX10 (v6.92.6600) | |
| Razer Blade 16 Core Ultra 9 386H (v8.20.8100) | |
| Asus TUF Gaming A16 FA608UP (v6.92.6600) | |
| AIDA64 / FP64 Ray-Trace | |
| MSI Raider 16 Max HX B2WJ (v8.20.8100) | |
| Przeciętny Intel Core Ultra 9 290HX Plus (18611 - 23843, n=6) | |
| MSI Crosshair 16 HX AI D2XWGKG (v6.92.6600) | |
| Alienware 16X Aurora Core Ultra 9 290HX Plus (v8.20.8100) | |
| Lenovo Legion 7 16IAX10 (v6.92.6600) | |
| Asus TUF Gaming A16 FA608UP (v6.92.6600) | |
| Razer Blade 16 Core Ultra 9 386H (v8.20.8100) | |
| AIDA64 / CPU PhotoWorxx | |
| Razer Blade 16 Core Ultra 9 386H (v8.20.8100) | |
| Przeciętny Intel Core Ultra 9 290HX Plus (51134 - 65272, n=6) | |
| Alienware 16X Aurora Core Ultra 9 290HX Plus (v8.20.8100) | |
| MSI Raider 16 Max HX B2WJ (v8.20.8100) | |
| Lenovo Legion 7 16IAX10 (v6.92.6600) | |
| Asus TUF Gaming A16 FA608UP (v6.92.6600) | |
| MSI Crosshair 16 HX AI D2XWGKG (v6.92.6600) | |
| AIDA64 / CPU CheckMate | |
| MSI Raider 16 Max HX B2WJ (v8.20.8100) | |
| Przeciętny Intel Core Ultra 9 290HX Plus (7624 - 8765, n=5) | |
| Alienware 16X Aurora Core Ultra 9 290HX Plus (v8.20.8100) | |
| Razer Blade 16 Core Ultra 9 386H (v8.20.8100) | |
Wydajność systemu
PCMark 10: Score | Essentials | Productivity | Digital Content Creation
CrossMark: Overall | Productivity | Creativity | Responsiveness
WebXPRT 3: Overall
WebXPRT 4: Overall
Mozilla Kraken 1.1: Total
Geekbench AI: Quantized GPU 1.7 | Half Precision GPU 1.7 | Single Precision GPU 1.7
| Performance rating | |
| Przeciętny Intel Core Ultra 9 290HX Plus, NVIDIA GeForce RTX 5090 Laptop | |
| MSI Raider 16 Max HX B2WJ | |
| Alienware 16X Aurora Core Ultra 9 290HX Plus | |
| Razer Blade 16 Core Ultra 9 386H | |
| MSI Crosshair 16 HX AI D2XWGKG | |
| Lenovo Legion 7 16IAX10 | |
| Asus TUF Gaming A16 FA608UP -4! | |
| PCMark 10 / Score | |
| Przeciętny Intel Core Ultra 9 290HX Plus, NVIDIA GeForce RTX 5090 Laptop (11015 - 12414, n=3) | |
| MSI Raider 16 Max HX B2WJ | |
| Alienware 16X Aurora Core Ultra 9 290HX Plus | |
| Razer Blade 16 Core Ultra 9 386H | |
| MSI Crosshair 16 HX AI D2XWGKG | |
| Lenovo Legion 7 16IAX10 | |
| PCMark 10 / Essentials | |
| Alienware 16X Aurora Core Ultra 9 290HX Plus | |
| Lenovo Legion 7 16IAX10 | |
| Przeciętny Intel Core Ultra 9 290HX Plus, NVIDIA GeForce RTX 5090 Laptop (11316 - 11604, n=3) | |
| MSI Raider 16 Max HX B2WJ | |
| Razer Blade 16 Core Ultra 9 386H | |
| MSI Crosshair 16 HX AI D2XWGKG | |
| PCMark 10 / Productivity | |
| Przeciętny Intel Core Ultra 9 290HX Plus, NVIDIA GeForce RTX 5090 Laptop (16305 - 25323, n=3) | |
| Alienware 16X Aurora Core Ultra 9 290HX Plus | |
| MSI Raider 16 Max HX B2WJ | |
| Razer Blade 16 Core Ultra 9 386H | |
| Lenovo Legion 7 16IAX10 | |
| MSI Crosshair 16 HX AI D2XWGKG | |
| PCMark 10 / Digital Content Creation | |
| MSI Raider 16 Max HX B2WJ | |
| Przeciętny Intel Core Ultra 9 290HX Plus, NVIDIA GeForce RTX 5090 Laptop (17665 - 19954, n=3) | |
| Alienware 16X Aurora Core Ultra 9 290HX Plus | |
| MSI Crosshair 16 HX AI D2XWGKG | |
| Razer Blade 16 Core Ultra 9 386H | |
| Lenovo Legion 7 16IAX10 | |
| CrossMark / Overall | |
| MSI Raider 16 Max HX B2WJ | |
| Alienware 16X Aurora Core Ultra 9 290HX Plus | |
| Przeciętny Intel Core Ultra 9 290HX Plus, NVIDIA GeForce RTX 5090 Laptop (2177 - 2401, n=3) | |
| Razer Blade 16 Core Ultra 9 386H | |
| MSI Crosshair 16 HX AI D2XWGKG | |
| Lenovo Legion 7 16IAX10 | |
| Asus TUF Gaming A16 FA608UP | |
| CrossMark / Productivity | |
| Alienware 16X Aurora Core Ultra 9 290HX Plus | |
| MSI Raider 16 Max HX B2WJ | |
| Przeciętny Intel Core Ultra 9 290HX Plus, NVIDIA GeForce RTX 5090 Laptop (1994 - 2213, n=3) | |
| Razer Blade 16 Core Ultra 9 386H | |
| MSI Crosshair 16 HX AI D2XWGKG | |
| Lenovo Legion 7 16IAX10 | |
| Asus TUF Gaming A16 FA608UP | |
| CrossMark / Creativity | |
| Przeciętny Intel Core Ultra 9 290HX Plus, NVIDIA GeForce RTX 5090 Laptop (2548 - 2786, n=3) | |
| MSI Raider 16 Max HX B2WJ | |
| Alienware 16X Aurora Core Ultra 9 290HX Plus | |
| Razer Blade 16 Core Ultra 9 386H | |
| MSI Crosshair 16 HX AI D2XWGKG | |
| Lenovo Legion 7 16IAX10 | |
| Asus TUF Gaming A16 FA608UP | |
| CrossMark / Responsiveness | |
| Alienware 16X Aurora Core Ultra 9 290HX Plus | |
| MSI Raider 16 Max HX B2WJ | |
| Przeciętny Intel Core Ultra 9 290HX Plus, NVIDIA GeForce RTX 5090 Laptop (1766 - 2249, n=3) | |
| Razer Blade 16 Core Ultra 9 386H | |
| MSI Crosshair 16 HX AI D2XWGKG | |
| Lenovo Legion 7 16IAX10 | |
| Asus TUF Gaming A16 FA608UP | |
| WebXPRT 3 / Overall | |
| Alienware 16X Aurora Core Ultra 9 290HX Plus | |
| MSI Raider 16 Max HX B2WJ | |
| Przeciętny Intel Core Ultra 9 290HX Plus, NVIDIA GeForce RTX 5090 Laptop (354 - 369, n=3) | |
| Lenovo Legion 7 16IAX10 | |
| MSI Crosshair 16 HX AI D2XWGKG | |
| Razer Blade 16 Core Ultra 9 386H | |
| Asus TUF Gaming A16 FA608UP | |
| WebXPRT 4 / Overall | |
| Alienware 16X Aurora Core Ultra 9 290HX Plus | |
| MSI Raider 16 Max HX B2WJ | |
| Przeciętny Intel Core Ultra 9 290HX Plus, NVIDIA GeForce RTX 5090 Laptop (310 - 336, n=3) | |
| Lenovo Legion 7 16IAX10 | |
| MSI Crosshair 16 HX AI D2XWGKG | |
| Razer Blade 16 Core Ultra 9 386H | |
| Asus TUF Gaming A16 FA608UP | |
| Mozilla Kraken 1.1 / Total | |
| Asus TUF Gaming A16 FA608UP | |
| Razer Blade 16 Core Ultra 9 386H | |
| Lenovo Legion 7 16IAX10 | |
| MSI Crosshair 16 HX AI D2XWGKG | |
| MSI Raider 16 Max HX B2WJ | |
| Przeciętny Intel Core Ultra 9 290HX Plus, NVIDIA GeForce RTX 5090 Laptop (393 - 399, n=3) | |
| Alienware 16X Aurora Core Ultra 9 290HX Plus | |
| Geekbench AI / Quantized GPU 1.7 | |
| Przeciętny Intel Core Ultra 9 290HX Plus, NVIDIA GeForce RTX 5090 Laptop (25151 - 25211, n=2) | |
| MSI Raider 16 Max HX B2WJ | |
| Razer Blade 16 Core Ultra 9 386H | |
| Alienware 16X Aurora Core Ultra 9 290HX Plus | |
| MSI Crosshair 16 HX AI D2XWGKG | |
| Asus TUF Gaming A16 FA608UP | |
| Lenovo Legion 7 16IAX10 | |
| Geekbench AI / Half Precision GPU 1.7 | |
| Przeciętny Intel Core Ultra 9 290HX Plus, NVIDIA GeForce RTX 5090 Laptop (55223 - 56393, n=2) | |
| MSI Raider 16 Max HX B2WJ | |
| Alienware 16X Aurora Core Ultra 9 290HX Plus | |
| Razer Blade 16 Core Ultra 9 386H | |
| MSI Crosshair 16 HX AI D2XWGKG | |
| Asus TUF Gaming A16 FA608UP | |
| Lenovo Legion 7 16IAX10 | |
| Geekbench AI / Single Precision GPU 1.7 | |
| Przeciętny Intel Core Ultra 9 290HX Plus, NVIDIA GeForce RTX 5090 Laptop (31828 - 32576, n=2) | |
| MSI Raider 16 Max HX B2WJ | |
| Razer Blade 16 Core Ultra 9 386H | |
| Alienware 16X Aurora Core Ultra 9 290HX Plus | |
| MSI Crosshair 16 HX AI D2XWGKG | |
| Asus TUF Gaming A16 FA608UP | |
| Lenovo Legion 7 16IAX10 | |
* ... im mniej tym lepiej
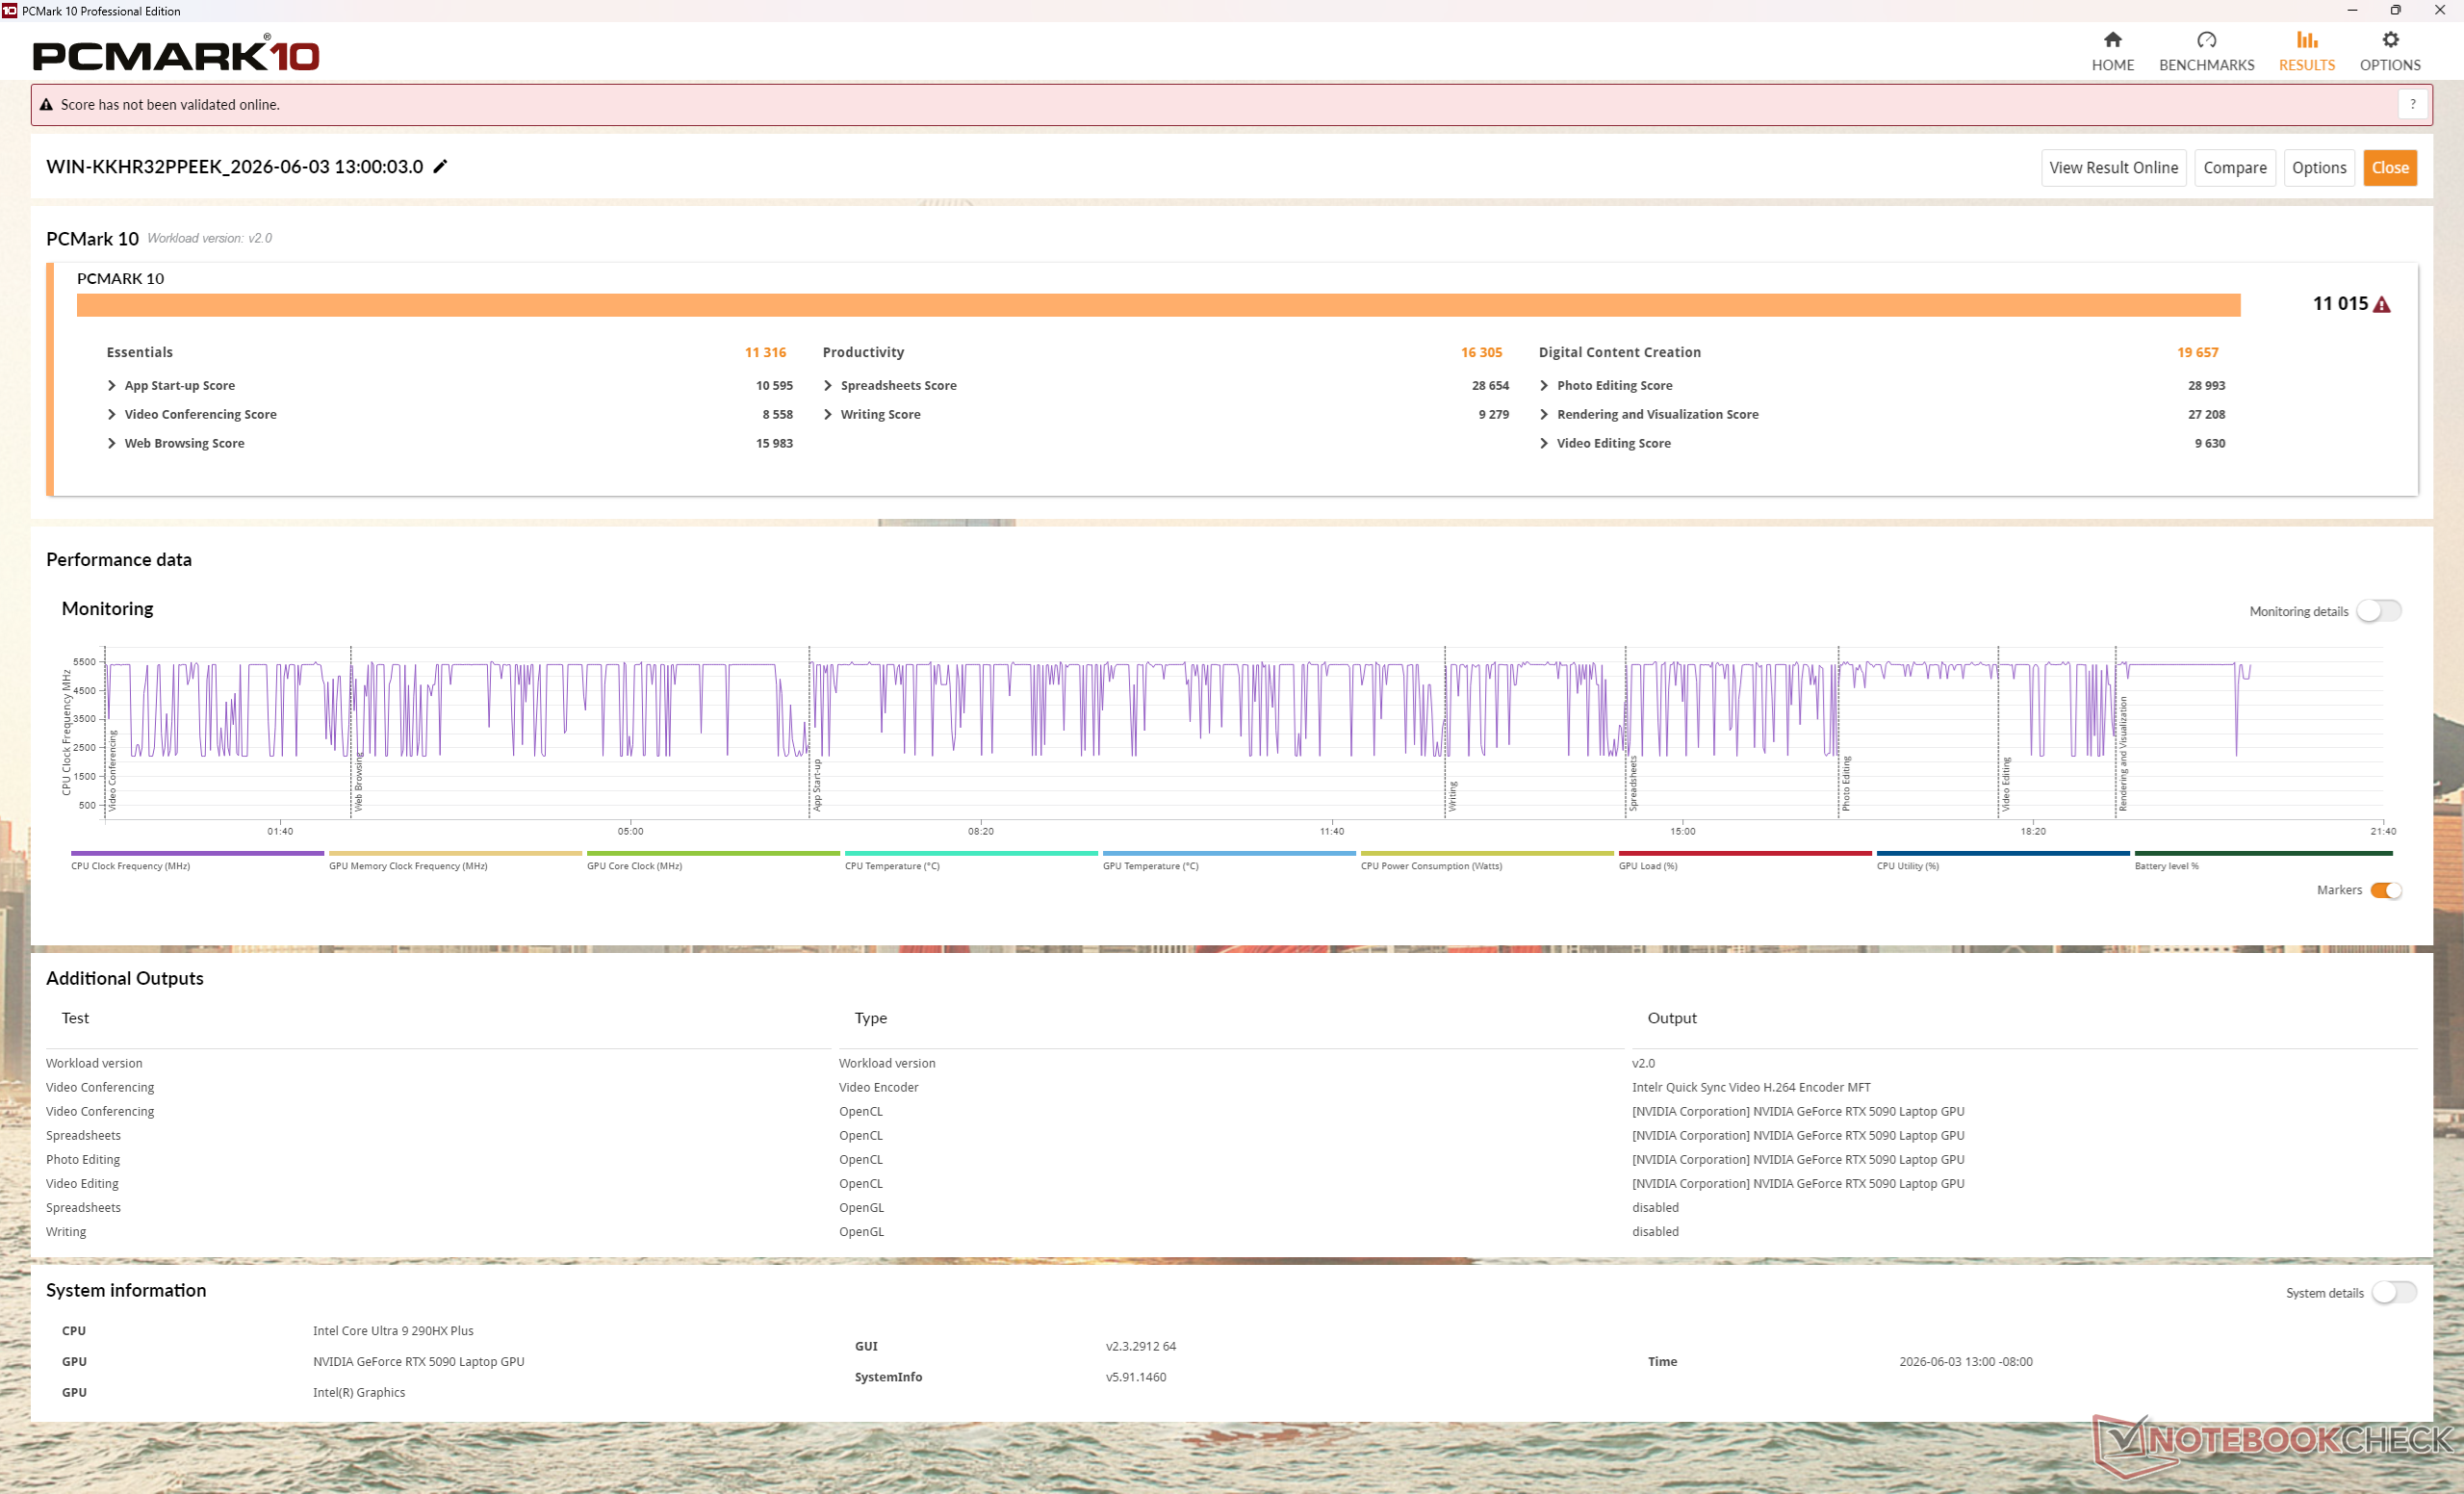
| PCMark 10 Score | 11015 pkt. | |
Pomoc | ||
| AIDA64 / Memory Copy | |
| Razer Blade 16 Core Ultra 9 386H | |
| Lenovo Legion 7 16IAX10 | |
| Przeciętny Intel Core Ultra 9 290HX Plus (76912 - 93930, n=6) | |
| MSI Raider 16 Max HX B2WJ | |
| Alienware 16X Aurora Core Ultra 9 290HX Plus | |
| MSI Crosshair 16 HX AI D2XWGKG | |
| Asus TUF Gaming A16 FA608UP | |
| AIDA64 / Memory Read | |
| Razer Blade 16 Core Ultra 9 386H | |
| Przeciętny Intel Core Ultra 9 290HX Plus (84638 - 98574, n=6) | |
| MSI Raider 16 Max HX B2WJ | |
| Lenovo Legion 7 16IAX10 | |
| Alienware 16X Aurora Core Ultra 9 290HX Plus | |
| MSI Crosshair 16 HX AI D2XWGKG | |
| Asus TUF Gaming A16 FA608UP | |
| AIDA64 / Memory Write | |
| Razer Blade 16 Core Ultra 9 386H | |
| Asus TUF Gaming A16 FA608UP | |
| Przeciętny Intel Core Ultra 9 290HX Plus (76094 - 100988, n=6) | |
| MSI Raider 16 Max HX B2WJ | |
| Lenovo Legion 7 16IAX10 | |
| Alienware 16X Aurora Core Ultra 9 290HX Plus | |
| MSI Crosshair 16 HX AI D2XWGKG | |
| AIDA64 / Memory Latency | |
| MSI Crosshair 16 HX AI D2XWGKG | |
| Alienware 16X Aurora Core Ultra 9 290HX Plus | |
| Lenovo Legion 7 16IAX10 | |
| MSI Raider 16 Max HX B2WJ | |
| Przeciętny Intel Core Ultra 9 290HX Plus (100.7 - 108.4, n=6) | |
| Asus TUF Gaming A16 FA608UP | |
| Razer Blade 16 Core Ultra 9 386H | |
* ... im mniej tym lepiej
Opóźnienie DPC
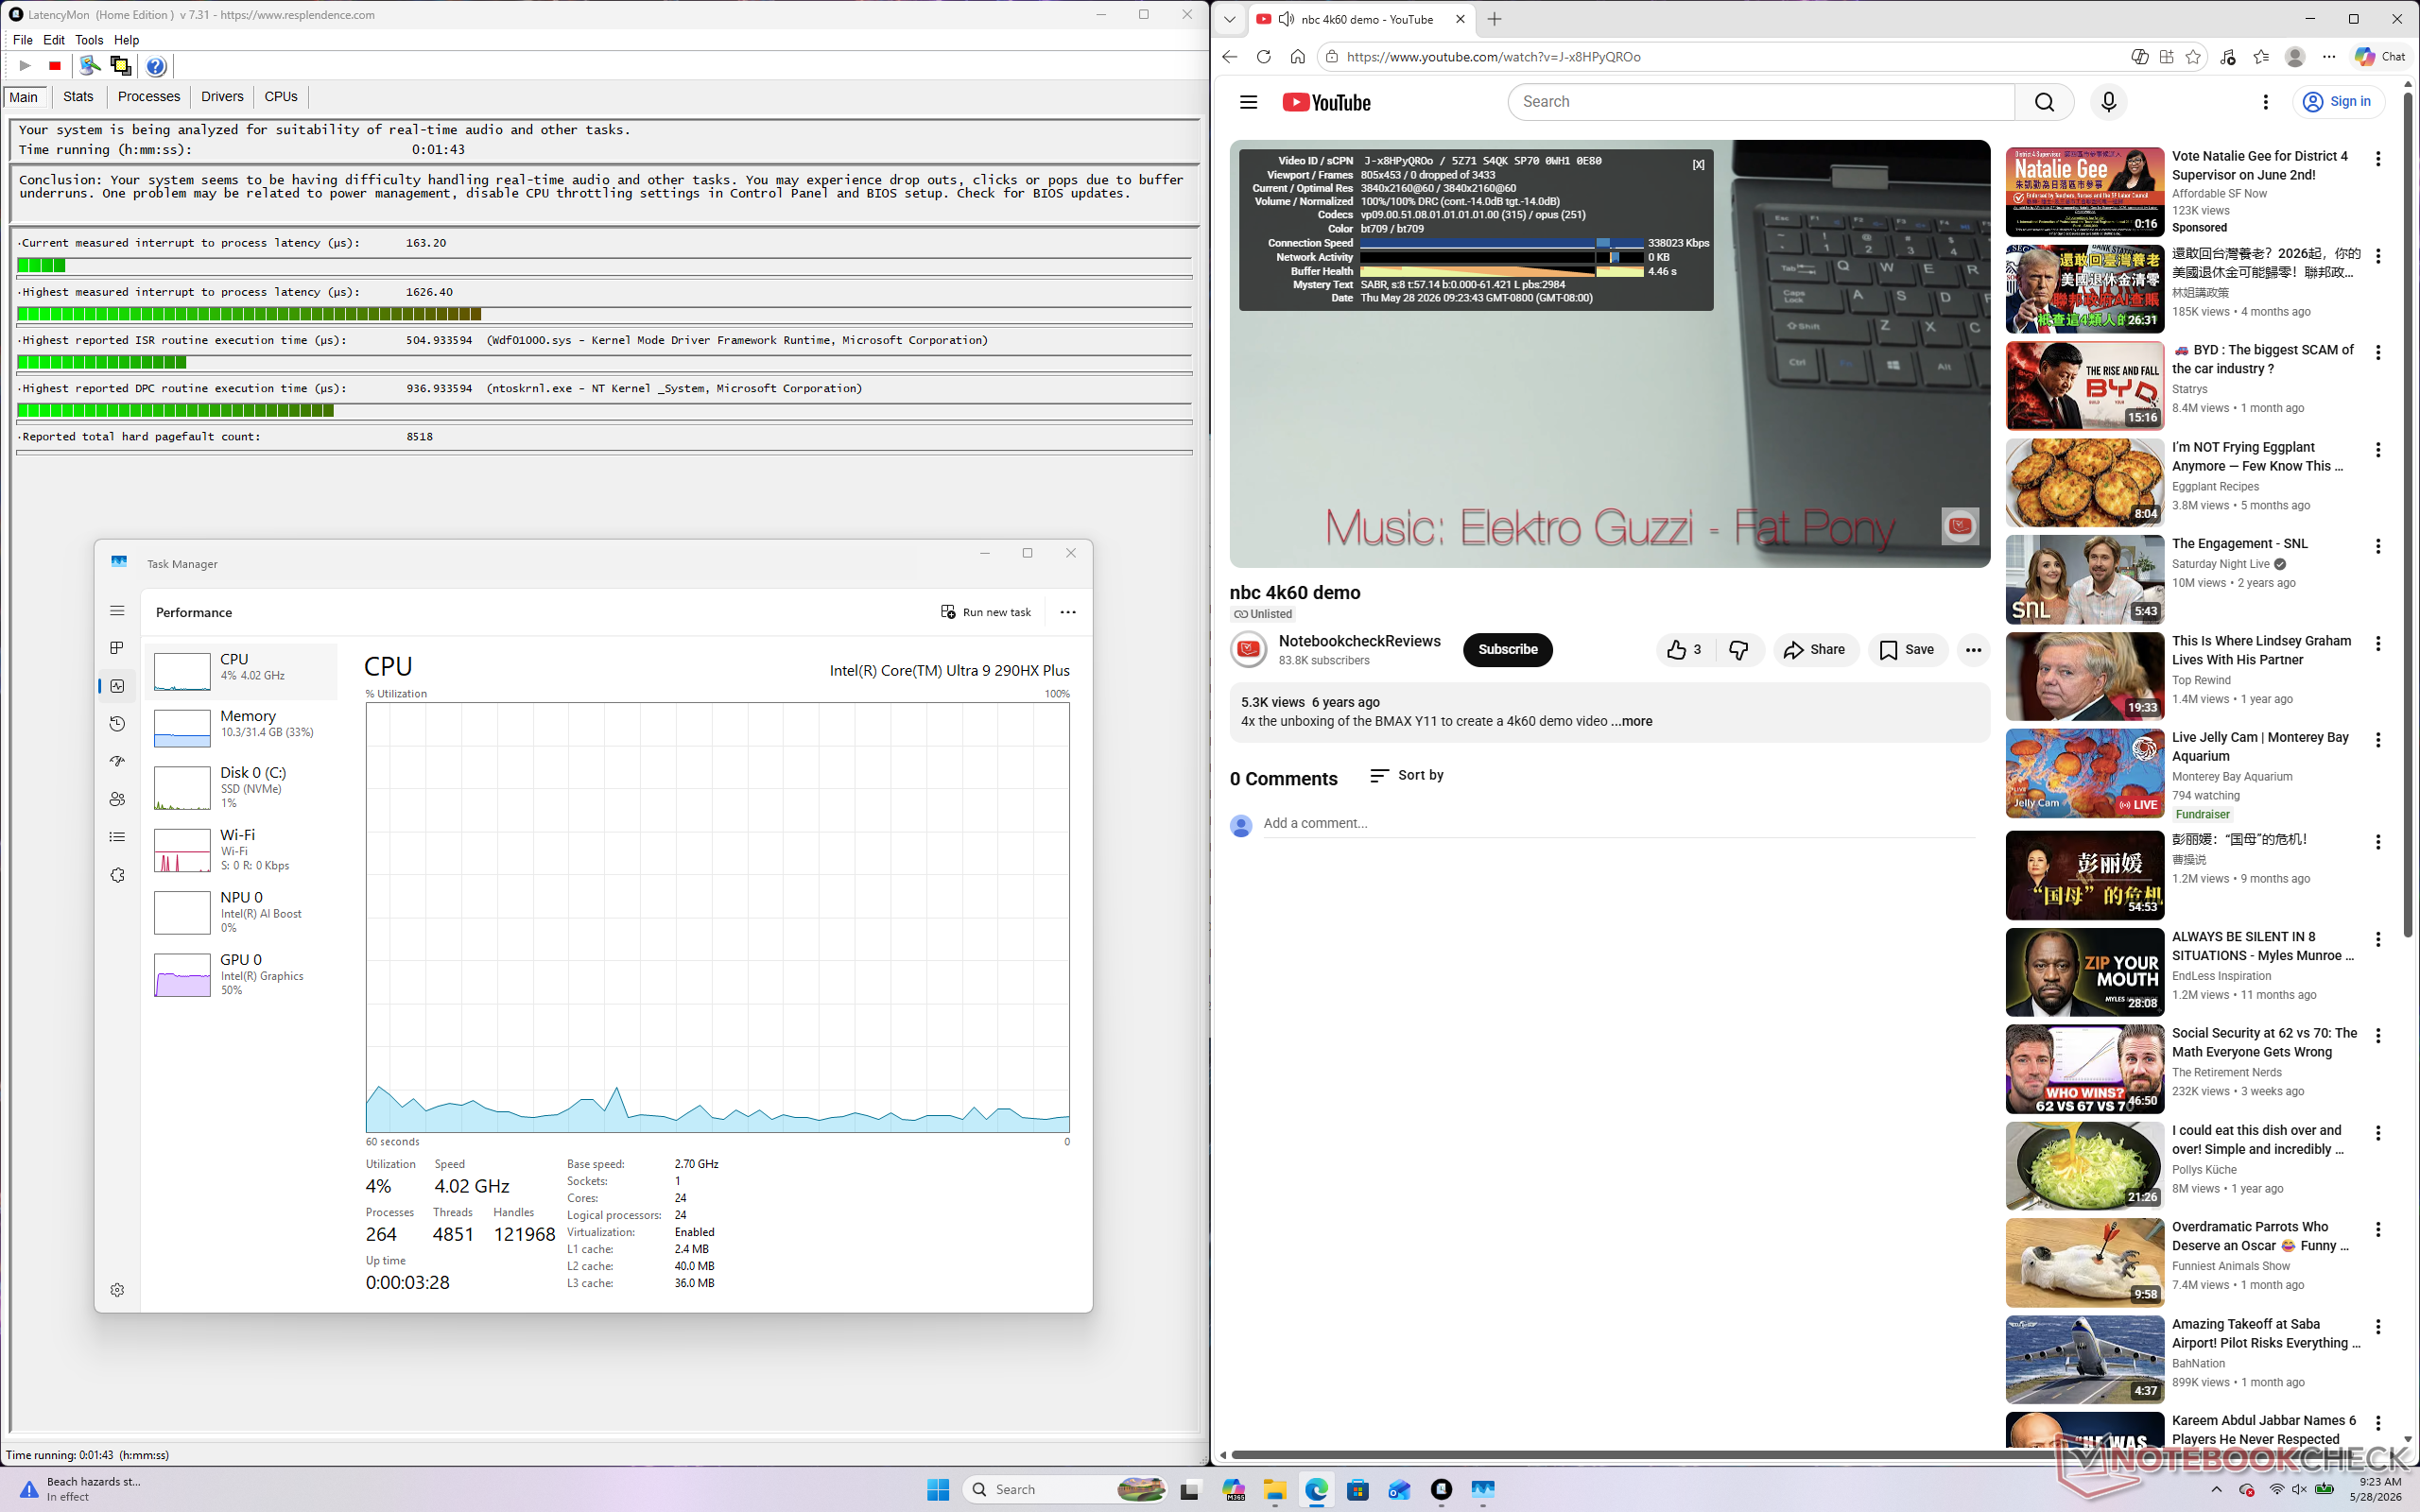
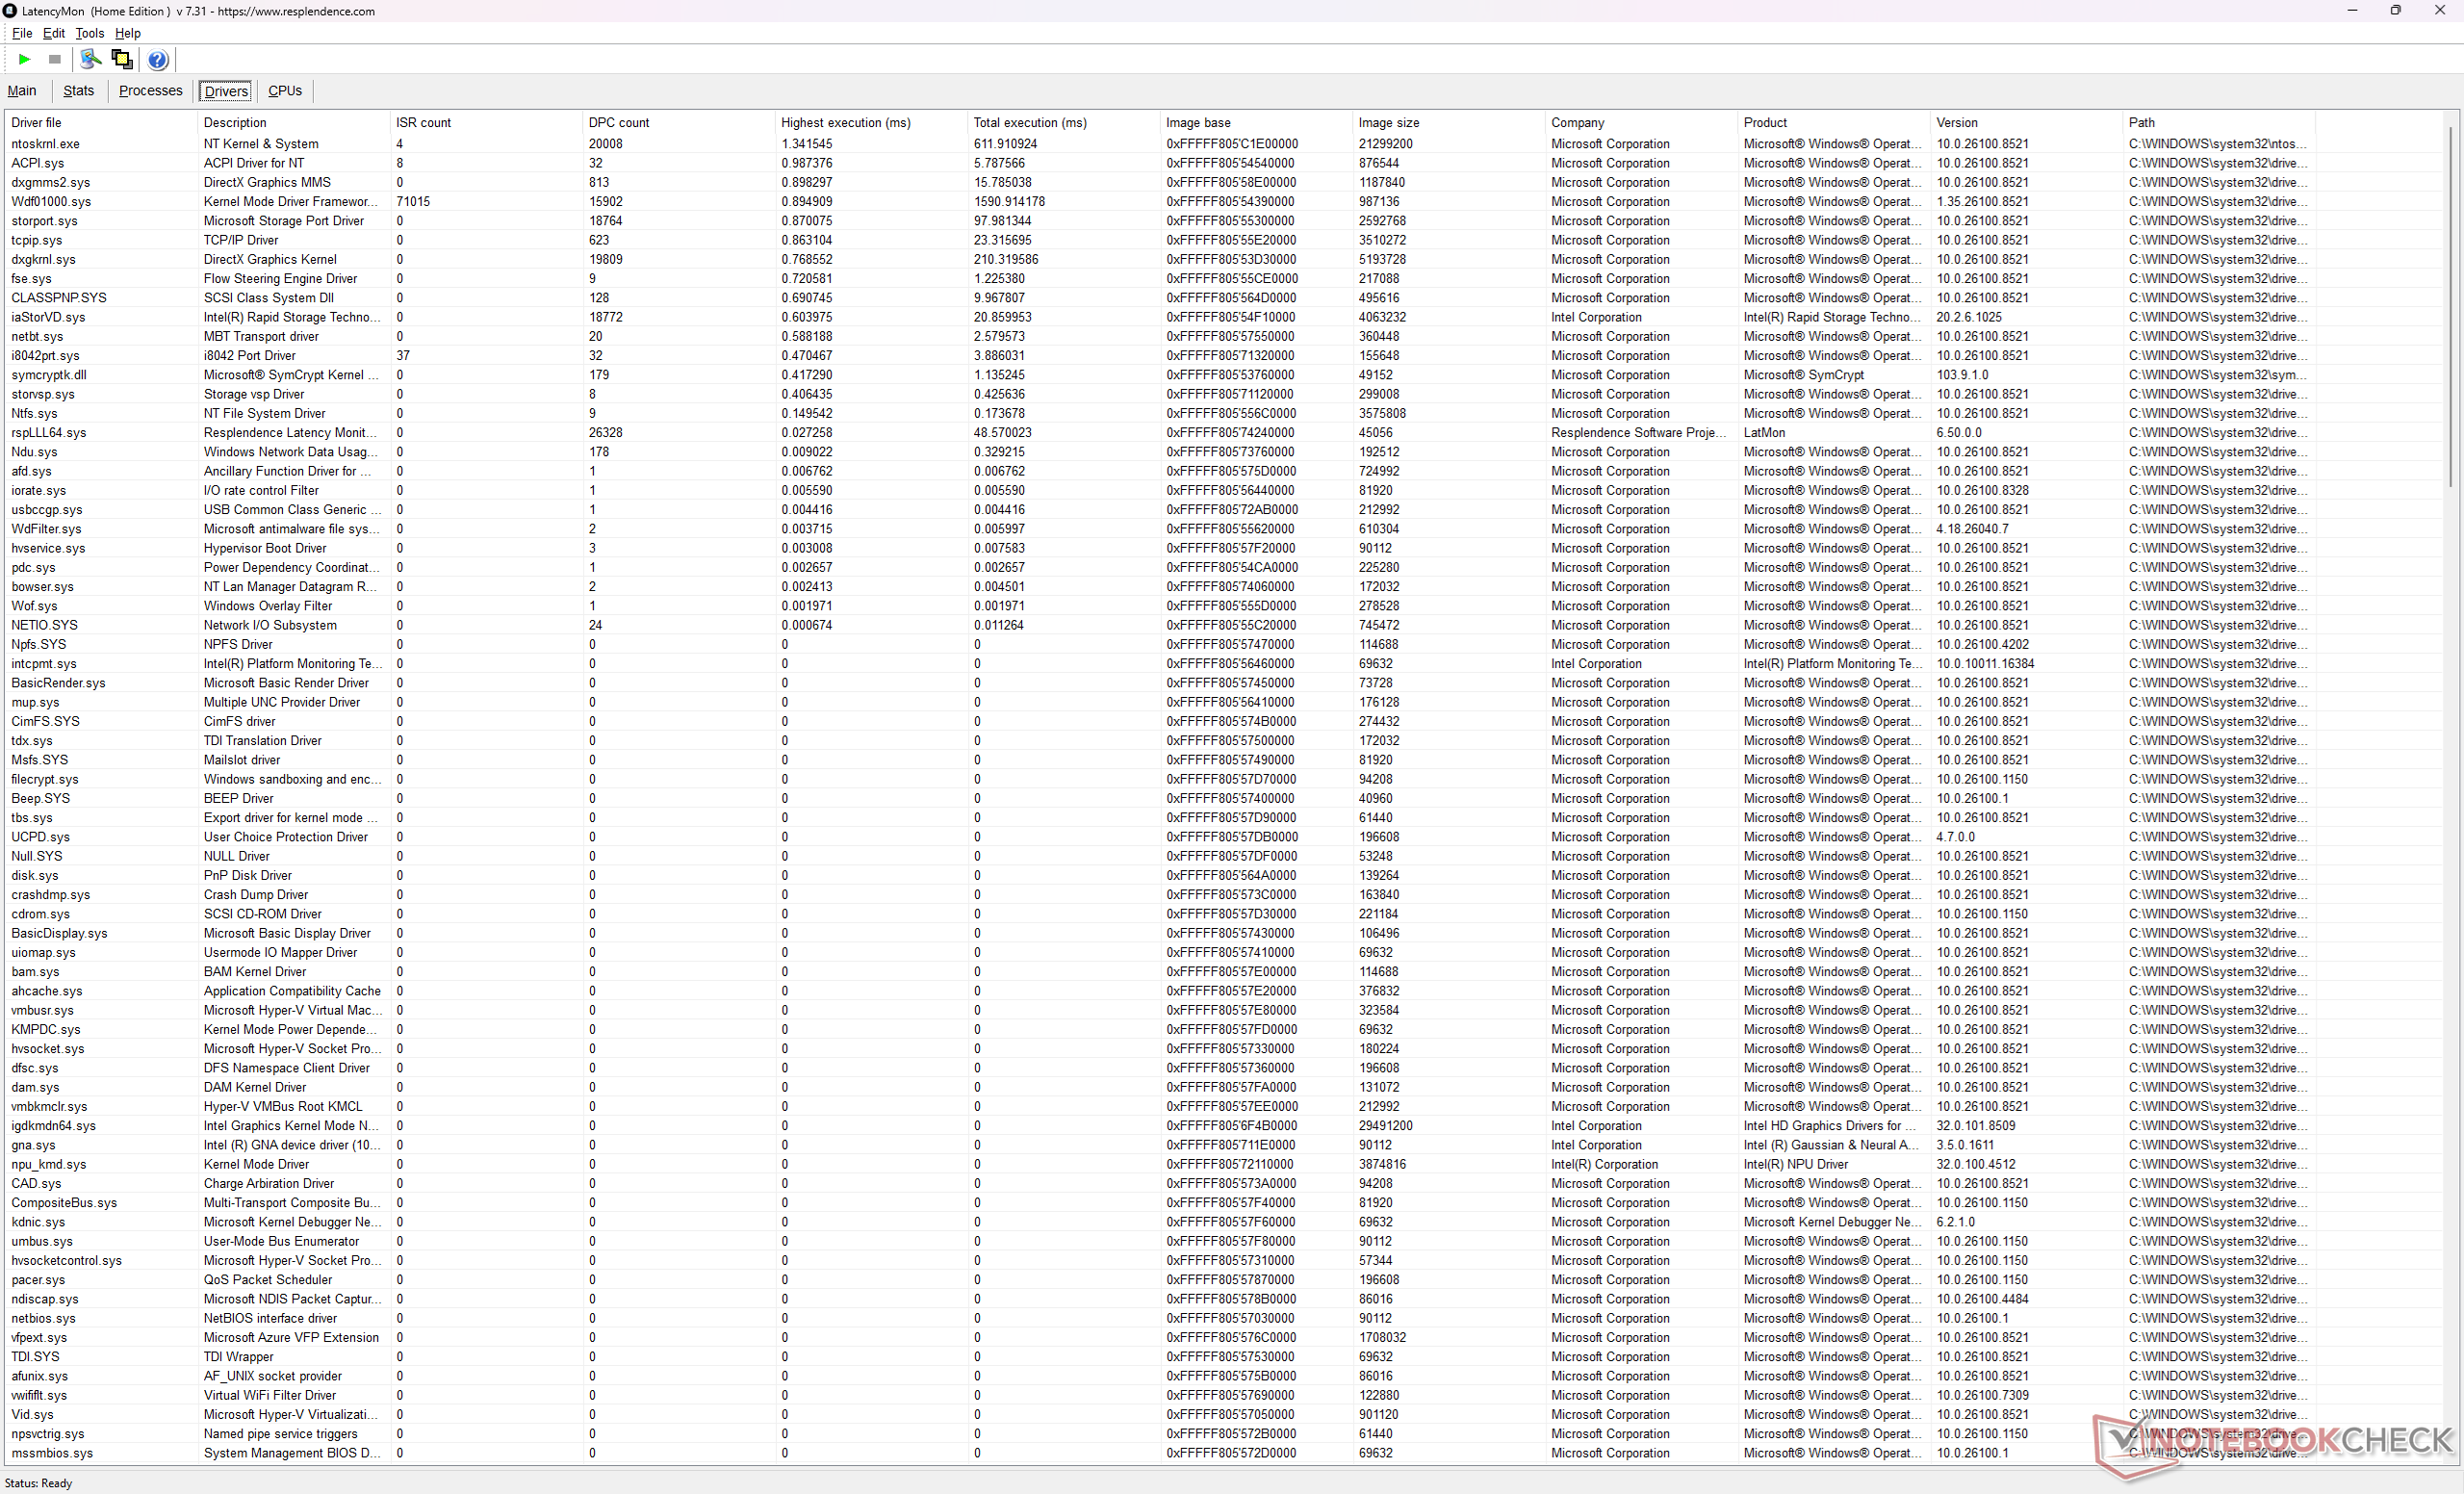
| DPC Latencies / LatencyMon - interrupt to process latency (max), Web, Youtube, Prime95 | |
| Alienware 16X Aurora Core Ultra 9 290HX Plus | |
| Razer Blade 16 Core Ultra 9 386H | |
| MSI Raider 16 Max HX B2WJ | |
| MSI Crosshair 16 HX AI D2XWGKG | |
| Lenovo Legion 7 16IAX10 | |
| Asus TUF Gaming A16 FA608UP | |
* ... im mniej tym lepiej
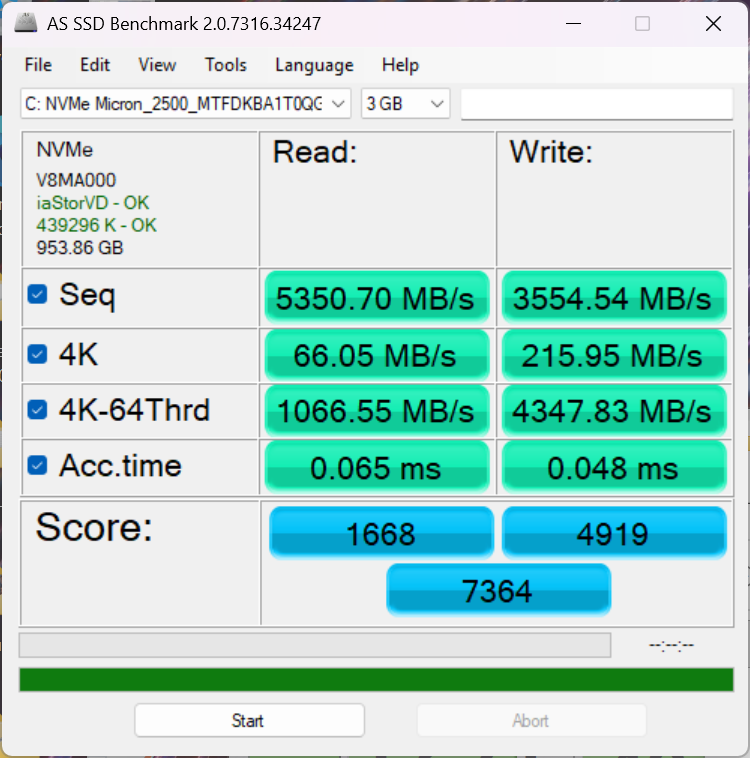
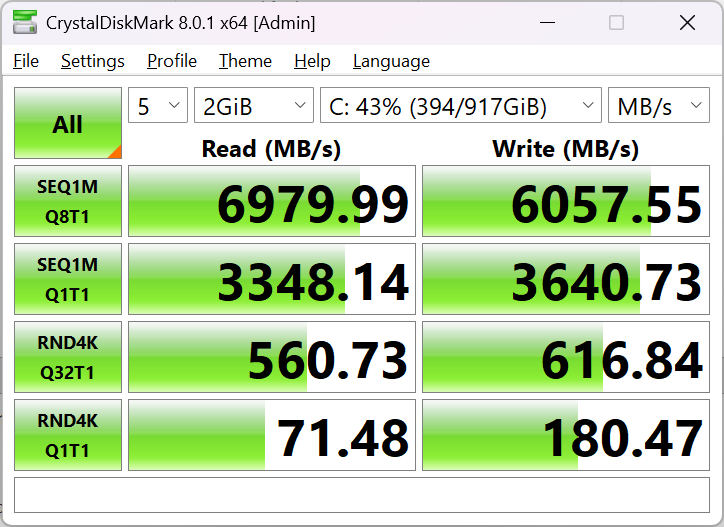
Urządzenia pamięci masowej
Nasza jednostka testowa jest dostarczana z tym samym Micron 2500 PCIe4 x4 NVMe SSD, który można znaleźć w Crosshair 16 HX.

* ... im mniej tym lepiej
Dławienie dysku: Pętla odczytu DiskSpd, głębokość kolejki 8
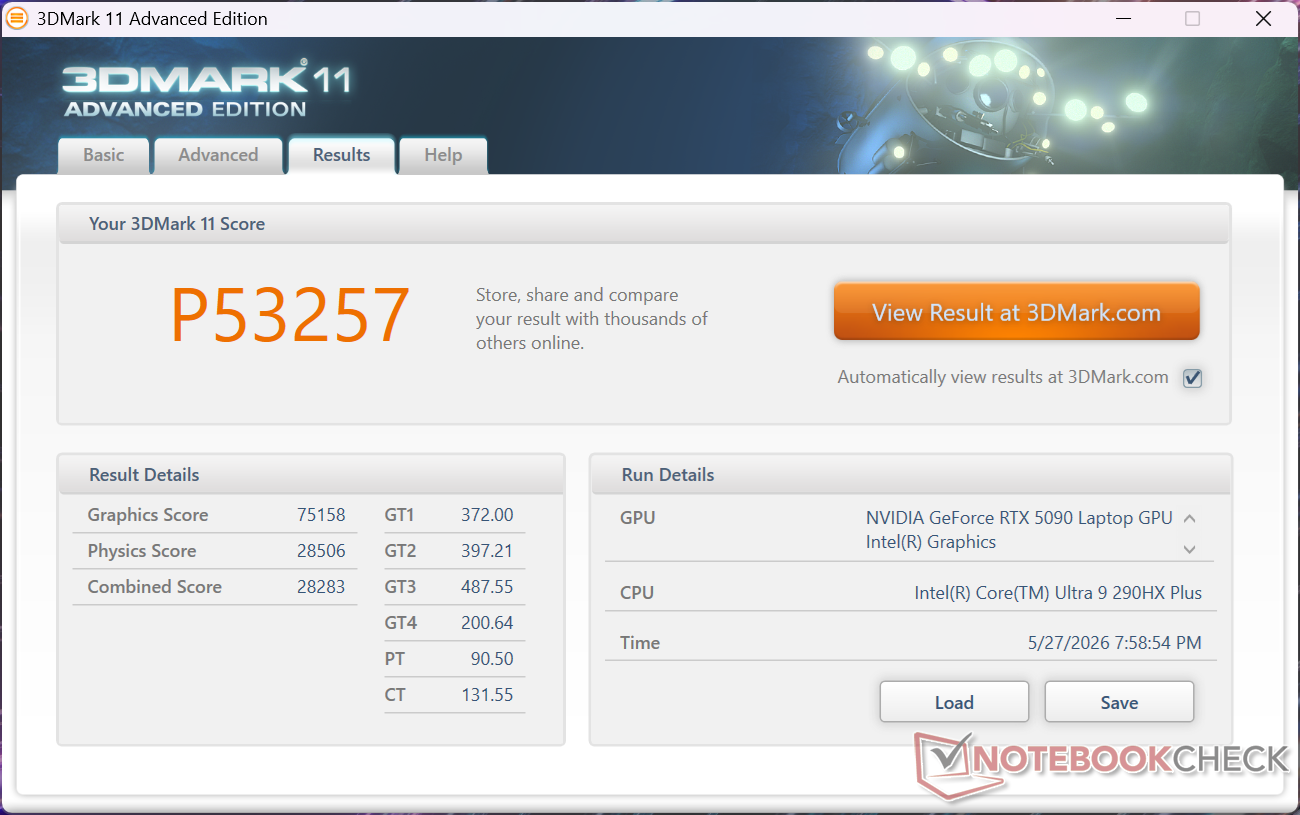
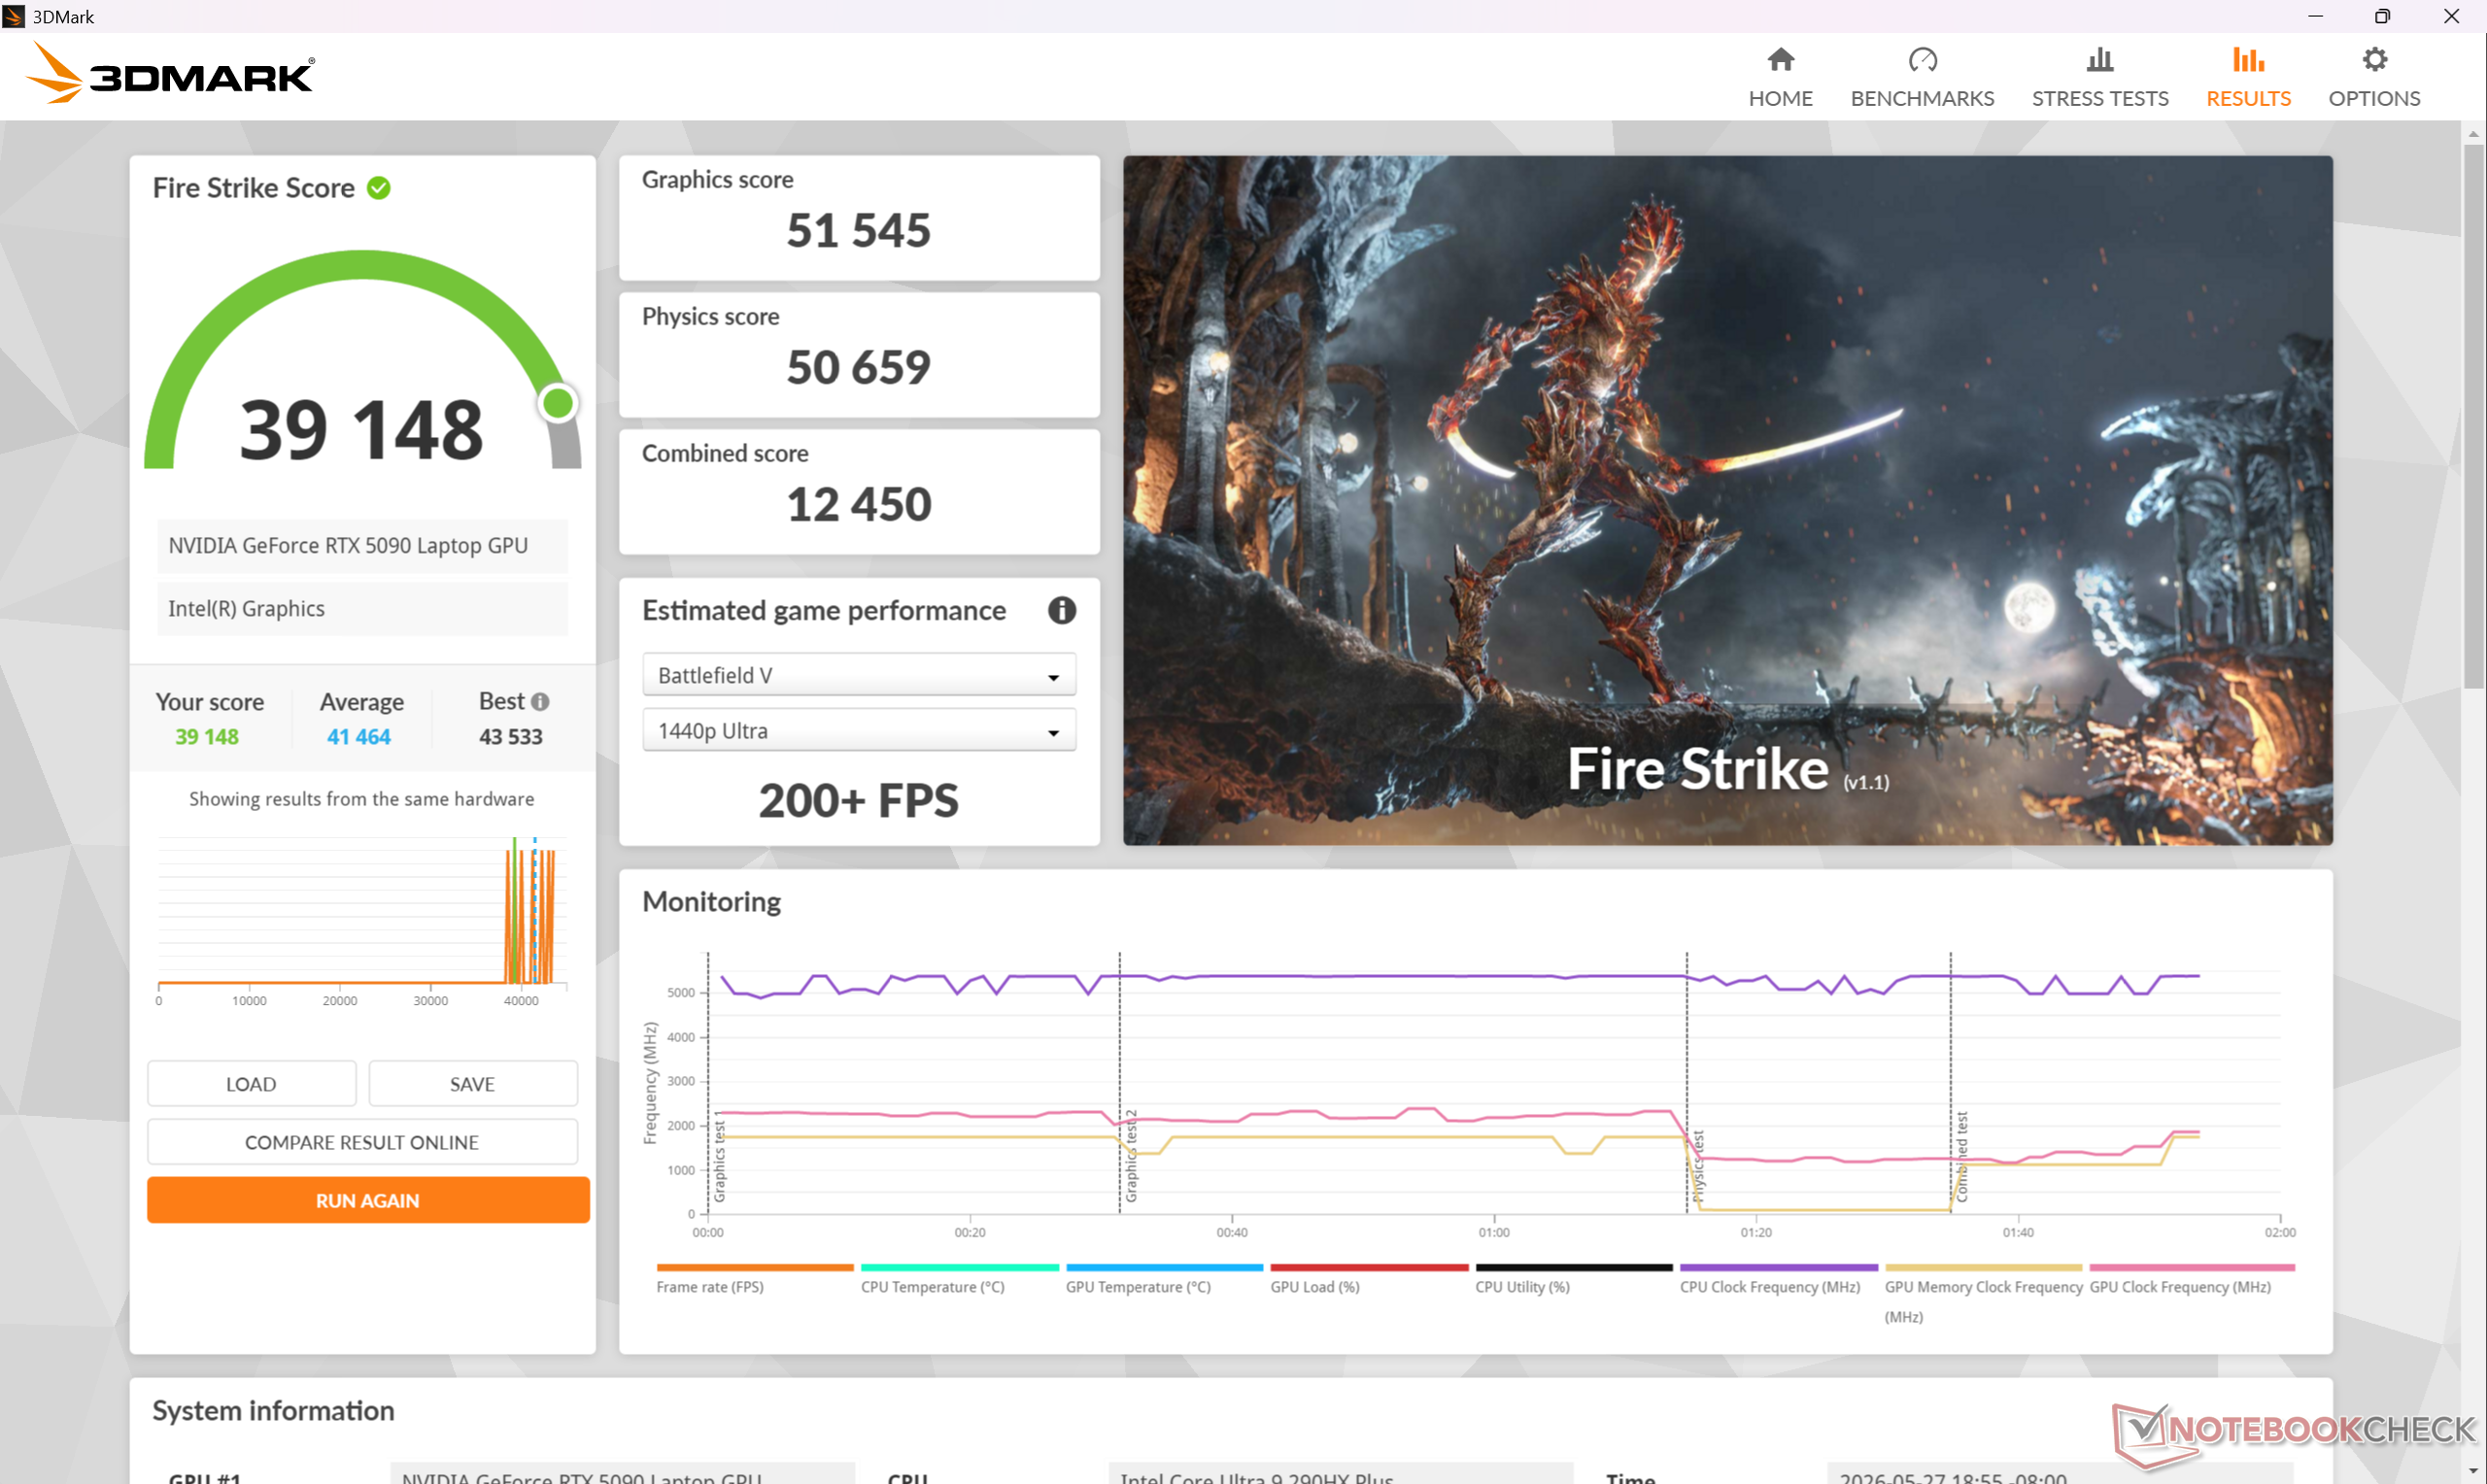
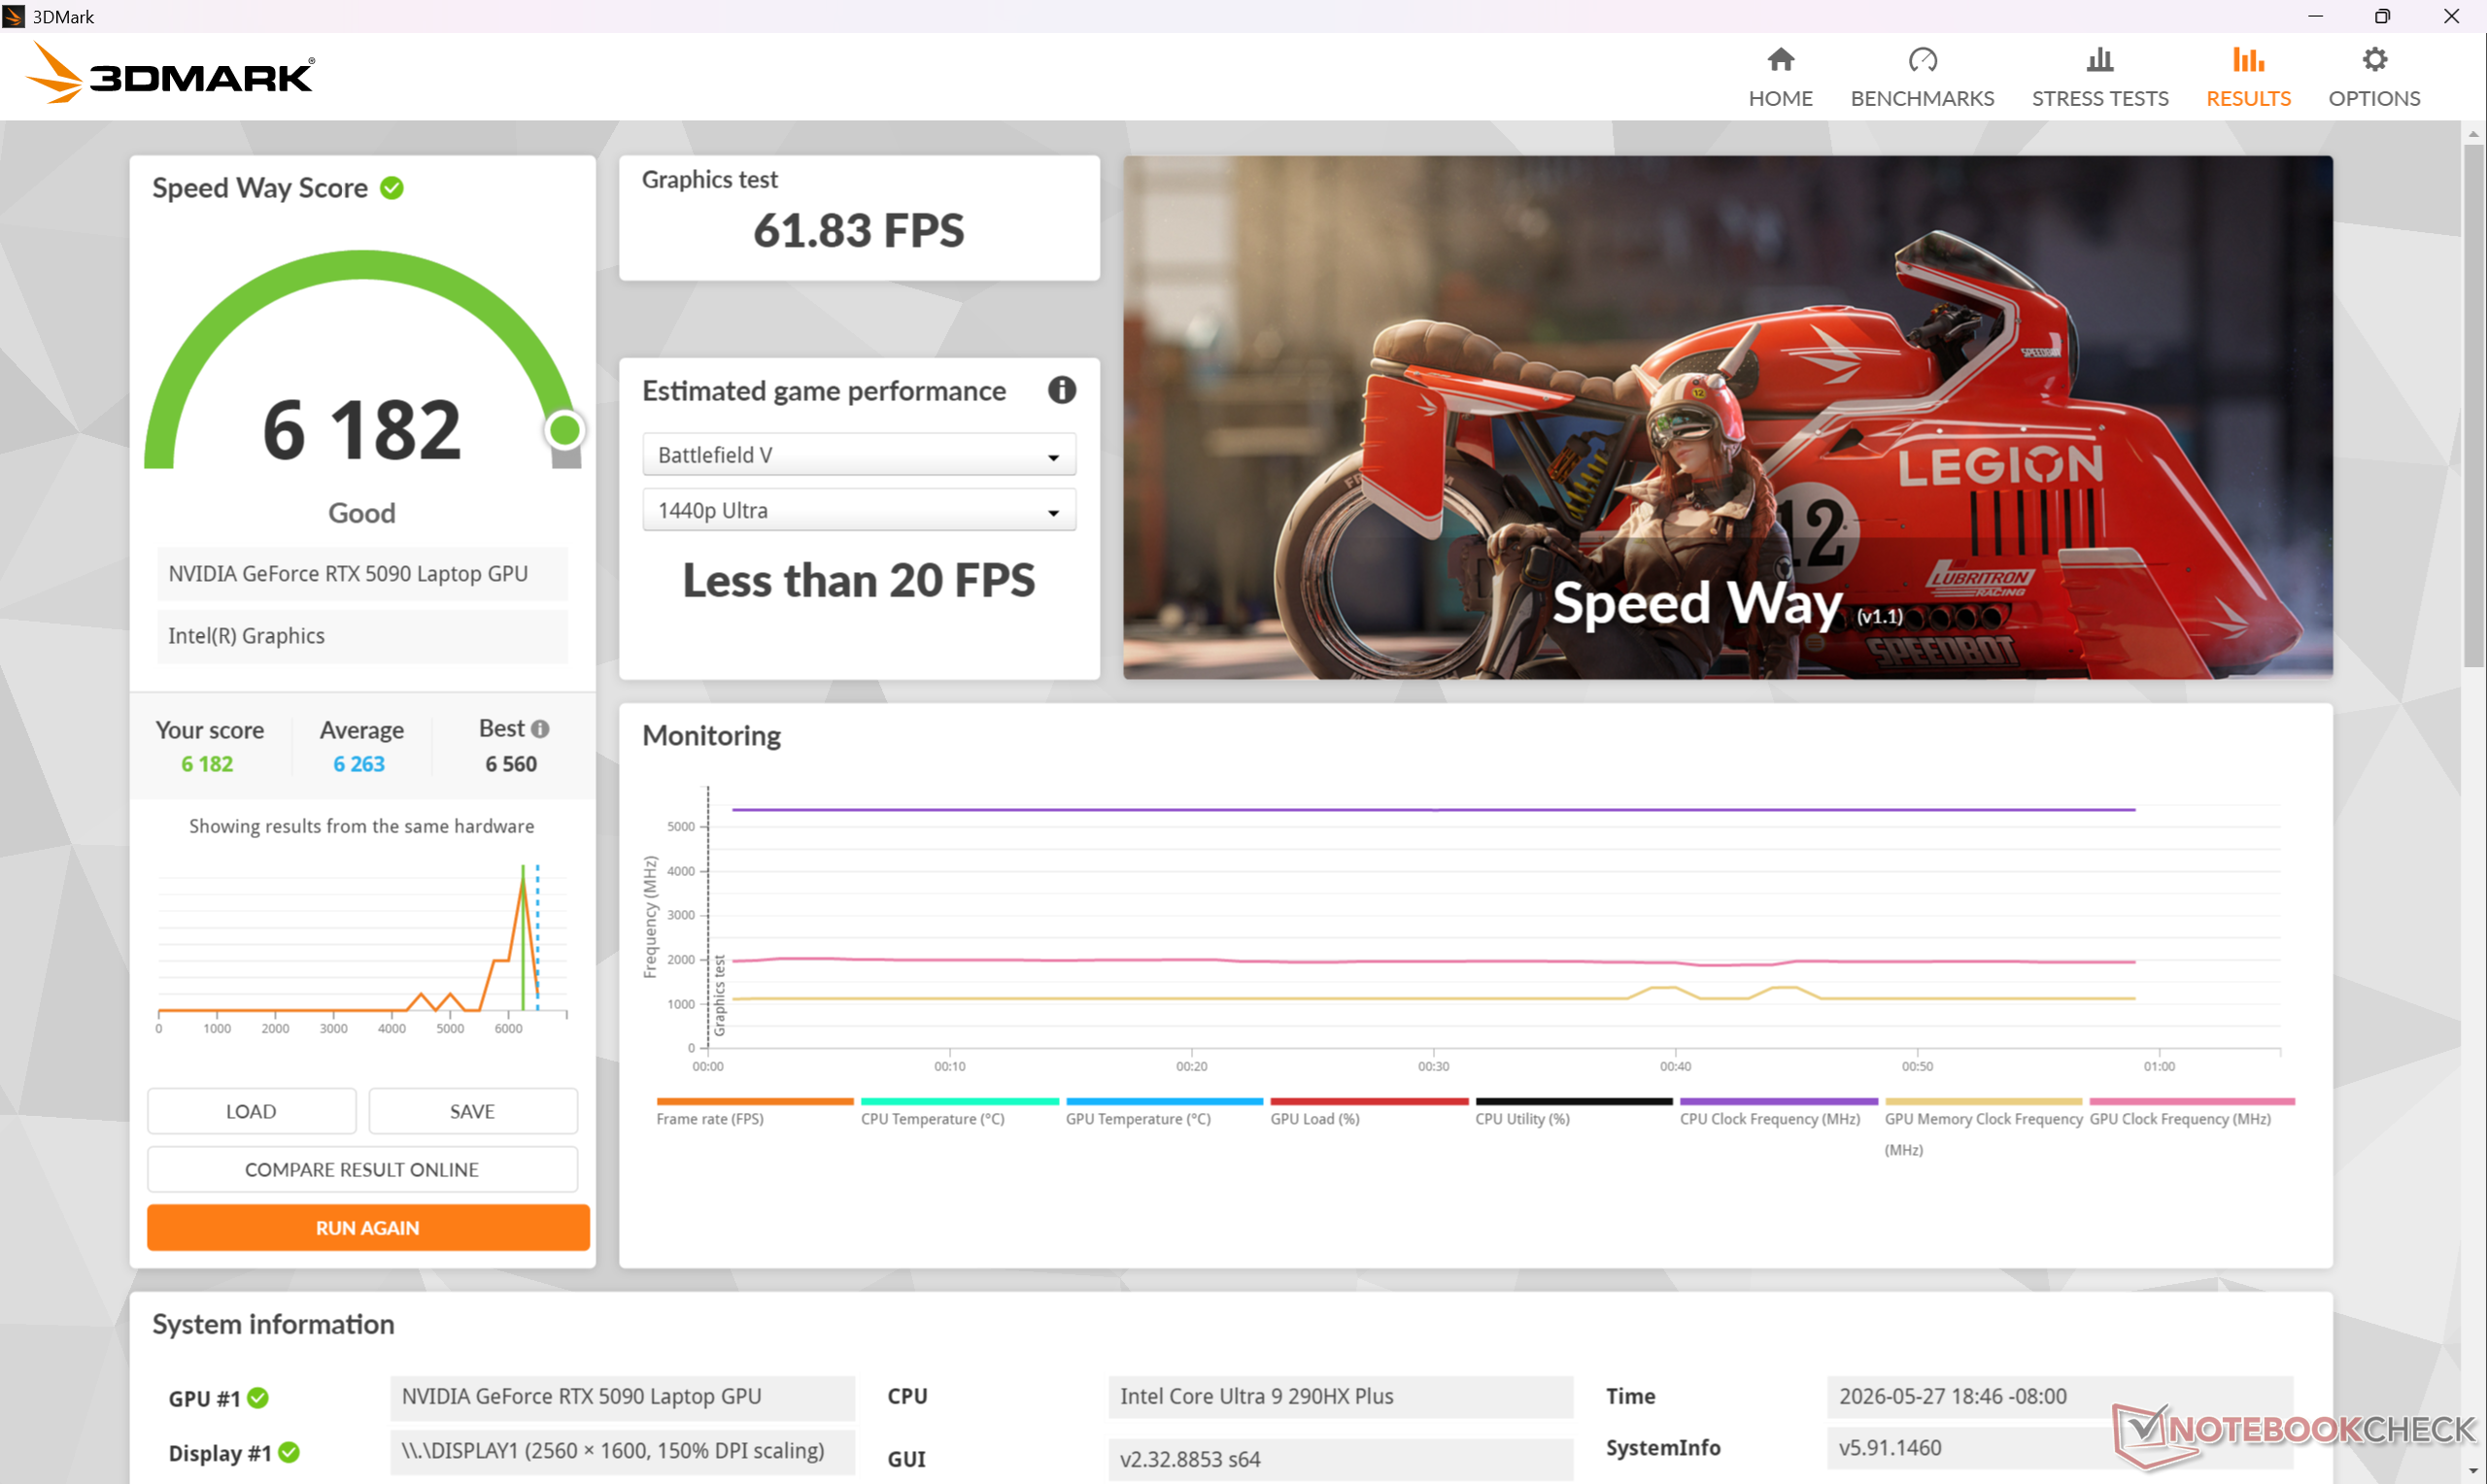
Wydajność GPU
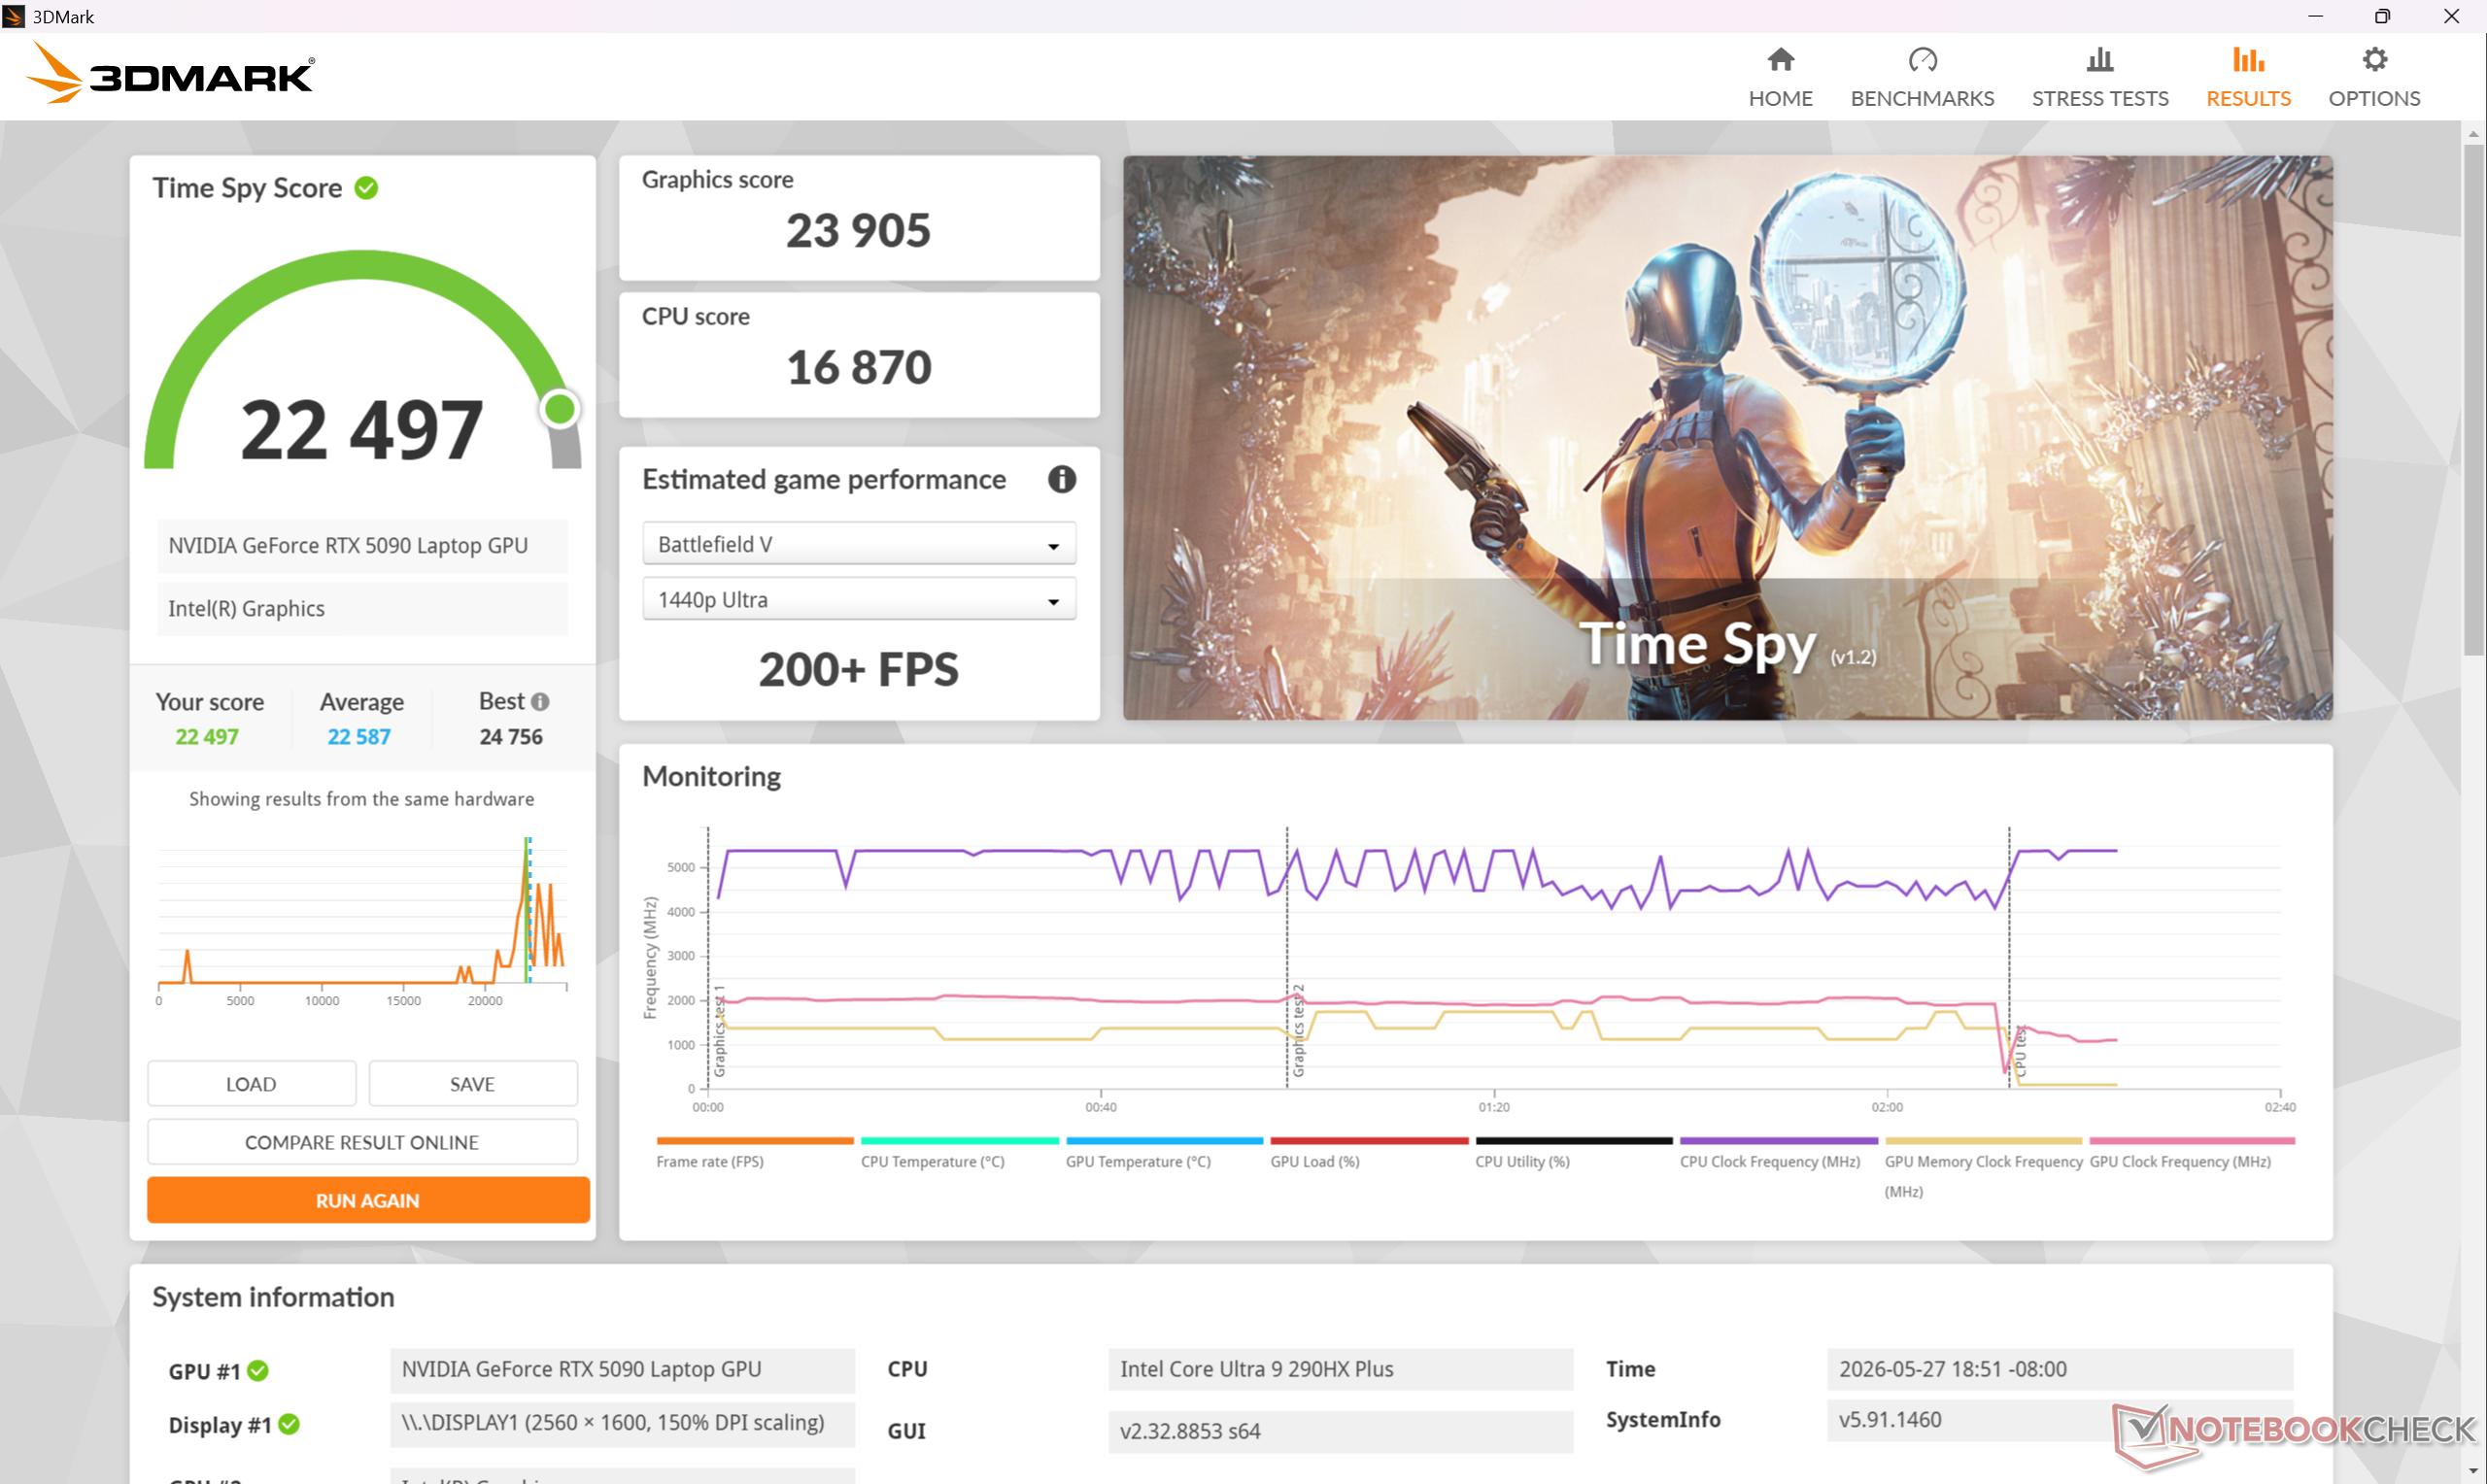
Uruchomienie systemu w trybie Apex lub Cooler Boost (tj. w trybie maksymalnego hałasu wentylatora) jest jedynym sposobem na uzyskanie największej mocy obliczeniowej zarówno z CPU, jak i GeForce RTX 5090 GPU, jak pokazuje poniższa tabela wyników Time Spy. Zejście do cichszego trybu Balanced zmniejsza ogólną wydajność o około 10 procent.
| Profil zasilania | Wynik grafiki | Wynik fizyki | Łączny wynik |
| Tryb Cooler Boost | 26009 | 16635 | 23981 |
| Tryb Apex | 25594 (-2%) | 16938 (-2%) | 23771 (-1%) |
| Tryb ekstremalnej wydajności | 23905 (-8%) | 16870 (-1%) | 22497 (-6%) |
| Tryb zrównoważony | 23572 (-9%) | 14462 (-13%) | 21536 (-10%) |
| Oszczędzanie energii | 18192 (-30%) | 13786 (-17%) | 17912 (-25%) |
| 3DMark Performance rating - Percent | |
| NVIDIA GeForce RTX 5090 Founders Edition | |
| Schenker XMG Neo 16 A25 5090 -1! | |
| MSI Raider 16 Max HX B2WJ | |
| Przeciętny NVIDIA GeForce RTX 5090 Laptop | |
| Razer Blade 16 Core Ultra 9 386H | |
| Alienware 16X Aurora Core Ultra 9 290HX Plus | |
| MSI Crosshair 16 HX AI D2XWGKG | |
| Lenovo Legion 7 16IAX10 | |
| Lenovo Legion 5 Pro 16 G7 i7 RTX 3070Ti -2! | |
| HP Omen Transcend 16 | |
| MSI Raider GE68HX 13VF | |
| 3DMark 11 Performance | 53257 pkt. | |
| 3DMark Cloud Gate Standard Score | 77700 pkt. | |
| 3DMark Fire Strike Score | 39148 pkt. | |
| 3DMark Time Spy Score | 22497 pkt. | |
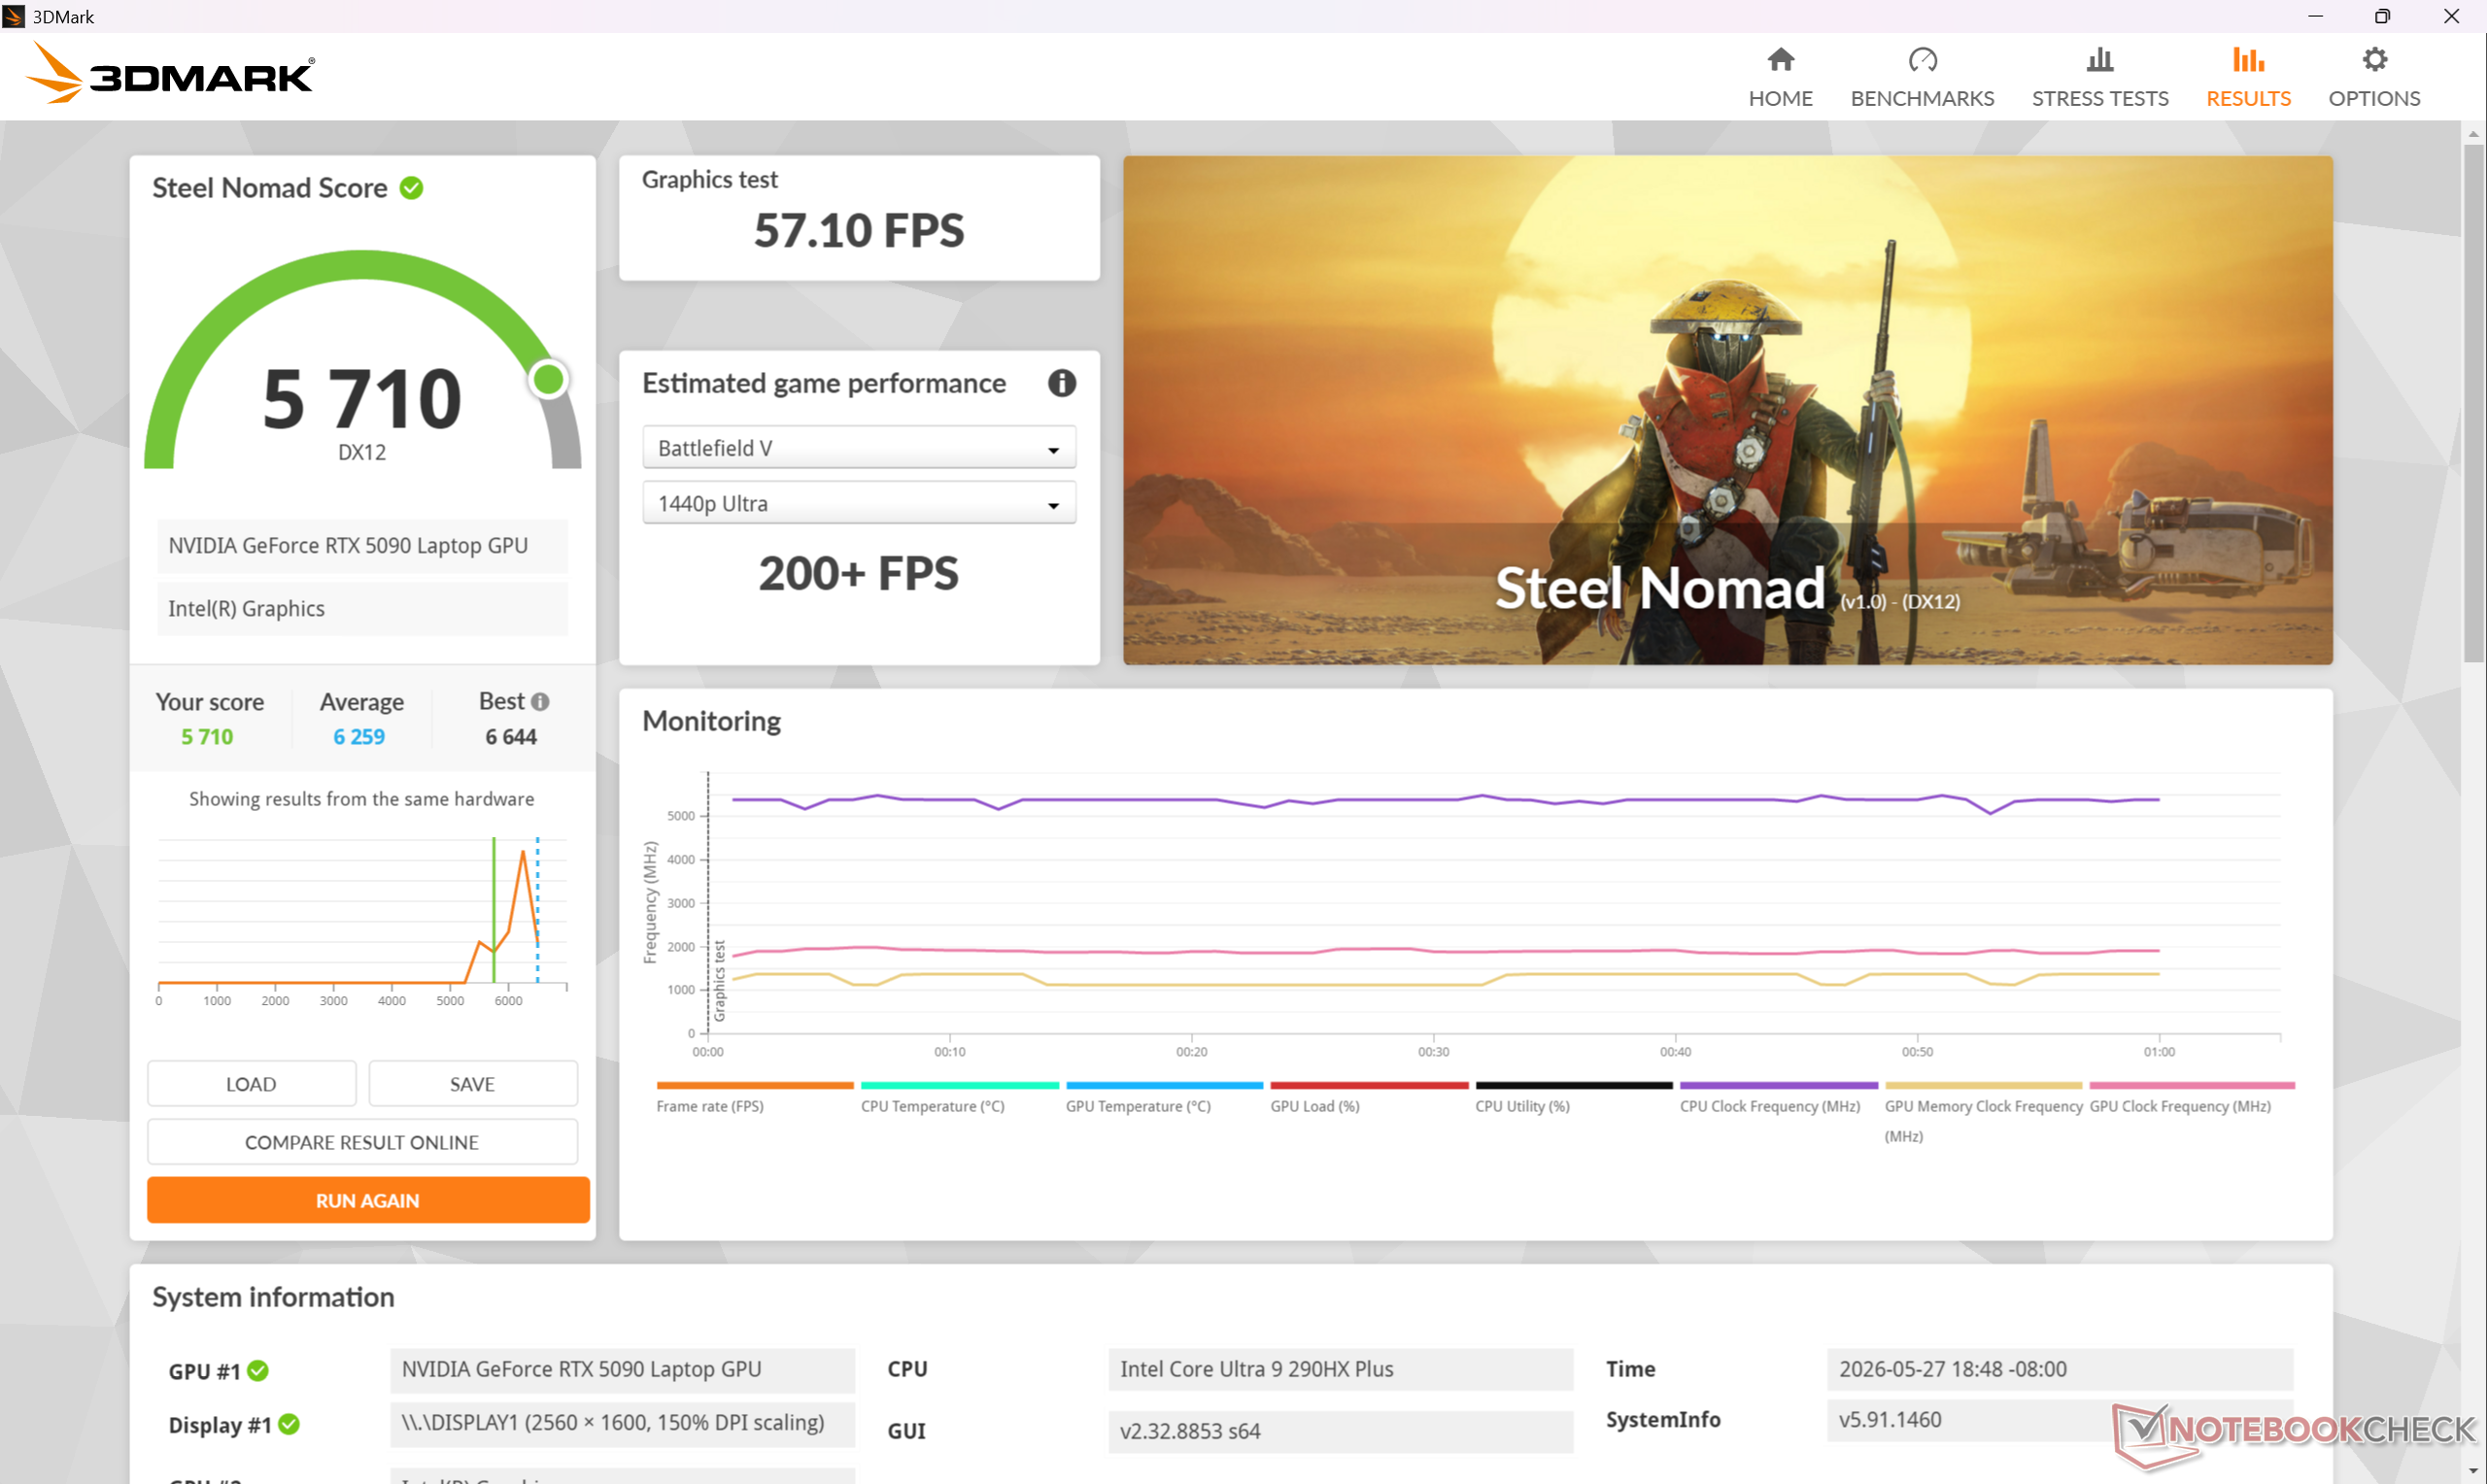
| 3DMark Steel Nomad Score | 5710 pkt. | |
Pomoc | ||
* ... im mniej tym lepiej
Wydajność w grach
Mobilna karta GeForce RTX 5090 prawdopodobnie lepiej współpracuje z natywnym wyświetlaczem 1600p zamiast 4K, biorąc pod uwagę, że wersja desktopowa może być dwa razy mocniejsza. Proszę pamiętać, że system musi być ustawiony na tryb Apex lub Cooler Boost, aby w pełni wykorzystać reklamowane 175 W TGP.
| Cyberpunk 2077 - 1920x1080 Ultra Preset (FSR off) | |
| MSI Raider 16 Max HX B2WJ | |
| Razer Blade 16 Core Ultra 9 386H | |
| Alienware 16X Aurora Core Ultra 9 290HX Plus | |
| Asus TUF Gaming A16 FA608UP | |
| MSI Crosshair 16 HX AI D2XWGKG | |
| Lenovo Legion 7 16IAX10 | |
| Baldur's Gate 3 - 1920x1080 Ultra Preset AA:T | |
| MSI Raider 16 Max HX B2WJ | |
| Razer Blade 16 Core Ultra 9 386H | |
| Alienware 16X Aurora Core Ultra 9 290HX Plus | |
| MSI Crosshair 16 HX AI D2XWGKG | |
| Asus TUF Gaming A16 FA608UP | |
| Lenovo Legion 7 16IAX10 | |
| GTA V - 1920x1080 Highest AA:4xMSAA + FX AF:16x | |
| MSI Raider 16 Max HX B2WJ | |
| Alienware 16X Aurora Core Ultra 9 290HX Plus | |
| Lenovo Legion 7 16IAX10 | |
| MSI Crosshair 16 HX AI D2XWGKG | |
| Asus TUF Gaming A16 FA608UP | |
| Razer Blade 16 Core Ultra 9 386H | |
| Final Fantasy XV Benchmark - 1920x1080 High Quality | |
| MSI Raider 16 Max HX B2WJ | |
| Razer Blade 16 Core Ultra 9 386H | |
| Alienware 16X Aurora Core Ultra 9 290HX Plus | |
| Asus TUF Gaming A16 FA608UP | |
| MSI Crosshair 16 HX AI D2XWGKG | |
| Lenovo Legion 7 16IAX10 | |
| Strange Brigade - 1920x1080 ultra AA:ultra AF:16 | |
| MSI Raider 16 Max HX B2WJ | |
| Razer Blade 16 Core Ultra 9 386H | |
| Alienware 16X Aurora Core Ultra 9 290HX Plus | |
| MSI Crosshair 16 HX AI D2XWGKG | |
| Lenovo Legion 7 16IAX10 | |
| Asus TUF Gaming A16 FA608UP | |
| Dota 2 Reborn - 1920x1080 ultra (3/3) best looking | |
| Alienware 16X Aurora Core Ultra 9 290HX Plus | |
| MSI Raider 16 Max HX B2WJ | |
| MSI Crosshair 16 HX AI D2XWGKG | |
| Lenovo Legion 7 16IAX10 | |
| Razer Blade 16 Core Ultra 9 386H | |
| Asus TUF Gaming A16 FA608UP | |
| Strange Brigade | |
| 1920x1080 ultra AA:ultra AF:16 | |
| Schenker XMG Neo 16 A25 5090 | |
| MSI Raider 16 Max HX B2WJ | |
| Przeciętny NVIDIA GeForce RTX 5090 Laptop (303 - 464, n=22) | |
| Razer Blade 16 Core Ultra 9 386H | |
| Alienware 16X Aurora Core Ultra 9 290HX Plus | |
| MSI Crosshair 16 HX AI D2XWGKG | |
| Lenovo Legion 7 16IAX10 | |
| HP Omen Transcend 16 | |
| Lenovo Legion 5 Pro 16 G7 i7 RTX 3070Ti | |
| MSI Raider GE68HX 13VF | |
| 2560x1440 ultra AA:ultra AF:16 | |
| Schenker XMG Neo 16 A25 5090 | |
| MSI Raider 16 Max HX B2WJ | |
| Przeciętny NVIDIA GeForce RTX 5090 Laptop (240 - 354, n=22) | |
| Razer Blade 16 Core Ultra 9 386H | |
| Alienware 16X Aurora Core Ultra 9 290HX Plus | |
| MSI Crosshair 16 HX AI D2XWGKG | |
| Lenovo Legion 7 16IAX10 | |
| Lenovo Legion 5 Pro 16 G7 i7 RTX 3070Ti | |
| HP Omen Transcend 16 | |
| 3840x2160 ultra AA:ultra AF:16 | |
| MSI Raider 16 Max HX B2WJ | |
| Razer Blade 16 Core Ultra 9 386H | |
| Przeciętny NVIDIA GeForce RTX 5090 Laptop (151.4 - 187.2, n=17) | |
| HP Omen Transcend 16 | |
| Dota 2 Reborn | |
| 1920x1080 ultra (3/3) best looking | |
| NVIDIA GeForce RTX 5090 Founders Edition | |
| Schenker XMG Neo 16 A25 5090 | |
| Alienware 16X Aurora Core Ultra 9 290HX Plus | |
| MSI Raider GE68HX 13VF | |
| MSI Raider 16 Max HX B2WJ | |
| Przeciętny NVIDIA GeForce RTX 5090 Laptop (132.4 - 248, n=24) | |
| MSI Crosshair 16 HX AI D2XWGKG | |
| HP Omen Transcend 16 | |
| Lenovo Legion 7 16IAX10 | |
| Razer Blade 16 Core Ultra 9 386H | |
| Lenovo Legion 5 Pro 16 G7 i7 RTX 3070Ti | |
| 3840x2160 ultra (3/3) best looking | |
| NVIDIA GeForce RTX 5090 Founders Edition | |
| Przeciętny NVIDIA GeForce RTX 5090 Laptop (131.2 - 193.1, n=17) | |
| MSI Raider 16 Max HX B2WJ | |
| Razer Blade 16 Core Ultra 9 386H | |
| HP Omen Transcend 16 | |
| GTA V | |
| 1920x1080 Highest AA:4xMSAA + FX AF:16x | |
| Schenker XMG Neo 16 A25 5090 | |
| MSI Raider 16 Max HX B2WJ | |
| Alienware 16X Aurora Core Ultra 9 290HX Plus | |
| Przeciętny NVIDIA GeForce RTX 5090 Laptop (102.9 - 186.9, n=19) | |
| Lenovo Legion 7 16IAX10 | |
| MSI Crosshair 16 HX AI D2XWGKG | |
| Lenovo Legion 5 Pro 16 G7 i7 RTX 3070Ti | |
| Razer Blade 16 Core Ultra 9 386H | |
| 2560x1440 Highest AA:4xMSAA + FX AF:16x | |
| Schenker XMG Neo 16 A25 5090 | |
| MSI Raider 16 Max HX B2WJ | |
| Przeciętny NVIDIA GeForce RTX 5090 Laptop (62.7 - 183.9, n=19) | |
| Alienware 16X Aurora Core Ultra 9 290HX Plus | |
| MSI Crosshair 16 HX AI D2XWGKG | |
| Lenovo Legion 7 16IAX10 | |
| Lenovo Legion 5 Pro 16 G7 i7 RTX 3070Ti | |
| Razer Blade 16 Core Ultra 9 386H | |
| 3840x2160 Highest AA:4xMSAA + FX AF:16x | |
| MSI Raider 16 Max HX B2WJ | |
| Przeciętny NVIDIA GeForce RTX 5090 Laptop (84.4 - 123.2, n=12) | |
| Razer Blade 16 Core Ultra 9 386H | |
| 3840x2160 High/On (Advanced Graphics Off) AA:FX AF:8x | |
| MSI Raider 16 Max HX B2WJ | |
| Razer Blade 16 Core Ultra 9 386H | |
| Przeciętny NVIDIA GeForce RTX 5090 Laptop (150.7 - 186.6, n=10) | |
Cyberpunk 2077 ultra FPS Chart
| low | med. | high | ultra | QHD DLSS | QHD | 4K DLSS | 4K | |
|---|---|---|---|---|---|---|---|---|
| GTA V (2015) | 191.4 | 190.9 | 187.5 | 165.2 | 162.3 | 181.5 | ||
| Dota 2 Reborn (2015) | 225 | 206 | 189.6 | 176.1 | 160 | |||
| Final Fantasy XV Benchmark (2018) | 234 | 236 | 205 | 171.3 | 96.3 | |||
| X-Plane 11.11 (2018) | 154.8 | 138 | 112.6 | 93.8 | ||||
| Strange Brigade (2018) | 639 | 503 | 471 | 433 | 329 | 179.6 | ||
| Baldur's Gate 3 (2023) | 287 | 242 | 211 | 207 | 202 | 147.7 | 125.9 | 83.1 |
| Cyberpunk 2077 (2023) | 199.4 | 196.6 | 177.3 | 161.7 | 122.7 | 111.2 | 61 | 50.4 |
| F1 24 (2024) | 353 | 379 | 364 | 153.8 | 154.1 | 99.8 | 85.3 | 50.5 |
| Black Myth: Wukong (2024) | 122 | 97 | 58 | 65 | 45 | 46 | 27 | |
| Assassin's Creed Shadows (2025) | 102 | 89 | 69 | 70 | 59 | 56 | 43 |
Emisje
Hałas systemowy
Hałas wentylatora jest ściśle powiązany z pięcioma ustawieniami profilu mocy w kolejności od najniższej do najwyższej wydajności: Eco, Balanced, Extreme Performance, Apex i Cooler Boost. Podczas uruchamiania Cyberpunk 2077 na tych profilach, hałas wentylatora ma tendencję do stabilizowania się odpowiednio na poziomie 36,2 dB(A), 47,5 dB(A), 51,1 dB(A), 57 dB(A) i 60,2 dB(A). Pulsowanie jest generalnie minimalne, gdy ustawiony jest tryb zrównoważony lub niższy. Mimo to 51,1 dB(A) podczas grania w trybie Extreme Performance jest nieco cichsze niż w konkurencyjnych modelach, takich jak Lenovo Legion 7 16IAX10 lub Razer Blade 16.
Hałas
| luz |
| 26.6 / 26.7 / 26.9 dB |
| obciążenie |
| 36 / 60.2 dB |
 | ||
30 dB cichy 40 dB(A) słyszalny 50 dB(A) irytujący |
||
min: | ||
| MSI Raider 16 Max HX B2WJ Ultra 9 290HX Plus, GeForce RTX 5090 Laptop | MSI Crosshair 16 HX AI D2XWGKG Ultra 9 275HX, GeForce RTX 5070 Laptop | Razer Blade 16 Core Ultra 9 386H Ultra 9 386H, GeForce RTX 5090 Laptop | Alienware 16X Aurora Core Ultra 9 290HX Plus Ultra 9 290HX Plus, GeForce RTX 5070 Ti Laptop | Asus TUF Gaming A16 FA608UP R7 260, GeForce RTX 5070 Laptop | Lenovo Legion 7 16IAX10 Ultra 7 255HX, GeForce RTX 5060 Laptop | |
|---|---|---|---|---|---|---|
| Noise | -11% | -1% | -4% | -11% | 1% | |
| wyłączone / środowisko * (dB) | 23.1 | 25.56 -11% | 23.1 -0% | 23.4 -1% | 25.1 -9% | 23.9 -3% |
| Idle Minimum * (dB) | 26.6 | 28.3 -6% | 23.4 12% | 23.8 11% | 32.2 -21% | 24 10% |
| Idle Average * (dB) | 26.7 | 28.3 -6% | 25.4 5% | 23.8 11% | 32.2 -21% | 26 3% |
| Idle Maximum * (dB) | 26.9 | 28.3 -5% | 29.3 -9% | 31.4 -17% | 32.2 -20% | 29.4 -9% |
| Load Average * (dB) | 36 | 50.26 -40% | 42.6 -18% | 48.7 -35% | 38.1 -6% | 35.4 2% |
| Cyberpunk 2077 ultra * (dB) | 51.1 | 57.8 -13% | 53.6 -5% | 51.5 -1% | 53.9 -5% | 54.6 -7% |
| Load Maximum * (dB) | 60.2 | 57.95 4% | 53.7 11% | 59.8 1% | 57.1 5% | 54.7 9% |
* ... im mniej tym lepiej
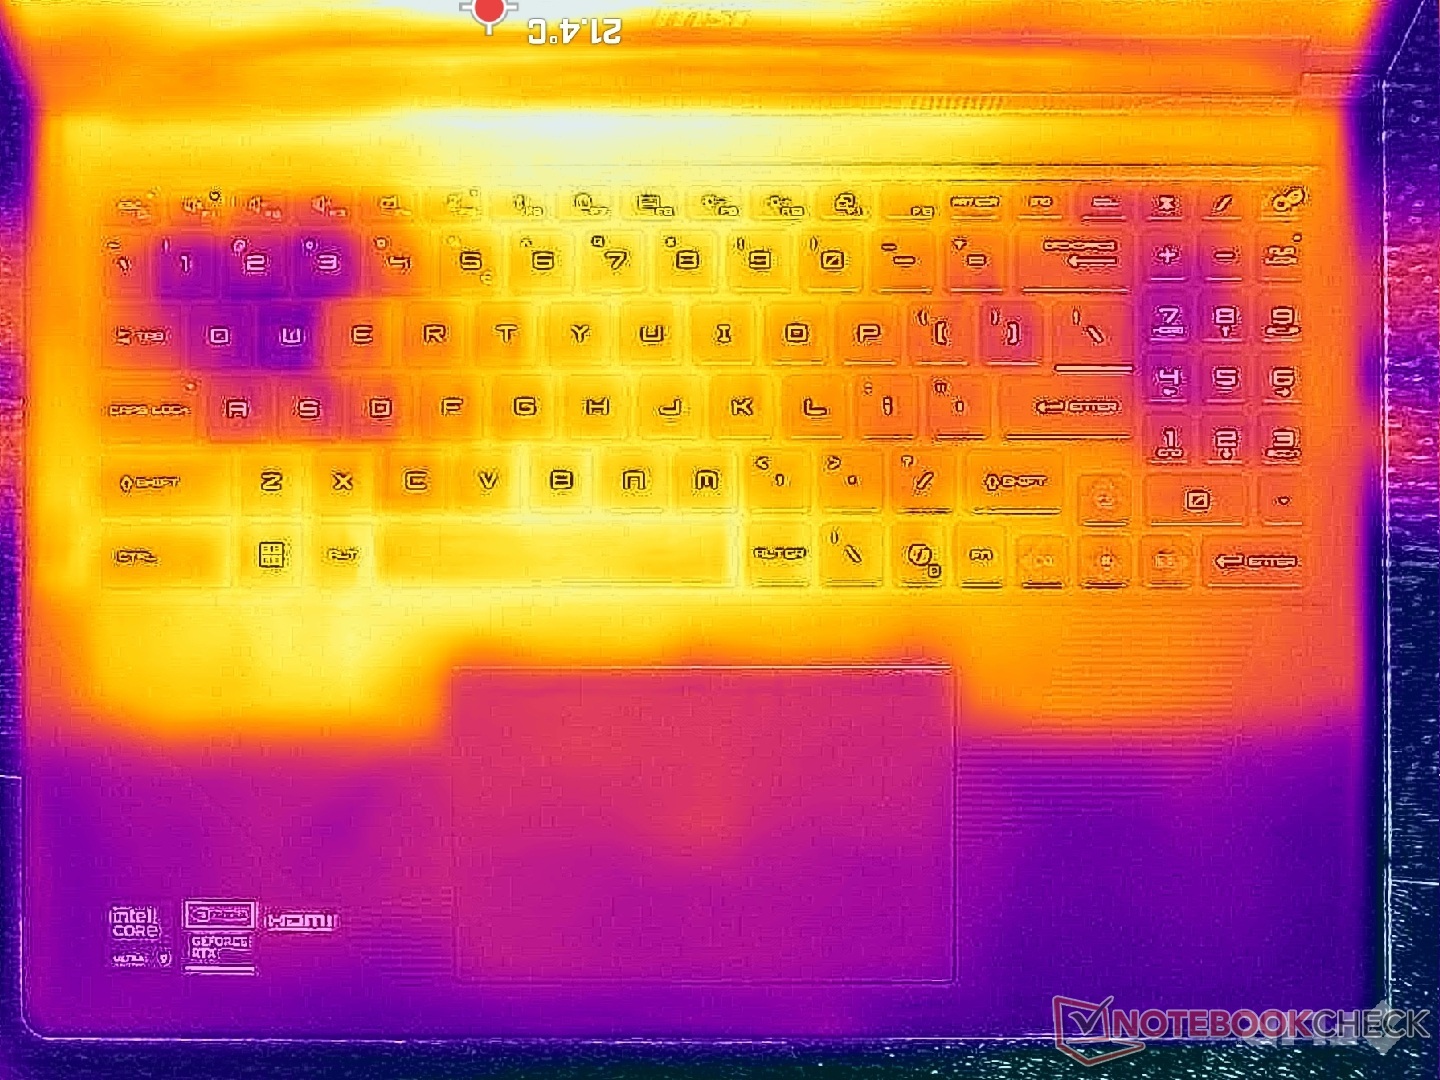
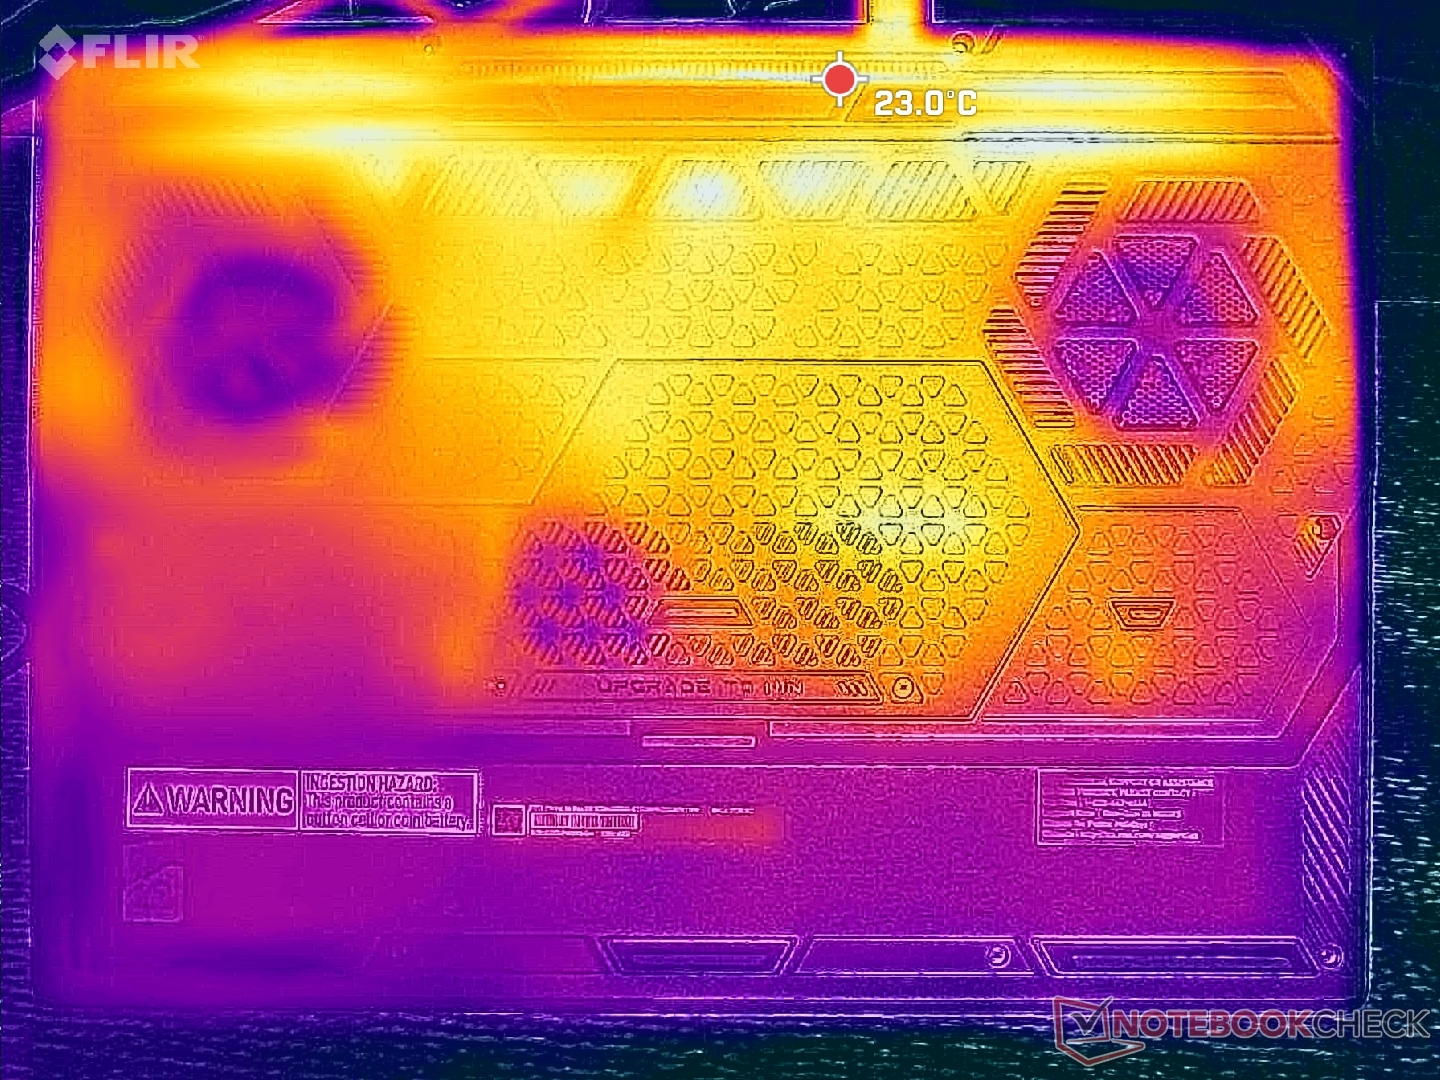
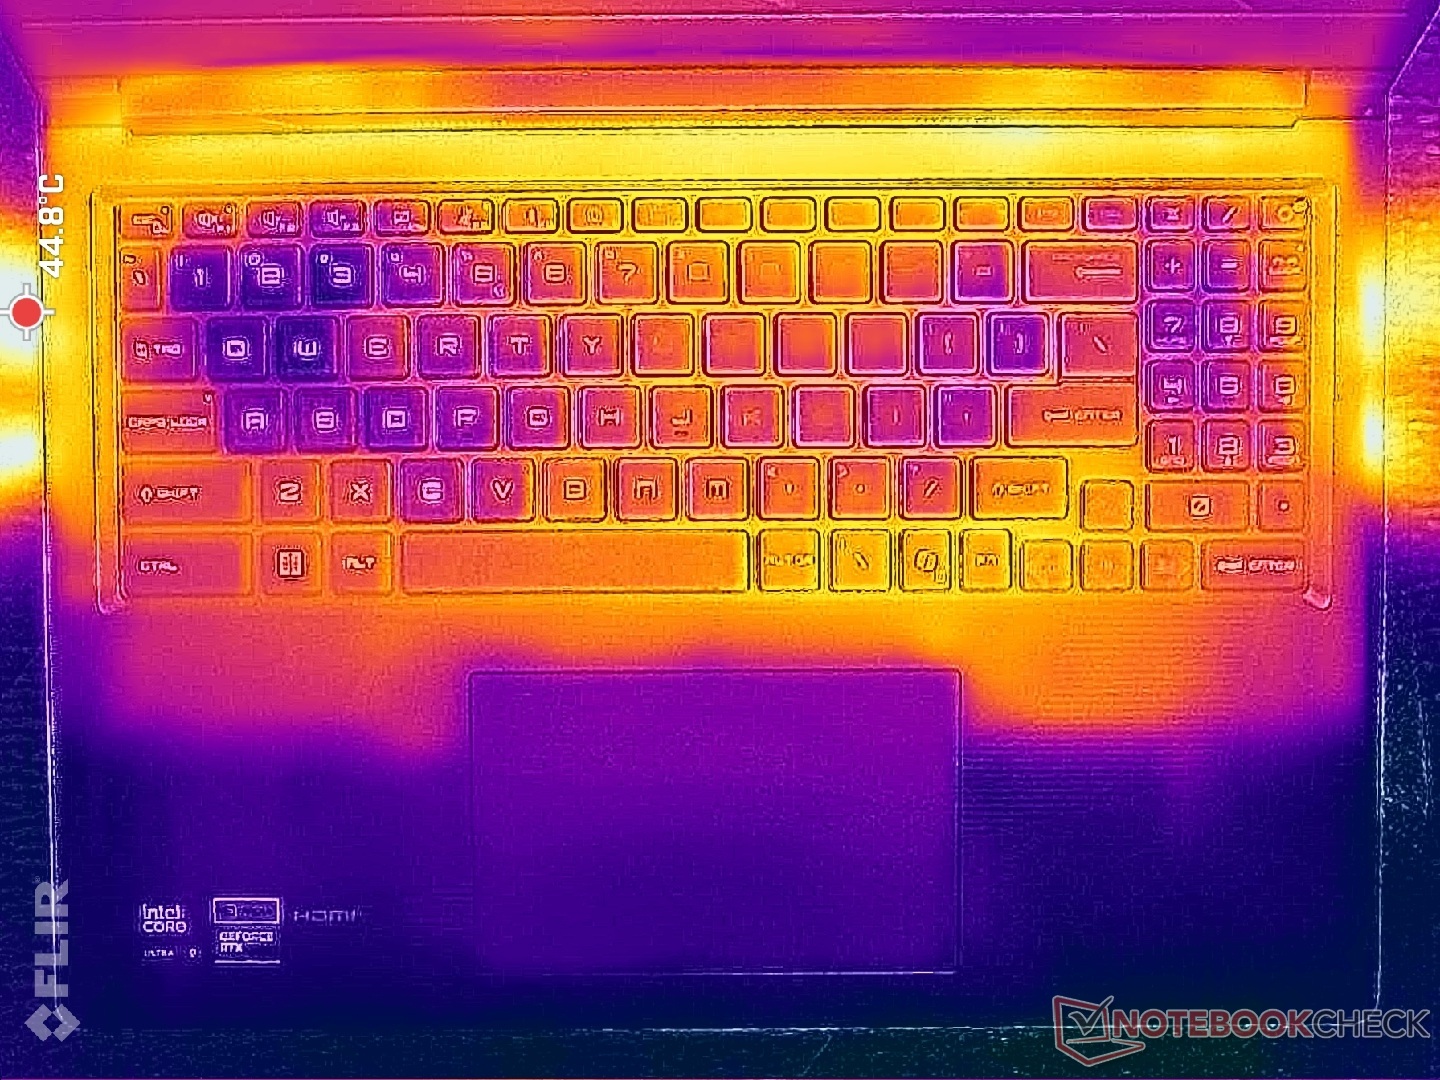
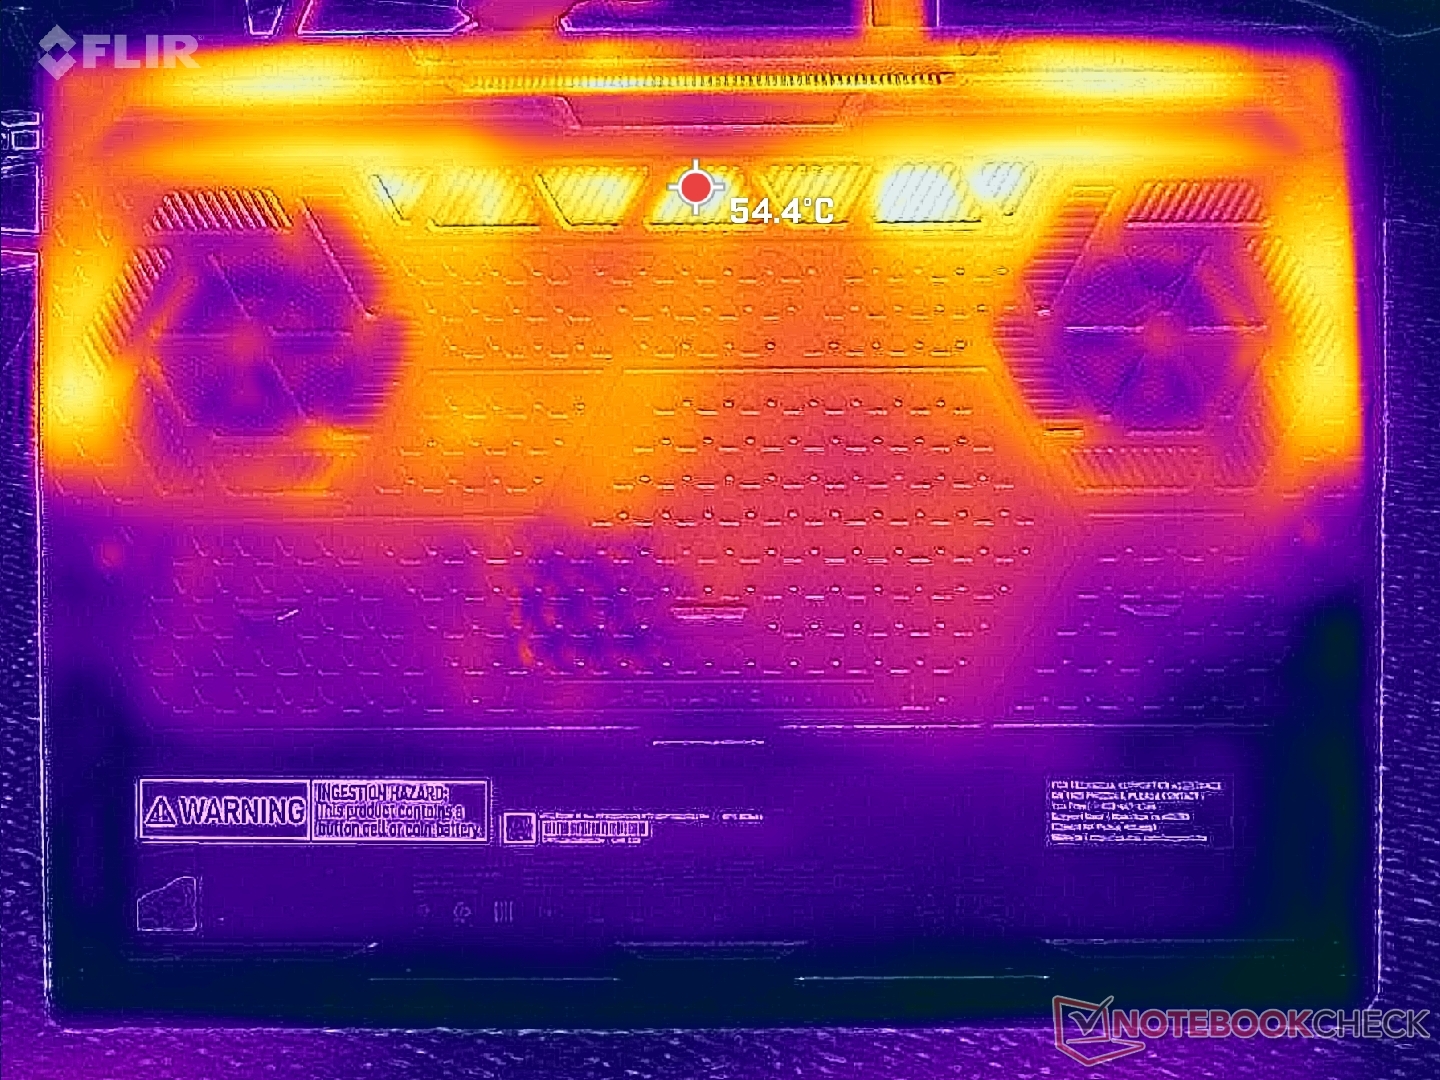
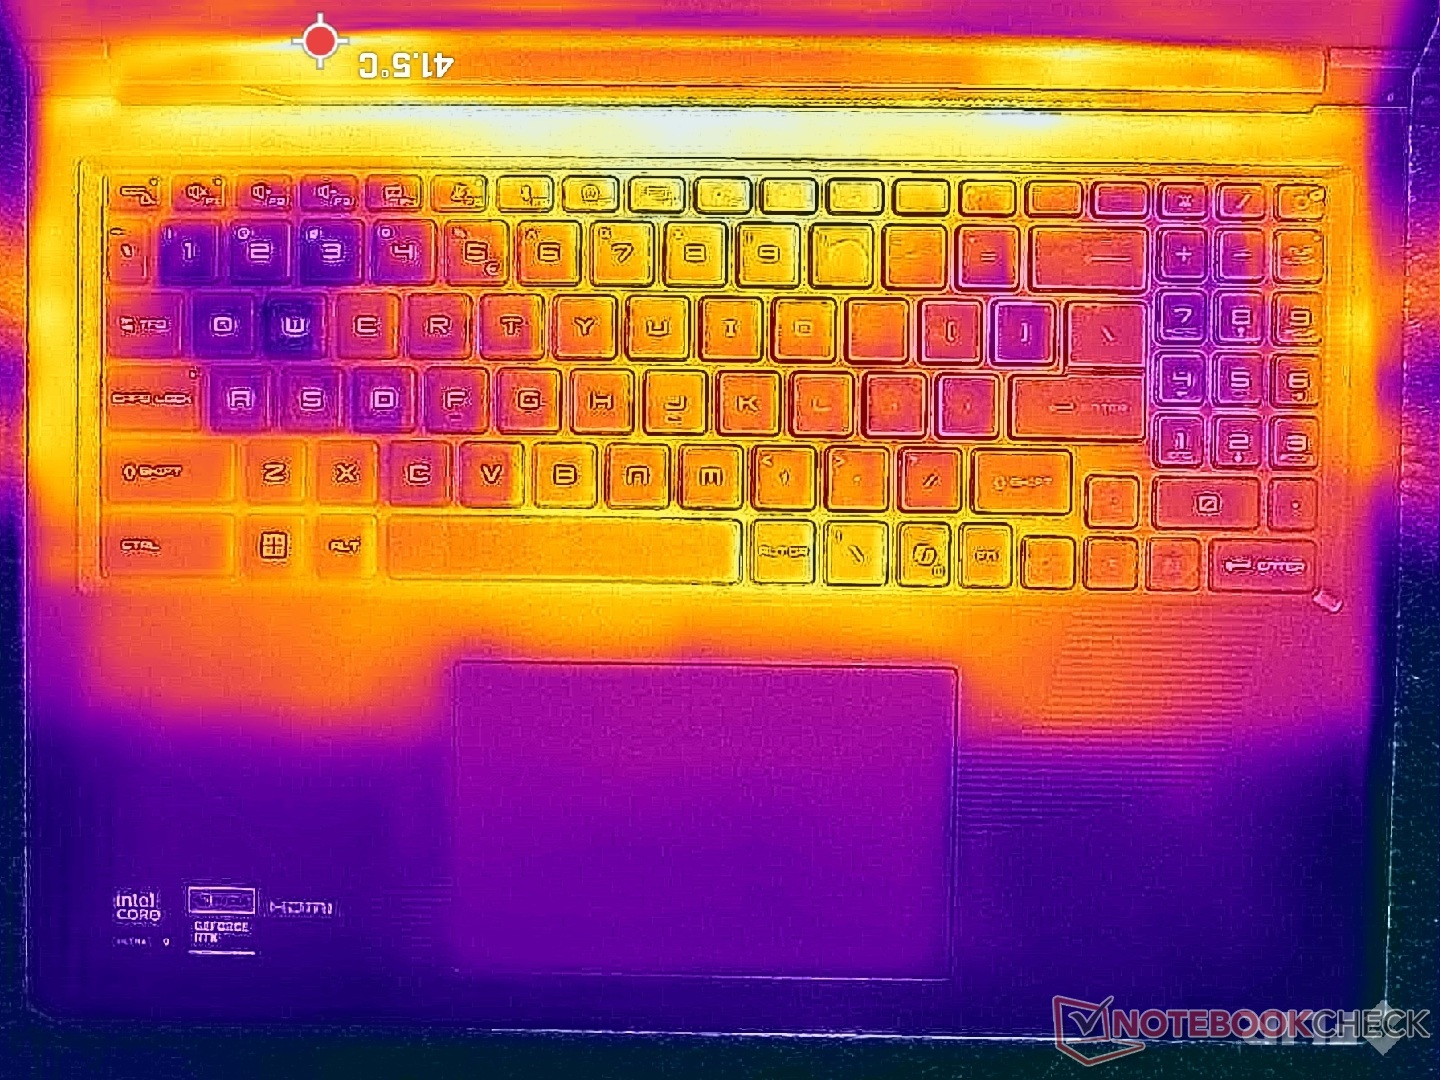
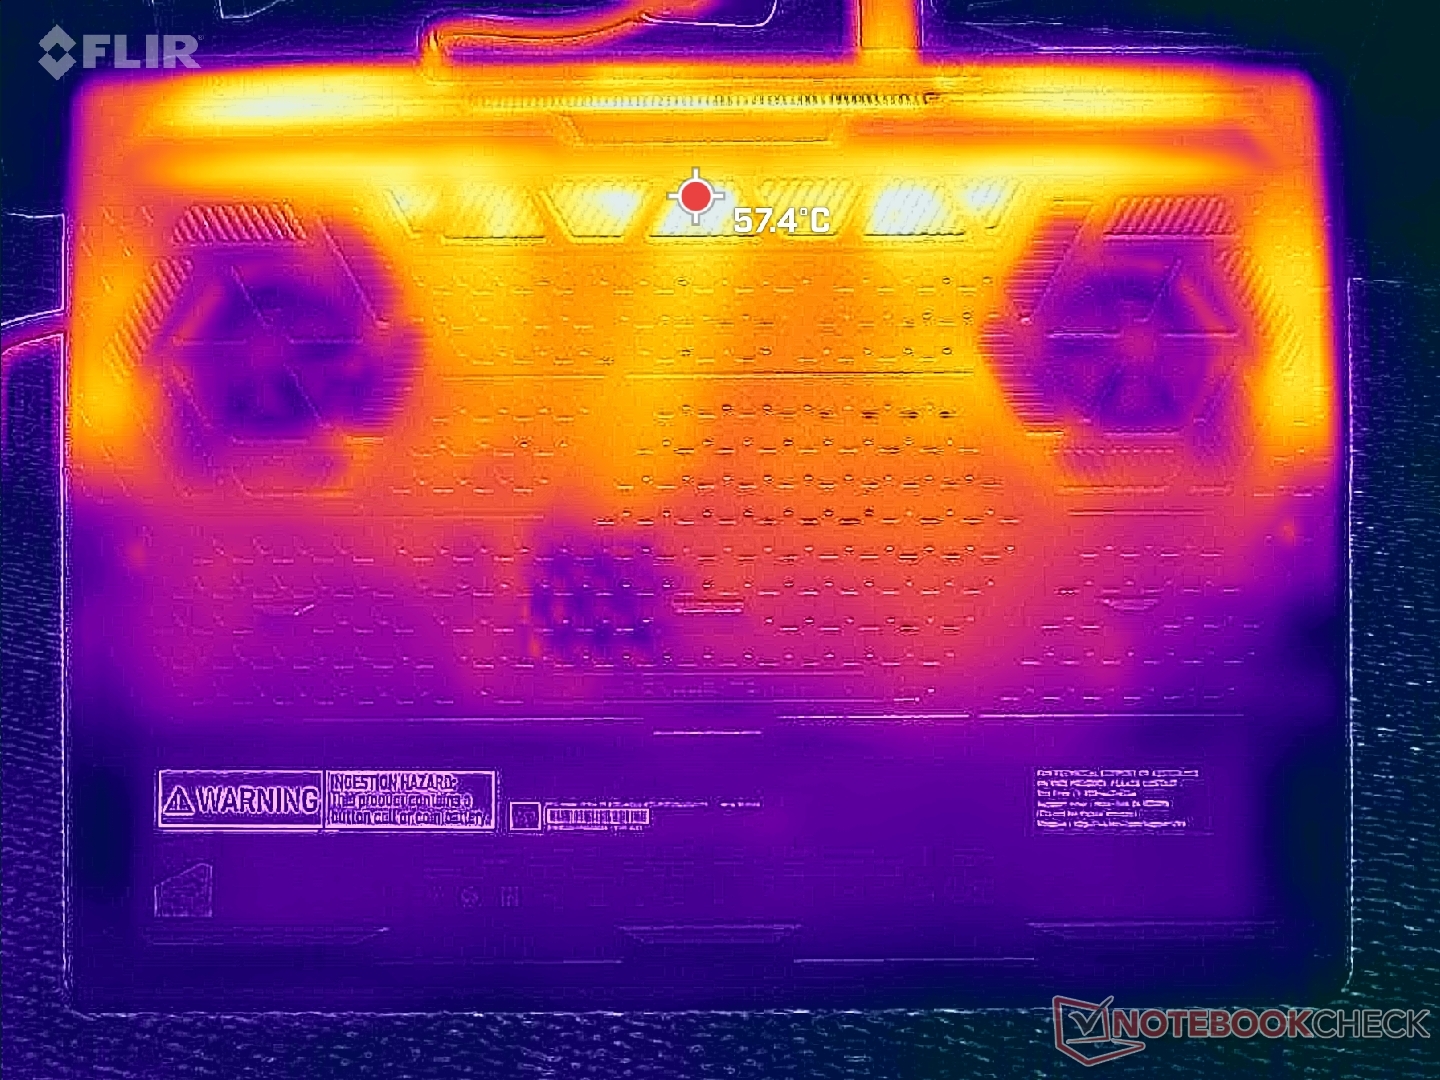
Temperatura
Temperatura gorących punktów na powierzchni osiągnęła odpowiednio 44 C i 46 C na pokładzie klawiatury i dolnej pokrywie, co jest o kilka stopni C chłodniejsze niż to, co zaobserwowaliśmy na cieńszym Razer Blade 16.
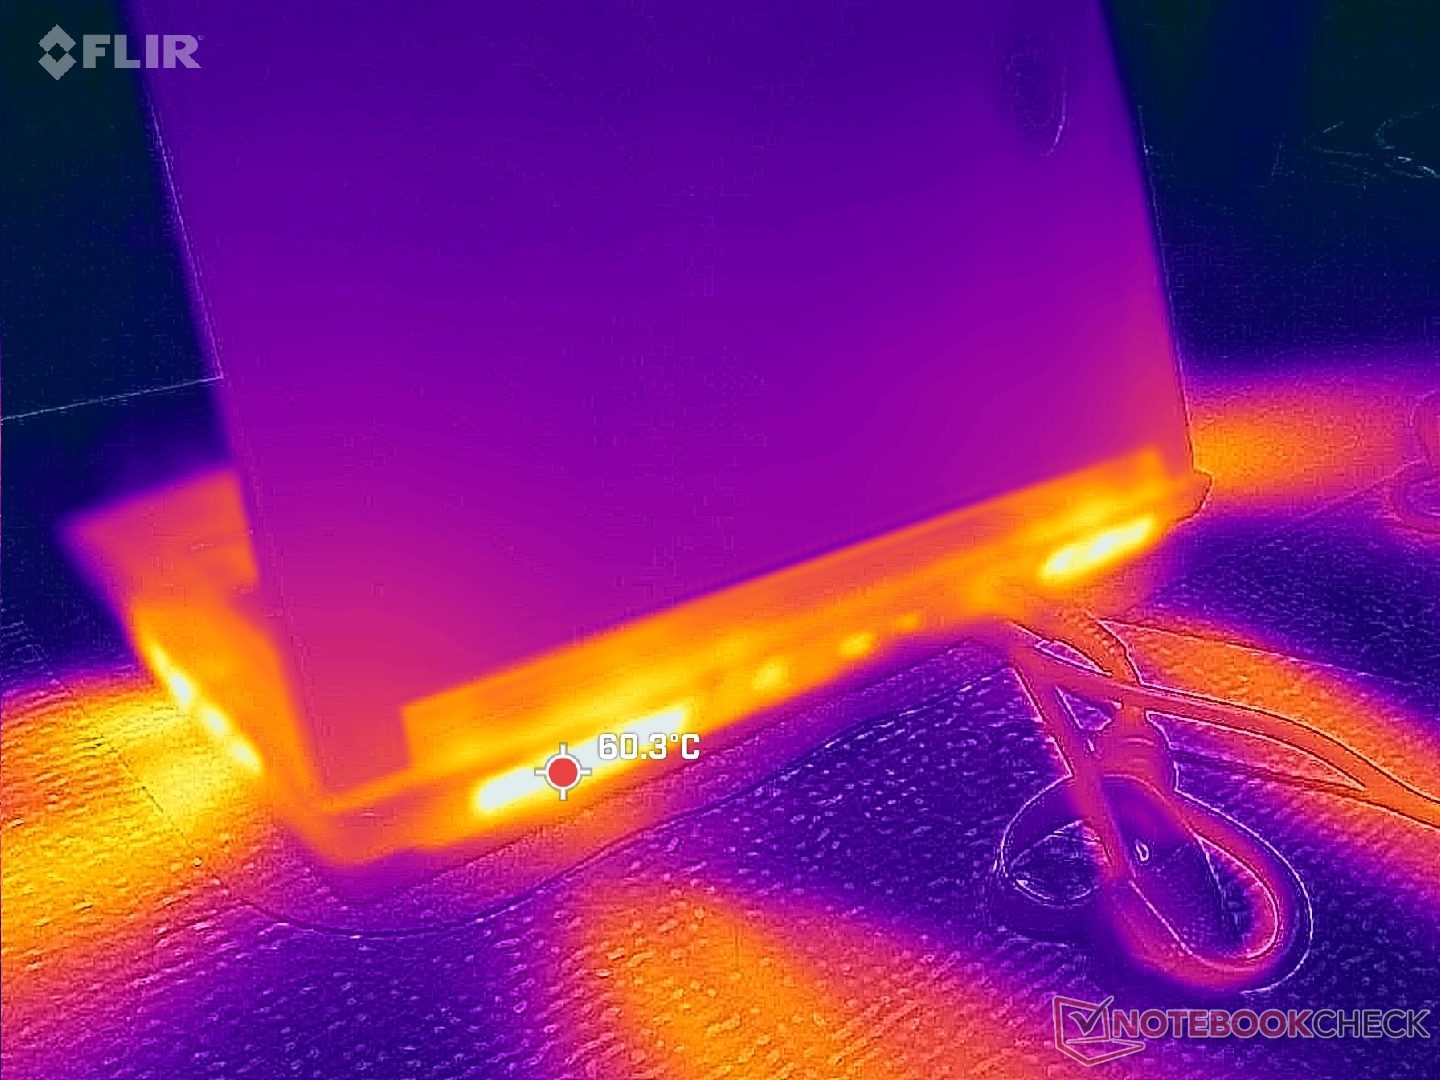
(±) Maksymalna temperatura w górnej części wynosi 43.2 °C / 110 F, w porównaniu do średniej 40.4 °C / 105 F , począwszy od 21.2 do 68.8 °C dla klasy Gaming.
(-) Dno nagrzewa się maksymalnie do 45.6 °C / 114 F, w porównaniu do średniej 43.2 °C / 110 F
(+) W stanie bezczynności średnia temperatura górnej części wynosi 26.1 °C / 79 F, w porównaniu ze średnią temperaturą urządzenia wynoszącą 33.9 °C / ### class_avg_f### F.
(±) 3: The average temperature for the upper side is 34.1 °C / 93 F, compared to the average of 33.9 °C / 93 F for the class Gaming.
(+) Podparcia dłoni i touchpad osiągają maksymalną temperaturę skóry (33.6 °C / 92.5 F) i dlatego nie są gorące.
(-) Średnia temperatura obszaru podparcia dłoni w podobnych urządzeniach wynosiła 28.8 °C / 83.8 F (-4.8 °C / -8.7 F).
| MSI Raider 16 Max HX B2WJ Ultra 9 290HX Plus, GeForce RTX 5090 Laptop | MSI Crosshair 16 HX AI D2XWGKG Ultra 9 275HX, GeForce RTX 5070 Laptop | Razer Blade 16 Core Ultra 9 386H Ultra 9 386H, GeForce RTX 5090 Laptop | Alienware 16X Aurora Core Ultra 9 290HX Plus Ultra 9 290HX Plus, GeForce RTX 5070 Ti Laptop | Asus TUF Gaming A16 FA608UP R7 260, GeForce RTX 5070 Laptop | Lenovo Legion 7 16IAX10 Ultra 7 255HX, GeForce RTX 5060 Laptop | |
|---|---|---|---|---|---|---|
| Heat | -3% | -17% | 2% | 8% | -14% | |
| Maximum Upper Side * (°C) | 43.2 | 44.8 -4% | 45.6 -6% | 48.2 -12% | 39.5 9% | 47 -9% |
| Maximum Bottom * (°C) | 45.6 | 43.4 5% | 47 -3% | 41 10% | 45.1 1% | 44 4% |
| Idle Upper Side * (°C) | 27.8 | 31.2 -12% | 35.2 -27% | 28.2 -1% | 25.7 8% | 35.6 -28% |
| Idle Bottom * (°C) | 29 | 28.8 1% | 37.6 -30% | 26.2 10% | 25.5 12% | 35.2 -21% |
* ... im mniej tym lepiej
Test warunków skrajnych
Procesor zwiększał taktowanie do 4,5 GHz, 215 W i 105 C przez około minutę po zainicjowaniu stresu Prime95. Następnie spadłby do 3,9 GHz i ~152 W, aby utrzymać łatwiejszą do opanowania temperaturę rdzenia 96 C Alienware 16 Area-51który jest dostarczany z dokładnie tym samym procesorem co nasz MSI, również ustabilizowałby się w wysokim zakresie 90 C w podobnych warunkach, co sugeruje, że Core Ultra 9 290HX Plus jest jednym z najcieplej pracujących mobilnych procesorów na rynku.
Proszę zwrócić uwagę na stale rosnącą średnią częstotliwość taktowania GPU przy zmianie na szybsze profile zasilania, jak pokazano na zrzutach ekranu i w poniższej tabeli.
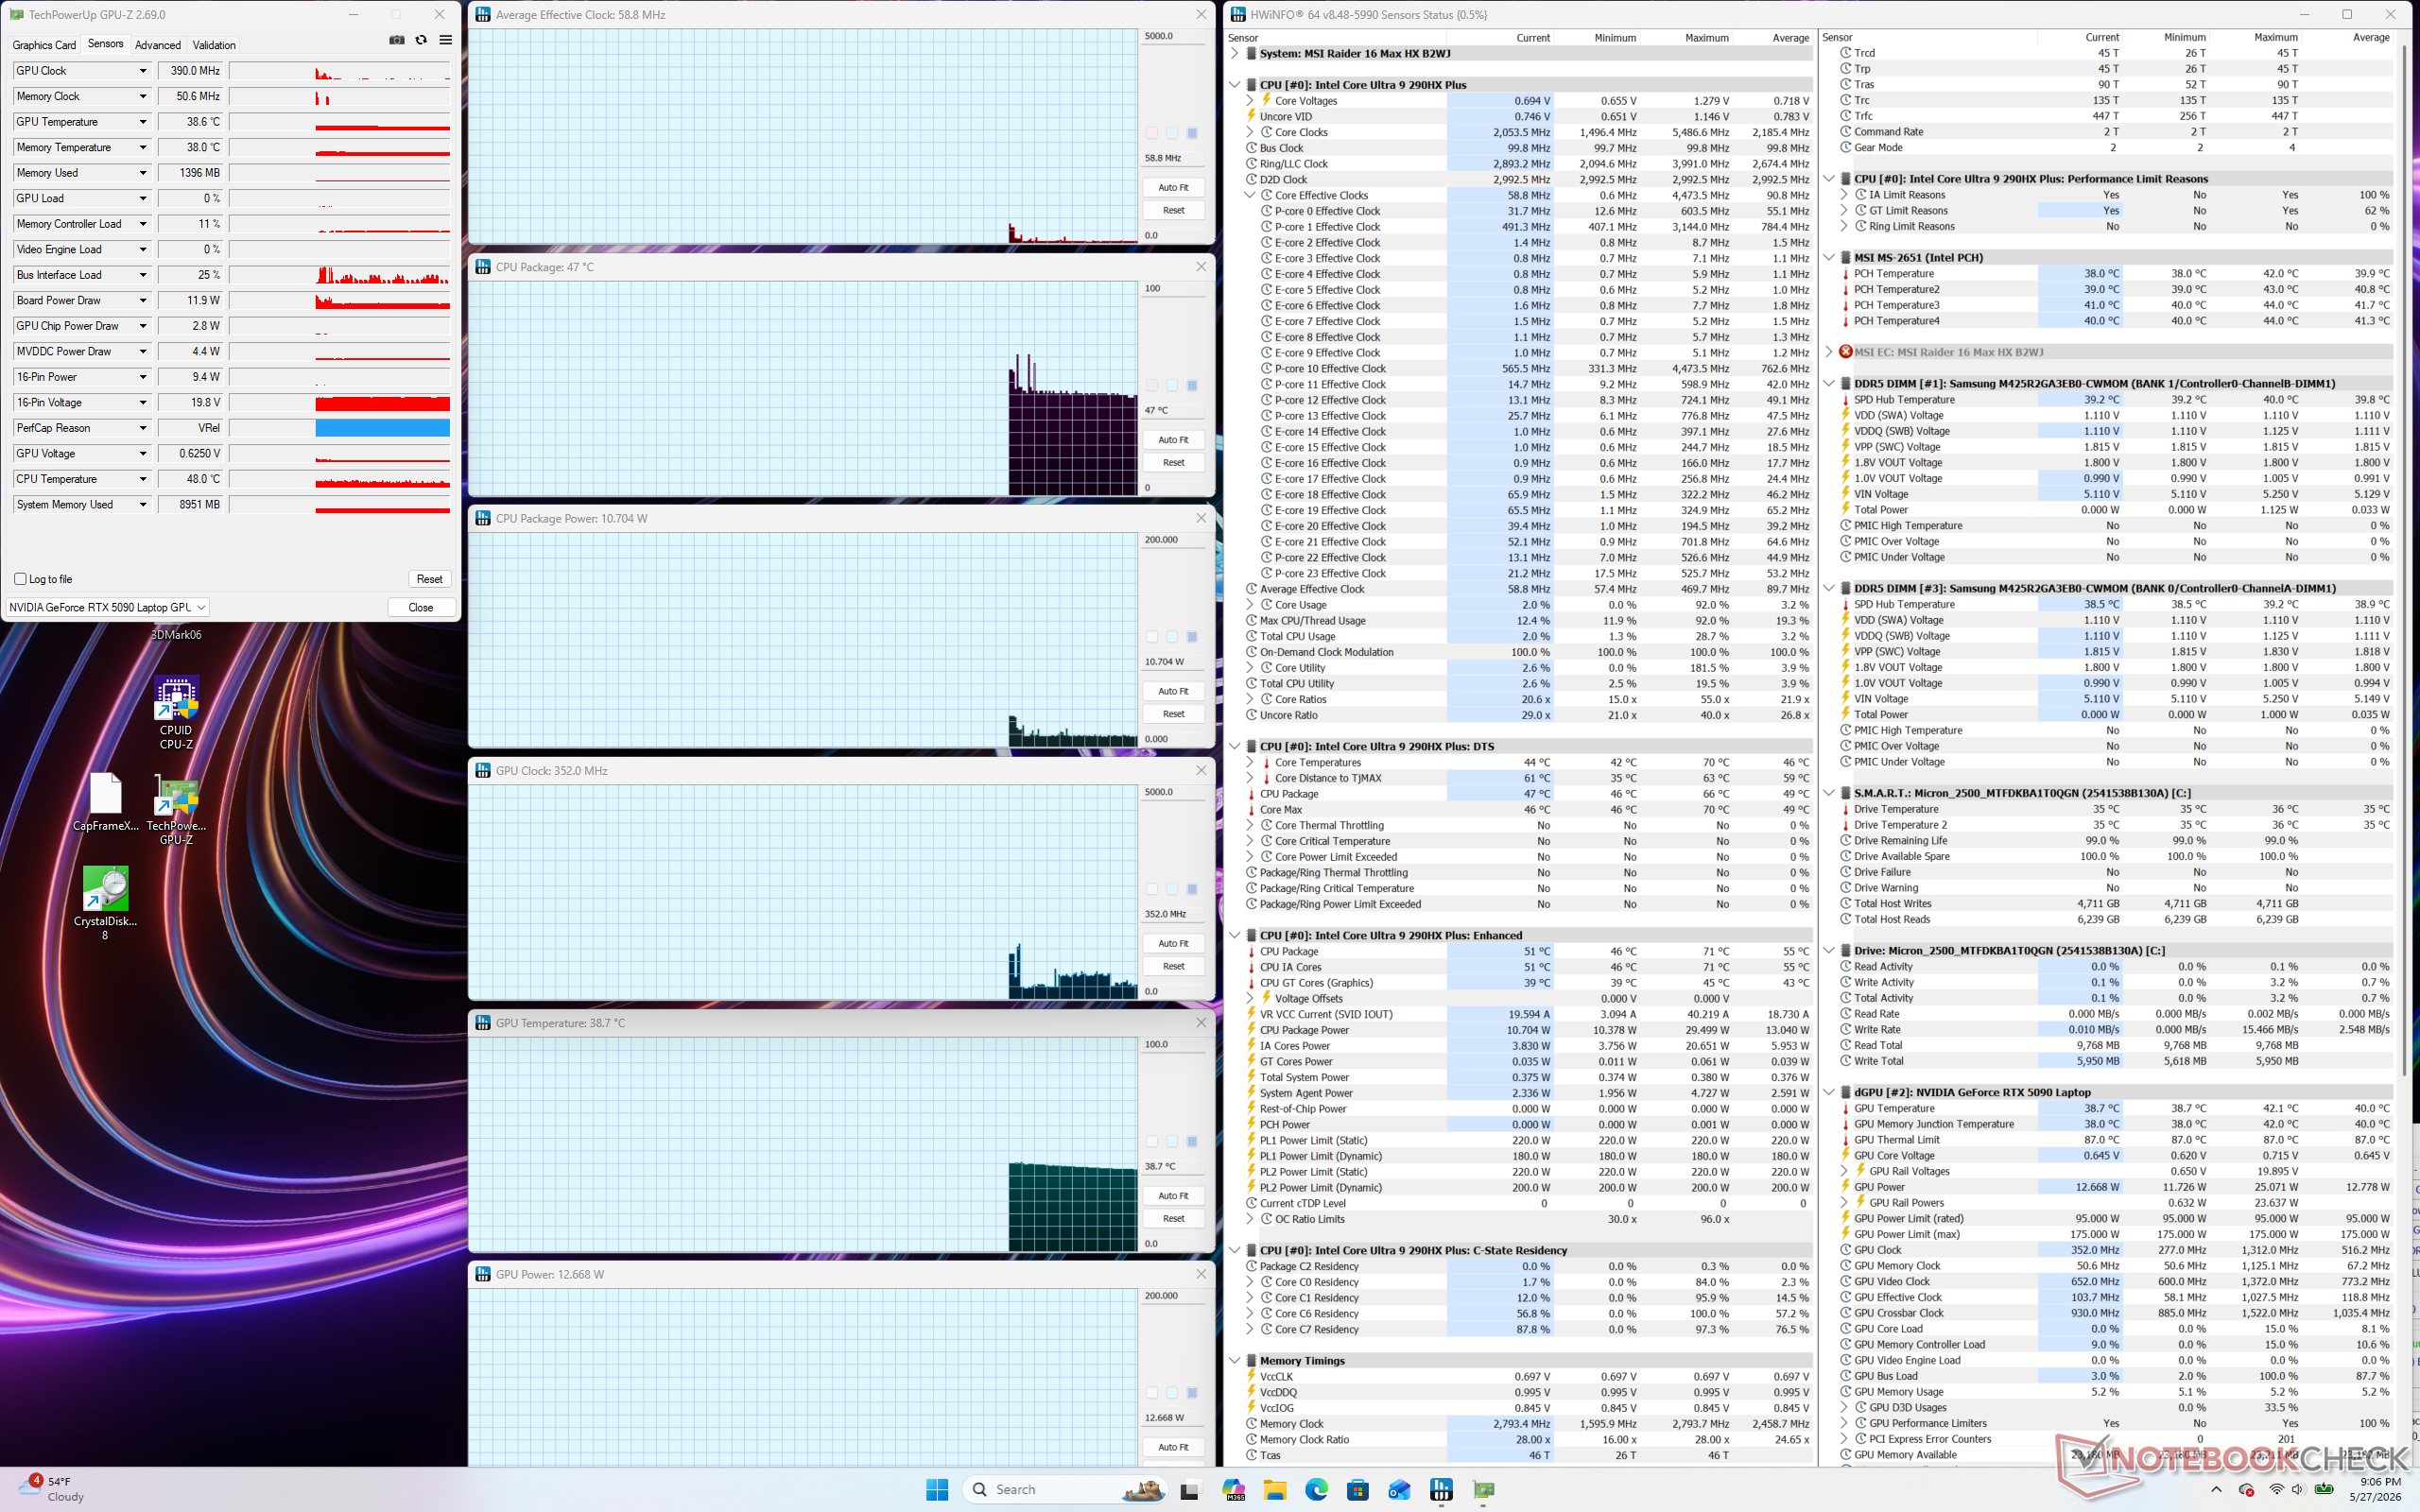
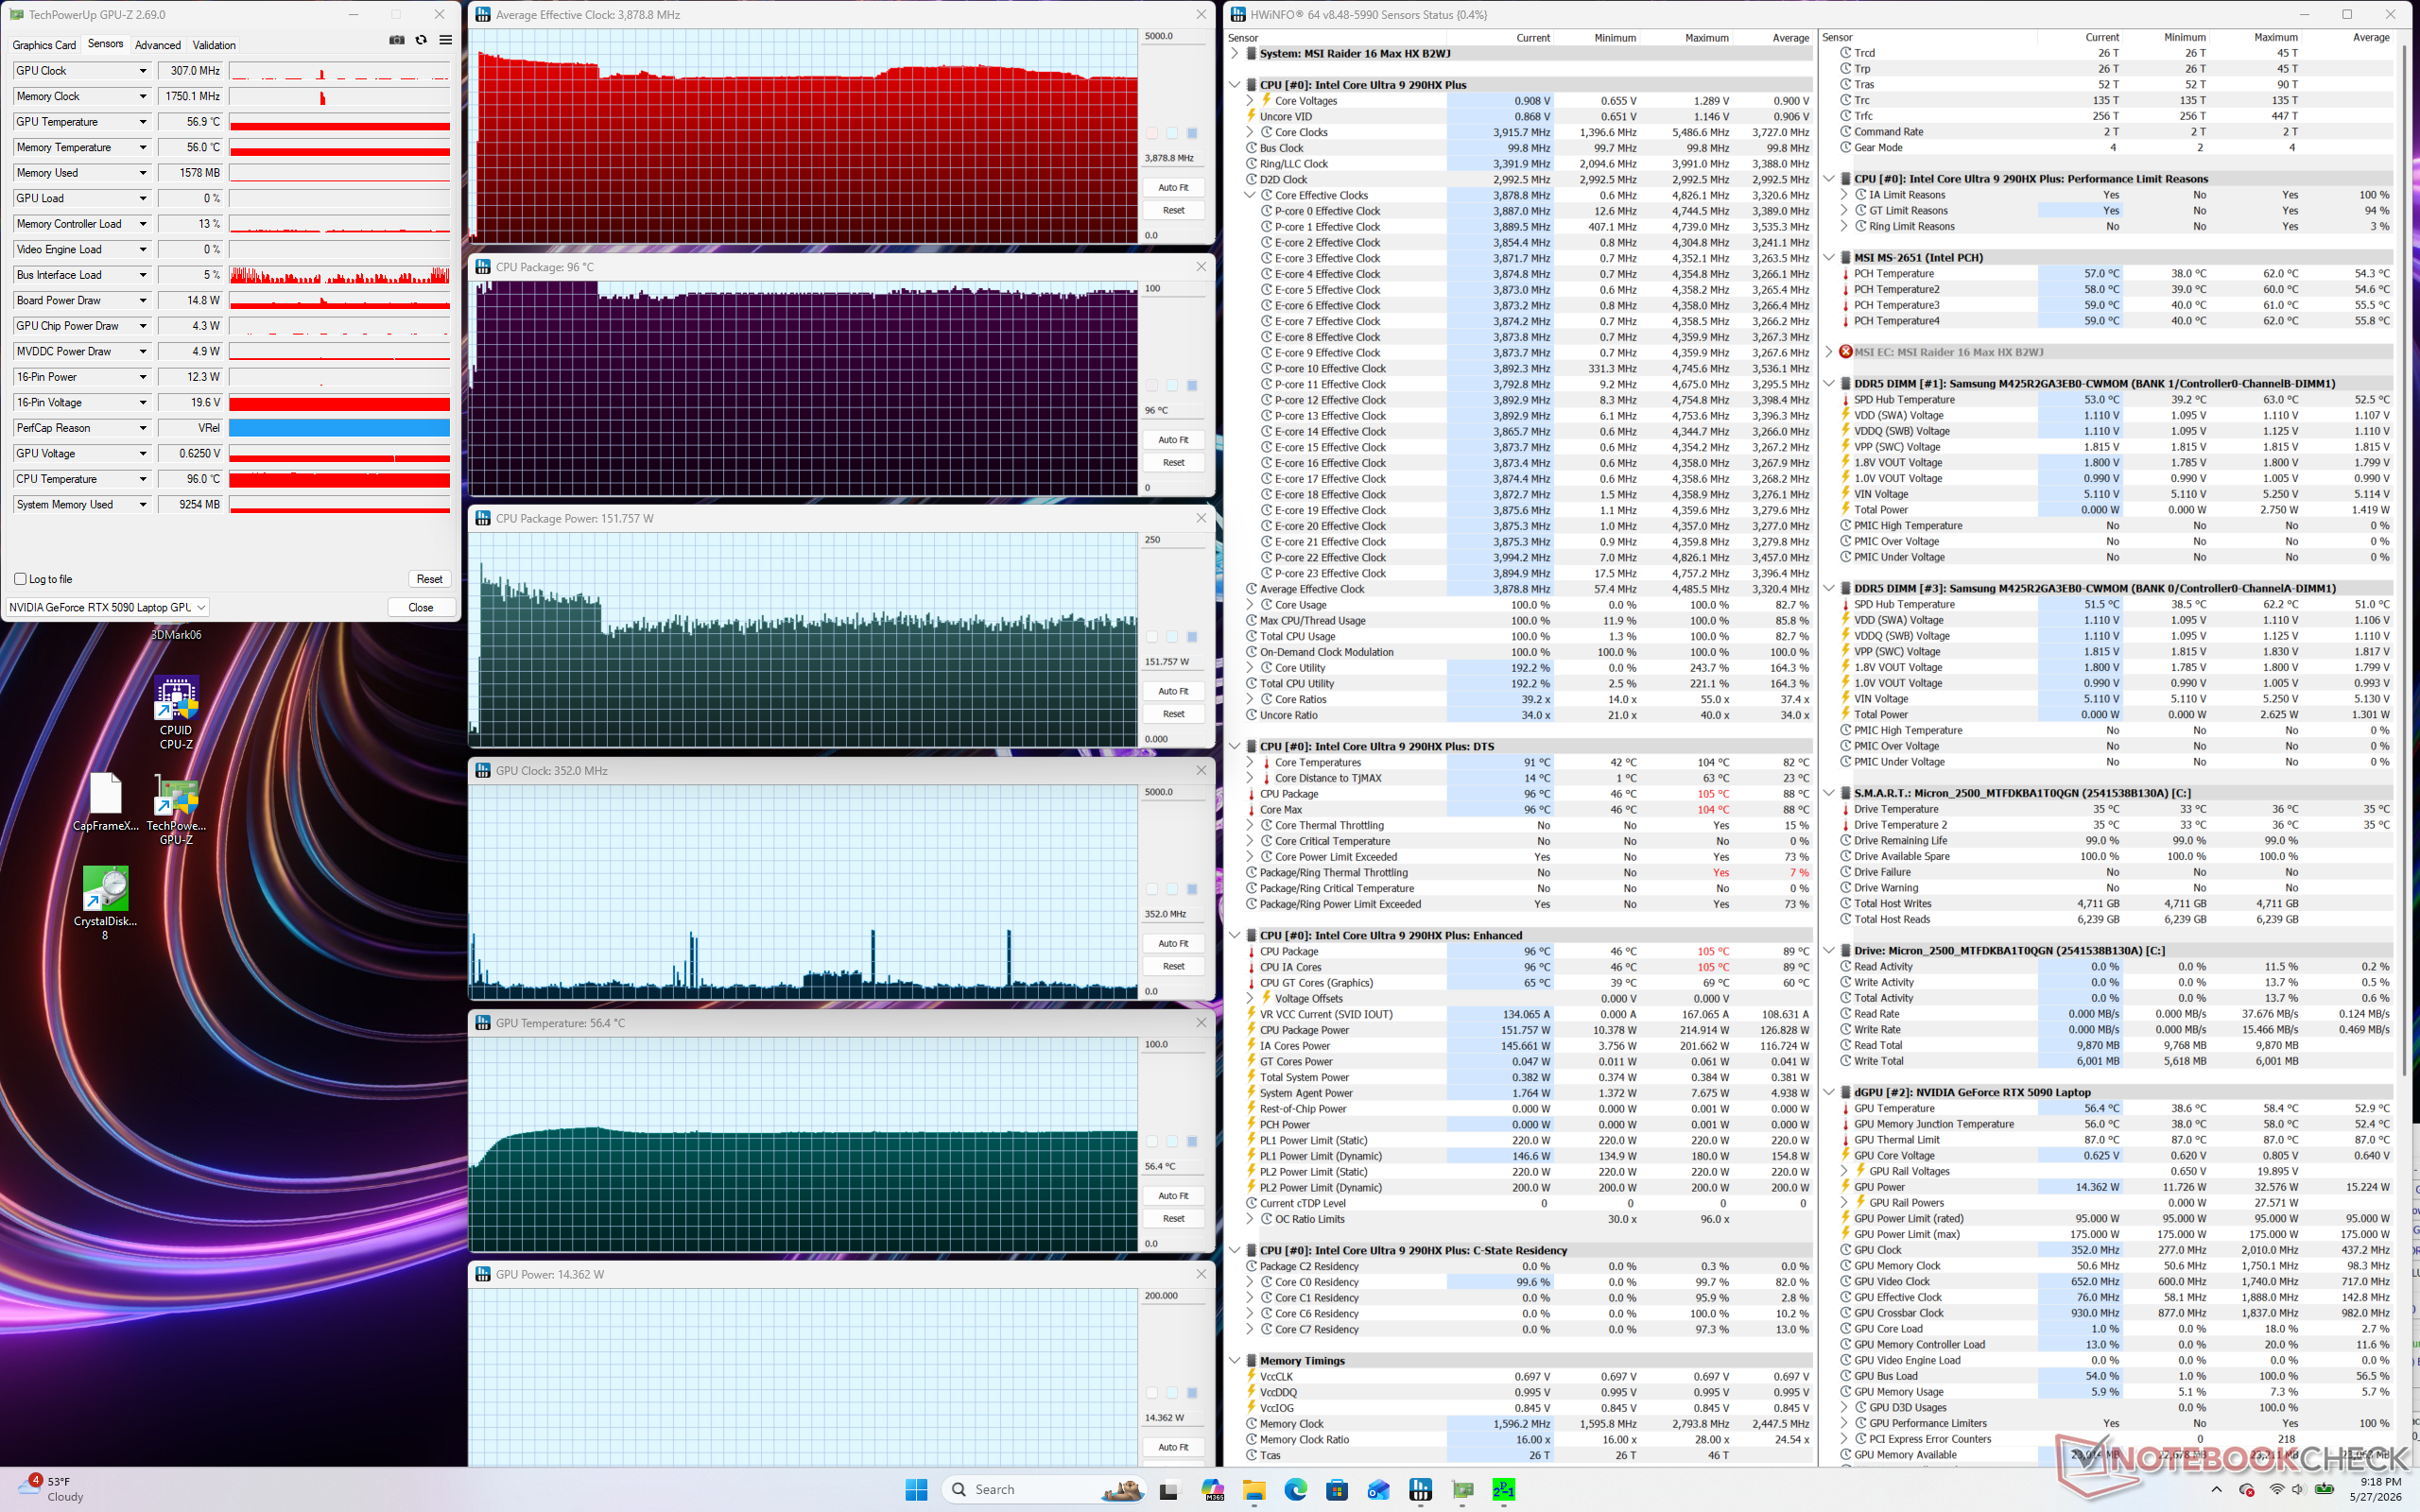
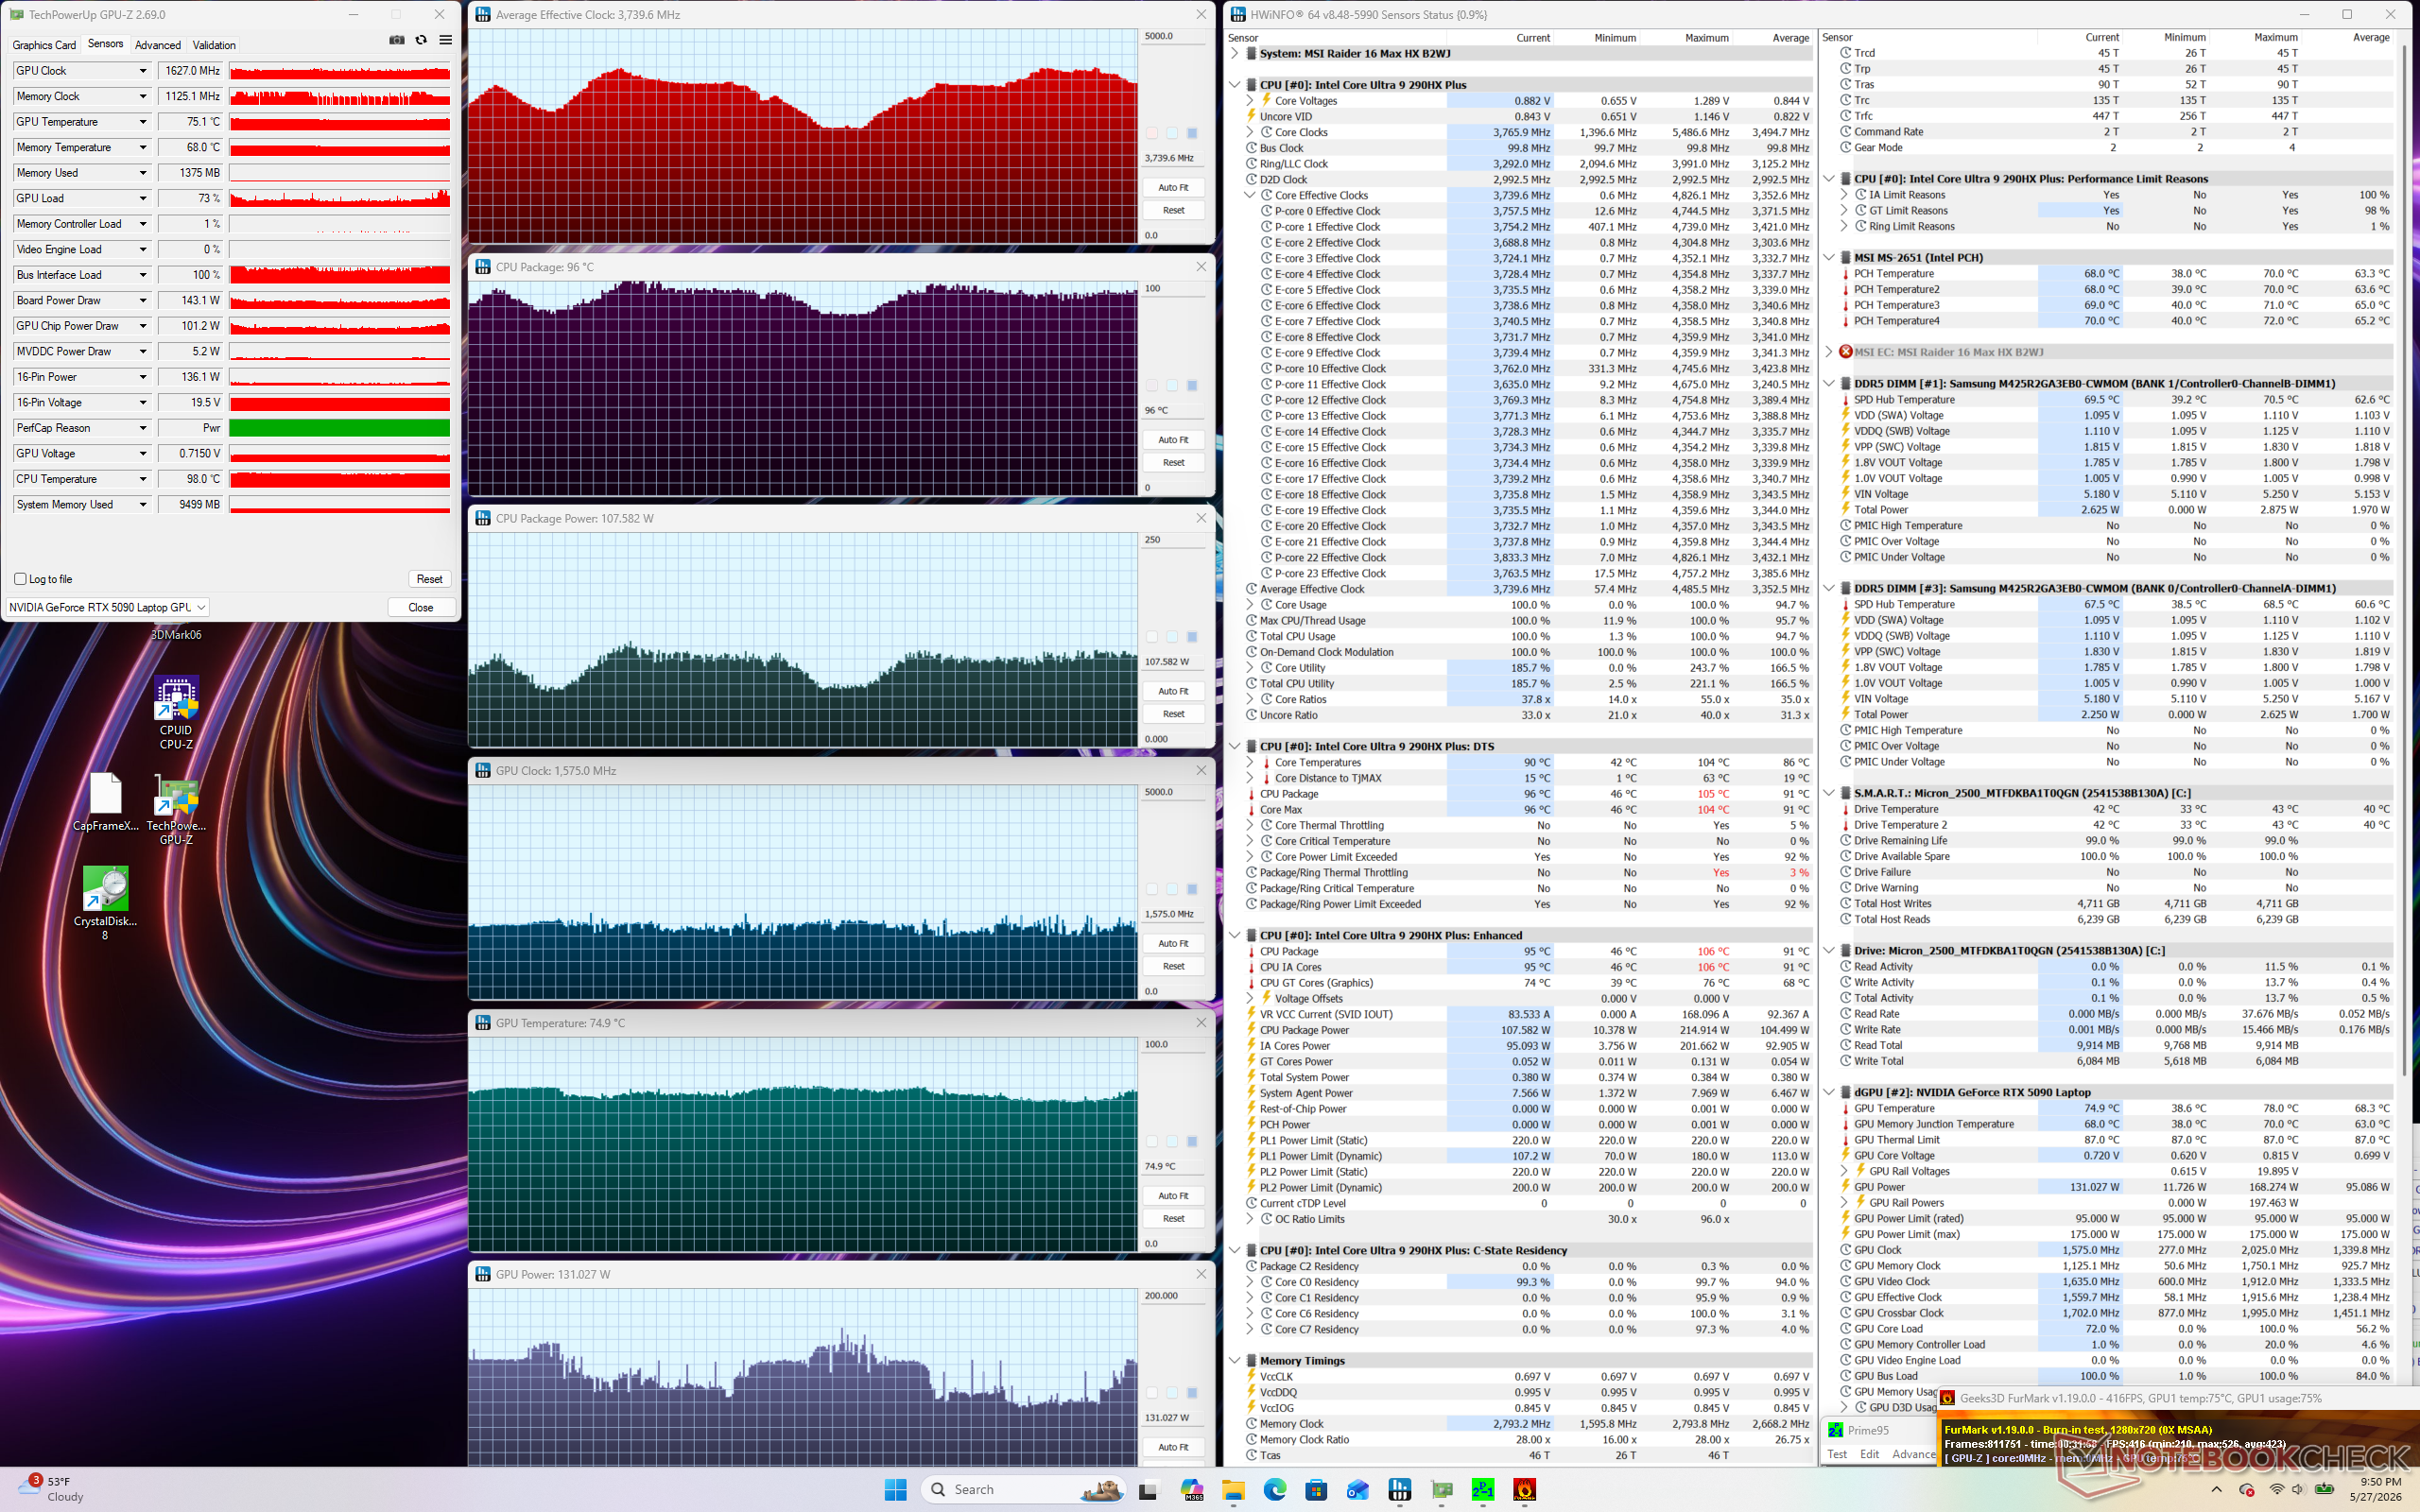
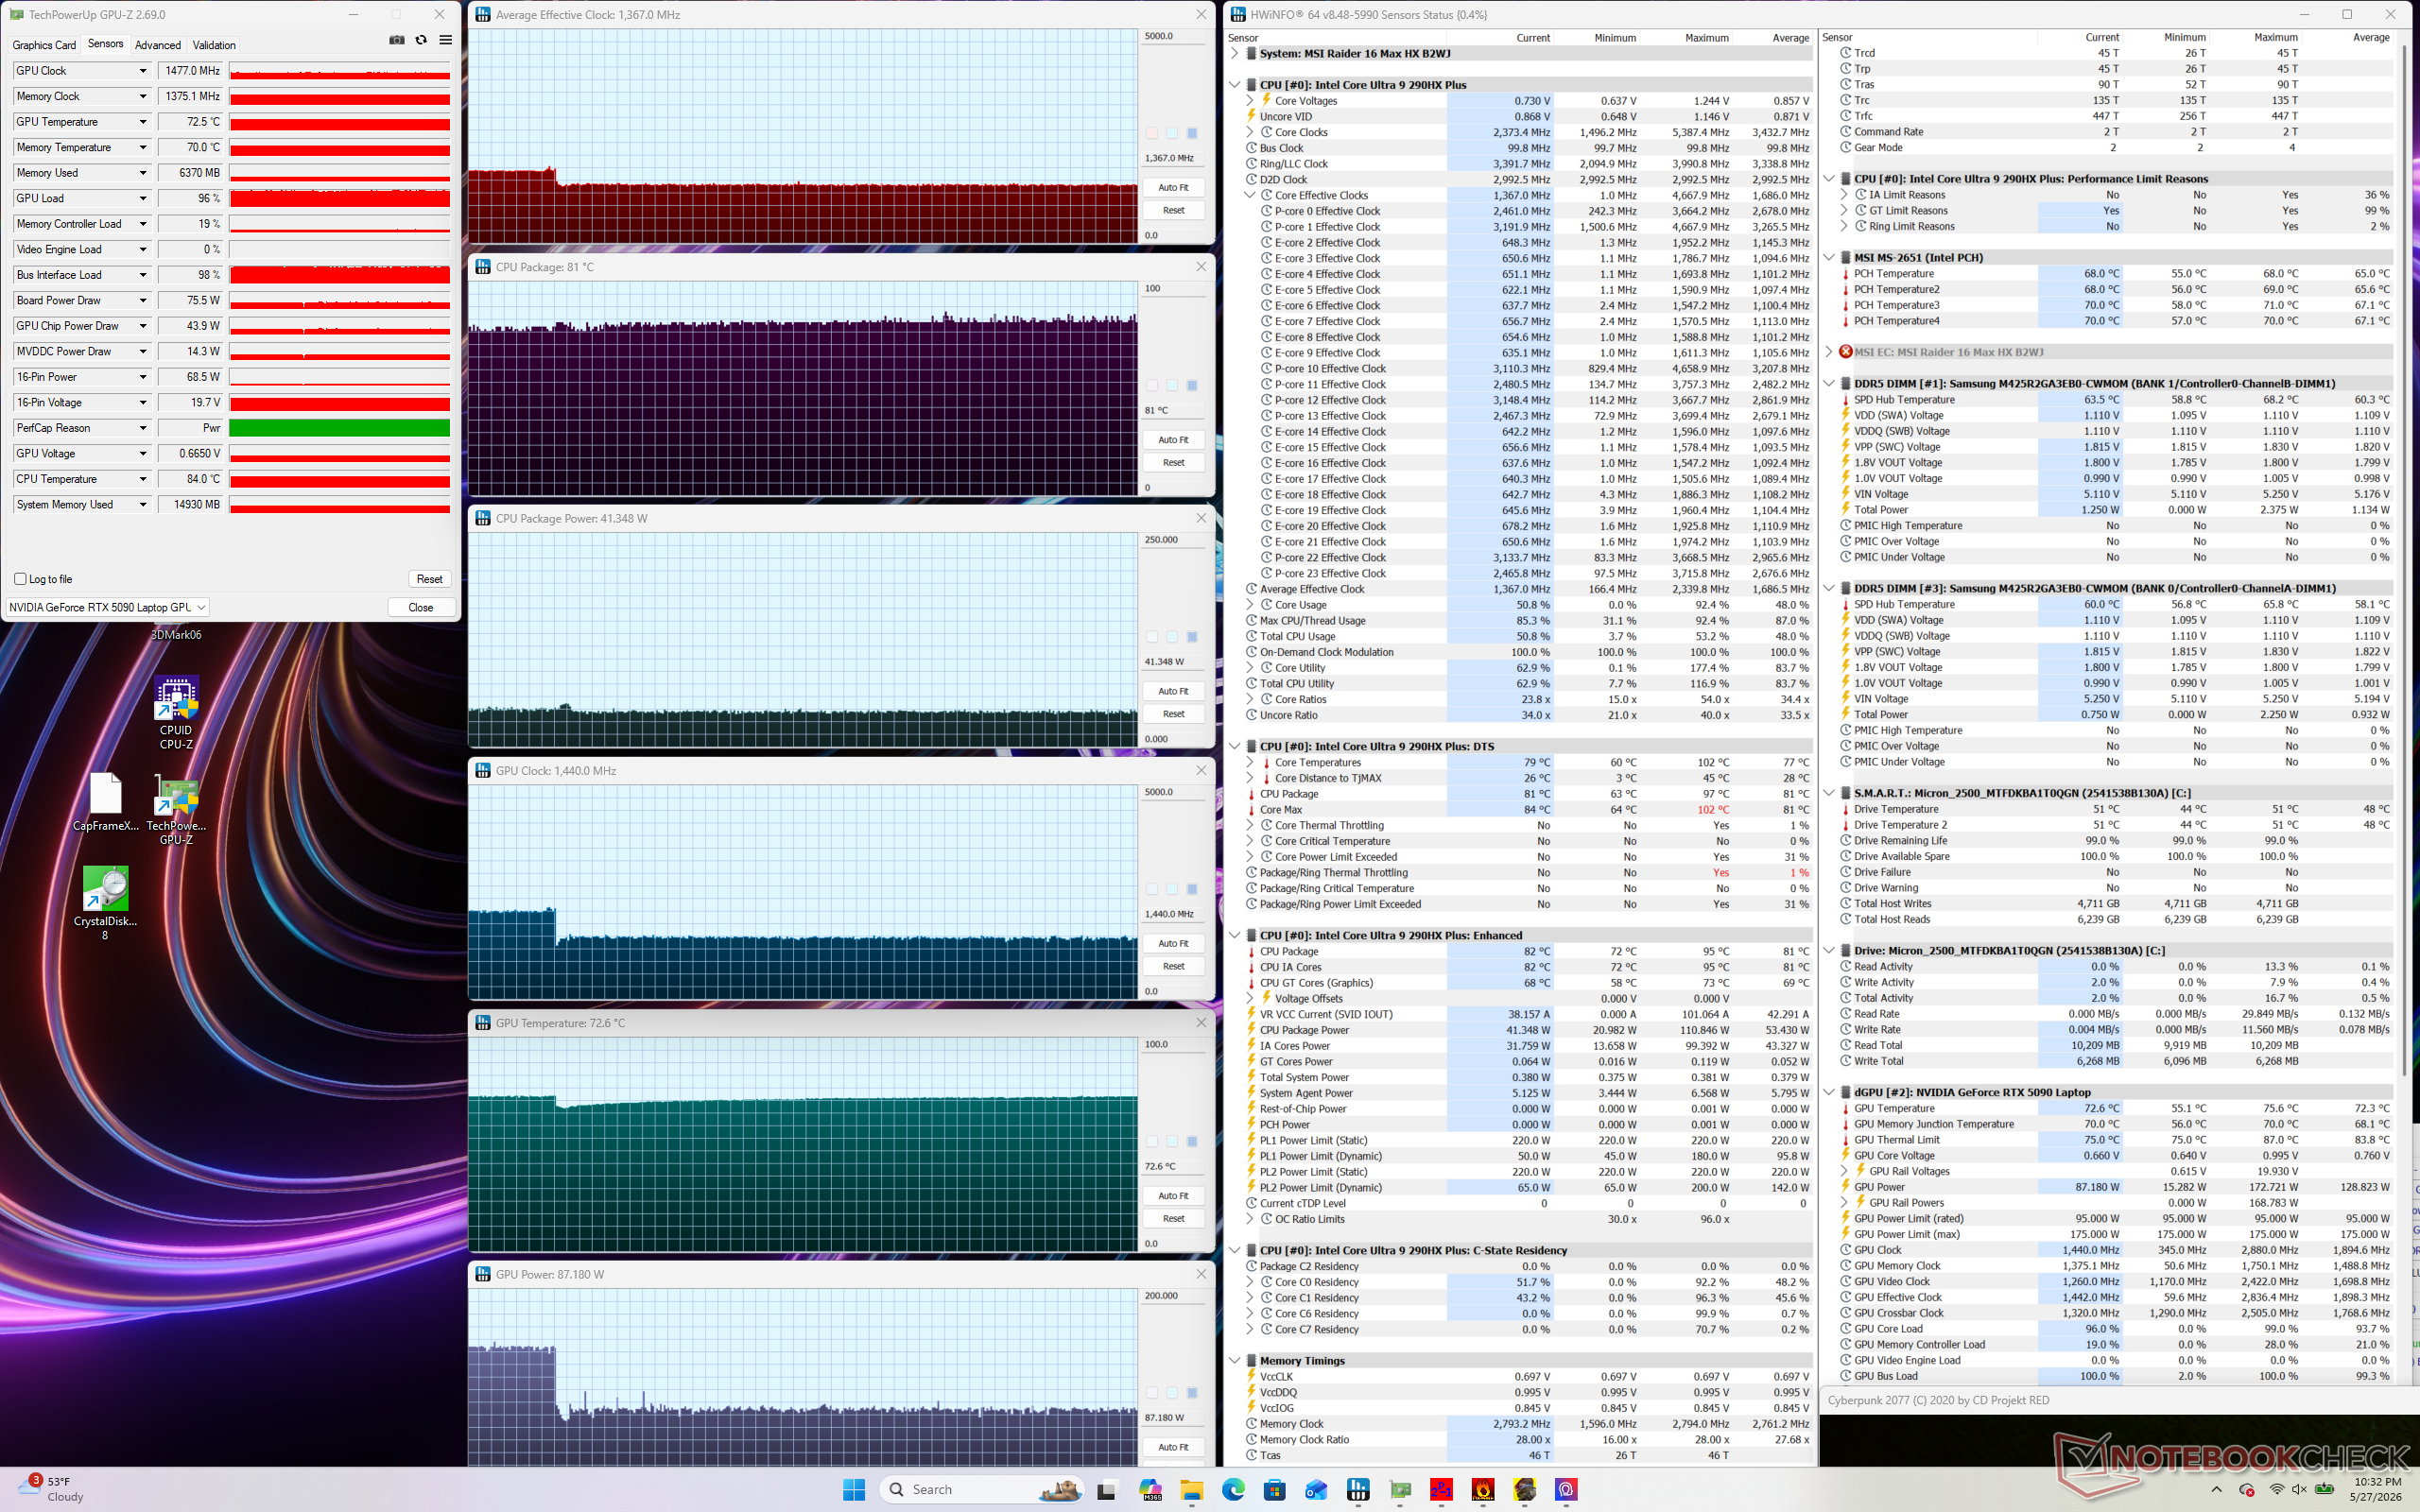
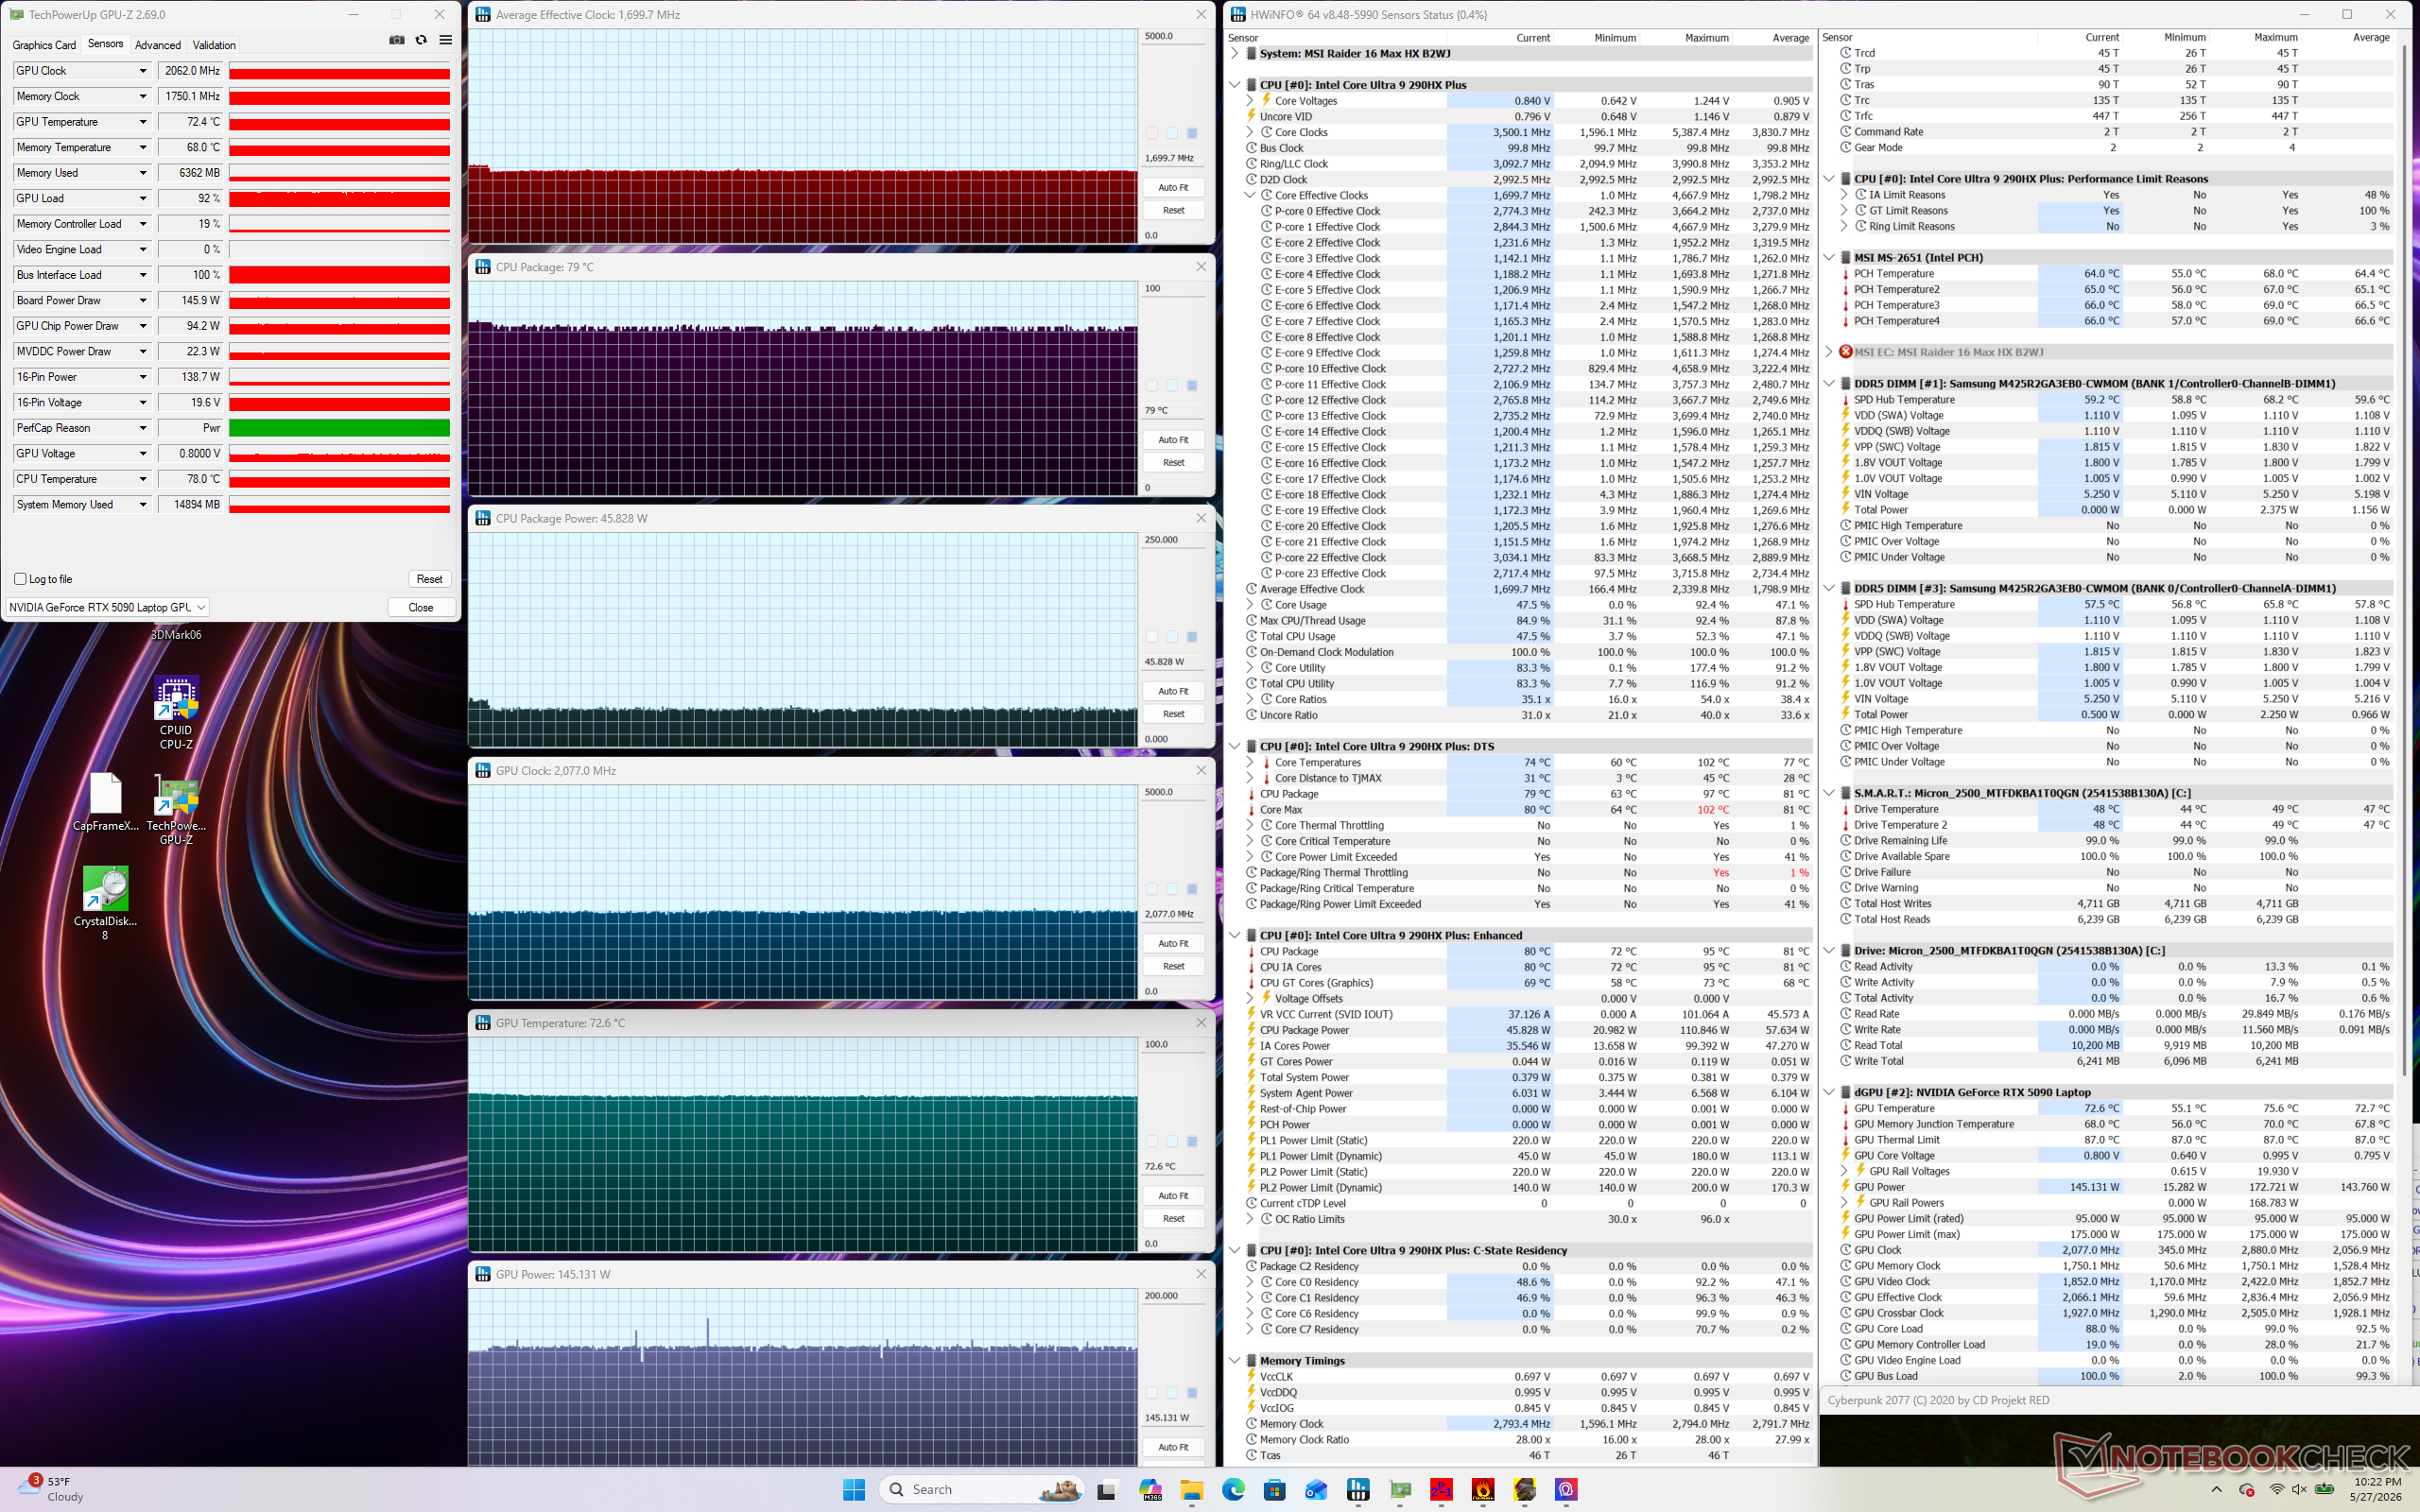
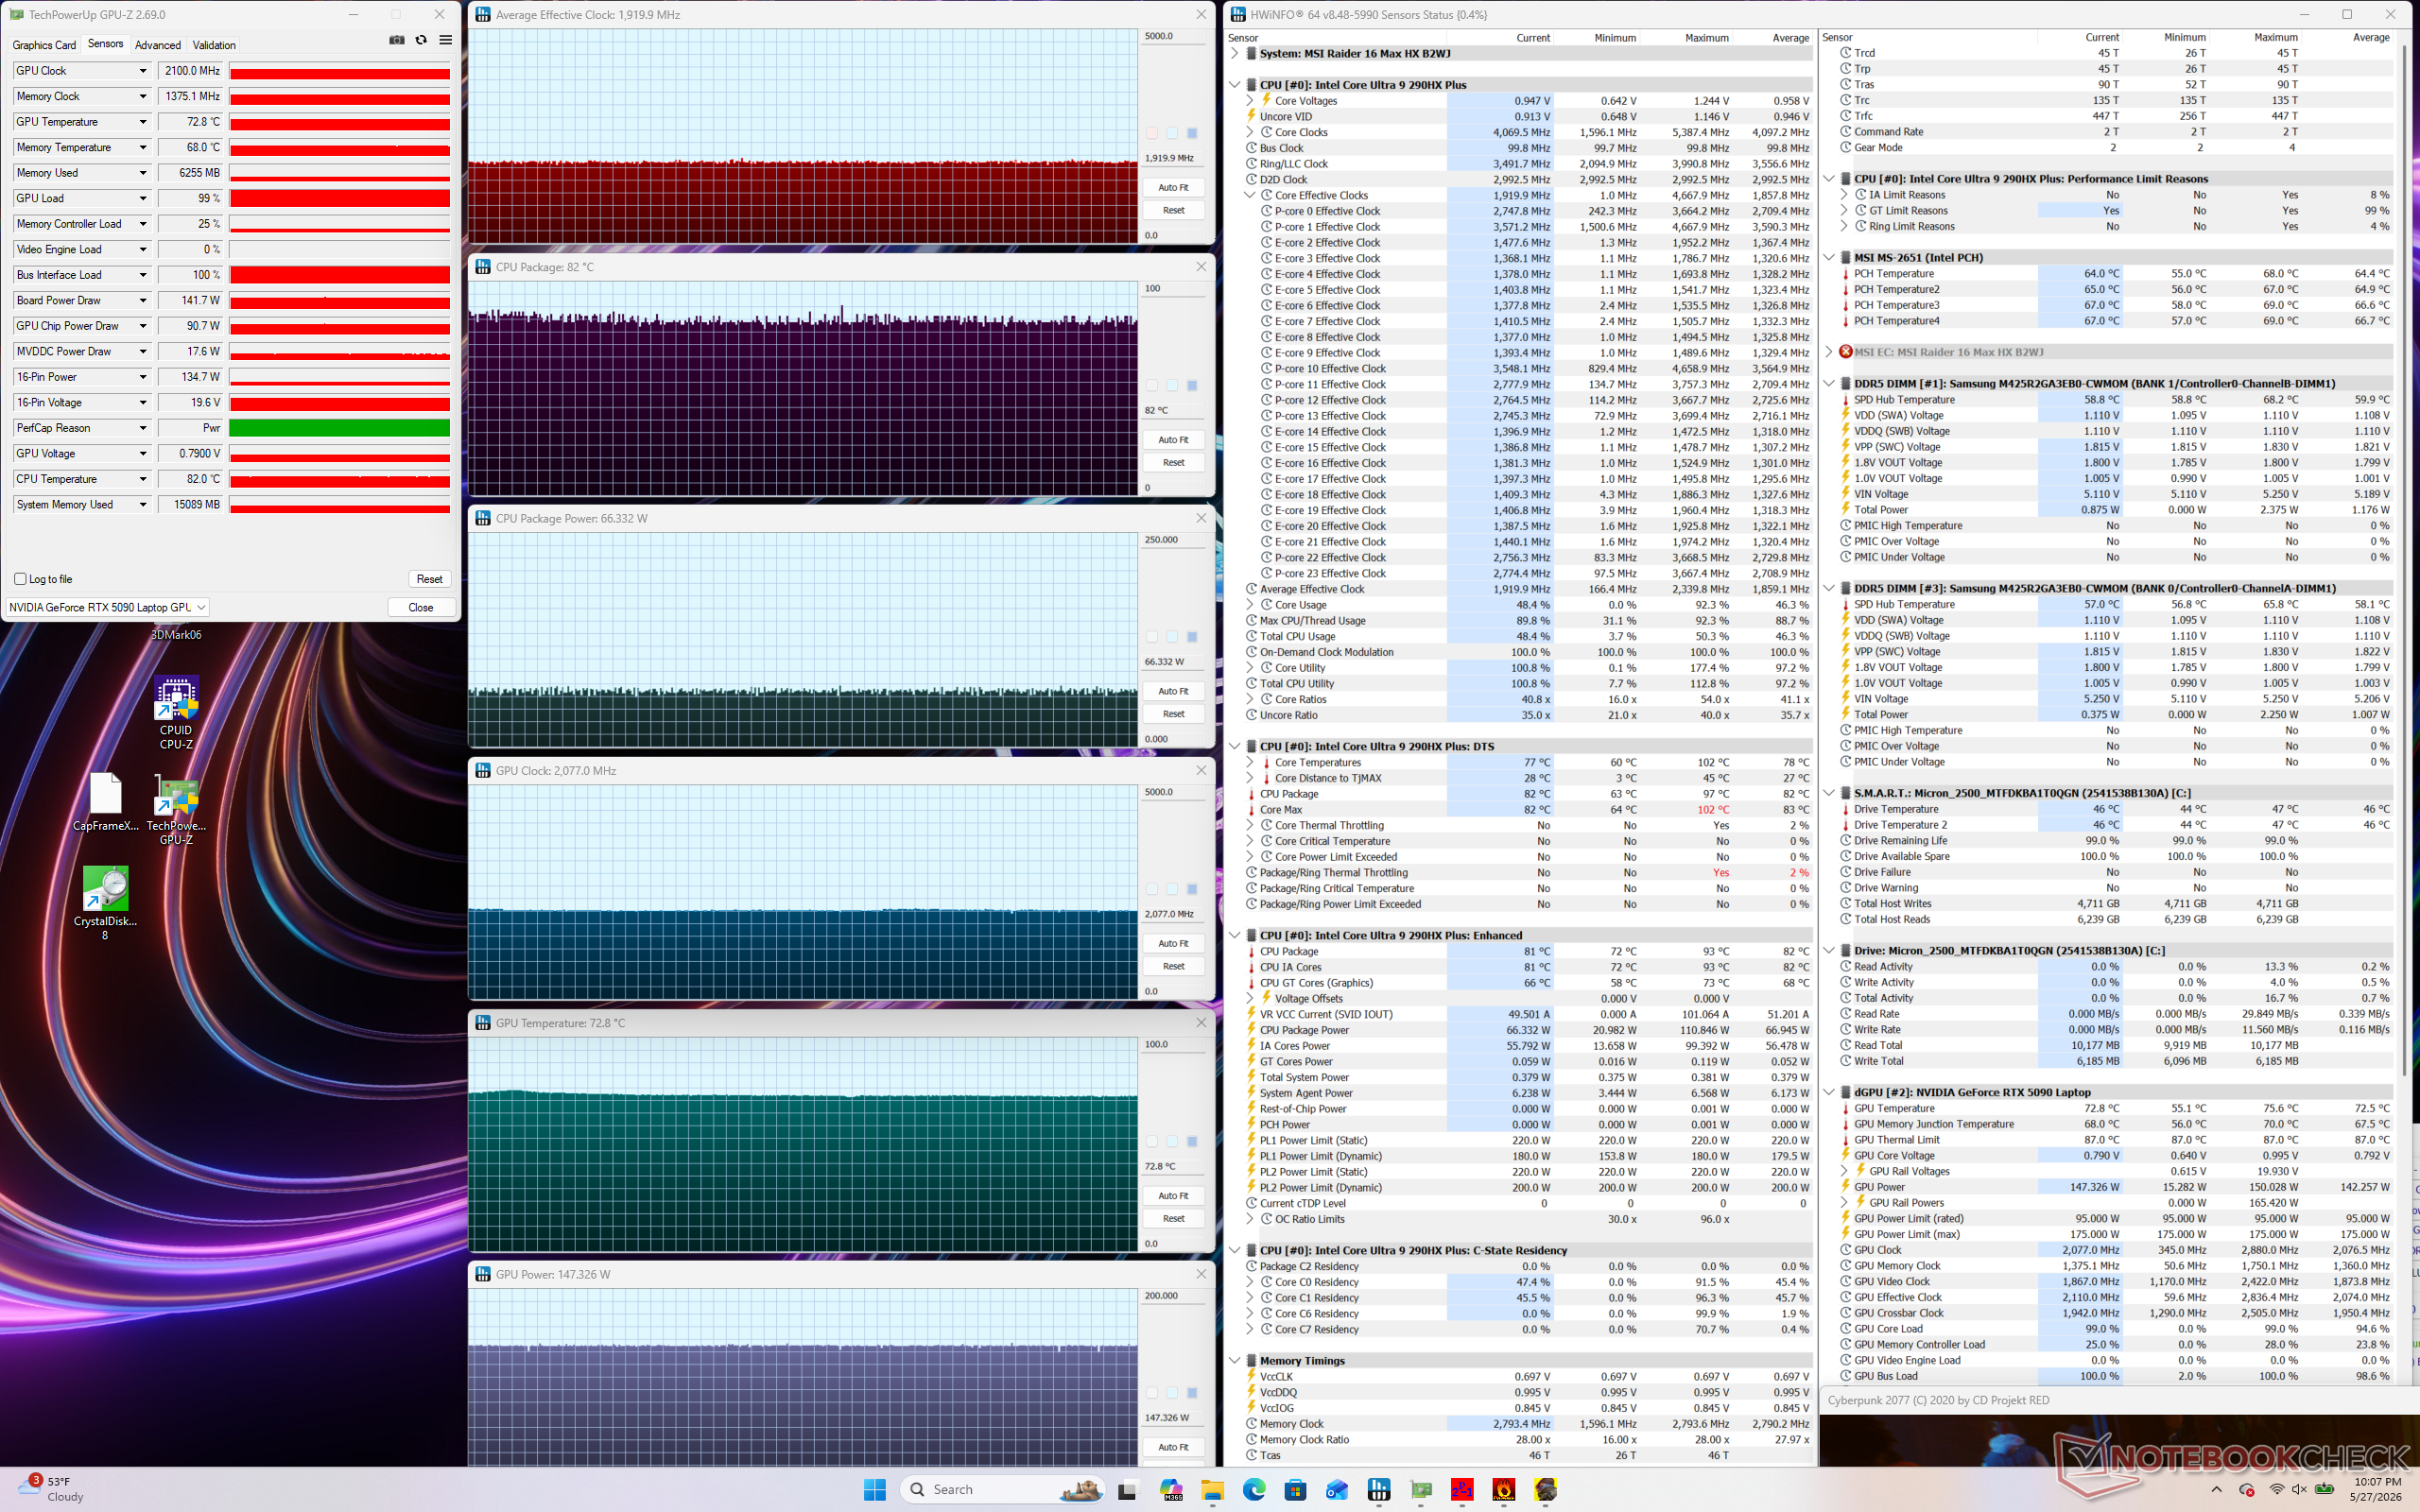

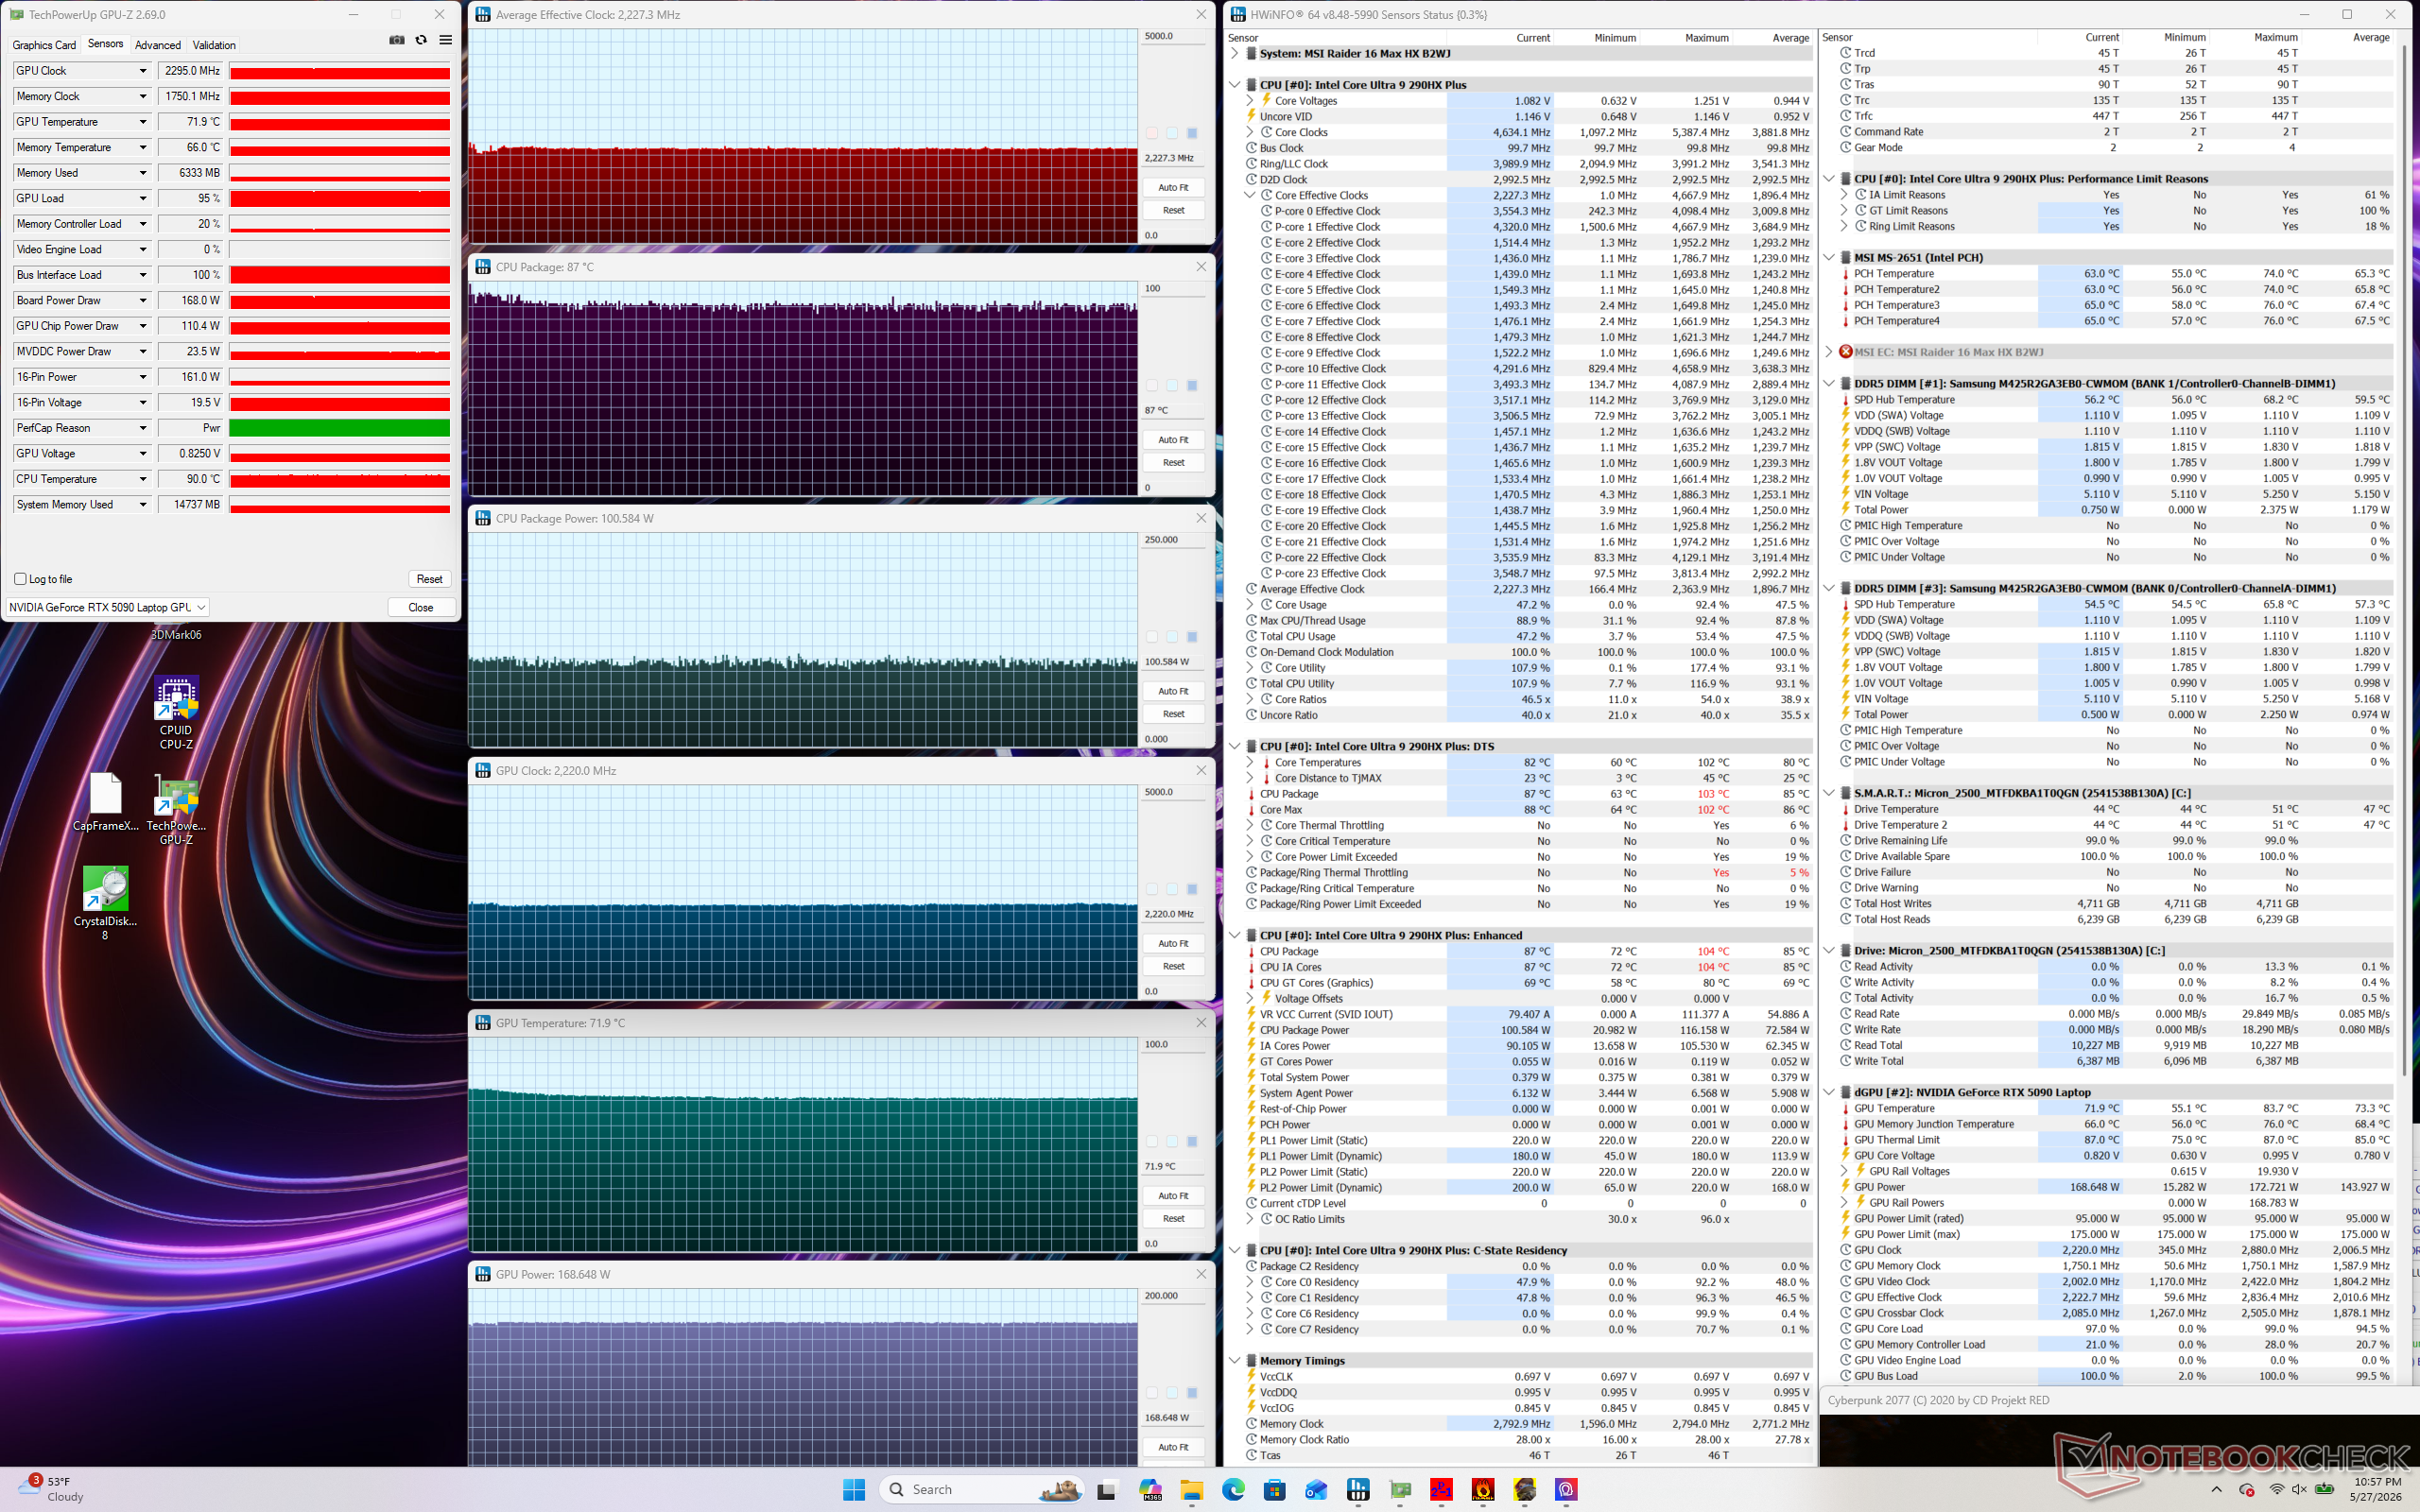
| Średnie taktowanieCPU (GHz) | Taktowanie GPU (MHz) | Średnia temperatura CPU (°C) | Średnia temperatura GPU (°C) | |
| System w stanie spoczynku | -- | -- | 47 | 39 |
| Prime95 Stress | 3.9 | -- | 96 | 56 |
| Prime95 + FurMark Stress | 2.7 - 3.9 | ~1600 | 96 | 75 |
| Cyberpunk 2077 Stress (tryb cichy) | 1.4 | 1440 | 81 | 73 |
| Cyberpunk 2077 Stress (tryb zrównoważony) | 1.7 | 2062 | 79 | 73 |
| Cyberpunk 2077 Stress (tryb ekstremalnej wydajności) | 1.9 | 2100 | 82 | 73 |
| Cyberpunk 2077 Stress (tryb Apex) | 2.3 | 2175 | 96 | 76 |
| Cyberpunk 2077 Stress (Cooler Boost Mode) | 2.2 | 2295 | 87 | 72 |
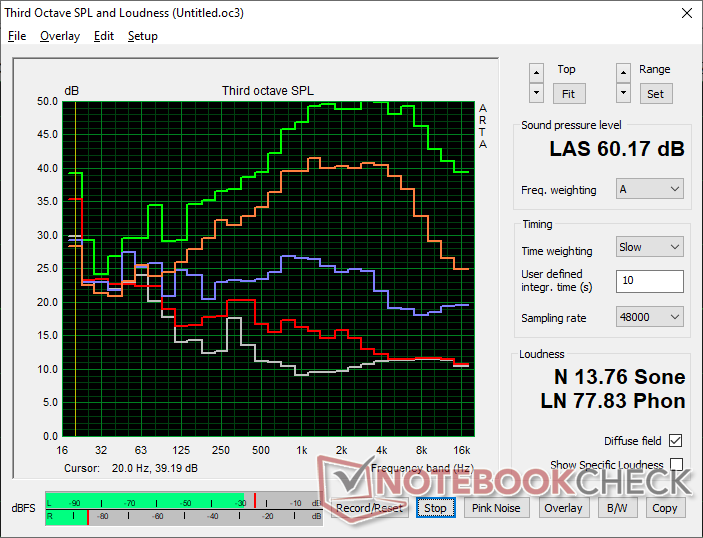
Głośniki
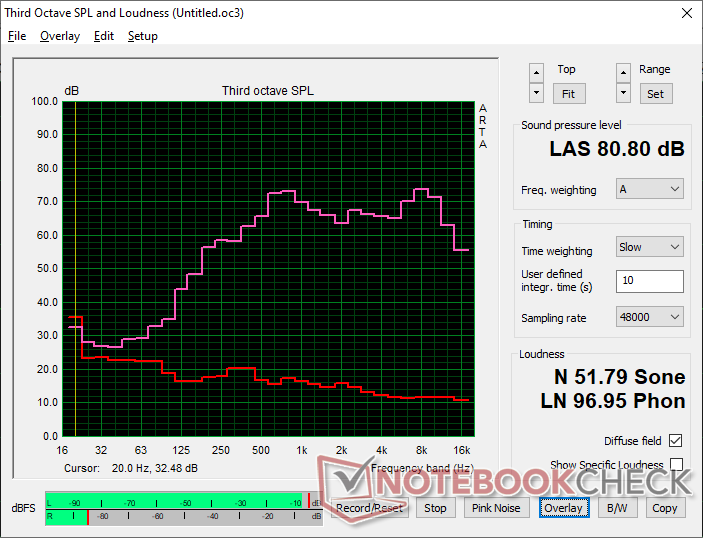
MSI Raider 16 Max HX B2WJ analiza dźwięku
(±) | głośność głośnika jest średnia, ale dobra (80.8 dB)
Bas 100 - 315 Hz
(-) | prawie brak basu - średnio 15.7% niższa od mediany
(±) | liniowość basu jest średnia (8.6% delta do poprzedniej częstotliwości)
Średnie 400 - 2000 Hz
(+) | zbalansowane środki średnie - tylko 3.2% od mediany
(+) | średnie są liniowe (6.1% delta do poprzedniej częstotliwości)
Wysokie 2–16 kHz
(+) | zrównoważone maksima - tylko 2.9% od mediany
(+) | wzloty są liniowe (4.9% delta do poprzedniej częstotliwości)
Ogólnie 100 - 16.000 Hz
(+) | ogólny dźwięk jest liniowy (14.5% różnicy w stosunku do mediany)
W porównaniu do tej samej klasy
» 27% wszystkich testowanych urządzeń w tej klasie było lepszych, 7% podobnych, 66% gorszych
» Najlepszy miał deltę 6%, średnia wynosiła ###średnia###%, najgorsza wynosiła 132%
W porównaniu do wszystkich testowanych urządzeń
» 18% wszystkich testowanych urządzeń było lepszych, 4% podobnych, 77% gorszych
» Najlepszy miał deltę 4%, średnia wynosiła ###średnia###%, najgorsza wynosiła 134%
Apple MacBook Pro 16 2021 M1 Pro analiza dźwięku
(+) | głośniki mogą odtwarzać stosunkowo głośno (84.7 dB)
Bas 100 - 315 Hz
(+) | dobry bas - tylko 3.8% od mediany
(+) | bas jest liniowy (5.2% delta do poprzedniej częstotliwości)
Średnie 400 - 2000 Hz
(+) | zbalansowane środki średnie - tylko 1.3% od mediany
(+) | średnie są liniowe (2.1% delta do poprzedniej częstotliwości)
Wysokie 2–16 kHz
(+) | zrównoważone maksima - tylko 1.9% od mediany
(+) | wzloty są liniowe (2.7% delta do poprzedniej częstotliwości)
Ogólnie 100 - 16.000 Hz
(+) | ogólny dźwięk jest liniowy (4.6% różnicy w stosunku do mediany)
W porównaniu do tej samej klasy
» 0% wszystkich testowanych urządzeń w tej klasie było lepszych, 0% podobnych, 100% gorszych
» Najlepszy miał deltę 5%, średnia wynosiła ###średnia###%, najgorsza wynosiła 45%
W porównaniu do wszystkich testowanych urządzeń
» 0% wszystkich testowanych urządzeń było lepszych, 0% podobnych, 100% gorszych
» Najlepszy miał deltę 4%, średnia wynosiła ###średnia###%, najgorsza wynosiła 134%
Zarządzanie energią
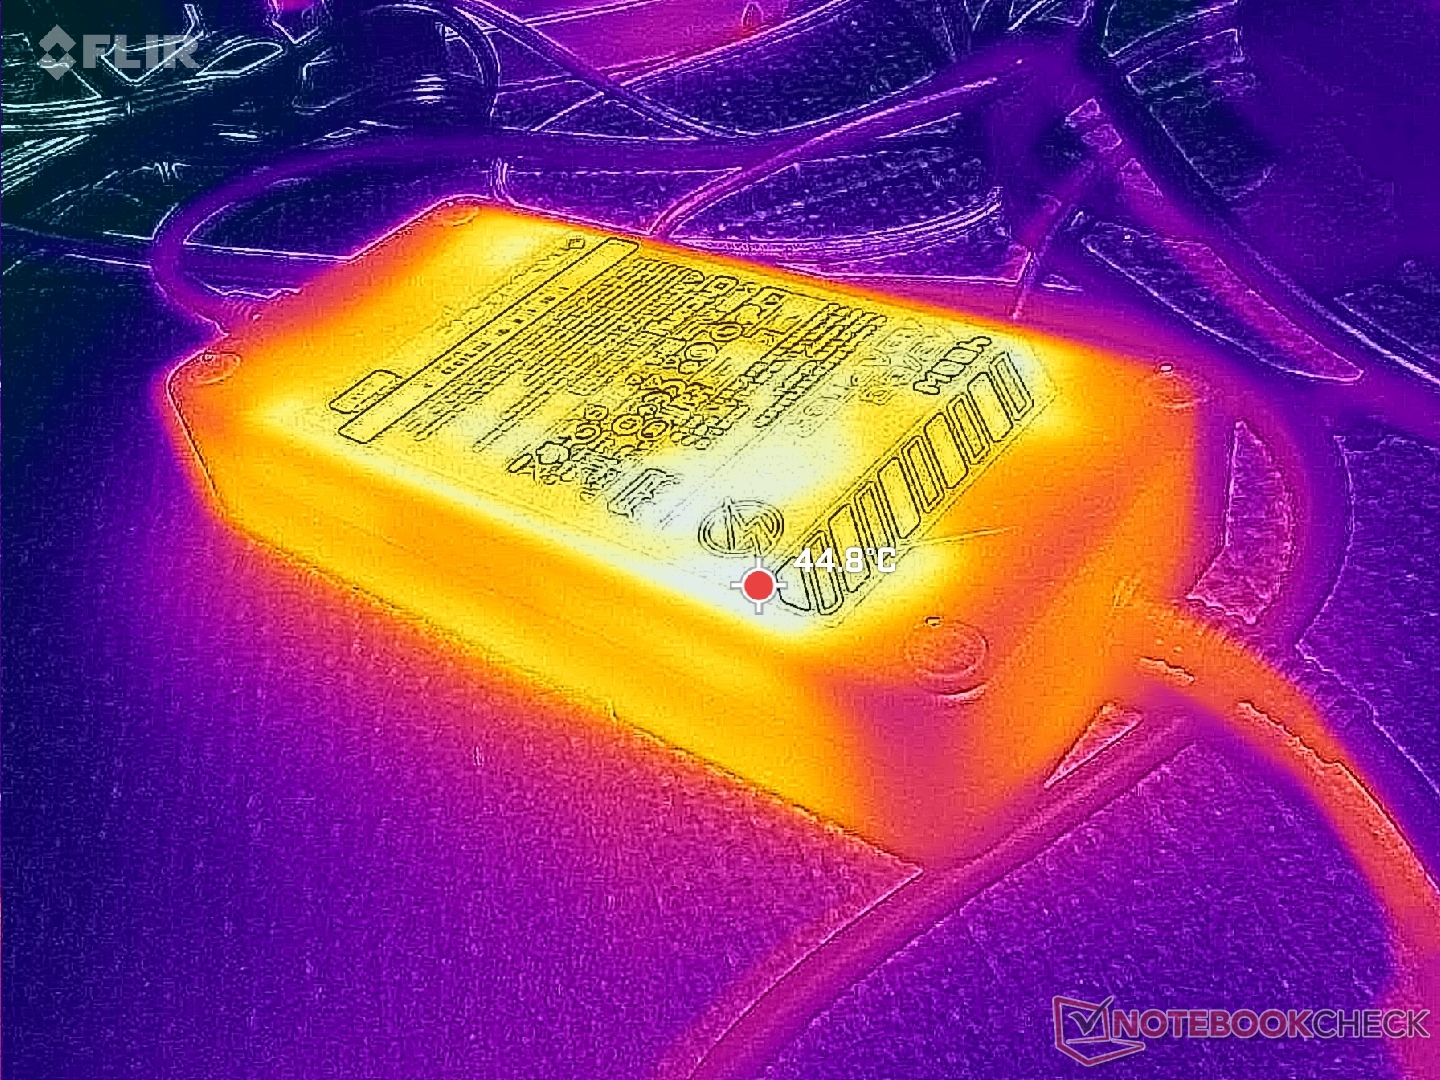
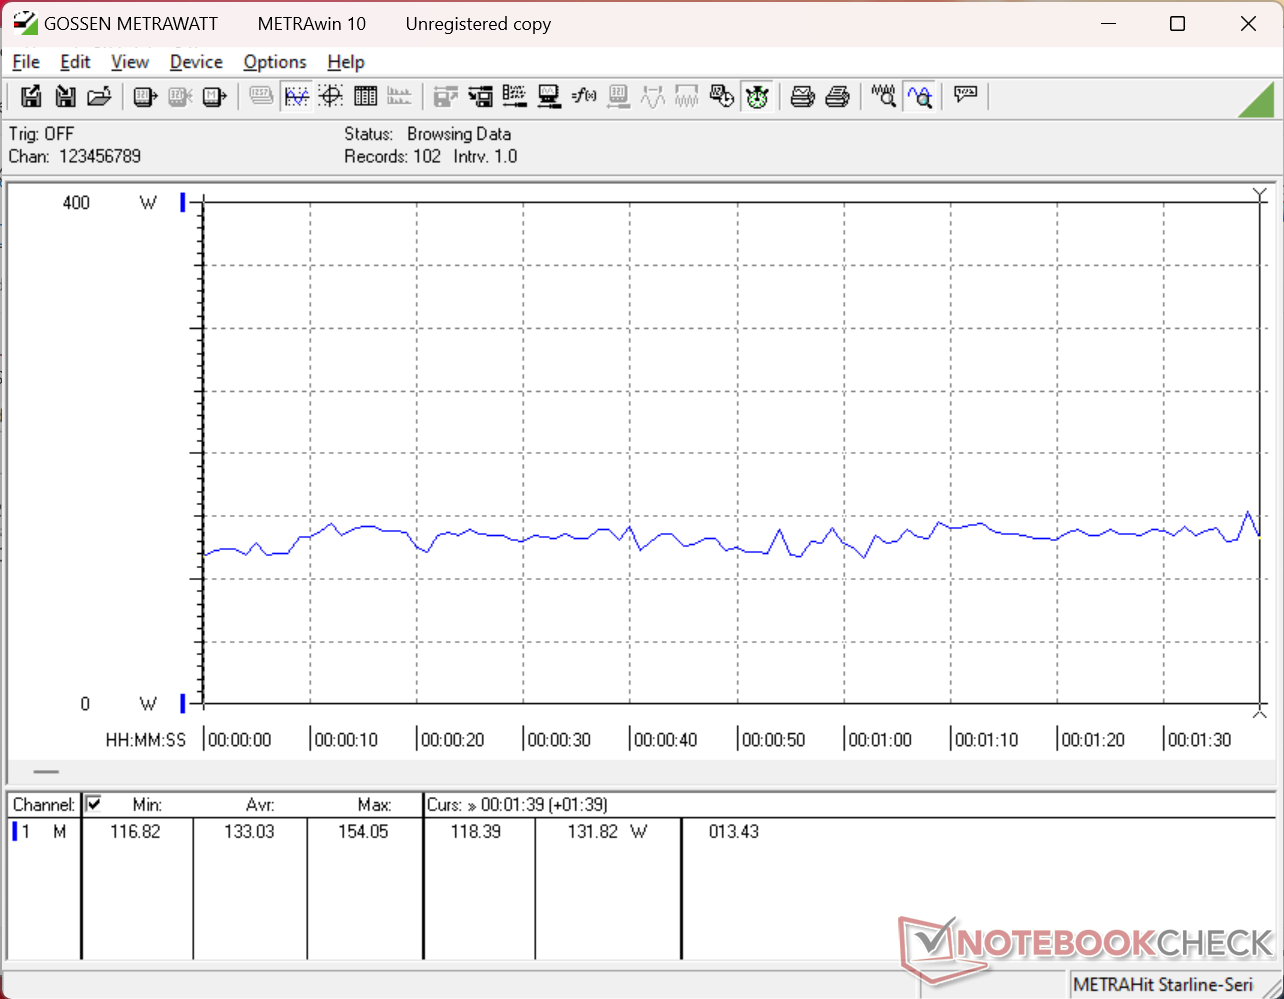
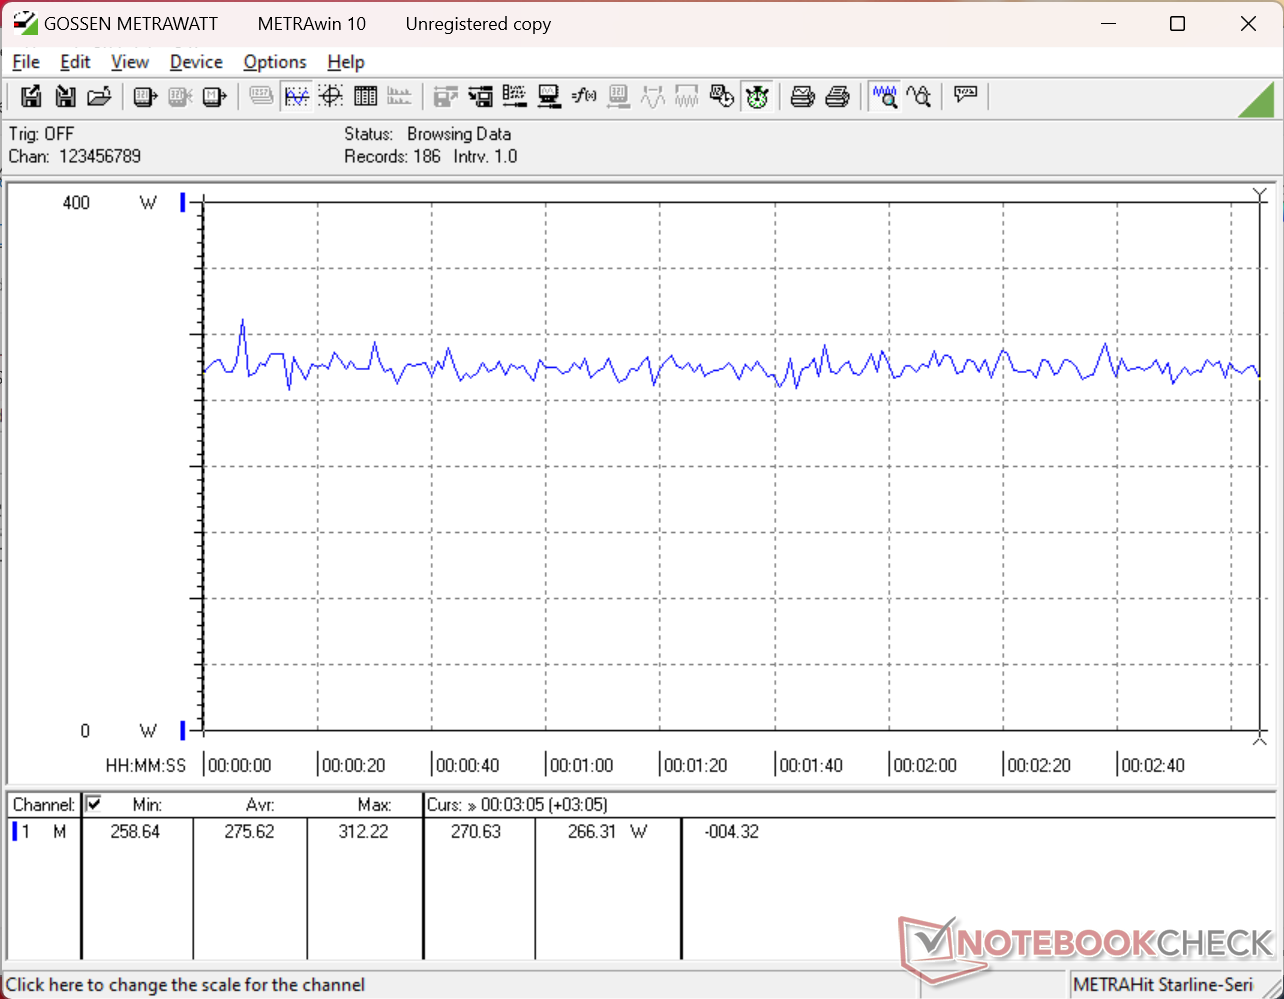
Zużycie energii
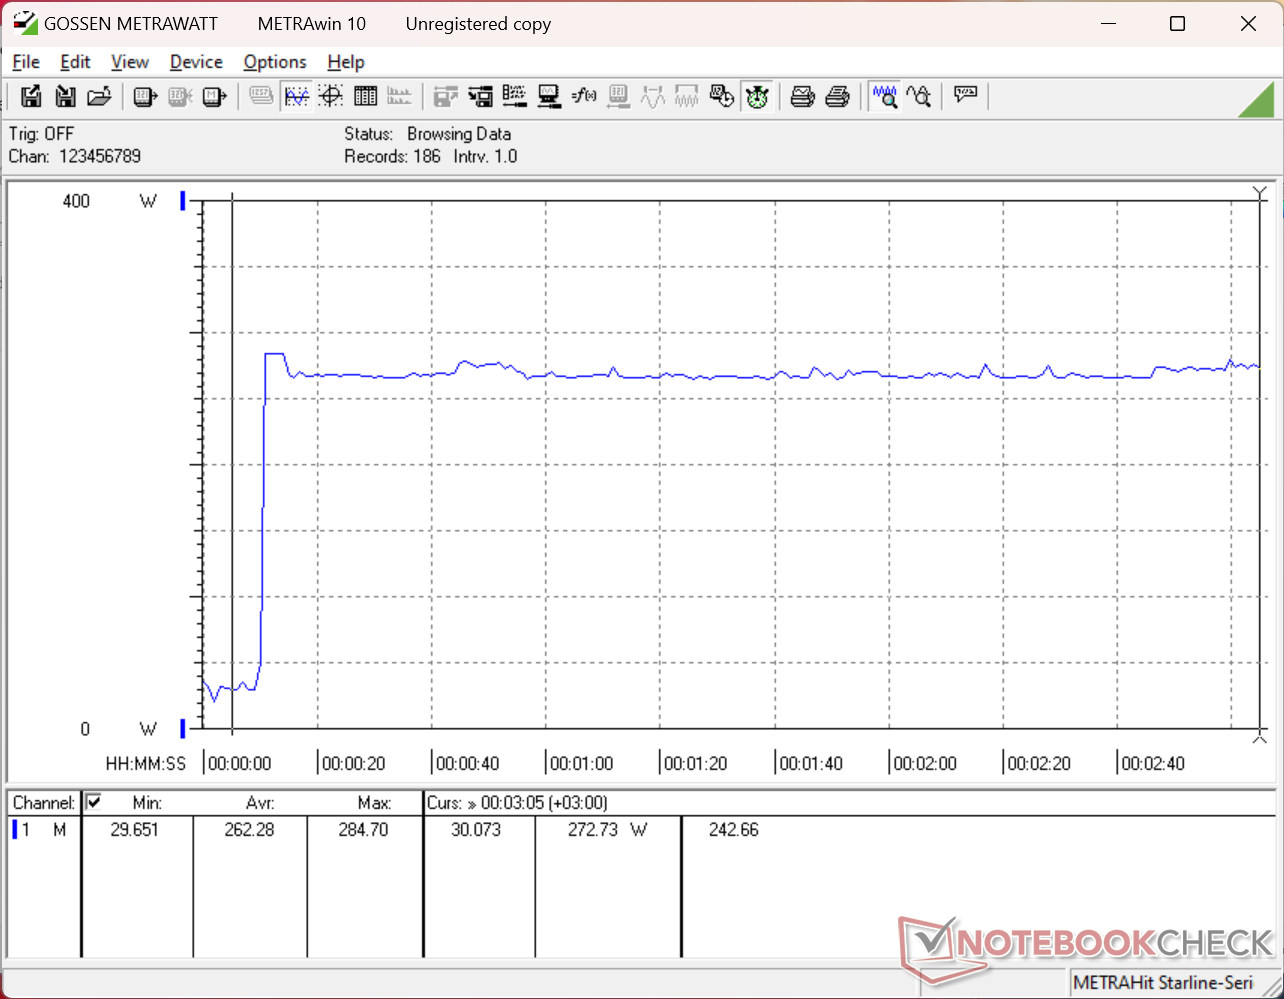
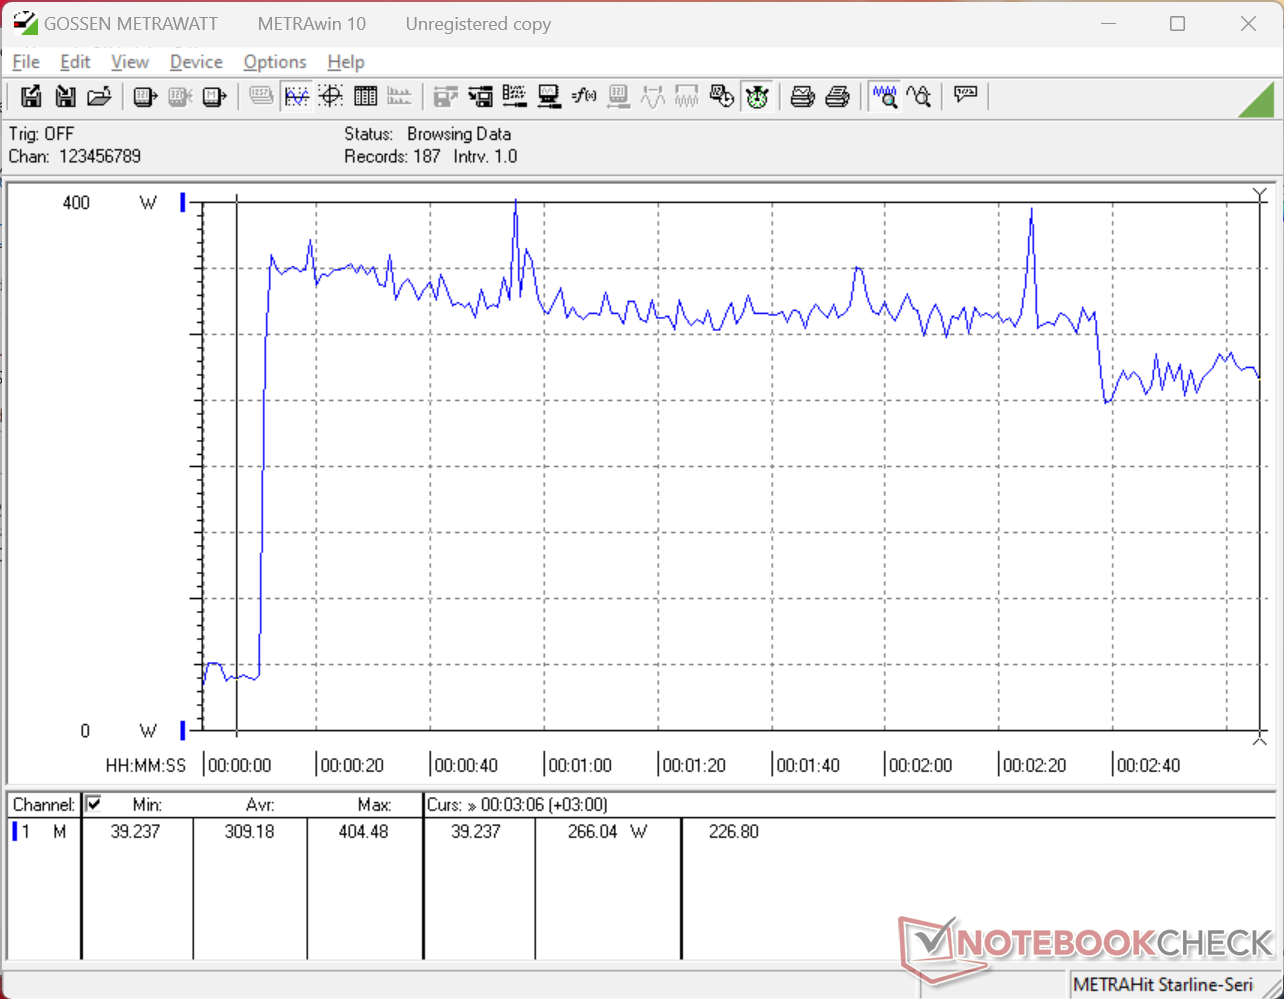
Zużycie energii jest przewidywalnie bardzo wysokie, biorąc pod uwagę zastosowany sprzęt. Uruchomienie Cyberpunk 2077 w trybie Extreme Performance jest o około 28 procent bardziej wymagające niż w przypadku Razer Blade 16 mimo że ten ostatni wyposażony jest w ten sam procesor graficzny RTX 5090. Dużą rozbieżność można przypisać procesorowi Arrow Lake-HX w porównaniu do wolniejszej, ale znacznie wydajniejszej serii Panther Lake-H.
Jesteśmy w stanie zarejestrować tymczasowy maksymalny pobór mocy 405 W, gdy korzystamy z dużego (~ 18,8 x 8,8 x 3,4 cm) zasilacza sieciowego 400 W.
| wyłączony / stan wstrzymania | |
| luz | |
| obciążenie |
|
Legenda:
min: | |
| MSI Raider 16 Max HX B2WJ Ultra 9 290HX Plus, GeForce RTX 5090 Laptop, Micron 2500 1TB MTFDKBA1T0QGN, OLED, 2560x1600, 16" | MSI Crosshair 16 HX AI D2XWGKG Ultra 9 275HX, GeForce RTX 5070 Laptop, Micron 2500 1TB MTFDKBA1T0QGN, IPS, 2560x1600, 16" | Razer Blade 16 Core Ultra 9 386H Ultra 9 386H, GeForce RTX 5090 Laptop, Lexar NM790 2TB, OLED, 2560x1600, 16" | Alienware 16X Aurora Core Ultra 9 290HX Plus Ultra 9 290HX Plus, GeForce RTX 5070 Ti Laptop, , OLED, 2560x1600, 16" | Asus TUF Gaming A16 FA608UP R7 260, GeForce RTX 5070 Laptop, Western Digital PC SN5000S SDEQNSJ-1T00, IPS, 2560x1600, 16" | Lenovo Legion 7 16IAX10 Ultra 7 255HX, GeForce RTX 5060 Laptop, WD PC SN7100S SDFPMSL-1T00-1101, OLED, 2560x1600, 16" | |
|---|---|---|---|---|---|---|
| Power Consumption | -53% | 8% | 19% | 38% | 13% | |
| Idle Minimum * (Watt) | 7.2 | 26.2 -264% | 4.4 39% | 6.9 4% | 4.6 36% | 9.4 -31% |
| Idle Average * (Watt) | 12 | 33.8 -182% | 22.3 -86% | 8.1 32% | 9.8 18% | 10.6 12% |
| Idle Maximum * (Watt) | 32.8 | 34 -4% | 30.4 7% | 31 5% | 10.2 69% | 36.4 -11% |
| Load Average * (Watt) | 133 | 112 16% | 110.7 17% | 131.6 1% | 76.1 43% | 107.7 19% |
| Cyberpunk 2077 ultra external monitor * (Watt) | 275 | 220 20% | 216 21% | 172.1 37% | 198.1 28% | 187.5 32% |
| Cyberpunk 2077 ultra * (Watt) | 276 | 224 19% | 216 22% | 198.3 28% | 198.9 28% | 188 32% |
| Load Maximum * (Watt) | 404.5 | 315 22% | 251.3 38% | 300.1 26% | 235.2 42% | 247 39% |
* ... im mniej tym lepiej
Pobór mocy Cyberpunk / Test warunków skrajnych
Zużycie energii przez monitor zewnętrzny
Żywotność baterii
Czas pracy jest przyzwoity, ale krótszy niż w wielu modelach poprzedniej generacji, częściowo ze względu na przejście z IPS na OLED.
| MSI Raider 16 Max HX B2WJ Ultra 9 290HX Plus, GeForce RTX 5090 Laptop, 91.8 Wh | MSI Crosshair 16 HX AI D2XWGKG Ultra 9 275HX, GeForce RTX 5070 Laptop, 90 Wh | Razer Blade 16 Core Ultra 9 386H Ultra 9 386H, GeForce RTX 5090 Laptop, 90 Wh | Alienware 16X Aurora Core Ultra 9 290HX Plus Ultra 9 290HX Plus, GeForce RTX 5070 Ti Laptop, 96 Wh | Asus TUF Gaming A16 FA608UP R7 260, GeForce RTX 5070 Laptop, 90 Wh | Lenovo Legion 7 16IAX10 Ultra 7 255HX, GeForce RTX 5060 Laptop, 84 Wh | |
|---|---|---|---|---|---|---|
| Czasy pracy | 41% | 48% | -6% | 65% | -41% | |
| WiFi v1.3 (h) | 7.9 | 11.1 41% | 11.7 48% | 7.4 -6% | 13 65% | 4.7 -41% |
| H.264 (h) | 14.2 |
Ocena Notebookcheck
Raider 16 Max HX jest cięższy i większy niż wiele innych 16-calowych laptopów do gier, ale w rezultacie jest w stanie wycisnąć większą wydajność z procesora i karty graficznej.
MSI Raider 16 Max HX B2WJ
- 09/06/2026 v8
Allen Ngo
 Total Sustainability Score:
 Potencjalni konkurenci w porównaniu
Obraz | Model / recenzja | Cena | Waga | Wysokość | Ekran |
|---|---|---|---|---|---|
1. 87.7%  | MSI Raider 16 Max HX B2WJ Intel Core Ultra 9 290HX Plus ⎘ NVIDIA GeForce RTX 5090 Laptop ⎘ 32 GB Pamięć, 1024 GB SSD | Amazon: Cena katalogowa: 4200 USD | 2.7 kg | 28.9 mm | 16.00" 2560x1600 189 PPI OLED |
2. 81.9%  | MSI Crosshair 16 HX AI D2XWGKG Intel Core Ultra 9 275HX ⎘ NVIDIA GeForce RTX 5070 Laptop ⎘ 16 GB Pamięć, 1024 GB SSD | Amazon: Cena katalogowa: 2500 EUR | 2.5 kg | 27.9 mm | 16.00" 2560x1600 189 PPI IPS |
3. 87.7%  | Razer Blade 16 Core Ultra 9 386H Intel Core Ultra 9 386H ⎘ NVIDIA GeForce RTX 5090 Laptop ⎘ 32 GB Pamięć, 2048 GB SSD | Amazon: 1. $3,499.99 Razer Blade 16 (2026) Gaming... 2. $4,899.99 Razer Blade 16 (2026) Gaming... 3. $4,699.99 Razer Blade 16 (2026) Gaming... Cena katalogowa: 4900 USD | 2.1 kg | 17.4 mm | 16.00" 2560x1600 189 PPI OLED |
4. 85.9%  | Alienware 16X Aurora Core Ultra 9 290HX Plus Intel Core Ultra 9 290HX Plus ⎘ NVIDIA GeForce RTX 5070 Ti Laptop ⎘ 32 GB Pamięć | Amazon: Cena katalogowa: 3000 USD | 2.6 kg | 23.4 mm | 16.00" 2560x1600 189 PPI OLED |
5. 83.8%  | Asus TUF Gaming A16 FA608UP AMD Ryzen 7 260 ⎘ NVIDIA GeForce RTX 5070 Laptop ⎘ 32 GB Pamięć, 1024 GB SSD | Amazon: Cena katalogowa: 2199€ | 2.2 kg | 25.7 mm | 16.00" 2560x1600 189 PPI IPS |
6. 86.6%  | Lenovo Legion 7 16IAX10 Intel Core Ultra 7 255HX ⎘ NVIDIA GeForce RTX 5060 Laptop ⎘ 32 GB Pamięć, 1024 GB SSD | Amazon: Cena katalogowa: 1650 USD | 2 kg | 17.9 mm | 16.00" 2560x1600 189 PPI OLED |
Przezroczystość
Wyboru urządzeń do recenzji dokonuje nasza redakcja. Próbka testowa została udostępniona autorowi jako pożyczka od producenta lub sprzedawcy detalicznego na potrzeby tej recenzji. Pożyczkodawca nie miał wpływu na tę recenzję, producent nie otrzymał też kopii tej recenzji przed publikacją. Nie było obowiązku publikowania tej recenzji. Jako niezależna firma medialna, Notebookcheck nie podlega władzy producentów, sprzedawców detalicznych ani wydawców.
Tak testuje Notebookcheck
Każdego roku Notebookcheck niezależnie sprawdza setki laptopów i smartfonów, stosując standardowe procedury, aby zapewnić porównywalność wszystkich wyników. Od około 20 lat stale rozwijamy nasze metody badawcze, ustanawiając przy tym standardy branżowe. W naszych laboratoriach testowych doświadczeni technicy i redaktorzy korzystają z wysokiej jakości sprzętu pomiarowego. Testy te obejmują wieloetapowy proces walidacji. Nasz kompleksowy system ocen opiera się na setkach uzasadnionych pomiarów i benchmarków, co pozwala zachować obiektywizm.
