Werdykt - Z wielką mocą przychodzi wielki rozmiar
Popularnym trendem w przypadku laptopów do gier jest coraz cieńsze i cieńsze, ale entuzjaści doskonale zdają sobie sprawę, że zmniejszenie milimetrów niezmiennie oznacza również zmniejszenie wydajności. Alienware 18 Area-51 może być większy i cięższy niż wielu konkurentów, ale udaje mu się działać chłodniej, szybciej, a czasem ciszej jednocześnie. Entuzjaści, którzy chcą wycisnąć jak najwięcej wydajności, nie muszą szukać dalej niż Alienware 18.
Duży rozmiar pozwala na znacznie więcej niż tylko wzrost wydajności. Model ten oferuje wysokiej jakości funkcje, których nie można znaleźć u większości cieńszych lub mniejszych konkurentów, w tym podwójne gniazda PCIe5 SSD, wygodne mechaniczne klawisze CherryMX, wyższej jakości głośniki oraz mocniejszą, bardziej nieelastyczną obudowę. Kupujący, którzy po prostu porównują specyfikacje konkurencyjnych laptopów, mogą przeoczyć niektóre z najlepszych funkcji Alienware.
Największymi wadami systemu poza jego ogromnym rozmiarem i wagą jest krótki czas pracy na baterii i brak jakichkolwiek opcji wyświetlania. Wyświetlacz IPS 1600p 300 Hz jest prawdopodobnie doskonały do gier, ale brak obsługi HDR i 4K jest nieco zaskakujący, biorąc pod uwagę, za ile Alienware 18 jest sprzedawany. Zużycie energii jest bardzo wysokie bez względu na ustawienia, co może zniechęcić użytkowników dbających o wydajność. Aspekty te można by poprawić, aby zapewnić Dellowi większy skok w stosunku do nieco bardziej wydajnego, zasilanego przez AMD MSI Raider A18 HX z mini-LED 4K. Tymczasem użytkownicy, którzy nie mają nic przeciwko zmniejszeniu wydajności o 10 do 15 procent na rzecz cieńszych (i głośniejszych) konstrukcji, mają wiele do wyboru, takich jak Razer Blade 18 lub Asus ROG Strix G18.
Za
Przeciw
Cena i dostępność
Amazon wysyła obecnie Alienware 18 Area-51 z grafiką RTX 5080 za 3500 USD. Wersja RTX 5090 jest dostępna bezpośrednio od firmy Dell za 4400 USD.
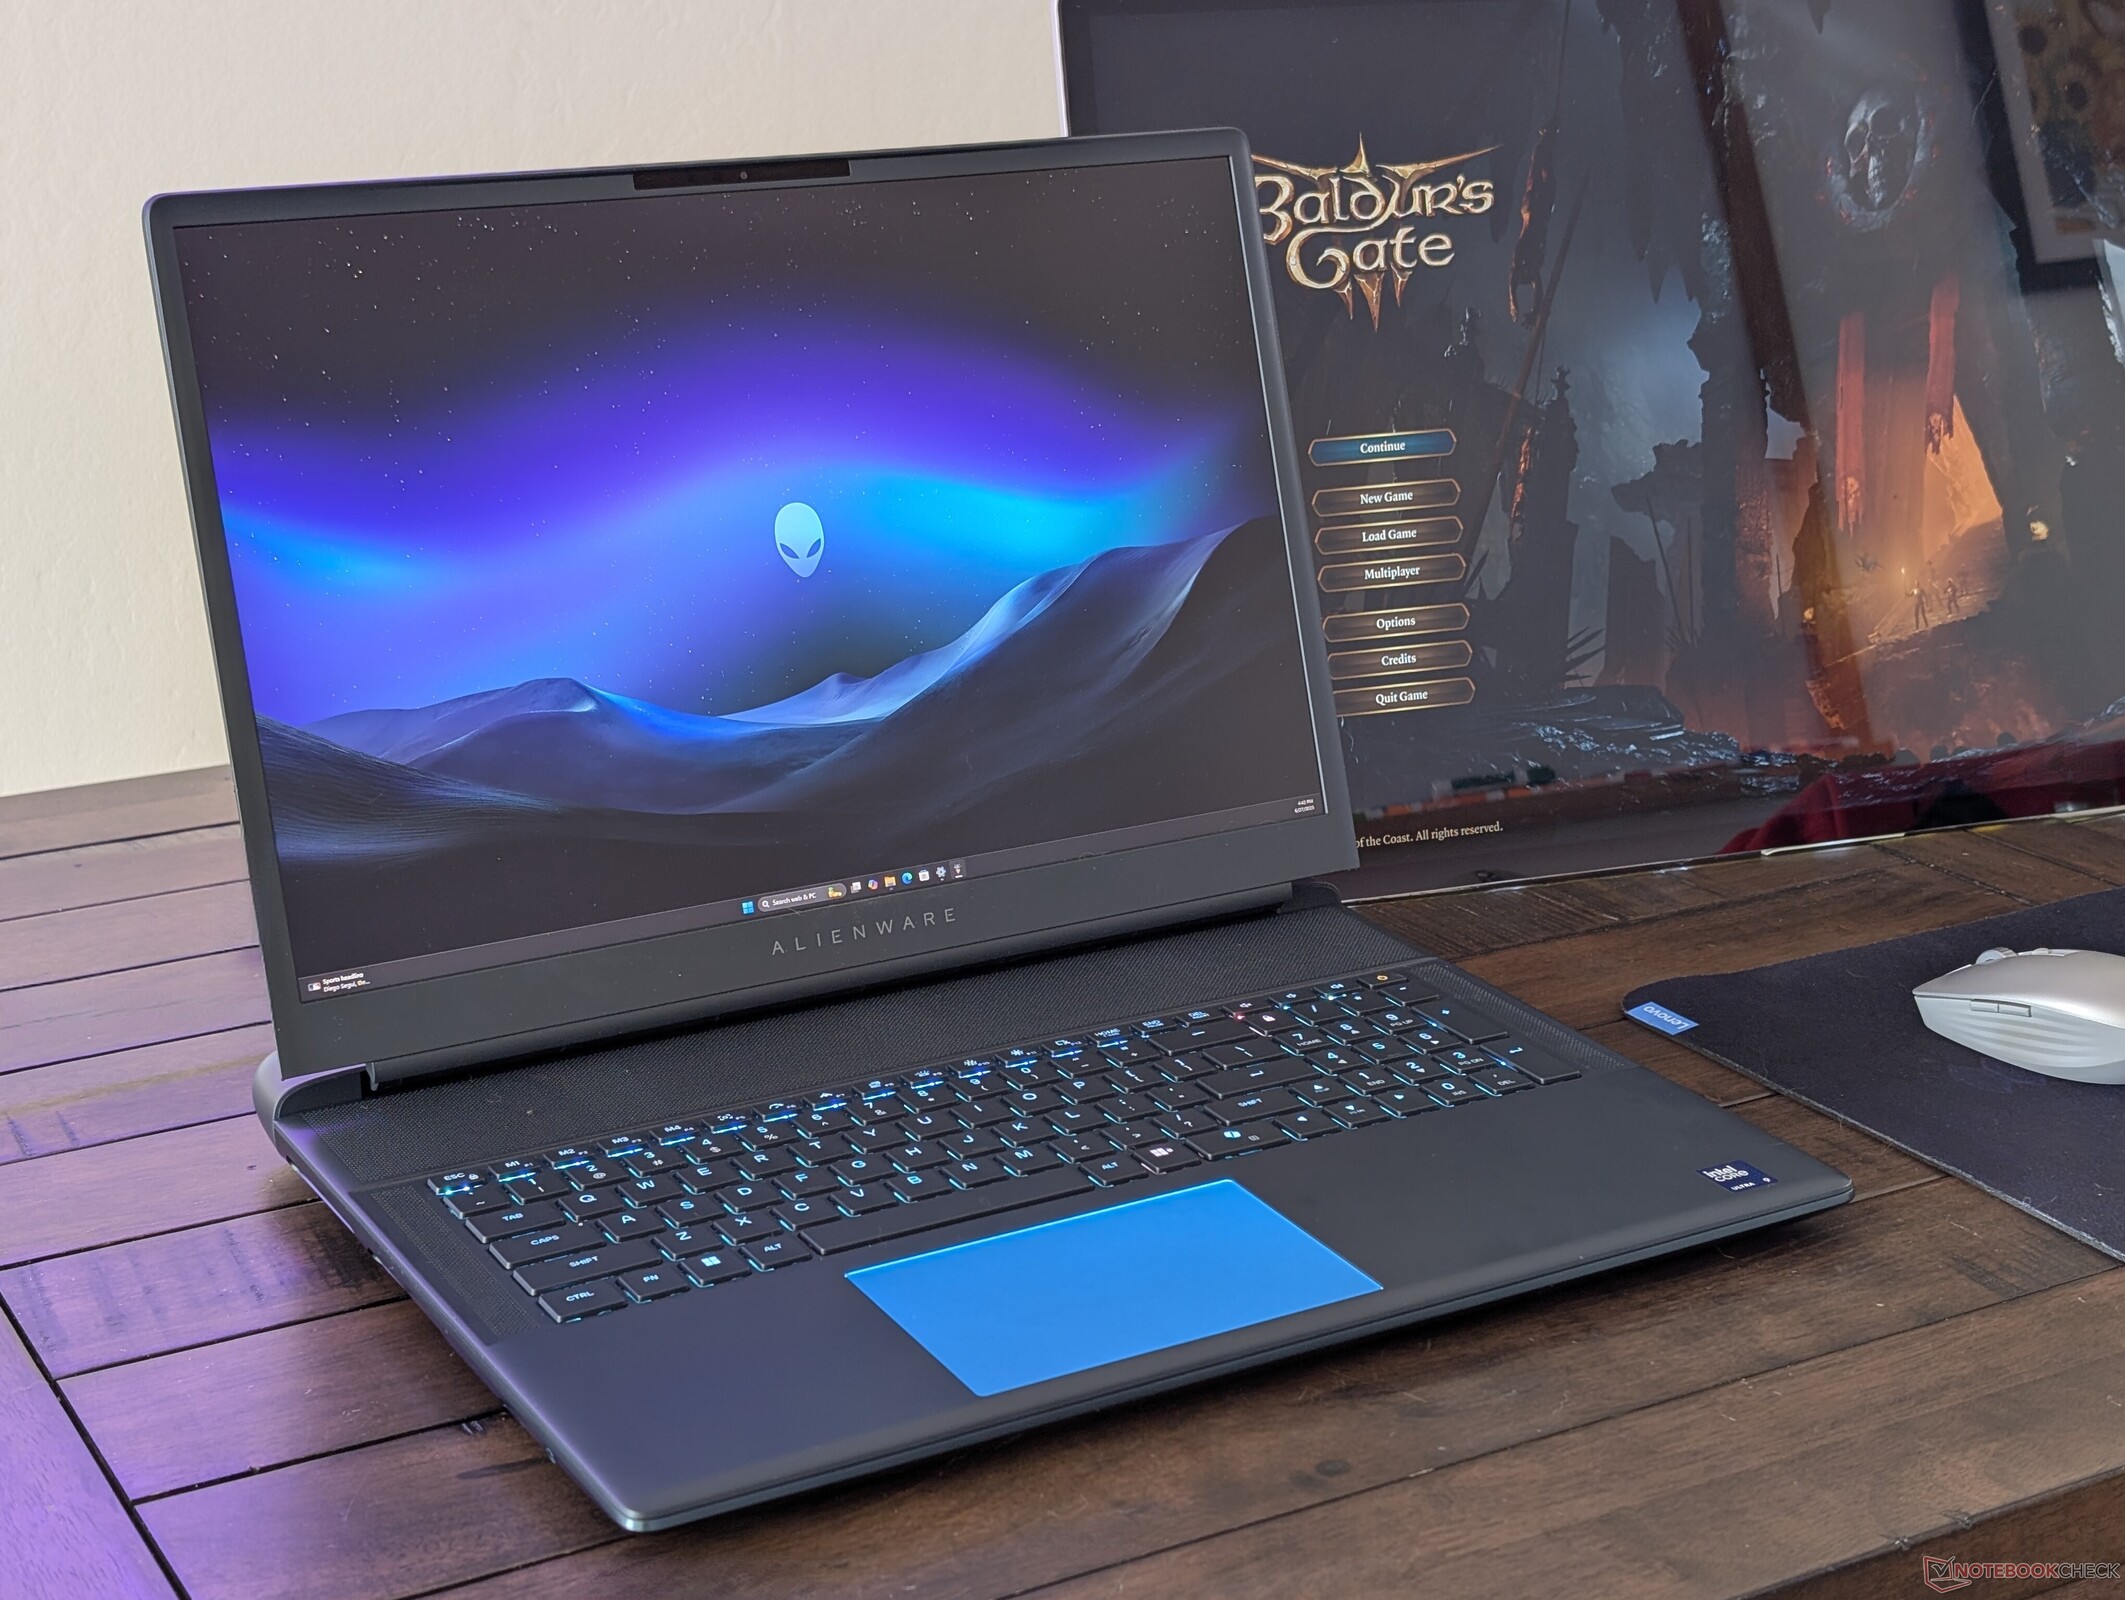
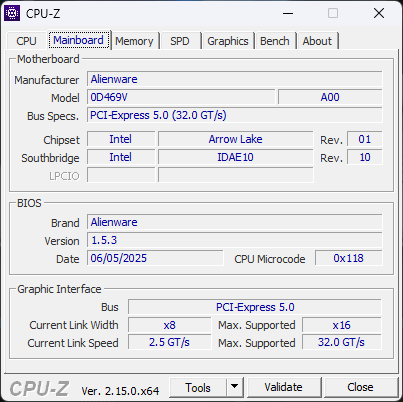
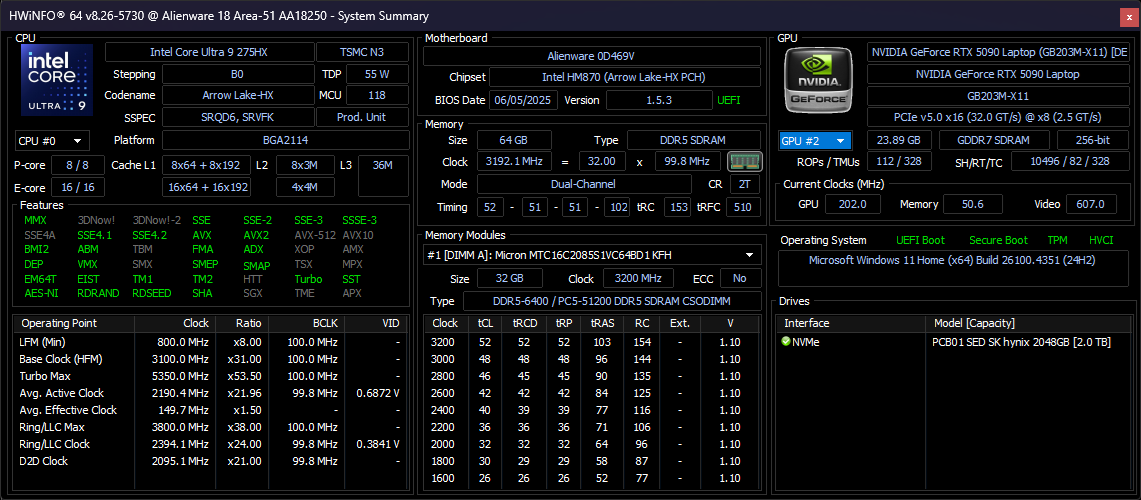
Alienware 18 Area-51 to najnowszy topowy laptop do gier firmy Dell o jeszcze większej mocy i wydajności w porównaniu z mniejszym 16-calowym Alienware 16. Jest bezpośrednim następcą zeszłorocznego Alienware m18 R2 wprowadzając całkowitą zmianę projektu zarówno wewnątrz, jak i na zewnątrz. Zniknęły procesory Raptor Lake-HX i procesory graficzne Ada LoveLace na rzecz nowszych opcji Arrow Lake-HX i Blackwell.
Nasza jednostka testowa to najwyższa dostępna konfiguracja z procesorem Core Ultra 9 275HX, kartą graficzną RTX 5090 o mocy 175 W GeForce i wyświetlaczem IPS o rozdzielczości 1600 pikseli za około 4400 USD. Mniejsze jednostki SKU zaczynają się od RTX 5070 Ti za 3300 USD, ale poza tym nie ma obecnie żadnych dodatkowych procesorów ani wyświetlaczy do wyboru.
Konkurenci w tej dziedzinie obejmują inne duże 18-calowe laptopy do gier, takie jak MSI Titan 18 HX, Aorus Master 18lub Asus ROG Strix Scar 18. Wiele z naszych komentarzy na temat Alienware 16 odnosi się do Alienware 18, ponieważ mają one ten sam język projektowania AW30.
Więcej recenzji Dell:
Specyfikacje
Case - Away With Hexagons
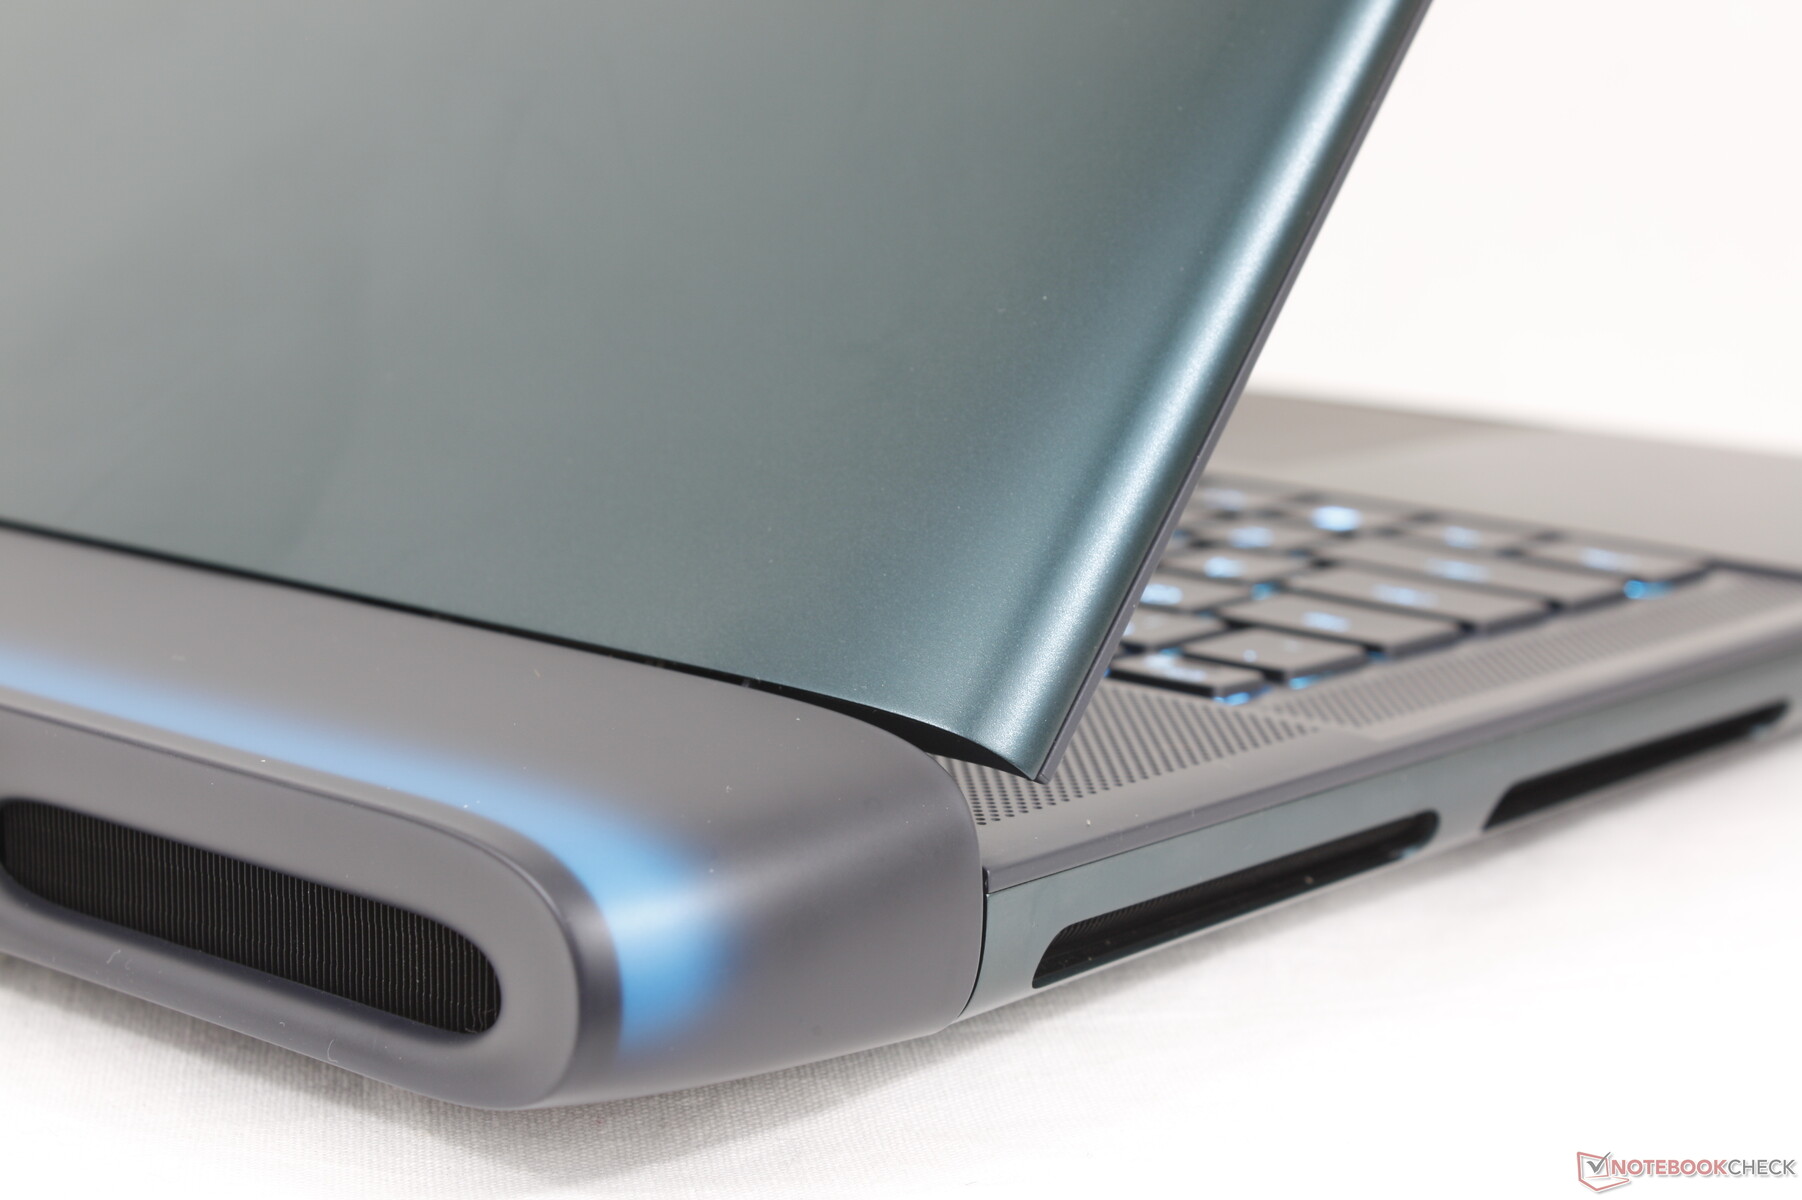
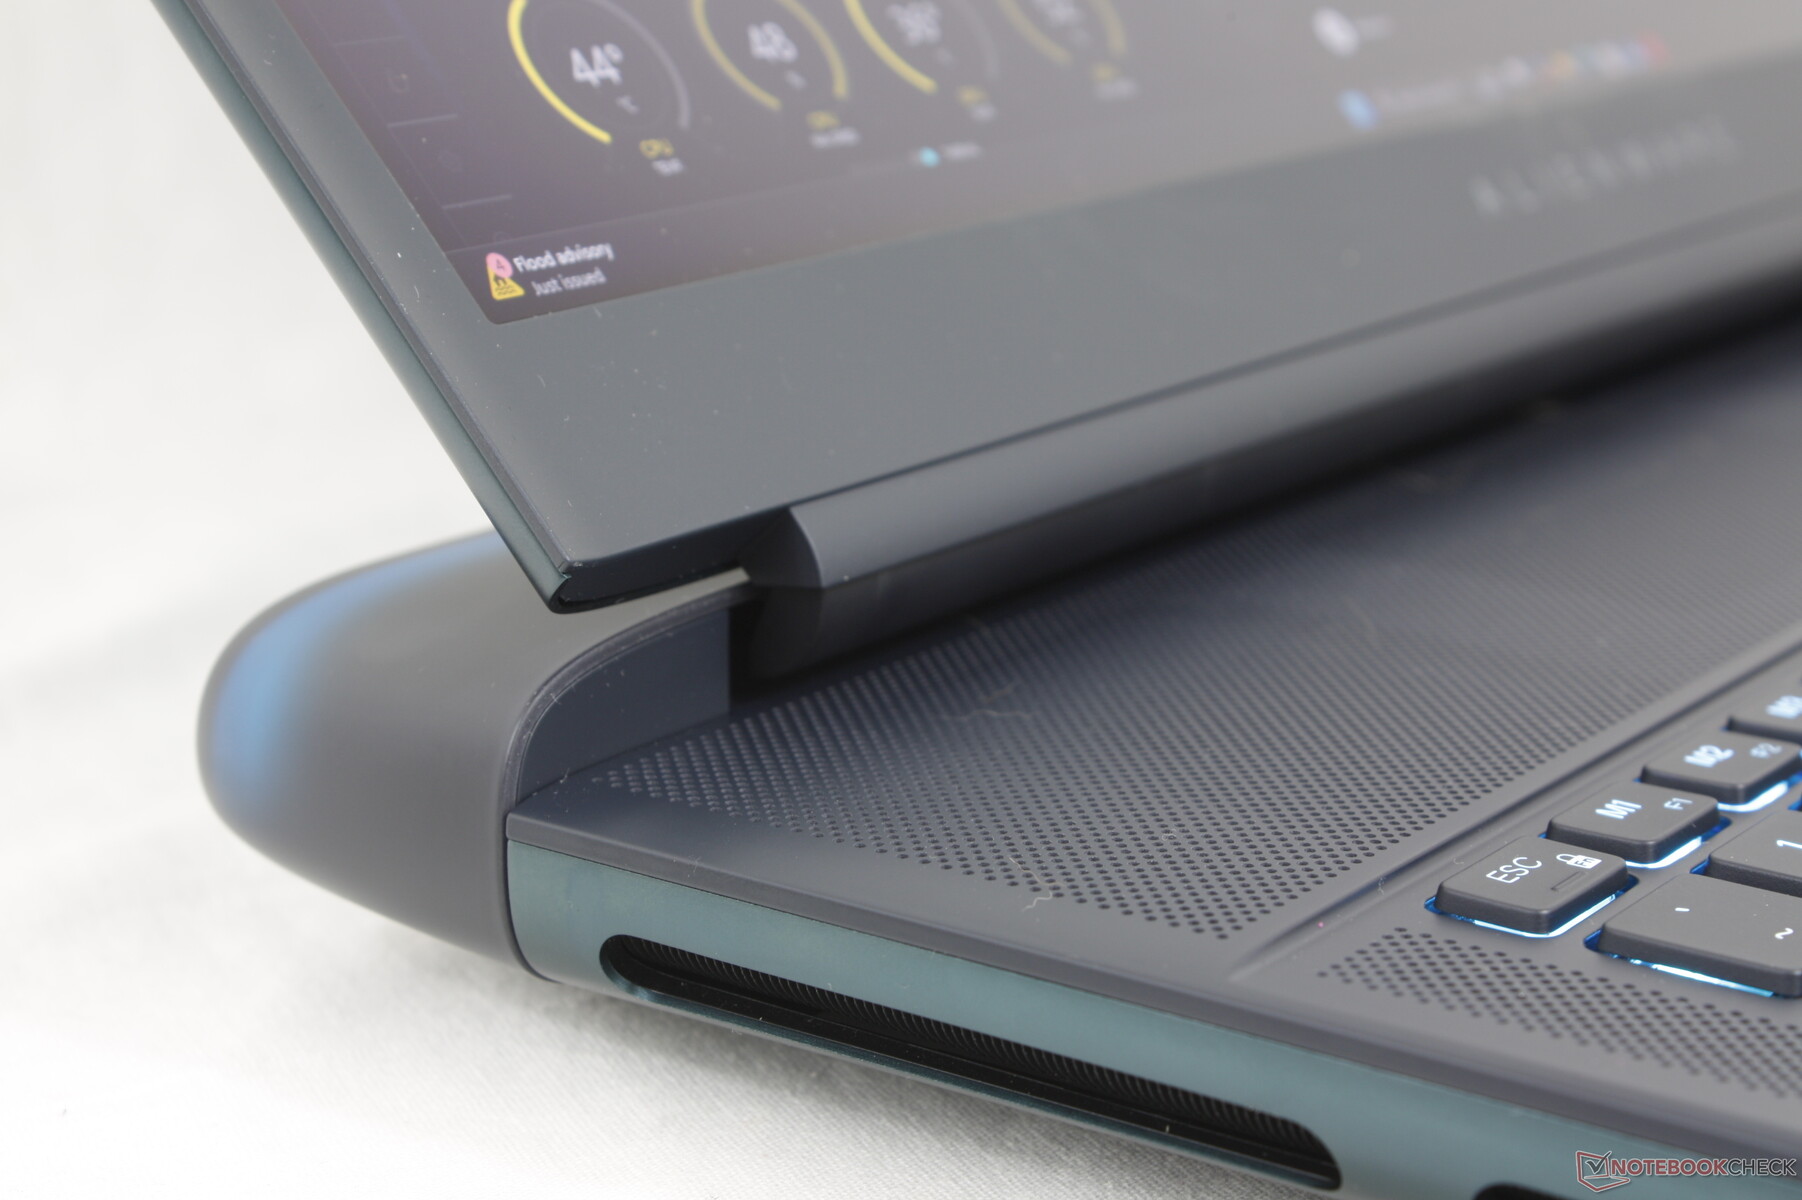
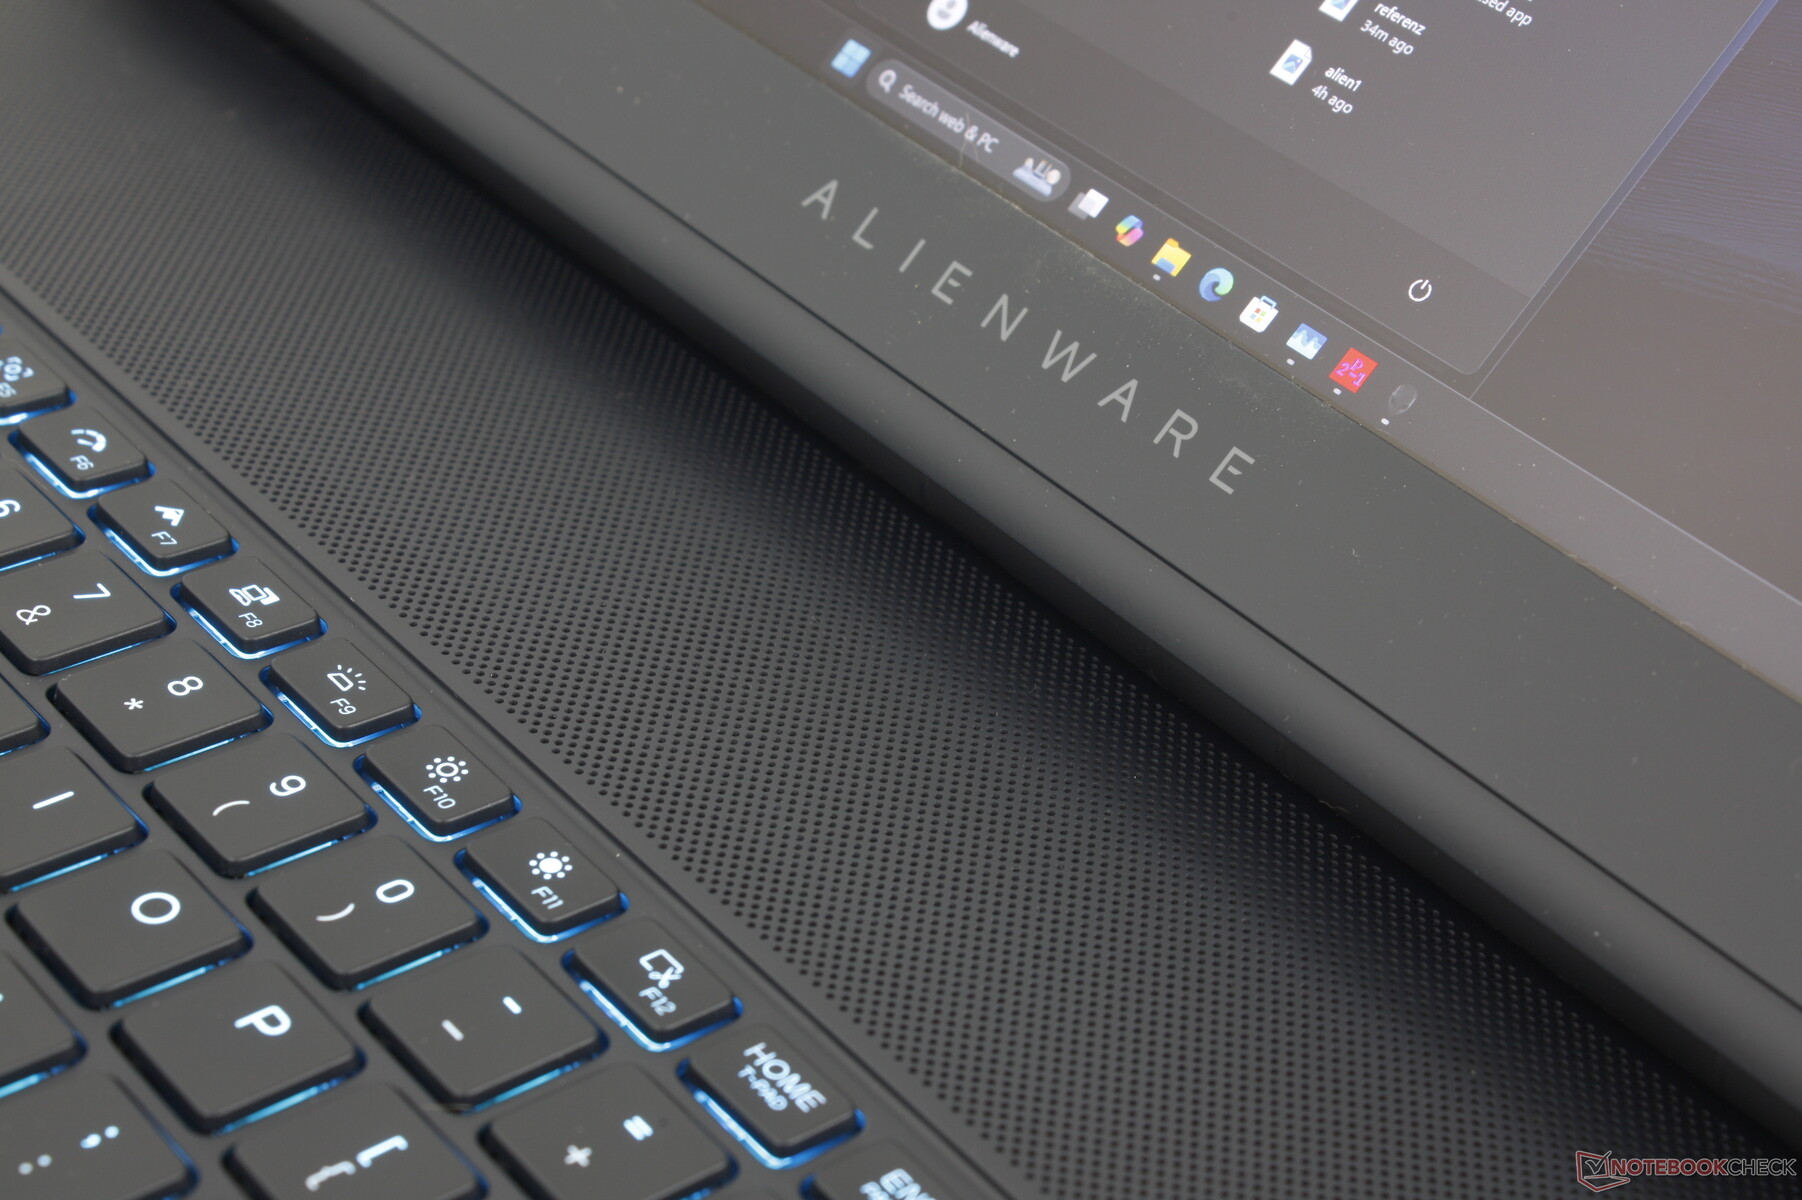
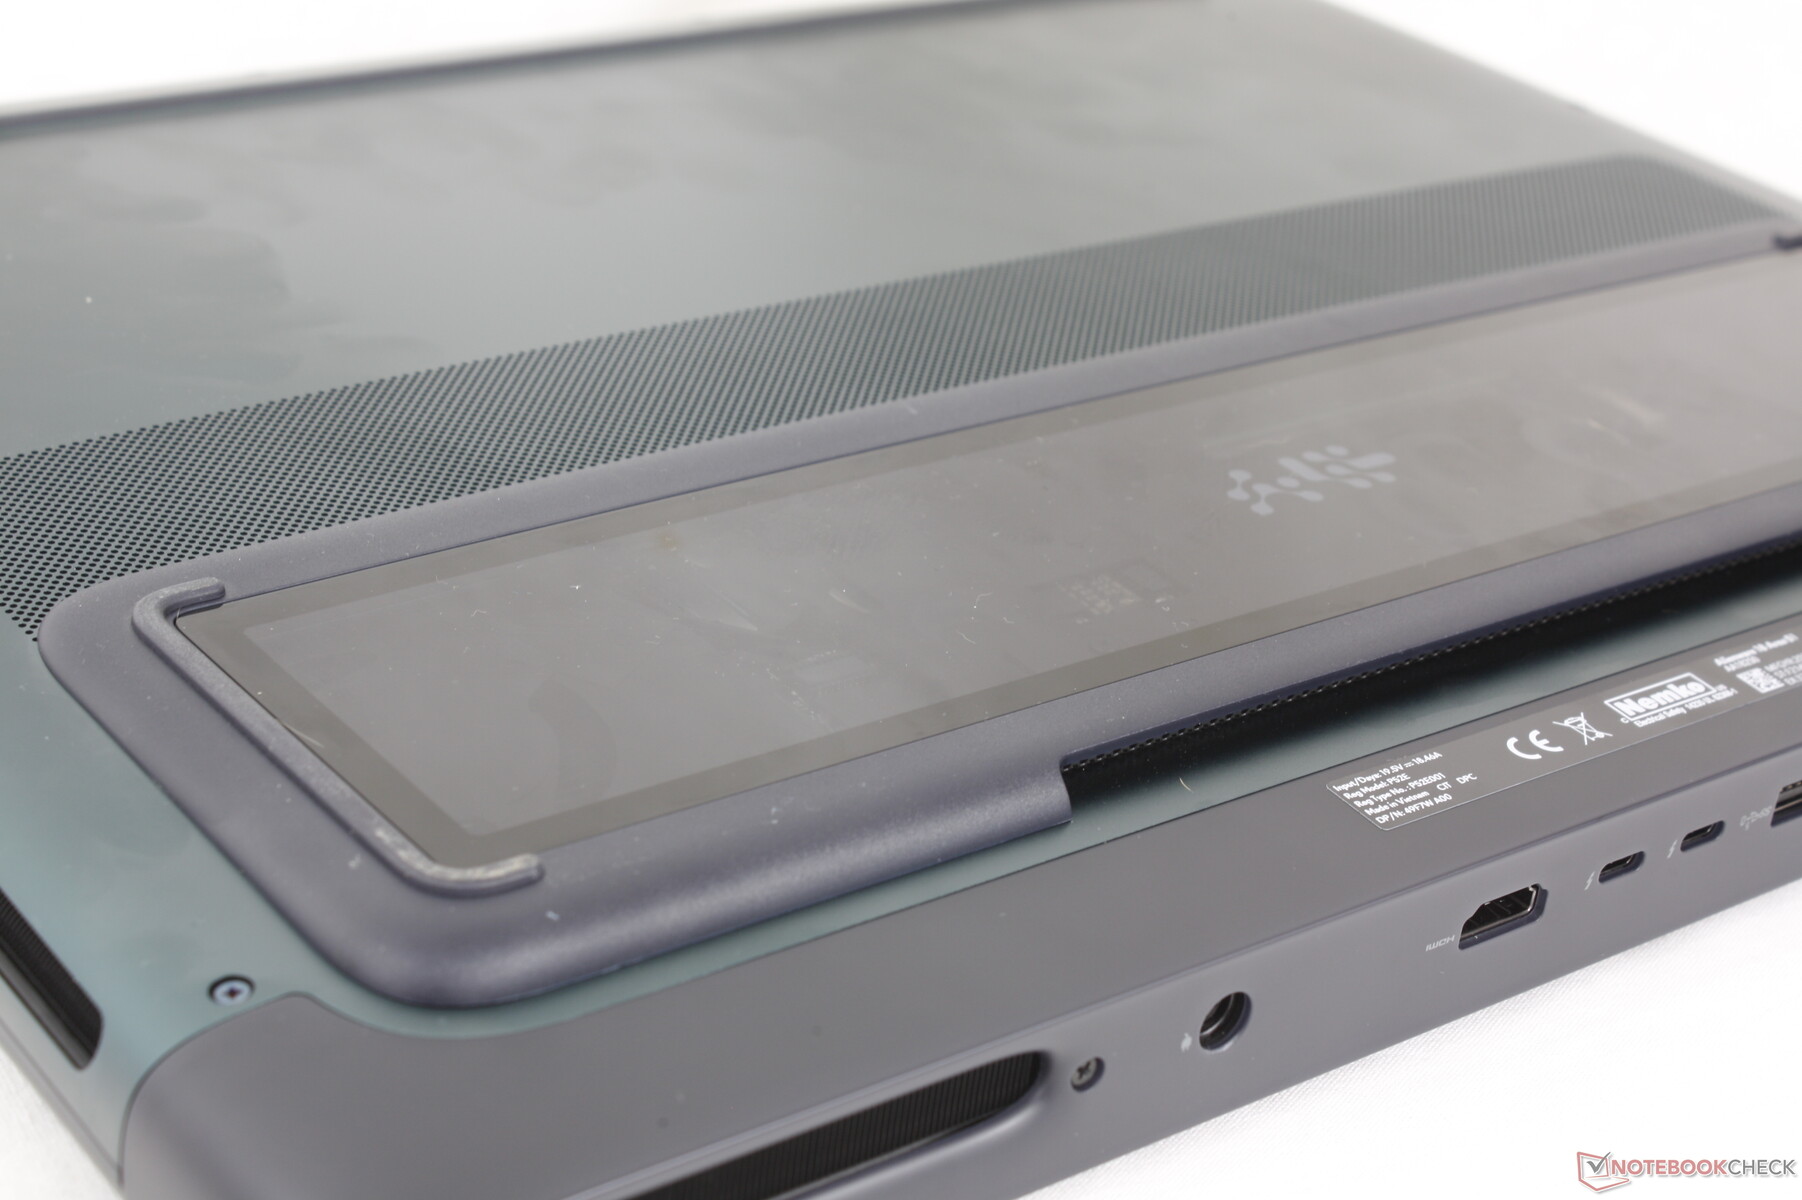
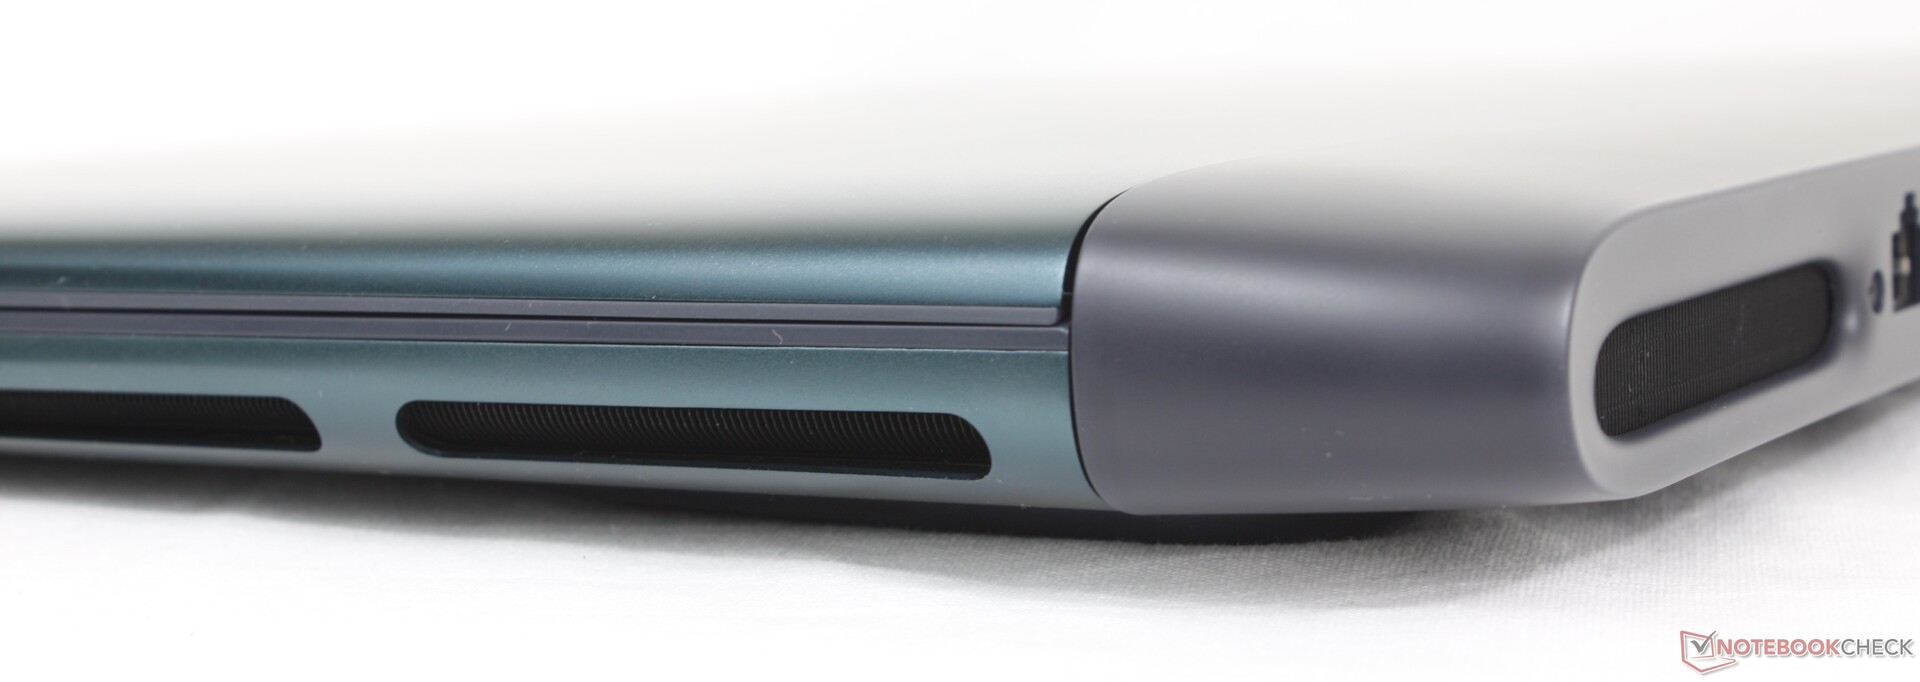
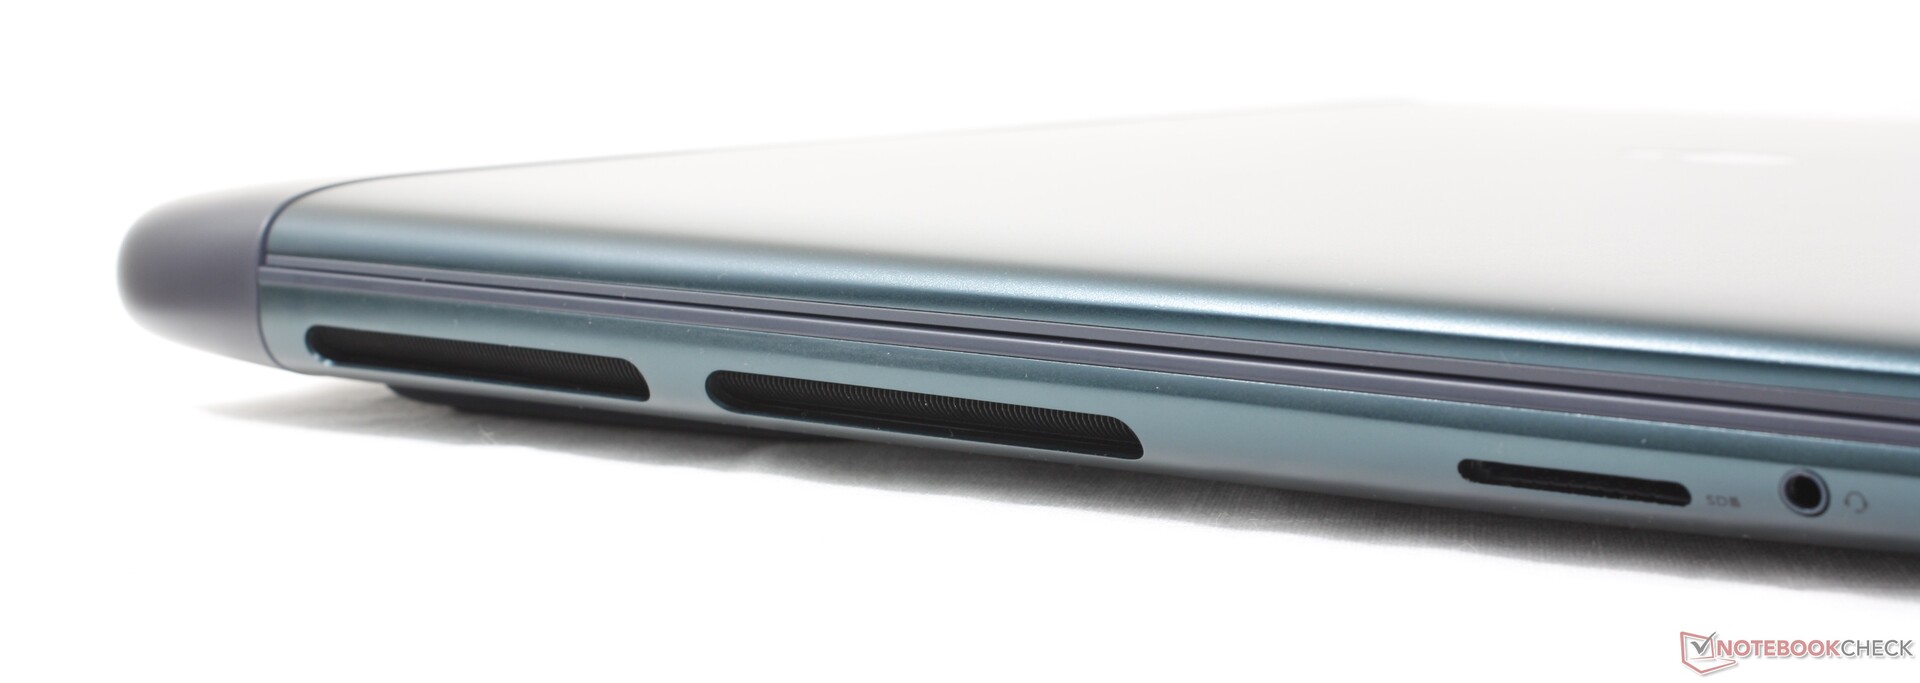
Konstrukcja AW30 w Alienware 16 prawdopodobnie działa jeszcze lepiej w przypadku większej 18-calowej obudowy. Jego godne uwagi cechy wizualne, takie jak zaokrąglone krawędzie, gładkie wykończenie zewnętrznej pokrywy, miękka dioda LED RGB z tyłu i okno Gorilla Glass na dole są większe, a przez to bardziej uderzające wizualnie niż w mniejszym 16-calowym modelu. System wygląda całkiem profesjonalnie pomimo nieprzyzwoicie dużej powierzchni.
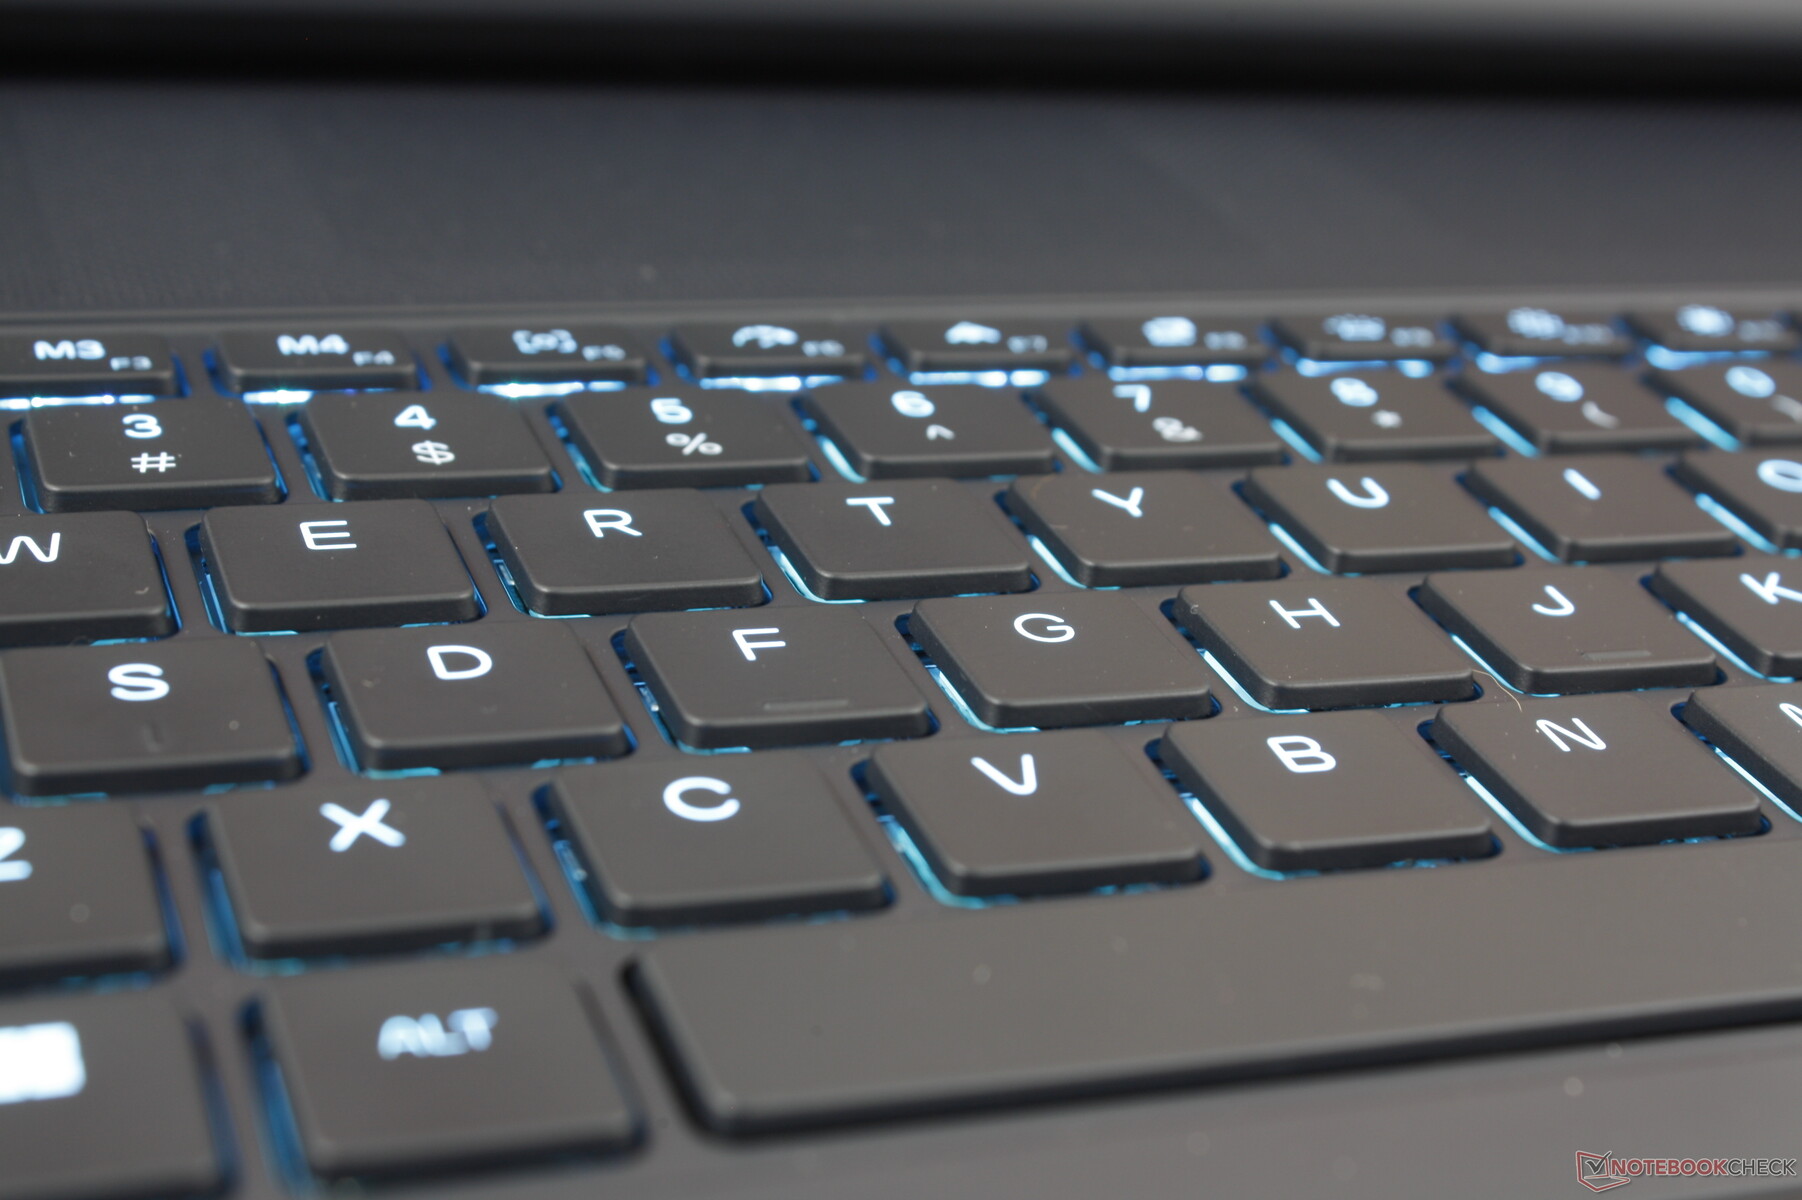
Nasz główny zarzut dotyczący konstrukcji nie jest związany ze sztywnością lub jakością, ale z miękką w dotyku czarną klawiaturą, na której bardzo szybko gromadzą się nieestetyczne odciski palców. Pudełko detaliczne powinno zawierać ściereczkę, ponieważ będą Państwo często wycierać tłuszcz z klawiszy i podpórek pod nadgarstki.
Alienware 18 to jeden z największych i najcięższych 18-calowych laptopów do gier na rynku. Jest o 600 g cięższy niż nawet MSI Titan 18 i choć nie jest tak gruby, to większa powierzchnia podstawy to rekompensuje.
Łączność
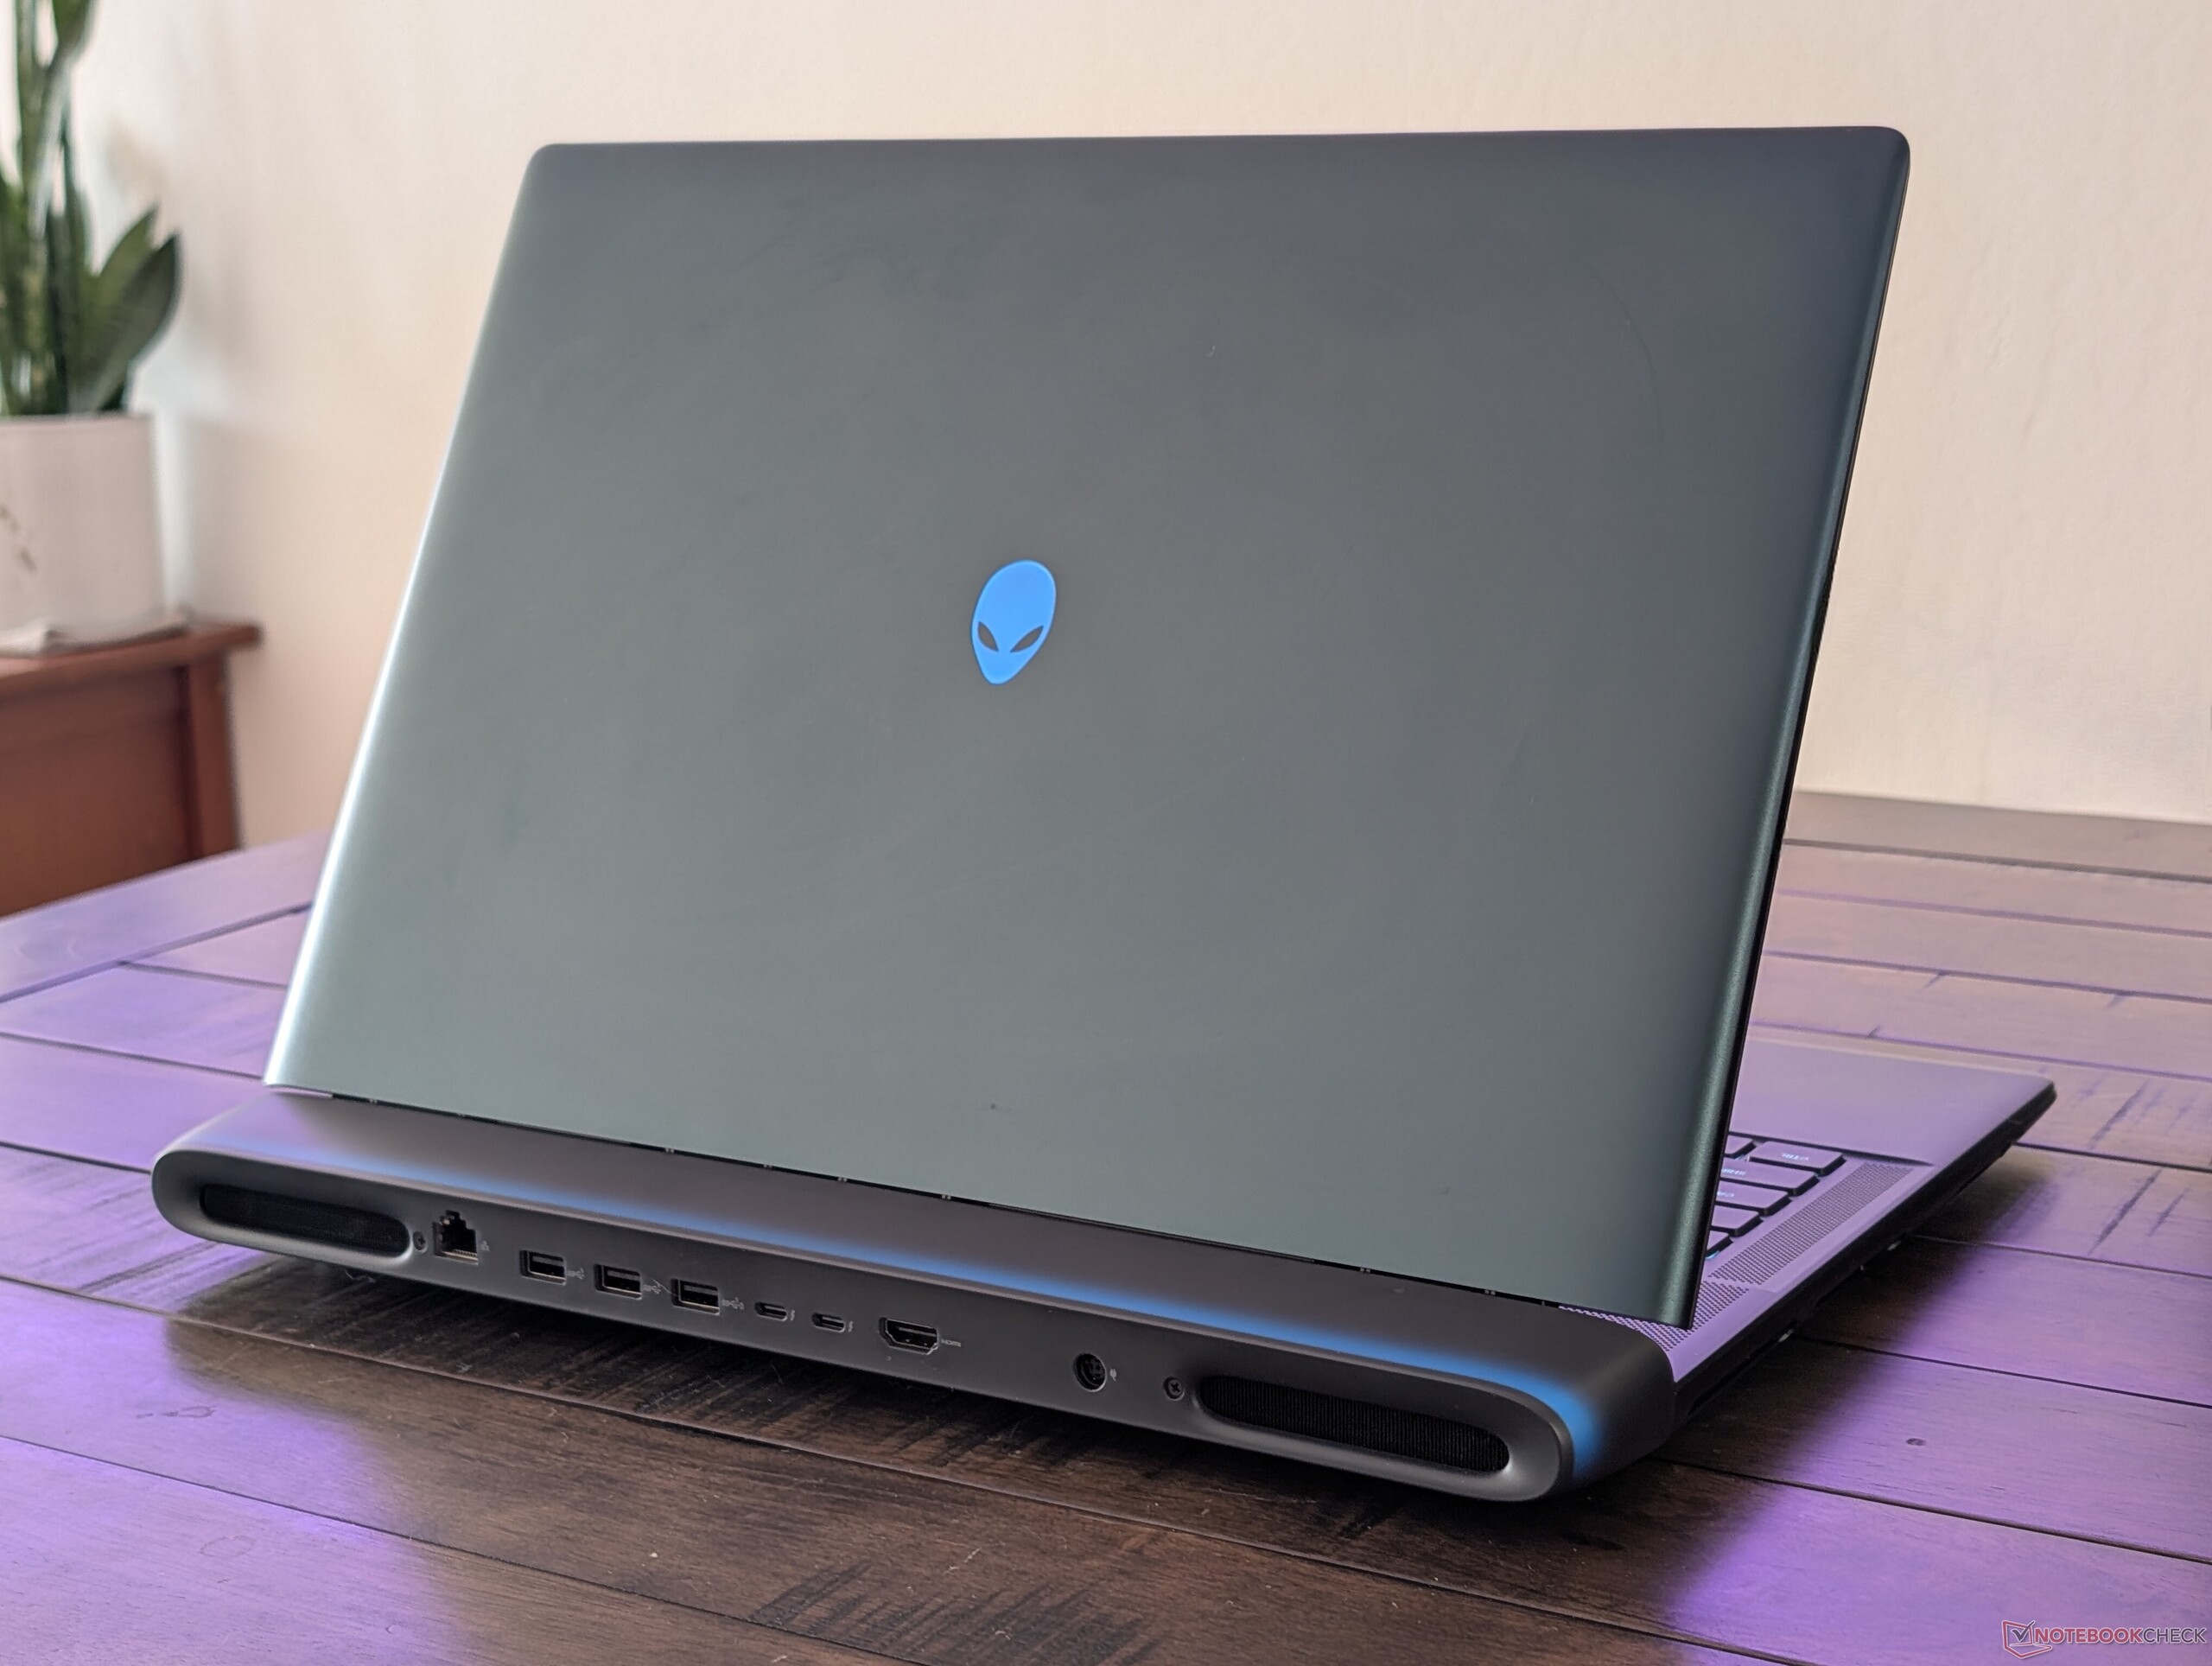
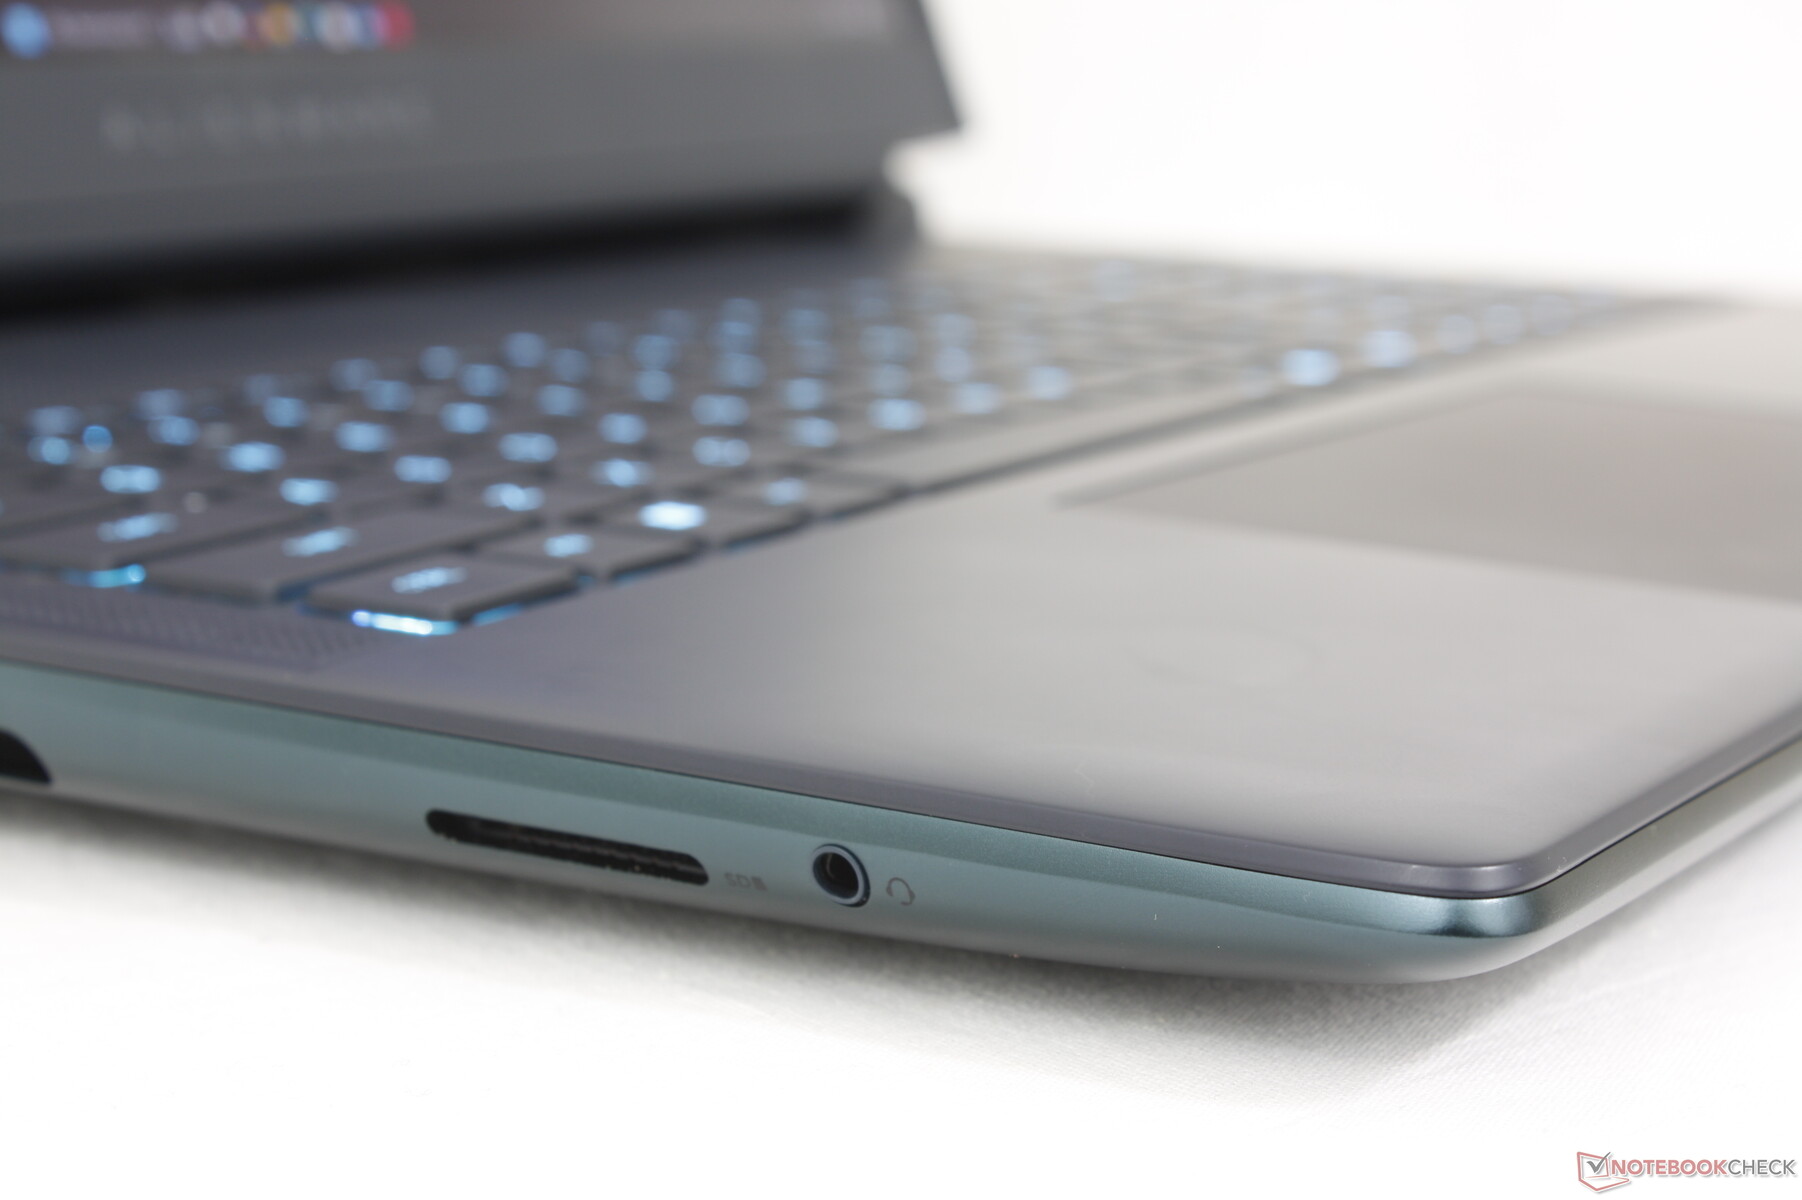
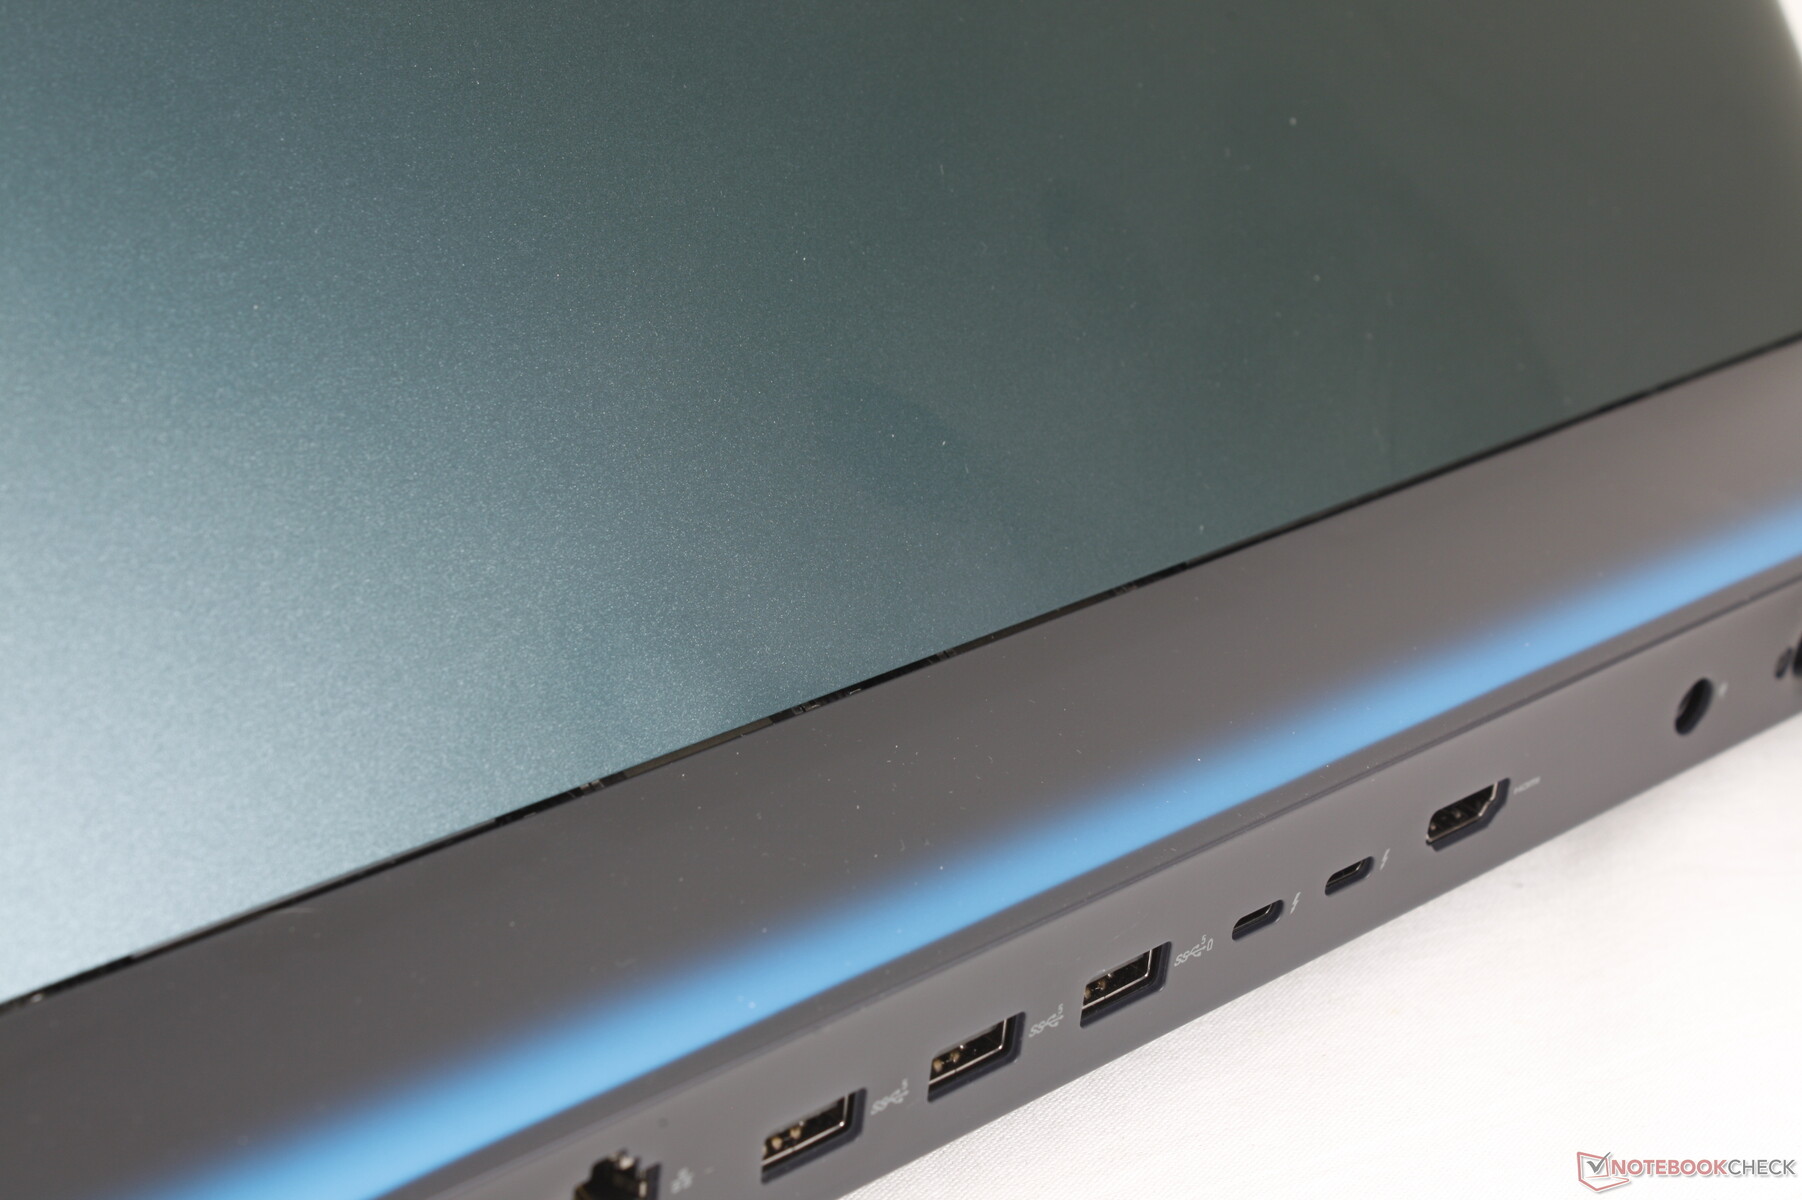
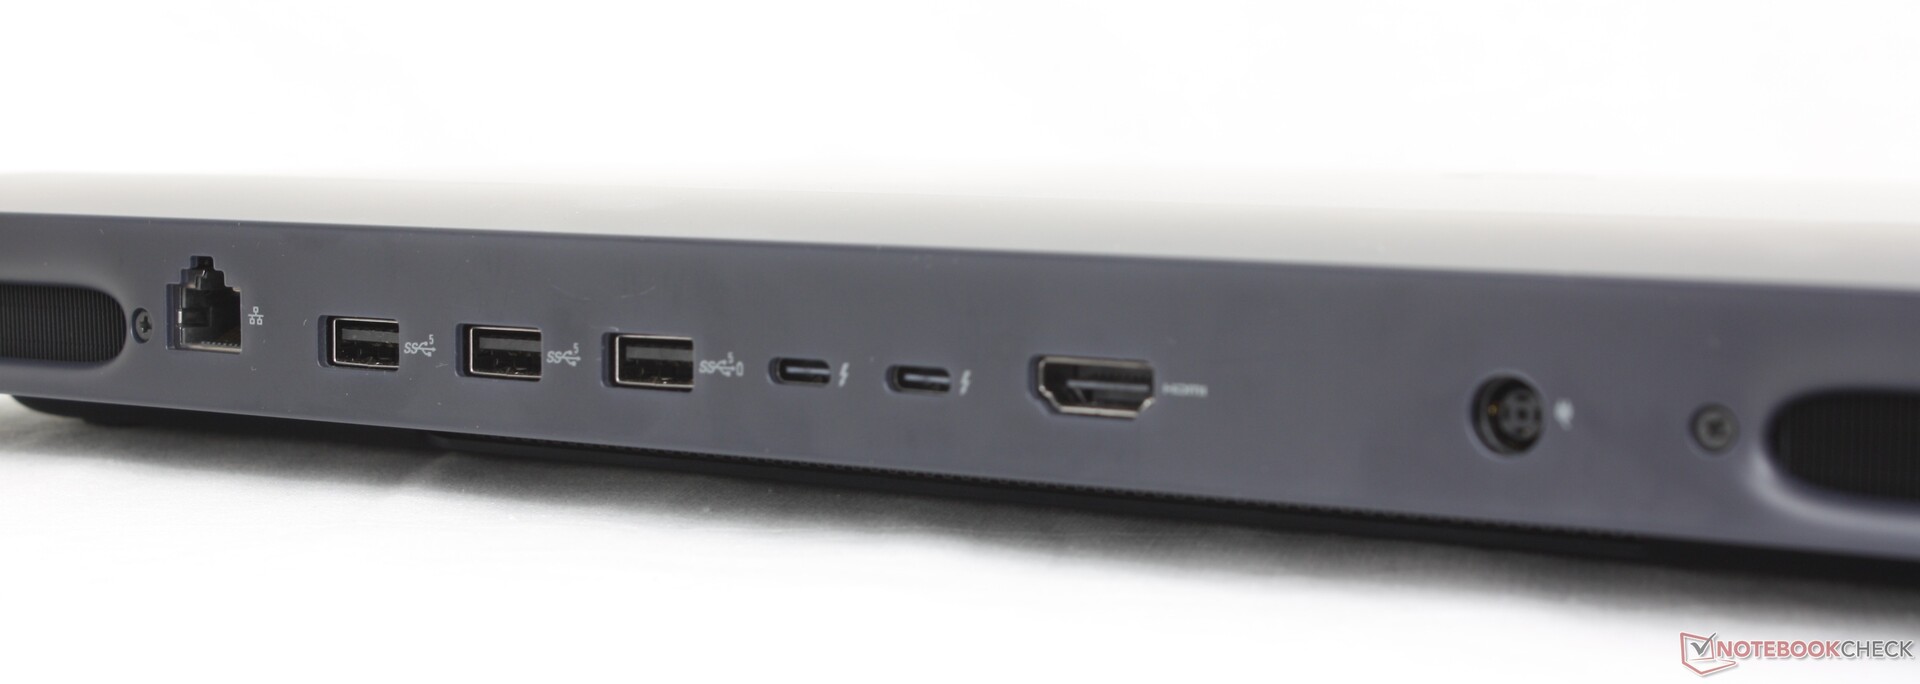
Wszystkie porty znalezione w Alienware 16 są obecne w Alienware 18 plus jeden godny uwagi dodatek: port RJ-45 5 Gbps. Port mini-DisplayPort w zeszłorocznym m18 R2 zniknął, podczas gdy czytnik kart SD został na szczęście przeniesiony w bardziej dostępne miejsce.
Proszę pamiętać, że konfiguracja z kartą graficzną RTX 5070 zapewni Państwu tylko Thunderbolt 4, a nie Thunderbolt 5.
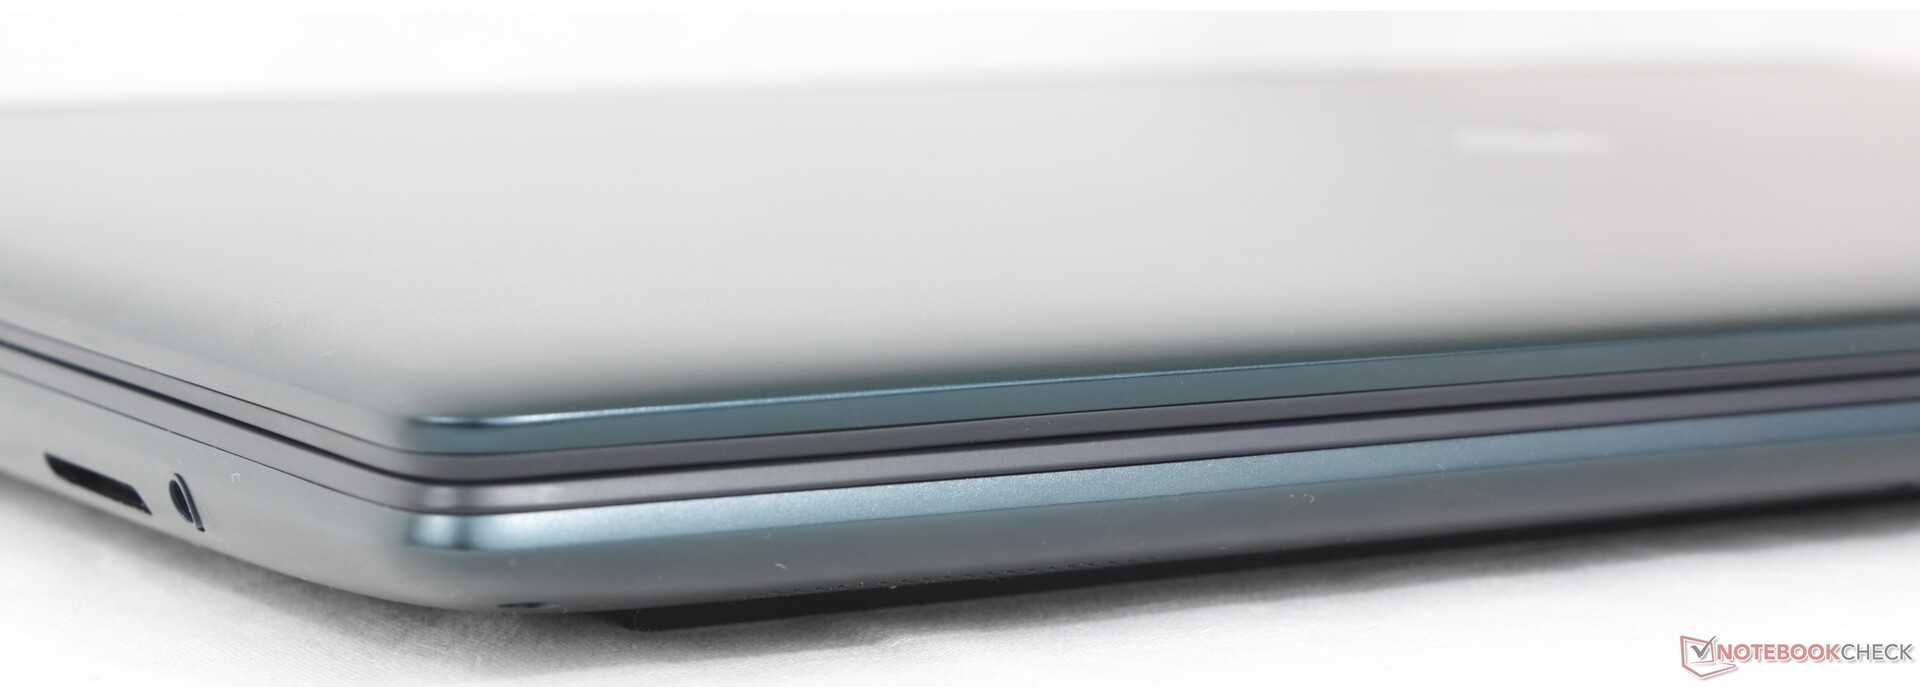
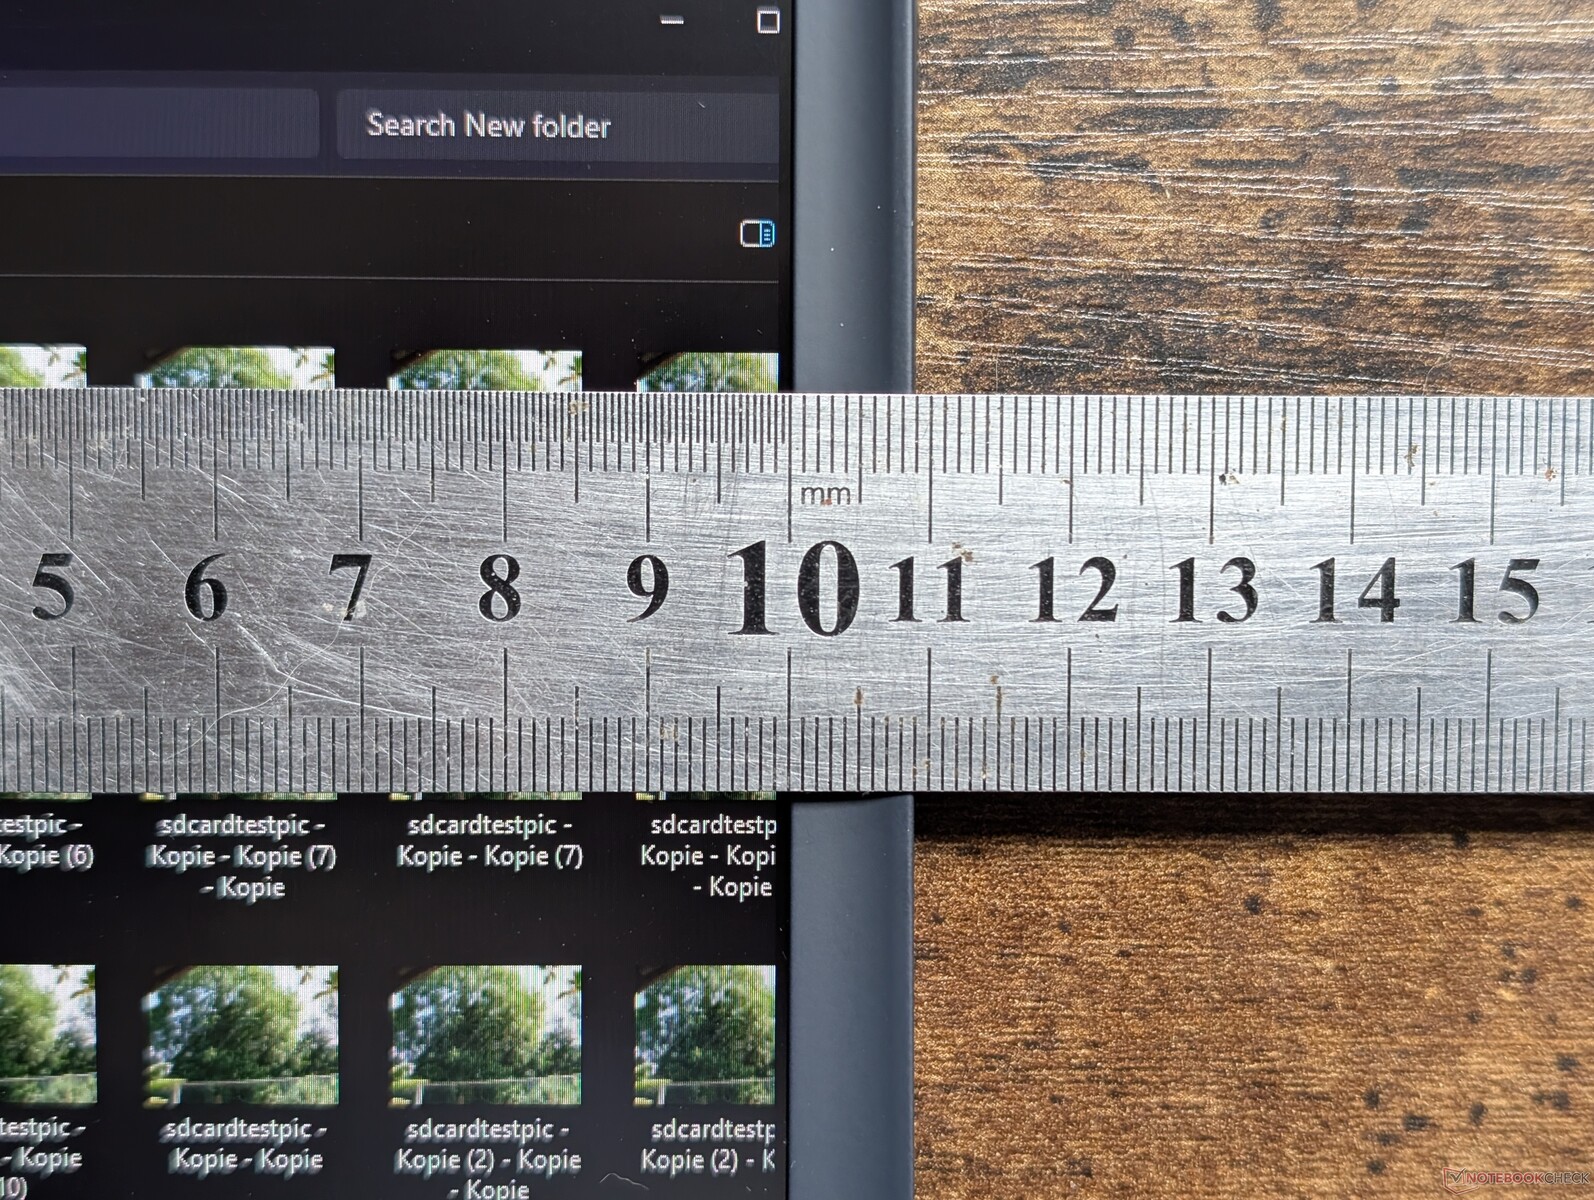
Czytnik kart SD
Pomimo szybkiej pracy, czytnik kart nie jest sprężynowy, więc włożona karta SD nadal wystaje o prawie połowę swojej długości, co utrudnia transport.

| SD Card Reader | |
| average JPG Copy Test (av. of 3 runs) | |
| Alienware 18 Area-51 (Toshiba Exceria Pro SDXC 64 GB UHS-II) | |
| Alienware m18 R2 (Toshiba Exceria Pro SDXC 64 GB UHS-II) | |
| Razer Blade 18 2024 RZ09-0509 (Toshiba Exceria Pro SDXC 64 GB UHS-II) | |
| Alienware 16 Area-51 (Toshiba Exceria Pro SDXC 64 GB UHS-II) | |
| Acer Predator Helios 18 PH18-72-98MW (AV PRO microSD 128 GB V60) | |
| MSI Titan 18 HX AI A2XWJG (AV PRO microSD 128 GB V60) | |
| MSI Raider A18 HX A9WIG-080 | |
| maximum AS SSD Seq Read Test (1GB) | |
| Alienware 18 Area-51 (Toshiba Exceria Pro SDXC 64 GB UHS-II) | |
| Alienware 16 Area-51 (Toshiba Exceria Pro SDXC 64 GB UHS-II) | |
| Razer Blade 18 2024 RZ09-0509 (Toshiba Exceria Pro SDXC 64 GB UHS-II) | |
| Alienware m18 R2 (Toshiba Exceria Pro SDXC 64 GB UHS-II) | |
| MSI Raider A18 HX A9WIG-080 | |
| MSI Titan 18 HX AI A2XWJG (AV PRO microSD 128 GB V60) | |
| Acer Predator Helios 18 PH18-72-98MW (AV PRO microSD 128 GB V60) | |
Komunikacja
Intel Killer BE1750W jest standardowo wyposażony w łączność Wi-Fi 7 i Bluetooth 5.4. Specyfikacje rdzenia są identyczne z BE1750x w Alienware 16 według Intela.
Kamera internetowa
Użytkownicy mogą skonfigurować kamerę internetową o rozdzielczości 2 MP lub 8 MP z obsługą podczerwieni. Nie ma żadnej opcji fizycznej migawki, co jest niedopatrzeniem w tak drogim systemie.


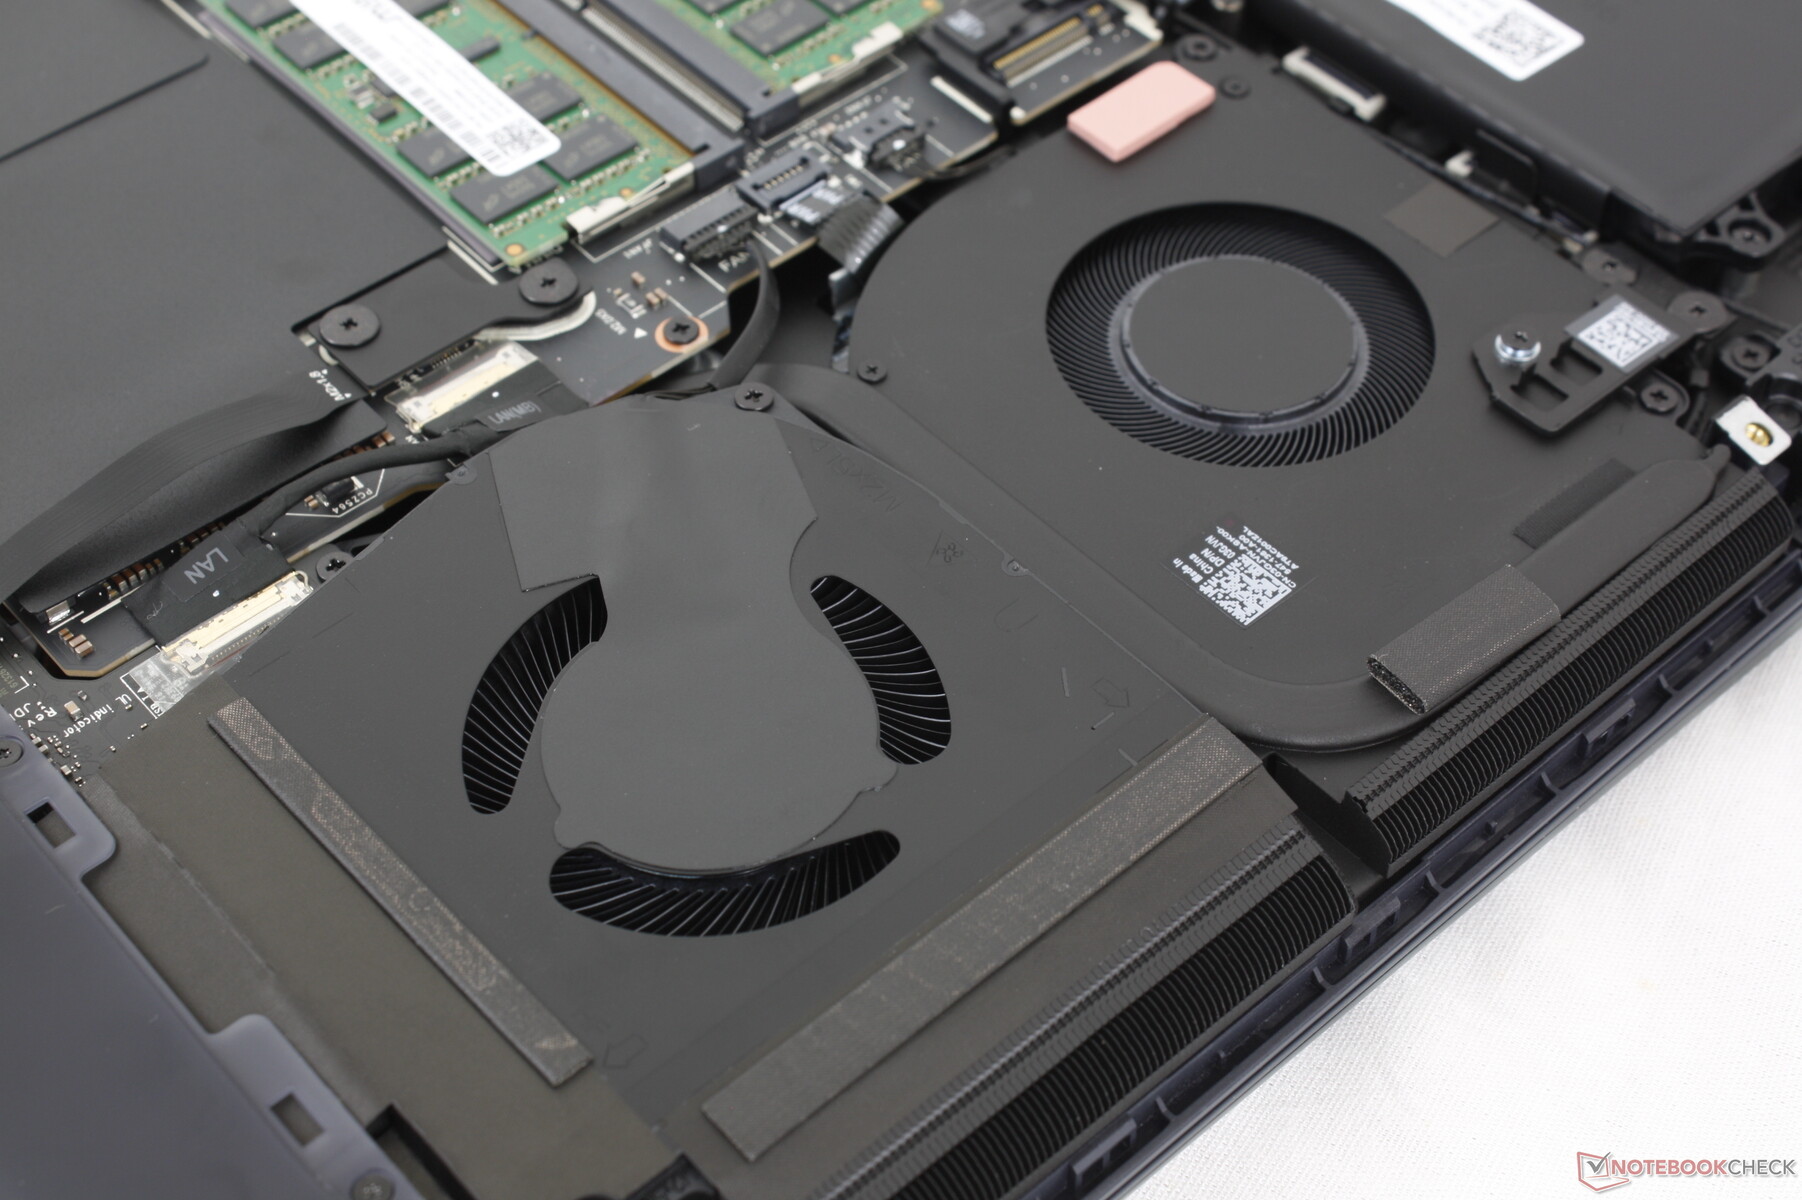
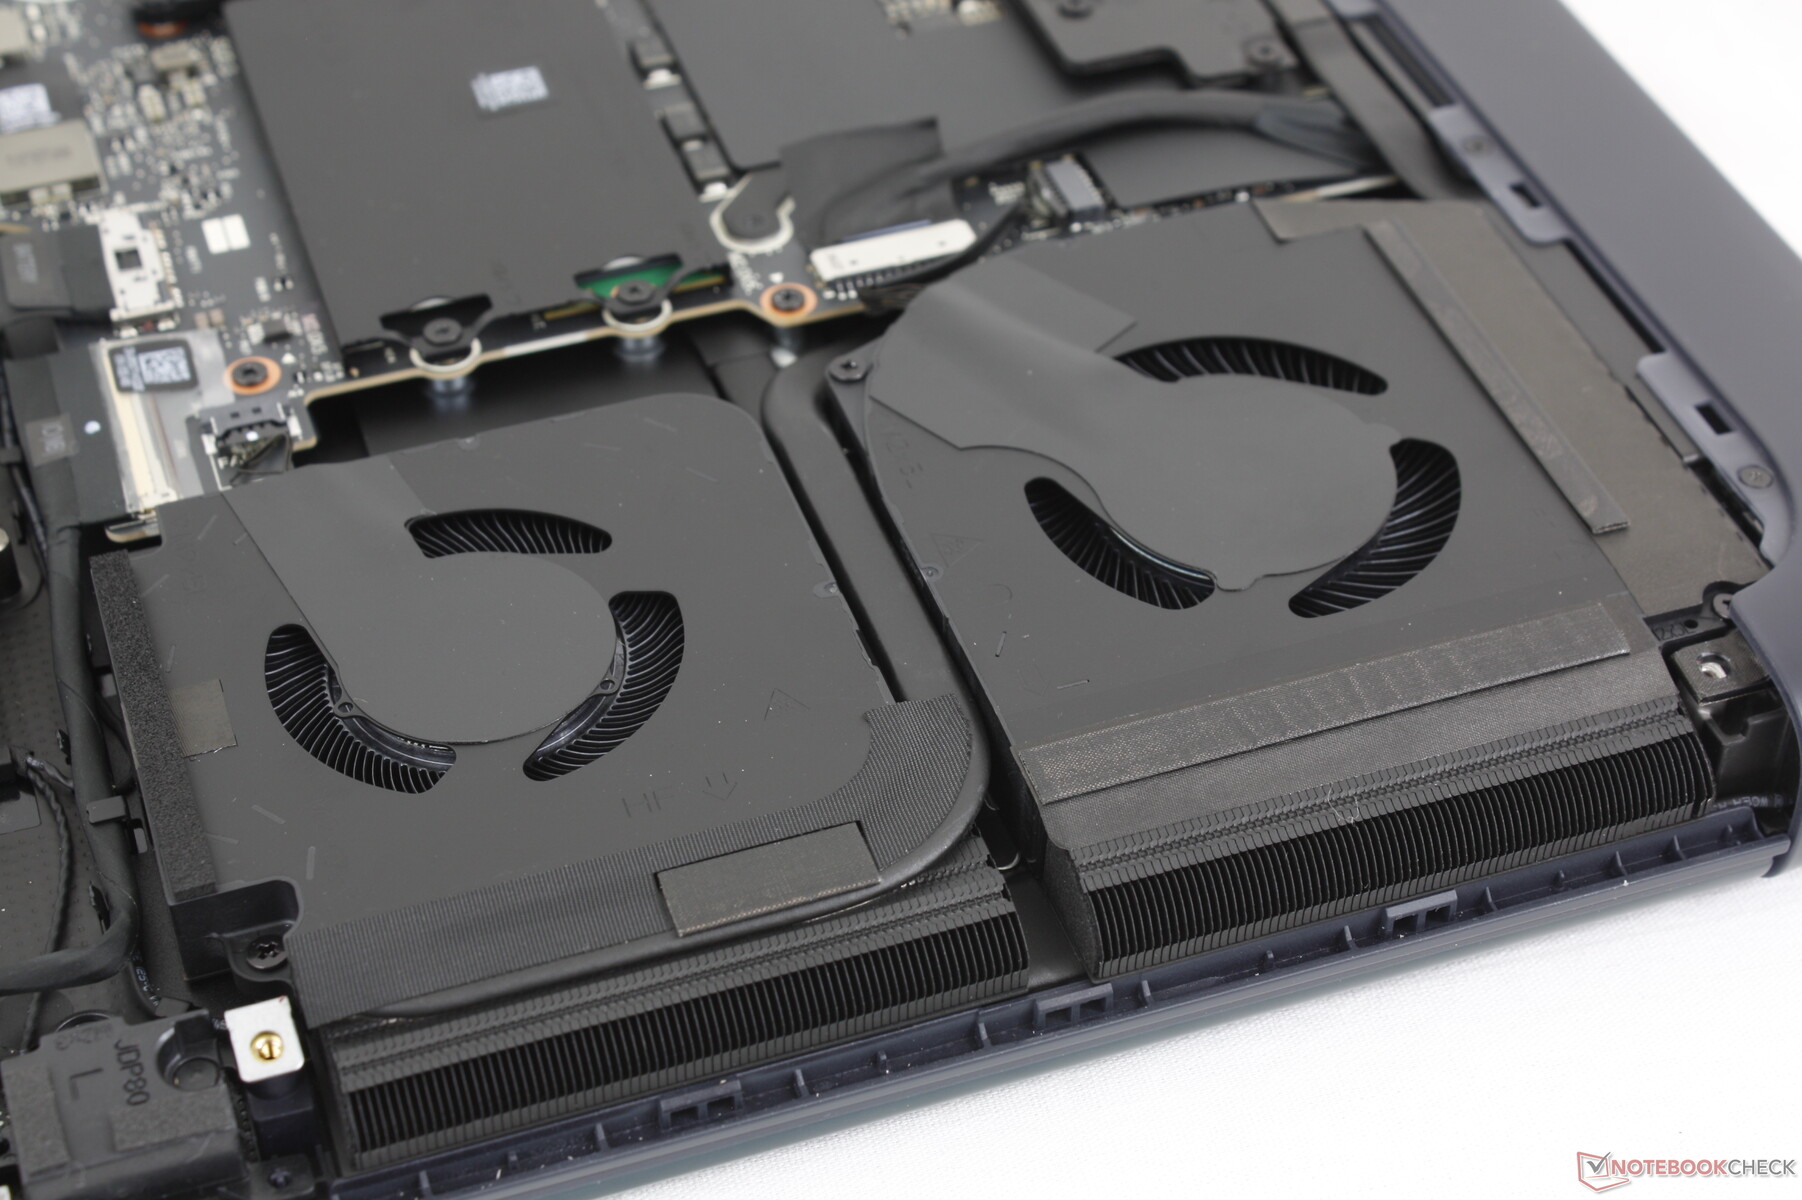
Konserwacja
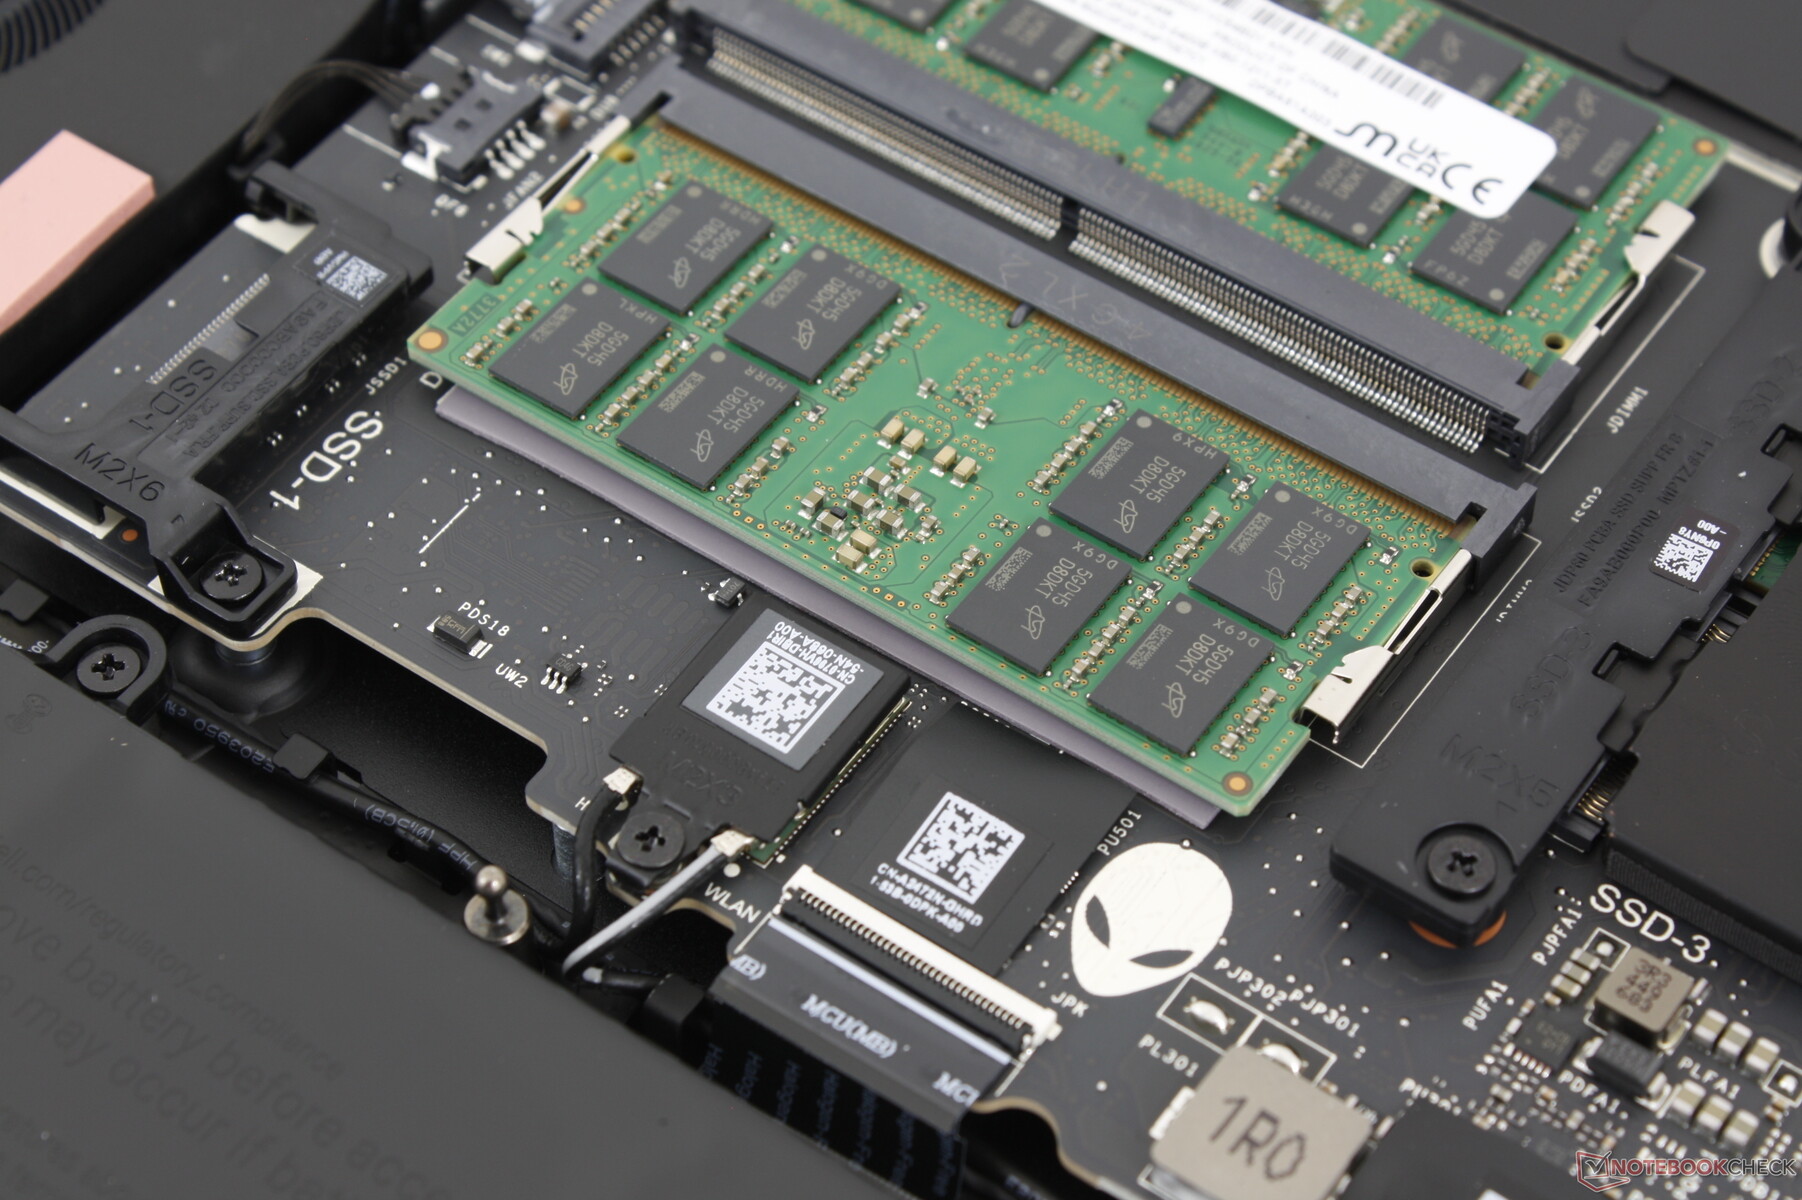
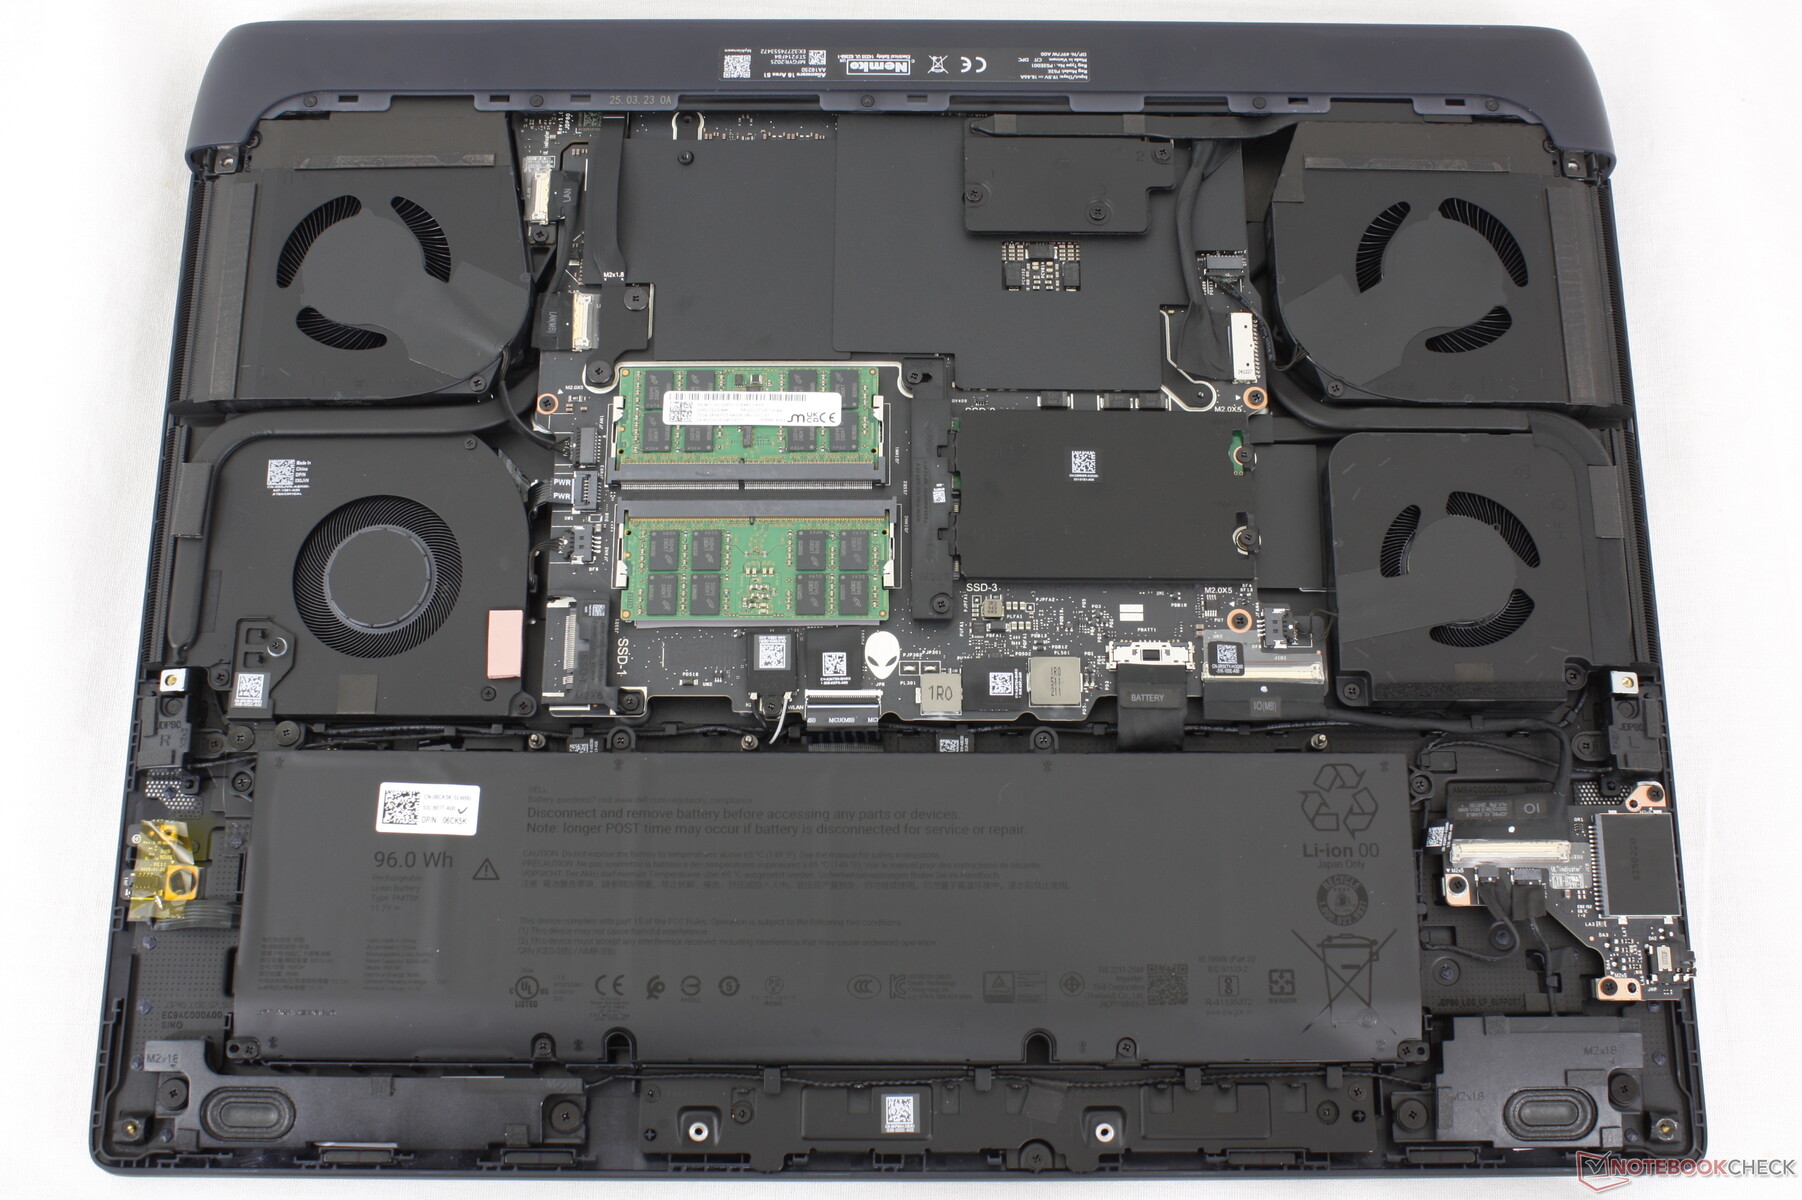
Dolny panel jest zabezpieczony ośmioma śrubami krzyżakowymi dla stosunkowo łatwego serwisowania. Wnętrze jest podobne do Alienware 16, ale z większymi wentylatorami dla lepszego chłodzenia i zmienionym gniazdem SSD.
Zrównoważony rozwój
Nie możemy znaleźć żadnych informacji na temat tworzyw sztucznych lub metalu pochodzących z recyklingu użytych podczas produkcji Alienware 18. Tymczasem opakowanie składa się głównie z papieru i tektury, aby nie zawierało tworzyw sztucznych.
Akcesoria i gwarancja
W pudełku detalicznym nie ma żadnych dodatków poza zasilaczem sieciowym i dokumentacją. W przypadku zakupu w Stanach Zjednoczonych obowiązuje standardowa roczna ograniczona gwarancja producenta.
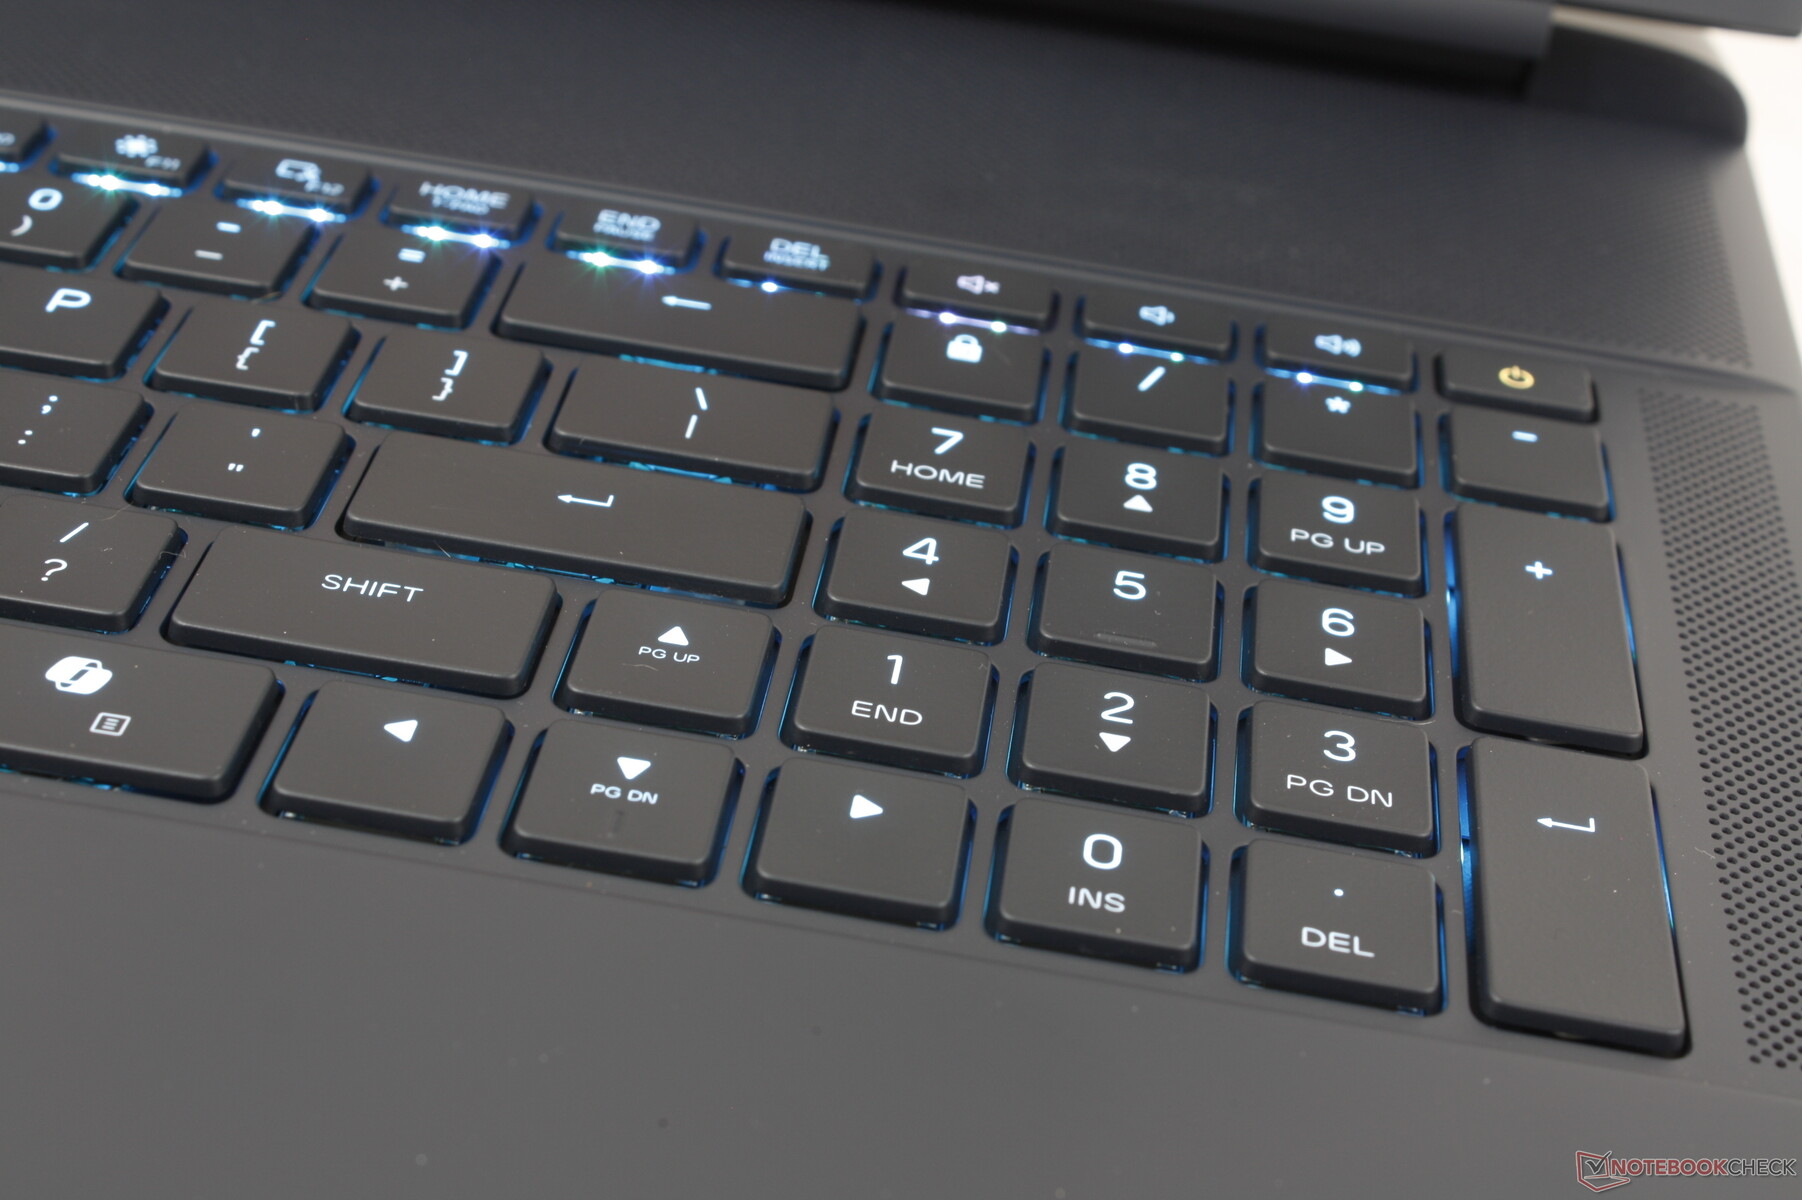
Urządzenia wejściowe - klikalne i wygodne
Klawiatura
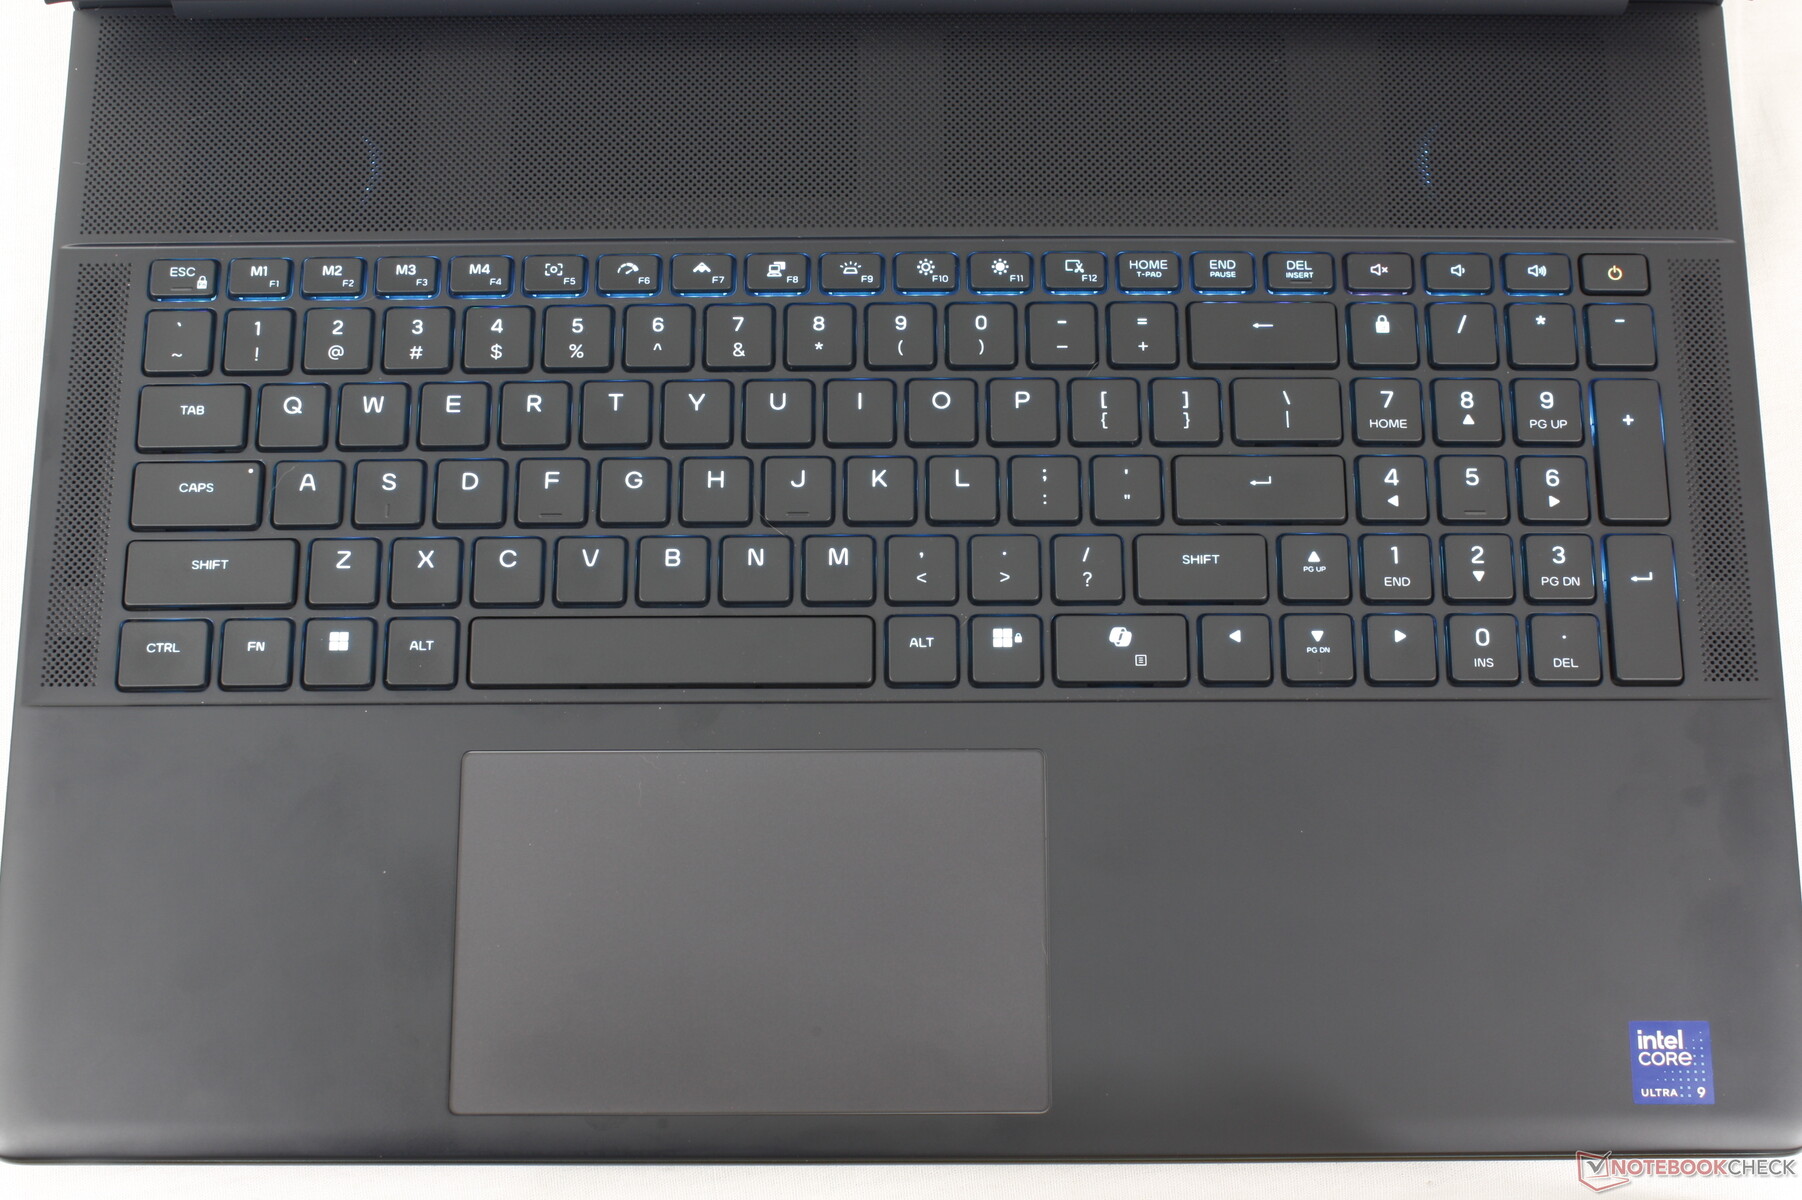
Niskoprofilowa klawiatura mechaniczna Cherry powróciła z Alienware 16 i zeszłorocznego Alienware m18 i zeszłorocznej serii Alienware m18. W rzeczywistości układ i funkcje klawiszy są niemal identyczne jak w serii Alienware m18, zapewniając zasadniczo takie same wrażenia podczas pisania. Te niskoprofilowe klawisze CherryMX są jednymi z najbardziej przestronnych i wygodnych, jakich doświadczyliśmy na laptopie do gier ze względu na ich klikalność, głęboki skok i głośne sprzężenie zwrotne. Użytkownicy mogą jednak nadal chcieć skonfigurować standardowe klawisze membranowe, ponieważ głośne i wysokie klawisze mechaniczne mogą nie być odpowiednie dla środowisk wrażliwych na hałas.
Panel dotykowy
Clickpad jest nieco większy w Alienware 18 w porównaniu do tego w Alienware 16 (13,2 x 8 cm vs. 11,2 x 6,5 cm). Płynna trakcja i głośne "kliknięcie" sprzężenia zwrotnego poza tym są identyczne między tymi dwoma modelami.

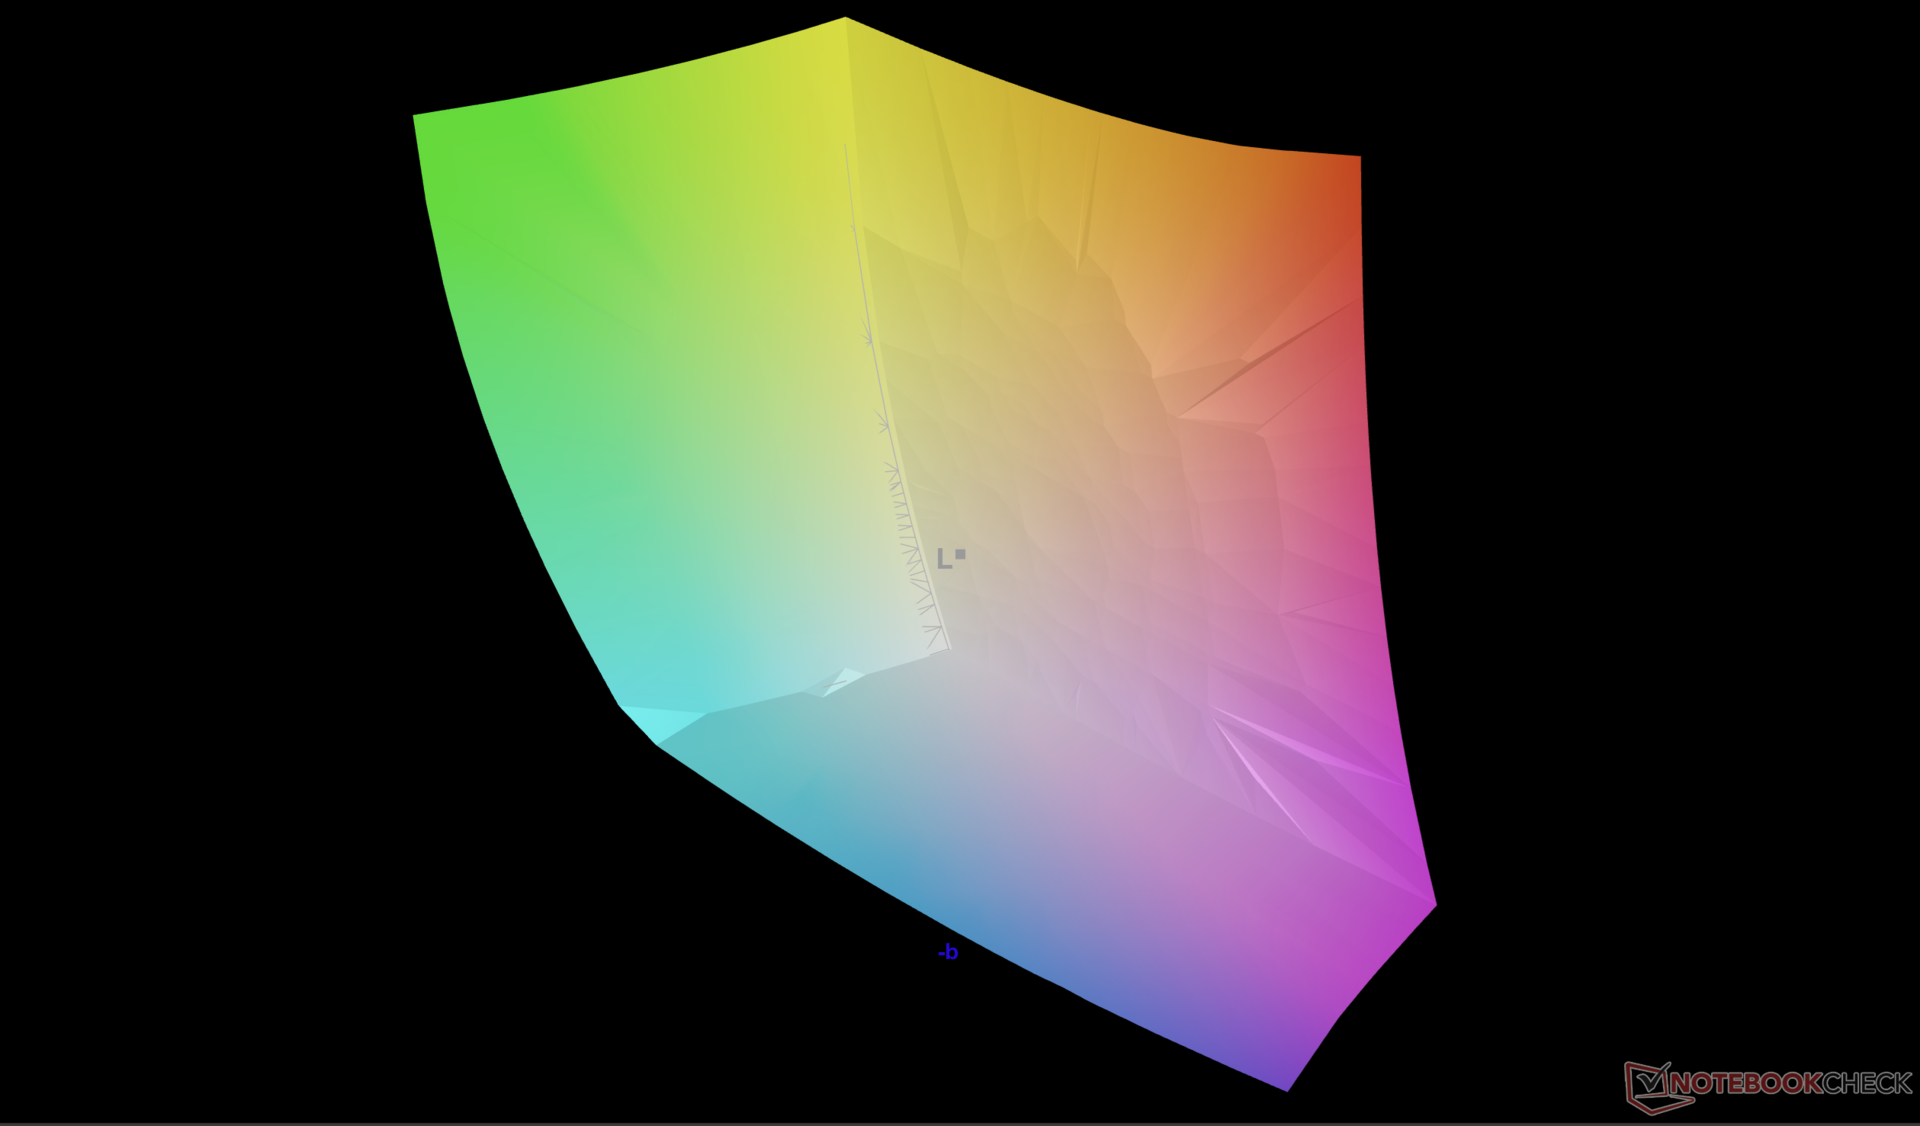
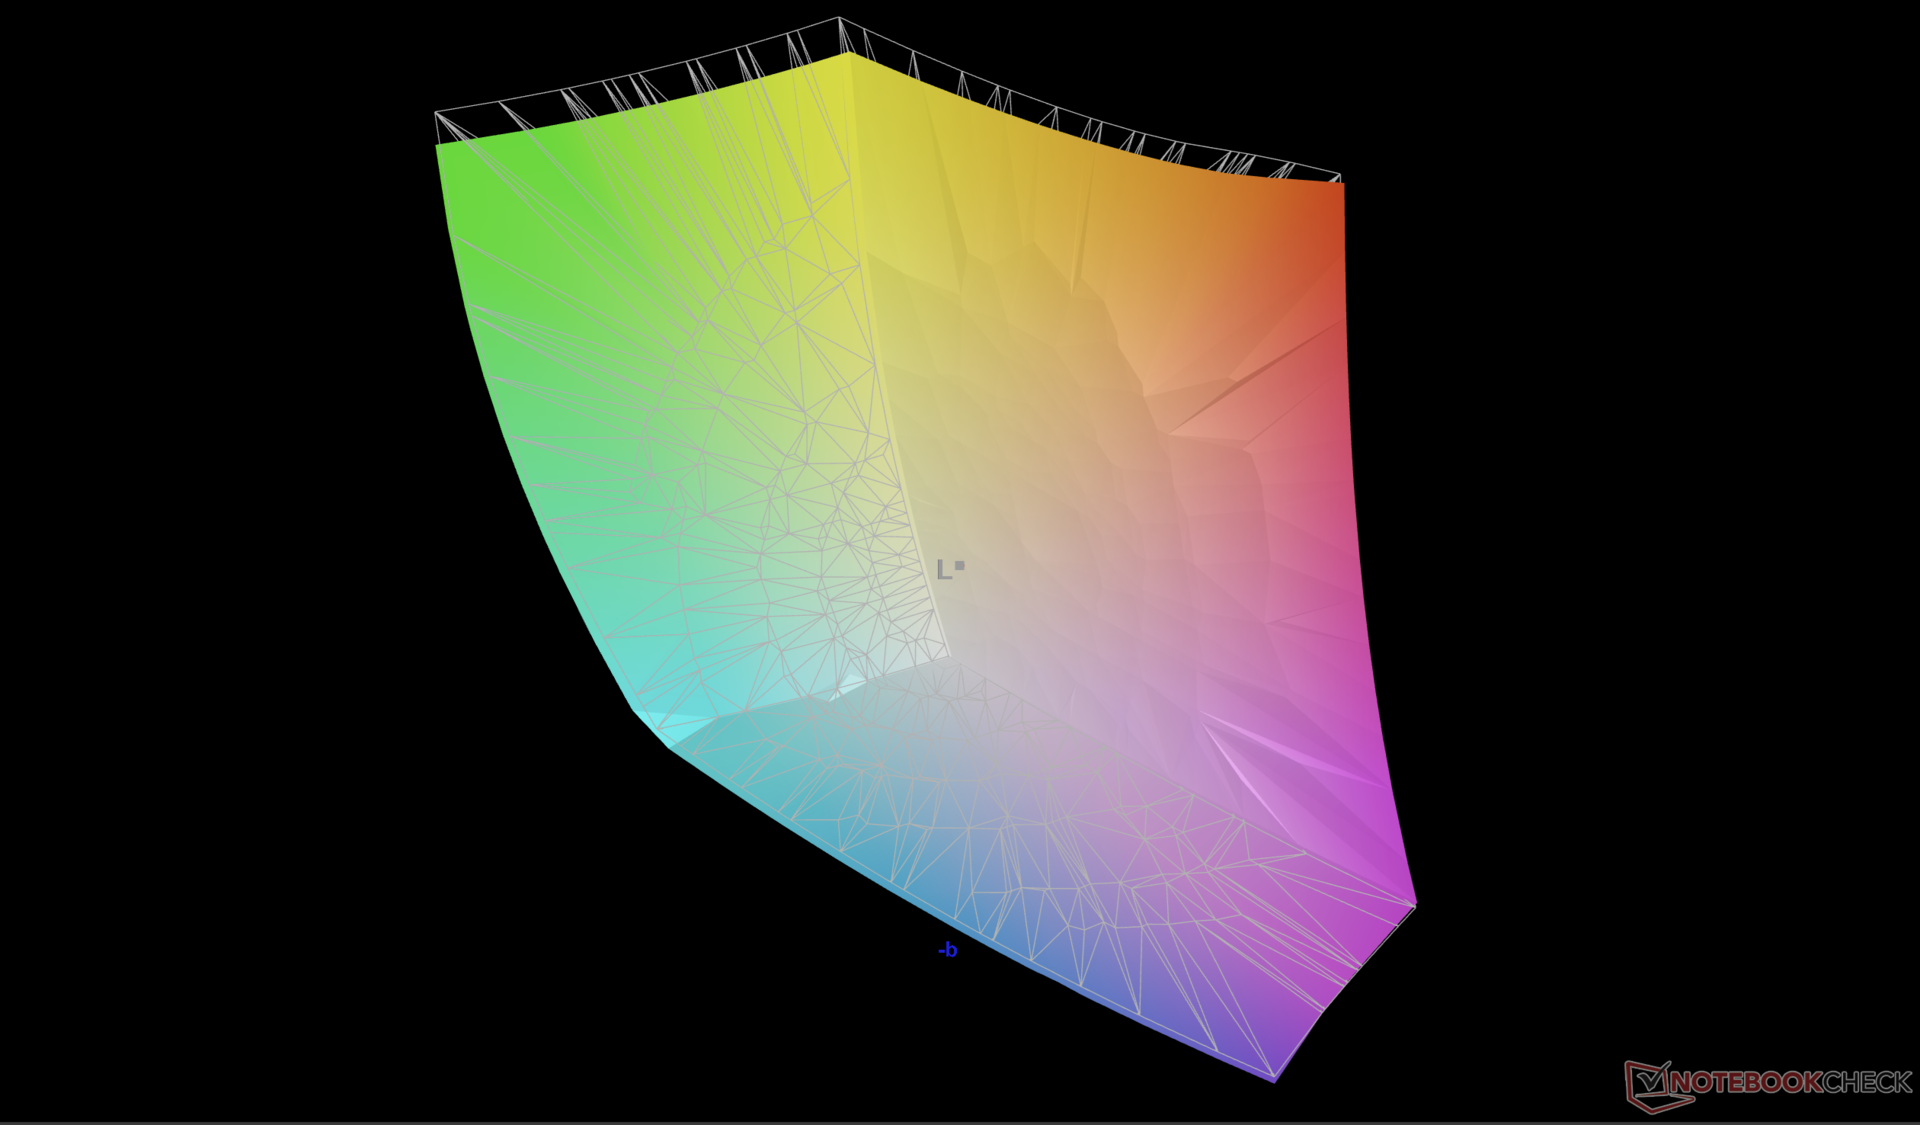
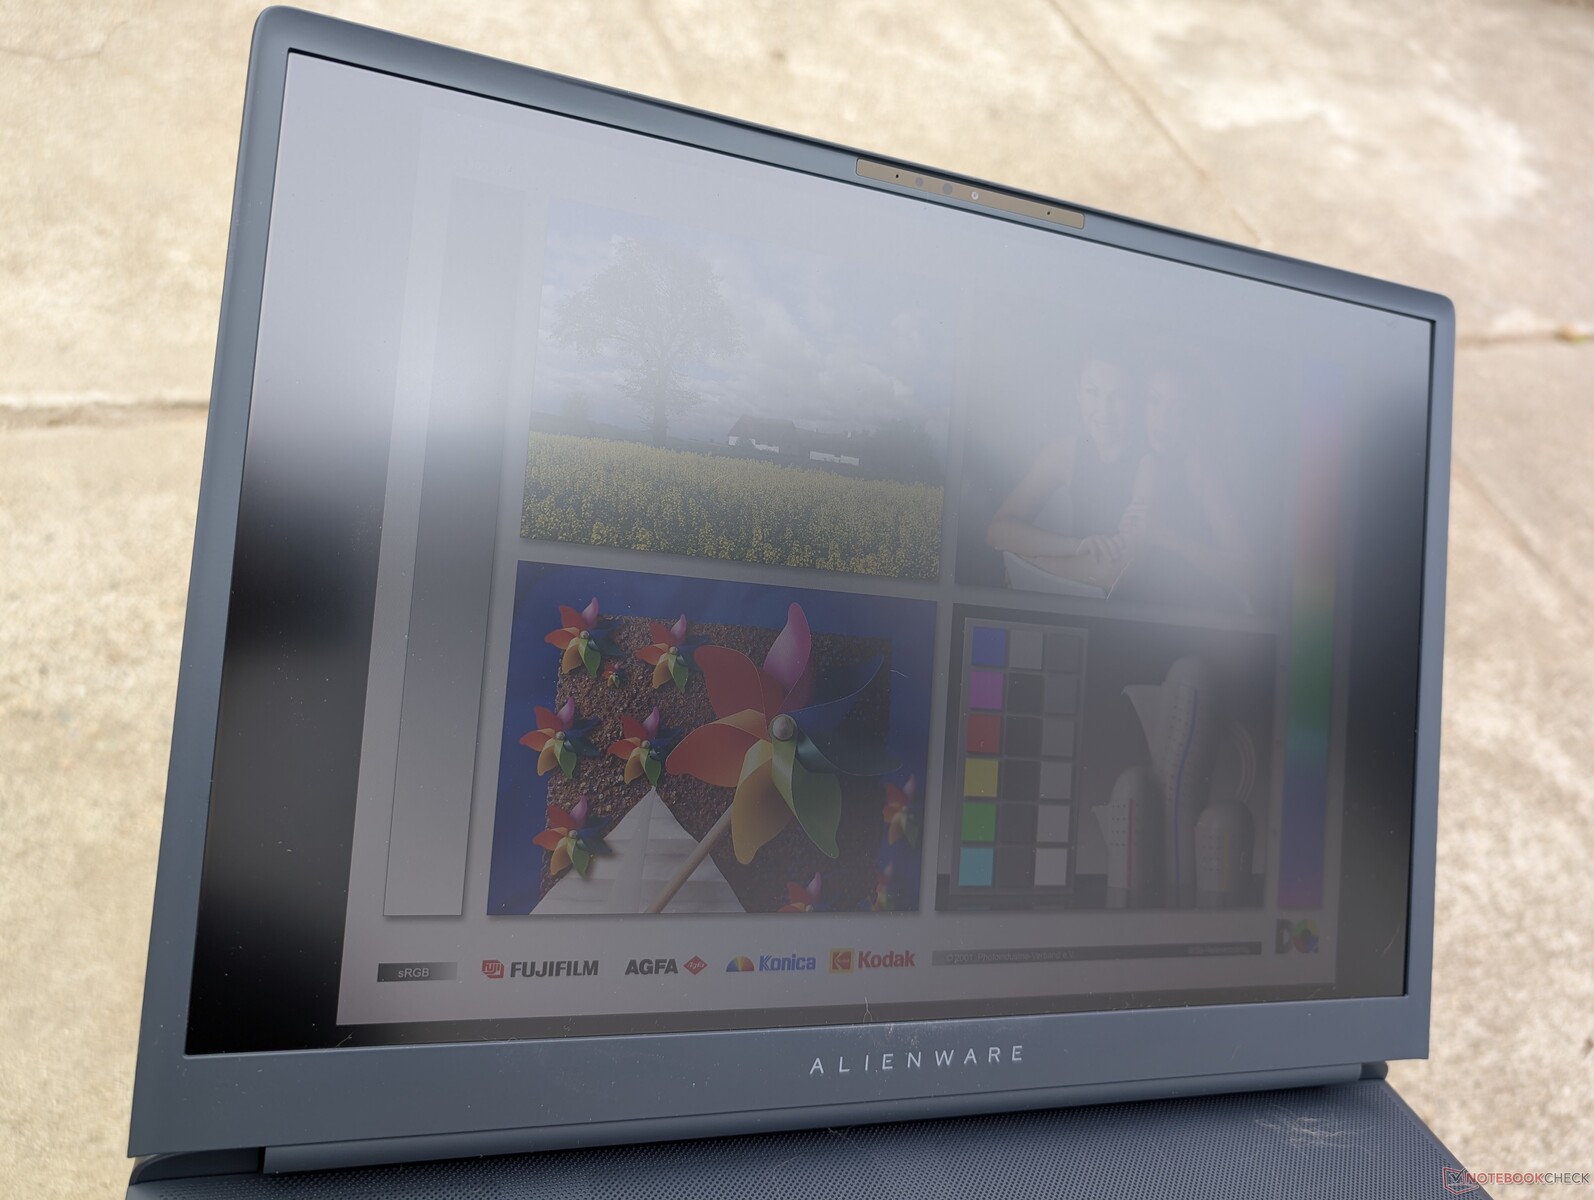
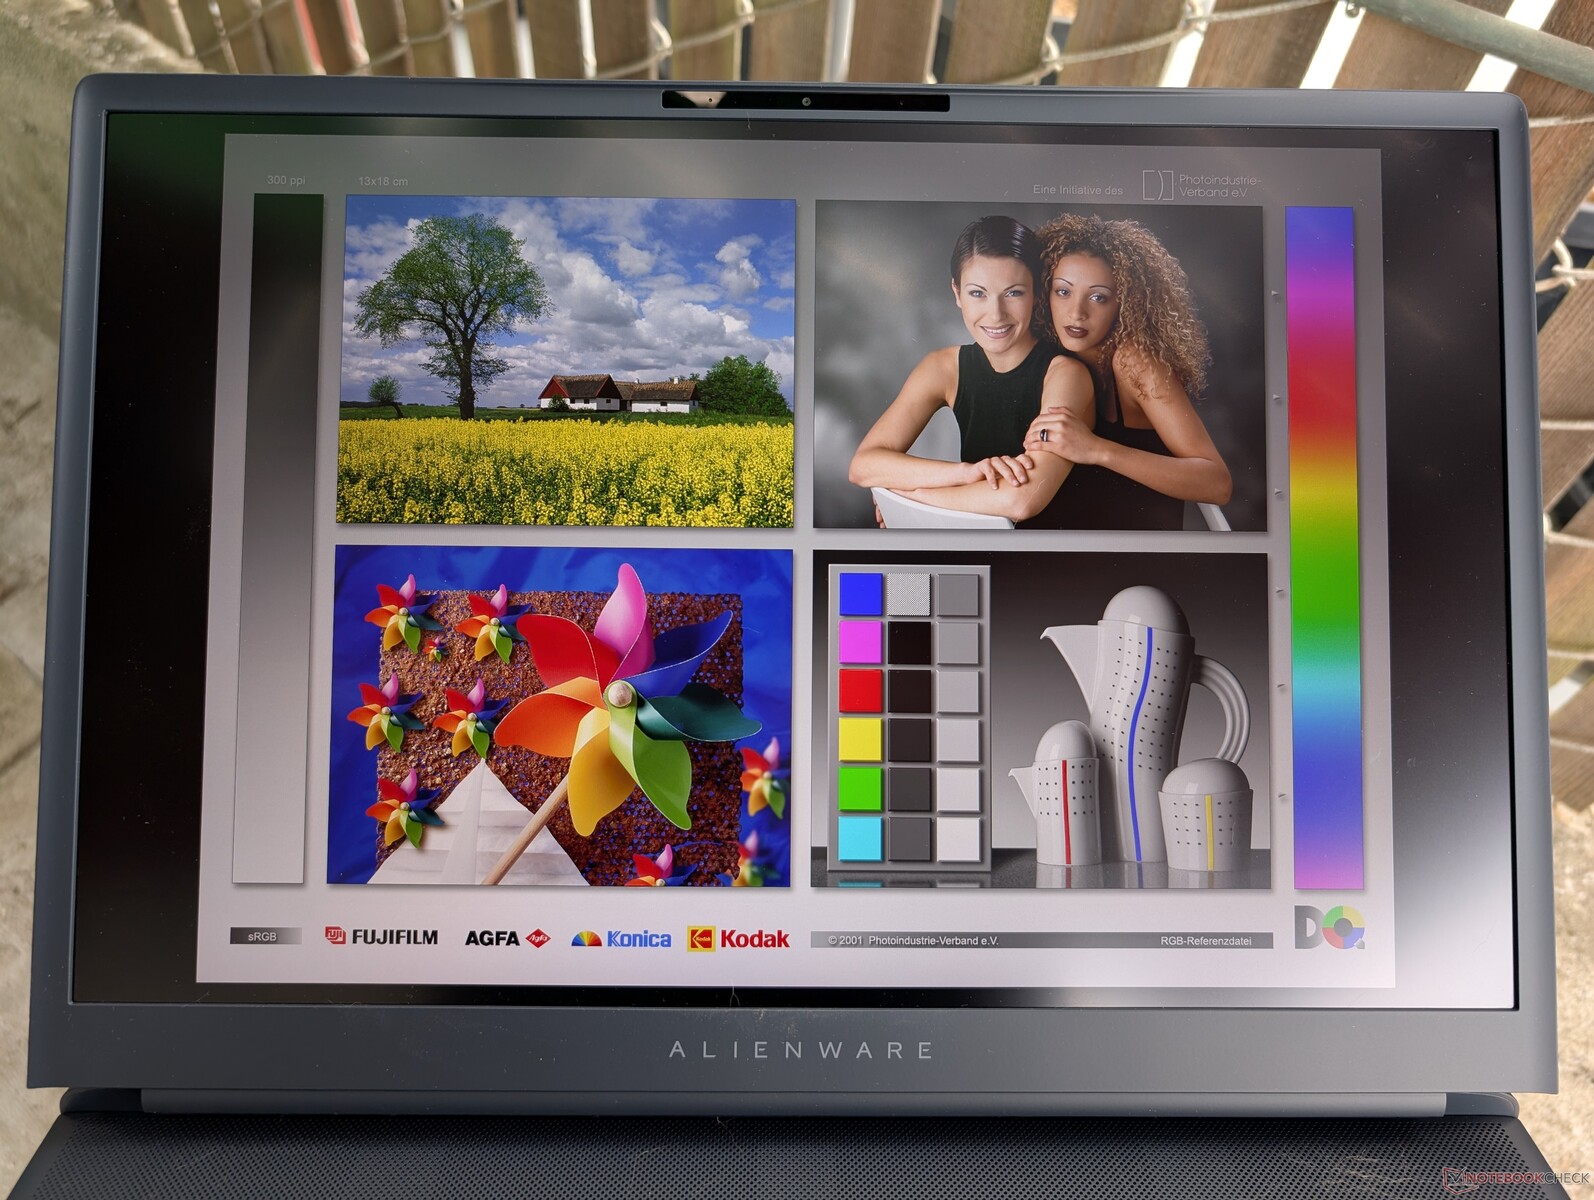
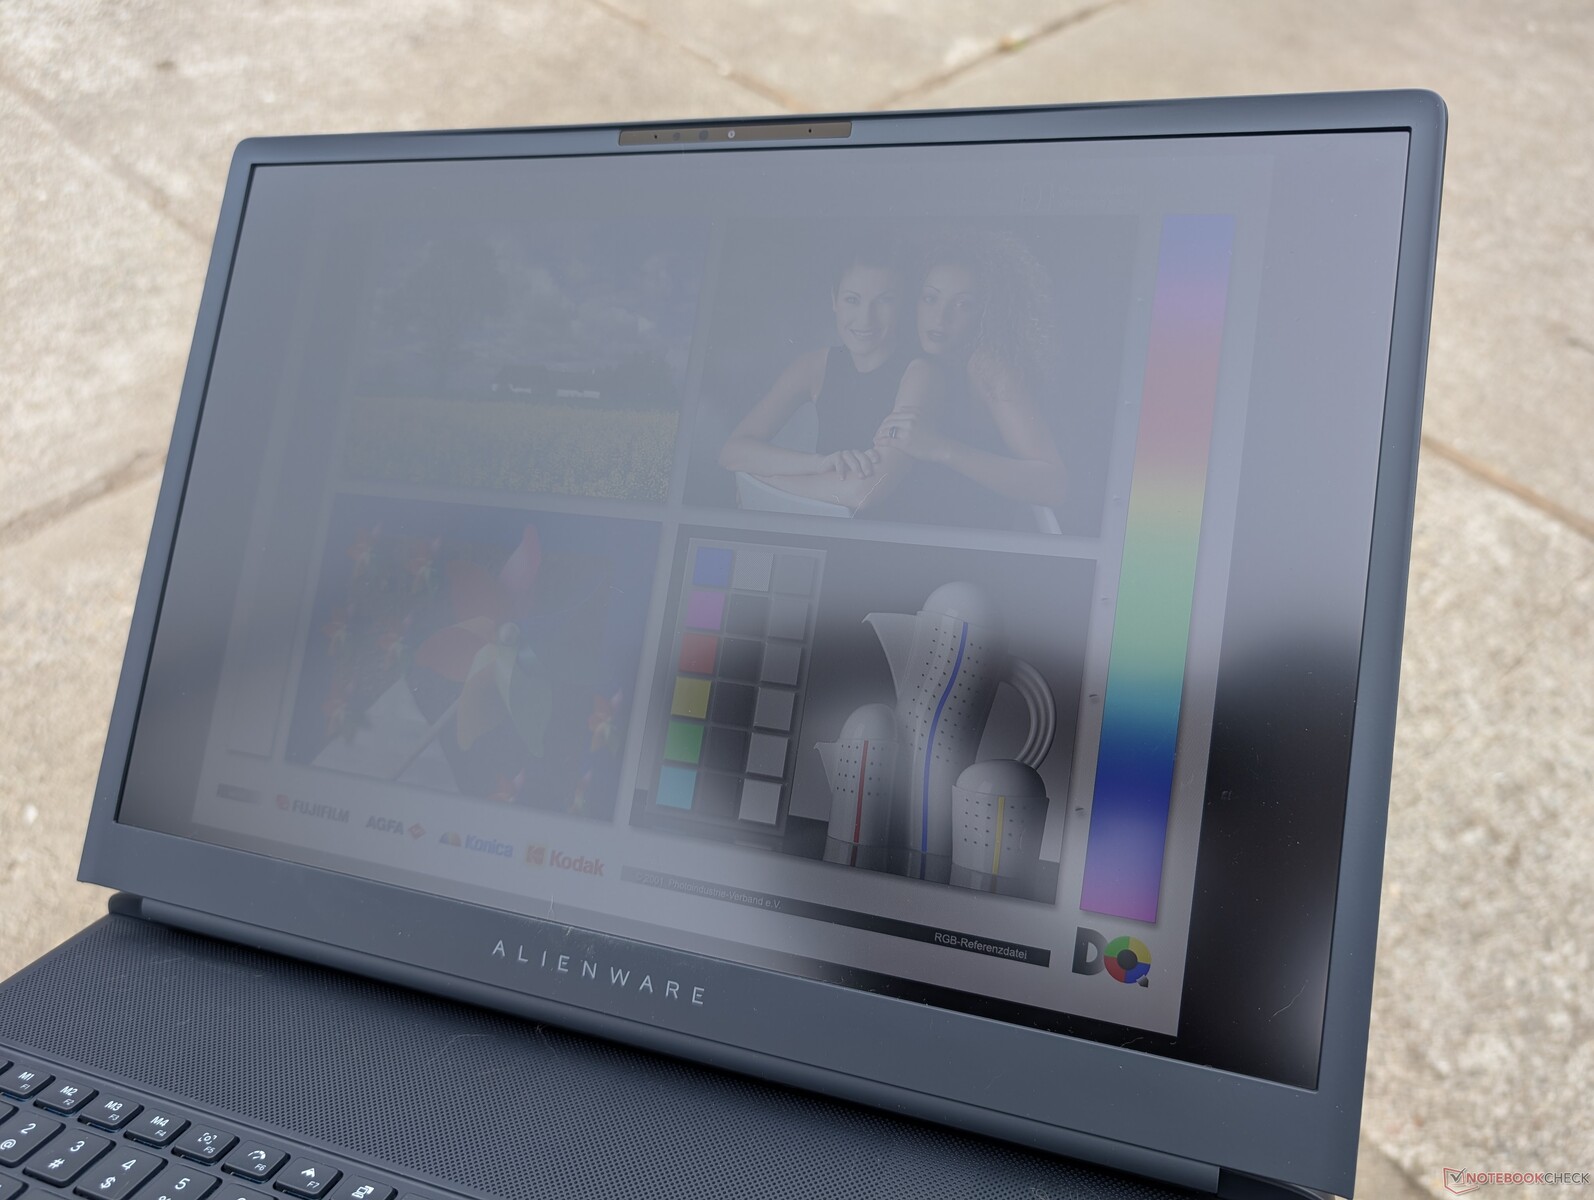
Wyświetlacz - dla Pana nie ma 4K
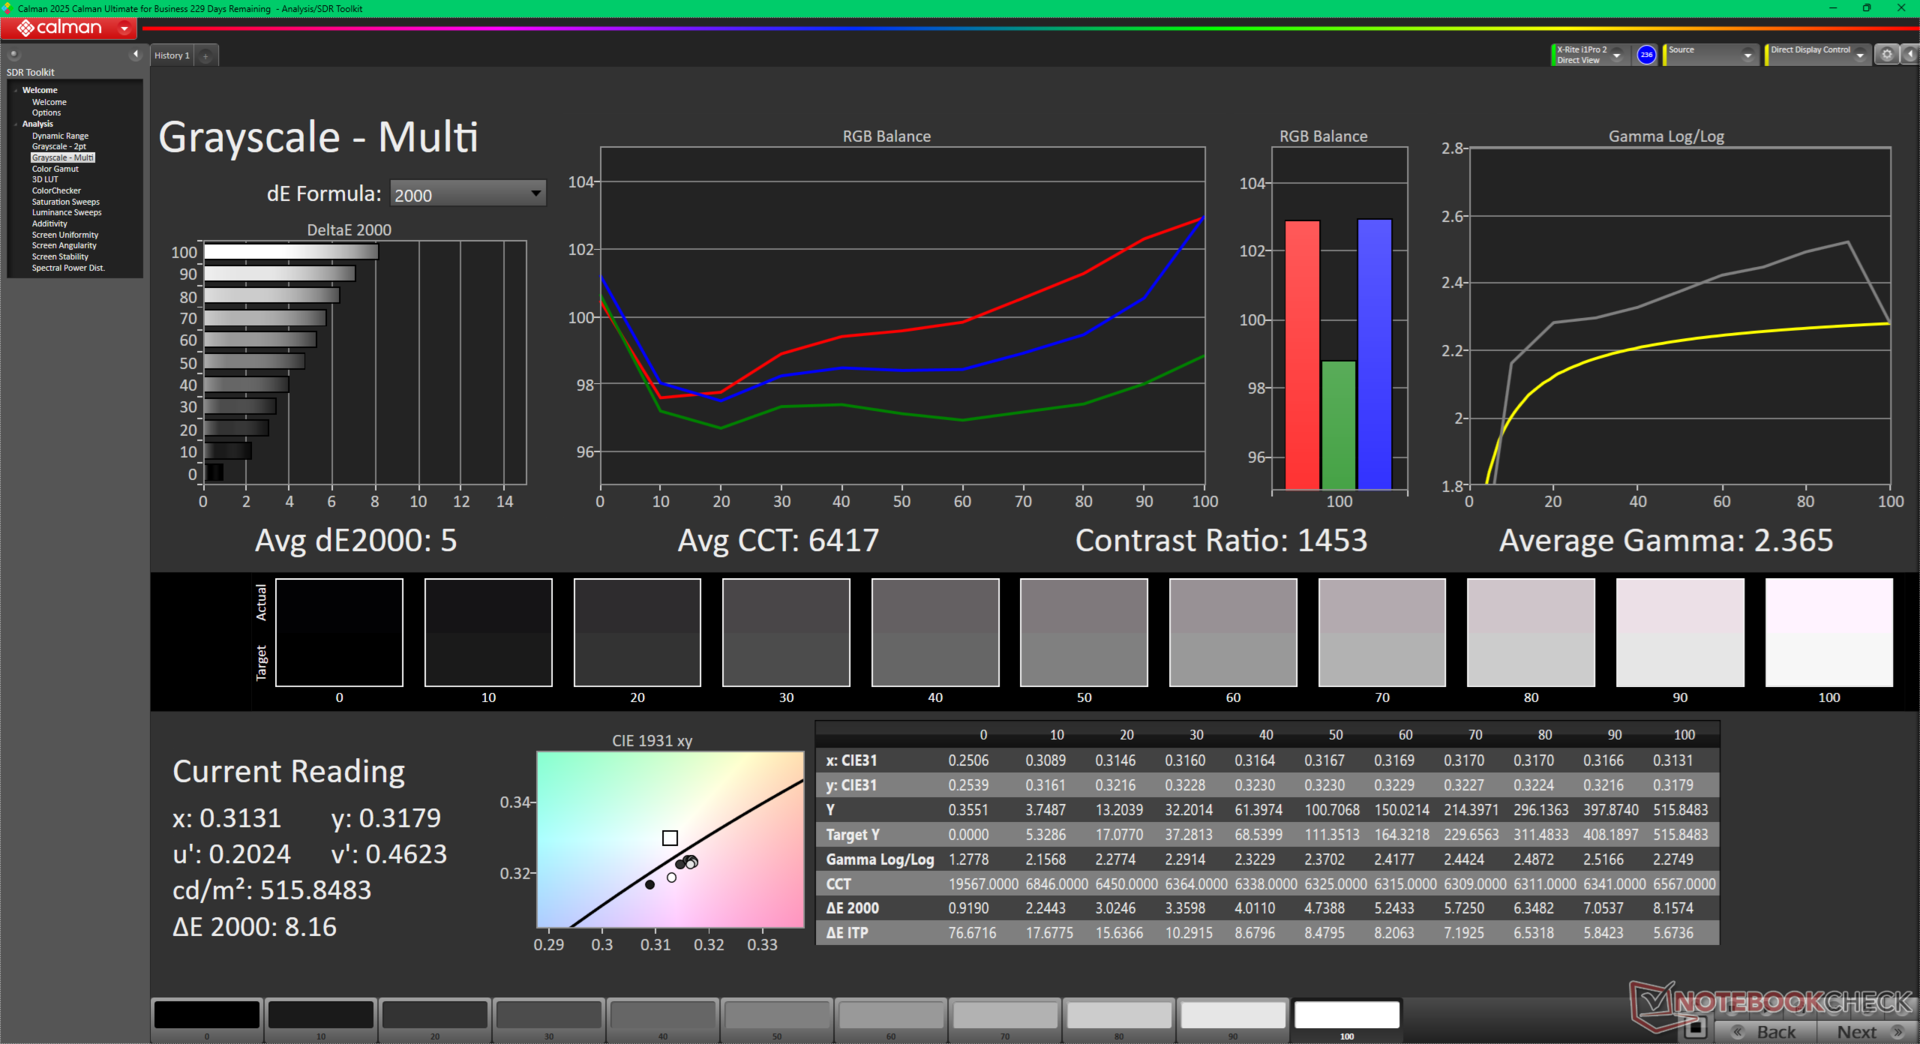
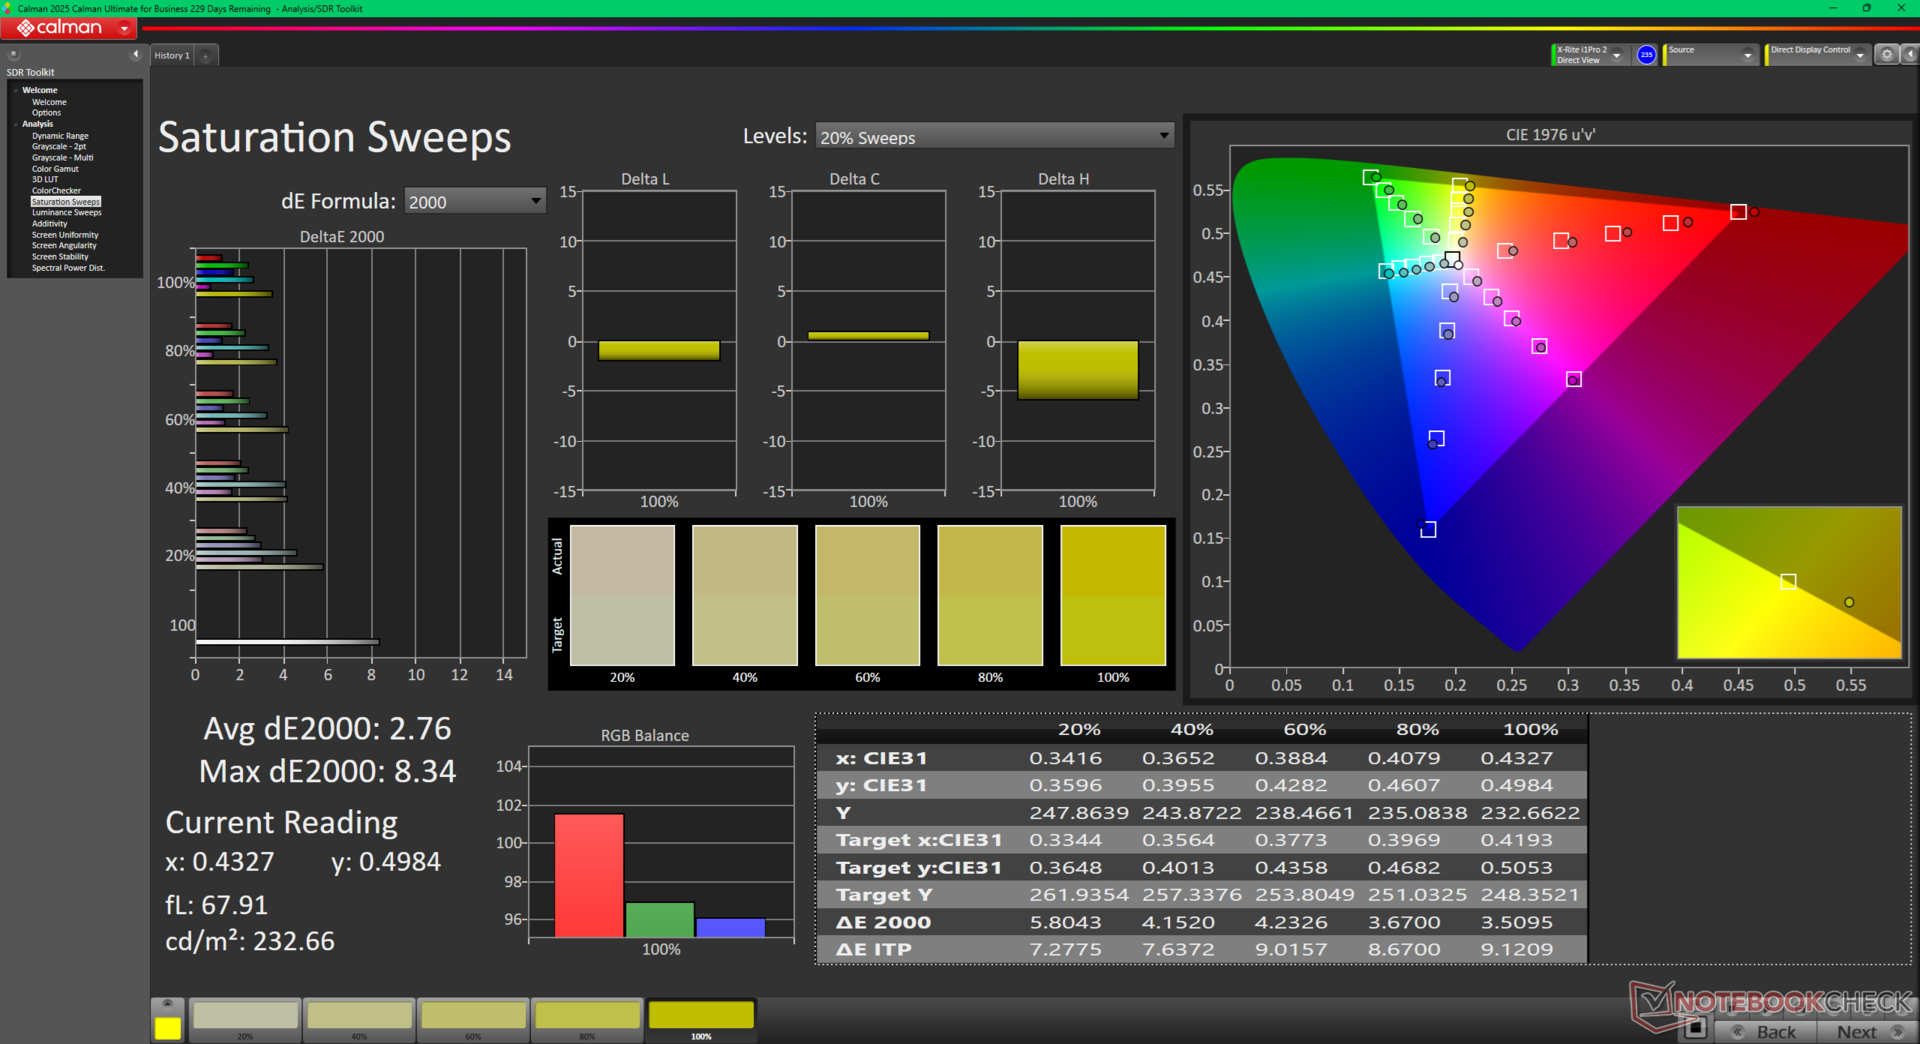
Obecnie dostępna jest tylko jedna opcja wyświetlania, na lepsze lub gorsze. Pozytywne aspekty obejmują bardzo wysoką częstotliwość odświeżania 300 Hz i pełne kolory DCI-P3 z obsługą Advanced Optimus. Z drugiej strony, wyświetlacz IPS nie obsługuje HDR i wszystkich zalet mini-LED lub OLED, takich jak głębokie poziomy czerni i wysokie maksymalne poziomy jasności. Niefortunne jest również to, że nie ma opcji 4K, biorąc pod uwagę duży 18-calowy rozmiar ekranu. Monitor MSI Raider A18 HX ma niewielką przewagę w tych konkretnych scenariuszach.


| |||||||||||||||||||||||||
rozświetlenie: 94 %
na akumulatorze: 512.5 cd/m²
kontrast: 1250:1 (czerń: 0.41 cd/m²)
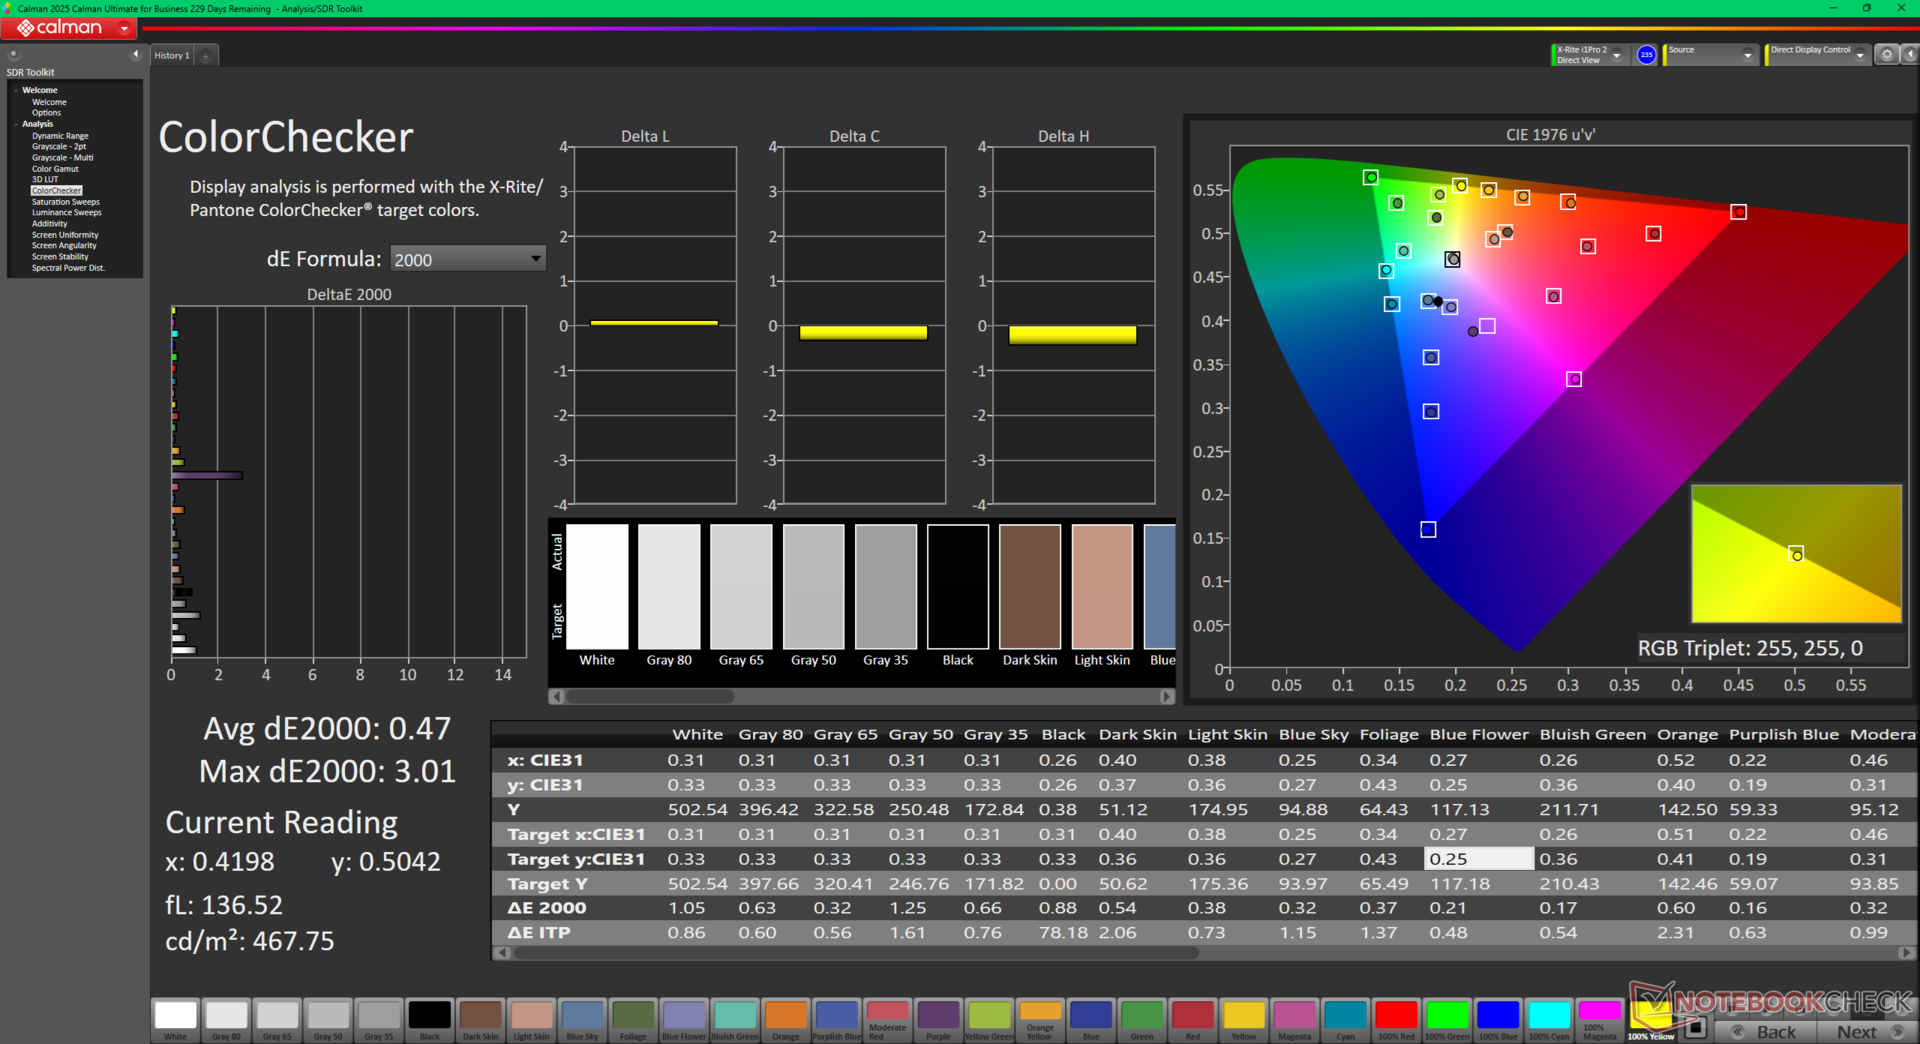
ΔE ColorChecker Calman: 3.24 | ∀{0.5-29.43 Ø4.72}
calibrated: 0.47
ΔE Greyscale Calman: 5 | ∀{0.09-98 Ø4.97}
89.7% AdobeRGB 1998 (Argyll 3D)
100% sRGB (Argyll 3D)
96.1% Display P3 (Argyll 3D)
Gamma: 2.37
CCT: 6417 K
| Alienware 18 Area-51 AU Optronics B180QAN, IPS, 2560x1600, 18", 300 Hz | Alienware 16 Area-51 AU Optronics B160QAN, IPS, 2560x1600, 16", 240 Hz | Alienware m18 R2 BOE NE18NZ1, IPS, 2560x1600, 18", 165 Hz | MSI Raider A18 HX A9WIG-080 B180ZAN01.0, MiniLED IPS, 3840x2400, 18", 120 Hz | Razer Blade 18 2024 RZ09-0509 BOE NE180QDM-NM1, Mini-LED, 2560x1600, 18", 300 Hz | Asus ROG Strix G18 G814JI NE180QDM-NZ2 (BOE0B35), IPS, 2560x1600, 18", 240 Hz | Acer Predator Helios 18 PH18-72-98MW B180QAN01.2 (AUO45A8), Mini-LED, 2560x1600, 18", 250 Hz | |
|---|---|---|---|---|---|---|---|
| Display | -0% | 0% | 3% | 0% | -1% | 2% | |
| Display P3 Coverage (%) | 96.1 | 96 0% | 97.8 2% | 99.9 4% | 99 3% | 98.1 2% | 99.7 4% |
| sRGB Coverage (%) | 100 | 100 0% | 99.5 0% | 100 0% | 100 0% | 99.9 0% | 100 0% |
| AdobeRGB 1998 Coverage (%) | 89.7 | 89.2 -1% | 88.9 -1% | 93.9 5% | 86.9 -3% | 85.6 -5% | 91.6 2% |
| Response Times | 40% | 20% | -76% | -10% | 27% | -32% | |
| Response Time Grey 50% / Grey 80% * (ms) | 13 ? | 4.8 ? 63% | 5.3 ? 59% | 23 ? -77% | 7.6 ? 42% | 5.6 ? 57% | 8 ? 38% |
| Response Time Black / White * (ms) | 8.7 ? | 7.2 ? 17% | 10.4 ? -20% | 15.1 ? -74% | 14 ? -61% | 9 ? -3% | 17.6 ? -102% |
| PWM Frequency (Hz) | 15203 | 26444 ? | 4832 ? | ||||
| PWM Amplitude * (%) | 100 | ||||||
| Screen | -6% | -3% | 331% | 15% | -1% | 148% | |
| Brightness middle (cd/m²) | 512.5 | 554 8% | 271.8 -47% | 510 0% | 605.4 18% | 471 -8% | 722 41% |
| Brightness (cd/m²) | 496 | 532 7% | 275 -45% | 470 -5% | 600 21% | 422 -15% | 724 46% |
| Brightness Distribution (%) | 94 | 88 -6% | 78 -17% | 85 -10% | 97 3% | 83 -12% | 93 -1% |
| Black Level * (cd/m²) | 0.41 | 0.52 -27% | 0.27 34% | 0.01 98% | 0.62 -51% | 0.47 -15% | 0.04 90% |
| Contrast (:1) | 1250 | 1065 -15% | 1007 -19% | 51000 3980% | 976 -22% | 1002 -20% | 18050 1344% |
| Colorchecker dE 2000 * | 3.24 | 2.81 13% | 2.48 23% | 4.5 -39% | 1.53 53% | 2.05 37% | 3.4 -5% |
| Colorchecker dE 2000 max. * | 8.4 | 8.32 1% | 5.59 33% | 7.3 13% | 4.15 51% | 4.15 51% | 5.32 37% |
| Colorchecker dE 2000 calibrated * | 0.47 | 0.65 -38% | 0.56 -19% | 5.7 -1113% | 0.8 -70% | 1.6 -240% | |
| Greyscale dE 2000 * | 5 | 4.7 6% | 3.7 26% | 2.3 54% | 2.6 48% | 2.8 44% | 3.8 24% |
| Gamma | 2.37 93% | 2.3 96% | 2.2 100% | 2.08 106% | 2.22 99% | 2.204 100% | 2.383 92% |
| CCT | 6417 101% | 6476 100% | 6355 102% | 6648 98% | 6843 95% | 7122 91% | 7051 92% |
| Całkowita średnia (program / ustawienia) | 11% /
2% | 6% /
1% | 86% /
203% | 2% /
8% | 8% /
3% | 39% /
91% |
* ... im mniej tym lepiej
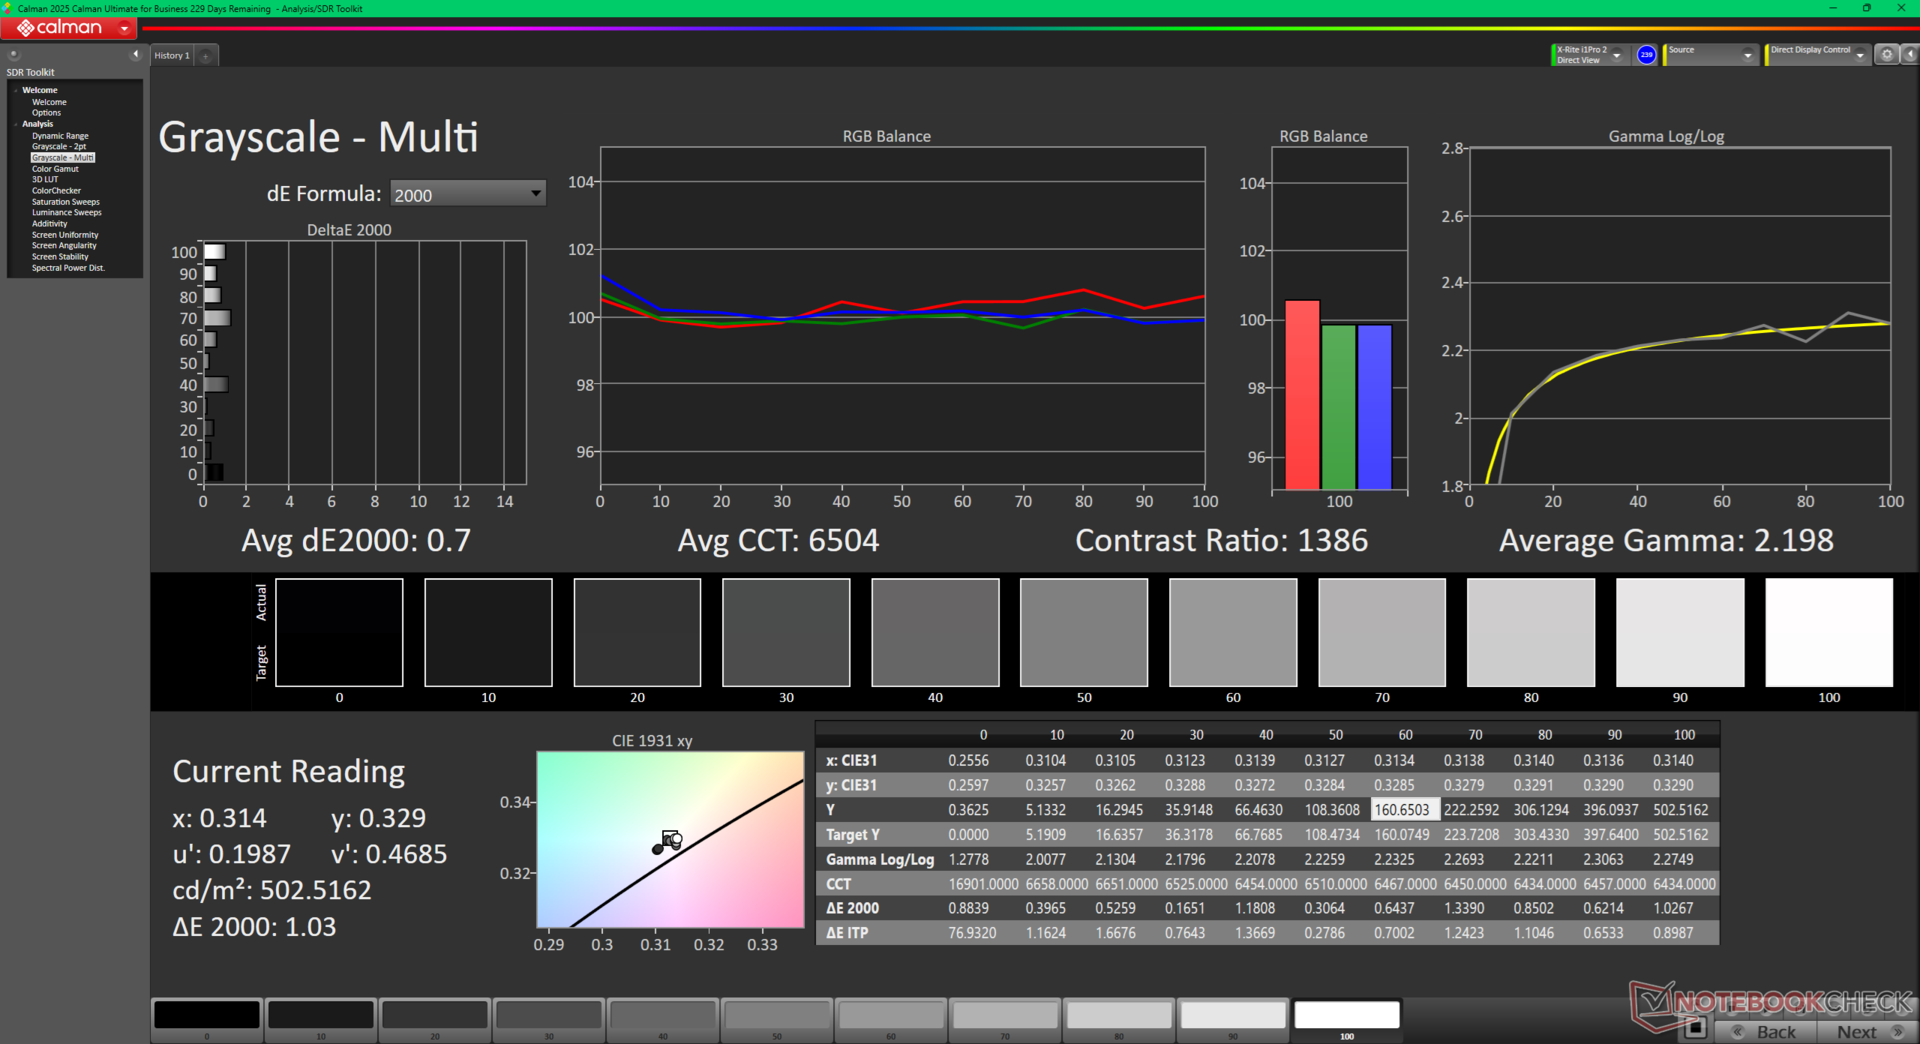
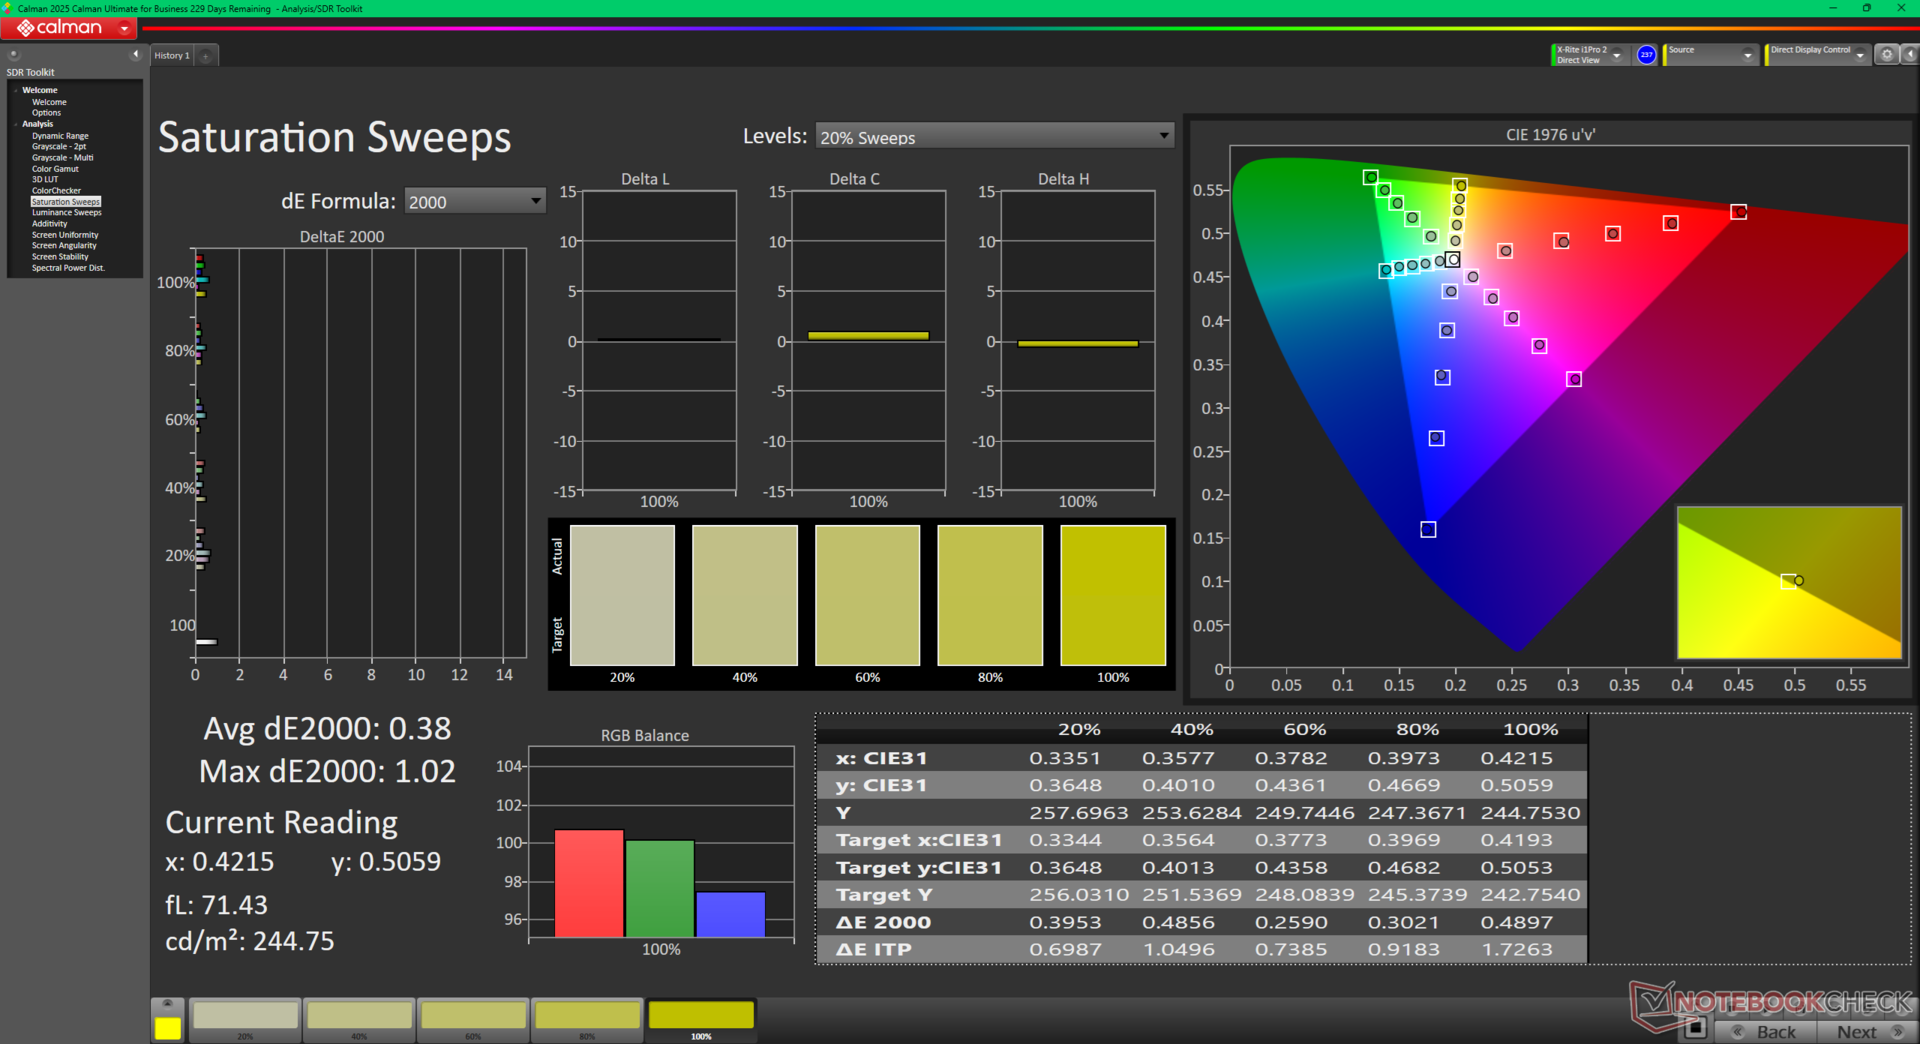
Wyświetlacz jest domyślnie skalibrowany do standardu sRGB. Samodzielna kalibracja za pomocą kolorymetru X-Rite poprawiłaby średnie wartości DeltaE skali szarości i kolorów do odpowiednio 0,7 i 0,47.

Wyświetl czasy reakcji
| ↔ Czas reakcji od czerni do bieli | ||
|---|---|---|
| 8.7 ms ... wzrost ↗ i spadek ↘ łącznie | ↗ 4.4 ms wzrost | 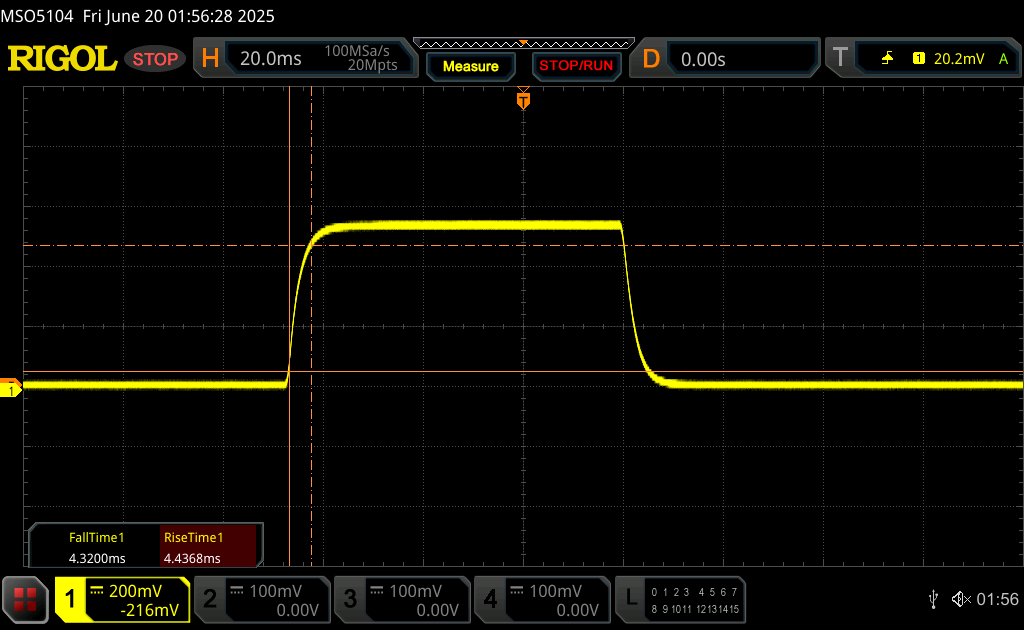 |
| ↘ 4.3 ms upadek | ||
| W naszych testach ekran wykazuje szybki czas reakcji i powinien nadawać się do gier. Dla porównania, wszystkie testowane urządzenia wahają się od 0.1 (minimum) do 240 (maksimum) ms. » 24 % wszystkich urządzeń jest lepszych. Oznacza to, że zmierzony czas reakcji jest lepszy od średniej wszystkich testowanych urządzeń (19.8 ms). | ||
| ↔ Czas reakcji 50% szarości do 80% szarości | ||
| 13 ms ... wzrost ↗ i spadek ↘ łącznie | ↗ 5.8 ms wzrost | 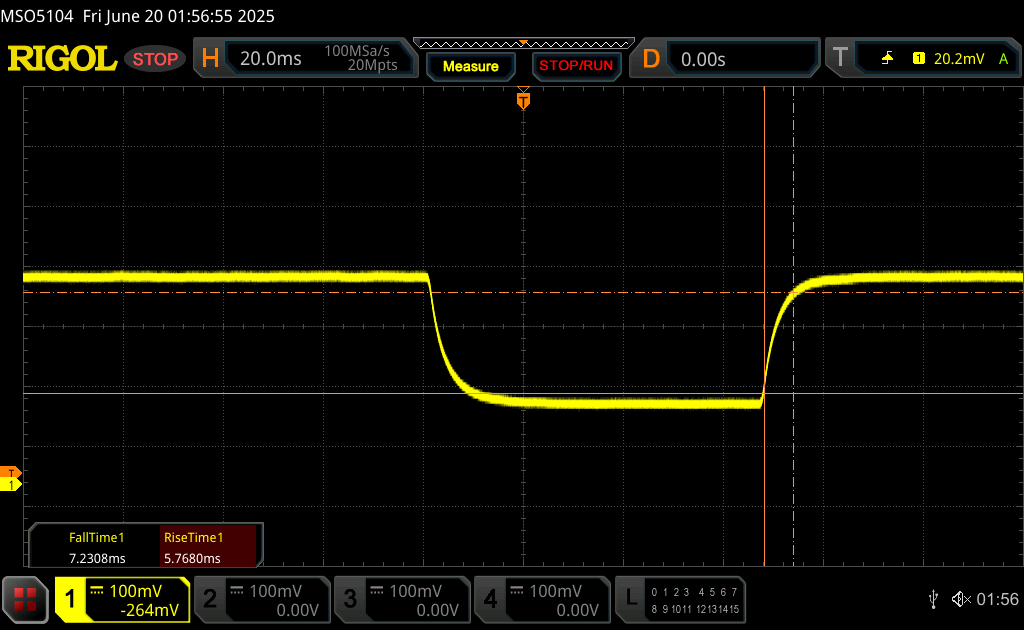 |
| ↘ 7.2 ms upadek | ||
| W naszych testach ekran wykazuje dobry współczynnik reakcji, ale może być zbyt wolny dla graczy rywalizujących ze sobą. Dla porównania, wszystkie testowane urządzenia wahają się od 0.165 (minimum) do 636 (maksimum) ms. » 26 % wszystkich urządzeń jest lepszych. Oznacza to, że zmierzony czas reakcji jest lepszy od średniej wszystkich testowanych urządzeń (31 ms). | ||
Migotanie ekranu / PWM (modulacja szerokości impulsu)
| Migotanie ekranu/nie wykryto PWM | 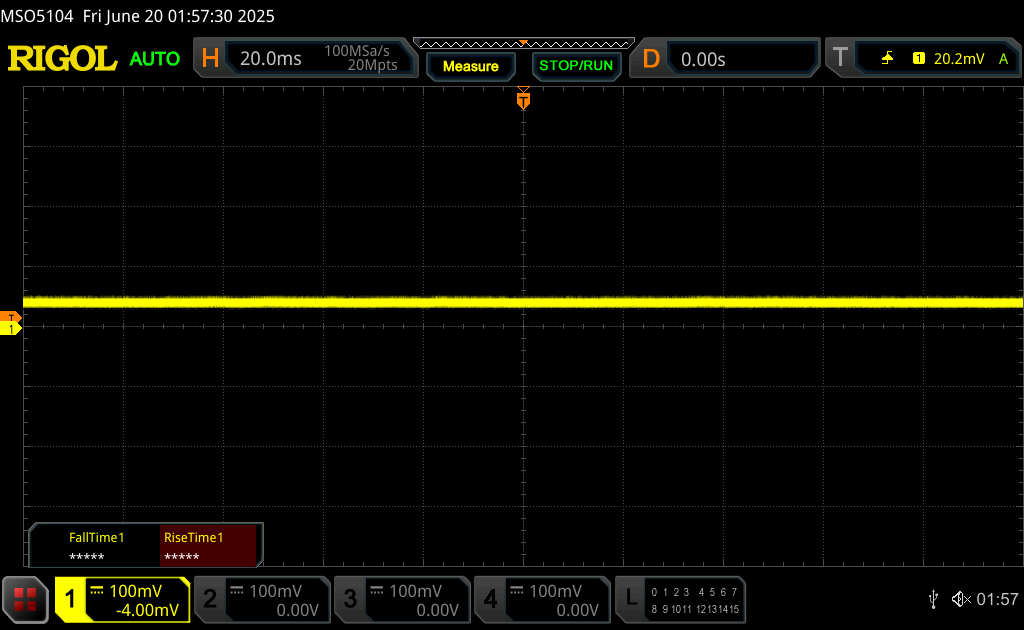 | ||
Dla porównania: 52 % wszystkich testowanych urządzeń nie używa PWM do przyciemniania wyświetlacza. Jeśli wykryto PWM, zmierzono średnio 7781 (minimum: 5 - maksimum: 343500) Hz. | |||
Panel o jasności 500 nitów jest około 2x jaśniejszy niż stosunkowo słaby panel Alienware m18 R2, co zapewnia lepszą widoczność na zewnątrz. Mimo to, będą Państwo chcieli pozostać w cieniu, gdy tylko będzie to możliwe, aby uniknąć wyblakłych kolorów. Ograniczona żywotność baterii i duża waga sprawiają, że system i tak nadaje się do użytku w pomieszczeniach.

Wydajność
Warunki testowania
Przed uruchomieniem poniższych testów porównawczych ustawiliśmy Alienware Command Center na tryb Performance. Wszelkie różnice między trybem wydajności a trybem Overdrive (tj. trybem Turbo) zostaną odnotowane. Alienware Command Center jest niezbędne do kontrolowania większości aspektów systemu, w tym diod LED i profili zasilania, ale czasami zawiesza się przy uruchomieniu bez konkretnego powodu.
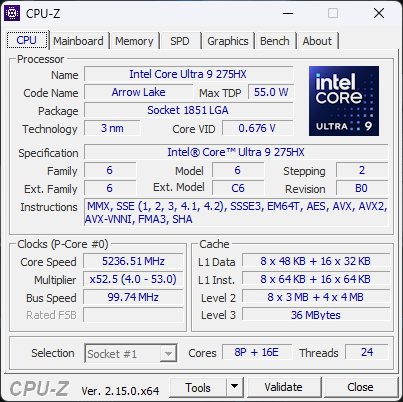
Procesor
Wydajność wielowątkowa jest o około 20 procent szybsza niż na Alienware 16 z tym samym Core Ultra 9 275HX CPU, mimo że oba systemy działają na profilu zasilania Performance. Uruchomienie wyższego profilu zasilania "Overdrive" wydaje się znacznie zwiększać wydajność procesora na Alienware 18, podczas gdy Alienware 16 widzi przyzwoity 10-procentowy wzrost wydajności. Oznacza to, że właściciele Alienware 18 niekoniecznie muszą uruchamiać swoje systemy w trybie Overdrive, aby uzyskać maksymalną wydajność.
Ogólna wydajność mieści się w granicach 5 punktów procentowych od konkurencyjnego Ryzen 9 9955HX3D jaki można znaleźć w MSI Raider A18 HX.
Użytkownicy dokonujący aktualizacji z zaledwie dwuletniej serii Meteor Lake-H, takiej jak Core Ultra 7 155H odnotują znaczny, około 2-krotny wzrost wydajności wielowątkowej.
Cinebench R15 Multi Loop
Cinebench R23: Multi Core | Single Core
Cinebench R20: CPU (Multi Core) | CPU (Single Core)
Cinebench R15: CPU Multi 64Bit | CPU Single 64Bit
Blender: v2.79 BMW27 CPU
7-Zip 18.03: 7z b 4 | 7z b 4 -mmt1
Geekbench 6.7: Multi-Core | Single-Core
Geekbench 5.5: Multi-Core | Single-Core
HWBOT x265 Benchmark v2.2: 4k Preset
LibreOffice : 20 Documents To PDF
R Benchmark 2.5: Overall mean
| CPU Performance rating | |
| MSI Titan 18 HX AI A2XWJG | |
| MSI Raider A18 HX A9WIG-080 | |
| Alienware 18 Area-51 | |
| Przeciętny Intel Core Ultra 9 275HX | |
| Alienware m18 R2 | |
| Alienware 16 Area-51 | |
| MSI Vector 16 HX AI A2XWHG | |
| Razer Blade 18 2024 RZ09-0509 | |
| Acer Predator Helios 18 PH18-72-98MW | |
| Asus ROG Strix G18 G814JI -2! | |
| Alienware m16 R2 -1! | |
| Lenovo Legion Slim 7 16APH8 | |
| Lenovo Legion S7 16ARHA7 -2! | |
| Asus TUF Gaming A16 FA617 -2! | |
| Cinebench R23 / Multi Core | |
| MSI Titan 18 HX AI A2XWJG | |
| MSI Raider A18 HX A9WIG-080 | |
| Alienware 18 Area-51 | |
| Przeciętny Intel Core Ultra 9 275HX (30712 - 40970, n=31) | |
| Alienware 16 Area-51 | |
| Alienware m18 R2 | |
| Razer Blade 18 2024 RZ09-0509 | |
| MSI Vector 16 HX AI A2XWHG | |
| Acer Predator Helios 18 PH18-72-98MW | |
| Asus ROG Strix G18 G814JI | |
| Alienware m16 R2 | |
| Lenovo Legion Slim 7 16APH8 | |
| Lenovo Legion S7 16ARHA7 | |
| Asus TUF Gaming A16 FA617 | |
| Cinebench R23 / Single Core | |
| Alienware m18 R2 | |
| Przeciętny Intel Core Ultra 9 275HX (2009 - 2267, n=31) | |
| Alienware 18 Area-51 | |
| MSI Titan 18 HX AI A2XWJG | |
| Acer Predator Helios 18 PH18-72-98MW | |
| MSI Vector 16 HX AI A2XWHG | |
| MSI Raider A18 HX A9WIG-080 | |
| Razer Blade 18 2024 RZ09-0509 | |
| Alienware 16 Area-51 | |
| Asus ROG Strix G18 G814JI | |
| Lenovo Legion Slim 7 16APH8 | |
| Alienware m16 R2 | |
| Lenovo Legion S7 16ARHA7 | |
| Asus TUF Gaming A16 FA617 | |
| Cinebench R20 / CPU (Multi Core) | |
| MSI Titan 18 HX AI A2XWJG | |
| Alienware 18 Area-51 | |
| MSI Raider A18 HX A9WIG-080 | |
| Przeciętny Intel Core Ultra 9 275HX (12026 - 16108, n=30) | |
| Alienware 16 Area-51 | |
| Alienware m18 R2 | |
| Razer Blade 18 2024 RZ09-0509 | |
| MSI Vector 16 HX AI A2XWHG | |
| Acer Predator Helios 18 PH18-72-98MW | |
| Asus ROG Strix G18 G814JI | |
| Alienware m16 R2 | |
| Lenovo Legion Slim 7 16APH8 | |
| Lenovo Legion S7 16ARHA7 | |
| Asus TUF Gaming A16 FA617 | |
| Cinebench R20 / CPU (Single Core) | |
| Alienware m18 R2 | |
| MSI Raider A18 HX A9WIG-080 | |
| Przeciętny Intel Core Ultra 9 275HX (774 - 870, n=30) | |
| Alienware 18 Area-51 | |
| MSI Titan 18 HX AI A2XWJG | |
| MSI Vector 16 HX AI A2XWHG | |
| Acer Predator Helios 18 PH18-72-98MW | |
| Razer Blade 18 2024 RZ09-0509 | |
| Alienware 16 Area-51 | |
| Asus ROG Strix G18 G814JI | |
| Alienware m16 R2 | |
| Lenovo Legion Slim 7 16APH8 | |
| Lenovo Legion S7 16ARHA7 | |
| Asus TUF Gaming A16 FA617 | |
| Cinebench R15 / CPU Multi 64Bit | |
| MSI Titan 18 HX AI A2XWJG | |
| MSI Raider A18 HX A9WIG-080 | |
| Alienware 18 Area-51 | |
| Przeciętny Intel Core Ultra 9 275HX (4737 - 6271, n=30) | |
| Alienware m18 R2 | |
| Alienware 16 Area-51 | |
| Acer Predator Helios 18 PH18-72-98MW | |
| Razer Blade 18 2024 RZ09-0509 | |
| MSI Vector 16 HX AI A2XWHG | |
| Asus ROG Strix G18 G814JI | |
| Alienware m16 R2 | |
| Lenovo Legion Slim 7 16APH8 | |
| Lenovo Legion S7 16ARHA7 | |
| Asus TUF Gaming A16 FA617 | |
| Cinebench R15 / CPU Single 64Bit | |
| Alienware 18 Area-51 | |
| Przeciętny Intel Core Ultra 9 275HX (306 - 343, n=31) | |
| MSI Vector 16 HX AI A2XWHG | |
| MSI Titan 18 HX AI A2XWJG | |
| MSI Raider A18 HX A9WIG-080 | |
| Alienware m18 R2 | |
| Acer Predator Helios 18 PH18-72-98MW | |
| Alienware 16 Area-51 | |
| Razer Blade 18 2024 RZ09-0509 | |
| Asus ROG Strix G18 G814JI | |
| Lenovo Legion Slim 7 16APH8 | |
| Lenovo Legion S7 16ARHA7 | |
| Alienware m16 R2 | |
| Asus TUF Gaming A16 FA617 | |
| Blender / v2.79 BMW27 CPU | |
| Asus TUF Gaming A16 FA617 | |
| Lenovo Legion S7 16ARHA7 | |
| Lenovo Legion Slim 7 16APH8 | |
| Asus ROG Strix G18 G814JI | |
| Acer Predator Helios 18 PH18-72-98MW | |
| MSI Vector 16 HX AI A2XWHG | |
| Razer Blade 18 2024 RZ09-0509 | |
| Alienware m18 R2 | |
| Alienware 16 Area-51 | |
| Przeciętny Intel Core Ultra 9 275HX (82 - 116, n=29) | |
| Alienware 18 Area-51 | |
| MSI Titan 18 HX AI A2XWJG | |
| MSI Raider A18 HX A9WIG-080 | |
| 7-Zip 18.03 / 7z b 4 | |
| MSI Raider A18 HX A9WIG-080 | |
| MSI Titan 18 HX AI A2XWJG | |
| Alienware m18 R2 | |
| Alienware 18 Area-51 | |
| Przeciętny Intel Core Ultra 9 275HX (98236 - 124155, n=30) | |
| Alienware 16 Area-51 | |
| Razer Blade 18 2024 RZ09-0509 | |
| Acer Predator Helios 18 PH18-72-98MW | |
| MSI Vector 16 HX AI A2XWHG | |
| Asus ROG Strix G18 G814JI | |
| Lenovo Legion Slim 7 16APH8 | |
| Alienware m16 R2 | |
| Lenovo Legion S7 16ARHA7 | |
| Asus TUF Gaming A16 FA617 | |
| 7-Zip 18.03 / 7z b 4 -mmt1 | |
| MSI Raider A18 HX A9WIG-080 | |
| Alienware m18 R2 | |
| MSI Titan 18 HX AI A2XWJG | |
| Przeciętny Intel Core Ultra 9 275HX (6026 - 7149, n=30) | |
| Lenovo Legion Slim 7 16APH8 | |
| Alienware 18 Area-51 | |
| Razer Blade 18 2024 RZ09-0509 | |
| MSI Vector 16 HX AI A2XWHG | |
| Alienware 16 Area-51 | |
| Acer Predator Helios 18 PH18-72-98MW | |
| Asus ROG Strix G18 G814JI | |
| Lenovo Legion S7 16ARHA7 | |
| Asus TUF Gaming A16 FA617 | |
| Alienware m16 R2 | |
| Geekbench 6.7 / Single-Core | |
| MSI Raider A18 HX A9WIG-080 | |
| MSI Titan 18 HX AI A2XWJG | |
| Alienware m18 R2 | |
| Alienware 18 Area-51 | |
| Przeciętny Intel Core Ultra 9 275HX (2843 - 3160, n=33) | |
| Acer Predator Helios 18 PH18-72-98MW | |
| Alienware 16 Area-51 | |
| MSI Vector 16 HX AI A2XWHG | |
| Razer Blade 18 2024 RZ09-0509 | |
| Lenovo Legion Slim 7 16APH8 | |
| Alienware m16 R2 | |
| Geekbench 5.5 / Multi-Core | |
| MSI Titan 18 HX AI A2XWJG | |
| MSI Raider A18 HX A9WIG-080 | |
| Alienware 18 Area-51 | |
| Przeciętny Intel Core Ultra 9 275HX (19105 - 25855, n=31) | |
| Alienware 16 Area-51 | |
| Alienware m18 R2 | |
| Acer Predator Helios 18 PH18-72-98MW | |
| Razer Blade 18 2024 RZ09-0509 | |
| MSI Vector 16 HX AI A2XWHG | |
| Asus ROG Strix G18 G814JI | |
| Alienware m16 R2 | |
| Lenovo Legion Slim 7 16APH8 | |
| Lenovo Legion S7 16ARHA7 | |
| Asus TUF Gaming A16 FA617 | |
| Geekbench 5.5 / Single-Core | |
| MSI Raider A18 HX A9WIG-080 | |
| Alienware 18 Area-51 | |
| MSI Titan 18 HX AI A2XWJG | |
| Przeciętny Intel Core Ultra 9 275HX (2033 - 2292, n=31) | |
| Alienware m18 R2 | |
| MSI Vector 16 HX AI A2XWHG | |
| Alienware 16 Area-51 | |
| Razer Blade 18 2024 RZ09-0509 | |
| Acer Predator Helios 18 PH18-72-98MW | |
| Lenovo Legion Slim 7 16APH8 | |
| Asus ROG Strix G18 G814JI | |
| Alienware m16 R2 | |
| Lenovo Legion S7 16ARHA7 | |
| Asus TUF Gaming A16 FA617 | |
| HWBOT x265 Benchmark v2.2 / 4k Preset | |
| MSI Titan 18 HX AI A2XWJG | |
| MSI Raider A18 HX A9WIG-080 | |
| Alienware 18 Area-51 | |
| Przeciętny Intel Core Ultra 9 275HX (30.7 - 43.8, n=30) | |
| Alienware m18 R2 | |
| Alienware 16 Area-51 | |
| MSI Vector 16 HX AI A2XWHG | |
| Acer Predator Helios 18 PH18-72-98MW | |
| Razer Blade 18 2024 RZ09-0509 | |
| Asus ROG Strix G18 G814JI | |
| Alienware m16 R2 | |
| Lenovo Legion Slim 7 16APH8 | |
| Lenovo Legion S7 16ARHA7 | |
| Asus TUF Gaming A16 FA617 | |
| LibreOffice / 20 Documents To PDF | |
| Acer Predator Helios 18 PH18-72-98MW | |
| Lenovo Legion Slim 7 16APH8 | |
| Asus TUF Gaming A16 FA617 | |
| Asus ROG Strix G18 G814JI | |
| Alienware m16 R2 | |
| Lenovo Legion S7 16ARHA7 | |
| Razer Blade 18 2024 RZ09-0509 | |
| MSI Titan 18 HX AI A2XWJG | |
| MSI Raider A18 HX A9WIG-080 | |
| Alienware m18 R2 | |
| Przeciętny Intel Core Ultra 9 275HX (33.2 - 62.1, n=30) | |
| MSI Vector 16 HX AI A2XWHG | |
| Alienware 16 Area-51 | |
| Alienware 18 Area-51 | |
| R Benchmark 2.5 / Overall mean | |
| Asus TUF Gaming A16 FA617 | |
| Alienware m16 R2 | |
| Lenovo Legion S7 16ARHA7 | |
| Lenovo Legion Slim 7 16APH8 | |
| Asus ROG Strix G18 G814JI | |
| Alienware 16 Area-51 | |
| MSI Vector 16 HX AI A2XWHG | |
| Acer Predator Helios 18 PH18-72-98MW | |
| Przeciętny Intel Core Ultra 9 275HX (0.3943 - 0.4568, n=30) | |
| Alienware 18 Area-51 | |
| MSI Titan 18 HX AI A2XWJG | |
| Razer Blade 18 2024 RZ09-0509 | |
| Alienware m18 R2 | |
| MSI Raider A18 HX A9WIG-080 | |
Cinebench R23: Multi Core | Single Core
Cinebench R20: CPU (Multi Core) | CPU (Single Core)
Cinebench R15: CPU Multi 64Bit | CPU Single 64Bit
Blender: v2.79 BMW27 CPU
7-Zip 18.03: 7z b 4 | 7z b 4 -mmt1
Geekbench 6.7: Multi-Core | Single-Core
Geekbench 5.5: Multi-Core | Single-Core
HWBOT x265 Benchmark v2.2: 4k Preset
LibreOffice : 20 Documents To PDF
R Benchmark 2.5: Overall mean
* ... im mniej tym lepiej
AIDA64: FP32 Ray-Trace | FPU Julia | CPU SHA3 | CPU Queen | FPU SinJulia | FPU Mandel | CPU AES | CPU ZLib | FP64 Ray-Trace | CPU PhotoWorxx
| Performance rating | |
| MSI Raider A18 HX A9WIG-080 | |
| Alienware 18 Area-51 | |
| Przeciętny Intel Core Ultra 9 275HX | |
| Alienware 16 Area-51 | |
| Alienware m18 R2 | |
| Razer Blade 18 2024 RZ09-0509 | |
| Acer Predator Helios 18 PH18-72-98MW | |
| Asus ROG Strix G18 G814JI | |
| AIDA64 / FP32 Ray-Trace | |
| MSI Raider A18 HX A9WIG-080 | |
| Alienware 18 Area-51 | |
| Przeciętny Intel Core Ultra 9 275HX (28039 - 39895, n=30) | |
| Alienware 16 Area-51 | |
| Alienware m18 R2 | |
| Razer Blade 18 2024 RZ09-0509 | |
| Acer Predator Helios 18 PH18-72-98MW | |
| Asus ROG Strix G18 G814JI | |
| AIDA64 / FPU Julia | |
| MSI Raider A18 HX A9WIG-080 | |
| Alienware 18 Area-51 | |
| Przeciętny Intel Core Ultra 9 275HX (140254 - 200744, n=30) | |
| Alienware 16 Area-51 | |
| Alienware m18 R2 | |
| Razer Blade 18 2024 RZ09-0509 | |
| Acer Predator Helios 18 PH18-72-98MW | |
| Asus ROG Strix G18 G814JI | |
| AIDA64 / CPU SHA3 | |
| MSI Raider A18 HX A9WIG-080 | |
| Alienware 18 Area-51 | |
| Przeciętny Intel Core Ultra 9 275HX (6710 - 9817, n=30) | |
| Alienware 16 Area-51 | |
| Alienware m18 R2 | |
| Razer Blade 18 2024 RZ09-0509 | |
| Acer Predator Helios 18 PH18-72-98MW | |
| Asus ROG Strix G18 G814JI | |
| AIDA64 / CPU Queen | |
| MSI Raider A18 HX A9WIG-080 | |
| Alienware 18 Area-51 | |
| Alienware m18 R2 | |
| Acer Predator Helios 18 PH18-72-98MW | |
| Razer Blade 18 2024 RZ09-0509 | |
| Przeciętny Intel Core Ultra 9 275HX (113887 - 140937, n=30) | |
| Alienware 16 Area-51 | |
| Asus ROG Strix G18 G814JI | |
| AIDA64 / FPU SinJulia | |
| MSI Raider A18 HX A9WIG-080 | |
| Alienware m18 R2 | |
| Razer Blade 18 2024 RZ09-0509 | |
| Acer Predator Helios 18 PH18-72-98MW | |
| Alienware 18 Area-51 | |
| Alienware 16 Area-51 | |
| Przeciętny Intel Core Ultra 9 275HX (11172 - 14425, n=30) | |
| Asus ROG Strix G18 G814JI | |
| AIDA64 / FPU Mandel | |
| MSI Raider A18 HX A9WIG-080 | |
| Alienware 18 Area-51 | |
| Przeciętny Intel Core Ultra 9 275HX (72596 - 104508, n=30) | |
| Alienware 16 Area-51 | |
| Alienware m18 R2 | |
| Razer Blade 18 2024 RZ09-0509 | |
| Acer Predator Helios 18 PH18-72-98MW | |
| Asus ROG Strix G18 G814JI | |
| AIDA64 / CPU AES | |
| MSI Raider A18 HX A9WIG-080 | |
| Alienware 18 Area-51 | |
| Alienware m18 R2 | |
| Przeciętny Intel Core Ultra 9 275HX (105608 - 247074, n=30) | |
| Alienware 16 Area-51 | |
| Razer Blade 18 2024 RZ09-0509 | |
| Acer Predator Helios 18 PH18-72-98MW | |
| Asus ROG Strix G18 G814JI | |
| AIDA64 / CPU ZLib | |
| MSI Raider A18 HX A9WIG-080 | |
| Alienware 18 Area-51 | |
| Alienware m18 R2 | |
| Przeciętny Intel Core Ultra 9 275HX (1582 - 2263, n=30) | |
| Alienware 16 Area-51 | |
| Razer Blade 18 2024 RZ09-0509 | |
| Acer Predator Helios 18 PH18-72-98MW | |
| Asus ROG Strix G18 G814JI | |
| AIDA64 / FP64 Ray-Trace | |
| MSI Raider A18 HX A9WIG-080 | |
| Alienware 18 Area-51 | |
| Przeciętny Intel Core Ultra 9 275HX (14847 - 21854, n=30) | |
| Alienware 16 Area-51 | |
| Alienware m18 R2 | |
| Razer Blade 18 2024 RZ09-0509 | |
| Acer Predator Helios 18 PH18-72-98MW | |
| Asus ROG Strix G18 G814JI | |
| AIDA64 / CPU PhotoWorxx | |
| Alienware 18 Area-51 | |
| Alienware 16 Area-51 | |
| Przeciętny Intel Core Ultra 9 275HX (37482 - 62916, n=30) | |
| Alienware m18 R2 | |
| Razer Blade 18 2024 RZ09-0509 | |
| Acer Predator Helios 18 PH18-72-98MW | |
| Asus ROG Strix G18 G814JI | |
| MSI Raider A18 HX A9WIG-080 | |
Wydajność systemu
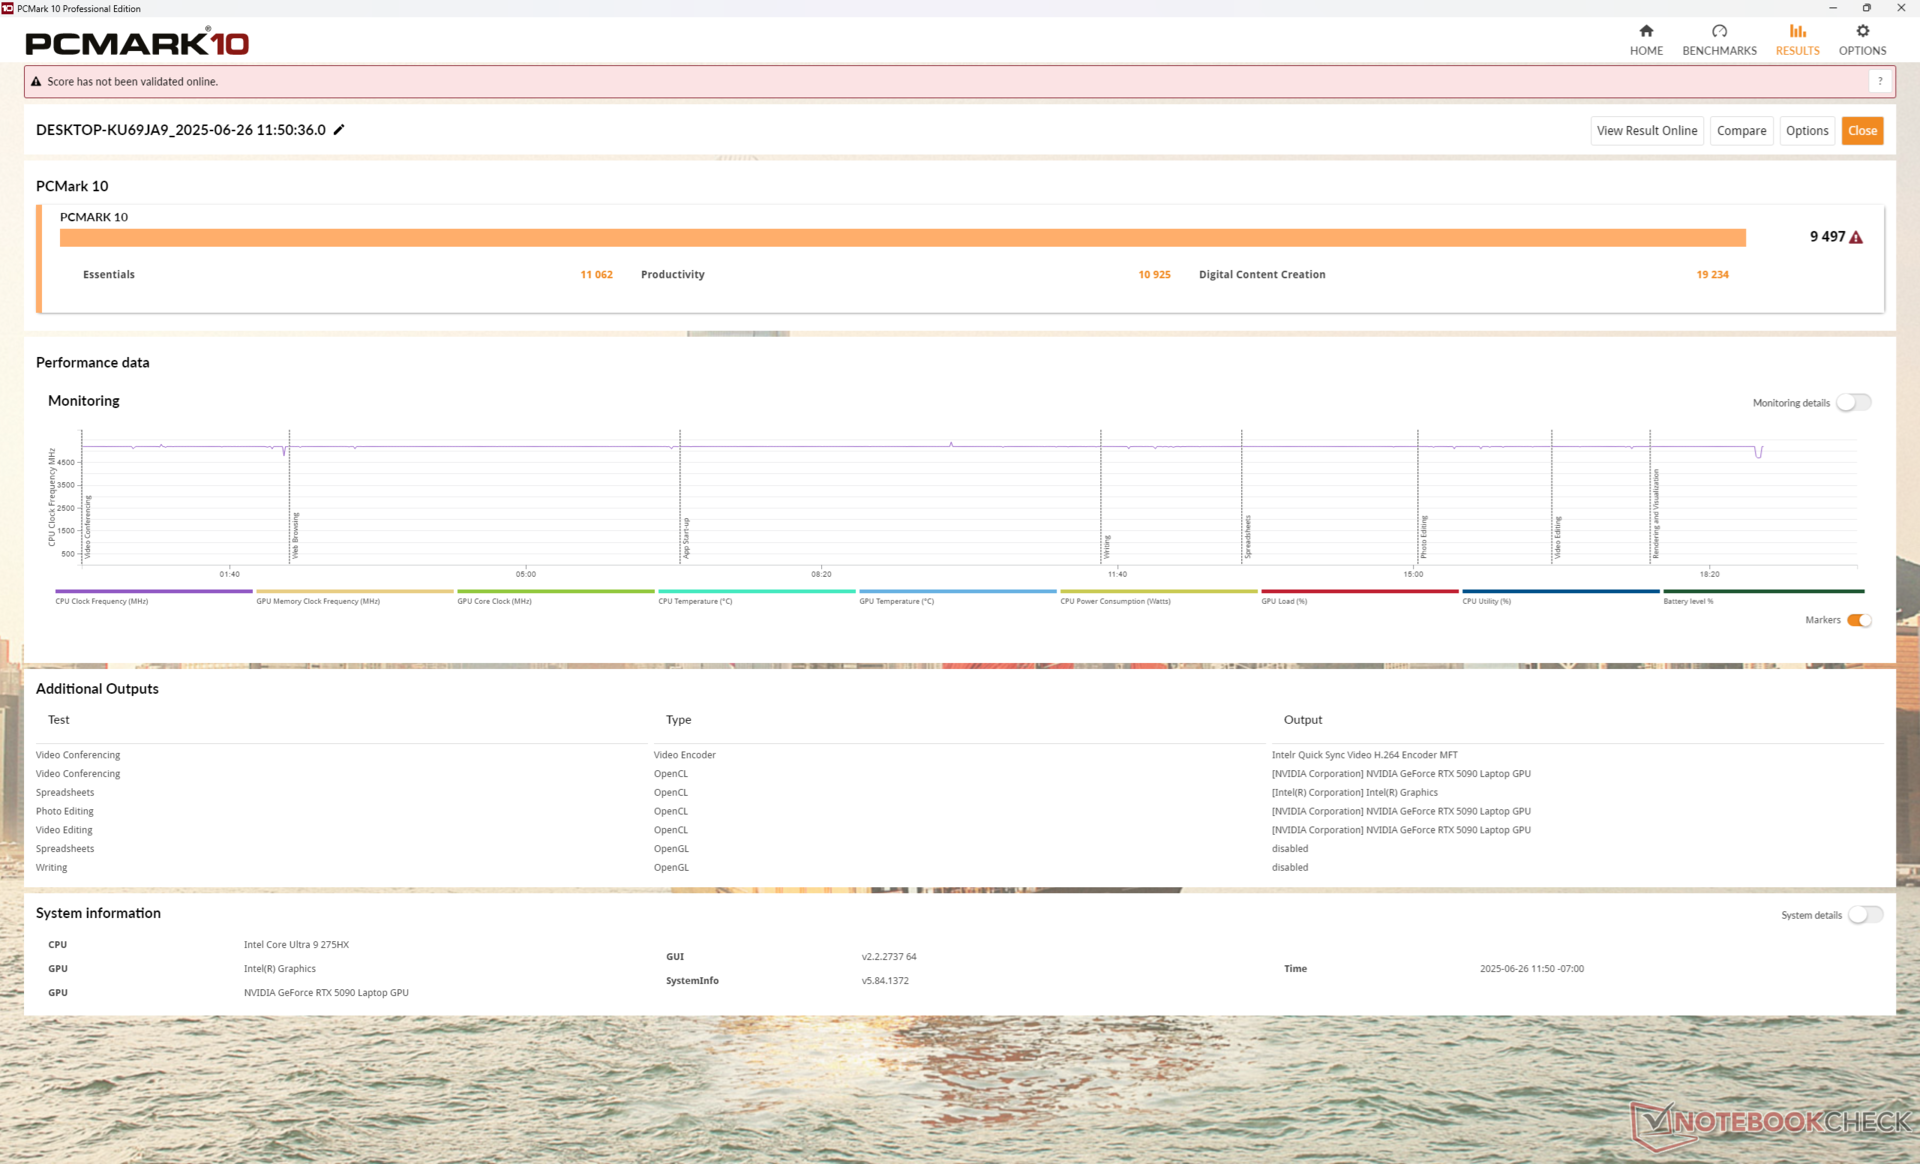
Średnie wyniki PCMark są jednymi z najwyższych spośród wszystkich 18-calowych laptopów do gier, w tym MSI Raider A18 HX napędzanego procesorem Ryzen 9 9955HX3D. Można to częściowo przypisać dyskowi SSD PCIe5 w naszej jednostce testowej Alienware.
PCMark 10: Score | Essentials | Productivity | Digital Content Creation
CrossMark: Overall | Productivity | Creativity | Responsiveness
WebXPRT 3: Overall
WebXPRT 4: Overall
Mozilla Kraken 1.1: Total
| Performance rating | |
| Alienware 18 Area-51 | |
| MSI Raider A18 HX A9WIG-080 | |
| Alienware 16 Area-51 | |
| Przeciętny Intel Core Ultra 9 275HX, NVIDIA GeForce RTX 5090 Laptop | |
| Alienware m18 R2 | |
| Razer Blade 18 2024 RZ09-0509 -1! | |
| Acer Predator Helios 18 PH18-72-98MW -6! | |
| Asus ROG Strix G18 G814JI -4! | |
| PCMark 10 / Score | |
| Alienware 18 Area-51 | |
| Alienware m18 R2 | |
| MSI Raider A18 HX A9WIG-080 | |
| Razer Blade 18 2024 RZ09-0509 | |
| Alienware 16 Area-51 | |
| Przeciętny Intel Core Ultra 9 275HX, NVIDIA GeForce RTX 5090 Laptop (7474 - 9497, n=11) | |
| Acer Predator Helios 18 PH18-72-98MW | |
| Asus ROG Strix G18 G814JI | |
| PCMark 10 / Essentials | |
| MSI Raider A18 HX A9WIG-080 | |
| Alienware m18 R2 | |
| Razer Blade 18 2024 RZ09-0509 | |
| Alienware 16 Area-51 | |
| Alienware 18 Area-51 | |
| Acer Predator Helios 18 PH18-72-98MW | |
| Przeciętny Intel Core Ultra 9 275HX, NVIDIA GeForce RTX 5090 Laptop (9994 - 11369, n=12) | |
| Asus ROG Strix G18 G814JI | |
| PCMark 10 / Productivity | |
| Alienware m18 R2 | |
| Alienware 18 Area-51 | |
| MSI Raider A18 HX A9WIG-080 | |
| Razer Blade 18 2024 RZ09-0509 | |
| Acer Predator Helios 18 PH18-72-98MW | |
| Przeciętny Intel Core Ultra 9 275HX, NVIDIA GeForce RTX 5090 Laptop (9122 - 10925, n=11) | |
| Alienware 16 Area-51 | |
| Asus ROG Strix G18 G814JI | |
| PCMark 10 / Digital Content Creation | |
| Alienware 18 Area-51 | |
| Alienware 16 Area-51 | |
| Przeciętny Intel Core Ultra 9 275HX, NVIDIA GeForce RTX 5090 Laptop (9952 - 19234, n=11) | |
| Alienware m18 R2 | |
| Razer Blade 18 2024 RZ09-0509 | |
| MSI Raider A18 HX A9WIG-080 | |
| Acer Predator Helios 18 PH18-72-98MW | |
| Asus ROG Strix G18 G814JI | |
| CrossMark / Overall | |
| Alienware 18 Area-51 | |
| MSI Raider A18 HX A9WIG-080 | |
| Przeciętny Intel Core Ultra 9 275HX, NVIDIA GeForce RTX 5090 Laptop (1995 - 2339, n=12) | |
| Alienware 16 Area-51 | |
| Alienware m18 R2 | |
| Razer Blade 18 2024 RZ09-0509 | |
| CrossMark / Productivity | |
| Alienware 18 Area-51 | |
| Przeciętny Intel Core Ultra 9 275HX, NVIDIA GeForce RTX 5090 Laptop (1847 - 2211, n=12) | |
| Alienware 16 Area-51 | |
| MSI Raider A18 HX A9WIG-080 | |
| Razer Blade 18 2024 RZ09-0509 | |
| Alienware m18 R2 | |
| CrossMark / Creativity | |
| MSI Raider A18 HX A9WIG-080 | |
| Alienware 18 Area-51 | |
| Przeciętny Intel Core Ultra 9 275HX, NVIDIA GeForce RTX 5090 Laptop (2170 - 2642, n=12) | |
| Alienware 16 Area-51 | |
| Alienware m18 R2 | |
| Razer Blade 18 2024 RZ09-0509 | |
| CrossMark / Responsiveness | |
| Alienware 18 Area-51 | |
| Alienware 16 Area-51 | |
| Przeciętny Intel Core Ultra 9 275HX, NVIDIA GeForce RTX 5090 Laptop (1673 - 2217, n=12) | |
| MSI Raider A18 HX A9WIG-080 | |
| Alienware m18 R2 | |
| Razer Blade 18 2024 RZ09-0509 | |
| WebXPRT 3 / Overall | |
| MSI Raider A18 HX A9WIG-080 | |
| Alienware 18 Area-51 | |
| Alienware 16 Area-51 | |
| Przeciętny Intel Core Ultra 9 275HX, NVIDIA GeForce RTX 5090 Laptop (315 - 372, n=12) | |
| Razer Blade 18 2024 RZ09-0509 | |
| Alienware m18 R2 | |
| Asus ROG Strix G18 G814JI | |
| Asus ROG Strix G18 G814JI | |
| WebXPRT 4 / Overall | |
| Alienware 18 Area-51 | |
| MSI Raider A18 HX A9WIG-080 | |
| Alienware 16 Area-51 | |
| Przeciętny Intel Core Ultra 9 275HX, NVIDIA GeForce RTX 5090 Laptop (301 - 341, n=11) | |
| Alienware m18 R2 | |
| Asus ROG Strix G18 G814JI | |
| Asus ROG Strix G18 G814JI | |
| Mozilla Kraken 1.1 / Total | |
| Asus ROG Strix G18 G814JI | |
| Asus ROG Strix G18 G814JI | |
| Razer Blade 18 2024 RZ09-0509 | |
| Acer Predator Helios 18 PH18-72-98MW | |
| Alienware m18 R2 | |
| Przeciętny Intel Core Ultra 9 275HX, NVIDIA GeForce RTX 5090 Laptop (402 - 424, n=12) | |
| Alienware 16 Area-51 | |
| Alienware 18 Area-51 | |
| MSI Raider A18 HX A9WIG-080 | |
* ... im mniej tym lepiej
| PCMark 10 Score | 9497 pkt. | |
Pomoc | ||
| AIDA64 / Memory Copy | |
| Alienware 18 Area-51 | |
| Alienware 16 Area-51 | |
| Przeciętny Intel Core Ultra 9 275HX (56003 - 94460, n=30) | |
| Alienware m18 R2 | |
| Acer Predator Helios 18 PH18-72-98MW | |
| Razer Blade 18 2024 RZ09-0509 | |
| Asus ROG Strix G18 G814JI | |
| MSI Raider A18 HX A9WIG-080 | |
| AIDA64 / Memory Read | |
| Alienware 18 Area-51 | |
| Alienware 16 Area-51 | |
| Alienware m18 R2 | |
| Acer Predator Helios 18 PH18-72-98MW | |
| Przeciętny Intel Core Ultra 9 275HX (55795 - 97151, n=30) | |
| Razer Blade 18 2024 RZ09-0509 | |
| Asus ROG Strix G18 G814JI | |
| MSI Raider A18 HX A9WIG-080 | |
| AIDA64 / Memory Write | |
| Alienware 18 Area-51 | |
| Alienware 16 Area-51 | |
| Przeciętny Intel Core Ultra 9 275HX (55663 - 116129, n=30) | |
| Alienware m18 R2 | |
| Acer Predator Helios 18 PH18-72-98MW | |
| Razer Blade 18 2024 RZ09-0509 | |
| Asus ROG Strix G18 G814JI | |
| MSI Raider A18 HX A9WIG-080 | |
| AIDA64 / Memory Latency | |
| Alienware 16 Area-51 | |
| Przeciętny Intel Core Ultra 9 275HX (105.8 - 161.6, n=30) | |
| Alienware 18 Area-51 | |
| MSI Raider A18 HX A9WIG-080 | |
| Razer Blade 18 2024 RZ09-0509 | |
| Alienware m18 R2 | |
| Asus ROG Strix G18 G814JI | |
| Acer Predator Helios 18 PH18-72-98MW | |
* ... im mniej tym lepiej
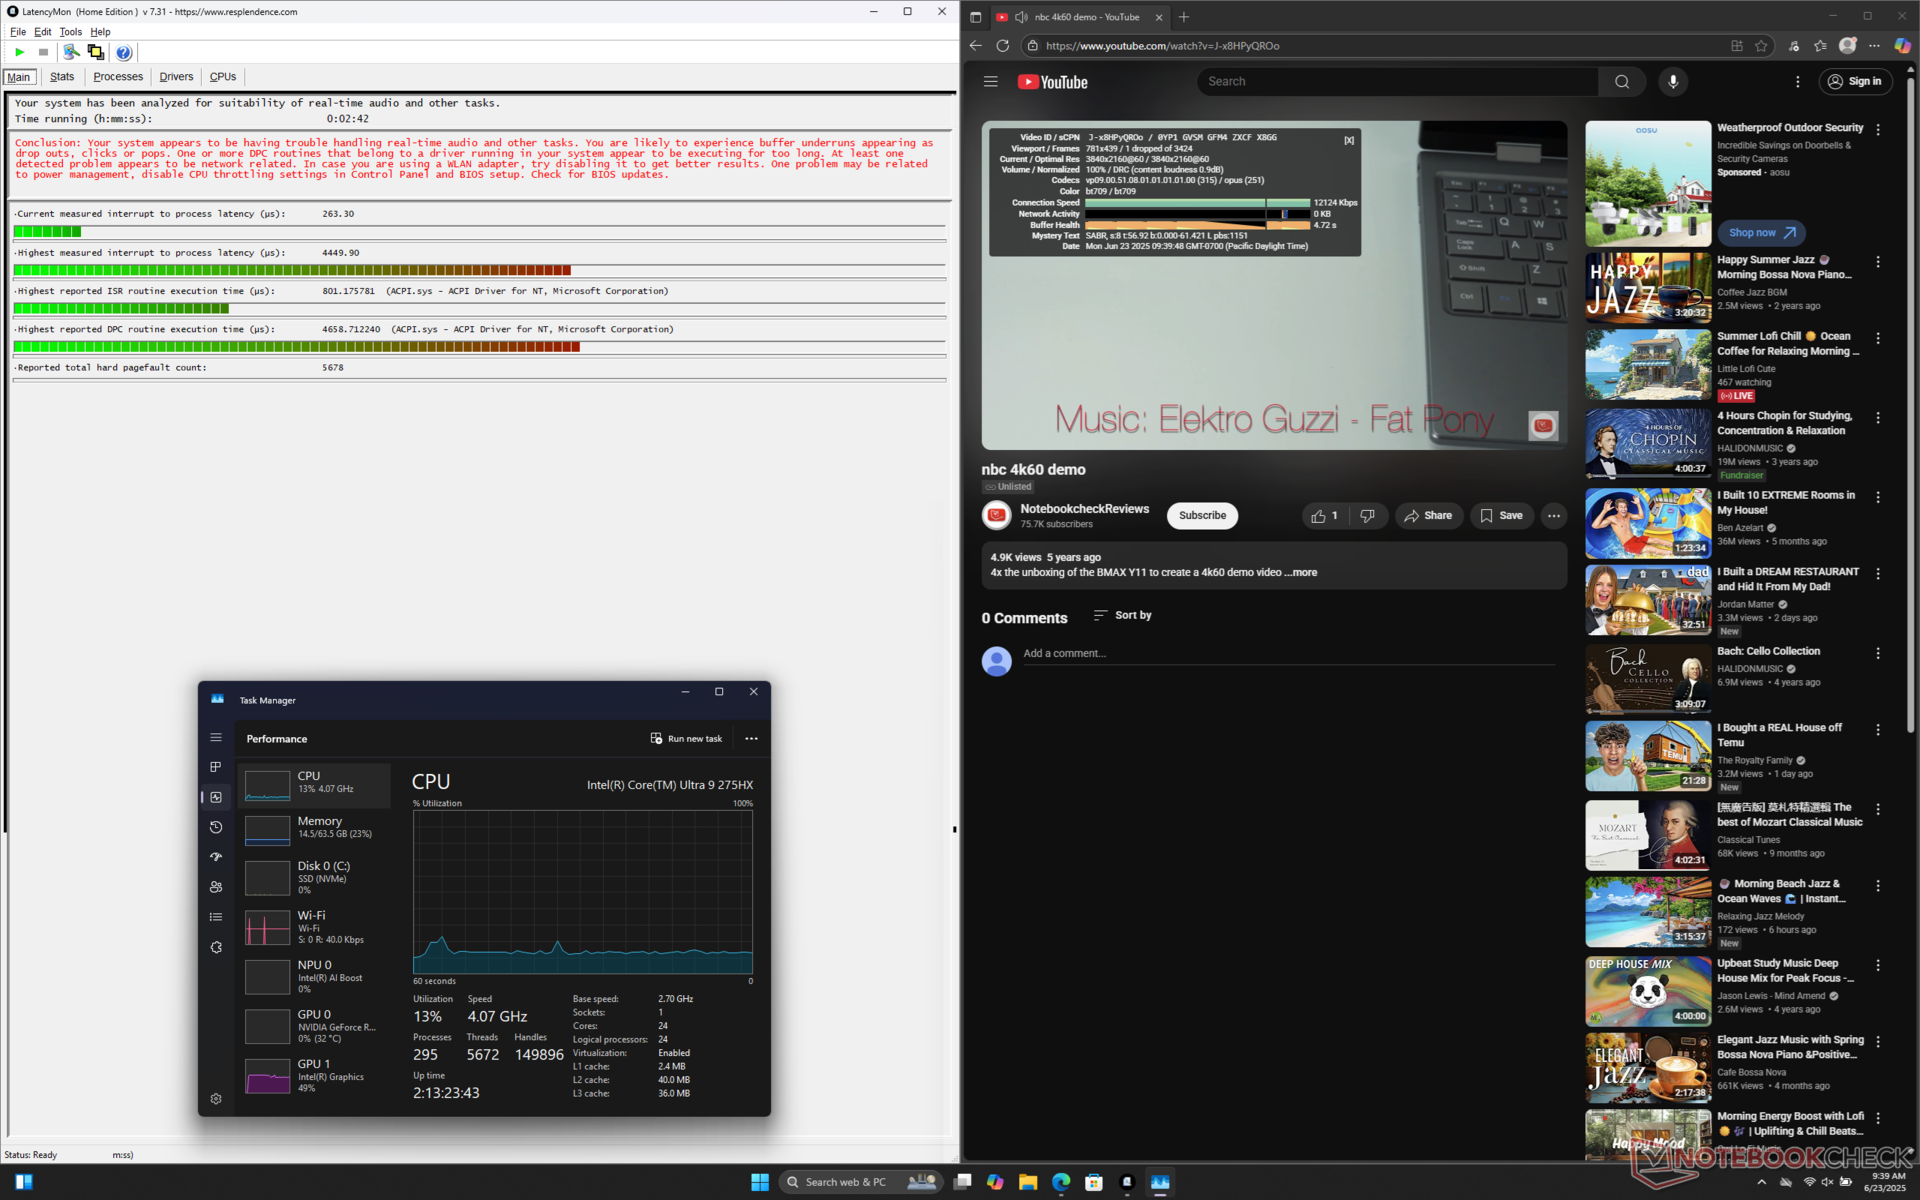
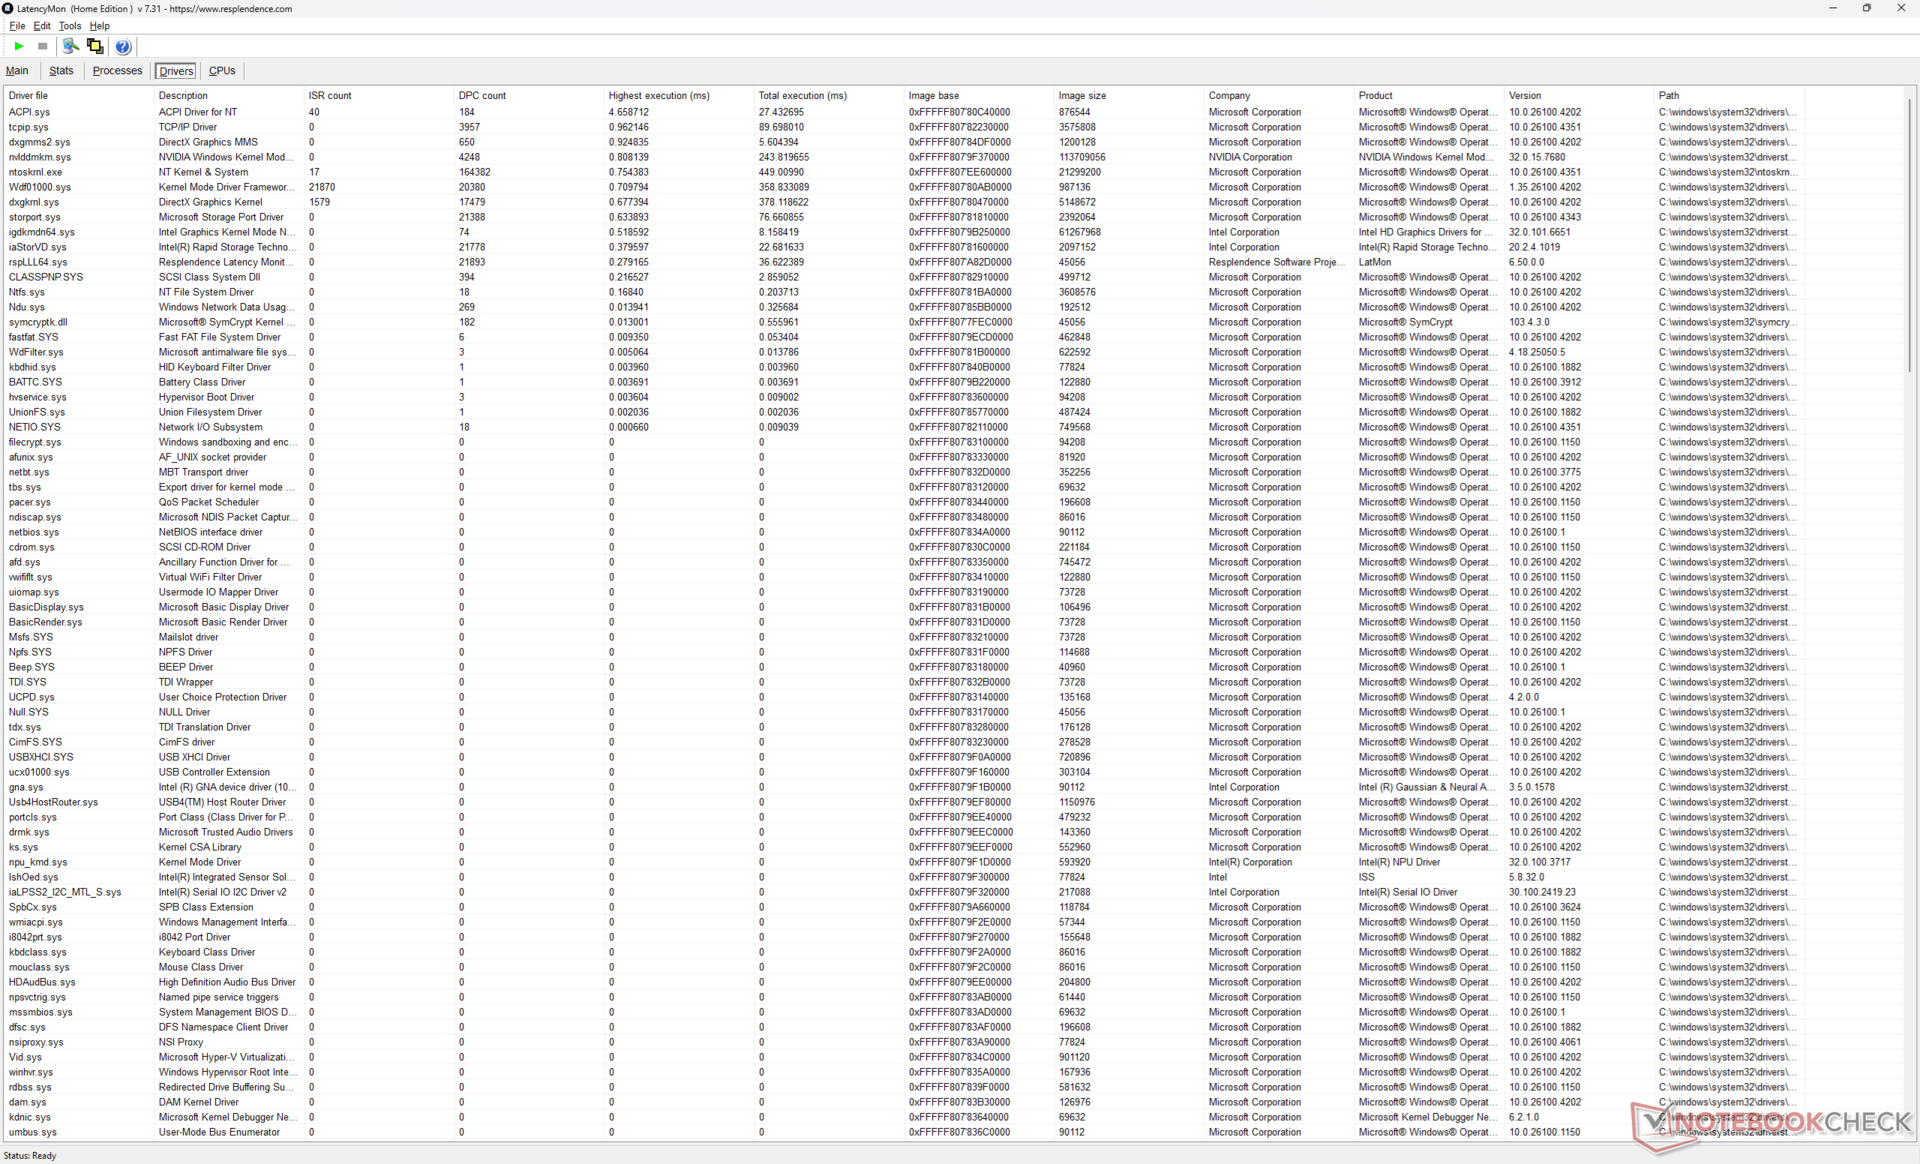
Opóźnienie DPC
LatencyMon ujawnia problemy z DPC, ale poza tym nie ma znaczących spadków klatek podczas odtwarzania treści wideo 4K60.
| DPC Latencies / LatencyMon - interrupt to process latency (max), Web, Youtube, Prime95 | |
| Alienware 18 Area-51 | |
| Alienware 16 Area-51 | |
| Acer Predator Helios 18 PH18-72-98MW | |
| Alienware m18 R2 | |
| Razer Blade 18 2024 RZ09-0509 | |
| Asus ROG Strix G18 G814JI | |
| MSI Raider A18 HX A9WIG-080 | |
* ... im mniej tym lepiej
Urządzenia pamięci masowej
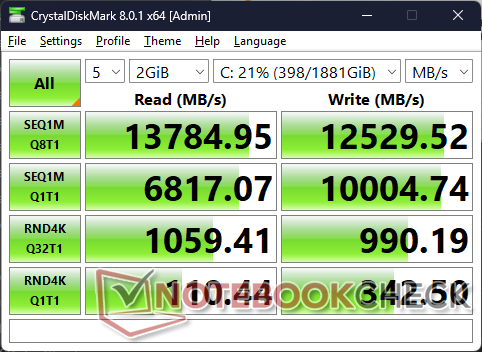
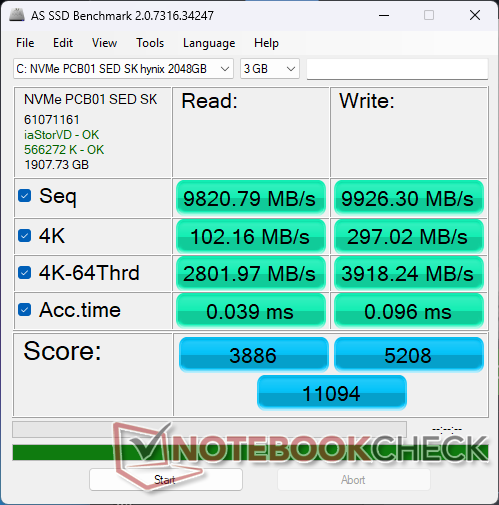
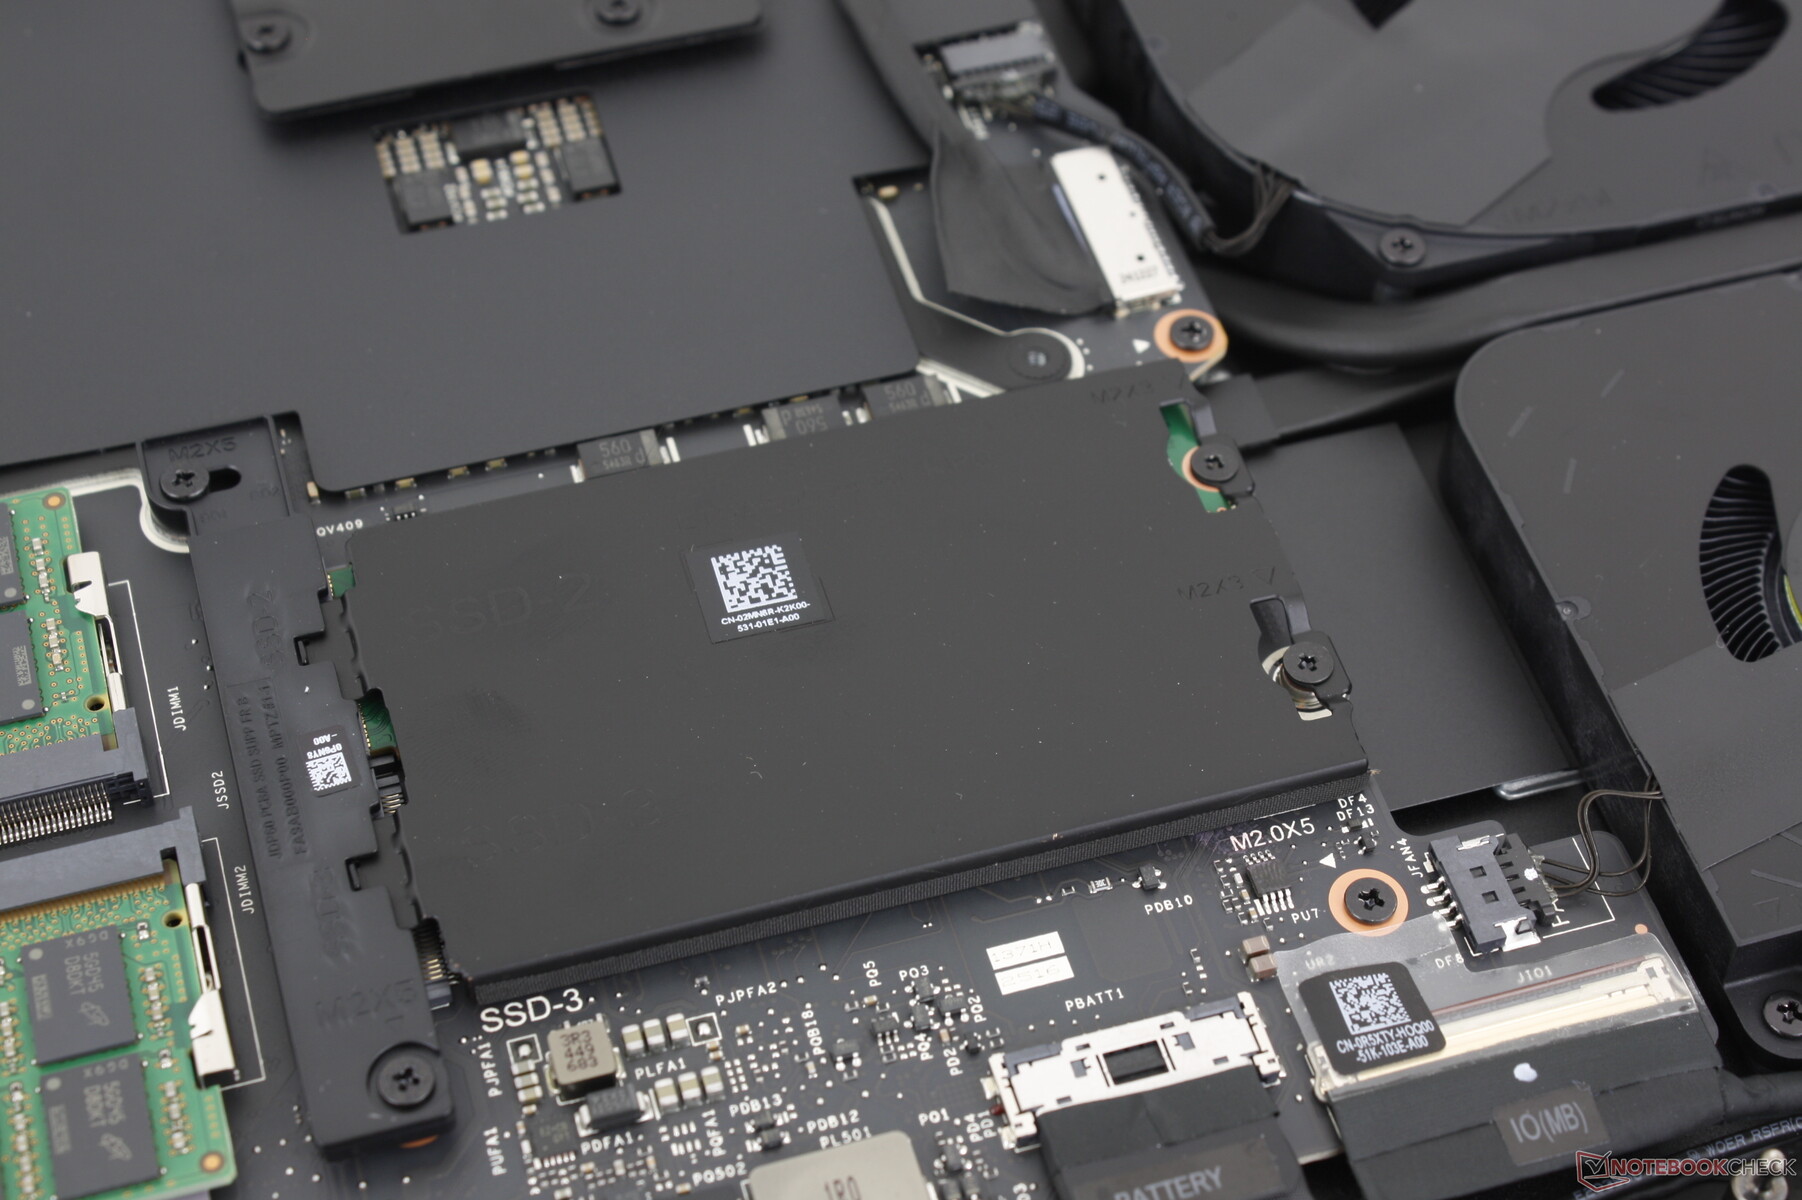
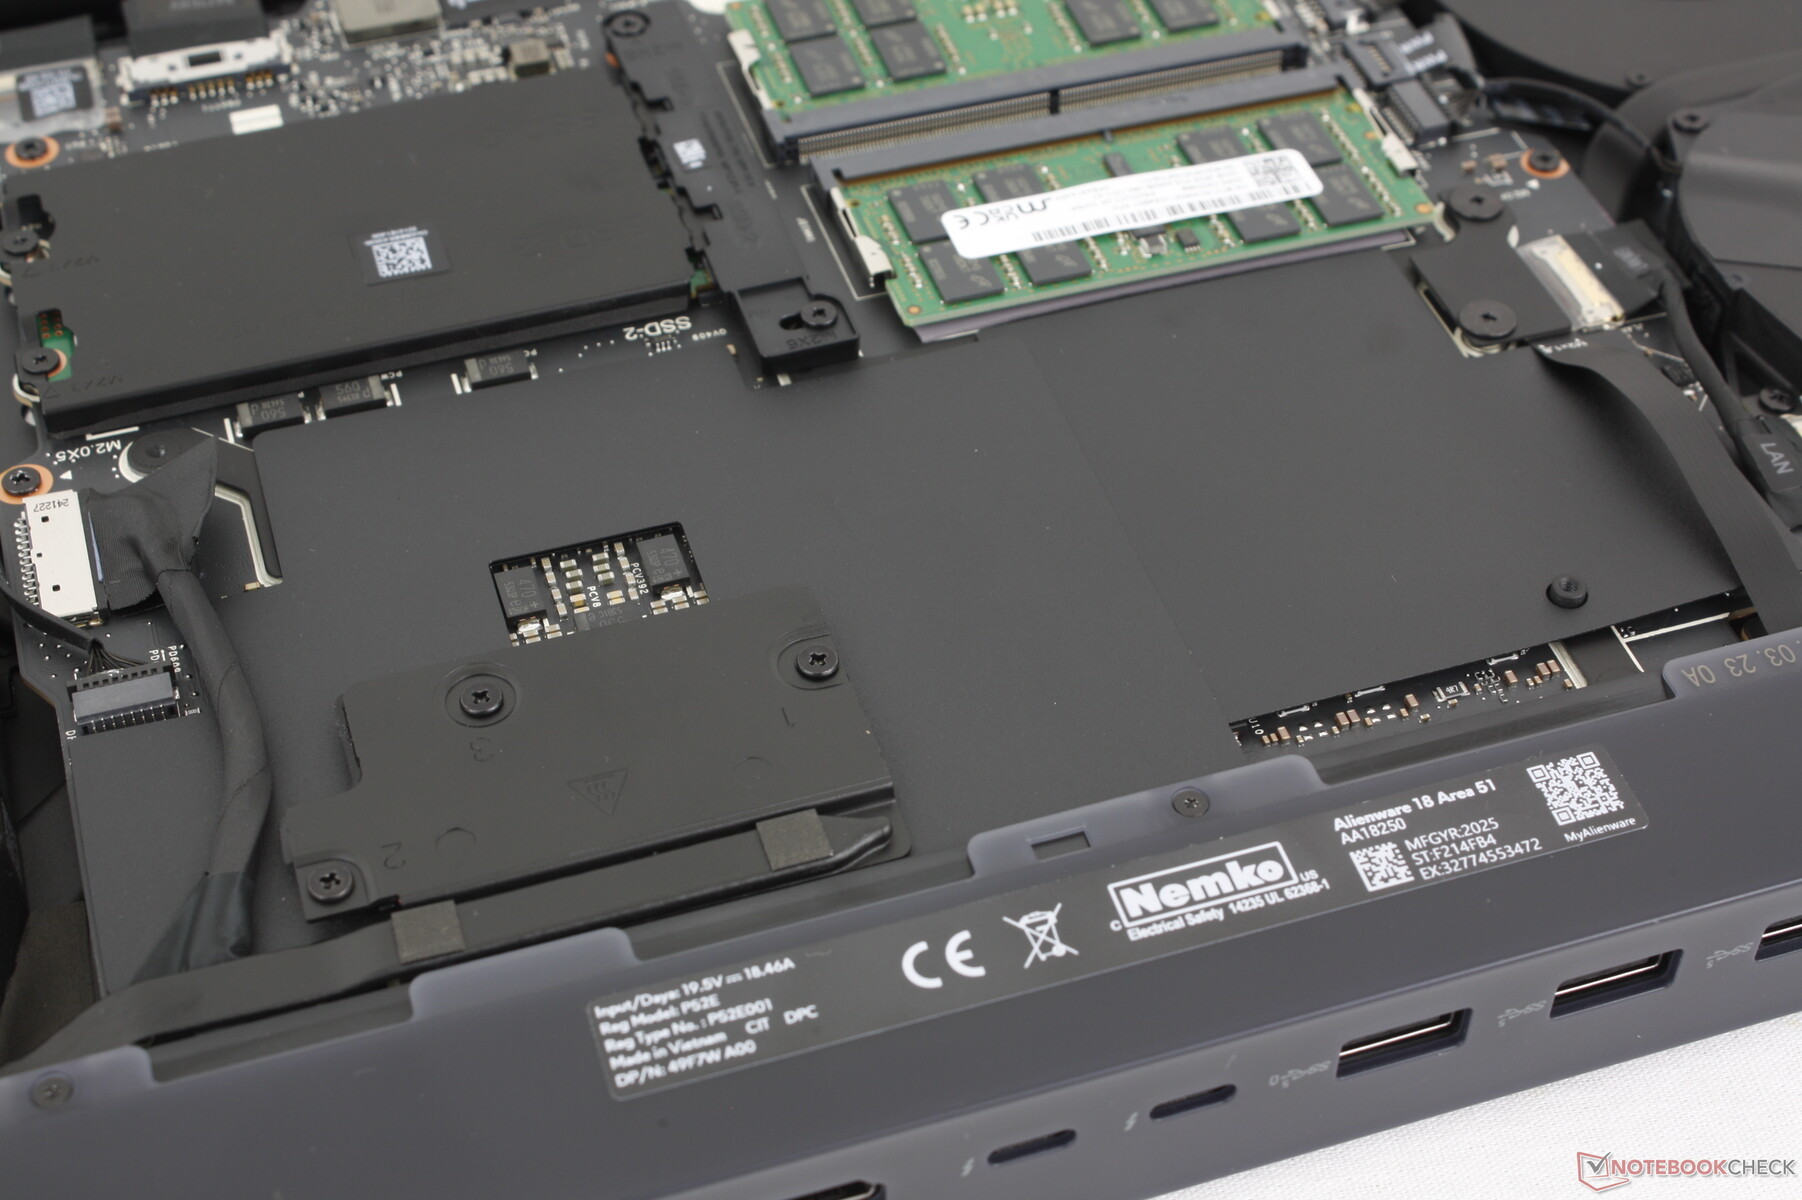
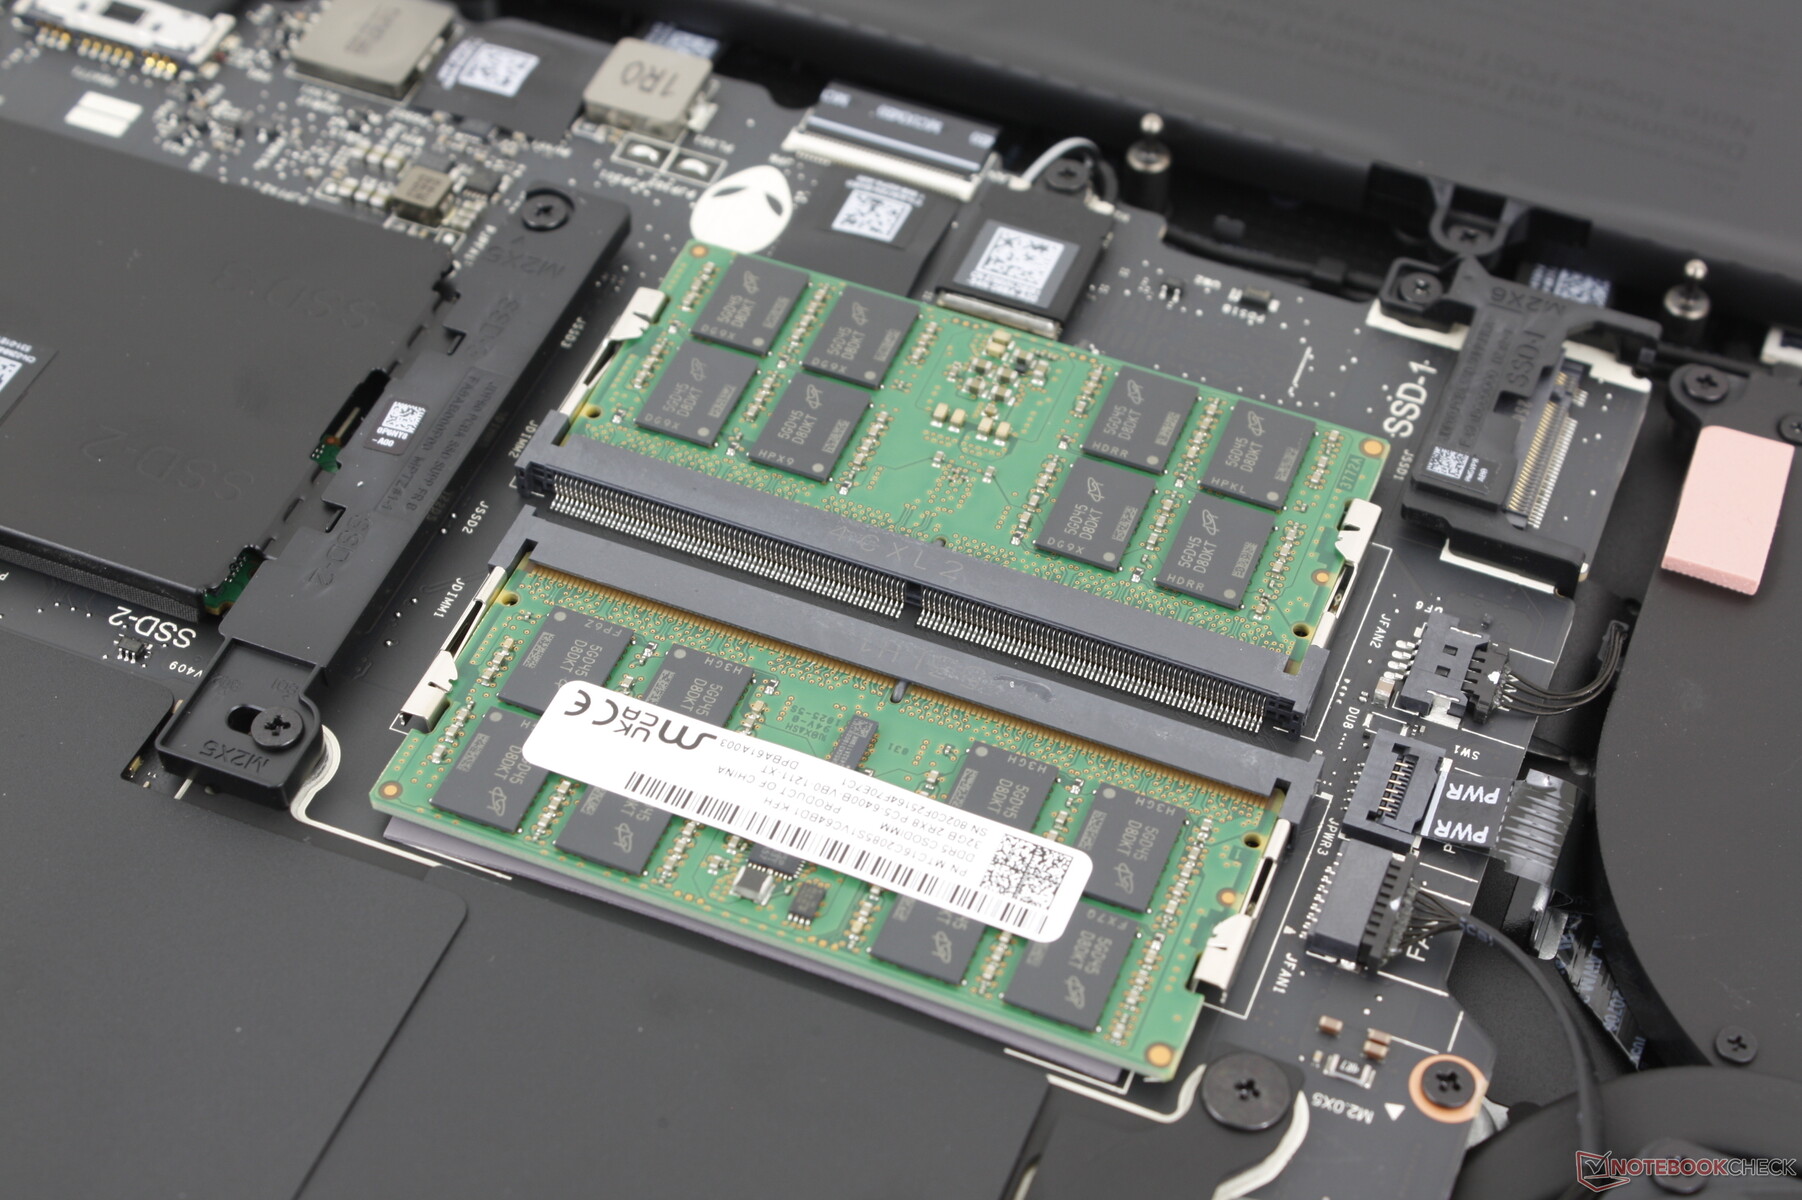
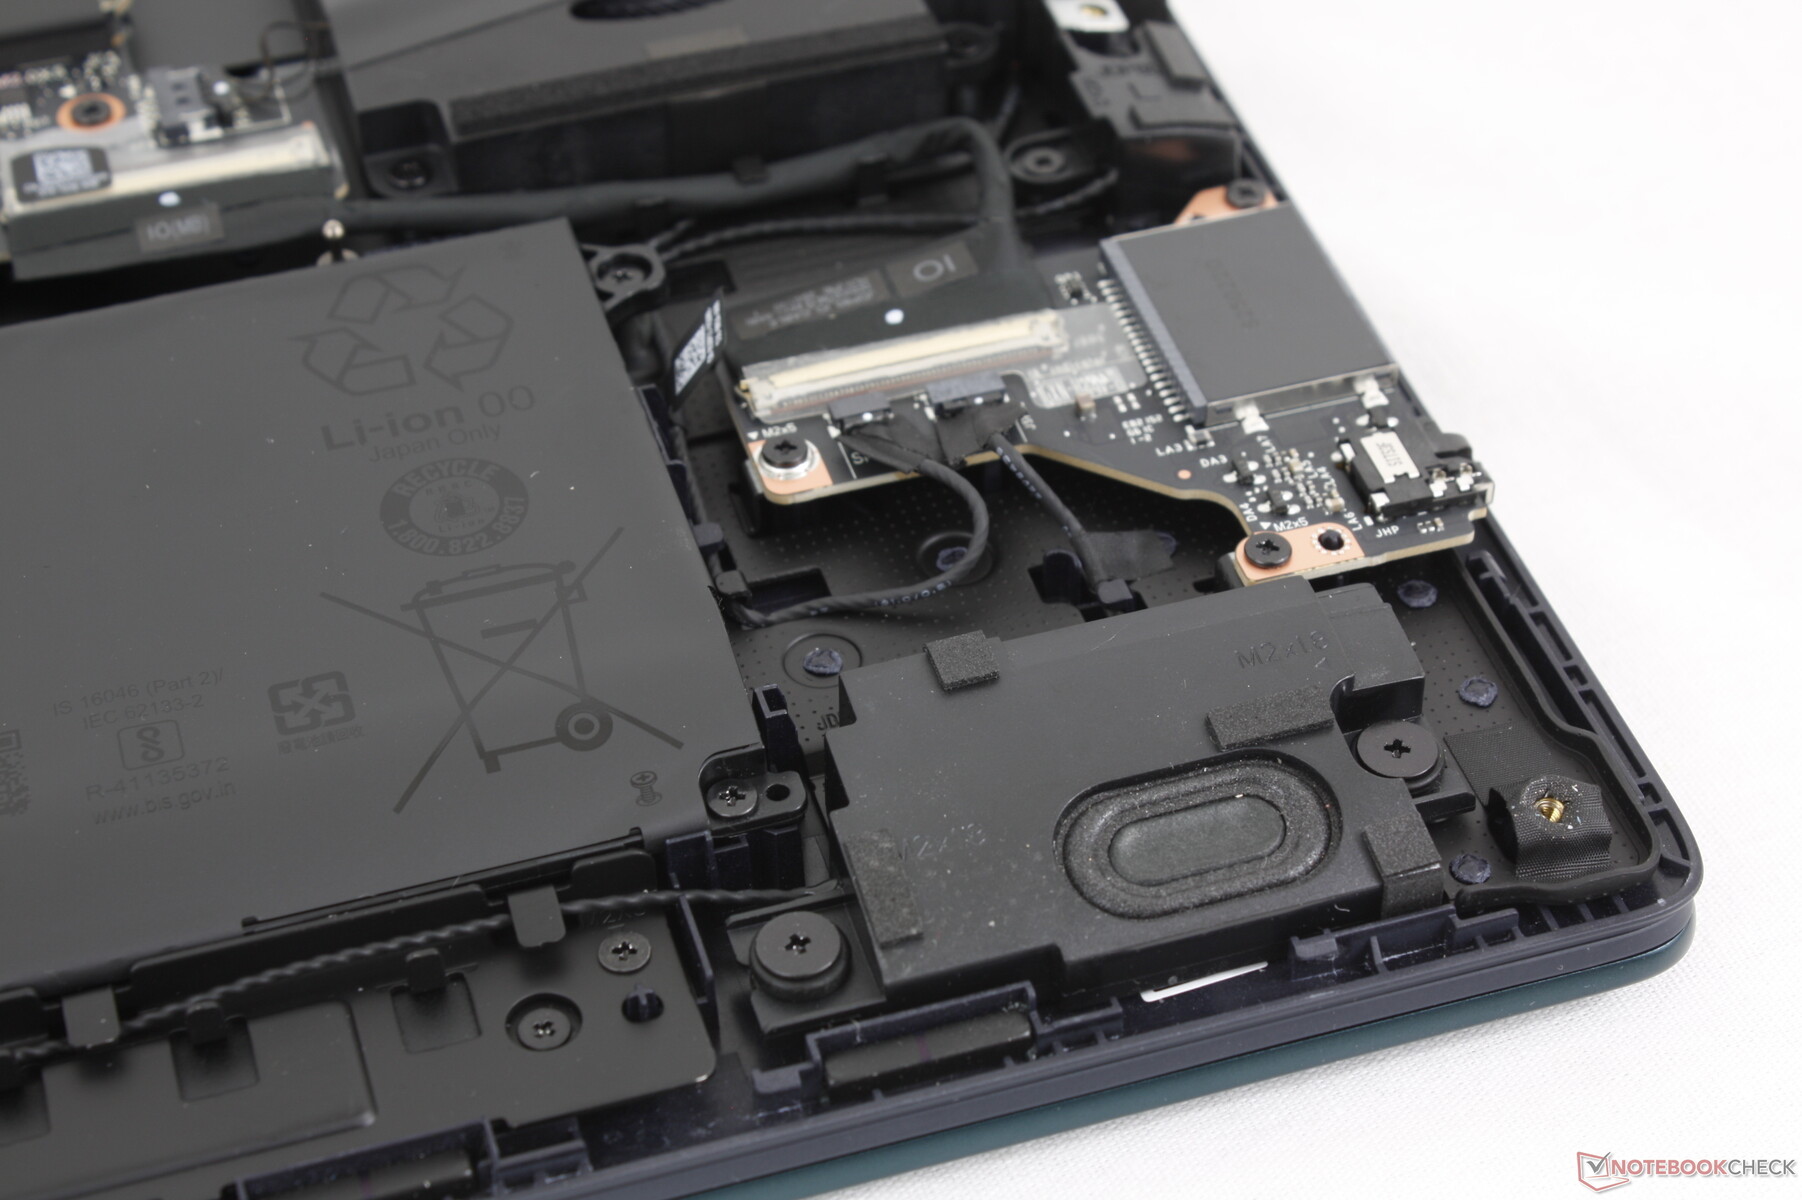
Nasza jednostka testowa jest dostarczana z SK Hynix PCB01 SED PCIe5 NVMe SSD oferującym stabilne prędkości transferu na poziomie ~14000 MB/s, nawet pod obciążeniem, jak pokazują nasze wyniki testu pętli DiskSpd poniżej. Wydajność może być nawet 2x wyższa niż w przypadku dysku SSD PCie4 SK Hynix PC811 w zeszłorocznym Alienware m18 R2. Warto wspomnieć, że dwa sloty PCIe5 M.2 2280 są wyposażone w rozpraszacz ciepła, podczas gdy trzeci slot PCIe4 2280 znajduje się bezpośrednio nad jednym z czterech wentylatorów, jak pokazano na poniższych zdjęciach.
Tylko jedno z trzech gniazd SSD obsługuje PCIe5 w przypadku konfiguracji laptopa z grafiką RTX 5070 Ti lub niższą.


* ... im mniej tym lepiej
Disk Throttling: DiskSpd Read Loop, Queue Depth 8
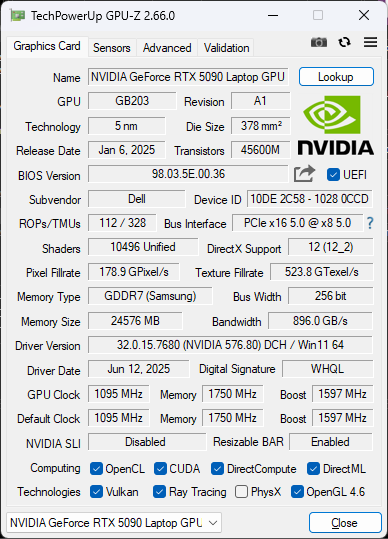
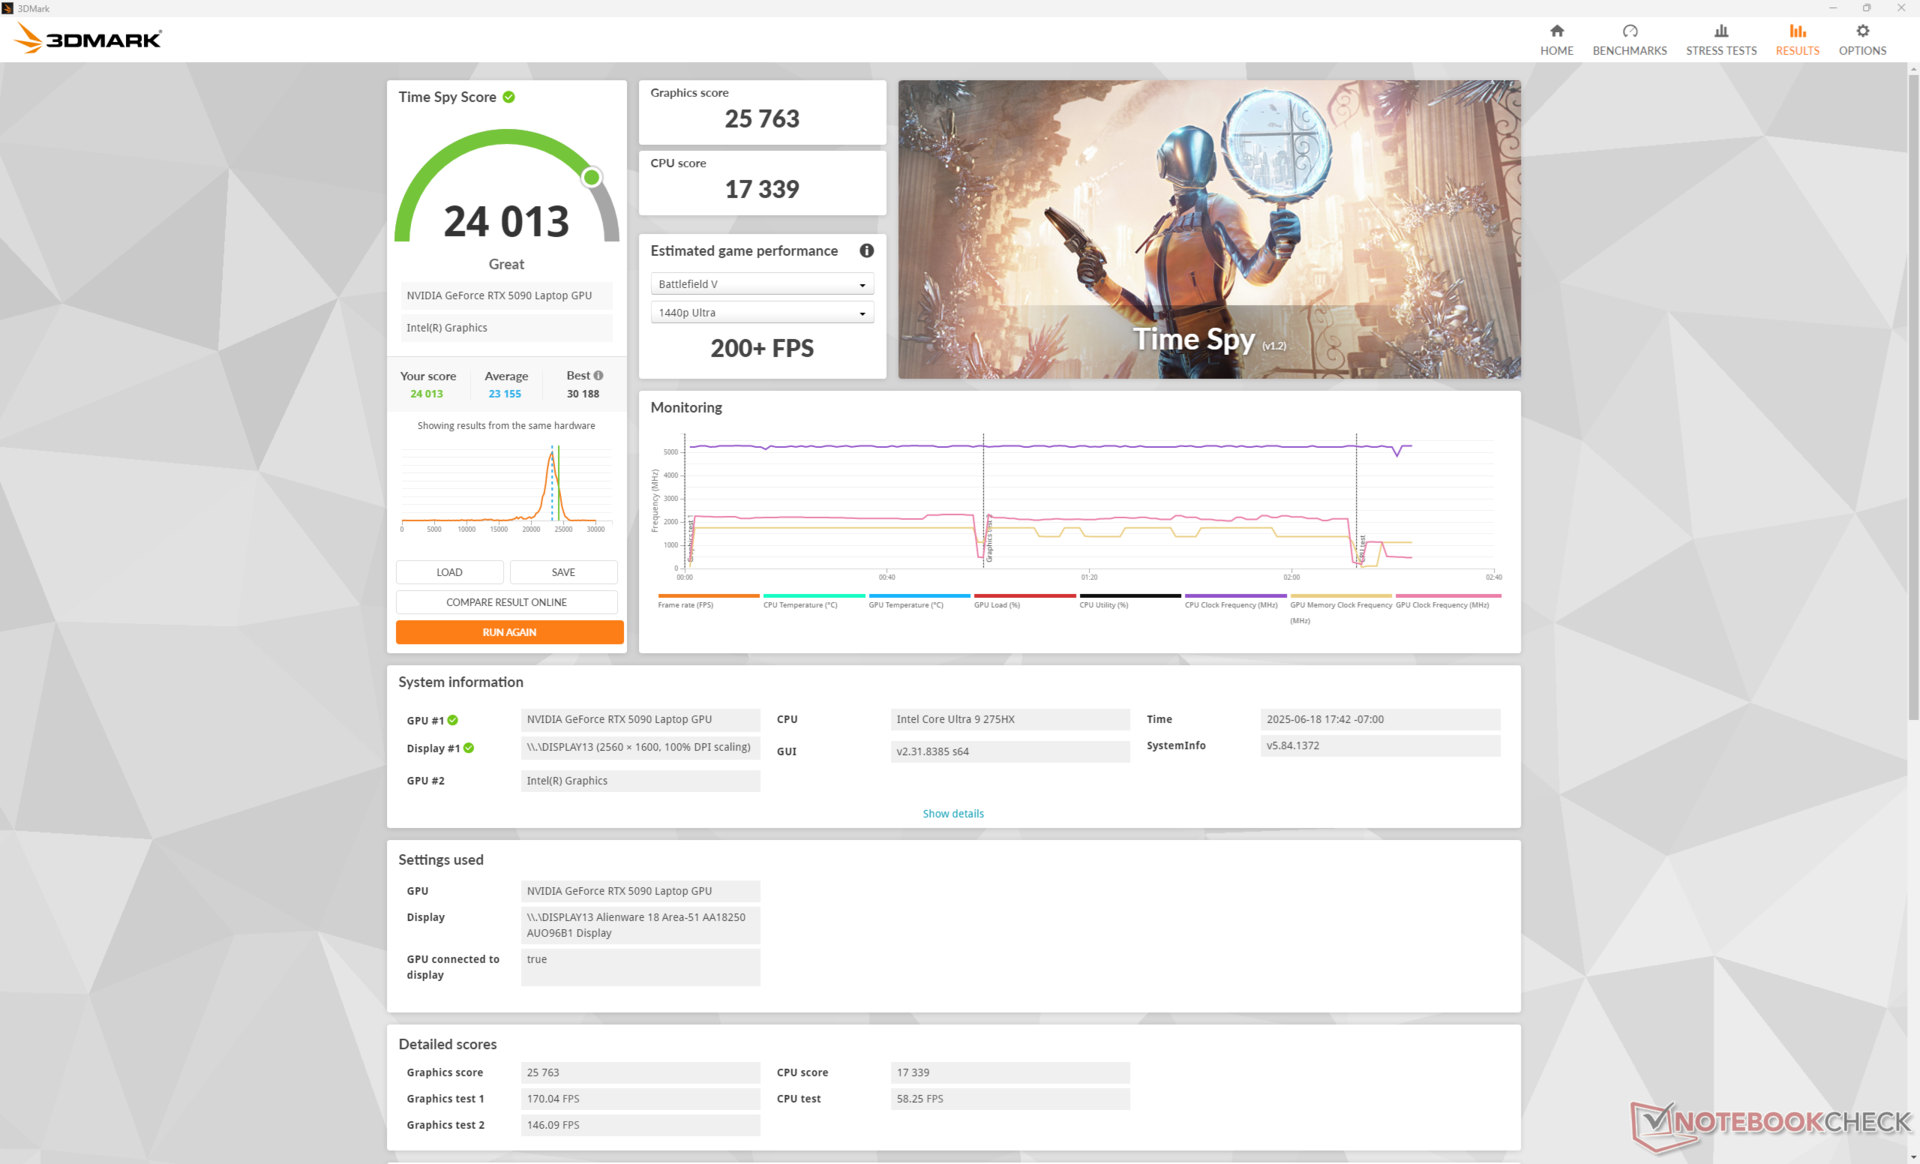
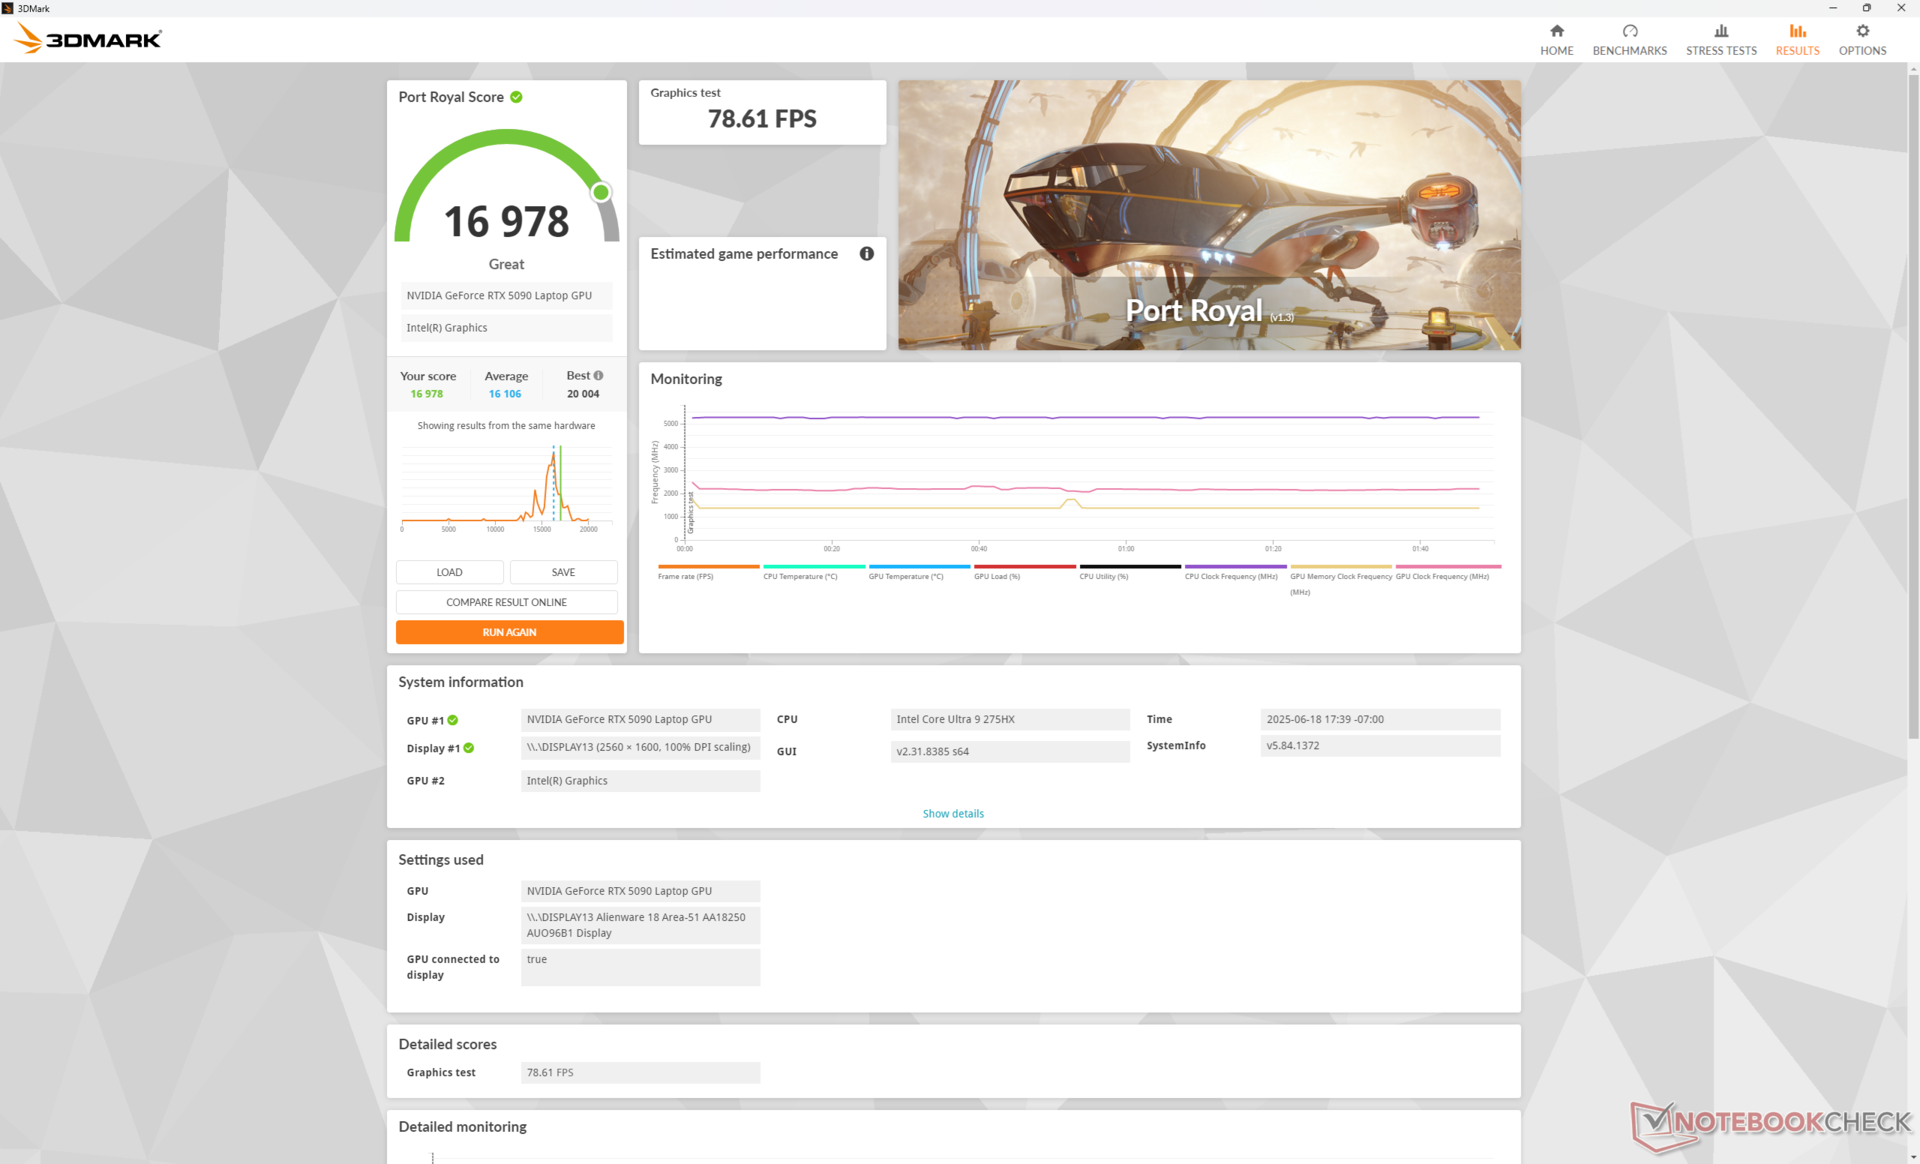
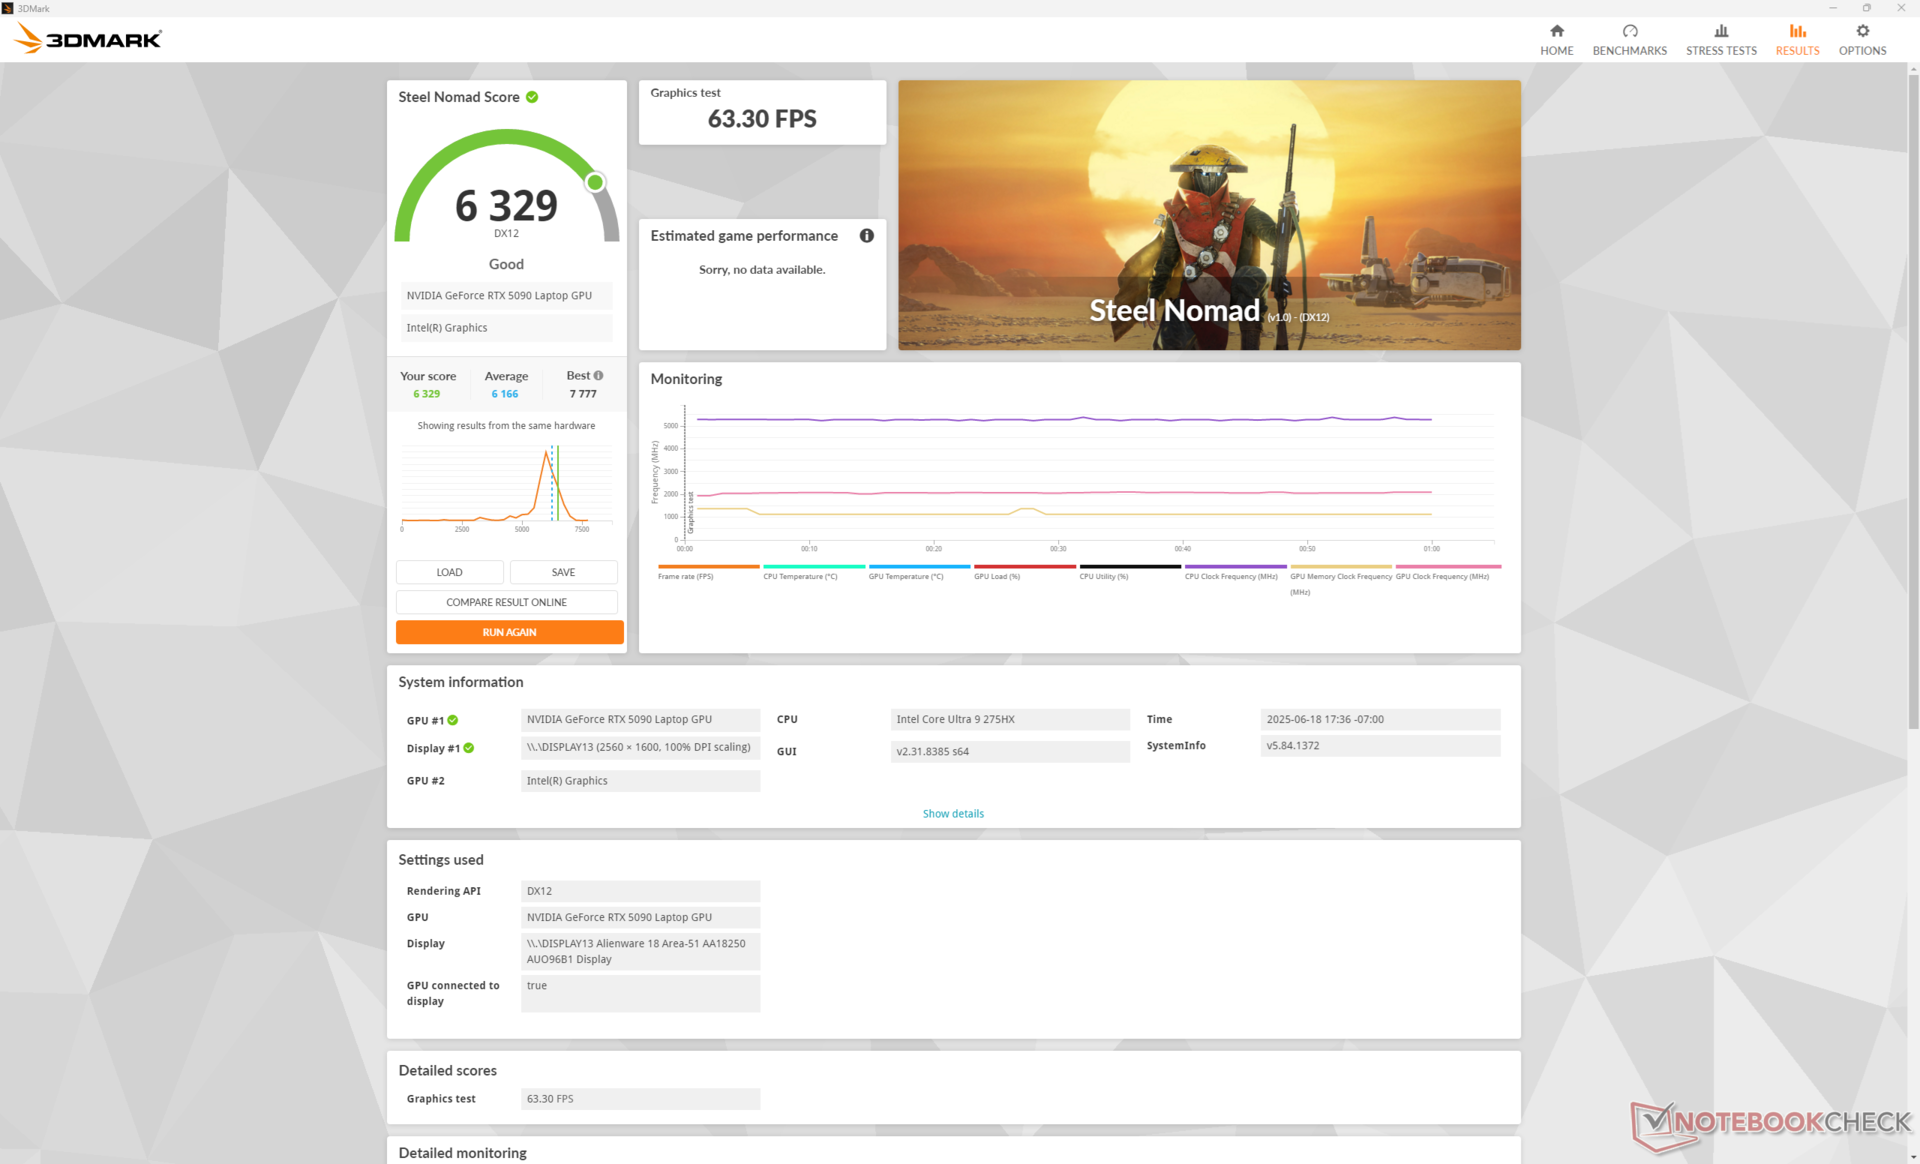
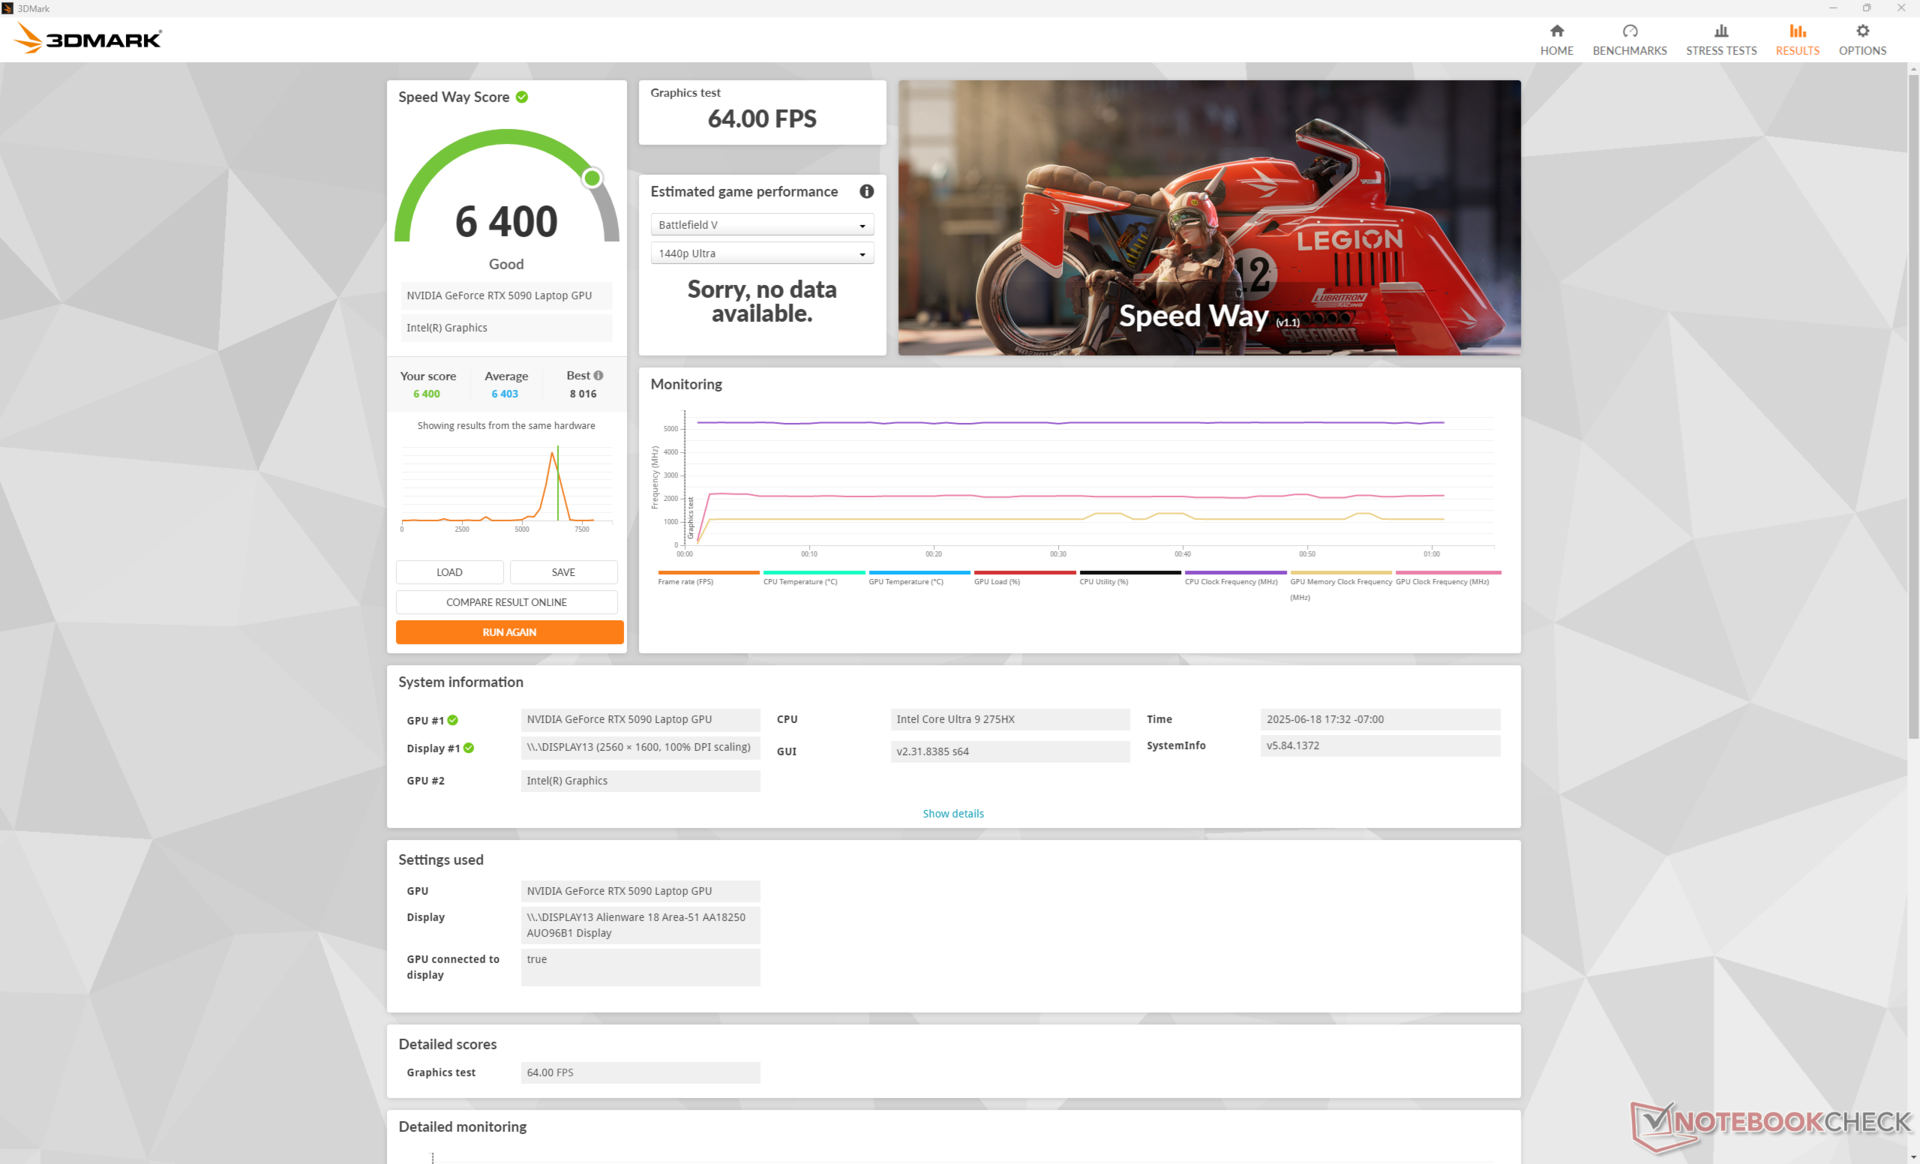
Wydajność GPU
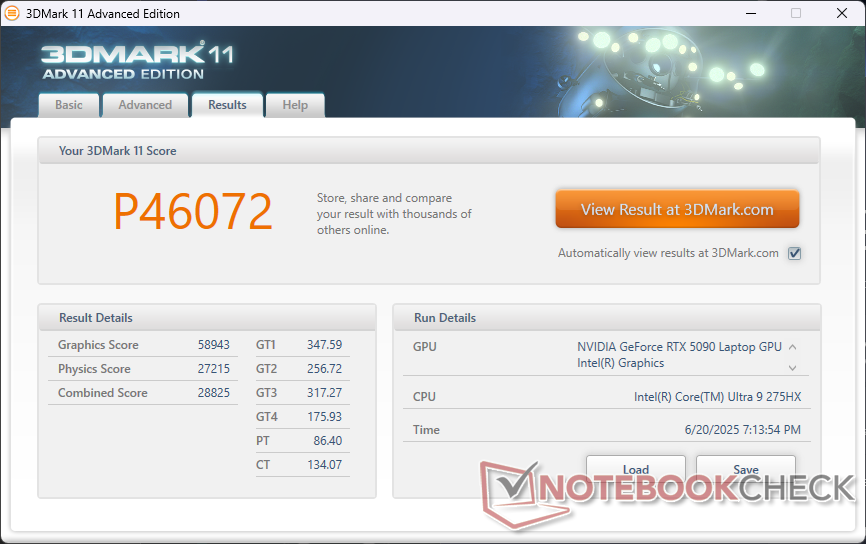
The GeForce RTX 5090 GPU w naszym Alienware 18 działa nieco szybciej niż większość innych laptopów w naszej bazie danych z tą samą grafiką RTX 5090, ponieważ GPU w Alienware może utrzymać wyższe limity mocy bliżej celu 175 W TGP. Mniejszy Asus ROG Strix Scar 16działa na przykład o około 8 procent wolniej niż na Alienware 18.
Spadek do poziomu RTX 5080 lub RTX 5070 Ti oczekuje się, że wydajność grafiki spadnie odpowiednio o około 10 do 15 procent i 30 do 45 procent w porównaniu z naszym systemem RTX 5090.
Praca w trybie Overdrive zapewnia co najwyżej minimalne korzyści w zakresie wydajności w porównaniu z trybem Performance, jak pokazuje poniższa tabela wyników Fire Strike. Wydajność spadłaby znacznie mniej niż oczekiwano, gdybyśmy ustawili tryb zrównoważony.
| Profil zasilania | Wynik grafiki | Wynik fizyki | Wynik łączny |
| Tryb Overdrive | 49289 | 48120 | 13445 |
| Tryb wydajności | 50772 (+3%) | 47552 (-1%) | 13217 (-2%) |
| Tryb zrównoważony | 46380 (-6%) | 48198 (-0%) | 11235 (-16%) |
| Tryb baterii | 33485 (-32%) | 29896 (-38%) | 8165 (-39%) |

| 3DMark Performance rating - Percent | |
| KFA2 GeForce RTX 4090 SG | |
| Alienware 18 Area-51 | |
| MSI Titan 18 HX AI A2XWJG | |
| Przeciętny NVIDIA GeForce RTX 5090 Laptop | |
| MSI Raider A18 HX A9WIG-080 -2! | |
| Alienware m18 R2 | |
| Alienware 16 Area-51 | |
| Razer Blade 18 2024 RZ09-0509 | |
| Acer Predator Helios 18 PH18-72-98MW -2! | |
| MSI Vector 16 HX AI A2XWHG -1! | |
| Alienware m16 R2 | |
| Asus ROG Strix G18 G814JI -1! | |
| Lenovo Legion Slim 7 16APH8 -1! | |
| Asus TUF Gaming A16 FA617 -1! | |
| Lenovo Legion S7 16ARHA7 -1! | |
| 3DMark 11 Performance | 46072 pkt. | |
| 3DMark Fire Strike Score | 39227 pkt. | |
| 3DMark Time Spy Score | 24013 pkt. | |
| 3DMark Steel Nomad Score | 6329 pkt. | |
Pomoc | ||
* ... im mniej tym lepiej
Wydajność w grach
Nasz Alienware 18 uruchamia gry konsekwentnie szybciej niż przeciętny laptop w naszej bazie danych z tym samym procesorem graficznym RTX 5090 o 5 do 15 procent. Wzrost wydajności był w dużej mierze przyrostowy w przestrzeni GPU laptopów, ponieważ Nvidia zamiast tego uczyniła generowanie wielu klatek jednym z kluczowych punktów sprzedaży serii RTX 50 Blackwell. Dla przykładu, nasz system jest w stanie uruchomić grę Alan Wake 2 na maksymalnych ustawieniach 4K RT przy 125 FPS z MFG x4, podczas gdy laptop RTX 4090 ostatniej generacji byłby ograniczony do generowania klatek x2 przy znacznie poniżej połowie średniej liczby klatek na sekundę. Jeśli Państwa ulubione tytuły nie obsługują MFG, takie jak F1 24, to wzrost wydajności w porównaniu do laptopów RTX 40 nie będzie tak znaczący. MFG jest kluczowe dla graczy, którzy chcą wykorzystać szybką częstotliwość odświeżania 300 Hz natywnego panelu.
Cyberpunk 2077 ultra FPS Chart
| low | med. | high | ultra | QHD DLSS | QHD | 4K DLSS | 4K | |
|---|---|---|---|---|---|---|---|---|
| Dota 2 Reborn (2015) | 217 | 193.8 | 188.3 | 171.5 | 165.3 | |||
| Final Fantasy XV Benchmark (2018) | 212 | 183.6 | 109.4 | |||||
| X-Plane 11.11 (2018) | 153.7 | 143.6 | 122.9 | 100.2 | ||||
| Strange Brigade (2018) | 456 | 350 | 185.5 | |||||
| Baldur's Gate 3 (2023) | 236.5 | 237.3 | 174.8 | 149.3 | 94 | |||
| Cyberpunk 2077 (2023) | 179.1 | 166.5 | 136.6 | 120.5 | 55 | |||
| Alan Wake 2 (2023) | 133.2 | 88.1 | 75.4 | 49.3 | ||||
| F1 24 (2024) | 155.4 | 156.3 | 106.4 | 90.6 | 52.2 | |||
| Black Myth: Wukong (2024) | 109 | 65 | 73 | 50 | 52 | 30 | ||
| Indiana Jones and the Great Circle (2024) | 140.3 | 133.7 | 112.6 | 73 | ||||
| Monster Hunter Wilds (2025) | 95.34 | 92.77 | 80.51 | 69.17 | 50.77 | |||
| Assassin's Creed Shadows (2025) | 75 | 76 | 64 | 61 | 46 | |||
| Battlefield 6 (2025) | 159.4 | 143.4 | 109.3 | 83.6 | 59.4 |
Emisje
Hałas systemowy
Hałas wentylatora oscyluje wokół 31 dB(A) podczas pracy z niewymagającymi obciążeniami, takimi jak przeglądarki lub strumieniowanie wideo. Hałas wzrasta dopiero po wprowadzeniu bardziej wymagających obciążeń, aby ograniczyć pulsowanie do minimum. Hałas jest zawsze słyszalny, ale generalnie nie rozprasza podczas grania.
Hałas wentylatora podczas grania ustabilizowałby się na poziomie 45,9 dB(A), 48,9 dB(A) i 55,9 dB(A), odpowiednio w trybie zrównoważonym, trybie wydajności i trybie Overdrive. Różnica w hałasie między trybami Performance i Overdrive jest znacząca, zwłaszcza w porównaniu do niewielkiego wzrostu wydajności, jaki zapewnia tryb Overdrive. W trybie wydajności hałas wentylatora jest o kilka decybeli cichszy niż w zeszłorocznym Alienware m18 R2 Alienware m18 R2.
Hałas
| luz |
| 30.2 / 30.6 / 30.6 dB |
| obciążenie |
| 38 / 55.9 dB |
 | ||
30 dB cichy 40 dB(A) słyszalny 50 dB(A) irytujący |
||
min: | ||
| Alienware 18 Area-51 GeForce RTX 5090 Laptop, Ultra 9 275HX | Alienware 16 Area-51 GeForce RTX 5080 Laptop, Ultra 9 275HX, Samsung PM9C1a MZ9L81T0HDLB | Alienware m18 R2 GeForce RTX 4090 Laptop GPU, i9-14900HX, SK Hynix PC811 HFS002TEM9X152N | MSI Raider A18 HX A9WIG-080 GeForce RTX 5080 Laptop, R9 9955HX3D, Samsung PM9E1 MZVLC2T0HBLD | Razer Blade 18 2024 RZ09-0509 GeForce RTX 4090 Laptop GPU, i9-14900HX | Asus ROG Strix G18 G814JI GeForce RTX 4070 Laptop GPU, i7-13650HX, Micron 2400 MTFDKBA1T0QFM | Acer Predator Helios 18 PH18-72-98MW GeForce RTX 4090 Laptop GPU, i9-14900HX, 2x SK Hynix HFS001TEJ9X115N (RAID 0) | |
|---|---|---|---|---|---|---|---|
| Noise | 7% | 8% | -1% | 5% | 5% | -14% | |
| wyłączone / środowisko * (dB) | 23.4 | 23.6 -1% | 23.6 -1% | 25.1 -7% | 23.4 -0% | 25 -7% | 25 -7% |
| Idle Minimum * (dB) | 30.2 | 25.4 16% | 23.8 21% | 28.6 5% | 23.9 21% | 26 14% | 30 1% |
| Idle Average * (dB) | 30.6 | 27.8 9% | 26.1 15% | 28.9 6% | 28.2 8% | 28 8% | 36 -18% |
| Idle Maximum * (dB) | 30.6 | 28.1 8% | 31.5 -3% | 29.2 5% | 29 5% | 29 5% | 44 -44% |
| Load Average * (dB) | 38 | 28.8 24% | 31.5 17% | 45.6 -20% | 36.8 3% | 41 -8% | 48 -26% |
| Cyberpunk 2077 ultra * (dB) | 48.9 | 50.4 -3% | 55.6 -14% | ||||
| Load Maximum * (dB) | 55.9 | 56.4 -1% | 56.6 -1% | 45.8 18% | 61.1 -9% | 46 18% | 51 9% |
| Witcher 3 ultra * (dB) | 52.1 | 54.1 | 44 | 49 |
* ... im mniej tym lepiej
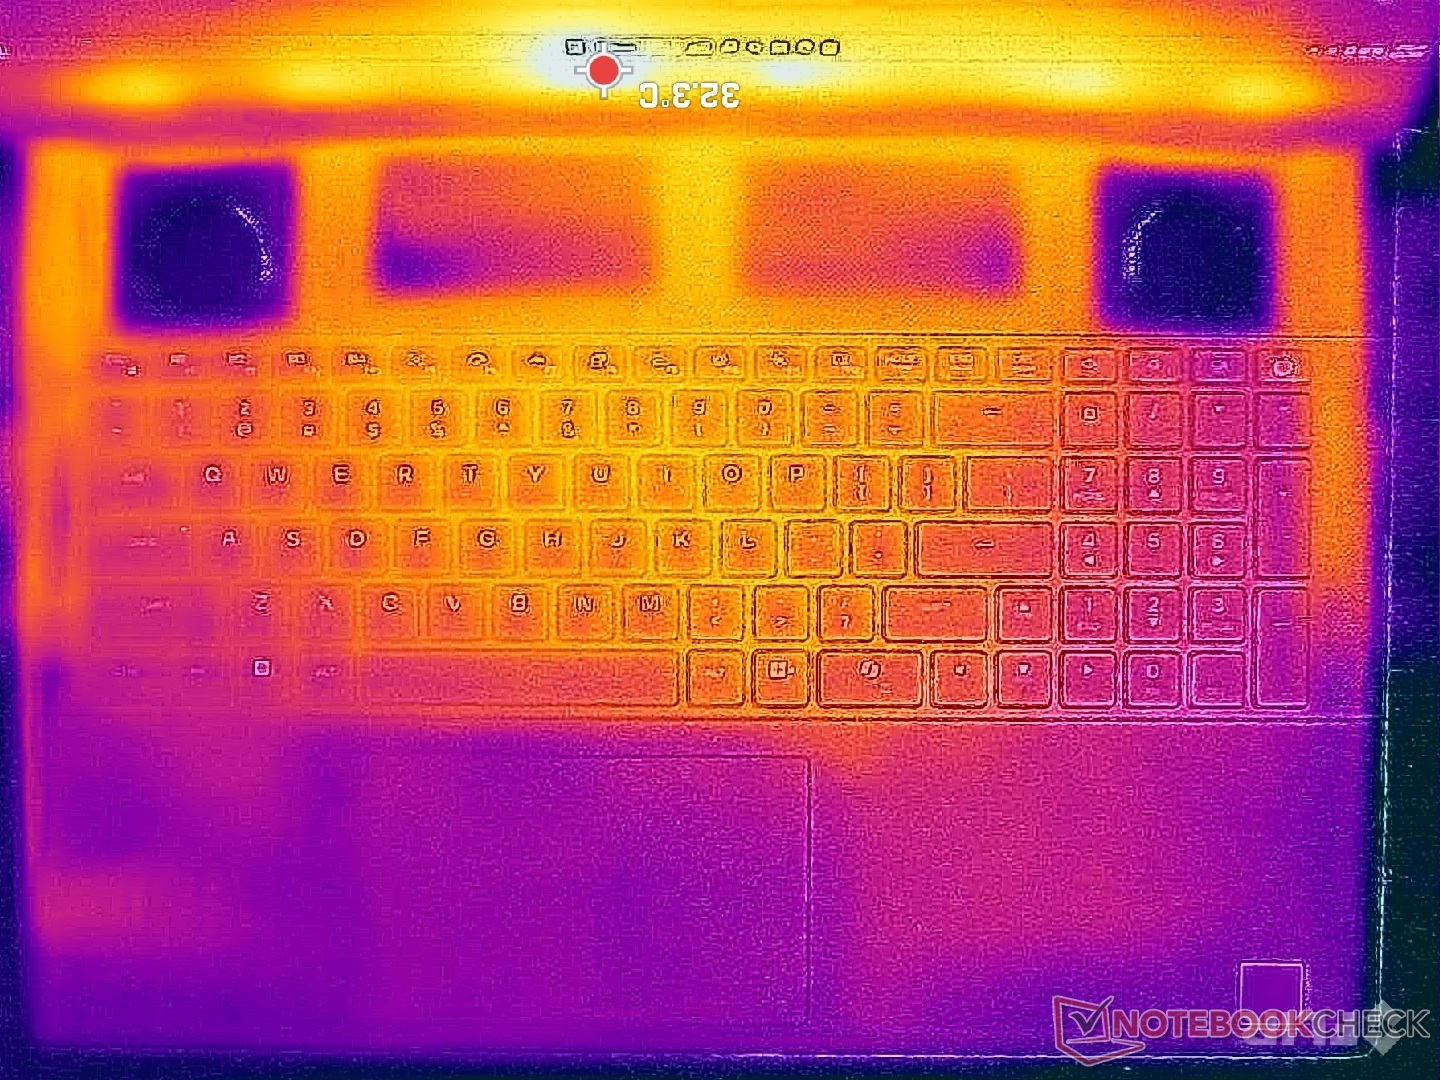
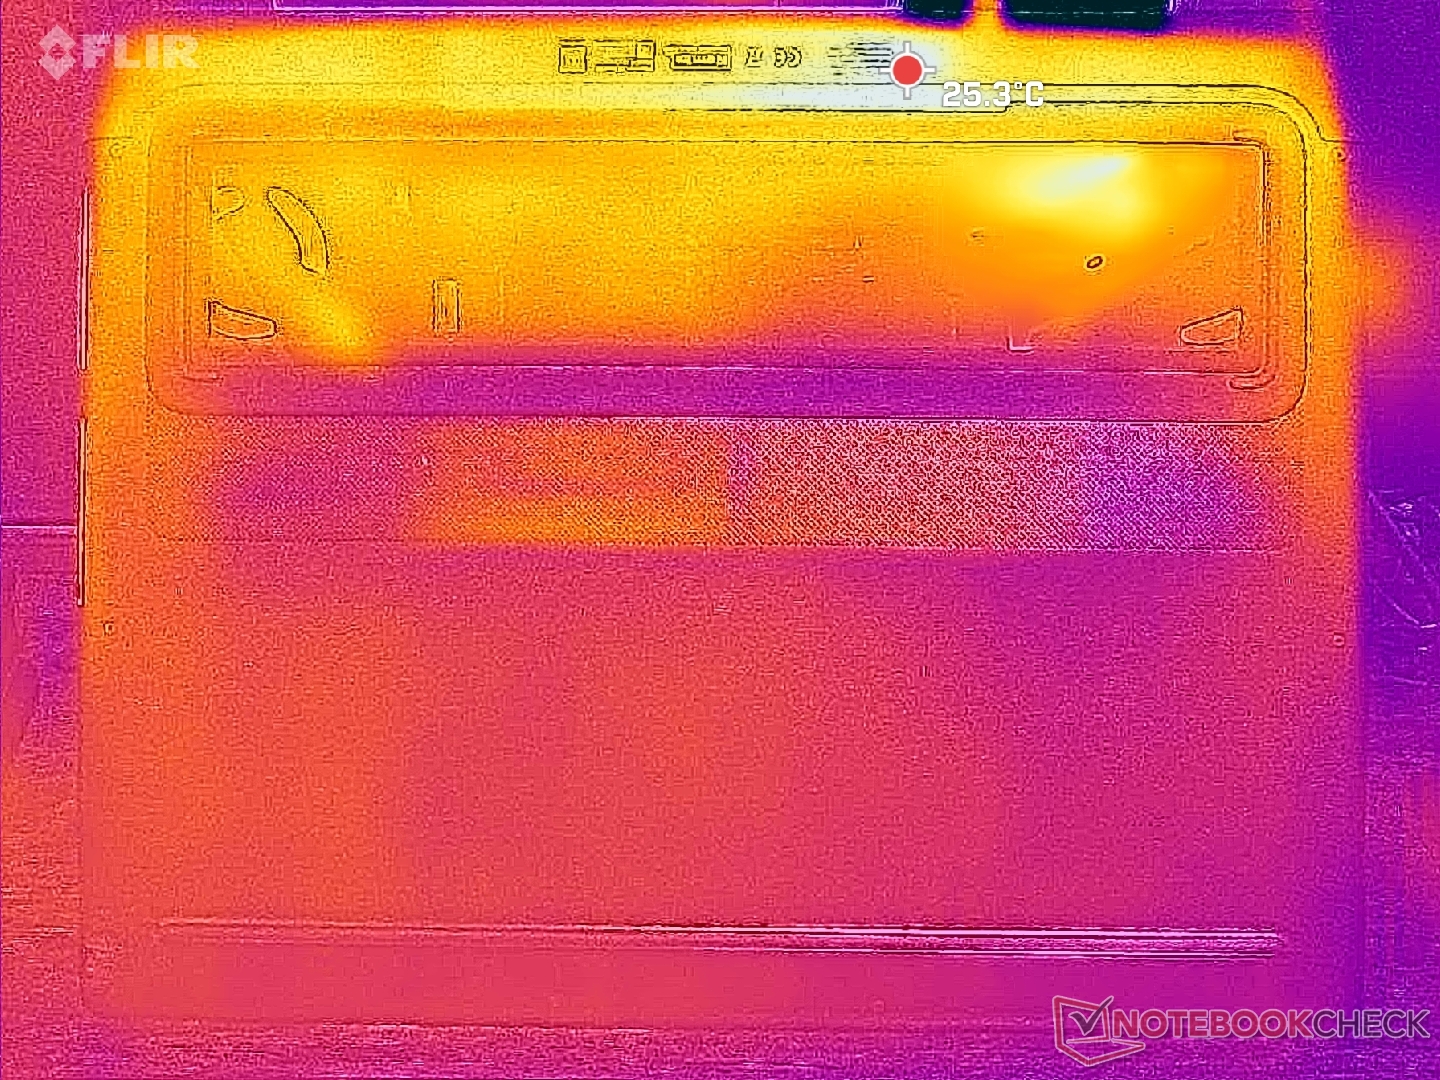
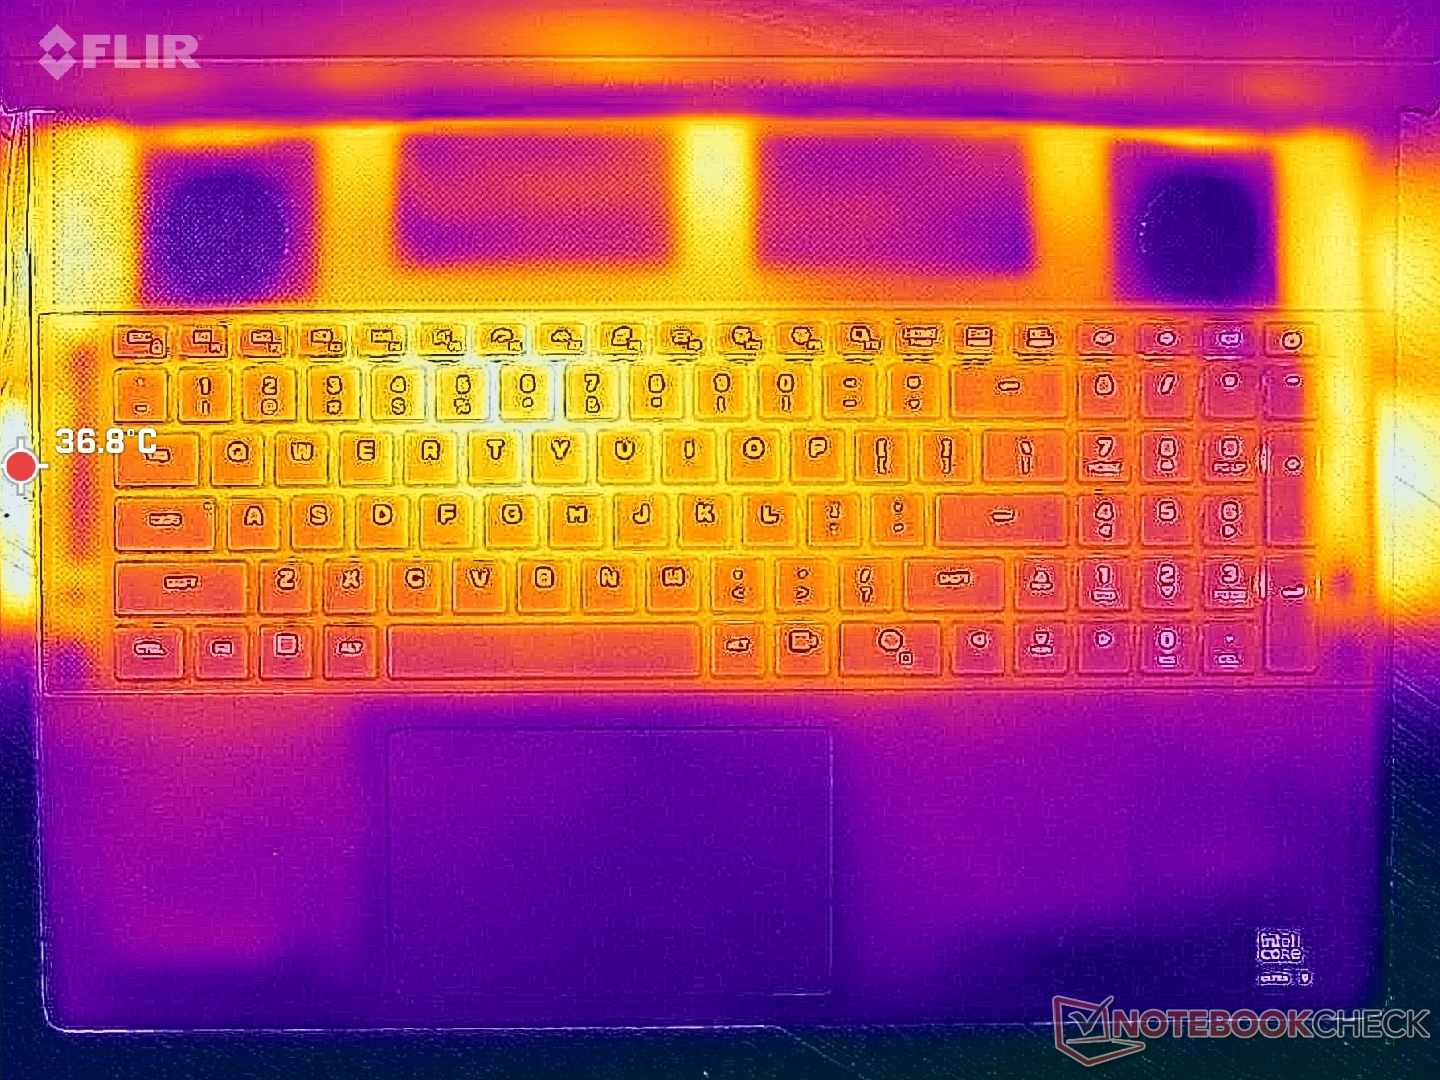
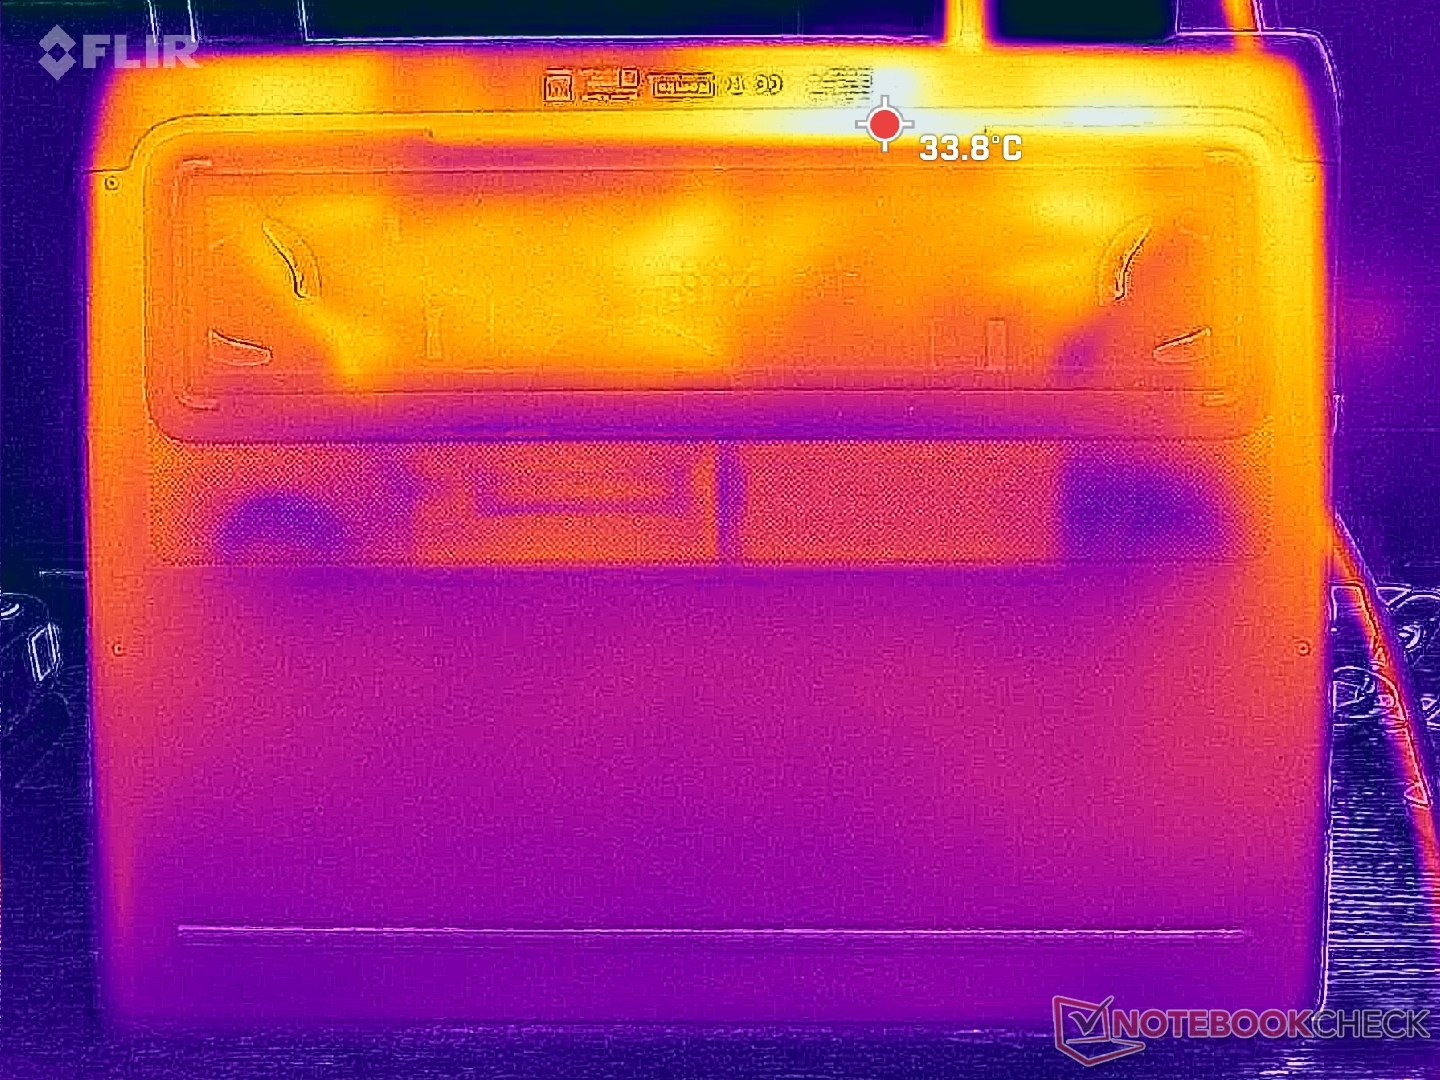
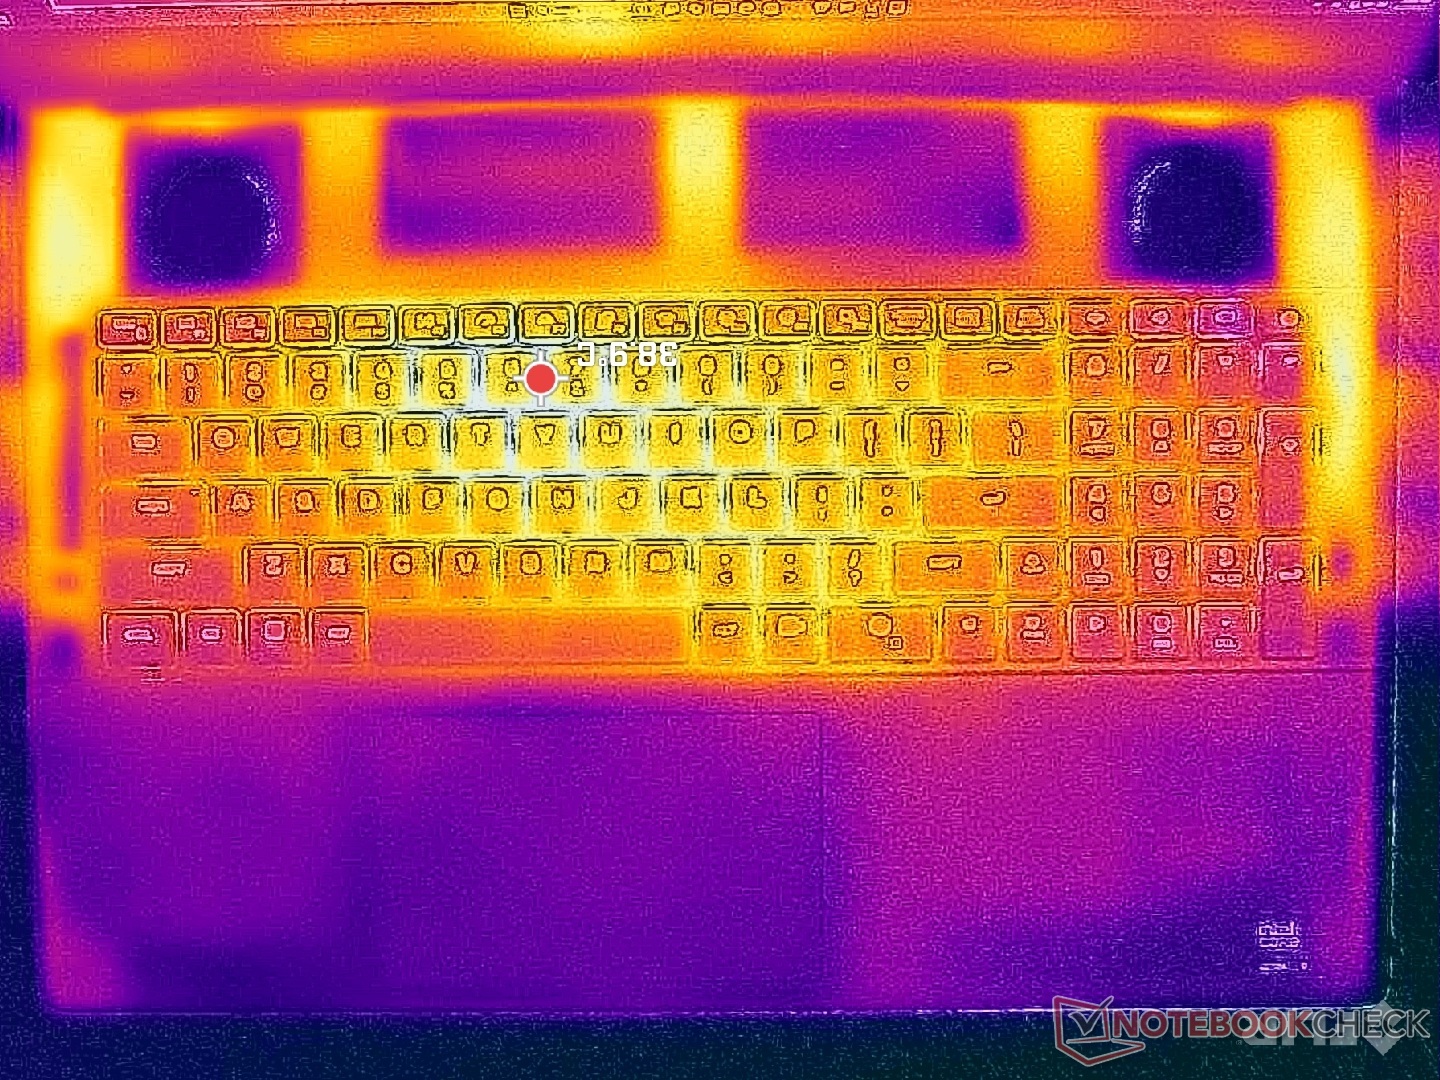
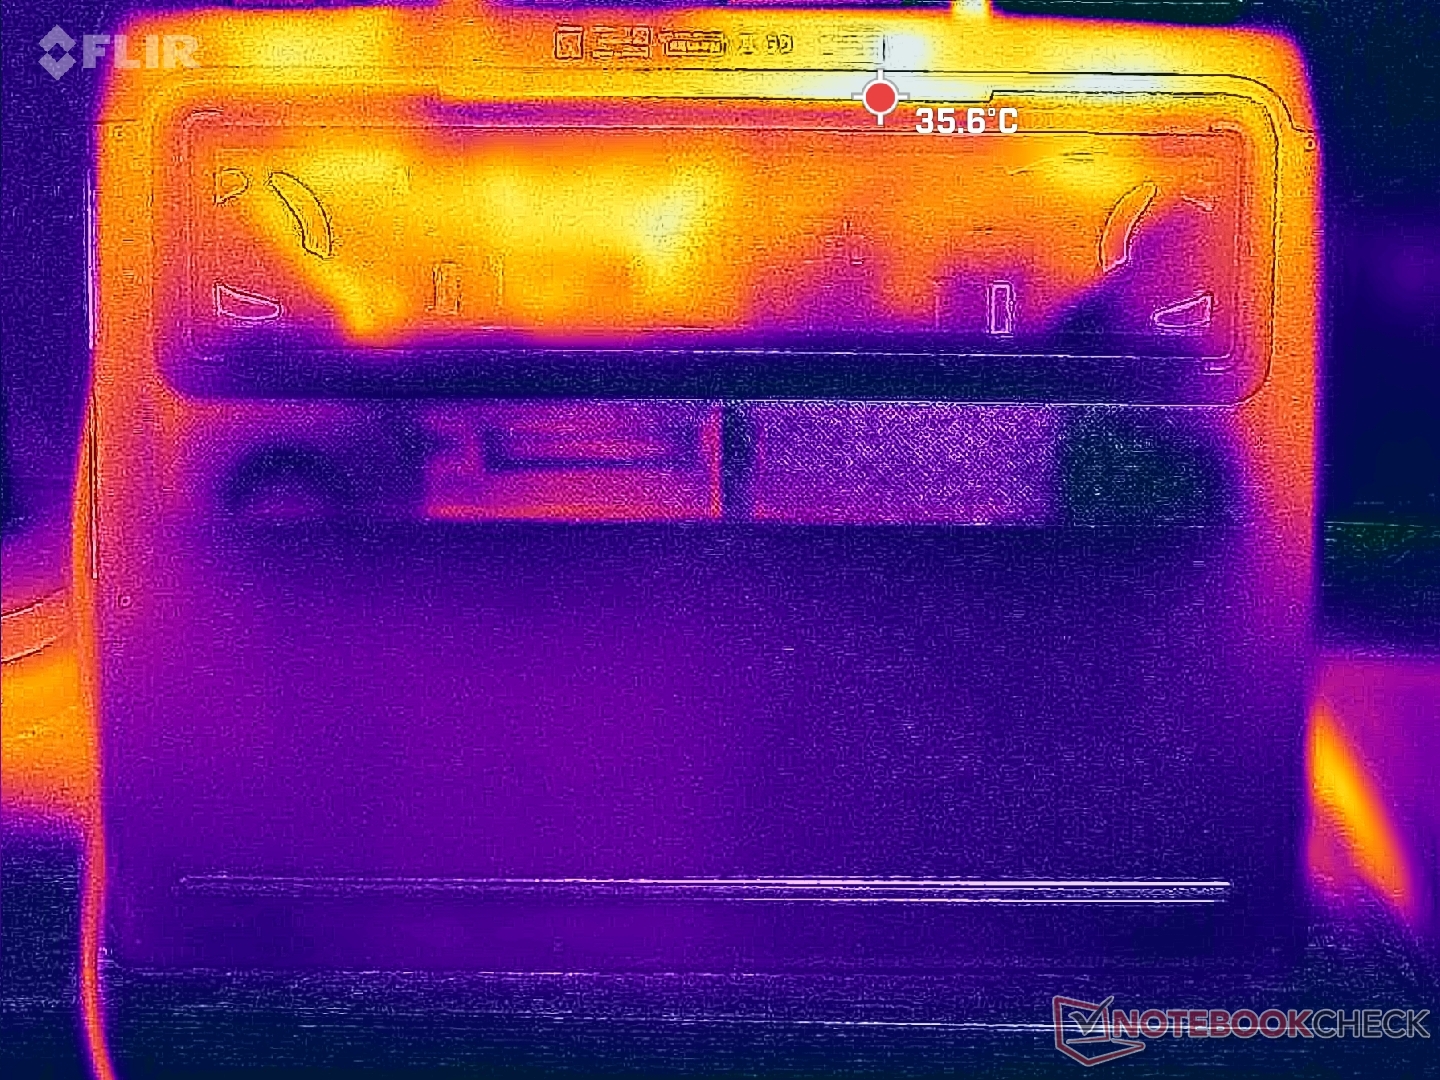
Temperatura
Średnie temperatury powierzchni są mniej więcej takie same jak w Alienware m18 R2, ale z chłodniejszymi gorącymi punktami, pomimo mniejszej ogólnej liczby kratek wentylacyjnych. MSI Raider A18 osiąga 50 C w niektórych miejscach podczas grania w porównaniu do zaledwie 36 C na naszym Alienware. Nie spodziewaliśmy się niczego mniej, biorąc pod uwagę, jak nieporęczna jest maszyna Alienware.
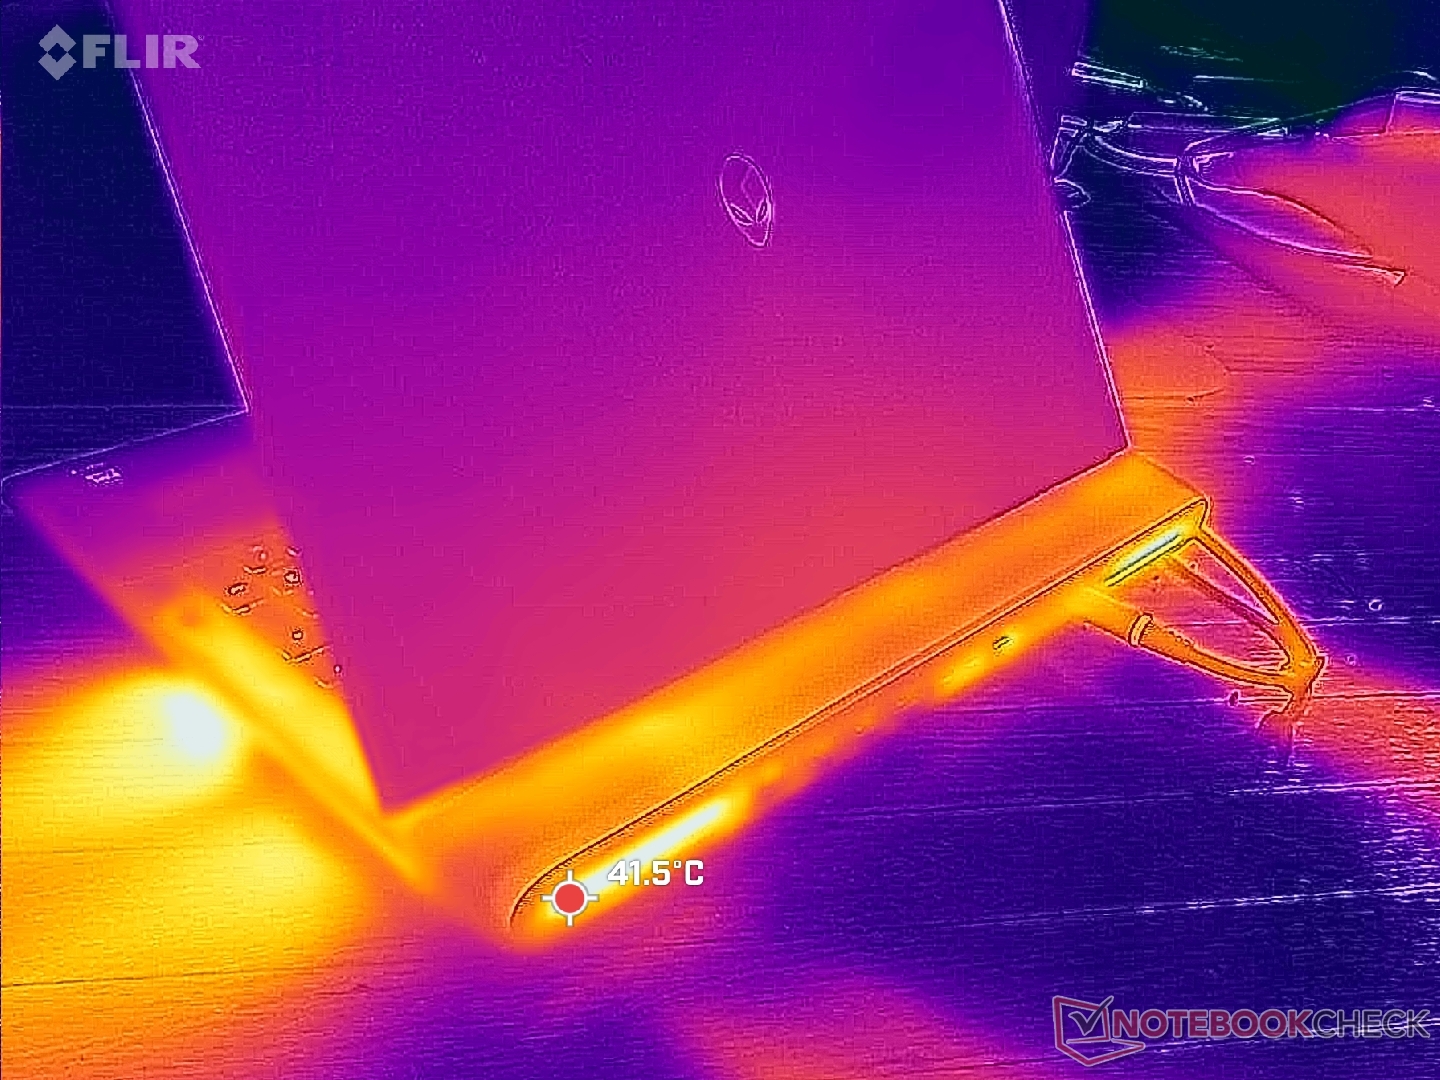
(+) Maksymalna temperatura w górnej części wynosi 36.8 °C / 98 F, w porównaniu do średniej 40.4 °C / 105 F , począwszy od 21.2 do 68.8 °C dla klasy Gaming.
(+) Dno nagrzewa się maksymalnie do 35.8 °C / 96 F, w porównaniu do średniej 43.2 °C / 110 F
(+) W stanie bezczynności średnia temperatura górnej części wynosi 28.5 °C / 83 F, w porównaniu ze średnią temperaturą urządzenia wynoszącą 33.9 °C / ### class_avg_f### F.
(+) 3: The average temperature for the upper side is 31.2 °C / 88 F, compared to the average of 33.9 °C / 93 F for the class Gaming.
(+) Podpórki pod nadgarstki i touchpad są chłodniejsze niż temperatura skóry i maksymalnie 26.8 °C / 80.2 F i dlatego są chłodne w dotyku.
(±) Średnia temperatura obszaru podparcia dłoni w podobnych urządzeniach wynosiła 28.8 °C / 83.8 F (+2 °C / 3.6 F).
| Alienware 18 Area-51 Intel Core Ultra 9 275HX, NVIDIA GeForce RTX 5090 Laptop | Alienware 16 Area-51 Intel Core Ultra 9 275HX, NVIDIA GeForce RTX 5080 Laptop | Alienware m18 R2 Intel Core i9-14900HX, NVIDIA GeForce RTX 4090 Laptop GPU | MSI Raider A18 HX A9WIG-080 AMD Ryzen 9 9955HX3D, NVIDIA GeForce RTX 5080 Laptop | Razer Blade 18 2024 RZ09-0509 Intel Core i9-14900HX, NVIDIA GeForce RTX 4090 Laptop GPU | Asus ROG Strix G18 G814JI Intel Core i7-13650HX, NVIDIA GeForce RTX 4070 Laptop GPU | Acer Predator Helios 18 PH18-72-98MW Intel Core i9-14900HX, NVIDIA GeForce RTX 4090 Laptop GPU | |
|---|---|---|---|---|---|---|---|
| Heat | -16% | -23% | -25% | -18% | -12% | -24% | |
| Maximum Upper Side * (°C) | 36.8 | 43.8 -19% | 41.2 -12% | 49.3 -34% | 43.2 -17% | 45 -22% | 43 -17% |
| Maximum Bottom * (°C) | 35.8 | 40 -12% | 34.6 3% | 50.9 -42% | 42.6 -19% | 47 -31% | 59 -65% |
| Idle Upper Side * (°C) | 30.6 | 35.8 -17% | 42.8 -40% | 35.2 -15% | 36 -18% | 28 8% | 32 -5% |
| Idle Bottom * (°C) | 30.8 | 35.2 -14% | 43.6 -42% | 33.5 -9% | 36.4 -18% | 31 -1% | 34 -10% |
* ... im mniej tym lepiej
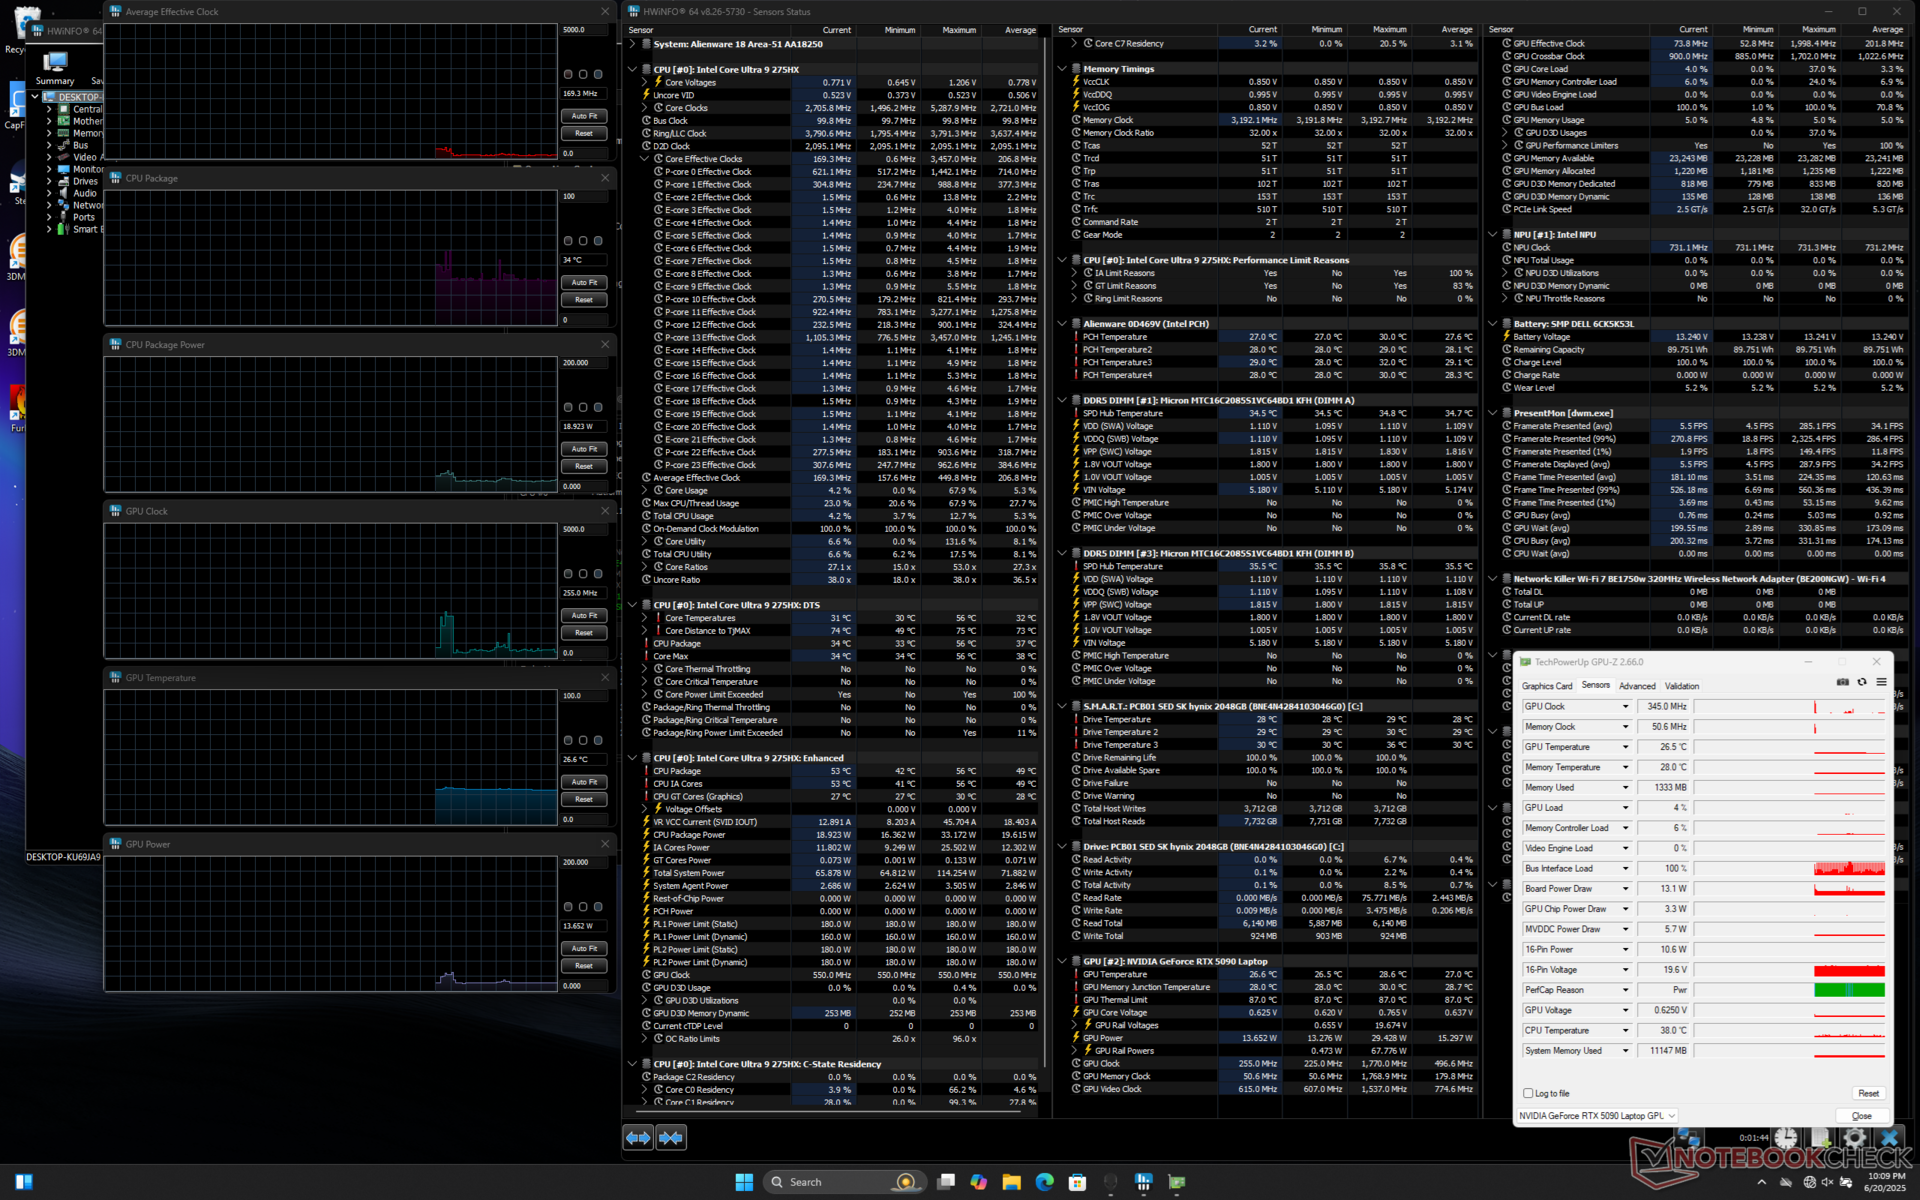
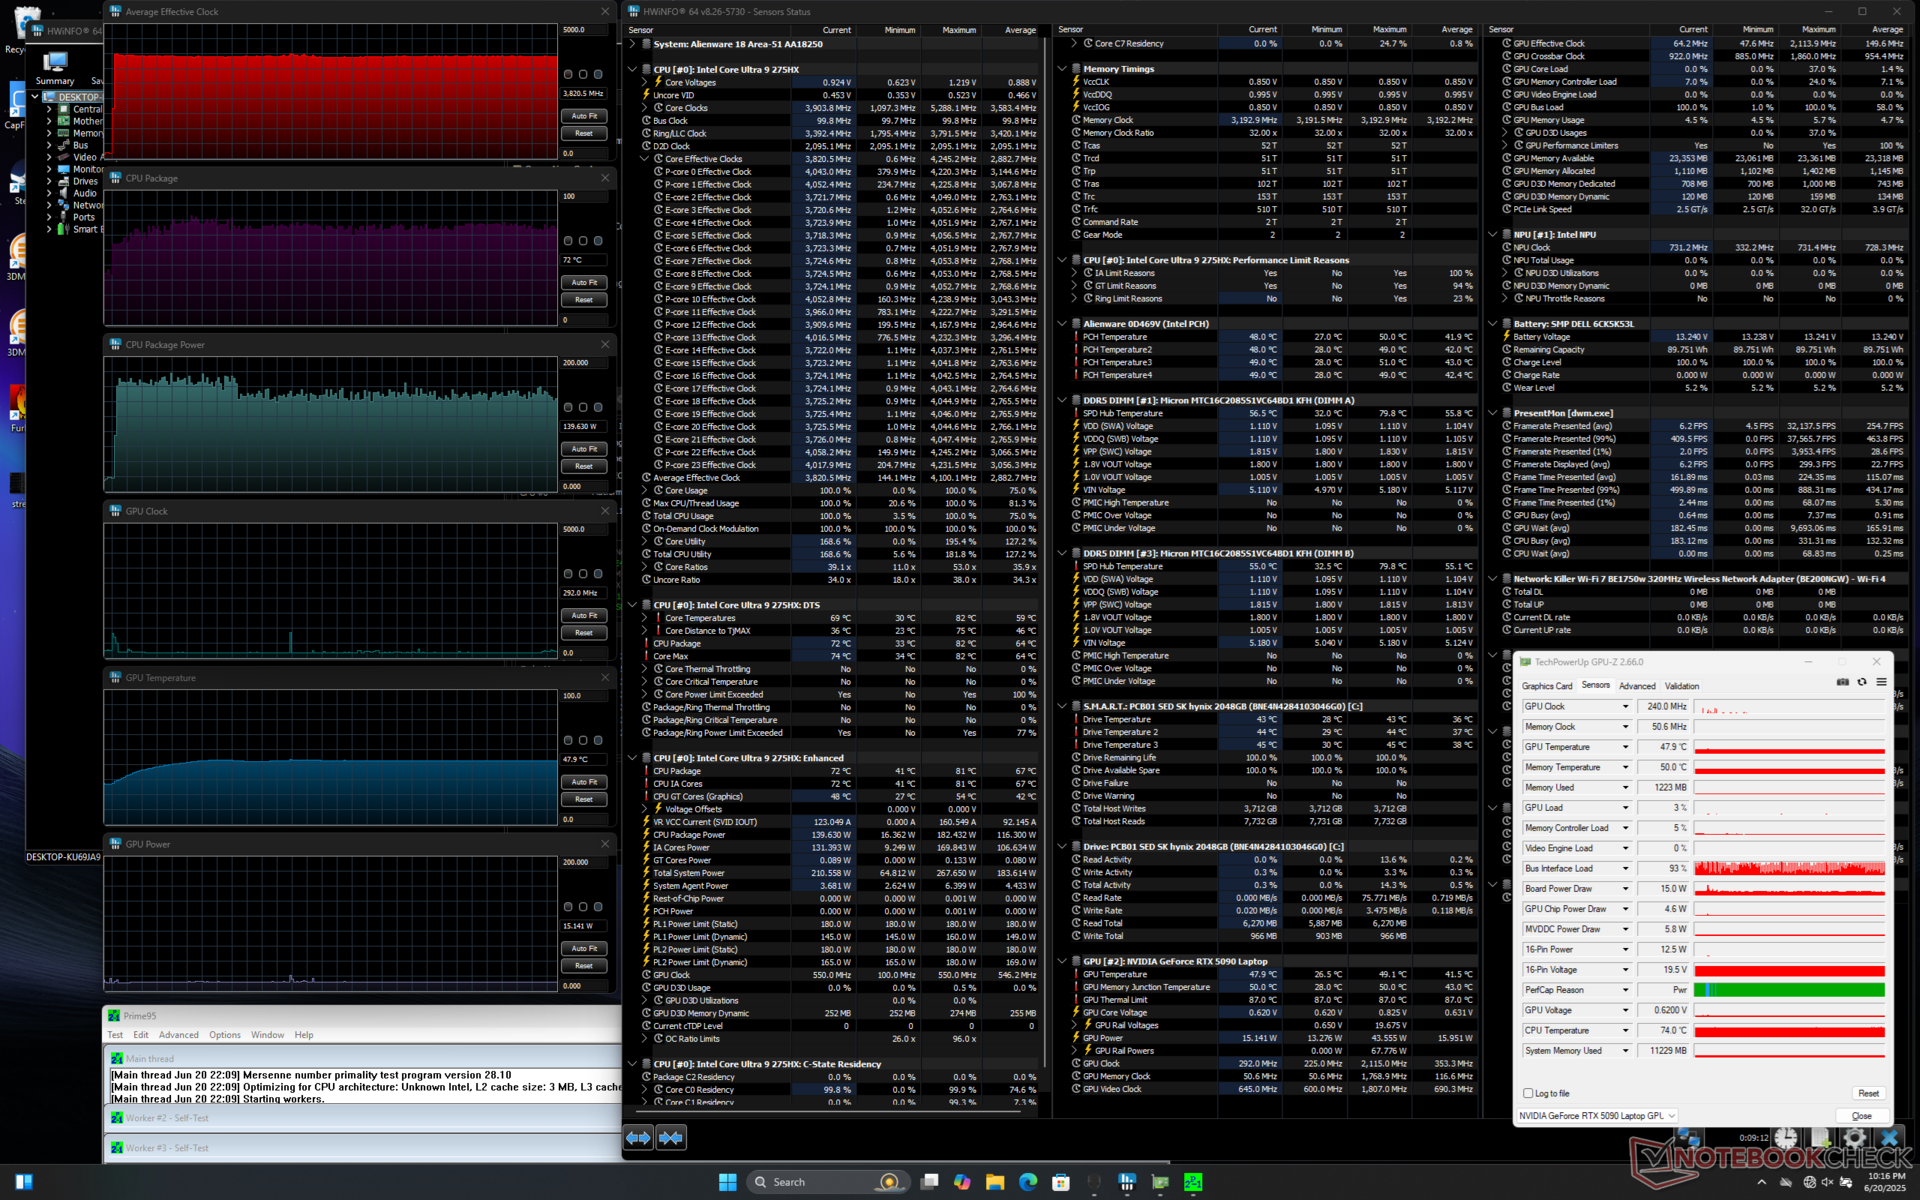
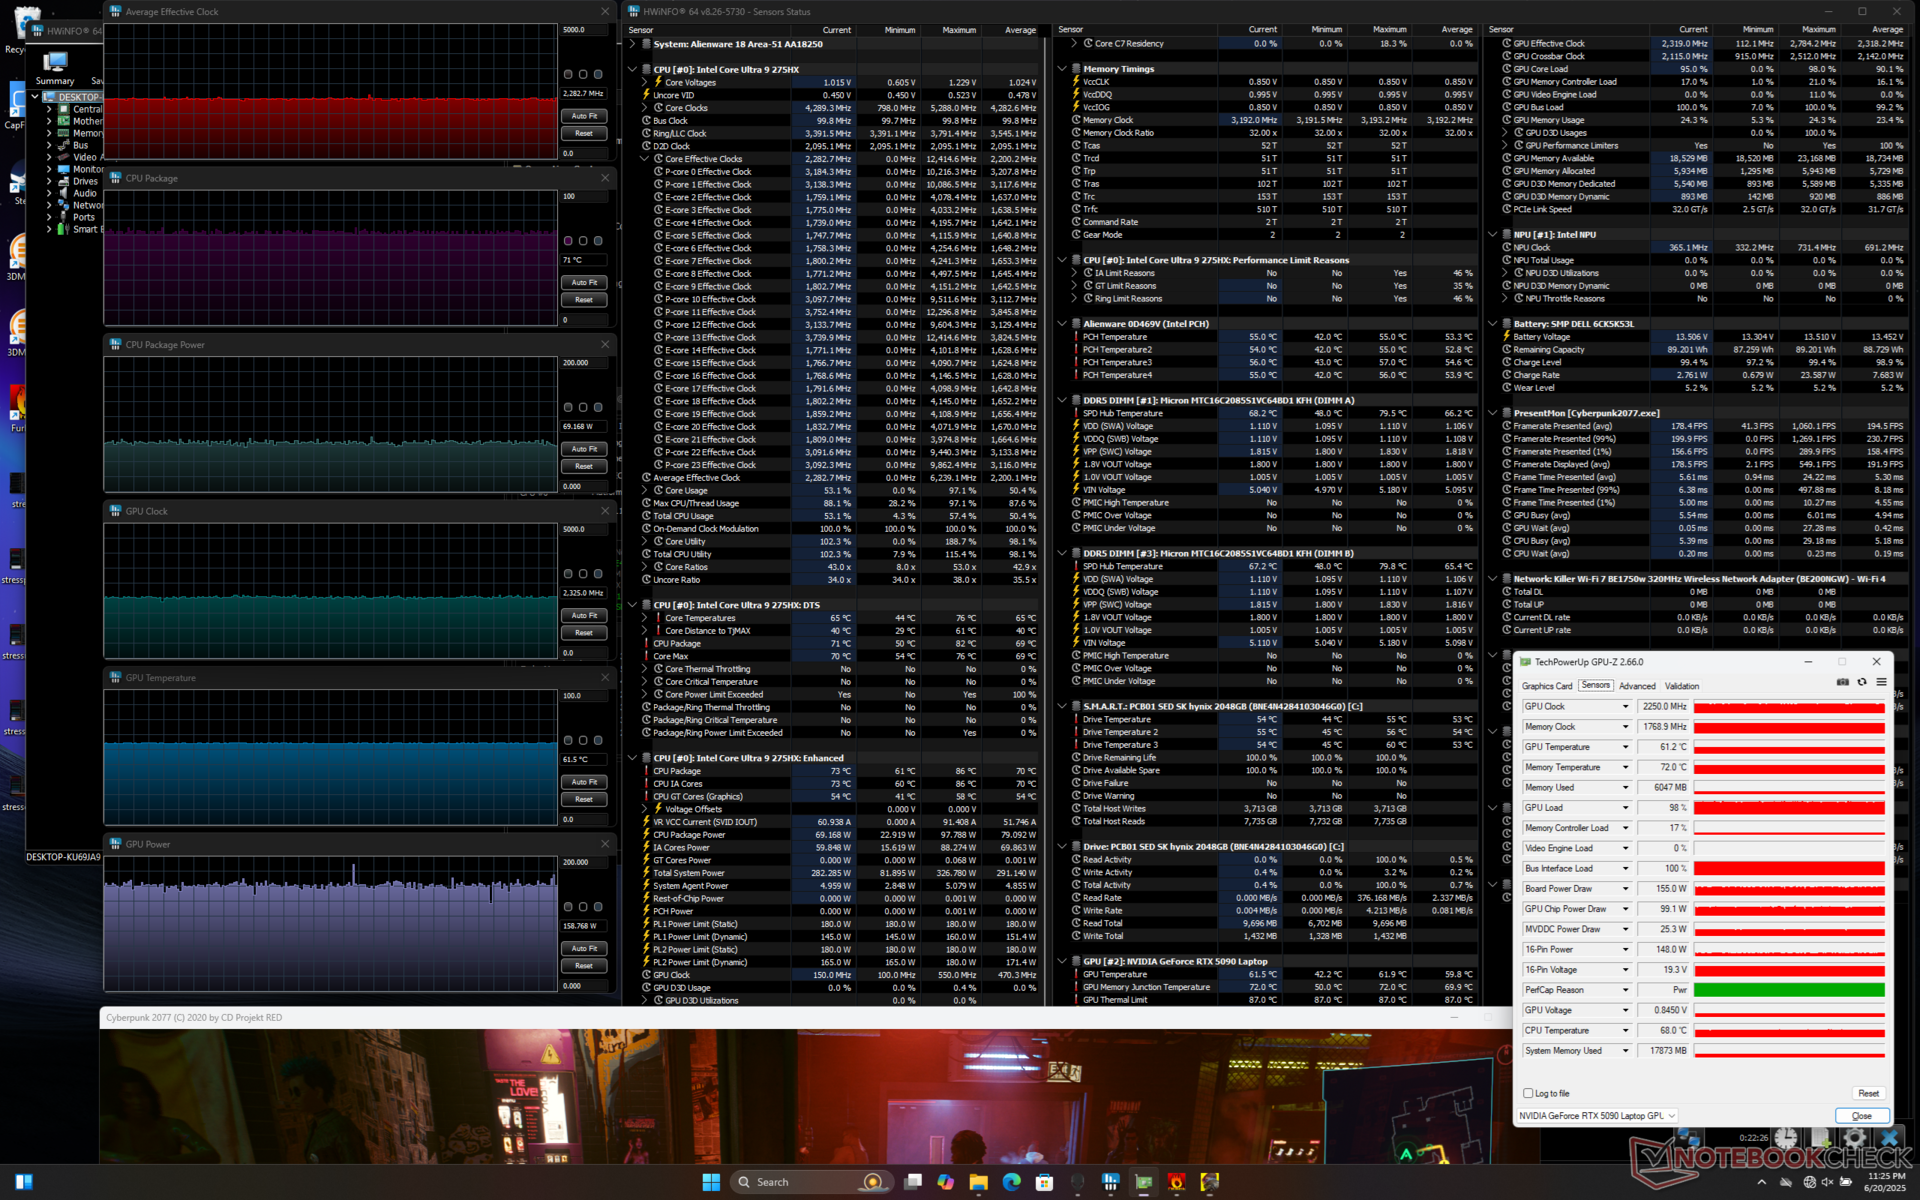
Test warunków skrajnych
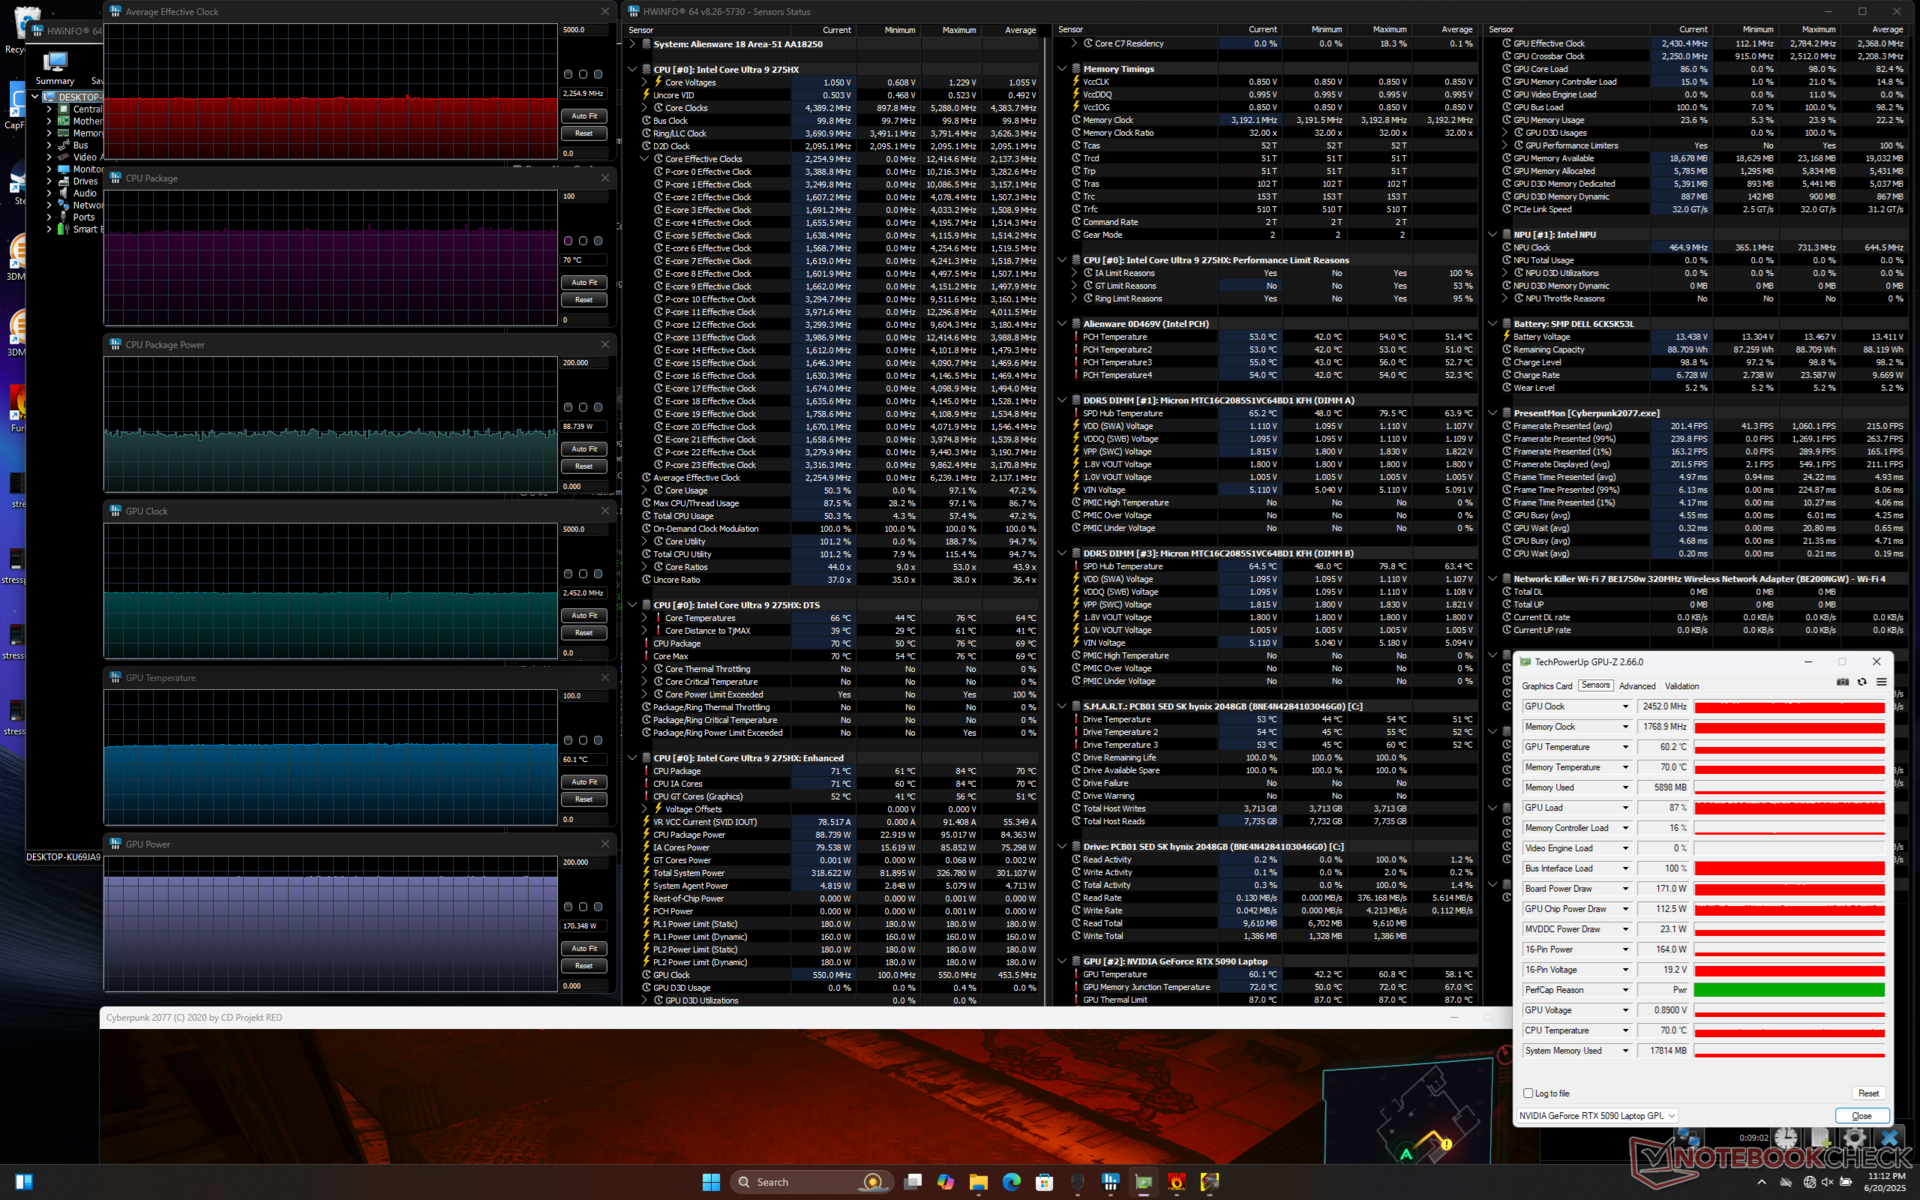
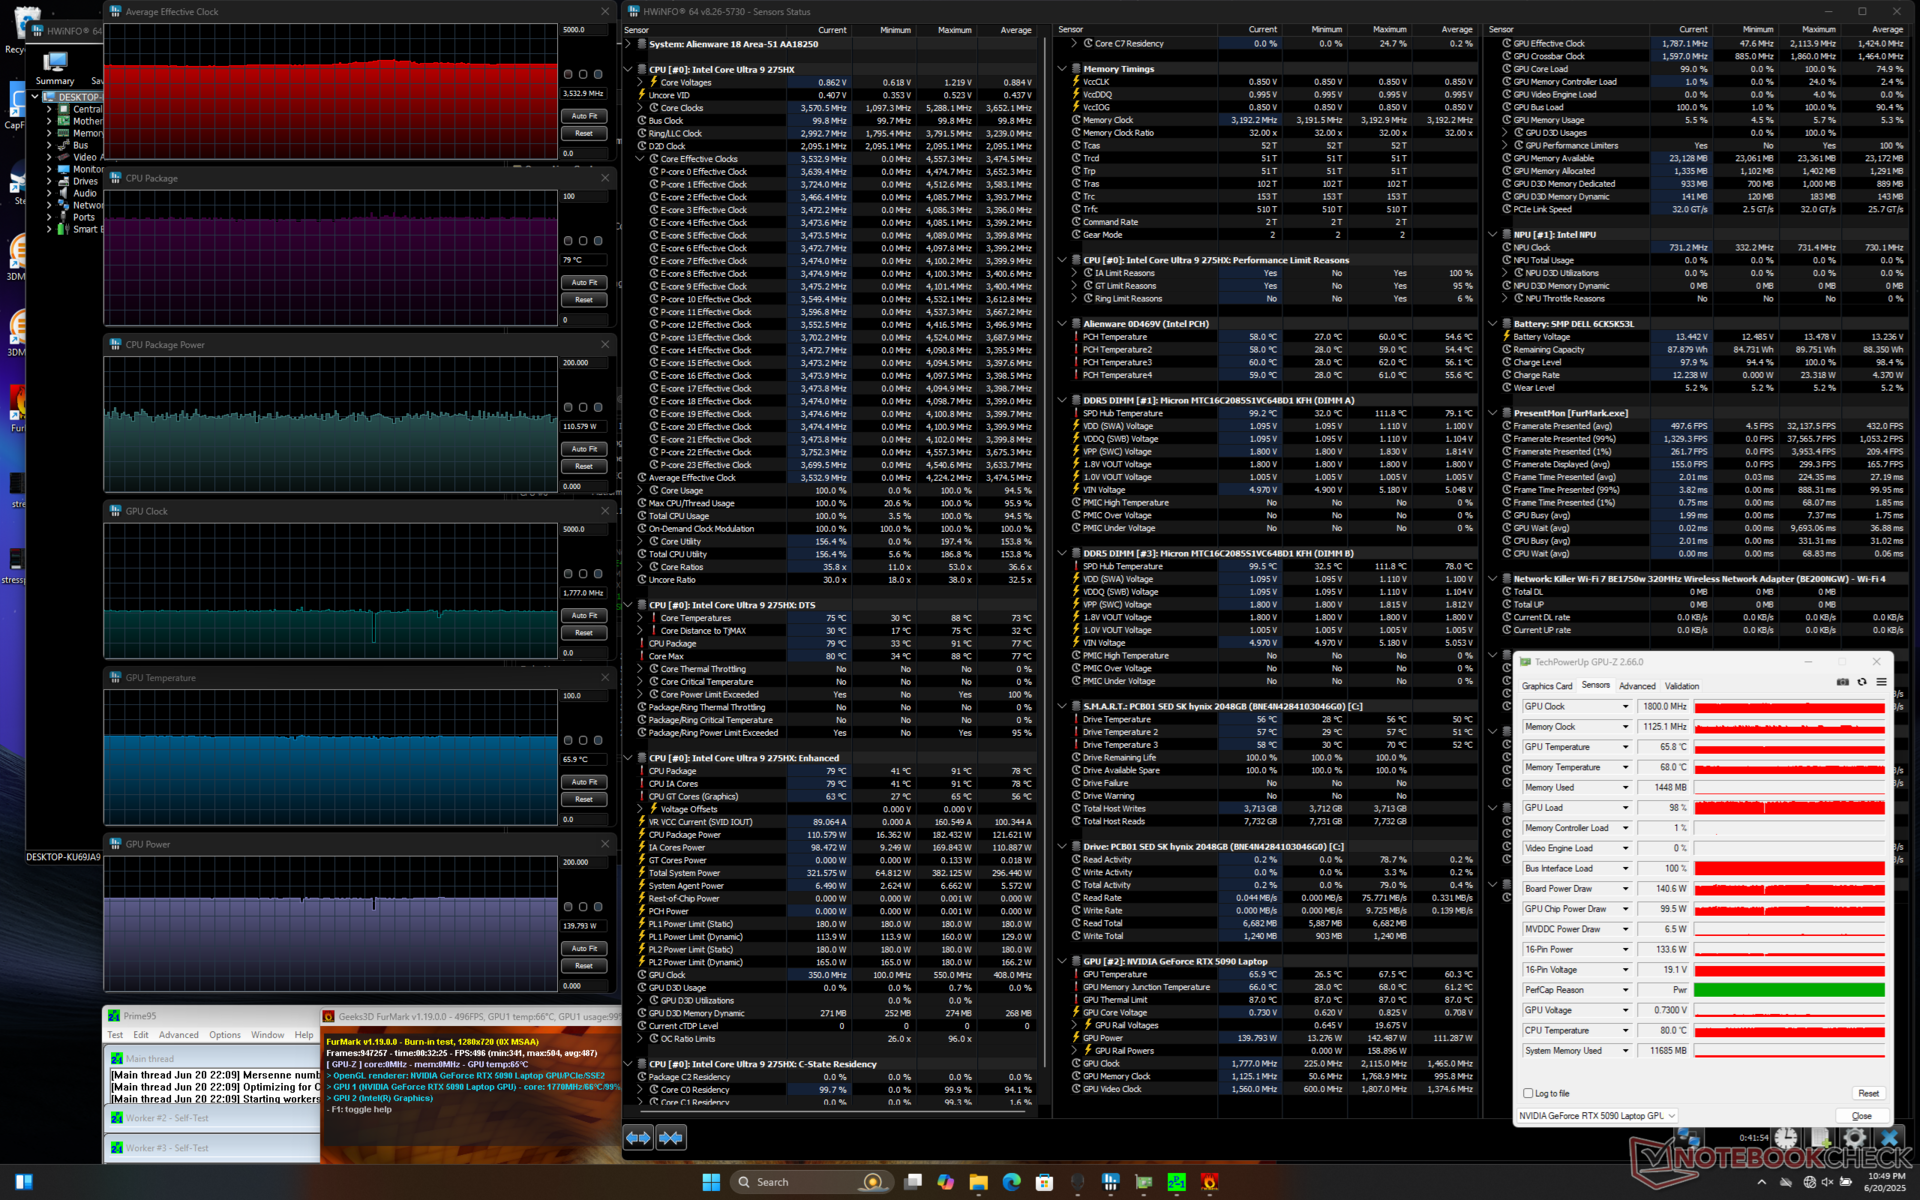
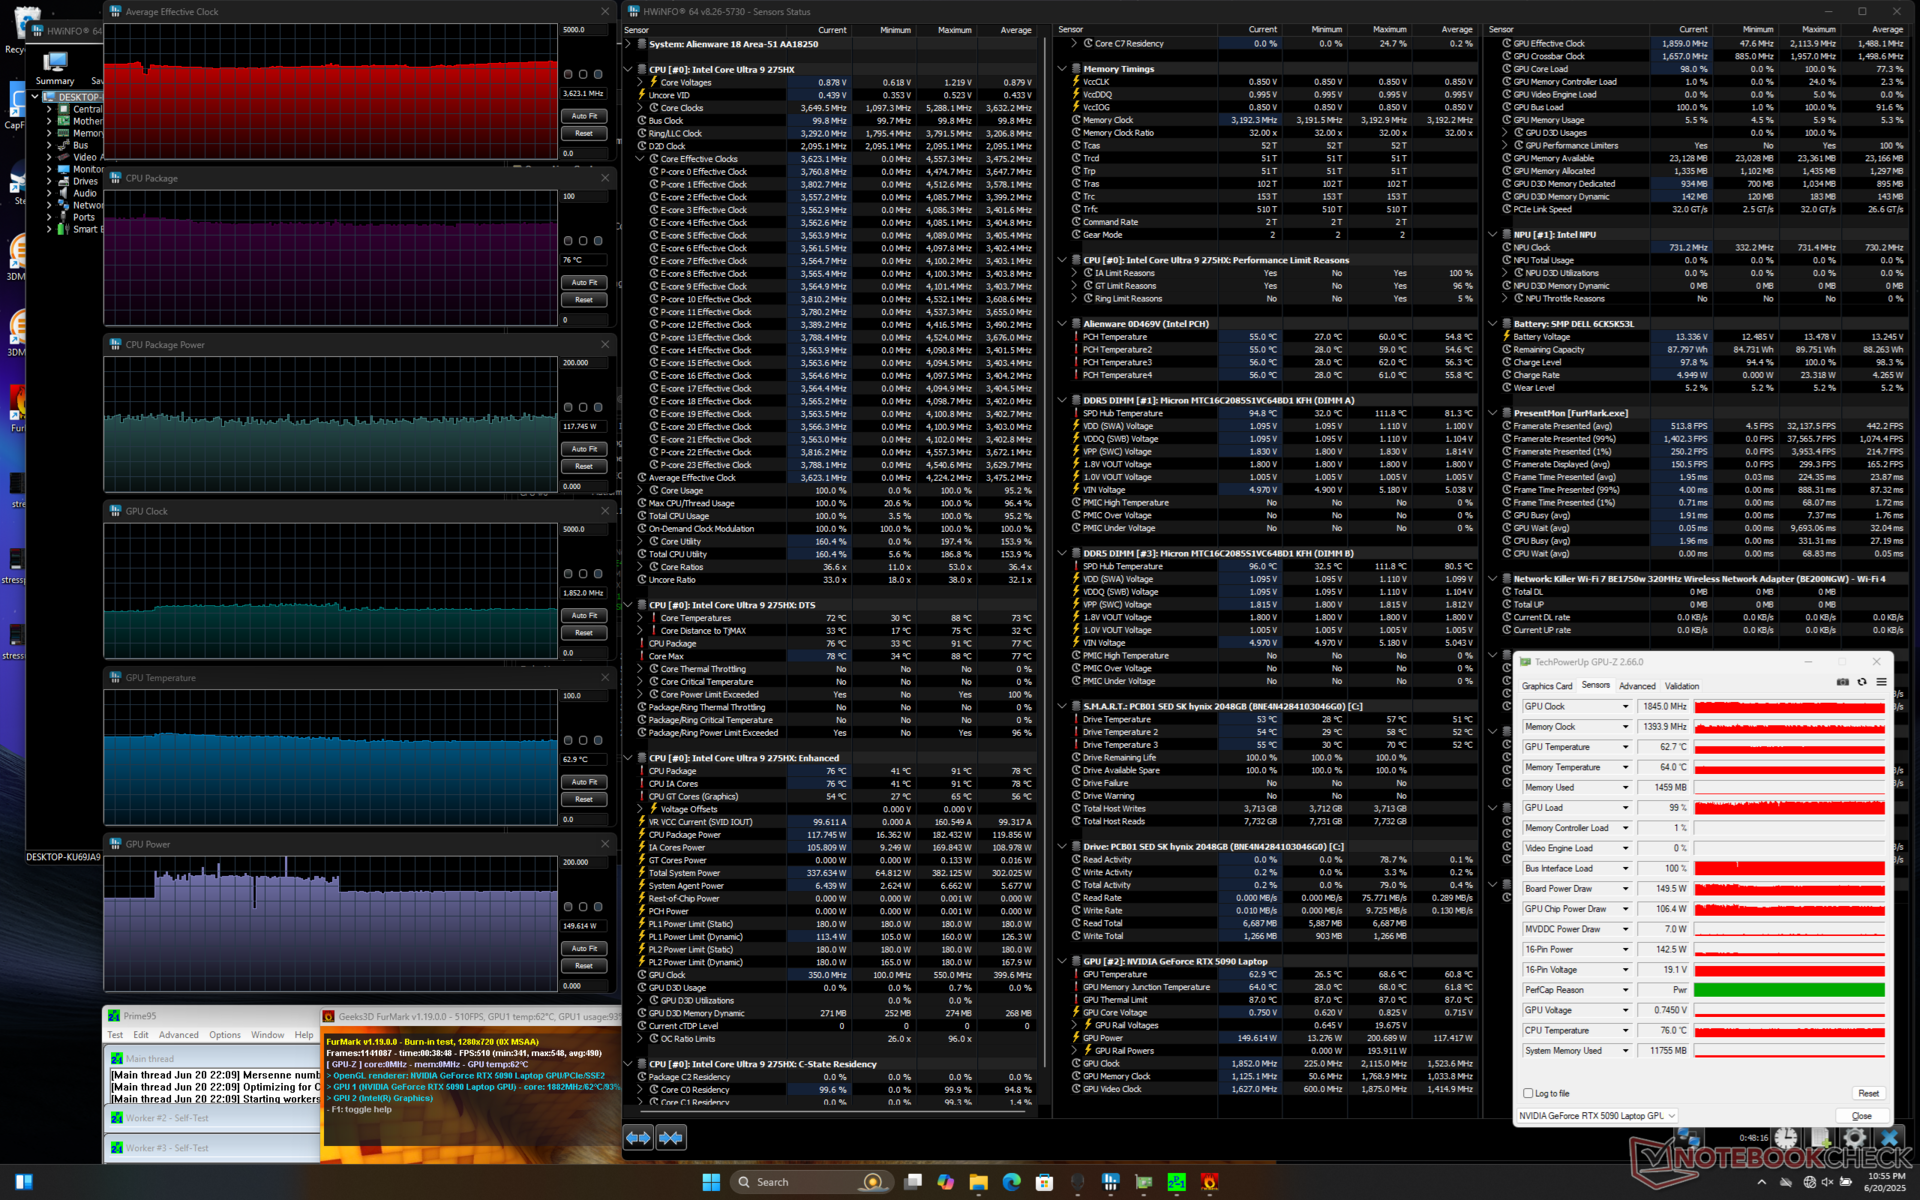
Średnie temperatury rdzenia pod obciążeniem są relatywnie niskie jak na laptop do gier. Podczas uruchamiania aplikacji Prime95 i FurMark, temperatury CPU i GPU ustabilizowały się odpowiednio na poziomie 79 C i 66 C, w porównaniu do 83 C i 77 C w przypadku mSI Vector A18 HX. Nasz Alienware 18 pozostałby chłodniejszy niż większość innych laptopów do gier podczas uruchamiania Cyberpunk 2077.
Procesor w trybie Performance osiągnąłby 4,0 GHz i ~165 W przez około minutę, po czym ostatecznie spadłby bardzo nieznacznie do 3,8 GHz, 145 W i 72 C. Zmiana profilu zasilania na tryb Overdrive przywróciłaby procesor do 4,0 GHz i ~165 W.
Pobór mocy karty graficznej podczas uruchamiania Cyberpunk 2077 w trybie Performance wynosił nieco poniżej 160 W w porównaniu do 171 W podczas uruchamiania tej samej gry w trybie Overdrive. Głośniejsze wentylatory w trybie Overdrive pozwalają na nieco szybsze taktowanie GPU przy jednoczesnym utrzymaniu temperatury rdzenia na mniej więcej tym samym poziomie.
| Średnie taktowanieCPU (GHz) | Taktowanie GPU (MHz) | Średnia temperatura CPU (°C) | Średnia temperatura GPU (°C) | |
| System w stanie spoczynku | -- | -- | 34 | 27 |
| Prime95 Stress | 3.8 | -- | 72 | 48 |
| Prime95 + FurMark Stress (tryb Overdrive) | 3.6 | 1852 | 76 | 63 |
| Prime95 + FurMark Stress (tryb wydajności) | 3.5 | 1777 | 79 | 66 |
| Cyberpunk 2077 Stress (tryb Overdrive) | 2.3 | 2452 | 70 | 60 |
| Cyberpunk 2077 Stress (tryb wydajności) | 2.3 | 2325 | 71 | 62 |
Głośniki
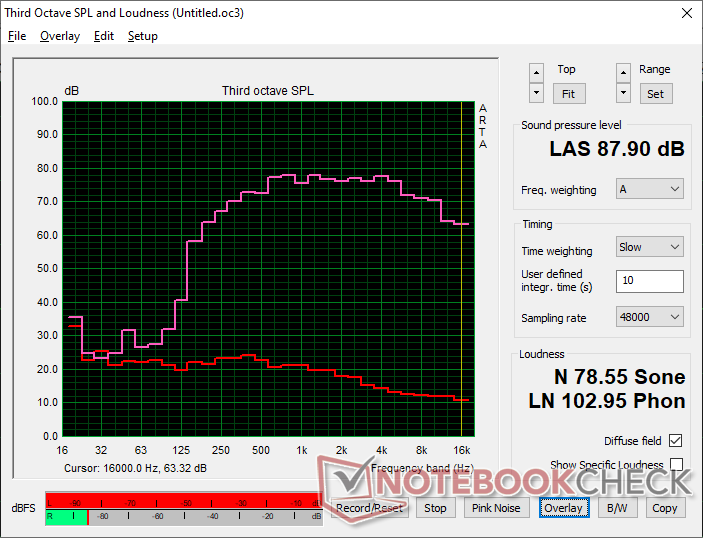
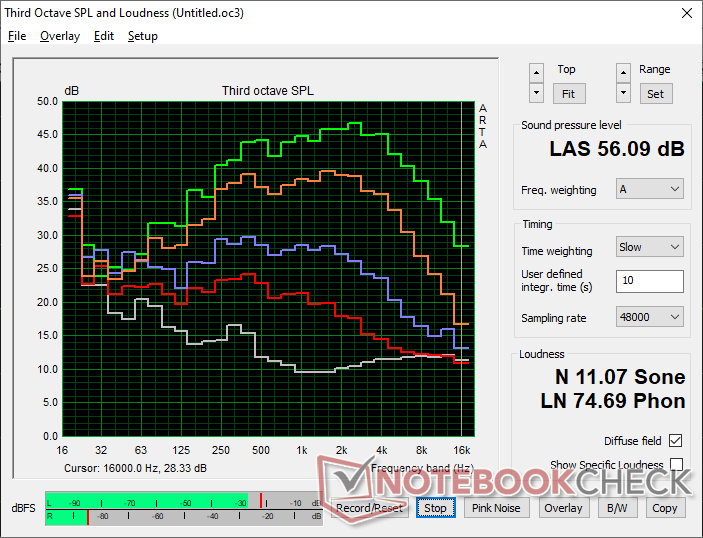
Alienware 18 Area-51 analiza dźwięku
(+) | głośniki mogą odtwarzać stosunkowo głośno (87.9 dB)
Bas 100 - 315 Hz
(-) | prawie brak basu - średnio 17.5% niższa od mediany
(±) | liniowość basu jest średnia (13.4% delta do poprzedniej częstotliwości)
Średnie 400 - 2000 Hz
(+) | zbalansowane środki średnie - tylko 3.1% od mediany
(+) | średnie są liniowe (3.6% delta do poprzedniej częstotliwości)
Wysokie 2–16 kHz
(+) | zrównoważone maksima - tylko 2.9% od mediany
(+) | wzloty są liniowe (2.9% delta do poprzedniej częstotliwości)
Ogólnie 100 - 16.000 Hz
(+) | ogólny dźwięk jest liniowy (14.2% różnicy w stosunku do mediany)
W porównaniu do tej samej klasy
» 25% wszystkich testowanych urządzeń w tej klasie było lepszych, 7% podobnych, 68% gorszych
» Najlepszy miał deltę 6%, średnia wynosiła ###średnia###%, najgorsza wynosiła 132%
W porównaniu do wszystkich testowanych urządzeń
» 17% wszystkich testowanych urządzeń było lepszych, 4% podobnych, 79% gorszych
» Najlepszy miał deltę 4%, średnia wynosiła ###średnia###%, najgorsza wynosiła 134%
Apple MacBook Pro 16 2021 M1 Pro analiza dźwięku
(+) | głośniki mogą odtwarzać stosunkowo głośno (84.7 dB)
Bas 100 - 315 Hz
(+) | dobry bas - tylko 3.8% od mediany
(+) | bas jest liniowy (5.2% delta do poprzedniej częstotliwości)
Średnie 400 - 2000 Hz
(+) | zbalansowane środki średnie - tylko 1.3% od mediany
(+) | średnie są liniowe (2.1% delta do poprzedniej częstotliwości)
Wysokie 2–16 kHz
(+) | zrównoważone maksima - tylko 1.9% od mediany
(+) | wzloty są liniowe (2.7% delta do poprzedniej częstotliwości)
Ogólnie 100 - 16.000 Hz
(+) | ogólny dźwięk jest liniowy (4.6% różnicy w stosunku do mediany)
W porównaniu do tej samej klasy
» 0% wszystkich testowanych urządzeń w tej klasie było lepszych, 0% podobnych, 100% gorszych
» Najlepszy miał deltę 5%, średnia wynosiła ###średnia###%, najgorsza wynosiła 45%
W porównaniu do wszystkich testowanych urządzeń
» 0% wszystkich testowanych urządzeń było lepszych, 0% podobnych, 100% gorszych
» Najlepszy miał deltę 4%, średnia wynosiła ###średnia###%, najgorsza wynosiła 134%
Zarządzanie energią
Zużycie energii
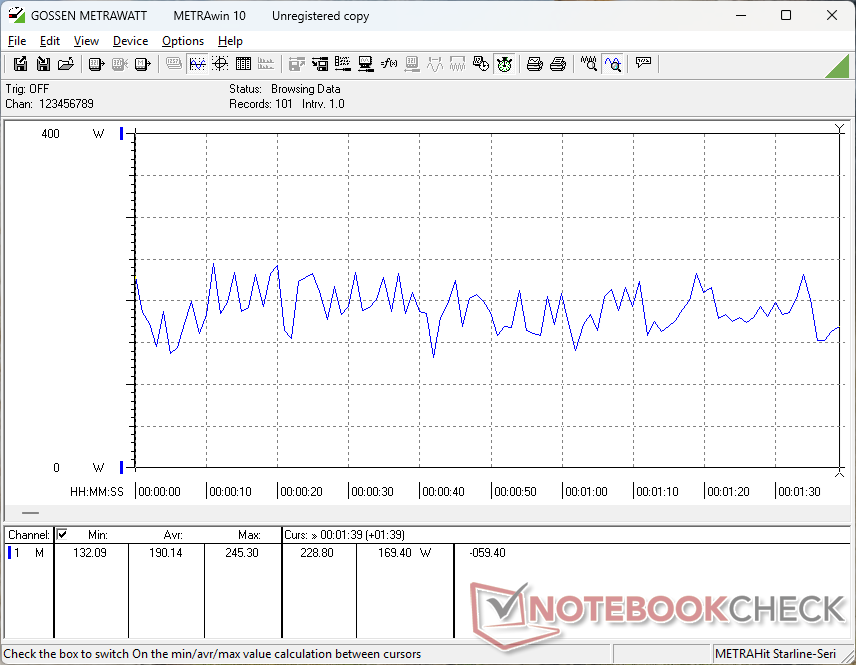
System jest bardzo wymagający nawet w trybie bezczynności na pulpicie przy minimalnej jasności i ustawieniach zasilania. Żywotność baterii jest zatem bardzo krótka bez względu na obciążenie ekranu, jak pokaże nasza następna sekcja poniżej.
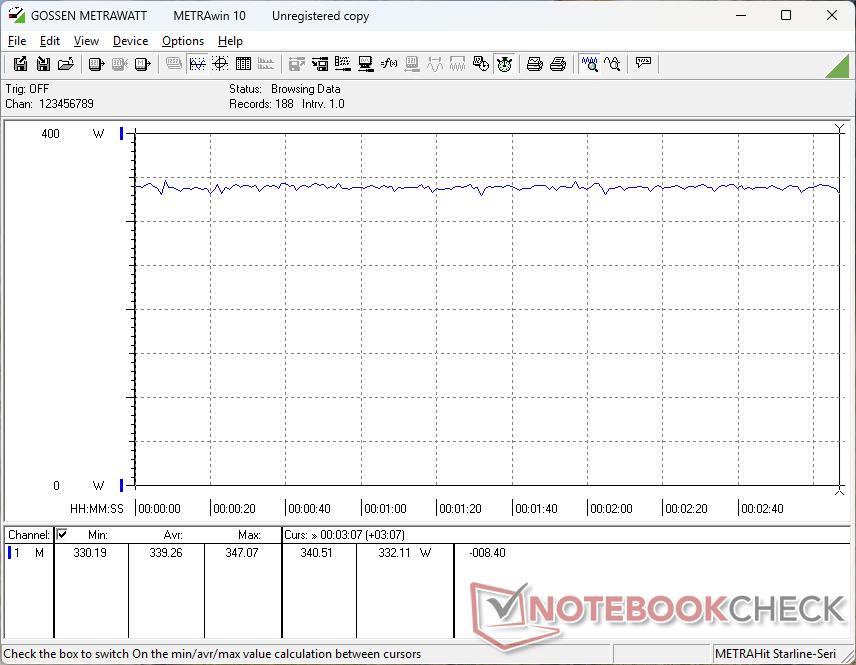
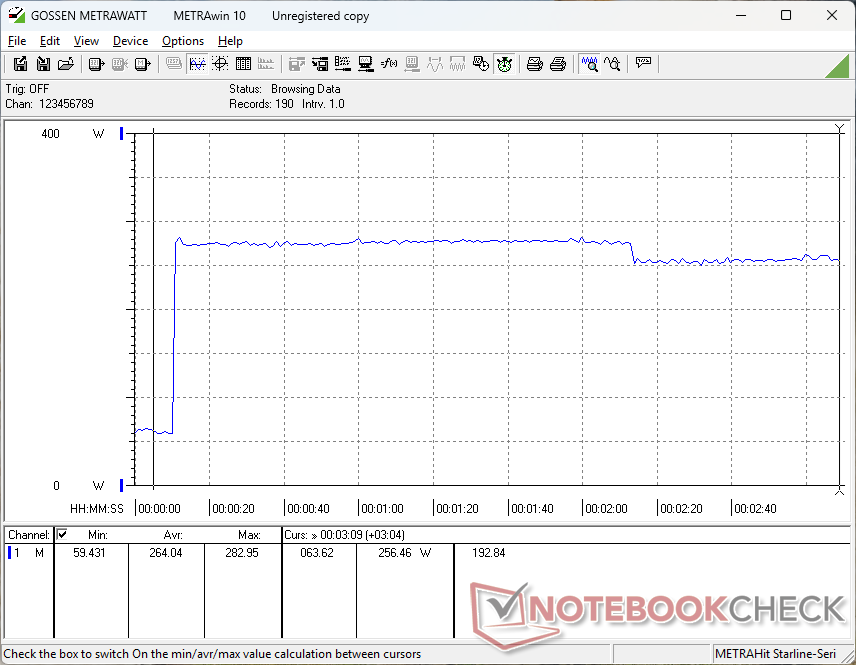
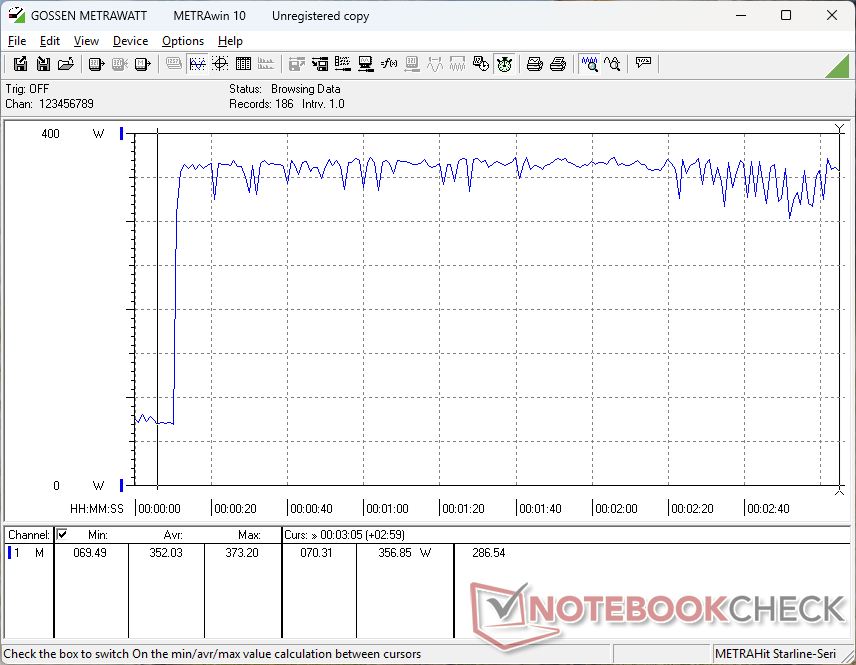
Uruchamiając Cyberpunk 2077 w celu odwzorowania typowych obciążeń w grach, pobór mocy wyniesie około 340 W w trybie Overdrive lub około 300 W w trybie Performance ze względu na obniżony pobór mocy procesora i karty graficznej, jak wspomniano w sekcji Stress Test powyżej. Wyniki są nadal zauważalnie wyższe niż to, co zarejestrowaliśmy na Alienware 16, a jednocześnie są niższe niż na zeszłorocznym Alienware m18 R2. Wydajność na wat poprawiła się z roku na rok, nawet jeśli Alienware 18 nie jest najbardziej wydajnym laptopem do gier.
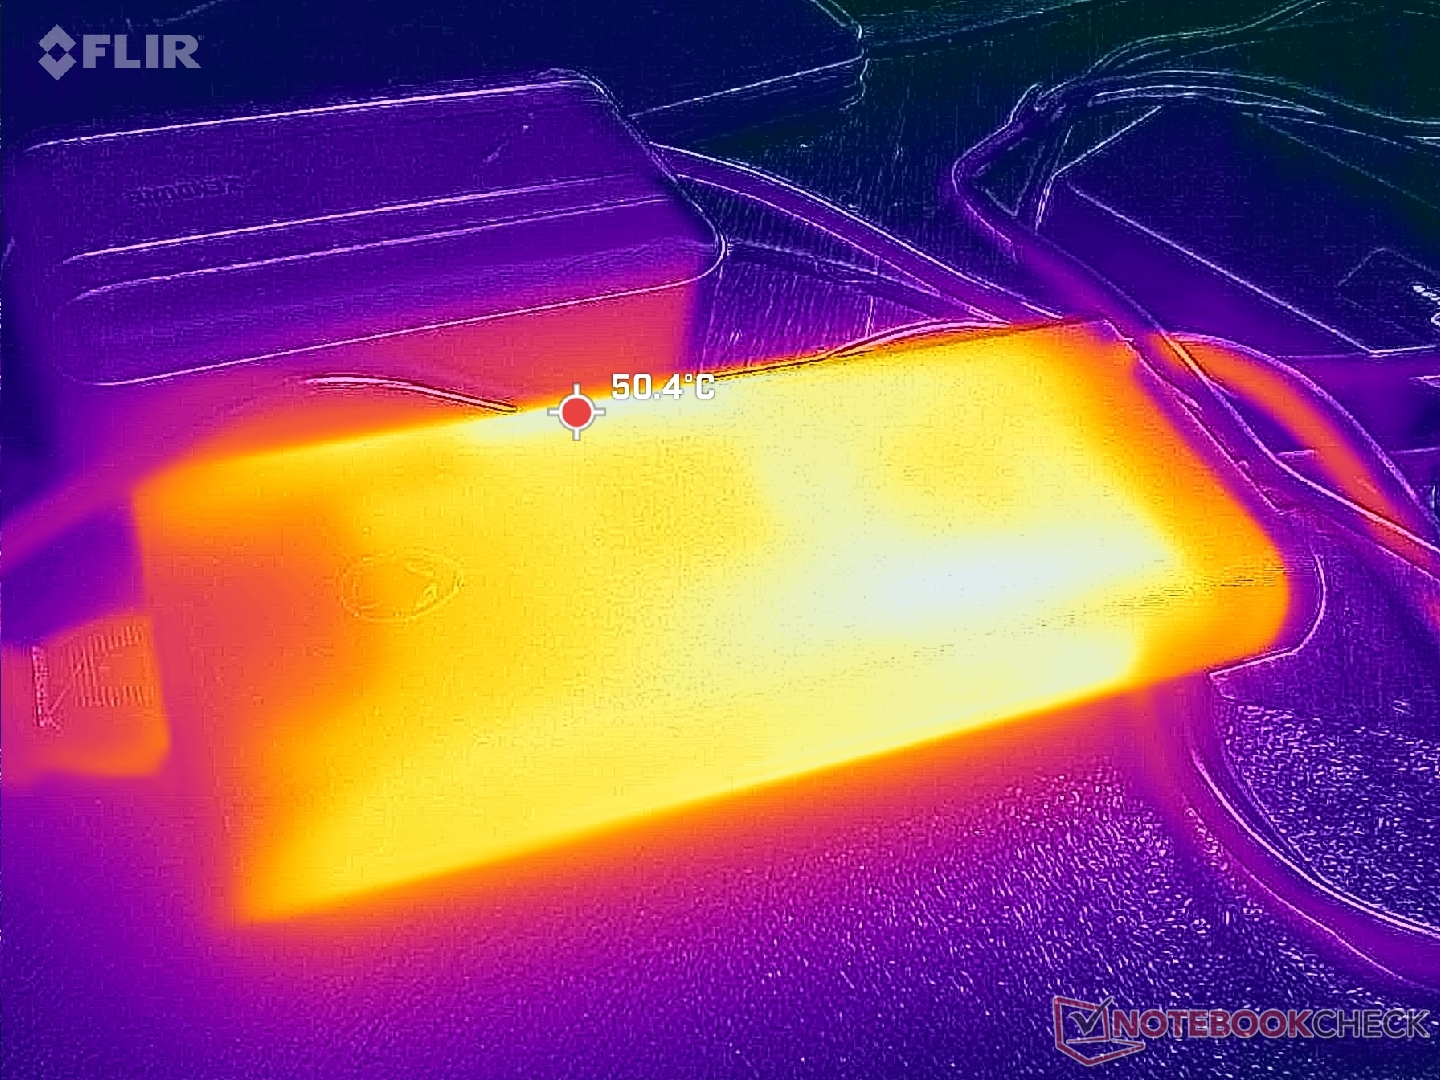
Jesteśmy w stanie zarejestrować maksymalny pobór 373 W z dużego (~ 18,9 x 8,7 x 2,5 cm) zasilacza sieciowego 360 W podczas uruchamiania Prime95 i FurMark. Ponieważ gry wymagają już od 300 W do 340 W, proszę spodziewać się spowolnienia tempa ładowania podczas jednoczesnego grania. Konkurencyjny Lenovo Legion Pro 7i 16 G10 wyposażony jest w mocniejszy zasilacz o mocy 400 W.
| wyłączony / stan wstrzymania | |
| luz | |
| obciążenie |
|
Legenda:
min: | |
| Alienware 18 Area-51 Ultra 9 275HX, GeForce RTX 5090 Laptop, , IPS, 2560x1600, 18" | Alienware 16 Area-51 Ultra 9 275HX, GeForce RTX 5080 Laptop, Samsung PM9C1a MZ9L81T0HDLB, IPS, 2560x1600, 16" | Alienware m18 R2 i9-14900HX, GeForce RTX 4090 Laptop GPU, SK Hynix PC811 HFS002TEM9X152N, IPS, 2560x1600, 18" | MSI Raider A18 HX A9WIG-080 R9 9955HX3D, GeForce RTX 5080 Laptop, Samsung PM9E1 MZVLC2T0HBLD, MiniLED IPS, 3840x2400, 18" | Razer Blade 18 2024 RZ09-0509 i9-14900HX, GeForce RTX 4090 Laptop GPU, , Mini-LED, 2560x1600, 18" | Asus ROG Strix G18 G814JI i7-13650HX, GeForce RTX 4070 Laptop GPU, Micron 2400 MTFDKBA1T0QFM, IPS, 2560x1600, 18" | Acer Predator Helios 18 PH18-72-98MW i9-14900HX, GeForce RTX 4090 Laptop GPU, 2x SK Hynix HFS001TEJ9X115N (RAID 0), Mini-LED, 2560x1600, 18" | MSI Titan 18 HX AI A2XWJG Ultra 9 285HX, GeForce RTX 5090 Laptop, 1x Samsung PM9E1 MZVLC2T0HBLD-00BT7 + 2x Samsung PM9A1 MZVL22T0HDLB-00BT7 (RAID 0), Mini-LED, 3840x2160, 18" | |
|---|---|---|---|---|---|---|---|---|
| Power Consumption | 24% | 30% | 4% | 20% | 55% | 21% | 25% | |
| Idle Minimum * (Watt) | 38.4 | 27 30% | 10.6 72% | 41.5 -8% | 25.4 34% | 8 79% | 31 19% | 19.01 50% |
| Idle Average * (Watt) | 45.6 | 33.5 27% | 20.9 54% | 53.5 -17% | 37.7 17% | 15 67% | 35 23% | 30.92 32% |
| Idle Maximum * (Watt) | 57.5 | 41.4 28% | 40 30% | 53.8 6% | 57.9 -1% | 26 55% | 43 25% | 33.84 41% |
| Load Average * (Watt) | 190.1 | 124.7 34% | 201.1 -6% | 168.5 11% | 128.4 32% | 102 46% | 144 24% | 105.4 45% |
| Cyberpunk 2077 ultra external monitor * (Watt) | 333 | 249 25% | 295 11% | 330 1% | ||||
| Cyberpunk 2077 ultra * (Watt) | 340 | 256 25% | 298 12% | 343 -1% | ||||
| Load Maximum * (Watt) | 373.2 | 367.2 2% | 378.9 -2% | 323.7 13% | 297.9 20% | 267 28% | 318 15% | 354 5% |
| Witcher 3 ultra * (Watt) | 358 | 273.1 | 178.6 | 228 |
* ... im mniej tym lepiej
Power Consumption Cyberpunk / Stress Test
Power Consumption external Monitor
Żywotność baterii
Czasy pracy są krótsze niż te, które zarejestrowaliśmy na Alienware 16, wynosząc nieco poniżej 2 godzin przeglądania w świecie rzeczywistym, nawet po ustawieniu trybu iGPU, częstotliwości odświeżania 60 Hz i profilu zasilania bateryjnego. Większość innych laptopów do gier jest w stanie zaoferować znacznie dłuższy czas pracy pomimo ogromnych 18-calowych ekranów.
Ładowanie od stanu pustego do pełnej pojemności zajmuje niecałe 2 godziny przy użyciu dołączonego zasilacza sieciowego. Ładowanie przez USB-C jest obsługiwane, choć w znacznie wolniejszym tempie.
| Alienware 18 Area-51 Ultra 9 275HX, GeForce RTX 5090 Laptop, 96 Wh | Alienware 16 Area-51 Ultra 9 275HX, GeForce RTX 5080 Laptop, 96 Wh | Alienware m18 R2 i9-14900HX, GeForce RTX 4090 Laptop GPU, 97 Wh | MSI Raider A18 HX A9WIG-080 R9 9955HX3D, GeForce RTX 5080 Laptop, 99 Wh | Razer Blade 18 2024 RZ09-0509 i9-14900HX, GeForce RTX 4090 Laptop GPU, 91.7 Wh | Asus ROG Strix G18 G814JI i7-13650HX, GeForce RTX 4070 Laptop GPU, 90 Wh | Acer Predator Helios 18 PH18-72-98MW i9-14900HX, GeForce RTX 4090 Laptop GPU, 90 Wh | MSI Titan 18 HX AI A2XWJG Ultra 9 285HX, GeForce RTX 5090 Laptop, 99 Wh | |
|---|---|---|---|---|---|---|---|---|
| Czasy pracy | 40% | 140% | 5% | 120% | 305% | 60% | 115% | |
| WiFi v1.3 (h) | 2 | 2.8 40% | 4.8 140% | 2.1 5% | 4.4 120% | 8.1 305% | 3.2 60% | 4.3 115% |
| Reader / Idle (h) | 3.1 | 6.6 | 11.7 | |||||
| Load (h) | 1.1 | 1 | 1.2 | 1.1 | 1.5 | |||
| H.264 (h) | 3 | |||||||
| Cyberpunk 2077 ultra 150cd (h) | 1.2 |
Ocena Notebookcheck
Alienware 18 Area-51
- 01/07/2025 v8
Allen Ngo
 Total Sustainability Score:
 Potential Competitors in Comparison
Obraz | Model / recenzja | Cena | Waga | Wysokość | Ekran |
|---|---|---|---|---|---|
1. 86.2% 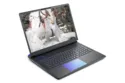 | Alienware 18 Area-51 Intel Core Ultra 9 275HX ⎘ NVIDIA GeForce RTX 5090 Laptop ⎘ 64 GB Pamięć | Amazon: 1. $2,390.17 Alienware 18 Area-51 Gaming ... 2. $3,066.75 Alienware 18 Area-51 Gaming ... 3. $3,899.99 Dell Alienware 18 Area-51 Ga... Cena katalogowa: 4400 USD | 4.2 kg | 24.32 mm | 18.00" 2560x1600 168 PPI IPS |
2. 85.7%  | Alienware 16 Area-51 Intel Core Ultra 9 275HX ⎘ NVIDIA GeForce RTX 5080 Laptop ⎘ 32 GB Pamięć, 1024 GB SSD | Amazon: 1. $2,599.99 Alienware 16 Area-51 Gaming ... 2. $3,799.99 Alienware 16 Area-51 Gaming ... 3. $4,599.99 Alienware 16 Area-51 Gaming ... Cena katalogowa: 3500 USD | 3.3 kg | 28.5 mm | 16.00" 2560x1600 189 PPI IPS |
3. 89.5% v7 (old) 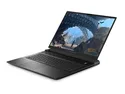 | Alienware m18 R2 Intel Core i9-14900HX ⎘ NVIDIA GeForce RTX 4090 Laptop GPU ⎘ 32 GB Pamięć, 2048 GB SSD | Amazon: 1. $2,599.97 Alienware M18 R2 Gaming Lapt... 2. $2,390.17 Alienware 18 Area-51 Gaming ... 3. $3,899.99 Dell Alienware 18 Area-51 Ga... Cena katalogowa: 3300 USD | 4 kg | 26.7 mm | 18.00" 2560x1600 168 PPI IPS |
4. 85.1% 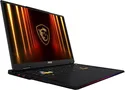 | MSI Raider A18 HX A9WIG-080 AMD Ryzen 9 9955HX3D ⎘ NVIDIA GeForce RTX 5080 Laptop ⎘ 64 GB Pamięć, 2048 GB SSD | Amazon: Cena katalogowa: 4350 Euro | 3.6 kg | 34 mm | 18.00" 3840x2400 252 PPI MiniLED IPS |
5. 90.5% v7 (old)  | Razer Blade 18 2024 RZ09-0509 Intel Core i9-14900HX ⎘ NVIDIA GeForce RTX 4090 Laptop GPU ⎘ 32 GB Pamięć | Amazon: Cena katalogowa: 4500 USD | 3.1 kg | 21.9 mm | 18.00" 2560x1600 168 PPI Mini-LED |
6. 87.4% v7 (old) 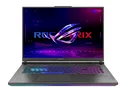 | Asus ROG Strix G18 G814JI Intel Core i7-13650HX ⎘ NVIDIA GeForce RTX 4070 Laptop GPU ⎘ 32 GB Pamięć, 1024 GB SSD | Amazon: 1. $3,419.00 ASUS ROG Strix G18 G814 Gami... 2. $1,382.26 ASUS ROG Strix G18 (2025) Ga... 3. $3,059.00 ASUS ROG Strix G18 G814 Gami... Cena katalogowa: 2699 EUR | 3 kg | 31 mm | 18.00" 2560x1600 168 PPI IPS |
7. 87.1% v7 (old)  | Acer Predator Helios 18 PH18-72-98MW Intel Core i9-14900HX ⎘ NVIDIA GeForce RTX 4090 Laptop GPU ⎘ 32 GB Pamięć, 2048 GB SSD | Amazon: 1. $23.99 DC Power Jack Charging Port ... 2. $69.00 330W 19.5V 16.92A AC Charger... 3. $2,849.00 acer Predator Helios Neo 18"... | 3.3 kg | 29.5 mm | 18.00" 2560x1600 168 PPI Mini-LED |
Przezroczystość
Wyboru urządzeń do recenzji dokonuje nasza redakcja. Próbka testowa została udostępniona autorowi jako pożyczka od producenta lub sprzedawcy detalicznego na potrzeby tej recenzji. Pożyczkodawca nie miał wpływu na tę recenzję, producent nie otrzymał też kopii tej recenzji przed publikacją. Nie było obowiązku publikowania tej recenzji. Jako niezależna firma medialna, Notebookcheck nie podlega władzy producentów, sprzedawców detalicznych ani wydawców.
Tak testuje Notebookcheck
Każdego roku Notebookcheck niezależnie sprawdza setki laptopów i smartfonów, stosując standardowe procedury, aby zapewnić porównywalność wszystkich wyników. Od około 20 lat stale rozwijamy nasze metody badawcze, ustanawiając przy tym standardy branżowe. W naszych laboratoriach testowych doświadczeni technicy i redaktorzy korzystają z wysokiej jakości sprzętu pomiarowego. Testy te obejmują wieloetapowy proces walidacji. Nasz kompleksowy system ocen opiera się na setkach uzasadnionych pomiarów i benchmarków, co pozwala zachować obiektywizm.
