Werdykt
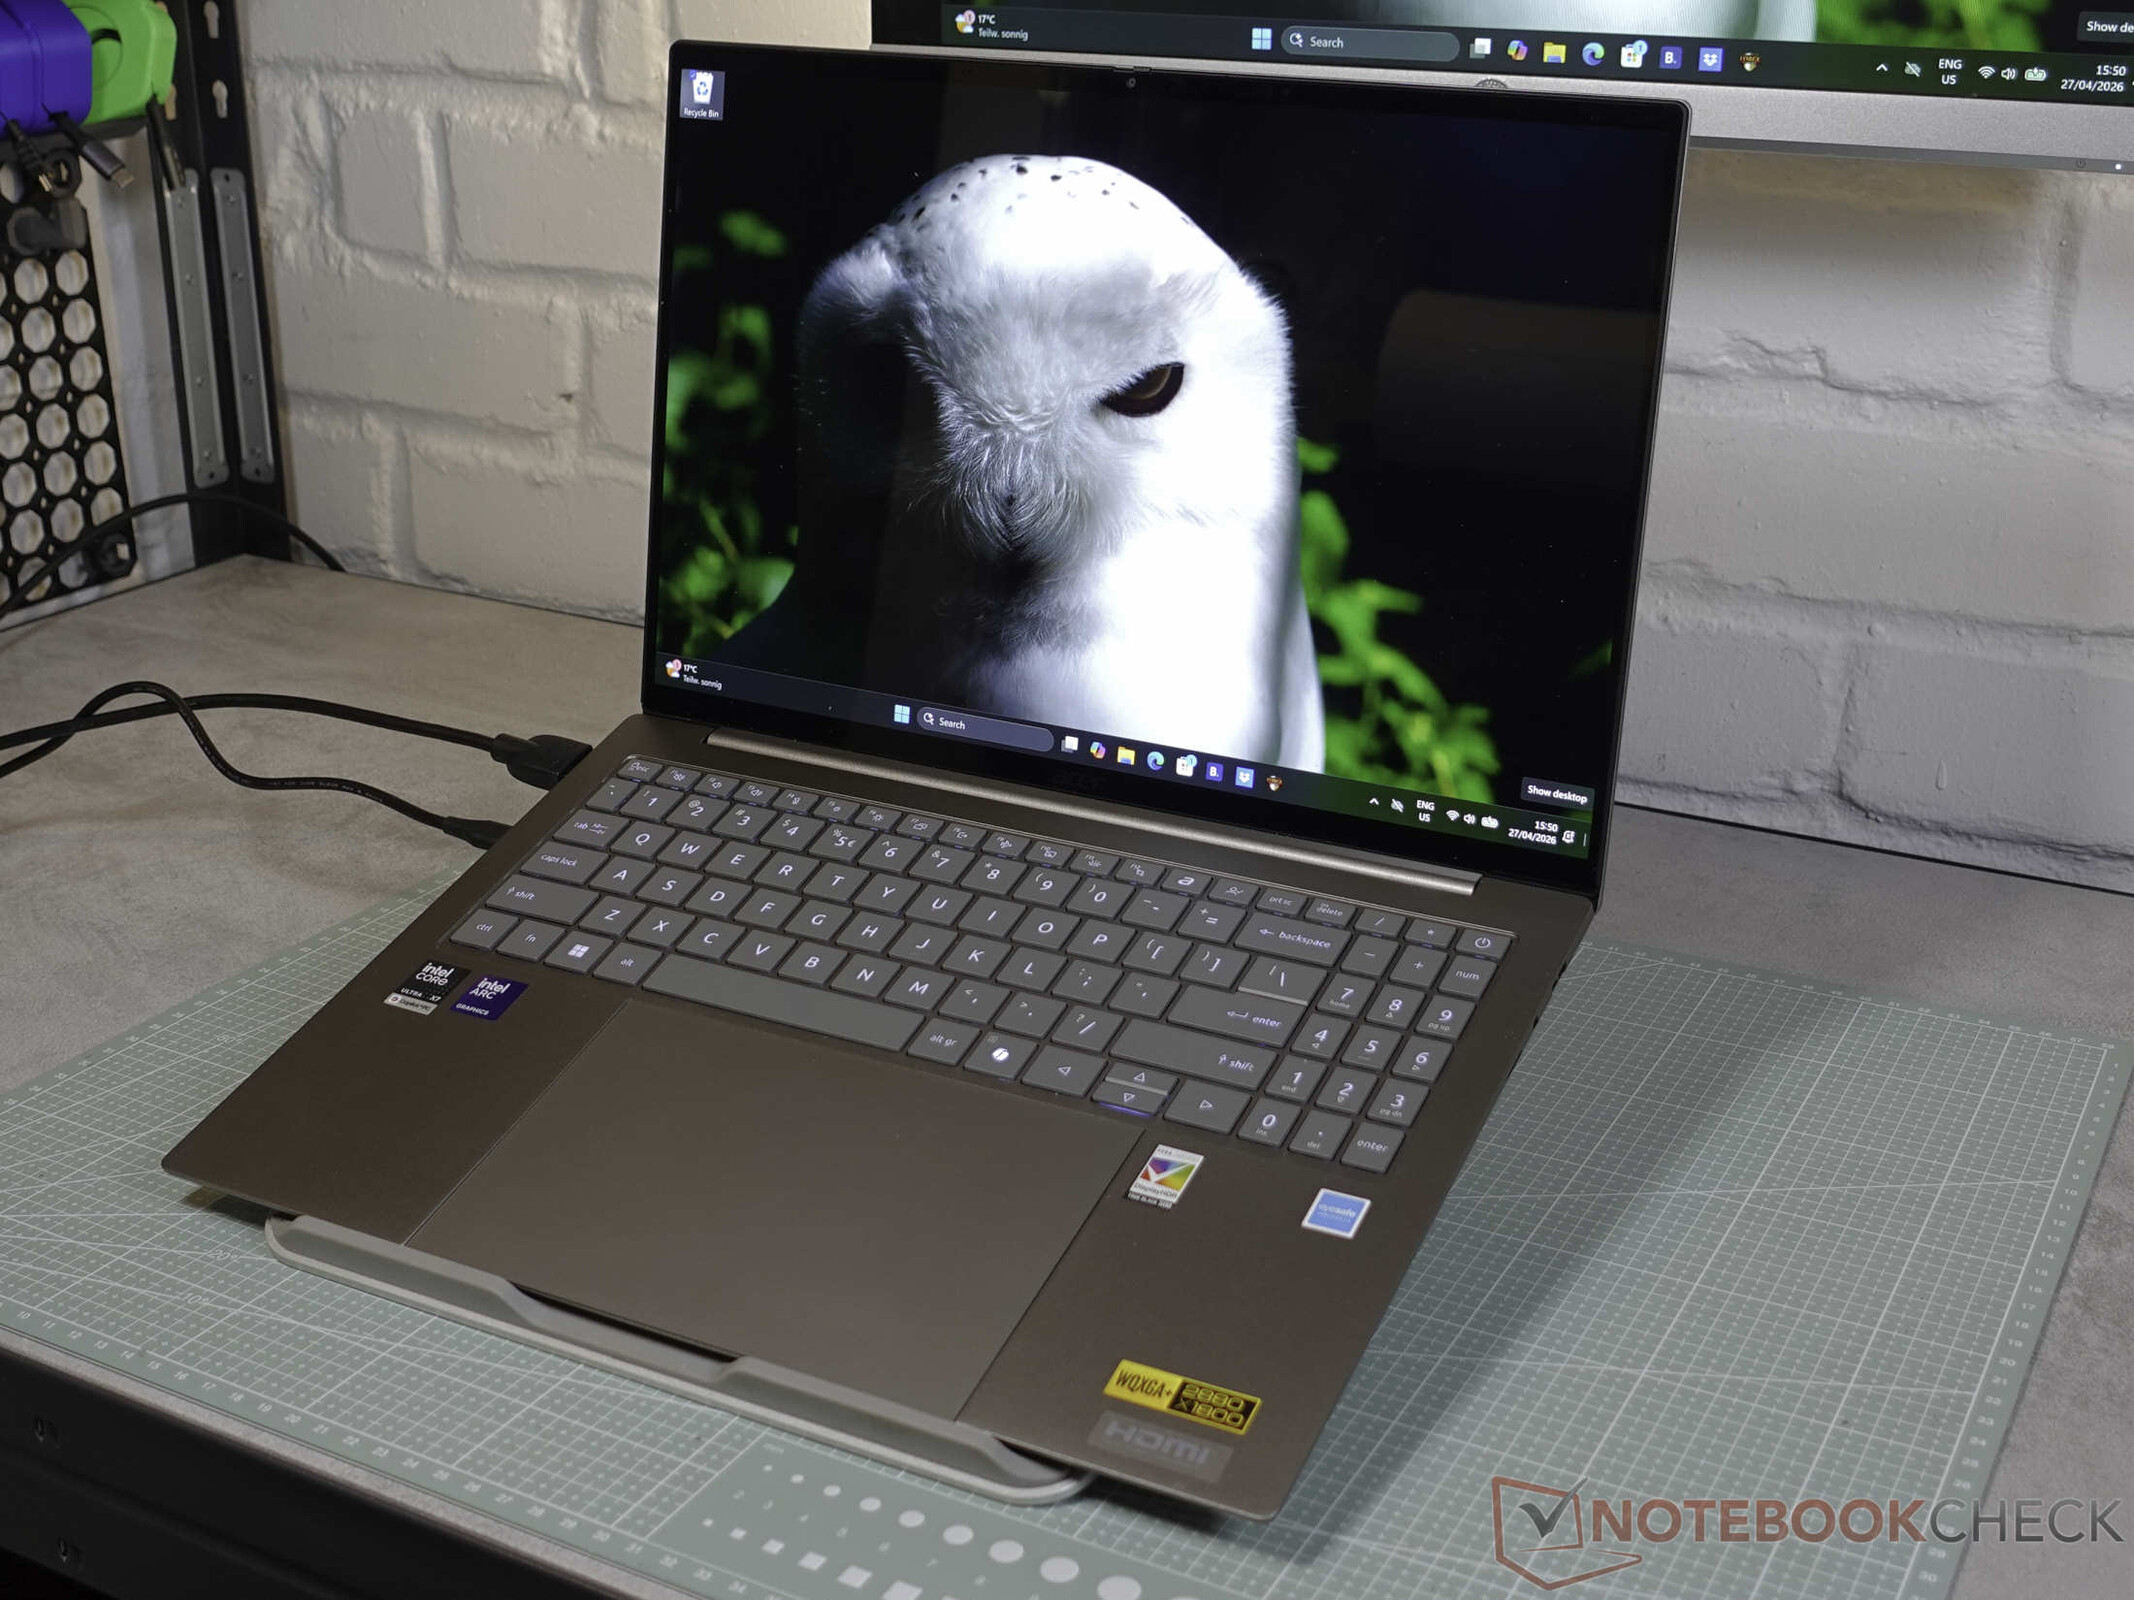
Acer Swift 16 AI okazuje się być potężnym towarzyszem codziennych zadań. Dzięki procesorowi Intel Core Ultra X7 358H pod maską, wydajność stanowi znaczący krok naprzód w porównaniu do poprzedniego modelu. Laptop wyróżnia się wydajnym systemem chłodzenia i baterią, która wystarcza na ponad 16 godzin przeglądania Internetu.
Podczas gdy ponadwymiarowy haptyczny touchpad jest imponujący, jego sama skala może czasami przeszkadzać w wygodnym pisaniu. Kamera internetowa i głośniki są po prostu przeciętne, ale Acer ostatecznie dostarcza bardzo fajne i trwałe urządzenie dla zaawansowanych użytkowników.
Za
Przeciw
Ceny i dostępność
Cena została ustalona na około 1600 euro. W zależności od regionu, konkretne konfiguracje mogą się różnić, a niektóre lokalne rynki oferują wersje z inną pamięcią lub nawet szybszym procesorem Core Ultra X9.
Spezifikationen
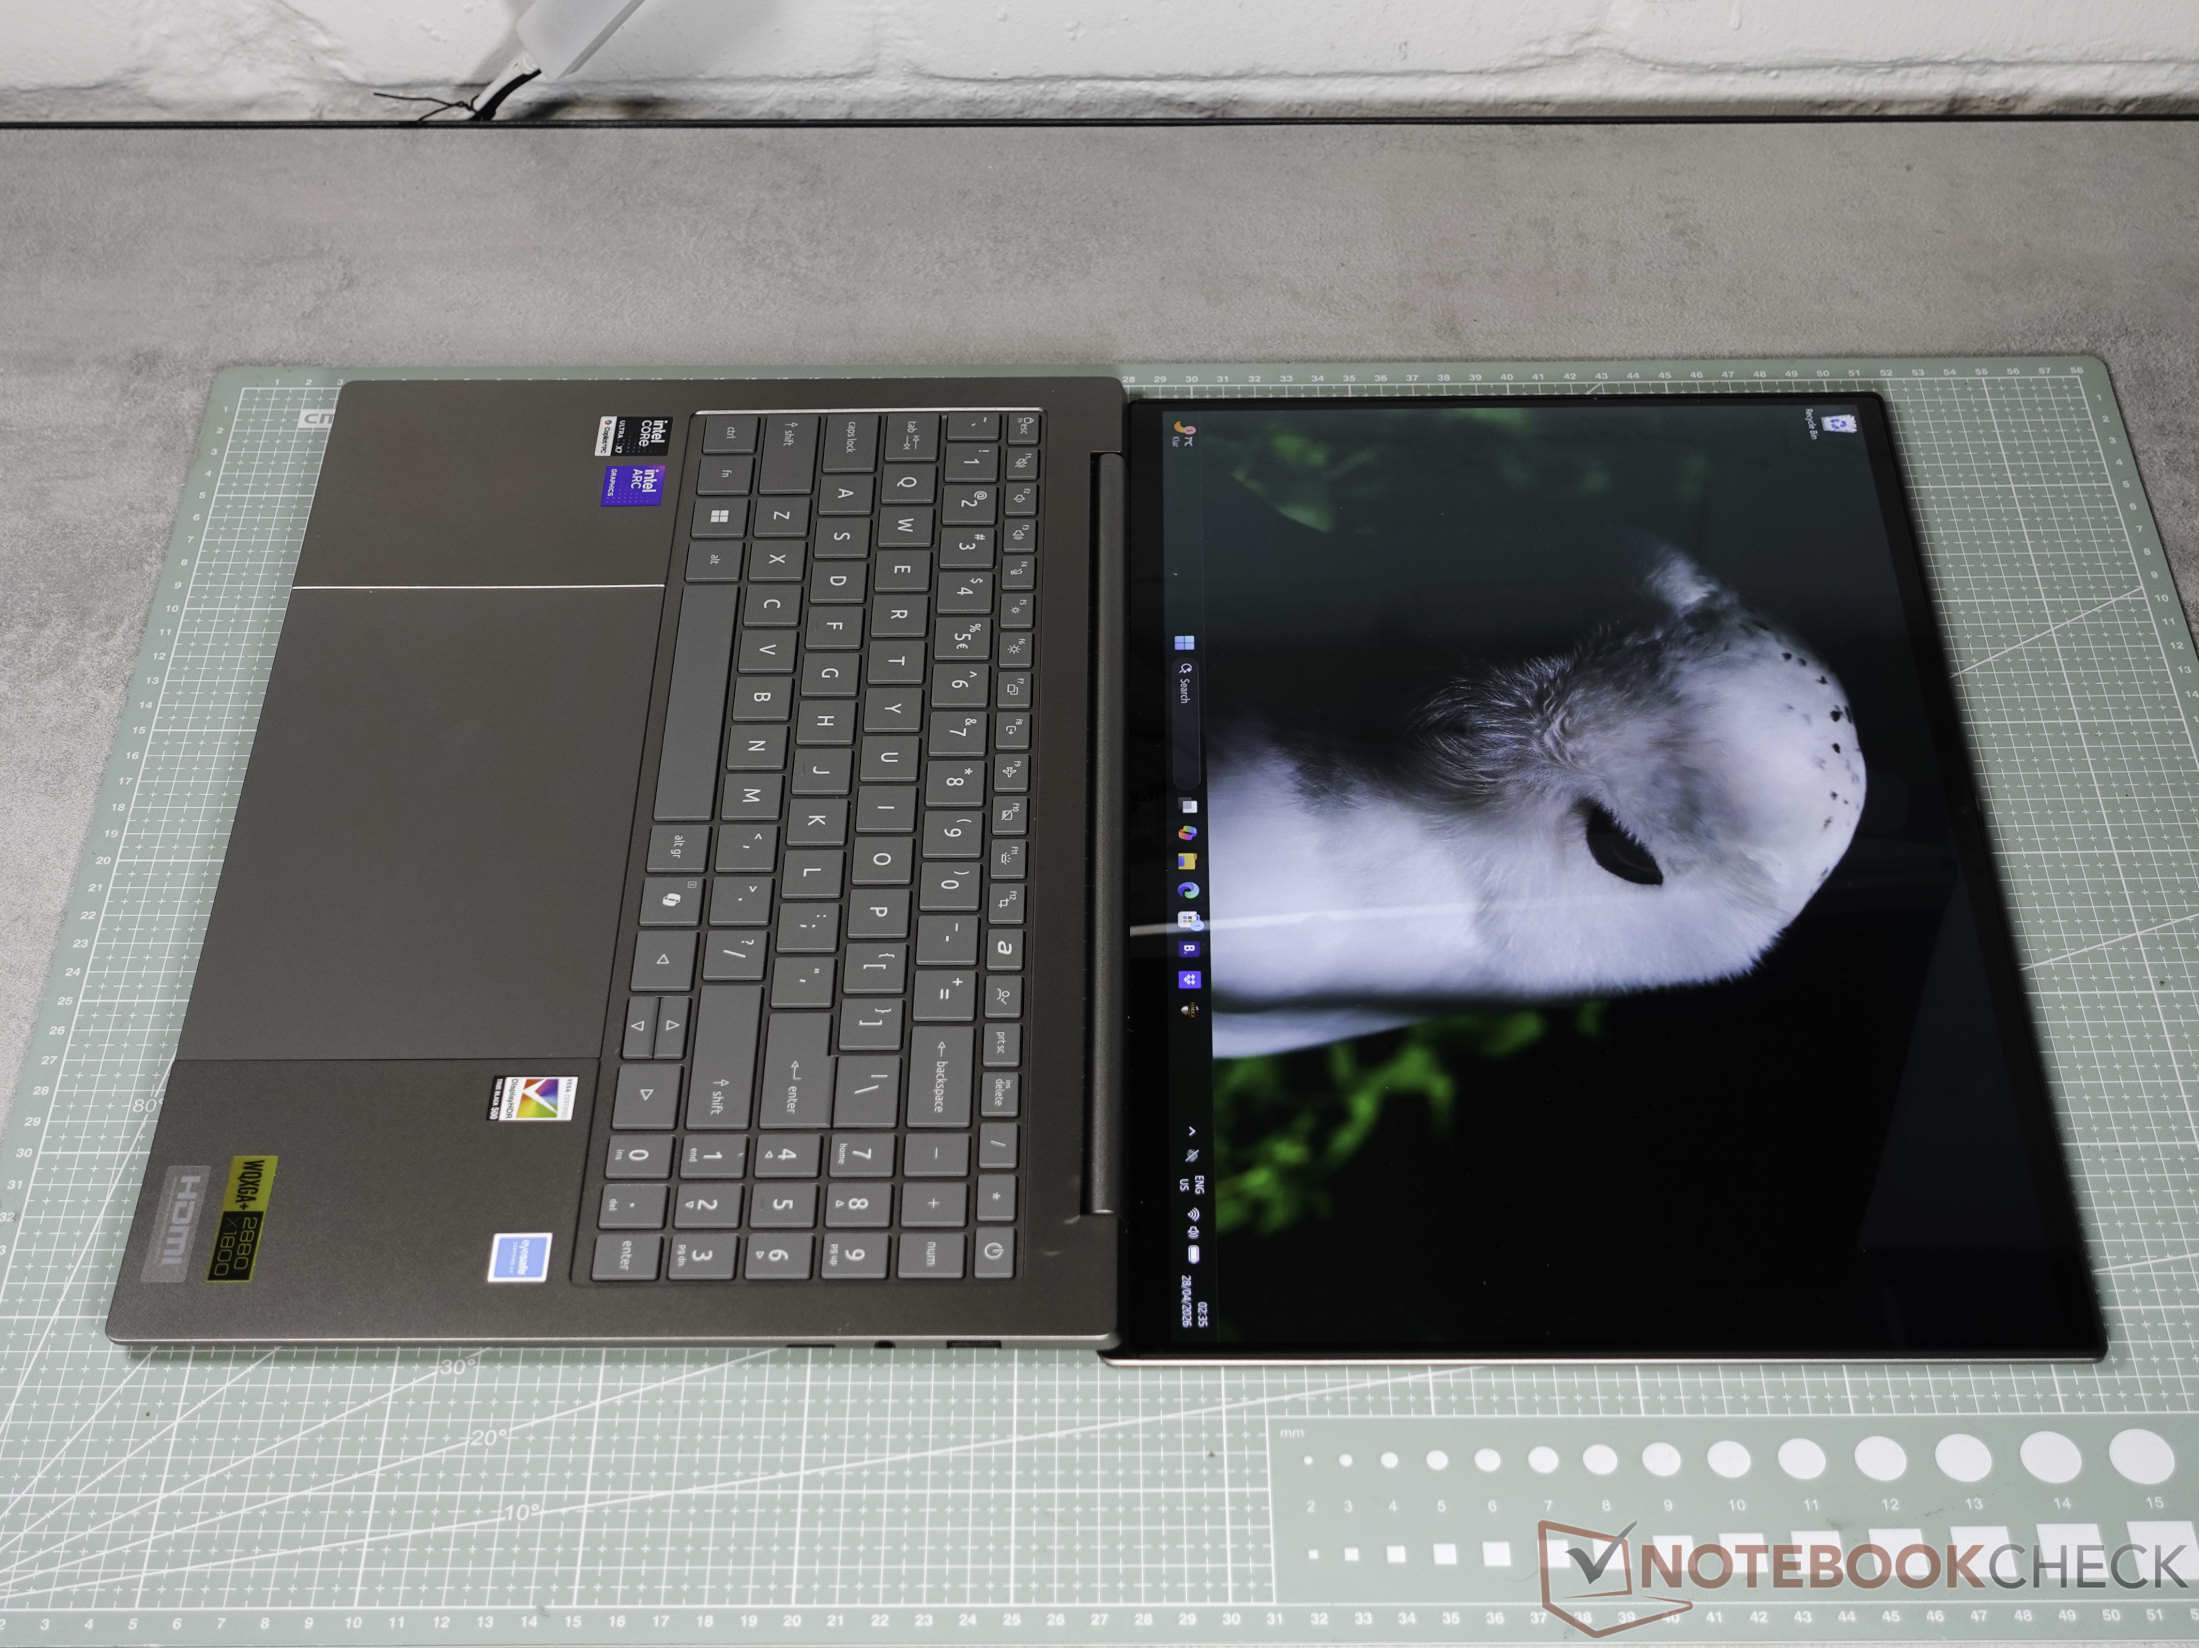
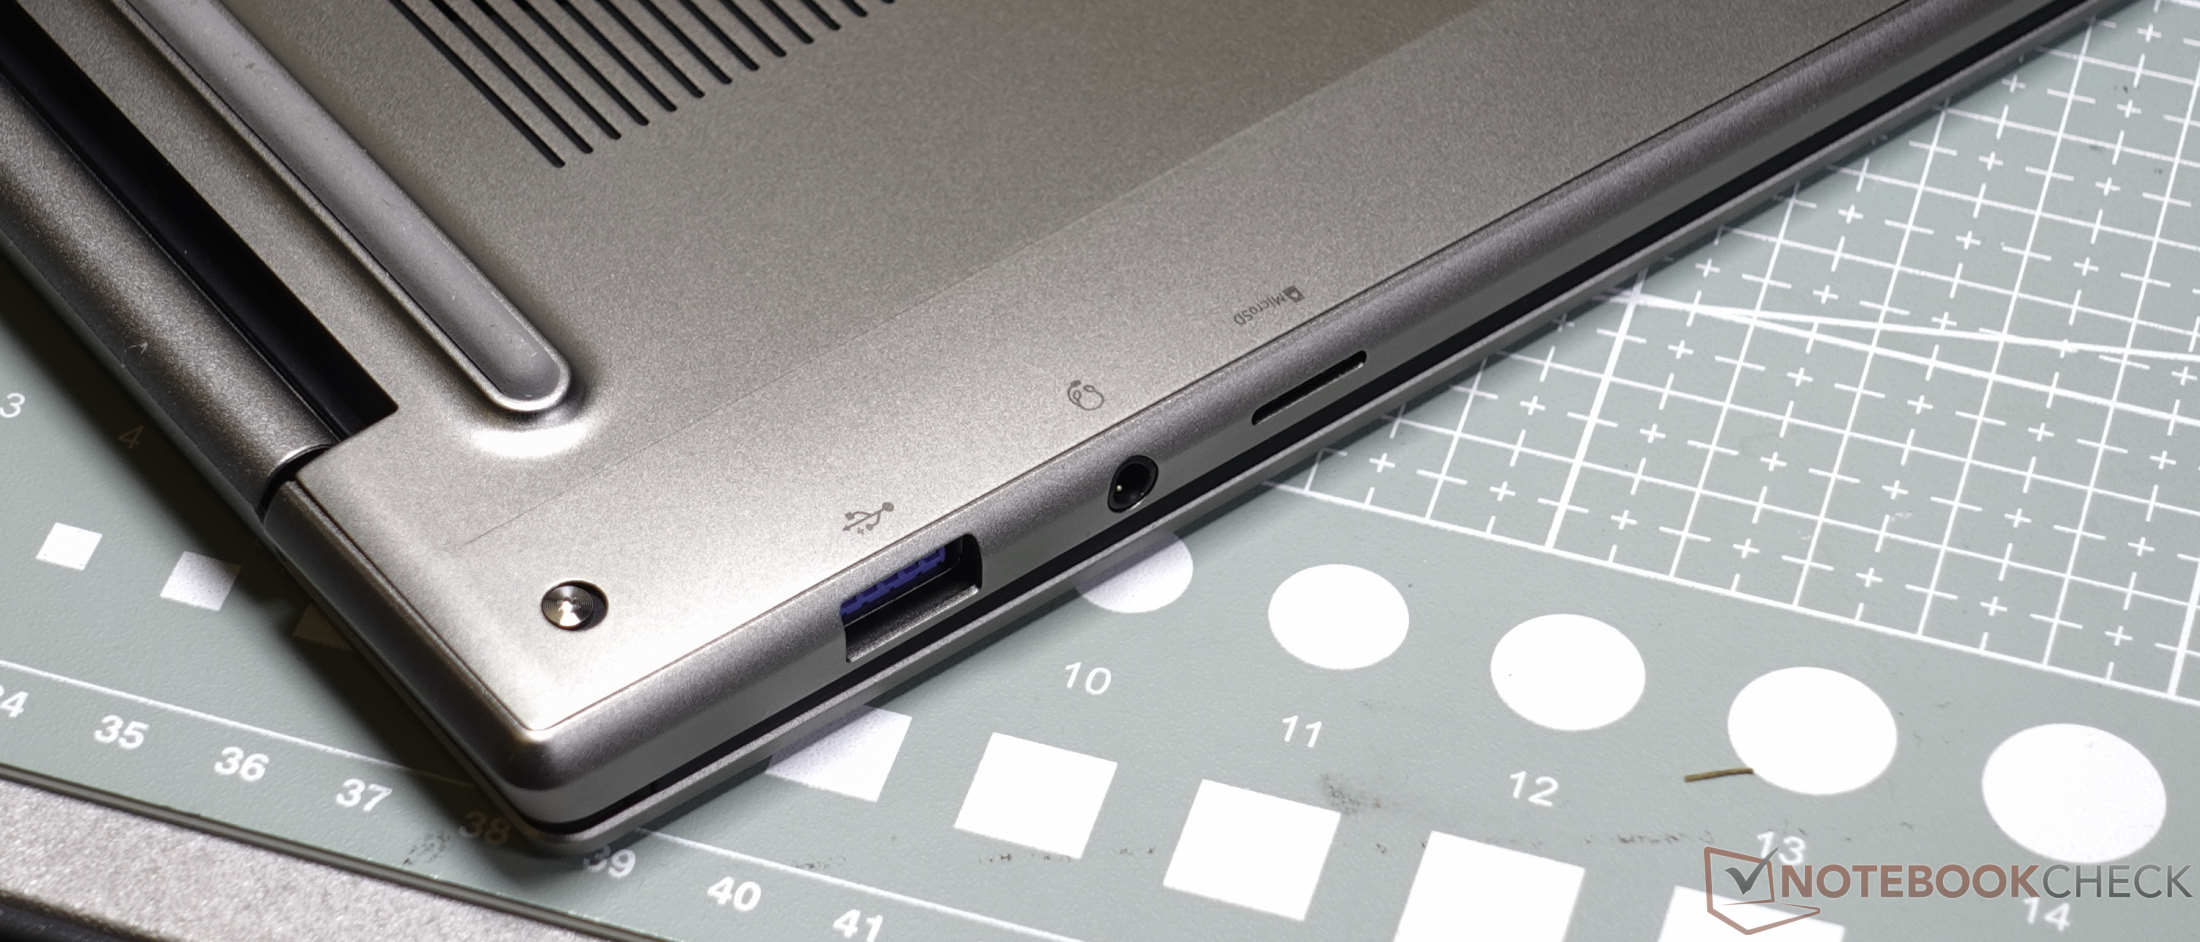
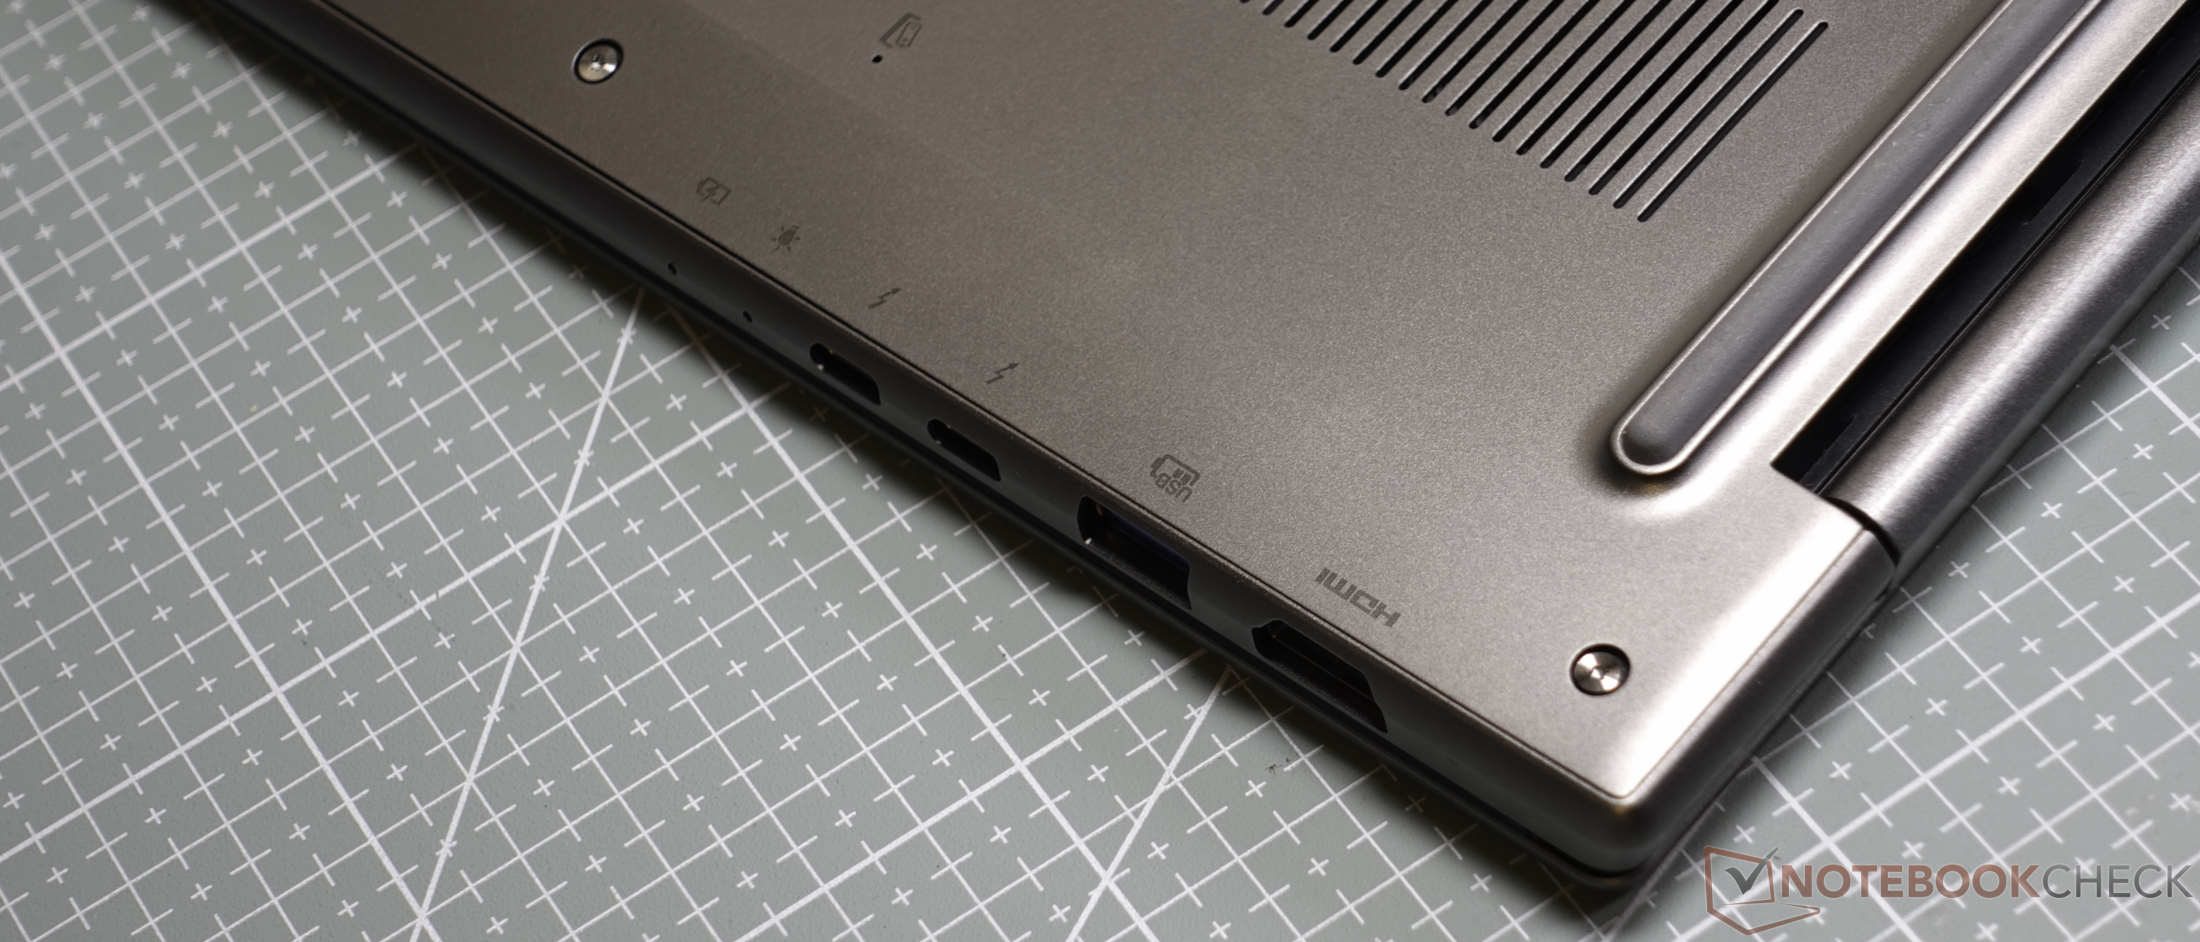
Obudowa i łączność
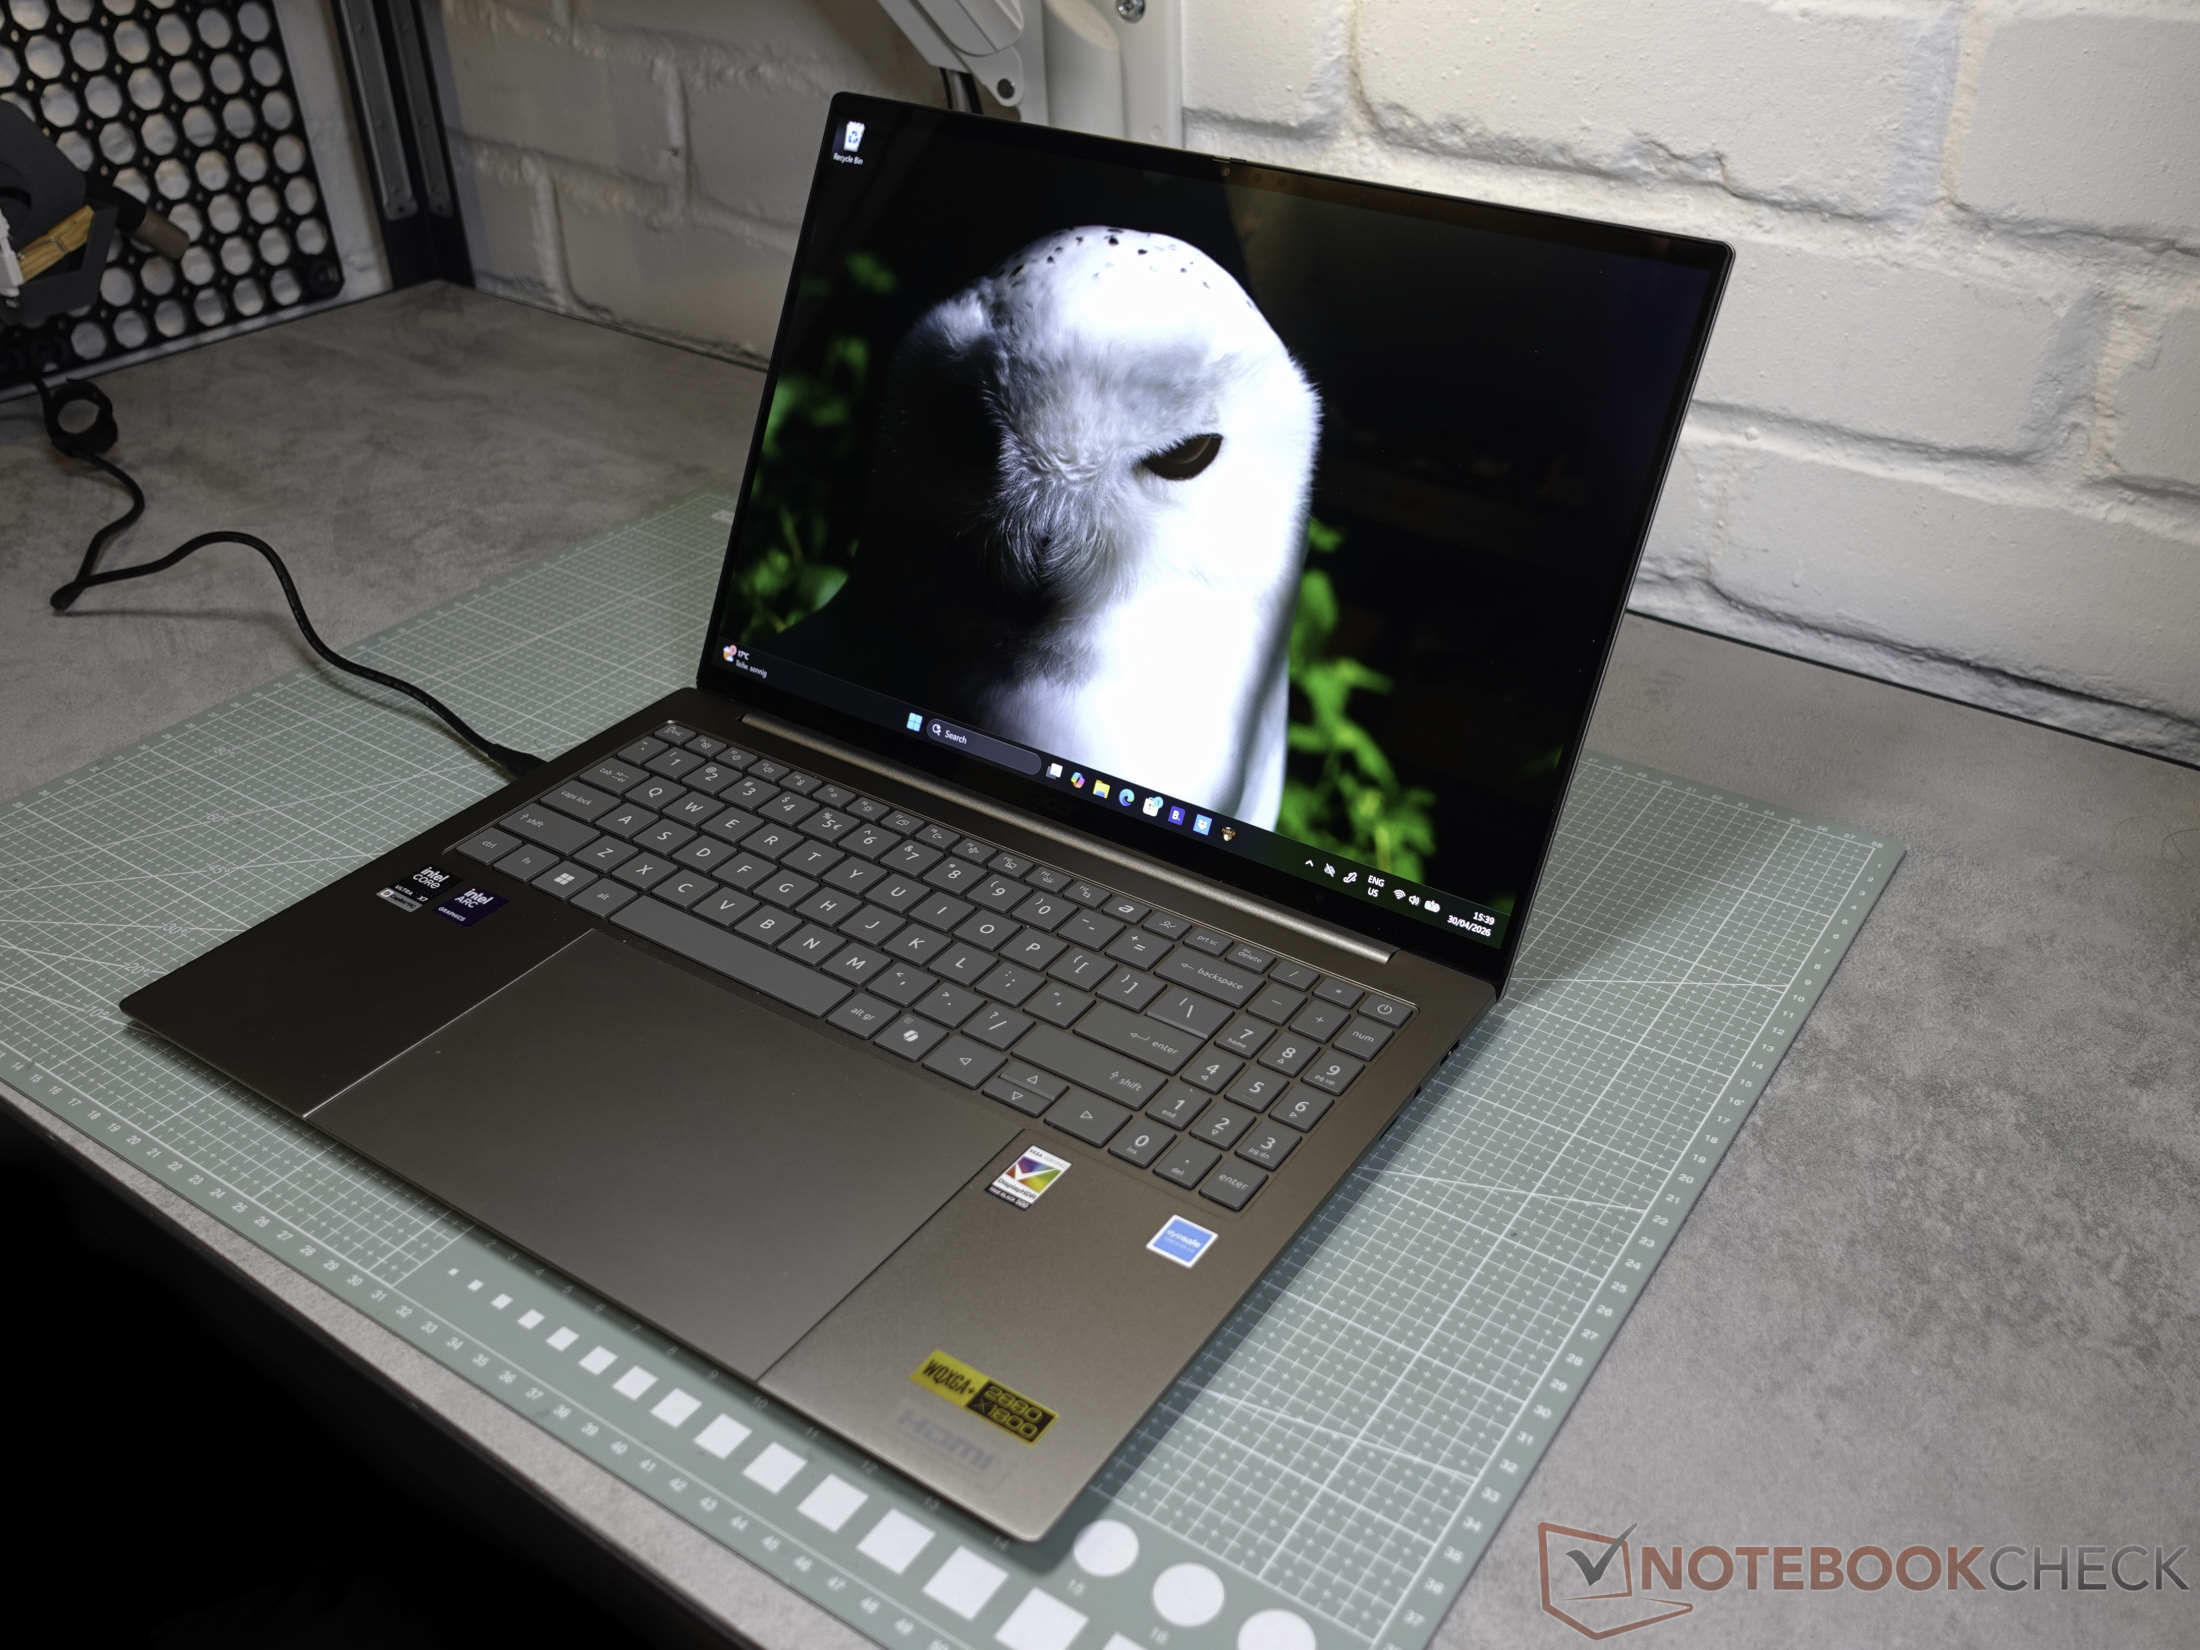
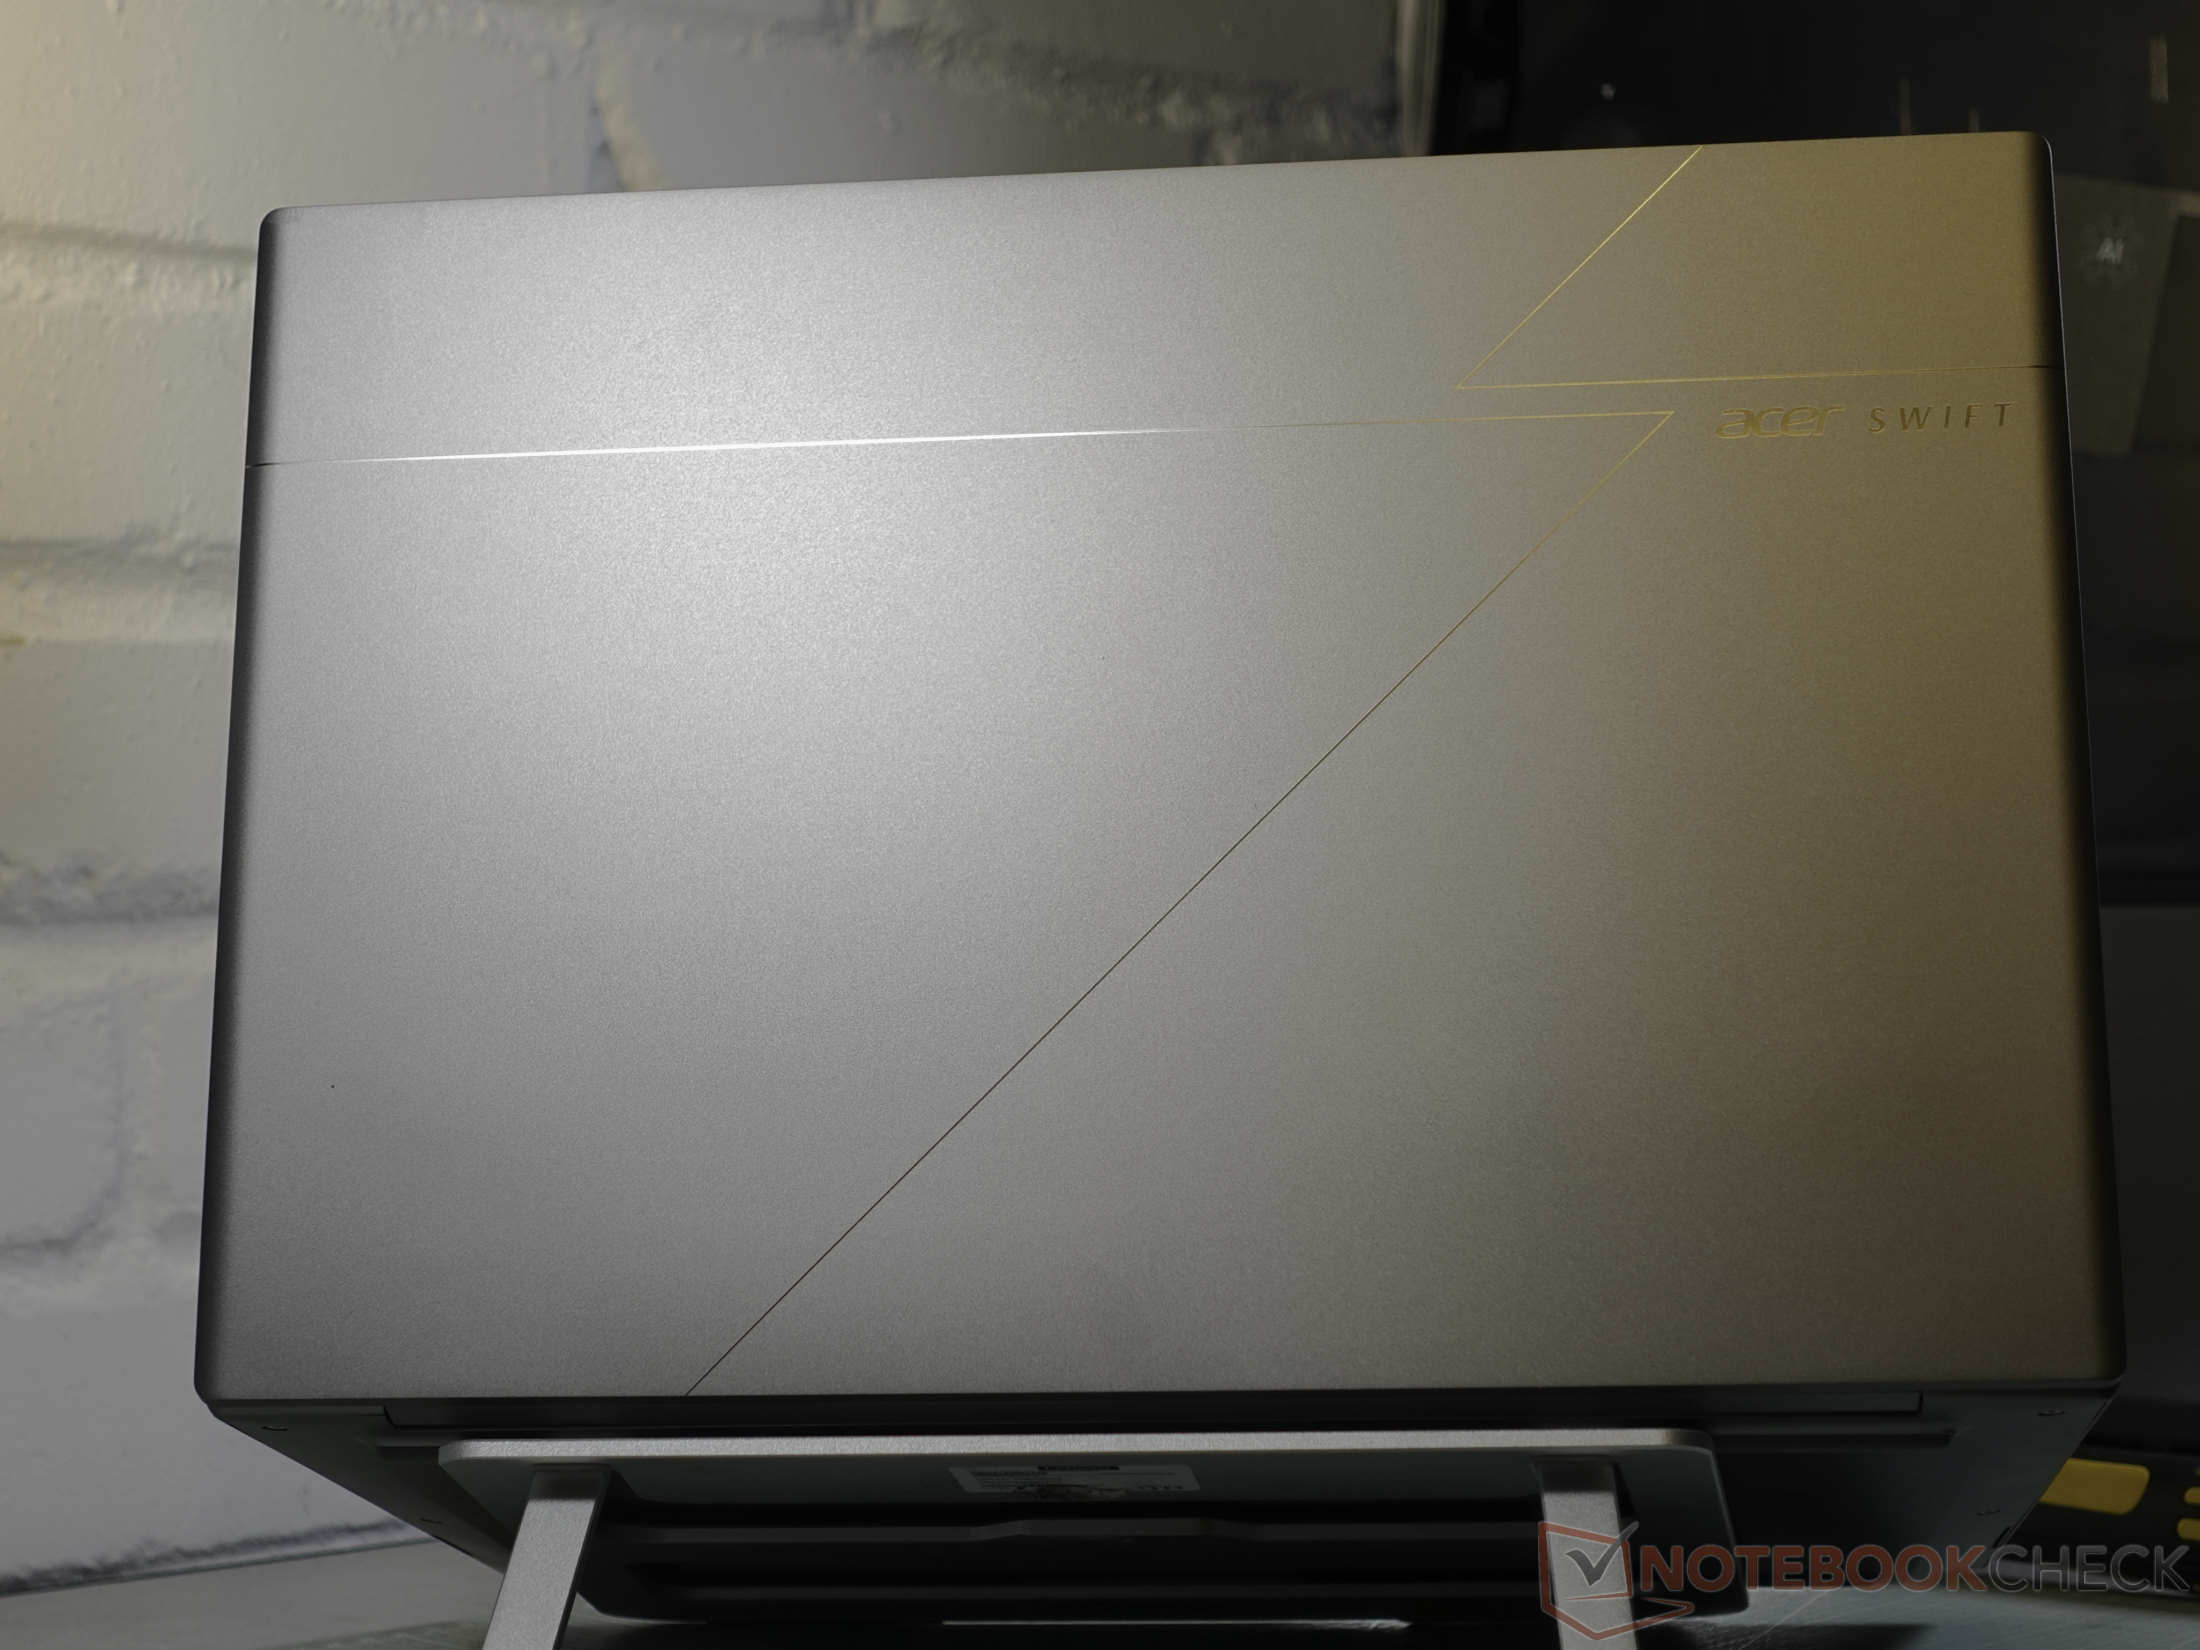
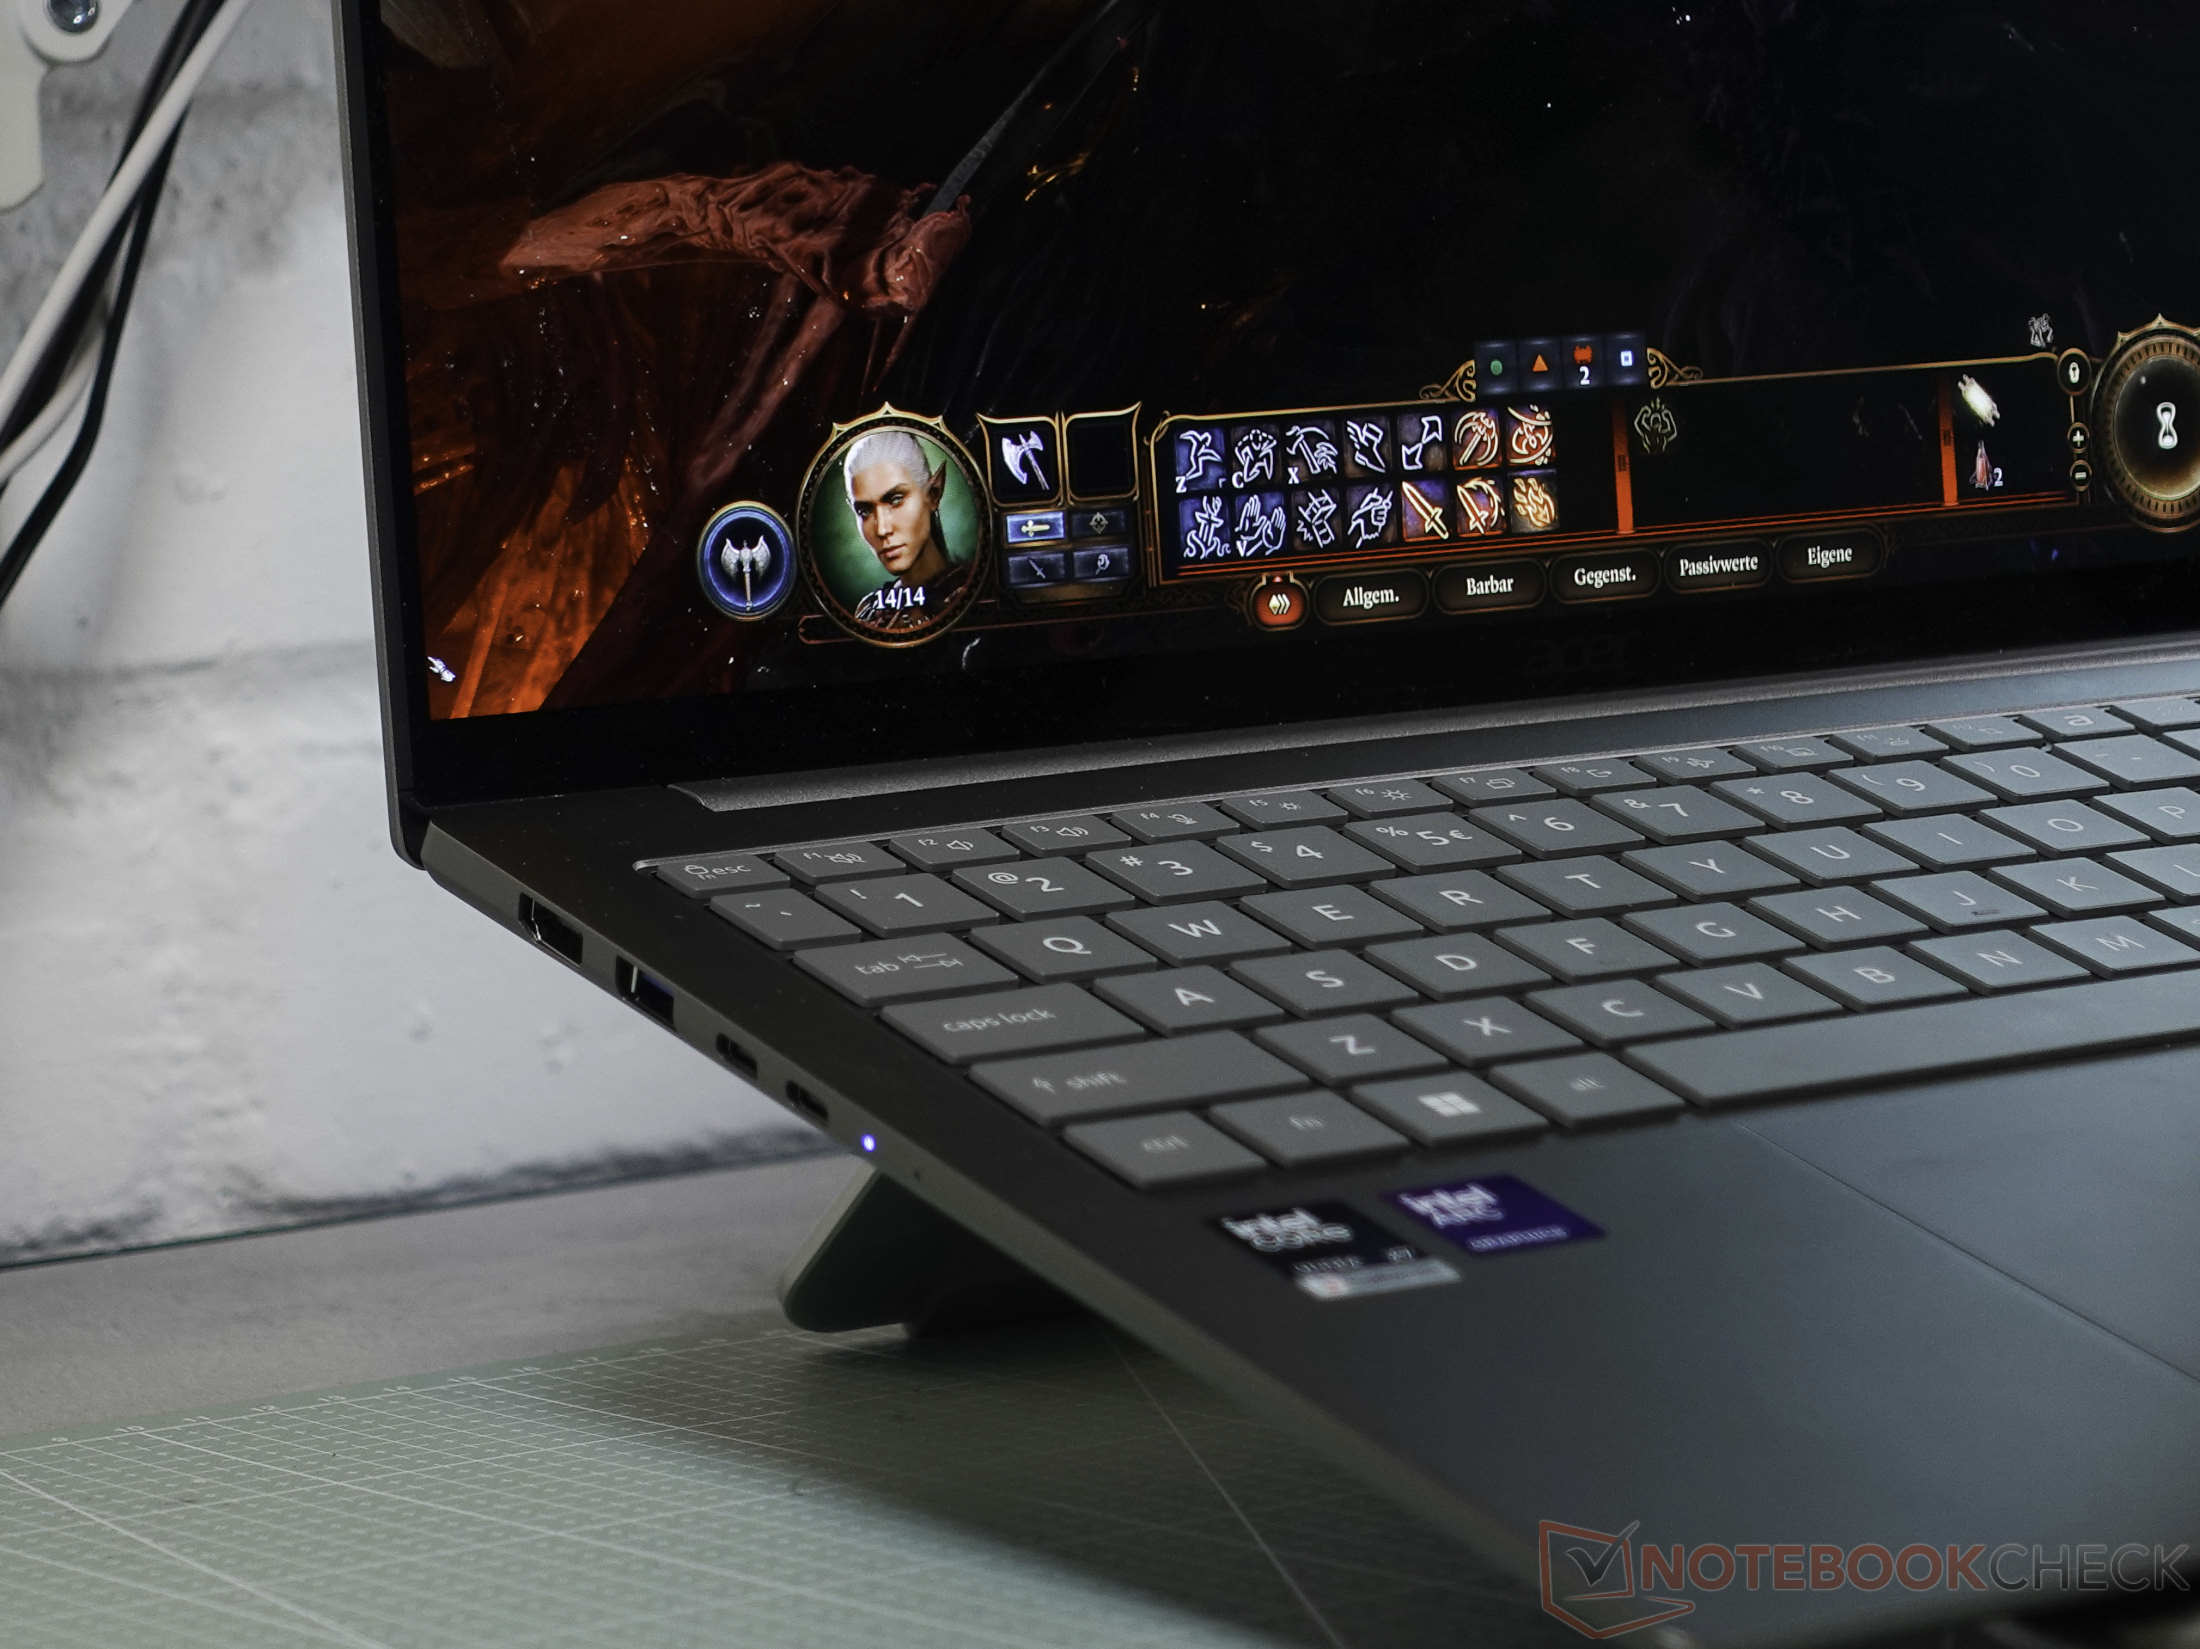
Metalowo-szklana konstrukcja sprawia wrażenie wysokiej jakości i solidności. Acer zdecydował się tym razem na zaokrąglone krawędzie, unikając poprzedniej ostrej estetyki. Obudowa pozostaje solidna i cicha. Niezwykłym szczegółem jest to, że etykiety portów są ukryte na spodzie. Łączność jest bogata jak na tak smukłe urządzenie, wyposażone w dwa porty Thunderbolt, USB-A i gniazdo microSD. W zestawie znajduje się nowoczesne Wi-Fi 7. Ekran otwiera się o 180 stopni, co jest przydatne podczas korzystania z pióra. Opakowanie jest przyjazne dla środowiska, wykorzystując bardzo mało plastiku.
| SD Card Reader - average JPG Copy Test (av. of 3 runs) | |
| Średnia w klasie Multimedia (23 - 531, n=43, ostatnie 2 lata) | |
| Acer Swift 16 AI SF16-71T-75YX | |


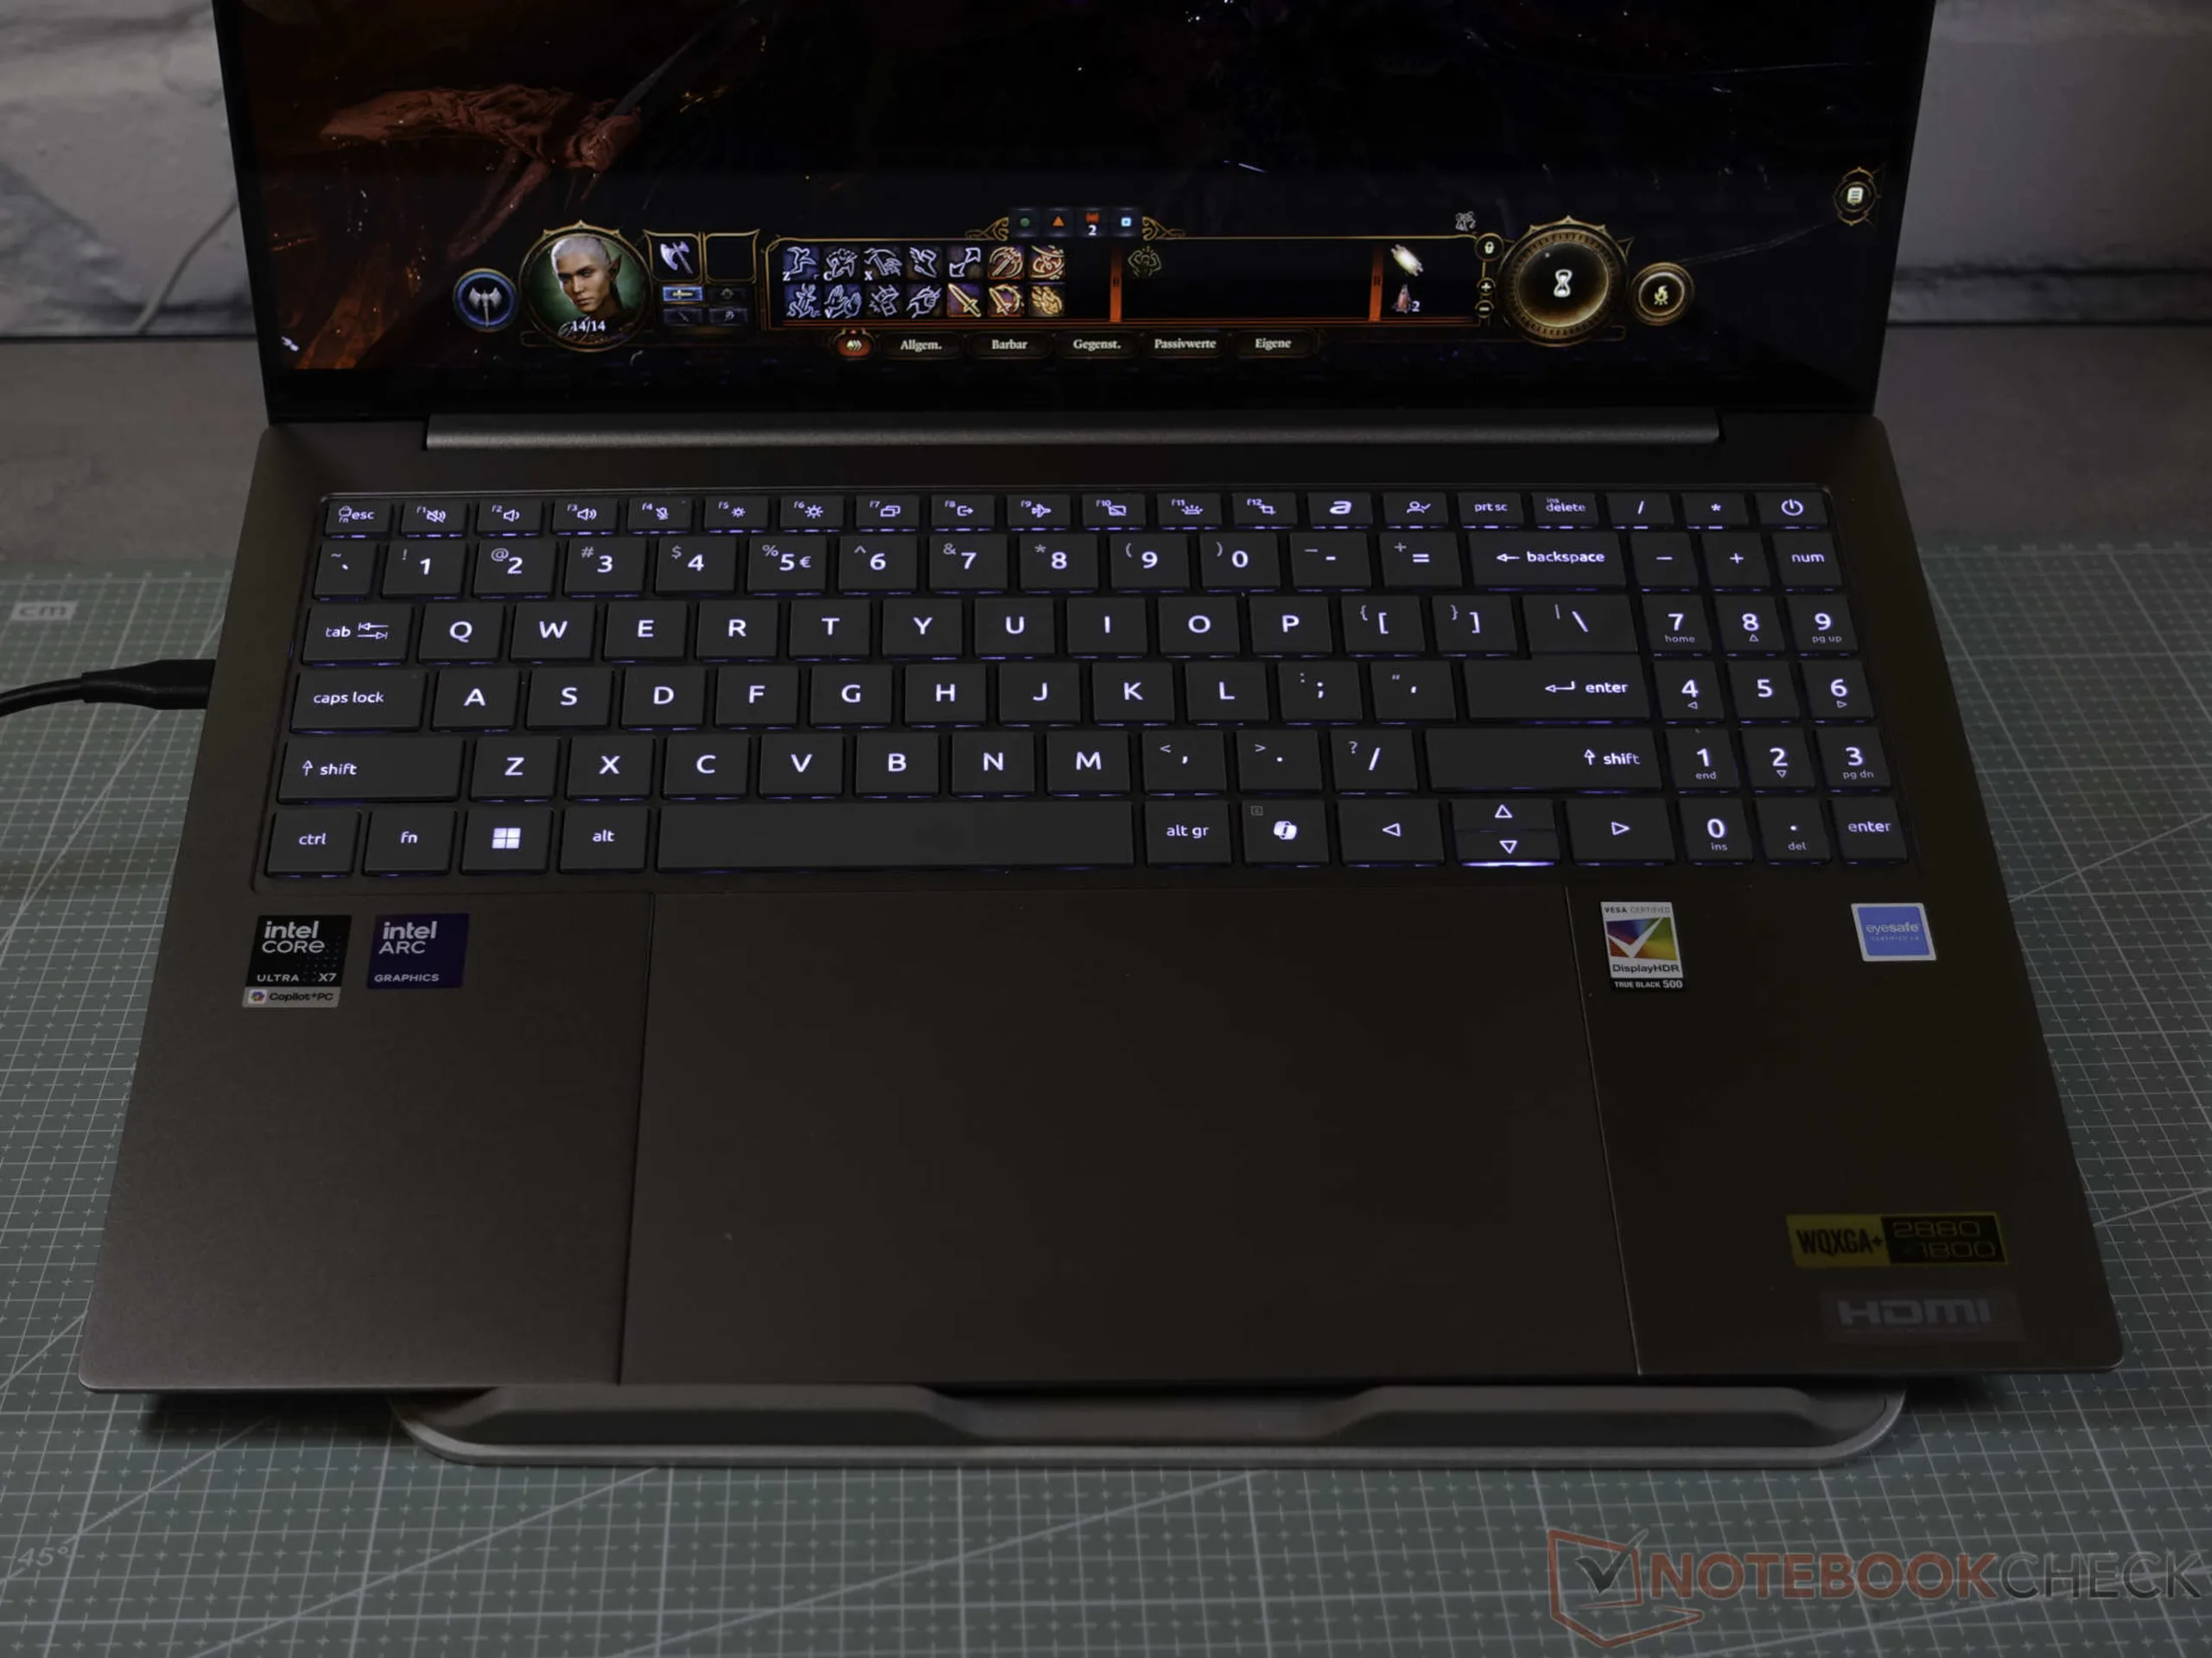
Urządzenia wejściowe
Ogromny touchpad o wymiarach 17 x 11 cm dominuje na pokładzie. Współpracuje on z precyzyjnymi piórami i zapewnia satysfakcjonujące uczucie kliknięcia, choć jego szerokość oznacza mniej miejsca na dłonie podczas długich sesji pisania. Sama klawiatura jest wygodna i podświetlana, w tym przycisk Copilot do szybkiego dostępu do AI.
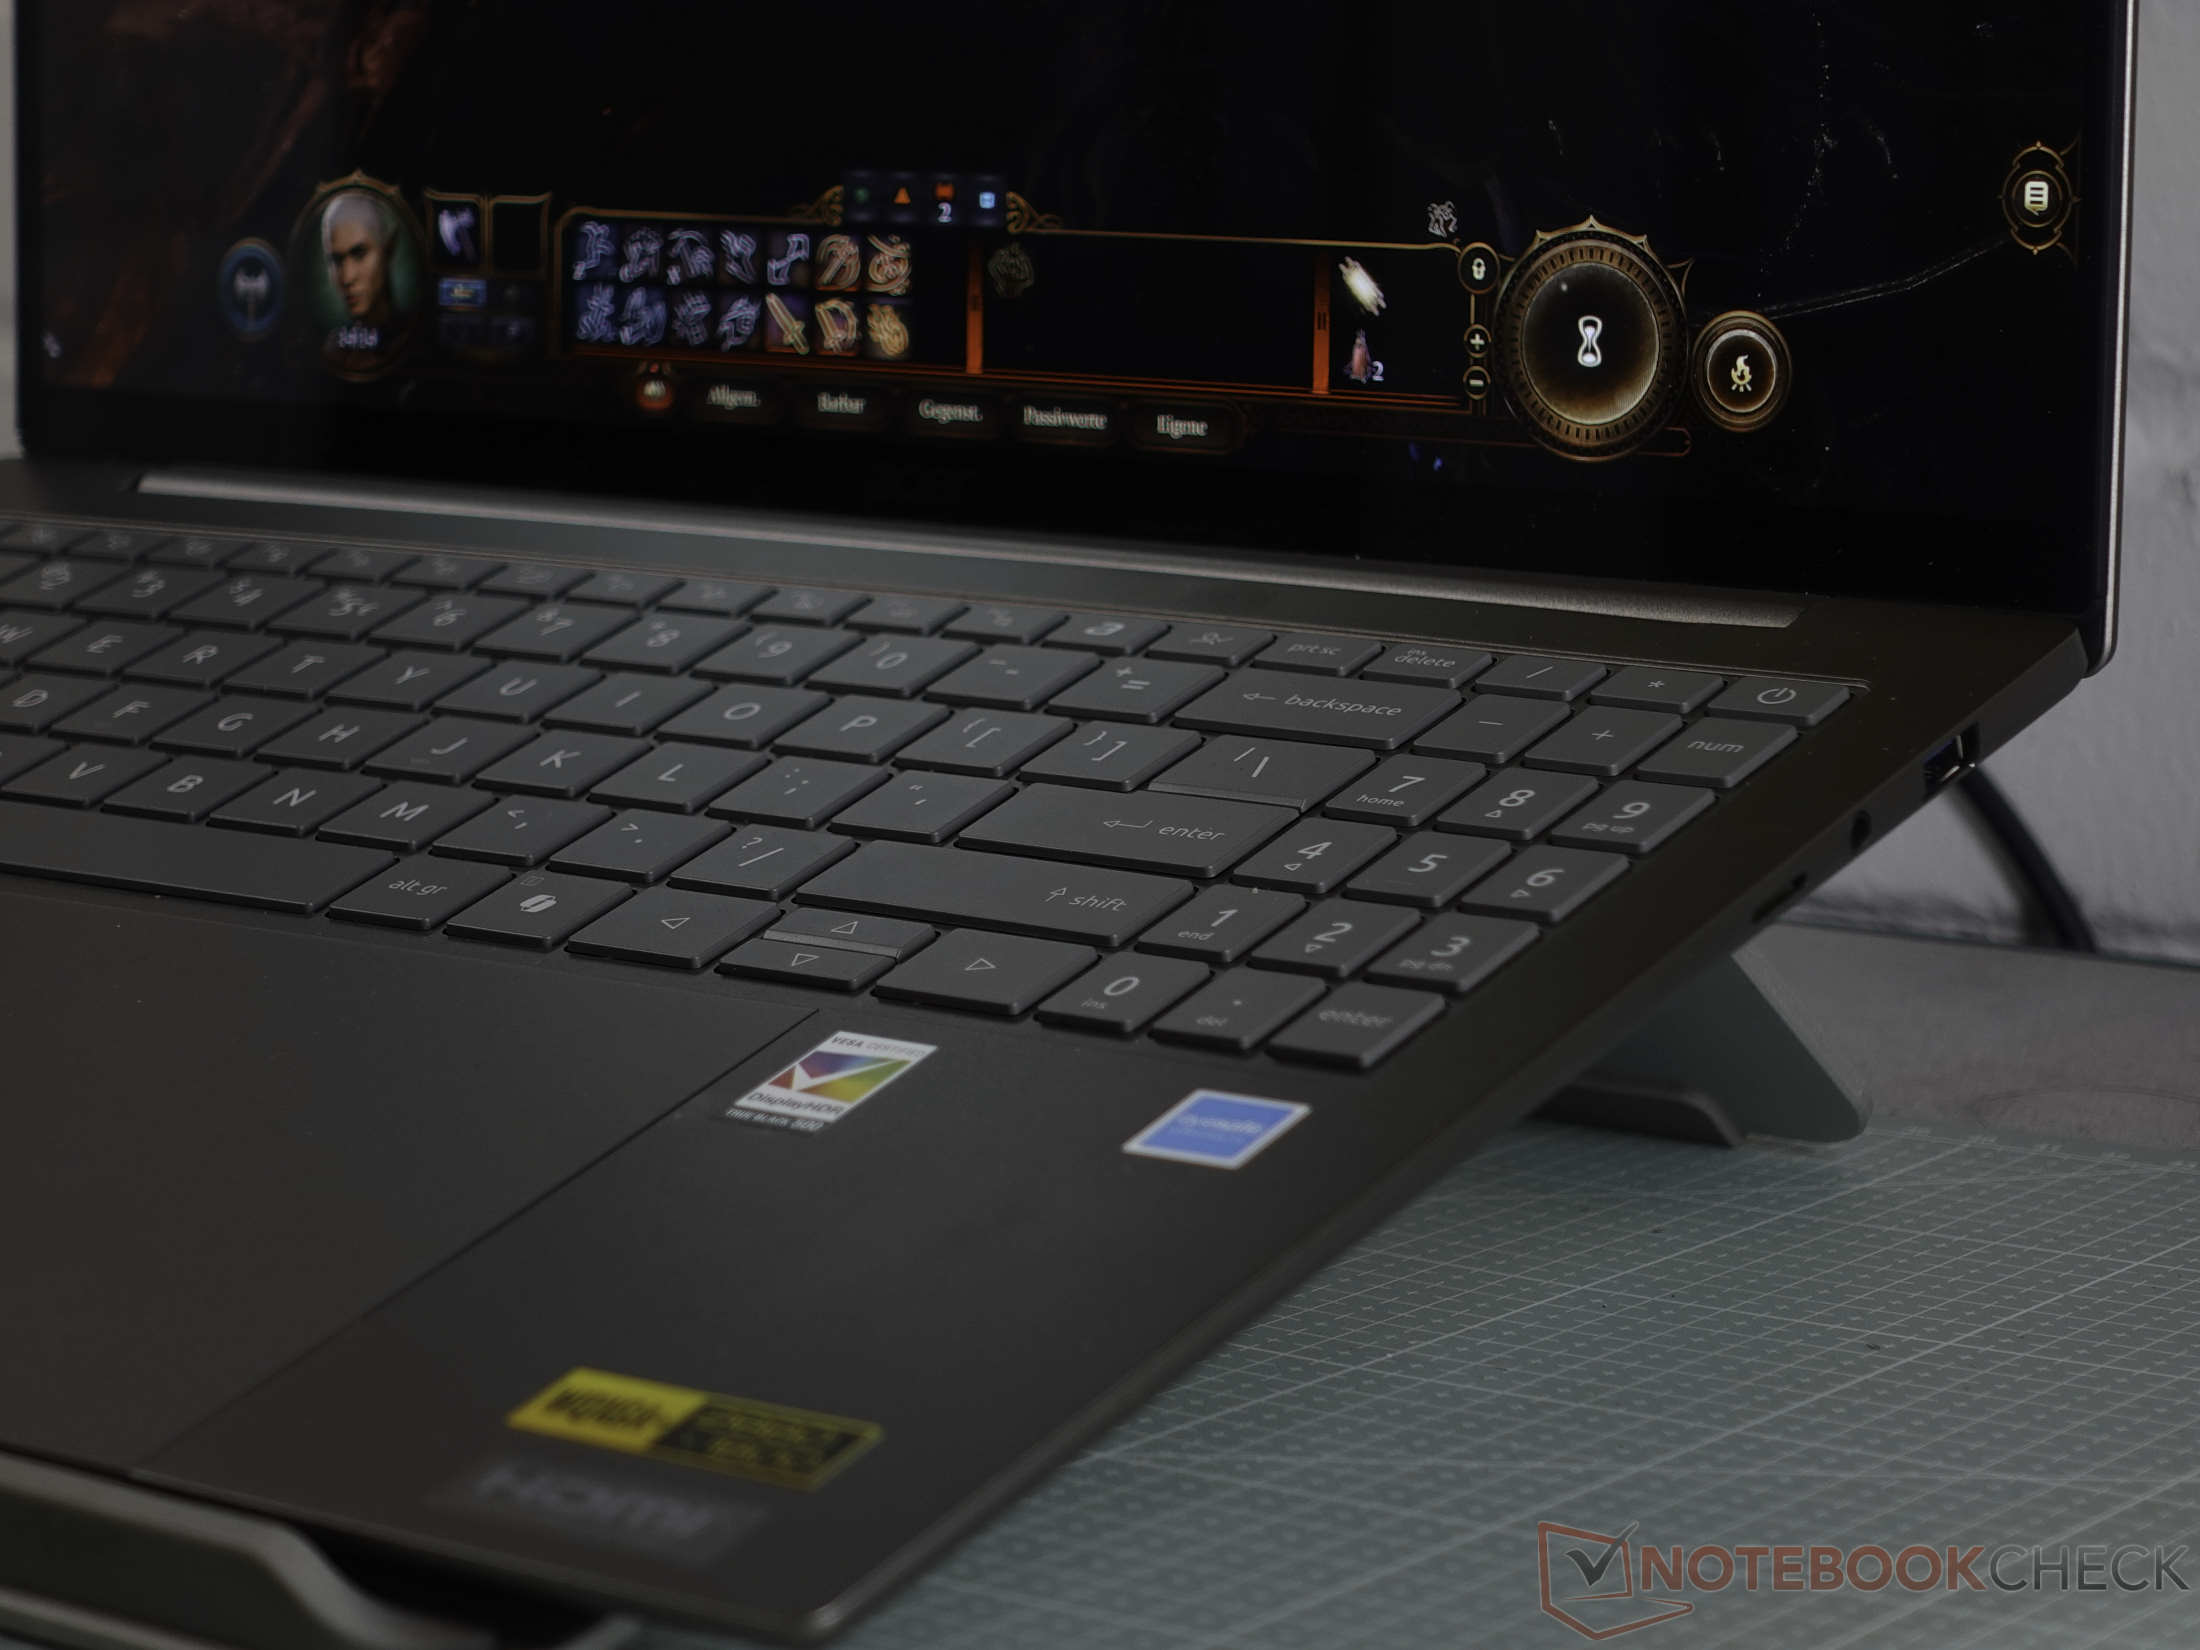
Wyświetlacz
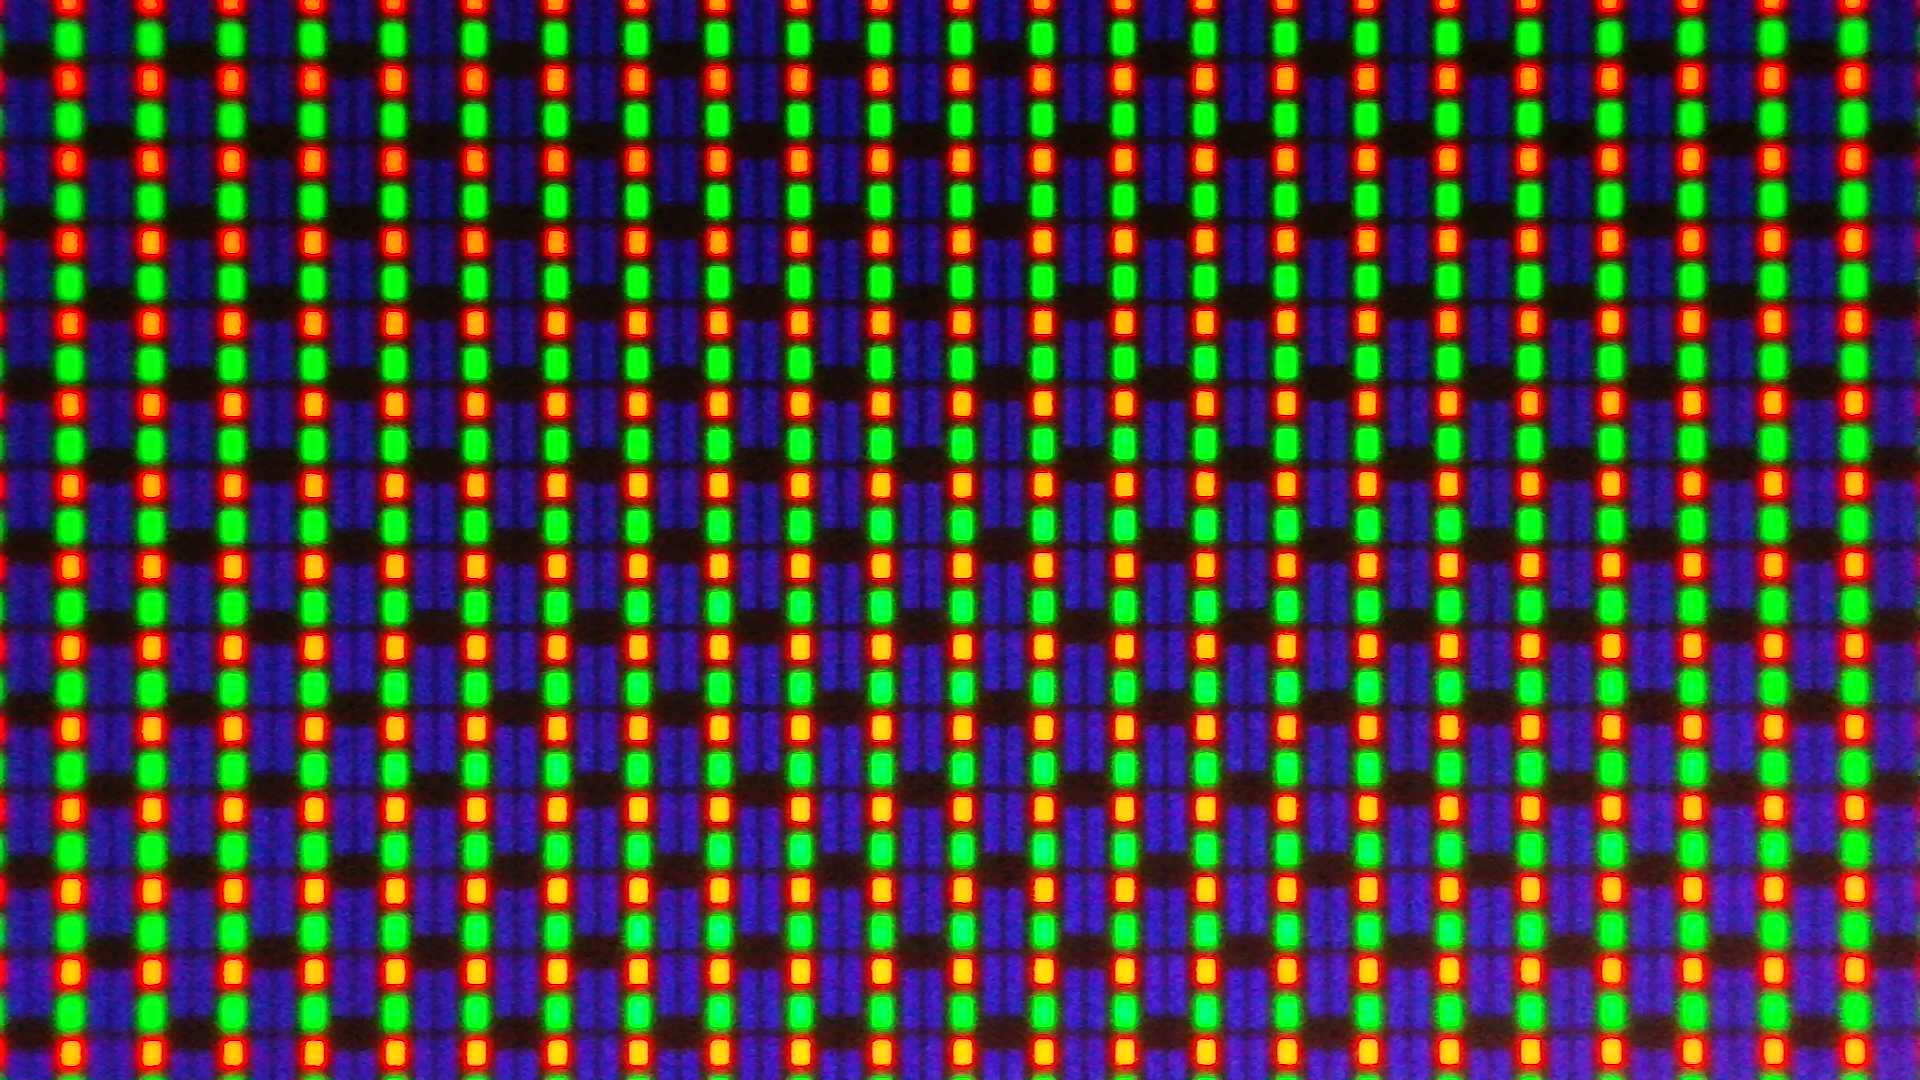
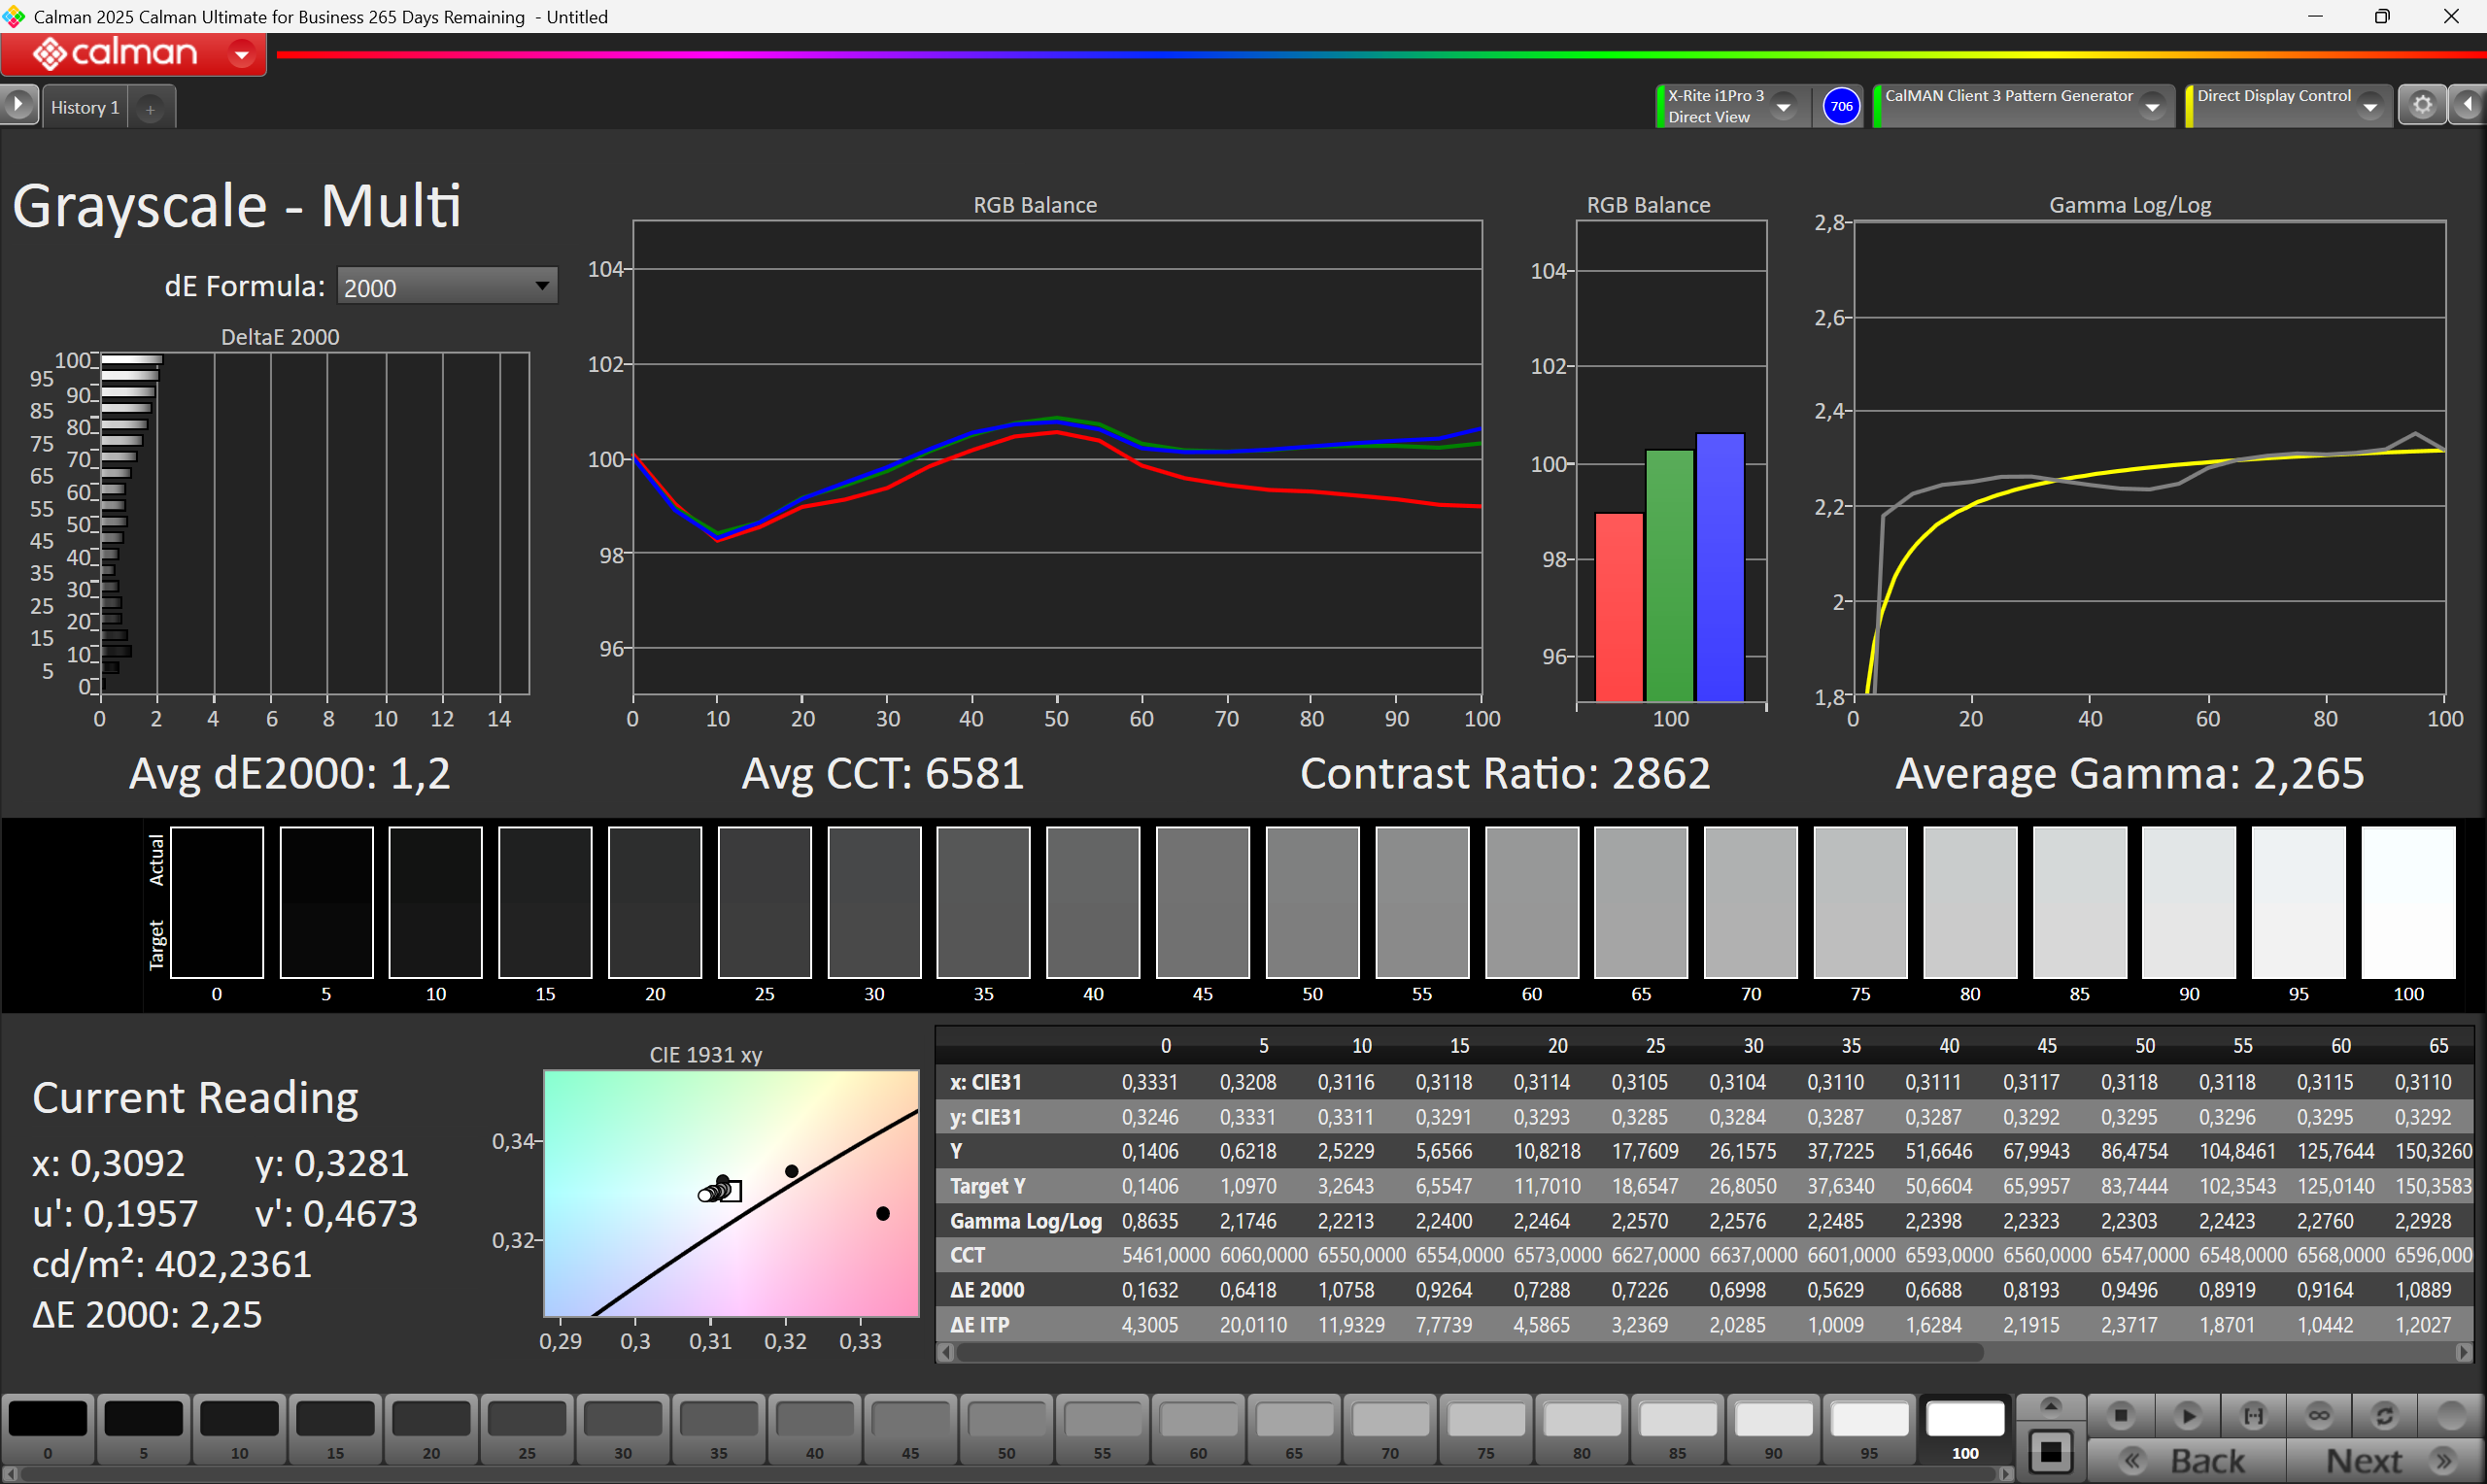
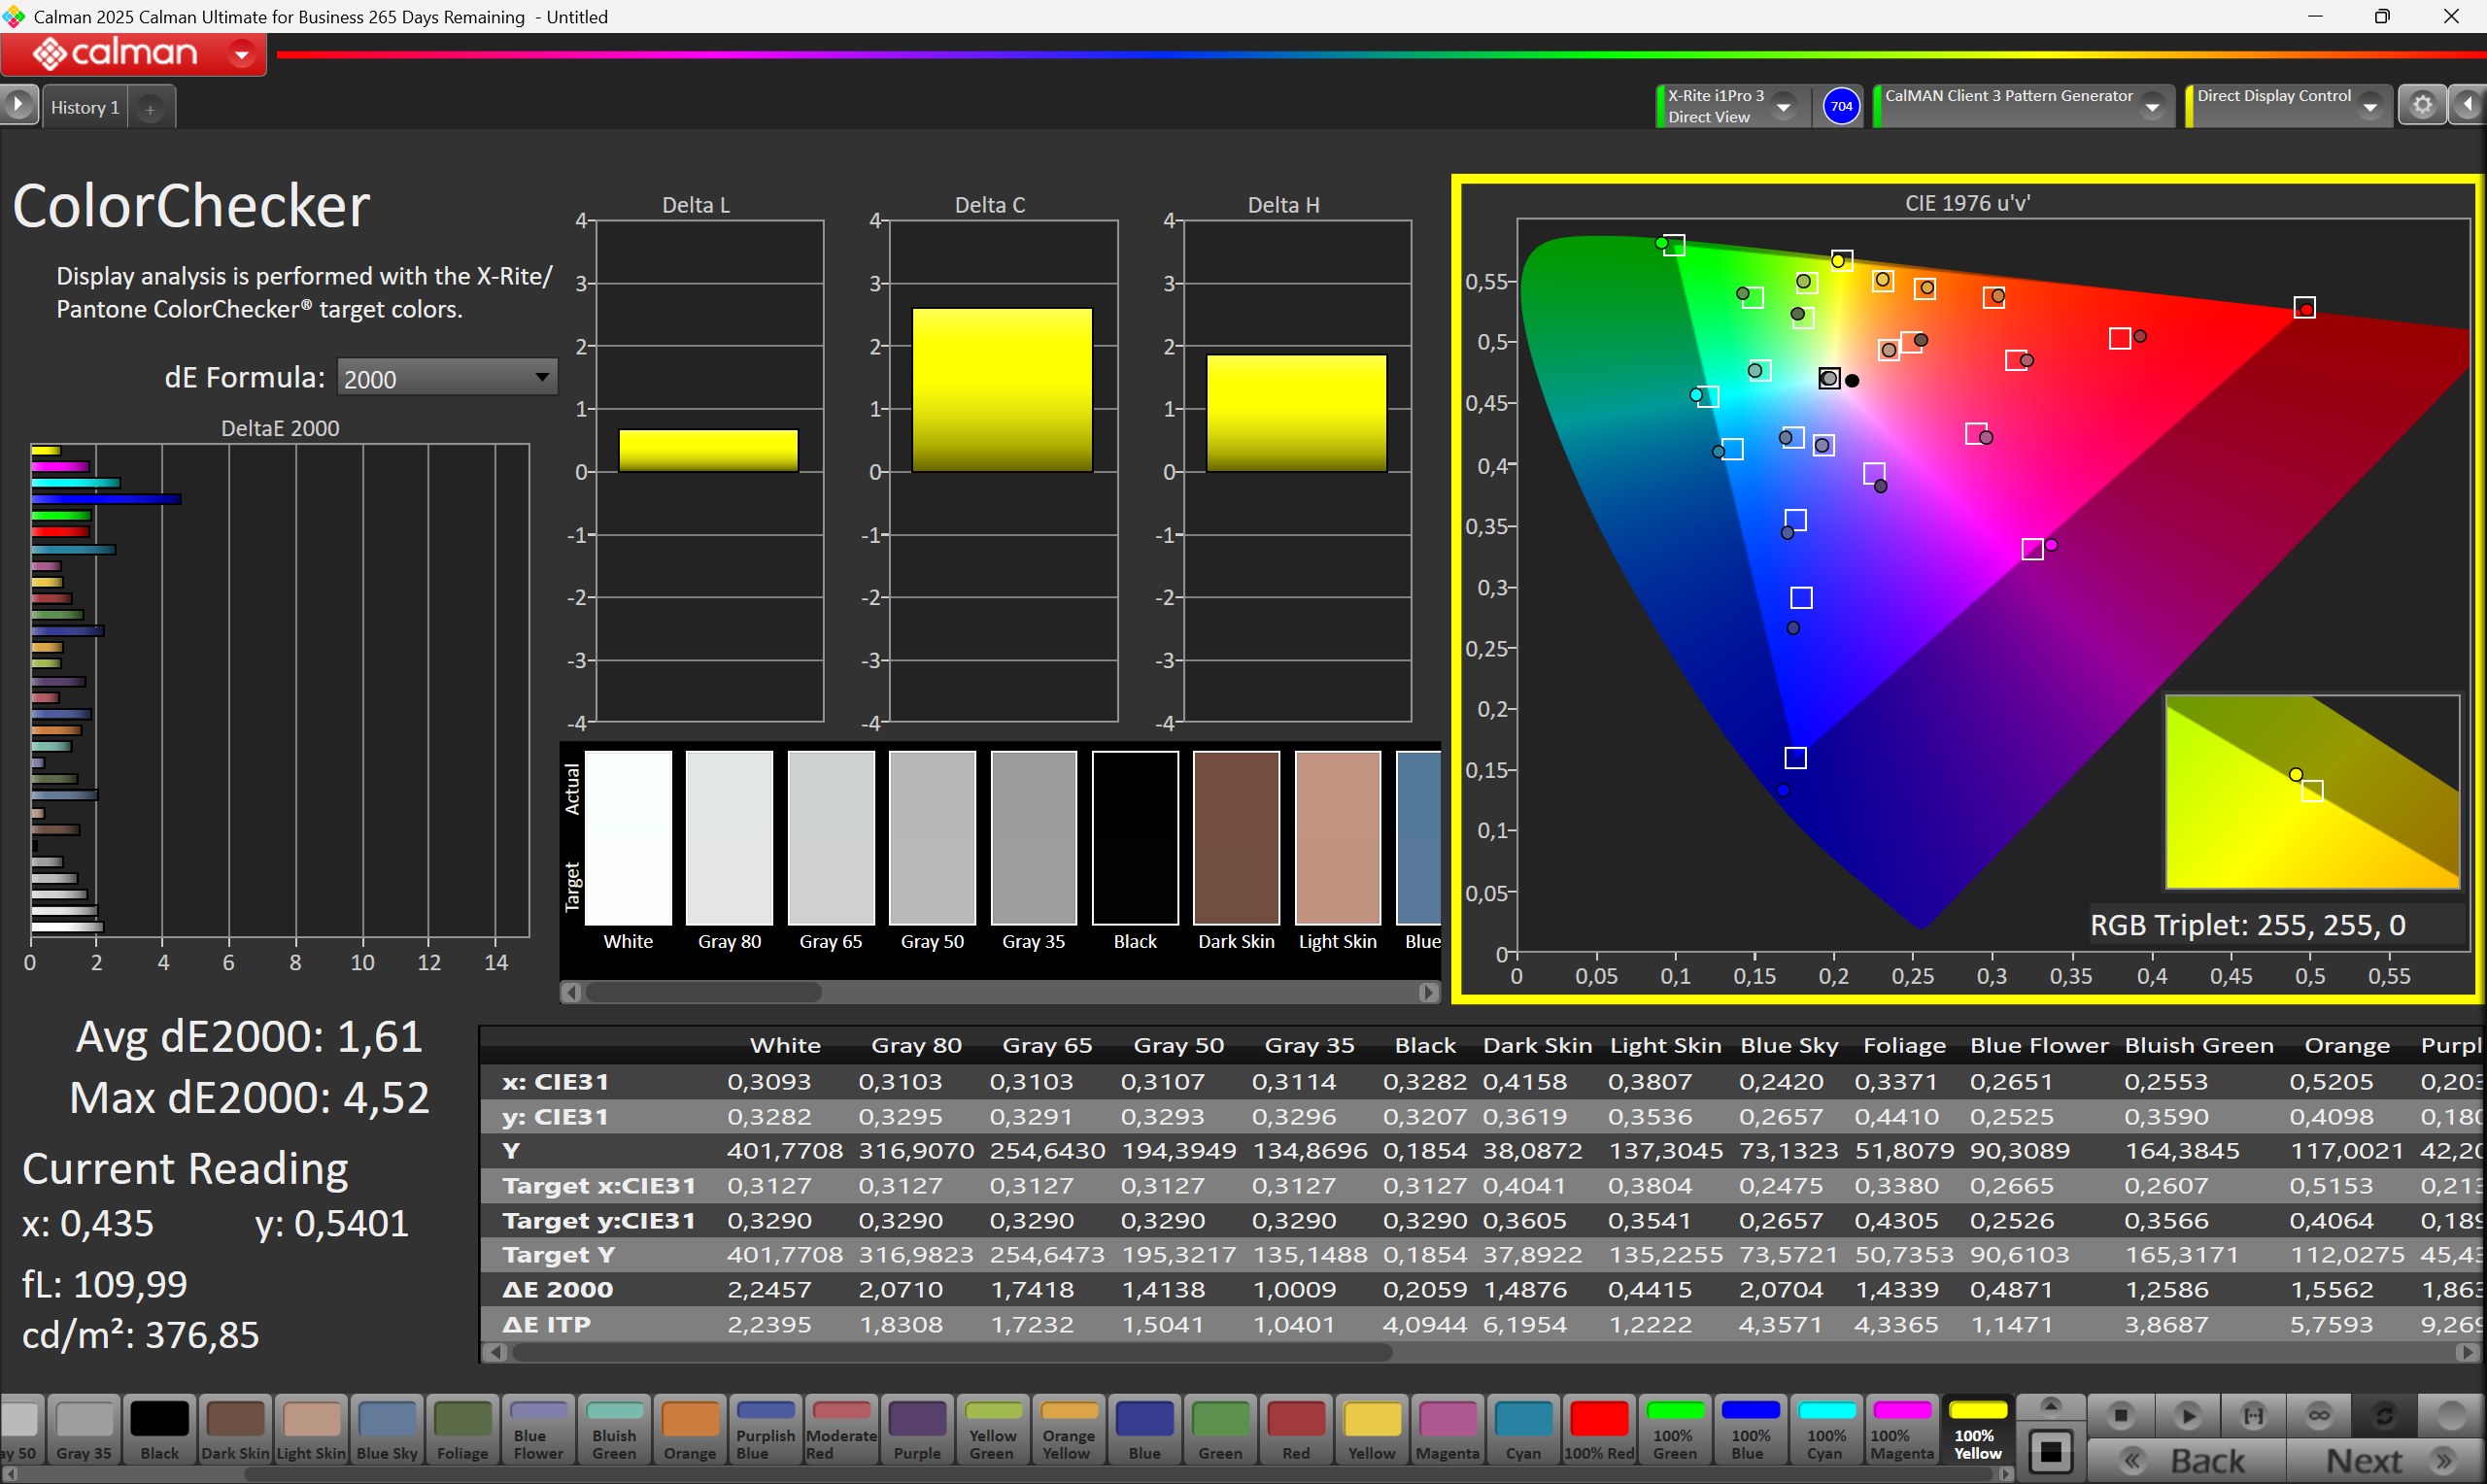
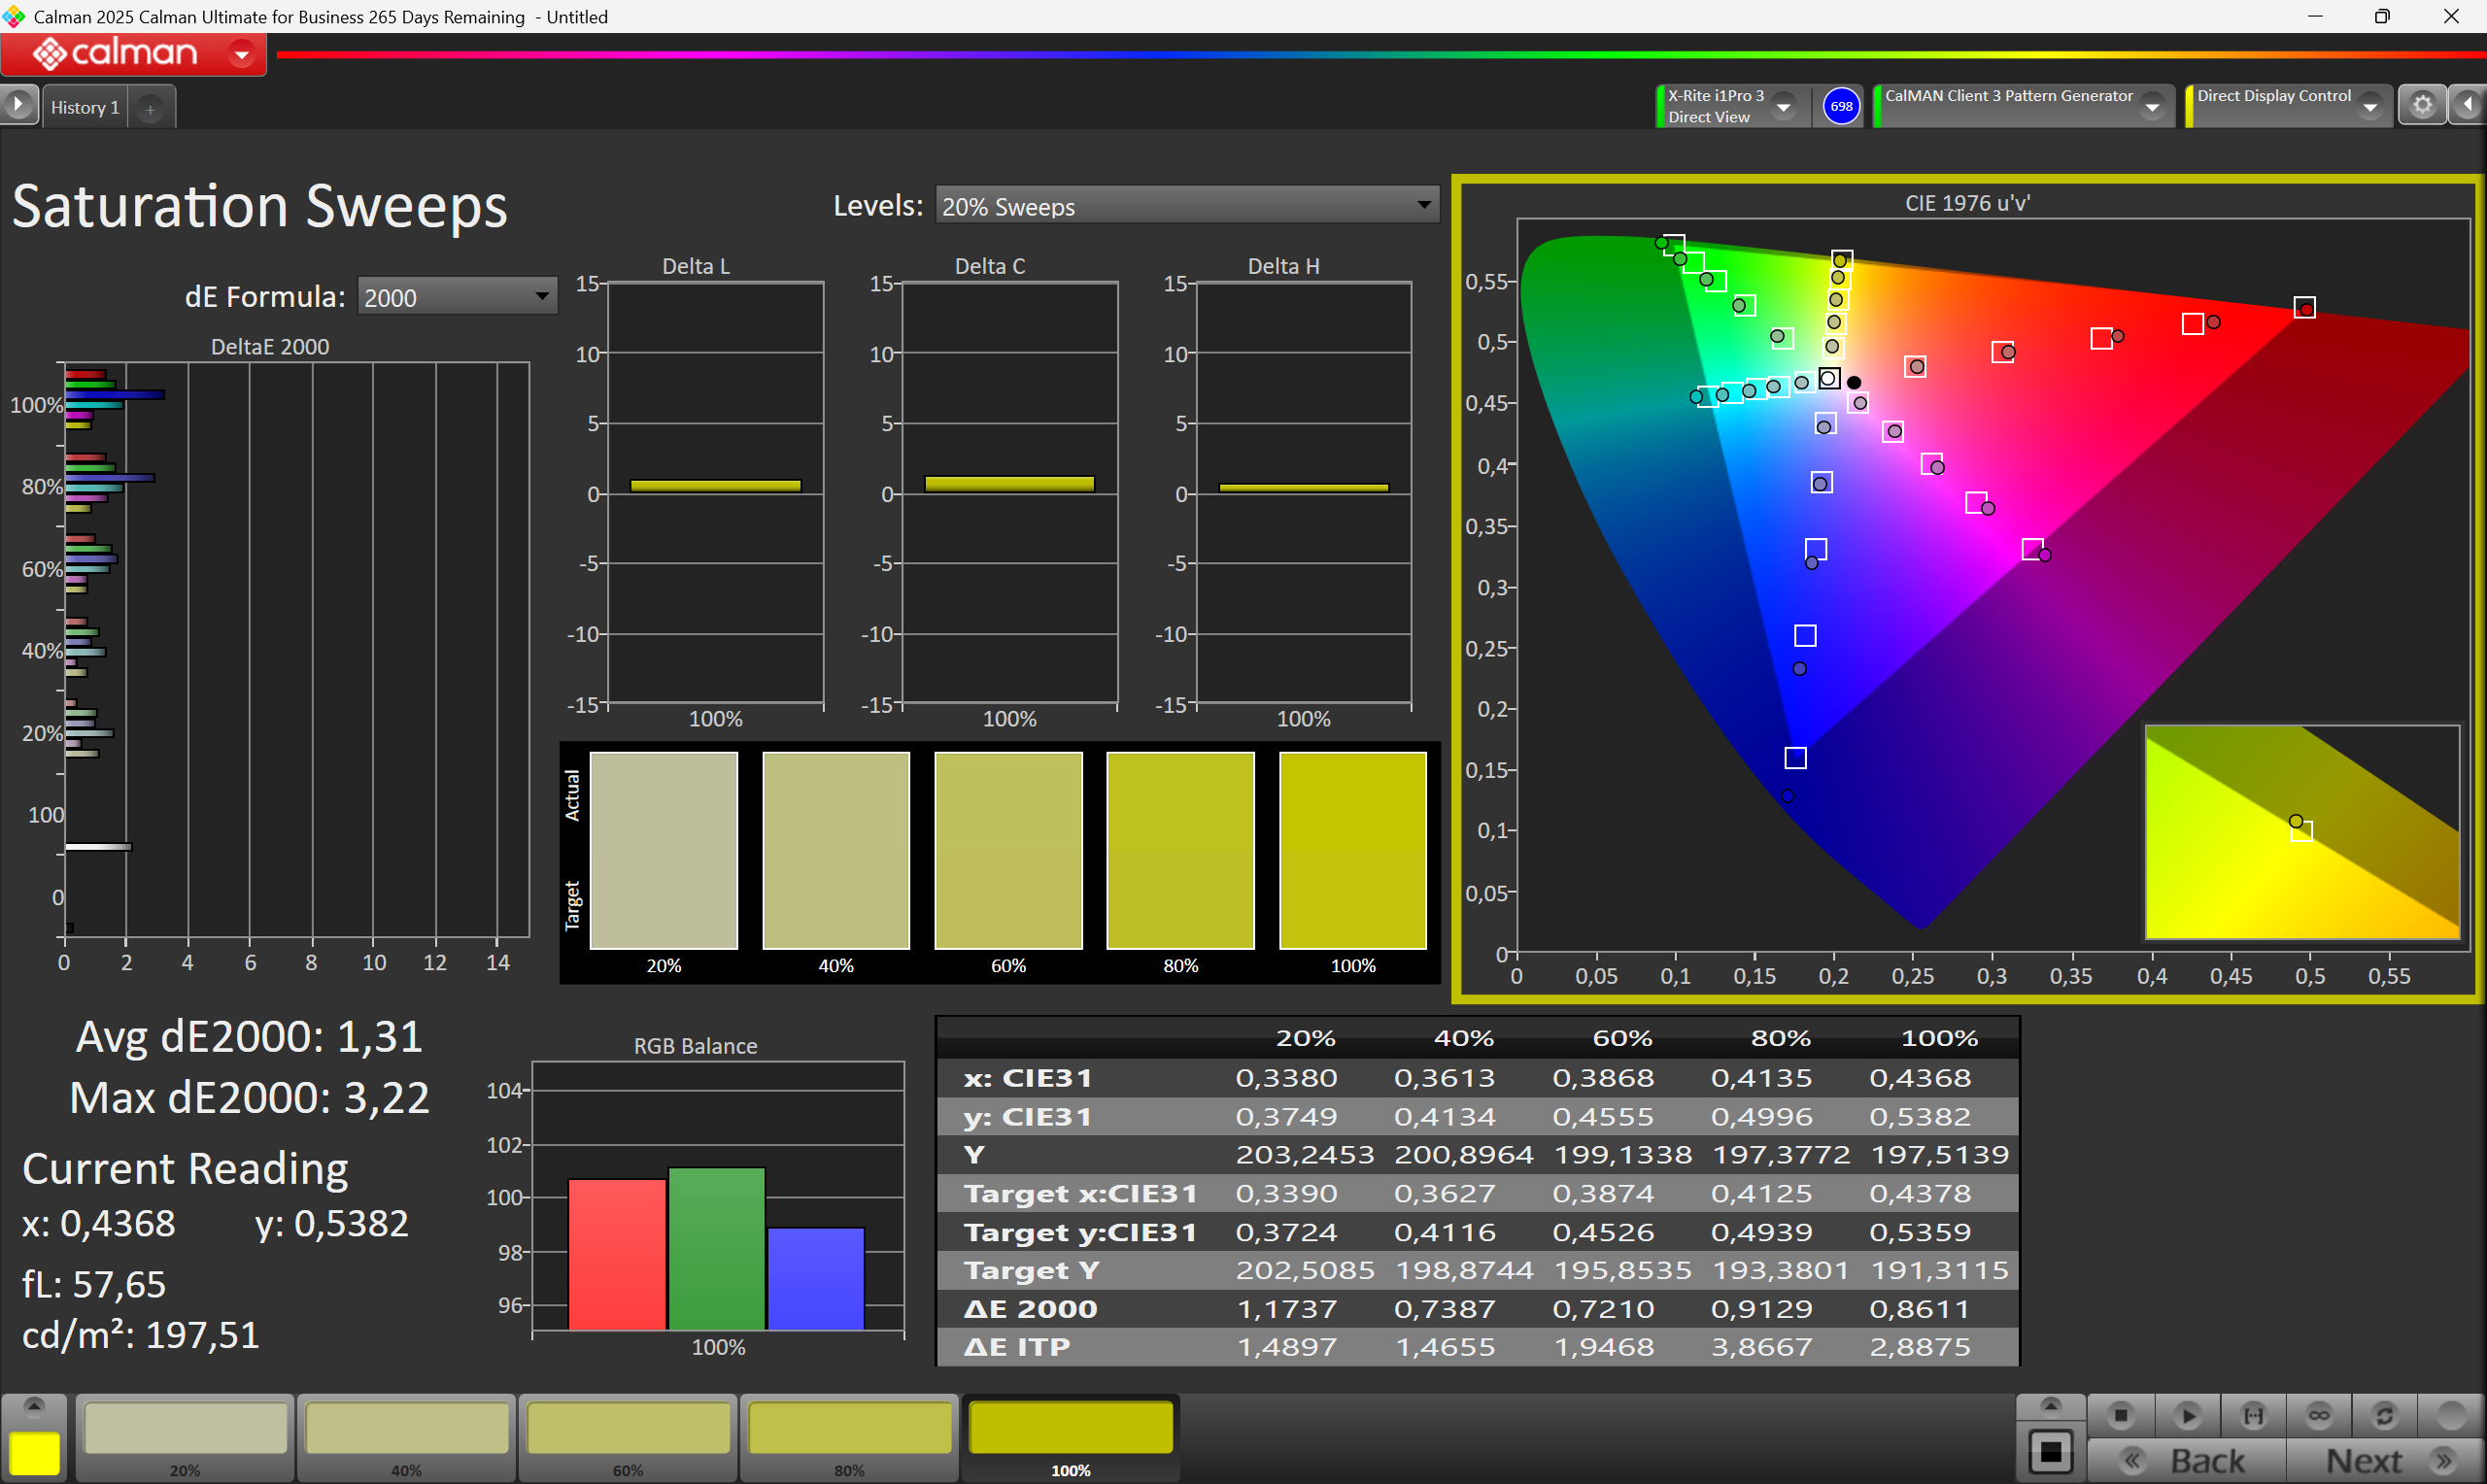
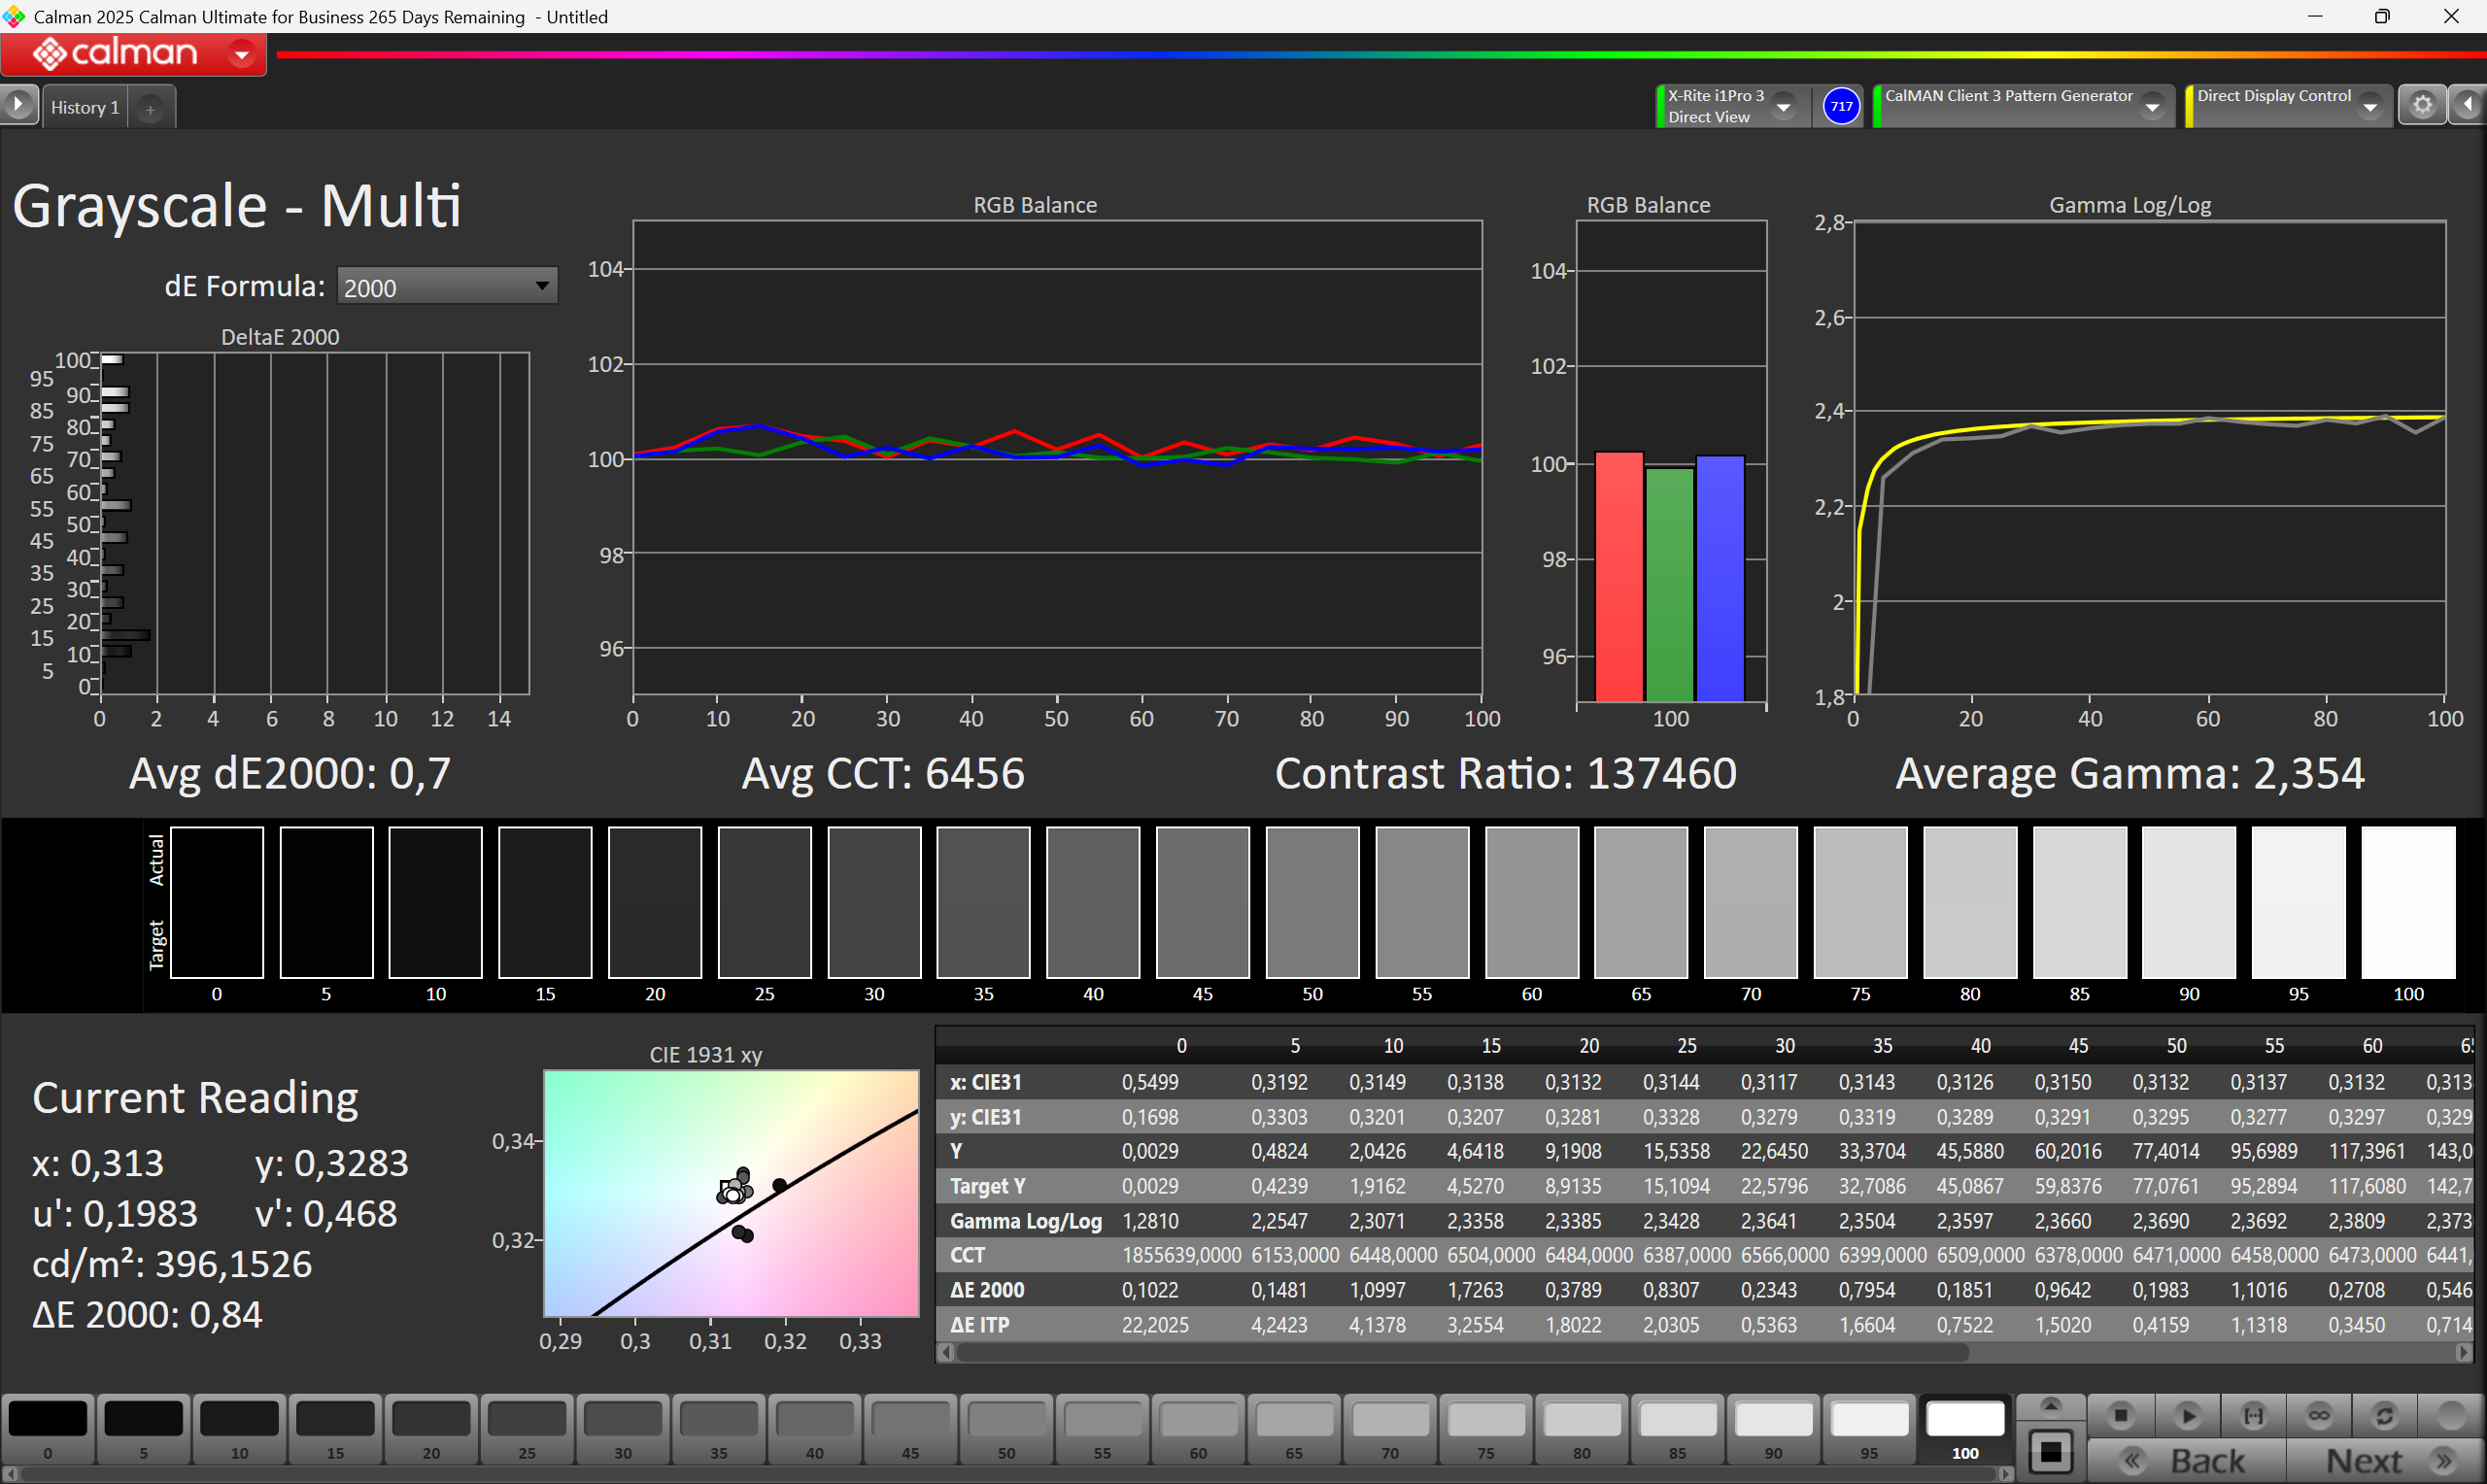
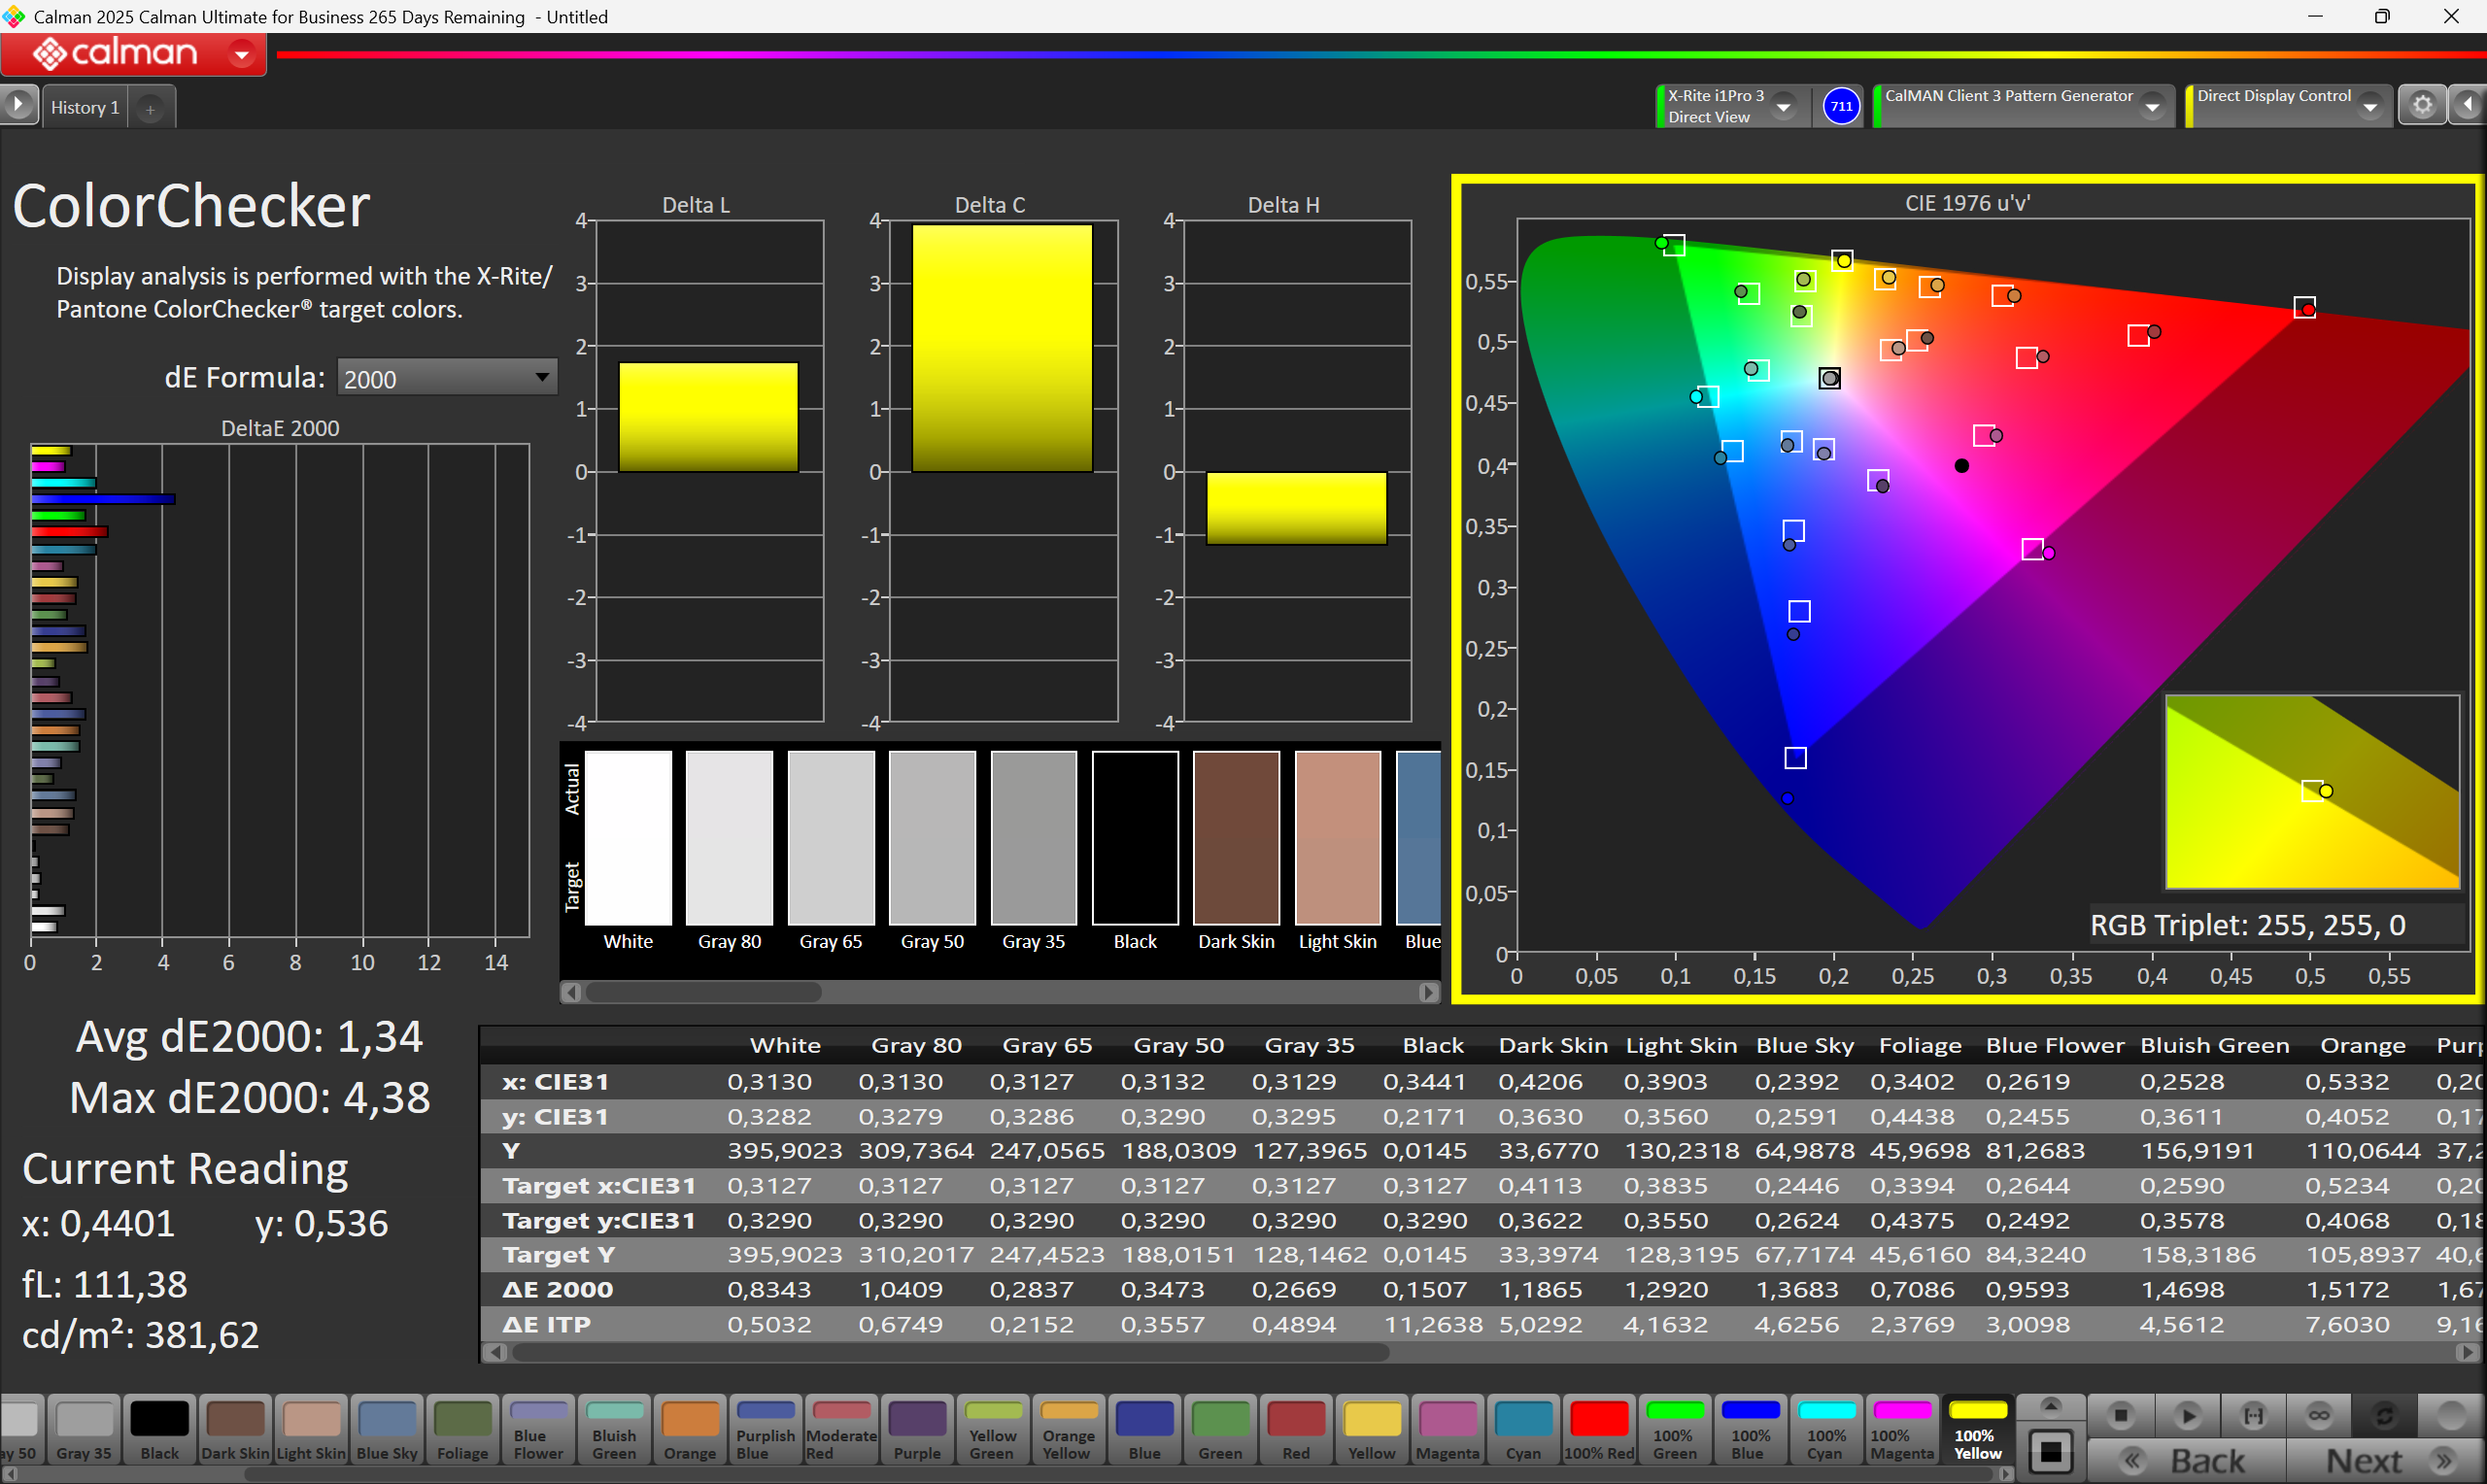
Ekran OLED jest ostry i płynny, oferując rozdzielczość 2880 x 1800 pikseli przy 120 Hz. Kolory od razu wyglądają świetnie, a błyszczące wykończenie dodaje wyrazistości, choć może odbijać światło. Adaptacyjna częstotliwość odświeżania pomiędzy 48 a 120 Hz sprawia, że jest on bardziej wydajny niż inne szybkie panele OLED. Dokładność odwzorowania kolorów jest doskonała od razu po wyjęciu z pudełka, z wartością DeltaE2000 poniżej 2.
| |||||||||||||||||||||||||
rozświetlenie: 99 %
na akumulatorze: 400 cd/m²
kontrast: 30769:1 (czerń: 0.013 cd/m²)
ΔE ColorChecker Calman: 1.61 | ∀{0.5-29.43 Ø4.73}
calibrated: 1.34
ΔE Greyscale Calman: 2.25 | ∀{0.09-98 Ø4.97}
93.4% AdobeRGB 1998 (Argyll 3D)
100% sRGB (Argyll 3D)
99.89% Display P3 (Argyll 3D)
Gamma: 2.265
CCT: 6581 K
| Acer Swift 16 AI SF16-71T-75YX ATNA60CL11, OLED, 2880x1800, 16", 120 Hz | Dell XPS 16 Core Ultra X7 358H LG Philips 160WV1, OLED, 3200x2000, 16", 120 Hz | MSI Prestige 14 Flip AI+ 2026 ATNA40KW05-0, OLED, 1920x1200, 14", 60 Hz | Asus ZenBook Duo UX8407AA NB140B9M-T01, OLED, 2880x1800, 14", 144 Hz | Asus ExpertBook Ultra B9406CAA Samsung ATNA40LE01-0, OLED, 2880x1800, 14", 120 Hz | Acer Swift 16 AI SF16-51T-932H, Ultra 9 288V SDC41B6, OLED, 2880x1800, 16", 120 Hz | |
|---|---|---|---|---|---|---|
| Display | 1% | -1% | -2% | -4% | 0% | |
| HDR Peak Brightness (cd/m²) | 613 | |||||
| Display P3 Coverage (%) | 99.89 | 99.5 0% | 100 0% | 99.5 0% | 96.2 -4% | 99.9 0% |
| sRGB Coverage (%) | 100 | 100 0% | 100 0% | 100 0% | 100 0% | 100 0% |
| AdobeRGB 1998 Coverage (%) | 93.4 | 96.5 3% | 91.8 -2% | 88.7 -5% | 86.7 -7% | 94.6 1% |
| Response Times | 81% | 74% | 69% | 85% | 16% | |
| Response Time Grey 50% / Grey 80% * (ms) | 4.6 ? | 0.65 ? 86% | 1.87 ? 59% | 0.26 ? 94% | 0.71 ? 85% | 4.8 ? -4% |
| Response Time Black / White * (ms) | 18 ? | 0.87 ? 95% | 1.53 ? 91% | 0.4 ? 98% | 0.94 ? 95% | 18 ? -0% |
| PWM Frequency (Hz) | 481 | 240.2 ? | 480 ? | 720 ? | 968.8 ? | 481 |
| PWM Amplitude * (%) | 82 | 31 62% | 22 73% | 70 15% | 20 76% | 39 52% |
| Screen | -21% | 6% | 3% | 36% | 1% | |
| Brightness middle (cd/m²) | 400 | 395.4 -1% | 292 -27% | 497 24% | 600.5 50% | 425 6% |
| Brightness (cd/m²) | 402 | 392 -2% | 292 -27% | 495 23% | 612 52% | 421 5% |
| Brightness Distribution (%) | 99 | 95 -4% | 98 -1% | 96 -3% | 96 -3% | 98 -1% |
| Black Level * (cd/m²) | 0.013 | 0.01 23% | 0.0219 -68% | |||
| Contrast (:1) | 30769 | 29200 -5% | 19406 -37% | |||
| Colorchecker dE 2000 * | 1.61 | 3.69 -129% | 1.4 13% | 1.6 1% | 1.18 27% | 1.73 -7% |
| Colorchecker dE 2000 max. * | 4.52 | 7.94 -76% | 2.2 51% | 4.5 -0% | 3.4 25% | 3.82 15% |
| Colorchecker dE 2000 calibrated * | 1.34 | 0.68 49% | 1.5 -12% | 0.73 46% | ||
| Greyscale dE 2000 * | 2.25 | 1.9 16% | 1.7 24% | 2.5 -11% | 1 56% | 0.09 96% |
| Gamma | 2.265 97% | 2.28 96% | 2.12 104% | 2.19 100% | 2.27 97% | 2.346 94% |
| CCT | 6581 99% | 6274 104% | 6510 100% | 6567 99% | 6567 99% | 6432 101% |
| Całkowita średnia (program / ustawienia) | 20% /
8% | 26% /
19% | 23% /
17% | 39% /
38% | 6% /
4% |
* ... im mniej tym lepiej
Błyszczące wykończenie sprawia, że kolory wyglądają żywo, ale odbicia są dość zauważalne w jasnym świetle. Standardowe poziomy jasności sięgają około 400 cd/m², a szczyty HDR osiągają ponad 600 cd/m². Podczas gdy niezwykle krótki czas reakcji jest wyraźną zaletą OLED, ekran wykorzystuje PWM do sterowania jasnością przy 481 Hz

Wyświetl czasy reakcji
| ↔ Czas reakcji od czerni do bieli | ||
|---|---|---|
| 18 ms ... wzrost ↗ i spadek ↘ łącznie | ↗ 14.4 ms wzrost |  |
| ↘ 0.6 ms upadek | ||
| W naszych testach ekran wykazuje dobry współczynnik reakcji, ale może być zbyt wolny dla graczy rywalizujących ze sobą. Dla porównania, wszystkie testowane urządzenia wahają się od 0.1 (minimum) do 240 (maksimum) ms. » 40 % wszystkich urządzeń jest lepszych. Oznacza to, że zmierzony czas reakcji jest zbliżony do średniej wszystkich testowanych urządzeń (19.9 ms). | ||
| ↔ Czas reakcji 50% szarości do 80% szarości | ||
| 4.6 ms ... wzrost ↗ i spadek ↘ łącznie | ↗ 2.4 ms wzrost |  |
| ↘ 2.2 ms upadek | ||
| W naszych testach ekran wykazuje bardzo szybką reakcję i powinien bardzo dobrze nadawać się do szybkich gier. Dla porównania, wszystkie testowane urządzenia wahają się od 0.165 (minimum) do 636 (maksimum) ms. » 16 % wszystkich urządzeń jest lepszych. Oznacza to, że zmierzony czas reakcji jest lepszy od średniej wszystkich testowanych urządzeń (31.1 ms). | ||
Migotanie ekranu / PWM (modulacja szerokości impulsu)
| Wykryto migotanie ekranu/wykryto PWM | 481 Hz Amplitude: 82 % |  | |
Podświetlenie wyświetlacza miga z częstotliwością 481 Hz (najgorszy przypadek, np. przy użyciu PWM) . Częstotliwość 481 Hz jest stosunkowo wysoka, więc większość użytkowników wrażliwych na PWM nie powinna zauważyć żadnego migotania. Istnieją jednak doniesienia, że niektórzy użytkownicy są nadal wrażliwi na PWM przy częstotliwości 500 Hz i wyższej, więc należy zachować ostrożność. Dla porównania: 52 % wszystkich testowanych urządzeń nie używa PWM do przyciemniania wyświetlacza. Jeśli wykryto PWM, zmierzono średnio 7798 (minimum: 5 - maksimum: 343500) Hz. | |||


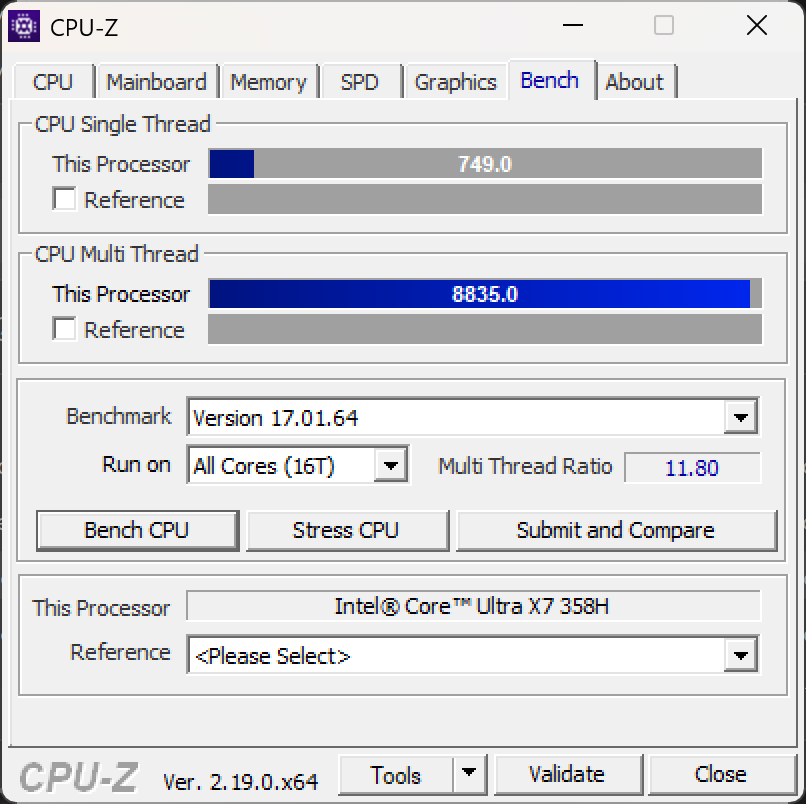
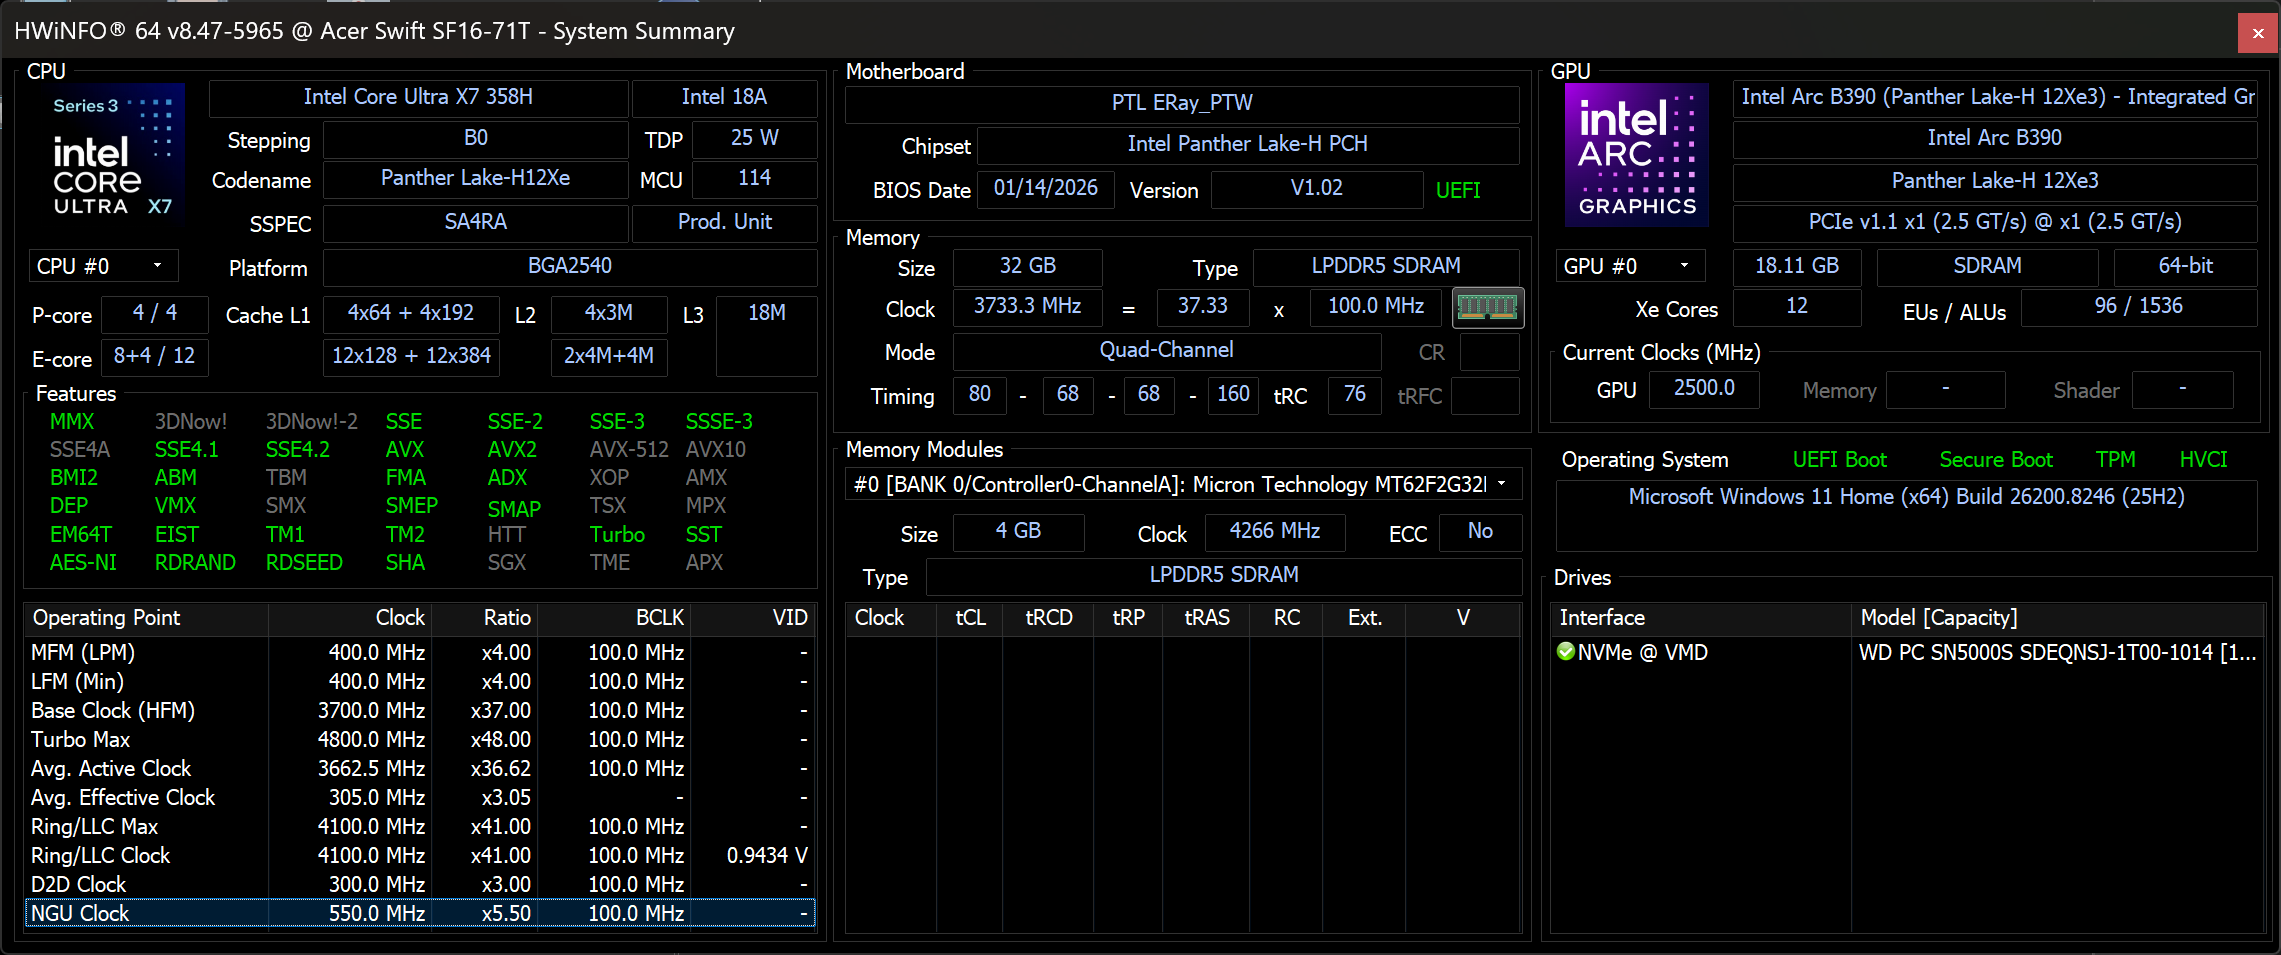
Wydajność
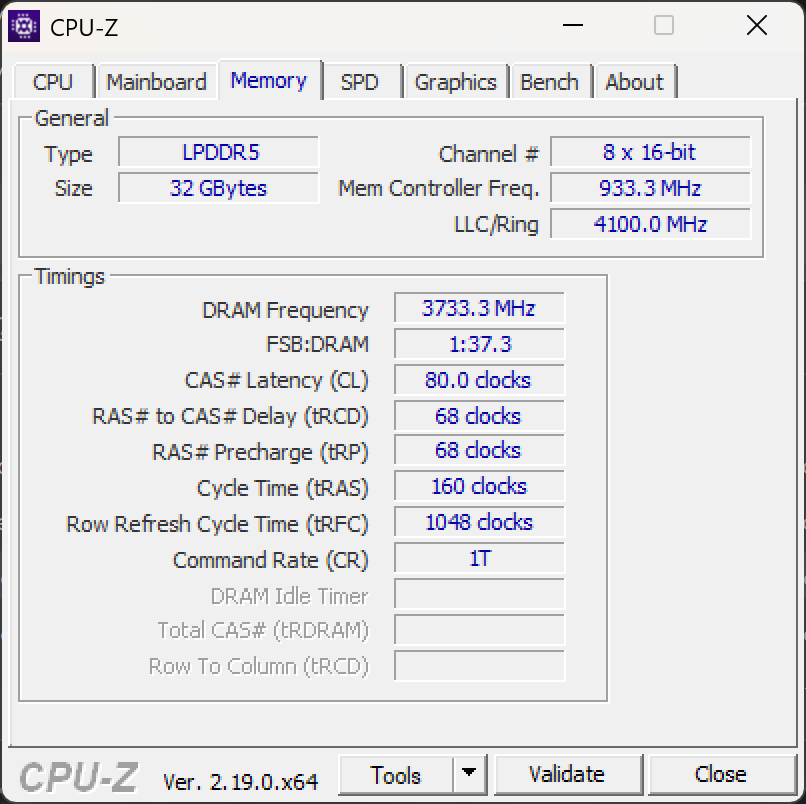
Swift 16 jest napędzany nowym procesorem Intel Core Ultra X7 358H z generacji Panther Lake. Procesor ten stanowi znaczący skok, zapewniając o prawie 40% wyższą wydajność niż Ultra 9 w poprzednim modelu. Ogólna szybkość systemu jest wspierana przez 32 GB pamięci RAM LPDDR5 i szybki dysk SSD Western Digital NVMe, który osiąga prędkość odczytu ponad 6300 MB/s. Za grafikę odpowiada zintegrowana jednostka Intel Arc B390 iGPU oparta na nowej architekturze Xe3, zapewniająca wystarczającą moc do codziennych gier i kreatywnych zadań. Na pokładzie znajduje się również dedykowana jednostka NPU z 50 TOPS do lokalnego przetwarzania AI, dzięki czemu urządzenie jest certyfikowanym komputerem Copilot+.
Warunki testowania
Swift 16 AI został przetestowany w trybie wydajności, umożliwiając procesorowi utrzymanie stałego TDP na poziomie około 60 watów. Alternatywne ustawienia obejmują tryb cichy, który wynosi średnio 20 watów, oraz tryb normalny, który zaczyna się od 50 watów, a następnie spada do 30 watów. Przełączanie pomiędzy tymi profilami zasilania odbywa się za pomocą kombinacji klawiszy Fn+F.
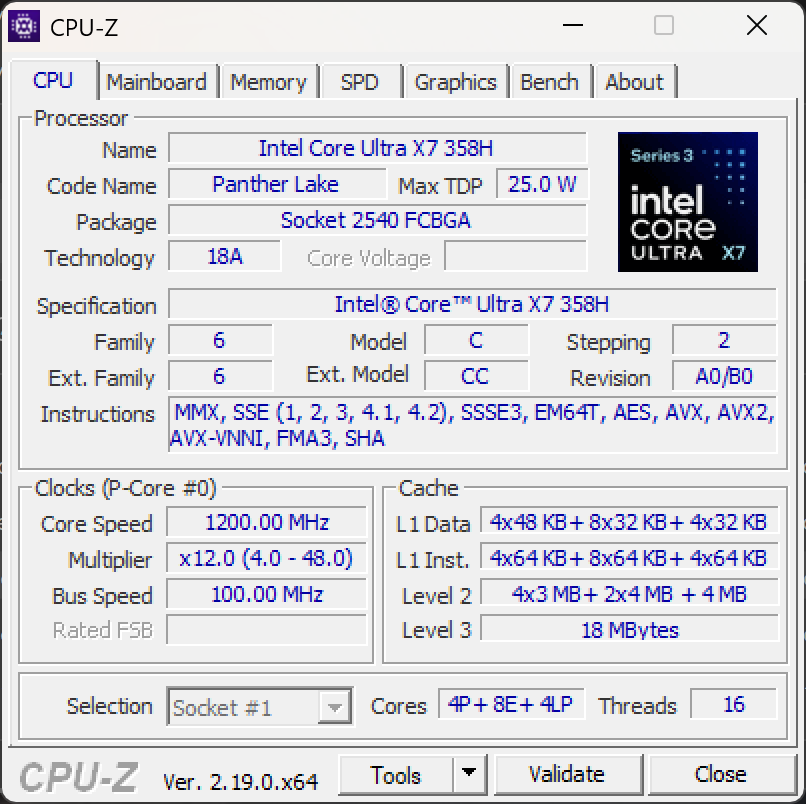
Procesor
Zintegrowany procesor Intel Core Ultra X7 358H jest częścią zupełnie nowej generacji Panther Lake i stanowi główną atrakcję laptopa. Układ Panther Lake oferuje 16 rdzeni i 16 wątków, ponieważ Intel nadal odchodzi od wielowątkowości.
Cinebench R15 Multi Dauertest
Cinebench R23: Multi Core | Single Core
Cinebench R20: CPU (Multi Core) | CPU (Single Core)
Cinebench R15: CPU Multi 64Bit | CPU Single 64Bit
Blender: v2.79 BMW27 CPU
7-Zip 18.03: 7z b 4 | 7z b 4 -mmt1
Geekbench 6.7: Multi-Core | Single-Core
Geekbench 5.5: Multi-Core | Single-Core
HWBOT x265 Benchmark v2.2: 4k Preset
LibreOffice : 20 Documents To PDF
R Benchmark 2.5: Overall mean
| CPU Performance rating | |
| Asus ZenBook Duo UX8407AA | |
| Asus ExpertBook Ultra B9406CAA | |
| Dell XPS 16 Core Ultra X7 358H | |
| Przeciętny Intel Core Ultra X7 358H | |
| Acer Swift 16 AI SF16-71T-75YX | |
| MSI Prestige 14 Flip AI+ 2026 | |
| Średnia w klasie Multimedia | |
| Acer Swift 16 AI SF16-51T-932H, Ultra 9 288V | |
| Cinebench R23 / Multi Core | |
| Asus ZenBook Duo UX8407AA | |
| Asus ExpertBook Ultra B9406CAA | |
| Acer Swift 16 AI SF16-71T-75YX | |
| Acer Swift 16 AI SF16-71T-75YX | |
| Acer Swift 16 AI SF16-71T-75YX | |
| Przeciętny Intel Core Ultra X7 358H (13187 - 19841, n=10) | |
| Dell XPS 16 Core Ultra X7 358H | |
| MSI Prestige 14 Flip AI+ 2026 | |
| Średnia w klasie Multimedia (4861 - 33362, n=81, ostatnie 2 lata) | |
| Acer Swift 16 AI SF16-51T-932H, Ultra 9 288V | |
| Cinebench R23 / Single Core | |
| Asus ZenBook Duo UX8407AA | |
| Dell XPS 16 Core Ultra X7 358H | |
| MSI Prestige 14 Flip AI+ 2026 | |
| Acer Swift 16 AI SF16-71T-75YX | |
| Acer Swift 16 AI SF16-71T-75YX | |
| Asus ExpertBook Ultra B9406CAA | |
| Przeciętny Intel Core Ultra X7 358H (2037 - 2087, n=9) | |
| Acer Swift 16 AI SF16-51T-932H, Ultra 9 288V | |
| Średnia w klasie Multimedia (1128 - 2459, n=73, ostatnie 2 lata) | |
| Cinebench R20 / CPU (Multi Core) | |
| Asus ZenBook Duo UX8407AA | |
| Acer Swift 16 AI SF16-71T-75YX | |
| Asus ExpertBook Ultra B9406CAA | |
| Przeciętny Intel Core Ultra X7 358H (6848 - 7749, n=8) | |
| Dell XPS 16 Core Ultra X7 358H | |
| MSI Prestige 14 Flip AI+ 2026 | |
| Średnia w klasie Multimedia (1887 - 12912, n=64, ostatnie 2 lata) | |
| Acer Swift 16 AI SF16-51T-932H, Ultra 9 288V | |
| Cinebench R20 / CPU (Single Core) | |
| Asus ZenBook Duo UX8407AA | |
| Asus ExpertBook Ultra B9406CAA | |
| MSI Prestige 14 Flip AI+ 2026 | |
| Acer Swift 16 AI SF16-71T-75YX | |
| Przeciętny Intel Core Ultra X7 358H (767 - 792, n=8) | |
| Dell XPS 16 Core Ultra X7 358H | |
| Acer Swift 16 AI SF16-51T-932H, Ultra 9 288V | |
| Średnia w klasie Multimedia (425 - 853, n=64, ostatnie 2 lata) | |
| Cinebench R15 / CPU Multi 64Bit | |
| Asus ZenBook Duo UX8407AA | |
| MSI Prestige 14 Flip AI+ 2026 | |
| Acer Swift 16 AI SF16-71T-75YX | |
| Asus ExpertBook Ultra B9406CAA | |
| Przeciętny Intel Core Ultra X7 358H (2937 - 3135, n=8) | |
| Dell XPS 16 Core Ultra X7 358H | |
| Średnia w klasie Multimedia (856 - 5224, n=68, ostatnie 2 lata) | |
| Acer Swift 16 AI SF16-51T-932H, Ultra 9 288V | |
| Cinebench R15 / CPU Single 64Bit | |
| Asus ExpertBook Ultra B9406CAA | |
| Acer Swift 16 AI SF16-71T-75YX | |
| Asus ZenBook Duo UX8407AA | |
| Dell XPS 16 Core Ultra X7 358H | |
| Przeciętny Intel Core Ultra X7 358H (286 - 312, n=8) | |
| Acer Swift 16 AI SF16-51T-932H, Ultra 9 288V | |
| MSI Prestige 14 Flip AI+ 2026 | |
| Średnia w klasie Multimedia (184.8 - 326, n=66, ostatnie 2 lata) | |
| Blender / v2.79 BMW27 CPU | |
| Acer Swift 16 AI SF16-51T-932H, Ultra 9 288V | |
| Średnia w klasie Multimedia (100 - 557, n=65, ostatnie 2 lata) | |
| MSI Prestige 14 Flip AI+ 2026 | |
| Dell XPS 16 Core Ultra X7 358H | |
| Przeciętny Intel Core Ultra X7 358H (171 - 218, n=8) | |
| Asus ExpertBook Ultra B9406CAA | |
| Acer Swift 16 AI SF16-71T-75YX | |
| Asus ZenBook Duo UX8407AA | |
| 7-Zip 18.03 / 7z b 4 | |
| Asus ExpertBook Ultra B9406CAA | |
| Asus ZenBook Duo UX8407AA | |
| Acer Swift 16 AI SF16-71T-75YX | |
| Dell XPS 16 Core Ultra X7 358H | |
| Przeciętny Intel Core Ultra X7 358H (58746 - 68533, n=8) | |
| Średnia w klasie Multimedia (29095 - 130368, n=62, ostatnie 2 lata) | |
| MSI Prestige 14 Flip AI+ 2026 | |
| Acer Swift 16 AI SF16-51T-932H, Ultra 9 288V | |
| 7-Zip 18.03 / 7z b 4 -mmt1 | |
| Asus ZenBook Duo UX8407AA | |
| Dell XPS 16 Core Ultra X7 358H | |
| MSI Prestige 14 Flip AI+ 2026 | |
| Przeciętny Intel Core Ultra X7 358H (6091 - 6526, n=8) | |
| Asus ExpertBook Ultra B9406CAA | |
| Acer Swift 16 AI SF16-71T-75YX | |
| Średnia w klasie Multimedia (3666 - 7545, n=63, ostatnie 2 lata) | |
| Acer Swift 16 AI SF16-51T-932H, Ultra 9 288V | |
| Geekbench 6.7 / Multi-Core | |
| Asus ZenBook Duo UX8407AA | |
| MSI Prestige 14 Flip AI+ 2026 | |
| Dell XPS 16 Core Ultra X7 358H | |
| Asus ExpertBook Ultra B9406CAA | |
| Przeciętny Intel Core Ultra X7 358H (15698 - 17121, n=9) | |
| Acer Swift 16 AI SF16-71T-75YX | |
| Średnia w klasie Multimedia (4983 - 29415, n=76, ostatnie 2 lata) | |
| Acer Swift 16 AI SF16-51T-932H, Ultra 9 288V | |
| Geekbench 6.7 / Single-Core | |
| Asus ZenBook Duo UX8407AA | |
| MSI Prestige 14 Flip AI+ 2026 | |
| Dell XPS 16 Core Ultra X7 358H | |
| Średnia w klasie Multimedia (1534 - 4335, n=75, ostatnie 2 lata) | |
| Przeciętny Intel Core Ultra X7 358H (2818 - 2927, n=9) | |
| Acer Swift 16 AI SF16-71T-75YX | |
| Asus ExpertBook Ultra B9406CAA | |
| Acer Swift 16 AI SF16-51T-932H, Ultra 9 288V | |
| Geekbench 5.5 / Multi-Core | |
| Asus ZenBook Duo UX8407AA | |
| Asus ExpertBook Ultra B9406CAA | |
| MSI Prestige 14 Flip AI+ 2026 | |
| Dell XPS 16 Core Ultra X7 358H | |
| Przeciętny Intel Core Ultra X7 358H (16012 - 17028, n=8) | |
| Acer Swift 16 AI SF16-71T-75YX | |
| Średnia w klasie Multimedia (4652 - 20422, n=62, ostatnie 2 lata) | |
| Acer Swift 16 AI SF16-51T-932H, Ultra 9 288V | |
| Geekbench 5.5 / Single-Core | |
| Asus ZenBook Duo UX8407AA | |
| Dell XPS 16 Core Ultra X7 358H | |
| MSI Prestige 14 Flip AI+ 2026 | |
| Asus ExpertBook Ultra B9406CAA | |
| Przeciętny Intel Core Ultra X7 358H (2030 - 2142, n=8) | |
| Acer Swift 16 AI SF16-71T-75YX | |
| Acer Swift 16 AI SF16-51T-932H, Ultra 9 288V | |
| Średnia w klasie Multimedia (805 - 2974, n=62, ostatnie 2 lata) | |
| HWBOT x265 Benchmark v2.2 / 4k Preset | |
| Asus ZenBook Duo UX8407AA | |
| Asus ExpertBook Ultra B9406CAA | |
| Acer Swift 16 AI SF16-71T-75YX | |
| Przeciętny Intel Core Ultra X7 358H (19.5 - 23.1, n=8) | |
| Dell XPS 16 Core Ultra X7 358H | |
| MSI Prestige 14 Flip AI+ 2026 | |
| Średnia w klasie Multimedia (5.26 - 36.1, n=63, ostatnie 2 lata) | |
| Acer Swift 16 AI SF16-51T-932H, Ultra 9 288V | |
| LibreOffice / 20 Documents To PDF | |
| Acer Swift 16 AI SF16-51T-932H, Ultra 9 288V | |
| Acer Swift 16 AI SF16-71T-75YX | |
| Asus ExpertBook Ultra B9406CAA | |
| Średnia w klasie Multimedia (23.9 - 146.7, n=64, ostatnie 2 lata) | |
| Dell XPS 16 Core Ultra X7 358H | |
| Przeciętny Intel Core Ultra X7 358H (38.5 - 56.9, n=8) | |
| MSI Prestige 14 Flip AI+ 2026 | |
| Asus ZenBook Duo UX8407AA | |
| R Benchmark 2.5 / Overall mean | |
| Średnia w klasie Multimedia (0.3604 - 0.947, n=63, ostatnie 2 lata) | |
| Acer Swift 16 AI SF16-51T-932H, Ultra 9 288V | |
| Acer Swift 16 AI SF16-71T-75YX | |
| MSI Prestige 14 Flip AI+ 2026 | |
| Przeciętny Intel Core Ultra X7 358H (0.4127 - 0.4483, n=9) | |
| Asus ExpertBook Ultra B9406CAA | |
| Dell XPS 16 Core Ultra X7 358H | |
| Asus ZenBook Duo UX8407AA | |
* ... im mniej tym lepiej
AIDA64: FP32 Ray-Trace | FPU Julia | CPU SHA3 | FPU SinJulia | FPU Mandel | CPU AES | CPU ZLib | FP64 Ray-Trace | CPU PhotoWorxx | CPU CheckMate
| Performance rating | |
| Acer Swift 16 AI SF16-71T-75YX | |
| Dell XPS 16 Core Ultra X7 358H | |
| Średnia w klasie Multimedia | |
| Przeciętny Intel Core Ultra X7 358H | |
| MSI Prestige 14 Flip AI+ 2026 | |
| Acer Swift 16 AI SF16-51T-932H, Ultra 9 288V -1! | |
| Asus ZenBook Duo UX8407AA -1! | |
| Asus ExpertBook Ultra B9406CAA -1! | |
| AIDA64 / FP32 Ray-Trace | |
| Acer Swift 16 AI SF16-71T-75YX (v8.20.8100) | |
| Średnia w klasie Multimedia (2214 - 50388, n=60, ostatnie 2 lata) | |
| Dell XPS 16 Core Ultra X7 358H (v8.20.8100) | |
| Przeciętny Intel Core Ultra X7 358H (12221 - 17932, n=8) | |
| MSI Prestige 14 Flip AI+ 2026 (v8.20.8100) | |
| Acer Swift 16 AI SF16-51T-932H, Ultra 9 288V (v6.92.6600) | |
| Asus ZenBook Duo UX8407AA (v6.92.6600) | |
| Asus ExpertBook Ultra B9406CAA (v6.92.6600) | |
| AIDA64 / FPU Julia | |
| Acer Swift 16 AI SF16-71T-75YX (v8.20.8100) | |
| Dell XPS 16 Core Ultra X7 358H (v8.20.8100) | |
| Średnia w klasie Multimedia (12867 - 201874, n=61, ostatnie 2 lata) | |
| MSI Prestige 14 Flip AI+ 2026 (v8.20.8100) | |
| Przeciętny Intel Core Ultra X7 358H (29930 - 95525, n=8) | |
| Acer Swift 16 AI SF16-51T-932H, Ultra 9 288V (v6.92.6600) | |
| Asus ZenBook Duo UX8407AA (v6.92.6600) | |
| Asus ExpertBook Ultra B9406CAA (v6.92.6600) | |
| AIDA64 / CPU SHA3 | |
| Acer Swift 16 AI SF16-71T-75YX (v8.20.8100) | |
| Asus ExpertBook Ultra B9406CAA (v6.92.6600) | |
| Asus ZenBook Duo UX8407AA (v6.92.6600) | |
| Przeciętny Intel Core Ultra X7 358H (3910 - 4911, n=8) | |
| Dell XPS 16 Core Ultra X7 358H (v8.20.8100) | |
| MSI Prestige 14 Flip AI+ 2026 (v8.20.8100) | |
| Średnia w klasie Multimedia (653 - 8623, n=61, ostatnie 2 lata) | |
| Acer Swift 16 AI SF16-51T-932H, Ultra 9 288V (v6.92.6600) | |
| AIDA64 / FPU SinJulia | |
| Średnia w klasie Multimedia (1240 - 28794, n=61, ostatnie 2 lata) | |
| Acer Swift 16 AI SF16-71T-75YX (v8.20.8100) | |
| Dell XPS 16 Core Ultra X7 358H (v8.20.8100) | |
| Przeciętny Intel Core Ultra X7 358H (4735 - 7038, n=8) | |
| MSI Prestige 14 Flip AI+ 2026 (v8.20.8100) | |
| Asus ZenBook Duo UX8407AA (v6.92.6600) | |
| Asus ExpertBook Ultra B9406CAA (v6.92.6600) | |
| Acer Swift 16 AI SF16-51T-932H, Ultra 9 288V (v6.92.6600) | |
| AIDA64 / FPU Mandel | |
| Acer Swift 16 AI SF16-71T-75YX (v8.20.8100) | |
| Dell XPS 16 Core Ultra X7 358H (v8.20.8100) | |
| Średnia w klasie Multimedia (6395 - 105740, n=60, ostatnie 2 lata) | |
| MSI Prestige 14 Flip AI+ 2026 (v8.20.8100) | |
| Przeciętny Intel Core Ultra X7 358H (14716 - 50734, n=8) | |
| Acer Swift 16 AI SF16-51T-932H, Ultra 9 288V (v6.92.6600) | |
| Asus ZenBook Duo UX8407AA (v6.92.6600) | |
| Asus ExpertBook Ultra B9406CAA (v6.92.6600) | |
| AIDA64 / CPU AES | |
| Acer Swift 16 AI SF16-71T-75YX (v8.20.8100) | |
| Średnia w klasie Multimedia (13243 - 126790, n=61, ostatnie 2 lata) | |
| Dell XPS 16 Core Ultra X7 358H (v8.20.8100) | |
| MSI Prestige 14 Flip AI+ 2026 (v8.20.8100) | |
| Przeciętny Intel Core Ultra X7 358H (5127 - 67510, n=8) | |
| Acer Swift 16 AI SF16-51T-932H, Ultra 9 288V (v6.92.6600) | |
| Asus ZenBook Duo UX8407AA (v6.92.6600) | |
| Asus ExpertBook Ultra B9406CAA (v6.92.6600) | |
| AIDA64 / CPU ZLib | |
| Asus ZenBook Duo UX8407AA (v6.92.6600) | |
| Asus ExpertBook Ultra B9406CAA (v6.92.6600) | |
| Acer Swift 16 AI SF16-71T-75YX (v8.20.8100) | |
| Przeciętny Intel Core Ultra X7 358H (932 - 1179, n=8) | |
| Dell XPS 16 Core Ultra X7 358H (v8.20.8100) | |
| Średnia w klasie Multimedia (167.2 - 2022, n=61, ostatnie 2 lata) | |
| MSI Prestige 14 Flip AI+ 2026 (v8.20.8100) | |
| Acer Swift 16 AI SF16-51T-932H, Ultra 9 288V (v6.92.6600) | |
| AIDA64 / FP64 Ray-Trace | |
| Średnia w klasie Multimedia (1014 - 26875, n=61, ostatnie 2 lata) | |
| Acer Swift 16 AI SF16-71T-75YX (v8.20.8100) | |
| Dell XPS 16 Core Ultra X7 358H (v8.20.8100) | |
| Przeciętny Intel Core Ultra X7 358H (6506 - 9447, n=8) | |
| MSI Prestige 14 Flip AI+ 2026 (v8.20.8100) | |
| Acer Swift 16 AI SF16-51T-932H, Ultra 9 288V (v6.92.6600) | |
| Asus ExpertBook Ultra B9406CAA (v6.92.6600) | |
| Asus ZenBook Duo UX8407AA (v6.92.6600) | |
| AIDA64 / CPU PhotoWorxx | |
| Dell XPS 16 Core Ultra X7 358H (v8.20.8100) | |
| MSI Prestige 14 Flip AI+ 2026 (v8.20.8100) | |
| Przeciętny Intel Core Ultra X7 358H (30538 - 88154, n=8) | |
| Acer Swift 16 AI SF16-71T-75YX (v8.20.8100) | |
| Acer Swift 16 AI SF16-51T-932H, Ultra 9 288V (v6.92.6600) | |
| Średnia w klasie Multimedia (12860 - 88154, n=61, ostatnie 2 lata) | |
| Asus ZenBook Duo UX8407AA (v6.92.6600) | |
| Asus ExpertBook Ultra B9406CAA (v6.92.6600) | |
| AIDA64 / CPU CheckMate | |
| MSI Prestige 14 Flip AI+ 2026 (v8.20.8100) | |
| Acer Swift 16 AI SF16-71T-75YX (v8.20.8100) | |
| Przeciętny Intel Core Ultra X7 358H (4187 - 4475, n=7) | |
| Dell XPS 16 Core Ultra X7 358H (v8.20.8100) | |
| Średnia w klasie Multimedia (1570 - 4742, n=15, ostatnie 2 lata) | |
Wydajność systemu
PCMark 10: Score | Essentials | Productivity | Digital Content Creation
CrossMark: Overall | Productivity | Creativity | Responsiveness
WebXPRT 3: Overall
WebXPRT 4: Overall
Mozilla Kraken 1.1: Total
| Performance rating | |
| Asus ZenBook Duo UX8407AA | |
| MSI Prestige 14 Flip AI+ 2026 | |
| Dell XPS 16 Core Ultra X7 358H | |
| Przeciętny Intel Core Ultra X7 358H, Intel Arc B390 12 Xe3 Panther Lake iGPU | |
| Acer Swift 16 AI SF16-71T-75YX | |
| Asus ExpertBook Ultra B9406CAA | |
| Średnia w klasie Multimedia | |
| Acer Swift 16 AI SF16-51T-932H, Ultra 9 288V | |
| PCMark 10 / Score | |
| Asus ZenBook Duo UX8407AA | |
| MSI Prestige 14 Flip AI+ 2026 | |
| Dell XPS 16 Core Ultra X7 358H | |
| Przeciętny Intel Core Ultra X7 358H, Intel Arc B390 12 Xe3 Panther Lake iGPU (8834 - 9880, n=8) | |
| Asus ExpertBook Ultra B9406CAA | |
| Acer Swift 16 AI SF16-71T-75YX | |
| Acer Swift 16 AI SF16-71T-75YX | |
| Średnia w klasie Multimedia (4325 - 10386, n=58, ostatnie 2 lata) | |
| Acer Swift 16 AI SF16-51T-932H, Ultra 9 288V | |
| PCMark 10 / Essentials | |
| MSI Prestige 14 Flip AI+ 2026 | |
| Dell XPS 16 Core Ultra X7 358H | |
| Asus ZenBook Duo UX8407AA | |
| Acer Swift 16 AI SF16-71T-75YX | |
| Przeciętny Intel Core Ultra X7 358H, Intel Arc B390 12 Xe3 Panther Lake iGPU (10282 - 11263, n=7) | |
| Asus ExpertBook Ultra B9406CAA | |
| Acer Swift 16 AI SF16-51T-932H, Ultra 9 288V | |
| Średnia w klasie Multimedia (8025 - 11664, n=57, ostatnie 2 lata) | |
| PCMark 10 / Productivity | |
| Asus ZenBook Duo UX8407AA | |
| MSI Prestige 14 Flip AI+ 2026 | |
| Dell XPS 16 Core Ultra X7 358H | |
| Przeciętny Intel Core Ultra X7 358H, Intel Arc B390 12 Xe3 Panther Lake iGPU (13908 - 16780, n=7) | |
| Asus ExpertBook Ultra B9406CAA | |
| Acer Swift 16 AI SF16-71T-75YX | |
| Średnia w klasie Multimedia (7323 - 18233, n=57, ostatnie 2 lata) | |
| Acer Swift 16 AI SF16-51T-932H, Ultra 9 288V | |
| PCMark 10 / Digital Content Creation | |
| Asus ZenBook Duo UX8407AA | |
| Acer Swift 16 AI SF16-71T-75YX | |
| MSI Prestige 14 Flip AI+ 2026 | |
| Dell XPS 16 Core Ultra X7 358H | |
| Przeciętny Intel Core Ultra X7 358H, Intel Arc B390 12 Xe3 Panther Lake iGPU (13082 - 13893, n=7) | |
| Asus ExpertBook Ultra B9406CAA | |
| Średnia w klasie Multimedia (3651 - 16240, n=57, ostatnie 2 lata) | |
| Acer Swift 16 AI SF16-51T-932H, Ultra 9 288V | |
| CrossMark / Overall | |
| Asus ZenBook Duo UX8407AA | |
| Dell XPS 16 Core Ultra X7 358H | |
| MSI Prestige 14 Flip AI+ 2026 | |
| Przeciętny Intel Core Ultra X7 358H, Intel Arc B390 12 Xe3 Panther Lake iGPU (1884 - 2119, n=8) | |
| Acer Swift 16 AI SF16-71T-75YX | |
| Asus ExpertBook Ultra B9406CAA | |
| Średnia w klasie Multimedia (866 - 2728, n=67, ostatnie 2 lata) | |
| Acer Swift 16 AI SF16-51T-932H, Ultra 9 288V | |
| CrossMark / Productivity | |
| Asus ZenBook Duo UX8407AA | |
| Dell XPS 16 Core Ultra X7 358H | |
| MSI Prestige 14 Flip AI+ 2026 | |
| Przeciętny Intel Core Ultra X7 358H, Intel Arc B390 12 Xe3 Panther Lake iGPU (1678 - 1928, n=8) | |
| Acer Swift 16 AI SF16-71T-75YX | |
| Średnia w klasie Multimedia (931 - 2489, n=67, ostatnie 2 lata) | |
| Asus ExpertBook Ultra B9406CAA | |
| Acer Swift 16 AI SF16-51T-932H, Ultra 9 288V | |
| CrossMark / Creativity | |
| Asus ZenBook Duo UX8407AA | |
| Dell XPS 16 Core Ultra X7 358H | |
| MSI Prestige 14 Flip AI+ 2026 | |
| Przeciętny Intel Core Ultra X7 358H, Intel Arc B390 12 Xe3 Panther Lake iGPU (2241 - 2529, n=8) | |
| Acer Swift 16 AI SF16-71T-75YX | |
| Asus ExpertBook Ultra B9406CAA | |
| Średnia w klasie Multimedia (907 - 3465, n=67, ostatnie 2 lata) | |
| Acer Swift 16 AI SF16-51T-932H, Ultra 9 288V | |
| CrossMark / Responsiveness | |
| MSI Prestige 14 Flip AI+ 2026 | |
| Dell XPS 16 Core Ultra X7 358H | |
| Przeciętny Intel Core Ultra X7 358H, Intel Arc B390 12 Xe3 Panther Lake iGPU (1560 - 1837, n=8) | |
| Asus ZenBook Duo UX8407AA | |
| Acer Swift 16 AI SF16-71T-75YX | |
| Asus ExpertBook Ultra B9406CAA | |
| Średnia w klasie Multimedia (605 - 2024, n=67, ostatnie 2 lata) | |
| Acer Swift 16 AI SF16-51T-932H, Ultra 9 288V | |
| WebXPRT 3 / Overall | |
| Asus ZenBook Duo UX8407AA | |
| Średnia w klasie Multimedia (136.4 - 596, n=70, ostatnie 2 lata) | |
| MSI Prestige 14 Flip AI+ 2026 | |
| Przeciętny Intel Core Ultra X7 358H, Intel Arc B390 12 Xe3 Panther Lake iGPU (293 - 338, n=8) | |
| Acer Swift 16 AI SF16-71T-75YX | |
| Asus ExpertBook Ultra B9406CAA | |
| Dell XPS 16 Core Ultra X7 358H | |
| Acer Swift 16 AI SF16-51T-932H, Ultra 9 288V | |
| WebXPRT 4 / Overall | |
| Asus ZenBook Duo UX8407AA | |
| MSI Prestige 14 Flip AI+ 2026 | |
| Dell XPS 16 Core Ultra X7 358H | |
| Przeciętny Intel Core Ultra X7 358H, Intel Arc B390 12 Xe3 Panther Lake iGPU (278 - 305, n=7) | |
| Acer Swift 16 AI SF16-71T-75YX | |
| Średnia w klasie Multimedia (167.3 - 402, n=71, ostatnie 2 lata) | |
| Acer Swift 16 AI SF16-51T-932H, Ultra 9 288V | |
| Asus ExpertBook Ultra B9406CAA | |
| Mozilla Kraken 1.1 / Total | |
| Acer Swift 16 AI SF16-51T-932H, Ultra 9 288V | |
| Średnia w klasie Multimedia (228 - 835, n=74, ostatnie 2 lata) | |
| Przeciętny Intel Core Ultra X7 358H, Intel Arc B390 12 Xe3 Panther Lake iGPU (445 - 460, n=8) | |
| Dell XPS 16 Core Ultra X7 358H | |
| Asus ExpertBook Ultra B9406CAA | |
| Acer Swift 16 AI SF16-71T-75YX | |
| MSI Prestige 14 Flip AI+ 2026 | |
| Asus ZenBook Duo UX8407AA | |
* ... im mniej tym lepiej
| PCMark 10 Score | 9293 pkt. | |
Pomoc | ||
| AIDA64 / Memory Copy | |
| Dell XPS 16 Core Ultra X7 358H | |
| Asus ZenBook Duo UX8407AA | |
| Przeciętny Intel Core Ultra X7 358H (102745 - 132135, n=7) | |
| MSI Prestige 14 Flip AI+ 2026 | |
| Acer Swift 16 AI SF16-51T-932H, Ultra 9 288V | |
| Acer Swift 16 AI SF16-71T-75YX | |
| Średnia w klasie Multimedia (21158 - 132135, n=61, ostatnie 2 lata) | |
| AIDA64 / Memory Read | |
| Asus ZenBook Duo UX8407AA | |
| Dell XPS 16 Core Ultra X7 358H | |
| Asus ExpertBook Ultra B9406CAA | |
| MSI Prestige 14 Flip AI+ 2026 | |
| Przeciętny Intel Core Ultra X7 358H (97755 - 118888, n=8) | |
| Acer Swift 16 AI SF16-71T-75YX | |
| Acer Swift 16 AI SF16-51T-932H, Ultra 9 288V | |
| Średnia w klasie Multimedia (19699 - 174586, n=61, ostatnie 2 lata) | |
| AIDA64 / Memory Write | |
| Asus ZenBook Duo UX8407AA | |
| Dell XPS 16 Core Ultra X7 358H | |
| Przeciętny Intel Core Ultra X7 358H (105984 - 134998, n=8) | |
| MSI Prestige 14 Flip AI+ 2026 | |
| Asus ExpertBook Ultra B9406CAA | |
| Acer Swift 16 AI SF16-51T-932H, Ultra 9 288V | |
| Acer Swift 16 AI SF16-71T-75YX | |
| Średnia w klasie Multimedia (17733 - 134998, n=61, ostatnie 2 lata) | |
| AIDA64 / Memory Latency | |
| Średnia w klasie Multimedia (7 - 535, n=60, ostatnie 2 lata) | |
| Acer Swift 16 AI SF16-71T-75YX | |
| Acer Swift 16 AI SF16-51T-932H, Ultra 9 288V | |
| MSI Prestige 14 Flip AI+ 2026 | |
| Dell XPS 16 Core Ultra X7 358H | |
| Asus ZenBook Duo UX8407AA | |
| Przeciętny Intel Core Ultra X7 358H (84.6 - 101.9, n=8) | |
* ... im mniej tym lepiej
Urządzenia pamięci masowej

* ... im mniej tym lepiej
Dławienie dysku: Pętla odczytu DiskSpd, głębokość kolejki 8
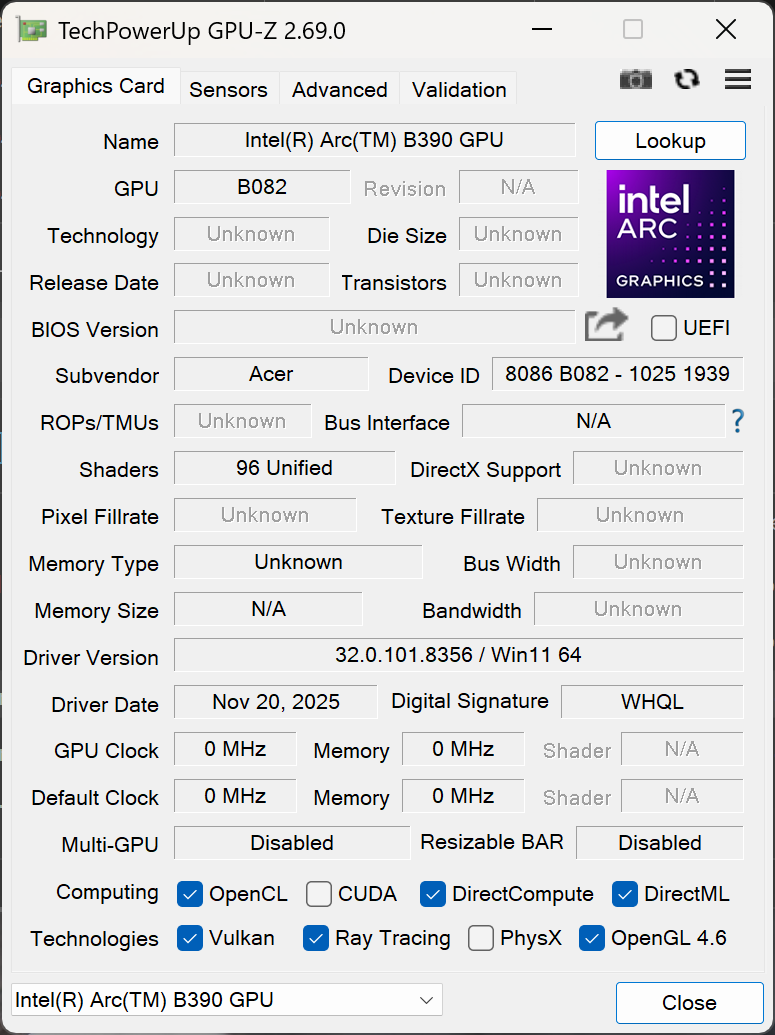
Wydajność GPU
Ponieważ nie ma dedykowanego układu graficznego, Intel Arc B390 iGPU z architekturą Xe3 obsługuje wszystkie wymagania graficzne. To zintegrowane rozwiązanie sprawdza się zarówno w grach, jak i aplikacjach z akceleracją GPU. Jest w stanie płynnie uruchamiać aktualne tytuły na średnich i wysokich ustawieniach.
| 3DMark 11 Performance | 18576 pkt. | |
| 3DMark Ice Storm Standard Score | 225072 pkt. | |
| 3DMark Cloud Gate Standard Score | 48108 pkt. | |
| 3DMark Fire Strike Score | 13950 pkt. | |
| 3DMark Time Spy Score | 7209 pkt. | |
| 3DMark Steel Nomad Score | 1573 pkt. | |
| 3DMark Steel Nomad Light Score | 5821 pkt. | |
Pomoc | ||
* ... im mniej tym lepiej
Wydajność w grach
| low | med. | high | ultra | QHD | |
|---|---|---|---|---|---|
| GTA V (2015) | 177.6 | 171.2 | 103.7 | 40.9 | |
| Dota 2 Reborn (2015) | 119.8 | 99 | 112.3 | 100.5 | |
| Final Fantasy XV Benchmark (2018) | 134.8 | 72.6 | 52.3 | 38.7 | |
| X-Plane 11.11 (2018) | 61.1 | 45 | 41.4 | ||
| Strange Brigade (2018) | 356 | 119.4 | 99.6 | 89.7 | |
| Baldur's Gate 3 (2023) | 39.4 | ||||
| Cyberpunk 2077 (2023) | 65.3 | 49.3 | 43.2 | 35.6 | 14.3 |
| F1 25 (2025) | 134.8 | 111.7 | 86.4 |
Emisje i zużycie energii
Pomimo wysokiej wydajności, Swift 16 pozostaje wyjątkowo chłodny. Podczas gdy wentylatory są słyszalne pod obciążeniem, system chłodzenia jest bardzo wydajny. Konfiguracja z dwoma wentylatorami, która zasysa powietrze przez klawiaturę, utrzymuje temperaturę powierzchni na poziomie około 32 °C nawet pod obciążeniem. Głośnikom brakuje nieco głębi i najlepiej nadają się do okazjonalnego odtwarzania multimediów. Zarządzanie energią jest doskonałe, a 70-watowa bateria wytrzymała ponad 16 godzin w teście Wi-Fi. Pod pełnym obciążeniem system pobiera ponad 100 watów. Kompaktowy 100-watowy zasilacz nagrzewa się znacznie bardziej niż sam laptop, co świadczy o dużym obciążeniu elektroniki.
Geräuschemissionen
Hałas
| luz |
| 25.4 / 26.1 / 26.4 dB |
| obciążenie |
| / 48.4 dB |
 | ||
30 dB cichy 40 dB(A) słyszalny 50 dB(A) irytujący |
||
min: | ||
| Acer Swift 16 AI SF16-71T-75YX Ultra X7 358H, Arc B390 Panther Lake iGPU | Dell XPS 16 Core Ultra X7 358H Ultra X7 358H, Arc B390 Panther Lake iGPU | MSI Prestige 14 Flip AI+ 2026 Ultra X7 358H, Arc B390 Panther Lake iGPU | Asus ZenBook Duo UX8407AA Ultra X9 388H, Arc B390 Panther Lake iGPU | Asus ExpertBook Ultra B9406CAA Ultra X7 358H, Arc B390 Panther Lake iGPU | Acer Swift 16 AI SF16-51T-932H, Ultra 9 288V Core Ultra 9 288V, Arc 140V | |
|---|---|---|---|---|---|---|
| Noise | 8% | 2% | 4% | 10% | 3% | |
| wyłączone / środowisko * (dB) | 25.4 | 23.3 8% | 25.4 -0% | 25 2% | 22.9 10% | 25.8 -2% |
| Idle Minimum * (dB) | 25.4 | 23.4 8% | 25.4 -0% | 25 2% | 23.4 8% | 25.8 -2% |
| Idle Average * (dB) | 26.1 | 23.4 10% | 25.4 3% | 25 4% | 23.4 10% | 25.8 1% |
| Idle Maximum * (dB) | 26.4 | 25.8 2% | 25.4 4% | 25 5% | 23.4 11% | 26.7 -1% |
| Cyberpunk 2077 ultra * (dB) | 48.1 | 38.1 21% | 46.5 3% | 45.9 5% | 42.8 11% | 44.4 8% |
| Load Maximum * (dB) | 48.4 | 48.6 -0% | 46.5 4% | 45.9 5% | 45.2 7% | 41.1 15% |
| Load Average * (dB) | 38 | 33.1 | 36.4 | 28.6 |
* ... im mniej tym lepiej
Temperatura
(+) Maksymalna temperatura w górnej części wynosi 32 °C / 90 F, w porównaniu do średniej 36.8 °C / 98 F , począwszy od 21 do 71 °C dla klasy Multimedia.
(+) Dno nagrzewa się maksymalnie do 37 °C / 99 F, w porównaniu do średniej 39.1 °C / 102 F
(+) W stanie bezczynności średnia temperatura górnej części wynosi 23.2 °C / 74 F, w porównaniu ze średnią temperaturą urządzenia wynoszącą 31.3 °C / ### class_avg_f### F.
(+) Podpórki pod nadgarstki i touchpad są chłodniejsze niż temperatura skóry i maksymalnie 22 °C / 71.6 F i dlatego są chłodne w dotyku.
(+) Średnia temperatura obszaru podparcia dłoni w podobnych urządzeniach wynosiła 28.7 °C / 83.7 F (+6.7 °C / 12.1 F).
| Acer Swift 16 AI SF16-71T-75YX Ultra X7 358H, Arc B390 Panther Lake iGPU | Dell XPS 16 Core Ultra X7 358H Ultra X7 358H, Arc B390 Panther Lake iGPU | MSI Prestige 14 Flip AI+ 2026 Ultra X7 358H, Arc B390 Panther Lake iGPU | Asus ZenBook Duo UX8407AA Ultra X9 388H, Arc B390 Panther Lake iGPU | Asus ExpertBook Ultra B9406CAA Ultra X7 358H, Arc B390 Panther Lake iGPU | Acer Swift 16 AI SF16-51T-932H, Ultra 9 288V Core Ultra 9 288V, Arc 140V | |
|---|---|---|---|---|---|---|
| Heat | -2% | -13% | -6% | -3% | -5% | |
| Maximum Upper Side * (°C) | 32 | 40.6 -27% | 47.1 -47% | 35.3 -10% | 38.6 -21% | 37.9 -18% |
| Maximum Bottom * (°C) | 37 | 39.8 -8% | 46.2 -25% | 44.3 -20% | 38.4 -4% | 31.5 15% |
| Idle Upper Side * (°C) | 27 | 23.2 14% | 24.3 10% | 25.5 6% | 24.6 9% | 28.3 -5% |
| Idle Bottom * (°C) | 27 | 23.8 12% | 24.5 9% | 26.7 1% | 26 4% | 29.7 -10% |
* ... im mniej tym lepiej
Głośniki
Acer Swift 16 AI SF16-71T-75YX analiza dźwięku
(+) | głośniki mogą odtwarzać stosunkowo głośno (85 dB)
Bas 100 - 315 Hz
(-) | prawie brak basu - średnio 18% niższa od mediany
(±) | liniowość basu jest średnia (8.6% delta do poprzedniej częstotliwości)
Średnie 400 - 2000 Hz
(+) | zbalansowane środki średnie - tylko 2.7% od mediany
(±) | liniowość środka jest średnia (7% delta do poprzedniej częstotliwości)
Wysokie 2–16 kHz
(±) | wyższe maksima - średnio 5.5% wyższe od mediany
(±) | liniowość wysokich wartości jest średnia (8.4% delta do poprzedniej częstotliwości)
Ogólnie 100 - 16.000 Hz
(±) | liniowość ogólnego dźwięku jest średnia (15.3% różnicy w stosunku do mediany)
W porównaniu do tej samej klasy
» 38% wszystkich testowanych urządzeń w tej klasie było lepszych, 3% podobnych, 59% gorszych
» Najlepszy miał deltę 5%, średnia wynosiła ###średnia###%, najgorsza wynosiła 45%
W porównaniu do wszystkich testowanych urządzeń
» 22% wszystkich testowanych urządzeń było lepszych, 4% podobnych, 74% gorszych
» Najlepszy miał deltę 4%, średnia wynosiła ###średnia###%, najgorsza wynosiła 134%
Apple MacBook Pro 16 2021 M1 Pro analiza dźwięku
(+) | głośniki mogą odtwarzać stosunkowo głośno (84.7 dB)
Bas 100 - 315 Hz
(+) | dobry bas - tylko 3.8% od mediany
(+) | bas jest liniowy (5.2% delta do poprzedniej częstotliwości)
Średnie 400 - 2000 Hz
(+) | zbalansowane środki średnie - tylko 1.3% od mediany
(+) | średnie są liniowe (2.1% delta do poprzedniej częstotliwości)
Wysokie 2–16 kHz
(+) | zrównoważone maksima - tylko 1.9% od mediany
(+) | wzloty są liniowe (2.7% delta do poprzedniej częstotliwości)
Ogólnie 100 - 16.000 Hz
(+) | ogólny dźwięk jest liniowy (4.6% różnicy w stosunku do mediany)
W porównaniu do tej samej klasy
» 0% wszystkich testowanych urządzeń w tej klasie było lepszych, 0% podobnych, 100% gorszych
» Najlepszy miał deltę 5%, średnia wynosiła ###średnia###%, najgorsza wynosiła 45%
W porównaniu do wszystkich testowanych urządzeń
» 0% wszystkich testowanych urządzeń było lepszych, 0% podobnych, 100% gorszych
» Najlepszy miał deltę 4%, średnia wynosiła ###średnia###%, najgorsza wynosiła 134%
Zużycie energii
| wyłączony / stan wstrzymania | |
| luz | |
| obciążenie |
|
Legenda:
min: | |
| Acer Swift 16 AI SF16-71T-75YX Ultra X7 358H, Arc B390 Panther Lake iGPU, Western Digital PC SN5000S SDEQNSJ-1T00, OLED, 2880x1800, 16" | Dell XPS 16 Core Ultra X7 358H Ultra X7 358H, Arc B390 Panther Lake iGPU, , OLED, 3200x2000, 16" | MSI Prestige 14 Flip AI+ 2026 Ultra X7 358H, Arc B390 Panther Lake iGPU, Phison 1 TB ESR01TBTCCZ-27J, OLED, 1920x1200, 14" | Asus ZenBook Duo UX8407AA Ultra X9 388H, Arc B390 Panther Lake iGPU, Samsung PM9C1b MZVL82T0HBL1, OLED, 2880x1800, 14" | Asus ExpertBook Ultra B9406CAA Ultra X7 358H, Arc B390 Panther Lake iGPU, Samsung PM9E1 MZVLC2T0HBLD, OLED, 2880x1800, 14" | Acer Swift 16 AI SF16-51T-932H, Ultra 9 288V Core Ultra 9 288V, Arc 140V, Western Digital PC SN5000S SDEQNSJ-1T00, OLED, 2880x1800, 16" | Przeciętny Intel Arc B390 12 Xe3 Panther Lake iGPU | Średnia w klasie Multimedia | |
|---|---|---|---|---|---|---|---|---|
| Power Consumption | 21% | 38% | -1% | 35% | 19% | 27% | -13% | |
| Idle Minimum * (Watt) | 5.12 | 4 22% | 2.8 45% | 4.8 6% | 3.5 32% | 5.7 -11% | 3.67 ? 28% | 5.71 ? -12% |
| Idle Average * (Watt) | 7.14 | 4.4 38% | 4.2 41% | 9.8 -37% | 4 44% | 7.4 -4% | 5.59 ? 22% | 10.1 ? -41% |
| Idle Maximum * (Watt) | 13 | 10.2 22% | 4.5 65% | 10.2 22% | 5.3 59% | 7.9 39% | 8.58 ? 34% | 12.4 ? 5% |
| Cyberpunk 2077 ultra * (Watt) | 73.1 | 62.6 14% | 59.9 18% | 76.3 -4% | 61.3 16% | 49.8 32% | ||
| Cyberpunk 2077 ultra external monitor * (Watt) | 73.1 | 62.4 15% | 58.6 20% | 75.3 -3% | 61.4 16% | |||
| Load Maximum * (Watt) | 107 | 94.6 12% | 64 40% | 96 10% | 63.4 41% | 65.41 39% | 83.6 ? 22% | 112.2 ? -5% |
| Load Average * (Watt) | 44.2 | 48.9 | 47.3 | 43.7 | 45.6 ? | 65 ? |
* ... im mniej tym lepiej
Energieaufnahme Cyberpunk / Stresstest
Zużycie energii przez monitor zewnętrzny
Żywotność baterii
| Acer Swift 16 AI SF16-71T-75YX Ultra X7 358H, Arc B390 Panther Lake iGPU, 70 Wh | Dell XPS 16 Core Ultra X7 358H Ultra X7 358H, Arc B390 Panther Lake iGPU, 70 Wh | MSI Prestige 14 Flip AI+ 2026 Ultra X7 358H, Arc B390 Panther Lake iGPU, 81 Wh | Asus ZenBook Duo UX8407AA Ultra X9 388H, Arc B390 Panther Lake iGPU, 99 Wh | Asus ExpertBook Ultra B9406CAA Ultra X7 358H, Arc B390 Panther Lake iGPU, 70 Wh | Acer Swift 16 AI SF16-51T-932H, Ultra 9 288V Core Ultra 9 288V, Arc 140V, 70 Wh | Średnia w klasie Multimedia | |
|---|---|---|---|---|---|---|---|
| Czasy pracy | -37% | 20% | 4% | -1% | -19% | -26% | |
| WiFi v1.3 (h) | 16.3 | 10.3 -37% | 19.6 20% | 17 4% | 16.1 -1% | 13.2 -19% | 12 ? -26% |
| H.264 (h) | 21.4 | 16.4 ? | |||||
| Load (h) | 2.3 | 1.675 ? |
Ocena Notebookcheck
Acer Swift 16 AI to niezwykle fajny i trwały koń roboczy, który skutecznie zapewnia ogromny wzrost wydajności architektury Panther Lake. Jego ponadwymiarowy touchpad pozostaje w centrum uwagi, przynosząc zarówno plusy, jak i minusy.
Acer Swift 16 AI SF16-71T-75YX
- 01/05/2026 v8
Marc Herter
 Total Sustainability Score:
 Możliwe alternatywy w porównaniu
Obraz | Model / recenzja | Cena | Waga | Wysokość | Ekran |
|---|---|---|---|---|---|
1. 84.4%  | Acer Swift 16 AI SF16-71T-75YX Intel Core Ultra X7 358H ⎘ Intel Arc B390 12 Xe3 Panther Lake iGPU ⎘ 32 GB Pamięć, 1024 GB SSD | Amazon: | 1.4 kg | 16.25 mm | 16.00" 2880x1800 OLED |
2. 87.2% 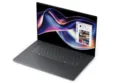 | Dell XPS 16 Core Ultra X7 358H Intel Core Ultra X7 358H ⎘ Intel Arc B390 12 Xe3 Panther Lake iGPU ⎘ 32 GB Pamięć | Amazon: 1. $1,977.99 Dell Premium 16 (Previously ... 2. $2,658.65 Dell Premium 16 (XPS 16 2025... 3. $2,599.00 Dell Premium 16 (XPS 16 2025... Cena katalogowa: 2350 USD | 1.7 kg | 14.62 mm | 16.00" 3200x2000 236 PPI OLED |
3. 84.2% 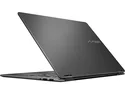 | MSI Prestige 14 Flip AI+ 2026 Intel Core Ultra X7 358H ⎘ Intel Arc B390 12 Xe3 Panther Lake iGPU ⎘ 32 GB Pamięć, 1000 GB SSD | Amazon: 1. $1,397.51 MSI Prestige 14 AI+ EVO PRE1... 2. $2,431.19 MSI Prestige 16 Flip AI+ 16"... 3. $1,199.00 msi Prestige A16 AI+ (2025) ... Cena katalogowa: 1549€ | 1.4 kg | 13.9 mm | 14.00" 1920x1200 162 PPI OLED |
4. 88.5%  | Asus ZenBook Duo UX8407AA Intel Core Ultra X9 388H ⎘ Intel Arc B390 12 Xe3 Panther Lake iGPU ⎘ 32 GB Pamięć, 2048 GB SSD | Amazon: $2,499.99 Cena katalogowa: 2599€ | 1.7 kg | 23.4 mm | 14.00" 2880x1800 243 PPI OLED |
5. 87.6%  | Asus ExpertBook Ultra B9406CAA Intel Core Ultra X7 358H ⎘ Intel Arc B390 12 Xe3 Panther Lake iGPU ⎘ 32 GB Pamięć, 2048 GB SSD | Amazon: | 1.1 kg | 15.9 mm | 14.00" 2880x1800 243 PPI OLED |
6. 85.3%  | Acer Swift 16 AI SF16-51T-932H, Ultra 9 288V Intel Core Ultra 9 288V ⎘ Intel Arc Graphics 140V ⎘ 32 GB Pamięć, 1024 GB SSD | Amazon: | 1.5 kg | 15.95 mm | 16.00" 2880x1800 212 PPI OLED |
Przezroczystość
Wyboru urządzeń do recenzji dokonuje nasza redakcja. Próbka testowa została udostępniona autorowi jako pożyczka od producenta lub sprzedawcy detalicznego na potrzeby tej recenzji. Pożyczkodawca nie miał wpływu na tę recenzję, producent nie otrzymał też kopii tej recenzji przed publikacją. Nie było obowiązku publikowania tej recenzji. Jako niezależna firma medialna, Notebookcheck nie podlega władzy producentów, sprzedawców detalicznych ani wydawców.
Tak testuje Notebookcheck
Każdego roku Notebookcheck niezależnie sprawdza setki laptopów i smartfonów, stosując standardowe procedury, aby zapewnić porównywalność wszystkich wyników. Od około 20 lat stale rozwijamy nasze metody badawcze, ustanawiając przy tym standardy branżowe. W naszych laboratoriach testowych doświadczeni technicy i redaktorzy korzystają z wysokiej jakości sprzętu pomiarowego. Testy te obejmują wieloetapowy proces walidacji. Nasz kompleksowy system ocen opiera się na setkach uzasadnionych pomiarów i benchmarków, co pozwala zachować obiektywizm.
