Recenzja Dell XPS 14 2024 - multimedialny laptop z najwolniejszym RTX 4050 na świecie
Przez wiele lat Dell XPS 15 był dobrze znanym rozmiarem w segmencie multimediów. W 2024 roku producent zastąpił 15-calowy model dwiema nowymi wersjami z 14- i 16-calowymi ekranami. Dziś przyjrzymy się nowemu XPS 14 9440, którego cena początkowa wynosząca 1499 USD bezpiecznie cementuje go w segmencie premium. W zamian otrzymujemy nowy procesor Meteor-Lake Core Ultra 7 155H, 16 GB pamięci RAM, dysk SSD o pojemności 512 GB i panel Full-HD.
Nasze urządzenie testowe z procesorem Core Ultra 7, 32 GB pamięci RAM, dyskiem SSD o pojemności 1 TB, kartą graficzną GeForce RTX 4050 Laptop oraz panelem OLED o wysokiej rozdzielczości 120 Hz kosztuje aż 2399 USD i w rezultacie musi konkurować z innymi wysokiej klasy laptopami multimedialnymi i modelami do gier, takimi jak Razer Blade 14 lub Asus ROG Zephyrus G14, które są jeszcze tańsze, ale oferują mocniejsze komponenty.
Potencjalni konkurenci w porównaniu
Ocena | Data | Model | Waga | Wysokość | Rozmiar | Rezolucja | Cena |
|---|---|---|---|---|---|---|---|
| 86.3 % v7 (old) | 04/2024 | Dell XPS 14 2024 OLED Ultra 7 155H, GeForce RTX 4050 Laptop GPU | 1.8 kg | 19 mm | 14.50" | 3200x2000 | |
| 92.8 % v7 (old) | 11/2023 | Apple MacBook Pro 14 2023 M3 Max Apple M3 Max 16-Core, M3 Max 40-Core GPU | 1.6 kg | 15.5 mm | 14.20" | 3024x1964 | |
| 85.5 % v7 (old) | 10/2023 | Microsoft Surface Laptop Studio 2 RTX 4060 i7-13700H, GeForce RTX 4060 Laptop GPU | 2 kg | 22 mm | 14.40" | 2400x1600 | |
| 89.8 % v7 (old) | 07/2023 | Lenovo Yoga Pro 9-14IRP G8 i7-13705H, GeForce RTX 4050 Laptop GPU | 1.7 kg | 17.6 mm | 14.50" | 3072x1920 | |
| 86.3 % v7 (old) | 07/2023 | Acer Swift X SFX14-71G i7-13700H, GeForce RTX 4050 Laptop GPU | 1.5 kg | 17.9 mm | 14.50" | 2880x1800 | |
| 89.3 % v7 (old) | 06/2023 | Asus Zenbook Pro 14 OLED UX6404VI i9-13900H, GeForce RTX 4070 Laptop GPU | 1.7 kg | 17.9 mm | 14.50" | 2880x1800 | |
| 93 % v7 (old) | 02/2024 | Asus ROG Zephyrus G14 2024 GA403U R9 8945HS, GeForce RTX 4070 Laptop GPU | 1.5 kg | 16.3 mm | 14.00" | 2880x1800 | |
| 89.7 % v7 (old) | 02/2024 | Razer Blade 14 RZ09-0508 R9 8945HS, GeForce RTX 4070 Laptop GPU | 1.9 kg | 17.99 mm | 14.00" | 2560x1600 |
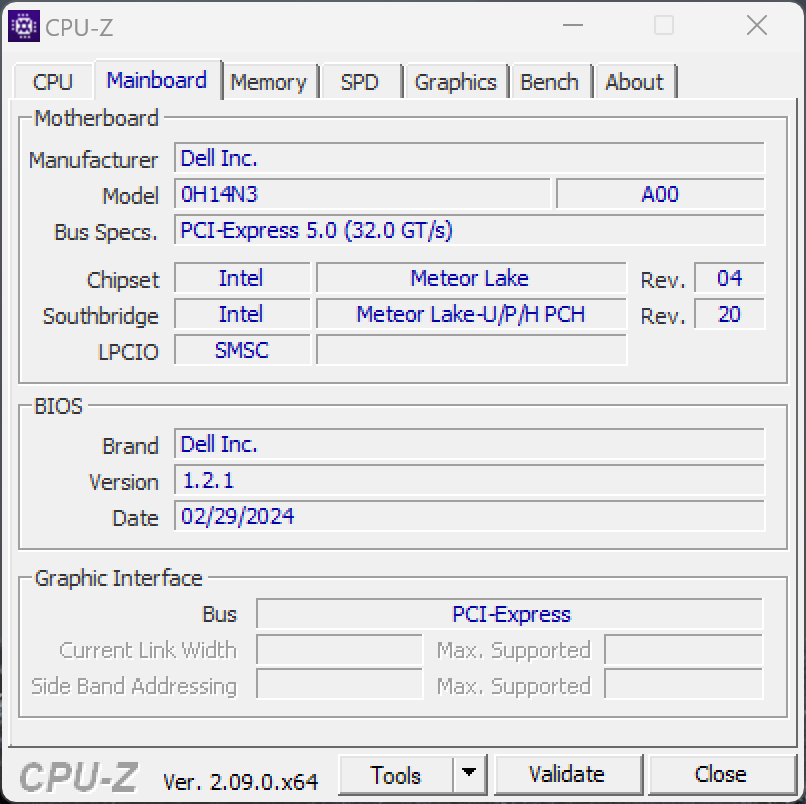
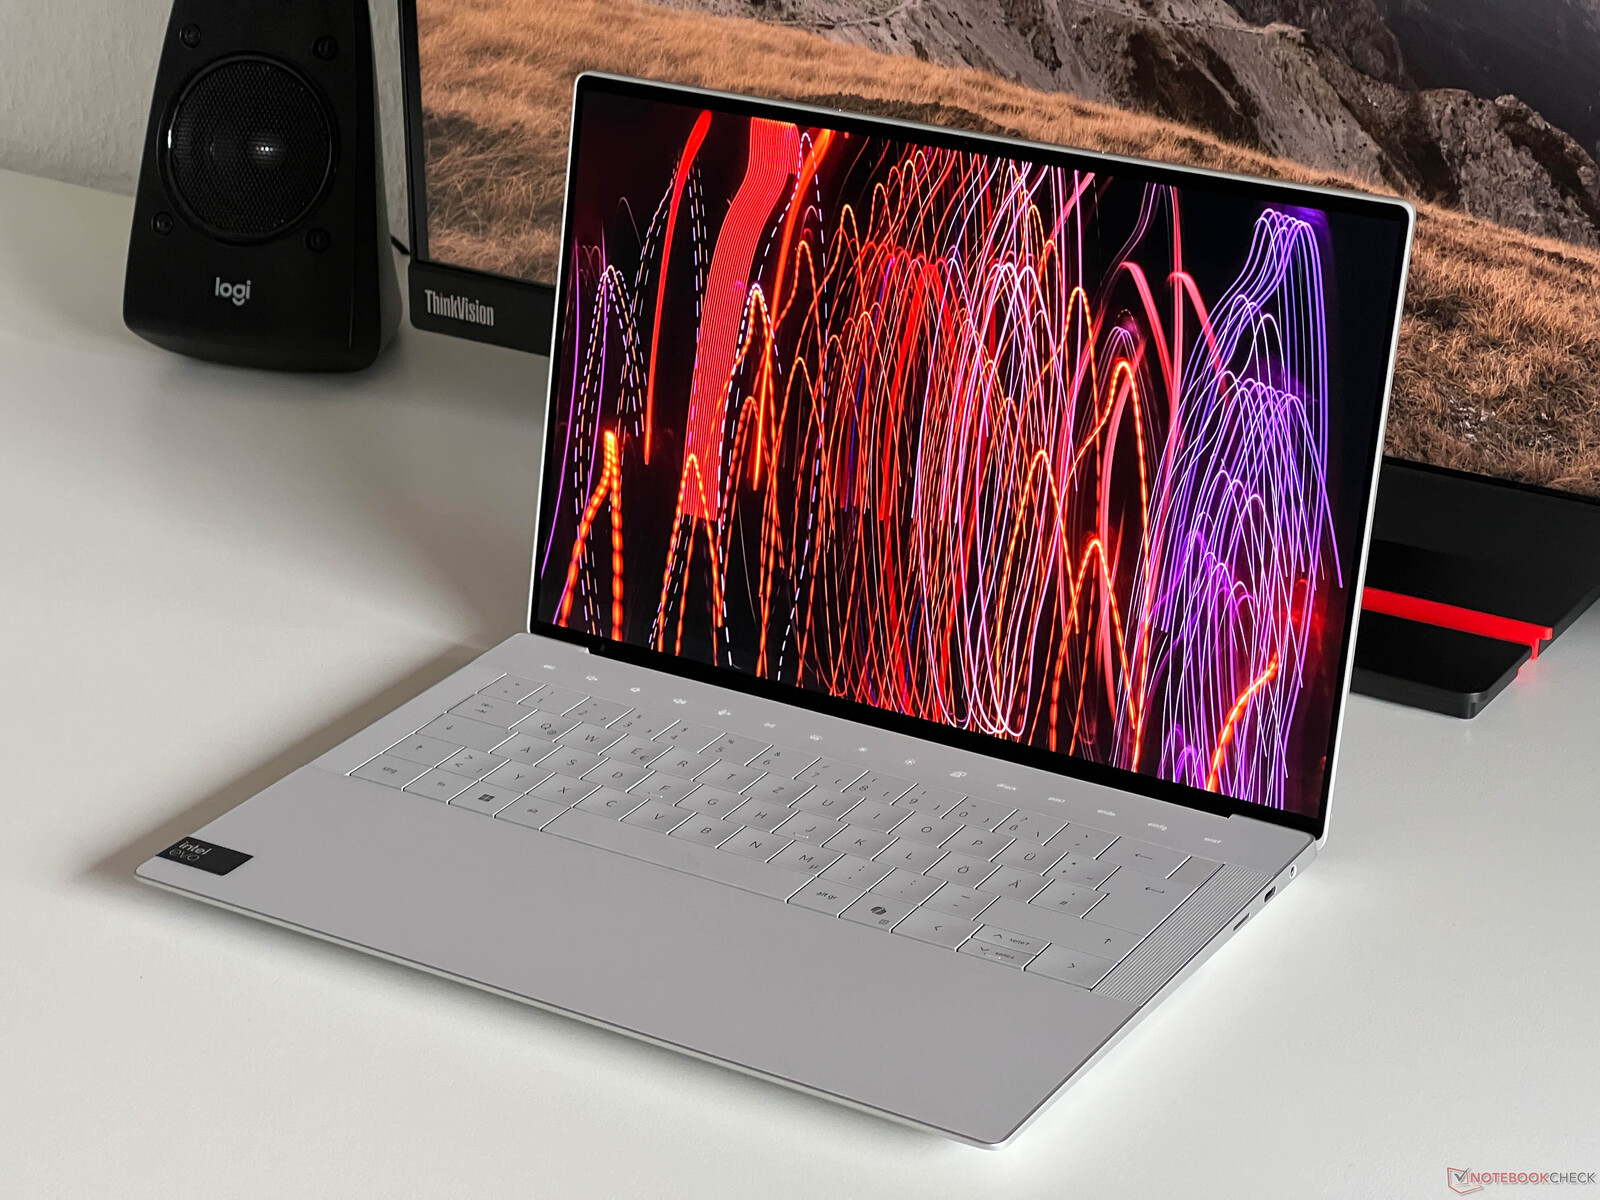
Obudowa - XPS 14 ze stabilną, ale nieporęczną aluminiową obudową
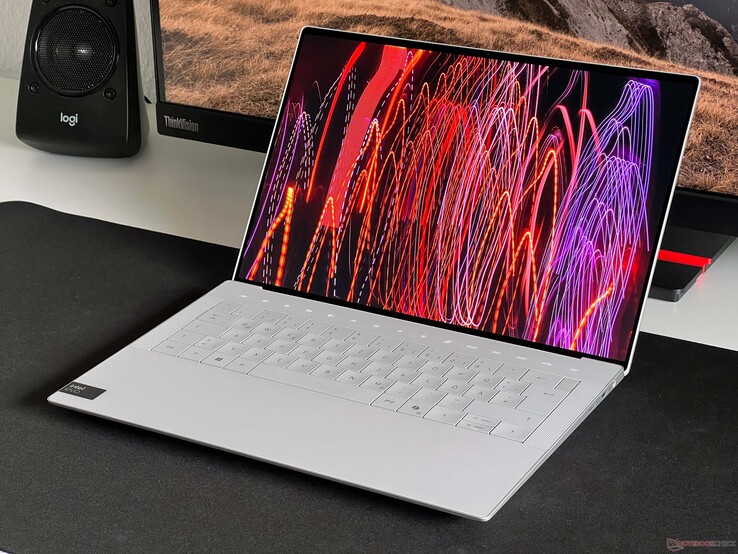
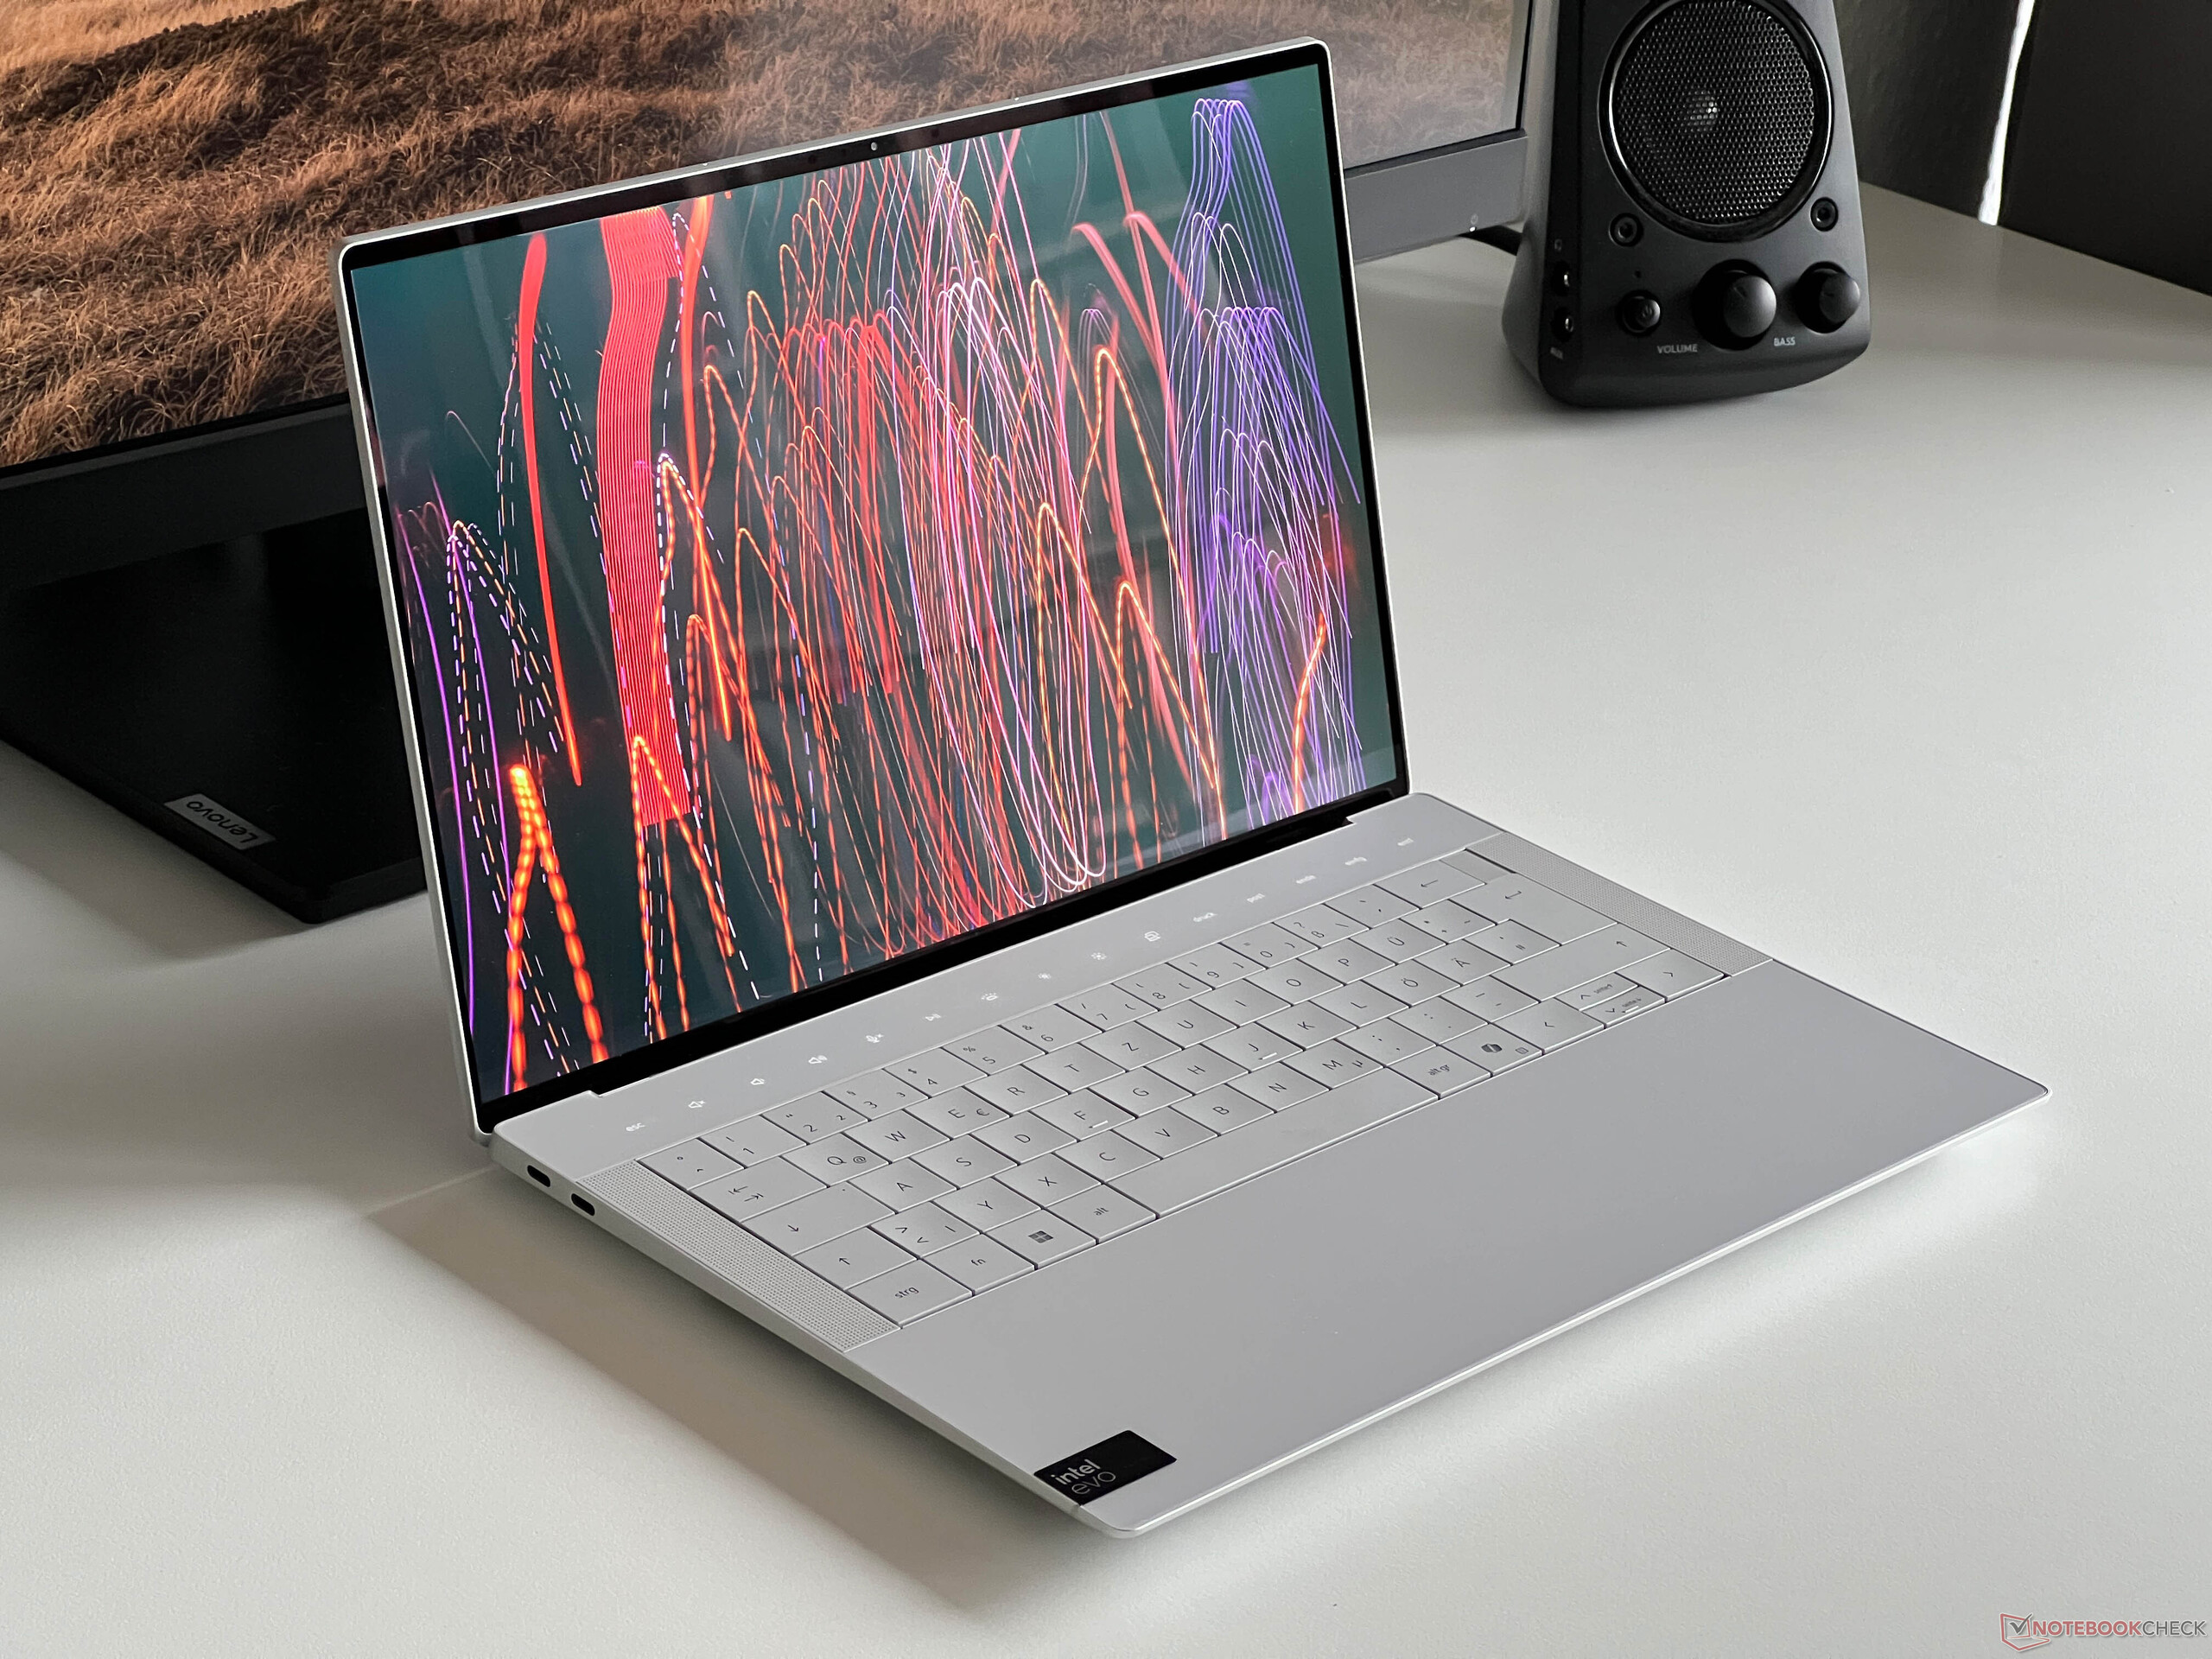
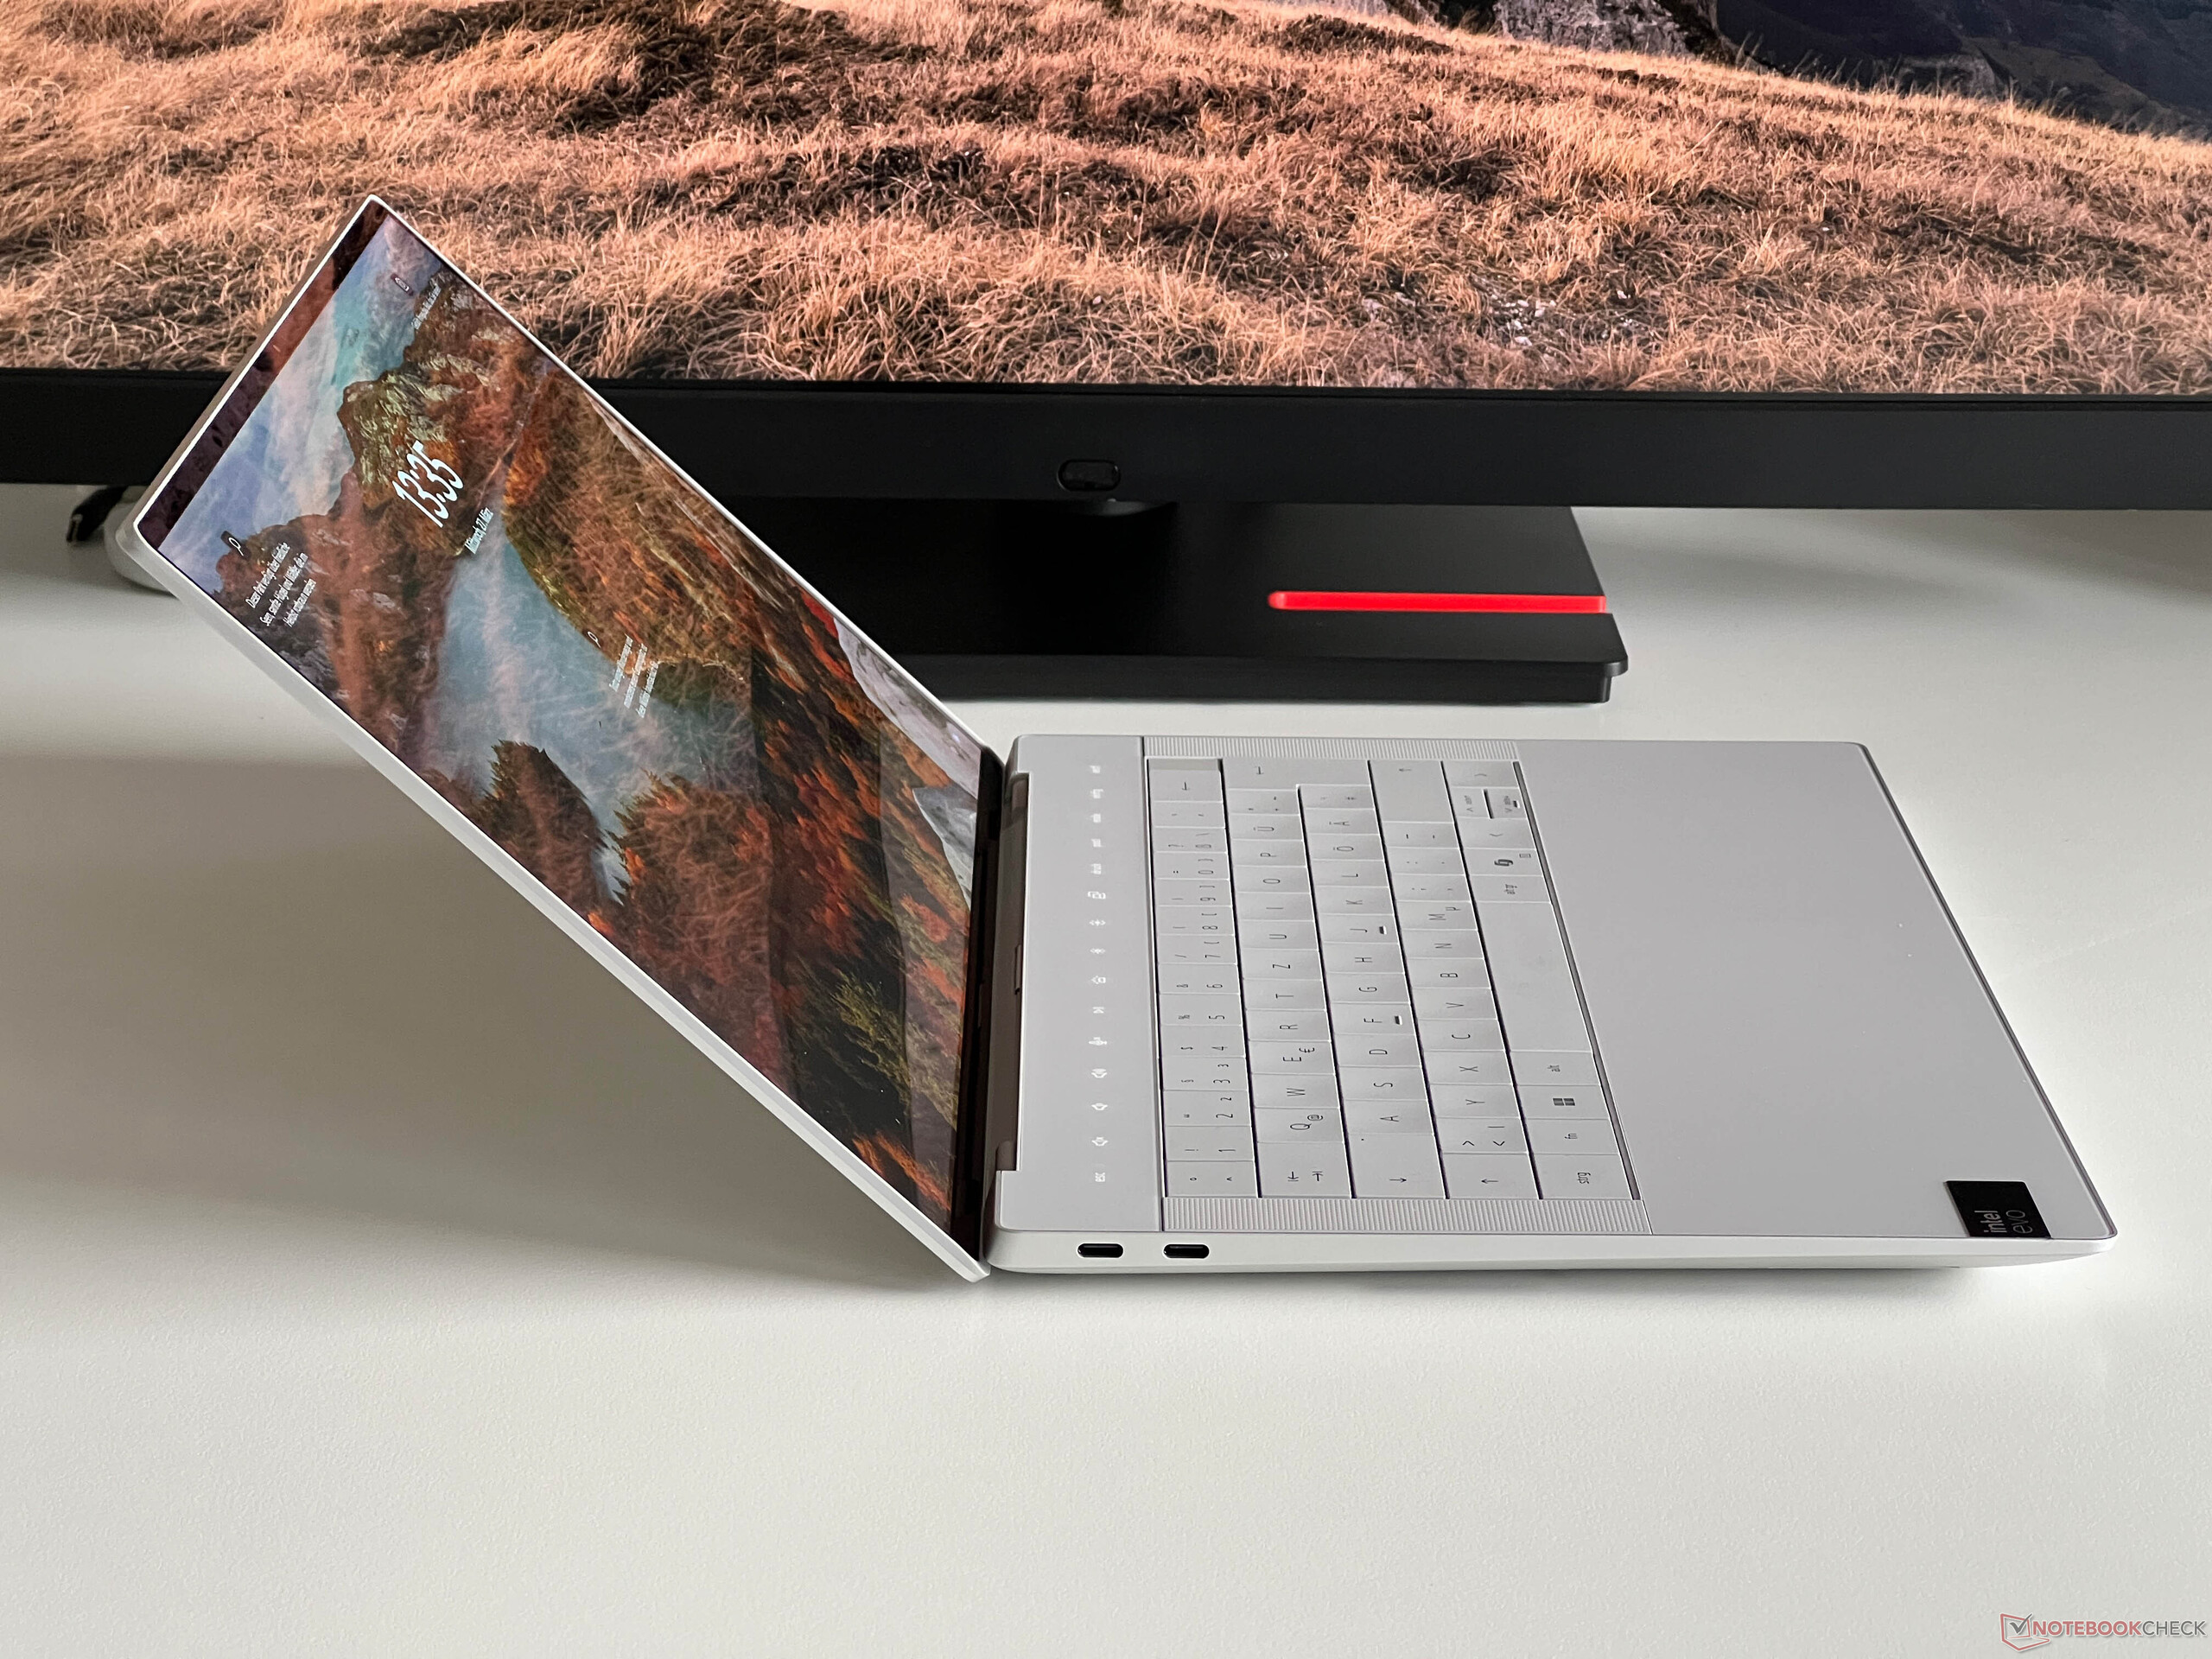
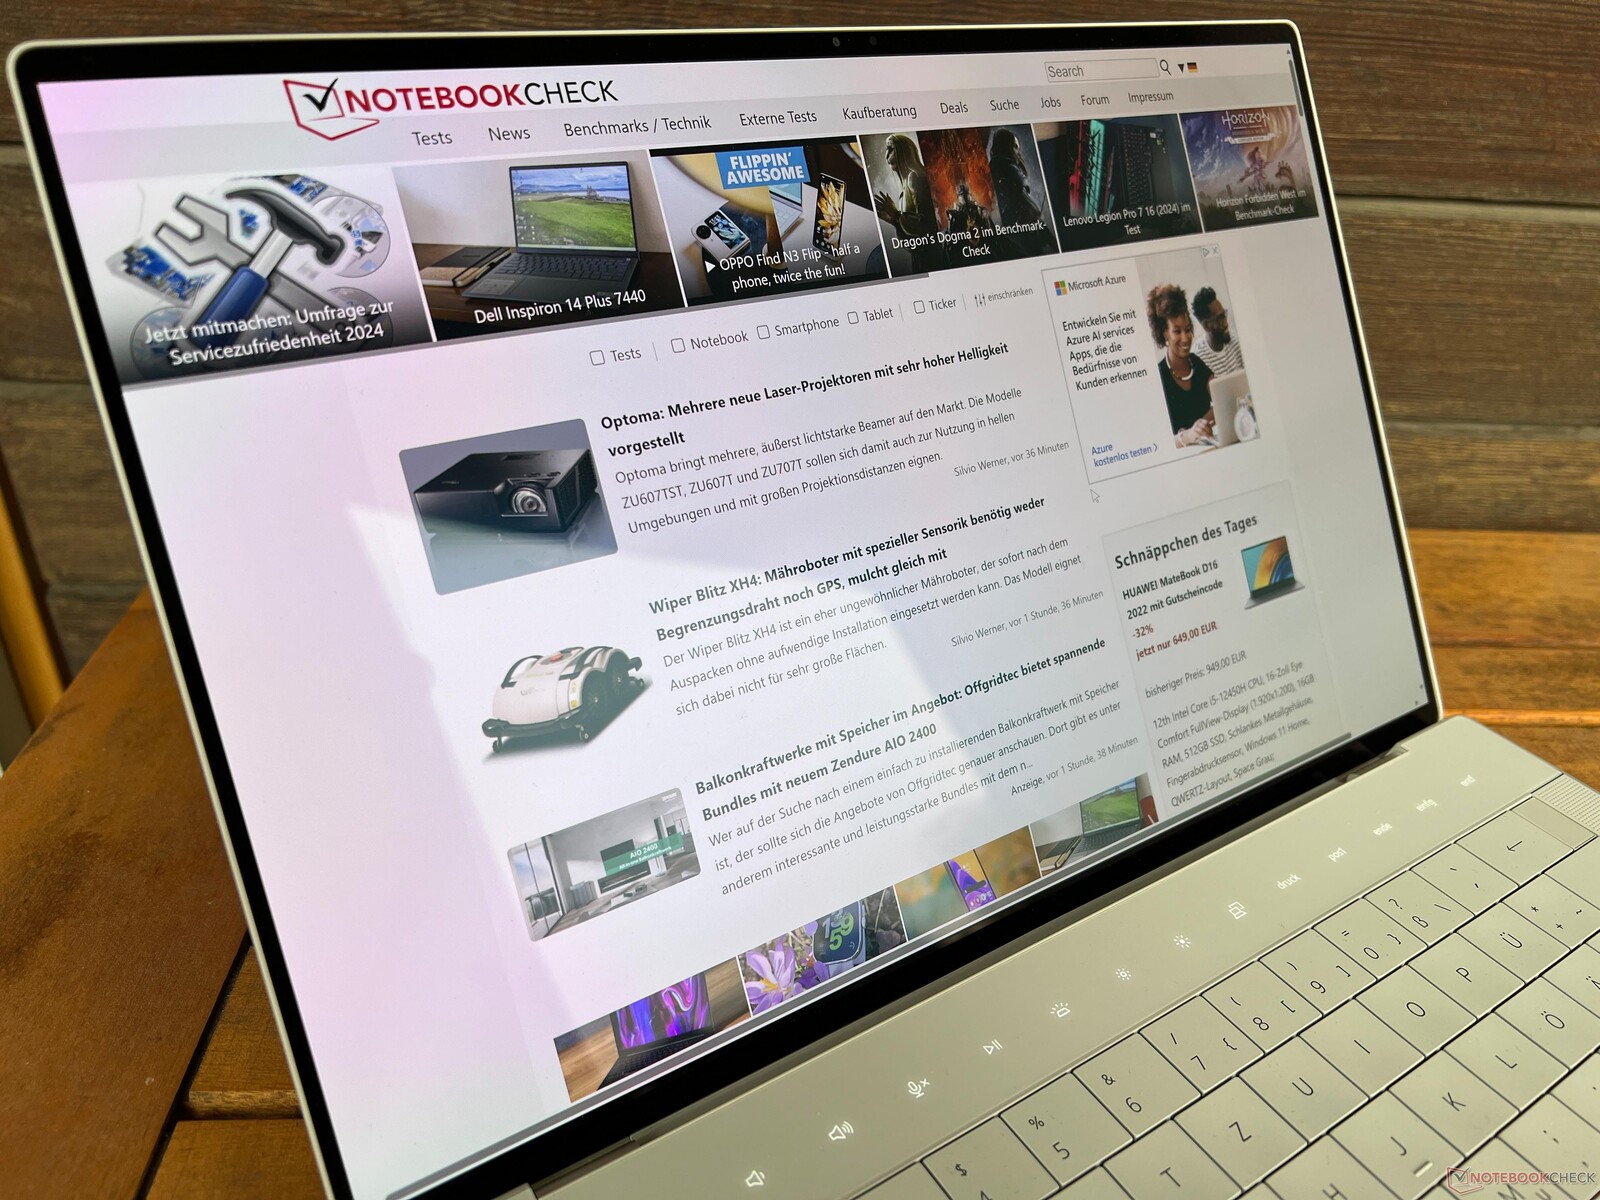
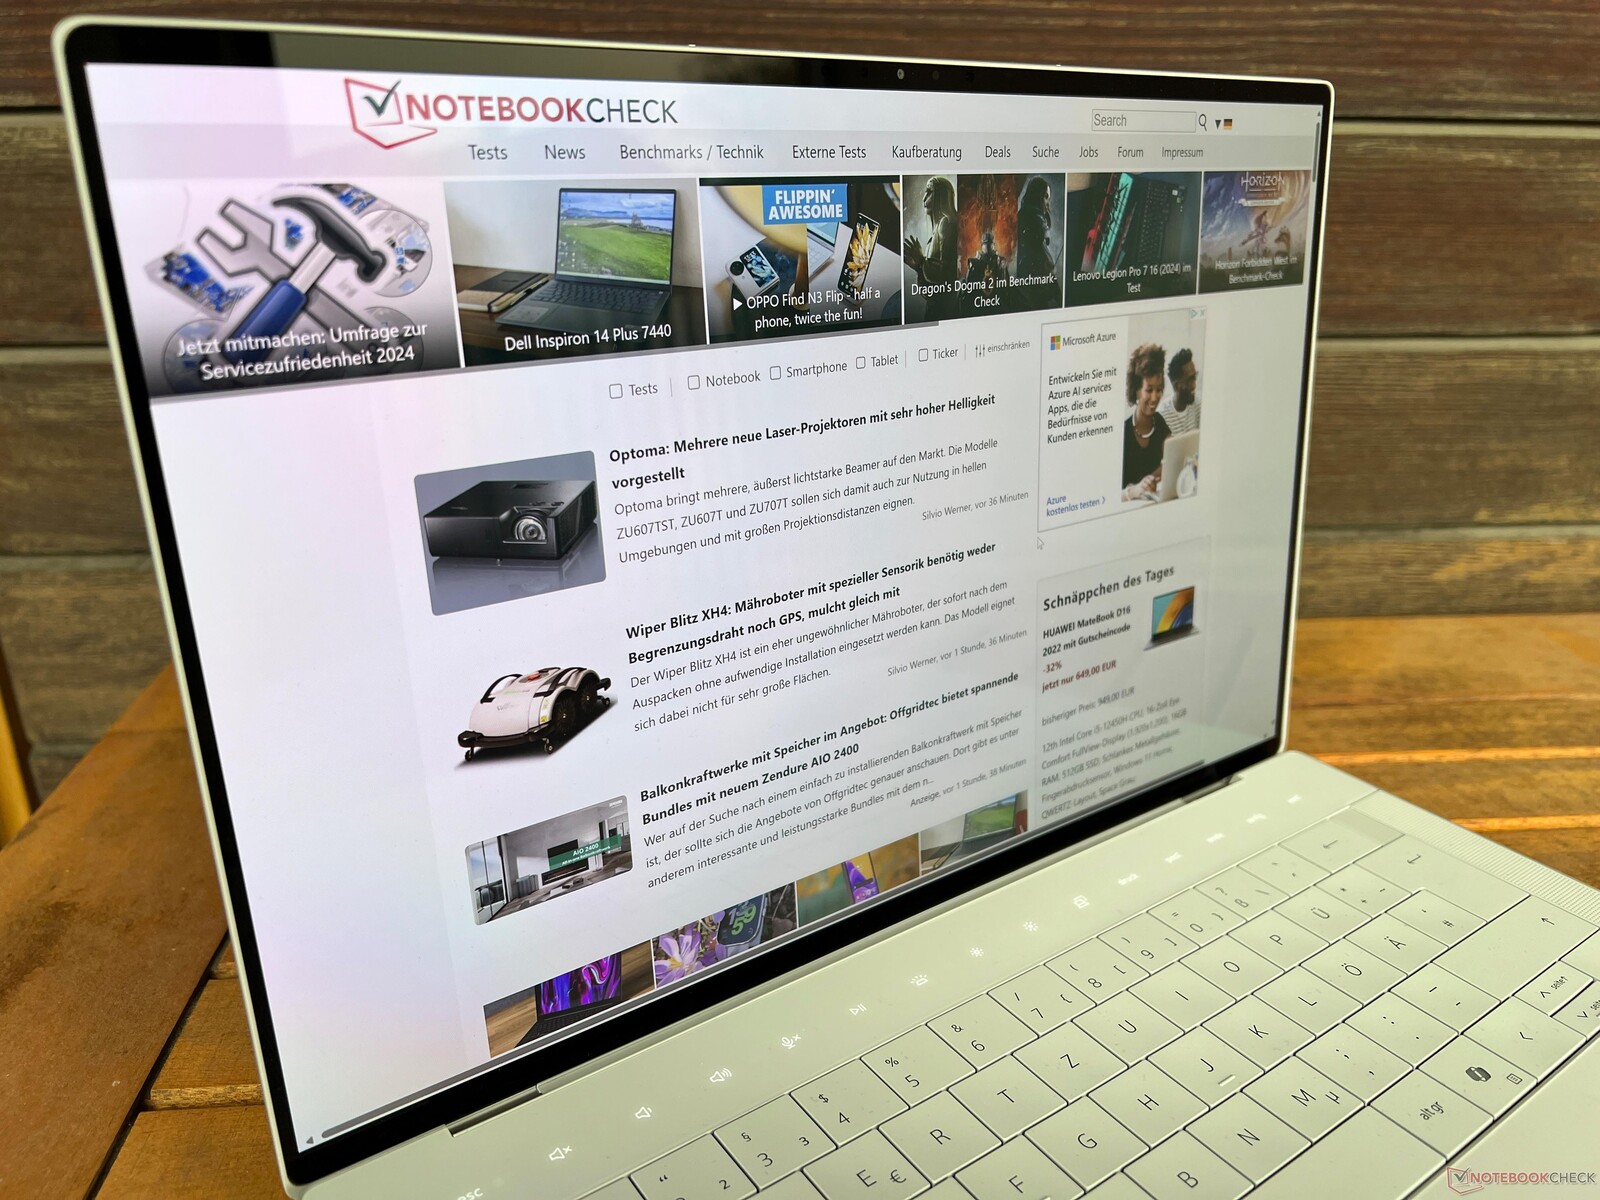
Design nowego XPS-a jest mocno inspirowany zeszłorocznym XPS 13 Plus. Zachowano klinowy kształt starych modeli, a Dell oferuje urządzenie w kolorze Platinum lub Graphite (ciemnoszarym). Jednostka bazowa jest zwężona z przodu, dzięki czemu sprawia wrażenie smuklejszego urządzenia, ale po jej podniesieniu staje się oczywiste, jak ciężka jest i ogólnie, jak nieporęczna jest obudowa. Wizualnie, nowy XPS 14 robi dobre wrażenie i zaraz po otwarciu pokrywy, dominuje ciągła szklana podpórka pod nadgarstki bez widocznego touchpada i biała klawiatura bez żadnych odstępów między klawiszami. Odciski palców nie stanowią problemu na podpórce pod nadgarstki, ale można zauważyć niewielkie ślady na pokrywie.
Jakość wykonania aluminiowej obudowy jest znakomita, gdyż jednostka bazowa nie daje się wgnieść ani wypaczyć i nie odnotowaliśmy żadnych odgłosów skrzypienia. Wyświetlacz jest równie stabilny, a zawiasy zostały dobrze ustawione, co oznacza, że chwieje się tylko nieznacznie, gdy reguluje się kąt pokrywy (maksymalnie 135 stopni). Kształt przedniej krawędzi utrudnia jednak otwieranie pokrywy jedną ręką.
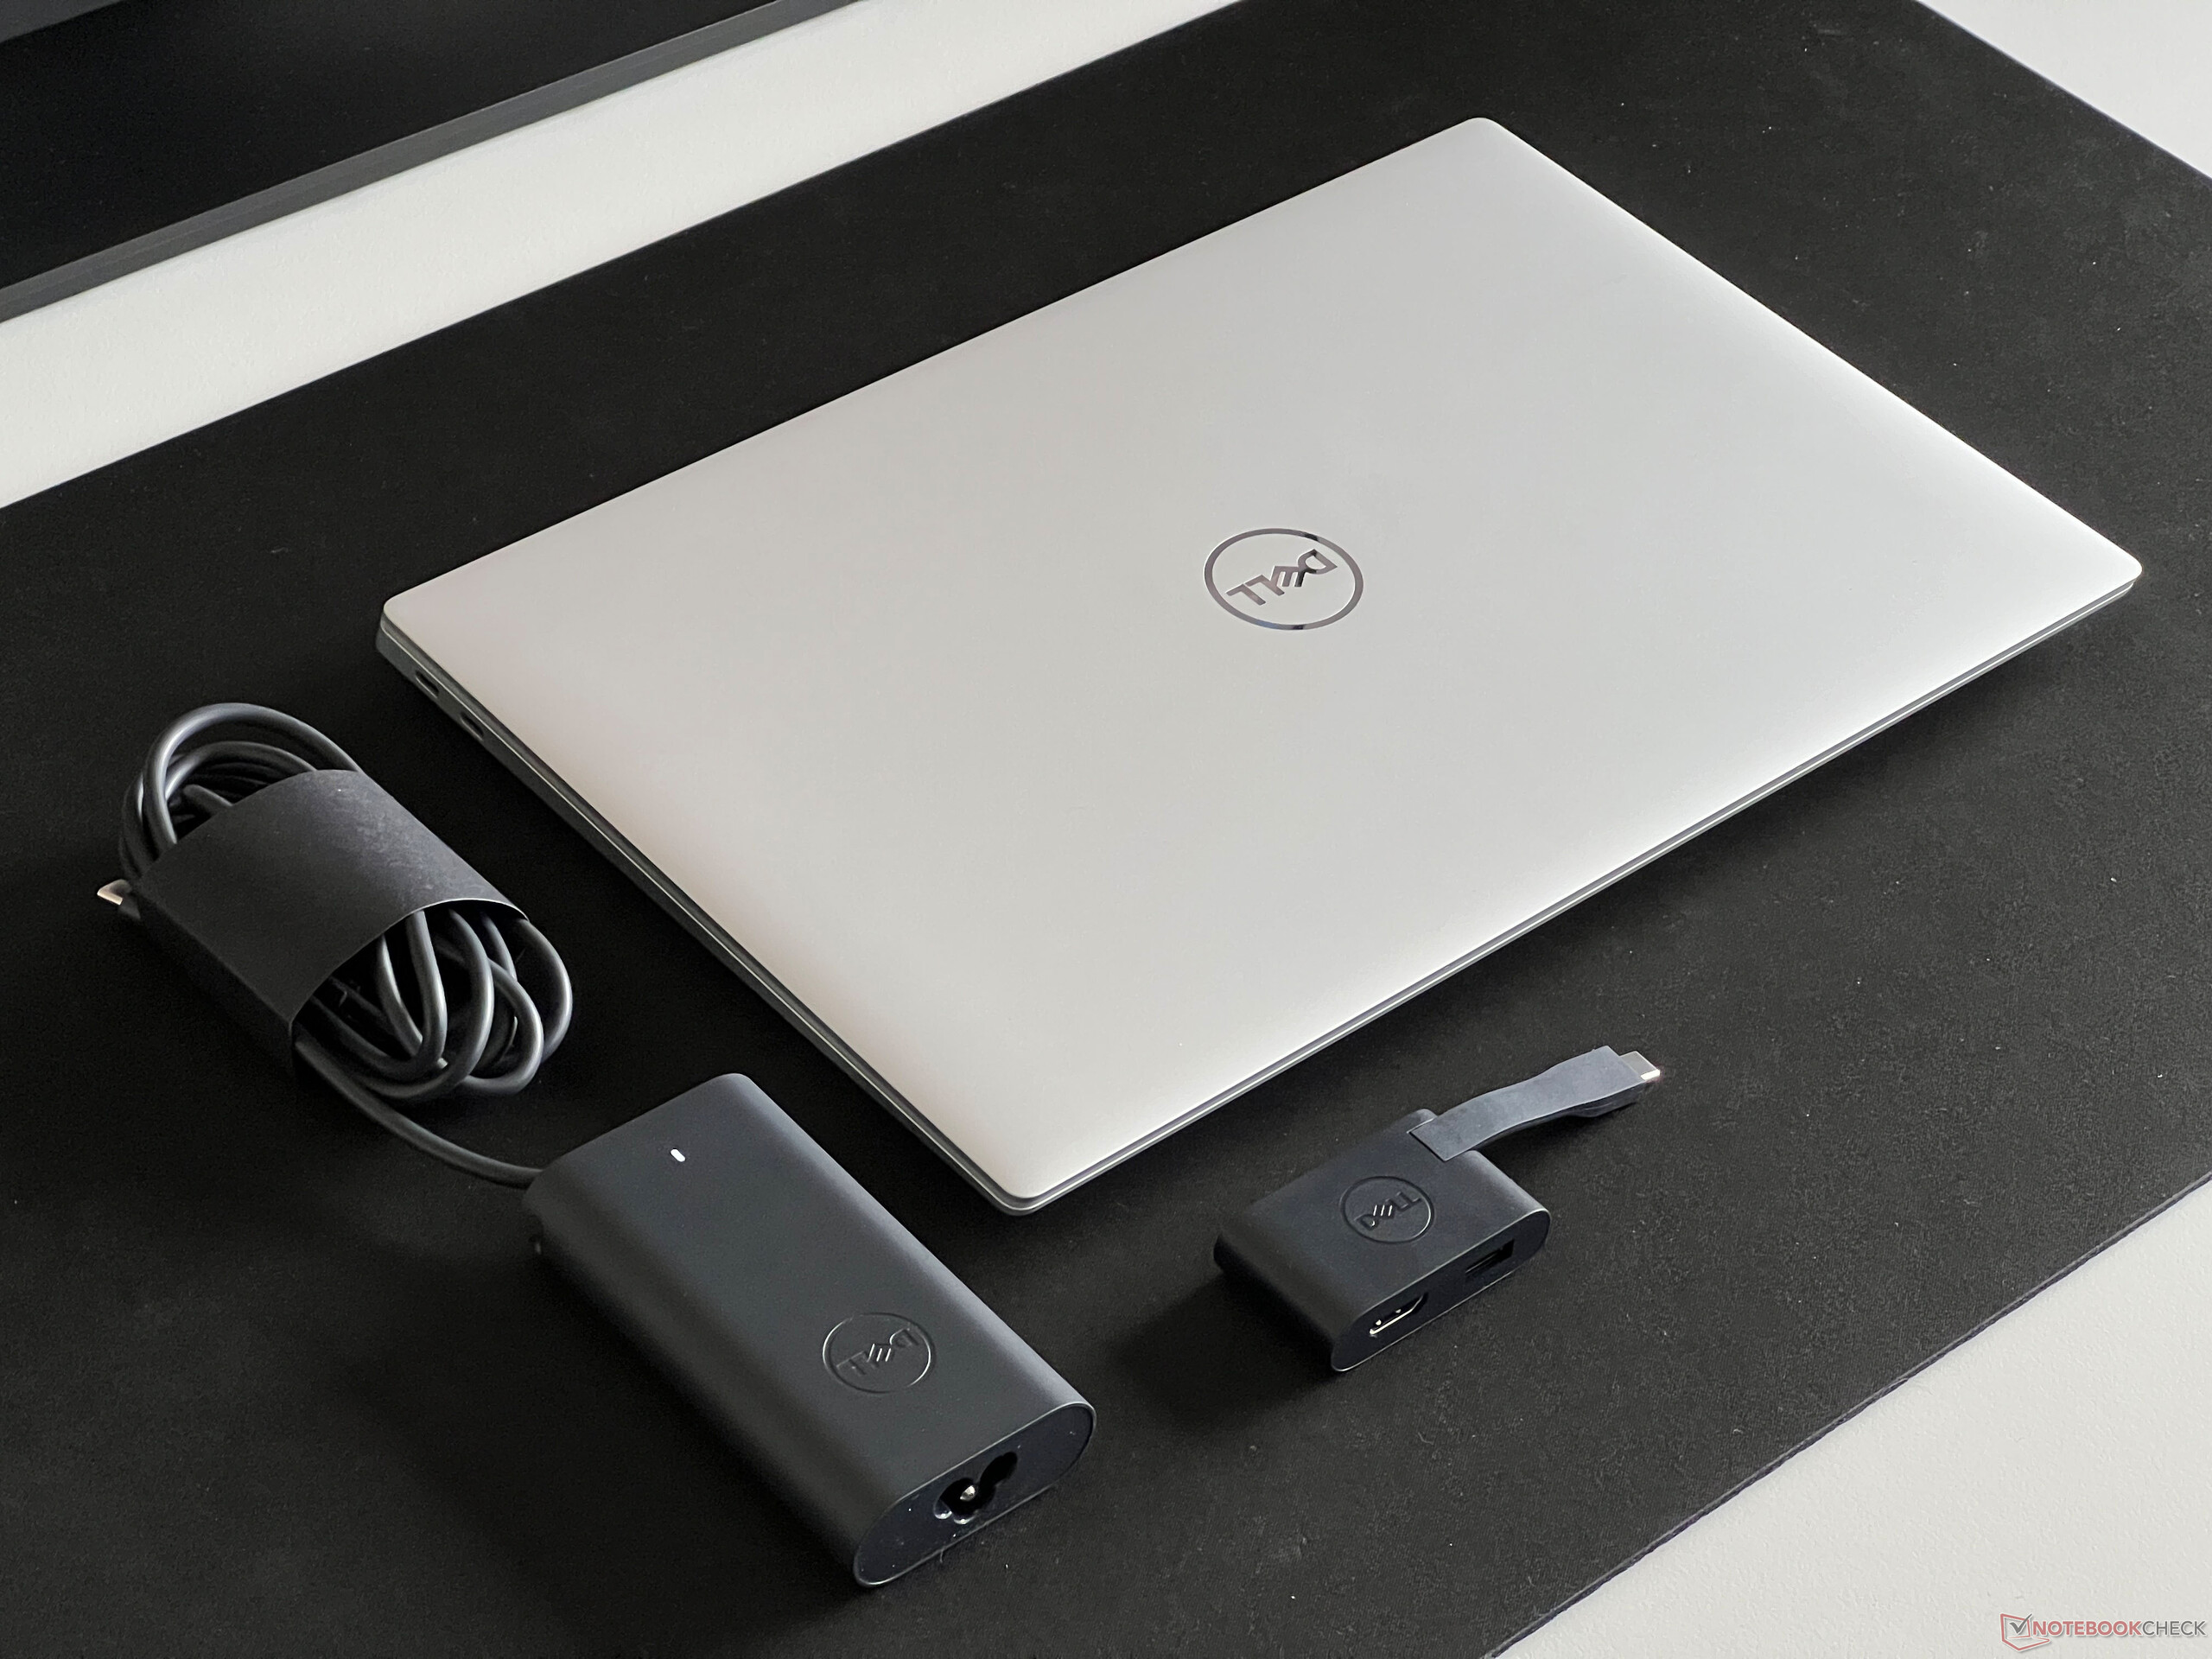

XPS 14 waży prawie 1,8 kg i jest również stosunkowo gruby, mierząc 19 mm. To czyni go jednym z najcięższych urządzeń w naszej grupie porównawczej - tylko Surface Laptop Studio ze składanym ekranem jest nieco grubszy i cięższy. Ponadto Blade 14 jest nieco cięższy, ale nie tak gruby. Nawet MacBook Proktóry wydaje się dość masywny ze względu na swoją konstrukcję, jest o około 3,5 mm cieńszy. 100-watowy zasilacz dodaje kolejne 352 gramy do wagi.
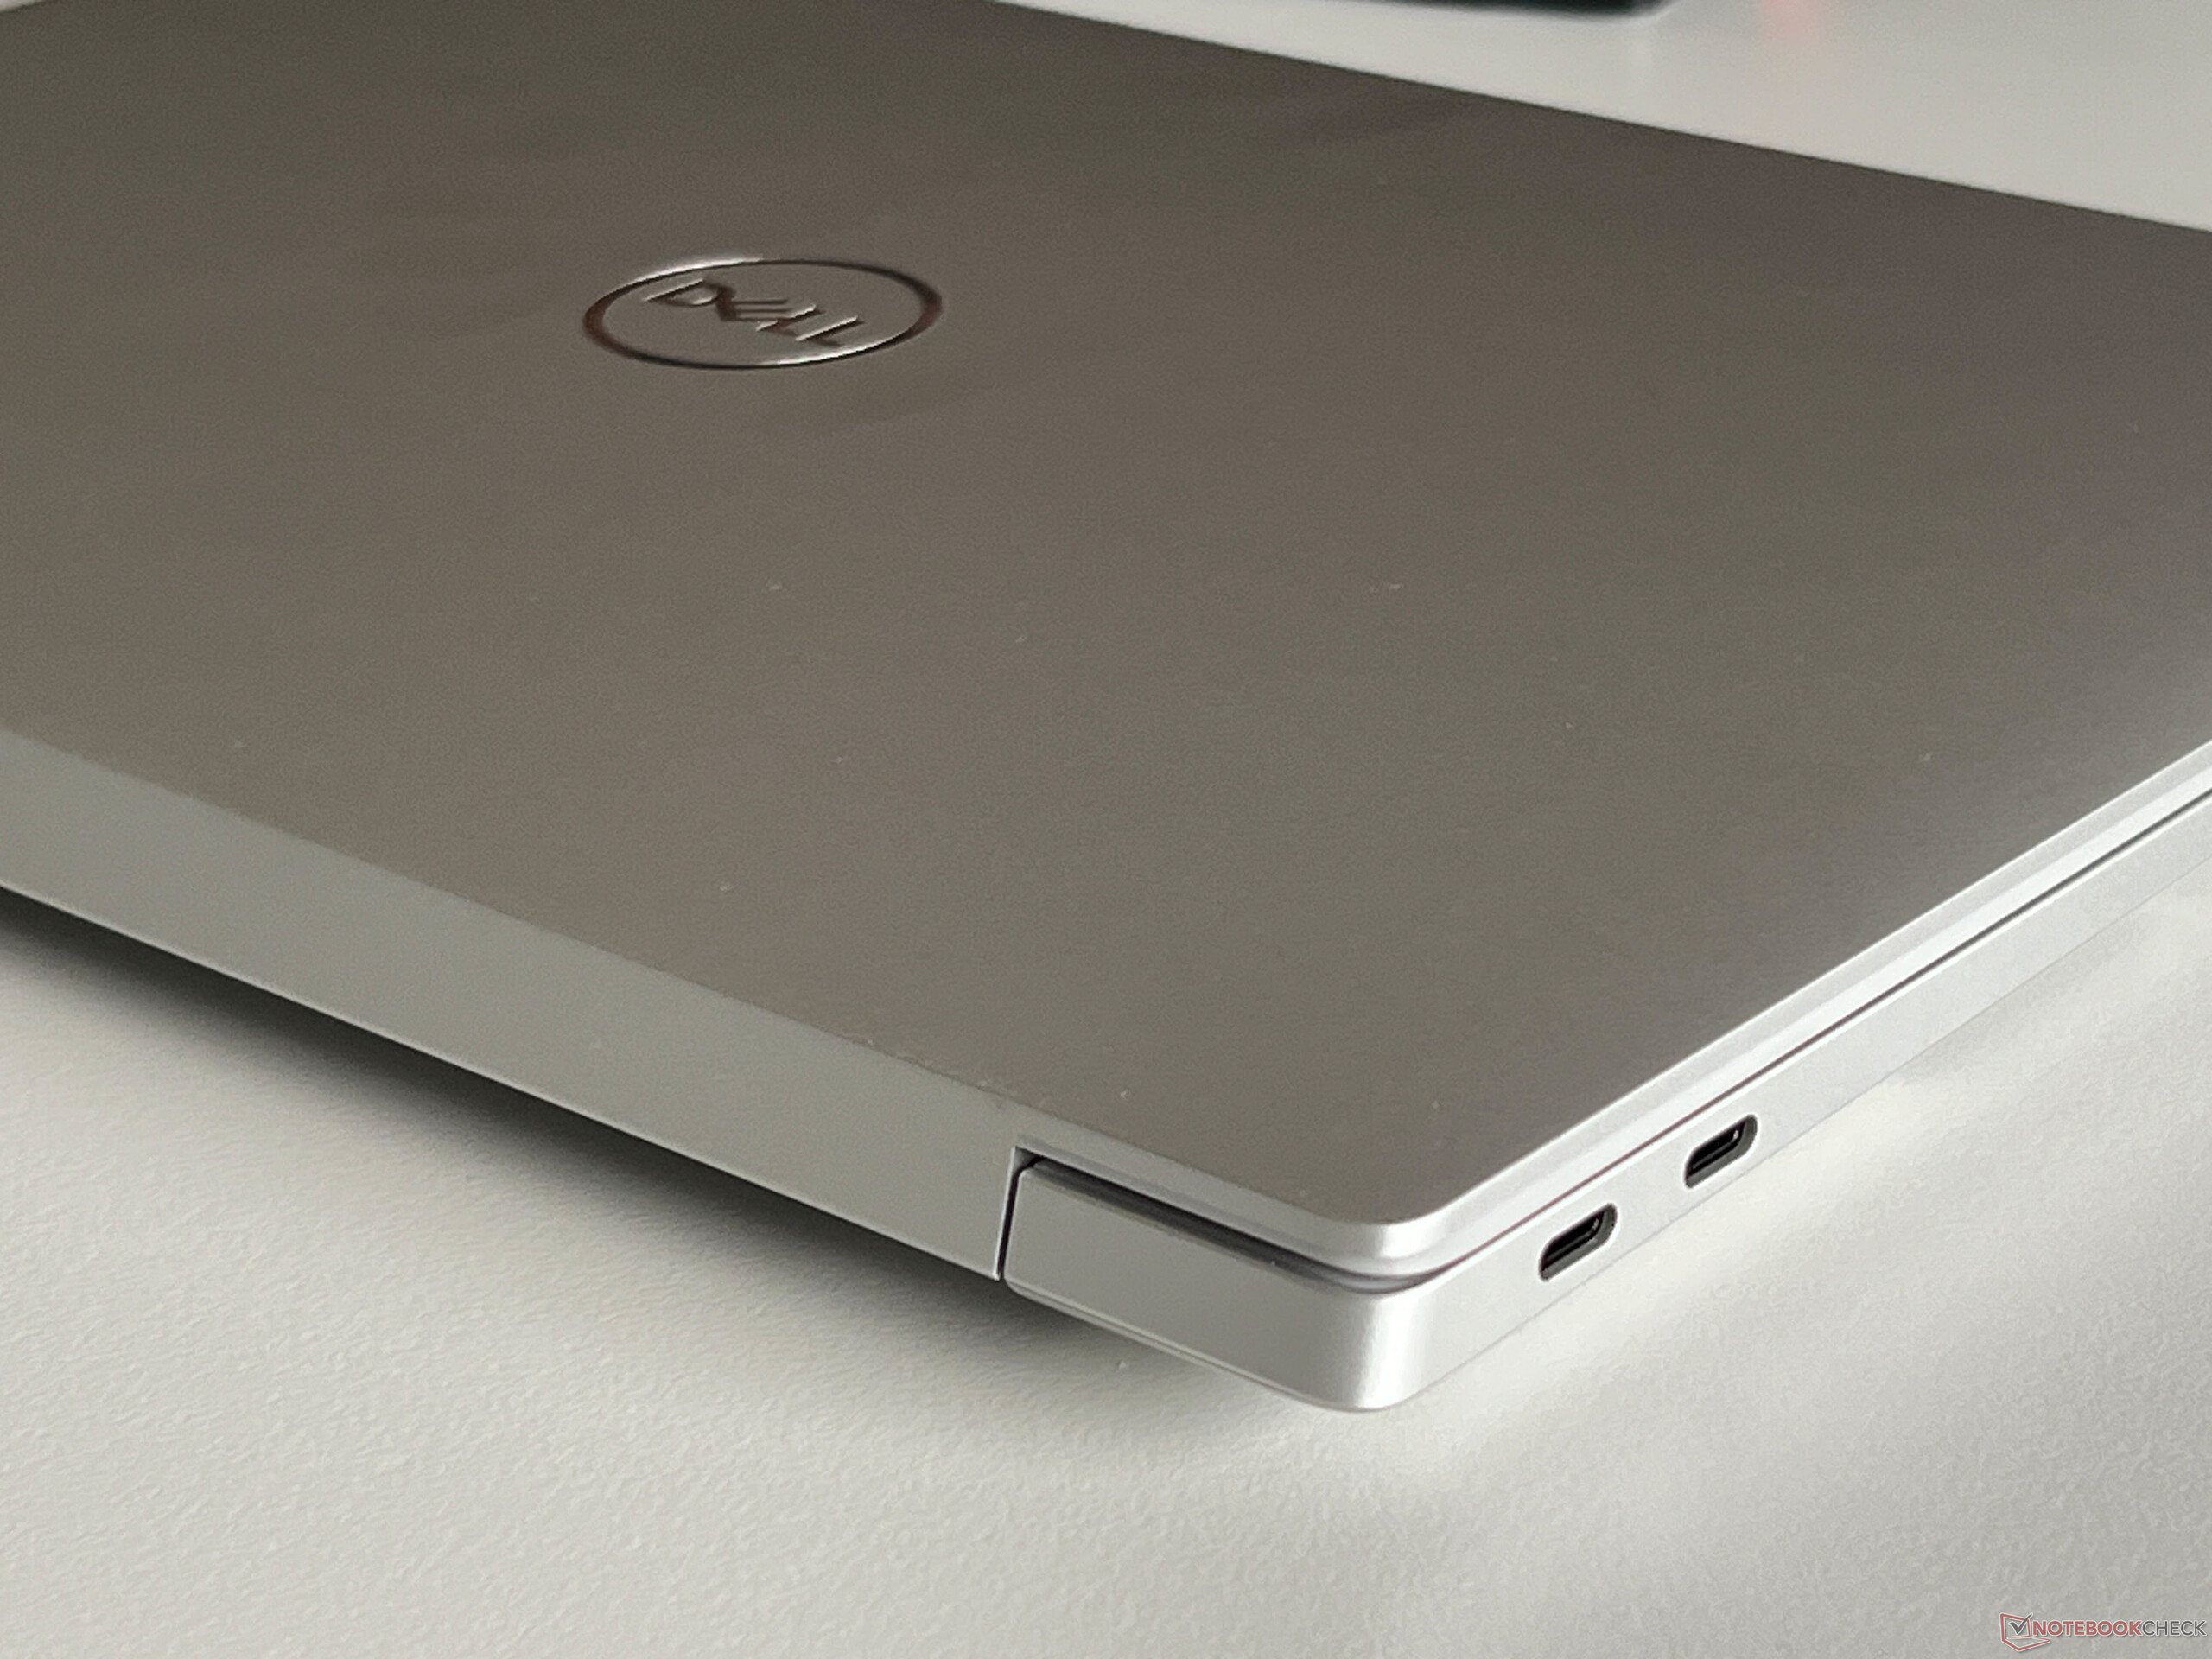
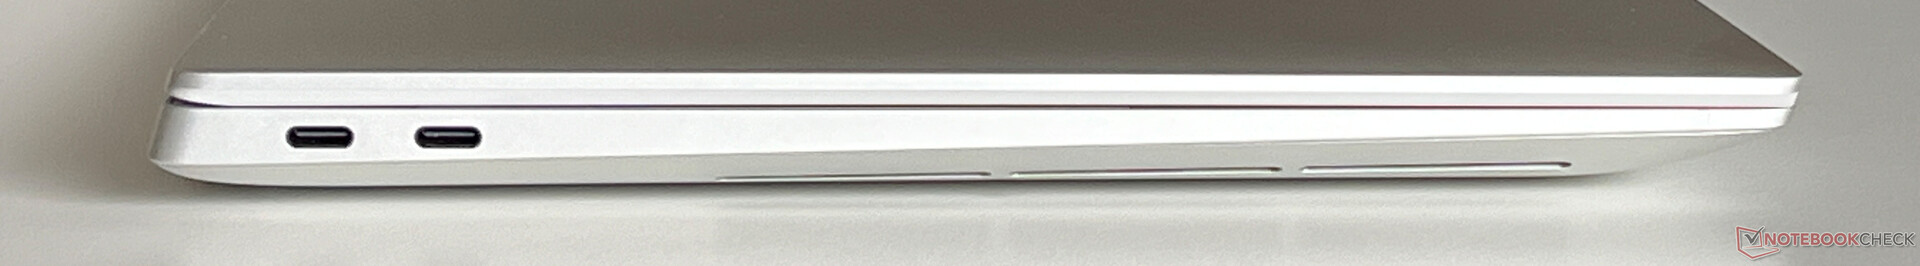
Łączność - 3x Thunderbolt 4 w XPS
Pomimo stosunkowo grubej jednostki bazowej, Dell opiera się wyłącznie na złączach USB-C, z których wszystkie obsługują Thunderbolt 4. Zakres dostawy obejmuje małą stację dokującą ze złączem USB-A, a także wyjście HDMI. Ogólnie rzecz biorąc, nowy XPS 14 9440 pozostaje w tyle za urządzeniami porównawczymi, a nawet MacBook ma wyjście HDMI bezpośrednio podłączone do urządzenia.
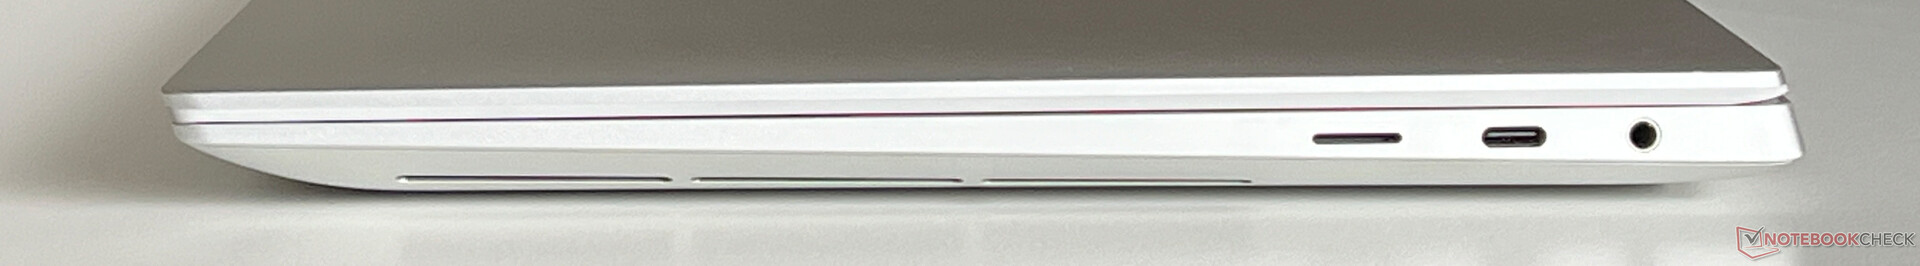
Czytnik kart SD
Po prawej stronie urządzenia znajduje się czytnik kart microSD (mechanizm piórkowy), który niemal w całości przyjmuje kompaktowe karty pamięci. W połączeniu z naszą referencyjną kartą (Angelbird AV Pro V60), jego transfery osiągnęły maksymalnie około 200 MB/s, a podczas kopiowania plików graficznych zmierzyliśmy dobre 144 MB/s.
| SD Card Reader | |
| average JPG Copy Test (av. of 3 runs) | |
| Microsoft Surface Laptop Studio 2 RTX 4060 (Angelbird AV Pro V60) | |
| Apple MacBook Pro 14 2023 M3 Max (Angelbird AV Pro V60) | |
| Asus ROG Zephyrus G14 2024 GA403U (Angelbird AV Pro V60) | |
| Dell XPS 14 2024 OLED (Angelbird AV Pro V60) | |
| Średnia w klasie Multimedia (23 - 531, n=43, ostatnie 2 lata) | |
| Asus Zenbook Pro 14 OLED UX6404VI (Angelbird AV Pro V60) | |
| Acer Swift X SFX14-71G (Angelbird AV Pro V60) | |
| Lenovo Yoga Pro 9-14IRP G8 (Angelbird AV Pro V60) | |
| maximum AS SSD Seq Read Test (1GB) | |
| Asus Zenbook Pro 14 OLED UX6404VI (Angelbird AV Pro V60) | |
| Apple MacBook Pro 14 2023 M3 Max (Angelbird AV Pro V60) | |
| Dell XPS 14 2024 OLED (Angelbird AV Pro V60) | |
| Asus ROG Zephyrus G14 2024 GA403U (Angelbird AV Pro V60) | |
| Microsoft Surface Laptop Studio 2 RTX 4060 (Angelbird AV Pro V60) | |
| Średnia w klasie Multimedia (27.9 - 1455, n=42, ostatnie 2 lata) | |
| Acer Swift X SFX14-71G (Angelbird AV Pro V60) | |
| Lenovo Yoga Pro 9-14IRP G8 (Angelbird AV Pro V60) | |
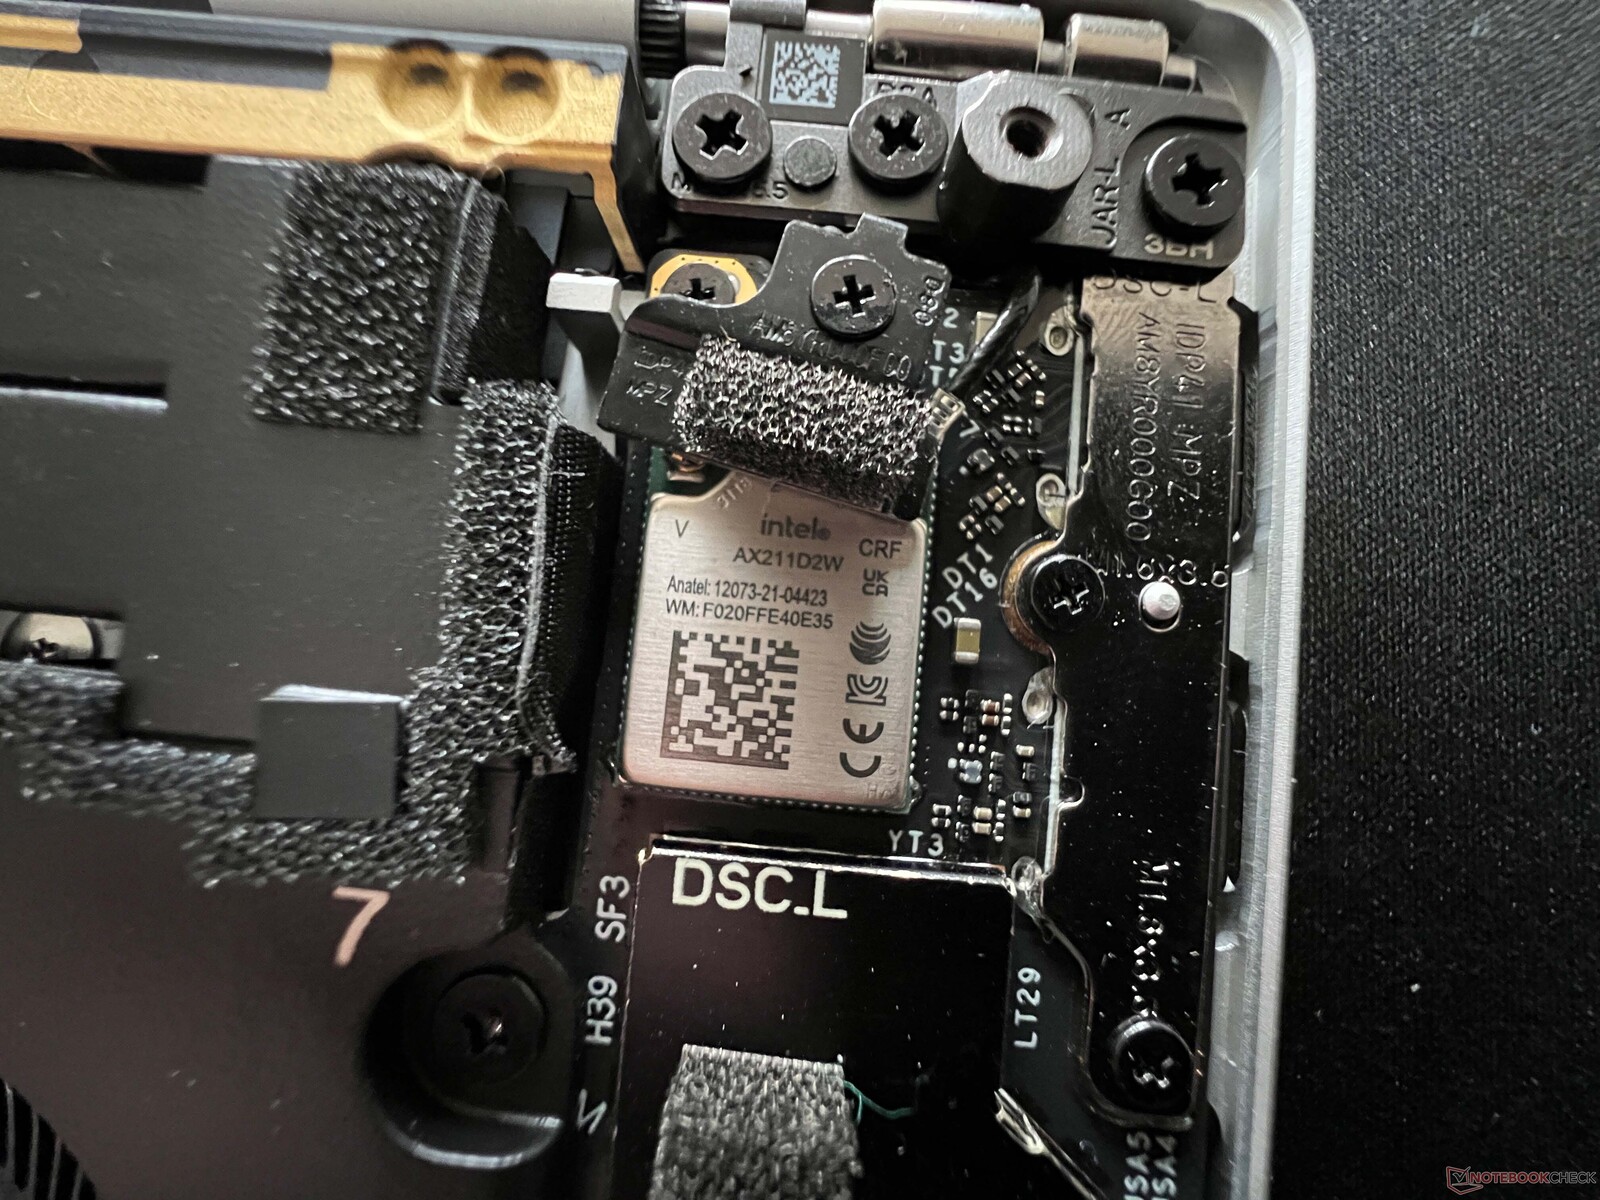
Komunikacja
Moduł WLAN od Intela (AX211) obsługuje standard Wi-Fi 6E w częstotliwościach 6 GHz i podczas naszego testu WLAN z wykorzystaniem naszego referencyjnego routera od Asusa, jego prędkości transferu były bardzo wysokie i stabilne. Nie odnotowaliśmy również żadnych problemów podczas korzystania z innych routerów podczas tego testu. Z drugiej strony, XPS 14 9440 nie obsługuje Wi-Fi 7.
| Networking | |
| Dell XPS 14 2024 OLED | |
| iperf3 transmit AXE11000 | |
| iperf3 receive AXE11000 | |
| Apple MacBook Pro 14 2023 M3 Max | |
| iperf3 transmit AXE11000 | |
| iperf3 receive AXE11000 | |
| Microsoft Surface Laptop Studio 2 RTX 4060 | |
| iperf3 transmit AXE11000 | |
| iperf3 receive AXE11000 | |
| Lenovo Yoga Pro 9-14IRP G8 | |
| iperf3 transmit AXE11000 | |
| iperf3 receive AXE11000 | |
| Acer Swift X SFX14-71G | |
| iperf3 transmit AXE11000 | |
| iperf3 receive AXE11000 | |
| Asus Zenbook Pro 14 OLED UX6404VI | |
| iperf3 transmit AXE11000 | |
| iperf3 receive AXE11000 | |
| Asus ROG Zephyrus G14 2024 GA403U | |
| iperf3 transmit AXE11000 | |
| iperf3 receive AXE11000 | |
| Razer Blade 14 RZ09-0508 | |
| iperf3 transmit AXE11000 | |
| iperf3 receive AXE11000 | |
| iperf3 transmit AXE11000 6GHz | |
| iperf3 receive AXE11000 6GHz | |
Kamera internetowa
Dell zainstalował kamerę internetową 1080p w górnej części ramki wyświetlacza, a także kamerę na podczerwień do rozpoznawania twarzy za pomocą Windows Hello. Jakość kamery internetowej jest dobra w dobrych warunkach oświetleniowych. Co więcej, kamera obsługuje efekty studyjne (miękkie ogniskowanie tła, śledzenie oczu, automatyczne kadrowanie) jako część systemu operacyjnego, co oznacza, że działa niezależnie od używanej aplikacji.


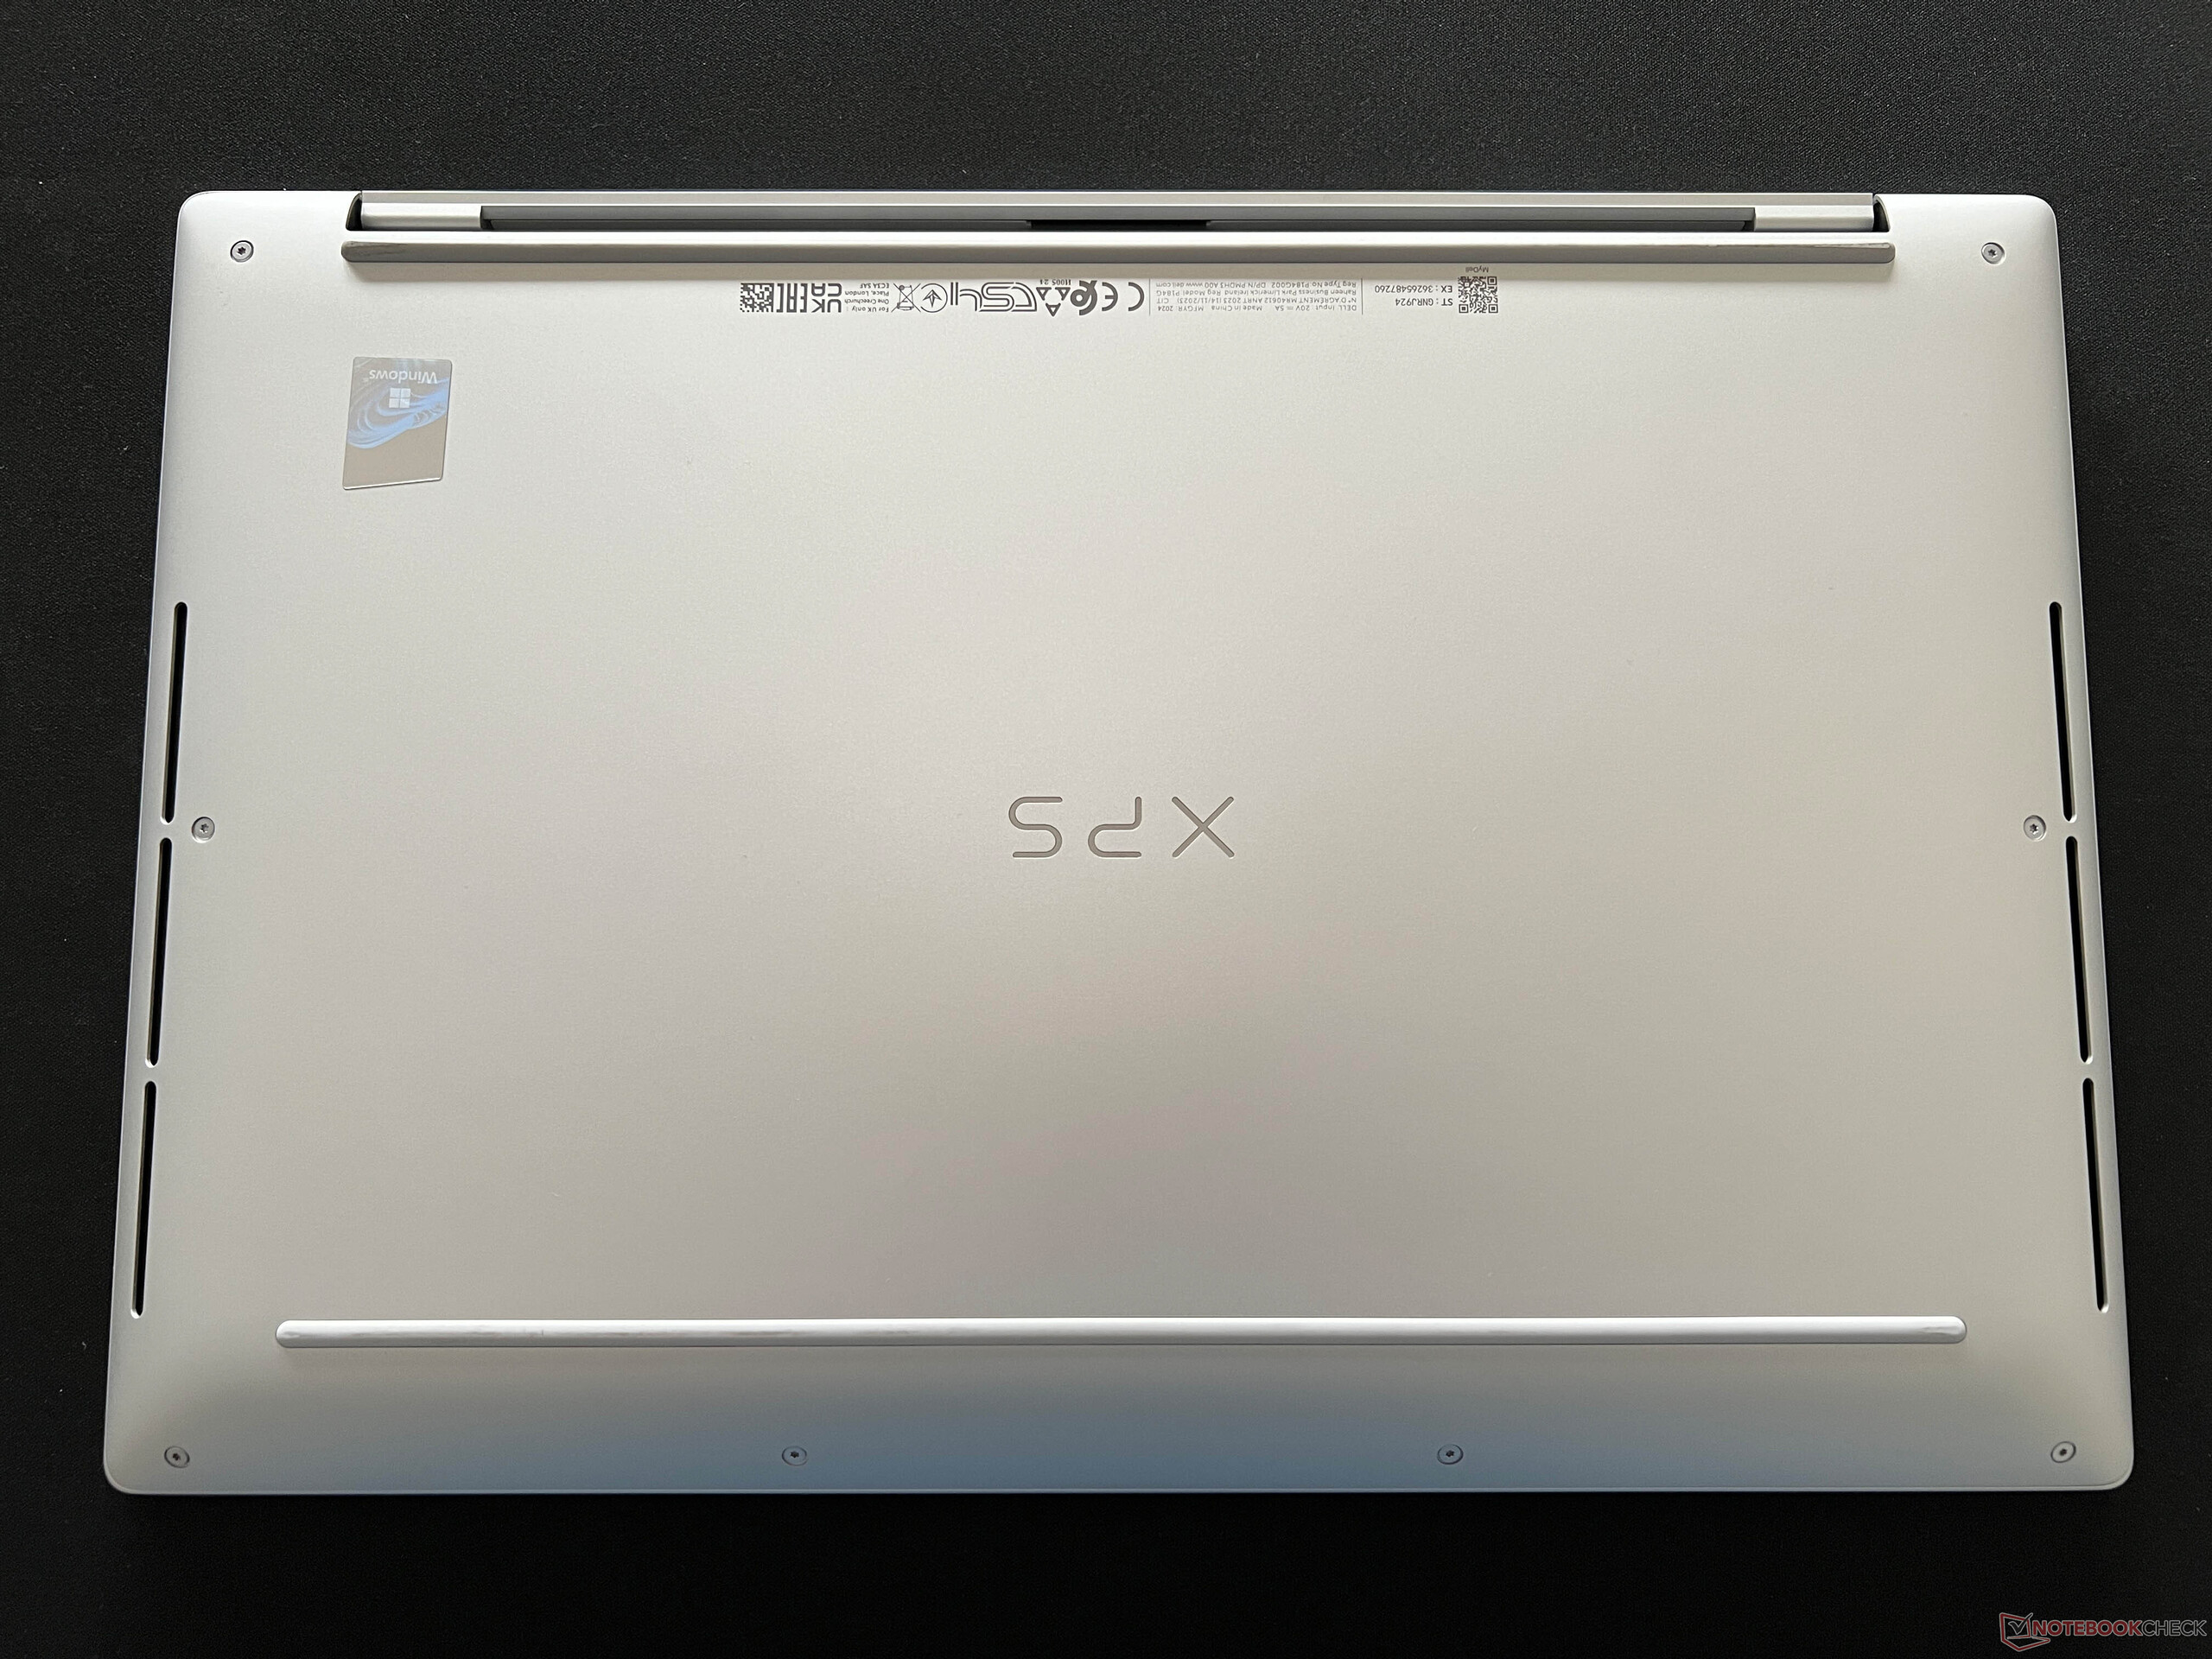
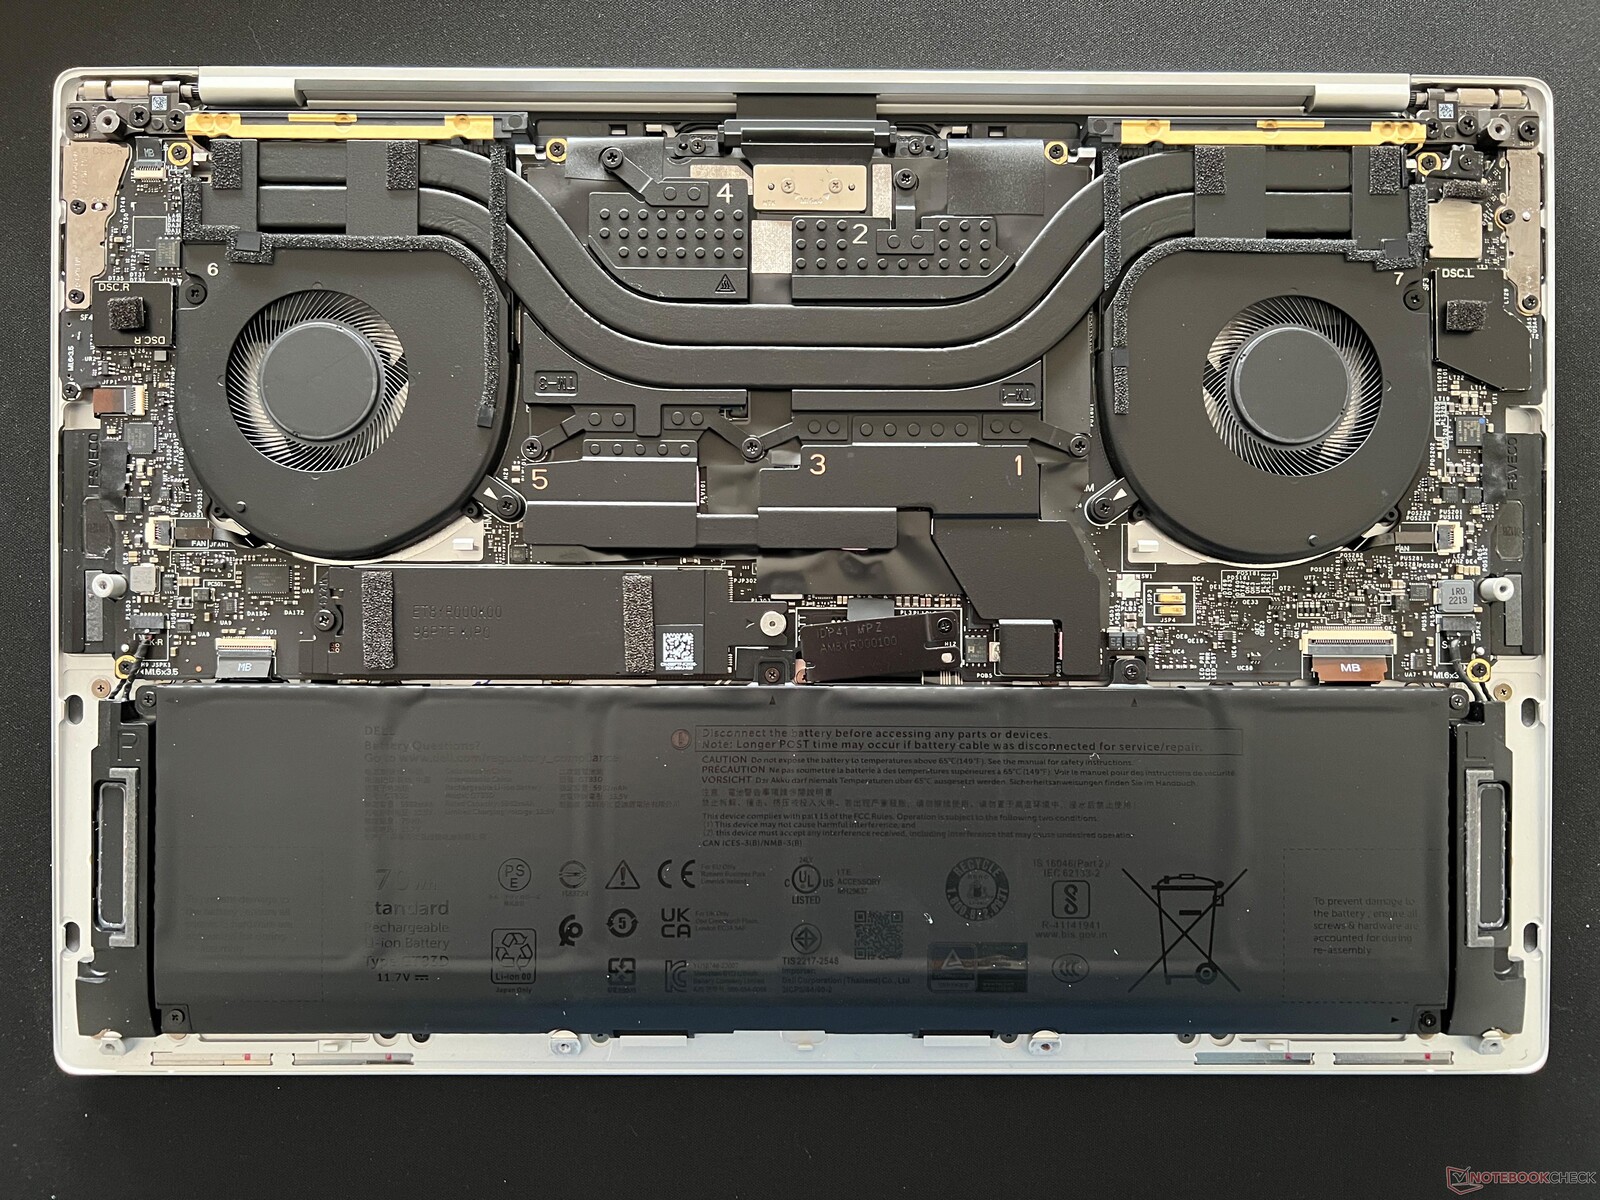
Konserwacja
Dolna pokrywa jest mocowana za pomocą ośmiu śrub Torx (T5) i można ją łatwo zdjąć. Jednak większość komponentów, w tym moduły pamięci RAM i WLAN, jest przylutowana. Mimo to wentylatory można wyczyścić, a dysk SSD M.2-2280 można wymienić. Bateria jest przykręcana i w razie potrzeby można ją również wymienić.
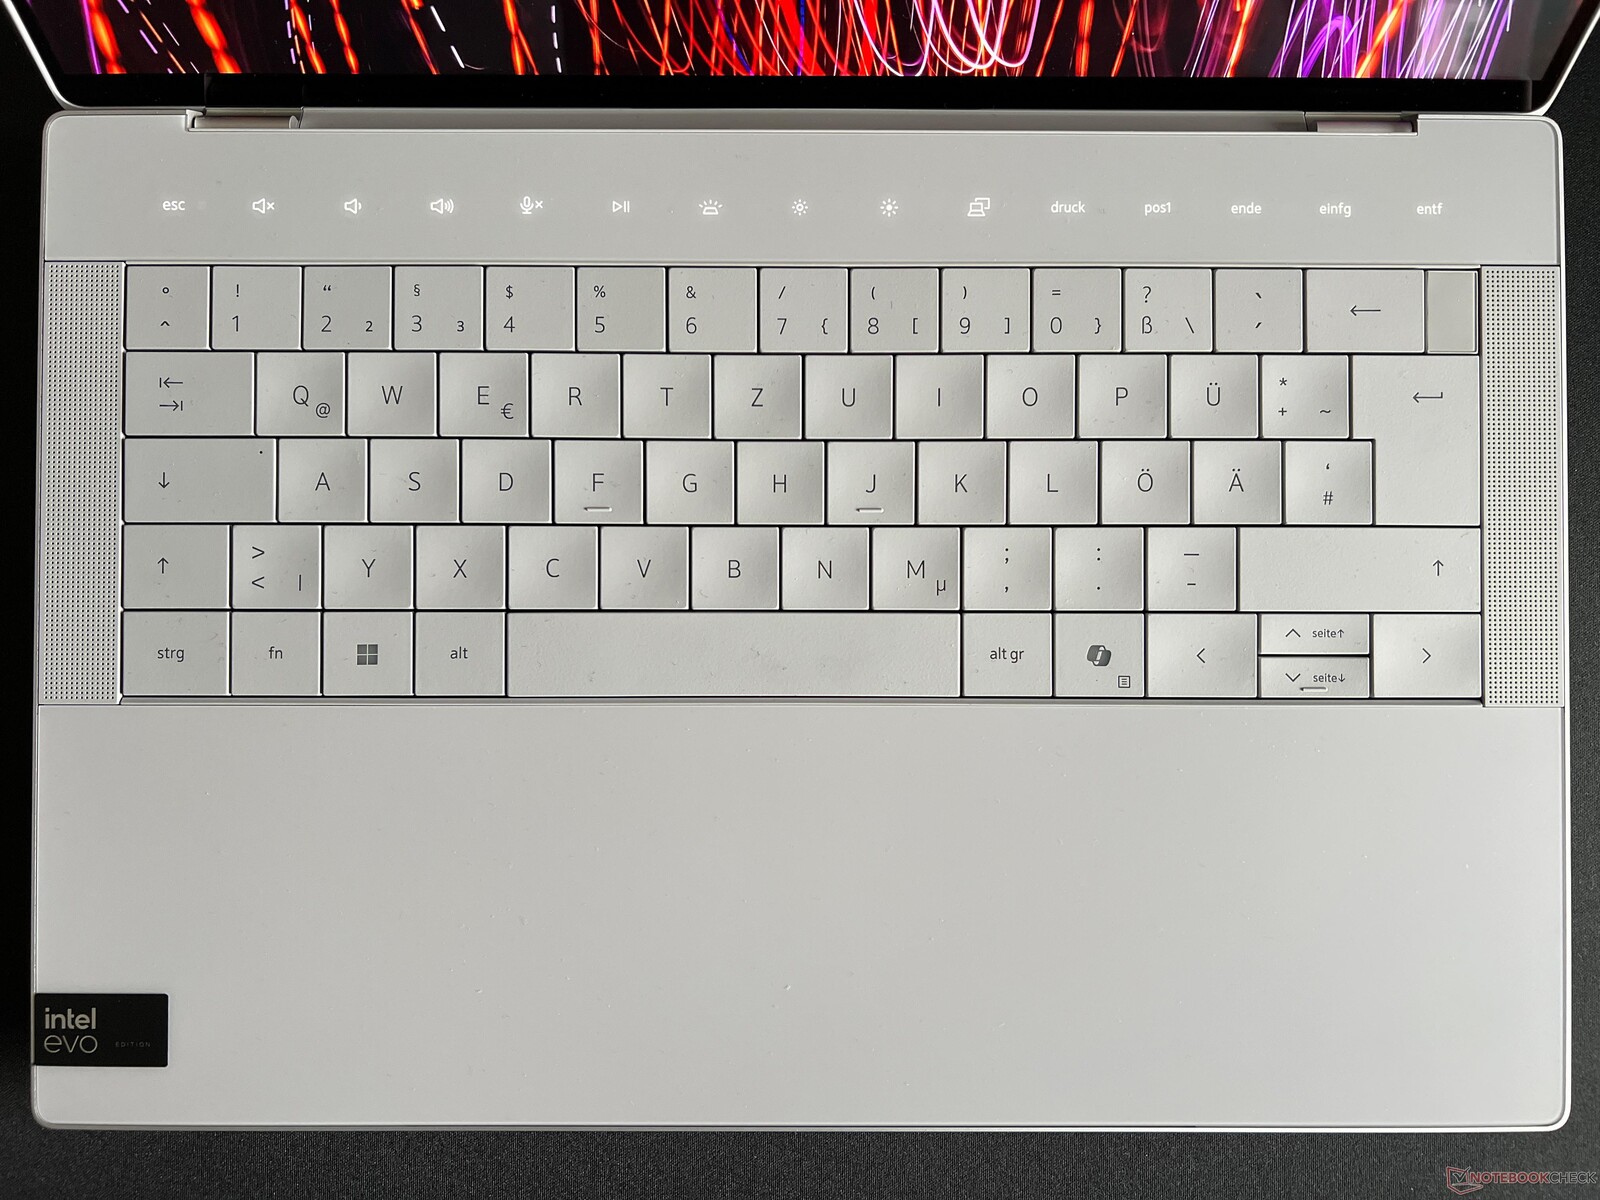
Urządzenia wejściowe - Klawiatura wymaga przyzwyczajenia i irytujące klawisze funkcyjne
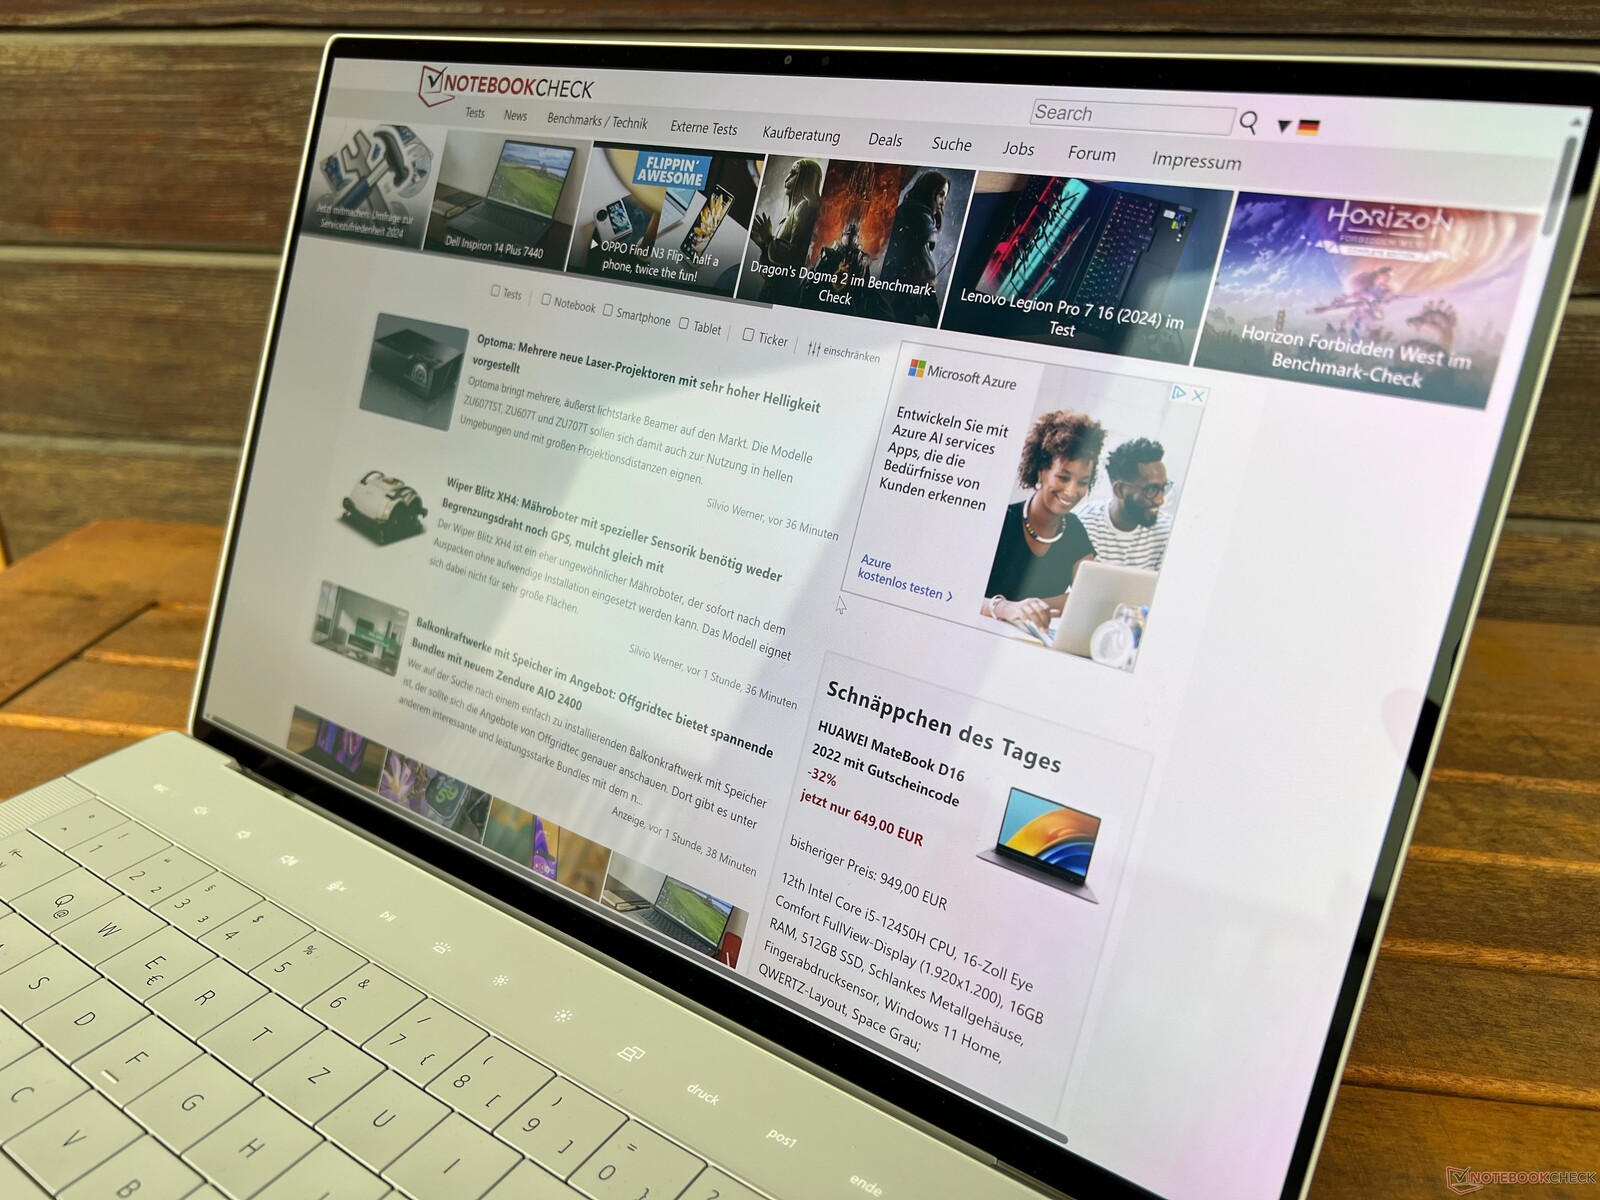
Dell zdecydował się wykorzystać konstrukcję klawiatury XPS 13 Plus, instalując również klawiaturę, w której klawisze nie mają żadnych przerw między nimi w nowym XPS 14. Same klawisze są lekko wklęsłe i pisanie na nich jest wygodne, ponieważ naciśnięcia klawiszy są precyzyjne. Istnieje jednak kilka innych problemów, ponieważ często trafiamy w niewłaściwy klawisz, a klawiatura zdecydowanie wymaga przyzwyczajenia. Malutkie pionowe klawisze strzałek, które są trudne do trafienia, jeśli masz nieco większe palce, były również irytujące, a hałas wydawany przez większe klawisze (spacja, Enter) jest znacznie głośniejszy. Przycisk zasilania (który zawiera skaner linii papilarnych) znajduje się w prawym górnym rogu, gdzie można by się spodziewać klawisza Delete, co prowadzi nas do kolejnego problemu.
Klawisze funkcyjne są zainstalowane jako pasek dotykowy i są zawsze podświetlone, co może być irytujące na przykład podczas odtwarzania filmów. Normalne klawisze F można wyświetlić za pomocą klawisza FN, który, szczerze mówiąc, również działa dobrze i nie mieliśmy problemów z nierozpoznanymi wejściami podczas testu. Jednak nie można nawet używać klawisza Esc na ślepo i zawsze trzeba patrzeć na klawisze.
Mieliśmy problem z podświetleniem klawiatury, ponieważ podświetlenie paska dotykowego wyłącza się, gdy jest nieaktywne, ale nie podczas odtwarzania filmów przez wiele godzin bez żadnego wprowadzania danych. Jasne podświetlenie klawiatury jest również stale regulowane przez czujnik i nie można wpływać na jego intensywność - przynajmniej nie znaleźliśmy takiej opcji. Czujnik nie jest również zainteresowany tym, czy oświetlenie zostało wyłączone ręcznie krótko wcześniej; gdy tylko warunki oświetleniowe nieznacznie się zmienią, oświetlenie zostanie ponownie włączone.

Touchpad jest w pełni zintegrowany z podpórką pod nadgarstki i nie można powiedzieć, gdzie się zaczyna, a gdzie kończy. Touchpad wykorzystuje całą wysokość podpórki pod nadgarstki, a jego szerokość rozciąga się od środka lewego klawisza Alt do tuż nad nowym klawiszem Co-Pilot. Ogólnie rzecz biorąc, touchpad działał dobrze i okazał się przyjemny i gładki, z równomiernym haptycznym sprzężeniem zwrotnym, ale czasami napotykaliśmy problemy, jeśli opuściliśmy obszar lub rozpoczęliśmy ruchy nieco poza faktycznym obszarem touchpada. W przeciwieństwie do paska dotykowego, jest to jednak tylko drobny punkt krytyki. Opcjonalny panel OLED jest również wyposażony w pojemnościowy ekran dotykowy, który działa doskonale.
Wyświetlacz - dotykowy OLED 3,2K
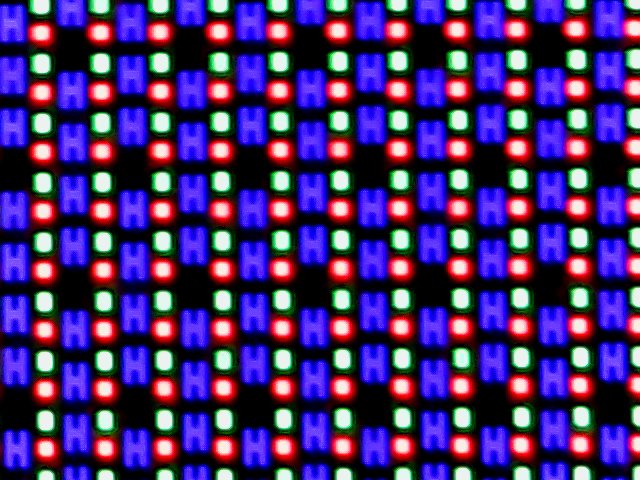
Nowy XPS 14 9440 jest standardowo wyposażony w 14,5-calowy panel Full HD (bez ekranu dotykowego); za dopłatą 300 USD można zamiast niego wybrać ekran dotykowy OLED o wysokiej rozdzielczości, który ma rozdzielczość 3200 x 2000 pikseli. Subiektywnie, jakość obrazu panelu refleksyjnego jest ogólnie bardzo dobra, ponieważ treści są wyświetlane niezwykle ostro, a kolory wydają się żywe - ale można zauważyć lekki efekt rastrowy podczas wyświetlania w szczególności jasnych treści. Nie zauważyliśmy tego samego problemu na obecnej generacji OLED od Samsunga (np. Galaxy Book4 Pro 14, recenzja wkrótce), a OLED Della pozostaje nieco w tyle pod względem jasności.
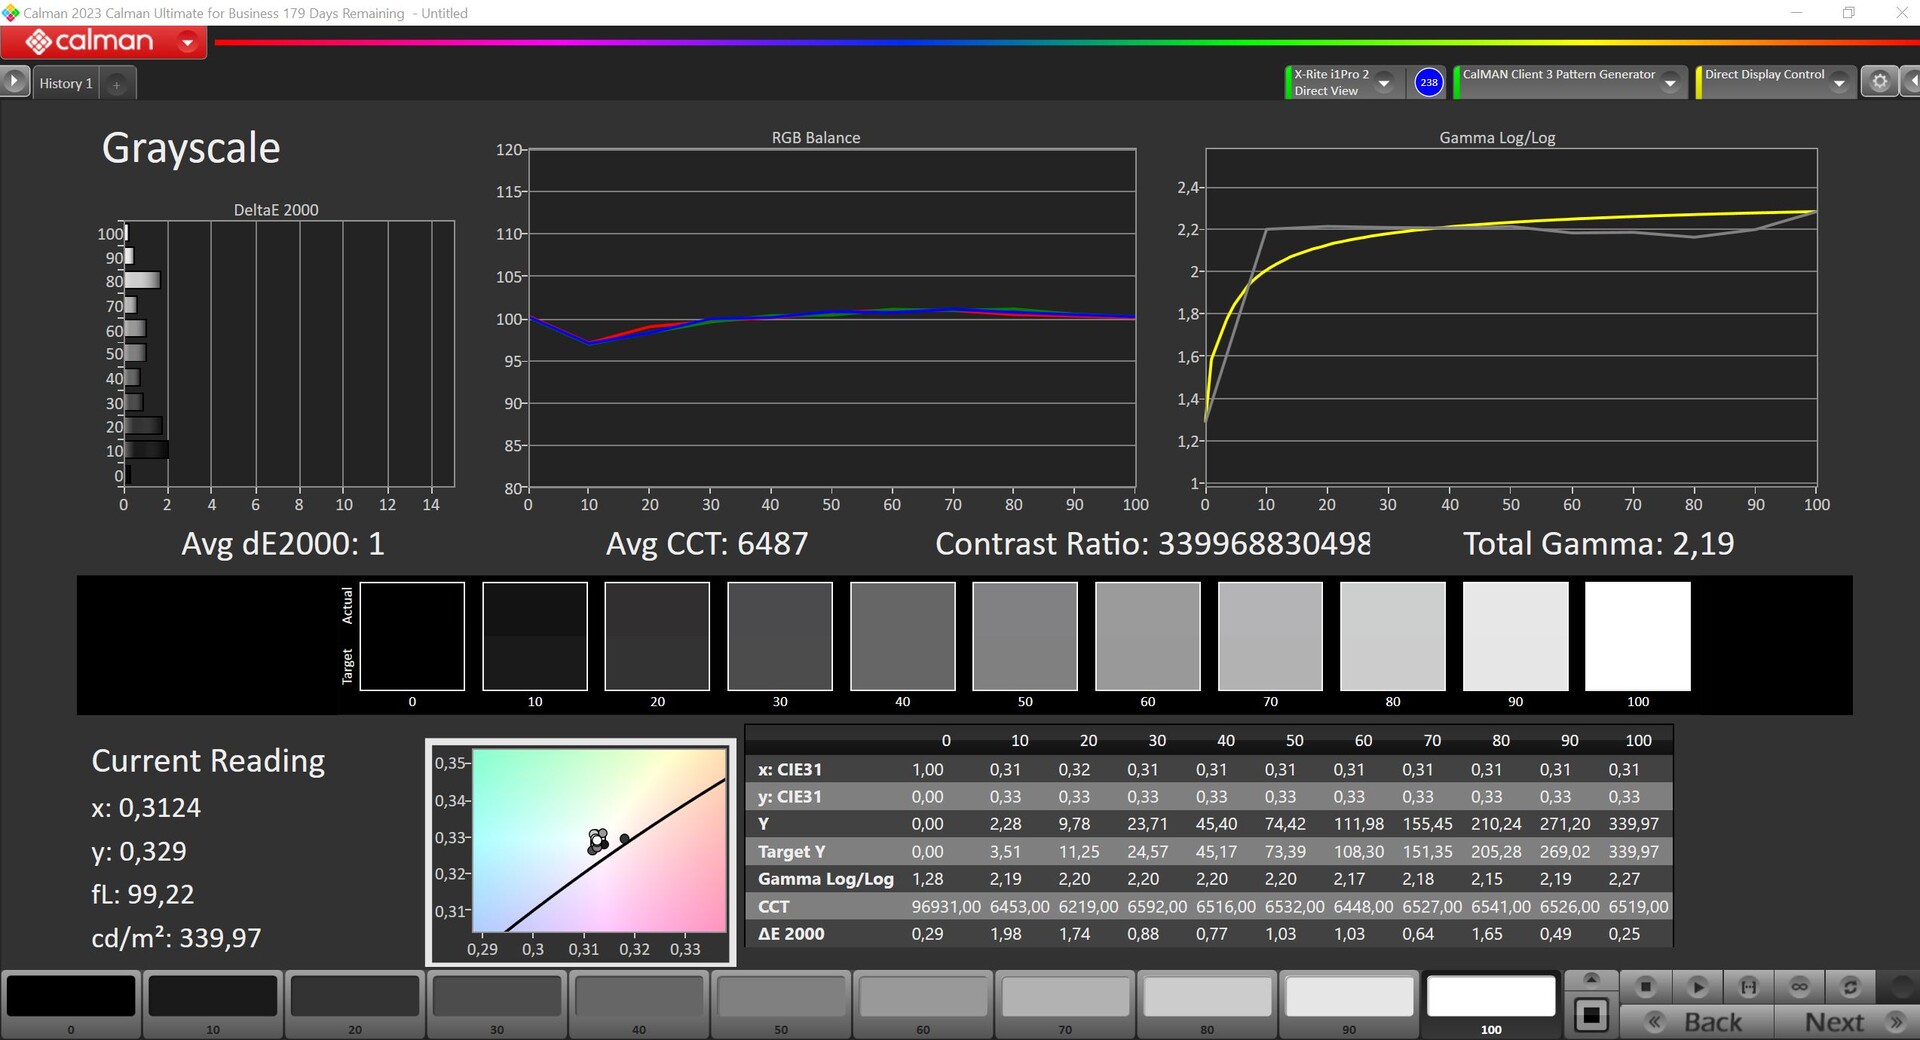
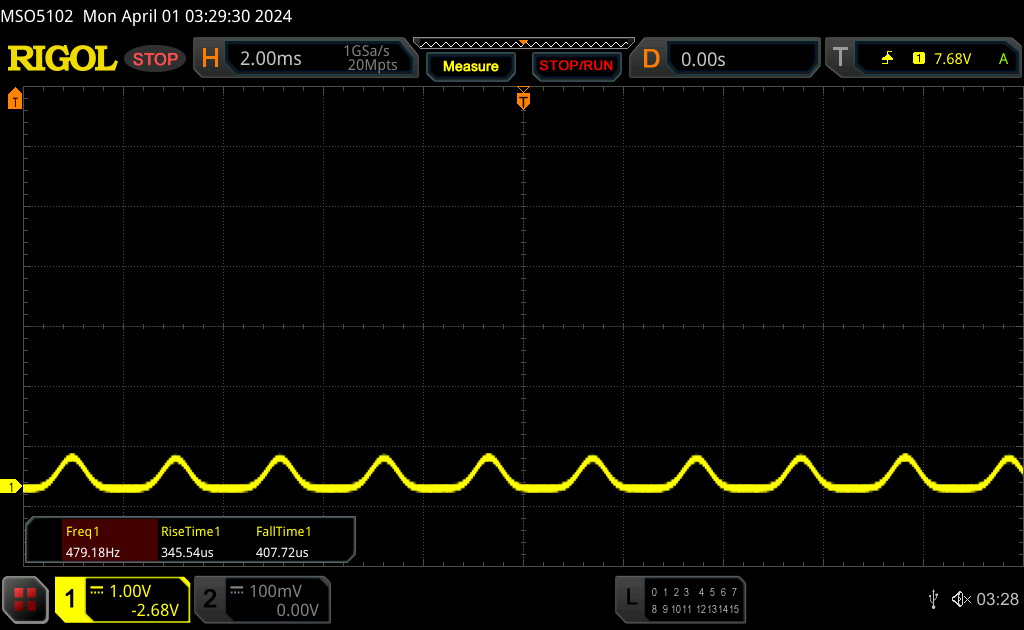
W trybie SDR zmierzyliśmy średnio nieco ponad 350 cd/m², co czyni go podobnym do starego Zenbooka Pro - obecne OLED-y Samsunga o nieco niższej rozdzielczości 2,8K i częstotliwości odświeżania 120 Hz (np. ROG Zephyrus G14 lub IdeaPad Pro 5), z drugiej strony, zarządzają ponad 400 cd/m². Jego wartość czerni wynosi 0, co prowadzi do niezwykle wysokiego współczynnika kontrastu i, w przeciwieństwie do paneli IPS, naprawdę ciemnej czerni. Co więcej, ekran OLED może pochwalić się kilkoma wyraźnymi zaletami pod względem czasu reakcji, ale z kolei wykorzystuje PWM z częstotliwością 480 Hz na wszystkich poziomach jasności.
W trybie HDR jego maksymalna jasność przy wyświetlaniu małego fragmentu obrazu wyniosła 625 cd/m², a przy wyświetlaniu niemal całkowicie białego ekranu osiągnęła ~580 cd/m². Jak na ekran OLED są to dobre wartości, jednak jego konkurenci z Mini-LED mogą zaoferować jeszcze więcej w tym aspekcie, zwłaszcza MacBook Pro 14 z jasnością ponad 1500 cd/m². Co więcej, macOS nadal ma ogromną przewagę, jeśli chodzi o obsługę treści HDR.
| |||||||||||||||||||||||||
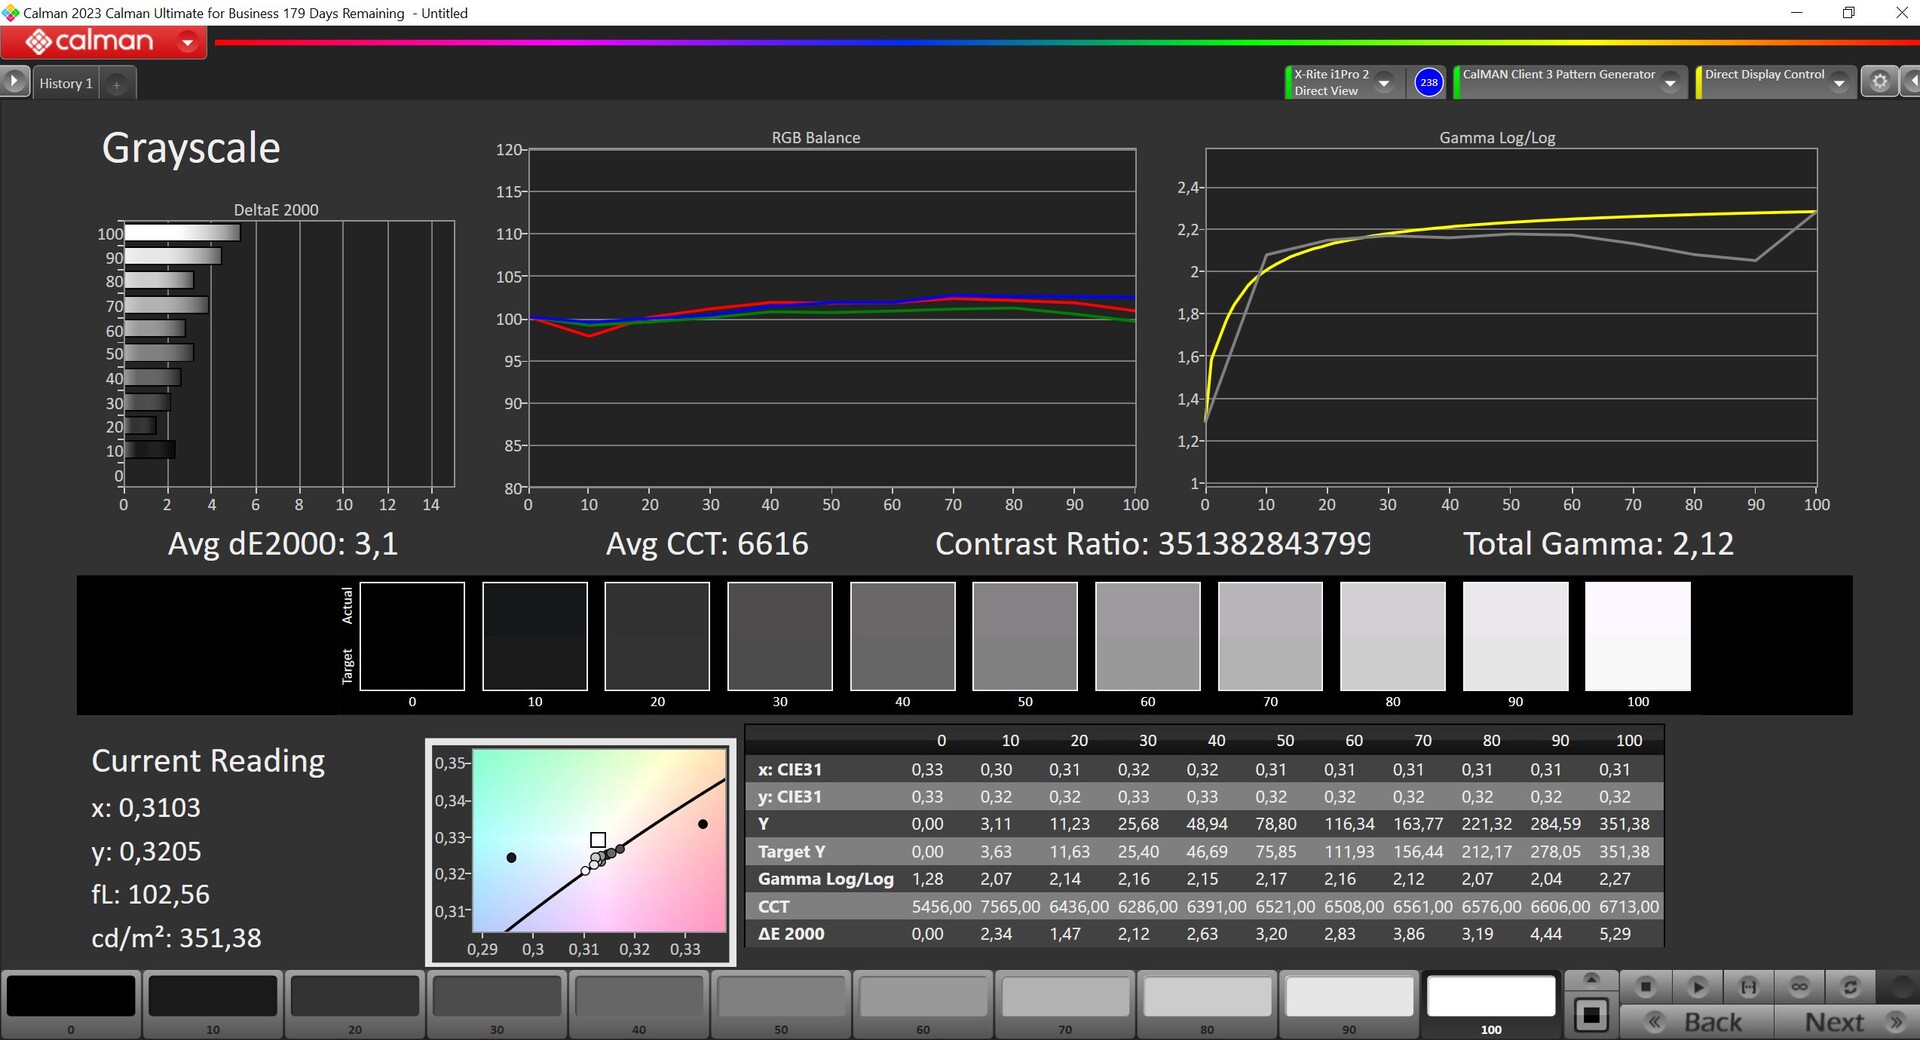
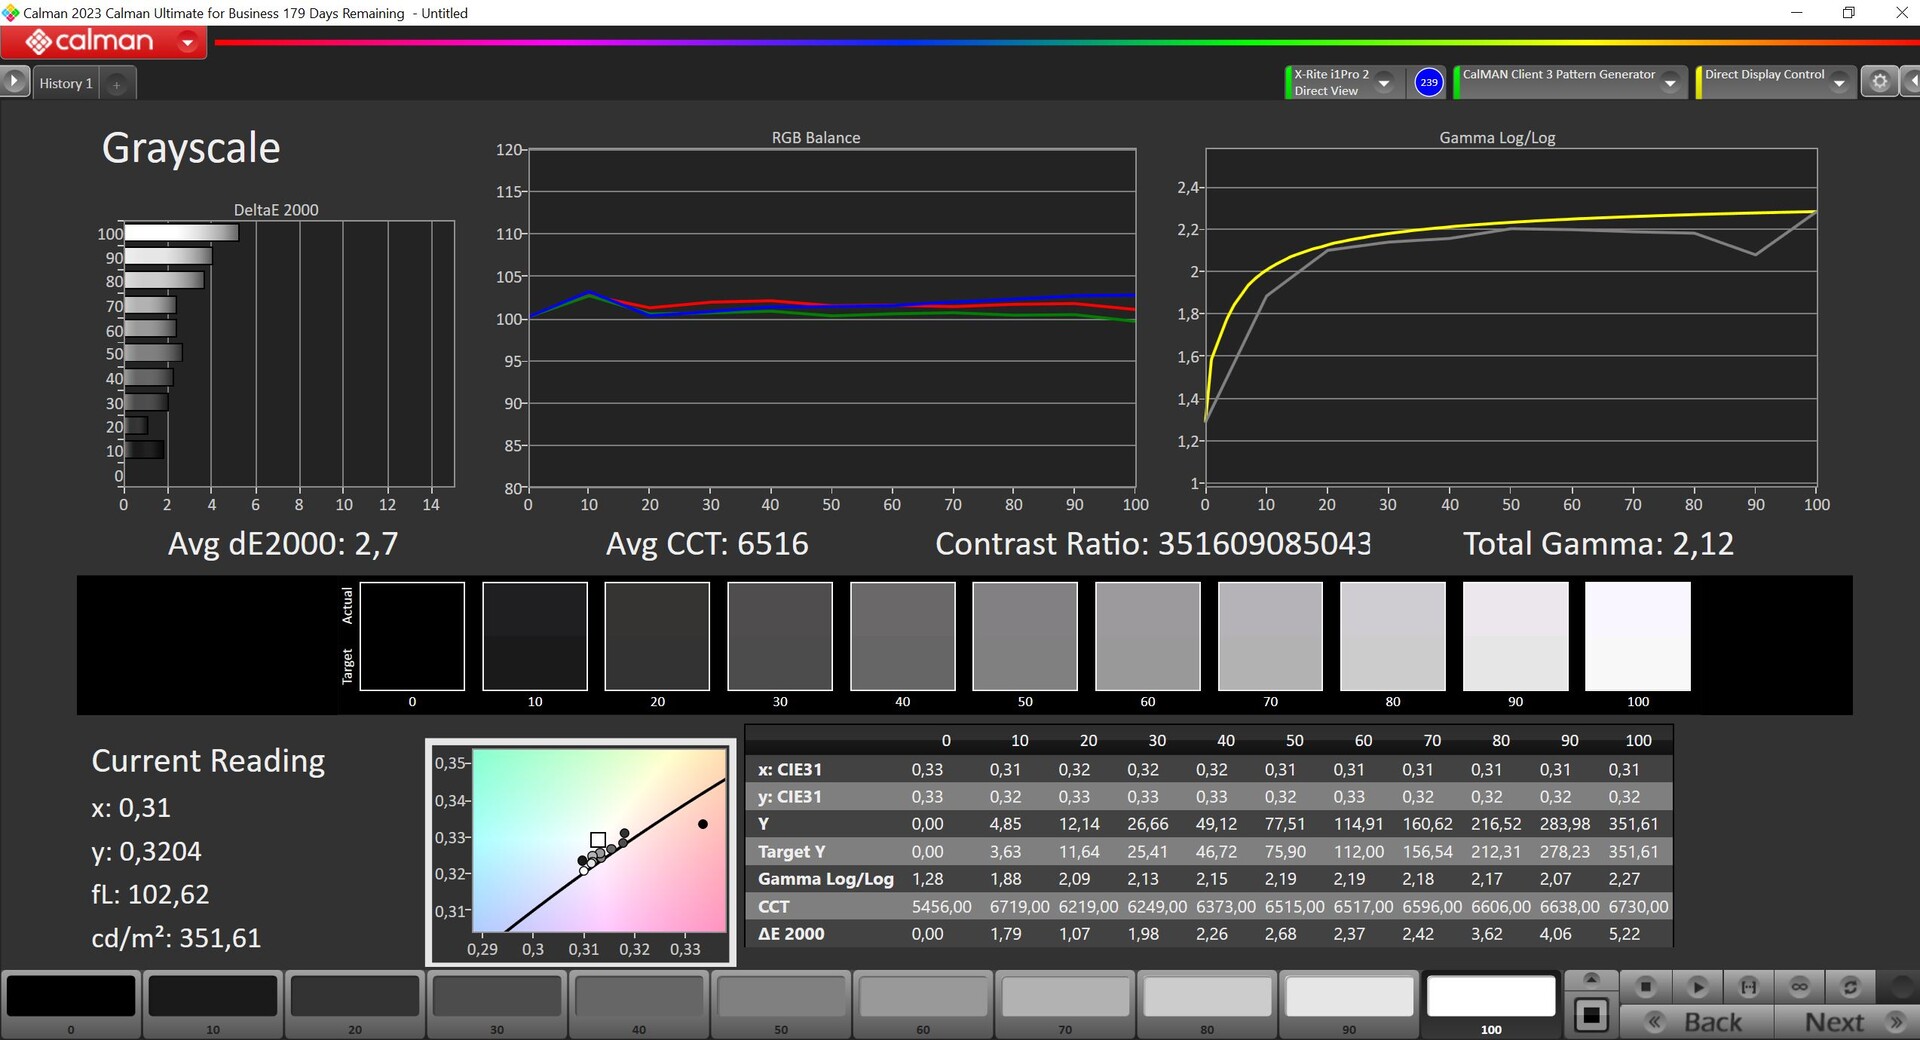
rozświetlenie: 97 %
kontrast: ∞:1 (czerń: 0 cd/m²)
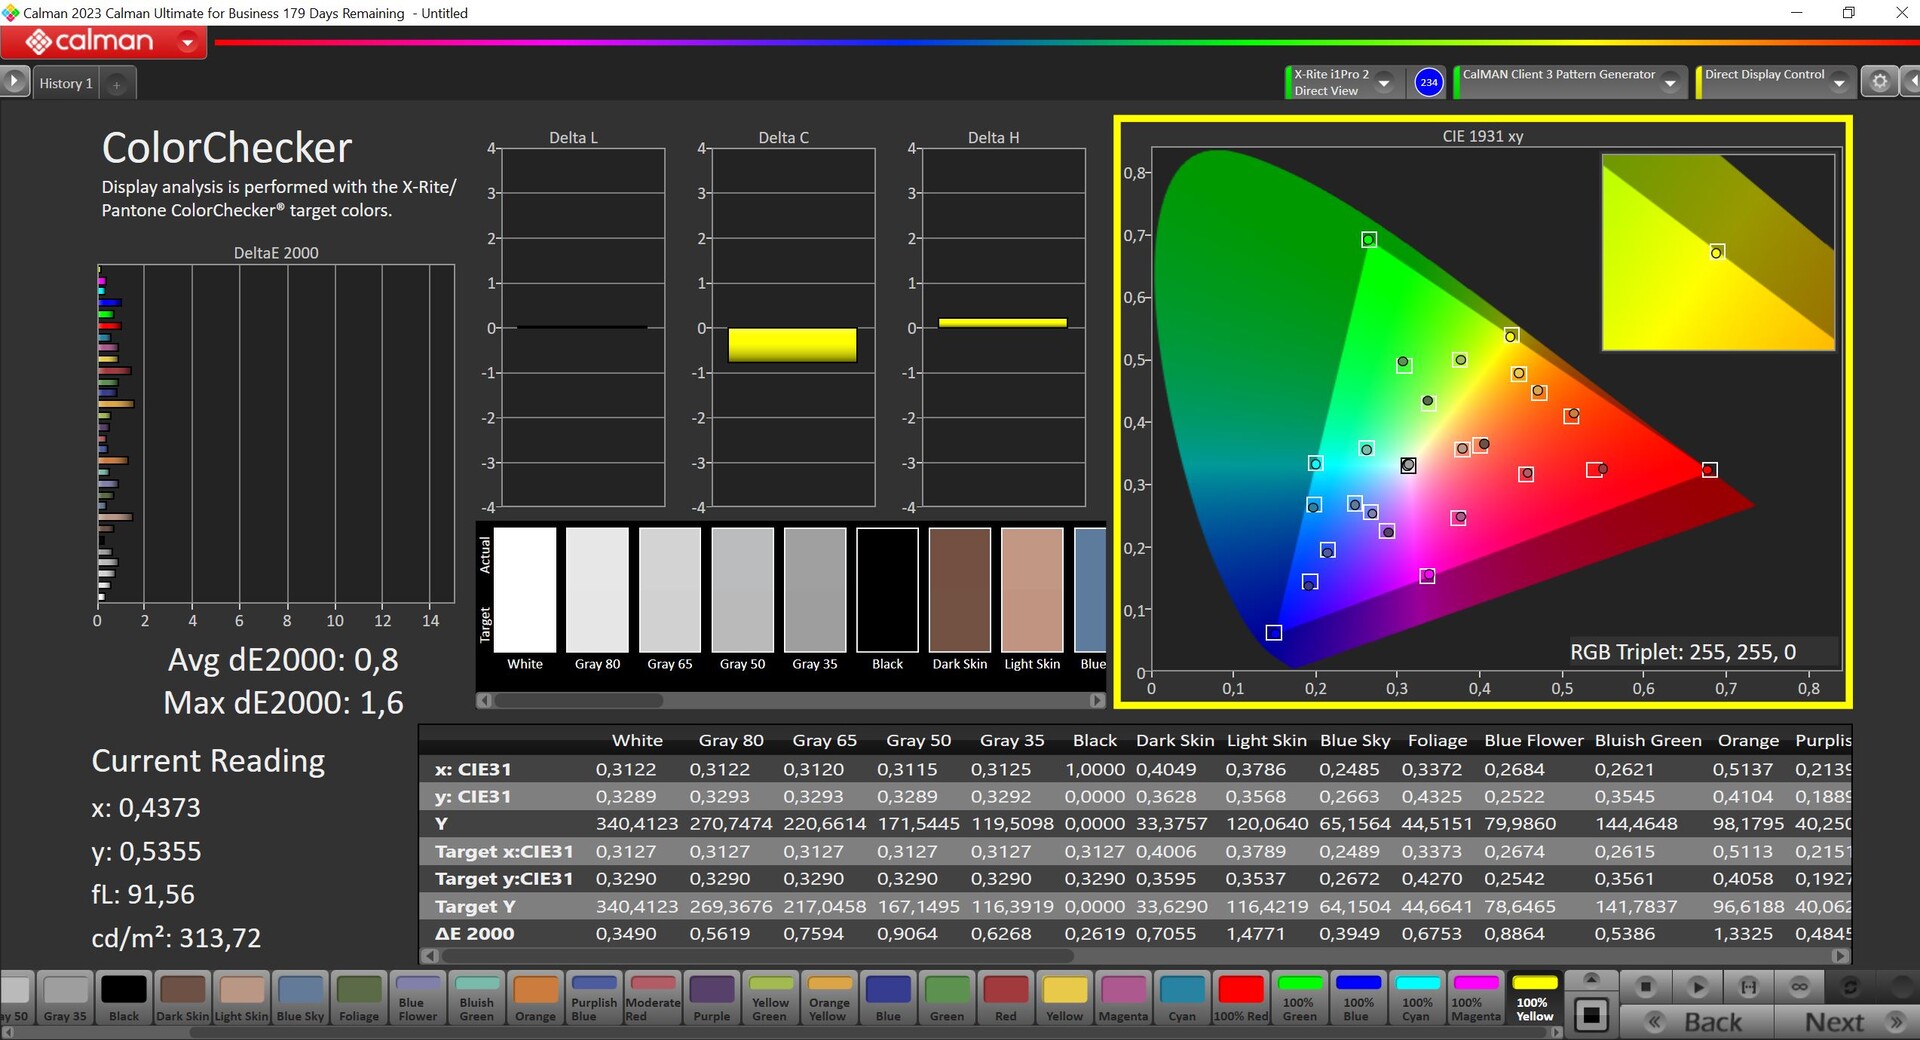
ΔE ColorChecker Calman: 1.7 | ∀{0.5-29.43 Ø4.73}
calibrated: 0.8
ΔE Greyscale Calman: 3.1 | ∀{0.09-98 Ø4.97}
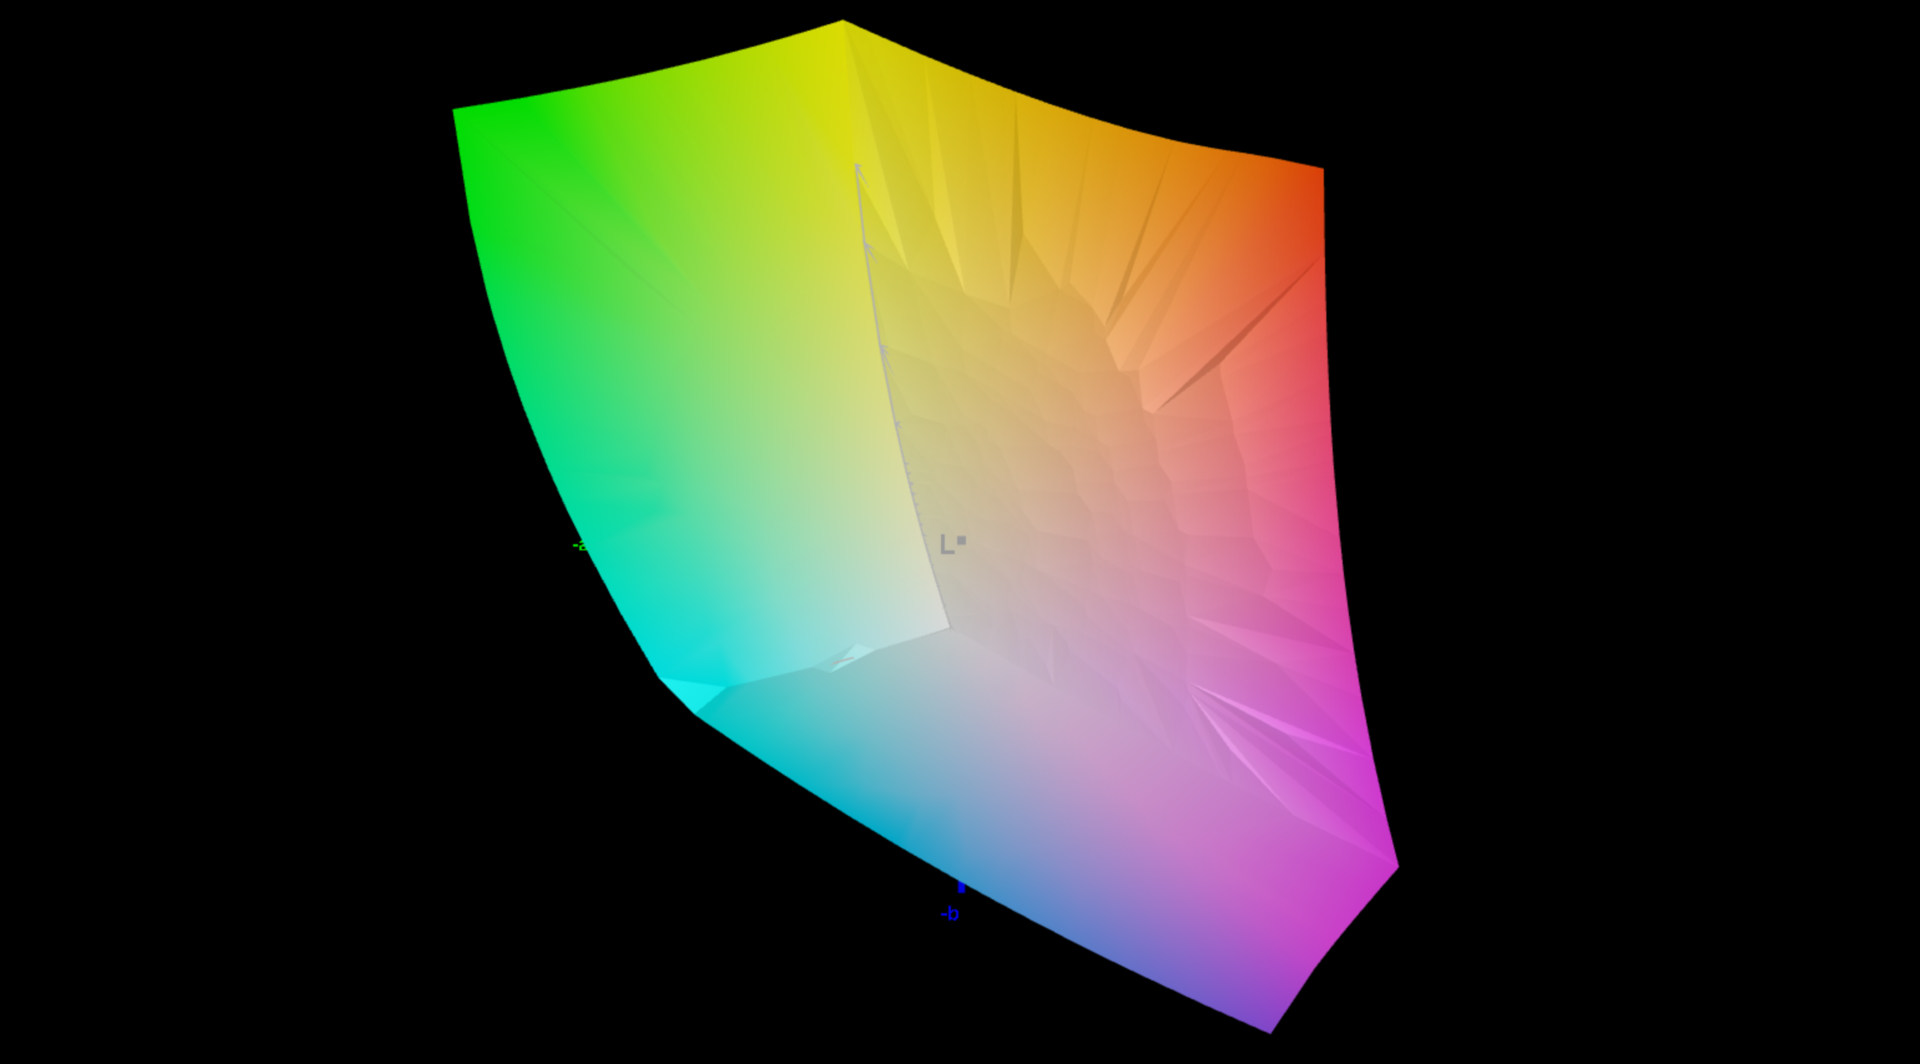
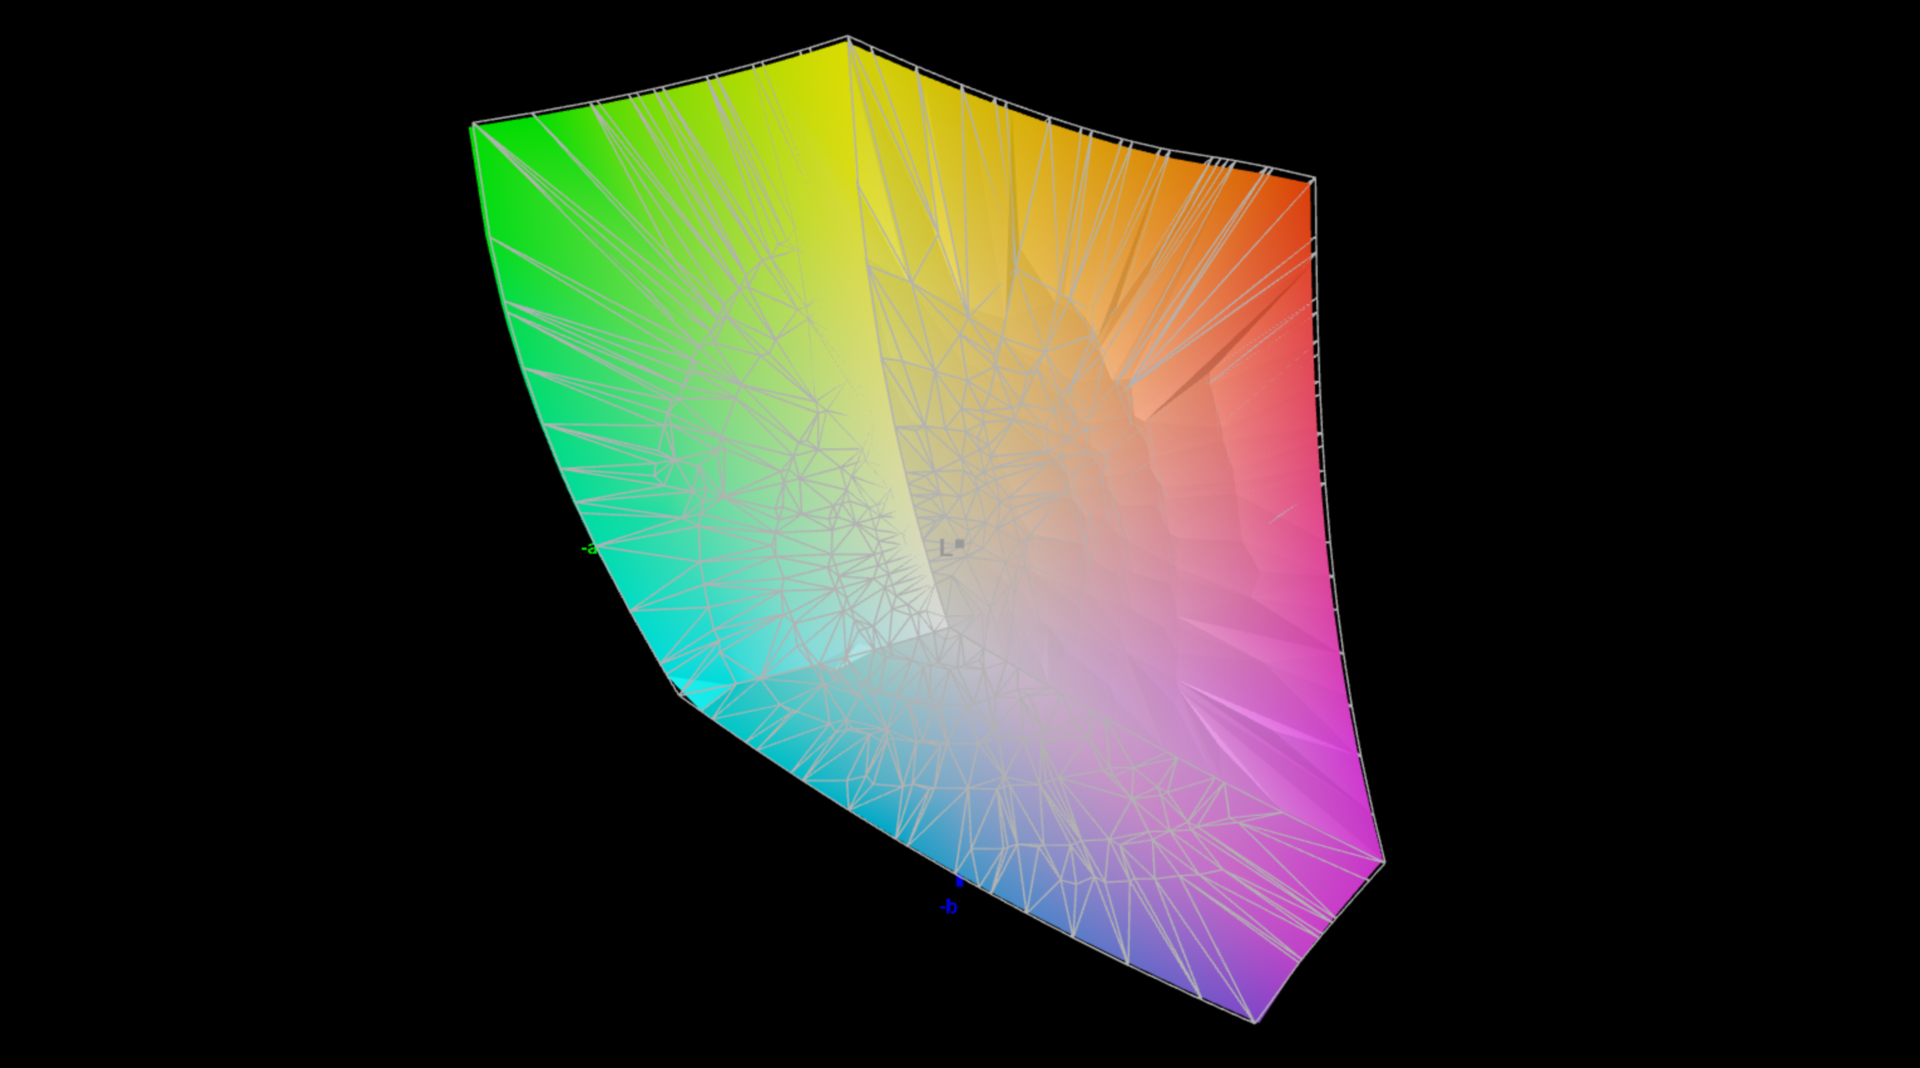
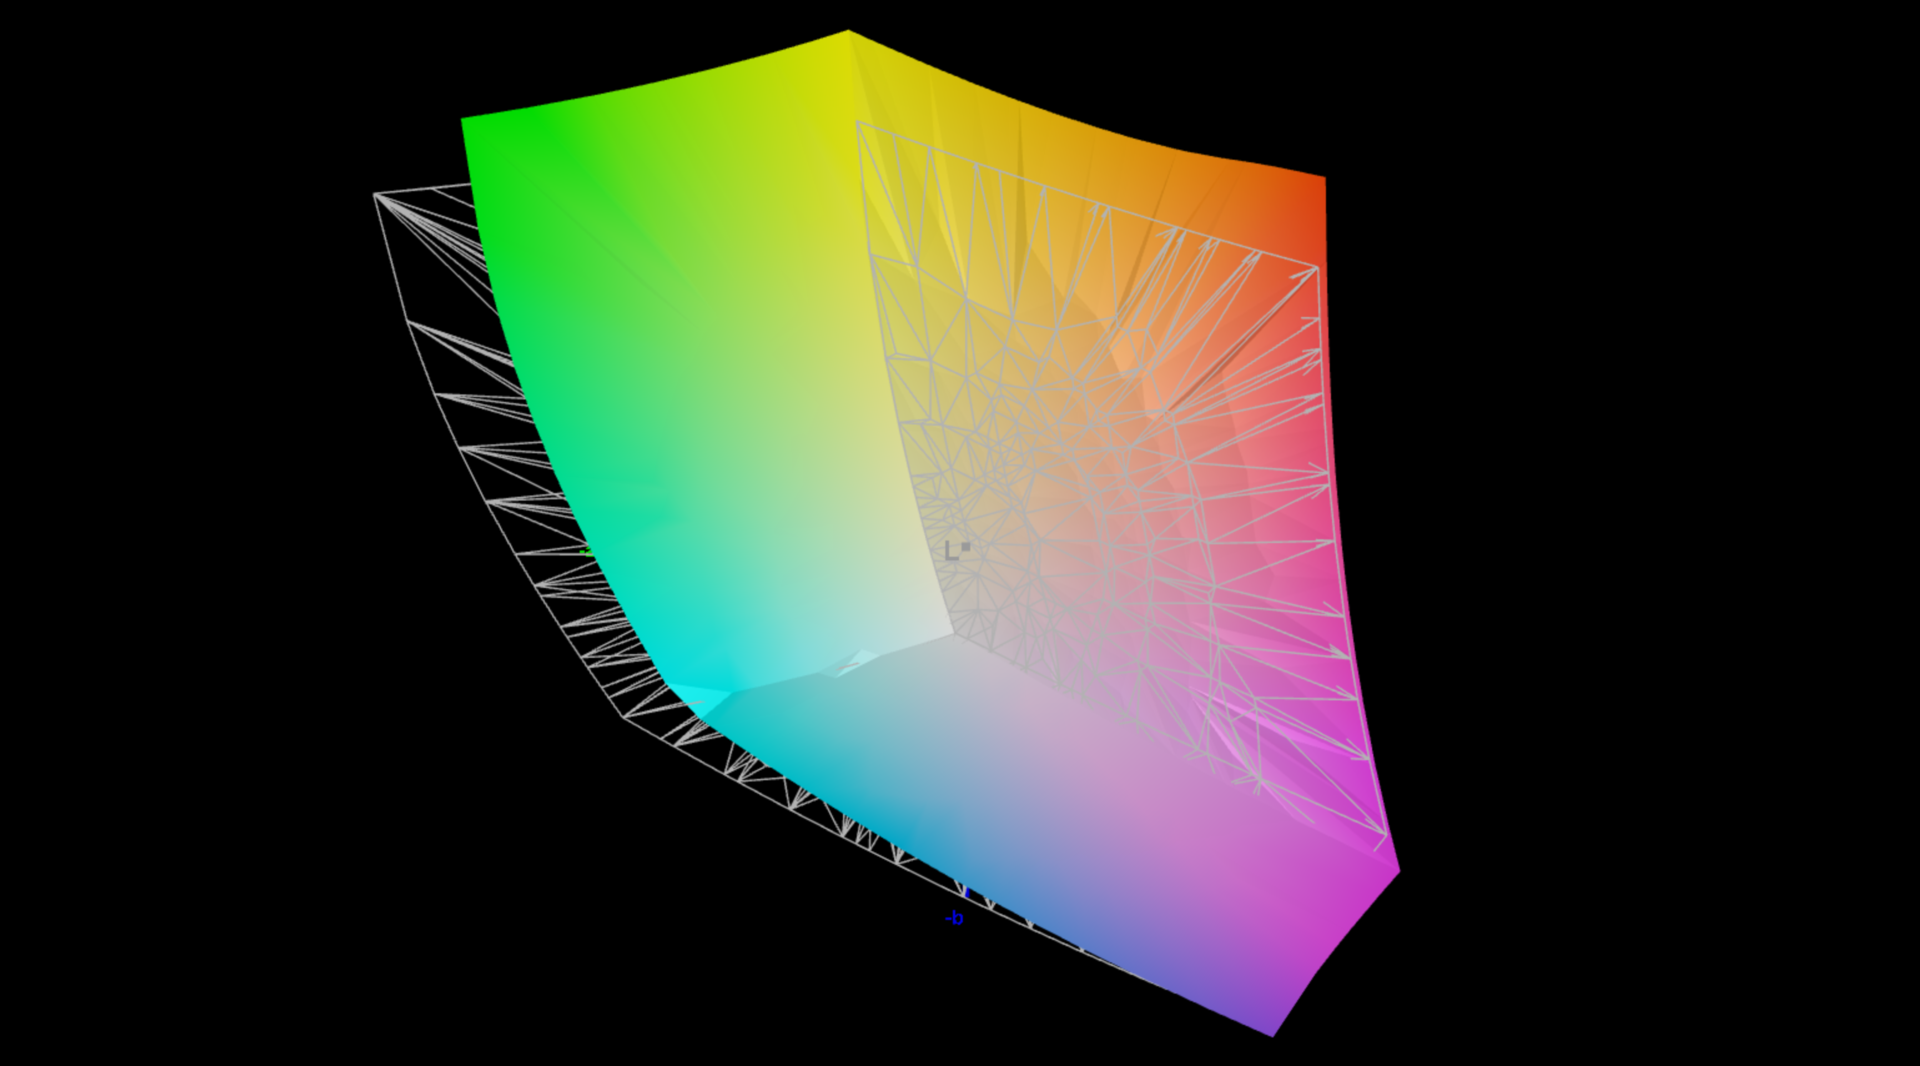
87.2% AdobeRGB 1998 (Argyll 3D)
100% sRGB (Argyll 3D)
98.5% Display P3 (Argyll 3D)
Gamma: 2.12
CCT: 6616 K
| Dell XPS 14 2024 OLED SDC41A2, OLED, 3200x2000, 14.5" | Apple MacBook Pro 14 2023 M3 Max Mini-LED, 3024x1964, 14.2" | Microsoft Surface Laptop Studio 2 RTX 4060 LQ144P1JX01, IPS, 2400x1600, 14.4" | Lenovo Yoga Pro 9-14IRP G8 CSOT T3 MNE507HZ2-1, Mini-LED, 3072x1920, 14.5" | Acer Swift X SFX14-71G ATNA45AF03-0, OLED, 2880x1800, 14.5" | Asus Zenbook Pro 14 OLED UX6404VI SDC4190, OLED, 2880x1800, 14.5" | Asus ROG Zephyrus G14 2024 GA403U ATNA40CU05-0, OLED, 2880x1800, 14" | Razer Blade 14 RZ09-0508 TL140ADXP04-0, IPS, 2560x1600, 14" | |
|---|---|---|---|---|---|---|---|---|
| Display | 1% | -18% | 1% | 4% | 4% | 1% | -2% | |
| Display P3 Coverage (%) | 98.5 | 99.2 1% | 66.7 -32% | 92 -7% | 99.9 1% | 99.6 1% | 99.6 1% | 96.9 -2% |
| sRGB Coverage (%) | 100 | 99 -1% | 99.7 0% | 99.9 0% | 100 0% | 100 0% | 99.8 0% | |
| AdobeRGB 1998 Coverage (%) | 87.2 | 68.9 -21% | 96.9 11% | 96.2 10% | 97.5 12% | 89.9 3% | 85 -3% | |
| Response Times | -10789% | -7671% | -1548% | 33% | -7% | 12% | -868% | |
| Response Time Grey 50% / Grey 80% * (ms) | 0.7 ? | 80.8 ? -11443% | 77.6 ? -10986% | 12.7 ? -1714% | 0.4 ? 43% | 0.67 ? 4% | 0.62 ? 11% | 6 ? -757% |
| Response Time Black / White * (ms) | 0.77 ? | 78.8 ? -10134% | 34.3 ? -4355% | 11.4 ? -1381% | 0.6 ? 22% | 0.9 ? -17% | 0.68 ? 12% | 8.3 ? -978% |
| PWM Frequency (Hz) | 480 | 14878 ? | 17600 ? | 6000 ? | 240 ? | 240 | 960 ? | |
| Screen | 28% | 46% | -26% | -24% | 26% | 32% | -3% | |
| Brightness middle (cd/m²) | 351 | 610 74% | 511 46% | 670 91% | 388 11% | 356 1% | 423 21% | 484.1 38% |
| Brightness (cd/m²) | 353 | 600 70% | 503 42% | 680 93% | 390 10% | 358 1% | 424 20% | 466 32% |
| Brightness Distribution (%) | 97 | 96 -1% | 89 -8% | 89 -8% | 98 1% | 99 2% | 98 1% | 89 -8% |
| Black Level * (cd/m²) | 0.26 | 0.19 | 0.01 | 0.38 | ||||
| Colorchecker dE 2000 * | 1.7 | 1.7 -0% | 0.5 71% | 4 -135% | 2.2 -29% | 0.8 53% | 0.7 59% | 2.23 -31% |
| Colorchecker dE 2000 max. * | 2.2 | 2.3 -5% | 1.1 50% | 4.5 -105% | 3.9 -77% | 1.6 27% | 1.8 18% | 4.57 -108% |
| Colorchecker dE 2000 calibrated * | 0.8 | 1.3 -63% | 1.9 -137% | 0.74 7% | ||||
| Greyscale dE 2000 * | 3.1 | 2.1 32% | 0.8 74% | 4.9 -58% | 1.4 55% | 0.9 71% | 0.8 74% | 1.6 48% |
| Gamma | 2.12 104% | 2.22 99% | 2.19 100% | 2.22 99% | 2.22 99% | 2.19 100% | 2.18 101% | 2.24 98% |
| CCT | 6616 98% | 6874 95% | 6650 98% | 5735 113% | 6380 102% | 6590 99% | 6505 100% | 6816 95% |
| Contrast (:1) | 1965 | 3526 | 42300 | 1274 | ||||
| Całkowita średnia (program / ustawienia) | -3587% /
-2378% | -2548% /
-1375% | -524% /
-273% | 4% /
-8% | 8% /
14% | 15% /
20% | -291% /
-147% |
* ... im mniej tym lepiej
Przeanalizowaliśmy ekran za pomocą profesjonalnego oprogramowania CalMAN (X-Rite i1 Pro 2) i użyliśmy ustawienia wstępnego "Vivid", które zapewniło najlepsze zmierzone wartości. Ogólnie rzecz biorąc, profil ten jest już zadowalający, ponieważ wszystkie kolory pozostały poniżej ważnego odchylenia DelteE-2000 wynoszącego 3 w porównaniu do referencyjnej przestrzeni kolorów P3 - tylko jego odwzorowanie w skali szarości nie było najlepsze. Zauważyliśmy również minimalny odcień kolorów, ale jest to zauważalne tylko w bezpośrednim porównaniu ze skalibrowanym ekranem. Dzięki profilowi "Internet" Dell zapewnia użytkownikom profil sRGB, a kolory są również bardzo dokładne przy użyciu tego ustawienia.
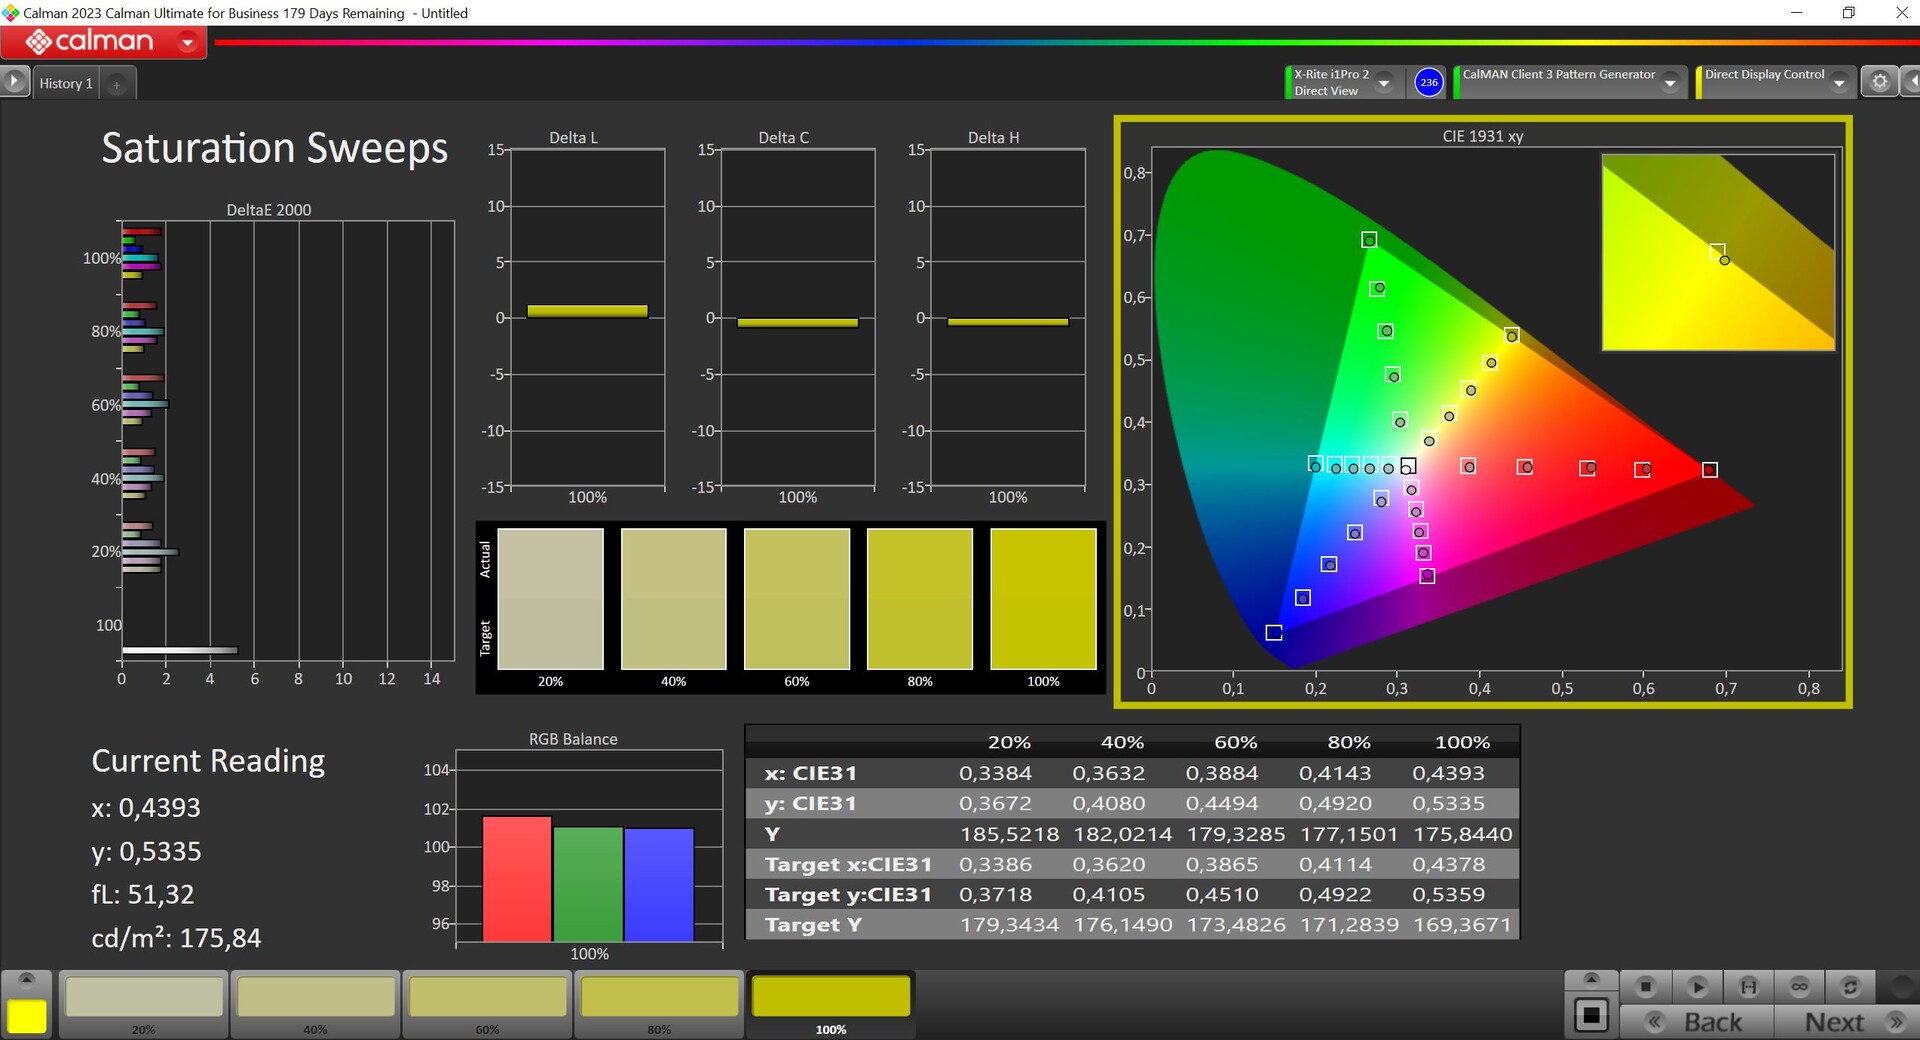
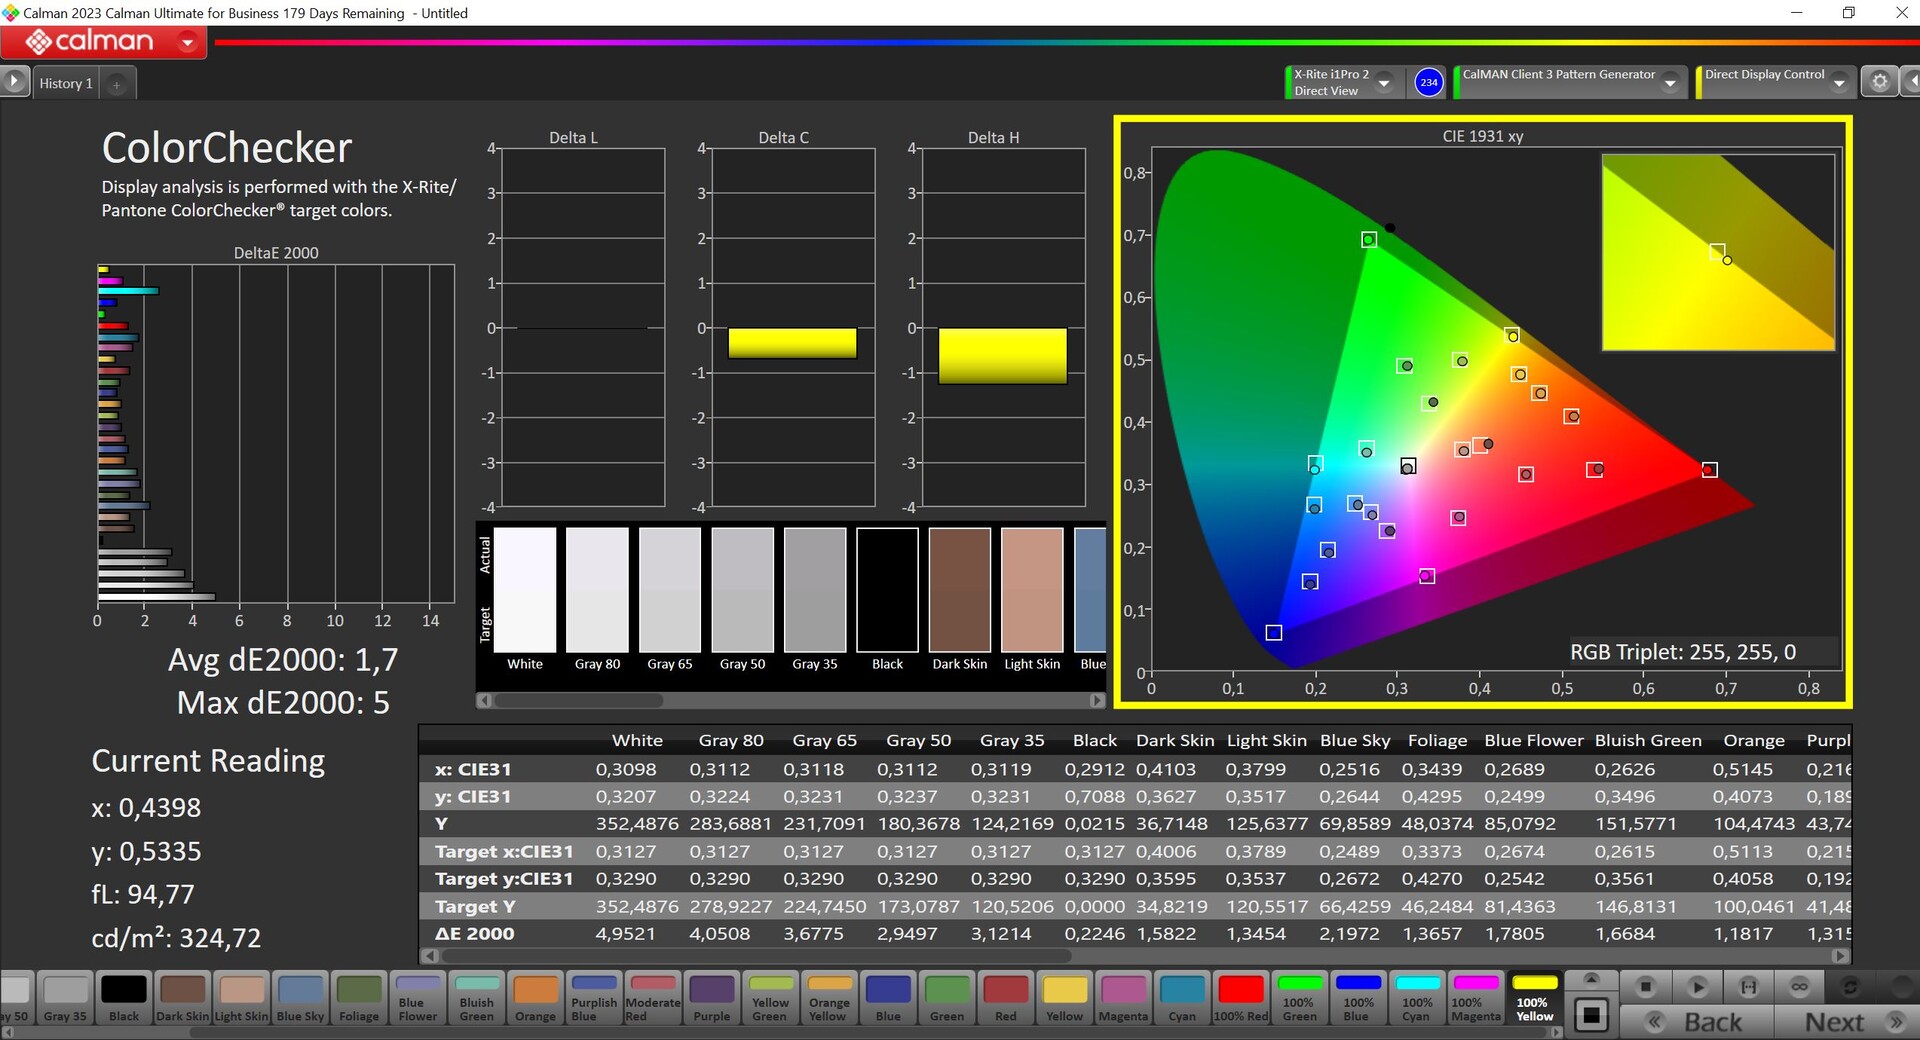
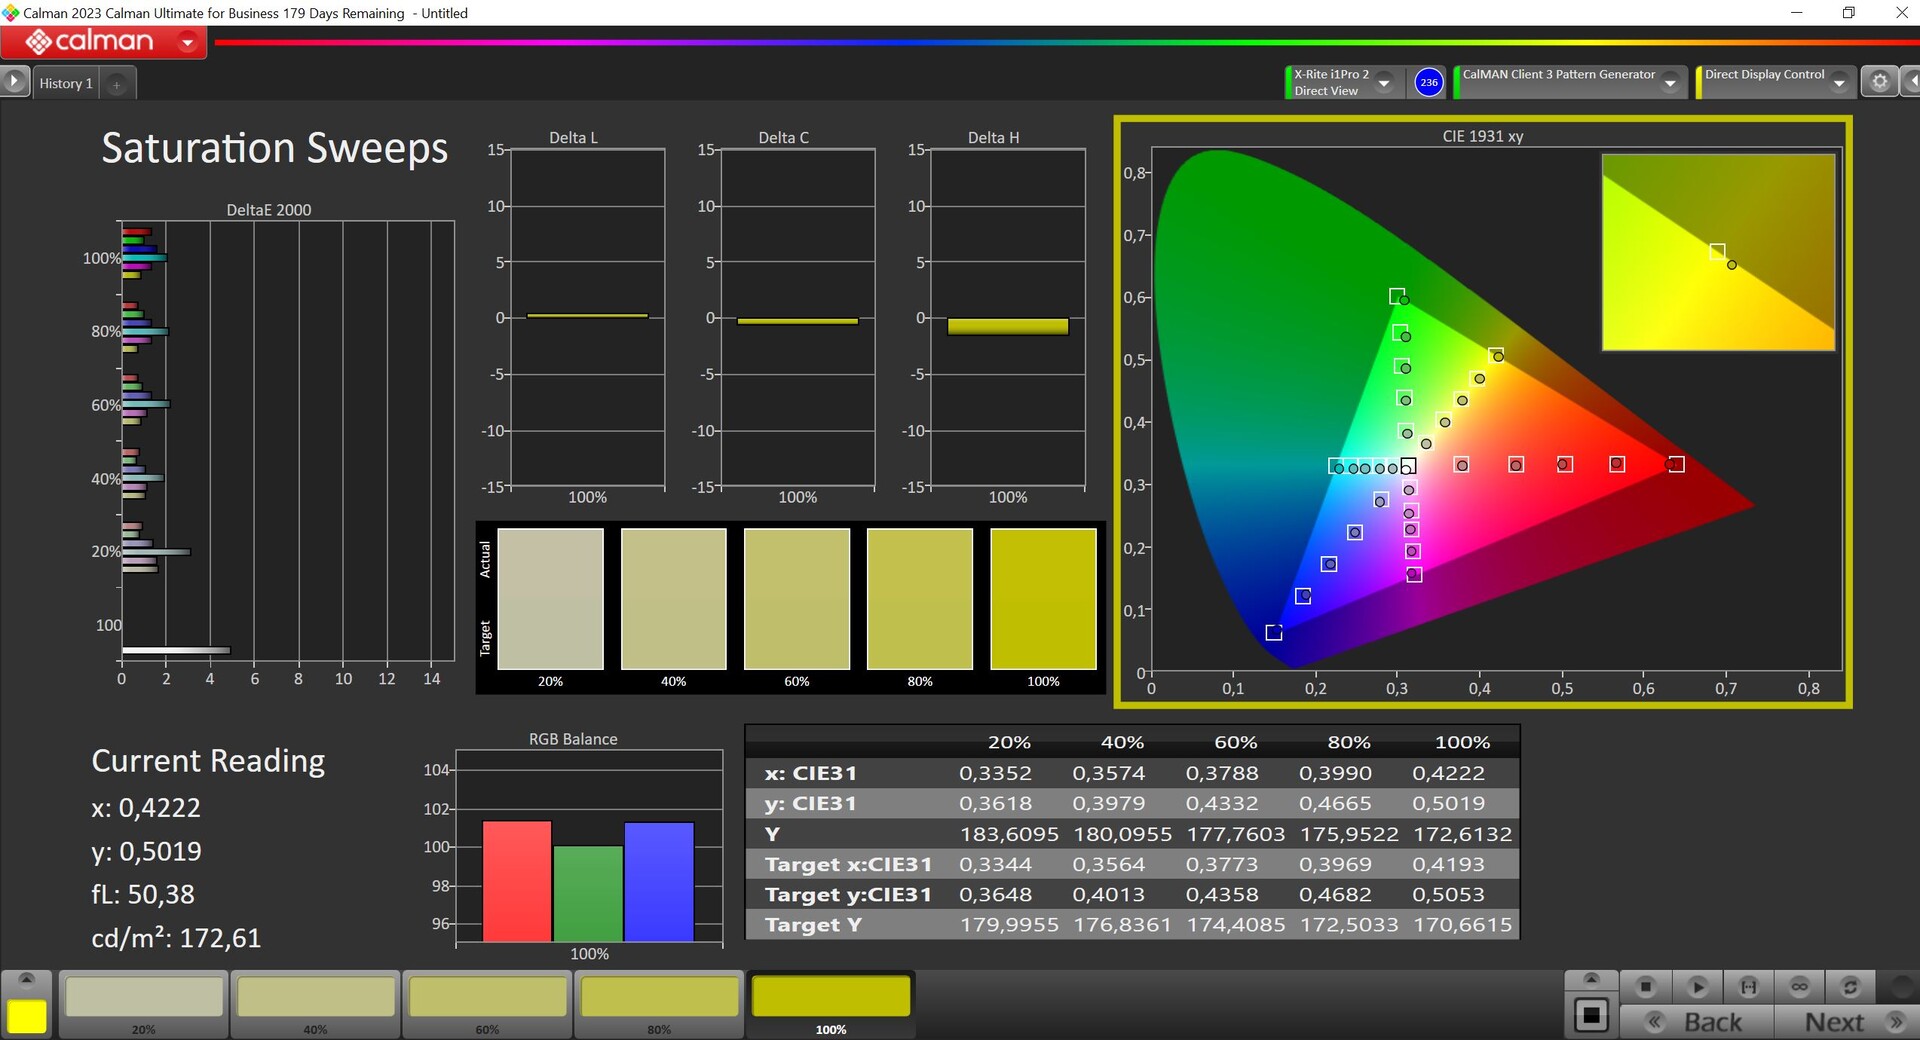
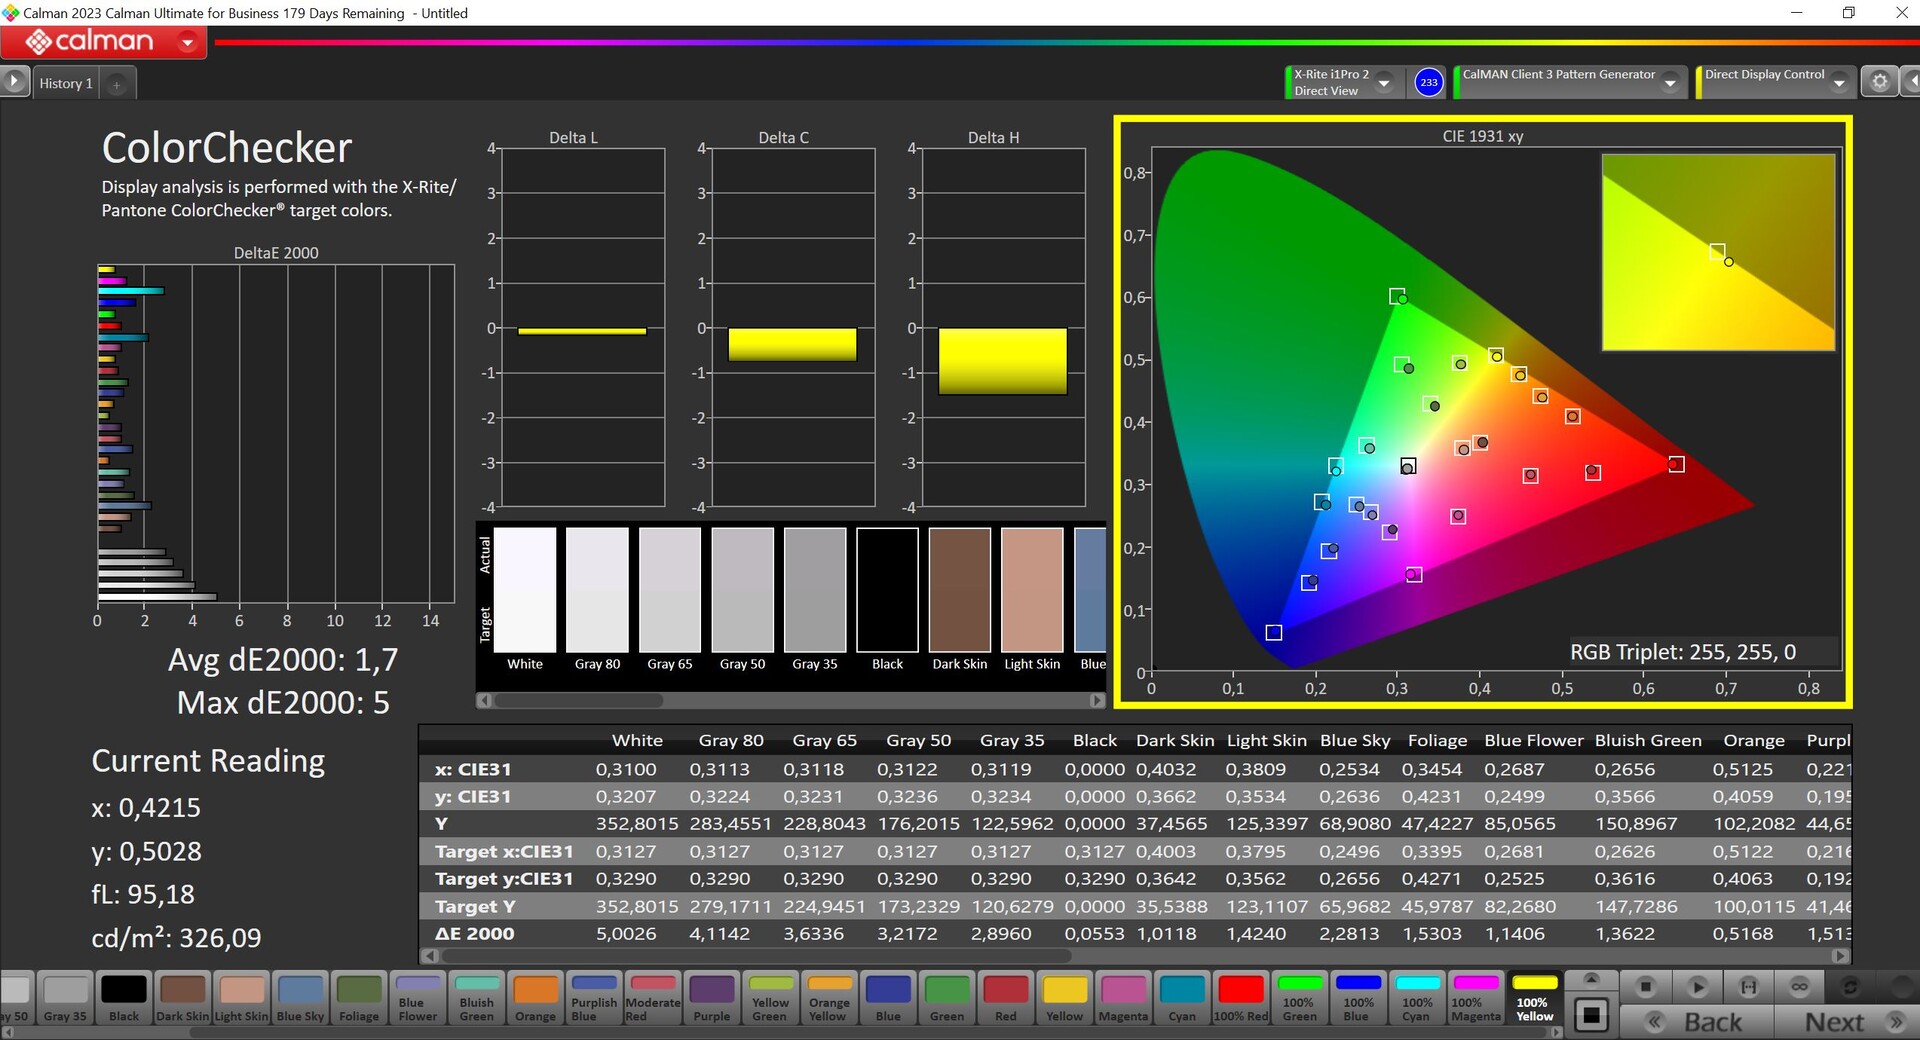
Z drugiej strony, nasza własna kalibracja pokazała, że panel jest w stanie osiągnąć jeszcze więcej i oprócz lepszego odwzorowania skali szarości, poprawiliśmy również dokładność odwzorowania kolorów. Jest on w stanie w pełni pokryć przestrzenie kolorów P3 i sRGB, co oznacza, że XPS 14 doskonale nadaje się do edycji zdjęć/filmów - choć to samo można powiedzieć o urządzeniach konkurencji.

Wyświetl czasy reakcji
| ↔ Czas reakcji od czerni do bieli | ||
|---|---|---|
| 0.77 ms ... wzrost ↗ i spadek ↘ łącznie | ↗ 0.42 ms wzrost | 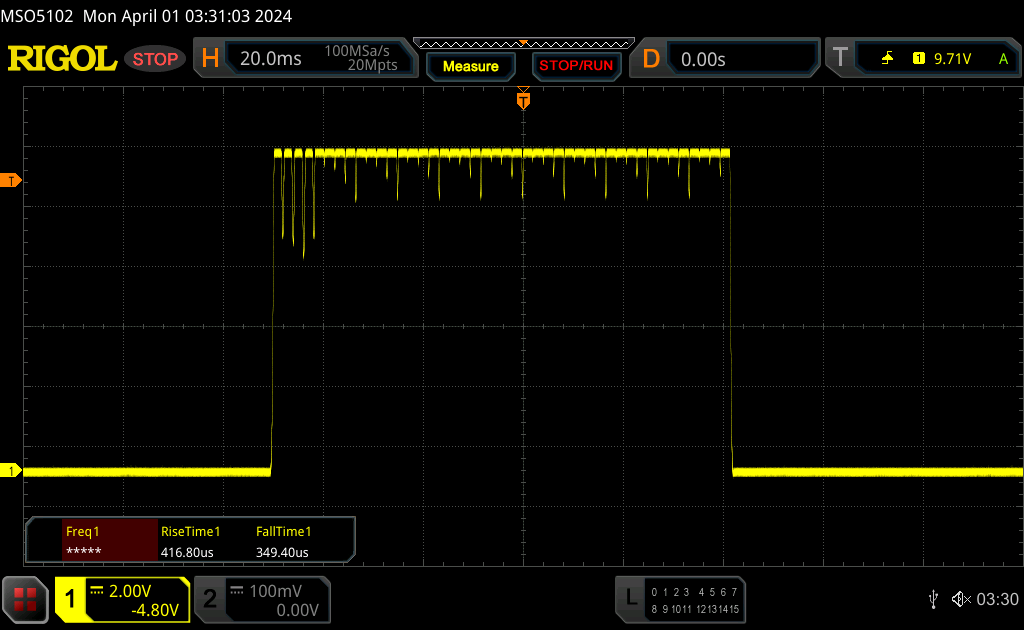 |
| ↘ 0.35 ms upadek | ||
| W naszych testach ekran wykazuje bardzo szybką reakcję i powinien bardzo dobrze nadawać się do szybkich gier. Dla porównania, wszystkie testowane urządzenia wahają się od 0.1 (minimum) do 240 (maksimum) ms. » 2 % wszystkich urządzeń jest lepszych. Oznacza to, że zmierzony czas reakcji jest lepszy od średniej wszystkich testowanych urządzeń (19.9 ms). | ||
| ↔ Czas reakcji 50% szarości do 80% szarości | ||
| 0.7 ms ... wzrost ↗ i spadek ↘ łącznie | ↗ 0.39 ms wzrost | 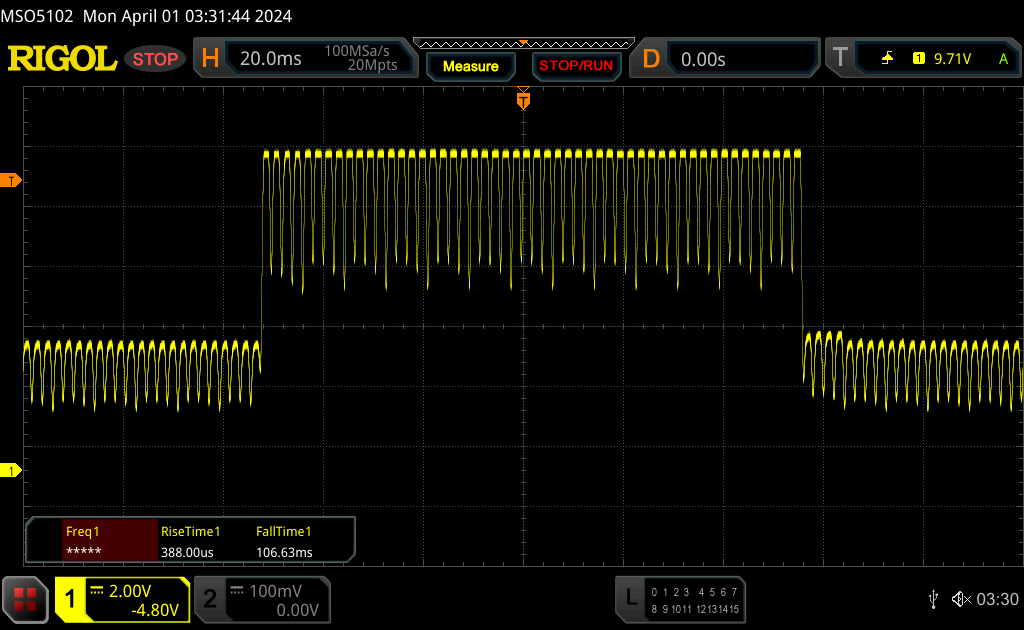 |
| ↘ 0.31 ms upadek | ||
| W naszych testach ekran wykazuje bardzo szybką reakcję i powinien bardzo dobrze nadawać się do szybkich gier. Dla porównania, wszystkie testowane urządzenia wahają się od 0.165 (minimum) do 636 (maksimum) ms. » 2 % wszystkich urządzeń jest lepszych. Oznacza to, że zmierzony czas reakcji jest lepszy od średniej wszystkich testowanych urządzeń (31.1 ms). | ||
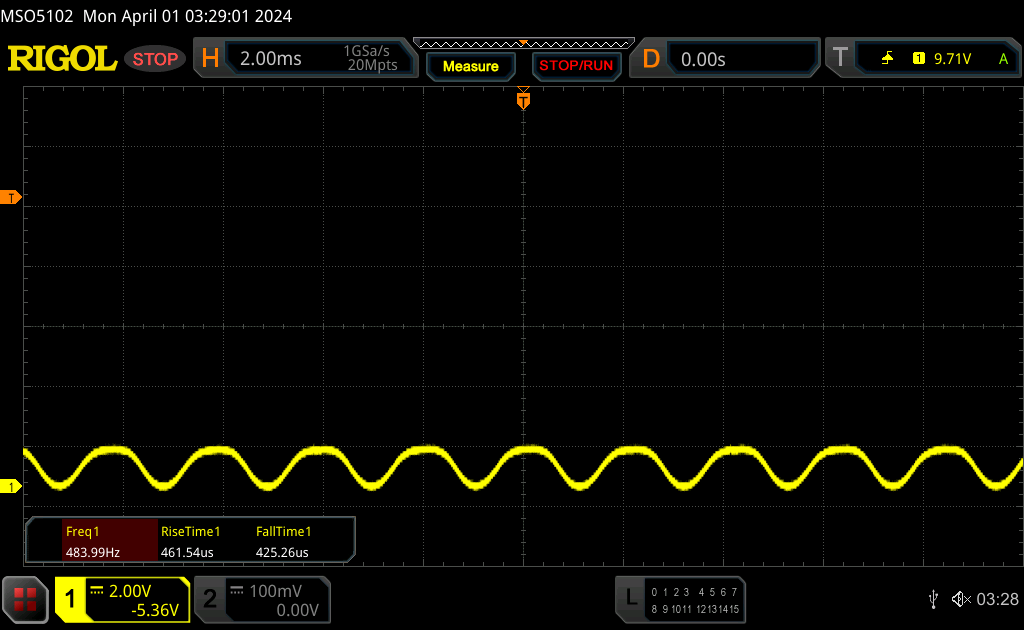
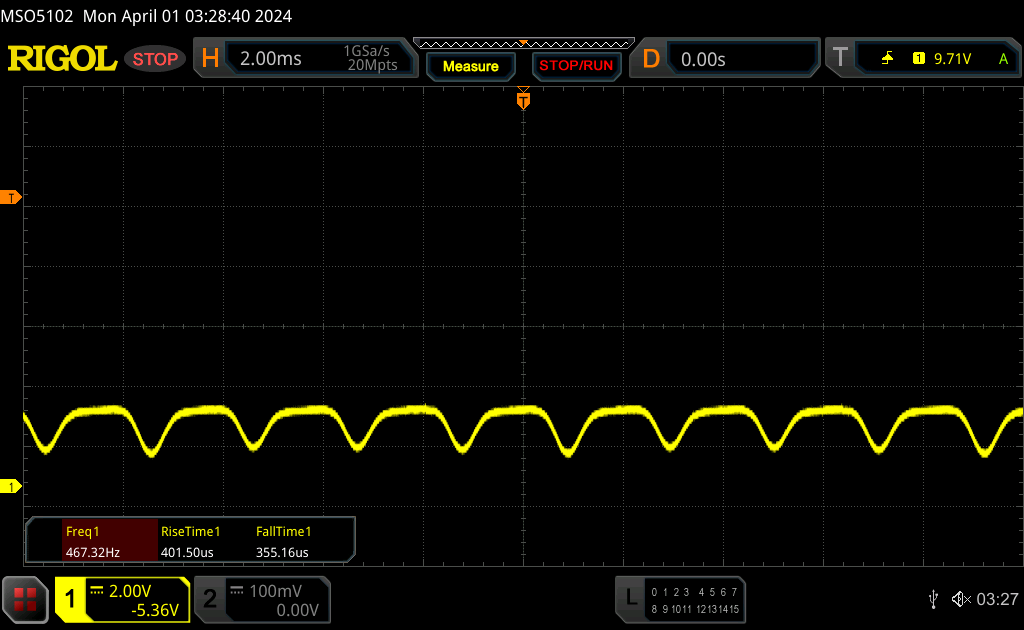
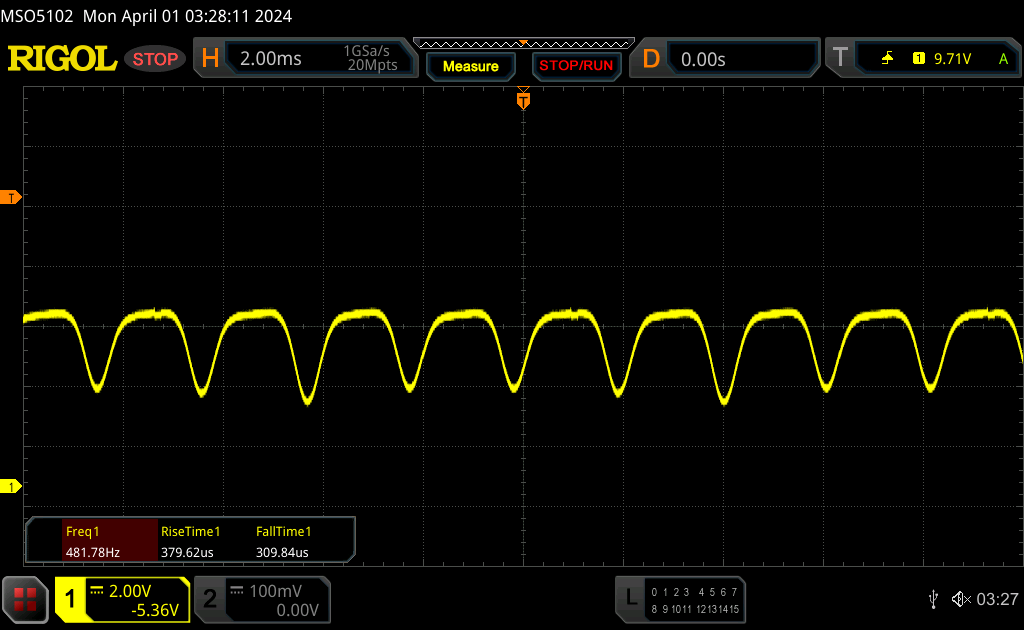
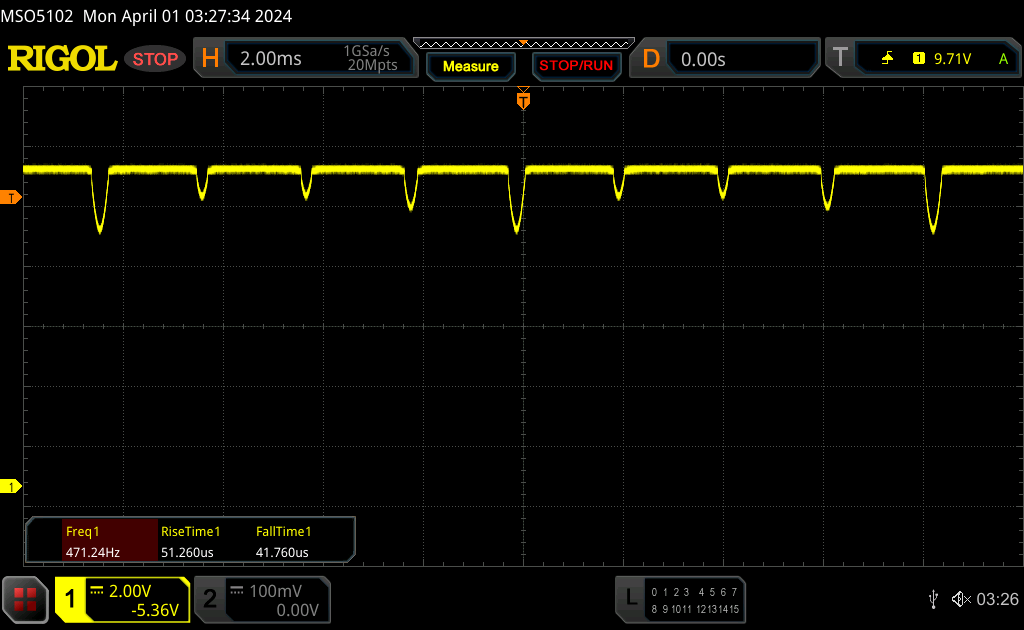
Migotanie ekranu / PWM (modulacja szerokości impulsu)
| Wykryto migotanie ekranu/wykryto PWM | 480 Hz | 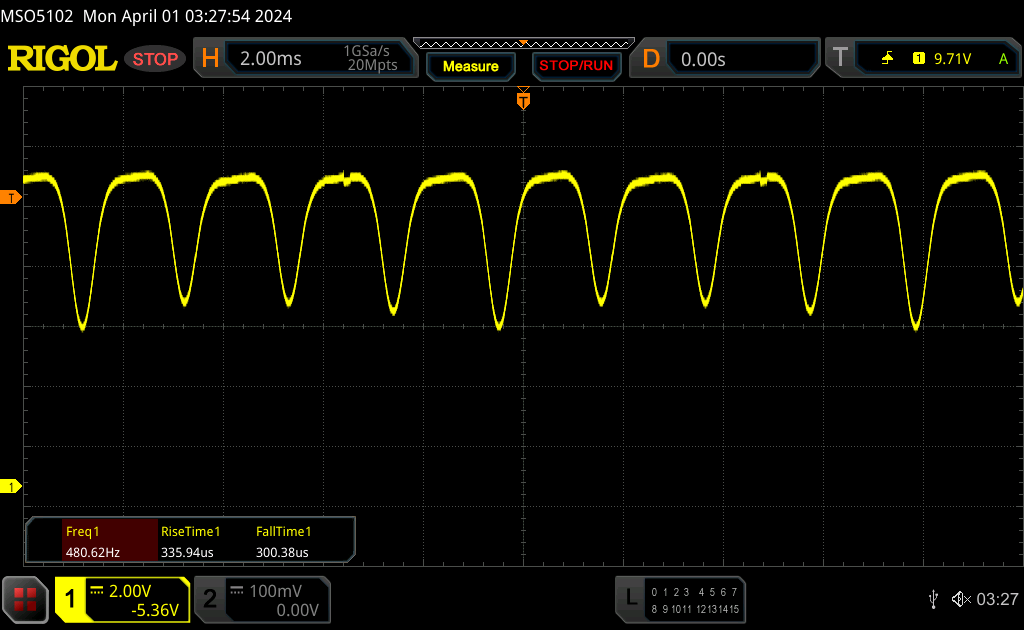 | |
Podświetlenie wyświetlacza miga z częstotliwością 480 Hz (najgorszy przypadek, np. przy użyciu PWM) . Częstotliwość 480 Hz jest stosunkowo wysoka, więc większość użytkowników wrażliwych na PWM nie powinna zauważyć żadnego migotania. Istnieją jednak doniesienia, że niektórzy użytkownicy są nadal wrażliwi na PWM przy częstotliwości 500 Hz i wyższej, więc należy zachować ostrożność. Dla porównania: 52 % wszystkich testowanych urządzeń nie używa PWM do przyciemniania wyświetlacza. Jeśli wykryto PWM, zmierzono średnio 7798 (minimum: 5 - maksimum: 343500) Hz. | |||
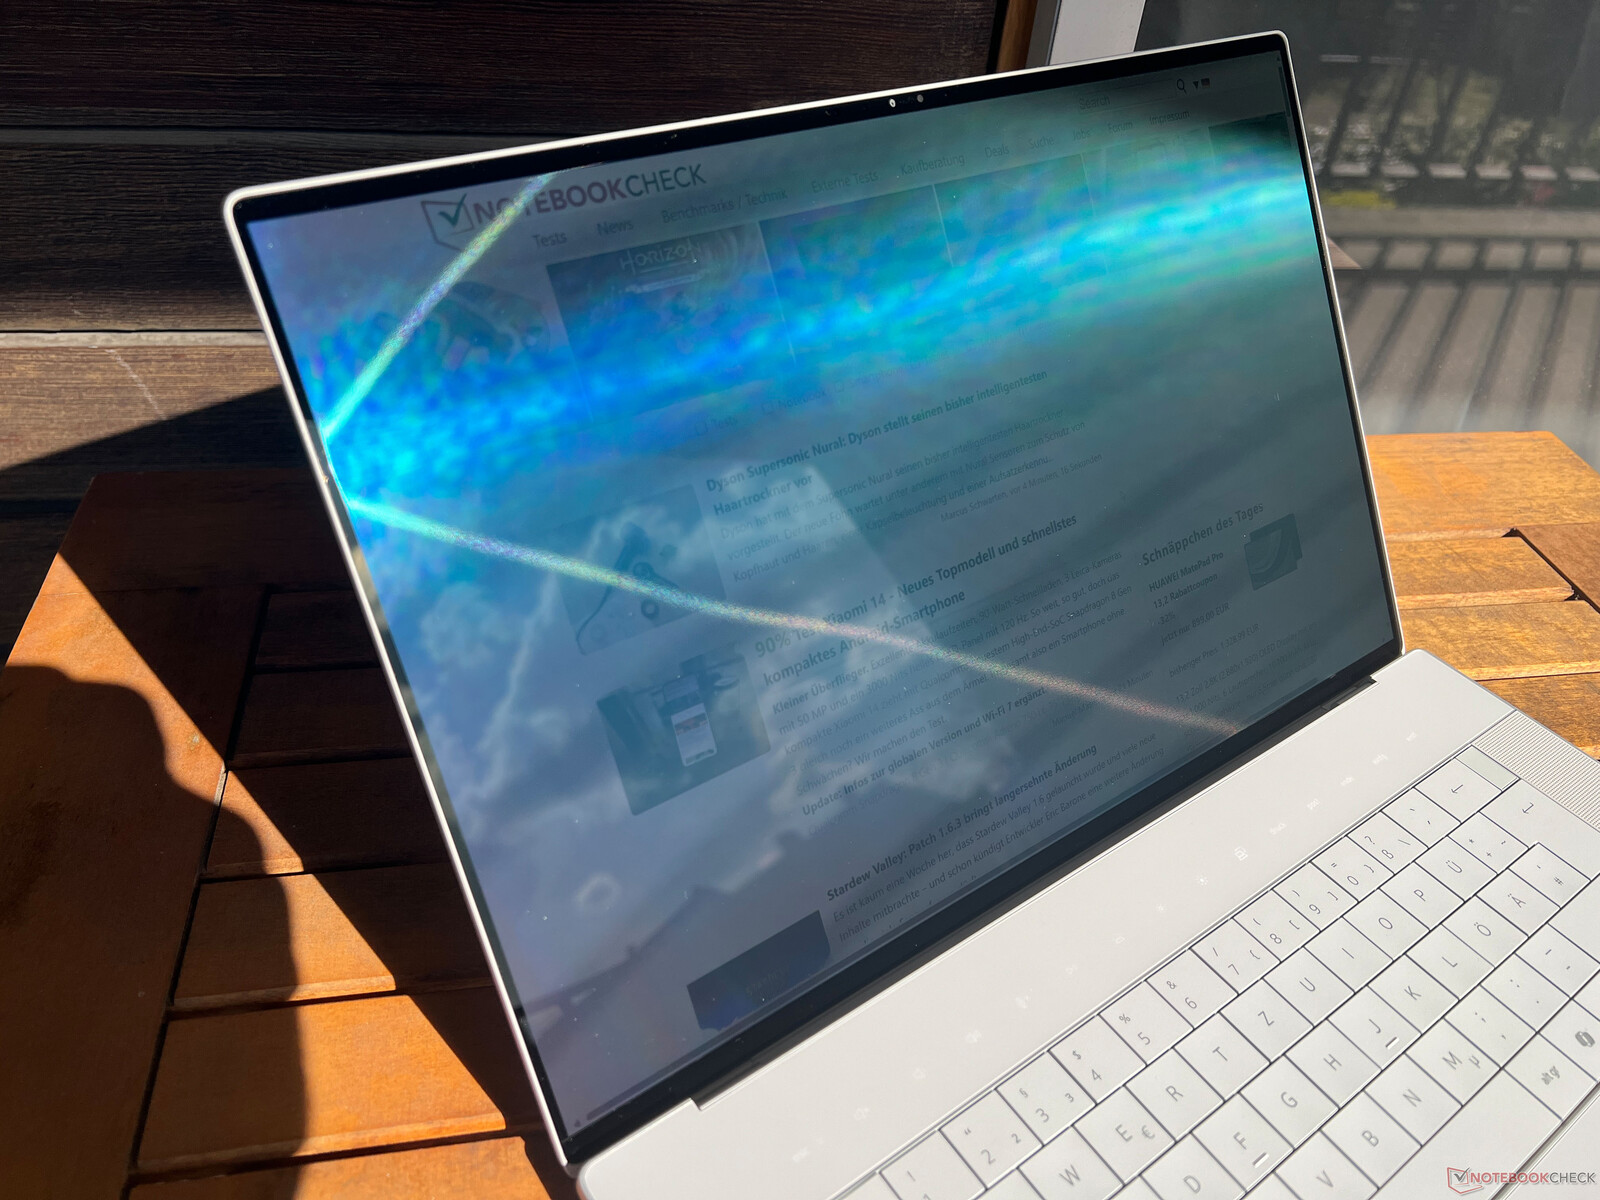
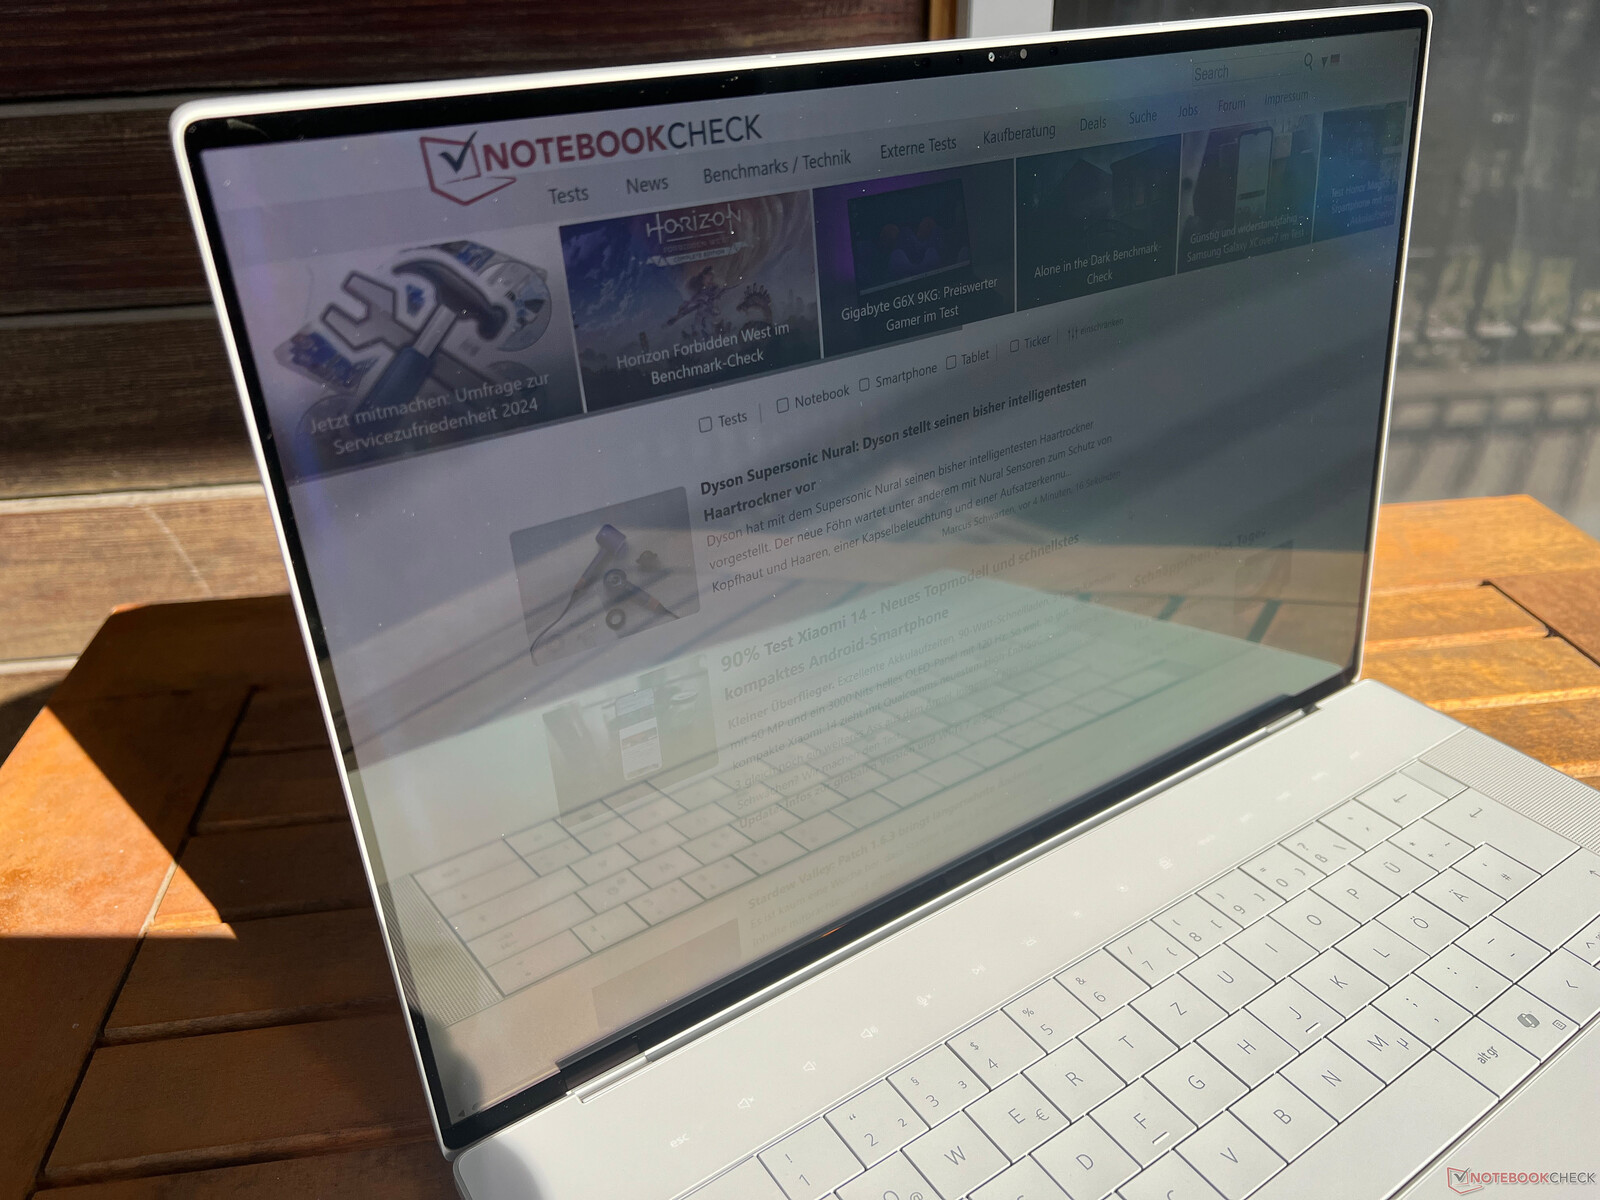
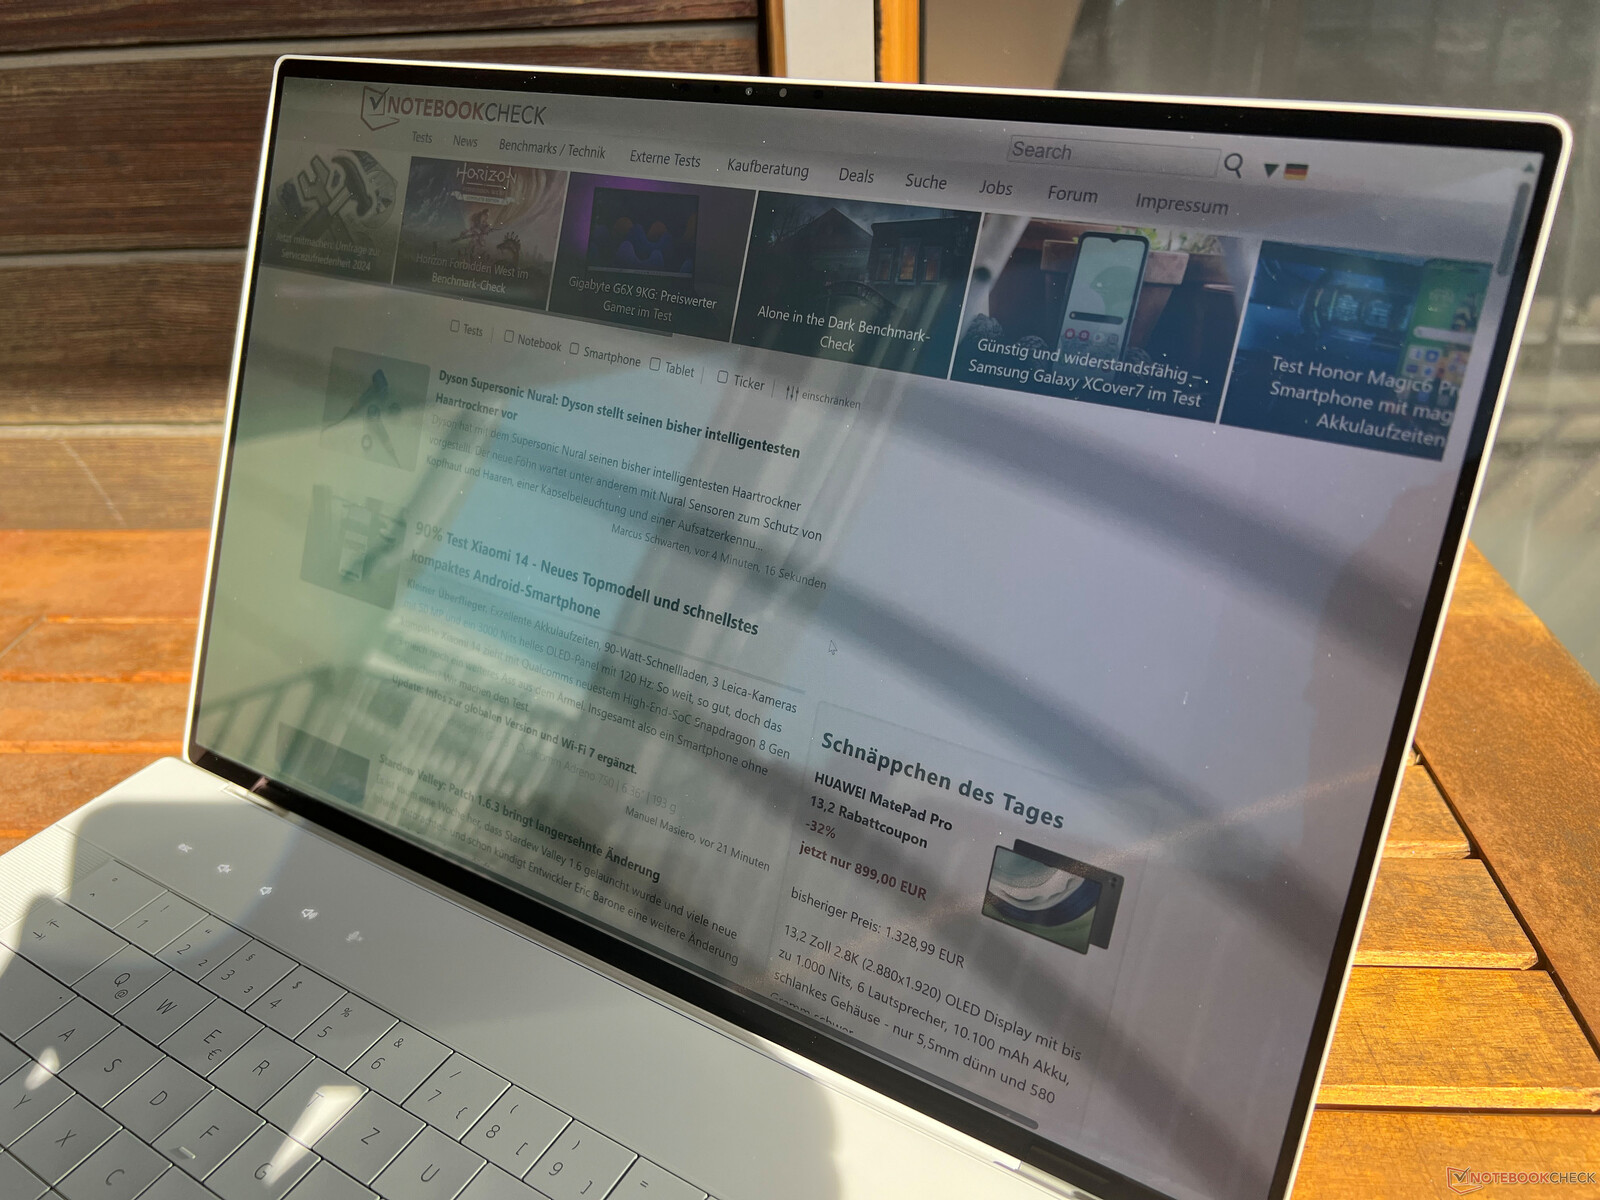
Ekran dotykowy jest bardzo odblaskowy, co może prowadzić do pewnych problemów również w pomieszczeniach. Na zewnątrz należy unikać odbić od źródeł światła lub jasnych powierzchni. W pochmurne dni można całkiem dobrze korzystać z urządzenia na zewnątrz, podczas gdy słoneczne dni mogą powodować pewne problemy. Stabilność kąta widzenia jest ogólnie dobra, ale przy dużym odchyleniu od środka obrazu można zauważyć niebieskie migotanie, które jest typowe dla wyświetlaczy OLED.

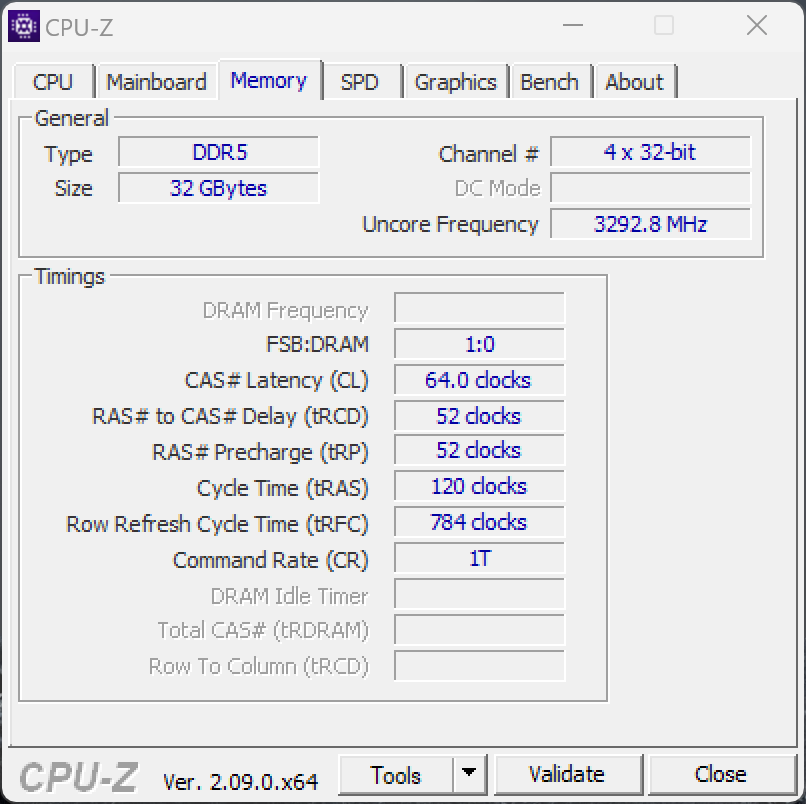
Wydajność - Szybka pamięć RAM tylko z GPU Nvidia
Nowy XPS 14 9440 jest dostępny wyłącznie z nowymi mobilnymi procesorami Core-Ultra-7 (155H i 165H) od Intela i co najwyżej może być wyposażony w 64 GB pamięci RAM - co często nie ma miejsca w przypadku jego konkurentów. Jeśli zaś chodzi o pamięć RAM, to pewne ograniczenia napotkamy decydując się na model bez GPU GeForce, gdyż wówczas będziemy musieli zadowolić się wolniejszą pamięcią LDPPR5-6400 RAM i maksymalnie 32 GB. Szybsza pamięć RAM LPDDR5x-7467 jest zarezerwowana dla modeli z dGPU, chociaż zintegrowane Arc iGPU skorzystałoby na tym w szczególności.
Warunki testowania
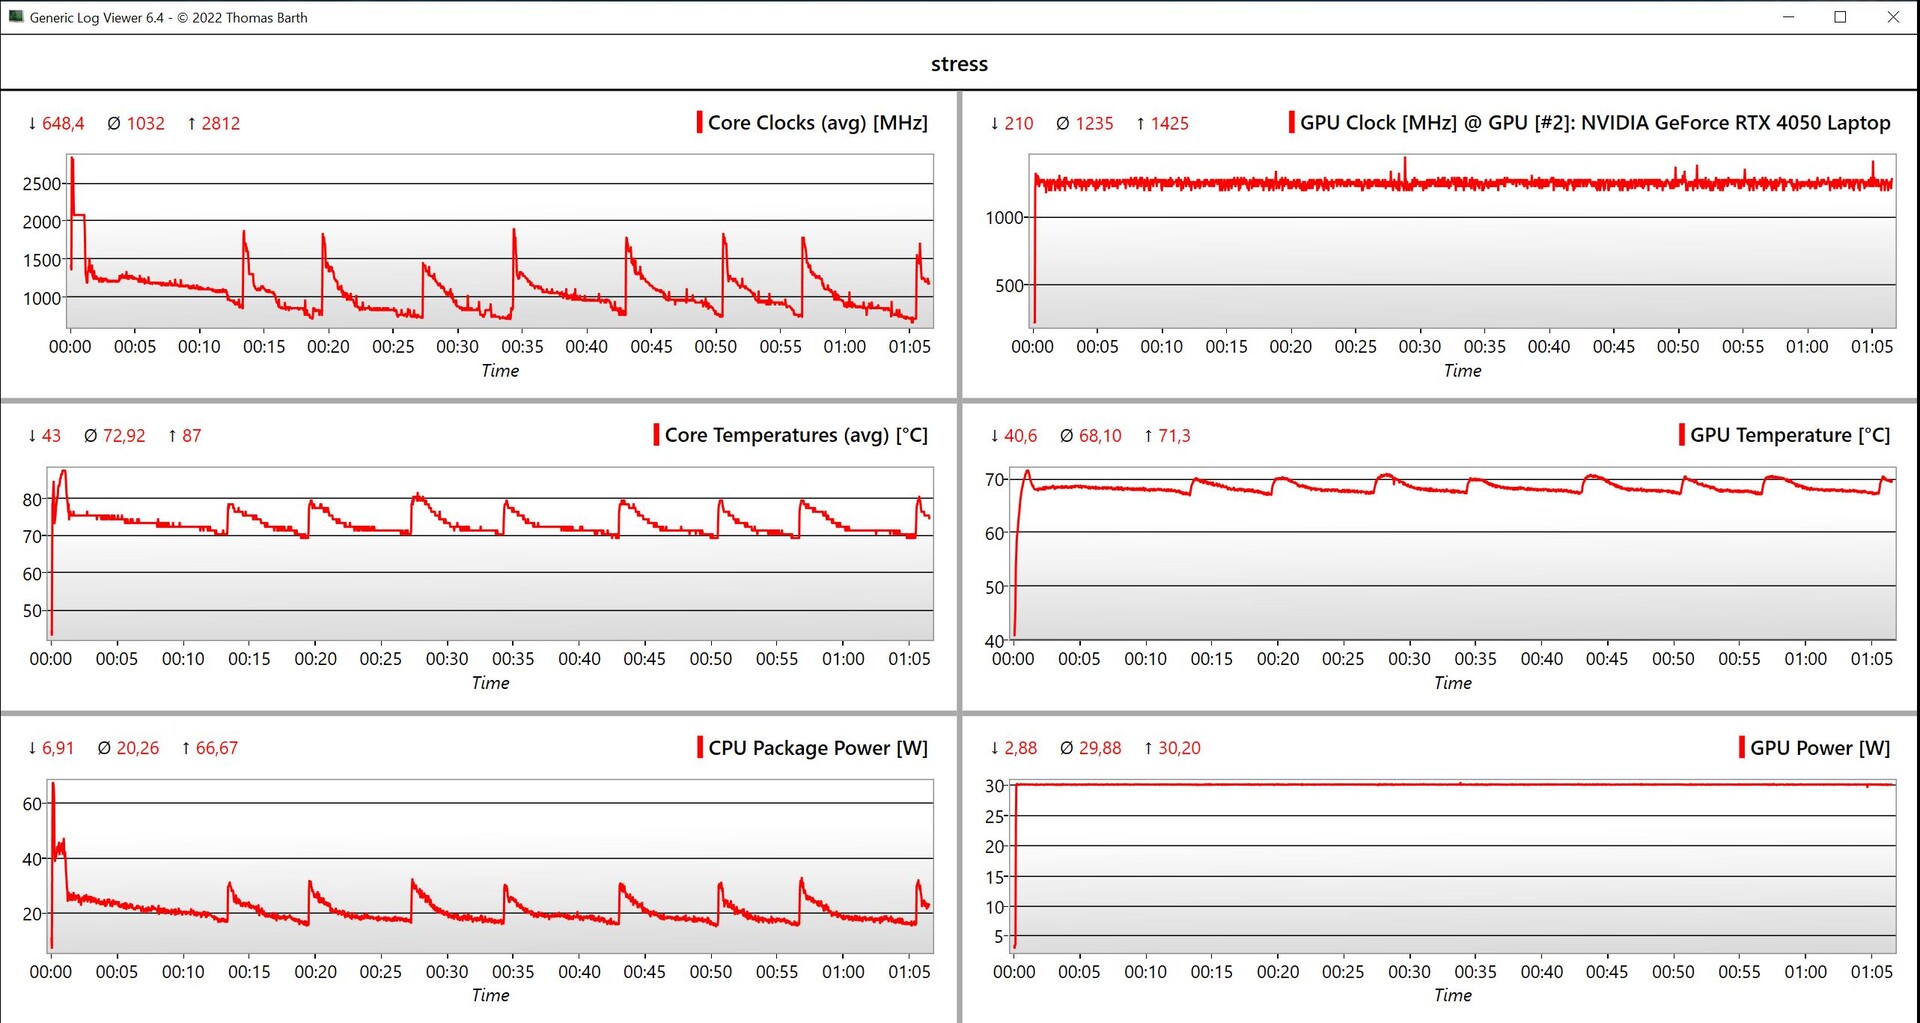
Dell oferuje różne profile energetyczne, które można również łączyć z ustawieniami wydajności systemu Windows. Domyślnym profilem jest Optimized, który wykorzystaliśmy również w poniższych testach porównawczych i pomiarach. Wydajność procesora można nieznacznie zwiększyć za pomocą profilu Ultra Performance, ale nie ma różnic w wydajności GPU, a maksymalne TGP laptopa RTX 4050 wynosi zaledwie 30 watów (chociaż według sterownika jest to 40 watów).
| Profil energetyczny | Obciążenie CPU | CB R23 Multi | Obciążenie GPU | Time Spy grafika | Cyberpunk 2077 1080p Ultra |
maks. emisja hałasu wentylatora |
|---|---|---|---|---|---|---|
| Cichy | 64 -> 24 waty | 9,969 punktów | 25 watów | 5,059 punktów | 32fps | 38.9 dB(A) |
| Zoptymalizowany | 64 -> 30 watów | 14,106 punktów | 30 watów | 5,107 punktów | 35.8fps | 43.3 dB(A) |
| Ultra Performance | 64 -> 40 watów | 15,477 punktów | 30 watów | 5,046 punktów | 36.6fps | 48.4 dB(A) |
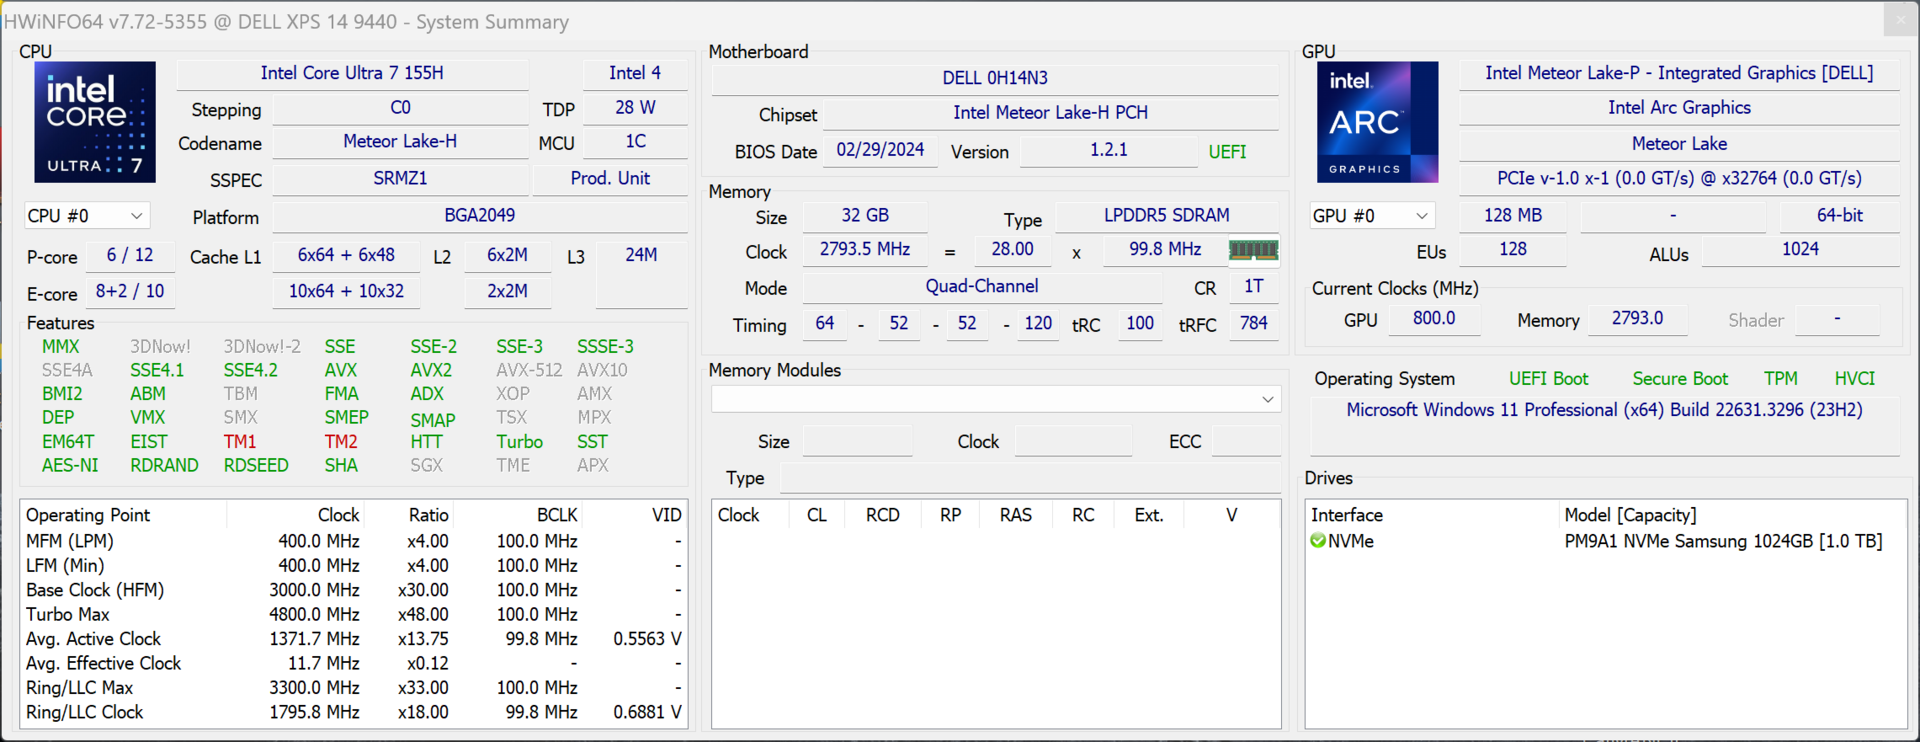
Procesor - Core Ultra 7 155H
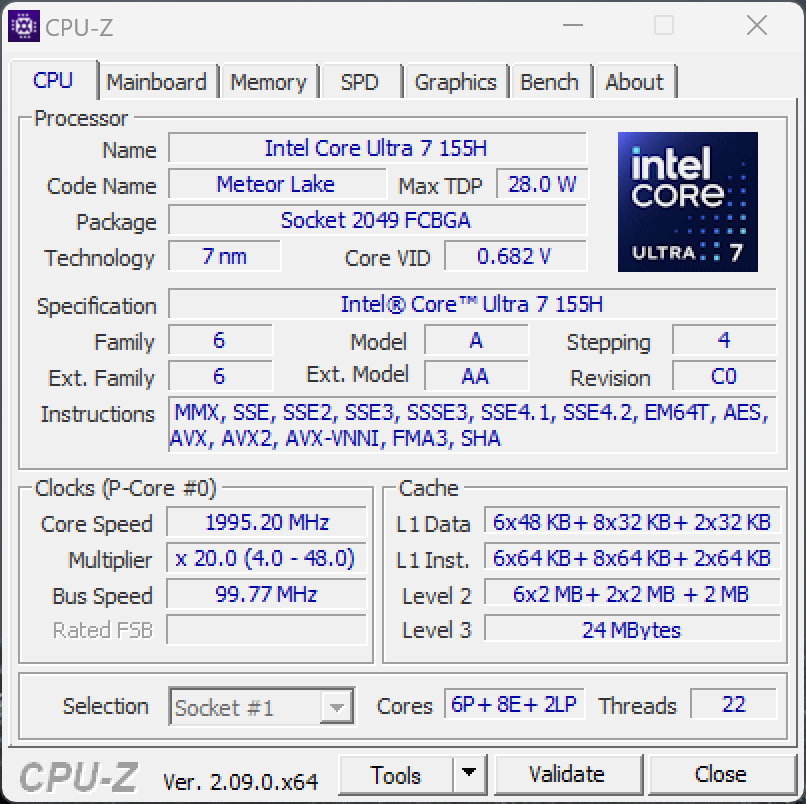
Core Ultra 7 155H należy do obecnej generacji Meteor Lake Intela, oferując łącznie 16 rdzeni (22 wątki) z sześcioma szybkimi rdzeniami o wysokiej wydajności, które mogą taktować z częstotliwością do 4,8 GHz. Jest to następca modelu Core i7-13700H, a jako że nie ma już układów z serii P, nowy Core Ultra 7 155H pokrywa dalszy obszar TDP wynoszący 28-115 watów. W przypadku XPS 14 9440 procesor jest w stanie zużywać do 64 watów przez krótki czas, po czym jego zużycie dość szybko spada do 30 watów. Oznacza to, że nasze urządzenie testowe było w stanie odnieść sukces nad konkurencyjnymi urządzeniami tylko podczas krótkich testów, podczas gdy przy dłuższych okresach obciążenia jego wydajność wielordzeniowa spadła zauważalnie (około 30%). Jedynie Acer Swift X był w tym przypadku jeszcze wolniejszy.
Nowy XPS często musiał przyznawać się do porażki z konkurentami, jeśli chodzi o wydajność jednordzeniową, ale jest to ogólny problem, z którym muszą sobie radzić nowe procesory Meteor Lake. Oczywiście jego wydajność jest wystarczająco dobra do codziennego użytku, ale jako klient nie możesz powstrzymać się od pytania, dlaczego nie otrzymujesz lepszej wydajności pomimo grubszej obudowy i drogiej ceny.
Podczas pracy na baterii procesor szybko spada z 64 do 28 watów, a jego wydajność wielordzeniowa jest o około 12% gorsza. Więcej testów porównawczych procesora można znaleźć w naszej sekcji technicznej .
Cinebench R15 Multi continuous test
Cinebench R23: Multi Core | Single Core
Cinebench R20: CPU (Multi Core) | CPU (Single Core)
Cinebench R15: CPU Multi 64Bit | CPU Single 64Bit
Blender: v2.79 BMW27 CPU
7-Zip 18.03: 7z b 4 | 7z b 4 -mmt1
Geekbench 6.7: Multi-Core | Single-Core
Geekbench 5.5: Multi-Core | Single-Core
HWBOT x265 Benchmark v2.2: 4k Preset
LibreOffice : 20 Documents To PDF
R Benchmark 2.5: Overall mean
| CPU Performance rating | |
| Apple MacBook Pro 14 2023 M3 Max -5! | |
| Asus Zenbook Pro 14 OLED UX6404VI -2! | |
| Razer Blade 14 RZ09-0508 | |
| Lenovo Yoga Pro 9-14IRP G8 | |
| Asus ROG Zephyrus G14 2024 GA403U | |
| Microsoft Surface Laptop Studio 2 RTX 4060 | |
| Średnia w klasie Multimedia | |
| Acer Swift X SFX14-71G -2! | |
| Dell XPS 14 2024 OLED | |
| Przeciętny Intel Core Ultra 7 155H | |
| Cinebench R23 / Multi Core | |
| Apple MacBook Pro 14 2023 M3 Max | |
| Asus Zenbook Pro 14 OLED UX6404VI | |
| Lenovo Yoga Pro 9-14IRP G8 | |
| Razer Blade 14 RZ09-0508 | |
| Asus ROG Zephyrus G14 2024 GA403U | |
| Średnia w klasie Multimedia (4861 - 33362, n=81, ostatnie 2 lata) | |
| Microsoft Surface Laptop Studio 2 RTX 4060 | |
| Acer Swift X SFX14-71G | |
| Przeciętny Intel Core Ultra 7 155H (9769 - 19007, n=52) | |
| Dell XPS 14 2024 OLED | |
| Cinebench R23 / Single Core | |
| Asus Zenbook Pro 14 OLED UX6404VI | |
| Apple MacBook Pro 14 2023 M3 Max | |
| Średnia w klasie Multimedia (1128 - 2459, n=73, ostatnie 2 lata) | |
| Microsoft Surface Laptop Studio 2 RTX 4060 | |
| Acer Swift X SFX14-71G | |
| Lenovo Yoga Pro 9-14IRP G8 | |
| Razer Blade 14 RZ09-0508 | |
| Asus ROG Zephyrus G14 2024 GA403U | |
| Dell XPS 14 2024 OLED | |
| Przeciętny Intel Core Ultra 7 155H (1496 - 1815, n=52) | |
| Cinebench R20 / CPU (Multi Core) | |
| Asus Zenbook Pro 14 OLED UX6404VI | |
| Lenovo Yoga Pro 9-14IRP G8 | |
| Razer Blade 14 RZ09-0508 | |
| Asus ROG Zephyrus G14 2024 GA403U | |
| Średnia w klasie Multimedia (1887 - 12912, n=64, ostatnie 2 lata) | |
| Microsoft Surface Laptop Studio 2 RTX 4060 | |
| Dell XPS 14 2024 OLED | |
| Acer Swift X SFX14-71G | |
| Apple MacBook Pro 14 2023 M3 Max | |
| Przeciętny Intel Core Ultra 7 155H (3798 - 7409, n=50) | |
| Cinebench R20 / CPU (Single Core) | |
| Asus Zenbook Pro 14 OLED UX6404VI | |
| Acer Swift X SFX14-71G | |
| Microsoft Surface Laptop Studio 2 RTX 4060 | |
| Lenovo Yoga Pro 9-14IRP G8 | |
| Średnia w klasie Multimedia (425 - 853, n=64, ostatnie 2 lata) | |
| Razer Blade 14 RZ09-0508 | |
| Asus ROG Zephyrus G14 2024 GA403U | |
| Dell XPS 14 2024 OLED | |
| Przeciętny Intel Core Ultra 7 155H (601 - 696, n=50) | |
| Apple MacBook Pro 14 2023 M3 Max | |
| Cinebench R15 / CPU Multi 64Bit | |
| Apple MacBook Pro 14 2023 M3 Max | |
| Asus Zenbook Pro 14 OLED UX6404VI | |
| Razer Blade 14 RZ09-0508 | |
| Lenovo Yoga Pro 9-14IRP G8 | |
| Microsoft Surface Laptop Studio 2 RTX 4060 | |
| Asus ROG Zephyrus G14 2024 GA403U | |
| Dell XPS 14 2024 OLED | |
| Średnia w klasie Multimedia (856 - 5224, n=68, ostatnie 2 lata) | |
| Acer Swift X SFX14-71G | |
| Przeciętny Intel Core Ultra 7 155H (1932 - 2880, n=56) | |
| Cinebench R15 / CPU Single 64Bit | |
| Asus Zenbook Pro 14 OLED UX6404VI | |
| Razer Blade 14 RZ09-0508 | |
| Asus ROG Zephyrus G14 2024 GA403U | |
| Średnia w klasie Multimedia (184.8 - 326, n=66, ostatnie 2 lata) | |
| Acer Swift X SFX14-71G | |
| Microsoft Surface Laptop Studio 2 RTX 4060 | |
| Lenovo Yoga Pro 9-14IRP G8 | |
| Apple MacBook Pro 14 2023 M3 Max | |
| Dell XPS 14 2024 OLED | |
| Przeciętny Intel Core Ultra 7 155H (99.6 - 268, n=52) | |
| Blender / v2.79 BMW27 CPU | |
| Acer Swift X SFX14-71G | |
| Dell XPS 14 2024 OLED | |
| Średnia w klasie Multimedia (100 - 557, n=65, ostatnie 2 lata) | |
| Microsoft Surface Laptop Studio 2 RTX 4060 | |
| Przeciętny Intel Core Ultra 7 155H (175 - 381, n=47) | |
| Apple MacBook Pro 14 2023 M3 Max | |
| Asus ROG Zephyrus G14 2024 GA403U | |
| Lenovo Yoga Pro 9-14IRP G8 | |
| Razer Blade 14 RZ09-0508 | |
| Asus Zenbook Pro 14 OLED UX6404VI | |
| 7-Zip 18.03 / 7z b 4 | |
| Asus Zenbook Pro 14 OLED UX6404VI | |
| Razer Blade 14 RZ09-0508 | |
| Lenovo Yoga Pro 9-14IRP G8 | |
| Asus ROG Zephyrus G14 2024 GA403U | |
| Microsoft Surface Laptop Studio 2 RTX 4060 | |
| Średnia w klasie Multimedia (29095 - 130368, n=62, ostatnie 2 lata) | |
| Przeciętny Intel Core Ultra 7 155H (41739 - 70254, n=50) | |
| Acer Swift X SFX14-71G | |
| Dell XPS 14 2024 OLED | |
| 7-Zip 18.03 / 7z b 4 -mmt1 | |
| Asus Zenbook Pro 14 OLED UX6404VI | |
| Razer Blade 14 RZ09-0508 | |
| Microsoft Surface Laptop Studio 2 RTX 4060 | |
| Acer Swift X SFX14-71G | |
| Lenovo Yoga Pro 9-14IRP G8 | |
| Asus ROG Zephyrus G14 2024 GA403U | |
| Średnia w klasie Multimedia (3666 - 7545, n=63, ostatnie 2 lata) | |
| Dell XPS 14 2024 OLED | |
| Przeciętny Intel Core Ultra 7 155H (4594 - 5621, n=50) | |
| Geekbench 6.7 / Multi-Core | |
| Apple MacBook Pro 14 2023 M3 Max | |
| Średnia w klasie Multimedia (4983 - 29415, n=76, ostatnie 2 lata) | |
| Lenovo Yoga Pro 9-14IRP G8 | |
| Lenovo Yoga Pro 9-14IRP G8 | |
| Razer Blade 14 RZ09-0508 | |
| Microsoft Surface Laptop Studio 2 RTX 4060 | |
| Dell XPS 14 2024 OLED | |
| Asus ROG Zephyrus G14 2024 GA403U | |
| Przeciętny Intel Core Ultra 7 155H (7732 - 13656, n=55) | |
| Geekbench 6.7 / Single-Core | |
| Apple MacBook Pro 14 2023 M3 Max | |
| Średnia w klasie Multimedia (1534 - 4335, n=75, ostatnie 2 lata) | |
| Razer Blade 14 RZ09-0508 | |
| Microsoft Surface Laptop Studio 2 RTX 4060 | |
| Asus ROG Zephyrus G14 2024 GA403U | |
| Lenovo Yoga Pro 9-14IRP G8 | |
| Lenovo Yoga Pro 9-14IRP G8 | |
| Dell XPS 14 2024 OLED | |
| Przeciętny Intel Core Ultra 7 155H (1901 - 2473, n=52) | |
| Geekbench 5.5 / Multi-Core | |
| Apple MacBook Pro 14 2023 M3 Max | |
| Asus Zenbook Pro 14 OLED UX6404VI | |
| Lenovo Yoga Pro 9-14IRP G8 | |
| Średnia w klasie Multimedia (4652 - 20422, n=62, ostatnie 2 lata) | |
| Dell XPS 14 2024 OLED | |
| Microsoft Surface Laptop Studio 2 RTX 4060 | |
| Razer Blade 14 RZ09-0508 | |
| Przeciętny Intel Core Ultra 7 155H (10017 - 13556, n=52) | |
| Asus ROG Zephyrus G14 2024 GA403U | |
| Acer Swift X SFX14-71G | |
| Geekbench 5.5 / Single-Core | |
| Apple MacBook Pro 14 2023 M3 Max | |
| Asus Zenbook Pro 14 OLED UX6404VI | |
| Razer Blade 14 RZ09-0508 | |
| Średnia w klasie Multimedia (805 - 2974, n=62, ostatnie 2 lata) | |
| Lenovo Yoga Pro 9-14IRP G8 | |
| Microsoft Surface Laptop Studio 2 RTX 4060 | |
| Acer Swift X SFX14-71G | |
| Asus ROG Zephyrus G14 2024 GA403U | |
| Dell XPS 14 2024 OLED | |
| Przeciętny Intel Core Ultra 7 155H (1462 - 1824, n=52) | |
| HWBOT x265 Benchmark v2.2 / 4k Preset | |
| Razer Blade 14 RZ09-0508 | |
| Asus ROG Zephyrus G14 2024 GA403U | |
| Asus Zenbook Pro 14 OLED UX6404VI | |
| Lenovo Yoga Pro 9-14IRP G8 | |
| Średnia w klasie Multimedia (5.26 - 36.1, n=63, ostatnie 2 lata) | |
| Microsoft Surface Laptop Studio 2 RTX 4060 | |
| Przeciętny Intel Core Ultra 7 155H (9.93 - 21.2, n=50) | |
| Dell XPS 14 2024 OLED | |
| Acer Swift X SFX14-71G | |
| LibreOffice / 20 Documents To PDF | |
| Asus ROG Zephyrus G14 2024 GA403U | |
| Średnia w klasie Multimedia (23.9 - 146.7, n=64, ostatnie 2 lata) | |
| Dell XPS 14 2024 OLED | |
| Przeciętny Intel Core Ultra 7 155H (37.5 - 79.2, n=49) | |
| Razer Blade 14 RZ09-0508 | |
| Lenovo Yoga Pro 9-14IRP G8 | |
| Microsoft Surface Laptop Studio 2 RTX 4060 | |
| Asus Zenbook Pro 14 OLED UX6404VI | |
| Acer Swift X SFX14-71G | |
| R Benchmark 2.5 / Overall mean | |
| Przeciętny Intel Core Ultra 7 155H (0.4457 - 0.53, n=49) | |
| Dell XPS 14 2024 OLED | |
| Średnia w klasie Multimedia (0.3604 - 0.947, n=63, ostatnie 2 lata) | |
| Asus ROG Zephyrus G14 2024 GA403U | |
| Acer Swift X SFX14-71G | |
| Microsoft Surface Laptop Studio 2 RTX 4060 | |
| Lenovo Yoga Pro 9-14IRP G8 | |
| Razer Blade 14 RZ09-0508 | |
| Asus Zenbook Pro 14 OLED UX6404VI | |
* ... im mniej tym lepiej
AIDA64: FP32 Ray-Trace | FPU Julia | CPU SHA3 | CPU Queen | FPU SinJulia | FPU Mandel | CPU AES | CPU ZLib | FP64 Ray-Trace | CPU PhotoWorxx
| Performance rating | |
| Razer Blade 14 RZ09-0508 | |
| Asus ROG Zephyrus G14 2024 GA403U | |
| Asus Zenbook Pro 14 OLED UX6404VI | |
| Lenovo Yoga Pro 9-14IRP G8 | |
| Średnia w klasie Multimedia | |
| Przeciętny Intel Core Ultra 7 155H | |
| Microsoft Surface Laptop Studio 2 RTX 4060 | |
| Dell XPS 14 2024 OLED | |
| Acer Swift X SFX14-71G | |
| AIDA64 / FP32 Ray-Trace | |
| Razer Blade 14 RZ09-0508 | |
| Asus ROG Zephyrus G14 2024 GA403U | |
| Średnia w klasie Multimedia (2214 - 50388, n=60, ostatnie 2 lata) | |
| Lenovo Yoga Pro 9-14IRP G8 | |
| Asus Zenbook Pro 14 OLED UX6404VI | |
| Przeciętny Intel Core Ultra 7 155H (6670 - 18470, n=50) | |
| Microsoft Surface Laptop Studio 2 RTX 4060 | |
| Dell XPS 14 2024 OLED | |
| Acer Swift X SFX14-71G | |
| AIDA64 / FPU Julia | |
| Razer Blade 14 RZ09-0508 | |
| Asus ROG Zephyrus G14 2024 GA403U | |
| Asus Zenbook Pro 14 OLED UX6404VI | |
| Średnia w klasie Multimedia (12867 - 201874, n=61, ostatnie 2 lata) | |
| Lenovo Yoga Pro 9-14IRP G8 | |
| Microsoft Surface Laptop Studio 2 RTX 4060 | |
| Przeciętny Intel Core Ultra 7 155H (40905 - 93181, n=50) | |
| Dell XPS 14 2024 OLED | |
| Acer Swift X SFX14-71G | |
| AIDA64 / CPU SHA3 | |
| Razer Blade 14 RZ09-0508 | |
| Asus ROG Zephyrus G14 2024 GA403U | |
| Asus Zenbook Pro 14 OLED UX6404VI | |
| Średnia w klasie Multimedia (653 - 8623, n=61, ostatnie 2 lata) | |
| Lenovo Yoga Pro 9-14IRP G8 | |
| Przeciętny Intel Core Ultra 7 155H (1940 - 4436, n=50) | |
| Microsoft Surface Laptop Studio 2 RTX 4060 | |
| Dell XPS 14 2024 OLED | |
| Acer Swift X SFX14-71G | |
| AIDA64 / CPU Queen | |
| Razer Blade 14 RZ09-0508 | |
| Asus ROG Zephyrus G14 2024 GA403U | |
| Asus Zenbook Pro 14 OLED UX6404VI | |
| Lenovo Yoga Pro 9-14IRP G8 | |
| Acer Swift X SFX14-71G | |
| Microsoft Surface Laptop Studio 2 RTX 4060 | |
| Dell XPS 14 2024 OLED | |
| Przeciętny Intel Core Ultra 7 155H (64698 - 94181, n=50) | |
| Średnia w klasie Multimedia (13483 - 181505, n=49, ostatnie 2 lata) | |
| AIDA64 / FPU SinJulia | |
| Razer Blade 14 RZ09-0508 | |
| Asus ROG Zephyrus G14 2024 GA403U | |
| Lenovo Yoga Pro 9-14IRP G8 | |
| Asus Zenbook Pro 14 OLED UX6404VI | |
| Przeciętny Intel Core Ultra 7 155H (5639 - 10647, n=50) | |
| Średnia w klasie Multimedia (1240 - 28794, n=61, ostatnie 2 lata) | |
| Dell XPS 14 2024 OLED | |
| Microsoft Surface Laptop Studio 2 RTX 4060 | |
| Acer Swift X SFX14-71G | |
| AIDA64 / FPU Mandel | |
| Razer Blade 14 RZ09-0508 | |
| Asus ROG Zephyrus G14 2024 GA403U | |
| Średnia w klasie Multimedia (6395 - 105740, n=60, ostatnie 2 lata) | |
| Lenovo Yoga Pro 9-14IRP G8 | |
| Asus Zenbook Pro 14 OLED UX6404VI | |
| Przeciętny Intel Core Ultra 7 155H (18236 - 47685, n=50) | |
| Microsoft Surface Laptop Studio 2 RTX 4060 | |
| Dell XPS 14 2024 OLED | |
| Acer Swift X SFX14-71G | |
| AIDA64 / CPU AES | |
| Razer Blade 14 RZ09-0508 | |
| Asus ROG Zephyrus G14 2024 GA403U | |
| Acer Swift X SFX14-71G | |
| Asus Zenbook Pro 14 OLED UX6404VI | |
| Przeciętny Intel Core Ultra 7 155H (45713 - 152179, n=50) | |
| Lenovo Yoga Pro 9-14IRP G8 | |
| Średnia w klasie Multimedia (13243 - 126790, n=61, ostatnie 2 lata) | |
| Microsoft Surface Laptop Studio 2 RTX 4060 | |
| Dell XPS 14 2024 OLED | |
| AIDA64 / CPU ZLib | |
| Asus Zenbook Pro 14 OLED UX6404VI | |
| Razer Blade 14 RZ09-0508 | |
| Lenovo Yoga Pro 9-14IRP G8 | |
| Asus ROG Zephyrus G14 2024 GA403U | |
| Średnia w klasie Multimedia (167.2 - 2022, n=61, ostatnie 2 lata) | |
| Przeciętny Intel Core Ultra 7 155H (557 - 1250, n=50) | |
| Microsoft Surface Laptop Studio 2 RTX 4060 | |
| Dell XPS 14 2024 OLED | |
| Acer Swift X SFX14-71G | |
| AIDA64 / FP64 Ray-Trace | |
| Razer Blade 14 RZ09-0508 | |
| Asus ROG Zephyrus G14 2024 GA403U | |
| Średnia w klasie Multimedia (1014 - 26875, n=61, ostatnie 2 lata) | |
| Lenovo Yoga Pro 9-14IRP G8 | |
| Asus Zenbook Pro 14 OLED UX6404VI | |
| Microsoft Surface Laptop Studio 2 RTX 4060 | |
| Przeciętny Intel Core Ultra 7 155H (3569 - 9802, n=50) | |
| Dell XPS 14 2024 OLED | |
| Acer Swift X SFX14-71G | |
| AIDA64 / CPU PhotoWorxx | |
| Lenovo Yoga Pro 9-14IRP G8 | |
| Dell XPS 14 2024 OLED | |
| Średnia w klasie Multimedia (12860 - 88154, n=61, ostatnie 2 lata) | |
| Przeciętny Intel Core Ultra 7 155H (32719 - 54223, n=50) | |
| Microsoft Surface Laptop Studio 2 RTX 4060 | |
| Asus Zenbook Pro 14 OLED UX6404VI | |
| Razer Blade 14 RZ09-0508 | |
| Acer Swift X SFX14-71G | |
| Asus ROG Zephyrus G14 2024 GA403U | |
Wydajność systemu
Subiektywnie jego wydajność jest bardzo dobra - ale tak jest w przypadku praktycznie wszystkich drogich nowoczesnych laptopów. Podczas testów nie napotkaliśmy żadnych problemów, jednak w syntetycznych benchmarkach konkurencja znacznie wyprzedziła nowego XPS 14 9440.
CrossMark: Overall | Productivity | Creativity | Responsiveness
WebXPRT 3: Overall
WebXPRT 4: Overall
Mozilla Kraken 1.1: Total
| PCMark 10 / Score | |
| Razer Blade 14 RZ09-0508 | |
| Średnia w klasie Multimedia (4325 - 10386, n=58, ostatnie 2 lata) | |
| Asus Zenbook Pro 14 OLED UX6404VI | |
| Asus ROG Zephyrus G14 2024 GA403U | |
| Lenovo Yoga Pro 9-14IRP G8 | |
| Microsoft Surface Laptop Studio 2 RTX 4060 | |
| Acer Swift X SFX14-71G | |
| Przeciętny Intel Core Ultra 7 155H, NVIDIA GeForce RTX 4050 Laptop GPU (6537 - 6973, n=5) | |
| Dell XPS 14 2024 OLED | |
| PCMark 10 / Essentials | |
| Acer Swift X SFX14-71G | |
| Razer Blade 14 RZ09-0508 | |
| Lenovo Yoga Pro 9-14IRP G8 | |
| Asus Zenbook Pro 14 OLED UX6404VI | |
| Microsoft Surface Laptop Studio 2 RTX 4060 | |
| Średnia w klasie Multimedia (8025 - 11664, n=57, ostatnie 2 lata) | |
| Przeciętny Intel Core Ultra 7 155H, NVIDIA GeForce RTX 4050 Laptop GPU (9463 - 10446, n=5) | |
| Dell XPS 14 2024 OLED | |
| Asus ROG Zephyrus G14 2024 GA403U | |
| PCMark 10 / Productivity | |
| Średnia w klasie Multimedia (7323 - 18233, n=57, ostatnie 2 lata) | |
| Razer Blade 14 RZ09-0508 | |
| Asus Zenbook Pro 14 OLED UX6404VI | |
| Asus ROG Zephyrus G14 2024 GA403U | |
| Acer Swift X SFX14-71G | |
| Microsoft Surface Laptop Studio 2 RTX 4060 | |
| Przeciętny Intel Core Ultra 7 155H, NVIDIA GeForce RTX 4050 Laptop GPU (8769 - 9272, n=5) | |
| Lenovo Yoga Pro 9-14IRP G8 | |
| Dell XPS 14 2024 OLED | |
| PCMark 10 / Digital Content Creation | |
| Razer Blade 14 RZ09-0508 | |
| Asus ROG Zephyrus G14 2024 GA403U | |
| Asus Zenbook Pro 14 OLED UX6404VI | |
| Lenovo Yoga Pro 9-14IRP G8 | |
| Microsoft Surface Laptop Studio 2 RTX 4060 | |
| Średnia w klasie Multimedia (3651 - 16240, n=57, ostatnie 2 lata) | |
| Acer Swift X SFX14-71G | |
| Przeciętny Intel Core Ultra 7 155H, NVIDIA GeForce RTX 4050 Laptop GPU (8602 - 10622, n=5) | |
| Dell XPS 14 2024 OLED | |
| CrossMark / Overall | |
| Apple MacBook Pro 14 2023 M3 Max | |
| Asus Zenbook Pro 14 OLED UX6404VI | |
| Acer Swift X SFX14-71G | |
| Lenovo Yoga Pro 9-14IRP G8 | |
| Średnia w klasie Multimedia (866 - 2728, n=67, ostatnie 2 lata) | |
| Razer Blade 14 RZ09-0508 | |
| Asus ROG Zephyrus G14 2024 GA403U | |
| Microsoft Surface Laptop Studio 2 RTX 4060 | |
| Dell XPS 14 2024 OLED | |
| Przeciętny Intel Core Ultra 7 155H, NVIDIA GeForce RTX 4050 Laptop GPU (1552 - 1740, n=5) | |
| CrossMark / Productivity | |
| Acer Swift X SFX14-71G | |
| Apple MacBook Pro 14 2023 M3 Max | |
| Asus Zenbook Pro 14 OLED UX6404VI | |
| Razer Blade 14 RZ09-0508 | |
| Średnia w klasie Multimedia (931 - 2489, n=67, ostatnie 2 lata) | |
| Lenovo Yoga Pro 9-14IRP G8 | |
| Asus ROG Zephyrus G14 2024 GA403U | |
| Microsoft Surface Laptop Studio 2 RTX 4060 | |
| Dell XPS 14 2024 OLED | |
| Przeciętny Intel Core Ultra 7 155H, NVIDIA GeForce RTX 4050 Laptop GPU (1459 - 1659, n=5) | |
| CrossMark / Creativity | |
| Apple MacBook Pro 14 2023 M3 Max | |
| Asus Zenbook Pro 14 OLED UX6404VI | |
| Lenovo Yoga Pro 9-14IRP G8 | |
| Średnia w klasie Multimedia (907 - 3465, n=67, ostatnie 2 lata) | |
| Microsoft Surface Laptop Studio 2 RTX 4060 | |
| Acer Swift X SFX14-71G | |
| Asus ROG Zephyrus G14 2024 GA403U | |
| Razer Blade 14 RZ09-0508 | |
| Dell XPS 14 2024 OLED | |
| Przeciętny Intel Core Ultra 7 155H, NVIDIA GeForce RTX 4050 Laptop GPU (1811 - 1943, n=5) | |
| CrossMark / Responsiveness | |
| Acer Swift X SFX14-71G | |
| Razer Blade 14 RZ09-0508 | |
| Asus Zenbook Pro 14 OLED UX6404VI | |
| Lenovo Yoga Pro 9-14IRP G8 | |
| Średnia w klasie Multimedia (605 - 2024, n=67, ostatnie 2 lata) | |
| Asus ROG Zephyrus G14 2024 GA403U | |
| Apple MacBook Pro 14 2023 M3 Max | |
| Microsoft Surface Laptop Studio 2 RTX 4060 | |
| Dell XPS 14 2024 OLED | |
| Przeciętny Intel Core Ultra 7 155H, NVIDIA GeForce RTX 4050 Laptop GPU (1167 - 1467, n=5) | |
| WebXPRT 3 / Overall | |
| Apple MacBook Pro 14 2023 M3 Max | |
| Średnia w klasie Multimedia (136.4 - 596, n=70, ostatnie 2 lata) | |
| Asus Zenbook Pro 14 OLED UX6404VI | |
| Razer Blade 14 RZ09-0508 | |
| Acer Swift X SFX14-71G | |
| Lenovo Yoga Pro 9-14IRP G8 | |
| Microsoft Surface Laptop Studio 2 RTX 4060 | |
| Asus ROG Zephyrus G14 2024 GA403U | |
| Dell XPS 14 2024 OLED | |
| Przeciętny Intel Core Ultra 7 155H, NVIDIA GeForce RTX 4050 Laptop GPU (262 - 285, n=5) | |
| WebXPRT 4 / Overall | |
| Asus Zenbook Pro 14 OLED UX6404VI | |
| Średnia w klasie Multimedia (167.3 - 402, n=71, ostatnie 2 lata) | |
| Microsoft Surface Laptop Studio 2 RTX 4060 | |
| Acer Swift X SFX14-71G | |
| Lenovo Yoga Pro 9-14IRP G8 | |
| Razer Blade 14 RZ09-0508 | |
| Dell XPS 14 2024 OLED | |
| Przeciętny Intel Core Ultra 7 155H, NVIDIA GeForce RTX 4050 Laptop GPU (247 - 260, n=5) | |
| Asus ROG Zephyrus G14 2024 GA403U | |
| Mozilla Kraken 1.1 / Total | |
| Dell XPS 14 2024 OLED | |
| Przeciętny Intel Core Ultra 7 155H, NVIDIA GeForce RTX 4050 Laptop GPU (416 - 561, n=5) | |
| Asus ROG Zephyrus G14 2024 GA403U | |
| Lenovo Yoga Pro 9-14IRP G8 | |
| Microsoft Surface Laptop Studio 2 RTX 4060 | |
| Acer Swift X SFX14-71G | |
| Razer Blade 14 RZ09-0508 | |
| Asus Zenbook Pro 14 OLED UX6404VI | |
| Średnia w klasie Multimedia (228 - 835, n=74, ostatnie 2 lata) | |
| Apple MacBook Pro 14 2023 M3 Max | |
* ... im mniej tym lepiej
| PCMark 10 Score | 6537 pkt. | |
Pomoc | ||
| AIDA64 / Memory Copy | |
| Dell XPS 14 2024 OLED | |
| Przeciętny Intel Core Ultra 7 155H (62397 - 96791, n=50) | |
| Średnia w klasie Multimedia (21158 - 132135, n=61, ostatnie 2 lata) | |
| Lenovo Yoga Pro 9-14IRP G8 | |
| Asus ROG Zephyrus G14 2024 GA403U | |
| Razer Blade 14 RZ09-0508 | |
| Microsoft Surface Laptop Studio 2 RTX 4060 | |
| Asus Zenbook Pro 14 OLED UX6404VI | |
| Acer Swift X SFX14-71G | |
| AIDA64 / Memory Read | |
| Dell XPS 14 2024 OLED | |
| Średnia w klasie Multimedia (19699 - 174586, n=61, ostatnie 2 lata) | |
| Przeciętny Intel Core Ultra 7 155H (60544 - 90647, n=50) | |
| Lenovo Yoga Pro 9-14IRP G8 | |
| Asus Zenbook Pro 14 OLED UX6404VI | |
| Acer Swift X SFX14-71G | |
| Microsoft Surface Laptop Studio 2 RTX 4060 | |
| Razer Blade 14 RZ09-0508 | |
| Asus ROG Zephyrus G14 2024 GA403U | |
| AIDA64 / Memory Write | |
| Asus ROG Zephyrus G14 2024 GA403U | |
| Lenovo Yoga Pro 9-14IRP G8 | |
| Razer Blade 14 RZ09-0508 | |
| Średnia w klasie Multimedia (17733 - 134998, n=61, ostatnie 2 lata) | |
| Microsoft Surface Laptop Studio 2 RTX 4060 | |
| Dell XPS 14 2024 OLED | |
| Przeciętny Intel Core Ultra 7 155H (58692 - 93451, n=50) | |
| Acer Swift X SFX14-71G | |
| Asus Zenbook Pro 14 OLED UX6404VI | |
| AIDA64 / Memory Latency | |
| Przeciętny Intel Core Ultra 7 155H (116.2 - 233, n=50) | |
| Dell XPS 14 2024 OLED | |
| Średnia w klasie Multimedia (7 - 535, n=60, ostatnie 2 lata) | |
| Asus ROG Zephyrus G14 2024 GA403U | |
| Acer Swift X SFX14-71G | |
| Razer Blade 14 RZ09-0508 | |
| Lenovo Yoga Pro 9-14IRP G8 | |
| Microsoft Surface Laptop Studio 2 RTX 4060 | |
| Asus Zenbook Pro 14 OLED UX6404VI | |
* ... im mniej tym lepiej
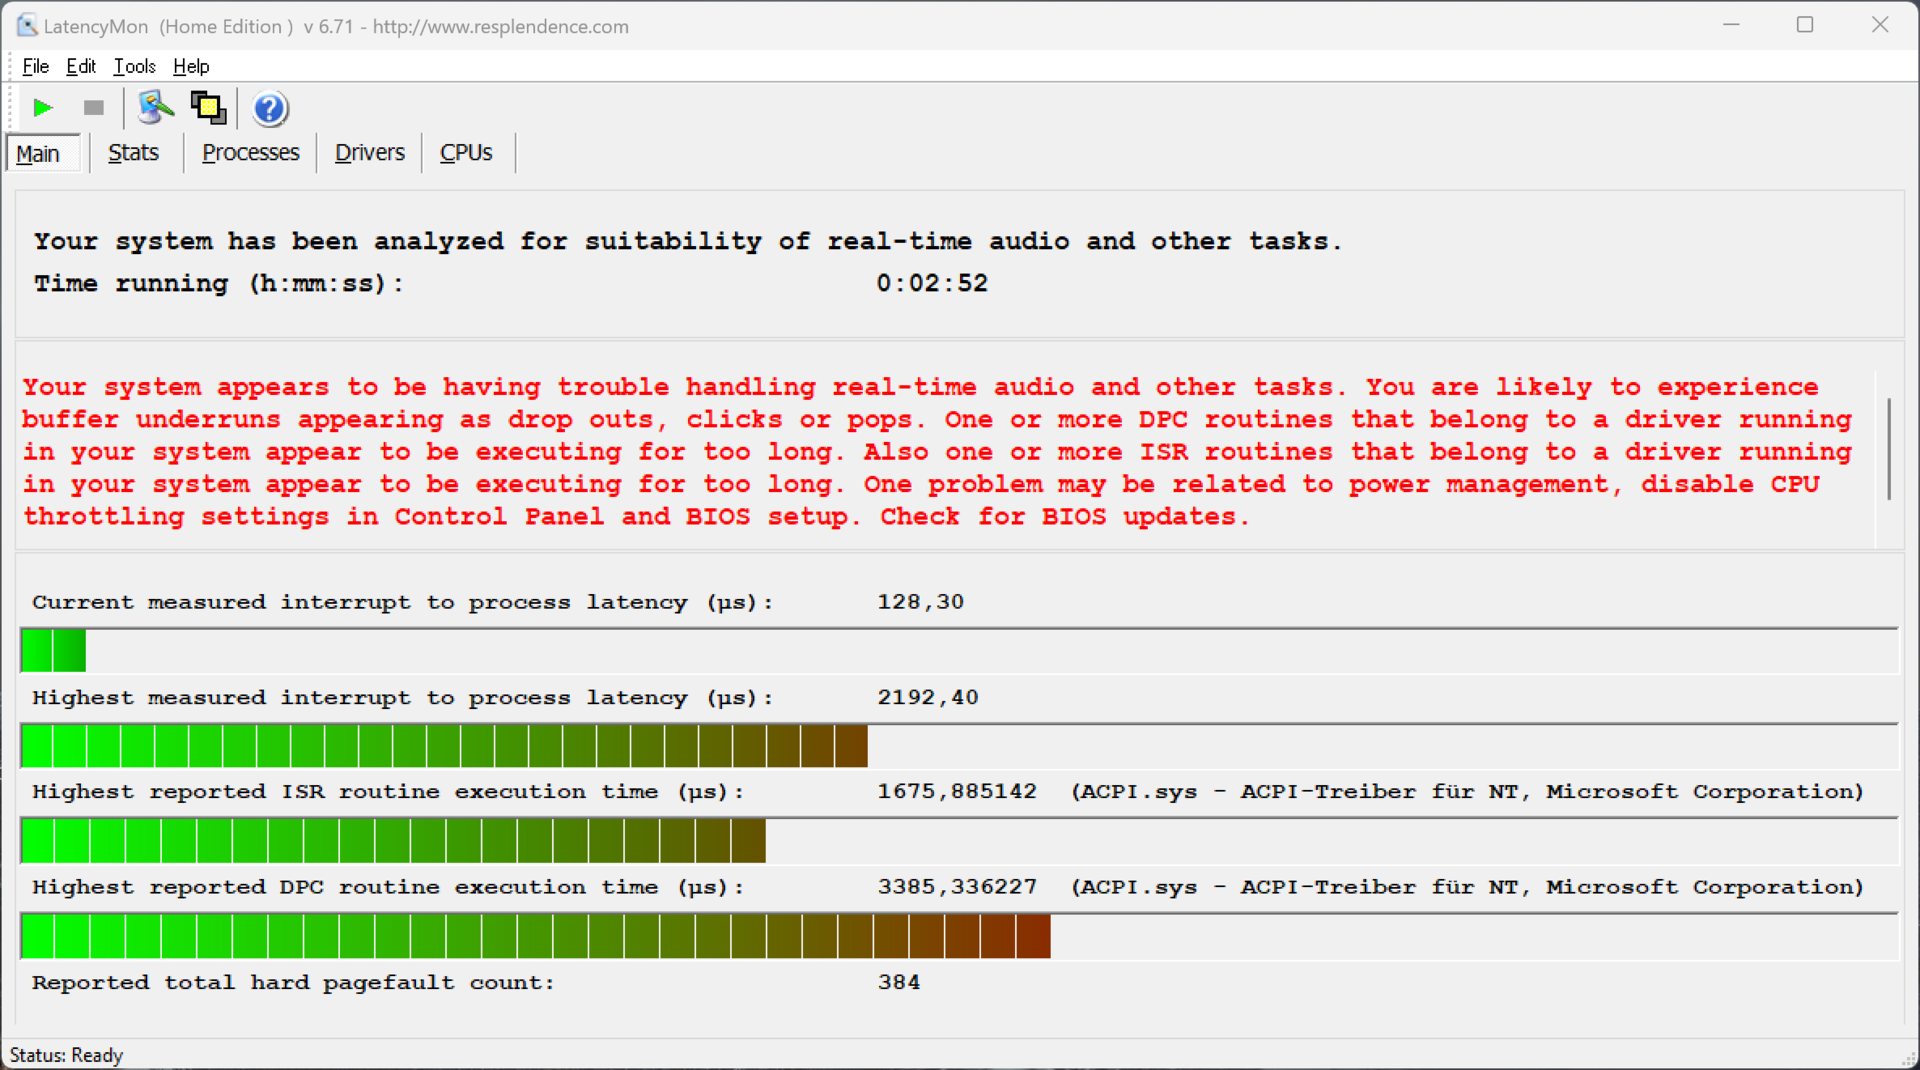
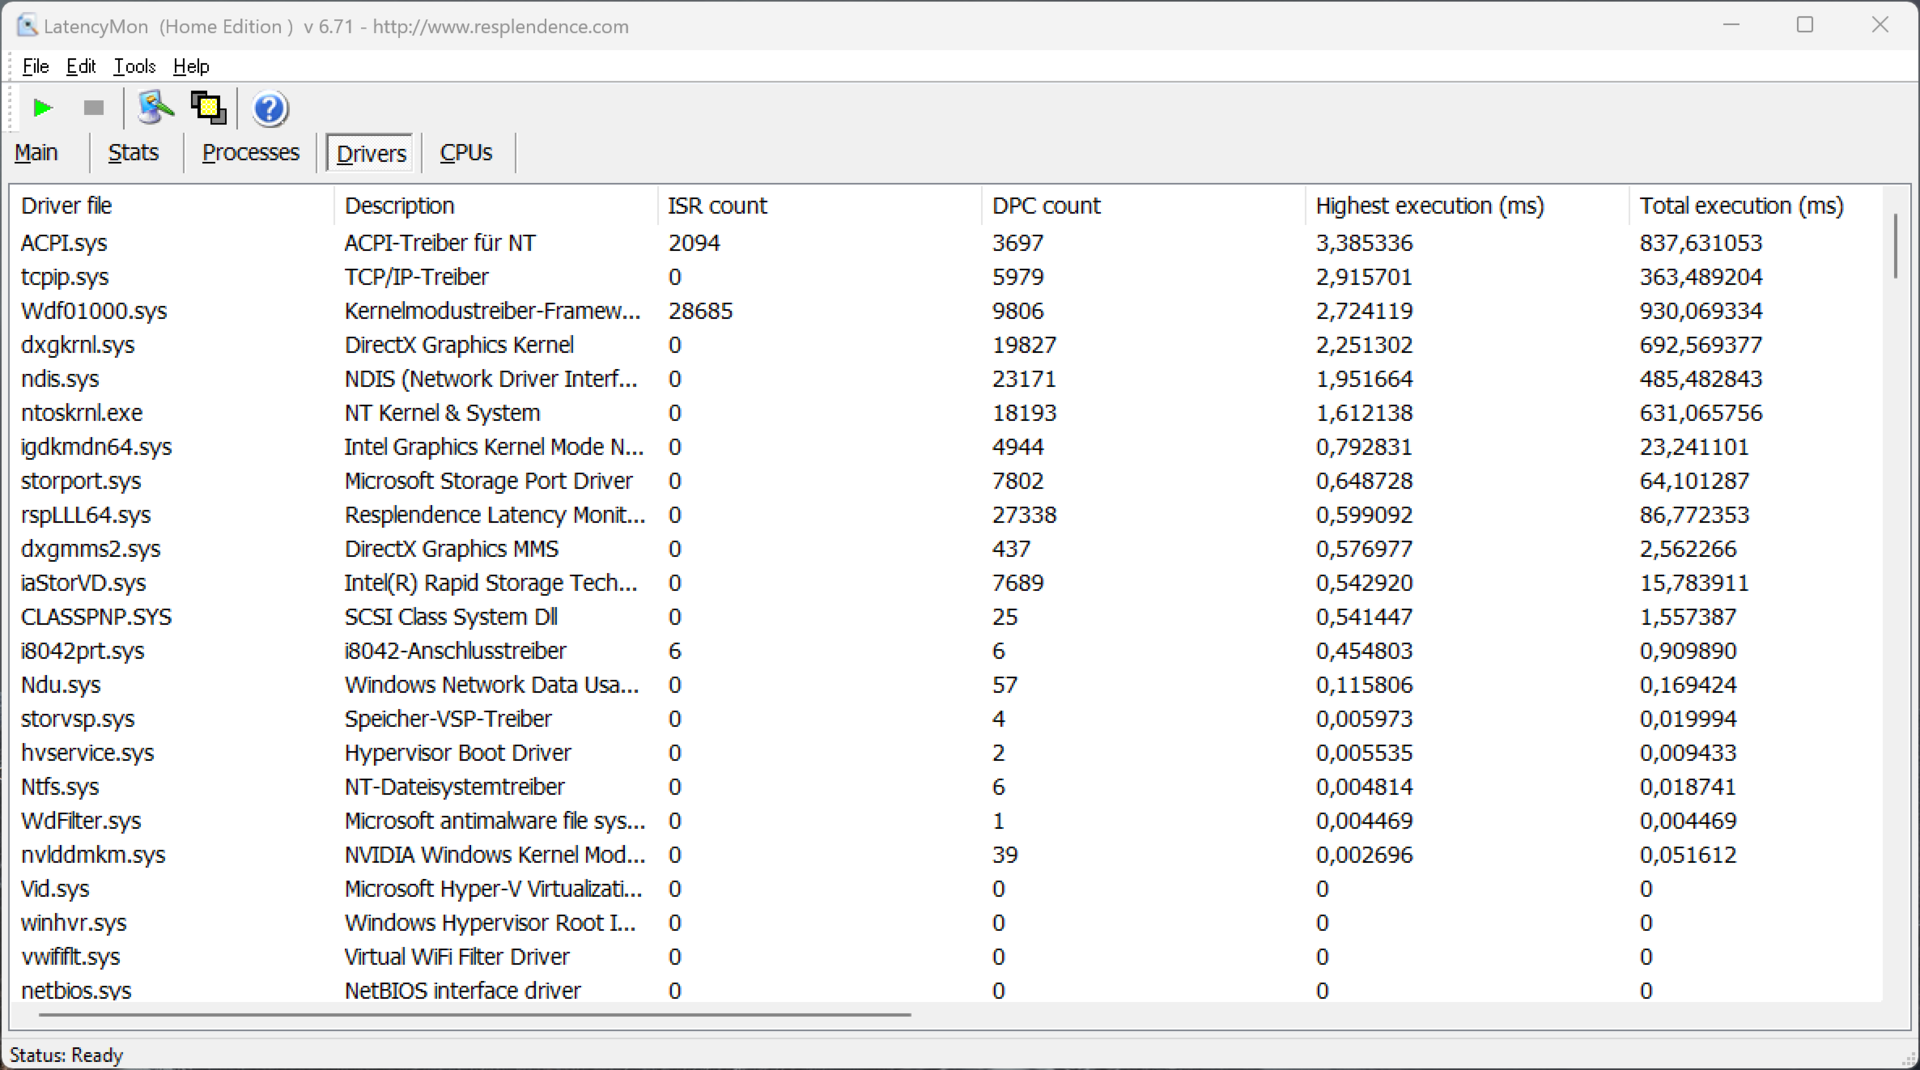
Opóźnienia DPC
W naszym ustandaryzowanym teście opóźnień (surfowanie po sieci, odtwarzanie YouTube w 4K, obciążenie CPU), urządzenie testowe z aktualną wersją BIOS-u wykazało znaczne ograniczenia podczas korzystania z aplikacji audio w czasie rzeczywistym.
| DPC Latencies / LatencyMon - interrupt to process latency (max), Web, Youtube, Prime95 | |
| Microsoft Surface Laptop Studio 2 RTX 4060 | |
| Acer Swift X SFX14-71G | |
| Dell XPS 14 2024 OLED | |
| Asus Zenbook Pro 14 OLED UX6404VI | |
| Lenovo Yoga Pro 9-14IRP G8 | |
| Razer Blade 14 RZ09-0508 | |
| Asus ROG Zephyrus G14 2024 GA403U | |
* ... im mniej tym lepiej
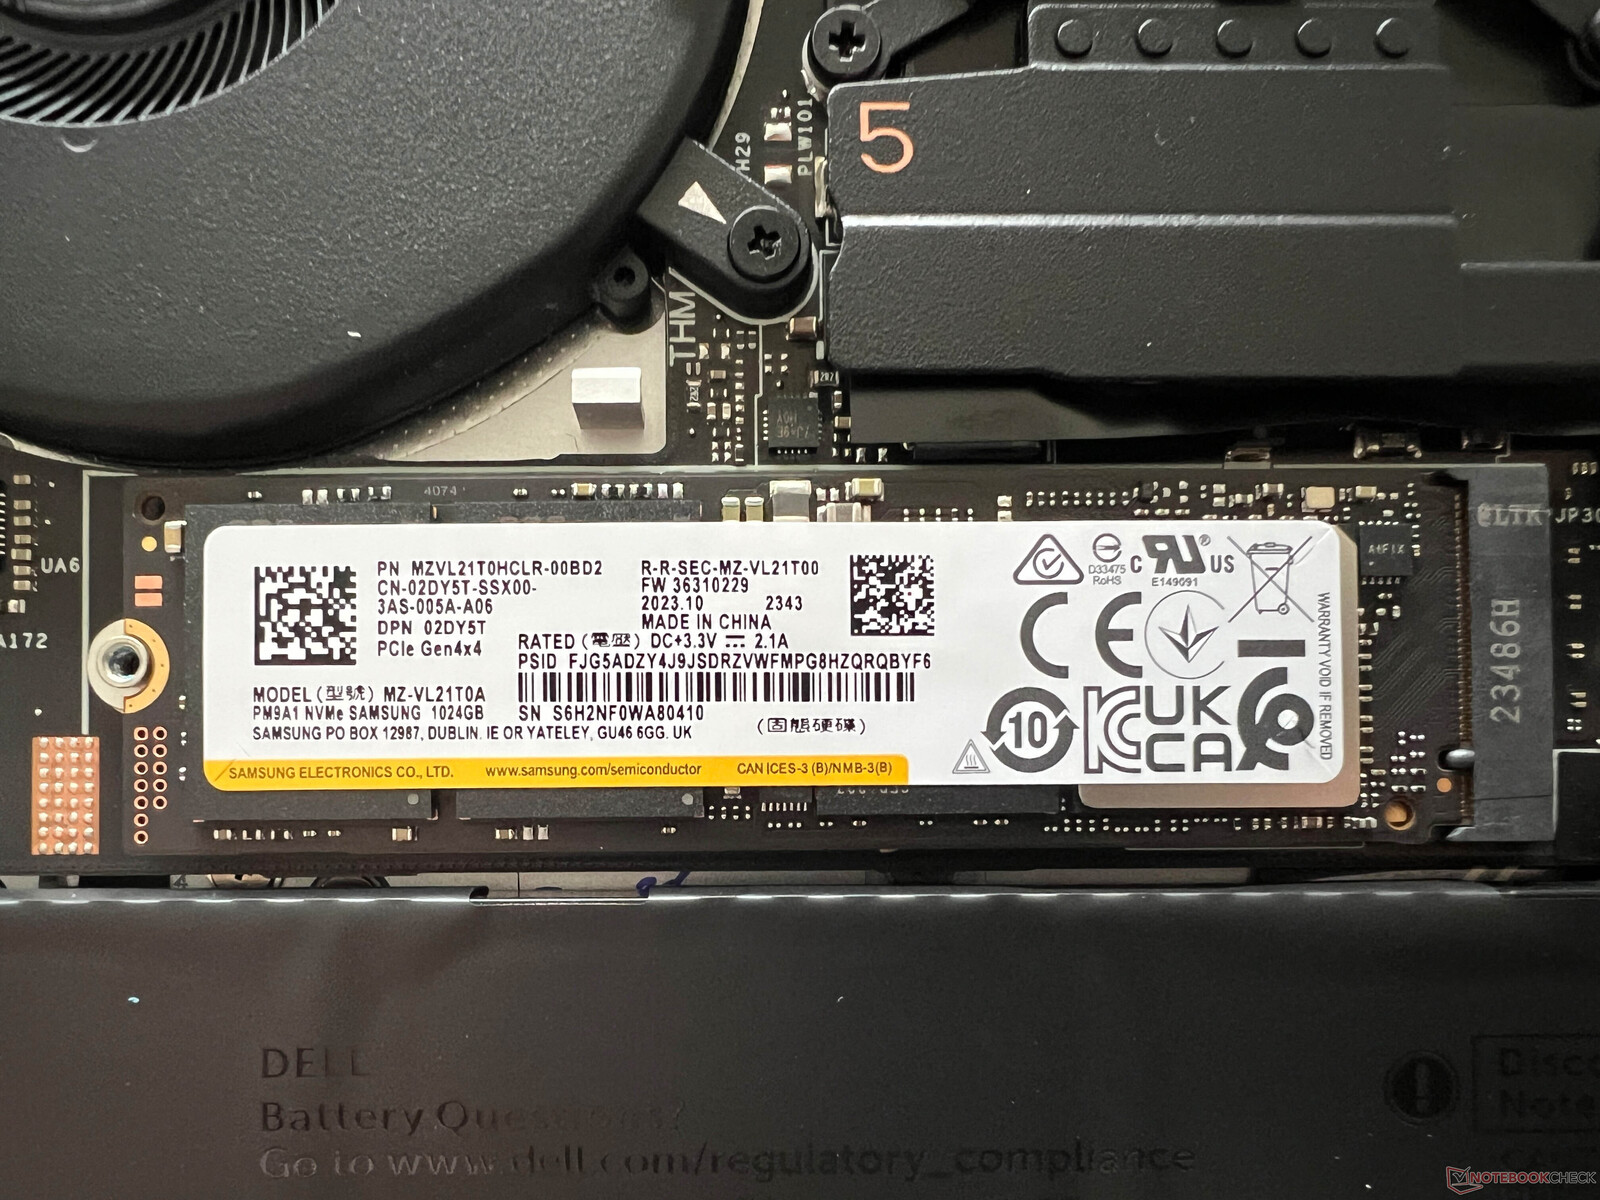
Urządzenia pamięci masowej
Nowy XPS 14 9440 jest wyposażony w gniazdo PCIe 4.0, a nasze urządzenie testowe wykorzystuje wariant Samsung PM9A1 o pojemności 1 TB, przy czym model ten jest wersją OEM 980 Pro. Ogólnie rzecz biorąc, wydajność dysku SSD jest świetna, a jego maksymalne prędkości transferu są bardzo wysokie. Ponadto wartości te pozostały całkowicie stabilne przy dłuższych okresach obciążenia, co nie zawsze jest oczywiste. Po pierwszym uruchomieniu urządzenia użytkownicy mają do dyspozycji 837 GB wolnego miejsca. Więcej testów porównawczych SSD znajdą Państwo tutaj.

* ... im mniej tym lepiej
Reading continuous performance: DiskSpd Read Loop, Queue Depth 8
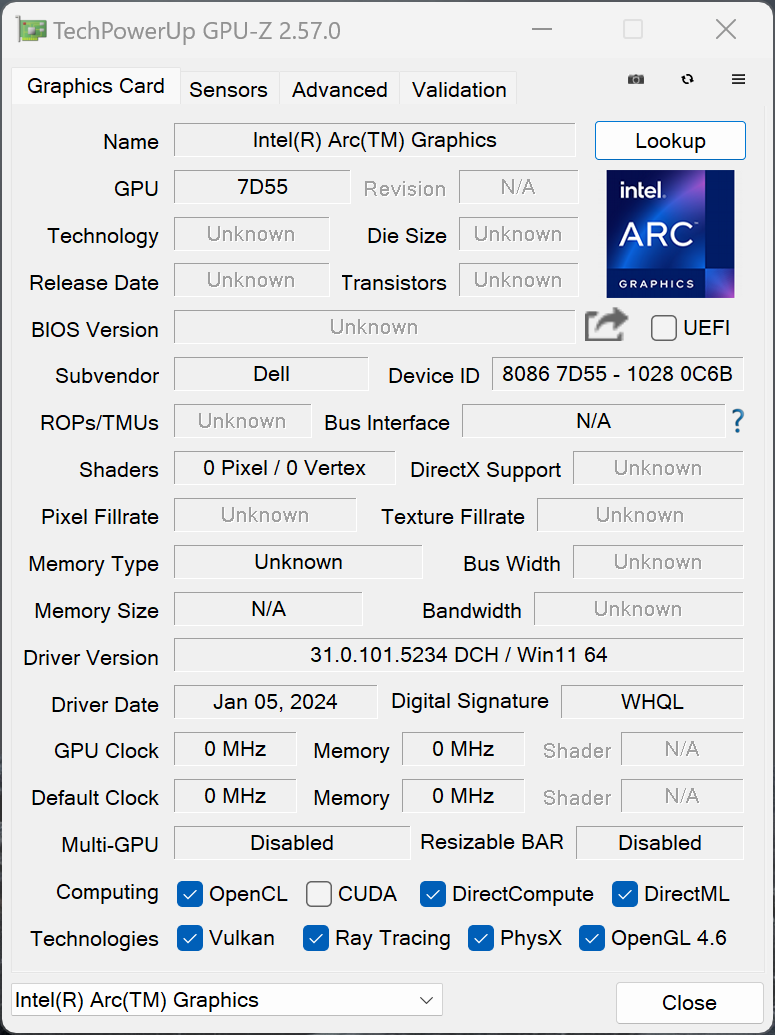
Karta graficzna
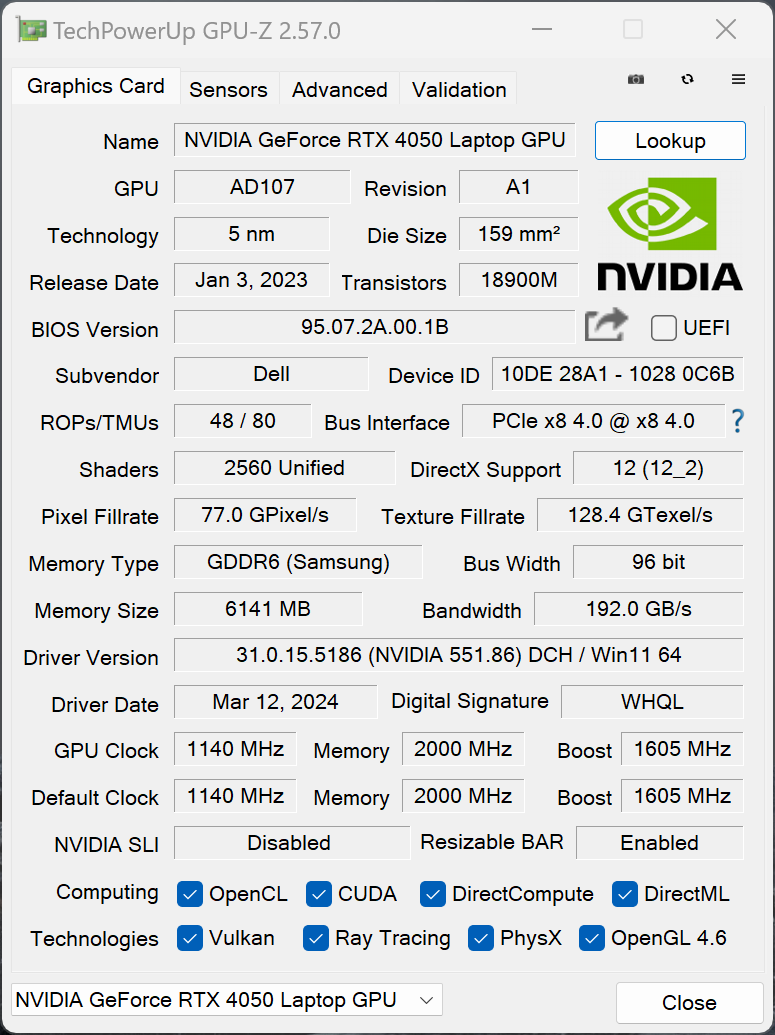
XPS 14 9440 jest dostępny w wersji z iGPU lub z dedykowaną kartą graficzną Nvidia GeForce RTX 4050 Laptopczyli model zainstalowany w naszym urządzeniu testowym. W przeciwieństwie do większego XPS 16, Dell zdecydował się nie używać przełączania grafiki Advanced Optimus. Według Nvidii, RTX 4050 Laptop działa w zakresie TGP 35-115 watów i zgodnie ze sterownikiem graficznym, GPU może zużywać 40 watów w XPS 14 - ale w praktyce tak nie jest. Sam Dell podał jedynie 30 watów i wartość tę udało się potwierdzić za pomocą naszych testów. Nawet użycie profilu Ultra Performance nie spowodowało zwiększenia wydajności. Oznacza to, że model ten jest najwolniejszą wersją RTX 4050 Laptop, którą do tej pory testowaliśmy, a konkurencja (również wyposażona w RTX 4050 Laptop) oferuje po prostu wyższą wydajność graficzną. XPS 14 to po prostu słowa poza urządzeniami takimi jak Zephyrus G14 z RTX 4070 Laptop.
Pod stałym obciążeniem jego wydajność graficzna pozostaje stabilna. Jednak podczas korzystania z baterii nie jest w stanie utrzymać nawet 30 watów, co prowadzi do spadku wydajności GPU o około 17% (4,259 punktów @ Time Spy Graphics). Więcej testów porównawczych GPU można znaleźć na stronie tutaj.
| 3DMark 11 Performance | 13881 pkt. | |
| 3DMark Fire Strike Score | 12382 pkt. | |
| 3DMark Time Spy Score | 5395 pkt. | |
Pomoc | ||
| Blender / v3.3 Classroom OPTIX/RTX | |
| Dell XPS 14 2024 OLED | |
| Średnia w klasie Multimedia (12 - 105, n=24, ostatnie 2 lata) | |
| Acer Swift X SFX14-71G | |
| Przeciętny NVIDIA GeForce RTX 4050 Laptop GPU (25 - 37, n=40) | |
| Lenovo Yoga Pro 9-14IRP G8 | |
| Microsoft Surface Laptop Studio 2 RTX 4060 | |
| Asus ROG Zephyrus G14 2024 GA403U | |
| Asus Zenbook Pro 14 OLED UX6404VI | |
| Razer Blade 14 RZ09-0508 | |
| Blender / v3.3 Classroom CUDA | |
| Dell XPS 14 2024 OLED | |
| Średnia w klasie Multimedia (20 - 186, n=24, ostatnie 2 lata) | |
| Acer Swift X SFX14-71G | |
| Przeciętny NVIDIA GeForce RTX 4050 Laptop GPU (47 - 68, n=39) | |
| Lenovo Yoga Pro 9-14IRP G8 | |
| Microsoft Surface Laptop Studio 2 RTX 4060 | |
| Asus Zenbook Pro 14 OLED UX6404VI | |
| Asus ROG Zephyrus G14 2024 GA403U | |
| Razer Blade 14 RZ09-0508 | |
| Blender / v3.3 Classroom CPU | |
| Acer Swift X SFX14-71G | |
| Dell XPS 14 2024 OLED | |
| Średnia w klasie Multimedia (134.5 - 1042, n=68, ostatnie 2 lata) | |
| Przeciętny NVIDIA GeForce RTX 4050 Laptop GPU (243 - 907, n=40) | |
| Microsoft Surface Laptop Studio 2 RTX 4060 | |
| Lenovo Yoga Pro 9-14IRP G8 | |
| Asus ROG Zephyrus G14 2024 GA403U | |
| Asus Zenbook Pro 14 OLED UX6404VI | |
| Razer Blade 14 RZ09-0508 | |
| Apple MacBook Pro 14 2023 M3 Max | |
| Blender / v3.3 Classroom METAL | |
| Średnia w klasie Multimedia (17.8 - 68, n=5, ostatnie 2 lata) | |
| Apple MacBook Pro 14 2023 M3 Max | |
* ... im mniej tym lepiej
Wydajność w grach
Jeśli chodzi o wydajność w grach, sytuacja jest porównywalna z wydajnością GPU, co również skutkuje nowym XPS 14 9440 z RTX 4050 Laptop pozostaje daleko w tyle za konkurencją i innymi laptopami wyposażonymi w RTX 4050. Podczas grania w obecne gry, użytkownik jest zazwyczaj ograniczony do 1080p i wysokich ustawień detali, ponieważ przy użyciu maksymalnych ustawień, często osiąga się tylko nieco ponad 30 klatek na sekundę. W takim scenariuszu trzeba będzie albo zmniejszyć szczegóły, albo skorzystać z technologii skalowania w górę, takich jak DLSS Nvidii. Przynajmniej jego wydajność w grach pozostaje stabilna nawet podczas dłuższych sesji.
| The Witcher 3 - 1920x1080 Ultra Graphics & Postprocessing (HBAO+) | |
| Razer Blade 14 RZ09-0508 | |
| Asus Zenbook Pro 14 OLED UX6404VI | |
| Asus ROG Zephyrus G14 2024 GA403U | |
| Microsoft Surface Laptop Studio 2 RTX 4060 | |
| Lenovo Yoga Pro 9-14IRP G8 | |
| Acer Swift X SFX14-71G | |
| Dell XPS 14 2024 OLED | |
| Średnia w klasie Multimedia (11 - 121, n=13, ostatnie 2 lata) | |
| Call of Duty Modern Warfare 3 2023 | |
| 1920x1080 Extreme Preset | |
| Razer Blade 14 RZ09-0508 | |
| Asus ROG Zephyrus G14 2024 GA403U | |
| Średnia w klasie Multimedia (31 - 120, n=3, ostatnie 2 lata) | |
| Przeciętny NVIDIA GeForce RTX 4050 Laptop GPU (45 - 80, n=2) | |
| Dell XPS 14 2024 OLED | |
| 2560x1440 Extreme Preset | |
| Średnia w klasie Multimedia (n=1ostatnie 2 lata) | |
| Razer Blade 14 RZ09-0508 | |
| Asus ROG Zephyrus G14 2024 GA403U | |
| Przeciętny NVIDIA GeForce RTX 4050 Laptop GPU (29 - 53, n=2) | |
| Dell XPS 14 2024 OLED | |
Witcher 3 FPS diagram
| low | med. | high | ultra | QHD | |
|---|---|---|---|---|---|
| GTA V (2015) | 119.9 | 106 | 62.7 | 44.3 | |
| The Witcher 3 (2015) | 98 | 52.4 | 39 | ||
| Dota 2 Reborn (2015) | 119.7 | 118.5 | 116.5 | 103.6 | |
| Final Fantasy XV Benchmark (2018) | 99.2 | 70.8 | 52.3 | 38 | |
| X-Plane 11.11 (2018) | 109.8 | 86.2 | 77.1 | ||
| Far Cry 5 (2018) | 108 | 85 | 80 | 76 | 51 |
| Strange Brigade (2018) | 239 | 130 | 105 | 92 | 61 |
| F1 23 (2023) | 102.9 | 113.5 | 93.5 | 27.3 | 16.7 |
| Baldur's Gate 3 (2023) | 73.4 | 56 | 49.8 | 48.3 | 32.4 |
| Cyberpunk 2077 (2023) | 67.2 | 50.1 | 42.4 | 35.8 | 20.6 |
| Call of Duty Modern Warfare 3 2023 (2023) | 73 | 65 | 48 | 45 | 29 |
Emisje - Wysoka aktywność wentylatora
Emisja hałasu
Biorąc pod uwagę jego niską wydajność, można by założyć, że jednostka chłodząca laptopa przynajmniej działa bardzo cicho, jednak tak nie jest, a jego pasywne chłodzenie również nie jest zbyt dobre. Nawet podczas prostych zadań wentylatory są często aktywne, ale przy mniej niż 30 dB(A) są nadal dość ciche. Wentylatory były nawet aktywne podczas odtwarzania wideo. Gdy tylko poddamy podzespoły wyższym wymaganiom, szybko robi się znacznie głośniej, co oznacza, że można spodziewać się od 39 do 43 dB(A) podczas grania - przy czym 43 dB(A) odpowiada również maksimum podczas korzystania z profilu Optimized. W trybie cichym odnotowaliśmy maksymalnie 38,9 dB(A), co nie jest dużo cichsze, a przy aktywowanej Ultra Performance zmierzyliśmy głośne 48,4 dB(A). Na szczęście nie odnotowaliśmy żadnych dodatkowych odgłosów elektronicznych pochodzących z naszej próbki testowej.
Hałas
| luz |
| 24.3 / 26.5 / 28.5 dB |
| obciążenie |
| 37 / 43.3 dB |
 | ||
30 dB cichy 40 dB(A) słyszalny 50 dB(A) irytujący |
||
min: | ||
| Dell XPS 14 2024 OLED GeForce RTX 4050 Laptop GPU, Ultra 7 155H, Samsung PM9A1 MZVL21T0HCLR | Apple MacBook Pro 14 2023 M3 Max M3 Max 40-Core GPU, Apple M3 Max 16-Core, Apple SSD AP2048Z | Microsoft Surface Laptop Studio 2 RTX 4060 GeForce RTX 4060 Laptop GPU, i7-13700H, Kioxia XG8 KXG80ZNV1T02 | Lenovo Yoga Pro 9-14IRP G8 GeForce RTX 4050 Laptop GPU, i7-13705H, Samsung PM9A1 MZVL21T0HCLR | Acer Swift X SFX14-71G GeForce RTX 4050 Laptop GPU, i7-13700H, Samsung PM9A1 MZVL21T0HCLR | Asus Zenbook Pro 14 OLED UX6404VI GeForce RTX 4070 Laptop GPU, i9-13900H, Micron 3400 2TB MTFDKBA2T0TFH | Asus ROG Zephyrus G14 2024 GA403U GeForce RTX 4070 Laptop GPU, R9 8945HS, WD PC SN560 SDDPNQE-1T00 | Razer Blade 14 RZ09-0508 GeForce RTX 4070 Laptop GPU, R9 8945HS, Samsung PM9A1 MZVL21T0HCLR | |
|---|---|---|---|---|---|---|---|---|
| Noise | 5% | -9% | -10% | -15% | -1% | -3% | -3% | |
| wyłączone / środowisko * (dB) | 24.3 | 24.8 -2% | 23.9 2% | 24.8 -2% | 24.8 -2% | 23.3 4% | 23.9 2% | 24.3 -0% |
| Idle Minimum * (dB) | 24.3 | 24.8 -2% | 23.9 2% | 24.8 -2% | 28.2 -16% | 23.3 4% | 23.9 2% | 25 -3% |
| Idle Average * (dB) | 26.5 | 24.8 6% | 24.4 8% | 24.8 6% | 31.8 -20% | 23.3 12% | 23.9 10% | 25 6% |
| Idle Maximum * (dB) | 28.5 | 24.8 13% | 26.9 6% | 24.8 13% | 31.8 -12% | 23.3 18% | 23.9 16% | 25 12% |
| Load Average * (dB) | 37 | 25.8 30% | 48.5 -31% | 47.4 -28% | 38.2 -3% | 39.3 -6% | 46.2 -25% | 33 11% |
| Witcher 3 ultra * (dB) | 39.1 | 43.4 -11% | 51.8 -32% | 52.9 -35% | 50 -28% | 48.8 -25% | 46.2 -18% | 49.5 -27% |
| Load Maximum * (dB) | 43.3 | 43.4 -0% | 51.8 -20% | 52.9 -22% | 52.2 -21% | 48.8 -13% | 46.2 -7% | 51.9 -20% |
* ... im mniej tym lepiej
Temperatura
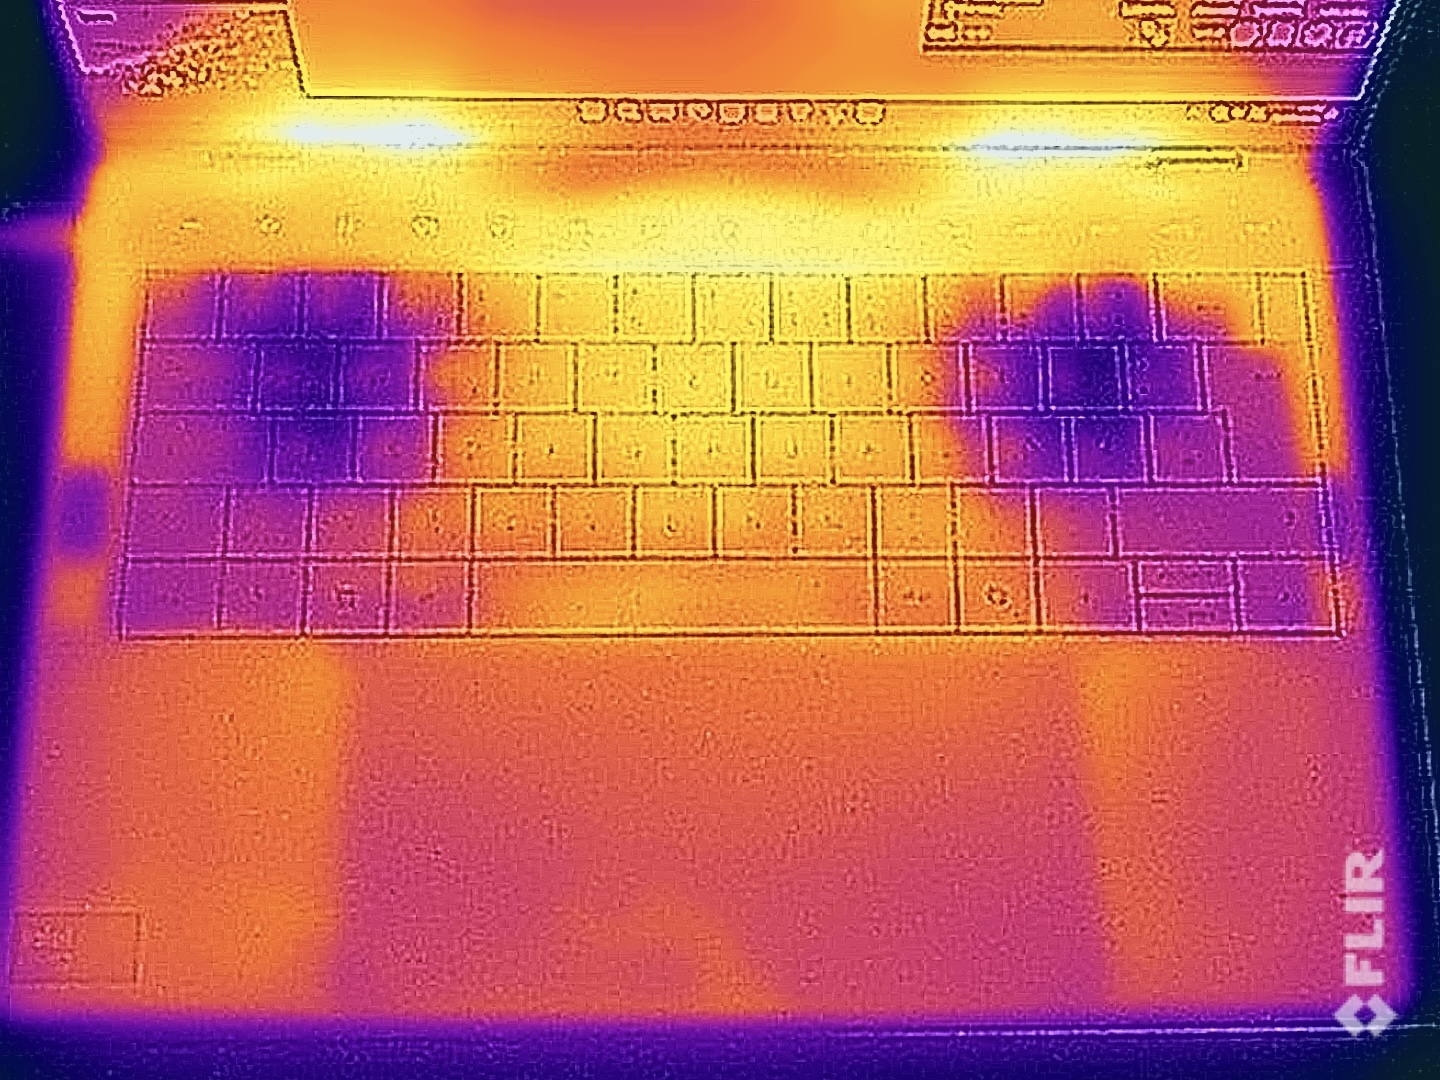
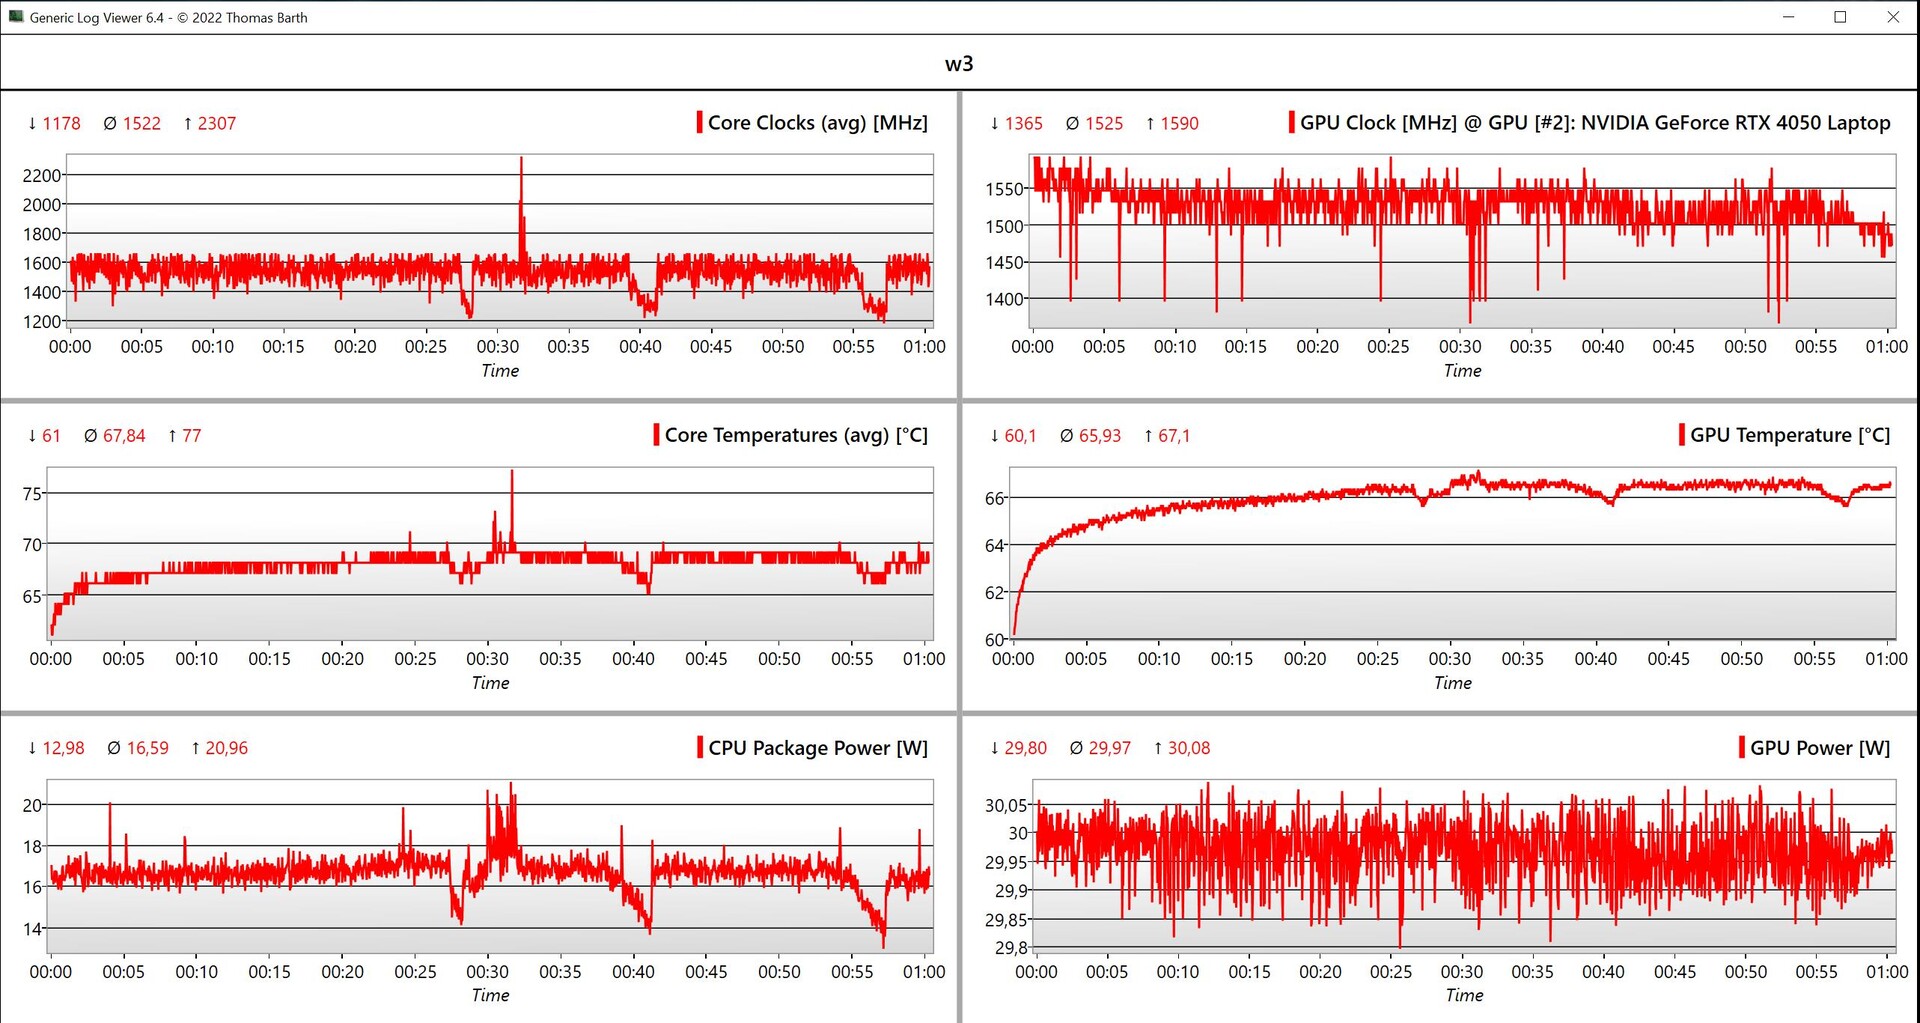
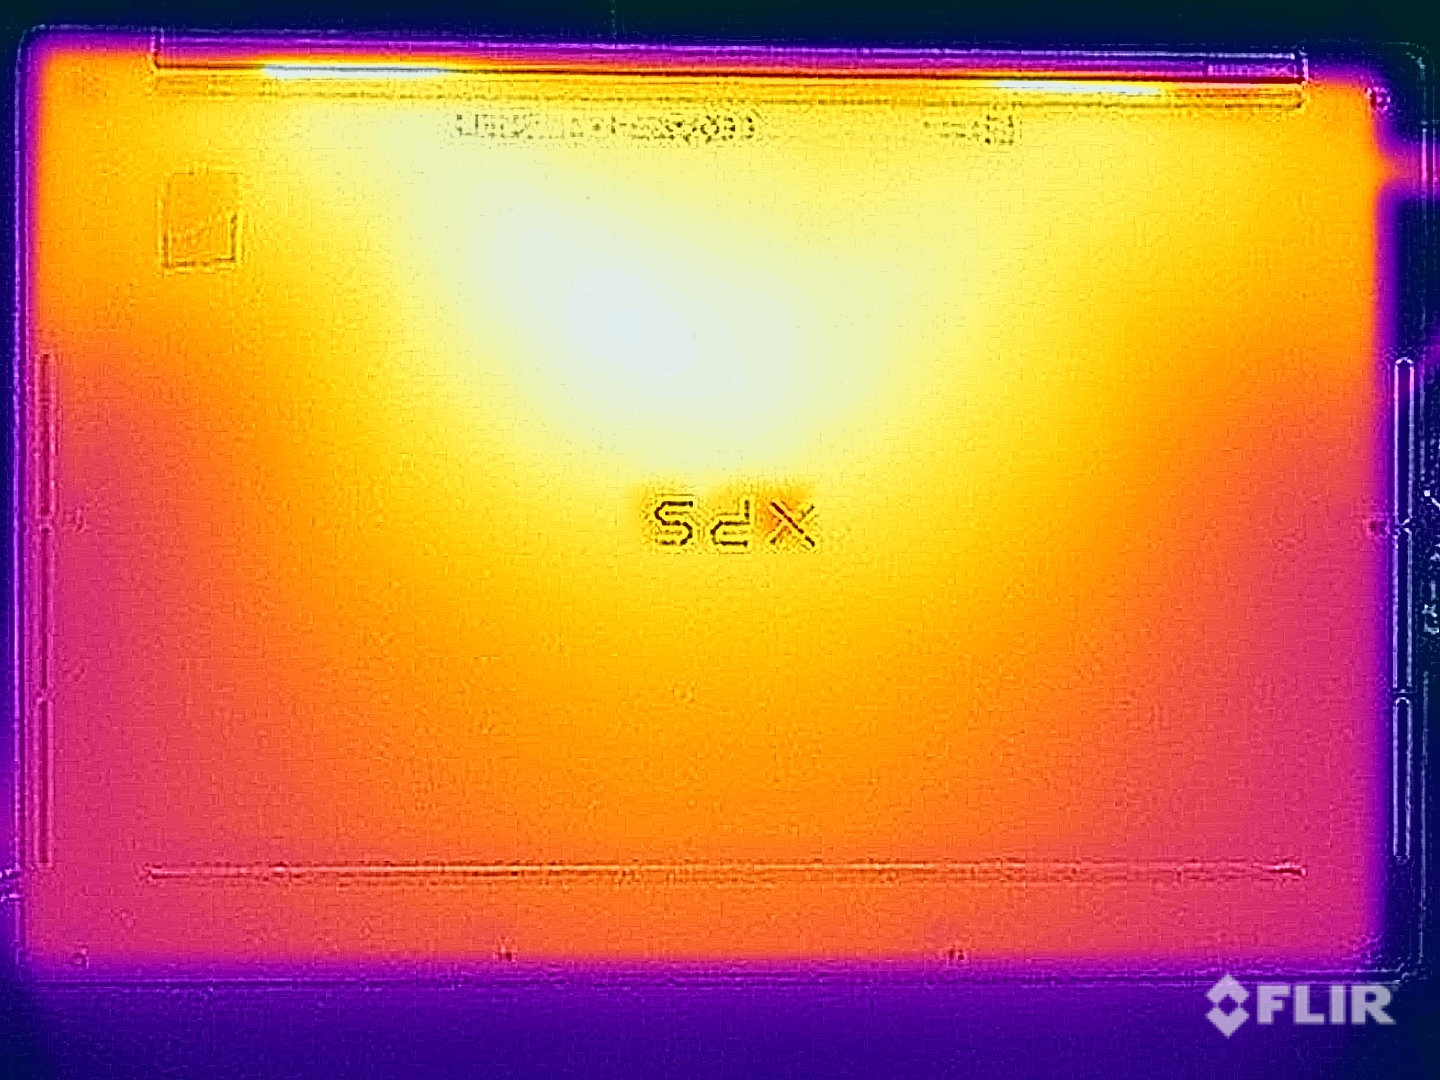
XPS 14 nie wykazał żadnych problemów z temperaturami powierzchni. Na biegu jałowym i podczas mniej wymagających zadań, metalowa obudowa ledwo się nagrzewała i nawet pod pełnym obciążeniem, zmierzyliśmy tylko maksymalnie ~42 °C w tylnym środkowym obszarze spodu urządzenia. Oczywiście temperatura ta jest zauważalna, jednak nadal można uniknąć umieszczenia laptopa na udach. Zmierzyliśmy maksymalnie około 40 °C na górze jednostki bazowej, przy czym obszar klawiatury pozostał nieco chłodniejszy, co nie prowadziło do żadnych ograniczeń podczas pisania.
Podczas testu obciążeniowego z połączonym obciążeniem CPU/GPU, karta graficzna pozostawała stabilna na poziomie 30 W, podczas gdy pobór mocy procesora zależał od temperatury. Po zużyciu 66 watów, a następnie 40 watów przez krótki czas, jego zużycie zrównoważyło się między 20-30 watów. Gdy tylko temperatura układu osiągnęła 80 °C, jego zużycie energii zaczęło powoli spadać, a gdy temperatura układu spadła poniżej 70 °C, jego zużycie ponownie wzrosło na krótką chwilę. Średnio podczas testu obciążeniowego procesor zużywał nieco ponad 20 watów.
(±) Maksymalna temperatura w górnej części wynosi 40.5 °C / 105 F, w porównaniu do średniej 36.8 °C / 98 F , począwszy od 21 do 71 °C dla klasy Multimedia.
(±) Dno nagrzewa się maksymalnie do 42.6 °C / 109 F, w porównaniu do średniej 39.1 °C / 102 F
(+) W stanie bezczynności średnia temperatura górnej części wynosi 26.1 °C / 79 F, w porównaniu ze średnią temperaturą urządzenia wynoszącą 31.3 °C / ### class_avg_f### F.
(±) Podczas gry w Wiedźmina 3 średnia temperatura górnej części wynosi 35.2 °C / 95 F, w porównaniu do średniej temperatury urządzenia wynoszącej 31.3 °C / ## #class_avg_f### F.
(+) Podparcia dłoni i touchpad osiągają maksymalną temperaturę skóry (33.6 °C / 92.5 F) i dlatego nie są gorące.
(-) Średnia temperatura obszaru podparcia dłoni w podobnych urządzeniach wynosiła 28.7 °C / 83.7 F (-4.9 °C / -8.8 F).
| Dell XPS 14 2024 OLED Intel Core Ultra 7 155H, NVIDIA GeForce RTX 4050 Laptop GPU | Apple MacBook Pro 14 2023 M3 Max Apple M3 Max 16-Core, Apple M3 Max 40-Core GPU | Microsoft Surface Laptop Studio 2 RTX 4060 Intel Core i7-13700H, NVIDIA GeForce RTX 4060 Laptop GPU | Lenovo Yoga Pro 9-14IRP G8 Intel Core i7-13705H, NVIDIA GeForce RTX 4050 Laptop GPU | Acer Swift X SFX14-71G Intel Core i7-13700H, NVIDIA GeForce RTX 4050 Laptop GPU | Asus Zenbook Pro 14 OLED UX6404VI Intel Core i9-13900H, NVIDIA GeForce RTX 4070 Laptop GPU | Asus ROG Zephyrus G14 2024 GA403U AMD Ryzen 9 8945HS, NVIDIA GeForce RTX 4070 Laptop GPU | Razer Blade 14 RZ09-0508 AMD Ryzen 9 8945HS, NVIDIA GeForce RTX 4070 Laptop GPU | |
|---|---|---|---|---|---|---|---|---|
| Heat | 4% | 1% | -10% | -6% | -8% | -7% | -17% | |
| Maximum Upper Side * (°C) | 40.5 | 45.9 -13% | 40.4 -0% | 41 -1% | 46.4 -15% | 40.6 -0% | 46.6 -15% | 41.8 -3% |
| Maximum Bottom * (°C) | 42.6 | 42.1 1% | 42.2 1% | 56.7 -33% | 49 -15% | 49.5 -16% | 47.8 -12% | 42.2 1% |
| Idle Upper Side * (°C) | 26.9 | 23.4 13% | 26.6 1% | 27.4 -2% | 26.5 1% | 28.2 -5% | 26.7 1% | 34.8 -29% |
| Idle Bottom * (°C) | 27.8 | 23.8 14% | 27 3% | 29.1 -5% | 26.6 4% | 30.6 -10% | 27.8 -0% | 37.4 -35% |
* ... im mniej tym lepiej
Głośniki
Dell zainstalował w laptopie system głośników z czterema modułami (2x głośniki niskotonowe, 2x głośniki wysokotonowe) o łącznej mocy 8 watów. Jego dźwięk jest ogólnie dobry, ale nie tak potężny jak w przypadku konkurencyjnych modeli, takich jak MacBook Pro 14 a zwłaszcza ROG Zephyrus G14 oferują lepsze systemy dźwiękowe.
Dell XPS 14 2024 OLED analiza dźwięku
(+) | głośniki mogą odtwarzać stosunkowo głośno (82.8 dB)
Bas 100 - 315 Hz
(±) | zredukowany bas - średnio 9.9% niższy od mediany
(±) | liniowość basu jest średnia (10.1% delta do poprzedniej częstotliwości)
Średnie 400 - 2000 Hz
(+) | zbalansowane środki średnie - tylko 4.4% od mediany
(+) | średnie są liniowe (3.8% delta do poprzedniej częstotliwości)
Wysokie 2–16 kHz
(+) | zrównoważone maksima - tylko 2.3% od mediany
(±) | liniowość wysokich wartości jest średnia (7% delta do poprzedniej częstotliwości)
Ogólnie 100 - 16.000 Hz
(+) | ogólny dźwięk jest liniowy (11% różnicy w stosunku do mediany)
W porównaniu do tej samej klasy
» 16% wszystkich testowanych urządzeń w tej klasie było lepszych, 3% podobnych, 81% gorszych
» Najlepszy miał deltę 5%, średnia wynosiła ###średnia###%, najgorsza wynosiła 45%
W porównaniu do wszystkich testowanych urządzeń
» 6% wszystkich testowanych urządzeń było lepszych, 2% podobnych, 92% gorszych
» Najlepszy miał deltę 4%, średnia wynosiła ###średnia###%, najgorsza wynosiła 134%
Apple MacBook Pro 14 2023 M3 Max analiza dźwięku
(+) | głośniki mogą odtwarzać stosunkowo głośno (85 dB)
Bas 100 - 315 Hz
(+) | dobry bas - tylko 4.9% od mediany
(±) | liniowość basu jest średnia (8.4% delta do poprzedniej częstotliwości)
Średnie 400 - 2000 Hz
(+) | zbalansowane środki średnie - tylko 1.2% od mediany
(+) | średnie są liniowe (2.8% delta do poprzedniej częstotliwości)
Wysokie 2–16 kHz
(+) | zrównoważone maksima - tylko 2.6% od mediany
(+) | wzloty są liniowe (2.6% delta do poprzedniej częstotliwości)
Ogólnie 100 - 16.000 Hz
(+) | ogólny dźwięk jest liniowy (5.6% różnicy w stosunku do mediany)
W porównaniu do tej samej klasy
» 2% wszystkich testowanych urządzeń w tej klasie było lepszych, 1% podobnych, 97% gorszych
» Najlepszy miał deltę 5%, średnia wynosiła ###średnia###%, najgorsza wynosiła 45%
W porównaniu do wszystkich testowanych urządzeń
» 0% wszystkich testowanych urządzeń było lepszych, 0% podobnych, 100% gorszych
» Najlepszy miał deltę 4%, średnia wynosiła ###średnia###%, najgorsza wynosiła 134%
Asus ROG Zephyrus G14 2024 GA403U analiza dźwięku
(+) | głośniki mogą odtwarzać stosunkowo głośno (84.7 dB)
Bas 100 - 315 Hz
(+) | dobry bas - tylko 3.5% od mediany
(±) | liniowość basu jest średnia (7.3% delta do poprzedniej częstotliwości)
Średnie 400 - 2000 Hz
(+) | zbalansowane środki średnie - tylko 3.8% od mediany
(+) | średnie są liniowe (3.6% delta do poprzedniej częstotliwości)
Wysokie 2–16 kHz
(+) | zrównoważone maksima - tylko 1.4% od mediany
(+) | wzloty są liniowe (3.5% delta do poprzedniej częstotliwości)
Ogólnie 100 - 16.000 Hz
(+) | ogólny dźwięk jest liniowy (5.8% różnicy w stosunku do mediany)
W porównaniu do tej samej klasy
» 0% wszystkich testowanych urządzeń w tej klasie było lepszych, 0% podobnych, 100% gorszych
» Najlepszy miał deltę 6%, średnia wynosiła ###średnia###%, najgorsza wynosiła 132%
W porównaniu do wszystkich testowanych urządzeń
» 0% wszystkich testowanych urządzeń było lepszych, 0% podobnych, 100% gorszych
» Najlepszy miał deltę 4%, średnia wynosiła ###średnia###%, najgorsza wynosiła 134%
Zarządzanie energią - OLED o wysokim zużyciu energii
Zużycie energii
Ekran OLED o wysokiej rozdzielczości wymaga sporo energii i przy pełnej jasności, w trybie bezczynności i ze standardowym ciemnym obrazem tła, odnotowaliśmy nieco ponad 10 watów. Jego konkurenci Mini-LED mogą wymagać jeszcze więcej energii, ale też świecą jaśniej - ponadto jaśniejszy Zephyrus G14 jest bardziej oszczędny, zużywając maksymalnie 9 watów. Pod pełnym obciążeniem zmierzyliśmy maksymalnie 107 watów przez krótki okres, który następnie szybko zrównoważył się do około 75 watów. Oznacza to, że dostarczony 100-watowy zasilacz jest wystarczający.
| wyłączony / stan wstrzymania | |
| luz | |
| obciążenie |
|
Legenda:
min: | |
| Dell XPS 14 2024 OLED Ultra 7 155H, GeForce RTX 4050 Laptop GPU, Samsung PM9A1 MZVL21T0HCLR, OLED, 3200x2000, 14.5" | Apple MacBook Pro 14 2023 M3 Max Apple M3 Max 16-Core, M3 Max 40-Core GPU, Apple SSD AP2048Z, Mini-LED, 3024x1964, 14.2" | Microsoft Surface Laptop Studio 2 RTX 4060 i7-13700H, GeForce RTX 4060 Laptop GPU, Kioxia XG8 KXG80ZNV1T02, IPS, 2400x1600, 14.4" | Lenovo Yoga Pro 9-14IRP G8 i7-13705H, GeForce RTX 4050 Laptop GPU, Samsung PM9A1 MZVL21T0HCLR, Mini-LED, 3072x1920, 14.5" | Acer Swift X SFX14-71G i7-13700H, GeForce RTX 4050 Laptop GPU, Samsung PM9A1 MZVL21T0HCLR, OLED, 2880x1800, 14.5" | Asus Zenbook Pro 14 OLED UX6404VI i9-13900H, GeForce RTX 4070 Laptop GPU, Micron 3400 2TB MTFDKBA2T0TFH, OLED, 2880x1800, 14.5" | Asus ROG Zephyrus G14 2024 GA403U R9 8945HS, GeForce RTX 4070 Laptop GPU, WD PC SN560 SDDPNQE-1T00, OLED, 2880x1800, 14" | Razer Blade 14 RZ09-0508 R9 8945HS, GeForce RTX 4070 Laptop GPU, Samsung PM9A1 MZVL21T0HCLR, IPS, 2560x1600, 14" | Przeciętny NVIDIA GeForce RTX 4050 Laptop GPU | Średnia w klasie Multimedia | |
|---|---|---|---|---|---|---|---|---|---|---|
| Power Consumption | -6% | 5% | -60% | -12% | -39% | -13% | -136% | -51% | 4% | |
| Idle Minimum * (Watt) | 8.1 | 2.6 68% | 3 63% | 10.9 -35% | 8.4 -4% | 7.5 7% | 6.9 15% | 20.9 -158% | 9.95 ? -23% | 5.71 ? 30% |
| Idle Average * (Watt) | 9.9 | 11.8 -19% | 7.1 28% | 17.7 -79% | 11.5 -16% | 11.1 -12% | 8.6 13% | 25.6 -159% | 15.8 ? -60% | 10.1 ? -2% |
| Idle Maximum * (Watt) | 10.4 | 12.2 -17% | 7.6 27% | 19.3 -86% | 11.9 -14% | 11.6 -12% | 9 13% | 32.1 -209% | 20.1 ? -93% | 12.4 ? -19% |
| Load Average * (Watt) | 75.6 | 99.9 -32% | 73.1 3% | 93.3 -23% | 84.9 -12% | 91.9 -22% | 75.2 1% | 72.7 4% | 88 ? -16% | 65 ? 14% |
| Witcher 3 ultra * (Watt) | 65.6 | 92.5 -41% | 113.9 -74% | 129.5 -97% | 83.6 -27% | 132.2 -102% | 109.7 -67% | 182.1 -178% | ||
| Load Maximum * (Watt) | 107.1 | 101.7 5% | 128.5 -20% | 150.2 -40% | 104.2 3% | 208 -94% | 161.6 -51% | 228.4 -113% | 176.3 ? -65% | 112.2 ? -5% |
* ... im mniej tym lepiej
Power consumption Witcher 3 / stress test
Power consumption with external monitor
Czas trwania
Pojemność akumulatora wynosi 69,5 Wh, a jego czasy pracy są niestety tylko przeciętne. Przy jasności 150 cd/m² (69% maksymalnej jasności SDR naszego urządzenia testowego) i przy 60 Hz, nasz test WLAN trwał 7:45 godzin (6:55 godzin przy 120 Hz), a przy pełnej jasności 6:24 godzin (5:47 godzin przy 120 Hz). Test wideo przy 150 cd/m² trwał 10:35 godzin, a wideo HDR można było odtwarzać przez 10:35 godzin przy maksymalnej jasności.
Dell oferuje dwa różne profile ładowania i w trybie normalnym, pełne naładowanie przy włączonym urządzeniu zajmuje niecałe 1:50 godziny (80% w ~90 minut), a przy włączonym trybie ekspresowym 80 minut (80% w ~56 minut).
| Dell XPS 14 2024 OLED Ultra 7 155H, GeForce RTX 4050 Laptop GPU, 69.5 Wh | Apple MacBook Pro 14 2023 M3 Max Apple M3 Max 16-Core, M3 Max 40-Core GPU, 72.6 Wh | Microsoft Surface Laptop Studio 2 RTX 4060 i7-13700H, GeForce RTX 4060 Laptop GPU, 58 Wh | Lenovo Yoga Pro 9-14IRP G8 i7-13705H, GeForce RTX 4050 Laptop GPU, 75 Wh | Acer Swift X SFX14-71G i7-13700H, GeForce RTX 4050 Laptop GPU, 76 Wh | Asus Zenbook Pro 14 OLED UX6404VI i9-13900H, GeForce RTX 4070 Laptop GPU, 76 Wh | Asus ROG Zephyrus G14 2024 GA403U R9 8945HS, GeForce RTX 4070 Laptop GPU, 73 Wh | Razer Blade 14 RZ09-0508 R9 8945HS, GeForce RTX 4070 Laptop GPU, 68 Wh | Średnia w klasie Multimedia | |
|---|---|---|---|---|---|---|---|---|---|
| Czasy pracy | 52% | 27% | -6% | -19% | -15% | 6% | -9% | 46% | |
| H.264 (h) | 10.6 | 18 70% | 11.3 7% | 9.1 -14% | 9.5 -10% | 8.5 -20% | 12.1 14% | 16.4 ? 55% | |
| WiFi v1.3 (h) | 7.8 | 15.2 95% | 8.3 6% | 8 3% | 7.7 -1% | 7.6 -3% | 9.3 19% | 7.1 -9% | 12 ? 54% |
| Load (h) | 1.3 | 1.2 -8% | 2.2 69% | 1.2 -8% | 0.7 -46% | 1 -23% | 1.1 -15% | 1.2 -8% | 1.675 ? 29% |
| Reader / Idle (h) | 8 | 25.2 ? |
Za
Przeciw
Werdykt - Nowy XPS 14 musi przyznać się do porażki z konkurencją
Nowy Dell XPS 14 9440 wzbudził kilka pytań po naszym teście. Jesteśmy najbardziej zaskoczeni jego ogólną koncepcją, ponieważ nowy 14-calowy XPS jest bardzo ciężkim, grubym i drogim laptopem w porównaniu do konkurencyjnych urządzeń - co naturalnie niesie ze sobą pewne oczekiwania. Jednak jego wydajność znajduje się na zupełnie drugim końcu skali i za około 2500 USD otrzymują Państwo najwolniejszą wersję GeForce RTX 4050 Laptop, którą do tej pory testowaliśmy. Co więcej, jego wentylatory nie są bynajmniej ciche.
Konstrukcja nowych modeli Della jest inspirowana XPS 13 Plus 9320, przyjmując również jego nietypowe urządzenia wejściowe, które przynoszą ze sobą sporo problemów. Zdecydowanie trzeba przyzwyczaić się do klawiatury z płaskimi klawiszami i chociaż pasek dotykowy dla klawiszy funkcyjnych - w tym klawisza ESC - może wyglądać ładnie na zdjęciach, jego praktyczne zastosowanie po prostu nie istnieje, a jeśli już, to jego jasność po prostu przeszkadza. Dzieje się tak na przykład podczas oglądania filmów w ciemnym otoczeniu. Z drugiej strony bezramkowy touchpad działa całkiem dobrze. Sama obudowa jest dobrze zbudowana i oferuje dobrą stabilność, ale jest po prostu dość masywna. Chociaż jego opcje łączności obejmują trzy nowoczesne porty USB-C, w tym Thunderbolt, a także szybki czytnik kart, konkurencja generalnie oferuje więcej, takich jak wyjście HDMI i USB-A.
Nowy XPS 14 9440 kładzie duży nacisk na elegancki wygląd, ale zaniedbuje przy tym podstawowe aspekty, takie jak ergonomia, a przede wszystkim wydajność. Biorąc pod uwagę wysoką cenę, XPS 14 nie ma szans z konkurentami, takimi jak Asus ROG Zephyrus G14, który jest lepszy praktycznie pod każdym względem, a także jest znacznie tańszy.
Opcjonalny wyświetlacz OLED o rozdzielczości 3200 x 2000 pikseli oferuje dobrą jakość obrazu z dokładnymi profilami P3 i sRGB, jednak bliższe przyjrzenie się ujawnia efekt rastra - szczególnie podczas oglądania jasnych treści. Przy maksymalnej jasności SDR wynoszącej 350 cd/m², panel Samsunga nie jest w stanie dotrzymać kroku najnowszej generacji OLED-ów, gdyż obecne 120-Hz OLED-y 2.8K osiągają już nawet 400 cd/m². Co więcej, wyższe poziomy jasności prowadzą do ciągłego migotania PWM. Co więcej, ekran OLED zużywa sporo energii, co przekłada się na przeciętne czasy pracy.
Jedyną przewagą XPS 14 nad konkurentami jest możliwość zakupu go z maksymalnie 64 GB pamięci RAM i dyskiem SSD o pojemności 4 TB prosto od producenta. Poza tym nowy XPS pozostaje w tyle pod każdym względem. Znacznie lepszy ROG Zephyrus G14-który jest lżejszy i cieńszy - oferuje znacznie lepszą wydajność procesora, znacznie szybsze RTX 4070 Laptopwięcej opcji łączności, lepsze urządzenia wejściowe, lepsze głośniki i świetny ekran OLED 2,8K 120 Hz za 2800 USD. Laptop ten oferuje nawet rozwiązanie programowe przeciwdziałające migotaniu PWM. Tylko jego wentylatory stają się nieco głośniejsze. XPS nie ma również szans w porównaniu do Yoga Pro 9 14 od Lenovoz 14,5-calowym panelem Mini-LED i 80-watową wersją laptopa RTX 4050. Tylko Apple's MacBook Pro 14 z procesorem M3 Max jest sporo droższy, jednak pod względem wydajności (CPU i GPU) działa na zupełnie nowym poziomie, a jego całkowity pakiet jest również lepszy.
Nawet podstawowy model nowego XPS 14 9440 z Core Ultra 7 155H, 16 GB RAM, 512-GB SSD i panelem Full-HD nie ma większego sensu, ponieważ wtedy jego masywna obudowa i duża waga są jeszcze bardziej zauważalne. Ponadto, wariant iGPU, który skorzystałby na szybkiej pamięci RAM, obecnie jest dostarczany tylko z wolniejszą pamięcią RAM LPDDR5x-6400. Jego cena, wynosząca około 2000 USD, jest również zdecydowanie zbyt wysoka, a za tę kwotę można również uzyskać podstawowy model ROG Zephyrus G14 z Ryzen 9 8945HSoLED 2,8K, 16 GB pamięci RAM, dyskiem SSD 512 GB i dedykowaną kartą graficzną GeForce RTX 4050 Laptop.
Cena i dostępność
Nowy XPS 14 9440 można zamówić bezpośrednio w firmie Dell, a jego ceny zaczynają się od 1499 USD.
Dell XPS 14 2024 OLED
- 03/04/2024 v7 (old)
Andreas Osthoff
Przezroczystość
Wyboru urządzeń do recenzji dokonuje nasza redakcja. Próbka testowa została udostępniona autorowi jako pożyczka od producenta lub sprzedawcy detalicznego na potrzeby tej recenzji. Pożyczkodawca nie miał wpływu na tę recenzję, producent nie otrzymał też kopii tej recenzji przed publikacją. Nie było obowiązku publikowania tej recenzji. Jako niezależna firma medialna, Notebookcheck nie podlega władzy producentów, sprzedawców detalicznych ani wydawców.
Tak testuje Notebookcheck
Każdego roku Notebookcheck niezależnie sprawdza setki laptopów i smartfonów, stosując standardowe procedury, aby zapewnić porównywalność wszystkich wyników. Od około 20 lat stale rozwijamy nasze metody badawcze, ustanawiając przy tym standardy branżowe. W naszych laboratoriach testowych doświadczeni technicy i redaktorzy korzystają z wysokiej jakości sprzętu pomiarowego. Testy te obejmują wieloetapowy proces walidacji. Nasz kompleksowy system ocen opiera się na setkach uzasadnionych pomiarów i benchmarków, co pozwala zachować obiektywizm.Price comparison

