Werdykt - prosty biznes premium
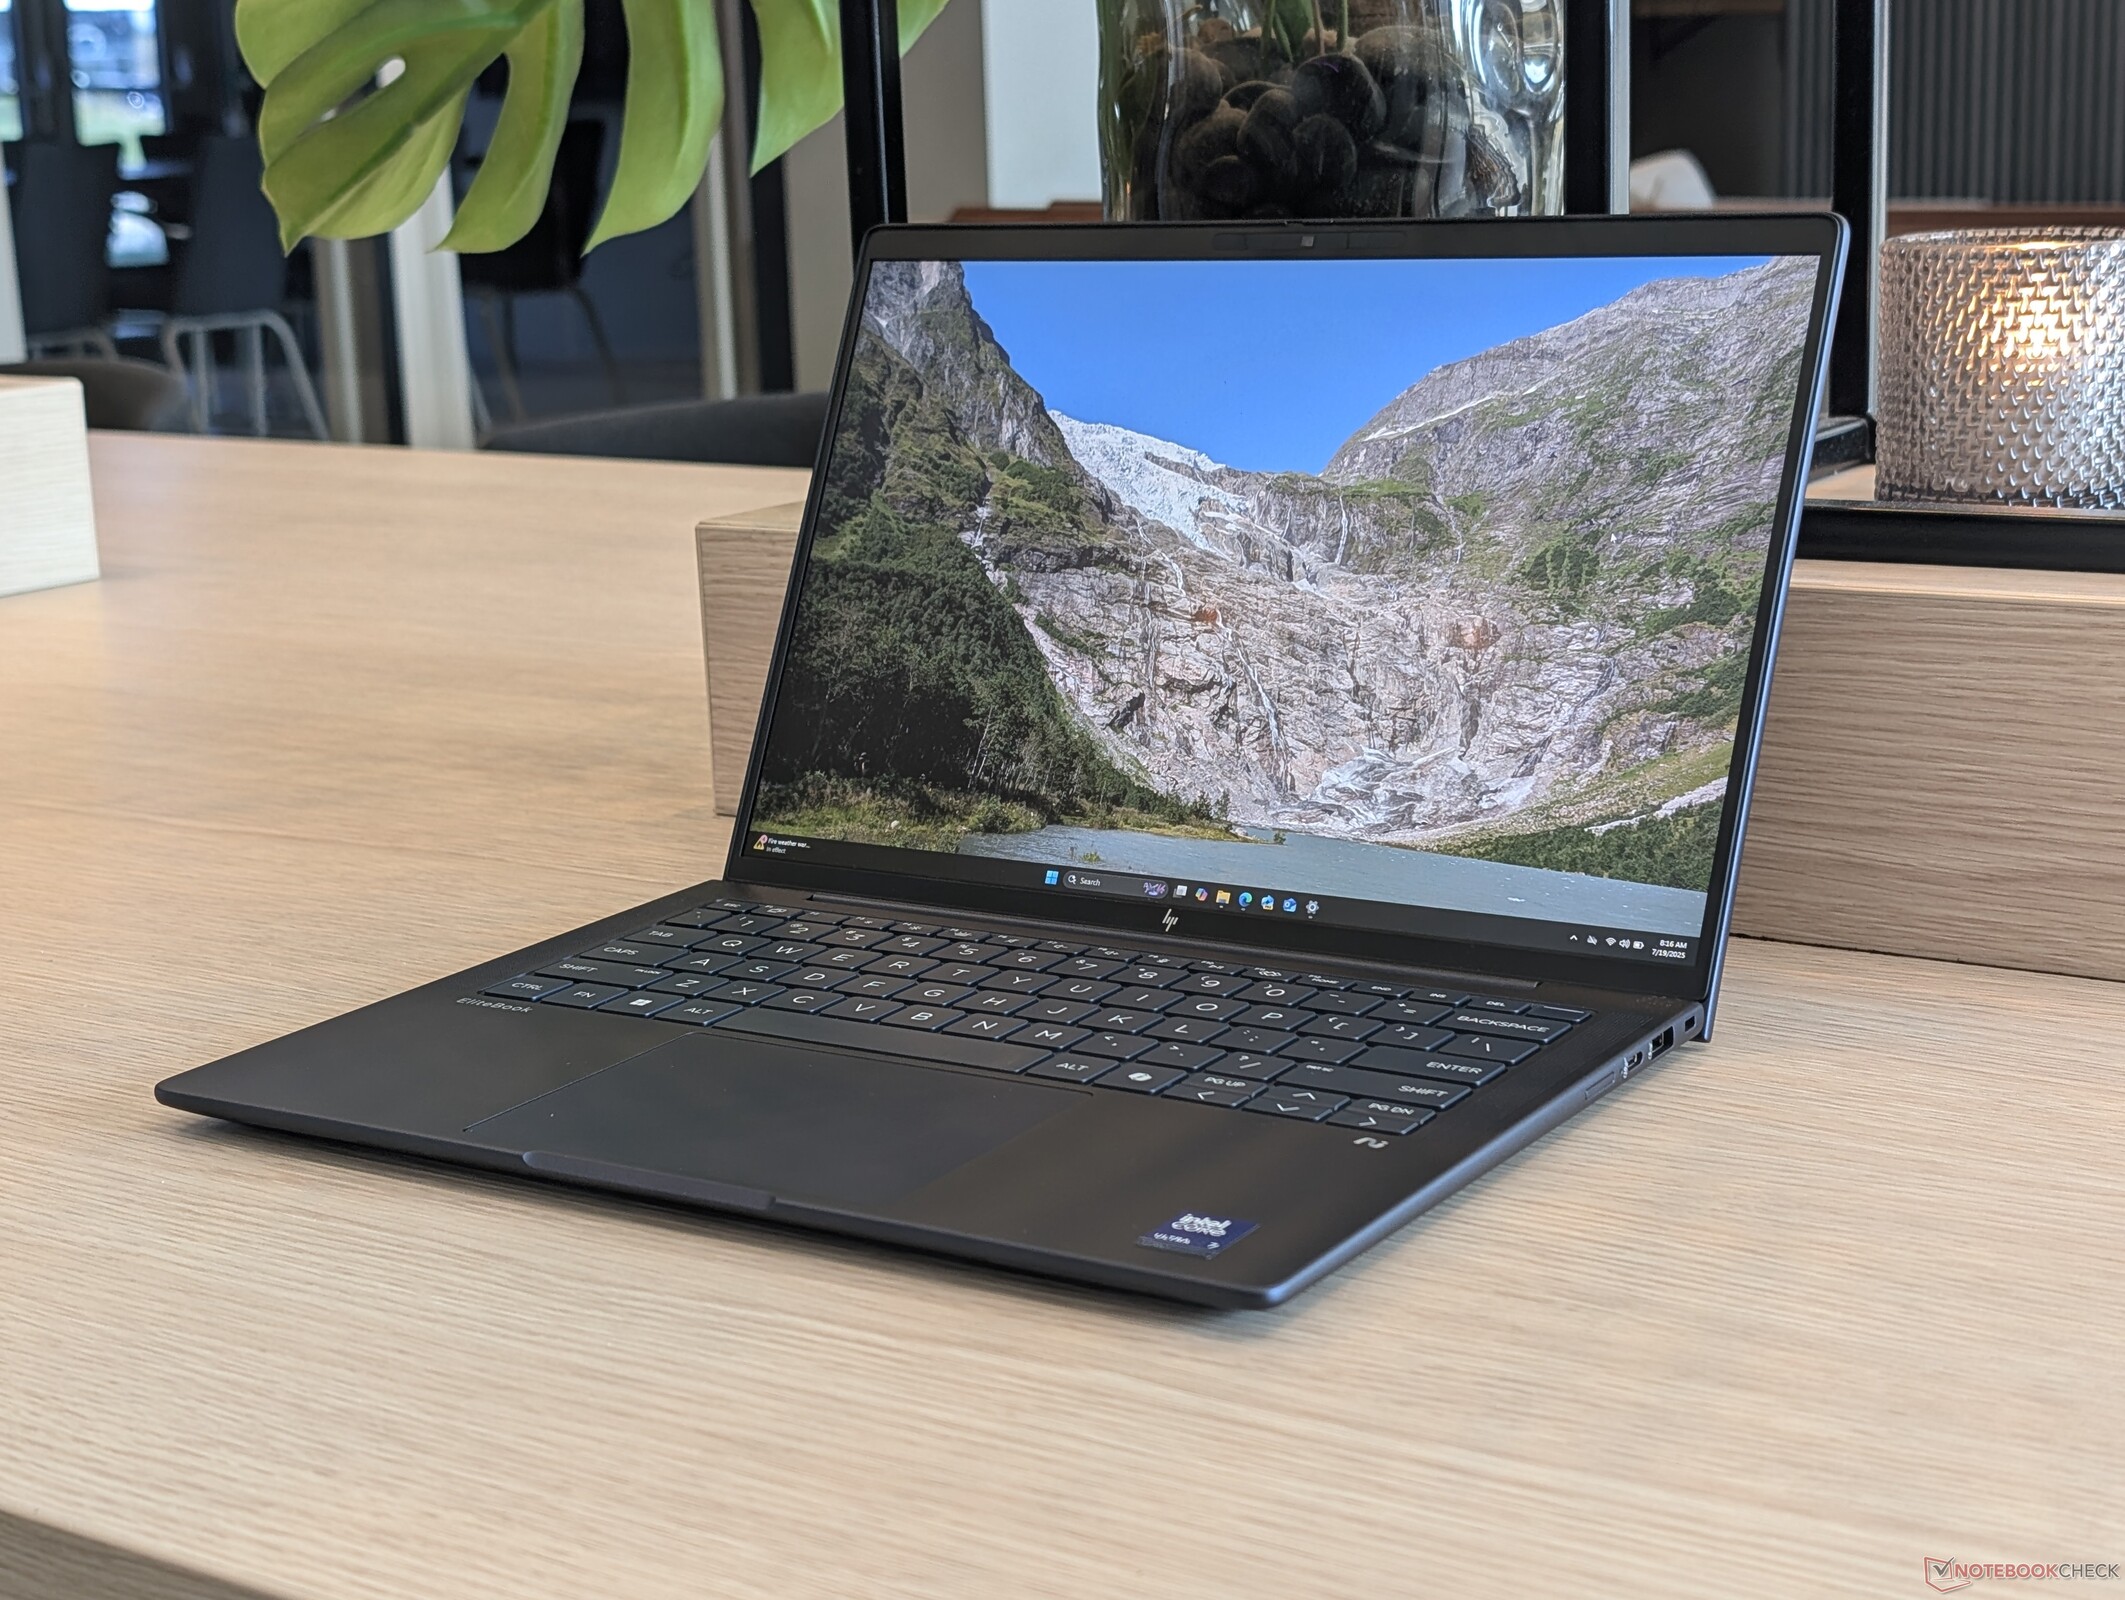
Natomiast EliteBook Ultra G1i 14 kładzie nacisk na OLED i smukłość, a EliteBook X G1a 14 kładą nacisk na wydajność dzięki unikalnemu procesorowi Ryzen AI 9 HX Pro, EliteBook X G1i 14 jest bardziej przyziemnym rozwiązaniem z całej trójki, które rezygnuje z fantazyjnego OLED i procesorów z serii HX na rzecz mocnych podstaw. Jego procesor Lunar Lake i podstawowy wyświetlacz IPS 60 Hz nie zrobią wrażenia na łowcach wydajności lub twórcach treści, ale są one opakowane w elegancką metalową obudowę, która jest idealna do pracy biurowej w ruchu.
Alternatywy takie jak Dell Latitude 9440 są cięższe niż nasz EliteBook, podczas gdy inne, takie jak Lenovo ThinkPad X1 Carbon G13 są lżejsze, choć pozbawione funkcji WWAN.
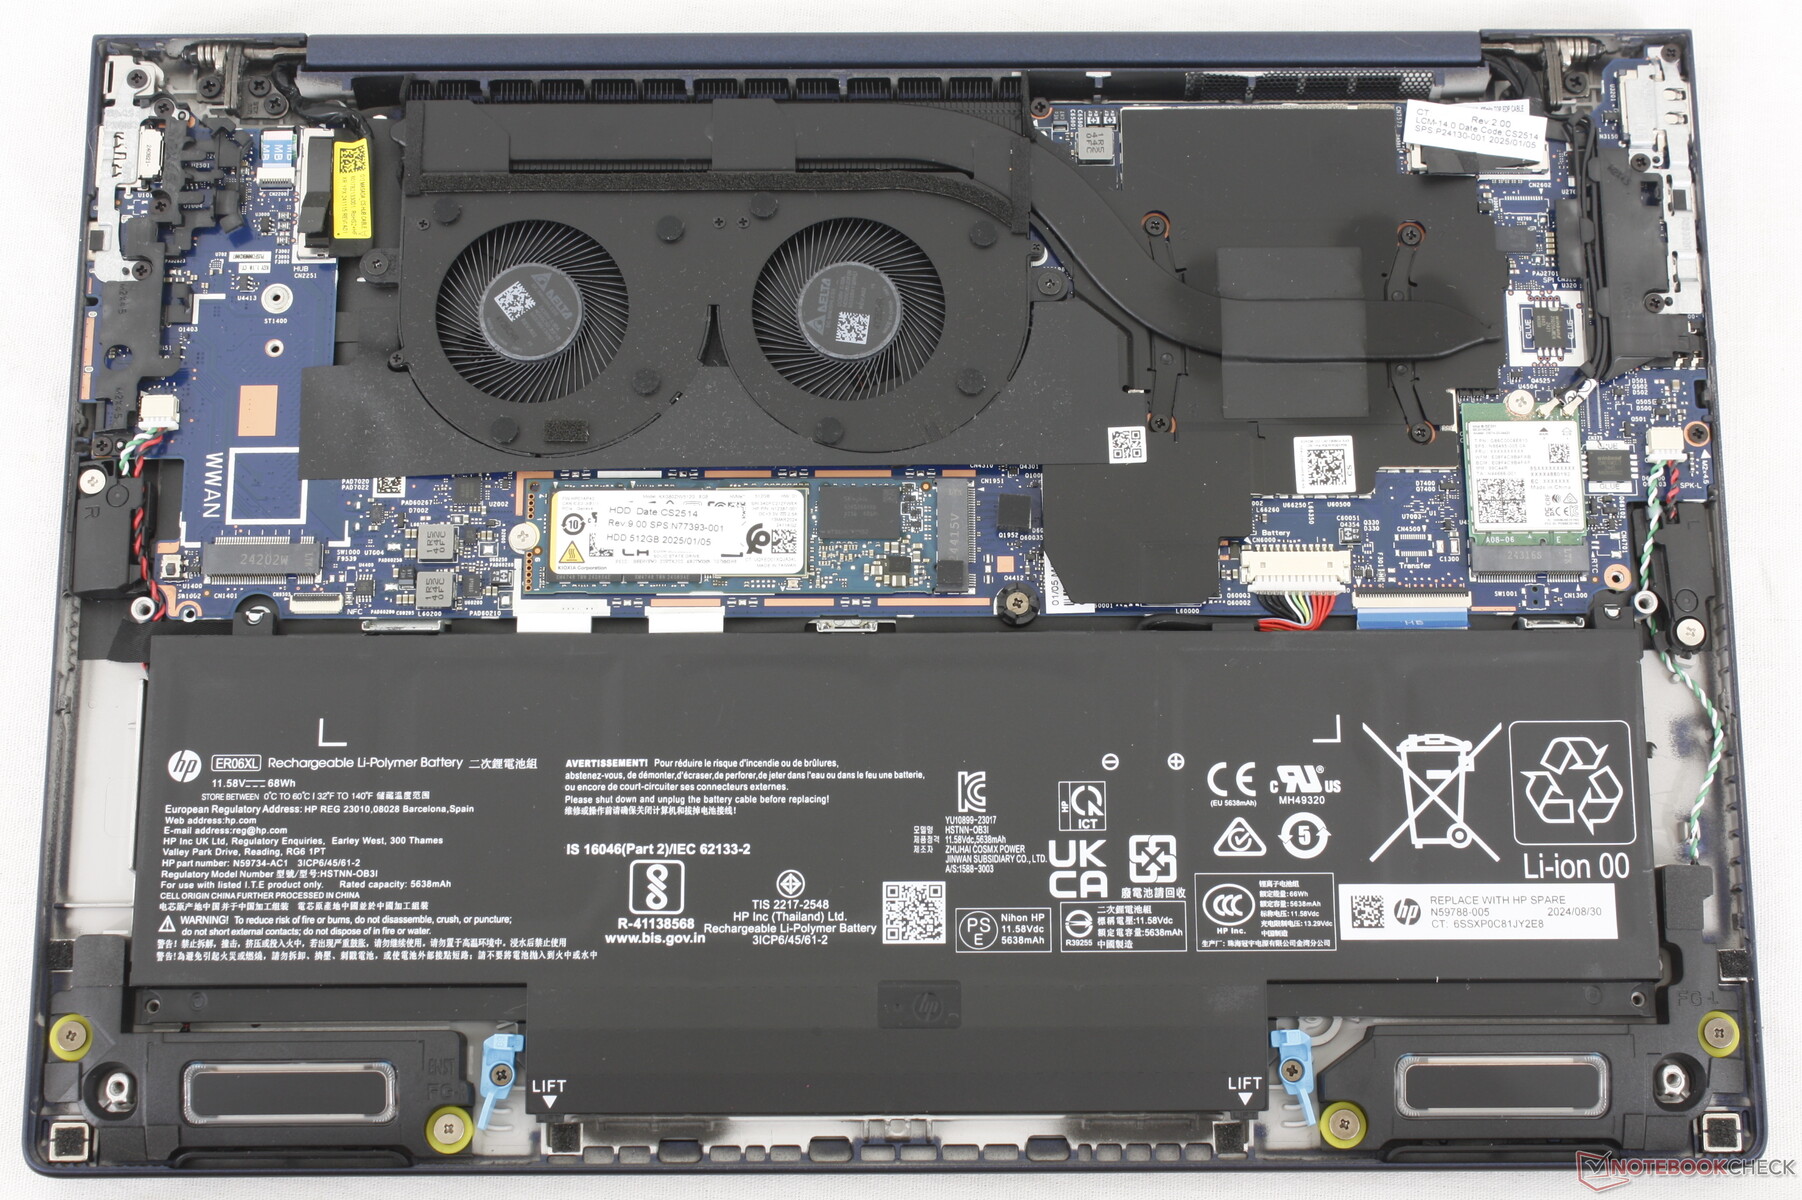
Czas pracy na baterii jest godną uwagi zaletą EliteBook X G1i 14. Ponieważ model ten nie oferuje konfiguracji OLED w przeciwieństwie do większości innych flagowych subnotebooków, czasy pracy mogą być zauważalnie dłuższe o kilka godzin podczas przeglądania stron internetowych. Aby zmaksymalizować tę przewagę, należy skonfigurować z większym akumulatorem 68 Wh.
Sprzęt odpowiedzialny za wydłużony czas pracy na baterii jest również odpowiedzialny za niektóre wady systemu. Surowa wydajność procesora jest skromna, a brak OLED może być uciążliwy dla aplikacji multimedialnych, a wszystko to w imię poprawy żywotności baterii. EliteBook X G1i 14 jest wystarczający do przetwarzania tekstu i lekkiej edycji w podróży, podczas gdy wspomniany EliteBook Ultra G1i 14 lub EliteBook X G1a 14 może pokryć bardziej wymagające scenariusze.
Za
Przeciw
Cena i dostępność
HP dostarcza obecnie EliteBook X Ultra G1i 14 w cenie od 2700 USD za konfigurację podstawową do 3300 USD w wersji recenzowanej.
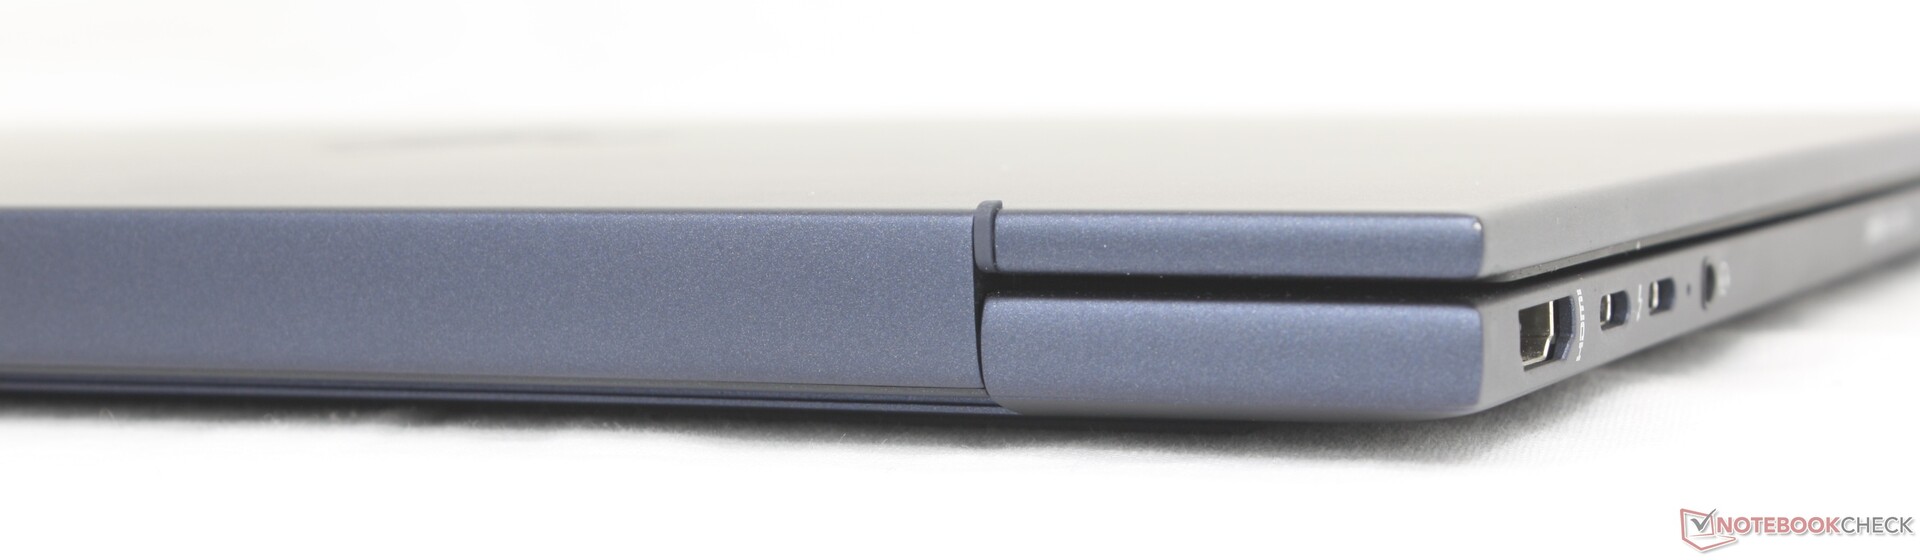
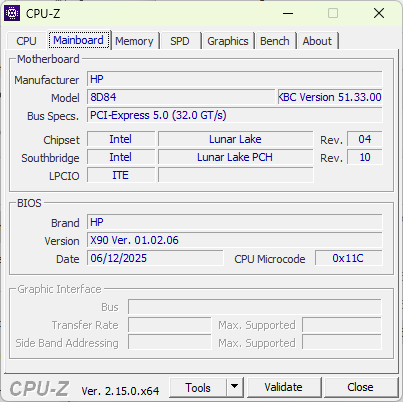
EliteBook X G1i 14 to wyższej klasy subnotebook biznesowy, będący następcą starszej serii Serii EliteBook 1040. Nie należy go mylić z modelem EliteBook Ultra G1i 14 który oferuje inne porty, procesory i opcje wyświetlania, a także nieco inną konstrukcję obudowy.
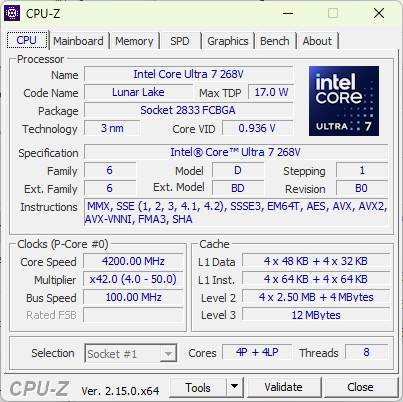
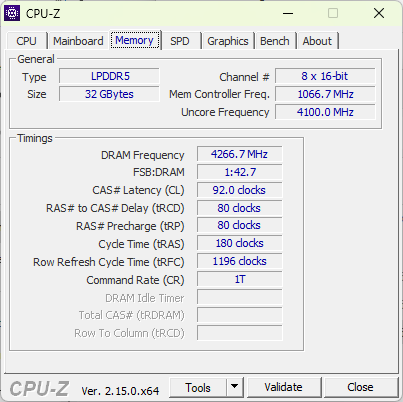
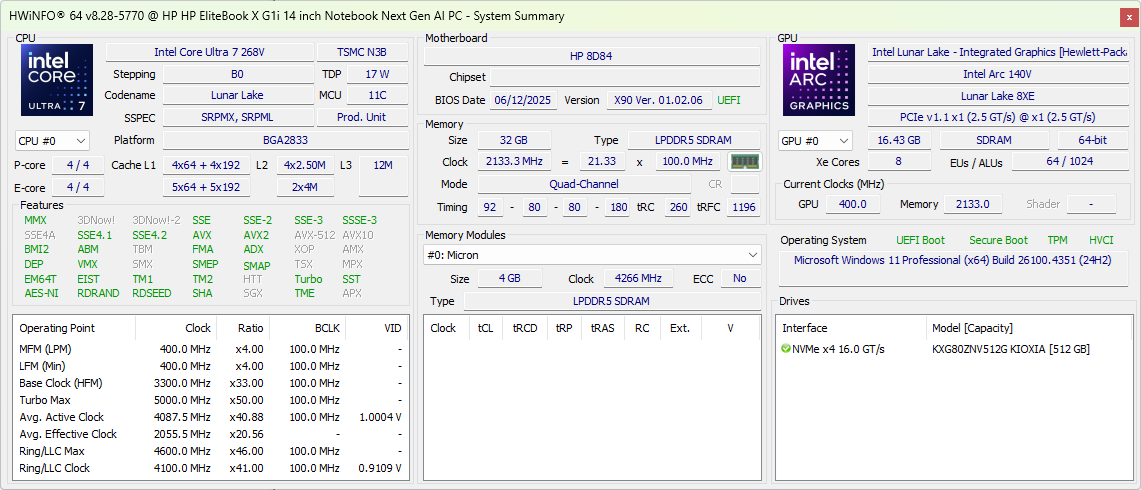
Nasza jednostka testowa to środkowa konfiguracja z procesorem Lunar Lake Core Ultra 7 268V, baterią 68 Wh i ekranem dotykowym IPS 1200p 60 Hz za około 3300 USD. Inne jednostki SKU zaczynają się od Core Ultra 5 238V, mniejszej baterii 56 Wh lub ekranu dotykowego IPS o wyższej rozdzielczości 1600p 120 Hz.
Więcej recenzji HP:
Specyfikacje
Przypadek
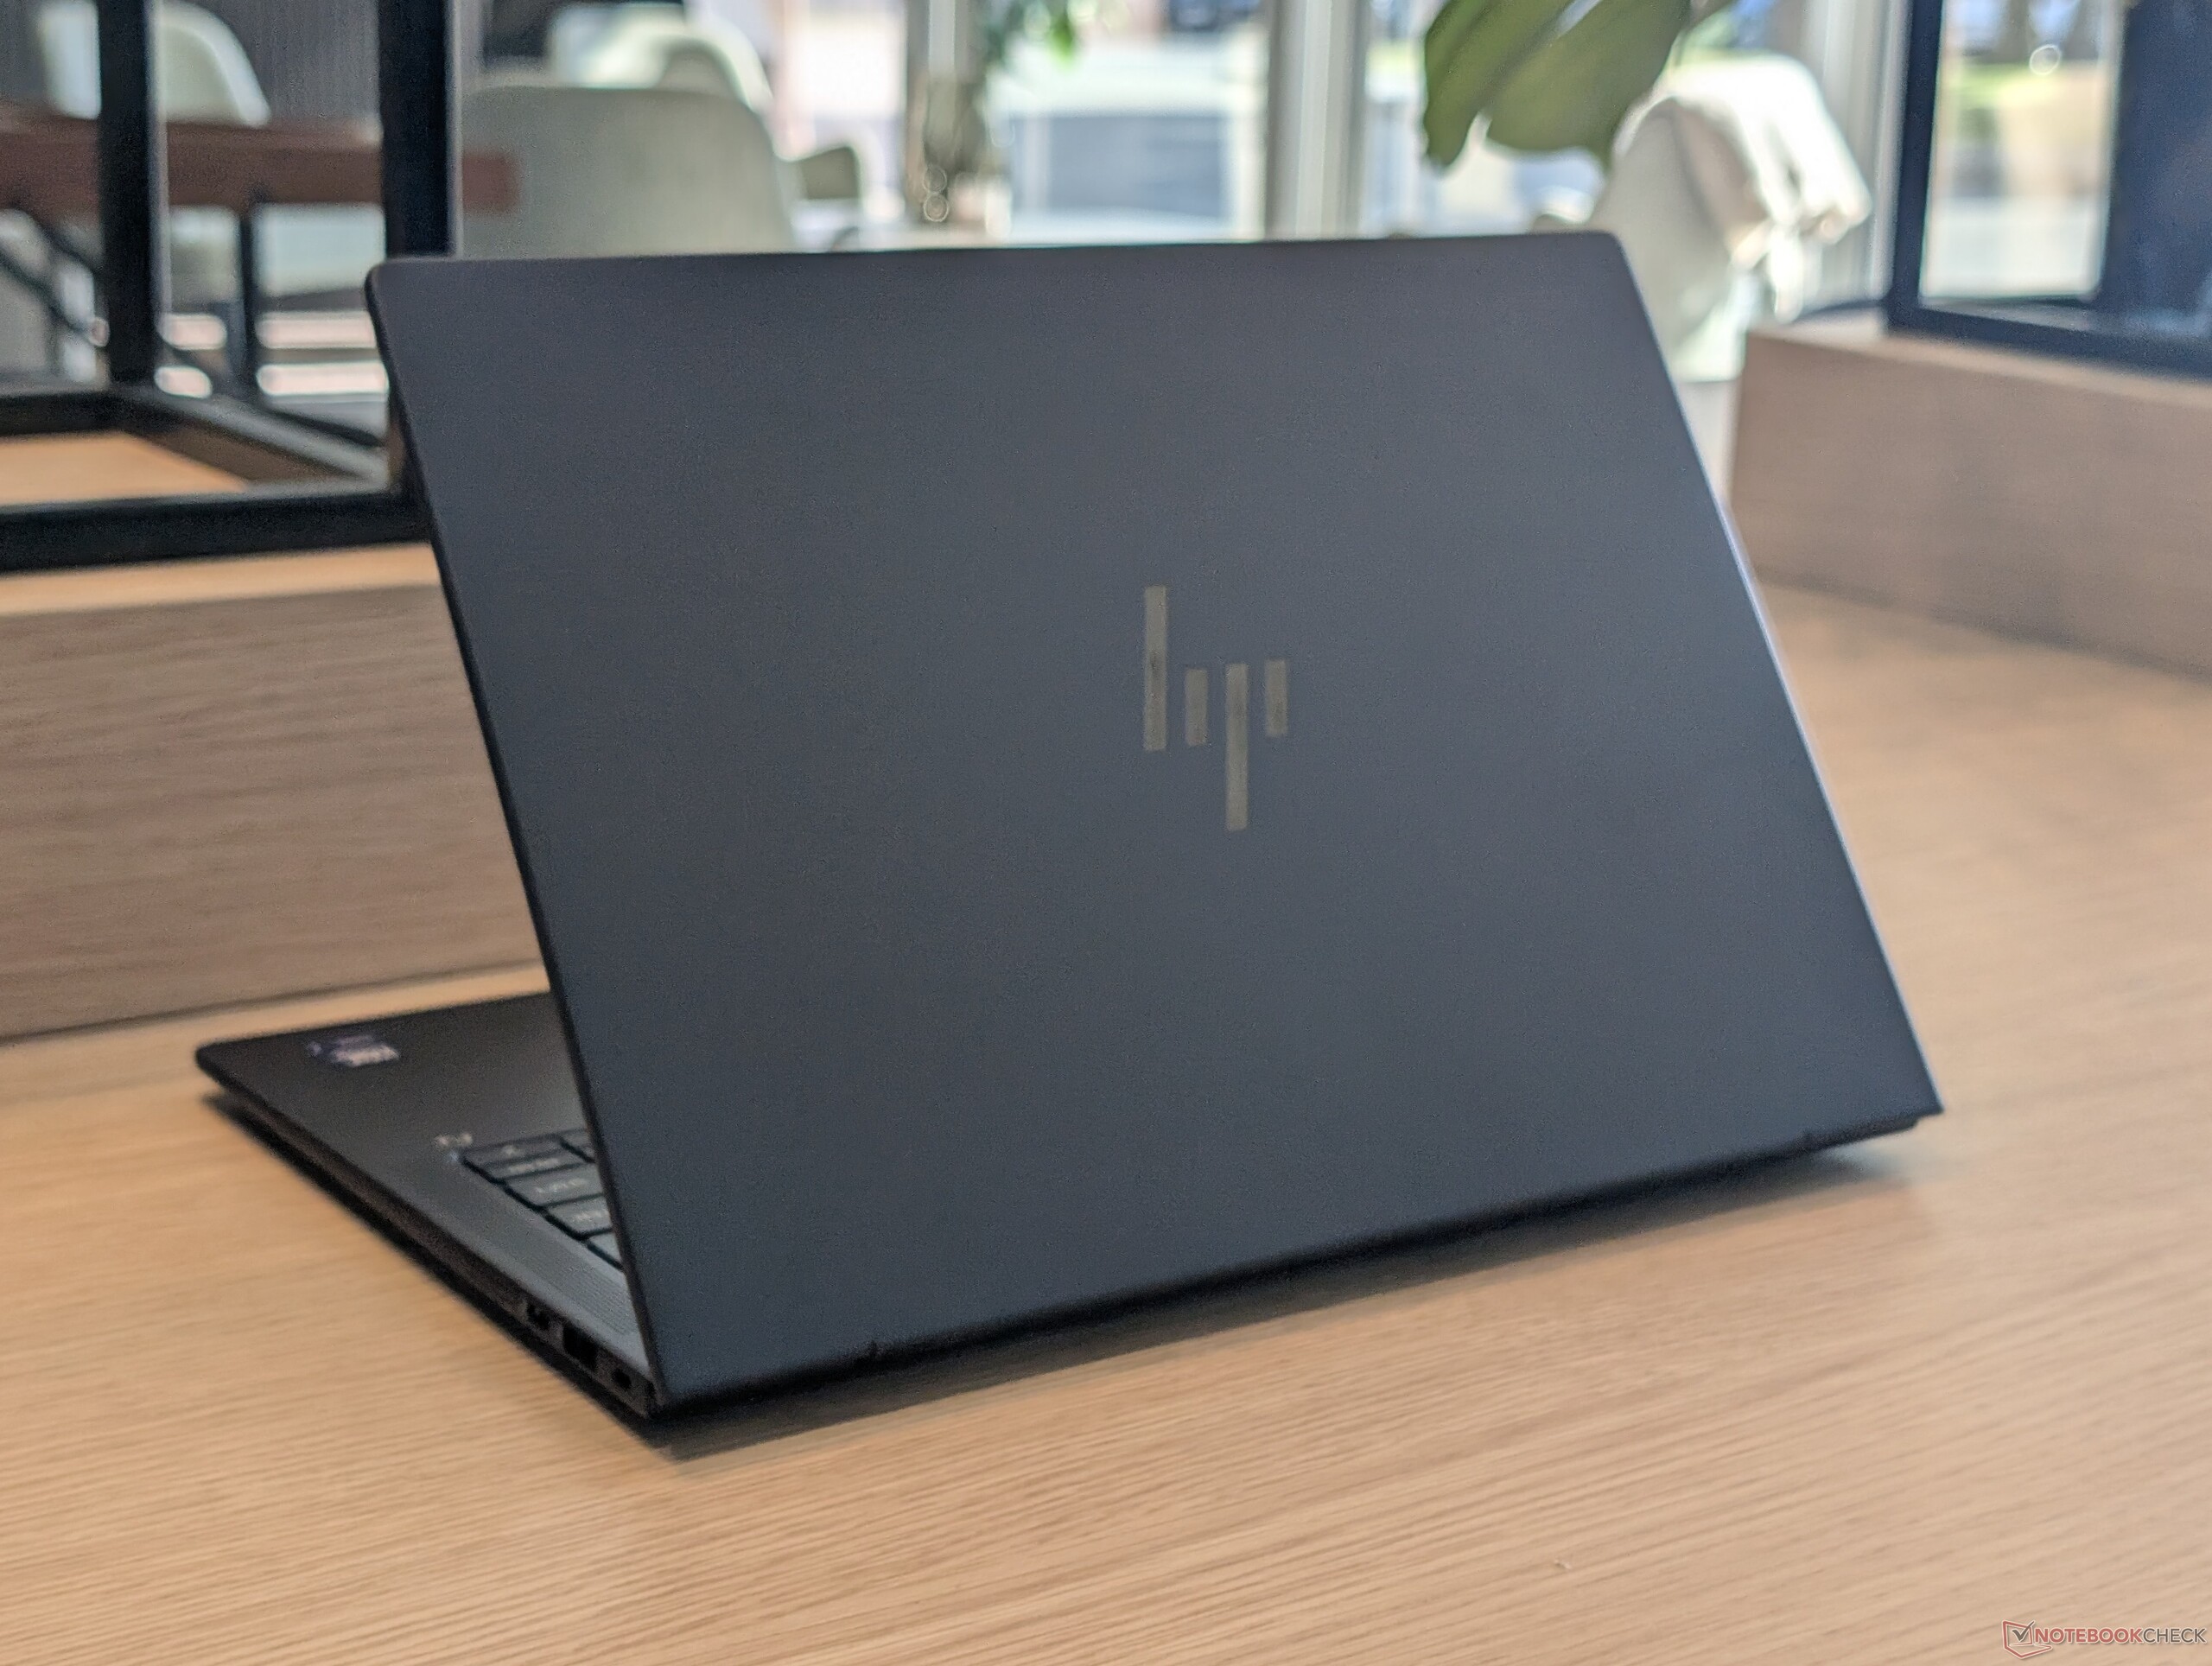
System jest nieco większy i grubszy niż EliteBook Ultra G1i 14, ale poza tym jest zbudowany z podobnych materiałów ze stopów metali, co zapewnia podobne wrażenia.
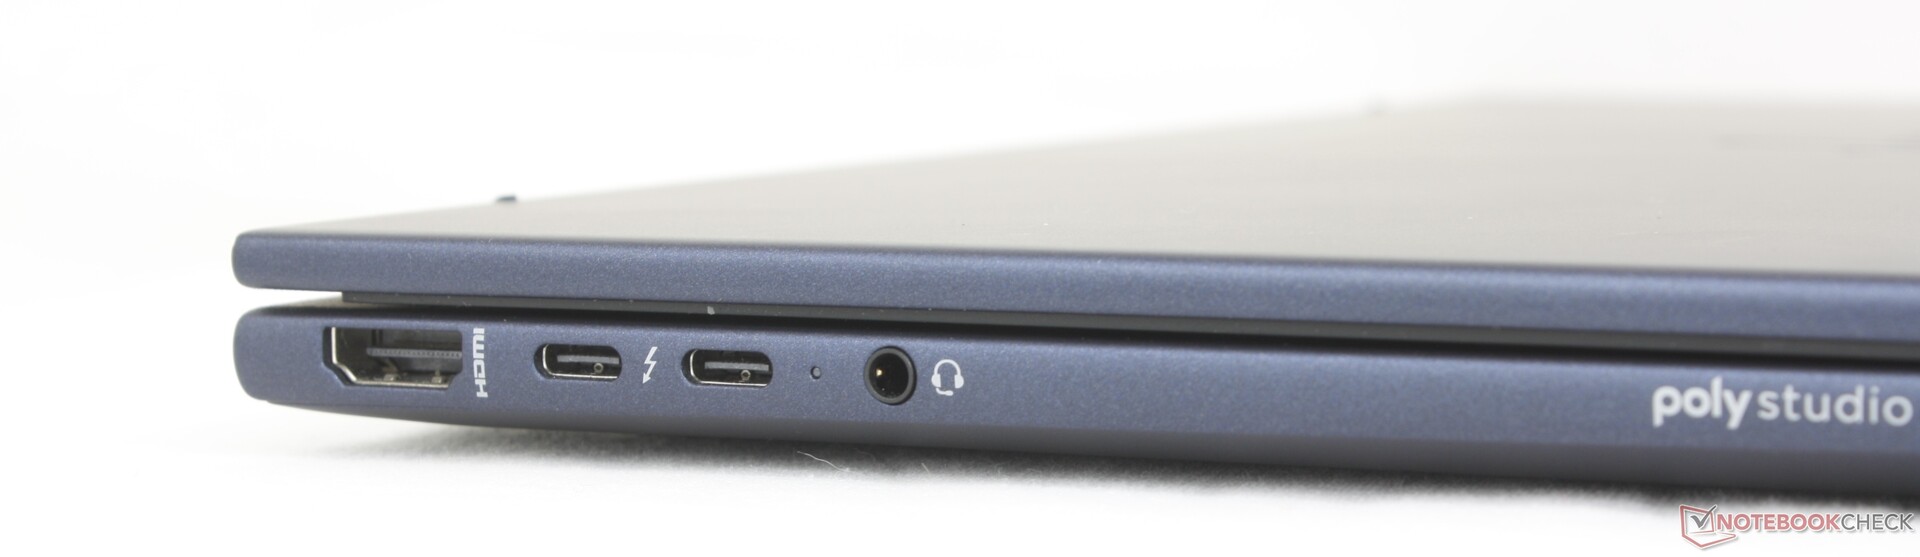
Łączność
Komunikacja
Kamera internetowa


Konserwacja
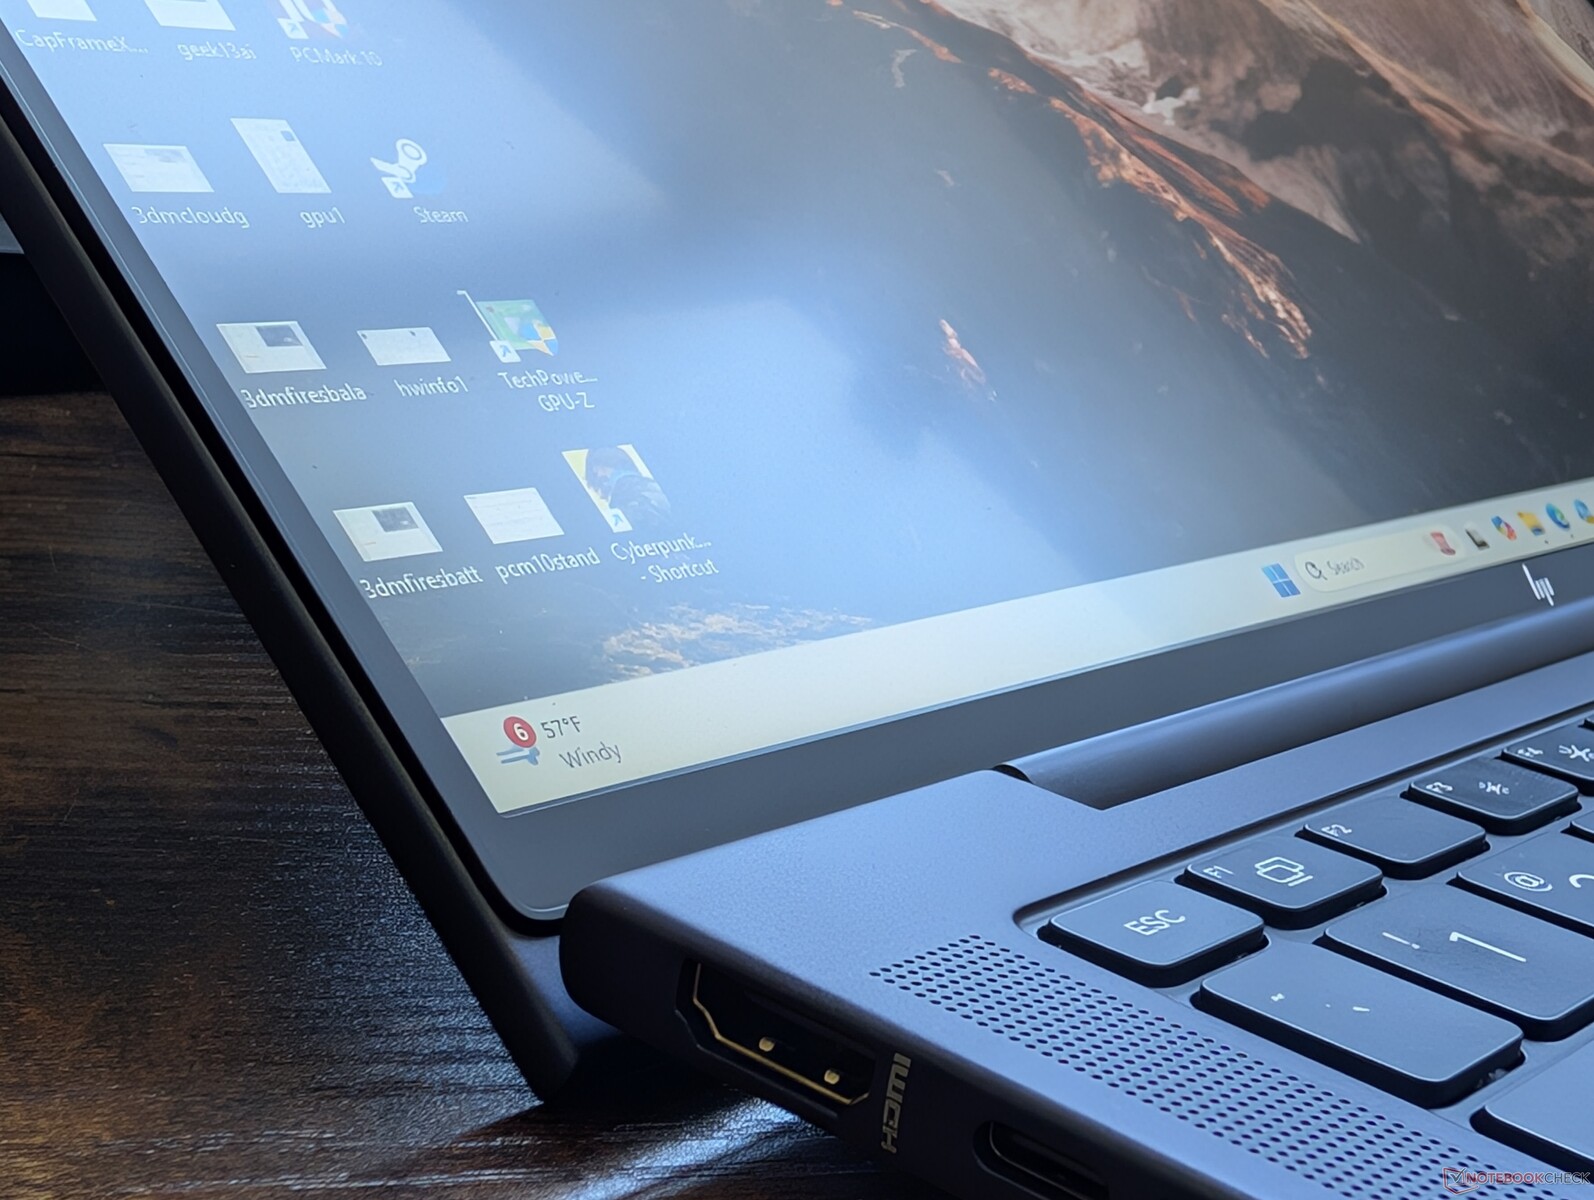
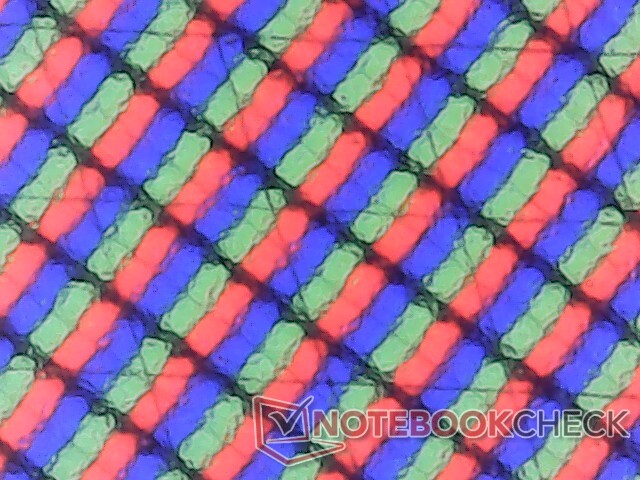
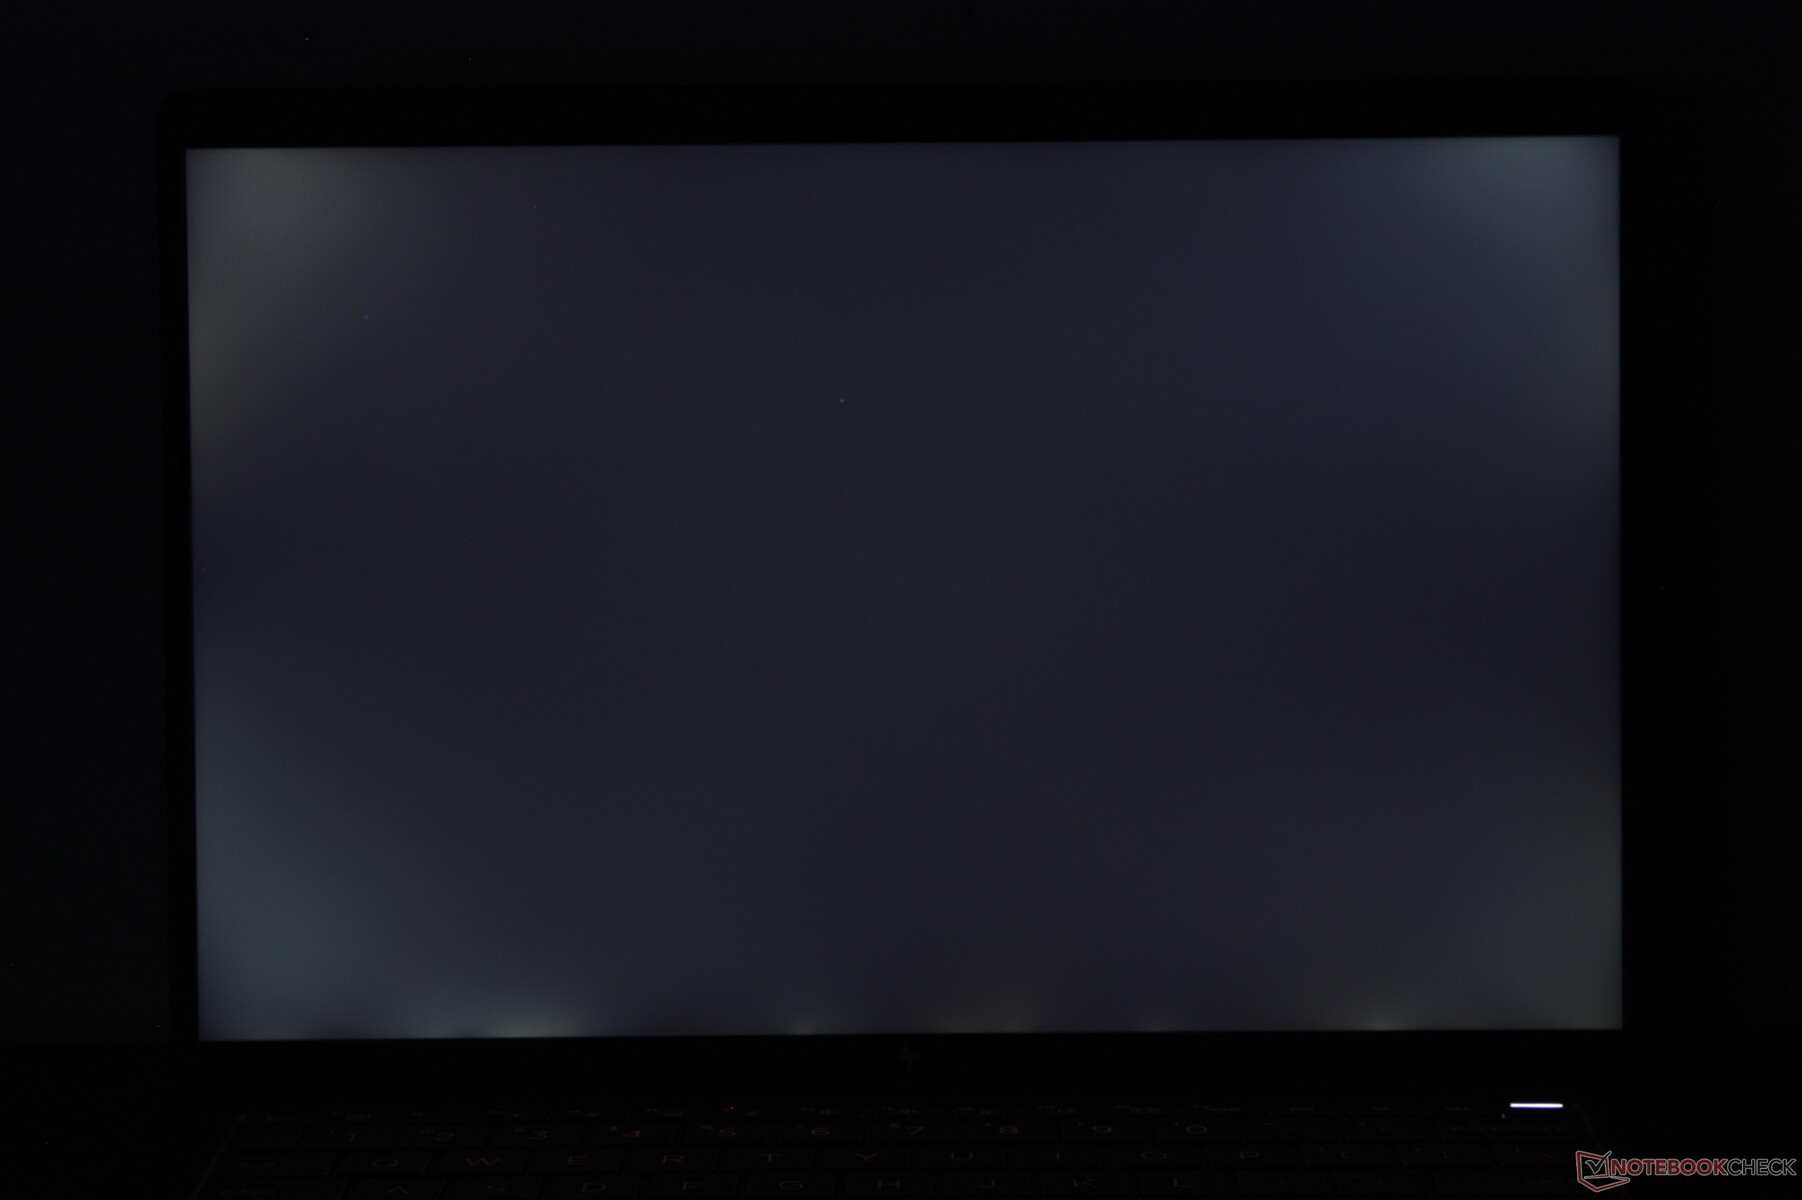
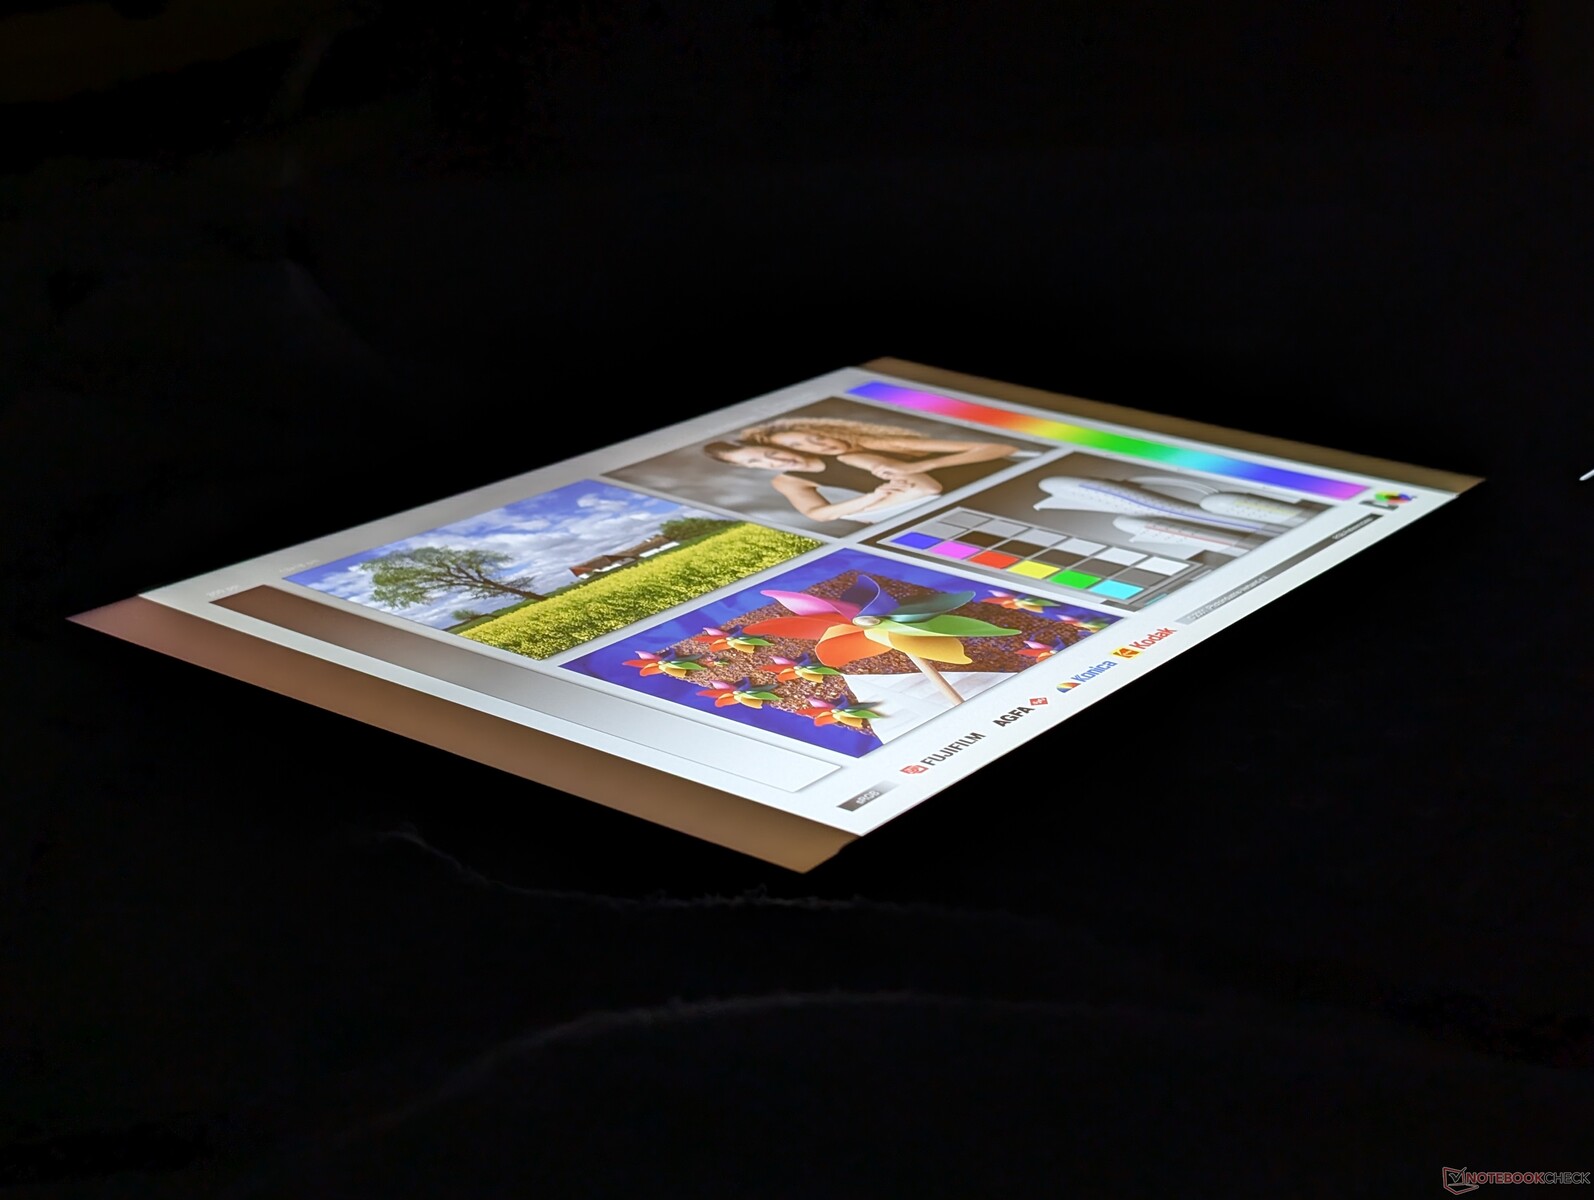
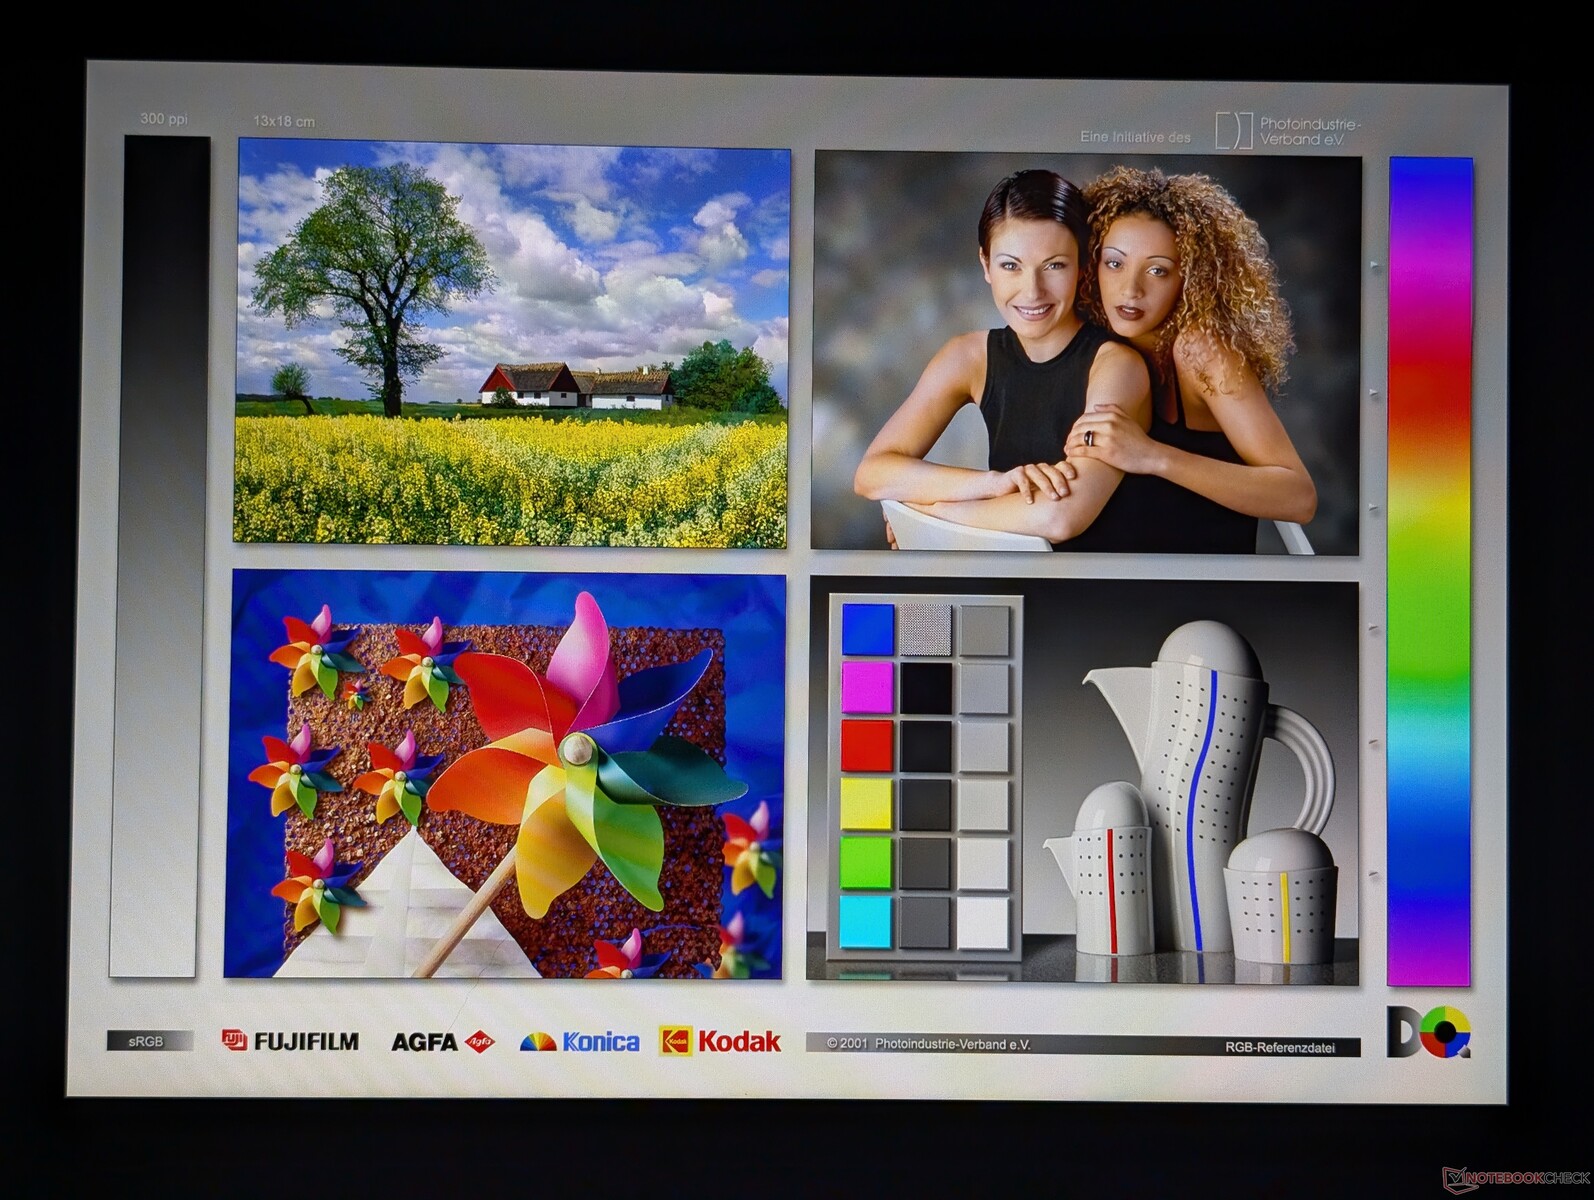
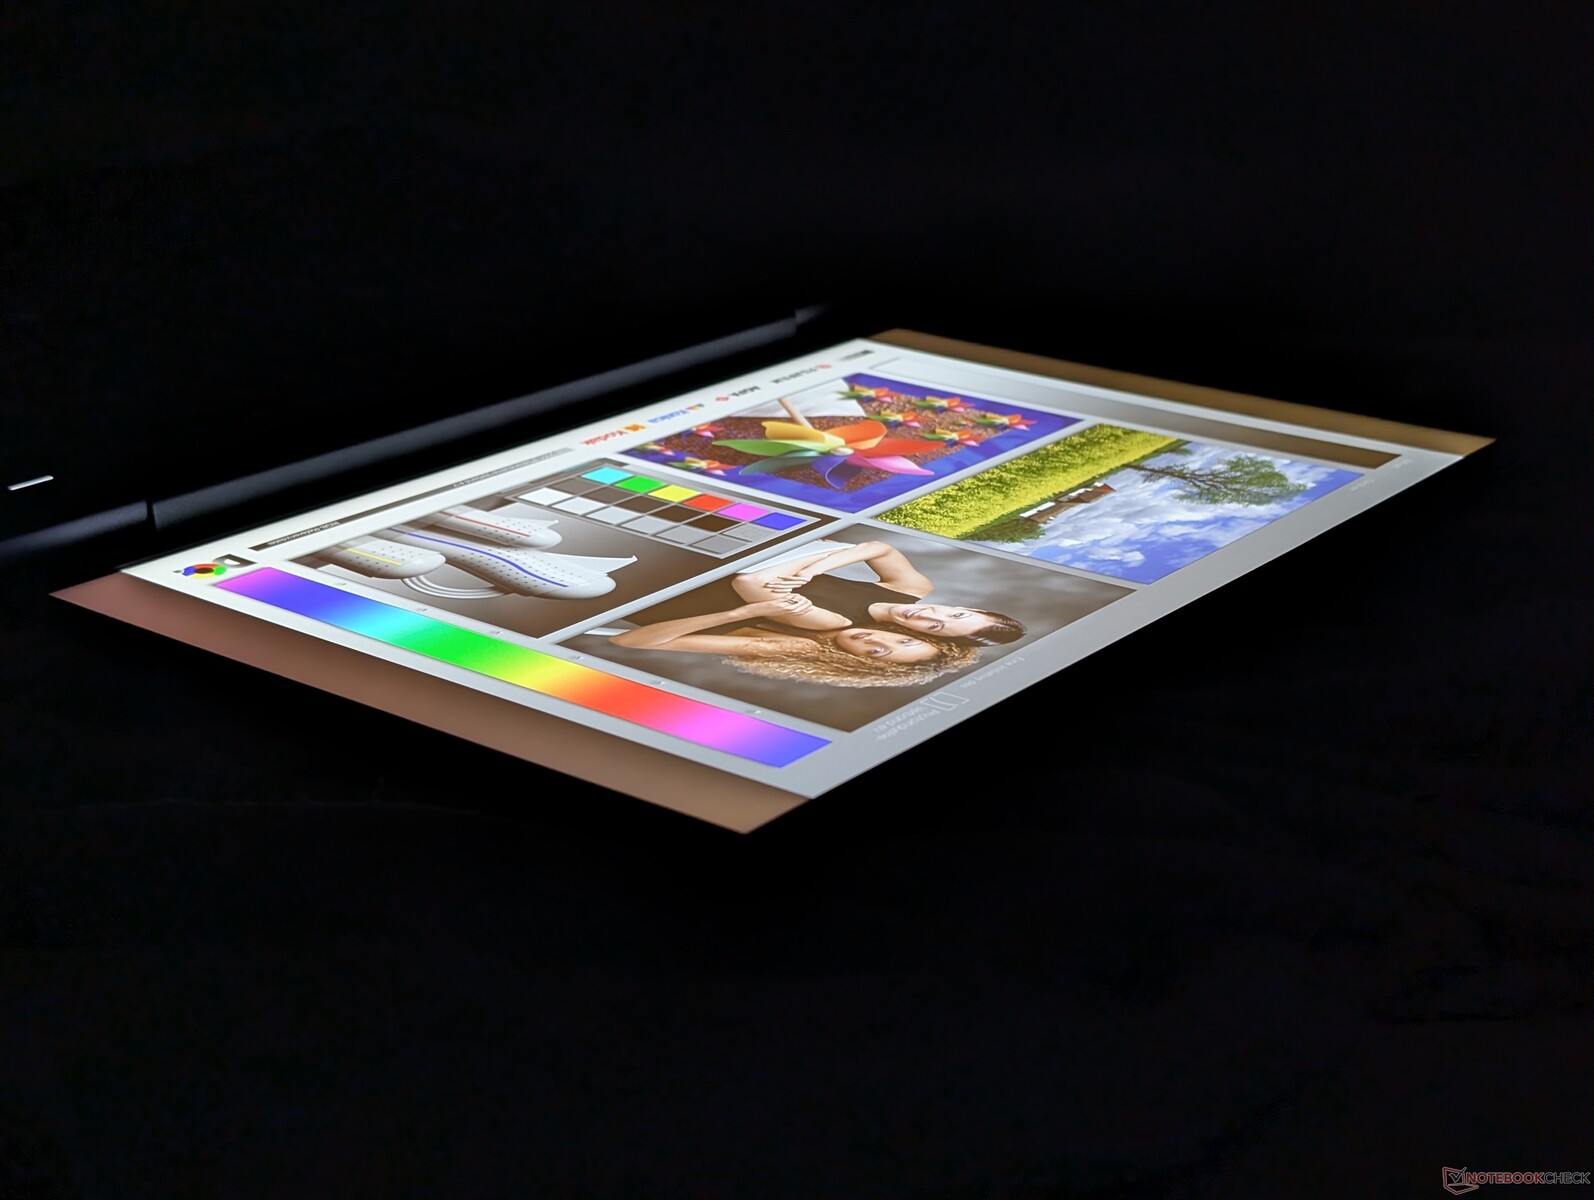
Wyświetlacz

| |||||||||||||||||||||||||
rozświetlenie: 91 %
na akumulatorze: 487.5 cd/m²
kontrast: 1875:1 (czerń: 0.26 cd/m²)
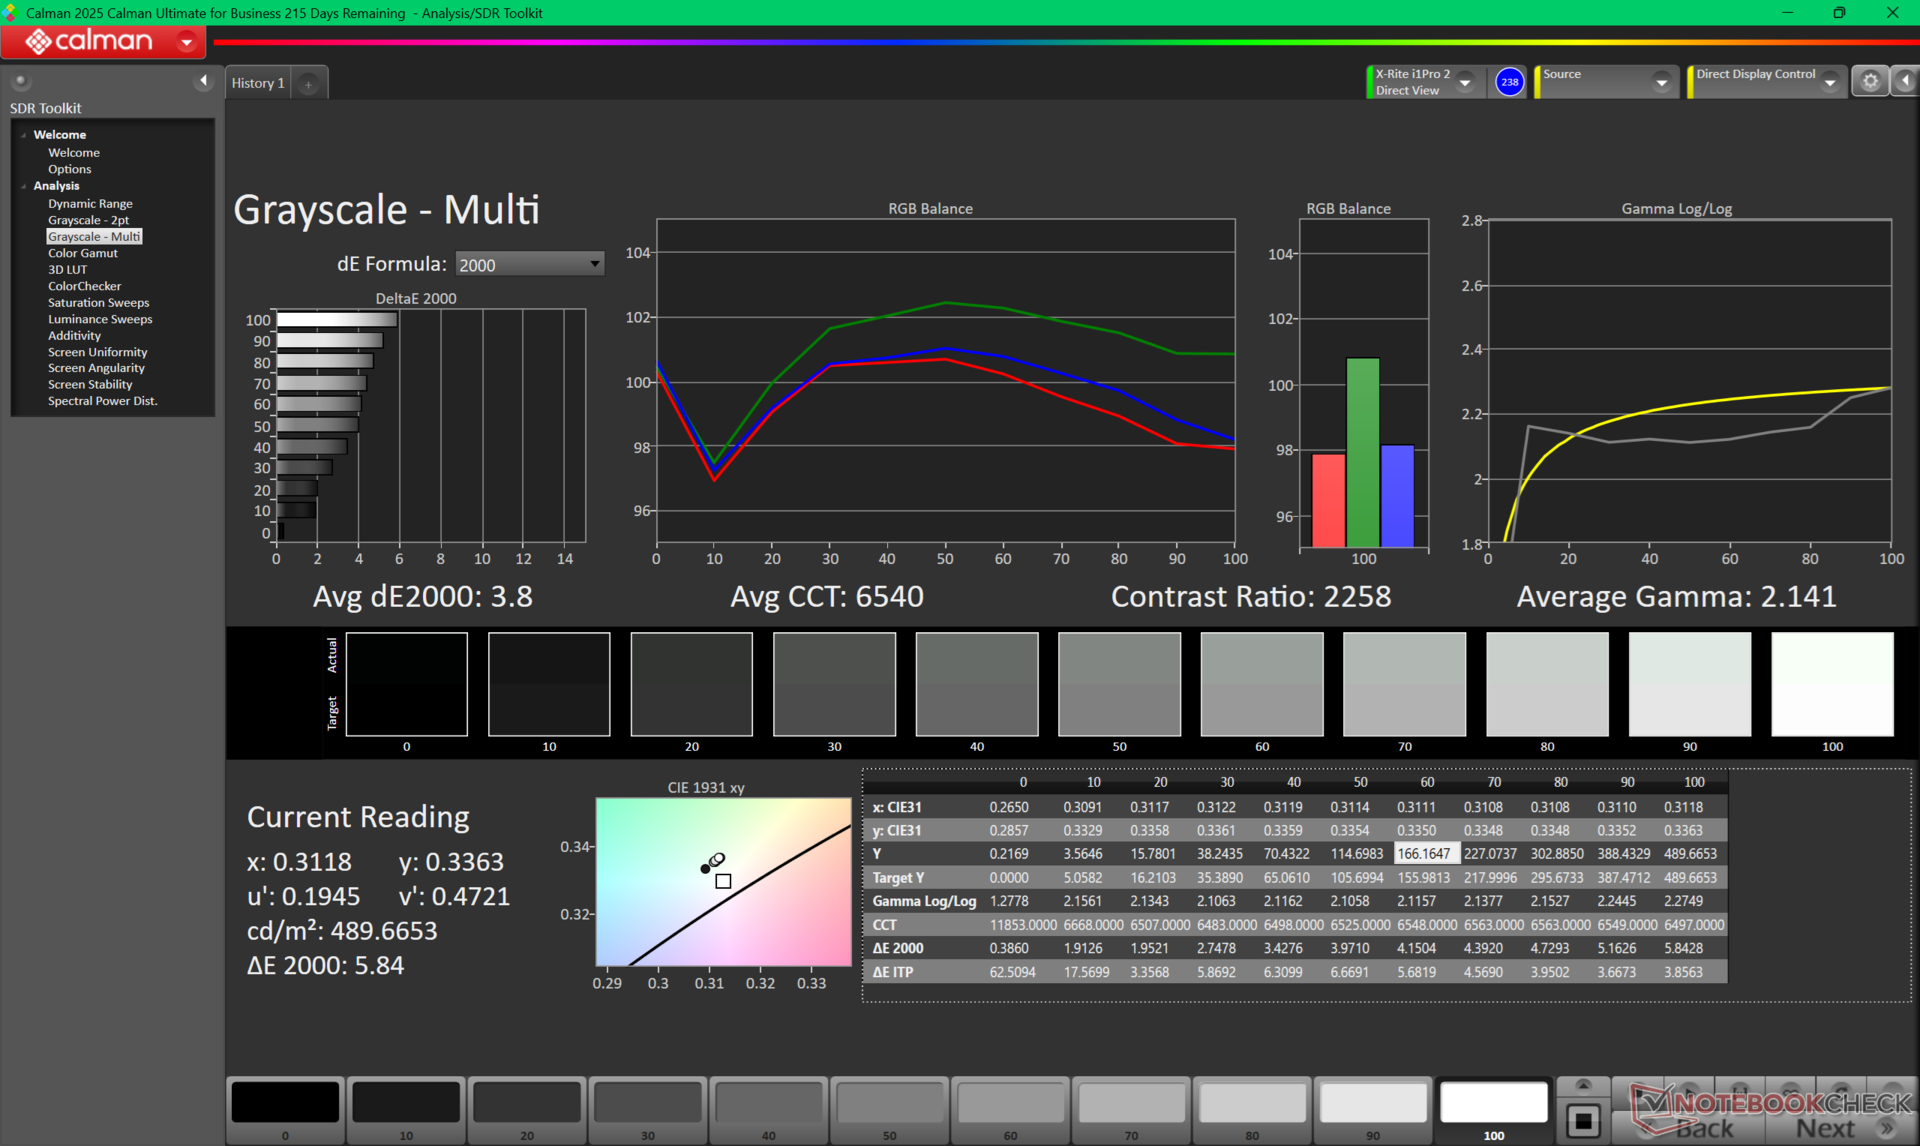
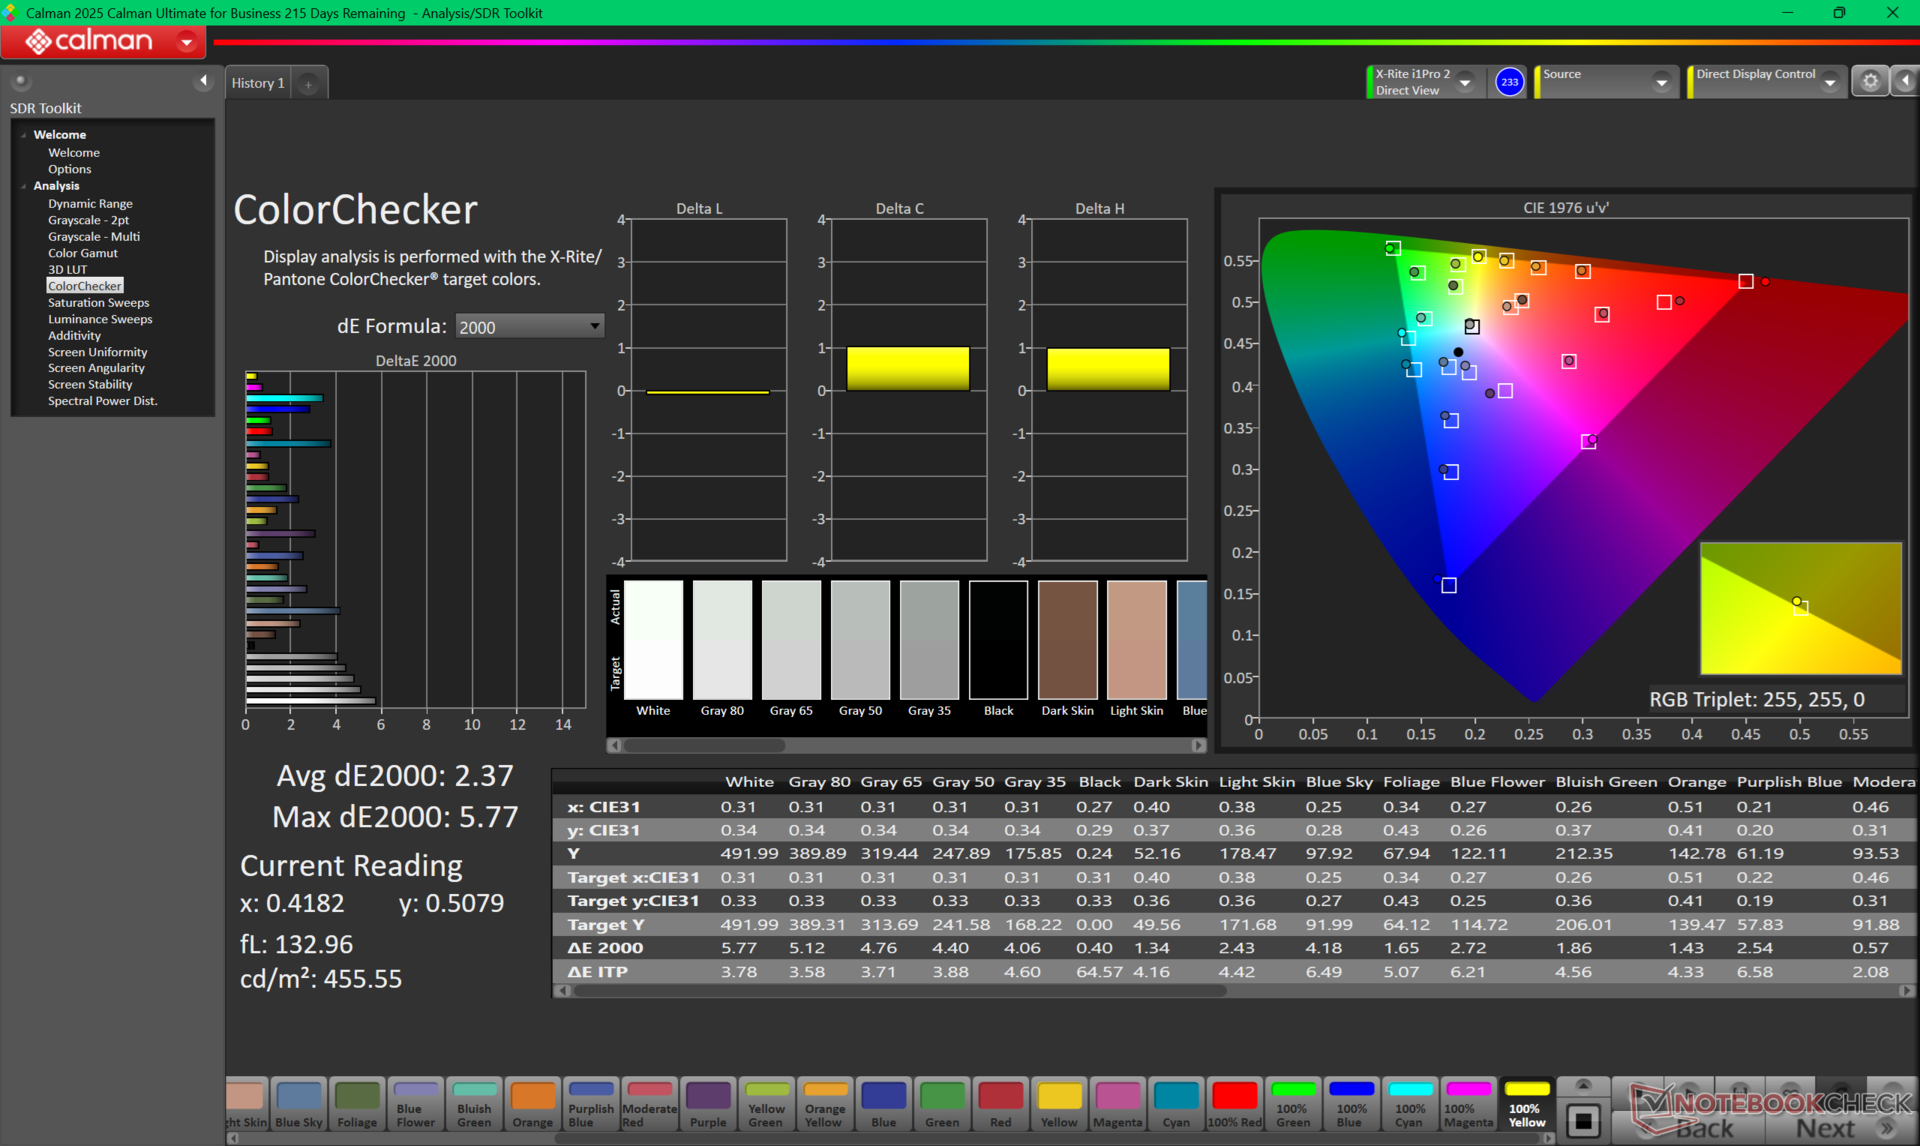
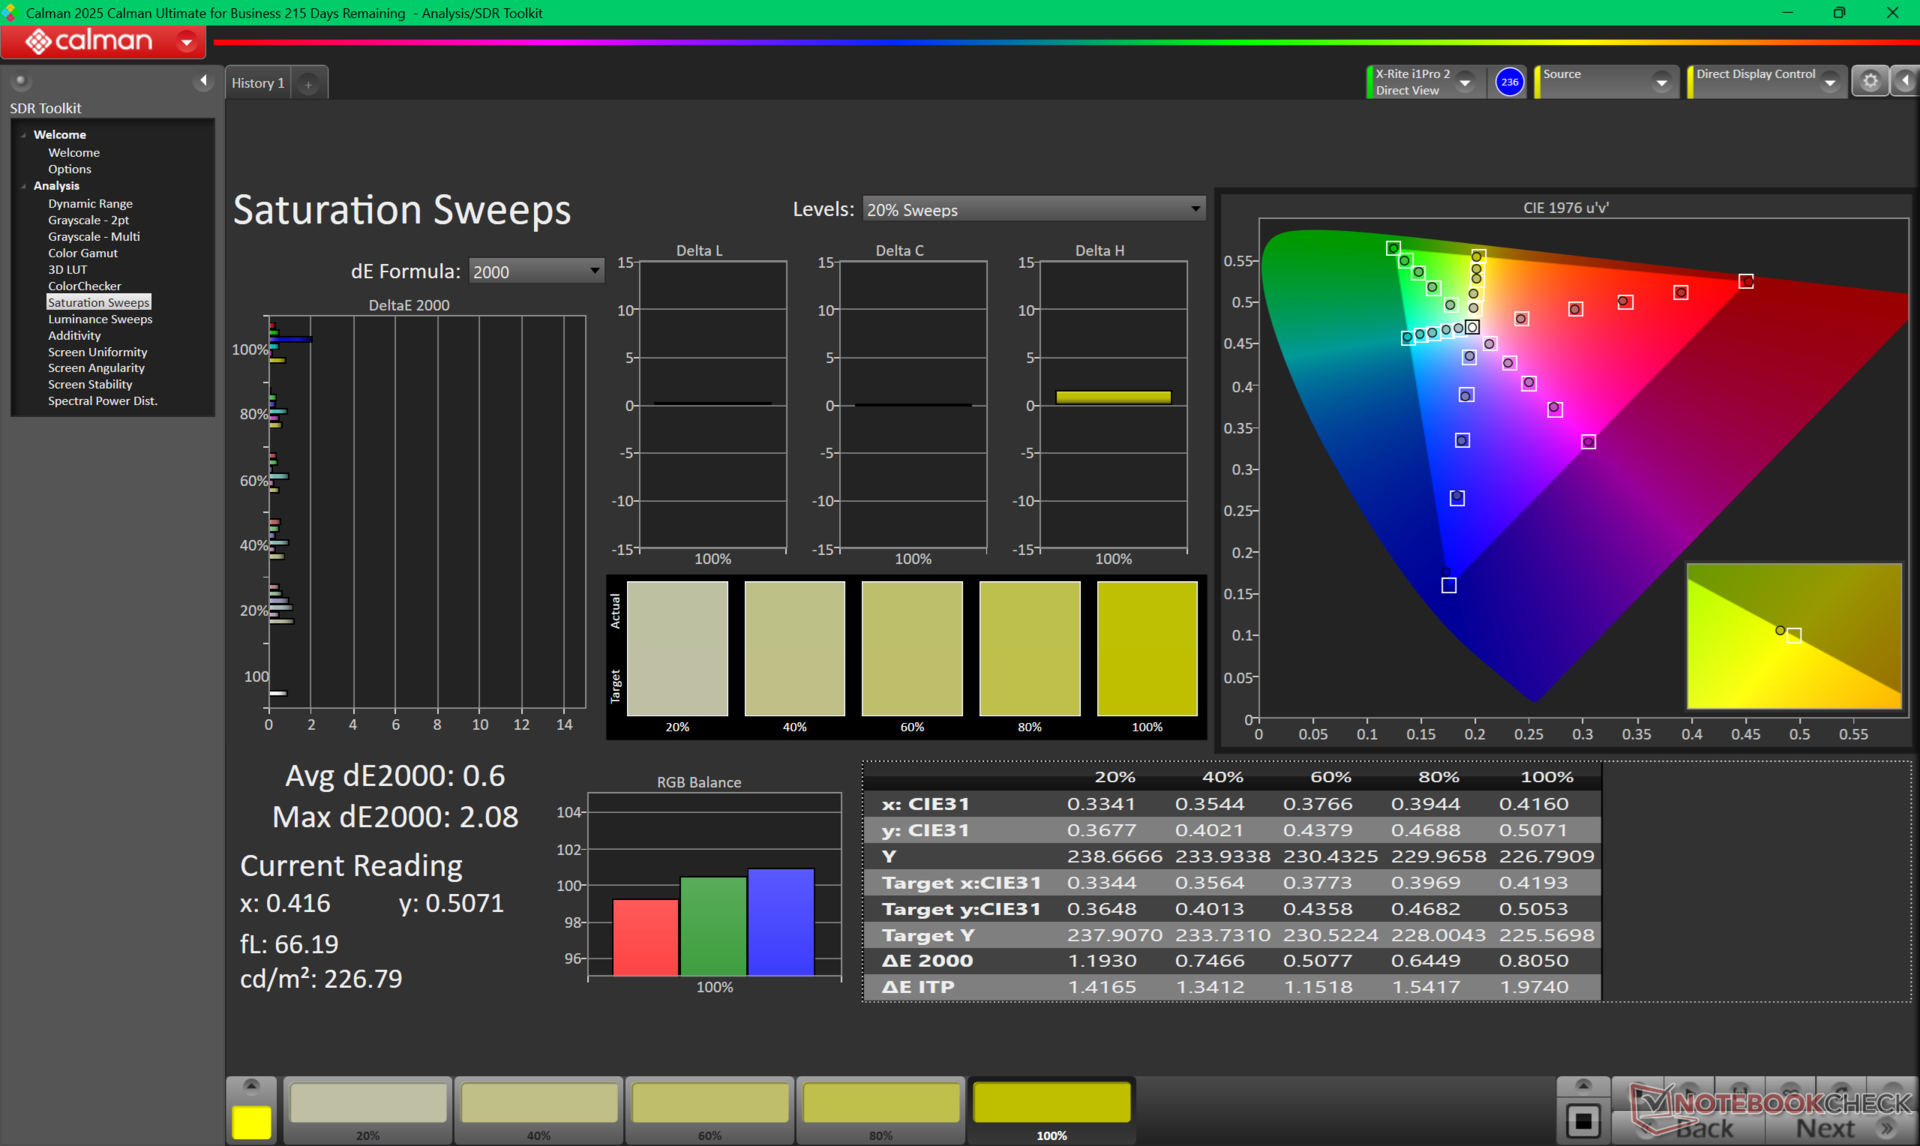
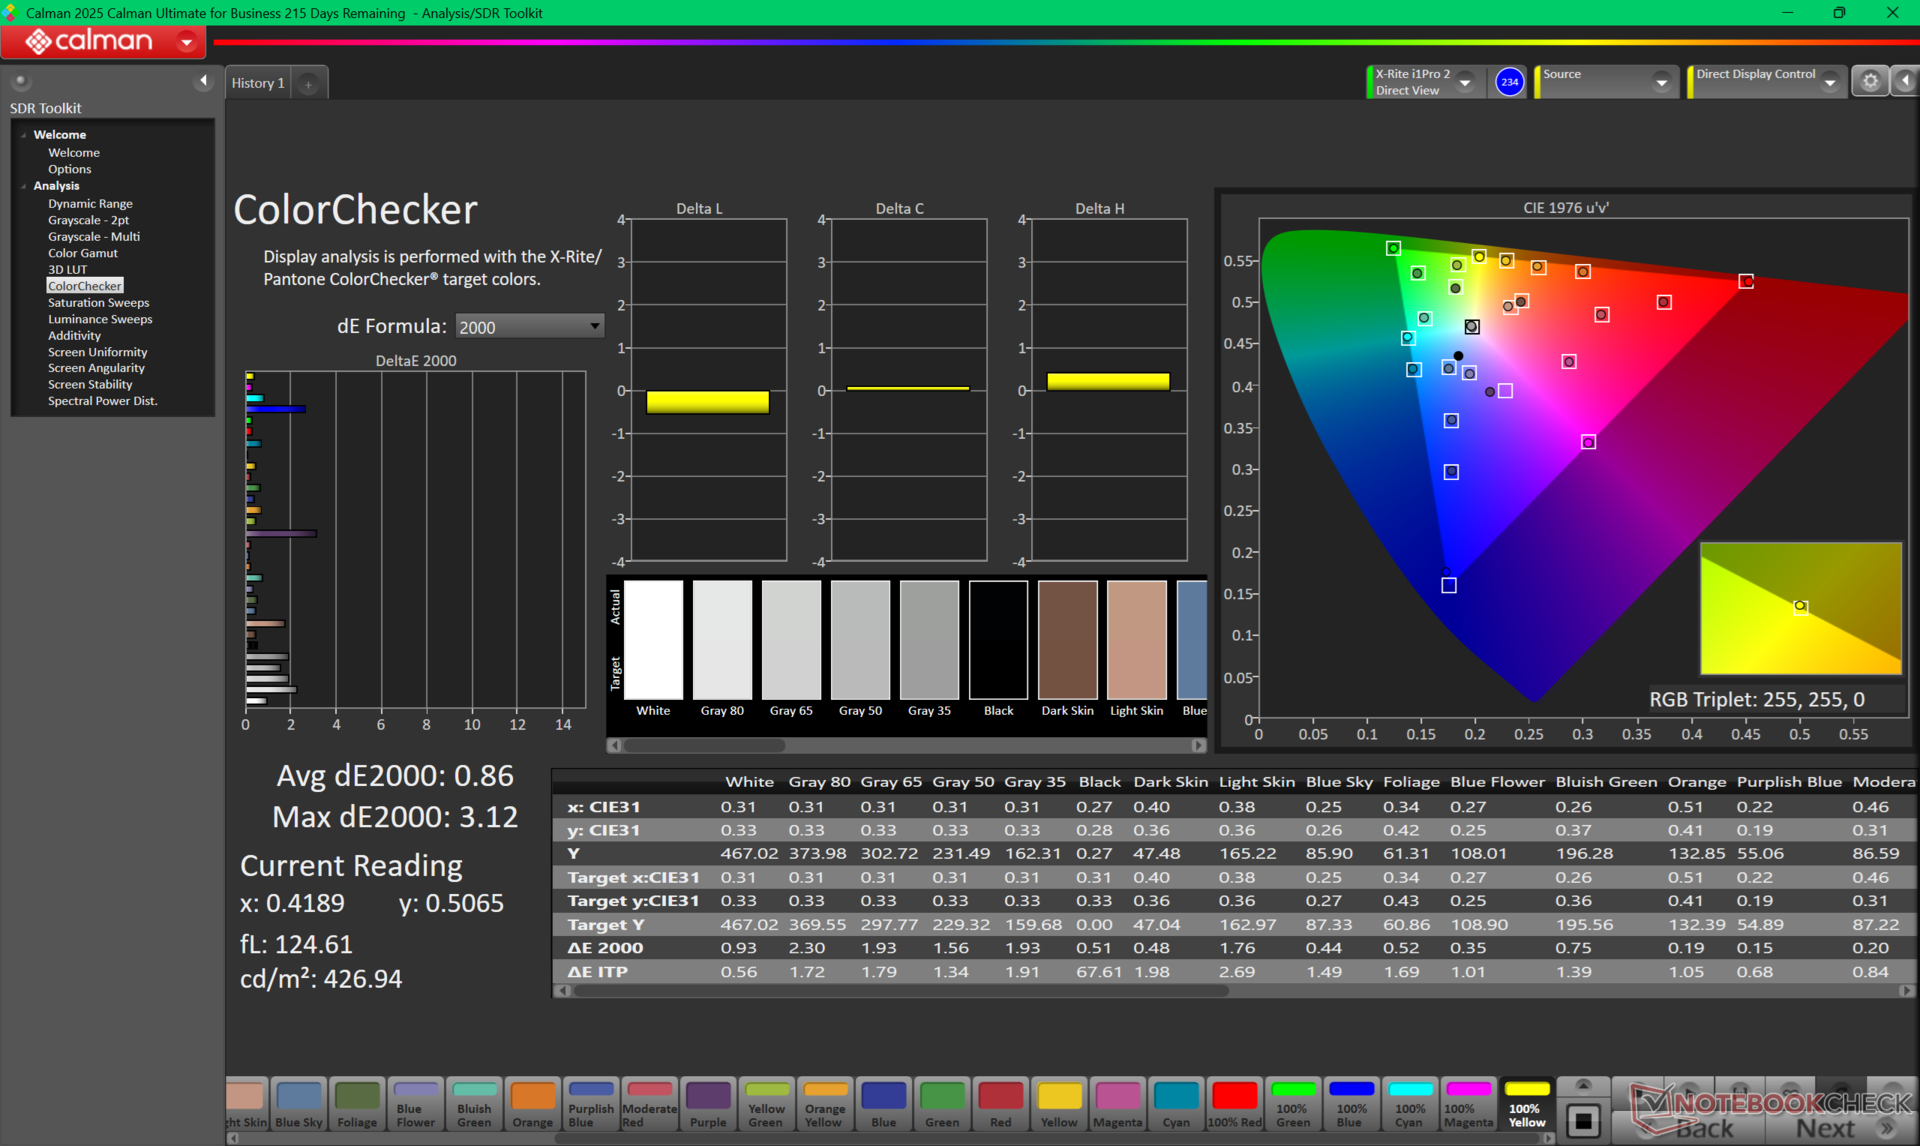
ΔE ColorChecker Calman: 2.37 | ∀{0.5-29.43 Ø4.71}
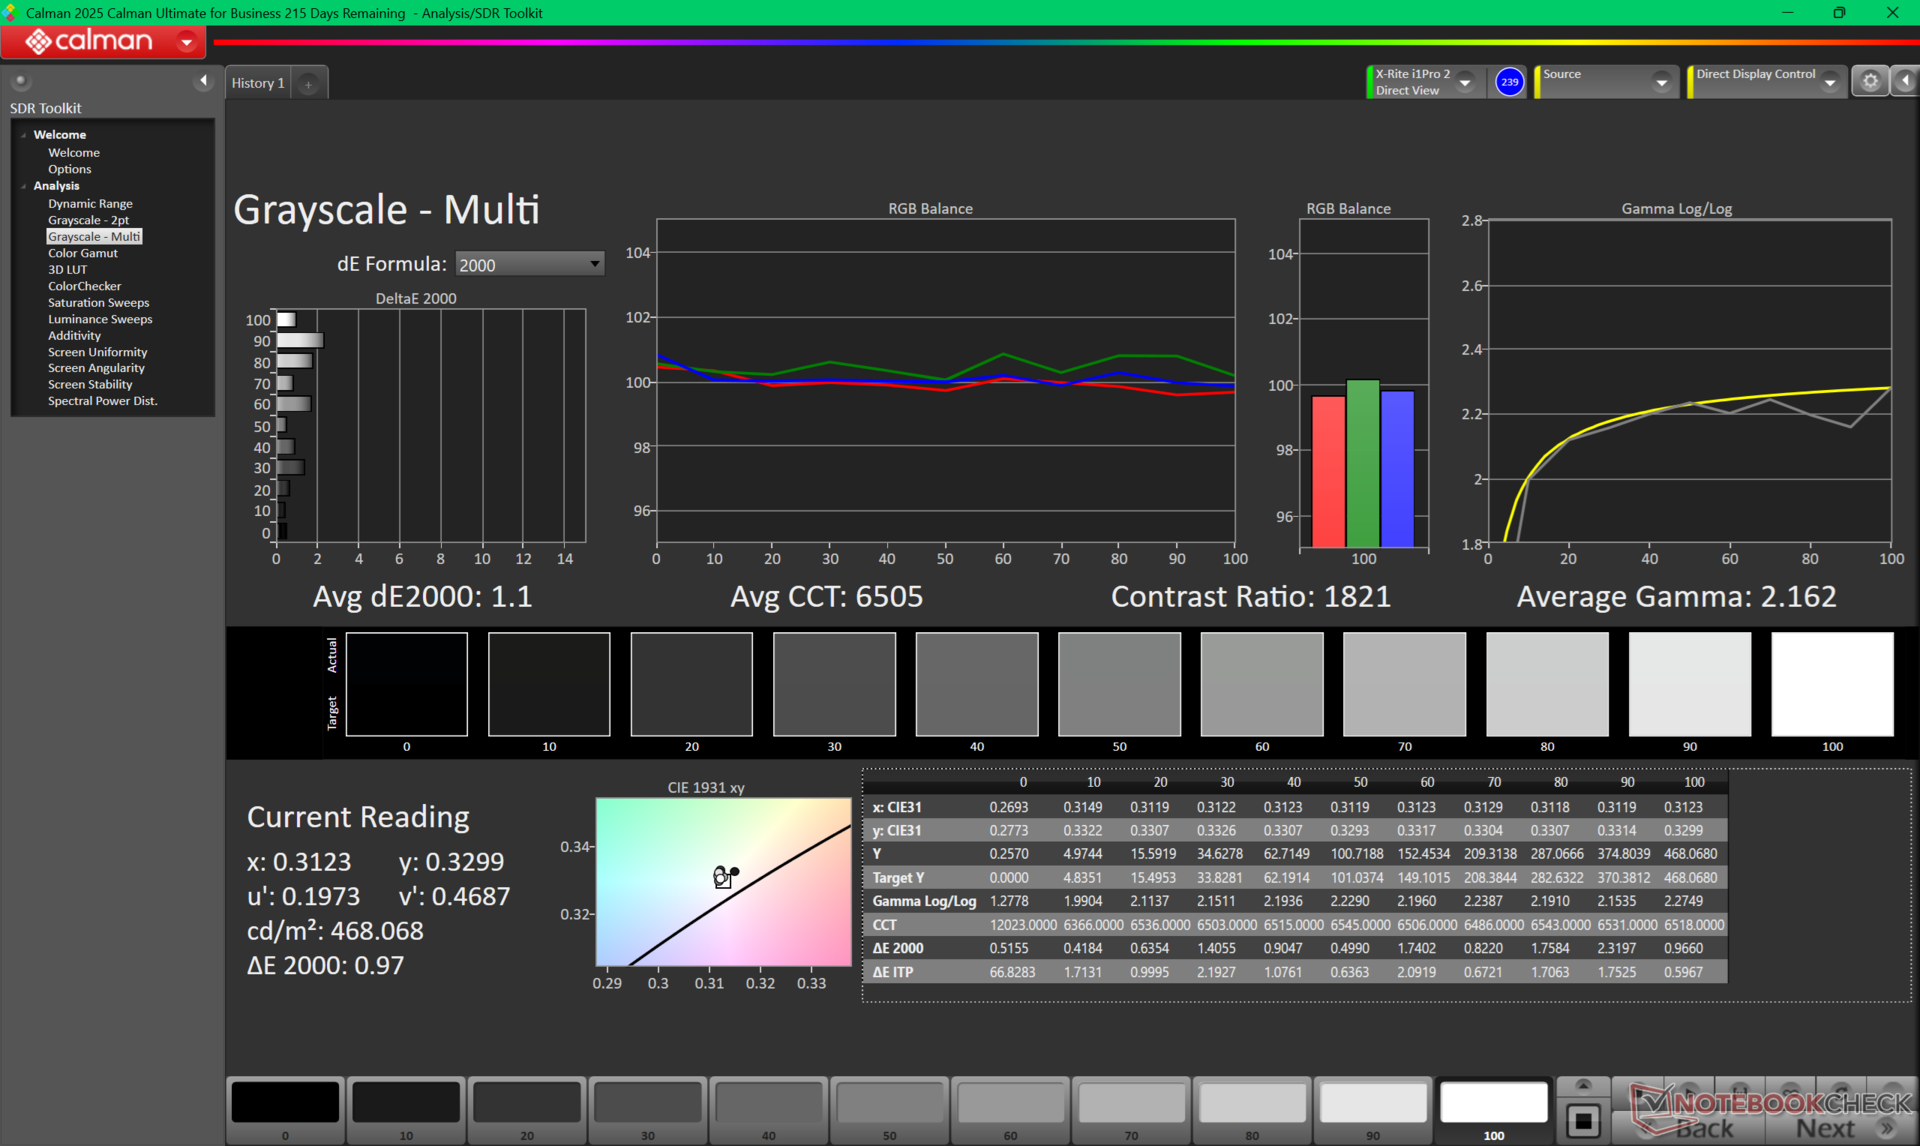
calibrated: 0.86
ΔE Greyscale Calman: 3.8 | ∀{0.09-98 Ø4.96}
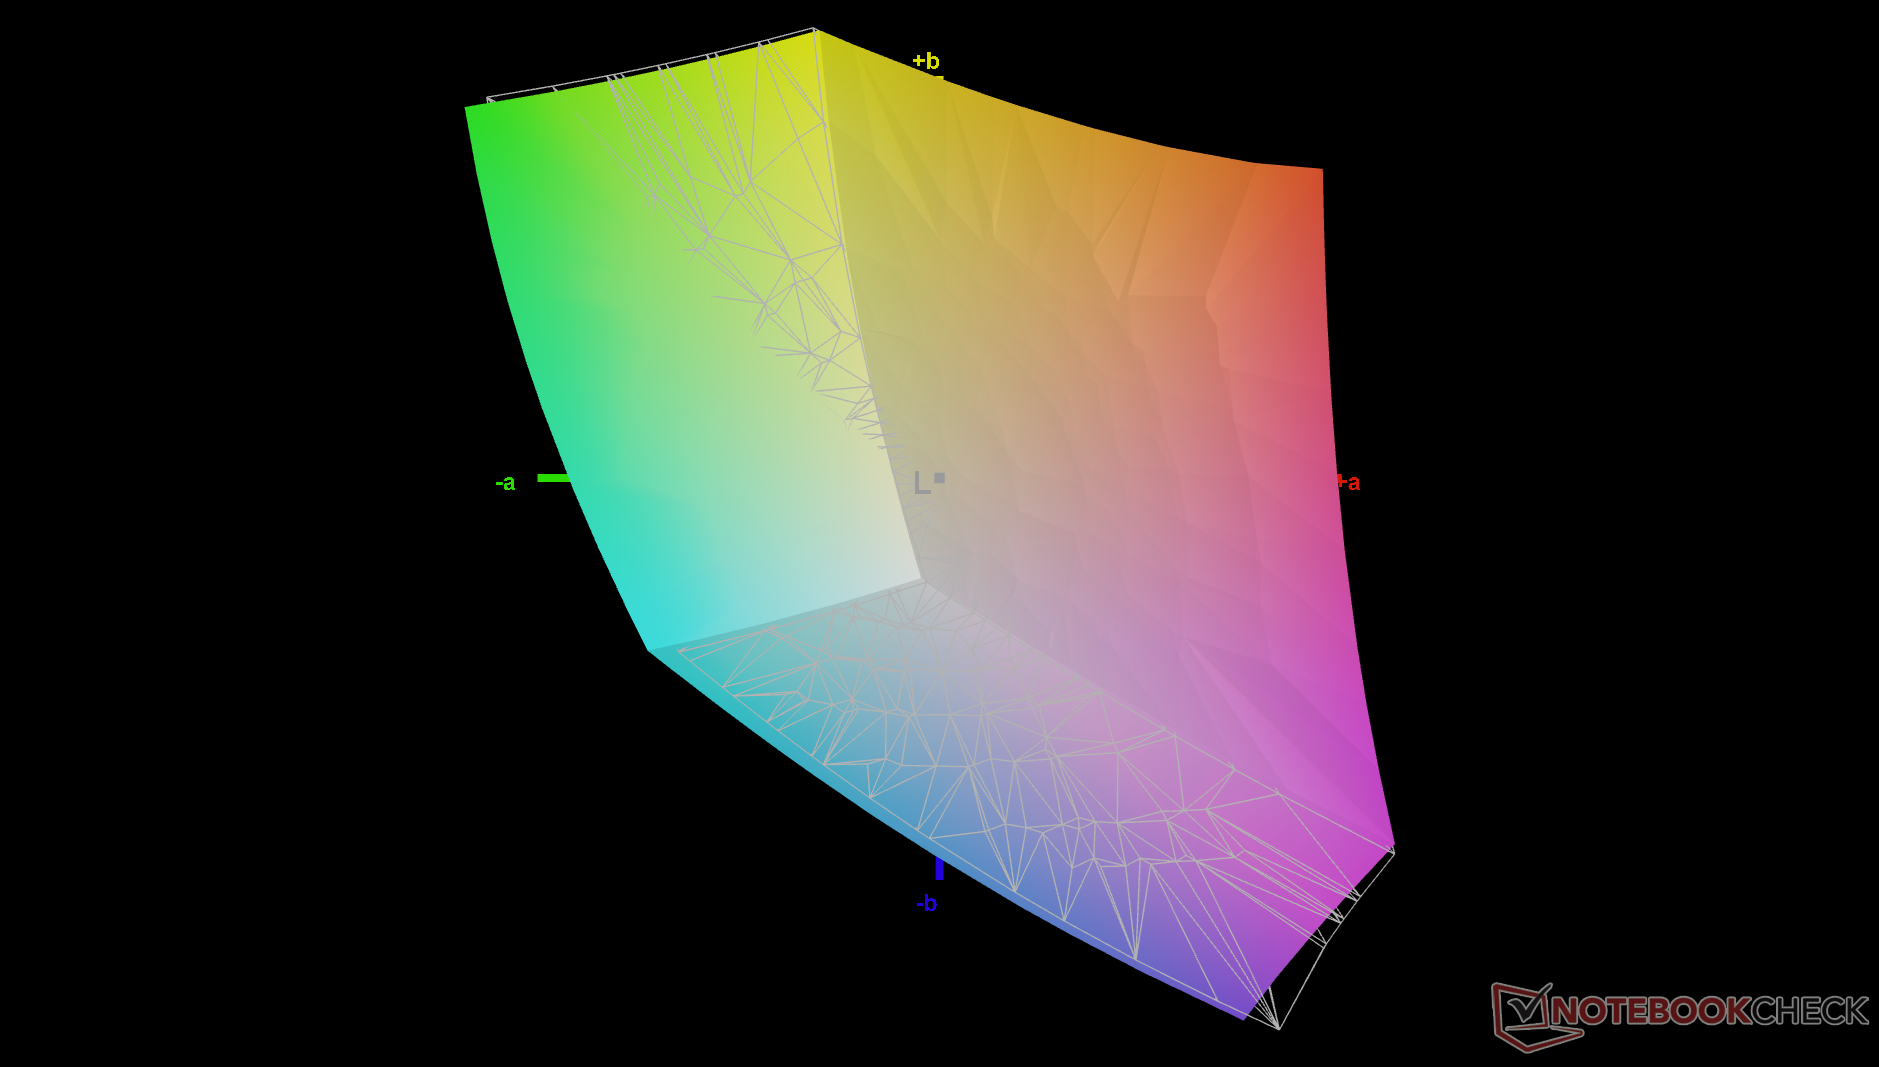
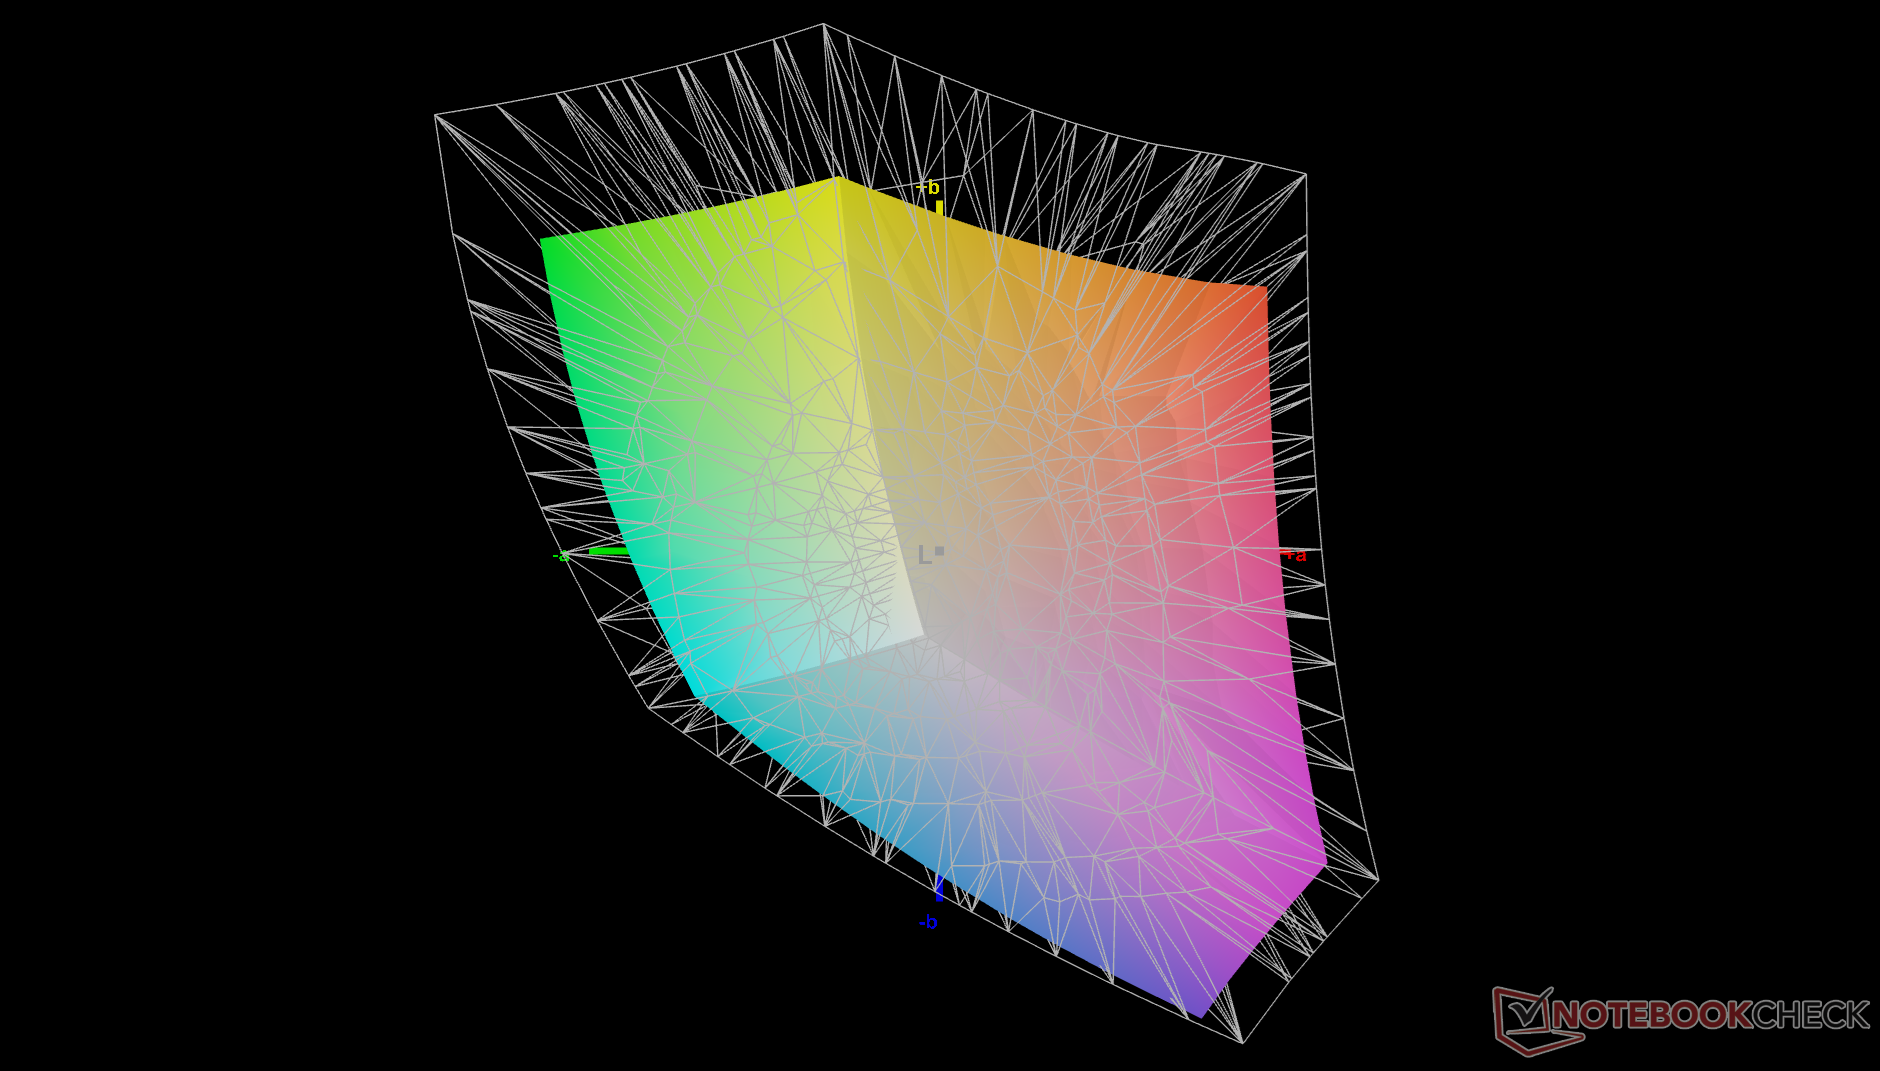
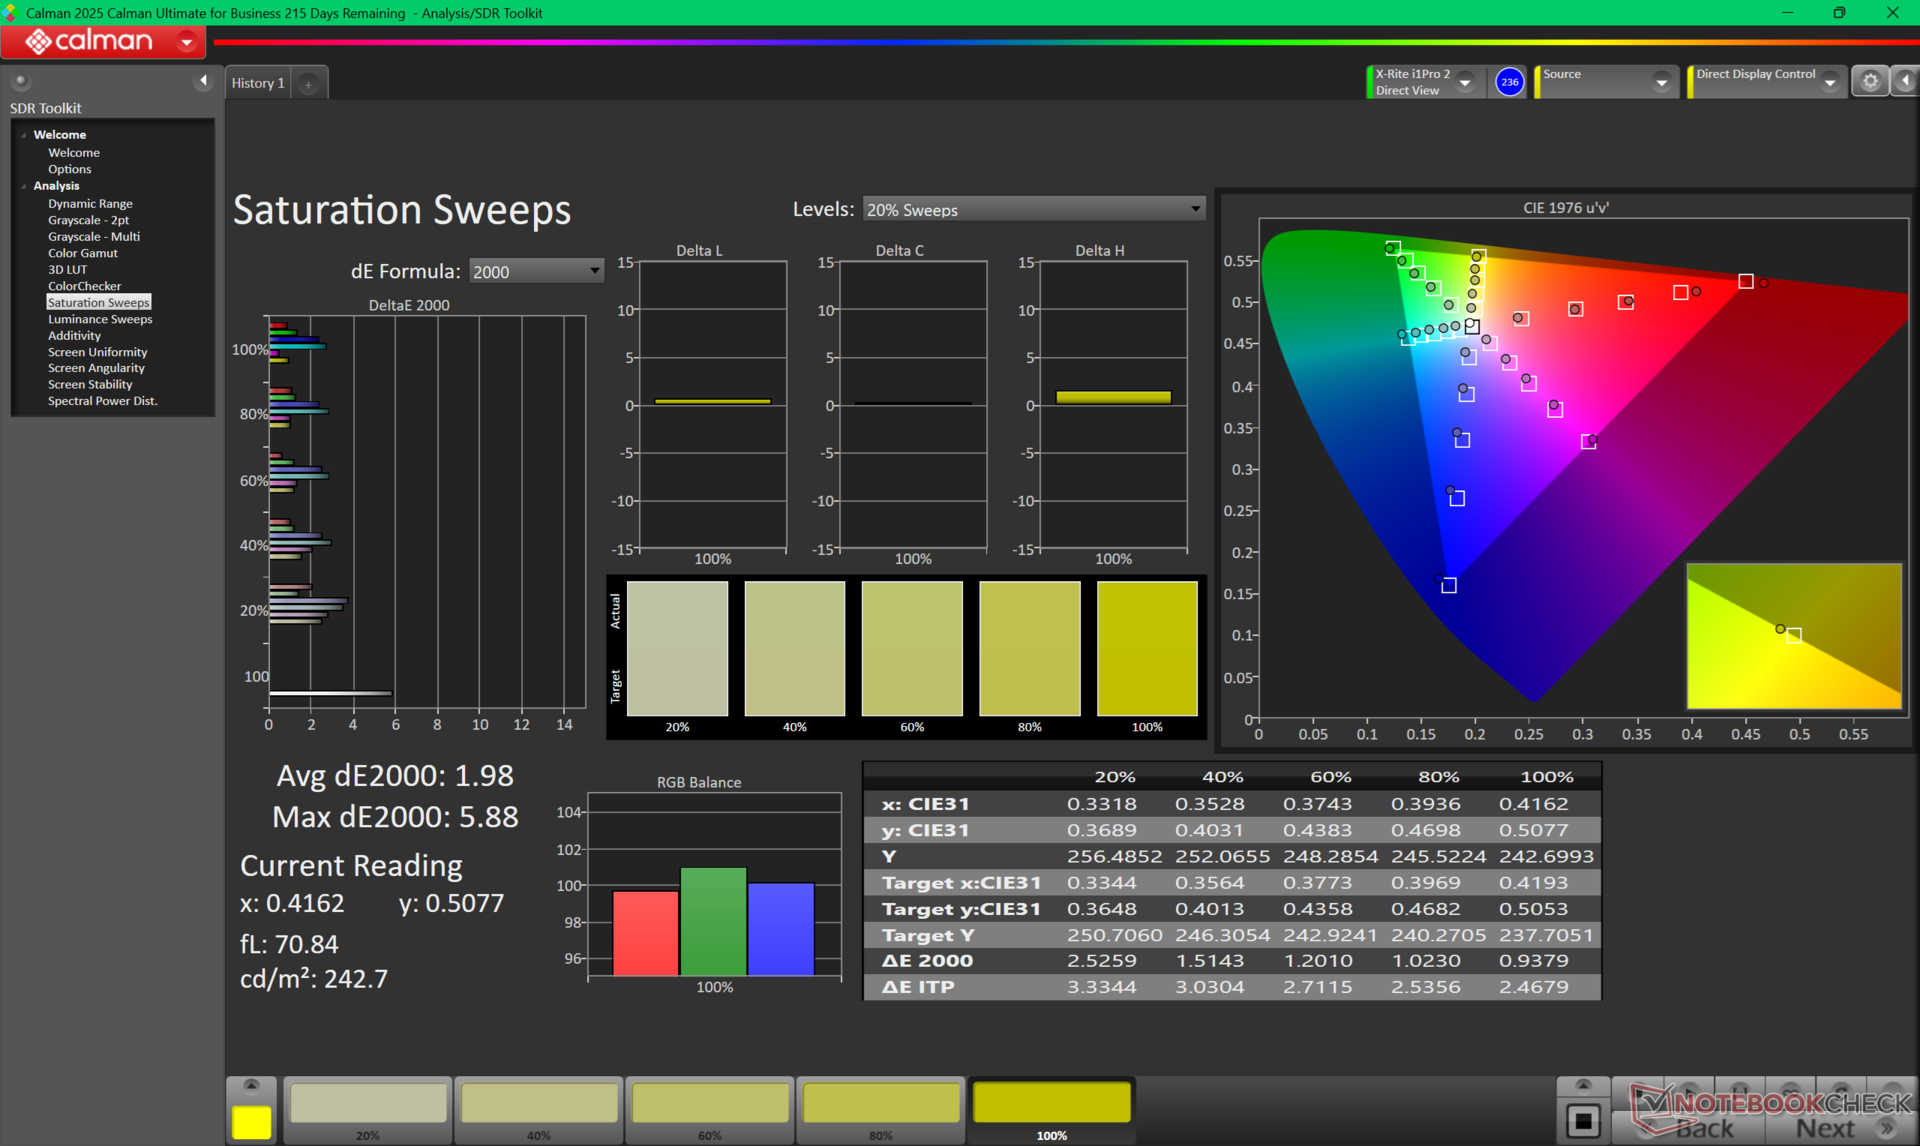
71.6% AdobeRGB 1998 (Argyll 3D)
98.4% sRGB (Argyll 3D)
69.9% Display P3 (Argyll 3D)
Gamma: 2.14
CCT: 6540 K
| HP EliteBook X G1i 14 AI IPS, 1920x1200, 14", 60 Hz | HP EliteBook Ultra G1i 14 SDC41AA, OLED, 2880x1800, 14", 120 Hz | HP EliteBook X G1a 14 AI LG Philips LGD07A1, IPS, 1920x1200, 14", 60 Hz | Dell Pro 14 Premium LG Phillips 140WT1, OLED, 2880x1800, 14", 60 Hz | Lenovo ThinkBook 14 Gen 8 21SJ007SGE LEN140WUXGA, IPS LED, 1920x1200, 14", 60 Hz | Asus Zenbook 14 OLED UX3405CA Samsung ATNA40CU09-0, OLED, 2880x1800, 14", 120 Hz | |
|---|---|---|---|---|---|---|
| Display | 27% | -9% | 26% | -40% | 25% | |
| Display P3 Coverage (%) | 69.9 | 99.7 43% | 62.6 -10% | 99 42% | 41.5 -41% | 99.4 42% |
| sRGB Coverage (%) | 98.4 | 100 2% | 93.2 -5% | 100 2% | 60.3 -39% | 100 2% |
| AdobeRGB 1998 Coverage (%) | 71.6 | 98 37% | 64 -11% | 95.8 34% | 42.9 -40% | 93.9 31% |
| Response Times | 98% | -21% | 94% | 49% | 67% | |
| Response Time Grey 50% / Grey 80% * (ms) | 42.3 ? | 0.74 ? 98% | 55.8 ? -32% | 1.4 ? 97% | 19.3 ? 54% | 11.2 ? 74% |
| Response Time Black / White * (ms) | 28 ? | 0.7 ? 97% | 30.5 ? -9% | 2.7 ? 90% | 15.8 ? 44% | 11.6 ? 59% |
| PWM Frequency (Hz) | 480 ? | 241.1 ? | 480 | |||
| PWM Amplitude * (%) | 26 | 32 | 11.1 | |||
| Screen | 0% | -43% | -5% | -118% | -4% | |
| Brightness middle (cd/m²) | 487.5 | 392 -20% | 442.8 -9% | 392.3 -20% | 271 -44% | 329 -33% |
| Brightness (cd/m²) | 469 | 378 -19% | 412 -12% | 392 -16% | 276 -41% | 329 -30% |
| Brightness Distribution (%) | 91 | 95 4% | 87 -4% | 95 4% | 89 -2% | 98 8% |
| Black Level * (cd/m²) | 0.26 | 0.22 15% | 0.29 -12% | |||
| Contrast (:1) | 1875 | 2013 7% | 934 -50% | |||
| Colorchecker dE 2000 * | 2.37 | 2.4 -1% | 5.92 -150% | 3.39 -43% | 6.4 -170% | 2.54 -7% |
| Colorchecker dE 2000 max. * | 5.77 | 6.6 -14% | 10.46 -81% | 6.53 -13% | 20.7 -259% | 3.36 42% |
| Colorchecker dE 2000 calibrated * | 0.86 | 1.31 -52% | 0.99 -15% | 5.1 -493% | 1.14 -33% | |
| Greyscale dE 2000 * | 3.8 | 1.9 50% | 7.6 -100% | 1.1 71% | 3.6 5% | 2.8 26% |
| Gamma | 2.14 103% | 2.21 100% | 2.22 99% | 2.23 99% | 1.99 111% | 2.16 102% |
| CCT | 6540 99% | 6463 101% | 6728 97% | 6502 100% | 6576 99% | 6547 99% |
| Całkowita średnia (program / ustawienia) | 42% /
25% | -24% /
-32% | 38% /
19% | -36% /
-78% | 29% /
15% |
* ... im mniej tym lepiej
Wyświetl czasy reakcji
| ↔ Czas reakcji od czerni do bieli | ||
|---|---|---|
| 28 ms ... wzrost ↗ i spadek ↘ łącznie | ↗ 15.7 ms wzrost | 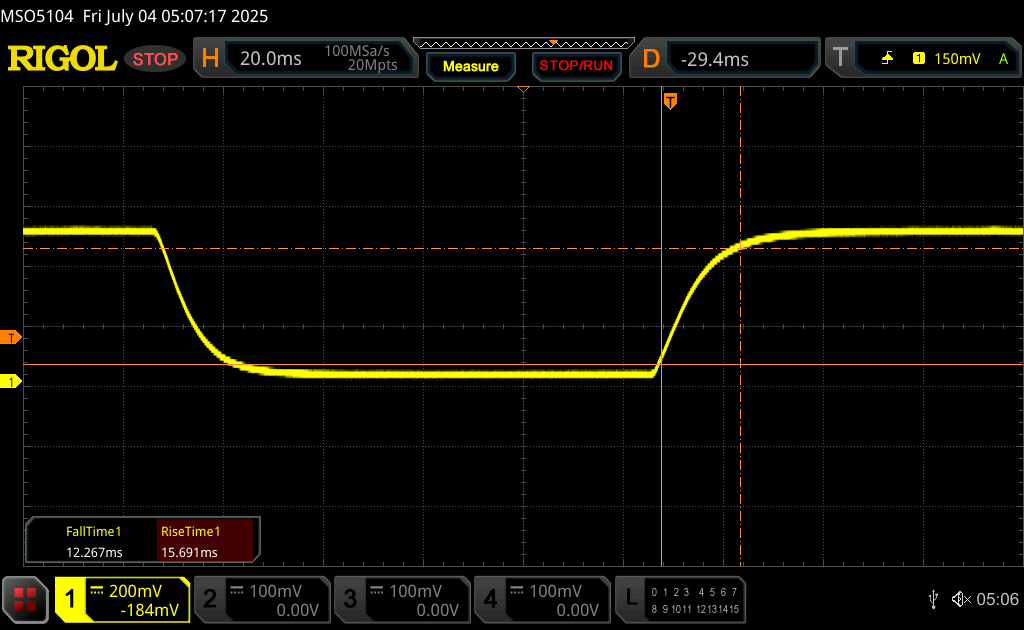 |
| ↘ 12.3 ms upadek | ||
| W naszych testach ekran wykazuje stosunkowo powolne tempo reakcji i może być zbyt wolny dla graczy. Dla porównania, wszystkie testowane urządzenia wahają się od 0.1 (minimum) do 240 (maksimum) ms. » 71 % wszystkich urządzeń jest lepszych. Oznacza to, że zmierzony czas reakcji jest gorszy od średniej wszystkich testowanych urządzeń (19.8 ms). | ||
| ↔ Czas reakcji 50% szarości do 80% szarości | ||
| 42.3 ms ... wzrost ↗ i spadek ↘ łącznie | ↗ 19.1 ms wzrost | 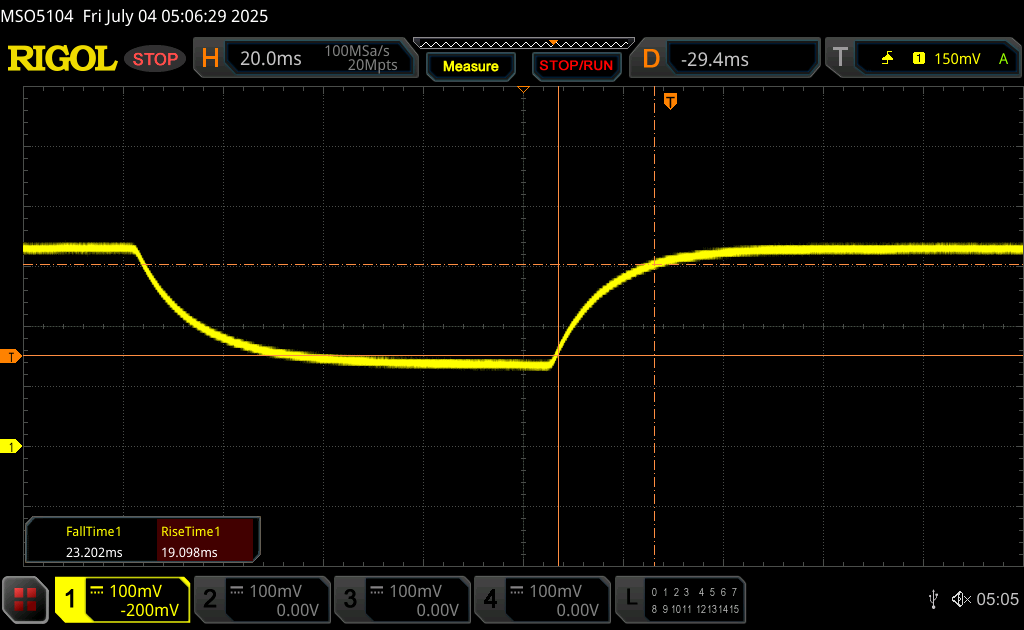 |
| ↘ 23.2 ms upadek | ||
| W naszych testach ekran wykazuje powolne tempo reakcji, co będzie niezadowalające dla graczy. Dla porównania, wszystkie testowane urządzenia wahają się od 0.165 (minimum) do 636 (maksimum) ms. » 70 % wszystkich urządzeń jest lepszych. Oznacza to, że zmierzony czas reakcji jest gorszy od średniej wszystkich testowanych urządzeń (31 ms). | ||
Migotanie ekranu / PWM (modulacja szerokości impulsu)
| Migotanie ekranu/nie wykryto PWM | 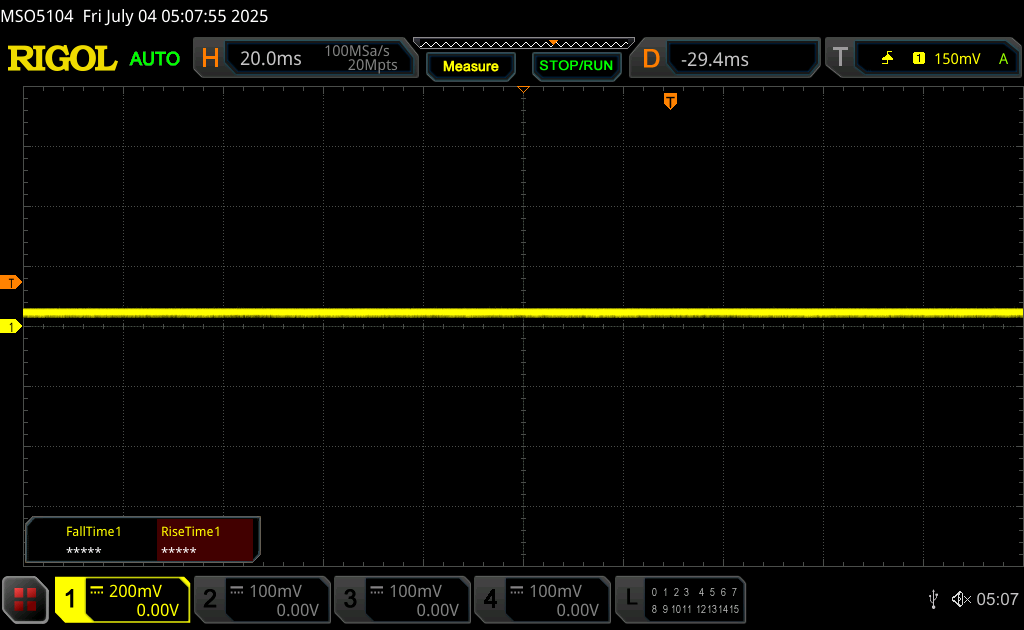 | ||
Dla porównania: 52 % wszystkich testowanych urządzeń nie używa PWM do przyciemniania wyświetlacza. Jeśli wykryto PWM, zmierzono średnio 7757 (minimum: 5 - maksimum: 343500) Hz. | |||
Wydajność
Warunki testowania
Przed uruchomieniem poniższych testów porównawczych ustawiliśmy system Windows w tryb wydajności.
Procesor
Cinebench R15 Multi Loop
Cinebench R23: Multi Core | Single Core
Cinebench R20: CPU (Multi Core) | CPU (Single Core)
Cinebench R15: CPU Multi 64Bit | CPU Single 64Bit
Blender: v2.79 BMW27 CPU
7-Zip 18.03: 7z b 4 | 7z b 4 -mmt1
Geekbench 6.7: Multi-Core | Single-Core
Geekbench 5.5: Multi-Core | Single-Core
HWBOT x265 Benchmark v2.2: 4k Preset
LibreOffice : 20 Documents To PDF
R Benchmark 2.5: Overall mean
| Cinebench R20 / CPU (Multi Core) | |
| HP ZBook Ultra G1a 14 | |
| HP EliteBook X G1a 14 AI | |
| Razer Blade 14 2025 | |
| Lenovo ThinkBook 14 Gen 8 21SJ007SGE | |
| Lenovo IdeaPad Pro 5 14AKP G10 | |
| Asus Zenbook 14 OLED UX3405CA | |
| Lenovo ThinkPad P14s Gen 6 21RV0017GE | |
| HP EliteBook X G1i 14 AI | |
| Dell Pro 14 Premium | |
| Przeciętny Intel Core Ultra 7 268V (3811 - 4255, n=5) | |
| HP EliteBook Ultra G1i 14 | |
| Cinebench R20 / CPU (Single Core) | |
| Lenovo ThinkBook 14 Gen 8 21SJ007SGE | |
| Asus Zenbook 14 OLED UX3405CA | |
| Lenovo IdeaPad Pro 5 14AKP G10 | |
| HP ZBook Ultra G1a 14 | |
| Razer Blade 14 2025 | |
| Lenovo ThinkPad P14s Gen 6 21RV0017GE | |
| Przeciętny Intel Core Ultra 7 268V (733 - 764, n=5) | |
| HP EliteBook X G1a 14 AI | |
| Dell Pro 14 Premium | |
| HP EliteBook X G1i 14 AI | |
| HP EliteBook Ultra G1i 14 | |
| Cinebench R15 / CPU Single 64Bit | |
| Lenovo ThinkBook 14 Gen 8 21SJ007SGE | |
| HP ZBook Ultra G1a 14 | |
| Lenovo IdeaPad Pro 5 14AKP G10 | |
| Przeciętny Intel Core Ultra 7 268V (287 - 302, n=5) | |
| Dell Pro 14 Premium | |
| HP EliteBook X G1i 14 AI | |
| HP EliteBook Ultra G1i 14 | |
| HP EliteBook X G1a 14 AI | |
| Asus Zenbook 14 OLED UX3405CA | |
| Razer Blade 14 2025 | |
| Lenovo ThinkPad P14s Gen 6 21RV0017GE | |
| HWBOT x265 Benchmark v2.2 / 4k Preset | |
| HP ZBook Ultra G1a 14 | |
| Razer Blade 14 2025 | |
| Lenovo ThinkPad P14s Gen 6 21RV0017GE | |
| Lenovo IdeaPad Pro 5 14AKP G10 | |
| Lenovo ThinkBook 14 Gen 8 21SJ007SGE | |
| HP EliteBook X G1a 14 AI | |
| Asus Zenbook 14 OLED UX3405CA | |
| HP EliteBook X G1i 14 AI | |
| Dell Pro 14 Premium | |
| Przeciętny Intel Core Ultra 7 268V (10.4 - 13.9, n=5) | |
| HP EliteBook Ultra G1i 14 | |
| LibreOffice / 20 Documents To PDF | |
| Asus Zenbook 14 OLED UX3405CA | |
| HP EliteBook X G1a 14 AI | |
| Razer Blade 14 2025 | |
| HP ZBook Ultra G1a 14 | |
| Lenovo ThinkPad P14s Gen 6 21RV0017GE | |
| Lenovo IdeaPad Pro 5 14AKP G10 | |
| Przeciętny Intel Core Ultra 7 268V (44.9 - 60.8, n=5) | |
| HP EliteBook X G1i 14 AI | |
| Dell Pro 14 Premium | |
| HP EliteBook Ultra G1i 14 | |
| Lenovo ThinkBook 14 Gen 8 21SJ007SGE | |
* ... im mniej tym lepiej
AIDA64: FP32 Ray-Trace | FPU Julia | CPU SHA3 | CPU Queen | FPU SinJulia | FPU Mandel | CPU AES | CPU ZLib | FP64 Ray-Trace | CPU PhotoWorxx
| Performance rating | |
| HP EliteBook X G1a 14 AI | |
| Lenovo ThinkBook 14 Gen 8 21SJ007SGE | |
| Asus Zenbook 14 OLED UX3405CA | |
| HP EliteBook X G1i 14 AI | |
| Dell Pro 14 Premium | |
| Przeciętny Intel Core Ultra 7 268V | |
| HP EliteBook Ultra G1i 14 | |
| AIDA64 / FP32 Ray-Trace | |
| HP EliteBook X G1a 14 AI | |
| Lenovo ThinkBook 14 Gen 8 21SJ007SGE | |
| Asus Zenbook 14 OLED UX3405CA | |
| HP EliteBook X G1i 14 AI | |
| Dell Pro 14 Premium | |
| Przeciętny Intel Core Ultra 7 268V (10556 - 12759, n=5) | |
| HP EliteBook Ultra G1i 14 | |
| AIDA64 / FPU Julia | |
| HP EliteBook X G1a 14 AI | |
| Lenovo ThinkBook 14 Gen 8 21SJ007SGE | |
| Asus Zenbook 14 OLED UX3405CA | |
| HP EliteBook X G1i 14 AI | |
| Dell Pro 14 Premium | |
| Przeciętny Intel Core Ultra 7 268V (47659 - 62563, n=5) | |
| HP EliteBook Ultra G1i 14 | |
| AIDA64 / CPU SHA3 | |
| HP EliteBook X G1a 14 AI | |
| Lenovo ThinkBook 14 Gen 8 21SJ007SGE | |
| Asus Zenbook 14 OLED UX3405CA | |
| HP EliteBook X G1i 14 AI | |
| Dell Pro 14 Premium | |
| Przeciętny Intel Core Ultra 7 268V (2117 - 2803, n=5) | |
| HP EliteBook Ultra G1i 14 | |
| AIDA64 / CPU Queen | |
| HP EliteBook X G1a 14 AI | |
| Asus Zenbook 14 OLED UX3405CA | |
| Lenovo ThinkBook 14 Gen 8 21SJ007SGE | |
| Dell Pro 14 Premium | |
| Przeciętny Intel Core Ultra 7 268V (49629 - 49759, n=5) | |
| HP EliteBook X G1i 14 AI | |
| HP EliteBook Ultra G1i 14 | |
| AIDA64 / FPU SinJulia | |
| HP EliteBook X G1a 14 AI | |
| Lenovo ThinkBook 14 Gen 8 21SJ007SGE | |
| Asus Zenbook 14 OLED UX3405CA | |
| HP EliteBook Ultra G1i 14 | |
| Dell Pro 14 Premium | |
| Przeciętny Intel Core Ultra 7 268V (4351 - 4429, n=5) | |
| HP EliteBook X G1i 14 AI | |
| AIDA64 / FPU Mandel | |
| HP EliteBook X G1a 14 AI | |
| Lenovo ThinkBook 14 Gen 8 21SJ007SGE | |
| Asus Zenbook 14 OLED UX3405CA | |
| HP EliteBook X G1i 14 AI | |
| Dell Pro 14 Premium | |
| Przeciętny Intel Core Ultra 7 268V (25929 - 33207, n=5) | |
| HP EliteBook Ultra G1i 14 | |
| AIDA64 / CPU AES | |
| HP EliteBook X G1a 14 AI | |
| Lenovo ThinkBook 14 Gen 8 21SJ007SGE | |
| Asus Zenbook 14 OLED UX3405CA | |
| Dell Pro 14 Premium | |
| HP EliteBook X G1i 14 AI | |
| Przeciętny Intel Core Ultra 7 268V (33196 - 39140, n=5) | |
| HP EliteBook Ultra G1i 14 | |
| AIDA64 / CPU ZLib | |
| HP EliteBook X G1a 14 AI | |
| Lenovo ThinkBook 14 Gen 8 21SJ007SGE | |
| Asus Zenbook 14 OLED UX3405CA | |
| HP EliteBook X G1i 14 AI | |
| Dell Pro 14 Premium | |
| Przeciętny Intel Core Ultra 7 268V (441 - 633, n=5) | |
| HP EliteBook Ultra G1i 14 | |
| AIDA64 / FP64 Ray-Trace | |
| HP EliteBook X G1a 14 AI | |
| Lenovo ThinkBook 14 Gen 8 21SJ007SGE | |
| Asus Zenbook 14 OLED UX3405CA | |
| HP EliteBook X G1i 14 AI | |
| Dell Pro 14 Premium | |
| Przeciętny Intel Core Ultra 7 268V (5938 - 6960, n=5) | |
| HP EliteBook Ultra G1i 14 | |
| AIDA64 / CPU PhotoWorxx | |
| Asus Zenbook 14 OLED UX3405CA | |
| HP EliteBook X G1i 14 AI | |
| Dell Pro 14 Premium | |
| Przeciętny Intel Core Ultra 7 268V (46733 - 55083, n=5) | |
| HP EliteBook Ultra G1i 14 | |
| HP EliteBook X G1a 14 AI | |
| Lenovo ThinkBook 14 Gen 8 21SJ007SGE | |
Wydajność systemu
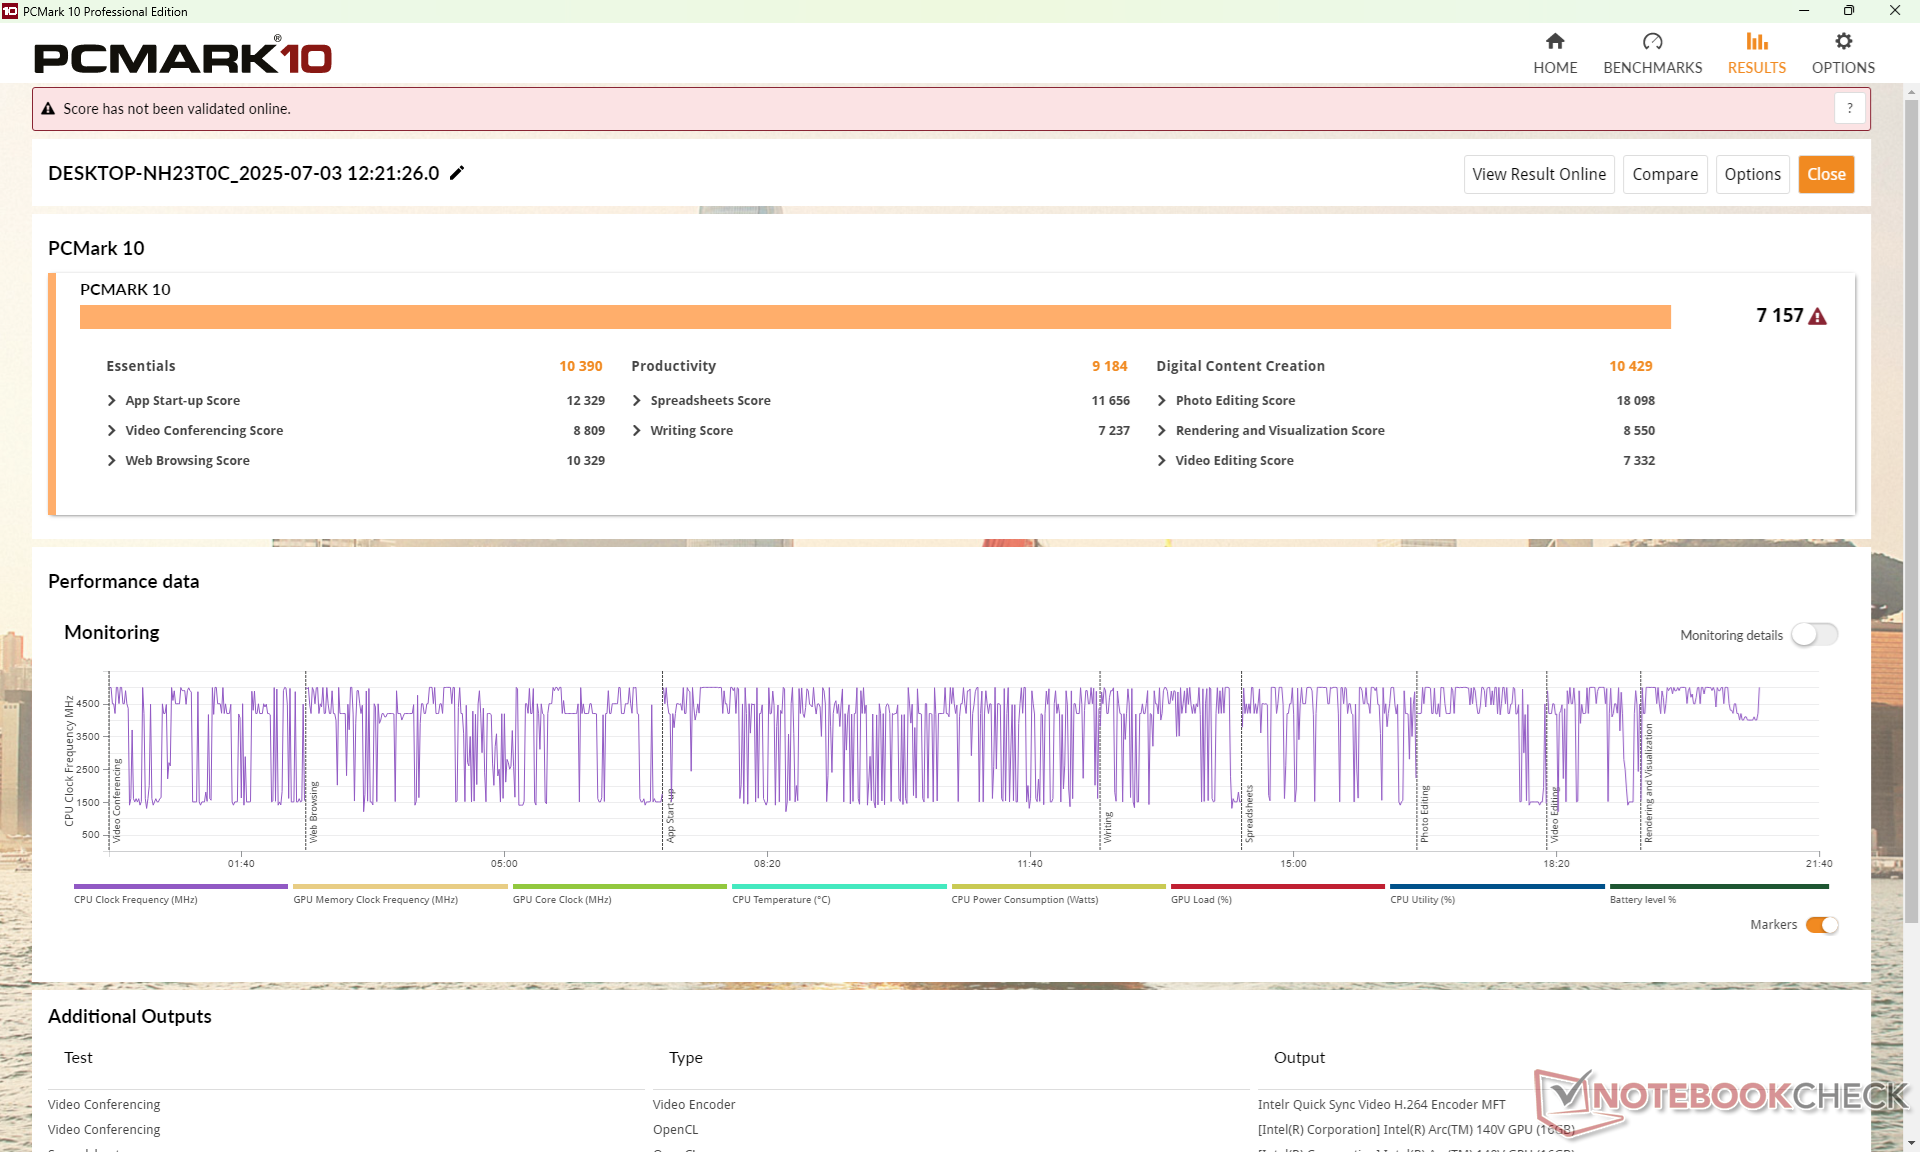
PCMark 10: Score | Essentials | Productivity | Digital Content Creation
CrossMark: Overall | Productivity | Creativity | Responsiveness
WebXPRT 3: Overall
WebXPRT 4: Overall
Mozilla Kraken 1.1: Total
| Performance rating | |
| Lenovo ThinkBook 14 Gen 8 21SJ007SGE | |
| Asus ZenBook Duo OLED UX8406CA | |
| HP EliteBook X G1a 14 AI | |
| Dell Pro 14 Premium | |
| HP EliteBook Ultra G1i 14 | |
| HP EliteBook X G1i 14 AI | |
| Przeciętny Intel Core Ultra 7 268V, Intel Arc Graphics 140V | |
| PCMark 10 / Score | |
| Lenovo ThinkBook 14 Gen 8 21SJ007SGE | |
| HP EliteBook X G1a 14 AI | |
| Asus ZenBook Duo OLED UX8406CA | |
| Dell Pro 14 Premium | |
| HP EliteBook Ultra G1i 14 | |
| HP EliteBook X G1i 14 AI | |
| Przeciętny Intel Core Ultra 7 268V, Intel Arc Graphics 140V (6729 - 7236, n=5) | |
| PCMark 10 / Essentials | |
| Lenovo ThinkBook 14 Gen 8 21SJ007SGE | |
| HP EliteBook X G1a 14 AI | |
| Asus ZenBook Duo OLED UX8406CA | |
| HP EliteBook Ultra G1i 14 | |
| Dell Pro 14 Premium | |
| HP EliteBook X G1i 14 AI | |
| Przeciętny Intel Core Ultra 7 268V, Intel Arc Graphics 140V (10007 - 10701, n=5) | |
| PCMark 10 / Productivity | |
| HP EliteBook X G1a 14 AI | |
| HP EliteBook Ultra G1i 14 | |
| Lenovo ThinkBook 14 Gen 8 21SJ007SGE | |
| Dell Pro 14 Premium | |
| HP EliteBook X G1i 14 AI | |
| Przeciętny Intel Core Ultra 7 268V, Intel Arc Graphics 140V (8766 - 9217, n=5) | |
| Asus ZenBook Duo OLED UX8406CA | |
| PCMark 10 / Digital Content Creation | |
| Asus ZenBook Duo OLED UX8406CA | |
| Lenovo ThinkBook 14 Gen 8 21SJ007SGE | |
| HP EliteBook X G1a 14 AI | |
| HP EliteBook X G1i 14 AI | |
| Dell Pro 14 Premium | |
| Przeciętny Intel Core Ultra 7 268V, Intel Arc Graphics 140V (9425 - 10429, n=5) | |
| HP EliteBook Ultra G1i 14 | |
| CrossMark / Overall | |
| Lenovo ThinkBook 14 Gen 8 21SJ007SGE | |
| Asus ZenBook Duo OLED UX8406CA | |
| Dell Pro 14 Premium | |
| HP EliteBook Ultra G1i 14 | |
| Przeciętny Intel Core Ultra 7 268V, Intel Arc Graphics 140V (1643 - 1763, n=5) | |
| HP EliteBook X G1a 14 AI | |
| HP EliteBook X G1i 14 AI | |
| CrossMark / Productivity | |
| Lenovo ThinkBook 14 Gen 8 21SJ007SGE | |
| Asus ZenBook Duo OLED UX8406CA | |
| Dell Pro 14 Premium | |
| HP EliteBook Ultra G1i 14 | |
| Przeciętny Intel Core Ultra 7 268V, Intel Arc Graphics 140V (1577 - 1696, n=5) | |
| HP EliteBook X G1i 14 AI | |
| HP EliteBook X G1a 14 AI | |
| CrossMark / Creativity | |
| Lenovo ThinkBook 14 Gen 8 21SJ007SGE | |
| Asus ZenBook Duo OLED UX8406CA | |
| Dell Pro 14 Premium | |
| HP EliteBook Ultra G1i 14 | |
| HP EliteBook X G1a 14 AI | |
| Przeciętny Intel Core Ultra 7 268V, Intel Arc Graphics 140V (1866 - 2021, n=5) | |
| HP EliteBook X G1i 14 AI | |
| CrossMark / Responsiveness | |
| Lenovo ThinkBook 14 Gen 8 21SJ007SGE | |
| Asus ZenBook Duo OLED UX8406CA | |
| HP EliteBook X G1a 14 AI | |
| HP EliteBook Ultra G1i 14 | |
| Dell Pro 14 Premium | |
| Przeciętny Intel Core Ultra 7 268V, Intel Arc Graphics 140V (1239 - 1313, n=5) | |
| HP EliteBook X G1i 14 AI | |
| WebXPRT 3 / Overall | |
| HP EliteBook X G1a 14 AI | |
| Lenovo ThinkBook 14 Gen 8 21SJ007SGE | |
| Dell Pro 14 Premium | |
| HP EliteBook X G1i 14 AI | |
| Przeciętny Intel Core Ultra 7 268V, Intel Arc Graphics 140V (266 - 317, n=5) | |
| HP EliteBook Ultra G1i 14 | |
| Asus ZenBook Duo OLED UX8406CA | |
| WebXPRT 4 / Overall | |
| Lenovo ThinkBook 14 Gen 8 21SJ007SGE | |
| Dell Pro 14 Premium | |
| HP EliteBook X G1i 14 AI | |
| HP EliteBook Ultra G1i 14 | |
| Przeciętny Intel Core Ultra 7 268V, Intel Arc Graphics 140V (245 - 292, n=5) | |
| HP EliteBook X G1a 14 AI | |
| Asus ZenBook Duo OLED UX8406CA | |
| Mozilla Kraken 1.1 / Total | |
| HP EliteBook Ultra G1i 14 | |
| HP EliteBook X G1i 14 AI | |
| Przeciętny Intel Core Ultra 7 268V, Intel Arc Graphics 140V (460 - 476, n=5) | |
| Asus ZenBook Duo OLED UX8406CA | |
| HP EliteBook X G1a 14 AI | |
| Dell Pro 14 Premium | |
| Lenovo ThinkBook 14 Gen 8 21SJ007SGE | |
* ... im mniej tym lepiej
| PCMark 10 Score | 7157 pkt. | |
Pomoc | ||
| AIDA64 / Memory Copy | |
| HP EliteBook Ultra G1i 14 | |
| Dell Pro 14 Premium | |
| HP EliteBook X G1i 14 AI | |
| Przeciętny Intel Core Ultra 7 268V (100445 - 108317, n=5) | |
| Asus Zenbook 14 OLED UX3405CA | |
| HP EliteBook X G1a 14 AI | |
| Lenovo ThinkBook 14 Gen 8 21SJ007SGE | |
| AIDA64 / Memory Read | |
| HP EliteBook X G1a 14 AI | |
| HP EliteBook Ultra G1i 14 | |
| Dell Pro 14 Premium | |
| Przeciętny Intel Core Ultra 7 268V (82511 - 88341, n=5) | |
| HP EliteBook X G1i 14 AI | |
| Lenovo ThinkBook 14 Gen 8 21SJ007SGE | |
| Asus Zenbook 14 OLED UX3405CA | |
| AIDA64 / Memory Write | |
| Dell Pro 14 Premium | |
| HP EliteBook Ultra G1i 14 | |
| Przeciętny Intel Core Ultra 7 268V (104206 - 117888, n=5) | |
| HP EliteBook X G1i 14 AI | |
| HP EliteBook X G1a 14 AI | |
| Lenovo ThinkBook 14 Gen 8 21SJ007SGE | |
| Asus Zenbook 14 OLED UX3405CA | |
| AIDA64 / Memory Latency | |
| Asus Zenbook 14 OLED UX3405CA | |
| HP EliteBook X G1a 14 AI | |
| Lenovo ThinkBook 14 Gen 8 21SJ007SGE | |
| Dell Pro 14 Premium | |
| HP EliteBook X G1i 14 AI | |
| Przeciętny Intel Core Ultra 7 268V (94.4 - 101.5, n=5) | |
| HP EliteBook Ultra G1i 14 | |
* ... im mniej tym lepiej
Opóźnienie DPC
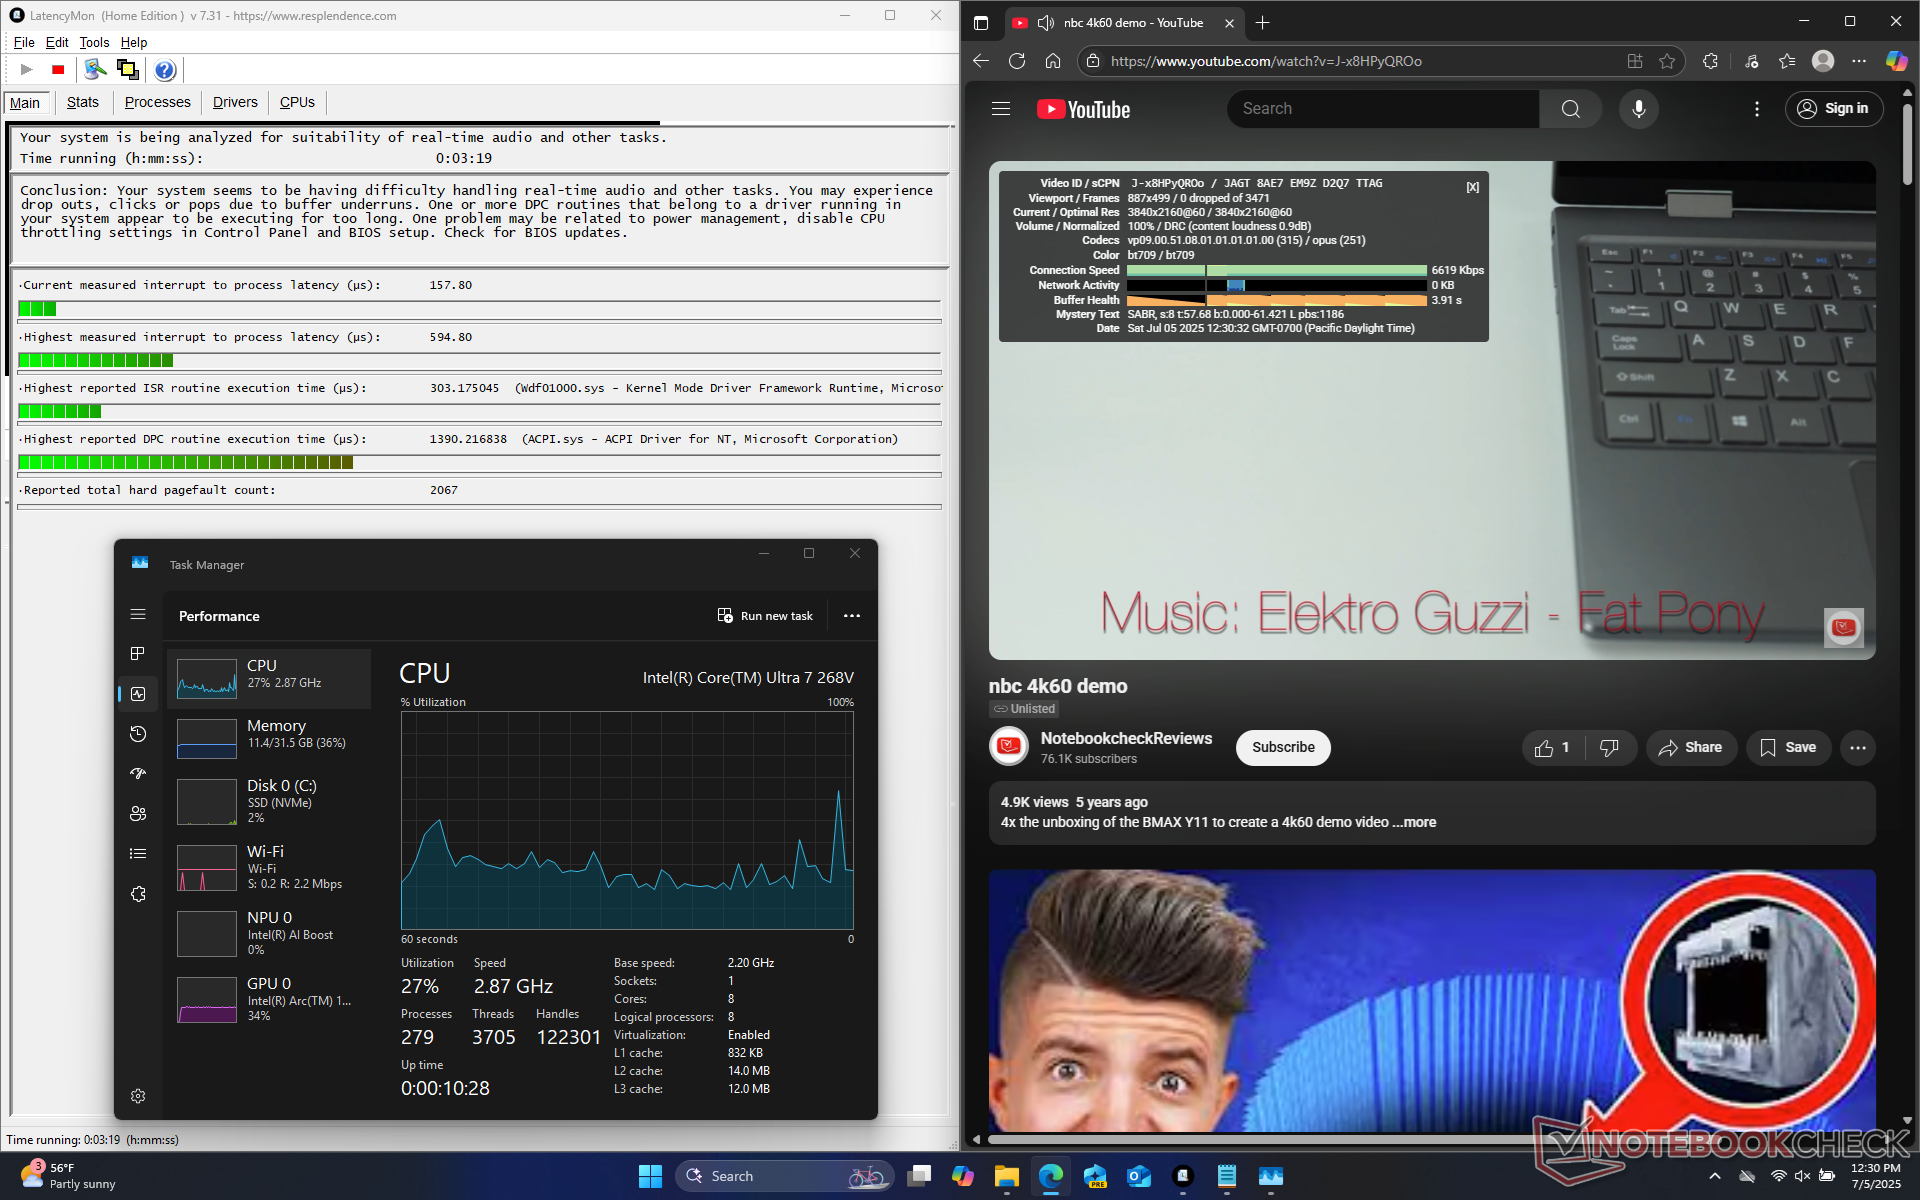
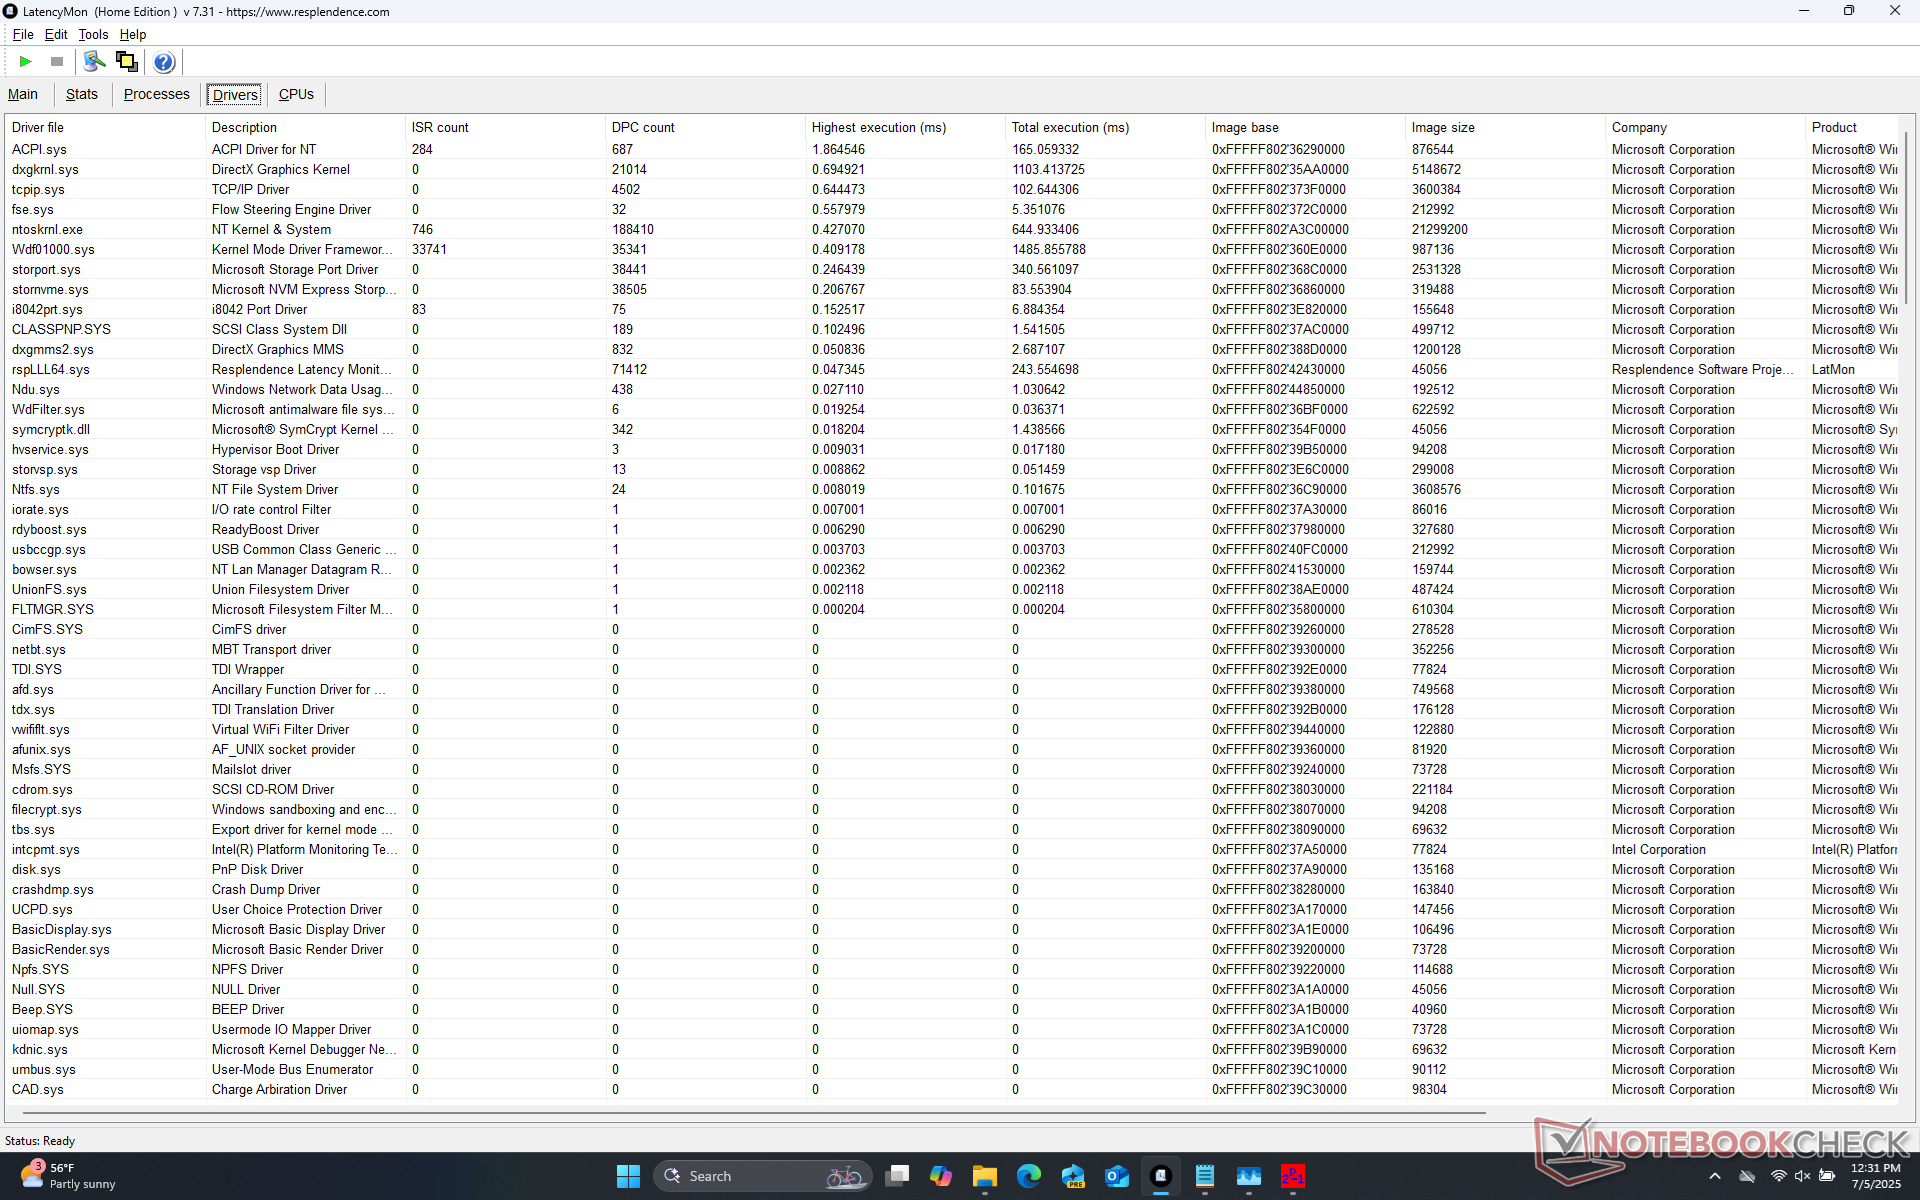
| DPC Latencies / LatencyMon - interrupt to process latency (max), Web, Youtube, Prime95 | |
| Dell Pro 14 Premium | |
| HP EliteBook Ultra G1i 14 | |
| Lenovo ThinkBook 14 Gen 8 21SJ007SGE | |
| HP EliteBook X G1i 14 AI | |
| HP EliteBook X G1a 14 AI | |
* ... im mniej tym lepiej
Urządzenia pamięci masowej
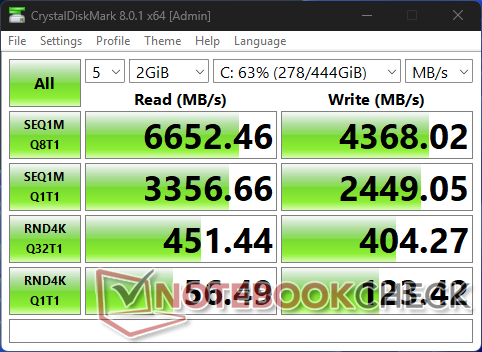
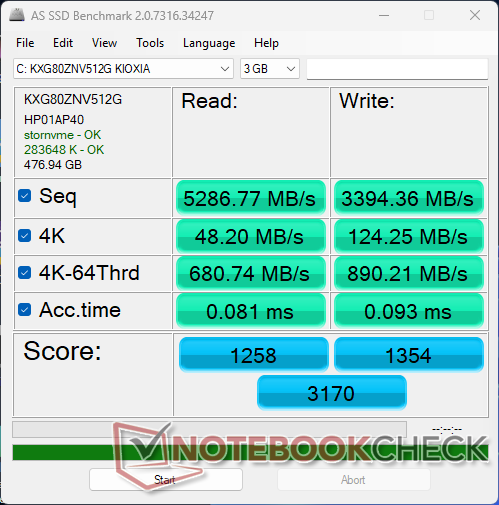

| Drive Performance rating - Percent | |
| Lenovo ThinkBook 14 Gen 8 21SJ007SGE | |
| HP EliteBook X G1a 14 AI | |
| HP EliteBook Ultra G1i 14 | |
| Asus Zenbook 14 OLED UX3405CA -11! | |
| HP EliteBook X G1i 14 AI | |
| Dell Pro 14 Premium | |
* ... im mniej tym lepiej
Disk Throttling: DiskSpd Read Loop, Queue Depth 8
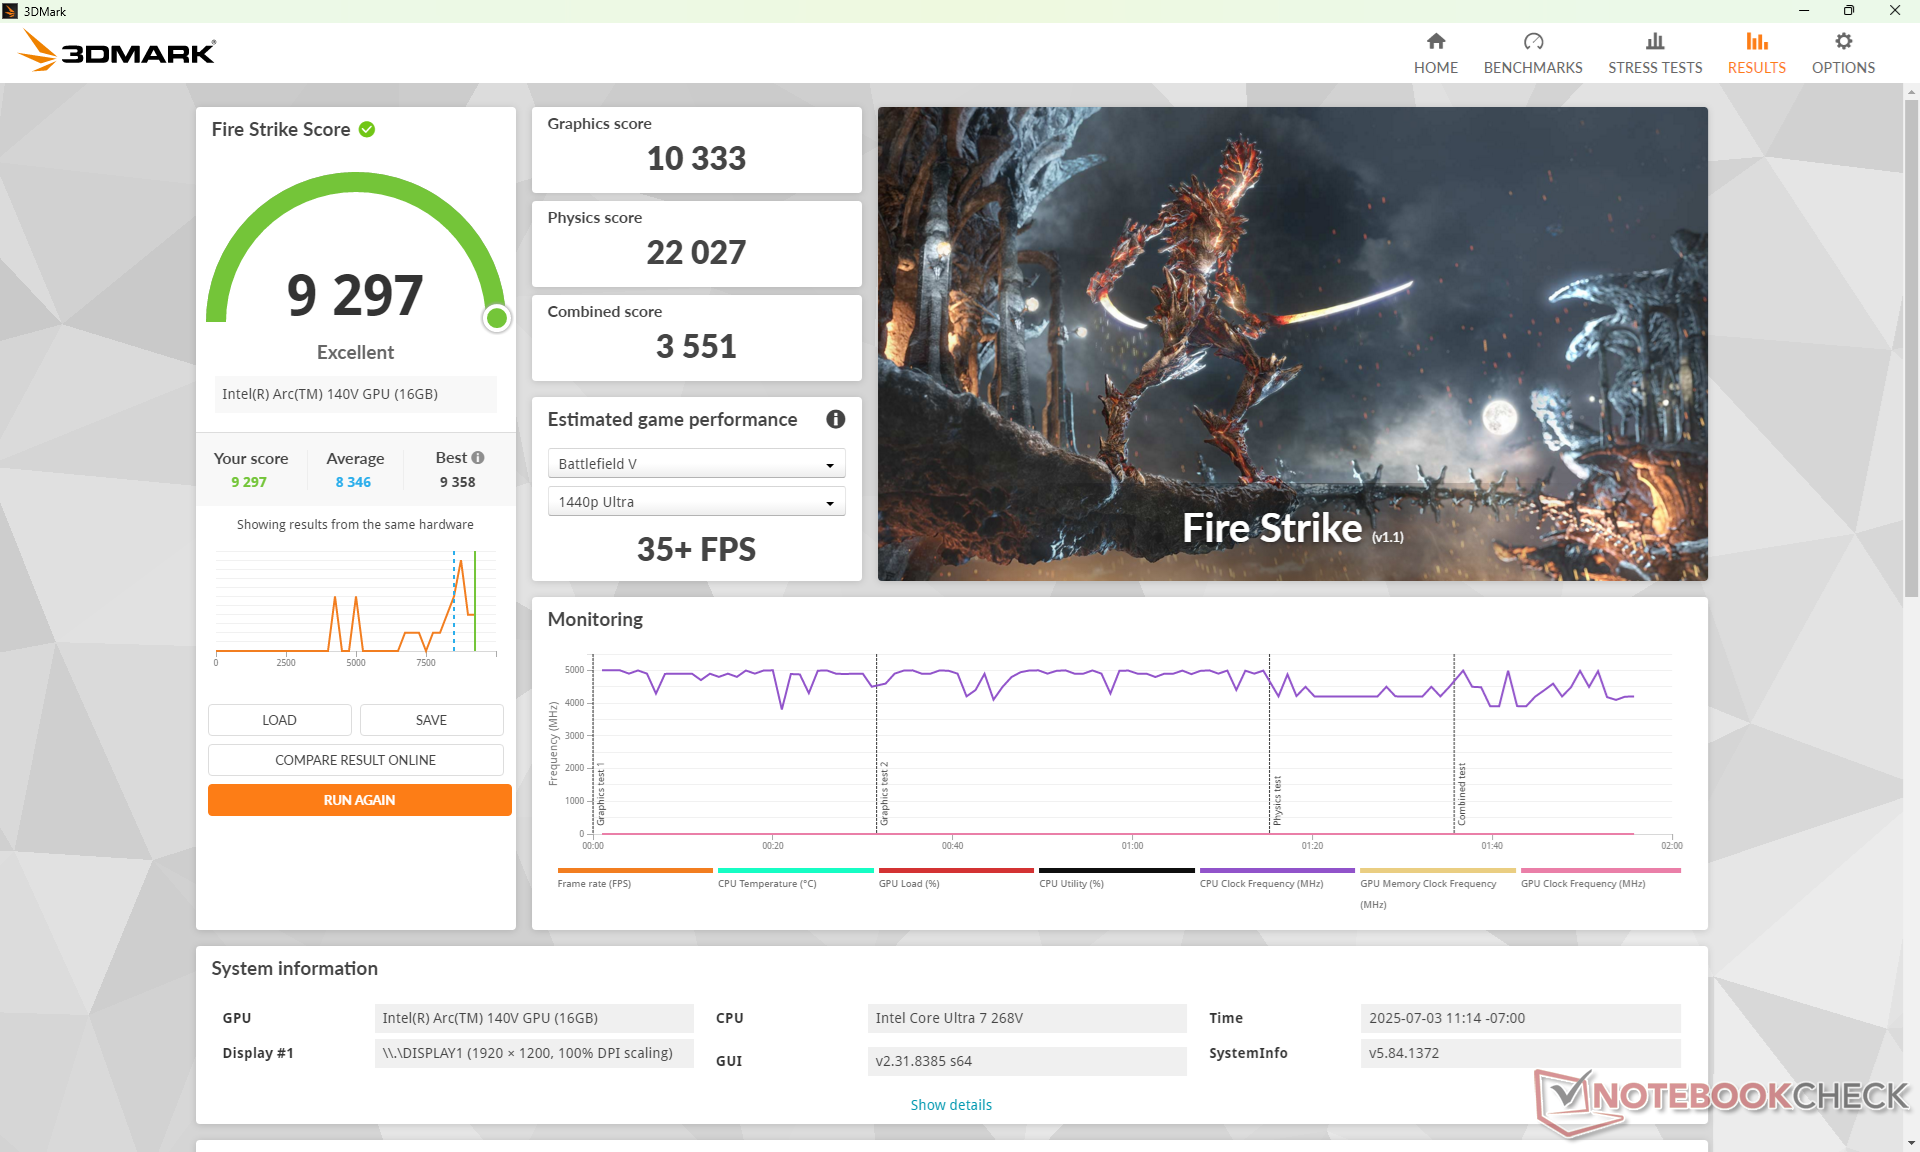
Wydajność GPU
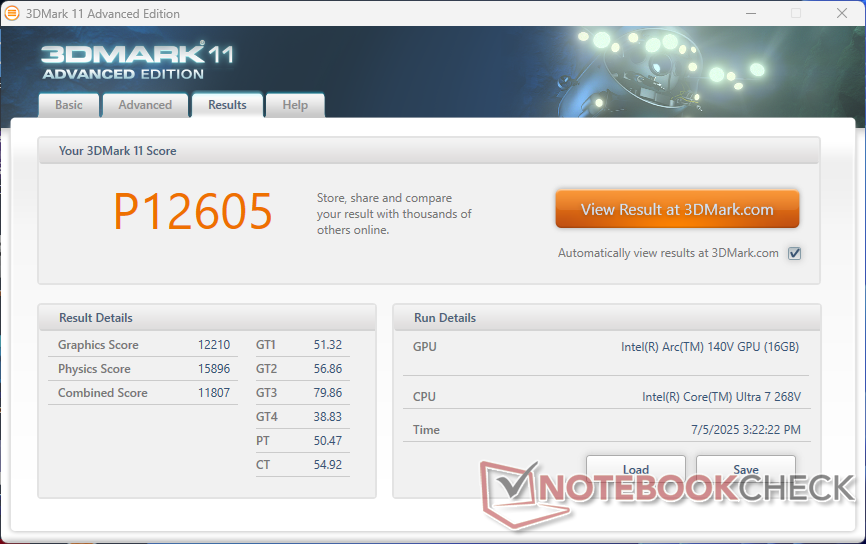
| 3DMark 11 Performance | 12605 pkt. | |
| 3DMark Fire Strike Score | 9297 pkt. | |
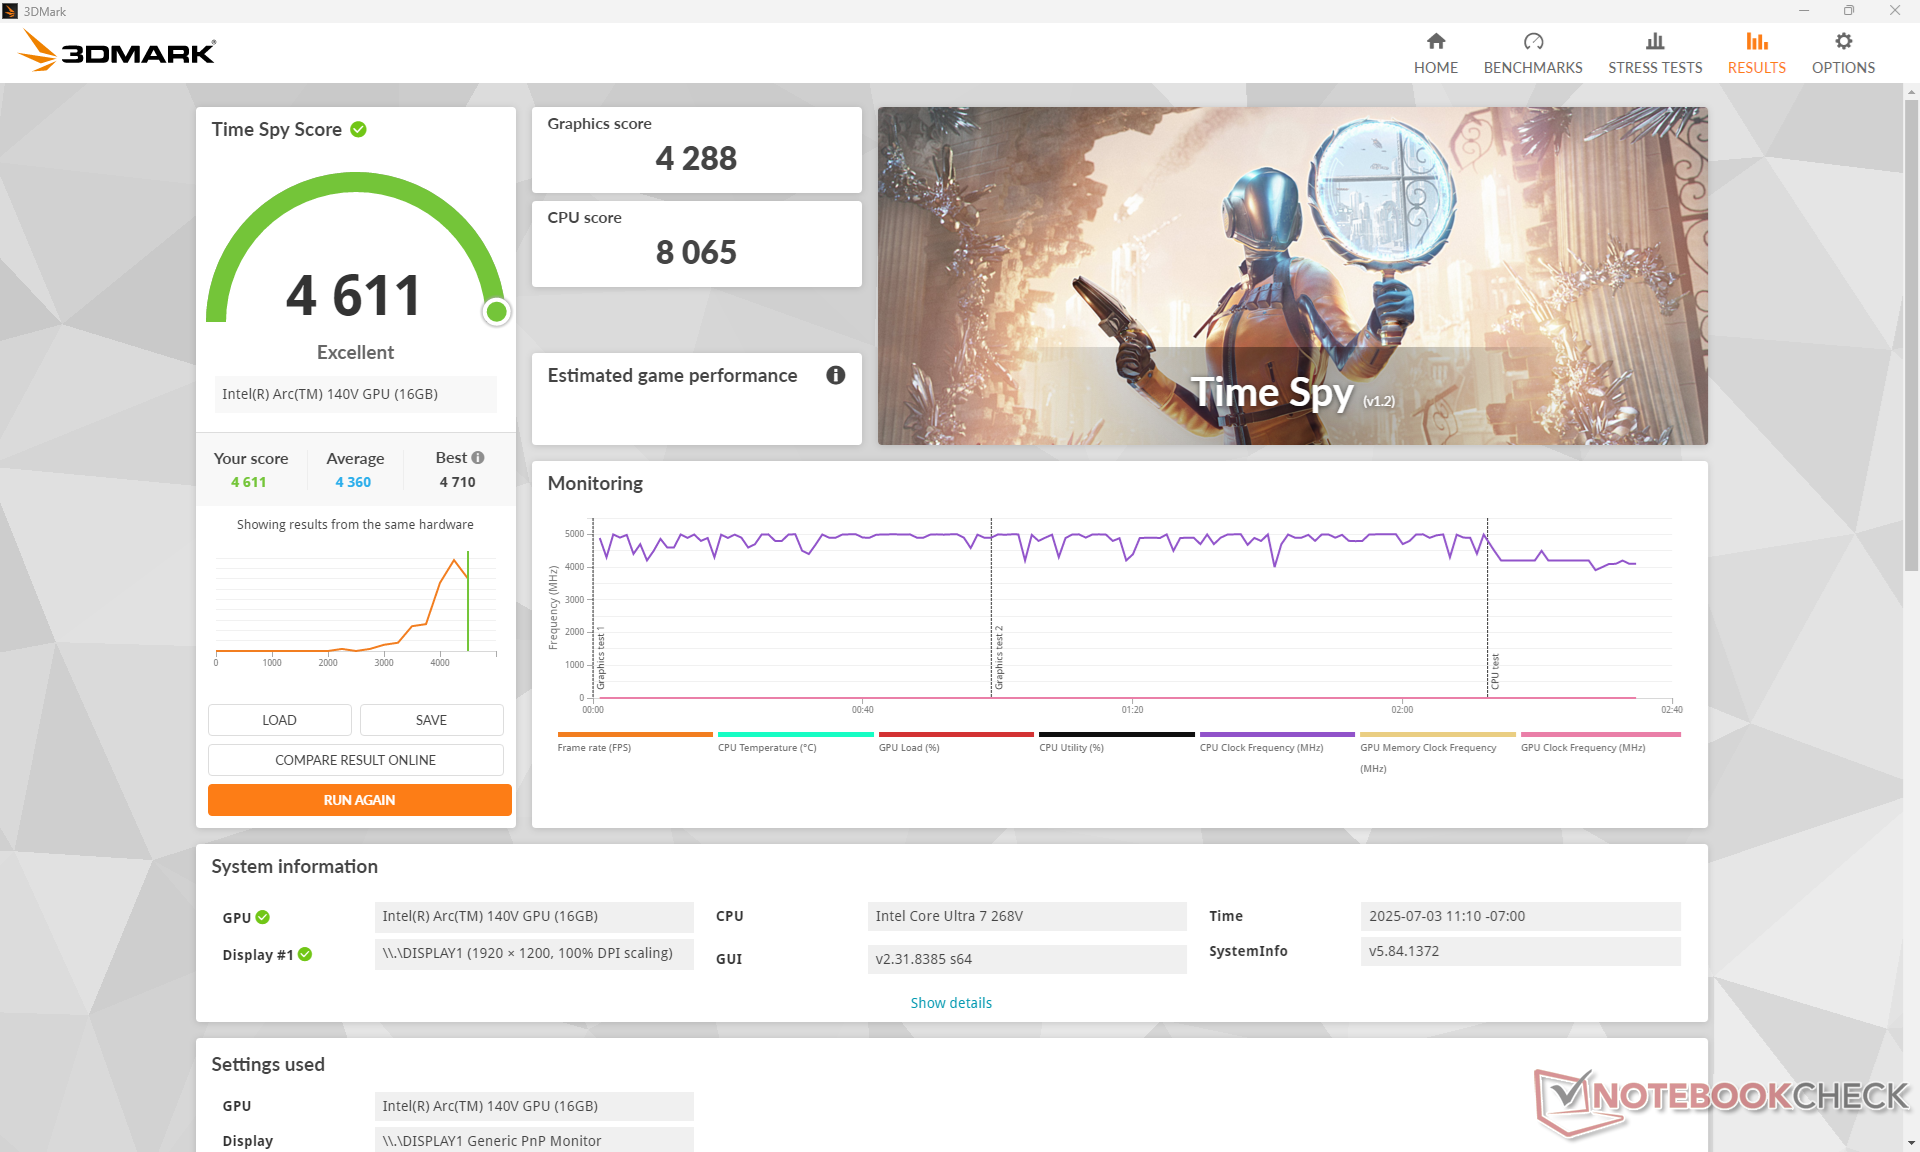
| 3DMark Time Spy Score | 4611 pkt. | |
Pomoc | ||
* ... im mniej tym lepiej
Cyberpunk 2077 ultra FPS Chart
| low | med. | high | ultra | |
|---|---|---|---|---|
| GTA V (2015) | 157.5 | 153.7 | 76.3 | 29 |
| Dota 2 Reborn (2015) | 98.2 | 89.8 | 80 | 85.8 |
| Final Fantasy XV Benchmark (2018) | 90.1 | 50.3 | 36.2 | |
| X-Plane 11.11 (2018) | 43.8 | 37.2 | 33.2 | |
| Strange Brigade (2018) | 251 | 82.4 | 68.4 | 60.2 |
| Baldur's Gate 3 (2023) | 44.2 | 37 | 32.9 | 32.2 |
| Cyberpunk 2077 (2023) | 49 | 39.7 | 34.1 | 29.9 |
| F1 24 (2024) | 96.6 | 83.5 | 65.7 | 22 |
Emisje
Hałas systemowy
Hałas
| luz |
| 28.4 / 28.4 / 28.8 dB |
| obciążenie |
| 33.5 / 40.4 dB |
 | ||
30 dB cichy 40 dB(A) słyszalny 50 dB(A) irytujący |
||
min: | ||
| HP EliteBook X G1i 14 AI Arc 140V, Core Ultra 7 268V, Kioxia XG8 KXG80ZNV512G | HP EliteBook Ultra G1i 14 Arc 140V, Core Ultra 7 258V, Kioxia XG8 KXG80ZNV1T02 | HP EliteBook X G1a 14 AI Radeon 890M, Ryzen AI 9 HX PRO 375, Kioxia XG8 KXG80ZNV1T02 | Dell Pro 14 Premium Arc 140V, Core Ultra 7 268V, Kioxia BG6 KBG6AZNV1T02 | Lenovo ThinkBook 14 Gen 8 21SJ007SGE Arc 140T, Ultra 7 255H, Western Digital PCSN5000S SDEPMSJ-1T00-1101 | Asus ZenBook Duo OLED UX8406CA Arc 140T, Ultra 9 285H, Western Digital PC SN5000S SDEQNSJ-1T00 | |
|---|---|---|---|---|---|---|
| Noise | 17% | 11% | 6% | 4% | 7% | |
| wyłączone / środowisko * (dB) | 28.2 | 23.9 15% | 24 15% | 23.1 18% | 25.2 11% | 23.6 16% |
| Idle Minimum * (dB) | 28.4 | 23.9 16% | 24.4 14% | 23.1 19% | 25.2 11% | 23.6 17% |
| Idle Average * (dB) | 28.4 | 23.9 16% | 24.4 14% | 23.1 19% | 25.2 11% | 23.6 17% |
| Idle Maximum * (dB) | 28.8 | 23.9 17% | 24.5 15% | 23.1 20% | 25.2 12% | 23.6 18% |
| Load Average * (dB) | 33.5 | 28.4 15% | 25.4 24% | 38.2 -14% | 32.9 2% | 39.8 -19% |
| Cyberpunk 2077 ultra * (dB) | 39.1 | 31.5 19% | 39.3 -1% | 44.2 -13% | 44.1 -13% | 39.8 -2% |
| Load Maximum * (dB) | 40.4 | 31.5 22% | 43.1 -7% | 44.2 -9% | 43.9 -9% | 39.8 1% |
* ... im mniej tym lepiej
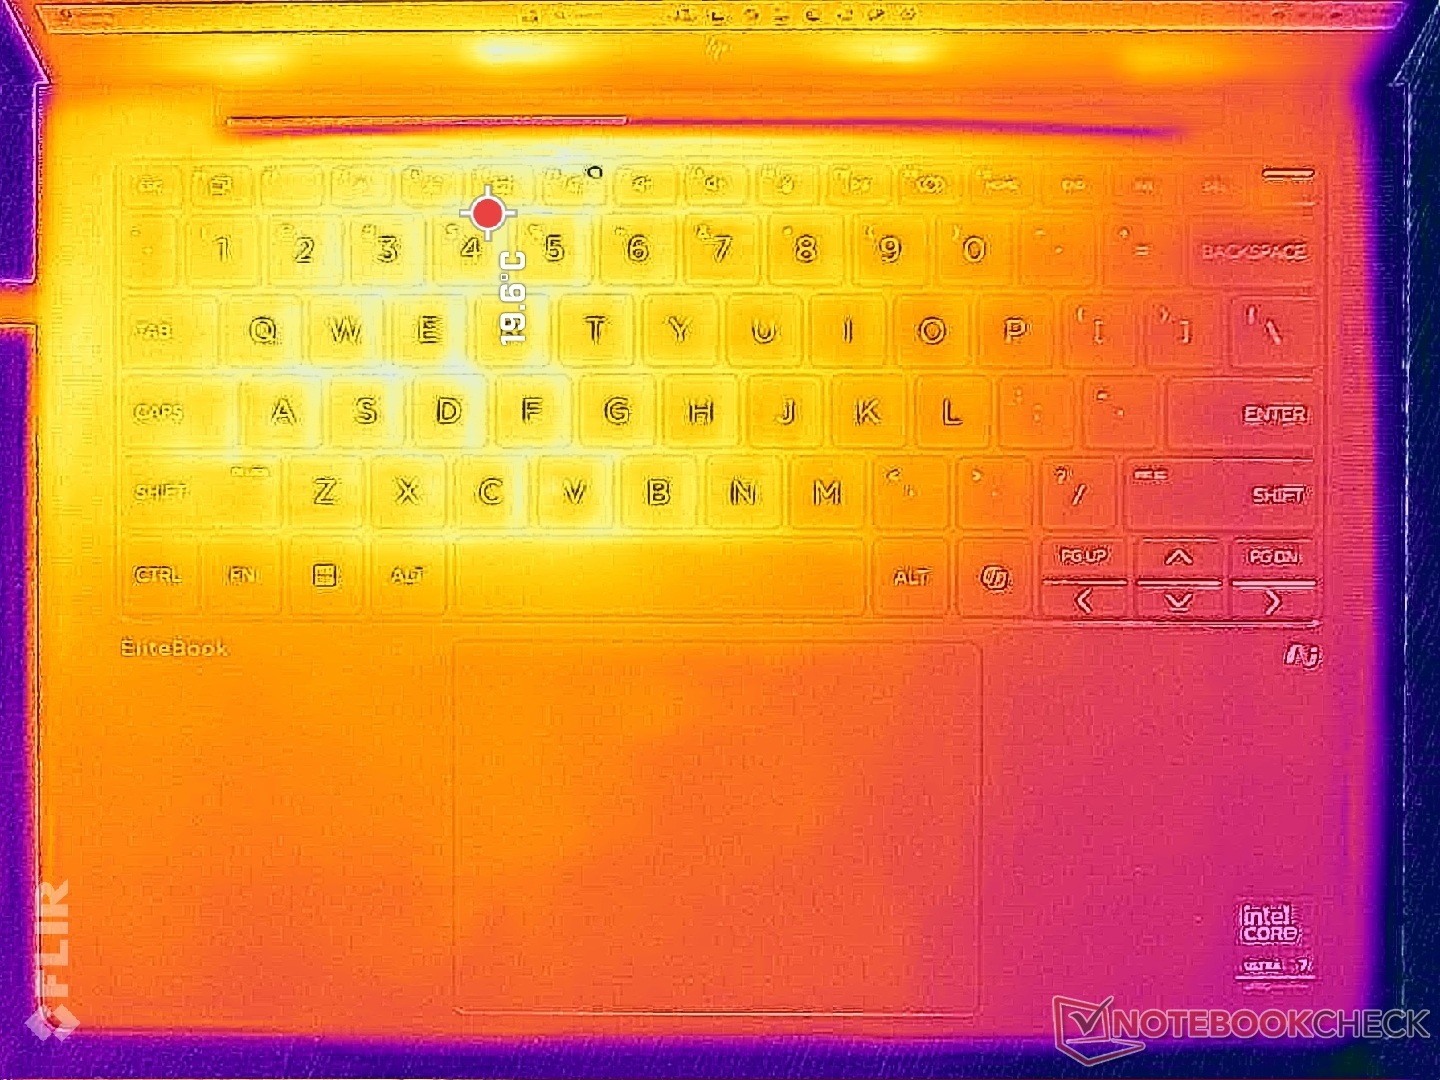
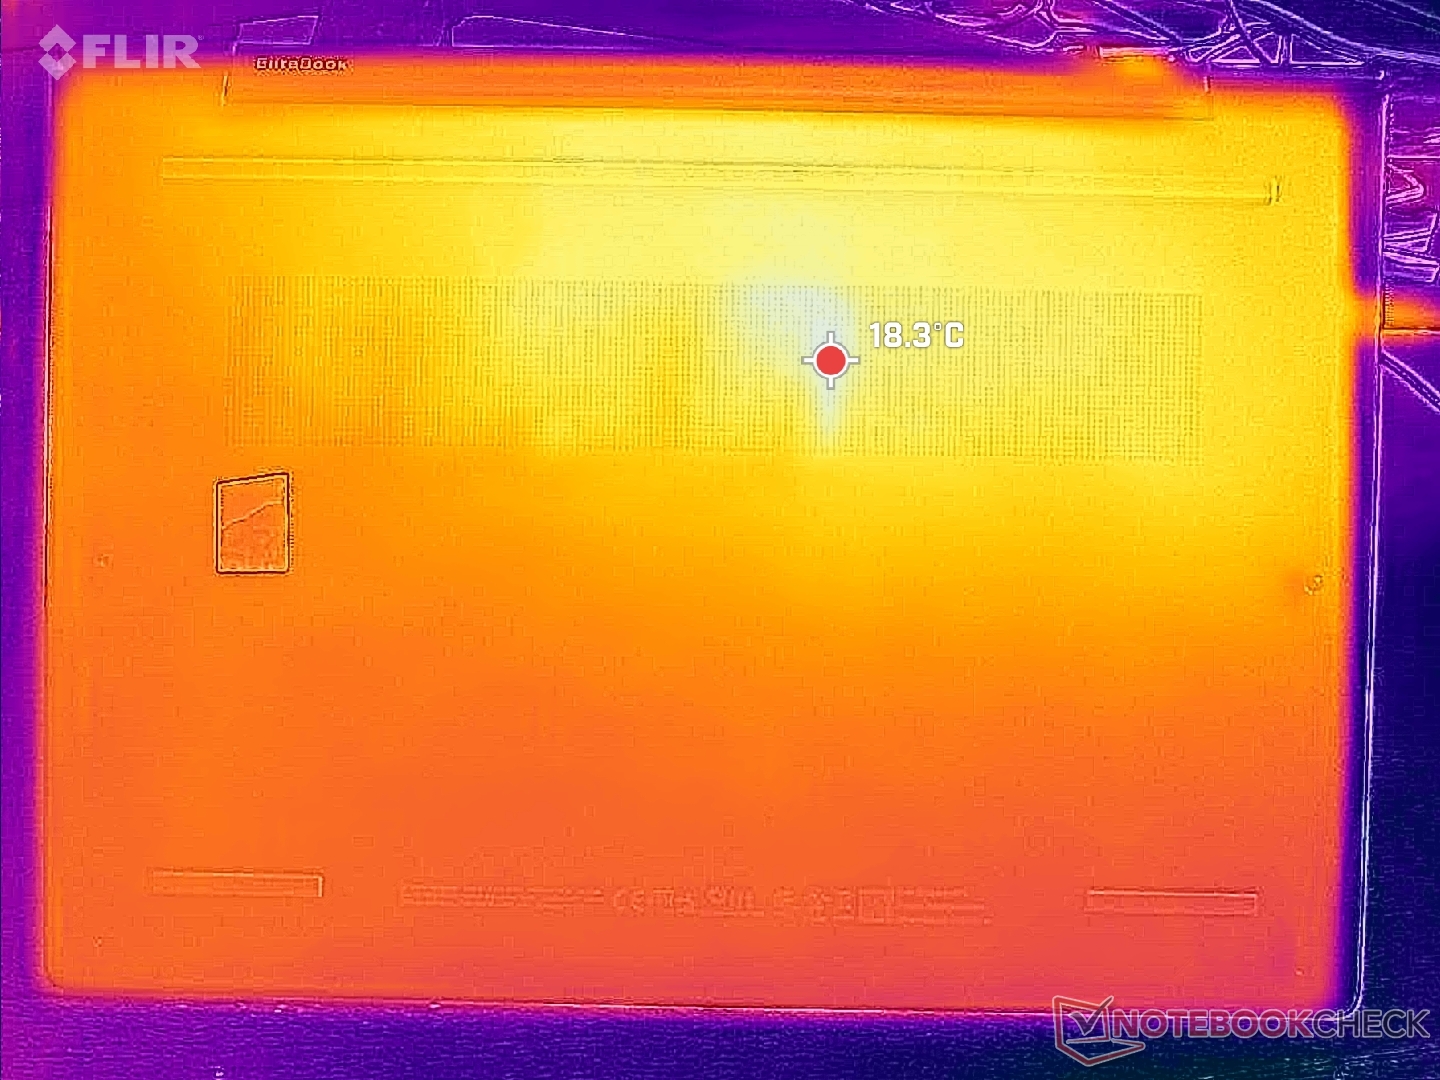
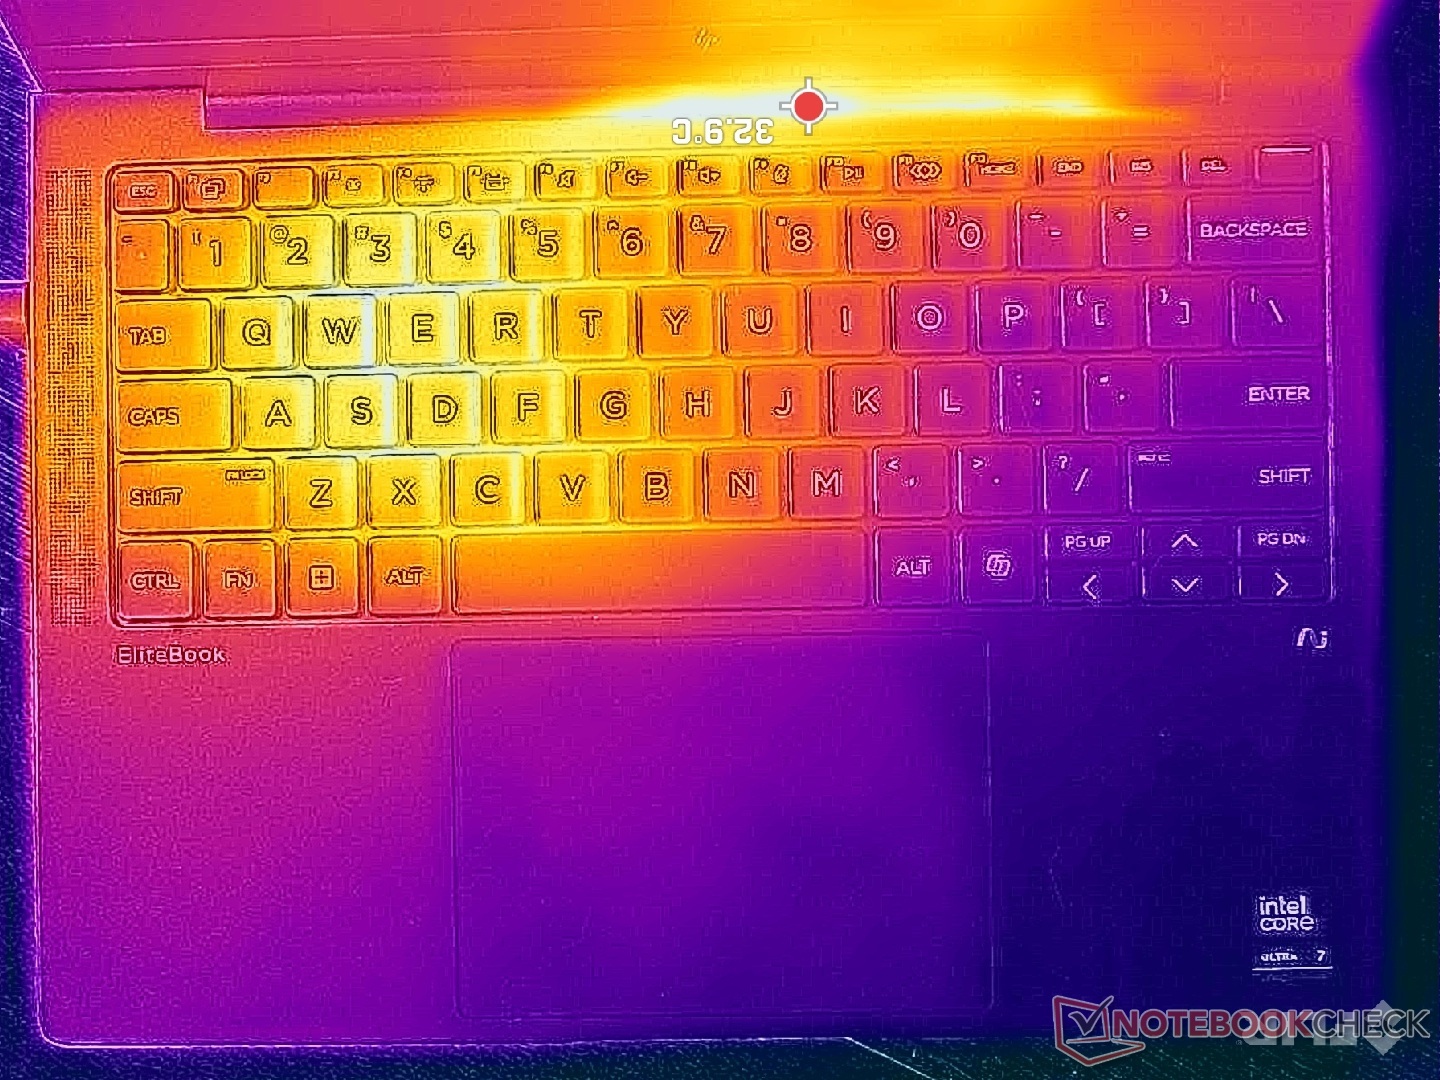
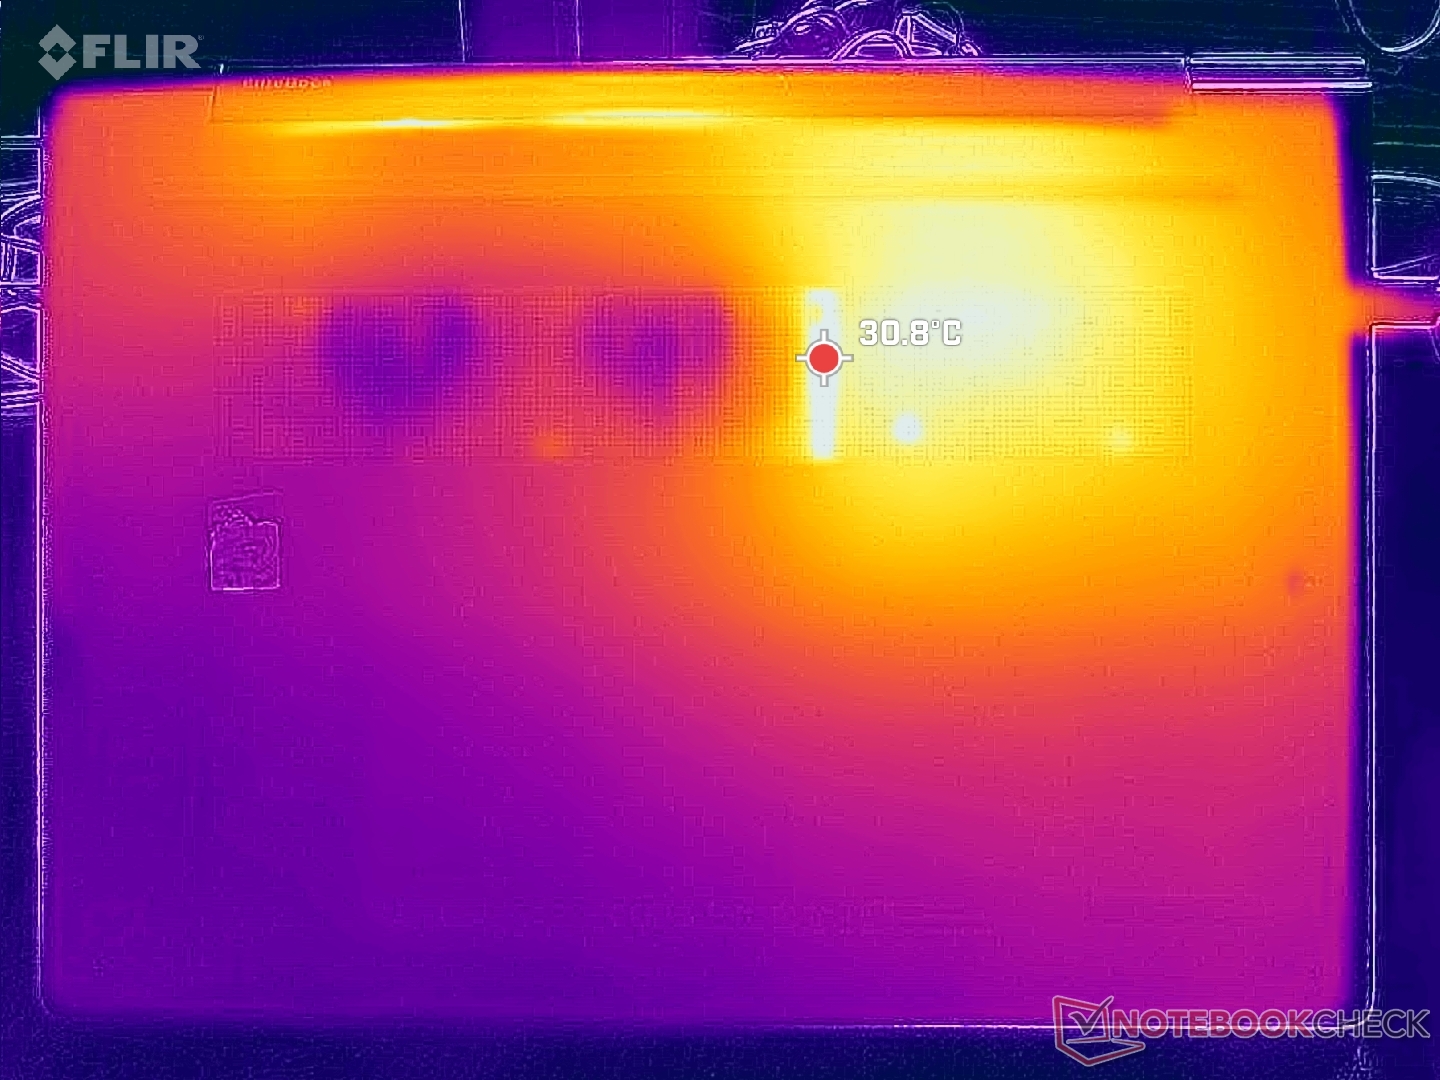
Temperatura
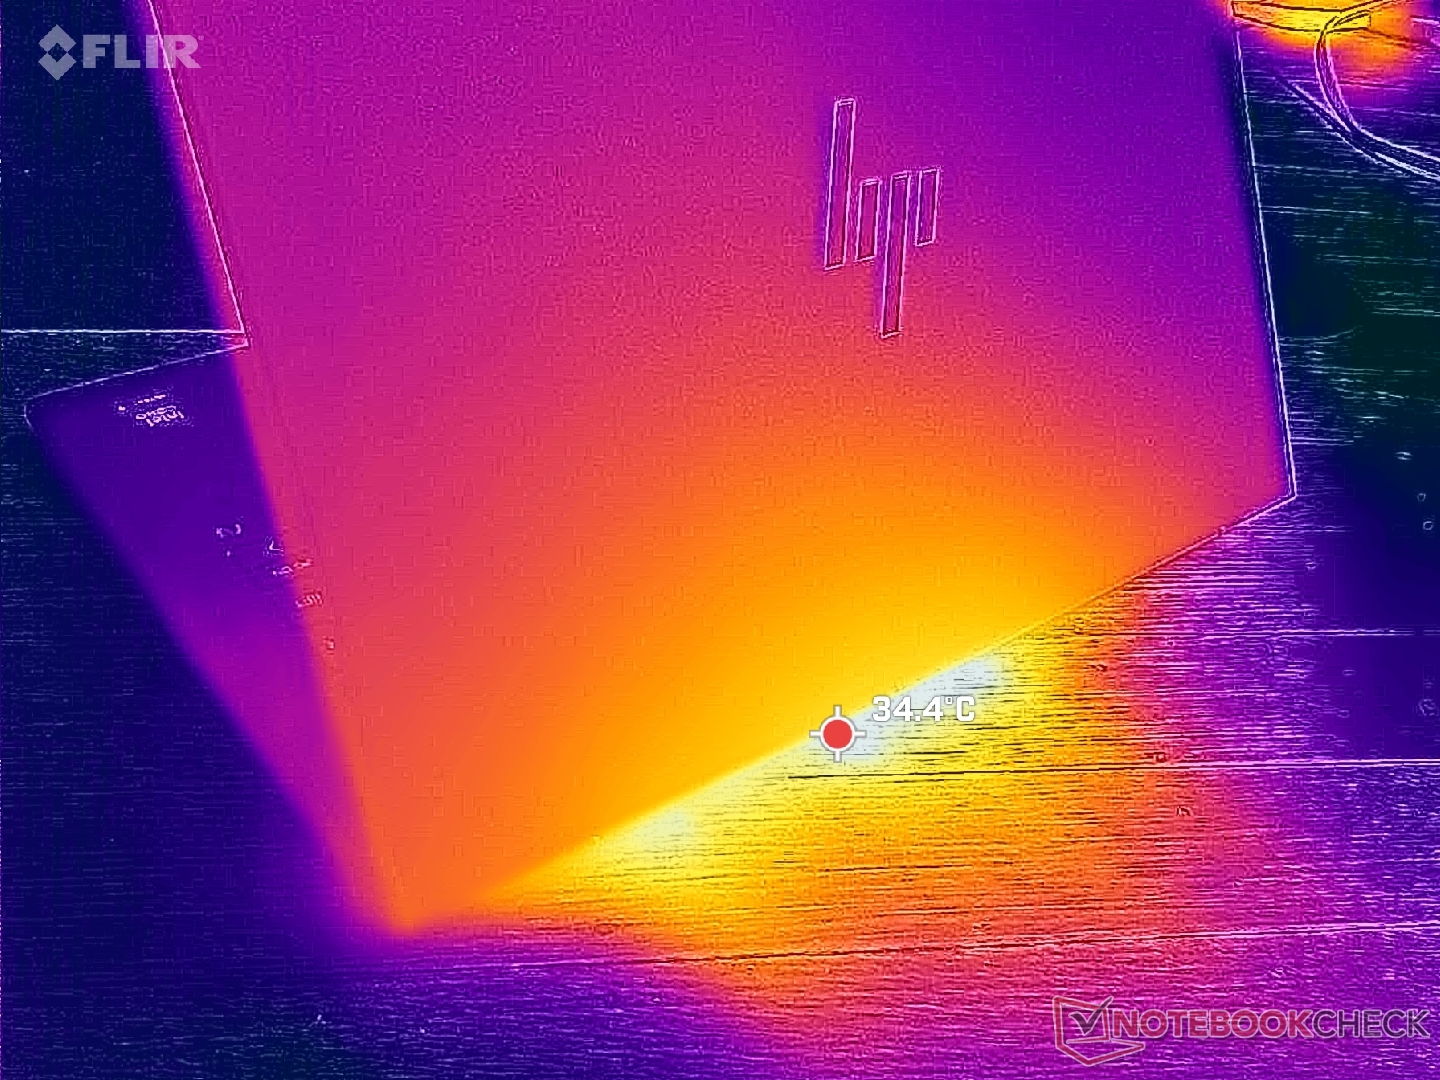
(+) Maksymalna temperatura w górnej części wynosi 35 °C / 95 F, w porównaniu do średniej 35.9 °C / 97 F , począwszy od 21.4 do 59 °C dla klasy Subnotebook.
(+) Dno nagrzewa się maksymalnie do 33.4 °C / 92 F, w porównaniu do średniej 39.2 °C / 103 F
(+) W stanie bezczynności średnia temperatura górnej części wynosi 22.3 °C / 72 F, w porównaniu ze średnią temperaturą urządzenia wynoszącą 30.8 °C / ### class_avg_f### F.
(+) Podpórki pod nadgarstki i touchpad są chłodniejsze niż temperatura skóry i maksymalnie 23.8 °C / 74.8 F i dlatego są chłodne w dotyku.
(+) Średnia temperatura obszaru podparcia dłoni w podobnych urządzeniach wynosiła 28.2 °C / 82.8 F (+4.4 °C / 8 F).
| HP EliteBook X G1i 14 AI Intel Core Ultra 7 268V, Intel Arc Graphics 140V | HP EliteBook Ultra G1i 14 Intel Core Ultra 7 258V, Intel Arc Graphics 140V | HP EliteBook X G1a 14 AI AMD Ryzen AI 9 HX PRO 375, AMD Radeon 890M | Dell Pro 14 Premium Intel Core Ultra 7 268V, Intel Arc Graphics 140V | Lenovo ThinkBook 14 Gen 8 21SJ007SGE Intel Core Ultra 7 255H, Intel Arc Graphics 140T | Asus ZenBook Duo OLED UX8406CA Intel Core Ultra 9 285H, Intel Arc Graphics 140T | |
|---|---|---|---|---|---|---|
| Heat | -9% | -4% | -4% | -35% | -14% | |
| Maximum Upper Side * (°C) | 35 | 37.9 -8% | 36 -3% | 33 6% | 44.1 -26% | 35.3 -1% |
| Maximum Bottom * (°C) | 33.4 | 44.3 -33% | 34.2 -2% | 28 16% | 44.6 -34% | 47.2 -41% |
| Idle Upper Side * (°C) | 23.8 | 23.3 2% | 25 -5% | 28 -18% | 31.6 -33% | 24.8 -4% |
| Idle Bottom * (°C) | 24.2 | 23.6 2% | 25.6 -6% | 28.8 -19% | 35.4 -46% | 26.2 -8% |
* ... im mniej tym lepiej
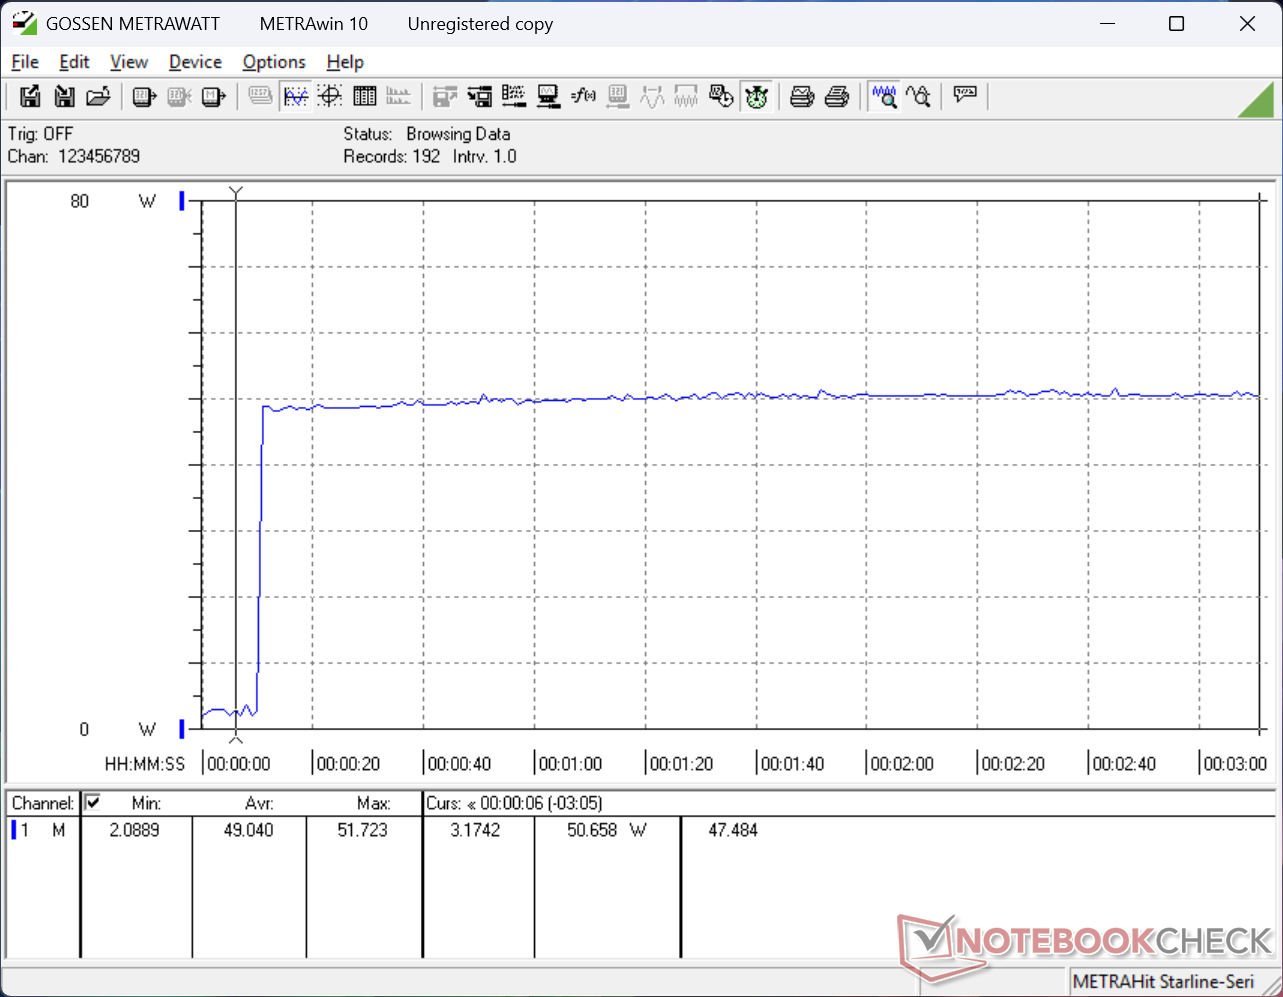
Test warunków skrajnych
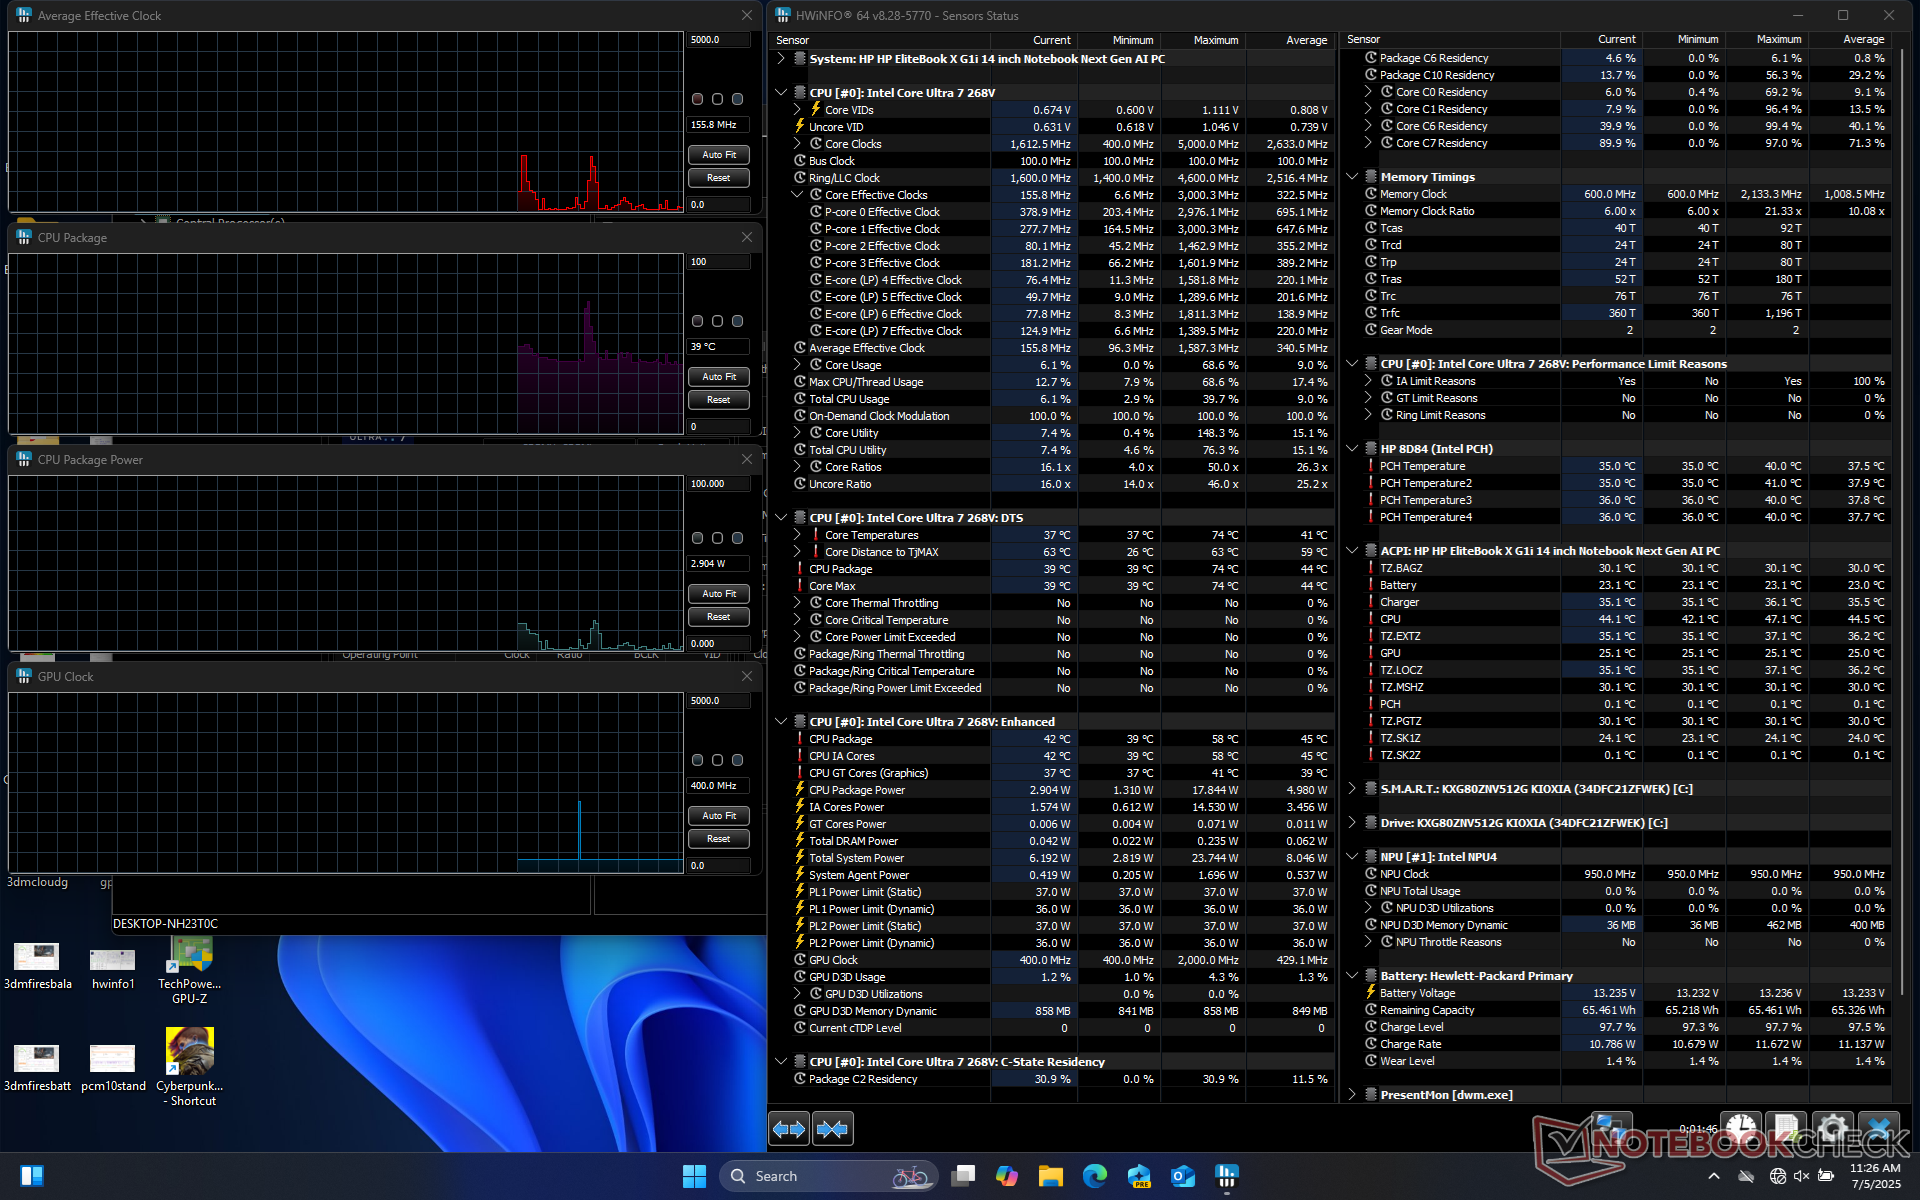
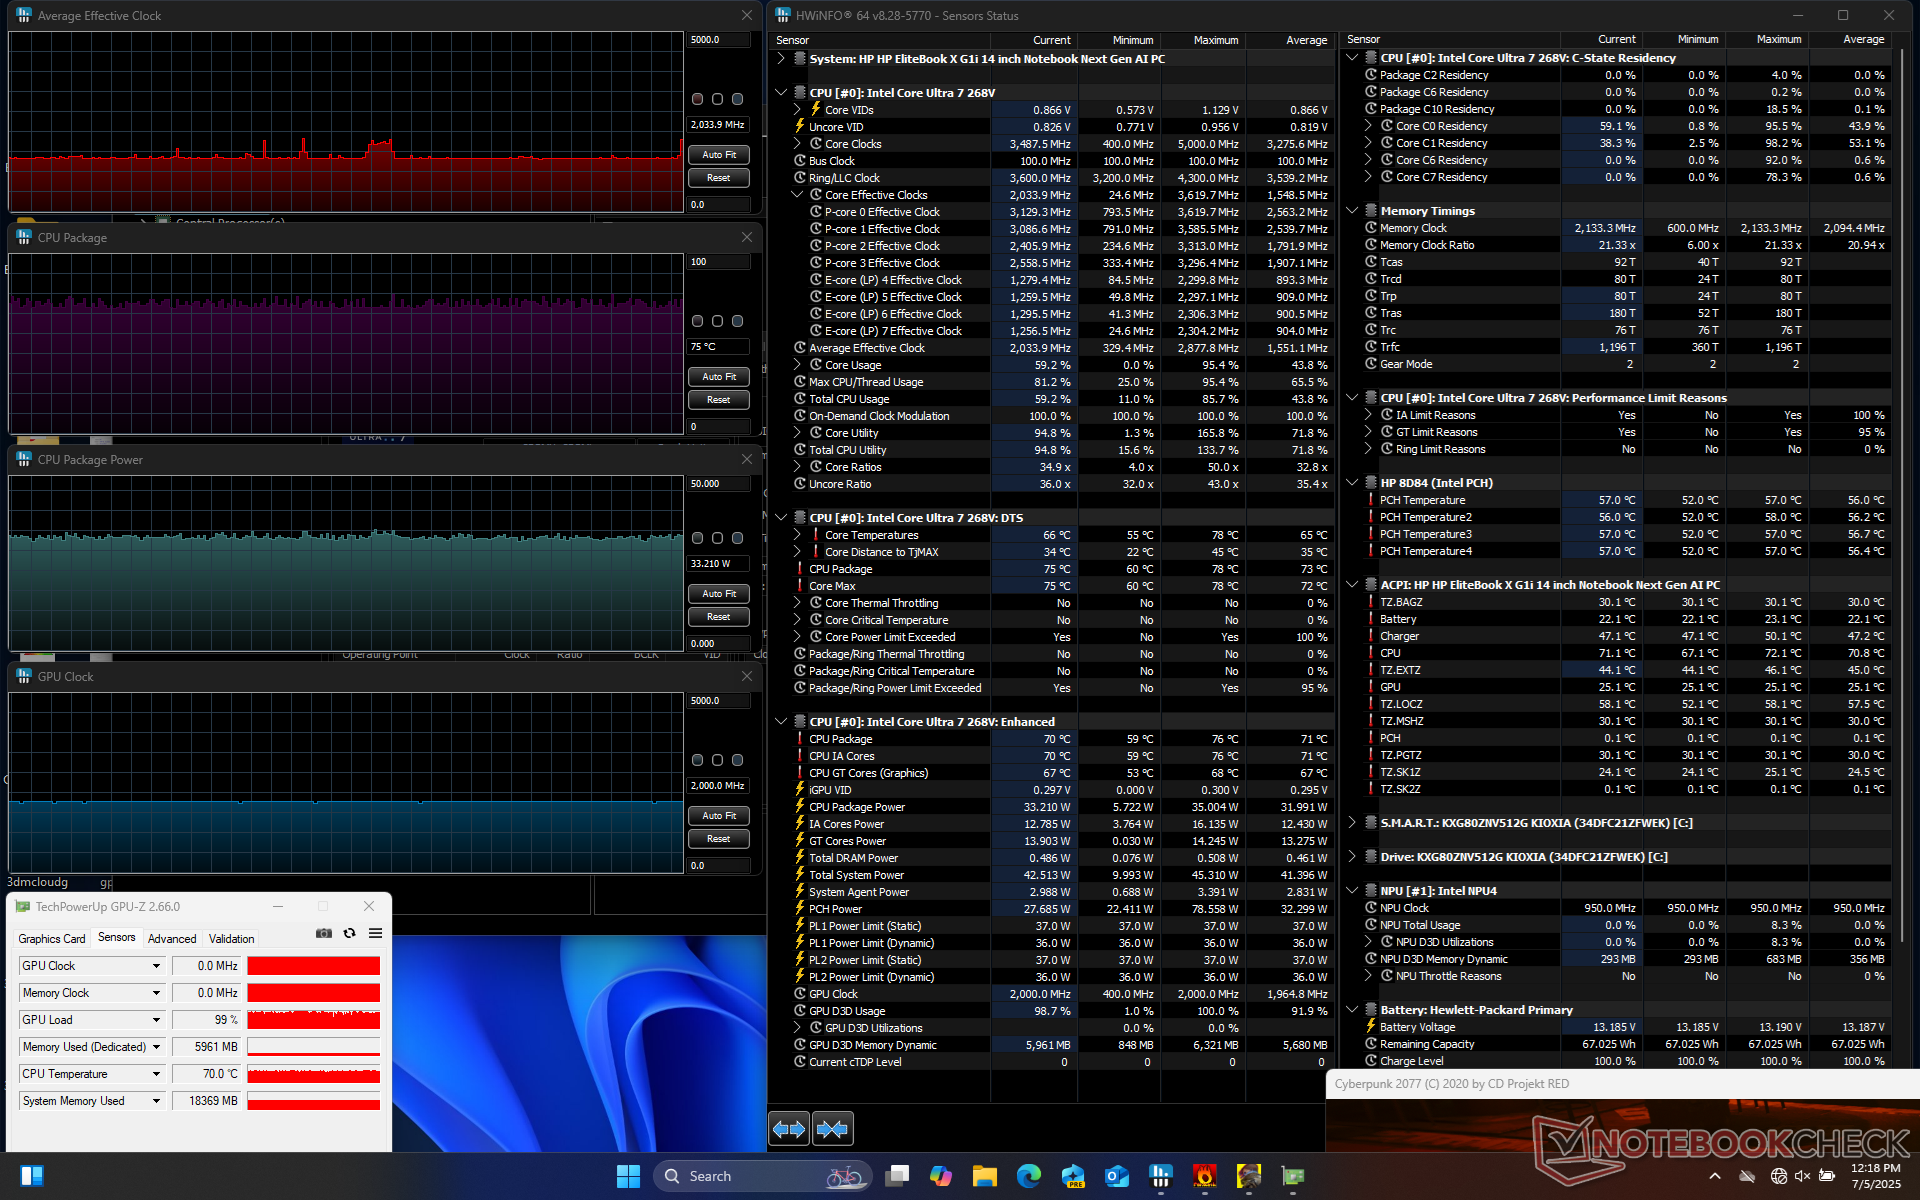
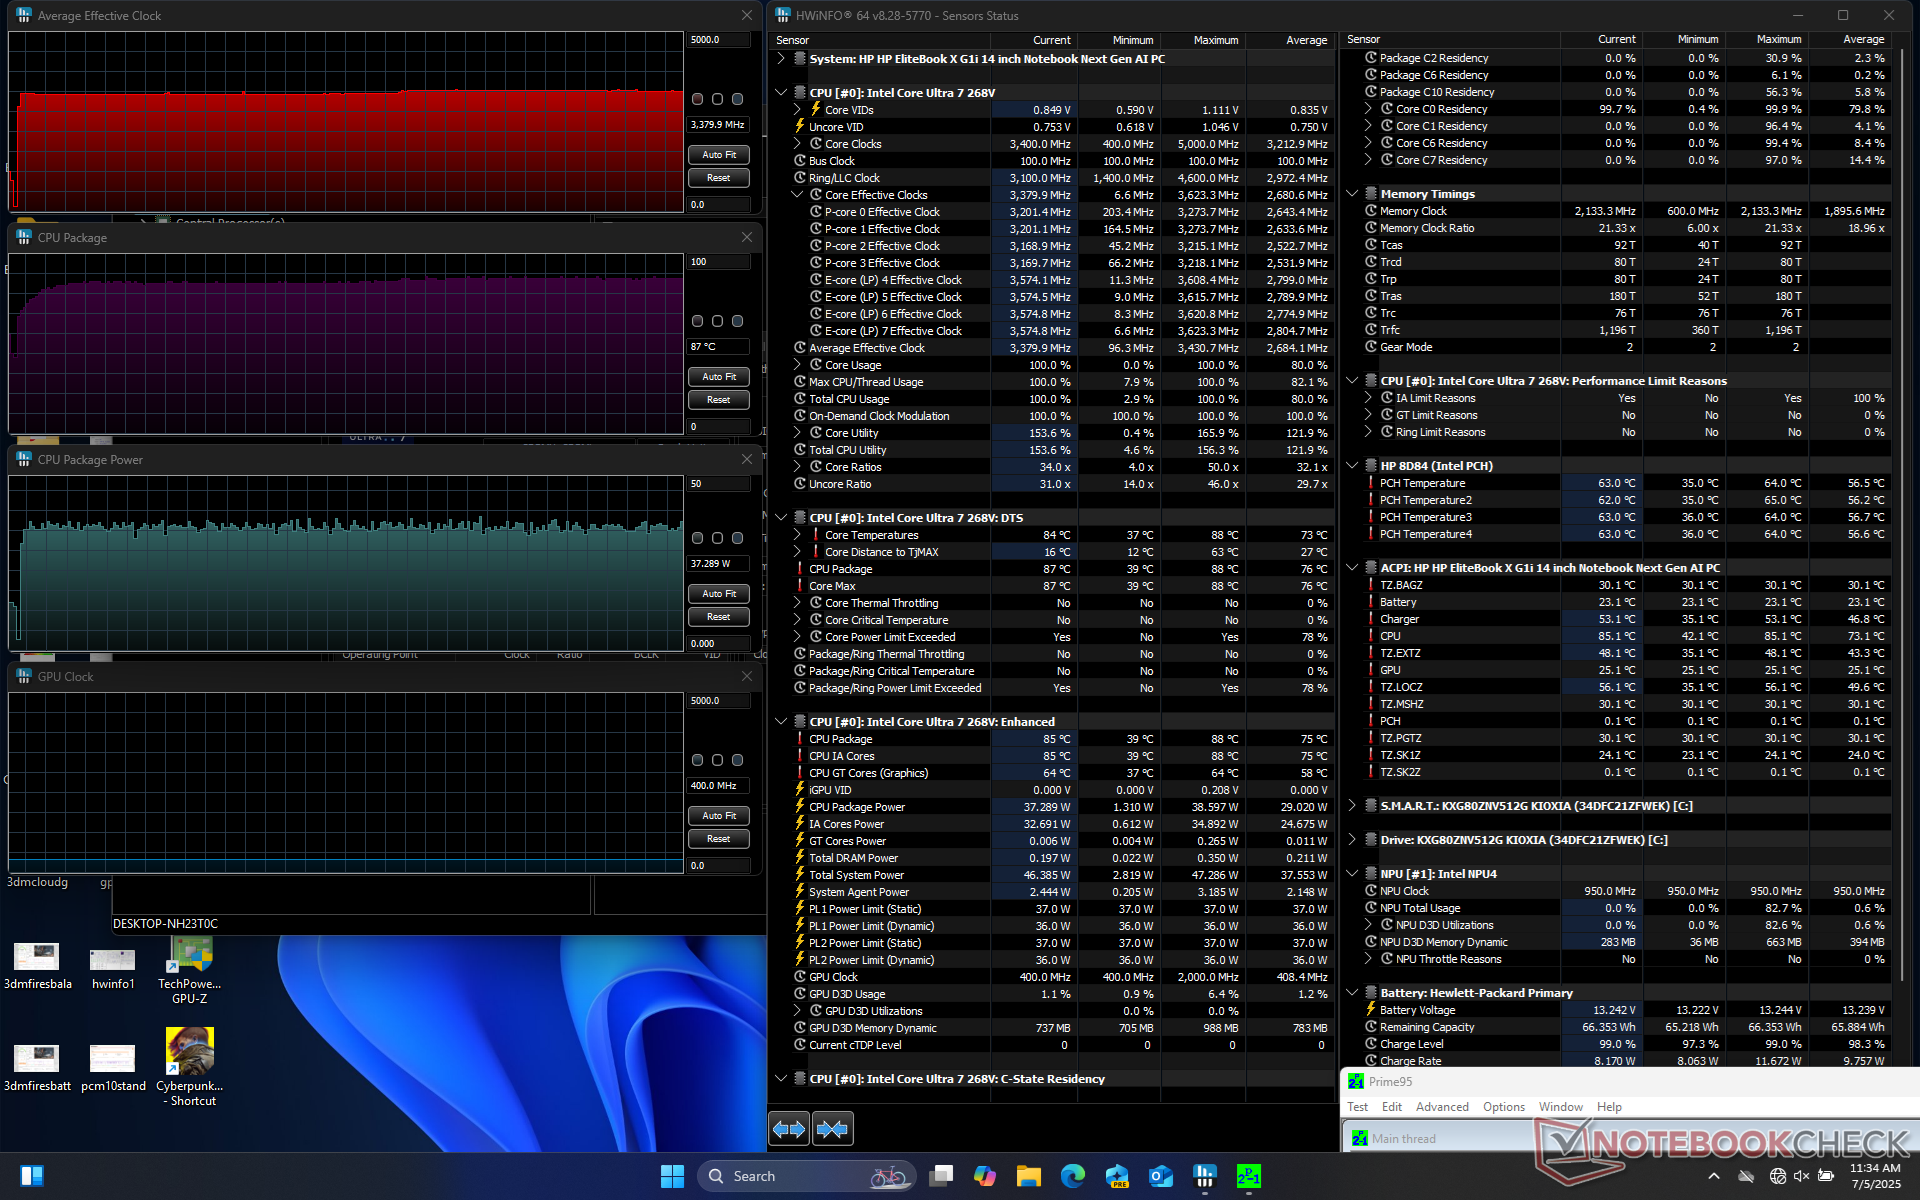
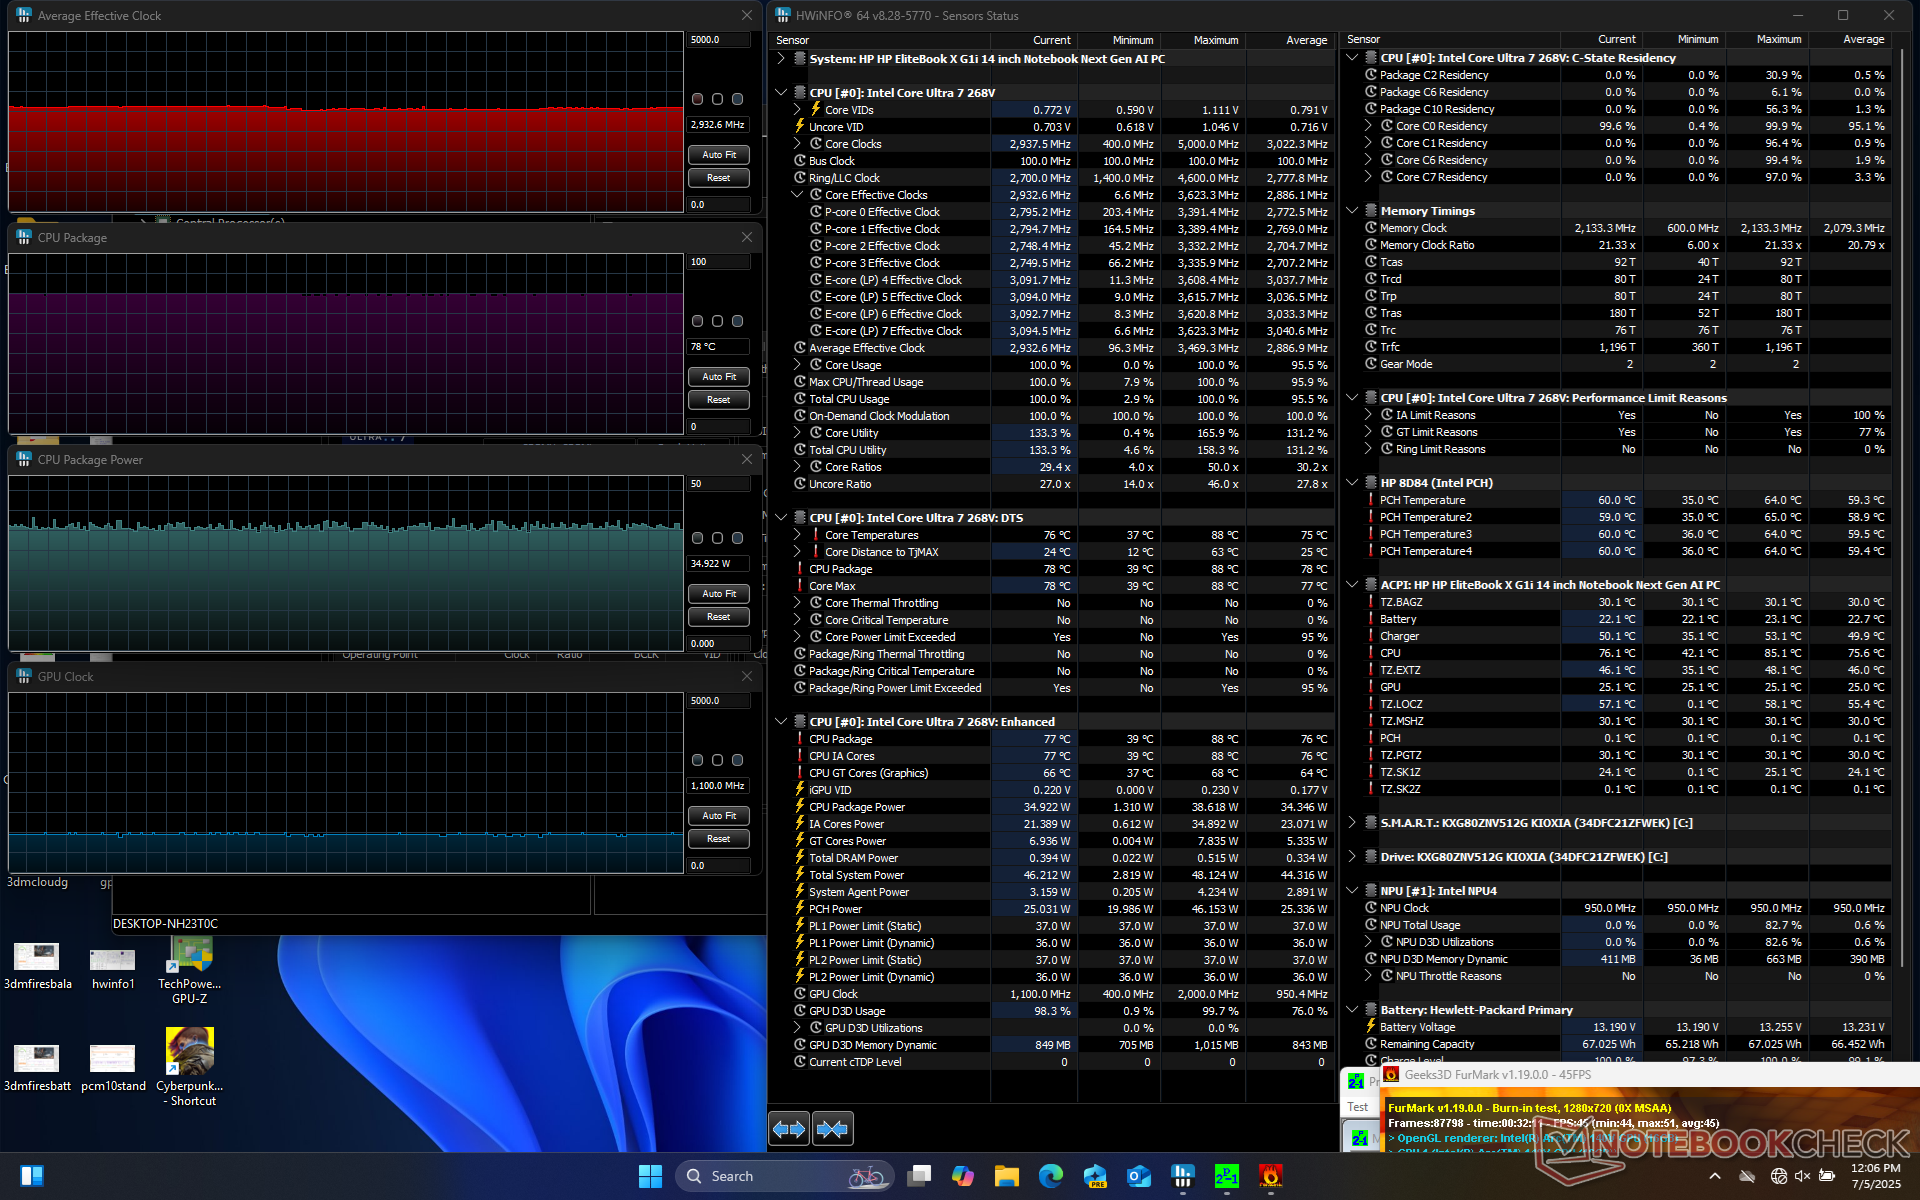
| Średnie taktowanie CPU (GHz) | Taktowanie GPU (MHz) | Średnia temperatura CPU (°C) | |
| System bezczynności | -- | -- | 39 |
| Prime95 Stress | 3.4 | -- | 87 |
| Prime95 + FurMark Stress | 3.0 | 1100 | 78 |
| Cyberpunk 2077 Stress | 1.5 | 2000 | 75 |
Głośniki
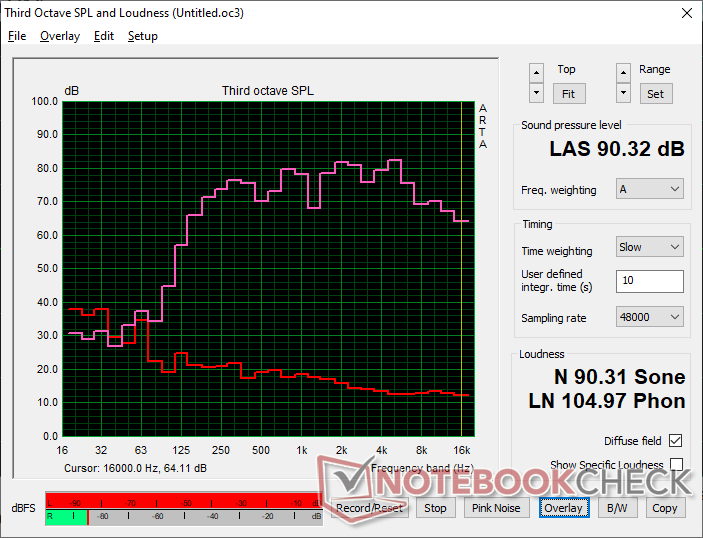
HP EliteBook X G1i 14 AI analiza dźwięku
(+) | głośniki mogą odtwarzać stosunkowo głośno (90.3 dB)
Bas 100 - 315 Hz
(±) | zredukowany bas - średnio 11% niższy od mediany
(±) | liniowość basu jest średnia (12.1% delta do poprzedniej częstotliwości)
Średnie 400 - 2000 Hz
(+) | zbalansowane środki średnie - tylko 3.9% od mediany
(±) | liniowość środka jest średnia (8.9% delta do poprzedniej częstotliwości)
Wysokie 2–16 kHz
(+) | zrównoważone maksima - tylko 4% od mediany
(+) | wzloty są liniowe (6.5% delta do poprzedniej częstotliwości)
Ogólnie 100 - 16.000 Hz
(+) | ogólny dźwięk jest liniowy (12% różnicy w stosunku do mediany)
W porównaniu do tej samej klasy
» 14% wszystkich testowanych urządzeń w tej klasie było lepszych, 4% podobnych, 81% gorszych
» Najlepszy miał deltę 5%, średnia wynosiła ###średnia###%, najgorsza wynosiła 53%
W porównaniu do wszystkich testowanych urządzeń
» 9% wszystkich testowanych urządzeń było lepszych, 2% podobnych, 88% gorszych
» Najlepszy miał deltę 4%, średnia wynosiła ###średnia###%, najgorsza wynosiła 134%
Apple MacBook Pro 16 2021 M1 Pro analiza dźwięku
(+) | głośniki mogą odtwarzać stosunkowo głośno (84.7 dB)
Bas 100 - 315 Hz
(+) | dobry bas - tylko 3.8% od mediany
(+) | bas jest liniowy (5.2% delta do poprzedniej częstotliwości)
Średnie 400 - 2000 Hz
(+) | zbalansowane środki średnie - tylko 1.3% od mediany
(+) | średnie są liniowe (2.1% delta do poprzedniej częstotliwości)
Wysokie 2–16 kHz
(+) | zrównoważone maksima - tylko 1.9% od mediany
(+) | wzloty są liniowe (2.7% delta do poprzedniej częstotliwości)
Ogólnie 100 - 16.000 Hz
(+) | ogólny dźwięk jest liniowy (4.6% różnicy w stosunku do mediany)
W porównaniu do tej samej klasy
» 0% wszystkich testowanych urządzeń w tej klasie było lepszych, 0% podobnych, 100% gorszych
» Najlepszy miał deltę 5%, średnia wynosiła ###średnia###%, najgorsza wynosiła 45%
W porównaniu do wszystkich testowanych urządzeń
» 0% wszystkich testowanych urządzeń było lepszych, 0% podobnych, 100% gorszych
» Najlepszy miał deltę 4%, średnia wynosiła ###średnia###%, najgorsza wynosiła 134%
Zarządzanie energią
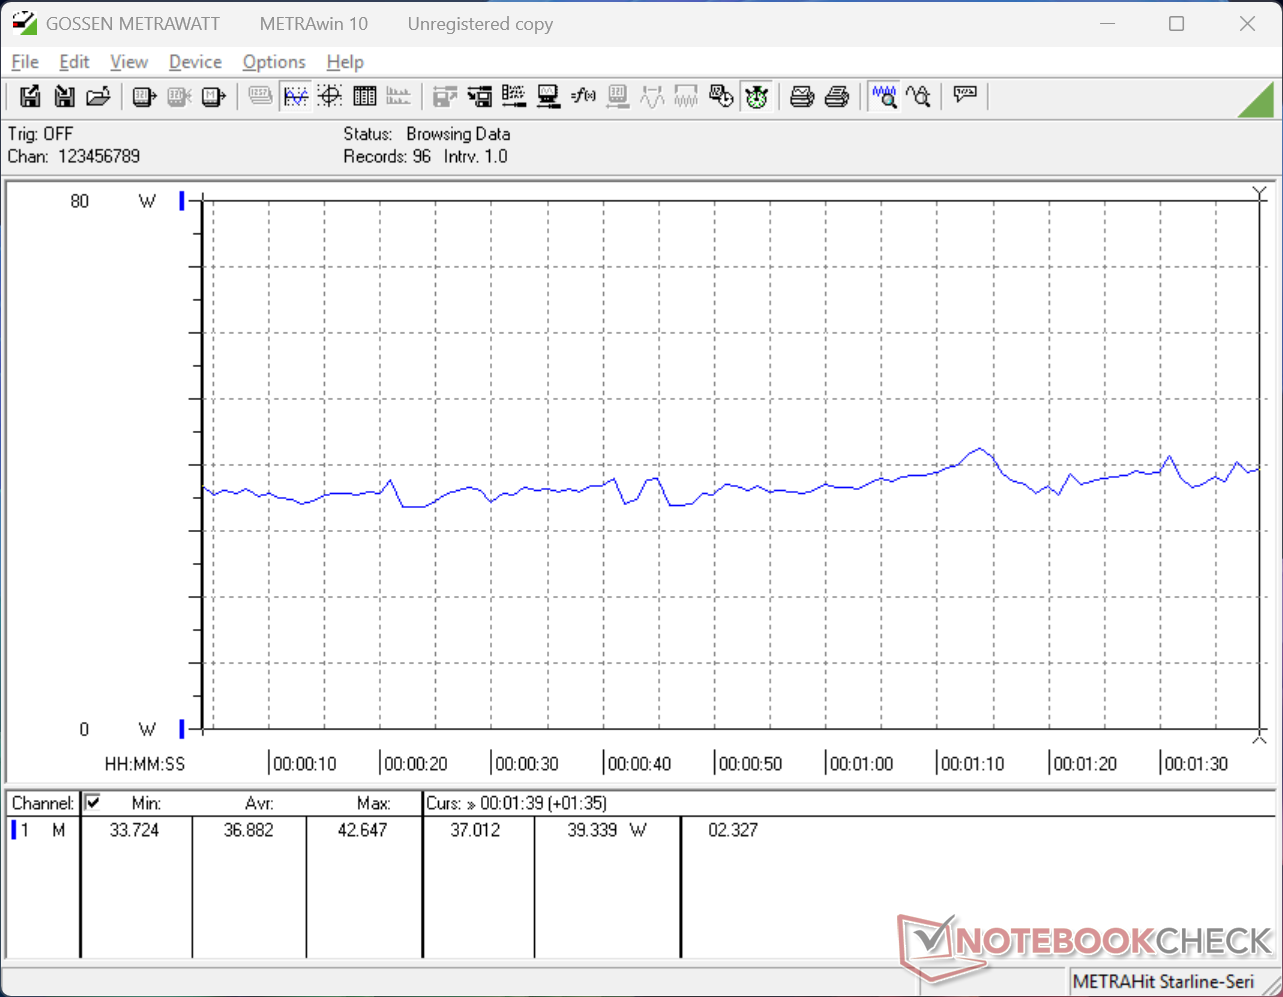
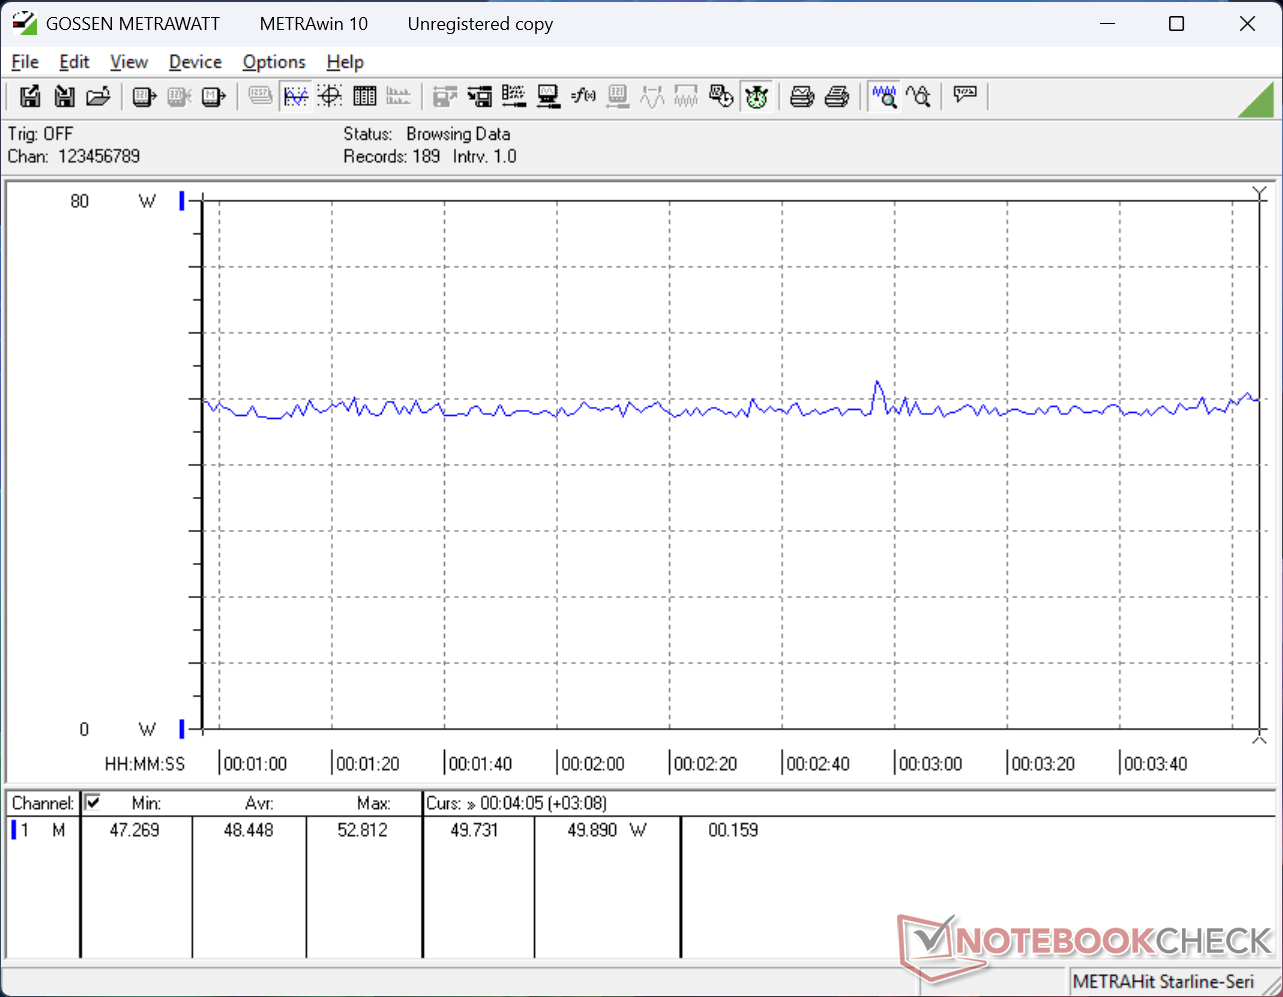
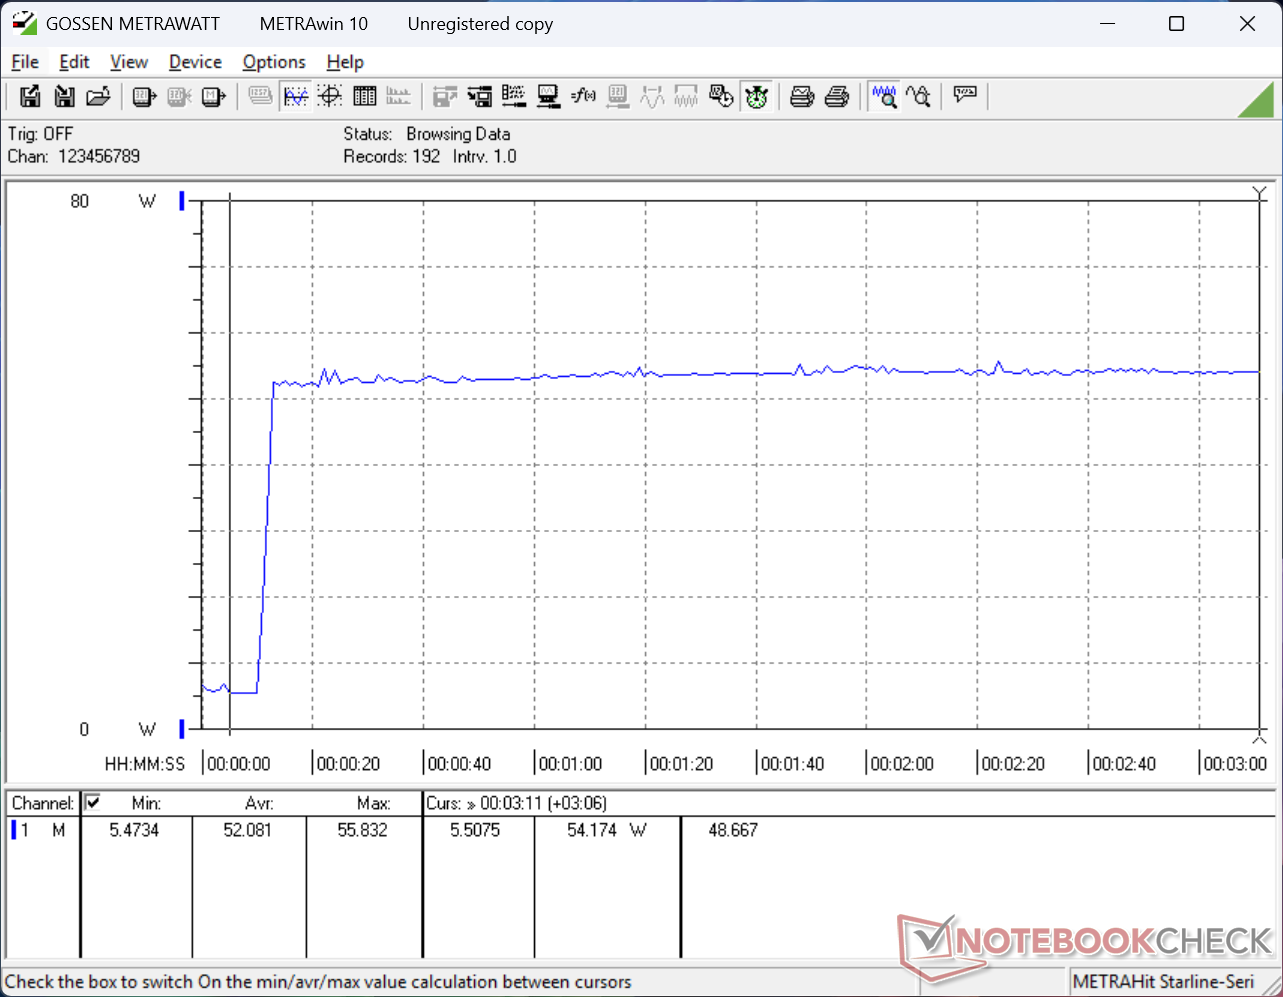
Zużycie energii
| wyłączony / stan wstrzymania | |
| luz | |
| obciążenie |
|
Legenda:
min: | |
| HP EliteBook X G1i 14 AI Core Ultra 7 268V, Arc 140V, Kioxia XG8 KXG80ZNV512G, IPS, 1920x1200, 14" | HP EliteBook Ultra G1i 14 Core Ultra 7 258V, Arc 140V, Kioxia XG8 KXG80ZNV1T02, OLED, 2880x1800, 14" | HP EliteBook X G1a 14 AI Ryzen AI 9 HX PRO 375, Radeon 890M, Kioxia XG8 KXG80ZNV1T02, IPS, 1920x1200, 14" | Dell Pro 14 Premium Core Ultra 7 268V, Arc 140V, Kioxia BG6 KBG6AZNV1T02, OLED, 2880x1800, 14" | Lenovo ThinkBook 14 Gen 8 21SJ007SGE Ultra 7 255H, Arc 140T, Western Digital PCSN5000S SDEPMSJ-1T00-1101, IPS LED, 1920x1200, 14" | Asus Zenbook S 14 UX5406 Core Ultra 7 258V, Arc 140V, WD PC SN560 SDDPNQE-1T00, OLED, 2880x1800, 14" | |
|---|---|---|---|---|---|---|
| Power Consumption | -2% | -87% | -5% | -43% | -12% | |
| Idle Minimum * (Watt) | 2.5 | 3.7 -48% | 6.5 -160% | 3.5 -40% | 4.1 -64% | 5.1 -104% |
| Idle Average * (Watt) | 5.4 | 5.4 -0% | 8.7 -61% | 4.3 20% | 7.8 -44% | 6.2 -15% |
| Idle Maximum * (Watt) | 5.8 | 5.7 2% | 10.3 -78% | 7.9 -36% | 10.7 -84% | 6.9 -19% |
| Load Average * (Watt) | 36.9 | 39.4 -7% | 75.7 -105% | 38.9 -5% | 53.1 -44% | 38.7 -5% |
| Cyberpunk 2077 ultra external monitor * (Watt) | 44.9 | 32.4 28% | 73.1 -63% | 38.7 14% | 56.7 -26% | 28.6 36% |
| Cyberpunk 2077 ultra * (Watt) | 48.5 | 35.3 27% | 76.2 -57% | 39 20% | 56.9 -17% | 33.1 32% |
| Load Maximum * (Watt) | 54.6 | 62.9 -15% | 100.7 -84% | 60.7 -11% | 65.7 -20% | 60 -10% |
* ... im mniej tym lepiej
Power Consumption Cyberpunk / Stress Test
Power Consumption external Monitor
Żywotność baterii
| HP EliteBook X G1i 14 AI Core Ultra 7 268V, Arc 140V, 68 Wh | HP EliteBook Ultra G1i 14 Core Ultra 7 258V, Arc 140V, 64 Wh | HP EliteBook X G1a 14 AI Ryzen AI 9 HX PRO 375, Radeon 890M, 74.5 Wh | Dell Pro 14 Premium Core Ultra 7 268V, Arc 140V, 60 Wh | Lenovo ThinkBook 14 Gen 8 21SJ007SGE Ultra 7 255H, Arc 140T, 45 Wh | Asus Zenbook S 14 UX5406 Core Ultra 7 258V, Arc 140V, 72 Wh | |
|---|---|---|---|---|---|---|
| Czasy pracy | -35% | -23% | -18% | -61% | -23% | |
| WiFi v1.3 (h) | 18.5 | 12 -35% | 14.2 -23% | 15.2 -18% | 7.3 -61% | 14.3 -23% |
| Reader / Idle (h) | 21.2 | |||||
| Load (h) | 0.8 | 2.6 | ||||
| H.264 (h) | 20 |
Ocena Notebookcheck
HP EliteBook X G1i 14 AI
- 23/07/2025 v8
Allen Ngo
 Total Sustainability Score:
 Potencjalni konkurenci w porównaniu
Obraz | Model / recenzja | Cena | Waga | Wysokość | Ekran |
|---|---|---|---|---|---|
1. 85.1% 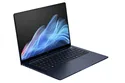 | HP EliteBook X G1i 14 AI Intel Core Ultra 7 268V ⎘ Intel Arc Graphics 140V ⎘ 32 GB Pamięć, 512 GB SSD | Amazon: Cena katalogowa: 3300 USD | 1.2 kg | 15 mm | 14.00" 1920x1200 162 PPI IPS |
2. 89.6% 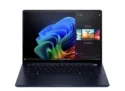 | HP EliteBook Ultra G1i 14 Intel Core Ultra 7 258V ⎘ Intel Arc Graphics 140V ⎘ 32 GB Pamięć, 1024 GB SSD | Amazon: Cena katalogowa: 2349€ | 1.2 kg | 12.1 mm | 14.00" 2880x1800 243 PPI OLED |
3. 88.7% 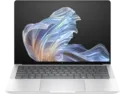 | HP EliteBook X G1a 14 AI AMD Ryzen AI 9 HX PRO 375 ⎘ AMD Radeon 890M ⎘ 32 GB Pamięć, 1024 GB SSD | Amazon: Cena katalogowa: 2200 USD | 1.5 kg | 13.2 mm | 14.00" 1920x1200 162 PPI IPS |
4. 86.4%  | Dell Pro 14 Premium Intel Core Ultra 7 268V ⎘ Intel Arc Graphics 140V ⎘ 32 GB Pamięć, 1024 GB SSD | Cena katalogowa: 2500 USD | 1.3 kg | 17.95 mm | 14.00" 2880x1800 243 PPI OLED |
5. 83.9%  | Lenovo ThinkBook 14 Gen 8 21SJ007SGE Intel Core Ultra 7 255H ⎘ Intel Arc Graphics 140T ⎘ 32 GB Pamięć, 1024 GB SSD | Amazon: Cena katalogowa: 1090 Euro | 1.5 kg | 20.8 mm | 14.00" 1920x1200 162 PPI IPS LED |
6.  | Asus Zenbook 14 OLED UX3405CA Intel Core Ultra 7 255H ⎘ Intel Arc Graphics 140T ⎘ 32 GB Pamięć, 1024 GB SSD | Amazon: 1. $839.00 ASUS Zenbook 14 UX3405CA 14"... 2. $1,099.00 ASUS Zenbook 14 Laptop 14" W... 3. $1,699.99 ASUS Zenbook 14 AI PC OLED T... Cena katalogowa: 1399 EUR | 1.3 kg | 14.9 mm | 14.00" 2880x1800 243 PPI OLED |
Przezroczystość
Wyboru urządzeń do recenzji dokonuje nasza redakcja. Próbka testowa została udostępniona autorowi jako pożyczka od producenta lub sprzedawcy detalicznego na potrzeby tej recenzji. Pożyczkodawca nie miał wpływu na tę recenzję, producent nie otrzymał też kopii tej recenzji przed publikacją. Nie było obowiązku publikowania tej recenzji. Jako niezależna firma medialna, Notebookcheck nie podlega władzy producentów, sprzedawców detalicznych ani wydawców.
Tak testuje Notebookcheck
Każdego roku Notebookcheck niezależnie sprawdza setki laptopów i smartfonów, stosując standardowe procedury, aby zapewnić porównywalność wszystkich wyników. Od około 20 lat stale rozwijamy nasze metody badawcze, ustanawiając przy tym standardy branżowe. W naszych laboratoriach testowych doświadczeni technicy i redaktorzy korzystają z wysokiej jakości sprzętu pomiarowego. Testy te obejmują wieloetapowy proces walidacji. Nasz kompleksowy system ocen opiera się na setkach uzasadnionych pomiarów i benchmarków, co pozwala zachować obiektywizm.
