Recenzja laptopa HP ZBook Studio 16 G9: Stacja robocza z wyświetlaczem DreamColor 120 Hz
ZBook Studio firmy HP to wysokiej jakości i smukła mobilna stacja robocza, która stanowi bezpośrednią konkurencję dla takich modeli jak np.Dell Precision 5560 lub Lenovo ThinkPad P1.mimo, że posiada wydajne podzespoły, to jednak nacisk na mobilność jest większy w porównaniu z dużo bardziej masywnymi modelami HP Serii ZBook Fury
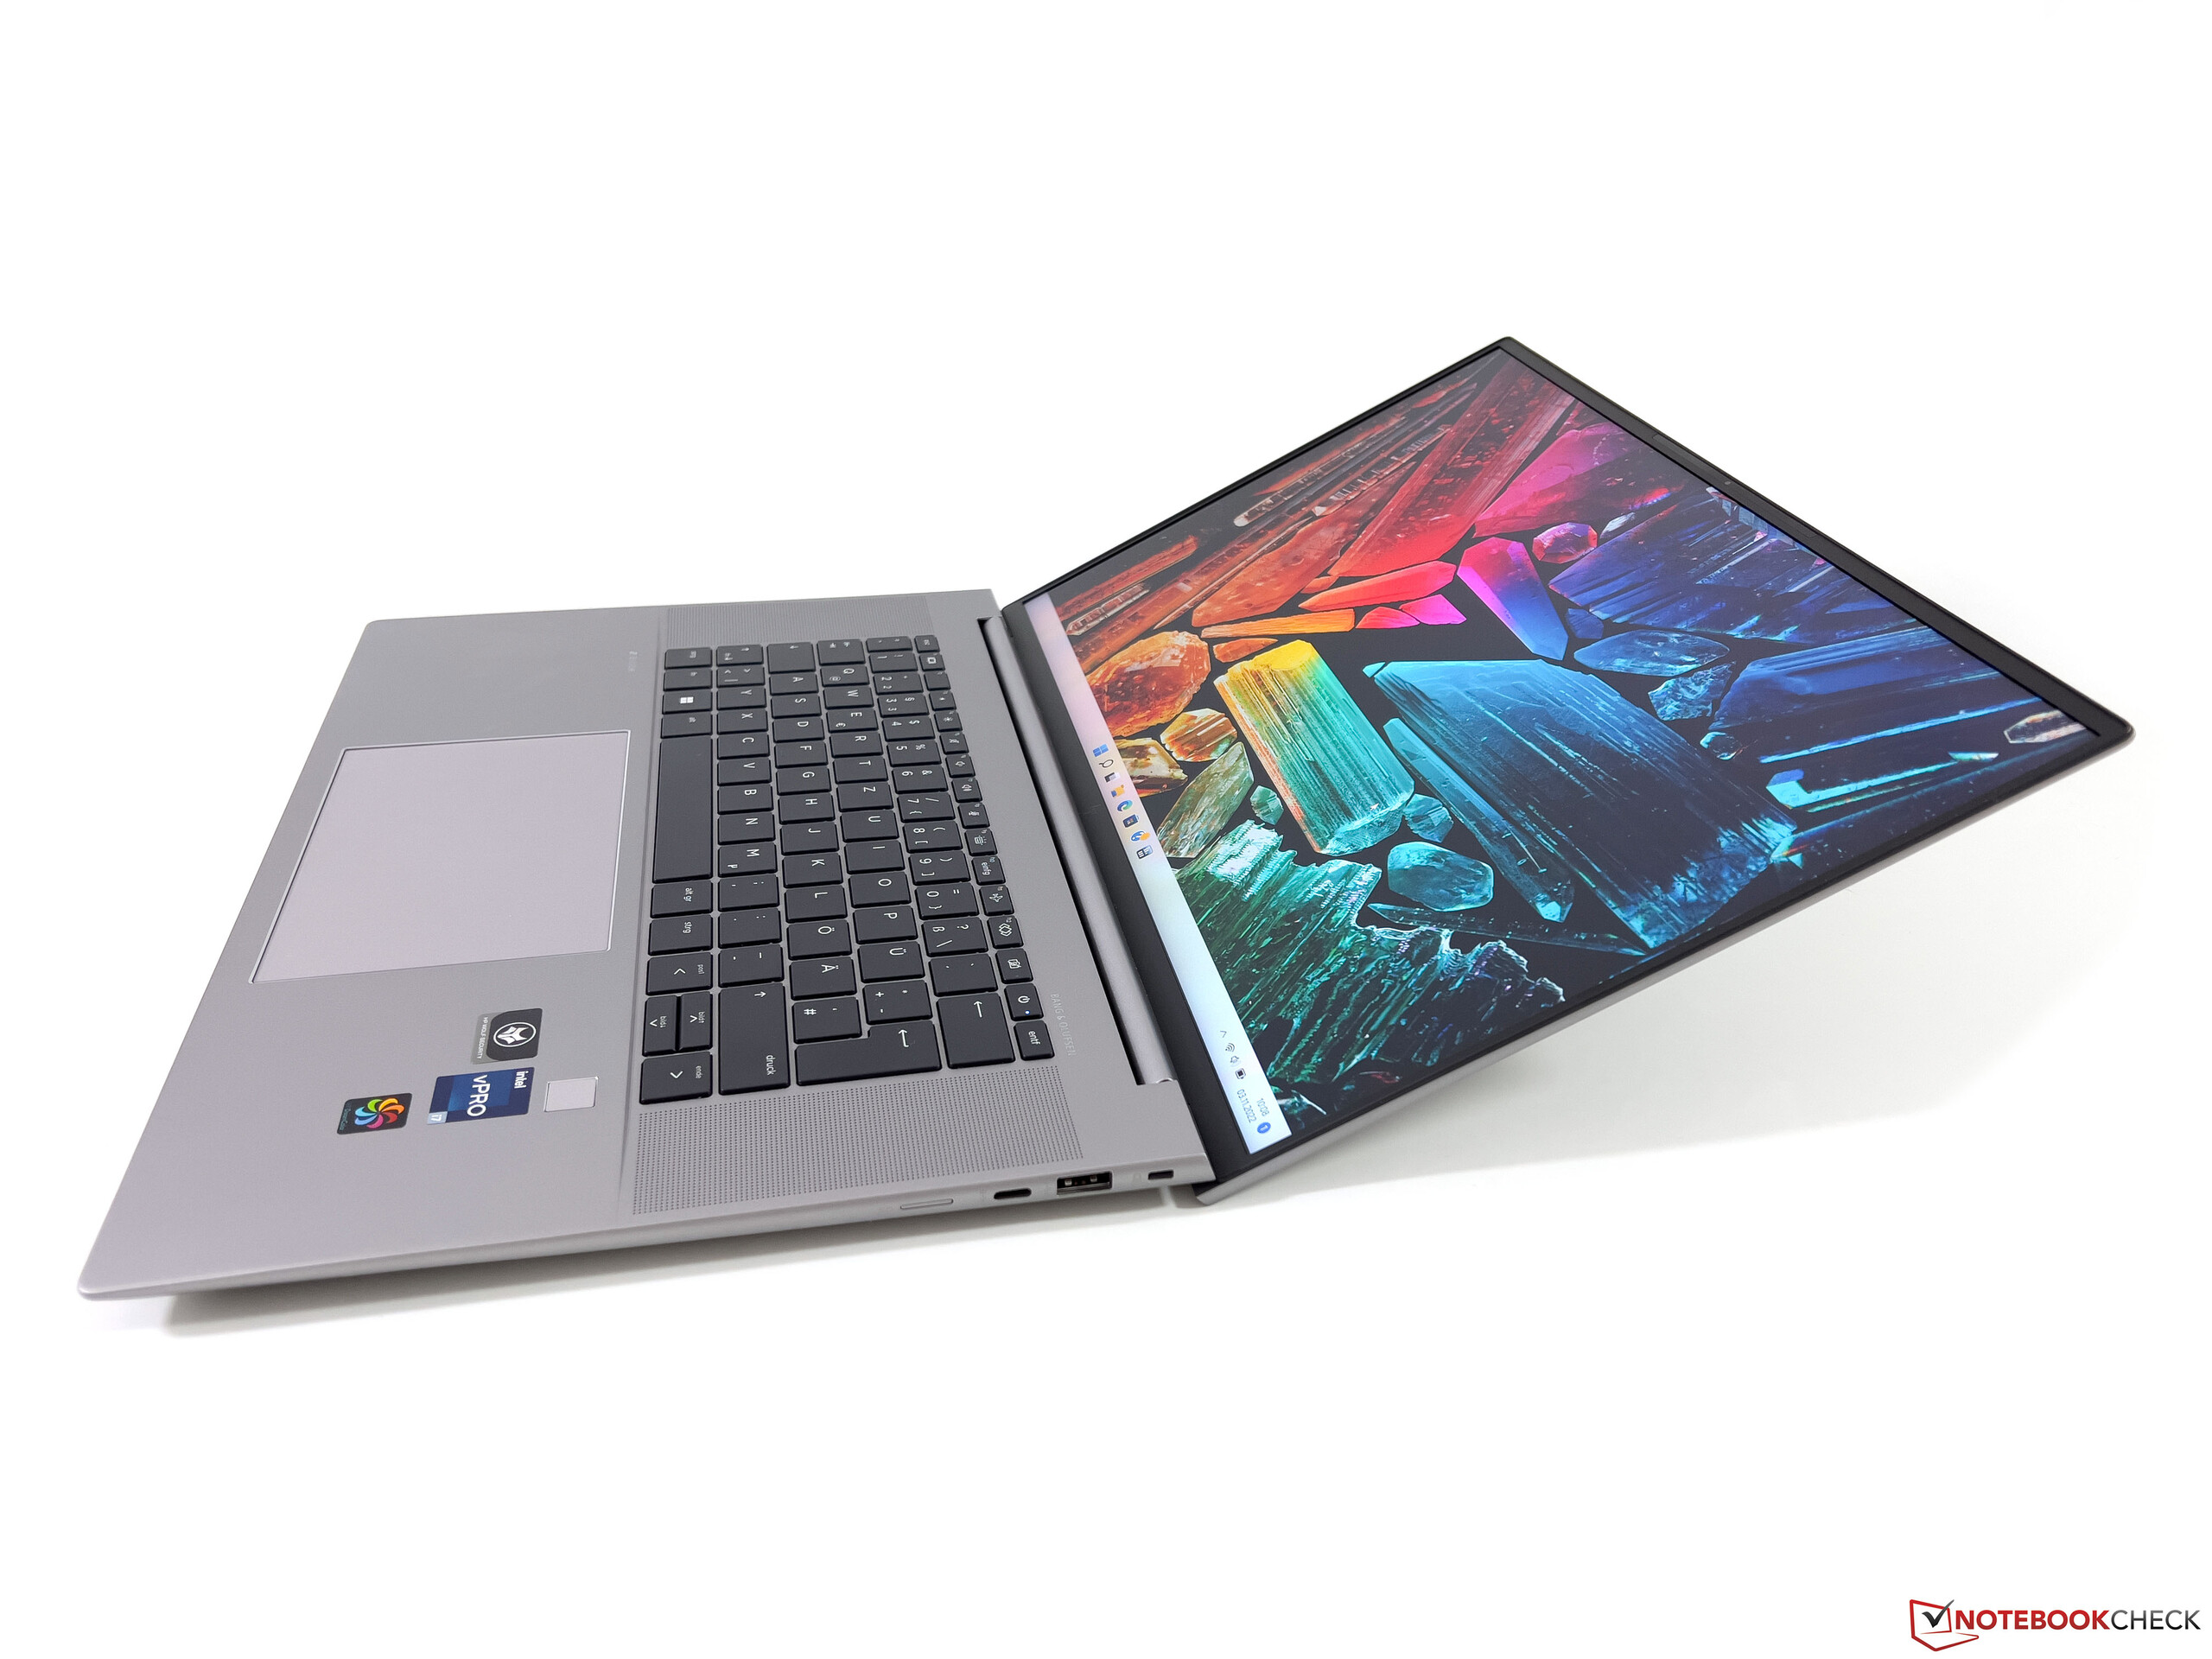
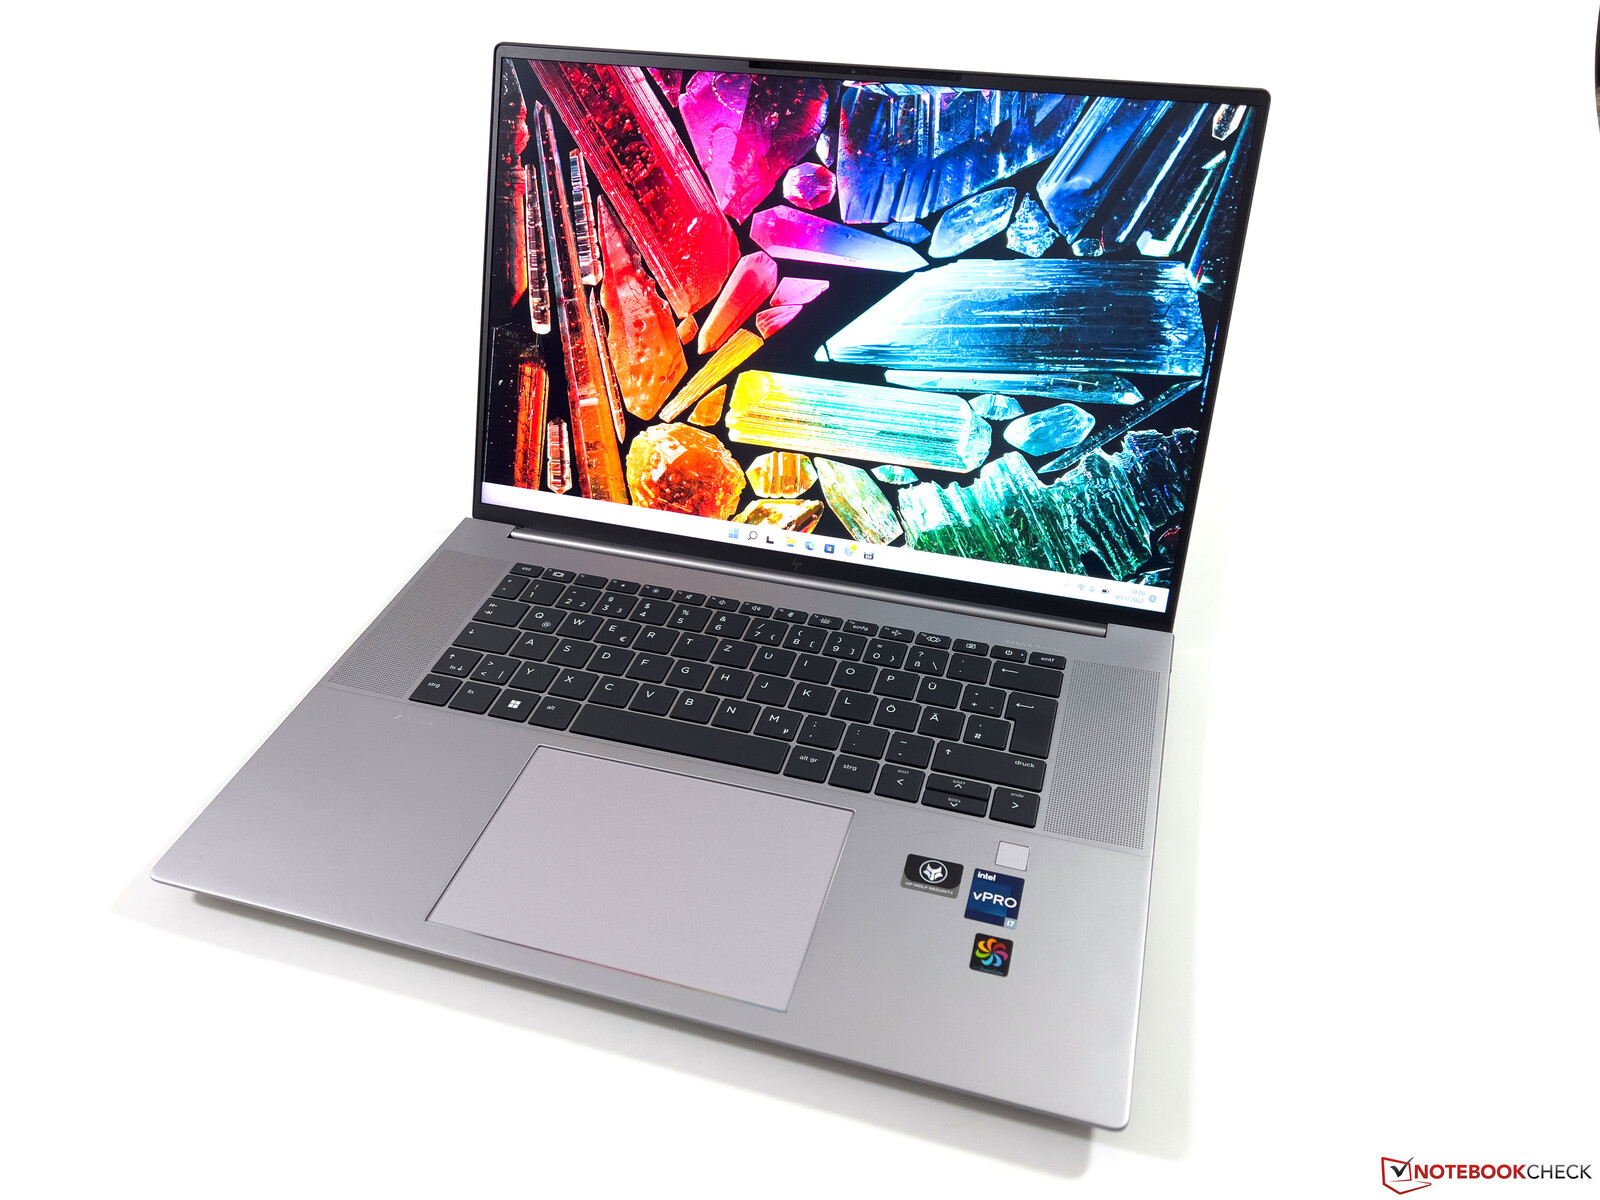
Nowy ZBook Studio 16 G9 oferuje kilka istotnych modernizacji, ponieważ HP dokonało przejścia z 15,6-calowego wyświetlacza (16:9) starego modelu G8 na nowe 16-calowe panele w formacie 16:10, czemu towarzyszy zupełnie nowa obudowa. W ofercie znajduje się szeroki wachlarz konfiguracji, zwłaszcza jeśli chodzi o karty graficzne. Nasze kosztujące ~3300 USD urządzenie recenzenckie jest dobrze wyposażone, gdyż obecny m.in.Procesor Core i7-12800Hod Intela wspierany jest przez 32 GB pamięci RAM oraz dysk SSD PCIe 4.0 o pojemności 1 TB. Do gry wchodzi także panel 4K DreamColor o częstotliwości odświeżania 120 Hz, a wymagającą obróbką grafiki zajmuje się profesjonalna Nvidia RTX A2000 (porównywalna z GeForce RTX 3050 Ti).
Potencjalni konkurenci w porównaniu
Ocena | Data | Model | Waga | Wysokość | Rozmiar | Rezolucja | Cena |
|---|---|---|---|---|---|---|---|
| 90.1 % v7 (old) | 11/2022 | HP ZBook Studio 16 G9 62U04EA i7-12800H, RTX A2000 Laptop GPU | 1.8 kg | 19 mm | 16.00" | 3840x2400 | |
| 89.3 % v7 (old) | Lenovo ThinkPad P1 G4-20Y4Z9DVUS i7-11800H, T1200 Laptop GPU | 1.8 kg | 17.7 mm | 16.00" | 2560x1600 | ||
| 92.5 % v7 (old) | Apple MacBook Pro 16 2021 M1 Max M1 Max, M1 Max 32-Core GPU | 2.2 kg | 16.8 mm | 16.20" | 3456x2234 | ||
| 88.3 % v7 (old) | Dell Precision 5000 5560 i7-11850H, RTX A2000 Laptop GPU | 2 kg | 18 mm | 15.60" | 3840x2400 | ||
| 87.8 % v7 (old) | HP ZBook Studio 15 G8 i9-11950H, GeForce RTX 3070 Laptop GPU | 1.9 kg | 18 mm | 15.60" | 3840x2160 |
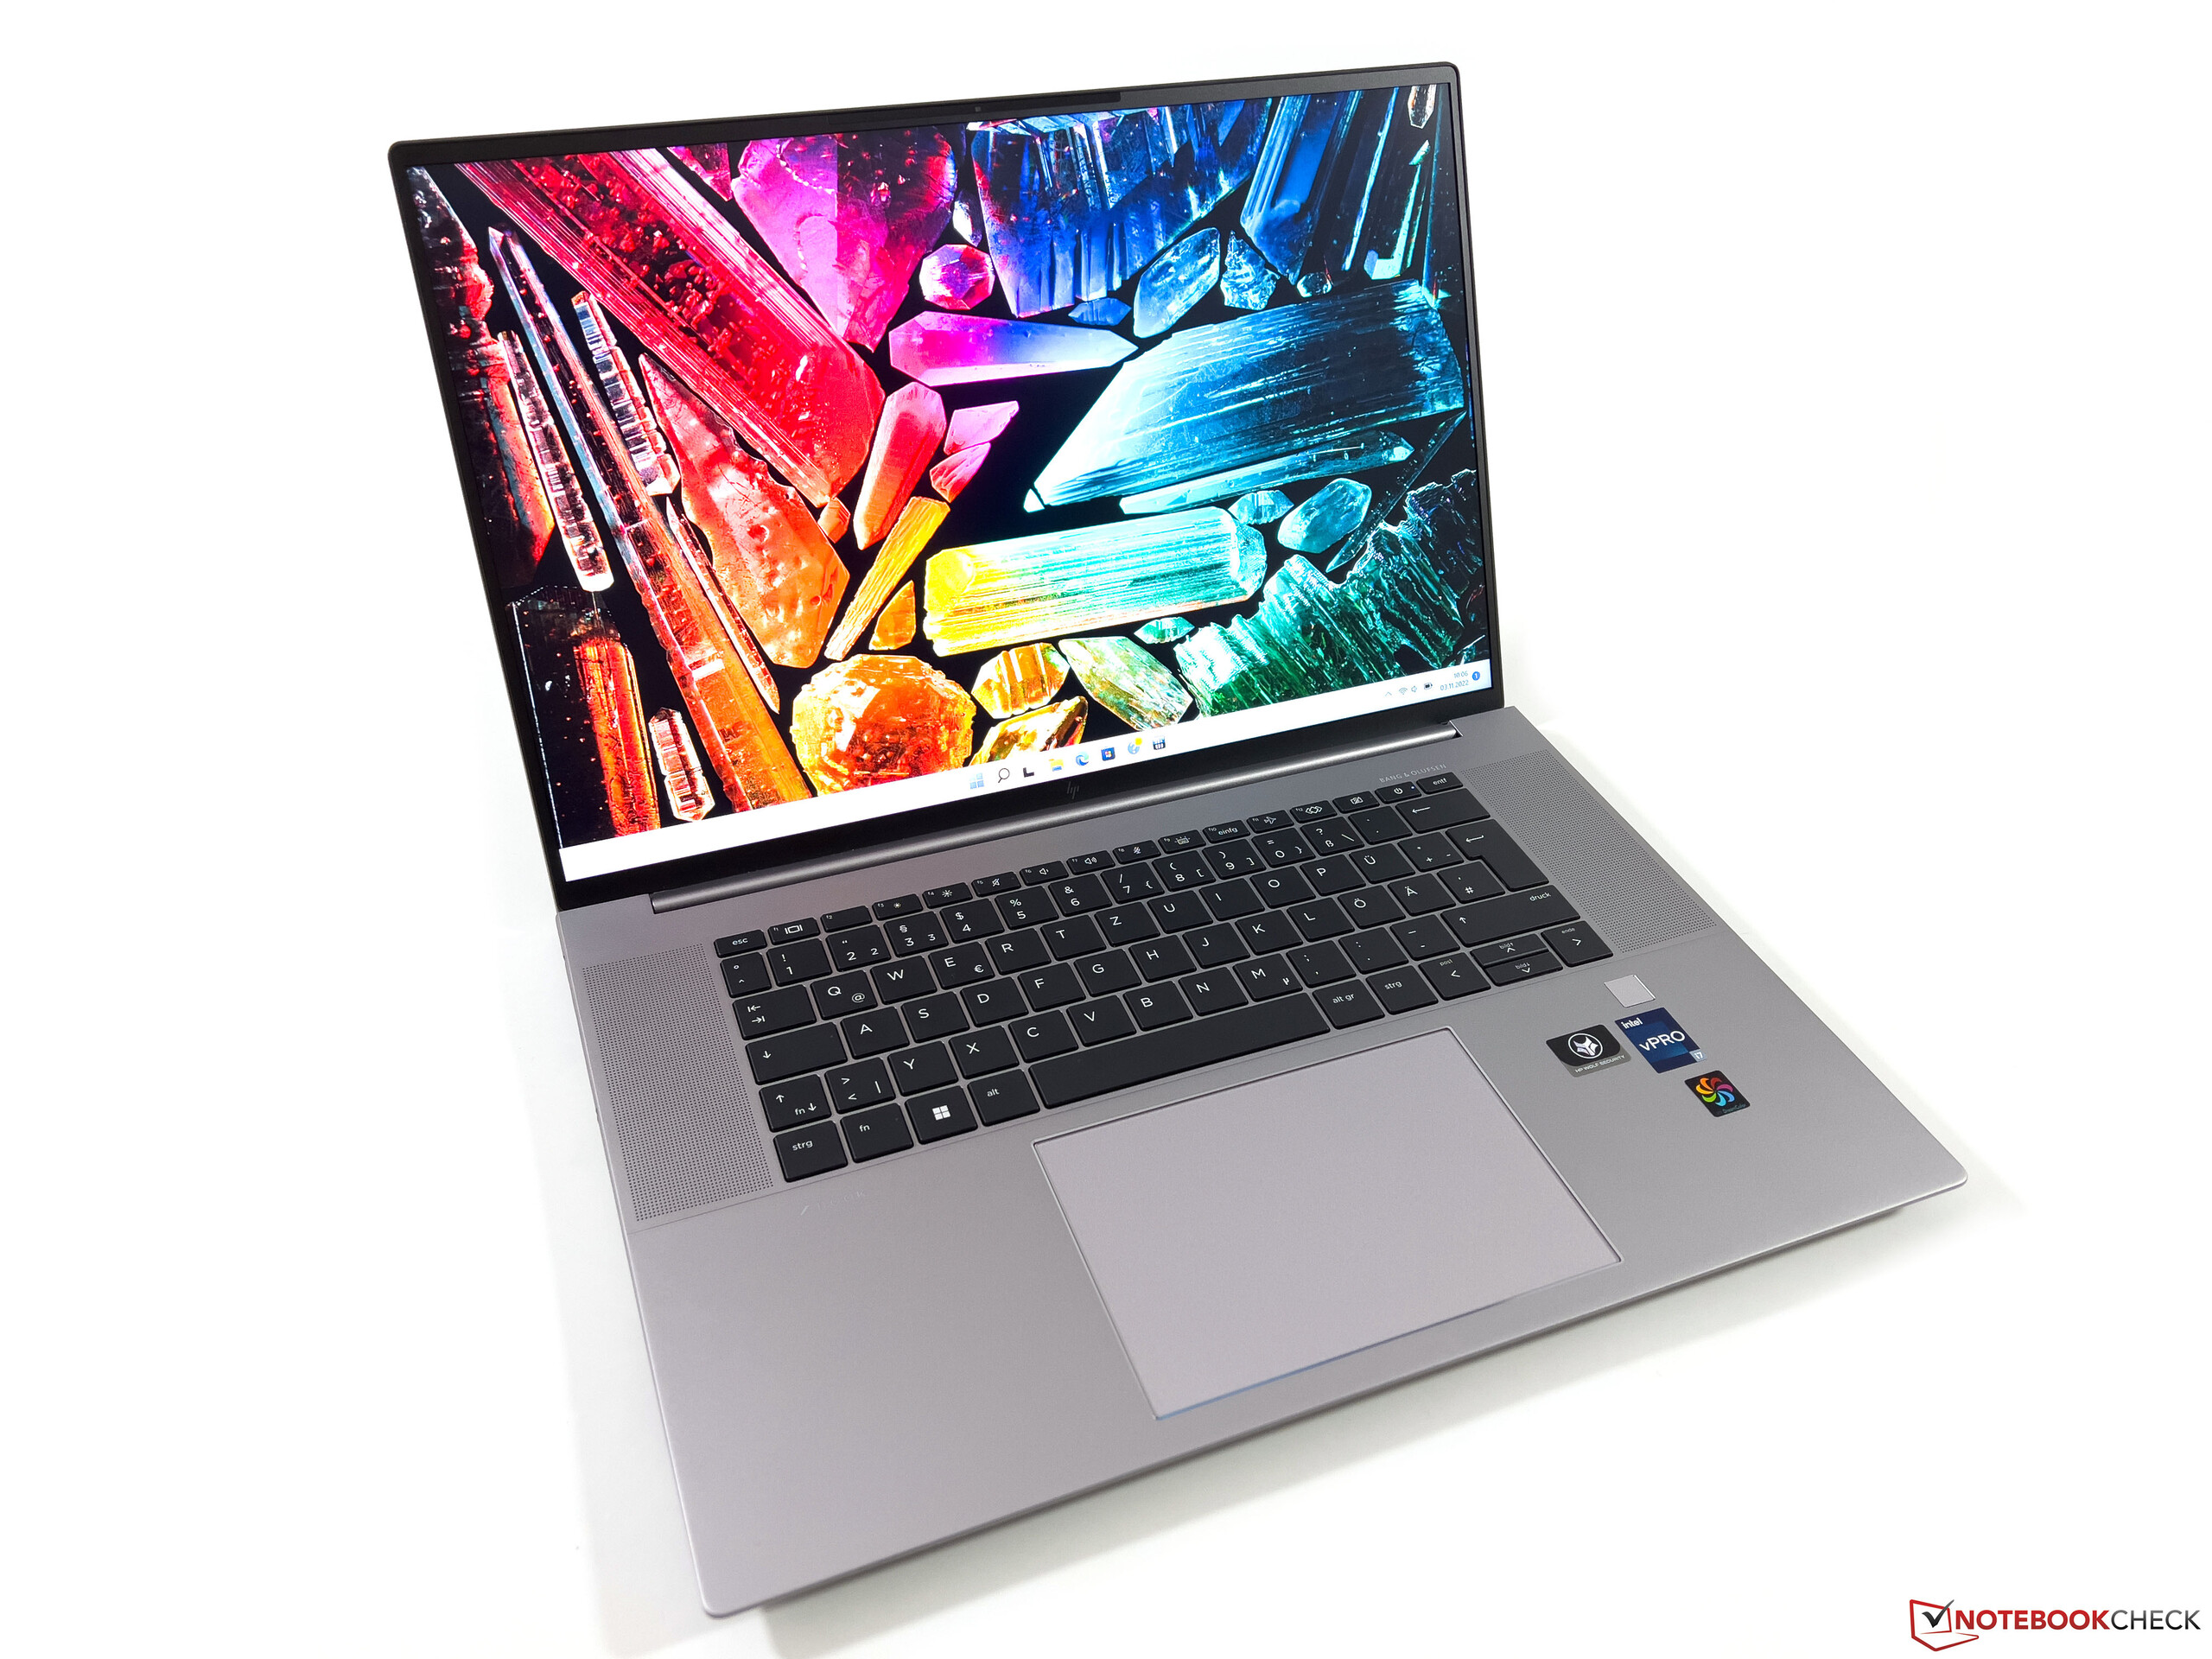
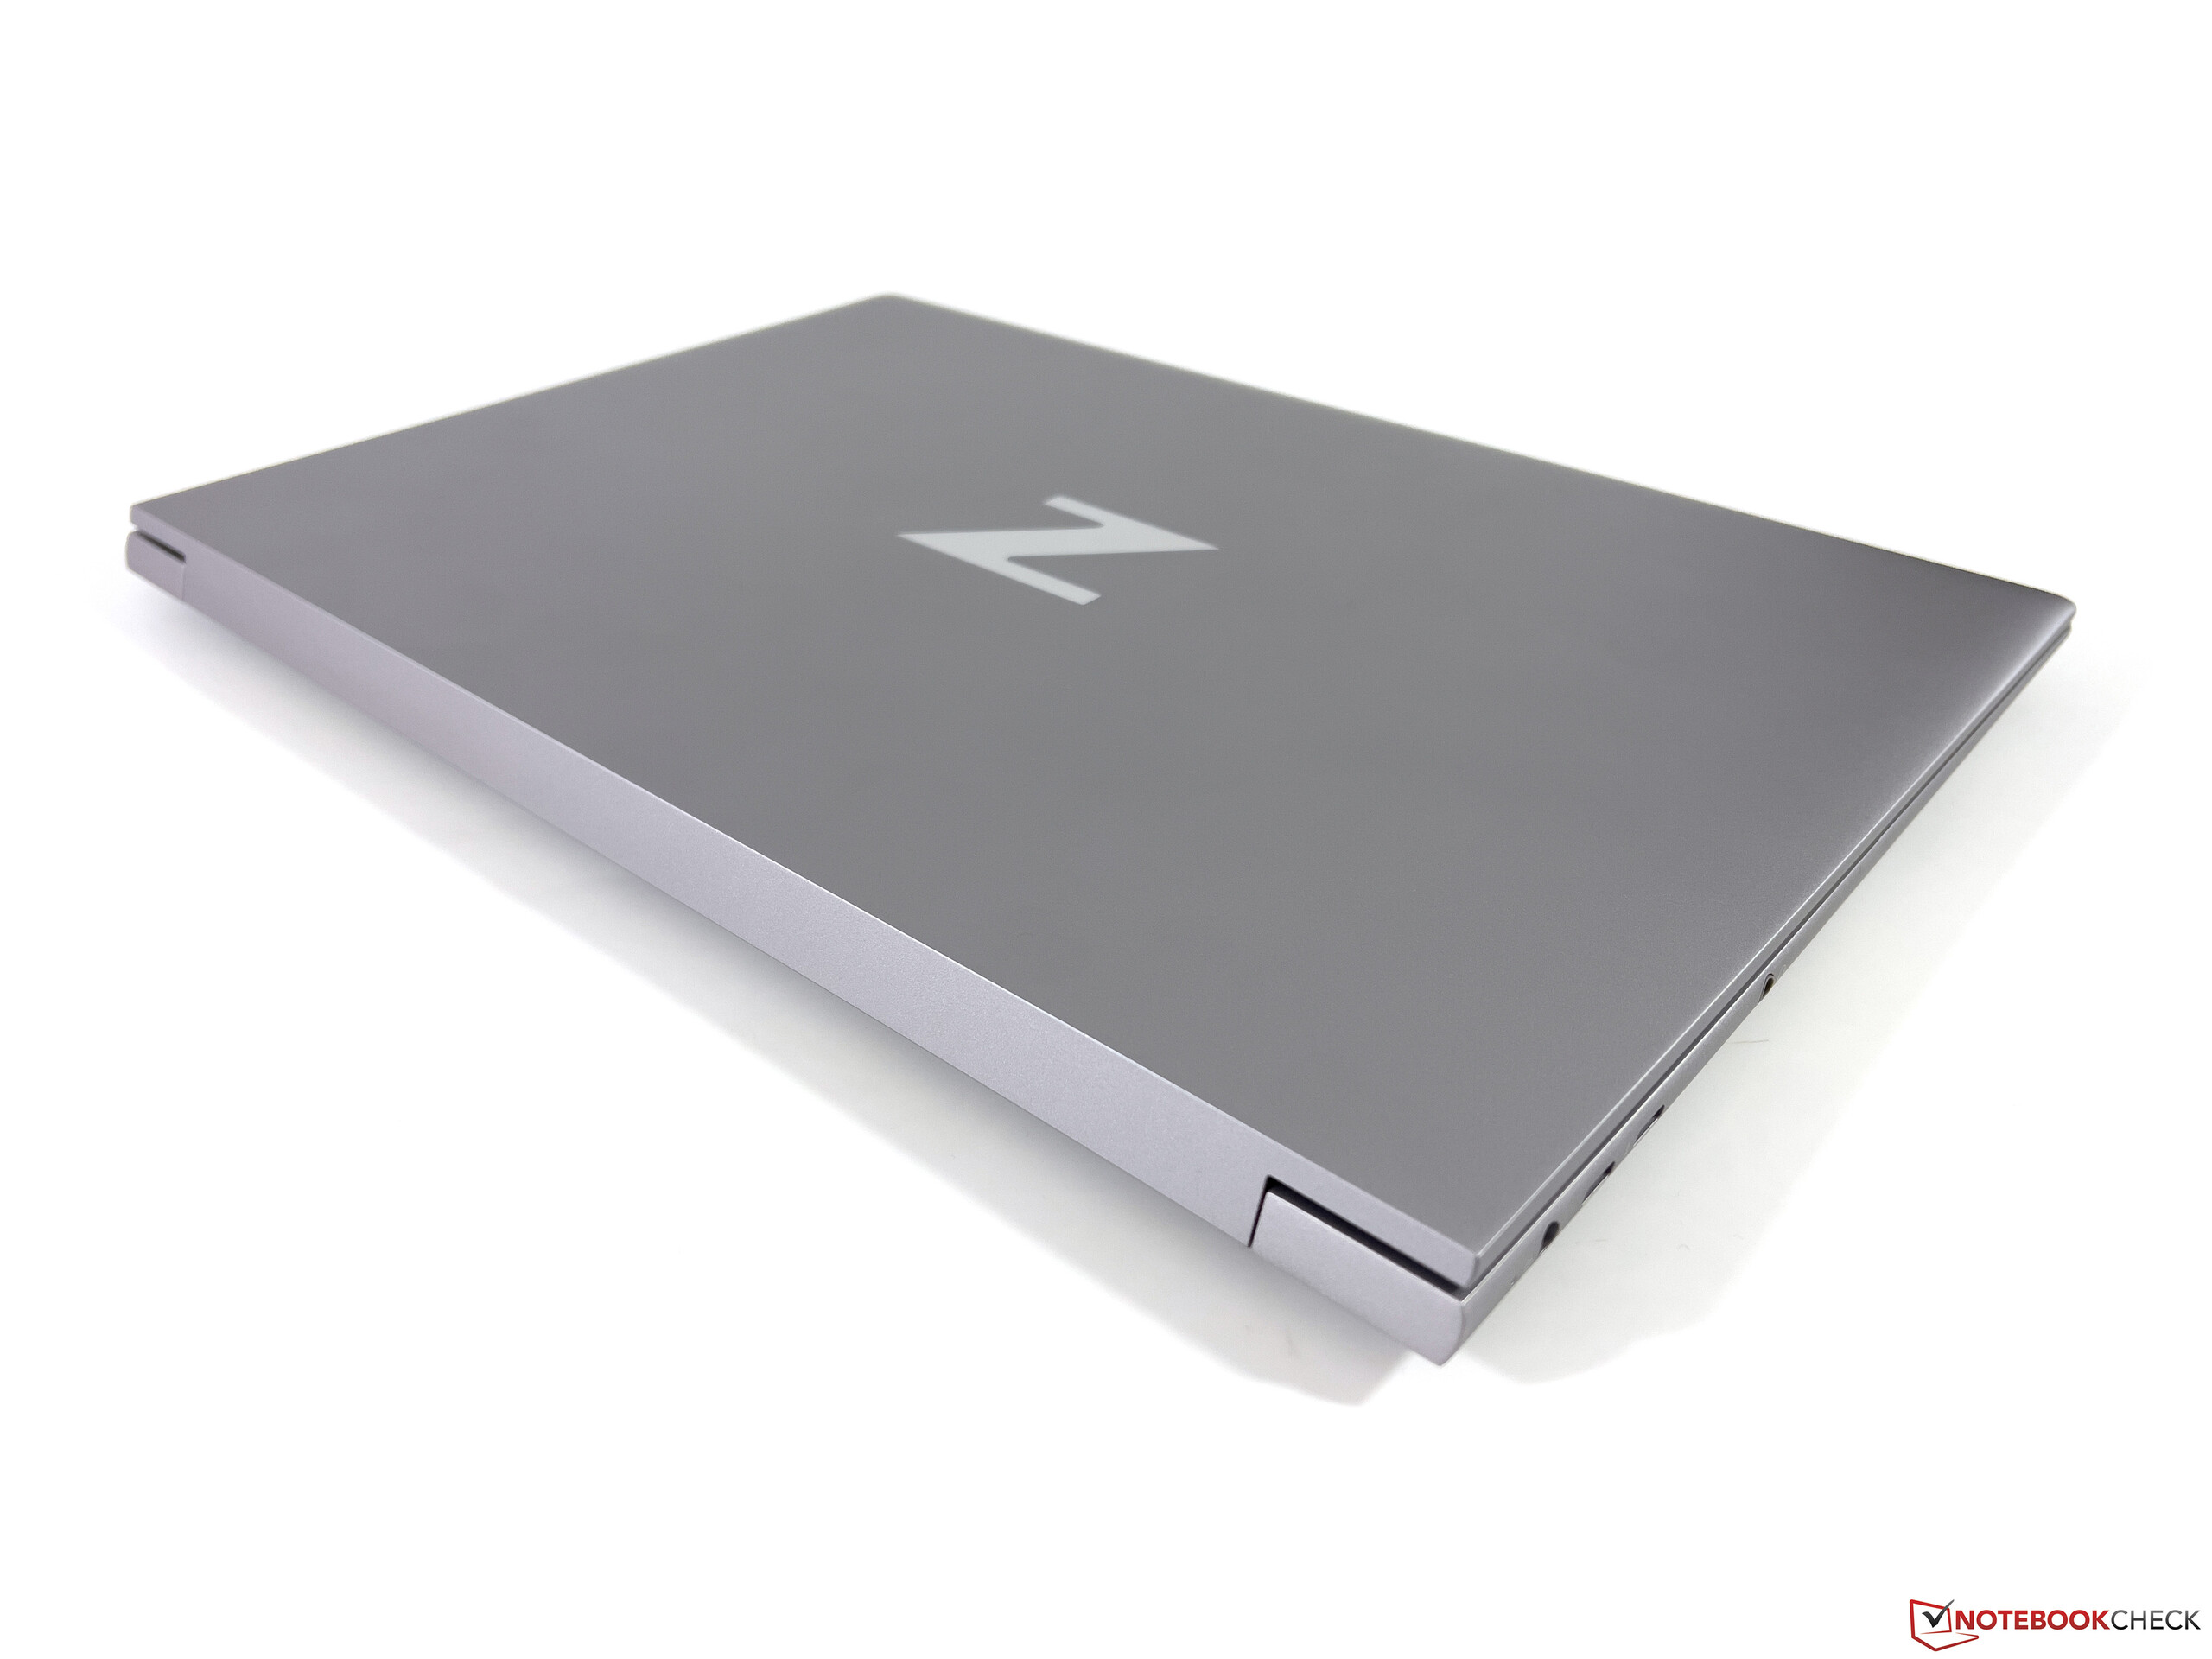
Obudowa - ZBook z aluminiową obudową
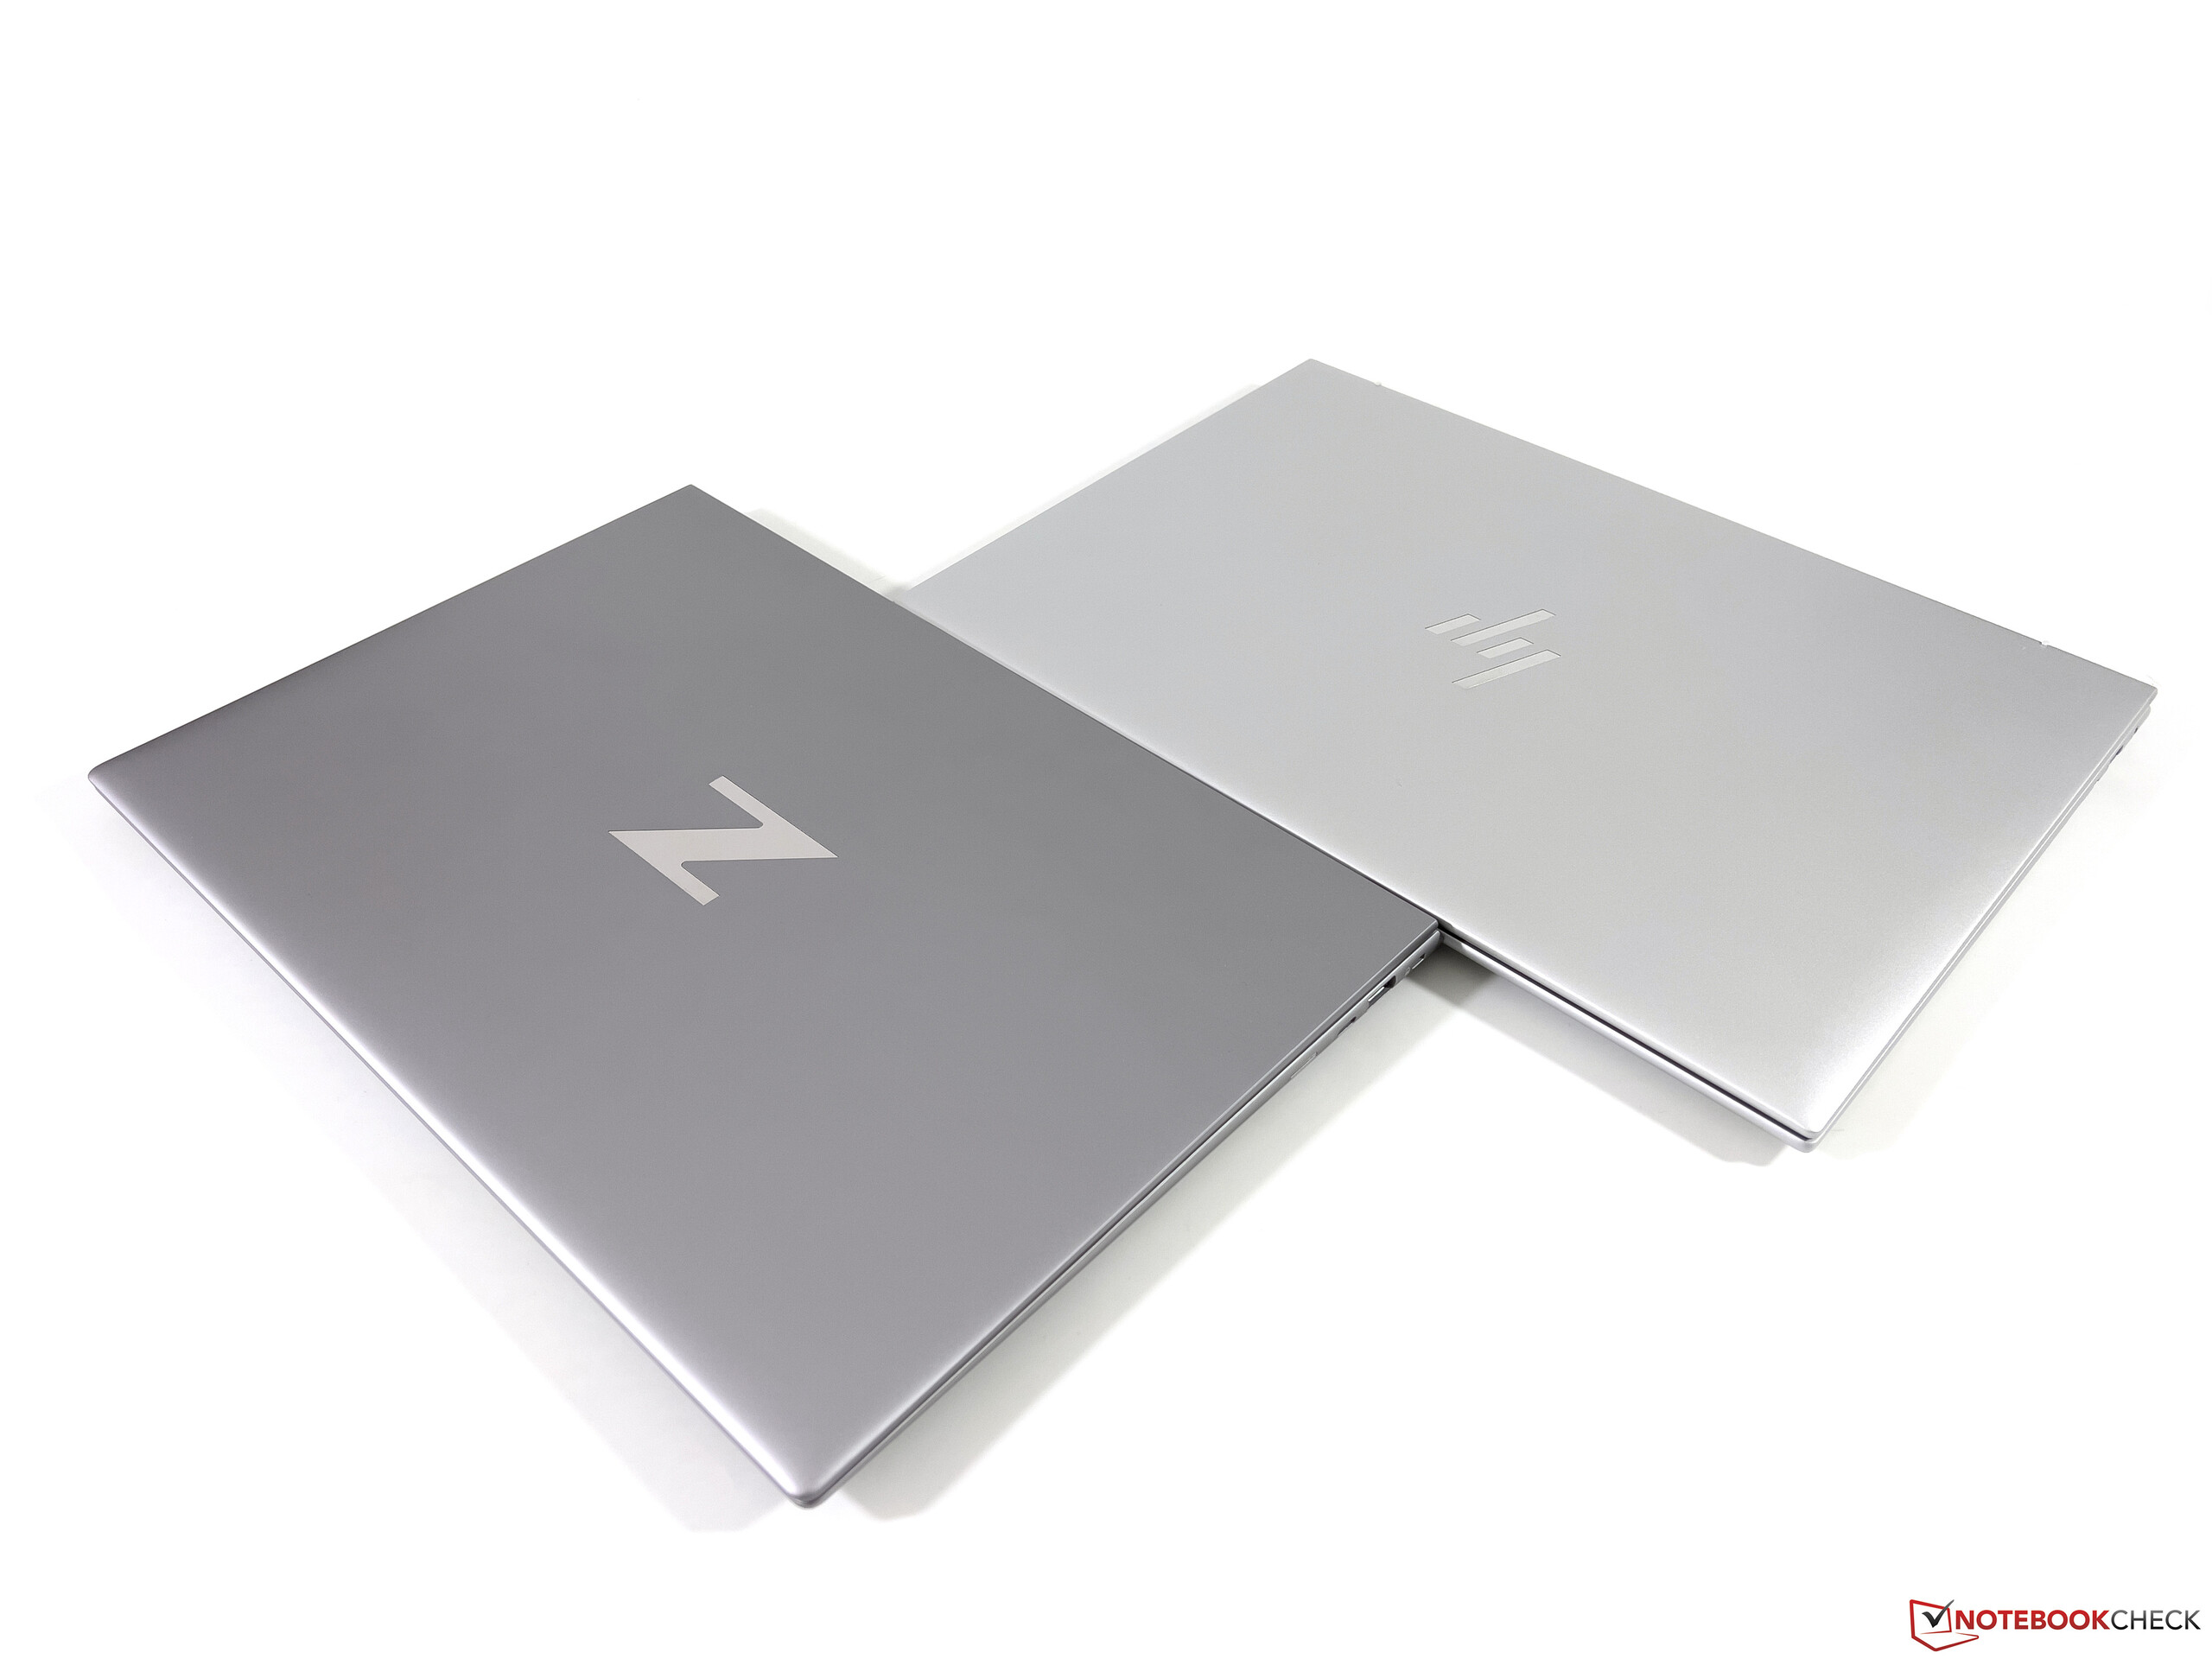
Choć nie rzuca się to od razu w oczy, HP stosuje w nowym ZBooku Studio 16 G9 zupełnie nową obudowę. Krawędzie z tyłu są nadal kanciaste, ale reszta obudowy jest teraz nieco bardziej okrągła. W porównaniu ze zwykłymi modelami EliteBooków (srebrnymi) ten model ma ciemniejszą szarość, co wyraźnie widać na poniższym zdjęciu porównawczym. Gdy tylko otworzy się panel ekranu, od razu rzucają się w oczy wąskie krawędzie ekranu, które wyglądają bardzo nowocześnie.
Pod względem jakościowym metalowa obudowa jest bez zarzutu, ponieważ zarówno jednostka podstawowa jak i stosunkowo cienka pokrywa ekranu są bardzo stabilne. Nie udało nam się wywołać żadnych trzeszczących dźwięków ani błędów w obrazie. Również zawias ekranu jest bardzo dobrze wyregulowany i przy zmianie kąta otwarcia, który wynosi maksymalnie około 150 stopni, występują tylko minimalne drgania.
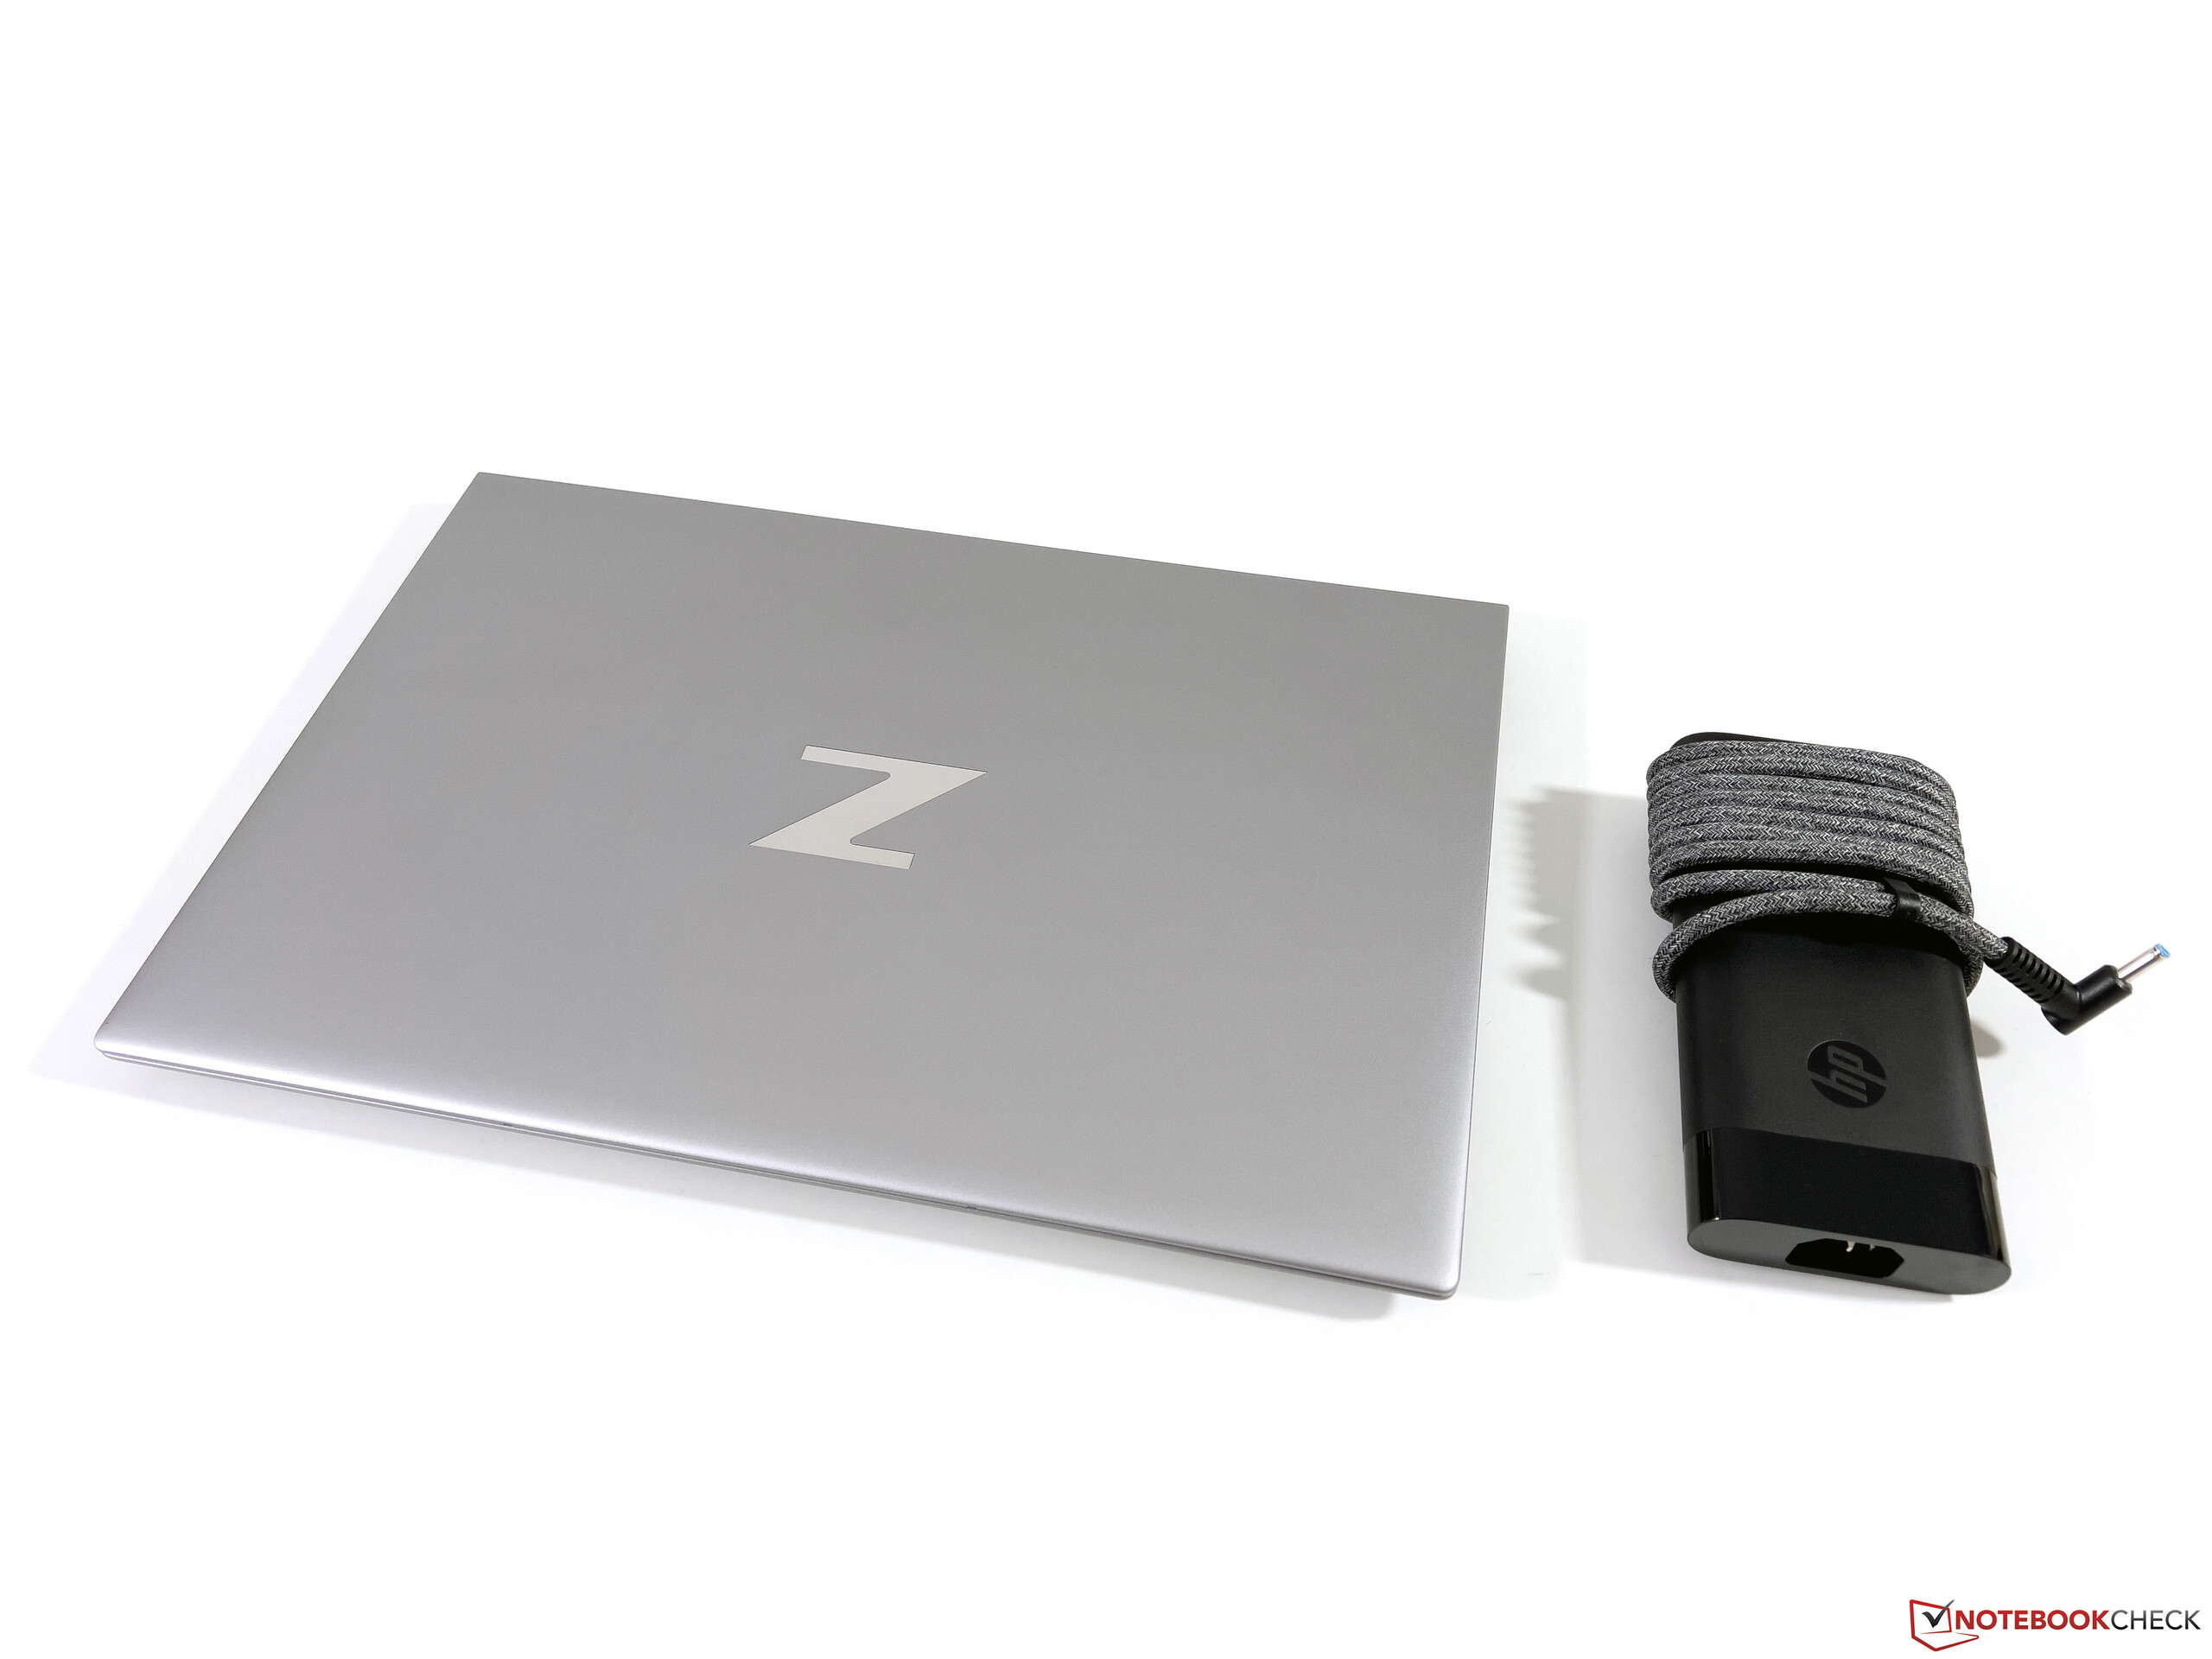
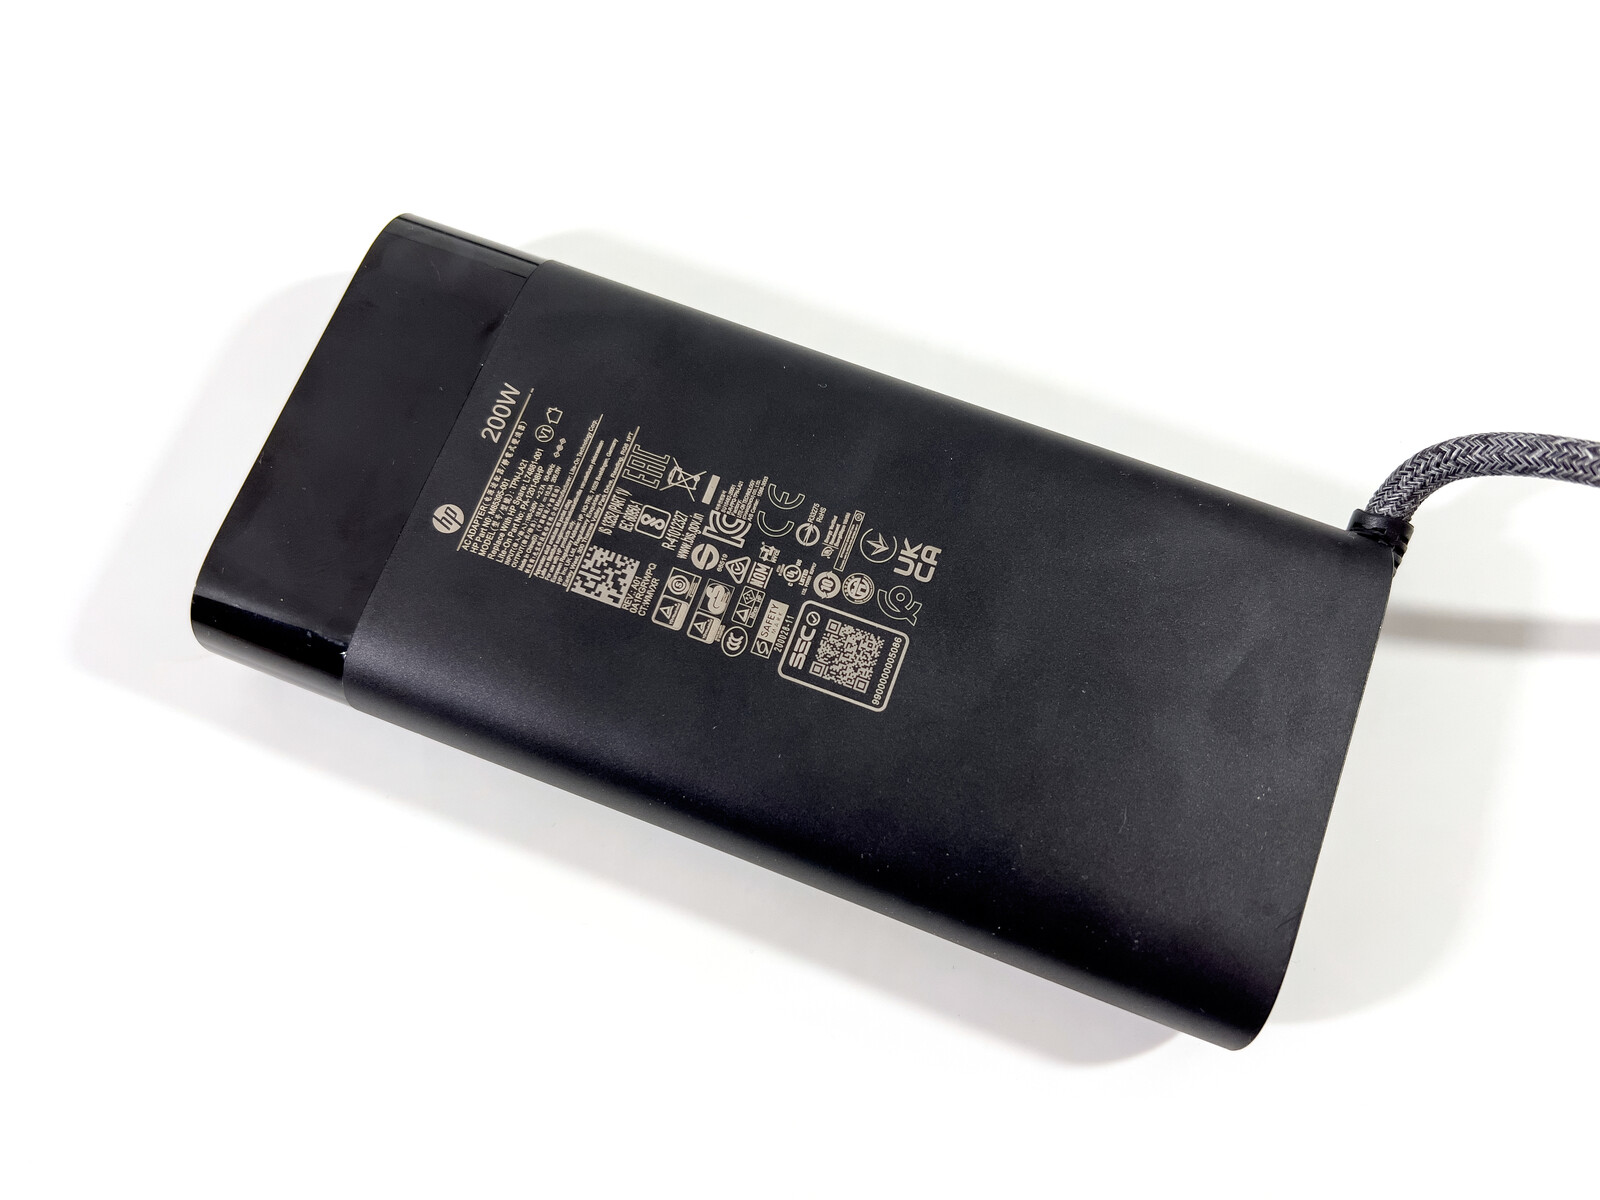
W porównaniu ze starymZBook Studio 15 G8, nowy 16-calowy model stał się nieco głębszy i nieco szerszy. Z drugiej strony nowy ZBook jest jednym z najlżejszych modeli ważąc w tej konfiguracji nieco ponad 1,8 kg. 200-watowy zasilacz dodaje kolejne 613 gramów.
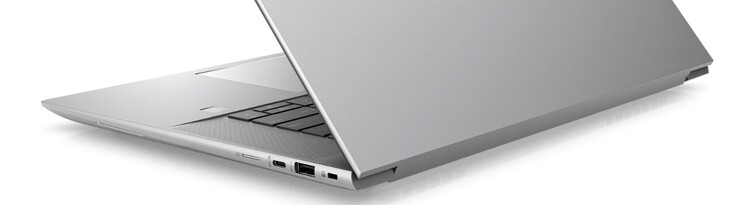
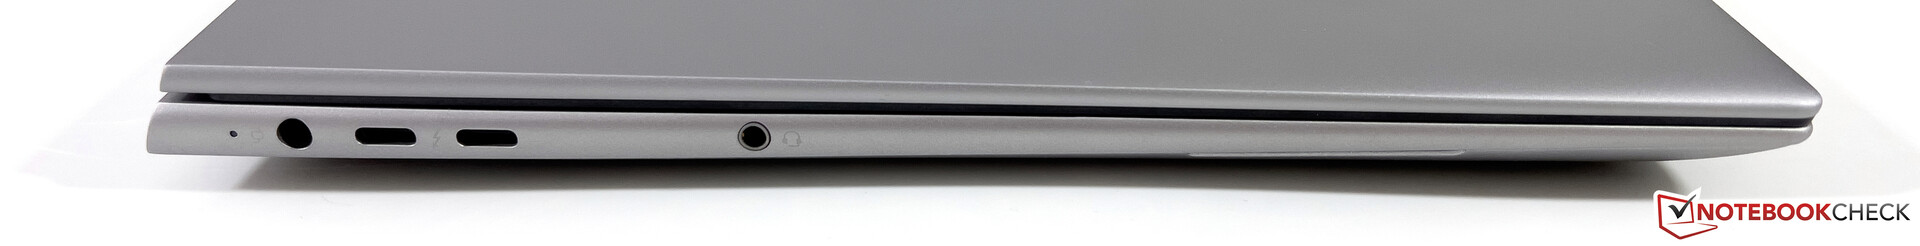
Wyposażenie - 2x Thunderbolt 4
W portach zaszły drobne zmiany, gdyż DisplayPort musiał ustąpić miejsca kolejnemu portowi USB-C. Zmienił się także układ w porównaniu do m.in.poprzednika; denerwuje fakt, że ZBooka nie można ładować przez USB-C
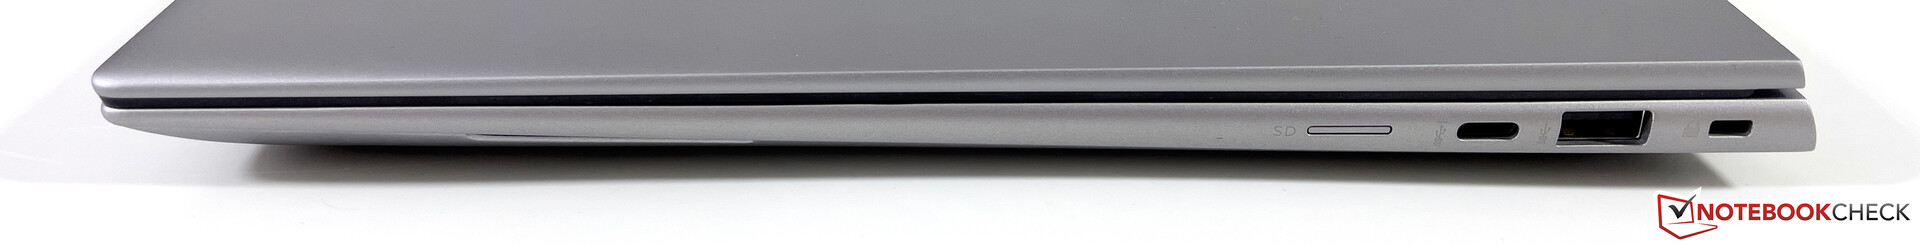
Czytnik kart SD
HP zamieniłoStudio 15 G8pełnoprawny czytnik SD na czytnik microSD, który w pełni akceptuje karty microSD. Czytnik ma mechanizm sprężynowy i wyjmowanie włożonych kart może być nieco kłopotliwe. Pod względem szybkości działania czytnik kart pozostaje na tym samym poziomie około 80 MB/s, ale konkurencja jest szybsza.
| SD Card Reader | |
| average JPG Copy Test (av. of 3 runs) | |
| Lenovo ThinkPad P1 G4-20Y4Z9DVUS (Angelbird AV Pro V60) | |
| Dell Precision 5000 5560 (AV Pro V60) | |
| Średnia w klasie Workstation (49.6 - 681, n=14, ostatnie 2 lata) | |
| HP ZBook Studio 15 G8 (AV Pro V60) | |
| HP ZBook Studio 16 G9 62U04EA (Angelbird AV PRO V60) | |
| maximum AS SSD Seq Read Test (1GB) | |
| Średnia w klasie Workstation (87.6 - 1455, n=14, ostatnie 2 lata) | |
| Dell Precision 5000 5560 (AV Pro V60) | |
| Lenovo ThinkPad P1 G4-20Y4Z9DVUS (Angelbird AV Pro V60) | |
| HP ZBook Studio 15 G8 (AV Pro V60) | |
| HP ZBook Studio 16 G9 62U04EA (Angelbird AV PRO V60) | |
Komunikacja
Nowoczesny moduł AX211 od Intela obsługuje aktualny standard Wi-Fi 6E i bez problemu udało nam się połączyć z siecią 6 GHz naszego referencyjnego routera od Asusa. Prędkości transferu są bardzo dobre i nie wykryto żadnych problemów z jakością sygnału. Moduł WWAN (LTE lub 5G) nie jest dostępny w ZBooku Studio 16 G9.
| Networking | |
| HP ZBook Studio 16 G9 62U04EA | |
| iperf3 receive AXE11000 6GHz | |
| iperf3 transmit AXE11000 6GHz | |
| Lenovo ThinkPad P1 G4-20Y4Z9DVUS | |
| iperf3 receive AX12 | |
| iperf3 transmit AX12 | |
| Dell Precision 5000 5560 | |
| iperf3 receive AX12 | |
| iperf3 transmit AX12 | |
| Apple MacBook Pro 16 2021 M1 Pro | |
| iperf3 receive AXE11000 | |
| iperf3 transmit AXE11000 | |
| iperf3 receive AX12 | |
| iperf3 transmit AX12 | |
Kamera internetowa
W kwestii kamery internetowej nowy ZBook Studio rozczarowuje, gdyż ma do dyspozycji tylko matrycę 720p. Kolory są jeszcze w porządku, ale zdjęcia są po prostu mało ostre i szczegółowe.


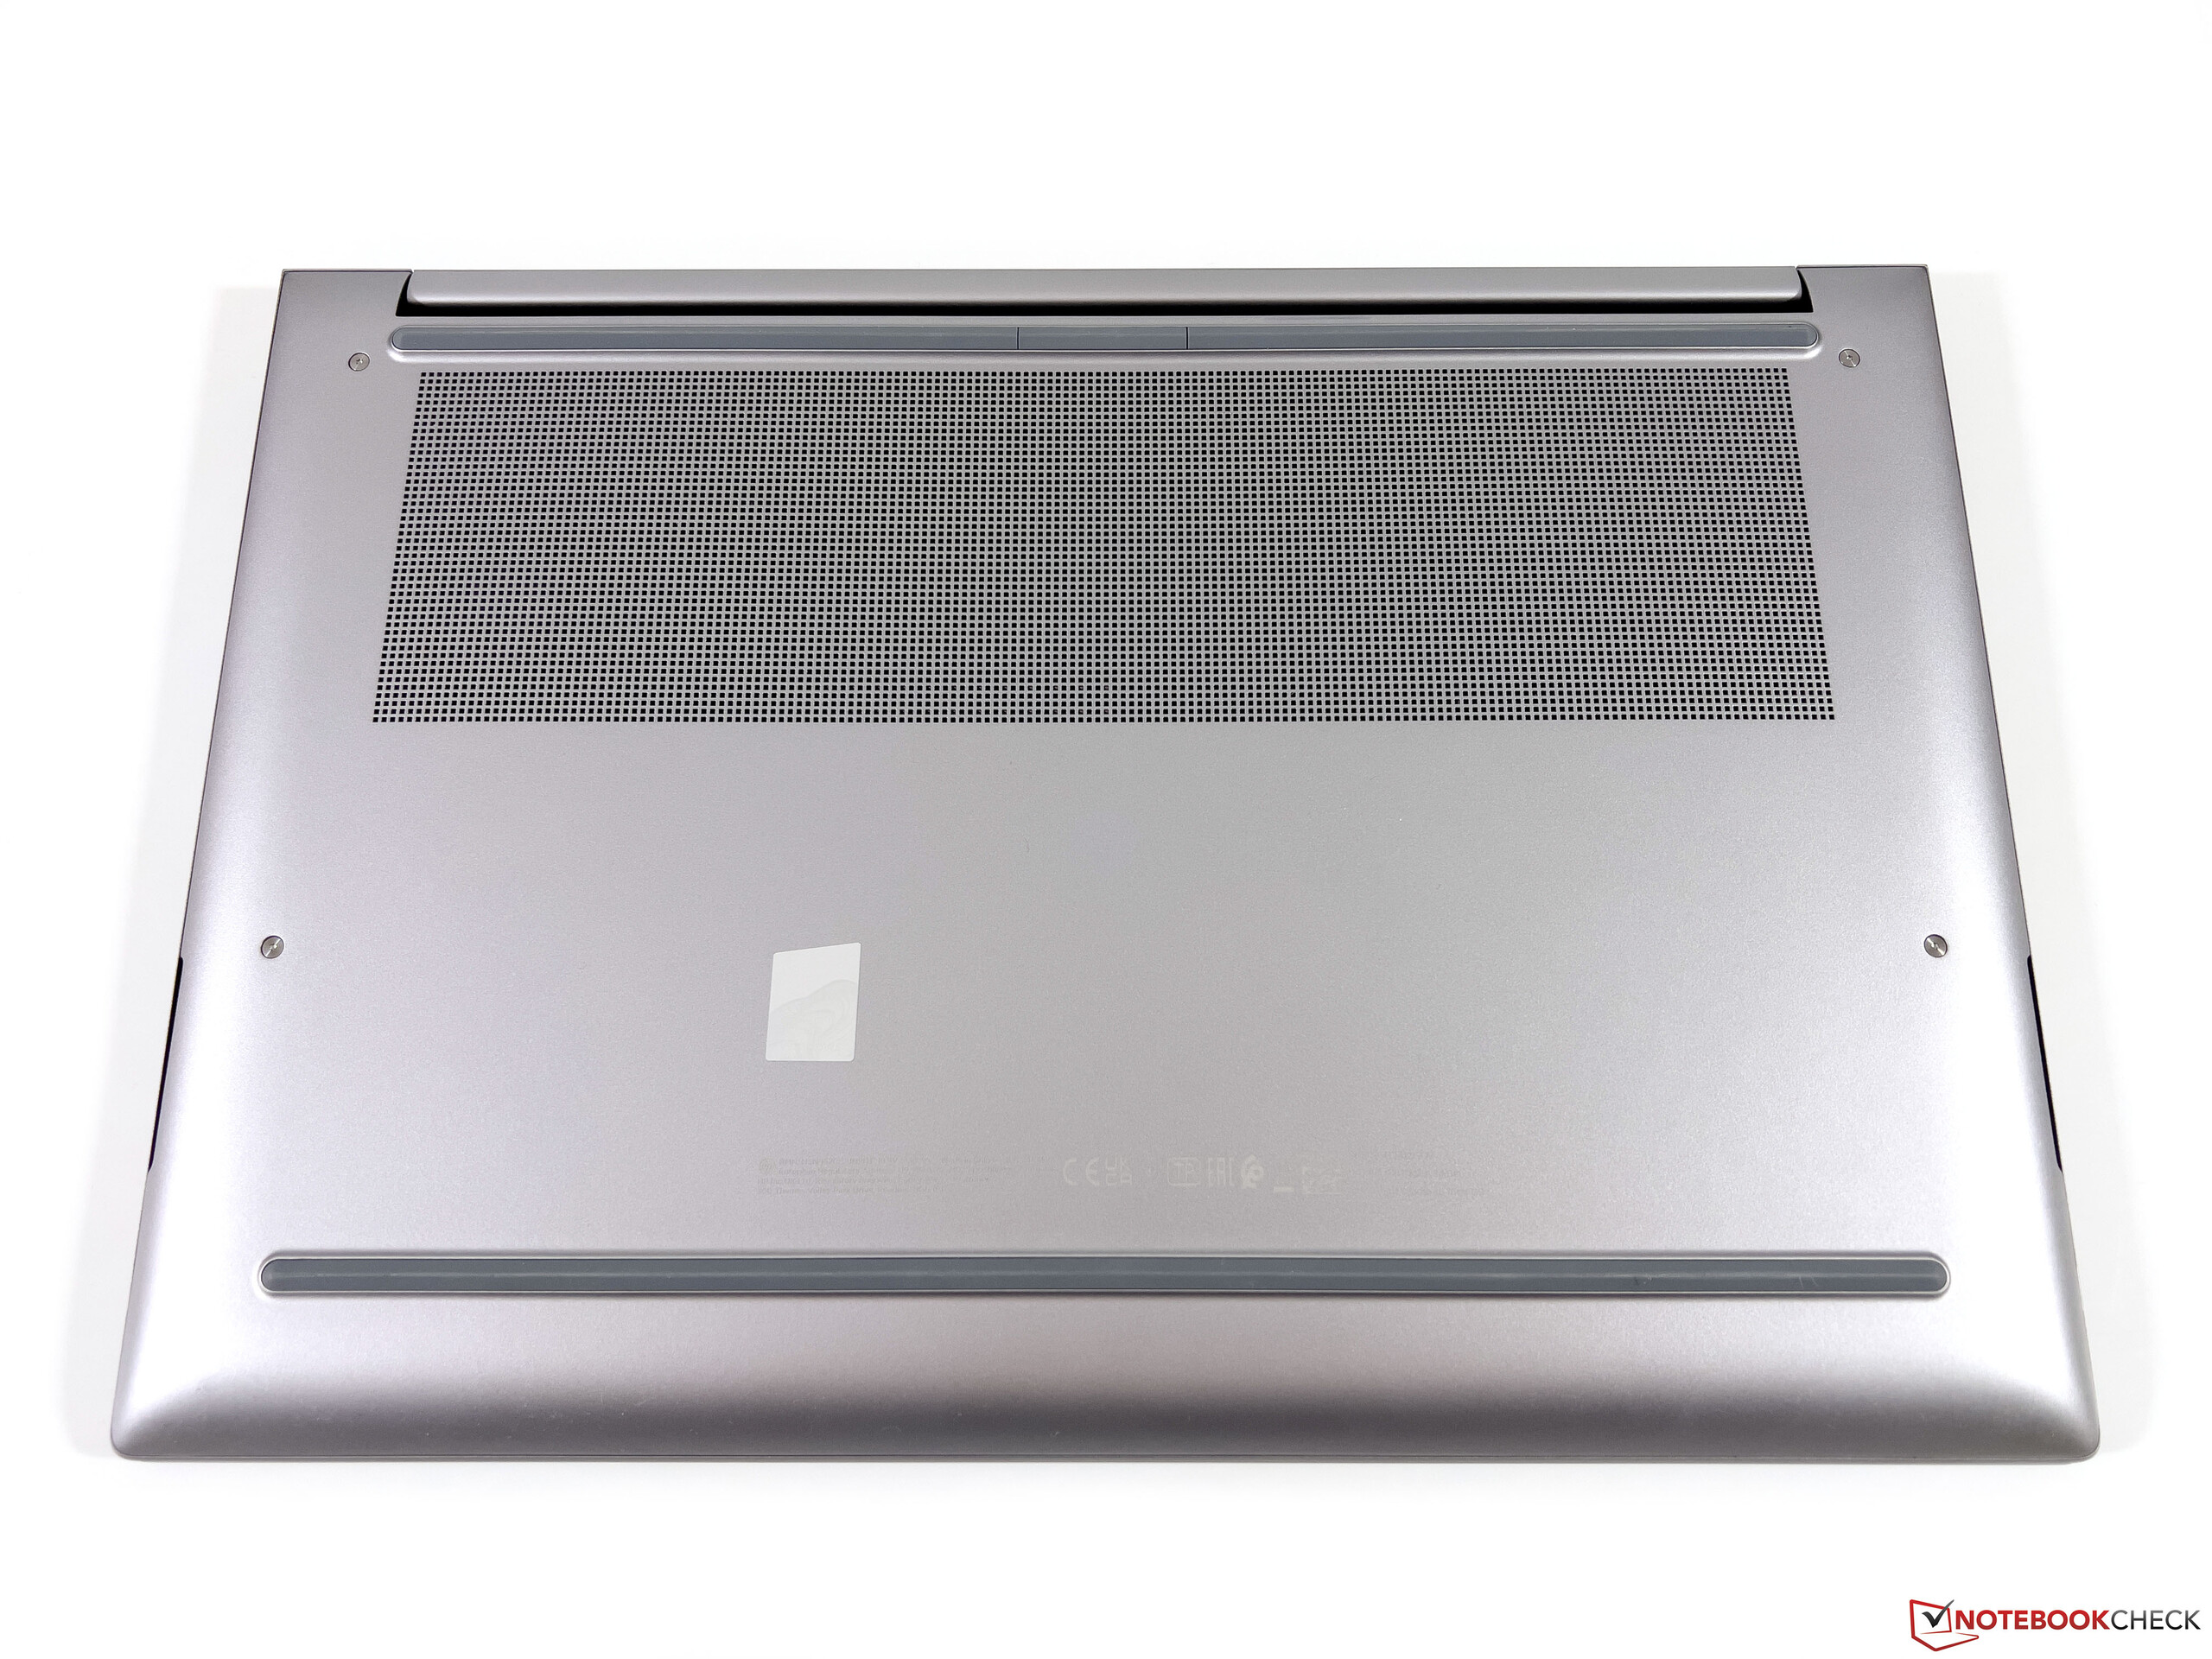
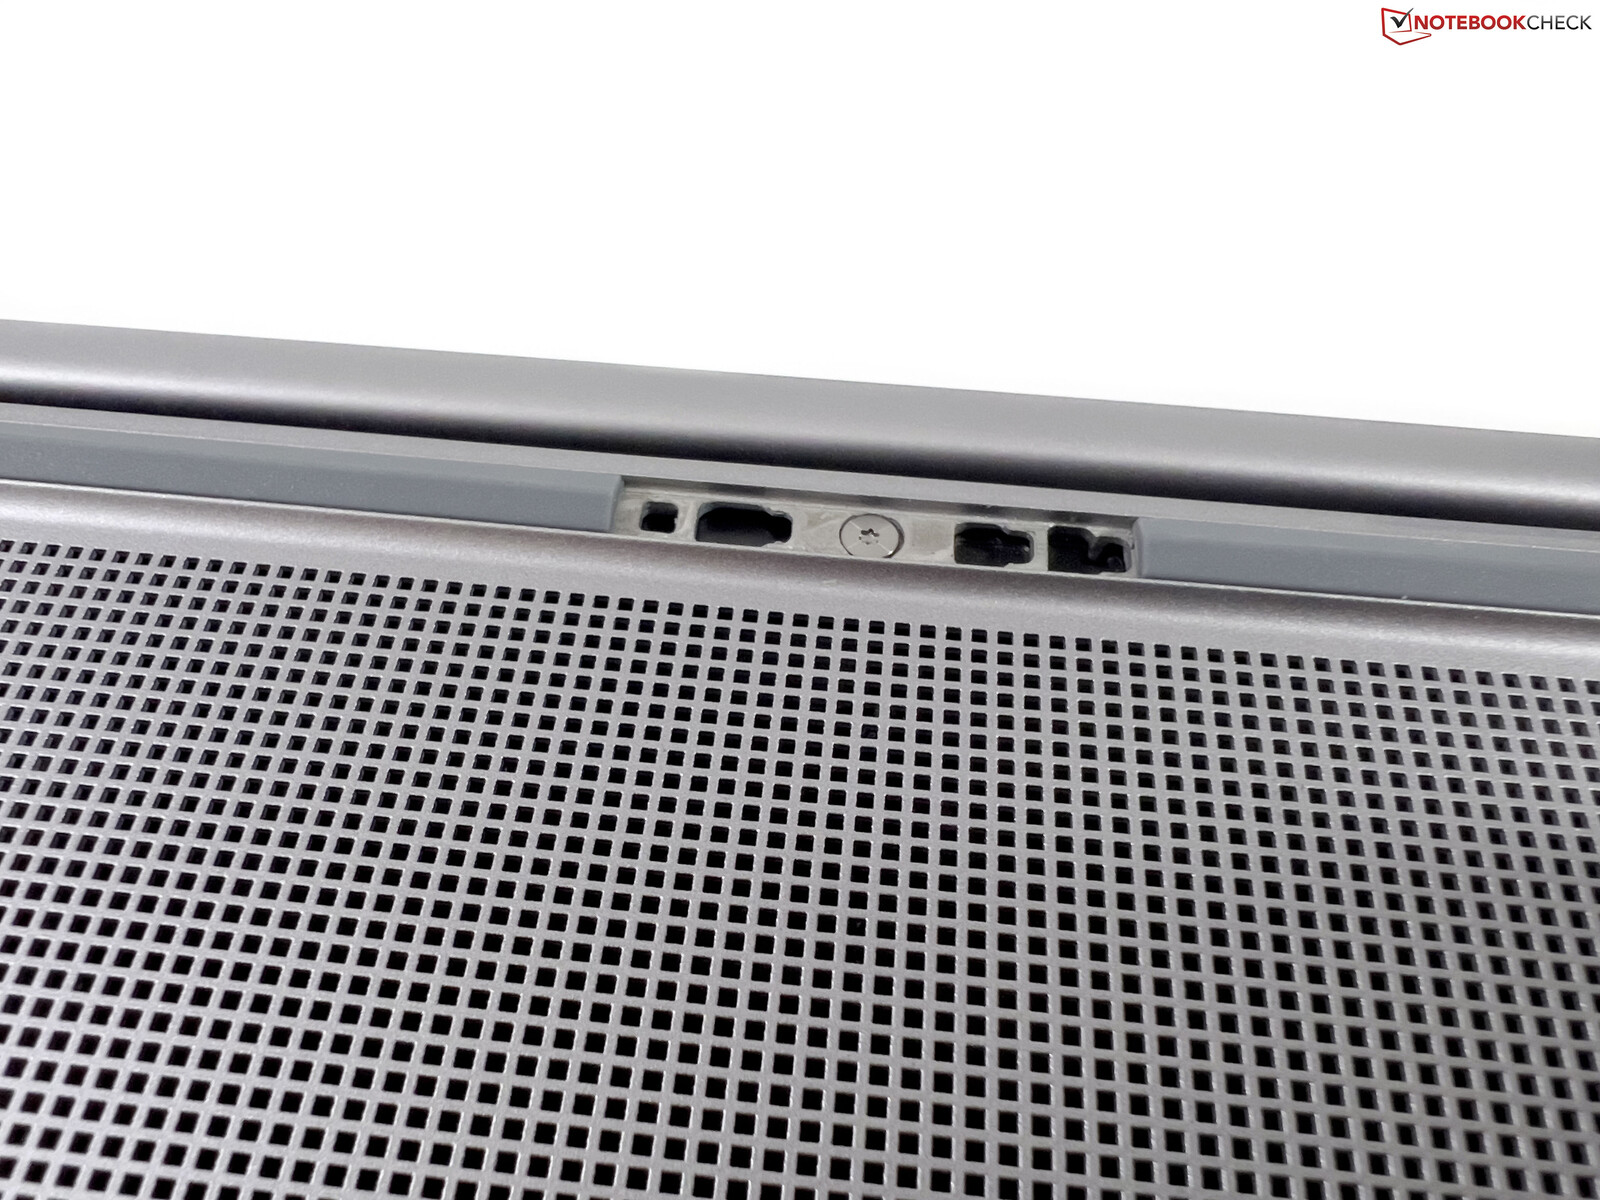
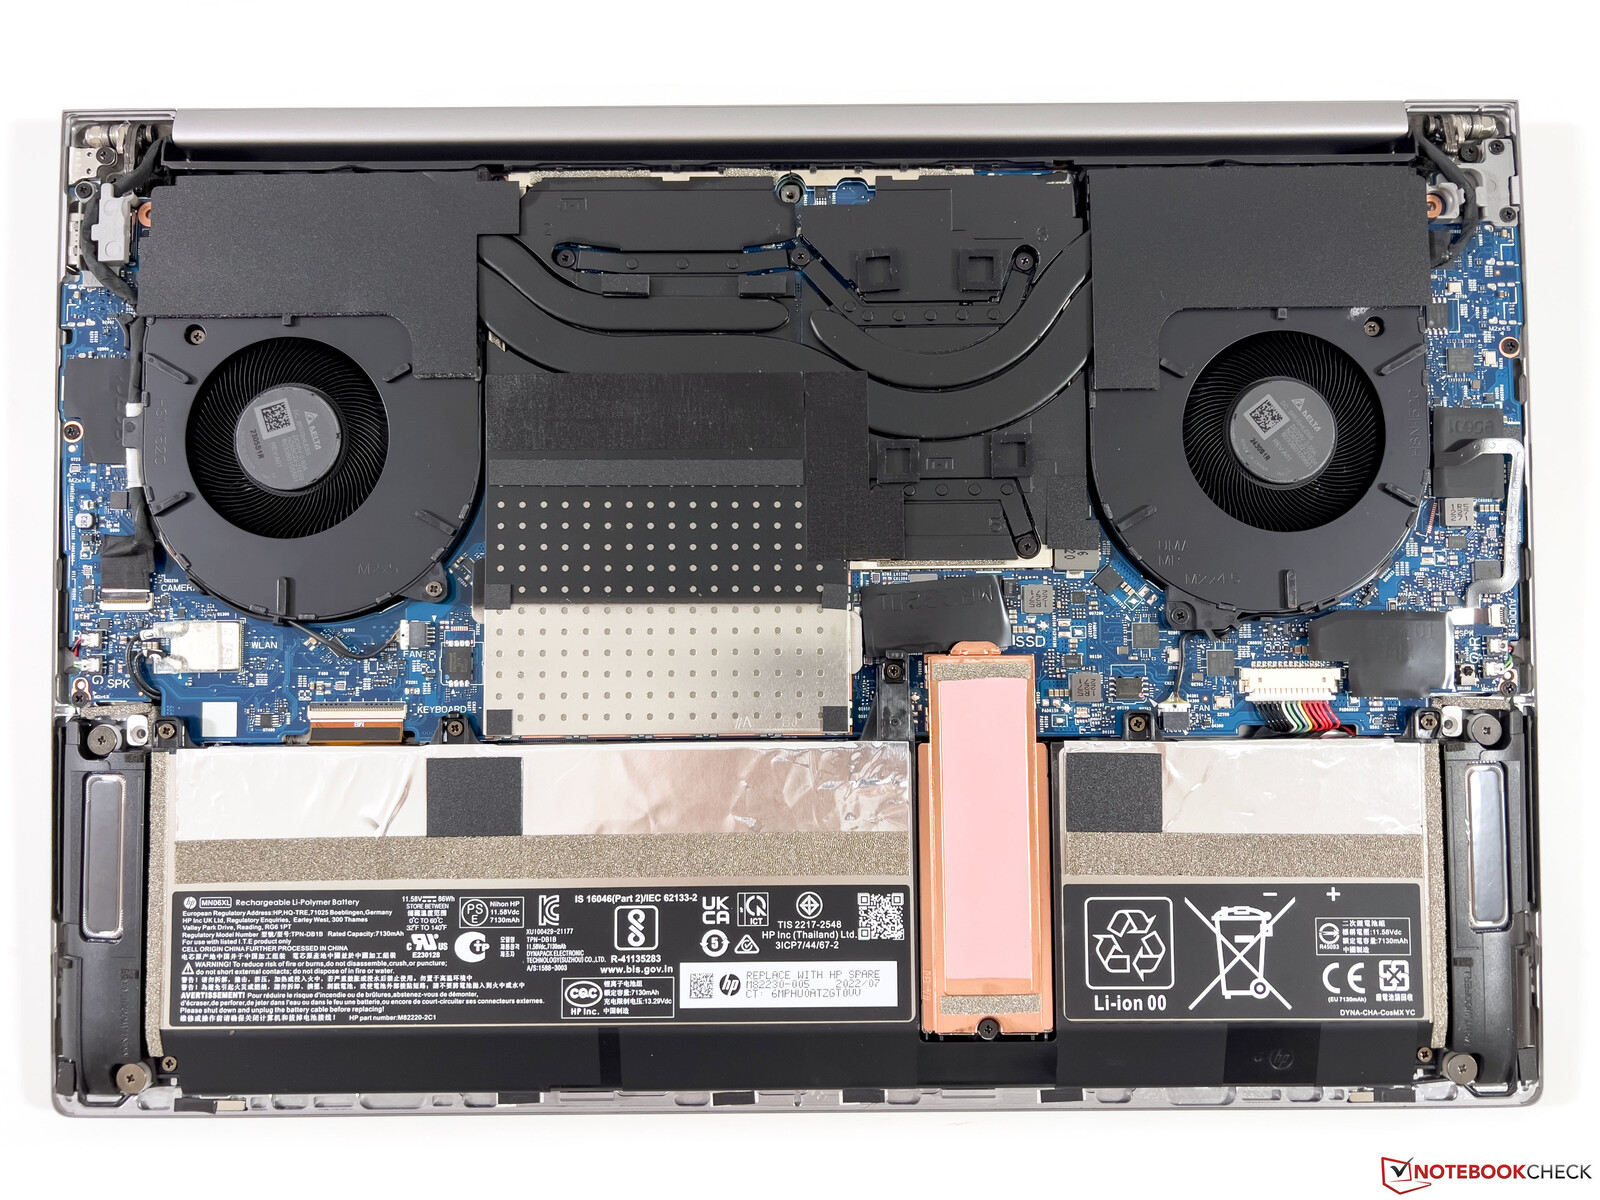
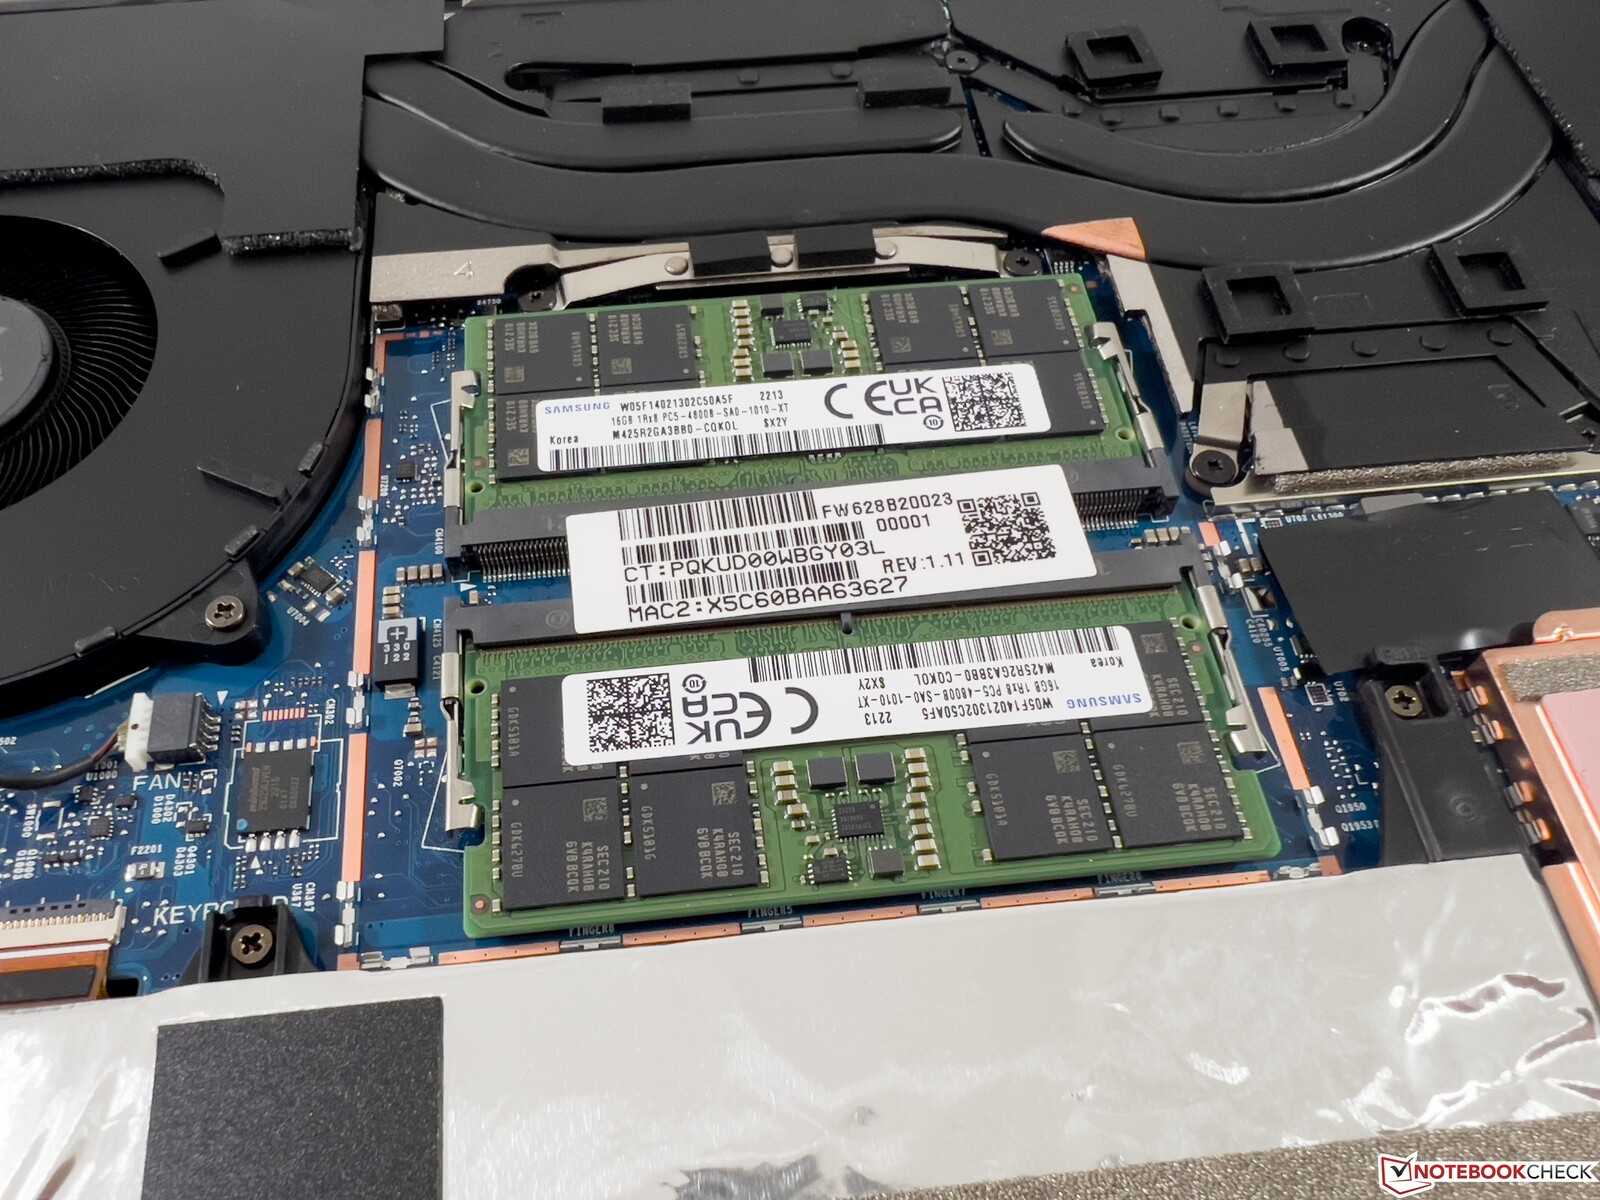
Konserwacja
Opcje konserwacji nieco się poprawiły, bowiem HP ponownie wprowadziło w Studio 16 G9 zatoki SO-DIMM RAM, dlatego też można teraz po raz kolejny rozbudować pamięć RAM. Dotyczy to także dysku SSD M.2-2280, a wentylatory można także wyczyścić. Moduł WLAN jest jednak przylutowany do płyty głównej. Według karty specyfikacji modele z chłodzeniem Vapor-Chamber powinny mieć też dwa gniazda SODIMM.
Dostęp do podzespołów jest bardzo utrudniony, gdyż pod tylną gumową stopką znajduje się śrubka obudowy. W środku gumową stopkę można zdjąć przy odrobinie nacisku, ale materiał jest bardzo twardy i szybko dochodzi do odkształceń. Ta mała część raczej nie przetrwa kilkukrotnego wyjmowania bez szwanku.
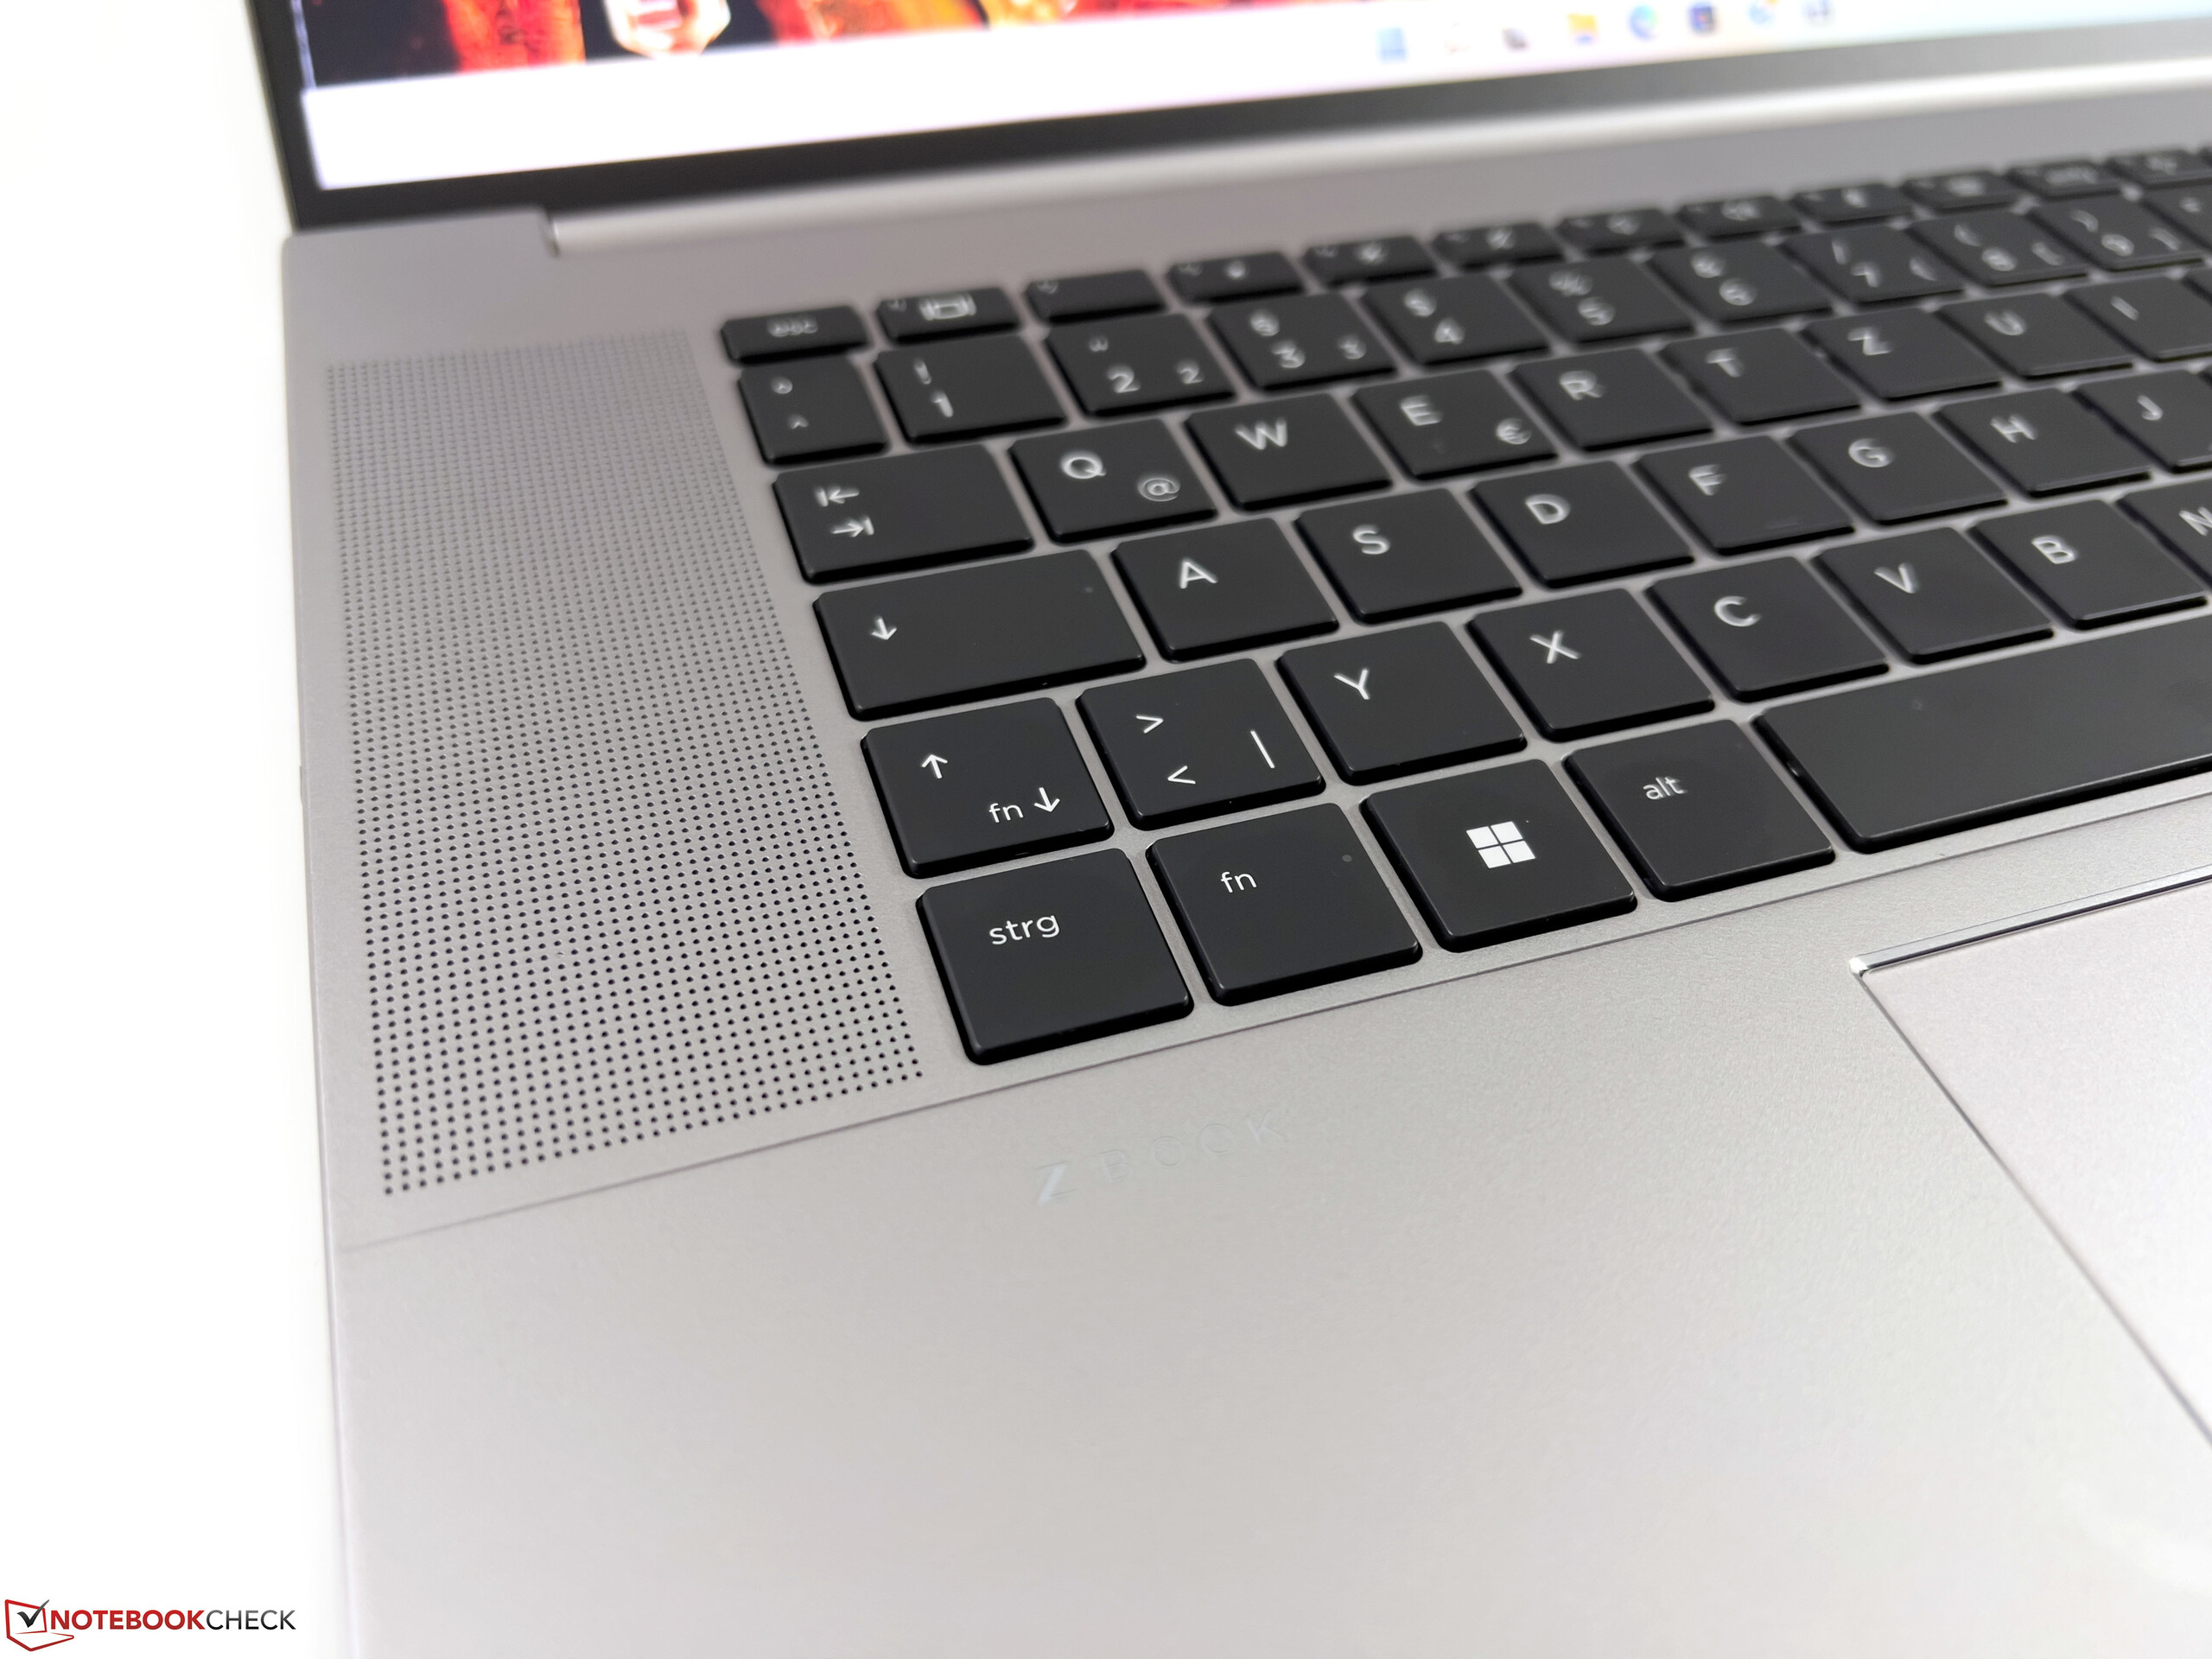
Urządzenia wejściowe - Mniejsza i słabsza klawiatura
Klawiatura
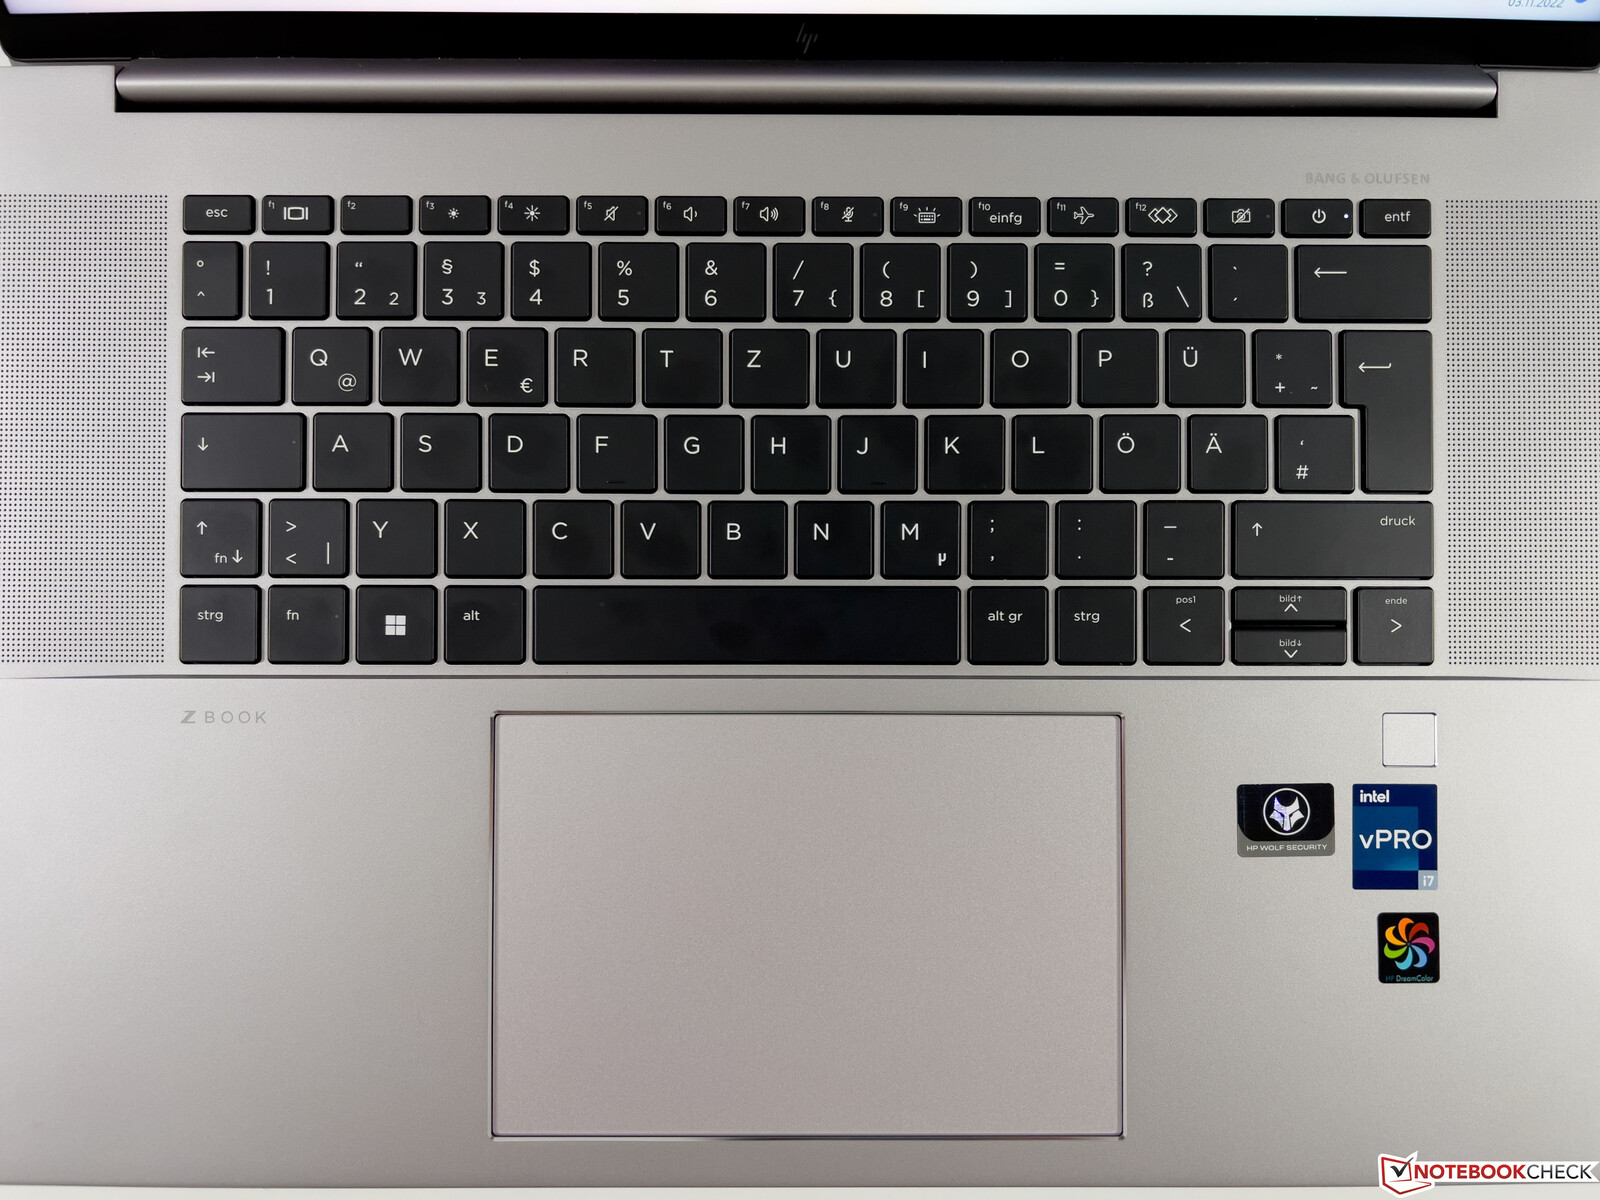
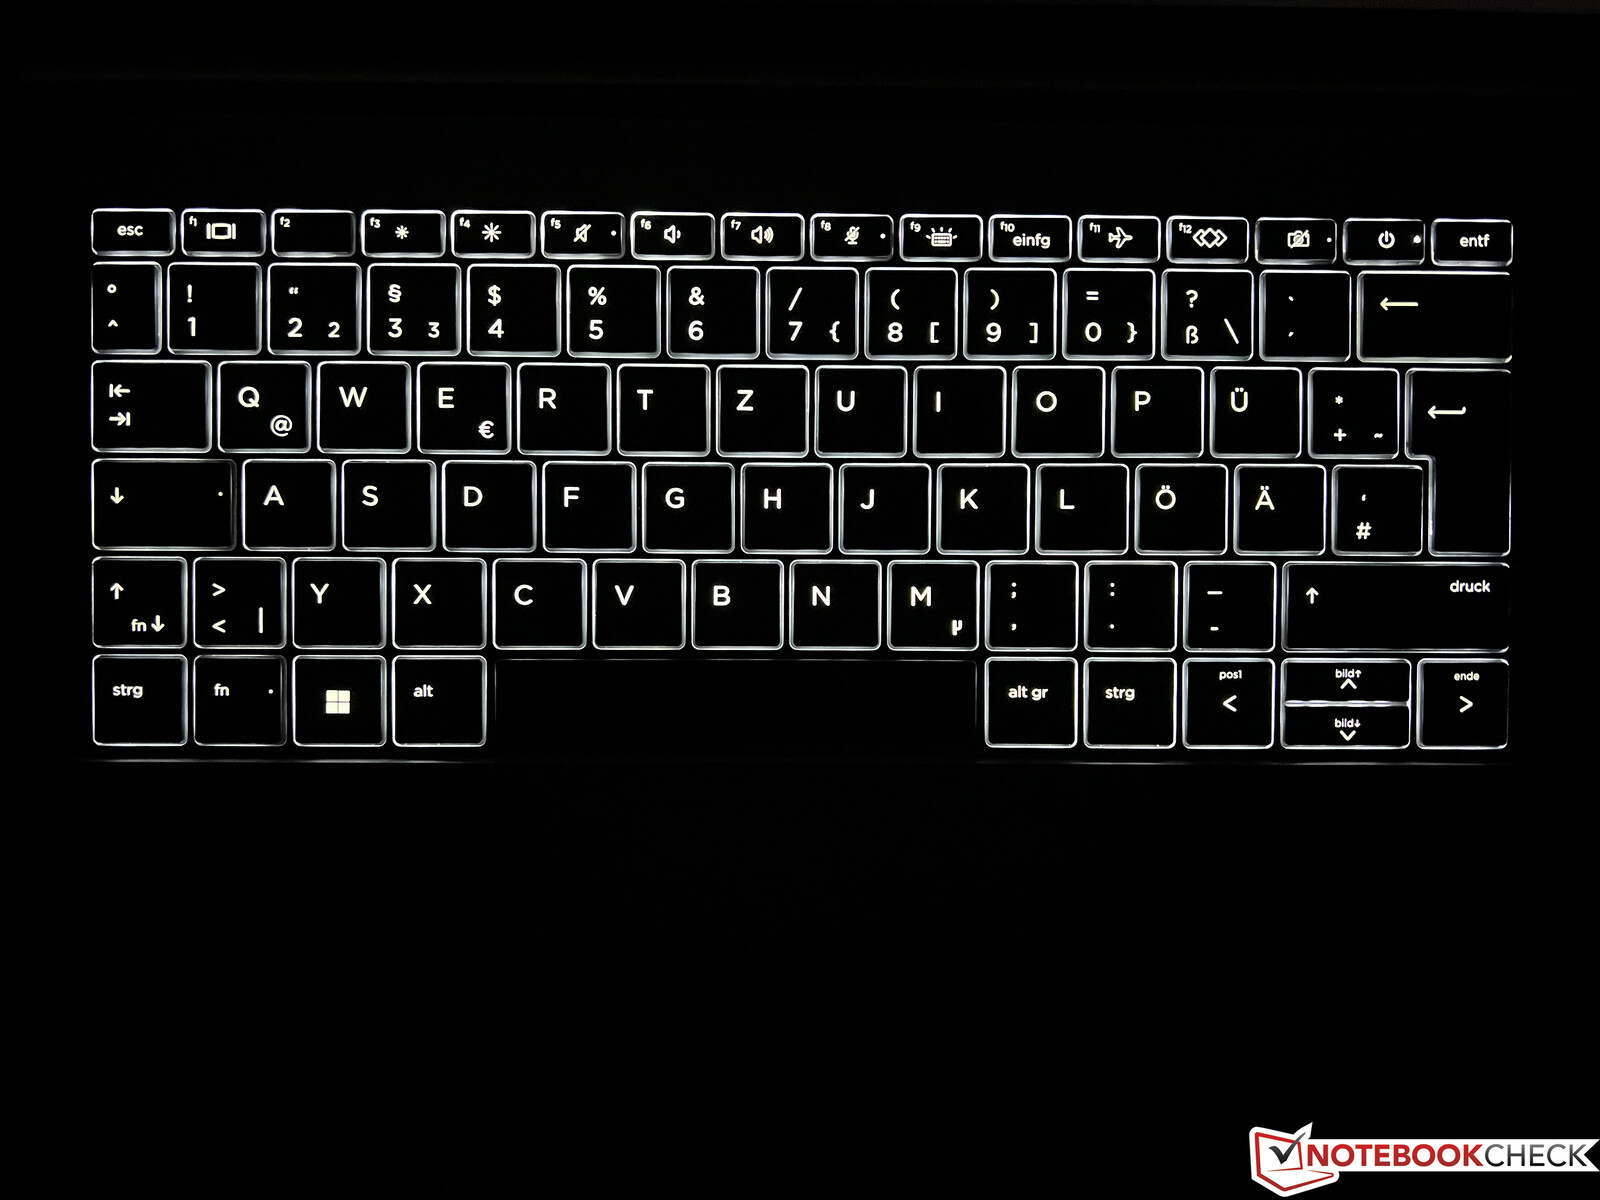
W porównaniu ze starym modelem HP instaluje teraz bardziej kompaktową klawiaturę bez dodatkowych klawiszy po prawej stronie. Właściwie jest tu więcej niż wystarczająco miejsca na pełną klawiaturę z blokiem numerycznym (jak np. wZBook Firefly 16 G9), ale przestrzeń ta jest wykorzystywana na głośniki. W konsekwencji oznacza to również, że nie ma już dedykowanych klawiszy dla funkcji Page Up i Page Down. Ogólnie rzecz biorąc, klawiatura przesunęła się bardziej w stronę ekranu w jednostce zasadniczej.
Klawiatura ma podświetlenie i jest wodoodporna, ale mechanika nie jest do końca przekonująca. Skok klawiszy jest nieco bardziej rykowaty i ogólnie nie jest tak dobry jak w ZBooku Firefly 16 G9 (czy identycznie zbudowanym EliteBooku 865 G9). W porównaniu z.poprzednika, jest to też lekki krok wstecz.
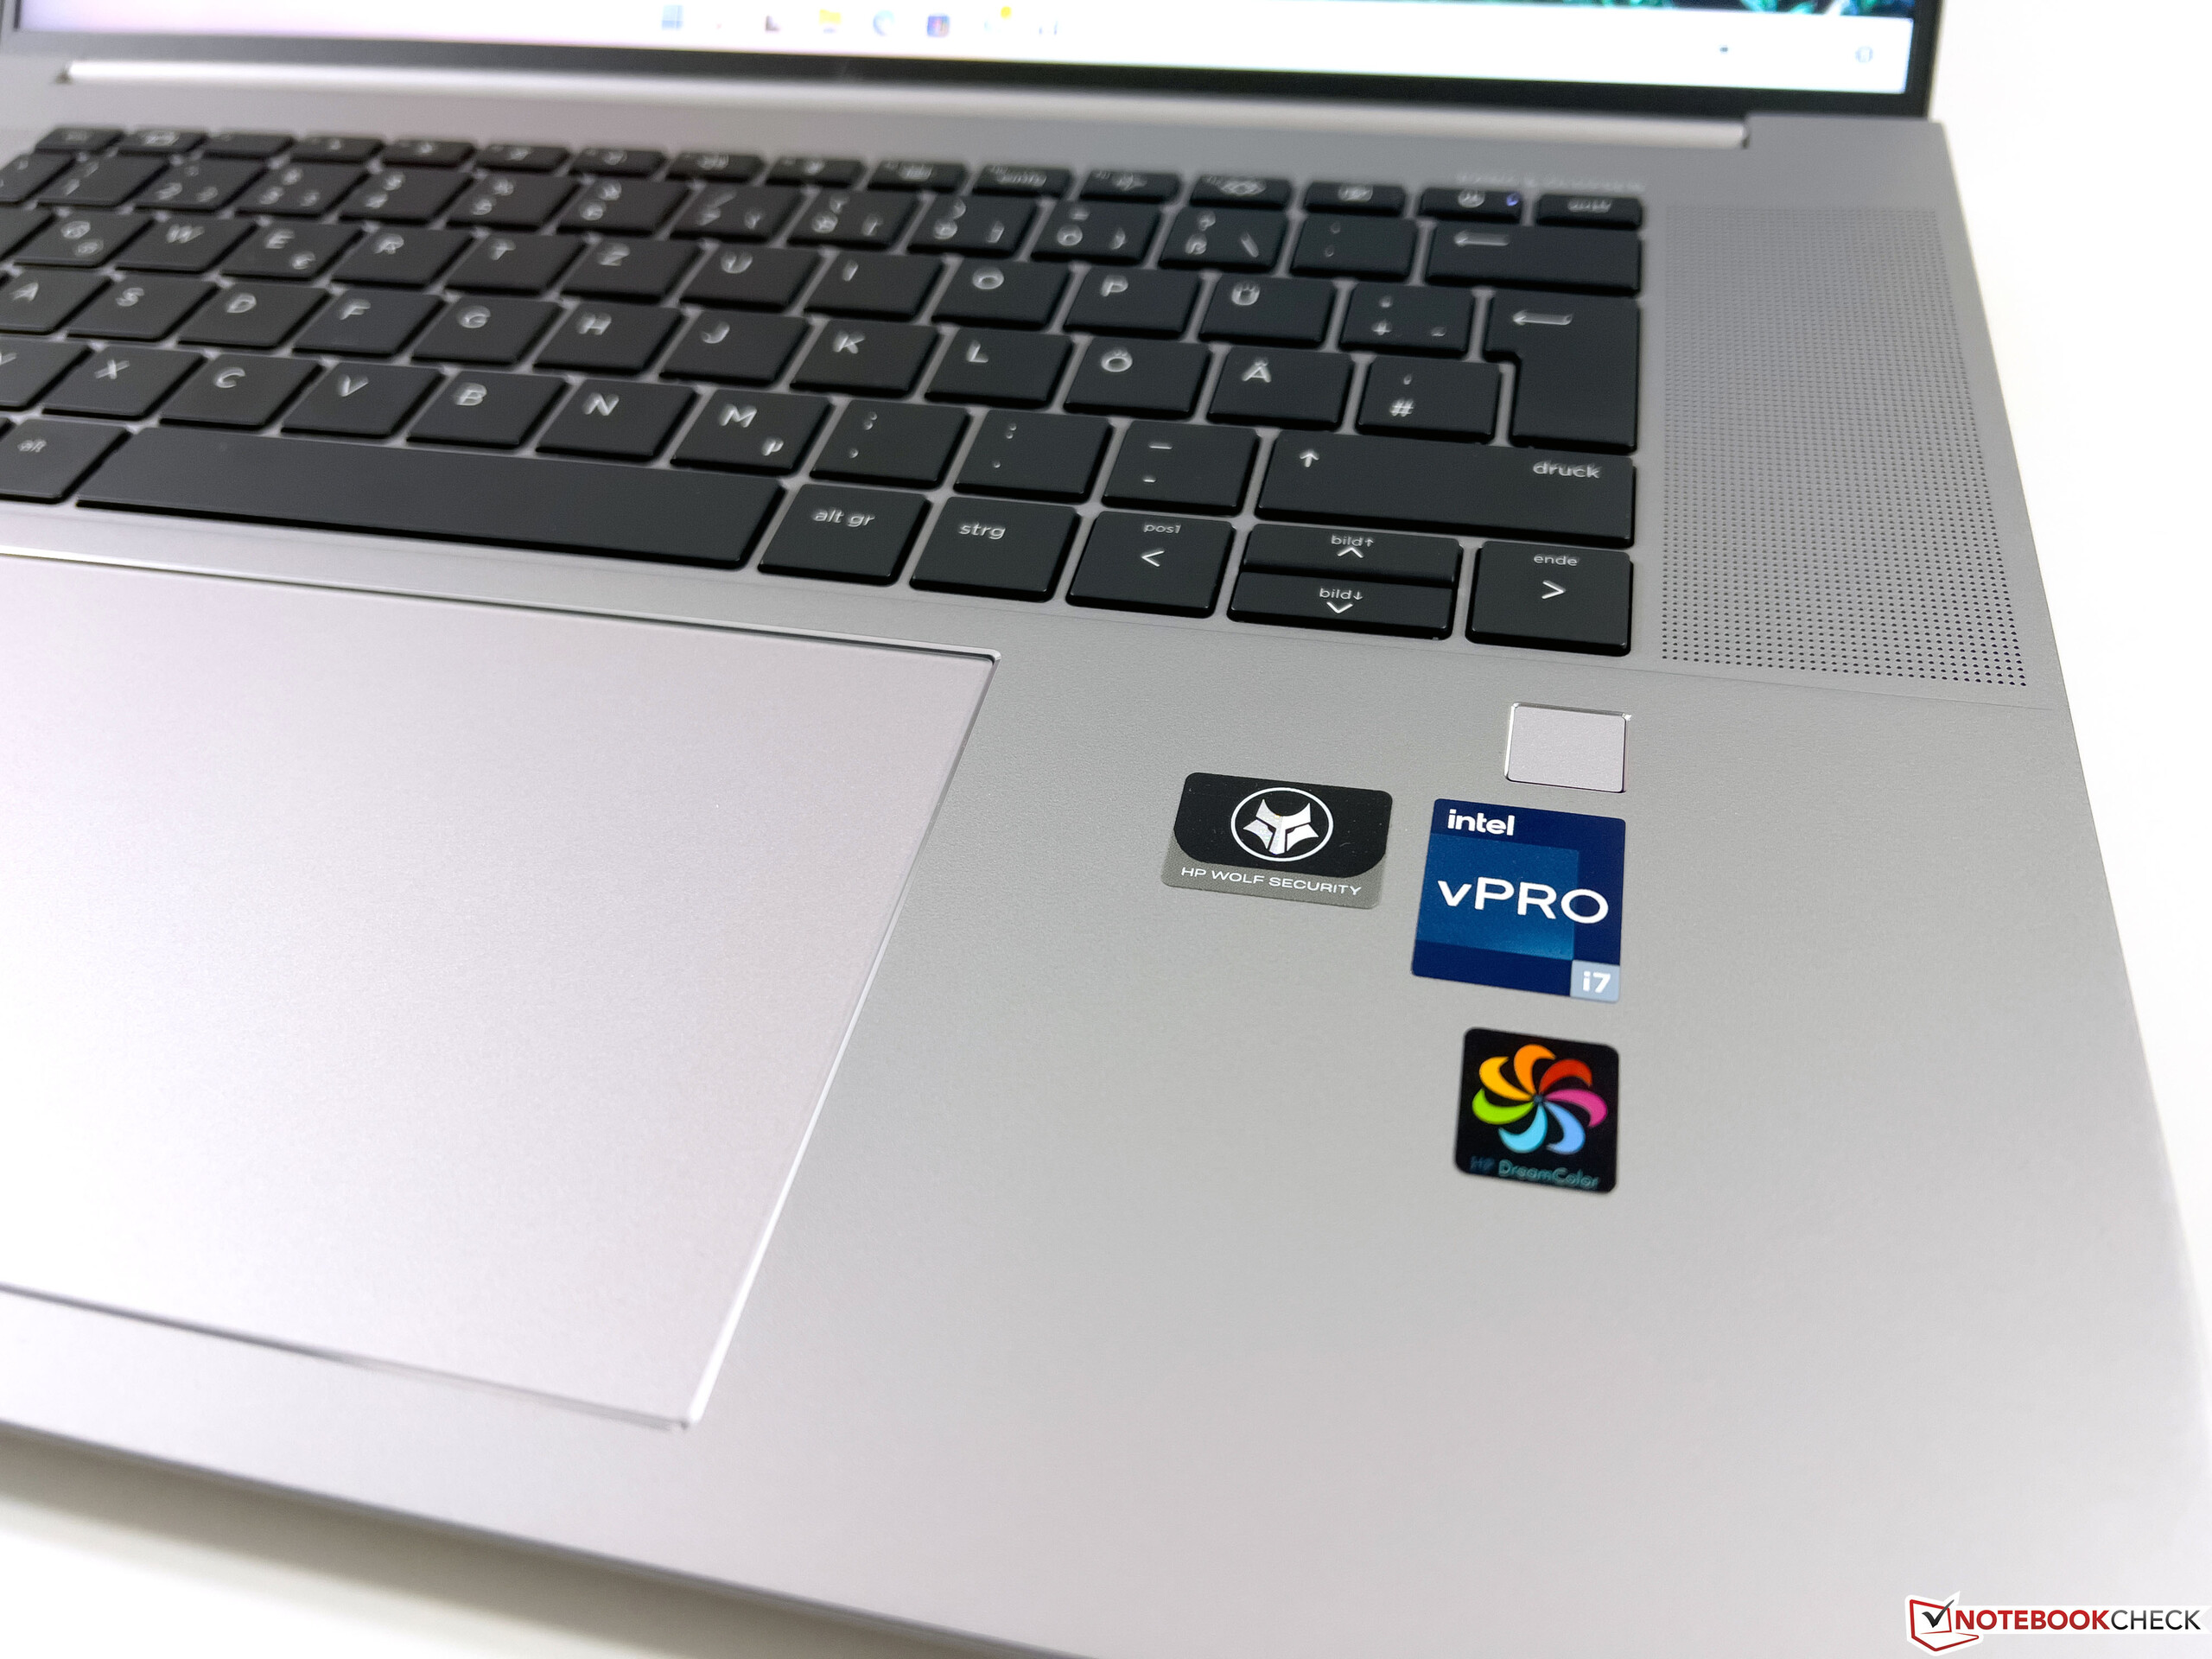
Touchpad
HP wyrzuciło PointStick i dedykowane przyciski myszy z ZBooków Studio kilka lat temu, a teraz zamiast nich stosuje duży ClickPad, który jest nawet większy niż stary model - ma 13,4 x 8,9 cm. ClickPad wypada dobrze: działanie jest bez zarzutu, właściwości ślizgowe są doskonałe, a podkładka wytwarza stłumiony, ale wysokiej jakości odgłos klikania.
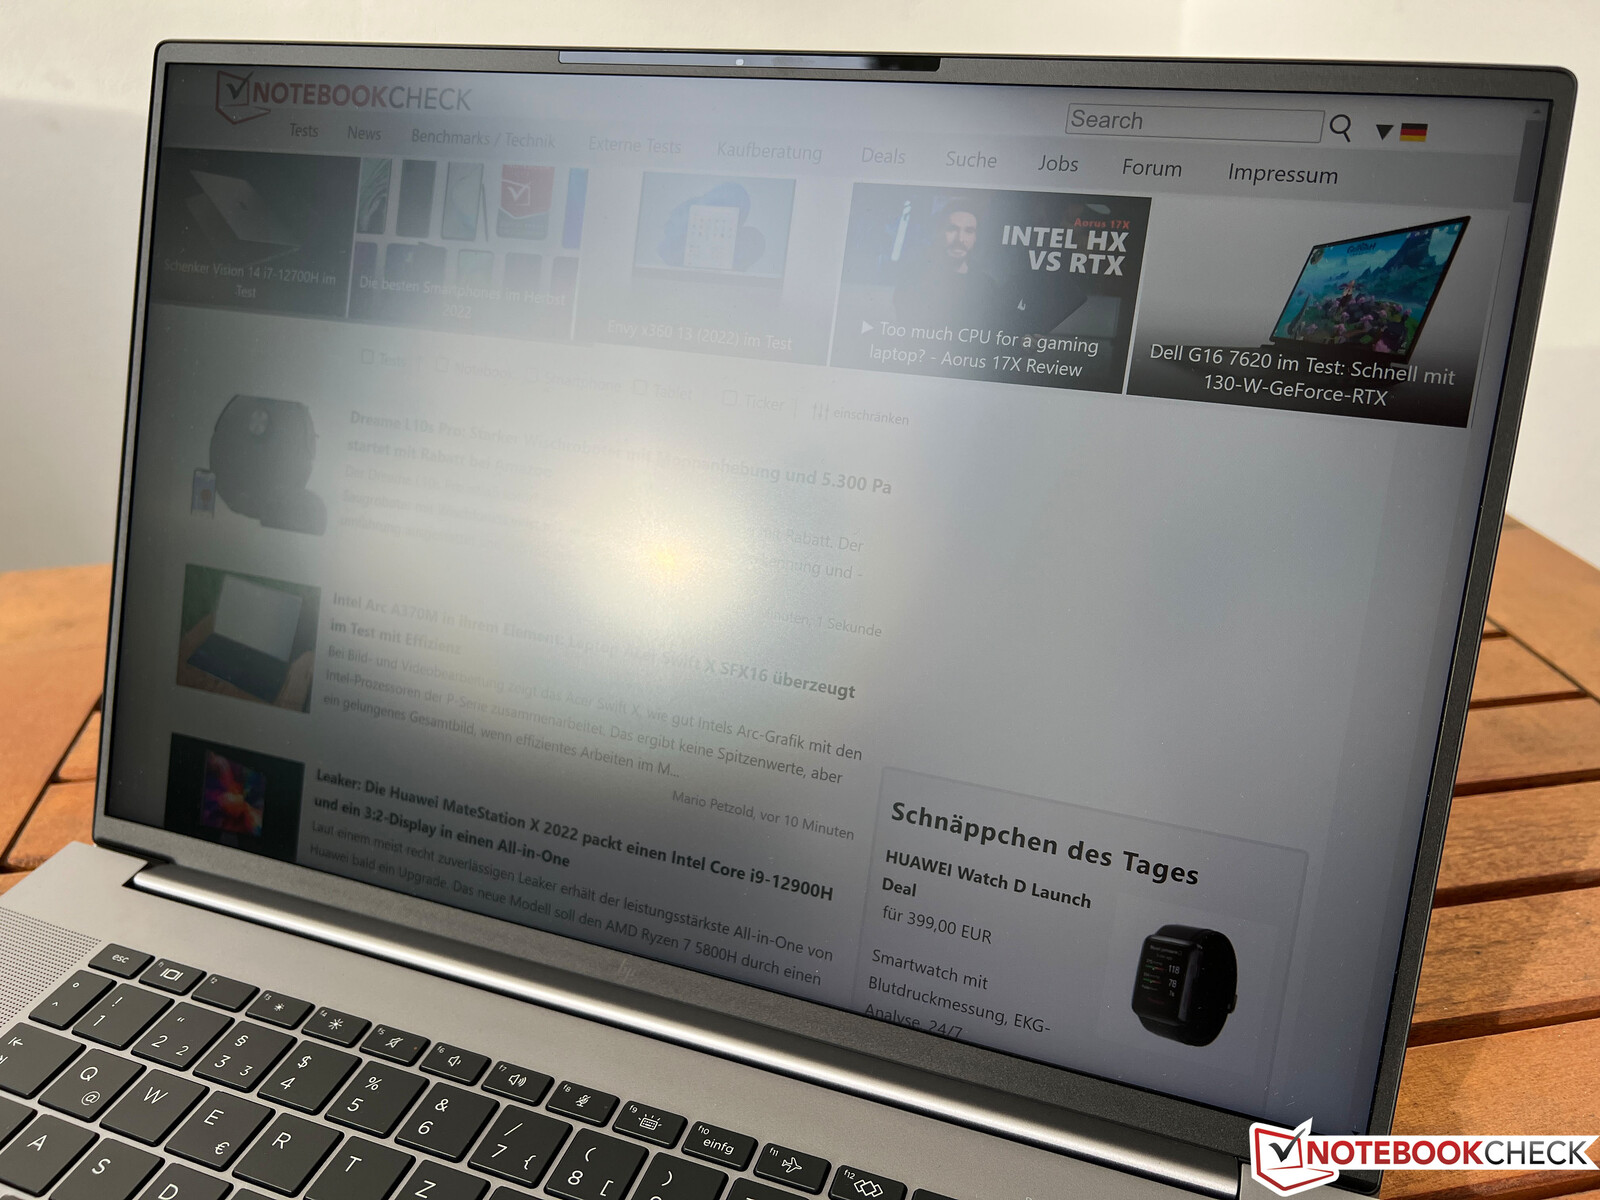
Wyświetlacz - 4K DreamColor przy 120 Hz
HP stosuje teraz większe 16-calowe wyświetlacze w formacie 16:10, a do wyboru są w sumie cztery różne panele:
- 1.920 x 1.200 pikseli, IPS, matowy, 400 nitów, niskie zużycie energii, 100% sRGB.
- 1.920 x 1.200 pikseli, IPS, matowy, 1.000 nitów, filtr prywatności SureView, 72% NTSC
- 3.840 x 2.400 pikseli, IPS, matowy, 500 nitów, DreamColor, 120 Hz, 100% DCI-P3
- 3.840 x 2.400 pikseli, OLED, 400 nitów, Corning Gorilla Glass 5, 100% DCI-P3
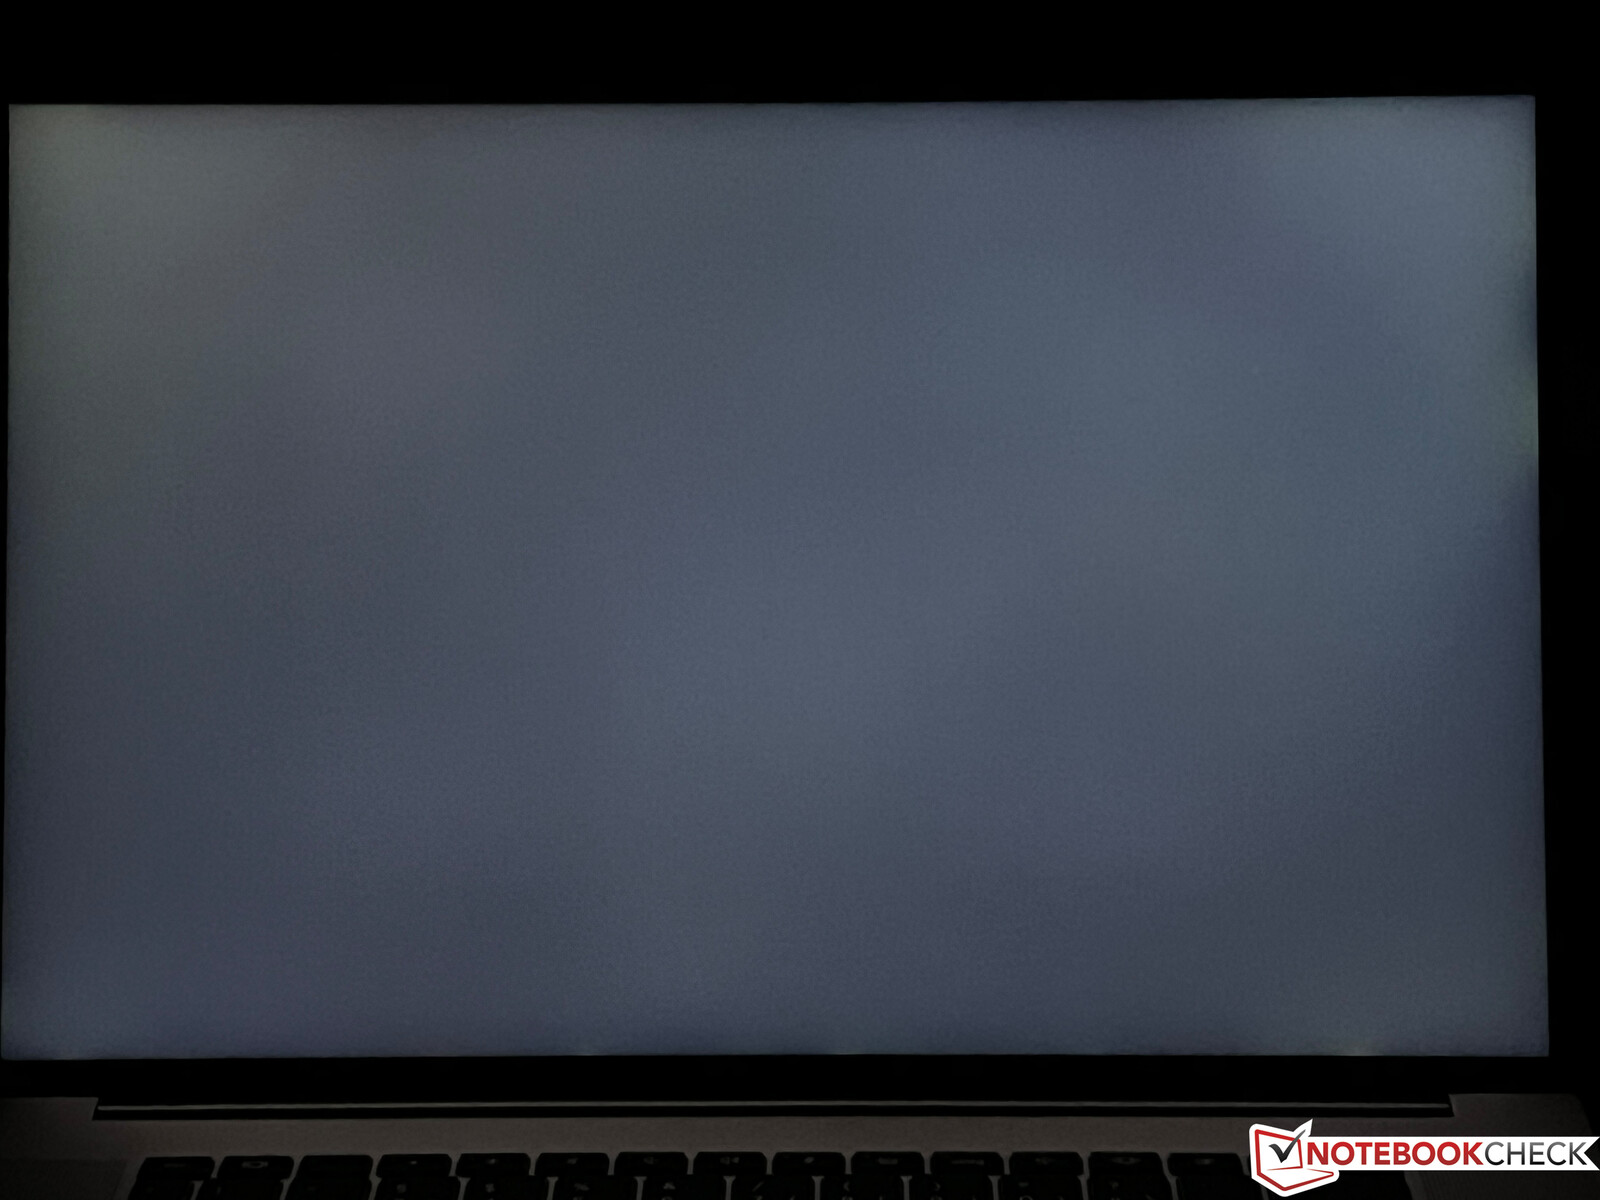
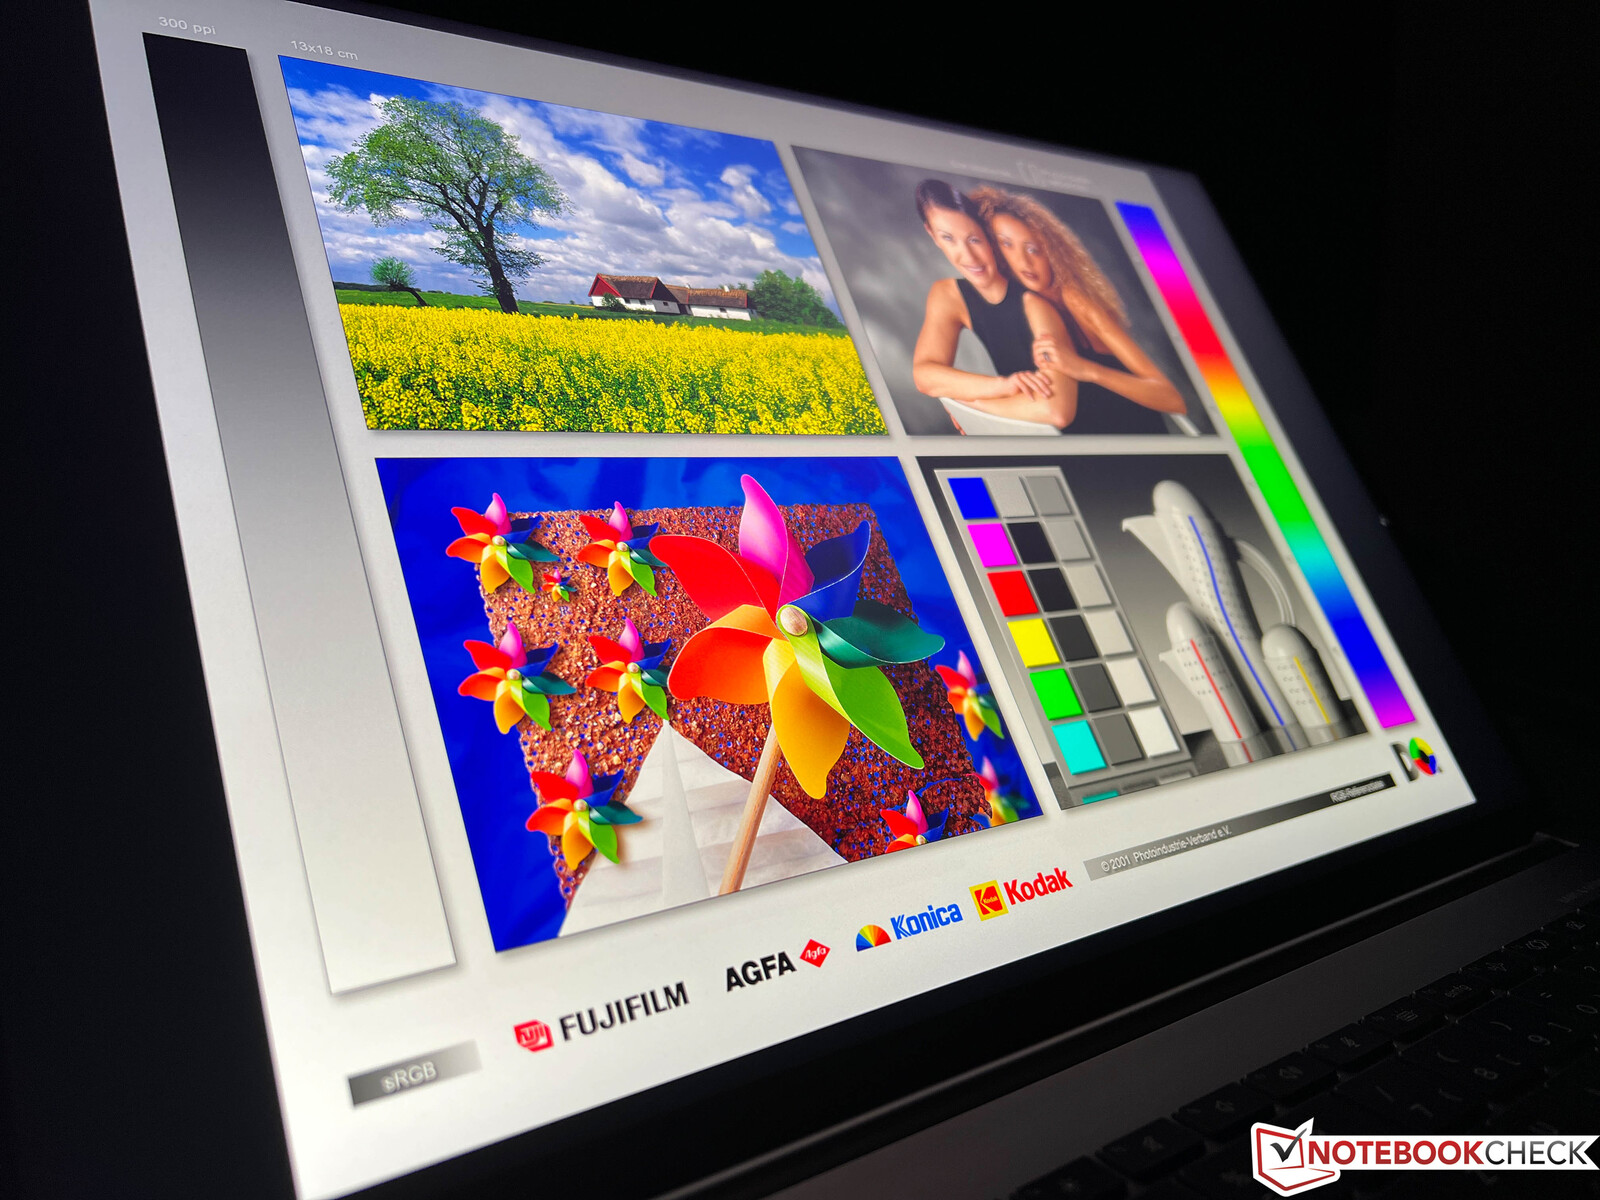
Nasze urządzenie recenzenckie jest wyposażone w panel 4K DreamColor, który oferuje doskonałą subiektywną jakość obrazu. Matowy ekran jest tylko lekko ziarnisty, nawet na jasnych powierzchniach, ale nie jest to zauważalne, gdy siedzi się w normalnej odległości. Jednocześnie treści są niezwykle ostre, a kolory bardzo żywe. Średnią jasność określiliśmy na dobre cd/m², ale wartość czerni na poziomie 0,47 jest bardzo wysoka, co skutkuje przyzwoitym współczynnikiem kontrastu na poziomie "tylko" ~1 200:1.
Wyższa częstotliwość 120 Hz jest również zauważalna w praktyce - ruchy ekranu są bardzo płynne, zwłaszcza podczas przewijania dokumentów czy stron internetowych, a czasy reakcji są również bardzo szybkie jak na panel IPS. Migotanie PWM nie występuje, a stabilność kątów widzenia jest bardzo dobra, nie ma też irytujących aureoli.

| |||||||||||||||||||||||||
rozświetlenie: 84 %
na akumulatorze: 553 cd/m²
kontrast: 1179:1 (czerń: 0.47 cd/m²)
ΔE ColorChecker Calman: 1 | ∀{0.5-29.43 Ø4.73}
calibrated: 0.6
ΔE Greyscale Calman: 1.6 | ∀{0.09-98 Ø4.97}
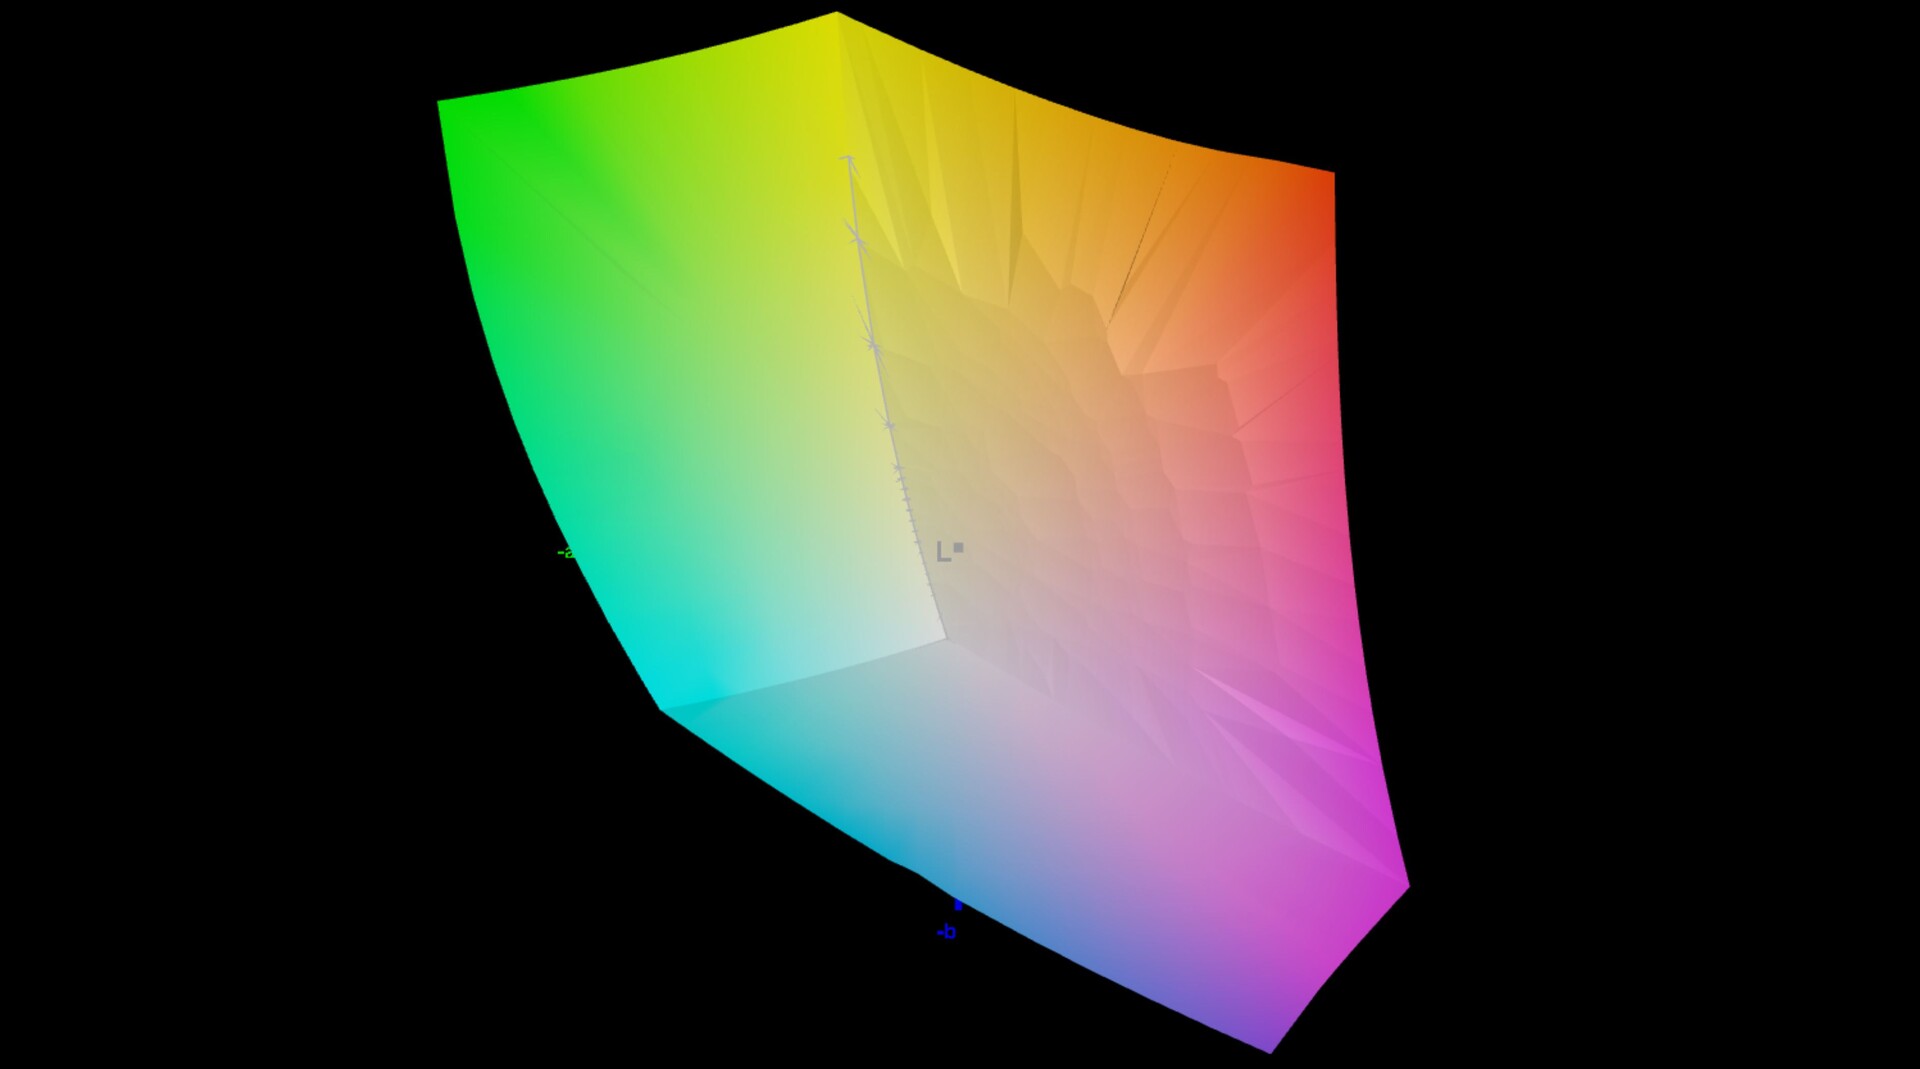
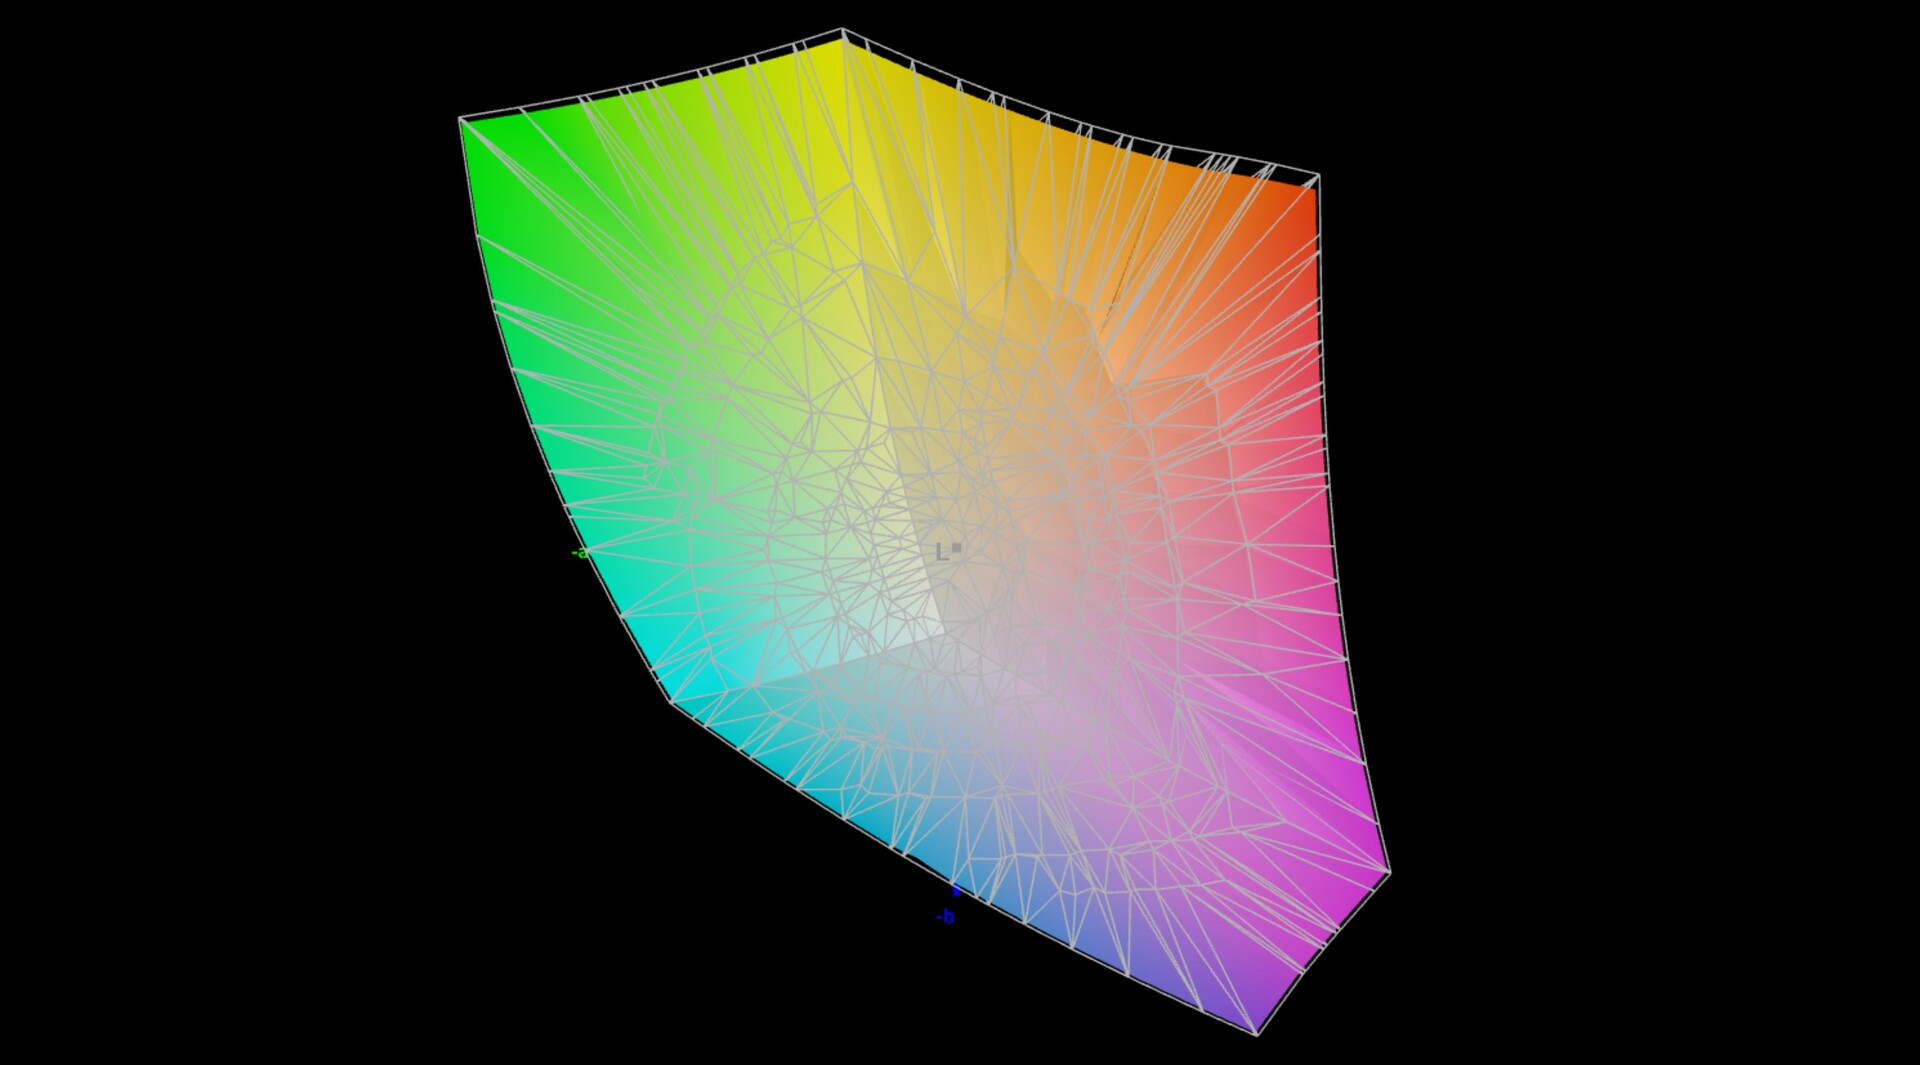
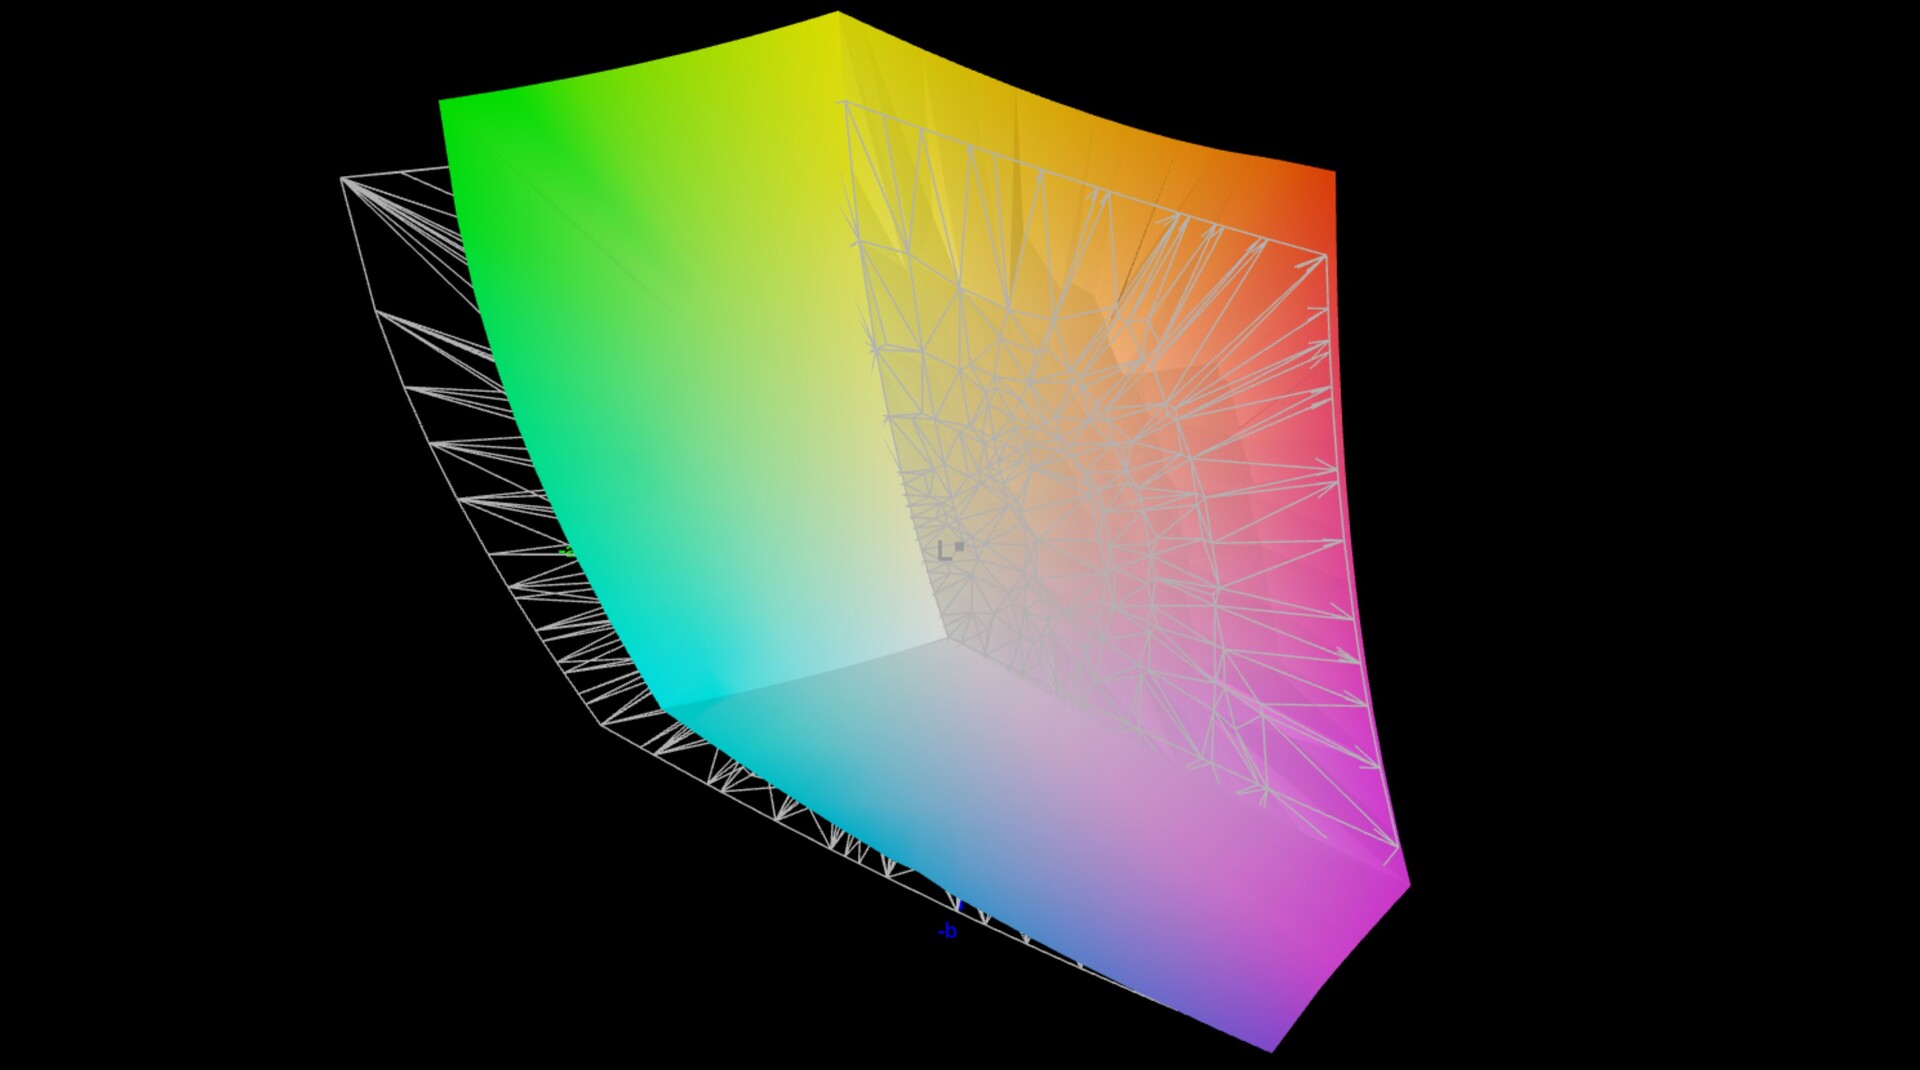
86.3% AdobeRGB 1998 (Argyll 3D)
99.9% sRGB (Argyll 3D)
97.5% Display P3 (Argyll 3D)
Gamma: 2.29
CCT: 6458 K
| HP ZBook Studio 16 G9 62U04EA BOE0A52, IPS, 3840x2400, 16" | Lenovo ThinkPad P1 G4-20Y4Z9DVUS NE160QDM-N63, IPS, 2560x1600, 16" | Apple MacBook Pro 16 2021 M1 Max Mini-LED, 3456x2234, 16.2" | Dell Precision 5000 5560 Sharp LQ156R1, IPS, 3840x2400, 15.6" | HP ZBook Studio 15 G8 SDC4145, OLED, 3840x2160, 15.6" | |
|---|---|---|---|---|---|
| Display | -13% | 4% | 4% | ||
| Display P3 Coverage (%) | 97.5 | 72.7 -25% | 94.9 -3% | 99.9 2% | |
| sRGB Coverage (%) | 99.9 | 99.3 -1% | 100 0% | 100 0% | |
| AdobeRGB 1998 Coverage (%) | 86.3 | 74.7 -13% | 100 16% | 95.3 10% | |
| Response Times | -204% | -303% | 73% | ||
| Response Time Grey 50% / Grey 80% * (ms) | 15.3 ? | 40.8 -167% | 47.2 ? -208% | 2.4 ? 84% | |
| Response Time Black / White * (ms) | 6.1 ? | 20.8 -241% | 30.4 ? -398% | 2.4 ? 61% | |
| PWM Frequency (Hz) | 240.4 ? | ||||
| Screen | -60% | 256% | -83% | -166% | |
| Brightness middle (cd/m²) | 554 | 441 -20% | 507 -8% | 501.5 -9% | 379.6 -31% |
| Brightness (cd/m²) | 516 | 420 -19% | 494 -4% | 467 -9% | 380 -26% |
| Brightness Distribution (%) | 84 | 90 7% | 96 14% | 83 -1% | 95 13% |
| Black Level * (cd/m²) | 0.47 | 0.27 43% | 0.02 96% | 0.44 6% | |
| Contrast (:1) | 1179 | 1633 39% | 25350 2050% | 1140 -3% | |
| Colorchecker dE 2000 * | 1 | 2.6 -160% | 1.4 -40% | 4.73 -373% | 5.15 -415% |
| Colorchecker dE 2000 max. * | 2.4 | 6 -150% | 2.8 -17% | 8.45 -252% | 7.79 -225% |
| Colorchecker dE 2000 calibrated * | 0.6 | 1.2 -100% | 0.51 15% | 3.1 -417% | |
| Greyscale dE 2000 * | 1.6 | 4.5 -181% | 2.3 -44% | 3.6 -125% | 2.6 -63% |
| Gamma | 2.29 96% | 2.18 101% | 2.27 97% | 2.08 106% | 1.99 111% |
| CCT | 6458 101% | 6623 98% | 6792 96% | 6447 101% | 6166 105% |
| Całkowita średnia (program / ustawienia) | -92% /
-71% | 256% /
256% | -127% /
-96% | -30% /
-84% |
* ... im mniej tym lepiej
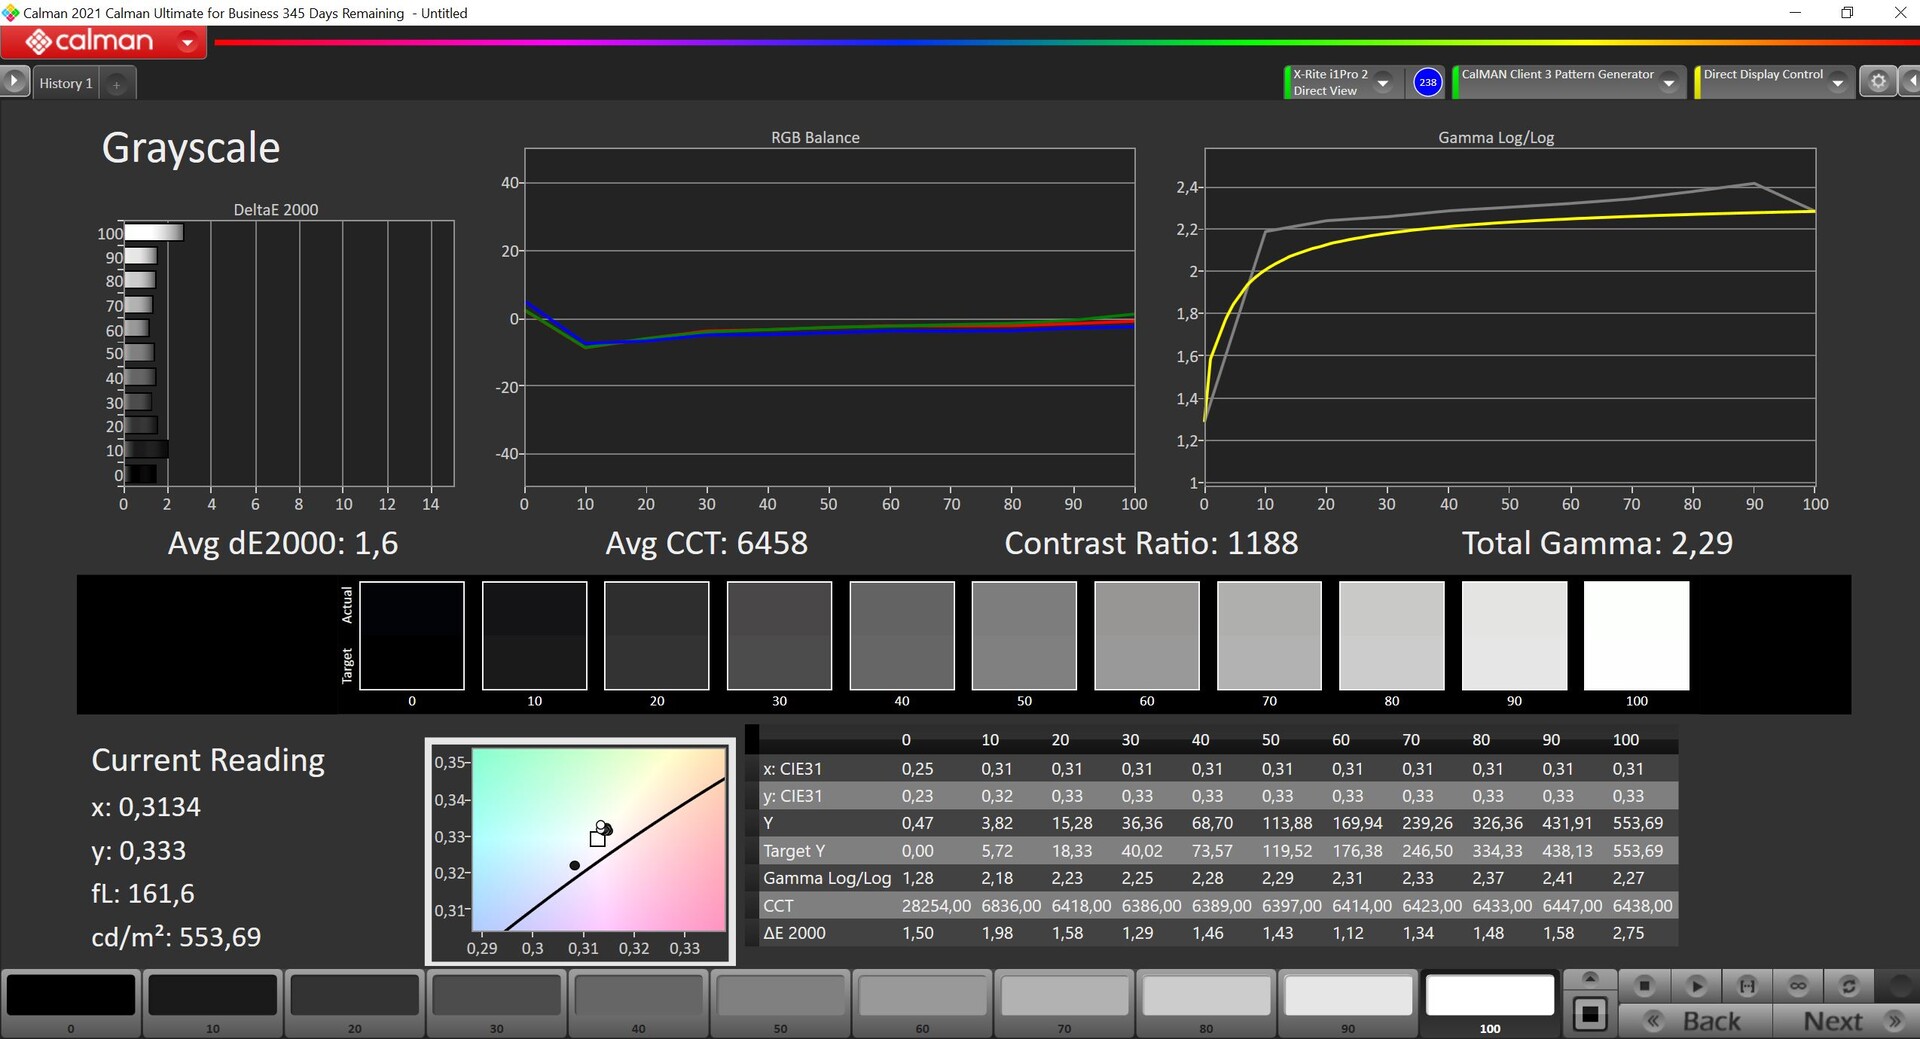

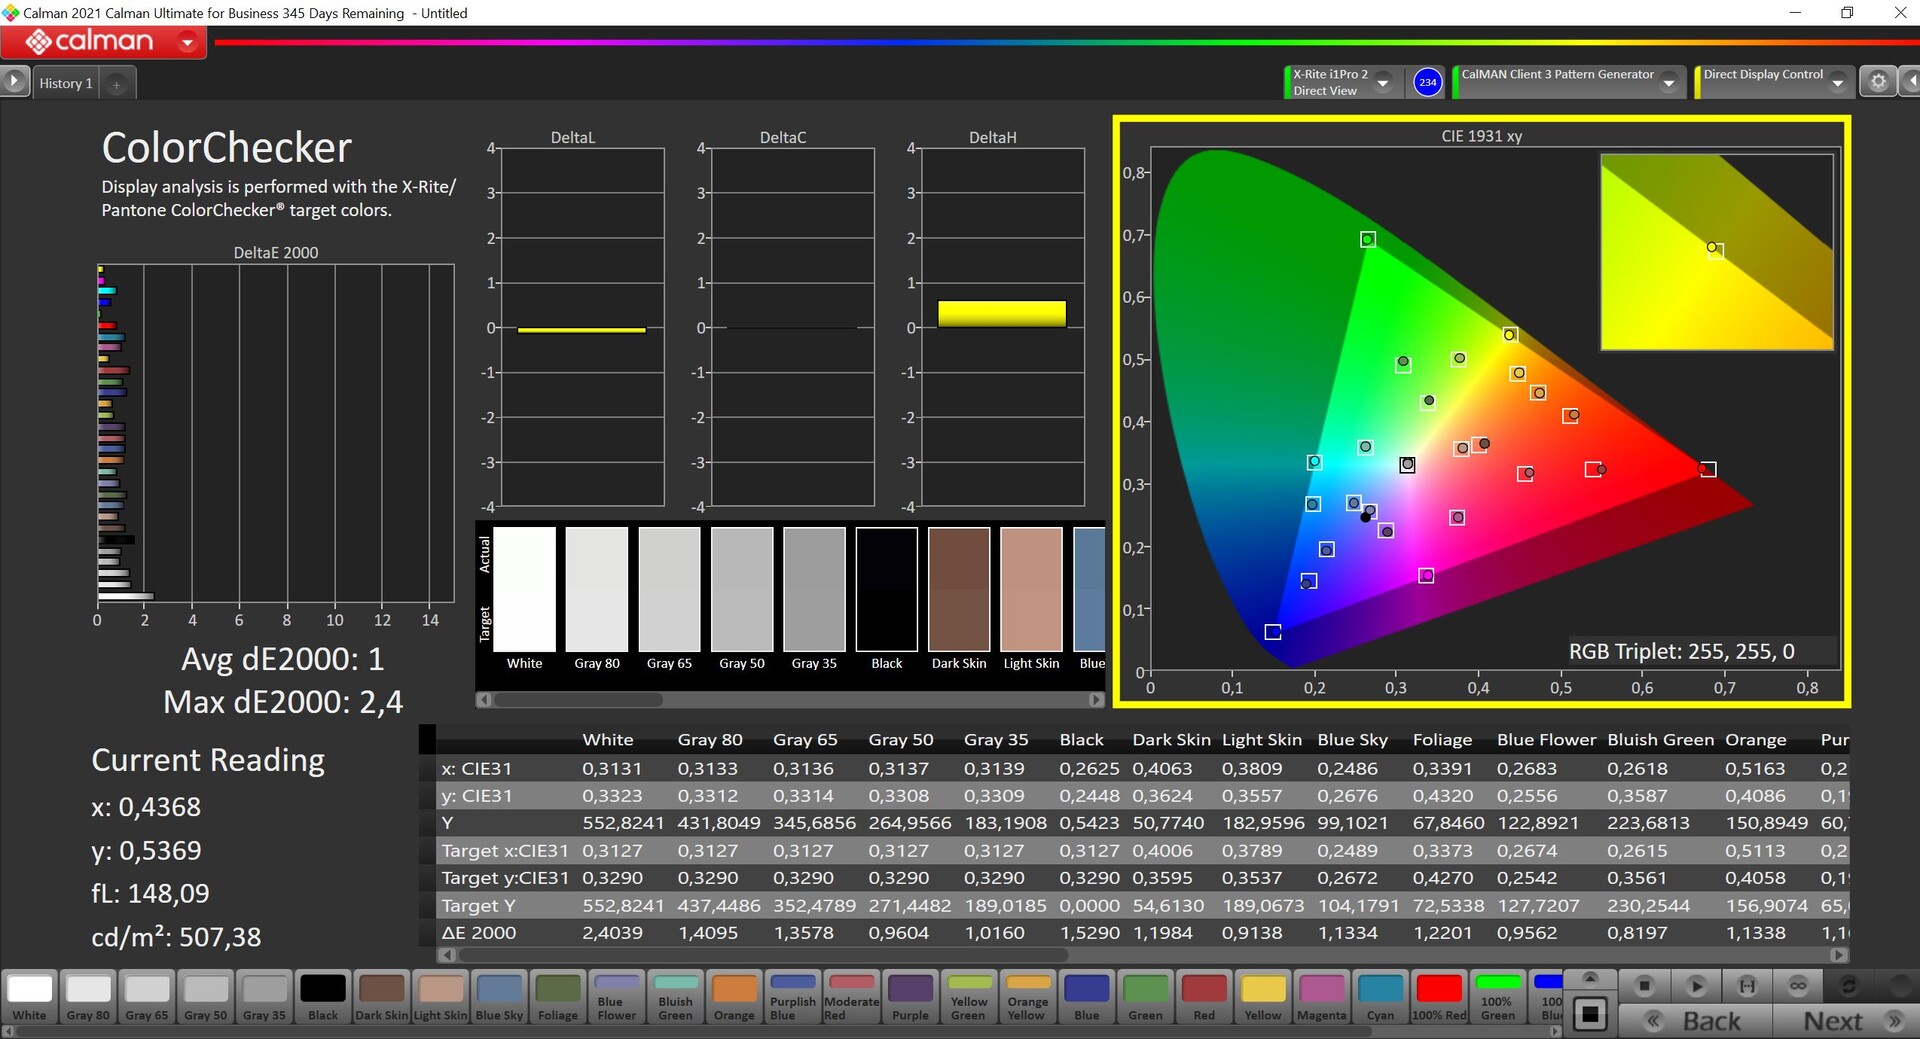

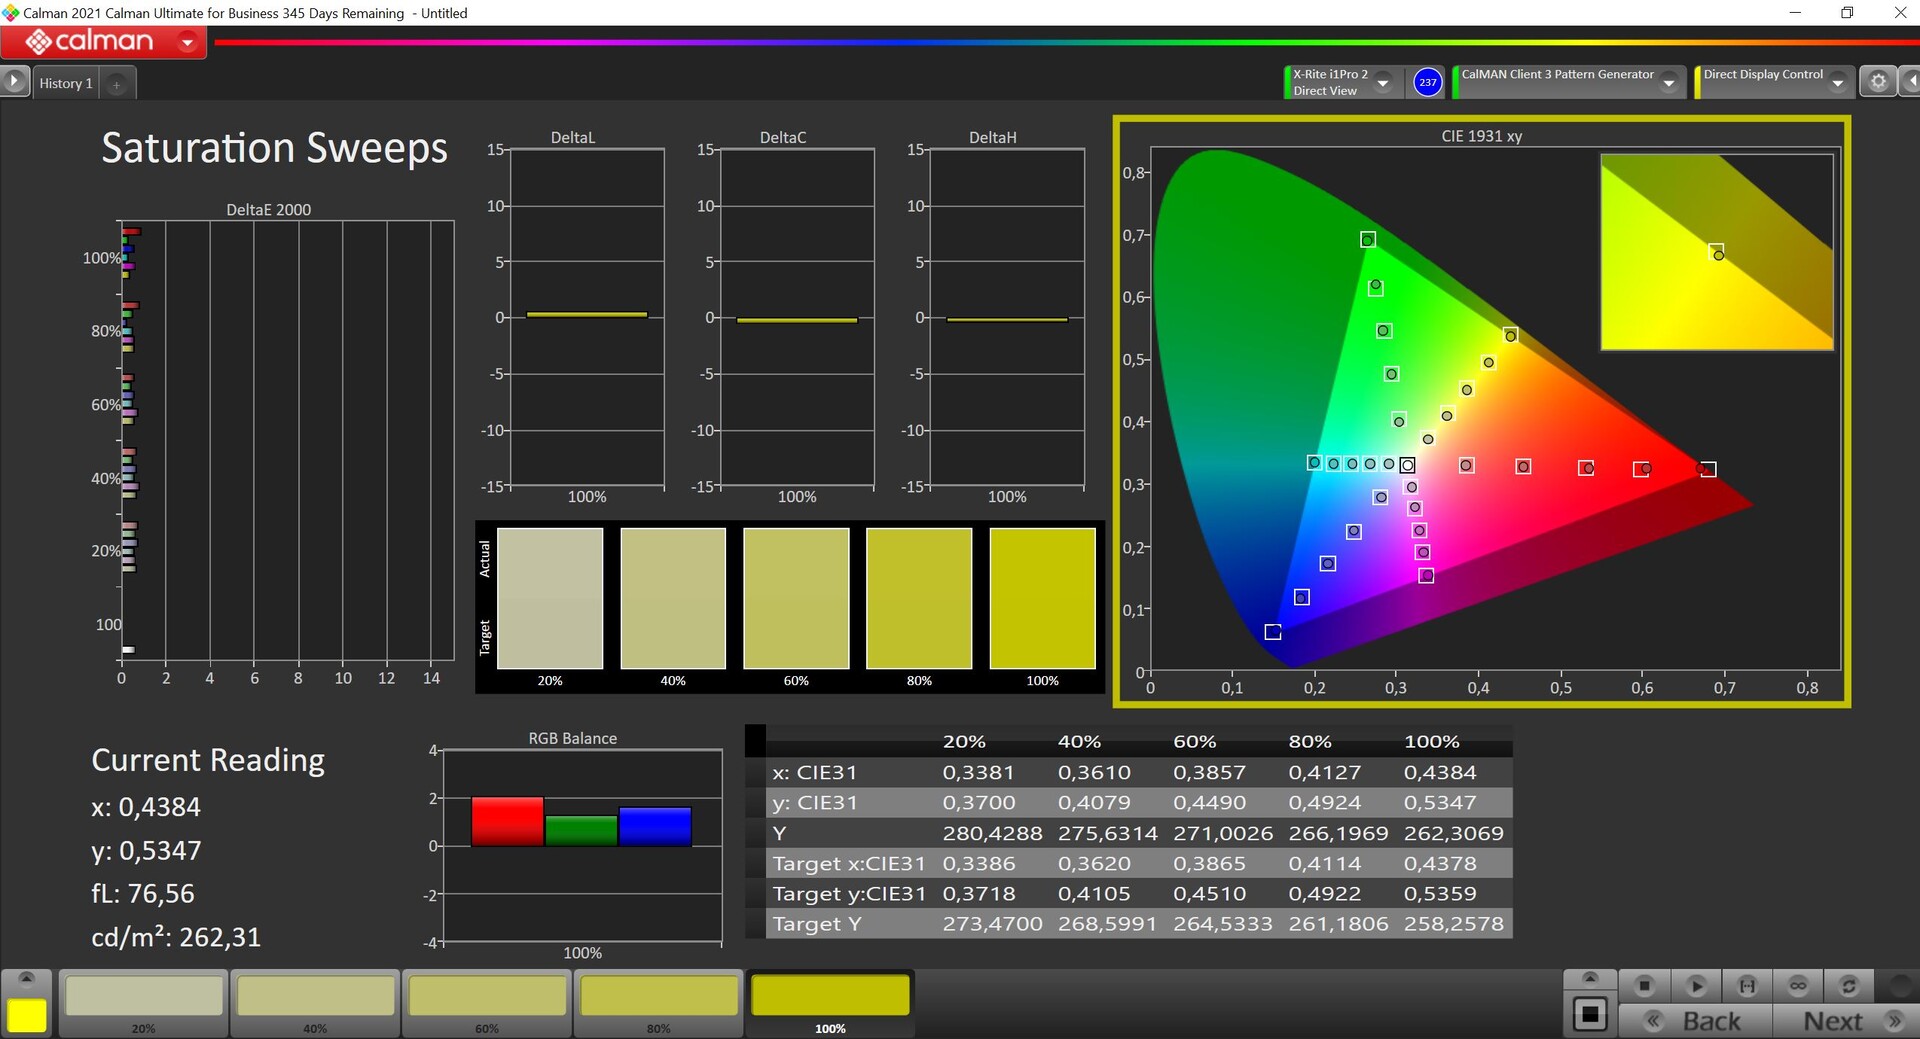

Wyświetlacz DreamColor jest już bardzo dobrze wyregulowany ex works. W naszej analizie za pomocą profesjonalnego oprogramowania CalMAN wszystkie odchylenia są już poniżej ważnej granicy 3 i nie ma żadnych odchyleń kolorów. Przy własnej kalibracji udało nam się wycisnąć z panelu nieco więcej, ale różnica ta jest tylko mierzalna, a nie odczuwalna.
Nadal jednak nie jesteśmy w pełni usatysfakcjonowani, ponieważ w porównaniu do wcześniejszych modeli DreamColor, przez pewien czas pełne pokrycie widziała tylko przestrzeń barw DCI-P3, podczas gdy kiedyś było to AdobeRGB. Ponadto kiedyś istniało oprogramowanie DreamColor, za pomocą którego można było przełączać przestrzeń barwną, a więc można było pracować np. w przestrzeni barwnej sRGB.
Wyświetl czasy reakcji
| ↔ Czas reakcji od czerni do bieli | ||
|---|---|---|
| 6.1 ms ... wzrost ↗ i spadek ↘ łącznie | ↗ 2.1 ms wzrost | 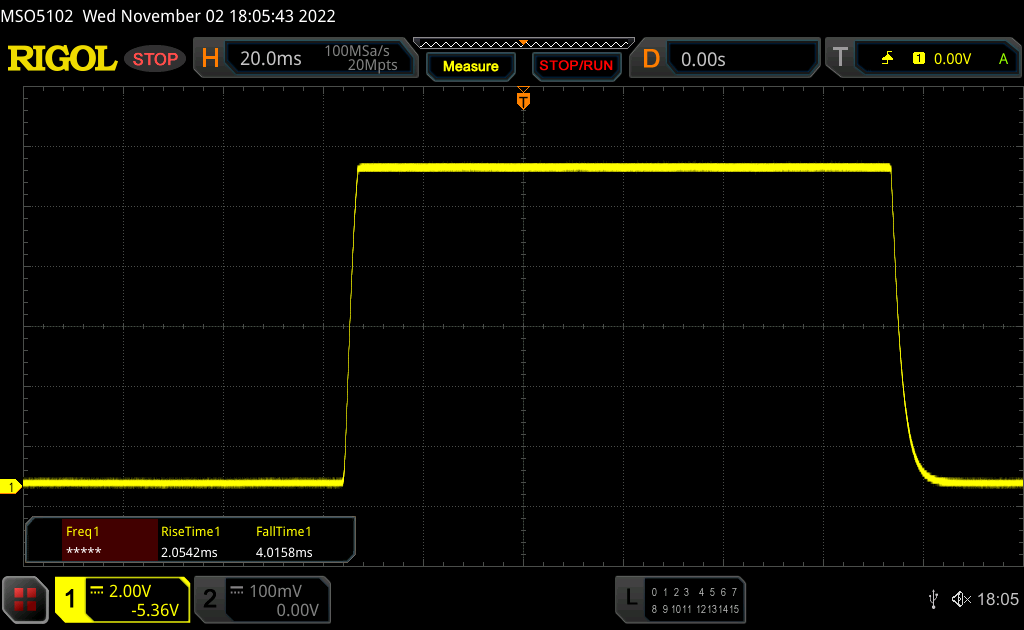 |
| ↘ 4 ms upadek | ||
| W naszych testach ekran wykazuje bardzo szybką reakcję i powinien bardzo dobrze nadawać się do szybkich gier. Dla porównania, wszystkie testowane urządzenia wahają się od 0.1 (minimum) do 240 (maksimum) ms. » 20 % wszystkich urządzeń jest lepszych. Oznacza to, że zmierzony czas reakcji jest lepszy od średniej wszystkich testowanych urządzeń (19.9 ms). | ||
| ↔ Czas reakcji 50% szarości do 80% szarości | ||
| 15.3 ms ... wzrost ↗ i spadek ↘ łącznie | ↗ 6.9 ms wzrost | 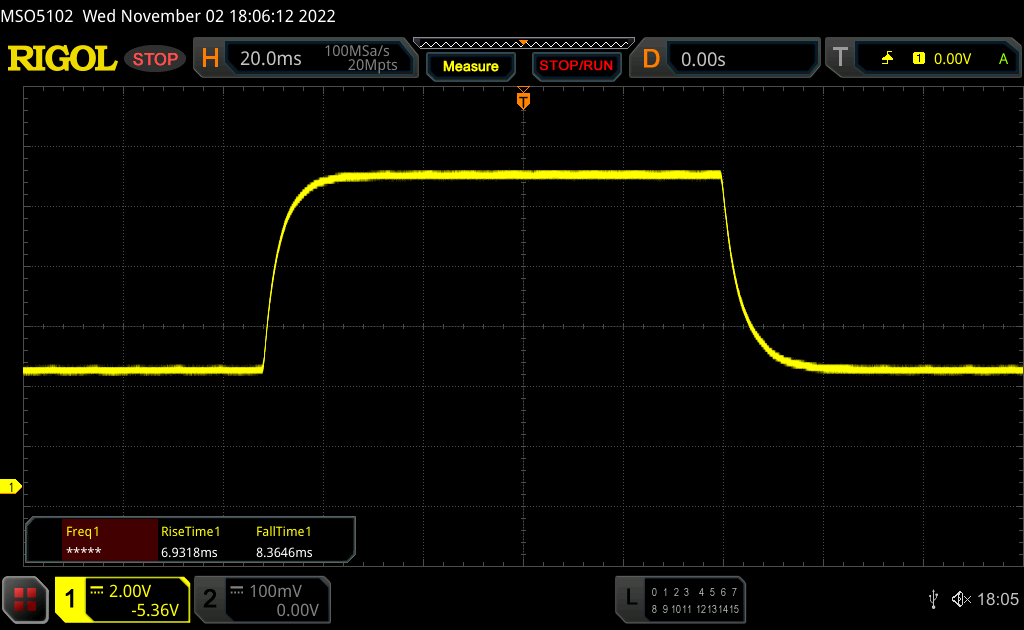 |
| ↘ 8.4 ms upadek | ||
| W naszych testach ekran wykazuje dobry współczynnik reakcji, ale może być zbyt wolny dla graczy rywalizujących ze sobą. Dla porównania, wszystkie testowane urządzenia wahają się od 0.165 (minimum) do 636 (maksimum) ms. » 30 % wszystkich urządzeń jest lepszych. Oznacza to, że zmierzony czas reakcji jest lepszy od średniej wszystkich testowanych urządzeń (31.1 ms). | ||
Migotanie ekranu / PWM (modulacja szerokości impulsu)
| Migotanie ekranu/nie wykryto PWM | 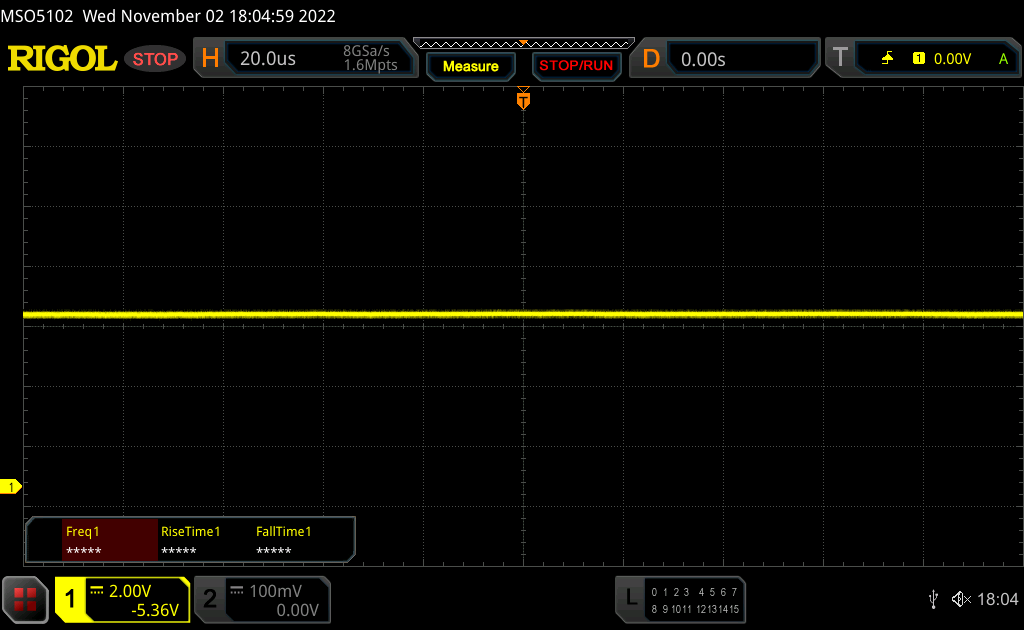 | ||
Dla porównania: 52 % wszystkich testowanych urządzeń nie używa PWM do przyciemniania wyświetlacza. Jeśli wykryto PWM, zmierzono średnio 7798 (minimum: 5 - maksimum: 343500) Hz. | |||
Na świeżym powietrzu można wygodnie pracować z ZBook Studio 16 G9. Dzięki matowej powierzchni i dobrej jasności zawartość ekranu jest dobrze widoczna, nawet w jasne dni. Należy jedynie unikać bezpośrednich odbić od źródeł światła
Wydajność - Alder Lake i dużo GPU
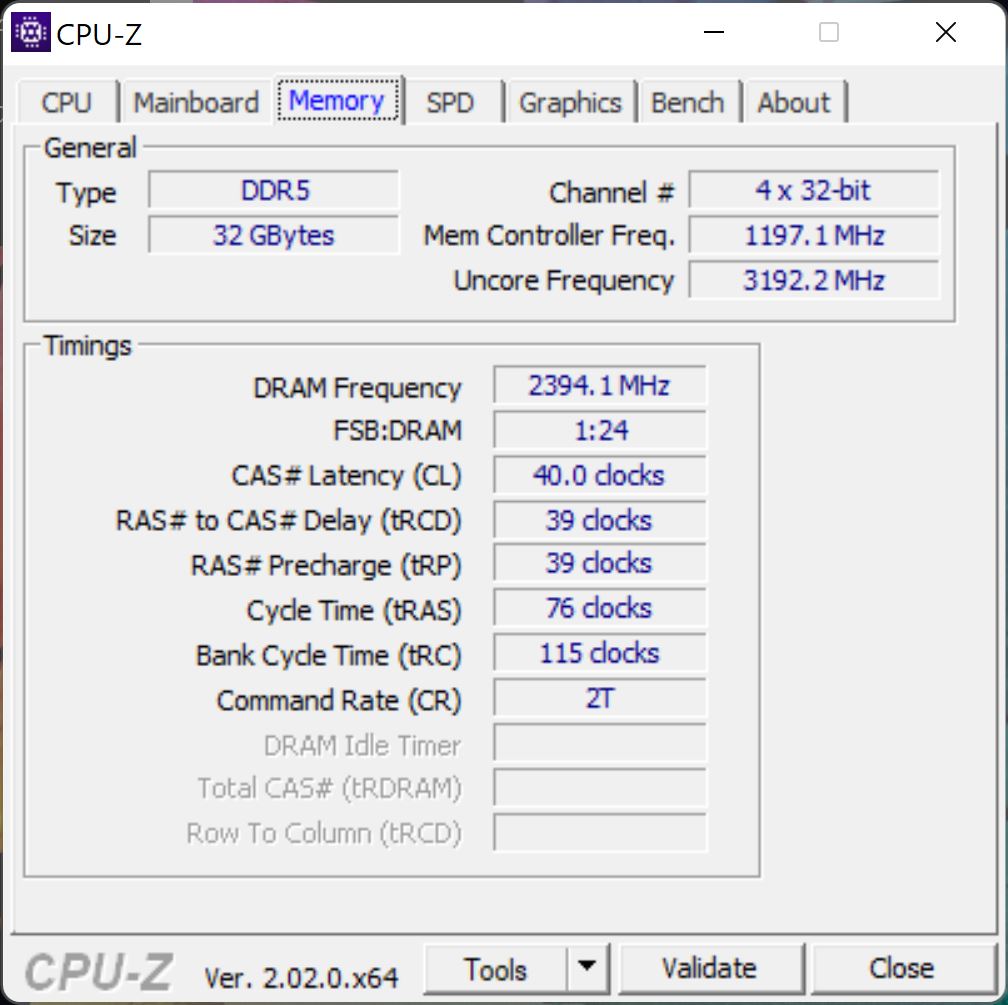
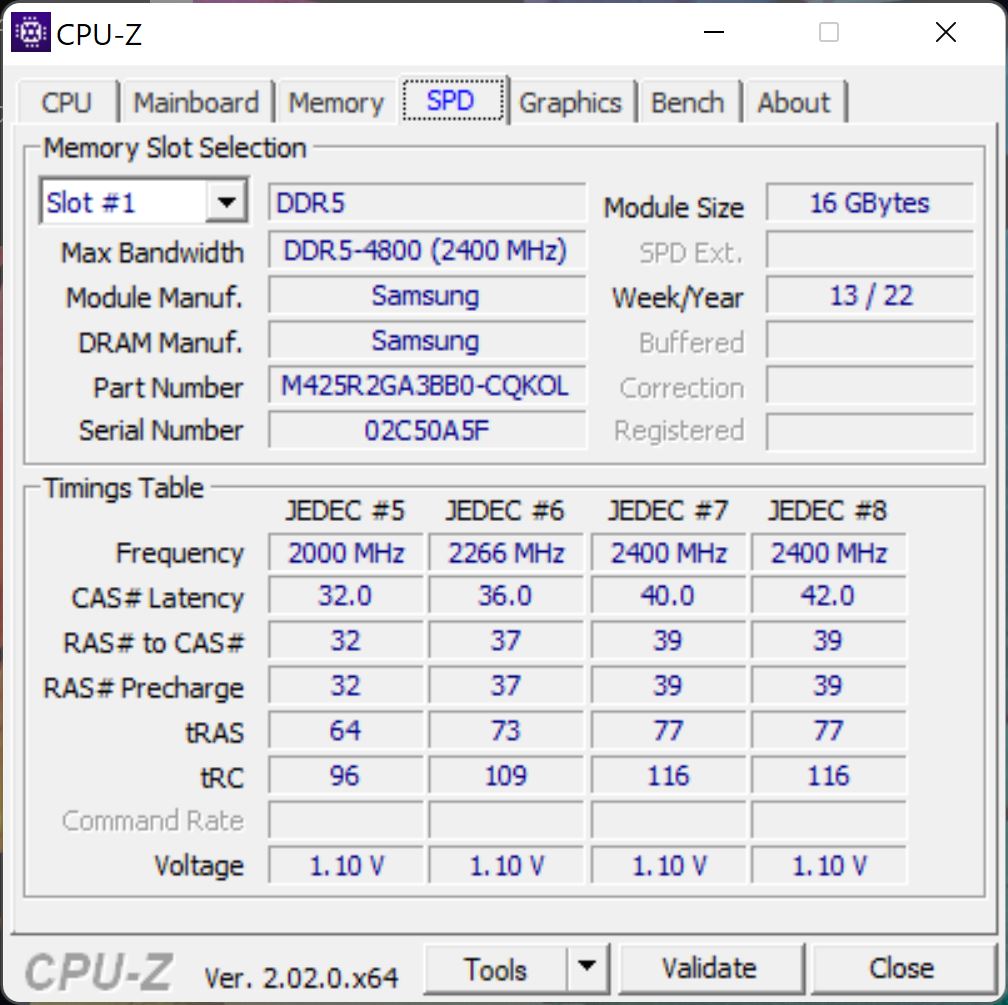
HP oferuje ZBook Studio 16 G9 z procesoremCore i7-12800H lub Core i9-12900H, oba pochodzą z obecnej generacji Alder Lake Intela i obsługują vPro. Jeśli natomiast chodzi o wybór karty graficznej, to można wybierać z całego portfolio profesjonalnych GPU Nvidii, począwszy od RTX A1000 aż do RTX A5500 z 16 GB VRAM, a także profesjonalny AMD Radeon Pro 6600M. Jeśli nie potrzebujesz specjalnych certyfikatów sterowników, HP nadal oferuje najnowsze procesory graficzne GeForce (RTX 3060 do RTX 3080 Ti).ZBook oferuje również dwa gniazda SODIMM (DDR5-4800 RAM) dla maksymalnie 64 GB (2x 32 GB).
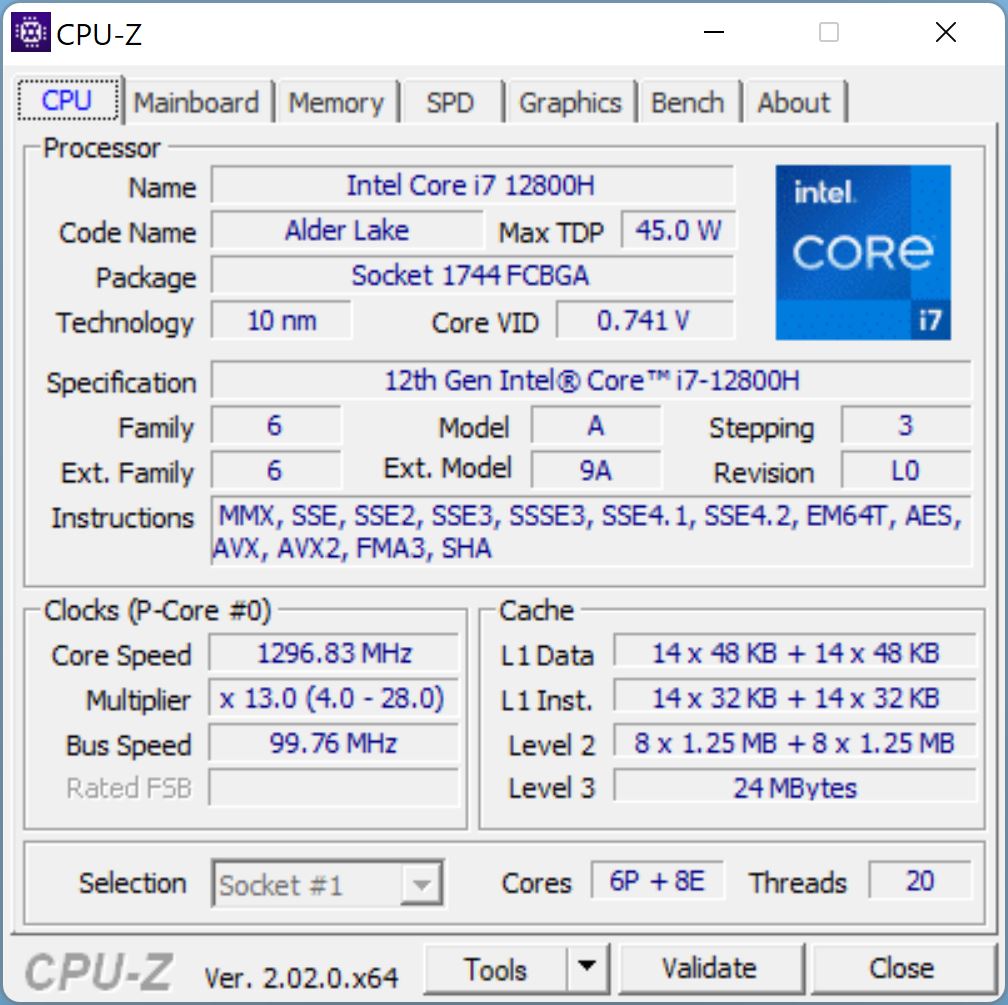
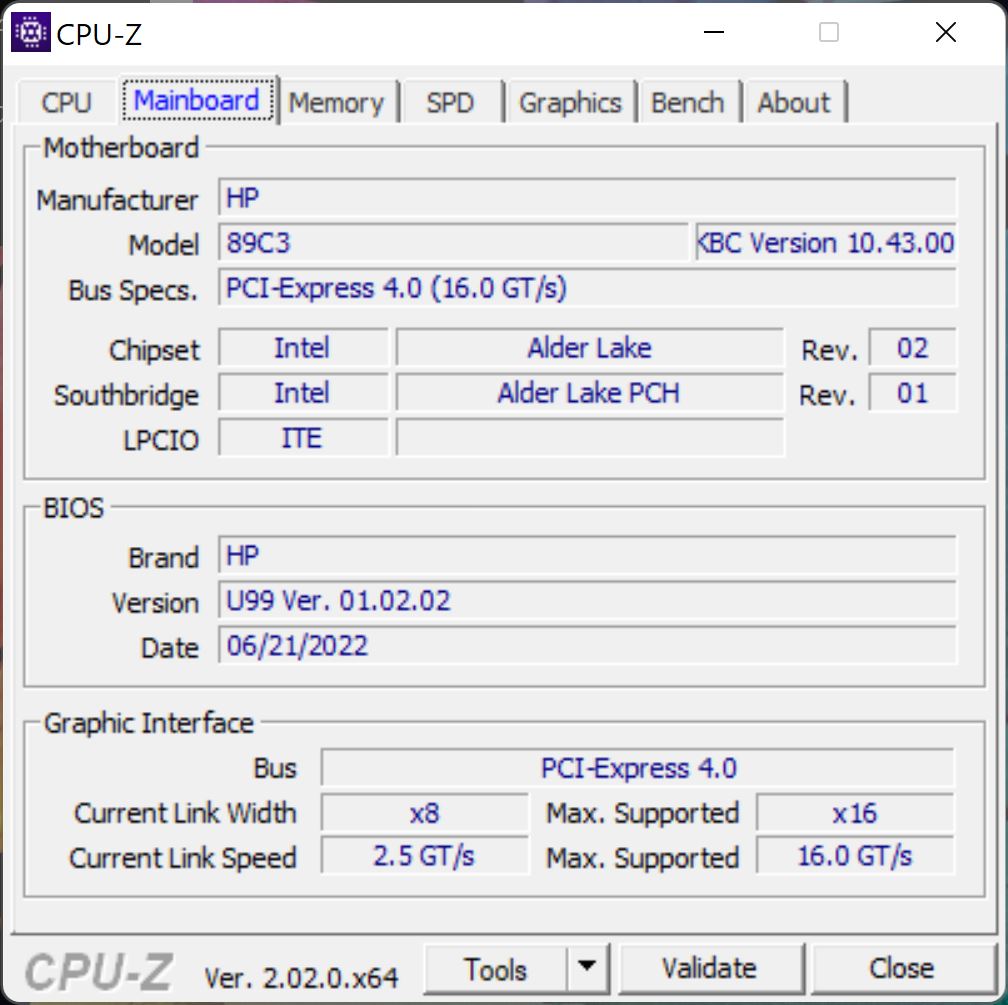
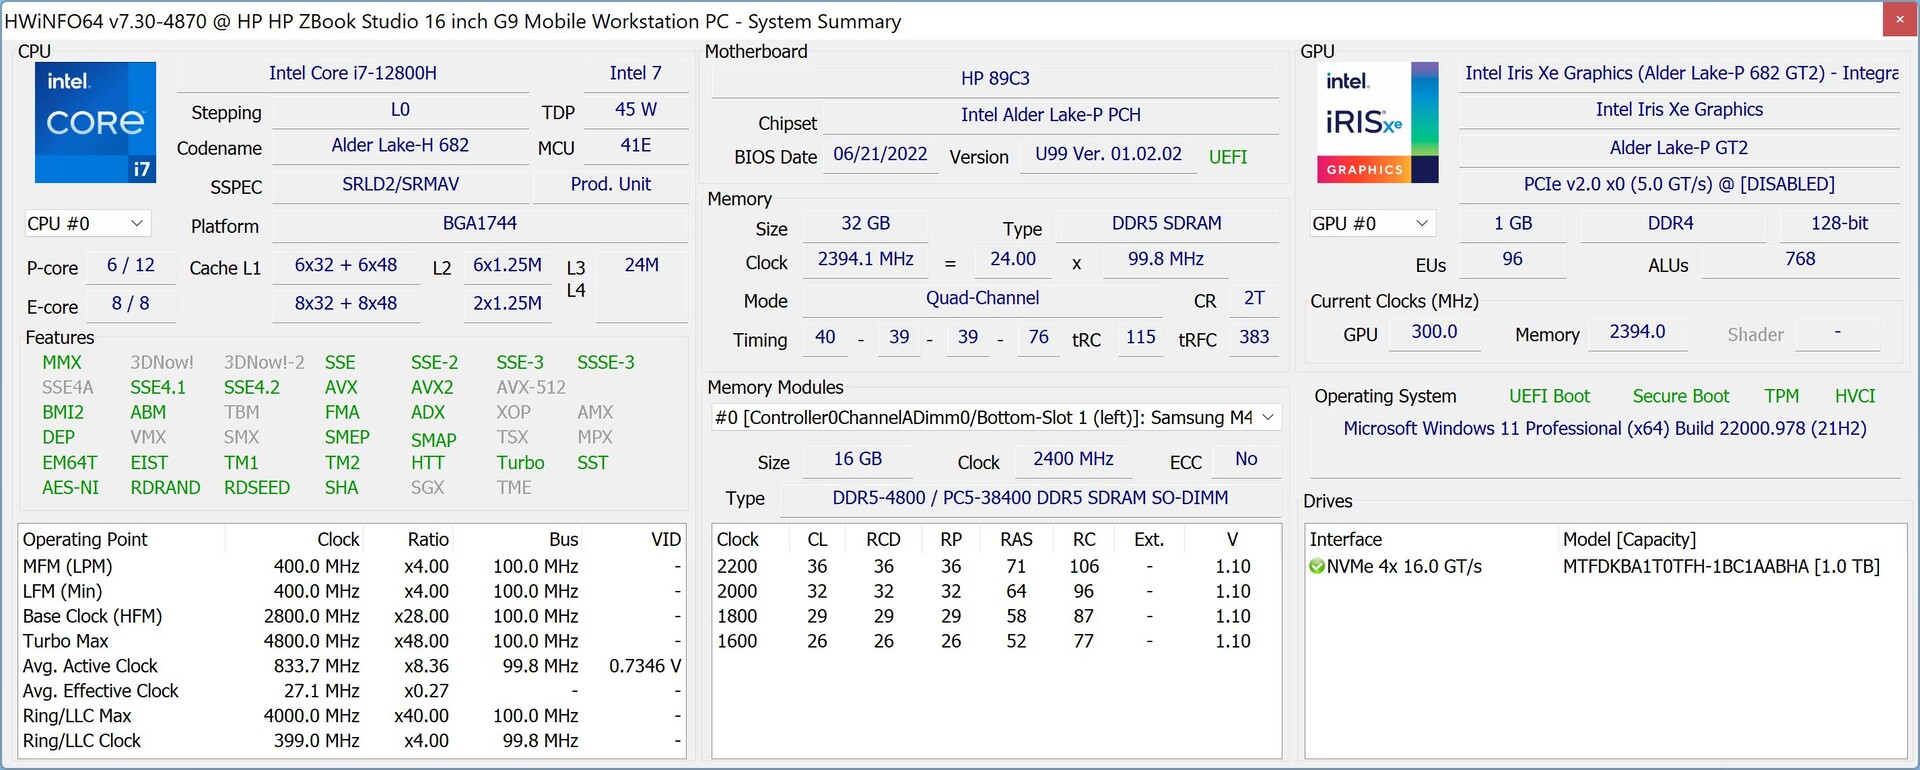
Procesor - Core i7-12800H
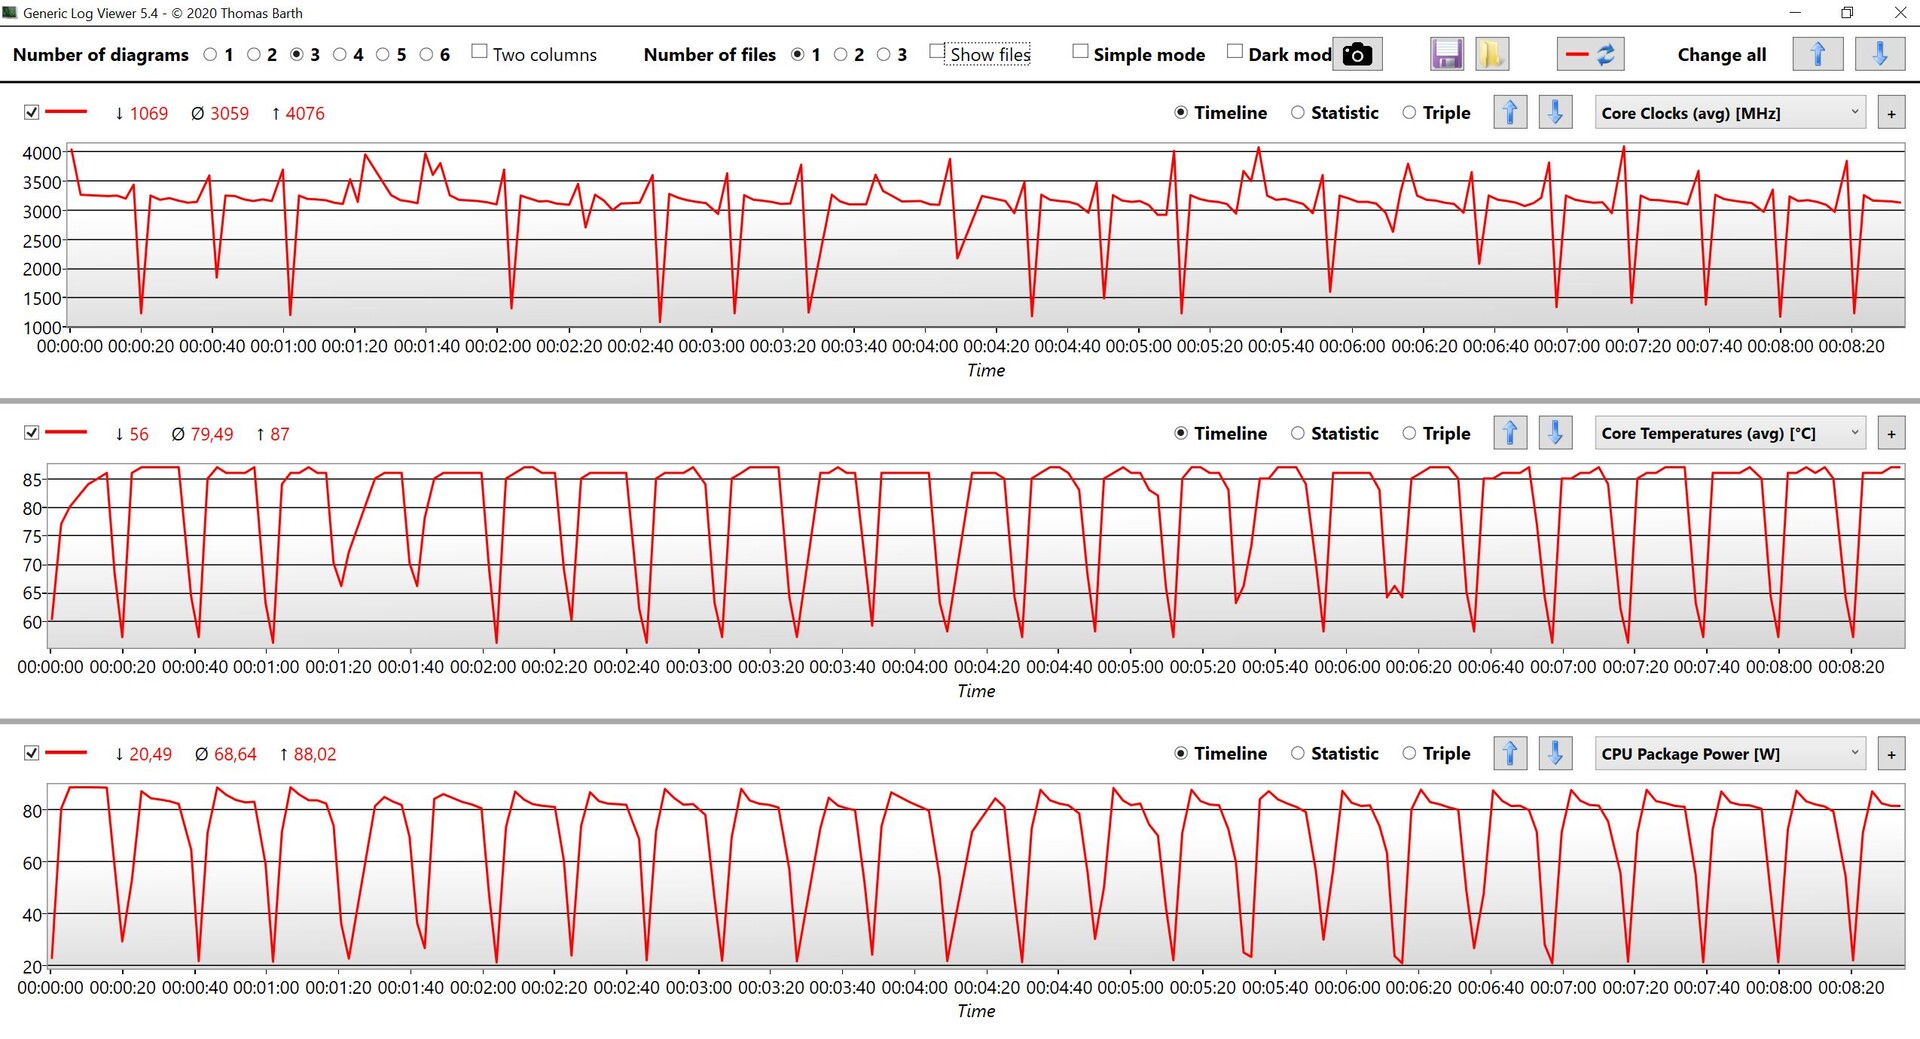
Na stronie Core i7-12800Hłączy 6 szybkich rdzeni wydajnościowych z 8 wydajnymi. W zasadzie odpowiada to zwykłemu Core i7-12700H, ale osiąga minimalnie wyższe częstotliwości Turbo, a ponadto obsługuje technologię vPro Intela. Wartości wydajności w ZBook Studio 16 G9 są bardzo dobre, gdyż procesor jest w stanie zużywać maksymalnie 88 watów, a pod trwałym obciążeniem poziom ten wynosi 70 watów. Podczas naszej pętli Cinebench R15 procesor bardzo szybko odzyskuje sprawność, a także jest w stanie bardzo dobrze wykorzystać wysokie taktowanie Turbo. Wyniki w trybie jednordzeniowym są również doskonałe. Biorąc pod uwagę wszystkie benchmarki CPU razem, nowy model jest o 30% szybszy od poprzedniego ZBook Studio 15 G8 z Core i9-11950H.
Na zasilaniu akumulatorowym procesor ten może pobierać maksymalnie 60 W, dlatego wydajność wielordzeniowa jest nieco niższa (-18%). Więcej benchmarków procesora jest dostępnych tutaj.
Cinebench R15 Multi Sustained Load
Cinebench R23: Multi Core | Single Core
Cinebench R20: CPU (Multi Core) | CPU (Single Core)
Cinebench R15: CPU Multi 64Bit | CPU Single 64Bit
Blender: v2.79 BMW27 CPU
7-Zip 18.03: 7z b 4 | 7z b 4 -mmt1
Geekbench 5.5: Multi-Core | Single-Core
HWBOT x265 Benchmark v2.2: 4k Preset
LibreOffice : 20 Documents To PDF
R Benchmark 2.5: Overall mean
| CPU Performance rating | |
| Średnia w klasie Workstation | |
| HP ZBook Studio 16 G9 62U04EA | |
| Przeciętny Intel Core i7-12800H | |
| Apple MacBook Pro 16 2021 M1 Max -5! | |
| HP ZBook Studio 15 G8 | |
| Lenovo ThinkPad P1 G4-20Y4Z9DVUS | |
| Dell Precision 5000 5560 -2! | |
| Cinebench R23 / Multi Core | |
| Średnia w klasie Workstation (14055 - 38520, n=25, ostatnie 2 lata) | |
| HP ZBook Studio 16 G9 62U04EA | |
| Przeciętny Intel Core i7-12800H (9777 - 16597, n=5) | |
| Apple MacBook Pro 16 2021 M1 Max | |
| Lenovo ThinkPad P1 G4-20Y4Z9DVUS | |
| HP ZBook Studio 15 G8 | |
| Dell Precision 5000 5560 | |
| Cinebench R23 / Single Core | |
| Średnia w klasie Workstation (1712 - 2228, n=25, ostatnie 2 lata) | |
| HP ZBook Studio 16 G9 62U04EA | |
| Przeciętny Intel Core i7-12800H (1796 - 1859, n=5) | |
| HP ZBook Studio 15 G8 | |
| Apple MacBook Pro 16 2021 M1 Max | |
| Dell Precision 5000 5560 | |
| Lenovo ThinkPad P1 G4-20Y4Z9DVUS | |
| Cinebench R20 / CPU (Multi Core) | |
| Średnia w klasie Workstation (5471 - 15043, n=25, ostatnie 2 lata) | |
| HP ZBook Studio 16 G9 62U04EA | |
| Przeciętny Intel Core i7-12800H (3741 - 6433, n=5) | |
| Lenovo ThinkPad P1 G4-20Y4Z9DVUS | |
| HP ZBook Studio 15 G8 | |
| Dell Precision 5000 5560 | |
| Apple MacBook Pro 16 2021 M1 Max | |
| Cinebench R20 / CPU (Single Core) | |
| Średnia w klasie Workstation (671 - 857, n=25, ostatnie 2 lata) | |
| HP ZBook Studio 16 G9 62U04EA | |
| Przeciętny Intel Core i7-12800H (690 - 714, n=5) | |
| HP ZBook Studio 15 G8 | |
| Lenovo ThinkPad P1 G4-20Y4Z9DVUS | |
| Dell Precision 5000 5560 | |
| Apple MacBook Pro 16 2021 M1 Max | |
| Cinebench R15 / CPU Multi 64Bit | |
| Średnia w klasie Workstation (2489 - 5810, n=25, ostatnie 2 lata) | |
| HP ZBook Studio 16 G9 62U04EA | |
| Przeciętny Intel Core i7-12800H (1566 - 2697, n=5) | |
| Lenovo ThinkPad P1 G4-20Y4Z9DVUS | |
| HP ZBook Studio 15 G8 | |
| Apple MacBook Pro 16 2021 M1 Max | |
| Dell Precision 5000 5560 | |
| Cinebench R15 / CPU Single 64Bit | |
| Średnia w klasie Workstation (191.4 - 328, n=25, ostatnie 2 lata) | |
| HP ZBook Studio 16 G9 62U04EA | |
| Przeciętny Intel Core i7-12800H (242 - 269, n=5) | |
| HP ZBook Studio 15 G8 | |
| Dell Precision 5000 5560 | |
| Lenovo ThinkPad P1 G4-20Y4Z9DVUS | |
| Apple MacBook Pro 16 2021 M1 Max | |
| Blender / v2.79 BMW27 CPU | |
| Dell Precision 5000 5560 | |
| HP ZBook Studio 15 G8 | |
| Lenovo ThinkPad P1 G4-20Y4Z9DVUS | |
| Przeciętny Intel Core i7-12800H (192 - 306, n=5) | |
| HP ZBook Studio 16 G9 62U04EA | |
| Apple MacBook Pro 16 2021 M1 Max | |
| Średnia w klasie Workstation (91 - 261, n=25, ostatnie 2 lata) | |
| 7-Zip 18.03 / 7z b 4 | |
| Średnia w klasie Workstation (54741 - 116969, n=25, ostatnie 2 lata) | |
| HP ZBook Studio 16 G9 62U04EA | |
| Przeciętny Intel Core i7-12800H (44553 - 68930, n=5) | |
| Lenovo ThinkPad P1 G4-20Y4Z9DVUS | |
| HP ZBook Studio 15 G8 | |
| Dell Precision 5000 5560 | |
| 7-Zip 18.03 / 7z b 4 -mmt1 | |
| Średnia w klasie Workstation (5126 - 6960, n=25, ostatnie 2 lata) | |
| HP ZBook Studio 16 G9 62U04EA | |
| Przeciętny Intel Core i7-12800H (5726 - 5976, n=5) | |
| HP ZBook Studio 15 G8 | |
| Dell Precision 5000 5560 | |
| Lenovo ThinkPad P1 G4-20Y4Z9DVUS | |
| Geekbench 5.5 / Multi-Core | |
| Średnia w klasie Workstation (11542 - 25554, n=25, ostatnie 2 lata) | |
| HP ZBook Studio 16 G9 62U04EA | |
| Apple MacBook Pro 16 2021 M1 Max | |
| Przeciętny Intel Core i7-12800H (9607 - 12940, n=5) | |
| Lenovo ThinkPad P1 G4-20Y4Z9DVUS | |
| HP ZBook Studio 15 G8 | |
| Geekbench 5.5 / Single-Core | |
| Średnia w klasie Workstation (1781 - 2183, n=25, ostatnie 2 lata) | |
| HP ZBook Studio 16 G9 62U04EA | |
| Przeciętny Intel Core i7-12800H (1739 - 1842, n=5) | |
| Apple MacBook Pro 16 2021 M1 Max | |
| HP ZBook Studio 15 G8 | |
| Lenovo ThinkPad P1 G4-20Y4Z9DVUS | |
| HWBOT x265 Benchmark v2.2 / 4k Preset | |
| Średnia w klasie Workstation (14.4 - 40.5, n=25, ostatnie 2 lata) | |
| HP ZBook Studio 16 G9 62U04EA | |
| Przeciętny Intel Core i7-12800H (11.7 - 19.4, n=5) | |
| HP ZBook Studio 15 G8 | |
| Lenovo ThinkPad P1 G4-20Y4Z9DVUS | |
| Dell Precision 5000 5560 | |
| LibreOffice / 20 Documents To PDF | |
| Lenovo ThinkPad P1 G4-20Y4Z9DVUS | |
| HP ZBook Studio 15 G8 | |
| Dell Precision 5000 5560 | |
| Średnia w klasie Workstation (37.1 - 74.7, n=25, ostatnie 2 lata) | |
| Przeciętny Intel Core i7-12800H (41.3 - 51.5, n=5) | |
| HP ZBook Studio 16 G9 62U04EA | |
| R Benchmark 2.5 / Overall mean | |
| Lenovo ThinkPad P1 G4-20Y4Z9DVUS | |
| HP ZBook Studio 15 G8 | |
| Dell Precision 5000 5560 | |
| Przeciętny Intel Core i7-12800H (0.4442 - 0.4715, n=5) | |
| HP ZBook Studio 16 G9 62U04EA | |
| Średnia w klasie Workstation (0.3825 - 0.603, n=25, ostatnie 2 lata) | |
* ... im mniej tym lepiej
AIDA64: FP32 Ray-Trace | FPU Julia | CPU SHA3 | CPU Queen | FPU SinJulia | FPU Mandel | CPU AES | CPU ZLib | FP64 Ray-Trace | CPU PhotoWorxx
| Performance rating | |
| Średnia w klasie Workstation | |
| HP ZBook Studio 16 G9 62U04EA | |
| Lenovo ThinkPad P1 G4-20Y4Z9DVUS | |
| HP ZBook Studio 15 G8 | |
| Przeciętny Intel Core i7-12800H | |
| AIDA64 / FP32 Ray-Trace | |
| Średnia w klasie Workstation (10658 - 61611, n=25, ostatnie 2 lata) | |
| Lenovo ThinkPad P1 G4-20Y4Z9DVUS | |
| HP ZBook Studio 16 G9 62U04EA | |
| HP ZBook Studio 15 G8 | |
| Przeciętny Intel Core i7-12800H (5839 - 15206, n=5) | |
| AIDA64 / FPU Julia | |
| Średnia w klasie Workstation (56664 - 186971, n=25, ostatnie 2 lata) | |
| HP ZBook Studio 16 G9 62U04EA | |
| Lenovo ThinkPad P1 G4-20Y4Z9DVUS | |
| HP ZBook Studio 15 G8 | |
| Przeciętny Intel Core i7-12800H (27801 - 80002, n=5) | |
| AIDA64 / CPU SHA3 | |
| Średnia w klasie Workstation (2608 - 8975, n=25, ostatnie 2 lata) | |
| Lenovo ThinkPad P1 G4-20Y4Z9DVUS | |
| HP ZBook Studio 15 G8 | |
| HP ZBook Studio 16 G9 62U04EA | |
| Przeciętny Intel Core i7-12800H (2013 - 3684, n=5) | |
| AIDA64 / CPU Queen | |
| HP ZBook Studio 16 G9 62U04EA | |
| Średnia w klasie Workstation (60778 - 144411, n=25, ostatnie 2 lata) | |
| HP ZBook Studio 15 G8 | |
| Przeciętny Intel Core i7-12800H (85965 - 108084, n=5) | |
| Lenovo ThinkPad P1 G4-20Y4Z9DVUS | |
| AIDA64 / FPU SinJulia | |
| Średnia w klasie Workstation (8165 - 29343, n=25, ostatnie 2 lata) | |
| HP ZBook Studio 15 G8 | |
| Lenovo ThinkPad P1 G4-20Y4Z9DVUS | |
| HP ZBook Studio 16 G9 62U04EA | |
| Przeciętny Intel Core i7-12800H (7027 - 9658, n=5) | |
| AIDA64 / FPU Mandel | |
| Średnia w klasie Workstation (27301 - 98153, n=25, ostatnie 2 lata) | |
| HP ZBook Studio 16 G9 62U04EA | |
| Lenovo ThinkPad P1 G4-20Y4Z9DVUS | |
| HP ZBook Studio 15 G8 | |
| Przeciętny Intel Core i7-12800H (15765 - 38179, n=5) | |
| AIDA64 / CPU AES | |
| Średnia w klasie Workstation (56077 - 187841, n=25, ostatnie 2 lata) | |
| Lenovo ThinkPad P1 G4-20Y4Z9DVUS | |
| HP ZBook Studio 15 G8 | |
| HP ZBook Studio 16 G9 62U04EA | |
| Przeciętny Intel Core i7-12800H (55371 - 73928, n=5) | |
| AIDA64 / CPU ZLib | |
| Średnia w klasie Workstation (742 - 2148, n=25, ostatnie 2 lata) | |
| HP ZBook Studio 16 G9 62U04EA | |
| Przeciętny Intel Core i7-12800H (701 - 1047, n=5) | |
| Lenovo ThinkPad P1 G4-20Y4Z9DVUS | |
| HP ZBook Studio 15 G8 | |
| AIDA64 / FP64 Ray-Trace | |
| Średnia w klasie Workstation (5580 - 32891, n=25, ostatnie 2 lata) | |
| HP ZBook Studio 16 G9 62U04EA | |
| Lenovo ThinkPad P1 G4-20Y4Z9DVUS | |
| HP ZBook Studio 15 G8 | |
| Przeciętny Intel Core i7-12800H (3257 - 8559, n=5) | |
| AIDA64 / CPU PhotoWorxx | |
| Średnia w klasie Workstation (37151 - 93684, n=25, ostatnie 2 lata) | |
| HP ZBook Studio 16 G9 62U04EA | |
| Przeciętny Intel Core i7-12800H (31329 - 40992, n=5) | |
| HP ZBook Studio 15 G8 | |
| Lenovo ThinkPad P1 G4-20Y4Z9DVUS | |
Wydajność systemu
ZBook Studio 16 G9 to bardzo wydajne i responsywne urządzenie, co potwierdzają również dobre wyniki w benchmarkach. Podczas testów nie zaobserwowano żadnych problemów.
CrossMark: Overall | Productivity | Creativity | Responsiveness
| PCMark 10 / Score | |
| Średnia w klasie Workstation (6436 - 10409, n=21, ostatnie 2 lata) | |
| HP ZBook Studio 15 G8 | |
| Dell Precision 5000 5560 | |
| HP ZBook Studio 16 G9 62U04EA | |
| Przeciętny Intel Core i7-12800H, NVIDIA RTX A2000 Laptop GPU (n=1) | |
| Lenovo ThinkPad P1 G4-20Y4Z9DVUS | |
| PCMark 10 / Essentials | |
| Dell Precision 5000 5560 | |
| Średnia w klasie Workstation (9622 - 11157, n=21, ostatnie 2 lata) | |
| Lenovo ThinkPad P1 G4-20Y4Z9DVUS | |
| HP ZBook Studio 15 G8 | |
| HP ZBook Studio 16 G9 62U04EA | |
| Przeciętny Intel Core i7-12800H, NVIDIA RTX A2000 Laptop GPU (n=1) | |
| PCMark 10 / Productivity | |
| Średnia w klasie Workstation (8789 - 20616, n=21, ostatnie 2 lata) | |
| Dell Precision 5000 5560 | |
| HP ZBook Studio 15 G8 | |
| Lenovo ThinkPad P1 G4-20Y4Z9DVUS | |
| HP ZBook Studio 16 G9 62U04EA | |
| Przeciętny Intel Core i7-12800H, NVIDIA RTX A2000 Laptop GPU (n=1) | |
| PCMark 10 / Digital Content Creation | |
| Średnia w klasie Workstation (7744 - 15631, n=21, ostatnie 2 lata) | |
| HP ZBook Studio 15 G8 | |
| HP ZBook Studio 16 G9 62U04EA | |
| Przeciętny Intel Core i7-12800H, NVIDIA RTX A2000 Laptop GPU (n=1) | |
| Dell Precision 5000 5560 | |
| Lenovo ThinkPad P1 G4-20Y4Z9DVUS | |
| CrossMark / Overall | |
| Średnia w klasie Workstation (1307 - 2267, n=24, ostatnie 2 lata) | |
| HP ZBook Studio 16 G9 62U04EA | |
| Przeciętny Intel Core i7-12800H, NVIDIA RTX A2000 Laptop GPU (n=1) | |
| Apple MacBook Pro 16 2021 M1 Max | |
| Lenovo ThinkPad P1 G4-20Y4Z9DVUS | |
| CrossMark / Productivity | |
| Średnia w klasie Workstation (1130 - 2122, n=24, ostatnie 2 lata) | |
| HP ZBook Studio 16 G9 62U04EA | |
| Przeciętny Intel Core i7-12800H, NVIDIA RTX A2000 Laptop GPU (n=1) | |
| Lenovo ThinkPad P1 G4-20Y4Z9DVUS | |
| Apple MacBook Pro 16 2021 M1 Max | |
| CrossMark / Creativity | |
| Średnia w klasie Workstation (1657 - 2725, n=24, ostatnie 2 lata) | |
| Apple MacBook Pro 16 2021 M1 Max | |
| HP ZBook Studio 16 G9 62U04EA | |
| Przeciętny Intel Core i7-12800H, NVIDIA RTX A2000 Laptop GPU (n=1) | |
| Lenovo ThinkPad P1 G4-20Y4Z9DVUS | |
| CrossMark / Responsiveness | |
| Średnia w klasie Workstation (993 - 2096, n=24, ostatnie 2 lata) | |
| HP ZBook Studio 16 G9 62U04EA | |
| Przeciętny Intel Core i7-12800H, NVIDIA RTX A2000 Laptop GPU (n=1) | |
| Lenovo ThinkPad P1 G4-20Y4Z9DVUS | |
| Apple MacBook Pro 16 2021 M1 Max | |
| PCMark 10 Score | 6321 pkt. | |
Pomoc | ||
| AIDA64 / Memory Copy | |
| Średnia w klasie Workstation (56003 - 164795, n=25, ostatnie 2 lata) | |
| HP ZBook Studio 16 G9 62U04EA | |
| Przeciętny Intel Core i7-12800H (48643 - 62522, n=5) | |
| HP ZBook Studio 15 G8 | |
| Lenovo ThinkPad P1 G4-20Y4Z9DVUS | |
| AIDA64 / Memory Read | |
| Średnia w klasie Workstation (55795 - 121563, n=25, ostatnie 2 lata) | |
| HP ZBook Studio 16 G9 62U04EA | |
| Przeciętny Intel Core i7-12800H (56629 - 66199, n=5) | |
| HP ZBook Studio 15 G8 | |
| Lenovo ThinkPad P1 G4-20Y4Z9DVUS | |
| AIDA64 / Memory Write | |
| Średnia w klasie Workstation (55663 - 214520, n=25, ostatnie 2 lata) | |
| HP ZBook Studio 16 G9 62U04EA | |
| Przeciętny Intel Core i7-12800H (50923 - 66074, n=5) | |
| HP ZBook Studio 15 G8 | |
| Lenovo ThinkPad P1 G4-20Y4Z9DVUS | |
| AIDA64 / Memory Latency | |
| Średnia w klasie Workstation (84.5 - 165.2, n=25, ostatnie 2 lata) | |
| HP ZBook Studio 16 G9 62U04EA | |
| Lenovo ThinkPad P1 G4-20Y4Z9DVUS | |
| HP ZBook Studio 15 G8 | |
| Przeciętny Intel Core i7-12800H (89.3 - 95.2, n=5) | |
* ... im mniej tym lepiej
Opóźnienie DPC
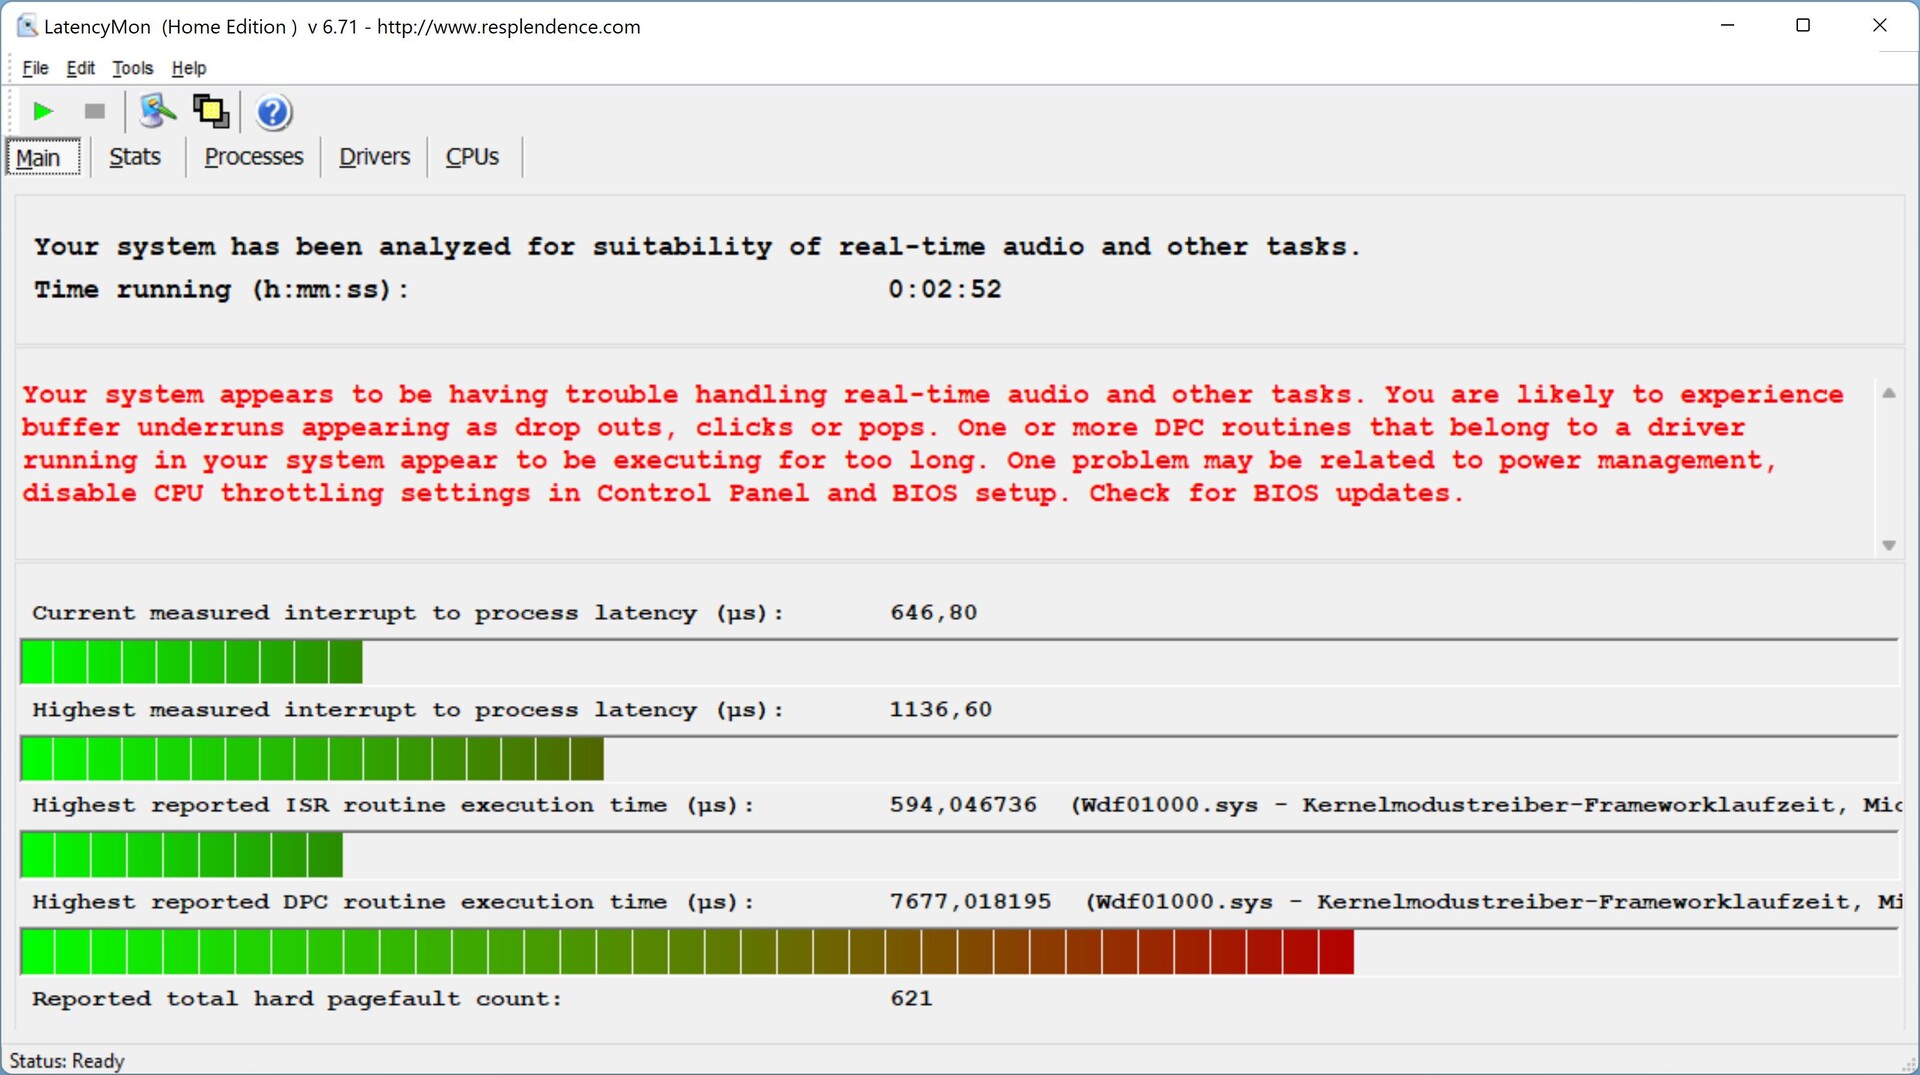
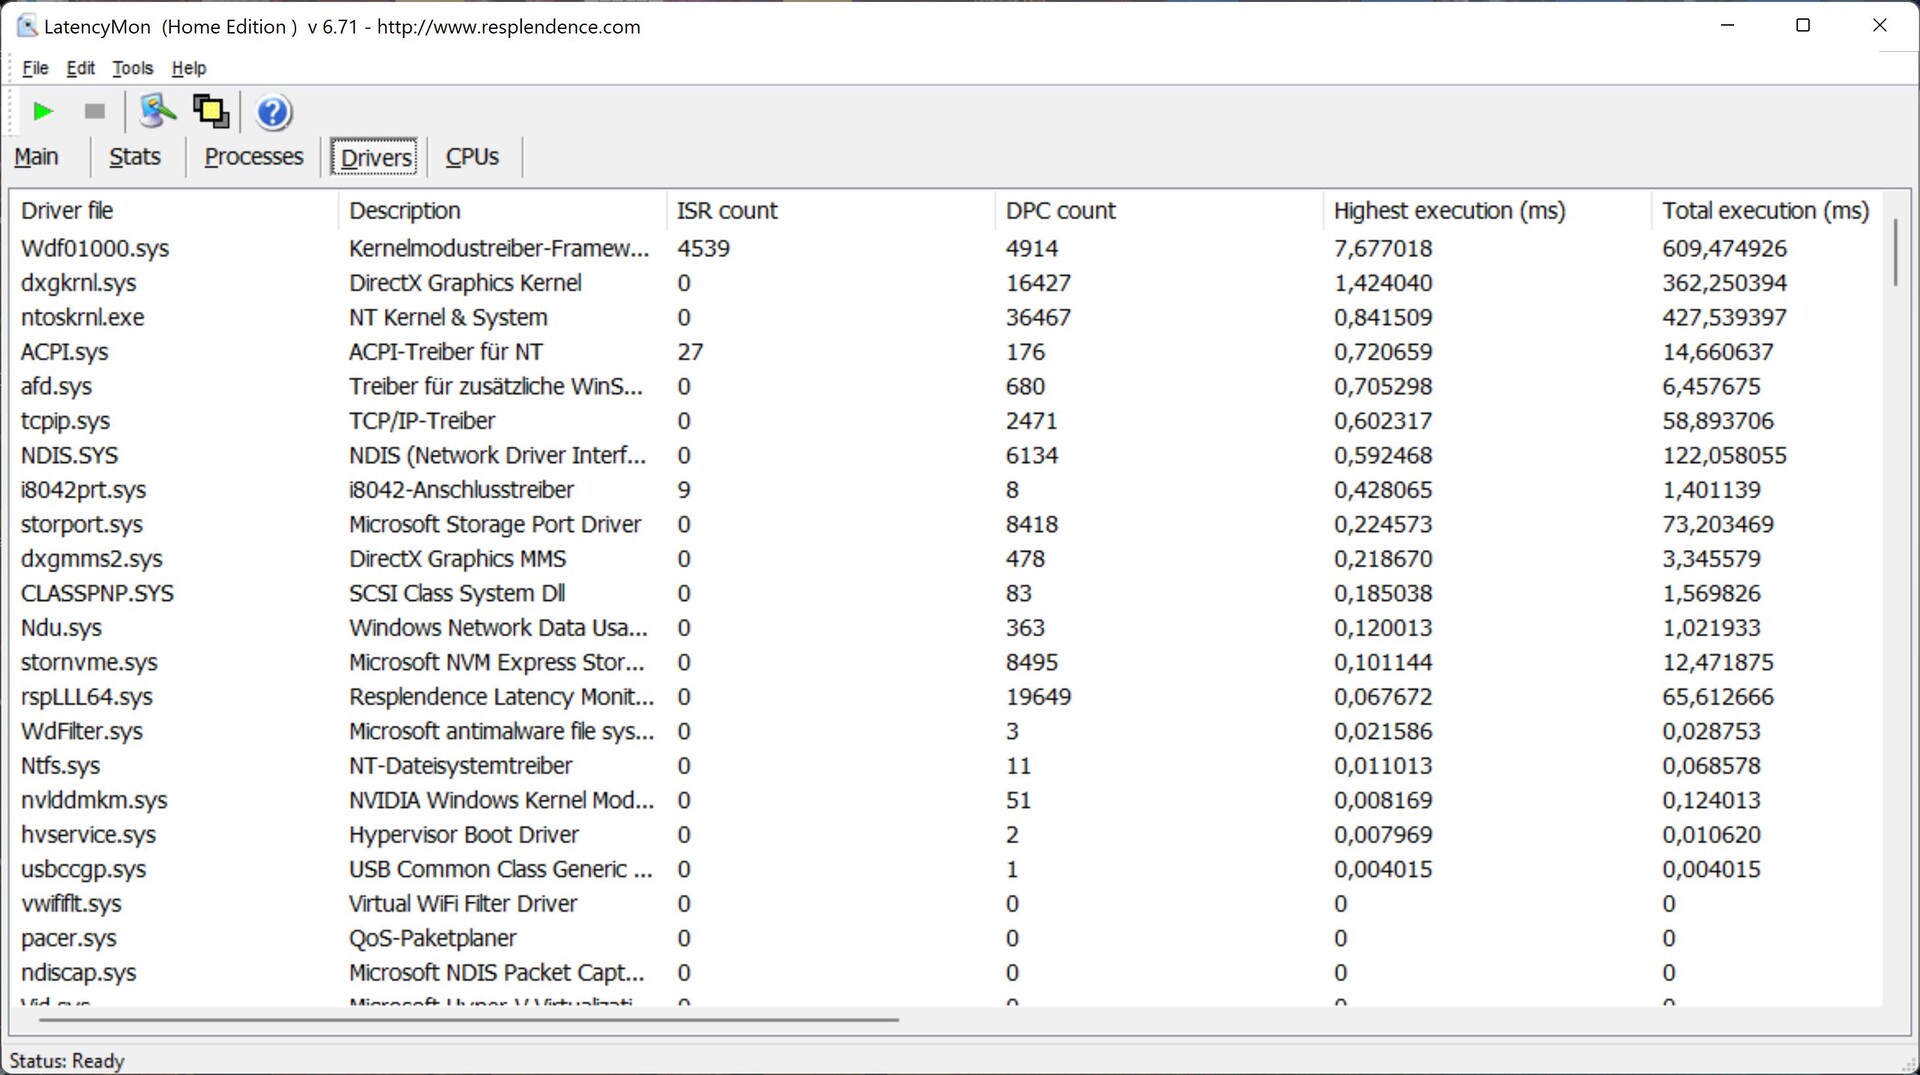
Obecna wersja BIOS-u w naszym urządzeniu recenzenckim wykazuje lekkie ograniczenia w naszym standardowym teście opóźnień (przeglądanie stron internetowych, odtwarzanie YouTube 4K, obciążenie procesora) i dlatego nie jest optymalnie dostosowana do zastosowań audio w czasie rzeczywistym.
| DPC Latencies / LatencyMon - interrupt to process latency (max), Web, Youtube, Prime95 | |
| HP ZBook Studio 15 G8 | |
| Lenovo ThinkPad P1 G4-20Y4Z9DVUS | |
| HP ZBook Studio 16 G9 62U04EA | |
| Dell Precision 5000 5560 | |
* ... im mniej tym lepiej
Urządzenia do przechowywania danych
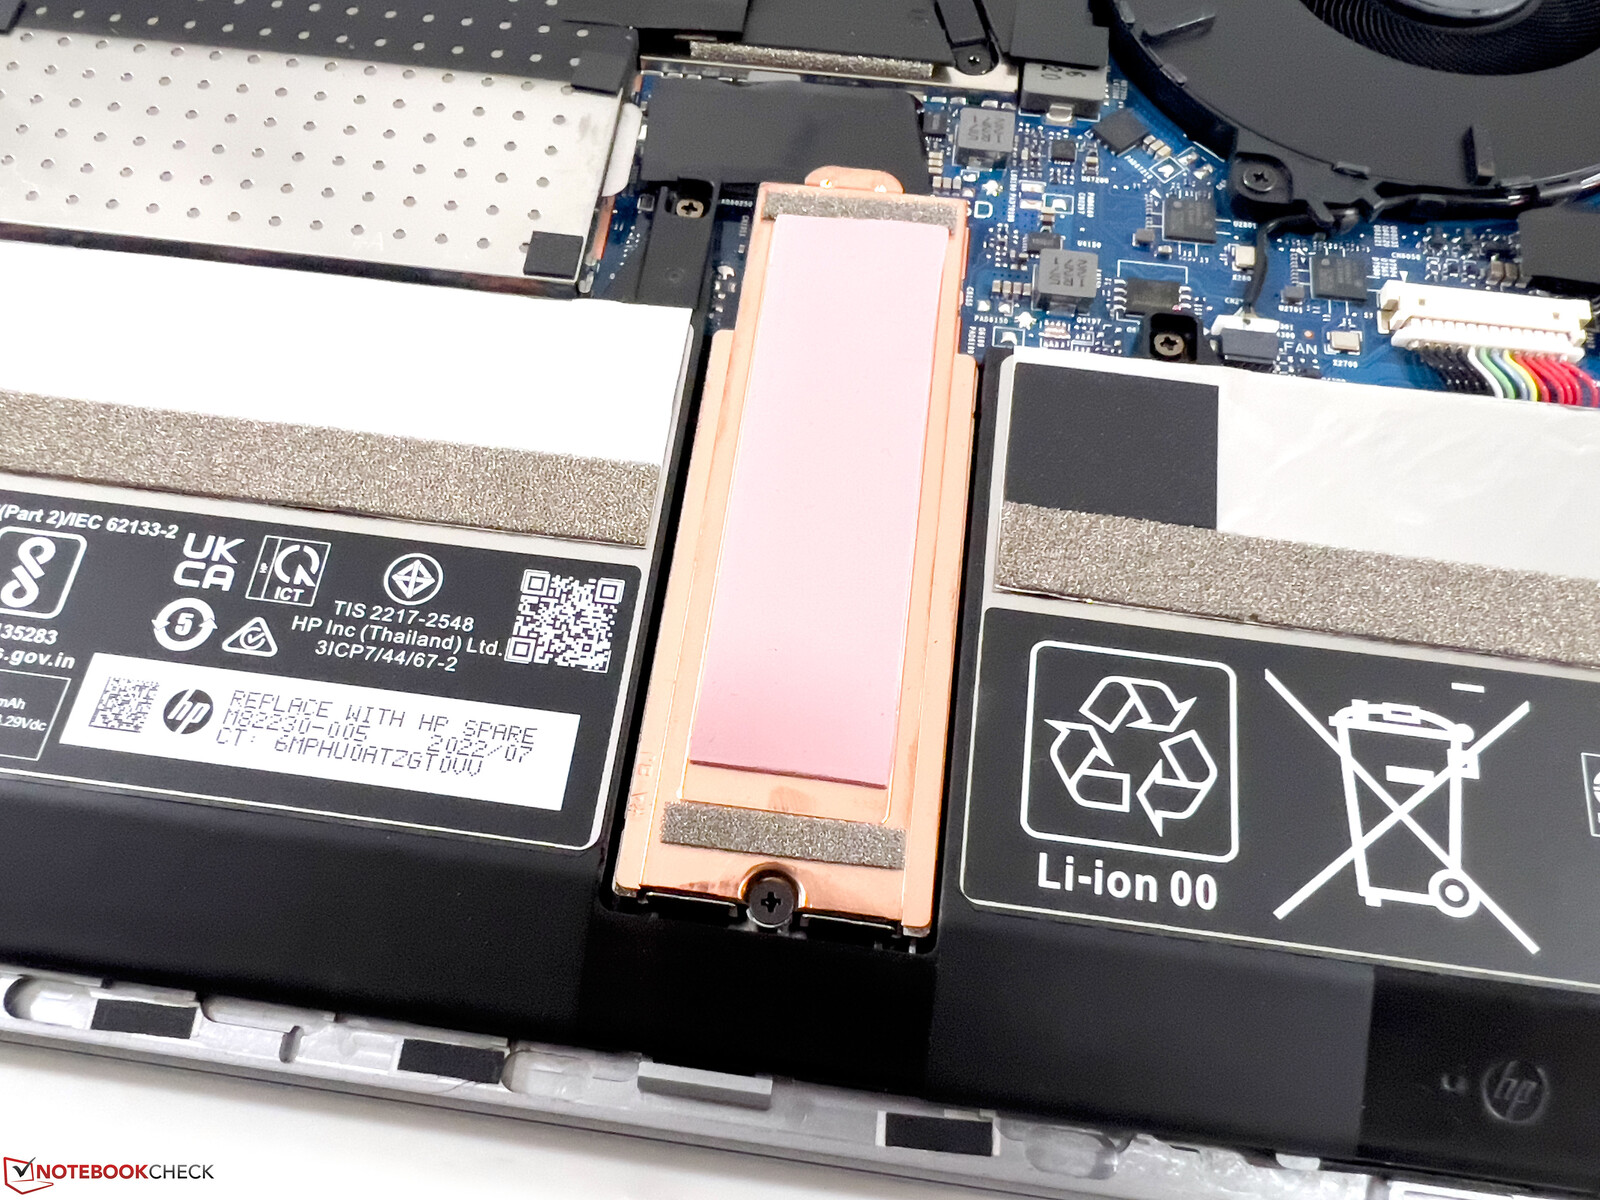
HP stosuje szybki dysk SSD PCIe 4.0 Micron 3400 o pojemności 1 TB (880 GB dostępne po pierwszym uruchomieniu). Transfery są bardzo wysokie i po kilku minutach występuje tylko minimalny spadek wydajności, nawet pod stałym obciążeniem, ale w praktyce nie ma to znaczenia. Więcej benchmarków dysków SSD jest dostępnych m.in tutaj.

| Drive Performance rating - Percent | |
| Średnia w klasie Workstation | |
| Przeciętny Micron 3400 1TB MTFDKBA1T0TFH | |
| Dell Precision 5000 5560 | |
| HP ZBook Studio 16 G9 62U04EA | |
| Lenovo ThinkPad P1 G4-20Y4Z9DVUS | |
| HP ZBook Studio 15 G8 | |
* ... im mniej tym lepiej
Sustained Read Performance: DiskSpd Read Loop, Queue Depth 8
Karta graficzna - Nvidia RTX A2000
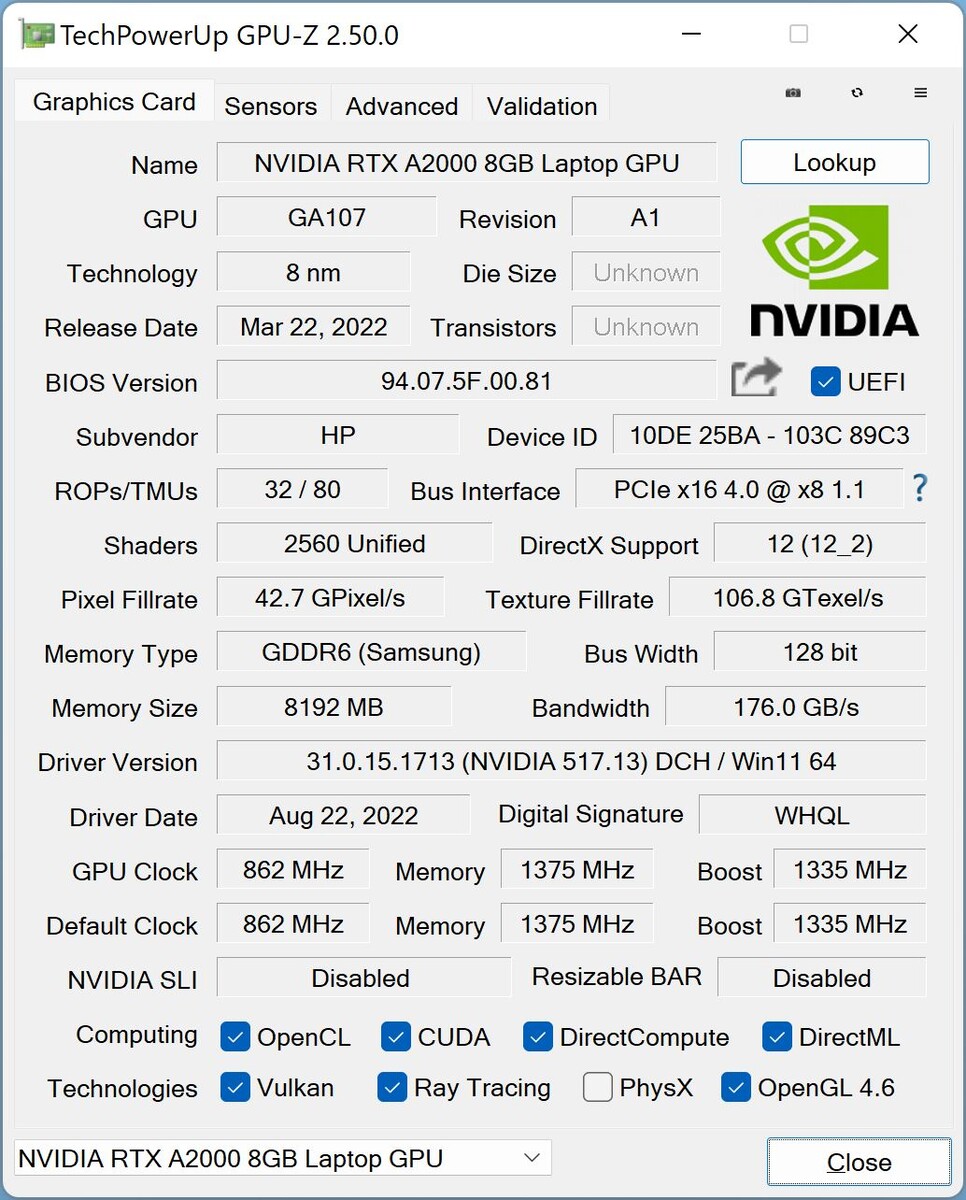
Na stronie Nvidia RTX A2000to profesjonalny procesor graficzny oparty na układzie GA107, który dzieli wiele podobieństw z m.in GeForce RTX 3050 Tipomimo identycznego oznaczenia, RTX A2000 otrzymał w tym roku aktualizację: zamiast 4 GB GDDR6 VRAM mieści teraz 8 GB VRAM o nieco wyższej prędkości.
HP używa 45-watowej wersji RTX A2000, przy czym dodatkowe 5 watów jest dostępne do wykorzystania przez procesor. Dzięki temu jest to jedna z wolniejszych wersji, a średnie wyniki dla tego GPU w naszej bazie są również nieco wyższe. Pod względem surowej wydajności RTX A2000 w ZBook Studio 16 G9 jest mniej więcej na równi zM1-Pro-GPU w MacBook Pro 16.
Na stronie RTX 3070ze starego Studio 15 G8 jest oczywiście lepszy pod względem surowej wydajności, ale w profesjonalnych testach RTX A2000 od czasu do czasu ma wyraźną przewagę dzięki profesjonalnym sterownikom. Co więcej, wydajność RTX A2000 pozostaje całkowicie stabilna pod stałym obciążeniem, co widać zarówno w teście stresu 3DMark, jak i w naszej pętli Witcher 3. Gaming jest również możliwy w przypadku ZBooka; w zależności od tytułu, często oferuje on wystarczającą moc dla wysokich do maksymalnych detali w Full HD.
Na zasilaniu akumulatorowym pobór mocy przez GPU jest ograniczony do 35 W, co odpowiada deficytowi około 20%. Więcej benchmarków GPU znajduje się w naszym dziale technicznym.
| 3DMark Performance rating - Percent | |
| Średnia w klasie Workstation | |
| Apple MacBook Pro 16 2021 M1 Max -21! | |
| Przeciętny NVIDIA RTX A2000 Laptop GPU | |
| HP ZBook Studio 15 G8 -11! | |
| Dell Precision 5000 5560 -3! | |
| HP ZBook Studio 16 G9 62U04EA | |
| Apple MacBook Pro 16 2021 M1 Pro -21! | |
| Lenovo ThinkPad P1 G4-20Y4Z9DVUS -1! | |
| 3DMark 11 - 1280x720 Performance GPU | |
| Średnia w klasie Workstation (10888 - 69594, n=25, ostatnie 2 lata) | |
| HP ZBook Studio 15 G8 | |
| HP ZBook Studio 16 G9 62U04EA | |
| Przeciętny NVIDIA RTX A2000 Laptop GPU (14831 - 19823, n=9) | |
| Dell Precision 5000 5560 | |
| Lenovo ThinkPad P1 G4-20Y4Z9DVUS | |
| 3DMark | |
| 1920x1080 Fire Strike Graphics | |
| Średnia w klasie Workstation (7578 - 52560, n=25, ostatnie 2 lata) | |
| HP ZBook Studio 15 G8 | |
| Przeciętny NVIDIA RTX A2000 Laptop GPU (10415 - 15988, n=9) | |
| HP ZBook Studio 16 G9 62U04EA | |
| Dell Precision 5000 5560 | |
| Lenovo ThinkPad P1 G4-20Y4Z9DVUS | |
| 2560x1440 Time Spy Graphics | |
| Średnia w klasie Workstation (2725 - 24806, n=25, ostatnie 2 lata) | |
| HP ZBook Studio 15 G8 | |
| Przeciętny NVIDIA RTX A2000 Laptop GPU (4228 - 6108, n=9) | |
| HP ZBook Studio 16 G9 62U04EA | |
| Dell Precision 5000 5560 | |
| Lenovo ThinkPad P1 G4-20Y4Z9DVUS | |
| Wild Life Extreme Unlimited | |
| Apple MacBook Pro 16 2021 M1 Max | |
| Średnia w klasie Workstation (n=1ostatnie 2 lata) | |
| Apple MacBook Pro 16 2021 M1 Pro | |
| HP ZBook Studio 16 G9 62U04EA | |
| Przeciętny NVIDIA RTX A2000 Laptop GPU (9041 - 9895, n=2) | |
| V-Ray Benchmark Next 4.10 - GPU | |
| Średnia w klasie Workstation (82 - 1362, n=24, ostatnie 2 lata) | |
| Przeciętny NVIDIA RTX A2000 Laptop GPU (194 - 255, n=6) | |
| HP ZBook Studio 16 G9 62U04EA | |
| Lenovo ThinkPad P1 G4-20Y4Z9DVUS | |
| Geekbench 5.5 - OpenCL Score | |
| Średnia w klasie Workstation (33651 - 272866, n=25, ostatnie 2 lata) | |
| Przeciętny NVIDIA RTX A2000 Laptop GPU (58687 - 72661, n=7) | |
| Apple MacBook Pro 16 2021 M1 Max | |
| HP ZBook Studio 16 G9 62U04EA | |
| Lenovo ThinkPad P1 G4-20Y4Z9DVUS | |
| Apple MacBook Pro 16 2021 M1 Pro | |
| 3DMark 11 Performance | 18475 pkt. | |
| 3DMark Fire Strike Score | 12211 pkt. | |
| 3DMark Time Spy Score | 5523 pkt. | |
Pomoc | ||
* ... im mniej tym lepiej
Witcher 3 FPS chart
| low | med. | high | ultra | QHD | 4K | |
|---|---|---|---|---|---|---|
| GTA V (2015) | 185.7 | 181.1 | 146.3 | 72.1 | 51.8 | 44.1 |
| The Witcher 3 (2015) | 282 | 188 | 103 | 48.8 | 33 | |
| Dota 2 Reborn (2015) | 181.5 | 166.9 | 157.4 | 149.4 | 72.3 | |
| Final Fantasy XV Benchmark (2018) | 141.7 | 78 | 56.4 | 41 | 23.1 | |
| X-Plane 11.11 (2018) | 138.8 | 119 | 97 | 76.5 | ||
| Far Cry 5 (2018) | 165 | 96 | 88 | 83 | 57 | 26 |
| Strange Brigade (2018) | 289 | 134 | 106 | 92 | 66 | 35 |
| F1 2021 (2021) | 290 | 166 | 138.5 | 68.4 | 48.3 | 25.7 |
| Cyberpunk 2077 1.6 (2022) | 69 | 59 | 44 | 37 | 23 | |
| F1 22 (2022) | 155.4 | 147.8 | 111.6 | 33.6 | 20.7 | 9.76 |
Emisja - Zbook z bardzo dobrymi głośnikami
Hałas
Dwa wentylatory ZBooka Studio 16 G9 uruchamiają się szybko, nawet pod niewielkim obciążeniem, a ogólna wydajność pasywnego układu chłodzenia nie jest zbyt dobra. Już podczas otwierania przeglądarki internetowej wentylatory wystrzeliwały w górę. Pod większym obciążeniem wentylatory przyspieszają bardzo szybko: zmierzyliśmy między 45-48 dB(A) pod połączonym obciążeniem. Co ciekawe, wentylatory robią się nawet nieco głośniejsze pod surowym obciążeniem procesora na poziomie 51 dB(A). Nie wykryto żadnych elektronicznych odgłosów.
Hałas
| luz |
| 24 / 27.7 / 27.7 dB |
| obciążenie |
| 39.8 / 47.7 dB |
 | ||
30 dB cichy 40 dB(A) słyszalny 50 dB(A) irytujący |
||
min: | ||
| HP ZBook Studio 16 G9 62U04EA RTX A2000 Laptop GPU, i7-12800H, Micron 3400 1TB MTFDKBA1T0TFH | Lenovo ThinkPad P1 G4-20Y4Z9DVUS T1200 Laptop GPU, i7-11800H, Samsung PM9A1 MZVL2512HCJQ | Apple MacBook Pro 16 2021 M1 Max M1 Max 32-Core GPU, M1 Max, Apple SSD AP2048R | Dell Precision 5000 5560 RTX A2000 Laptop GPU, i7-11850H, Samsung PM9A1 MZVL22T0HBLB | HP ZBook Studio 15 G8 GeForce RTX 3070 Laptop GPU, i9-11950H, Samsung PM981a MZVLB2T0HALB | |
|---|---|---|---|---|---|
| Noise | -1% | 5% | 13% | -1% | |
| wyłączone / środowisko * (dB) | 24 | 24.3 -1% | 24.2 -1% | 23.4 2% | 23.5 2% |
| Idle Minimum * (dB) | 24 | 24.3 -1% | 24.2 -1% | 23.6 2% | 25.3 -5% |
| Idle Average * (dB) | 27.7 | 24.3 12% | 24.2 13% | 23.6 15% | 25.3 9% |
| Idle Maximum * (dB) | 27.7 | 26.6 4% | 24.2 13% | 23.6 15% | 25.3 9% |
| Load Average * (dB) | 39.8 | 46.8 -18% | 42.9 -8% | 25.8 35% | 41.2 -4% |
| Witcher 3 ultra * (dB) | 44.3 | 46.8 -6% | 39.5 11% | 40.1 9% | 49.4 -12% |
| Load Maximum * (dB) | 47.7 | 46.8 2% | 42.9 10% | 41.4 13% | 49.4 -4% |
* ... im mniej tym lepiej
Temperatura
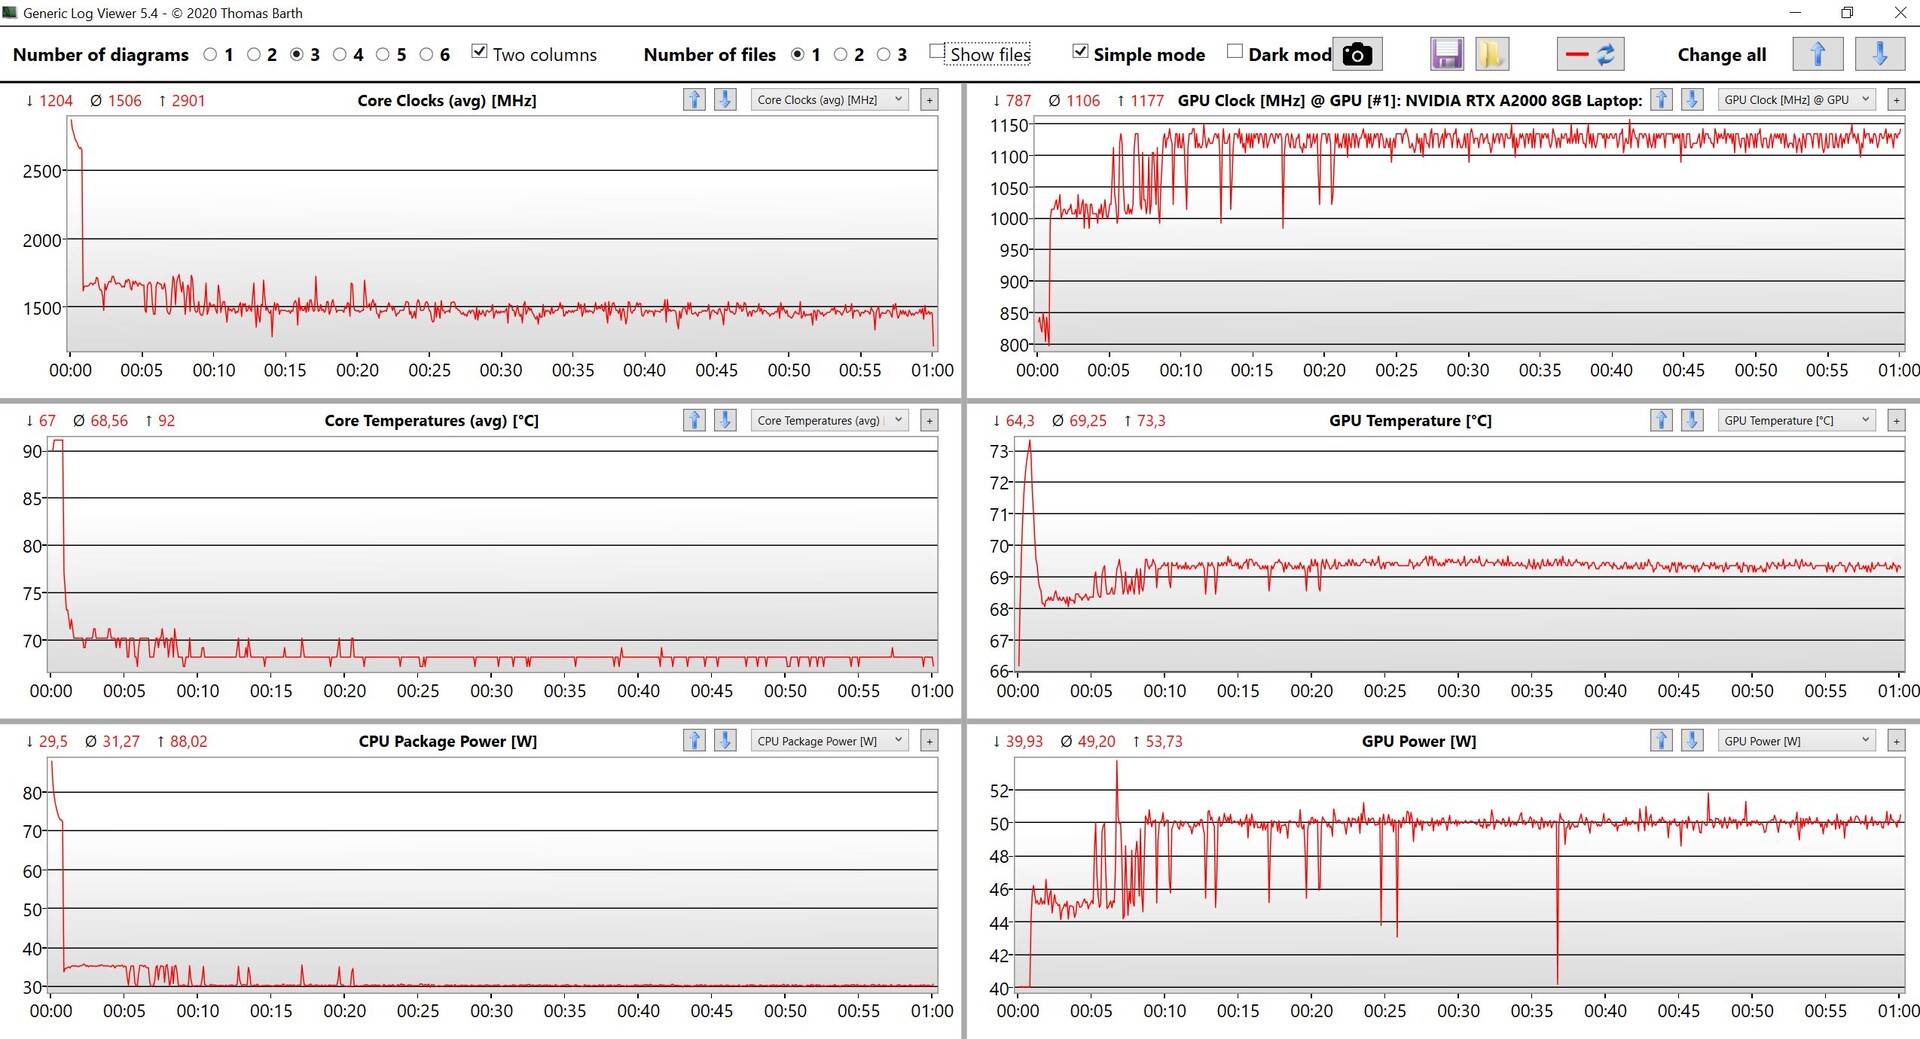
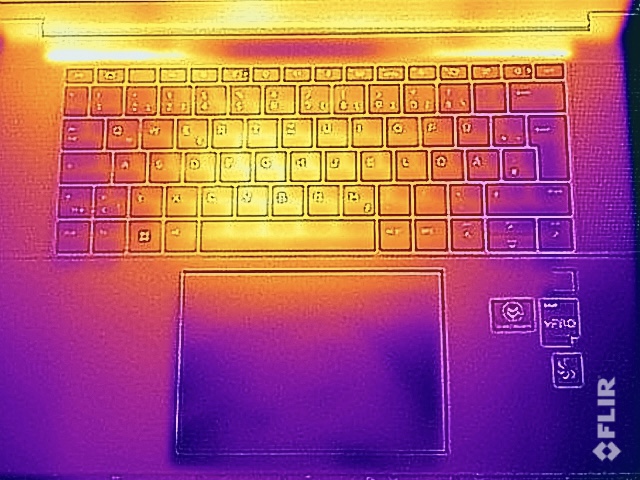
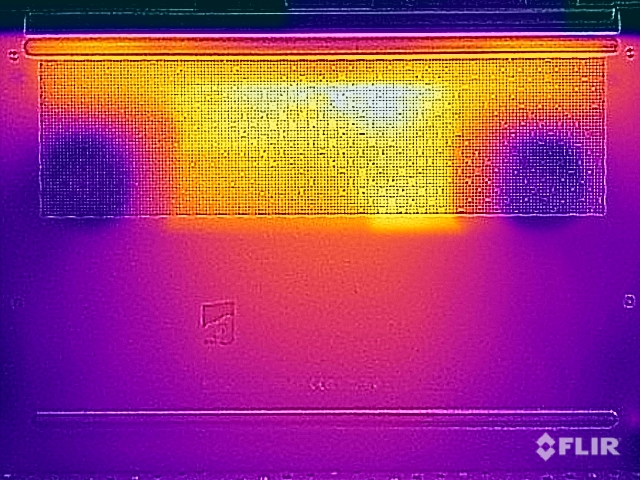
HP dobrze kontroluje temperatury powierzchni nowego ZBooka Studio 16 G9. Obudowa ledwie nagrzewa się pod niewielkim obciążeniem, a cały obszar klawiatury utrzymuje się w przyjemnych temperaturach z maksimum nieco poniżej 36°C, nawet pod maksymalnym obciążeniem. Od spodu robi się nieco cieplej i należy uważać, by unikać kontaktu skóry z hotspotem w obszarze środkowym (~53°C), ale nie ma tu żadnych ogólnych ograniczeń.
W teście obciążeniowym procesor początkowo osiąga poziom 35 W, a karta grafiki - 45 W. W trakcie dalszych testów stosunek ten ulega jednak przesunięciu - procesor spada do 30 W, podczas gdy GPU wzrasta w tym samym czasie do 50 W. Potwierdza to, że system chłodzenia jest w stanie trwale schłodzić łącznie około 80 watów. Niestety nie możemy wypowiedzieć się w kwestii konfiguracji z mocniejszymi kartami graficznymi (od RTX A3000 do GeForce RTX 3060), ponieważ zastosowano tutaj mocniejsze chłodzenie Vapor-Chamber.
(+) Maksymalna temperatura w górnej części wynosi 38.7 °C / 102 F, w porównaniu do średniej 38.2 °C / 101 F , począwszy od 22.2 do 69.8 °C dla klasy Workstation.
(-) Dno nagrzewa się maksymalnie do 53.4 °C / 128 F, w porównaniu do średniej 41.1 °C / 106 F
(+) W stanie bezczynności średnia temperatura górnej części wynosi 25.9 °C / 79 F, w porównaniu ze średnią temperaturą urządzenia wynoszącą 32 °C / ### class_avg_f### F.
(+) Podczas gry w Wiedźmina 3 średnia temperatura górnej części wynosi 30.6 °C / 87 F, w porównaniu do średniej temperatury urządzenia wynoszącej 32 °C / ## #class_avg_f### F.
(+) Podpórki pod nadgarstki i touchpad są chłodniejsze niż temperatura skóry i maksymalnie 28.1 °C / 82.6 F i dlatego są chłodne w dotyku.
(±) Średnia temperatura obszaru podparcia dłoni w podobnych urządzeniach wynosiła 27.8 °C / 82 F (-0.3 °C / -0.6 F).
| HP ZBook Studio 16 G9 62U04EA Intel Core i7-12800H, NVIDIA RTX A2000 Laptop GPU | Lenovo ThinkPad P1 G4-20Y4Z9DVUS Intel Core i7-11800H, NVIDIA T1200 Laptop GPU | Apple MacBook Pro 16 2021 M1 Max Apple M1 Max, Apple M1 Max 32-Core GPU | Dell Precision 5000 5560 Intel Core i7-11850H, NVIDIA RTX A2000 Laptop GPU | HP ZBook Studio 15 G8 Intel Core i9-11950H, NVIDIA GeForce RTX 3070 Laptop GPU | |
|---|---|---|---|---|---|
| Heat | -3% | 12% | -11% | -5% | |
| Maximum Upper Side * (°C) | 38.7 | 49.9 -29% | 42.3 -9% | 48.2 -25% | 49 -27% |
| Maximum Bottom * (°C) | 53.4 | 56.7 -6% | 41.7 22% | 42.6 20% | 54.2 -1% |
| Idle Upper Side * (°C) | 27.3 | 25.5 7% | 23.9 12% | 34.8 -27% | 26.2 4% |
| Idle Bottom * (°C) | 31.6 | 26.2 17% | 23.9 24% | 35.2 -11% | 30.2 4% |
* ... im mniej tym lepiej
Mówcy
Jak wcześniej wspomniano, HP umieściło teraz głośniki obok klawiatury i wydajność czterech modułów jest bardzo dobra. Dźwięk jest bardzo obszerny i powstaje efekt stereo. Jedynie basy mogłyby się nieco poprawić, ale to niektórzy uznaliby za dzielenie włosa na czworo.
HP ZBook Studio 16 G9 62U04EA analiza dźwięku
(±) | głośność głośnika jest średnia, ale dobra (81.6 dB)
Bas 100 - 315 Hz
(±) | zredukowany bas - średnio 8.7% niższy od mediany
(±) | liniowość basu jest średnia (10.4% delta do poprzedniej częstotliwości)
Średnie 400 - 2000 Hz
(+) | zbalansowane środki średnie - tylko 3.7% od mediany
(+) | średnie są liniowe (4.6% delta do poprzedniej częstotliwości)
Wysokie 2–16 kHz
(+) | zrównoważone maksima - tylko 2.7% od mediany
(+) | wzloty są liniowe (3.5% delta do poprzedniej częstotliwości)
Ogólnie 100 - 16.000 Hz
(+) | ogólny dźwięk jest liniowy (10.6% różnicy w stosunku do mediany)
W porównaniu do tej samej klasy
» 9% wszystkich testowanych urządzeń w tej klasie było lepszych, 5% podobnych, 87% gorszych
» Najlepszy miał deltę 7%, średnia wynosiła ###średnia###%, najgorsza wynosiła 35%
W porównaniu do wszystkich testowanych urządzeń
» 6% wszystkich testowanych urządzeń było lepszych, 1% podobnych, 93% gorszych
» Najlepszy miał deltę 4%, średnia wynosiła ###średnia###%, najgorsza wynosiła 134%
Apple MacBook Pro 16 2021 M1 Pro analiza dźwięku
(+) | głośniki mogą odtwarzać stosunkowo głośno (84.7 dB)
Bas 100 - 315 Hz
(+) | dobry bas - tylko 3.8% od mediany
(+) | bas jest liniowy (5.2% delta do poprzedniej częstotliwości)
Średnie 400 - 2000 Hz
(+) | zbalansowane środki średnie - tylko 1.3% od mediany
(+) | średnie są liniowe (2.1% delta do poprzedniej częstotliwości)
Wysokie 2–16 kHz
(+) | zrównoważone maksima - tylko 1.9% od mediany
(+) | wzloty są liniowe (2.7% delta do poprzedniej częstotliwości)
Ogólnie 100 - 16.000 Hz
(+) | ogólny dźwięk jest liniowy (4.6% różnicy w stosunku do mediany)
W porównaniu do tej samej klasy
» 0% wszystkich testowanych urządzeń w tej klasie było lepszych, 0% podobnych, 100% gorszych
» Najlepszy miał deltę 5%, średnia wynosiła ###średnia###%, najgorsza wynosiła 45%
W porównaniu do wszystkich testowanych urządzeń
» 0% wszystkich testowanych urządzeń było lepszych, 0% podobnych, 100% gorszych
» Najlepszy miał deltę 4%, średnia wynosiła ###średnia###%, najgorsza wynosiła 134%
Zarządzanie energią - DreamColor zużywa dużo energii
Pobór mocy
Panel DreamColor o wysokiej rozdzielczości wymaga sporo mocy, co potwierdzają pomiary na poziomie prawie 19 watów w trybie bezczynności. Panel OLED 4K poprzednika był pod tym względem jeszcze bardziej głodny. Nie zarejestrowano żadnych nieprawidłowości pod obciążeniem.
Zmierzyliśmy maksymalny szczytowy pobór 186 watów, ale szybko wyrównuje się on w okolicach 120 watów. Dołączony 200-watowy zasilacz jest więc jak najbardziej wystarczający.
| wyłączony / stan wstrzymania | |
| luz | |
| obciążenie |
|
Legenda:
min: | |
| HP ZBook Studio 16 G9 62U04EA i7-12800H, RTX A2000 Laptop GPU, Micron 3400 1TB MTFDKBA1T0TFH, IPS, 3840x2400, 16" | Lenovo ThinkPad P1 G4-20Y4Z9DVUS i7-11800H, T1200 Laptop GPU, Samsung PM9A1 MZVL2512HCJQ, IPS, 2560x1600, 16" | Apple MacBook Pro 16 2021 M1 Max M1 Max, M1 Max 32-Core GPU, Apple SSD AP2048R, Mini-LED, 3456x2234, 16.2" | Dell Precision 5000 5560 i7-11850H, RTX A2000 Laptop GPU, Samsung PM9A1 MZVL22T0HBLB, IPS, 3840x2400, 15.6" | HP ZBook Studio 15 G8 i9-11950H, GeForce RTX 3070 Laptop GPU, Samsung PM981a MZVLB2T0HALB, OLED, 3840x2160, 15.6" | Przeciętny NVIDIA RTX A2000 Laptop GPU | Średnia w klasie Workstation | |
|---|---|---|---|---|---|---|---|
| Power Consumption | 6% | 15% | 12% | -25% | 12% | 5% | |
| Idle Minimum * (Watt) | 7.2 | 9.9 -38% | 5.4 25% | 6.2 14% | 11 -53% | 6.6 ? 8% | 8.94 ? -24% |
| Idle Average * (Watt) | 18.1 | 13.9 23% | 16.4 9% | 13.9 23% | 18.8 -4% | 11.8 ? 35% | 13.8 ? 24% |
| Idle Maximum * (Watt) | 18.5 | 14.6 21% | 16.7 10% | 23.8 -29% | 31.7 -71% | 16.7 ? 10% | 17.5 ? 5% |
| Load Average * (Watt) | 112.8 | 95 16% | 94 17% | 95.7 15% | 105.2 7% | 116.3 ? -3% | 95 ? 16% |
| Witcher 3 ultra * (Watt) | 106.7 | 98.9 7% | 104 3% | 87 18% | 148 -39% | ||
| Load Maximum * (Watt) | 186 | 170.8 8% | 135 27% | 132.6 29% | 171.8 8% | 171.2 ? 8% | 175.2 ? 6% |
* ... im mniej tym lepiej
Power consumption Witcher 3 / Stress test
Power consumption with an external monitor
Czas pracy na baterii
Mimo dużego akumulatora o pojemności 86 Wh, czasy pracy na baterii nie są szczególnie długie. W naszym teście Wi-Fi zanotowaliśmy między 4,5-6,5 godziny, w zależności od jasności. Oczywiście jest to w zupełności wystarczające do okazjonalnych spotkań, ale nie na tyle, by pokryć cały dzień pracy bez zasilacza. W świetle tych wyników ZBook Studio 16 G9 plasuje się więc na końcu pola porównawczego. Osoby zainteresowane ZBookiem Studio i potrzebujące dłuższych czasów pracy na akumulatorze powinny wybrać konfigurację z wyświetlaczem o niskim poborze mocy (400 nitów).
Pełne naładowanie akumulatora trwa 2 godziny po włączeniu urządzenia; 80% pojemności jest dostępne już po około godzinie.
| HP ZBook Studio 16 G9 62U04EA i7-12800H, RTX A2000 Laptop GPU, 86 Wh | Lenovo ThinkPad P1 G4-20Y4Z9DVUS i7-11800H, T1200 Laptop GPU, 90 Wh | Apple MacBook Pro 16 2021 M1 Max M1 Max, M1 Max 32-Core GPU, 99.6 Wh | Dell Precision 5000 5560 i7-11850H, RTX A2000 Laptop GPU, 86 Wh | HP ZBook Studio 15 G8 i9-11950H, GeForce RTX 3070 Laptop GPU, 83 Wh | Średnia w klasie Workstation | |
|---|---|---|---|---|---|---|
| Czasy pracy | 40% | 79% | 32% | 31% | 26% | |
| H.264 (h) | 8.5 | 17 100% | 9.51 ? 12% | |||
| WiFi v1.3 (h) | 6.3 | 8.8 40% | 14.9 137% | 6.3 0% | 6.2 -2% | 8.53 ? 35% |
| Load (h) | 1.1 | 1.1 0% | 1.8 64% | 1.8 64% | 1.429 ? 30% |
Za
Przeciw
Werdykt - ZBook Studio G9 solidnym awansem
Nowy ZBook Studio 16 G9 to solidny upgrae w kilku obszarach. Mobilny laptop HP dla stacji roboczej pozostaje niezwykle wysokiej jakości, ale teraz wygląda znacznie bardziej nowocześnie dzięki nowemu wyświetlaczowi 16:10. Ponadto na pokładzie ponownie znalazły się dwa gniazda SODIMM, więc pamięć RAM można łatwo rozbudować. Jedynym problemem jest tutaj trudny dostęp do podzespołów
Wydajność dwóch głównych podzespołów jest ogólnie dobra: Procesor Core i7 korzysta z wysokich limitów mocy, a Nvidia RTX A2000 oferuje stabilną wydajność, nawet jeśli jest to jedna z wolniejszych wersji o maksymalnej mocy 50 W (TGP). Konwencjonalne chłodzenie osiąga jednak swoje granice pod połączonym obciążeniem, dlatego w modelach z mocniejszymi GPU HP instaluje chłodzenie z komorą parową. Wyświetlacz DreamColor o częstotliwości odświeżania 120 Hz oferuje bardzo dobrą subiektywną jakość obrazu, a w testach imponuje również wiernym odwzorowaniem kolorów, ale też wymaga sporo mocy.
HP ZBook Studio 16 G9 to wysokiej jakości i wydajna mobilna stacja robocza, która mimo 16-calowej obudowy jest nadal dość mobilna
Tradycyjnie ZBook Studio nie oferuje dedykowanego bloku numerycznego, a miejsce obok klawiatury jest wykorzystywane na (bardzo dobry) układ dźwiękowy. Trzeba tu jednak wspomnieć, że klawiatura w tańszym ZBook Firefly 16 G9 (a także EliteBooka 865 G9) jest tylko trochę lepsza i również oferuje blok numeryczny. Kolejnym punktem krytyki, choć na poziomie powierzchownym, jest czucie pisania w droższym ZBooku Studio 16 G93, który naprawdę nie powinien wypadać tutaj gorzej. Trzeba też mieć na uwadze, że w codziennym użytkowaniu wentylatory również odpalają się stosunkowo szybko
Nie mamy jeszcze okazji zapoznać się z innymi obecnymi i konkurencyjnymi mobilnymi stacjami roboczymi, ale nowy ZBook Studio 16 G9 ma wiele zalet i jest ogólnie rzecz biorąc bardzo solidnym zestawem
Cena i dostępność
Zainteresowanym nabywcom zaleca się bezpośrednie sprawdzenie dostępności za pośrednictwem sklepu internetowego z laptopami HP (w stosownych przypadkach). Każdy region oferuje zróżnicowany sprzęt (zwłaszcza panele) i specyfikacje. Na przykład konfiguracje w USA wahają się od 2 374,05 USD aż do 6 432,00 USD. Dotyczy to również innych krajów, takich jak UK, Indie oraz Australia.
Ceny są aktualne na dzień 13.11.2022 i mogą ulec zmianie
HP ZBook Studio 16 G9 62U04EA
- 10/11/2022 v7 (old)
Andreas Osthoff
Price comparison

