Werdykt - Ważący 1 kg laptop biznesowy z możliwościami gamingowymi
Panther Lake to skok generacyjny w stosunku do Lunar Lake i Arrow Lake, zwłaszcza pod względem wydajności graficznej i wydajności GPU na wat. Działa on w podobnym zakresie mocy jak Arrow Lake-H, oferując jednocześnie wydajność podobną do GeForce RTX 4050 na 14-calowym laptopie o wadze 1 kg. Co więcej, procesor dziedziczy wiele zalet Lunar Lake, w tym zarówno długi czas pracy na baterii, jak i mocną jednostkę NPU. Systemy AMD Strix Halo, takie jak 14-calowy HP ZBook Ultra G1a mogą być jeszcze szybsze, ale działają również w wyższych zakresach mocy niż seria Panther Lake-X.
Zauważalną wadą Asusa jest to, że musi być podłączony do sieci, aby uzyskać maksymalną wydajność procesora. W przeciwnym razie system osiąga niższy pułap TDP, co pociąga za sobą spadek wydajności. Większość starszych laptopów ze zintegrowanym układem graficznym nie wykazuje takiego zachowania podczas pracy na zasilaniu bateryjnym.
Jeśli chodzi o samego laptopa, haptyczny clickpad może być zbyt czuły, podczas gdy matowy OLED jest zauważalnie bardziej ziarnisty niż bardziej popularne błyszczące panele. Niektórzy użytkownicy biznesowi mogą jednak zignorować te niedociągnięcia ze względu na imponującą przenośność i potencjał wydajności systemu jako całości.
Za
Przeciw
Cena i dostępność
ExpertBook Ultra z Panther Lake ma trafić do sprzedaży w 2. kwartale 2026 roku. Asus nie ogłosił żadnych cen w momencie publikacji.
Spis treści
- Werdykt - Ważący 1 kg laptop biznesowy z możliwościami gamingowymi
- Specyfikacje
- Obudowa - stop magnezowo-aluminiowy CNC z powłoką nanoceramiczną
- Łączność
- Urządzenia wejściowe - Zbyt czuły Clickpad
- Wyświetlacz - Tandem OLED, VRR, HDR i matowe szkło Corning Gorilla Glass
- Wydajność - laptop do gier w przebraniu
- Emisje
- Zarządzanie energią
- Ocena Notebookcheck
- Potencjalni konkurenci w porównaniu
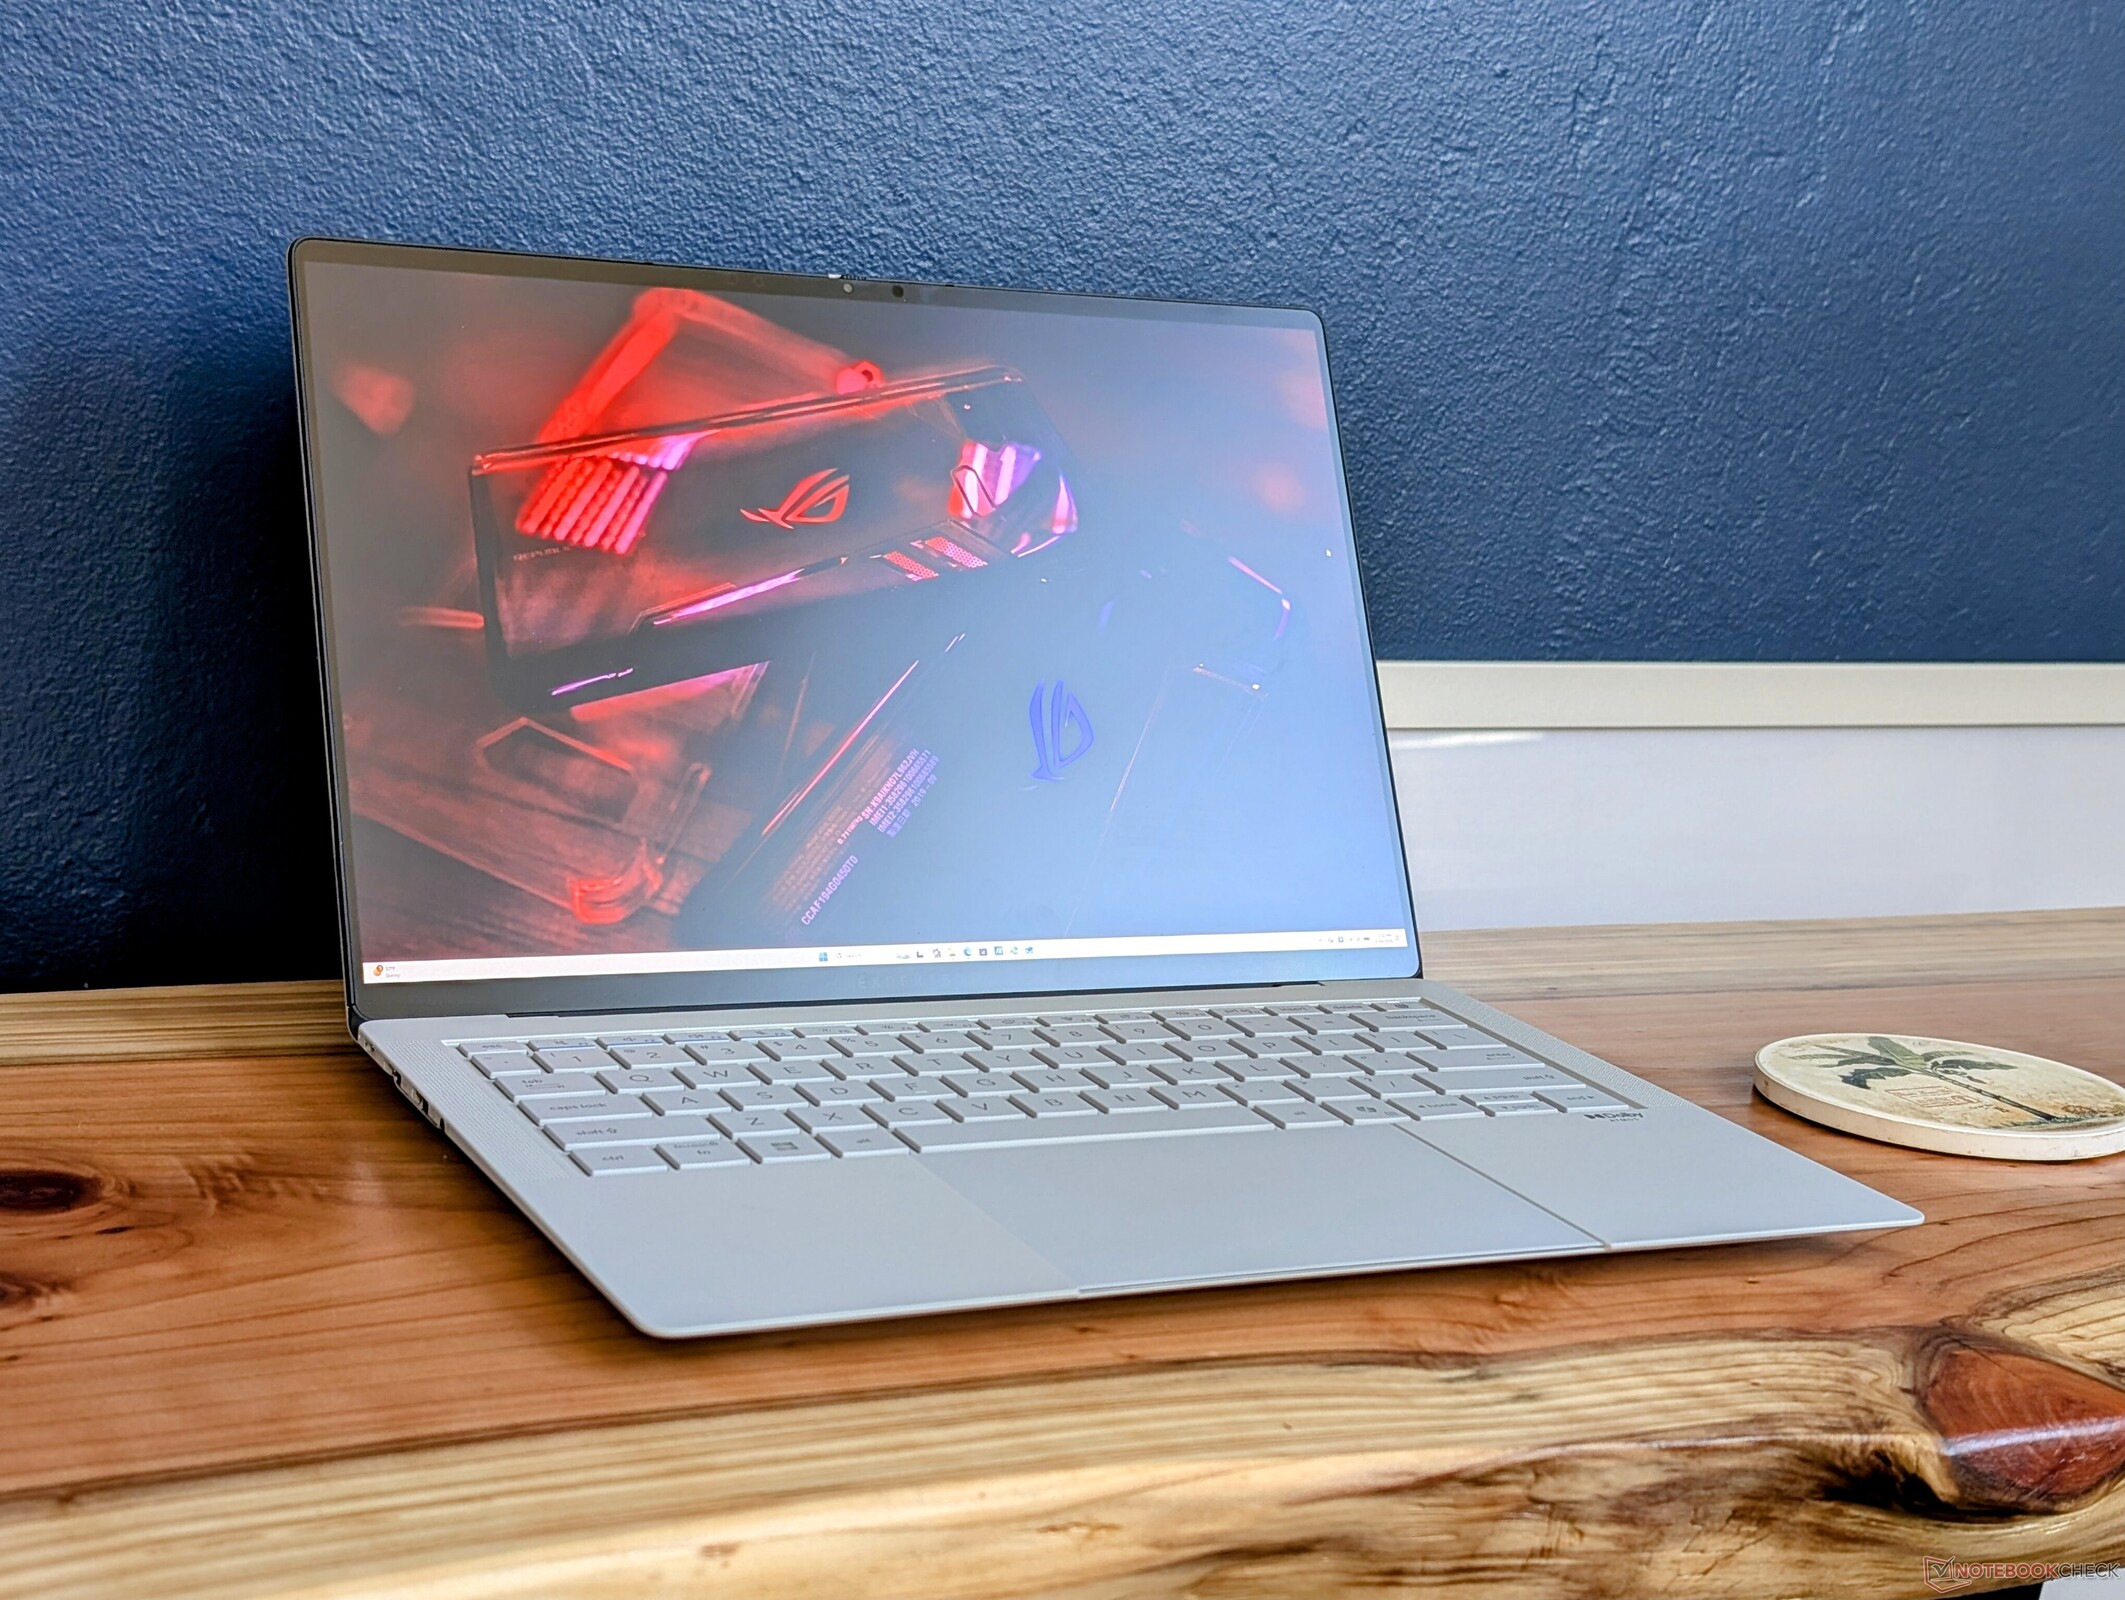
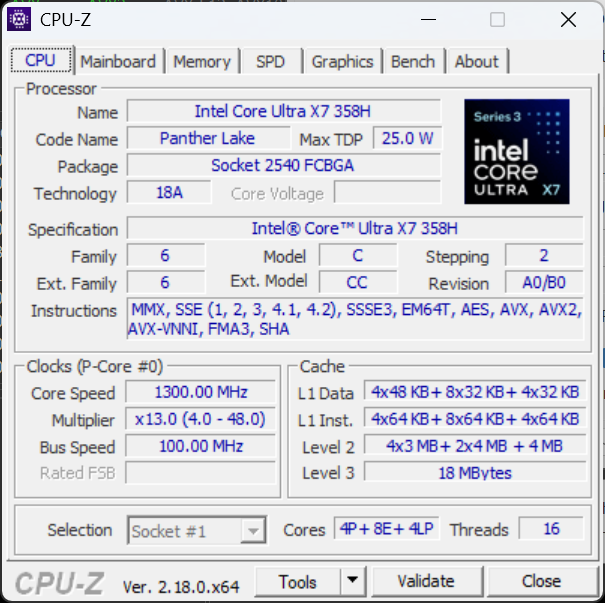
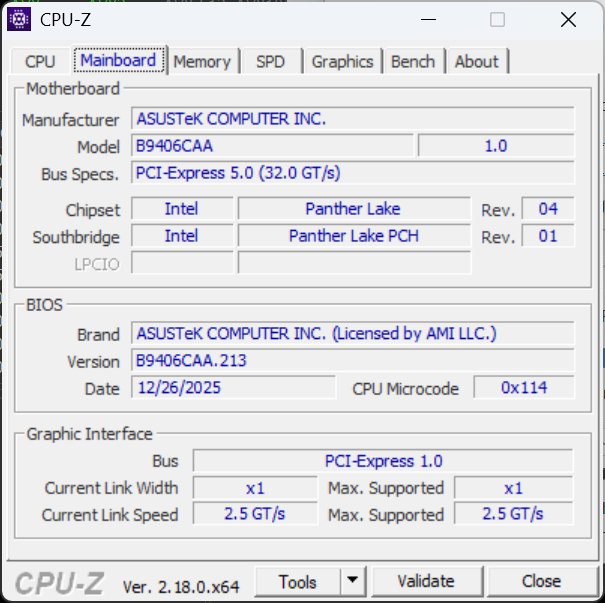
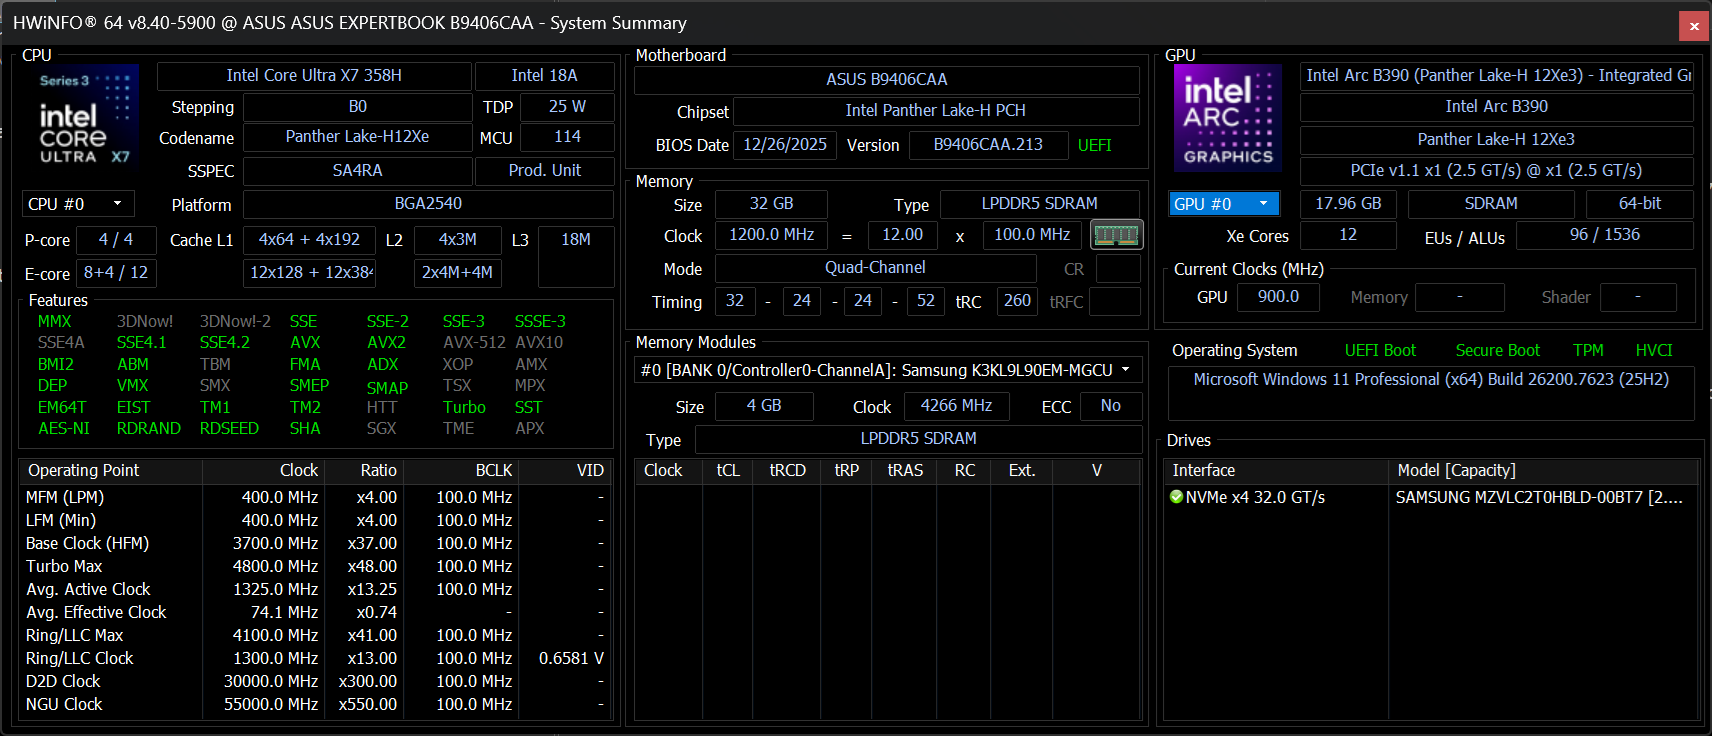
Zaprezentowany zaledwie kilka tygodni temu na targach CES 2026, ExpertBook Ultra to nowy flagowy 14-calowy laptop biznesowy Asusa wyposażony w zupełnie nowe funkcje w ultralekkiej obudowie. Model ten wyróżnia się tym, że jest jednym z pierwszych powszechnie dostępnych laptopów działających na najnowszej platformie Intel Panther Lake-H.
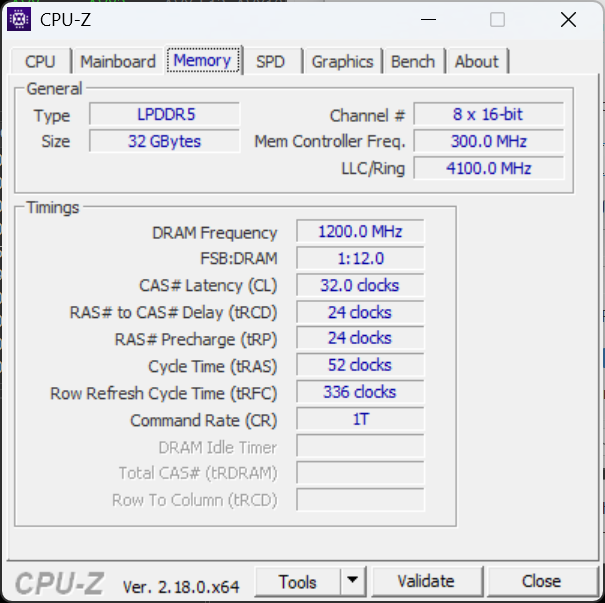
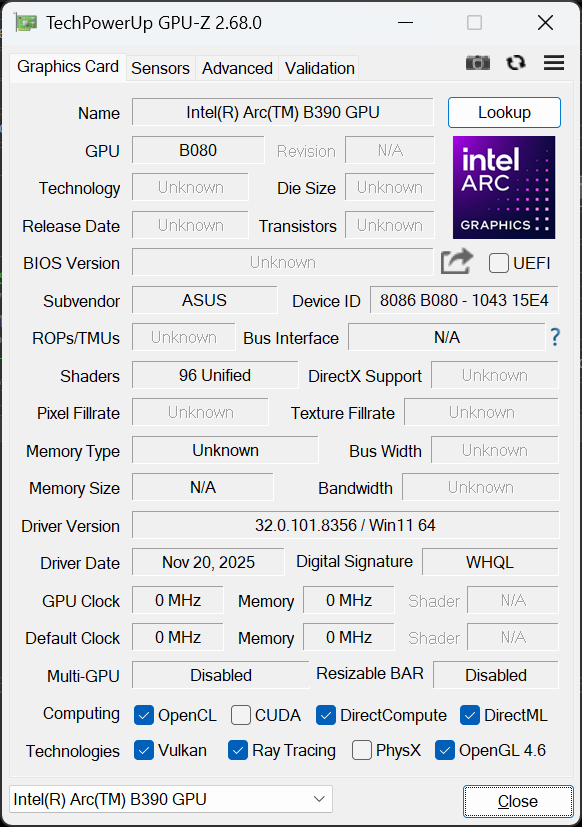
Nasz testowy egzemplarz został wyposażony w procesor Core Ultra X7 358H i 32 GB wlutowanej pamięci LPDDR5X RAM, podczas gdy wyższe wersje posiadają Core Ultra X9 388H z dwukrotnie większą pamięcią. Wszystkie amerykańskie konfiguracje zawierają ten sam matowy ekran dotykowy OLED 2880 x 1800 120 Hz oraz zintegrowany układ graficzny Arc B390. Dostępne są opcje kolorystyczne Morn Grey i Jet Fog.
Konkurentami w tej dziedzinie są inne cienkie i lekkie 14-calowe laptopy biznesowe, takie jak te z serii Lenovo ThinkPad T14s, Dell Pro 14 Premiumlub HP EliteBook Ultra 14.
Więcej recenzji Asusa:
Specyfikacje
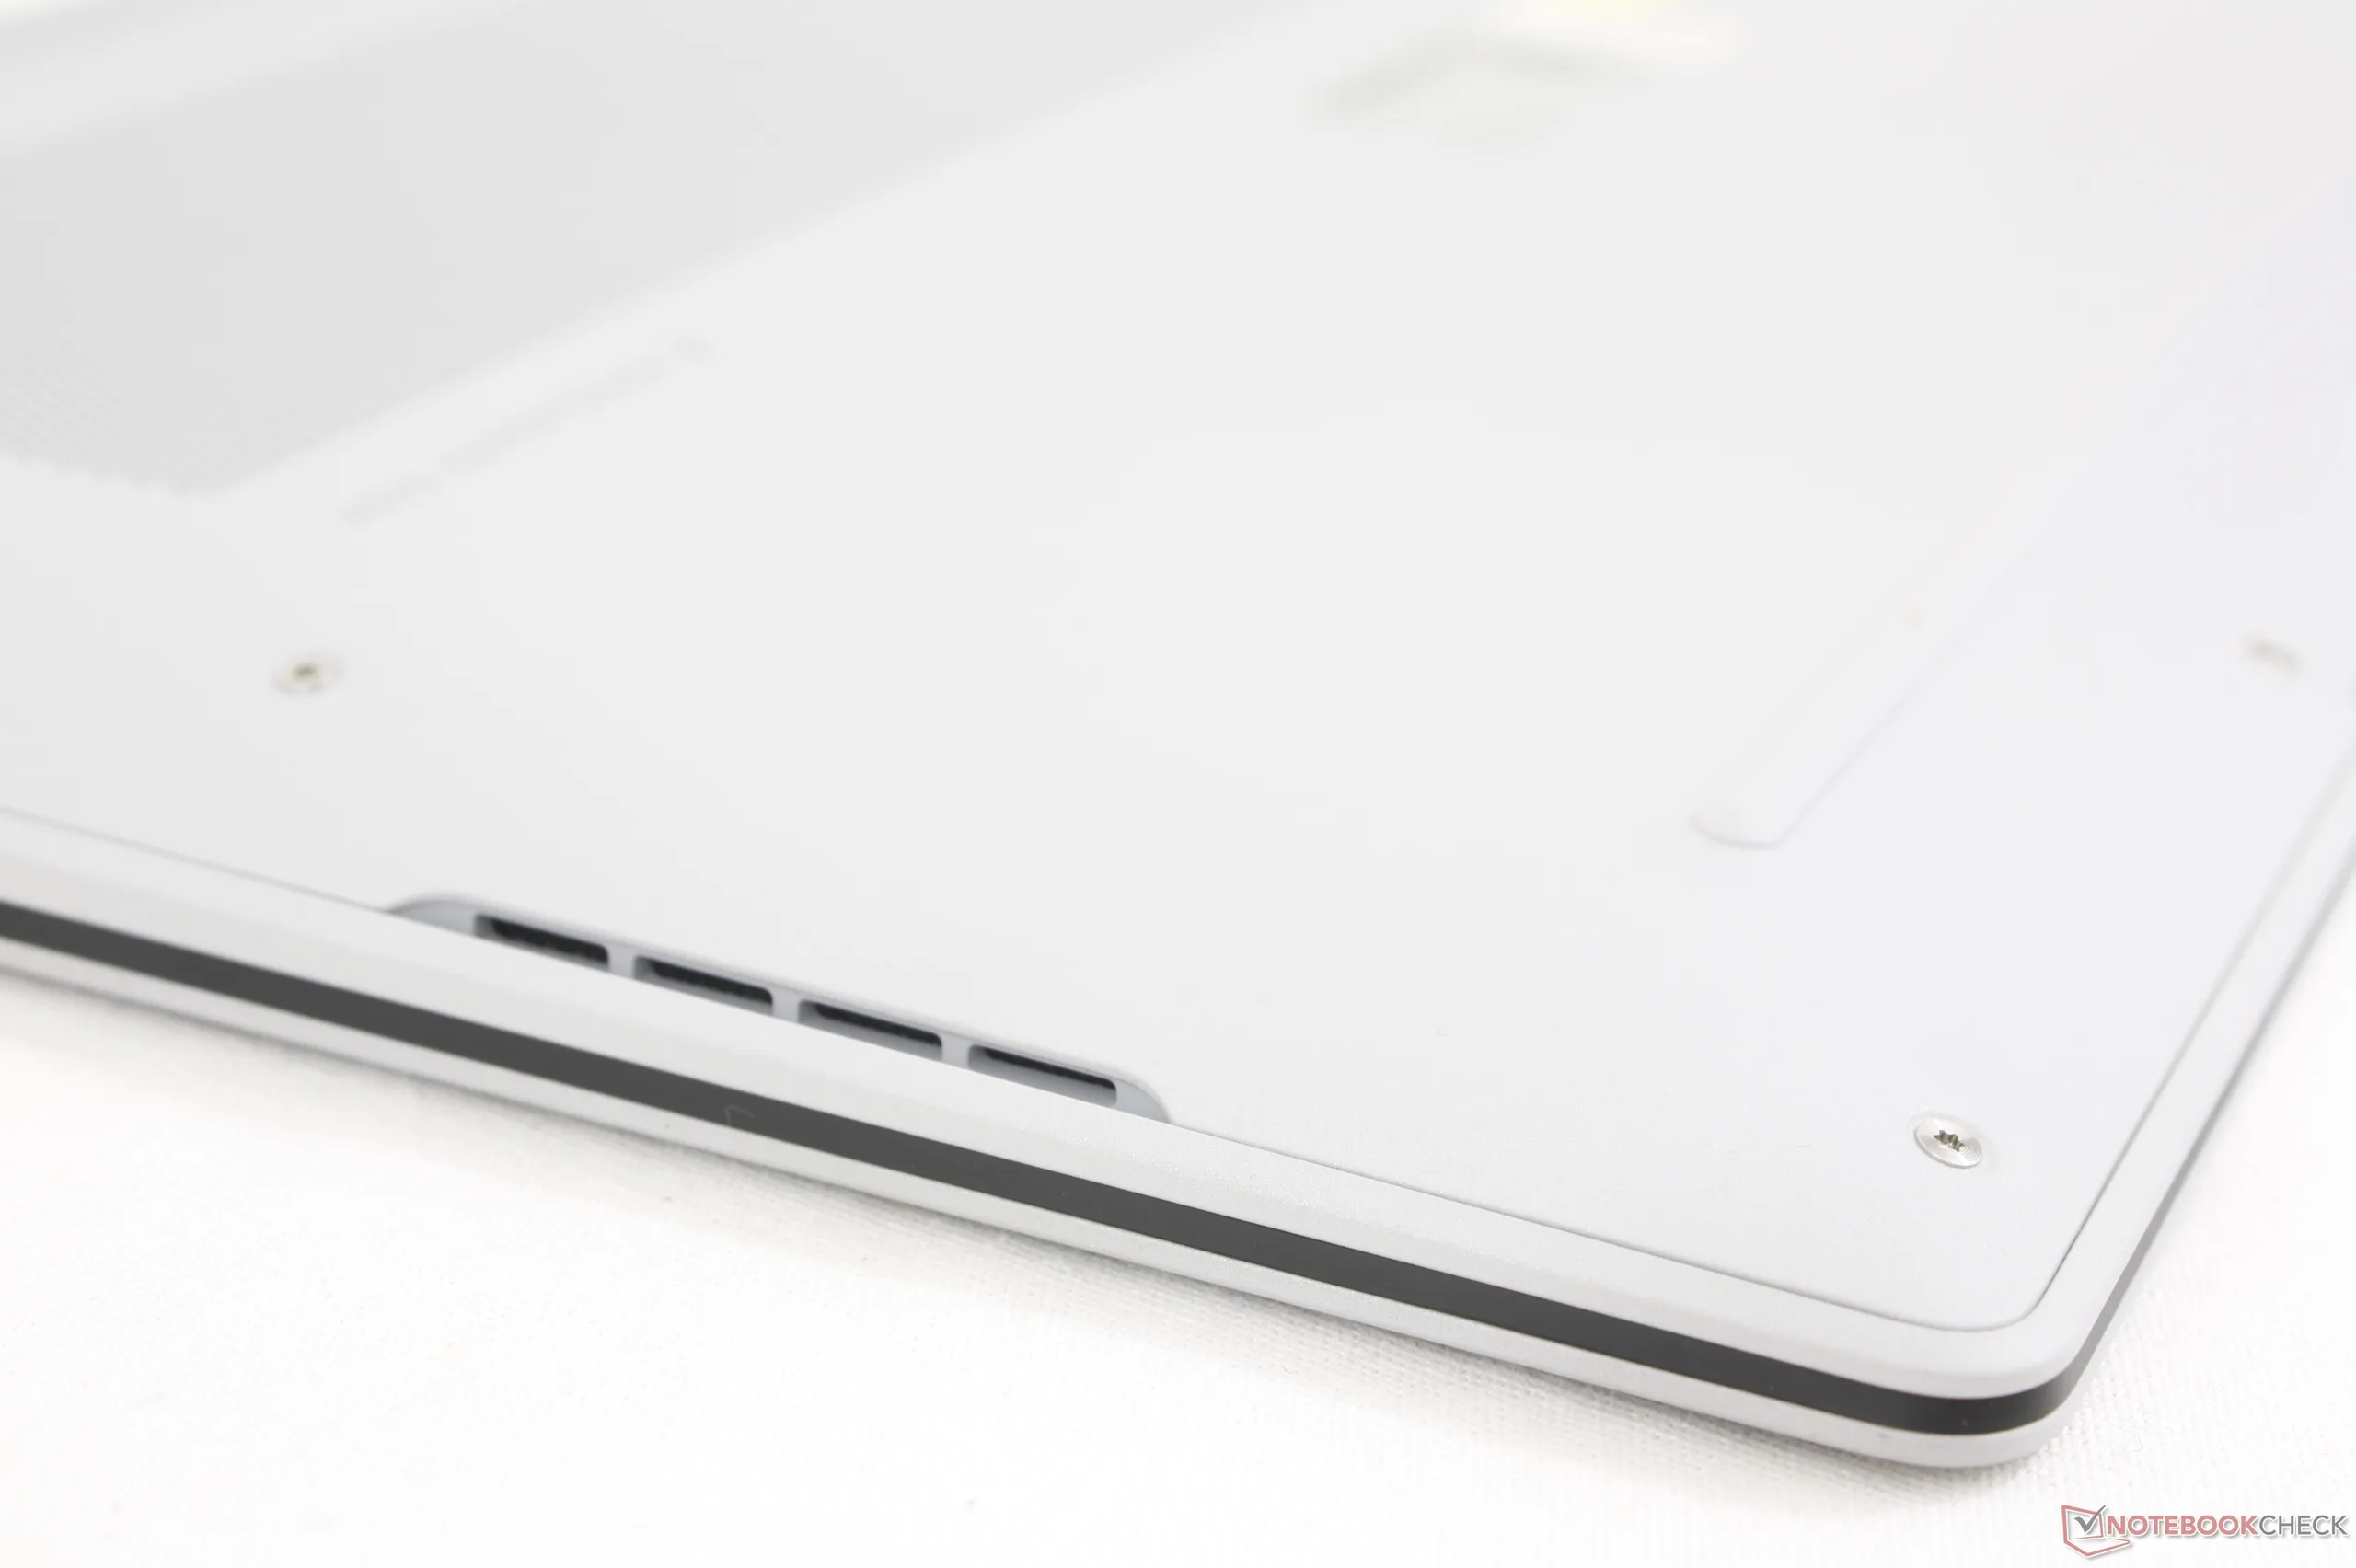
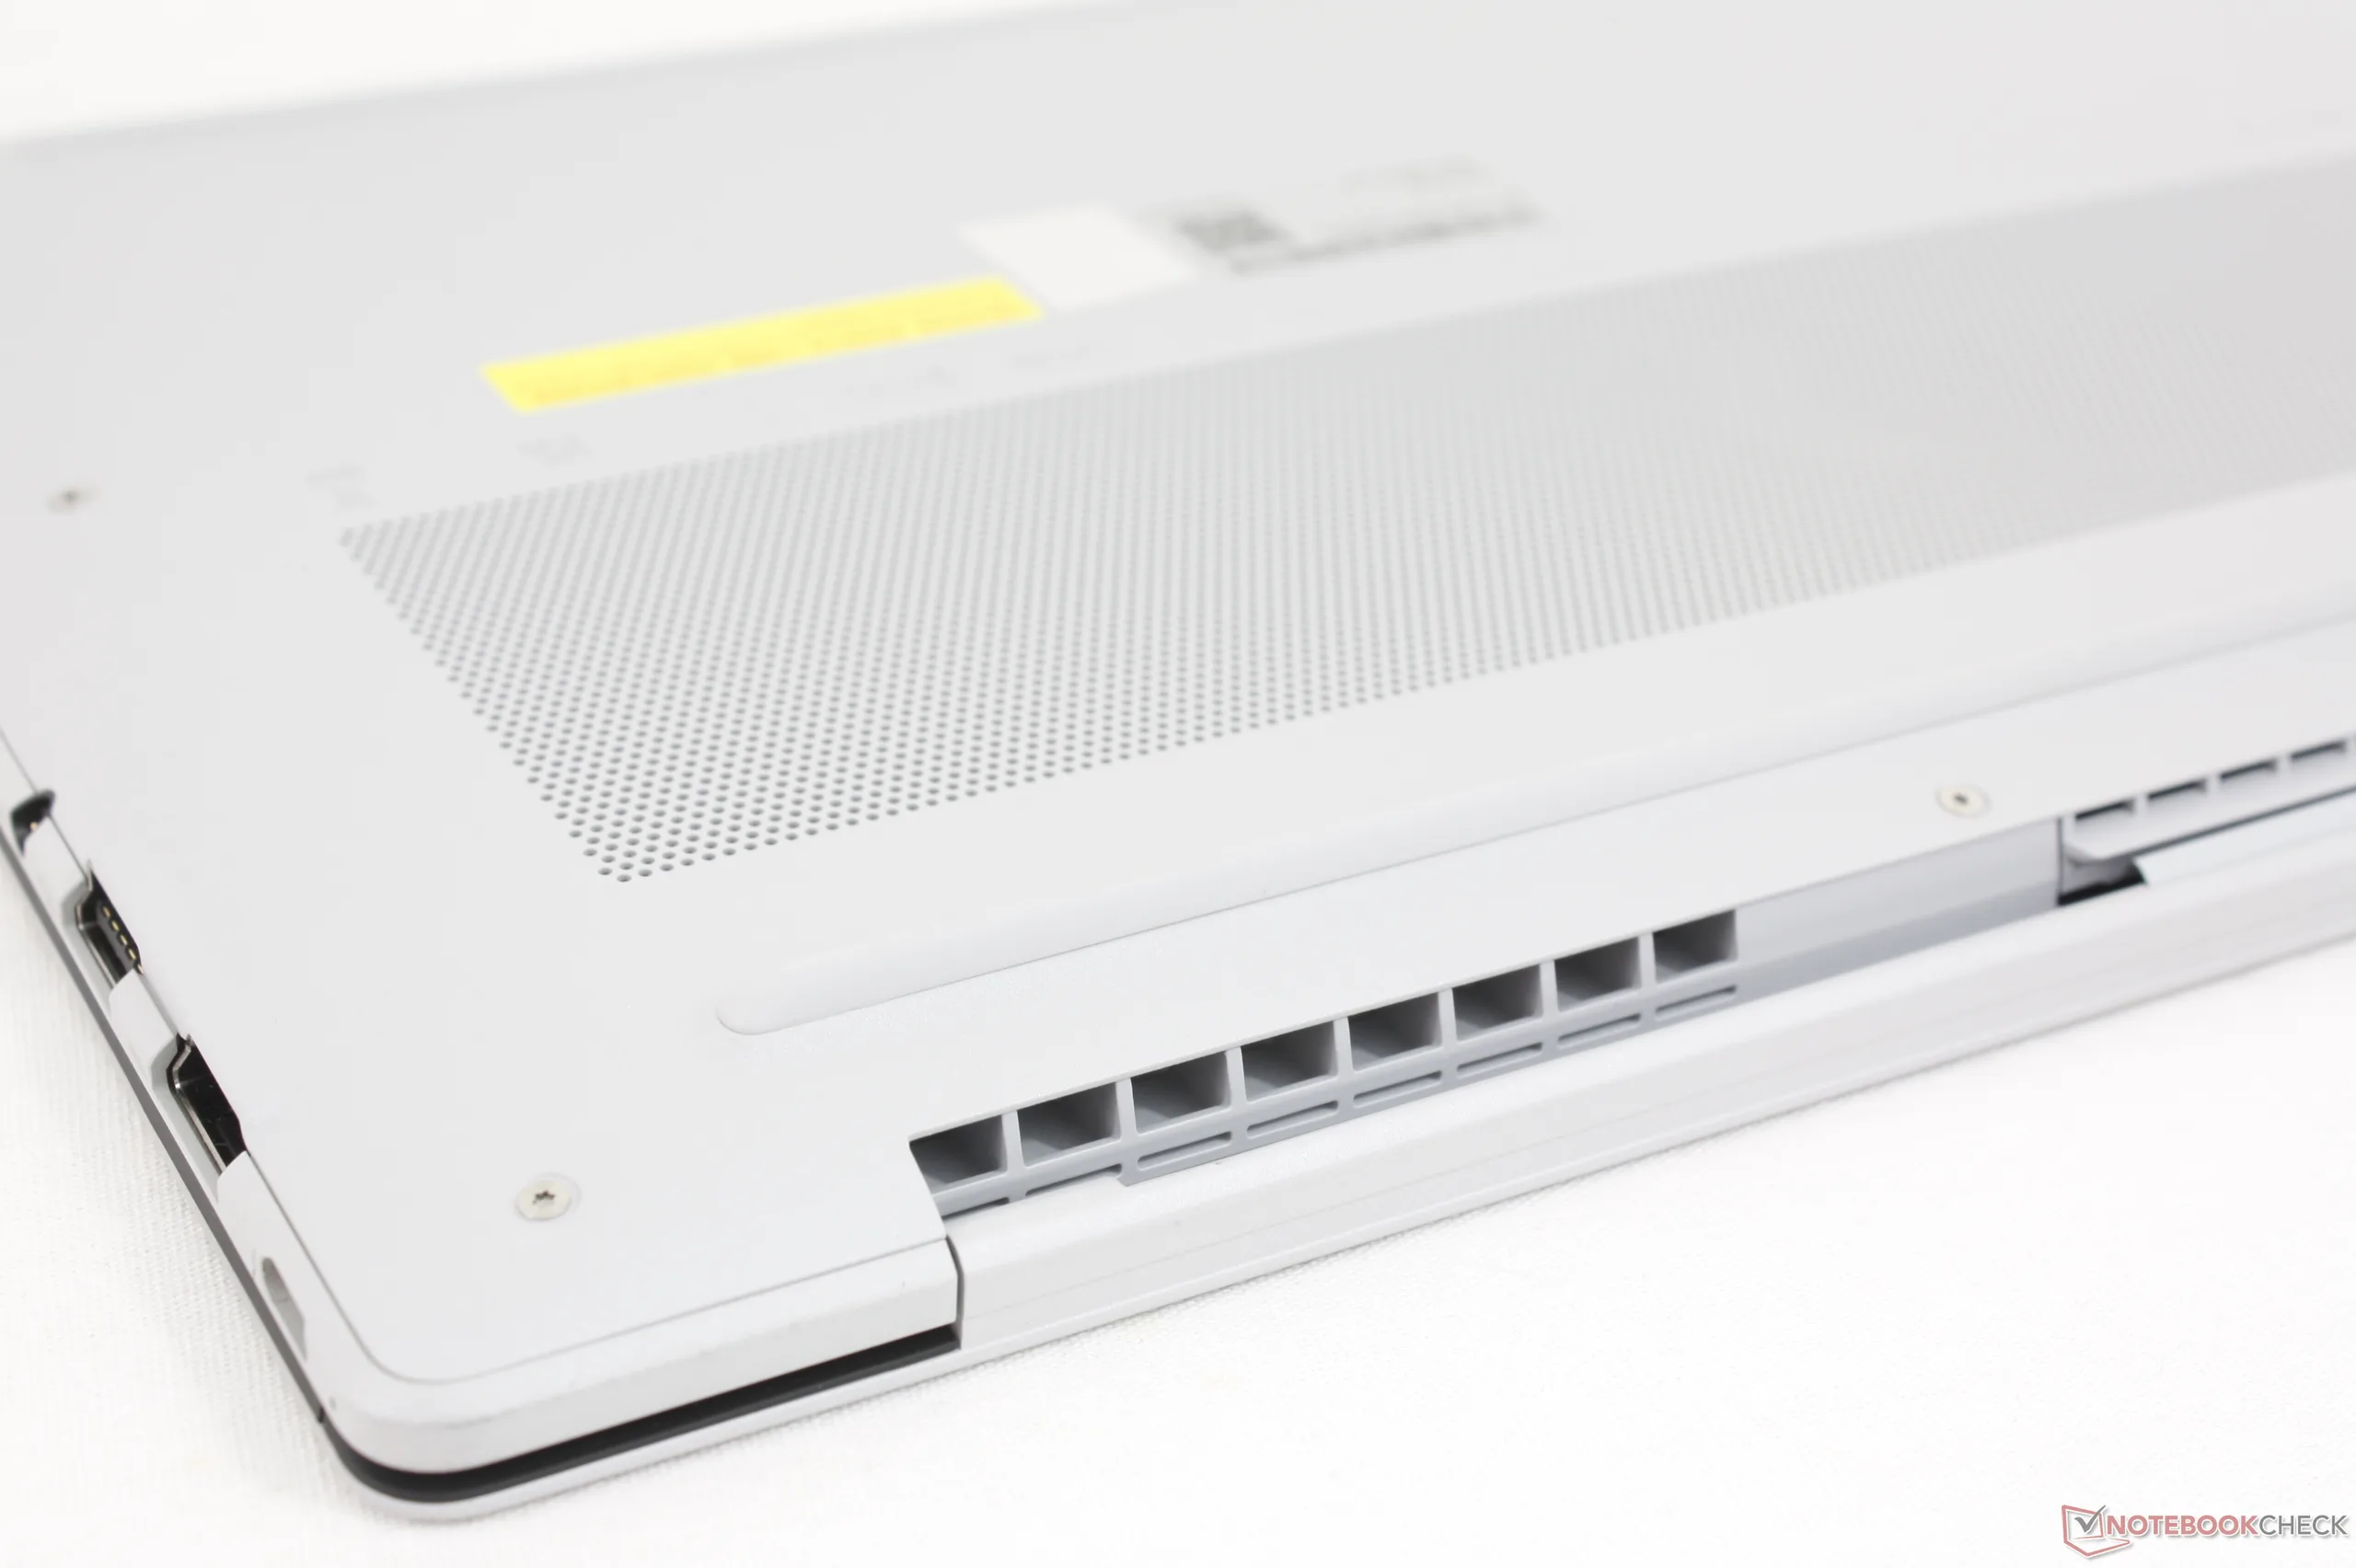
Obudowa - stop magnezowo-aluminiowy CNC z powłoką nanoceramiczną
Oprócz atrakcyjnego wyglądu, obudowa ExpertBook Ultra wyróżnia się powłoką "nano-ceramiczną" 9H, która jest bardziej odporna na zarysowania i odciski palców niż zwykły szczotkowany stop metalu większości innych laptopów z wyższej półki. Pod względem tekstury, jej matowa powierzchnia jest bardziej szorstka i lekko ziarnista, w przeciwieństwie do super gładkiego i błyszczącego połysku alternatywnych rozwiązań. Sztywność obudowy jest w większości zachowana dzięki certyfikatowi MIL-STD 810H i tylko nieznacznie większemu ugięciu wzdłuż podstawy i pokrywy w porównaniu do czegoś takiego jak Razer Blade 14.
Sztywność zawiasów jest zbyt słaba, ponieważ zwykłe podniesienie systemu powoduje opadnięcie wyświetlacza. Asus twierdzi, że ta kwestia zostanie rozwiązana, gdy model stanie się dostępny dla konsumentów.
Zintegrowany pasek białego światła o nazwie ExpertLumi można znaleźć wzdłuż dolnej krawędzi wyświetlacza. Dioda LED jest jednak czysto estetyczna, ponieważ nie służy niczemu innemu niż świeceniu podczas uruchamiania i logowania.
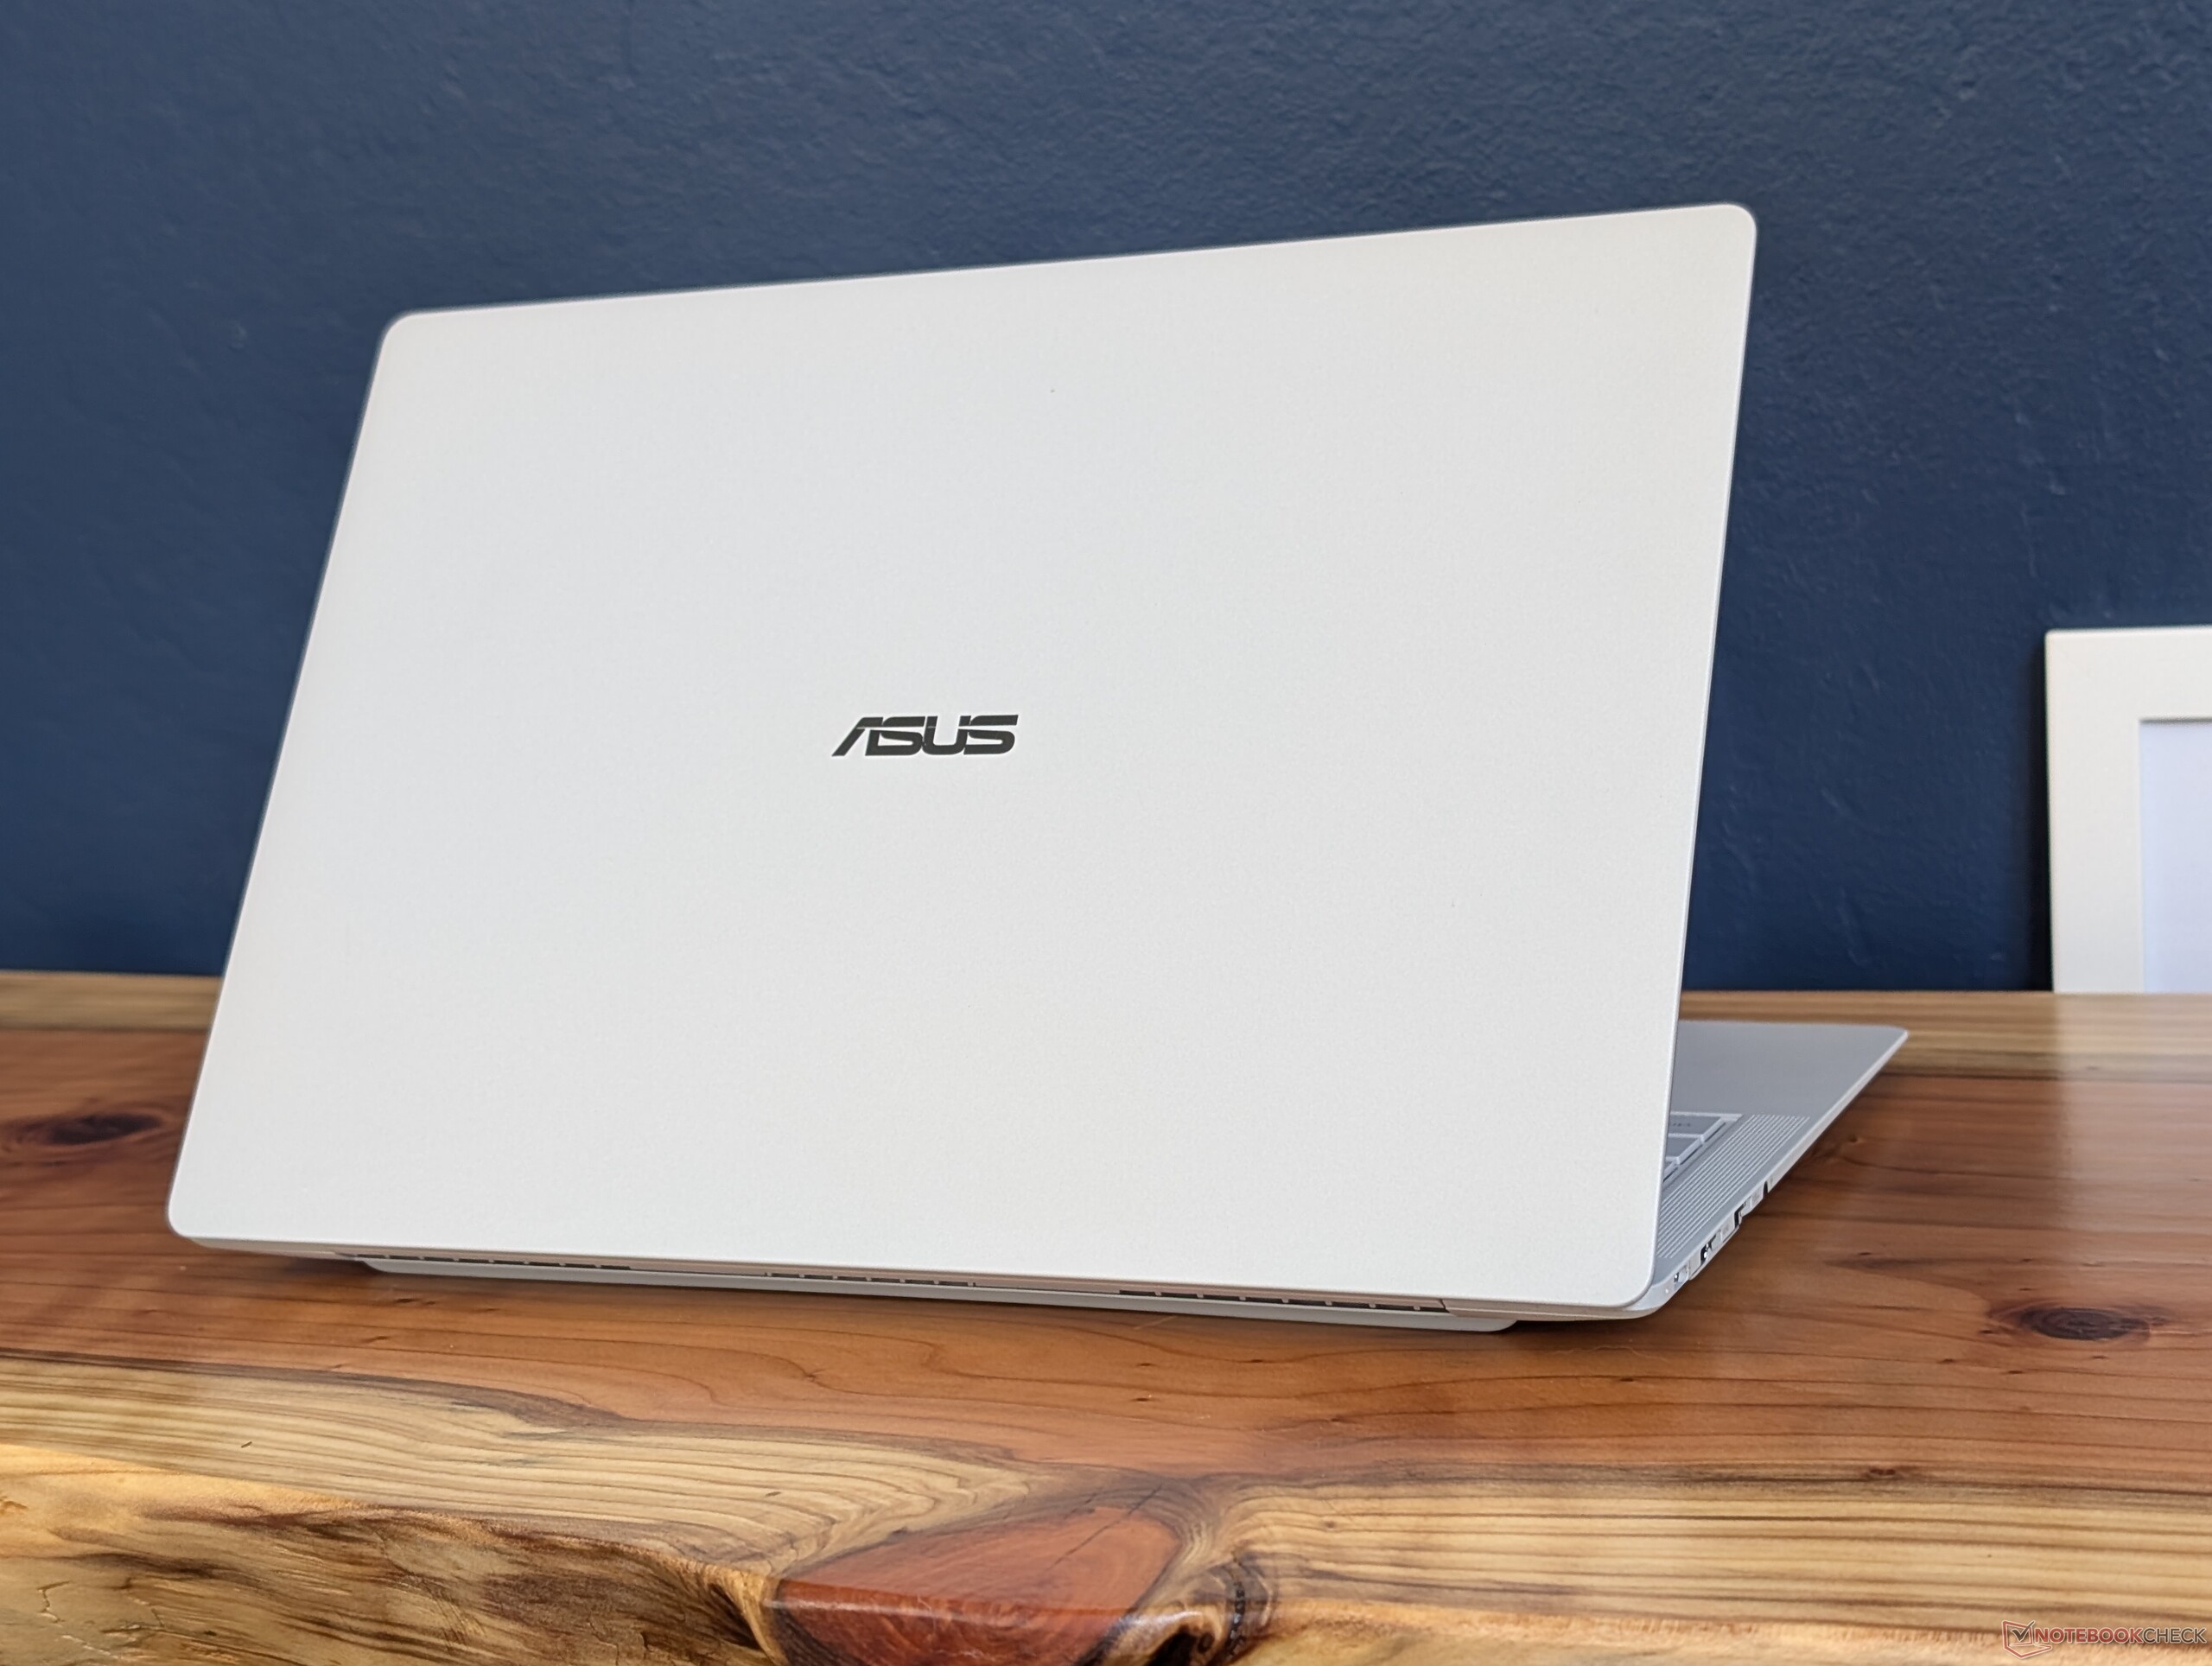
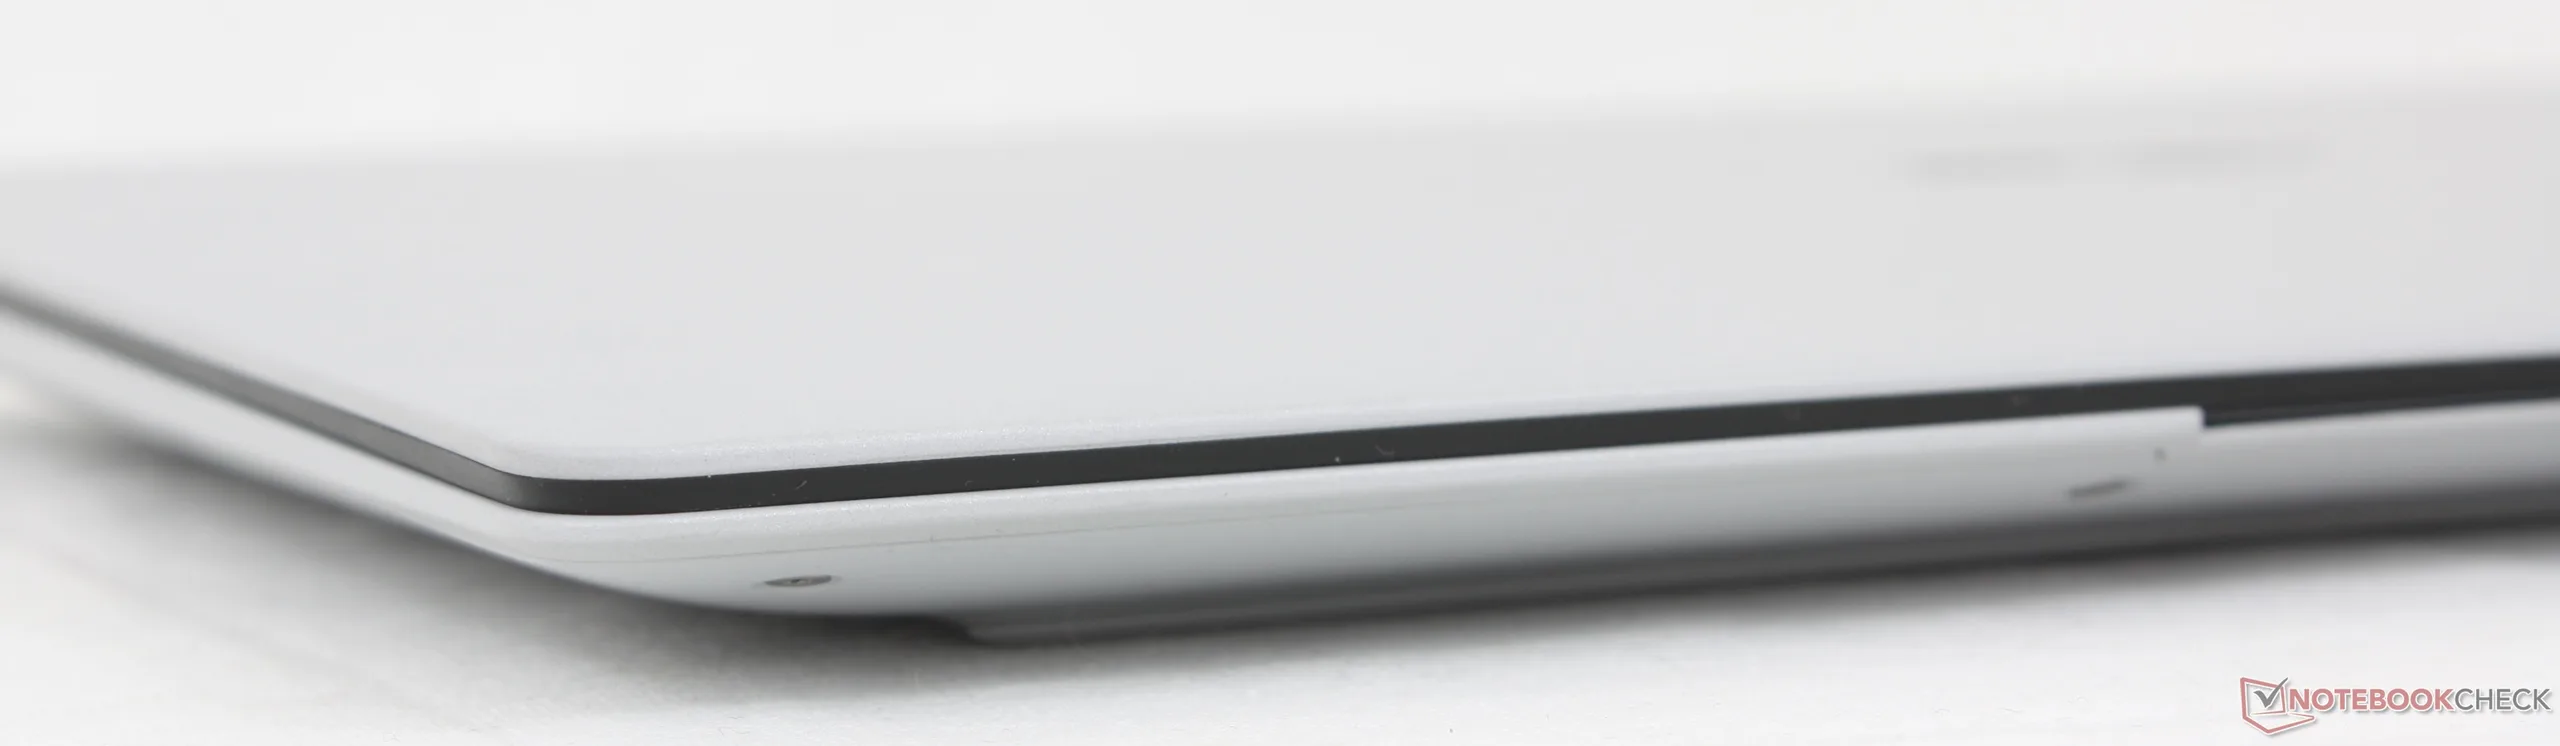
Ten Asus jest nie tylko jednym z pierwszych laptopów z Panther Lake, ale także jednym z najlżejszych modeli w kategorii 14-calowej, ważącym zaledwie 1,1 kg. Dostępni są jeszcze cieńsi konkurenci, w tym EliteBook Ultra G1i 14 lub Samsung Galaxy Book5 Pro 14ale każdy z nich jest również nieco cięższy od naszego Asusa.

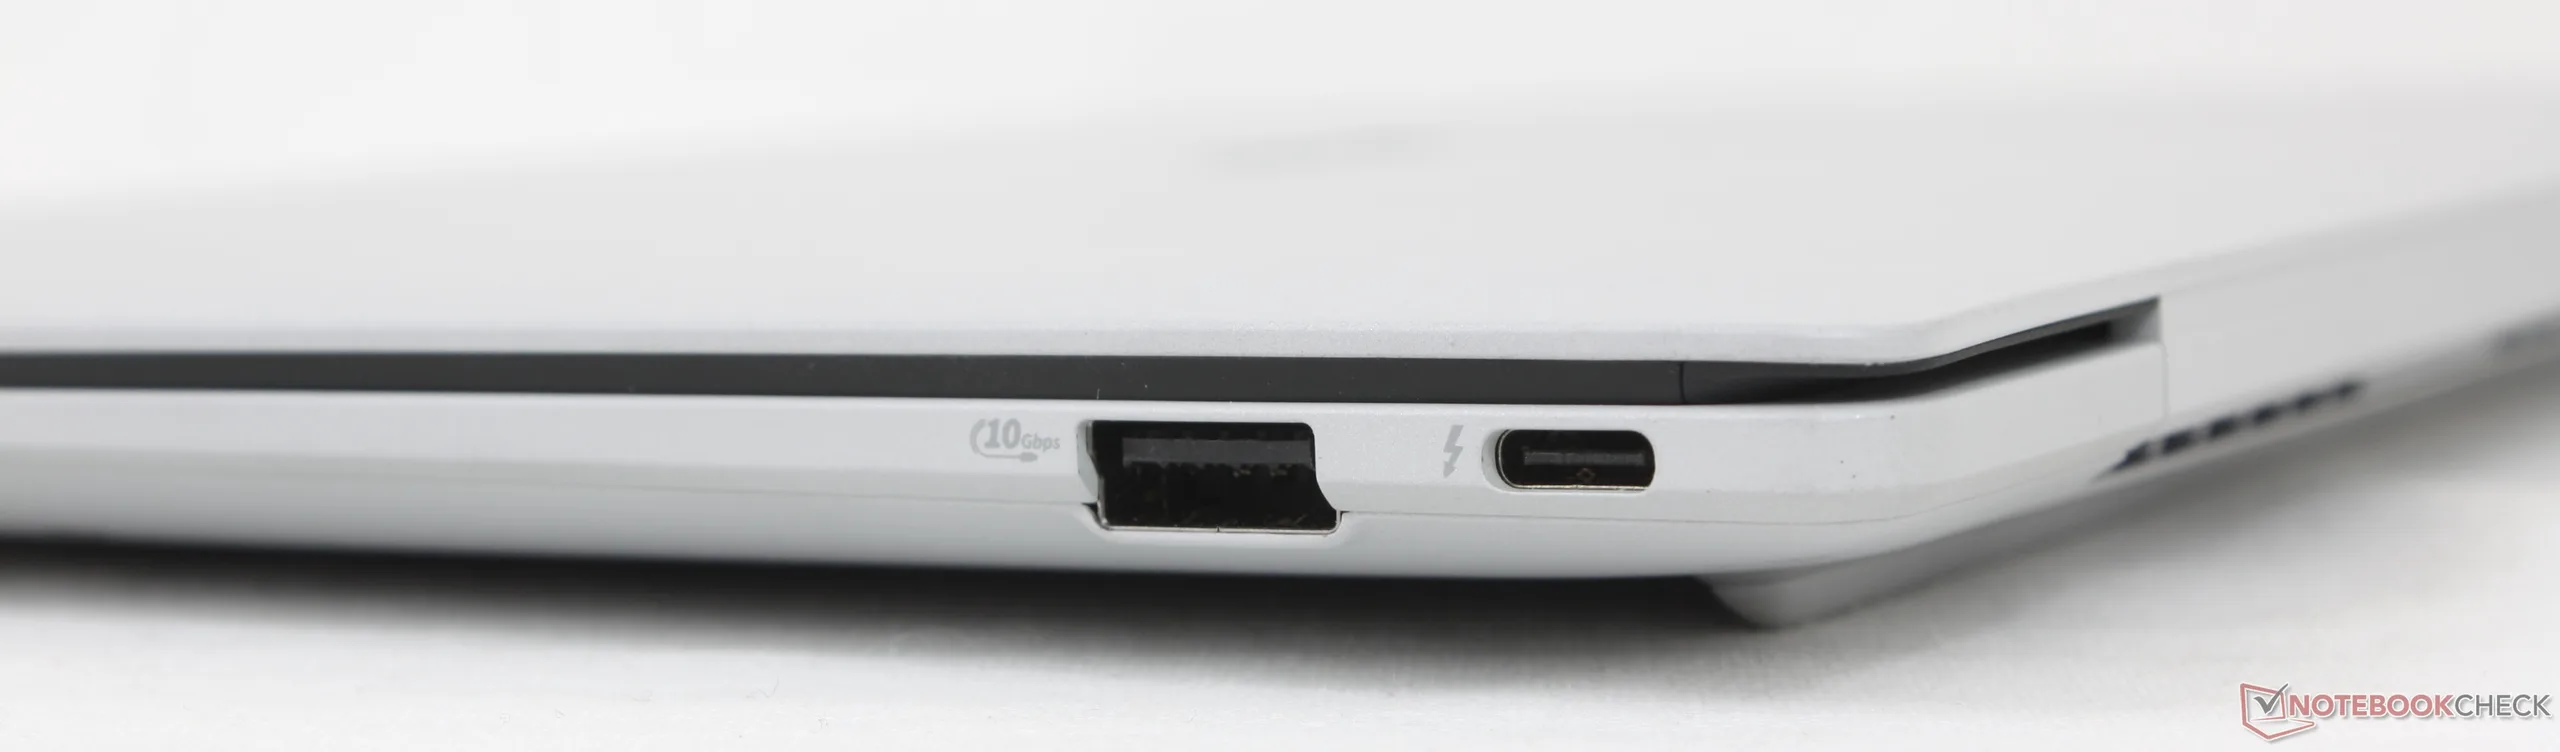
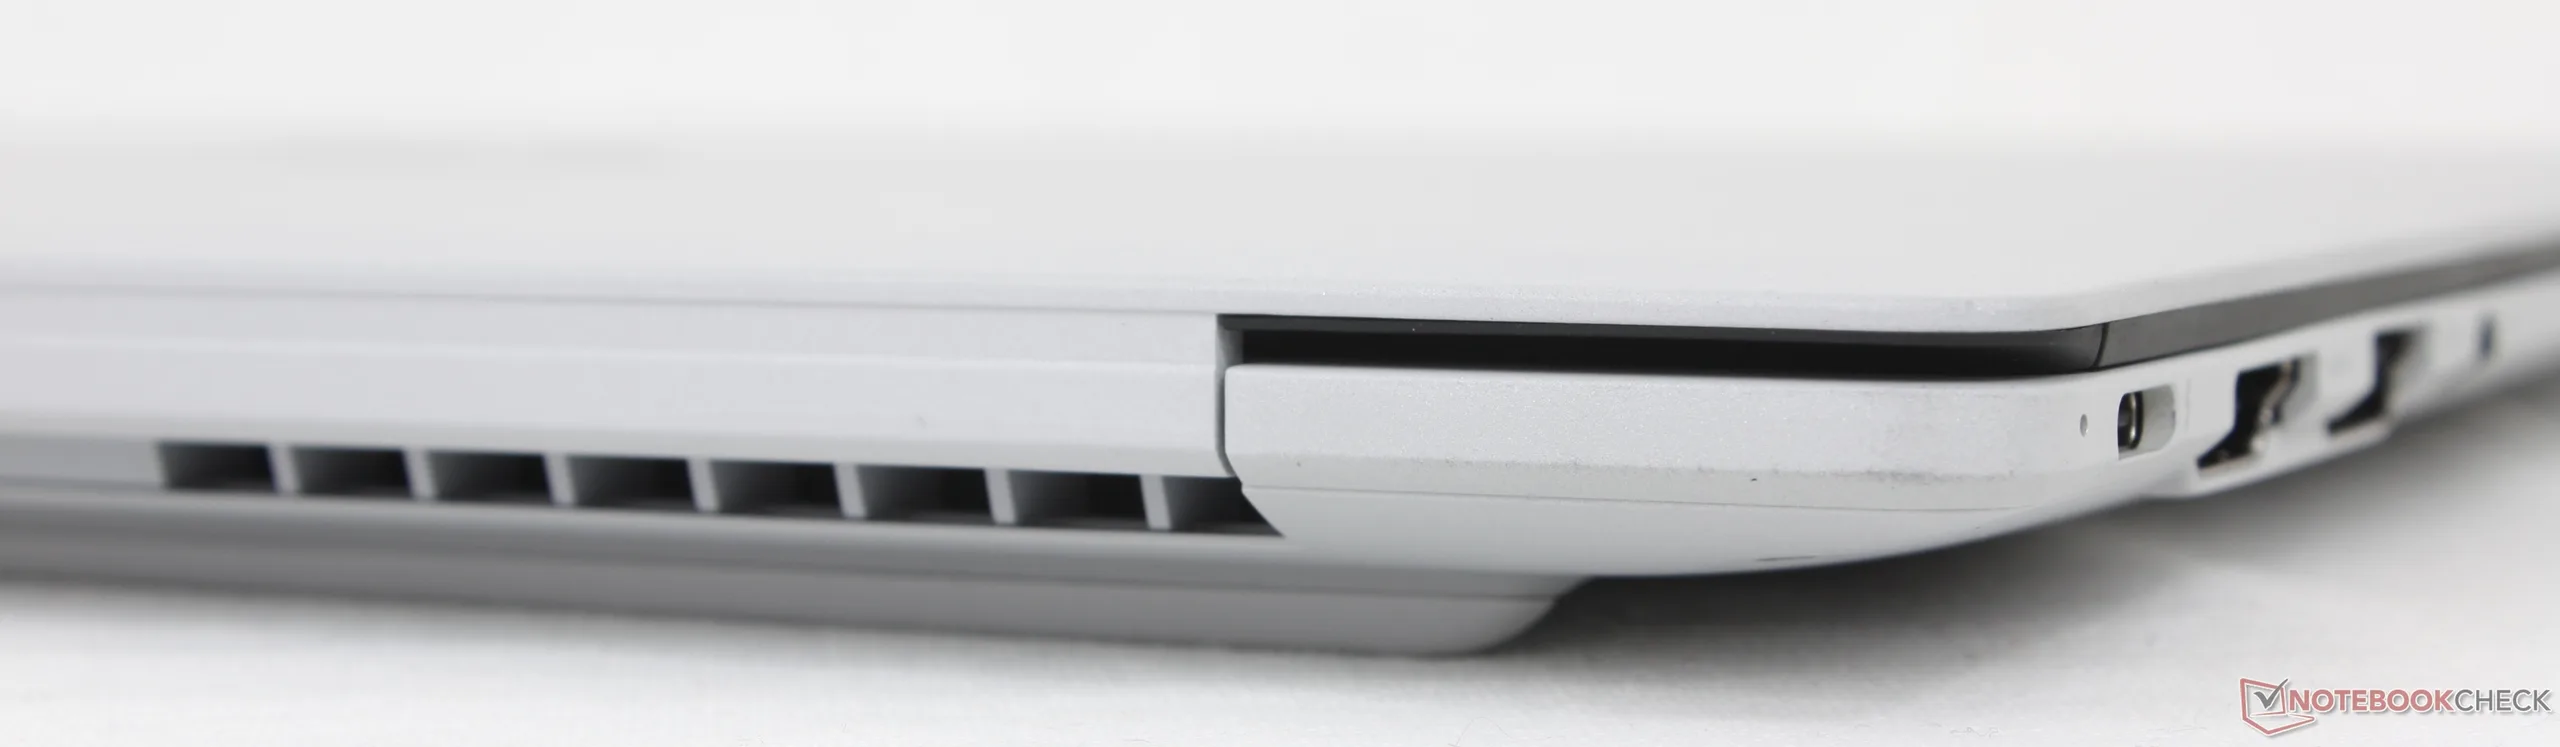
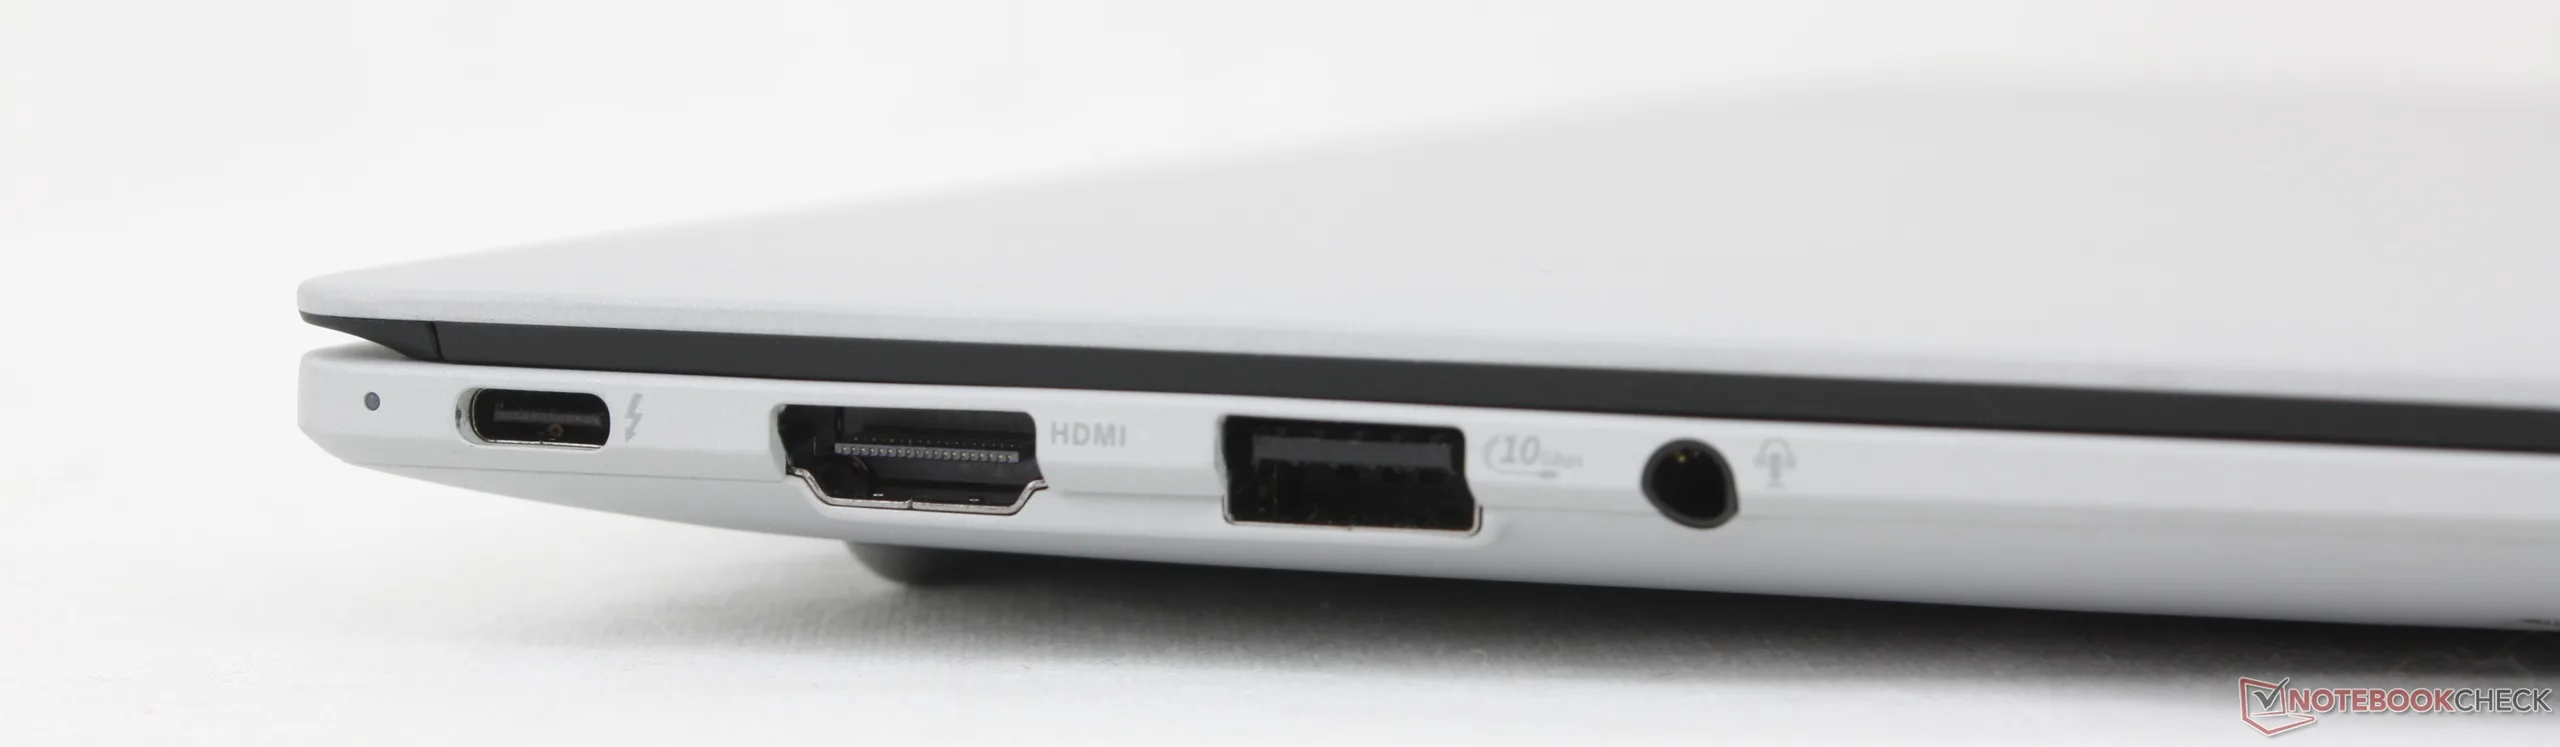
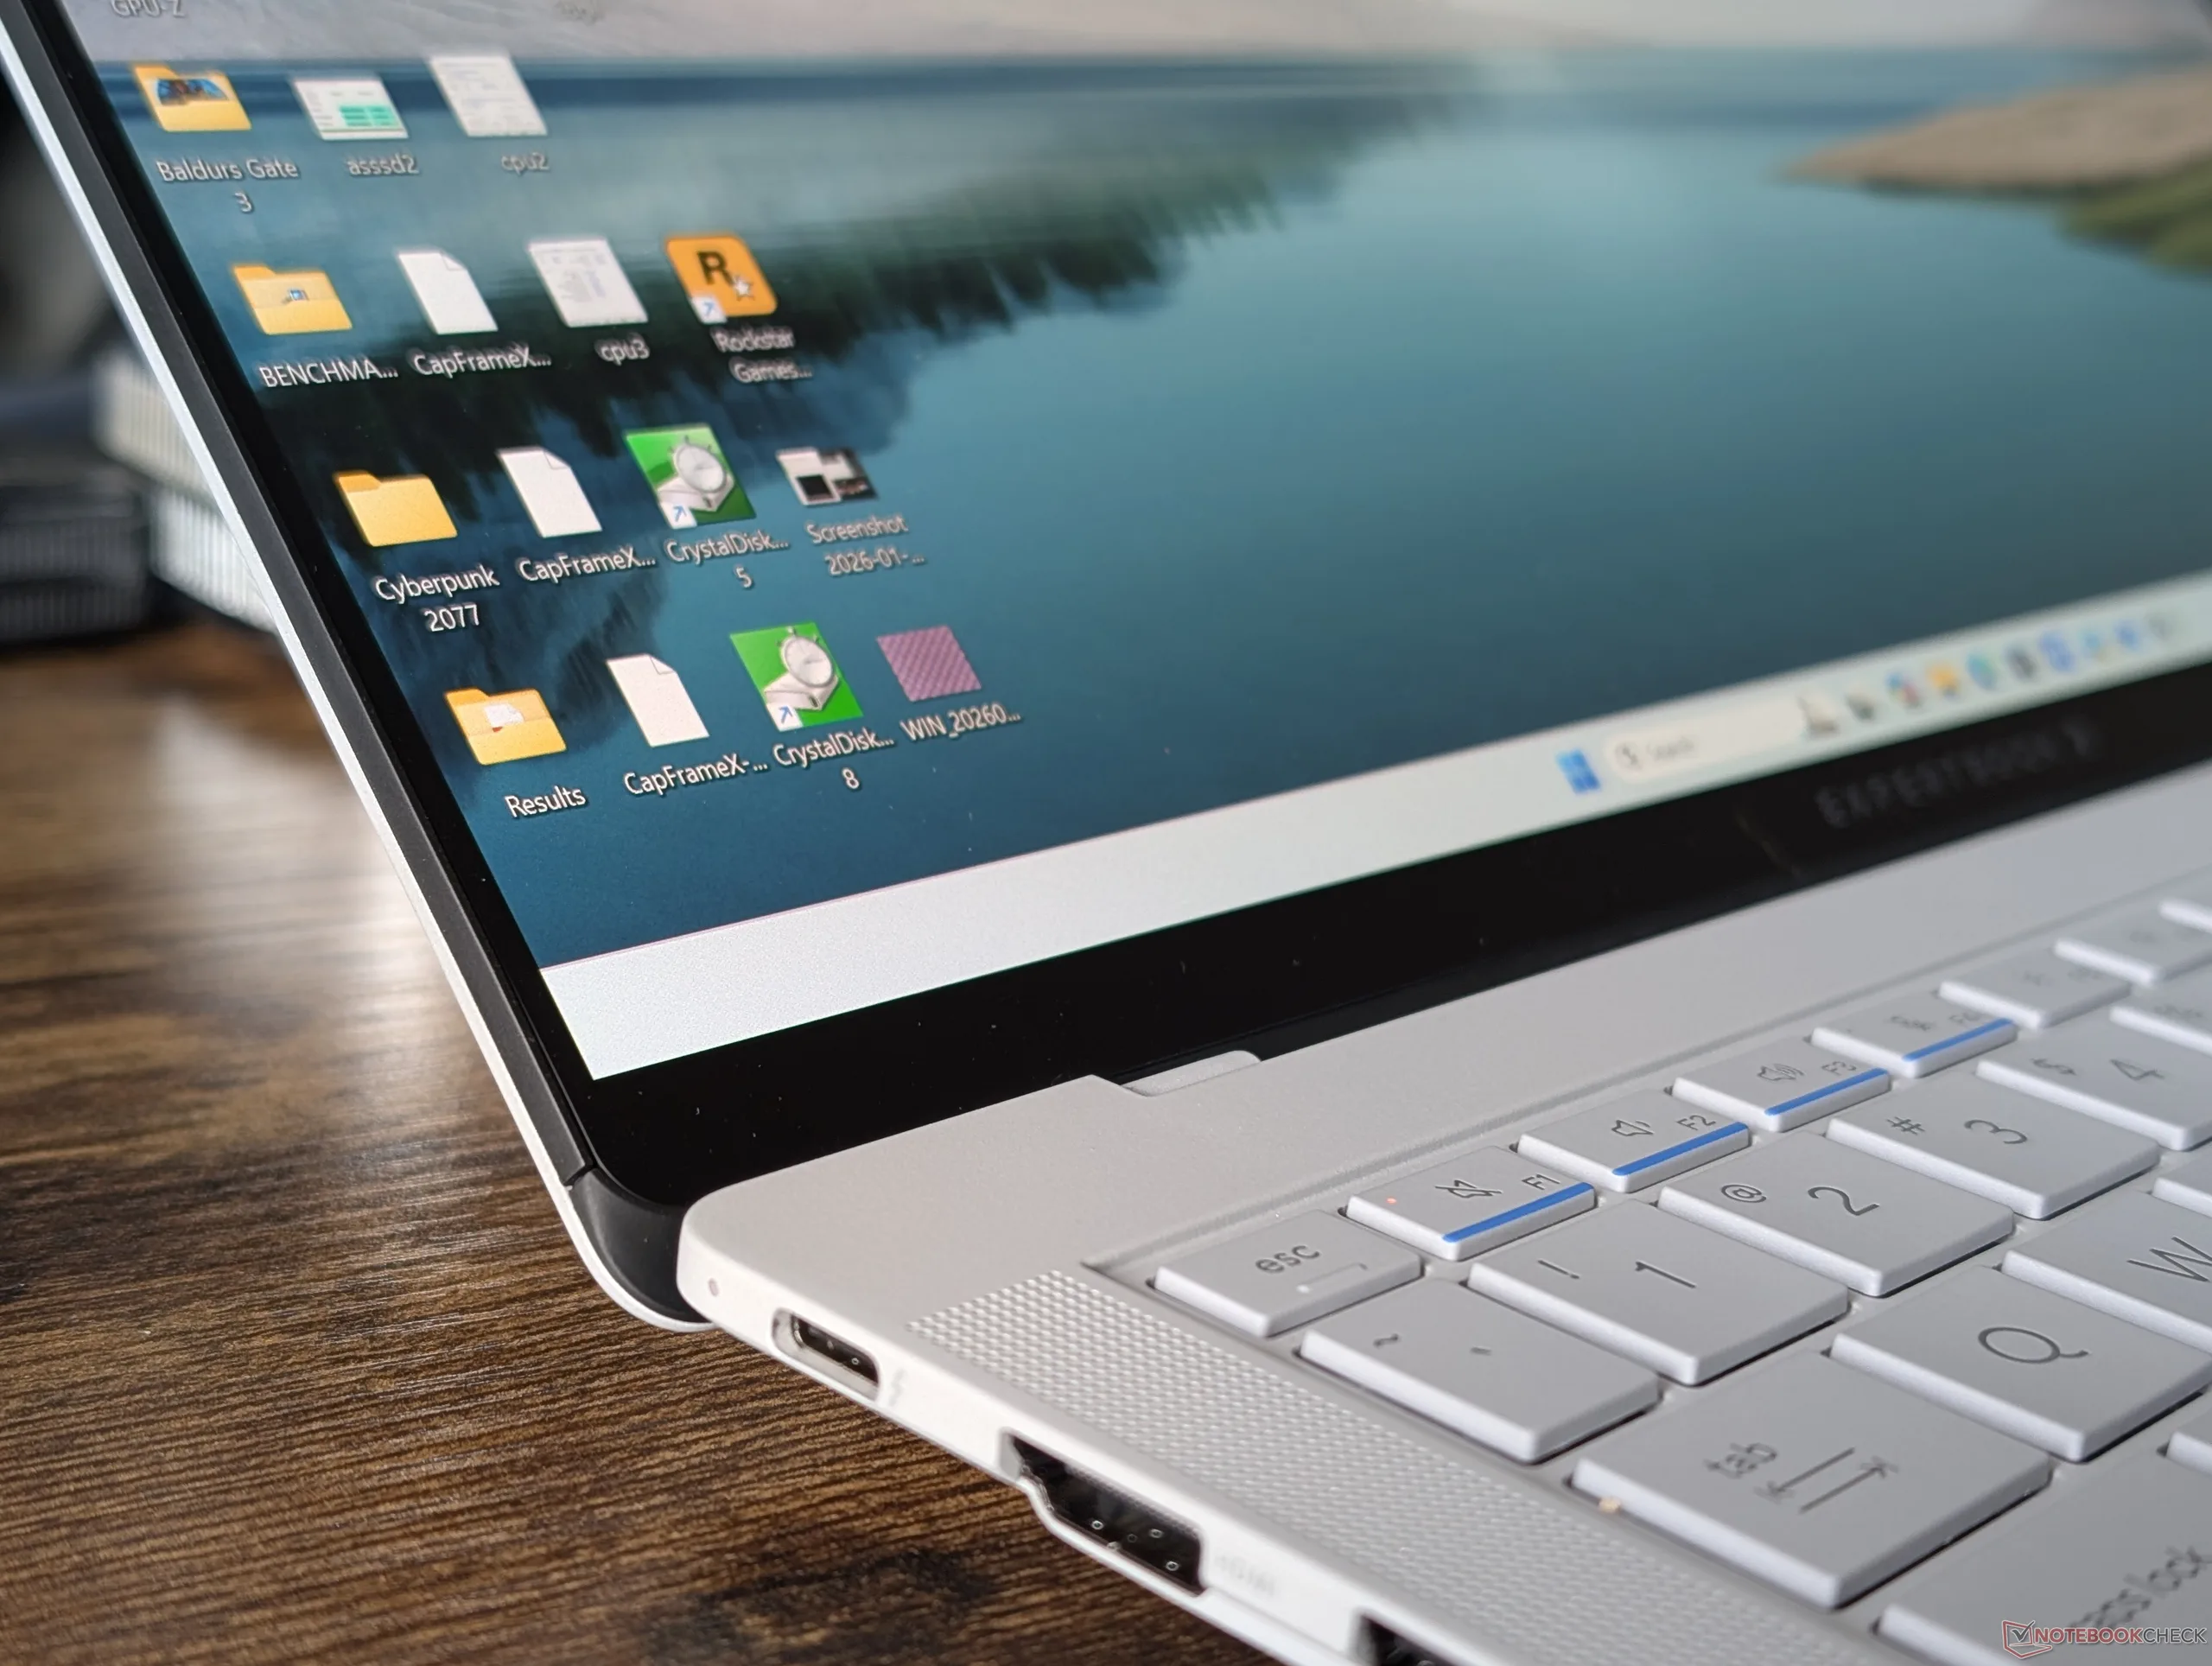
Łączność
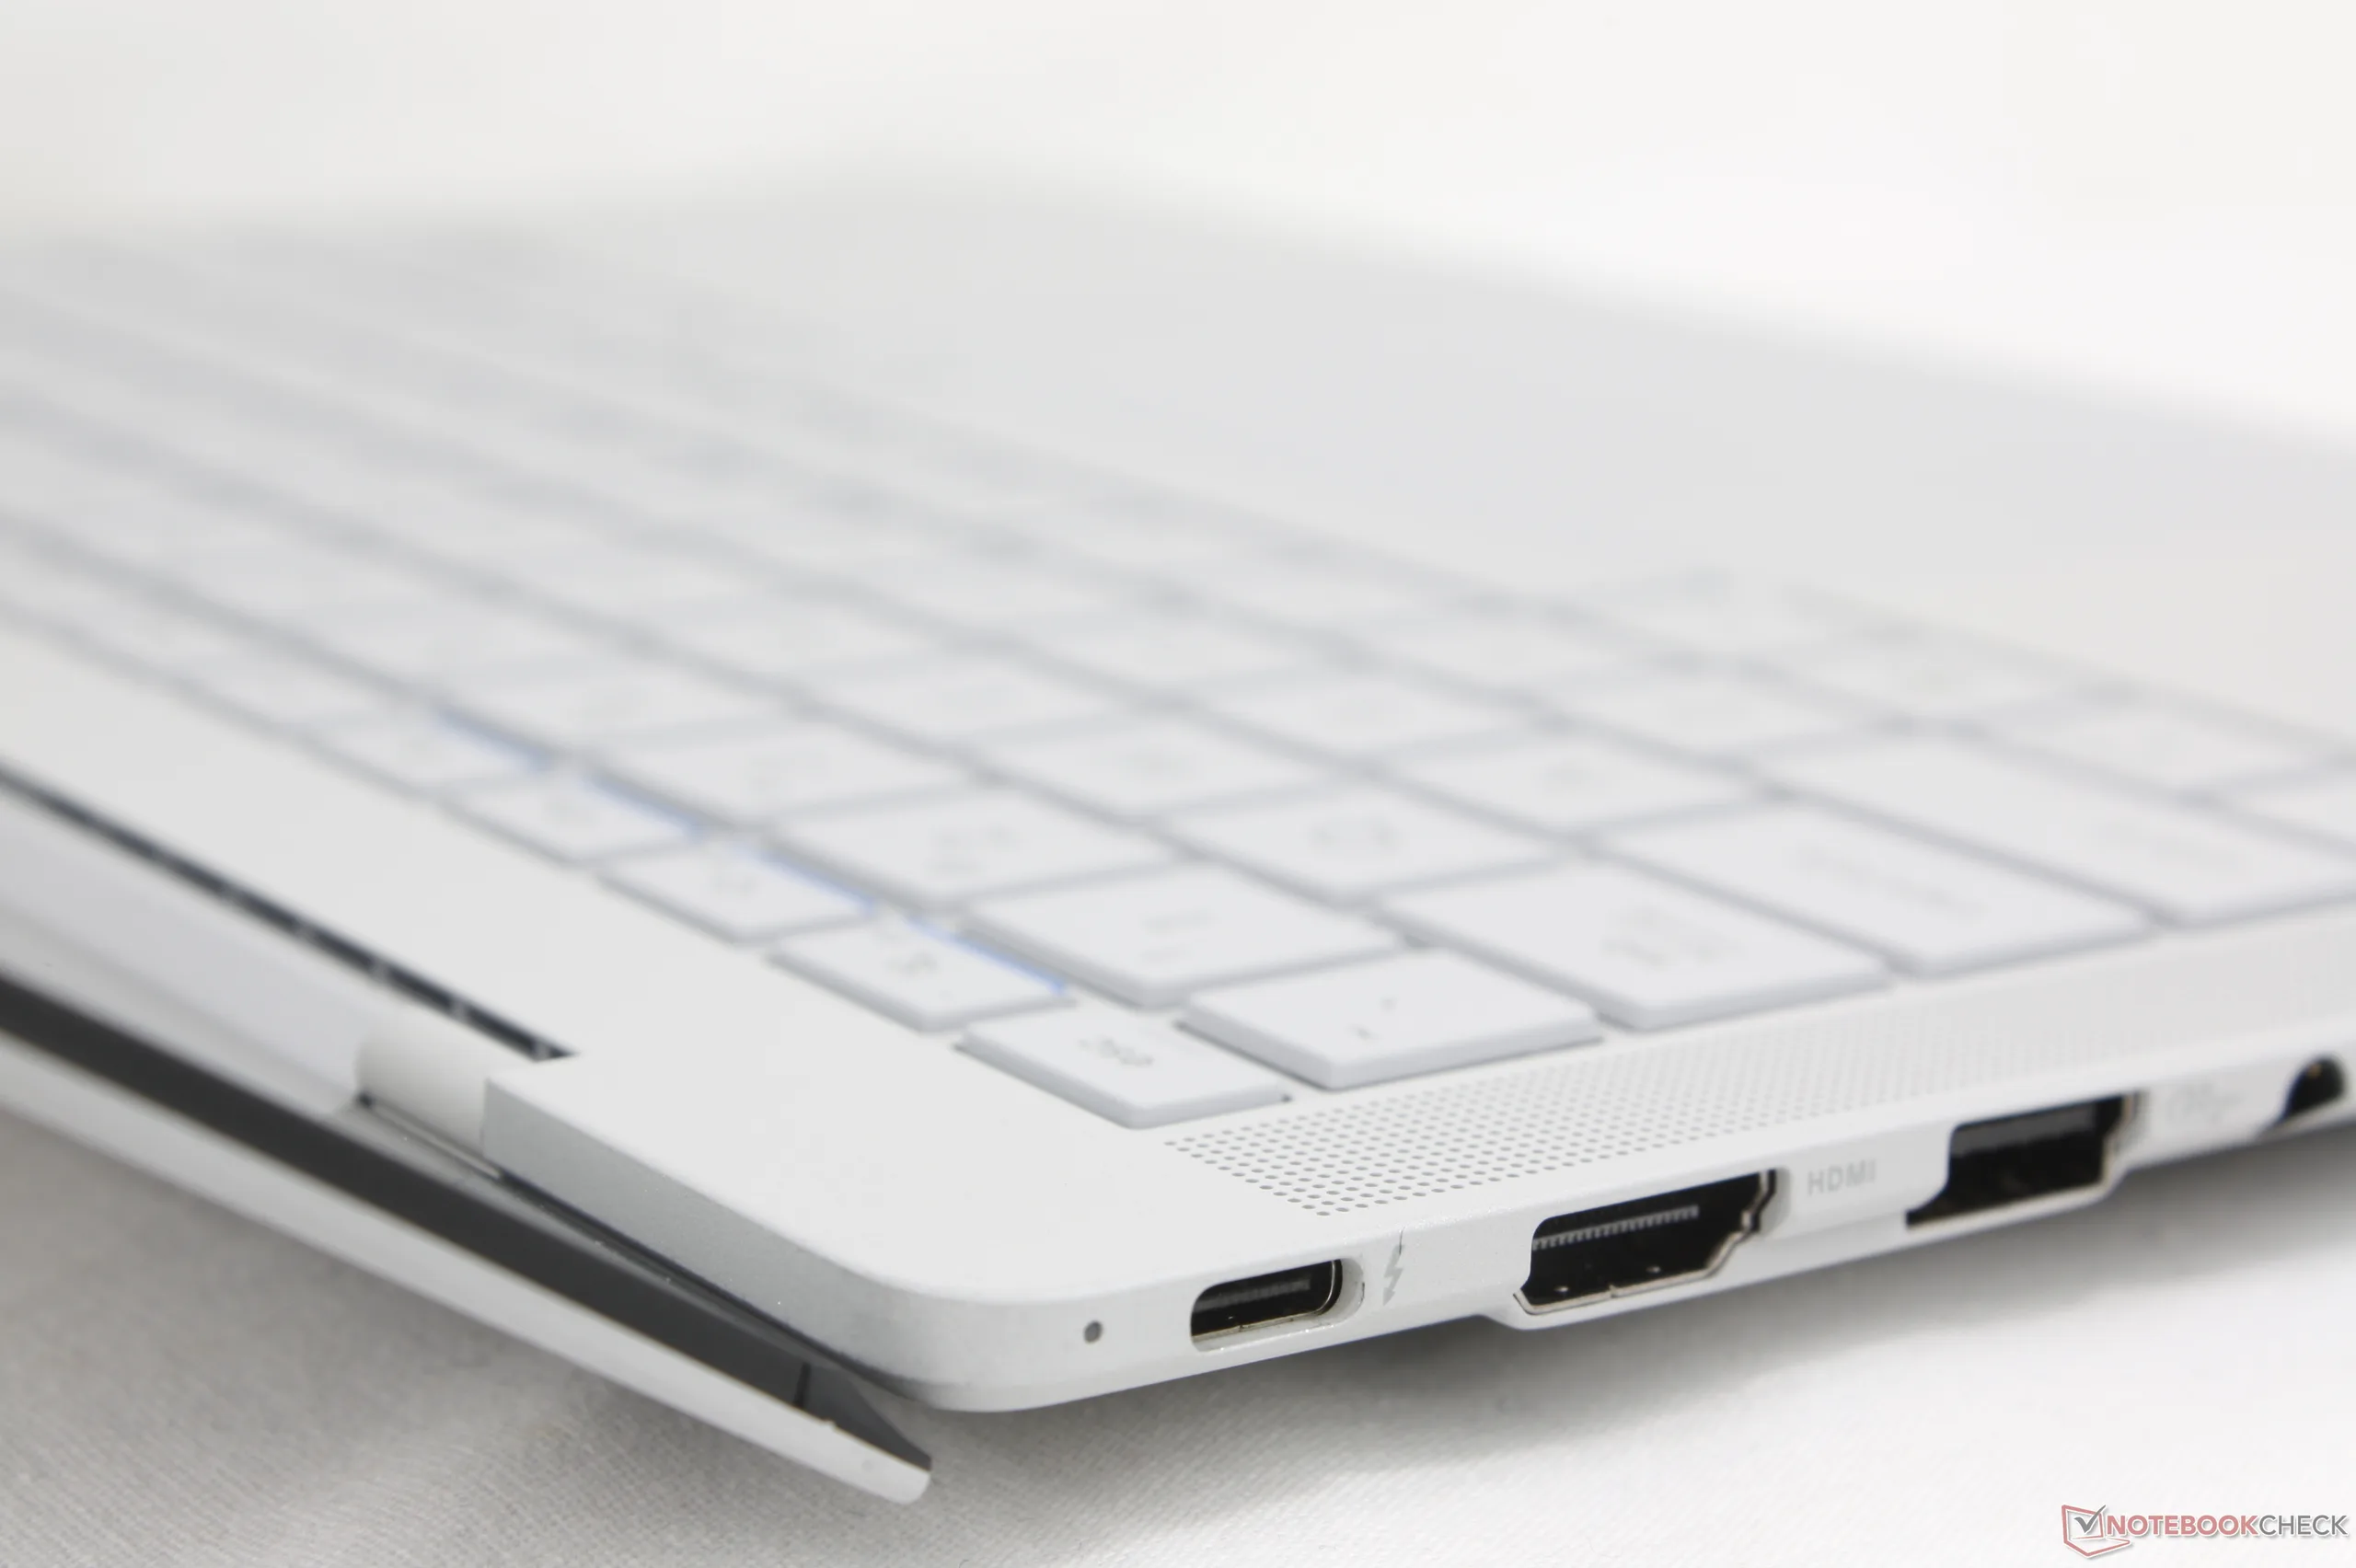
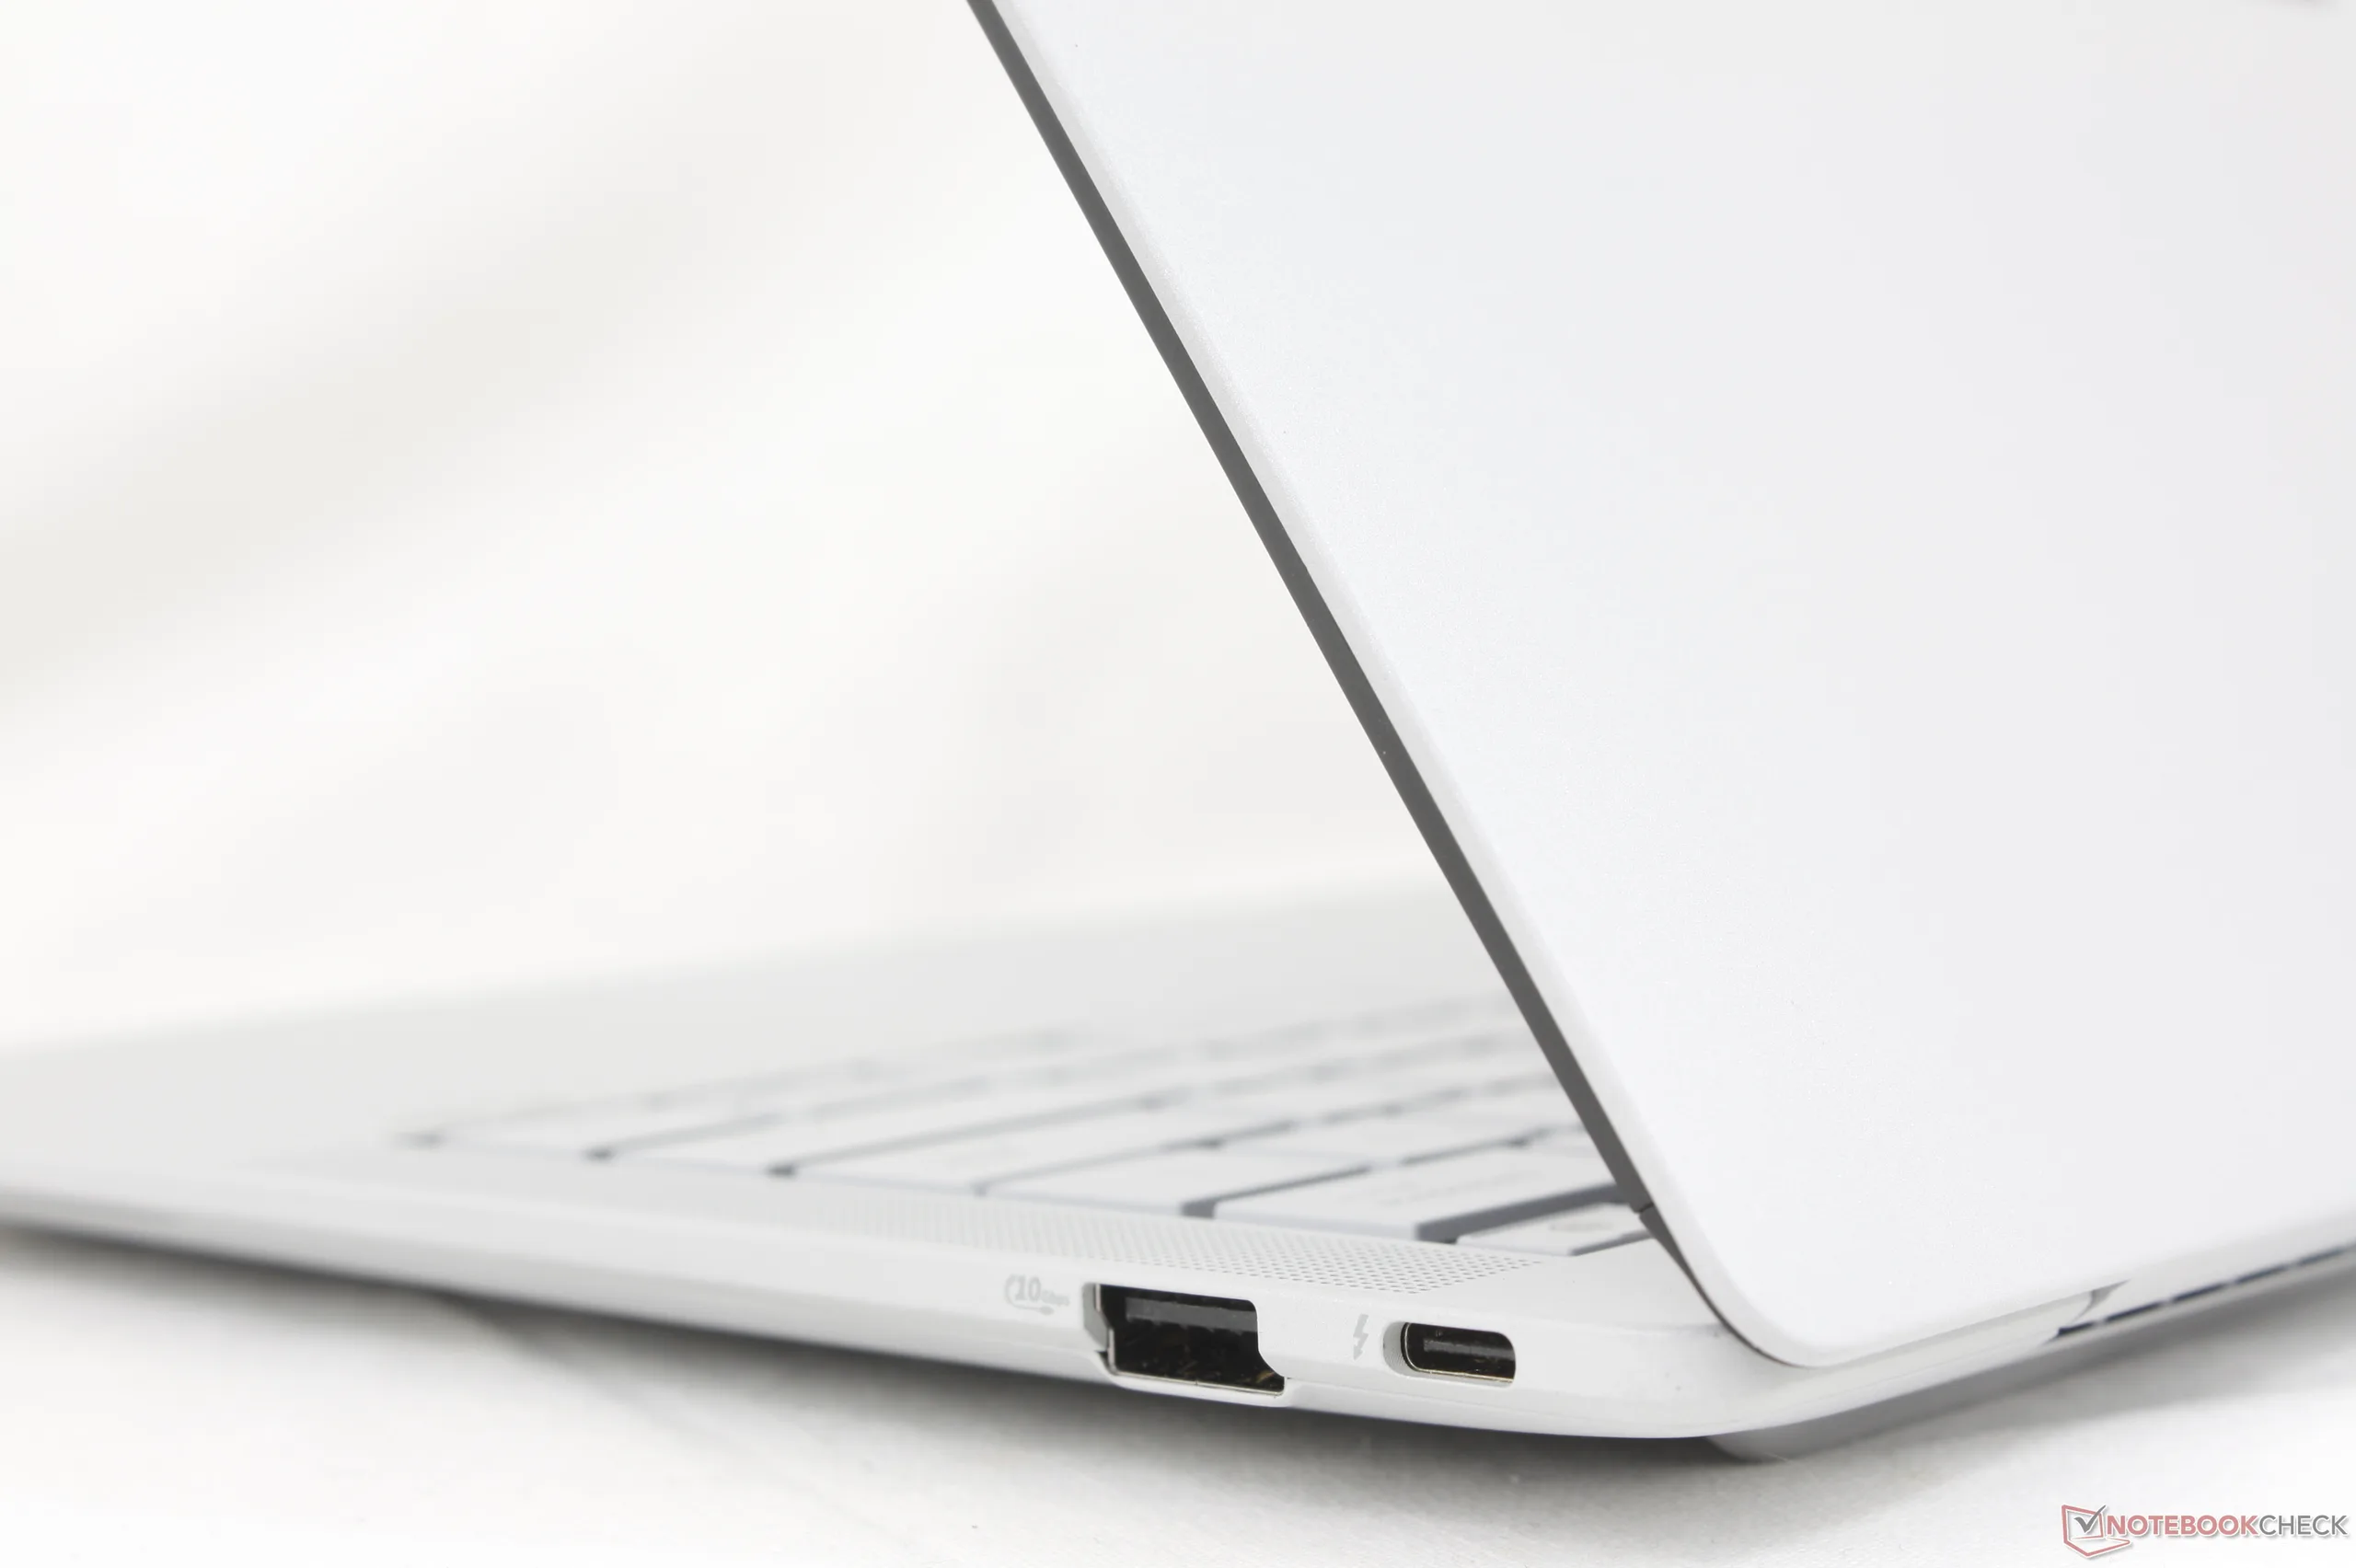
Opcje portów są porównywalne z ThinkPad T14s Gen 6 aczkolwiek bez opcji Smart Card. W Asusie doceniamy jednak to, że dwa porty USB-C są podzielone między prawą i lewą krawędź systemu, co ułatwia ładowanie. Dla porównania, te same dwa porty USB-C we wspomnianym ThinkPadzie znajdują się tylko wzdłuż lewej krawędzi.
Komunikacja
Kamera internetowa


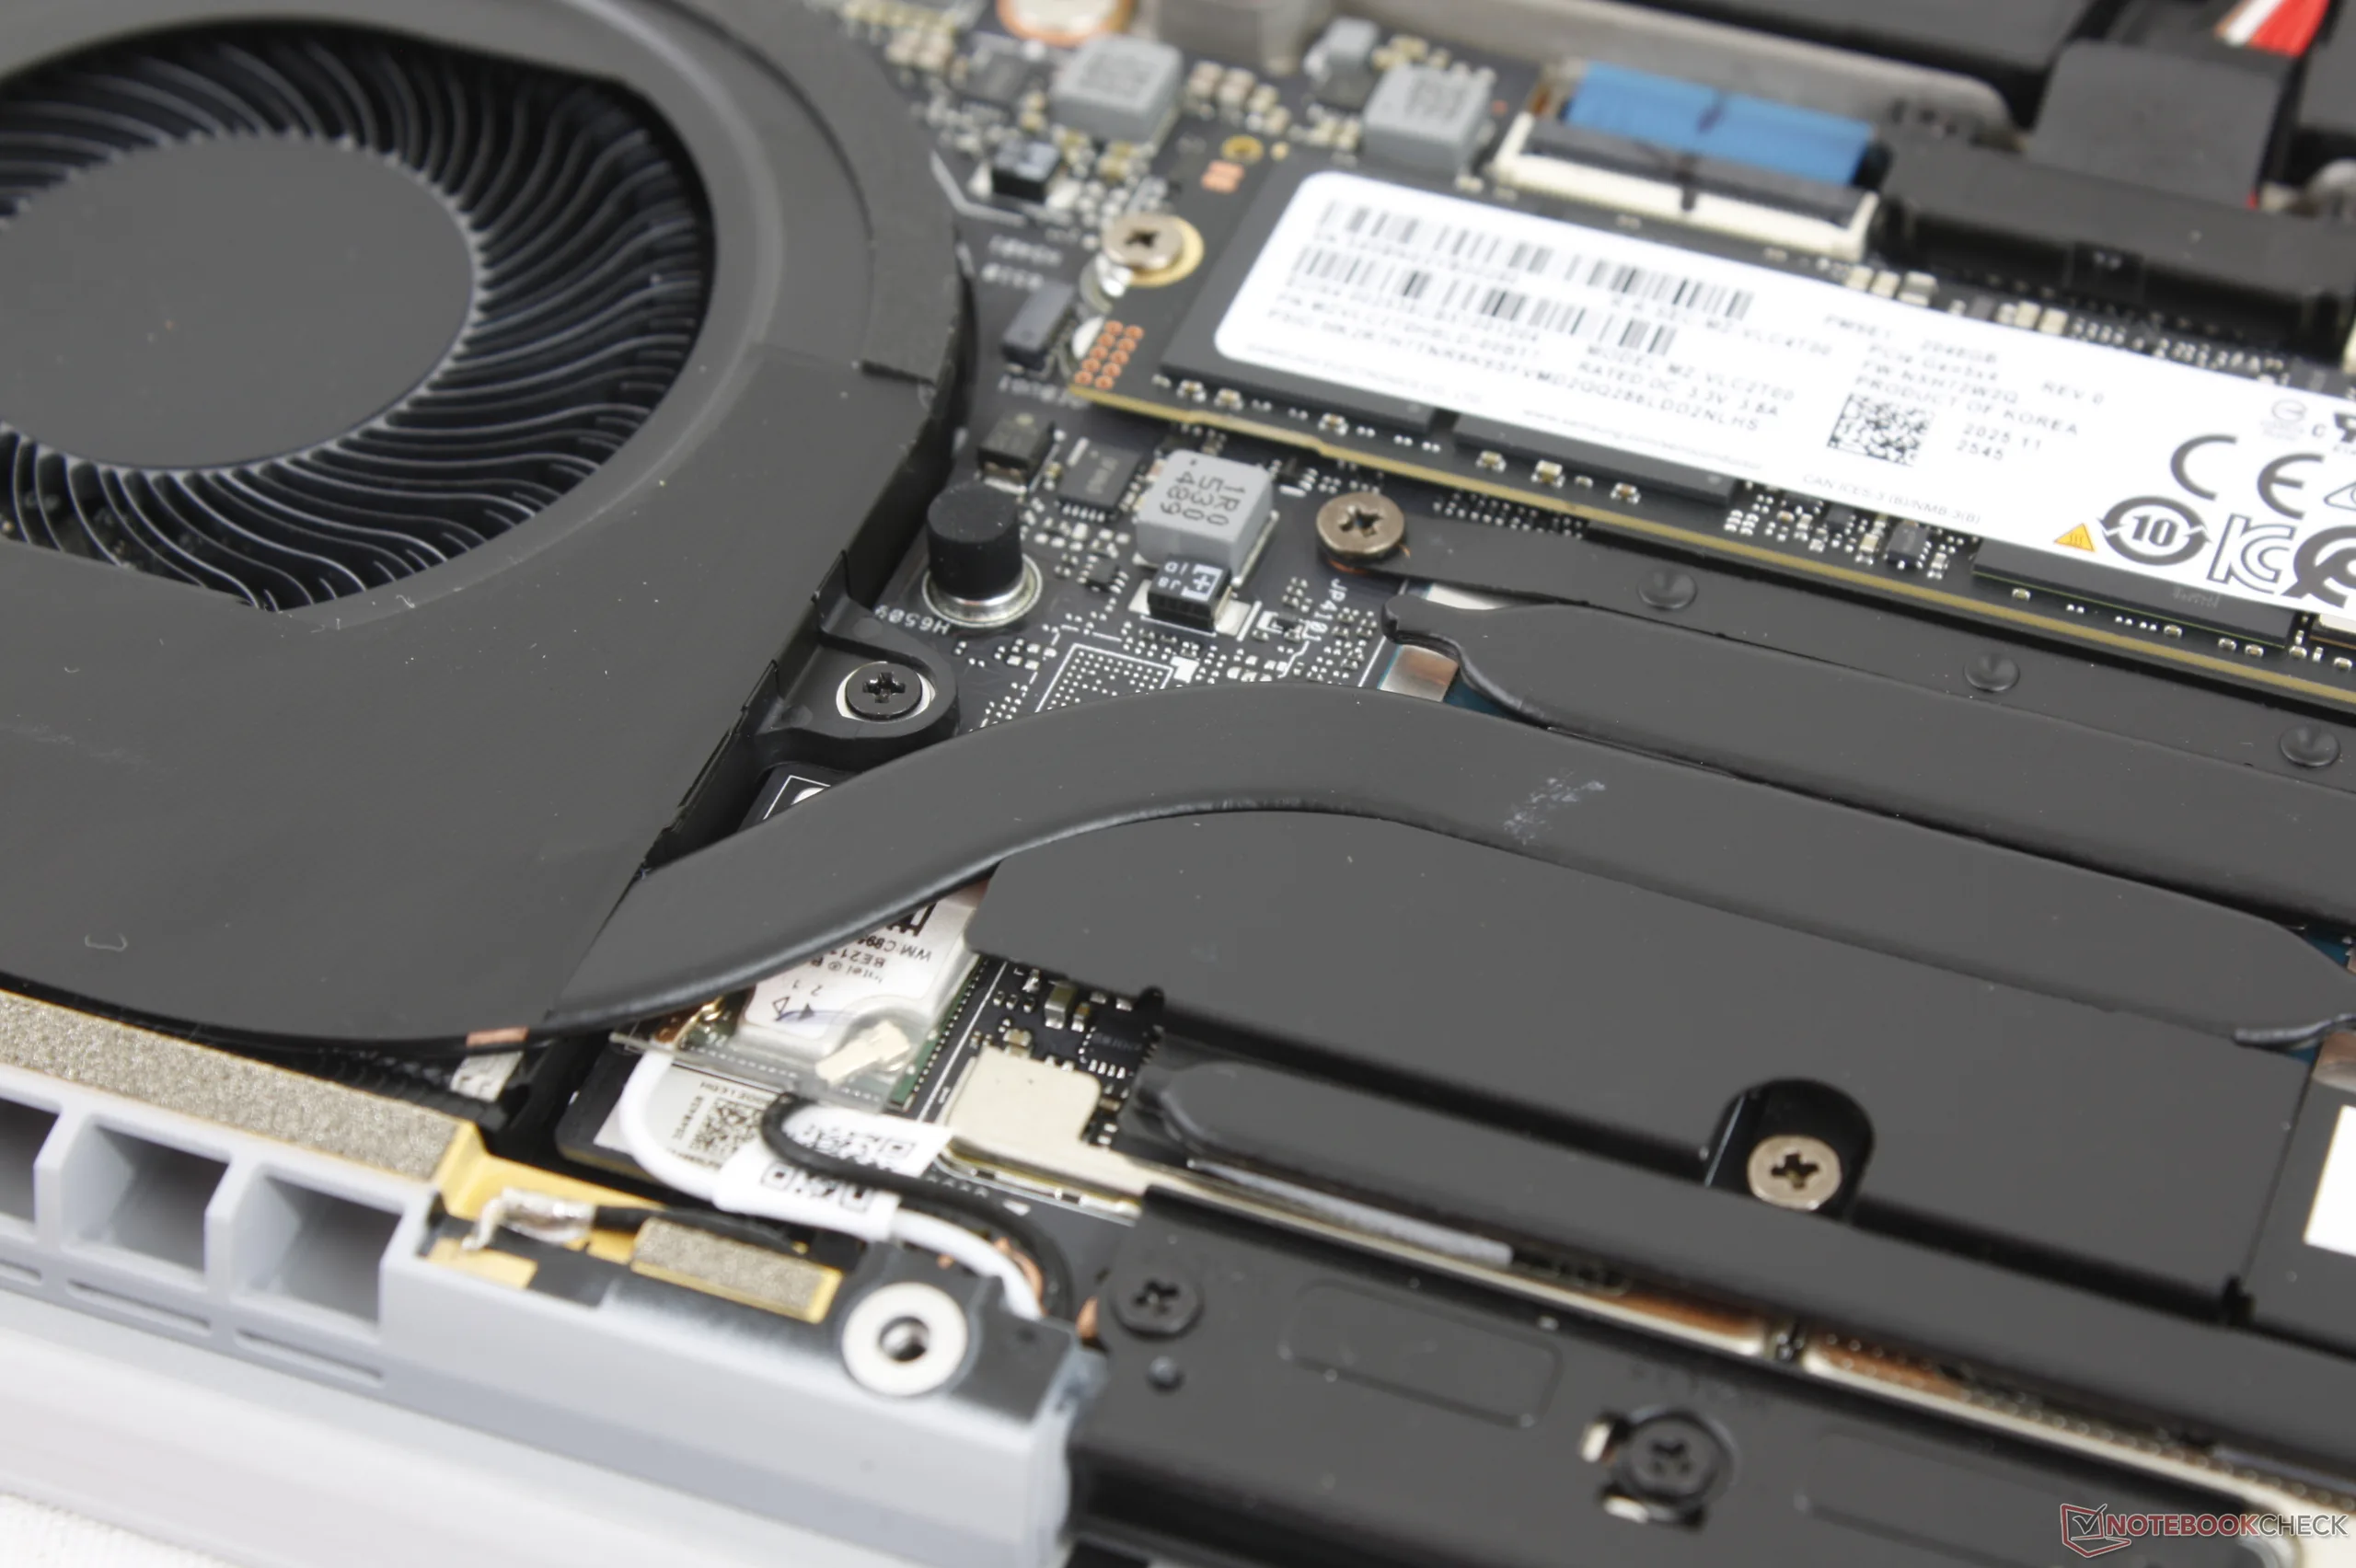
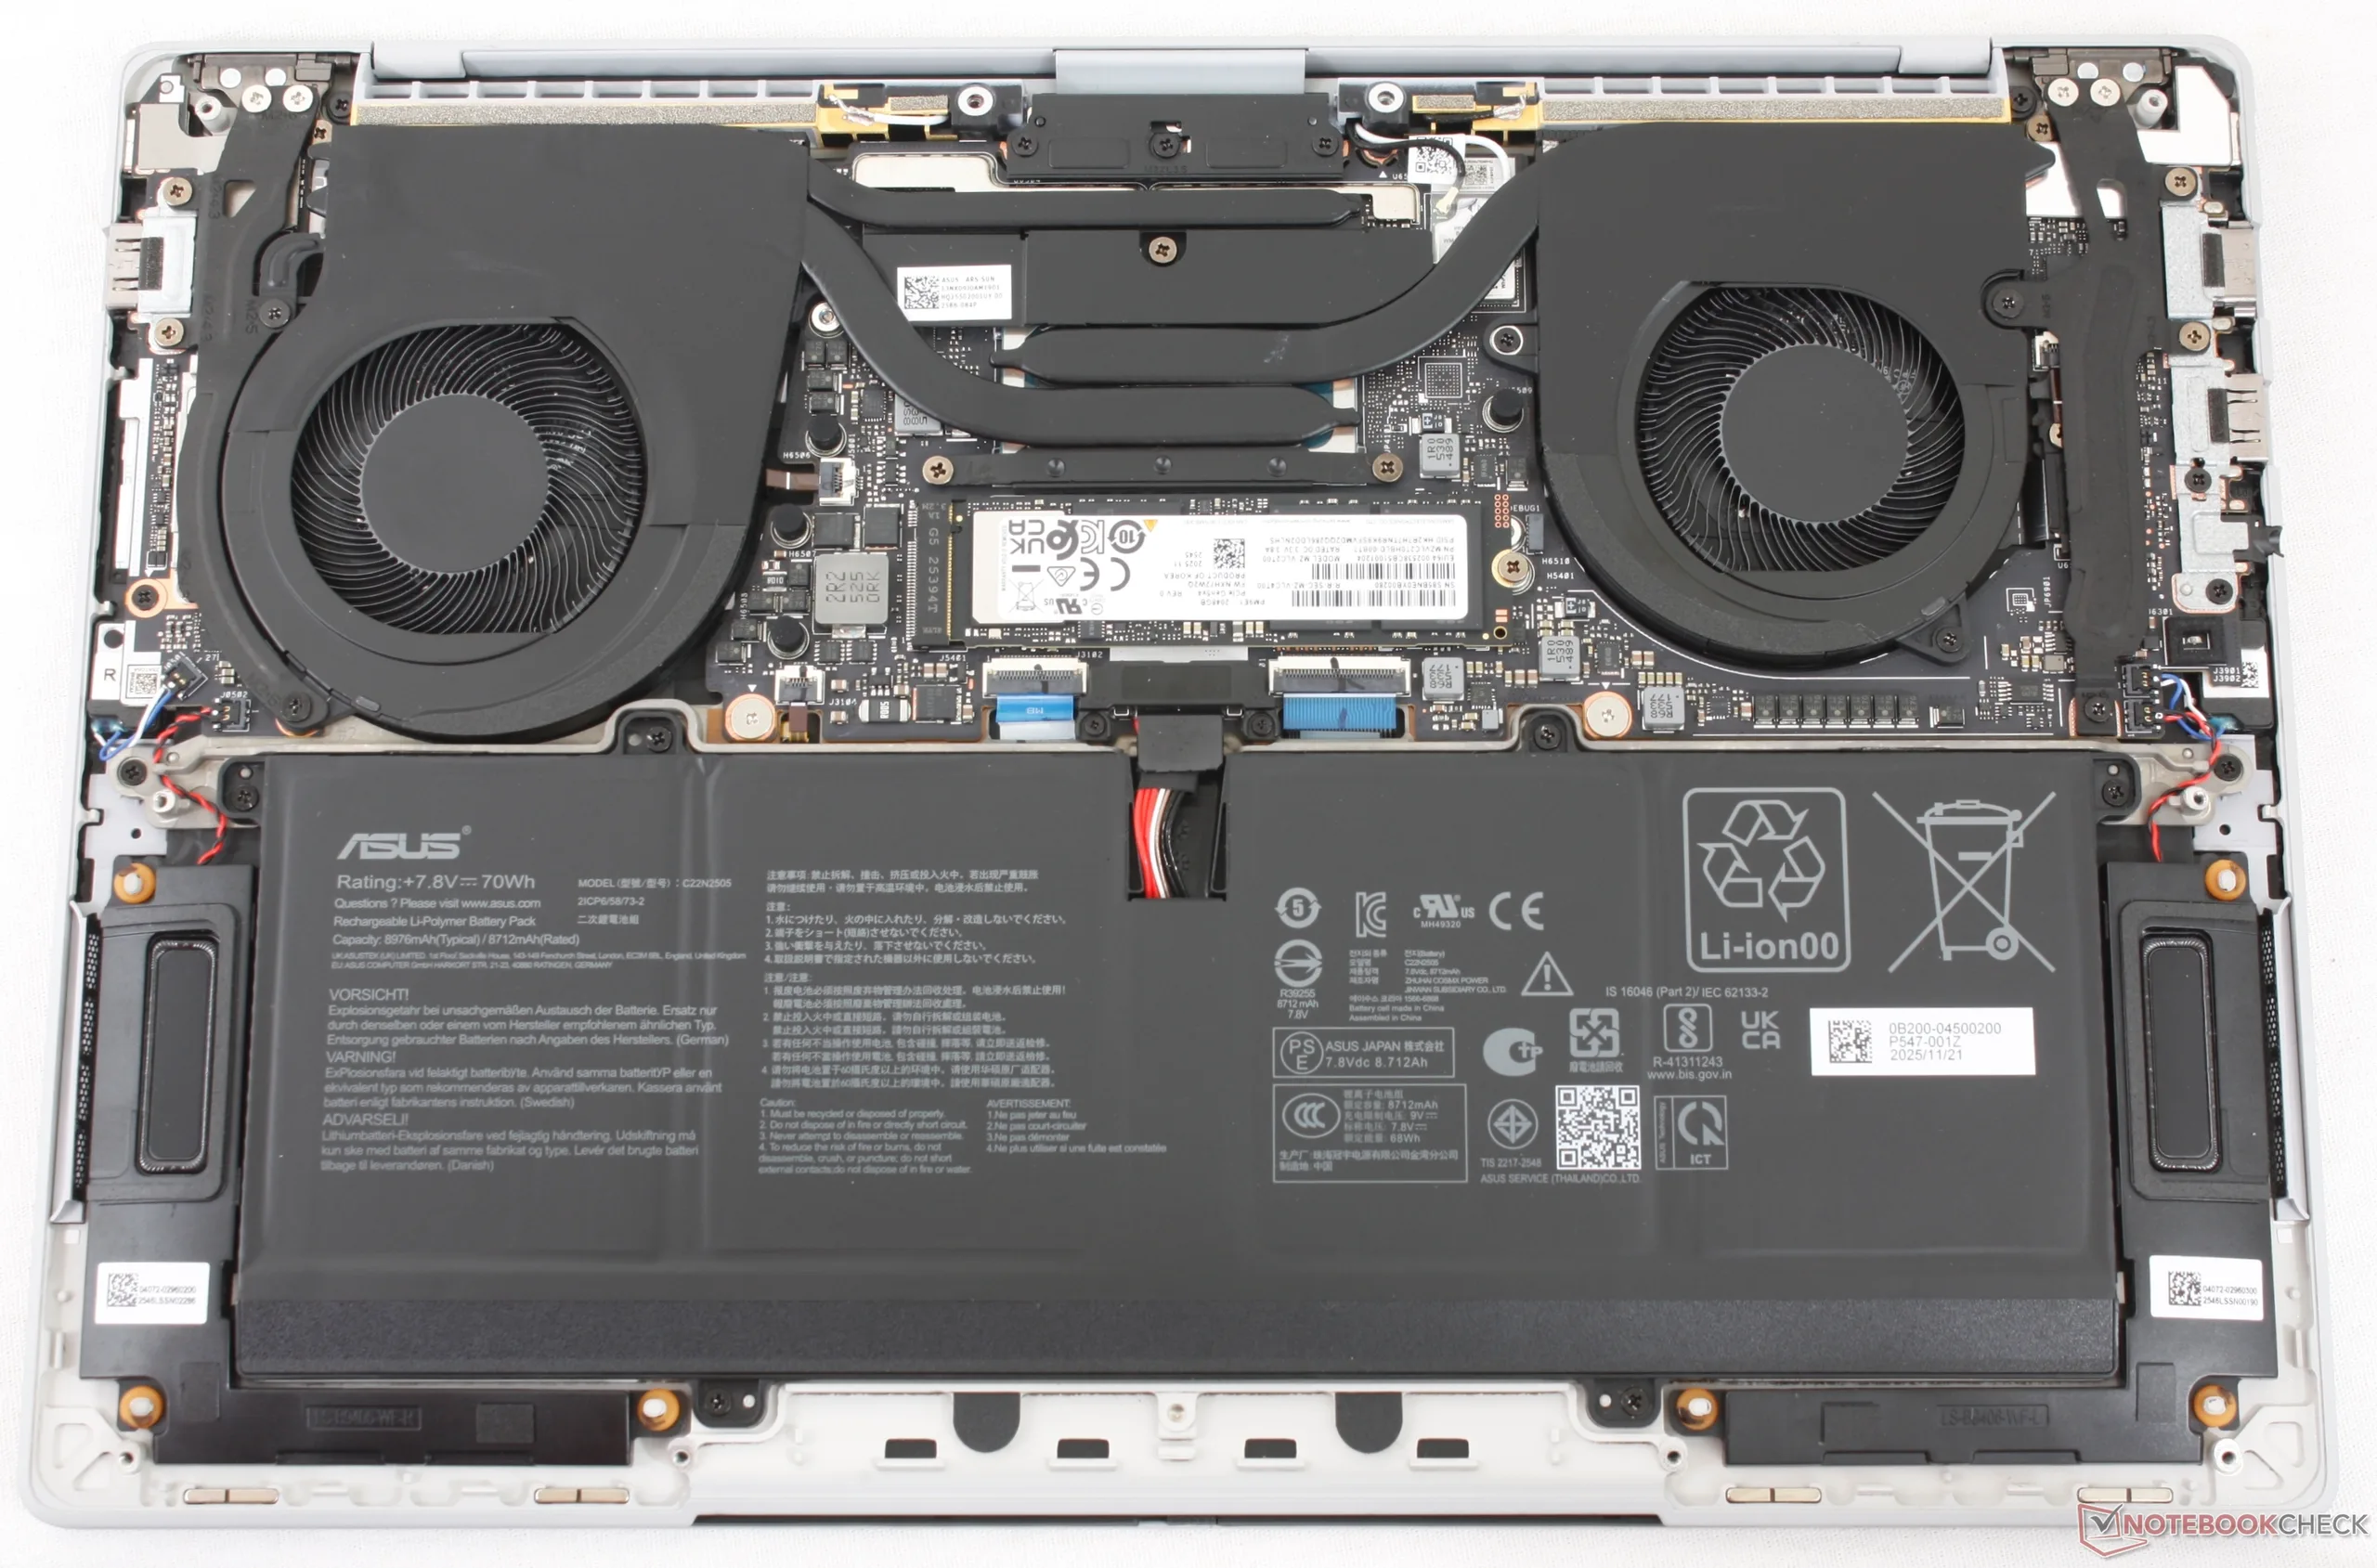
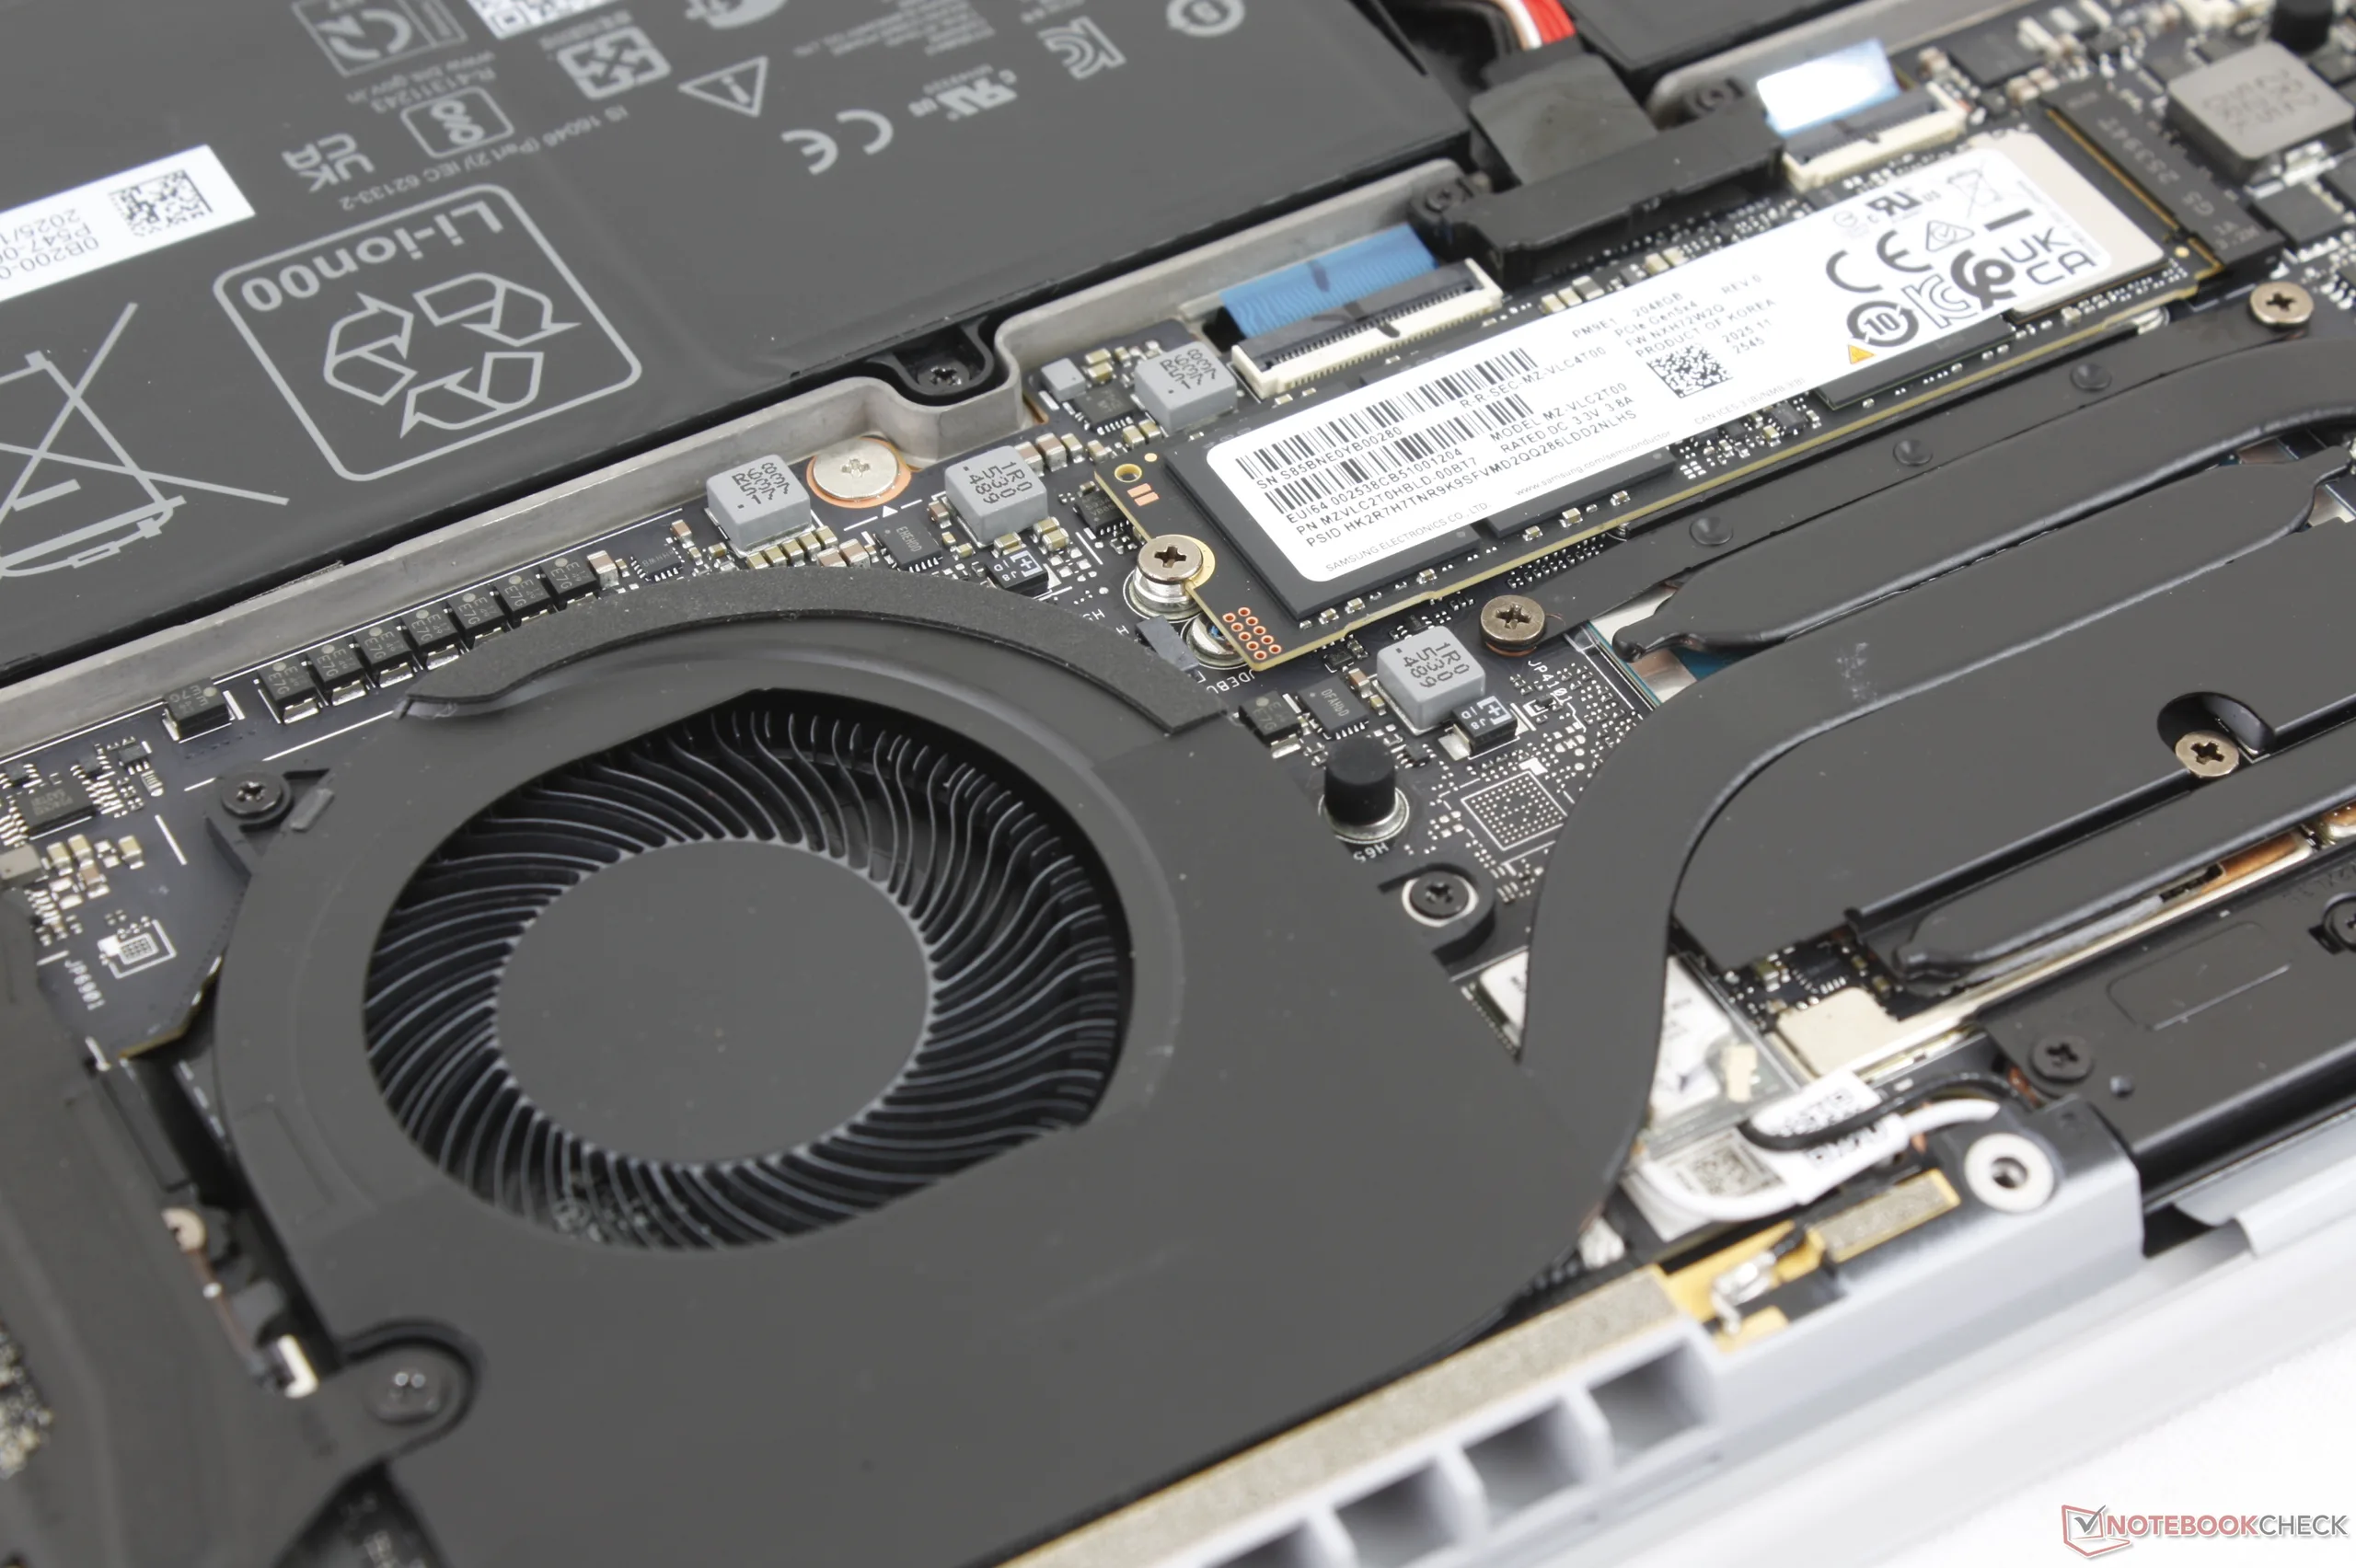
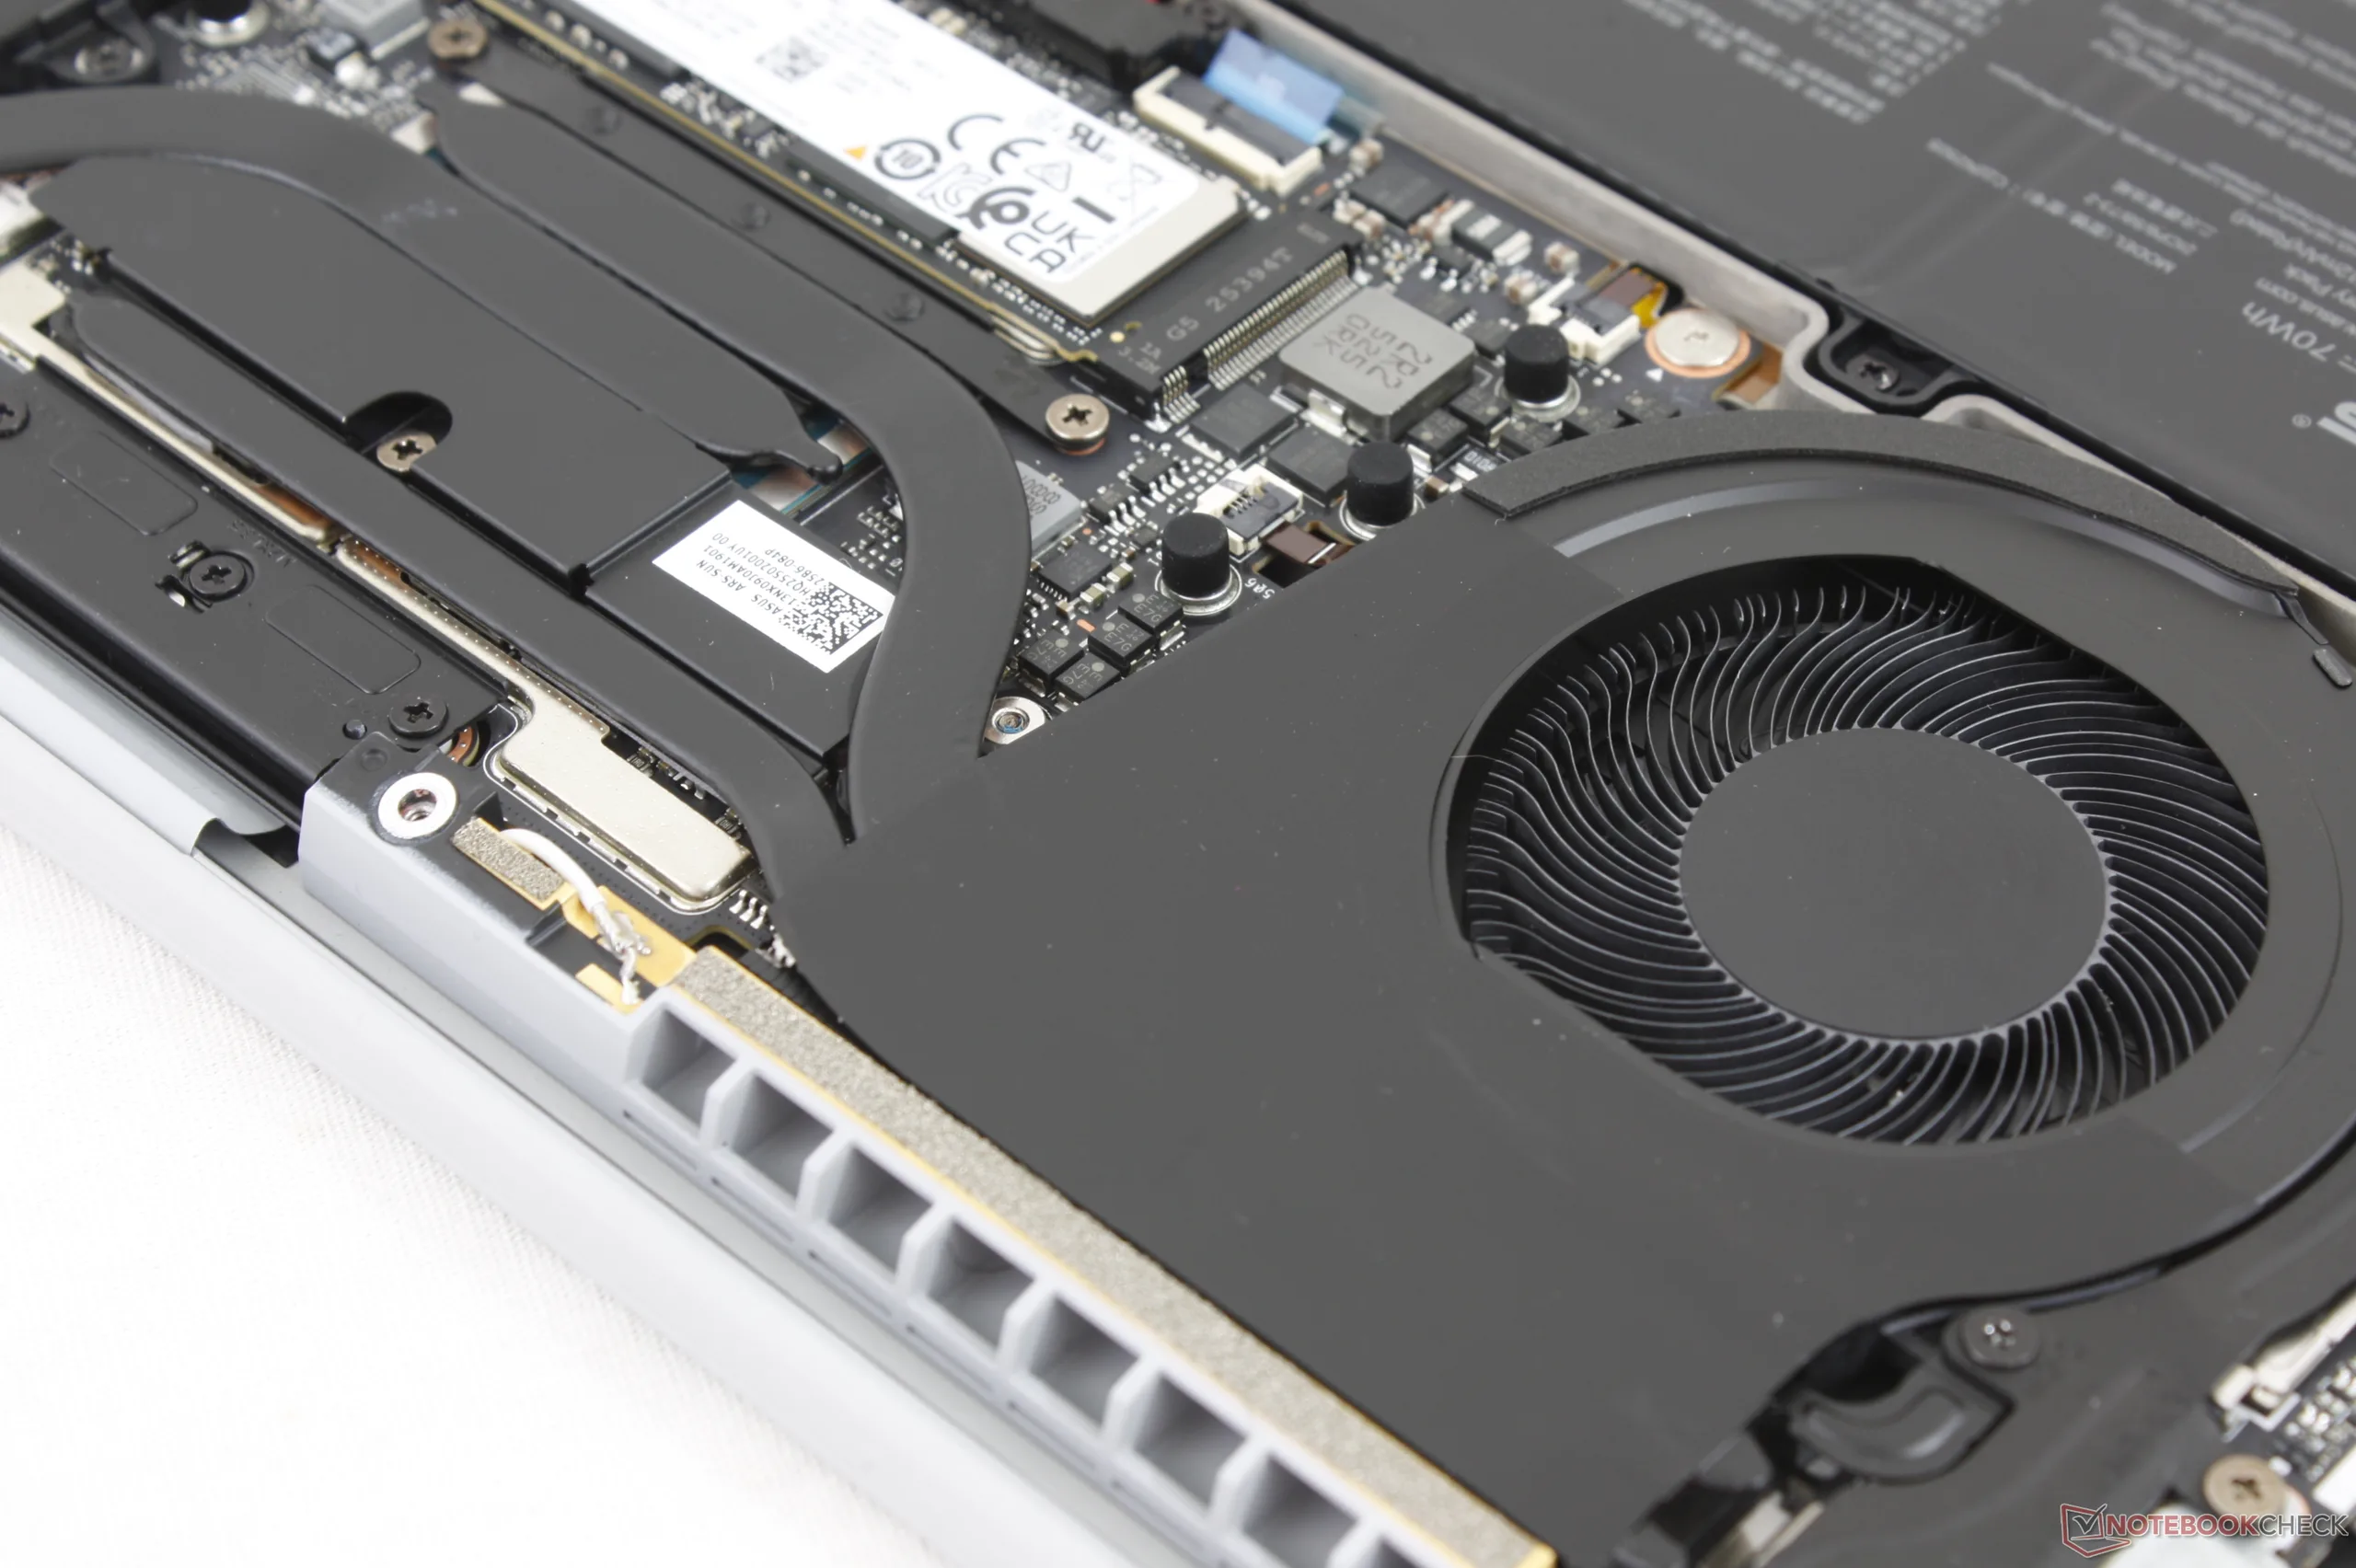
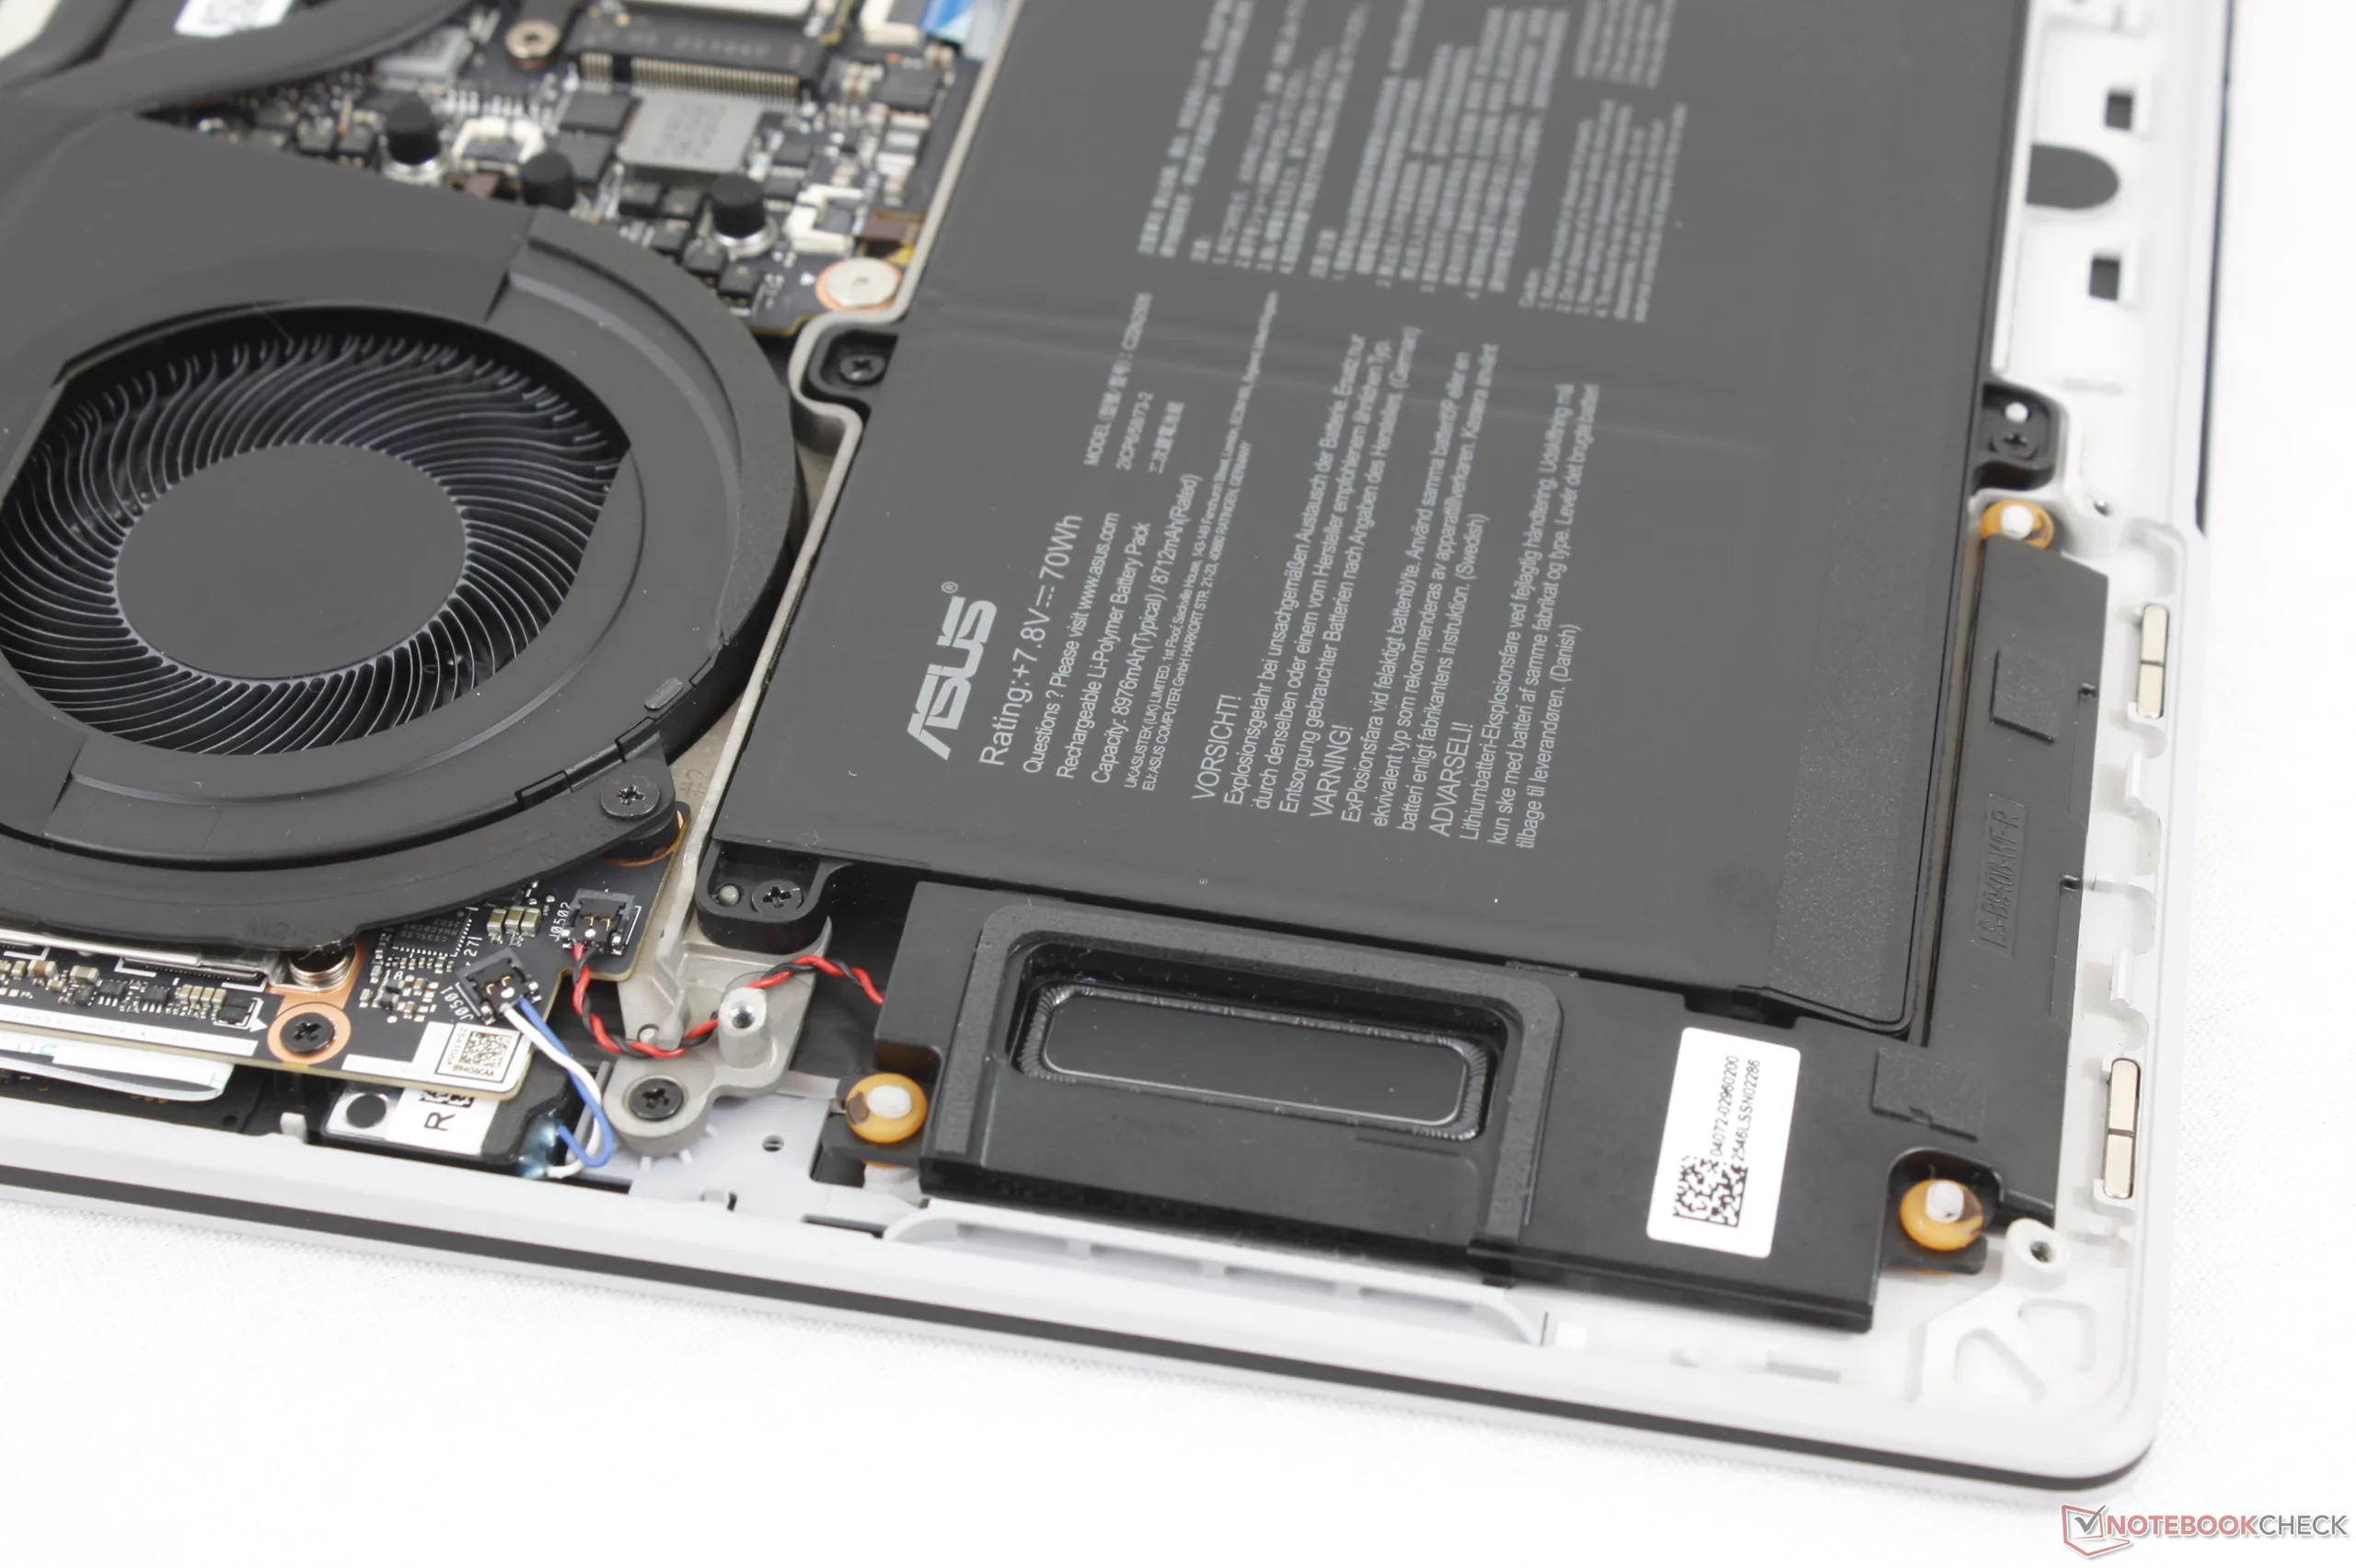
Konserwacja
Dolny panel jest zabezpieczony dziesięcioma śrubami T5 Torx, co ułatwia serwisowanie. Możliwości rozbudowy są jednak ograniczone, gdyż moduły pamięci RAM są wlutowane, a miejsce na dysku SSD M.2 2280 jest tylko jedno.
Zrównoważony rozwój
Model ten wykorzystuje w 90 procentach stop magnezu i aluminium pochodzący z recyklingu, do 35 procent tworzyw sztucznych na nasadki klawiszy i ramkę oraz w 100 procentach metale ziem rzadkich pochodzące z recyklingu. Opakowanie składa się niemal w całości z papieru i tektury, a zasilacz sieciowy owinięty jest w plastikowe opakowanie.
Akcesoria i gwarancja
W pudełku detalicznym nie ma żadnych dodatków poza zasilaczem sieciowym i dokumentacją. W przypadku zakupu w Stanach Zjednoczonych obowiązuje trzyletnia ograniczona gwarancja producenta.
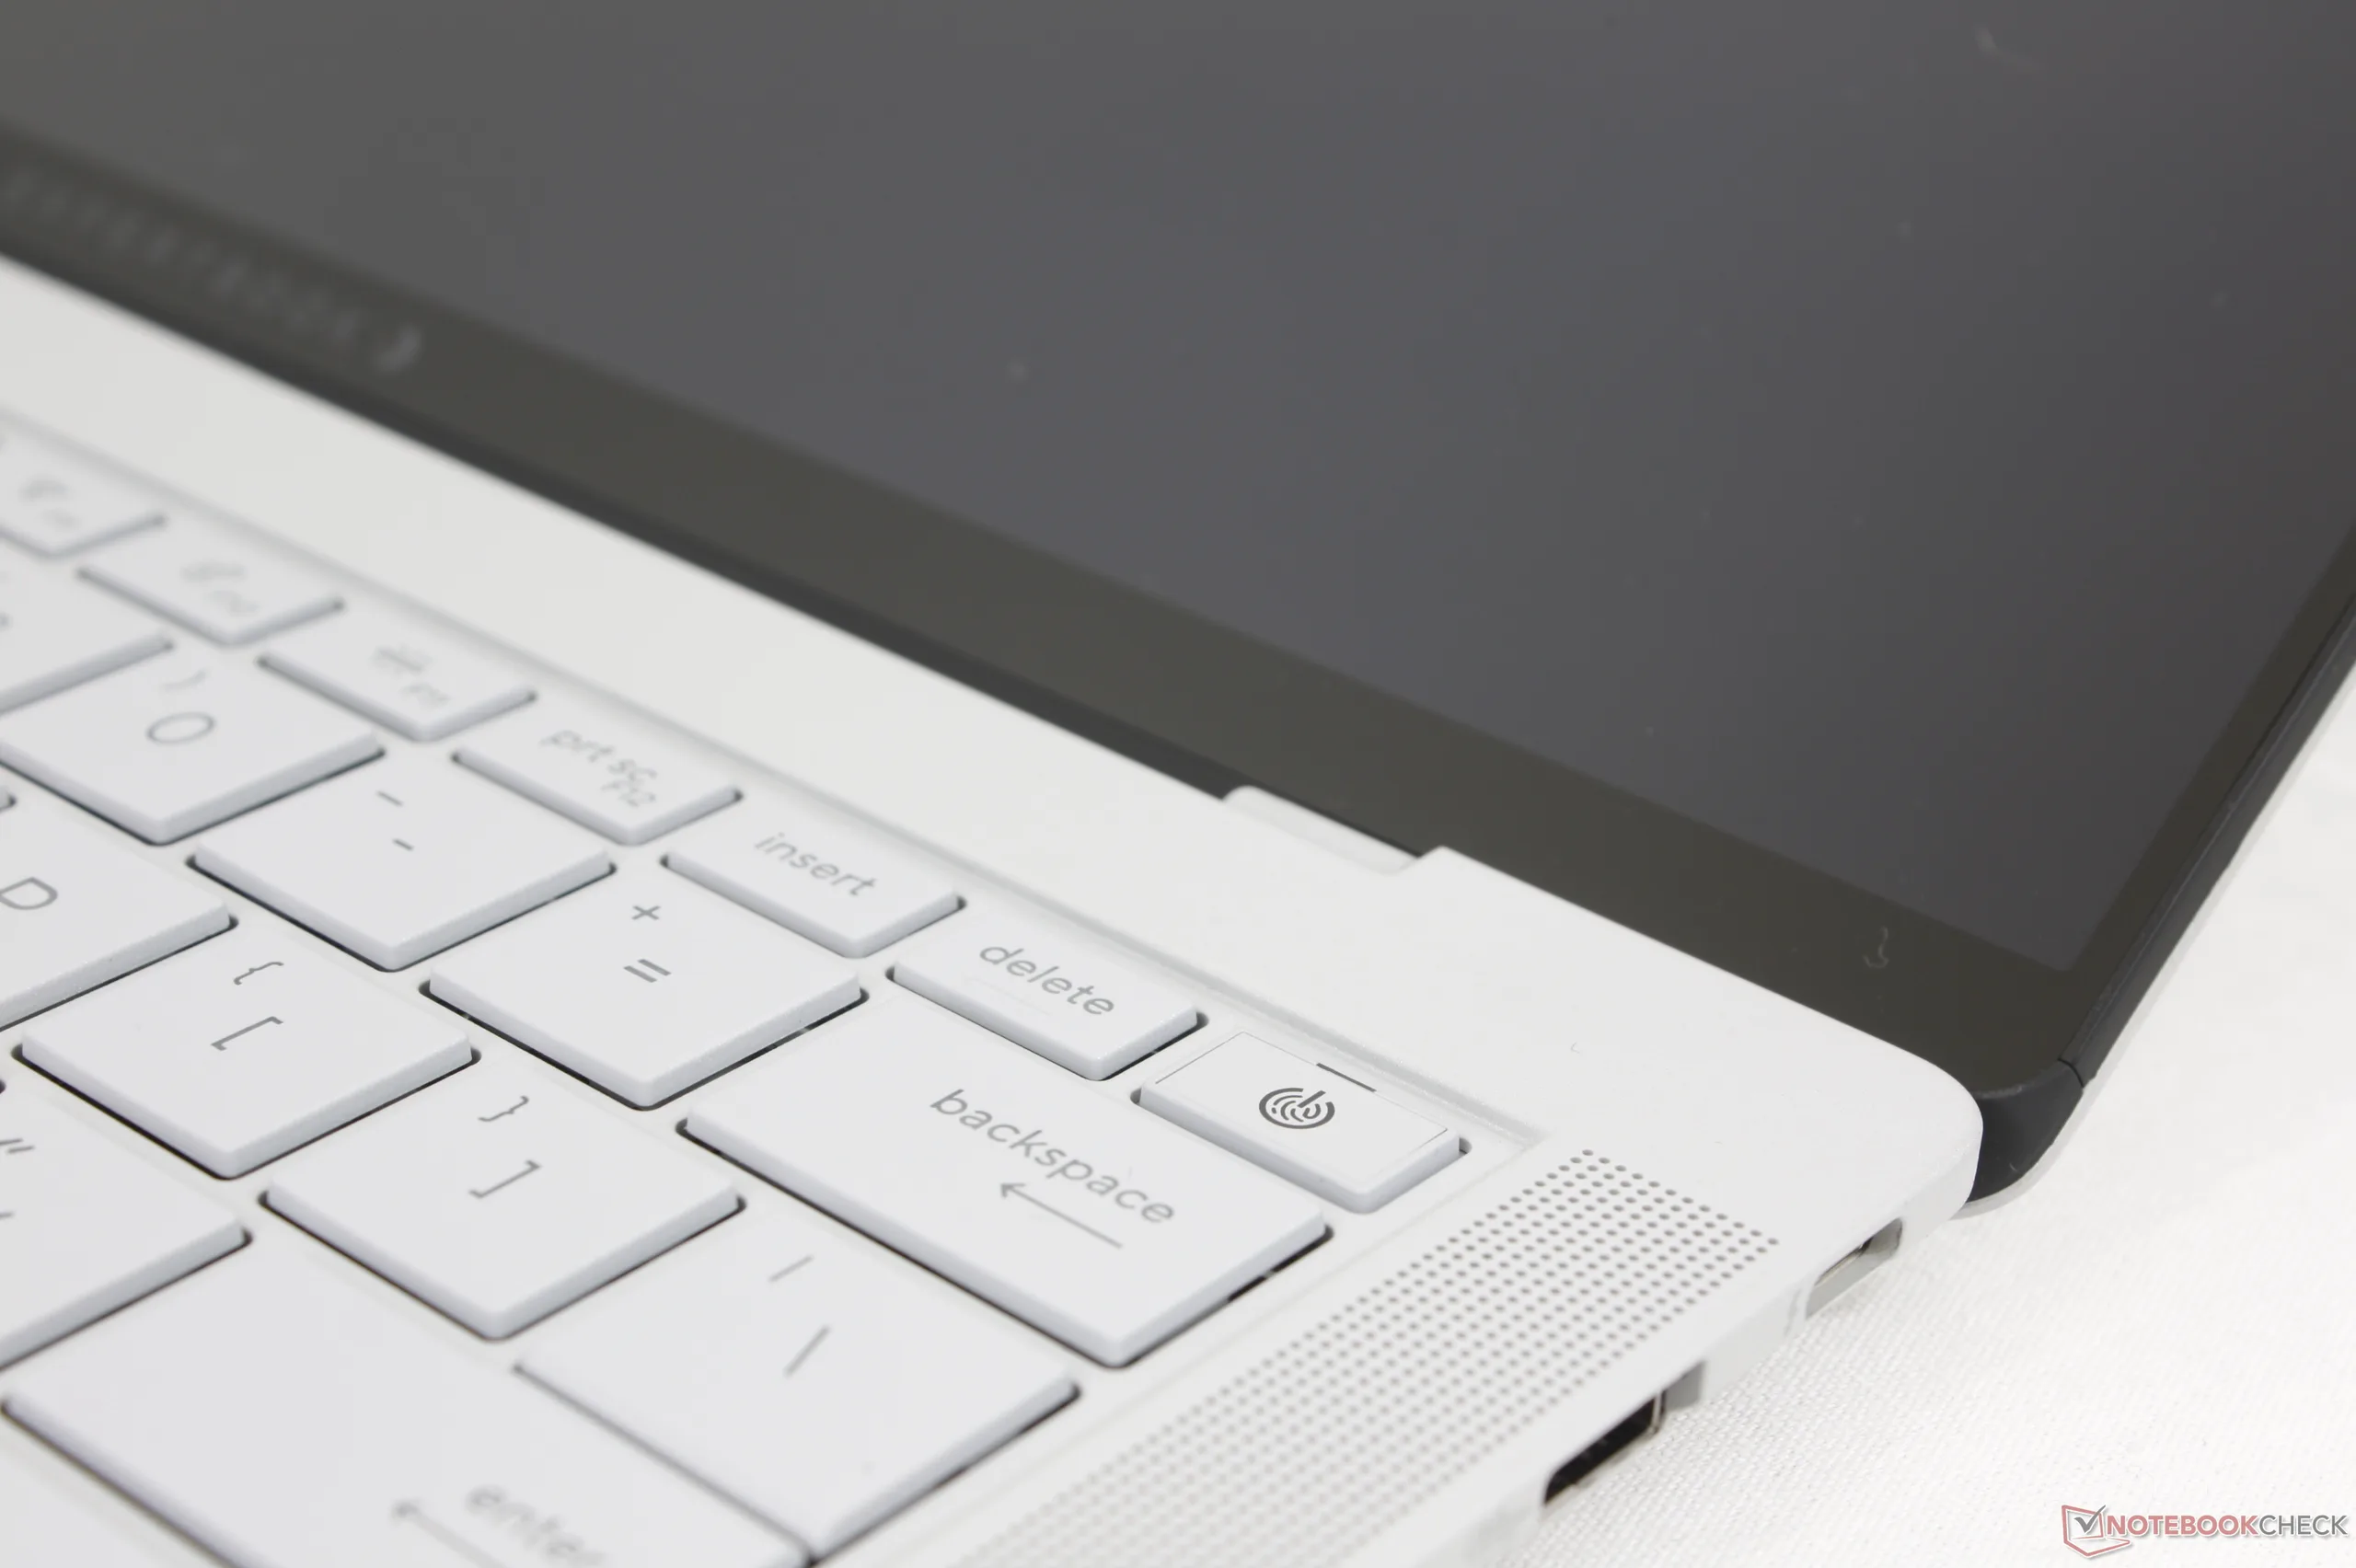
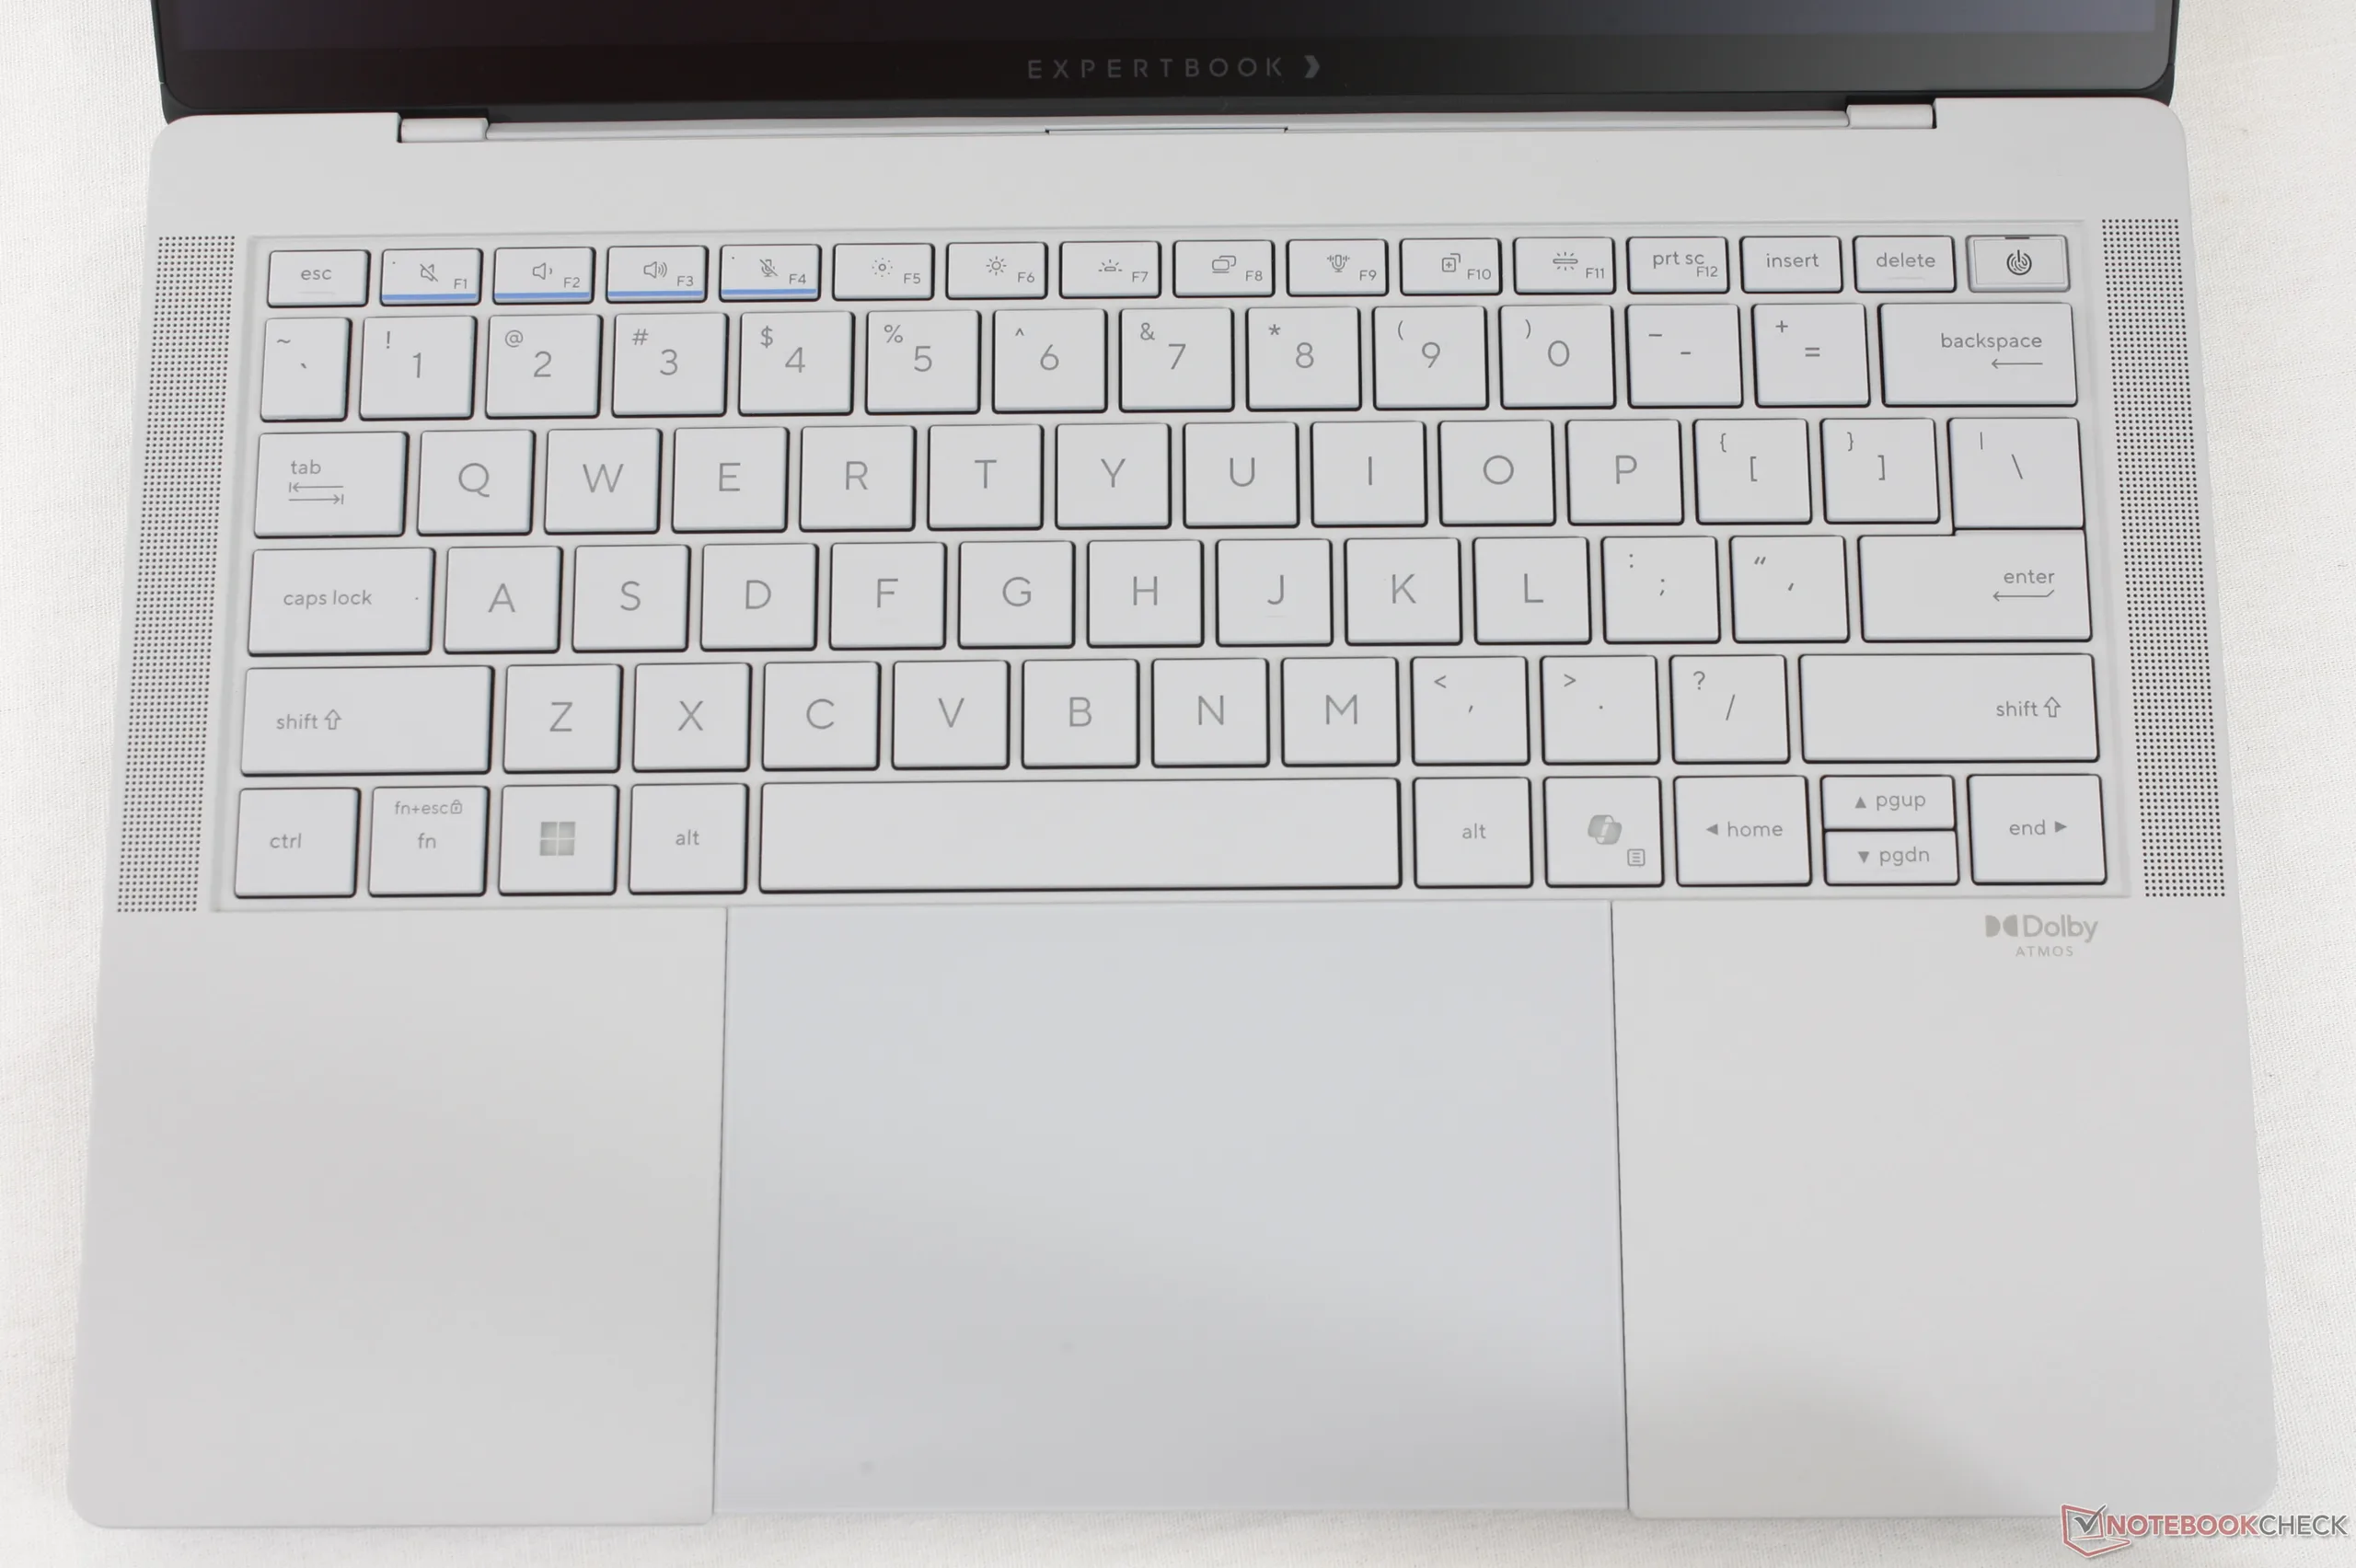
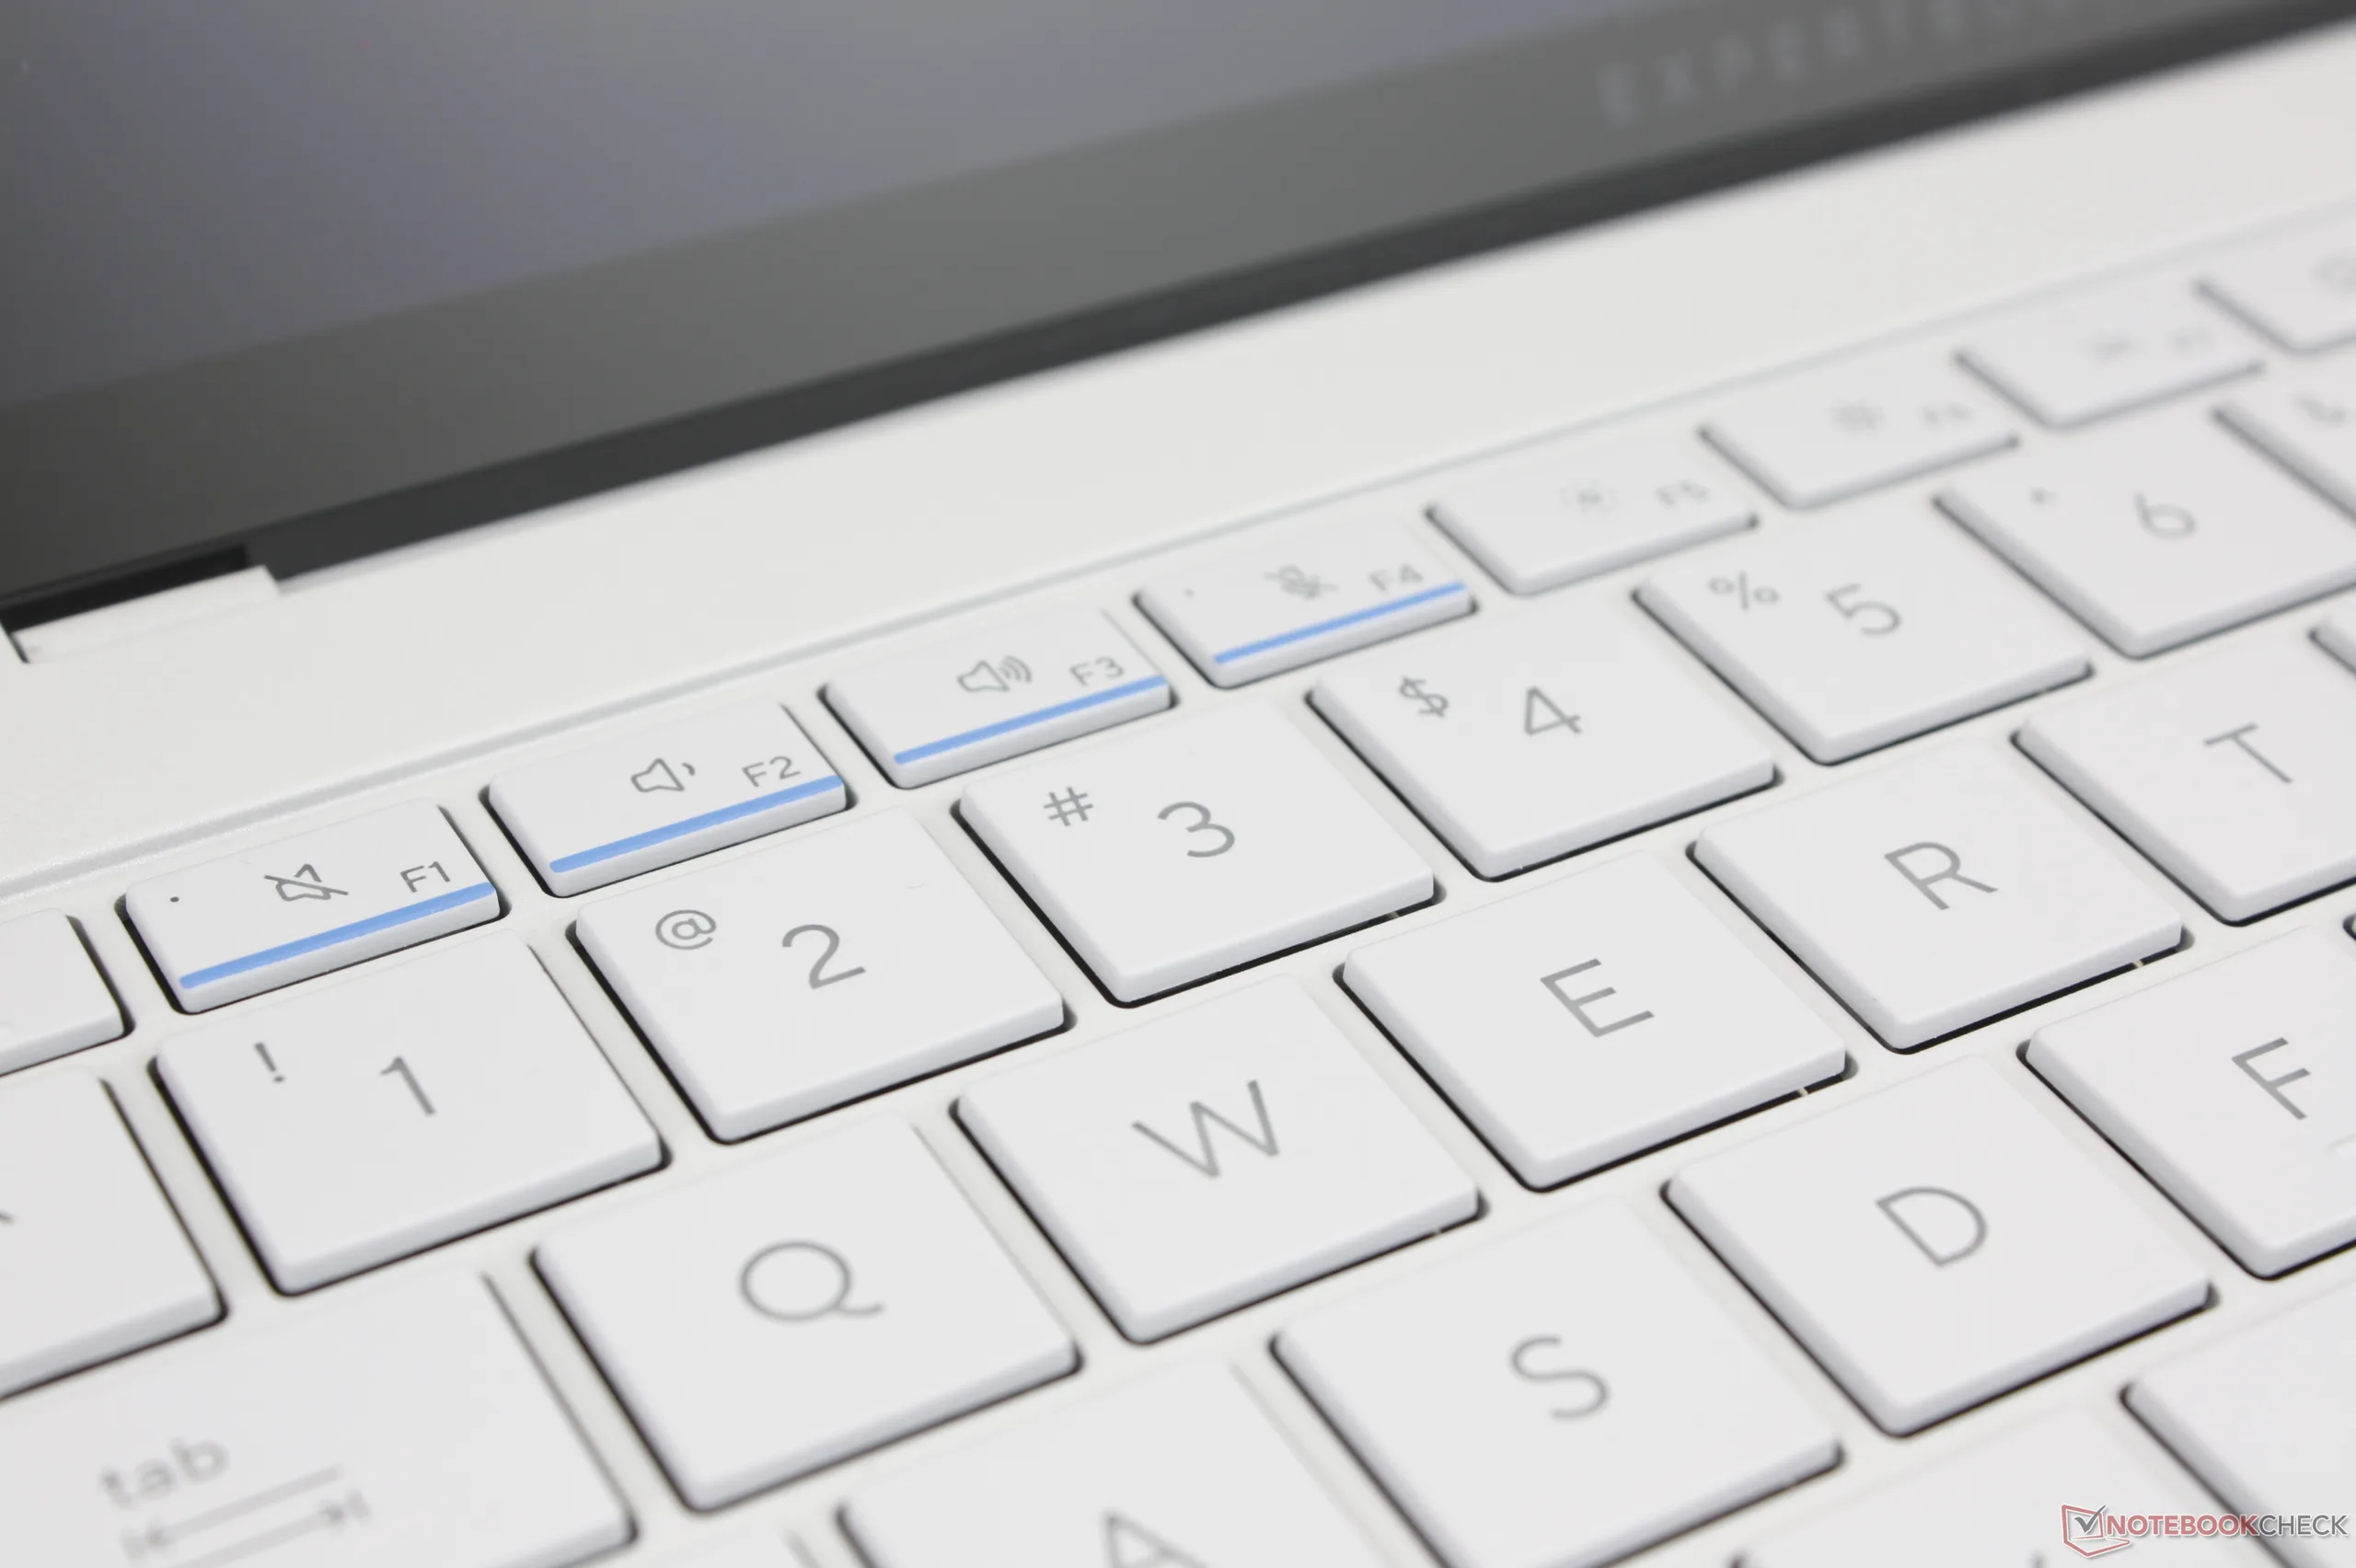
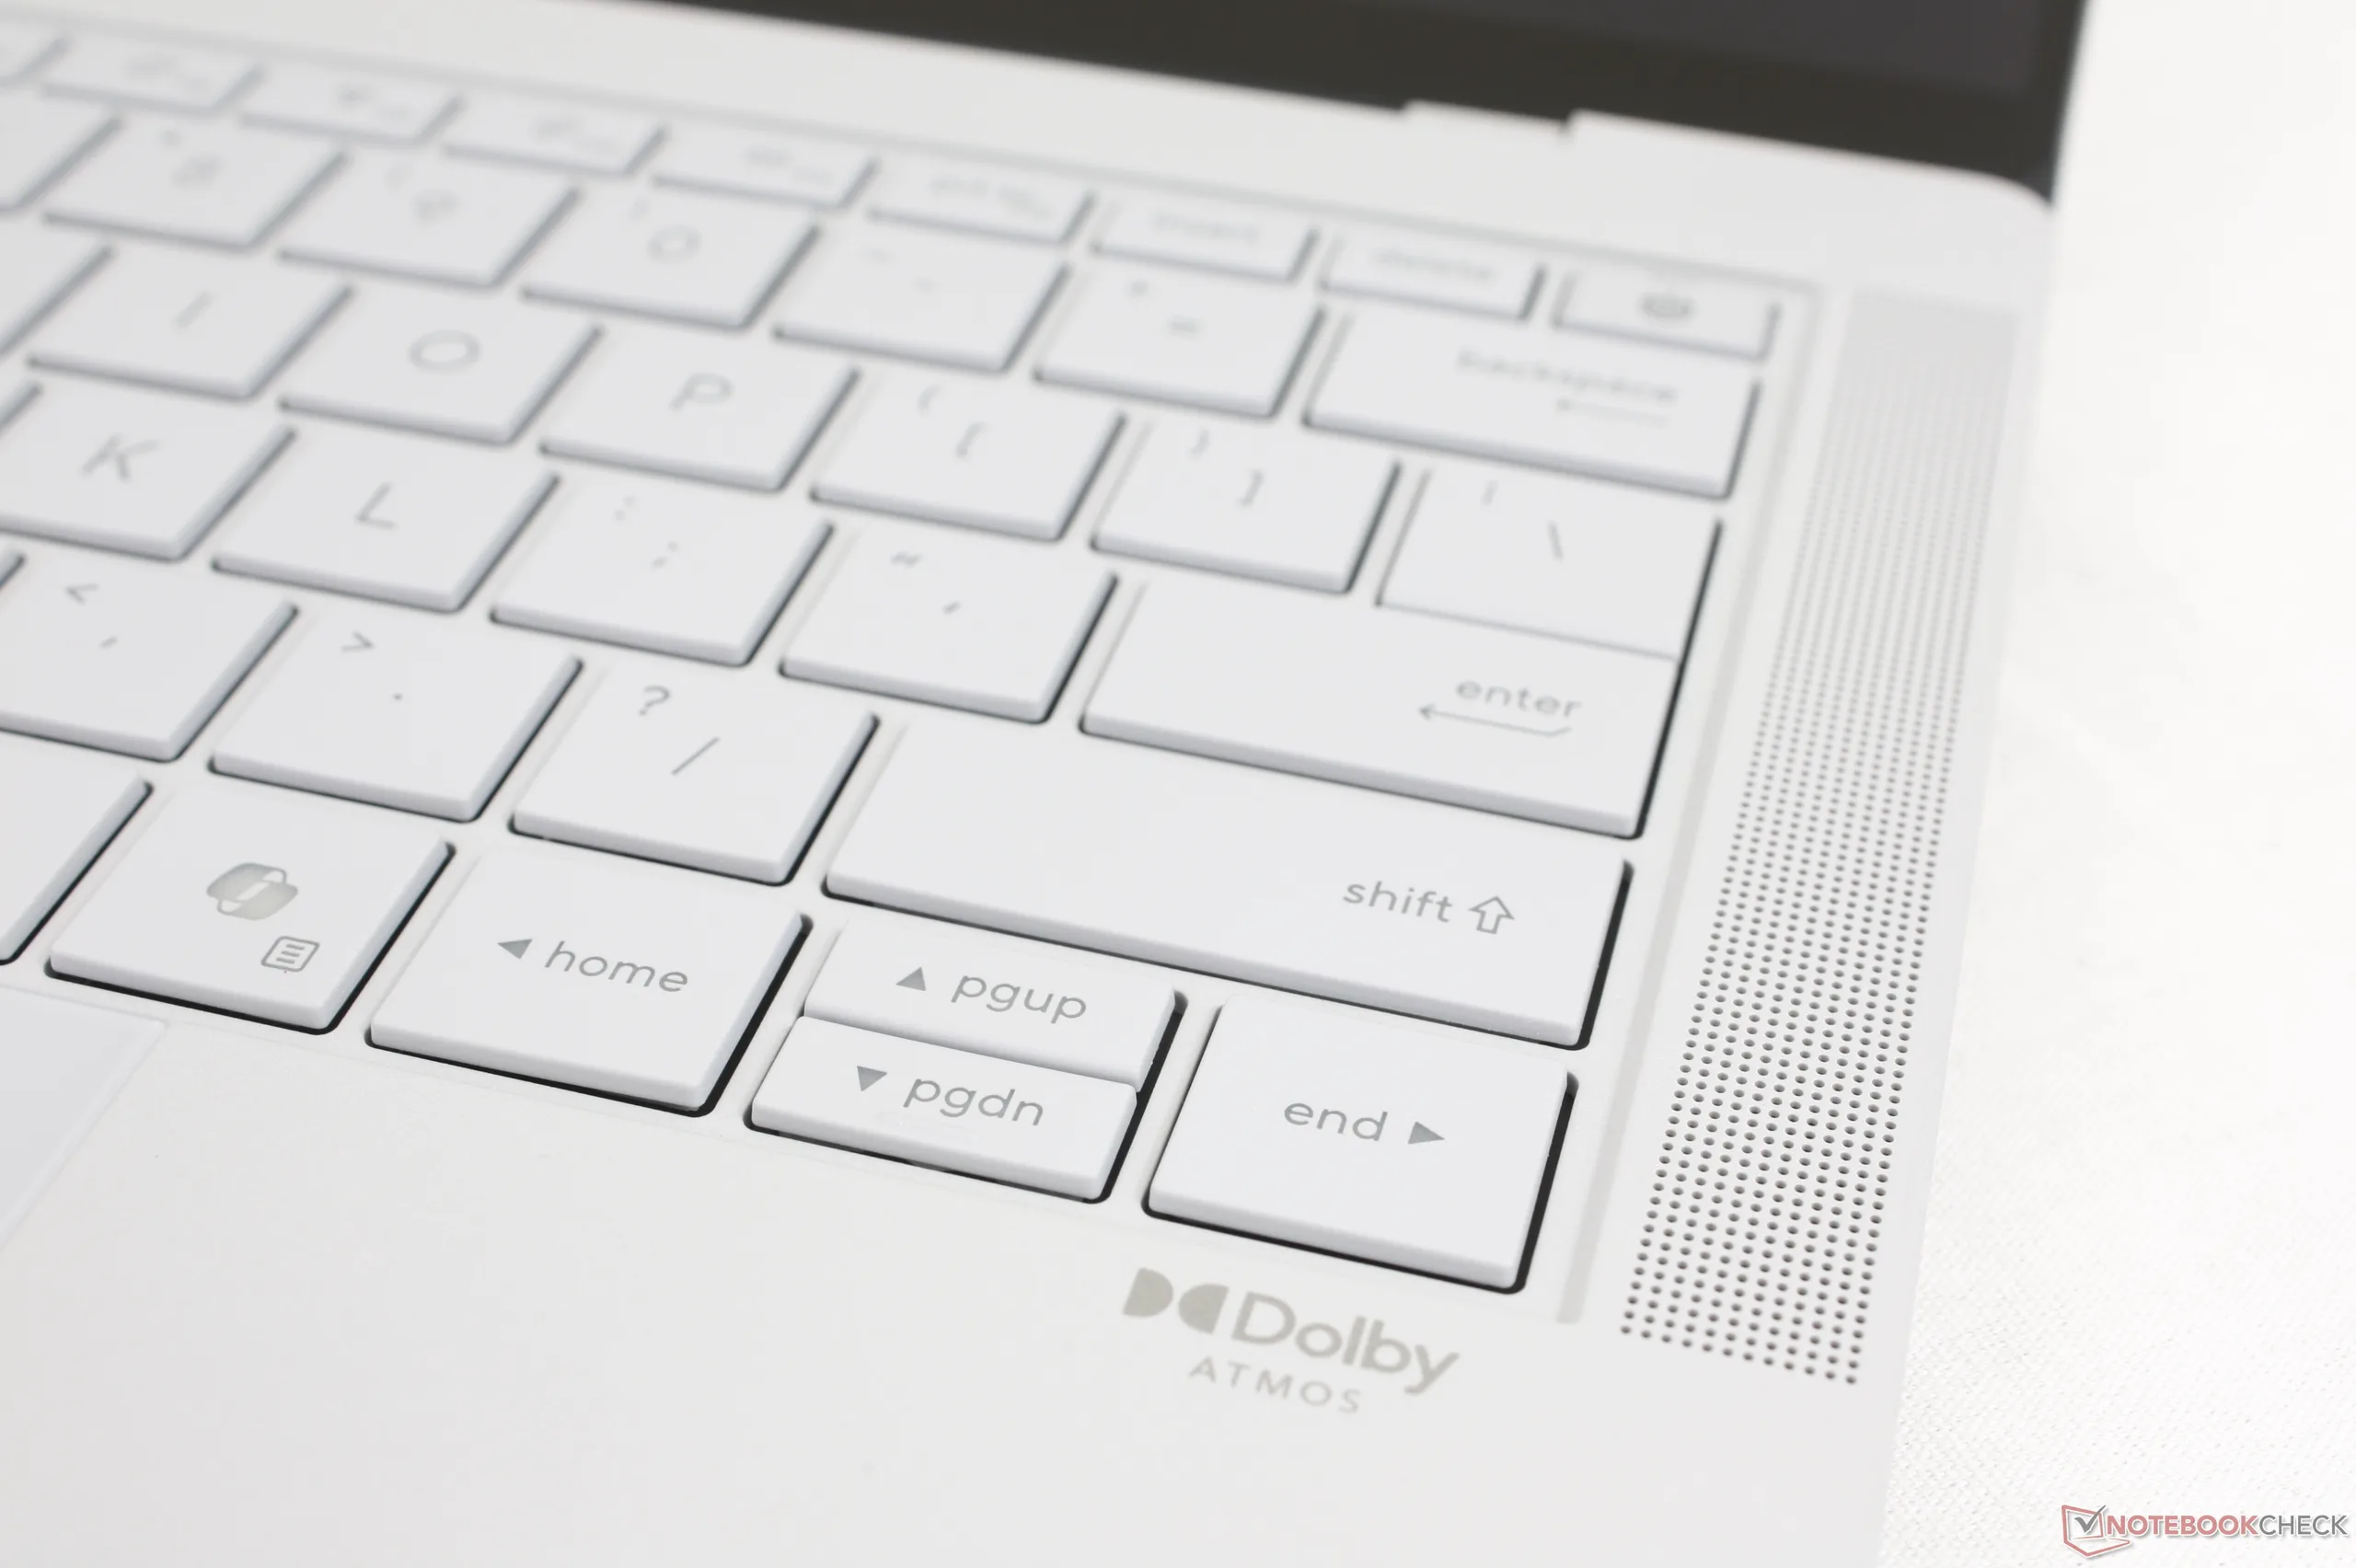
Urządzenia wejściowe - Zbyt czuły Clickpad
Klawiatura
Klawisze mają skok 1,5 mm z przyzwoicie mocnym sprzężeniem zwrotnym dla maszynistek. Mimo to, w szczególności klawisze spacji i Enter mogłyby zyskać na silniejszym sprzężeniu zwrotnym, ponieważ są raczej lekkie w porównaniu z tymi samymi klawiszami w ThinkPadzie lub EliteBooku.
Panel dotykowy
Podczas gdy clickpad jest przyzwoicie duży i ma wymiary 12,8 x 8,8 cm, haptyczne sprzężenie zwrotne podczas klikania jest bardzo słabe, co daje niezadowalające odczucia. Co więcej, przednia krawędź klawiatury jest całkowicie zlicowana z przednią krawędzią obudowy, w przeciwieństwie do większości innych laptopów, co oznacza, że przypadkowe kliknięcia lub ruchy są częstsze w naszym doświadczeniu.
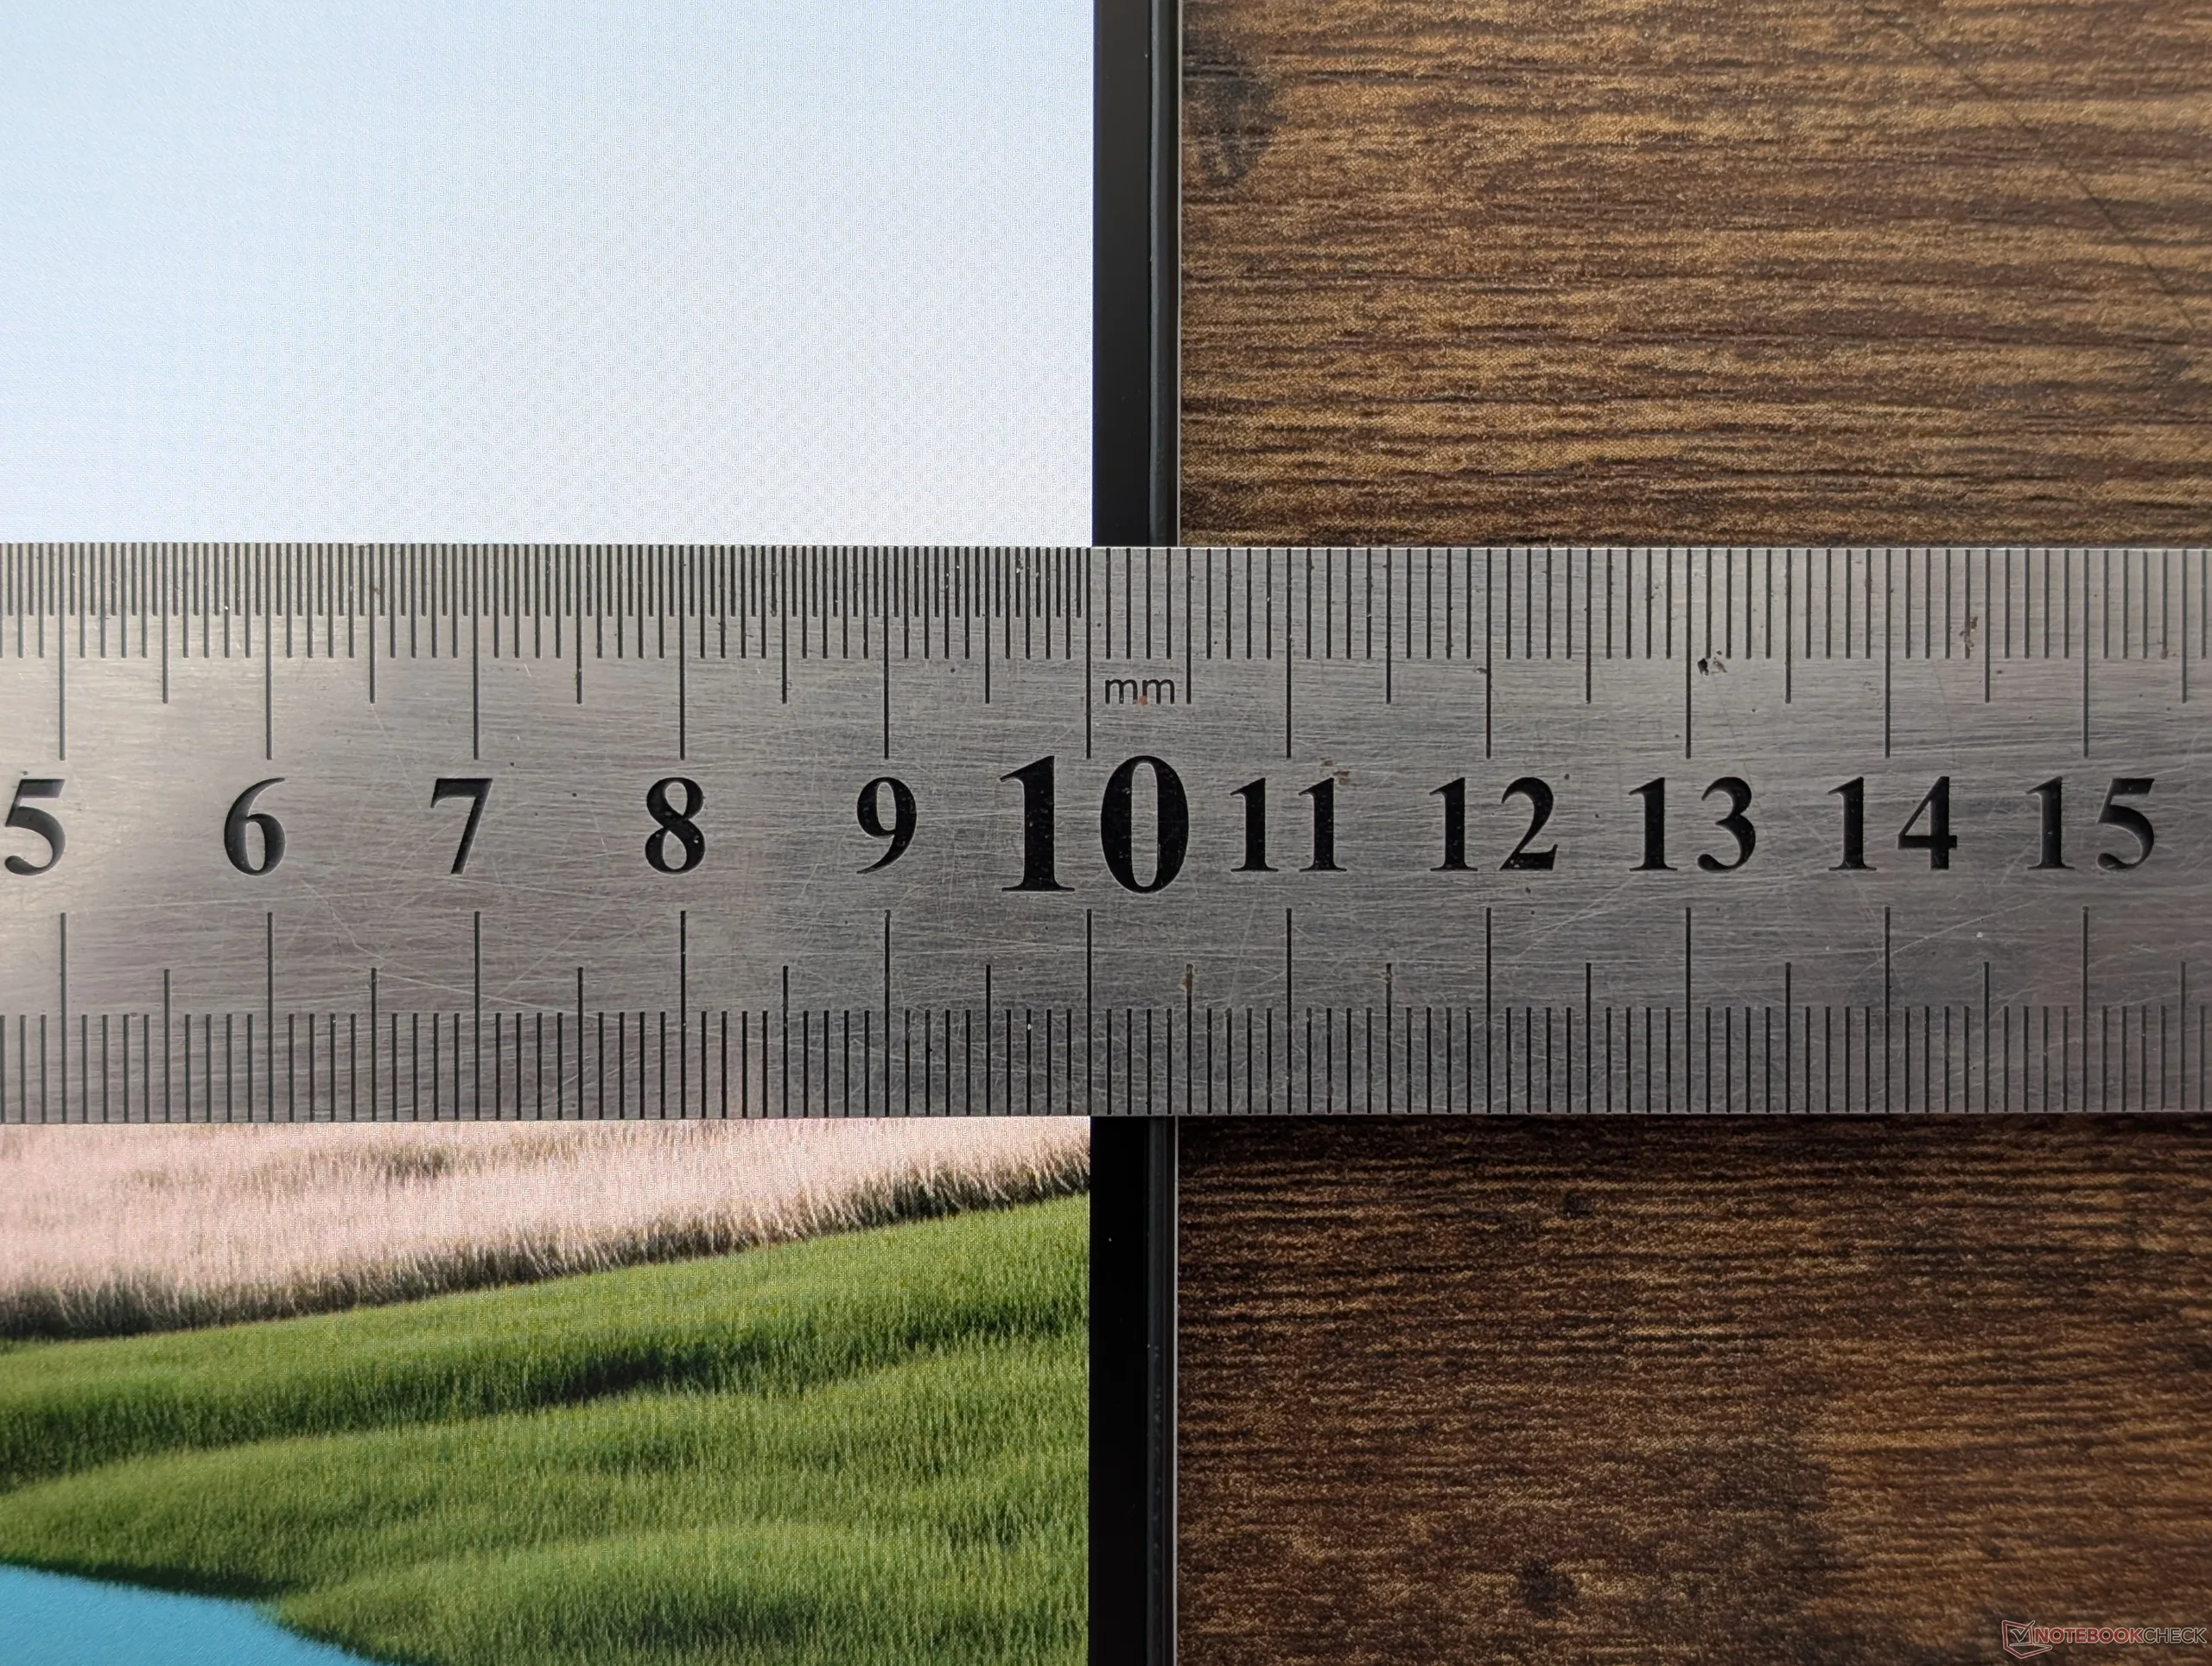
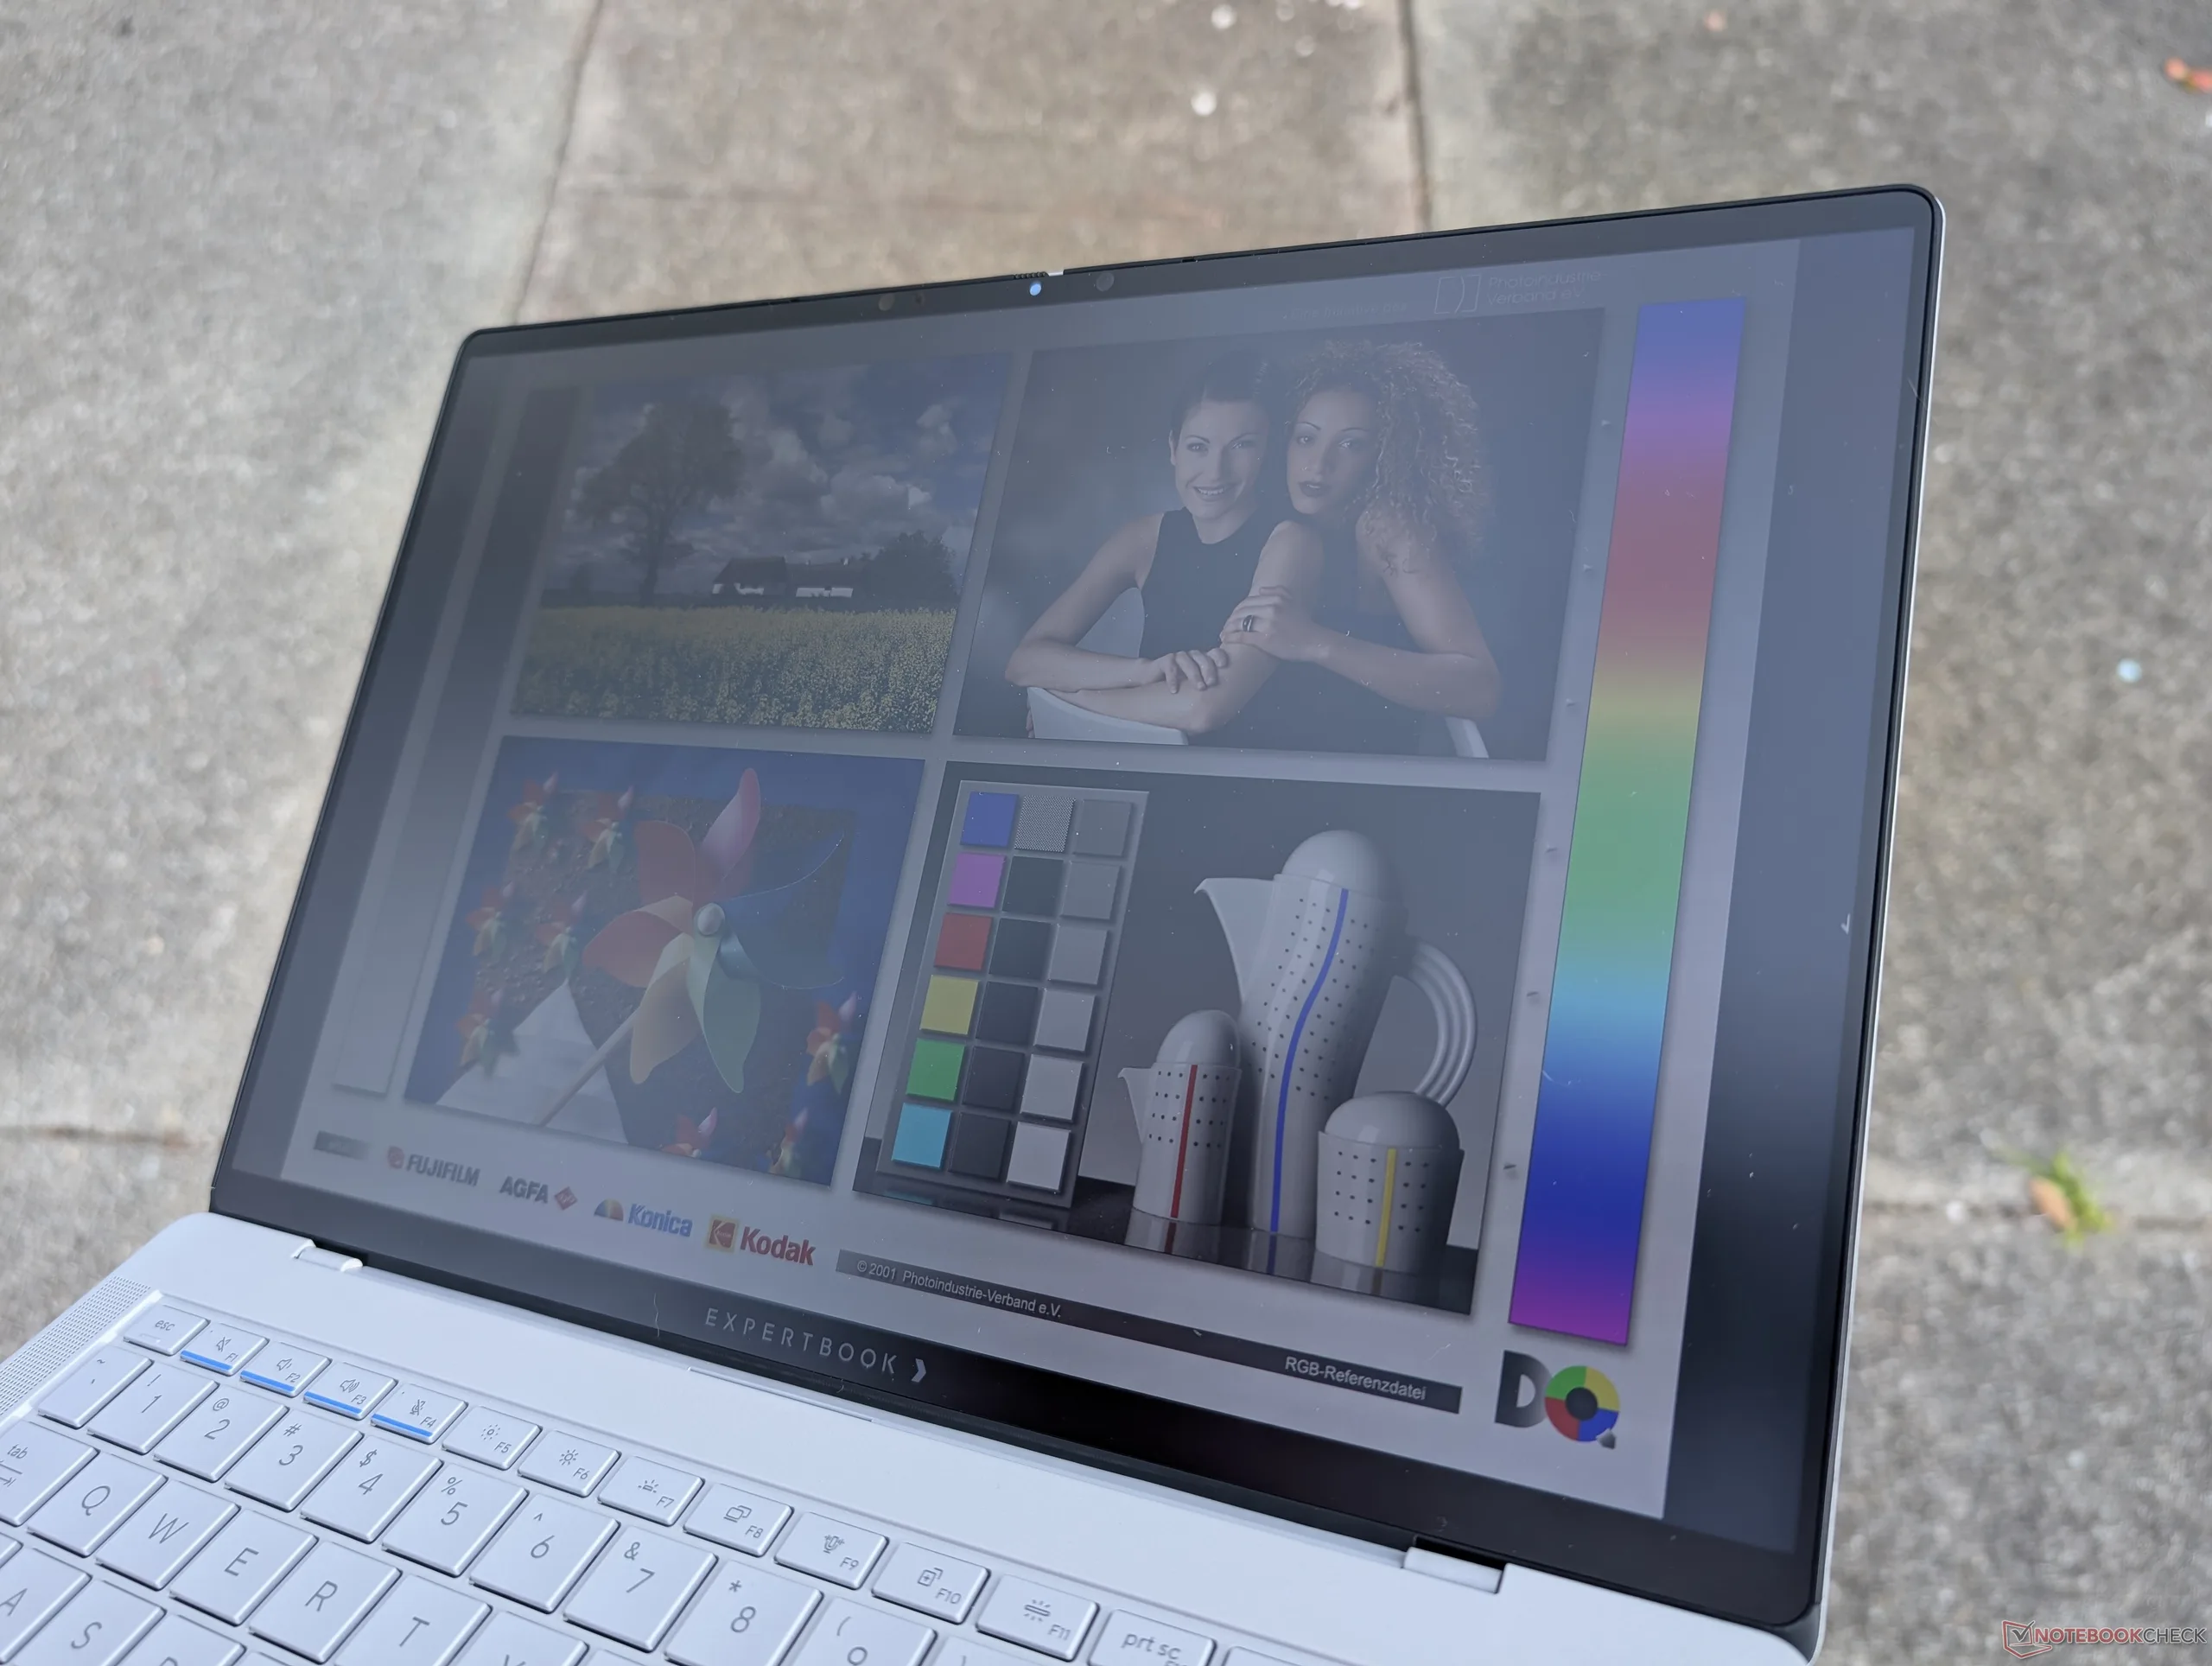
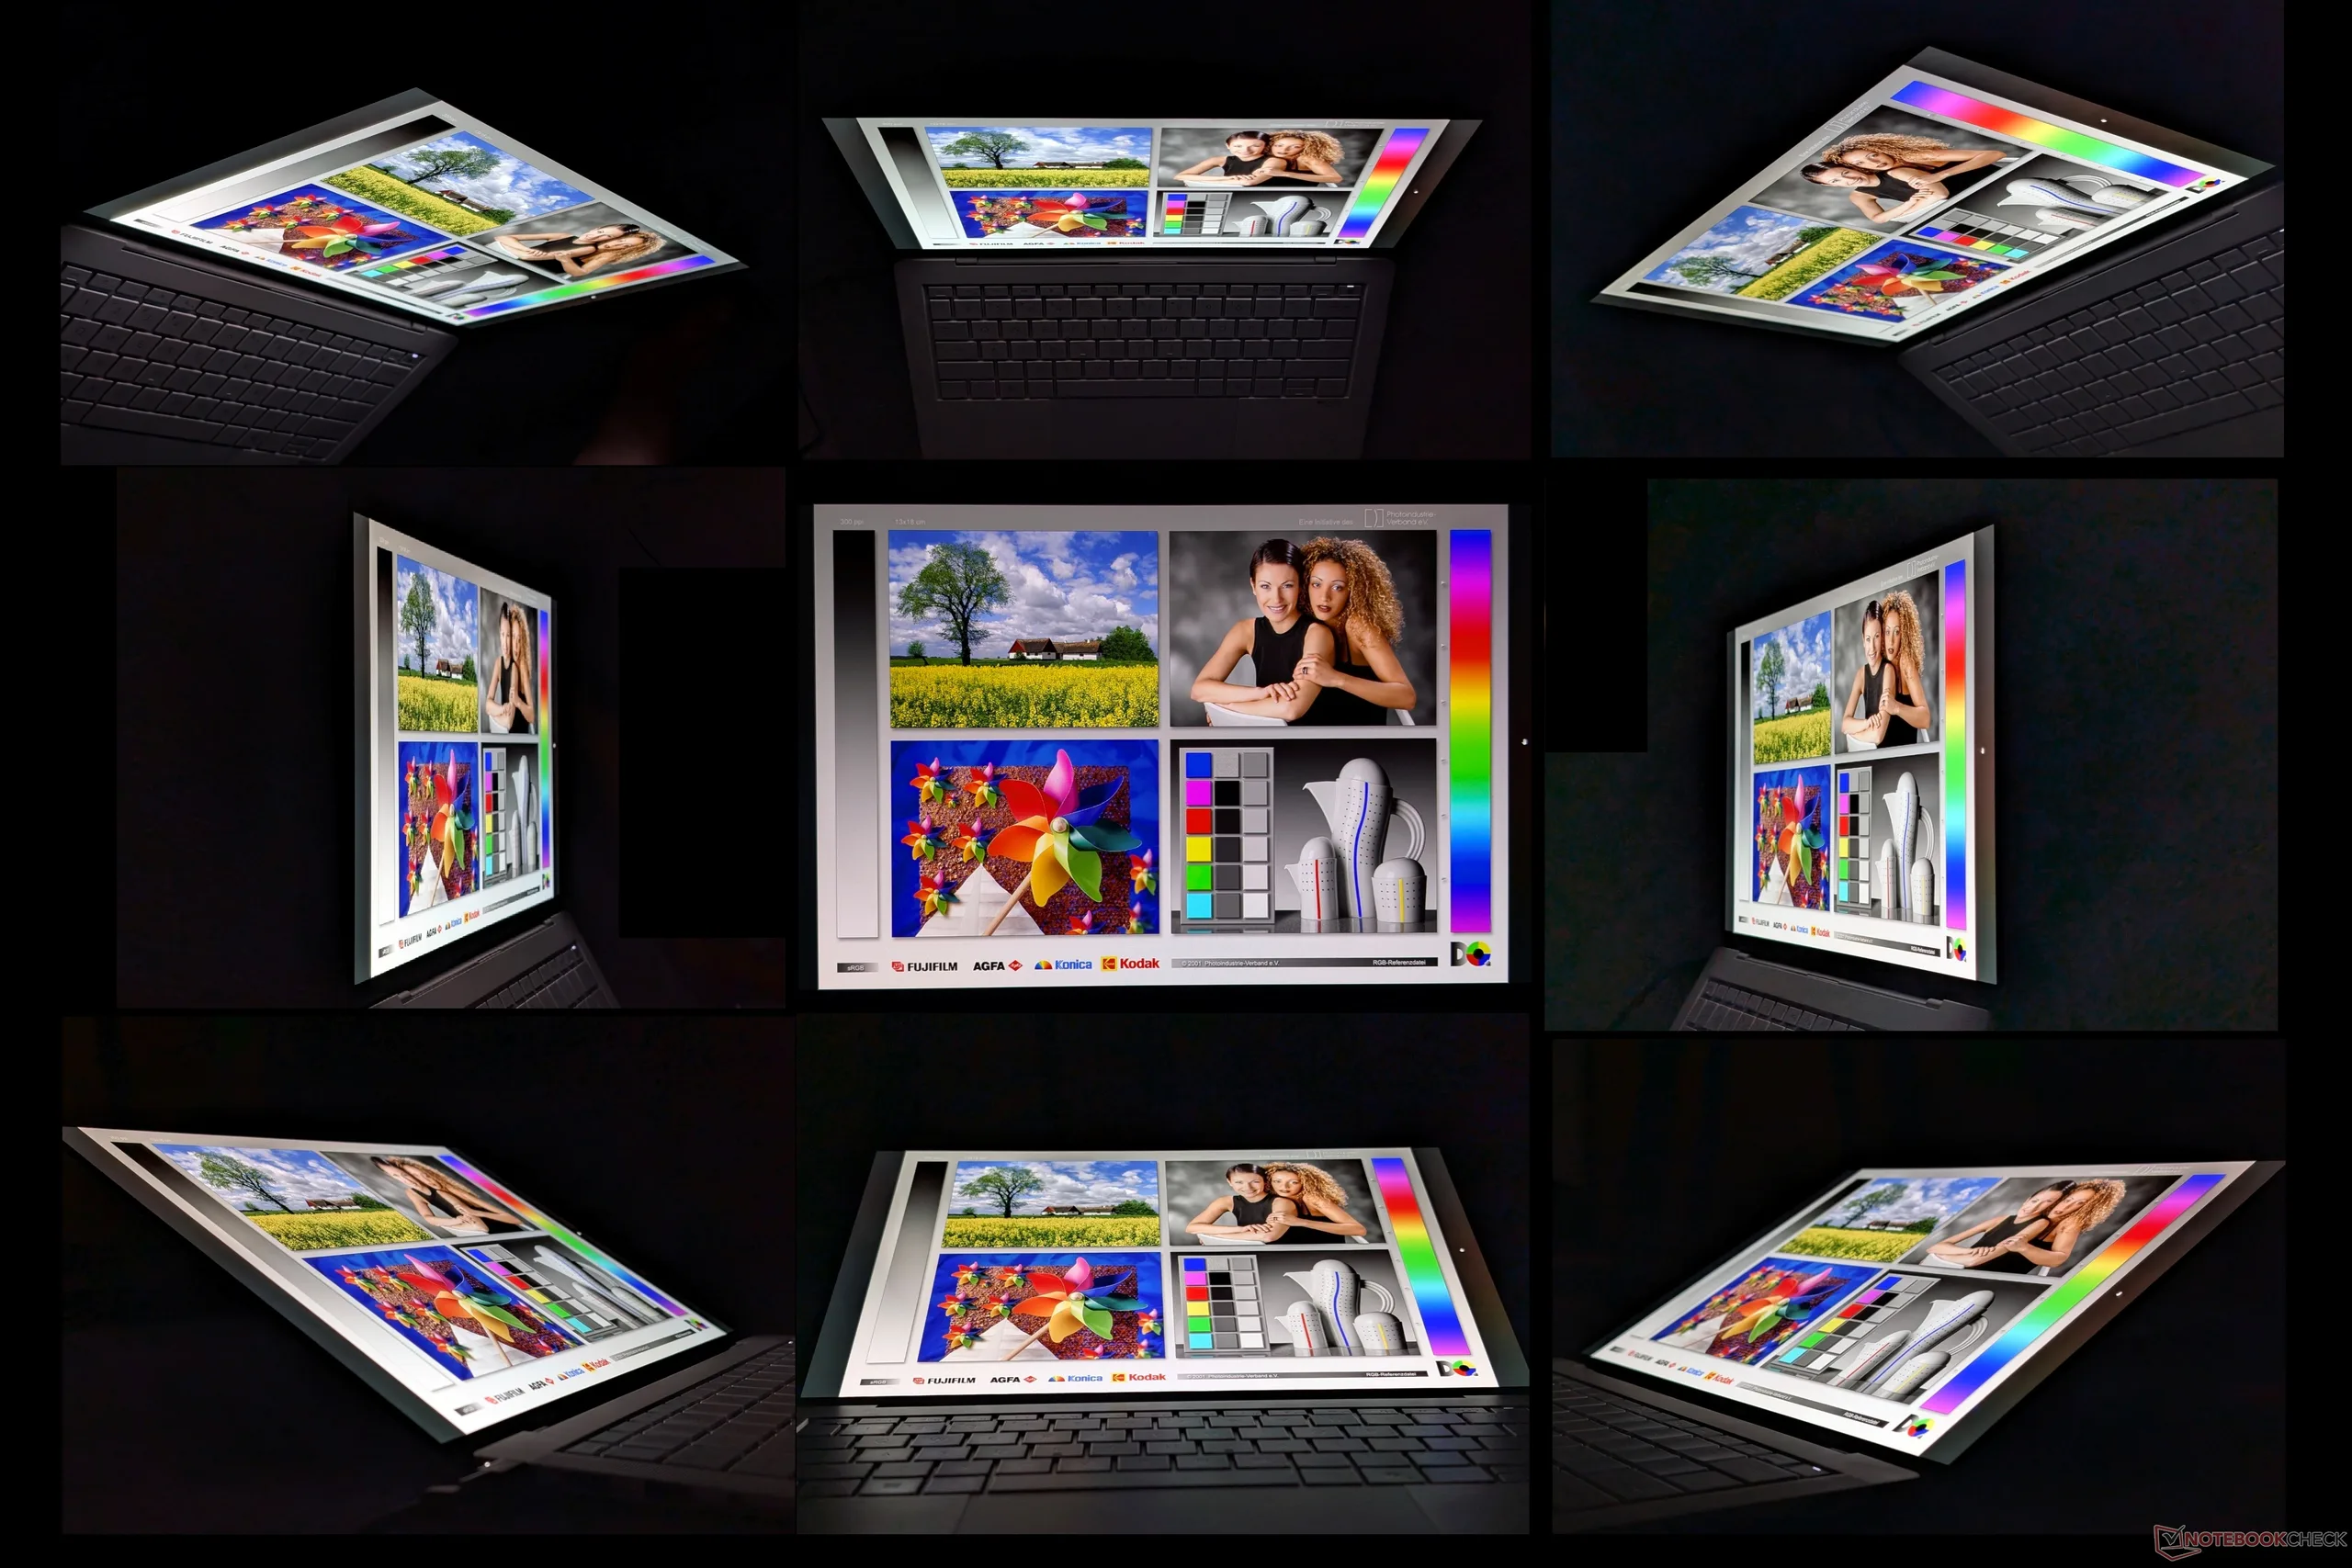
Wyświetlacz - Tandem OLED, VRR, HDR i matowe szkło Corning Gorilla Glass
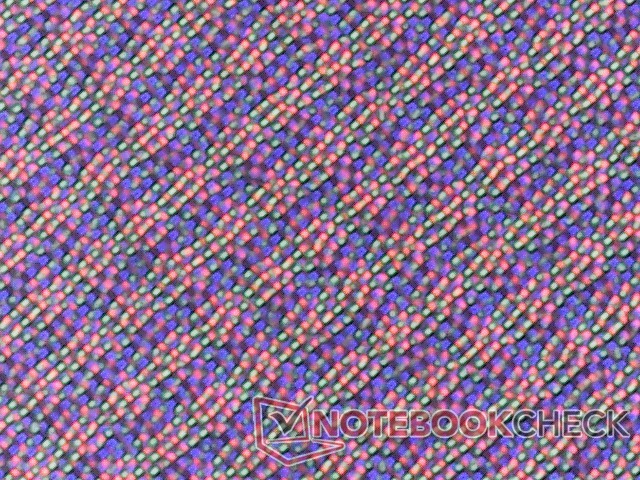
Kluczową zaletą tandemowego OLED jest znacznie wyższy poziom jasności w porównaniu do standardowego OLED. Rzeczywiście, jesteśmy w stanie zmierzyć maksymalną jasność 1403 nitów w trybie HDR, podczas gdy wyświetlacze OLED w większości innych laptopów osiągają zaledwie połowę lub mniej. Wyższe poziomy jasności w połączeniu z głębokimi poziomami czerni, z których znany jest OLED, prowadzą do jeszcze bardziej żywych treści HDR na ExpertBook Ultra. Maksymalna jasność jest ograniczona do 600 nitów w domyślnym trybie SDR.
Niestety, matowa powłoka Gorilla Glass w tym modelu prowadzi do zauważalnej ziarnistości w porównaniu do typowych błyszczących paneli OLED, do których większość użytkowników jest przyzwyczajona.
| |||||||||||||||||||||||||
rozświetlenie: 96 %
na akumulatorze: 600.5 cd/m²
kontrast: ∞:1 (czerń: 0 cd/m²)
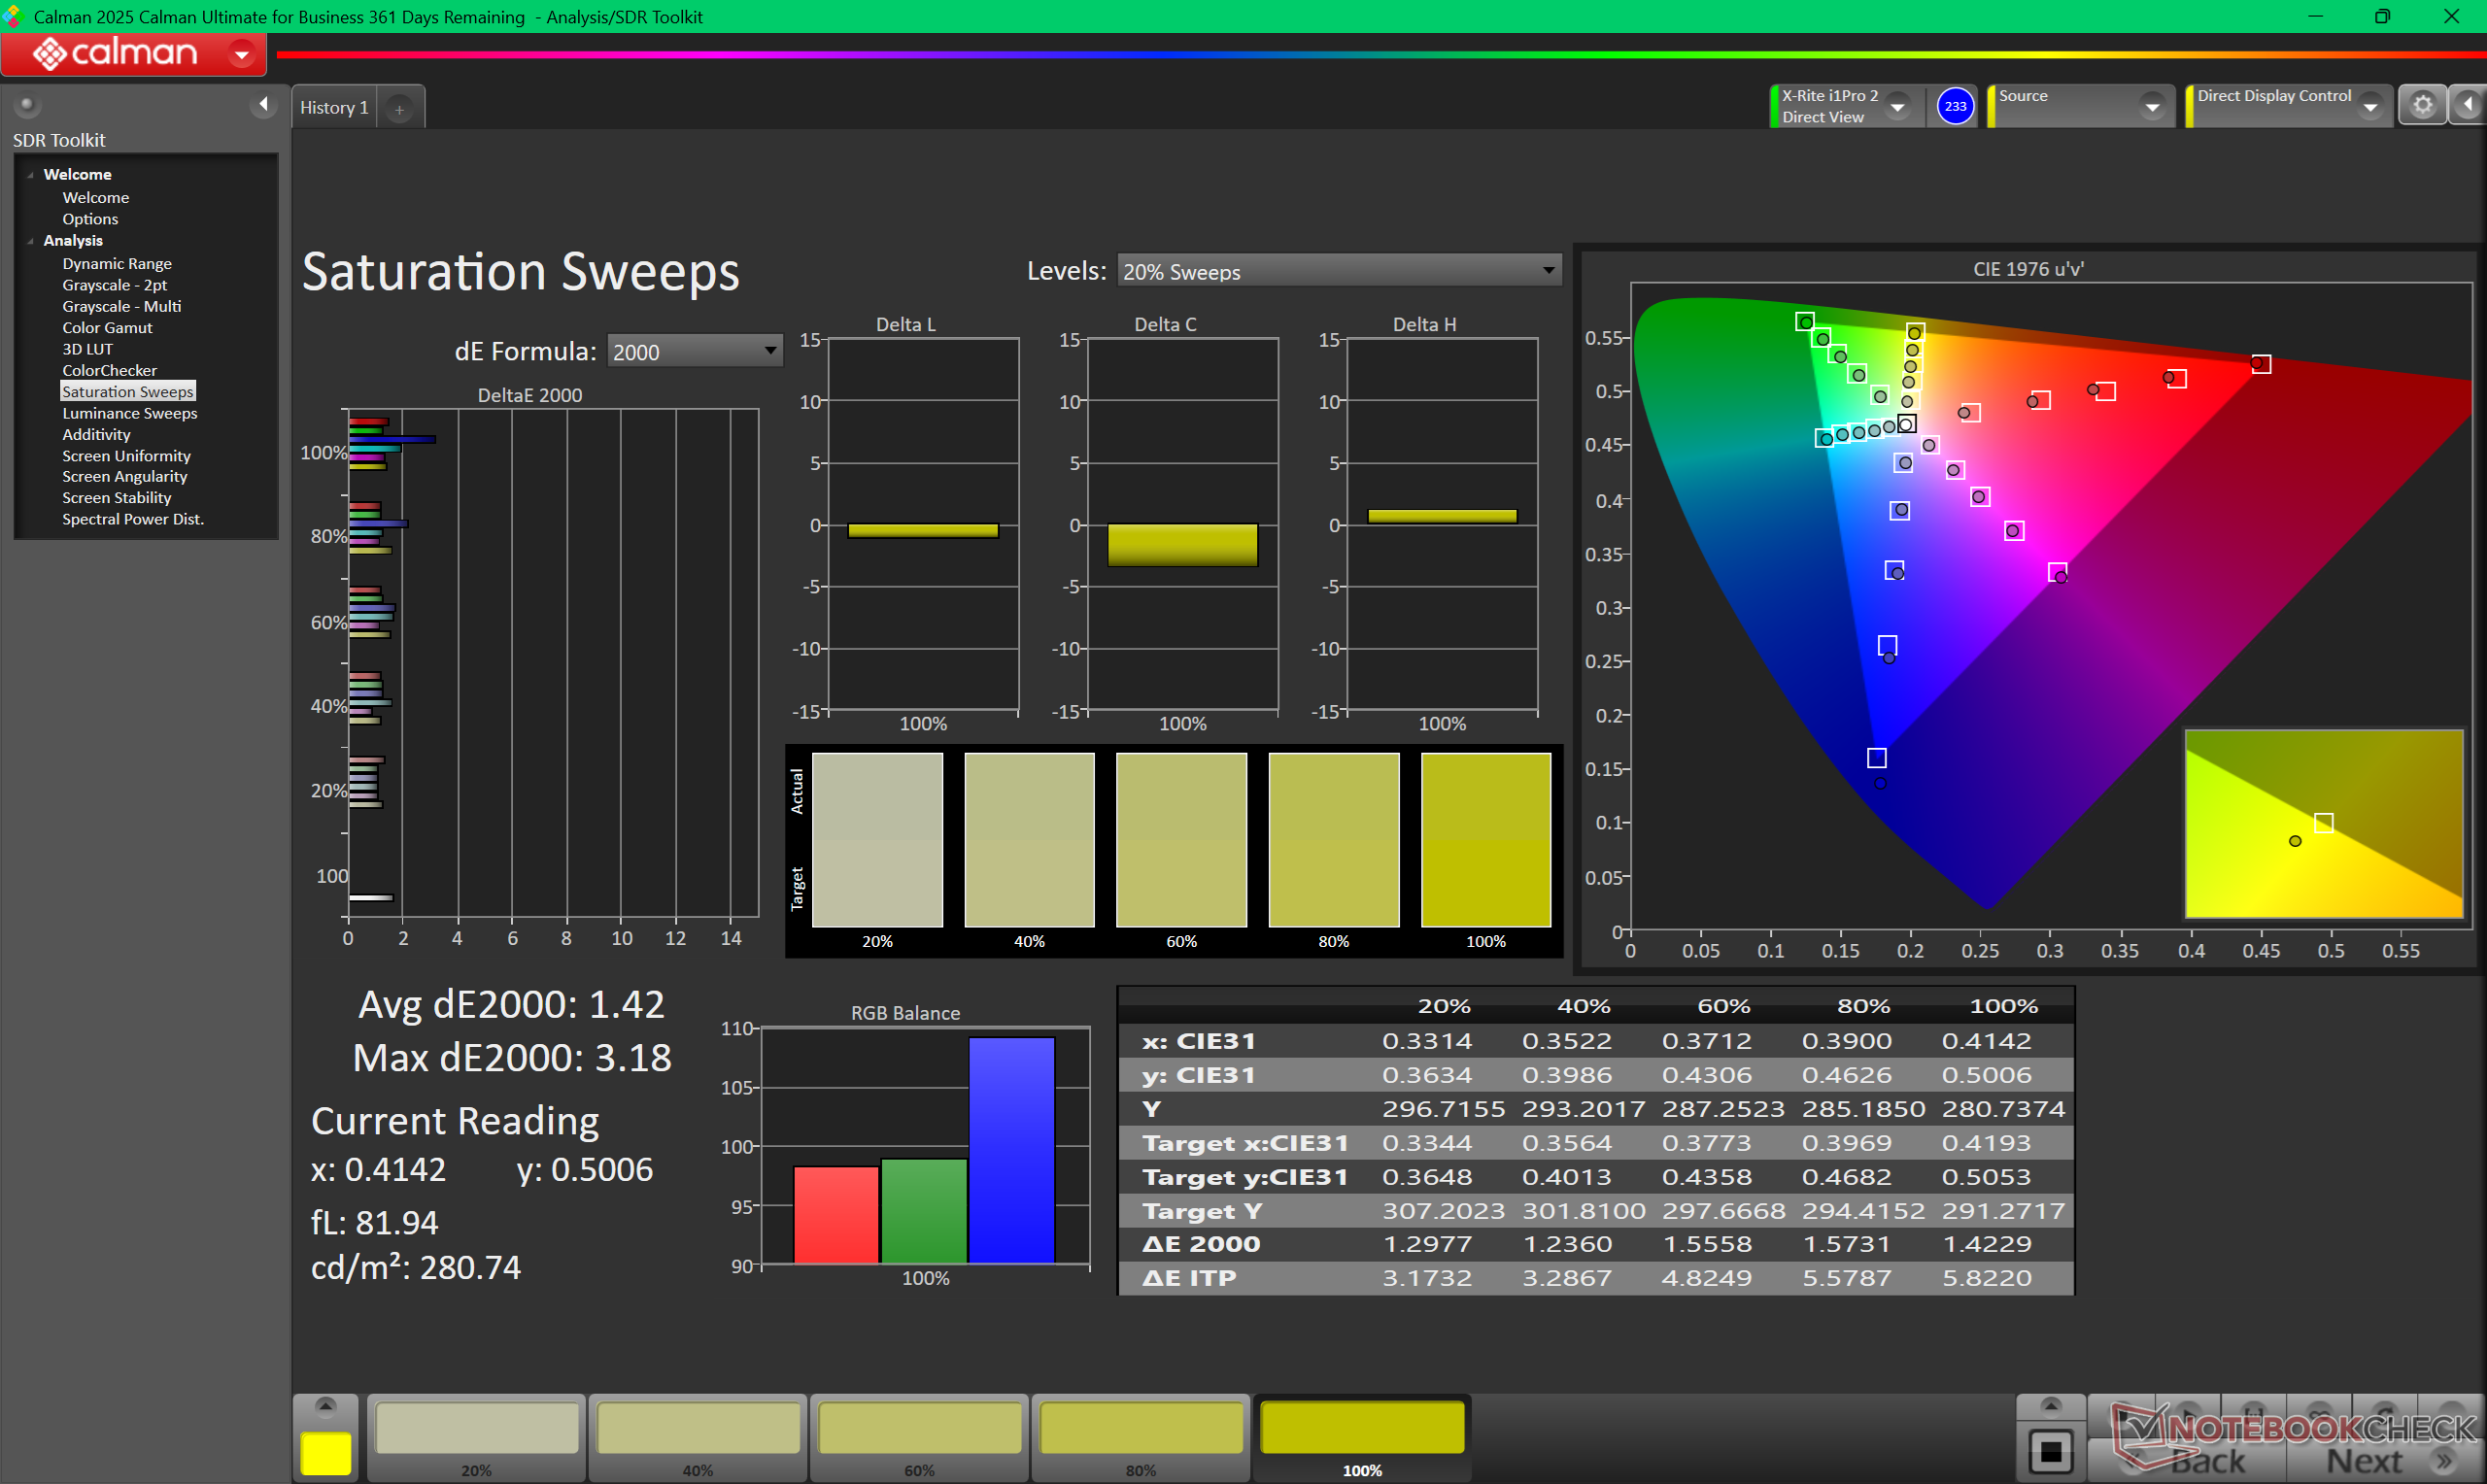
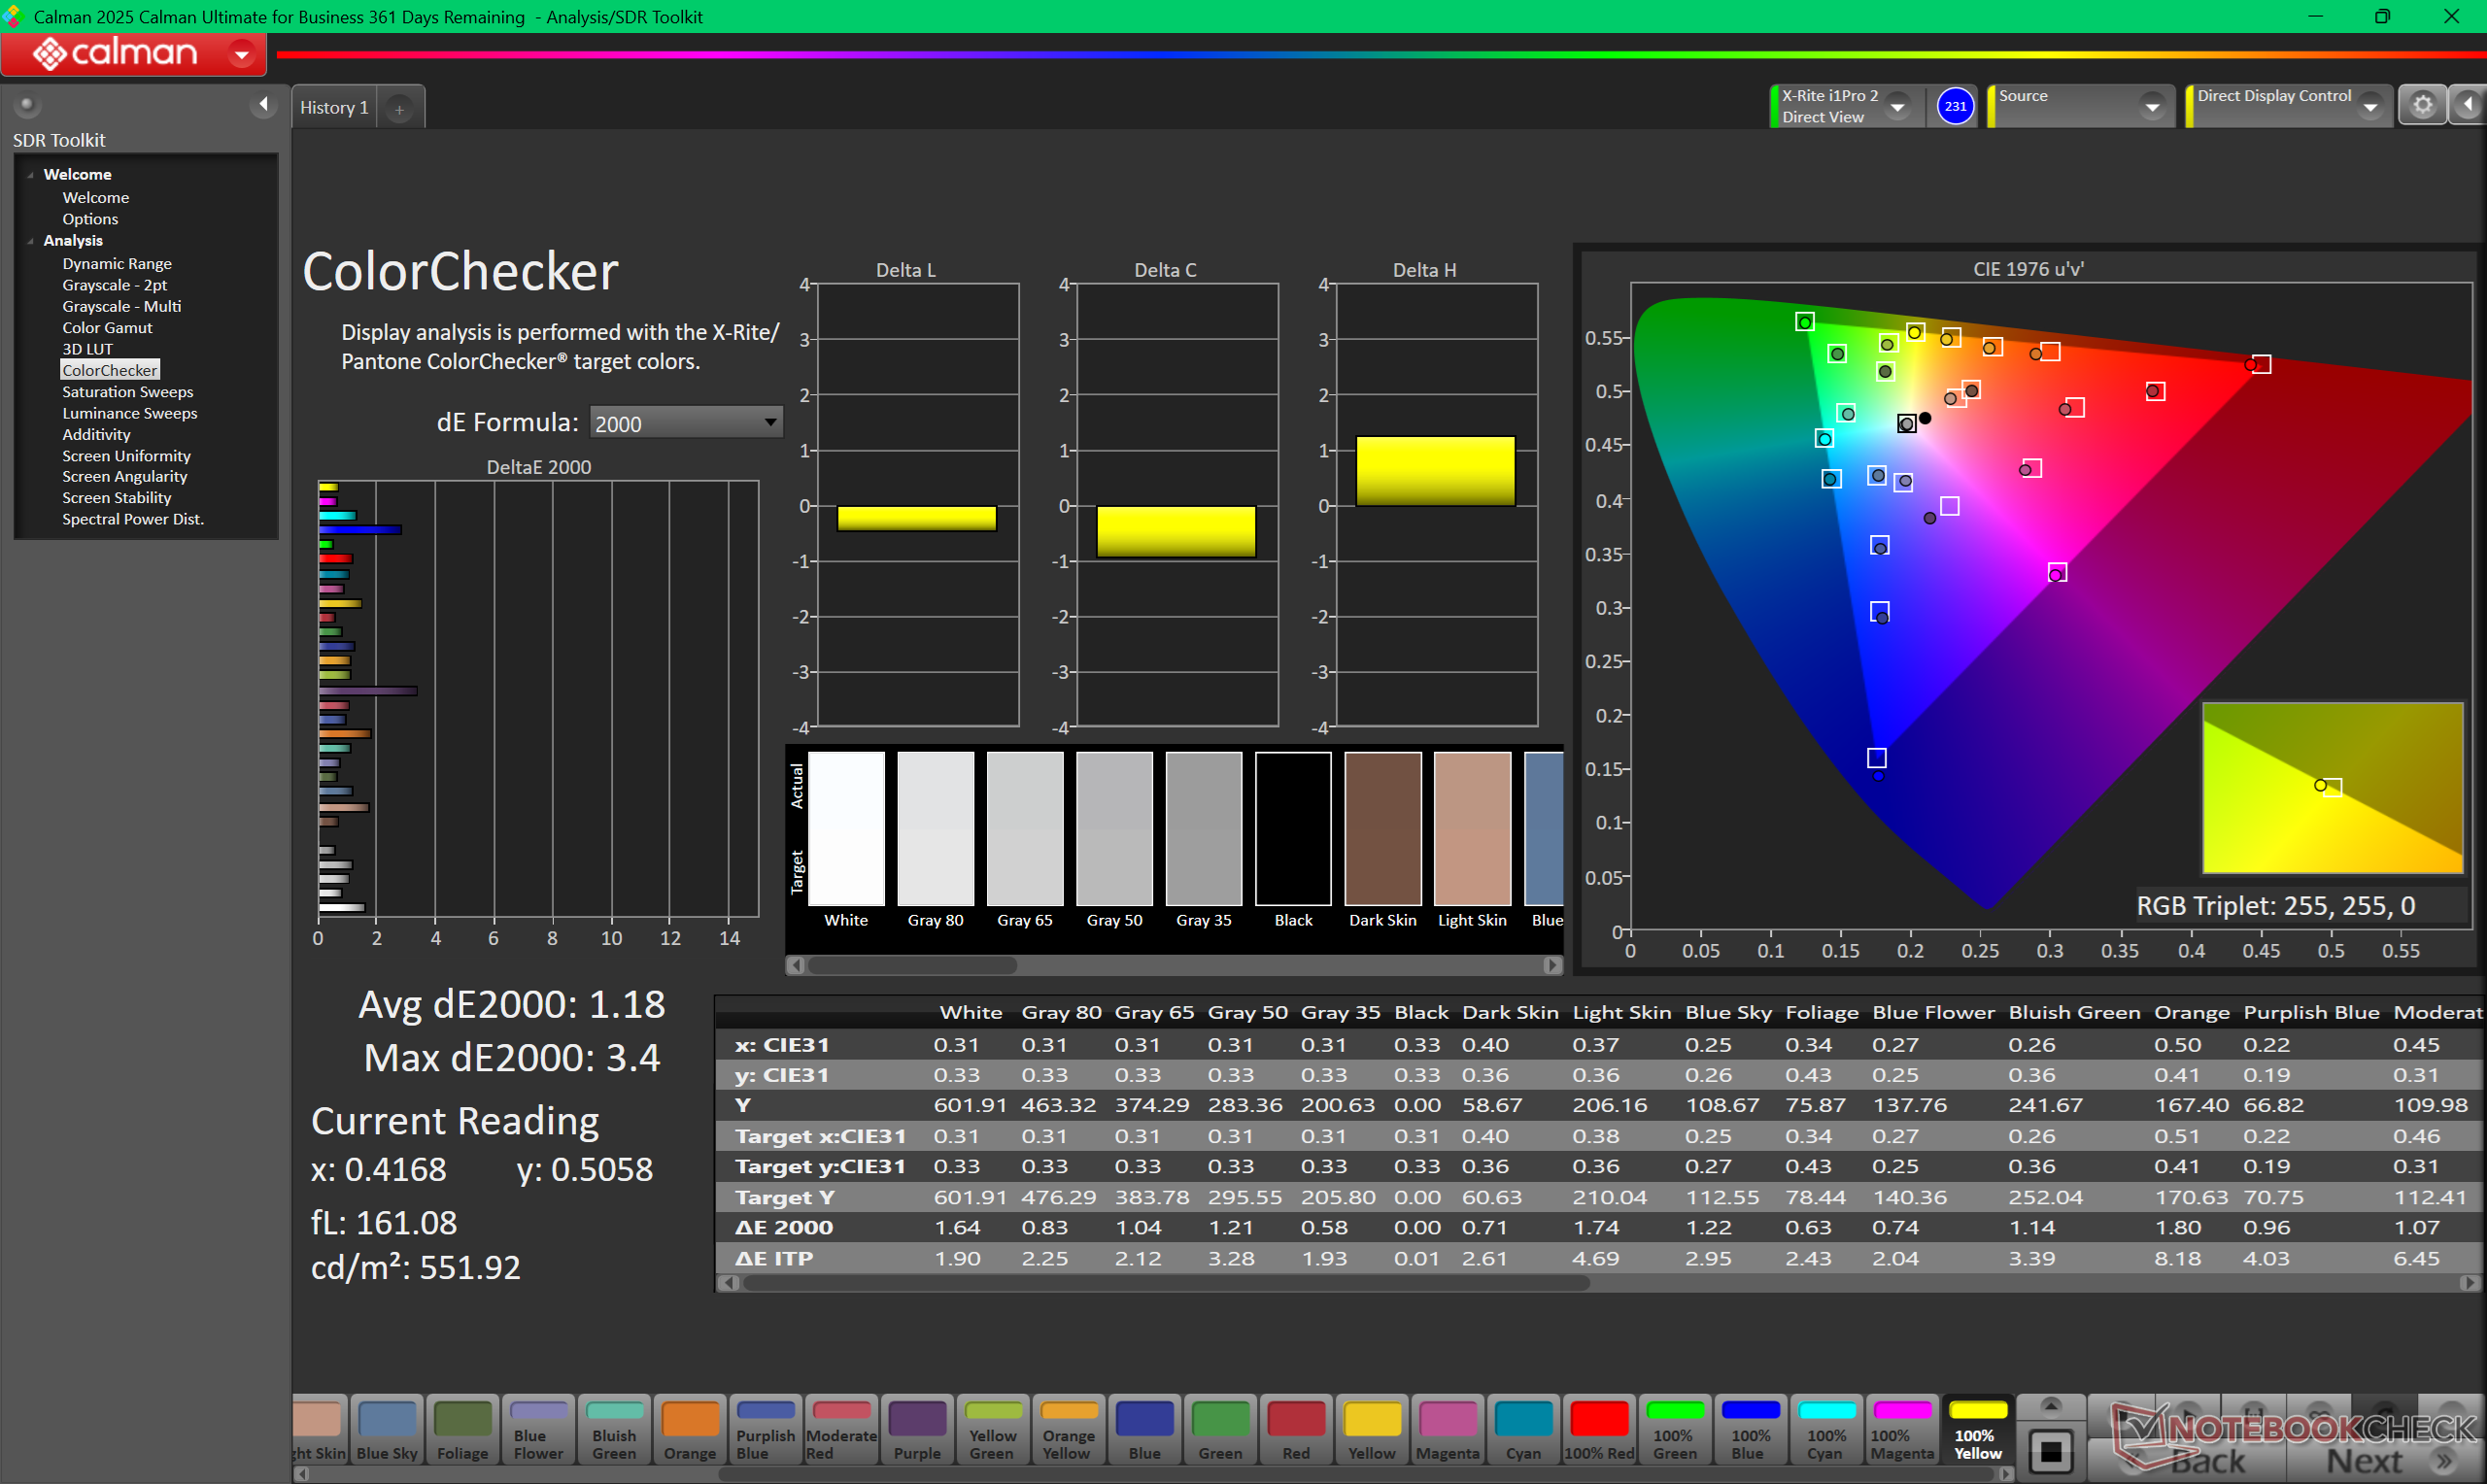
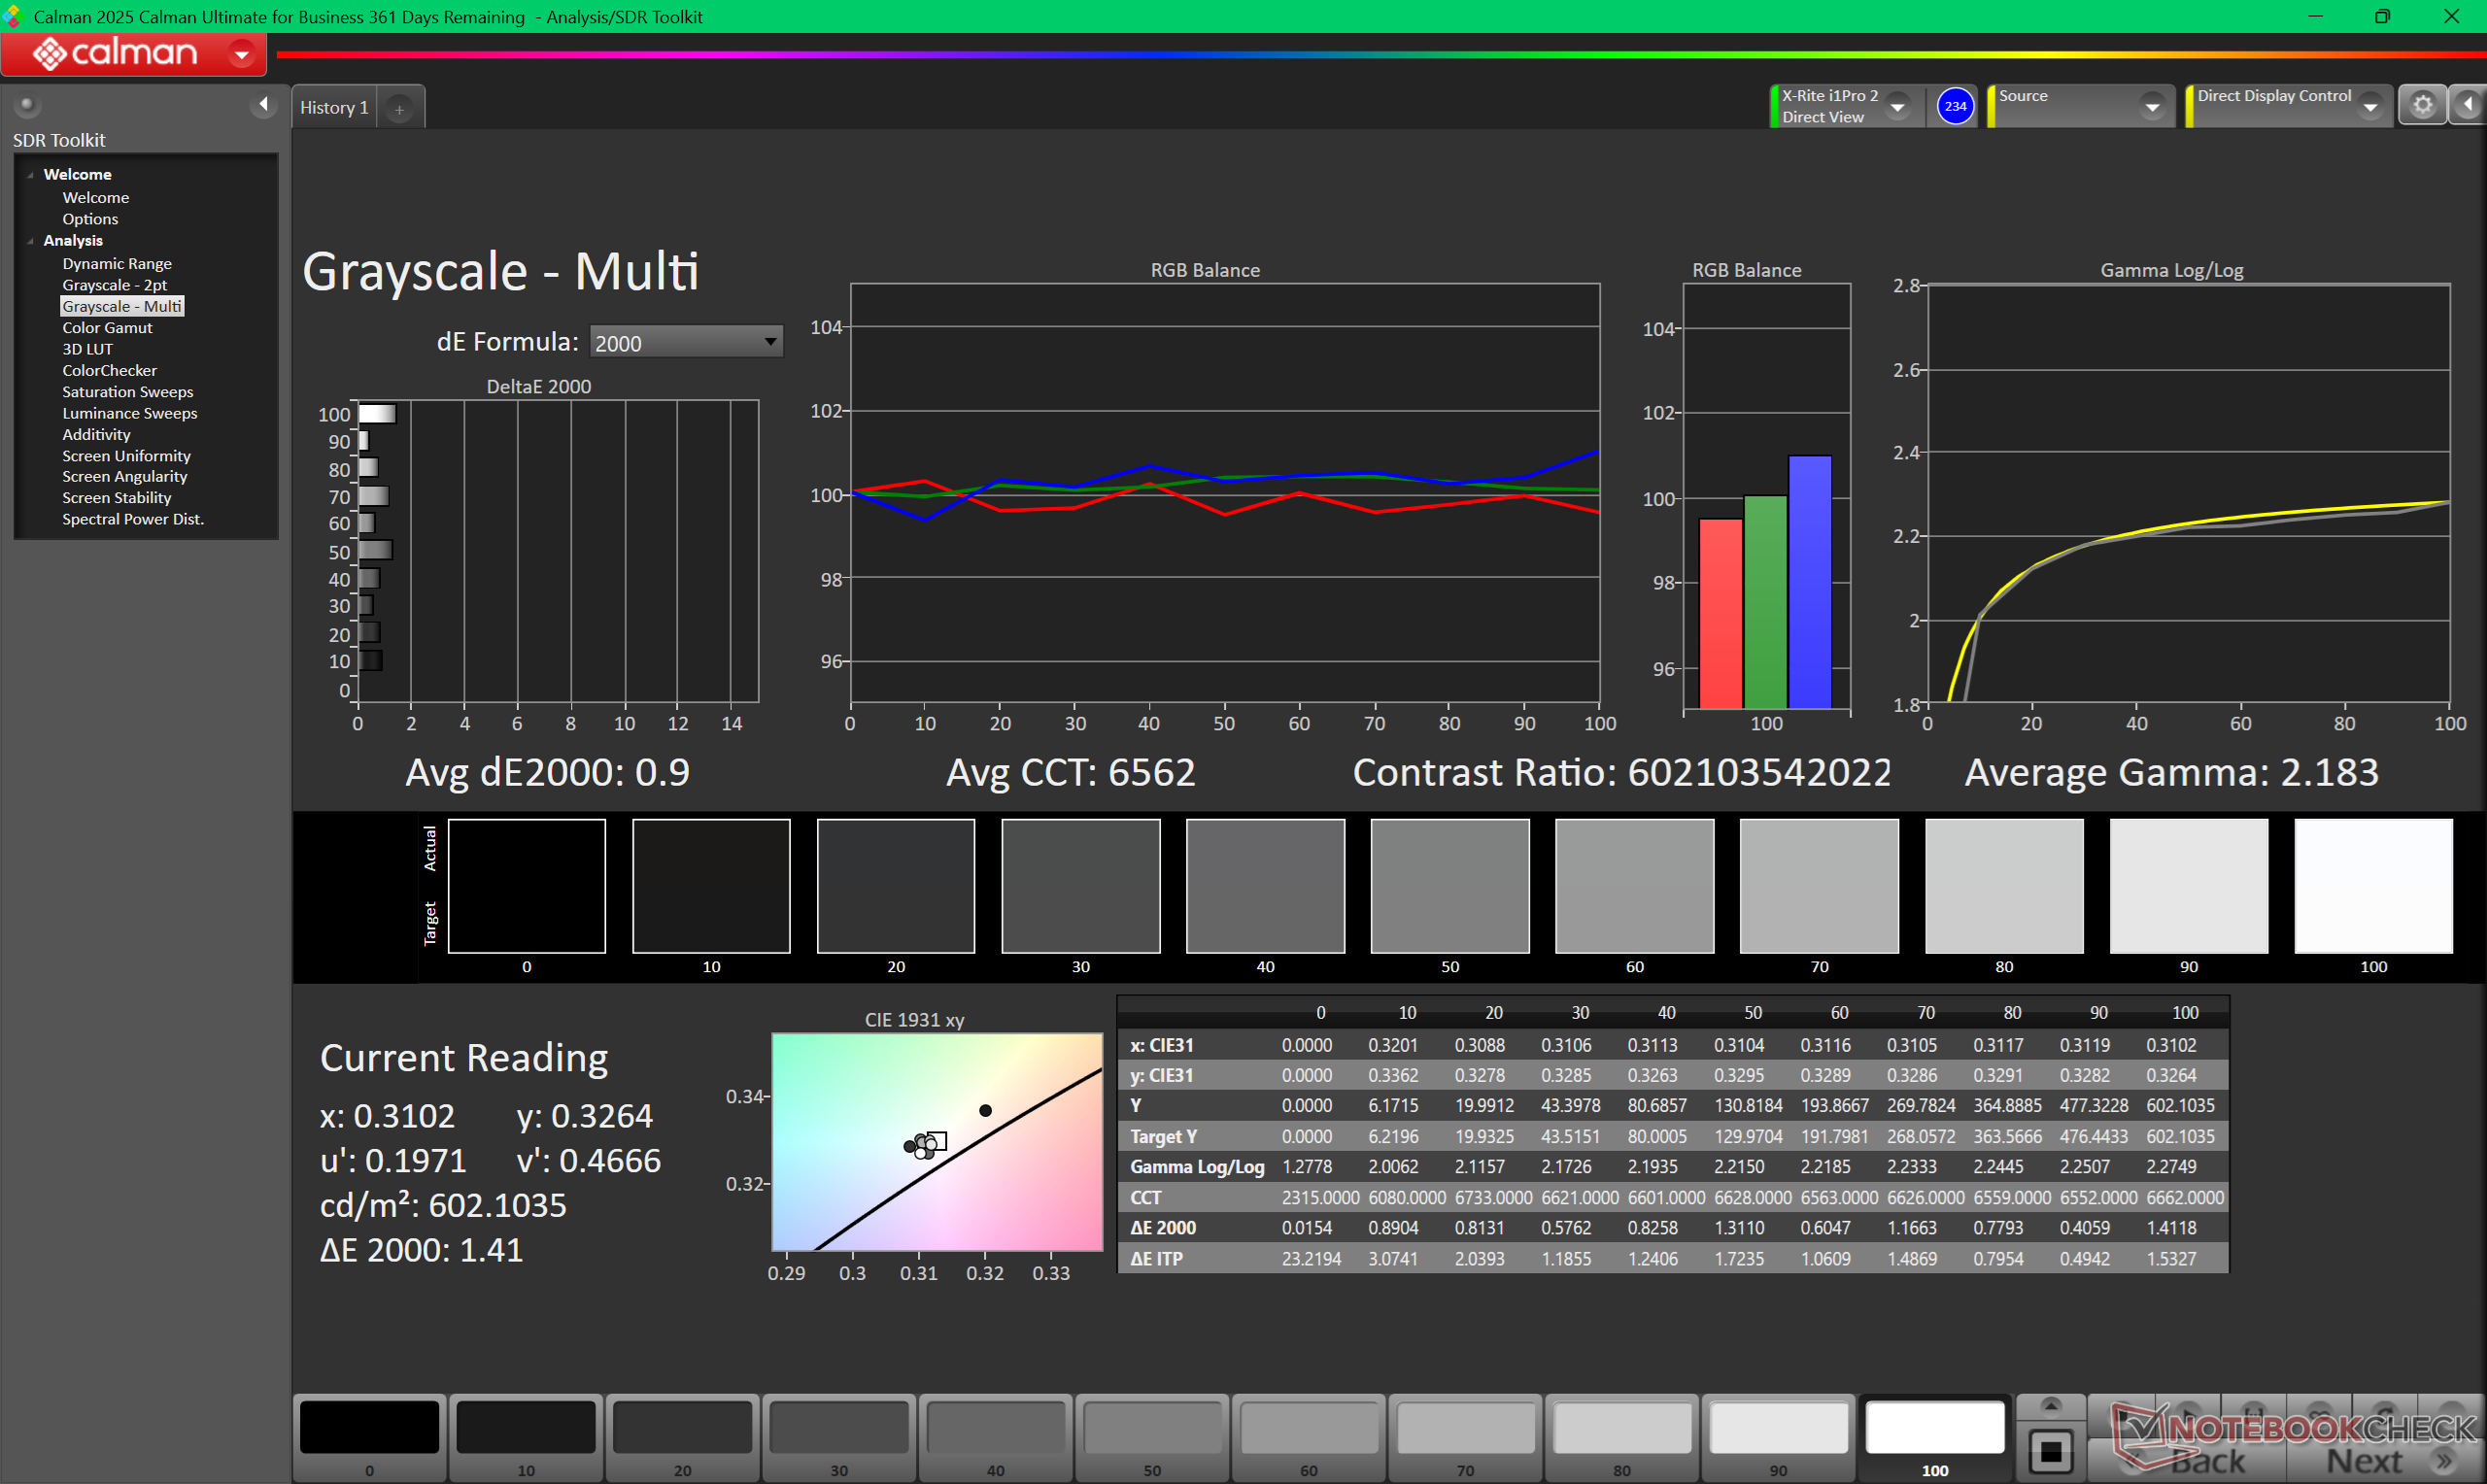
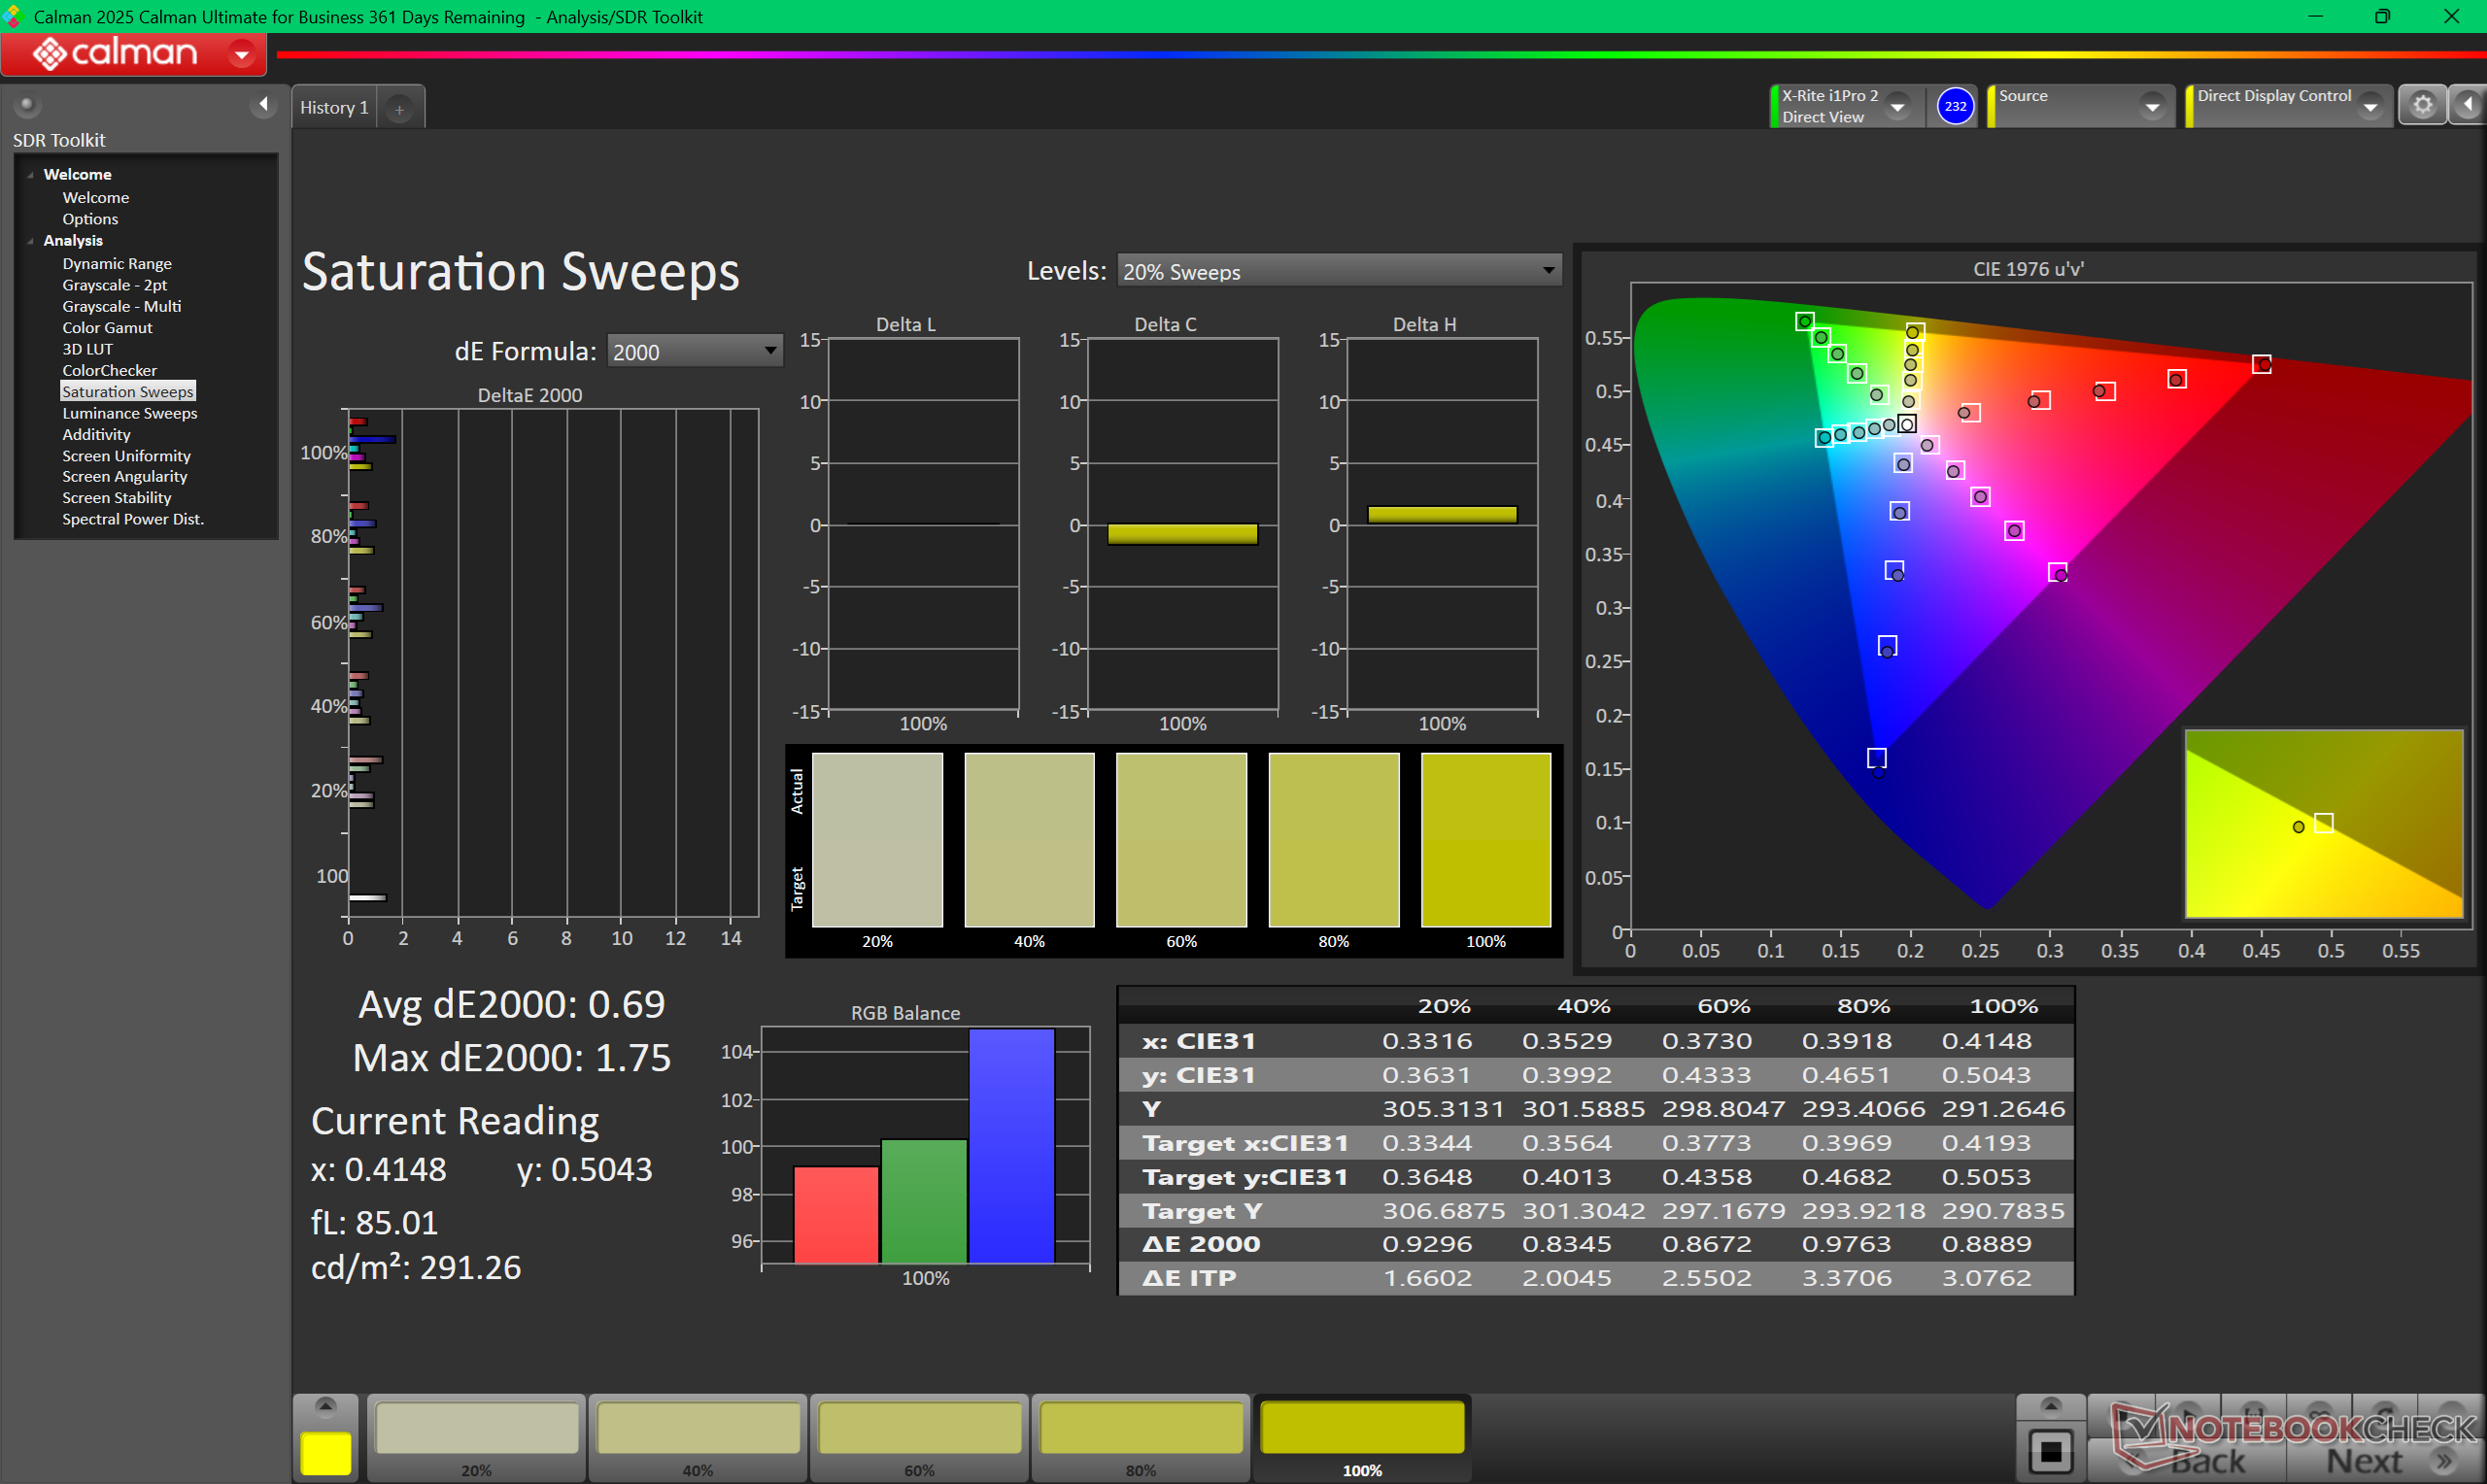
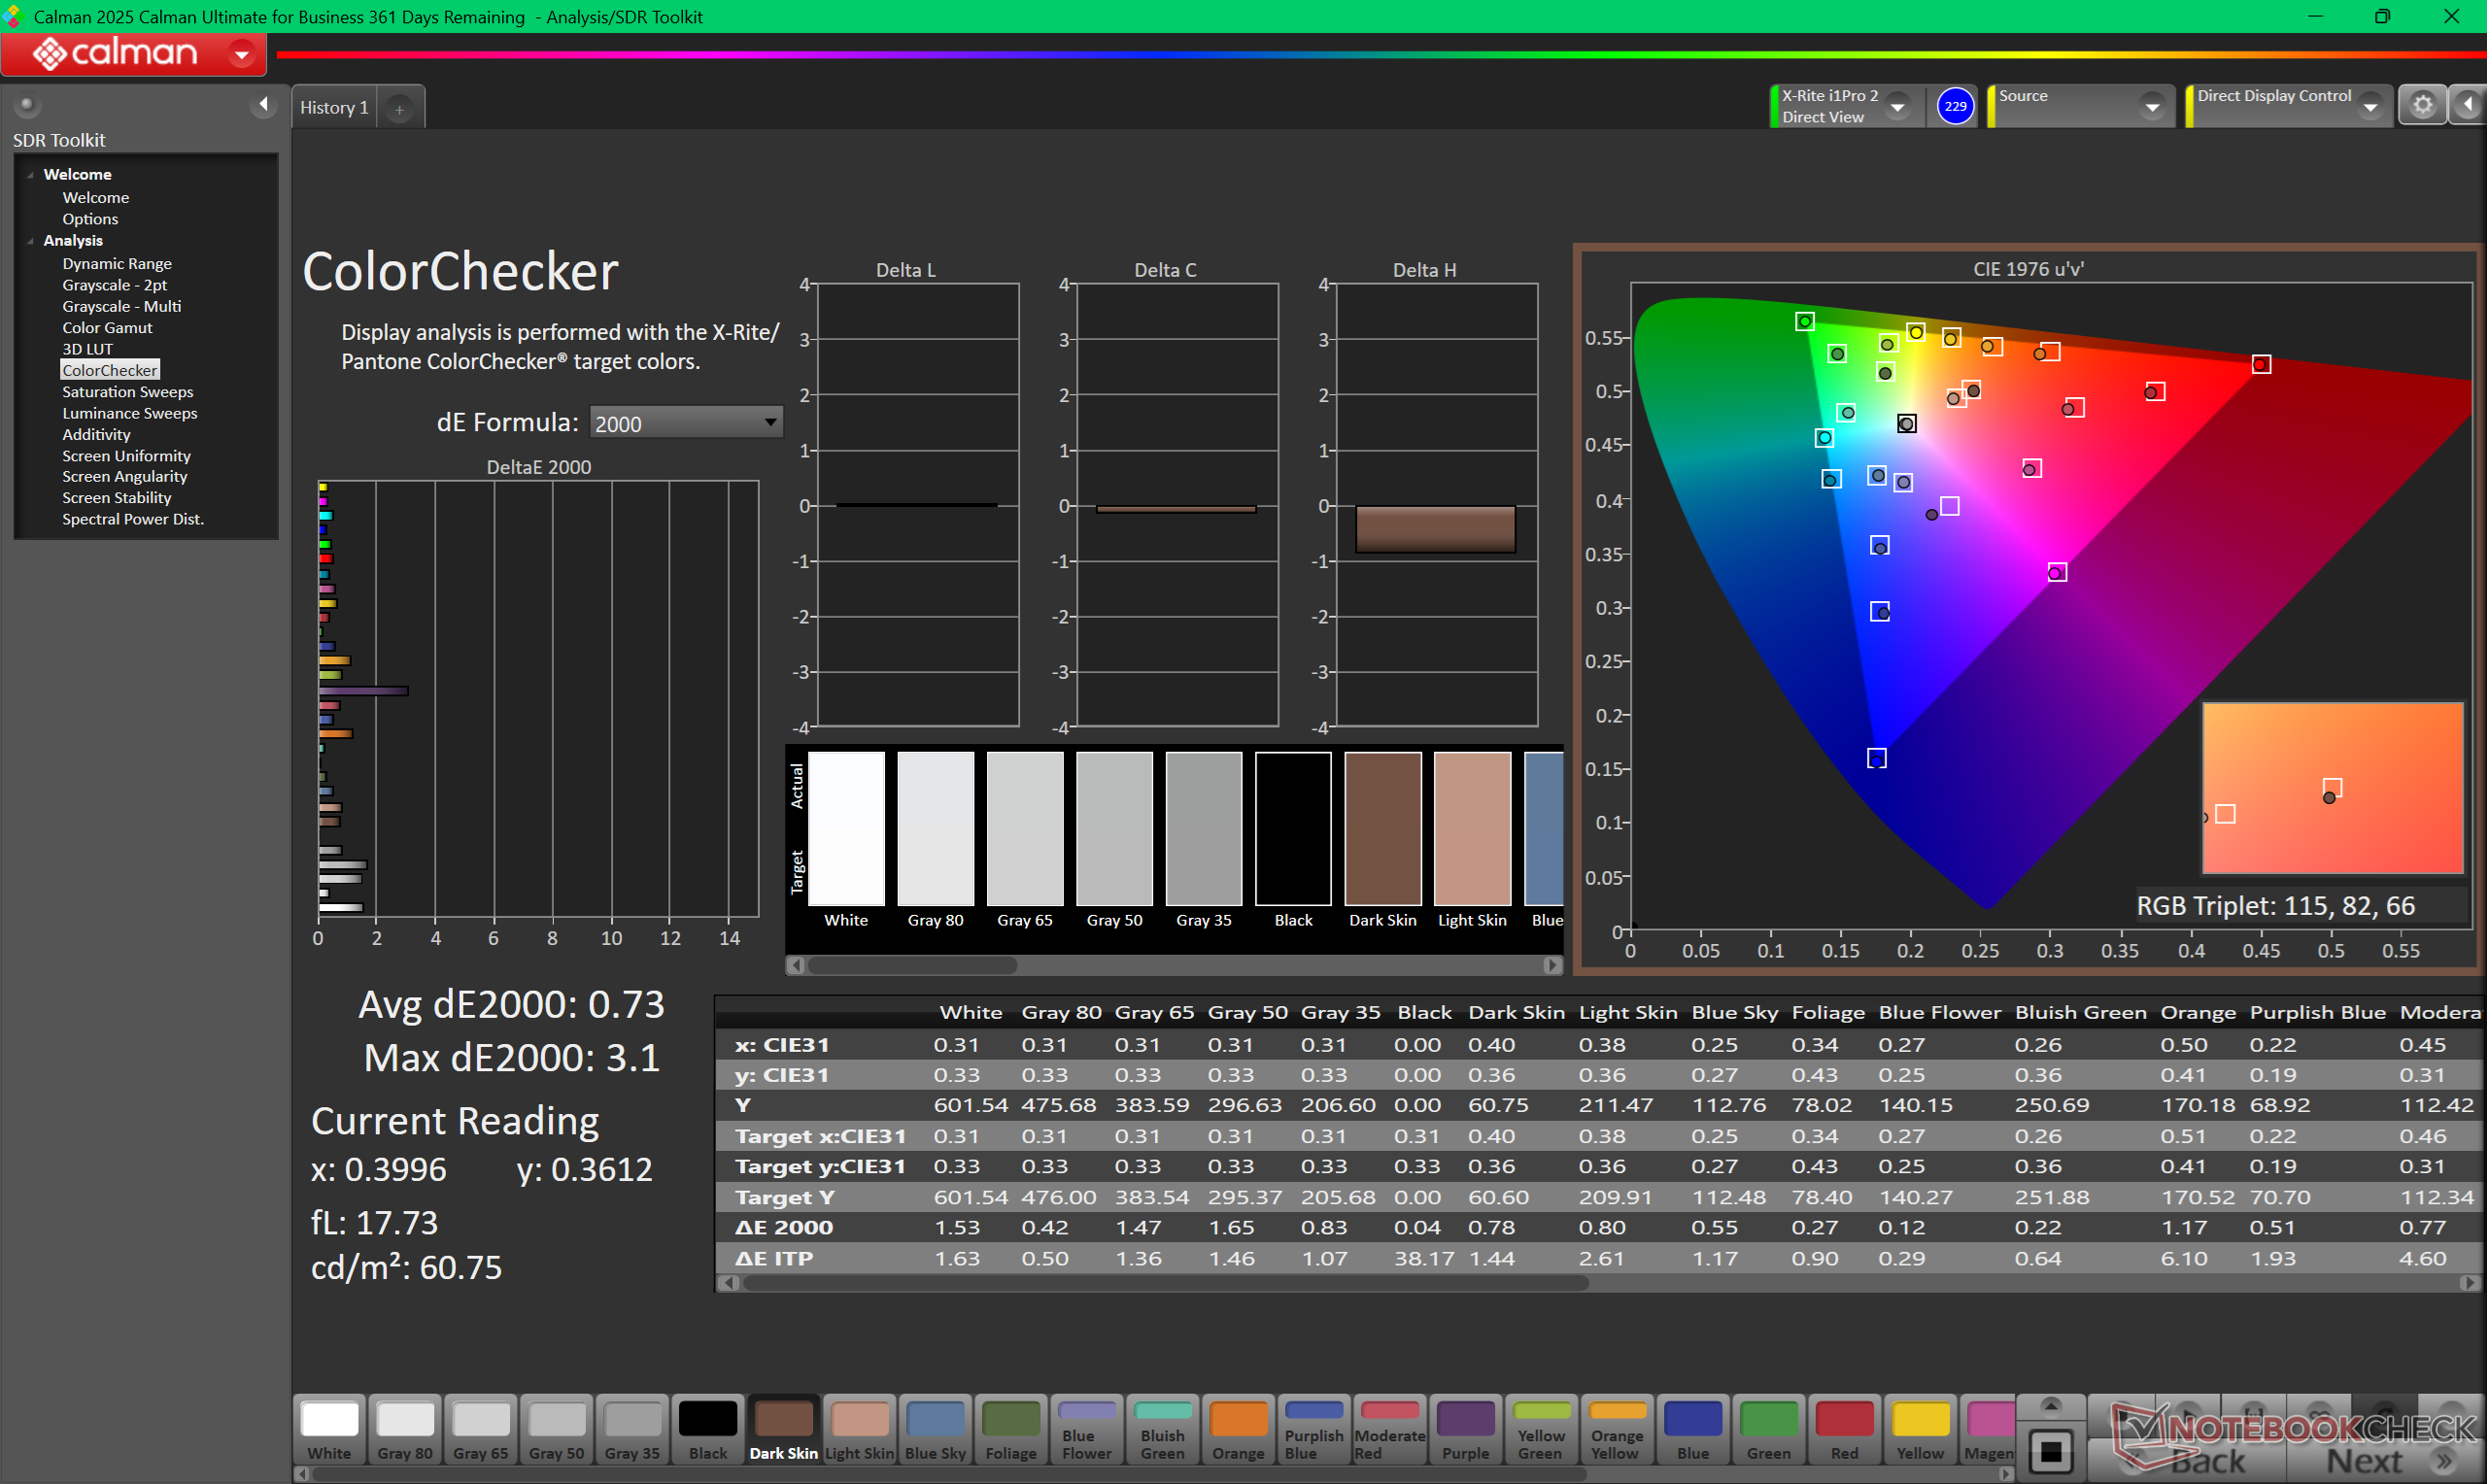
ΔE ColorChecker Calman: 1.18 | ∀{0.5-29.43 Ø4.71}
calibrated: 0.73
ΔE Greyscale Calman: 1 | ∀{0.09-98 Ø4.96}
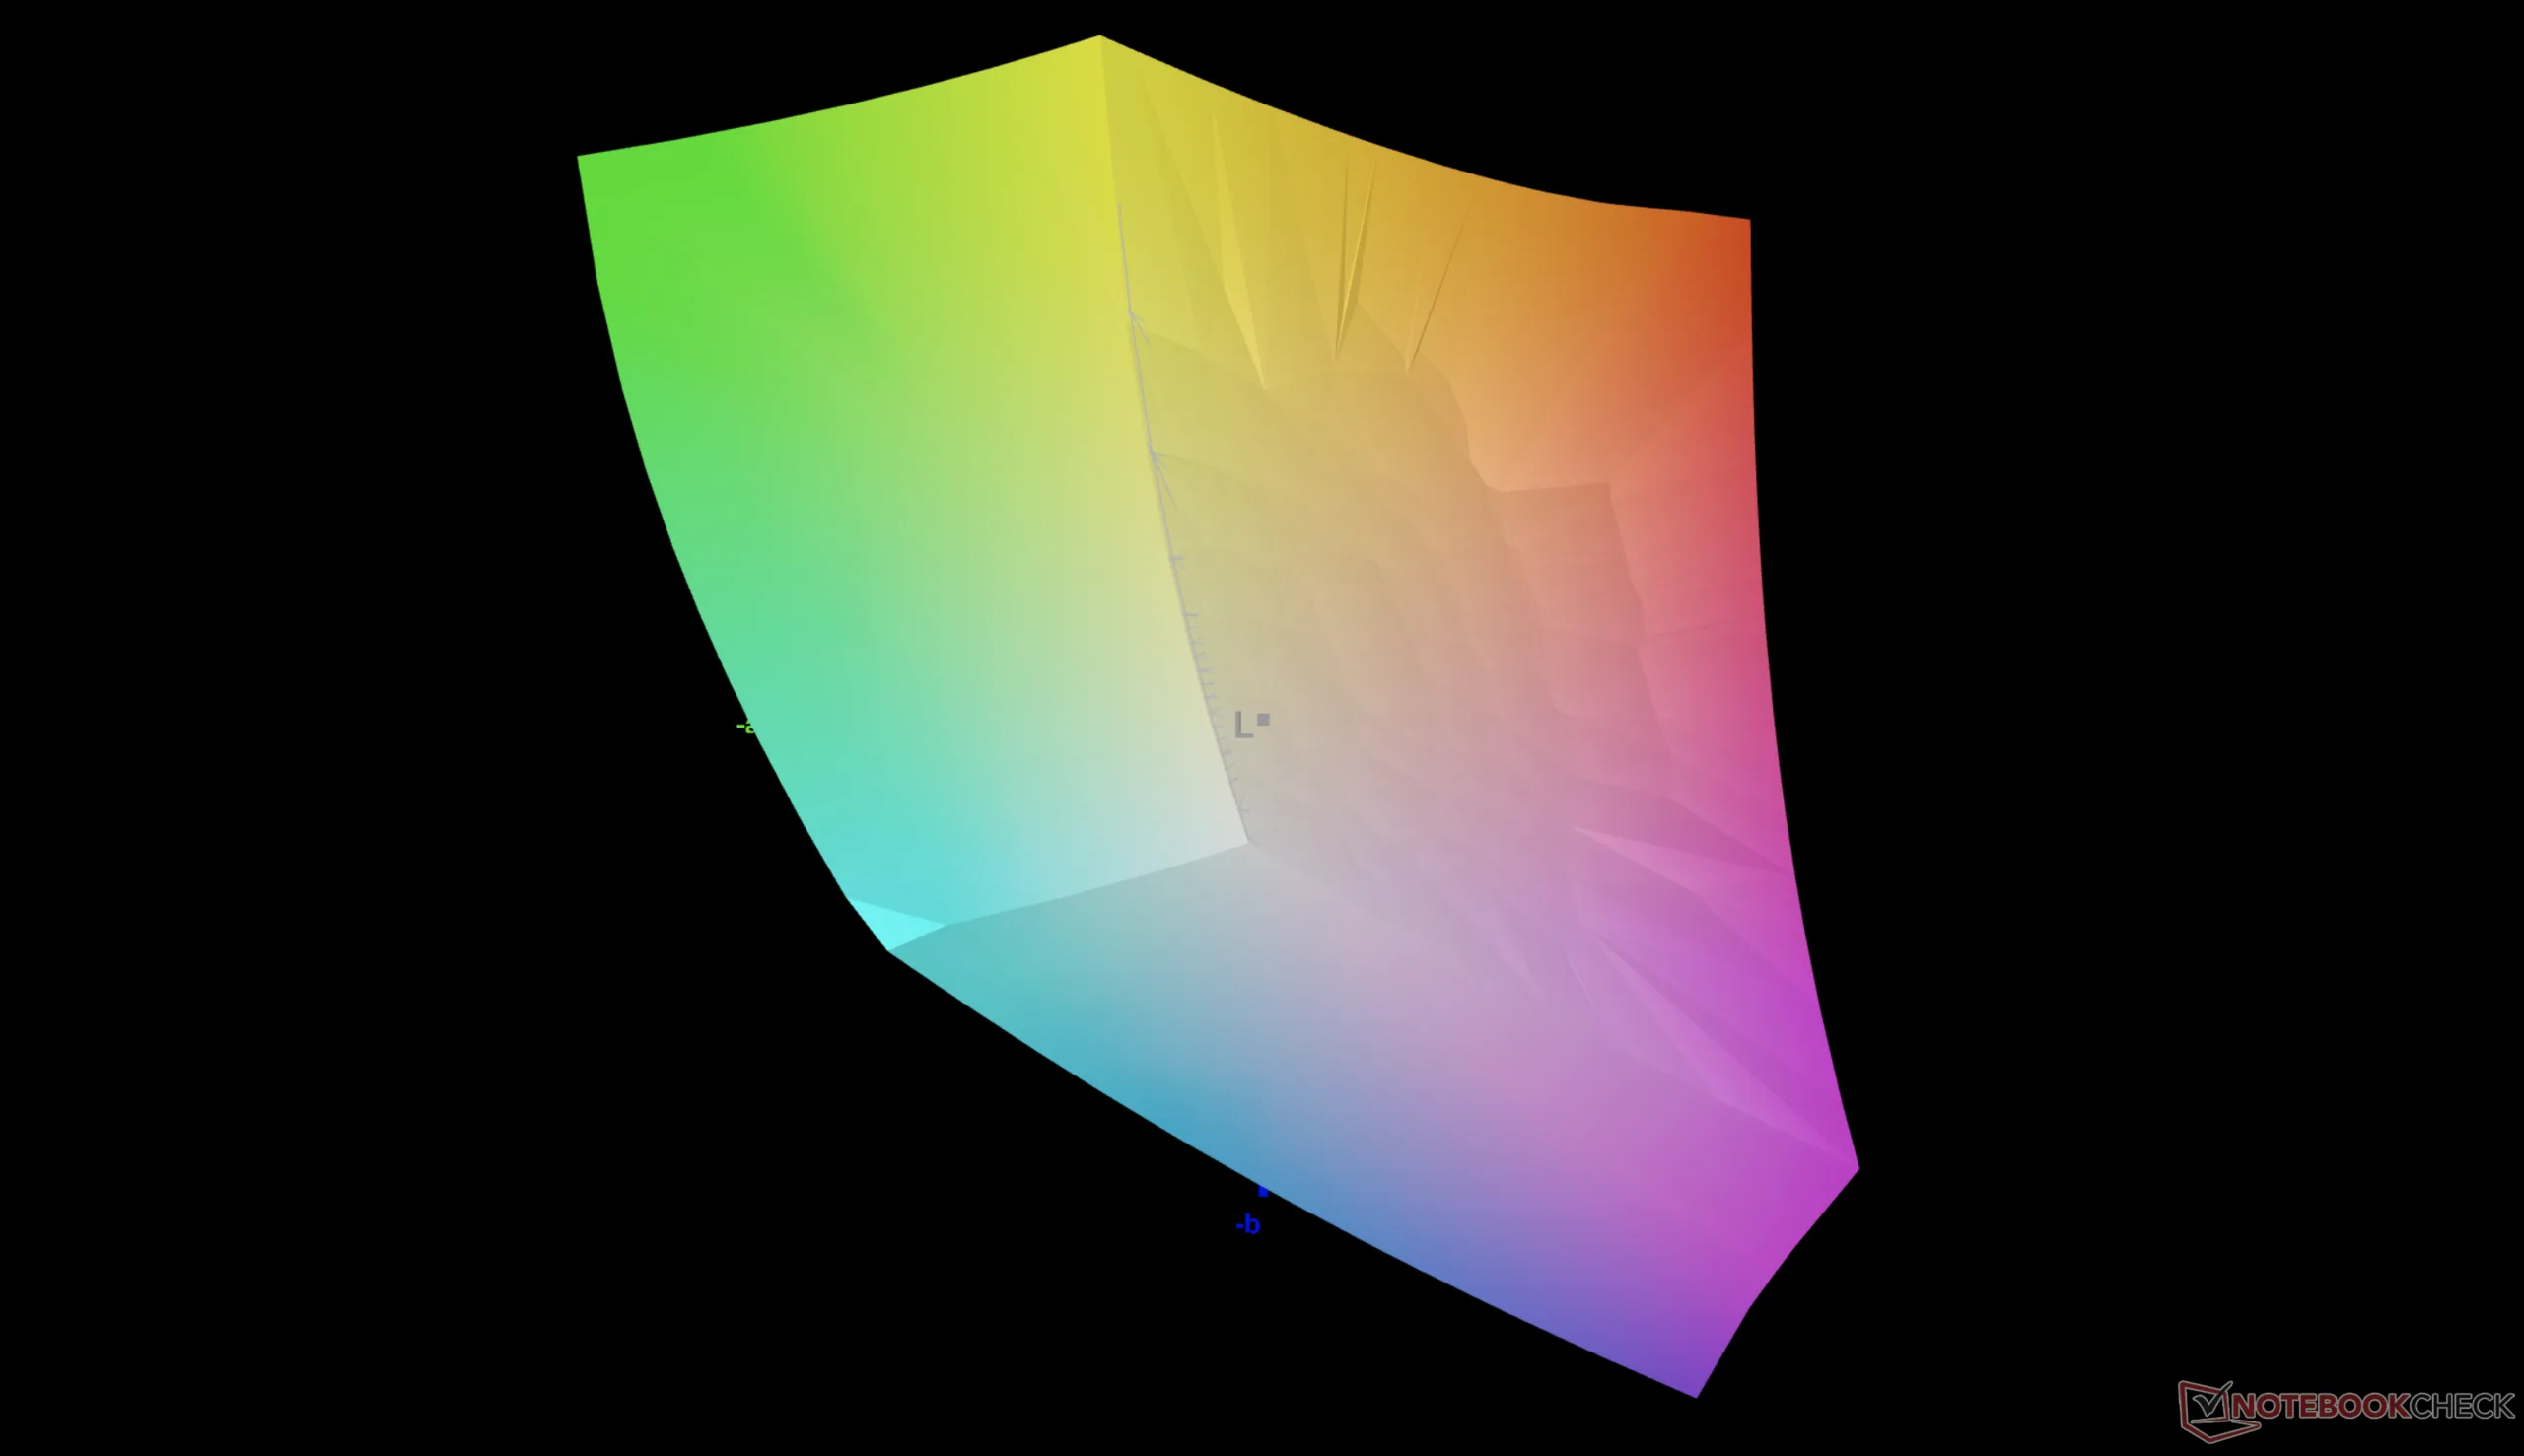
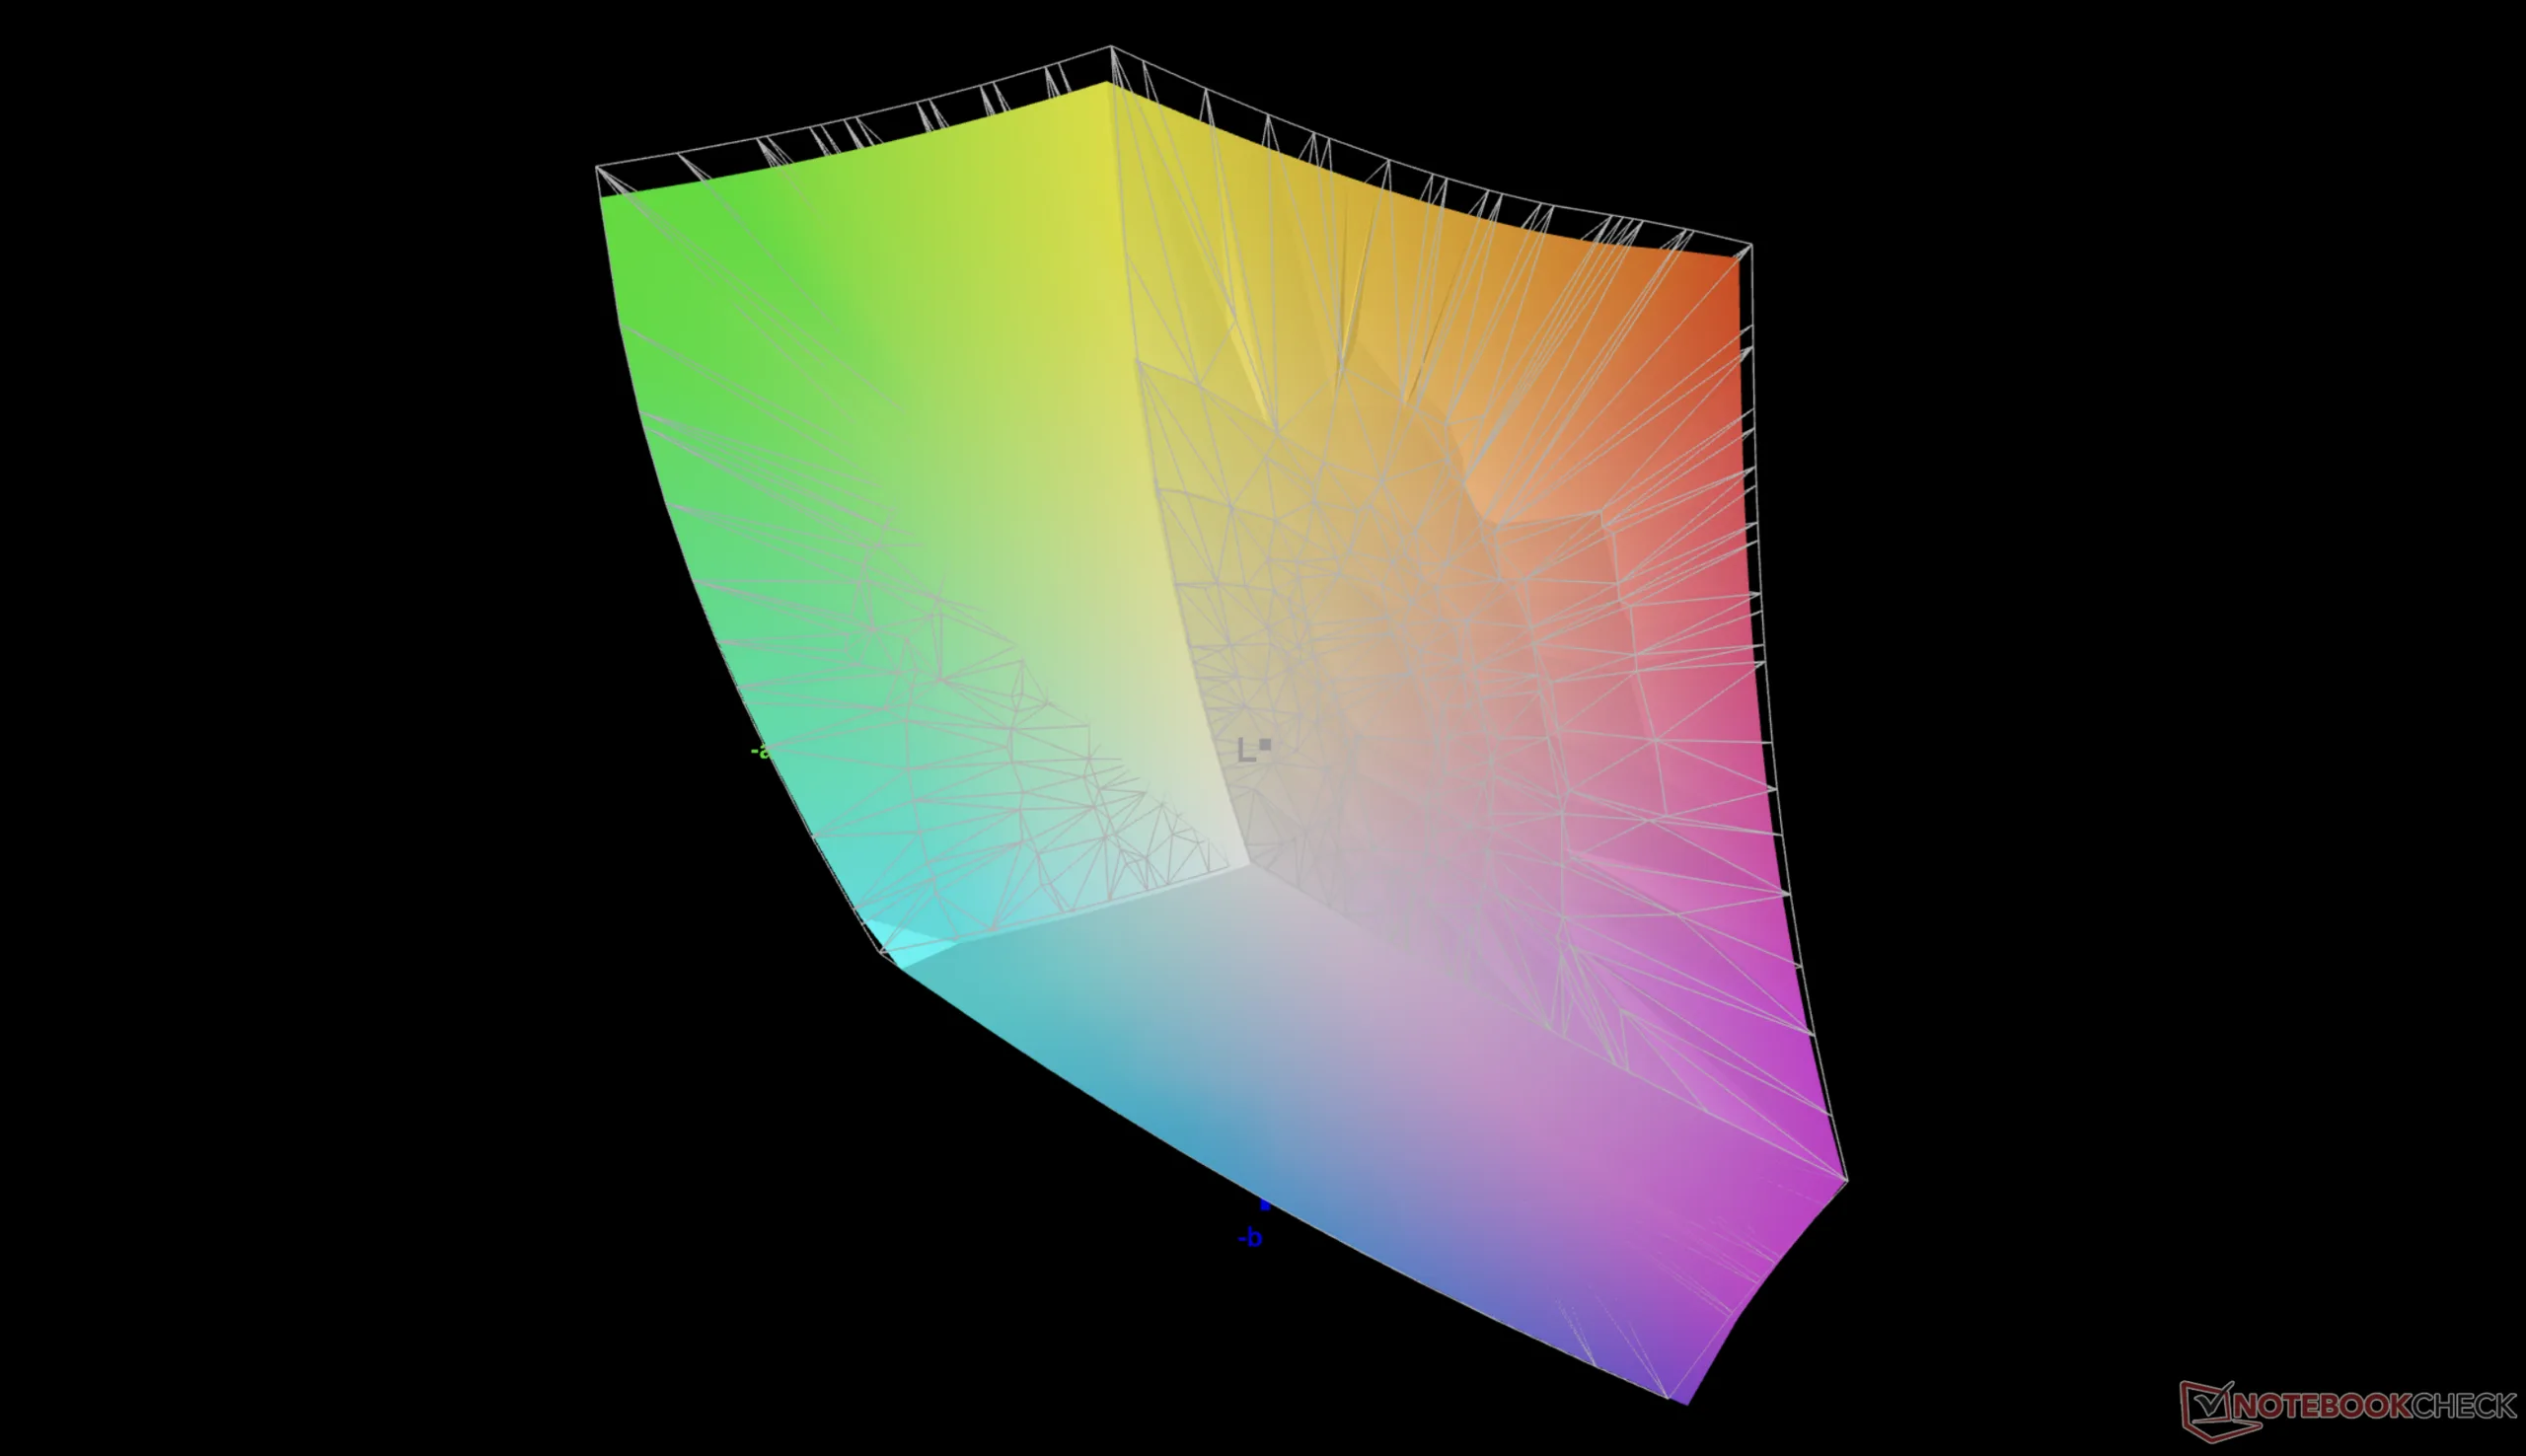
86.7% AdobeRGB 1998 (Argyll 3D)
100% sRGB (Argyll 3D)
96.2% Display P3 (Argyll 3D)
Gamma: 2.27
CCT: 6567 K
| Asus ExpertBook Ultra B9406CAA Samsung ATNA40LE01-0, OLED, 2880x1800, 14", 120 Hz | Dell Pro 14 Plus PB14255 GH77W LP140WU4, IPS LED, 1920x1200, 14", 60 Hz | Asus ExpertBook PM3406 MNE007QS3-6, IPS, 1920x1200, 14", 60 Hz | Lenovo ThinkPad P14s Gen 6 21QT0012GE TL145MDXP02, IPS LED, 3072x1920, 14.5", 120 Hz | Samsung Galaxy Book5 Pro 14 940XHA ATNA40CU07-0, OLED, 2880x1800, 14", 120 Hz | HP EliteBook Ultra G1i 14 SDC41AA, OLED, 2880x1800, 14", 120 Hz | |
|---|---|---|---|---|---|---|
| Display | -53% | -51% | 1% | 5% | 6% | |
| Display P3 Coverage (%) | 96.2 | 37.5 -61% | 39.3 -59% | 98.3 2% | 99.9 4% | 99.7 4% |
| sRGB Coverage (%) | 100 | 56.3 -44% | 58.1 -42% | 100 0% | 100 0% | 100 0% |
| AdobeRGB 1998 Coverage (%) | 86.7 | 38.8 -55% | 40.6 -53% | 86.5 0% | 95.7 10% | 98 13% |
| Response Times | -2931% | -2748% | -2962% | -73% | -3% | |
| Response Time Grey 50% / Grey 80% * (ms) | 0.71 ? | 27.1 ? -3717% | 27.6 ? -3787% | 28.3 ? -3886% | 0.83 ? -17% | 0.74 ? -4% |
| Response Time Black / White * (ms) | 0.94 ? | 21.1 ? -2145% | 17 ? -1709% | 20.1 ? -2038% | 0.69 ? 27% | 0.7 ? 26% |
| PWM Frequency (Hz) | 968.8 ? | 240 ? | 480 ? | |||
| PWM Amplitude * (%) | 20 | 66 -230% | 26 -30% | |||
| Screen | -242% | -215% | -60% | -55% | -60% | |
| Brightness middle (cd/m²) | 600.5 | 315 -48% | 320 -47% | 546 -9% | 400 -33% | 392 -35% |
| Brightness (cd/m²) | 612 | 295 -52% | 310 -49% | 502 -18% | 402 -34% | 378 -38% |
| Brightness Distribution (%) | 96 | 87 -9% | 93 -3% | 88 -8% | 99 3% | 95 -1% |
| Black Level * (cd/m²) | 0.25 | 0.26 | 0.4 | |||
| Colorchecker dE 2000 * | 1.18 | 6 -408% | 5.1 -332% | 3.1 -163% | 2.1 -78% | 2.4 -103% |
| Colorchecker dE 2000 max. * | 3.4 | 15.2 -347% | 18.1 -432% | 6.1 -79% | 3.3 3% | 6.6 -94% |
| Colorchecker dE 2000 calibrated * | 0.73 | 5.1 -599% | 4.9 -571% | 1.6 -119% | ||
| Greyscale dE 2000 * | 1 | 3.3 -230% | 1.7 -70% | 1.8 -80% | 2.3 -130% | 1.9 -90% |
| Gamma | 2.27 97% | 2.02 109% | 2.21 100% | 2.16 102% | 2.26 97% | 2.21 100% |
| CCT | 6567 99% | 6140 106% | 6398 102% | 6824 95% | 6795 96% | 6463 101% |
| Contrast (:1) | 1260 | 1231 | 1365 | |||
| Całkowita średnia (program / ustawienia) | -1075% /
-643% | -1005% /
-596% | -1007% /
-571% | -41% /
-46% | -19% /
-29% |
* ... im mniej tym lepiej

Wyświetl czasy reakcji
| ↔ Czas reakcji od czerni do bieli | ||
|---|---|---|
| 0.94 ms ... wzrost ↗ i spadek ↘ łącznie | ↗ 0.49 ms wzrost | 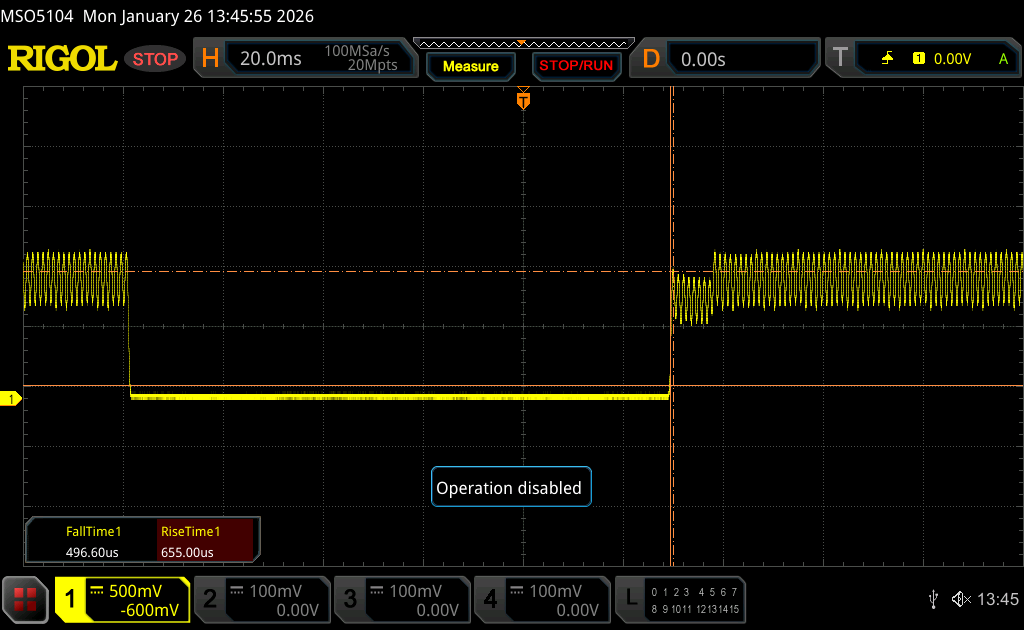 |
| ↘ 0.45 ms upadek | ||
| W naszych testach ekran wykazuje bardzo szybką reakcję i powinien bardzo dobrze nadawać się do szybkich gier. Dla porównania, wszystkie testowane urządzenia wahają się od 0.1 (minimum) do 240 (maksimum) ms. » 3 % wszystkich urządzeń jest lepszych. Oznacza to, że zmierzony czas reakcji jest lepszy od średniej wszystkich testowanych urządzeń (19.8 ms). | ||
| ↔ Czas reakcji 50% szarości do 80% szarości | ||
| 0.71 ms ... wzrost ↗ i spadek ↘ łącznie | ↗ 0.38 ms wzrost | 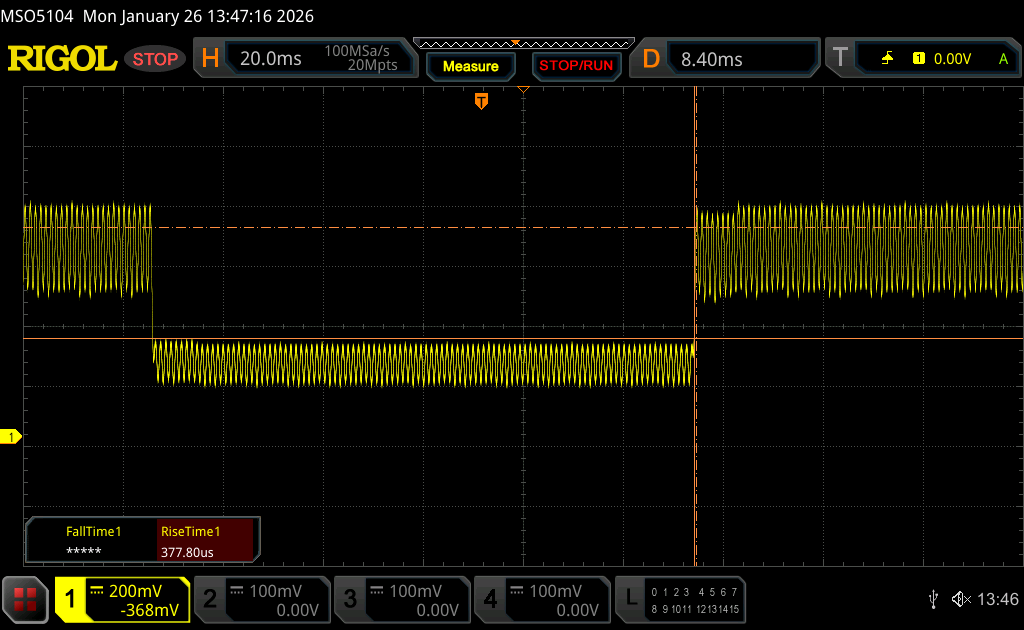 |
| ↘ 0.33 ms upadek | ||
| W naszych testach ekran wykazuje bardzo szybką reakcję i powinien bardzo dobrze nadawać się do szybkich gier. Dla porównania, wszystkie testowane urządzenia wahają się od 0.165 (minimum) do 636 (maksimum) ms. » 2 % wszystkich urządzeń jest lepszych. Oznacza to, że zmierzony czas reakcji jest lepszy od średniej wszystkich testowanych urządzeń (31 ms). | ||
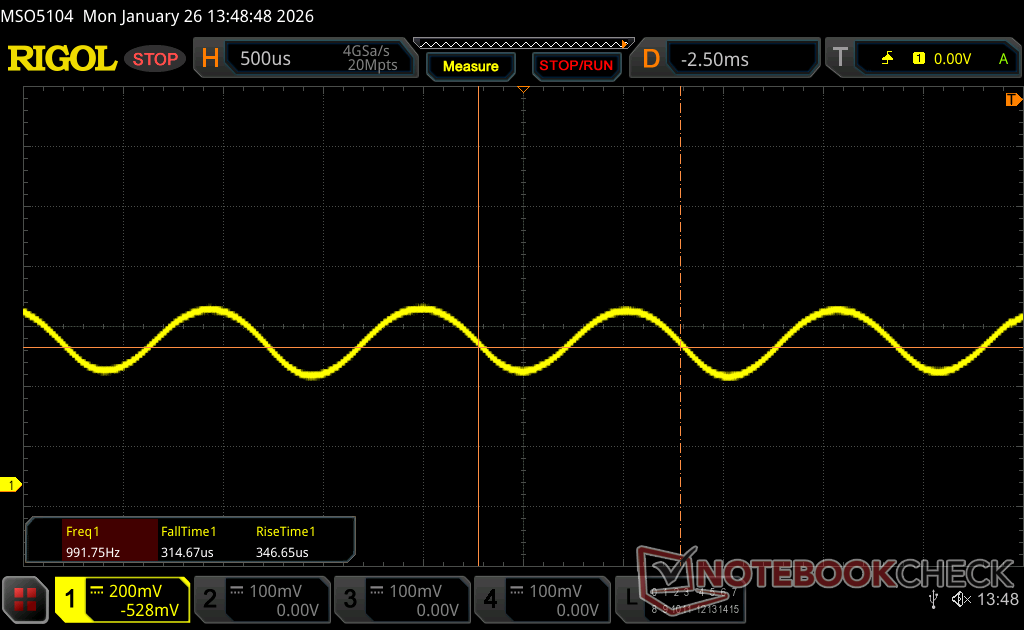
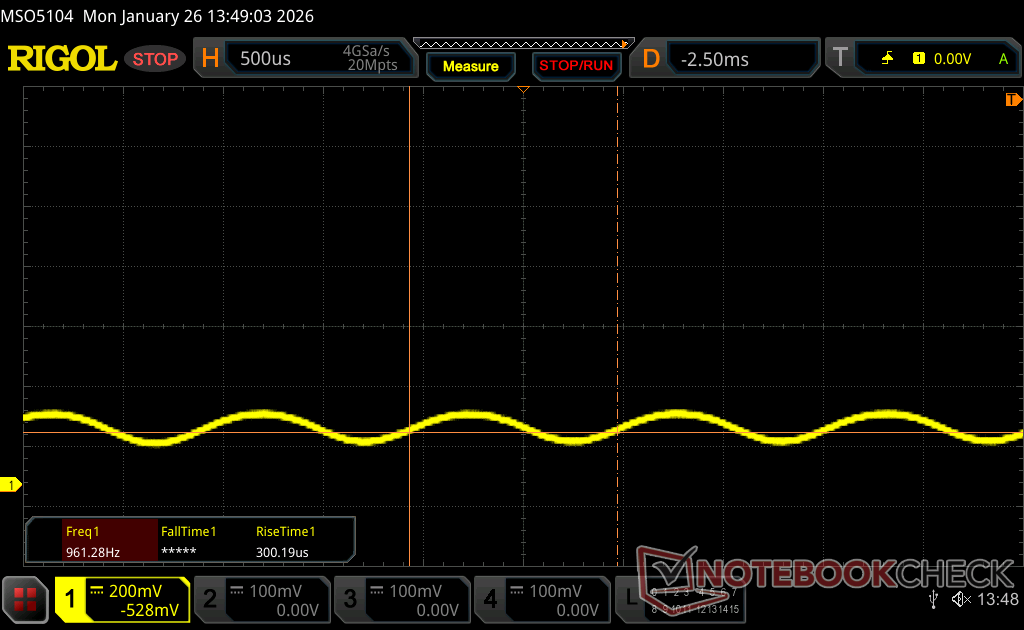
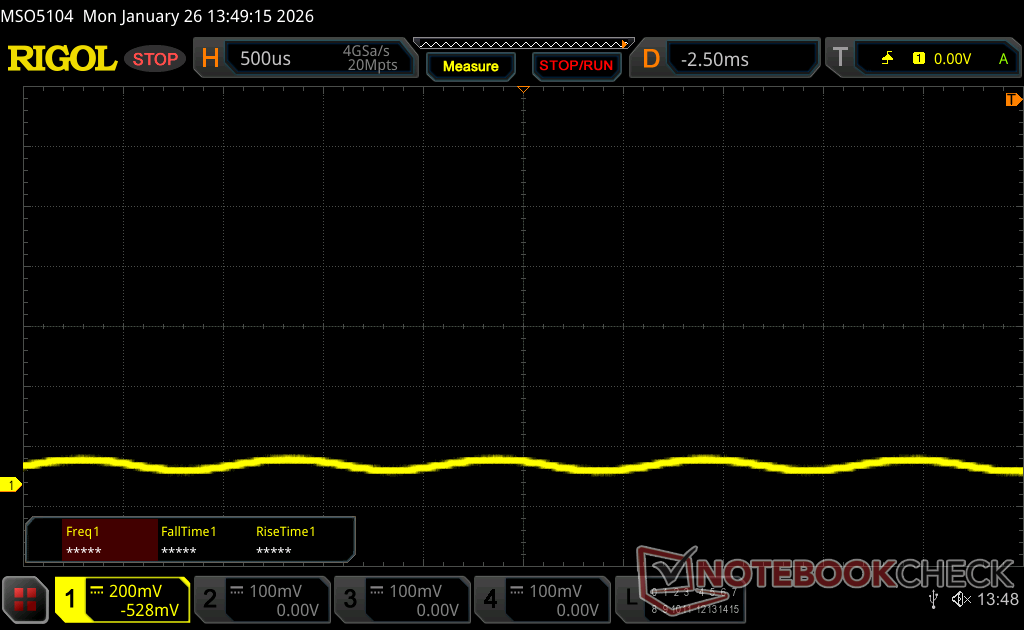
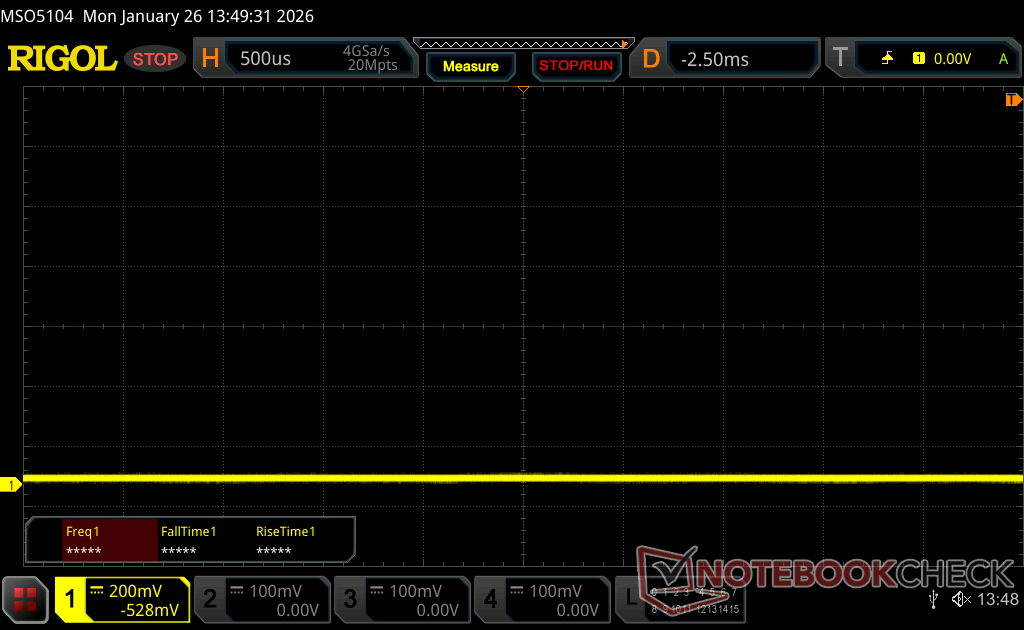
Migotanie ekranu / PWM (modulacja szerokości impulsu)
| Wykryto migotanie ekranu/wykryto PWM | 968.8 Hz Amplitude: 20 % | ≤ 100 % ustawienia jasności | 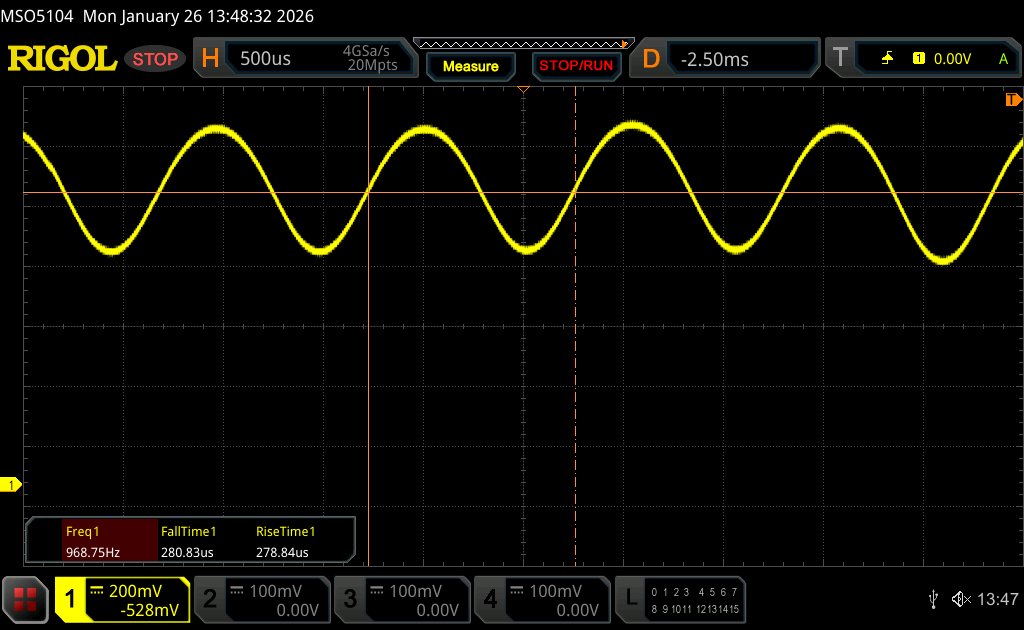 |
Podświetlenie wyświetlacza miga z częstotliwością 968.8 Hz (najgorszy przypadek, np. przy użyciu PWM) Wykryto migotanie przy ustawieniu jasności 100 % i poniżej. Powyżej tego ustawienia jasności nie powinno być żadnego migotania ani PWM. Częstotliwość 968.8 Hz jest dość wysoka, więc większość użytkowników wrażliwych na PWM nie powinna zauważyć żadnego migotania. Dla porównania: 52 % wszystkich testowanych urządzeń nie używa PWM do przyciemniania wyświetlacza. Jeśli wykryto PWM, zmierzono średnio 7754 (minimum: 5 - maksimum: 343500) Hz. | |||
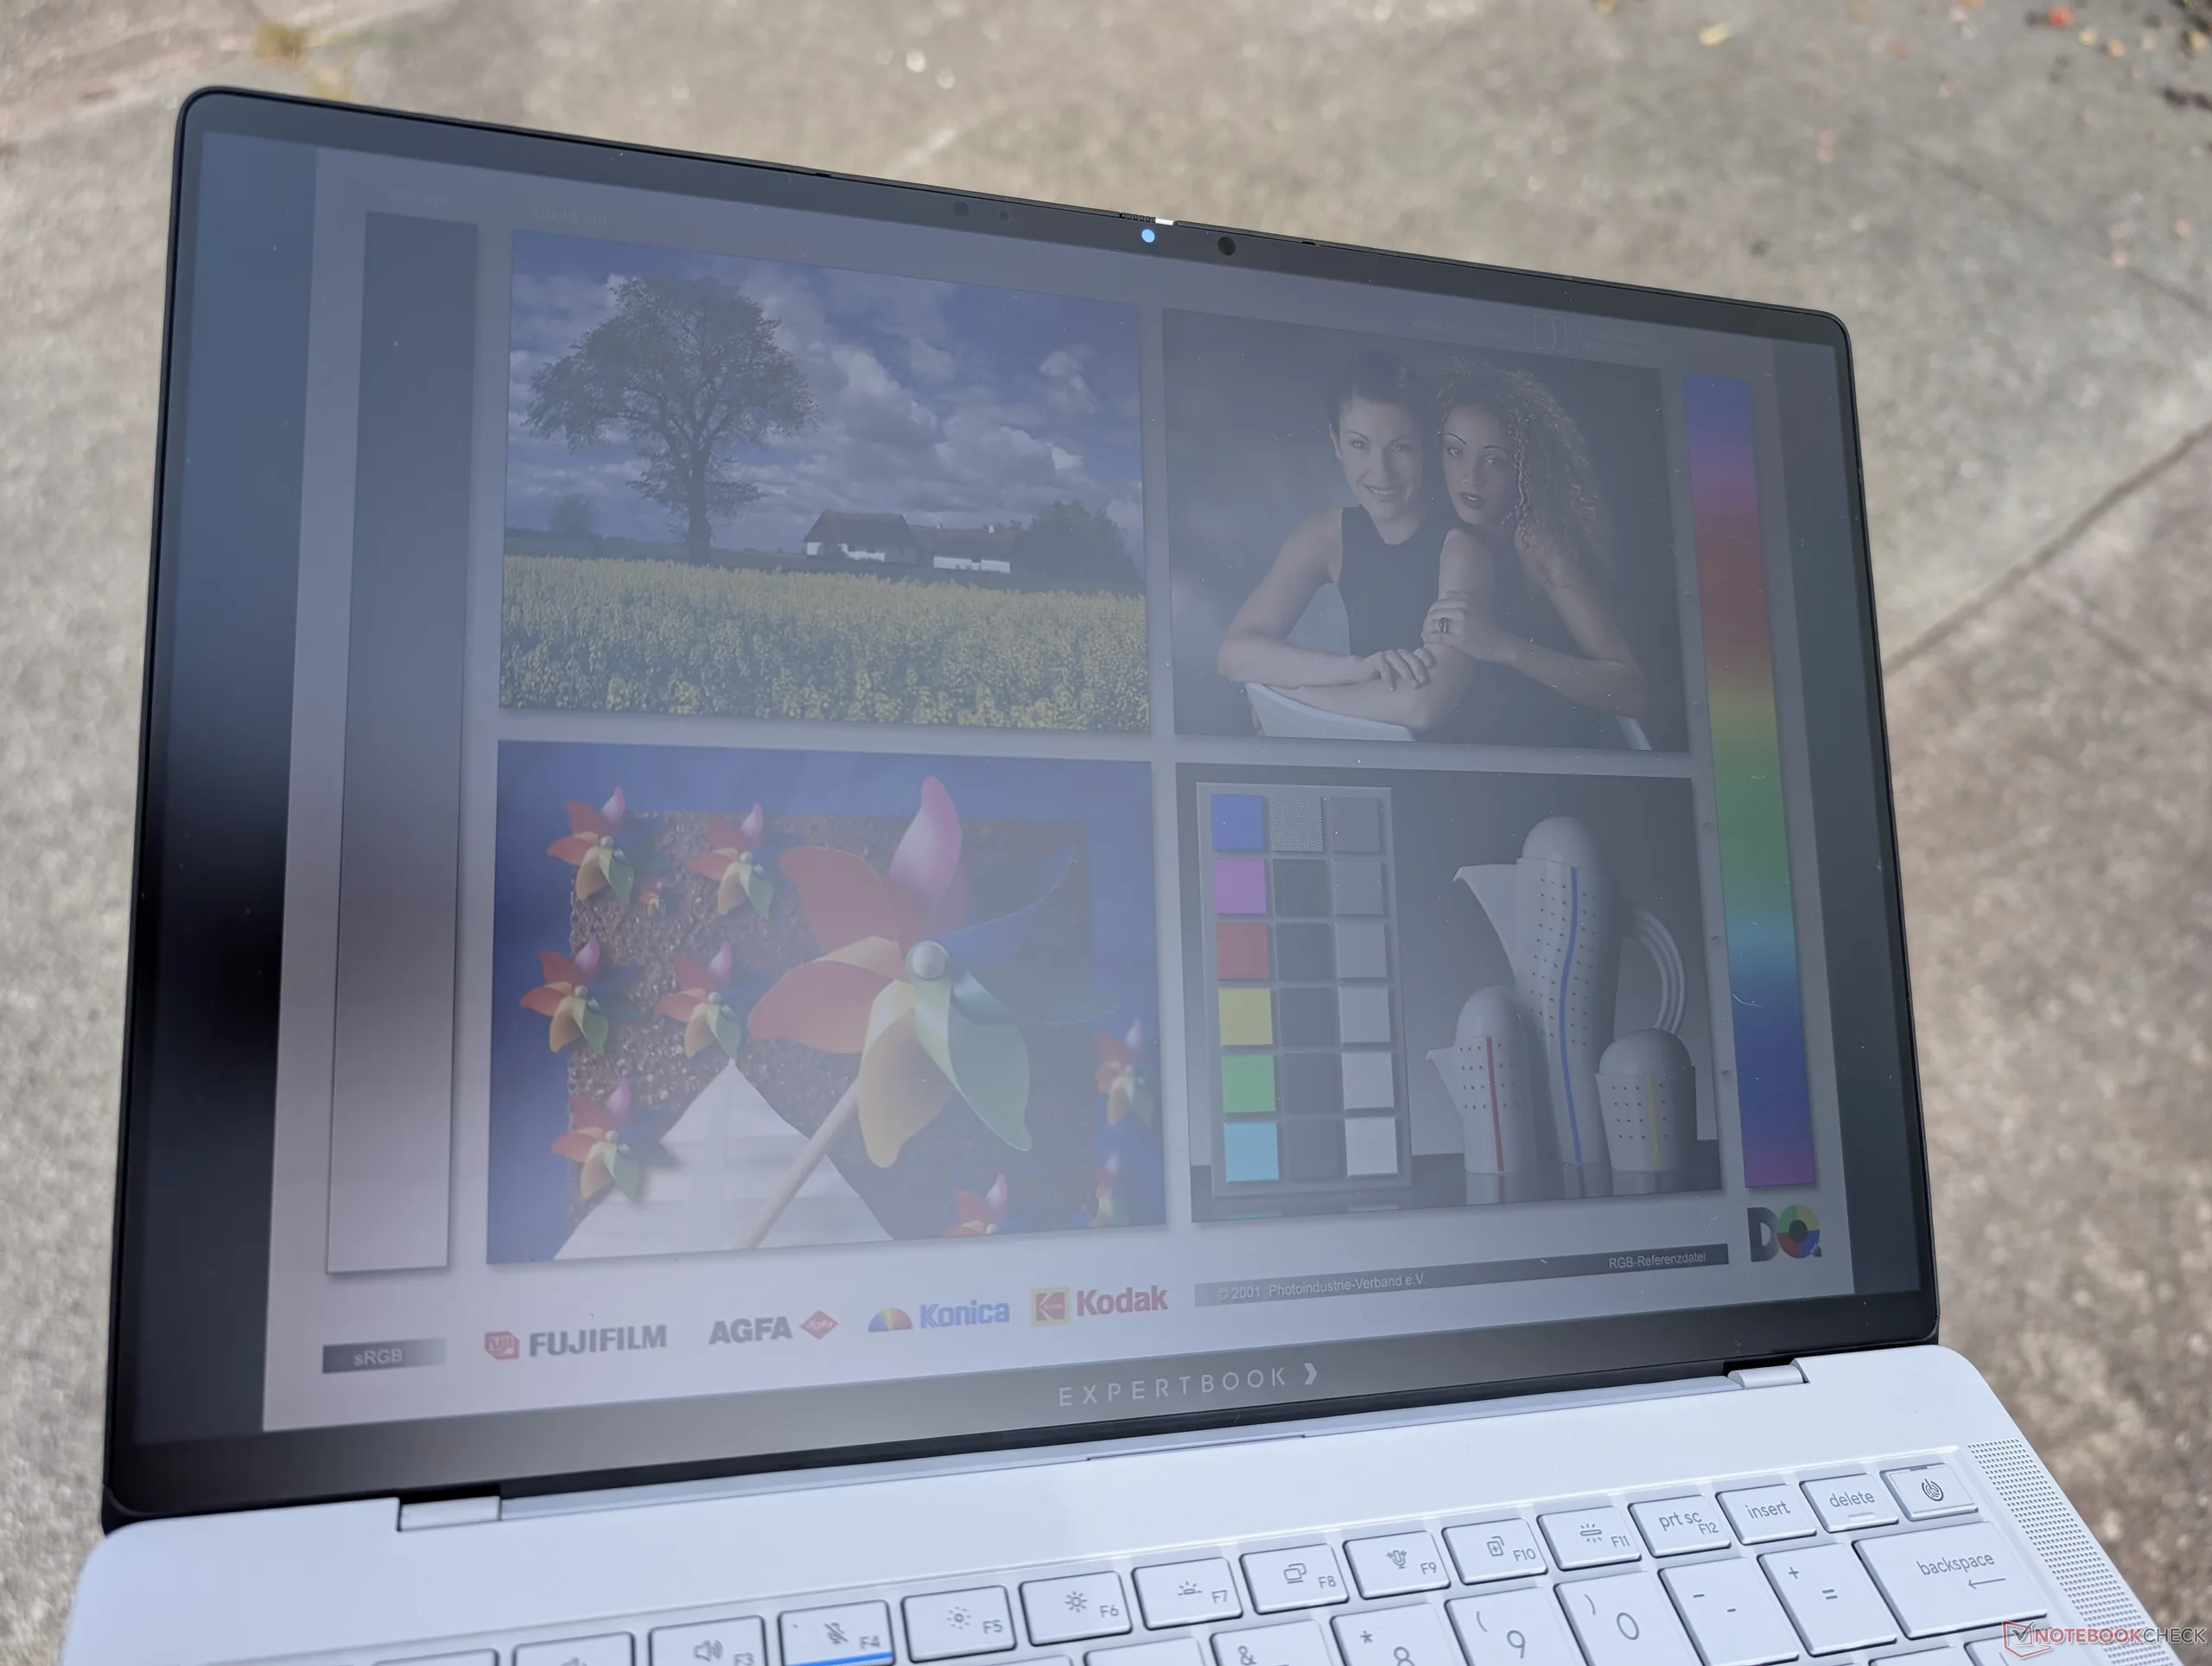
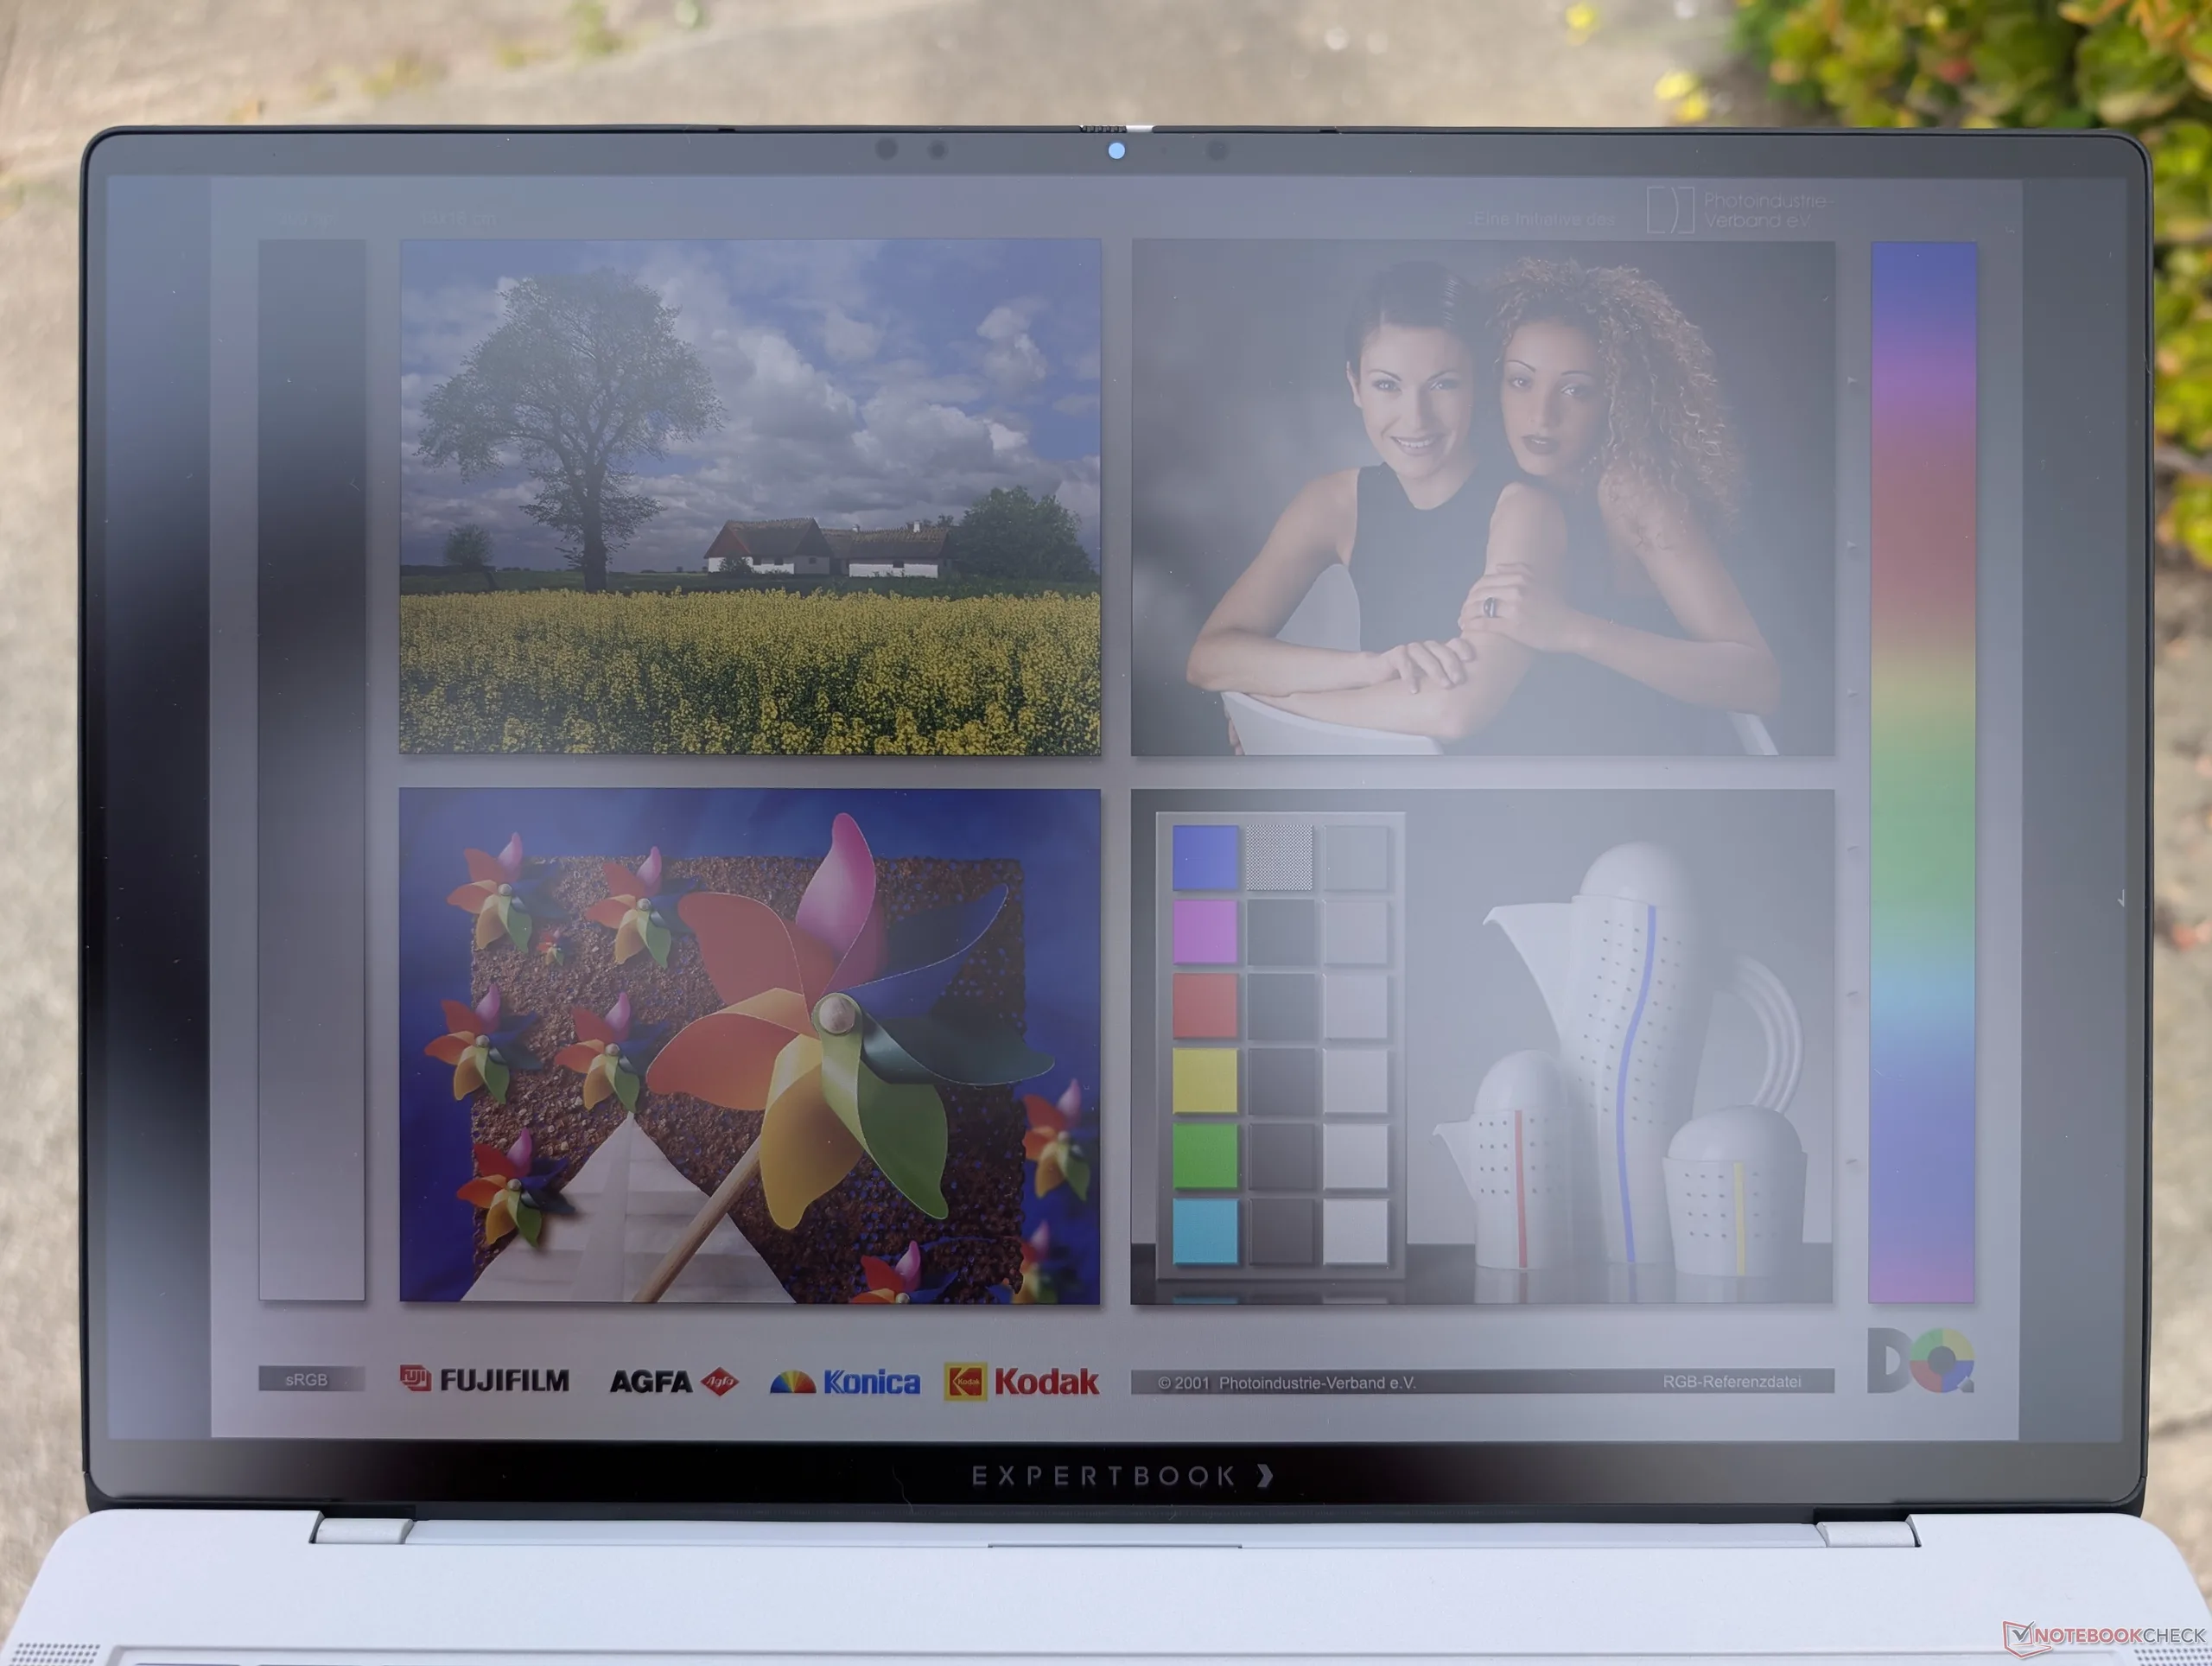
Widoczność na zewnątrz jest tylko przeciętna pomimo matowej powłoki, ponieważ kolory mogą nadal wyglądać na wyblakłe lub przytłumione w pochmurny dzień.
Wydajność - laptop do gier w przebraniu
Warunki testowania
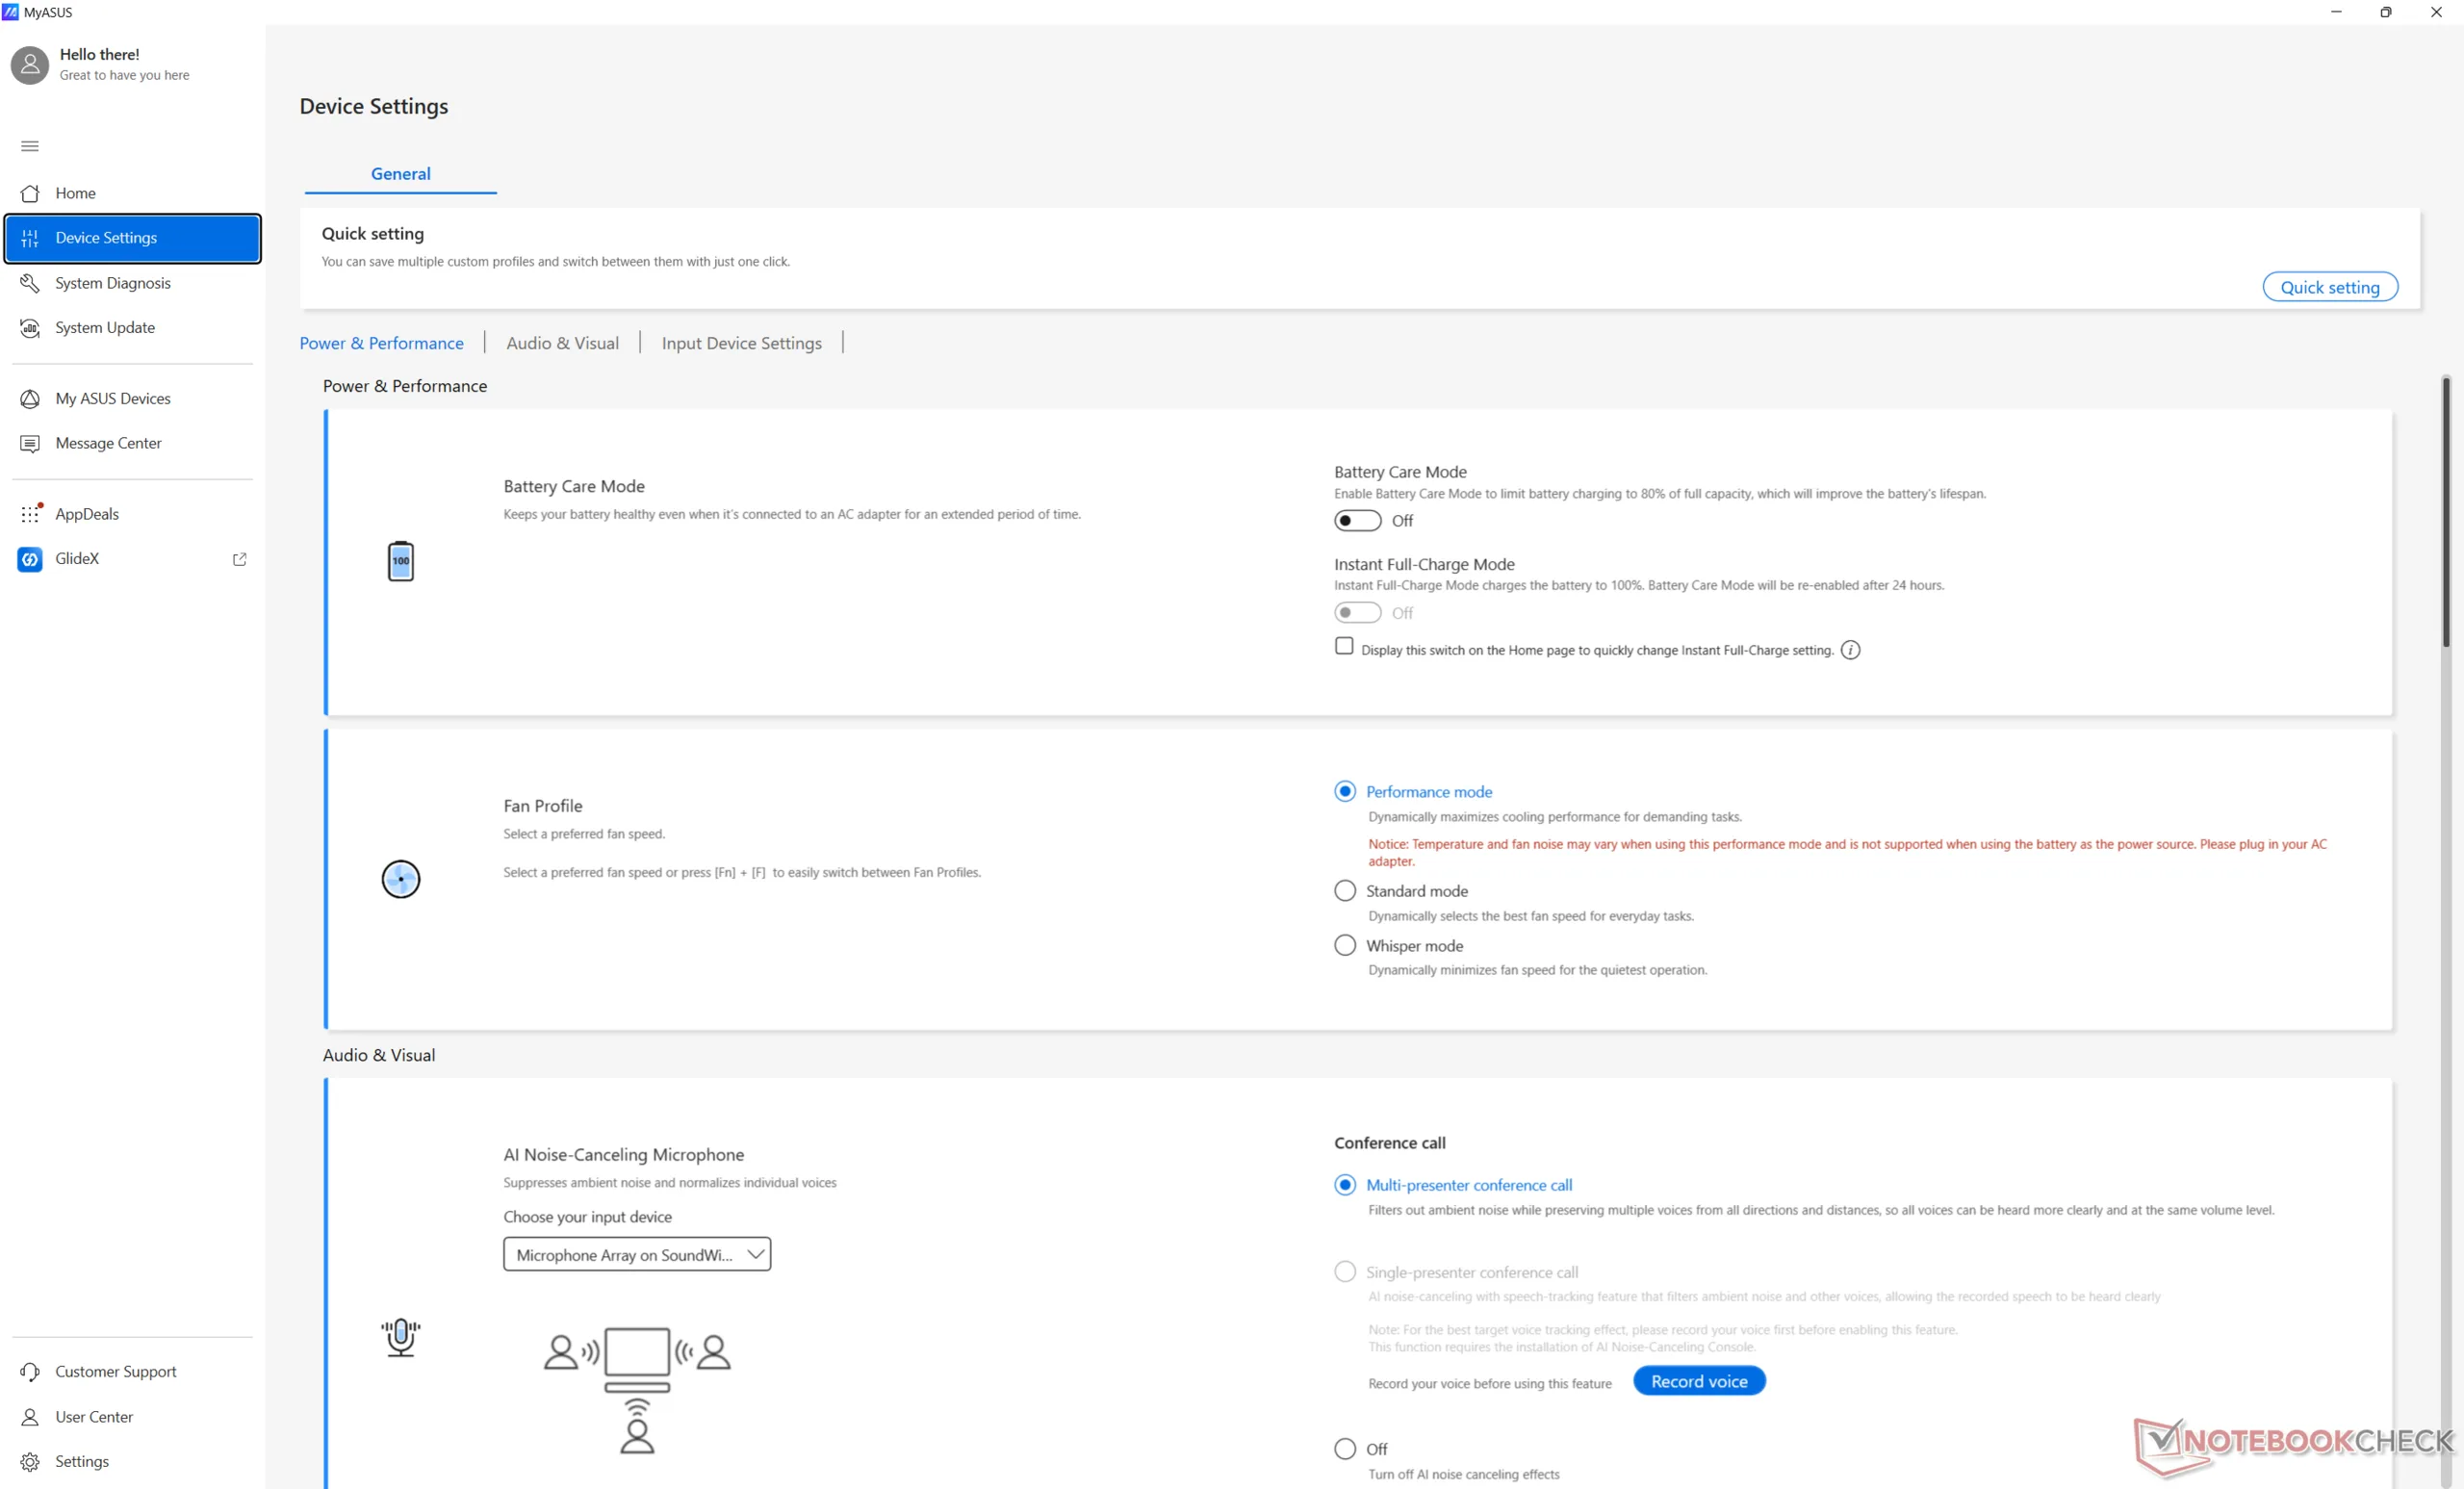
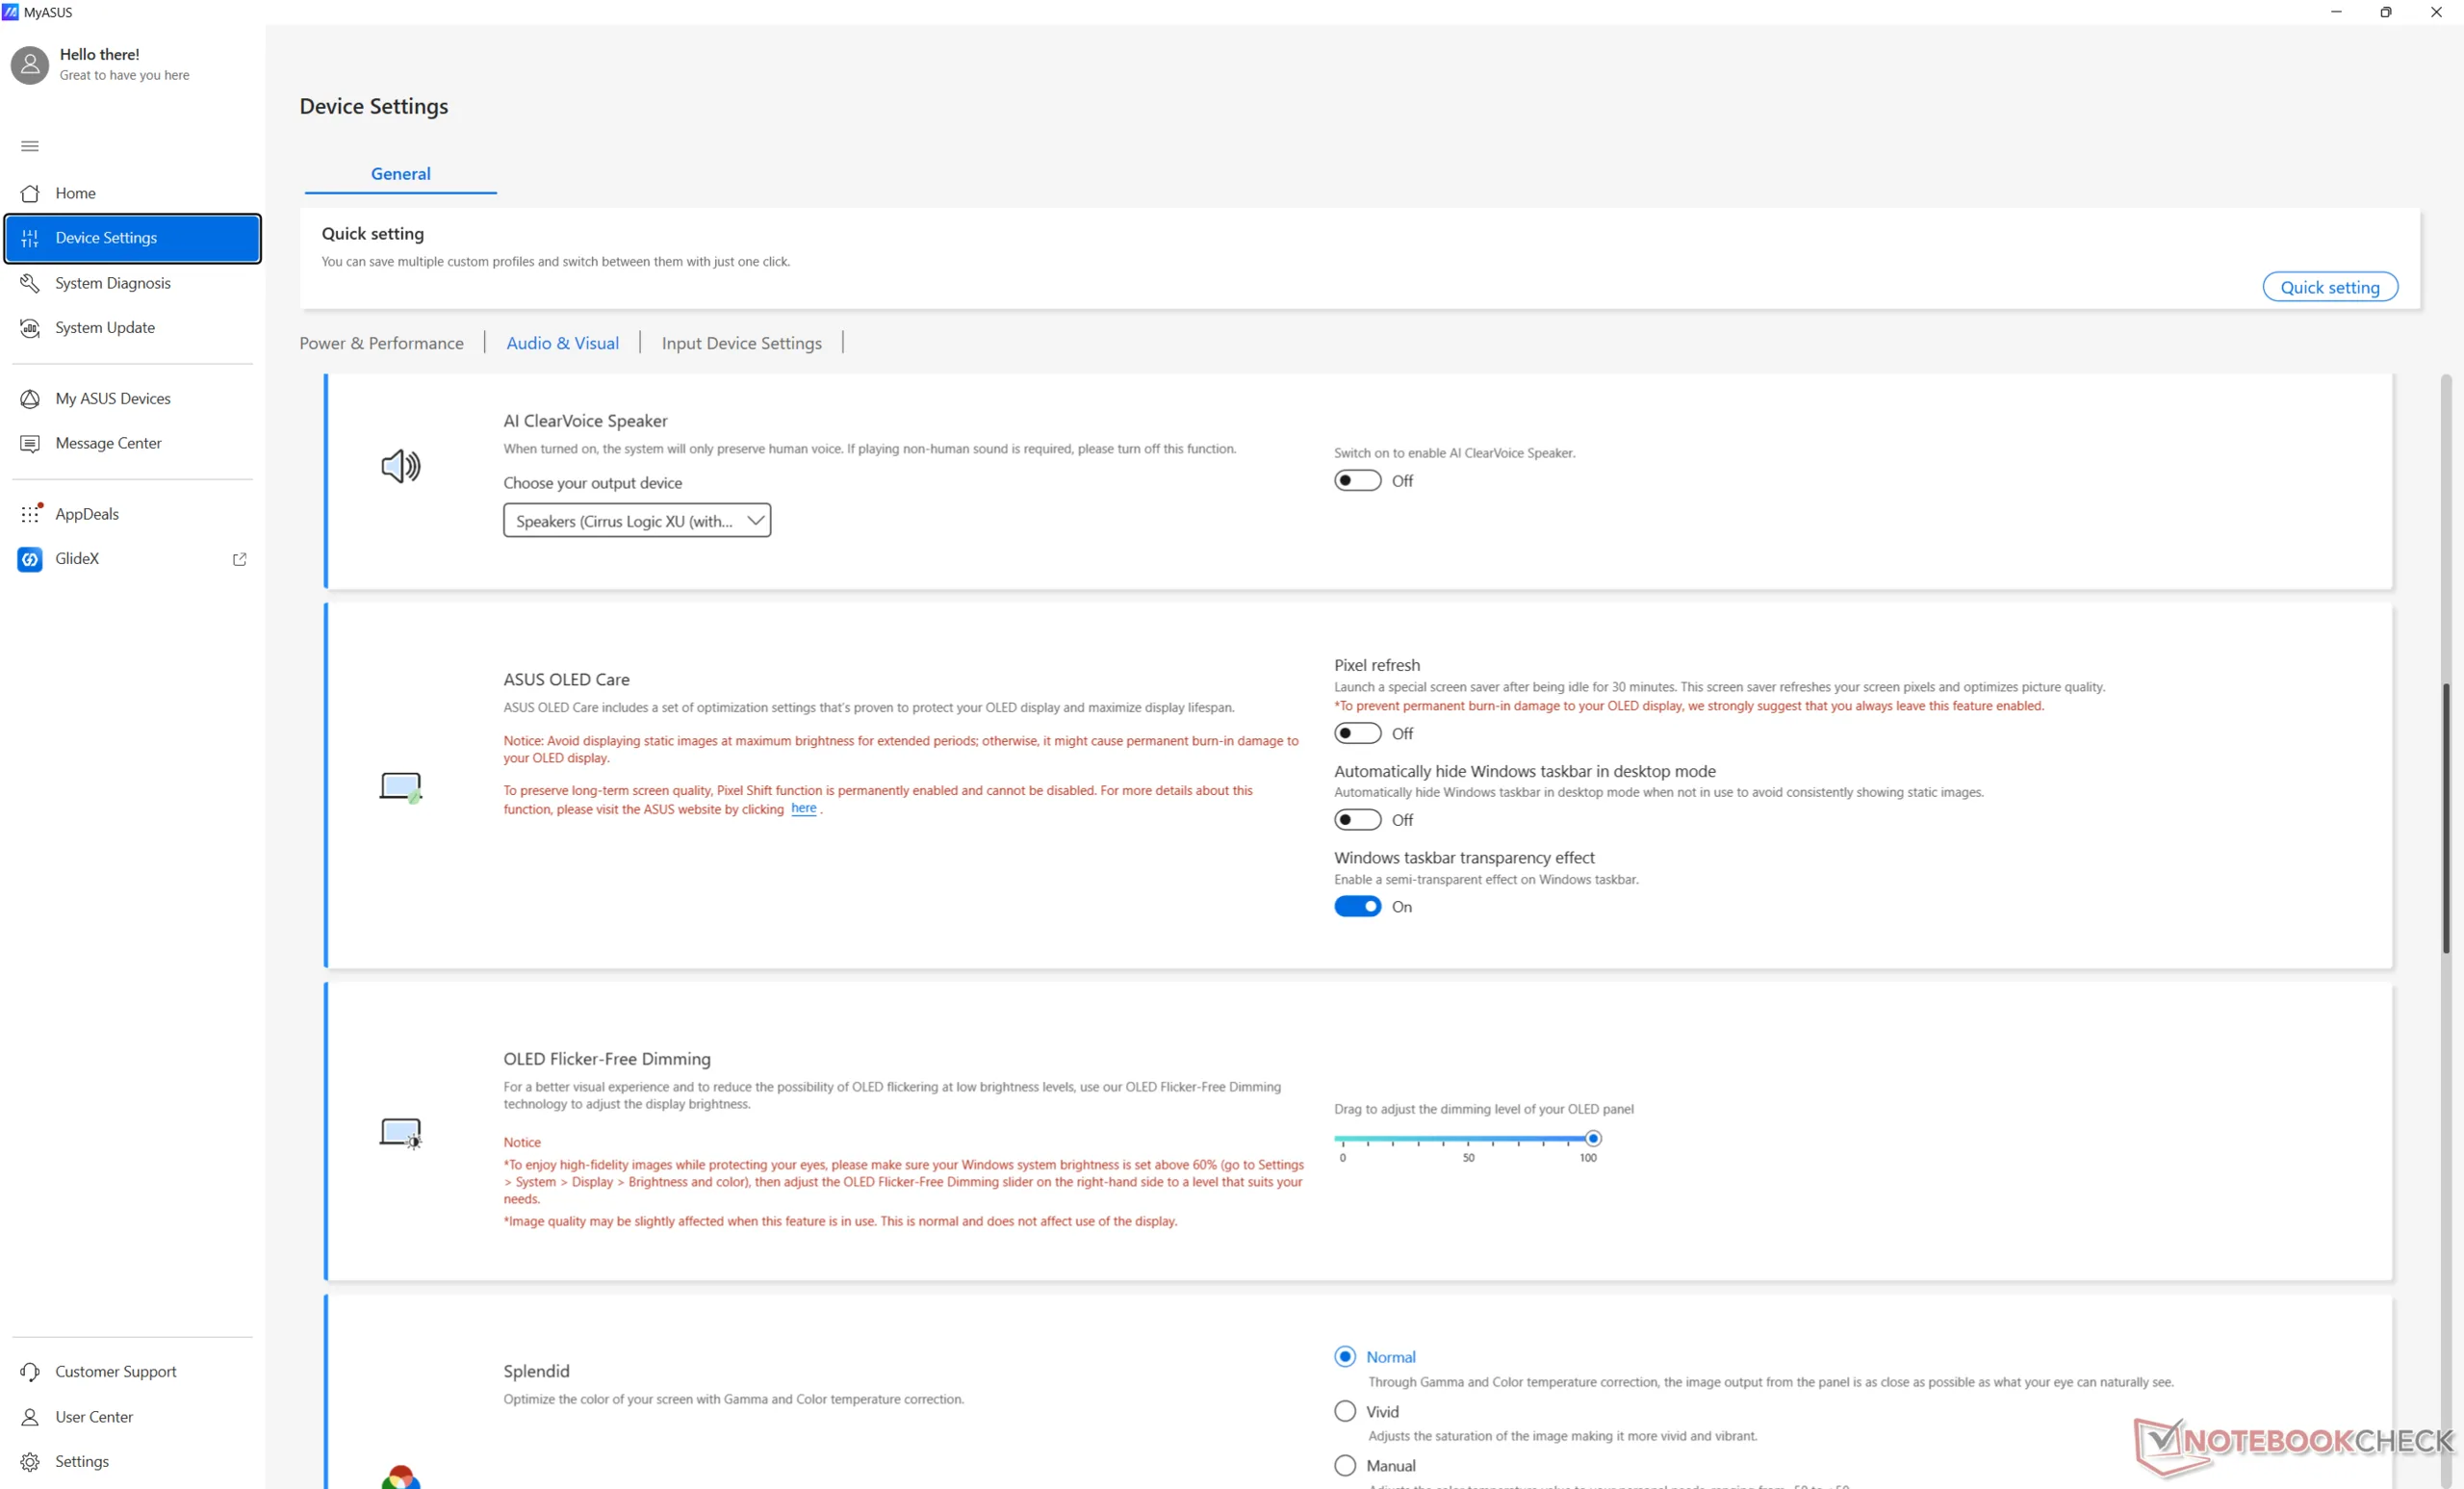
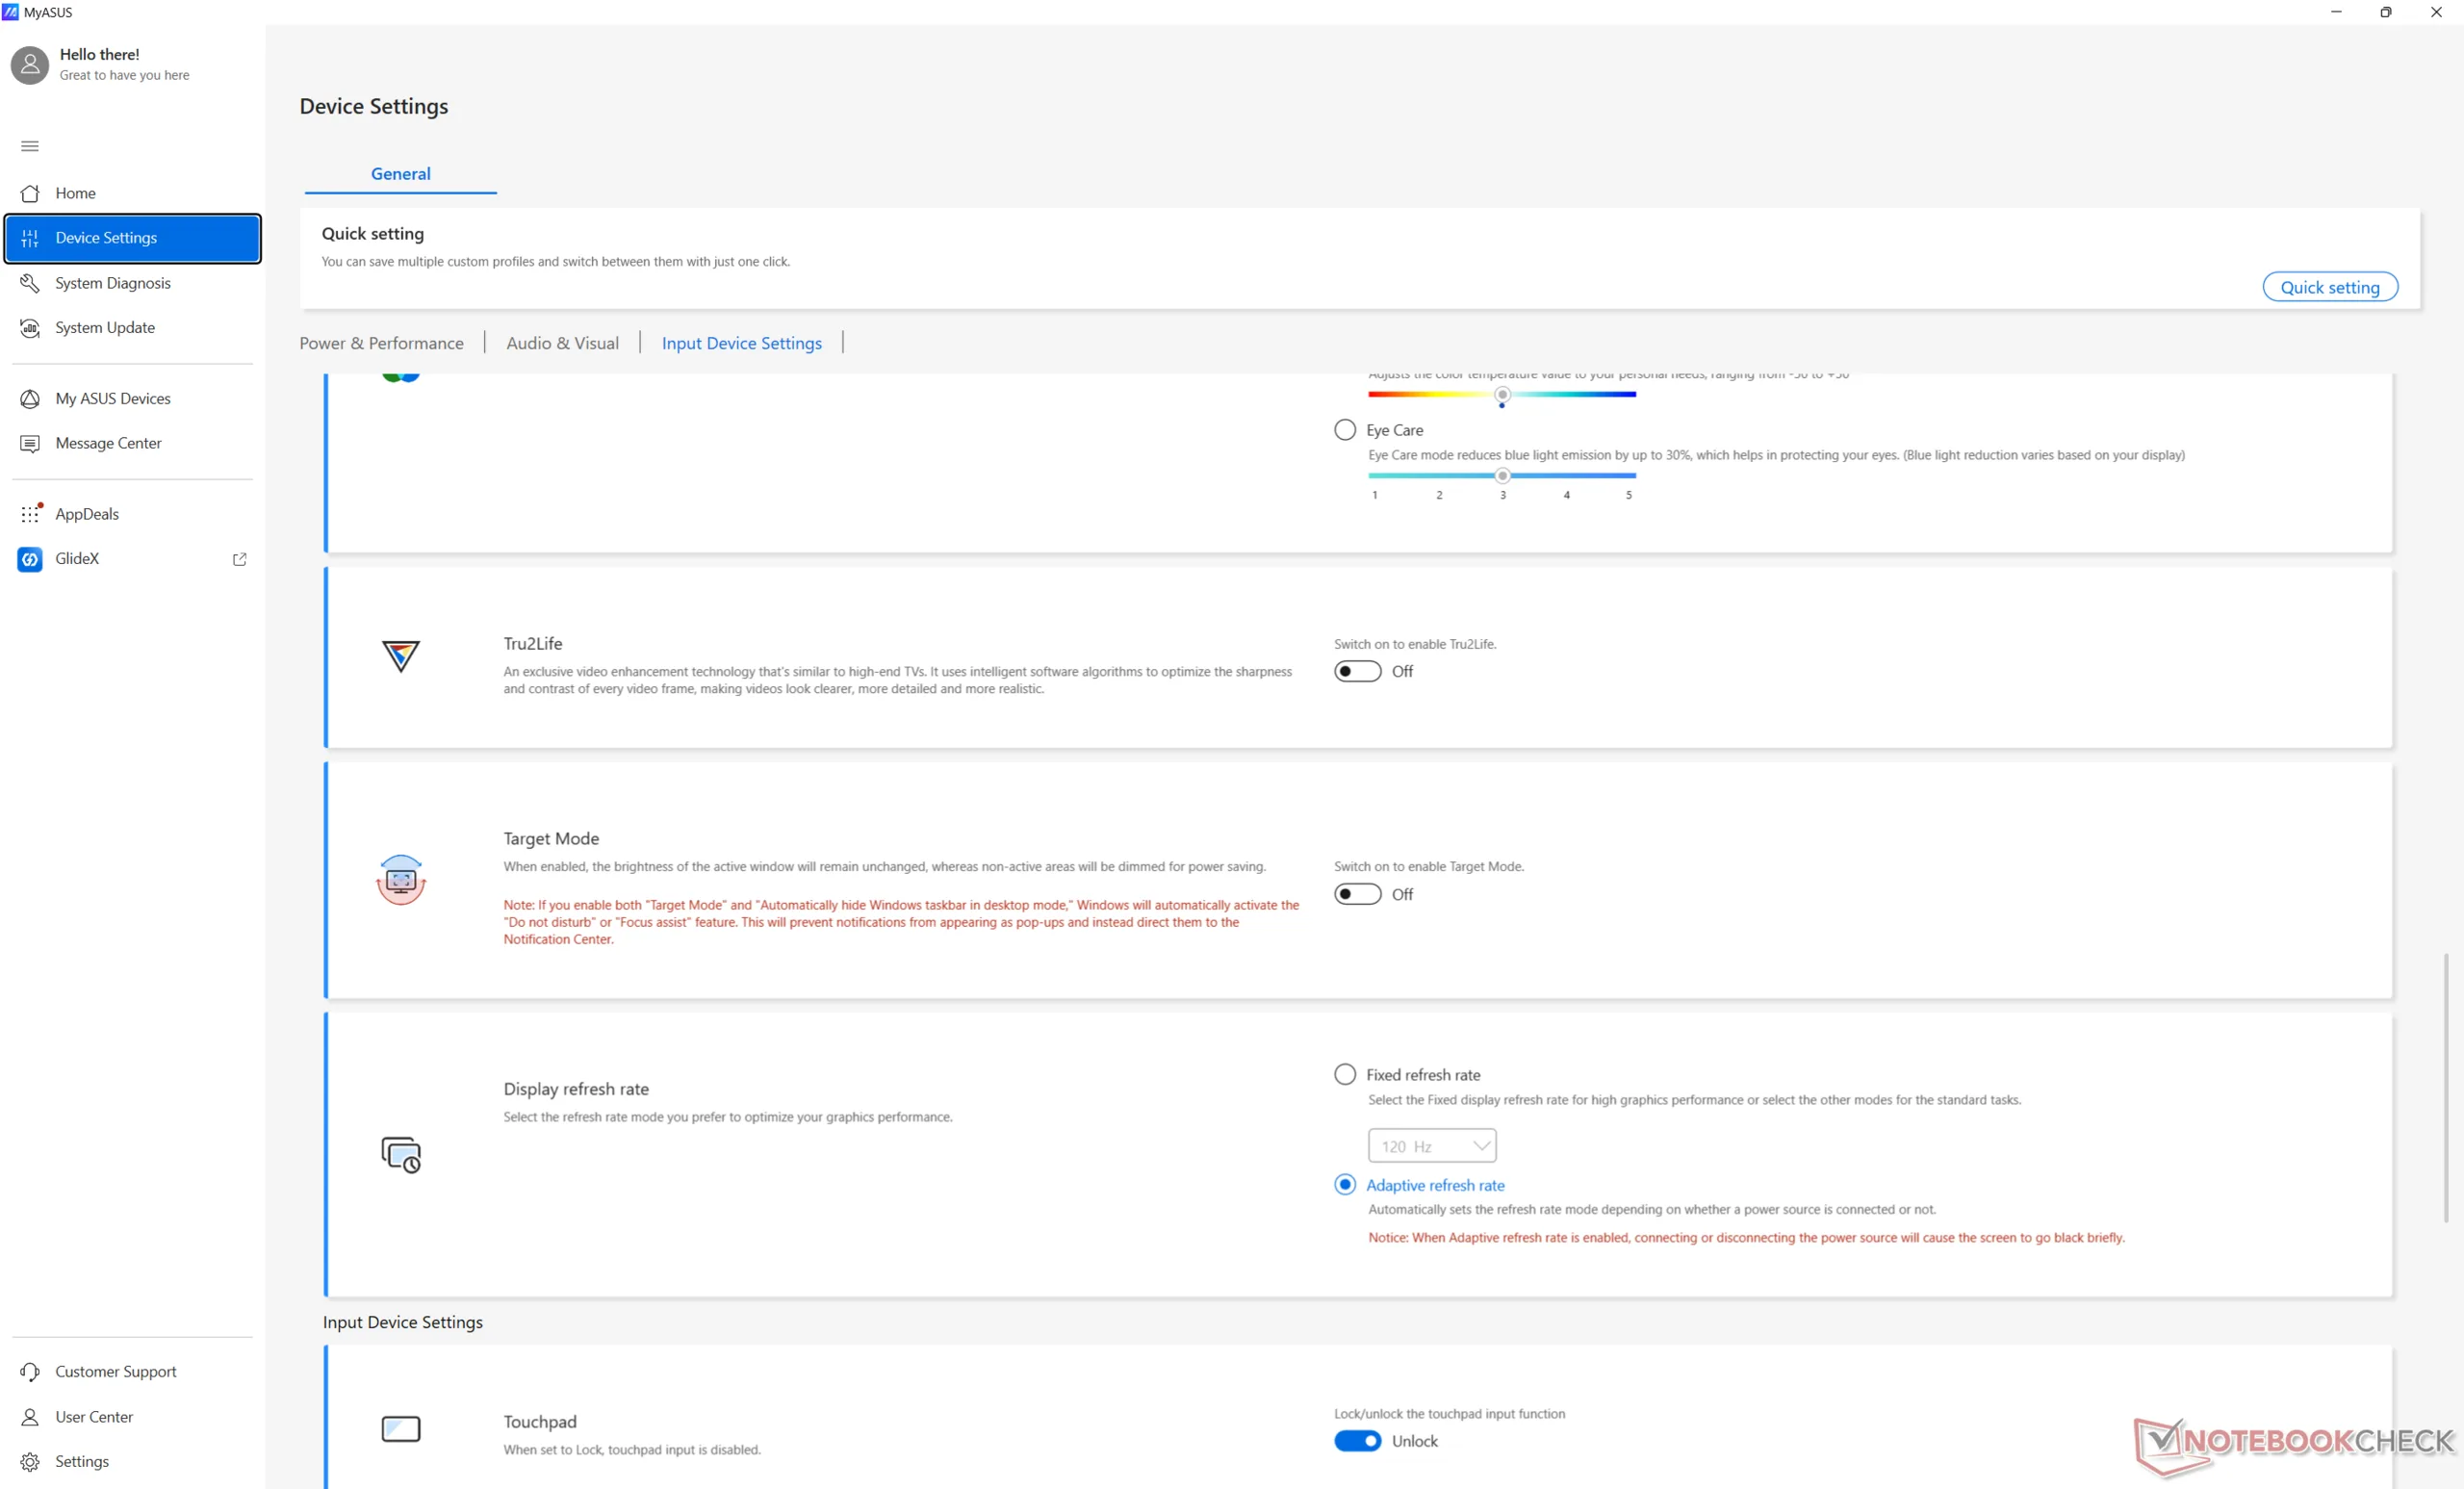
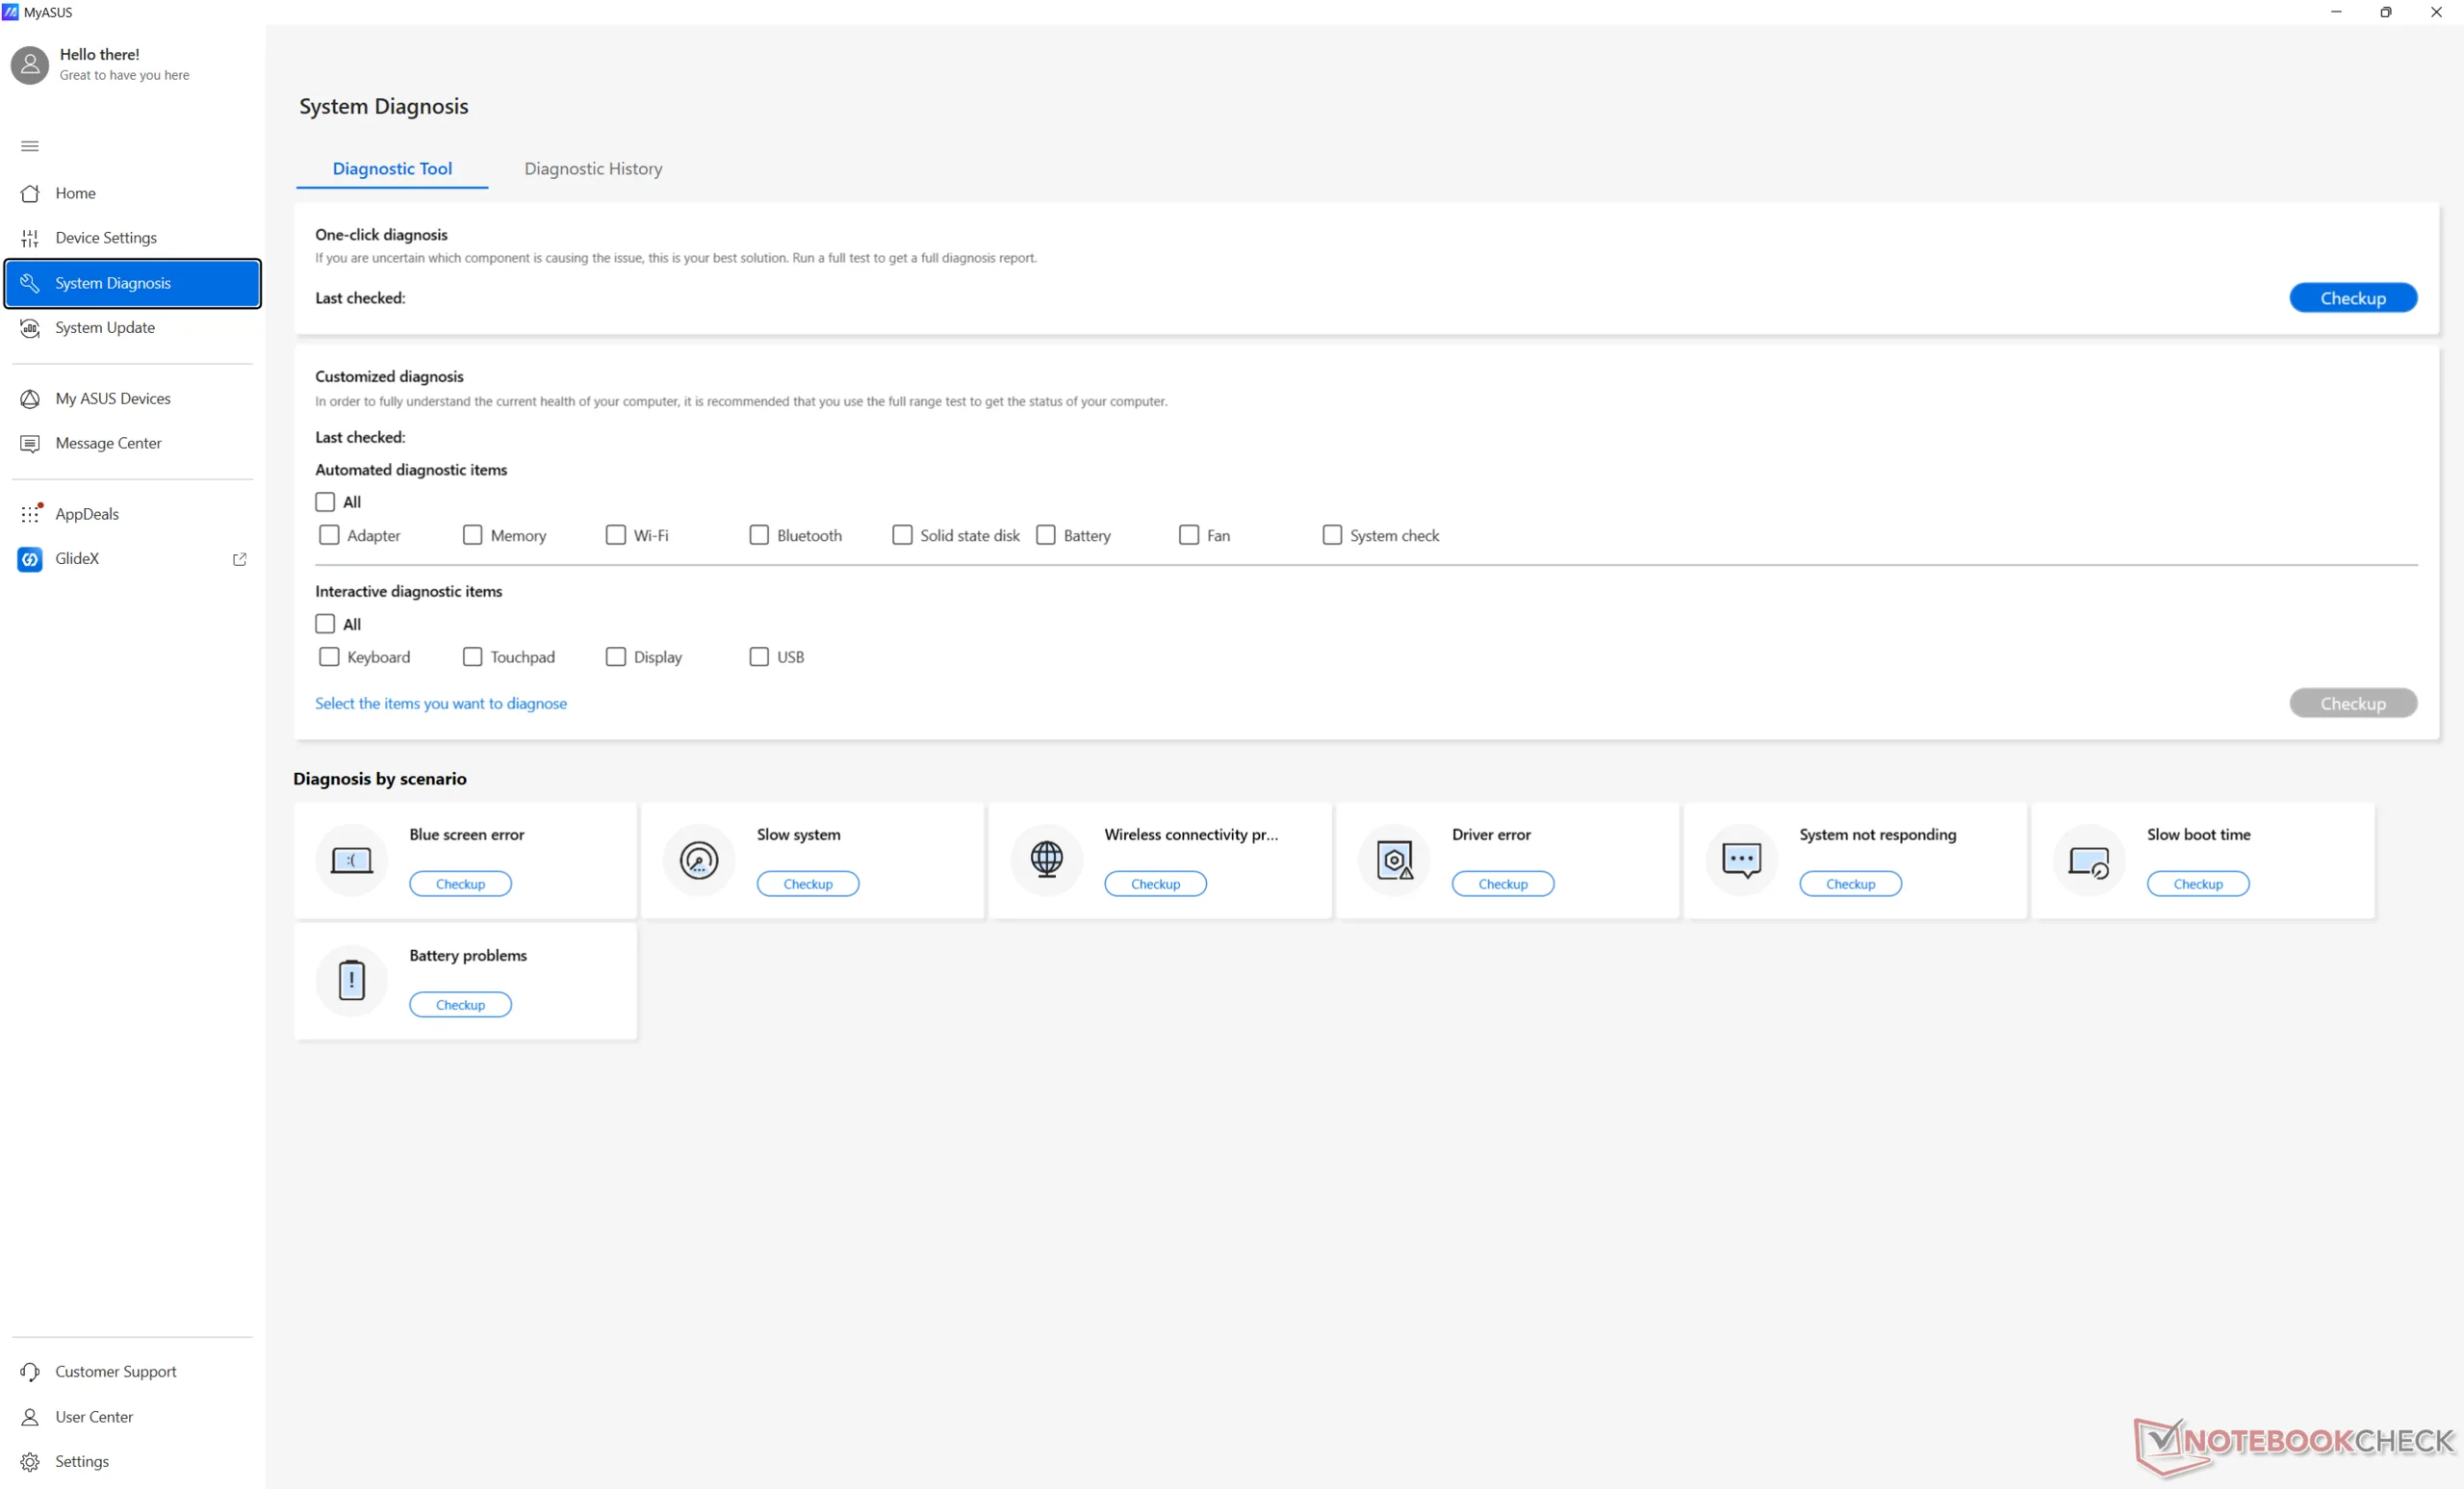
Przed wykonaniem poniższych testów ustawiliśmy system Windows i aplikację MyAsus w tryb wydajności.
Procesor
Surowa wydajność procesora Core Ultra X7 358H jest niemal identyczna z zeszłorocznym Arrow Lake-H Core Ultra 7 265H lub około 10 do 15 procent szybszy niż bardziej popularny Core Ultra 7 255H. Choć może to brzmieć niezbyt imponująco, wzrost wydajności iGPU, wydajności NPU i zużycia energii jest znacznie bardziej znaczący, co pokażą nasze liczby w kolejnych sekcjach.
Wydajność procesora jest stosunkowo stabilna w czasie, z nieco większymi wahaniami niż Core Ultra 7 265H w ThinkPad P14s Gen 6, jak pokazuje poniższy wykres.
Konkurencyjny Ryzen AI 9 HX 370 nadal może być szybszy o około 20 procent, jeśli chodzi o obciążenia wielowątkowe dla użytkowników, którzy chcą zmaksymalizować surową moc obliczeniową.
Cinebench R15 Multi Loop
Cinebench R23: Multi Core | Single Core
Cinebench R20: CPU (Multi Core) | CPU (Single Core)
Cinebench R15: CPU Multi 64Bit | CPU Single 64Bit
Blender: v2.79 BMW27 CPU
7-Zip 18.03: 7z b 4 | 7z b 4 -mmt1
Geekbench 6.7: Multi-Core | Single-Core
Geekbench 5.5: Multi-Core | Single-Core
HWBOT x265 Benchmark v2.2: 4k Preset
LibreOffice : 20 Documents To PDF
R Benchmark 2.5: Overall mean
* ... im mniej tym lepiej
AIDA64: FP32 Ray-Trace | FPU Julia | CPU SHA3 | CPU Queen | FPU SinJulia | FPU Mandel | CPU AES | CPU ZLib | FP64 Ray-Trace | CPU PhotoWorxx
| Performance rating | |
| Asus ExpertBook PM3406 | |
| Lenovo ThinkPad P14s Gen 6 21QT0012GE | |
| Dell Pro 14 Plus PB14255 GH77W | |
| Przeciętny Intel Core Ultra X7 358H | |
| Asus ExpertBook Ultra B9406CAA | |
| Samsung Galaxy Book5 Pro 14 940XHA | |
| HP EliteBook Ultra G1i 14 | |
| AIDA64 / FP32 Ray-Trace | |
| Asus ExpertBook PM3406 | |
| Lenovo ThinkPad P14s Gen 6 21QT0012GE | |
| Dell Pro 14 Plus PB14255 GH77W | |
| Przeciętny Intel Core Ultra X7 358H (12221 - 18710, n=10) | |
| Asus ExpertBook Ultra B9406CAA | |
| Samsung Galaxy Book5 Pro 14 940XHA | |
| HP EliteBook Ultra G1i 14 | |
| AIDA64 / FPU Julia | |
| Lenovo ThinkPad P14s Gen 6 21QT0012GE | |
| Asus ExpertBook PM3406 | |
| Przeciętny Intel Core Ultra X7 358H (29930 - 96559, n=10) | |
| Dell Pro 14 Plus PB14255 GH77W | |
| Samsung Galaxy Book5 Pro 14 940XHA | |
| HP EliteBook Ultra G1i 14 | |
| Asus ExpertBook Ultra B9406CAA | |
| AIDA64 / CPU SHA3 | |
| Lenovo ThinkPad P14s Gen 6 21QT0012GE | |
| Asus ExpertBook Ultra B9406CAA | |
| Przeciętny Intel Core Ultra X7 358H (3910 - 4955, n=10) | |
| Asus ExpertBook PM3406 | |
| Dell Pro 14 Plus PB14255 GH77W | |
| Samsung Galaxy Book5 Pro 14 940XHA | |
| HP EliteBook Ultra G1i 14 | |
| AIDA64 / CPU Queen | |
| Asus ExpertBook PM3406 | |
| Dell Pro 14 Plus PB14255 GH77W | |
| Lenovo ThinkPad P14s Gen 6 21QT0012GE | |
| Przeciętny Intel Core Ultra X7 358H (63425 - 63827, n=2) | |
| Asus ExpertBook Ultra B9406CAA | |
| HP EliteBook Ultra G1i 14 | |
| Samsung Galaxy Book5 Pro 14 940XHA | |
| AIDA64 / FPU SinJulia | |
| Asus ExpertBook PM3406 | |
| Dell Pro 14 Plus PB14255 GH77W | |
| Lenovo ThinkPad P14s Gen 6 21QT0012GE | |
| Przeciętny Intel Core Ultra X7 358H (4735 - 7038, n=10) | |
| Asus ExpertBook Ultra B9406CAA | |
| HP EliteBook Ultra G1i 14 | |
| Samsung Galaxy Book5 Pro 14 940XHA | |
| AIDA64 / FPU Mandel | |
| Lenovo ThinkPad P14s Gen 6 21QT0012GE | |
| Asus ExpertBook PM3406 | |
| Przeciętny Intel Core Ultra X7 358H (14716 - 50766, n=10) | |
| Dell Pro 14 Plus PB14255 GH77W | |
| Samsung Galaxy Book5 Pro 14 940XHA | |
| HP EliteBook Ultra G1i 14 | |
| Asus ExpertBook Ultra B9406CAA | |
| AIDA64 / CPU AES | |
| Asus ExpertBook PM3406 | |
| Lenovo ThinkPad P14s Gen 6 21QT0012GE | |
| Dell Pro 14 Plus PB14255 GH77W | |
| Przeciętny Intel Core Ultra X7 358H (5127 - 68737, n=10) | |
| HP EliteBook Ultra G1i 14 | |
| Samsung Galaxy Book5 Pro 14 940XHA | |
| Asus ExpertBook Ultra B9406CAA | |
| AIDA64 / CPU ZLib | |
| Lenovo ThinkPad P14s Gen 6 21QT0012GE | |
| Asus ExpertBook Ultra B9406CAA | |
| Przeciętny Intel Core Ultra X7 358H (932 - 1179, n=10) | |
| Asus ExpertBook PM3406 | |
| Dell Pro 14 Plus PB14255 GH77W | |
| HP EliteBook Ultra G1i 14 | |
| Samsung Galaxy Book5 Pro 14 940XHA | |
| AIDA64 / FP64 Ray-Trace | |
| Asus ExpertBook PM3406 | |
| Lenovo ThinkPad P14s Gen 6 21QT0012GE | |
| Dell Pro 14 Plus PB14255 GH77W | |
| Przeciętny Intel Core Ultra X7 358H (6506 - 9612, n=10) | |
| Asus ExpertBook Ultra B9406CAA | |
| Samsung Galaxy Book5 Pro 14 940XHA | |
| HP EliteBook Ultra G1i 14 | |
| AIDA64 / CPU PhotoWorxx | |
| Przeciętny Intel Core Ultra X7 358H (30538 - 88533, n=10) | |
| HP EliteBook Ultra G1i 14 | |
| Samsung Galaxy Book5 Pro 14 940XHA | |
| Lenovo ThinkPad P14s Gen 6 21QT0012GE | |
| Dell Pro 14 Plus PB14255 GH77W | |
| Asus ExpertBook Ultra B9406CAA | |
| Asus ExpertBook PM3406 | |
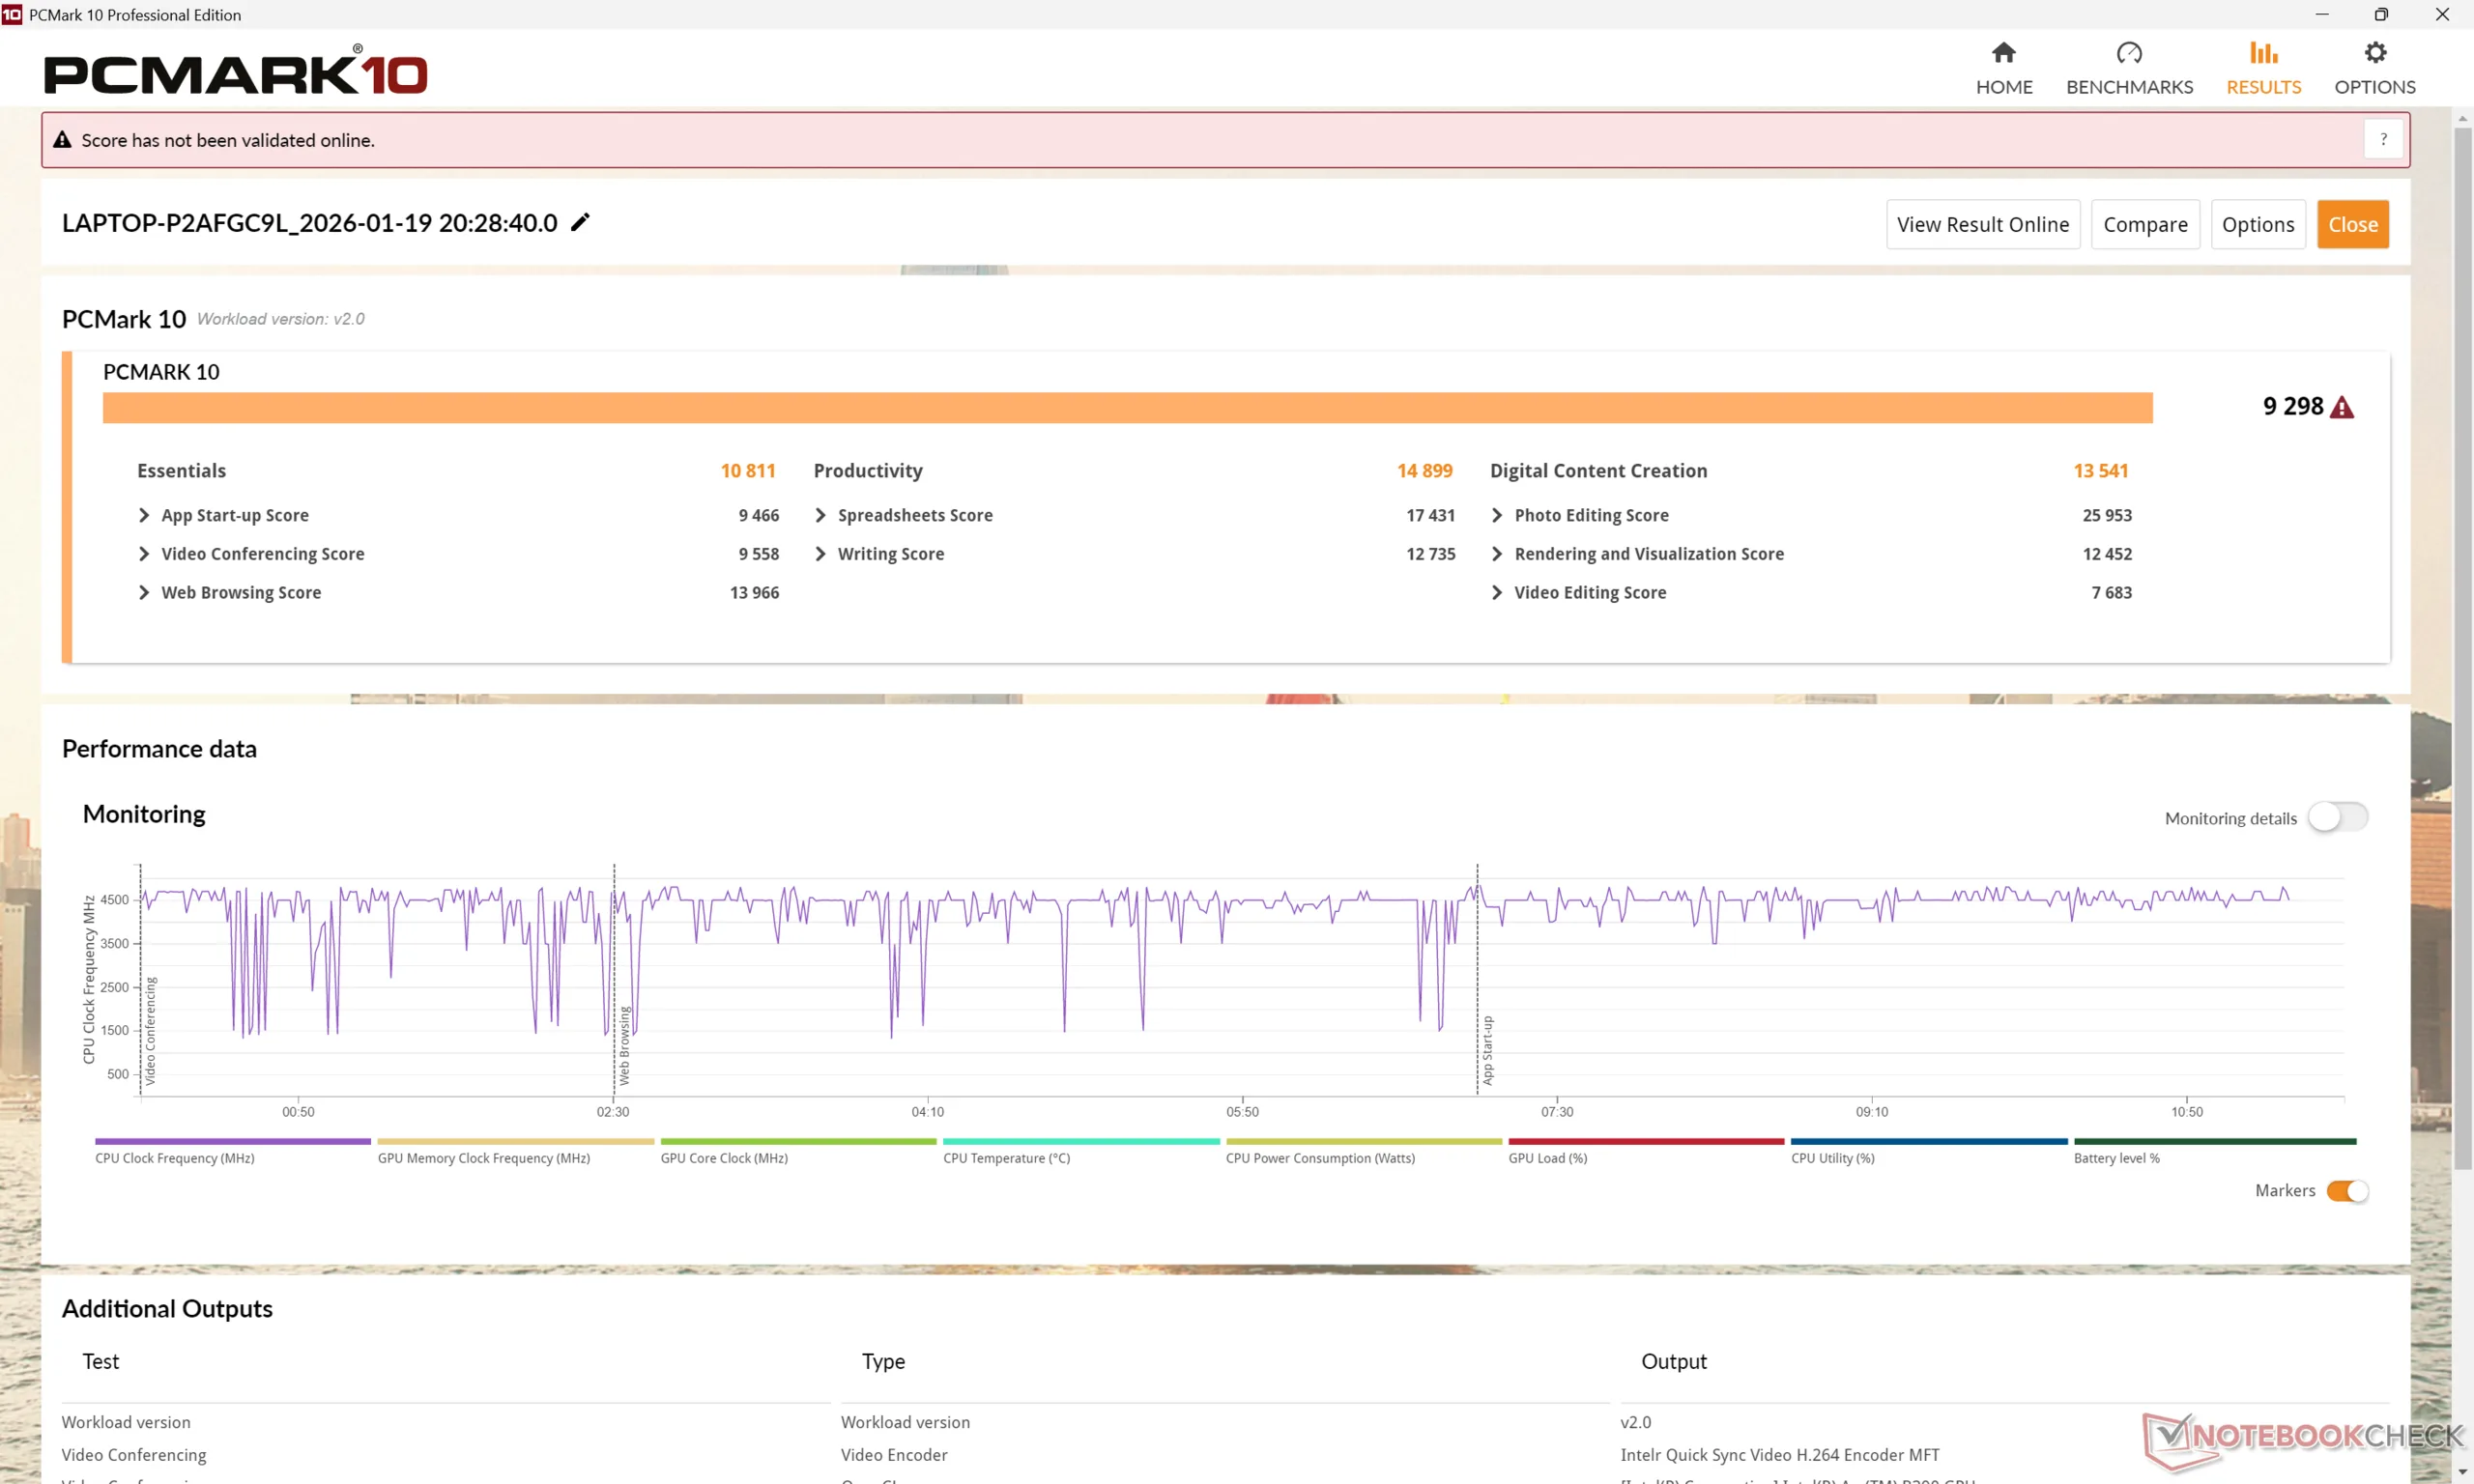
Wydajność systemu
Wyniki PCMark 10 są komfortowo wyższe niż w przypadku większości innych 14-calowych laptopów ze zintegrowanym układem graficznym, zwłaszcza w podteście Digital Content Creation wymagającym użycia GPU.
PCMark 10: Score | Essentials | Productivity | Digital Content Creation
CrossMark: Overall | Productivity | Creativity | Responsiveness
WebXPRT 3: Overall
WebXPRT 4: Overall
Mozilla Kraken 1.1: Total
Geekbench AI: Quantized GPU 1.7 | Half Precision GPU 1.7 | Single Precision GPU 1.7
| PCMark 10 / Score | |
| Asus ExpertBook Ultra B9406CAA | |
| Asus ExpertBook PM3406 | |
| HP EliteBook Ultra G1i 14 | |
| Lenovo ThinkPad P14s Gen 6 21QT0012GE | |
| Dell Pro 14 Plus PB14255 GH77W | |
| Samsung Galaxy Book5 Pro 14 940XHA | |
| CrossMark / Overall | |
| Asus ExpertBook Ultra B9406CAA | |
| Lenovo ThinkPad P14s Gen 6 21QT0012GE | |
| Dell Pro 14 Plus PB14255 GH77W | |
| HP EliteBook Ultra G1i 14 | |
| Samsung Galaxy Book5 Pro 14 940XHA | |
| Asus ExpertBook PM3406 | |
| WebXPRT 3 / Overall | |
| Lenovo ThinkPad P14s Gen 6 21QT0012GE | |
| Dell Pro 14 Plus PB14255 GH77W | |
| Asus ExpertBook Ultra B9406CAA | |
| HP EliteBook Ultra G1i 14 | |
| Samsung Galaxy Book5 Pro 14 940XHA | |
| Asus ExpertBook PM3406 | |
| WebXPRT 4 / Overall | |
| Lenovo ThinkPad P14s Gen 6 21QT0012GE | |
| HP EliteBook Ultra G1i 14 | |
| Asus ExpertBook Ultra B9406CAA | |
| Samsung Galaxy Book5 Pro 14 940XHA | |
| Asus ExpertBook PM3406 | |
| Dell Pro 14 Plus PB14255 GH77W | |
| Geekbench AI / Quantized GPU 1.7 | |
| Asus ExpertBook Ultra B9406CAA | |
| Samsung Galaxy Book5 Pro 14 940XHA | |
| Geekbench AI / Half Precision GPU 1.7 | |
| Asus ExpertBook Ultra B9406CAA | |
| Samsung Galaxy Book5 Pro 14 940XHA | |
| Geekbench AI / Single Precision GPU 1.7 | |
| Asus ExpertBook Ultra B9406CAA | |
| Samsung Galaxy Book5 Pro 14 940XHA | |
* ... im mniej tym lepiej
| PCMark 10 Score | 9298 pkt. | |
Pomoc | ||
| AIDA64 / Memory Copy | |
| Przeciętny Intel Core Ultra X7 358H (102745 - 132135, n=9) | |
| HP EliteBook Ultra G1i 14 | |
| Samsung Galaxy Book5 Pro 14 940XHA | |
| Dell Pro 14 Plus PB14255 GH77W | |
| Lenovo ThinkPad P14s Gen 6 21QT0012GE | |
| Asus ExpertBook PM3406 | |
| AIDA64 / Memory Read | |
| Asus ExpertBook Ultra B9406CAA | |
| Przeciętny Intel Core Ultra X7 358H (97755 - 120727, n=10) | |
| HP EliteBook Ultra G1i 14 | |
| Samsung Galaxy Book5 Pro 14 940XHA | |
| Lenovo ThinkPad P14s Gen 6 21QT0012GE | |
| Dell Pro 14 Plus PB14255 GH77W | |
| Asus ExpertBook PM3406 | |
| AIDA64 / Memory Write | |
| Przeciętny Intel Core Ultra X7 358H (105712 - 134998, n=10) | |
| Asus ExpertBook Ultra B9406CAA | |
| HP EliteBook Ultra G1i 14 | |
| Samsung Galaxy Book5 Pro 14 940XHA | |
| Dell Pro 14 Plus PB14255 GH77W | |
| Lenovo ThinkPad P14s Gen 6 21QT0012GE | |
| Asus ExpertBook PM3406 | |
| AIDA64 / Memory Latency | |
| Lenovo ThinkPad P14s Gen 6 21QT0012GE | |
| Dell Pro 14 Plus PB14255 GH77W | |
| HP EliteBook Ultra G1i 14 | |
| Samsung Galaxy Book5 Pro 14 940XHA | |
| Asus ExpertBook PM3406 | |
| Przeciętny Intel Core Ultra X7 358H (84.1 - 103.3, n=10) | |
* ... im mniej tym lepiej
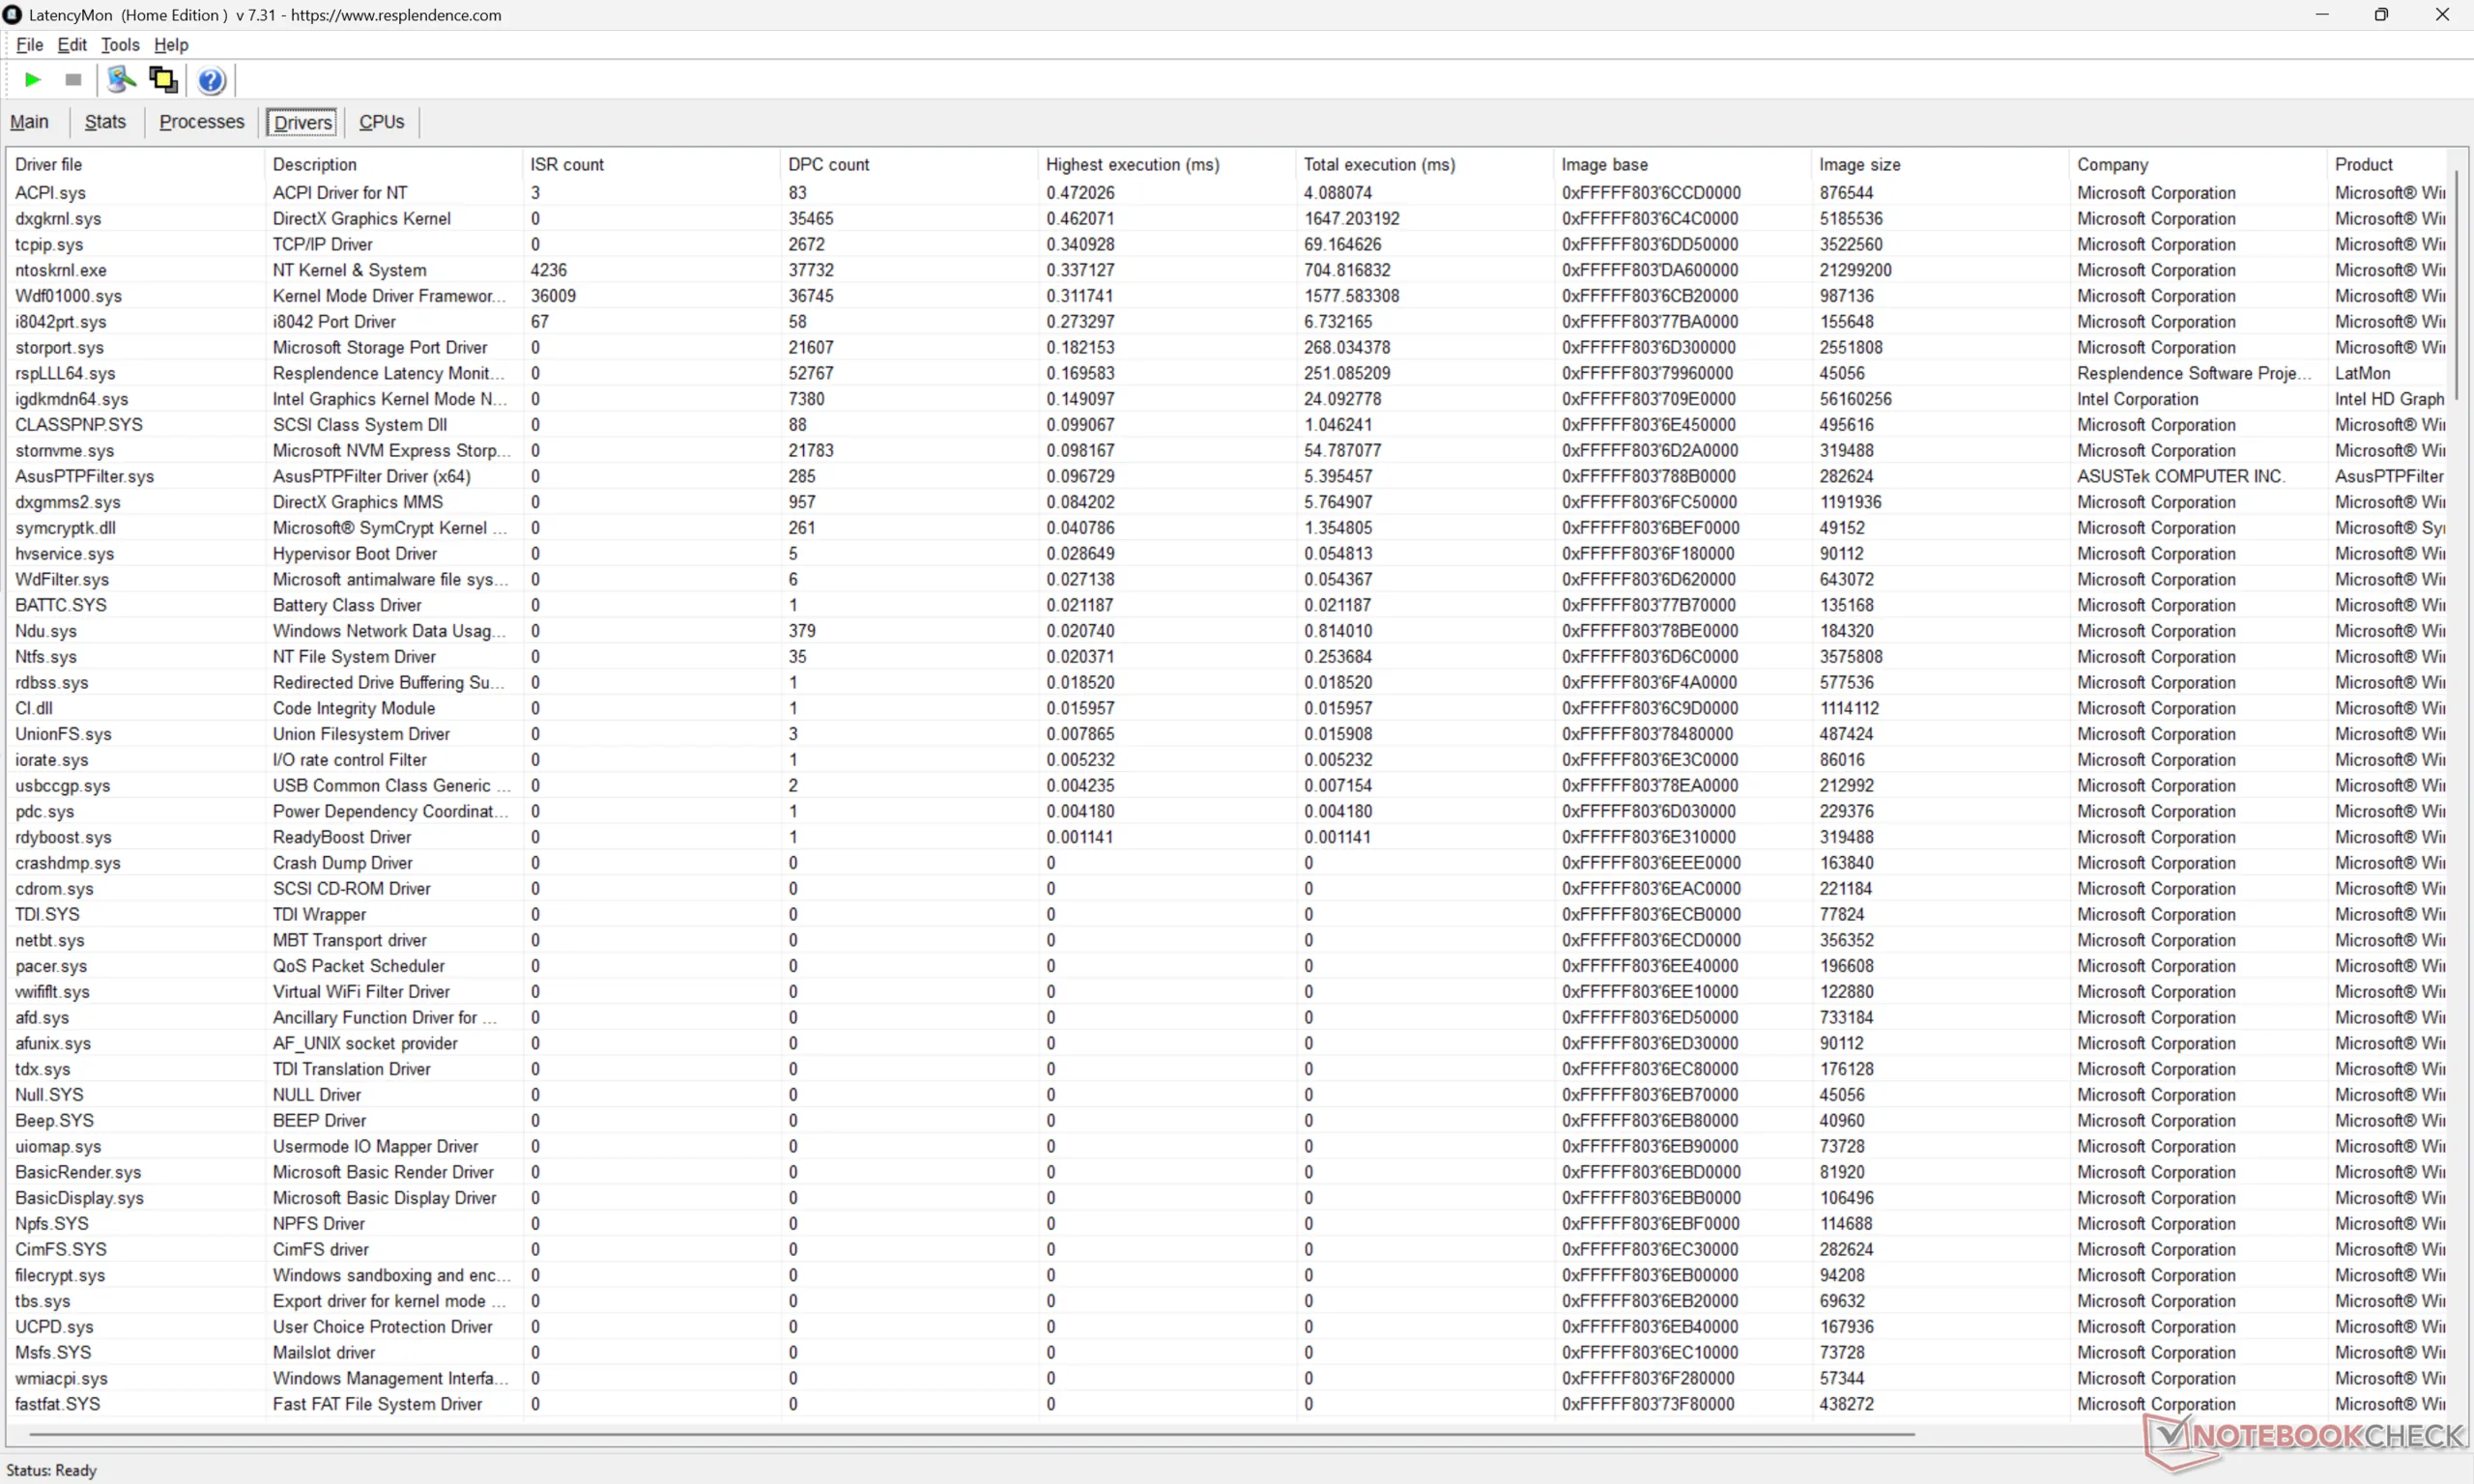
Opóźnienie DPC
LatencyMon nie wykazuje żadnych problemów z DPC ani spadków klatek podczas odtwarzania treści wideo 4K60.
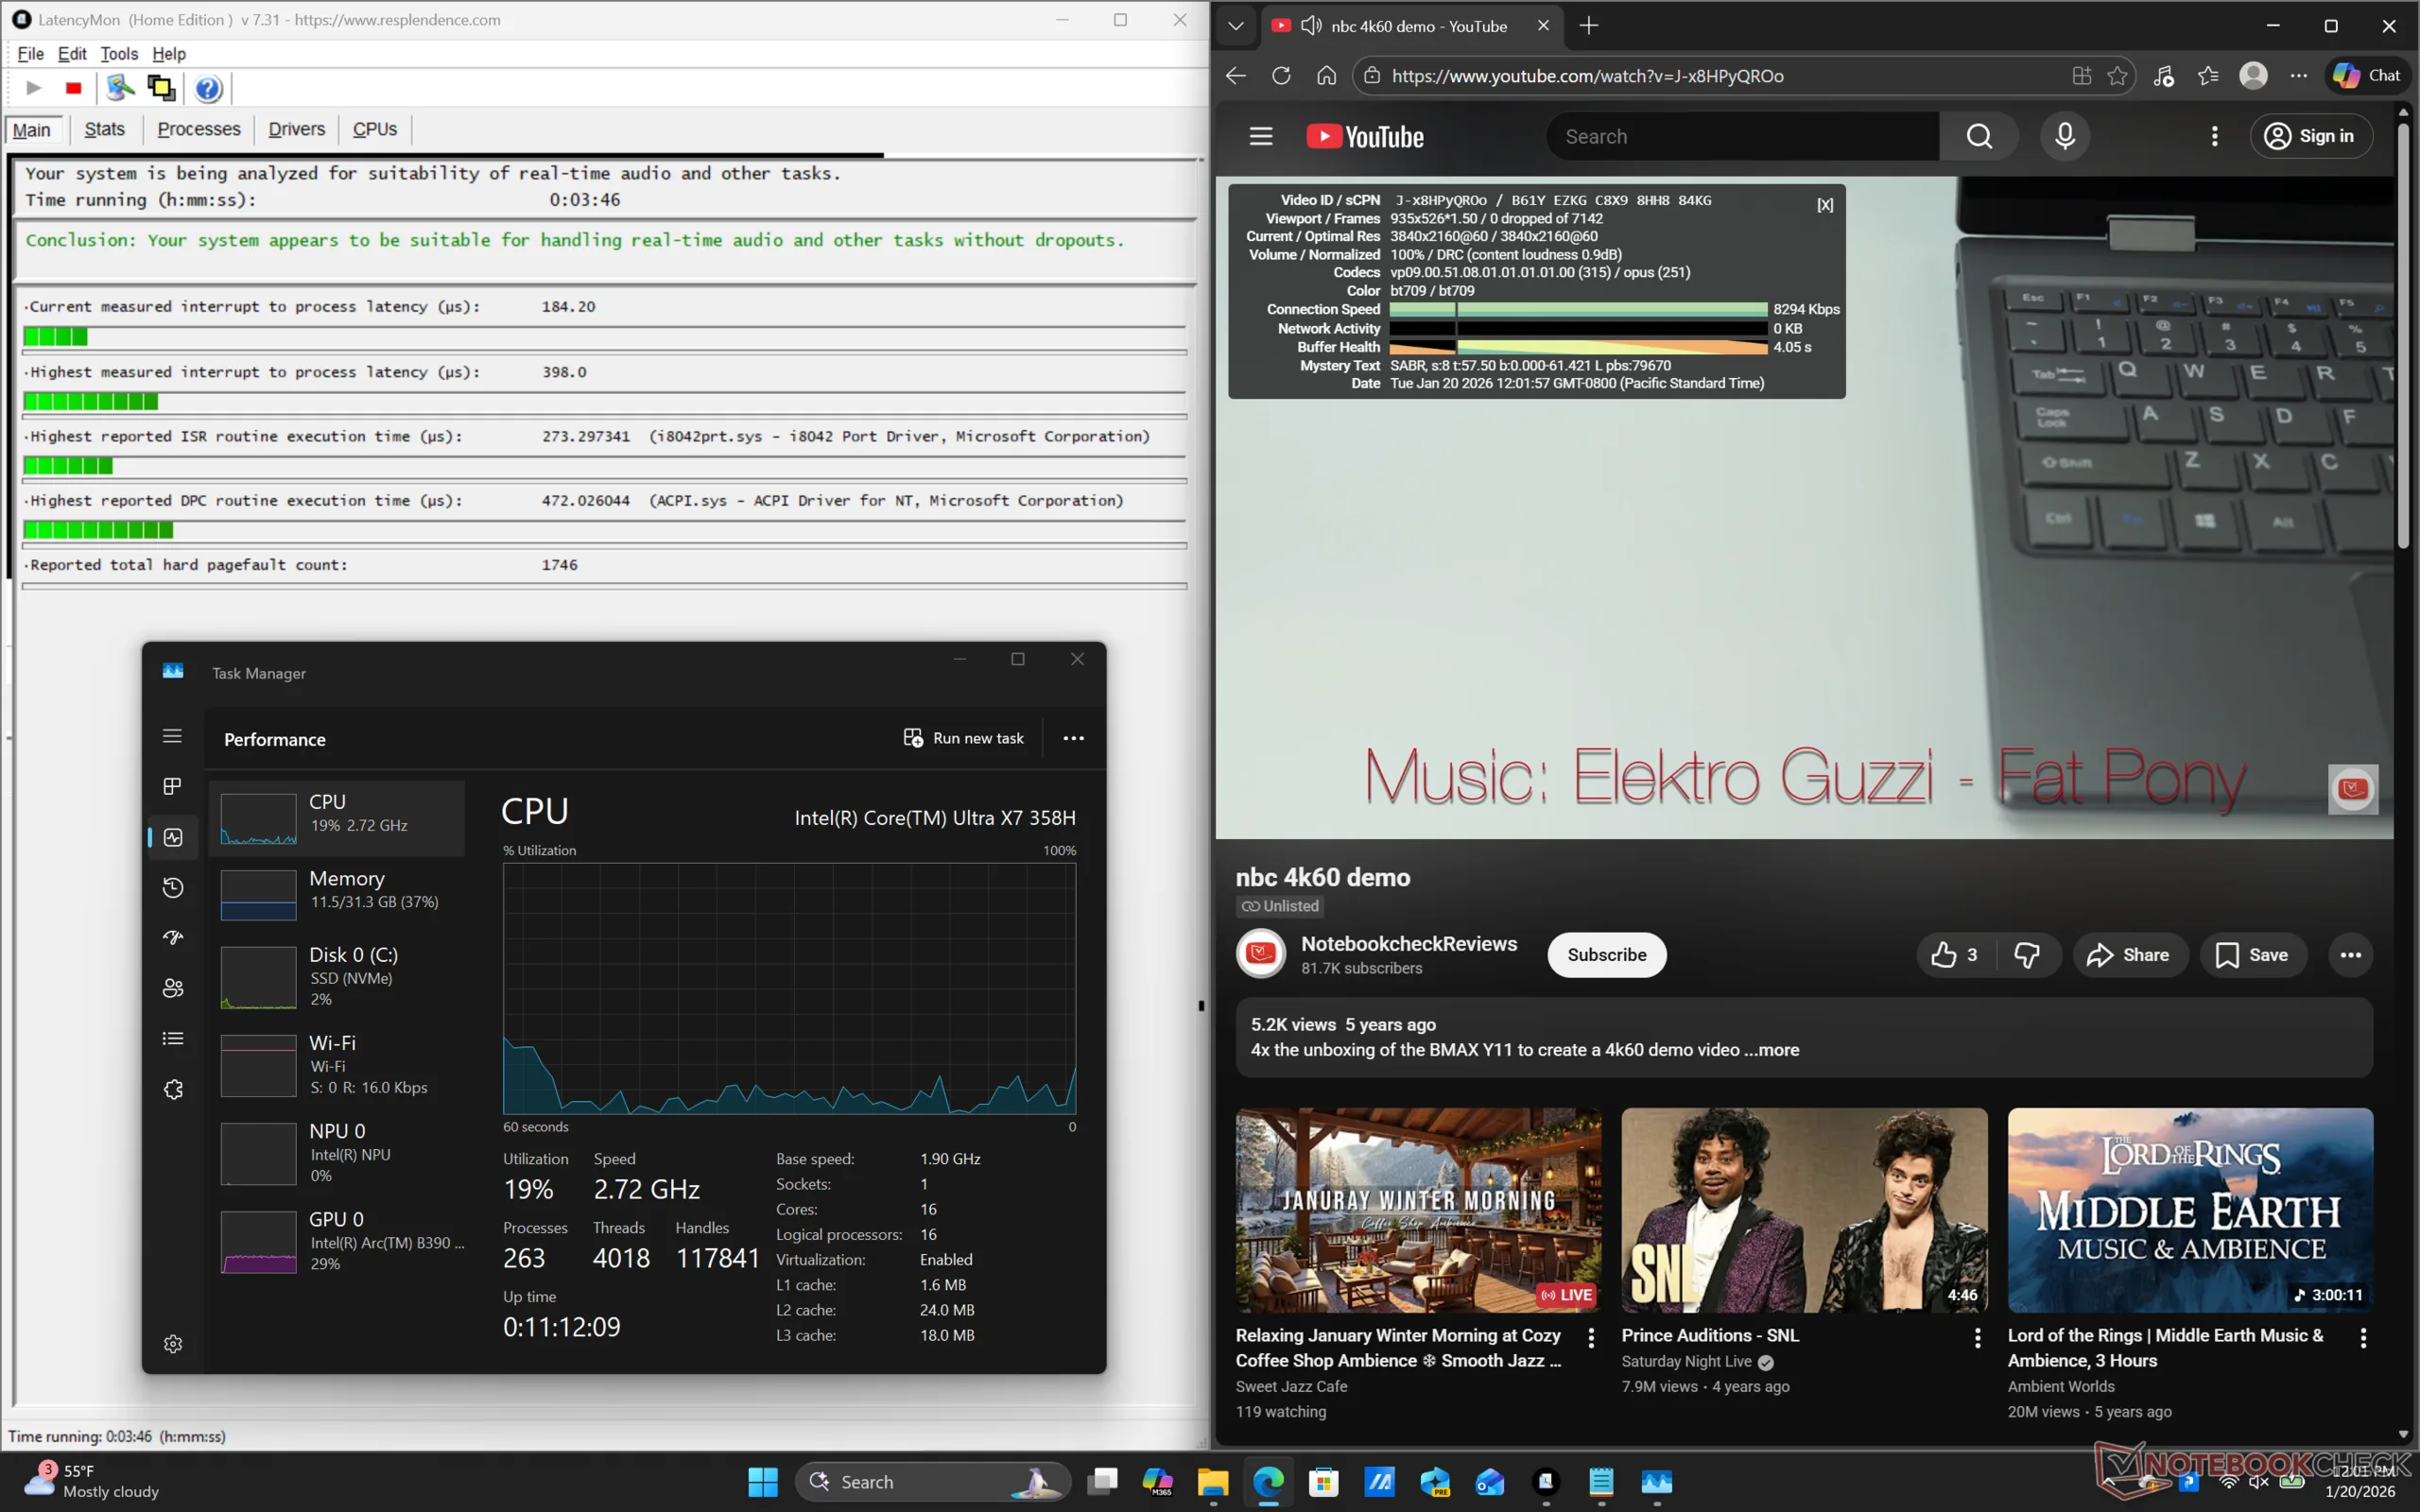
| DPC Latencies / LatencyMon - interrupt to process latency (max), Web, Youtube, Prime95 | |
| Asus ExpertBook PM3406 | |
| Dell Pro 14 Plus PB14255 GH77W | |
| Samsung Galaxy Book5 Pro 14 940XHA | |
| Lenovo ThinkPad P14s Gen 6 21QT0012GE | |
| HP EliteBook Ultra G1i 14 | |
| Asus ExpertBook Ultra B9406CAA | |
* ... im mniej tym lepiej
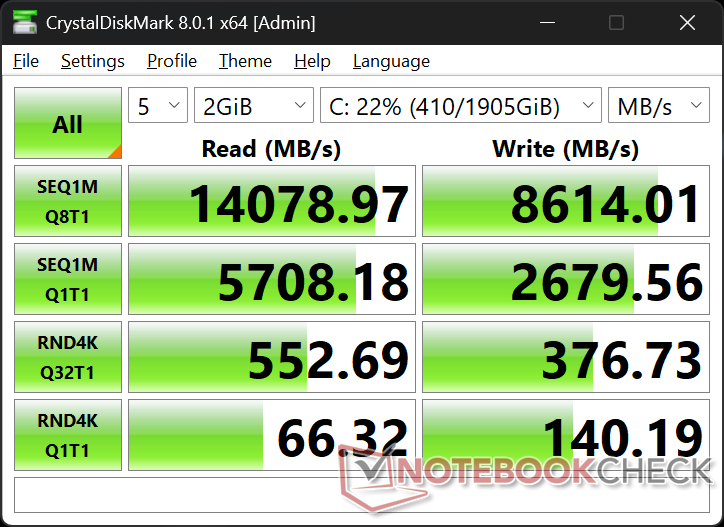
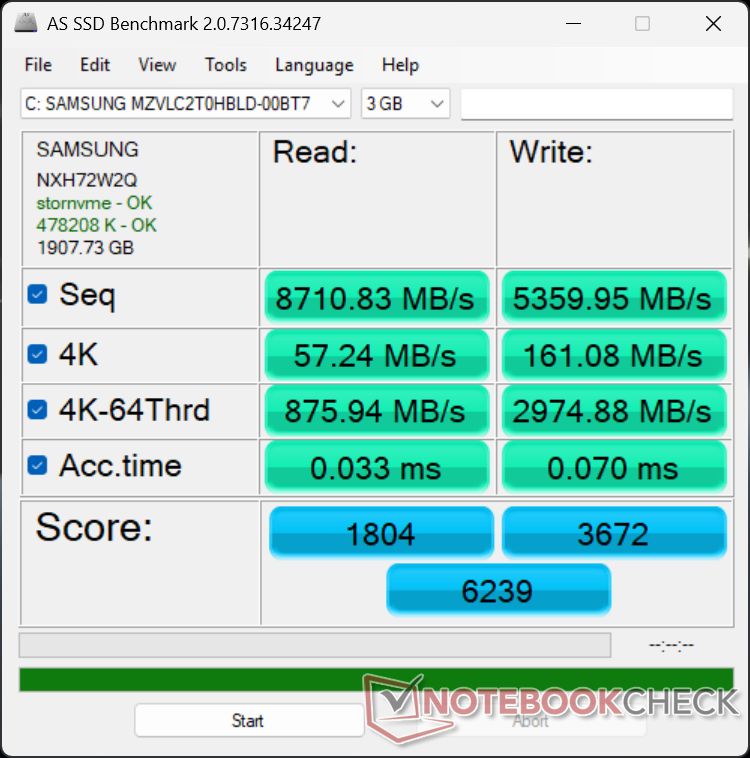
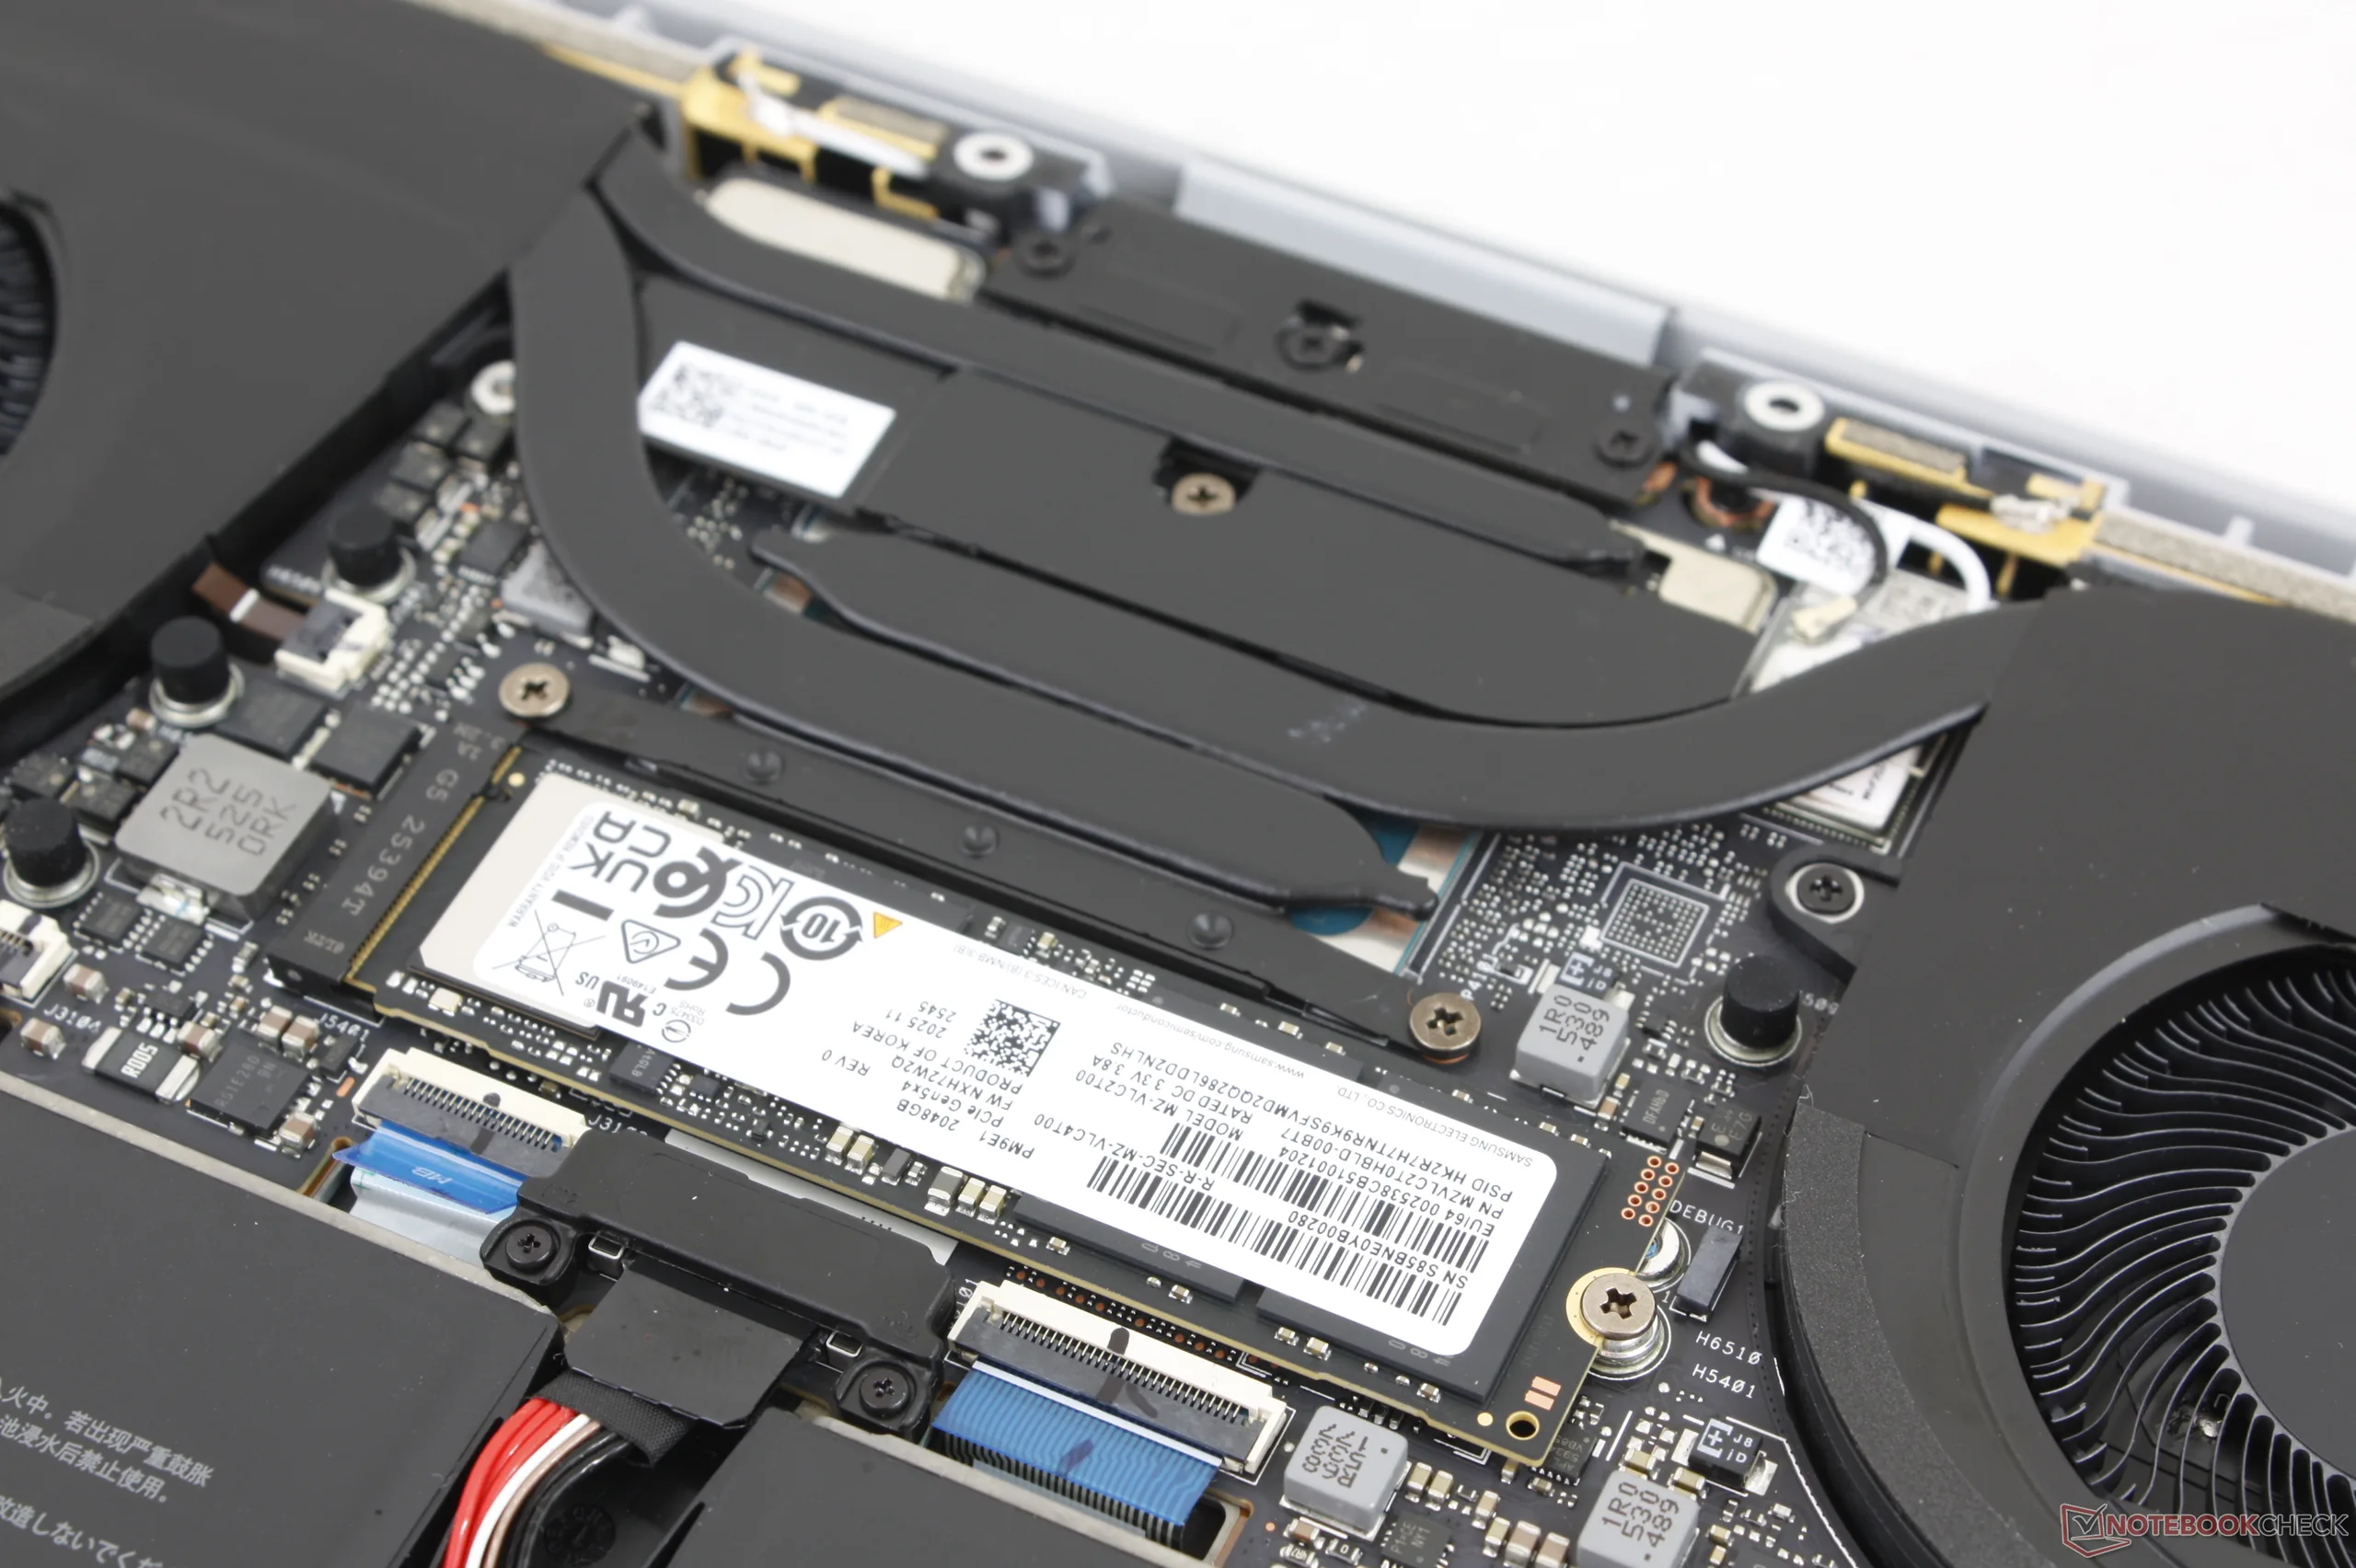
Urządzenia pamięci masowej - PCIe5 NVMe SSD
Nasza jednostka testowa jest dostarczana z dyskiem 2 TB Samsung MZVLC2T0HBLD PCIe5 x4 NVMe SSD dla prędkości transferu do ~14000 MB/s. Jak pokazuje poniższy wykres, prędkość ta jest jednak stabilna tylko przez około minutę, po czym spada do 5000 MB/s. Pomimo tego, ogólna wydajność jest nadal wyższa niż w przypadku większości dysków PCIe4.

* ... im mniej tym lepiej
Dławienie dysku: Pętla odczytu DiskSpd, głębokość kolejki 8
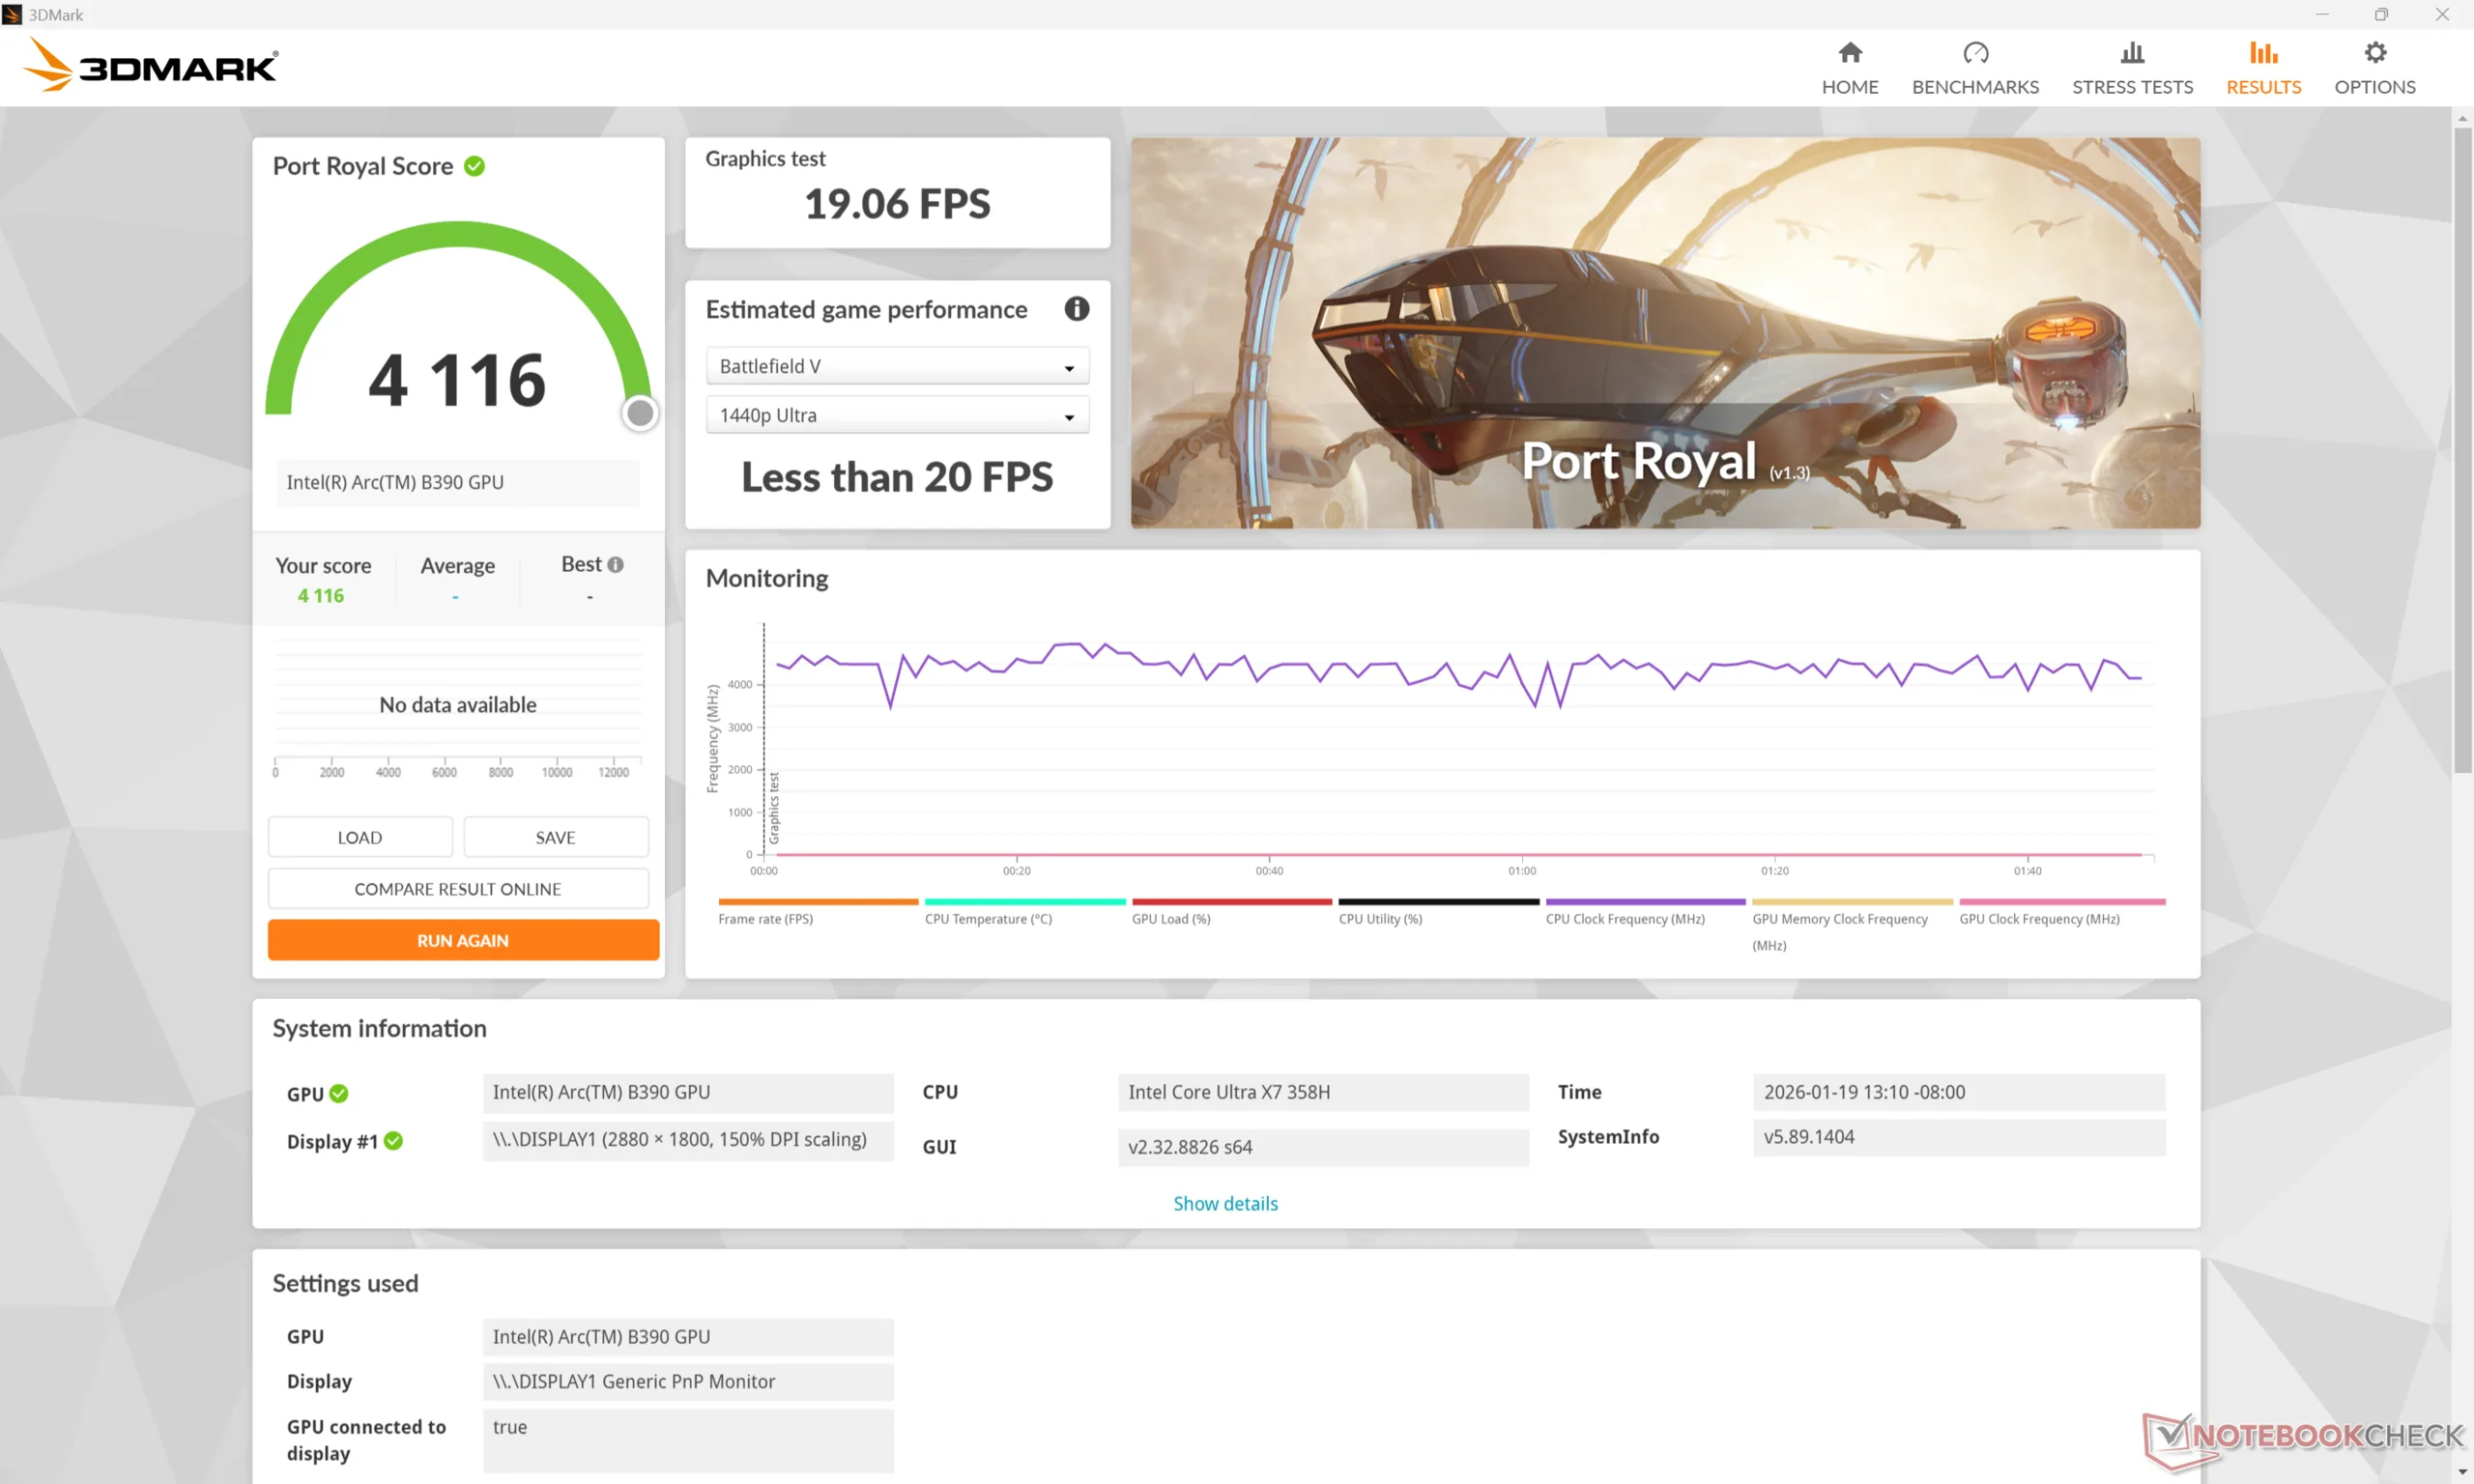
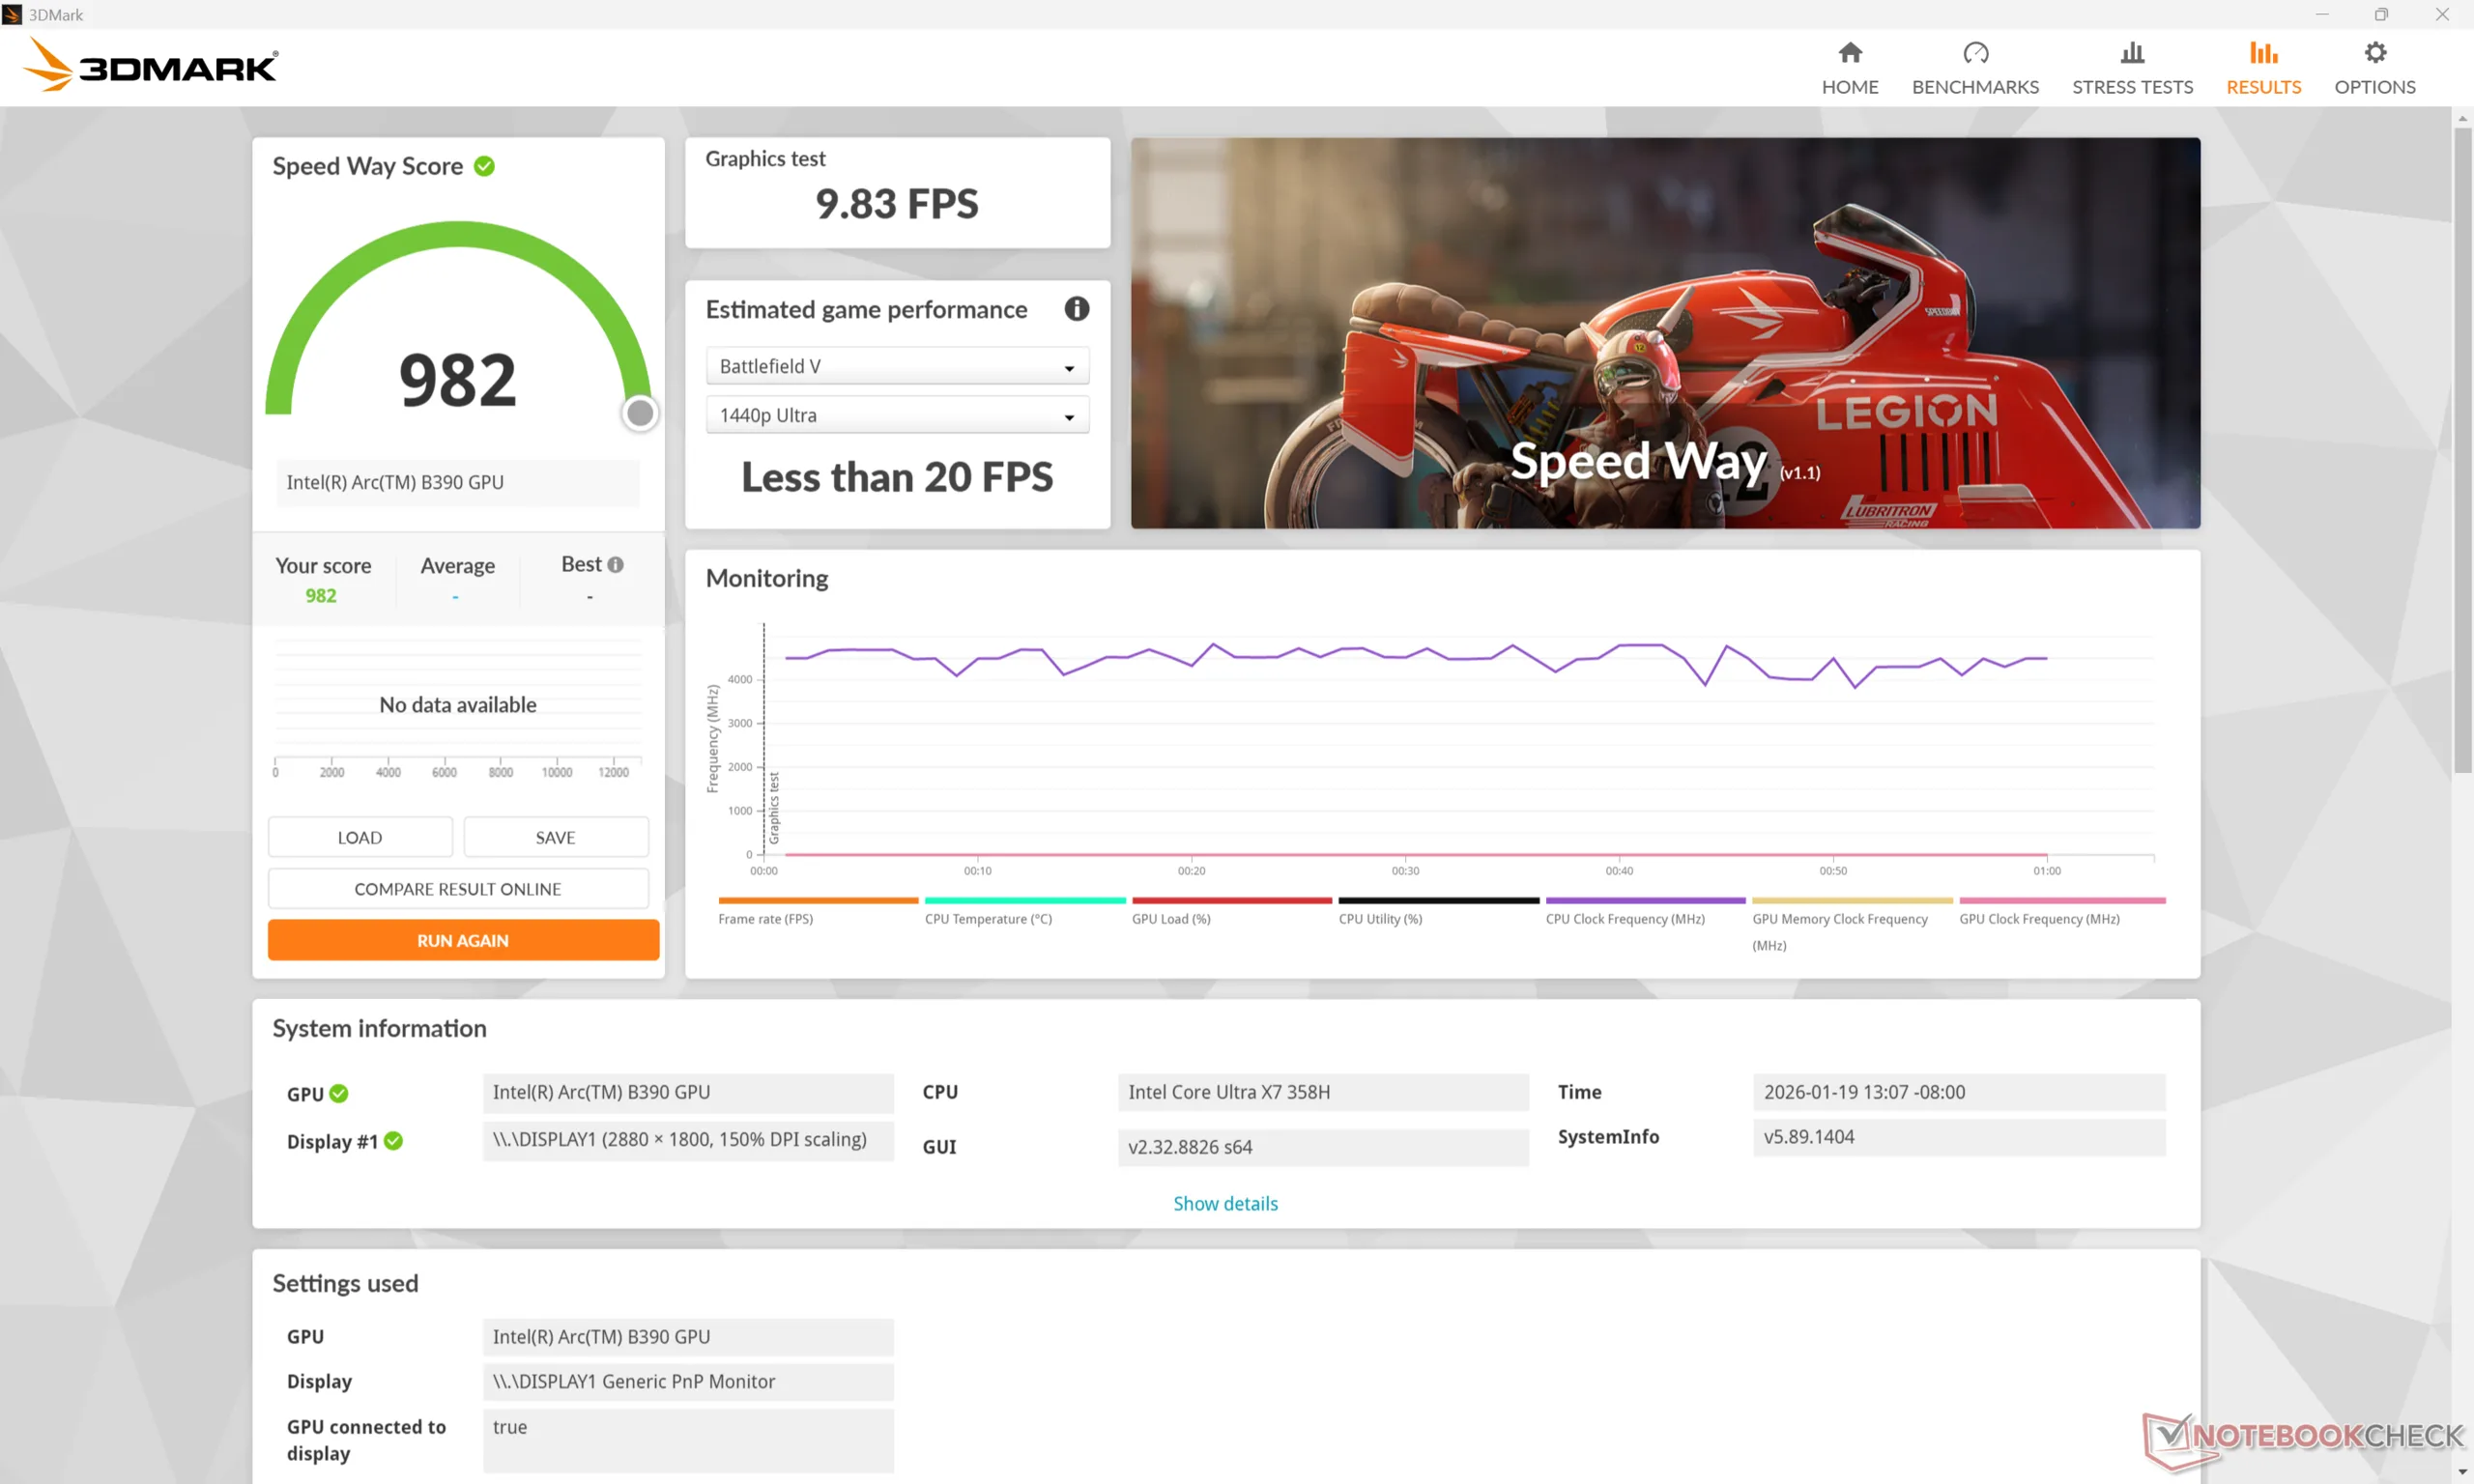
Wydajność GPU - zaskakująco dobra do gier
Zintegrowany Arc B390 jest znaczącym ulepszeniem w stosunku do poprzedniego Arc 140T, Arc 140Vlub konkurencyjnych Radeon 890M nawet o 80 procent według benchmarków 3DMark. Skok jest tak duży, że B390 jest tylko 10 do 15 procent za dyskretnym GeForce RTX 4050 w tych samych syntetycznych testach porównawczych.
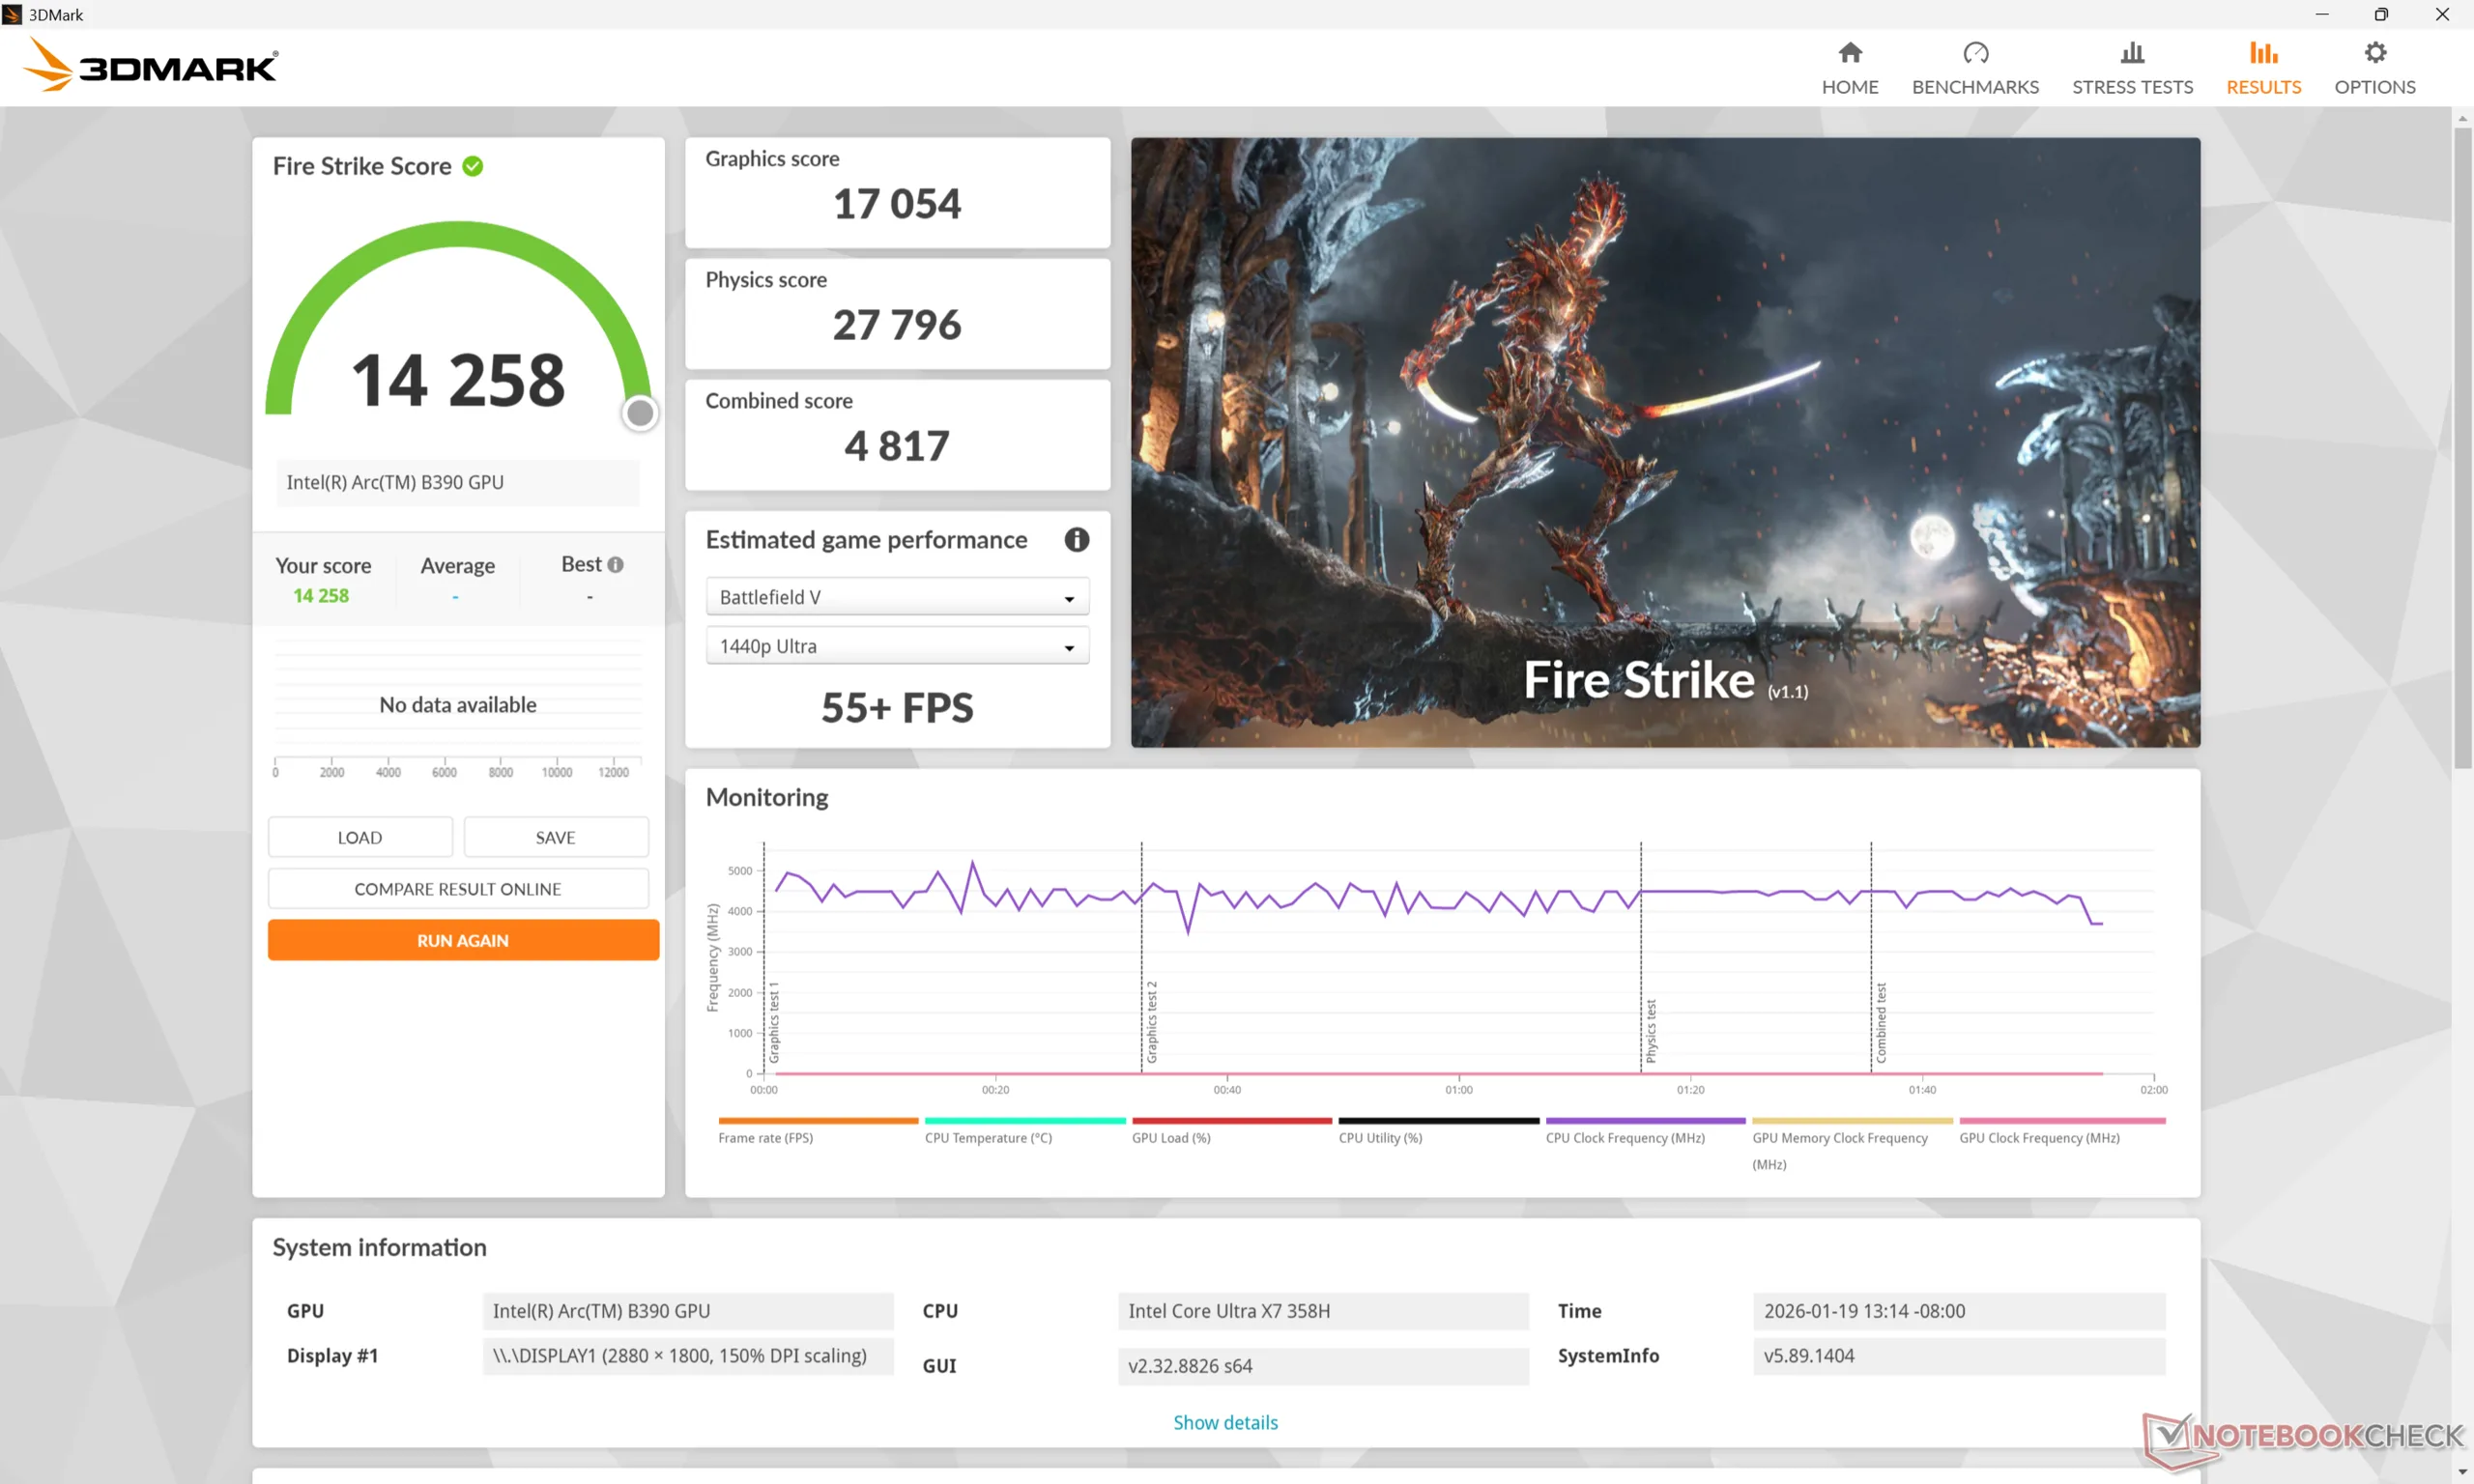
Uruchomienie trybu zrównoważonego zamiast trybu wydajności wpłynie na ogólną wydajność z dość dużym marginesem, jak pokazuje nasza tabela wyników Fire Strike poniżej.
| Profil zasilania | Wynik grafiki | Wynik fizyki | Wynik łączny |
| Tryb wydajności (45 W+) | 17054 | 27796 | 4817 |
| Tryb zrównoważony (25 W+) | 14823 (-13%) | 22613 (-19%) | 3813 (-21%) |
| Zasilanie bateryjne | 14912 (-13%) | 22146 (-20%) | 4236 (-12%) |
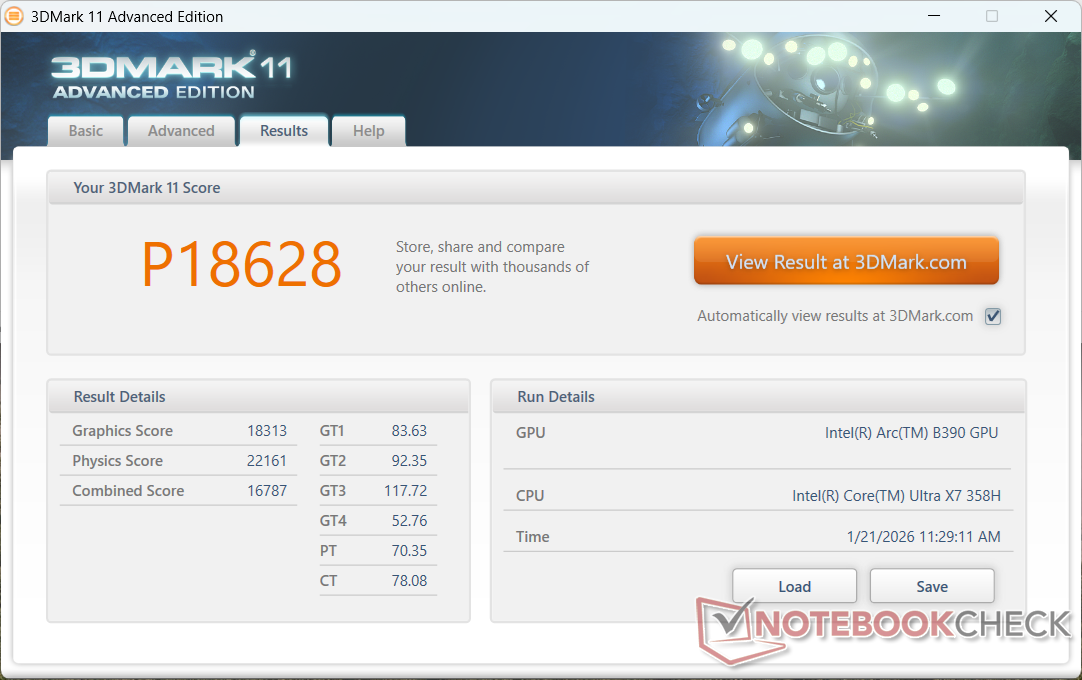
| 3DMark 11 Performance | 18628 pkt. | |
| 3DMark Cloud Gate Standard Score | 44565 pkt. | |
| 3DMark Fire Strike Score | 14258 pkt. | |
| 3DMark Time Spy Score | 7270 pkt. | |
Pomoc | ||
* ... im mniej tym lepiej
Wydajność w grach
Choć nie jest to maszyna do gier, B890 jest wystarczająco wydajny, aby uruchomić nawet wymagające tytuły, takie jak Cyberpunk 2077 na średnich ustawieniach 1080p przy średnio 63 FPS przed zastosowaniem jakiegokolwiek skalowania AI lub funkcji generowania klatek. Black Myth Wukong może również działać przy średnich ustawieniach 1080p z rozsądną średnią 35 FPS.
| GTA V - 1920x1080 Highest AA:4xMSAA + FX AF:16x | |
| Lenovo Yoga Pro 7 14IMH9, RTX 4050 | |
| Lenovo ThinkPad P14s Gen 6 21QT0012GE | |
| Asus ExpertBook Ultra B9406CAA | |
| HP EliteBook Ultra G1i 14 | |
| Samsung Galaxy Book5 Pro 14 940XHA | |
| Asus ExpertBook PM3406 | |
| Strange Brigade - 1920x1080 ultra AA:ultra AF:16 | |
| Lenovo Yoga Pro 7 14IMH9, RTX 4050 | |
| Asus ExpertBook Ultra B9406CAA | |
| HP EliteBook Ultra G1i 14 | |
| Samsung Galaxy Book5 Pro 14 940XHA | |
| Asus ExpertBook PM3406 | |
| Black Myth: Wukong | |
| 1280x720 low TSR 100 | |
| HP ZBook Ultra G1a 14 | |
| Przeciętny Intel Arc B390 12 Xe3 Panther Lake iGPU (51 - 71, n=3) | |
| Asus ExpertBook Ultra B9406CAA | |
| 1920x1080 low TSR 100 | |
| HP ZBook Ultra G1a 14 | |
| Asus ExpertBook Ultra B9406CAA | |
| Przeciętny Intel Arc B390 12 Xe3 Panther Lake iGPU (43 - 47, n=3) | |
| 1920x1080 medium TSR 100 | |
| HP ZBook Ultra G1a 14 | |
| Przeciętny Intel Arc B390 12 Xe3 Panther Lake iGPU (34 - 37, n=3) | |
| Asus ExpertBook Ultra B9406CAA | |
| 1920x1080 high TSR 100 | |
| HP ZBook Ultra G1a 14 | |
| Asus ExpertBook Ultra B9406CAA | |
| Przeciętny Intel Arc B390 12 Xe3 Panther Lake iGPU (26 - 29, n=3) | |
| 1920x1080 cinematic TSR 100 | |
| HP ZBook Ultra G1a 14 | |
| Asus ExpertBook Ultra B9406CAA | |
| Przeciętny Intel Arc B390 12 Xe3 Panther Lake iGPU (14 - 16, n=3) | |
| 2560x1440 cinematic TSR 100 | |
| HP ZBook Ultra G1a 14 | |
| Asus ExpertBook Ultra B9406CAA | |
| Przeciętny Intel Arc B390 12 Xe3 Panther Lake iGPU (11 - 11, n=2) | |
| ARC Raiders | |
| 1920x1080 Low Preset | |
| Asus ExpertBook Ultra B9406CAA | |
| HP ZBook Ultra G1a 14 | |
| Przeciętny Intel Arc B390 12 Xe3 Panther Lake iGPU (104.3 - 176.7, n=3) | |
| 1920x1080 Medium Preset AA:TSR | |
| HP ZBook Ultra G1a 14 | |
| Asus ExpertBook Ultra B9406CAA | |
| Przeciętny Intel Arc B390 12 Xe3 Panther Lake iGPU (57 - 58.1, n=3) | |
| 1920x1080 High Preset AA:TSR | |
| HP ZBook Ultra G1a 14 | |
| Przeciętny Intel Arc B390 12 Xe3 Panther Lake iGPU (42.4 - 43.8, n=3) | |
| Asus ExpertBook Ultra B9406CAA | |
| 1920x1080 Epic Preset + Epic Raytracing AA:TSR | |
| HP ZBook Ultra G1a 14 | |
| Asus ExpertBook Ultra B9406CAA | |
| Przeciętny Intel Arc B390 12 Xe3 Panther Lake iGPU (28 - 30.4, n=3) | |
| 2560x1440 Epic Preset + Epic Raytracing AA:TSR | |
| HP ZBook Ultra G1a 14 | |
| Asus ExpertBook Ultra B9406CAA | |
| Przeciętny Intel Arc B390 12 Xe3 Panther Lake iGPU (19.2 - 20.9, n=3) | |
Cyberpunk 2077 ultra FPS Chart
| low | med. | high | ultra | QHD | |
|---|---|---|---|---|---|
| GTA V (2015) | 179.4 | 173 | 111.9 | 45.3 | 31.5 |
| Dota 2 Reborn (2015) | 119.8 | 92.6 | 103.5 | 102.5 | |
| Final Fantasy XV Benchmark (2018) | 134.5 | 76.1 | 55.4 | 41 | |
| X-Plane 11.11 (2018) | 58.5 | 45.5 | 39.7 | ||
| Strange Brigade (2018) | 388 | 132.7 | 107.6 | 99.5 | 72.3 |
| Baldur's Gate 3 (2023) | 71.4 | 60.8 | 54.3 | 53.4 | 37.8 |
| Cyberpunk 2077 (2023) | 77.7 | 63.1 | 53.8 | 47.2 | 28.3 |
| F1 24 (2024) | 146.3 | 135 | 104.3 | 38 | 25.2 |
| Black Myth: Wukong (2024) | 45 | 35 | 28 | 15 | 11 |
| ARC Raiders (2025) | 176.7 | 57.5 | 42.5 | 29.4 | 20.1 |
Emisje
Hałas systemowy
Hałas wentylatora podczas pracy przy niskim lub średnim obciążeniu zachowuje się bardziej jak laptop z serii U, mimo że ExpertBook Ultra działa na procesorze z serii H. W przypadku bardziej wymagających obciążeń, takich jak gry, hałas wentylatora osiągnie jednak szczyt w połowie zakresu 40 dB(A), co jest bardziej typowe dla systemów z serii H.
Proszę zauważyć, że hałas wentylatora podczas grania w trybie zrównoważonym ustabilizowałby się na poziomie 31,8 dB(A) w porównaniu do 42,8 dB(A) w trybie wydajności. Niższy hałas pociąga za sobą spadek wydajności, jak wspomniano powyżej.
Hałas
| luz |
| 23.4 / 23.4 / 23.4 dB |
| obciążenie |
| 28.6 / 45.2 dB |
 | ||
30 dB cichy 40 dB(A) słyszalny 50 dB(A) irytujący |
||
min: | ||
| Asus ExpertBook Ultra B9406CAA Ultra X7 358H, Arc B390 Panther Lake iGPU | Dell Pro 14 Plus PB14255 GH77W Ryzen AI 7 PRO 350, Radeon 860M | Asus ExpertBook PM3406 Ryzen AI 7 350, Radeon 860M | Lenovo ThinkPad P14s Gen 6 21QT0012GE Ultra 7 265H, RTX PRO 500 Blackwell Generation Laptop | Samsung Galaxy Book5 Pro 14 940XHA Core Ultra 5 226V, Arc 130V | HP EliteBook Ultra G1i 14 Core Ultra 7 258V, Arc 140V | |
|---|---|---|---|---|---|---|
| Noise | -2% | -5% | -15% | 1% | 7% | |
| wyłączone / środowisko * (dB) | 22.9 | 24.9 -9% | 25.7 -12% | 25.1 -10% | 25.1 -10% | 23.9 -4% |
| Idle Minimum * (dB) | 23.4 | 24.9 -6% | 25.7 -10% | 25.1 -7% | 25.1 -7% | 23.9 -2% |
| Idle Average * (dB) | 23.4 | 24.9 -6% | 25.7 -10% | 25.1 -7% | 25.1 -7% | 23.9 -2% |
| Idle Maximum * (dB) | 23.4 | 27.6 -18% | 25.7 -10% | 29.4 -26% | 25.1 -7% | 23.9 -2% |
| Load Average * (dB) | 28.6 | 29.3 -2% | 33.6 -17% | 42.3 -48% | 29.3 -2% | 28.4 1% |
| Cyberpunk 2077 ultra * (dB) | 42.8 | 37.5 12% | 39.1 9% | 45.4 -6% | 33.1 23% | 31.5 26% |
| Load Maximum * (dB) | 45.2 | 37.5 17% | 39.1 13% | 45.5 -1% | 38.7 14% | 31.5 30% |
* ... im mniej tym lepiej
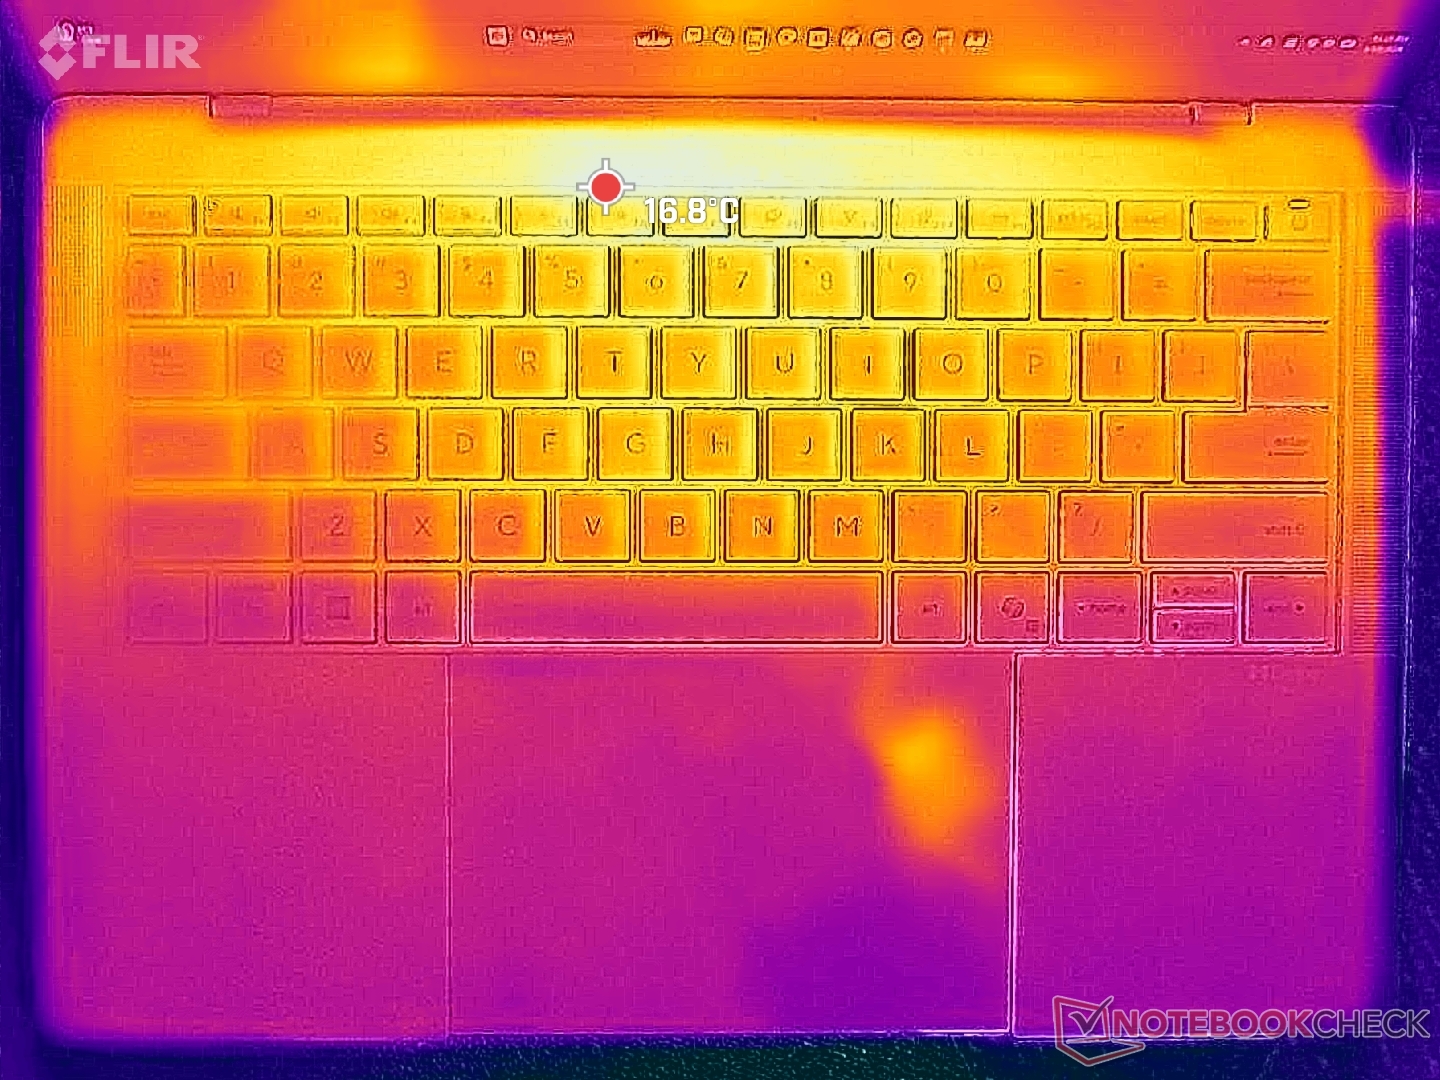
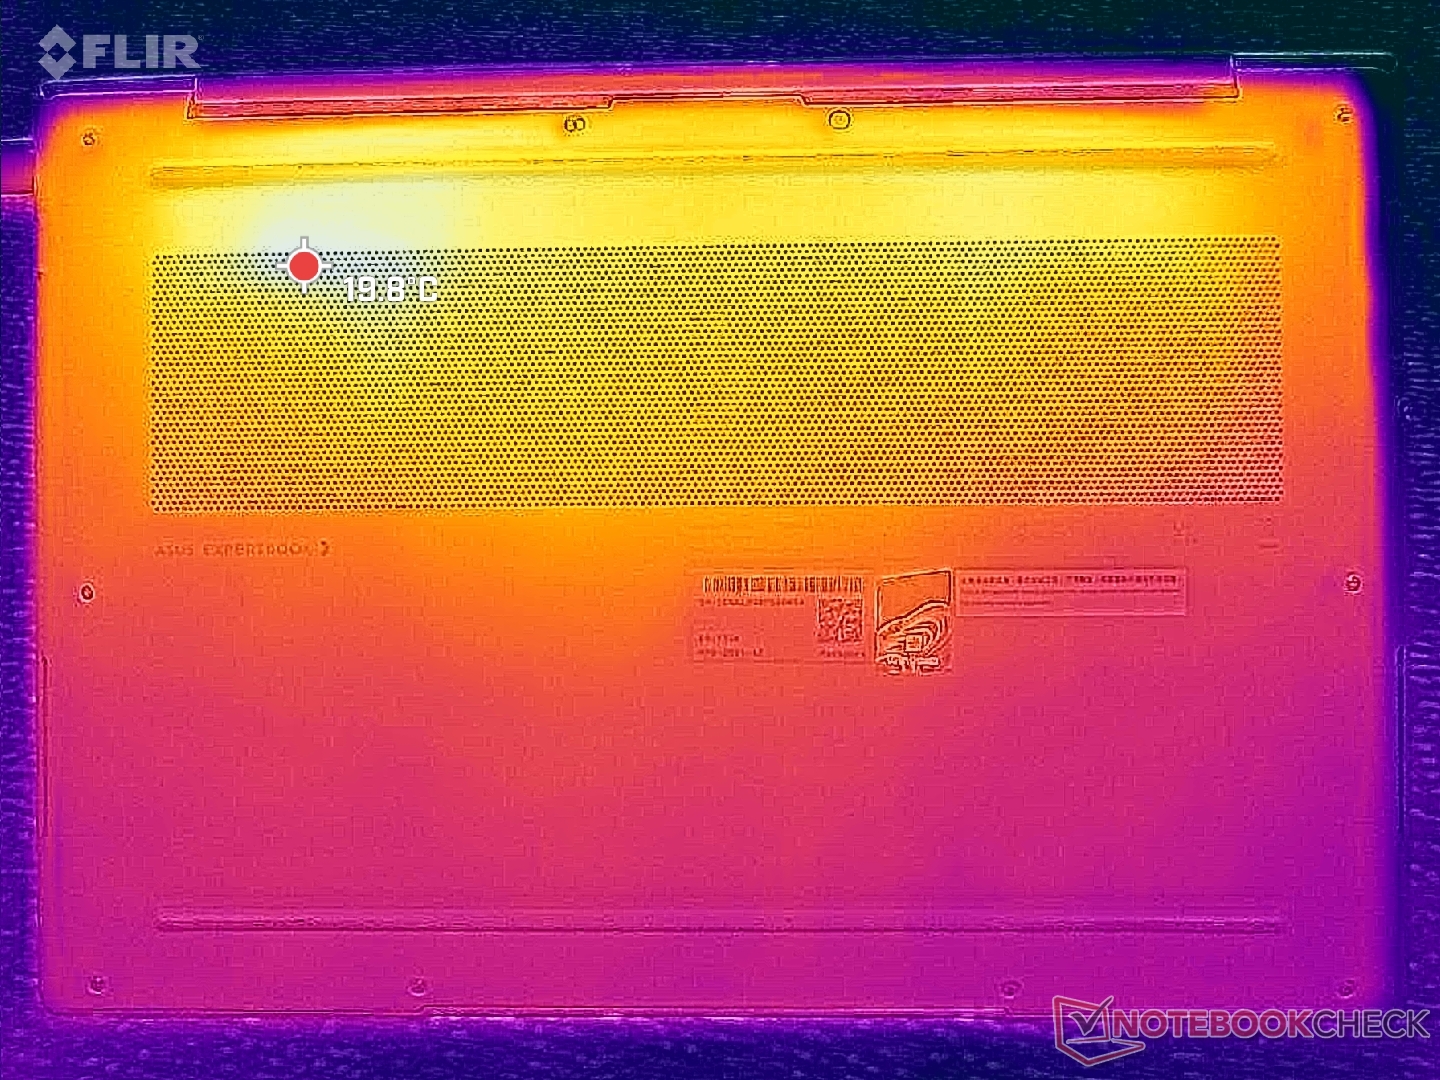
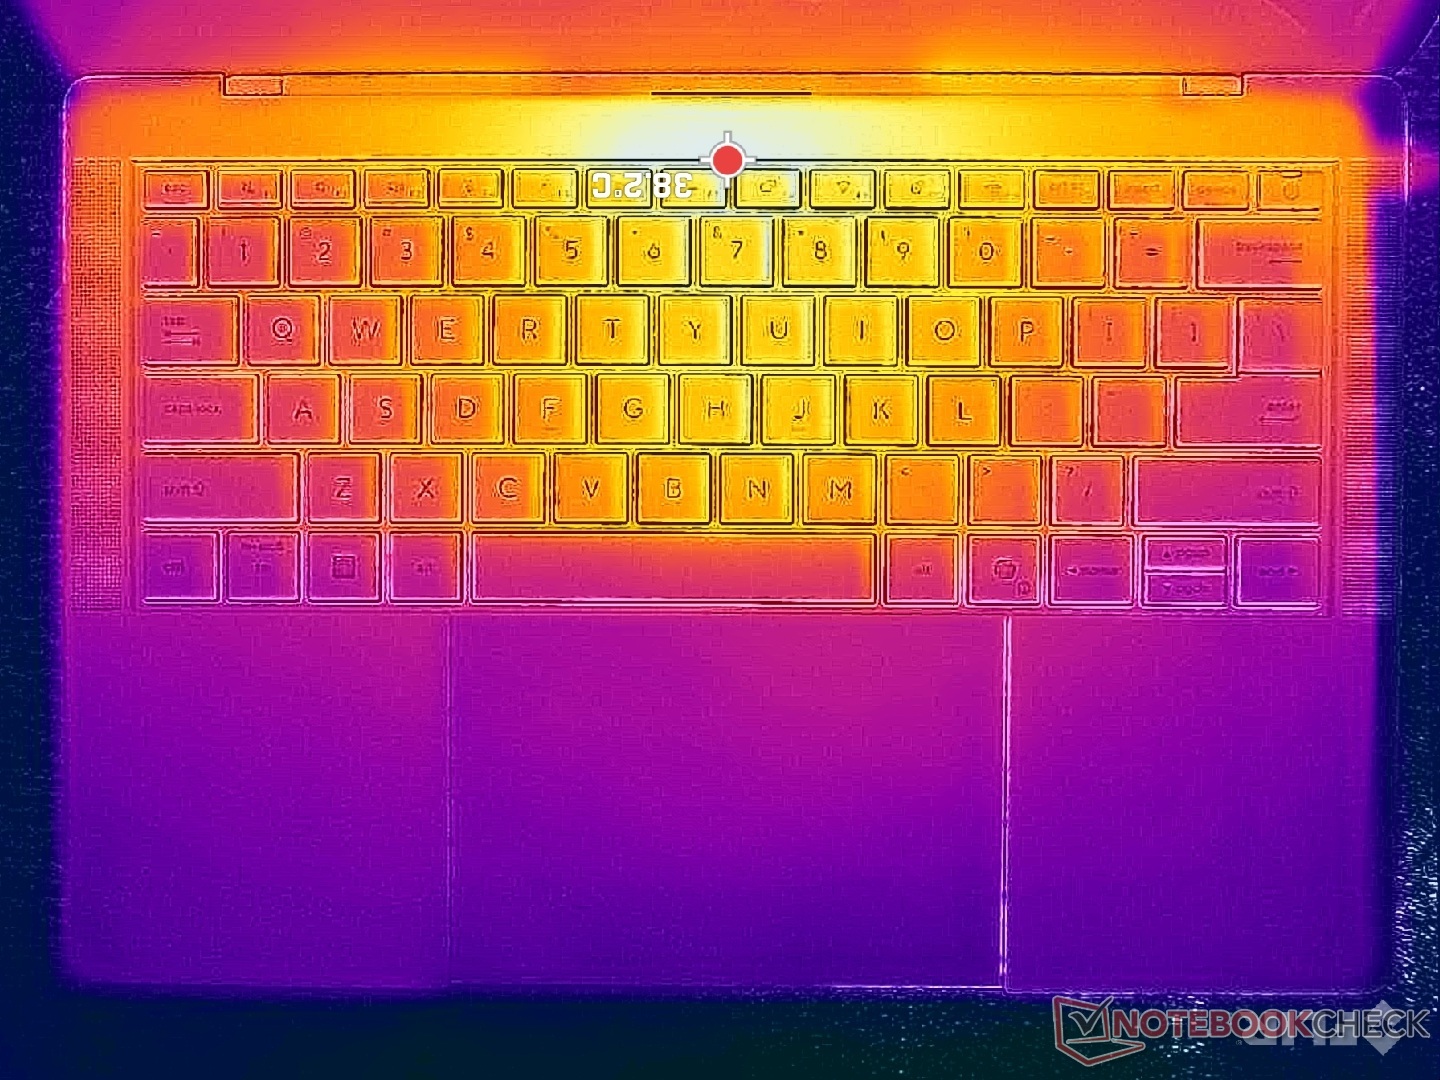
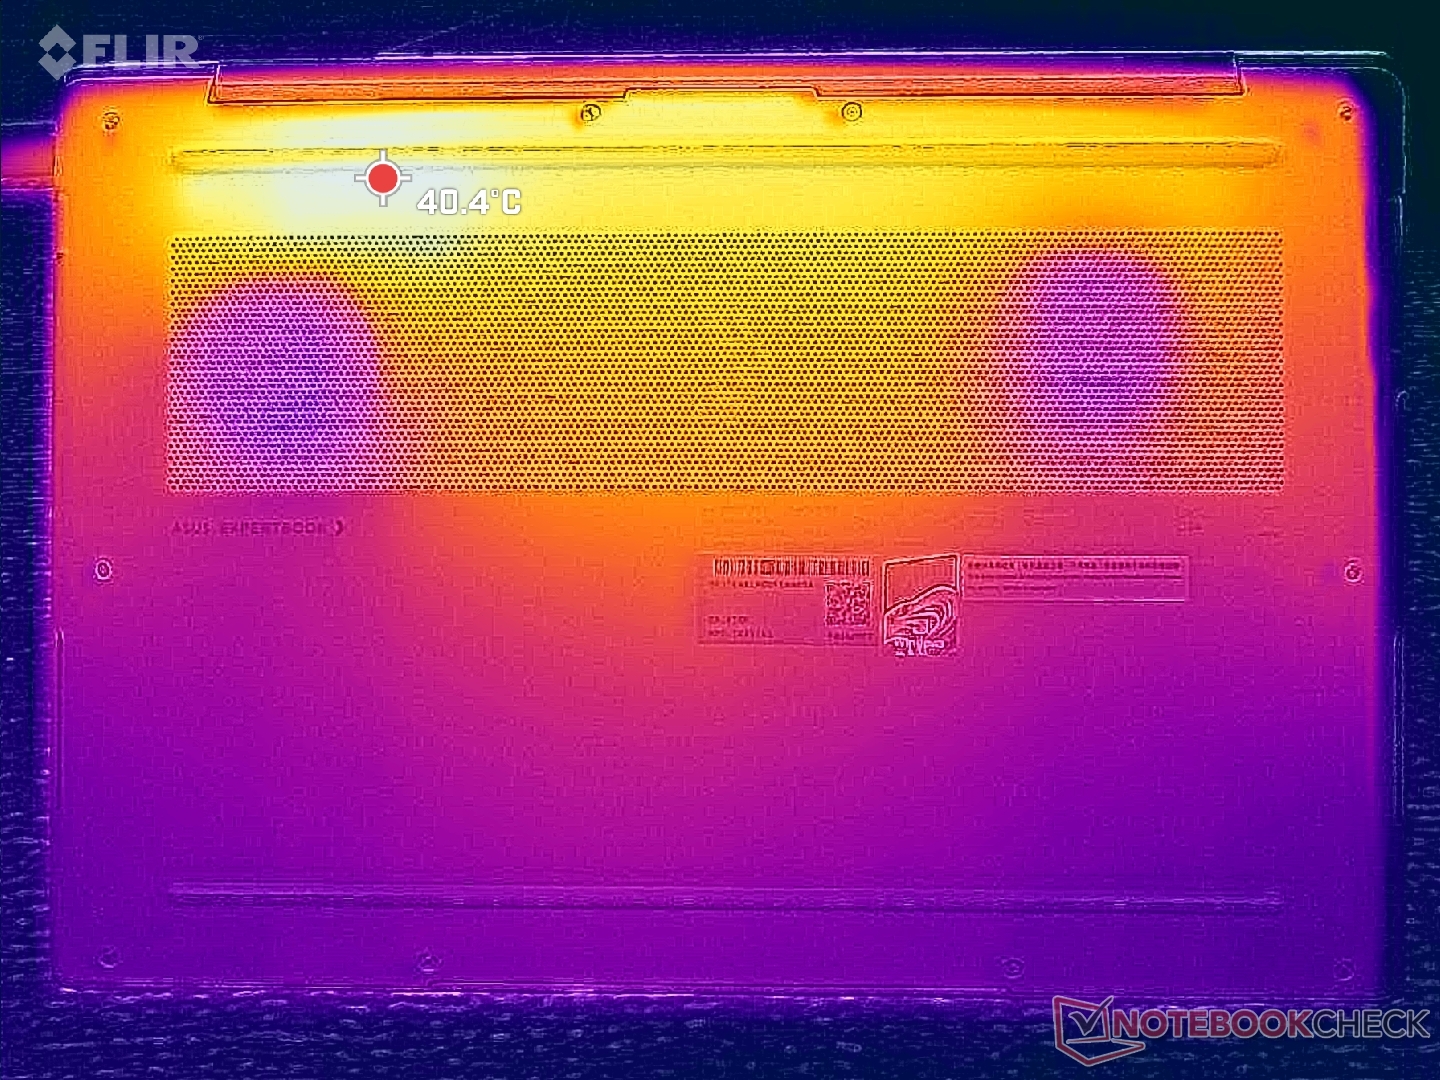
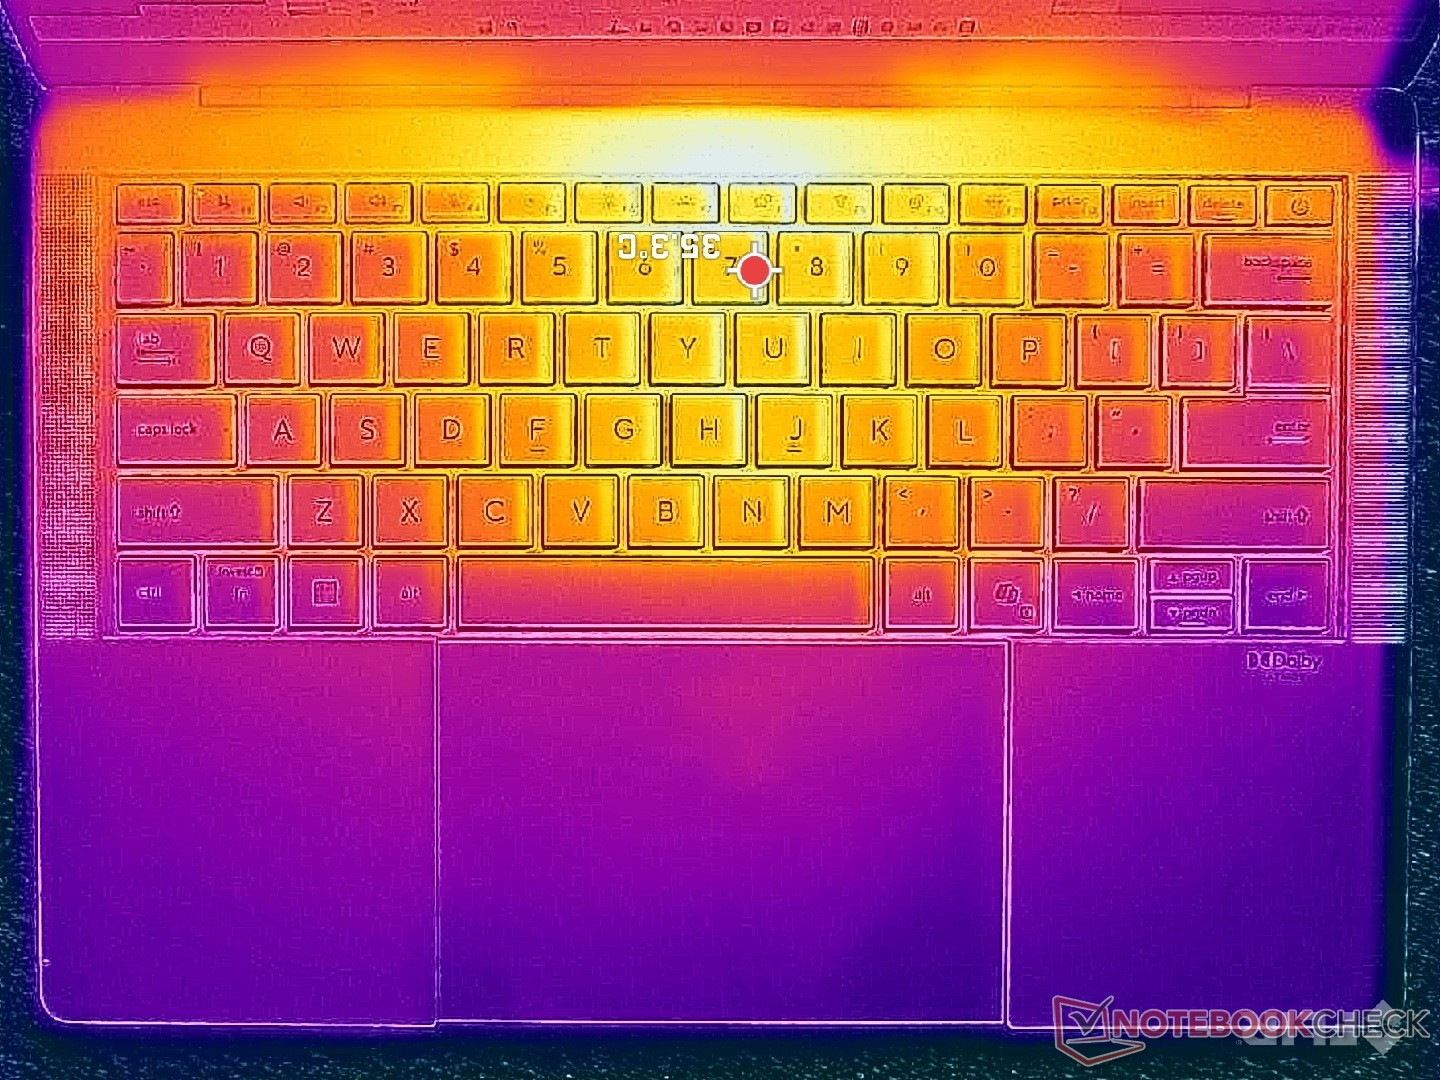
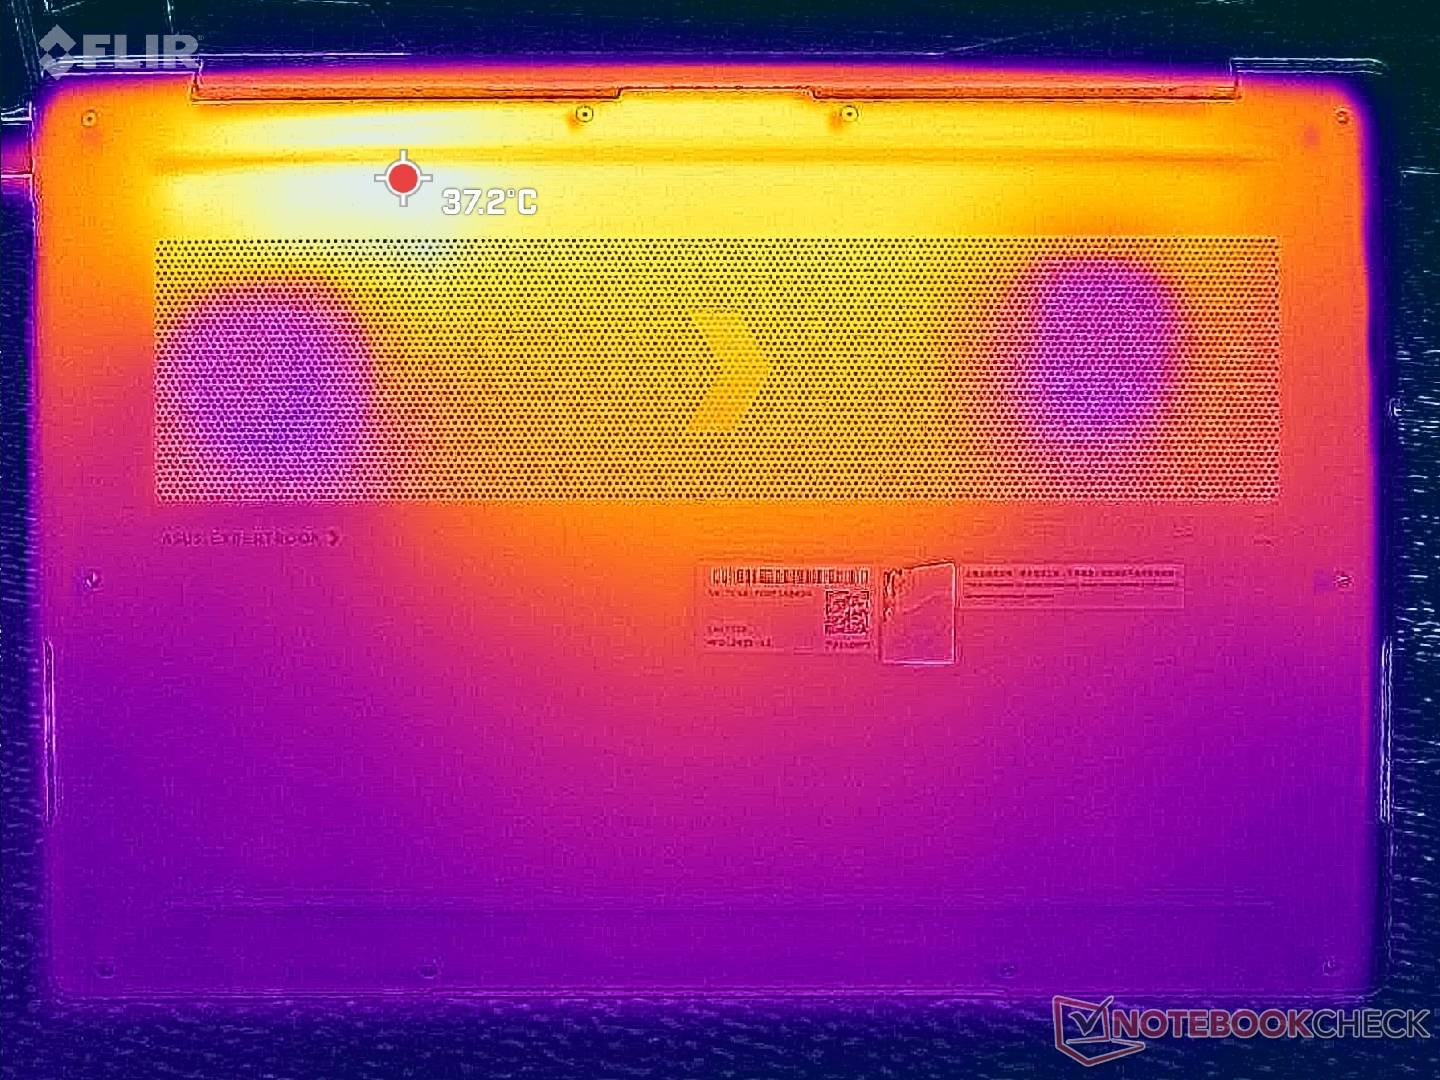
Temperatura
Gradient temperatury na powierzchni jest mniej więcej symetryczny ze względu na rozwiązanie chłodzące pod spodem. Gorące punkty na środku klawiatury i dolnym panelu mogą osiągnąć do 41 C każdy przy długotrwałym obciążeniu, co jest nieco niższą temperaturą niż w przypadku HP EliteBook Ultra G1i 14 wyposażonym w wolniejszy procesor Lunar Lake-V.
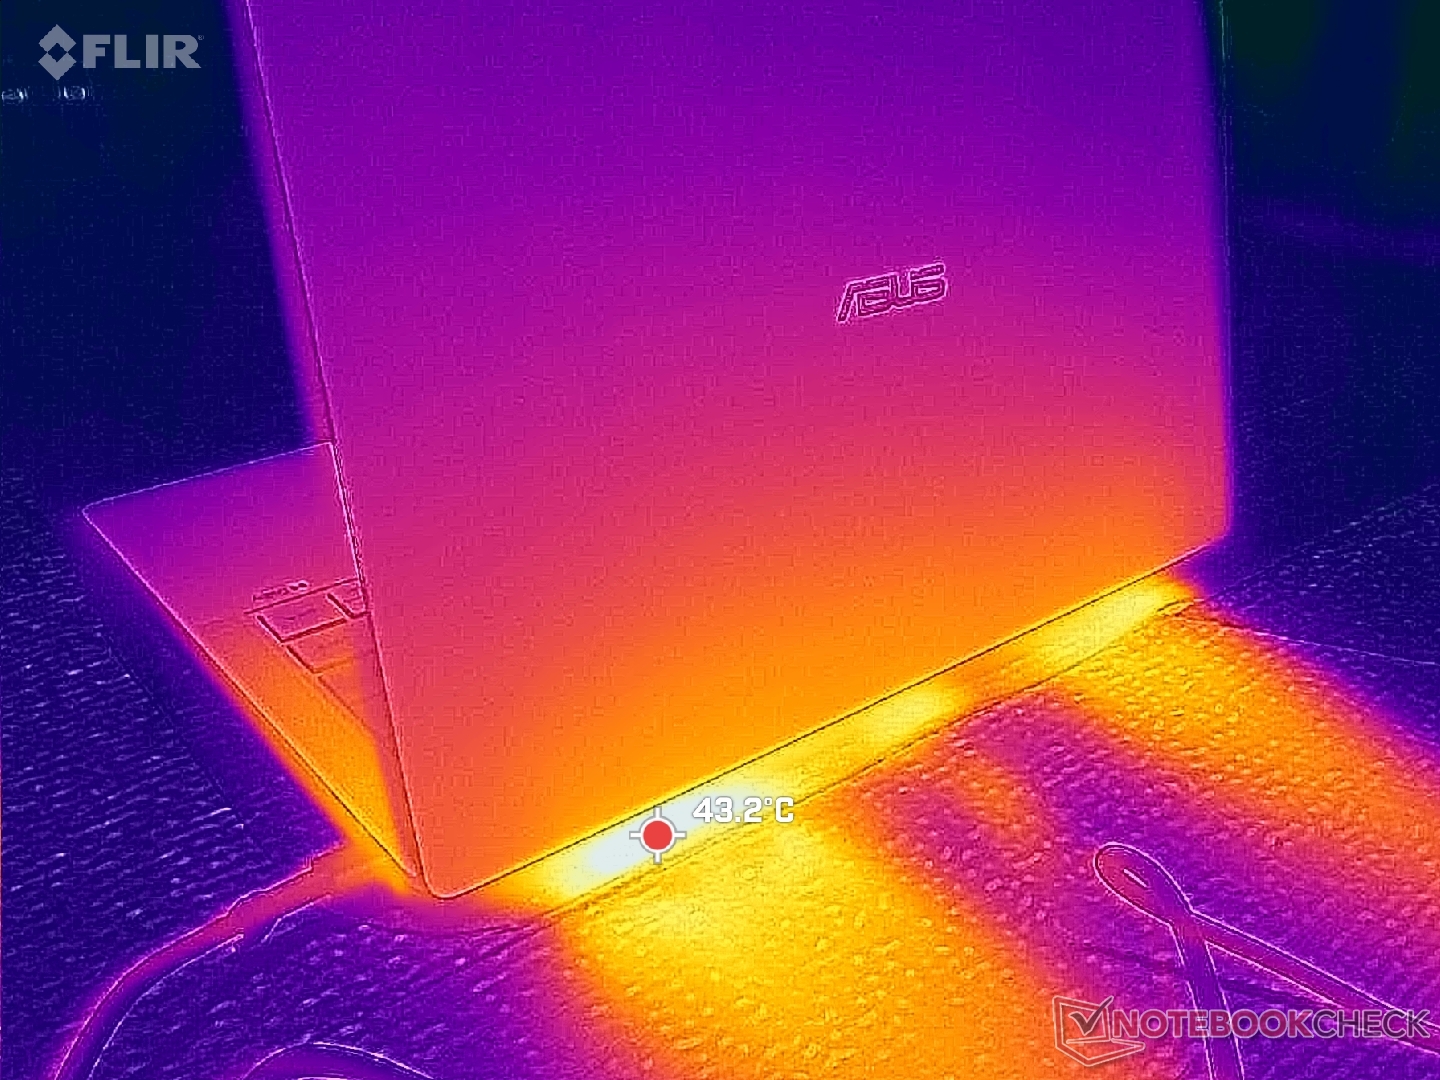
(+) Maksymalna temperatura w górnej części wynosi 38.6 °C / 101 F, w porównaniu do średniej 34.3 °C / 94 F , począwszy od 21.2 do 62.5 °C dla klasy Office.
(+) Dno nagrzewa się maksymalnie do 38.4 °C / 101 F, w porównaniu do średniej 36.8 °C / 98 F
(+) W stanie bezczynności średnia temperatura górnej części wynosi 23 °C / 73 F, w porównaniu ze średnią temperaturą urządzenia wynoszącą 29.5 °C / ### class_avg_f### F.
(+) 3: The average temperature for the upper side is 31.8 °C / 89 F, compared to the average of 29.5 °C / 85 F for the class Office.
(+) Podpórki pod nadgarstki i touchpad są chłodniejsze niż temperatura skóry i maksymalnie 26.6 °C / 79.9 F i dlatego są chłodne w dotyku.
(±) Średnia temperatura obszaru podparcia dłoni w podobnych urządzeniach wynosiła 27.5 °C / 81.5 F (+0.9 °C / 1.6 F).
| Asus ExpertBook Ultra B9406CAA Ultra X7 358H, Arc B390 Panther Lake iGPU | Dell Pro 14 Plus PB14255 GH77W Ryzen AI 7 PRO 350, Radeon 860M | Asus ExpertBook PM3406 Ryzen AI 7 350, Radeon 860M | Lenovo ThinkPad T14s Gen 6 Intel Core Ultra 5 228V, Arc 130V | Samsung Galaxy Book5 Pro 14 940XHA Core Ultra 5 226V, Arc 130V | HP EliteBook Ultra G1i 14 Core Ultra 7 258V, Arc 140V | |
|---|---|---|---|---|---|---|
| Heat | -9% | -4% | -9% | -6% | 0% | |
| Maximum Upper Side * (°C) | 38.6 | 38.1 1% | 39.8 -3% | 42.6 -10% | 41.4 -7% | 37.9 2% |
| Maximum Bottom * (°C) | 38.4 | 40.1 -4% | 40.8 -6% | 41.6 -8% | 44.6 -16% | 44.3 -15% |
| Idle Upper Side * (°C) | 24.6 | 28.9 -17% | 26 -6% | 27.1 -10% | 24.9 -1% | 23.3 5% |
| Idle Bottom * (°C) | 26 | 29.6 -14% | 26.3 -1% | 27.6 -6% | 25.5 2% | 23.6 9% |
* ... im mniej tym lepiej
Test warunków skrajnych
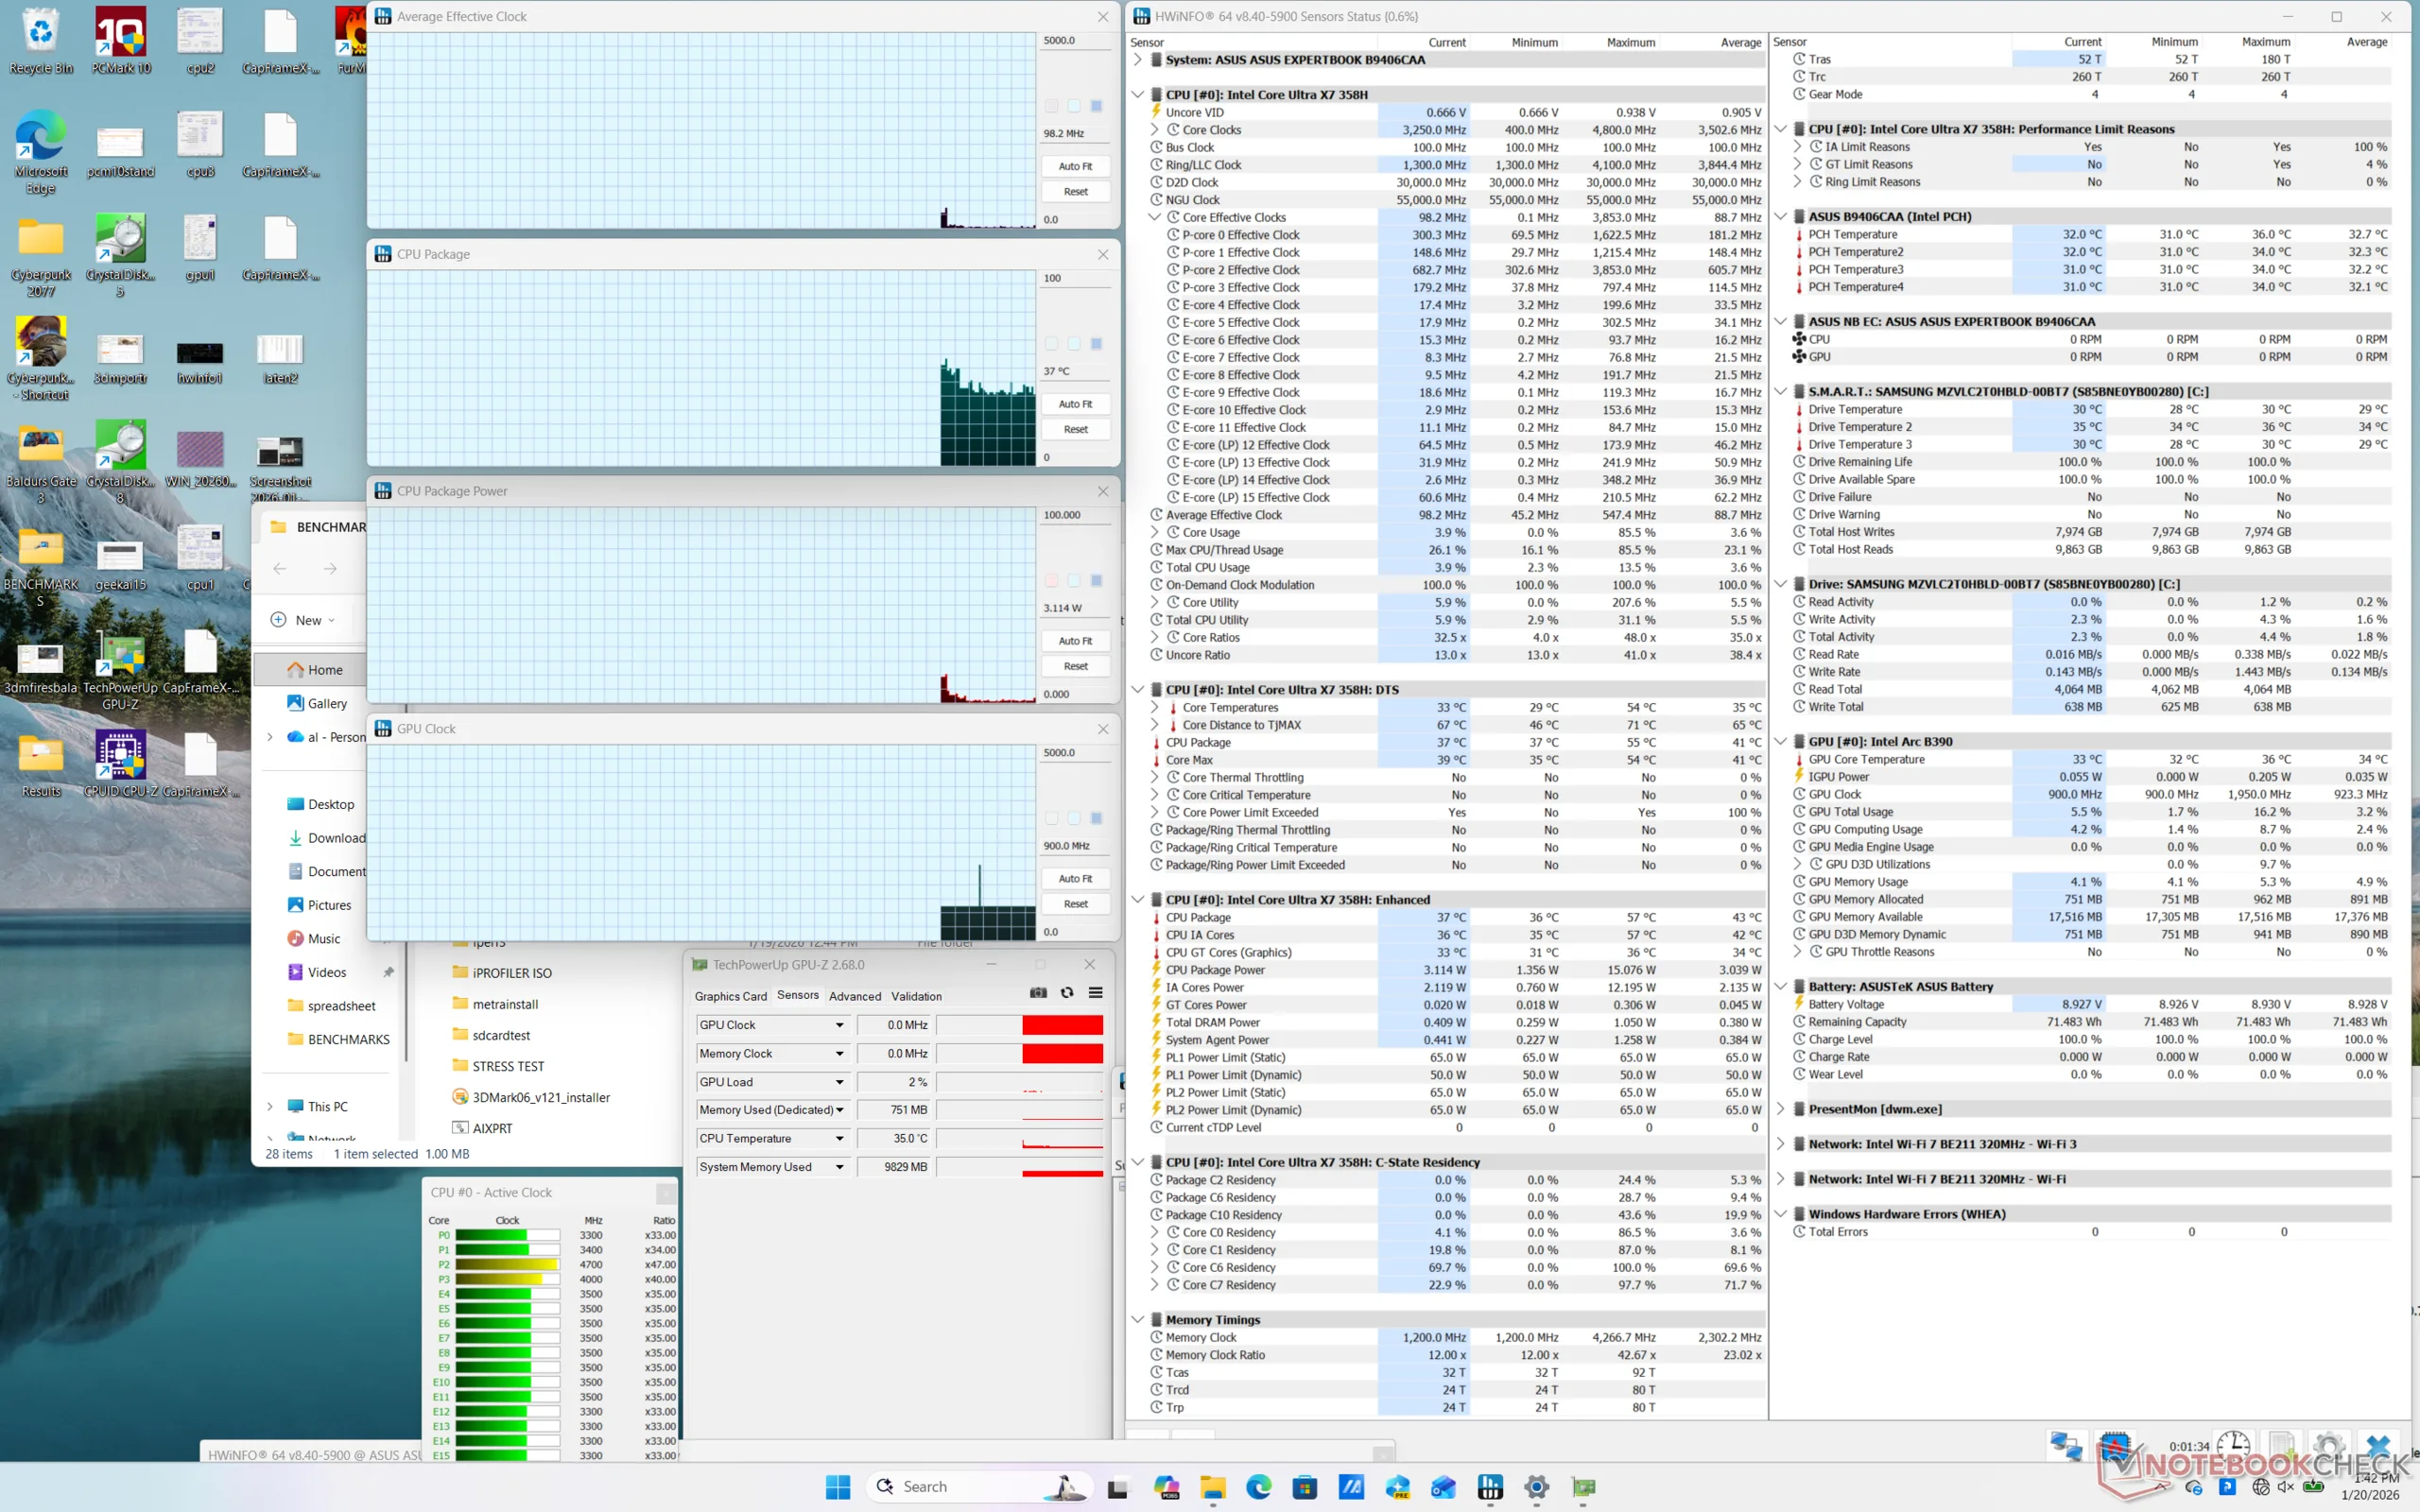
Procesor przyspieszyłby do 2,8 GHz i 62 W podczas inicjowania stresu Prime95, zanim osiągnąłby temperaturę rdzenia 98 C około minutę później. Później wydajność spadła do 2,6 GHz, aby utrzymać łatwiejszą do opanowania temperaturę rdzenia i pobór odpowiednio 85 C i 48 W. Maksymalna wydajność Turbo Boost jest zatem możliwa do utrzymania tylko przez ograniczony czas.
Częstotliwość taktowania GPU i temperatura podczas uruchamiania Cyberpunk 2077 w trybie Performance ustabilizowałyby się odpowiednio na poziomie 2500 MHz i 88 C, w porównaniu do zaledwie 2050 MHz i 59 C po ustawieniu trybu Balanced. Dlatego też warto uruchomić grę w trybie Performance, gdy potrzebna jest dodatkowa moc obliczeniowa. 88 C w trybie wydajności jest jednak cieplejsze niż byśmy chcieli, ponieważ konkurencyjny HP EliteBook X G1a 14 ustabilizowałby się w chłodniejszym zakresie 70 C, gdy został poddany podobnym warunkom.
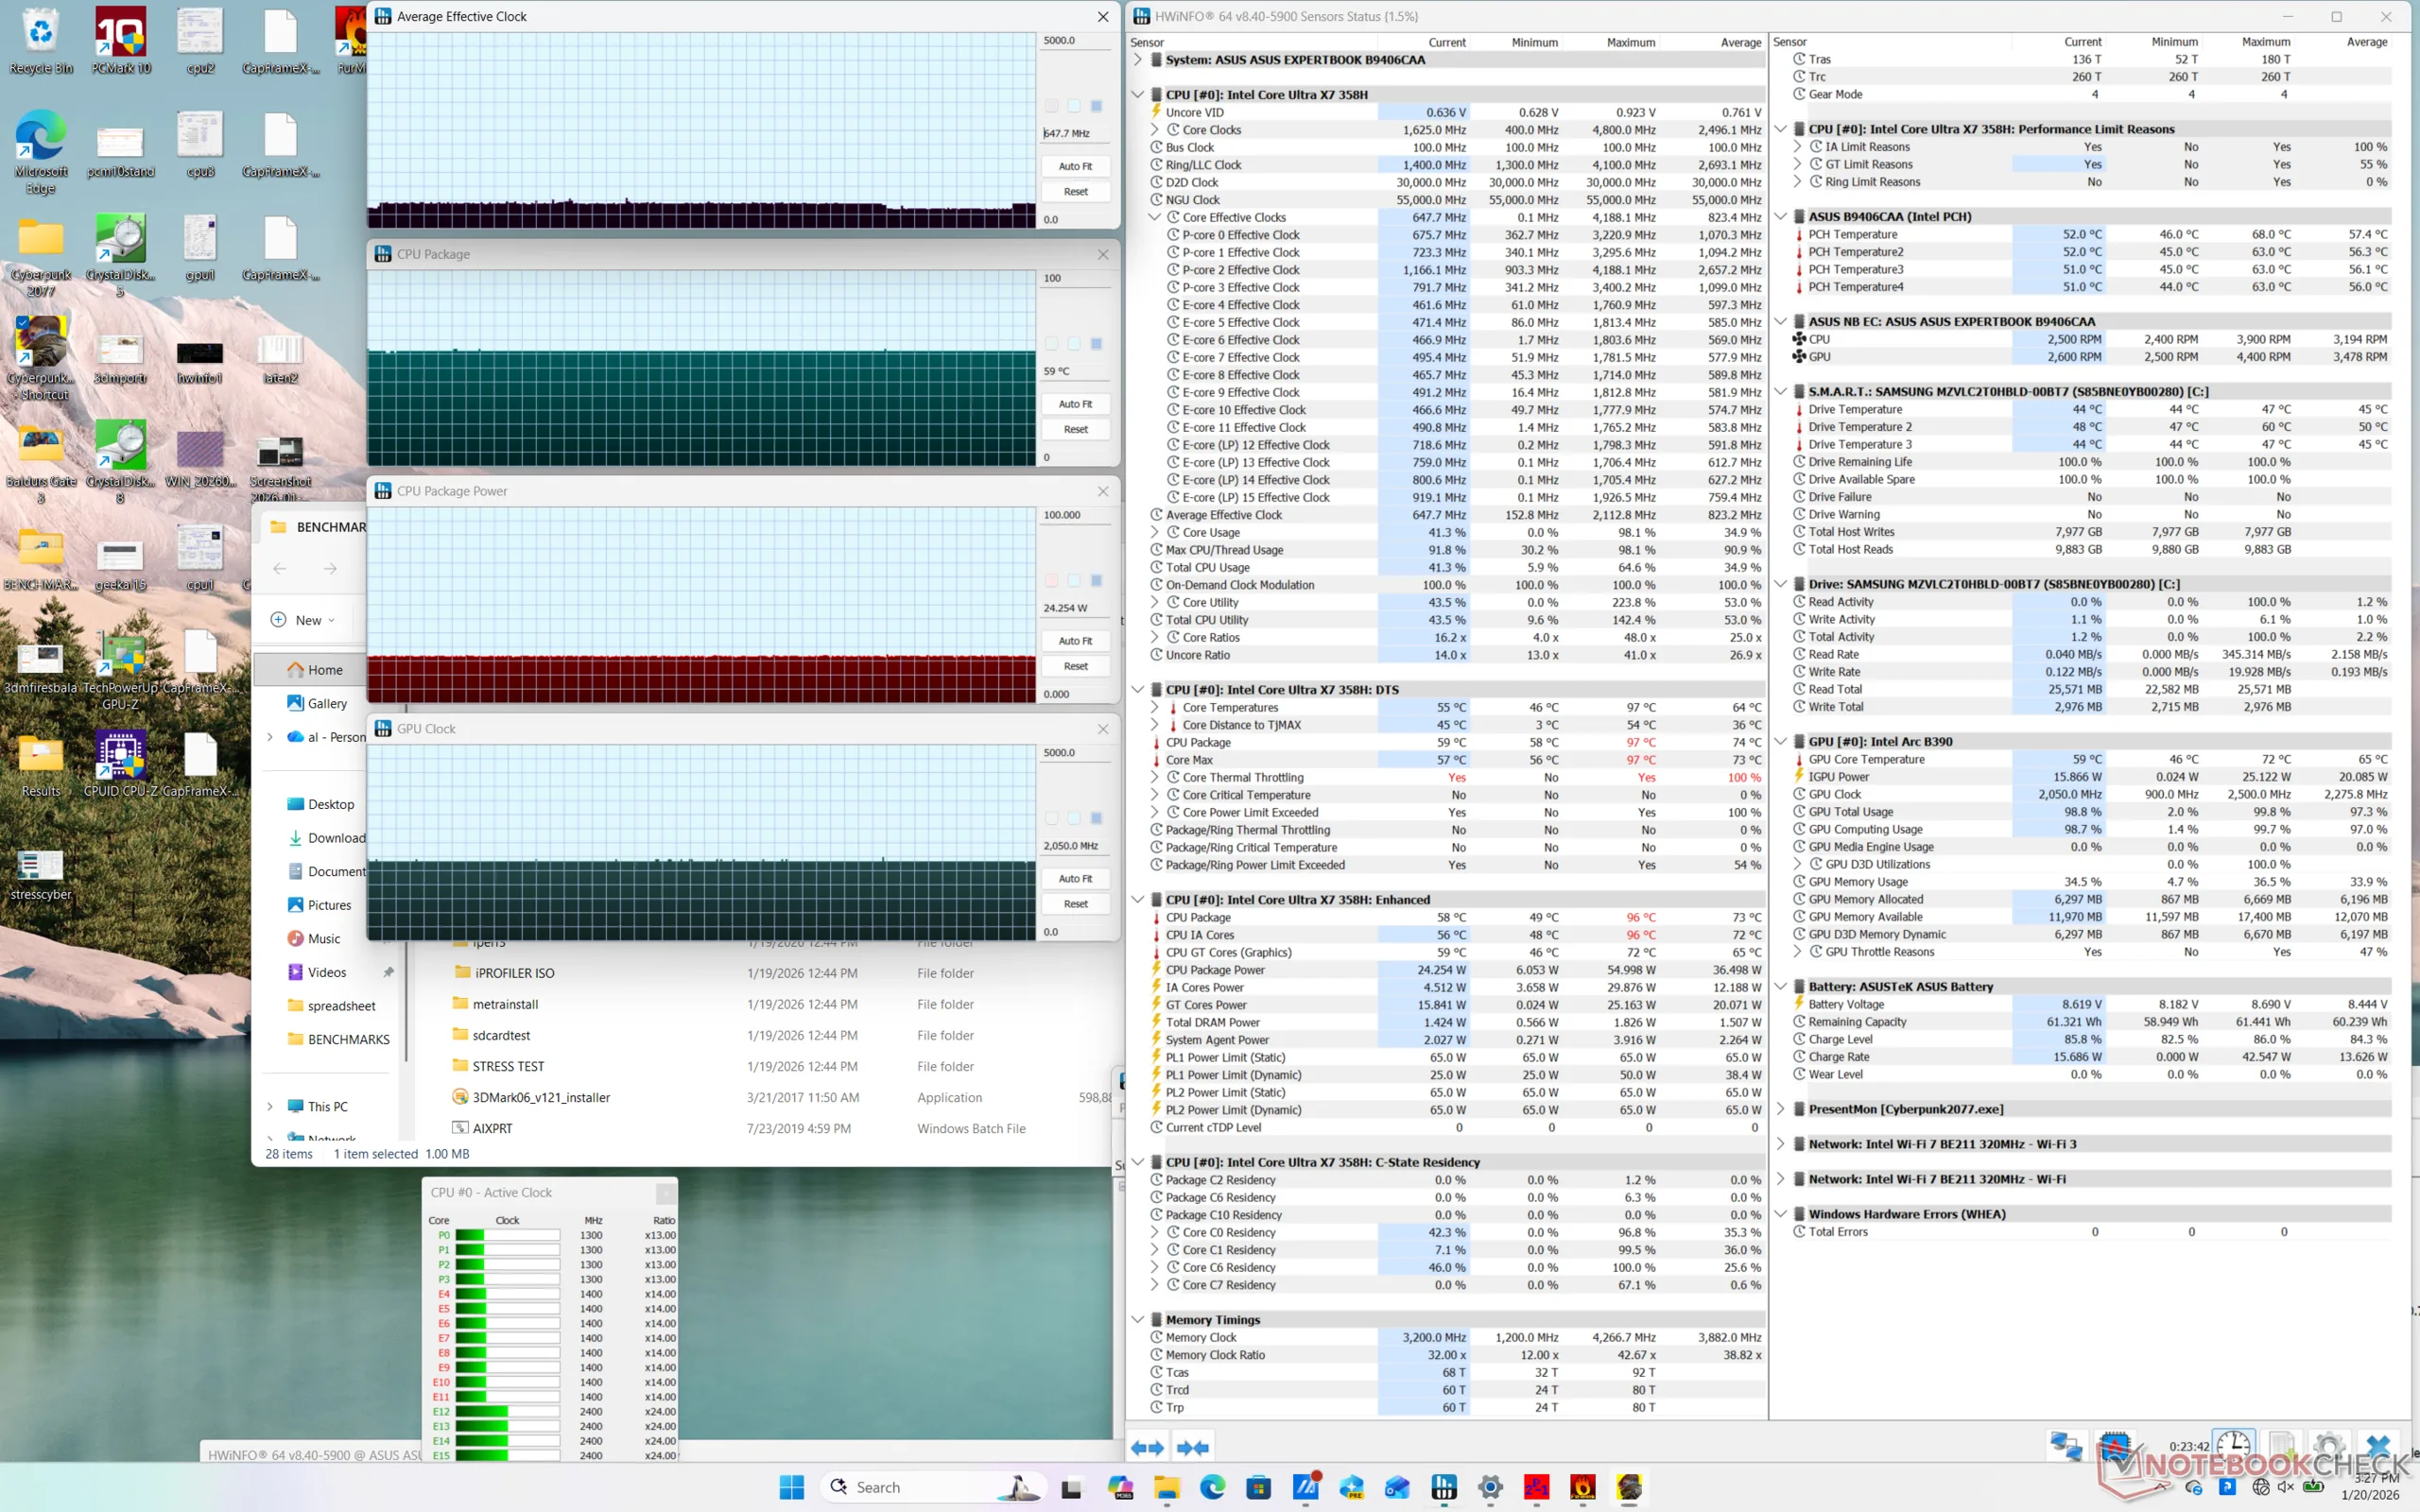
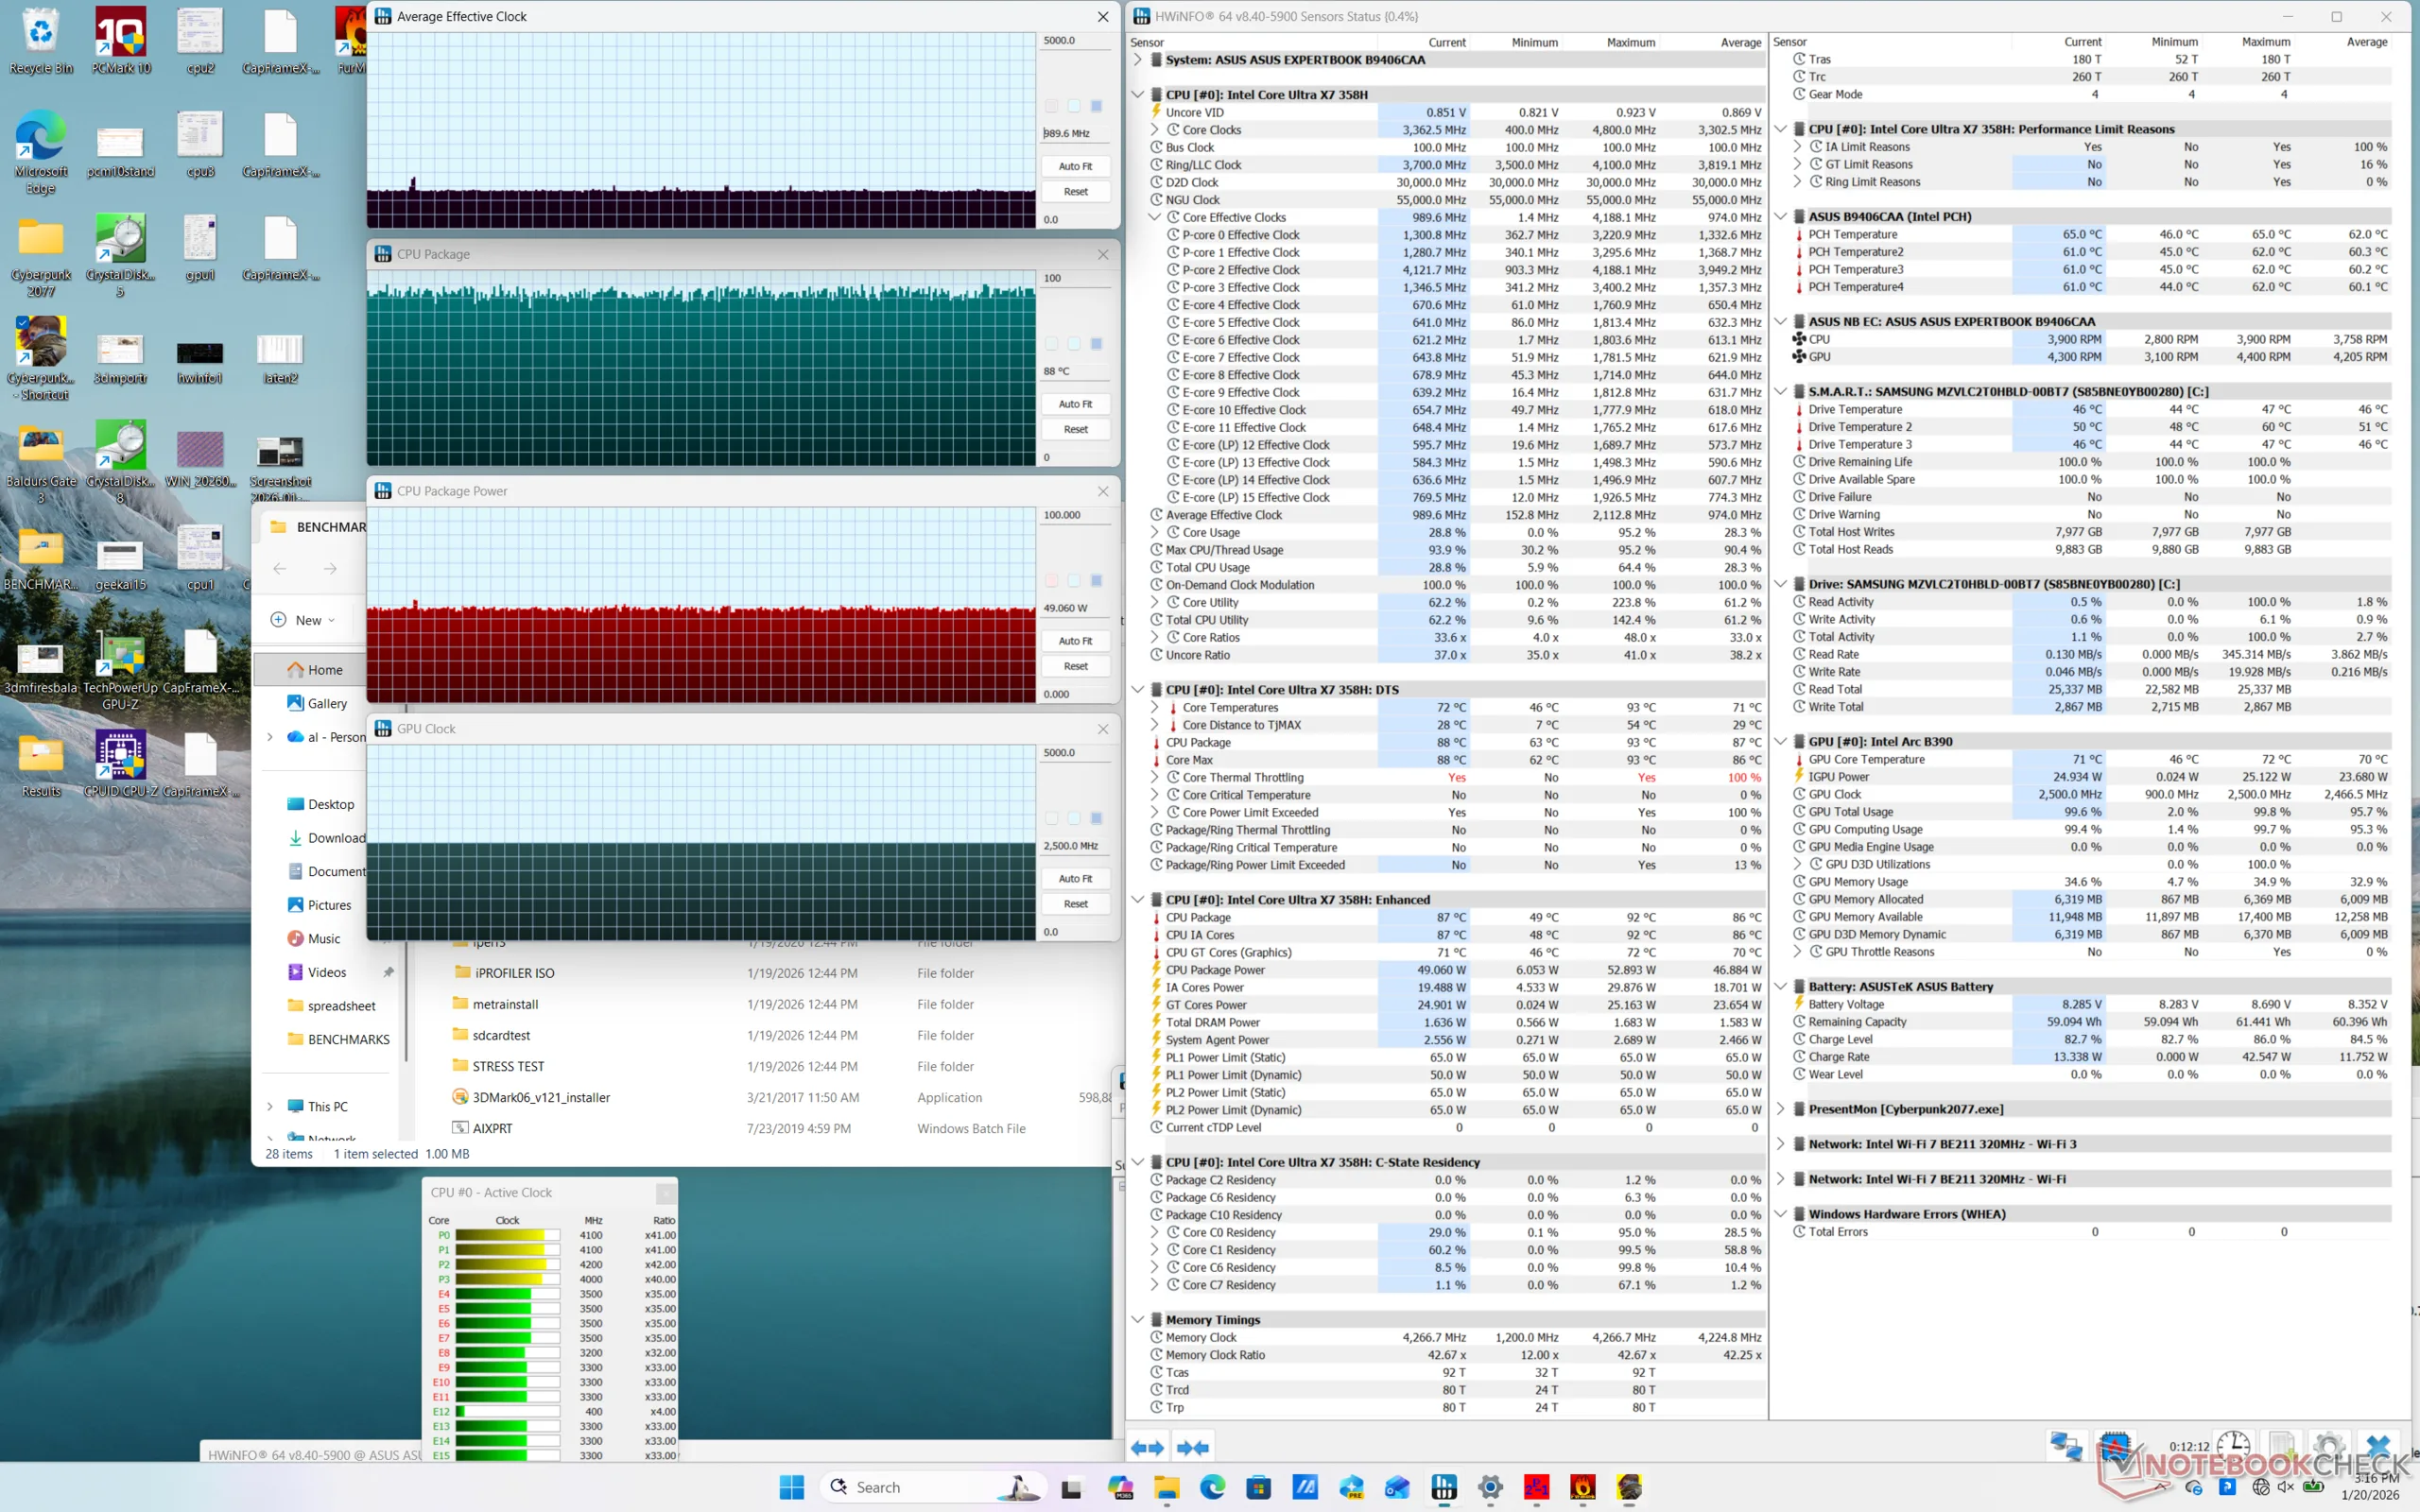
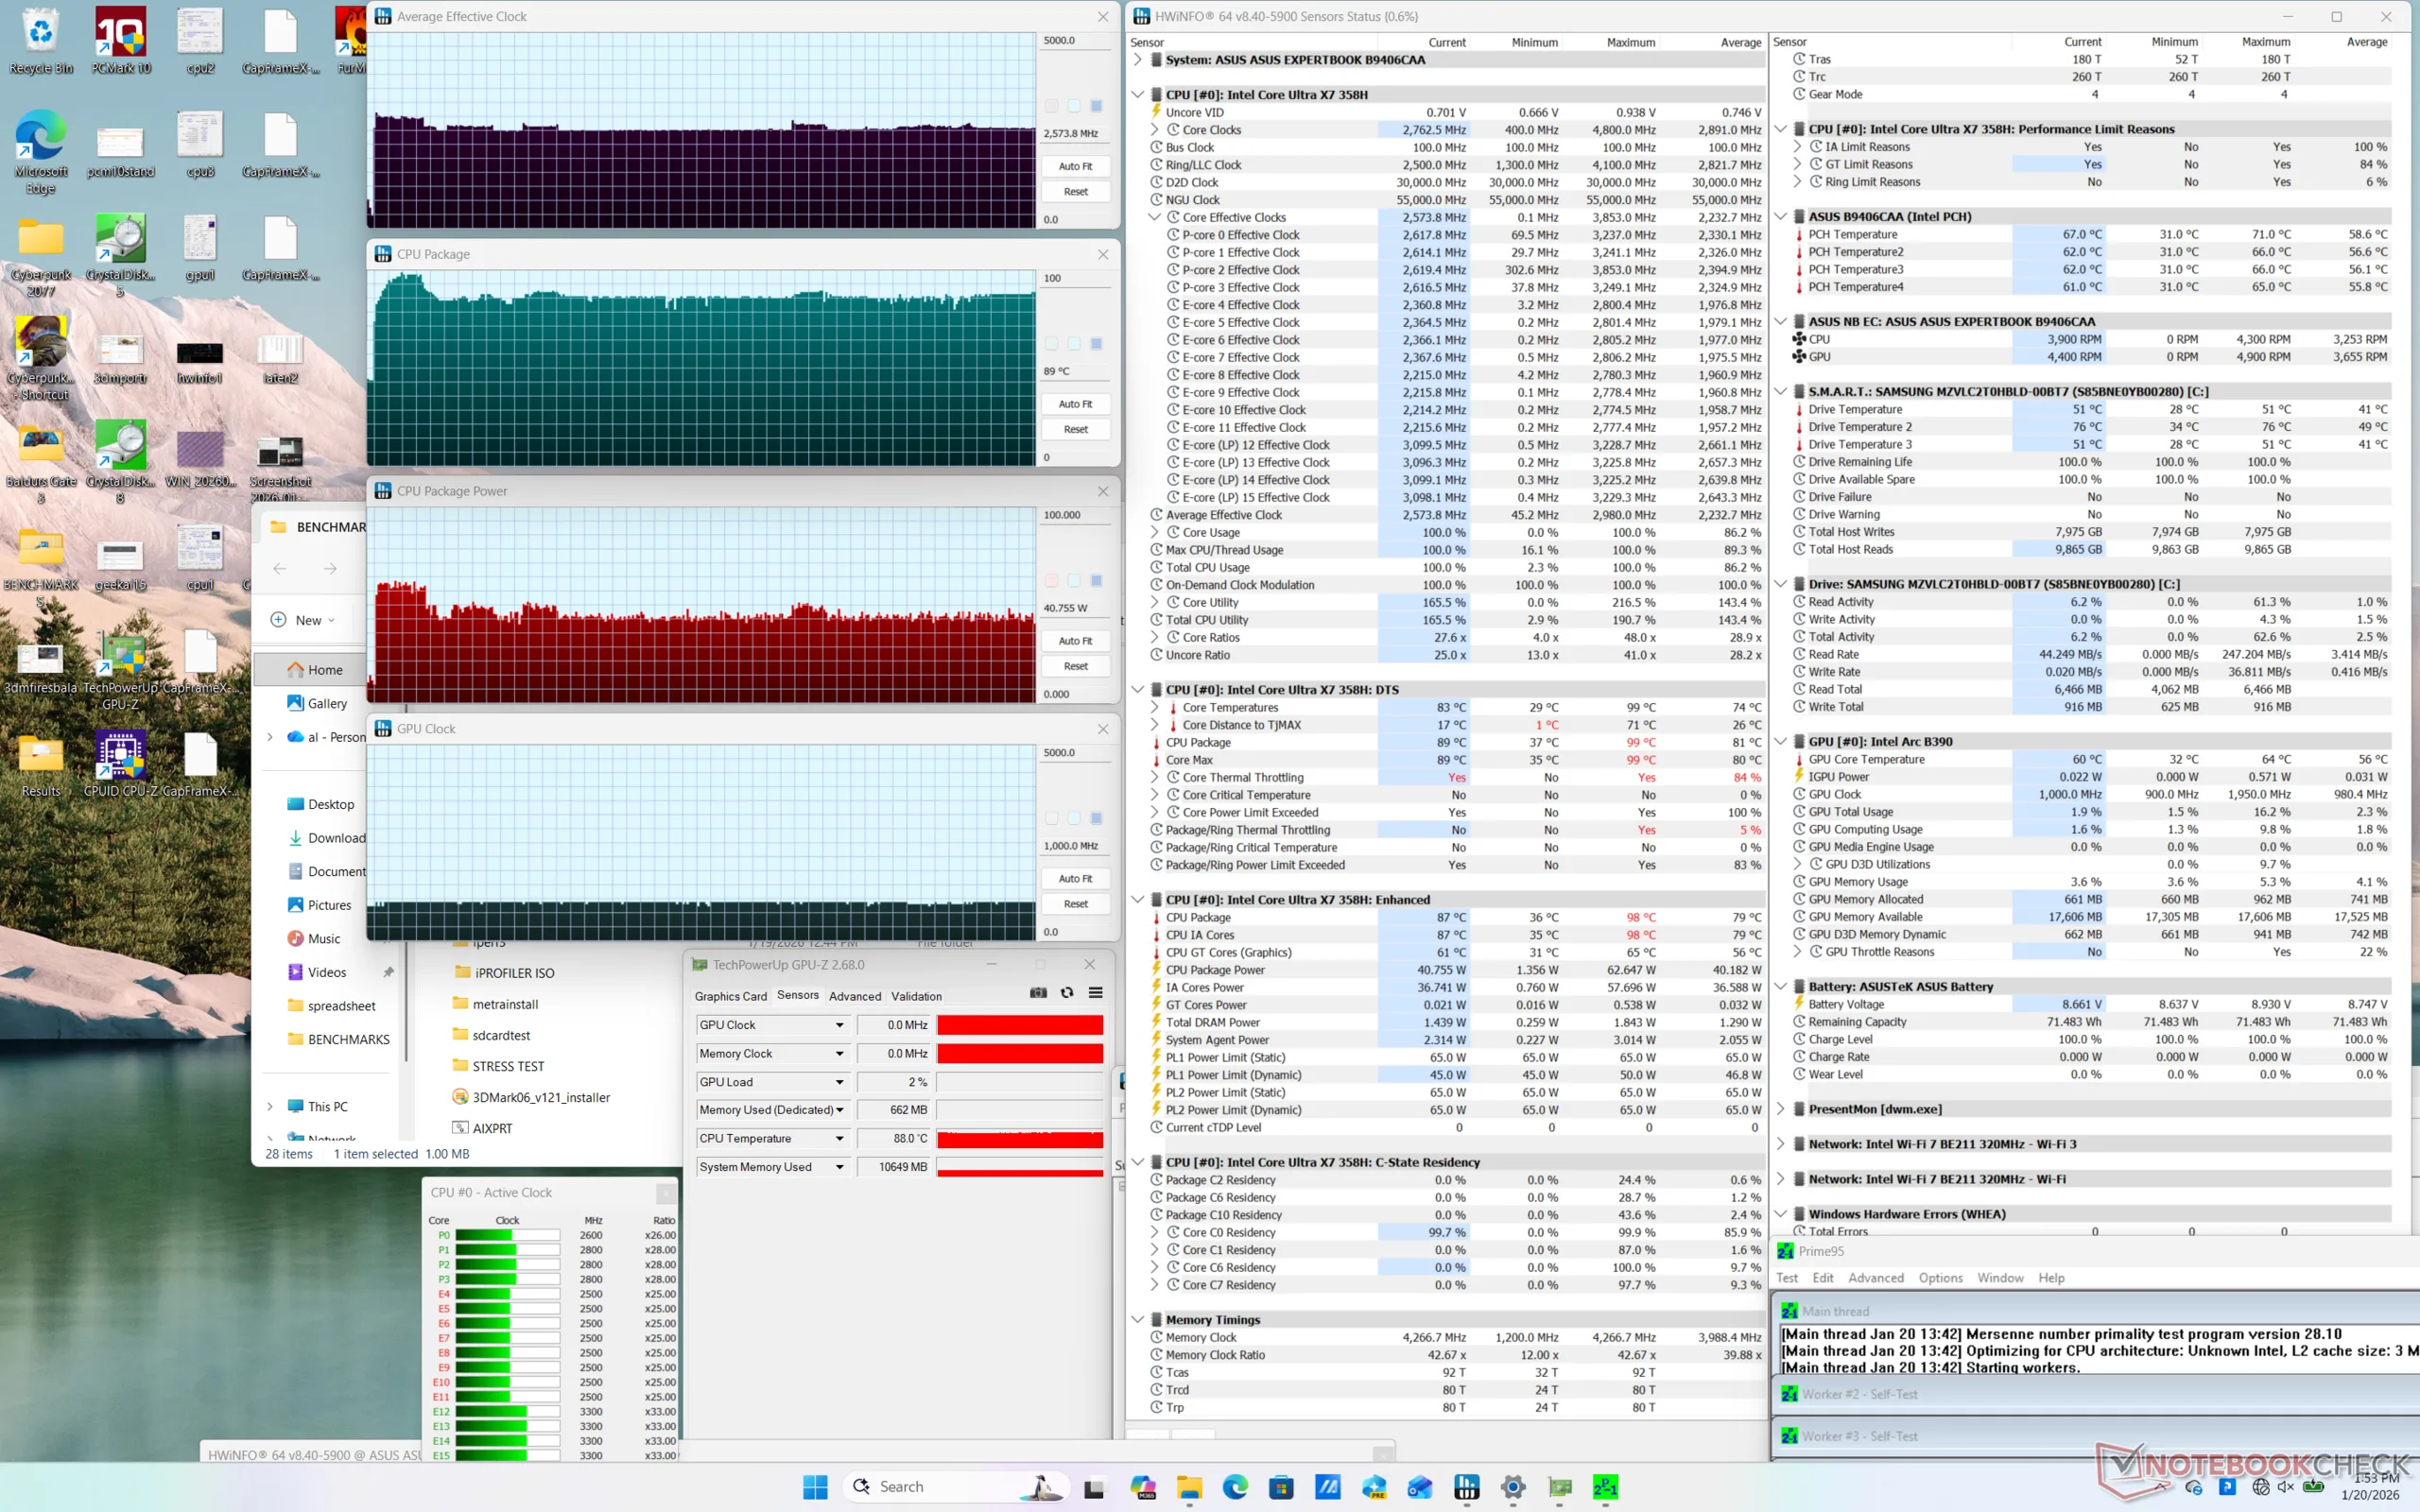
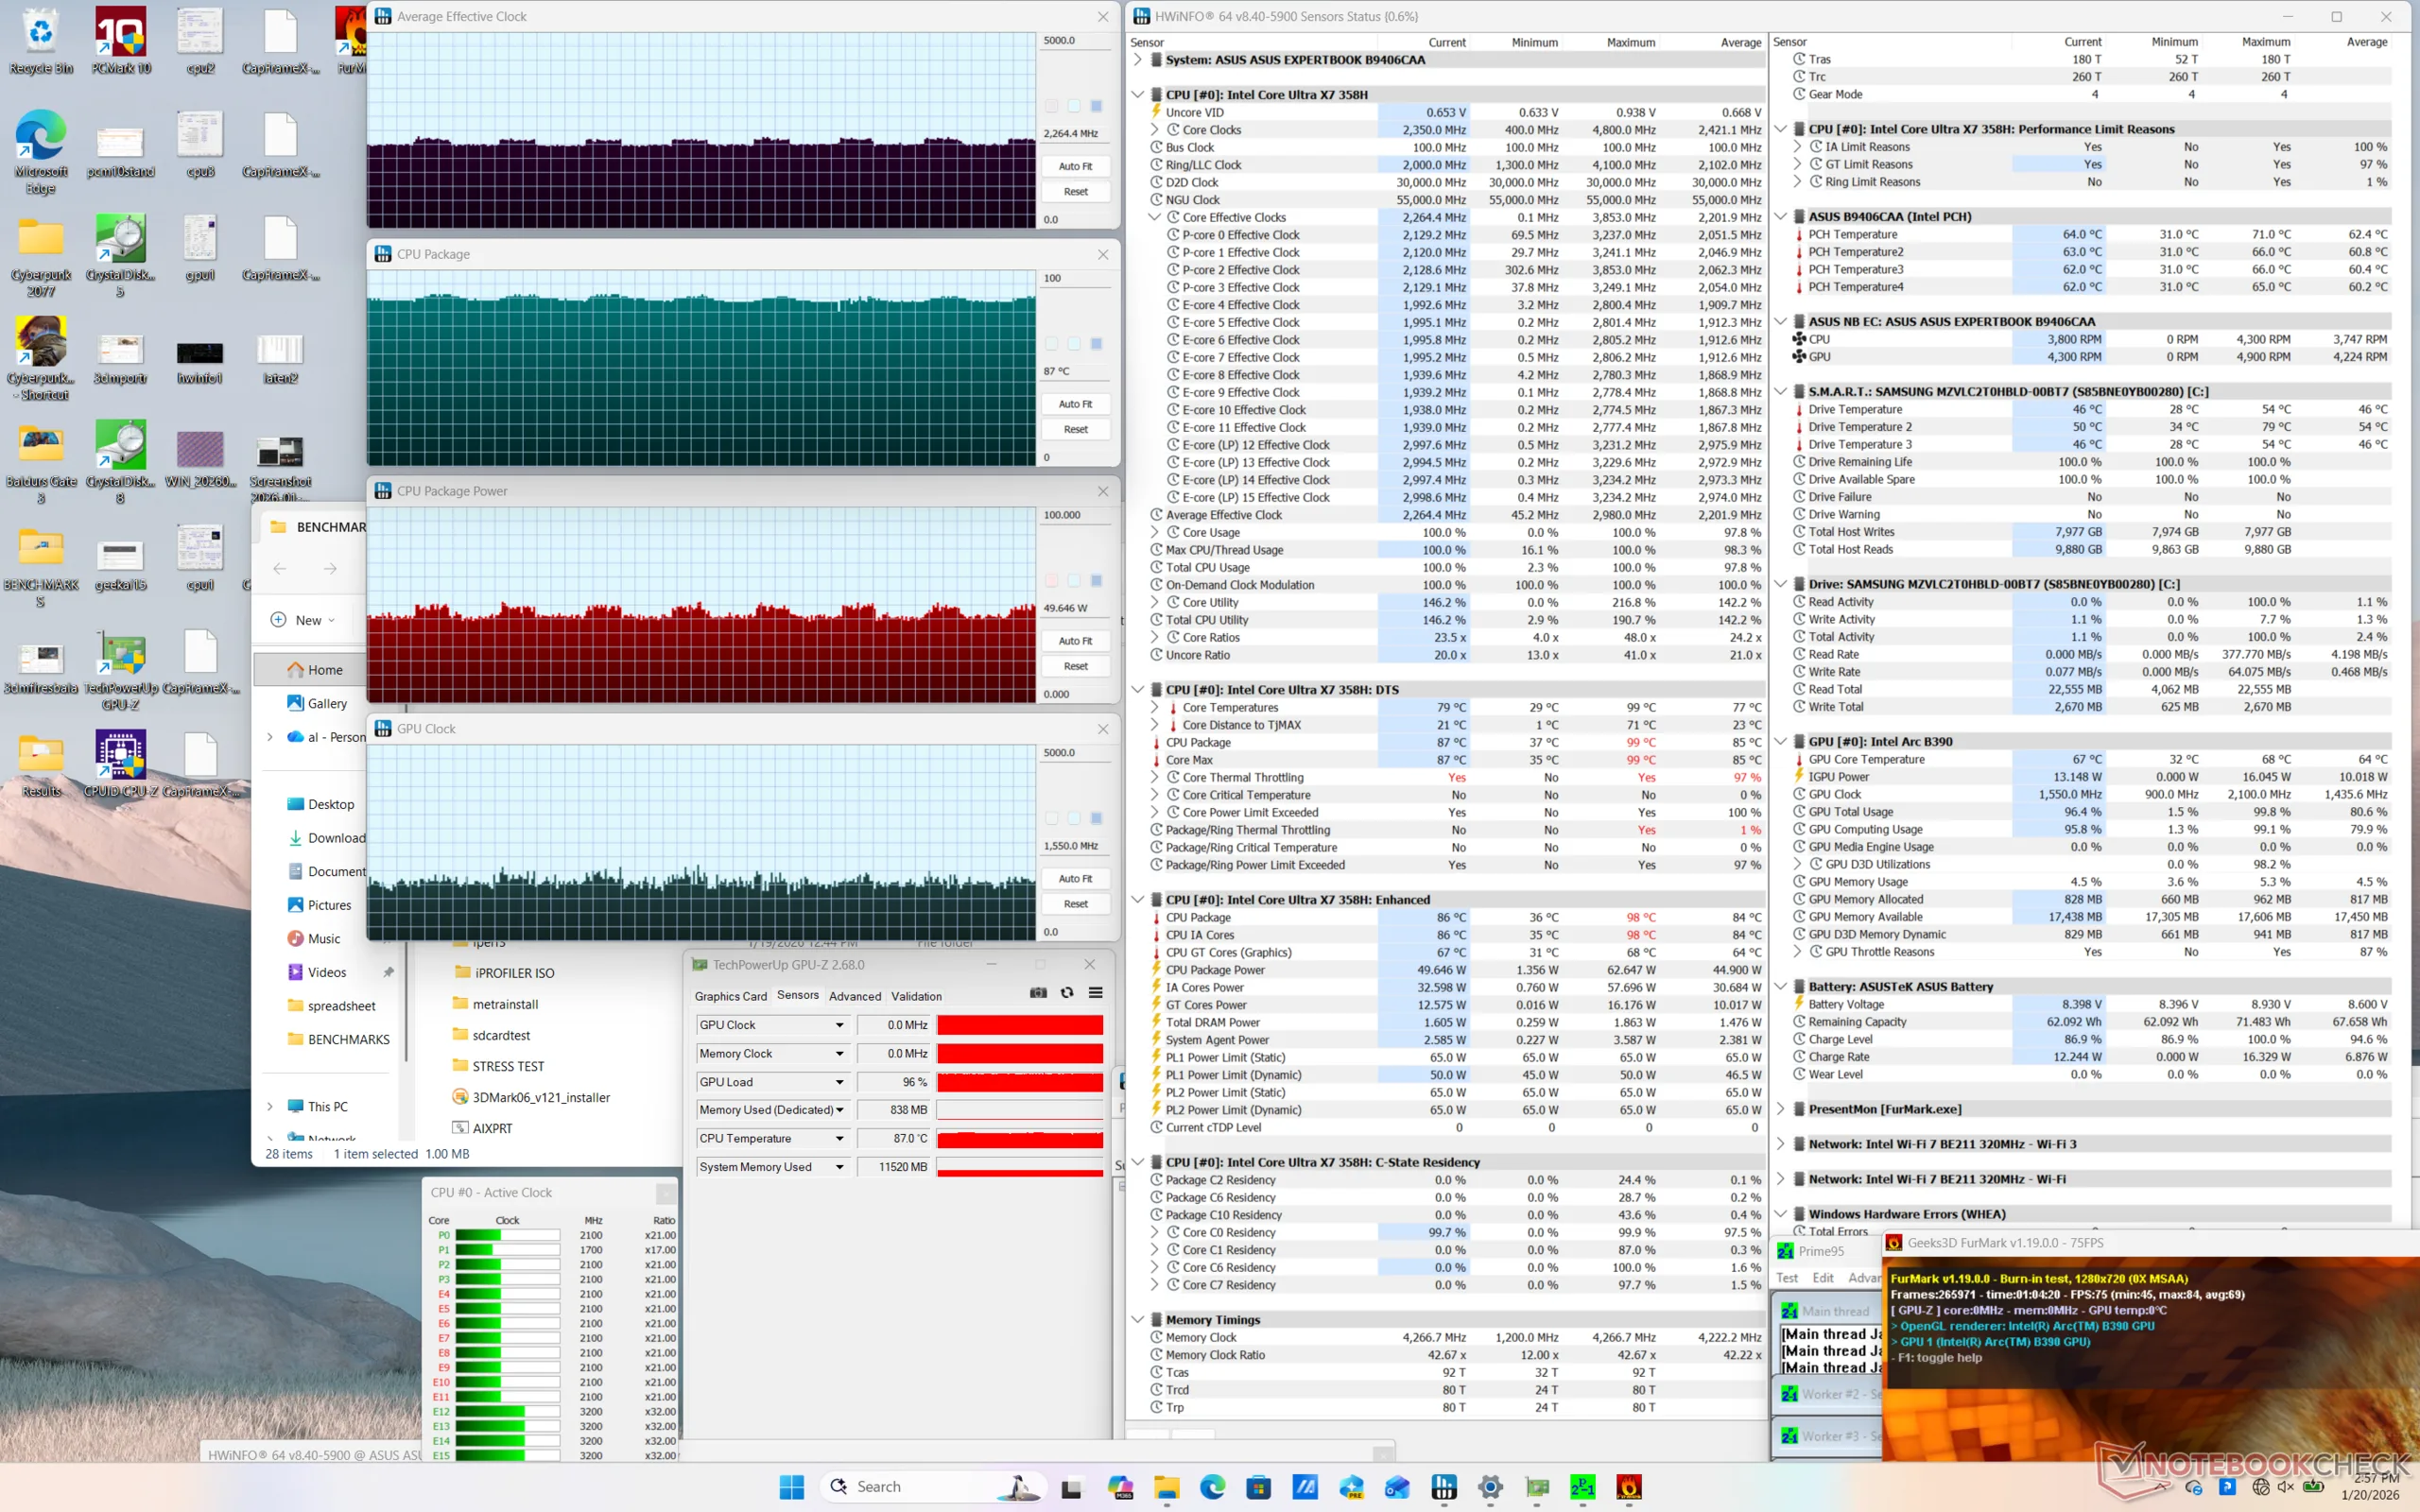
| Taktowanie CPU (GHz) | Taktowanie GPU (MHz) | Średnia temperatura CPU (°C) | |
| System bezczynności | -- | -- | 37 |
| Prime95 Stress | 2.6 | 1000 | 89 |
| Prime95 + FurMark Stress | ~2.2 | ~1550 | 87 |
| Cyberpunk 2077 Stress (tryb zrównoważony) | 0.6 | 2050 | 59 |
| Cyberpunk 2077 Stress (tryb wydajności) | 1.0 | 2500 | 88 |
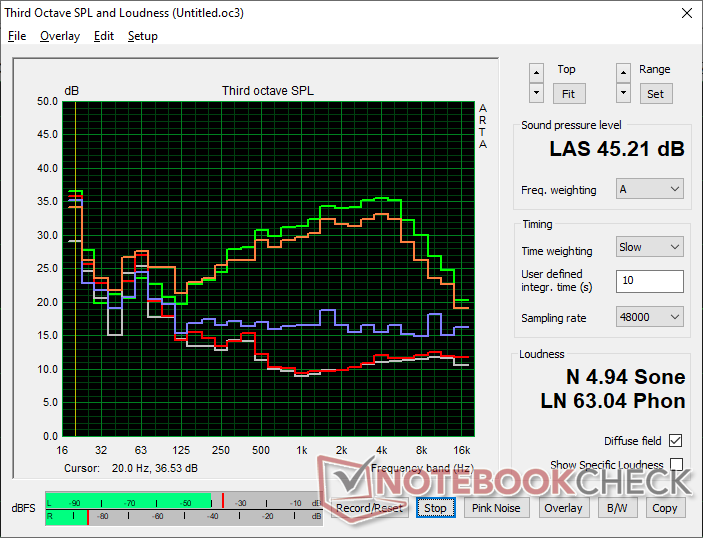
Głośniki
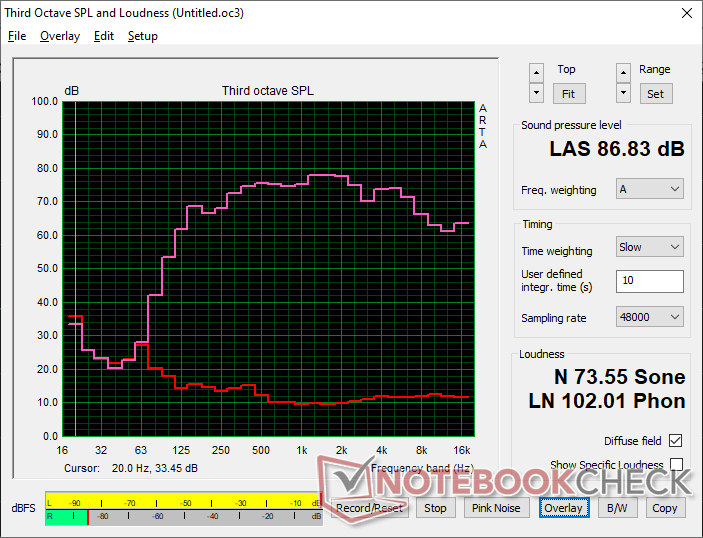
Asus ExpertBook Ultra B9406CAA analiza dźwięku
(+) | głośniki mogą odtwarzać stosunkowo głośno (86.8 dB)
Bas 100 - 315 Hz
(±) | zredukowany bas - średnio 8.4% niższy od mediany
(±) | liniowość basu jest średnia (9.3% delta do poprzedniej częstotliwości)
Średnie 400 - 2000 Hz
(+) | zbalansowane środki średnie - tylko 2.5% od mediany
(+) | średnie są liniowe (1.5% delta do poprzedniej częstotliwości)
Wysokie 2–16 kHz
(+) | zrównoważone maksima - tylko 3.7% od mediany
(+) | wzloty są liniowe (5.2% delta do poprzedniej częstotliwości)
Ogólnie 100 - 16.000 Hz
(+) | ogólny dźwięk jest liniowy (8.5% różnicy w stosunku do mediany)
W porównaniu do tej samej klasy
» 0% wszystkich testowanych urządzeń w tej klasie było lepszych, 0% podobnych, 99% gorszych
» Najlepszy miał deltę 7%, średnia wynosiła ###średnia###%, najgorsza wynosiła 53%
W porównaniu do wszystkich testowanych urządzeń
» 2% wszystkich testowanych urządzeń było lepszych, 1% podobnych, 97% gorszych
» Najlepszy miał deltę 4%, średnia wynosiła ###średnia###%, najgorsza wynosiła 134%
Apple MacBook Pro 16 2021 M1 Pro analiza dźwięku
(+) | głośniki mogą odtwarzać stosunkowo głośno (84.7 dB)
Bas 100 - 315 Hz
(+) | dobry bas - tylko 3.8% od mediany
(+) | bas jest liniowy (5.2% delta do poprzedniej częstotliwości)
Średnie 400 - 2000 Hz
(+) | zbalansowane środki średnie - tylko 1.3% od mediany
(+) | średnie są liniowe (2.1% delta do poprzedniej częstotliwości)
Wysokie 2–16 kHz
(+) | zrównoważone maksima - tylko 1.9% od mediany
(+) | wzloty są liniowe (2.7% delta do poprzedniej częstotliwości)
Ogólnie 100 - 16.000 Hz
(+) | ogólny dźwięk jest liniowy (4.6% różnicy w stosunku do mediany)
W porównaniu do tej samej klasy
» 0% wszystkich testowanych urządzeń w tej klasie było lepszych, 0% podobnych, 100% gorszych
» Najlepszy miał deltę 5%, średnia wynosiła ###średnia###%, najgorsza wynosiła 45%
W porównaniu do wszystkich testowanych urządzeń
» 0% wszystkich testowanych urządzeń było lepszych, 0% podobnych, 100% gorszych
» Najlepszy miał deltę 4%, średnia wynosiła ###średnia###%, najgorsza wynosiła 134%
Zarządzanie energią
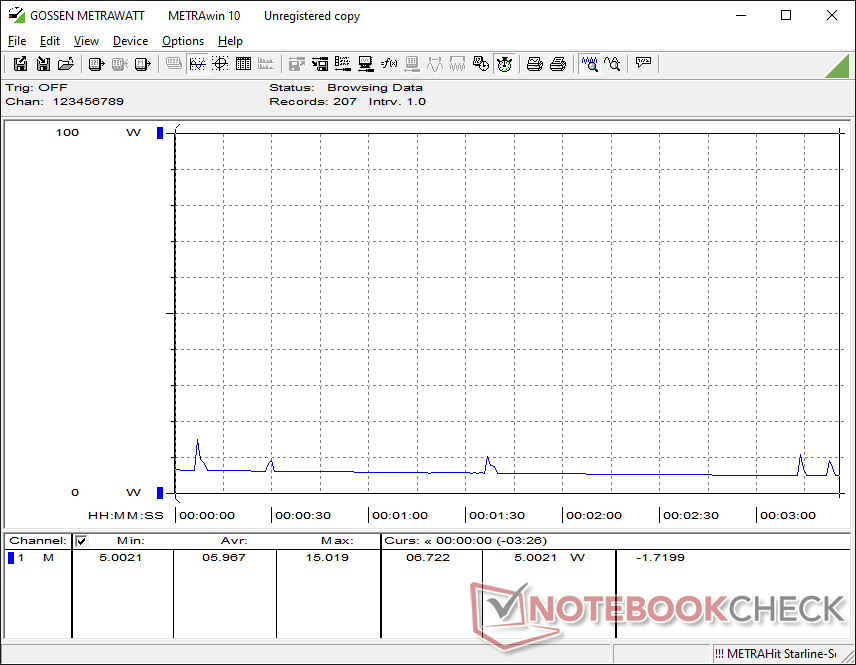
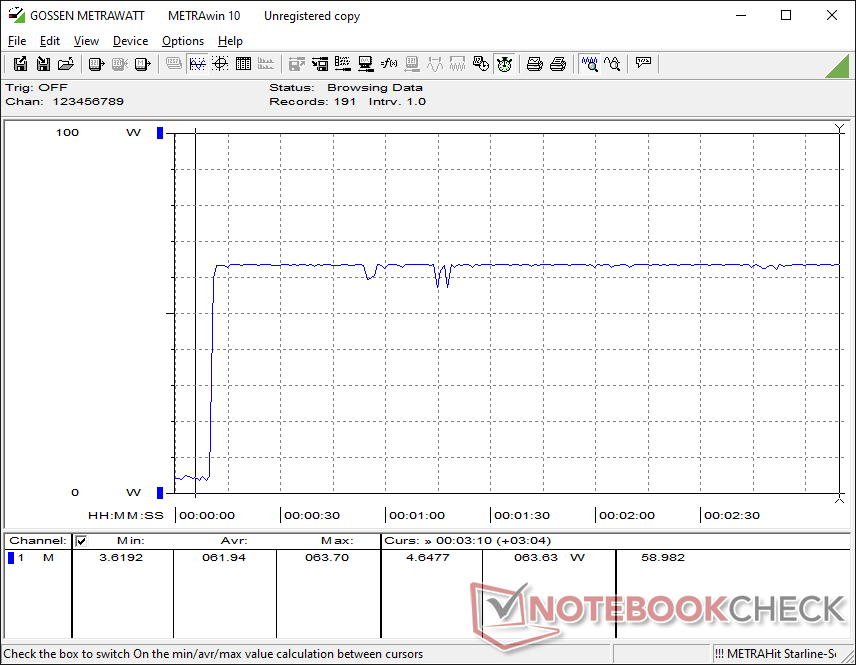
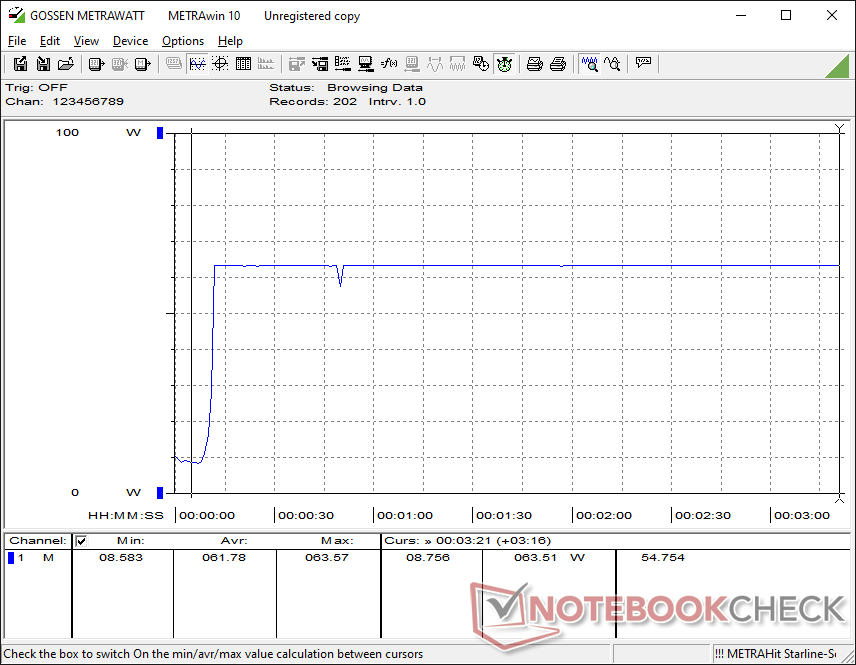
Zużycie energii
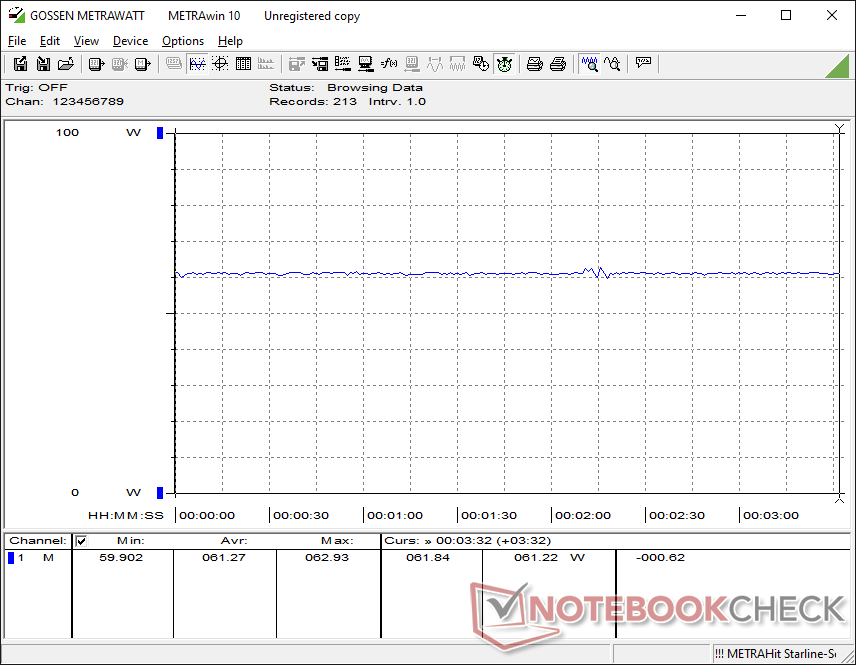
Ogólne zużycie energii jest dość podobne do zasilanego przez Ryzen AI 9 Lenovo ThinkPad P14s Gen 6, choć z kilkoma ważnymi obserwacjami. Po pierwsze, uruchomienie Cyberpunk 2077 wymaga około 61 W na naszym Asusie w porównaniu do 56 W na Lenovo, mimo że Arc B890 działa do 80 procent szybciej, co zapewnia znaczną przewagę wydajności na wat, jeśli chodzi o grafikę. Z drugiej jednak strony, uruchomienie Prime95 pobierałoby średnio 64 W w porównaniu do 55 W w przypadku tego samego Lenovo, co sugeruje stosunkowo niewielkie różnice, jeśli chodzi o wydajność procesora na wat.
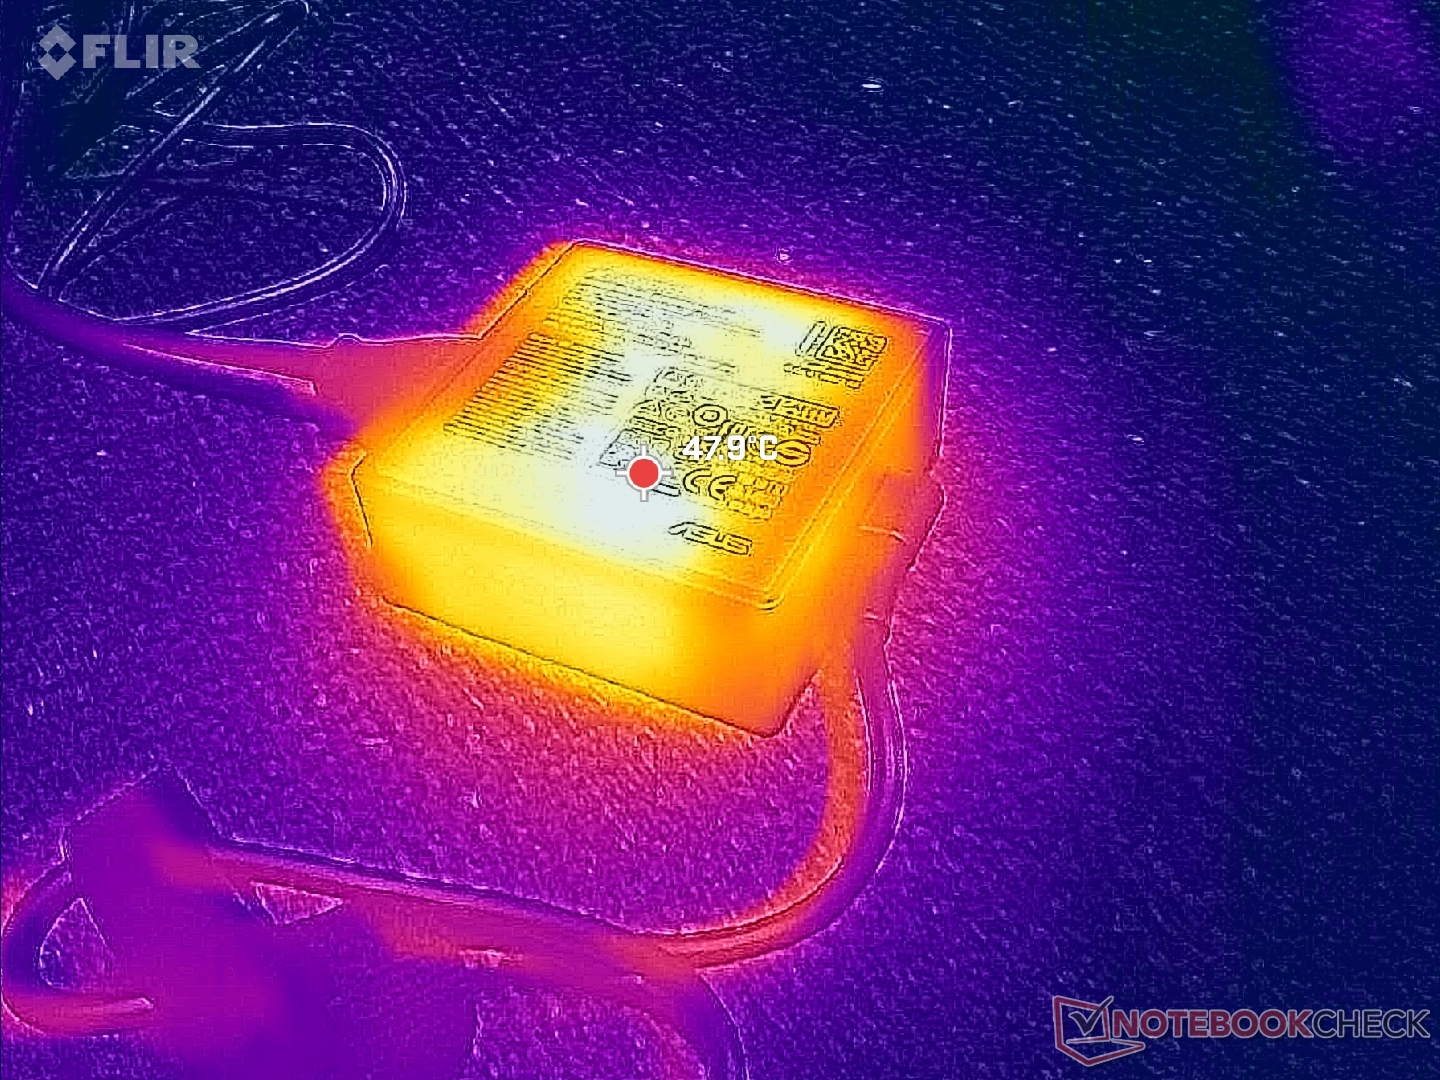
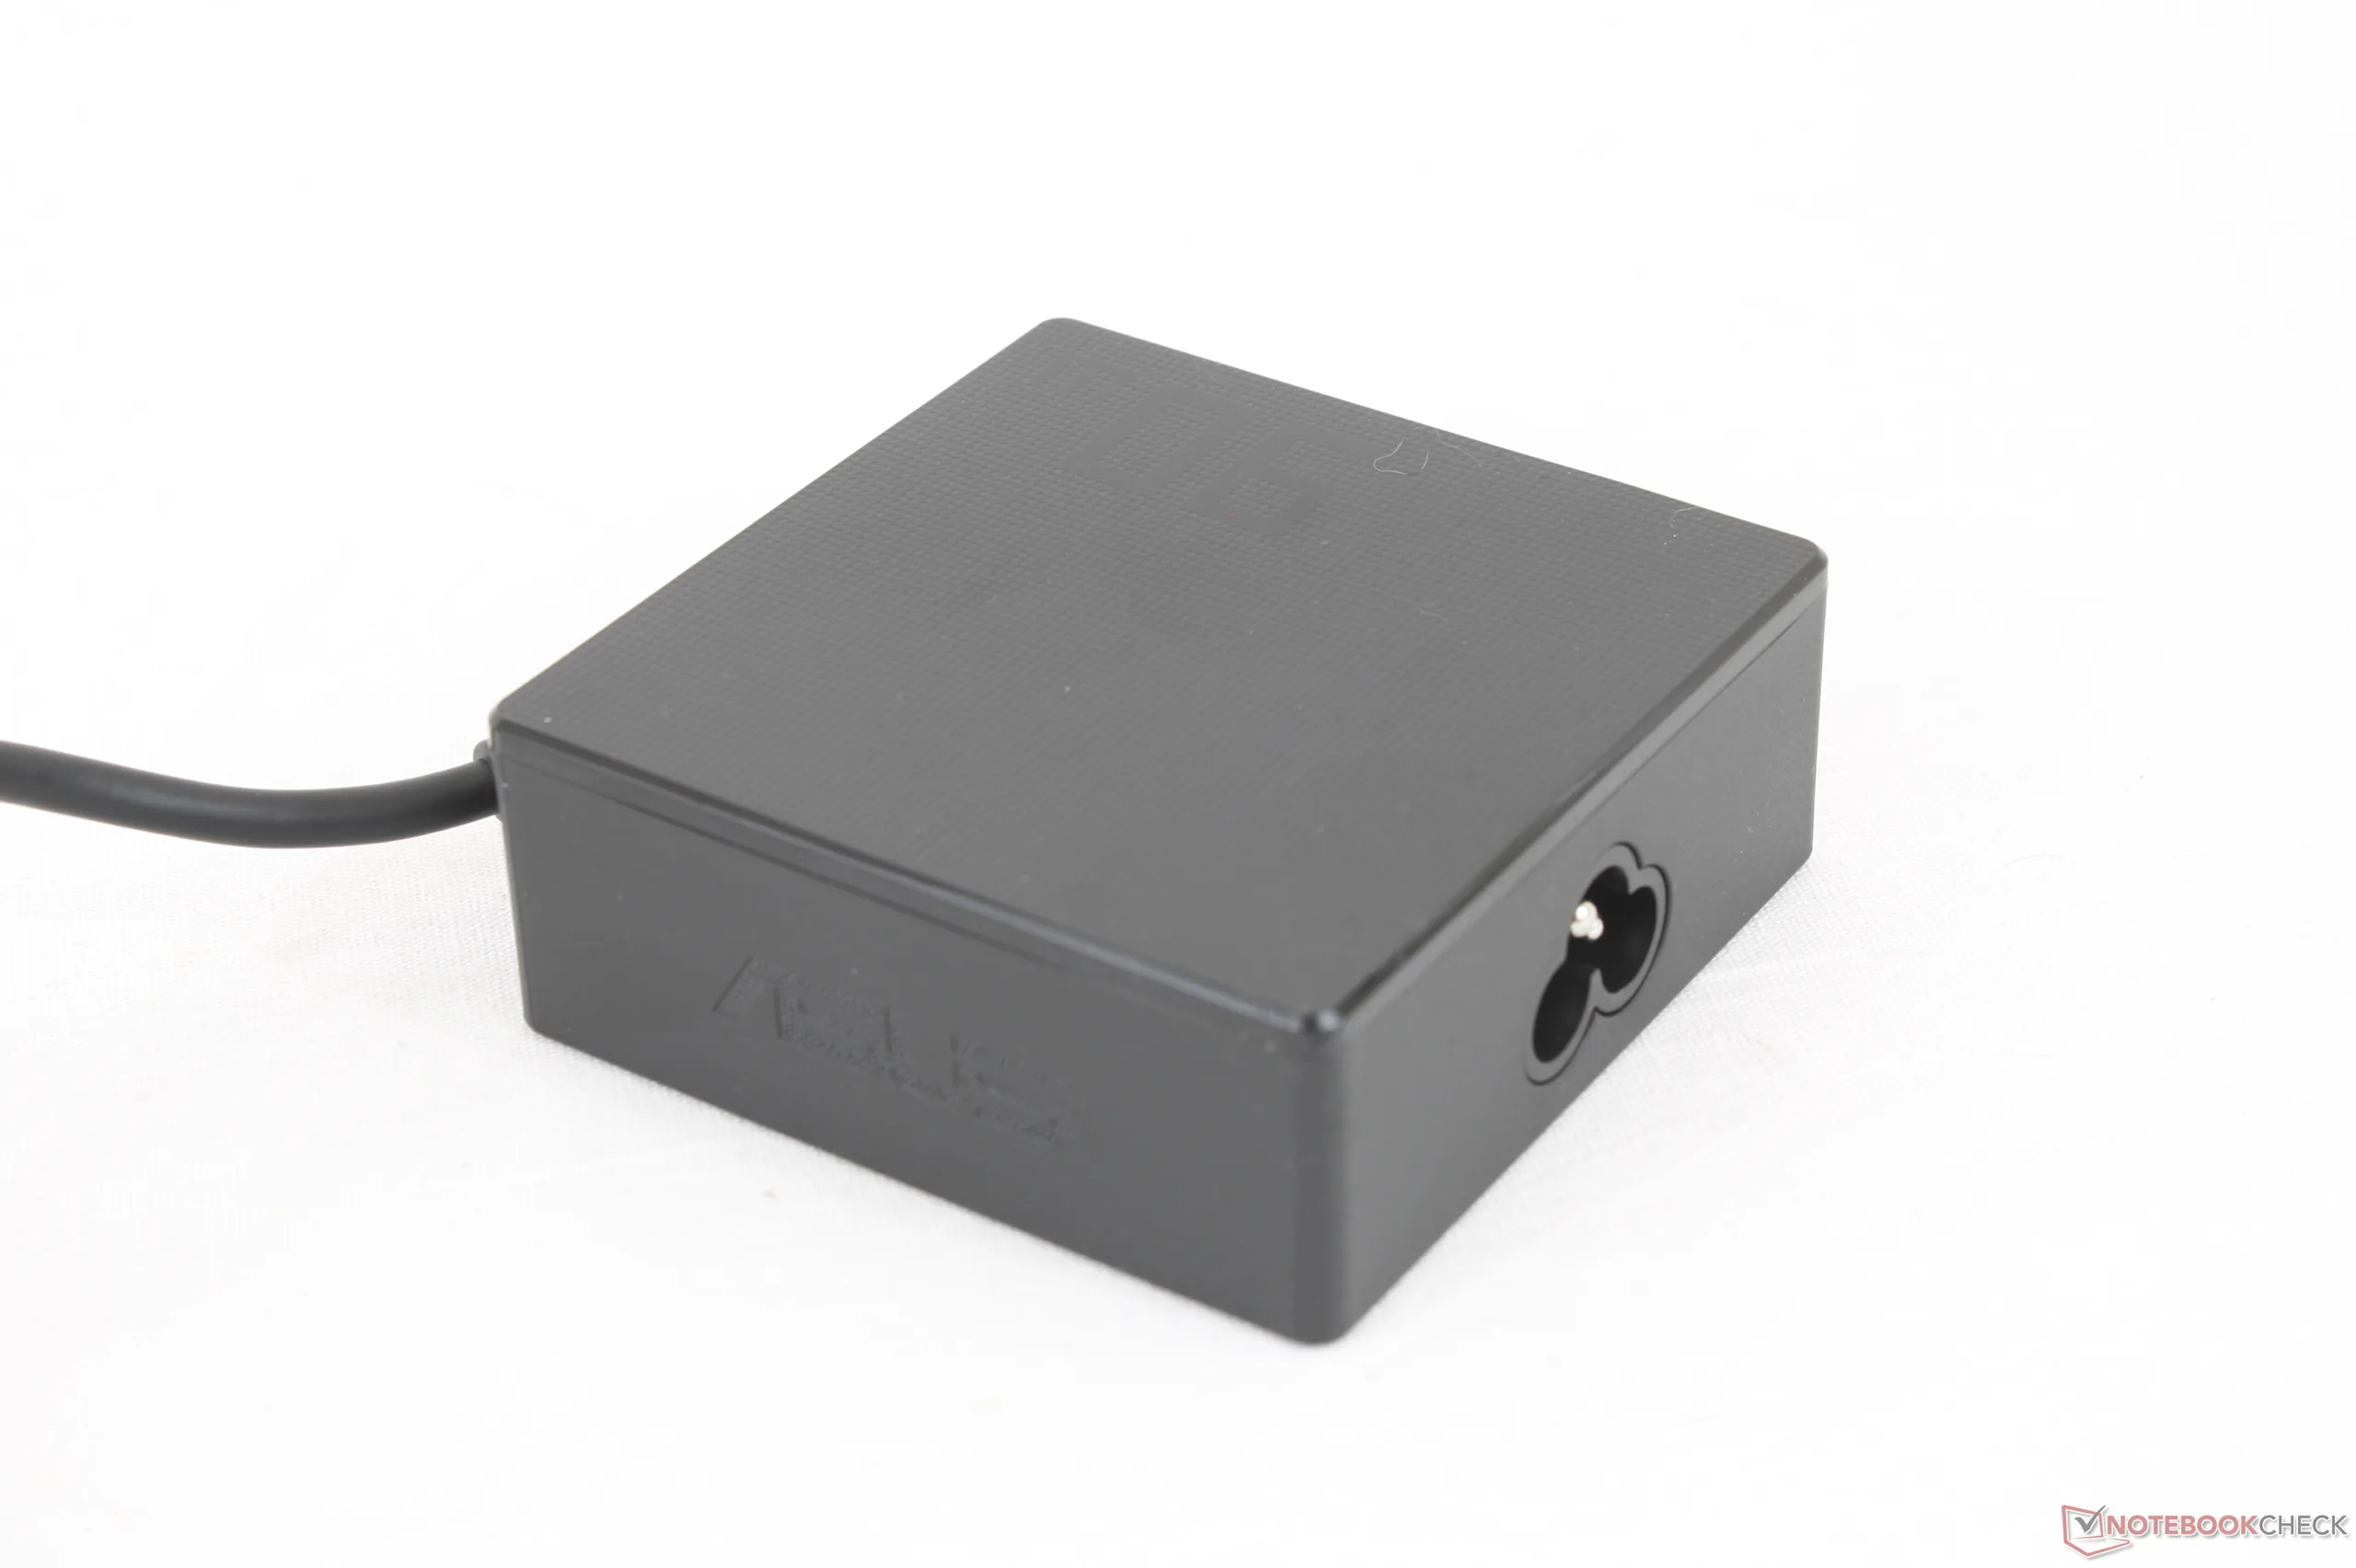
Całkowite zużycie energii, gdy procesor jest w pełni wykorzystany, osiąga wartość nieco poniżej 65 W z dołączonym zasilaczem sieciowym USB-C o mocy 90 W.
| wyłączony / stan wstrzymania | |
| luz | |
| obciążenie |
|
Legenda:
min: | |
| Asus ExpertBook Ultra B9406CAA Ultra X7 358H, Arc B390 Panther Lake iGPU, Samsung PM9E1 MZVLC2T0HBLD, OLED, 2880x1800, 14" | Dell Pro 14 Plus PB14255 GH77W Ryzen AI 7 PRO 350, Radeon 860M, Micron 2500 1TB MTFDKBA1T0QGN, IPS LED, 1920x1200, 14" | Asus ExpertBook PM3406 Ryzen AI 7 350, Radeon 860M, Western Digital PC SN5000S SDEQNSJ-512G-1002, IPS, 1920x1200, 14" | Lenovo ThinkPad T14s Gen 6 Intel Core Ultra 5 228V, Arc 130V, SK hynix PCB01 HFS001TFM9X179N GL, IPS LED, 1920x1200, 14" | Samsung Galaxy Book5 Pro 14 940XHA Core Ultra 5 226V, Arc 130V, Samsung PM9C1 MZVL8512HELU, OLED, 2880x1800, 14" | HP EliteBook Ultra G1i 14 Core Ultra 7 258V, Arc 140V, Kioxia XG8 KXG80ZNV1T02, OLED, 2880x1800, 14" | |
|---|---|---|---|---|---|---|
| Power Consumption | -9% | -15% | 15% | 8% | 7% | |
| Idle Minimum * (Watt) | 3.5 | 3.7 -6% | 3.2 9% | 3 14% | 3.7 -6% | 3.7 -6% |
| Idle Average * (Watt) | 4 | 7.3 -83% | 6.1 -53% | 4.7 -18% | 5.2 -30% | 5.4 -35% |
| Idle Maximum * (Watt) | 5.3 | 8.5 -60% | 6.9 -30% | 5.4 -2% | 5.4 -2% | 5.7 -8% |
| Load Average * (Watt) | 43.7 | 37.4 14% | 56.4 -29% | 31.8 27% | 26.2 40% | 39.4 10% |
| Cyberpunk 2077 ultra * (Watt) | 61.3 | 35.9 41% | 64.9 -6% | 38.7 37% | 47.4 23% | 35.3 42% |
| Cyberpunk 2077 ultra external monitor * (Watt) | 61.4 | 40.3 34% | 45.3 26% | 37.1 40% | 42.7 30% | 32.4 47% |
| Load Maximum * (Watt) | 63.4 | 64.6 -2% | 76.1 -20% | 58.9 7% | 63.5 -0% | 62.9 1% |
* ... im mniej tym lepiej
Pobór mocy Cyberpunk / Test warunków skrajnych
Zużycie energii przez monitor zewnętrzny
Żywotność baterii
Podczas gdy pojemność 70 Wh jest zwyczajna dla 14-calowej klasy wielkości, żywotność baterii jest czymś innym. Asus może wytrzymać nieco ponad 16 godzin rzeczywistego przeglądania sieci WLAN przed automatycznym wyłączeniem, co stanowi kilka godzin dłużej niż wiele innych subnotebooków, w tym własny, napędzany przez AMD ExpertBook PM3406.
| Asus ExpertBook Ultra B9406CAA Ultra X7 358H, Arc B390 Panther Lake iGPU, 70 Wh | Dell Pro 14 Plus PB14255 GH77W Ryzen AI 7 PRO 350, Radeon 860M, 55 Wh | Asus ExpertBook PM3406 Ryzen AI 7 350, Radeon 860M, 70 Wh | Lenovo ThinkPad P14s Gen 6 21QT0012GE Ultra 7 265H, RTX PRO 500 Blackwell Generation Laptop, 75 Wh | Samsung Galaxy Book5 Pro 14 940XHA Core Ultra 5 226V, Arc 130V, 63 Wh | HP EliteBook Ultra G1i 14 Core Ultra 7 258V, Arc 140V, 64 Wh | |
|---|---|---|---|---|---|---|
| Czasy pracy | -27% | -13% | -38% | -37% | -25% | |
| WiFi v1.3 (h) | 16.1 | 11.8 -27% | 14 -13% | 10 -38% | 10.1 -37% | 12 -25% |
| Load (h) | 1.8 | 2 |
Ocena Notebookcheck
Najwyższej klasy lekki laptop biznesowy o imponującej wydajności w stosunku do objętości, ale z mieszanymi urządzeniami wejściowymi i matowym ekranem dotykowym OLED.
Asus ExpertBook Ultra B9406CAA
- 26/01/2026 v8
Allen Ngo
 Total Sustainability Score:
 Potencjalni konkurenci w porównaniu
Obraz | Model / recenzja | Cena | Waga | Wysokość | Ekran |
|---|---|---|---|---|---|
1. 87.6%  | Asus ExpertBook Ultra B9406CAA Intel Core Ultra X7 358H ⎘ Intel Arc B390 12 Xe3 Panther Lake iGPU ⎘ 32 GB Pamięć, 2048 GB SSD | Amazon: | 1.1 kg | 15.9 mm | 14.00" 2880x1800 243 PPI OLED |
2. 84.5% 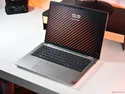 | Dell Pro 14 Plus PB14255 GH77W AMD Ryzen AI 7 PRO 350 ⎘ AMD Radeon 860M ⎘ 32 GB Pamięć, 1024 GB SSD | Amazon: Cena katalogowa: 1630 Euro | 1.6 kg | 22 mm | 14.00" 1920x1200 162 PPI IPS LED |
3. 84.7% 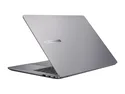 | Asus ExpertBook PM3406 AMD Ryzen AI 7 350 ⎘ AMD Radeon 860M ⎘ 16 GB Pamięć, 512 GB SSD | Amazon: Cena katalogowa: 979€ | 1.4 kg | 17.9 mm | 14.00" 1920x1200 162 PPI IPS |
4. 85.3% 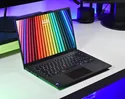 | Lenovo ThinkPad P14s Gen 6 21QT0012GE Intel Core Ultra 7 265H ⎘ NVIDIA RTX PRO 500 Blackwell Generation Laptop ⎘ 64 GB Pamięć, 2048 GB SSD | Amazon: Cena katalogowa: 2760 Euro | 1.7 kg | 23 mm | 14.50" 3072x1920 250 PPI IPS LED |
5. 86.9%  | Samsung Galaxy Book5 Pro 14 940XHA Intel Core Ultra 5 226V ⎘ Intel Arc Graphics 130V ⎘ 16 GB Pamięć, 512 GB SSD | Amazon: Cena katalogowa: 1699€ | 1.2 kg | 11.6 mm | 14.00" 2880x1800 243 PPI OLED |
6. 89.6%  | HP EliteBook Ultra G1i 14 Intel Core Ultra 7 258V ⎘ Intel Arc Graphics 140V ⎘ 32 GB Pamięć, 1024 GB SSD | Amazon: Cena katalogowa: 2349€ | 1.2 kg | 12.1 mm | 14.00" 2880x1800 243 PPI OLED |
Przezroczystość
Wyboru urządzeń do recenzji dokonuje nasza redakcja. Próbka testowa została udostępniona autorowi jako pożyczka od producenta lub sprzedawcy detalicznego na potrzeby tej recenzji. Pożyczkodawca nie miał wpływu na tę recenzję, producent nie otrzymał też kopii tej recenzji przed publikacją. Nie było obowiązku publikowania tej recenzji. Jako niezależna firma medialna, Notebookcheck nie podlega władzy producentów, sprzedawców detalicznych ani wydawców.
Tak testuje Notebookcheck
Każdego roku Notebookcheck niezależnie sprawdza setki laptopów i smartfonów, stosując standardowe procedury, aby zapewnić porównywalność wszystkich wyników. Od około 20 lat stale rozwijamy nasze metody badawcze, ustanawiając przy tym standardy branżowe. W naszych laboratoriach testowych doświadczeni technicy i redaktorzy korzystają z wysokiej jakości sprzętu pomiarowego. Testy te obejmują wieloetapowy proces walidacji. Nasz kompleksowy system ocen opiera się na setkach uzasadnionych pomiarów i benchmarków, co pozwala zachować obiektywizm.
