Notebookcheck Logo

Recenzja stacji roboczej Dell Precision 7670: Debiut Core i7-12850HX i CAMM RAM
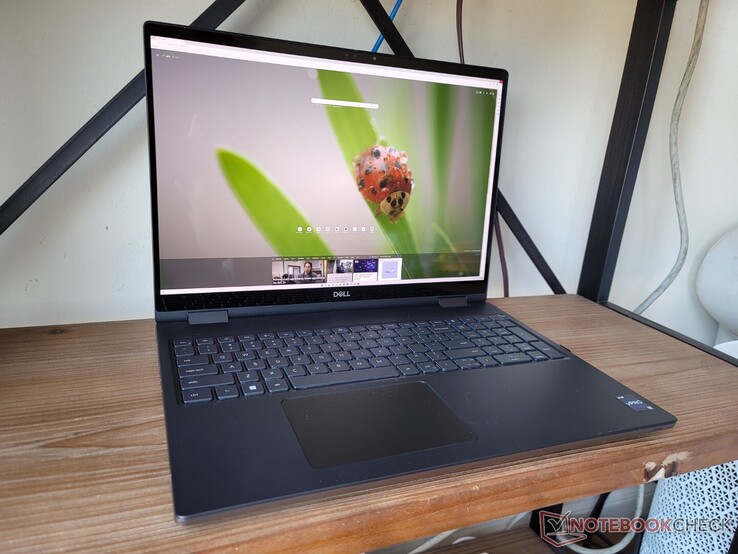
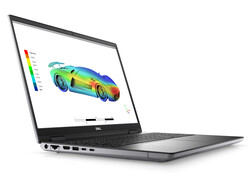
Pierwszy w historii 16-calowy Dell Precision. Precision 7670 ma wiele na swoich barkach. Nie tylko jest dostępny w dwóch wariantach grubości, ale jest też pierwszym komercyjnym produktem wykorzystującym pamięć CAMM RAM i jednym z niewielu, które dostarczane są z procesorem Core i7-12850HX vPro. Jest dobrze, ale nie bez wad.
Alder Lake Laptop / Notebook Workstation Business
Pionier technologii CAMM RAM

Seria Precision 7000 jest domem dla flagowych mobilnych stacji roboczych Della w przeciwieństwie do średniej klasy serii Precision 5000 lub budżetowej serii Precision 3000. Model Precision 7670 jest pierwszym 16-calowym modelem w rodzinie, siedzącym pomiędzy 15,6-calowym Precision 7560 a 17,3-calowym Precision 7760. Co ciekawe, Dell produkuje dwa warianty modelu Precision 7670 o nazwach "Performance base" i "Thin base". Ta recenzja dotyczy wariantu "Thin base", a recenzja "Performance base" pojawi się w późniejszym terminie.

Opcje są bardzo szerokie, od Core i5-12600HX do i9-12950HX, grafiki Iris Xe do dyskretnego Nvidia RTX A5500, wyświetlaczy FHD IPS do 4K OLED, a nawet SODIMM lub CAMM RAM do 128 GB. Nasz konkretny egzemplarz recenzencki to konfiguracja klasy średniej z procesorem i7-12850HX, 95 W RTX A2000 i ekranem dotykowym 4K OLED za około 4100 USD.

Niestety nie ma obecnie opcji Xeon lub ECC RAM dla Precision 7670, ale vPro jest obsługiwane we wszystkich SKU.

W chwili obecnej istnieje niewielu bezpośrednich konkurentów, ponieważ przestrzeń 16-calowych stacji roboczych jest wciąż stosunkowo nowa. Obecne alternatywy to m.in Asus ProArt StudioBook Pro 16, Lenovo ThinkPad P1 G4i HP ZBook Fury 16.

Więcej recenzji Della:

Dell Precision 7670
Procesor
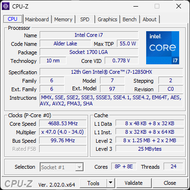
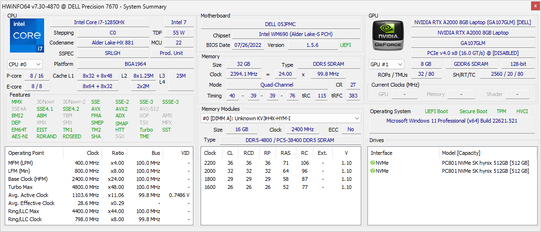
Intel Core i7-12850HX 16 x 1.5 - 4.8 GHz, 153 W PL2 / Short Burst, 72 W PL1 / Sustained, Alder Lake-HX
Karta grafiki
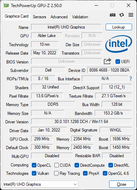
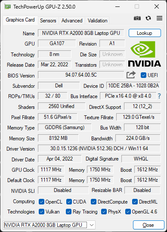
NVIDIA RTX A2000 Laptop GPU - 8 GB VRAM, rdzeń: 1612 MHz, pamięć: 1750 MHz, 95 W TDP, GDDR6, 512.36, Optimus
Pamięć
32 GB 
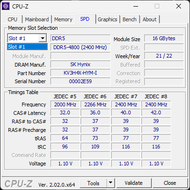
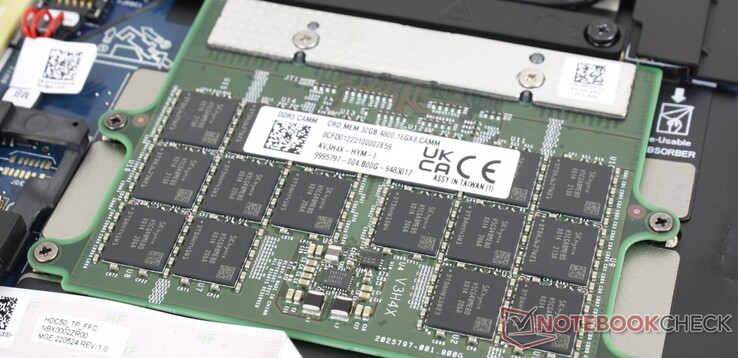
, DDR5-4800, 40-39-39-76, Dual-Channel, CAMM
Matryca
16.00 cali 16:10, 3840 x 2400 pikseli 283 PPI, 10-point capacitive, Samsung 160YV03, OLED, refleksująca: tak, 60 Hz
Chipset
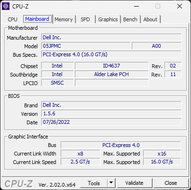
Intel WM690 (Alder Lake-S PCH)
Dysk twardy
SK Hynix HFS001TEJ9X115N, 1024 GB 
Karta dźwiękowa
Intel Alder Lake-S PCH - cAVS (Audio, Voice, Speech)
Złącza
5 USB 3.1 Gen2, 2 Thunderbolt, USB-C Power Delivery (PD), 1 HDMI, 2 DisplayPort, 1 blokada Kensingtona, gniazda audio: 3.5 mm headset, czytnik kart: SD, Brightness Sensor
Łączność
Intel Ethernet Connection I219-LM (10/100/1000MBit/s), Intel Wi-Fi 6E AX211 (a/b/g/h/n = Wi-Fi 4/ac = Wi-Fi 5/ax = Wi-Fi 6/ Wi-Fi 6E 6 GHz), Bluetooth 5.2
Gabaryty
wysokość x szerokość x głębokość (mm): 24.7 x 356 x 258.34
Akumulator
83 Wh litowo-polimerowy, 6-cell
System operacyjny
Microsoft Windows 11 Pro
Camera
kamerka: 1080p30
Primary Camera: 2.1 MPix
Inne
głośniki: Stereo, Waves Max Pro, klawiatura: Chiclet, podświetlanie klawiatury: tak, Dell Command, PremierColor, Optimizer, Power Manager, Digital Delivery, 36 miesiące(y) gwarancji
Waga
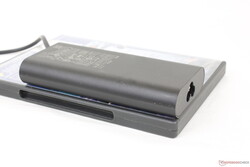
2.724 kg, zasilacz: 484 g
Cena
4100 USD
Note: The manufacturer may use components from different suppliers including display panels, drives or memory sticks with similar specifications.


Potencjalni konkurenci w porównaniu

Rating
Date
Model
Weight
Height
Size
Resolution
Best Price
88.4 %
10/2022
Dell Precision 7670
i7-12850HX, RTX A2000 Laptop GPU
2.7 kg24.7 mm16.00"3840x2400
89.3 %
Lenovo ThinkPad P1 G4-20Y4Z9DVUS
i7-11800H, T1200 Laptop GPU
1.8 kg17.7 mm16.00"2560x1600
Asus ProArt StudioBook 16 W7600H5A-2BL2
W-11955M, RTX A5000 Laptop GPU
2.4 kg21.4 mm16.00"3840x2400
88.3 %
Dell Precision 5000 5560
i7-11850H, RTX A2000 Laptop GPU
2 kg18 mm15.60"3840x2400
87.8 %
Dell Precision 7550
W-10885M, Quadro RTX 5000 Max-Q
2.8 kg27.36 mm15.60"3840x2160
90.3 %
HP ZBook Fury 15 G8
i9-11950H, RTX A5000 Laptop GPU
2.5 kg25.9 mm15.60"3840x2160

Obudowa - klasyczna Precision Look And Feel

Konstrukcja podwozia i materiały ściśle odpowiadają modelowi 2020 Precision 7550. Na przykład czarny pokład klawiatury jest nadal lekko gumowany, co daje wrażenie wysokiej jakości, a zewnętrzny metalowy szkielet pozostaje gruby, co daje mocniejsze pierwsze wrażenie niż w przypadku modelu ThinkPad P1 G4 lub Asus ProArt StudioBook. Nacisk na środek klawiatury lub zewnętrzną pokrywę powoduje odkształcenie ich powierzchni w nieco większym stopniu niż w przypadku modelu HP ZBook Studio HP ZBook Studioale poza tym nie zauważamy skrzypienia ani większych słabych punktów.

Mimo że nasz egzemplarz testowy to wersja z "cienką podstawą", Precision 7670 jest nadal stosunkowo duży i ciężki. Przy grubości 24,7 mm system jest grubszy od Asusa ProArt StudioBook 16 i tylko o włos cieńszy od HP ZBook Fury 15 G8. Jest też znacznie cięższy - po kilkaset gramów - co wynika po części z większej, 16-calowej obudowy o proporcjach 16:10.

Podstawa "Performance" jest o około 3 mm grubsza i co najmniej 70 g cięższa od podstawy "Thin" w zależności od konfiguracji.

Podwozie składa się z odzyskanych włókien węglowych i bioplastików
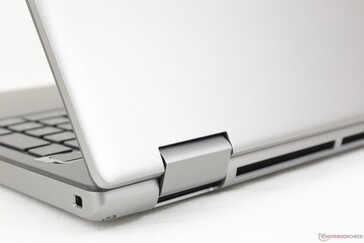
Gładka, jasnosrebrna pokrywa zewnętrzna ma fakturę podobną do serii XPS lub większości innych modeli Precision
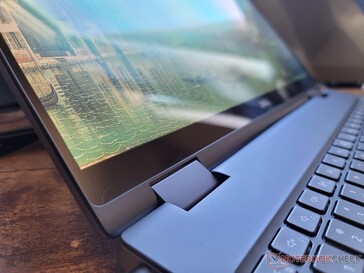
Wyświetlacz może otworzyć się w pełnym zakresie 180 stopni
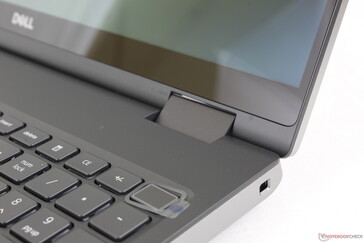
Sztywność zawiasów jest przyzwoita, z minimalnym teeteringiem. Jednak przy większych kątach mógłby być sztywniejszy
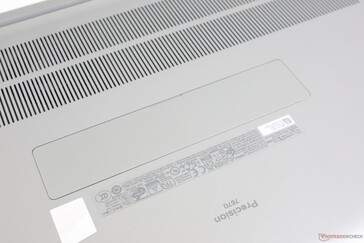
Opcjonalny właz umożliwiający dostęp do jednego z wewnętrznych dysków SSD bez konieczności zdejmowania całego panelu dolnego
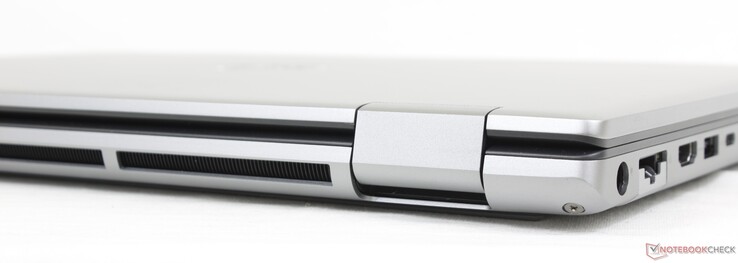
Obudowa testowana w systemie MIL-STD. Większa część tyłu jest zarezerwowana dla wentylacji

Porównanie wielkości

360 mm 242 mm 27.36 mm 2.8 kg362 mm 264 mm 21.4 mm 2.4 kg357 mm 242.5 mm 25.9 mm 2.5 kg356 mm 258.34 mm 24.7 mm 2.7 kg359.5 mm 253.8 mm 17.7 mm 1.8 kg344.72 mm 230.14 mm 18 mm 2 kg297 mm 210 mm 1 mm 5.7 g

Łączność - Thunderbolt 4, ale brak PD-In

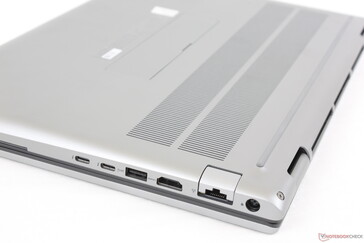
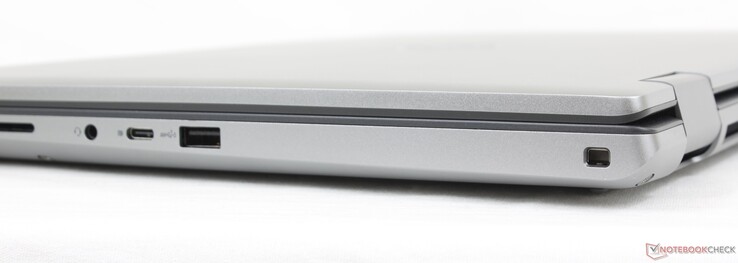
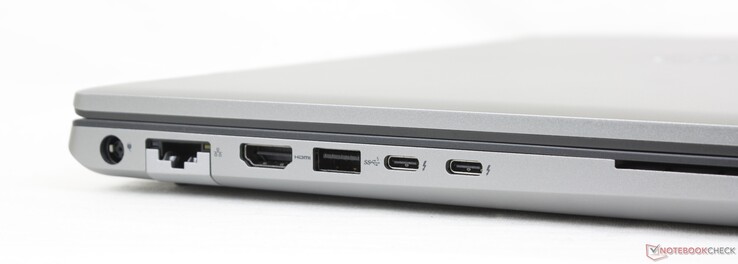
Opcje portów są doskonałe, zwłaszcza że jest ich więcej niż w większości innych stacji roboczych. Wiele portów znajduje się wzdłuż lewej krawędzi, natomiast porty na prawej krawędzi są raczej blisko przodu. Należy pamiętać, że port RJ-45 obsługuje tylko prędkość do 1 Gbps zamiast 10 Gbps.

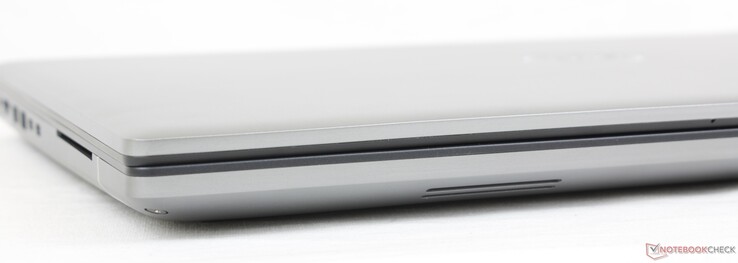
Front: Brak portów
Front: Brak portów
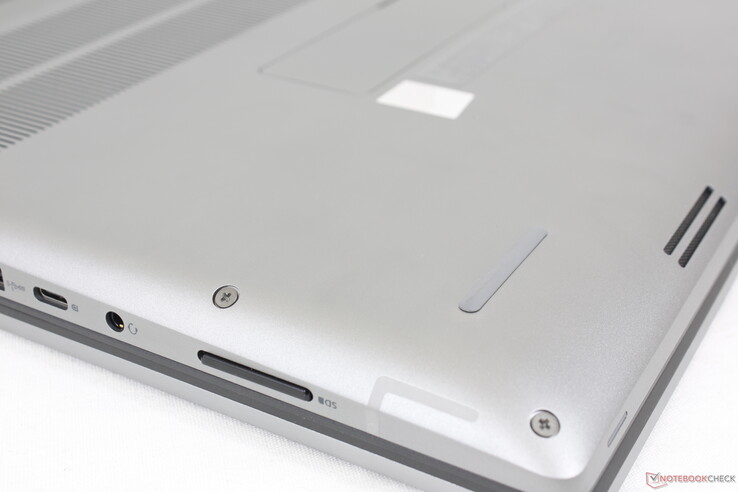
Po prawej stronie: Czytnik SD, słuchawki 3,5 mm, Thunderbolt 4 w Power Delivery + DisplayPort 1.4, USB-A 3.2, gniazdo Wedge lock
Tył: Brak portów
Tył: Brak portów
Po lewej: zasilacz AC, Gigabit RJ-45, HDMI 2.1, USB-A 3.2, 2x Thunderbolt 4 z Power Delivery + DisplayPort 1.4, czytnik Smart Card

Czytnik kart SD

Szybkość transferu przy użyciu sprężynowego czytnika SD jest równie szybka jak w przypadku Precision 7550 lub ponad dwukrotnie szybsza niż w przypadku HP ZBook Fury G8. Przeniesienie 1 GB zdjęć z naszej karty UHS-II na pulpit zajmuje tylko 5 do 6 sekund.

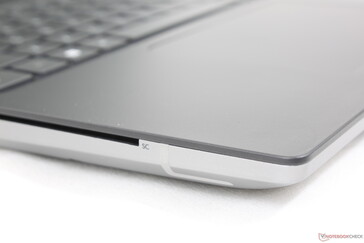
Całkowicie włożona karta SD przylega do krawędzi
SD Card Reader
average JPG Copy Test (av. of 3 runs)
Lenovo ThinkPad P1 G4-20Y4Z9DVUS
Intel Core i7-11800H (Angelbird AV Pro V60)
207 MB/s +9%
Dell Precision 5000 5560
Intel Core i7-11850H (AV Pro V60)
196.9 MB/s +4%
Dell Precision 7670
Intel Core i7-12850HX (Toshiba Exceria Pro SDXC 64 GB UHS-II)
189.6 MB/s
Dell Precision 7550
Intel Xeon W-10885M (Toshiba Exceria Pro SDXC 64 GB UHS-II)
188.2 MB/s -1%
HP ZBook Fury 15 G8
Intel Core i9-11950H (AV Pro V60)
75.6 MB/s -60%
Asus ProArt StudioBook 16 W7600H5A-2BL2
Intel Xeon W-11955M (AV Pro SD microSD 128 GB V60)
68.3 MB/s -64%
maximum AS SSD Seq Read Test (1GB)
Dell Precision 5000 5560
Intel Core i7-11850H (AV Pro V60)
198.4 MB/s +1%
Dell Precision 7550
Intel Xeon W-10885M (Toshiba Exceria Pro SDXC 64 GB UHS-II)
196.4 MB/s 0%
Dell Precision 7670
Intel Core i7-12850HX (Toshiba Exceria Pro SDXC 64 GB UHS-II)
195.8 MB/s
Lenovo ThinkPad P1 G4-20Y4Z9DVUS
Intel Core i7-11800H (Angelbird AV Pro V60)
188 MB/s -4%
HP ZBook Fury 15 G8
Intel Core i9-11950H (AV Pro V60)
87.2 MB/s -55%
Asus ProArt StudioBook 16 W7600H5A-2BL2
Intel Xeon W-11955M (AV Pro SD microSD 128 GB V60)
86.7 MB/s -56%

Komunikacja

W standardzie znajduje się układ Intel AX211, który zapewnia łączność Wi-Fi 6E oraz opcjonalnie Bluetooth. Niestety, w wielu sytuacjach Wi-Fi 6E niekoniecznie jest szybsze od Wi-Fi 6. Szybkość transferu wydaje się znacznie bardziej zróżnicowana na naszej Precision 7670 w porównaniu z większością innych stacji roboczych, nawet w odległości jednego do dwóch metrów od naszego punktu dostępowego 6 GHz.

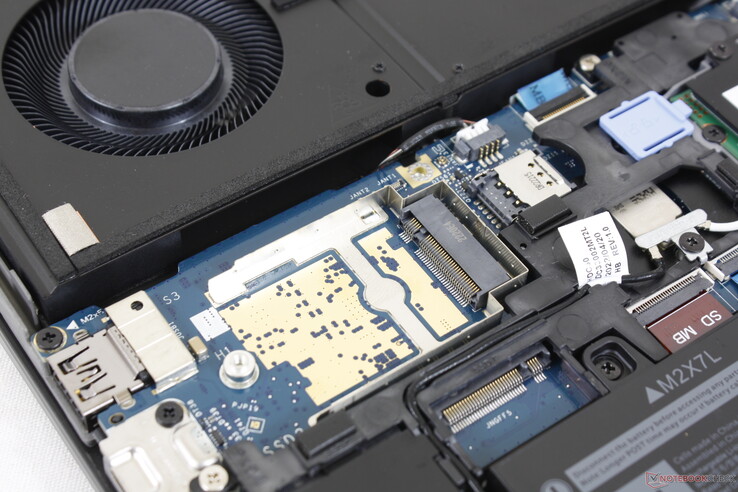
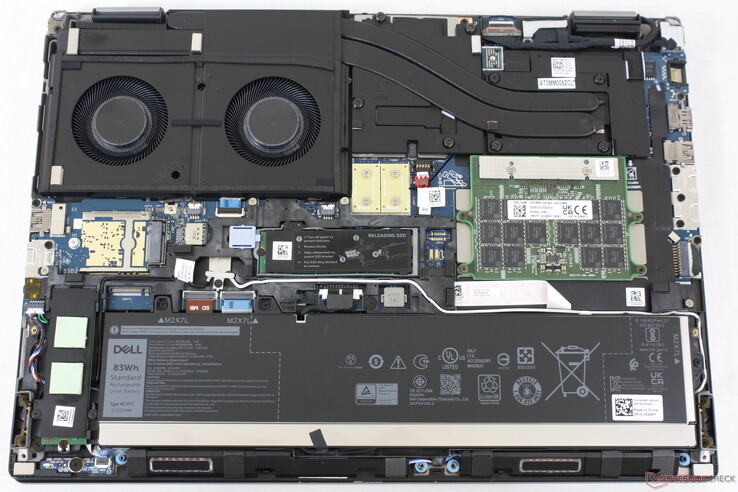
Pusty slot WAN, ponieważ nasze urządzenie nie było skonfigurowane z łącznością 4G lub 5G. Gniazdo Nano-SIM i moduł WLAN 1216 można zobaczyć po prawej stronie
Networking
iperf3 transmit AX12
Lenovo ThinkPad P1 G4-20Y4Z9DVUS
Intel Wi-Fi 6E AX210
1506 (796min - 1696max) MBit/s
HP ZBook Fury 15 G8
Intel Wi-Fi 6 AX201
1211 (954min - 1321max) MBit/s
Dell Precision 7550
Intel Wi-Fi 6 AX201
1011 (507min - 1065max) MBit/s
Dell Precision 5000 5560
Intel Wi-Fi 6 AX201
981 (864min - 1044max) MBit/s
Asus ProArt StudioBook 16 W7600H5A-2BL2
Intel Wi-Fi 6 AX201
884 (468min - 938max) MBit/s
iperf3 receive AX12
Dell Precision 5000 5560
Intel Wi-Fi 6 AX201
1382 (1340min - 1446max) MBit/s
Lenovo ThinkPad P1 G4-20Y4Z9DVUS
Intel Wi-Fi 6E AX210
1361 (1205min - 1473max) MBit/s
Dell Precision 7550
Intel Wi-Fi 6 AX201
1316 (579min - 1479max) MBit/s
HP ZBook Fury 15 G8
Intel Wi-Fi 6 AX201
1249 (1170min - 1318max) MBit/s
Asus ProArt StudioBook 16 W7600H5A-2BL2
Intel Wi-Fi 6 AX201
579 (368min - 652max) MBit/s
iperf3 receive AXE11000 6GHz
Dell Precision 7670
Intel Wi-Fi 6E AX211
1291 (749min - 1395max) MBit/s
iperf3 transmit AXE11000 6GHz
Dell Precision 7670
Intel Wi-Fi 6E AX211
1097 (844min - 1256max) MBit/s
05010015020025030035040045050055060065070075080085090095010001050110011501200125013001350Tooltip
Dell Precision 7670; iperf3 transmit AXE11000 6GHz; iperf 3.1.3: Ø1097 (844-1256)
Dell Precision 7670; iperf3 receive AXE11000 6GHz; iperf 3.1.3: Ø1291 (749-1395)

Kamera internetowa

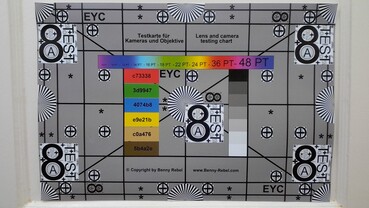
Kamera internetowa o rozdzielczości 2 MP jest ulepszeniem w stosunku do kamer 1 MP w większości systemów XPS. Nadal jednak wypada blado w porównaniu z kamerami 5 MP w większości najnowszych laptopów HP

Zarówno podczerwień, jak i migawka są dołączone, odpowiednio, dla wsparcia Windows Hello i prywatności.
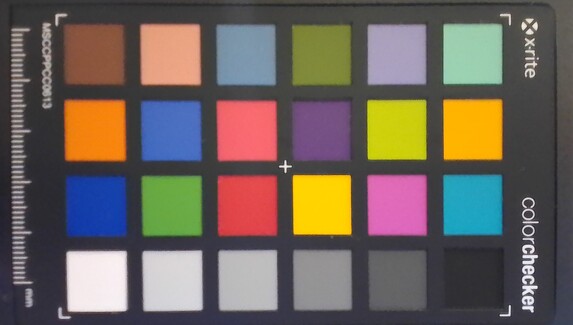
ColorChecker
6.9 ∆E
8.1 ∆E
10.9 ∆E
15.5 ∆E
12 ∆E
9.1 ∆E
6.1 ∆E
8.1 ∆E
12.2 ∆E
7.5 ∆E
11.3 ∆E
6.4 ∆E
4 ∆E
9.1 ∆E
12.3 ∆E
4.5 ∆E
9.7 ∆E
10.4 ∆E
5.4 ∆E
3.2 ∆E
7.8 ∆E
9.5 ∆E
6.4 ∆E
2.7 ∆E
ColorChecker Dell Precision 7670: 8.3 ∆E min: 2.75 - max: 15.52 ∆E

Konserwacja - łatwy dostęp

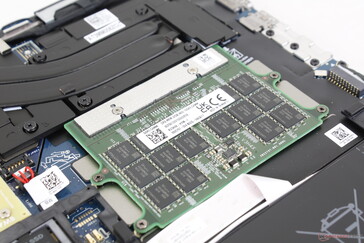
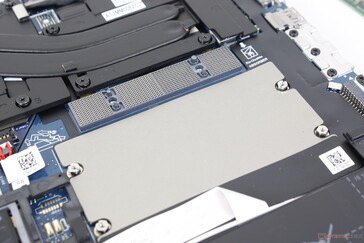
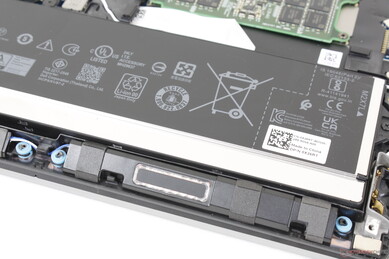
Dolny panel jest zabezpieczony 6 śrubkami Philipsa, co ułatwia serwisowanie. Użytkownicy mają dostęp do dwóch slotów M.2 PCIe4 x4 2280, slotu WAN, slotu Nano-SIM oraz slotów SODIMM lub CAMM w zależności od konfiguracji. Moduł WLAN nie jest wymienny.

Niektóre konfiguracje mogą pomieścić do trzech dysków SSD M.2, czego przykładem jest trzecie gniazdo M.2 w pobliżu krawędzi akumulatora.

Więcej informacji na temat pamięci RAM CAMM można znaleźć na naszej stronie zapowiedzi tutaj.

Akcesoria i gwarancja

W pudełku nie ma żadnych dodatków poza zasilaczem sieciowym i dokumentacją. Trzyletnia ograniczona gwarancja producenta jest standardem w przypadku zakupu bezpośrednio od firmy Dell.

Urządzenia wejściowe - duży clickpad z wygodną klawiaturą

Klawiatura

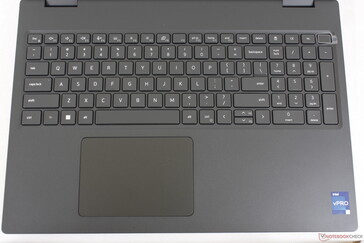
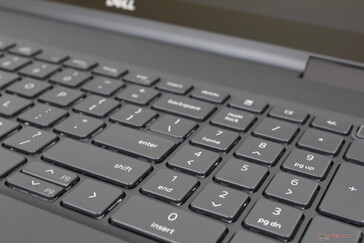
Układ klawiszy i opinie nie uległy zmianie w stosunku do modelu Precision 7550. Klawisze są naszym zdaniem nieco głośniejsze od klawiszy w serii XPS, ale za to mają silniejsze sprzężenie zwrotne i głębszy skok. Klawisze strzałek są jednak nadal ciasne, w przeciwieństwie do większych klawiszy strzałek w ThinkPadzie P1 G4 czy Asusie ProArt StudioBook.

Touchpad

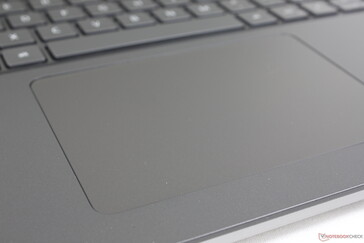
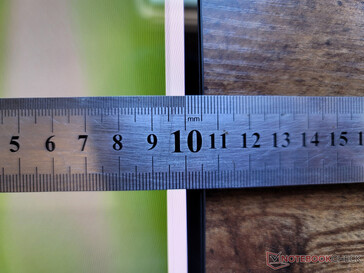
Klikpad jest większy niż ten w modelu Precision 7550 (11,5 x 8 cm vs. 10 x 6,5 cm). Nie ma już jednak dedykowanych przycisków myszy, a więc wrażenia użytkownika są bliższe tradycyjnemu Ultrabookowi niż biznesowemu ThinkPadowi czy ZBookowi, w których przyciski myszy są nadal widoczne. Osobiście wolimy dedykowane przyciski, ponieważ akcje przeciągania i upuszczania są łatwiejsze, ale brak przycisków zaowocował większą powierzchnią clickpada, co inni mogą docenić.

Czarny pokład klawiatury i klawisze bardzo szybko gromadzą odciski palców
Sprzężenie zwrotne podczas klikania nie jest zbyt ostre ani miękkie, co zapewnia satysfakcjonujące odczucia
Dwupoziomowe białe podświetlenie podświetla wszystkie klawisze i symbole
Klawisze Numpad są tej samej wielkości co główne klawisze QWERTY

Wyświetlacz - bez opcji 120 Hz

Dell oferuje trzy opcje wyświetlacza, jak w tym piśmie

  • 1200p, 60 Hz, 60 procent sRGB, 250 nitów, bezdotykowy
  • 1200p, 60 Hz, 99% DCI-P3, 500 nitów, bezdotykowy, IPS
  • 2400p, 60 Hz, 100 procent DCI-P3, 400 nitów, dotykowy, OLED

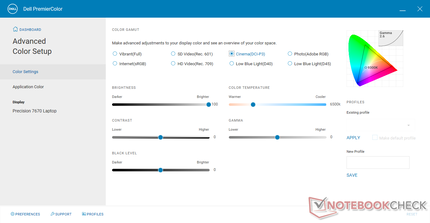
Nasze niezależne pomiary poniżej odzwierciedlają tylko pogrubioną opcję powyżej. Jeśli dokładne kolory są ważne dla Twoich zadań, to zdecydowanie zalecamy unikanie podstawowej opcji 250 nitów, ponieważ jej reprodukcja kolorów jest tak słaba, jak w przypadku wielu budżetowych laptopów konsumenckich. Właściciele powinni zapoznać się z oprogramowaniem Dell PremierColor służącym do regulacji profilu kolorów wyświetlacza

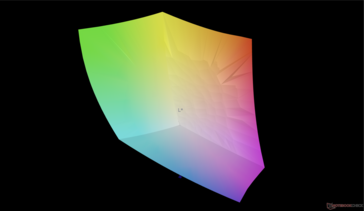
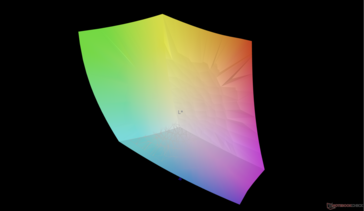
Choć jesteśmy w stanie potwierdzić pełne pokrycie DCI-P3 panelu OLED za pomocą naszego własnego kolorymetru X-Rite, maksymalna jasność ekranu wynosi tylko około 340 nitów w porównaniu z reklamowanymi 400 nitami, nawet po wyłączeniu automatycznej kontroli jasności. To sprawia, że nasz wyświetlacz jest ciemniejszy niż w większości innych stacji roboczych, gdzie jasność 450-nitów lub większa jest powszechna.

Wyraźna matryca subpikselowa o minimalnej ziarnistości, doskonała jednorodność jasności i brak krwawienia z podświetlenia
Ustawienia Dell PremierColor dla naszych pomiarów DCI-P3
Ochrona szklana od krawędzi do krawędzi
Bardzo wąskie ramki dla stacji roboczej
345.8
cd/m²
339.7
cd/m²
341.8
cd/m²
345.3
cd/m²
340.1
cd/m²
341
cd/m²
344.1
cd/m²
339.9
cd/m²
339.7
cd/m²
podświetlenie ekranu
Samsung 160YV03 tested with X-Rite i1Pro 2
maksimum: 345.8 cd/m² (Nits) średnia: 341.9 cd/m² Minimum: 0.86 cd/m²
rozświetlenie: 98 %
na akumulatorze: 340.1 cd/m²
kontrast: ∞:1 (czerń: 0 cd/m²)
ΔE Color 2.5 | 0.5-29.43 Ø5
ΔE Greyscale 3.5 | 0.57-98 Ø5.3
97.5% AdobeRGB 1998 (Argyll 2.2.0 3D)
100% sRGB (Argyll 2.2.0 3D)
99.9% Display P3 (Argyll 2.2.0 3D)
Gamma: 2.12
Dell Precision 7670
Samsung 160YV03, OLED, 3840x2400, 16.00
Lenovo ThinkPad P1 G4-20Y4Z9DVUS
NE160QDM-N63, IPS, 2560x1600, 16.00
Asus ProArt StudioBook 16 W7600H5A-2BL2
ATNA60YV02-0, OLED, 3840x2400, 16.00
Dell Precision 5000 5560
Sharp LQ156R1, IPS, 3840x2400, 15.60
Dell Precision 7550
AU Optronics B156ZAN, IPS, 3840x2160, 15.60
HP ZBook Fury 15 G8
BOE0969, IPS, 3840x2160, 15.60
Display
-17%
0%
-1%
-6%
-5%
Display P3 Coverage
99.9
72.7
-27%
99.9
0%
94.9
-5%
82.1
-18%
95.9
-4%
sRGB Coverage
100
99.3
-1%
100
0%
100
0%
99.6
0%
100
0%
AdobeRGB 1998 Coverage
97.5
74.7
-23%
98.6
1%
100
3%
96.8
-1%
87.3
-10%
Response Times
-1494%
99%
-1902%
-2098%
-565%
Response Time Grey 50% / Grey 80% *
1.9 ?(1.1, 0.8)
40.8
-2047%
2 ?(1, 1)
-5%
47.2 ?(25.2, 22)
-2384%
51.2 ?(24.4, 26.8)
-2595%
14.8 ?(7.6, 7.2)
-679%
Response Time Black / White *
2 ?(0.8, 1.2)
20.8
-940%
2 ?(1, 1)
-0%
30.4 ?(16.4, 14)
-1420%
34 ?(20, 14)
-1600%
11 ?(7.6, 3.4)
-450%
PWM Frequency
59.5 ?(100)
240 ?(80)
303%
Screen
7%
18%
-4%
-16%
-10%
Brightness middle
340.1
441
30%
353
4%
501.5
47%
473.5
39%
626
84%
Brightness
342
420
23%
360
5%
467
37%
461
35%
589
72%
Brightness Distribution
98
90
-8%
96
-2%
83
-15%
90
-8%
87
-11%
Black Level *
0.27
0.44
0.55
0.58
Colorchecker dE 2000 *
2.5
2.6
-4%
2.45
2%
4.73
-89%
4.8
-92%
5.41
-116%
Colorchecker dE 2000 max. *
8.19
6
27%
3.75
54%
8.45
-3%
8.73
-7%
9.05
-11%
Greyscale dE 2000 *
3.5
4.5
-29%
1.88
46%
3.6
-3%
5.6
-60%
6.2
-77%
Gamma
2.12 104%
2.18 101%
2.31 95%
2.08 106%
2.34 94%
2.66 83%
CCT
6704 97%
6623 98%
6441 101%
6447 101%
7549 86%
6101 107%
Contrast
1633
1140
861
1079
Colorchecker dE 2000 calibrated *
1.2
2.77
0.51
3.08
0.6
Color Space (Percent of AdobeRGB 1998)
86.4
Color Space (Percent of sRGB)
99.7
Total Average (Program / Settings)
-501% / -273%
39% / 34%
-636% / -348%
-707% / -392%
-193% / -109%

* ... im mniej tym lepiej

vs. sRGB
vs. sRGB
vs. P3
vs. P3

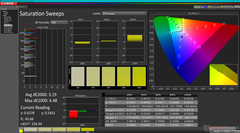
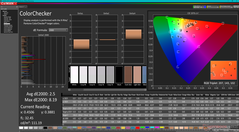
Nigdzie w żadnej z reklam czy materiałów Della nie ma mowy o fabrycznie skalibrowanym wyświetlaczu. Skala szarości i kolory są mimo wszystko dość dokładne na naszym panelu OLED, a średnie wartości deltaE wynoszą odpowiednio 3,5 i 2,5.

Skala szarości (vs. P3)
Przemiatanie nasycenia (vs. P3)
ColorChecker (vs. P3)

Display Response Times

Display response times show how fast the screen is able to change from one color to the next. Slow response times can lead to afterimages and can cause moving objects to appear blurry (ghosting). Gamers of fast-paced 3D titles should pay special attention to fast response times.
       Response Time Black to White
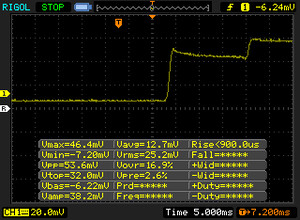
2 ms ... rise ↗ and fall ↘ combined↗ 0.8 ms rise
↘ 1.2 ms fall
The screen shows very fast response rates in our tests and should be very well suited for fast-paced gaming.
In comparison, all tested devices range from 0.1 (minimum) to 240 (maximum) ms. » 6 % of all devices are better.
This means that the measured response time is better than the average of all tested devices (21.5 ms).
       Response Time 50% Grey to 80% Grey
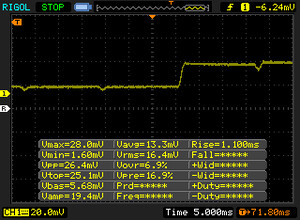
1.9 ms ... rise ↗ and fall ↘ combined↗ 1.1 ms rise
↘ 0.8 ms fall
The screen shows very fast response rates in our tests and should be very well suited for fast-paced gaming.
In comparison, all tested devices range from 0.2 (minimum) to 636 (maximum) ms. » 5 % of all devices are better.
This means that the measured response time is better than the average of all tested devices (33.7 ms).

Screen Flickering / PWM (Pulse-Width Modulation)

To dim the screen, some notebooks will simply cycle the backlight on and off in rapid succession - a method called Pulse Width Modulation (PWM) . This cycling frequency should ideally be undetectable to the human eye. If said frequency is too low, users with sensitive eyes may experience strain or headaches or even notice the flickering altogether.
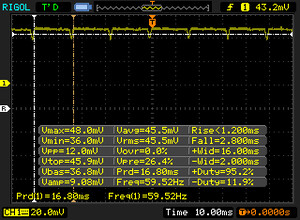
Screen flickering / PWM detected 59.5 Hz ≤ 100 % brightness setting

The display backlight flickers at 59.5 Hz (worst case, e.g., utilizing PWM) Flickering detected at a brightness setting of 100 % and below. There should be no flickering or PWM above this brightness setting.

The frequency of 59.5 Hz is very low, so the flickering may cause eyestrain and headaches after extended use.

In comparison: 53 % of all tested devices do not use PWM to dim the display. If PWM was detected, an average of 17900 (minimum: 5 - maximum: 3846000) Hz was measured.

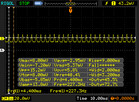
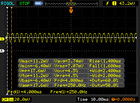
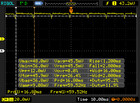
Migotanie jest obecne na wszystkich poziomach jasności, podobnie jak w większości innych paneli OLED. Jesteśmy w stanie wykryć częstotliwość 250 Hz od 1 do 56 procent jasności i 59,5 Hz od 57 procent jasności do maksimum.

0 procent jasności
0 procent jasności
25 procent jasności
25 procent jasności
jasność 50 procent
jasność 50 procent
jasność 75 procent
jasność 75 procent
100-procentowa jasność

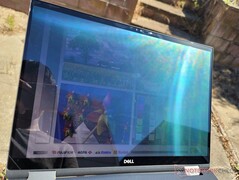
Jest ciężki odblaski, mimo że jest to technicznie "anti-glare" wyświetlacz. Podświetlenie nie jest wystarczająco jasne, aby wygodnie oglądać w większości scenariuszy na zewnątrz, chyba że zdarzy Ci się być w cieniu. Jeśli widoczność na zewnątrz jest ważna, to polecamy sprawdzićHP ZBook Fury 15 G8 który ma wyświetlacz prawie dwa razy jaśniejszy niż nasz egzemplarz Precision.

Na zewnątrz w świetle słonecznym
Na zewnątrz w cieniu
Na zewnątrz w świetle słonecznym
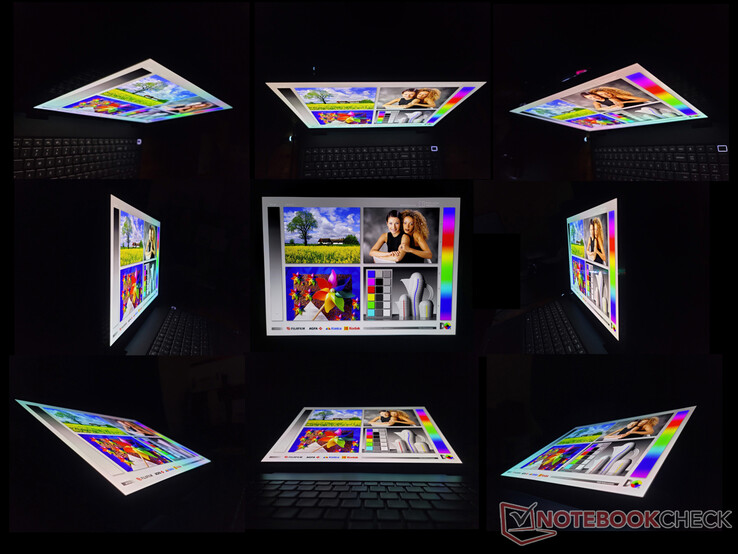
Szerokie kąty widzenia OLED. Efekt tęczy widoczny jest pod ekstremalnymi kątami, co jest unikalne dla paneli OLED

Wydajność - Intel vPro dla wszystkich


Warunki badania

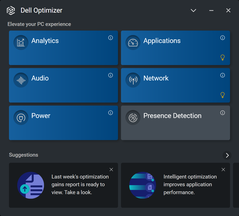
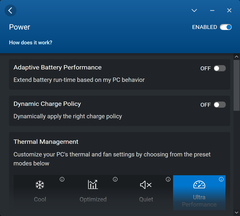
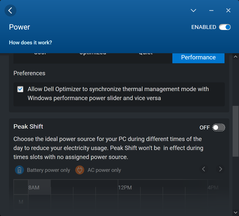
Przed uruchomieniem poniższych benchmarków ustawiliśmy nasz egzemplarz w trybie Ultra Performance za pomocą oprogramowania Dell Optimizer, a procesor graficzny w trybie dyskretnym za pomocą panelu sterowania Nvidii. Irytujące jest to, że profil zasilania można ustawić za pośrednictwem systemu Windows, programu Dell Optimizer lub Dell Power Manager, co może być bardzo mylące. Zalecamy włączenie synchronizacji profilu zasilania pomiędzy trzema różnymi aplikacjami poprzez Optimizer, jak pokazuje poniższy zrzut ekranu.

Procesor

Na papierze Core i7-12850HX ma podobne częstotliwości taktowania, liczbę rdzeni i wielkość pamięci podręcznej jak i7-12800HX ale z dodatkową obsługą vPro. W rzeczywistości jednak ich osiągi mogą się dość znacznie różnić

Wydajność procesora jest bardziej zbliżona do Core i7-12800H niż do Core i7-12800HX. W rzeczywistości wydajność wielowątkowa jest o około 30 procent wolniejsza niż w przypadku modelu i7-12800HX, który można znaleźć na płycie głównej MSI GE67 HXze względu na bardziej wydajne rozwiązanie chłodzące. Mimo to, wydajność jest wciąż jedną z najszybszych w porównaniu z innymi stacjami roboczymi, jako że wiele z nich wciąż pracuje na procesorach Intel 11. generacji.

Trwałość Turbo Boost mogłaby być lepsza. Podczas uruchamiania programu CineBench R15 xT w pętli wydajność spadała nawet o 25 procent po dwóch lub trzech powtórzeniach, co pomaga wyjaśnić duży deficyt wydajności w stosunku do wspomnianego Core i7-12800HX.

Cinebench R15 Multi Loop

0125250375500625750875100011251250137515001625175018752000212522502375Tooltip
Dell Precision 7670 Intel Core i7-12850HX: Ø1890 (1813.24-2431.76)
HP ZBook Fury 17 G8-4A6A9EA Intel Core i9-11950H: Ø1949 (1895.02-2129.93)
MSI WE76 11UM-456 Intel Core i9-11980HK: Ø2021 (1955.32-2192.14)
HP ZBook Fury 17 G7 119W5EA Intel Core i9-10885H: Ø1456 (1429.34-1516.82)
MSI WS66 10TMT-207US Intel Core i9-10980HK: Ø1668 (1647.11-1843.74)
Cinebench R20: CPU (Multi Core) | CPU (Single Core)
Cinebench R23: Multi Core | Single Core
Cinebench R15: CPU Multi 64Bit | CPU Single 64Bit
Blender: v2.79 BMW27 CPU
7-Zip 18.03: 7z b 4 | 7z b 4 -mmt1
Geekbench 5.5: Multi-Core | Single-Core
HWBOT x265 Benchmark v2.2: 4k Preset
LibreOffice : 20 Documents To PDF
R Benchmark 2.5: Overall mean
Cinebench R20 / CPU (Multi Core)
MSI GE67 HX 12UGS
Intel Core i7-12800HX
8564 Points +38%
Average Intel Core i7-12850HX
  (6217 - 6764, n=2)
6491 Points +4%
Dell Precision 7670
Intel Core i7-12850HX
6217 Points
Razer Blade 17 RTX 3080 Ti
Intel Core i7-12800H
5928 Points -5%
Lenovo Legion 7 16ARHA7
AMD Ryzen 9 6900HX
5616 Points -10%
HP Envy 16 h0112nr
Intel Core i7-12700H
5053 Points -19%
Asus Zenbook Pro 15 OLED UM535Q
AMD Ryzen 9 5900HX
4981 Points -20%
Lenovo ThinkPad P1 G4-20Y4Z9DVUS
Intel Core i7-11800H
4776 Points -23%
HP ZBook Fury 15 G8
Intel Core i9-11950H
4669 Points -25%
Dell Precision 5000 5470
Intel Core i9-12900H
4594 Points -26%
Asus ProArt StudioBook 16 W7600H5A-2BL2
Intel Xeon W-11955M
4250 Points -32%
Dell Precision 7550
Intel Xeon W-10885M
3930 Points -37%
Dell Precision 5000 5560
Intel Core i7-11850H
3826 Points -38%
Cinebench R20 / CPU (Single Core)
Razer Blade 17 RTX 3080 Ti
Intel Core i7-12800H
708 Points +3%
Average Intel Core i7-12850HX
  (687 - 708, n=2)
698 Points +2%
Dell Precision 7670
Intel Core i7-12850HX
687 Points
Dell Precision 5000 5470
Intel Core i9-12900H
685 Points 0%
HP Envy 16 h0112nr
Intel Core i7-12700H
683 Points -1%
MSI GE67 HX 12UGS
Intel Core i7-12800HX
676 Points -2%
HP ZBook Fury 15 G8
Intel Core i9-11950H
618 Points -10%
Lenovo Legion 7 16ARHA7
AMD Ryzen 9 6900HX
612 Points -11%
Lenovo ThinkPad P1 G4-20Y4Z9DVUS
Intel Core i7-11800H
585 Points -15%
Dell Precision 5000 5560
Intel Core i7-11850H
583 Points -15%
Asus Zenbook Pro 15 OLED UM535Q
AMD Ryzen 9 5900HX
577 Points -16%
Asus ProArt StudioBook 16 W7600H5A-2BL2
Intel Xeon W-11955M
568 Points -17%
Dell Precision 7550
Intel Xeon W-10885M
488 Points -29%
Cinebench R23 / Multi Core
MSI GE67 HX 12UGS
Intel Core i7-12800HX
22456 (19998.9min - 22456.2max) Points +49%
Average Intel Core i7-12850HX
  (15093 - 17510, n=2)
16302 Points +8%
Razer Blade 17 RTX 3080 Ti
Intel Core i7-12800H
15283 (13561.5min - 15283.1max) Points +1%
Dell Precision 7670
Intel Core i7-12850HX
15093 (12275min - 15093.4max) Points
Lenovo Legion 7 16ARHA7
AMD Ryzen 9 6900HX
14455 (14309.4min - 14455.1max) Points -4%
HP Envy 16 h0112nr
Intel Core i7-12700H
13094 (11750.2min - 13094.1max) Points -13%
Dell Precision 5000 5470
Intel Core i9-12900H
13077 (12213.6min - 13076.7max) Points -13%
Asus Zenbook Pro 15 OLED UM535Q
AMD Ryzen 9 5900HX
12845 (12414.2min - 12844.5max) Points -15%
Lenovo ThinkPad P1 G4-20Y4Z9DVUS
Intel Core i7-11800H
12382 Points -18%
HP ZBook Fury 15 G8
Intel Core i9-11950H
12247 (11482min - 12246.8max) Points -19%
Asus ProArt StudioBook 16 W7600H5A-2BL2
Intel Xeon W-11955M
10862 (10718min - 10862.2max) Points -28%
Dell Precision 5000 5560
Intel Core i7-11850H
9779 (9273.99min - 9779.26max) Points -35%
Cinebench R23 / Single Core
Razer Blade 17 RTX 3080 Ti
Intel Core i7-12800H
1839 Points +15%
MSI GE67 HX 12UGS
Intel Core i7-12800HX
1812 Points +14%
Dell Precision 5000 5470
Intel Core i9-12900H
1777 Points +11%
HP Envy 16 h0112nr
Intel Core i7-12700H
1772 Points +11%
Average Intel Core i7-12850HX
  (1596 - 1845, n=2)
1721 Points +8%
HP ZBook Fury 15 G8
Intel Core i9-11950H
1596 Points 0%
Dell Precision 7670
Intel Core i7-12850HX
1596 Points
Lenovo Legion 7 16ARHA7
AMD Ryzen 9 6900HX
1564 Points -2%
Dell Precision 5000 5560
Intel Core i7-11850H
1513 Points -5%
Lenovo ThinkPad P1 G4-20Y4Z9DVUS
Intel Core i7-11800H
1510 Points -5%
Asus ProArt StudioBook 16 W7600H5A-2BL2
Intel Xeon W-11955M
1480 Points -7%
Asus Zenbook Pro 15 OLED UM535Q
AMD Ryzen 9 5900HX
1479 Points -7%
Cinebench R15 / CPU Multi 64Bit
MSI GE67 HX 12UGS
Intel Core i7-12800HX
3383 (3163.31min - 3383.24max) Points +39%
Average Intel Core i7-12850HX
  (2432 - 2926, n=2)
2679 Points +10%
HP Envy 16 h0112nr
Intel Core i7-12700H
2590 (2293.84min - 2590.34max) Points +6%
Dell Precision 7670
Intel Core i7-12850HX
2432 (1813.24min - 2431.76max) Points
Lenovo Legion 7 16ARHA7
AMD Ryzen 9 6900HX
2355 (2320.19min - 2354.74max) Points -3%
Dell Precision 5000 5470
Intel Core i9-12900H
2313 (1355.47min - 2312.54max) Points -5%
Razer Blade 17 RTX 3080 Ti
Intel Core i7-12800H
2222 (2140.41min - 2221.61max) Points -9%
Asus Zenbook Pro 15 OLED UM535Q
AMD Ryzen 9 5900HX
2114 (2054.55min - 2114.16max) Points -13%
Lenovo ThinkPad P1 G4-20Y4Z9DVUS
Intel Core i7-11800H
2112 (1827.4min - 2112.04max) Points -13%
Asus ProArt StudioBook 16 W7600H5A-2BL2
Intel Xeon W-11955M
1846 (1747.11min - 1845.61max) Points -24%
HP ZBook Fury 15 G8
Intel Core i9-11950H
1827 (1695.06min - 1826.82max) Points -25%
Dell Precision 7550
Intel Xeon W-10885M
1652 (1577.91min - 1652.14max) Points -32%
Dell Precision 5000 5560
Intel Core i7-11850H
1547 (1468.05min - 1546.97max) Points -36%
Cinebench R15 / CPU Single 64Bit
Razer Blade 17 RTX 3080 Ti
Intel Core i7-12800H
265 Points +5%
Average Intel Core i7-12850HX
  (253 - 268, n=2)
261 Points +3%
MSI GE67 HX 12UGS
Intel Core i7-12800HX
260 Points +3%
HP Envy 16 h0112nr
Intel Core i7-12700H
256 Points +1%
Dell Precision 7670
Intel Core i7-12850HX
253 Points
Lenovo Legion 7 16ARHA7
AMD Ryzen 9 6900HX
251 Points -1%
Dell Precision 5000 5470
Intel Core i9-12900H
248 Points -2%
HP ZBook Fury 15 G8
Intel Core i9-11950H
241 Points -5%
Asus Zenbook Pro 15 OLED UM535Q
AMD Ryzen 9 5900HX
236 Points -7%
Dell Precision 5000 5560
Intel Core i7-11850H
232 Points -8%
Lenovo ThinkPad P1 G4-20Y4Z9DVUS
Intel Core i7-11800H
231 Points -9%
Asus ProArt StudioBook 16 W7600H5A-2BL2
Intel Xeon W-11955M
230 Points -9%
Dell Precision 7550
Intel Xeon W-10885M
208 Points -18%
Blender / v2.79 BMW27 CPU
Dell Precision 5000 5560
Intel Core i7-11850H
313 Seconds * -53%
Dell Precision 7550
Intel Xeon W-10885M
281 Seconds * -37%
Asus ProArt StudioBook 16 W7600H5A-2BL2
Intel Xeon W-11955M
276 Seconds * -35%
HP ZBook Fury 15 G8
Intel Core i9-11950H
261 Seconds * -27%
Lenovo ThinkPad P1 G4-20Y4Z9DVUS
Intel Core i7-11800H
250 Seconds * -22%
HP Envy 16 h0112nr
Intel Core i7-12700H
249 Seconds * -21%
Dell Precision 5000 5470
Intel Core i9-12900H
248 Seconds * -21%
Asus Zenbook Pro 15 OLED UM535Q
AMD Ryzen 9 5900HX
245 Seconds * -20%
Razer Blade 17 RTX 3080 Ti
Intel Core i7-12800H
222 Seconds * -8%
Lenovo Legion 7 16ARHA7
AMD Ryzen 9 6900HX
215 Seconds * -5%
Dell Precision 7670
Intel Core i7-12850HX
205 Seconds *
Average Intel Core i7-12850HX
  (181 - 205, n=2)
193 Seconds * +6%
MSI GE67 HX 12UGS
Intel Core i7-12800HX
153.1 Seconds * +25%
7-Zip 18.03 / 7z b 4
MSI GE67 HX 12UGS
Intel Core i7-12800HX
76947 MIPS +43%
Lenovo Legion 7 16ARHA7
AMD Ryzen 9 6900HX
62721 MIPS +16%
Razer Blade 17 RTX 3080 Ti
Intel Core i7-12800H
62100 MIPS +15%
Average Intel Core i7-12850HX
  (53893 - 69464, n=2)
61679 MIPS +14%
Asus Zenbook Pro 15 OLED UM535Q
AMD Ryzen 9 5900HX
58141 MIPS +8%
HP Envy 16 h0112nr
Intel Core i7-12700H
54715 MIPS +2%
Dell Precision 7670
Intel Core i7-12850HX
53893 MIPS
Dell Precision 5000 5470
Intel Core i9-12900H
51968 MIPS -4%
Lenovo ThinkPad P1 G4-20Y4Z9DVUS
Intel Core i7-11800H
50077 MIPS -7%
HP ZBook Fury 15 G8
Intel Core i9-11950H
50060 MIPS -7%
Dell Precision 7550
Intel Xeon W-10885M
48044 MIPS -11%
Asus ProArt StudioBook 16 W7600H5A-2BL2
Intel Xeon W-11955M
47264 MIPS -12%
Dell Precision 5000 5560
Intel Core i7-11850H
44890 MIPS -17%
7-Zip 18.03 / 7z b 4 -mmt1
Razer Blade 17 RTX 3080 Ti
Intel Core i7-12800H
5820 MIPS +4%
Average Intel Core i7-12850HX
  (5608 - 5916, n=2)
5762 MIPS +3%
HP ZBook Fury 15 G8
Intel Core i9-11950H
5755 MIPS +3%
Dell Precision 5000 5560
Intel Core i7-11850H
5727 MIPS +2%
HP Envy 16 h0112nr
Intel Core i7-12700H
5706 MIPS +2%
Lenovo Legion 7 16ARHA7
AMD Ryzen 9 6900HX
5679 MIPS +1%
MSI GE67 HX 12UGS
Intel Core i7-12800HX
5624 MIPS 0%
Dell Precision 7670
Intel Core i7-12850HX
5608 MIPS
Lenovo ThinkPad P1 G4-20Y4Z9DVUS
Intel Core i7-11800H
5596 MIPS 0%
Asus Zenbook Pro 15 OLED UM535Q
AMD Ryzen 9 5900HX
5595 MIPS 0%
Dell Precision 5000 5470
Intel Core i9-12900H
5505 MIPS -2%
Dell Precision 7550
Intel Xeon W-10885M
5495 MIPS -2%
Asus ProArt StudioBook 16 W7600H5A-2BL2
Intel Xeon W-11955M
5222 MIPS -7%
Geekbench 5.5 / Multi-Core
MSI GE67 HX 12UGS
Intel Core i7-12800HX
14213 Points +23%
Razer Blade 17 RTX 3080 Ti
Intel Core i7-12800H
12797 Points +11%
HP Envy 16 h0112nr
Intel Core i7-12700H
12640 Points +10%
Average Intel Core i7-12850HX
  (11509 - 13095, n=2)
12302 Points +7%
Dell Precision 5000 5470
Intel Core i9-12900H
12252 Points +6%
Dell Precision 7670
Intel Core i7-12850HX
11509 Points
Lenovo Legion 7 16ARHA7
AMD Ryzen 9 6900HX
10018 Points -13%
Asus Zenbook Pro 15 OLED UM535Q
AMD Ryzen 9 5900HX
8445 Points -27%
Dell Precision 7550
Intel Xeon W-10885M
8378 Points -27%
Asus ProArt StudioBook 16 W7600H5A-2BL2
Intel Xeon W-11955M
8349 Points -27%
Lenovo ThinkPad P1 G4-20Y4Z9DVUS
Intel Core i7-11800H
8272 Points -28%
Geekbench 5.5 / Single-Core
Dell Precision 5000 5470
Intel Core i9-12900H
1805 Points +2%
Average Intel Core i7-12850HX
  (1777 - 1787, n=2)
1782 Points 0%
Dell Precision 7670
Intel Core i7-12850HX
1777 Points
HP Envy 16 h0112nr
Intel Core i7-12700H
1773 Points 0%
MSI GE67 HX 12UGS
Intel Core i7-12800HX
1759 Points -1%
Razer Blade 17 RTX 3080 Ti
Intel Core i7-12800H
1739 Points -2%
Lenovo Legion 7 16ARHA7
AMD Ryzen 9 6900HX
1589 Points -11%
Lenovo ThinkPad P1 G4-20Y4Z9DVUS
Intel Core i7-11800H
1572 Points -12%
Asus Zenbook Pro 15 OLED UM535Q
AMD Ryzen 9 5900HX
1518 Points -15%
Asus ProArt StudioBook 16 W7600H5A-2BL2
Intel Xeon W-11955M
1487 Points -16%
Dell Precision 7550
Intel Xeon W-10885M
1331 Points -25%
HWBOT x265 Benchmark v2.2 / 4k Preset
MSI GE67 HX 12UGS
Intel Core i7-12800HX
24.9 fps +44%
Lenovo Legion 7 16ARHA7
AMD Ryzen 9 6900HX
18.2 fps +5%
Dell Precision 7670
Intel Core i7-12850HX
17.3 fps
Average Intel Core i7-12850HX
  (17.2 - 17.3, n=2)
17.3 fps 0%
Razer Blade 17 RTX 3080 Ti
Intel Core i7-12800H
16.8 fps -3%
Asus Zenbook Pro 15 OLED UM535Q
AMD Ryzen 9 5900HX
15.2 fps -12%
HP Envy 16 h0112nr
Intel Core i7-12700H
14.9 fps -14%
HP ZBook Fury 15 G8
Intel Core i9-11950H
14.2 fps -18%
Lenovo ThinkPad P1 G4-20Y4Z9DVUS
Intel Core i7-11800H
14.2 fps -18%
Asus ProArt StudioBook 16 W7600H5A-2BL2
Intel Xeon W-11955M
13.4 fps -23%
Dell Precision 5000 5470
Intel Core i9-12900H
13.4 fps -23%
Dell Precision 7550
Intel Xeon W-10885M
13.1 fps -24%
Dell Precision 5000 5560
Intel Core i7-11850H
12.6 fps -27%
LibreOffice / 20 Documents To PDF
Lenovo Legion 7 16ARHA7
AMD Ryzen 9 6900HX
54 s * -11%
HP ZBook Fury 15 G8
Intel Core i9-11950H
52.2 s * -7%
Lenovo ThinkPad P1 G4-20Y4Z9DVUS
Intel Core i7-11800H
50.2 s * -3%
Asus Zenbook Pro 15 OLED UM535Q
AMD Ryzen 9 5900HX
49.5 s * -2%
Dell Precision 7670
Intel Core i7-12850HX
48.6 s *
Dell Precision 5000 5560
Intel Core i7-11850H
48 s * +1%
Average Intel Core i7-12850HX
  (46.9 - 48.6, n=2)
47.8 s * +2%
Dell Precision 7550
Intel Xeon W-10885M
46.5 s * +4%
Razer Blade 17 RTX 3080 Ti
Intel Core i7-12800H
46.4 s * +5%
Dell Precision 5000 5470
Intel Core i9-12900H
45.8 s * +6%
HP Envy 16 h0112nr
Intel Core i7-12700H
45.3 s * +7%
MSI GE67 HX 12UGS
Intel Core i7-12800HX
42 s * +14%
Asus ProArt StudioBook 16 W7600H5A-2BL2
Intel Xeon W-11955M
23 s * +53%
R Benchmark 2.5 / Overall mean
Dell Precision 7550
Intel Xeon W-10885M
0.57 sec * -21%
Asus ProArt StudioBook 16 W7600H5A-2BL2
Intel Xeon W-11955M
0.57 sec * -21%
Lenovo ThinkPad P1 G4-20Y4Z9DVUS
Intel Core i7-11800H
0.559 sec * -19%
HP ZBook Fury 15 G8
Intel Core i9-11950H
0.544 sec * -16%
Dell Precision 5000 5560
Intel Core i7-11850H
0.543 sec * -16%
Asus Zenbook Pro 15 OLED UM535Q
AMD Ryzen 9 5900HX
0.508 sec * -8%
Lenovo Legion 7 16ARHA7
AMD Ryzen 9 6900HX
0.4907 sec * -4%
Dell Precision 5000 5470
Intel Core i9-12900H
0.4771 sec * -2%
Dell Precision 7670
Intel Core i7-12850HX
0.4698 sec *
Average Intel Core i7-12850HX
  (0.45 - 0.4698, n=2)
0.4599 sec * +2%
MSI GE67 HX 12UGS
Intel Core i7-12800HX
0.459 sec * +2%
HP Envy 16 h0112nr
Intel Core i7-12700H
0.4586 sec * +2%
Razer Blade 17 RTX 3080 Ti
Intel Core i7-12800H
0.4583 sec * +2%
Cinebench R20: CPU (Multi Core) | CPU (Single Core)
Cinebench R23: Multi Core | Single Core
Cinebench R15: CPU Multi 64Bit | CPU Single 64Bit
Blender: v2.79 BMW27 CPU
7-Zip 18.03: 7z b 4 | 7z b 4 -mmt1
Geekbench 5.5: Multi-Core | Single-Core
HWBOT x265 Benchmark v2.2: 4k Preset
LibreOffice : 20 Documents To PDF
R Benchmark 2.5: Overall mean

* ... im mniej tym lepiej

Cinebench R15 CPU Multi 64Bit
2432 Points
Cinebench R15 OpenGL 64Bit
312 fps
Cinebench R15 Ref. Match 64Bit
99.6 %
Cinebench R15 CPU Single 64Bit
253 Points
Pomoc
Performance Rating
Average Intel Core i7-12850HX
 
91.3 pt
HP ZBook Fury 15 G8
Intel Core i9-11950H, RTX A5000 Laptop GPU
89.3 pt
Lenovo ThinkPad P1 G4-20Y4Z9DVUS
Intel Core i7-11800H, T1200 Laptop GPU
88.4 pt
Dell Precision 7670
Intel Core i7-12850HX, RTX A2000 Laptop GPU
80.4 pt
Asus ProArt StudioBook 16 W7600H5A-2BL2 -9!
Intel Xeon W-11955M, RTX A5000 Laptop GPU
0 pt
Dell Precision 5000 5560 -9!
Intel Core i7-11850H, RTX A2000 Laptop GPU
0 pt
AIDA64 / FP32 Ray-Trace
Lenovo ThinkPad P1 G4-20Y4Z9DVUS
Intel Core i7-11800H, T1200 Laptop GPU
15248 KRay/s +17%
Average Intel Core i7-12850HX
  (12983 - 16752, n=2)
14868 KRay/s +15%
HP ZBook Fury 15 G8
Intel Core i9-11950H, RTX A5000 Laptop GPU
14775 KRay/s +14%
Dell Precision 7670
Intel Core i7-12850HX, RTX A2000 Laptop GPU
12983 KRay/s
AIDA64 / FPU Julia
Average Intel Core i7-12850HX
  (68219 - 87231, n=2)
77725 Points +14%
Dell Precision 7670
Intel Core i7-12850HX, RTX A2000 Laptop GPU
68219 Points
Lenovo ThinkPad P1 G4-20Y4Z9DVUS
Intel Core i7-11800H, T1200 Laptop GPU
63515 Points -7%
HP ZBook Fury 15 G8
Intel Core i9-11950H, RTX A5000 Laptop GPU
61337 Points -10%
AIDA64 / CPU SHA3
Lenovo ThinkPad P1 G4-20Y4Z9DVUS
Intel Core i7-11800H, T1200 Laptop GPU
4217 MB/s +36%
HP ZBook Fury 15 G8
Intel Core i9-11950H, RTX A5000 Laptop GPU
4032 MB/s +30%
Average Intel Core i7-12850HX
  (3098 - 3818, n=2)
3458 MB/s +12%
Dell Precision 7670
Intel Core i7-12850HX, RTX A2000 Laptop GPU
3098 MB/s
AIDA64 / CPU Queen
HP ZBook Fury 15 G8
Intel Core i9-11950H, RTX A5000 Laptop GPU
97840 Points +266%
Lenovo ThinkPad P1 G4-20Y4Z9DVUS
Intel Core i7-11800H, T1200 Laptop GPU
91827 Points +244%
Average Intel Core i7-12850HX
  (26716 - 95664, n=2)
61190 Points +129%
Dell Precision 7670
Intel Core i7-12850HX, RTX A2000 Laptop GPU
26716 Points
AIDA64 / FPU SinJulia
Average Intel Core i7-12850HX
  (9869 - 11286, n=2)
10578 Points +7%
HP ZBook Fury 15 G8
Intel Core i9-11950H, RTX A5000 Laptop GPU
10001 Points +1%
Dell Precision 7670
Intel Core i7-12850HX, RTX A2000 Laptop GPU
9869 Points
Lenovo ThinkPad P1 G4-20Y4Z9DVUS
Intel Core i7-11800H, T1200 Laptop GPU
9783 Points -1%
AIDA64 / FPU Mandel
Average Intel Core i7-12850HX
  (34218 - 42580, n=2)
38399 Points +12%
Lenovo ThinkPad P1 G4-20Y4Z9DVUS
Intel Core i7-11800H, T1200 Laptop GPU
37783 Points +10%
HP ZBook Fury 15 G8
Intel Core i9-11950H, RTX A5000 Laptop GPU
36771 Points +7%
Dell Precision 7670
Intel Core i7-12850HX, RTX A2000 Laptop GPU
34218 Points
AIDA64 / CPU AES
Lenovo ThinkPad P1 G4-20Y4Z9DVUS
Intel Core i7-11800H, T1200 Laptop GPU
88402 MB/s +40%
HP ZBook Fury 15 G8
Intel Core i9-11950H, RTX A5000 Laptop GPU
83095 MB/s +31%
Average Intel Core i7-12850HX
  (63362 - 80775, n=2)
72069 MB/s +14%
Dell Precision 7670
Intel Core i7-12850HX, RTX A2000 Laptop GPU
63362 MB/s
AIDA64 / CPU ZLib
Average Intel Core i7-12850HX
  (817 - 1102, n=2)
960 MB/s +18%
Dell Precision 7670
Intel Core i7-12850HX, RTX A2000 Laptop GPU
817 MB/s
Lenovo ThinkPad P1 G4-20Y4Z9DVUS
Intel Core i7-11800H, T1200 Laptop GPU
804 MB/s -2%
HP ZBook Fury 15 G8
Intel Core i9-11950H, RTX A5000 Laptop GPU
756 MB/s -7%
Asus ProArt StudioBook 16 W7600H5A-2BL2
Intel Xeon W-11955M, RTX A5000 Laptop GPU
0 MB/s -100%
Asus ProArt StudioBook 16 W7600H5A-2BL2
Intel Xeon W-11955M, RTX A5000 Laptop GPU
0 MB/s -100%
Dell Precision 5000 5560
Intel Core i7-11850H, RTX A2000 Laptop GPU
0 MB/s -100%
AIDA64 / FP64 Ray-Trace
Average Intel Core i7-12850HX
  (7671 - 9145, n=2)
8408 KRay/s +10%
Lenovo ThinkPad P1 G4-20Y4Z9DVUS
Intel Core i7-11800H, T1200 Laptop GPU
8170 KRay/s +7%
HP ZBook Fury 15 G8
Intel Core i9-11950H, RTX A5000 Laptop GPU
8075 KRay/s +5%
Dell Precision 7670
Intel Core i7-12850HX, RTX A2000 Laptop GPU
7671 KRay/s
AIDA64 / CPU PhotoWorxx
Dell Precision 7670
Intel Core i7-12850HX, RTX A2000 Laptop GPU
42035 MPixel/s
Average Intel Core i7-12850HX
  (33415 - 42035, n=2)
37725 MPixel/s -10%
HP ZBook Fury 15 G8
Intel Core i9-11950H, RTX A5000 Laptop GPU
26370 MPixel/s -37%
Lenovo ThinkPad P1 G4-20Y4Z9DVUS
Intel Core i7-11800H, T1200 Laptop GPU
15524 MPixel/s -63%

Wydajność systemu

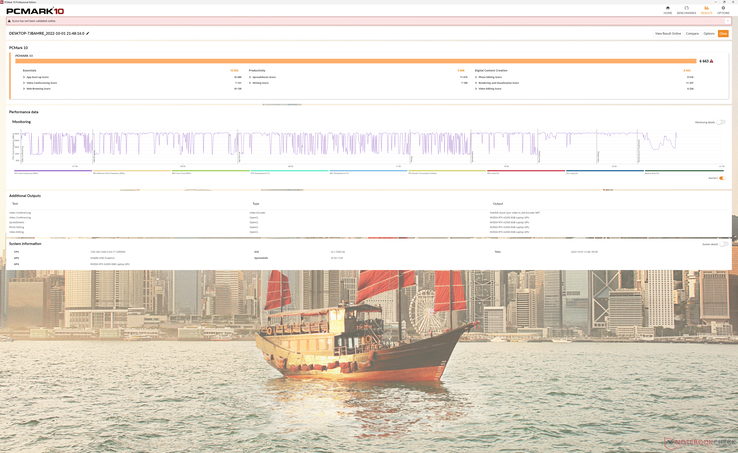
Wyniki PCMark 10 są zbliżone do innych stacji roboczych napędzanych przez procesory z serii Core H i układy graficzne Nvidia Quadro. Modele z szybszym RTX A5000 takie jak HP ZBook Fury 15 G8, wciąż przewyższają nasz testowy egzemplarz Precision 7670 w benchmarkach wykorzystujących GPU, takich jak Digital Content Creation.

PCMark 10 Standard
PCMark 10 Standard
PCMark 10 / Score
Asus ProArt StudioBook 16 W7600H5A-2BL2
RTX A5000 Laptop GPU, W-11955M, 2x Micron 2300 2TB MTFDHBA2T0TDV (RAID 0)
6951 Points +4%
HP ZBook Fury 15 G8
RTX A5000 Laptop GPU, i9-11950H, Samsung PM981a MZVLB1T0HBLR
6789 Points +2%
Dell Precision 5000 5560
RTX A2000 Laptop GPU, i7-11850H, Samsung PM9A1 MZVL22T0HBLB
6676 Points 0%
Dell Precision 7670
RTX A2000 Laptop GPU, i7-12850HX, SK Hynix HFS001TEJ9X115N
6663 Points
Lenovo ThinkPad P1 G4-20Y4Z9DVUS
T1200 Laptop GPU, i7-11800H, Samsung PM9A1 MZVL2512HCJQ
6147 Points -8%
Dell Precision 7550
Quadro RTX 5000 Max-Q, W-10885M, SK Hynix PC601A NVMe 1TB
5904 Points -11%
PCMark 10 / Essentials
Dell Precision 5000 5560
RTX A2000 Laptop GPU, i7-11850H, Samsung PM9A1 MZVL22T0HBLB
10596 Points 0%
Dell Precision 7670
RTX A2000 Laptop GPU, i7-12850HX, SK Hynix HFS001TEJ9X115N
10555 Points
Asus ProArt StudioBook 16 W7600H5A-2BL2
RTX A5000 Laptop GPU, W-11955M, 2x Micron 2300 2TB MTFDHBA2T0TDV (RAID 0)
10145 Points -4%
HP ZBook Fury 15 G8
RTX A5000 Laptop GPU, i9-11950H, Samsung PM981a MZVLB1T0HBLR
10037 Points -5%
Lenovo ThinkPad P1 G4-20Y4Z9DVUS
T1200 Laptop GPU, i7-11800H, Samsung PM9A1 MZVL2512HCJQ
9956 Points -6%
Dell Precision 7550
Quadro RTX 5000 Max-Q, W-10885M, SK Hynix PC601A NVMe 1TB
9811 Points -7%
PCMark 10 / Productivity
Dell Precision 7670
RTX A2000 Laptop GPU, i7-12850HX, SK Hynix HFS001TEJ9X115N
9008 Points
Dell Precision 5000 5560
RTX A2000 Laptop GPU, i7-11850H, Samsung PM9A1 MZVL22T0HBLB
9005 Points 0%
Asus ProArt StudioBook 16 W7600H5A-2BL2
RTX A5000 Laptop GPU, W-11955M, 2x Micron 2300 2TB MTFDHBA2T0TDV (RAID 0)
8971 Points 0%
HP ZBook Fury 15 G8
RTX A5000 Laptop GPU, i9-11950H, Samsung PM981a MZVLB1T0HBLR
8491 Points -6%
Lenovo ThinkPad P1 G4-20Y4Z9DVUS
T1200 Laptop GPU, i7-11800H, Samsung PM9A1 MZVL2512HCJQ
8353 Points -7%
Dell Precision 7550
Quadro RTX 5000 Max-Q, W-10885M, SK Hynix PC601A NVMe 1TB
7735 Points -14%
PCMark 10 / Digital Content Creation
Asus ProArt StudioBook 16 W7600H5A-2BL2
RTX A5000 Laptop GPU, W-11955M, 2x Micron 2300 2TB MTFDHBA2T0TDV (RAID 0)
10015 Points +19%
HP ZBook Fury 15 G8
RTX A5000 Laptop GPU, i9-11950H, Samsung PM981a MZVLB1T0HBLR
9967 Points +18%
Dell Precision 5000 5560
RTX A2000 Laptop GPU, i7-11850H, Samsung PM9A1 MZVL22T0HBLB
8463 Points 0%
Dell Precision 7670
RTX A2000 Laptop GPU, i7-12850HX, SK Hynix HFS001TEJ9X115N
8443 Points
Lenovo ThinkPad P1 G4-20Y4Z9DVUS
T1200 Laptop GPU, i7-11800H, Samsung PM9A1 MZVL2512HCJQ
7581 Points -10%
Dell Precision 7550
Quadro RTX 5000 Max-Q, W-10885M, SK Hynix PC601A NVMe 1TB
7360 Points -13%
CrossMark / Overall
Lenovo ThinkPad P1 G4-20Y4Z9DVUS
T1200 Laptop GPU, i7-11800H, Samsung PM9A1 MZVL2512HCJQ
1526 Points +1%
Dell Precision 7670
RTX A2000 Laptop GPU, i7-12850HX, SK Hynix HFS001TEJ9X115N
1509 Points
CrossMark / Productivity
Lenovo ThinkPad P1 G4-20Y4Z9DVUS
T1200 Laptop GPU, i7-11800H, Samsung PM9A1 MZVL2512HCJQ
1521 Points +5%
Dell Precision 7670
RTX A2000 Laptop GPU, i7-12850HX, SK Hynix HFS001TEJ9X115N
1445 Points
CrossMark / Creativity
Dell Precision 7670
RTX A2000 Laptop GPU, i7-12850HX, SK Hynix HFS001TEJ9X115N
1682 Points
Lenovo ThinkPad P1 G4-20Y4Z9DVUS
T1200 Laptop GPU, i7-11800H, Samsung PM9A1 MZVL2512HCJQ
1606 Points -5%
CrossMark / Responsiveness
Lenovo ThinkPad P1 G4-20Y4Z9DVUS
T1200 Laptop GPU, i7-11800H, Samsung PM9A1 MZVL2512HCJQ
1323 Points +7%
Dell Precision 7670
RTX A2000 Laptop GPU, i7-12850HX, SK Hynix HFS001TEJ9X115N
1238 Points
PCMark 10 Score
6663 pkt.
Pomoc
AIDA64 / Memory Copy
Dell Precision 7670
Intel Core i7-12850HX, RTX A2000 Laptop GPU
62841 MB/s
HP ZBook Fury 15 G8
Intel Core i9-11950H, RTX A5000 Laptop GPU
48565 MB/s -23%
Lenovo ThinkPad P1 G4-20Y4Z9DVUS
Intel Core i7-11800H, T1200 Laptop GPU
39344 MB/s -37%
AIDA64 / Memory Read
Dell Precision 7670
Intel Core i7-12850HX, RTX A2000 Laptop GPU
68747 MB/s
HP ZBook Fury 15 G8
Intel Core i9-11950H, RTX A5000 Laptop GPU
46598 MB/s -32%
Lenovo ThinkPad P1 G4-20Y4Z9DVUS
Intel Core i7-11800H, T1200 Laptop GPU
40872 MB/s -41%
AIDA64 / Memory Write
Dell Precision 7670
Intel Core i7-12850HX, RTX A2000 Laptop GPU
64365 MB/s
HP ZBook Fury 15 G8
Intel Core i9-11950H, RTX A5000 Laptop GPU
45808 MB/s -29%
Lenovo ThinkPad P1 G4-20Y4Z9DVUS
Intel Core i7-11800H, T1200 Laptop GPU
40723 MB/s -37%
AIDA64 / Memory Latency
HP ZBook Fury 15 G8
Intel Core i9-11950H, RTX A5000 Laptop GPU
88.6 ns * -0%
Dell Precision 7670
Intel Core i7-12850HX, RTX A2000 Laptop GPU
88.5 ns *
Lenovo ThinkPad P1 G4-20Y4Z9DVUS
Intel Core i7-11800H, T1200 Laptop GPU
83.8 ns * +5%
Asus ProArt StudioBook 16 W7600H5A-2BL2
Intel Xeon W-11955M, RTX A5000 Laptop GPU
0 ns * +100%
Asus ProArt StudioBook 16 W7600H5A-2BL2
Intel Xeon W-11955M, RTX A5000 Laptop GPU
0 ns * +100%

* ... im mniej tym lepiej

Opóźnienie DPC

latencyMon ujawnia drobne problemy z DPC podczas otwierania wielu kart przeglądarki na naszej stronie głównej. Co więcej, odtwarzanie wideo 4K przy 60 FPS jest niedoskonałe - podczas naszego minutowego filmu testowego spadło 47 klatek.

DPC Latencies / LatencyMon - interrupt to process latency (max), Web, Youtube, Prime95
Dell Precision 7550
Quadro RTX 5000 Max-Q, W-10885M, SK Hynix PC601A NVMe 1TB
10043 μs * -733%
Asus ProArt StudioBook 16 W7600H5A-2BL2
RTX A5000 Laptop GPU, W-11955M, 2x Micron 2300 2TB MTFDHBA2T0TDV (RAID 0)
1493 μs * -24%
Lenovo ThinkPad P1 G4-20Y4Z9DVUS
T1200 Laptop GPU, i7-11800H, Samsung PM9A1 MZVL2512HCJQ
1419 μs * -18%
Dell Precision 7670
RTX A2000 Laptop GPU, i7-12850HX, SK Hynix HFS001TEJ9X115N
1205.3 μs *
Dell Precision 5000 5560
RTX A2000 Laptop GPU, i7-11850H, Samsung PM9A1 MZVL22T0HBLB
759 μs * +37%
HP ZBook Fury 15 G8
RTX A5000 Laptop GPU, i9-11950H, Samsung PM981a MZVLB1T0HBLR
578 μs * +52%

* ... im mniej tym lepiej

Urządzenia pamięci masowej - szalone prędkości dzięki PCIe4 x4 RAID 0

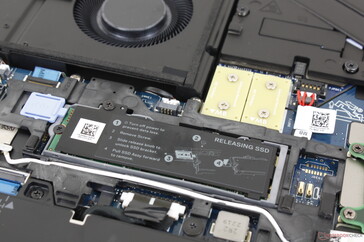
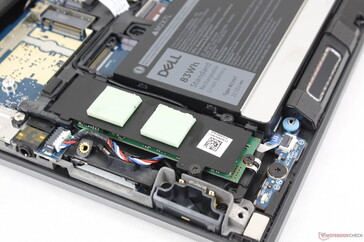
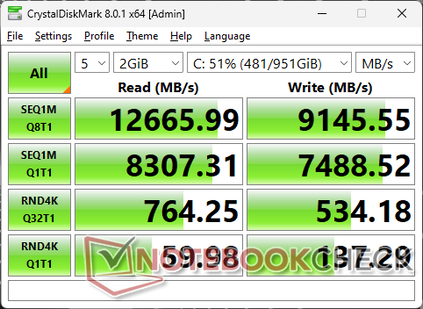
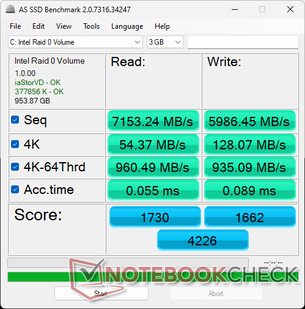
Wszystkie konfiguracje mogą obsługiwać maksymalnie dwa dyski SSD M.2, a niektóre nawet trzy. Nasza konkretna jednostka testowa jest wyposażona w dwa SK Hynix PC801 PCIe4 x4 NVMe SSD w RAID 0, które zapewniają sekwencyjny odczyt i zapis na poziomie odpowiednio prawie 13000 MB/s i 9200 MB/s. Podczas obciążenia pod DiskSpd dyski nie wykazywały oznak dławienia wydajności nawet po długim czasie. Na dołączonych dyskach SSD znajdują się rozpraszacze ciepła lub podkładki termiczne, które pomagają w odprowadzaniu ciepła.

Główny slot M.2 2280 na środku jest dostępny przez własną małą, opcjonalną klapę
Drugie i opcjonalne trzecie gniazdo M.2 2280 znajduje się pod prawym oparciem dłoni
CDM 8
CDM 8
AS SSD
AS SSD
SK Hynix HFS001TEJ9X115N
CDM 5/6 Read Seq Q32T1: 12786 MB/s
CDM 5/6 Write Seq Q32T1: 9500 MB/s
CDM 5/6 Read 4K Q32T1: 760.5 MB/s
CDM 5/6 Write 4K Q32T1: 536.6 MB/s
CDM 5 Read Seq: 8284 MB/s
CDM 5 Write Seq: 7455 MB/s
CDM 5/6 Read 4K: 59.74 MB/s
CDM 5/6 Write 4K: 136.3 MB/s
Drive Performance Rating - Percent
Dell Precision 5000 5560
Samsung PM9A1 MZVL22T0HBLB
79.2 pt
Dell Precision 7670
SK Hynix HFS001TEJ9X115N
74.4 pt
Lenovo ThinkPad P1 G4-20Y4Z9DVUS
Samsung PM9A1 MZVL2512HCJQ
73.6 pt
Asus ProArt StudioBook 16 W7600H5A-2BL2
2x Micron 2300 2TB MTFDHBA2T0TDV (RAID 0)
58.6 pt
HP ZBook Fury 15 G8
Samsung PM981a MZVLB1T0HBLR
48.5 pt
Dell Precision 7550
SK Hynix PC601A NVMe 1TB
44.9 pt
DiskSpd
seq read
Dell Precision 5000 5560
Samsung PM9A1 MZVL22T0HBLB
3402 (3327.13min - 3402.21max) MB/s +16%
Lenovo ThinkPad P1 G4-20Y4Z9DVUS
Samsung PM9A1 MZVL2512HCJQ
3198 (2801.23min - 3198.05max) MB/s +9%
Dell Precision 7670
SK Hynix HFS001TEJ9X115N
2931 (2920.07min - 2930.98max) MB/s
Asus ProArt StudioBook 16 W7600H5A-2BL2
2x Micron 2300 2TB MTFDHBA2T0TDV (RAID 0)
2419 (2064.08min - 2418.84max) MB/s -17%
Asus ProArt StudioBook 16 W7600H5A-2BL2
2x Micron 2300 2TB MTFDHBA2T0TDV (RAID 0)
2388 (2192.8min - 2388.07max) MB/s -19%
HP ZBook Fury 15 G8
Samsung PM981a MZVLB1T0HBLR
2213 (2206.83min - 2213.36max) MB/s -24%
Dell Precision 7550
SK Hynix PC601A NVMe 1TB
1693 (1690.7min - 1692.79max) MB/s -42%
seq write
Dell Precision 7670
SK Hynix HFS001TEJ9X115N
7185 (7028.4min - 7184.53max) MB/s
Dell Precision 5000 5560
Samsung PM9A1 MZVL22T0HBLB
2950 (2919.03min - 2949.85max) MB/s -59%
Lenovo ThinkPad P1 G4-20Y4Z9DVUS
Samsung PM9A1 MZVL2512HCJQ
2767 (2739.3min - 2767.11max) MB/s -61%
Asus ProArt StudioBook 16 W7600H5A-2BL2
2x Micron 2300 2TB MTFDHBA2T0TDV (RAID 0)
2755 (2420.1min - 2754.55max) MB/s -62%
Asus ProArt StudioBook 16 W7600H5A-2BL2
2x Micron 2300 2TB MTFDHBA2T0TDV (RAID 0)
2720 (2204.11min - 2719.6max) MB/s -62%
Dell Precision 7550
SK Hynix PC601A NVMe 1TB
2103 (2002.13min - 2102.6max) MB/s -71%
HP ZBook Fury 15 G8
Samsung PM981a MZVLB1T0HBLR
1889 (1868.98min - 1888.7max) MB/s -74%
seq q8 t1 read
Dell Precision 5000 5560
Samsung PM9A1 MZVL22T0HBLB
7036 (6609.8min - 7035.53max) MB/s +18%
Lenovo ThinkPad P1 G4-20Y4Z9DVUS
Samsung PM9A1 MZVL2512HCJQ
6742 (5587.44min - 6742.34max) MB/s +13%
Asus ProArt StudioBook 16 W7600H5A-2BL2
2x Micron 2300 2TB MTFDHBA2T0TDV (RAID 0)
6274 (5892.58min - 6274.29max) MB/s +5%
Asus ProArt StudioBook 16 W7600H5A-2BL2
2x Micron 2300 2TB MTFDHBA2T0TDV (RAID 0)
6053 (5002.76min - 6052.8max) MB/s +1%
Dell Precision 7670
SK Hynix HFS001TEJ9X115N
5974 (5689.31min - 5973.95max) MB/s
Dell Precision 7550
SK Hynix PC601A NVMe 1TB
3454 (2823.4min - 3453.81max) MB/s -42%
HP ZBook Fury 15 G8
Samsung PM981a MZVLB1T0HBLR
3408 (3377.67min - 3408.19max) MB/s -43%
seq q8 t1 write
Dell Precision 7670
SK Hynix HFS001TEJ9X115N
9243 (9104.19min - 9242.96max) MB/s
Asus ProArt StudioBook 16 W7600H5A-2BL2
2x Micron 2300 2TB MTFDHBA2T0TDV (RAID 0)
5154 (5111.23min - 5153.51max) MB/s -44%
Asus ProArt StudioBook 16 W7600H5A-2BL2
2x Micron 2300 2TB MTFDHBA2T0TDV (RAID 0)
5146 (4733.66min - 5145.56max) MB/s -44%
Dell Precision 5000 5560
Samsung PM9A1 MZVL22T0HBLB
5109 (5060.79min - 5108.66max) MB/s -45%
Lenovo ThinkPad P1 G4-20Y4Z9DVUS
Samsung PM9A1 MZVL2512HCJQ
4844 (4829.73min - 4844.04max) MB/s -48%
HP ZBook Fury 15 G8
Samsung PM981a MZVLB1T0HBLR
2769 (2761.53min - 2769.29max) MB/s -70%
Dell Precision 7550
SK Hynix PC601A NVMe 1TB
2639 (2537.93min - 2639.02max) MB/s -71%
4k q1 t1 read
Dell Precision 5000 5560
Samsung PM9A1 MZVL22T0HBLB
80.8 (80.46min - 80.76max) MB/s +37%
Lenovo ThinkPad P1 G4-20Y4Z9DVUS
Samsung PM9A1 MZVL2512HCJQ
66.8 (66.72min - 66.78max) MB/s +14%
Dell Precision 7670
SK Hynix HFS001TEJ9X115N
58.8 (58.07min - 58.79max) MB/s
Asus ProArt StudioBook 16 W7600H5A-2BL2
2x Micron 2300 2TB MTFDHBA2T0TDV (RAID 0)
50.9 (43.69min - 50.91max) MB/s -13%
Asus ProArt StudioBook 16 W7600H5A-2BL2
2x Micron 2300 2TB MTFDHBA2T0TDV (RAID 0)
44.1 (38.83min - 44.09max) MB/s -25%
Dell Precision 7550
SK Hynix PC601A NVMe 1TB
43 (42.94min - 43max) MB/s -27%
HP ZBook Fury 15 G8
Samsung PM981a MZVLB1T0HBLR
39 (38.93min - 39.04max) MB/s -34%
4k q1 t1 write
Dell Precision 5000 5560
Samsung PM9A1 MZVL22T0HBLB
183 (182.04min - 183.17max) MB/s +35%
Lenovo ThinkPad P1 G4-20Y4Z9DVUS
Samsung PM9A1 MZVL2512HCJQ
140 (139.56min - 139.91max) MB/s +3%
Dell Precision 7670
SK Hynix HFS001TEJ9X115N
135.6 (133.9min - 135.64max) MB/s
Dell Precision 7550
SK Hynix PC601A NVMe 1TB
120 (118.98min - 119.8max) MB/s -12%
Asus ProArt StudioBook 16 W7600H5A-2BL2
2x Micron 2300 2TB MTFDHBA2T0TDV (RAID 0)
106 (104.21min - 105.58max) MB/s -22%
Asus ProArt StudioBook 16 W7600H5A-2BL2
2x Micron 2300 2TB MTFDHBA2T0TDV (RAID 0)
102 (100.51min - 101.6max) MB/s -25%
HP ZBook Fury 15 G8
Samsung PM981a MZVLB1T0HBLR
96.6 (95.43min - 96.57max) MB/s -29%
4k q32 t16 read
Dell Precision 7670
SK Hynix HFS001TEJ9X115N
1176 (1023.94min - 1175.98max) MB/s
Lenovo ThinkPad P1 G4-20Y4Z9DVUS
Samsung PM9A1 MZVL2512HCJQ
934 (920.06min - 933.51max) MB/s -21%
HP ZBook Fury 15 G8
Samsung PM981a MZVLB1T0HBLR
792 (785.81min - 791.55max) MB/s -33%
Asus ProArt StudioBook 16 W7600H5A-2BL2
2x Micron 2300 2TB MTFDHBA2T0TDV (RAID 0)
783 (693.78min - 782.9max) MB/s -33%
Asus ProArt StudioBook 16 W7600H5A-2BL2
2x Micron 2300 2TB MTFDHBA2T0TDV (RAID 0)
769 (682.08min - 768.78max) MB/s -35%
Dell Precision 5000 5560
Samsung PM9A1 MZVL22T0HBLB
756 (747.7min - 756.38max) MB/s -36%
Dell Precision 7550
SK Hynix PC601A NVMe 1TB
638 (610.68min - 637.76max) MB/s -46%
4k q32 t16 write
Dell Precision 7670
SK Hynix HFS001TEJ9X115N
1192 (947.36min - 1192.4max) MB/s
Asus ProArt StudioBook 16 W7600H5A-2BL2
2x Micron 2300 2TB MTFDHBA2T0TDV (RAID 0)
443 (434.35min - 442.99max) MB/s -63%
Asus ProArt StudioBook 16 W7600H5A-2BL2
2x Micron 2300 2TB MTFDHBA2T0TDV (RAID 0)
434 (421.48min - 433.64max) MB/s -64%
Dell Precision 5000 5560
Samsung PM9A1 MZVL22T0HBLB
422 (415.41min - 421.56max) MB/s -65%
Dell Precision 7550
SK Hynix PC601A NVMe 1TB
366 (361.63min - 365.75max) MB/s -69%
HP ZBook Fury 15 G8
Samsung PM981a MZVLB1T0HBLR
354 (344.74min - 354.13max) MB/s -70%
Lenovo ThinkPad P1 G4-20Y4Z9DVUS
Samsung PM9A1 MZVL2512HCJQ
291 (285.97min - 290.61max) MB/s -76%
AS SSD
Score Total
Dell Precision 5000 5560
Samsung PM9A1 MZVL22T0HBLB
5753 Points +36%
Lenovo ThinkPad P1 G4-20Y4Z9DVUS
Samsung PM9A1 MZVL2512HCJQ
5398 Points +28%
Asus ProArt StudioBook 16 W7600H5A-2BL2
2x Micron 2300 2TB MTFDHBA2T0TDV (RAID 0)
4256 Points +1%
Dell Precision 7670
SK Hynix HFS001TEJ9X115N
4226 Points
HP ZBook Fury 15 G8
Samsung PM981a MZVLB1T0HBLR
4046 Points -4%
Dell Precision 7550
SK Hynix PC601A NVMe 1TB
3801 Points -10%
Score Read
Dell Precision 5000 5560
Samsung PM9A1 MZVL22T0HBLB
1827 Points +6%
Asus ProArt StudioBook 16 W7600H5A-2BL2
2x Micron 2300 2TB MTFDHBA2T0TDV (RAID 0)
1765 Points +2%
Dell Precision 7670
SK Hynix HFS001TEJ9X115N
1730 Points
Lenovo ThinkPad P1 G4-20Y4Z9DVUS
Samsung PM9A1 MZVL2512HCJQ
1534 Points -11%
Dell Precision 7550
SK Hynix PC601A NVMe 1TB
1373 Points -21%
HP ZBook Fury 15 G8
Samsung PM981a MZVLB1T0HBLR
1211 Points -30%
Score Write
Lenovo ThinkPad P1 G4-20Y4Z9DVUS
Samsung PM9A1 MZVL2512HCJQ
3177 Points +91%
Dell Precision 5000 5560
Samsung PM9A1 MZVL22T0HBLB
3133 Points +89%
HP ZBook Fury 15 G8
Samsung PM981a MZVLB1T0HBLR
2271 Points +37%
Dell Precision 7550
SK Hynix PC601A NVMe 1TB
1762 Points +6%
Asus ProArt StudioBook 16 W7600H5A-2BL2
2x Micron 2300 2TB MTFDHBA2T0TDV (RAID 0)
1722 Points +4%
Dell Precision 7670
SK Hynix HFS001TEJ9X115N
1662 Points
Seq Read
Dell Precision 7670
SK Hynix HFS001TEJ9X115N
7153.24 MB/s
Dell Precision 5000 5560
Samsung PM9A1 MZVL22T0HBLB
5169 MB/s -28%
Asus ProArt StudioBook 16 W7600H5A-2BL2
2x Micron 2300 2TB MTFDHBA2T0TDV (RAID 0)
4317 MB/s -40%
Lenovo ThinkPad P1 G4-20Y4Z9DVUS
Samsung PM9A1 MZVL2512HCJQ
4112 MB/s -43%
HP ZBook Fury 15 G8
Samsung PM981a MZVLB1T0HBLR
2937 MB/s -59%
Dell Precision 7550
SK Hynix PC601A NVMe 1TB
2028 MB/s -72%
Seq Write
Dell Precision 7670
SK Hynix HFS001TEJ9X115N
5986.45 MB/s
Asus ProArt StudioBook 16 W7600H5A-2BL2
2x Micron 2300 2TB MTFDHBA2T0TDV (RAID 0)
2037 MB/s -66%
Dell Precision 5000 5560
Samsung PM9A1 MZVL22T0HBLB
1986 MB/s -67%
Lenovo ThinkPad P1 G4-20Y4Z9DVUS
Samsung PM9A1 MZVL2512HCJQ
1785 MB/s -70%
HP ZBook Fury 15 G8
Samsung PM981a MZVLB1T0HBLR
1688 MB/s -72%
Dell Precision 7550
SK Hynix PC601A NVMe 1TB
1193 MB/s -80%
4K Read
Dell Precision 5000 5560
Samsung PM9A1 MZVL22T0HBLB
78 MB/s +43%
Lenovo ThinkPad P1 G4-20Y4Z9DVUS
Samsung PM9A1 MZVL2512HCJQ
72.2 MB/s +33%
Dell Precision 7670
SK Hynix HFS001TEJ9X115N
54.37 MB/s
Asus ProArt StudioBook 16 W7600H5A-2BL2
2x Micron 2300 2TB MTFDHBA2T0TDV (RAID 0)
48.97 MB/s -10%
HP ZBook Fury 15 G8
Samsung PM981a MZVLB1T0HBLR
44.27 MB/s -19%
Dell Precision 7550
SK Hynix PC601A NVMe 1TB
42.31 MB/s -22%
4K Write
Dell Precision 5000 5560
Samsung PM9A1 MZVL22T0HBLB
214.6 MB/s +68%
Lenovo ThinkPad P1 G4-20Y4Z9DVUS
Samsung PM9A1 MZVL2512HCJQ
164 MB/s +28%
Dell Precision 7670
SK Hynix HFS001TEJ9X115N
128.07 MB/s
Asus ProArt StudioBook 16 W7600H5A-2BL2
2x Micron 2300 2TB MTFDHBA2T0TDV (RAID 0)
112.4 MB/s -12%
HP ZBook Fury 15 G8
Samsung PM981a MZVLB1T0HBLR
105.8 MB/s -17%
Dell Precision 7550
SK Hynix PC601A NVMe 1TB
105.5 MB/s -18%
4K-64 Read
Asus ProArt StudioBook 16 W7600H5A-2BL2
2x Micron 2300 2TB MTFDHBA2T0TDV (RAID 0)
1253 MB/s +30%
Dell Precision 5000 5560
Samsung PM9A1 MZVL22T0HBLB
1232 MB/s +28%
Dell Precision 7550
SK Hynix PC601A NVMe 1TB
1128 MB/s +17%
Lenovo ThinkPad P1 G4-20Y4Z9DVUS
Samsung PM9A1 MZVL2512HCJQ
1050 MB/s +9%
Dell Precision 7670
SK Hynix HFS001TEJ9X115N
960.49 MB/s
HP ZBook Fury 15 G8
Samsung PM981a MZVLB1T0HBLR
873 MB/s -9%
4K-64 Write
Lenovo ThinkPad P1 G4-20Y4Z9DVUS
Samsung PM9A1 MZVL2512HCJQ
2835 MB/s +203%
Dell Precision 5000 5560
Samsung PM9A1 MZVL22T0HBLB
2719 MB/s +191%
HP ZBook Fury 15 G8
Samsung PM981a MZVLB1T0HBLR
1996 MB/s +113%
Dell Precision 7550
SK Hynix PC601A NVMe 1TB
1537 MB/s +64%
Asus ProArt StudioBook 16 W7600H5A-2BL2
2x Micron 2300 2TB MTFDHBA2T0TDV (RAID 0)
1473 MB/s +58%
Dell Precision 7670
SK Hynix HFS001TEJ9X115N
935.09 MB/s
Access Time Read
Dell Precision 7550
SK Hynix PC601A NVMe 1TB
0.069 ms * -25%
Dell Precision 7670
SK Hynix HFS001TEJ9X115N
0.055 ms *
HP ZBook Fury 15 G8
Samsung PM981a MZVLB1T0HBLR
0.048 ms * +13%
Asus ProArt StudioBook 16 W7600H5A-2BL2
2x Micron 2300 2TB MTFDHBA2T0TDV (RAID 0)
0.045 ms * +18%
Lenovo ThinkPad P1 G4-20Y4Z9DVUS
Samsung PM9A1 MZVL2512HCJQ
0.028 ms * +49%
Dell Precision 5000 5560
Samsung PM9A1 MZVL22T0HBLB
0.024 ms * +56%
Access Time Write
HP ZBook Fury 15 G8
Samsung PM981a MZVLB1T0HBLR
0.107 ms * -20%
Dell Precision 7550
SK Hynix PC601A NVMe 1TB
0.106 ms * -19%
Dell Precision 7670
SK Hynix HFS001TEJ9X115N
0.089 ms *
Asus ProArt StudioBook 16 W7600H5A-2BL2
2x Micron 2300 2TB MTFDHBA2T0TDV (RAID 0)
0.083 ms * +7%
Dell Precision 5000 5560
Samsung PM9A1 MZVL22T0HBLB
0.059 ms * +34%
Lenovo ThinkPad P1 G4-20Y4Z9DVUS
Samsung PM9A1 MZVL2512HCJQ
0.024 ms * +73%

* ... im mniej tym lepiej

Disk Throttling: DiskSpd Read Loop, Queue Depth 8

02855708551140142517101995228025652850313534203705399042754560484551305415Tooltip
Dell Precision 7670: Ø5630 (4859.66-5691.52)

Wydajność GPU - 95 W TGP Graphics

Na stronie RTX A2000 wywodzi się z GeForce RTX 3050 Ti i dlatego oba procesory graficzne mają podobne surowe liczby wydajności. Aktualizacja do RTX A3000 lub RTX A5500 ma zwiększyć wydajność odpowiednio o 15 do 20 procent i 70 do 90 procent.

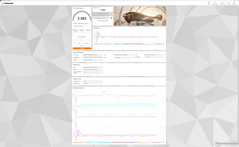
Co ciekawe, wydajność ray-tracingu Port Royal jest znacznie lepsza od tego, co odnotowaliśmy na starszymPrecision 5560 mimo że dzielą one ten sam procesor graficzny RTX A2000. Podejrzewamy, że może to być spowodowane zarówno znacznie wyższym celem TGP (95 W vs. 45 W), jak i nowszym sterownikiem Nvidii (512.36 vs. 472.12) naszego Precision 7670.

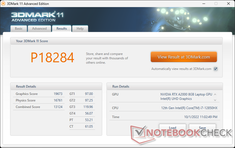
3DMark 11
3DMark 11
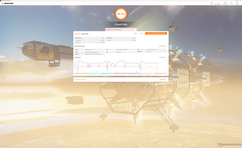
Cloud Gate
Cloud Gate
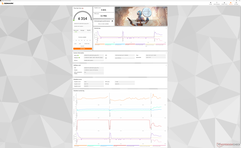
Time Spy
Time Spy
Port Royal
Port Royal
Fire Strike
Fire Strike
Fire Strike Ultra
Fire Strike Ultra
3DMark
1920x1080 Fire Strike Graphics
MSI GE67 HX 12UGS
NVIDIA GeForce RTX 3070 Ti Laptop GPU, Intel Core i7-12800HX
31096 Points +118%
Asus ProArt StudioBook 16 W7600H5A-2BL2
NVIDIA RTX A5000 Laptop GPU, Intel Xeon W-11955M
27271 Points +91%
HP ZBook Fury 15 G8
NVIDIA RTX A5000 Laptop GPU, Intel Core i9-11950H
23579 Points +65%
Dell Precision 7550
NVIDIA Quadro RTX 5000 Max-Q, Intel Xeon W-10885M
19342 Points +35%
HP Envy 16 h0112nr
NVIDIA GeForce RTX 3060 Laptop GPU, Intel Core i7-12700H
18797 Points +31%
HP ZBook Fury 17 G8-4A6A9EA
NVIDIA RTX A3000 Laptop GPU, Intel Core i9-11950H
17034 Points +19%
Dell Precision 7670
NVIDIA RTX A2000 Laptop GPU, Intel Core i7-12850HX
14295 Points
Average NVIDIA RTX A2000 Laptop GPU
  (10415 - 15988, n=9)
13167 Points -8%
Asus Zenbook Pro 15 OLED UM535Q
NVIDIA GeForce RTX 3050 Ti Laptop GPU, AMD Ryzen 9 5900HX
13002 Points -9%
Dell Precision 5000 5560
NVIDIA RTX A2000 Laptop GPU, Intel Core i7-11850H
11970 Points -16%
Dell Precision 5000 5470
NVIDIA RTX A1000 Laptop GPU, Intel Core i9-12900H
10914 Points -24%
Lenovo ThinkPad P1 G4-20Y4Z9DVUS
NVIDIA T1200 Laptop GPU, Intel Core i7-11800H
10134 Points -29%
2560x1440 Time Spy Graphics
MSI GE67 HX 12UGS
NVIDIA GeForce RTX 3070 Ti Laptop GPU, Intel Core i7-12800HX
11938 Points +105%
Asus ProArt StudioBook 16 W7600H5A-2BL2
NVIDIA RTX A5000 Laptop GPU, Intel Xeon W-11955M
10307 Points +77%
HP ZBook Fury 15 G8
NVIDIA RTX A5000 Laptop GPU, Intel Core i9-11950H
8242 Points +41%
HP Envy 16 h0112nr
NVIDIA GeForce RTX 3060 Laptop GPU, Intel Core i7-12700H
7708 Points +32%
Dell Precision 7550
NVIDIA Quadro RTX 5000 Max-Q, Intel Xeon W-10885M
7349 Points +26%
HP ZBook Fury 17 G8-4A6A9EA
NVIDIA RTX A3000 Laptop GPU, Intel Core i9-11950H
6530 Points +12%
Dell Precision 7670
NVIDIA RTX A2000 Laptop GPU, Intel Core i7-12850HX
5831 Points
Average NVIDIA RTX A2000 Laptop GPU
  (4228 - 6108, n=9)
5151 Points -12%
Asus Zenbook Pro 15 OLED UM535Q
NVIDIA GeForce RTX 3050 Ti Laptop GPU, AMD Ryzen 9 5900HX
4958 Points -15%
Dell Precision 5000 5560
NVIDIA RTX A2000 Laptop GPU, Intel Core i7-11850H
4616 Points -21%
Dell Precision 5000 5470
NVIDIA RTX A1000 Laptop GPU, Intel Core i9-12900H
4101 Points -30%
Lenovo ThinkPad P1 G4-20Y4Z9DVUS
NVIDIA T1200 Laptop GPU, Intel Core i7-11800H
3595 Points -38%
2560x1440 Time Spy Score
MSI GE67 HX 12UGS
NVIDIA GeForce RTX 3070 Ti Laptop GPU, Intel Core i7-12800HX
12239 Points +94%
Asus ProArt StudioBook 16 W7600H5A-2BL2
NVIDIA RTX A5000 Laptop GPU, Intel Xeon W-11955M
10157 Points +61%
HP ZBook Fury 15 G8
NVIDIA RTX A5000 Laptop GPU, Intel Core i9-11950H
8348 Points +32%
HP Envy 16 h0112nr
NVIDIA GeForce RTX 3060 Laptop GPU, Intel Core i7-12700H
8190 Points +30%
Dell Precision 7550
NVIDIA Quadro RTX 5000 Max-Q, Intel Xeon W-10885M
7579 Points +20%
HP ZBook Fury 17 G8-4A6A9EA
NVIDIA RTX A3000 Laptop GPU, Intel Core i9-11950H
6490 Points +3%
Dell Precision 7670
NVIDIA RTX A2000 Laptop GPU, Intel Core i7-12850HX
6314 Points
Average NVIDIA RTX A2000 Laptop GPU
  (4566 - 6692, n=9)
5572 Points -12%
Asus Zenbook Pro 15 OLED UM535Q
NVIDIA GeForce RTX 3050 Ti Laptop GPU, AMD Ryzen 9 5900HX
5338 Points -15%
Dell Precision 5000 5560
NVIDIA RTX A2000 Laptop GPU, Intel Core i7-11850H
4746 Points -25%
Dell Precision 5000 5470
NVIDIA RTX A1000 Laptop GPU, Intel Core i9-12900H
4558 Points -28%
Lenovo ThinkPad P1 G4-20Y4Z9DVUS
NVIDIA T1200 Laptop GPU, Intel Core i7-11800H
3937 Points -38%
2560x1440 Port Royal Graphics
HP ZBook Fury 15 G8
NVIDIA RTX A5000 Laptop GPU, Intel Core i9-11950H
5301 Points +57%
Dell Precision 7550
NVIDIA Quadro RTX 5000 Max-Q, Intel Xeon W-10885M
4391 Points +30%
HP ZBook Fury 17 G8-4A6A9EA
NVIDIA RTX A3000 Laptop GPU, Intel Core i9-11950H
3880 Points +15%
Dell Precision 7670
NVIDIA RTX A2000 Laptop GPU, Intel Core i7-12850HX
3385 Points
Average NVIDIA RTX A2000 Laptop GPU
  (707 - 3521, n=4)
2598 Points -23%
Dell Precision 5000 5560
NVIDIA RTX A2000 Laptop GPU, Intel Core i7-11850H
707 Points -79%
Dell Precision 5000 5470
NVIDIA RTX A1000 Laptop GPU, Intel Core i9-12900H
304 Points -91%
3DMark 11 - 1280x720 Performance GPU
MSI GE67 HX 12UGS
NVIDIA GeForce RTX 3070 Ti Laptop GPU, Intel Core i7-12800HX
42212 Points +115%
HP ZBook Fury 15 G8
NVIDIA RTX A5000 Laptop GPU, Intel Core i9-11950H
30423 Points +55%
HP Envy 16 h0112nr
NVIDIA GeForce RTX 3060 Laptop GPU, Intel Core i7-12700H
26862 Points +37%
Dell Precision 7550
NVIDIA Quadro RTX 5000 Max-Q, Intel Xeon W-10885M
26242 Points +33%
HP ZBook Fury 17 G8-4A6A9EA
NVIDIA RTX A3000 Laptop GPU, Intel Core i9-11950H
23699 Points +20%
Dell Precision 7670
NVIDIA RTX A2000 Laptop GPU, Intel Core i7-12850HX
19673 Points
Average NVIDIA RTX A2000 Laptop GPU
  (14831 - 19823, n=9)
17690 Points -10%
Asus Zenbook Pro 15 OLED UM535Q
NVIDIA GeForce RTX 3050 Ti Laptop GPU, AMD Ryzen 9 5900HX
17248 Points -12%
Dell Precision 5000 5560
NVIDIA RTX A2000 Laptop GPU, Intel Core i7-11850H
16236 Points -17%
Dell Precision 5000 5470
NVIDIA RTX A1000 Laptop GPU, Intel Core i9-12900H
14402 Points -27%
Lenovo ThinkPad P1 G4-20Y4Z9DVUS
NVIDIA T1200 Laptop GPU, Intel Core i7-11800H
14387 Points -27%
SPECviewperf 2020
3840x2160 3ds Max (3dsmax-07)
Asus ProArt StudioBook 16 W7600H5A-2BL2
NVIDIA RTX A5000 Laptop GPU, Intel Xeon W-11955M
87.8 fps +95%
HP ZBook Fury 15 G8
NVIDIA RTX A5000 Laptop GPU, Intel Core i9-11950H
77 fps +71%
HP ZBook Fury 17 G8-4A6A9EA
NVIDIA RTX A3000 Laptop GPU, Intel Core i9-11950H
49.66 fps +10%
Dell Precision 7670
NVIDIA RTX A2000 Laptop GPU, Intel Core i7-12850HX
45.1 fps
Average NVIDIA RTX A2000 Laptop GPU
  (26 - 45.1, n=4)
36 fps -20%
Dell Precision 5000 5560
NVIDIA RTX A2000 Laptop GPU, Intel Core i7-11850H
30.46 fps -32%
3840x2160 CATIA (catia-06)
Asus ProArt StudioBook 16 W7600H5A-2BL2
NVIDIA RTX A5000 Laptop GPU, Intel Xeon W-11955M
57.9 fps +54%
HP ZBook Fury 15 G8
NVIDIA RTX A5000 Laptop GPU, Intel Core i9-11950H
53 fps +41%
HP ZBook Fury 17 G8-4A6A9EA
NVIDIA RTX A3000 Laptop GPU, Intel Core i9-11950H
43.17 fps +15%
Dell Precision 7670
NVIDIA RTX A2000 Laptop GPU, Intel Core i7-12850HX
37.48 fps
Average NVIDIA RTX A2000 Laptop GPU
  (22.3 - 37.5, n=4)
29.7 fps -21%
Dell Precision 5000 5560
NVIDIA RTX A2000 Laptop GPU, Intel Core i7-11850H
22.34 fps -40%
3840x2160 Creo (creo-03)
HP ZBook Fury 15 G8
NVIDIA RTX A5000 Laptop GPU, Intel Core i9-11950H
89.8 fps +46%
Asus ProArt StudioBook 16 W7600H5A-2BL2
NVIDIA RTX A5000 Laptop GPU, Intel Xeon W-11955M
88.6 fps +44%
HP ZBook Fury 17 G8-4A6A9EA
NVIDIA RTX A3000 Laptop GPU, Intel Core i9-11950H
73.3 fps +19%
Dell Precision 7670
NVIDIA RTX A2000 Laptop GPU, Intel Core i7-12850HX
61.57 fps
Average NVIDIA RTX A2000 Laptop GPU
  (49.2 - 61.6, n=4)
55.5 fps -10%
Dell Precision 5000 5560
NVIDIA RTX A2000 Laptop GPU, Intel Core i7-11850H
49.77 fps -19%
3840x2160 Energy (energy-03)
Asus ProArt StudioBook 16 W7600H5A-2BL2
NVIDIA RTX A5000 Laptop GPU, Intel Xeon W-11955M
138.7 fps +1127%
HP ZBook Fury 17 G8-4A6A9EA
NVIDIA RTX A3000 Laptop GPU, Intel Core i9-11950H
112 fps +891%
HP ZBook Fury 15 G8
NVIDIA RTX A5000 Laptop GPU, Intel Core i9-11950H
39.3 fps +248%
Average NVIDIA RTX A2000 Laptop GPU
  (9.4 - 68.8, n=4)
25.6 fps +127%
Dell Precision 7670
NVIDIA RTX A2000 Laptop GPU, Intel Core i7-12850HX
11.3 fps
Dell Precision 5000 5560
NVIDIA RTX A2000 Laptop GPU, Intel Core i7-11850H
9.4 fps -17%
3840x2160 Maya (maya-06)
Asus ProArt StudioBook 16 W7600H5A-2BL2
NVIDIA RTX A5000 Laptop GPU, Intel Xeon W-11955M
134.5 fps +51%
HP ZBook Fury 15 G8
NVIDIA RTX A5000 Laptop GPU, Intel Core i9-11950H
119.2 fps +34%
HP ZBook Fury 17 G8-4A6A9EA
NVIDIA RTX A3000 Laptop GPU, Intel Core i9-11950H
103.6 fps +17%
Dell Precision 7670
NVIDIA RTX A2000 Laptop GPU, Intel Core i7-12850HX
88.9 fps
Average NVIDIA RTX A2000 Laptop GPU
  (79.3 - 88.9, n=4)
83.5 fps -6%
Dell Precision 5000 5560
NVIDIA RTX A2000 Laptop GPU, Intel Core i7-11850H
79.3 fps -11%
3840x2160 Medical (medical-03)
Asus ProArt StudioBook 16 W7600H5A-2BL2
NVIDIA RTX A5000 Laptop GPU, Intel Xeon W-11955M
23.58 fps +87%
HP ZBook Fury 15 G8
NVIDIA RTX A5000 Laptop GPU, Intel Core i9-11950H
21.42 fps +70%
HP ZBook Fury 17 G8-4A6A9EA
NVIDIA RTX A3000 Laptop GPU, Intel Core i9-11950H
14.73 fps +17%
Dell Precision 7670
NVIDIA RTX A2000 Laptop GPU, Intel Core i7-12850HX
12.59 fps
Dell Precision 5000 5560
NVIDIA RTX A2000 Laptop GPU, Intel Core i7-11850H
10.84 fps -14%
Average NVIDIA RTX A2000 Laptop GPU
  (8.89 - 12.6, n=4)
10.6 fps -16%
3840x2160 Siemens NX (snx-04)
Asus ProArt StudioBook 16 W7600H5A-2BL2
NVIDIA RTX A5000 Laptop GPU, Intel Xeon W-11955M
172.2 fps +45%
HP ZBook Fury 15 G8
NVIDIA RTX A5000 Laptop GPU, Intel Core i9-11950H
151.3 fps +27%
HP ZBook Fury 17 G8-4A6A9EA
NVIDIA RTX A3000 Laptop GPU, Intel Core i9-11950H
130.3 fps +10%
Dell Precision 7670
NVIDIA RTX A2000 Laptop GPU, Intel Core i7-12850HX
118.88 fps
Average NVIDIA RTX A2000 Laptop GPU
  (99.9 - 118.9, n=4)
112.5 fps -5%
Dell Precision 5000 5560
NVIDIA RTX A2000 Laptop GPU, Intel Core i7-11850H
99.9 fps -16%
3840x2160 Solidworks (solidworks-05)
Asus ProArt StudioBook 16 W7600H5A-2BL2
NVIDIA RTX A5000 Laptop GPU, Intel Xeon W-11955M
92.5 fps +56%
HP ZBook Fury 15 G8
NVIDIA RTX A5000 Laptop GPU, Intel Core i9-11950H
72.8 fps +23%
HP ZBook Fury 17 G8-4A6A9EA
NVIDIA RTX A3000 Laptop GPU, Intel Core i9-11950H
61.2 fps +3%
Dell Precision 7670
NVIDIA RTX A2000 Laptop GPU, Intel Core i7-12850HX
59.37 fps
Average NVIDIA RTX A2000 Laptop GPU
  (29.9 - 59.4, n=4)
42.9 fps -28%
Dell Precision 5000 5560
NVIDIA RTX A2000 Laptop GPU, Intel Core i7-11850H
31.2 fps -47%
1920x1080 3ds Max (3dsmax-07)
Asus ProArt StudioBook 16 W7600H5A-2BL2
NVIDIA RTX A5000 Laptop GPU, Intel Xeon W-11955M
123.1 fps +76%
HP ZBook Fury 15 G8
NVIDIA RTX A5000 Laptop GPU, Intel Core i9-11950H
120 fps +72%
Dell Precision 7670
NVIDIA RTX A2000 Laptop GPU, Intel Core i7-12850HX
69.89 fps
HP ZBook Fury 17 G8-4A6A9EA
NVIDIA RTX A3000 Laptop GPU, Intel Core i9-11950H
69.7 fps 0%
Average NVIDIA RTX A2000 Laptop GPU
  (54.4 - 72.9, n=9)
63.3 fps -9%
Dell Precision 5000 5560
NVIDIA RTX A2000 Laptop GPU, Intel Core i7-11850H
59.6 fps -15%
Dell Precision 5000 5470
NVIDIA RTX A1000 Laptop GPU, Intel Core i9-12900H
54.35 fps -22%
Lenovo ThinkPad P1 G4-20Y4Z9DVUS
NVIDIA T1200 Laptop GPU, Intel Core i7-11800H
50.2 fps -28%
1920x1080 CATIA (catia-06)
Asus ProArt StudioBook 16 W7600H5A-2BL2
NVIDIA RTX A5000 Laptop GPU, Intel Xeon W-11955M
98.8 fps +52%
HP ZBook Fury 15 G8
NVIDIA RTX A5000 Laptop GPU, Intel Core i9-11950H
93.6 fps +44%
HP ZBook Fury 17 G8-4A6A9EA
NVIDIA RTX A3000 Laptop GPU, Intel Core i9-11950H
73.7 fps +13%
Dell Precision 7670
NVIDIA RTX A2000 Laptop GPU, Intel Core i7-12850HX
65.05 fps
Average NVIDIA RTX A2000 Laptop GPU
  (46 - 67.9, n=9)
58 fps -11%
Dell Precision 5000 5560
NVIDIA RTX A2000 Laptop GPU, Intel Core i7-11850H
53.5 fps -18%
Dell Precision 5000 5470
NVIDIA RTX A1000 Laptop GPU, Intel Core i9-12900H
47.4 fps -27%
Lenovo ThinkPad P1 G4-20Y4Z9DVUS
NVIDIA T1200 Laptop GPU, Intel Core i7-11800H
41.6 fps -36%
1920x1080 Creo (creo-03)
Asus ProArt StudioBook 16 W7600H5A-2BL2
NVIDIA RTX A5000 Laptop GPU, Intel Xeon W-11955M
139.7 fps +25%
HP ZBook Fury 15 G8
NVIDIA RTX A5000 Laptop GPU, Intel Core i9-11950H
136 fps +22%
HP ZBook Fury 17 G8-4A6A9EA
NVIDIA RTX A3000 Laptop GPU, Intel Core i9-11950H
119.7 fps +7%
Dell Precision 7670
NVIDIA RTX A2000 Laptop GPU, Intel Core i7-12850HX
111.74 fps
Average NVIDIA RTX A2000 Laptop GPU
  (65.5 - 117, n=9)
97.6 fps -13%
Dell Precision 5000 5560
NVIDIA RTX A2000 Laptop GPU, Intel Core i7-11850H
91.5 fps -18%
Dell Precision 5000 5470
NVIDIA RTX A1000 Laptop GPU, Intel Core i9-12900H
87.16 fps -22%
Lenovo ThinkPad P1 G4-20Y4Z9DVUS
NVIDIA T1200 Laptop GPU, Intel Core i7-11800H
78.7 fps -30%
1920x1080 Energy (energy-03)
Asus ProArt StudioBook 16 W7600H5A-2BL2
NVIDIA RTX A5000 Laptop GPU, Intel Xeon W-11955M
67.9 fps +89%
HP ZBook Fury 15 G8
NVIDIA RTX A5000 Laptop GPU, Intel Core i9-11950H
55 fps +53%
HP ZBook Fury 17 G8-4A6A9EA
NVIDIA RTX A3000 Laptop GPU, Intel Core i9-11950H
45.04 fps +25%
Dell Precision 7670
NVIDIA RTX A2000 Laptop GPU, Intel Core i7-12850HX
35.95 fps
Average NVIDIA RTX A2000 Laptop GPU
  (26.1 - 36.9, n=9)
32.4 fps -10%
Dell Precision 5000 5560
NVIDIA RTX A2000 Laptop GPU, Intel Core i7-11850H
29.44 fps -18%
Dell Precision 5000 5470
NVIDIA RTX A1000 Laptop GPU, Intel Core i9-12900H
23.77 fps -34%
Lenovo ThinkPad P1 G4-20Y4Z9DVUS
NVIDIA T1200 Laptop GPU, Intel Core i7-11800H
19.3 fps -46%
1920x1080 Maya (maya-06)
Asus ProArt StudioBook 16 W7600H5A-2BL2
NVIDIA RTX A5000 Laptop GPU, Intel Xeon W-11955M
290 fps +20%
HP ZBook Fury 15 G8
NVIDIA RTX A5000 Laptop GPU, Intel Core i9-11950H
258.3 fps +7%
Dell Precision 7670
NVIDIA RTX A2000 Laptop GPU, Intel Core i7-12850HX
241.79 fps
Average NVIDIA RTX A2000 Laptop GPU
  (172.4 - 266, n=9)
208 fps -14%
HP ZBook Fury 17 G8-4A6A9EA
NVIDIA RTX A3000 Laptop GPU, Intel Core i9-11950H
207 fps -14%
Dell Precision 5000 5560
NVIDIA RTX A2000 Laptop GPU, Intel Core i7-11850H
196.6 fps -19%
Dell Precision 5000 5470
NVIDIA RTX A1000 Laptop GPU, Intel Core i9-12900H
189.59 fps -22%
Lenovo ThinkPad P1 G4-20Y4Z9DVUS
NVIDIA T1200 Laptop GPU, Intel Core i7-11800H
144.9 fps -40%
1920x1080 Medical (medical-03)
Asus ProArt StudioBook 16 W7600H5A-2BL2
NVIDIA RTX A5000 Laptop GPU, Intel Xeon W-11955M
58.7 fps +53%
HP ZBook Fury 15 G8
NVIDIA RTX A5000 Laptop GPU, Intel Core i9-11950H
56.9 fps +48%
HP ZBook Fury 17 G8-4A6A9EA
NVIDIA RTX A3000 Laptop GPU, Intel Core i9-11950H
44.4 fps +16%
Dell Precision 7670
NVIDIA RTX A2000 Laptop GPU, Intel Core i7-12850HX
38.36 fps
Dell Precision 5000 5560
NVIDIA RTX A2000 Laptop GPU, Intel Core i7-11850H
33.98 fps -11%
Average NVIDIA RTX A2000 Laptop GPU
  (27 - 38.4, n=9)
33.4 fps -13%
Dell Precision 5000 5470
NVIDIA RTX A1000 Laptop GPU, Intel Core i9-12900H
30.29 fps -21%
Lenovo ThinkPad P1 G4-20Y4Z9DVUS
NVIDIA T1200 Laptop GPU, Intel Core i7-11800H
24.85 fps -35%
1920x1080 Siemens NX (snx-04)
Asus ProArt StudioBook 16 W7600H5A-2BL2
NVIDIA RTX A5000 Laptop GPU, Intel Xeon W-11955M
309.1 fps +41%
HP ZBook Fury 15 G8
NVIDIA RTX A5000 Laptop GPU, Intel Core i9-11950H
285.4 fps +30%
HP ZBook Fury 17 G8-4A6A9EA
NVIDIA RTX A3000 Laptop GPU, Intel Core i9-11950H
232.4 fps +6%
Dell Precision 7670
NVIDIA RTX A2000 Laptop GPU, Intel Core i7-12850HX
219.04 fps
Average NVIDIA RTX A2000 Laptop GPU
  (136.9 - 222, n=9)
190.4 fps -13%
Dell Precision 5000 5560
NVIDIA RTX A2000 Laptop GPU, Intel Core i7-11850H
175.1 fps -20%
Dell Precision 5000 5470
NVIDIA RTX A1000 Laptop GPU, Intel Core i9-12900H
174.1 fps -21%
Lenovo ThinkPad P1 G4-20Y4Z9DVUS
NVIDIA T1200 Laptop GPU, Intel Core i7-11800H
164.1 fps -25%
1920x1080 Solidworks (solidworks-05)
Asus ProArt StudioBook 16 W7600H5A-2BL2
NVIDIA RTX A5000 Laptop GPU, Intel Xeon W-11955M
199.4 fps +40%
HP ZBook Fury 15 G8
NVIDIA RTX A5000 Laptop GPU, Intel Core i9-11950H
176 fps +24%
HP ZBook Fury 17 G8-4A6A9EA
NVIDIA RTX A3000 Laptop GPU, Intel Core i9-11950H
147.4 fps +4%
Dell Precision 7670
NVIDIA RTX A2000 Laptop GPU, Intel Core i7-12850HX
142.27 fps
Average NVIDIA RTX A2000 Laptop GPU
  (106.3 - 142.3, n=9)
124.3 fps -13%
Dell Precision 5000 5560
NVIDIA RTX A2000 Laptop GPU, Intel Core i7-11850H
114.3 fps -20%
Dell Precision 5000 5470
NVIDIA RTX A1000 Laptop GPU, Intel Core i9-12900H
108.5 fps -24%
Lenovo ThinkPad P1 G4-20Y4Z9DVUS
NVIDIA T1200 Laptop GPU, Intel Core i7-11800H
91.2 fps -36%
SPECviewperf 13
3ds Max (3dsmax-06)
HP ZBook Fury 15 G8
NVIDIA RTX A5000 Laptop GPU, Intel Core i9-11950H
183.8 fps +16%
Dell Precision 7550
NVIDIA Quadro RTX 5000 Max-Q, Intel Xeon W-10885M
176.2 fps +11%
Dell Precision 7670
NVIDIA RTX A2000 Laptop GPU, Intel Core i7-12850HX
158.96 fps
HP ZBook Fury 17 G8-4A6A9EA
NVIDIA RTX A3000 Laptop GPU, Intel Core i9-11950H
145.9 fps -8%
Average NVIDIA RTX A2000 Laptop GPU
  (120.5 - 165, n=9)
139.4 fps -12%
Dell Precision 5000 5560
NVIDIA RTX A2000 Laptop GPU, Intel Core i7-11850H
135.1 fps -15%
Dell Precision 5000 5470
NVIDIA RTX A1000 Laptop GPU, Intel Core i9-12900H
123.69 fps -22%
Lenovo ThinkPad P1 G4-20Y4Z9DVUS
NVIDIA T1200 Laptop GPU, Intel Core i7-11800H
105.4 fps -34%
Catia (catia-05)
HP ZBook Fury 15 G8
NVIDIA RTX A5000 Laptop GPU, Intel Core i9-11950H
243.4 fps +6%
Dell Precision 7550
NVIDIA Quadro RTX 5000 Max-Q, Intel Xeon W-10885M
242.9 fps +5%
HP ZBook Fury 17 G8-4A6A9EA
NVIDIA RTX A3000 Laptop GPU, Intel Core i9-11950H
231.4 fps 0%
Dell Precision 7670
NVIDIA RTX A2000 Laptop GPU, Intel Core i7-12850HX
230.27 fps
Average NVIDIA RTX A2000 Laptop GPU
  (159.1 - 251, n=9)
205 fps -11%
Dell Precision 5000 5560
NVIDIA RTX A2000 Laptop GPU, Intel Core i7-11850H
186.1 fps -19%
Dell Precision 5000 5470
NVIDIA RTX A1000 Laptop GPU, Intel Core i9-12900H
184.4 fps -20%
Lenovo ThinkPad P1 G4-20Y4Z9DVUS
NVIDIA T1200 Laptop GPU, Intel Core i7-11800H
169.4 fps -26%
Creo (creo-02)
Dell Precision 7550
NVIDIA Quadro RTX 5000 Max-Q, Intel Xeon W-10885M
224.9 fps
HP ZBook Fury 15 G8
NVIDIA RTX A5000 Laptop GPU, Intel Core i9-11950H
214.3 fps
HP ZBook Fury 17 G8-4A6A9EA
NVIDIA RTX A3000 Laptop GPU, Intel Core i9-11950H
186.9 fps
Average NVIDIA RTX A2000 Laptop GPU
  (117.1 - 207, n=8)
165.1 fps
Dell Precision 5000 5560
NVIDIA RTX A2000 Laptop GPU, Intel Core i7-11850H
161.4 fps
Dell Precision 5000 5470
NVIDIA RTX A1000 Laptop GPU, Intel Core i9-12900H
155.73 fps
Lenovo ThinkPad P1 G4-20Y4Z9DVUS
NVIDIA T1200 Laptop GPU, Intel Core i7-11800H
132.9 fps
Energy (energy-02)
HP ZBook Fury 15 G8
NVIDIA RTX A5000 Laptop GPU, Intel Core i9-11950H
53.2 fps +48%
HP ZBook Fury 17 G8-4A6A9EA
NVIDIA RTX A3000 Laptop GPU, Intel Core i9-11950H
45.12 fps +25%
Dell Precision 7550
NVIDIA Quadro RTX 5000 Max-Q, Intel Xeon W-10885M
36.8 fps +2%
Dell Precision 7670
NVIDIA RTX A2000 Laptop GPU, Intel Core i7-12850HX
36.03 fps
Average NVIDIA RTX A2000 Laptop GPU
  (23.9 - 36.8, n=9)
32.1 fps -11%
Dell Precision 5000 5560
NVIDIA RTX A2000 Laptop GPU, Intel Core i7-11850H
29.09 fps -19%
Dell Precision 5000 5470
NVIDIA RTX A1000 Laptop GPU, Intel Core i9-12900H
25.13 fps -30%
Lenovo ThinkPad P1 G4-20Y4Z9DVUS
NVIDIA T1200 Laptop GPU, Intel Core i7-11800H
19.29 fps -46%
Maya (maya-05)
HP ZBook Fury 15 G8
NVIDIA RTX A5000 Laptop GPU, Intel Core i9-11950H
219.7 fps +7%
Dell Precision 7550
NVIDIA Quadro RTX 5000 Max-Q, Intel Xeon W-10885M
210.4 fps +2%
Dell Precision 7670
NVIDIA RTX A2000 Laptop GPU, Intel Core i7-12850HX
206.15 fps
HP ZBook Fury 17 G8-4A6A9EA
NVIDIA RTX A3000 Laptop GPU, Intel Core i9-11950H
194.8 fps -6%
Average NVIDIA RTX A2000 Laptop GPU
  (117.2 - 221, n=9)
174.5 fps -15%
Dell Precision 5000 5560
NVIDIA RTX A2000 Laptop GPU, Intel Core i7-11850H
162 fps -21%
Dell Precision 5000 5470
NVIDIA RTX A1000 Laptop GPU, Intel Core i9-12900H
161.74 fps -22%
Lenovo ThinkPad P1 G4-20Y4Z9DVUS
NVIDIA T1200 Laptop GPU, Intel Core i7-11800H
127.8 fps -38%
Medical (medical-02)
HP ZBook Fury 15 G8
NVIDIA RTX A5000 Laptop GPU, Intel Core i9-11950H
109.4 fps +41%
Dell Precision 7550
NVIDIA Quadro RTX 5000 Max-Q, Intel Xeon W-10885M
97.7 fps +26%
HP ZBook Fury 17 G8-4A6A9EA
NVIDIA RTX A3000 Laptop GPU, Intel Core i9-11950H
94.8 fps +22%
Dell Precision 7670
NVIDIA RTX A2000 Laptop GPU, Intel Core i7-12850HX
77.52 fps
Average NVIDIA RTX A2000 Laptop GPU
  (54.7 - 78.3, n=9)
70.4 fps -9%
Dell Precision 5000 5560
NVIDIA RTX A2000 Laptop GPU, Intel Core i7-11850H
66.6 fps -14%
Dell Precision 5000 5470
NVIDIA RTX A1000 Laptop GPU, Intel Core i9-12900H
62.13 fps -20%
Lenovo ThinkPad P1 G4-20Y4Z9DVUS
NVIDIA T1200 Laptop GPU, Intel Core i7-11800H
53.6 fps -31%
Showcase (showcase-02)
HP ZBook Fury 15 G8
NVIDIA RTX A5000 Laptop GPU, Intel Core i9-11950H
103.8 fps +37%
Dell Precision 7550
NVIDIA Quadro RTX 5000 Max-Q, Intel Xeon W-10885M
95.2 fps +26%
HP ZBook Fury 17 G8-4A6A9EA
NVIDIA RTX A3000 Laptop GPU, Intel Core i9-11950H
84.1 fps +11%
Dell Precision 7670
NVIDIA RTX A2000 Laptop GPU, Intel Core i7-12850HX
75.83 fps
Average NVIDIA RTX A2000 Laptop GPU
  (58.8 - 79.2, n=9)
68 fps -10%
Dell Precision 5000 5560
NVIDIA RTX A2000 Laptop GPU, Intel Core i7-11850H
63 fps -17%
Dell Precision 5000 5470
NVIDIA RTX A1000 Laptop GPU, Intel Core i9-12900H
57.85 fps -24%
Lenovo ThinkPad P1 G4-20Y4Z9DVUS
NVIDIA T1200 Laptop GPU, Intel Core i7-11800H
46.84 fps -38%
Siemens NX (snx-03)
Dell Precision 7550
NVIDIA Quadro RTX 5000 Max-Q, Intel Xeon W-10885M
295.2 fps +35%
HP ZBook Fury 15 G8
NVIDIA RTX A5000 Laptop GPU, Intel Core i9-11950H
276 fps +26%
HP ZBook Fury 17 G8-4A6A9EA
NVIDIA RTX A3000 Laptop GPU, Intel Core i9-11950H
232.9 fps +7%
Dell Precision 7670
NVIDIA RTX A2000 Laptop GPU, Intel Core i7-12850HX
218.66 fps
Average NVIDIA RTX A2000 Laptop GPU
  (135.2 - 223, n=9)
191 fps -13%
Dell Precision 5000 5470
NVIDIA RTX A1000 Laptop GPU, Intel Core i9-12900H
185.06 fps -15%
Dell Precision 5000 5560
NVIDIA RTX A2000 Laptop GPU, Intel Core i7-11850H
176.3 fps -19%
Lenovo ThinkPad P1 G4-20Y4Z9DVUS
NVIDIA T1200 Laptop GPU, Intel Core i7-11800H
161.3 fps -26%
Solidworks (sw-04)
Dell Precision 7670
NVIDIA RTX A2000 Laptop GPU, Intel Core i7-12850HX
152.94 fps
Dell Precision 7550
NVIDIA Quadro RTX 5000 Max-Q, Intel Xeon W-10885M
150.4 fps -2%
HP ZBook Fury 17 G8-4A6A9EA
NVIDIA RTX A3000 Laptop GPU, Intel Core i9-11950H
149.8 fps -2%
HP ZBook Fury 15 G8
NVIDIA RTX A5000 Laptop GPU, Intel Core i9-11950H
144.9 fps -5%
Average NVIDIA RTX A2000 Laptop GPU
  (121.3 - 177, n=9)
144.6 fps -5%
Dell Precision 5000 5560
NVIDIA RTX A2000 Laptop GPU, Intel Core i7-11850H
140.8 fps -8%
Dell Precision 5000 5470
NVIDIA RTX A1000 Laptop GPU, Intel Core i9-12900H
134.89 fps -12%
Lenovo ThinkPad P1 G4-20Y4Z9DVUS
NVIDIA T1200 Laptop GPU, Intel Core i7-11800H
128.5 fps -16%
SPECviewperf 12
1900x1060 Solidworks (sw-03)
HP ZBook Fury 15 G8
NVIDIA RTX A5000 Laptop GPU, Intel Core i9-11950H
168.2 fps +18%
Dell Precision 7670
NVIDIA RTX A2000 Laptop GPU, Intel Core i7-12850HX
142.51 fps
Average NVIDIA RTX A2000 Laptop GPU
  (141.6 - 142.5, n=2)
142.1 fps 0%
Dell Precision 5000 5560
NVIDIA RTX A2000 Laptop GPU, Intel Core i7-11850H
141.6 fps -1%
Dell Precision 7550
NVIDIA Quadro RTX 5000 Max-Q, Intel Xeon W-10885M
138.4 fps -3%
Dell Precision 5000 5470
NVIDIA RTX A1000 Laptop GPU, Intel Core i9-12900H
129.42 fps -9%
1900x1060 Siemens NX (snx-02)
HP ZBook Fury 15 G8
NVIDIA RTX A5000 Laptop GPU, Intel Core i9-11950H
167.3 fps +38%
Dell Precision 7550
NVIDIA Quadro RTX 5000 Max-Q, Intel Xeon W-10885M
127.5 fps +5%
Dell Precision 7670
NVIDIA RTX A2000 Laptop GPU, Intel Core i7-12850HX
121.11 fps
Average NVIDIA RTX A2000 Laptop GPU
  (97.9 - 121.1, n=2)
109.5 fps -10%
Dell Precision 5000 5470
NVIDIA RTX A1000 Laptop GPU, Intel Core i9-12900H
100.82 fps -17%
Dell Precision 5000 5560
NVIDIA RTX A2000 Laptop GPU, Intel Core i7-11850H
97.9 fps -19%
1900x1060 Showcase (showcase-01)
HP ZBook Fury 15 G8
NVIDIA RTX A5000 Laptop GPU, Intel Core i9-11950H
110.3 fps +44%
Dell Precision 7550
NVIDIA Quadro RTX 5000 Max-Q, Intel Xeon W-10885M
96.1 fps +25%
Dell Precision 7670
NVIDIA RTX A2000 Laptop GPU, Intel Core i7-12850HX
76.6 fps
Average NVIDIA RTX A2000 Laptop GPU
  (63.3 - 76.6, n=2)
70 fps -9%
Dell Precision 5000 5560
NVIDIA RTX A2000 Laptop GPU, Intel Core i7-11850H
63.3 fps -17%
Dell Precision 5000 5470
NVIDIA RTX A1000 Laptop GPU, Intel Core i9-12900H
60.33 fps -21%
1900x1060 Medical (medical-01)
HP ZBook Fury 15 G8
NVIDIA RTX A5000 Laptop GPU, Intel Core i9-11950H
69.8 fps +40%
Dell Precision 7550
NVIDIA Quadro RTX 5000 Max-Q, Intel Xeon W-10885M
63.3 fps +27%
Dell Precision 7670
NVIDIA RTX A2000 Laptop GPU, Intel Core i7-12850HX
49.9 fps
Average NVIDIA RTX A2000 Laptop GPU
  (40 - 49.9, n=2)
45 fps -10%
Dell Precision 5000 5560
NVIDIA RTX A2000 Laptop GPU, Intel Core i7-11850H
40.04 fps -20%
Dell Precision 5000 5470
NVIDIA RTX A1000 Laptop GPU, Intel Core i9-12900H
36.33 fps -27%
1900x1060 Maya (maya-04)
HP ZBook Fury 15 G8
NVIDIA RTX A5000 Laptop GPU, Intel Core i9-11950H
113.8 fps +11%
Dell Precision 7670
NVIDIA RTX A2000 Laptop GPU, Intel Core i7-12850HX
102.25 fps
Average NVIDIA RTX A2000 Laptop GPU
  (89.7 - 102.3, n=2)
96 fps -6%
Dell Precision 5000 5560
NVIDIA RTX A2000 Laptop GPU, Intel Core i7-11850H
89.7 fps -12%
Dell Precision 5000 5470
NVIDIA RTX A1000 Laptop GPU, Intel Core i9-12900H
76.79 fps -25%
Dell Precision 7550
NVIDIA Quadro RTX 5000 Max-Q, Intel Xeon W-10885M
76.4 fps -25%
1900x1060 Energy (energy-01)
HP ZBook Fury 15 G8
NVIDIA RTX A5000 Laptop GPU, Intel Core i9-11950H
16.86 fps +39%
Dell Precision 7550
NVIDIA Quadro RTX 5000 Max-Q, Intel Xeon W-10885M
13.93 fps +15%
Dell Precision 7670
NVIDIA RTX A2000 Laptop GPU, Intel Core i7-12850HX
12.13 fps
Average NVIDIA RTX A2000 Laptop GPU
  (9.33 - 12.1, n=2)
10.7 fps -12%
Dell Precision 5000 5560
NVIDIA RTX A2000 Laptop GPU, Intel Core i7-11850H
9.33 fps -23%
Dell Precision 5000 5470
NVIDIA RTX A1000 Laptop GPU, Intel Core i9-12900H
8.45 fps -30%
1900x1060 Creo (creo-01)
HP ZBook Fury 15 G8
NVIDIA RTX A5000 Laptop GPU, Intel Core i9-11950H
151.3 fps +20%
Dell Precision 7550
NVIDIA Quadro RTX 5000 Max-Q, Intel Xeon W-10885M
136 fps +8%
Dell Precision 7670
NVIDIA RTX A2000 Laptop GPU, Intel Core i7-12850HX
125.61 fps
Average NVIDIA RTX A2000 Laptop GPU
  (106.8 - 125.6, n=2)
116.2 fps -7%
Dell Precision 5000 5560
NVIDIA RTX A2000 Laptop GPU, Intel Core i7-11850H
106.8 fps -15%
Dell Precision 5000 5470
NVIDIA RTX A1000 Laptop GPU, Intel Core i9-12900H
103.45 fps -18%
1900x1060 Catia (catia-04)
HP ZBook Fury 15 G8
NVIDIA RTX A5000 Laptop GPU, Intel Core i9-11950H
177.3 fps +20%
Dell Precision 7670
NVIDIA RTX A2000 Laptop GPU, Intel Core i7-12850HX
147.68 fps
Average NVIDIA RTX A2000 Laptop GPU
  (122.2 - 147.7, n=2)
134.9 fps -9%
Dell Precision 7550
NVIDIA Quadro RTX 5000 Max-Q, Intel Xeon W-10885M
125 fps -15%
Dell Precision 5000 5560
NVIDIA RTX A2000 Laptop GPU, Intel Core i7-11850H
122.2 fps -17%
Dell Precision 5000 5470
NVIDIA RTX A1000 Laptop GPU, Intel Core i9-12900H
116.61 fps -21%
3DMark 11 Performance
18284 pkt.
3DMark Cloud Gate Standard Score
28776 pkt.
3DMark Fire Strike Score
12990 pkt.
3DMark Time Spy Score
6314 pkt.
Pomoc
Blender
v3.3 Classroom HIP/AMD
Lenovo Legion 7 16ARHA7
AMD Radeon RX 6850M XT, AMD Ryzen 9 6900HX
51 Seconds *
v3.3 Classroom OPTIX/RTX
Dell Precision 5000 5470
NVIDIA RTX A1000 Laptop GPU, Intel Core i9-12900H
61 Seconds * -45%
HP Envy 16 h0112nr
NVIDIA GeForce RTX 3060 Laptop GPU, Intel Core i7-12700H
56 Seconds * -33%
Dell Precision 7670
NVIDIA RTX A2000 Laptop GPU, Intel Core i7-12850HX
42 Seconds *
v3.3 Classroom CUDA
Dell Precision 5000 5470
NVIDIA RTX A1000 Laptop GPU, Intel Core i9-12900H
112 Seconds * -42%
HP Envy 16 h0112nr
NVIDIA GeForce RTX 3060 Laptop GPU, Intel Core i7-12700H
89 Seconds * -13%
Dell Precision 7670
NVIDIA RTX A2000 Laptop GPU, Intel Core i7-12850HX
79 Seconds *
v3.3 Classroom CPU
HP Envy 16 h0112nr
NVIDIA GeForce RTX 3060 Laptop GPU, Intel Core i7-12700H
462 Seconds * -29%
Dell Precision 5000 5470
NVIDIA RTX A1000 Laptop GPU, Intel Core i9-12900H
448 Seconds * -25%
Lenovo Legion 7 16ARHA7
AMD Radeon RX 6850M XT, AMD Ryzen 9 6900HX
372 Seconds * -4%
Dell Precision 7670
NVIDIA RTX A2000 Laptop GPU, Intel Core i7-12850HX
359 Seconds *

* ... im mniej tym lepiej

The Witcher 3
1024x768 Low Graphics & Postprocessing
MSI GE67 HX 12UGS
Intel Core i7-12800HX, NVIDIA GeForce RTX 3070 Ti Laptop GPU
426.4 (402min) fps +44%
HP Envy 16 h0112nr
Intel Core i7-12700H, NVIDIA GeForce RTX 3060 Laptop GPU
402.3 (361min) fps +35%
Lenovo Legion 7 16ARHA7
AMD Ryzen 9 6900HX, AMD Radeon RX 6850M XT
384.5 (348min) fps +29%
HP ZBook Fury 15 G8
Intel Core i9-11950H, NVIDIA RTX A5000 Laptop GPU
335.1 (287min) fps +13%
Asus ProArt StudioBook 16 W7600H5A-2BL2
Intel Xeon W-11955M, NVIDIA RTX A5000 Laptop GPU
321 fps +8%
Dell Precision 7550
Intel Xeon W-10885M, NVIDIA Quadro RTX 5000 Max-Q
299 (228min) fps +1%
Dell Precision 7670
Intel Core i7-12850HX, NVIDIA RTX A2000 Laptop GPU
297.1 (160min) fps
Average NVIDIA RTX A2000 Laptop GPU
  (218 - 320, n=9)
273 fps -8%
Dell Precision 5000 5560
Intel Core i7-11850H, NVIDIA RTX A2000 Laptop GPU
259.8 (202min) fps -13%
Dell Precision 5000 5470
Intel Core i9-12900H, NVIDIA RTX A1000 Laptop GPU
244.1 (220min) fps -18%
Asus Zenbook Pro 15 OLED UM535Q
AMD Ryzen 9 5900HX, NVIDIA GeForce RTX 3050 Ti Laptop GPU
220 (192min) fps -26%
Lenovo ThinkPad P1 G4-20Y4Z9DVUS
Intel Core i7-11800H, NVIDIA T1200 Laptop GPU
198 fps -33%
1366x768 Medium Graphics & Postprocessing
MSI GE67 HX 12UGS
Intel Core i7-12800HX, NVIDIA GeForce RTX 3070 Ti Laptop GPU
329 (295min) fps +81%
HP Envy 16 h0112nr
Intel Core i7-12700H, NVIDIA GeForce RTX 3060 Laptop GPU
264 (250min) fps +45%
Lenovo Legion 7 16ARHA7
AMD Ryzen 9 6900HX, AMD Radeon RX 6850M XT
251.6 (236min) fps +38%
Dell Precision 7550
Intel Xeon W-10885M, NVIDIA Quadro RTX 5000 Max-Q
249.4 (223min) fps +37%
HP ZBook Fury 15 G8
Intel Core i9-11950H, NVIDIA RTX A5000 Laptop GPU
227.4 (210min) fps +25%
Asus ProArt StudioBook 16 W7600H5A-2BL2
Intel Xeon W-11955M, NVIDIA RTX A5000 Laptop GPU
217.9 fps +20%
Dell Precision 7670
Intel Core i7-12850HX, NVIDIA RTX A2000 Laptop GPU
181.7 (152min) fps
Average NVIDIA RTX A2000 Laptop GPU
  (145.6 - 220, n=9)
174.7 fps -4%
Asus Zenbook Pro 15 OLED UM535Q
AMD Ryzen 9 5900HX, NVIDIA GeForce RTX 3050 Ti Laptop GPU
161.6 (149min) fps -11%
Dell Precision 5000 5560
Intel Core i7-11850H, NVIDIA RTX A2000 Laptop GPU
151.9 (141min) fps -16%
Dell Precision 5000 5470
Intel Core i9-12900H, NVIDIA RTX A1000 Laptop GPU
147.5 (135min) fps -19%
Lenovo ThinkPad P1 G4-20Y4Z9DVUS
Intel Core i7-11800H, NVIDIA T1200 Laptop GPU
125 fps -31%
1920x1080 High Graphics & Postprocessing (Nvidia HairWorks Off)
MSI GE67 HX 12UGS
Intel Core i7-12800HX, NVIDIA GeForce RTX 3070 Ti Laptop GPU
223.3 (204min) fps +106%
Lenovo Legion 7 16ARHA7
AMD Ryzen 9 6900HX, AMD Radeon RX 6850M XT
208.1 (192min) fps +92%
HP Envy 16 h0112nr
Intel Core i7-12700H, NVIDIA GeForce RTX 3060 Laptop GPU
161.2 (152min) fps +48%
HP ZBook Fury 15 G8
Intel Core i9-11950H, NVIDIA RTX A5000 Laptop GPU
149.5 (141min) fps +38%
Dell Precision 7550
Intel Xeon W-10885M, NVIDIA Quadro RTX 5000 Max-Q
139.1 (63min) fps +28%
Asus ProArt StudioBook 16 W7600H5A-2BL2
Intel Xeon W-11955M, NVIDIA RTX A5000 Laptop GPU
124 fps +14%
Dell Precision 7670
Intel Core i7-12850HX, NVIDIA RTX A2000 Laptop GPU
108.6 (55min) fps
Dell Precision 5000 5560
Intel Core i7-11850H, NVIDIA RTX A2000 Laptop GPU
92.4 (86min) fps -15%
Asus Zenbook Pro 15 OLED UM535Q
AMD Ryzen 9 5900HX, NVIDIA GeForce RTX 3050 Ti Laptop GPU
92.1 (87min) fps -15%
Average NVIDIA RTX A2000 Laptop GPU
  (45 - 108.6, n=9)
90.2 fps -17%
Dell Precision 5000 5470
Intel Core i9-12900H, NVIDIA RTX A1000 Laptop GPU
82.1 (77min) fps -24%
Lenovo ThinkPad P1 G4-20Y4Z9DVUS
Intel Core i7-11800H, NVIDIA T1200 Laptop GPU
71 fps -35%
1920x1080 Ultra Graphics & Postprocessing (HBAO+)
Lenovo Legion 7 16ARHA7
AMD Ryzen 9 6900HX, AMD Radeon RX 6850M XT
118.1 (112min) fps +106%
MSI GE67 HX 12UGS
Intel Core i7-12800HX, NVIDIA GeForce RTX 3070 Ti Laptop GPU
112.7 (105min) fps +96%
Asus ProArt StudioBook 16 W7600H5A-2BL2
Intel Xeon W-11955M, NVIDIA RTX A5000 Laptop GPU
89.9 (87min, 88P1) fps +57%
HP Envy 16 h0112nr
Intel Core i7-12700H, NVIDIA GeForce RTX 3060 Laptop GPU
82.8 (78min) fps +44%
HP ZBook Fury 15 G8
Intel Core i9-11950H, NVIDIA RTX A5000 Laptop GPU
81.7 (78min) fps +42%
Dell Precision 7550
Intel Xeon W-10885M, NVIDIA Quadro RTX 5000 Max-Q
77.3 (73min) fps +35%
Dell Precision 7670
Intel Core i7-12850HX, NVIDIA RTX A2000 Laptop GPU
57.4 (55min) fps
Average NVIDIA RTX A2000 Laptop GPU
  (43.6 - 65.2, n=9)
51.8 fps -10%
Dell Precision 5000 5560
Intel Core i7-11850H, NVIDIA RTX A2000 Laptop GPU
50 (48min) fps -13%
Asus Zenbook Pro 15 OLED UM535Q
AMD Ryzen 9 5900HX, NVIDIA GeForce RTX 3050 Ti Laptop GPU
49.9 (47min) fps -13%
Dell Precision 5000 5470
Intel Core i9-12900H, NVIDIA RTX A1000 Laptop GPU
42.7 (40min) fps -26%
Lenovo ThinkPad P1 G4-20Y4Z9DVUS
Intel Core i7-11800H, NVIDIA T1200 Laptop GPU
36.7 (34min, 35P1) fps -36%
GTA V
1024x768 Lowest Settings possible
MSI GE67 HX 12UGS
Intel Core i7-12800HX, NVIDIA GeForce RTX 3070 Ti Laptop GPU
186.8 (3.06min, 200P1) fps +3%
HP Envy 16 h0112nr
Intel Core i7-12700H, NVIDIA GeForce RTX 3060 Laptop GPU
185.6 (1.956min, 142.9P1) fps +2%
Dell Precision 7670
Intel Core i7-12850HX, NVIDIA RTX A2000 Laptop GPU
181.7 (2.06min, 125P1) fps
Asus ProArt StudioBook 16 W7600H5A-2BL2
Intel Xeon W-11955M, NVIDIA RTX A5000 Laptop GPU
180 (3.57min, 143P1) fps -1%
Average NVIDIA RTX A2000 Laptop GPU
  (167.3 - 186.8, n=8)
180 fps -1%
Lenovo Legion 7 16ARHA7
AMD Ryzen 9 6900HX, AMD Radeon RX 6850M XT
179.2 (2.25min, 111.1P1) fps -1%
Dell Precision 5000 5560
Intel Core i7-11850H, NVIDIA RTX A2000 Laptop GPU
179 (3.37min, 111P1) fps -1%
HP ZBook Fury 15 G8
Intel Core i9-11950H, NVIDIA RTX A5000 Laptop GPU
175 (3.23min, 111P1) fps -4%
Asus Zenbook Pro 15 OLED UM535Q
AMD Ryzen 9 5900HX, NVIDIA GeForce RTX 3050 Ti Laptop GPU
172.8 (2.99min, 125P1) fps -5%
Dell Precision 5000 5470
Intel Core i9-12900H, NVIDIA RTX A1000 Laptop GPU
168 (2.71min, 90.9P1) fps -8%
1920x1080 Lowest Settings possible
MSI GE67 HX 12UGS
Intel Core i7-12800HX, NVIDIA GeForce RTX 3070 Ti Laptop GPU
186.9 (2.1min, 166.7P1) fps +4%
HP Envy 16 h0112nr
Intel Core i7-12700H, NVIDIA GeForce RTX 3060 Laptop GPU
182.8 (2.34min, 125P1) fps +2%
Lenovo Legion 7 16ARHA7
AMD Ryzen 9 6900HX, AMD Radeon RX 6850M XT
180.1 (4.05min, 142.9P1) fps 0%
Dell Precision 7670
Intel Core i7-12850HX, NVIDIA RTX A2000 Laptop GPU
179.9 (2.94min, 125P1) fps
Average NVIDIA RTX A2000 Laptop GPU
  (163 - 186.5, n=5)
171.9 fps -4%
Asus Zenbook Pro 15 OLED UM535Q
AMD Ryzen 9 5900HX, NVIDIA GeForce RTX 3050 Ti Laptop GPU
171.6 (3.58min, 111.1P1) fps -5%
Asus ProArt StudioBook 16 W7600H5A-2BL2
Intel Xeon W-11955M, NVIDIA RTX A5000 Laptop GPU
171 (3.27min, 83.3P1) fps -5%
HP ZBook Fury 15 G8
Intel Core i9-11950H, NVIDIA RTX A5000 Laptop GPU
168 (4.61min, 47.6P1) fps -7%
Dell Precision 5000 5560
Intel Core i7-11850H, NVIDIA RTX A2000 Laptop GPU
167 (4.58min, 83.3P1) fps -7%
Dell Precision 5000 5470
Intel Core i9-12900H, NVIDIA RTX A1000 Laptop GPU
161.9 (5.13min, 90.9P1) fps -10%
1366x768 Normal/Off AF:4x
MSI GE67 HX 12UGS
Intel Core i7-12800HX, NVIDIA GeForce RTX 3070 Ti Laptop GPU
184.7 (1.994min, 125P1) fps +4%
HP Envy 16 h0112nr
Intel Core i7-12700H, NVIDIA GeForce RTX 3060 Laptop GPU
181.2 (3.81min, 142.9P1) fps +2%
Dell Precision 7670
Intel Core i7-12850HX, NVIDIA RTX A2000 Laptop GPU
177.6 (4.08min, 125P1) fps
Asus ProArt StudioBook 16 W7600H5A-2BL2
Intel Xeon W-11955M, NVIDIA RTX A5000 Laptop GPU
175 (2.86min, 125P1) fps -1%
Lenovo Legion 7 16ARHA7
AMD Ryzen 9 6900HX, AMD Radeon RX 6850M XT
173.4 (5.02min, 125P1) fps -2%
Average NVIDIA RTX A2000 Laptop GPU
  (157.6 - 185.3, n=7)
173.2 fps -2%
Dell Precision 5000 5560
Intel Core i7-11850H, NVIDIA RTX A2000 Laptop GPU
170 (5.7min, 111P1) fps -4%
HP ZBook Fury 15 G8
Intel Core i9-11950H, NVIDIA RTX A5000 Laptop GPU
169 (5.45min, 111P1) fps -5%
Asus Zenbook Pro 15 OLED UM535Q
AMD Ryzen 9 5900HX, NVIDIA GeForce RTX 3050 Ti Laptop GPU
167.2 (4.49min, 100P1) fps -6%
Dell Precision 5000 5470
Intel Core i9-12900H, NVIDIA RTX A1000 Laptop GPU
159.8 (3.92min, 83.3P1) fps -10%
1920x1080 Normal/Off AF:4x
MSI GE67 HX 12UGS
Intel Core i7-12800HX, NVIDIA GeForce RTX 3070 Ti Laptop GPU
183.7 (2.06min, 142.9P1) fps +5%
HP Envy 16 h0112nr
Intel Core i7-12700H, NVIDIA GeForce RTX 3060 Laptop GPU
180.3 (3.17min, 142.9P1) fps +3%
Dell Precision 7670
Intel Core i7-12850HX, NVIDIA RTX A2000 Laptop GPU
174.5 (3.81min, 125P1) fps
Lenovo Legion 7 16ARHA7
AMD Ryzen 9 6900HX, AMD Radeon RX 6850M XT
173.4 (3.32min, 125P1) fps -1%
Average NVIDIA RTX A2000 Laptop GPU
  (155.7 - 184.1, n=5)
166.7 fps -4%
Asus Zenbook Pro 15 OLED UM535Q
AMD Ryzen 9 5900HX, NVIDIA GeForce RTX 3050 Ti Laptop GPU
165.5 (3.95min, 111.1P1) fps -5%
Asus ProArt StudioBook 16 W7600H5A-2BL2
Intel Xeon W-11955M, NVIDIA RTX A5000 Laptop GPU
164 (4.32min, 83.3P1) fps -6%
Dell Precision 5000 5560
Intel Core i7-11850H, NVIDIA RTX A2000 Laptop GPU
163 (6.83min, 90.9P1) fps -7%
HP ZBook Fury 15 G8
Intel Core i9-11950H, NVIDIA RTX A5000 Laptop GPU
160 (4.28min, 66.7P1) fps -8%
Dell Precision 5000 5470
Intel Core i9-12900H, NVIDIA RTX A1000 Laptop GPU
154.3 (4.2min, 83.3P1) fps -12%
1920x1080 High/On (Advanced Graphics Off) AA:2xMSAA + FX AF:8x
MSI GE67 HX 12UGS
Intel Core i7-12800HX, NVIDIA GeForce RTX 3070 Ti Laptop GPU
178.1 (3.97min, 142.9P1) fps +15%
HP Envy 16 h0112nr
Intel Core i7-12700H, NVIDIA GeForce RTX 3060 Laptop GPU
174.1 (3.43min, 125P1) fps +12%
Lenovo Legion 7 16ARHA7
AMD Ryzen 9 6900HX, AMD Radeon RX 6850M XT
162.4 (8.03min, 90.9P1) fps +5%
Asus ProArt StudioBook 16 W7600H5A-2BL2
Intel Xeon W-11955M, NVIDIA RTX A5000 Laptop GPU
158 (3.82min, 90.9P1) fps +2%
Dell Precision 7670
Intel Core i7-12850HX, NVIDIA RTX A2000 Laptop GPU
155.1 (3.79min, 111.1P1) fps
Average NVIDIA RTX A2000 Laptop GPU
  (112 - 164.5, n=8)
139 fps -10%
HP ZBook Fury 15 G8
Intel Core i9-11950H, NVIDIA RTX A5000 Laptop GPU
131 (11.7min, 35.7P1) fps -16%
Asus Zenbook Pro 15 OLED UM535Q
AMD Ryzen 9 5900HX, NVIDIA GeForce RTX 3050 Ti Laptop GPU
123.7 (16.1min, 83.3P1) fps -20%
Dell Precision 5000 5470
Intel Core i9-12900H, NVIDIA RTX A1000 Laptop GPU
113.7 (13.2min, 76.9P1) fps -27%
Dell Precision 5000 5560
Intel Core i7-11850H, NVIDIA RTX A2000 Laptop GPU
112 (15.5min, 55.6P1) fps -28%
1920x1080 Highest Settings possible AA:4xMSAA + FX AF:16x
MSI GE67 HX 12UGS
Intel Core i7-12800HX, NVIDIA GeForce RTX 3070 Ti Laptop GPU
122 (6.11min, 90.9P1) fps +54%
HP Envy 16 h0112nr
Intel Core i7-12700H, NVIDIA GeForce RTX 3060 Laptop GPU
103.3 (8.55min, 71.4P1) fps +31%
Lenovo Legion 7 16ARHA7
AMD Ryzen 9 6900HX, AMD Radeon RX 6850M XT
96.9 (7.1min, 62.5P1) fps +23%
Asus ProArt StudioBook 16 W7600H5A-2BL2
Intel Xeon W-11955M, NVIDIA RTX A5000 Laptop GPU
85.8 (21.2min, 52.6P1) fps +8%
Dell Precision 7670
Intel Core i7-12850HX, NVIDIA RTX A2000 Laptop GPU
79.1 (5.42min, 52.6P1) fps
HP ZBook Fury 15 G8
Intel Core i9-11950H, NVIDIA RTX A5000 Laptop GPU
76.1 (5.43min, 28.6P1) fps -4%
Average NVIDIA RTX A2000 Laptop GPU
  (57.8 - 84, n=8)
71.2 fps -10%
Asus Zenbook Pro 15 OLED UM535Q
AMD Ryzen 9 5900HX, NVIDIA GeForce RTX 3050 Ti Laptop GPU
66.7 (7.23min, 41.7P1) fps -16%
Dell Precision 5000 5470
Intel Core i9-12900H, NVIDIA RTX A1000 Laptop GPU
58.9 (9.57min, 38.5P1) fps -26%
Dell Precision 5000 5560
Intel Core i7-11850H, NVIDIA RTX A2000 Laptop GPU
57.8 (7.07min, 23.3P1) fps -27%
2560x1440 Highest Settings possible AA:4xMSAA + FX AF:16x
MSI GE67 HX 12UGS
Intel Core i7-12800HX, NVIDIA GeForce RTX 3070 Ti Laptop GPU
108.7 (11.2min, 76.9P1) fps +90%
Lenovo Legion 7 16ARHA7
AMD Ryzen 9 6900HX, AMD Radeon RX 6850M XT
90 (6.98min, 62.5P1) fps +58%
Asus ProArt StudioBook 16 W7600H5A-2BL2
Intel Xeon W-11955M, NVIDIA RTX A5000 Laptop GPU
82.2 (16min, 55.6P1) fps +44%
HP Envy 16 h0112nr
Intel Core i7-12700H, NVIDIA GeForce RTX 3060 Laptop GPU
76.7 (8.13min, 52.6P1) fps +34%
HP ZBook Fury 15 G8
Intel Core i9-11950H, NVIDIA RTX A5000 Laptop GPU
70.4 (4.81min, 27.8P1) fps +23%
Dell Precision 7670
Intel Core i7-12850HX, NVIDIA RTX A2000 Laptop GPU
57.1 (13.8min, 38.5P1) fps
Average NVIDIA RTX A2000 Laptop GPU
  (42.9 - 58.4, n=6)
50.3 fps -12%
Dell Precision 5000 5560
Intel Core i7-11850H, NVIDIA RTX A2000 Laptop GPU
42.9 (5.15min, 17.9P1) fps -25%
3840x2160 Highest Settings possible AA:4xMSAA + FX AF:16x
Asus ProArt StudioBook 16 W7600H5A-2BL2
Intel Xeon W-11955M, NVIDIA RTX A5000 Laptop GPU
44.4 (10.1min, 30.3P1) fps
HP ZBook Fury 15 G8
Intel Core i9-11950H, NVIDIA RTX A5000 Laptop GPU
42.1 (7.59min, 25.6P1) fps
Average NVIDIA RTX A2000 Laptop GPU
  ()
21.2 fps
3840x2160 High/On (Advanced Graphics Off) AA:FX AF:8x
Asus ProArt StudioBook 16 W7600H5A-2BL2
Intel Xeon W-11955M, NVIDIA RTX A5000 Laptop GPU
76.3 (29.3min, 47.6P1) fps
HP ZBook Fury 15 G8
Intel Core i9-11950H, NVIDIA RTX A5000 Laptop GPU
75.5 (13.9min, 28.6P1) fps
Average NVIDIA RTX A2000 Laptop GPU
  (41.2 - 45, n=3)
43.4 fps
Cyberpunk 2077 1.6
1920x1080 Low Preset
Lenovo Legion 7 16ARHA7
AMD Ryzen 9 6900HX, AMD Radeon RX 6850M XT
160 (61.9min) fps +104%
MSI GE67 HX 12UGS
Intel Core i7-12800HX, NVIDIA GeForce RTX 3070 Ti Laptop GPU
141.2 (37.3min) fps +80%
HP Envy 16 h0112nr
Intel Core i7-12700H, NVIDIA GeForce RTX 3060 Laptop GPU
115.7 (54min) fps +47%
Dell Precision 7670
Intel Core i7-12850HX, NVIDIA RTX A2000 Laptop GPU
78.5 (15.4min) fps
Average NVIDIA RTX A2000 Laptop GPU
  (69 - 78.5, n=2)
73.8 fps -6%
Asus Zenbook Pro 15 OLED UM535Q
AMD Ryzen 9 5900HX, NVIDIA GeForce RTX 3050 Ti Laptop GPU
70.6 (32.2min) fps -10%
Dell Precision 5000 5470
Intel Core i9-12900H, NVIDIA RTX A1000 Laptop GPU
61.3 (20.5min) fps -22%
1920x1080 Medium Preset
Lenovo Legion 7 16ARHA7
AMD Ryzen 9 6900HX, AMD Radeon RX 6850M XT
135.5 (61.4min) fps +108%
MSI GE67 HX 12UGS
Intel Core i7-12800HX, NVIDIA GeForce RTX 3070 Ti Laptop GPU
133.2 (37.3min) fps +105%
HP Envy 16 h0112nr
Intel Core i7-12700H, NVIDIA GeForce RTX 3060 Laptop GPU
94.4 (24.2min) fps +45%
Dell Precision 7670
Intel Core i7-12850HX, NVIDIA RTX A2000 Laptop GPU
65.1 (34.4min) fps
Average NVIDIA RTX A2000 Laptop GPU
  (59 - 65.1, n=2)
62.1 fps -5%
Asus Zenbook Pro 15 OLED UM535Q
AMD Ryzen 9 5900HX, NVIDIA GeForce RTX 3050 Ti Laptop GPU
59 (31.2min) fps -9%
Dell Precision 5000 5470
Intel Core i9-12900H, NVIDIA RTX A1000 Laptop GPU
50.4 (30.8min) fps -23%
1920x1080 High Preset
MSI GE67 HX 12UGS
Intel Core i7-12800HX, NVIDIA GeForce RTX 3070 Ti Laptop GPU
106 (54.1min) fps +93%
Lenovo Legion 7 16ARHA7
AMD Ryzen 9 6900HX, AMD Radeon RX 6850M XT
105.8 (60.3min) fps +92%
HP Envy 16 h0112nr
Intel Core i7-12700H, NVIDIA GeForce RTX 3060 Laptop GPU
72.3 (38.2min) fps +31%
Dell Precision 7670
Intel Core i7-12850HX, NVIDIA RTX A2000 Laptop GPU
55 (33.3min) fps
Average NVIDIA RTX A2000 Laptop GPU
  (44 - 55, n=2)
49.5 fps -10%
Asus Zenbook Pro 15 OLED UM535Q
AMD Ryzen 9 5900HX, NVIDIA GeForce RTX 3050 Ti Laptop GPU
44.5 (22min) fps -19%
Dell Precision 5000 5470
Intel Core i9-12900H, NVIDIA RTX A1000 Laptop GPU
36.7 (15.3min) fps -33%
1920x1080 Ultra Preset
MSI GE67 HX 12UGS
Intel Core i7-12800HX, NVIDIA GeForce RTX 3070 Ti Laptop GPU
88.1 (60.7min) fps +99%
Lenovo Legion 7 16ARHA7
AMD Ryzen 9 6900HX, AMD Radeon RX 6850M XT
87.2 (58.7min) fps +97%
HP Envy 16 h0112nr
Intel Core i7-12700H, NVIDIA GeForce RTX 3060 Laptop GPU
59.5 (38.5min) fps +34%
Dell Precision 7670
Intel Core i7-12850HX, NVIDIA RTX A2000 Laptop GPU
44.3 (29.7min) fps
Asus Zenbook Pro 15 OLED UM535Q
AMD Ryzen 9 5900HX, NVIDIA GeForce RTX 3050 Ti Laptop GPU
44 (16.2min) fps -1%
Average NVIDIA RTX A2000 Laptop GPU
  (37 - 44.3, n=2)
40.7 fps -8%
Dell Precision 5000 5470
Intel Core i9-12900H, NVIDIA RTX A1000 Laptop GPU
29 (11.4min) fps -35%
2560x1440 Ultra Preset
MSI GE67 HX 12UGS
Intel Core i7-12800HX, NVIDIA GeForce RTX 3070 Ti Laptop GPU
56.4 (38.2min) fps +106%
Lenovo Legion 7 16ARHA7
AMD Ryzen 9 6900HX, AMD Radeon RX 6850M XT
53.6 (35.6min) fps +96%
Dell Precision 7670
Intel Core i7-12850HX, NVIDIA RTX A2000 Laptop GPU
27.4 (18.3min) fps
Average NVIDIA RTX A2000 Laptop GPU
  (23 - 27.4, n=2)
25.2 fps -8%
Dota 2 Reborn
1280x720 min (0/3) fastest
MSI GE67 HX 12UGS
Intel Core i7-12800HX, NVIDIA GeForce RTX 3070 Ti Laptop GPU
181.2 (161min) fps 0%
Dell Precision 7670
Intel Core i7-12850HX, NVIDIA RTX A2000 Laptop GPU
180.8 (159.6min) fps
HP Envy 16 h0112nr
Intel Core i7-12700H, NVIDIA GeForce RTX 3060 Laptop GPU
180.6 (158.7min) fps 0%
Dell Precision 5000 5560
Intel Core i7-11850H, NVIDIA RTX A2000 Laptop GPU
173 (149min) fps -4%
Average NVIDIA RTX A2000 Laptop GPU
  (122.3 - 192.4, n=9)
171.6 fps -5%
HP ZBook Fury 15 G8
Intel Core i9-11950H, NVIDIA RTX A5000 Laptop GPU
164 (145min) fps -9%
Dell Precision 5000 5470
Intel Core i9-12900H, NVIDIA RTX A1000 Laptop GPU
160.8 (143.8min) fps -11%
Lenovo ThinkPad P1 G4-20Y4Z9DVUS
Intel Core i7-11800H, NVIDIA T1200 Laptop GPU
157 (139.4min) fps -13%
Dell Precision 7550
Intel Xeon W-10885M, NVIDIA Quadro RTX 5000 Max-Q
156 (137.7min) fps -14%
Lenovo Legion 7 16ARHA7
AMD Ryzen 9 6900HX, AMD Radeon RX 6850M XT
147.3 (124.9min) fps -19%
Asus ProArt StudioBook 16 W7600H5A-2BL2
Intel Xeon W-11955M, NVIDIA RTX A5000 Laptop GPU
144 (116.6min) fps -20%
Asus Zenbook Pro 15 OLED UM535Q
AMD Ryzen 9 5900HX, NVIDIA GeForce RTX 3050 Ti Laptop GPU
133.6 (119.4min) fps -26%
1366x768 med (1/3)
MSI GE67 HX 12UGS
Intel Core i7-12800HX, NVIDIA GeForce RTX 3070 Ti Laptop GPU
165.6 (143.9min) fps +4%
HP Envy 16 h0112nr
Intel Core i7-12700H, NVIDIA GeForce RTX 3060 Laptop GPU
164.8 (144min) fps +3%
Dell Precision 7670
Intel Core i7-12850HX, NVIDIA RTX A2000 Laptop GPU
159.3 (139.9min) fps
Dell Precision 5000 5560
Intel Core i7-11850H, NVIDIA RTX A2000 Laptop GPU
155 (136.7min) fps -3%
Average NVIDIA RTX A2000 Laptop GPU
  (111.1 - 174.7, n=9)
151.1 fps -5%
HP ZBook Fury 15 G8
Intel Core i9-11950H, NVIDIA RTX A5000 Laptop GPU
148 (129.9min) fps -7%
Dell Precision 5000 5470
Intel Core i9-12900H, NVIDIA RTX A1000 Laptop GPU
147.9 (106.5min) fps -7%
Dell Precision 7550
Intel Xeon W-10885M, NVIDIA Quadro RTX 5000 Max-Q
142 (124.9min) fps -11%
Lenovo ThinkPad P1 G4-20Y4Z9DVUS
Intel Core i7-11800H, NVIDIA T1200 Laptop GPU
138 (122min) fps -13%
Asus ProArt StudioBook 16 W7600H5A-2BL2
Intel Xeon W-11955M, NVIDIA RTX A5000 Laptop GPU
136 (108min) fps -15%
Asus Zenbook Pro 15 OLED UM535Q
AMD Ryzen 9 5900HX, NVIDIA GeForce RTX 3050 Ti Laptop GPU
123.7 (110.6min) fps -22%
Lenovo Legion 7 16ARHA7
AMD Ryzen 9 6900HX, AMD Radeon RX 6850M XT
110.9 (88.8min) fps -30%
1920x1080 high (2/3)
MSI GE67 HX 12UGS
Intel Core i7-12800HX, NVIDIA GeForce RTX 3070 Ti Laptop GPU
155.3 (136.9min) fps +7%
HP Envy 16 h0112nr
Intel Core i7-12700H, NVIDIA GeForce RTX 3060 Laptop GPU
149.1 (127.7min) fps +3%
Dell Precision 7670
Intel Core i7-12850HX, NVIDIA RTX A2000 Laptop GPU
145.1 (109.4min) fps
Average NVIDIA RTX A2000 Laptop GPU
  (105.3 - 168.4, n=9)
140.5 fps -3%
HP ZBook Fury 15 G8
Intel Core i9-11950H, NVIDIA RTX A5000 Laptop GPU
140 (121.3min) fps -4%
Dell Precision 5000 5560
Intel Core i7-11850H, NVIDIA RTX A2000 Laptop GPU
130 (112.5min) fps -10%
Lenovo ThinkPad P1 G4-20Y4Z9DVUS
Intel Core i7-11800H, NVIDIA T1200 Laptop GPU
128 (112.6min) fps -12%
Asus ProArt StudioBook 16 W7600H5A-2BL2
Intel Xeon W-11955M, NVIDIA RTX A5000 Laptop GPU
124 (103.4min) fps -15%
Dell Precision 7550
Intel Xeon W-10885M, NVIDIA Quadro RTX 5000 Max-Q
117 (100.8min) fps -19%
Asus Zenbook Pro 15 OLED UM535Q
AMD Ryzen 9 5900HX, NVIDIA GeForce RTX 3050 Ti Laptop GPU
116.9 (102.9min) fps -19%
Lenovo Legion 7 16ARHA7
AMD Ryzen 9 6900HX, AMD Radeon RX 6850M XT
113.7 (86.4min) fps -22%
Dell Precision 5000 5470
Intel Core i9-12900H, NVIDIA RTX A1000 Laptop GPU
112.3 (97.8min) fps -23%
1920x1080 ultra (3/3) best looking
MSI GE67 HX 12UGS
Intel Core i7-12800HX, NVIDIA GeForce RTX 3070 Ti Laptop GPU
147.7 (130.1min) fps +15%
HP Envy 16 h0112nr
Intel Core i7-12700H, NVIDIA GeForce RTX 3060 Laptop GPU
139 (117.8min) fps +8%
Dell Precision 5000 5470
Intel Core i9-12900H, NVIDIA RTX A1000 Laptop GPU
132.1 (114.8min) fps +3%
HP ZBook Fury 15 G8
Intel Core i9-11950H, NVIDIA RTX A5000 Laptop GPU
131 (112.8min) fps +2%
Average NVIDIA RTX A2000 Laptop GPU
  (100.4 - 158, n=9)
130.8 fps +2%
Dell Precision 7670
Intel Core i7-12850HX, NVIDIA RTX A2000 Laptop GPU
128.8 (100.1min) fps
Dell Precision 5000 5560
Intel Core i7-11850H, NVIDIA RTX A2000 Laptop GPU
119 (102min) fps -8%
Asus ProArt StudioBook 16 W7600H5A-2BL2
Intel Xeon W-11955M, NVIDIA RTX A5000 Laptop GPU
117 (97min) fps -9%
Lenovo ThinkPad P1 G4-20Y4Z9DVUS
Intel Core i7-11800H, NVIDIA T1200 Laptop GPU
116 (100.4min) fps -10%
Asus Zenbook Pro 15 OLED UM535Q
AMD Ryzen 9 5900HX, NVIDIA GeForce RTX 3050 Ti Laptop GPU
112.1 (97.4min) fps -13%
Dell Precision 7550
Intel Xeon W-10885M, NVIDIA Quadro RTX 5000 Max-Q
111 (95.4min) fps -14%
Lenovo Legion 7 16ARHA7
AMD Ryzen 9 6900HX, AMD Radeon RX 6850M XT
95.2 (75.3min) fps -26%
3840x2160 ultra (3/3) best looking
MSI GE67 HX 12UGS
Intel Core i7-12800HX, NVIDIA GeForce RTX 3070 Ti Laptop GPU
148.9 (128.7min) fps +90%
Asus ProArt StudioBook 16 W7600H5A-2BL2
Intel Xeon W-11955M, NVIDIA RTX A5000 Laptop GPU
118 (97.8min) fps +50%
Dell Precision 7550
Intel Xeon W-10885M, NVIDIA Quadro RTX 5000 Max-Q
98.7 (83.6min) fps +26%
HP ZBook Fury 15 G8
Intel Core i9-11950H, NVIDIA RTX A5000 Laptop GPU
95 (57.1min) fps +21%
Dell Precision 7670
Intel Core i7-12850HX, NVIDIA RTX A2000 Laptop GPU
78.5 (68.6min) fps
Average NVIDIA RTX A2000 Laptop GPU
  (62.9 - 83.2, n=6)
71.7 fps -9%
Dell Precision 5000 5560
Intel Core i7-11850H, NVIDIA RTX A2000 Laptop GPU
62.9 (57.3min) fps -20%
HP Envy 16 h0112nr
Intel Core i7-12700H, NVIDIA GeForce RTX 3060 Laptop GPU
46.9 (42.6min) fps -40%
Final Fantasy XV Benchmark
1280x720 Lite Quality
MSI GE67 HX 12UGS
Intel Core i7-12800HX, NVIDIA GeForce RTX 3070 Ti Laptop GPU
201 fps +55%
Asus ProArt StudioBook 16 W7600H5A-2BL2
Intel Xeon W-11955M, NVIDIA RTX A5000 Laptop GPU
184 fps +42%
Lenovo Legion 7 16ARHA7
AMD Ryzen 9 6900HX, AMD Radeon RX 6850M XT
180.6 fps +39%
HP Envy 16 h0112nr
Intel Core i7-12700H, NVIDIA GeForce RTX 3060 Laptop GPU
177.2 fps +37%
HP ZBook Fury 15 G8
Intel Core i9-11950H, NVIDIA RTX A5000 Laptop GPU
155 fps +20%
Dell Precision 7550
Intel Xeon W-10885M, NVIDIA Quadro RTX 5000 Max-Q
154 fps +19%
Dell Precision 7670
Intel Core i7-12850HX, NVIDIA RTX A2000 Laptop GPU
129.5 fps
Average NVIDIA RTX A2000 Laptop GPU
  (86.9 - 164.3, n=9)
127 fps -2%
Asus Zenbook Pro 15 OLED UM535Q
AMD Ryzen 9 5900HX, NVIDIA GeForce RTX 3050 Ti Laptop GPU
115.9 fps -11%
Dell Precision 5000 5470
Intel Core i9-12900H, NVIDIA RTX A1000 Laptop GPU
105.3 fps -19%
Lenovo ThinkPad P1 G4-20Y4Z9DVUS
Intel Core i7-11800H, NVIDIA T1200 Laptop GPU
102 fps -21%
Dell Precision 5000 5560
Intel Core i7-11850H, NVIDIA RTX A2000 Laptop GPU
86.9 fps -33%
1920x1080 Standard Quality
MSI GE67 HX 12UGS
Intel Core i7-12800HX, NVIDIA GeForce RTX 3070 Ti Laptop GPU
162.6 fps +102%
Lenovo Legion 7 16ARHA7
AMD Ryzen 9 6900HX, AMD Radeon RX 6850M XT
148.5 fps +85%
Asus ProArt StudioBook 16 W7600H5A-2BL2
Intel Xeon W-11955M, NVIDIA RTX A5000 Laptop GPU
123 fps +53%
HP Envy 16 h0112nr
Intel Core i7-12700H, NVIDIA GeForce RTX 3060 Laptop GPU
111.7 fps +39%
HP ZBook Fury 15 G8
Intel Core i9-11950H, NVIDIA RTX A5000 Laptop GPU
110 fps +37%
Dell Precision 7550
Intel Xeon W-10885M, NVIDIA Quadro RTX 5000 Max-Q
99.7 fps +24%
Dell Precision 7670
Intel Core i7-12850HX, NVIDIA RTX A2000 Laptop GPU
80.4 fps
Average NVIDIA RTX A2000 Laptop GPU
  (51.9 - 90.5, n=9)
72.9 fps -9%
Asus Zenbook Pro 15 OLED UM535Q
AMD Ryzen 9 5900HX, NVIDIA GeForce RTX 3050 Ti Laptop GPU
71 fps -12%
Dell Precision 5000 5560
Intel Core i7-11850H, NVIDIA RTX A2000 Laptop GPU
63.2 fps -21%
Dell Precision 5000 5470
Intel Core i9-12900H, NVIDIA RTX A1000 Laptop GPU
59.1 fps -26%
Lenovo ThinkPad P1 G4-20Y4Z9DVUS
Intel Core i7-11800H, NVIDIA T1200 Laptop GPU
56.5 fps -30%
1920x1080 High Quality
MSI GE67 HX 12UGS
Intel Core i7-12800HX, NVIDIA GeForce RTX 3070 Ti Laptop GPU
122.4 fps +102%
Lenovo Legion 7 16ARHA7
AMD Ryzen 9 6900HX, AMD Radeon RX 6850M XT
111.9 fps +85%
Asus ProArt StudioBook 16 W7600H5A-2BL2
Intel Xeon W-11955M, NVIDIA RTX A5000 Laptop GPU
91.8 fps +51%
HP Envy 16 h0112nr
Intel Core i7-12700H, NVIDIA GeForce RTX 3060 Laptop GPU
83.9 fps +38%
HP ZBook Fury 15 G8
Intel Core i9-11950H, NVIDIA RTX A5000 Laptop GPU
81.1 fps +34%
Dell Precision 7550
Intel Xeon W-10885M, NVIDIA Quadro RTX 5000 Max-Q
77.3 fps +28%
Dell Precision 7670
Intel Core i7-12850HX, NVIDIA RTX A2000 Laptop GPU
60.6 fps
Average NVIDIA RTX A2000 Laptop GPU
  (38.3 - 64, n=9)
52.5 fps -13%
Asus Zenbook Pro 15 OLED UM535Q
AMD Ryzen 9 5900HX, NVIDIA GeForce RTX 3050 Ti Laptop GPU
50.2 fps -17%
Dell Precision 5000 5560
Intel Core i7-11850H, NVIDIA RTX A2000 Laptop GPU
46.6 fps -23%
Dell Precision 5000 5470
Intel Core i9-12900H, NVIDIA RTX A1000 Laptop GPU
43 fps -29%
Lenovo ThinkPad P1 G4-20Y4Z9DVUS
Intel Core i7-11800H, NVIDIA T1200 Laptop GPU
39 fps -36%
2560x1440 High Quality
MSI GE67 HX 12UGS
Intel Core i7-12800HX, NVIDIA GeForce RTX 3070 Ti Laptop GPU
93 fps +109%
Lenovo Legion 7 16ARHA7
AMD Ryzen 9 6900HX, AMD Radeon RX 6850M XT
83.8 fps +89%
Asus ProArt StudioBook 16 W7600H5A-2BL2
Intel Xeon W-11955M, NVIDIA RTX A5000 Laptop GPU
70.6 fps +59%
HP ZBook Fury 15 G8
Intel Core i9-11950H, NVIDIA RTX A5000 Laptop GPU
62.6 fps +41%
HP Envy 16 h0112nr
Intel Core i7-12700H, NVIDIA GeForce RTX 3060 Laptop GPU
62 fps +40%
Dell Precision 7550
Intel Xeon W-10885M, NVIDIA Quadro RTX 5000 Max-Q
56 fps +26%
Dell Precision 7670
Intel Core i7-12850HX, NVIDIA RTX A2000 Laptop GPU
44.4 fps
Average NVIDIA RTX A2000 Laptop GPU
  (31.1 - 47.1, n=8)
38.8 fps -13%
Dell Precision 5000 5560
Intel Core i7-11850H, NVIDIA RTX A2000 Laptop GPU
34.4 fps -23%
Lenovo ThinkPad P1 G4-20Y4Z9DVUS
Intel Core i7-11800H, NVIDIA T1200 Laptop GPU
26.6 fps -40%
3840x2160 High Quality
Asus ProArt StudioBook 16 W7600H5A-2BL2
Intel Xeon W-11955M, NVIDIA RTX A5000 Laptop GPU
41 fps +58%
HP ZBook Fury 15 G8
Intel Core i9-11950H, NVIDIA RTX A5000 Laptop GPU
35.4 fps +36%
HP Envy 16 h0112nr
Intel Core i7-12700H, NVIDIA GeForce RTX 3060 Laptop GPU
34.6 fps +33%
Dell Precision 7550
Intel Xeon W-10885M, NVIDIA Quadro RTX 5000 Max-Q
32.8 fps +26%
Dell Precision 7670
Intel Core i7-12850HX, NVIDIA RTX A2000 Laptop GPU
26 fps
Average NVIDIA RTX A2000 Laptop GPU
  (17.7 - 26, n=5)
21.3 fps -18%
Dell Precision 5000 5560
Intel Core i7-11850H, NVIDIA RTX A2000 Laptop GPU
19.3 fps -26%
X-Plane 11.11
1280x720 low (fps_test=1)
MSI GE67 HX 12UGS
Intel Core i7-12800HX, NVIDIA GeForce RTX 3070 Ti Laptop GPU
145.5 fps +8%
HP Envy 16 h0112nr
Intel Core i7-12700H, NVIDIA GeForce RTX 3060 Laptop GPU
140.3 fps +4%
Dell Precision 7670
Intel Core i7-12850HX, NVIDIA RTX A2000 Laptop GPU
135.2 fps
Average NVIDIA RTX A2000 Laptop GPU
  (88.2 - 163.3, n=9)
130.1 fps -4%
Dell Precision 5000 5470
Intel Core i9-12900H, NVIDIA RTX A1000 Laptop GPU
118.7 fps -12%
Dell Precision 7550
Intel Xeon W-10885M, NVIDIA Quadro RTX 5000 Max-Q
118 fps -13%
Asus ProArt StudioBook 16 W7600H5A-2BL2
Intel Xeon W-11955M, NVIDIA RTX A5000 Laptop GPU
117 fps -13%
Dell Precision 5000 5560
Intel Core i7-11850H, NVIDIA RTX A2000 Laptop GPU
112 fps -17%
Lenovo ThinkPad P1 G4-20Y4Z9DVUS
Intel Core i7-11800H, NVIDIA T1200 Laptop GPU
109 fps -19%
HP ZBook Fury 15 G8
Intel Core i9-11950H, NVIDIA RTX A5000 Laptop GPU
108 fps -20%
Asus Zenbook Pro 15 OLED UM535Q
AMD Ryzen 9 5900HX, NVIDIA GeForce RTX 3050 Ti Laptop GPU
96.6 fps -29%
Lenovo Legion 7 16ARHA7
AMD Ryzen 9 6900HX, AMD Radeon RX 6850M XT
63.3 fps -53%
1920x1080 med (fps_test=2)
MSI GE67 HX 12UGS
Intel Core i7-12800HX, NVIDIA GeForce RTX 3070 Ti Laptop GPU
133.4 fps +28%
HP Envy 16 h0112nr
Intel Core i7-12700H, NVIDIA GeForce RTX 3060 Laptop GPU
127 fps +22%
Average NVIDIA RTX A2000 Laptop GPU
  (77 - 142.3, n=9)
109.3 fps +5%
Dell Precision 7670
Intel Core i7-12850HX, NVIDIA RTX A2000 Laptop GPU
104.1 fps
Dell Precision 7550
Intel Xeon W-10885M, NVIDIA Quadro RTX 5000 Max-Q
102 fps -2%
Asus ProArt StudioBook 16 W7600H5A-2BL2
Intel Xeon W-11955M, NVIDIA RTX A5000 Laptop GPU
102 fps -2%
Dell Precision 5000 5470
Intel Core i9-12900H, NVIDIA RTX A1000 Laptop GPU
94.8 fps -9%
Lenovo ThinkPad P1 G4-20Y4Z9DVUS
Intel Core i7-11800H, NVIDIA T1200 Laptop GPU
94 fps -10%
HP ZBook Fury 15 G8
Intel Core i9-11950H, NVIDIA RTX A5000 Laptop GPU
90.8 fps -13%
Dell Precision 5000 5560
Intel Core i7-11850H, NVIDIA RTX A2000 Laptop GPU
89.2 fps -14%
Asus Zenbook Pro 15 OLED UM535Q
AMD Ryzen 9 5900HX, NVIDIA GeForce RTX 3050 Ti Laptop GPU
84 fps -19%
Lenovo Legion 7 16ARHA7
AMD Ryzen 9 6900HX, AMD Radeon RX 6850M XT
51.2 fps -51%
1920x1080 high (fps_test=3)
MSI GE67 HX 12UGS
Intel Core i7-12800HX, NVIDIA GeForce RTX 3070 Ti Laptop GPU
105.9 fps +24%
HP Envy 16 h0112nr
Intel Core i7-12700H, NVIDIA GeForce RTX 3060 Laptop GPU
103 fps +20%
Average NVIDIA RTX A2000 Laptop GPU
  (63.2 - 112.5, n=9)
88.9 fps +4%
Dell Precision 7550
Intel Xeon W-10885M, NVIDIA Quadro RTX 5000 Max-Q
85.7 fps 0%
Dell Precision 7670
Intel Core i7-12850HX, NVIDIA RTX A2000 Laptop GPU
85.5 fps
Asus ProArt StudioBook 16 W7600H5A-2BL2
Intel Xeon W-11955M, NVIDIA RTX A5000 Laptop GPU
81.6 fps -5%
HP ZBook Fury 15 G8
Intel Core i9-11950H, NVIDIA RTX A5000 Laptop GPU
76.5 fps -11%
Dell Precision 5000 5470
Intel Core i9-12900H, NVIDIA RTX A1000 Laptop GPU
76.3 fps -11%
Lenovo ThinkPad P1 G4-20Y4Z9DVUS
Intel Core i7-11800H, NVIDIA T1200 Laptop GPU
75.6 fps -12%
Dell Precision 5000 5560
Intel Core i7-11850H, NVIDIA RTX A2000 Laptop GPU
75.1 fps -12%
Asus Zenbook Pro 15 OLED UM535Q
AMD Ryzen 9 5900HX, NVIDIA GeForce RTX 3050 Ti Laptop GPU
68.5 fps -20%
Lenovo Legion 7 16ARHA7
AMD Ryzen 9 6900HX, AMD Radeon RX 6850M XT
44.1 fps -48%
3840x2160 high (fps_test=3)
Average NVIDIA RTX A2000 Laptop GPU
  (45.3 - 93.8, n=6)
65.9 fps +20%
HP Envy 16 h0112nr
Intel Core i7-12700H, NVIDIA GeForce RTX 3060 Laptop GPU
60.5 fps +10%
Dell Precision 7670
Intel Core i7-12850HX, NVIDIA RTX A2000 Laptop GPU
55.1 fps
Asus ProArt StudioBook 16 W7600H5A-2BL2
Intel Xeon W-11955M, NVIDIA RTX A5000 Laptop GPU
52 fps -6%
Dell Precision 7550
Intel Xeon W-10885M, NVIDIA Quadro RTX 5000 Max-Q
48.8 fps -11%
HP ZBook Fury 15 G8
Intel Core i9-11950H, NVIDIA RTX A5000 Laptop GPU
48.6 fps -12%
Dell Precision 5000 5560
Intel Core i7-11850H, NVIDIA RTX A2000 Laptop GPU
45.3 fps -18%
Strange Brigade
1280x720 lowest AF:1
MSI GE67 HX 12UGS
Intel Core i7-12800HX, NVIDIA GeForce RTX 3070 Ti Laptop GPU
453 (227min, 346P1) fps +39%
Lenovo Legion 7 16ARHA7
AMD Ryzen 9 6900HX, AMD Radeon RX 6850M XT
445 (201min, 323P1) fps +37%
Asus ProArt StudioBook 16 W7600H5A-2BL2
Intel Xeon W-11955M, NVIDIA RTX A5000 Laptop GPU
419 (36.6min, 262P1) fps +29%
HP Envy 16 h0112nr
Intel Core i7-12700H, NVIDIA GeForce RTX 3060 Laptop GPU
418 (205min, 325P1) fps +29%
HP ZBook Fury 15 G8
Intel Core i9-11950H, NVIDIA RTX A5000 Laptop GPU
337 (41min, 44.1P1) fps +4%
Dell Precision 7670
Intel Core i7-12850HX, NVIDIA RTX A2000 Laptop GPU
325 (88.3min, 244P1) fps
Average NVIDIA RTX A2000 Laptop GPU
  (238 - 353, n=9)
293 fps -10%
Asus Zenbook Pro 15 OLED UM535Q
AMD Ryzen 9 5900HX, NVIDIA GeForce RTX 3050 Ti Laptop GPU
259 (114.5min, 177.4P1) fps -20%
Dell Precision 5000 5560
Intel Core i7-11850H, NVIDIA RTX A2000 Laptop GPU
251 (24.2min, 179P1) fps -23%
Dell Precision 5000 5470
Intel Core i9-12900H, NVIDIA RTX A1000 Laptop GPU
242 (128.8min, 183.1P1) fps -26%
1920x1080 medium AA:medium AF:4
Lenovo Legion 7 16ARHA7
AMD Ryzen 9 6900HX, AMD Radeon RX 6850M XT
303 (153.8min, 221P1) fps +100%
MSI GE67 HX 12UGS
Intel Core i7-12800HX, NVIDIA GeForce RTX 3070 Ti Laptop GPU
288 (173min, 227P1) fps +90%
Asus ProArt StudioBook 16 W7600H5A-2BL2
Intel Xeon W-11955M, NVIDIA RTX A5000 Laptop GPU
231 (77.4min, 171P1) fps +53%
HP Envy 16 h0112nr
Intel Core i7-12700H, NVIDIA GeForce RTX 3060 Laptop GPU
202 (59min, 164.6P1) fps +34%
HP ZBook Fury 15 G8
Intel Core i9-11950H, NVIDIA RTX A5000 Laptop GPU
195 (37.2min, 60.3P1) fps +29%
Dell Precision 7670
Intel Core i7-12850HX, NVIDIA RTX A2000 Laptop GPU
151.2 (34.5min, 121.4P1) fps
Average NVIDIA RTX A2000 Laptop GPU
  (113.8 - 159.4, n=8)
136.5 fps -10%
Asus Zenbook Pro 15 OLED UM535Q
AMD Ryzen 9 5900HX, NVIDIA GeForce RTX 3050 Ti Laptop GPU
126.9 (98min, 103.8P1) fps -16%
Dell Precision 5000 5470
Intel Core i9-12900H, NVIDIA RTX A1000 Laptop GPU
106.2 (82.7min, 91.1P1) fps -30%
1920x1080 high AA:high AF:8
Lenovo Legion 7 16ARHA7
AMD Ryzen 9 6900HX, AMD Radeon RX 6850M XT
261 (74.9min, 186.3P1) fps +116%
MSI GE67 HX 12UGS
Intel Core i7-12800HX, NVIDIA GeForce RTX 3070 Ti Laptop GPU
235 (75.3min, 181.1P1) fps +94%
Asus ProArt StudioBook 16 W7600H5A-2BL2
Intel Xeon W-11955M, NVIDIA RTX A5000 Laptop GPU
192 (89.6min, 141P1) fps +59%
HP ZBook Fury 15 G8
Intel Core i9-11950H, NVIDIA RTX A5000 Laptop GPU
165 (35.9min, 121P1) fps +36%
HP Envy 16 h0112nr
Intel Core i7-12700H, NVIDIA GeForce RTX 3060 Laptop GPU
162 (110.3min, 118.7P1) fps +34%
Dell Precision 7670
Intel Core i7-12850HX, NVIDIA RTX A2000 Laptop GPU
120.9 (81.7min, 93.3P1) fps
Average NVIDIA RTX A2000 Laptop GPU
  (89.9 - 125.9, n=8)
108 fps -11%
Asus Zenbook Pro 15 OLED UM535Q
AMD Ryzen 9 5900HX, NVIDIA GeForce RTX 3050 Ti Laptop GPU
102.1 (73min, 77.6P1) fps -16%
Dell Precision 5000 5470
Intel Core i9-12900H, NVIDIA RTX A1000 Laptop GPU
84.7 (61.1min, 63.7P1) fps -30%
1920x1080 ultra AA:ultra AF:16
Lenovo Legion 7 16ARHA7
AMD Ryzen 9 6900HX, AMD Radeon RX 6850M XT
224 (140min, 162.1P1) fps +116%
MSI GE67 HX 12UGS
Intel Core i7-12800HX, NVIDIA GeForce RTX 3070 Ti Laptop GPU
207 (107.5min, 154.2P1) fps +100%
Asus ProArt StudioBook 16 W7600H5A-2BL2
Intel Xeon W-11955M, NVIDIA RTX A5000 Laptop GPU
160 (89.3min, 114P1) fps +55%
HP ZBook Fury 15 G8
Intel Core i9-11950H, NVIDIA RTX A5000 Laptop GPU
147 (37.3min, 108P1) fps +42%
HP Envy 16 h0112nr
Intel Core i7-12700H, NVIDIA GeForce RTX 3060 Laptop GPU
140.4 (96.1min, 105.2P1) fps +36%
Dell Precision 7670
Intel Core i7-12850HX, NVIDIA RTX A2000 Laptop GPU
103.5 (61.1min, 79.3P1) fps
Average NVIDIA RTX A2000 Laptop GPU
  (77.8 - 108.8, n=8)
93.2 fps -10%
Asus Zenbook Pro 15 OLED UM535Q
AMD Ryzen 9 5900HX, NVIDIA GeForce RTX 3050 Ti Laptop GPU
87.5 (64.4min, 67.6P1) fps -15%
Dell Precision 5000 5470
Intel Core i9-12900H, NVIDIA RTX A1000 Laptop GPU
72.8 (53.2min, 56.3P1) fps -30%
2560x1440 ultra AA:ultra AF:16
Lenovo Legion 7 16ARHA7
AMD Ryzen 9 6900HX, AMD Radeon RX 6850M XT
161.7 (108.2min, 125.7P1) fps +111%
MSI GE67 HX 12UGS
Intel Core i7-12800HX, NVIDIA GeForce RTX 3070 Ti Laptop GPU
154.1 (113.5min, 117.6P1) fps +101%
Asus ProArt StudioBook 16 W7600H5A-2BL2
Intel Xeon W-11955M, NVIDIA RTX A5000 Laptop GPU
129 (70.7min, 98.8P1) fps +68%
HP ZBook Fury 15 G8
Intel Core i9-11950H, NVIDIA RTX A5000 Laptop GPU
108 (32.7min, 86P1) fps +41%
HP Envy 16 h0112nr
Intel Core i7-12700H, NVIDIA GeForce RTX 3060 Laptop GPU
103.5 (37.9min, 79.8P1) fps +35%
Dell Precision 7670
Intel Core i7-12850HX, NVIDIA RTX A2000 Laptop GPU
76.8 (59.2min, 63P1) fps
Average NVIDIA RTX A2000 Laptop GPU
  (54.3 - 76.8, n=6)
65.1 fps -15%
Dell Precision 5000 5560
Intel Core i7-11850H, NVIDIA RTX A2000 Laptop GPU
60.4 (46.4min, 48.3P1) fps -21%

Witcher 3 FPS Chart

051015202530354045505560Tooltip
Dell Precision 7670 i7-12850HX, RTX A2000 Laptop GPU: Ø56.4 (52-60)
low med. high ultraQHD4K
GTA V (2015) 181.7 177.6 155.1 79.1 57.1
The Witcher 3 (2015) 297.1 181.7 108.6 57.4
Dota 2 Reborn (2015) 180.8 159.3 145.1 128.8 78.5
Final Fantasy XV Benchmark (2018) 129.5 80.4 60.6 44.4 26
X-Plane 11.11 (2018) 135.2 104.1 85.5 55.1
Strange Brigade (2018) 325 151.2 120.9 103.5 76.8
Cyberpunk 2077 1.6 (2022) 78.5 65.1 55 44.3 27.4

Emisje

Szum systemu

Wentylatory prawie nigdy nie są bezgłośne, nawet podczas pracy na biegu jałowym na pulpicie, ale mimo to są ciche i trudne do zauważenia podczas niewielkiego obciążenia. Podczas odtwarzania filmów należy spodziewać się hałasu na poziomie poniżej 28 dB(A) przy cichym tle 22,7 dB(A). Szum wentylatora jest jeszcze cichszy i wynosi 24,5 dB(A) podczas przeglądania stron internetowych lub przetwarzania tekstów, co jest podobne do tego, co zaobserwowaliśmy w ZBook Fury 15 G8 lub Precision 5560

Poziom hałasu wzrasta nieco szybciej, kiedy wprowadzane jest większe obciążenie. Na przykład w pierwszej scenie benchmarku 3DMark 06 szum wentylatora osiągnął poziom 49 dB(A), nawet przy ustawieniu profilu zasilania Balanced. Przy ekstremalnym obciążeniu, takim jak Prime95 i FurMark, hałas wentylatora osiągnąłby wartość około 52 dB(A), podobnie jak w przypadku Precision 5560. Innymi słowy, Precision 7670 działa cicho w większości warunków, ale staje się dość hałaśliwy, gdy pojawi się choćby odrobina stresu.

Model wykorzystuje izolację termiczną GORE podobną do serii XPS 15
Chłodzenie składa się z dwóch wentylatorów ~60 mm z łopatkami z płynnego polimeru
zainstalowany moduł CAMM 32 GB
Moduł CAMM usunięty. Dell oferuje opcje SODIMM, jeśli nabywcy nie chcą przechodzić na CAMM
Profil hałasu wentylatora (Biały: Tło, Czerwony: System idle, Niebieski: 3DMark 06, Pomarańczowy: Witcher 3, Zielony: Prime95+FurMark stress)

Hałas

luz
22.9 / 22.9 / 24.5 dB
obciążenie
48.7 / 52.1 dB
  red to green bar
 
 
30 dB
cichy
40 dB(A)
słyszalny
50 dB(A)
irytujący
 
min: dark, med: mid, max: light   Earthworks M23R, Arta (odległość 15 cm)   environment noise: 22.7 dB(A)
dB(A) 0102030405060708090Deep BassMiddle BassHigh BassLower RangeMidsHigher MidsLower HighsMid HighsUpper HighsSuper Highs2032.53738.737.937.62523.927.12625.323.73122.530.322.622.321.34024.32721.623.823.65024.328.72220.8266326.223.719.720.724.2802524.519.419.4261002423.517.11625.512526.125.515.715.727.716027.627.512.613.129.920027.429.813.712.332.22503030.413.912.13331529.131.113.413.635.340028.930.711.310.93450029.130.8111034.263030.732.610.89.737.180031.833.99.59.336.9100031.833.89.89.136.3125033.635.59.39.339.3160032.834.49.89.738.320003133.710.29.837250032.235.410.510.338.831503235.310.810.839400036.440.811.211.142.9500038.242.311.311.445.4630033.738.311.411.543.1800027.433.311.711.338.11000021.928.911.711.834.11250017.923.911.511.327.91600017.923.81110.629.2SPL45.248.722.922.752.1N56.30.40.48.1median 30median 32.6median 11.3median 11.1median 36.3Delta33.31.41.23.8hearing rangehide median Fan NoiseDell Precision 7670
Dell Precision 7670
RTX A2000 Laptop GPU, i7-12850HX, SK Hynix HFS001TEJ9X115N
Lenovo ThinkPad P1 G4-20Y4Z9DVUS
T1200 Laptop GPU, i7-11800H, Samsung PM9A1 MZVL2512HCJQ
Asus ProArt StudioBook 16 W7600H5A-2BL2
RTX A5000 Laptop GPU, W-11955M, 2x Micron 2300 2TB MTFDHBA2T0TDV (RAID 0)
Dell Precision 5000 5560
RTX A2000 Laptop GPU, i7-11850H, Samsung PM9A1 MZVL22T0HBLB
Dell Precision 7550
Quadro RTX 5000 Max-Q, W-10885M, SK Hynix PC601A NVMe 1TB
HP ZBook Fury 15 G8
RTX A5000 Laptop GPU, i9-11950H, Samsung PM981a MZVLB1T0HBLR
Noise
-3%
-3%
11%
-9%
3%
off / environment *
22.7
24.3
-7%
26
-15%
23.4
-3%
25.8
-14%
24.1
-6%
Idle Minimum *
22.9
24.3
-6%
26
-14%
23.6
-3%
25.8
-13%
24.1
-5%
Idle Average *
22.9
24.3
-6%
26
-14%
23.6
-3%
25.8
-13%
24.1
-5%
Idle Maximum *
24.5
26.6
-9%
26.5
-8%
23.6
4%
25.9
-6%
24.8
-1%
Load Average *
48.7
46.8
4%
42
14%
25.8
47%
51.2
-5%
37.8
22%
Witcher 3 ultra *
45.2
46.8
-4%
40.1
11%
51.9
-15%
44.2
2%
Load Maximum *
52.1
46.8
10%
43
17%
41.4
21%
51.9
-0%
44.2
15%

* ... im mniej tym lepiej

Temperatura

Temperatury powierzchni są zawsze ciepłe bez względu na obciążenie ekranu. Na przykład podczas pracy na biegu jałowym w trybie Power Saver powierzchnia klawiatury i spód oscylowały w granicach 30 stopni Celsjusza każda, w porównaniu z 26 stopniami Celsjusza na ekranie.Lenovo ThinkPad P1 G4. StronaAsus ProArt StudioBook Pro 16 może być w podobnych warunkach jeszcze cieplejszy, osiągając prawie 35 C.

Podczas ekstremalnego obciążenia udało nam się odnotować gorące punkty o temperaturze 51 C i 46 C, odpowiednio na górze i na dole. Lewa połowa obudowy będzie zawsze cieplejsza od prawej ze względu na sposób rozmieszczenia chłodzenia i procesorów w środku.

Tylny wydech
Tylny wydech
Zasilacz AC może osiągnąć temperaturę ponad 55 C podczas długotrwałej pracy z wymagającym obciążeniem
 51 °C45.6 °C41 °C 
 44.4 °C41.8 °C34 °C 
 34.2 °C32.2 °C28.8 °C 
maks. w ogóle: 51 °C
średnia: 39.2 °C
34 °C43 °C45.8 °C
27.4 °C33.4 °C39.8 °C
28.4 °C29.6 °C33.6 °C
maks. w ogóle: 45.8 °C
średnia: 35 °C
zasilacz  64 °C | temperatura otoczenia 21 °C | Fluke 62 Mini IR Thermometer
(-) The average temperature for the upper side under maximal load is 39.2 °C / 103 F, compared to the average of 32 °C / 90 F for the devices in the class Workstation.
(-) The maximum temperature on the upper side is 51 °C / 124 F, compared to the average of 38.1 °C / 101 F, ranging from 22.2 to 69.8 °C for the class Workstation.
(-) The bottom heats up to a maximum of 45.8 °C / 114 F, compared to the average of 41.3 °C / 106 F
(+) In idle usage, the average temperature for the upper side is 29.8 °C / 86 F, compared to the device average of 32 °C / 90 F.
(±) Playing The Witcher 3, the average temperature for the upper side is 37.1 °C / 99 F, compared to the device average of 32 °C / 90 F.
(+) The palmrests and touchpad are reaching skin temperature as a maximum (34.2 °C / 93.6 F) and are therefore not hot.
(-) The average temperature of the palmrest area of similar devices was 27.8 °C / 82 F (-6.4 °C / -11.6 F).
System w stanie spoczynku (góra)
System w stanie spoczynku (na dole)
Witcher 3 stres (góra)
Witcher 3 naprężenie (dolne)
Stres Prime95+FurMark (góra)
Prime95+FurMark stress (bottom)
Dell Precision 7670
Intel Core i7-12850HX, NVIDIA RTX A2000 Laptop GPU
Lenovo ThinkPad P1 G4-20Y4Z9DVUS
Intel Core i7-11800H, NVIDIA T1200 Laptop GPU
Asus ProArt StudioBook 16 W7600H5A-2BL2
Intel Xeon W-11955M, NVIDIA RTX A5000 Laptop GPU
Dell Precision 5000 5560
Intel Core i7-11850H, NVIDIA RTX A2000 Laptop GPU
Dell Precision 7550
Intel Xeon W-10885M, NVIDIA Quadro RTX 5000 Max-Q
HP ZBook Fury 15 G8
Intel Core i9-11950H, NVIDIA RTX A5000 Laptop GPU
Heat
5%
-3%
-1%
2%
4%
Maximum Upper Side *
51
49.9
2%
45.7
10%
48.2
5%
49
4%
45.6
11%
Maximum Bottom *
45.8
56.7
-24%
48.3
-5%
42.6
7%
51
-11%
57.6
-26%
Idle Upper Side *
31.8
25.5
20%
35.3
-11%
34.8
-9%
28.2
11%
26
18%
Idle Bottom *
32.6
26.2
20%
34.4
-6%
35.2
-8%
32
2%
28.8
12%

* ... im mniej tym lepiej

Stress Test

Po uruchomieniu programu Prime95 w celu obciążenia procesora częstotliwość taktowania zegara i pobór mocy na płycie głównej wzrosły odpowiednio do 3,5 GHz i 153 W, co trwało najwyżej kilka sekund. W tym krótkim okresie temperatura rdzenia sięgała 100°C. Częstotliwość taktowania i pobór mocy następnie systematycznie spadały, zanim ustabilizowały się na poziomie 2,2 do 2,4 GHz i 73 W, odpowiednio, aby utrzymać bardziej znośną temperaturę rdzenia 85 C. Wydajność Turbo Boost nie jest zatem tak dobra, jak mieliśmy nadzieję, biorąc pod uwagę rozmiar tej stacji roboczej.

W przypadku uruchomienia strony Witcher 3, która reprezentuje stałe, duże obciążenie, częstotliwości taktowania GPU, temperatura i pobór mocy ustabilizowały się odpowiednio na poziomie 1777 MHz, 80 C i 80 W, w porównaniu z 1462 MHz, 75 C i 45 W, odpowiednio, na mniejszym Precision 5560 z tym samym układem GPU RTX A2000.

Praca na zasilaniu akumulatorowym ogranicza wydajność. Test Fire Strike na akumulatorze przyniósłby wyniki w zakresie fizyki i grafiki na poziomie odpowiednio 9820 i 6911 punktów, w porównaniu z 23868 i 14295 punktów przy zasilaniu sieciowym.

System nieaktywny
System nieaktywny
Witcher 3 stres
Witcher 3 stres
Prime95 stres
Prime95 stres
Prime95+FurMark stres
ZegarCPU (GHz) Zegar GPU (MHz) Średnia temperatura CPU (°C) Średnia temperatura GPU (°C)
System w stanie bezczynności -- -- 49 50
Prime95 Stress 2.2 -- 85 58
Prime95 + FurMark Stress 0,8 - 1,3 ~1450 76 - 86 62 - 72
Witcher 3 Stres 0,6 1777 70 80

Mówcy

Szum różowy przy maksymalnej głośności pokazuje głośniki głośniejsze niż przeciętne, ale ze słabszym odtwarzaniem basów
Głośniki stereo skierowane w dół wzdłuż dolnej krawędzi
dB(A) 0102030405060708090Deep BassMiddle BassHigh BassLower RangeMidsHigher MidsLower HighsMid HighsUpper HighsSuper Highs203538.7352533.82633.83134.122.634.14035.921.635.95036.42236.46338.719.738.7804019.44010047.117.147.112553.115.753.11606212.66220065.713.765.725065.513.965.53156513.46540067.311.367.350070.71170.763075.610.875.680075.39.575.31000739.873125073.49.373.4160077.39.877.3200079.910.279.9250078.510.578.531507810.878400078.511.278.5500082.111.382.1630082.611.482.680008311.7831000085.311.785.31250082.711.582.71600076.51176.5SPL91.722.991.7N92.50.492.5median 76.5median 11.3median 76.5Delta8.11.48.126.325.821.422.12624.925.127.622.532.523.448.72655.818.860.922.167.2267019.372.317.674.217.774.319.575.31571.711.871.311.27410.574.21072.710.17210.67210.97511.374.811.671.71269.71269.612.371.112.669.61270.111.269.824.784.70.666.6median 12median 71.73.42.2hearing rangehide median Pink NoiseDell Precision 7670Apple MacBook Pro 16 2021 M1 Pro
Frequency diagram (checkboxes can be checked and unchecked to compare devices)
Dell Precision 7670 audio analysis

(+) | speakers can play relatively loud (91.7 dB)
Bass 100 - 315 Hz
(-) | nearly no bass - on average 16.8% lower than median
(+) | bass is linear (6.7% delta to prev. frequency)
Mids 400 - 2000 Hz
(+) | balanced mids - only 3.5% away from median
(+) | mids are linear (3.9% delta to prev. frequency)
Highs 2 - 16 kHz
(+) | balanced highs - only 4.6% away from median
(+) | highs are linear (2% delta to prev. frequency)
Overall 100 - 16.000 Hz
(+) | overall sound is linear (12.2% difference to median)
Compared to same class
» 12% of all tested devices in this class were better, 3% similar, 86% worse
» The best had a delta of 7%, average was 18%, worst was 35%
Compared to all devices tested
» 7% of all tested devices were better, 2% similar, 91% worse
» The best had a delta of 4%, average was 25%, worst was 134%

Apple MacBook Pro 16 2021 M1 Pro audio analysis

(+) | speakers can play relatively loud (84.7 dB)
Bass 100 - 315 Hz
(+) | good bass - only 3.8% away from median
(+) | bass is linear (5.2% delta to prev. frequency)
Mids 400 - 2000 Hz
(+) | balanced mids - only 1.3% away from median
(+) | mids are linear (2.1% delta to prev. frequency)
Highs 2 - 16 kHz
(+) | balanced highs - only 1.9% away from median
(+) | highs are linear (2.7% delta to prev. frequency)
Overall 100 - 16.000 Hz
(+) | overall sound is linear (4.6% difference to median)
Compared to same class
» 0% of all tested devices in this class were better, 0% similar, 100% worse
» The best had a delta of 5%, average was 18%, worst was 45%
Compared to all devices tested
» 0% of all tested devices were better, 0% similar, 100% worse
» The best had a delta of 4%, average was 25%, worst was 134%

Zarządzanie energią - bardzo wymagające

Pobór mocy

System jest dość wymagający w większości warunków. Pobór mocy waha się pomiędzy 7 a 25 W w stanie spoczynku na pulpicie, podczas gdy większe obciążenia, takie jak 3DMark 06 czy Witcher 3 pobierają po około 140 W. Asus ProArt StudioBook 16 lub Precision 5560 w podobnych warunkach pobierają odpowiednio 132 i 96 W

Przy maksymalnym obciążeniu CPU i GPU pobór mocy może wynieść nawet 221 W, mimo że średniej wielkości zasilacz sieciowy (~13,7 x 6,6 x 2,3 cm) ma moc znamionową tylko 180 W. Ta ekstremalnie wysoka stawka będzie trwała tylko przez minutę, po czym spadnie do 114 W, jeśli CPU jest obciążony lub 180 W, jeśli zarówno CPU jak i GPU są obciążone jednocześnie. Szybkość ładowania laptopa może zwolnić do zatrzymania, jeśli w takich ekstremalnych warunkach w wyniku

Dell oferuje bardziej wydajny zasilacz 240 W w przypadku konfiguracji Precision 7670 z szybszymi opcjami GPU. Jednak na podstawie naszych ustaleń z zasilaczem 180 W, być może opcja 240 W powinna być standardem we wszystkich konfiguracjach Nvidia RTX.

pobór mocy w 3DMark 06
Witcher 3 stres
Witcher 3 stres
Zużycie wzrosłoby do 220,8 W na chwilę podczas inicjowania stresu Prime95, po czym spadłoby do 149 W, a następnie 114 W
Stres Prime95+FurMark rozpoczął się po 10s. Zużycie często przekraczało limit 180 W dla zasilacza AC
Pobór mocy
wyłączony / stan wstrzymaniadarklight 0.8 / 1.02 W
luzdarkmidlight 7.5 / 9.5 / 28.4 W
obciążenie midlight 139.1 / 220.8 W
 color bar
Legenda: min: dark, med: mid, max: light        Metrahit Energy
Currently we use the Metrahit Energy, a professional single phase power quality and energy measurement digital multimeter, for our measurements. Find out more about it here. All of our test methods can be found here.
Dell Precision 7670
i7-12850HX, RTX A2000 Laptop GPU, SK Hynix HFS001TEJ9X115N, OLED, 3840x2400, 16.00
Lenovo ThinkPad P1 G4-20Y4Z9DVUS
i7-11800H, T1200 Laptop GPU, Samsung PM9A1 MZVL2512HCJQ, IPS, 2560x1600, 16.00
Asus ProArt StudioBook 16 W7600H5A-2BL2
W-11955M, RTX A5000 Laptop GPU, 2x Micron 2300 2TB MTFDHBA2T0TDV (RAID 0), OLED, 3840x2400, 16.00
Dell Precision 5000 5560
i7-11850H, RTX A2000 Laptop GPU, Samsung PM9A1 MZVL22T0HBLB, IPS, 3840x2400, 15.60
Dell Precision 7550
W-10885M, Quadro RTX 5000 Max-Q, SK Hynix PC601A NVMe 1TB, IPS, 3840x2160, 15.60
HP ZBook Fury 15 G8
i9-11950H, RTX A5000 Laptop GPU, Samsung PM981a MZVLB1T0HBLR, IPS, 3840x2160, 15.60
Power Consumption
9%
-14%
16%
-12%
-13%
Idle Minimum *
7.5
9.9
-32%
12.4
-65%
6.2
17%
8.2
-9%
8.3
-11%
Idle Average *
9.5
13.9
-46%
16.5
-74%
13.9
-46%
16.8
-77%
19.9
-109%
Idle Maximum *
28.4
14.6
49%
25
12%
23.8
16%
24.4
14%
21.8
23%
Load Average *
139.1
95
32%
132
5%
95.7
31%
131
6%
110.9
20%
Witcher 3 ultra *
134
98.9
26%
132
1%
87
35%
156.6
-17%
165
-23%
Load Maximum *
220.8
170.8
23%
134
39%
132.6
40%
201.8
9%
171.8
22%

* ... im mniej tym lepiej

Power Consumption Witcher 3 / Stresstest

0153045607590105120135150165180195210Tooltip
Dell Precision 7670 i7-12850HX, RTX A2000 Laptop GPU; Witcher 3 ultra: Ø134 (130.6-149.8)
Asus ProArt StudioBook 16 W7600H5A-2BL2 W-11955M, RTX A5000 Laptop GPU; Witcher 3 ultra: Ø132.1 (130-139)
Dell Precision 7670 i7-12850HX, RTX A2000 Laptop GPU; 1280x720 Prime95 28.10 and Furmark 1.25: Ø174.9 (114.6-220)
Asus ProArt StudioBook 16 W7600H5A-2BL2 W-11955M, RTX A5000 Laptop GPU; 1280x720 Prime95 28.10 and Furmark 1.25: Ø138.4 (109-179)

Power Consumption external Monitor

0153045607590105120135150165180195210Tooltip
Dell Precision 7670 i7-12850HX, RTX A2000 Laptop GPU; Prime95 V2810 Stress (external Monitor): Ø132.7 (114.4-221)
Asus ProArt StudioBook 16 W7600H5A-2BL2 W-11955M, RTX A5000 Laptop GPU; Prime95 V2810 Stress (external Monitor): Ø89.3 (77.7-109)
Dell Precision 7670 i7-12850HX, RTX A2000 Laptop GPU; Cinebench R15 Multi (external Monitor): Ø185.9 (158-216)
Asus ProArt StudioBook 16 W7600H5A-2BL2 W-11955M, RTX A5000 Laptop GPU; Cinebench R15 Multi (external Monitor): Ø98.2 (75.9-106)
Dell Precision 7670 i7-12850HX, RTX A2000 Laptop GPU; 1280x720 FurMark 1.19 GPU Stress Test (external Monitor): Ø132.4 (128.7-137.7)
Asus ProArt StudioBook 16 W7600H5A-2BL2 W-11955M, RTX A5000 Laptop GPU; 1280x720 FurMark 1.19 GPU Stress Test (external Monitor): Ø125.1 (37-152)
Dell Precision 7670 i7-12850HX, RTX A2000 Laptop GPU; 1920x1080 The Witcher 3 ultra (external Monitor): Ø133.7 (130.8-137)
Asus ProArt StudioBook 16 W7600H5A-2BL2 W-11955M, RTX A5000 Laptop GPU; 1920x1080 The Witcher 3 ultra (external Monitor): Ø129.3 (111-141)

Czas pracy na baterii

Czas pracy sieci WLAN wynosi niecałe 6 godzin i jest krótszy niż w przypadku Precision 5560 lub Precision 7550. Jest to w dużej mierze spowodowane panelem OLED, który zużywa więcej energii niż IPS podczas wyświetlania białych kolorów. Ponieważ większość stron internetowych ma przeważnie biały kolor, ogólnie krótszy czas pracy na baterii nie jest niespodziewany

Ładowanie za pomocą dołączonego zasilacza AC trwa około 2 godzin. System nie może być ładowany przez USB-C, ponieważ nie obsługuje PD-in.

Wydajność akumulatora
luz
7h 52min
WiFi Websurfing
5h 55min
obciążenie
1h 15min
Dell Precision 7670
i7-12850HX, RTX A2000 Laptop GPU, 83 Wh
Lenovo ThinkPad P1 G4-20Y4Z9DVUS
i7-11800H, T1200 Laptop GPU, 90 Wh
Asus ProArt StudioBook 16 W7600H5A-2BL2
W-11955M, RTX A5000 Laptop GPU, 90 Wh
Dell Precision 5000 5560
i7-11850H, RTX A2000 Laptop GPU, 86 Wh
Dell Precision 7550
W-10885M, Quadro RTX 5000 Max-Q, 95 Wh
HP ZBook Fury 15 G8
i9-11950H, RTX A5000 Laptop GPU, 94 Wh
Czasy pracy
49%
-15%
36%
25%
4%
Reader / Idle
472
722
53%
666
41%
WiFi v1.3
355
529
49%
301
-15%
380
7%
534
50%
370
4%
Load
75
110
47%
62
-17%
H.264
106
Witcher 3 ultra
94

Za

+ łatwość serwisowania; do 3x gniazda M.2 SSD, wymienna pamięć RAM SODIMM lub CAMM
+ szybsza wydajność procesora niż w większości mobilnych stacji roboczych
+ pełne opcje wyświetlania DCI-P3 OLED
+ opcjonalna łączność 4G lub 5G
+ wygodna klawiatura

Przeciw

- ograniczona wydajność CPU Turbo Boost
- brak obsługi PD-in, Xeon lub ECC RAM
- Wyświetlacz OLED mógłby być jaśniejszy
- przeciętny czas pracy na baterii
- stosunkowo ciężki

Werdykt - Potężny bez bycia zbyt dużym

W recenzji: Dell Precision 7670 Model Thin. Jednostka testowa dostarczona przez firmę Dell

Model Precision 7670 konkuruje bezpośrednio z HP ZBook Fury 16 G9. Ponieważ nie recenzowaliśmy jeszcze modelu HP, możemy jedynie porównać naszą Precision do 16-calowegoLenovo ThinkPad P1 G4 lubAsus ProArt StudioBook Pro 16 W7600. Model Della jest w stanie zaoferować znacznie szybszą wydajność procesora niż oba te urządzenia, a także wiele dodatkowych funkcji, w tym łatwiejszy serwis, łączność WAN i więcej opcji pamięci masowej.

Model Precision 7670 jest najlepszy w konfiguracji z wyższymi opcjami procesora i karty graficznej. W przypadku niższych opcji można jednak znaleźć cieńsze i lżejsze alternatywy, które oferują mniej więcej ten sam poziom wydajności.

Waga jest kluczową wadą Precision 7670, ponieważ system jest prawie tak ciężki jak większy 17,3-calowy Precision 7550. Dodatkowo rozczarowuje fakt, że pomimo dużej wagi procesor Core i7-12850HX nie jest w stanie utrzymać częstotliwości taktowania Turbo Boost przez dłuższy czas. Wciąż jest szybki, ale nadmiar rozwiązań chłodzących ogranicza tu jego potencjał. Brak jakichkolwiek opcji procesorów Xeon sprawia, że Precision 7670 czuje się bardziej jak laptop typu Studio niż pełnoprawna stacja robocza, do której jest reklamowany.

Precision 7670 jest nadal świetny dla użytkowników o dużej mocy, którzy mogą skorzystać z posiadania wszystkich tych głodnych mocy rdzeni Intel 12. generacji i wysokiej klasy karty graficznej RTX A5500. Jednak w przypadku konfiguracji z niższej półki cenowej, smuklejsze i lżejsze modele 16-calowe, takie jak wspomniane Lenovo czy Asus, nadal mogą być przyzwoitą alternatywą.

Download your licensed rating image as SVG / PNG

Cena i dostępność

Model Precision 7670 jest obecnie dostępny na Newegg w tylko jednej konfiguracji. Zalecamy zamawianie bezpośrednio w firmie Dell w celu uzyskania szerszego wyboru konfiguracji i opcji gwarancyjnych.

Dell Precision 7670 - 06/10/2022 v7
Allen Ngo
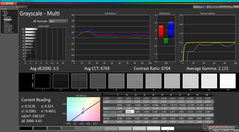
Wykonanie
87 / 98 → 88%
Klawiatura
88%
Myszka
90%
Komunikacja
75 / 80 → 93%
Waga
58 / 10-66 → 86%
Akumulator
68 / 95 → 72%
Wyświetlacz
87%
Wydajność w grach
92%
Wydajność w programach użytkowych
96%
Temperatura
86 / 95 → 90%
Hałas
79 / 90 → 88%
Głośniki
82%
Kamerka
43 / 85 → 51%
Średnio
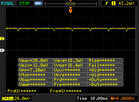
80%
88%
Workstation - Ważona średnia

Pricecompare

Please share our article, every link counts!
> laptopy testy i recenzje notebooki > Laptopy > Recenzja stacji roboczej Dell Precision 7670: Debiut Core i7-12850HX i CAMM RAM
Allen Ngo, 2022-10- 8 (Update: 2022-10- 8)