Werdykt - Wydajny mini PC z procesorem Intel Core Ultra X7, grafiką Arc i 64 GB pamięci RAM
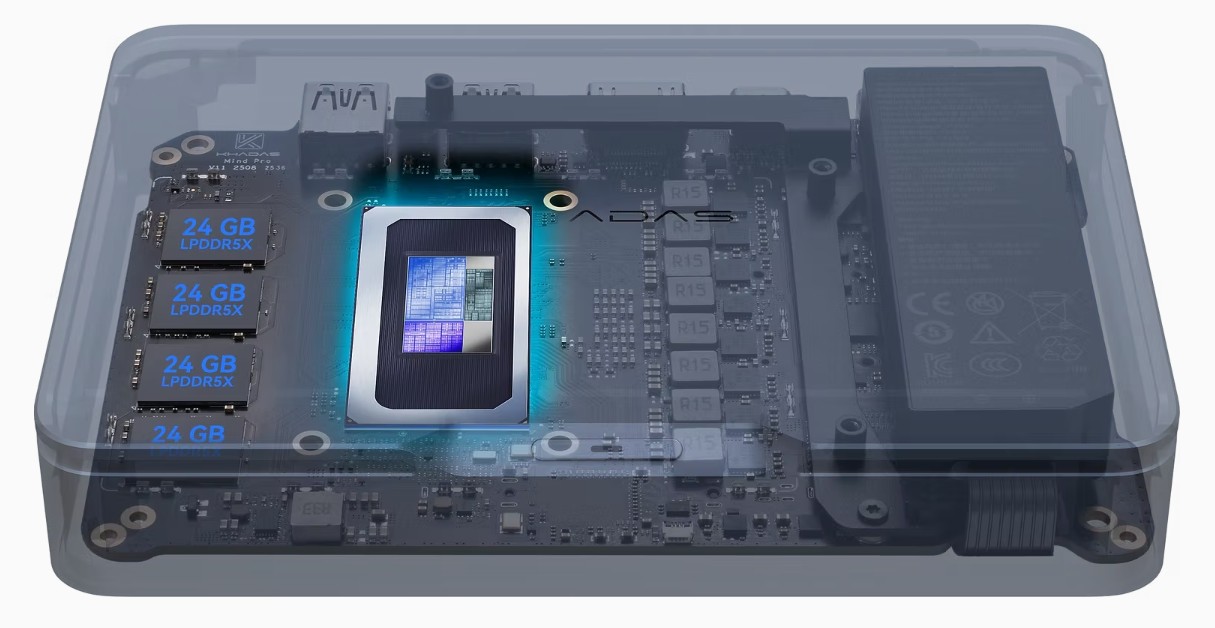
Khadas Mind Pro imponująco pokazuje w teście, jak wiele wydajności można teraz zmieścić w niezwykle kompaktowym mini PC. Dzięki procesorowi Intel Core Ultra X7 358H, system oferuje bardzo wysoką wydajność CPU, która z łatwością poradzi sobie nawet z najbardziej wymagającymi aplikacjami. Jednocześnie nowa jednostka Intel Arc iGPU generacji Xe3 zapewnia zauważalny skok graficzny w porównaniu do poprzednich modeli Mind i umożliwia korzystanie z aplikacji akcelerowanych przez GPU, a także okazjonalne granie. Szybka pamięć RAM jest również szczególnie pozytywną cechą, która wyraźnie przyczynia się do ogólnego doskonałego poziomu wydajności w benchmarkach systemu i pamięci.
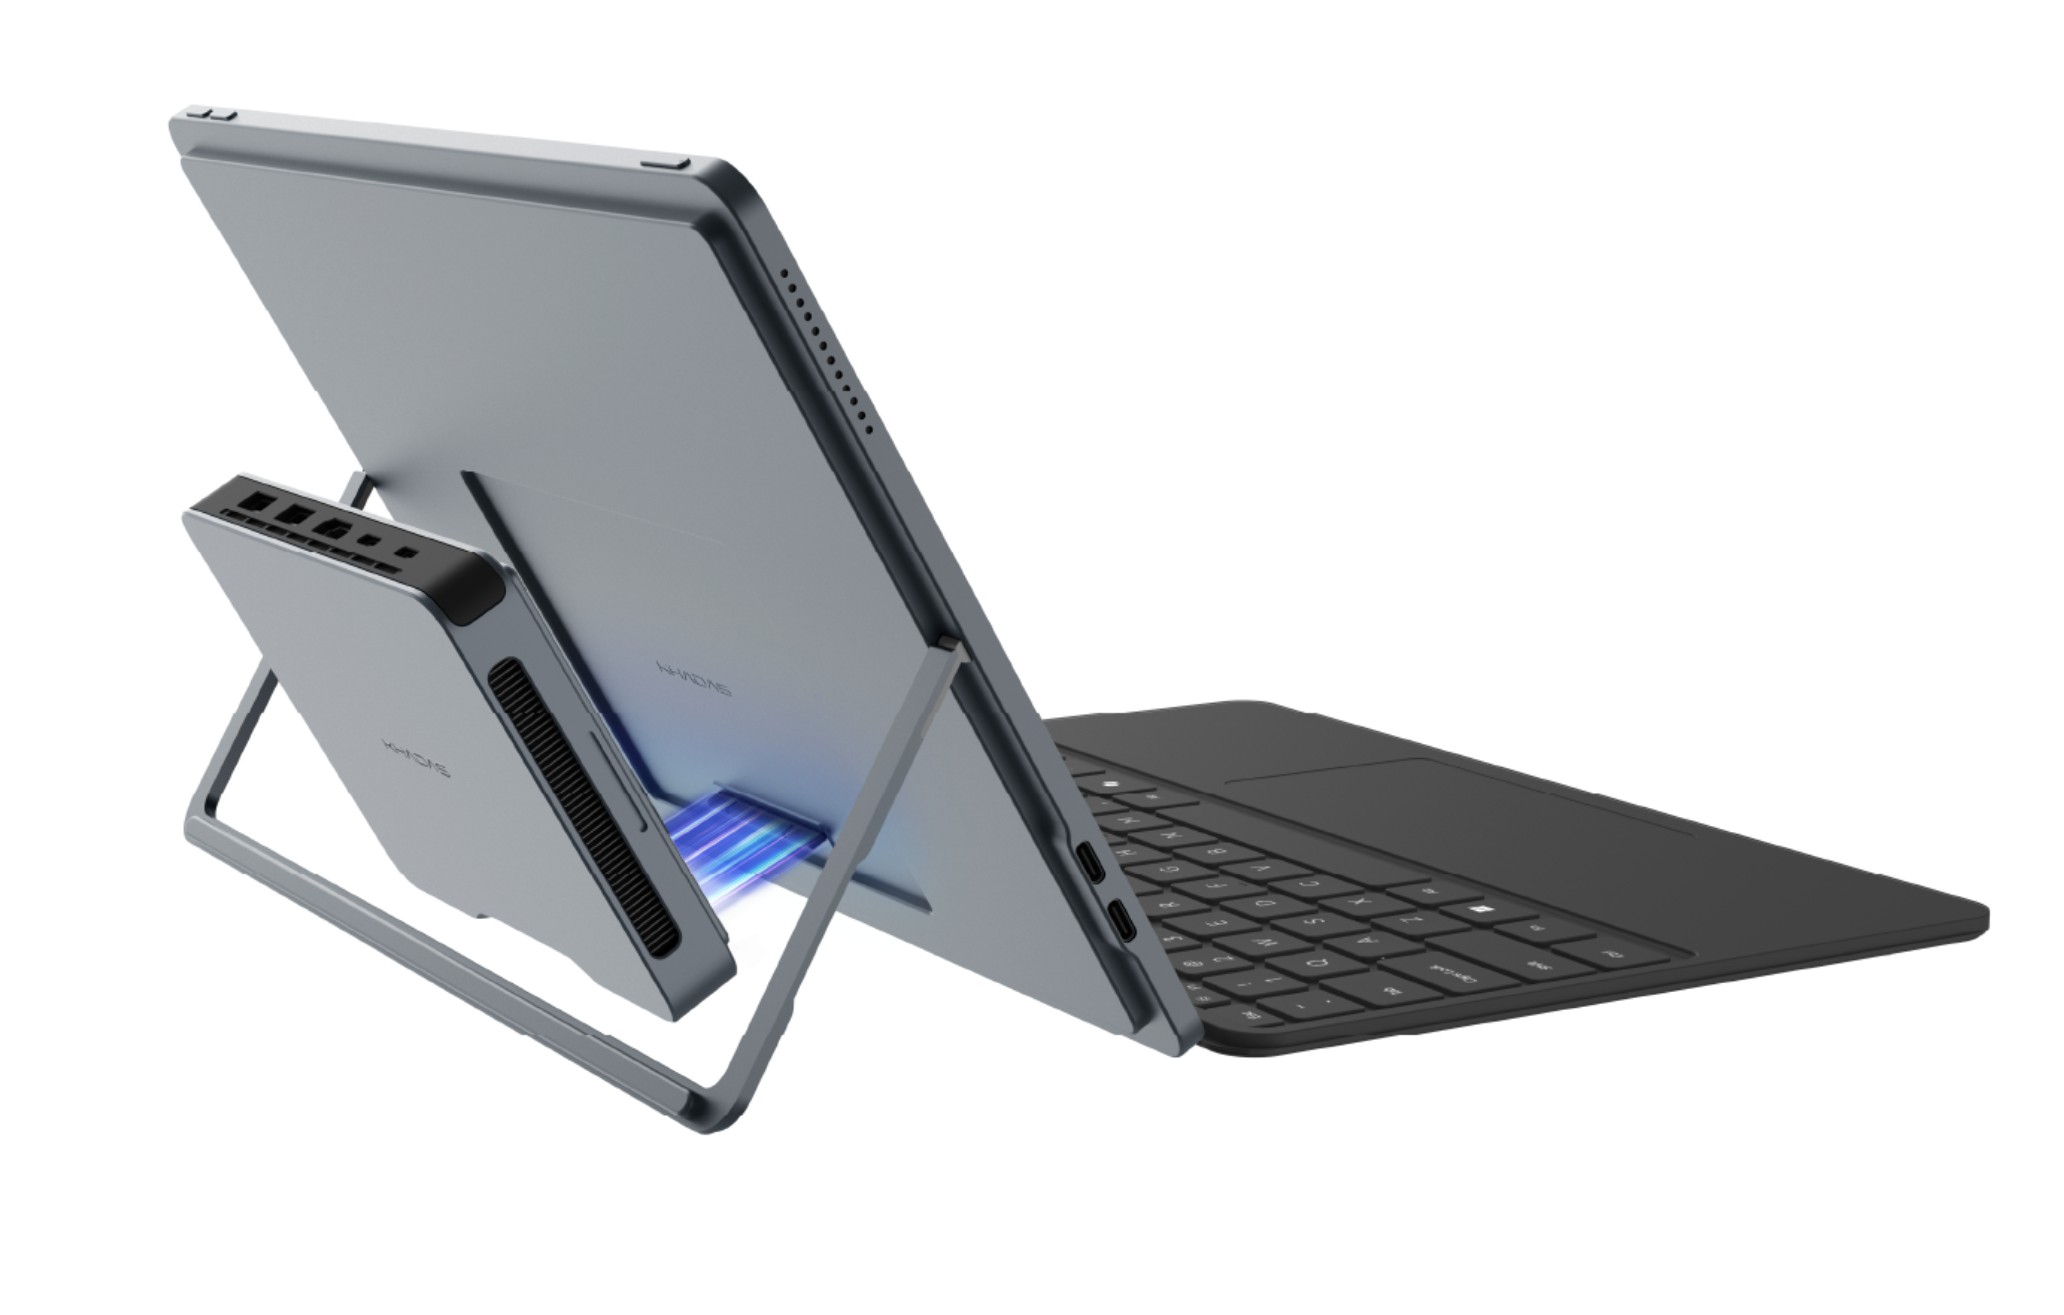
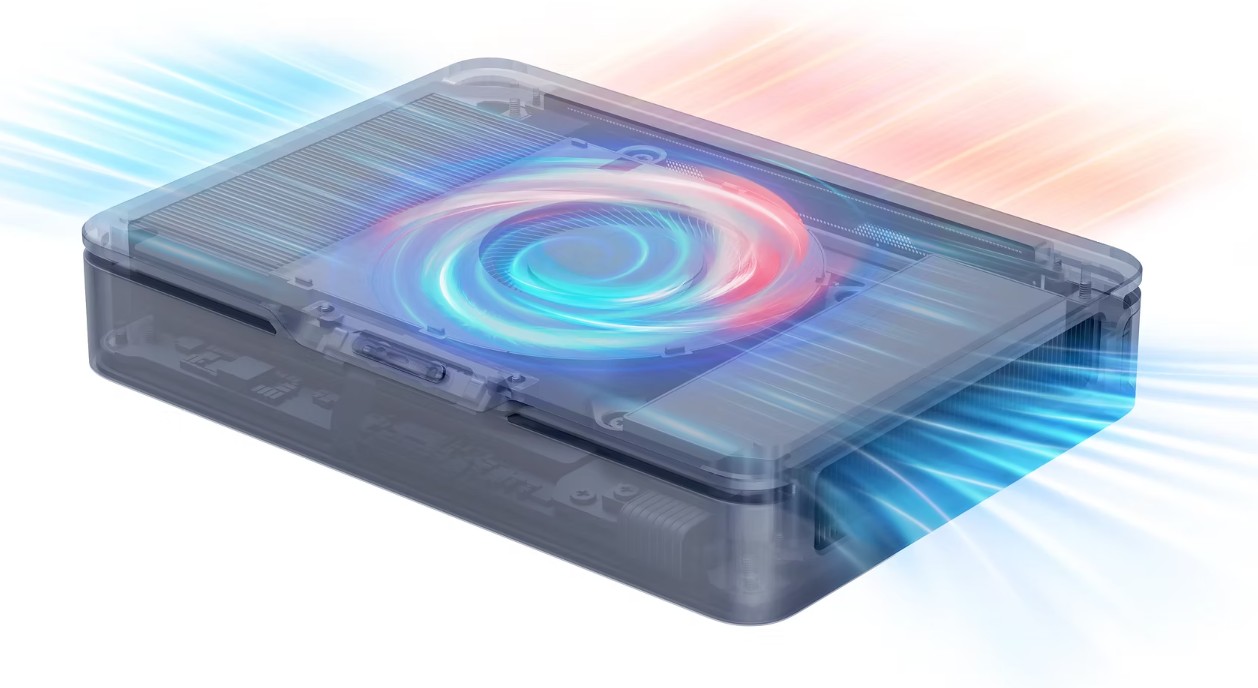
Khadas pozostaje również wierny swojej linii, jeśli chodzi o obudowę i jakość wykonania. Wysokiej jakości metalowa obudowa ma bardzo solidny i wysokiej jakości wygląd, podczas gdy nieco większy format Mind Pro ma zalety pod względem chłodzenia i hałasu. Jednocześnie system pozostaje niezwykle kompaktowy i kompatybilny z istniejącymi akcesoriami producenta. Zintegrowana bateria jest również praktyczna: nie tylko umożliwia dłuższą pracę w trybie gotowości, ale także pozwala na krótkotrwałą pracę Mini PC bez zasilacza. Oznacza to, że urządzenie można łatwo przełączać między różnymi stacjami roboczymi podczas pracy.
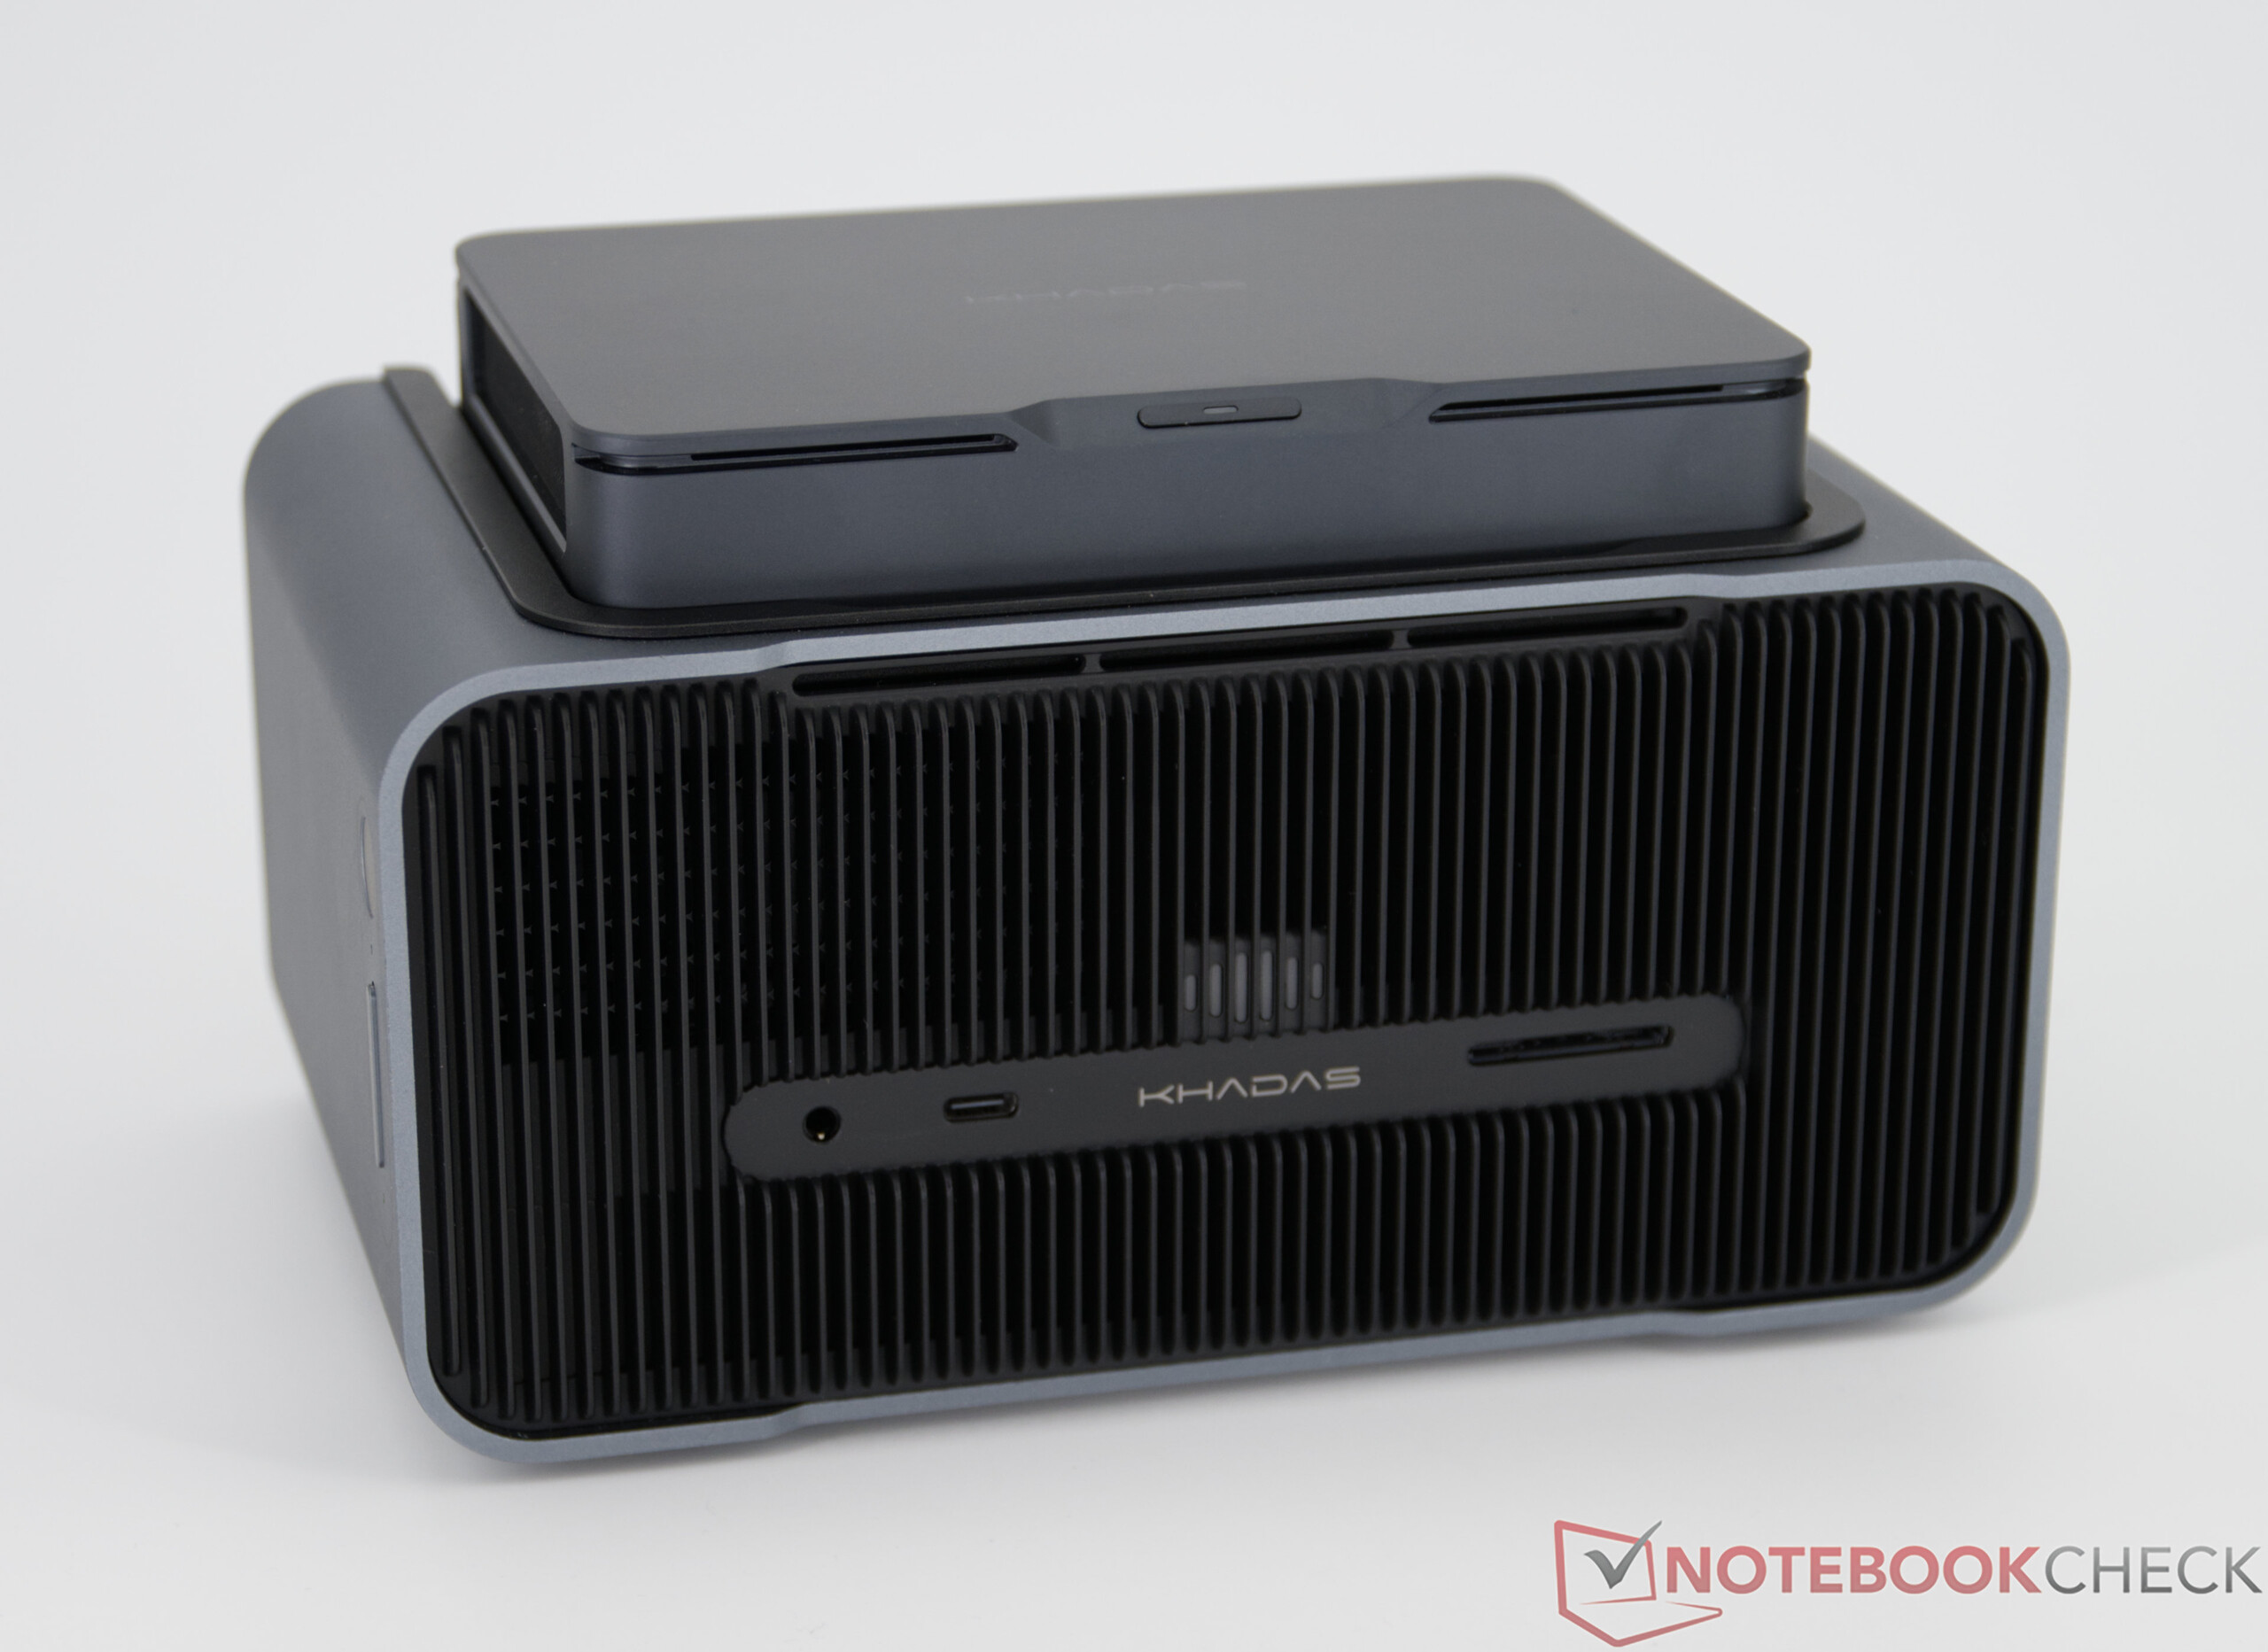
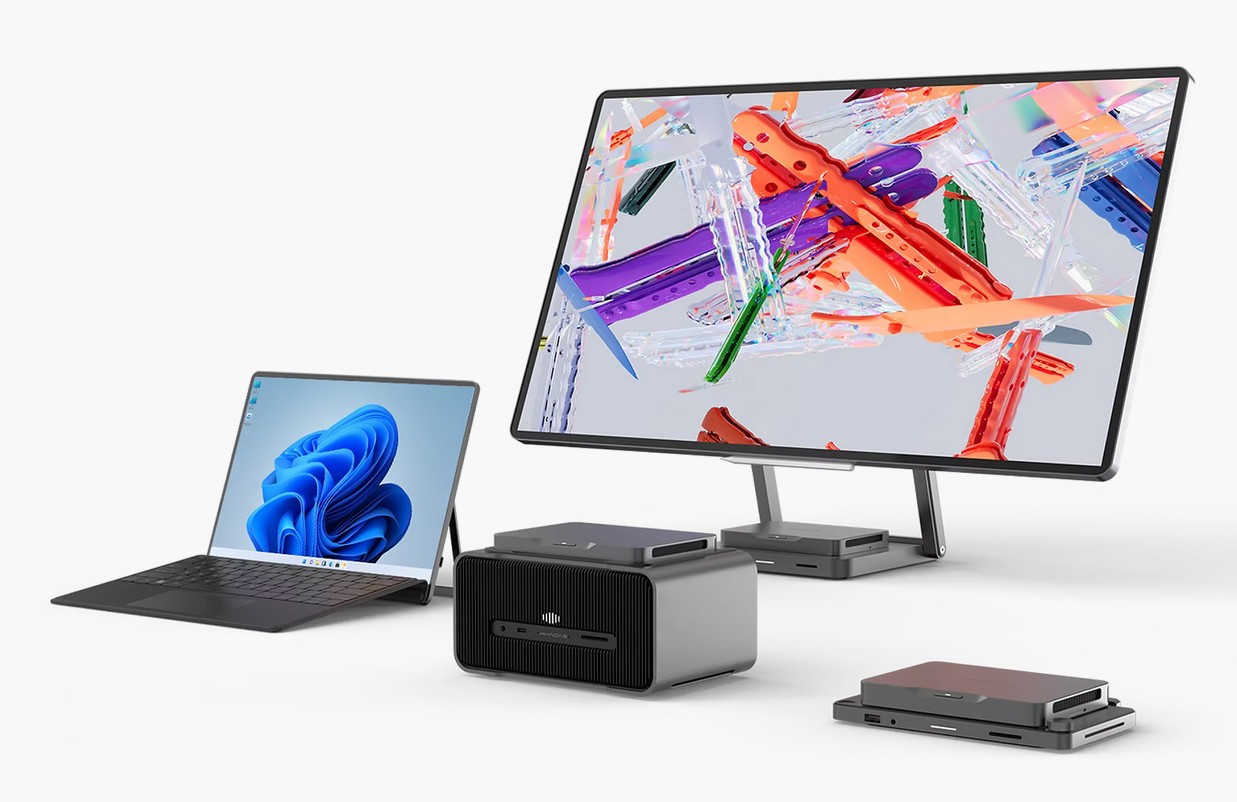
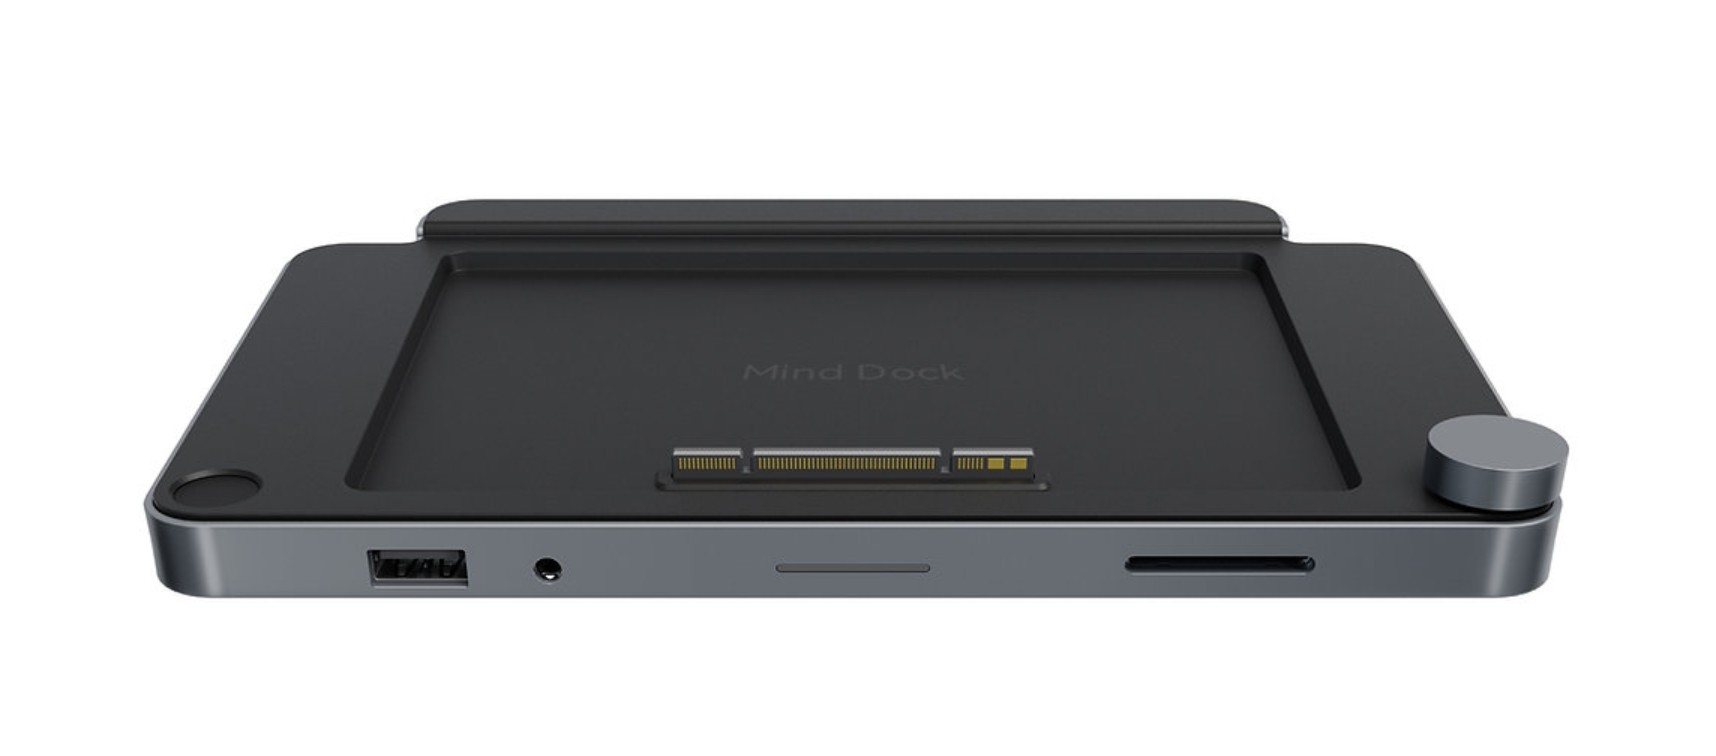
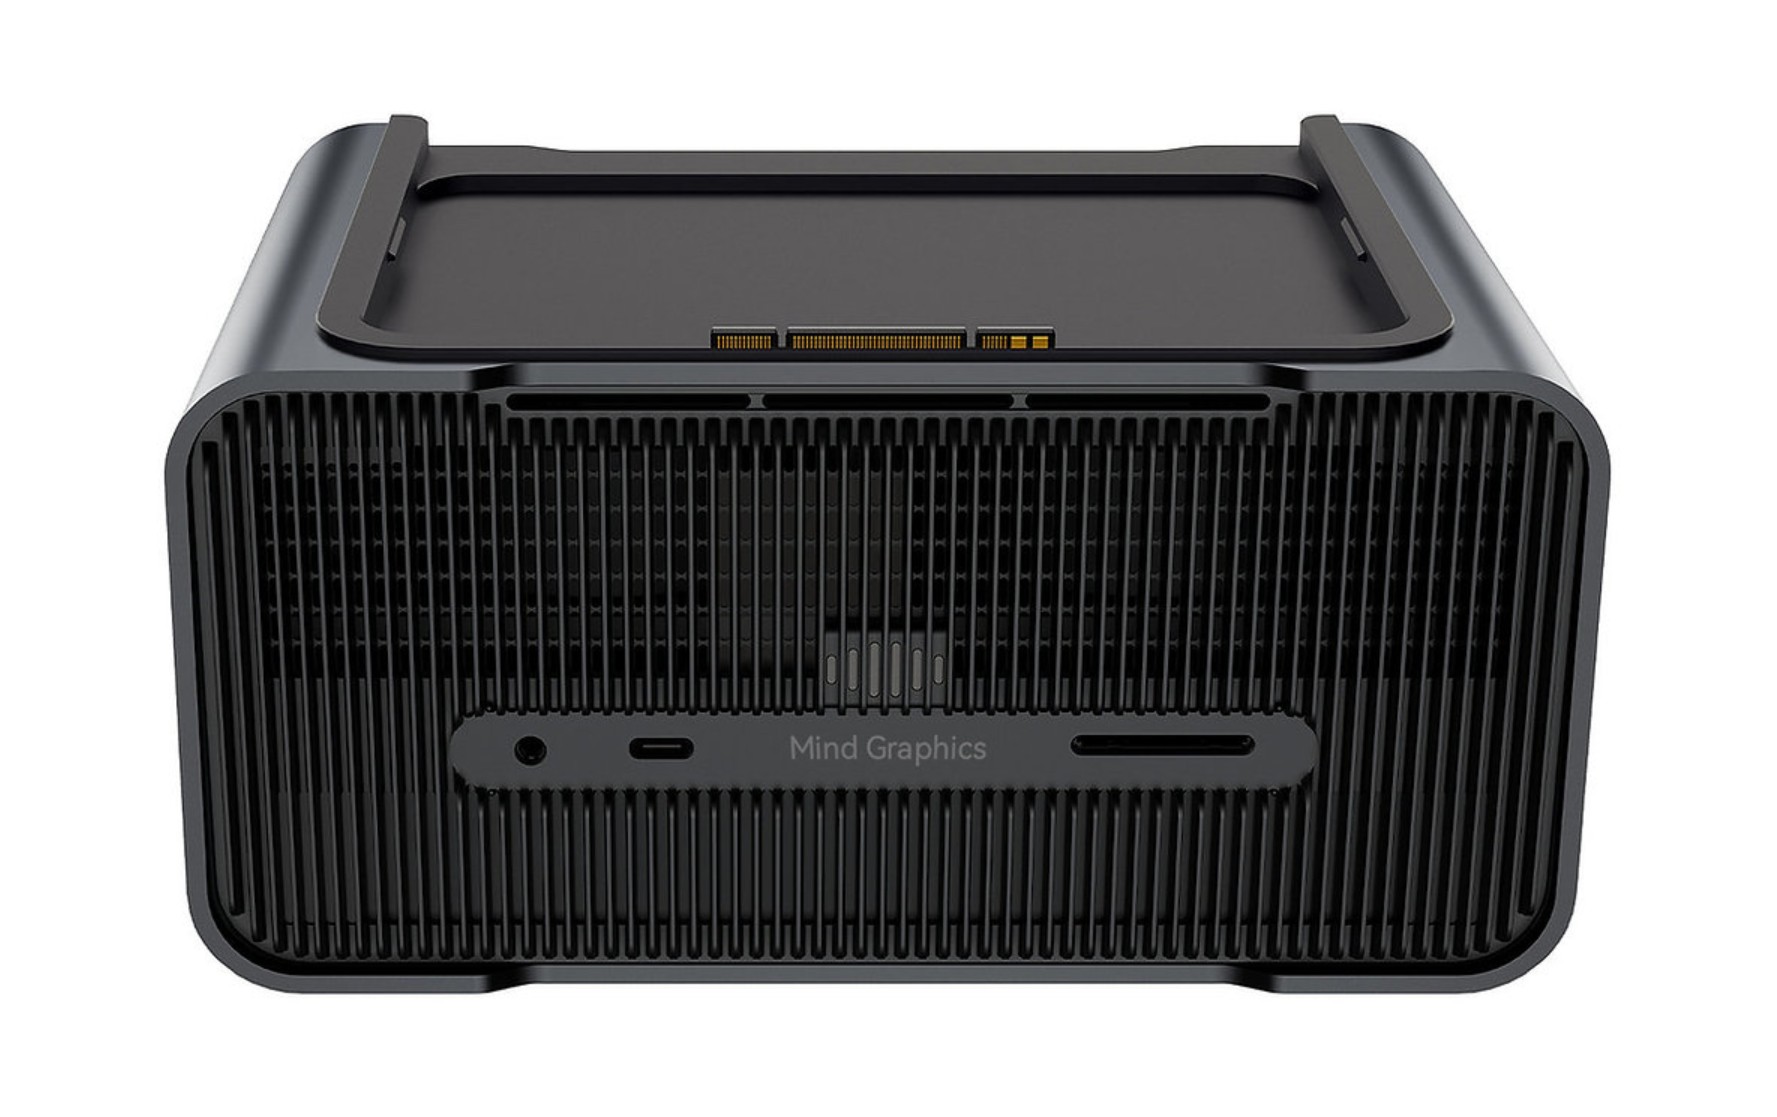
Modułowy ekosystem Khadas pozostaje główną zaletą systemu. Akcesoria takie jak Mind Dock, Graphics Dock lub Mind xPlay dodają dodatkowe funkcje do mini PC i przekształcają go we wszechstronną platformę dla różnych scenariuszy zastosowań - od klasycznych systemów stacjonarnych po mobilne stacje robocze.
Wciąż jednak istnieją punkty krytyczne. Możliwości modernizacji pozostają poważnie ograniczone, ponieważ pamięć RAM i moduł WLAN są wlutowane na miejscu. Ponadto cena jest na górnym końcu klasy Mini PC, biorąc pod uwagę oferowane funkcje. W zamian nabywcy otrzymują jednak wyjątkowo kompaktowy, wydajny i wysokiej jakości system.
Ostatecznie, Khadas Mind Pro to potężny mini PC klasy premium, który imponuje przede wszystkim wysoką wydajnością, wysoką wydajnością procesora i integracją z modułowym ekosystemem Khadas.
Za
Przeciw
Cena i dostępność
Khadas Mind Pro można zamówić w przedsprzedaży u producenta za $1,799 w testowanej przez nas konfiguracji.
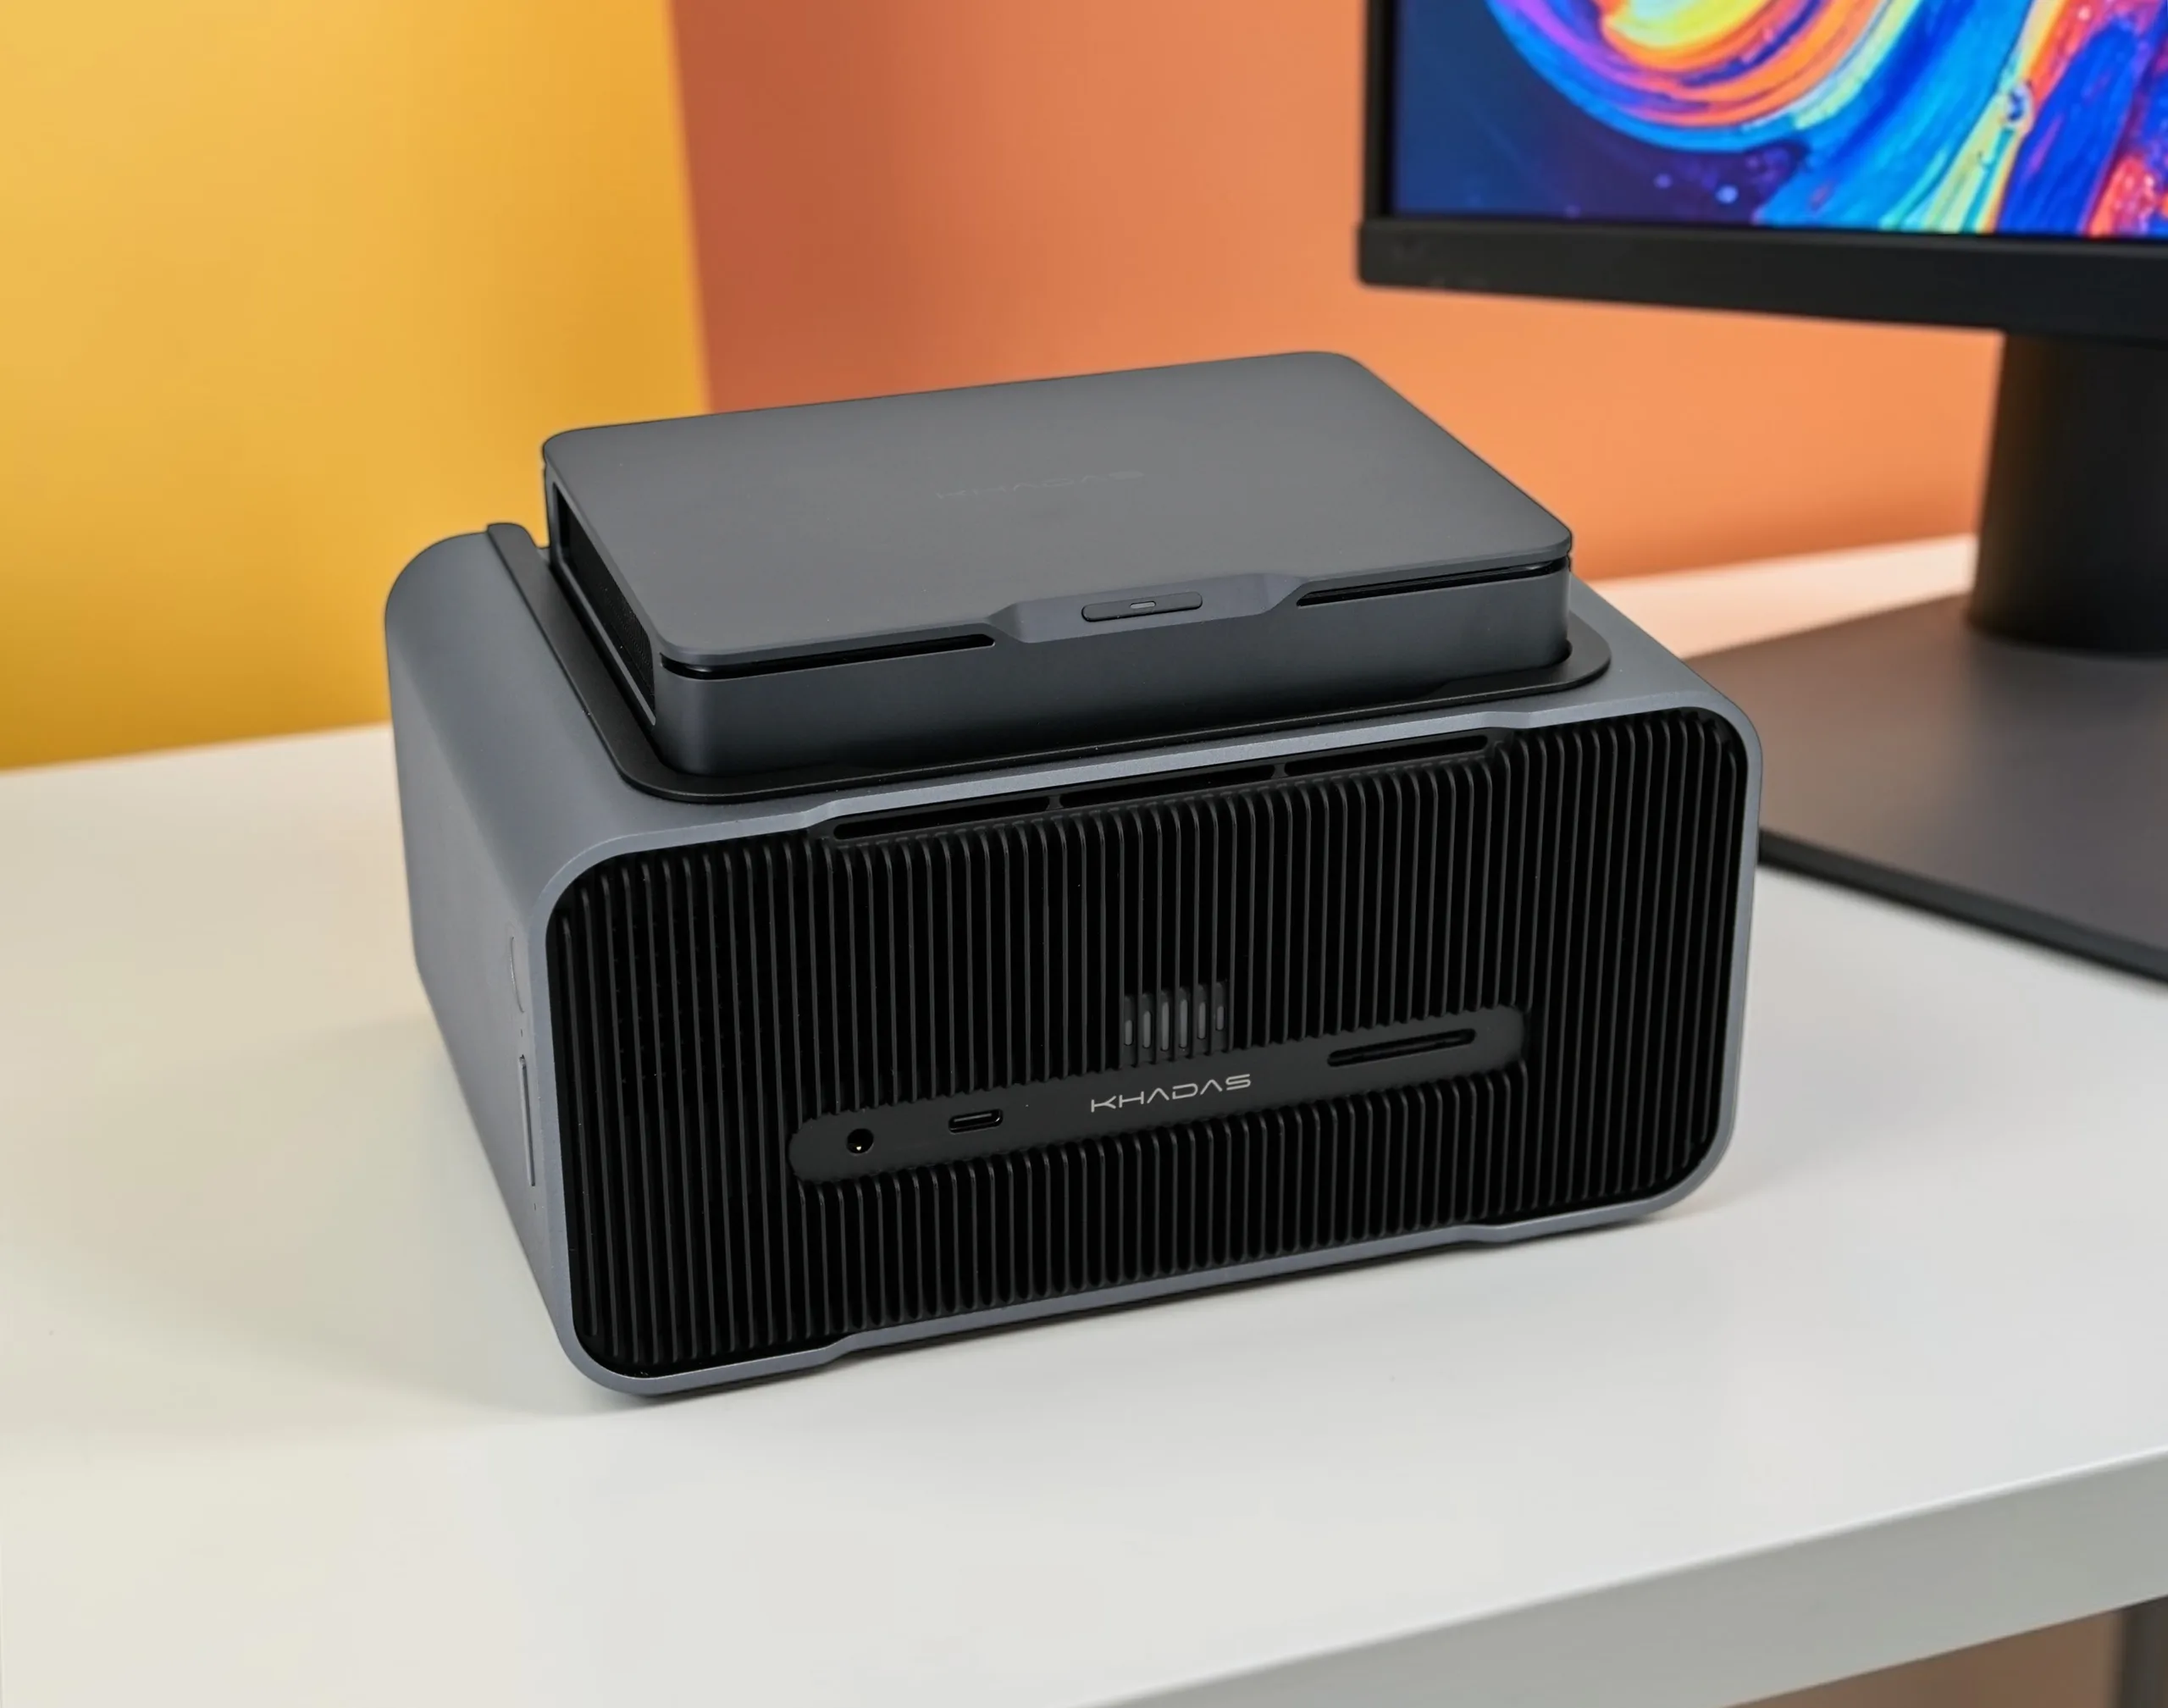
Wraz z Khadas Mind Pro, producent z Dalekiego Wschodu dodał kolejny model do swojej kompaktowej serii mini PC. Po przetestowaniu poprzednich systemów z serii Khadas Mind, teraz przyglądamy się bliżej najnowszemu odgałęzieniu. Wewnątrz znajduje się procesor Intel Core Ultra X7 358H, który obiecuje jeszcze lepszą wydajność niż poprzednie wersje.
Specyfikacje
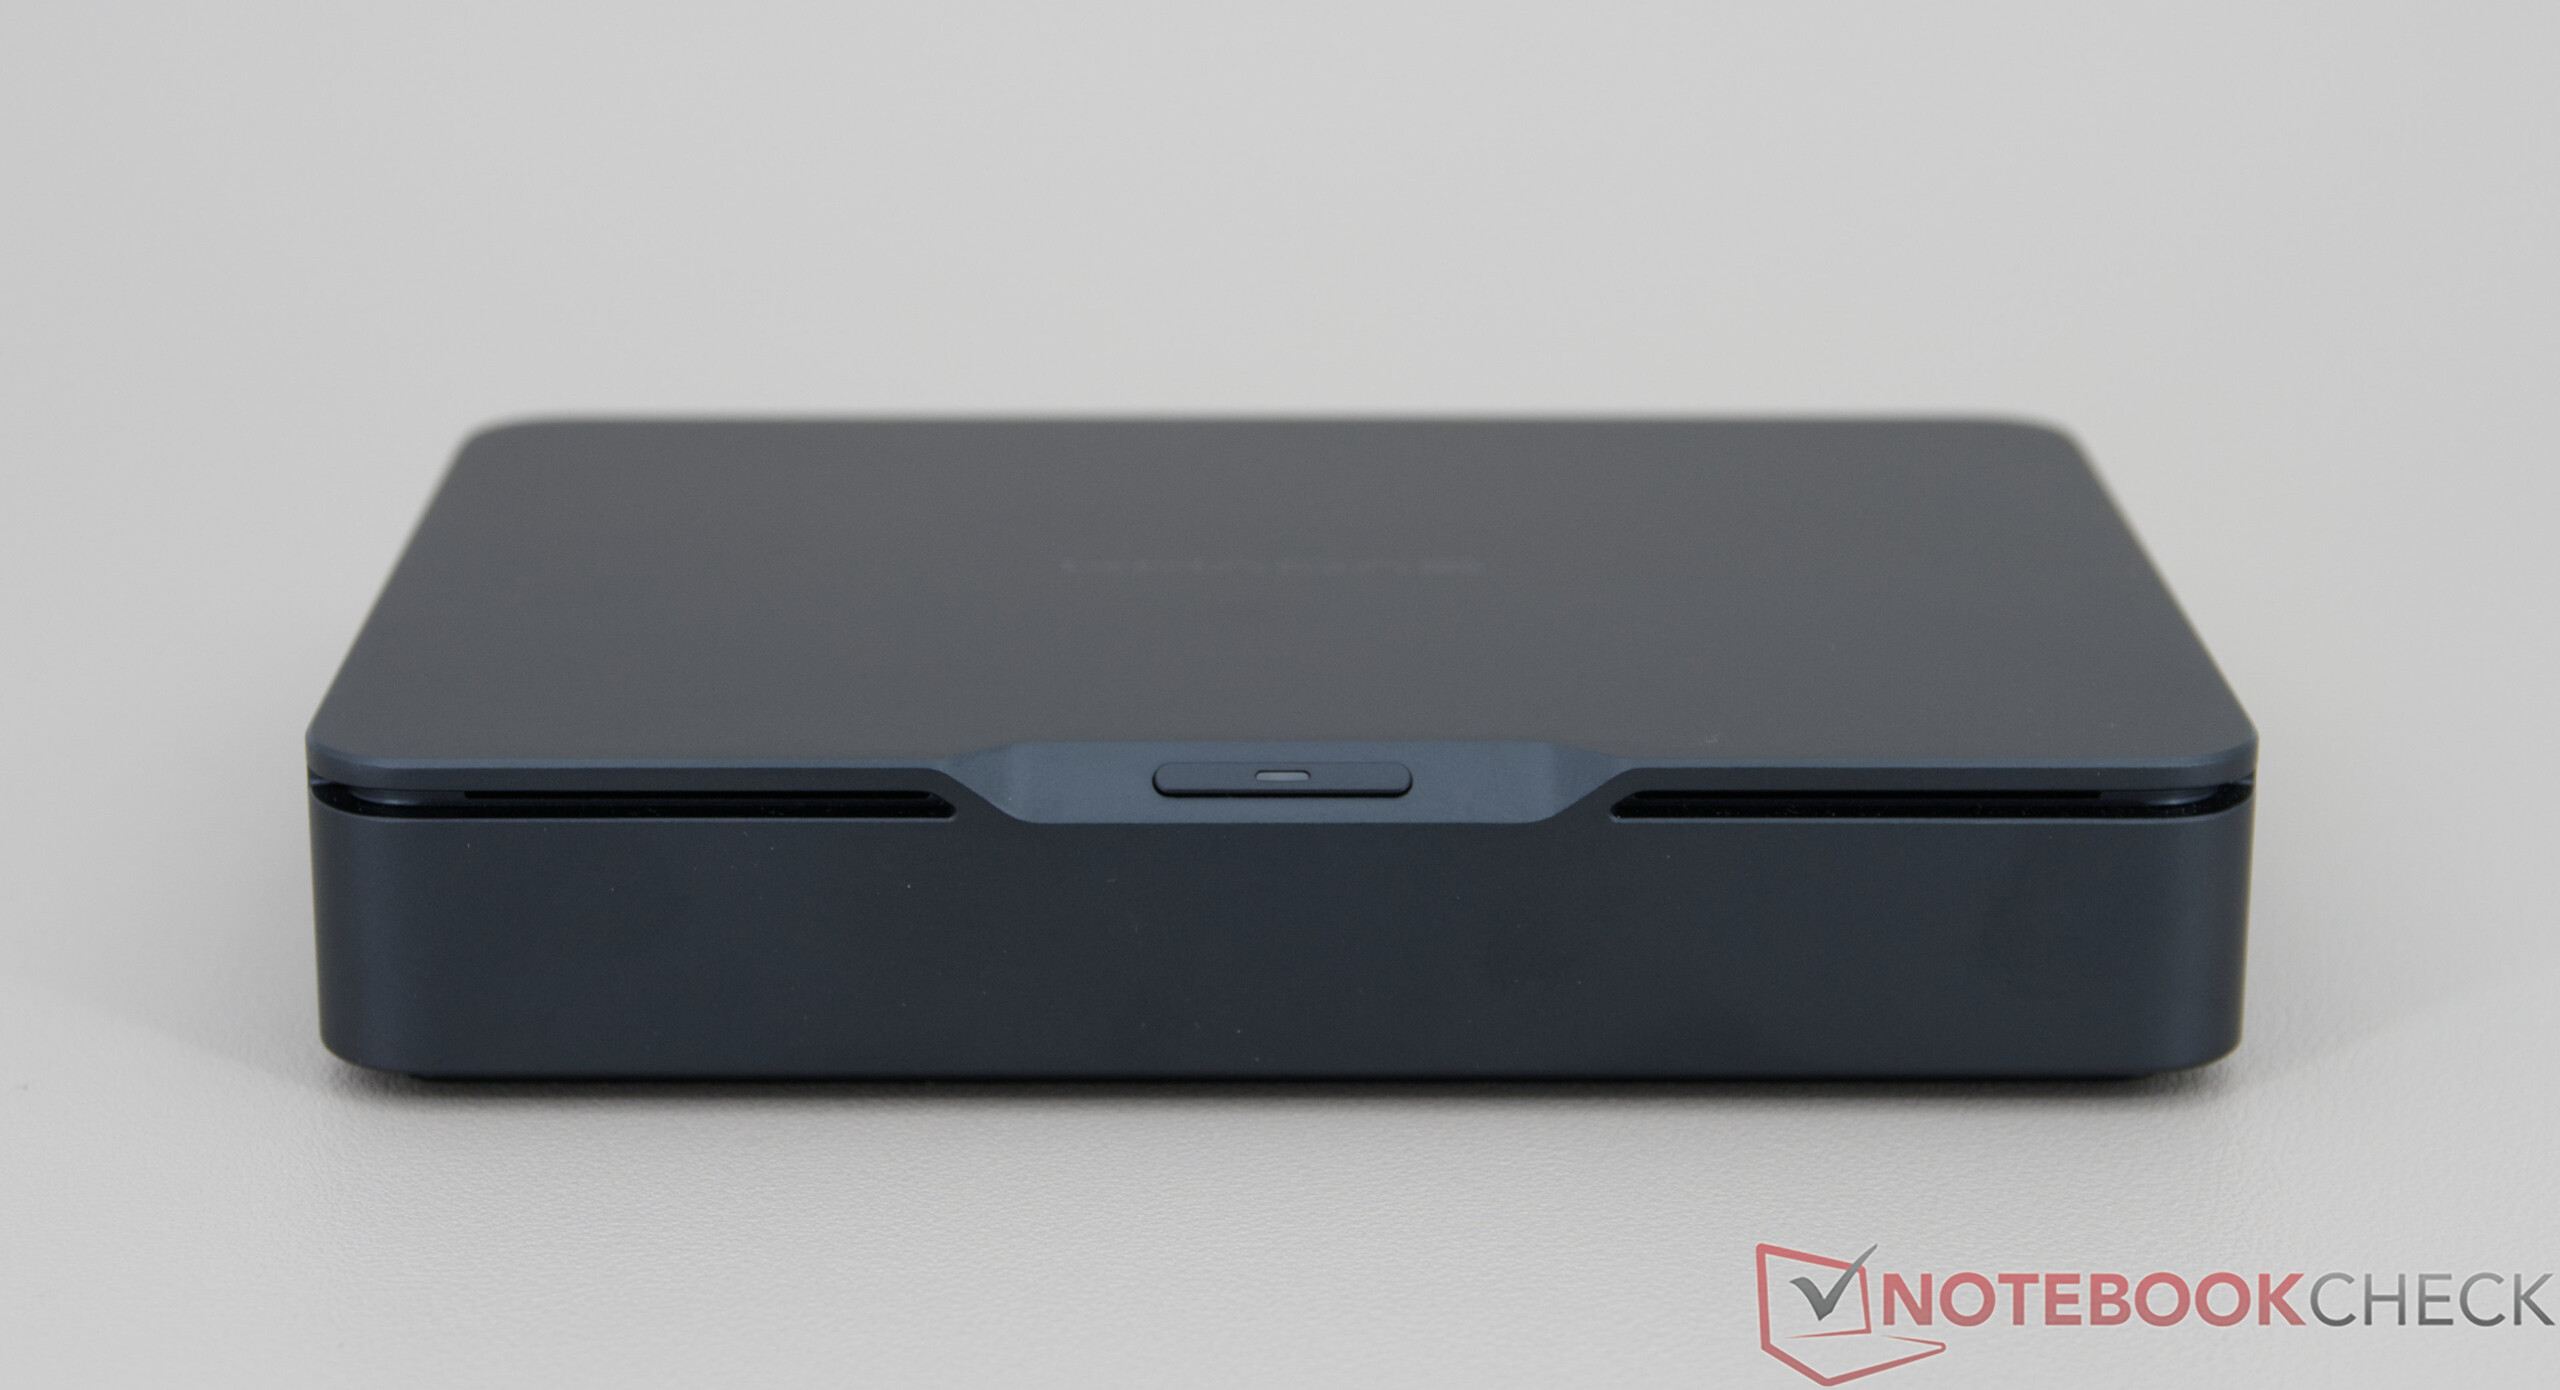
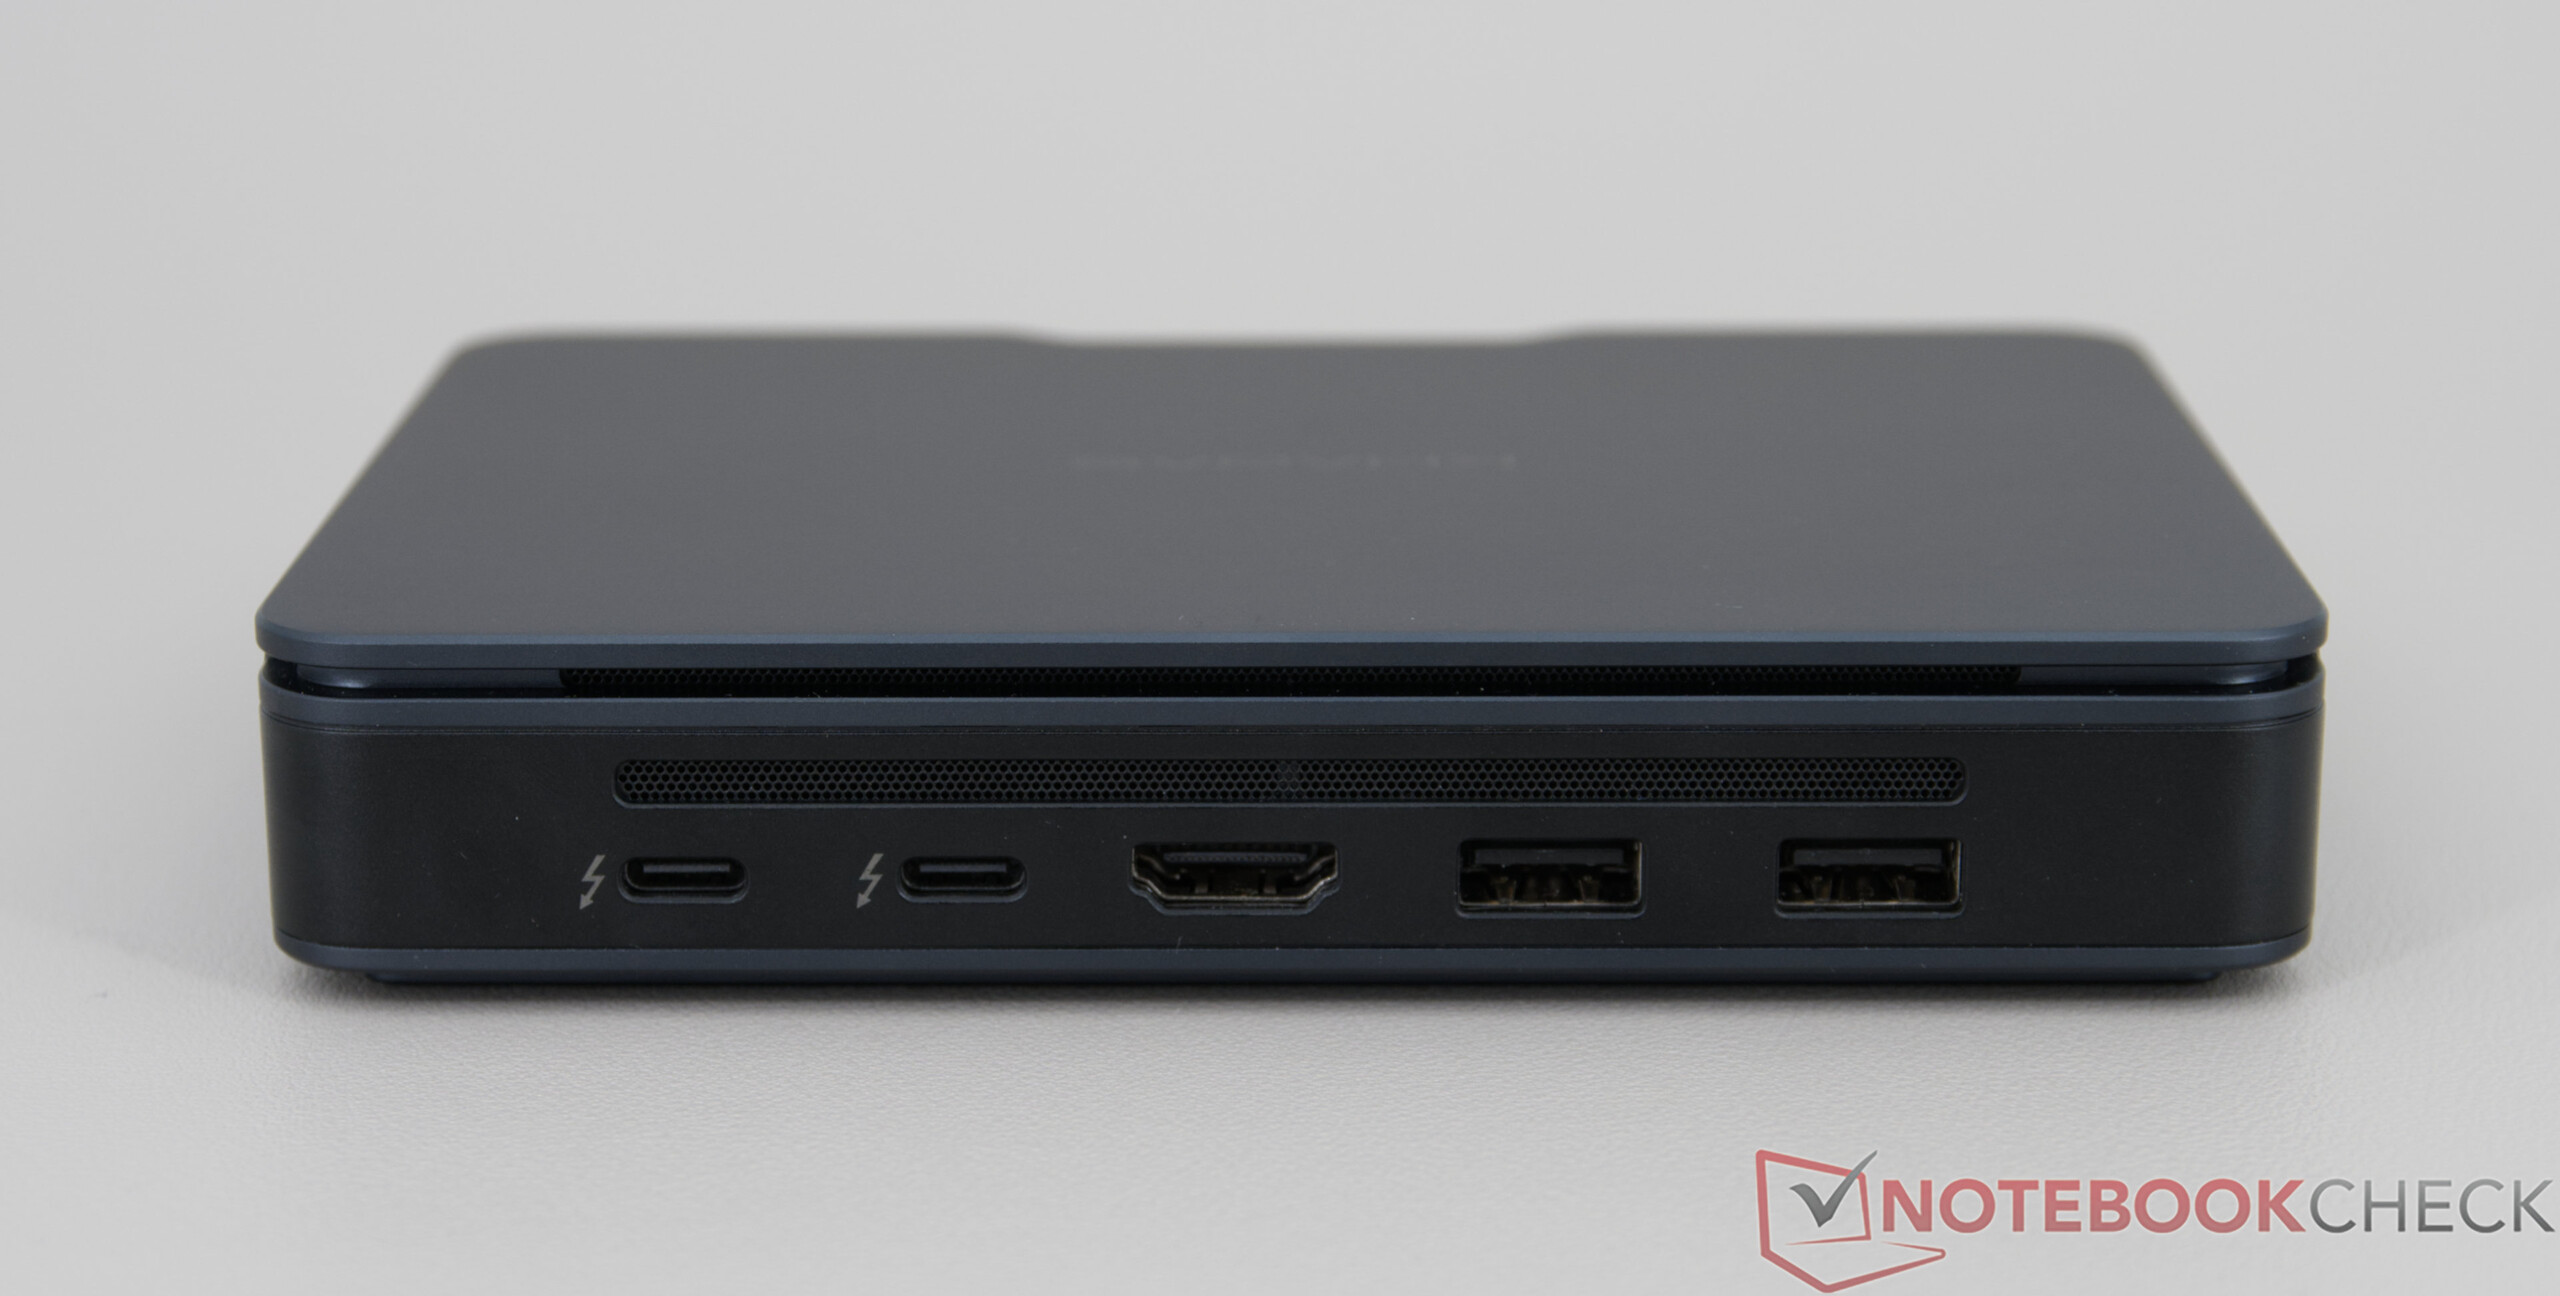
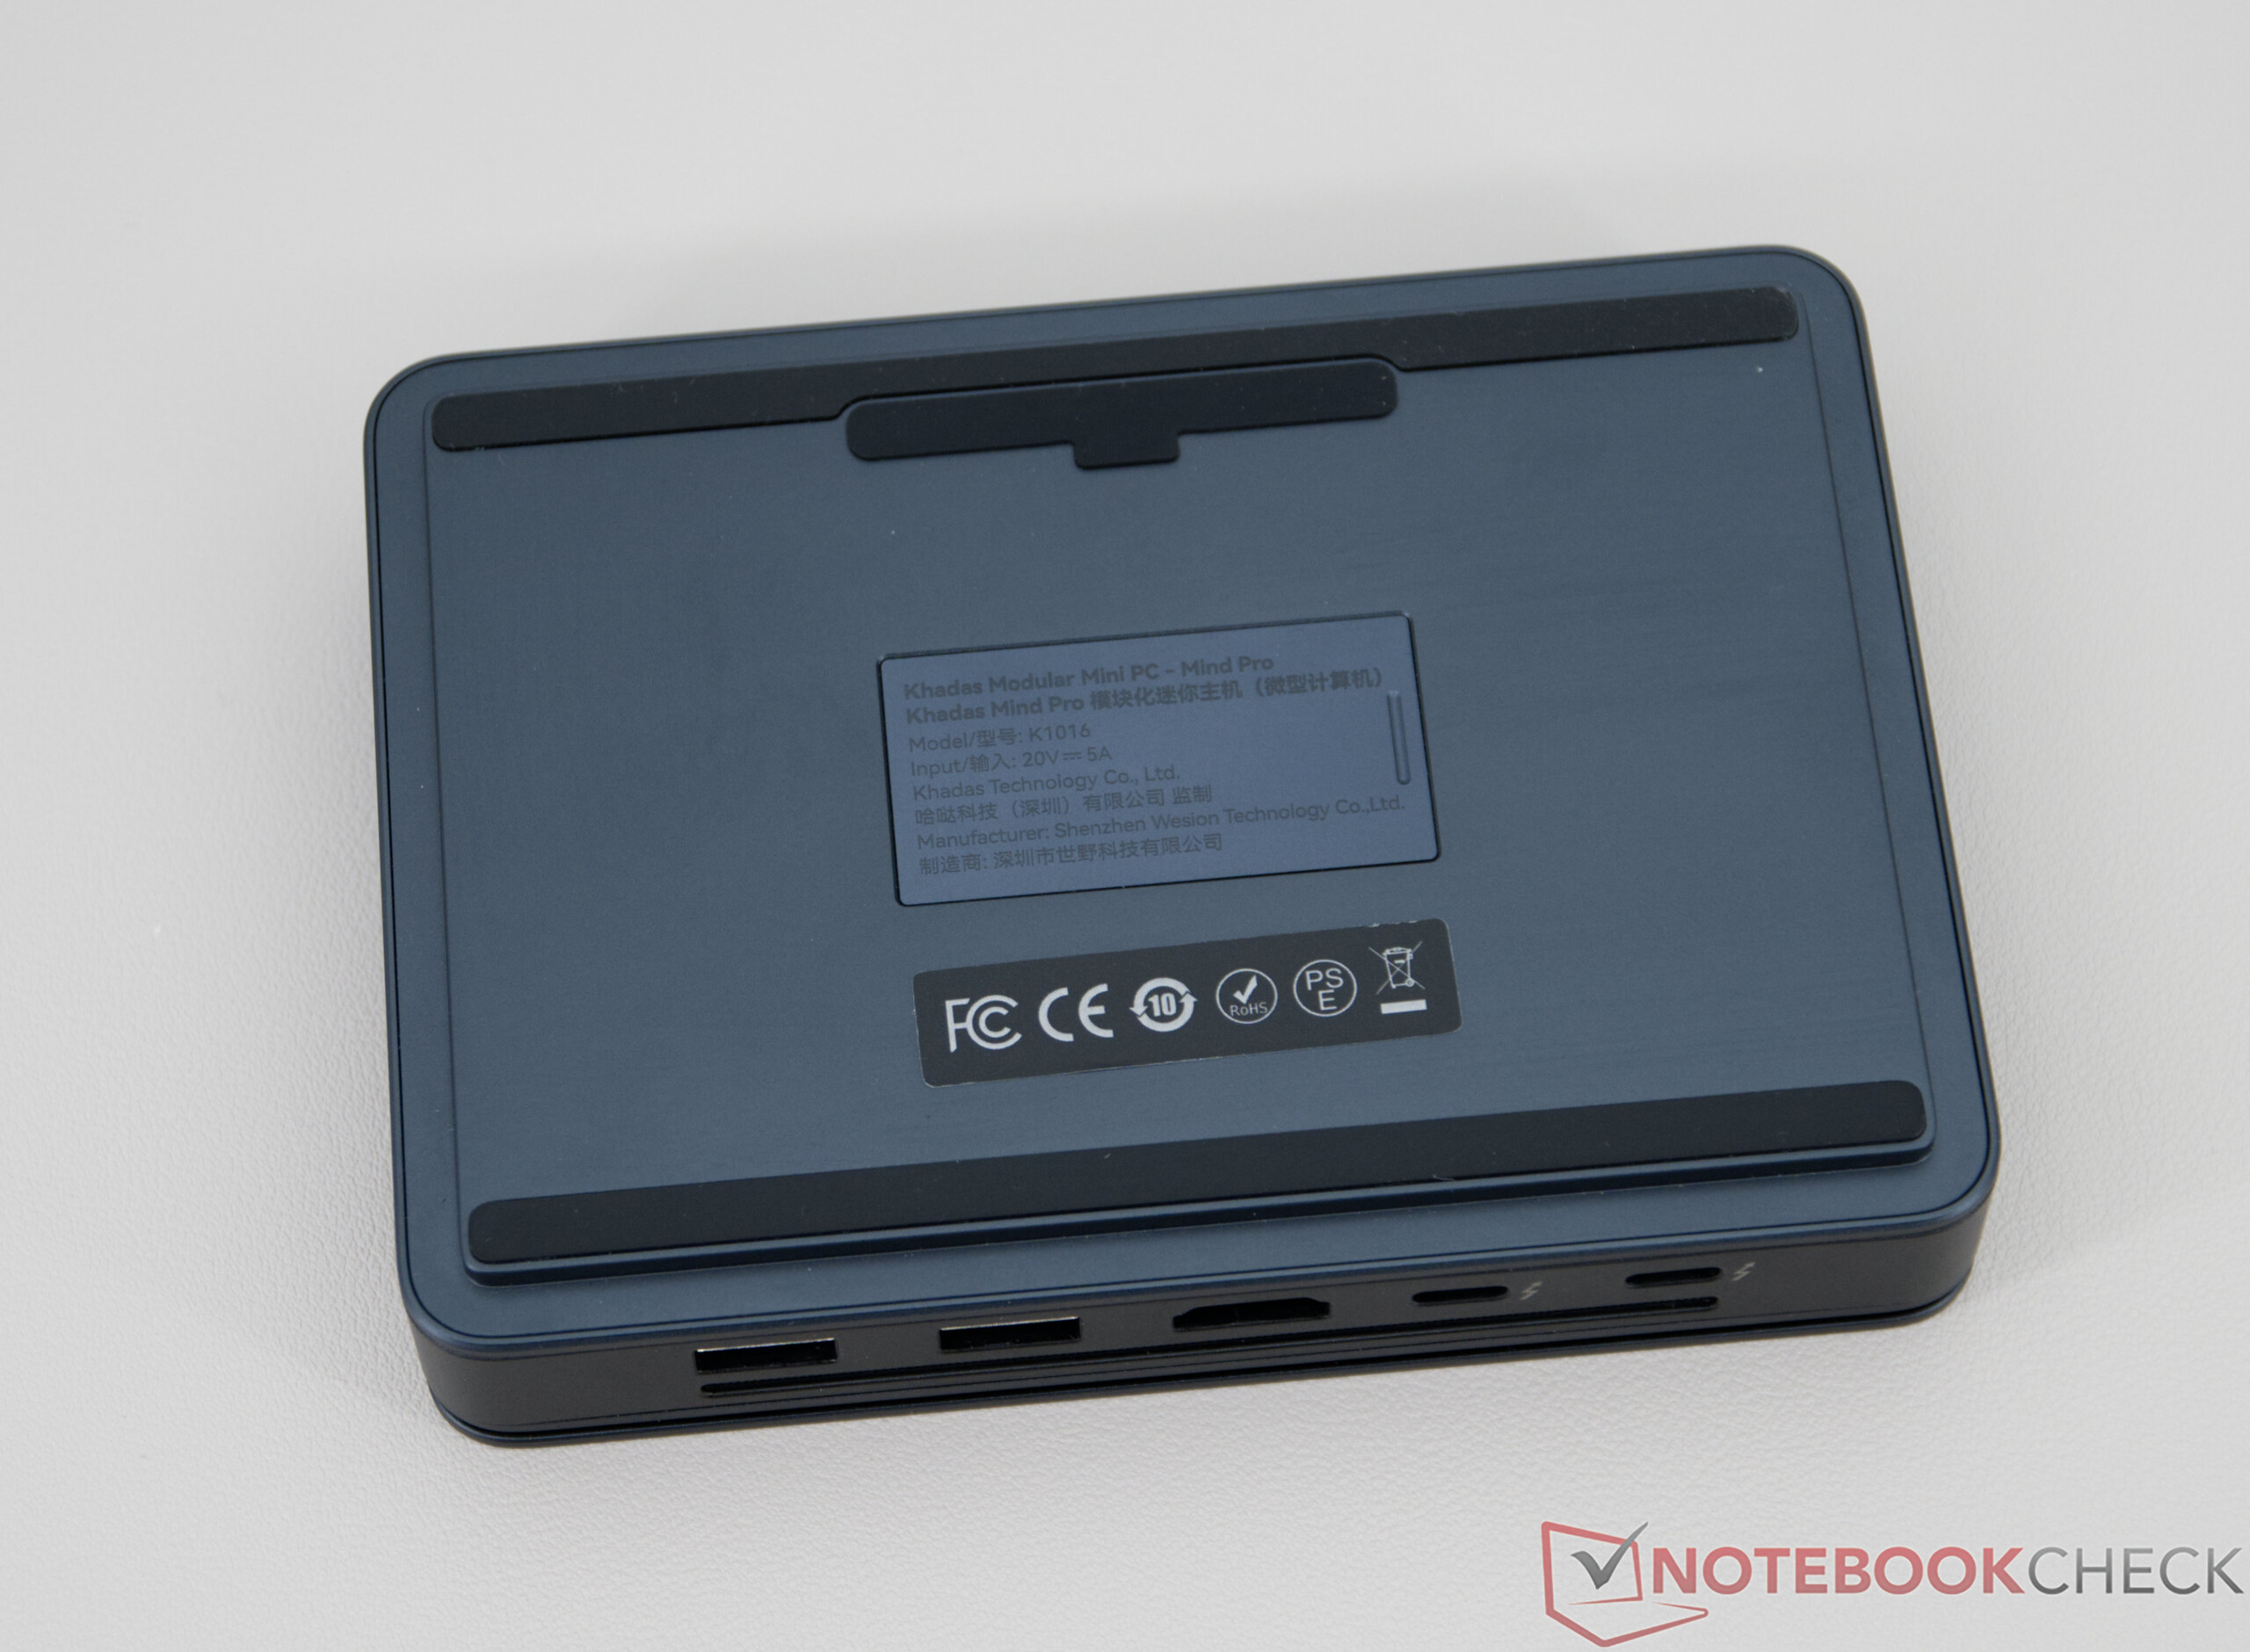


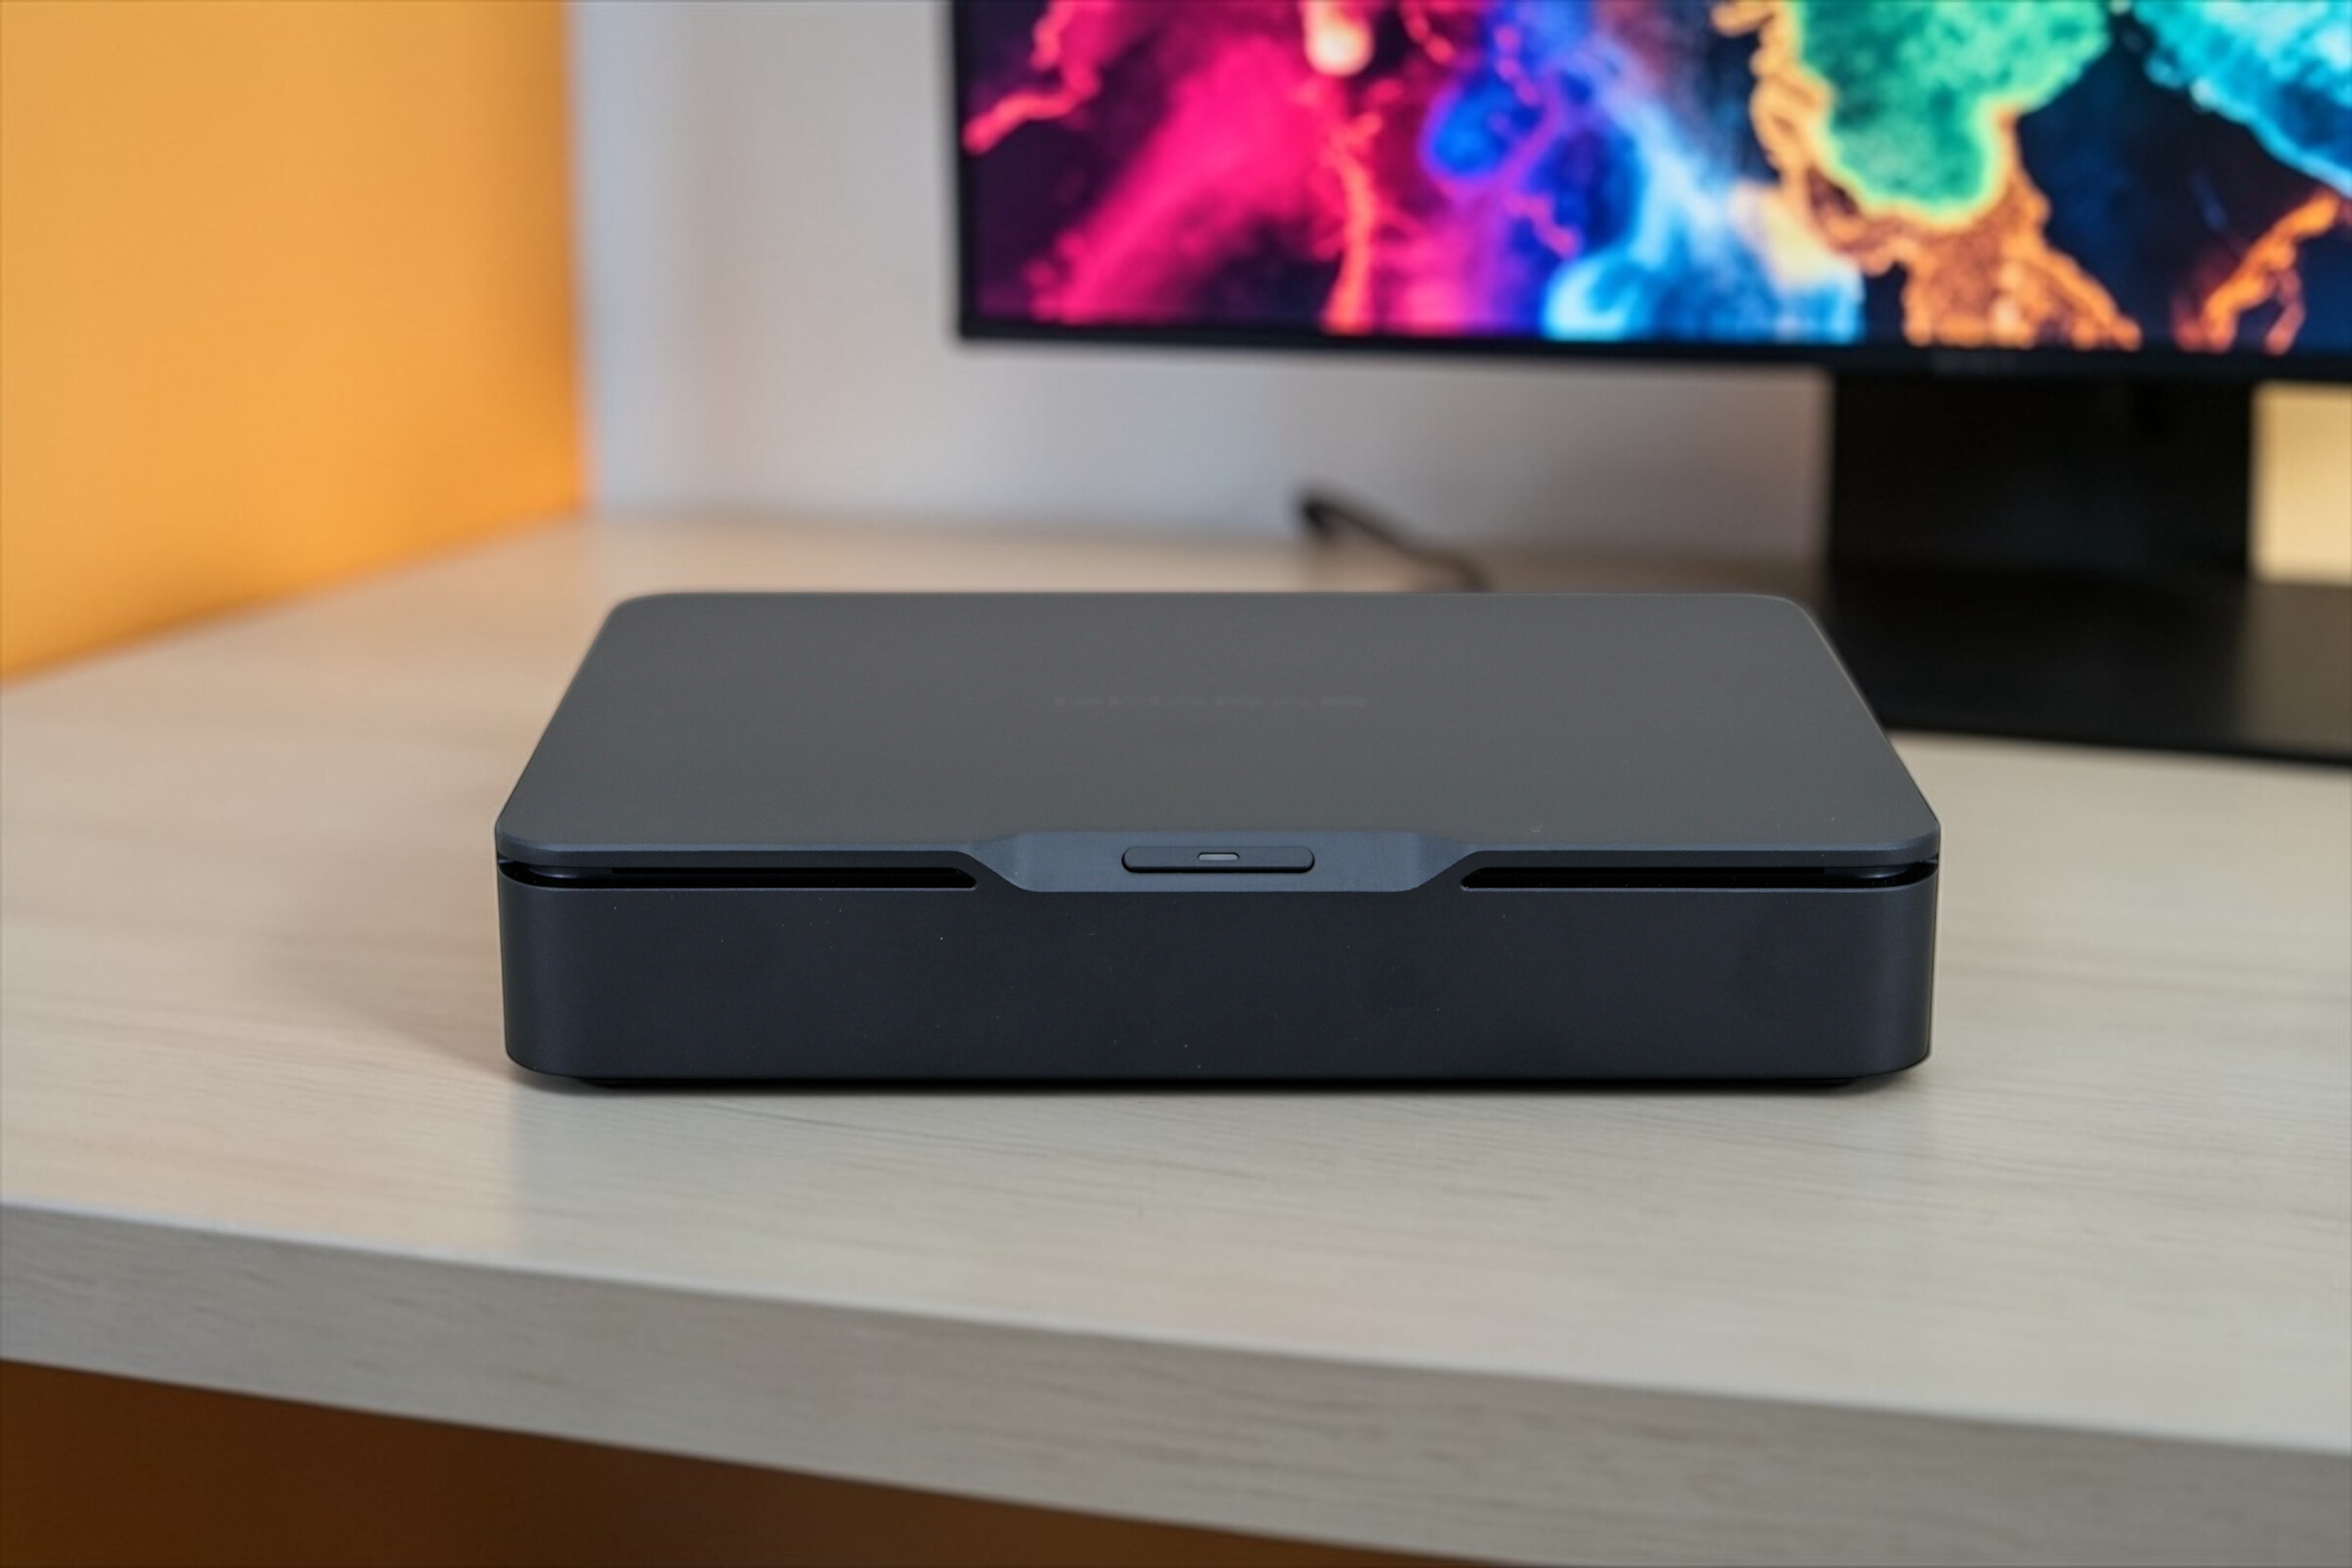
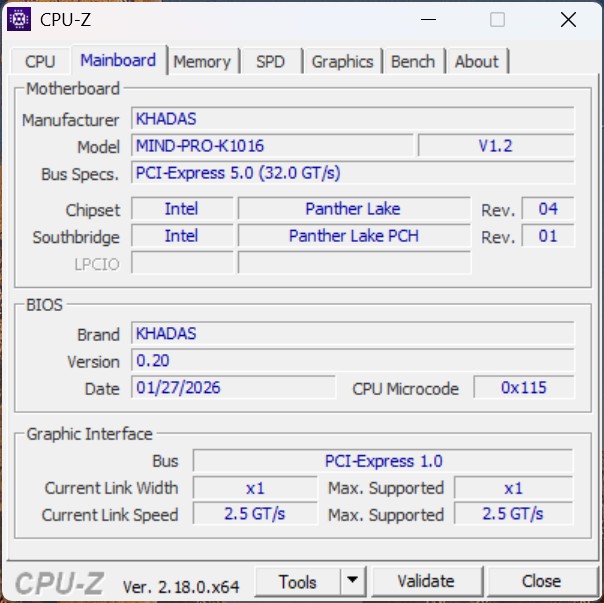
Obudowa i łączność
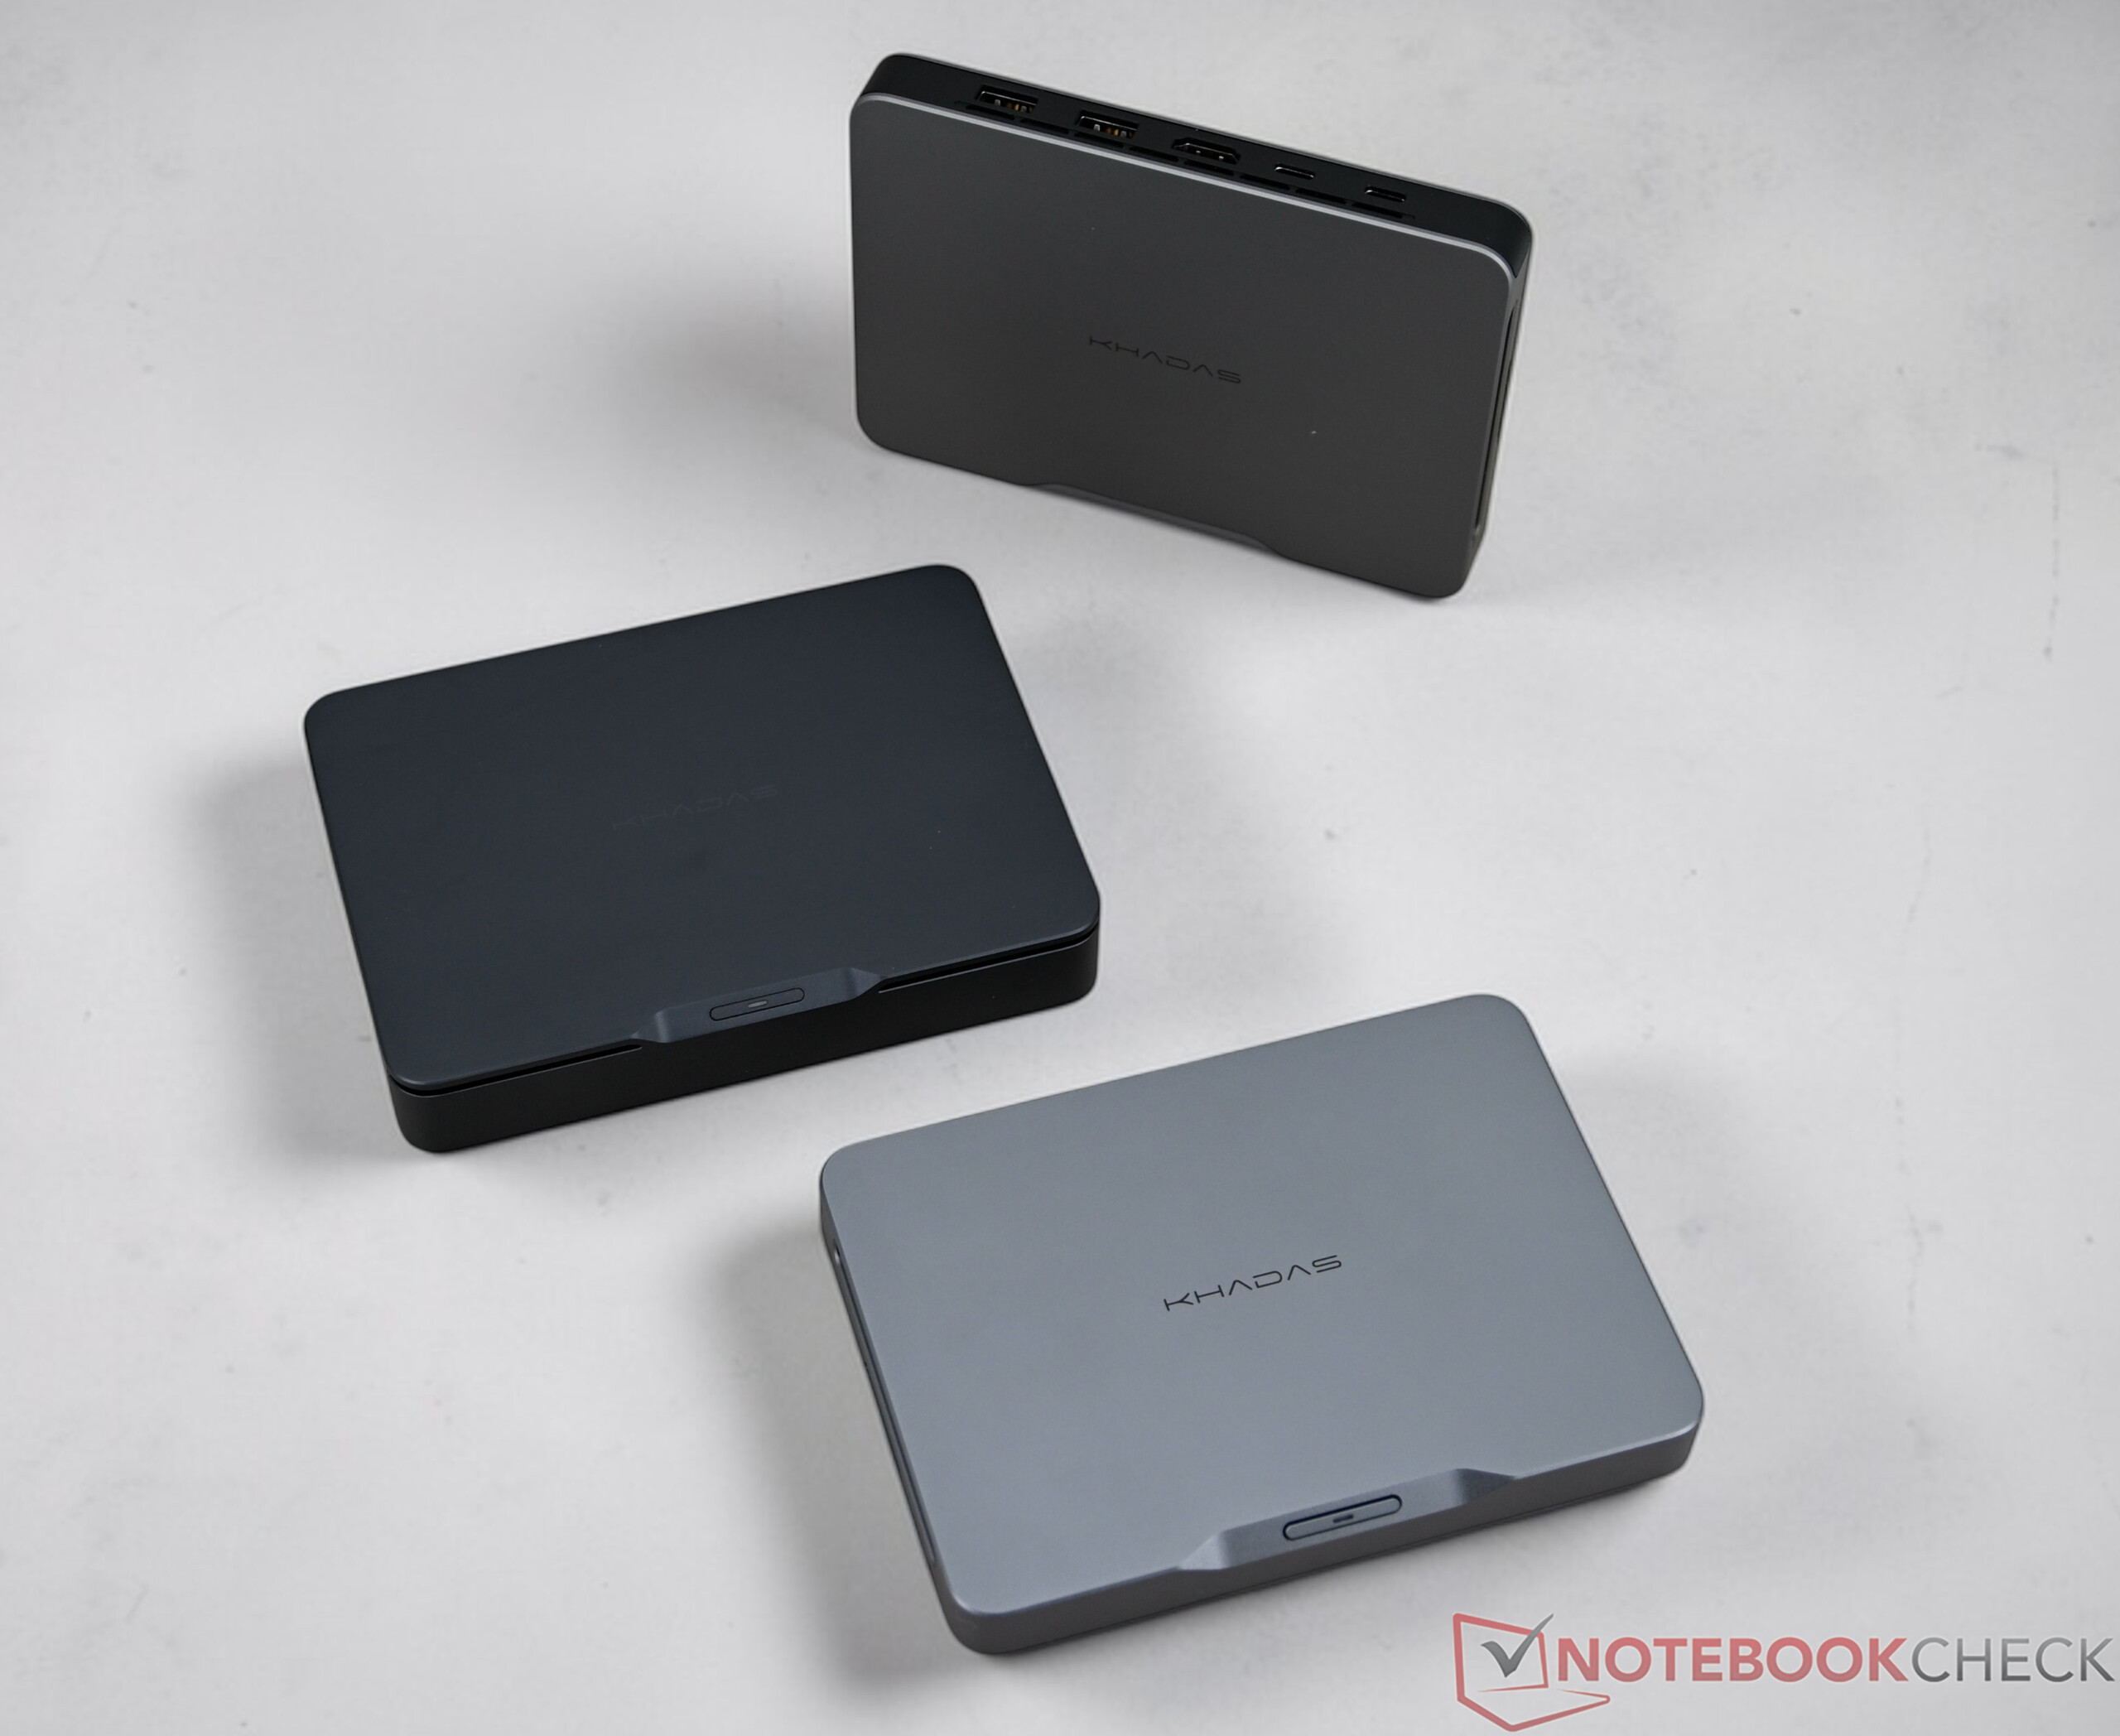
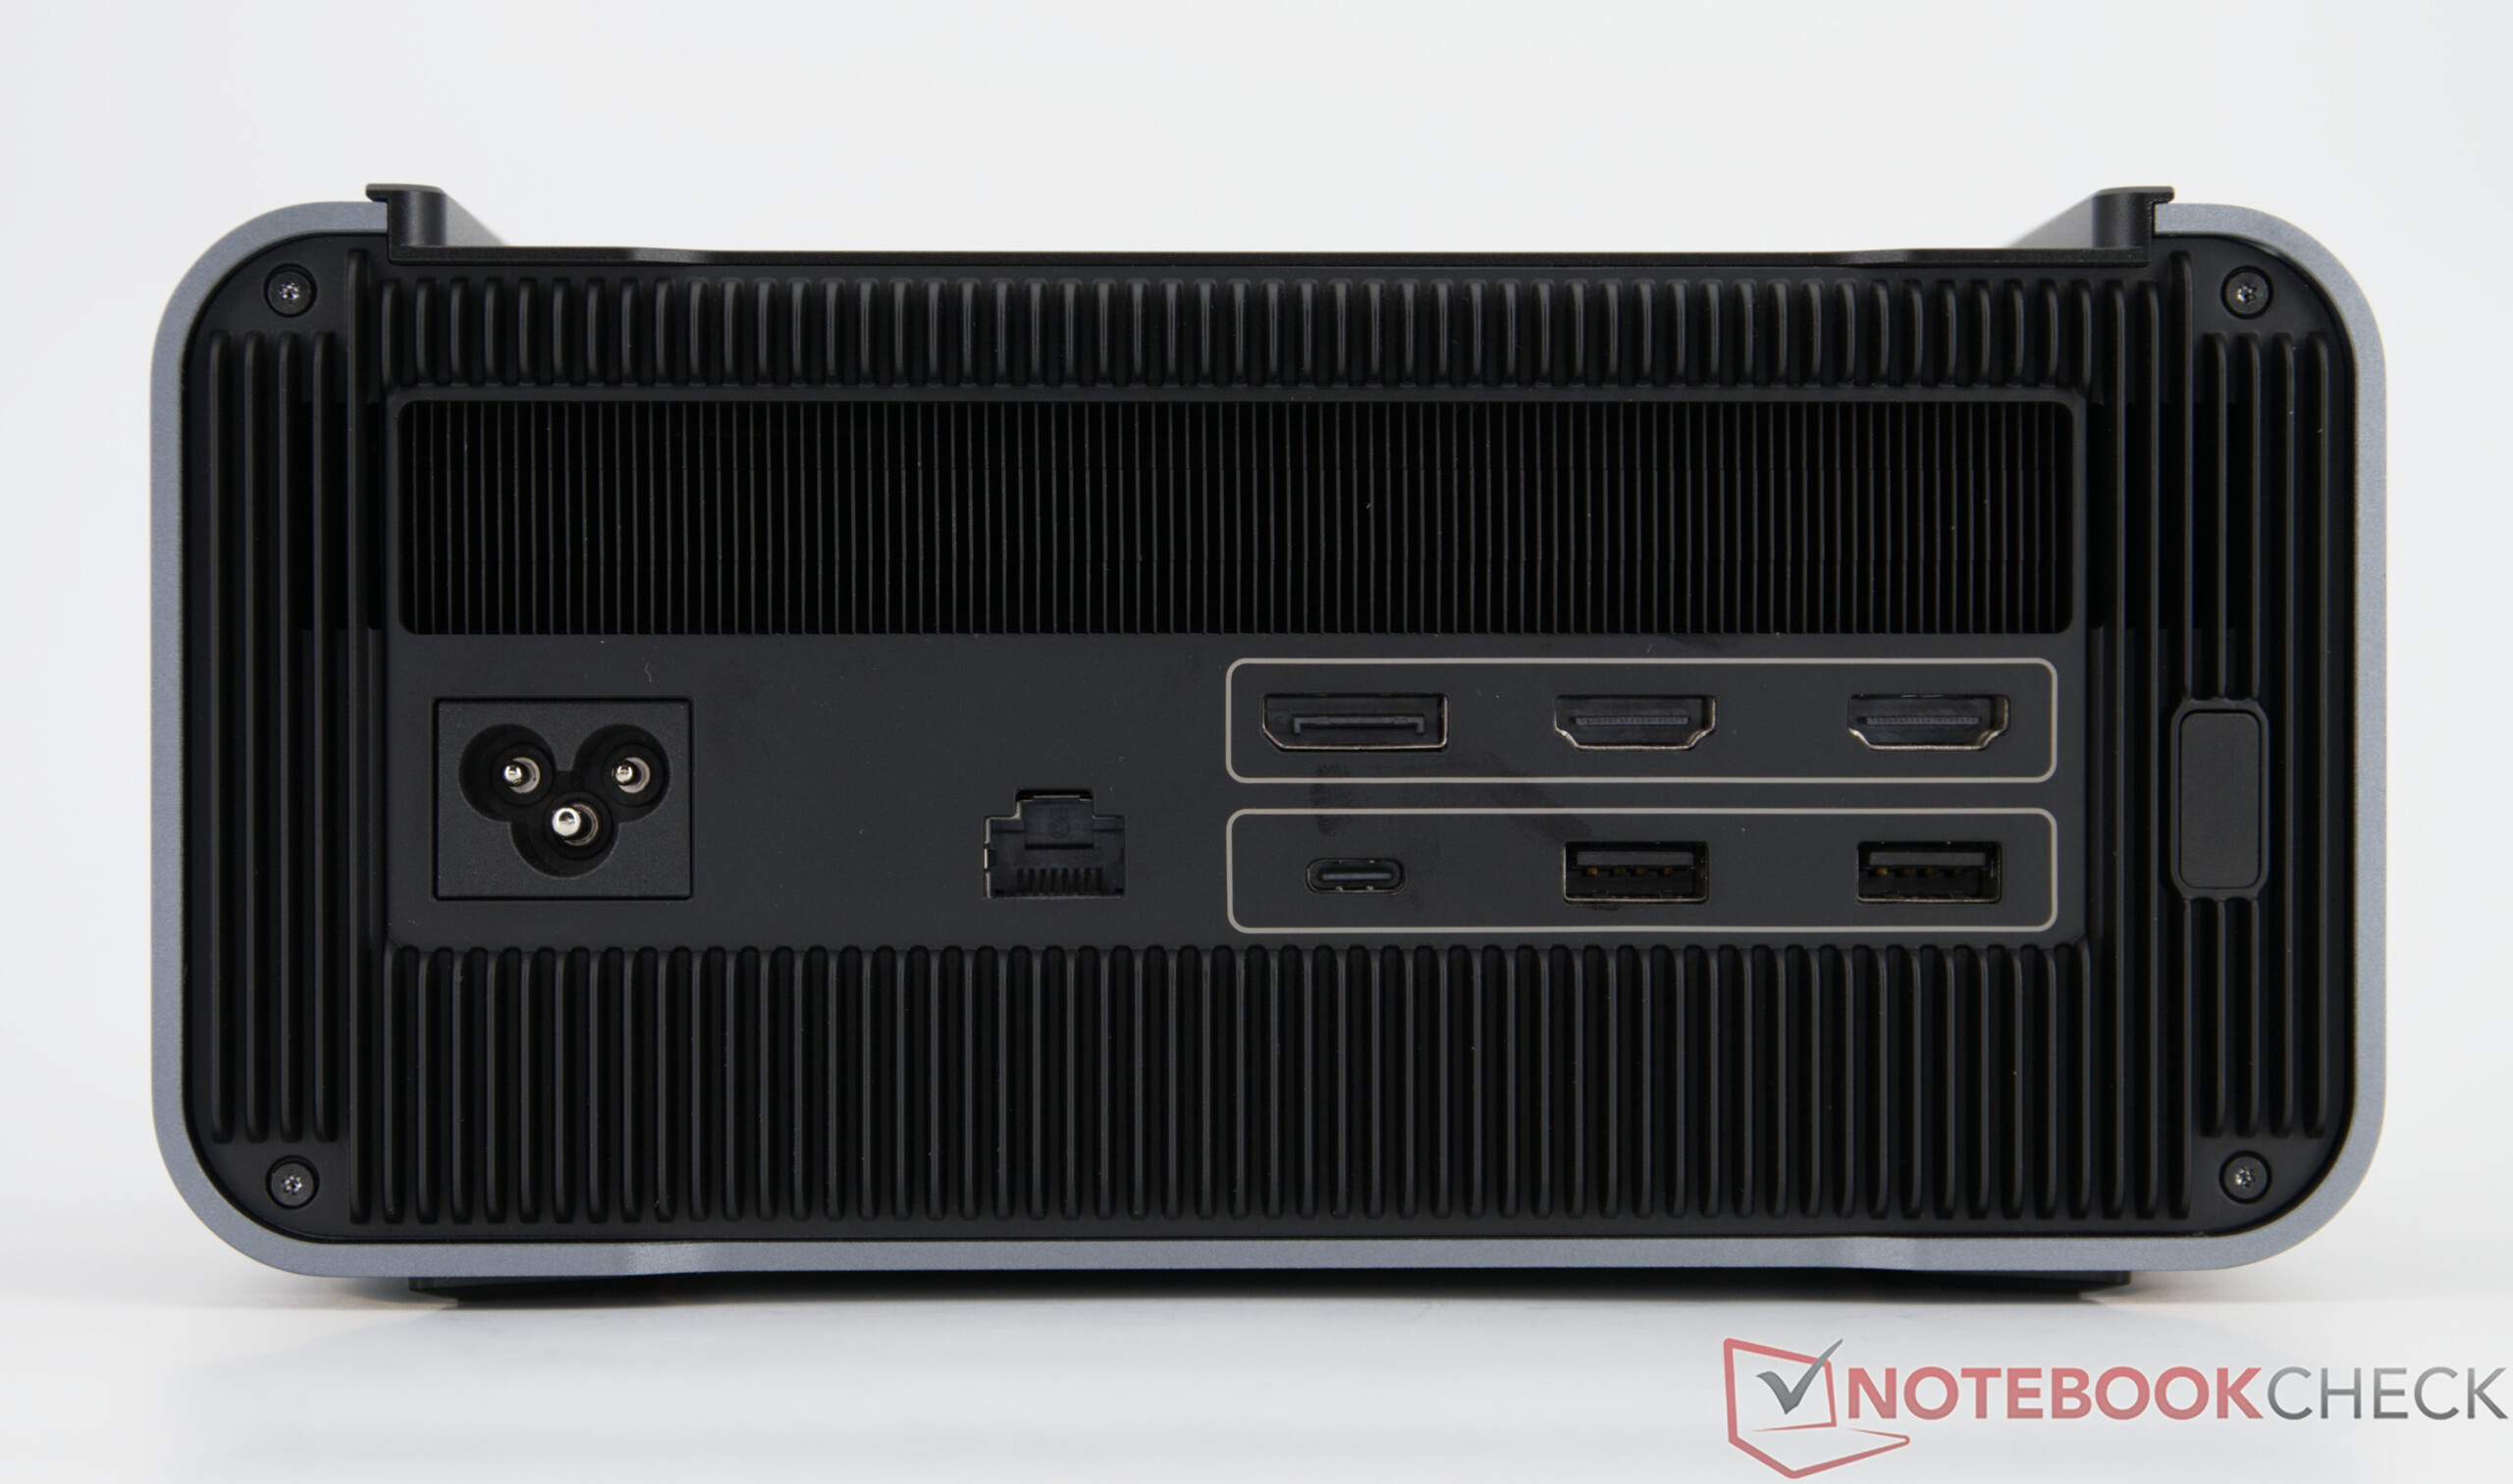
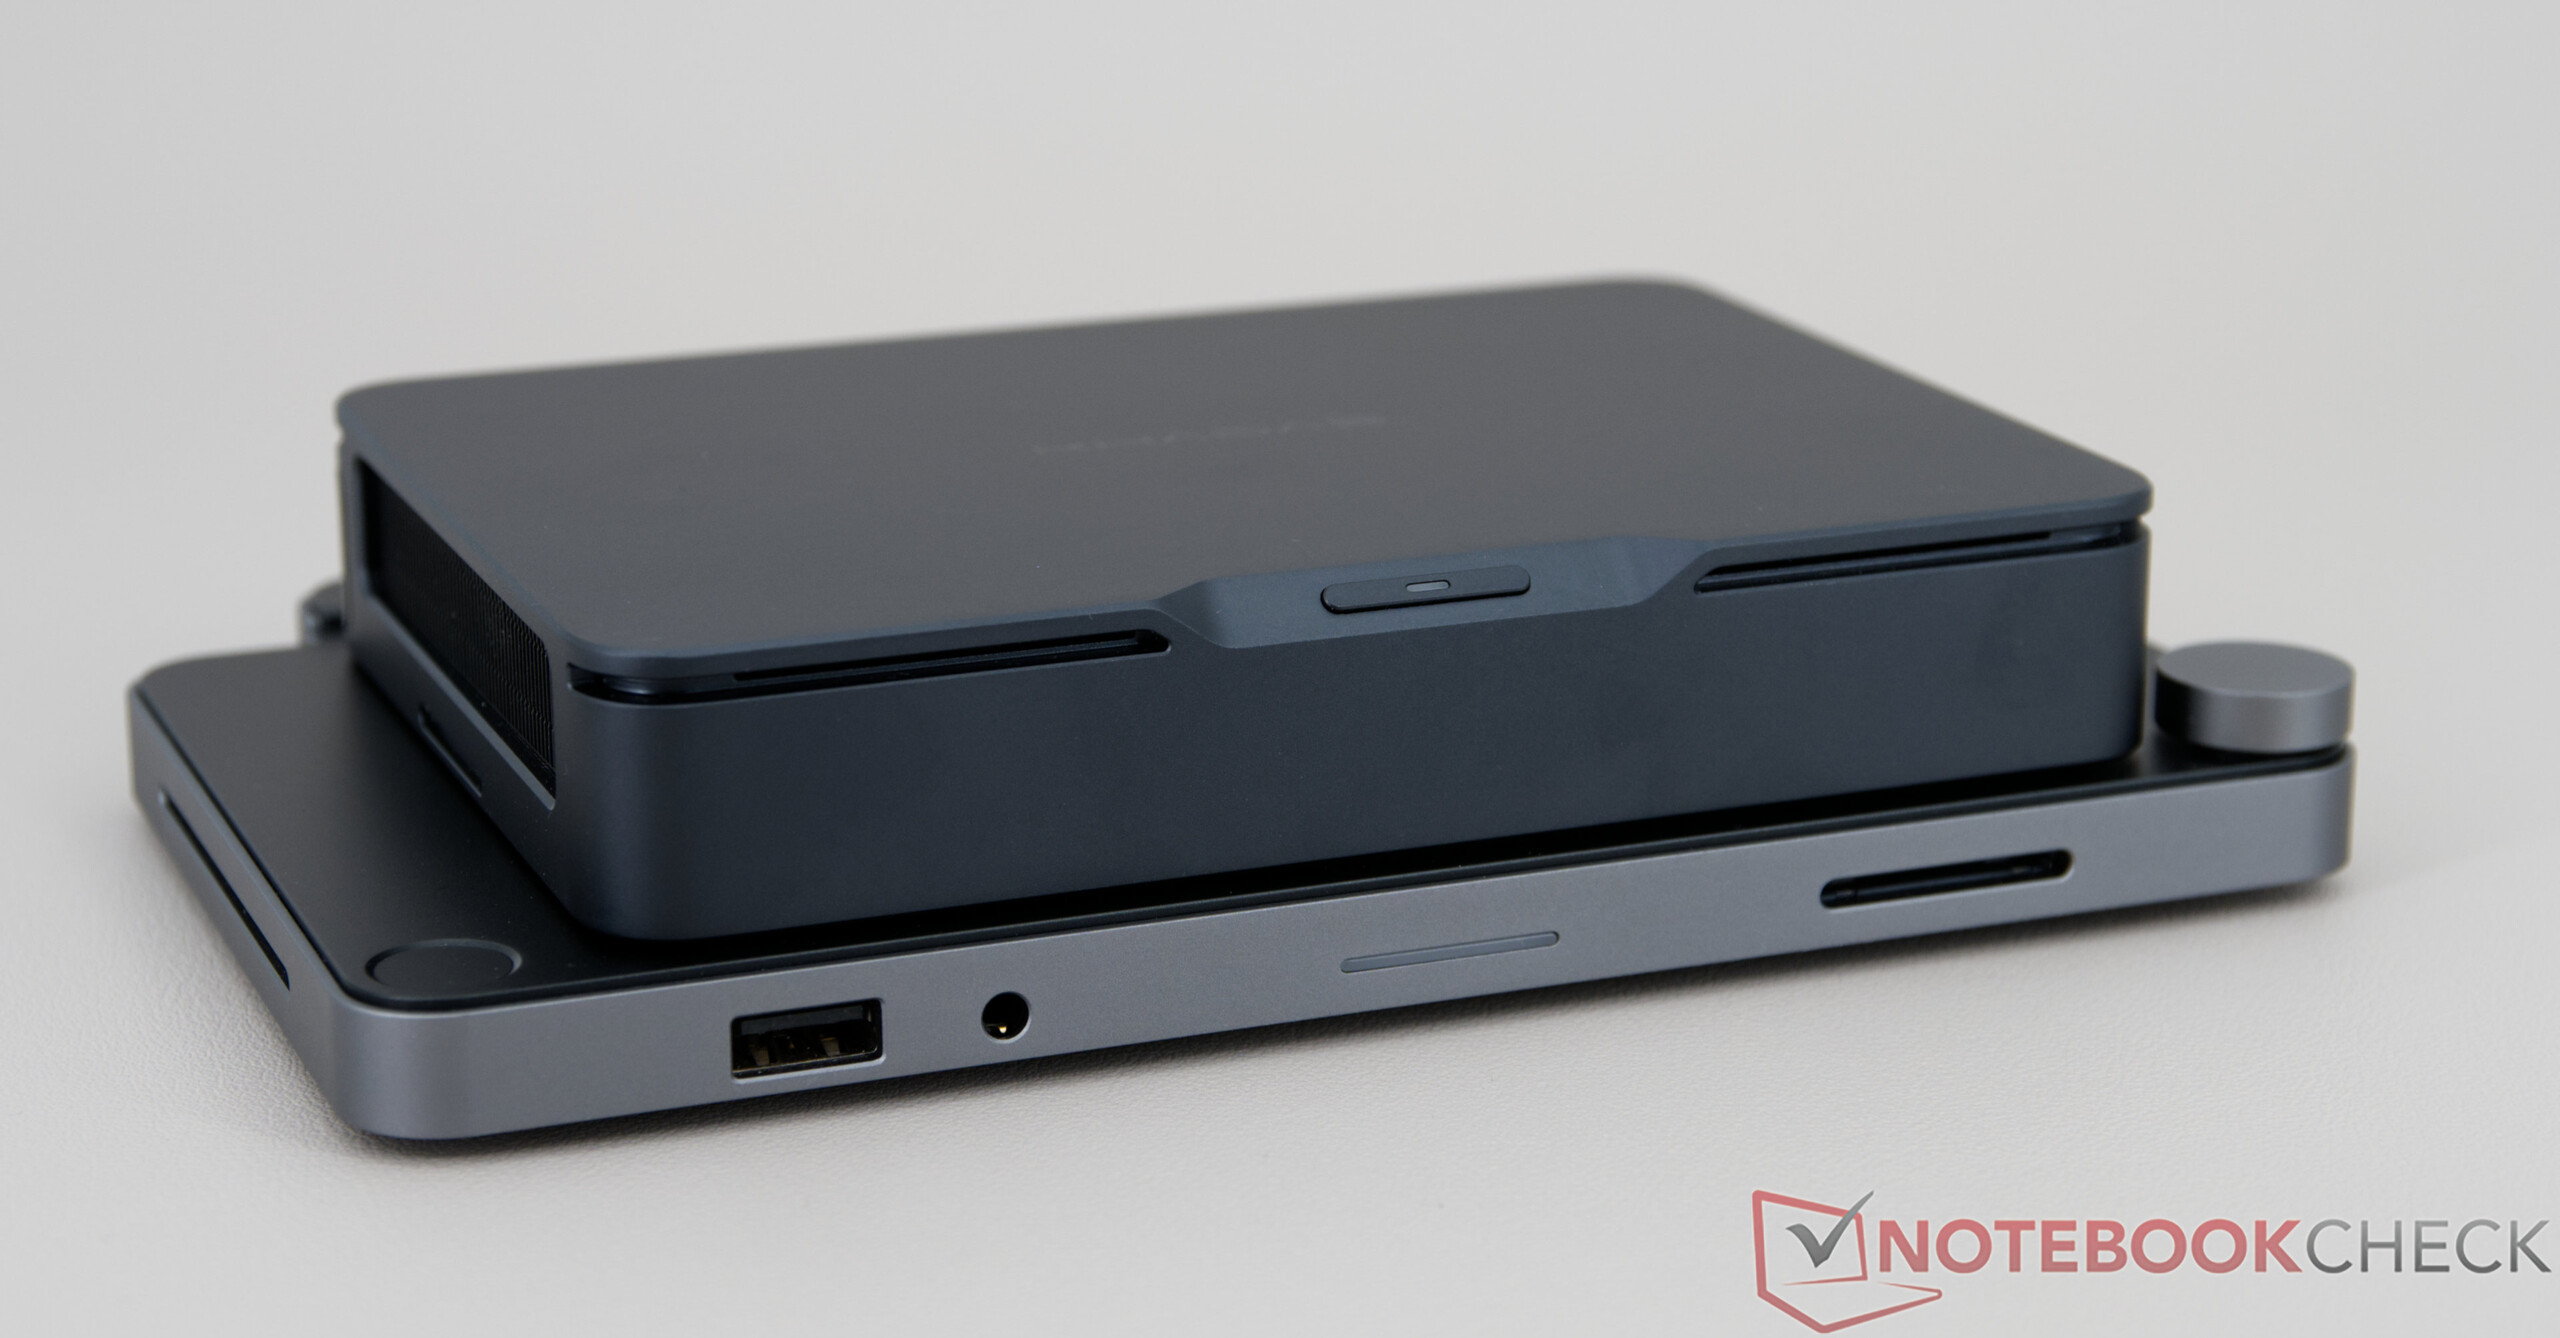
W porównaniu do Mind 2s obudowa Khadas Mind Pro stała się nieco grubsza, ale ogólnie pozostaje bardzo kompaktowa i nadal opiera się na niezwykle wysokiej jakości metalowej konstrukcji. Długość i szerokość pozostały niezmienione, dzięki czemu kompatybilność z własnymi akcesoriami firmy jest nadal gwarantowana.
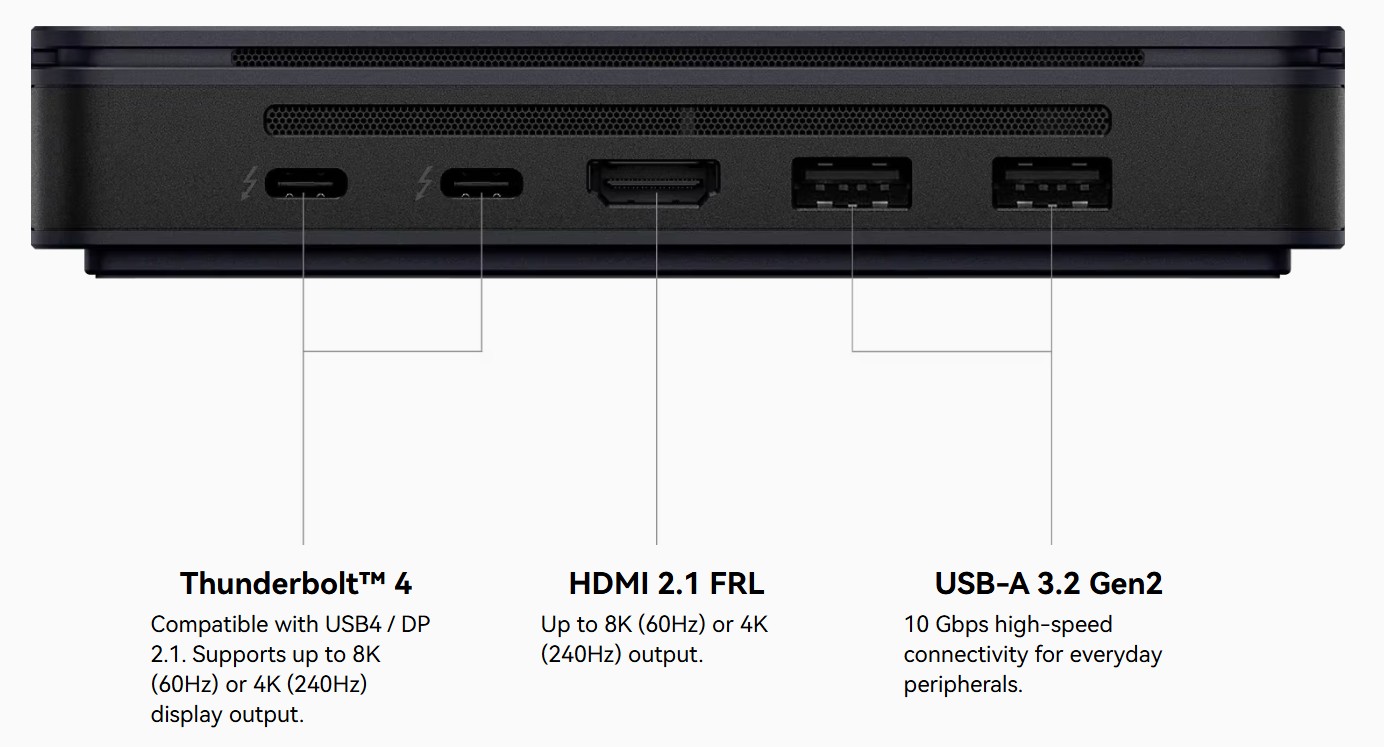
Nieco większa obudowa pozwala również Khadas na zintegrowanie większej baterii (7,98 Wh), która umożliwia pracę w trybie czuwania do 48 godzin. Złącze HDMI również zostało ulepszone: Jest ono teraz zgodne ze standardem HDMI 2.1 o przepustowości 48 Gbit/s, dzięki czemu obsługuje między innymi rozdzielczości 4K z częstotliwością do 240 Hz.
ADATA SE920 USB4-Speed
| Connectivity - USB 3.x / USB4 / TB - AS SSD Seq Read Test (1GB) | |
| GMK EVO-T1 | |
| Khadas Mind 2s | |
| Khadas Mind 2 | |
| Geekom A9 Max, AI 9 HX 370 | |
| Minisforum AI X1 Pro, HX 470 | |
| Khadas Mind Pro | |
| Średnia w klasie Mini PC (423 - 3906, n=44, ostatnie 2 lata) | |
Wydajność Wi-Fi
Akcesoria i akcesoria opcjonalne
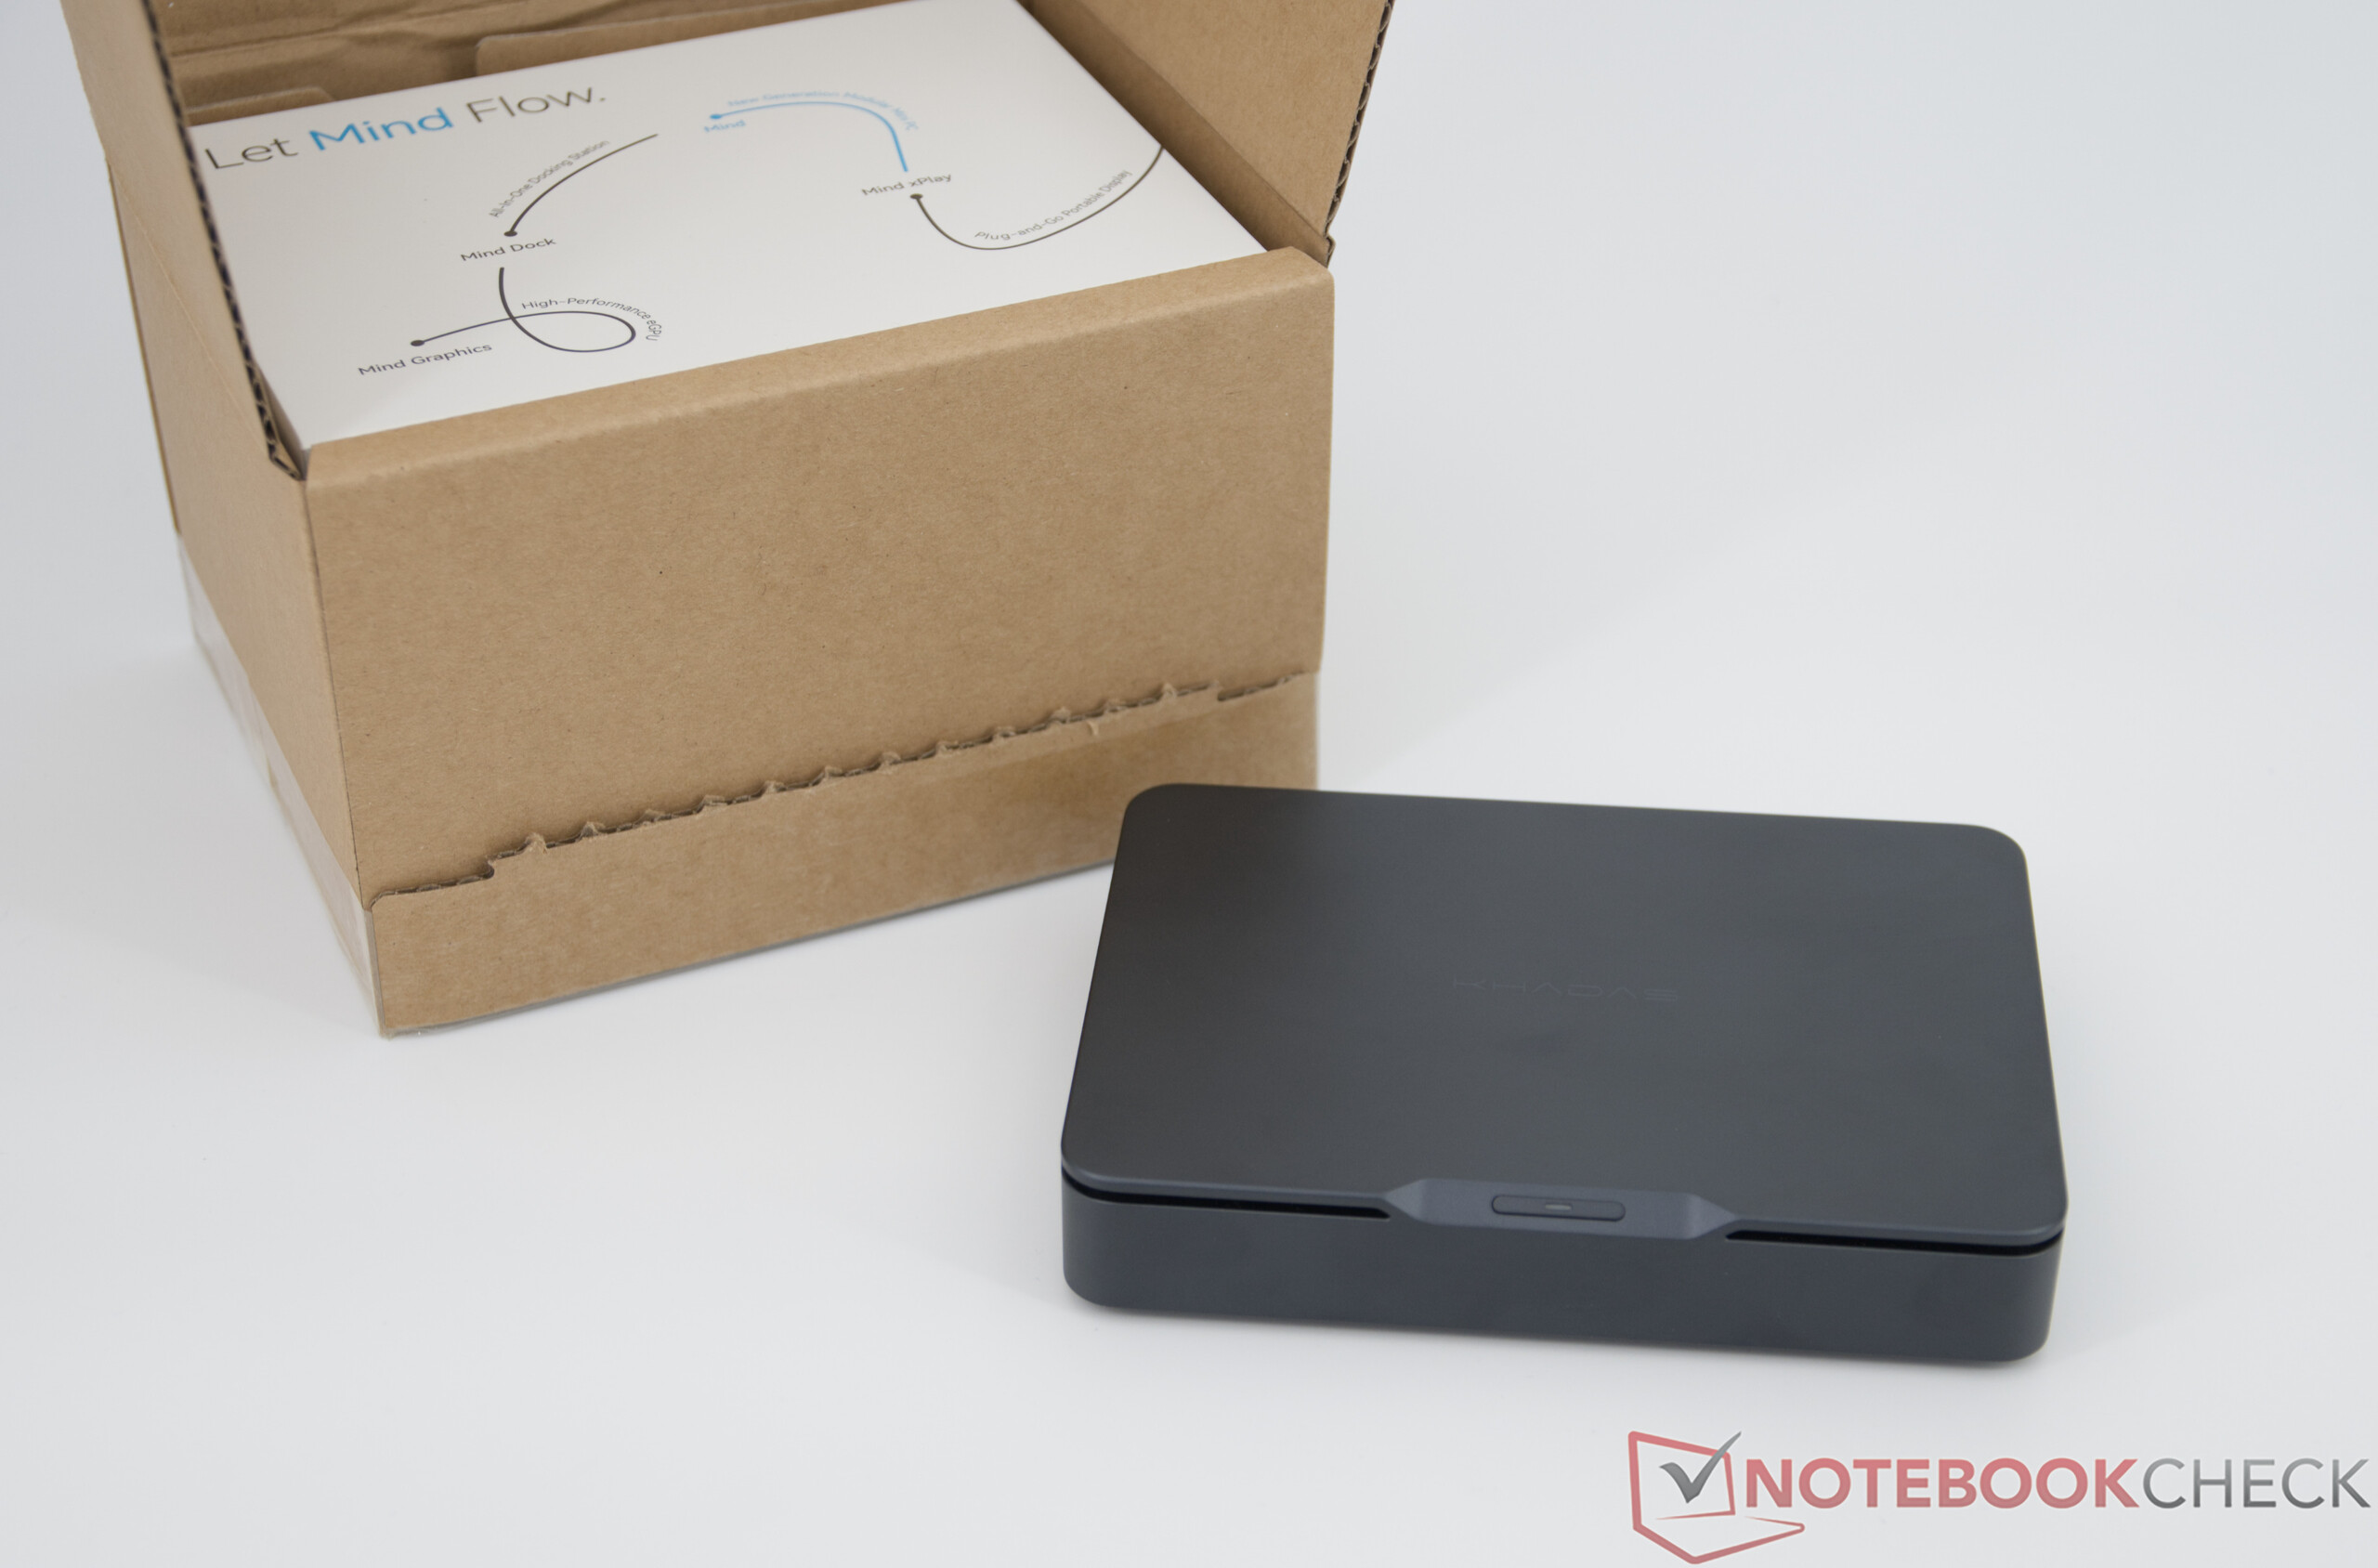
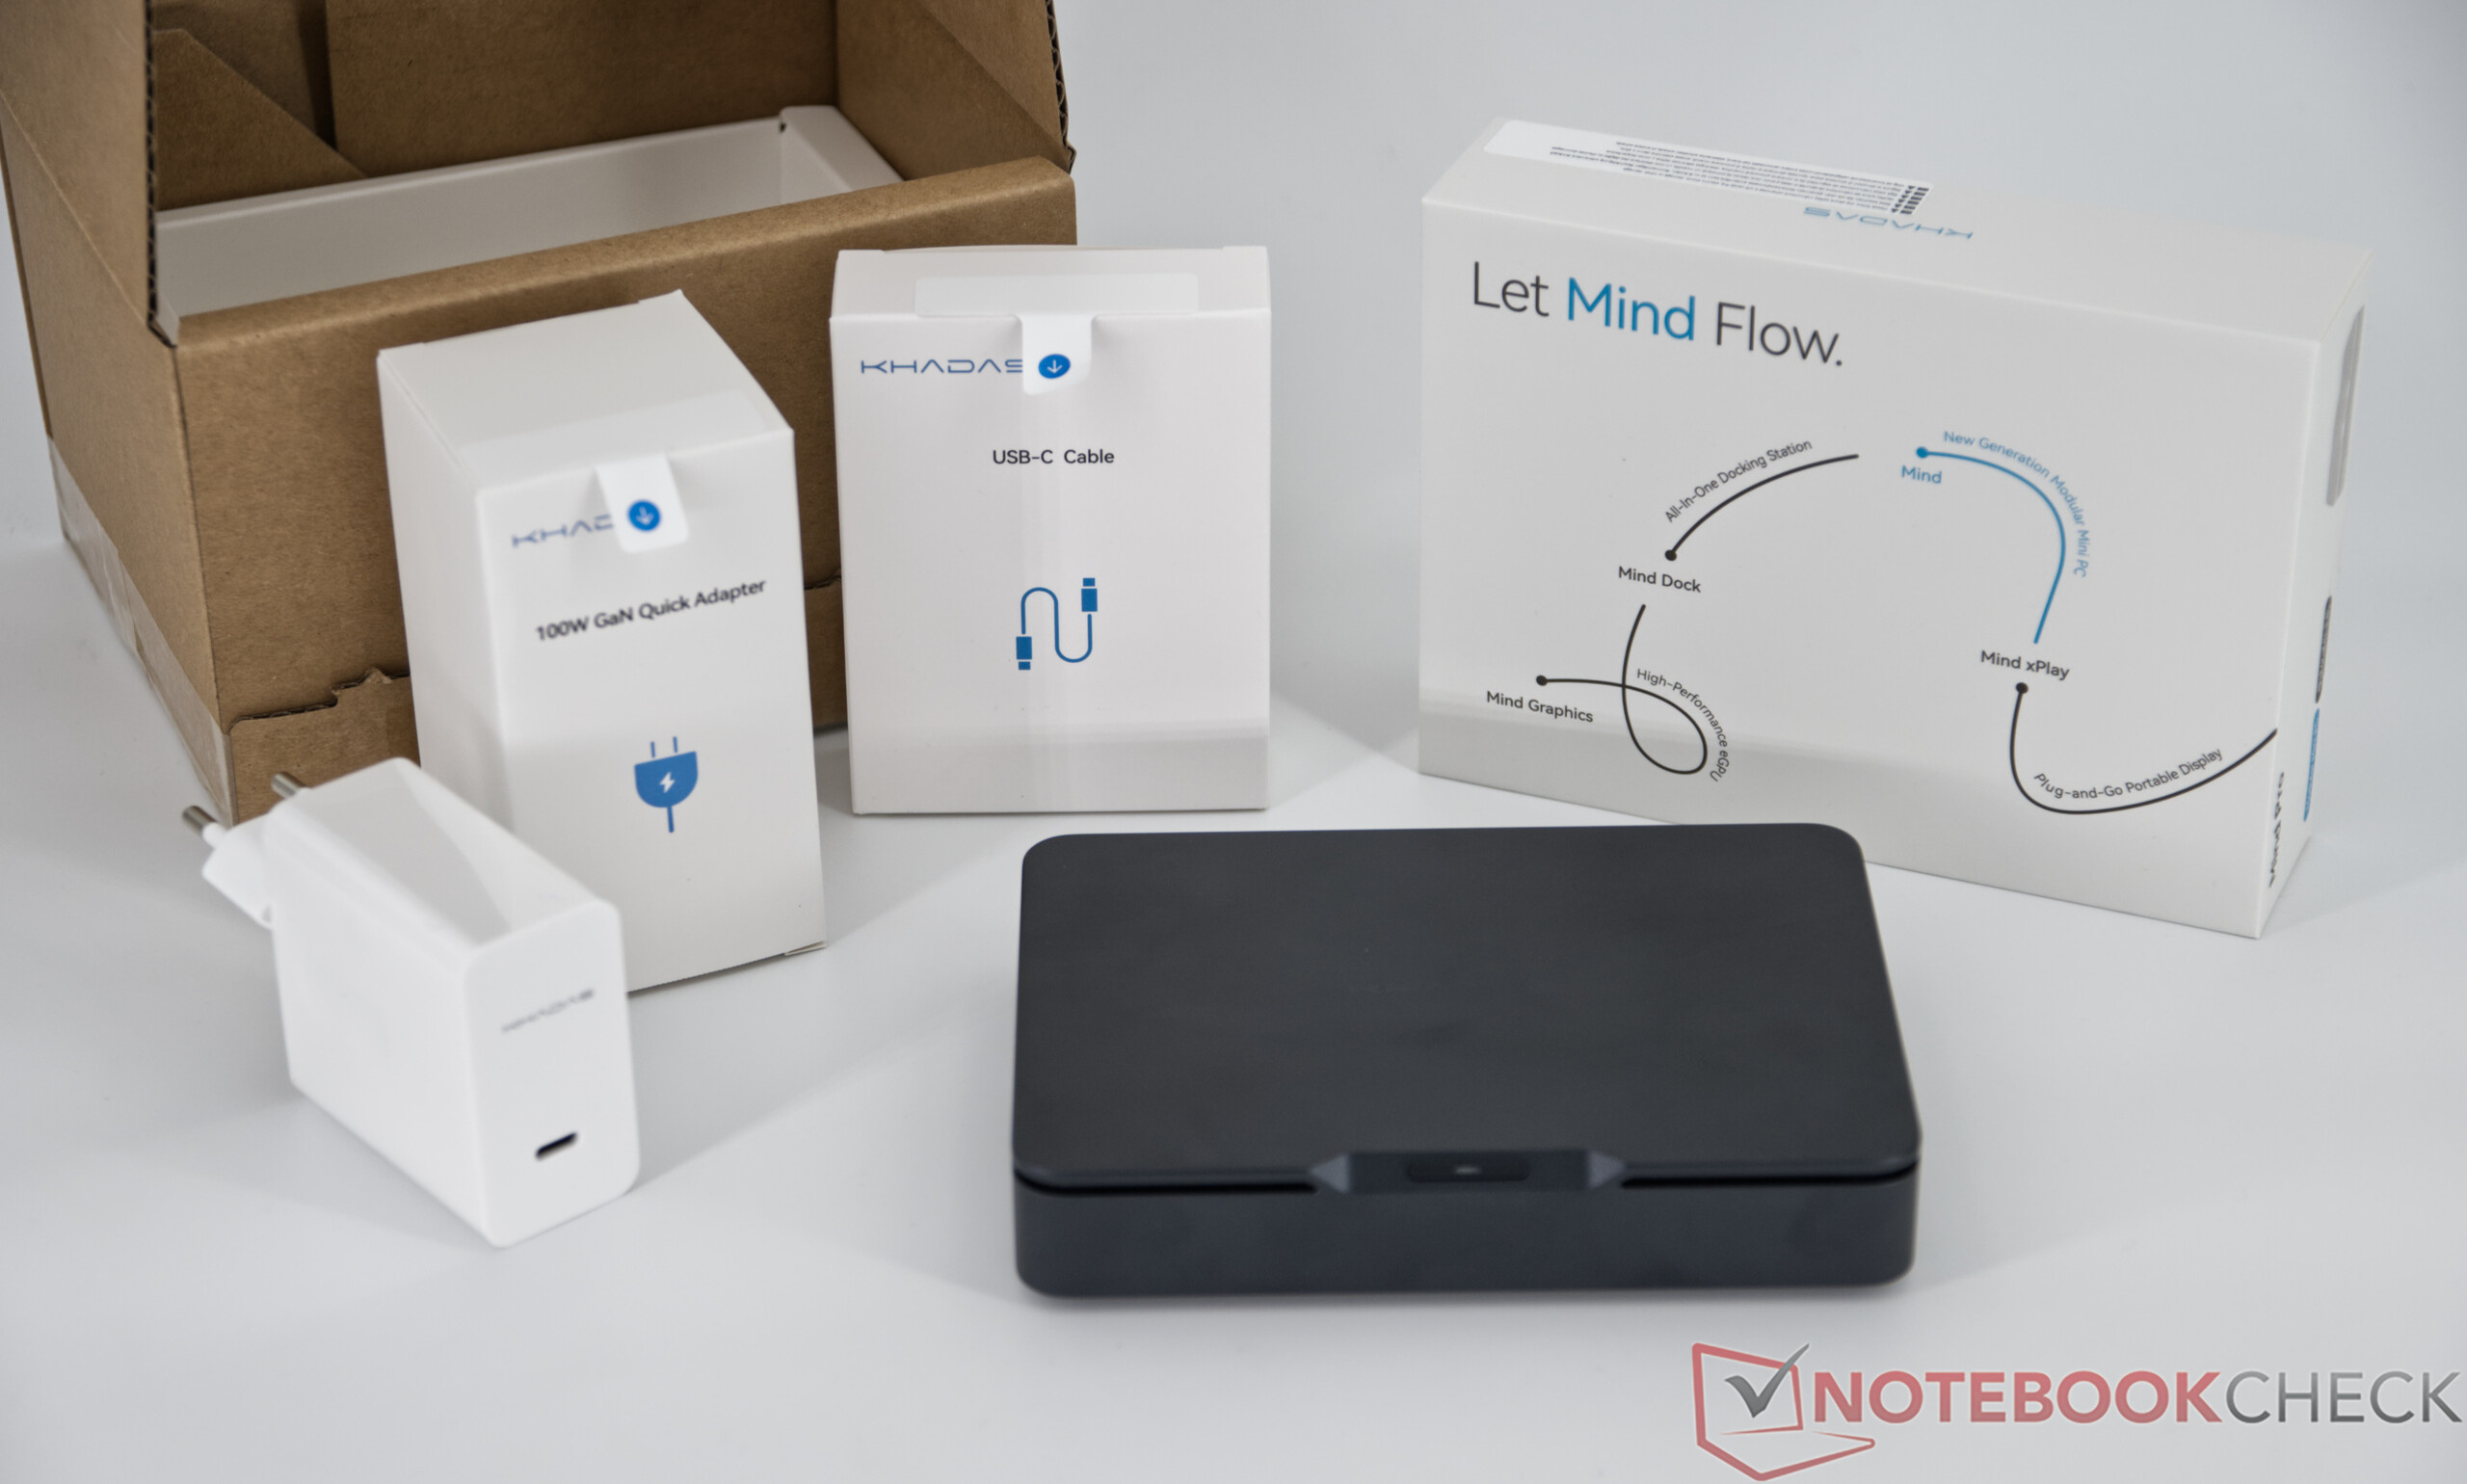
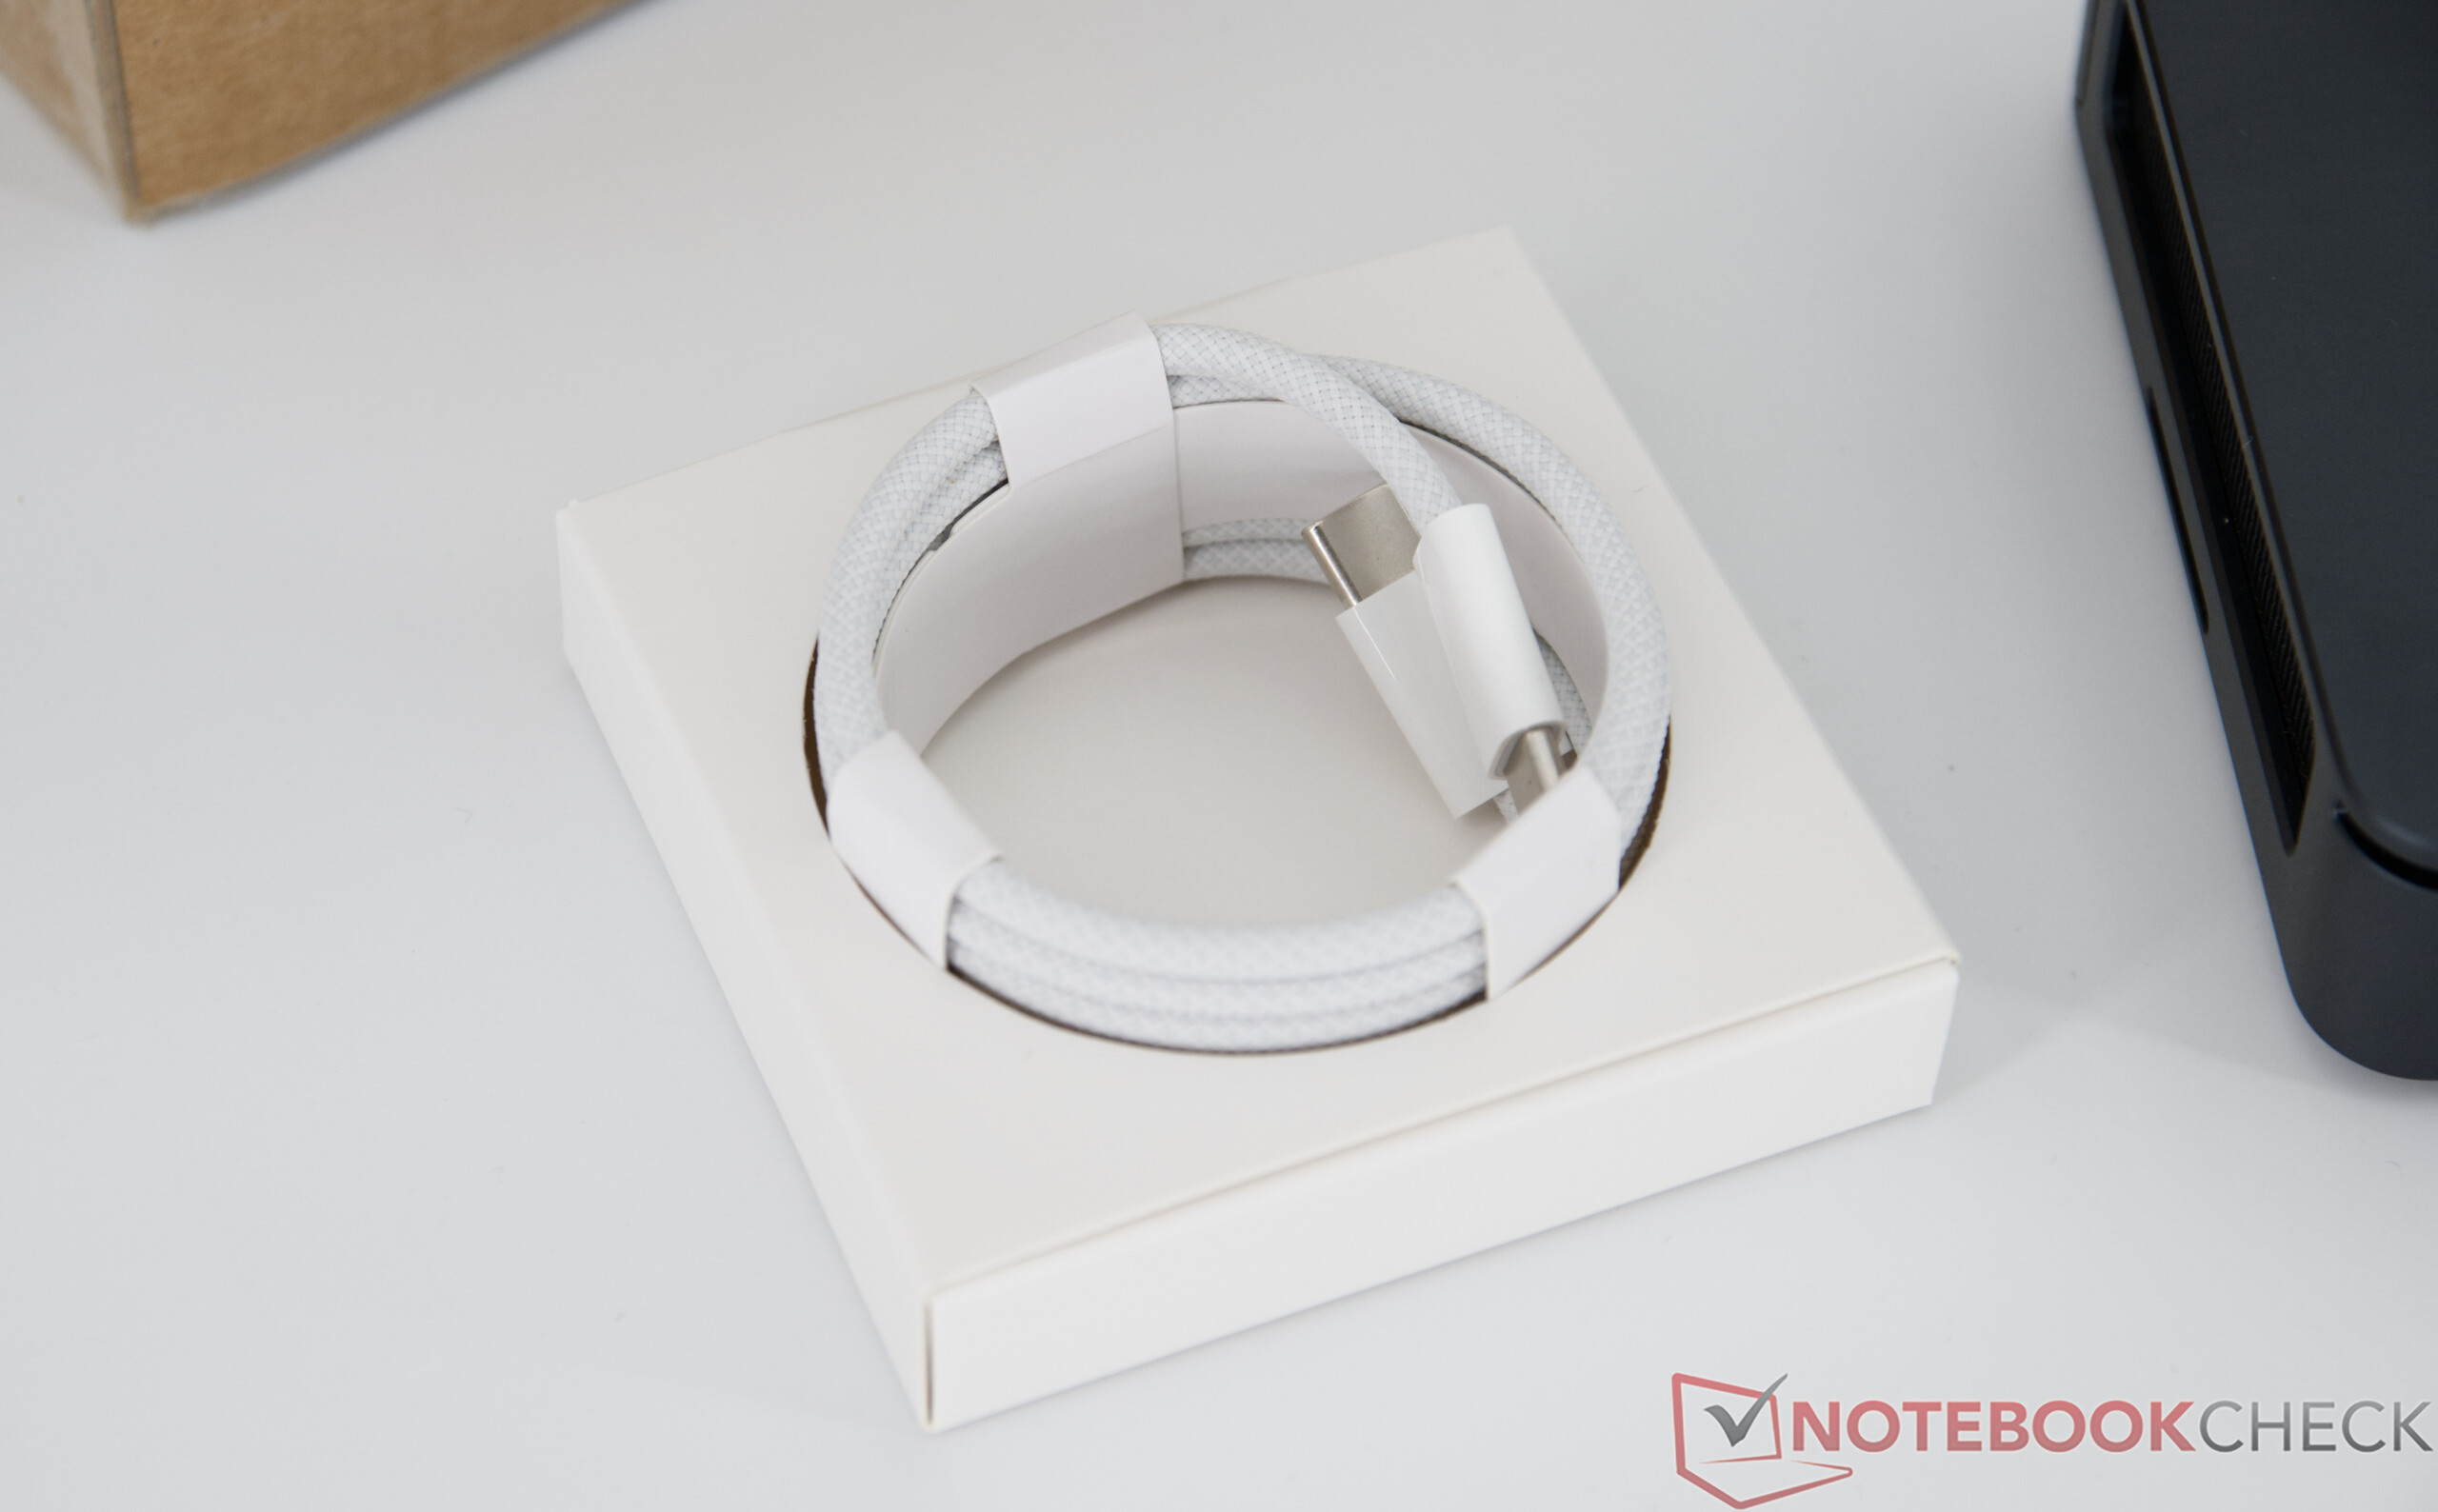
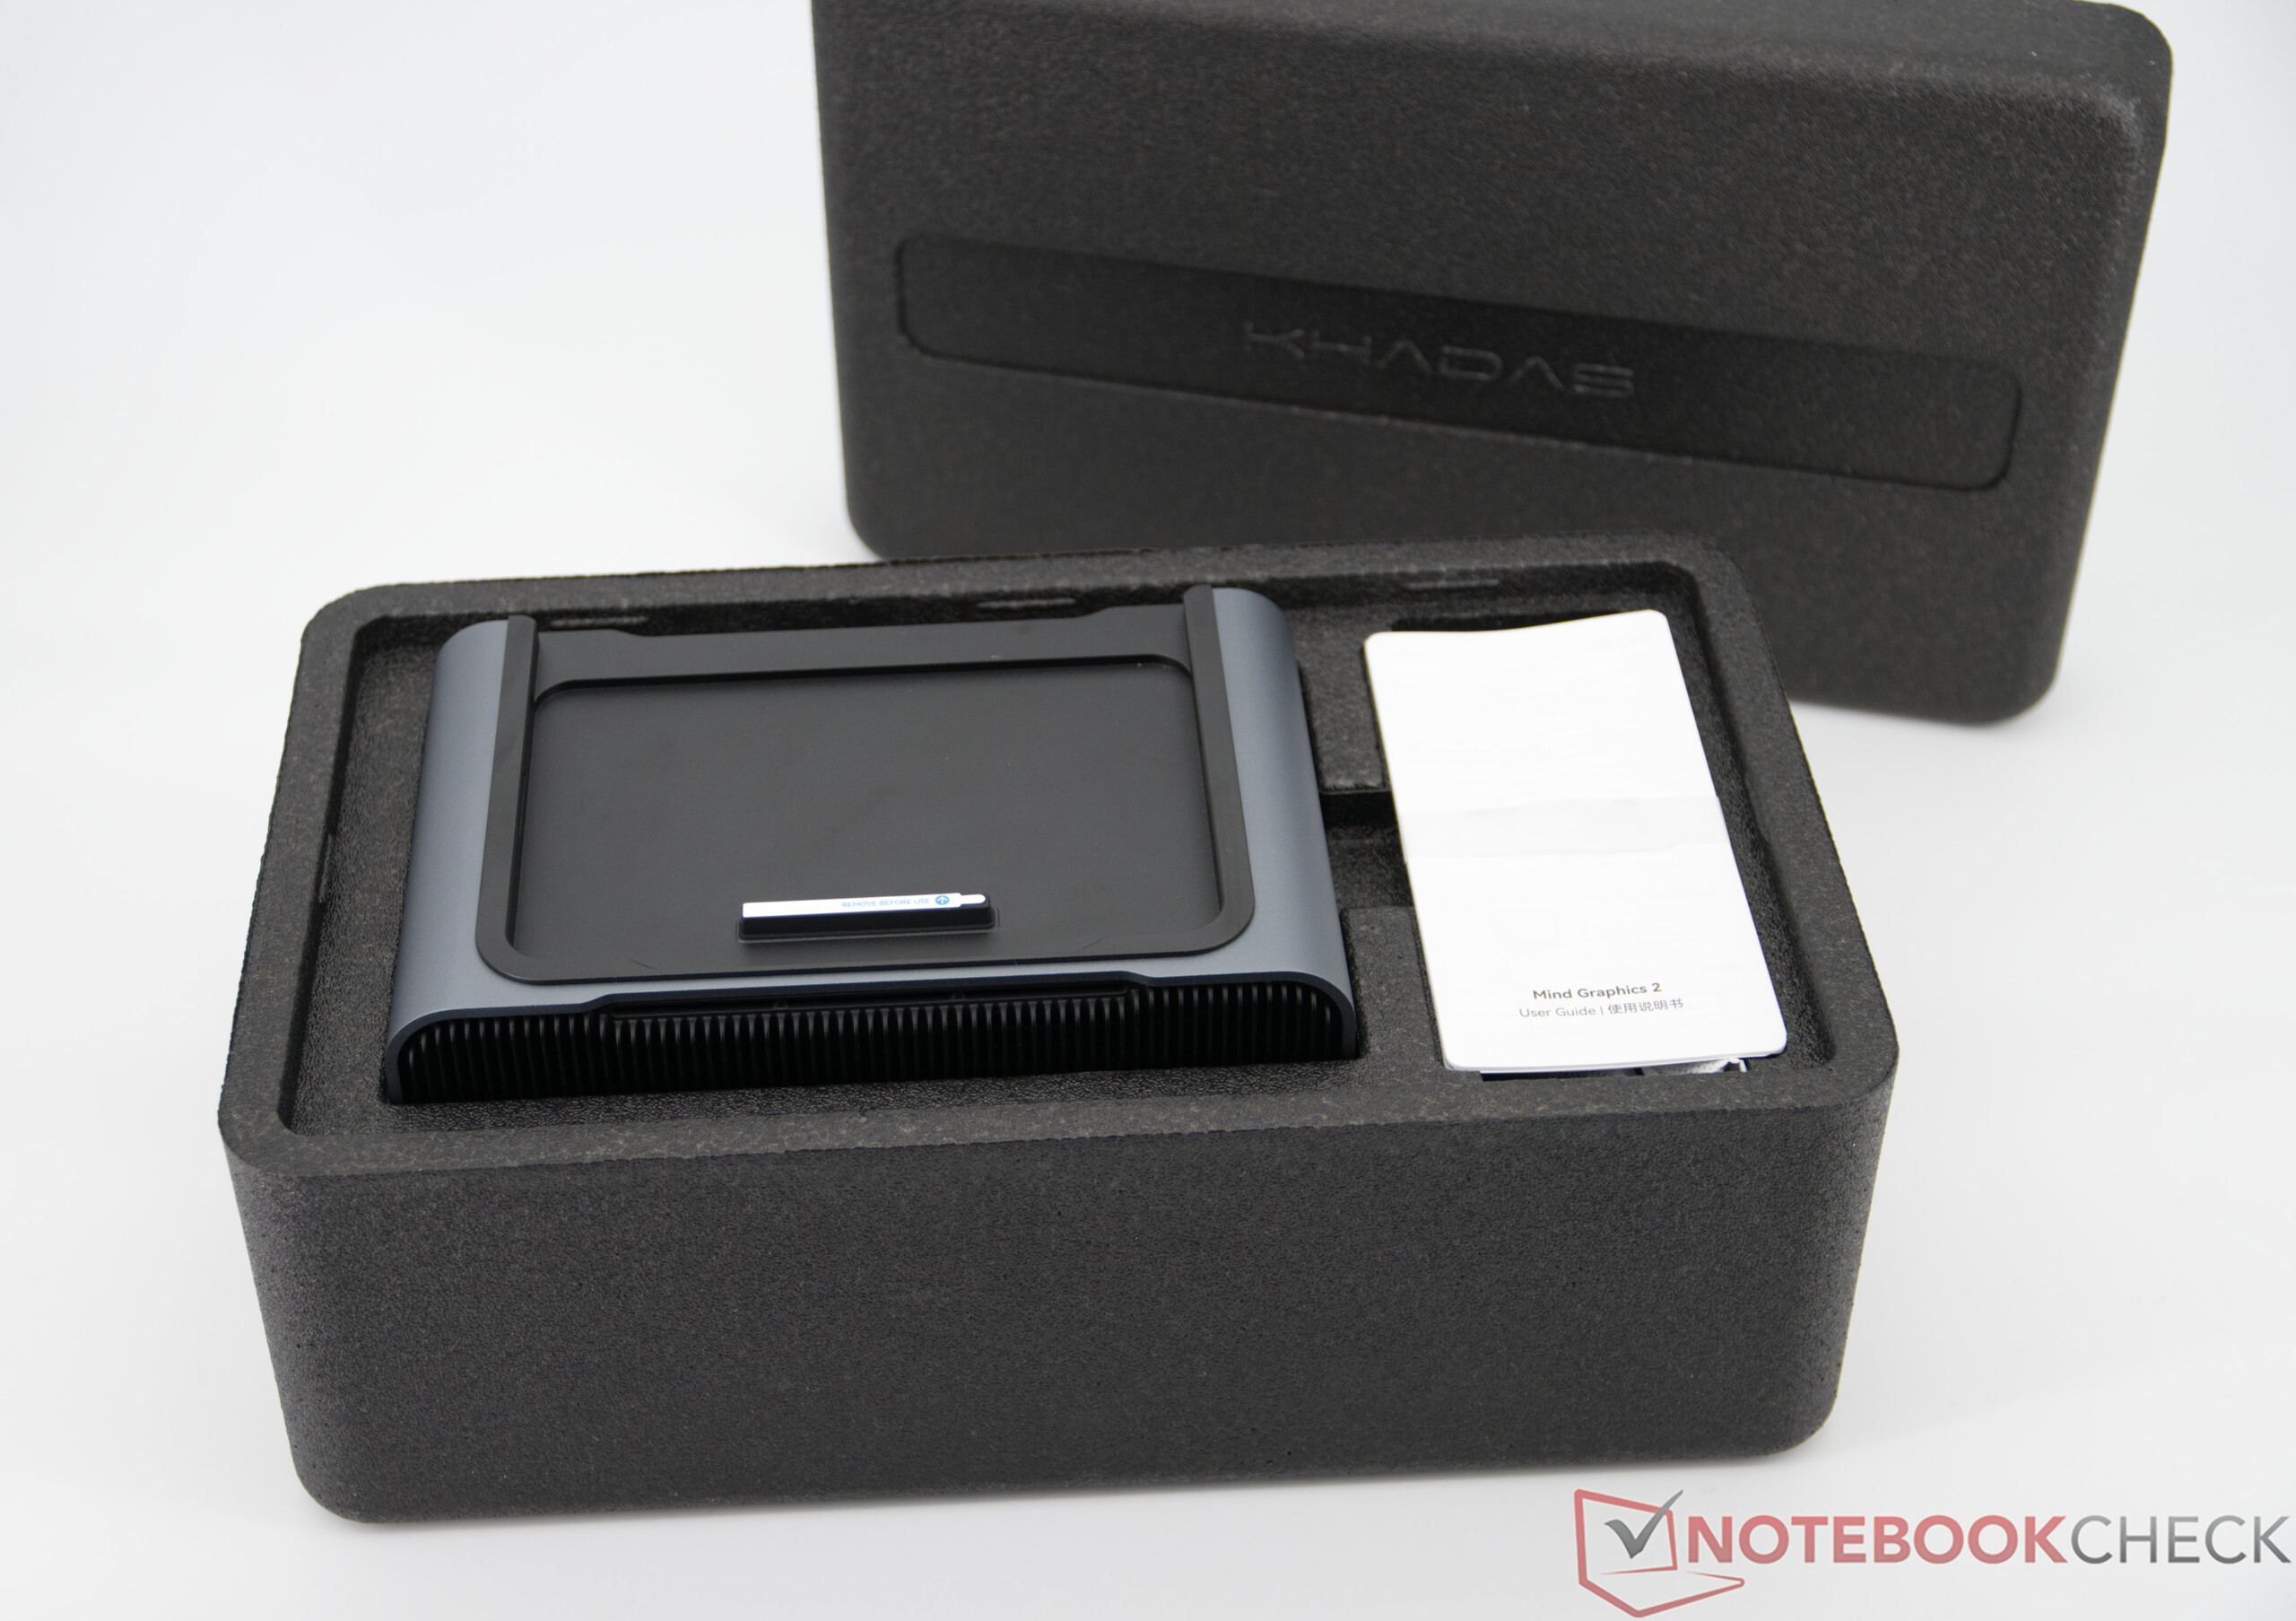
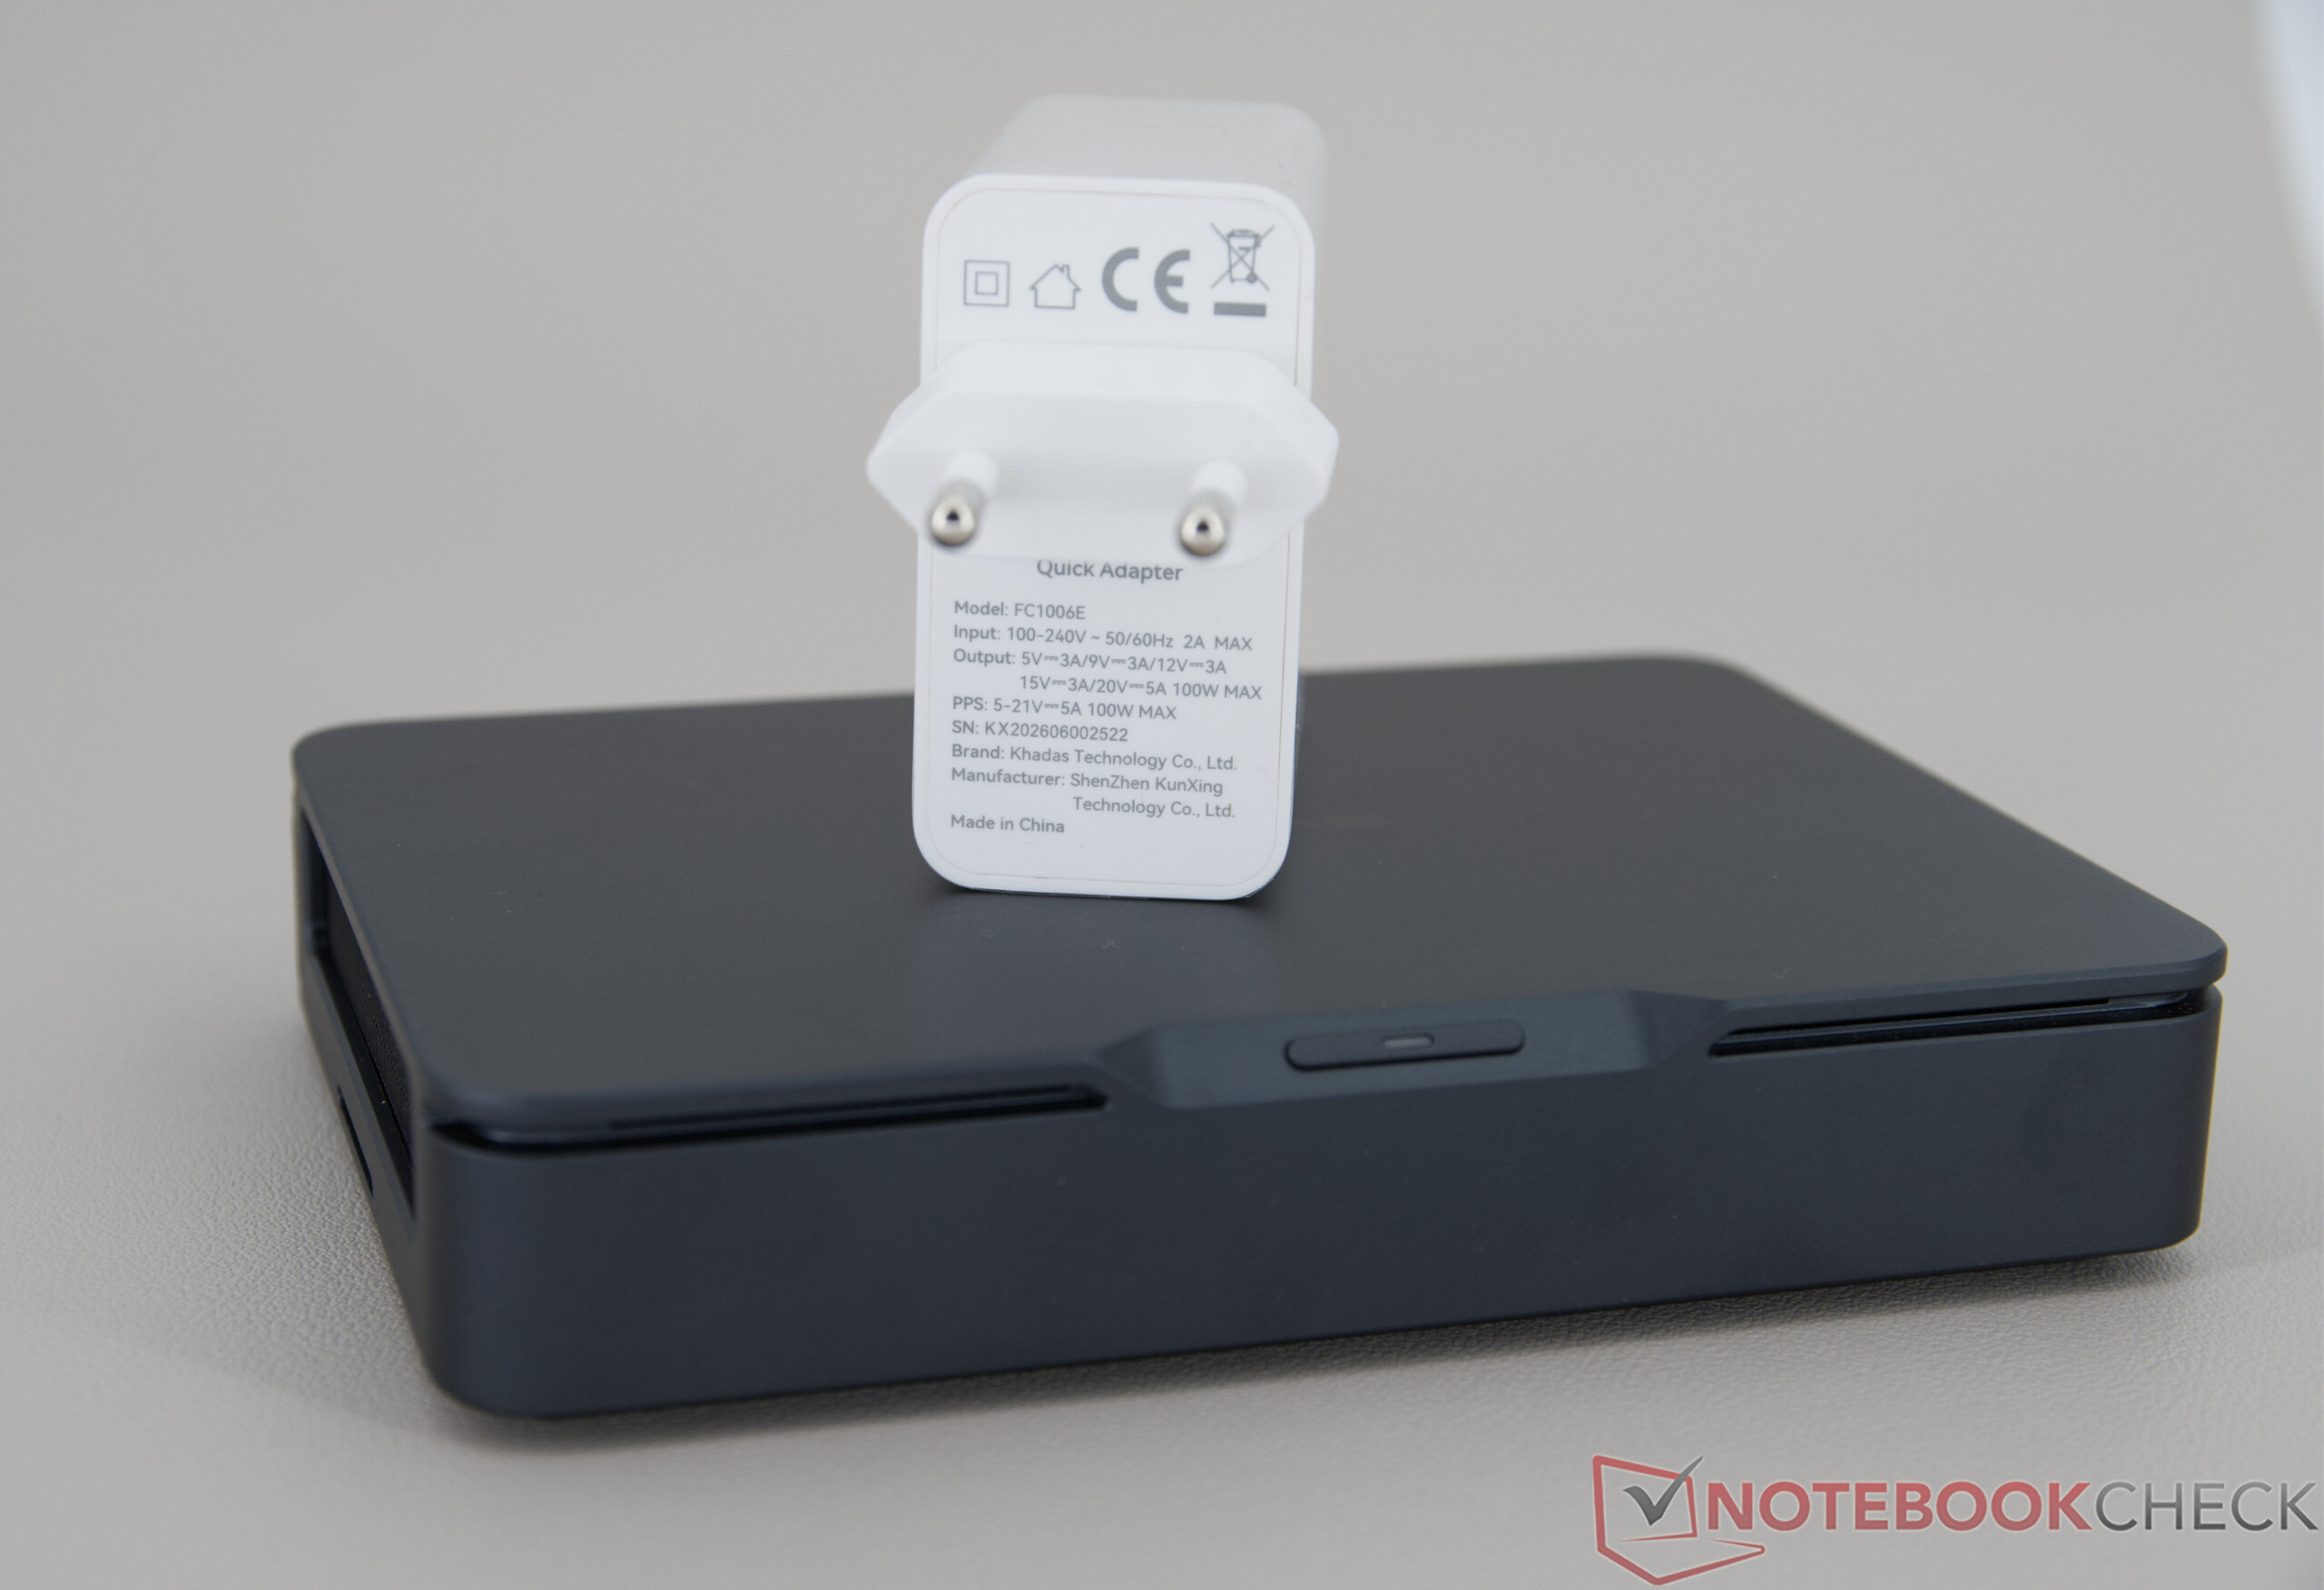
Zakres dostawy jest celowo minimalistyczny: opakowanie zawiera tylko sam mini PC i 100-watowy zasilacz, w tym kabel USB-C. Opcjonalne akcesoria, takie jak Mind Dock, Mind Leather Case lub Mind Graphics 2 Dock, należy zakupić osobno. Dzięki Mind xPlay, mini PC można rozszerzyć do rodzaju zamiennika laptopa, co oznacza, że producent obejmuje prawie wszystkie możliwe scenariusze zastosowań.
Konserwacja
Opcje konserwacji urządzenia są ograniczone. W codziennym użytkowaniu ograniczają się one zasadniczo do czyszczenia wentylatora. Podczas gdy pamięć masową można wymienić, zarówno pamięć RAM, jak i moduł WLAN są na stałe zintegrowane z płytą główną i dlatego nie można ich wymienić. Istnieje również możliwość zainstalowania drugiego nośnika danych M.2-2230 poprzez małą pokrywę na spodzie.
Zrównoważony rozwój
Kompaktowa konstrukcja mini PC pozostawia niewiele miejsca na naprawy lub modernizacje. Poza pamięcią masową, większość komponentów jest zintegrowana na stałe i dlatego nie można ich łatwo wymienić. Z drugiej strony, kompaktowe i zajmujące niewiele miejsca opakowanie, które ułatwia transport, jest pozytywną cechą. Producent nie podaje żadnych informacji na temat materiałów pochodzących z recyklingu lub aspektów zrównoważonego rozwoju. Według producenta okres gwarancji wynosi 24 miesiące.
Wydajność
Warunki testu
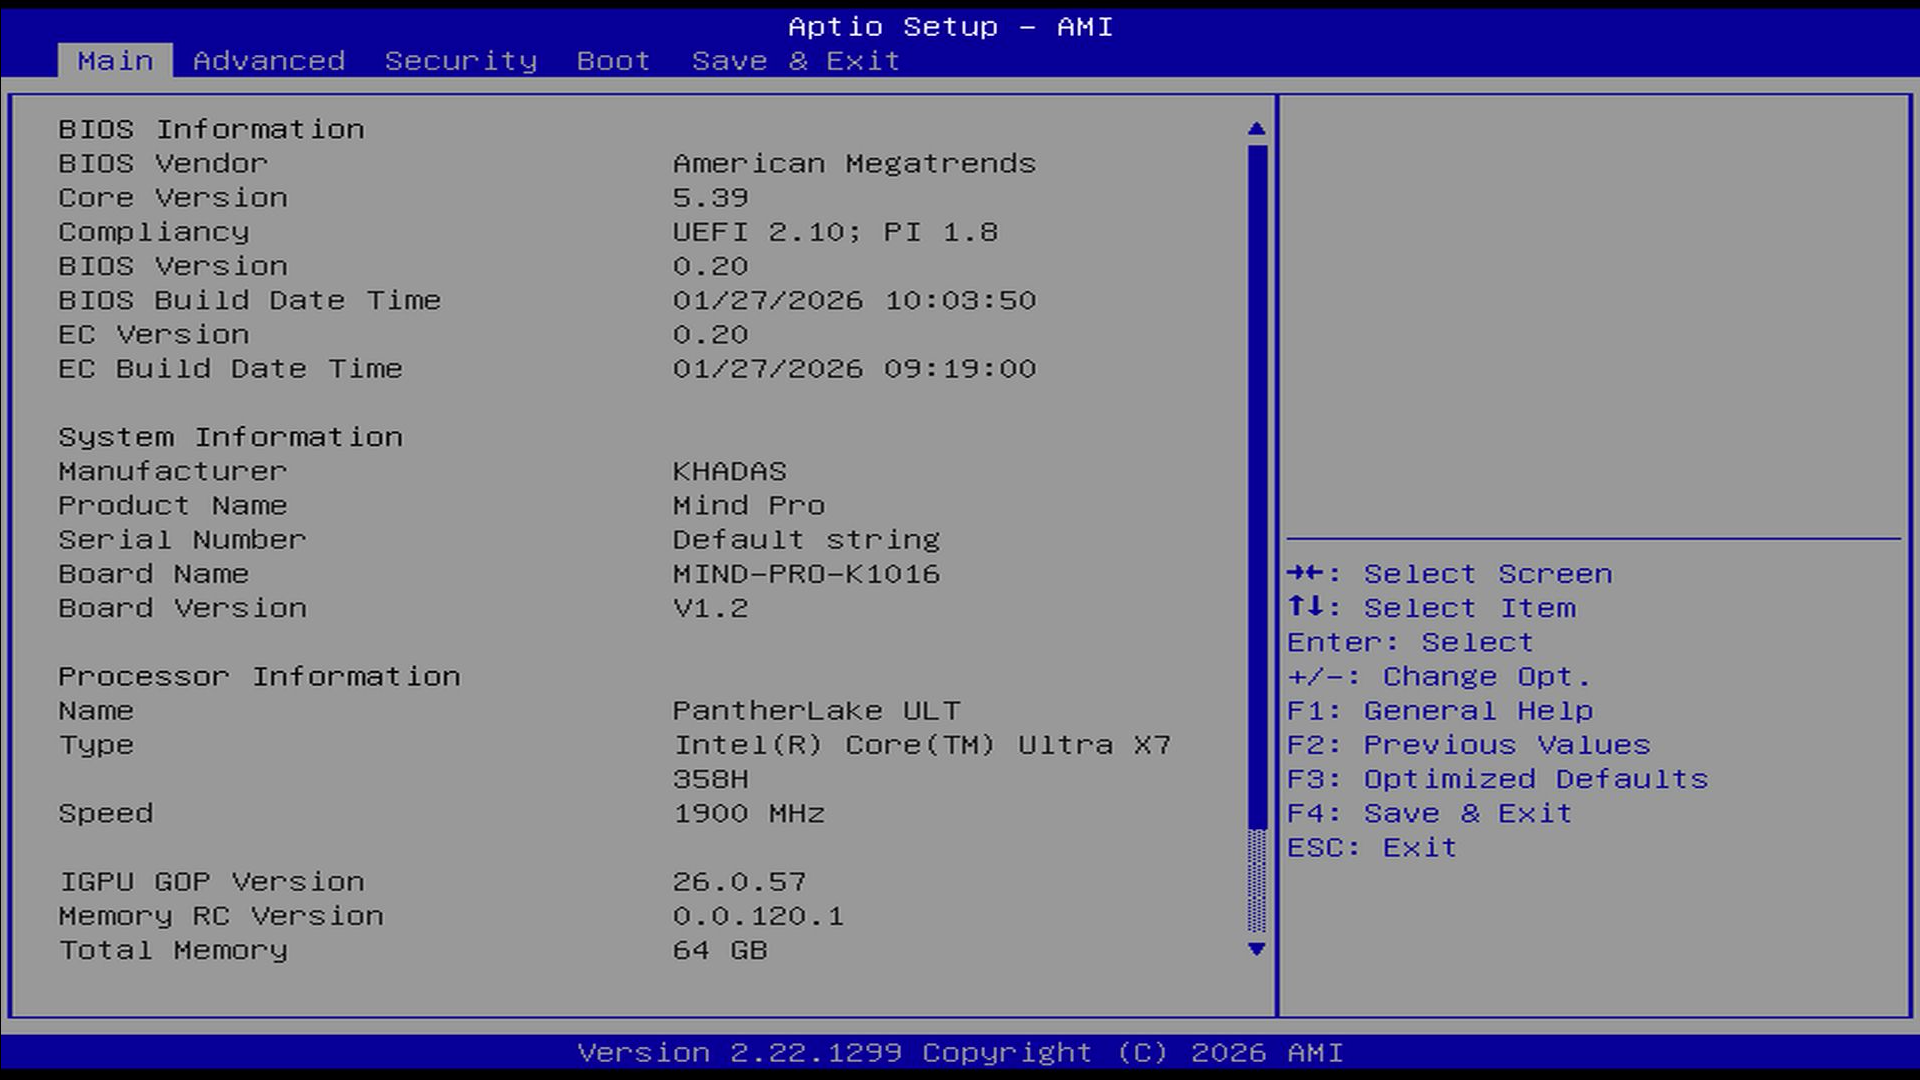
Wszystkie pomiary wydajności Khadas Mind Pro zostały przeprowadzone w fabrycznie ustawionym trybie zrównoważonym. Tryb oszczędzania energii i tryb wydajności są również dostępne za pośrednictwem wewnętrznego narzędzia, które można przełączać podczas pracy.
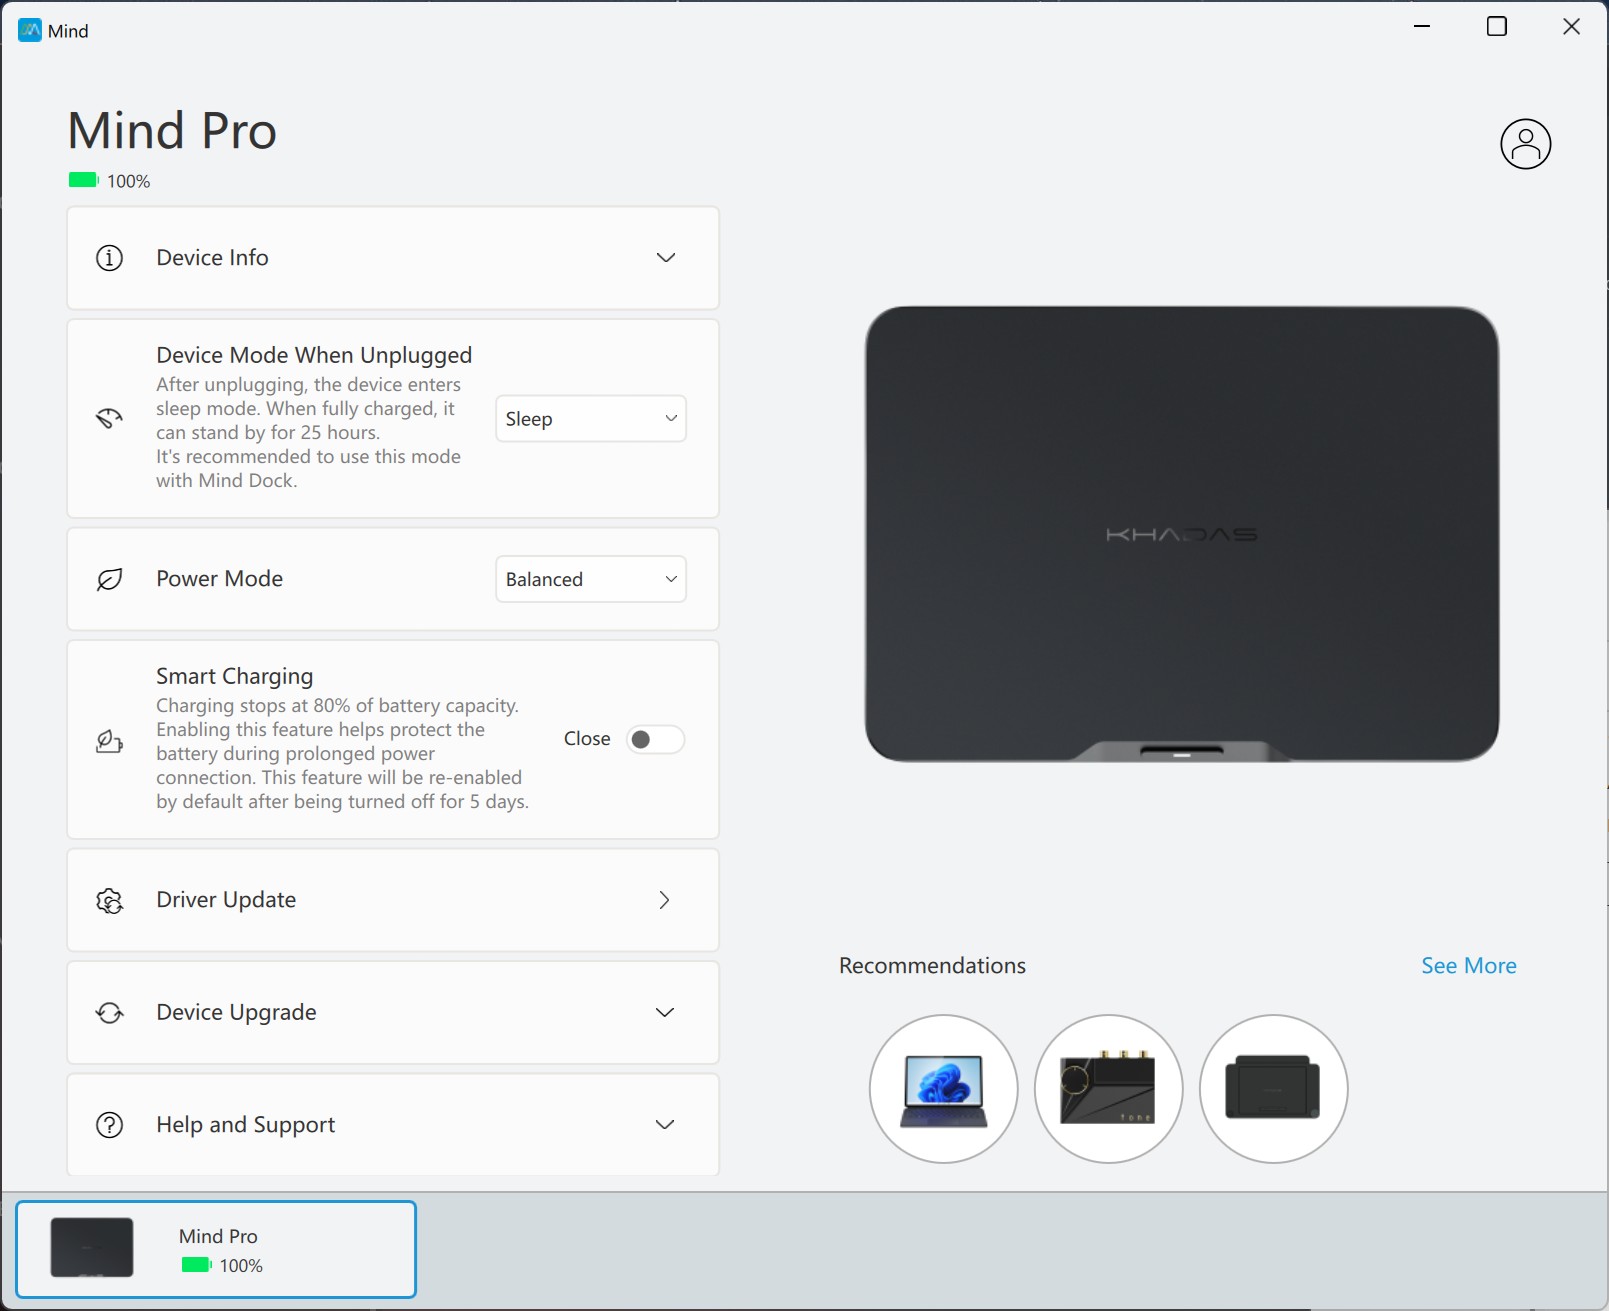
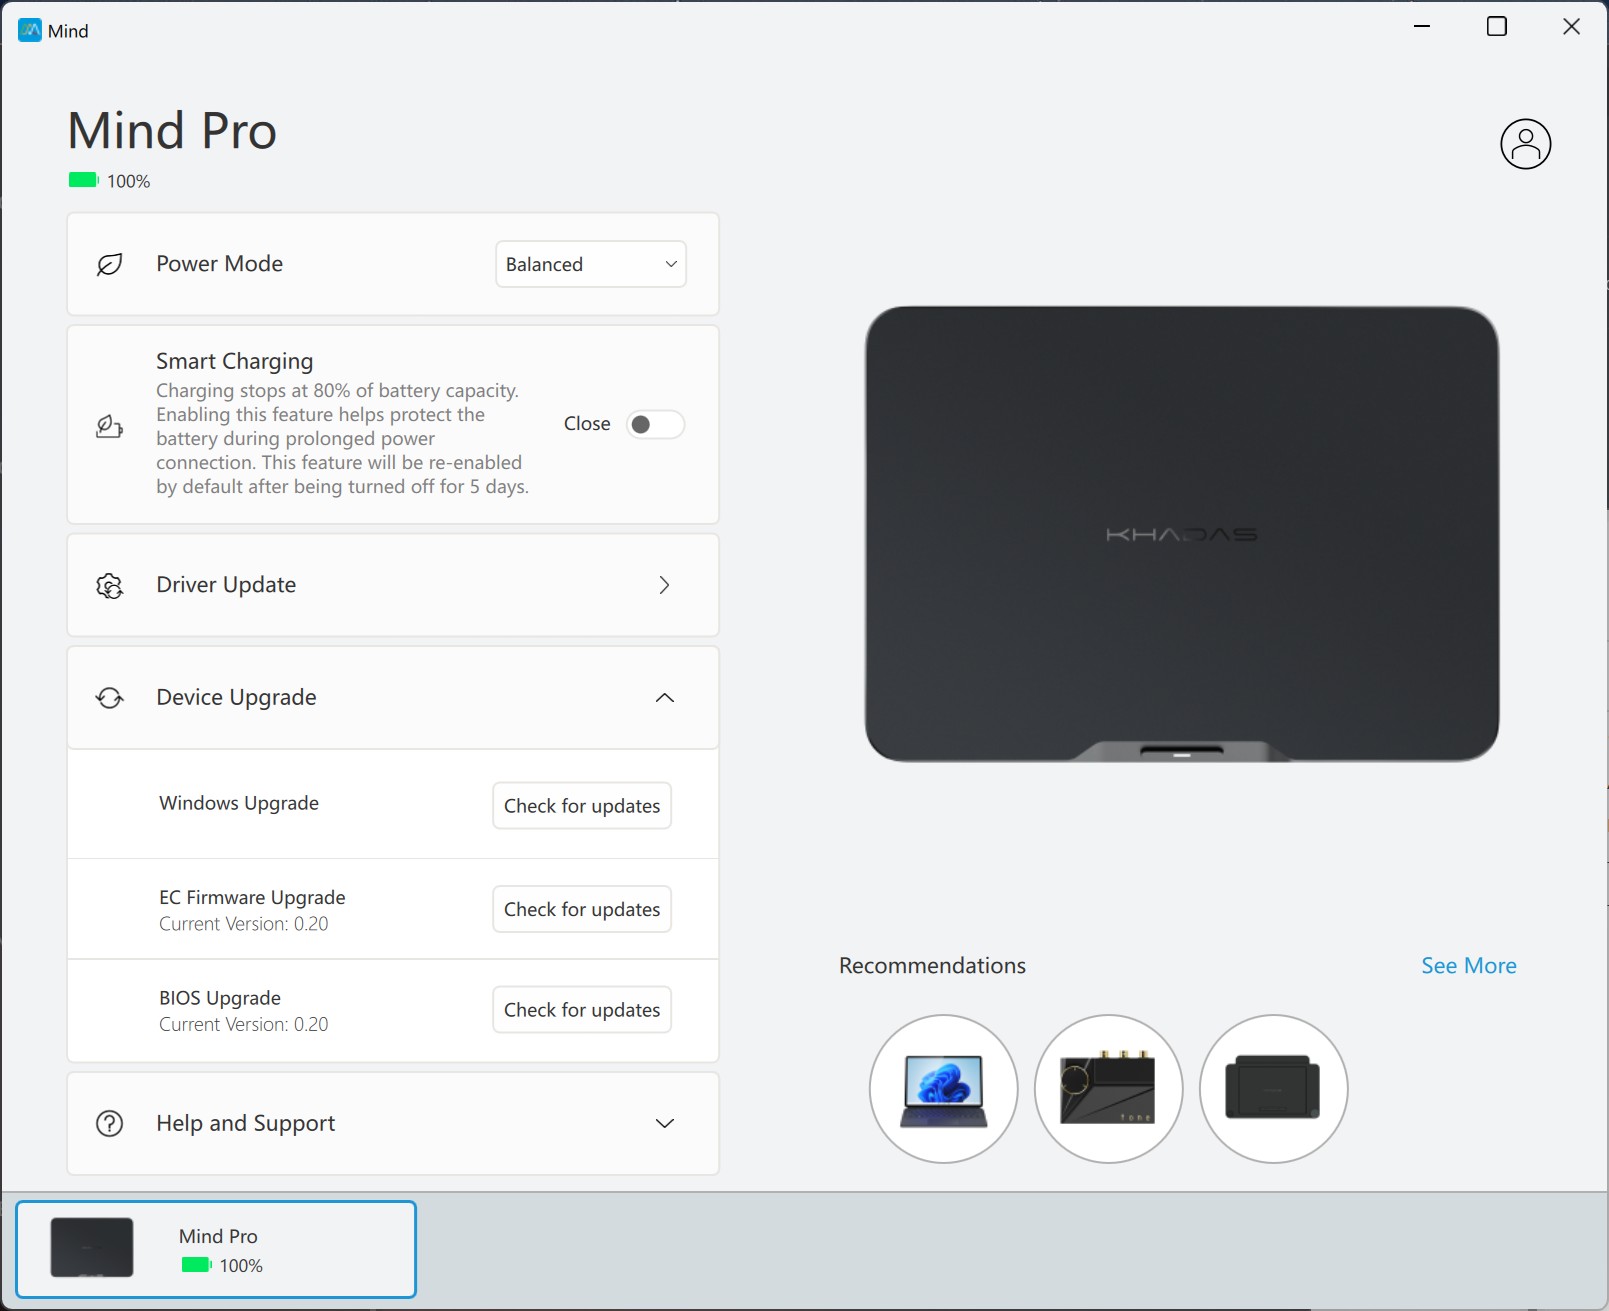
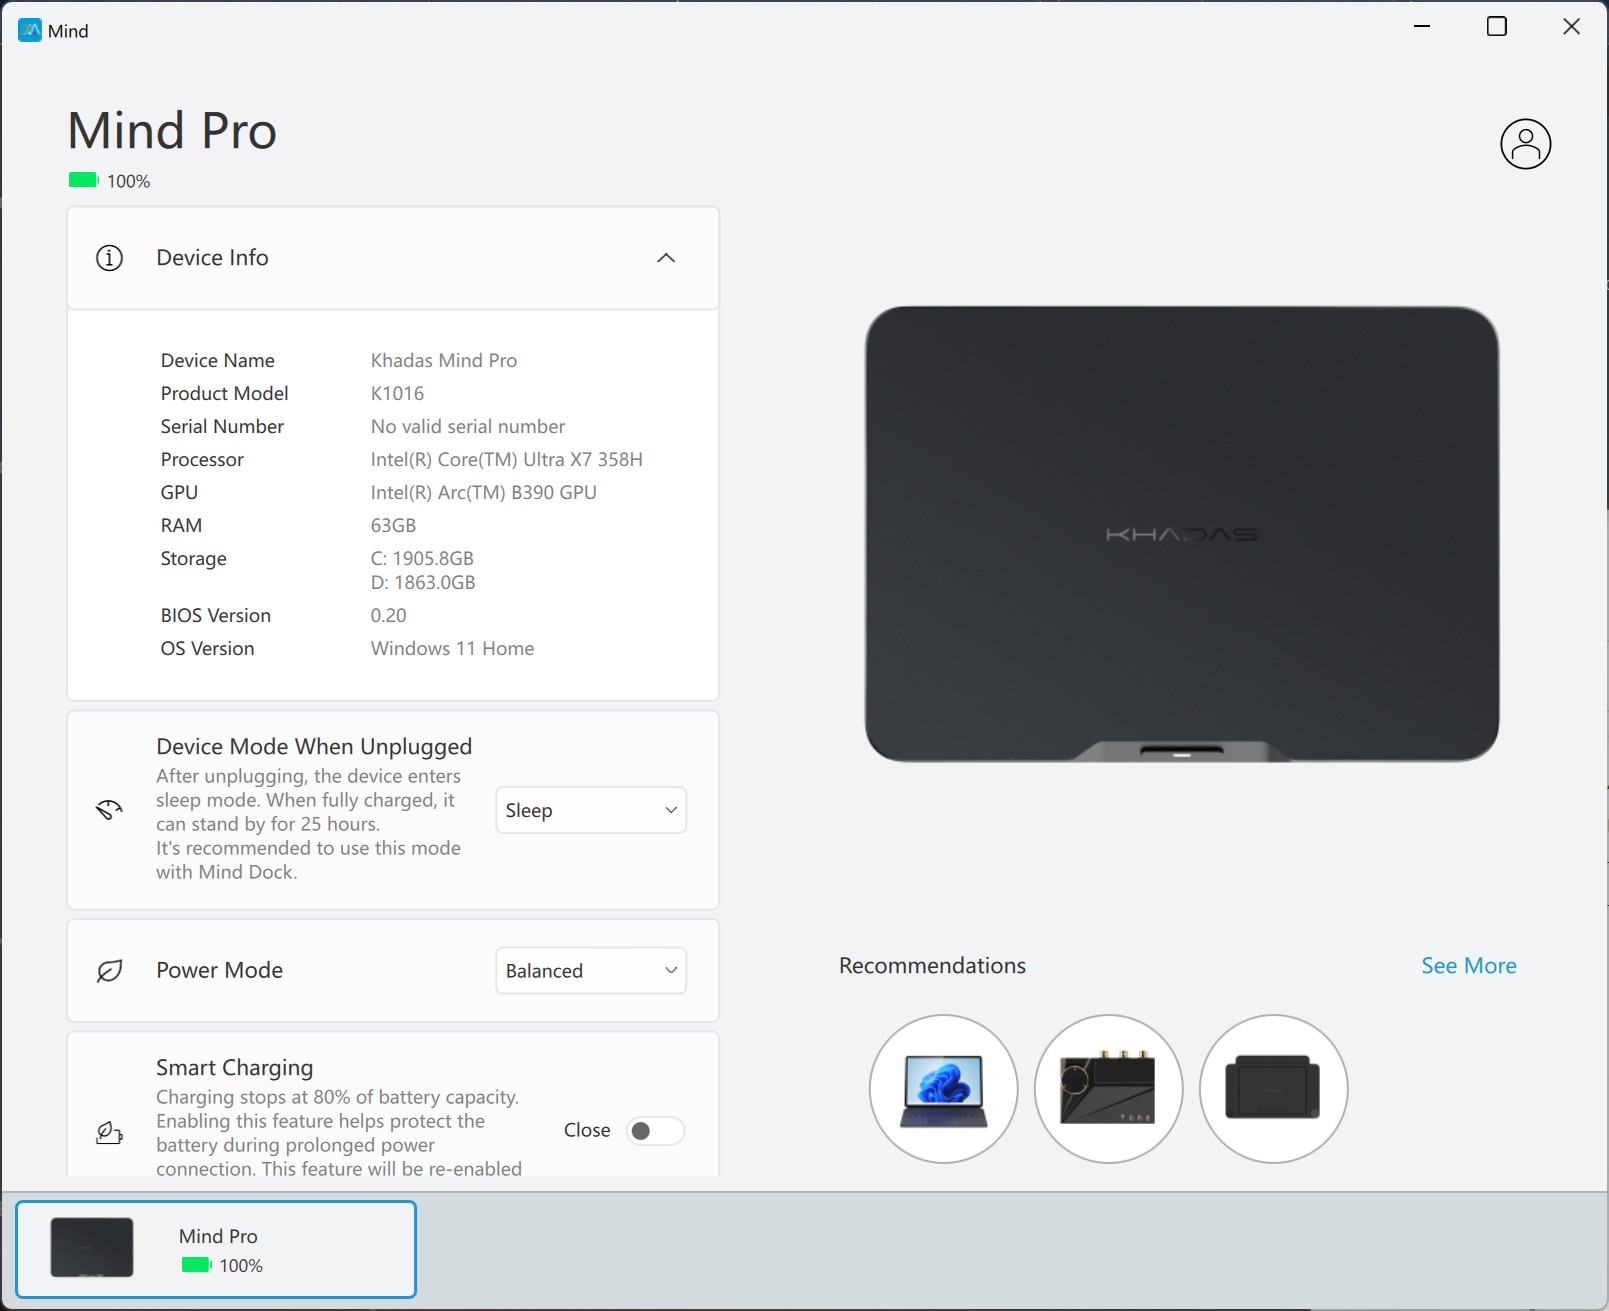
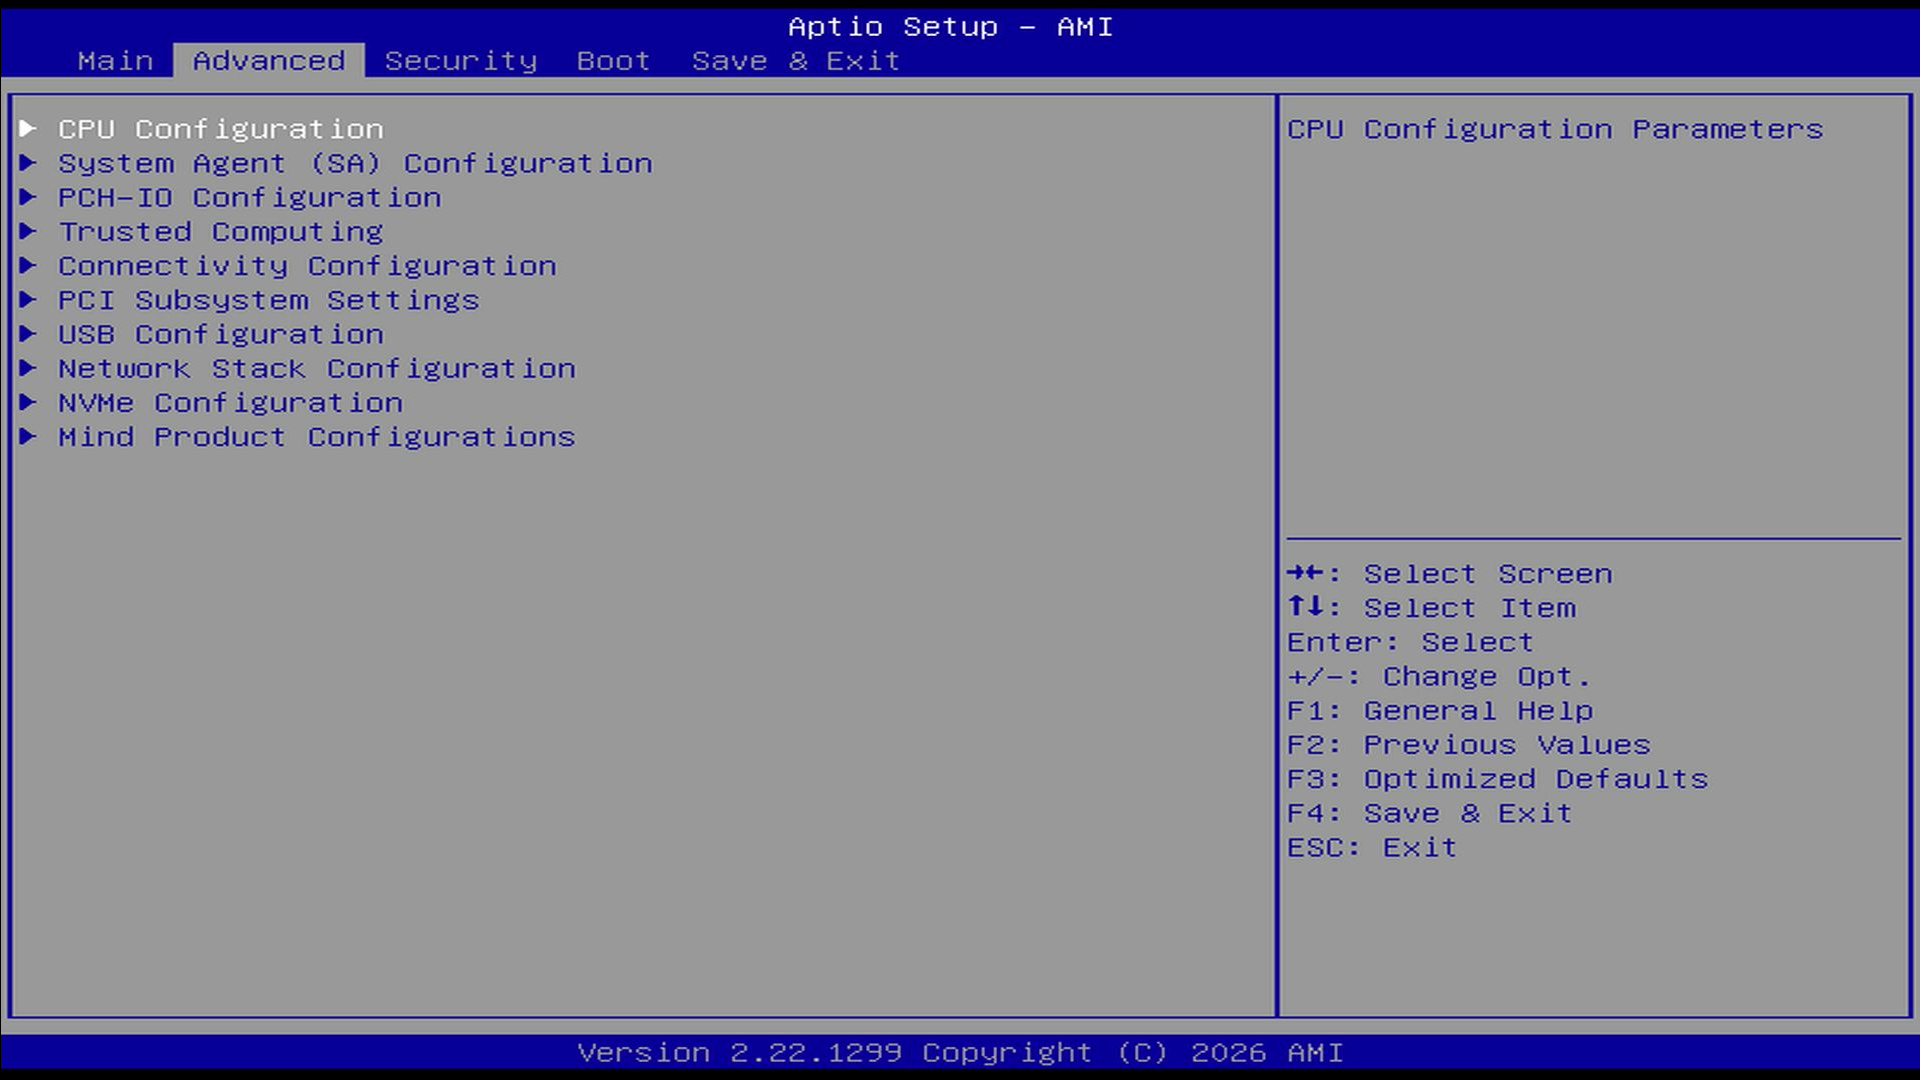
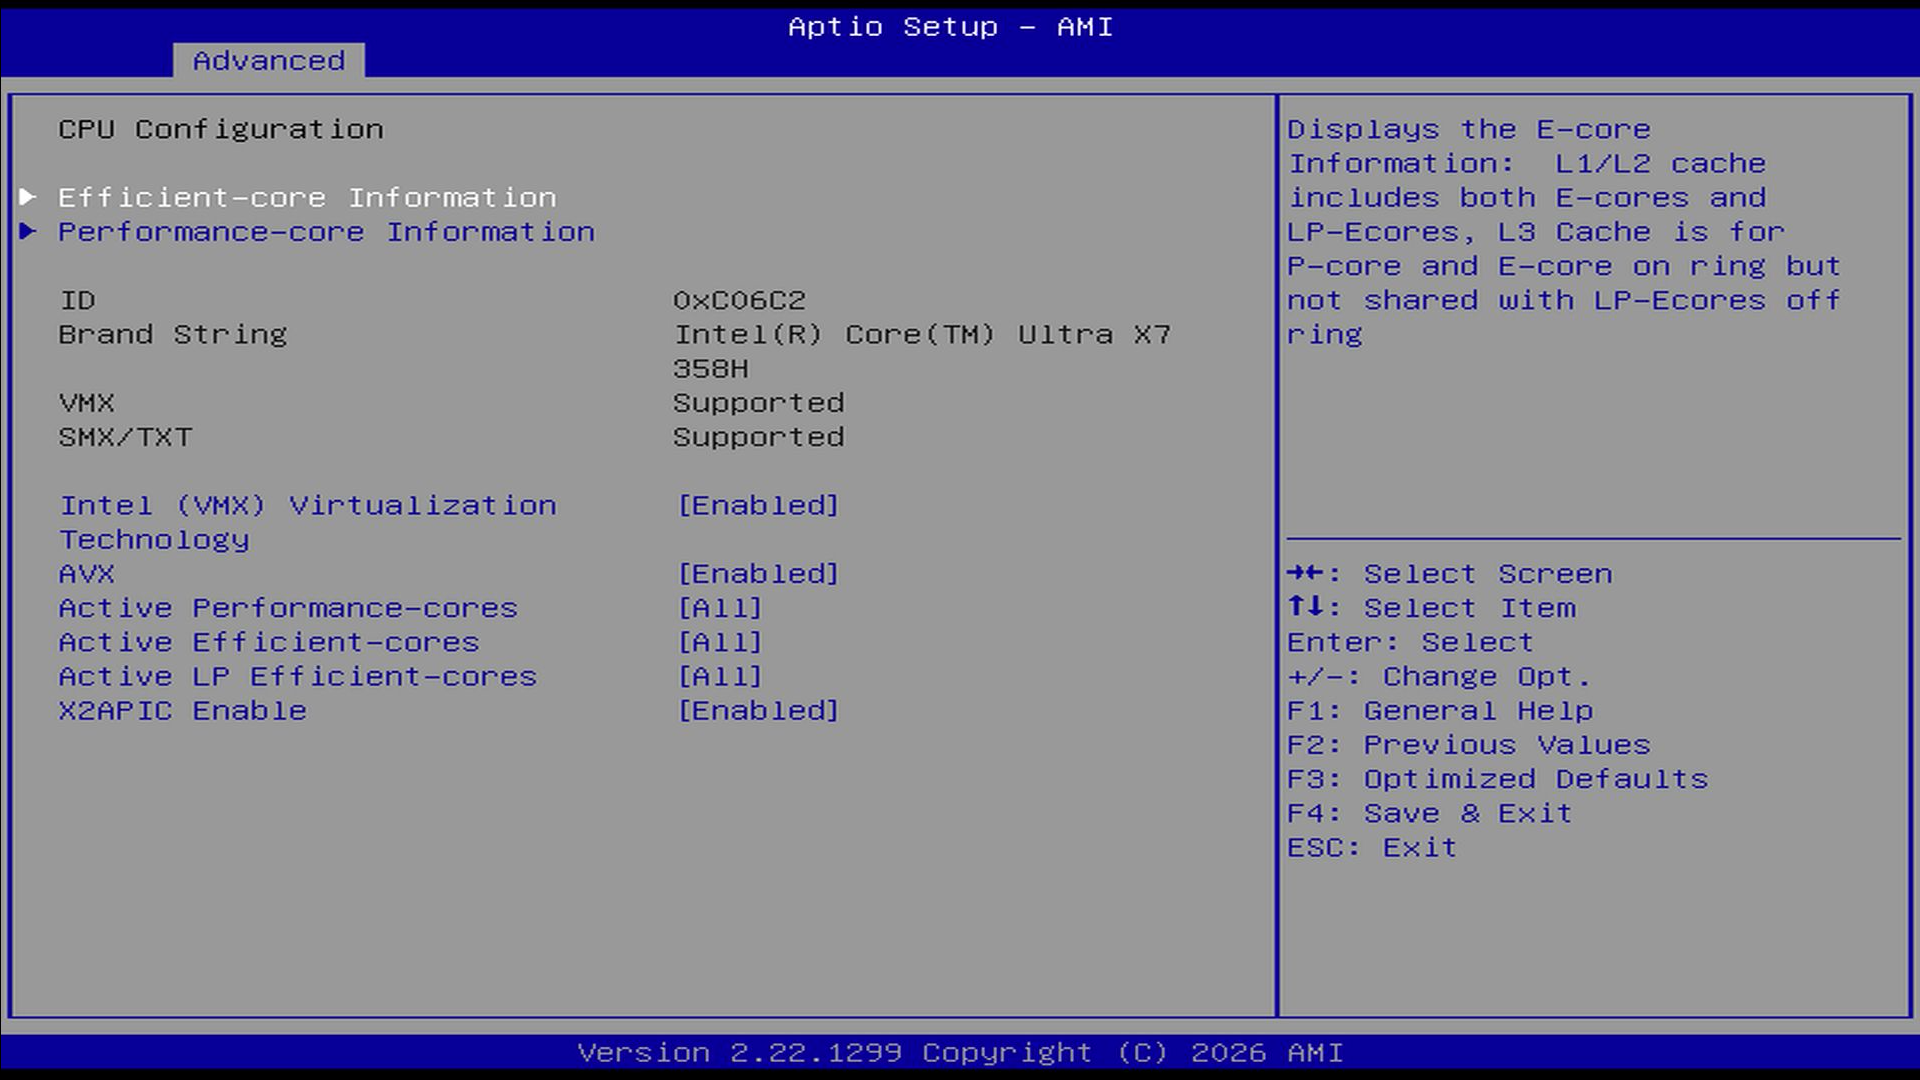
BIOS - Ustawienia
Procesor
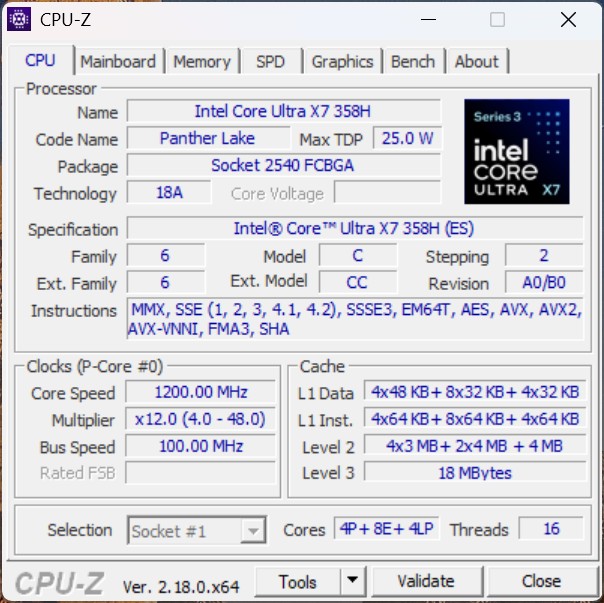
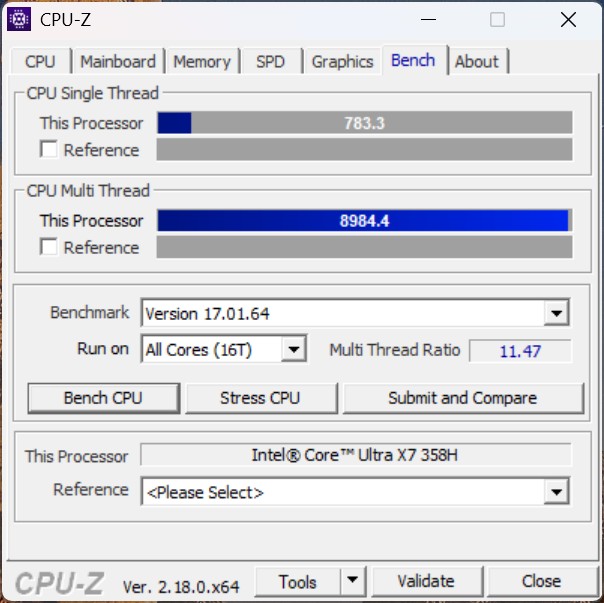
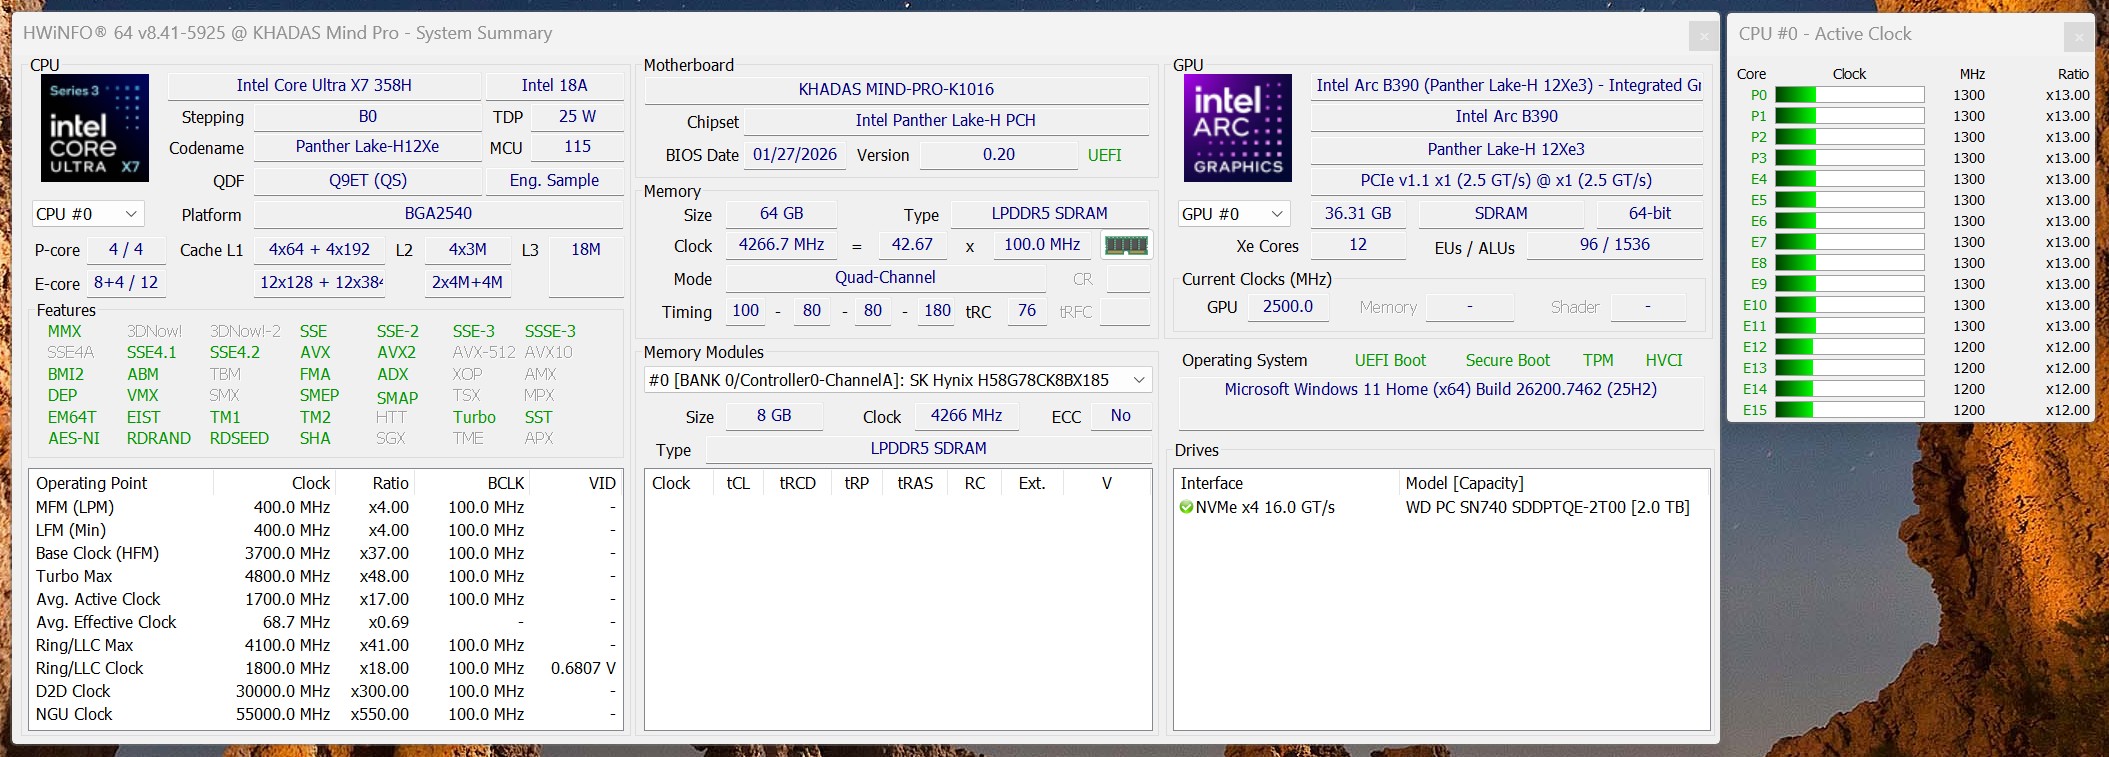
Intel Core Ultra X7 358H zastosowany w Khadas Mind Pro to jeden z najnowocześniejszych procesorów mobilnych, jakie Intel posiada obecnie w swoim portfolio. Dzięki nowoczesnej architekturze hybrydowej, procesor łączy w sobie kilka rdzeni o wysokiej wydajności i efektywności, umożliwiając zarówno wysoką wydajność szczytową, jak i wydajną codzienną pracę.
W syntetycznych testach porównawczych procesor pokazuje, że jest w stanie dotrzymać kroku procesorom AMD Ryzen AI 9. Aplikacje takie jak renderowanie lub edycja wideo korzystają z dużej liczby rdzeni i zwiększonych częstotliwości taktowania. W porównaniu do starszych modeli z serii Mind, wzrost wydajności jest zatem szczególnie znaczący w przypadku wysoce zrównoleglonych obciążeń roboczych.
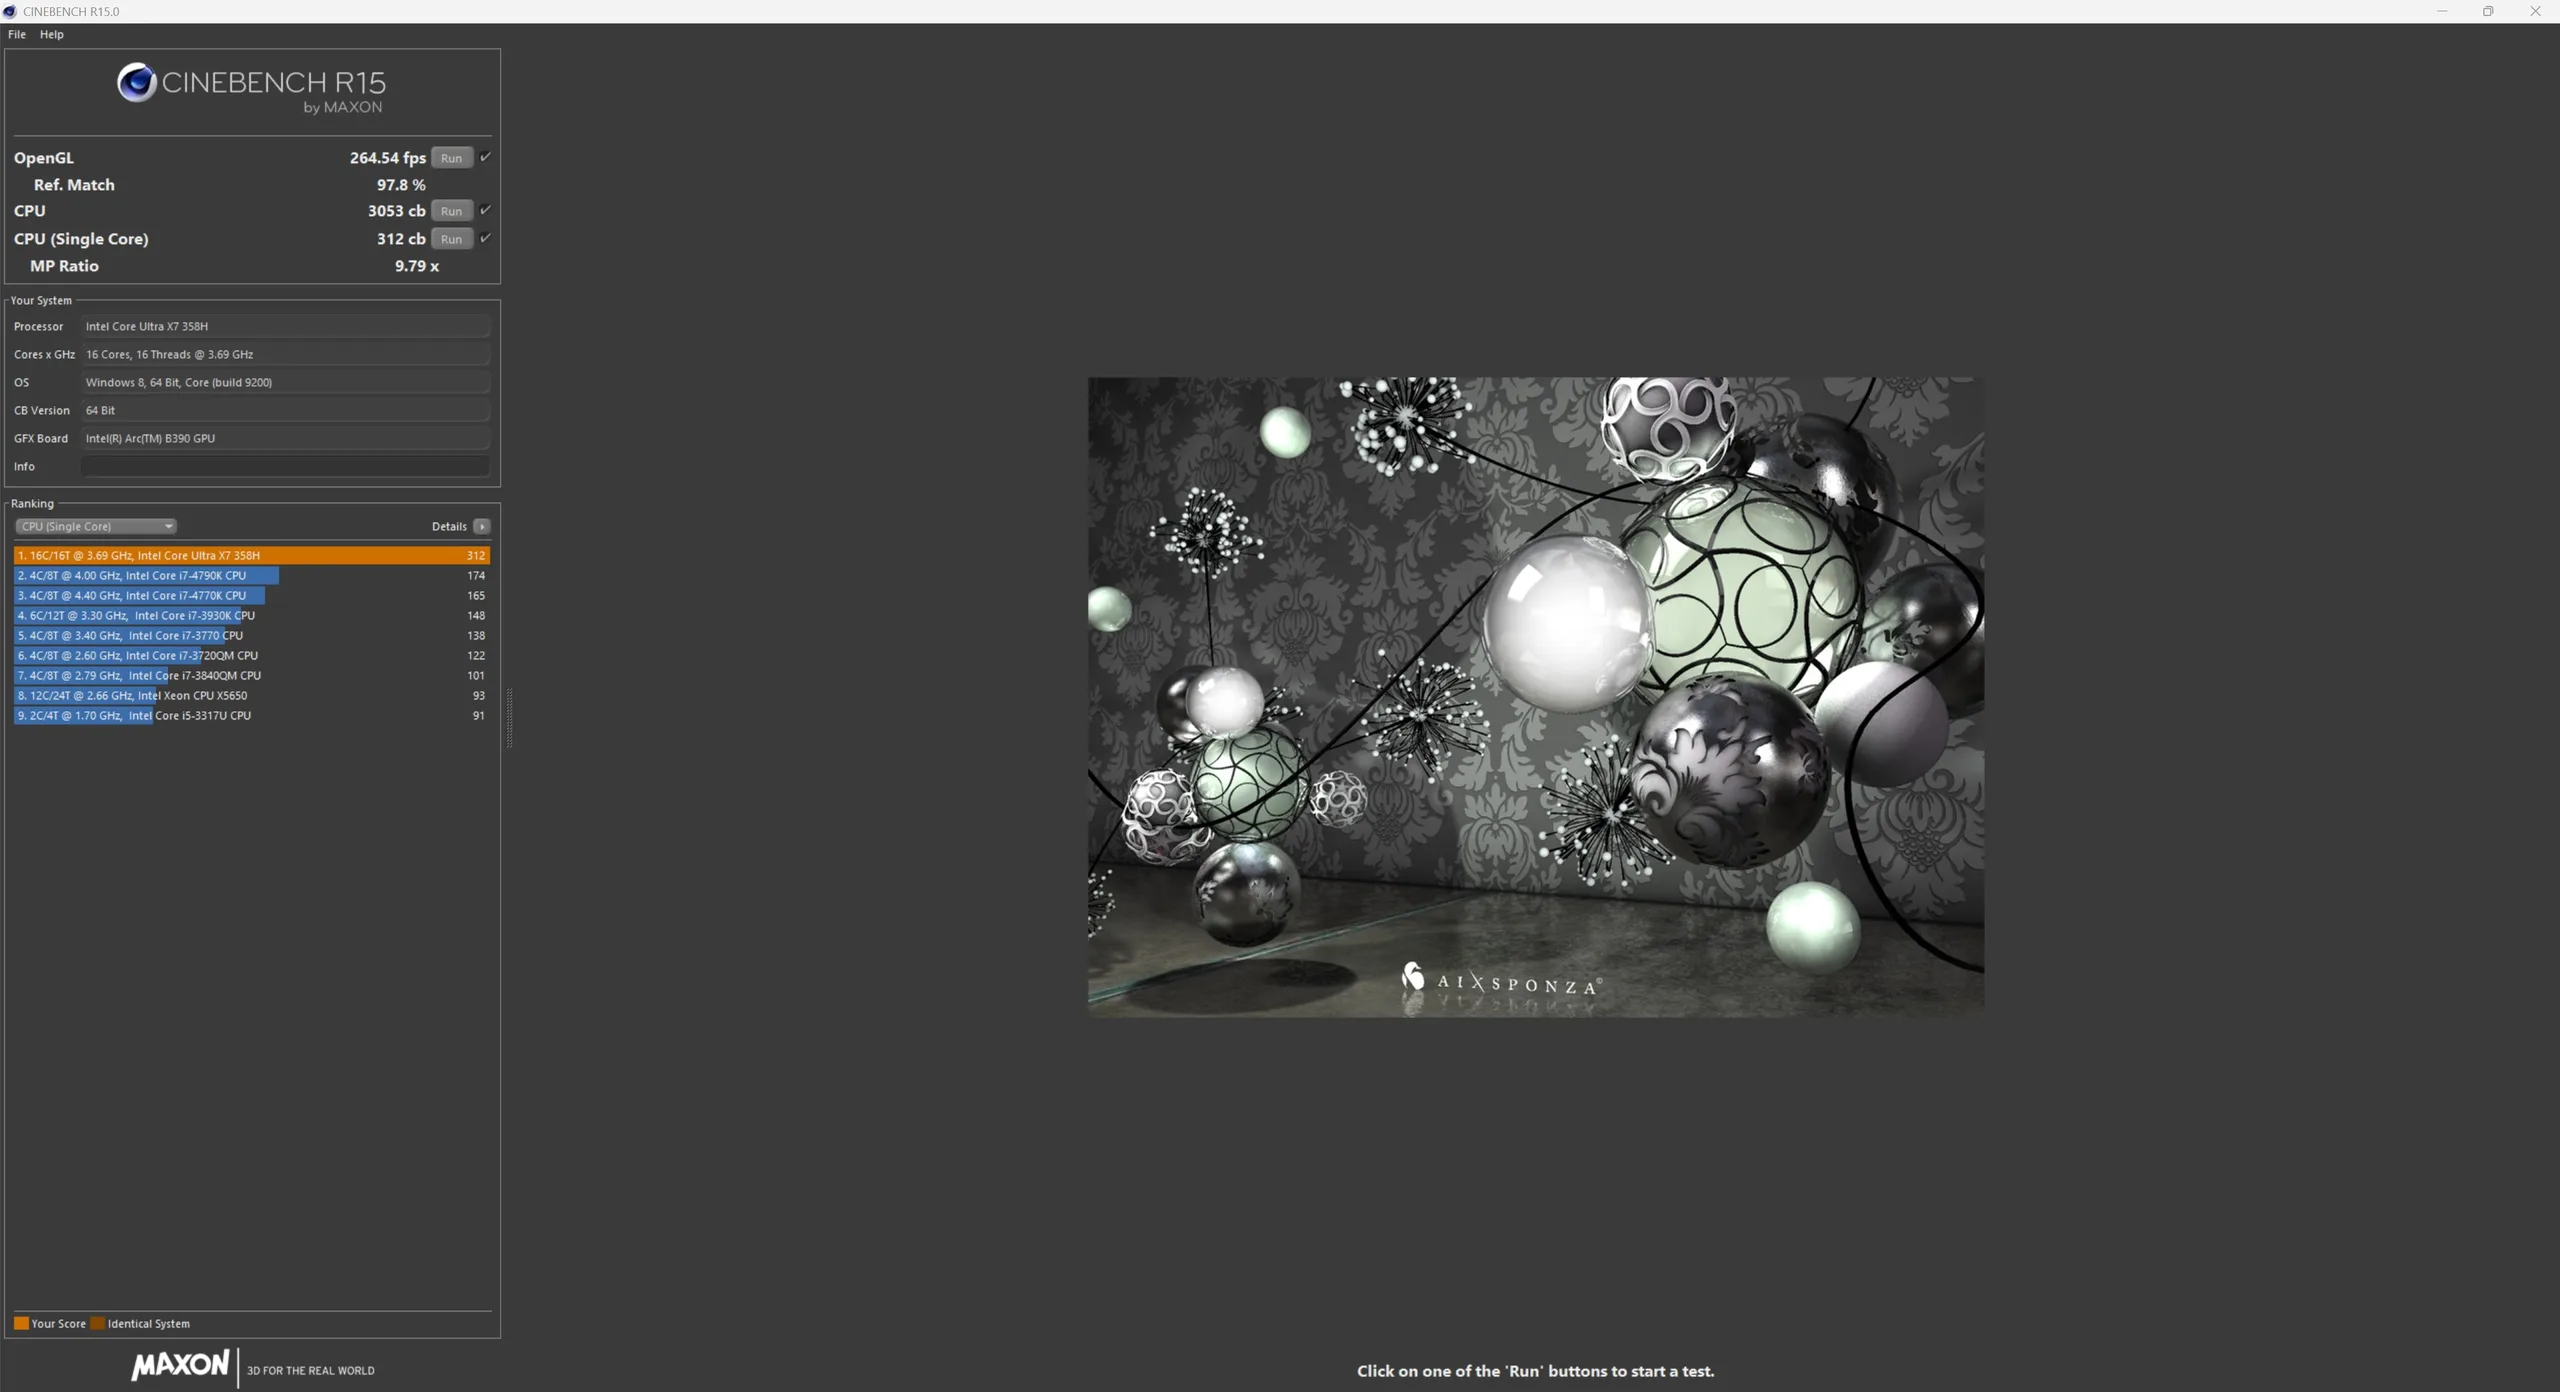
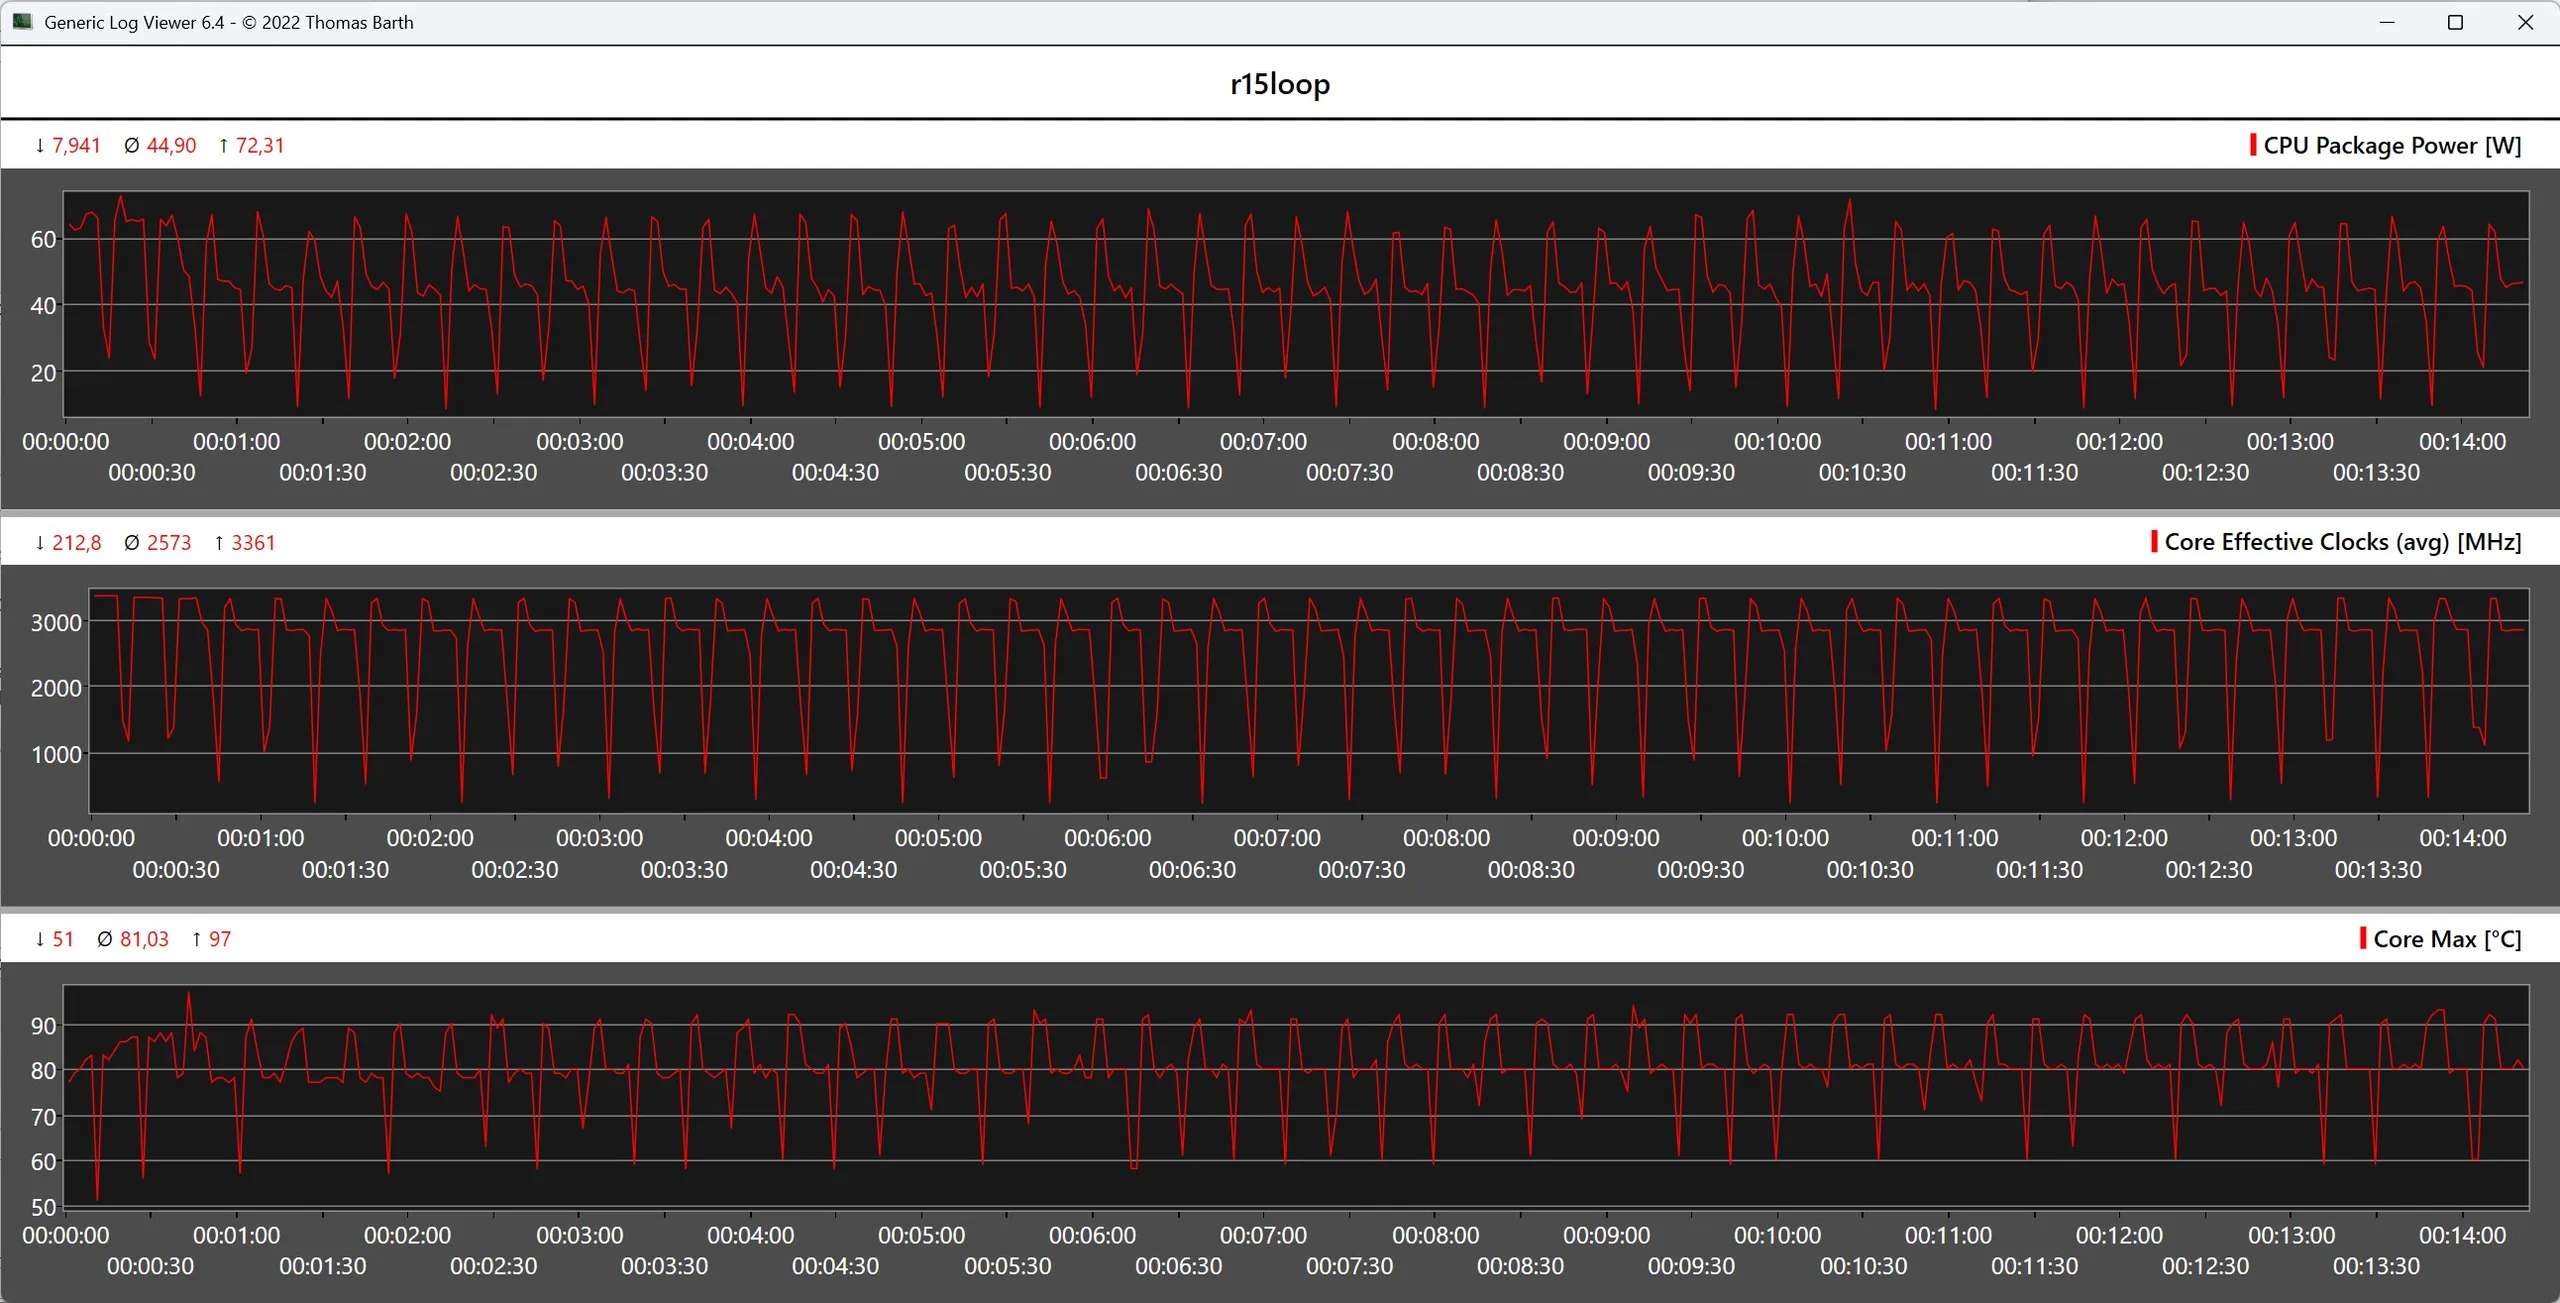
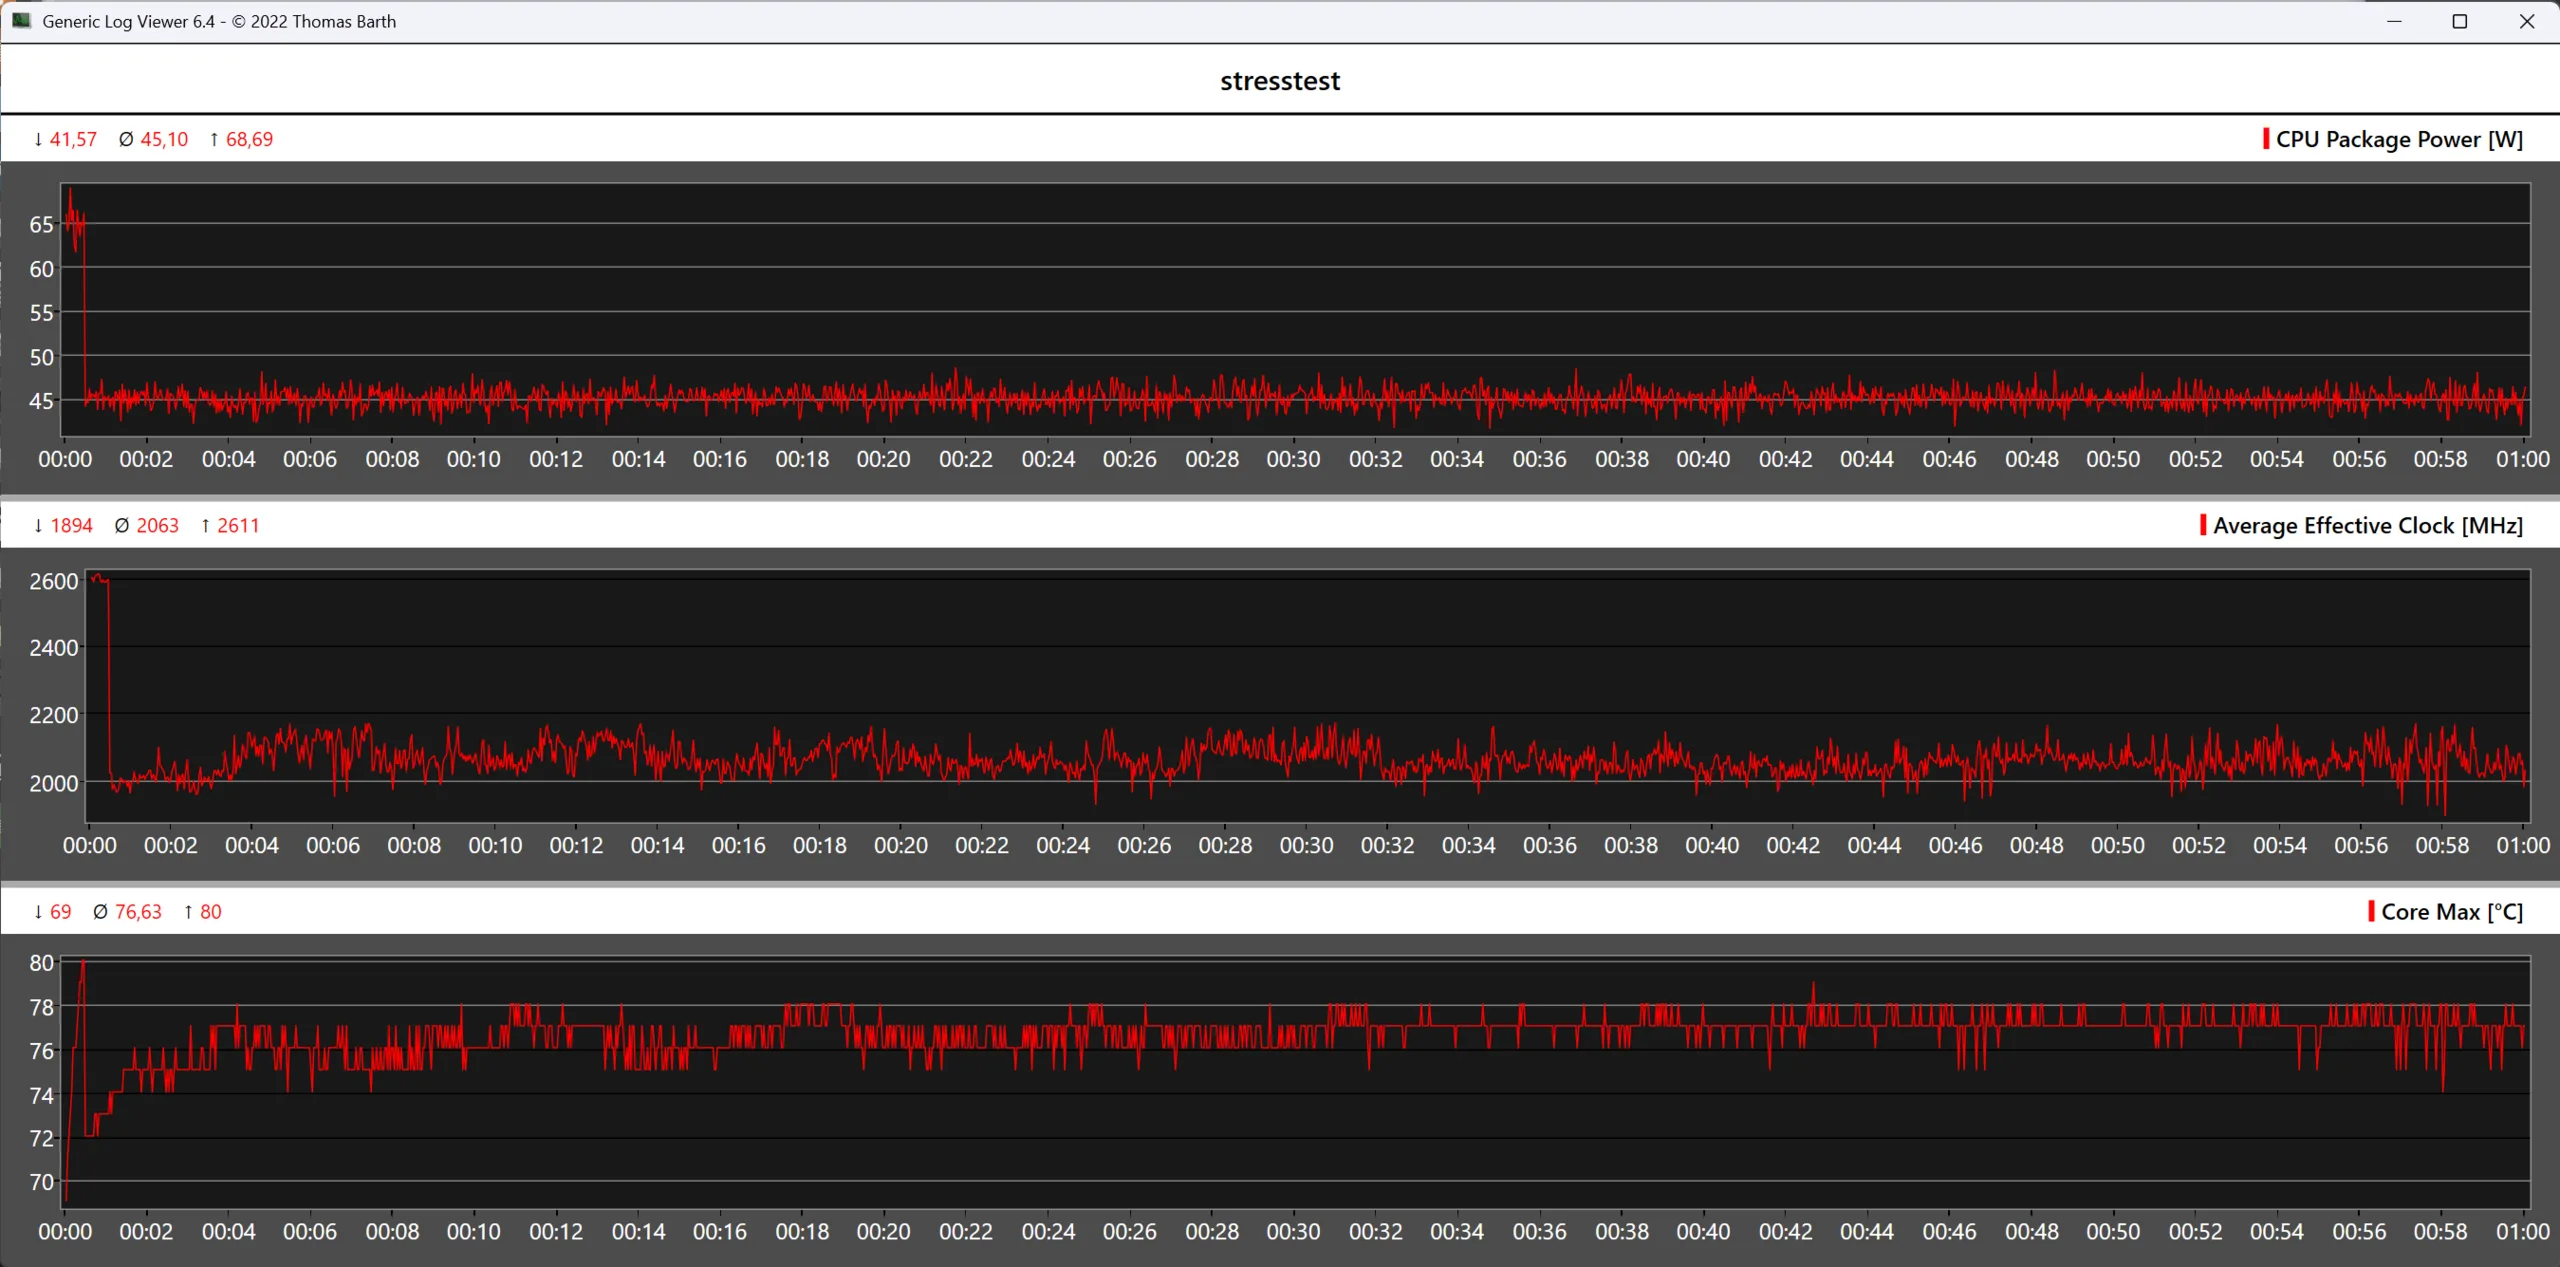
Wydajność Intel Core Ultra X7 358H nieznacznie spada przy długotrwałym obciążeniu, co można łatwo zaobserwować w wielopętli Cinebench R15. Średnio procesor pracuje przy poborze mocy około 45 watów, podczas gdy temperatury mogą wzrosnąć do 97 C w szczycie.
| Performance rating - Percent | |
| GMK EVO-T1 | |
| Khadas Mind Pro | |
| Geekom A9 Max, AI 9 HX 370 | |
| Minisforum AI X1 Pro, HX 470 | |
| Khadas Mind 2s | |
| Khadas Mind 2 | |
| Khadas Mind | |
| Cinebench R10 | |
| Rendering Single CPUs 64Bit | |
| Khadas Mind 2s | |
| Khadas Mind Pro | |
| GMK EVO-T1 | |
| Minisforum AI X1 Pro, HX 470 | |
| Geekom A9 Max, AI 9 HX 370 | |
| Khadas Mind | |
| Khadas Mind 2 | |
| Rendering Multiple CPUs 64Bit | |
| GMK EVO-T1 | |
| Khadas Mind Pro | |
| Minisforum AI X1 Pro, HX 470 | |
| Geekom A9 Max, AI 9 HX 370 | |
| Khadas Mind 2s | |
| Khadas Mind 2 | |
| Khadas Mind | |
| WinRAR - Result | |
| Khadas Mind 2s | |
| Khadas Mind Pro | |
| GMK EVO-T1 | |
| Khadas Mind 2 | |
| Khadas Mind | |
| Minisforum AI X1 Pro, HX 470 | |
| Geekom A9 Max, AI 9 HX 370 | |
| Geekbench 4.4 | |
| 64 Bit Multi-Core Score | |
| Khadas Mind Pro | |
| GMK EVO-T1 | |
| Geekom A9 Max, AI 9 HX 370 | |
| Khadas Mind 2s | |
| Minisforum AI X1 Pro, HX 470 | |
| Khadas Mind 2 | |
| Khadas Mind | |
| 64 Bit Single-Core Score | |
| Khadas Mind Pro | |
| Khadas Mind 2s | |
| GMK EVO-T1 | |
| Khadas Mind | |
| Minisforum AI X1 Pro, HX 470 | |
| Geekom A9 Max, AI 9 HX 370 | |
| Khadas Mind 2 | |
| 3DMark 11 - 1280x720 Performance Physics | |
| GMK EVO-T1 | |
| Khadas Mind Pro | |
| Khadas Mind 2s | |
| Geekom A9 Max, AI 9 HX 370 | |
| Khadas Mind 2 | |
| Minisforum AI X1 Pro, HX 470 | |
| Khadas Mind | |
| HWBOT x265 Benchmark v2.2 - 4k Preset | |
| Geekom A9 Max, AI 9 HX 370 | |
| Minisforum AI X1 Pro, HX 470 | |
| GMK EVO-T1 | |
| Khadas Mind Pro | |
| Khadas Mind 2s | |
| Khadas Mind 2 | |
| Khadas Mind | |
| R Benchmark 2.5 - Overall mean | |
| Khadas Mind 2 | |
| Khadas Mind | |
| GMK EVO-T1 | |
| Khadas Mind Pro | |
| Khadas Mind Pro | |
| Khadas Mind 2s | |
| Geekom A9 Max, AI 9 HX 370 | |
| Minisforum AI X1 Pro, HX 470 | |
| LibreOffice - 20 Documents To PDF | |
| Khadas Mind 2 | |
| Minisforum AI X1 Pro, HX 470 | |
| Geekom A9 Max, AI 9 HX 370 | |
| GMK EVO-T1 | |
| Khadas Mind 2s | |
| Khadas Mind Pro | |
| Khadas Mind | |
| Super Pi mod 1.5 XS 1M - 1M | |
| Geekom A9 Max, AI 9 HX 370 | |
| Minisforum AI X1 Pro, HX 470 | |
| Khadas Mind 2 | |
| Khadas Mind 2s | |
| GMK EVO-T1 | |
| Khadas Mind Pro | |
| Khadas Mind | |
| Super Pi mod 1.5 XS 2M - 2M | |
| Geekom A9 Max, AI 9 HX 370 | |
| Khadas Mind 2 | |
| Minisforum AI X1 Pro, HX 470 | |
| Khadas Mind 2s | |
| GMK EVO-T1 | |
| Khadas Mind Pro | |
| Khadas Mind | |
| Affinity Photo 2 - Combined (Multi CPU) | |
| GMK EVO-T1 | |
| Khadas Mind Pro | |
| Minisforum AI X1 Pro, HX 470 | |
| Geekom A9 Max, AI 9 HX 370 | |
| Khadas Mind 2s | |
| Khadas Mind 2 | |
| Khadas Mind | |
* ... im mniej tym lepiej
AIDA64: FP32 Ray-Trace | FPU Julia | CPU SHA3 | CPU Queen | FPU SinJulia | FPU Mandel | CPU AES | CPU ZLib | FP64 Ray-Trace | CPU PhotoWorxx | CPU CheckMate
| Performance rating | |
| Minisforum AI X1 Pro, HX 470 | |
| Geekom A9 Max, AI 9 HX 370 | |
| Średnia w klasie Mini PC | |
| Khadas Mind Pro -1! | |
| GMK EVO-T1 | |
| Khadas Mind 2s -1! | |
| Khadas Mind 2 -1! | |
| Khadas Mind -1! | |
| AIDA64 / FP32 Ray-Trace | |
| Minisforum AI X1 Pro, HX 470 (v6.92.6600) | |
| Minisforum AI X1 Pro, HX 470 (v8.20.8100) | |
| Geekom A9 Max, AI 9 HX 370 (v6.92.6600) | |
| Geekom A9 Max, AI 9 HX 370 (v8.20.8100) | |
| Średnia w klasie Mini PC (974 - 82725, n=97, ostatnie 2 lata) | |
| GMK EVO-T1 (v6.92.6600) | |
| GMK EVO-T1 (v8.20.8100) | |
| Khadas Mind Pro (v8.20.8100) | |
| Khadas Mind 2s (v6.92.6600) | |
| Khadas Mind 2 (v6.92.6600) | |
| Khadas Mind (v6.85.6300) | |
| AIDA64 / FPU Julia | |
| Minisforum AI X1 Pro, HX 470 (v8.20.8100) | |
| Minisforum AI X1 Pro, HX 470 (v6.92.6600) | |
| Geekom A9 Max, AI 9 HX 370 (v8.20.8100) | |
| Geekom A9 Max, AI 9 HX 370 (v6.92.6600) | |
| GMK EVO-T1 (v6.92.6600) | |
| GMK EVO-T1 (v8.20.8100) | |
| Średnia w klasie Mini PC (6115 - 363782, n=97, ostatnie 2 lata) | |
| Khadas Mind Pro (v8.20.8100) | |
| Khadas Mind 2s (v6.92.6600) | |
| Khadas Mind 2 (v6.92.6600) | |
| Khadas Mind (v6.85.6300) | |
| AIDA64 / CPU SHA3 | |
| Minisforum AI X1 Pro, HX 470 (v6.92.6600) | |
| Minisforum AI X1 Pro, HX 470 (v8.20.8100) | |
| Geekom A9 Max, AI 9 HX 370 (v6.92.6600) | |
| Geekom A9 Max, AI 9 HX 370 (v8.20.8100) | |
| GMK EVO-T1 (v6.92.6600) | |
| GMK EVO-T1 (v8.20.8100) | |
| Khadas Mind Pro (v8.20.8100) | |
| Średnia w klasie Mini PC (385 - 9475, n=97, ostatnie 2 lata) | |
| Khadas Mind 2s (v6.92.6600) | |
| Khadas Mind 2 (v6.92.6600) | |
| Khadas Mind (v6.85.6300) | |
| AIDA64 / CPU Queen | |
| Geekom A9 Max, AI 9 HX 370 (v6.92.6600) | |
| Średnia w klasie Mini PC (20501 - 154404, n=80, ostatnie 2 lata) | |
| Minisforum AI X1 Pro, HX 470 (v6.92.6600) | |
| Khadas Mind 2 (v6.92.6600) | |
| Khadas Mind (v6.85.6300) | |
| Khadas Mind 2s (v6.92.6600) | |
| GMK EVO-T1 (v6.92.6600) | |
| AIDA64 / FPU SinJulia | |
| Minisforum AI X1 Pro, HX 470 (v8.20.8100) | |
| Minisforum AI X1 Pro, HX 470 (v6.92.6600) | |
| Geekom A9 Max, AI 9 HX 370 (v8.20.8100) | |
| Geekom A9 Max, AI 9 HX 370 (v6.92.6600) | |
| Średnia w klasie Mini PC (1116 - 31931, n=97, ostatnie 2 lata) | |
| Khadas Mind 2 (v6.92.6600) | |
| GMK EVO-T1 (v6.92.6600) | |
| GMK EVO-T1 (v8.20.8100) | |
| Khadas Mind 2s (v6.92.6600) | |
| Khadas Mind Pro (v8.20.8100) | |
| Khadas Mind (v6.85.6300) | |
| AIDA64 / FPU Mandel | |
| Minisforum AI X1 Pro, HX 470 (v6.92.6600) | |
| Minisforum AI X1 Pro, HX 470 (v8.20.8100) | |
| Geekom A9 Max, AI 9 HX 370 (v8.20.8100) | |
| Geekom A9 Max, AI 9 HX 370 (v6.92.6600) | |
| GMK EVO-T1 (v6.92.6600) | |
| GMK EVO-T1 (v8.20.8100) | |
| Średnia w klasie Mini PC (3322 - 192994, n=97, ostatnie 2 lata) | |
| Khadas Mind Pro (v8.20.8100) | |
| Khadas Mind 2s (v6.92.6600) | |
| Khadas Mind 2 (v6.92.6600) | |
| Khadas Mind (v6.85.6300) | |
| AIDA64 / CPU AES | |
| Khadas Mind 2 (v6.92.6600) | |
| Średnia w klasie Mini PC (9915 - 204742, n=96, ostatnie 2 lata) | |
| Minisforum AI X1 Pro, HX 470 (v8.20.8100) | |
| Minisforum AI X1 Pro, HX 470 (v6.92.6600) | |
| Khadas Mind (v6.85.6300) | |
| Geekom A9 Max, AI 9 HX 370 (v8.20.8100) | |
| Geekom A9 Max, AI 9 HX 370 (v6.92.6600) | |
| GMK EVO-T1 (v6.92.6600) | |
| GMK EVO-T1 (v8.20.8100) | |
| Khadas Mind Pro (v8.20.8100) | |
| Khadas Mind 2s (v6.92.6600) | |
| AIDA64 / CPU ZLib | |
| Minisforum AI X1 Pro, HX 470 (v6.92.6600) | |
| Minisforum AI X1 Pro, HX 470 (v8.20.8100) | |
| Geekom A9 Max, AI 9 HX 370 (v6.92.6600) | |
| Geekom A9 Max, AI 9 HX 370 (v8.20.8100) | |
| Khadas Mind Pro (v8.20.8100) | |
| GMK EVO-T1 (v6.92.6600) | |
| GMK EVO-T1 (v8.20.8100) | |
| Średnia w klasie Mini PC (127.2 - 2431, n=97, ostatnie 2 lata) | |
| Khadas Mind 2s (v6.92.6600) | |
| Khadas Mind 2 (v6.92.6600) | |
| Khadas Mind (v6.85.6300) | |
| AIDA64 / FP64 Ray-Trace | |
| Minisforum AI X1 Pro, HX 470 (v6.92.6600) | |
| Minisforum AI X1 Pro, HX 470 (v8.20.8100) | |
| Geekom A9 Max, AI 9 HX 370 (v6.92.6600) | |
| Geekom A9 Max, AI 9 HX 370 (v8.20.8100) | |
| Średnia w klasie Mini PC (537 - 43587, n=97, ostatnie 2 lata) | |
| GMK EVO-T1 (v6.92.6600) | |
| GMK EVO-T1 (v8.20.8100) | |
| Khadas Mind Pro (v8.20.8100) | |
| Khadas Mind 2s (v6.92.6600) | |
| Khadas Mind 2 (v6.92.6600) | |
| Khadas Mind (v6.85.6300) | |
| AIDA64 / CPU PhotoWorxx | |
| Khadas Mind Pro (v8.20.8100) | |
| Khadas Mind 2s (v6.92.6600) | |
| GMK EVO-T1 (v8.20.8100) | |
| GMK EVO-T1 (v6.92.6600) | |
| Geekom A9 Max, AI 9 HX 370 (v8.20.8100) | |
| Geekom A9 Max, AI 9 HX 370 (v6.92.6600) | |
| Khadas Mind 2 (v6.92.6600) | |
| Khadas Mind (v6.85.6300) | |
| Średnia w klasie Mini PC (8069 - 96843, n=97, ostatnie 2 lata) | |
| Minisforum AI X1 Pro, HX 470 (v8.20.8100) | |
| Minisforum AI X1 Pro, HX 470 (v6.92.6600) | |
| AIDA64 / CPU CheckMate | |
| Minisforum AI X1 Pro, HX 470 (v8.20.8100) | |
| Geekom A9 Max, AI 9 HX 370 (v8.20.8100) | |
| Średnia w klasie Mini PC (1743 - 19453, n=17, ostatnie 2 lata) | |
| Khadas Mind Pro (v8.20.8100) | |
| GMK EVO-T1 (v8.20.8100) | |
Cinebench R15 Multi Loop
Wydajność systemu
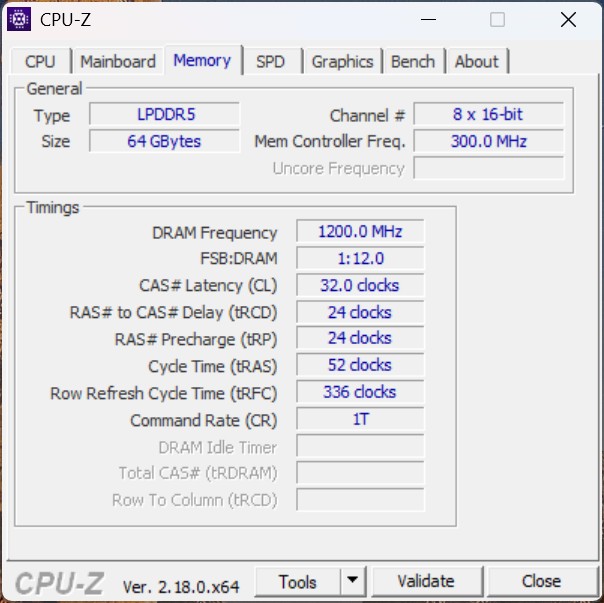
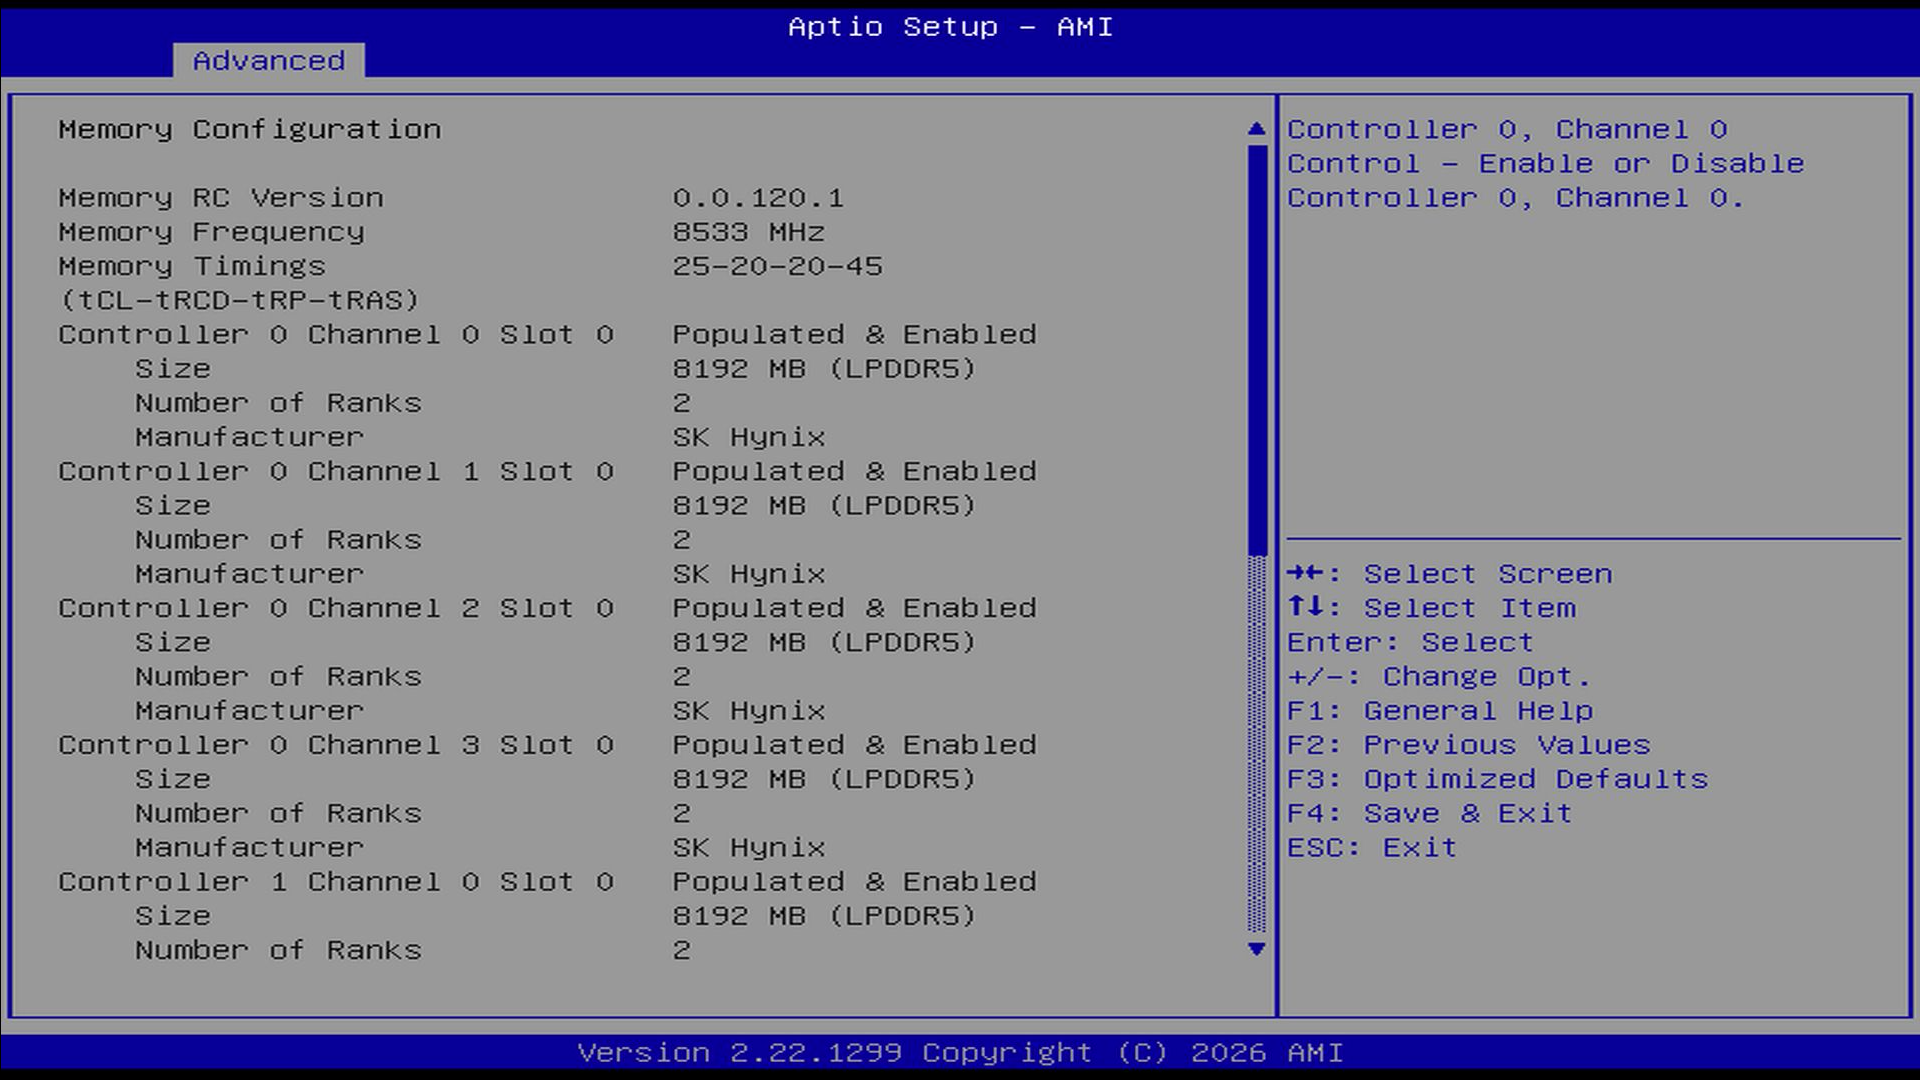
Ogólna wydajność systemu mini PC znacznie zyskuje dzięki nowemu SoC. W szczególności szybka pamięć RAM ma zauważalny wkład w wydajność, co znajduje odzwierciedlenie między innymi w testach pamięci RAM za pomocą AIDA64. Ponadto, zintegrowana jednostka NPU również została poprawiona i oferuje zauważalnie wyższą wydajność w porównaniu do poprzedniego modelu.
WebXPRT 4: Overall
WebXPRT 3: Overall
Mozilla Kraken 1.1: Total
CrossMark: Overall | Productivity | Creativity | Responsiveness
* ... im mniej tym lepiej
| AIDA64 / Memory Copy | |
| Khadas Mind Pro (v8.20.8100) | |
| Khadas Mind 2s (v6.92.6600) | |
| GMK EVO-T1 (v6.92.6600) | |
| GMK EVO-T1 (v8.20.8100) | |
| Khadas Mind 2 (v6.92.6600) | |
| Geekom A9 Max, AI 9 HX 370 (v6.92.6600) | |
| Geekom A9 Max, AI 9 HX 370 (v8.20.8100) | |
| Średnia w klasie Mini PC (15933 - 163031, n=97, ostatnie 2 lata) | |
| Khadas Mind (v6.85.6300) | |
| Minisforum AI X1 Pro, HX 470 (v8.20.8100) | |
| Minisforum AI X1 Pro, HX 470 (v6.92.6600) | |
| AIDA64 / Memory Read | |
| Khadas Mind Pro (v8.20.8100) | |
| Geekom A9 Max, AI 9 HX 370 (v6.92.6600) | |
| Geekom A9 Max, AI 9 HX 370 (v8.20.8100) | |
| Khadas Mind 2s (v6.92.6600) | |
| GMK EVO-T1 (v6.92.6600) | |
| GMK EVO-T1 (v8.20.8100) | |
| Khadas Mind 2 (v6.92.6600) | |
| Średnia w klasie Mini PC (14143 - 123769, n=97, ostatnie 2 lata) | |
| Khadas Mind (v6.85.6300) | |
| Minisforum AI X1 Pro, HX 470 (v6.92.6600) | |
| Minisforum AI X1 Pro, HX 470 (v8.20.8100) | |
| AIDA64 / Memory Write | |
| Khadas Mind Pro (v8.20.8100) | |
| Geekom A9 Max, AI 9 HX 370 (v8.20.8100) | |
| Geekom A9 Max, AI 9 HX 370 (v6.92.6600) | |
| Khadas Mind 2s (v6.92.6600) | |
| Średnia w klasie Mini PC (10630 - 216693, n=97, ostatnie 2 lata) | |
| GMK EVO-T1 (v6.92.6600) | |
| GMK EVO-T1 (v8.20.8100) | |
| Khadas Mind (v6.85.6300) | |
| Khadas Mind 2 (v6.92.6600) | |
| Minisforum AI X1 Pro, HX 470 (v8.20.8100) | |
| Minisforum AI X1 Pro, HX 470 (v6.92.6600) | |
| AIDA64 / Memory Latency | |
| Khadas Mind 2 (v6.92.6600) | |
| Khadas Mind 2s (v6.92.6600) | |
| GMK EVO-T1 (v8.20.8100) | |
| GMK EVO-T1 (v6.92.6600) | |
| Średnia w klasie Mini PC (88.1 - 170, n=98, ostatnie 2 lata) | |
| Minisforum AI X1 Pro, HX 470 (v8.20.8100) | |
| Minisforum AI X1 Pro, HX 470 (v6.92.6600) | |
| Khadas Mind Pro (v8.20.8100) | |
| Khadas Mind Pro (v6.92.6600) | |
| Geekom A9 Max, AI 9 HX 370 (v8.20.8100) | |
| Geekom A9 Max, AI 9 HX 370 (v6.92.6600) | |
| Khadas Mind (v6.85.6300) | |
* ... im mniej tym lepiej
| UL Procyon for Windows / Overall Score Integer NPU | |
| Khadas Mind Pro (OpenVINO) | |
| Minisforum AI X1 Pro, HX 470 (Ryzen AI) | |
| Geekom A9 Max, AI 9 HX 370 (AMD Ryzen AI) | |
| GMK EVO-T1 (OpenVINO) | |
| Khadas Mind 2s (OpenVINO) | |
| Khadas Mind 2 (OpenVINO) | |
| UL Procyon for Windows / Overall Score Integer GPU | |
| Khadas Mind Pro (Windows ML) | |
| Khadas Mind 2s (Windows ML) | |
| GMK EVO-T1 (Windows ML) | |
| Geekom A9 Max, AI 9 HX 370 (Windows ML) | |
| Minisforum AI X1 Pro, HX 470 (Windows ML) | |
| Khadas Mind 2 (Widows ML) | |
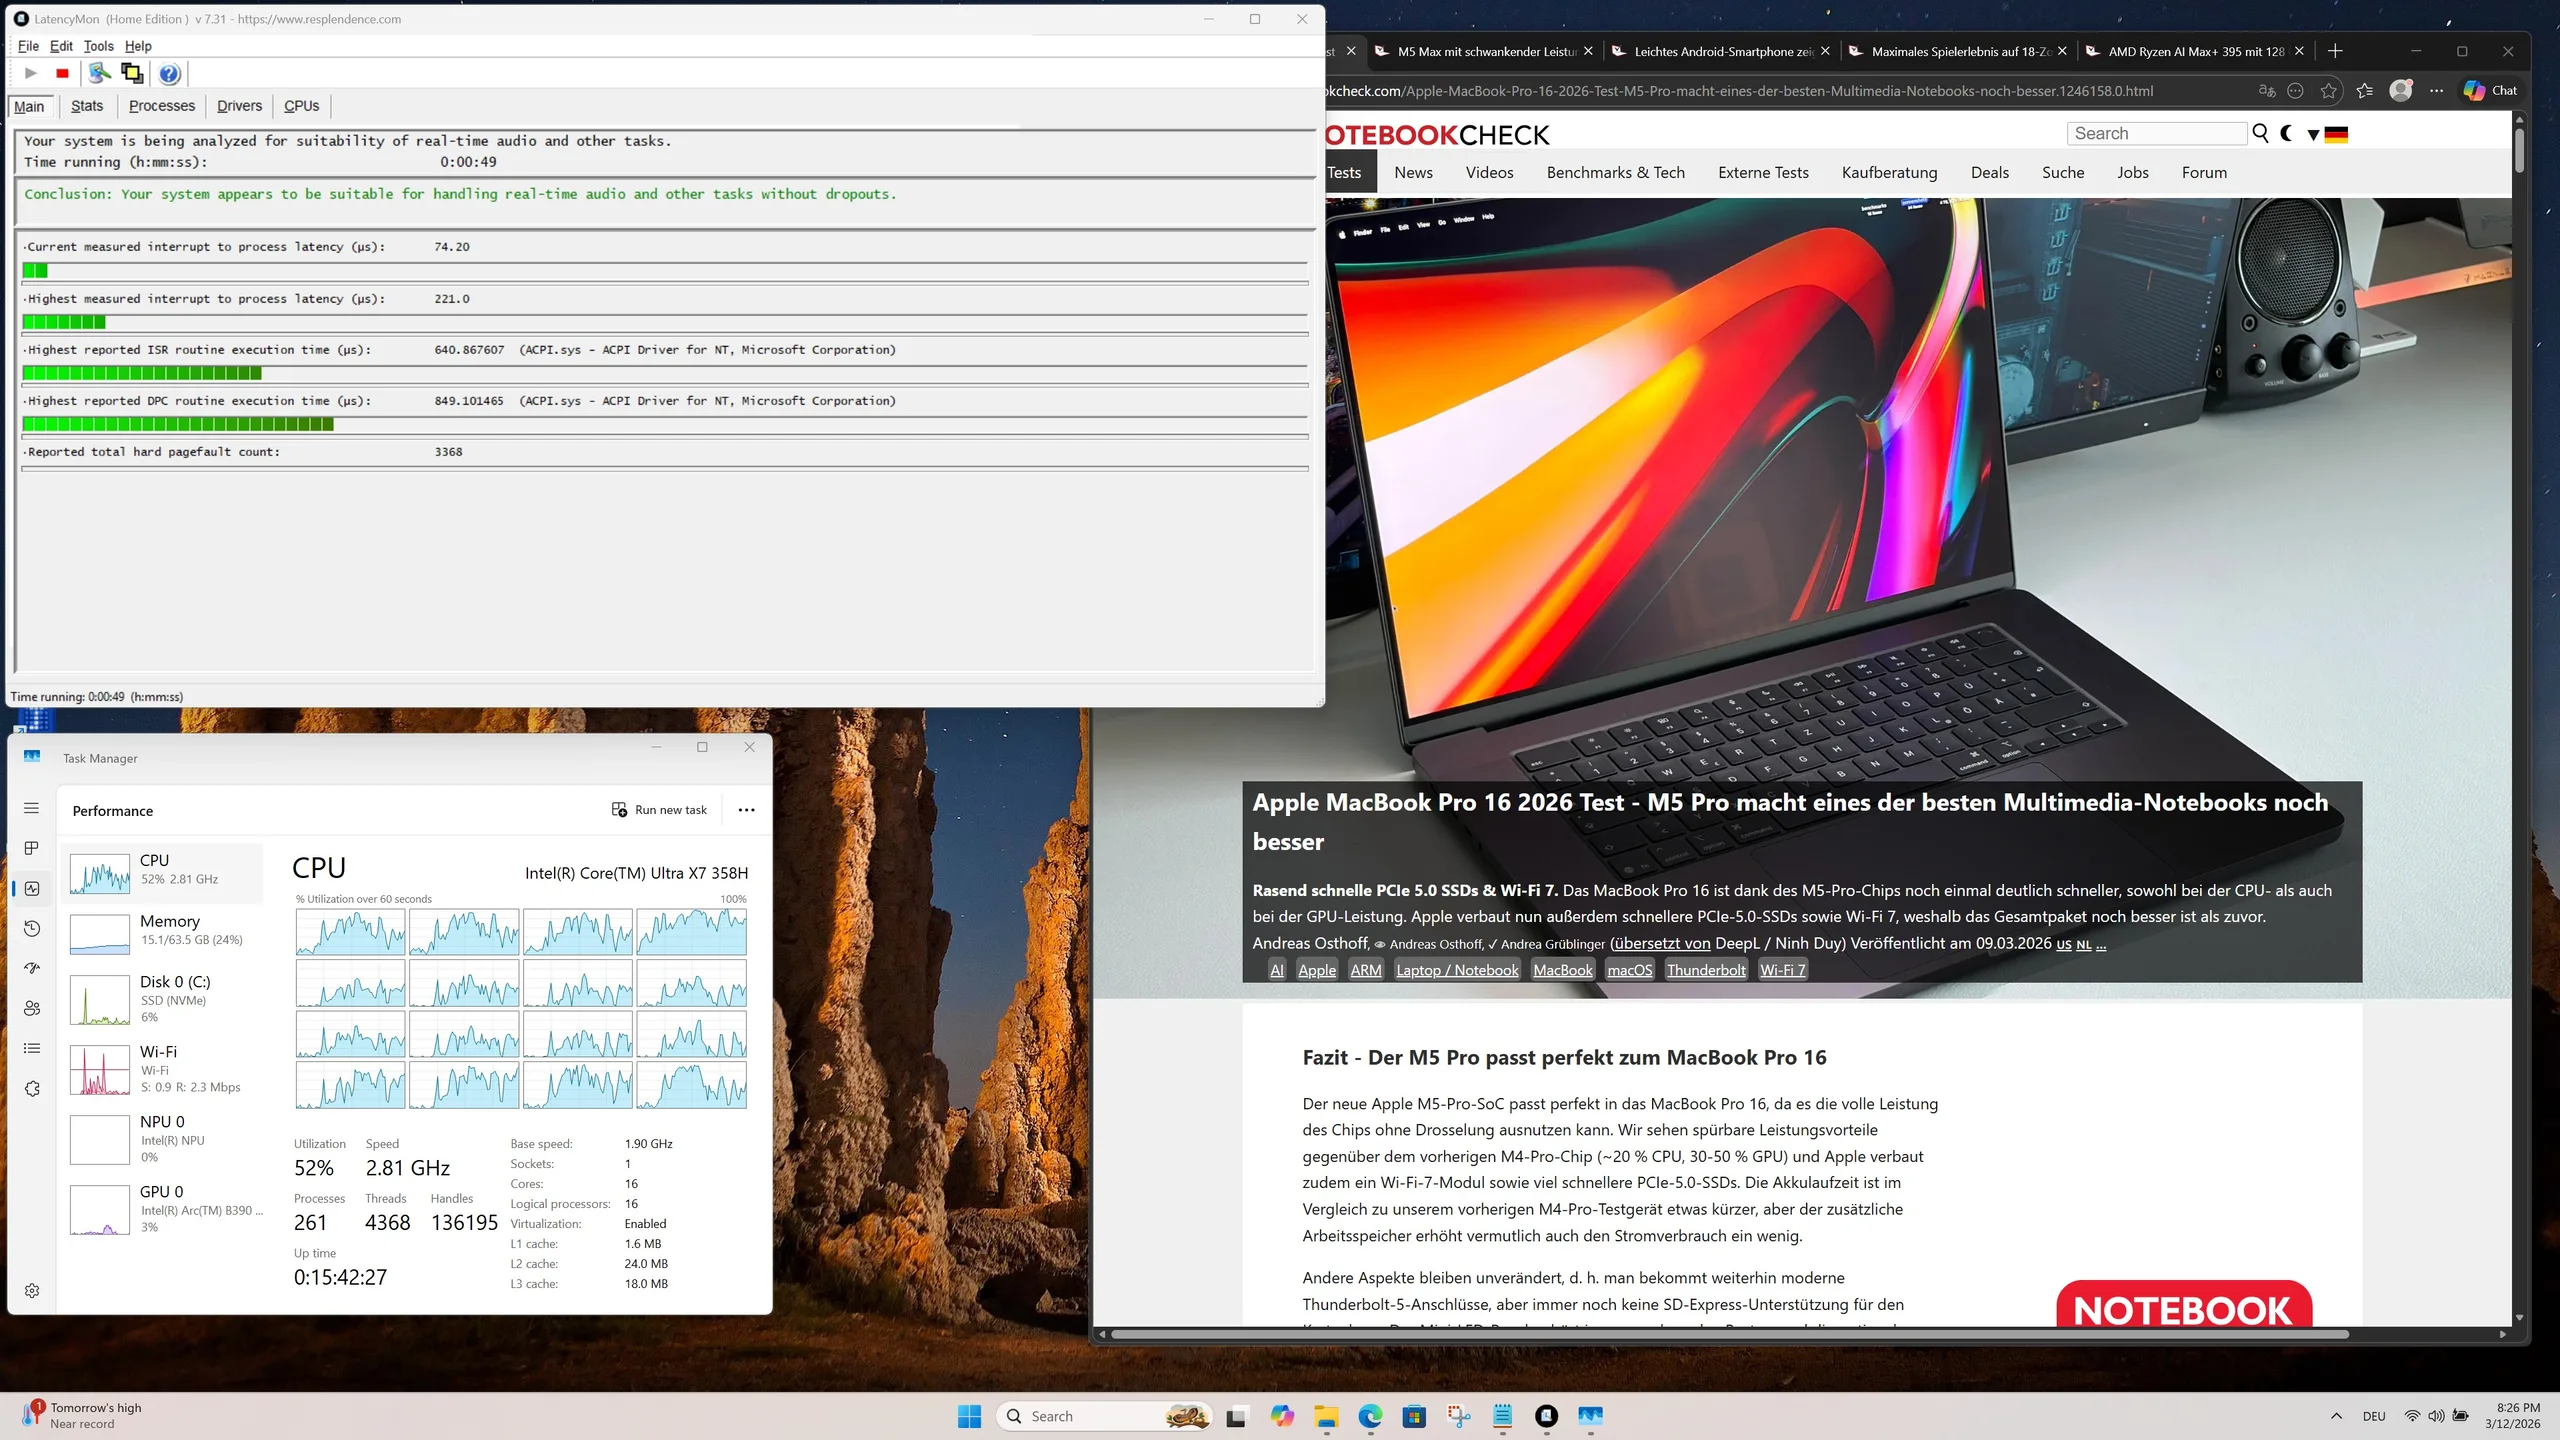
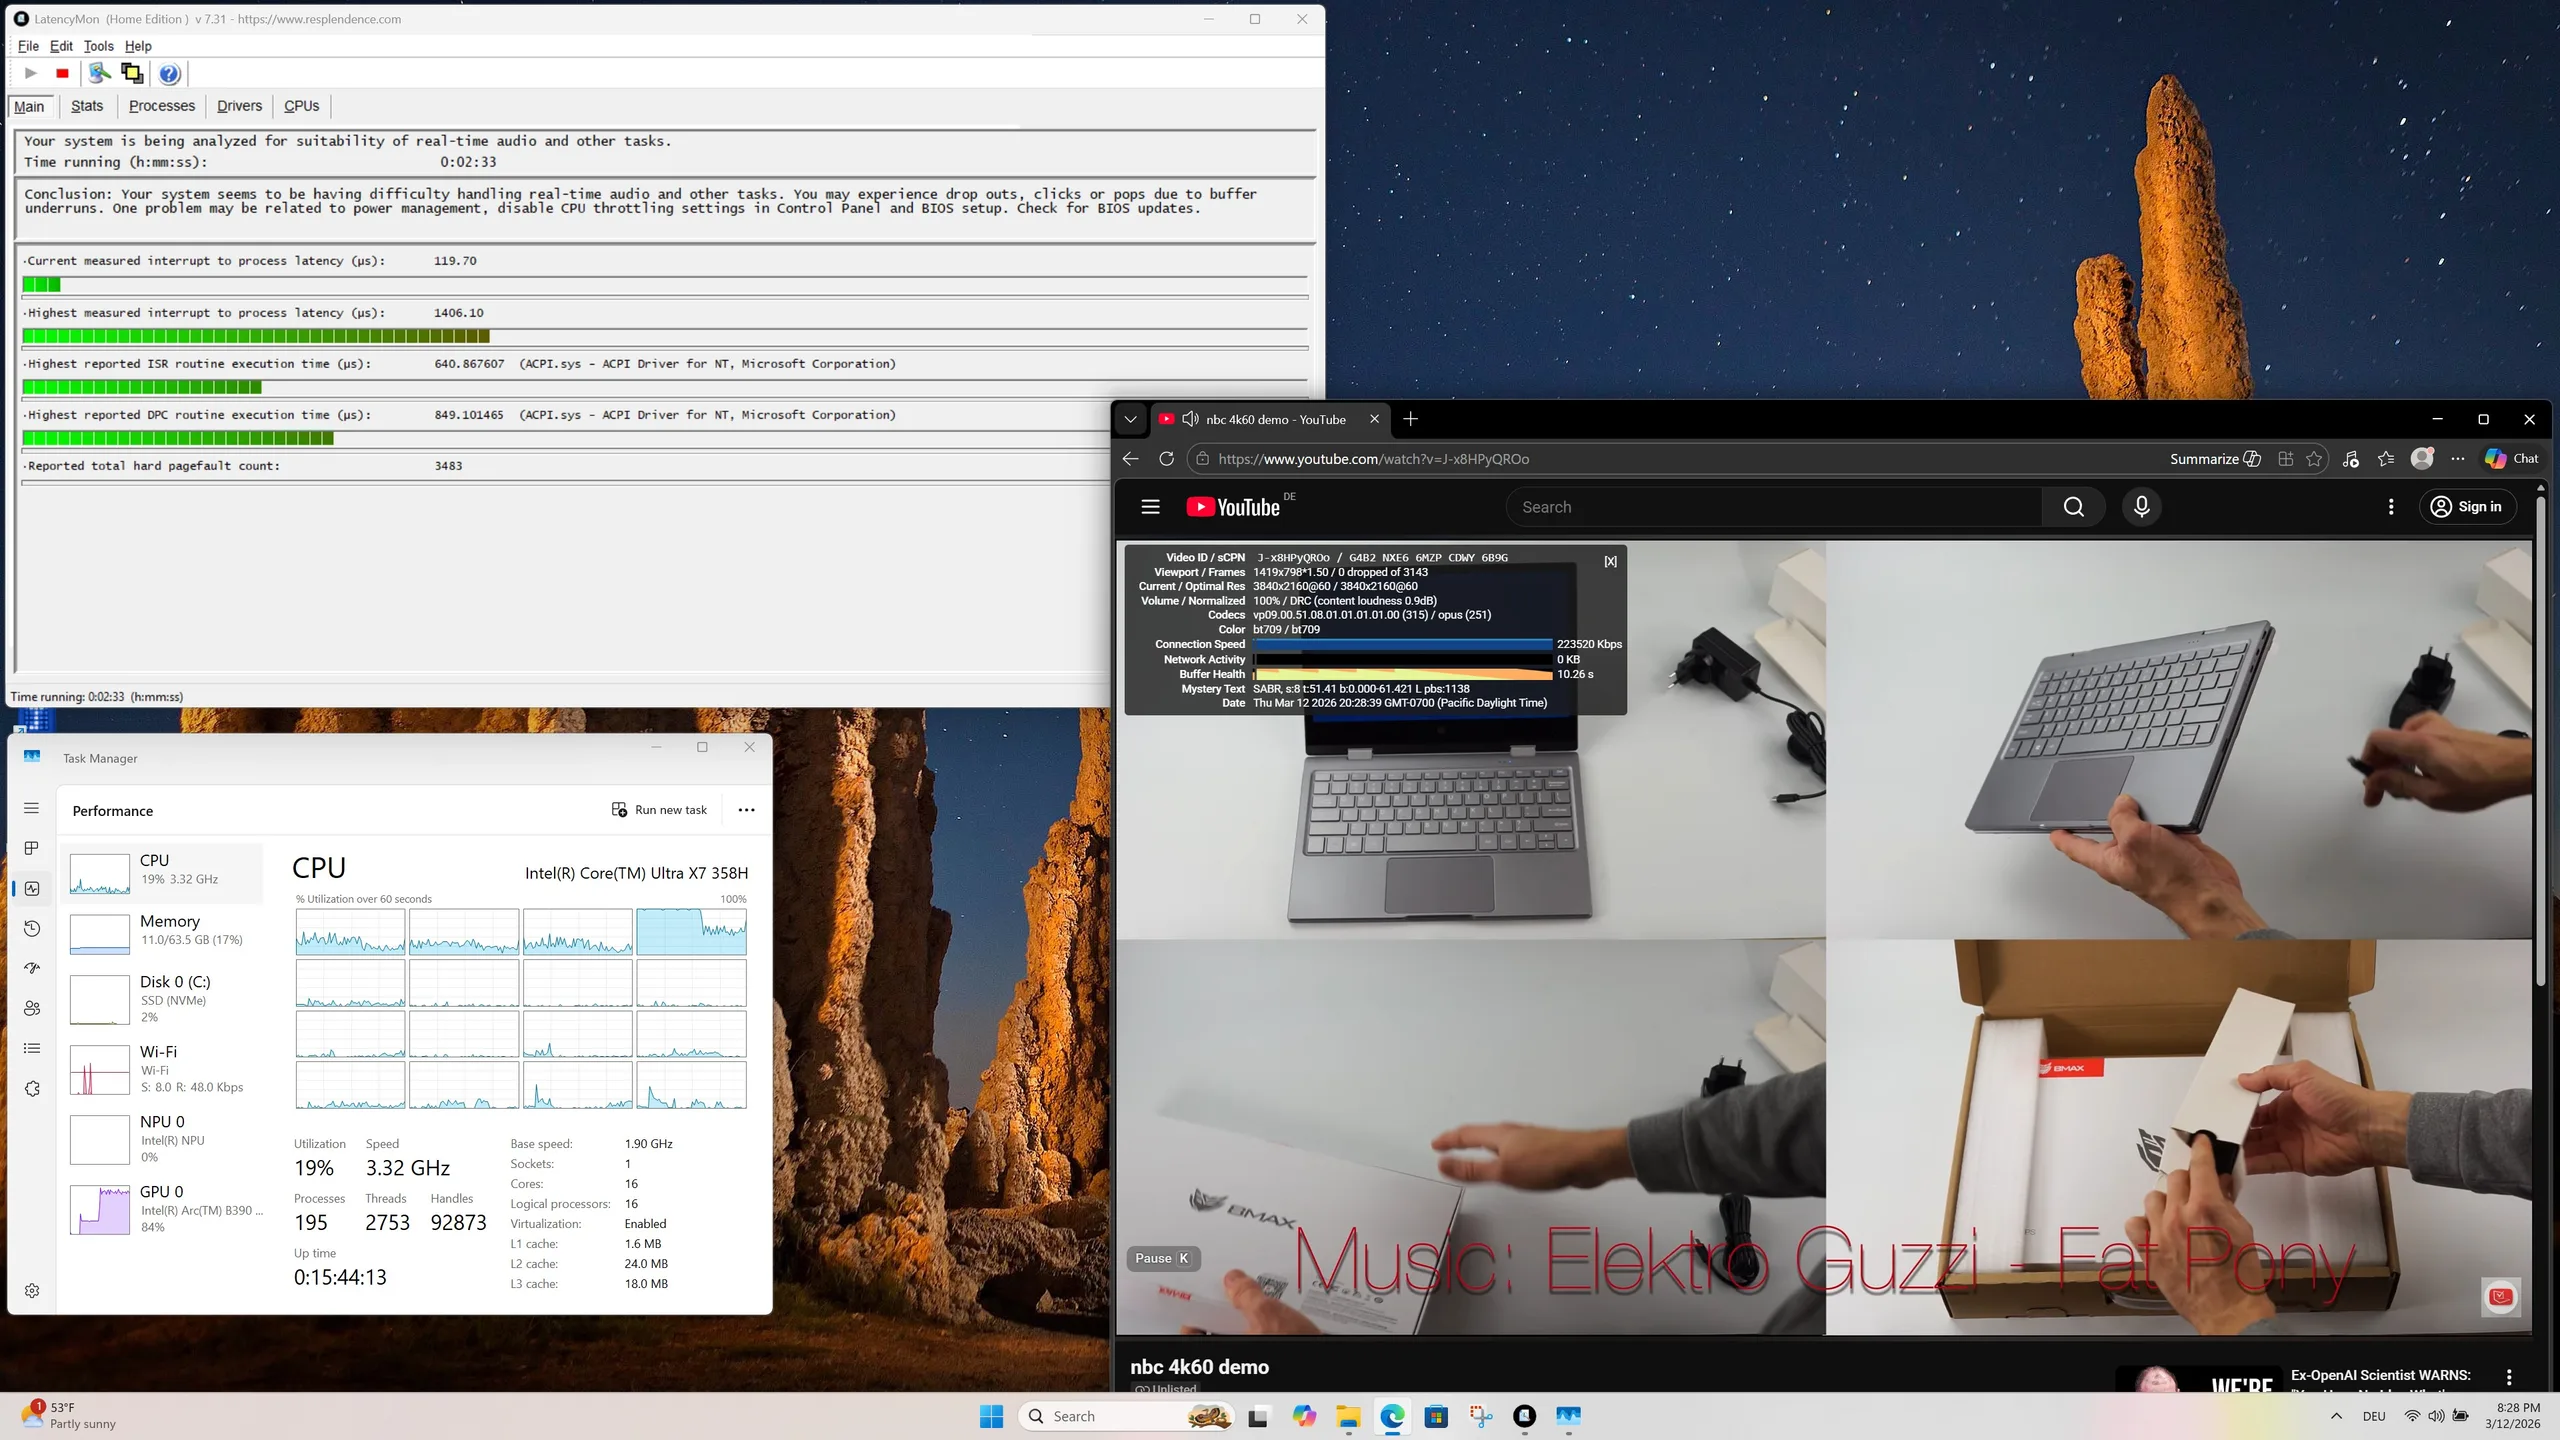
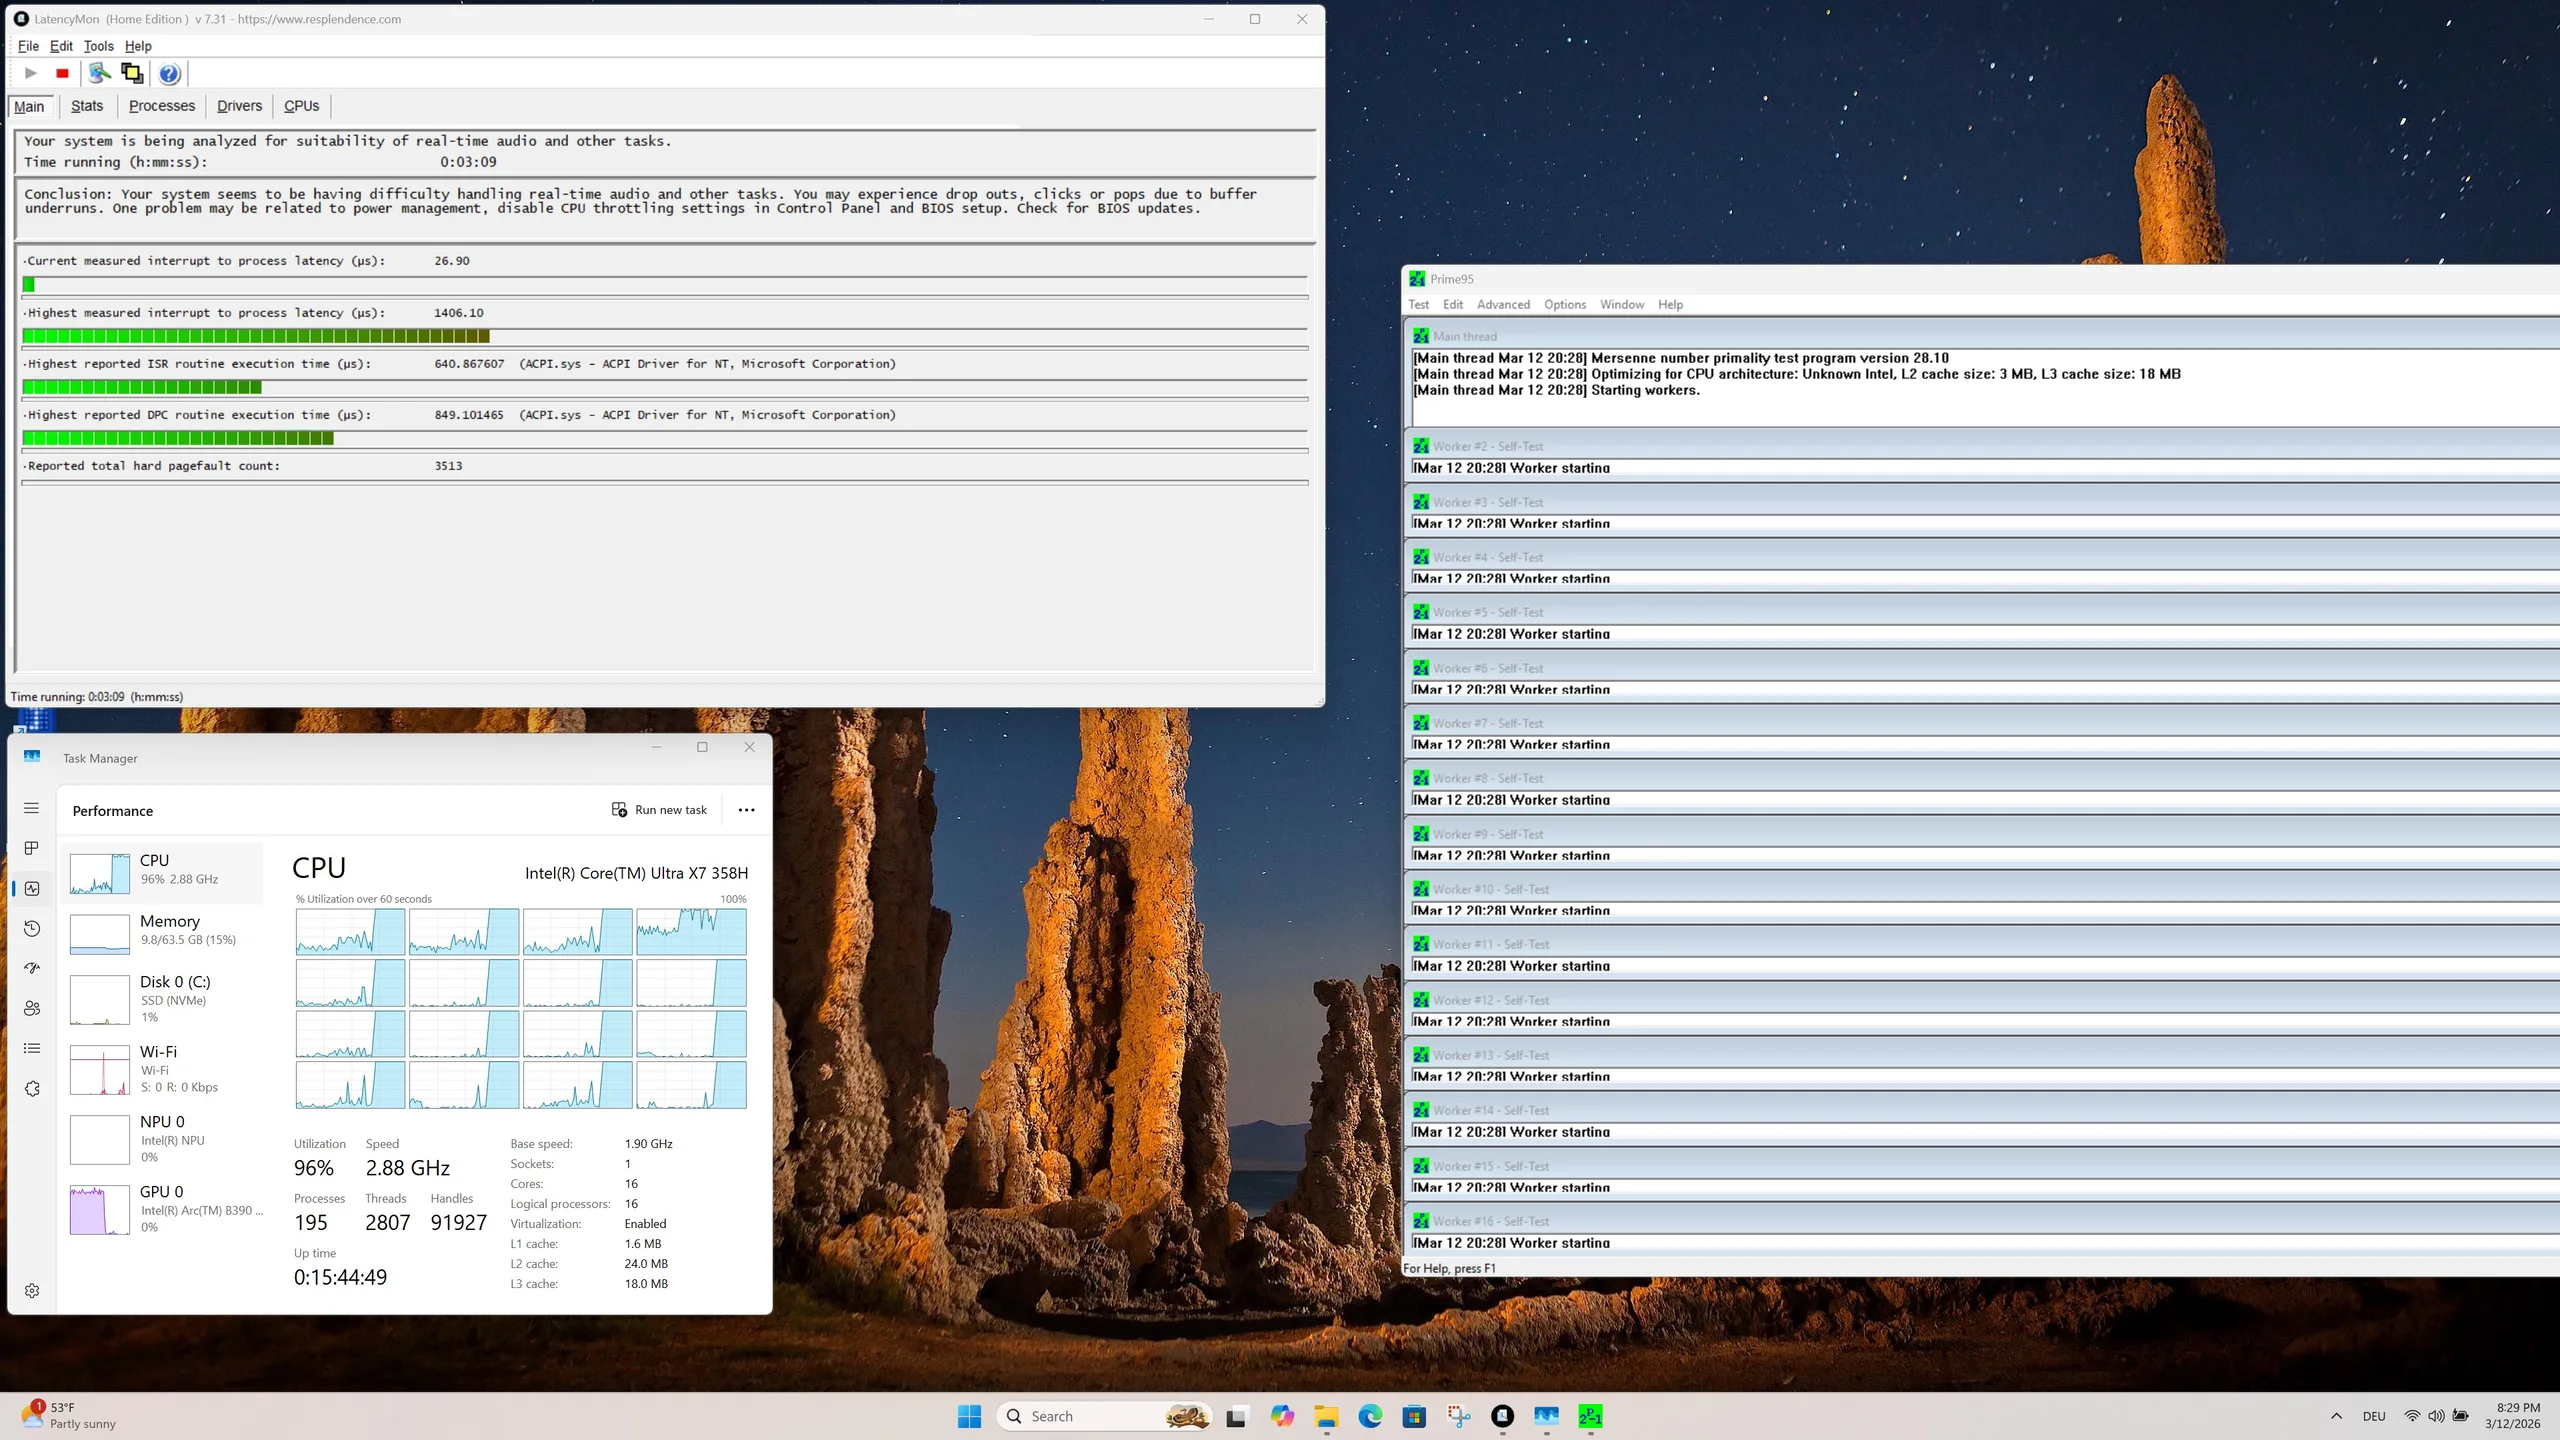
Opóźnienia DPC
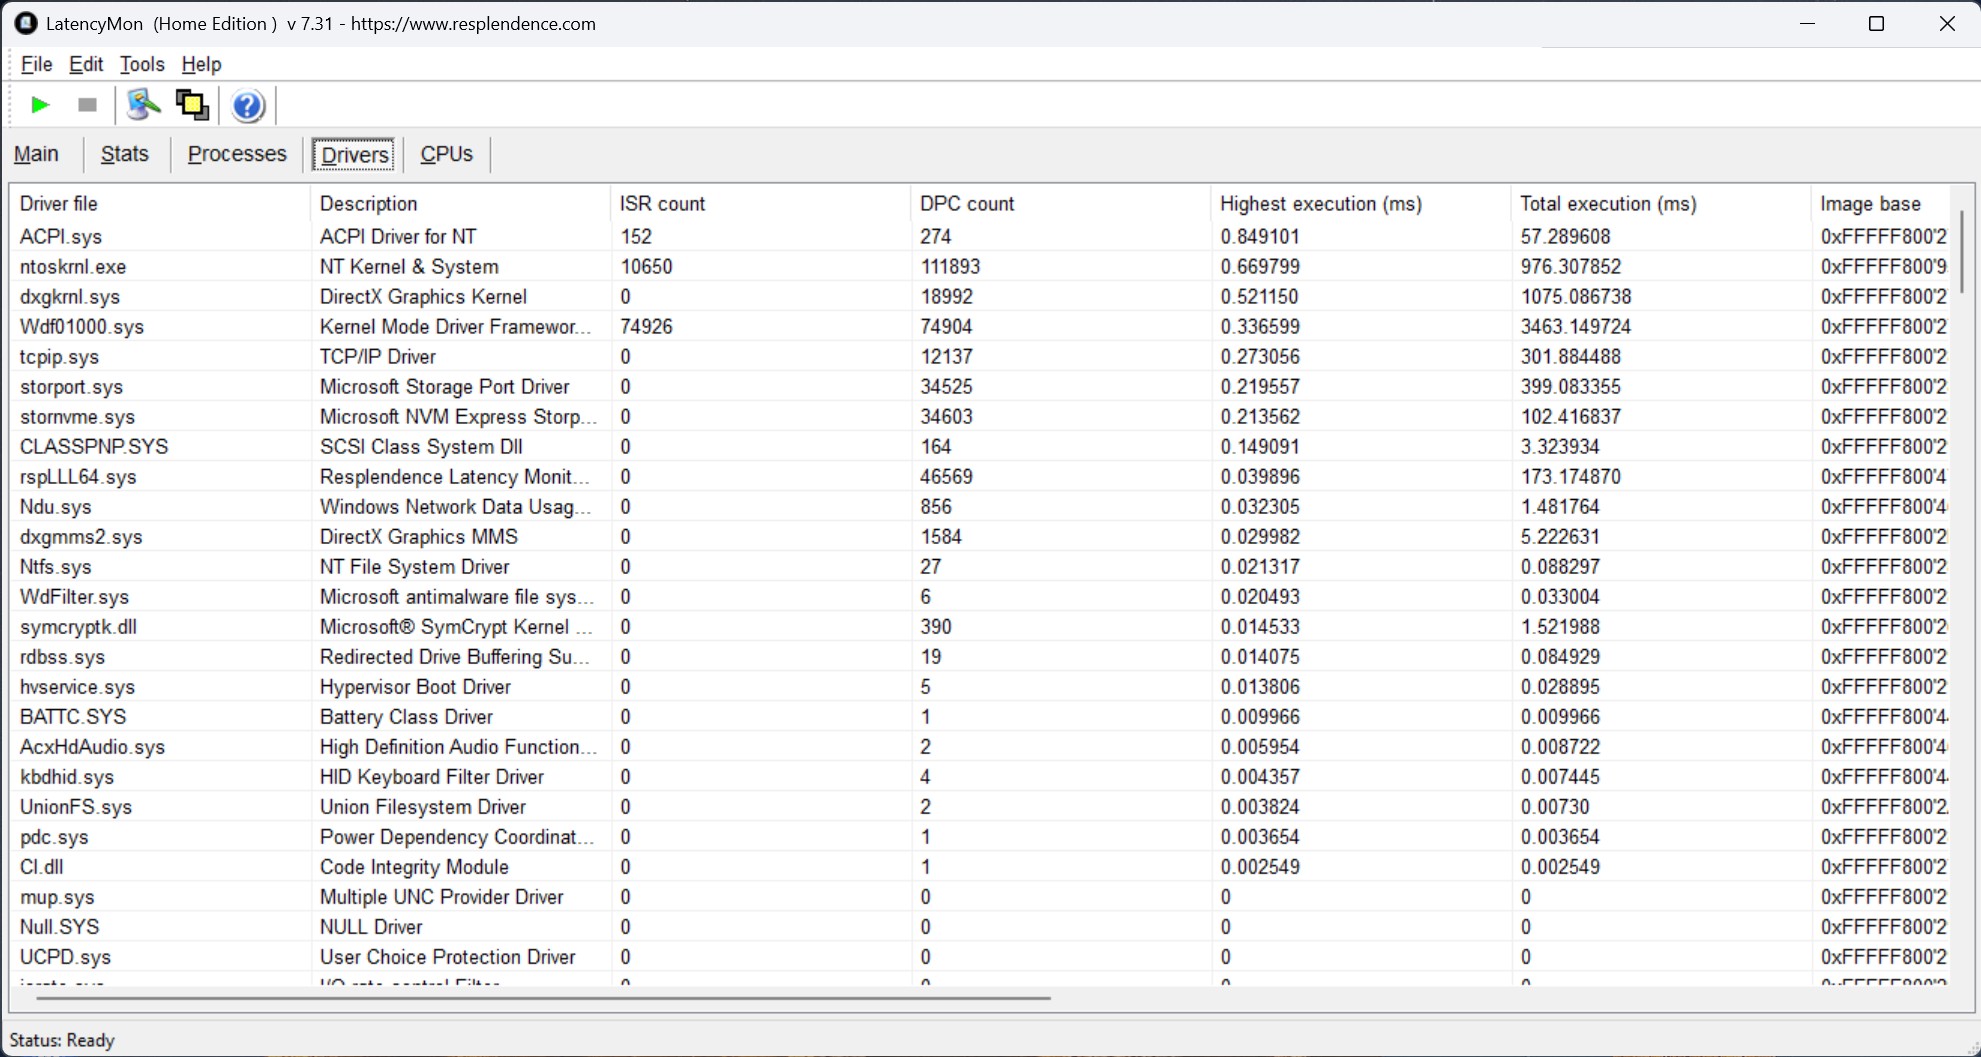
| DPC Latencies / LatencyMon - interrupt to process latency (max), Web, Youtube, Prime95 | |
| Minisforum AI X1 Pro, HX 470 | |
| Khadas Mind 2 | |
| Geekom A9 Max, AI 9 HX 370 | |
| Khadas Mind 2s | |
| GMK EVO-T1 | |
| Khadas Mind | |
| Khadas Mind Pro | |
* ... im mniej tym lepiej
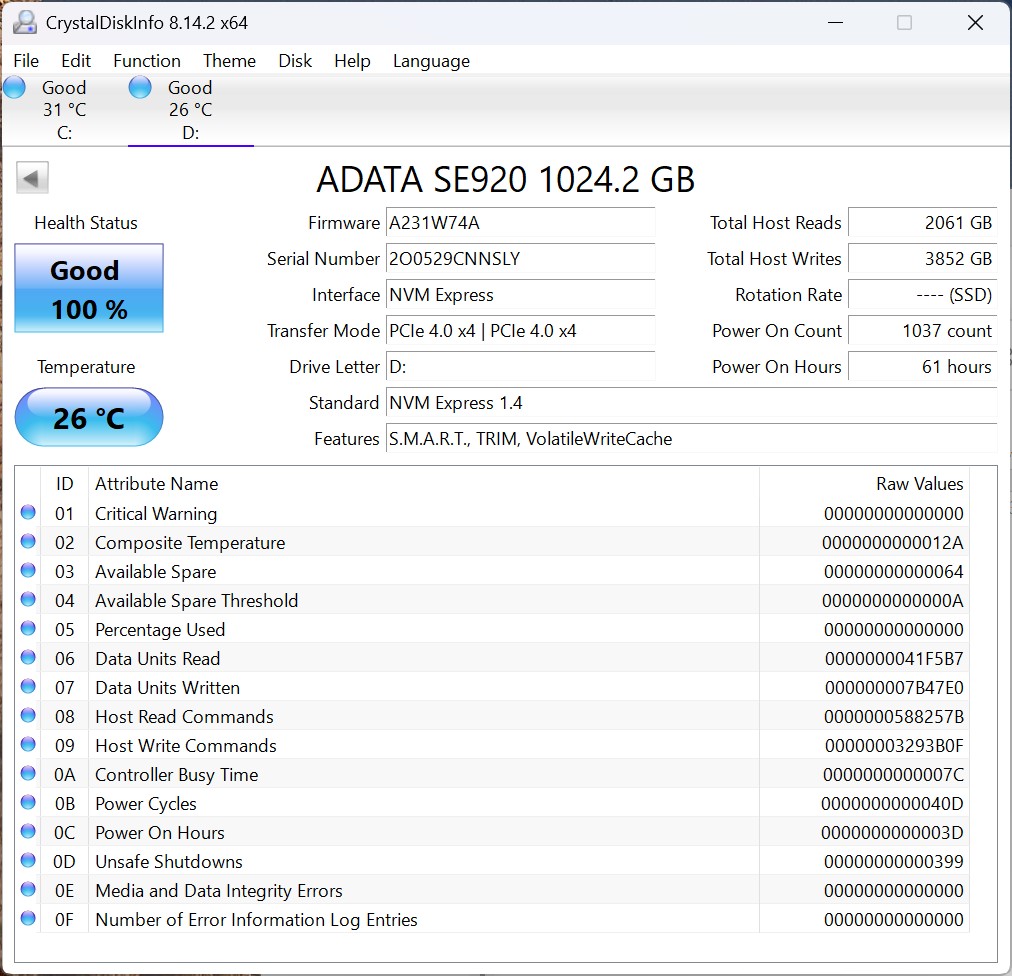
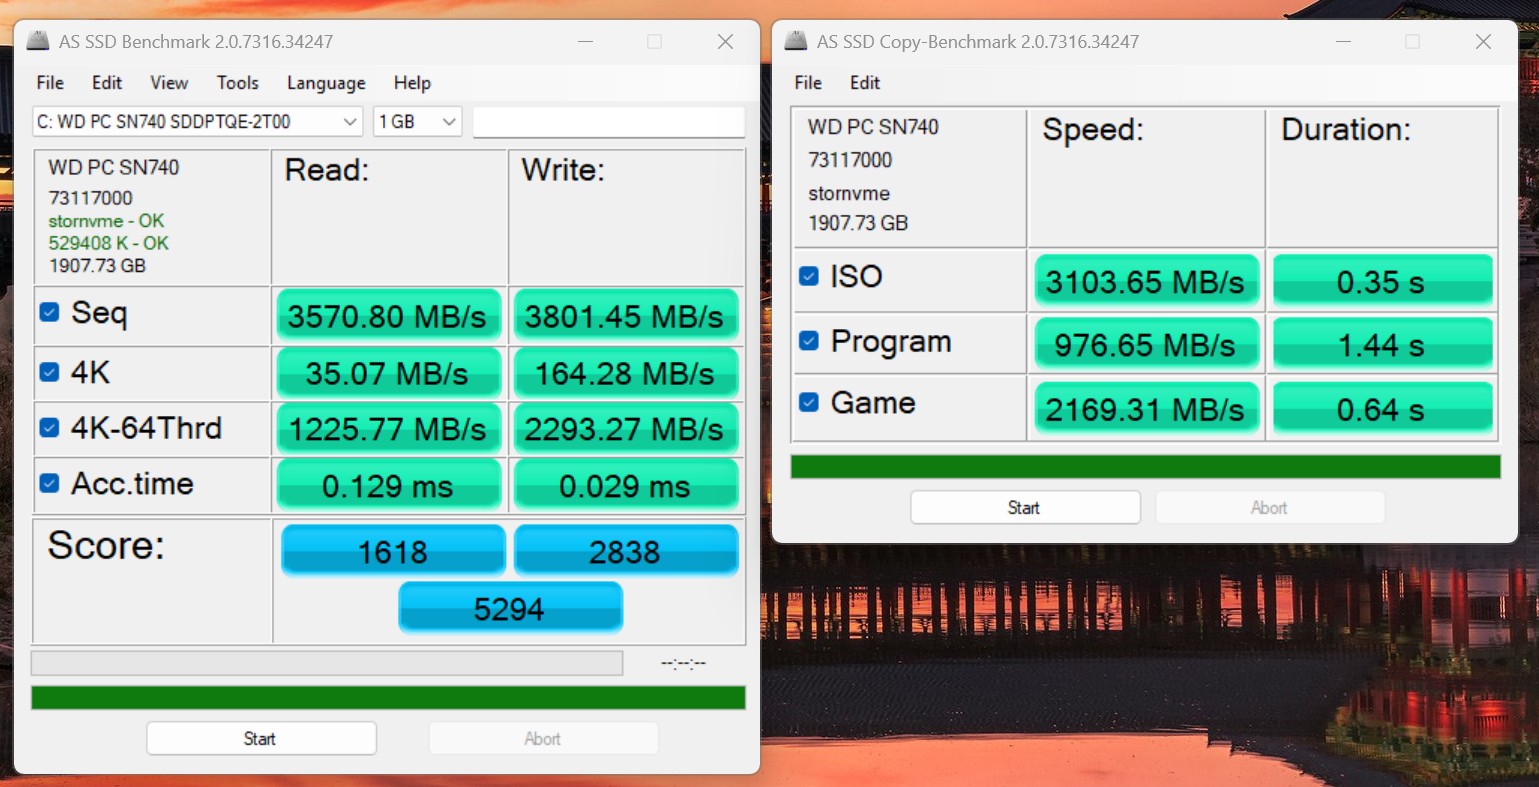
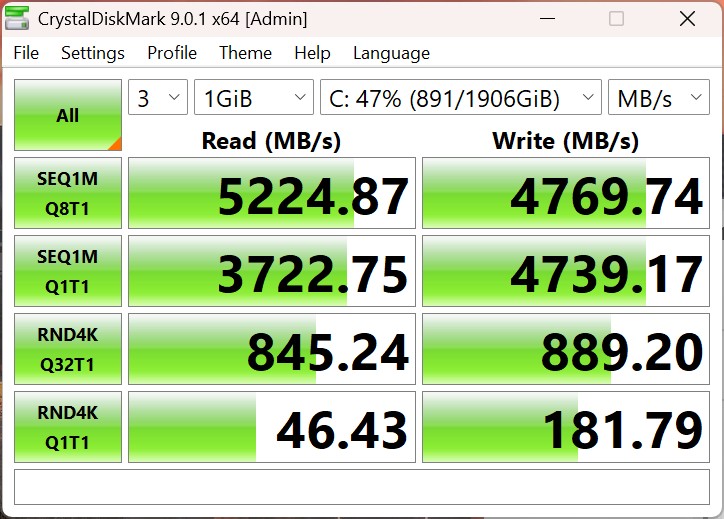
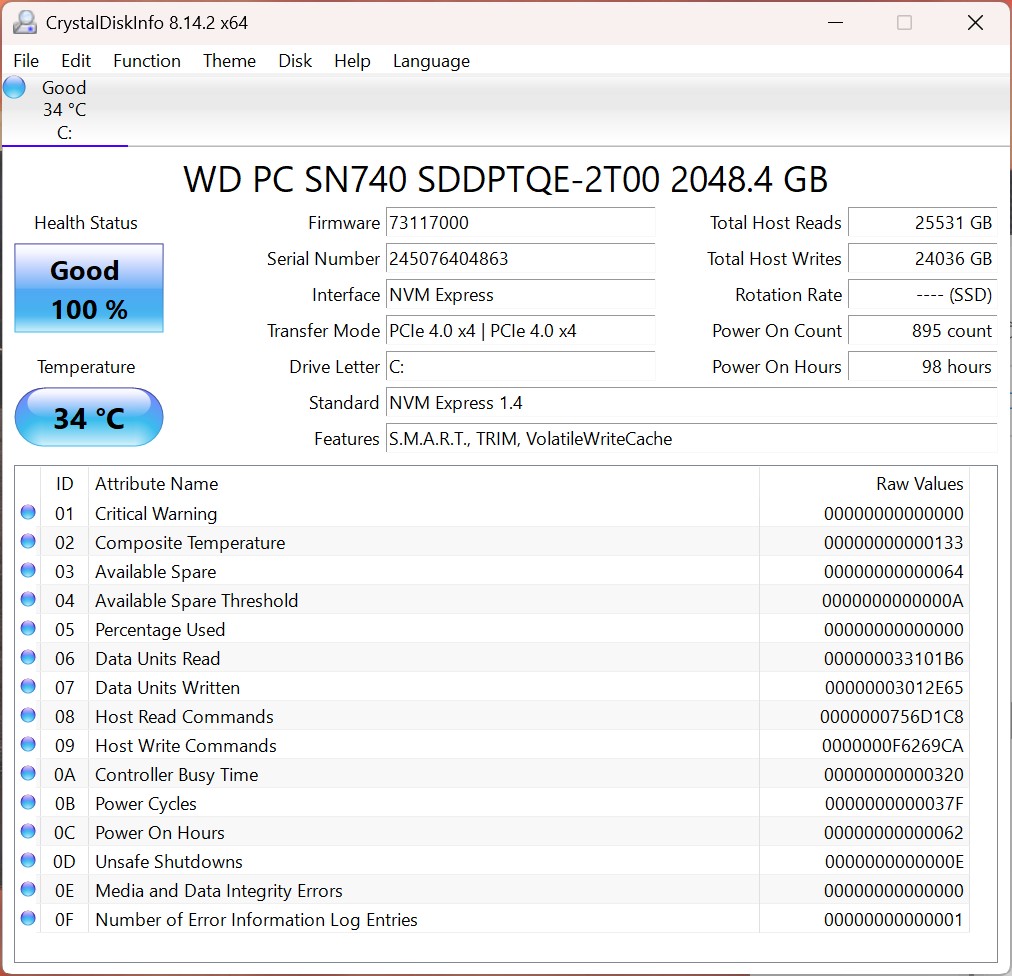
Urządzenia pamięci masowej
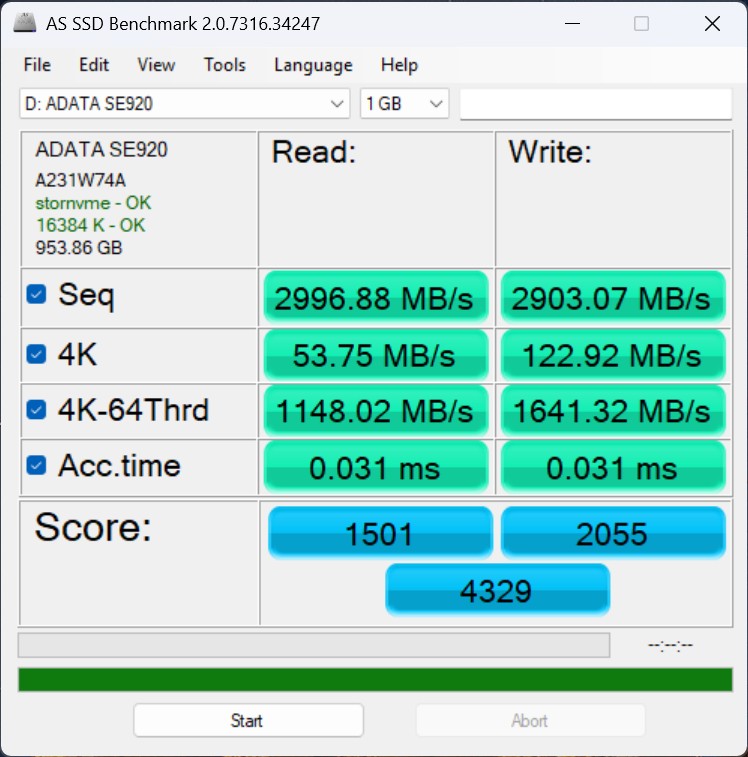
Khadas Mind Pro wykorzystuje dysk Western Digital SN740 SSD o pojemności 2 TB, który był już instalowany we wcześniejszych modelach z tej serii. W teście dysk zapewnia solidną wydajność i nie wykazuje spadków prędkości związanych z temperaturą.
Jest to dysk SSD M.2 w formacie 2230 (30 mm). Możliwe jest również doposażenie w dodatkowy dysk o tym samym rozmiarze.

| Drive Performance rating - Percent | |
| GMK EVO-T1 | |
| Khadas Mind | |
| Khadas Mind 2s | |
| Geekom A9 Max, AI 9 HX 370 | |
| Khadas Mind Pro | |
| Khadas Mind 2 | |
| Średnia w klasie Mini PC | |
| Minisforum AI X1 Pro, HX 470 | |
* ... im mniej tym lepiej
Dławienie dysku: Pętla odczytu DiskSpd, głębokość kolejki 8
Karta graficzna i wydajność w grach
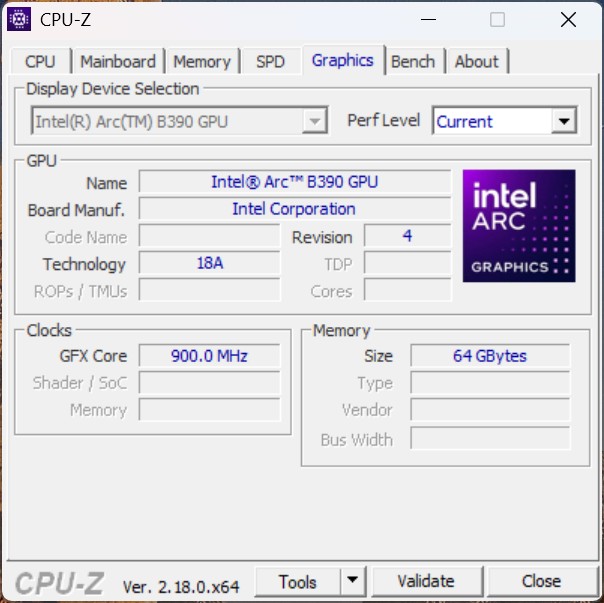
Khadas Mind Pro opiera się na Intel Arc B390 iGPU z 12 rdzeniami Xe3, która jest zintegrowana z procesorem Core Ultra X7 358H. W porównaniu do poprzedniej generacji, nowa architektura graficzna Xe3 oferuje zauważalny wzrost wydajności, co jest szczególnie widoczne w syntetycznych benchmarkach.
Zintegrowana grafika może również przynieść znaczące zyski w aplikacjach akcelerowanych przez GPU i jest ogólnie pozycjonowana mocniej niż iGPU z poprzednich modeli. Nawet AMD nie jest już w stanie nadążyć za swoimi modelami Radeon 890M. Tylko AMD Radeon 8060S z potężnych APU Strix Halo zapewnia zauważalnie wyższą wydajność. Wydajność iGPU Intel Arc B390 jest również wystarczająca do zwykłych gier. Bardziej wymagające tytuły działają nawet płynnie przy wysokich detalach, co oznacza, że obniżone ustawienia graficzne w wielu przypadkach nie są konieczne.
| 3DMark Performance rating - Percent | |
| Przeciętny AMD Radeon 8060S | |
| Khadas Mind Pro | |
| Geekom A9 Max, AI 9 HX 370 | |
| Khadas Mind 2s | |
| GMK EVO-T1 | |
| Khadas Mind 2 | |
| Minisforum AI X1 Pro, HX 470 | |
| Khadas Mind | |
| Unigine Valley 1.0 | |
| 1920x1080 Extreme HD DirectX AA:x8 | |
| Przeciętny AMD Radeon 8060S (77.4 - 111.1, n=7) | |
| Khadas Mind Pro | |
| Khadas Mind 2s | |
| Geekom A9 Max, AI 9 HX 370 | |
| GMK EVO-T1 | |
| Khadas Mind 2 | |
| Khadas Mind | |
| Minisforum AI X1 Pro, HX 470 | |
| 1920x1080 Extreme HD Preset OpenGL AA:x8 | |
| Przeciętny AMD Radeon 8060S (79 - 100.3, n=7) | |
| Khadas Mind Pro | |
| Khadas Mind 2s | |
| GMK EVO-T1 | |
| Geekom A9 Max, AI 9 HX 370 | |
| Khadas Mind 2 | |
| Khadas Mind | |
| Minisforum AI X1 Pro, HX 470 | |
| Affinity Photo 2 - Combined (Single / Multi GPU) | |
| Khadas Mind Pro | |
| GMK EVO-T1 | |
| Khadas Mind 2s | |
| Khadas Mind 2 | |
| Przeciętny AMD Radeon 8060S (3630 - 4219, n=7) | |
| Khadas Mind | |
| Geekom A9 Max, AI 9 HX 370 | |
| Minisforum AI X1 Pro, HX 470 | |
SPECworkstation 4.0: Graphics Score | Accelerator Score | Viewport Graphics | HandBrake | ONNX Inference
| Performance rating | |
| Przeciętny AMD Radeon 8060S | |
| Geekom A9 Max, AI 9 HX 370 | |
| Khadas Mind Pro | |
| GMK EVO-T1 | |
| Khadas Mind 2s | |
| Minisforum AI X1 Pro, HX 470 | |
| Khadas Mind 2 | |
| SPECworkstation 4.0 / Graphics Score | |
| Przeciętny AMD Radeon 8060S (6.21 - 7, n=7) | |
| Geekom A9 Max, AI 9 HX 370 | |
| Minisforum AI X1 Pro, HX 470 | |
| Khadas Mind Pro | |
| Khadas Mind 2s | |
| GMK EVO-T1 | |
| Khadas Mind 2 | |
| SPECworkstation 4.0 / Accelerator Score | |
| Przeciętny AMD Radeon 8060S (3.91 - 4.8, n=7) | |
| Khadas Mind 2s | |
| Geekom A9 Max, AI 9 HX 370 | |
| Khadas Mind Pro | |
| GMK EVO-T1 | |
| Khadas Mind 2 | |
| Minisforum AI X1 Pro, HX 470 | |
| SPECworkstation 4.0 / Viewport Graphics | |
| Przeciętny AMD Radeon 8060S (6.21 - 7, n=7) | |
| Geekom A9 Max, AI 9 HX 370 | |
| Minisforum AI X1 Pro, HX 470 | |
| Khadas Mind Pro | |
| Khadas Mind 2s | |
| GMK EVO-T1 | |
| Khadas Mind 2 | |
| SPECworkstation 4.0 / HandBrake | |
| Przeciętny AMD Radeon 8060S (2.02 - 2.65, n=7) | |
| GMK EVO-T1 | |
| Geekom A9 Max, AI 9 HX 370 | |
| Minisforum AI X1 Pro, HX 470 | |
| Khadas Mind Pro | |
| Khadas Mind 2s | |
| Khadas Mind 2 | |
| SPECworkstation 4.0 / ONNX Inference | |
| Przeciętny AMD Radeon 8060S (3.16 - 3.87, n=7) | |
| GMK EVO-T1 | |
| Geekom A9 Max, AI 9 HX 370 | |
| Khadas Mind Pro | |
| Khadas Mind 2s | |
| Minisforum AI X1 Pro, HX 470 | |
| Khadas Mind 2 | |
| Khadas Mind Pro, Intel Arc B390 12 Xe3 Panther Lake iGPU Ultra X7 358H | Geekom A9 Max, AI 9 HX 370, AMD Radeon 890M Ryzen AI 9 HX 370 | Minisforum AI X1 Pro, HX 470, AMD Radeon 890M Ryzen AI 9 HX 470 | Khadas Mind 2s, Intel Arc Graphics 140T Ultra 7 255H | GMK EVO-T1, Intel Arc Graphics 140T Ultra 9 285H | Khadas Mind 2, Intel Arc 8-Core iGPU Ultra 7 155H | Khadas Mind, Intel Iris Xe Graphics G7 96EUs i7-1360P | Średnia w klasie Mini PC | |
|---|---|---|---|---|---|---|---|---|
| SPECviewperf 2020 | 178% | 77% | -21% | -27% | -39% | -52% | 224% | |
| 3840x2160 Medical (medical-03) (fps) | 9.48 | 26.1 175% | 23.9 152% | 6.8 -28% | 7.02 -26% | 5.71 -40% | 2.67 -72% | 24.2 ? 155% |
| 3840x2160 Energy (energy-03) (fps) | 7.67 | 18 135% | 14 83% | 7.27 -5% | 7.4 -4% | 4.25 -45% | 2.97 -61% | 36.2 ? 372% |
| 3840x2160 Creo (creo-03) (fps) | 28.9 | 36.2 25% | 21.4 -26% | 24 -17% | 19.9 -31% | 18.1 -37% | 16.9 -42% | 52 ? 80% |
| 3840x2160 CATIA (catia-06) (fps) | 19.5 | 26 33% | 16.2 -17% | 14.3 -27% | 12.8 -34% | 11.3 -42% | 8.82 -55% | 36.7 ? 88% |
| 3840x2160 3ds Max (3dsmax-07) (fps) | 26.9 | 25.2 -6% | 13.4 -50% | 16.6 -38% | 14.6 -46% | 13.9 -48% | 10.1 -62% | 58.9 ? 119% |
| 3840x2160 Siemens NX (snx-04) (fps) | 7.09 | 70.6 896% | 39.2 453% | 6.27 -12% | 6.13 -14% | 5.57 -21% | 6.01 -15% | 52.5 ? 640% |
| 3840x2160 Maya (maya-06) (fps) | 69.4 | 59.3 -15% | 31.3 -55% | 53.1 -23% | 44.9 -35% | 41 -41% | 27.8 -60% | 150.1 ? 116% |
| 3DMark 05 Standard | 44482 pkt. | |
| 3DMark 06 Standard Score | 46797 pkt. | |
| 3DMark Vantage P Result | 66984 pkt. | |
| 3DMark 11 Performance | 18308 pkt. | |
| 3DMark Ice Storm Standard Score | 208990 pkt. | |
| 3DMark Cloud Gate Standard Score | 44272 pkt. | |
| 3DMark Fire Strike Score | 14069 pkt. | |
| 3DMark Fire Strike Extreme Score | 6449 pkt. | |
| 3DMark Time Spy Score | 7516 pkt. | |
| 3DMark Steel Nomad Score | 1608 pkt. | |
Pomoc | ||
| GTA V | |
| 1024x768 Lowest Settings possible | |
| Khadas Mind Pro | |
| Geekom A9 Max, AI 9 HX 370 | |
| Khadas Mind 2s | |
| GMK EVO-T1 | |
| Khadas Mind 2 | |
| Minisforum AI X1 Pro, HX 470 | |
| Khadas Mind | |
| 1920x1080 High/On (Advanced Graphics Off) AA:2xMSAA + FX AF:8x | |
| Khadas Mind Pro | |
| Geekom A9 Max, AI 9 HX 370 | |
| GMK EVO-T1 | |
| Khadas Mind 2s | |
| Minisforum AI X1 Pro, HX 470 | |
| Khadas Mind 2 | |
| Khadas Mind | |
| Dota 2 Reborn | |
| 1280x720 min (0/3) fastest | |
| Geekom A9 Max, AI 9 HX 370 | |
| Minisforum AI X1 Pro, HX 470 | |
| Khadas Mind Pro | |
| GMK EVO-T1 | |
| Khadas Mind 2s | |
| Khadas Mind | |
| Khadas Mind 2 | |
| 1920x1080 high (2/3) | |
| Khadas Mind Pro | |
| Geekom A9 Max, AI 9 HX 370 | |
| GMK EVO-T1 | |
| Khadas Mind | |
| Minisforum AI X1 Pro, HX 470 | |
| Khadas Mind 2s | |
| Khadas Mind 2 | |
| Cyberpunk 2077 | |
| 1920x1080 Low Preset (FSR off) | |
| Khadas Mind Pro | |
| Geekom A9 Max, AI 9 HX 370 | |
| GMK EVO-T1 | |
| Khadas Mind 2s | |
| Khadas Mind 2 | |
| Minisforum AI X1 Pro, HX 470 | |
| 1920x1080 High Preset (FSR off) | |
| Khadas Mind Pro | |
| Geekom A9 Max, AI 9 HX 370 | |
| Khadas Mind 2s | |
| GMK EVO-T1 | |
| Khadas Mind 2 | |
| Minisforum AI X1 Pro, HX 470 | |
| Baldur's Gate 3 | |
| 1280x720 Low Preset AA:SM | |
| Khadas Mind Pro | |
| Geekom A9 Max, AI 9 HX 370 | |
| GMK EVO-T1 | |
| Khadas Mind 2s | |
| Khadas Mind 2 | |
| Minisforum AI X1 Pro, HX 470 | |
| 1920x1080 High Preset AA:T | |
| Khadas Mind Pro | |
| Geekom A9 Max, AI 9 HX 370 | |
| GMK EVO-T1 | |
| Khadas Mind 2s | |
| Khadas Mind 2 | |
| Minisforum AI X1 Pro, HX 470 | |
| F1 24 | |
| 1920x1080 Low Preset AA:T AF:16x | |
| Khadas Mind Pro | |
| Geekom A9 Max, AI 9 HX 370 | |
| Khadas Mind 2s | |
| GMK EVO-T1 | |
| Khadas Mind 2 | |
| Minisforum AI X1 Pro, HX 470 | |
| 1920x1080 High Preset AA:T AF:16x | |
| Khadas Mind Pro | |
| GMK EVO-T1 | |
| Khadas Mind 2s | |
| Geekom A9 Max, AI 9 HX 370 | |
| Khadas Mind 2 | |
| Minisforum AI X1 Pro, HX 470 | |
Wykres FPS - 30 min Cyberpunk 2077 1920 x 1080 Ultra Preset (FSR wyłączony)
| low | med. | high | ultra | |
|---|---|---|---|---|
| GTA V (2015) | 175.9 | 169.3 | 108.8 | 44.2 |
| The Witcher 3 (2015) | 294 | 198.8 | 106.5 | 46.6 |
| Dota 2 Reborn (2015) | 129.5 | 88 | 104 | 101.5 |
| X-Plane 11.11 (2018) | 62.3 | 50.3 | 41.7 | |
| Strange Brigade (2018) | 374 | 136.6 | 116.7 | 101.4 |
| Baldur's Gate 3 (2023) | 63.8 | 47.5 | 42.7 | 42.3 |
| Cyberpunk 2077 (2023) | 85.6 | 68.6 | 57.8 | 50.6 |
| F1 24 (2024) | 160.3 | 147.7 | 109.6 | 38.4 |
| F1 25 (2025) | 149.8 | 124.1 | 94.8 |
Khada's Mind Pro z Mind Graphics 2 (GeForce RTX 5060 Ti) w teście wydajności
W połączeniu z kartą graficzną Mind Graphics 2 i Nvidia GeForce RTX 5060 Ti khadas Mind Pro znacznie zyskuje na wydajności graficznej. Zewnętrzny procesor graficzny wyraźnie podnosi system ponad poziom zintegrowanej grafiki, a także umożliwia korzystanie z bardziej wymagających aplikacji i nowoczesnych gier z wysokimi detalami. Dzięki wydajnemu procesorowi karta graficzna jest dobrze wykorzystywana, co skutkuje dobrze zbalansowanym zespołem. Przekształca to kompaktowy mini PC w potężną alternatywę dla komputerów stacjonarnych do gier i obciążeń akcelerowanych przez GPU. Wydajność karty graficznej Nvidia GeForce RTX 5060 Ti w połączeniu z procesorem AMD Ryzen 7 9800X3D nie dorównuje jednak konfiguracji Mini-PC. Różnica w wydajności pozostaje jednak do opanowania i ogólnie jest akceptowalna.
| Performance rating - Percent | |
| Asus TUF Gaming GeForce RTX 5060 Ti OC | |
| Mind Pro + Mind Graphics 2 | |
| Zotac GeForce RTX 5060 AMP | |
| Gigabyte Radeon RX 9060 XT Gaming OC 16G | |
| Intel Arc B580 | |
| 3DMark 11 - 1280x720 Performance GPU | |
| Gigabyte Radeon RX 9060 XT Gaming OC 16G | |
| Asus TUF Gaming GeForce RTX 5060 Ti OC | |
| Zotac GeForce RTX 5060 AMP | |
| Mind Pro + Mind Graphics 2 | |
| Intel Arc B580 | |
| 3DMark | |
| 2560x1440 Time Spy Graphics | |
| Gigabyte Radeon RX 9060 XT Gaming OC 16G | |
| Asus TUF Gaming GeForce RTX 5060 Ti OC | |
| Intel Arc B580 | |
| Zotac GeForce RTX 5060 AMP | |
| Mind Pro + Mind Graphics 2 | |
| 1920x1080 Fire Strike Graphics | |
| Asus TUF Gaming GeForce RTX 5060 Ti OC | |
| Gigabyte Radeon RX 9060 XT Gaming OC 16G | |
| Zotac GeForce RTX 5060 AMP | |
| Intel Arc B580 | |
| Mind Pro + Mind Graphics 2 | |
| 3840x2160 Fire Strike Ultra Graphics | |
| Gigabyte Radeon RX 9060 XT Gaming OC 16G | |
| Asus TUF Gaming GeForce RTX 5060 Ti OC | |
| Zotac GeForce RTX 5060 AMP | |
| Mind Pro + Mind Graphics 2 | |
| Intel Arc B580 | |
| Unigine Superposition | |
| 1280x720 720p Low | |
| Asus TUF Gaming GeForce RTX 5060 Ti OC | |
| Zotac GeForce RTX 5060 AMP | |
| Gigabyte Radeon RX 9060 XT Gaming OC 16G | |
| Intel Arc B580 | |
| Mind Pro + Mind Graphics 2 | |
| 1920x1080 1080p High | |
| Asus TUF Gaming GeForce RTX 5060 Ti OC | |
| Mind Pro + Mind Graphics 2 | |
| Zotac GeForce RTX 5060 AMP | |
| Gigabyte Radeon RX 9060 XT Gaming OC 16G | |
| Intel Arc B580 | |
| 1920x1080 1080p Extreme | |
| Asus TUF Gaming GeForce RTX 5060 Ti OC | |
| Mind Pro + Mind Graphics 2 | |
| Gigabyte Radeon RX 9060 XT Gaming OC 16G | |
| Intel Arc B580 | |
| Zotac GeForce RTX 5060 AMP | |
| 3840x2160 4k Optimized | |
| Asus TUF Gaming GeForce RTX 5060 Ti OC | |
| Mind Pro + Mind Graphics 2 | |
| Zotac GeForce RTX 5060 AMP | |
| Gigabyte Radeon RX 9060 XT Gaming OC 16G | |
| Intel Arc B580 | |
| 7680x4320 8k Optimized | |
| Asus TUF Gaming GeForce RTX 5060 Ti OC | |
| Mind Pro + Mind Graphics 2 | |
| Zotac GeForce RTX 5060 AMP | |
| Intel Arc B580 | |
| Gigabyte Radeon RX 9060 XT Gaming OC 16G | |
| Unigine Valley 1.0 | |
| 1920x1080 Extreme HD DirectX AA:x8 | |
| Asus TUF Gaming GeForce RTX 5060 Ti OC | |
| Mind Pro + Mind Graphics 2 | |
| Zotac GeForce RTX 5060 AMP | |
| Intel Arc B580 | |
| Gigabyte Radeon RX 9060 XT Gaming OC 16G | |
| 1920x1080 Extreme HD Preset OpenGL AA:x8 | |
| Asus TUF Gaming GeForce RTX 5060 Ti OC | |
| Mind Pro + Mind Graphics 2 | |
| Zotac GeForce RTX 5060 AMP | |
| Intel Arc B580 | |
| Gigabyte Radeon RX 9060 XT Gaming OC 16G | |
| Unigine Heaven 4.0 | |
| Extreme Preset OpenGL | |
| Asus TUF Gaming GeForce RTX 5060 Ti OC | |
| Mind Pro + Mind Graphics 2 | |
| Zotac GeForce RTX 5060 AMP | |
| Gigabyte Radeon RX 9060 XT Gaming OC 16G | |
| Intel Arc B580 | |
| Extreme Preset DX11 | |
| Asus TUF Gaming GeForce RTX 5060 Ti OC | |
| Mind Pro + Mind Graphics 2 | |
| Zotac GeForce RTX 5060 AMP | |
| Intel Arc B580 | |
| Gigabyte Radeon RX 9060 XT Gaming OC 16G | |
| Performance rating - Percent | |
| Asus TUF Gaming GeForce RTX 5060 Ti OC | |
| Mind Pro + Mind Graphics 2 | |
| Zotac GeForce RTX 5060 AMP | |
| Gigabyte Radeon RX 9060 XT Gaming OC 16G | |
| 3DMark 11 - 1280x720 Performance GPU | |
| Gigabyte Radeon RX 9060 XT Gaming OC 16G | |
| Asus TUF Gaming GeForce RTX 5060 Ti OC | |
| Zotac GeForce RTX 5060 AMP | |
| Mind Pro + Mind Graphics 2 | |
| 3DMark | |
| 2560x1440 Time Spy Graphics | |
| Gigabyte Radeon RX 9060 XT Gaming OC 16G | |
| Asus TUF Gaming GeForce RTX 5060 Ti OC | |
| Zotac GeForce RTX 5060 AMP | |
| Mind Pro + Mind Graphics 2 | |
| 1920x1080 Fire Strike Graphics | |
| Asus TUF Gaming GeForce RTX 5060 Ti OC | |
| Gigabyte Radeon RX 9060 XT Gaming OC 16G | |
| Zotac GeForce RTX 5060 AMP | |
| Mind Pro + Mind Graphics 2 | |
| 3840x2160 Fire Strike Ultra Graphics | |
| Gigabyte Radeon RX 9060 XT Gaming OC 16G | |
| Asus TUF Gaming GeForce RTX 5060 Ti OC | |
| Zotac GeForce RTX 5060 AMP | |
| Mind Pro + Mind Graphics 2 | |
| Unigine Superposition | |
| 1280x720 720p Low | |
| Asus TUF Gaming GeForce RTX 5060 Ti OC | |
| Zotac GeForce RTX 5060 AMP | |
| Gigabyte Radeon RX 9060 XT Gaming OC 16G | |
| Mind Pro + Mind Graphics 2 | |
| 1920x1080 1080p High | |
| Asus TUF Gaming GeForce RTX 5060 Ti OC | |
| Mind Pro + Mind Graphics 2 | |
| Zotac GeForce RTX 5060 AMP | |
| Gigabyte Radeon RX 9060 XT Gaming OC 16G | |
| 1920x1080 1080p Extreme | |
| Asus TUF Gaming GeForce RTX 5060 Ti OC | |
| Mind Pro + Mind Graphics 2 | |
| Gigabyte Radeon RX 9060 XT Gaming OC 16G | |
| Zotac GeForce RTX 5060 AMP | |
| 3840x2160 4k Optimized | |
| Asus TUF Gaming GeForce RTX 5060 Ti OC | |
| Mind Pro + Mind Graphics 2 | |
| Zotac GeForce RTX 5060 AMP | |
| Gigabyte Radeon RX 9060 XT Gaming OC 16G | |
| 7680x4320 8k Optimized | |
| Asus TUF Gaming GeForce RTX 5060 Ti OC | |
| Mind Pro + Mind Graphics 2 | |
| Zotac GeForce RTX 5060 AMP | |
| Gigabyte Radeon RX 9060 XT Gaming OC 16G | |
| Unigine Valley 1.0 | |
| 1920x1080 Extreme HD DirectX AA:x8 | |
| Asus TUF Gaming GeForce RTX 5060 Ti OC | |
| Mind Pro + Mind Graphics 2 | |
| Zotac GeForce RTX 5060 AMP | |
| Gigabyte Radeon RX 9060 XT Gaming OC 16G | |
| 1920x1080 Extreme HD Preset OpenGL AA:x8 | |
| Asus TUF Gaming GeForce RTX 5060 Ti OC | |
| Mind Pro + Mind Graphics 2 | |
| Zotac GeForce RTX 5060 AMP | |
| Gigabyte Radeon RX 9060 XT Gaming OC 16G | |
| Unigine Heaven 4.0 | |
| Extreme Preset OpenGL | |
| Asus TUF Gaming GeForce RTX 5060 Ti OC | |
| Mind Pro + Mind Graphics 2 | |
| Zotac GeForce RTX 5060 AMP | |
| Gigabyte Radeon RX 9060 XT Gaming OC 16G | |
| Extreme Preset DX11 | |
| Asus TUF Gaming GeForce RTX 5060 Ti OC | |
| Mind Pro + Mind Graphics 2 | |
| Zotac GeForce RTX 5060 AMP | |
| Gigabyte Radeon RX 9060 XT Gaming OC 16G | |
| ComputeMark v2.1 | |
| 1024x600 Normal, Score | |
| Asus TUF Gaming GeForce RTX 5060 Ti OC | |
| Mind Pro + Mind Graphics 2 | |
| Zotac GeForce RTX 5060 AMP | |
| Gigabyte Radeon RX 9060 XT Gaming OC 16G | |
| 1024x600 Normal, Fluid 3DTex | |
| Asus TUF Gaming GeForce RTX 5060 Ti OC | |
| Mind Pro + Mind Graphics 2 | |
| Zotac GeForce RTX 5060 AMP | |
| Gigabyte Radeon RX 9060 XT Gaming OC 16G | |
| 1024x600 Normal, Fluid 2DTexArr | |
| Asus TUF Gaming GeForce RTX 5060 Ti OC | |
| Mind Pro + Mind Graphics 2 | |
| Zotac GeForce RTX 5060 AMP | |
| Gigabyte Radeon RX 9060 XT Gaming OC 16G | |
| 1024x600 Normal, Mandel Vector | |
| Gigabyte Radeon RX 9060 XT Gaming OC 16G | |
| Asus TUF Gaming GeForce RTX 5060 Ti OC | |
| Mind Pro + Mind Graphics 2 | |
| Zotac GeForce RTX 5060 AMP | |
| 1024x600 Normal, Mandel Scalar | |
| Gigabyte Radeon RX 9060 XT Gaming OC 16G | |
| Asus TUF Gaming GeForce RTX 5060 Ti OC | |
| Mind Pro + Mind Graphics 2 | |
| Zotac GeForce RTX 5060 AMP | |
| 1024x600 Normal, QJuliaRayTrace | |
| Asus TUF Gaming GeForce RTX 5060 Ti OC | |
| Mind Pro + Mind Graphics 2 | |
| Zotac GeForce RTX 5060 AMP | |
| Gigabyte Radeon RX 9060 XT Gaming OC 16G | |
| Performance rating - Percent | |
| Asus TUF Gaming GeForce RTX 5060 Ti OC | |
| Gigabyte Radeon RX 9060 XT Gaming OC 16G | |
| Zotac GeForce RTX 5060 AMP | |
| Mind Pro + Mind Graphics 2 | |
| ASUS Dual GeForce RTX 4060 EVO OC | |
| Cyberpunk 2077 | |
| 1280x720 Low Preset (FSR off) | |
| Gigabyte Radeon RX 9060 XT Gaming OC 16G | |
| Zotac GeForce RTX 5060 AMP | |
| Asus TUF Gaming GeForce RTX 5060 Ti OC | |
| ASUS Dual GeForce RTX 4060 EVO OC | |
| Mind Pro + Mind Graphics 2 | |
| 1920x1080 Medium Preset (FSR off) | |
| Asus TUF Gaming GeForce RTX 5060 Ti OC | |
| Gigabyte Radeon RX 9060 XT Gaming OC 16G | |
| Zotac GeForce RTX 5060 AMP | |
| Mind Pro + Mind Graphics 2 | |
| ASUS Dual GeForce RTX 4060 EVO OC | |
| 1920x1080 High Preset (FSR off) | |
| Asus TUF Gaming GeForce RTX 5060 Ti OC | |
| Gigabyte Radeon RX 9060 XT Gaming OC 16G | |
| Zotac GeForce RTX 5060 AMP | |
| Mind Pro + Mind Graphics 2 | |
| ASUS Dual GeForce RTX 4060 EVO OC | |
| 1920x1080 Ultra Preset (FSR off) | |
| Asus TUF Gaming GeForce RTX 5060 Ti OC | |
| Gigabyte Radeon RX 9060 XT Gaming OC 16G | |
| Zotac GeForce RTX 5060 AMP | |
| Mind Pro + Mind Graphics 2 | |
| ASUS Dual GeForce RTX 4060 EVO OC | |
| 2560x1440 Ultra Preset (FSR off) | |
| Asus TUF Gaming GeForce RTX 5060 Ti OC | |
| Gigabyte Radeon RX 9060 XT Gaming OC 16G | |
| Mind Pro + Mind Graphics 2 | |
| Zotac GeForce RTX 5060 AMP | |
| ASUS Dual GeForce RTX 4060 EVO OC | |
| Baldur's Gate 3 | |
| 1920x1080 Low Preset AA:SM | |
| Asus TUF Gaming GeForce RTX 5060 Ti OC | |
| Gigabyte Radeon RX 9060 XT Gaming OC 16G | |
| Zotac GeForce RTX 5060 AMP | |
| Mind Pro + Mind Graphics 2 | |
| ASUS Dual GeForce RTX 4060 EVO OC | |
| 1920x1080 Medium Preset AA:T | |
| Asus TUF Gaming GeForce RTX 5060 Ti OC | |
| Gigabyte Radeon RX 9060 XT Gaming OC 16G | |
| Zotac GeForce RTX 5060 AMP | |
| Mind Pro + Mind Graphics 2 | |
| ASUS Dual GeForce RTX 4060 EVO OC | |
| 1920x1080 High Preset AA:T | |
| Asus TUF Gaming GeForce RTX 5060 Ti OC | |
| Zotac GeForce RTX 5060 AMP | |
| Gigabyte Radeon RX 9060 XT Gaming OC 16G | |
| Mind Pro + Mind Graphics 2 | |
| ASUS Dual GeForce RTX 4060 EVO OC | |
| 1920x1080 Ultra Preset AA:T | |
| Asus TUF Gaming GeForce RTX 5060 Ti OC | |
| Zotac GeForce RTX 5060 AMP | |
| Mind Pro + Mind Graphics 2 | |
| Gigabyte Radeon RX 9060 XT Gaming OC 16G | |
| ASUS Dual GeForce RTX 4060 EVO OC | |
| 2560x1440 Ultra Preset AA:T | |
| Asus TUF Gaming GeForce RTX 5060 Ti OC | |
| Mind Pro + Mind Graphics 2 | |
| Gigabyte Radeon RX 9060 XT Gaming OC 16G | |
| Zotac GeForce RTX 5060 AMP | |
| ASUS Dual GeForce RTX 4060 EVO OC | |
| F1 24 | |
| 1920x1080 Low Preset AA:T AF:16x | |
| Gigabyte Radeon RX 9060 XT Gaming OC 16G | |
| Asus TUF Gaming GeForce RTX 5060 Ti OC | |
| Zotac GeForce RTX 5060 AMP | |
| ASUS Dual GeForce RTX 4060 EVO OC | |
| Mind Pro + Mind Graphics 2 | |
| 1920x1080 Medium Preset AA:T AF:16x | |
| Asus TUF Gaming GeForce RTX 5060 Ti OC | |
| Gigabyte Radeon RX 9060 XT Gaming OC 16G | |
| Zotac GeForce RTX 5060 AMP | |
| ASUS Dual GeForce RTX 4060 EVO OC | |
| Mind Pro + Mind Graphics 2 | |
| 1920x1080 High Preset AA:T AF:16x | |
| Asus TUF Gaming GeForce RTX 5060 Ti OC | |
| Gigabyte Radeon RX 9060 XT Gaming OC 16G | |
| Zotac GeForce RTX 5060 AMP | |
| Mind Pro + Mind Graphics 2 | |
| ASUS Dual GeForce RTX 4060 EVO OC | |
| 1920x1080 Ultra High Preset AA:T AF:16x | |
| Gigabyte Radeon RX 9060 XT Gaming OC 16G | |
| Asus TUF Gaming GeForce RTX 5060 Ti OC | |
| Mind Pro + Mind Graphics 2 | |
| Zotac GeForce RTX 5060 AMP | |
| ASUS Dual GeForce RTX 4060 EVO OC | |
| 2560x1440 Ultra High Preset AA:T AF:16x | |
| Gigabyte Radeon RX 9060 XT Gaming OC 16G | |
| Asus TUF Gaming GeForce RTX 5060 Ti OC | |
| Mind Pro + Mind Graphics 2 | |
| Zotac GeForce RTX 5060 AMP | |
| ASUS Dual GeForce RTX 4060 EVO OC | |
| The Witcher 3 | |
| 1024x768 Low Graphics & Postprocessing | |
| Asus TUF Gaming GeForce RTX 5060 Ti OC | |
| Zotac GeForce RTX 5060 AMP | |
| Gigabyte Radeon RX 9060 XT Gaming OC 16G | |
| ASUS Dual GeForce RTX 4060 EVO OC | |
| Mind Pro + Mind Graphics 2 | |
| 1366x768 Medium Graphics & Postprocessing | |
| Asus TUF Gaming GeForce RTX 5060 Ti OC | |
| Gigabyte Radeon RX 9060 XT Gaming OC 16G | |
| Zotac GeForce RTX 5060 AMP | |
| ASUS Dual GeForce RTX 4060 EVO OC | |
| Mind Pro + Mind Graphics 2 | |
| 1920x1080 High Graphics & Postprocessing (Nvidia HairWorks Off) | |
| Asus TUF Gaming GeForce RTX 5060 Ti OC | |
| Zotac GeForce RTX 5060 AMP | |
| Gigabyte Radeon RX 9060 XT Gaming OC 16G | |
| Mind Pro + Mind Graphics 2 | |
| ASUS Dual GeForce RTX 4060 EVO OC | |
| 1920x1080 Ultra Graphics & Postprocessing (HBAO+) | |
| Asus TUF Gaming GeForce RTX 5060 Ti OC | |
| Gigabyte Radeon RX 9060 XT Gaming OC 16G | |
| Zotac GeForce RTX 5060 AMP | |
| Mind Pro + Mind Graphics 2 | |
| ASUS Dual GeForce RTX 4060 EVO OC | |
| 2560x1440 Ultra Graphics & Postprocessing (HBAO+) | |
| Asus TUF Gaming GeForce RTX 5060 Ti OC | |
| Mind Pro + Mind Graphics 2 | |
| Zotac GeForce RTX 5060 AMP | |
| Gigabyte Radeon RX 9060 XT Gaming OC 16G | |
| ASUS Dual GeForce RTX 4060 EVO OC | |
| Anno 117: Pax Romana | |
| 1920x1080 Low AA:T | |
| Asus TUF Gaming GeForce RTX 5060 Ti OC | |
| Gigabyte Radeon RX 9060 XT Gaming OC 16G | |
| Mind Pro + Mind Graphics 2 | |
| Zotac GeForce RTX 5060 AMP | |
| ASUS Dual GeForce RTX 4060 EVO OC | |
| 1920x1080 Medium AA:T | |
| Asus TUF Gaming GeForce RTX 5060 Ti OC | |
| Gigabyte Radeon RX 9060 XT Gaming OC 16G | |
| Zotac GeForce RTX 5060 AMP | |
| Mind Pro + Mind Graphics 2 | |
| ASUS Dual GeForce RTX 4060 EVO OC | |
| 1920x1080 High AA:T | |
| Asus TUF Gaming GeForce RTX 5060 Ti OC | |
| Gigabyte Radeon RX 9060 XT Gaming OC 16G | |
| Mind Pro + Mind Graphics 2 | |
| Zotac GeForce RTX 5060 AMP | |
| ASUS Dual GeForce RTX 4060 EVO OC | |
| 1920x1080 Ultra High AA:T | |
| Asus TUF Gaming GeForce RTX 5060 Ti OC | |
| Gigabyte Radeon RX 9060 XT Gaming OC 16G | |
| Mind Pro + Mind Graphics 2 | |
| Zotac GeForce RTX 5060 AMP | |
| ASUS Dual GeForce RTX 4060 EVO OC | |
| 2560x1440 Ultra High AA:T | |
| Asus TUF Gaming GeForce RTX 5060 Ti OC | |
| Gigabyte Radeon RX 9060 XT Gaming OC 16G | |
| Mind Pro + Mind Graphics 2 | |
| Zotac GeForce RTX 5060 AMP | |
| ASUS Dual GeForce RTX 4060 EVO OC | |
| Khadas Mind Pro Intel Core Ultra X7 358H, Intel Arc B390 12 Xe3 Panther Lake iGPU | Khadas Mind Pro Intel Core Ultra X7 358H, NVIDIA GeForce RTX 5060 Ti | NVIDIA Asus TUF Gaming GeForce RTX 5060 Ti OC AMD Ryzen 7 9800X3D, NVIDIA GeForce RTX 5060 Ti | Zotac GeForce RTX 5060 AMP AMD Ryzen 7 9800X3D, NVIDIA GeForce RTX 5060 | Gigabyte Radeon RX 9060 XT Gaming OC 16G AMD Ryzen 7 9800X3D, AMD Radeon RX 9060 XT 16GB | Średnia w klasie Mini PC | |
|---|---|---|---|---|---|---|
| SPECviewperf 2020 | 219% | 269% | 232% | 926% | 224% | |
| 3840x2160 Medical (medical-03) (fps) | 9.48 | 17.4 84% | 17.9 89% | 15.9 68% | 88.3 831% | 24.2 ? 155% |
| 3840x2160 Energy (energy-03) (fps) | 7.67 | 36.4 375% | 54.1 605% | 44.2 476% | 71.6 834% | 36.2 ? 372% |
| 3840x2160 Creo (creo-03) (fps) | 28.9 | 92.9 221% | 101 249% | 97.7 238% | 130 350% | 52 ? 80% |
| 3840x2160 CATIA (catia-06) (fps) | 19.5 | 42.9 120% | 45.1 131% | 43.2 122% | 82.9 325% | 36.7 ? 88% |
| 3840x2160 3ds Max (3dsmax-07) (fps) | 26.9 | 100 272% | 110 309% | 88 227% | 84.4 214% | 58.9 ? 119% |
| 3840x2160 Siemens NX (snx-04) (fps) | 7.09 | 20.2 185% | 21.3 200% | 22 210% | 272 3736% | 52.5 ? 640% |
| 3840x2160 Maya (maya-06) (fps) | 69.4 | 260 275% | 280 303% | 265 282% | 204 194% | 150.1 ? 116% |
| low | med. | high | ultra | QHD | 4K | |
|---|---|---|---|---|---|---|
| The Witcher 3 (2015) | 379 | 355 | 280 | 140.7 | 110.2 | 95.6 |
| Dota 2 Reborn (2015) | 177.4 | 159.7 | 152.8 | 143.9 | 128.8 | |
| Final Fantasy XV Benchmark (2018) | 206 | 187.2 | 140.9 | 108.7 | 62.9 | |
| X-Plane 11.11 (2018) | 138 | 125.8 | 106.1 | 86.5 | ||
| Baldur's Gate 3 (2023) | 185.9 | 147.7 | 128.9 | 128.2 | 93.7 | 51.4 |
| Cyberpunk 2077 (2023) | 142.9 | 138.3 | 121.2 | 109 | 72.6 | 32.8 |
| F1 24 (2024) | 231 | 242 | 234 | 92.3 | 61.5 | 31 |
| Anno 117: Pax Romana (2025) | 125.4 | 100.6 | 77 | 41.4 | 29.3 | 16.7 |
Emisje
Hałas systemowy
Khadas poprawił system chłodzenia w Mind Pro, co ma pozytywny wpływ na poziom hałasu. Dzięki nieco większej obudowie, mini PC jest ogólnie cichszy niż Mind 2s. Chociaż system pozostaje słyszalny pod obciążeniem, jest na bardziej umiarkowanym poziomie nieco ponad 40 dB(A) w szczycie.
W połączeniu z Mind Graphics 2, głośność wzrasta do 50,6 dB(A) pod pełnym obciążeniem. Z kolei w grach zmierzony poziom ciśnienia akustycznego jest zwykle nieco niższy i waha się od 45 do 46 dB(A). Poziom hałasu wzrasta również nieznacznie w trybie bezczynności, ale pozostaje na niskim poziomie około 31,5 dB(A).
Hałas
| luz |
| 24.9 / 24.9 / 25 dB |
| obciążenie |
| 40.1 / 40.2 dB |
 | ||
30 dB cichy 40 dB(A) słyszalny 50 dB(A) irytujący |
||
min: | ||
| Khadas Mind Pro Ultra X7 358H, Arc B390 Panther Lake iGPU | Geekom A9 Max, AI 9 HX 370 Ryzen AI 9 HX 370, Radeon 890M | Minisforum AI X1 Pro, HX 470 Ryzen AI 9 HX 470, Radeon 890M | Khadas Mind 2s Ultra 7 255H, Arc 140T | GMK EVO-T1 Ultra 9 285H, Arc 140T | Khadas Mind 2 Ultra 7 155H, Arc 8-Core | Khadas Mind i7-1360P, Iris Xe G7 96EUs | |
|---|---|---|---|---|---|---|---|
| Noise | -15% | 1% | -12% | -33% | -12% | -27% | |
| wyłączone / środowisko * (dB) | 24.6 | 24.8 -1% | 24.9 -1% | 24.3 1% | 24.7 -0% | 24.8 -1% | 25.2 -2% |
| Idle Minimum * (dB) | 24.9 | 25.4 -2% | 28.4 -14% | 26 -4% | 38.7 -55% | 26.1 -5% | 34.4 -38% |
| Idle Average * (dB) | 24.9 | 25.4 -2% | 28.6 -15% | 28.8 -16% | 38.8 -56% | 27 -8% | 34.4 -38% |
| Idle Maximum * (dB) | 25 | 25.5 -2% | 28.6 -14% | 29.2 -17% | 38.9 -56% | 30.4 -22% | 34.5 -38% |
| Load Average * (dB) | 40.1 | 49.8 -24% | 33.1 17% | 46.7 -16% | 51.6 -29% | 46 -15% | 44.7 -11% |
| Witcher 3 ultra * (dB) | 36.2 | 49.7 -37% | 32.3 11% | 38.7 -7% | 49 -35% | ||
| Cyberpunk 2077 ultra * (dB) | 39.7 | 49.6 -25% | 32.7 18% | 46.5 -17% | 52 -31% | 45.9 -16% | |
| Load Maximum * (dB) | 40.2 | 49.8 -24% | 39.2 2% | 46.7 -16% | 51.6 -28% | 46 -14% | 50.4 -25% |
* ... im mniej tym lepiej
Temperatura
Obudowa Khadas Mind Pro nagrzewa się tylko nieznacznie podczas bezczynności. Dzięki metalowej konstrukcji, generowane ciepło jest również stosunkowo równomiernie rozprowadzane po powierzchni. Pod obciążeniem temperatura obudowy znacznie wzrasta w porównaniu do trybu bezczynności. Niemniej jednak zmierzone temperatury powierzchni wynoszące nieco ponad 40 C pozostają ogólnie w niekrytycznym zakresie.
W teście obciążeniowym Intel Core Ultra X7 358H na krótko osiąga temperaturę do 80 C, co wciąż nie jest krytycznym wynikiem, biorąc pod uwagę maksymalną temperaturę podaną przez Intela. Przy średnim poborze mocy wynoszącym około 45 W, temperatura procesora ustabilizowała się następnie na poziomie około 76 C. SoC rozgrzał się jednak nieco bardziej w teście wielozadaniowym Cinebench R15 (97 C).
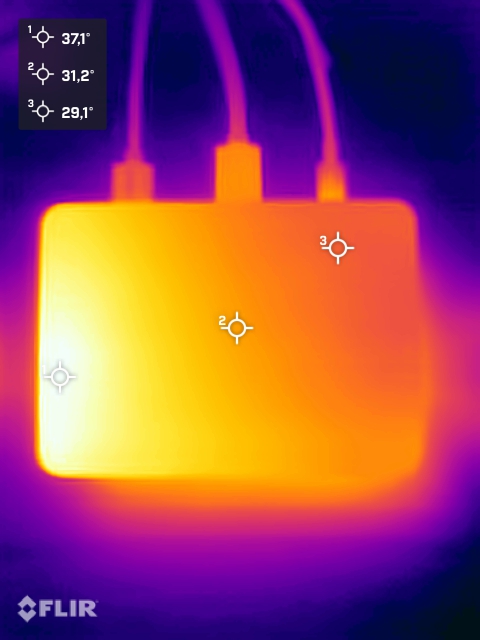
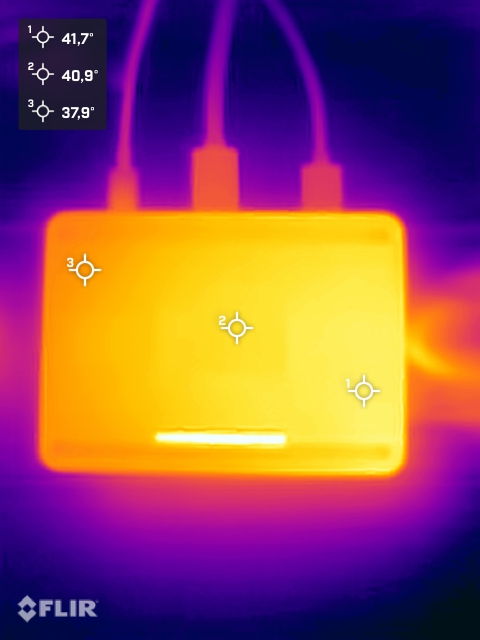
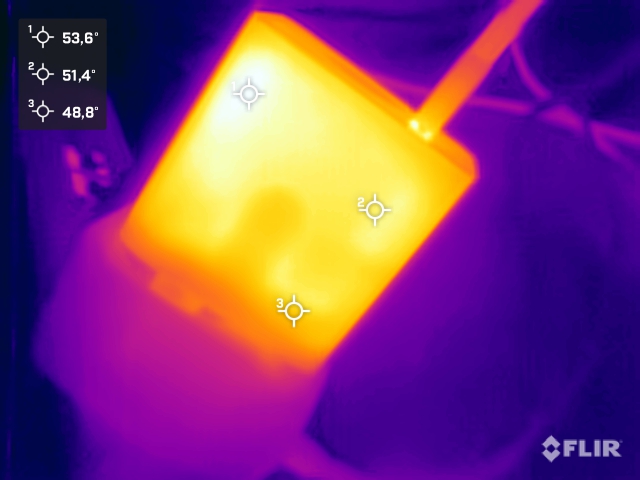
(±) Maksymalna temperatura w górnej części wynosi 40.2 °C / 104 F, w porównaniu do średniej 35.4 °C / 96 F , począwszy od 20.6 do 69.5 °C dla klasy Mini PC.
(±) Dno nagrzewa się maksymalnie do 42.5 °C / 109 F, w porównaniu do średniej 36.1 °C / 97 F
(+) W stanie bezczynności średnia temperatura górnej części wynosi 30 °C / 86 F, w porównaniu ze średnią temperaturą urządzenia wynoszącą 32.1 °C / ### class_avg_f### F.
(±) 3: The average temperature for the upper side is 35.5 °C / 96 F, compared to the average of 32.1 °C / 90 F for the class Mini PC.
Zarządzanie energią
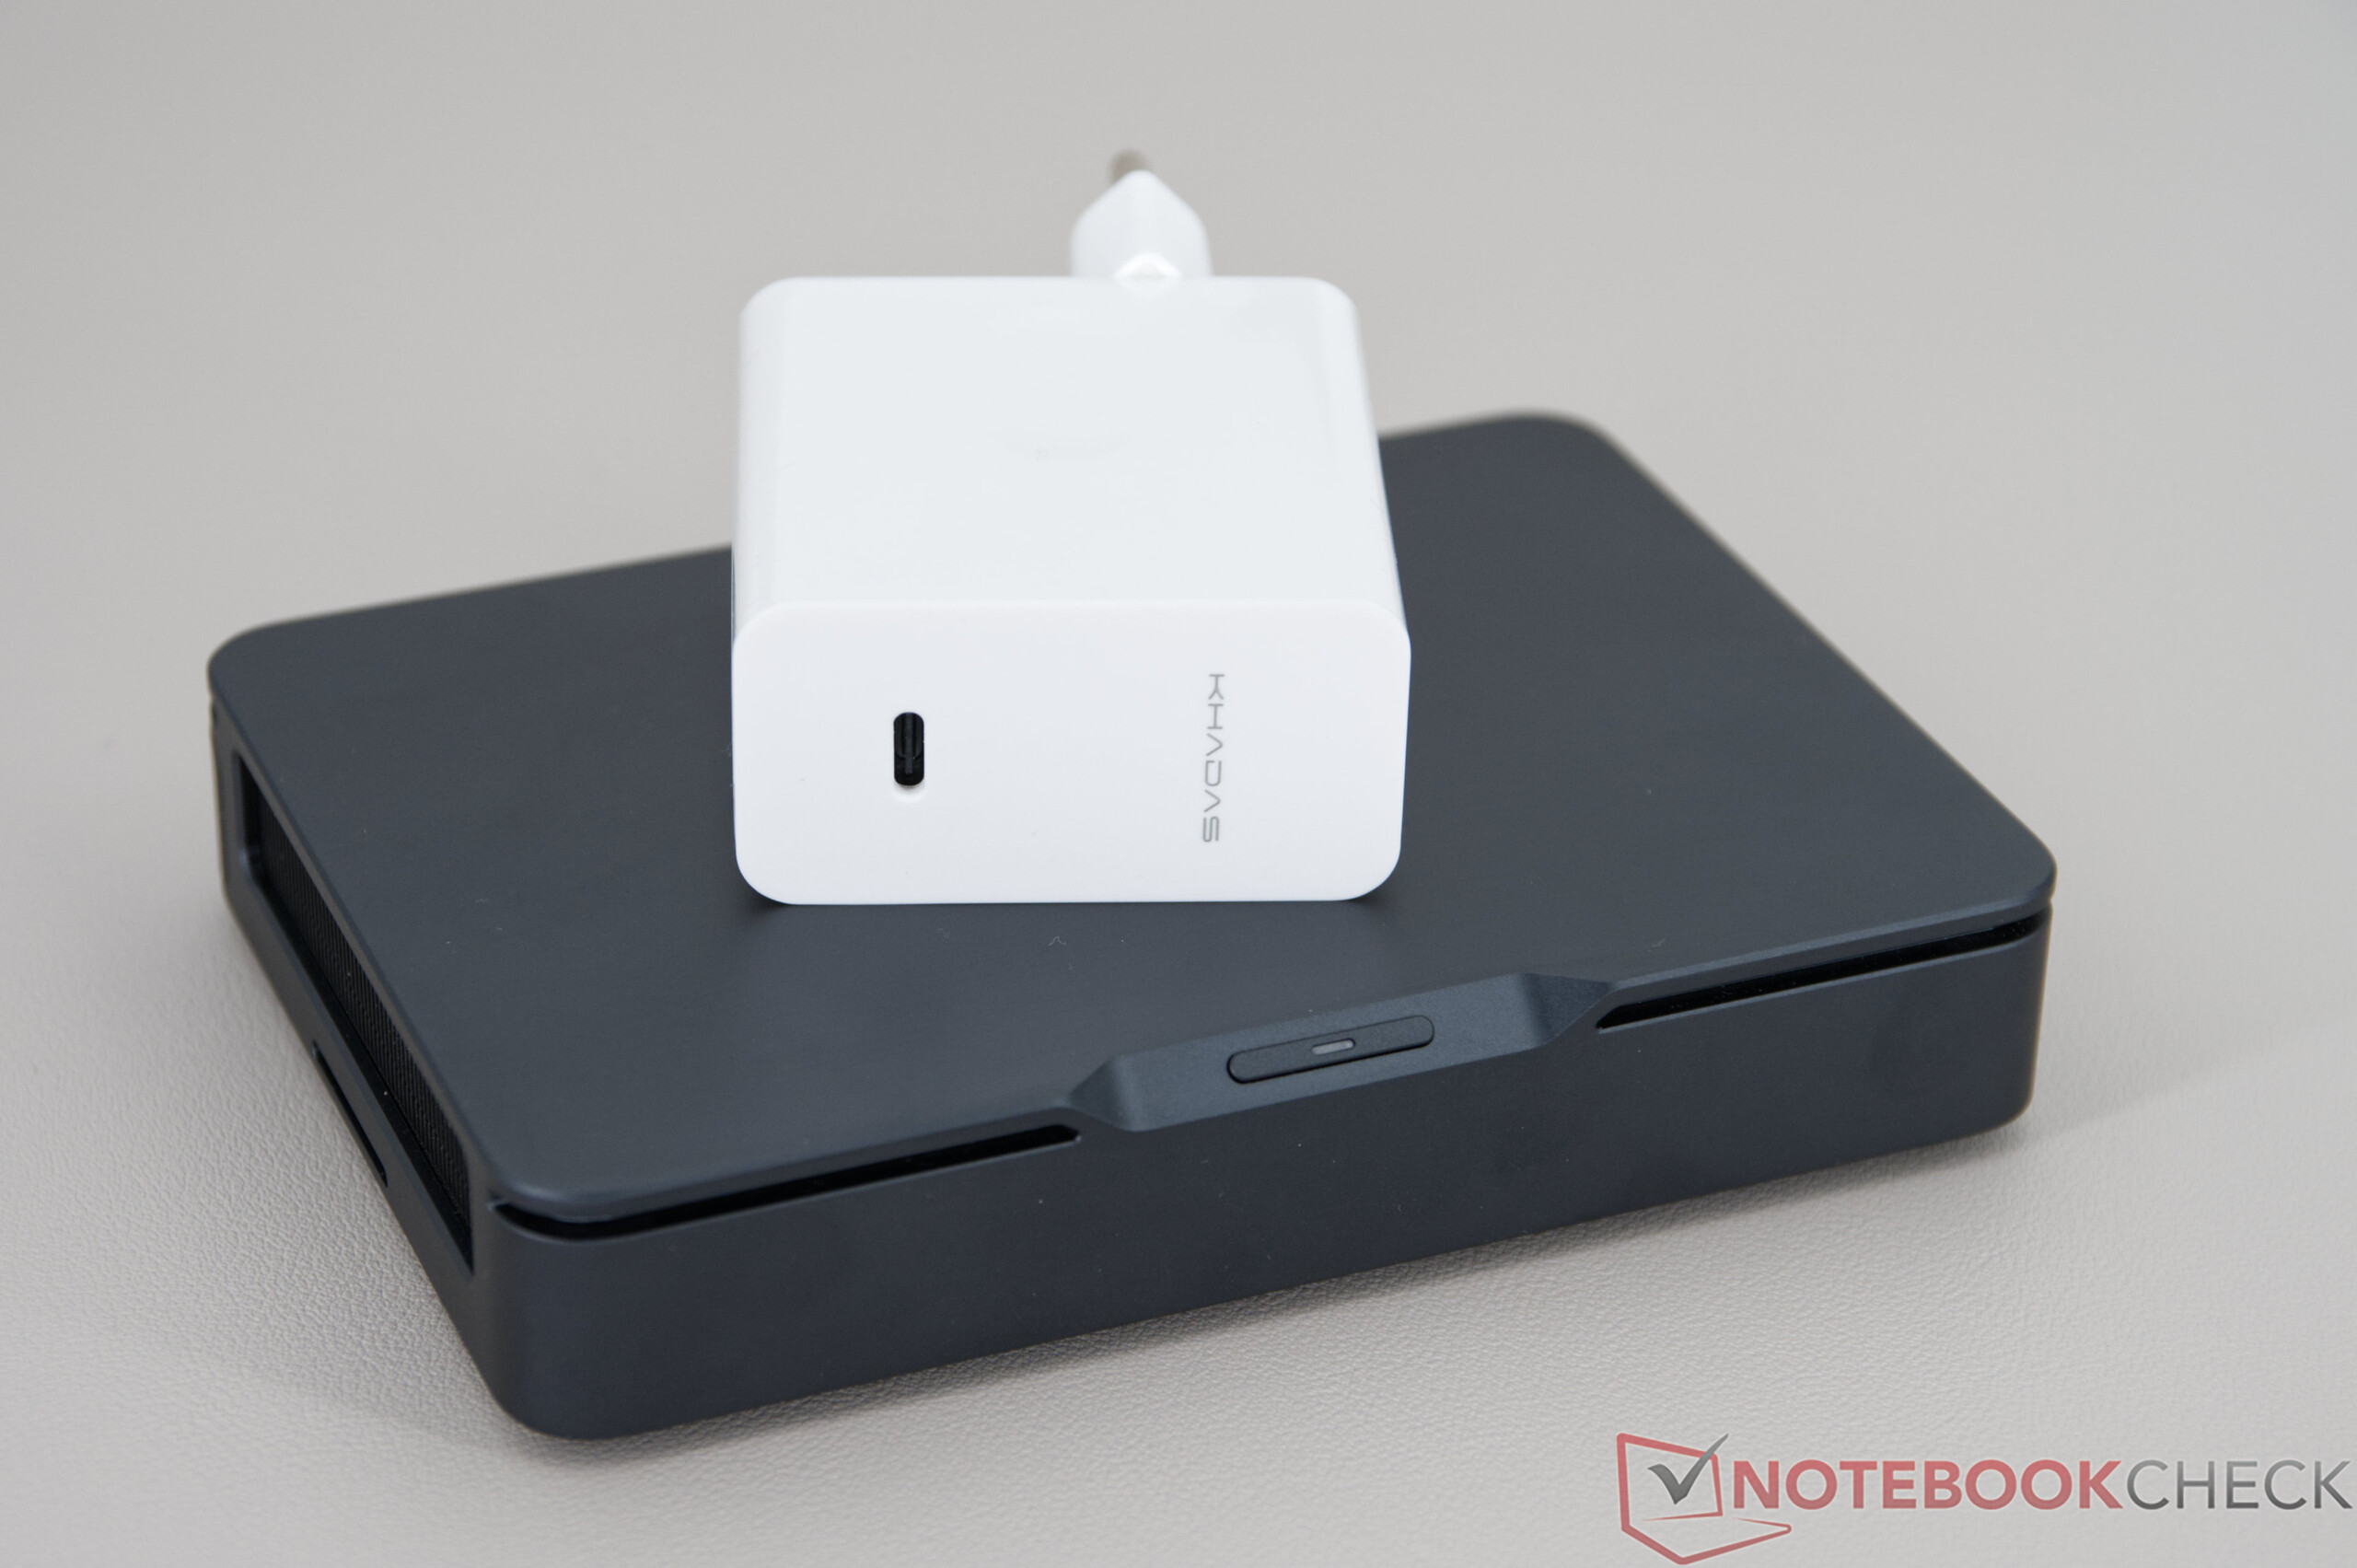
Khadas Mind Pro jest dostarczany ze 100-watowym zasilaczem, który oferuje wystarczające rezerwy dla mocniejszego systemu. W trybie bezczynności pobór mocy waha się od około 6,7 do 11,5 watów w zależności od stanu obciążenia, podczas gdy średnia około 53 watów jest mierzona pod obciążeniem. W krótkich okresach pobór może wzrosnąć do około 64,4 watów, ale nie stanowi to wyzwania dla zasilacza. Ogólnie rzecz biorąc, Mini-PC okazał się niezwykle wydajny w teście i był w stanie wyprzedzić wszystkie urządzenia porównawcze.
| wyłączony / stan wstrzymania | |
| luz | |
| obciążenie |
|
Legenda:
min: | |
| Khadas Mind Pro Ultra X7 358H, Arc B390 Panther Lake iGPU | Geekom A9 Max, AI 9 HX 370 Ryzen AI 9 HX 370, Radeon 890M | Minisforum AI X1 Pro, HX 470 Ryzen AI 9 HX 470, Radeon 890M | Khadas Mind 2s Ultra 7 255H, Arc 140T | GMK EVO-T1 Ultra 9 285H, Arc 140T | Khadas Mind 2 Ultra 7 155H, Arc 8-Core | Khadas Mind i7-1360P, Iris Xe G7 96EUs | Przeciętny Intel Arc B390 12 Xe3 Panther Lake iGPU | Średnia w klasie Mini PC | |
|---|---|---|---|---|---|---|---|---|---|
| Power Consumption | -23% | -34% | -46% | -58% | -57% | -67% | -17% | -96% | |
| Idle Minimum * (Watt) | 3.9 | 2.4 38% | 5.5 -41% | 6.7 -72% | 6.1 -56% | 9 -131% | 7.8 -100% | 3.79 ? 3% | 8.63 ? -121% |
| Idle Average * (Watt) | 4.7 | 4.6 2% | 7.7 -64% | 9.9 -111% | 7.9 -68% | 9.7 -106% | 10.9 -132% | 6.17 ? -31% | 10.8 ? -130% |
| Idle Maximum * (Watt) | 5.2 | 9.2 -77% | 9.1 -75% | 11.5 -121% | 13.2 -154% | 12.5 -140% | 11.8 -127% | 8.66 ? -67% | 13.5 ? -160% |
| Load Average * (Watt) | 42.6 | 78.4 -84% | 59.2 -39% | 53 -24% | 60.7 -42% | 49.7 -17% | 39.2 8% | 43.7 ? -3% | 63.6 ? -49% |
| Cyberpunk 2077 ultra external monitor * (Watt) | 67.5 | 77.8 -15% | 57.4 15% | 54.5 19% | 67.4 -0% | 51.3 24% | |||
| Load Maximum * (Watt) | 93.5 | 95.1 -2% | 92.4 1% | 64.4 31% | 117.1 -25% | 65.5 30% | 76.4 18% | 81.1 ? 13% | 110.9 ? -19% |
* ... im mniej tym lepiej
Wydajność energetyczna
| Performance rating - Percent | |
| Khadas Mind Pro | |
| Geekom A9 Max, AI 9 HX 370 | |
| Minisforum AI X1 Pro, HX 470 | |
| Khadas Mind 2s | |
| Khadas Mind 2 | |
| GMK EVO-T1 | |
| Khadas Mind | |
| Power Consumption | |
| Cinebench R23 Multi Power Efficiency - external Monitor | |
| Geekom A9 Max, AI 9 HX 370 | |
| Khadas Mind 2s | |
| Minisforum AI X1 Pro, HX 470 | |
| Khadas Mind 2 | |
| Khadas Mind Pro | |
| GMK EVO-T1 | |
| Khadas Mind | |
| Cinebench R23 Single Power Efficiency - external Monitor | |
| Khadas Mind Pro | |
| Minisforum AI X1 Pro, HX 470 | |
| Geekom A9 Max, AI 9 HX 370 | |
| Khadas Mind 2s | |
| GMK EVO-T1 | |
| Khadas Mind 2 | |
| Khadas Mind | |
| Cinebench R15 Multi Efficiency (external Monitor) | |
| Khadas Mind 2s | |
| Minisforum AI X1 Pro, HX 470 | |
| Geekom A9 Max, AI 9 HX 370 | |
| Khadas Mind 2 | |
| Khadas Mind Pro | |
| GMK EVO-T1 | |
| Khadas Mind | |
Pobór mocy - monitor zewnętrzny
zużycie energii z zewnętrznym monitorem
Ocena Notebookcheck
Khadas Mind Pro
- 15/03/2026 v8
Sebastian Bade
 Total Sustainability Score:
 Możliwe alternatywy w porównaniu
Obraz | Model / recenzja | Cena | Waga | Wymiary |
|---|---|---|---|---|
1. 84.5%  | Khadas Mind Pro Intel Core Ultra X7 358H ⎘ Intel Arc B390 12 Xe3 Panther Lake iGPU ⎘ 64 GB Pamięć, 2048 GB SSD | Amazon: 1. $1,349.00 Khadas Mind Graphics 2 eGPU ... 2. $1,399.00 Khadas Mind 2 Mini PC - Inte... 3. $1,099.00 Khadas Mind 2 Mini PC - Inte... Cena katalogowa: 1799€ | 566 g | 105 x 146 x 58 mm |
2. 82%  | Geekom A9 Max, AI 9 HX 370 AMD Ryzen AI 9 HX 370 ⎘ AMD Radeon 890M ⎘ 32 GB Pamięć, 2048 GB SSD | Amazon: Cena katalogowa: 999€ | 709 g | 132 x 135 x 46.9 mm |
3. 81.6%  | Minisforum AI X1 Pro, HX 470 AMD Ryzen AI 9 HX 470 ⎘ AMD Radeon 890M ⎘ 32 GB Pamięć, 1024 GB SSD | Amazon: Cena katalogowa: 1399€ | 1.3 kg | 195 x 195 x 42.5 mm |
4. 76.9%  | Khadas Mind 2s Intel Core Ultra 7 255H ⎘ Intel Arc Graphics 140T ⎘ 64 GB Pamięć, 2048 GB SSD | Amazon: Cena katalogowa: 1799€ | 436 g | 105 x 146 x 20 mm |
5. 75.4%  | GMK EVO-T1 Intel Core Ultra 9 285H ⎘ Intel Arc Graphics 140T ⎘ 64 GB Pamięć, 1024 GB SSD | Amazon: Cena katalogowa: 999€ | 946 g | 151 x 154 x 73.6 mm |
6. 73.6%  | Khadas Mind 2 Intel Core Ultra 7 155H ⎘ Intel Arc 8-Core iGPU ⎘ 32 GB Pamięć, 1024 GB SSD | Amazon: $1,099.00 Cena katalogowa: 1.099 USD | 437 g | 105 x 146 x 20 mm |
7. 78.8% v7 (old) 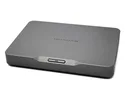 | Khadas Mind Intel Core i7-1360P ⎘ Intel Iris Xe Graphics G7 96EUs ⎘ 32 GB Pamięć, 1024 GB SSD | Amazon: 1. $1,099.00 Khadas Mind 2 Mini PC - Inte... 2. $1,399.00 Khadas Mind 2 Mini PC - Inte... 3. $549.00 Khadas Mind 1 Mini PC, Intel... Cena katalogowa: 799€ | 438 g | 105 x 146 x 20 mm |
Przezroczystość
Wyboru urządzeń do recenzji dokonuje nasza redakcja. Próbka testowa została udostępniona autorowi jako pożyczka od producenta lub sprzedawcy detalicznego na potrzeby tej recenzji. Pożyczkodawca nie miał wpływu na tę recenzję, producent nie otrzymał też kopii tej recenzji przed publikacją. Nie było obowiązku publikowania tej recenzji. Jako niezależna firma medialna, Notebookcheck nie podlega władzy producentów, sprzedawców detalicznych ani wydawców.
Tak testuje Notebookcheck
Każdego roku Notebookcheck niezależnie sprawdza setki laptopów i smartfonów, stosując standardowe procedury, aby zapewnić porównywalność wszystkich wyników. Od około 20 lat stale rozwijamy nasze metody badawcze, ustanawiając przy tym standardy branżowe. W naszych laboratoriach testowych doświadczeni technicy i redaktorzy korzystają z wysokiej jakości sprzętu pomiarowego. Testy te obejmują wieloetapowy proces walidacji. Nasz kompleksowy system ocen opiera się na setkach uzasadnionych pomiarów i benchmarków, co pozwala zachować obiektywizm.
