Debiut wydajności AMD Radeon RX 7900M: Recenzja laptopa Alienware m18 R1
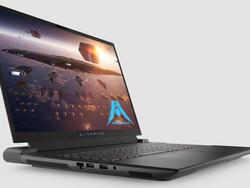
Jako pierwszy 18-calowy laptop do gier od Alienware od ponad dekady, Dell idzie na całość w swojej serii Alienware M18 R1, oferując opcje Intel, AMD i Nvidia, aby przyciągnąć jak najwięcej graczy. Użytkownicy mogą łączyć i dopasowywać procesory i karty graficzne Intel-Nvidia, AMD-Nvidia lub AMD-AMD, co jest bardzo rzadkie w przypadku laptopów do gier.
Nasza recenzowana jednostka to najnowsza konfiguracja AMD-AMD i jedna z pierwszych dostępnych, która oferuje 180 W RNDA3 Radeon RX 7900M jako alternatywę dla królującego mobilnego GeForce RTX 4080. Być może najbardziej godne uwagi jest to, że nowy procesor graficzny AMD obniża cenę konfiguracji RTX 4090 o 1200 USD, przy wszystkich innych opcjach utrzymanych na tym samym poziomie, osiągając ostateczną cenę 2300 USD.
Alternatywy dla Alienware m18 R1 obejmują inne wysokiej klasy 18-calowe laptopy do gier, takie jakAsus ROG Strix Scar 18, Razer Blade 18lubAcer Predator Helios 18. MSI nie oferuje obecnie żadnych nowoczesnych 18-calowych laptopów do gier.
Więcej recenzji Dell:
Potencjalni konkurenci w porównaniu
Ocena | Data | Model | Waga | Wysokość | Rozmiar | Rezolucja | Cena |
|---|---|---|---|---|---|---|---|
| 89.2 % v7 (old) | 11/2023 | Alienware m18 R1 AMD R9 7945HX, Radeon RX 7900M | 3.9 kg | 26.7 mm | 18.00" | 1920x1200 | |
| 90.7 % v7 (old) | 04/2023 | Alienware m18 R1 i9-13980HX, GeForce RTX 4090 Laptop GPU | 3.9 kg | 26.7 mm | 18.00" | 1920x1200 | |
| 88.3 % v7 (old) | 10/2023 | Acer Predator Helios 18 N23Q2 i9-13900HX, GeForce RTX 4080 Laptop GPU | 3.2 kg | 29.15 mm | 18.00" | 2560x1600 | |
| 91.4 % v7 (old) | 02/2023 | Razer Blade 18 RTX 4070 i9-13950HX, GeForce RTX 4070 Laptop GPU | 3 kg | 21.9 mm | 18.00" | 2560x1600 | |
| 86.6 % v7 (old) | 02/2023 | Asus ROG Strix Scar 18 2023 G834JY-N6005W i9-13980HX, GeForce RTX 4090 Laptop GPU | 3.1 kg | 30.8 mm | 18.00" | 2560x1600 | |
v (old) | MSI Raider GE78 HX 13VI i9-13980HX, GeForce RTX 4090 Laptop GPU | 17.30" | 2560x1600 |
Sprawa
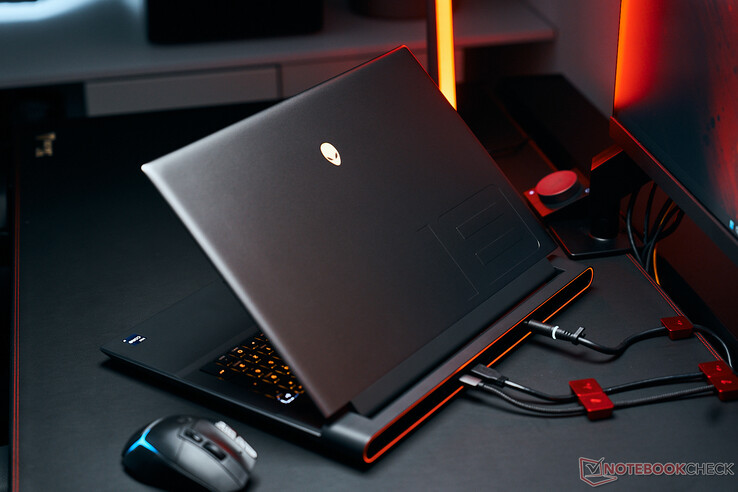
Wersje Intel i AMD Alienware m18 R1 mają tę samą konstrukcję obudowy i opcje kolorystyczne. Dlatego jedynym szybkim i łatwym sposobem wizualnego rozróżnienia między tymi dwoma modelami jest poszukiwanie logo Thunderbolt obok portów USB-C z tyłu. Proszę zapoznać się z naszą recenzją Konfiguracji Intel-Nvidia aby dowiedzieć się więcej o fizycznych cechach Alienware m18 R1.
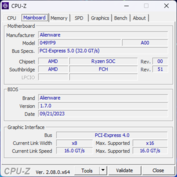
Rozczarowujące jest to, że USB4 nie jest obsługiwane.
Czytnik kart SD
| SD Card Reader | |
| average JPG Copy Test (av. of 3 runs) | |
| Razer Blade 18 RTX 4070 (Angelibird AV Pro V60) | |
| Alienware m18 R1 (Angelibird AV Pro V60) | |
| Alienware m18 R1 AMD (Toshiba Exceria Pro SDXC 64 GB UHS-II) | |
| Acer Predator Helios 18 N23Q2 | |
| MSI GE78HX 13VH-070US (Angelibird AV Pro V60) | |
| maximum AS SSD Seq Read Test (1GB) | |
| Alienware m18 R1 AMD (Toshiba Exceria Pro SDXC 64 GB UHS-II) | |
| Alienware m18 R1 (Angelibird AV Pro V60) | |
| Razer Blade 18 RTX 4070 (Angelibird AV Pro V60) | |
| MSI GE78HX 13VH-070US (Angelibird AV Pro V60) | |
| Acer Predator Helios 18 N23Q2 | |
Komunikacja
Kamera internetowa
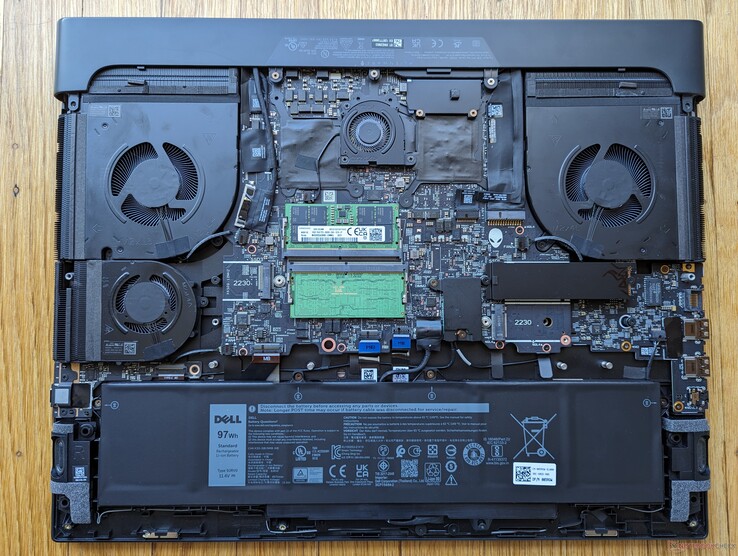
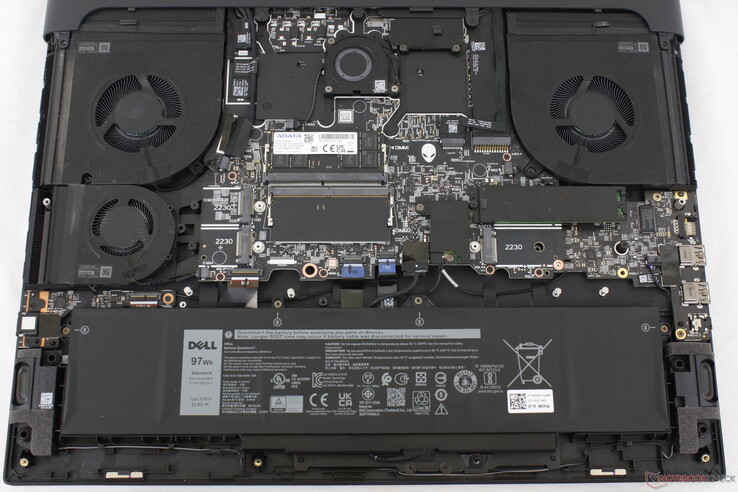
Konserwacja
Konfiguracja AMD-AMD obsługuje tylko do trzech dysków SSD M.2 NVMe, podczas gdy konfiguracja Intel-Nvidia obsługuje do czterech, jak pokazano na poniższych zdjęciach porównawczych. Ich wewnętrzne cechy są poza tym identyczne.
Akcesoria i gwarancja
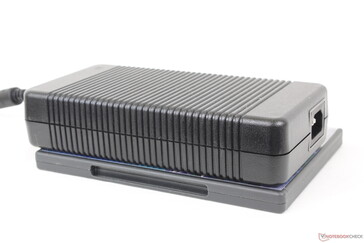
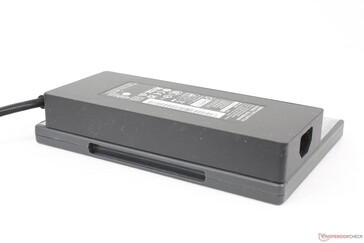
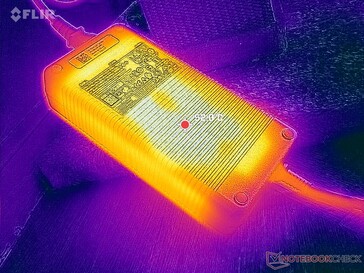
Dell nie przeszedł jeszcze na zasilacze GaN AC, które mogą zaoferować wyższą moc na objętość niż tradycyjne zasilacze AC. Dołączony zasilacz o mocy 330 W jest zatem bardzo nieporęczny w porównaniu do zasilaczy GaN o mocy 330 W, które są obecnie dostarczane z większością laptopów Razer Blade.
Standardowa roczna ograniczona gwarancja obowiązuje w przypadku zakupu w USA.
Wyświetlacz
Dostępne są dwie opcje wyświetlania FreeSync:
- 1920 x 1200, 480 Hz, 100% DCI-P3, IPS
- 2560 x 1600, 165 Hz, 100% DCI-P3, IPS
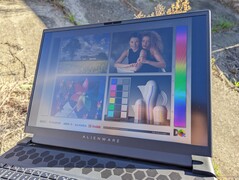
Nasza konfiguracja wykorzystuje pogrubiony powyżej panel, podobnie jak w naszej poprzedniej konfiguracji Intel-Nvidia. Tym razem jednak dostawca panelu jest inny (BOE vs Chi Mei), co sugeruje, że Dell pozyskuje panele 480 Hz od wielu dostawców dla swojej serii Alienware m18. Na szczęście nie ma między nimi większych różnic pod względem pokrycia kolorów, czasu reakcji lub kontrastu, co zapewnia bardzo podobne wrażenia wizualne.
Częstotliwość odświeżania 480 Hz jest najszybszą dostępną w laptopach w chwili pisania tego tekstu, zapewniając niezwykle płynny ruch z minimalnym efektem smużenia. Niemniej jednak, korzyści płynące z szybkich częstotliwości odświeżania stają się coraz bardziej marginalne, im wyższy poziom. Dlatego też warto rozważyć wyższą rozdzielczość 1600p, nawet jeśli częstotliwość odświeżania jest wolniejsza, ponieważ 165 Hz to wciąż jedwabiście płynne wrażenia.
Warto zauważyć, że natywną częstotliwość odświeżania 480 Hz można ustawić na 240 Hz lub 120 Hz za pośrednictwem systemu Windows, ale nie niżej. Szkoda, że nie ma opcji 60 Hz, ponieważ wysokie częstotliwości odświeżania wpływają na zużycie energii, jak pokaże nasza sekcja zarządzania energią poniżej.
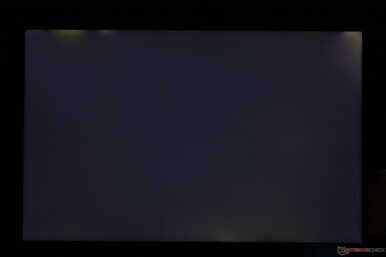
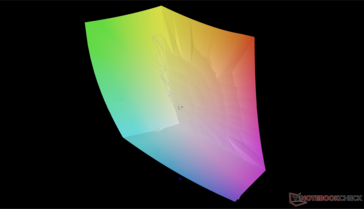
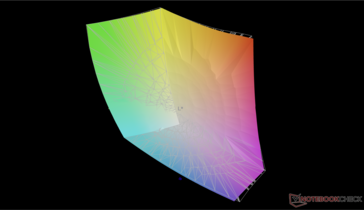
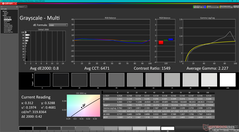
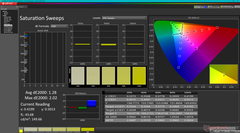
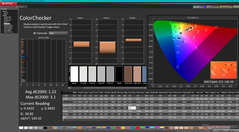
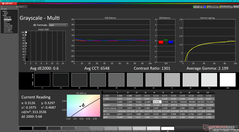
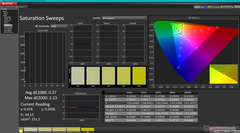
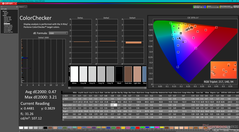
Co dziwne, model ten jest skalibrowany pod kątem spektrum sRGB po wyjęciu z pudełka, mimo że obsługuje pełne kolory DCI-P3. Taka sytuacja miała również miejsce w naszej konfiguracji Intel-Nvidia.
| |||||||||||||||||||||||||
rozświetlenie: 87 %
na akumulatorze: 319.6 cd/m²
kontrast: 1278:1 (czerń: 0.25 cd/m²)
ΔE ColorChecker Calman: 1.22 | ∀{0.5-29.43 Ø4.76}
calibrated: 0.47
ΔE Greyscale Calman: 0.8 | ∀{0.09-98 Ø5}
88.7% AdobeRGB 1998 (Argyll 3D)
99.7% sRGB (Argyll 3D)
98.5% Display P3 (Argyll 3D)
Gamma: 2.23
CCT: 6471 K
| Alienware m18 R1 AMD BOE NE18NZ1, IPS, 1920x1200, 18" | Alienware m18 R1 Chi Mei 180JME, IPS, 1920x1200, 18" | Acer Predator Helios 18 N23Q2 AUO45A8 (B180QAN01.2), IPS, 2560x1600, 18" | Razer Blade 18 RTX 4070 AU Optronics B180QAN01.0, IPS, 2560x1600, 18" | Asus ROG Strix Scar 18 2023 G834JY-N6005W NE180QDM-NZ2, IPS, 2560x1600, 18" | MSI GE78HX 13VH-070US AU Optronics B170QAN01.2, IPS, 2560x1600, 17" | |
|---|---|---|---|---|---|---|
| Display | 0% | 1% | -2% | -2% | -1% | |
| Display P3 Coverage (%) | 98.5 | 97.7 -1% | 99.8 1% | 96.9 -2% | 97.2 -1% | 97.6 -1% |
| sRGB Coverage (%) | 99.7 | 100 0% | 100 0% | 99.8 0% | 99.9 0% | 99.9 0% |
| AdobeRGB 1998 Coverage (%) | 88.7 | 89.8 1% | 91.8 3% | 85.3 -4% | 84.9 -4% | 86.5 -2% |
| Response Times | -5% | -128% | -17% | -42% | -9% | |
| Response Time Grey 50% / Grey 80% * (ms) | 2.8 ? | 3 ? -7% | 7.6 ? -171% | 4.2 ? -50% | 5.41 ? -93% | 4.2 ? -50% |
| Response Time Black / White * (ms) | 9.6 ? | 9.9 ? -3% | 17.8 ? -85% | 8 ? 17% | 8.62 ? 10% | 6.4 ? 33% |
| PWM Frequency (Hz) | 2509 | |||||
| Screen | -18% | -130% | -99% | -215% | -145% | |
| Brightness middle (cd/m²) | 319.6 | 372.8 17% | 360 13% | 549.6 72% | 490 53% | 398.6 25% |
| Brightness (cd/m²) | 304 | 367 21% | 355 17% | 524 72% | 468 54% | 384 26% |
| Brightness Distribution (%) | 87 | 97 11% | 92 6% | 89 2% | 86 -1% | 89 2% |
| Black Level * (cd/m²) | 0.25 | 0.32 -28% | 0.21 16% | 0.53 -112% | 0.54 -116% | 0.46 -84% |
| Contrast (:1) | 1278 | 1165 -9% | 1714 34% | 1037 -19% | 907 -29% | 867 -32% |
| Colorchecker dE 2000 * | 1.22 | 1.92 -57% | 3.82 -213% | 3.32 -172% | 4.97 -307% | 4.05 -232% |
| Colorchecker dE 2000 max. * | 3.1 | 3.65 -18% | 7.38 -138% | 6.63 -114% | 11.02 -255% | 8.68 -180% |
| Colorchecker dE 2000 calibrated * | 0.47 | 0.51 -9% | 2.24 -377% | 2.7 -474% | 2.97 -532% | 1.02 -117% |
| Greyscale dE 2000 * | 0.8 | 1.5 -88% | 5.06 -532% | 2 -150% | 7.2 -800% | 6.5 -713% |
| Gamma | 2.23 99% | 2.34 94% | 2.52 87% | 2.29 96% | 2.161 102% | 2.11 104% |
| CCT | 6471 100% | 6607 98% | 5657 115% | 6319 103% | 6515 100% | 7518 86% |
| Całkowita średnia (program / ustawienia) | -8% /
-12% | -86% /
-102% | -39% /
-67% | -86% /
-144% | -52% /
-95% |
* ... im mniej tym lepiej
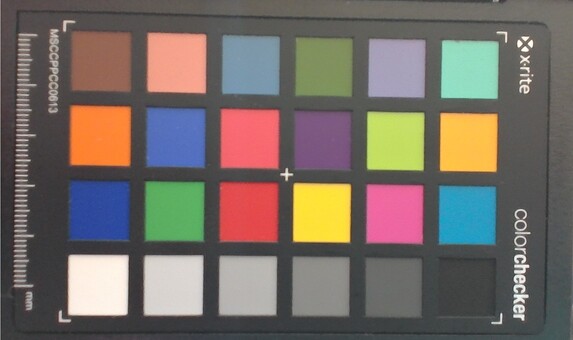
Średnie wartości DeltaE są znacznie poniżej 2, co sugeruje, że kalibracja użytkownika końcowego nie będzie konieczna dla większości użytkowników.
Wyświetl czasy reakcji
| ↔ Czas reakcji od czerni do bieli | ||
|---|---|---|
| 9.6 ms ... wzrost ↗ i spadek ↘ łącznie | ↗ 4.9 ms wzrost | |
| ↘ 4.7 ms upadek | ||
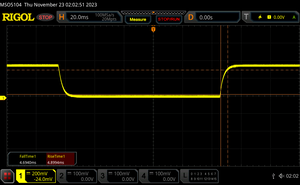
| W naszych testach ekran wykazuje szybki czas reakcji i powinien nadawać się do gier. Dla porównania, wszystkie testowane urządzenia wahają się od 0.1 (minimum) do 240 (maksimum) ms. » 25 % wszystkich urządzeń jest lepszych. Oznacza to, że zmierzony czas reakcji jest lepszy od średniej wszystkich testowanych urządzeń (20.1 ms). | ||
| ↔ Czas reakcji 50% szarości do 80% szarości | ||
| 2.8 ms ... wzrost ↗ i spadek ↘ łącznie | ↗ 1.2 ms wzrost | |
| ↘ 1.6 ms upadek | ||
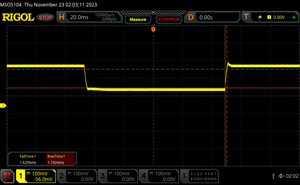
| W naszych testach ekran wykazuje bardzo szybką reakcję i powinien bardzo dobrze nadawać się do szybkich gier. Dla porównania, wszystkie testowane urządzenia wahają się od 0.165 (minimum) do 636 (maksimum) ms. » 11 % wszystkich urządzeń jest lepszych. Oznacza to, że zmierzony czas reakcji jest lepszy od średniej wszystkich testowanych urządzeń (31.4 ms). | ||
Migotanie ekranu / PWM (modulacja szerokości impulsu)
| Migotanie ekranu/nie wykryto PWM | |||
Dla porównania: 53 % wszystkich testowanych urządzeń nie używa PWM do przyciemniania wyświetlacza. Jeśli wykryto PWM, zmierzono średnio 8016 (minimum: 5 - maksimum: 343500) Hz. | |||
Wydajność
Warunki testowania
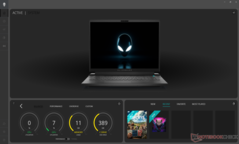
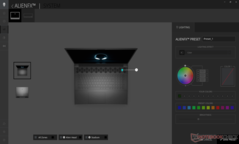
Przed uruchomieniem poniższych testów porównawczych ustawiliśmy Alienware Command Center na tryb Overdrive. Znajomość Command Center jest niezbędna do kontrolowania określonych funkcji laptopa, w tym oświetlenia RGB, profili zasilania i profili specyficznych dla gier.
Zaleca się również pobranie programu AMD Adrenalin w celu uzyskania najnowszych sterowników GPU i włączania/wyłączania wszystkich funkcji GPU.
Procesor
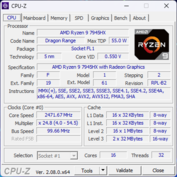
Wydajność procesora to klasyczny pojedynek AMD vs. Intel, w którym nasze Ryzen 9 7945HX oferuje od 5 do 10 procent wyższą surową wydajność wielowątkową niż konkurencyjnyCore i9-13980HX będąc jednocześnie od 5 do 10 procent wolniejszym w wydajności jednowątkowej. Zasadniczo jest na równi z najnowszym Ryzen 9 7945HX3D stając się jednym z najszybszych dostępnych procesorów mobilnych. Obniżenie wersji do Ryzen 9 7845HX lub Ryzen 7 7745HX spowoduje spadek wydajności procesora odpowiednio o około 20-25% i 40-50%.
Zrównoważona wydajność jest doskonała, czego przykładem są stałe wyniki podczas uruchamiania CineBench R15 xT w pętli.
Cinebench R15 Multi Loop
Cinebench R23: Multi Core | Single Core
Cinebench R20: CPU (Multi Core) | CPU (Single Core)
Cinebench R15: CPU Multi 64Bit | CPU Single 64Bit
Blender: v2.79 BMW27 CPU
7-Zip 18.03: 7z b 4 | 7z b 4 -mmt1
Geekbench 5.5: Multi-Core | Single-Core
HWBOT x265 Benchmark v2.2: 4k Preset
LibreOffice : 20 Documents To PDF
R Benchmark 2.5: Overall mean
| CPU Performance rating | |
| AMD Ryzen 9 7950X | |
| Alienware m18 R1 AMD | |
| Asus ROG Strix Scar 17 G733PY-XS96 | |
| Asus ROG Strix Scar 17 G733PYV-LL053X | |
| MSI GE78HX 13VH-070US | |
| Przeciętny AMD Ryzen 9 7945HX | |
| Alienware m18 R1 | |
| Acer Predator Helios 18 N23Q2 | |
| Razer Blade 18 RTX 4070 | |
| Alienware m16 R1 AMD | |
| MSI Titan GT77 12UHS | |
| Lenovo Legion Pro 5 16ARX8 | |
| MSI Stealth 17 Studio A13VH-014 | |
| Uniwell Technology GM7AG8N Liquid Cooling Box | |
| Schenker XMG Apex 17 (Late 23) | |
| Acer Nitro 17 AN17-41-R9LN | |
| Asus ROG Strix G17 G713QE-RB74 -2! | |
| Cinebench R23 / Multi Core | |
| AMD Ryzen 9 7950X | |
| Alienware m18 R1 AMD | |
| Asus ROG Strix Scar 17 G733PY-XS96 | |
| Przeciętny AMD Ryzen 9 7945HX (30783 - 34613, n=9) | |
| Asus ROG Strix Scar 17 G733PYV-LL053X | |
| MSI GE78HX 13VH-070US | |
| Alienware m18 R1 | |
| Acer Predator Helios 18 N23Q2 | |
| Razer Blade 18 RTX 4070 | |
| Alienware m16 R1 AMD | |
| MSI Titan GT77 12UHS | |
| MSI Stealth 17 Studio A13VH-014 | |
| Uniwell Technology GM7AG8N Liquid Cooling Box | |
| Lenovo Legion Pro 5 16ARX8 | |
| Schenker XMG Apex 17 (Late 23) | |
| Acer Nitro 17 AN17-41-R9LN | |
| Asus ROG Strix G17 G713QE-RB74 | |
| Cinebench R23 / Single Core | |
| MSI GE78HX 13VH-070US | |
| Alienware m18 R1 | |
| Acer Predator Helios 18 N23Q2 | |
| Razer Blade 18 RTX 4070 | |
| AMD Ryzen 9 7950X | |
| Alienware m18 R1 AMD | |
| Asus ROG Strix Scar 17 G733PYV-LL053X | |
| Przeciętny AMD Ryzen 9 7945HX (1861 - 1957, n=9) | |
| MSI Titan GT77 12UHS | |
| Asus ROG Strix Scar 17 G733PY-XS96 | |
| Alienware m16 R1 AMD | |
| Lenovo Legion Pro 5 16ARX8 | |
| Schenker XMG Apex 17 (Late 23) | |
| Uniwell Technology GM7AG8N Liquid Cooling Box | |
| MSI Stealth 17 Studio A13VH-014 | |
| Acer Nitro 17 AN17-41-R9LN | |
| Asus ROG Strix G17 G713QE-RB74 | |
| Cinebench R20 / CPU (Multi Core) | |
| AMD Ryzen 9 7950X | |
| Alienware m18 R1 AMD | |
| Asus ROG Strix Scar 17 G733PY-XS96 | |
| Asus ROG Strix Scar 17 G733PYV-LL053X | |
| Przeciętny AMD Ryzen 9 7945HX (10025 - 13769, n=9) | |
| MSI GE78HX 13VH-070US | |
| Alienware m18 R1 | |
| Acer Predator Helios 18 N23Q2 | |
| Razer Blade 18 RTX 4070 | |
| Alienware m16 R1 AMD | |
| MSI Titan GT77 12UHS | |
| MSI Stealth 17 Studio A13VH-014 | |
| Uniwell Technology GM7AG8N Liquid Cooling Box | |
| Lenovo Legion Pro 5 16ARX8 | |
| Schenker XMG Apex 17 (Late 23) | |
| Acer Nitro 17 AN17-41-R9LN | |
| Asus ROG Strix G17 G713QE-RB74 | |
| Cinebench R20 / CPU (Single Core) | |
| Alienware m18 R1 | |
| Acer Predator Helios 18 N23Q2 | |
| MSI GE78HX 13VH-070US | |
| Razer Blade 18 RTX 4070 | |
| AMD Ryzen 9 7950X | |
| Asus ROG Strix Scar 17 G733PYV-LL053X | |
| Alienware m18 R1 AMD | |
| Przeciętny AMD Ryzen 9 7945HX (712 - 760, n=9) | |
| MSI Titan GT77 12UHS | |
| Uniwell Technology GM7AG8N Liquid Cooling Box | |
| Asus ROG Strix Scar 17 G733PY-XS96 | |
| Alienware m16 R1 AMD | |
| Lenovo Legion Pro 5 16ARX8 | |
| Schenker XMG Apex 17 (Late 23) | |
| MSI Stealth 17 Studio A13VH-014 | |
| Acer Nitro 17 AN17-41-R9LN | |
| Asus ROG Strix G17 G713QE-RB74 | |
| Cinebench R15 / CPU Multi 64Bit | |
| AMD Ryzen 9 7950X | |
| Asus ROG Strix Scar 17 G733PYV-LL053X | |
| Alienware m18 R1 AMD | |
| Asus ROG Strix Scar 17 G733PY-XS96 | |
| Przeciętny AMD Ryzen 9 7945HX (4998 - 5663, n=10) | |
| MSI GE78HX 13VH-070US | |
| Alienware m18 R1 | |
| Acer Predator Helios 18 N23Q2 | |
| Razer Blade 18 RTX 4070 | |
| Alienware m16 R1 AMD | |
| MSI Titan GT77 12UHS | |
| MSI Stealth 17 Studio A13VH-014 | |
| Uniwell Technology GM7AG8N Liquid Cooling Box | |
| Lenovo Legion Pro 5 16ARX8 | |
| Schenker XMG Apex 17 (Late 23) | |
| Acer Nitro 17 AN17-41-R9LN | |
| Asus ROG Strix G17 G713QE-RB74 | |
| Cinebench R15 / CPU Single 64Bit | |
| AMD Ryzen 9 7950X | |
| Asus ROG Strix Scar 17 G733PYV-LL053X | |
| Alienware m18 R1 AMD | |
| Asus ROG Strix Scar 17 G733PY-XS96 | |
| Przeciętny AMD Ryzen 9 7945HX (290 - 311, n=10) | |
| MSI GE78HX 13VH-070US | |
| Alienware m18 R1 | |
| Razer Blade 18 RTX 4070 | |
| Alienware m16 R1 AMD | |
| Acer Predator Helios 18 N23Q2 | |
| Lenovo Legion Pro 5 16ARX8 | |
| MSI Stealth 17 Studio A13VH-014 | |
| MSI Titan GT77 12UHS | |
| Schenker XMG Apex 17 (Late 23) | |
| Uniwell Technology GM7AG8N Liquid Cooling Box | |
| Acer Nitro 17 AN17-41-R9LN | |
| Asus ROG Strix G17 G713QE-RB74 | |
| Blender / v2.79 BMW27 CPU | |
| Asus ROG Strix G17 G713QE-RB74 | |
| Acer Nitro 17 AN17-41-R9LN | |
| Schenker XMG Apex 17 (Late 23) | |
| Lenovo Legion Pro 5 16ARX8 | |
| MSI Stealth 17 Studio A13VH-014 | |
| Uniwell Technology GM7AG8N Liquid Cooling Box | |
| MSI Titan GT77 12UHS | |
| Alienware m16 R1 AMD | |
| Razer Blade 18 RTX 4070 | |
| Acer Predator Helios 18 N23Q2 | |
| MSI GE78HX 13VH-070US | |
| Alienware m18 R1 | |
| Asus ROG Strix Scar 17 G733PYV-LL053X | |
| Przeciętny AMD Ryzen 9 7945HX (87 - 100, n=9) | |
| Asus ROG Strix Scar 17 G733PY-XS96 | |
| Alienware m18 R1 AMD | |
| AMD Ryzen 9 7950X | |
| 7-Zip 18.03 / 7z b 4 | |
| AMD Ryzen 9 7950X | |
| Asus ROG Strix Scar 17 G733PY-XS96 | |
| Alienware m18 R1 AMD | |
| Asus ROG Strix Scar 17 G733PYV-LL053X | |
| Przeciętny AMD Ryzen 9 7945HX (123364 - 140932, n=9) | |
| Alienware m18 R1 | |
| MSI GE78HX 13VH-070US | |
| Acer Predator Helios 18 N23Q2 | |
| Razer Blade 18 RTX 4070 | |
| Alienware m16 R1 AMD | |
| MSI Titan GT77 12UHS | |
| MSI Stealth 17 Studio A13VH-014 | |
| Lenovo Legion Pro 5 16ARX8 | |
| Schenker XMG Apex 17 (Late 23) | |
| Uniwell Technology GM7AG8N Liquid Cooling Box | |
| Acer Nitro 17 AN17-41-R9LN | |
| Asus ROG Strix G17 G713QE-RB74 | |
| 7-Zip 18.03 / 7z b 4 -mmt1 | |
| AMD Ryzen 9 7950X | |
| Asus ROG Strix Scar 17 G733PY-XS96 | |
| Asus ROG Strix Scar 17 G733PYV-LL053X | |
| Przeciętny AMD Ryzen 9 7945HX (7319 - 7711, n=9) | |
| Alienware m18 R1 AMD | |
| Lenovo Legion Pro 5 16ARX8 | |
| MSI GE78HX 13VH-070US | |
| Alienware m16 R1 AMD | |
| Acer Predator Helios 18 N23Q2 | |
| Alienware m18 R1 | |
| Razer Blade 18 RTX 4070 | |
| Schenker XMG Apex 17 (Late 23) | |
| MSI Titan GT77 12UHS | |
| MSI Stealth 17 Studio A13VH-014 | |
| Uniwell Technology GM7AG8N Liquid Cooling Box | |
| Acer Nitro 17 AN17-41-R9LN | |
| Asus ROG Strix G17 G713QE-RB74 | |
| HWBOT x265 Benchmark v2.2 / 4k Preset | |
| AMD Ryzen 9 7950X | |
| Asus ROG Strix Scar 17 G733PY-XS96 | |
| Alienware m18 R1 AMD | |
| Asus ROG Strix Scar 17 G733PYV-LL053X | |
| Przeciętny AMD Ryzen 9 7945HX (33.8 - 37.6, n=8) | |
| MSI GE78HX 13VH-070US | |
| Alienware m18 R1 | |
| Razer Blade 18 RTX 4070 | |
| Acer Predator Helios 18 N23Q2 | |
| Alienware m16 R1 AMD | |
| MSI Titan GT77 12UHS | |
| Lenovo Legion Pro 5 16ARX8 | |
| MSI Stealth 17 Studio A13VH-014 | |
| Uniwell Technology GM7AG8N Liquid Cooling Box | |
| Schenker XMG Apex 17 (Late 23) | |
| Acer Nitro 17 AN17-41-R9LN | |
| Asus ROG Strix G17 G713QE-RB74 | |
| LibreOffice / 20 Documents To PDF | |
| Acer Nitro 17 AN17-41-R9LN | |
| Asus ROG Strix G17 G713QE-RB74 | |
| MSI Stealth 17 Studio A13VH-014 | |
| Acer Predator Helios 18 N23Q2 | |
| Uniwell Technology GM7AG8N Liquid Cooling Box | |
| Schenker XMG Apex 17 (Late 23) | |
| MSI GE78HX 13VH-070US | |
| Alienware m18 R1 | |
| Przeciętny AMD Ryzen 9 7945HX (35.5 - 60.4, n=8) | |
| Razer Blade 18 RTX 4070 | |
| Alienware m18 R1 AMD | |
| Alienware m16 R1 AMD | |
| MSI Titan GT77 12UHS | |
| Asus ROG Strix Scar 17 G733PYV-LL053X | |
| Lenovo Legion Pro 5 16ARX8 | |
| Asus ROG Strix Scar 17 G733PY-XS96 | |
| AMD Ryzen 9 7950X | |
| R Benchmark 2.5 / Overall mean | |
| Asus ROG Strix G17 G713QE-RB74 | |
| Acer Nitro 17 AN17-41-R9LN | |
| Uniwell Technology GM7AG8N Liquid Cooling Box | |
| Schenker XMG Apex 17 (Late 23) | |
| MSI Stealth 17 Studio A13VH-014 | |
| Alienware m16 R1 AMD | |
| Lenovo Legion Pro 5 16ARX8 | |
| MSI Titan GT77 12UHS | |
| Alienware m18 R1 AMD | |
| Asus ROG Strix Scar 17 G733PYV-LL053X | |
| Przeciętny AMD Ryzen 9 7945HX (0.3884 - 0.4159, n=8) | |
| Asus ROG Strix Scar 17 G733PY-XS96 | |
| Acer Predator Helios 18 N23Q2 | |
| Razer Blade 18 RTX 4070 | |
| Alienware m18 R1 | |
| MSI GE78HX 13VH-070US | |
| AMD Ryzen 9 7950X | |
Cinebench R23: Multi Core | Single Core
Cinebench R20: CPU (Multi Core) | CPU (Single Core)
Cinebench R15: CPU Multi 64Bit | CPU Single 64Bit
Blender: v2.79 BMW27 CPU
7-Zip 18.03: 7z b 4 | 7z b 4 -mmt1
Geekbench 5.5: Multi-Core | Single-Core
HWBOT x265 Benchmark v2.2: 4k Preset
LibreOffice : 20 Documents To PDF
R Benchmark 2.5: Overall mean
* ... im mniej tym lepiej
AIDA64: FP32 Ray-Trace | FPU Julia | CPU SHA3 | CPU Queen | FPU SinJulia | FPU Mandel | CPU AES | CPU ZLib | FP64 Ray-Trace | CPU PhotoWorxx
| Performance rating | |
| Alienware m18 R1 AMD | |
| Przeciętny AMD Ryzen 9 7945HX | |
| Acer Predator Helios 18 N23Q2 | |
| Alienware m18 R1 | |
| MSI GE78HX 13VH-070US | |
| Asus ROG Strix Scar 18 2023 G834JY-N6005W | |
| Razer Blade 18 RTX 4070 | |
| AIDA64 / FP32 Ray-Trace | |
| Alienware m18 R1 AMD | |
| Przeciętny AMD Ryzen 9 7945HX (50388 - 60169, n=7) | |
| Alienware m18 R1 | |
| Asus ROG Strix Scar 18 2023 G834JY-N6005W | |
| MSI GE78HX 13VH-070US | |
| Acer Predator Helios 18 N23Q2 | |
| Razer Blade 18 RTX 4070 | |
| AIDA64 / FPU Julia | |
| Alienware m18 R1 AMD | |
| Przeciętny AMD Ryzen 9 7945HX (201874 - 252486, n=7) | |
| Alienware m18 R1 | |
| MSI GE78HX 13VH-070US | |
| Asus ROG Strix Scar 18 2023 G834JY-N6005W | |
| Acer Predator Helios 18 N23Q2 | |
| Razer Blade 18 RTX 4070 | |
| AIDA64 / CPU SHA3 | |
| Alienware m18 R1 AMD | |
| Przeciętny AMD Ryzen 9 7945HX (8525 - 10389, n=7) | |
| Alienware m18 R1 | |
| Asus ROG Strix Scar 18 2023 G834JY-N6005W | |
| MSI GE78HX 13VH-070US | |
| Acer Predator Helios 18 N23Q2 | |
| Razer Blade 18 RTX 4070 | |
| AIDA64 / CPU Queen | |
| Alienware m18 R1 AMD | |
| Przeciętny AMD Ryzen 9 7945HX (175041 - 200651, n=7) | |
| Alienware m18 R1 | |
| Asus ROG Strix Scar 18 2023 G834JY-N6005W | |
| MSI GE78HX 13VH-070US | |
| Razer Blade 18 RTX 4070 | |
| Acer Predator Helios 18 N23Q2 | |
| AIDA64 / FPU SinJulia | |
| Alienware m18 R1 AMD | |
| Przeciętny AMD Ryzen 9 7945HX (28794 - 32988, n=7) | |
| Asus ROG Strix Scar 18 2023 G834JY-N6005W | |
| MSI GE78HX 13VH-070US | |
| Alienware m18 R1 | |
| Razer Blade 18 RTX 4070 | |
| Acer Predator Helios 18 N23Q2 | |
| AIDA64 / FPU Mandel | |
| Alienware m18 R1 AMD | |
| Przeciętny AMD Ryzen 9 7945HX (105740 - 134044, n=7) | |
| Alienware m18 R1 | |
| Asus ROG Strix Scar 18 2023 G834JY-N6005W | |
| MSI GE78HX 13VH-070US | |
| Acer Predator Helios 18 N23Q2 | |
| Razer Blade 18 RTX 4070 | |
| AIDA64 / CPU AES | |
| Acer Predator Helios 18 N23Q2 | |
| Przeciętny AMD Ryzen 9 7945HX (126790 - 325960, n=7) | |
| Alienware m18 R1 AMD | |
| Alienware m18 R1 | |
| MSI GE78HX 13VH-070US | |
| Asus ROG Strix Scar 18 2023 G834JY-N6005W | |
| Razer Blade 18 RTX 4070 | |
| AIDA64 / CPU ZLib | |
| Alienware m18 R1 AMD | |
| Przeciętny AMD Ryzen 9 7945HX (2022 - 2409, n=7) | |
| MSI GE78HX 13VH-070US | |
| Asus ROG Strix Scar 18 2023 G834JY-N6005W | |
| Alienware m18 R1 | |
| Acer Predator Helios 18 N23Q2 | |
| Razer Blade 18 RTX 4070 | |
| AIDA64 / FP64 Ray-Trace | |
| Alienware m18 R1 AMD | |
| Przeciętny AMD Ryzen 9 7945HX (26875 - 31796, n=7) | |
| Alienware m18 R1 | |
| Asus ROG Strix Scar 18 2023 G834JY-N6005W | |
| MSI GE78HX 13VH-070US | |
| Acer Predator Helios 18 N23Q2 | |
| Razer Blade 18 RTX 4070 | |
| AIDA64 / CPU PhotoWorxx | |
| Alienware m18 R1 | |
| Acer Predator Helios 18 N23Q2 | |
| MSI GE78HX 13VH-070US | |
| Razer Blade 18 RTX 4070 | |
| Asus ROG Strix Scar 18 2023 G834JY-N6005W | |
| Przeciętny AMD Ryzen 9 7945HX (31421 - 40095, n=7) | |
| Alienware m18 R1 AMD | |
Wydajność systemu
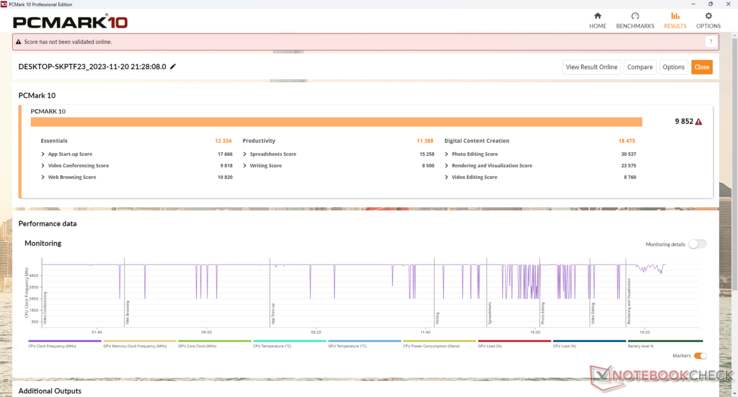
Wyniki PCMark są jednymi z najwyższych spośród wszystkich laptopów do gier, dzięki czemu nasz Alienware m18 jest na równi z najszybszymi alternatywami Intel-Nvidia. Niestety, wrażenia użytkownika są mniej niż gwiezdne w praktyce ze względu na wszystkie błędy, które zaobserwowaliśmy. Kilka z nich jest godnych uwagi:
- Główny wyświetlacz czasami wyłączał się bez powodu i wymagane było ponowne uruchomienie komputera
- Brak możliwości uruchomienia systemu po podłączeniu zewnętrznego monitora
- Brak możliwości uruchomienia benchmarków 3DMark Speed Way i Blender Classroom HIP/AMD
- Niezwykle wysoki pobór mocy w trybie czuwania
Problemy te występowały więcej niż jeden raz, nawet przy najnowszych aktualizacjach systemu Windows i sterownikach AMD zainstalowanych w momencie pisania tego tekstu (31.0.22023.1014).
Wydajność pamięci jest również zauważalnie wolniejsza niż w przypadku wielu laptopów do gier z procesorami Intela. Nie wydaje się to również być przypadkiem, ponieważ nasz Asus ROG Strix Scar 17 z tym samym procesorem Ryzen 9, co nasz Alienware, również zwróciłby podobnie niskie wyniki.
CrossMark: Overall | Productivity | Creativity | Responsiveness
| PCMark 10 / Score | |
| Alienware m18 R1 AMD | |
| Przeciętny AMD Ryzen 9 7945HX, AMD Radeon RX 7900M (n=1) | |
| MSI GE78HX 13VH-070US | |
| Asus ROG Strix Scar 18 2023 G834JY-N6005W | |
| Alienware m18 R1 | |
| Acer Predator Helios 18 N23Q2 | |
| Razer Blade 18 RTX 4070 | |
| PCMark 10 / Essentials | |
| Alienware m18 R1 AMD | |
| Przeciętny AMD Ryzen 9 7945HX, AMD Radeon RX 7900M (n=1) | |
| Razer Blade 18 RTX 4070 | |
| MSI GE78HX 13VH-070US | |
| Alienware m18 R1 | |
| Acer Predator Helios 18 N23Q2 | |
| PCMark 10 / Productivity | |
| Alienware m18 R1 AMD | |
| Przeciętny AMD Ryzen 9 7945HX, AMD Radeon RX 7900M (n=1) | |
| Acer Predator Helios 18 N23Q2 | |
| MSI GE78HX 13VH-070US | |
| Alienware m18 R1 | |
| Razer Blade 18 RTX 4070 | |
| PCMark 10 / Digital Content Creation | |
| Alienware m18 R1 AMD | |
| Przeciętny AMD Ryzen 9 7945HX, AMD Radeon RX 7900M (n=1) | |
| Alienware m18 R1 | |
| MSI GE78HX 13VH-070US | |
| Acer Predator Helios 18 N23Q2 | |
| Razer Blade 18 RTX 4070 | |
| CrossMark / Overall | |
| Acer Predator Helios 18 N23Q2 | |
| Alienware m18 R1 | |
| Razer Blade 18 RTX 4070 | |
| Asus ROG Strix Scar 18 2023 G834JY-N6005W | |
| Alienware m18 R1 AMD | |
| Przeciętny AMD Ryzen 9 7945HX, AMD Radeon RX 7900M (n=1) | |
| MSI GE78HX 13VH-070US | |
| CrossMark / Productivity | |
| Acer Predator Helios 18 N23Q2 | |
| Alienware m18 R1 | |
| Razer Blade 18 RTX 4070 | |
| Asus ROG Strix Scar 18 2023 G834JY-N6005W | |
| MSI GE78HX 13VH-070US | |
| Alienware m18 R1 AMD | |
| Przeciętny AMD Ryzen 9 7945HX, AMD Radeon RX 7900M (n=1) | |
| CrossMark / Creativity | |
| Alienware m18 R1 | |
| Asus ROG Strix Scar 18 2023 G834JY-N6005W | |
| Acer Predator Helios 18 N23Q2 | |
| Razer Blade 18 RTX 4070 | |
| Alienware m18 R1 AMD | |
| Przeciętny AMD Ryzen 9 7945HX, AMD Radeon RX 7900M (n=1) | |
| MSI GE78HX 13VH-070US | |
| CrossMark / Responsiveness | |
| Acer Predator Helios 18 N23Q2 | |
| Alienware m18 R1 | |
| Razer Blade 18 RTX 4070 | |
| MSI GE78HX 13VH-070US | |
| Asus ROG Strix Scar 18 2023 G834JY-N6005W | |
| Alienware m18 R1 AMD | |
| Przeciętny AMD Ryzen 9 7945HX, AMD Radeon RX 7900M (n=1) | |
| PCMark 10 Score | 9852 pkt. | |
Pomoc | ||
| AIDA64 / Memory Copy | |
| Alienware m18 R1 | |
| Acer Predator Helios 18 N23Q2 | |
| MSI GE78HX 13VH-070US | |
| Razer Blade 18 RTX 4070 | |
| Asus ROG Strix Scar 18 2023 G834JY-N6005W | |
| Przeciętny AMD Ryzen 9 7945HX (48948 - 57953, n=7) | |
| Alienware m18 R1 AMD | |
| Asus ROG Strix Scar 17 G733PYV-LL053X | |
| AIDA64 / Memory Read | |
| Alienware m18 R1 | |
| Acer Predator Helios 18 N23Q2 | |
| Razer Blade 18 RTX 4070 | |
| MSI GE78HX 13VH-070US | |
| Asus ROG Strix Scar 18 2023 G834JY-N6005W | |
| Alienware m18 R1 AMD | |
| Przeciętny AMD Ryzen 9 7945HX (56910 - 67753, n=7) | |
| Asus ROG Strix Scar 17 G733PYV-LL053X | |
| AIDA64 / Memory Write | |
| Alienware m18 R1 | |
| MSI GE78HX 13VH-070US | |
| Razer Blade 18 RTX 4070 | |
| Acer Predator Helios 18 N23Q2 | |
| Asus ROG Strix Scar 18 2023 G834JY-N6005W | |
| Przeciętny AMD Ryzen 9 7945HX (58602 - 70063, n=7) | |
| Alienware m18 R1 AMD | |
| Asus ROG Strix Scar 17 G733PYV-LL053X | |
| AIDA64 / Memory Latency | |
| Alienware m18 R1 AMD | |
| Asus ROG Strix Scar 18 2023 G834JY-N6005W | |
| Asus ROG Strix Scar 17 G733PYV-LL053X | |
| Razer Blade 18 RTX 4070 | |
| MSI GE78HX 13VH-070US | |
| Przeciętny AMD Ryzen 9 7945HX (77.1 - 91.3, n=7) | |
| Acer Predator Helios 18 N23Q2 | |
| Alienware m18 R1 | |
* ... im mniej tym lepiej
Opóźnienie DPC
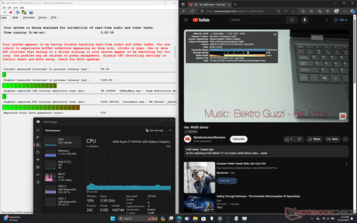
LatencyMon ujawnia niewielkie problemy z DPC podczas otwierania wielu kart przeglądarki na naszej stronie głównej, co nie jest niczym niezwykłym. odtwarzanie wideo 4K przy 60 FPS może być jednak lepsze, ponieważ jesteśmy w stanie nagrać 4 upuszczone klatki w 60-sekundowym oknie w porównaniu do 0 na Blade 18.
| DPC Latencies / LatencyMon - interrupt to process latency (max), Web, Youtube, Prime95 | |
| Acer Predator Helios 18 N23Q2 | |
| MSI GE78HX 13VH-070US | |
| Alienware m18 R1 | |
| Razer Blade 18 RTX 4070 | |
| Alienware m18 R1 AMD | |
| Asus ROG Strix Scar 18 2023 G834JY-N6005W | |
* ... im mniej tym lepiej
Urządzenia pamięci masowej
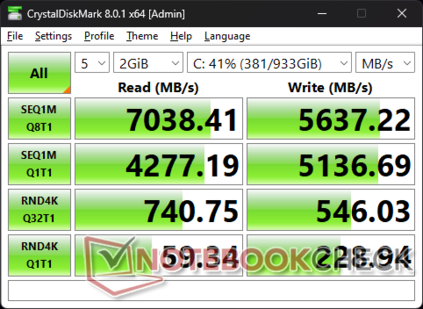
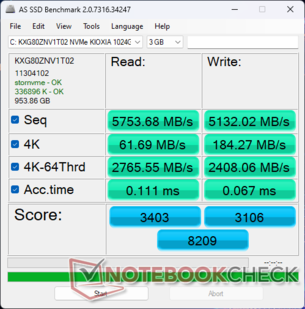
1 TBKioxia XG8 KXG80ZNV1T02 to wyższej klasy dysk SSD PCIe4 x4 NVMe podobny do serii Samsung PM9A1. Nasz dysk nie wykazywał problemów z dławieniem, utrzymując wysokie prędkości transferu na poziomie ~6300 MB/s przez dłuższy czas.
| Drive Performance rating - Percent | |
| Alienware m18 R1 | |
| Acer Predator Helios 18 N23Q2 | |
| MSI GE78HX 13VH-070US | |
| Razer Blade 18 RTX 4070 | |
| Alienware m18 R1 AMD | |
| Asus ROG Strix Scar 18 2023 G834JY-N6005W | |
* ... im mniej tym lepiej
Disk Throttling: DiskSpd Read Loop, Queue Depth 8
Wydajność GPU
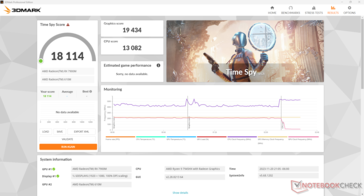
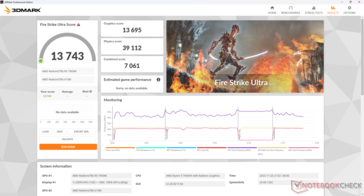
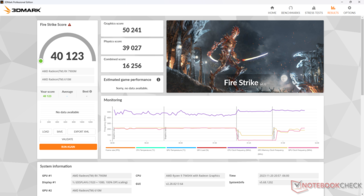
AMD wprowadza na rynek Radeon RX 7900M jako bezpośredniego konkurenta dla mobilnej GeForce RTX 4080 i uważamy, że jest to bardzo uczciwe porównanie. wyniki 3DMark są na równi z RTX 4080 w Alienware m16 R1 a nawet nieco szybsze w teście Fire Strike opartym na DX11. Surowy skok wydajności w porównaniu do zeszłorocznego Radeon RX 6850M XT jest znaczący i wynosi około 40 do 60 procent. AMD nie miało realnej odpowiedzi na mobilne RTX 4070, 4080 lub 4090 przed premierą Radeona RX 7900M.
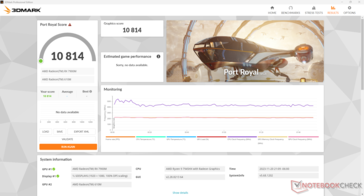
Akceleracja RT zawsze była słabym punktem serii Radeon, ale w przypadku Radeona RX 7900M uległa ona znacznej poprawie. Nasz wynik Port Royal jest o około 10 procent gorszy od mobilnego GeForce RTX 4080, co oznacza 2-krotny do 2,5-krotnego wzrost w porównaniu do zeszłorocznego Radeon RX 6800M. Włączenie RT nie było wcześniej zalecane w laptopach z kartami Radeon ze względu na ogromny spadek wydajności, ale Radeon RX 7900M jest punktem zwrotnym, na który czekali fani AMD.
Uruchomienie trybu Performance lub Balanced zamiast Overdrive zmniejsza wydajność o zaledwie kilka punktów procentowych, jak pokazuje nasza tabela wyników Fire Strike poniżej. Niewielkie różnice są godne uwagi, ponieważ różnice w hałasie wentylatorów między tymi trybami są znaczące, jak opisano szczegółowo w sekcji Hałas systemu poniżej.
| Profil zasilania | Wynik fizyki | Wynik grafiki | Łączny wynik |
| Tryb Overdrive | 39027 | 50241 | 16256 |
| Tryb wydajności | 37979 (-3%) | 47187 (-6%) | 16523 (-0%) |
| Tryb zrównoważony | 37590 (-4%) | 48170 (-4%) | 16382 (-0%) |
| Zasilanie bateryjne | 31494 (-19%) | 10735 (-79%) | 4174 (-74%) |
| 3DMark 11 Performance | 41670 pkt. | |
| 3DMark Fire Strike Score | 40123 pkt. | |
| 3DMark Time Spy Score | 18114 pkt. | |
Pomoc | ||
* ... im mniej tym lepiej
Wydajność w grach
Wyniki 3DMark dobrze przekładają się na rzeczywistą wydajność w grach. Liczba klatek na sekundę podczas testowania Cyberpunk 2077 lub F1 22 mieściłaby się w granicach jednocyfrowych punktów procentowych mobilnego RTX 4080 w większości scenariuszy. Jeśli jednak włączymy RT, spadek wydajności będzie nadal bardziej stromy w porównaniu do konkurencyjnego GPU Nvidii. Na przykład, nasz Alienware działałby o 15 i 35 procent wolniej niż mobilny RTX 4080 po włączeniu RT odpowiednio w F1 22 i Cyberpunk 2077, mimo że oba GPU są bardzo zbliżone, gdy RT jest wyłączony.
AMD wprowadziło FSR 3 wraz z premierą Radeona RX 7900M jako bezpośrednią odpowiedź na DLSS 3. Podobnie jak rozwiązanie Nvidii, technologia skalowania w górę obejmuje zarówno generowanie klatek, jak i redukcję opóźnień, aby zrównoważyć duży spadek wydajności po włączeniu RT. Niestety, FSR 3 jest obecnie w powijakach i prawie żadna gra nie obsługuje tej funkcji, podczas gdy liczba gier obsługujących DLSS 3 miała znacznie więcej czasu na rozwój. Nawet Cyberpunk 2077 nie obsługuje FSR 3 w chwili pisania tego tekstu. Więcej gier zostanie zaktualizowanych o obsługę FSR 3 w 2024 roku i później. W międzyczasie właściciele będą musieli poradzić sobie ze starszym, ale szerzej obsługiwanym FSR 2.
Warto zauważyć, że nie napotkaliśmy żadnych błędów przerywających rozgrywkę pomimo wszystkich problemów, które odnotowaliśmy w sekcji Wydajność systemu powyżej. Dodatkowe gry zostaną przetestowane i dodane do poniższej listy w miarę upływu czasu.
| Performance rating - Percent | |
| Alienware m18 R1 | |
| Asus ROG Strix Scar 18 2023 G834JY-N6005W -1! | |
| Acer Predator Helios 18 N23Q2 | |
| Alienware m18 R1 AMD | |
| MSI GE78HX 13VH-070US | |
| Razer Blade 18 RTX 4070 | |
| The Witcher 3 - 1920x1080 Ultra Graphics & Postprocessing (HBAO+) | |
| Alienware m18 R1 | |
| MSI GE78HX 13VH-070US | |
| Acer Predator Helios 18 N23Q2 | |
| Alienware m18 R1 AMD | |
| Razer Blade 18 RTX 4070 | |
| GTA V - 1920x1080 Highest AA:4xMSAA + FX AF:16x | |
| Acer Predator Helios 18 N23Q2 | |
| Alienware m18 R1 | |
| Asus ROG Strix Scar 18 2023 G834JY-N6005W | |
| Razer Blade 18 RTX 4070 | |
| Alienware m18 R1 AMD | |
| MSI GE78HX 13VH-070US | |
| Final Fantasy XV Benchmark - 1920x1080 High Quality | |
| Alienware m18 R1 | |
| Acer Predator Helios 18 N23Q2 | |
| Asus ROG Strix Scar 18 2023 G834JY-N6005W | |
| Alienware m18 R1 AMD | |
| MSI GE78HX 13VH-070US | |
| Razer Blade 18 RTX 4070 | |
| Strange Brigade - 1920x1080 ultra AA:ultra AF:16 | |
| Alienware m18 R1 | |
| Asus ROG Strix Scar 18 2023 G834JY-N6005W | |
| Alienware m18 R1 AMD | |
| Acer Predator Helios 18 N23Q2 | |
| MSI GE78HX 13VH-070US | |
| Razer Blade 18 RTX 4070 | |
| Dota 2 Reborn - 1920x1080 ultra (3/3) best looking | |
| Alienware m18 R1 | |
| Asus ROG Strix Scar 18 2023 G834JY-N6005W | |
| Acer Predator Helios 18 N23Q2 | |
| Razer Blade 18 RTX 4070 | |
| Alienware m18 R1 AMD | |
| MSI GE78HX 13VH-070US | |
| Tiny Tina's Wonderlands | |
| 1920x1080 Badass Preset (DX12) | |
| Alienware m18 R1 | |
| AMD Radeon RX 7900 GRE | |
| Alienware m16 R1 AMD | |
| Alienware m18 R1 AMD | |
| Przeciętny AMD Radeon RX 7900M (n=1) | |
| Asus TUF Gaming A16 FA617XS | |
| Corsair Voyager a1600 | |
| Asus ROG Zephyrus G14 GA402RJ | |
| 2560x1440 Badass Preset (DX12) | |
| Alienware m18 R1 | |
| AMD Radeon RX 7900 GRE | |
| Alienware m16 R1 AMD | |
| Alienware m18 R1 AMD | |
| Przeciętny AMD Radeon RX 7900M (n=1) | |
| Corsair Voyager a1600 | |
| Asus ROG Zephyrus G14 GA402RJ | |
| 3840x2160 Badass Preset (DX12) | |
| Alienware m18 R1 | |
| AMD Radeon RX 7900 GRE | |
| Alienware m16 R1 AMD | |
| Alienware m18 R1 AMD | |
| Przeciętny AMD Radeon RX 7900M (n=1) | |
| Corsair Voyager a1600 | |
| Ratchet & Clank Rift Apart | |
| 1920x1080 Very High Preset AA:T | |
| AMD Radeon RX 7900 GRE | |
| Alienware m18 R1 AMD | |
| Przeciętny AMD Radeon RX 7900M (n=1) | |
| 2560x1440 Very High Preset AA:T | |
| AMD Radeon RX 7900 GRE | |
| Alienware m18 R1 AMD | |
| Przeciętny AMD Radeon RX 7900M (n=1) | |
| 3840x2160 Very High Preset AA:T | |
| AMD Radeon RX 7900 GRE | |
| Alienware m18 R1 AMD | |
| Przeciętny AMD Radeon RX 7900M (n=1) | |
| 1920x1080 Very High Preset + Very High Raytracing AA:T | |
| Alienware m18 R1 AMD | |
| Przeciętny AMD Radeon RX 7900M (n=1) | |
Wydajność sporadycznie spadała do niskich 70 FPS z wysokiego poziomu ~180 FPS na biegu jałowym Witcher 3 jak pokazano na poniższym wykresie. Podczas rozgrywki spadki wydajności objawiają się jako zacinanie, nawet jeśli nie ma żadnych ruchów w grze. Występowałyby one z wyraźną częstotliwością, co sugerowałoby przeszkadzający problem w tle, którym należy się zająć.
Błąd wydajności nie wystąpiłby podczas powtarzania tego testu na konfiguracji Intel-Nvidia tego samego modelu Alienware.
Witcher 3 FPS Chart
| low | med. | high | ultra | QHD | 4K | |
|---|---|---|---|---|---|---|
| GTA V (2015) | 172.9 | 105 | 105.6 | 146 | ||
| The Witcher 3 (2015) | 167.7 | 116 | ||||
| Dota 2 Reborn (2015) | 162.8 | 146.2 | 122.5 | |||
| Final Fantasy XV Benchmark (2018) | 152.8 | 114.6 | 69.3 | |||
| X-Plane 11.11 (2018) | 83.7 | 64.3 | ||||
| Far Cry 5 (2018) | 128 | 123 | 103 | |||
| Strange Brigade (2018) | 344 | 249 | 130.5 | |||
| Shadow of the Tomb Raider (2018) | 207 | 198 | 139 | 76 | ||
| Cyberpunk 2077 1.6 (2022) | 135 | 93.3 | 44.3 | |||
| Tiny Tina's Wonderlands (2022) | 150.2 | 106.8 | 56 | |||
| F1 22 (2022) | 296 | 102.8 | 69.3 | 36.1 | ||
| Ratchet & Clank Rift Apart (2023) | 86.2 | 83.6 | 54.8 | |||
| Baldur's Gate 3 (2023) | 152.4 | 152.6 | 118.5 | 65.8 | ||
| Cyberpunk 2077 (2023) | 130.7 | 129.6 | 85.2 | 37.7 | ||
| Alan Wake 2 (2023) | 104.8 | 71.7 | 37.3 |
Emisje
Hałas systemowy
Nie ma większych różnic w hałasie wentylatorów między naszymi konfiguracjami Intel i AMD. Niekoniecznie jest to jednak dobra rzecz, ponieważ wentylatory w naszej jednostce AMD pulsowały dość często i pozornie bez powodu podczas przeglądania stron internetowych lub przesyłania strumieniowego wideo. System działał cicho przy 23 dB(A), a następnie gwałtownie pulsował do 33,5 dB(A), nawet gdy był włączony profil zasilania Quiet lub Battery.
Co ciekawe, nie ma różnic w hałasie wentylatora między profilami zasilania Balanced i Performance, ponieważ jesteśmy w stanie zarejestrować maksymalnie 48 dB(A) podczas grania na obu profilach. Granie w trybie Overdrive zwiększyłoby jednak hałas wentylatora do skrzeczących 54 dB(A). Użytkownicy mogą wtedy rozważyć grę w trybie Performance, aby uzyskać zauważalnie cichsze wentylatory, nawet jeśli oznacza to poświęcenie od 5 do 10 procent wydajności.
Proszę nie oczekiwać, że Alienware będzie działał znacznie ciszej niż inne 18-calowe laptopy do gier, mimo że ma dwa razy więcej wentylatorów w środku. System nadal działa głośniej niż 50 dB(A) podczas grania, co praktycznie wymaga dobrej pary słuchawek.
Hałas
| luz |
| 23 / 23.4 / 33.5 dB |
| obciążenie |
| 33.5 / 53.6 dB |
 | ||
30 dB cichy 40 dB(A) słyszalny 50 dB(A) irytujący |
||
min: | ||
| Alienware m18 R1 AMD Radeon RX 7900M, R9 7945HX, Kioxia XG8 KXG80ZNV1T02 | Alienware m18 R1 GeForce RTX 4090 Laptop GPU, i9-13980HX, SK hynix PC801 HFS001TEJ9X101N | Acer Predator Helios 18 N23Q2 GeForce RTX 4080 Laptop GPU, i9-13900HX, Samsung PM9A1 MZVL22T0HBLB | Razer Blade 18 RTX 4070 GeForce RTX 4070 Laptop GPU, i9-13950HX, SSSTC CA6-8D1024 | Asus ROG Strix Scar 18 2023 G834JY-N6005W GeForce RTX 4090 Laptop GPU, i9-13980HX, 2x Samsung PM9A1 MZVL21T0HCLR (RAID 0) | MSI GE78HX 13VH-070US GeForce RTX 4080 Laptop GPU, i9-13950HX, Samsung PM9A1 MZVL22T0HBLB | |
|---|---|---|---|---|---|---|
| Noise | 3% | -4% | 1% | -10% | -8% | |
| wyłączone / środowisko * (dB) | 22.4 | 22.8 -2% | 23 -3% | 23.5 -5% | 23.9 -7% | 23.4 -4% |
| Idle Minimum * (dB) | 23 | 23 -0% | 23 -0% | 23.8 -3% | 23.9 -4% | 24.2 -5% |
| Idle Average * (dB) | 23.4 | 23 2% | 23 2% | 23.8 -2% | 32.6 -39% | 25.6 -9% |
| Idle Maximum * (dB) | 33.5 | 23 31% | 23 31% | 26.8 20% | 32.6 3% | 31 7% |
| Load Average * (dB) | 33.5 | 35.6 -6% | 45.26 -35% | 37.3 -11% | 35.9 -7% | 43.3 -29% |
| Witcher 3 ultra * (dB) | 53.6 | 51.3 4% | 59.82 -12% | 48 10% | 56.3 -5% | |
| Load Maximum * (dB) | 53.6 | 56.7 -6% | 59.94 -12% | 53.5 -0% | 55.8 -4% | 59.1 -10% |
* ... im mniej tym lepiej
Temperatura
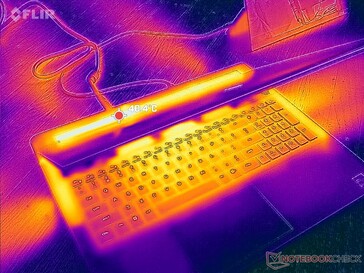
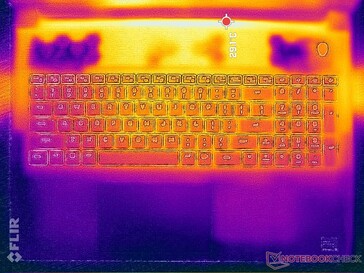
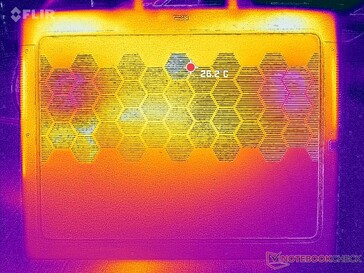
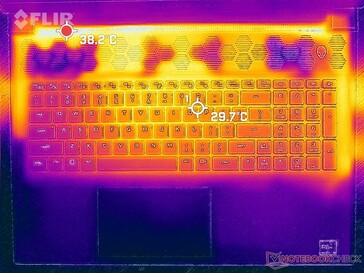
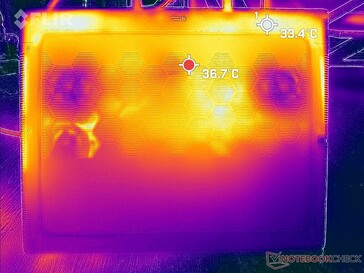
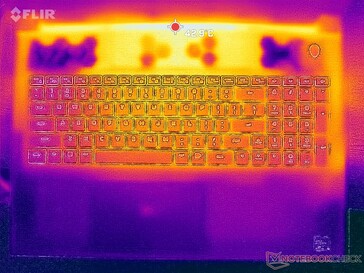
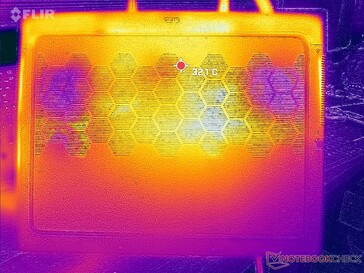
Temperatury powierzchni są podobne do tych, które odnotowaliśmy w konfiguracji Intel-Nvidia, a więc pozostają chłodniejsze niż można by się spodziewać ze względu na duży rozmiar ekranu, duże kratki wentylacyjne, dużą tylną konstrukcję i dużą liczbę wewnętrznych wentylatorów. Podpórki pod nadgarstki i klawiatura nigdy nie stają się nieprzyjemnie ciepłe w dotyku podczas grania, w przeciwieństwie do cieplejszych powierzchni mniejszych laptopów do gier, takich jak Razer Blade 16.
(±) Maksymalna temperatura w górnej części wynosi 40.2 °C / 104 F, w porównaniu do średniej 40.4 °C / 105 F , począwszy od 21.2 do 68.8 °C dla klasy Gaming.
(+) Dno nagrzewa się maksymalnie do 37.4 °C / 99 F, w porównaniu do średniej 43.3 °C / 110 F
(+) W stanie bezczynności średnia temperatura górnej części wynosi 26.6 °C / 80 F, w porównaniu ze średnią temperaturą urządzenia wynoszącą 33.9 °C / ### class_avg_f### F.
(+) Podczas gry w Wiedźmina 3 średnia temperatura górnej części wynosi 30.6 °C / 87 F, w porównaniu do średniej temperatury urządzenia wynoszącej 33.9 °C / ## #class_avg_f### F.
(+) Podpórki pod nadgarstki i touchpad są chłodniejsze niż temperatura skóry i maksymalnie 24.6 °C / 76.3 F i dlatego są chłodne w dotyku.
(+) Średnia temperatura obszaru podparcia dłoni w podobnych urządzeniach wynosiła 28.8 °C / 83.8 F (+4.2 °C / 7.5 F).
| Alienware m18 R1 AMD AMD Ryzen 9 7945HX, AMD Radeon RX 7900M | Alienware m18 R1 Intel Core i9-13980HX, NVIDIA GeForce RTX 4090 Laptop GPU | Acer Predator Helios 18 N23Q2 Intel Core i9-13900HX, NVIDIA GeForce RTX 4080 Laptop GPU | Razer Blade 18 RTX 4070 Intel Core i9-13950HX, NVIDIA GeForce RTX 4070 Laptop GPU | Asus ROG Strix Scar 18 2023 G834JY-N6005W Intel Core i9-13980HX, NVIDIA GeForce RTX 4090 Laptop GPU | MSI GE78HX 13VH-070US Intel Core i9-13950HX, NVIDIA GeForce RTX 4080 Laptop GPU | |
|---|---|---|---|---|---|---|
| Heat | 6% | -18% | -1% | -13% | -3% | |
| Maximum Upper Side * (°C) | 40.2 | 39 3% | 35 13% | 39.2 2% | 54 -34% | 37.4 7% |
| Maximum Bottom * (°C) | 37.4 | 36.4 3% | 56 -50% | 35.6 5% | 46 -23% | 45 -20% |
| Idle Upper Side * (°C) | 31.6 | 29.2 8% | 34 -8% | 31.8 -1% | 30 5% | 29.8 6% |
| Idle Bottom * (°C) | 30.6 | 27.8 9% | 39 -27% | 33.2 -8% | 31 -1% | 32.4 -6% |
* ... im mniej tym lepiej
Test warunków skrajnych
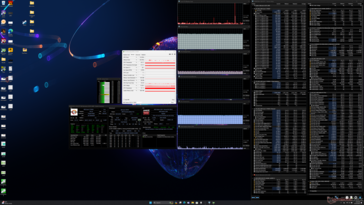
Temperatura procesora i pobór mocy pakietu podczas stresu Prime95 ustabilizowały się odpowiednio na poziomie ~97 C i ~145 W, co jest w rzeczywistości bardzo podobne do tego, co zaobserwowaliśmy w konfiguracji Intela z Core i9-13980HK. Turbo Boost jest jednak wyższy i bardziej agresywny w przypadku procesora Intela na początku testu, co pokazuje nasza sekcja Pobór mocy.
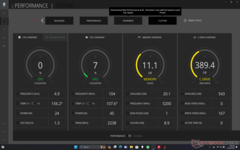
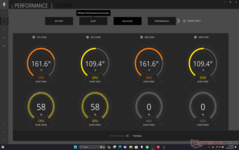
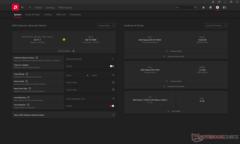
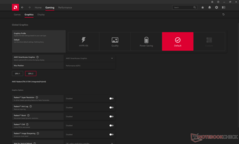
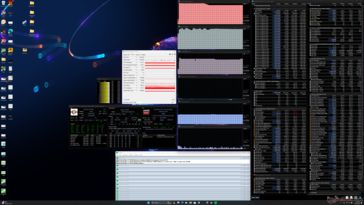
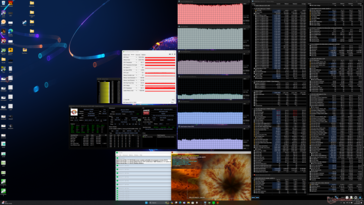
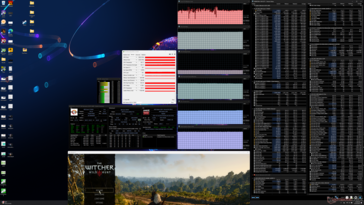
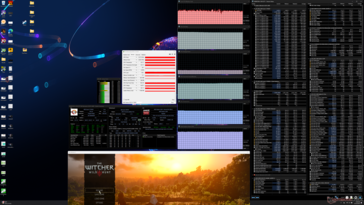
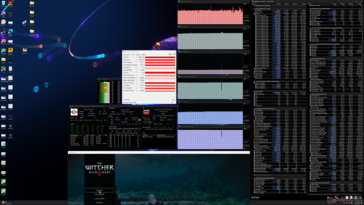
AMD reklamuje TGP na poziomie 180 W, który możemy osiągnąć podczas pracy w trybie Witcher 3 w trybie Overdrive. Zejście do trybu Balanced lub Performance obniża jednak pułap TGP do 165 W, jak pokazują poniższe zrzuty ekranu. W rezultacie częstotliwości taktowania GPU są nieco niższe, co koreluje z naszymi wynikami Fire Strike wspomnianymi powyżej, co oznacza, że bardzo głośny tryb Overdrive jest obowiązkowy dla uzyskania maksymalnej wydajności.
Powtarzając test Witcher 3 z naszą konfiguracją Intel-Nvidia RTX 4090 zaowocowałoby relatywnie niższym poborem mocy karty graficznej na poziomie 161 W, wykazując wyższą wydajność w przeliczeniu na wat w porównaniu do naszego Radeona RX 7900M.
Proszę zauważyć, że temperatury CPU i GPU są nieco niższe podczas grania w trybie Overdrive w porównaniu do trybu Balanced lub Performance, ponieważ wentylatory pracują zauważalnie głośniej.
| Taktowanie CPU (GHz) | Taktowanie GPU (MHz) | Średnia temperatura CPU (°C) | Średnia temperatura GPU (°C) | |
| System w stanie spoczynku | -- | -- | 74 | 47 |
| Prime95Stress | 4.5 - 4.9 | -- | 97 | 53 |
| Prime95+ FurMark Stress | ~4.6 | 1253 | 99 | 67 |
| Witcher 3 Obciążenie (trybOverdrive) | ~3,5 | 2208 | 77 | 82 |
| Witcher 3 Obciążenie (trybwydajności) | ~3.2 | 2127 | 80 | 83 |
| Witcher 3 Stres (trybzrównoważony) | ~3.4 | 2082 | 84 | 86 |
Głośniki
Alienware m18 R1 AMD analiza dźwięku
(+) | głośniki mogą odtwarzać stosunkowo głośno (84.2 dB)
Bas 100 - 315 Hz
(-) | prawie brak basu - średnio 22.7% niższa od mediany
(-) | bas nie jest liniowy (15.8% delta do poprzedniej częstotliwości)
Średnie 400 - 2000 Hz
(+) | zbalansowane środki średnie - tylko 1.5% od mediany
(+) | średnie są liniowe (3.8% delta do poprzedniej częstotliwości)
Wysokie 2–16 kHz
(+) | zrównoważone maksima - tylko 3.6% od mediany
(+) | wzloty są liniowe (5.5% delta do poprzedniej częstotliwości)
Ogólnie 100 - 16.000 Hz
(±) | liniowość ogólnego dźwięku jest średnia (16.5% różnicy w stosunku do mediany)
W porównaniu do tej samej klasy
» 42% wszystkich testowanych urządzeń w tej klasie było lepszych, 7% podobnych, 52% gorszych
» Najlepszy miał deltę 6%, średnia wynosiła ###średnia###%, najgorsza wynosiła 132%
W porównaniu do wszystkich testowanych urządzeń
» 27% wszystkich testowanych urządzeń było lepszych, 6% podobnych, 67% gorszych
» Najlepszy miał deltę 4%, średnia wynosiła ###średnia###%, najgorsza wynosiła 134%
Apple MacBook Pro 16 2021 M1 Pro analiza dźwięku
(+) | głośniki mogą odtwarzać stosunkowo głośno (84.7 dB)
Bas 100 - 315 Hz
(+) | dobry bas - tylko 3.8% od mediany
(+) | bas jest liniowy (5.2% delta do poprzedniej częstotliwości)
Średnie 400 - 2000 Hz
(+) | zbalansowane środki średnie - tylko 1.3% od mediany
(+) | średnie są liniowe (2.1% delta do poprzedniej częstotliwości)
Wysokie 2–16 kHz
(+) | zrównoważone maksima - tylko 1.9% od mediany
(+) | wzloty są liniowe (2.7% delta do poprzedniej częstotliwości)
Ogólnie 100 - 16.000 Hz
(+) | ogólny dźwięk jest liniowy (4.6% różnicy w stosunku do mediany)
W porównaniu do tej samej klasy
» 0% wszystkich testowanych urządzeń w tej klasie było lepszych, 0% podobnych, 100% gorszych
» Najlepszy miał deltę 5%, średnia wynosiła ###średnia###%, najgorsza wynosiła 45%
W porównaniu do wszystkich testowanych urządzeń
» 0% wszystkich testowanych urządzeń było lepszych, 0% podobnych, 100% gorszych
» Najlepszy miał deltę 4%, średnia wynosiła ###średnia###%, najgorsza wynosiła 134%
Zarządzanie energią
Zużycie energii
Zużycie energii w Alienware m18 R1 waha się między konfiguracjami AMD-AMD i Intel-Nvidia. Z jednej strony Ryzen 7 7945HX jest bardziej wydajny niż Core i9-13980HX; jest w stanie ukończyć test porównawczy CineBench R15 xT w mniej więcej tym samym czasie co Core i9, jednocześnie wymagając od 50 do 60 W mniej energii z sieci. Z drugiej strony, Radeon RX 7900M jest mniej wydajny niż GeForce RTX 4080 lub 4090; na przykład uruchomienie FurMark pobrałoby około 50 W więcej na naszej konfiguracji AMD. Ogólna wydajność w przeliczeniu na wat może zatem skłaniać się ku jednej konfiguracji w zależności od tego, jak intensywnie wykorzystują Państwo CPU lub GPU w swoich aplikacjach.
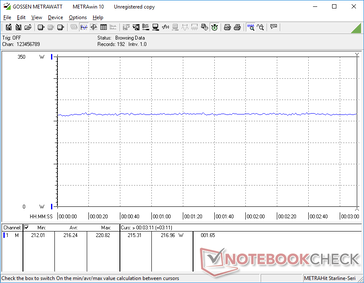
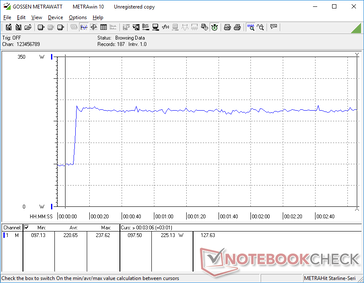
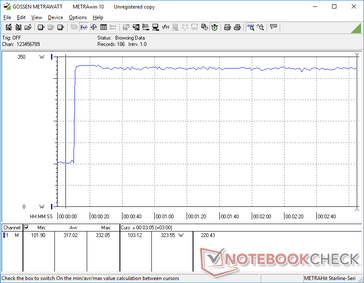
Jednoczesne uruchomienie CPU i GPU przy 100-procentowym wykorzystaniu nadal pobierałoby do 333 W z dużego zasilacza sieciowego o mocy 330 W, podobnie jak w przypadku konfiguracji Intel-Nvidia. Jednakże, procesor Intel Core i9 ma tendencję do pobierania większej ilości energii bardziej liberalnie niż nasz Ryzen 9, a więc ogólny pobór mocy jest wyższy niż w przypadku naszej konfiguracji opartej w całości na układach AMD podczas grania. Można to zaobserwować podczas uruchamiania Witcher 3 jak pokazuje poniższa tabela.
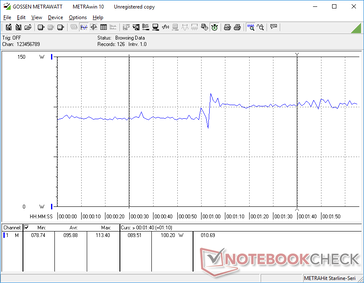
Zużycie energii podczas bezczynności na pulpicie nie jest zoptymalizowane, co może przyczyniać się do bardzo krótkiego czasu pracy na baterii. Czasami jesteśmy w stanie zmierzyć zużycie na poziomie nawet 101 W, nawet przy zrównoważonym profilu zasilania bez aktywnych aplikacji. Zużycie w trybie czuwania również jest bardzo wysokie i wynosi 25 W, podczas gdy powinno być bliższe zaledwie 1 lub 2 watów.
Zalecamy zmniejszenie częstotliwości odświeżania z 480 Hz do 120 Hz, jeśli chodzi o zużycie energii, ponieważ ta prosta zmiana może zaoszczędzić do 11 W, jak pokazuje poniższy wykres. Szkoda, że ten konkretny panel nie oferuje opcji zmiennej częstotliwości odświeżania.
| wyłączony / stan wstrzymania | |
| luz | |
| obciążenie |
|
Legenda:
min: | |
| Alienware m18 R1 AMD R9 7945HX, Radeon RX 7900M, Kioxia XG8 KXG80ZNV1T02, IPS, 1920x1200, 18" | HP Omen 16-wf000 i7-13700HX, GeForce RTX 4080 Laptop GPU, SK hynix PC801 HFS002TEJ9X101N, IPS, 2560x1440, 16.1" | Alienware m18 R1 i9-13980HX, GeForce RTX 4090 Laptop GPU, SK hynix PC801 HFS001TEJ9X101N, IPS, 1920x1200, 18" | Acer Predator Helios 18 N23Q2 i9-13900HX, GeForce RTX 4080 Laptop GPU, Samsung PM9A1 MZVL22T0HBLB, IPS, 2560x1600, 18" | Razer Blade 18 RTX 4070 i9-13950HX, GeForce RTX 4070 Laptop GPU, SSSTC CA6-8D1024, IPS, 2560x1600, 18" | MSI GE78HX 13VH-070US i9-13950HX, GeForce RTX 4080 Laptop GPU, Samsung PM9A1 MZVL22T0HBLB, IPS, 2560x1600, 17" | |
|---|---|---|---|---|---|---|
| Power Consumption | 32% | 13% | 31% | 25% | 29% | |
| Idle Minimum * (Watt) | 30.3 | 21.8 28% | 21.6 29% | 16 47% | 24.5 19% | 16.1 47% |
| Idle Average * (Watt) | 55.6 | 26 53% | 25.2 55% | 19 66% | 34.1 39% | 24 57% |
| Idle Maximum * (Watt) | 101.1 | 36 64% | 56.7 44% | 21.3 79% | 47.7 53% | 34 66% |
| Load Average * (Watt) | 160.3 | 115.5 28% | 164.1 -2% | 124 23% | 140 13% | 123.6 23% |
| Witcher 3 ultra * (Watt) | 216 | 214 1% | 311 -44% | 289 -34% | 202 6% | 286 -32% |
| Load Maximum * (Watt) | 332.1 | 269.7 19% | 338.9 -2% | 319 4% | 261 21% | 285.7 14% |
* ... im mniej tym lepiej
Power Consumption Witcher 3 / Stresstest
Power Consumption external Monitor
Żywotność baterii
Czasy pracy są bardzo słabe, nawet jak na dużego laptopa do gier. Nawet w najlepszym scenariuszu z dosłownie wszystkim wyłączonym lub ustawionym na minimum (AlienFX wyłączony, minimalna jasność wyświetlacza, częstotliwość odświeżania 120 Hz, brak uruchomionych aplikacji, wyłączona łączność bezprzewodowa, tryb oszczędzania baterii), jesteśmy w stanie zarejestrować tylko niecałe 4,5 godziny czasu pracy przed automatycznym wyłączeniem. Czas ten spadłby do zaledwie 95 minut podczas przeglądania stron internetowych w porównaniu do Acer Predator Helios 18 lub Razer Blade 18, które mogą działać o kilka godzin dłużej.
Ładowanie od stanu pustego do pełnej pojemności za pomocą dołączonego zasilacza sieciowego zajmuje około 2 do 2,5 godziny. Model ten nie obsługuje ładowania przez USB-C, w przeciwieństwie do większości innych nowoczesnych laptopów do gier, więc podczas podróży jesteś zasadniczo przywiązany do gigantycznego zasilacza sieciowego o mocy 330 W.
| Alienware m18 R1 AMD R9 7945HX, Radeon RX 7900M, 97 Wh | Alienware m18 R1 i9-13980HX, GeForce RTX 4090 Laptop GPU, 97 Wh | Acer Predator Helios 18 N23Q2 i9-13900HX, GeForce RTX 4080 Laptop GPU, 90 Wh | Razer Blade 18 RTX 4070 i9-13950HX, GeForce RTX 4070 Laptop GPU, 91.7 Wh | Asus ROG Strix Scar 18 2023 G834JY-N6005W i9-13980HX, GeForce RTX 4090 Laptop GPU, 90 Wh | MSI GE78HX 13VH-070US i9-13950HX, GeForce RTX 4080 Laptop GPU, 99 Wh | |
|---|---|---|---|---|---|---|
| Czasy pracy | 77% | 179% | 109% | 218% | 171% | |
| Reader / Idle (h) | 4.5 | 5.6 24% | 7 56% | 7.3 62% | ||
| WiFi v1.3 (h) | 1.4 | 4.3 207% | 4.4 214% | 4 186% | 7.1 407% | 6.1 336% |
| Load (h) | 0.7 | 0.7 0% | 1.7 143% | 1.3 86% | 0.9 29% | 1.5 114% |
| H.264 (h) | 4.8 | 7 | ||||
| Witcher 3 ultra (h) | 0.9 |
Za
Przeciw
Werdykt - mobilny GeForce RTX 4080 Challenger, na którego czekaliśmy
W chwili pisania tego tekstu konfiguracja Core i9-13900HX/RTX 4080 Alienware m18 R1 z 32 GB pamięci RAM, 1 TB SSD i wyświetlaczem 1200p kosztuje 2950 USD. Tymczasem konfiguracja Ryzen 9 7945HX/RX 7900M z dokładnie taką samą pamięcią RAM, dyskiem SSD i wyświetlaczem kosztuje 2300 USD. Opcja w pełni oparta na układach AMD oferuje wyższą wydajność CPU i niemal identyczną wydajność GPU za prawie 700 USD mniej. Nie trzeba dodawać, że wydajność w przeliczeniu na dolara jest zdecydowanie najsilniejszym punktem sprzedaży nowych SKU AMD i jednym z największych powodów, dla których warto pominąć Intela i Nvidię. Różnica w cenie jest tak duża, że można nawet pominąć wszystkie problemy, których doświadczyliśmy na naszej wczesnej jednostce testowej, tylko po to, by zaoszczędzić setki dolarów.
Laptopy do gier z kartą GeForce RTX 4080 przez cały rok cieszyły się zawyżonymi cenami. Bardzo opłacalna karta AMD Radeon RX 7900M jest odpowiednim pretendentem, aby w końcu sprowadzić te ceny z powrotem na ziemię.
Mimo to, błędy nie są bez znaczenia. Wyłączanie się wyświetlacza, problemy z uruchamianiem, przeskakiwanie klatek podczas odtwarzania wideo, zacinanie się podczas grania i niezwykle wysoki pobór mocy na biegu jałowym powinny zostać bezwzględnie wyeliminowane. W rezultacie nie ma szaleńczego pośpiechu, aby wyjść i kupić Alienware m18 R1 w pełni AMD, podczas gdy czekamy na poprawki i wsparcie FSR 3, które będą powoli wdrażane w miarę upływu czasu.
Nadal istnieją powody, aby wybrać Intel-Nvidia zamiast AMD-AMD, gdy wszystkie błędy zostaną rozwiązane. Choć Radeon 7900M może być imponujący, mobilny RTX 4080 nadal jest średnio szybszy, zwłaszcza jeśli lubią Państwo grać z włączonym RT. Ci, którzy chcą najlepszego i najszybszego bez względu na koszty, powinni zatem trzymać się serii GeForce. Dla reszty z nas, śmiertelników z ograniczonym budżetem, Radeon 7900M wygląda na solidną alternatywę dla drogiego RTX 4080, na który wielu czekało. Mamy nadzieję, że GPU pojawi się w wielu innych laptopach do gier w najbliższej przyszłości, a nie tylko w kilku wybranych.
Cena i dostępność
Dell wysyła teraz bezpośrednio Alienware m18 R1 we wszystkich poziomach konfiguracji. Alternatywnie, Best Buy oferuje konfigurację Ryzen 9/7900M za 2800 USD.
Alienware m18 R1 AMD
- 26/11/2023 v7 (old)
Allen Ngo
Przezroczystość
Wyboru urządzeń do recenzji dokonuje nasza redakcja. Próbka testowa została udostępniona autorowi jako pożyczka od producenta lub sprzedawcy detalicznego na potrzeby tej recenzji. Pożyczkodawca nie miał wpływu na tę recenzję, producent nie otrzymał też kopii tej recenzji przed publikacją. Nie było obowiązku publikowania tej recenzji. Jako niezależna firma medialna, Notebookcheck nie podlega władzy producentów, sprzedawców detalicznych ani wydawców.
Tak testuje Notebookcheck
Każdego roku Notebookcheck niezależnie sprawdza setki laptopów i smartfonów, stosując standardowe procedury, aby zapewnić porównywalność wszystkich wyników. Od około 20 lat stale rozwijamy nasze metody badawcze, ustanawiając przy tym standardy branżowe. W naszych laboratoriach testowych doświadczeni technicy i redaktorzy korzystają z wysokiej jakości sprzętu pomiarowego. Testy te obejmują wieloetapowy proces walidacji. Nasz kompleksowy system ocen opiera się na setkach uzasadnionych pomiarów i benchmarków, co pozwala zachować obiektywizm.

