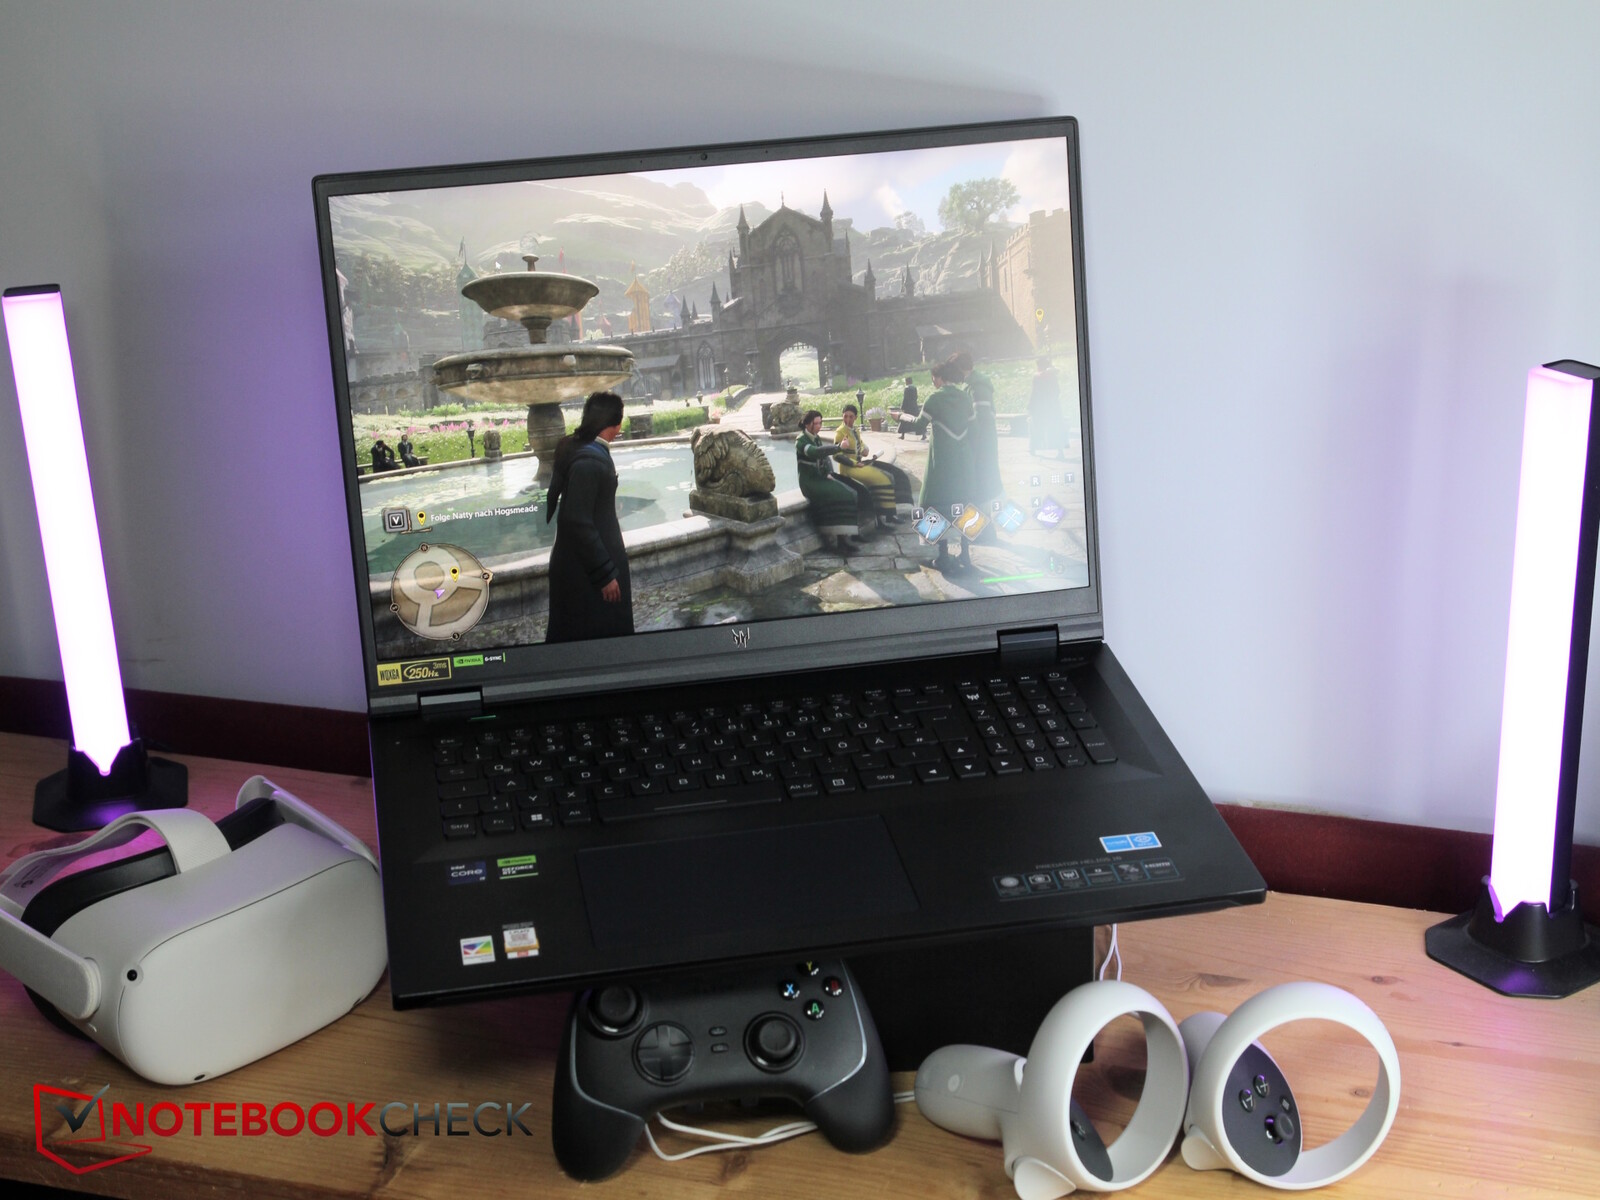
Recenzja laptopa Acer Predator Helios 18: Gracz RTX 4080 z wyświetlaczem MiniLED o jasności ponad 1000 nitów

Karta graficzna RTX 4060 wyposażony Acer Predator Helios 16 uzyskał pełną ocenę 90 procent w naszej lipcowej recenzji. Teraz przyjrzymy się 18-calowemu modelowi high-end z procesorem Intel HX, kartą graficzną RTX 4080 i wyświetlaczem MiniLED.
Do porównania używamy innych 18-calowych graczy, a także 17-calowych graczy o podobnej specyfikacji, ponieważ Predator Helios 18 jest pierwszym z RTX 4080 wśród naszych recenzji 18-calowych laptopów. Wśród konkurentów znajdują sięMSI Raider GE78 HX 13VHi HP Omen 17laptop Alienware m18 R1, Asus ROG Strix G18 G814JI i Razer Blade 18.
Potencjalni konkurenci w porównaniu
Ocena | Data | Model | Waga | Wysokość | Rozmiar | Rezolucja | Cena |
|---|---|---|---|---|---|---|---|
| 88.3 % v7 (old) | 10/2023 | Acer Predator Helios 18 N23Q2 i9-13900HX, GeForce RTX 4080 Laptop GPU | 3.2 kg | 29.15 mm | 18.00" | 2560x1600 | |
| 88.3 % v7 (old) | 03/2023 | MSI GE78HX 13VH-070US i9-13950HX, GeForce RTX 4080 Laptop GPU | 3 kg | 23 mm | 17.00" | 2560x1600 | |
| 85.4 % v7 (old) | 03/2023 | HP Omen 17-ck2097ng i9-13900HX, GeForce RTX 4080 Laptop GPU | 2.8 kg | 27 mm | 17.30" | 2560x1440 | |
| 90.7 % v7 (old) | 04/2023 | Alienware m18 R1 i9-13980HX, GeForce RTX 4090 Laptop GPU | 3.9 kg | 26.7 mm | 18.00" | 1920x1200 | |
| 87.4 % v7 (old) | 03/2023 | Asus ROG Strix G18 G814JI i7-13650HX, GeForce RTX 4070 Laptop GPU | 3 kg | 31 mm | 18.00" | 2560x1600 | |
| 91.4 % v7 (old) | 02/2023 | Razer Blade 18 RTX 4070 i9-13950HX, GeForce RTX 4070 Laptop GPU | 3 kg | 21.9 mm | 18.00" | 2560x1600 |
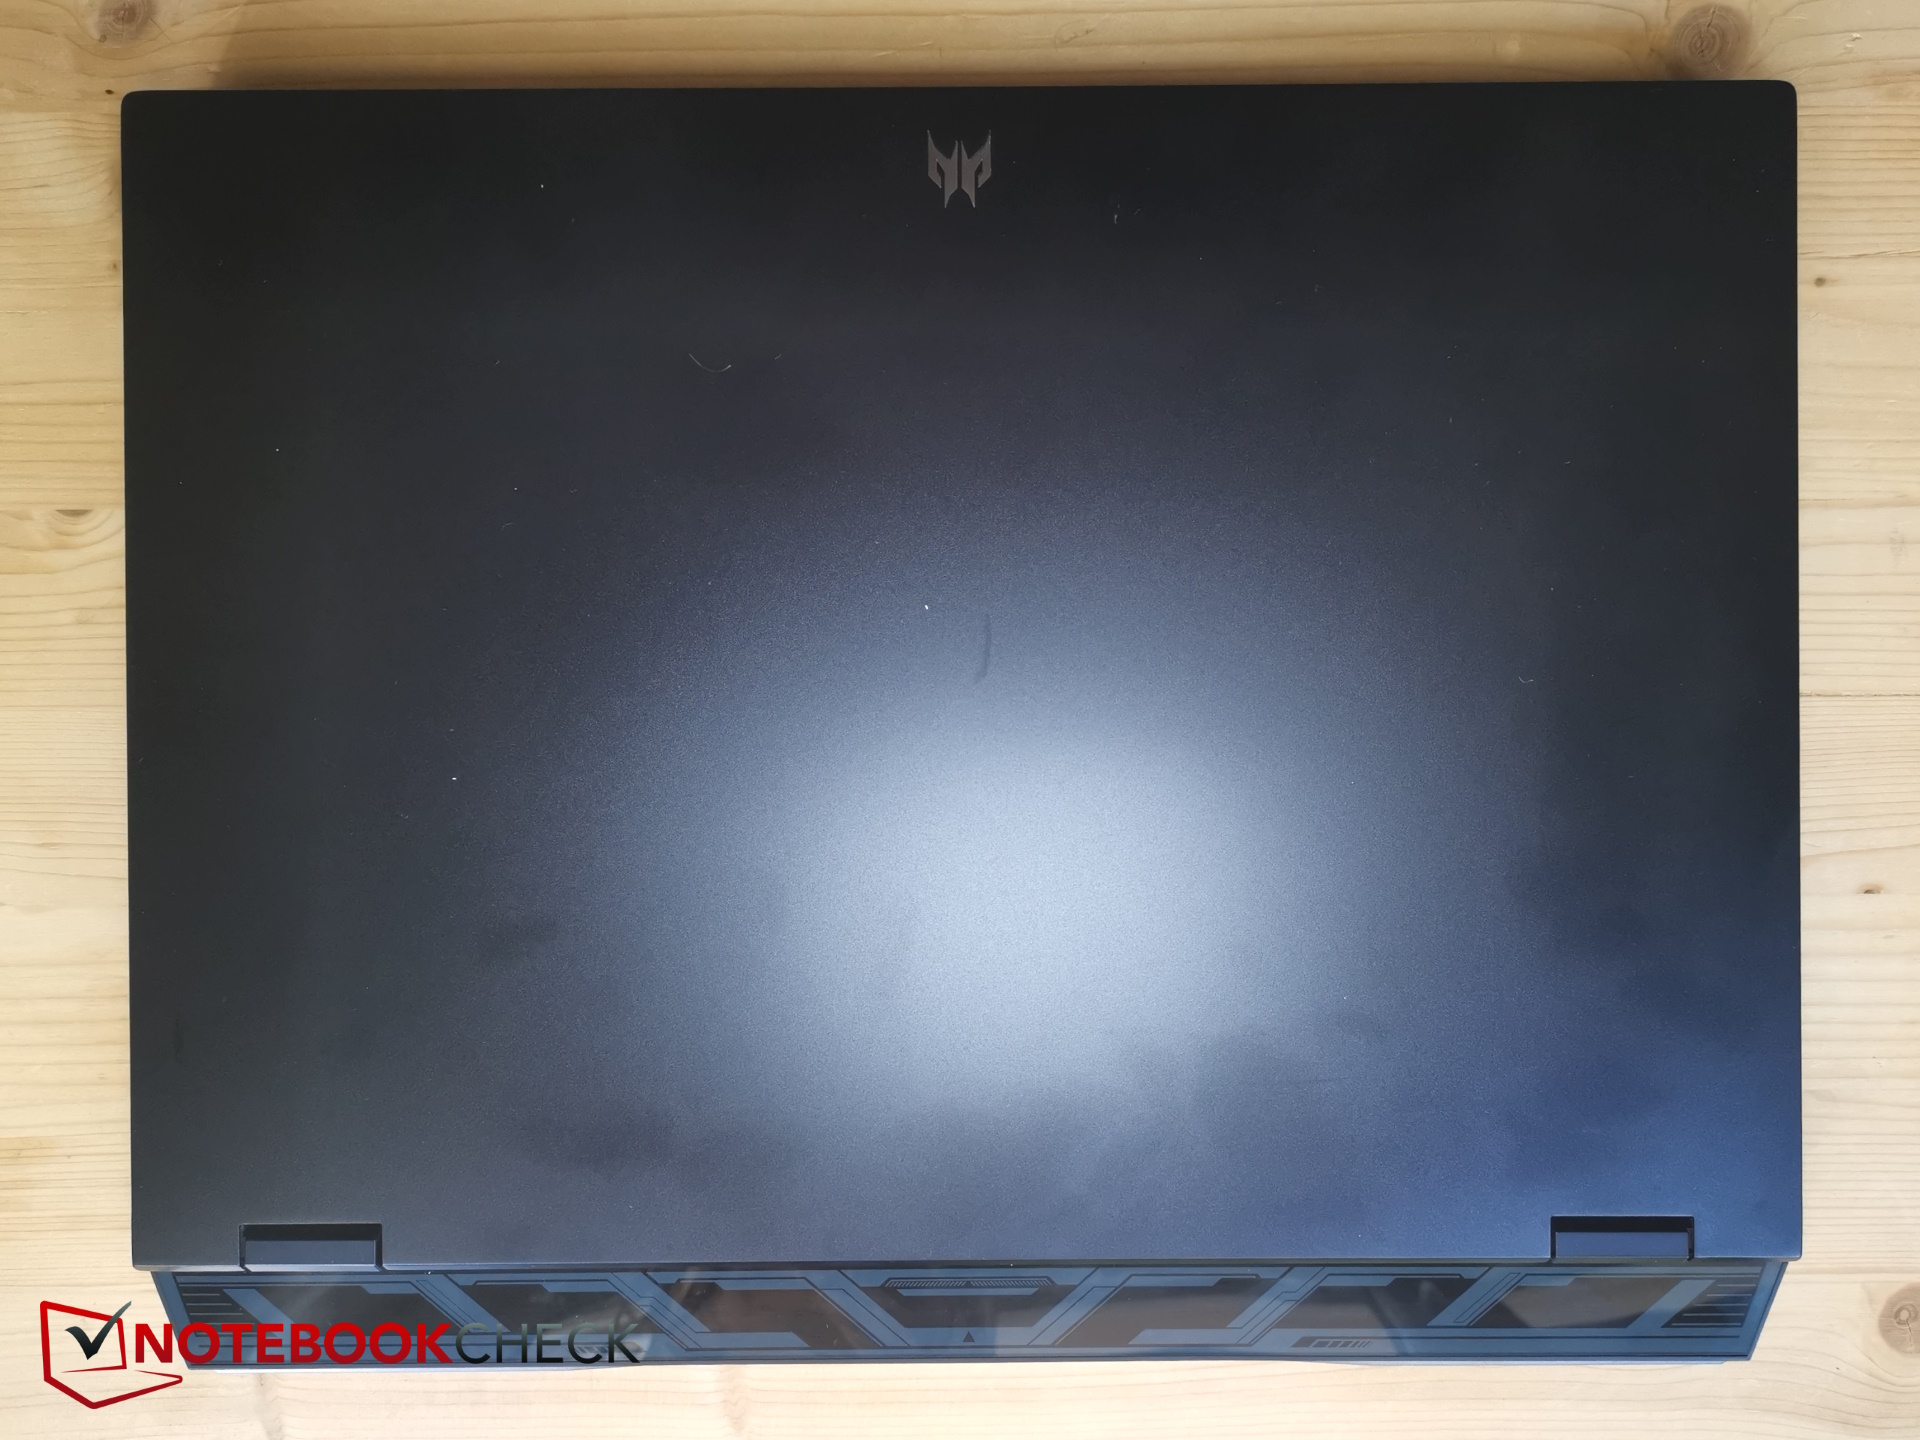
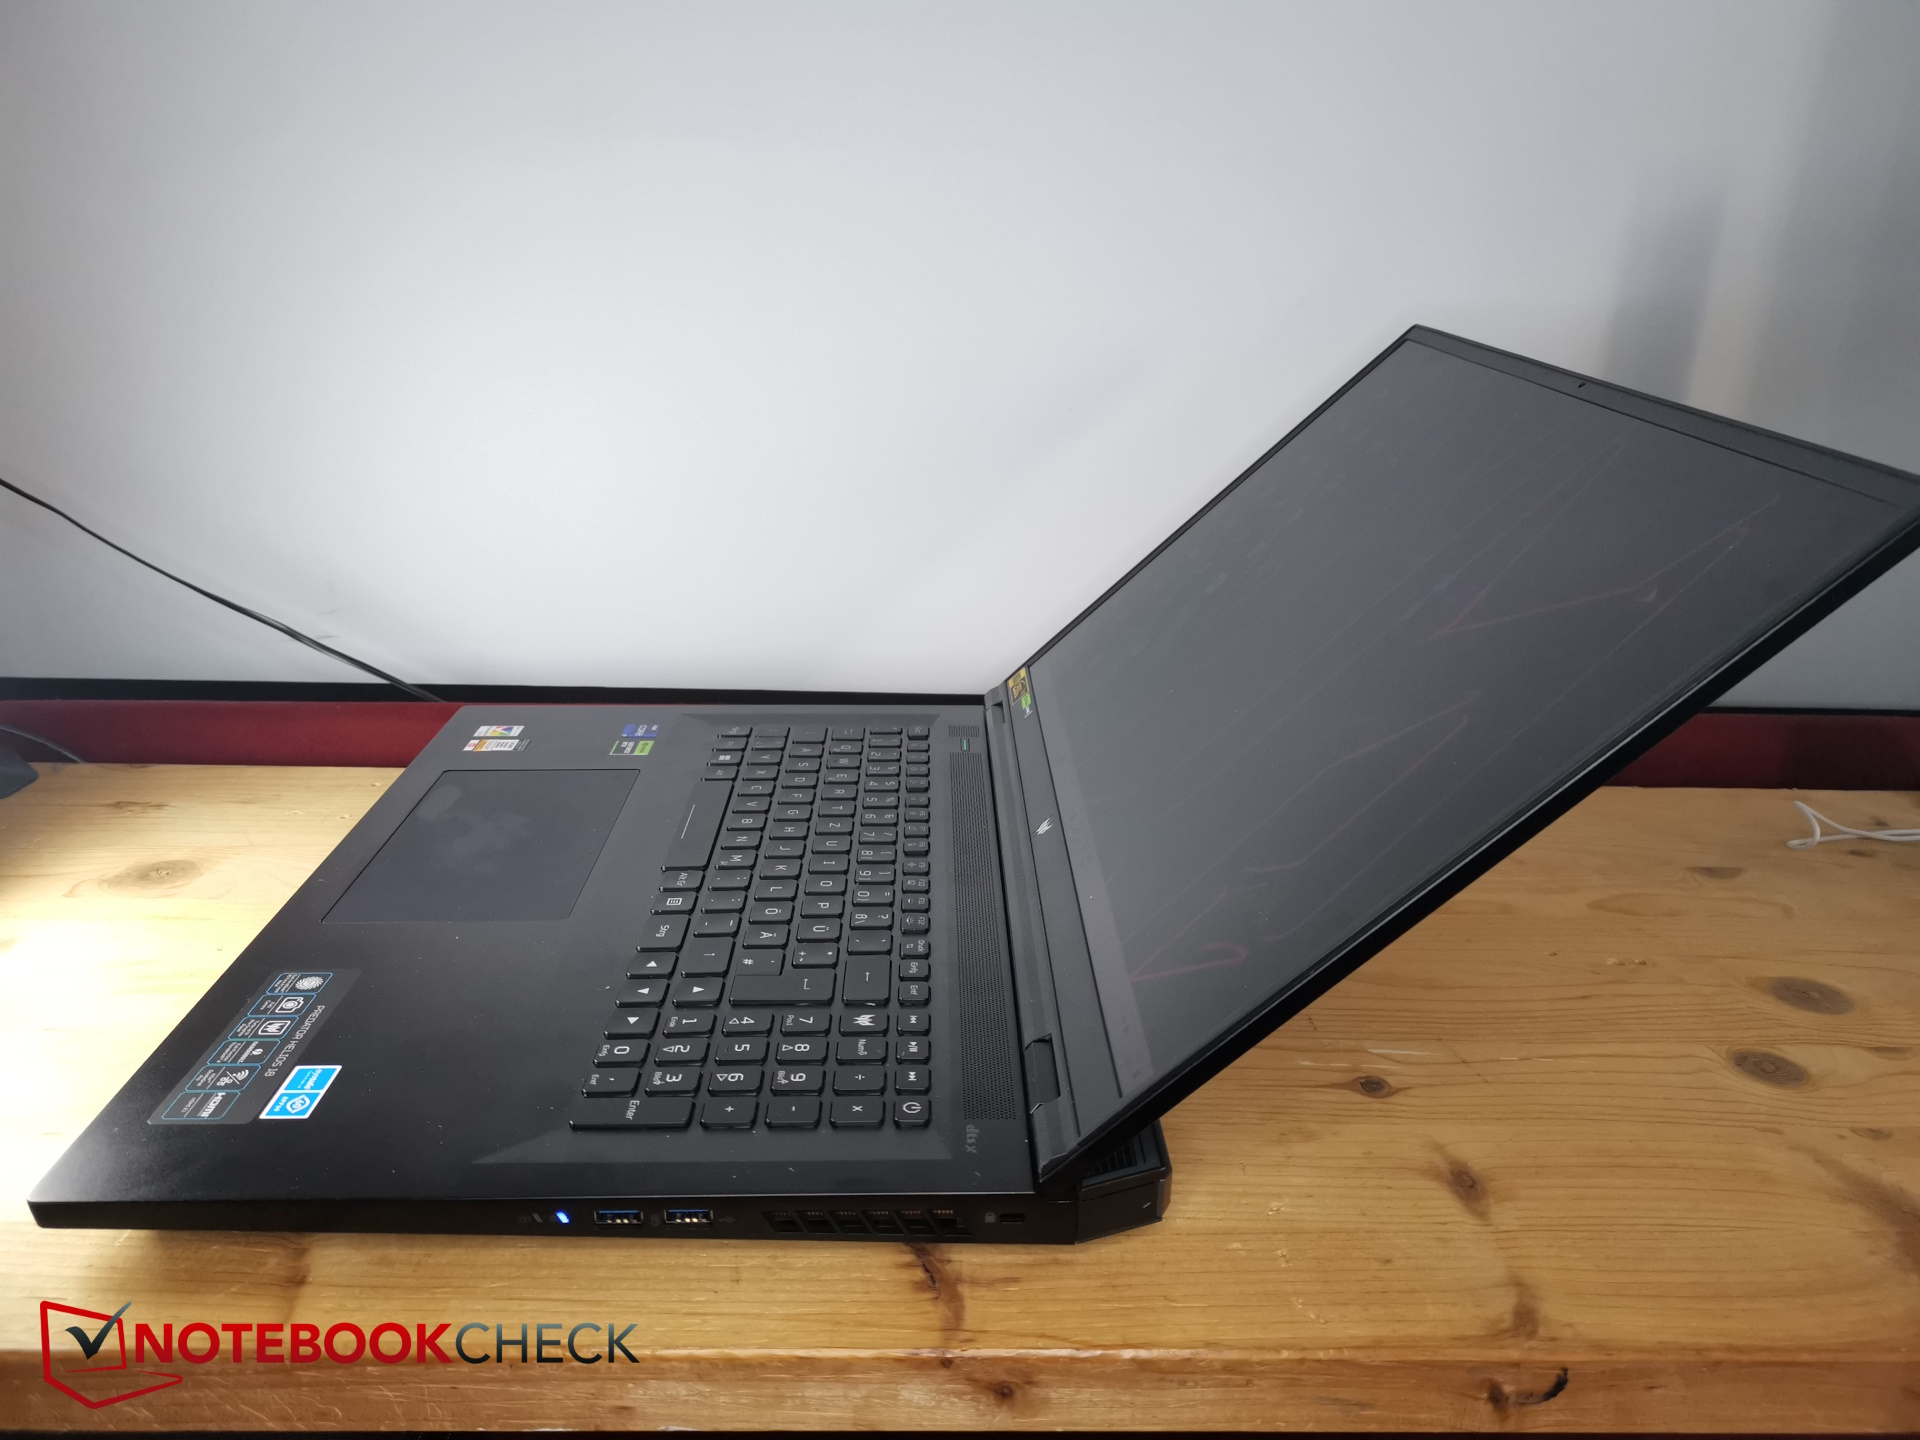
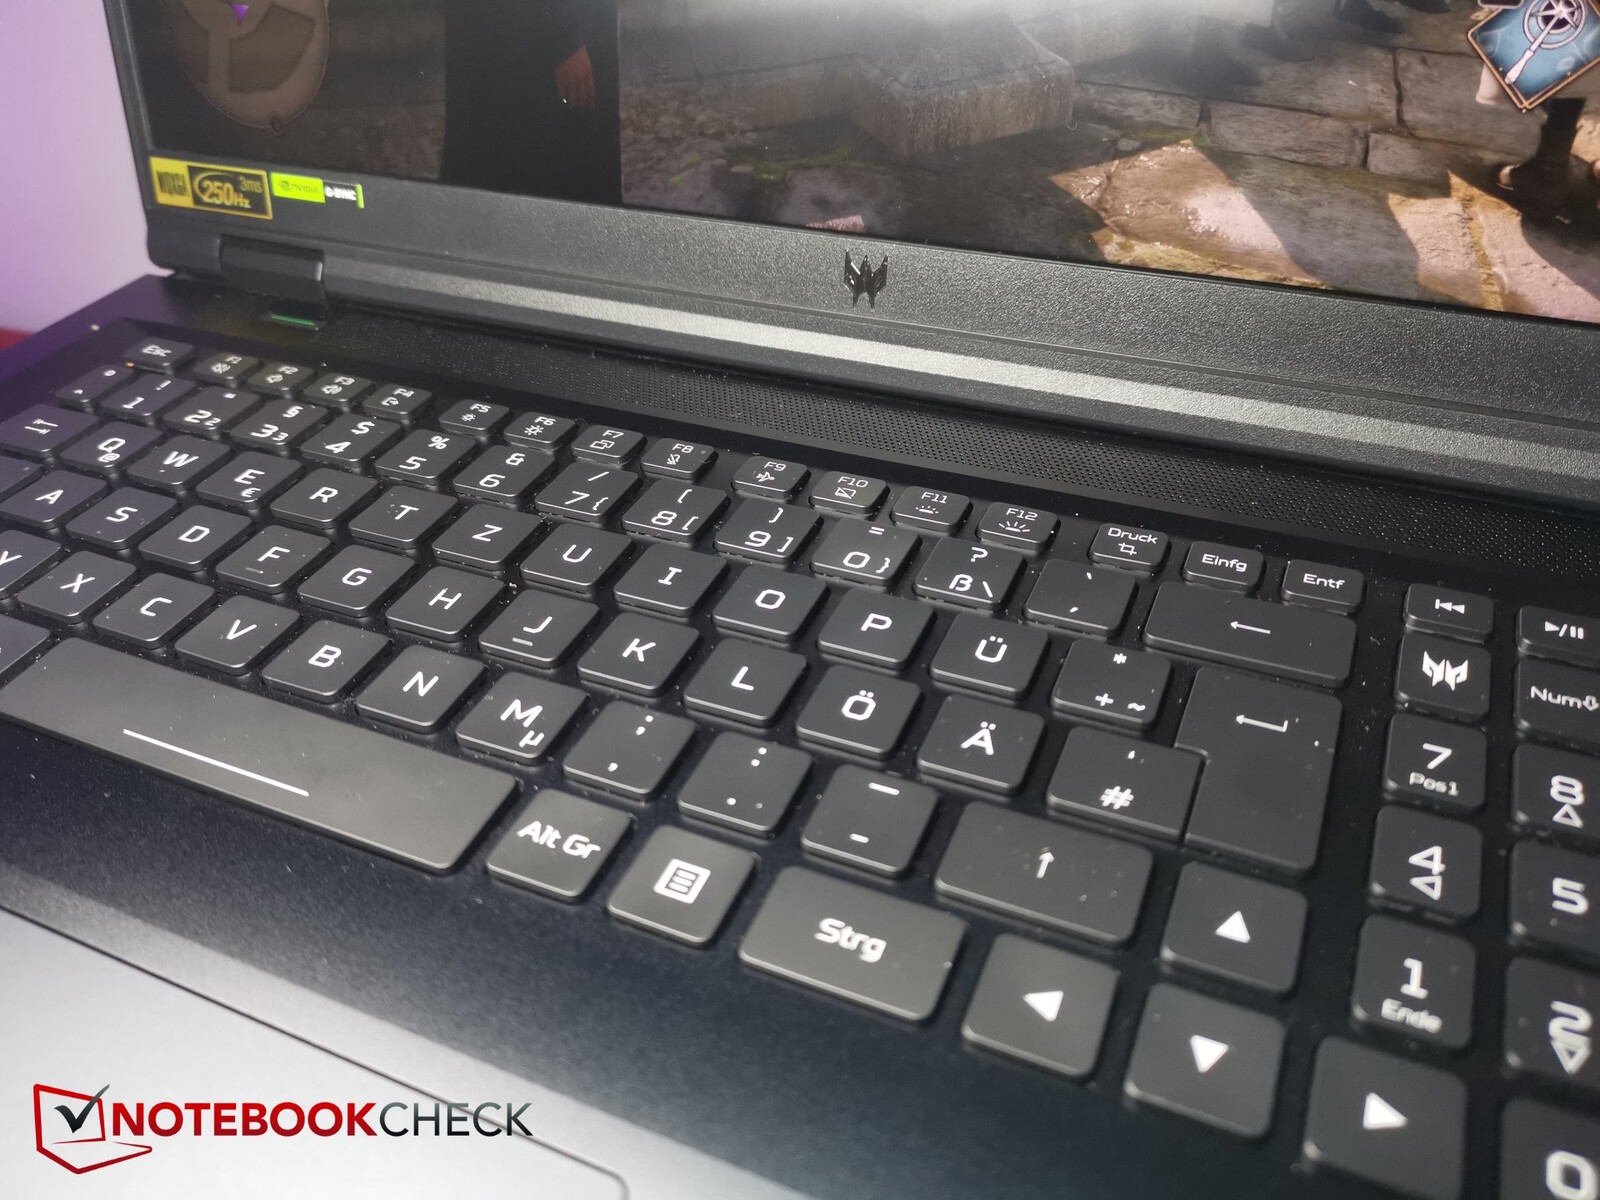
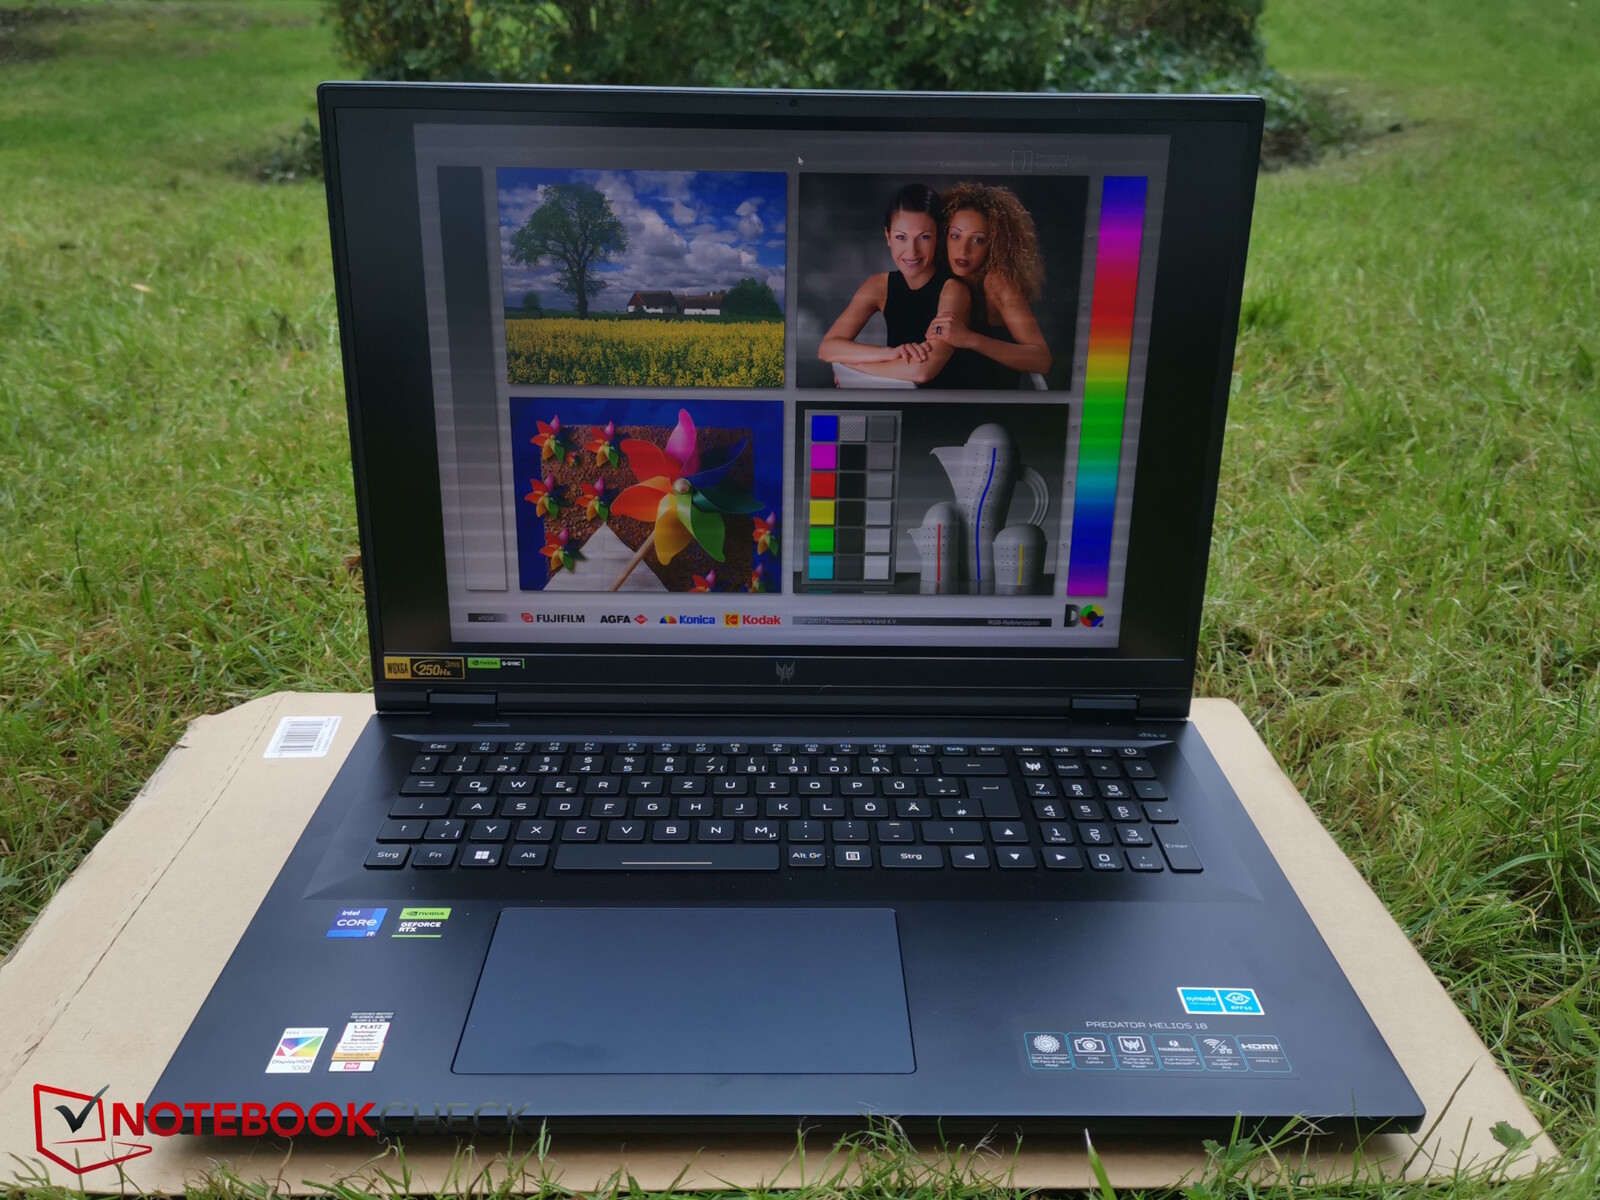
Obudowa - Czarne aluminium dla Acer Predator
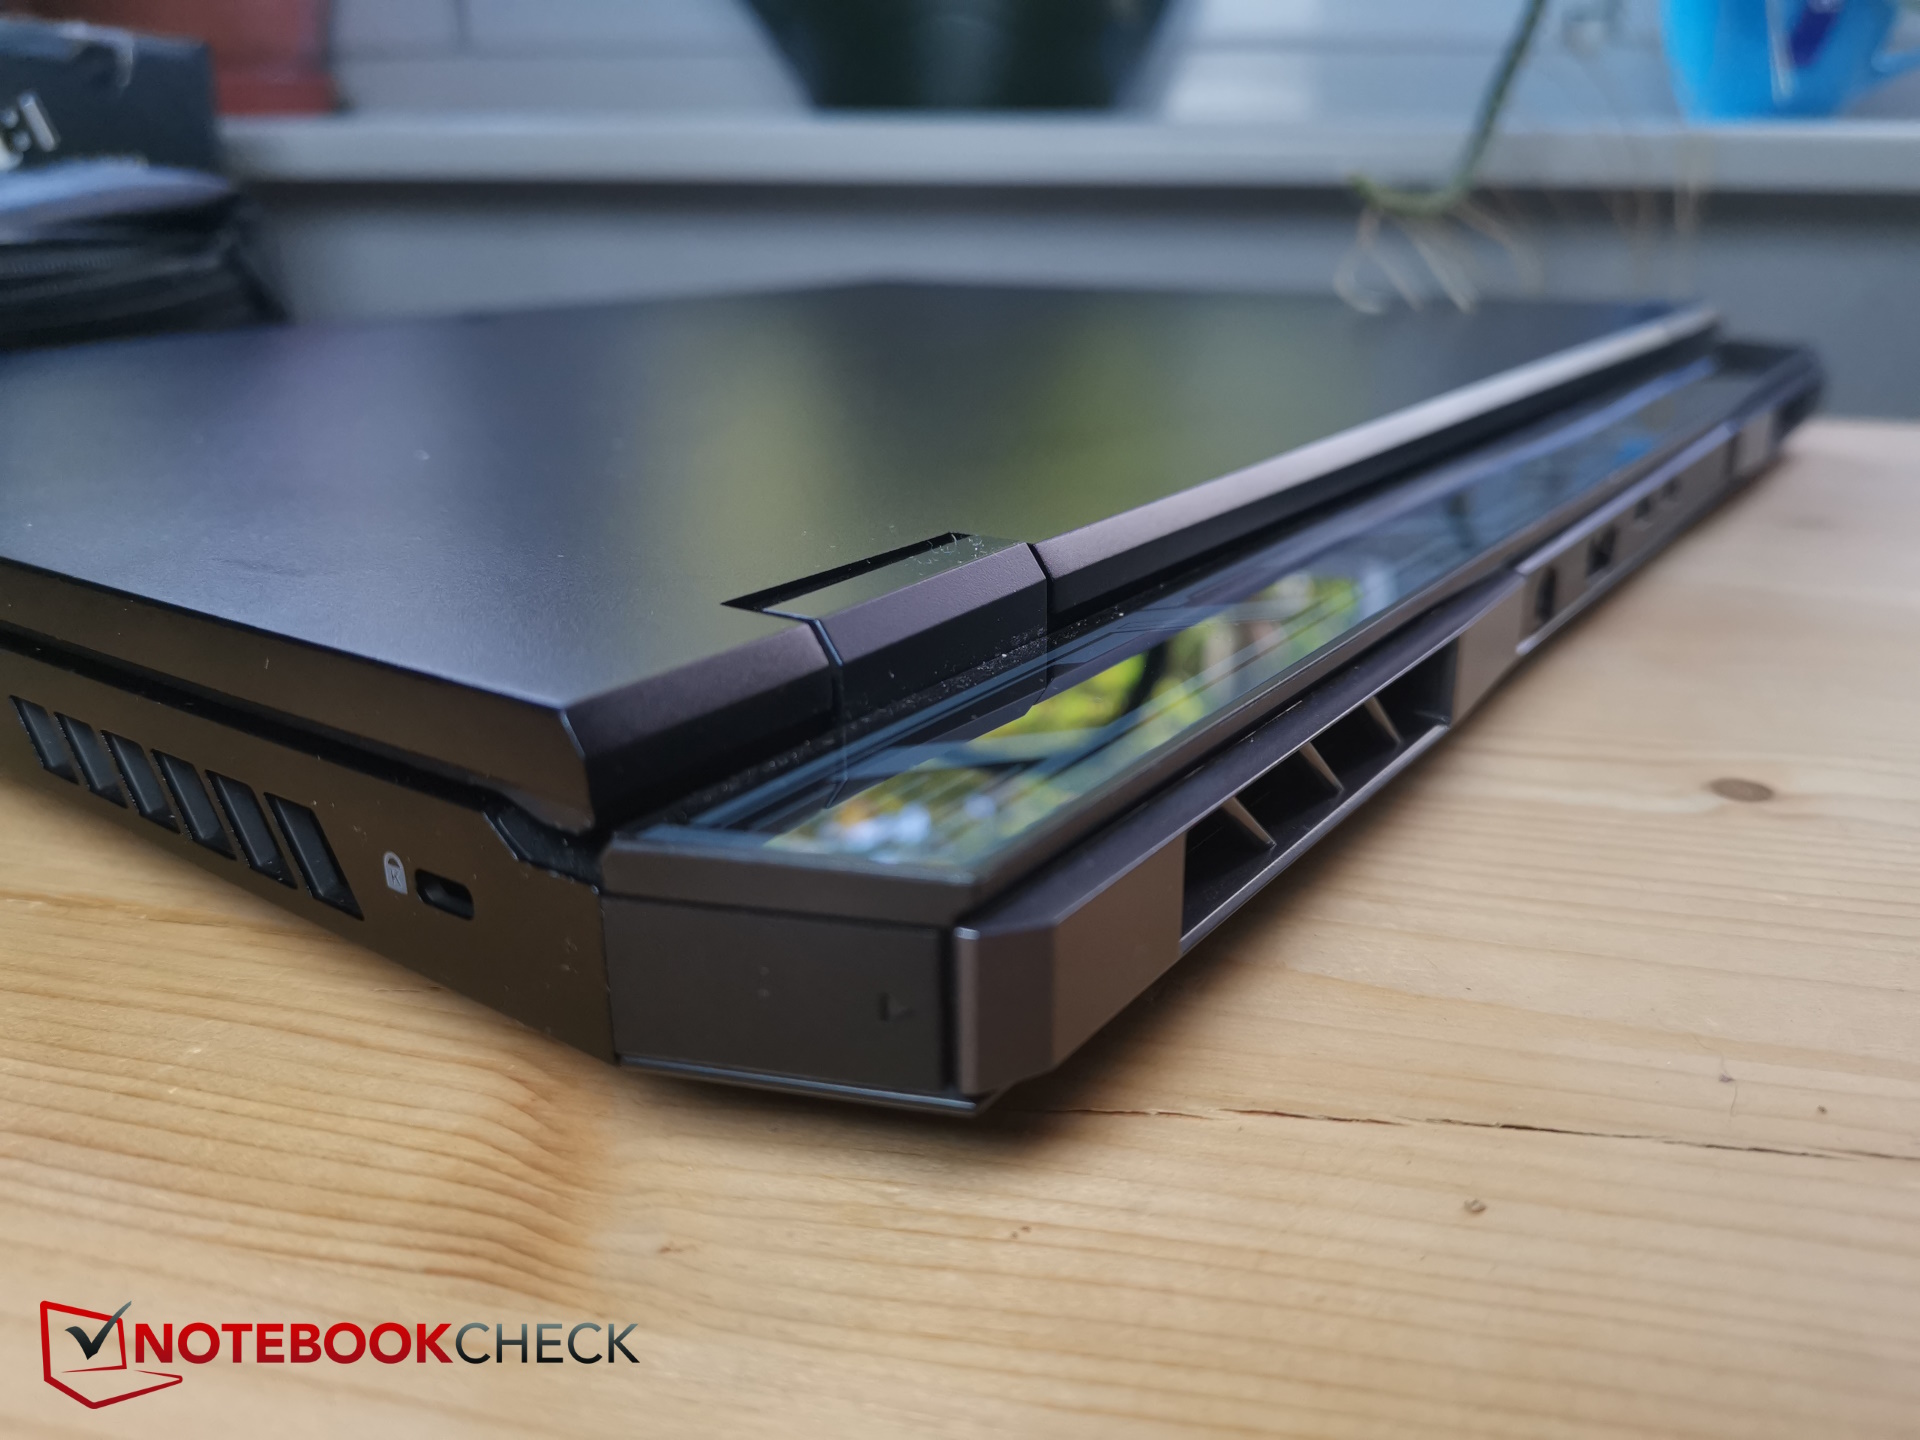
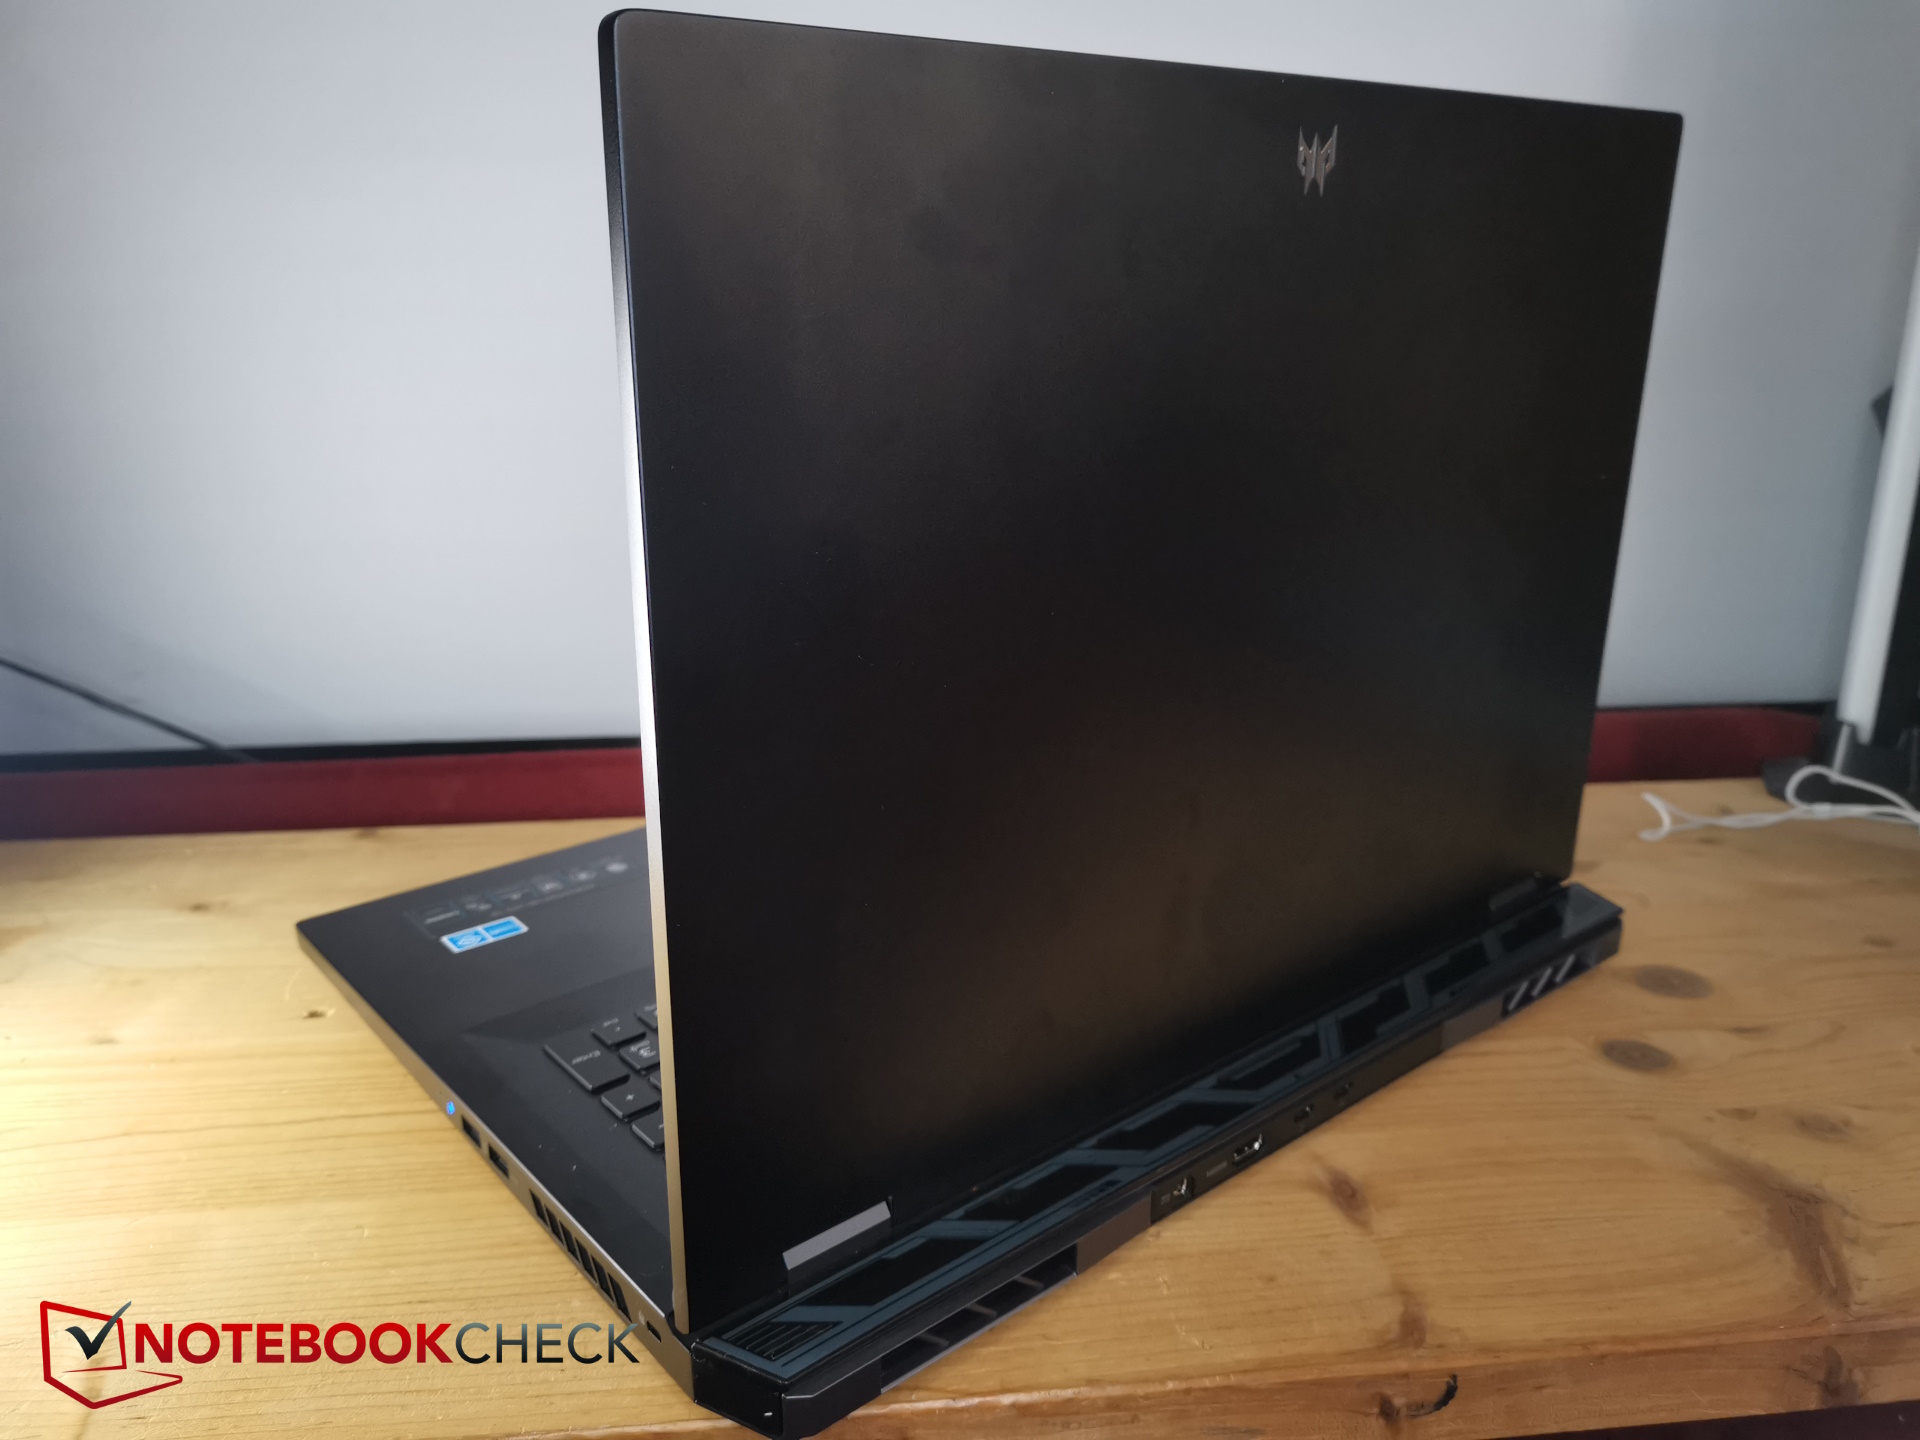
Acer zaprojektował Helios 18 w ciemnej, niemal niepozornej czerni. Urządzenie nie stara się jednak ukryć swojego gamingowego charakteru, charakteryzującego się małym logo Predator na pokrywie wyświetlacza i wystającym systemem chłodzenia z tyłu.
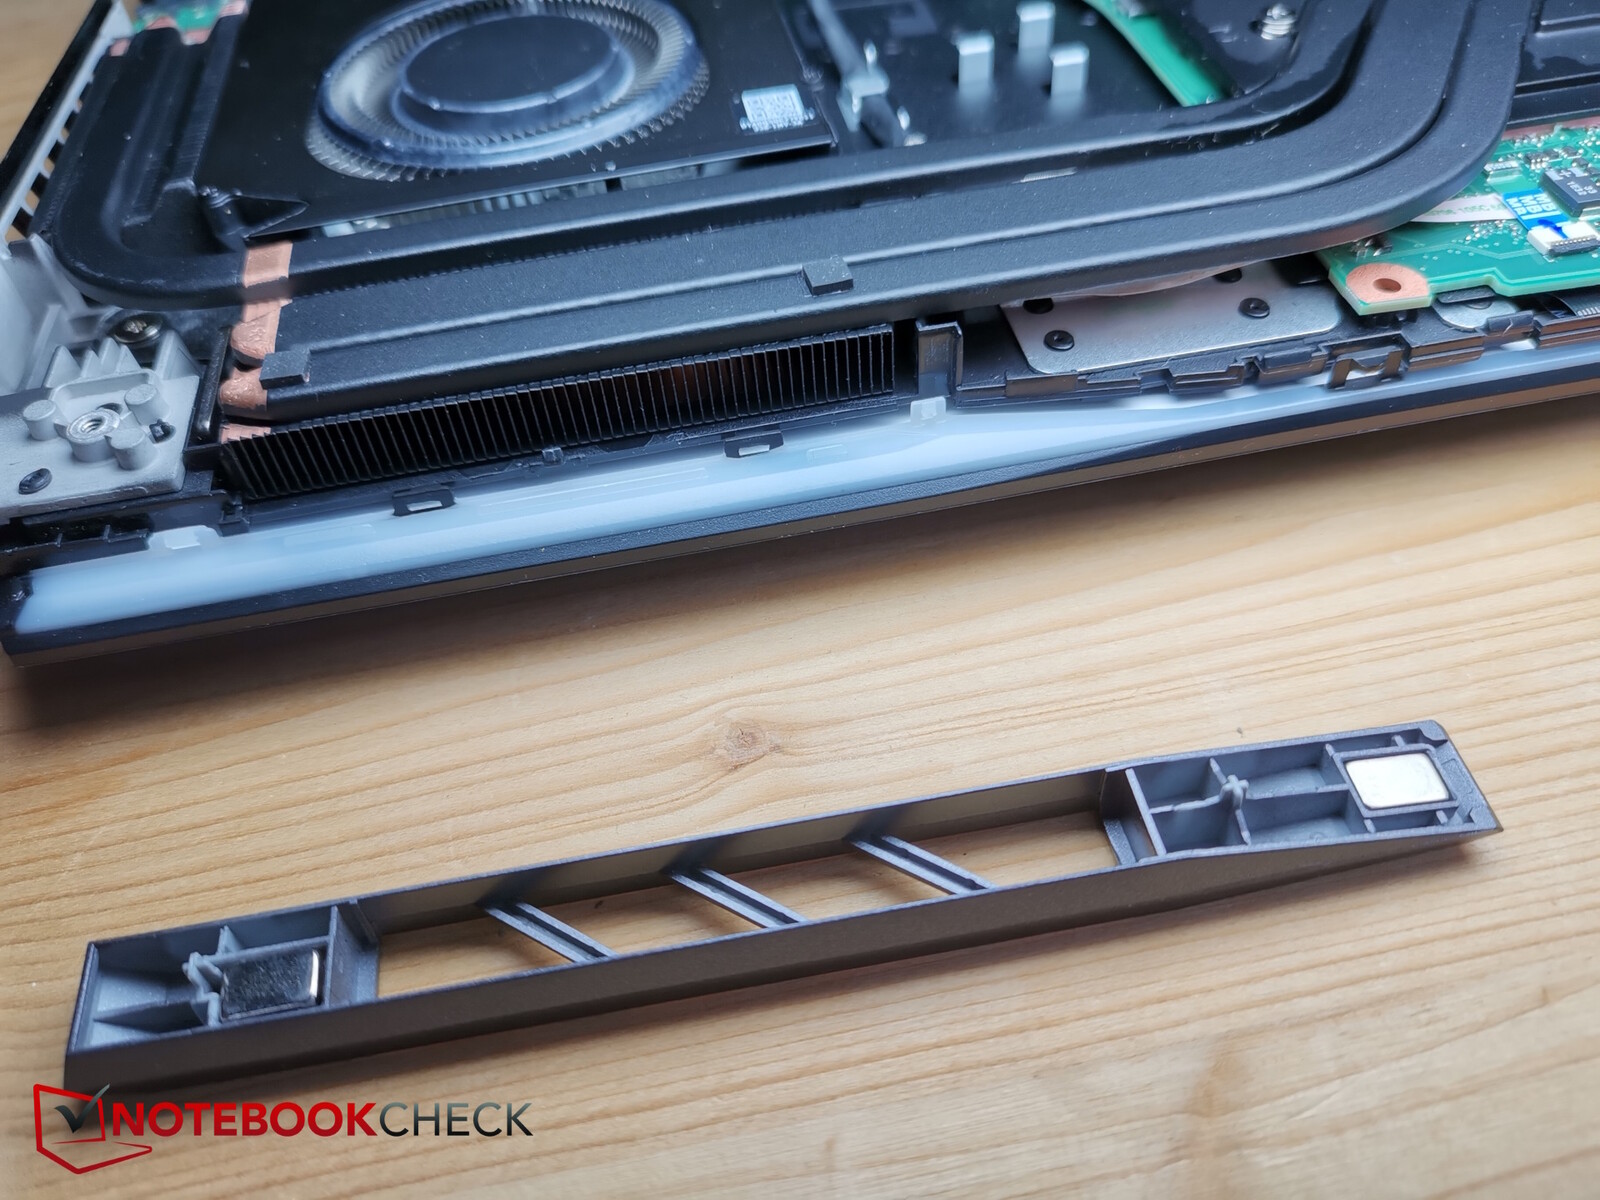
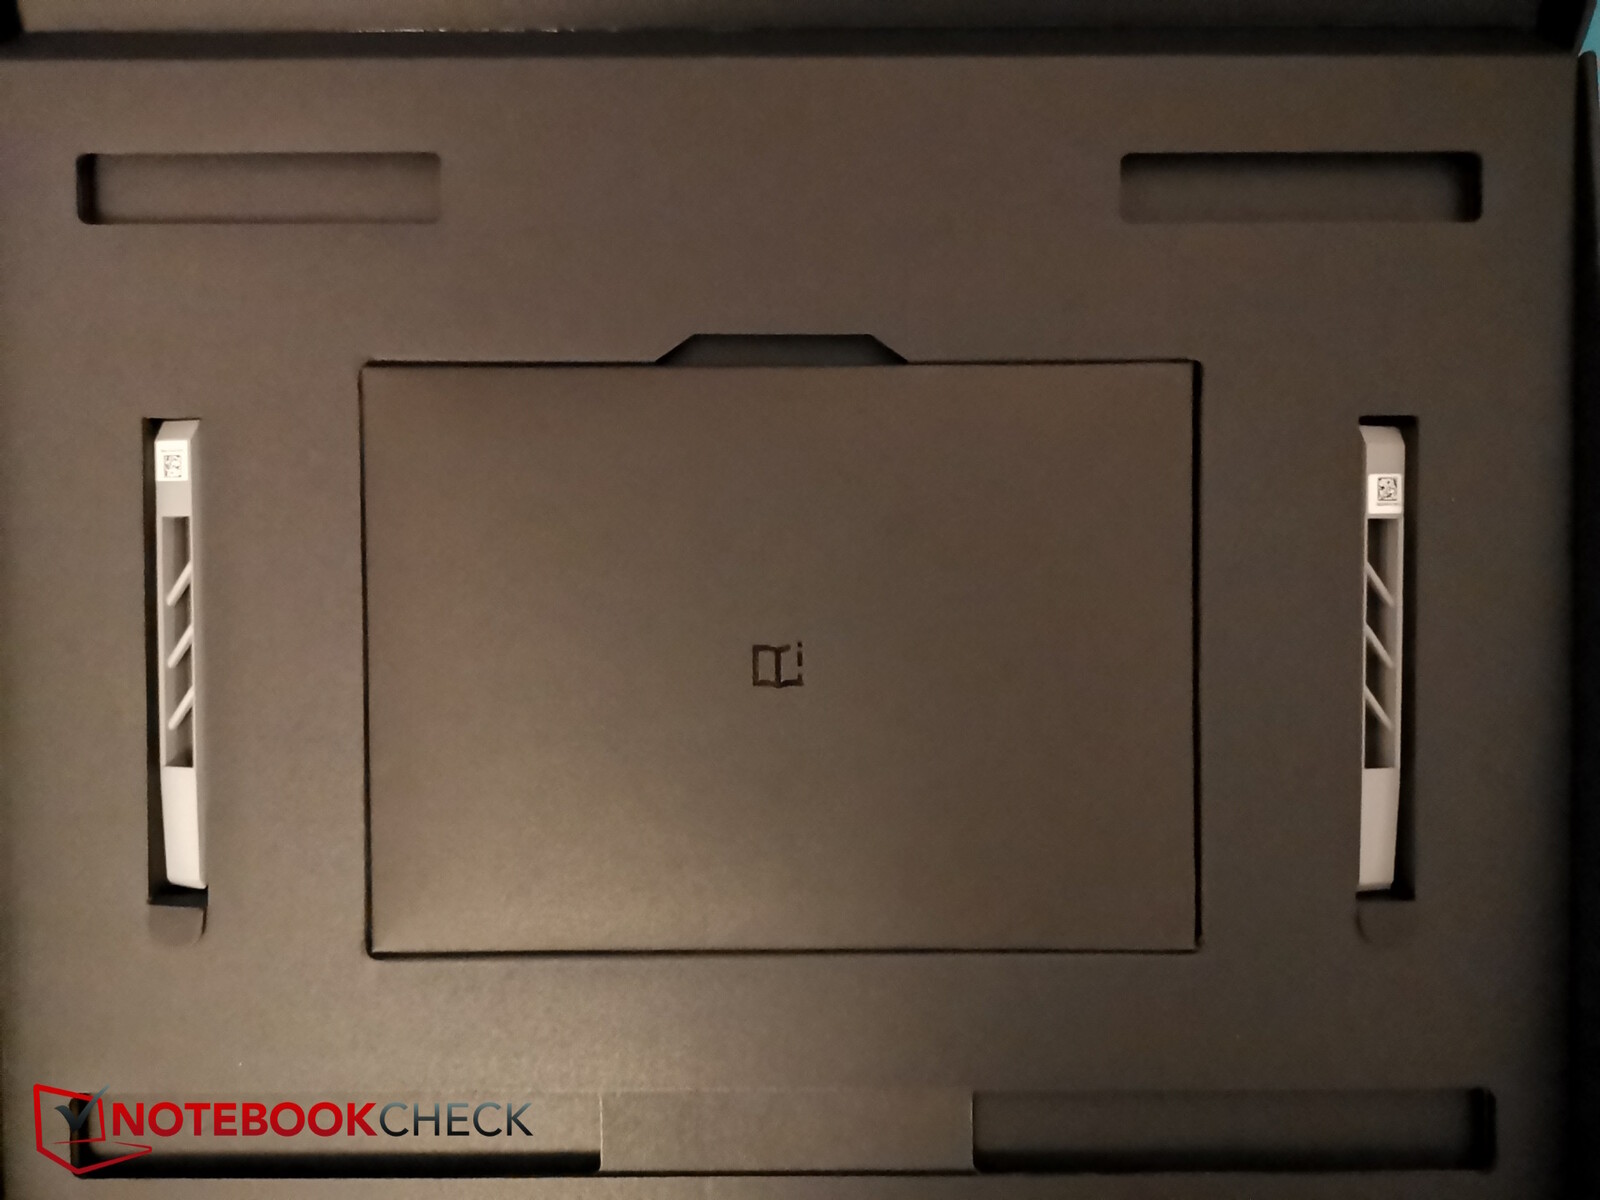
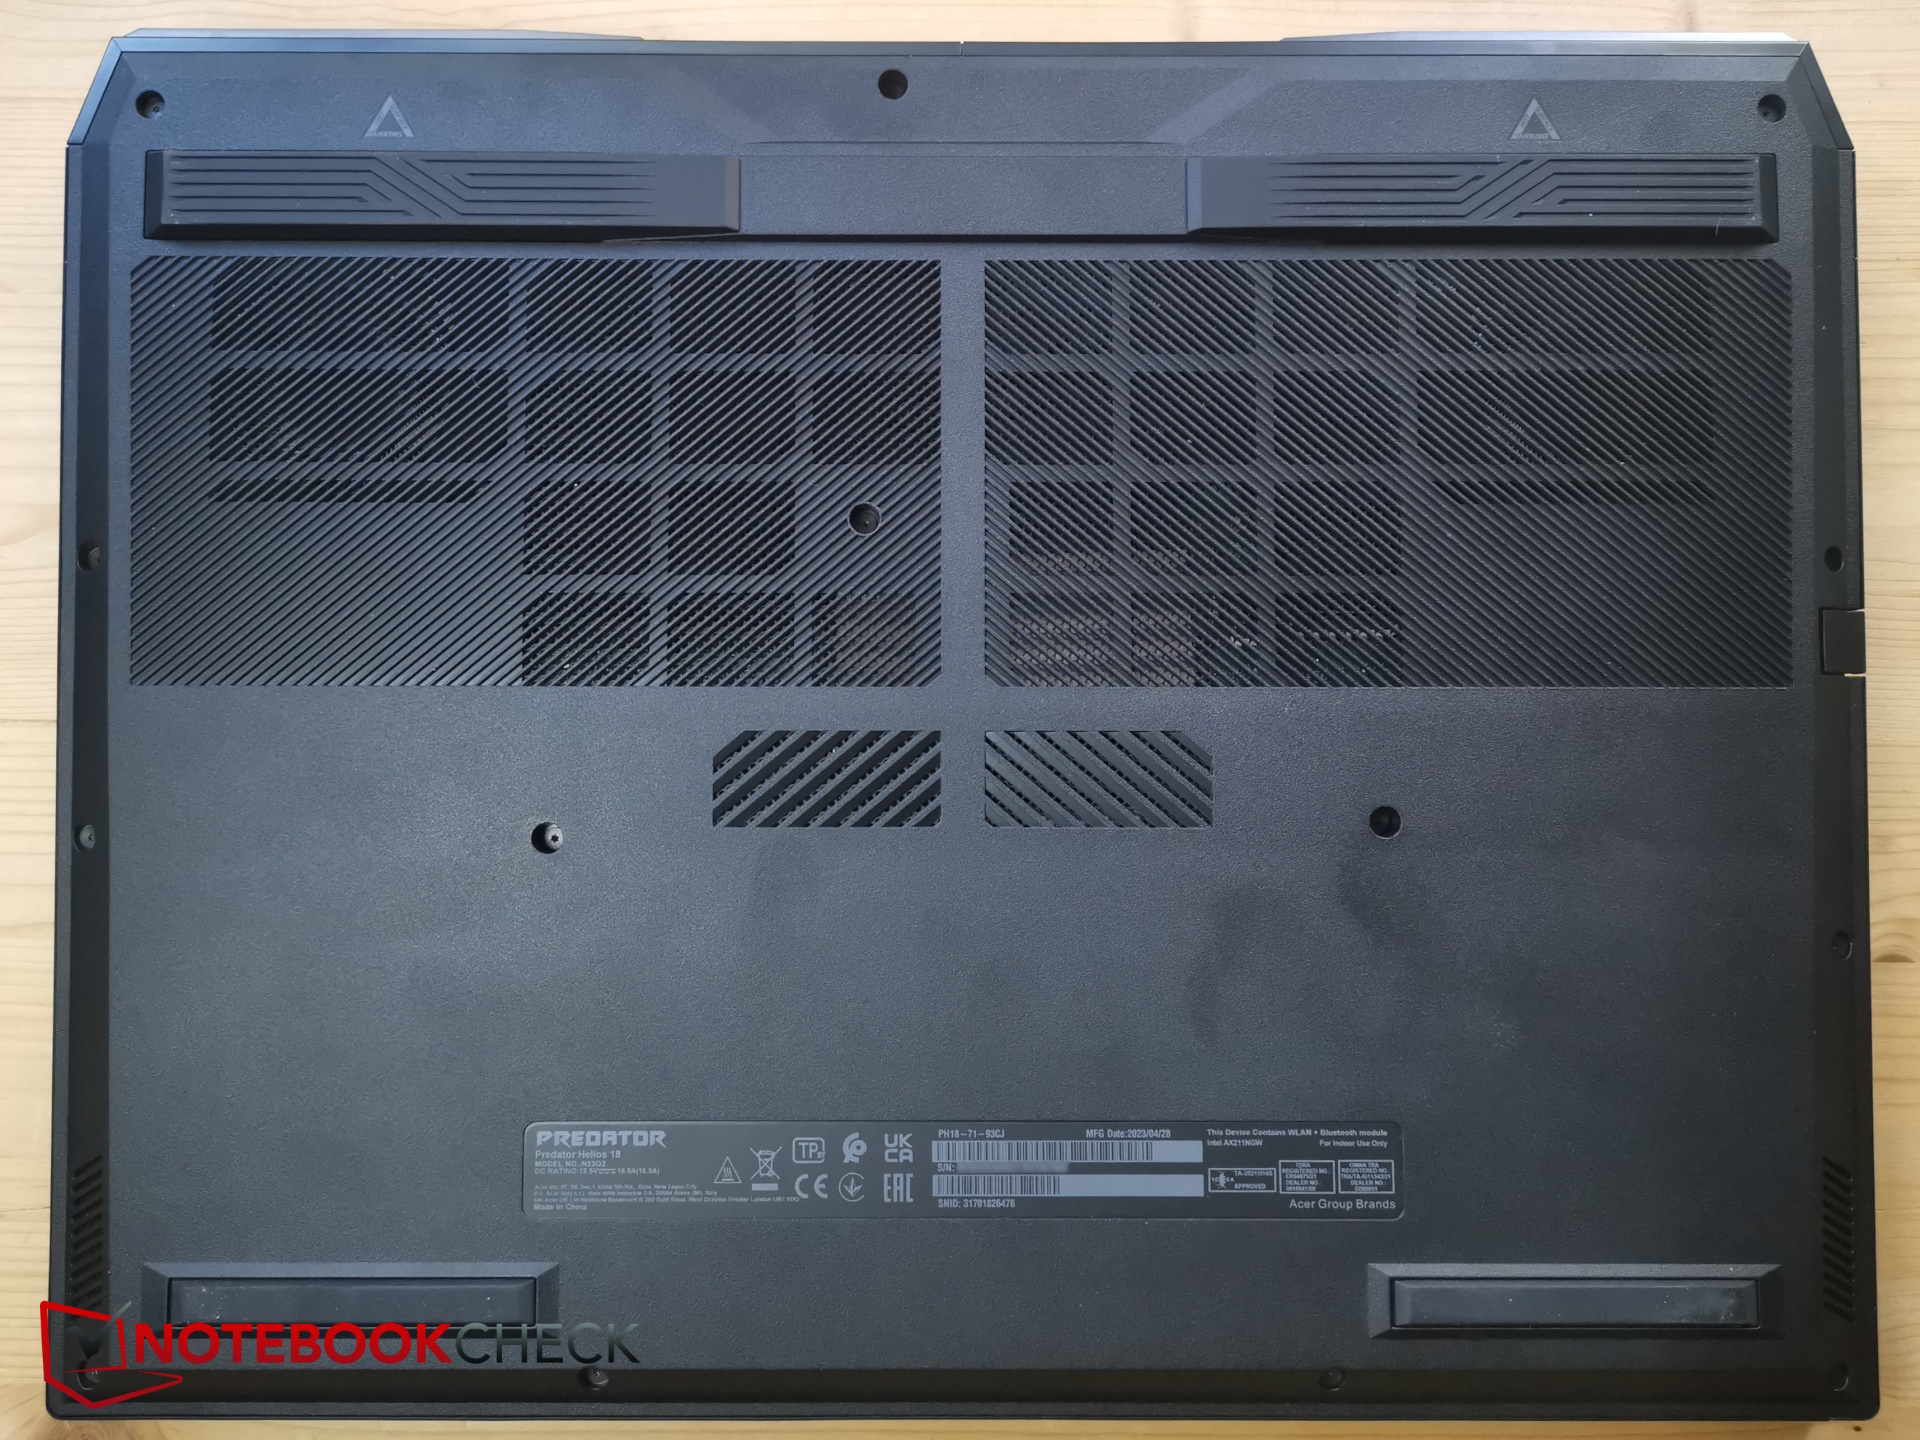
Jakość wykonania nie pozostawia miejsca na krytykę: szczeliny są niezauważalne. Tylne wyloty powietrza można nawet dostosować - Acer dołącza kolejną parę kratek wentylacyjnych, które można dodatkowo dostosować za pomocą drukarki 3D.
Pokrywa wyświetlacza i podstawa zostały wykonane z aluminium, podczas gdy krawędzie wyświetlacza, tylny moduł chłodzenia i spód laptopa zostały wykonane z tworzywa sztucznego. Metal zapewnia Heliosowi 18 dobrą sztywność i nic nie trzeszczy ani nie pęka pod wpływem naprężeń skrętnych. Łatwo jednak gromadzą się tu odciski palców, a górna część podstawy może być nieco wciśnięta pomimo metalu, nawet podczas pisania na klawiaturze. Pozostaje to jednak w granicach możliwości i wynika z dużej powierzchni.
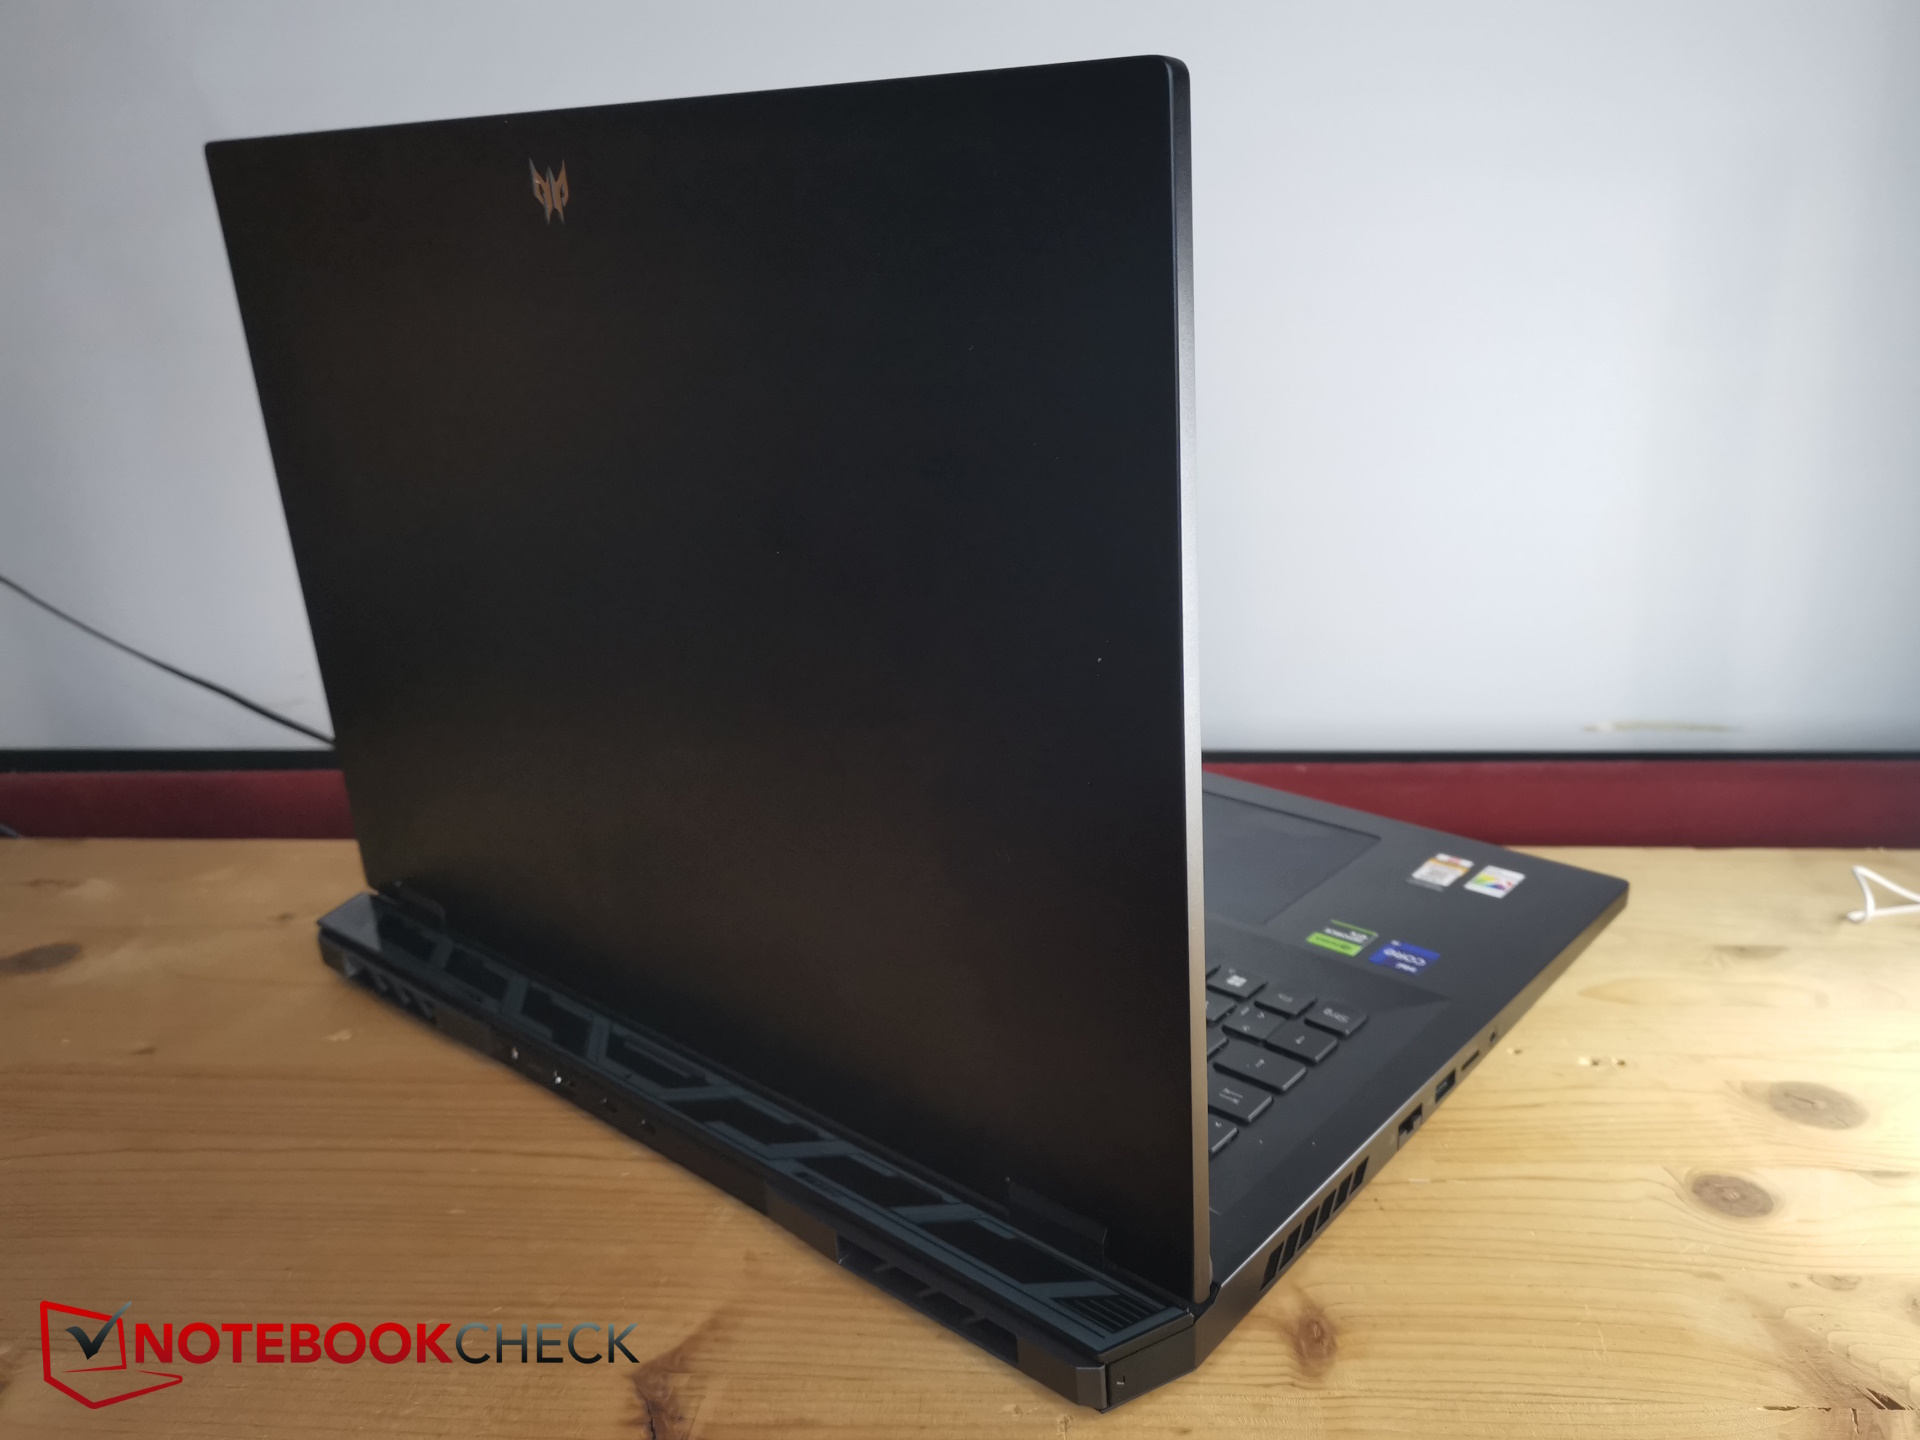
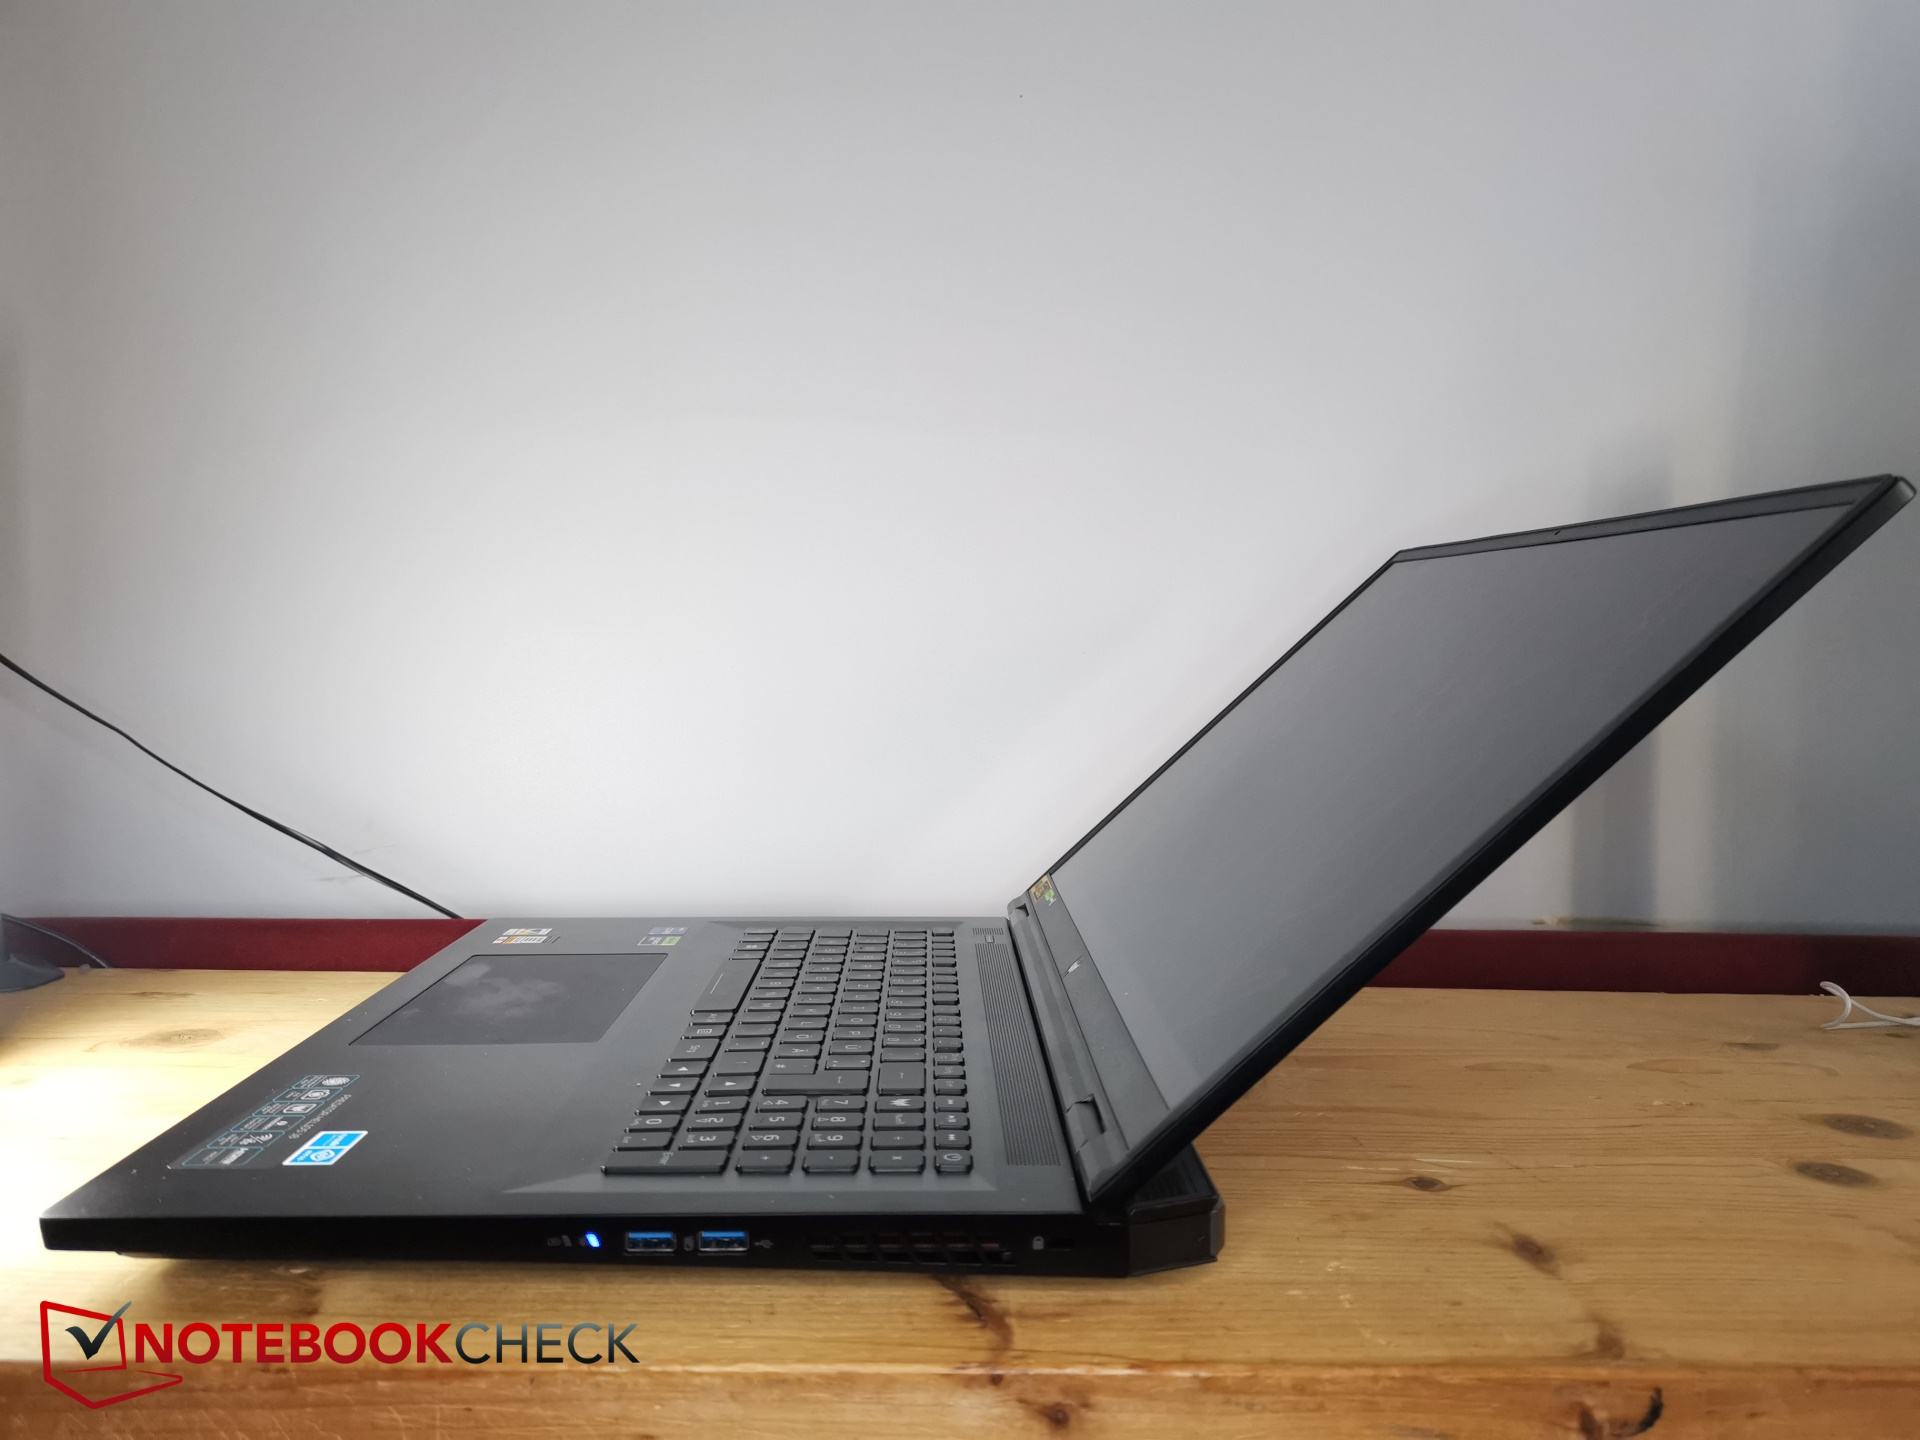
W porównaniu do 18-calowej konkurencji, Helios 18 plasuje się pośrodku pod względem rozmiaru. Alienware m18 jest nieco większy, a Asus ROG Strix G18 mniejszy. Ten ostatni jest nieco grubszy, podczas gdy Alienware m18 jest cieńszy. Pod względem wagi Alien jest wyraźnie cięższy, a G18 nieco lżejszy.
17-calowe komputery dla graczy są częściowo znacznie mniejsze, a także cieńsze.
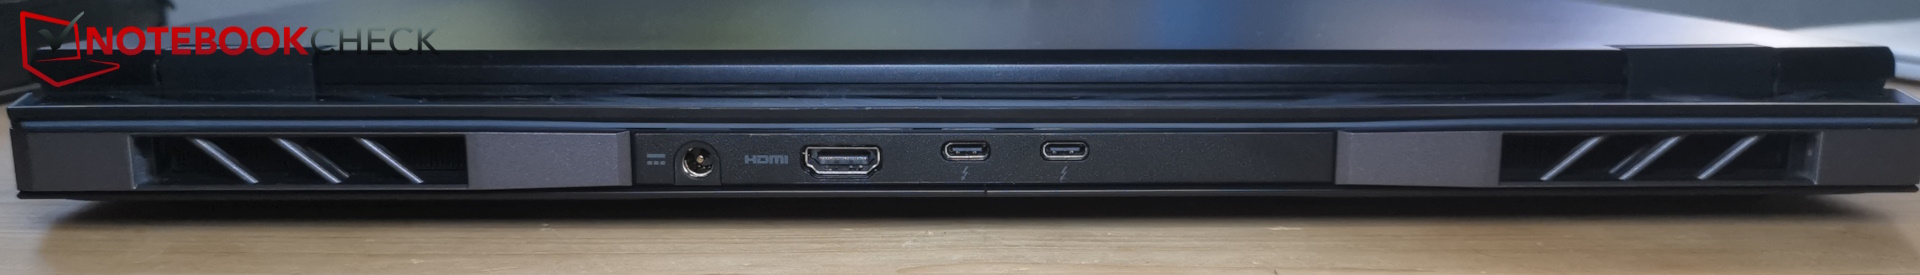
Wyposażenie - 2x Thunderbolt 4 w Predator Helios
Helios 18 posiada wszystkie niezbędne porty. Na pokładzie znajdują się dwa porty Thunderbolt 4 w postaci USB-C. Jedynie PowerDelivery nie jest dostępne. Czytnik kart SD akceptuje "tylko" karty MicroSD.
Porty są rozłożone na trzech bokach, chociaż z tyłu wciąż jest miejsce i można było z łatwością pomieścić jeden z wielu portów po lewej stronie. Wolelibyśmy port LAN z tyłu i jeden z coraz ważniejszych portów USB-C z boku.
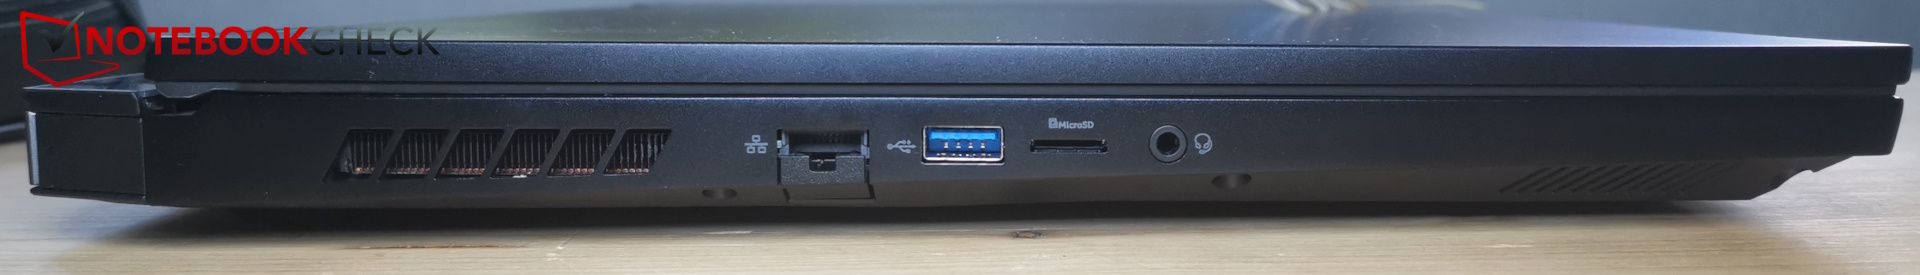
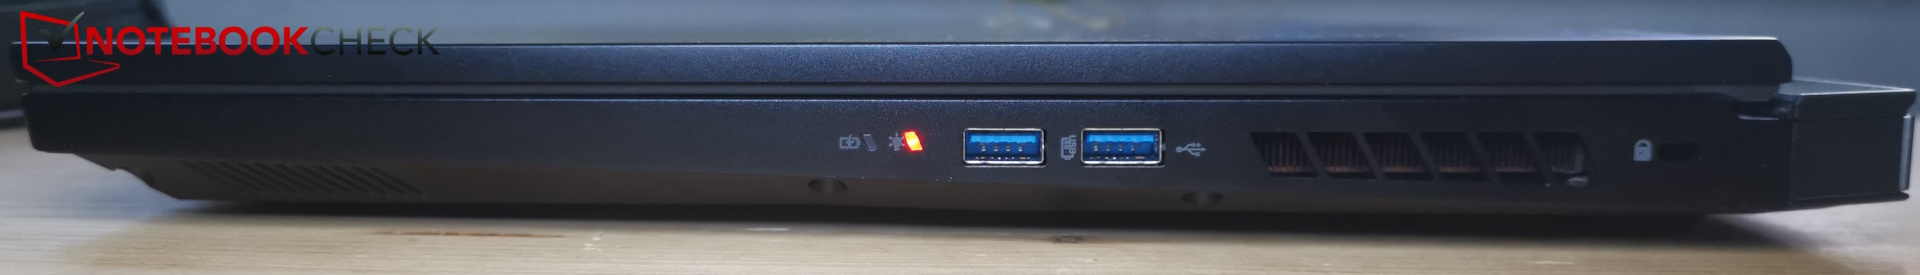
Czytnik kart SD
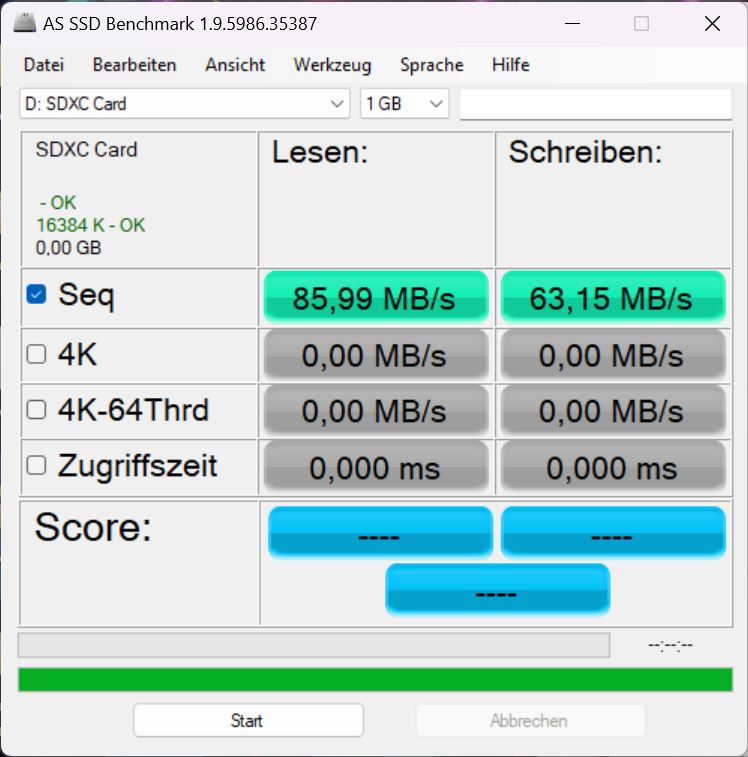
Włożone karty microSD wsuwają się na miejsce i nie wystają. Wkładanie naszej karty AV PRO microSD 128 GB V60 okazało się nieco kłopotliwe, ponieważ trzeba było wcisnąć ją do środka nieco dalej niż równo, aby ją zablokować i odblokować.
Prędkość jest na średnim poziomie; czytniki kart w Blade 18 lub Alienware m18są znacznie szybsze.
| SD Card Reader | |
| average JPG Copy Test (av. of 3 runs) | |
| Razer Blade 18 RTX 4070 (Angelibird AV Pro V60) | |
| Alienware m18 R1 (Angelibird AV Pro V60) | |
| Średnia w klasie Gaming (20.9 - 210, n=54, ostatnie 2 lata) | |
| HP Omen 17-ck2097ng (AV PRO microSD 128 GB V60) | |
| Acer Predator Helios 18 N23Q2 | |
| MSI GE78HX 13VH-070US (Angelibird AV Pro V60) | |
| maximum AS SSD Seq Read Test (1GB) | |
| Alienware m18 R1 (Angelibird AV Pro V60) | |
| Razer Blade 18 RTX 4070 (Angelibird AV Pro V60) | |
| Średnia w klasie Gaming (25.5 - 261, n=51, ostatnie 2 lata) | |
| MSI GE78HX 13VH-070US (Angelibird AV Pro V60) | |
| Acer Predator Helios 18 N23Q2 | |
| HP Omen 17-ck2097ng (AV PRO microSD 128 GB V60) | |
Komunikacja
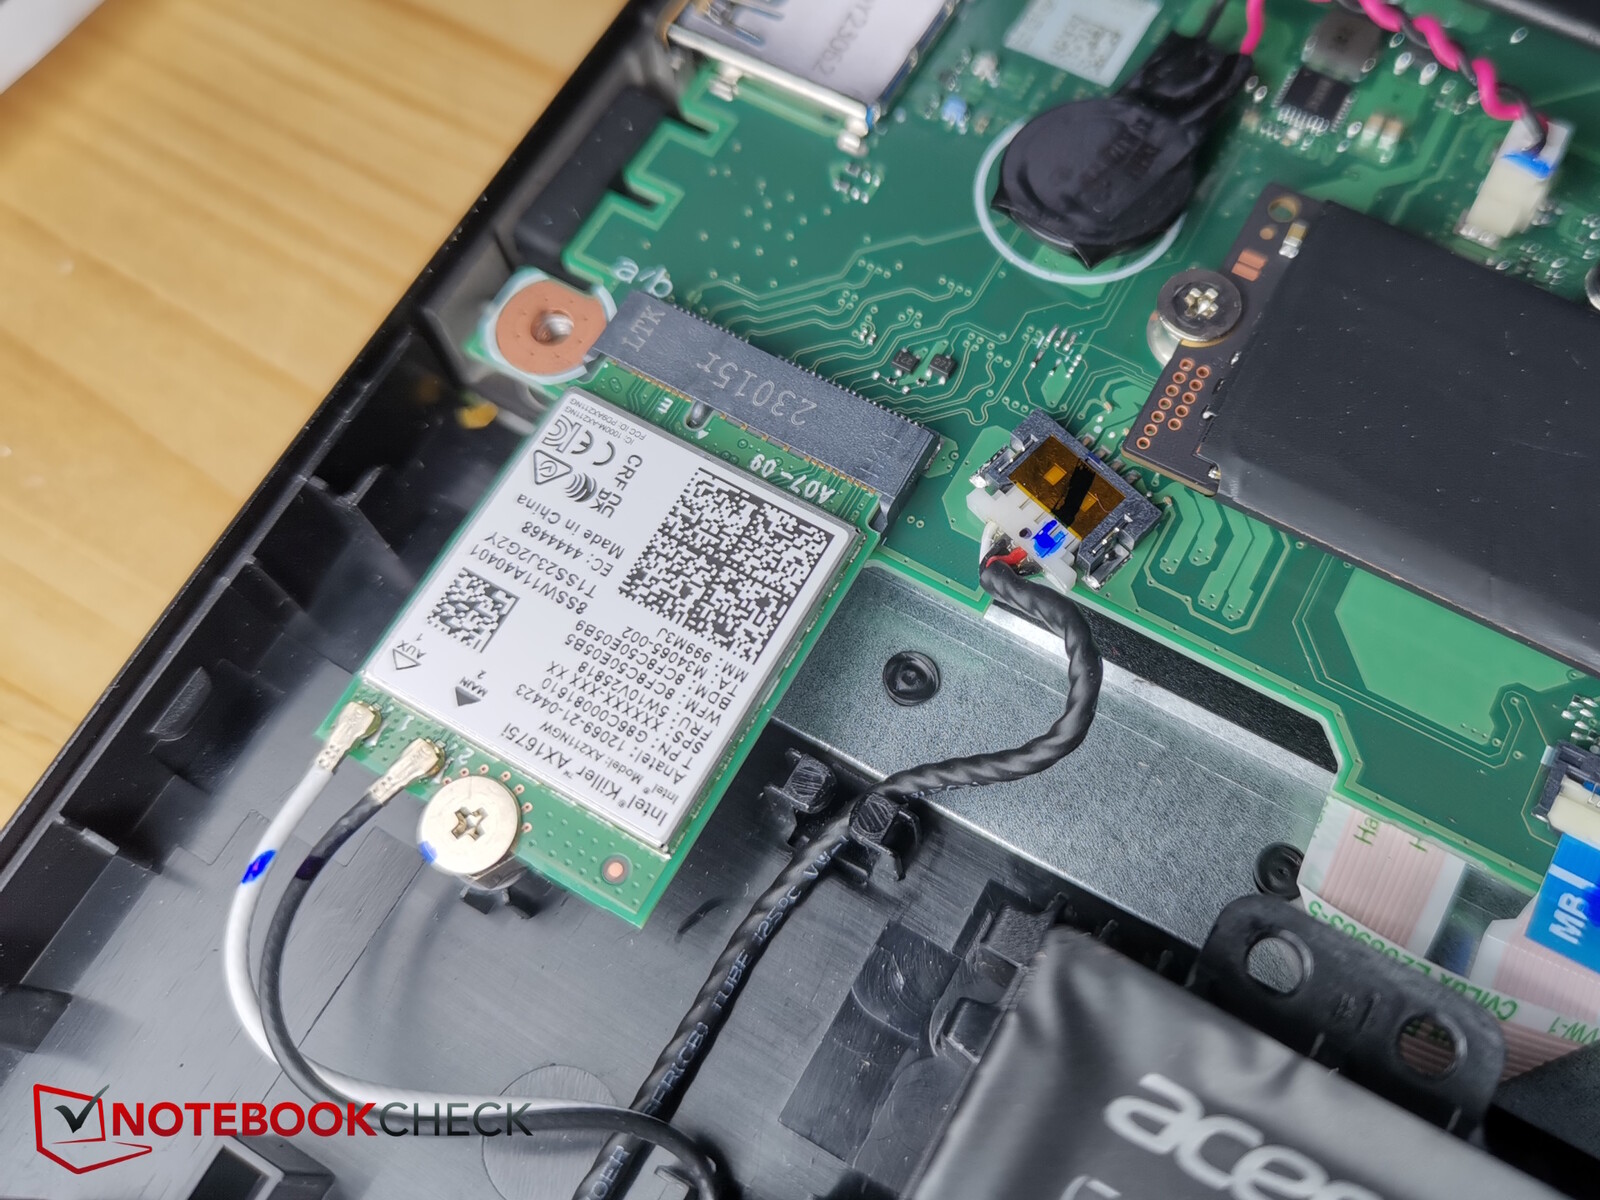
Acer zastosował moduł WiFi Killer WiFi 6E AX1675i, który obsługuje 6E w trybie 6 GHz i zapewnia dobry transfer na poziomie około 1,5 Mbit/s. W sieci 5 GHz jest on znacznie wolniejszy, osiągając około 900 Mbit/s.
Prędkości transferu okazują się bardzo stabilne.
Kamera internetowa
Kamera wykonuje zdjęcia i filmy w rozdzielczości FullHD. Jakość jest akceptowalna: odchylenia kolorów pozostają w granicach. Niebieskie odcienie wykazują najwyższe odchylenia.


Bezpieczeństwo
TPM jest na pokładzie, podobnie jak złącze do stalowego zamka. Nie ma jednak czujnika linii papilarnych.
Akcesoria i gwarancja
Oprócz laptopa, zasilacza i zwykłej dokumentacji, w zestawie znajduje się para alternatywnych osłon wentylatorów na tył Heliosa 18.
Acer zapewnia 24-miesięczną standardową gwarancję w Niemczech. Może się ona różnić w innych krajach, więc potencjalni nabywcy powinni dokładnie sprawdzić ją przed zakupem.
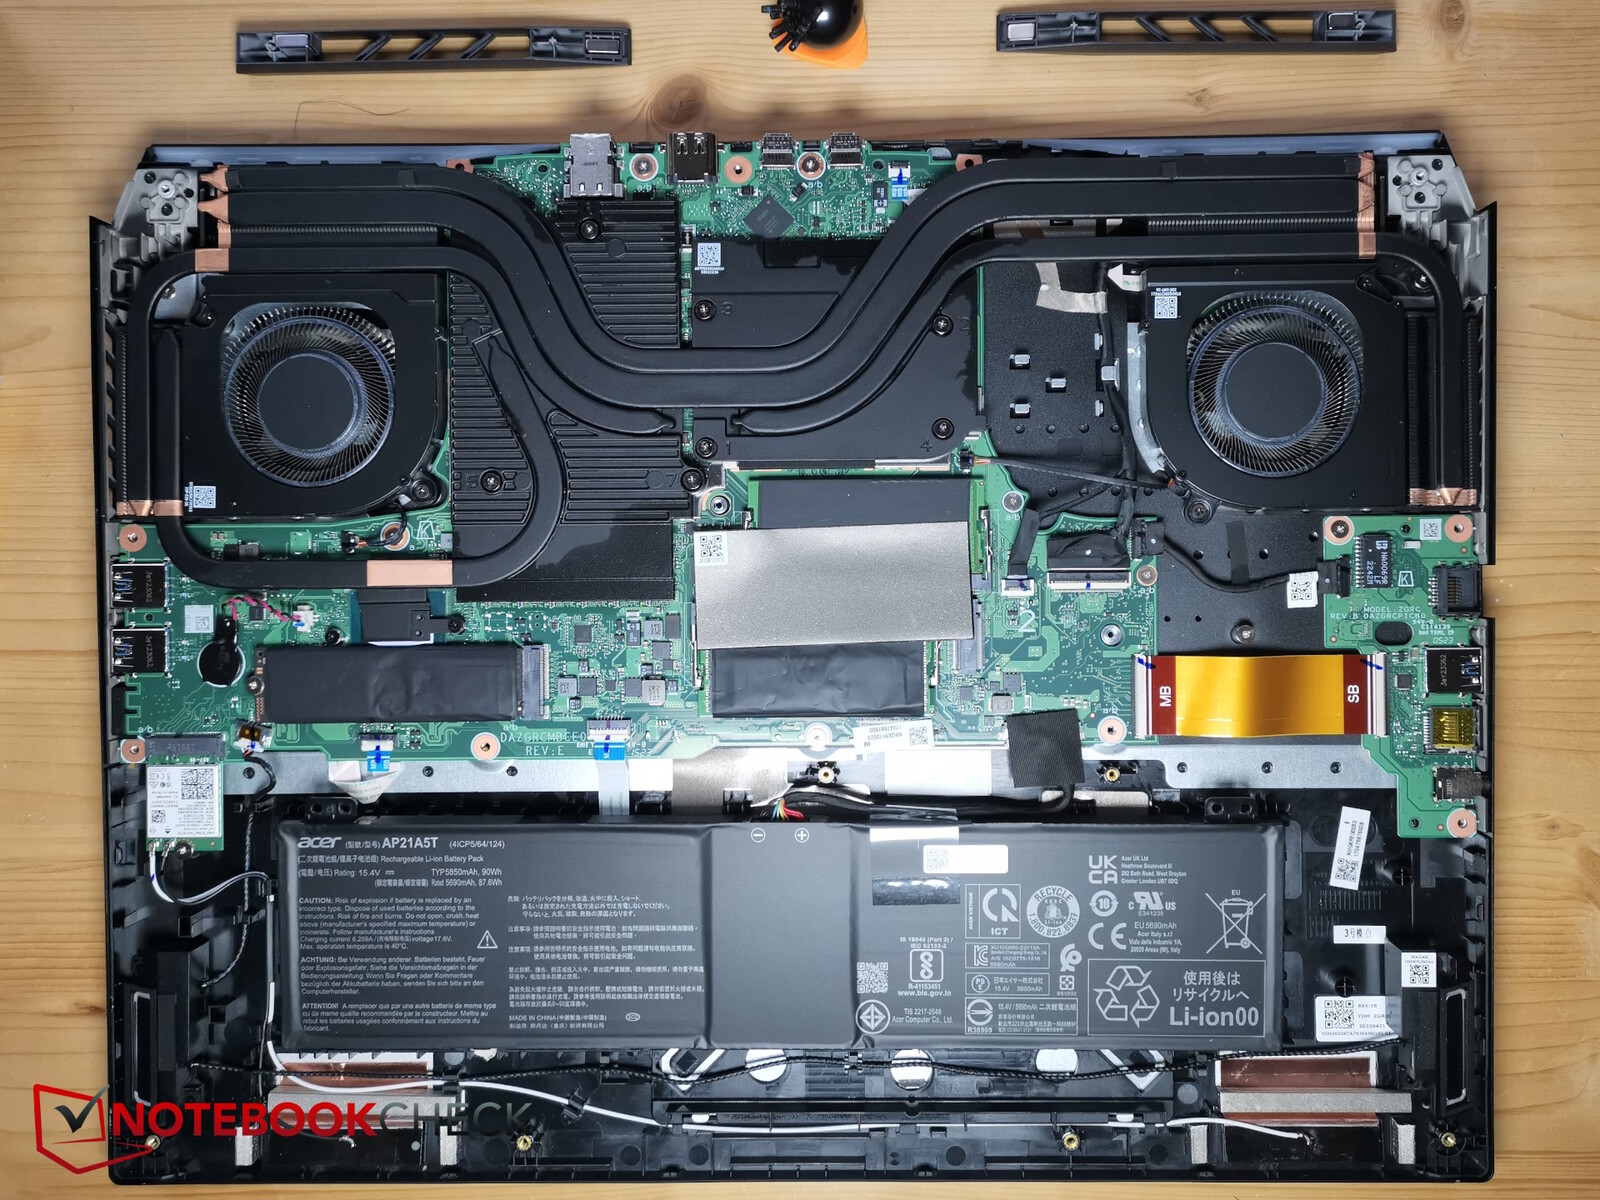
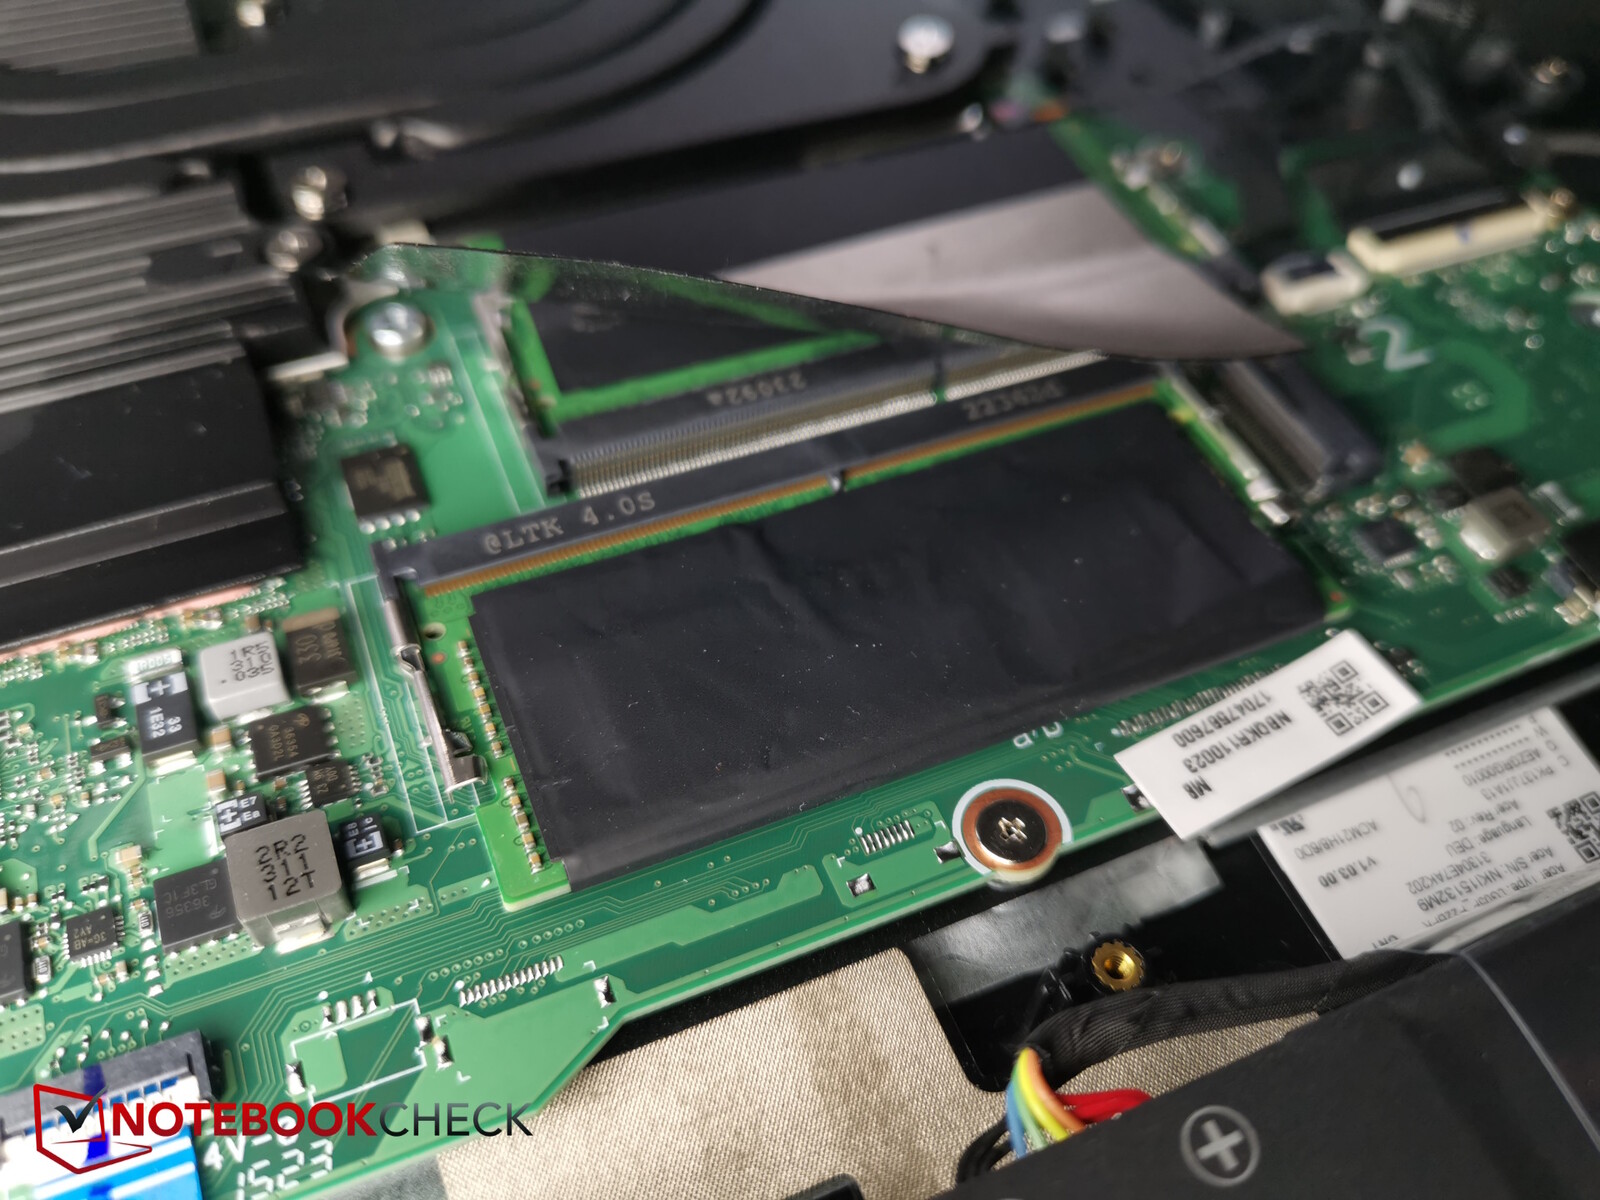
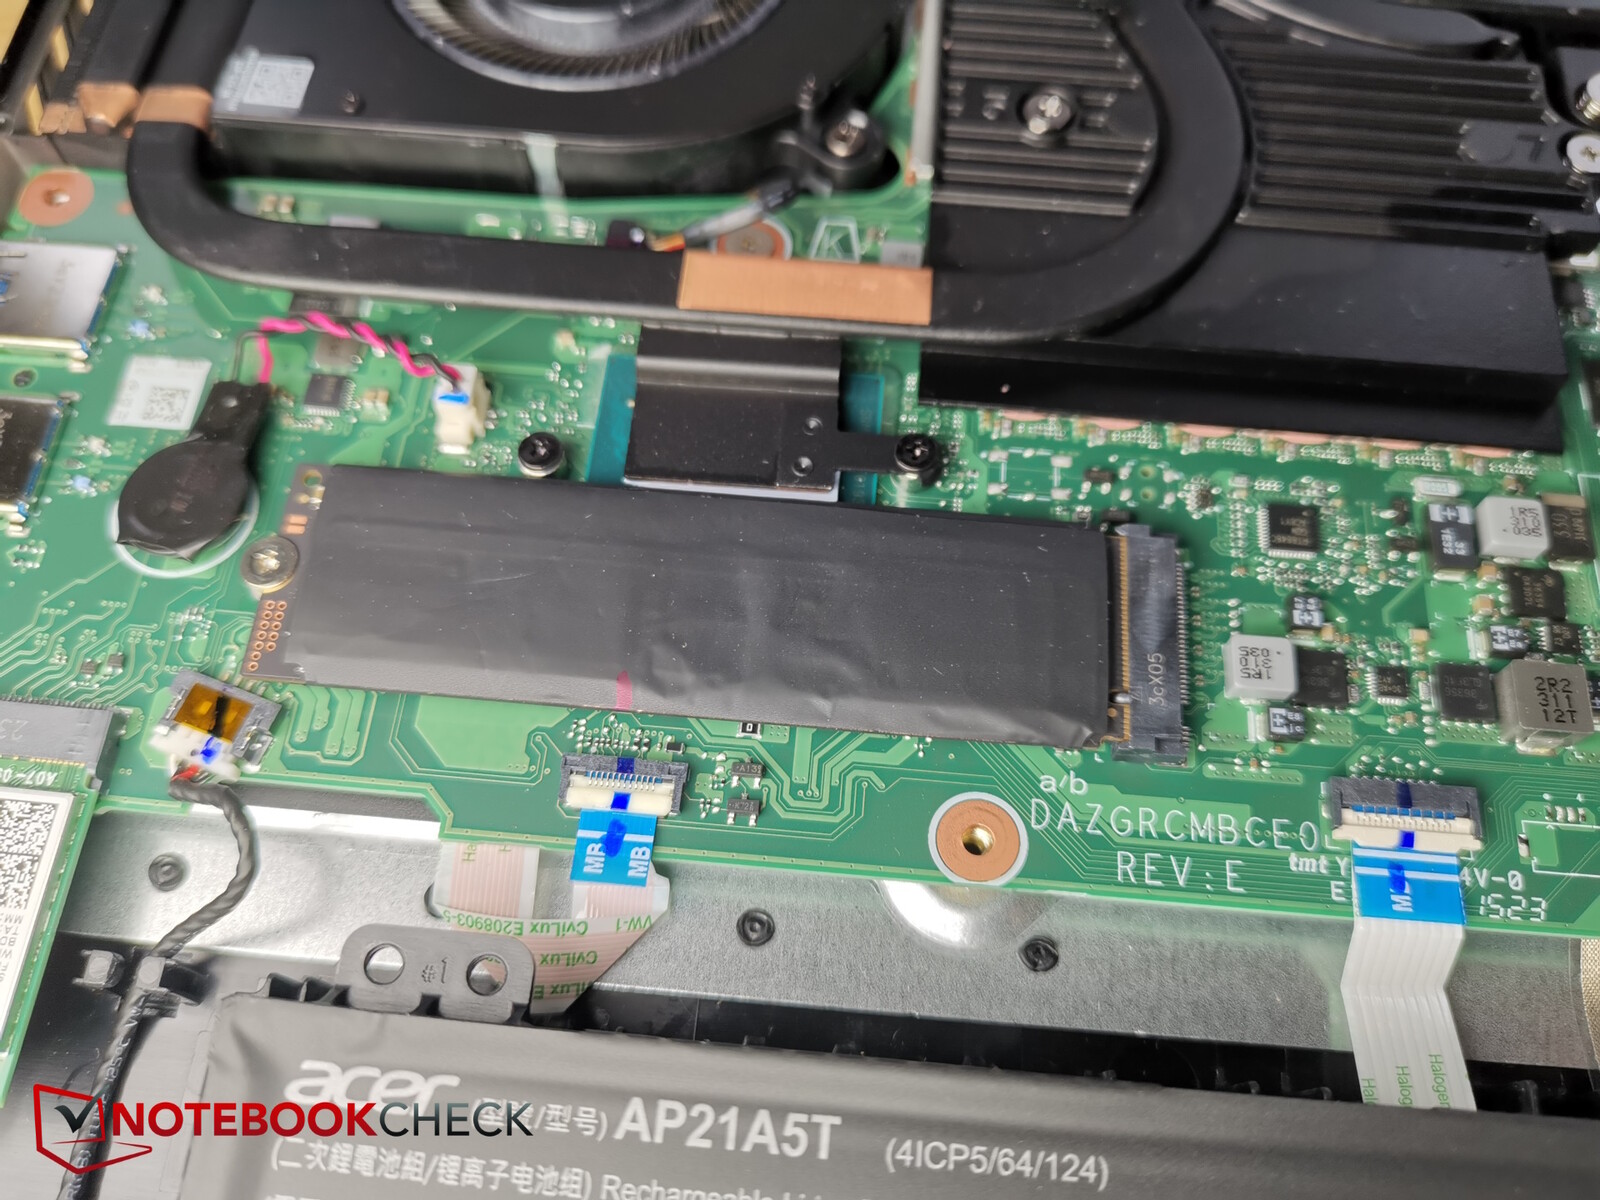
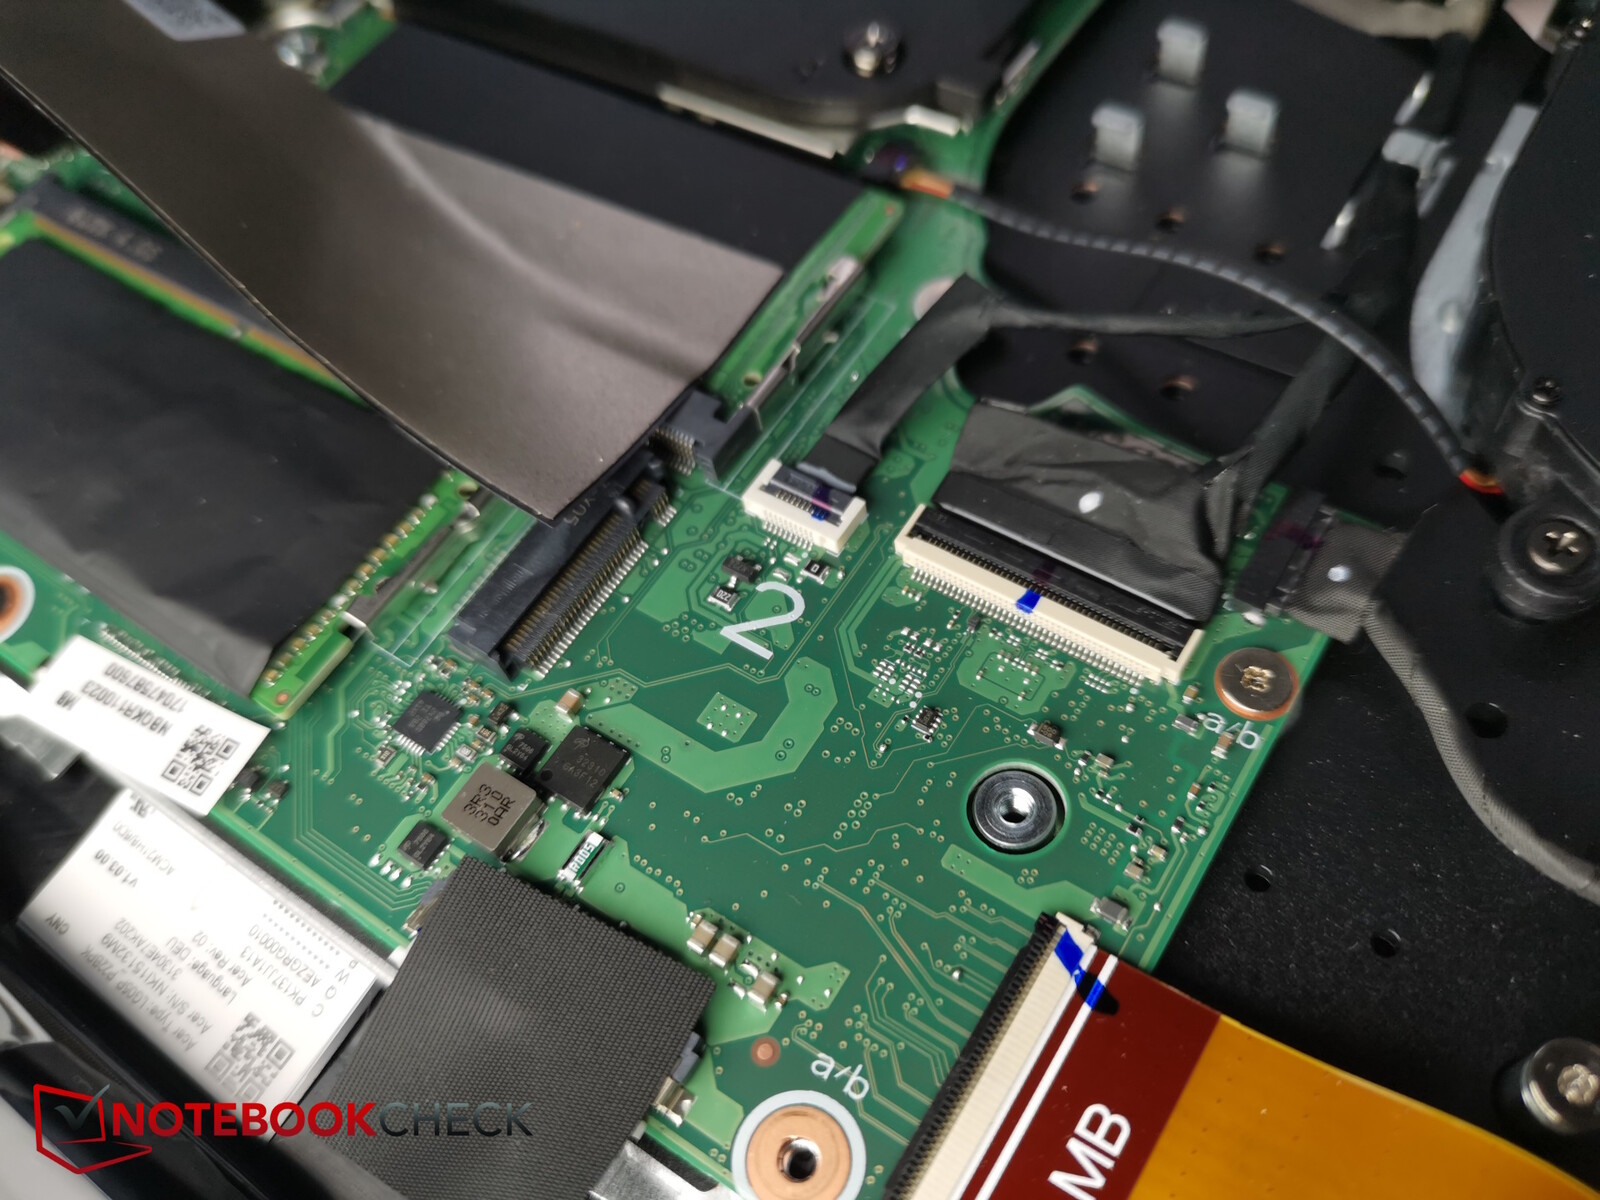
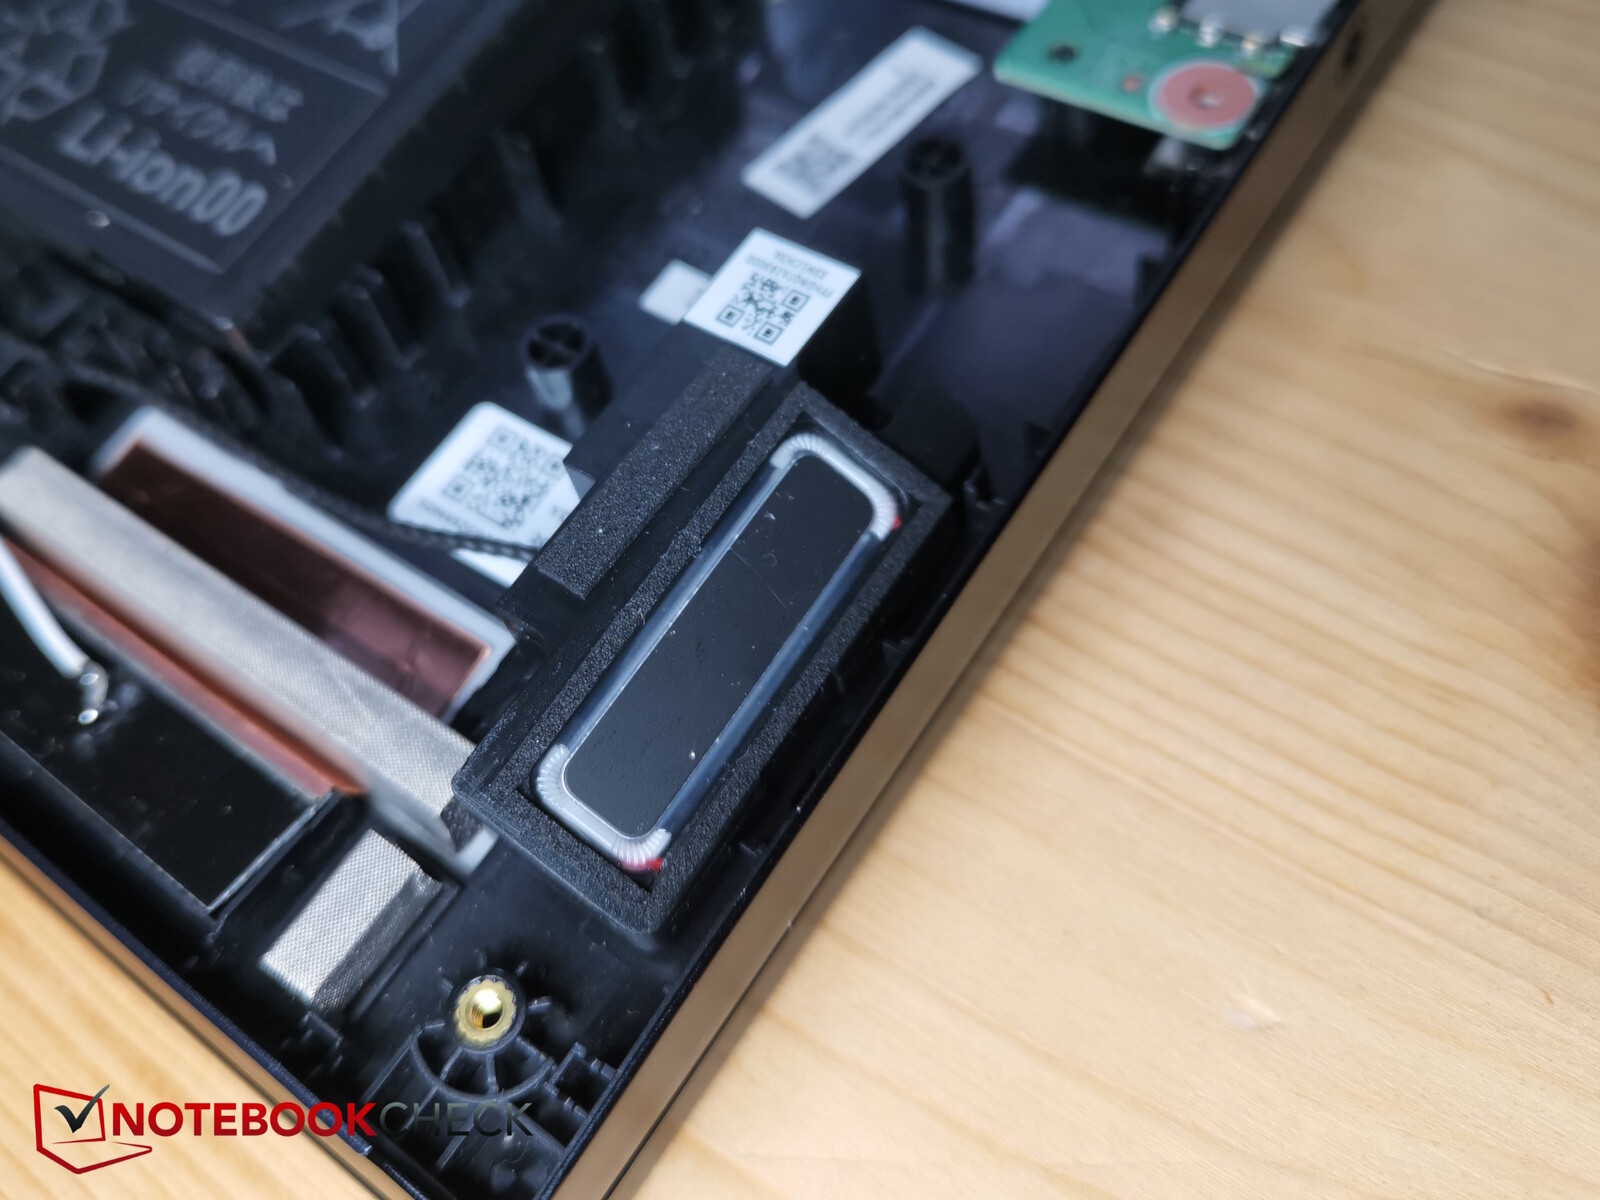
Konserwacja
Otwarcie Heliosa 18 nie jest tak łatwe ze względu na ciasne zaciski i sztywną aluminiową podstawę, ale nadal jest wykonalne. Najpierw należy poluzować 14 śrub Torx tego samego rozmiaru. Następnie najlepiej jest podważyć tył od przednich rogów, najlepiej za pomocą plastikowego narzędzia o wąskich krawędziach
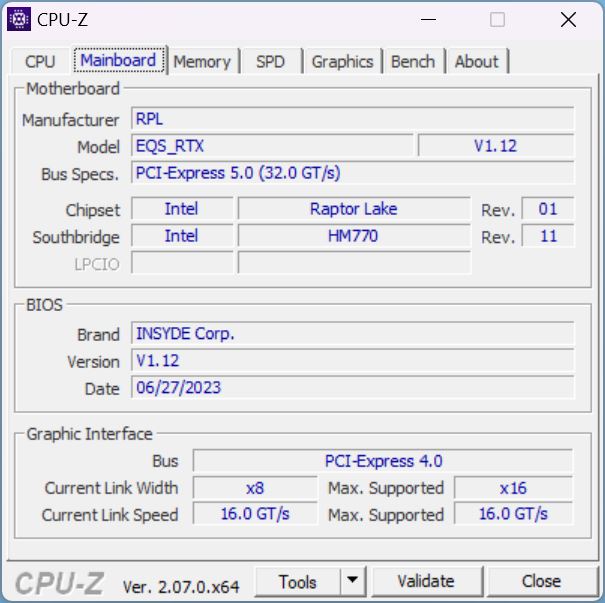
Wewnątrz Acer Predator użytkownik ma dostęp do wentylatorów, baterii, dysku SSD (plus drugie gniazdo), gniazd pamięci RAM i modułu WiFi.
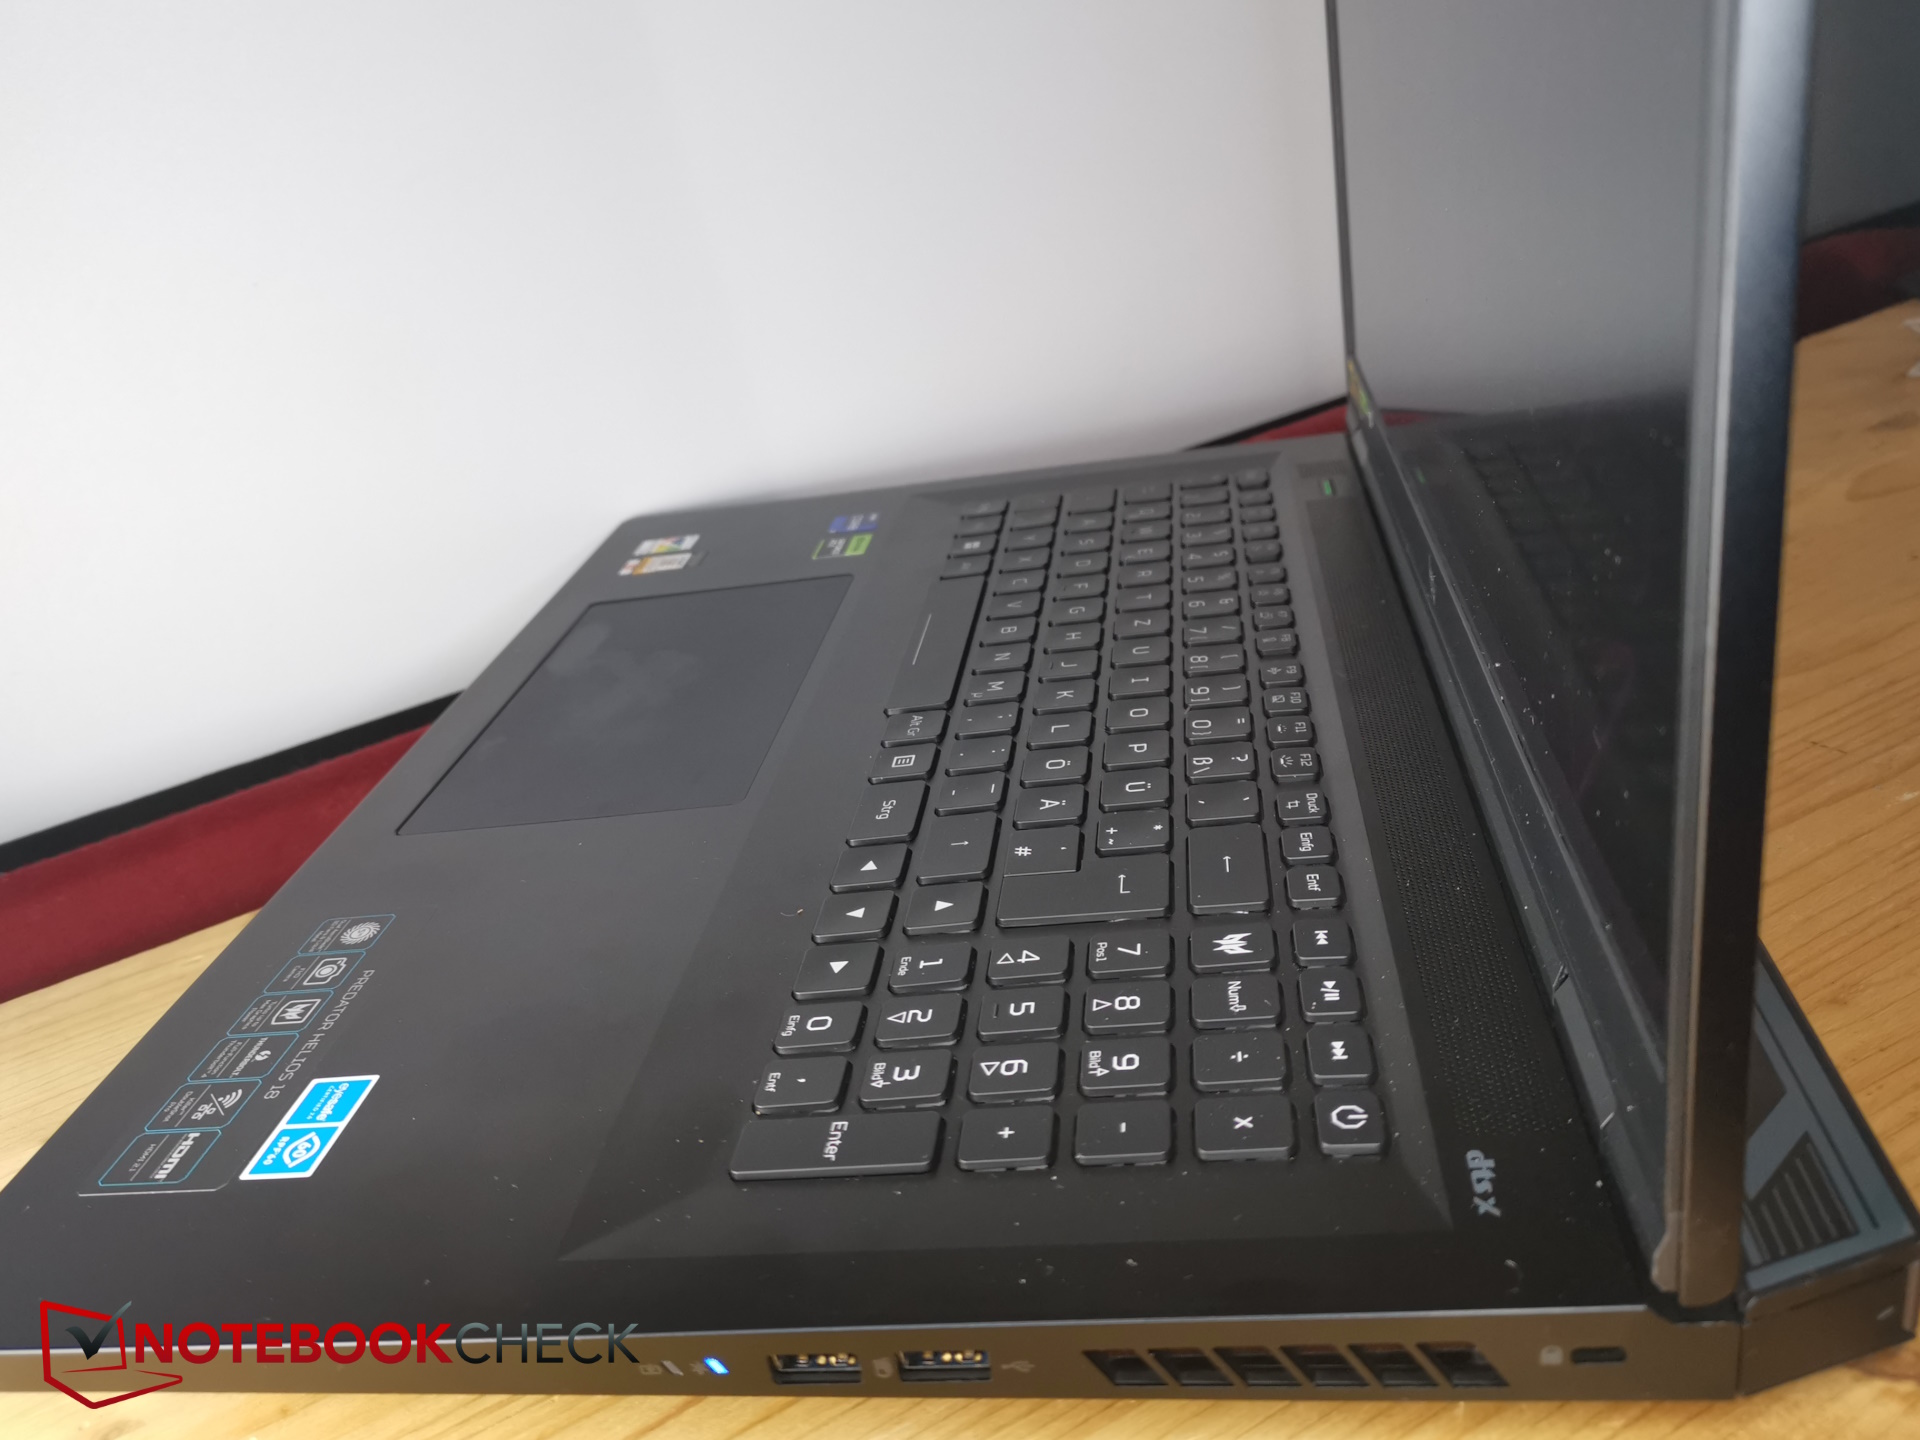
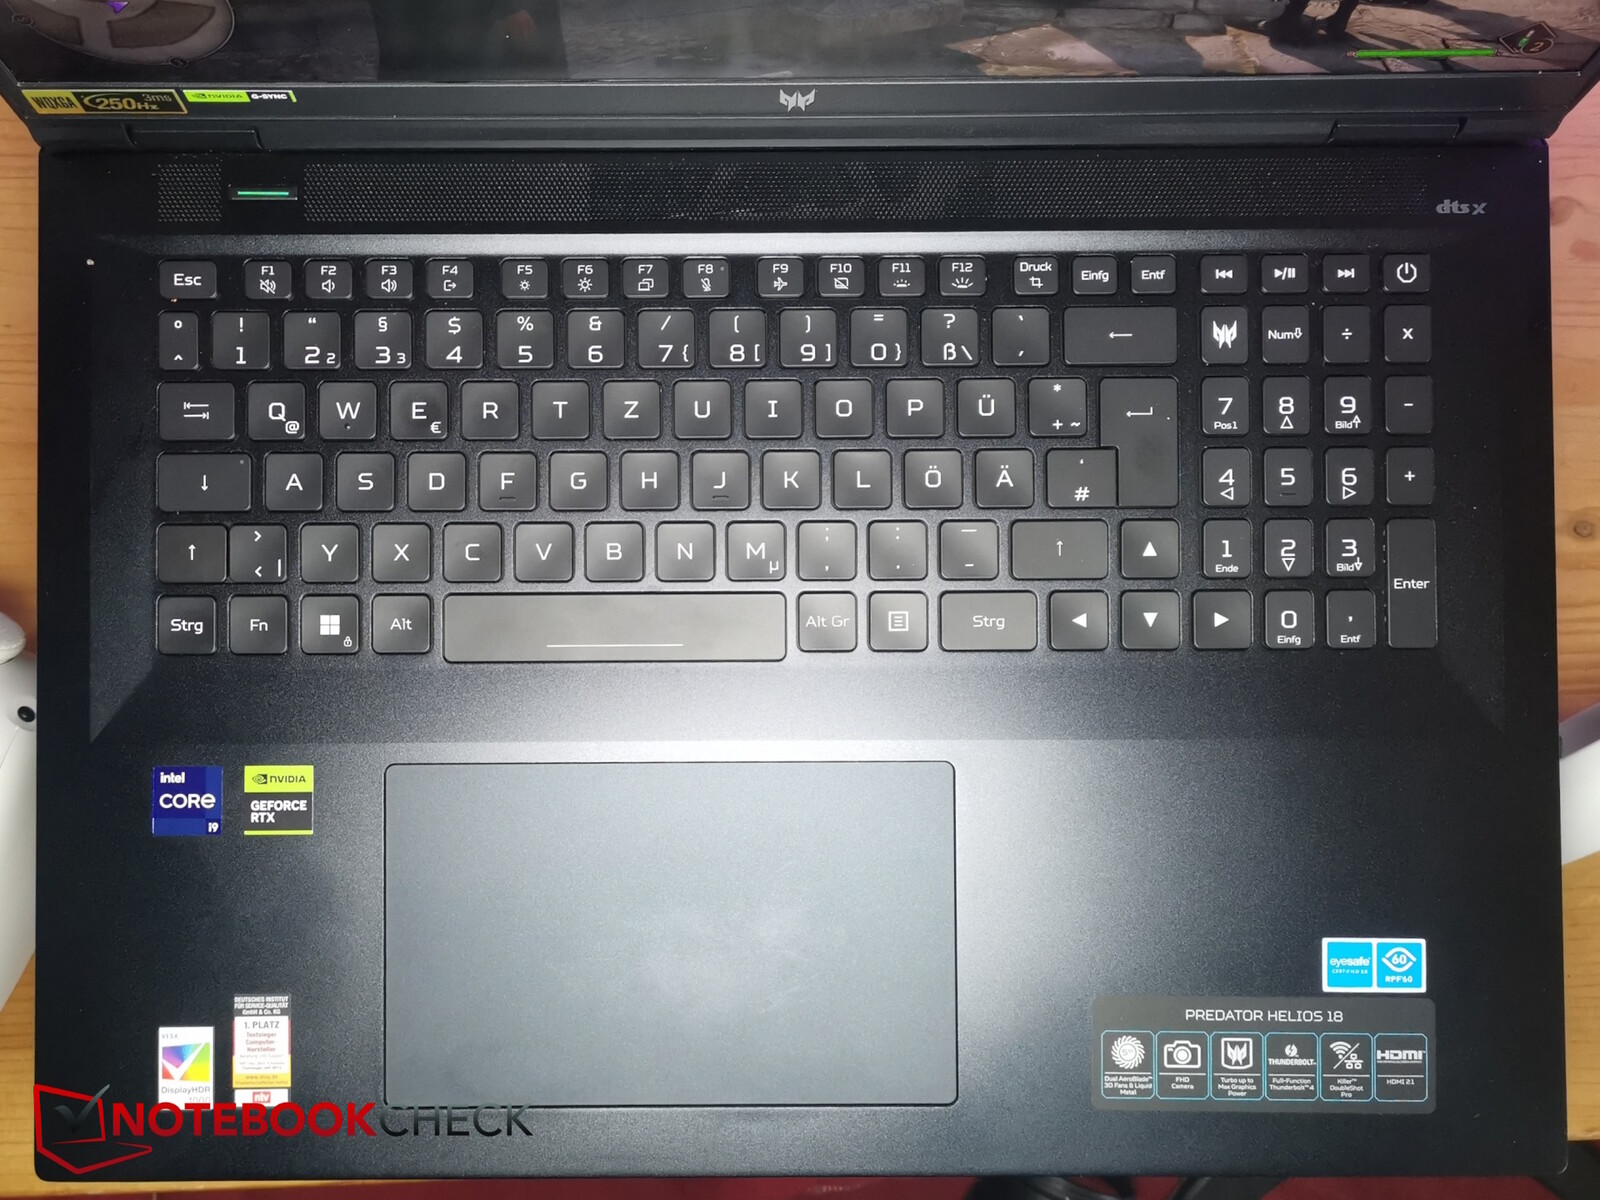
Urządzenia wejściowe - MiniLED również dla klawiszy
Klawiatura

Predator ma bardzo uporządkowany układ, który obejmuje pełnowymiarowe klawisze strzałek, klawiaturę numeryczną po prawej stronie i dodatkowe klawisze do wywoływania oprogramowania Predator Sense i przełączania trybów wydajności
Klawisze mają wymiary 1,5 x 1,5 mm, średni skok i wyczuwalne sprzężenie zwrotne, które mogłoby być nieco twardsze. Hałas podczas pisania jest umiarkowany, a szybkość pisania szybka.
Według firmy Acer, podświetlenie RGB dla każdego klawisza działa za pomocą diod MiniLED, podobnie jak wyświetlacz, i można je regulować na czterech poziomach.
Panel dotykowy
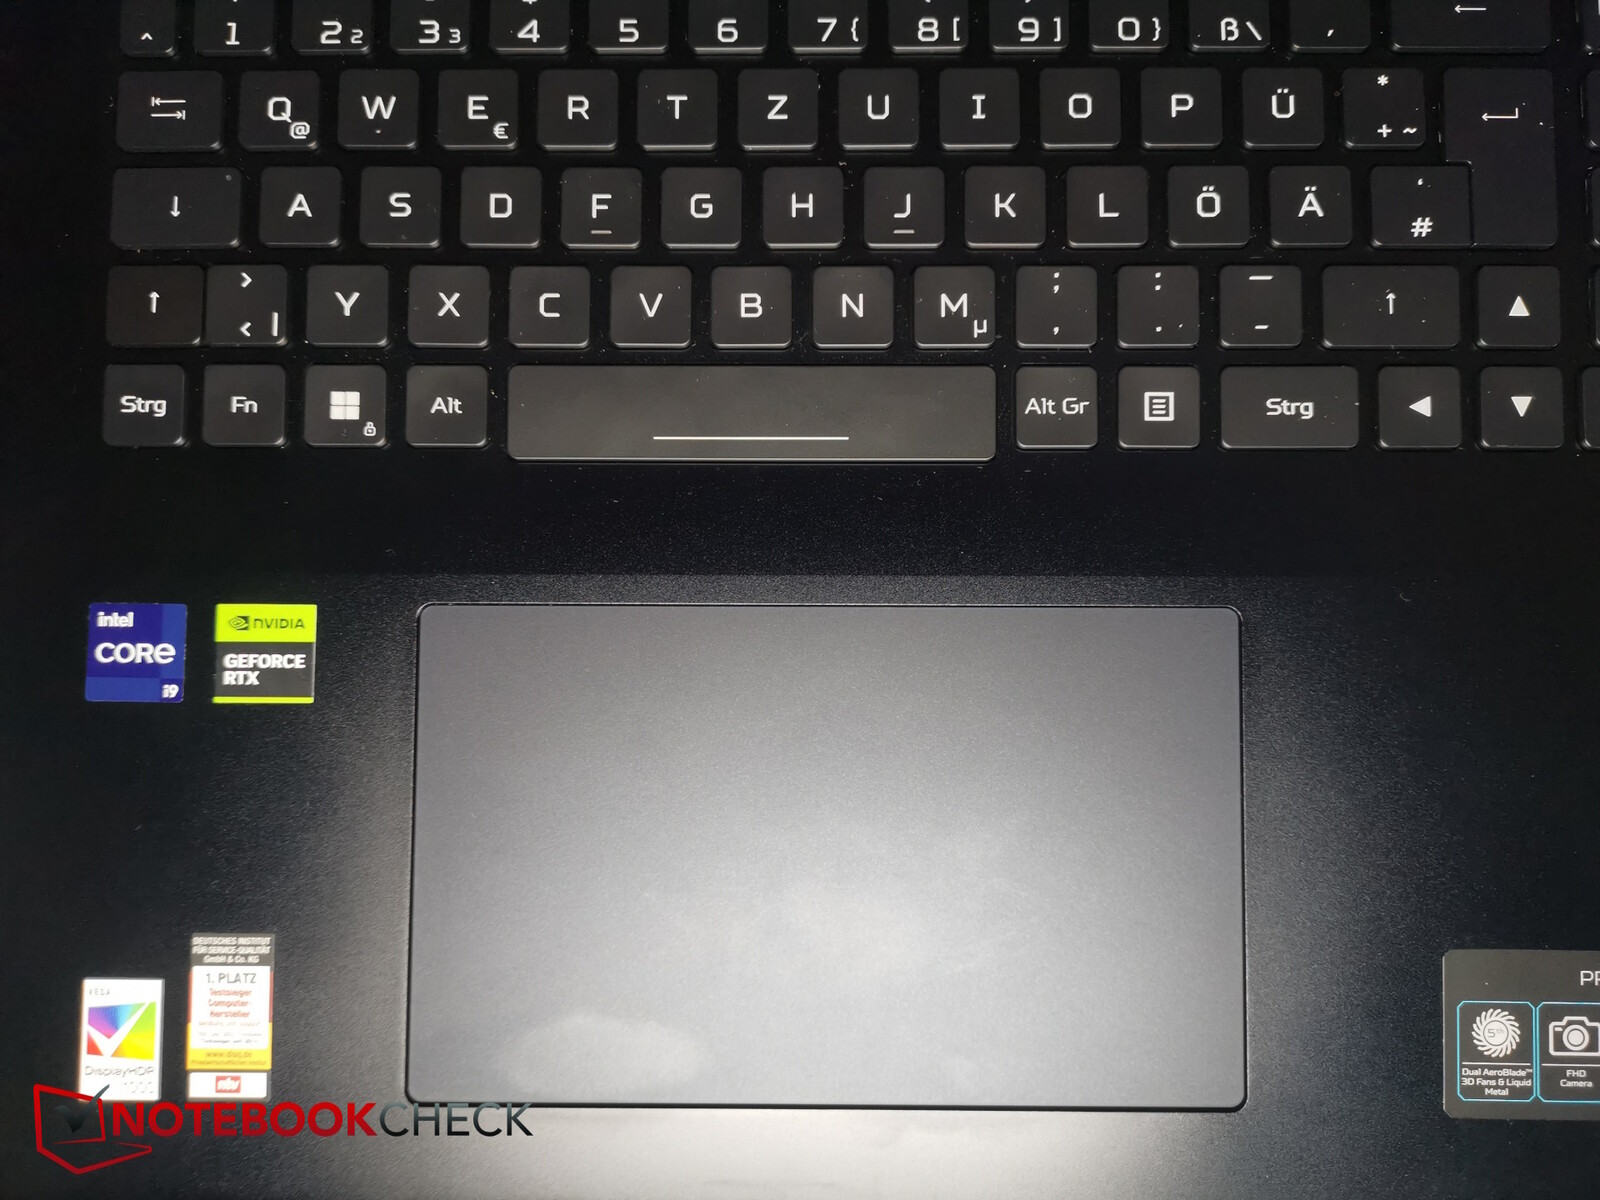
18-calowy touchpad jest wręcz ogromny (ok. 15,2 x 9,1 cm) i oferuje bardzo dobre właściwości ślizgowe, które prawie nigdy nie powodują zacinania się.
Zintegrowane przyciski są bardzo ciche i mają bardzo krótki skok, ale wyzwalają się niezawodnie i zapewniają dobre sprzężenie zwrotne.
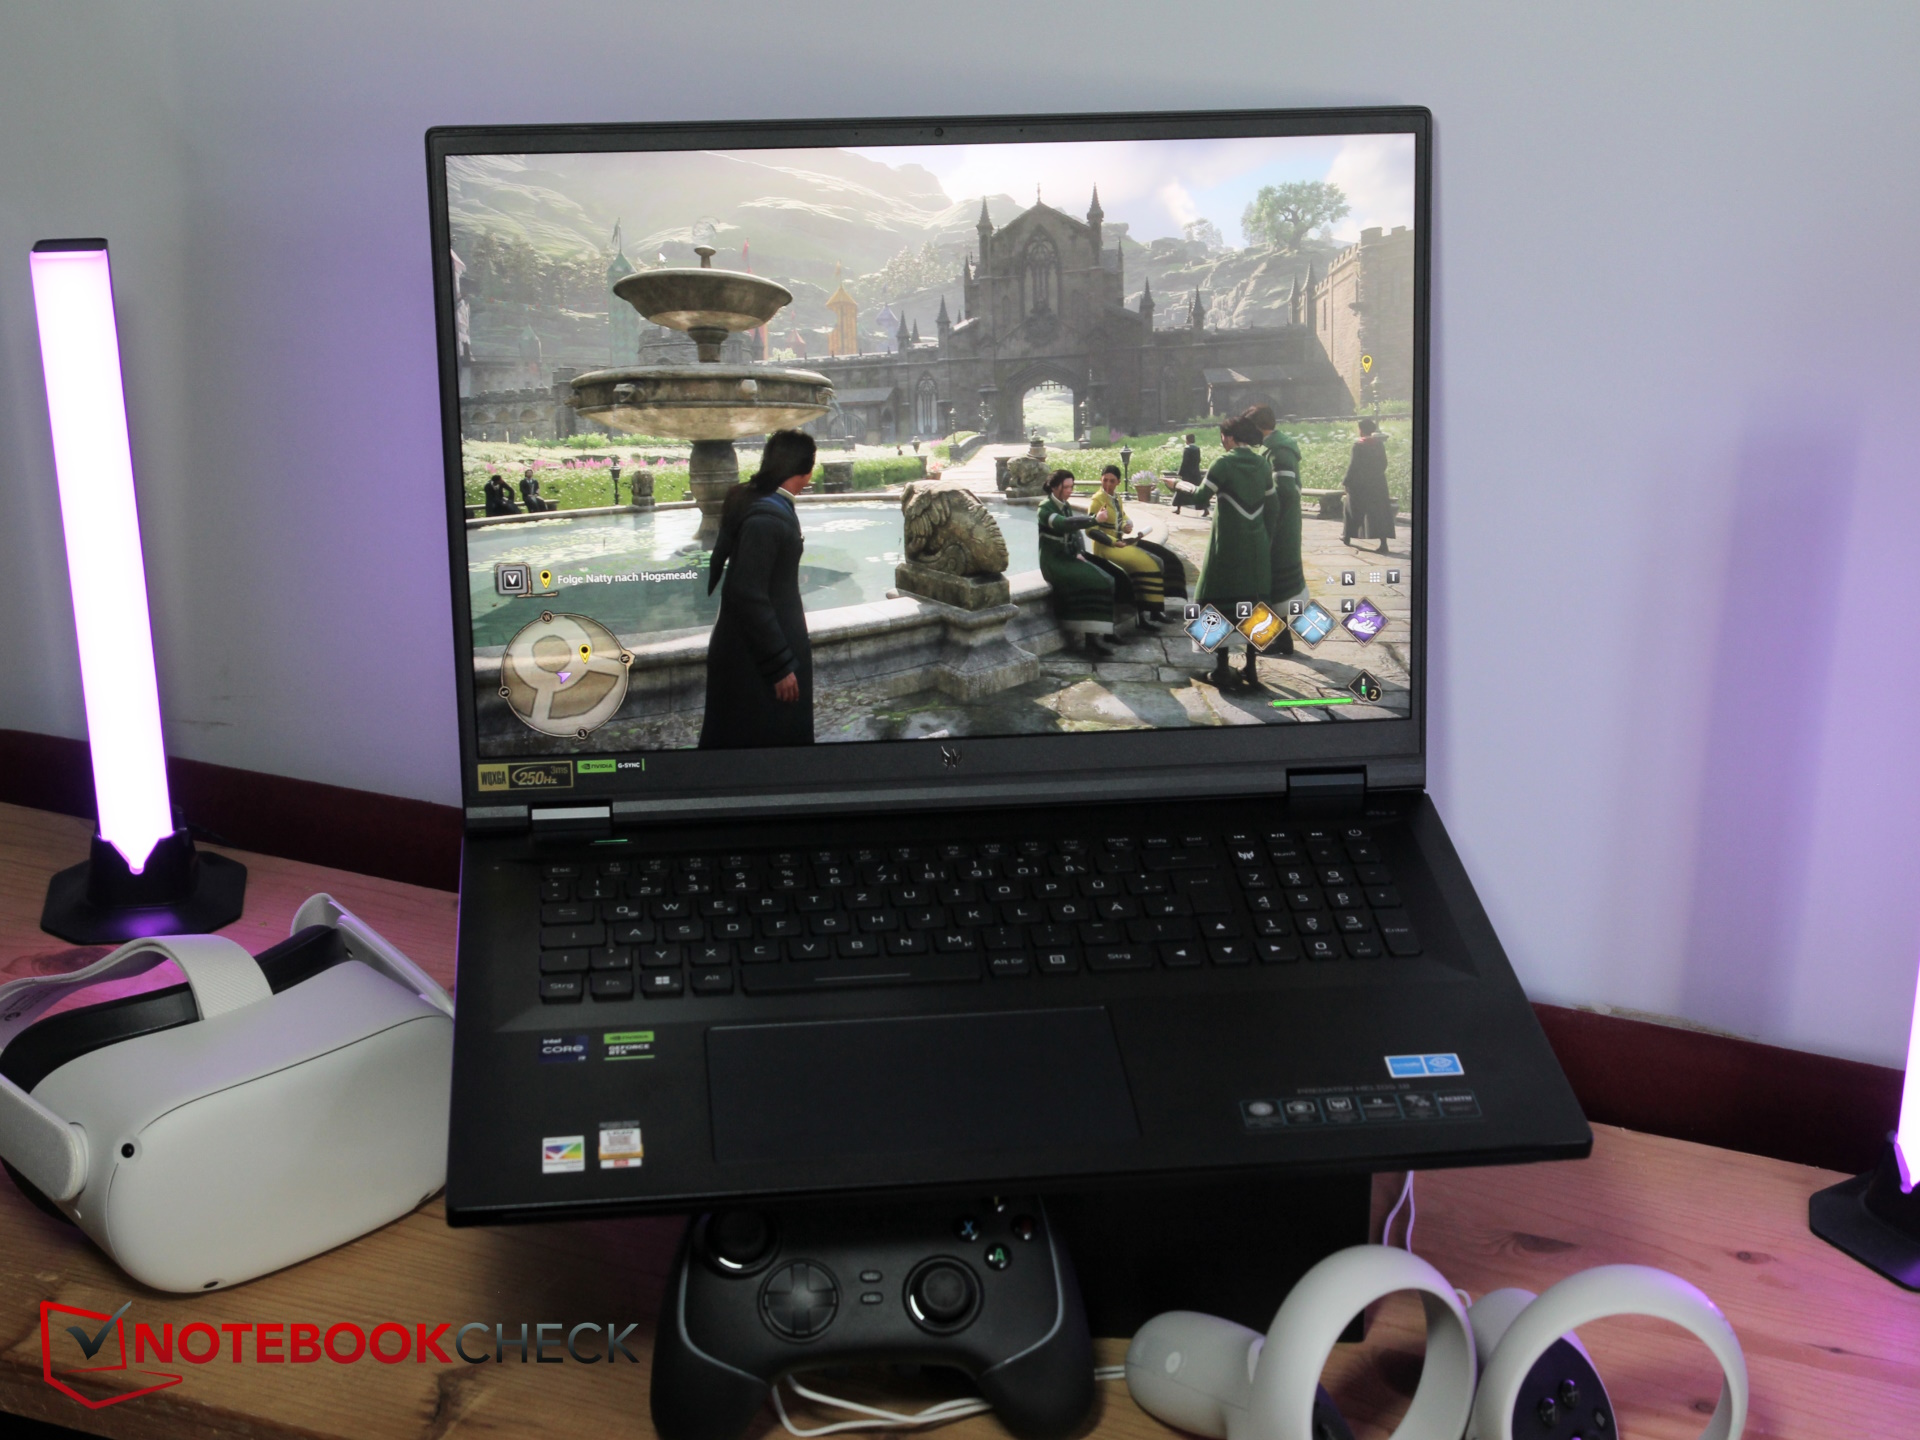
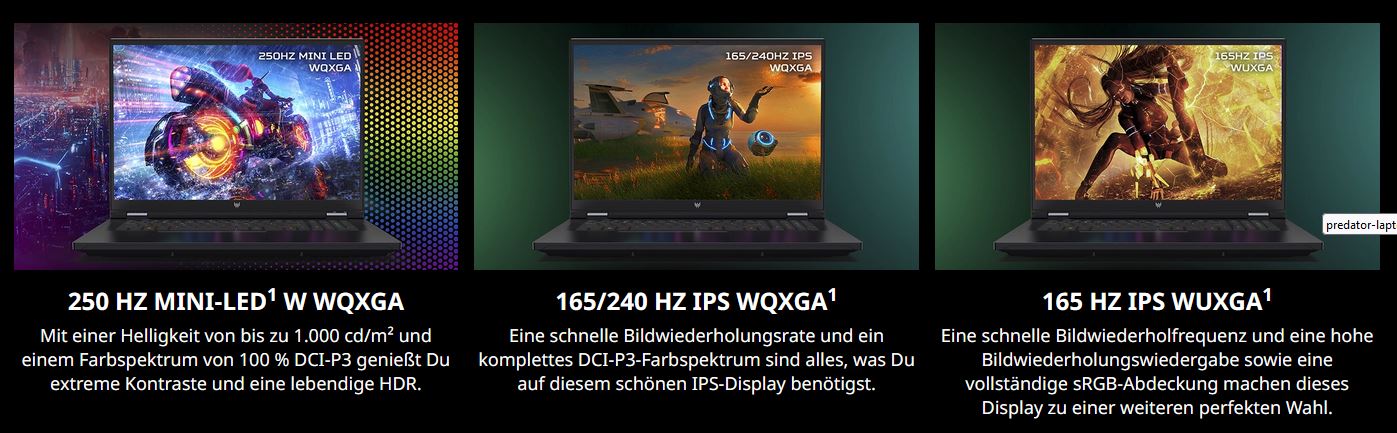
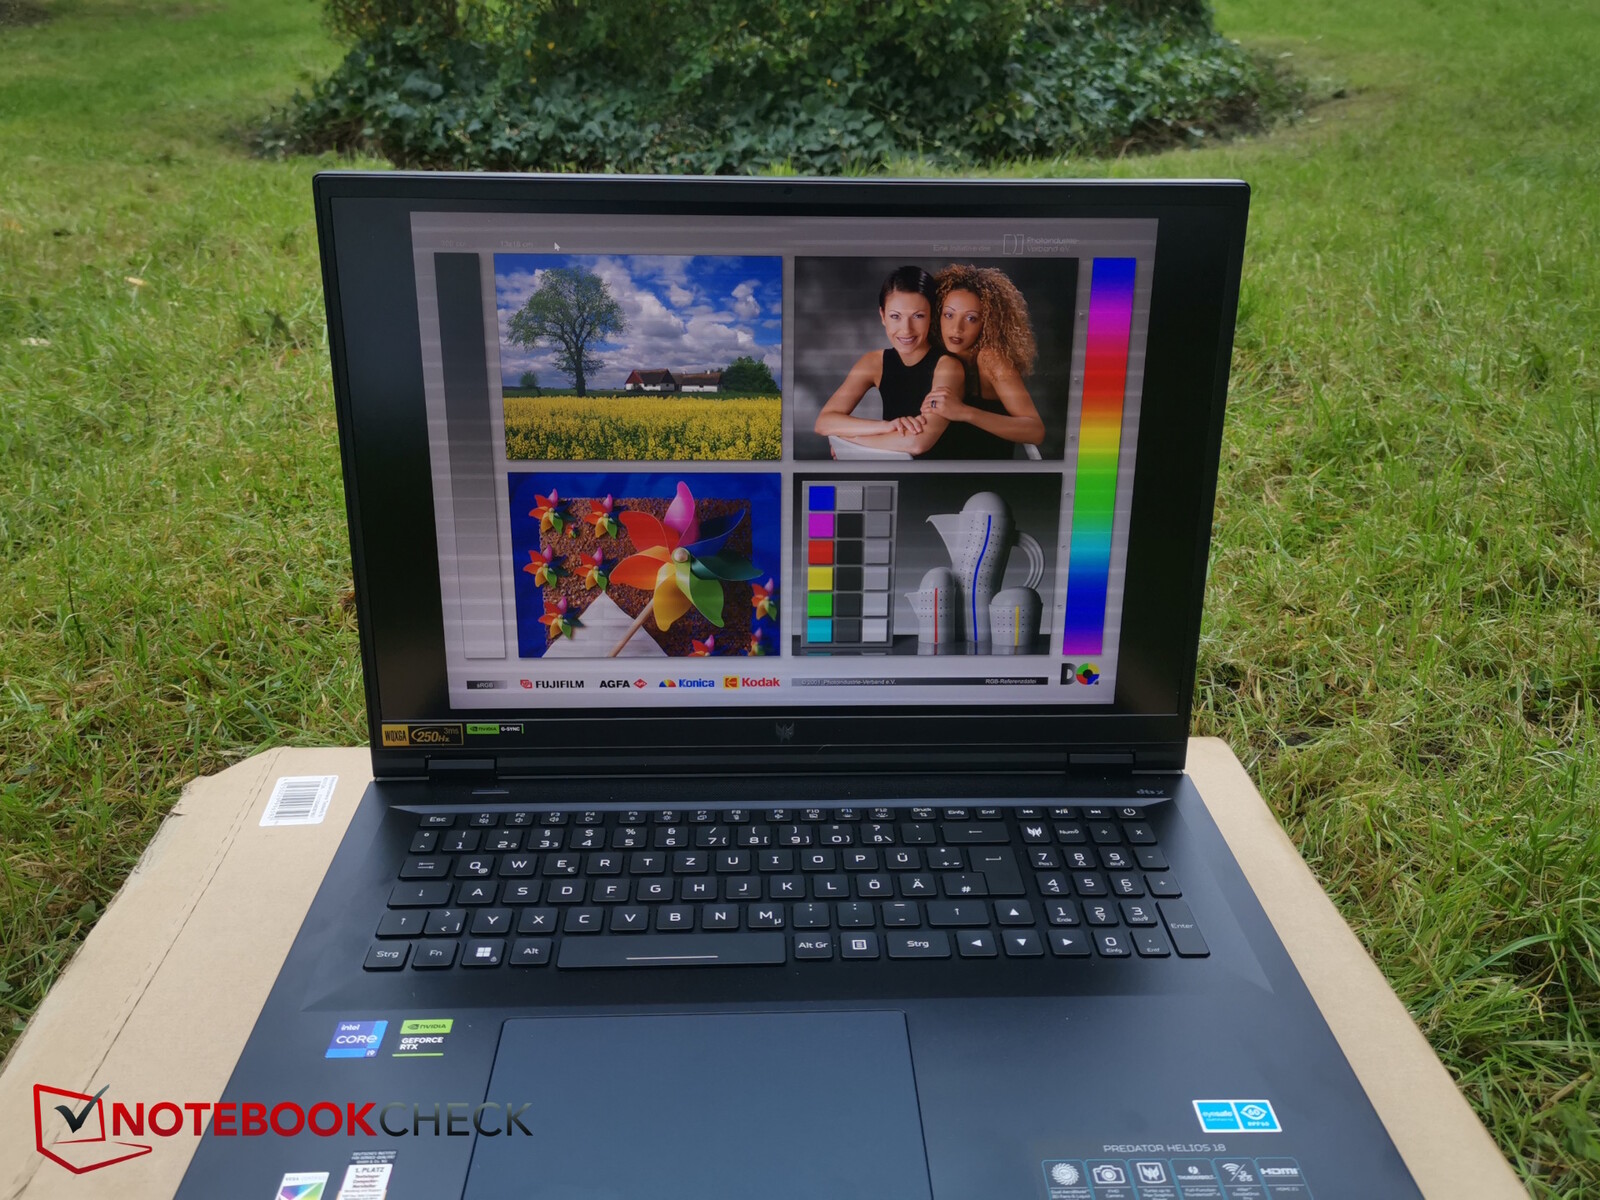
Wyświetlacz - diody MiniLED o jasności ponad 1000 nitów
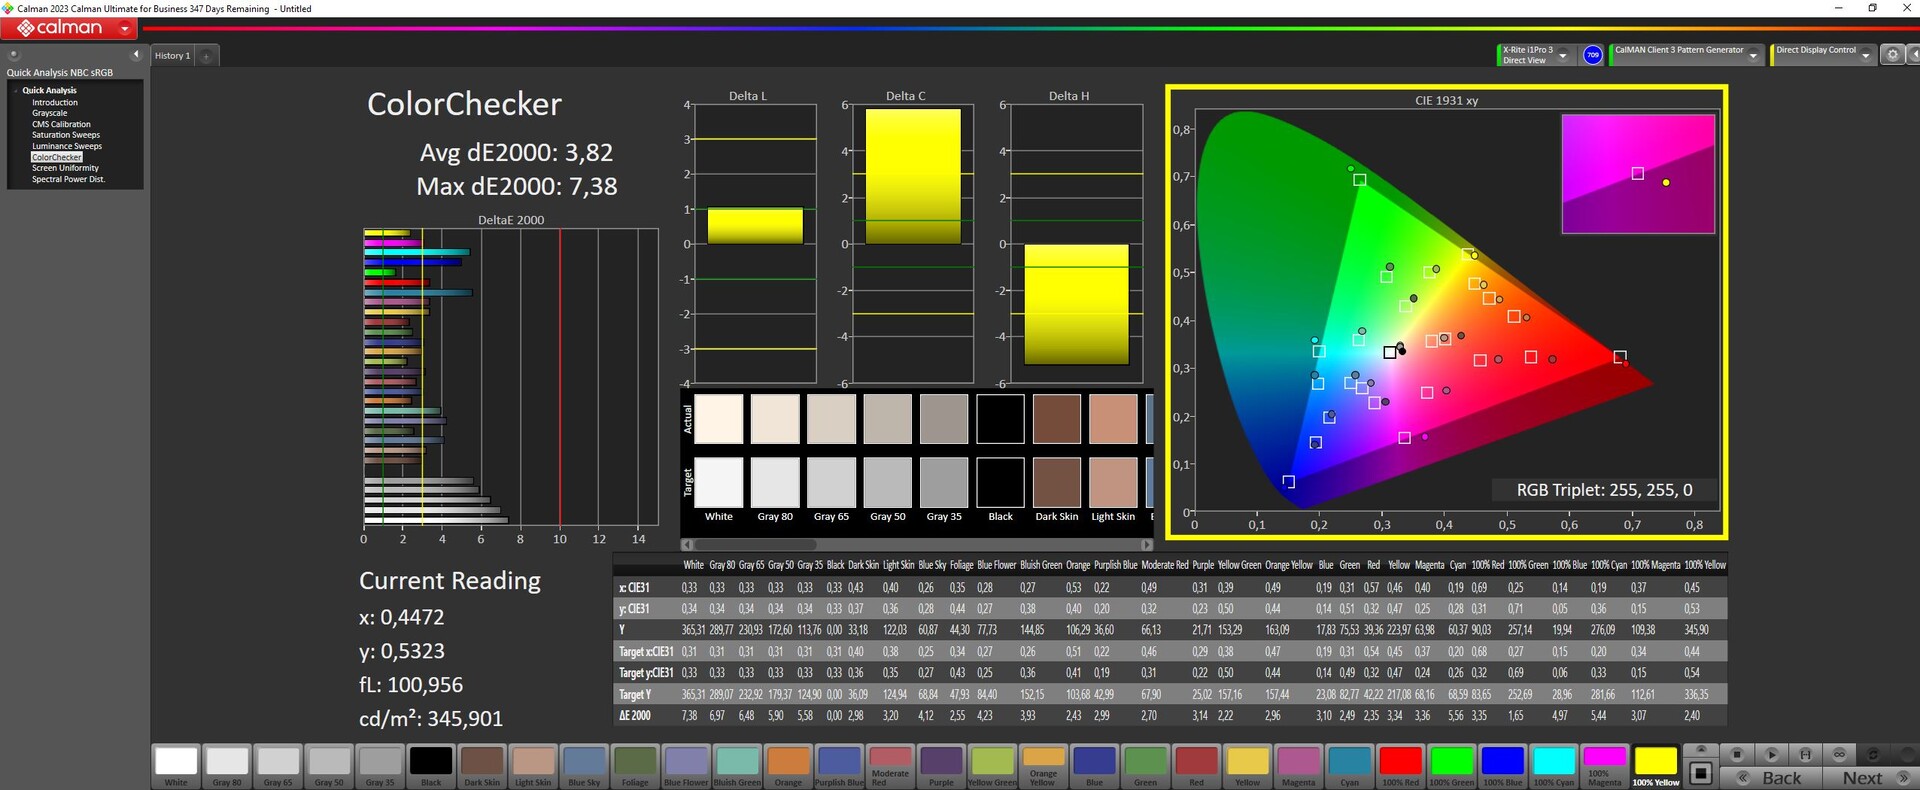
Helios 18 jest opcjonalnie dostępny z fantastycznym wyświetlaczem MiniLED o częstotliwości odświeżania 250 Hz, który jest również zainstalowany w naszym urządzeniu testowym. Nie widać tu aureoli, czerń jest bogata bez irytujących artefaktów świetlnych, a kontrast jest odpowiednio dobry.
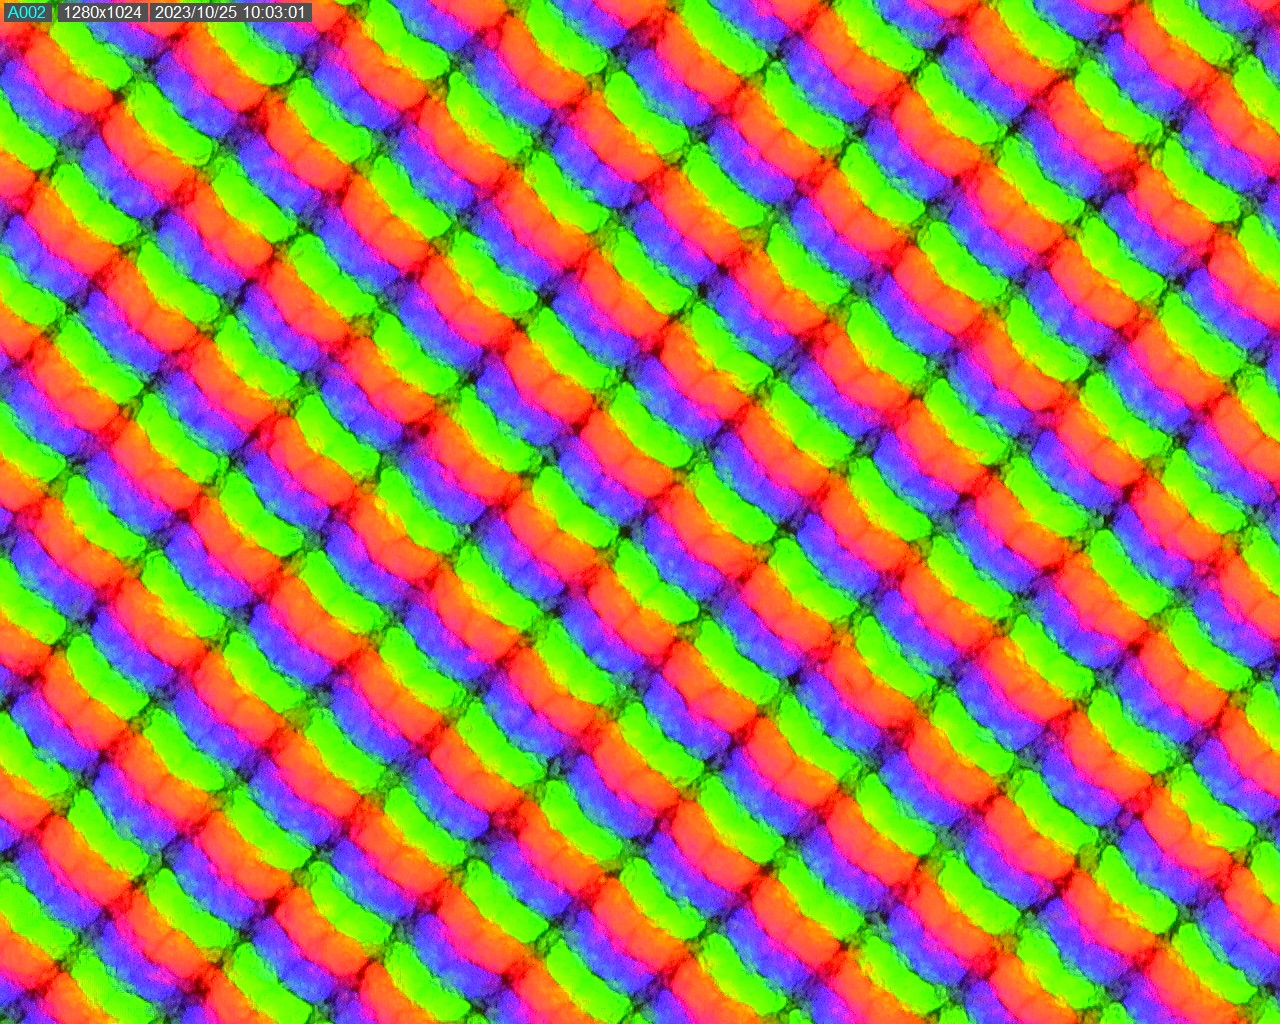
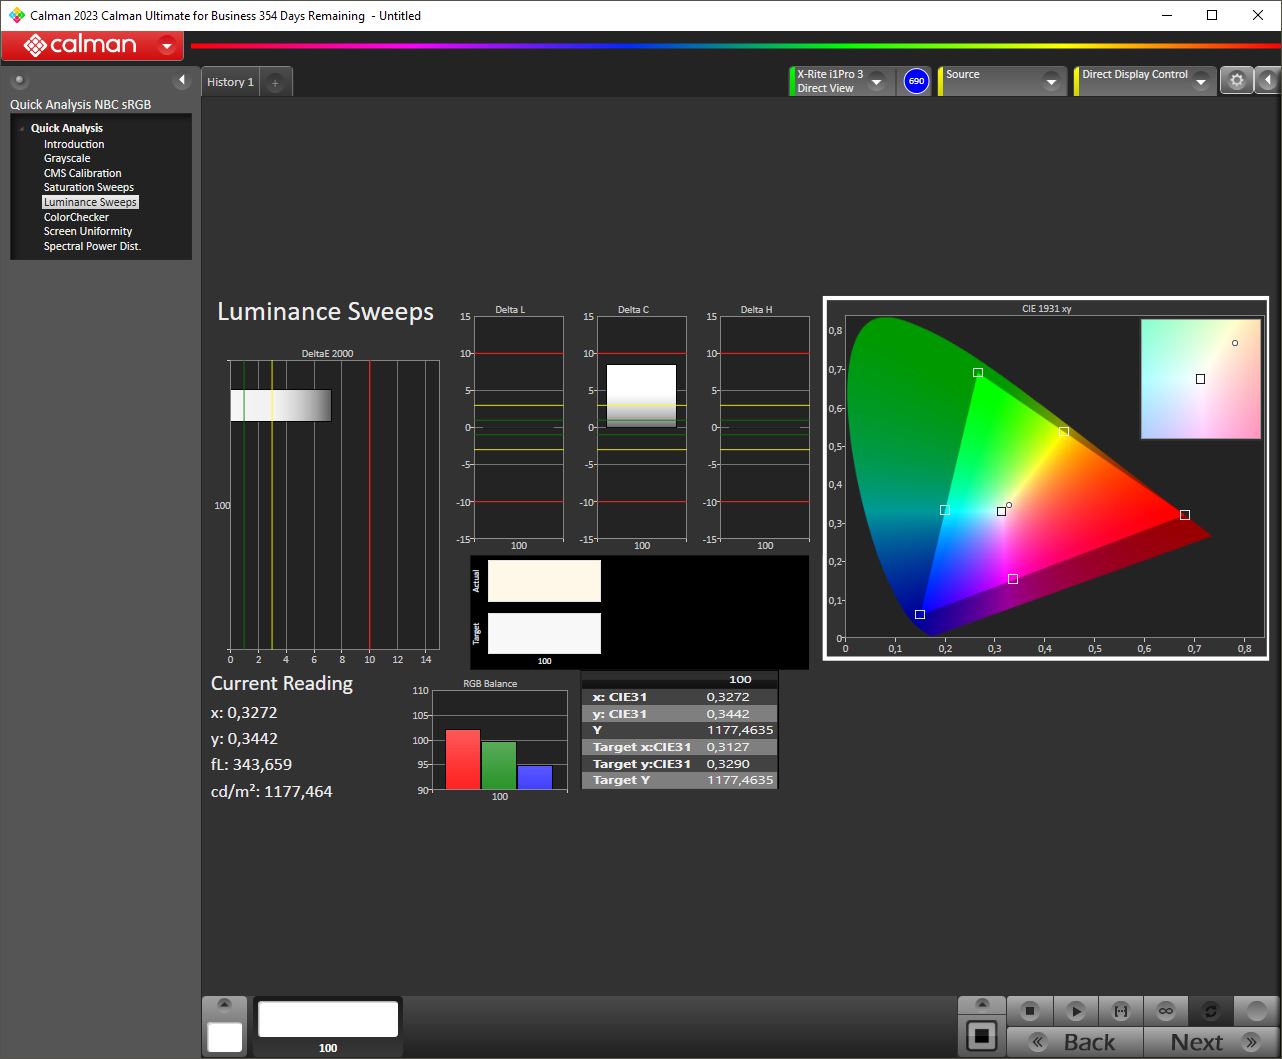
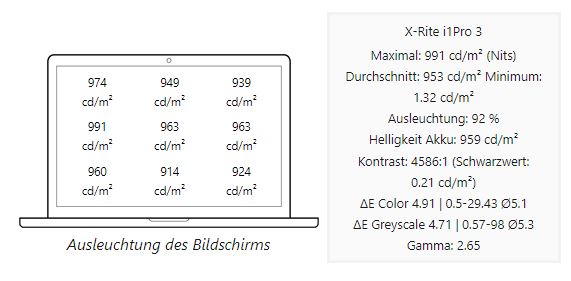
W normalnym trybie SDR panel AU Optronics osiąga około 350 nitów. Jednak ekran wytwarza jeszcze większą jasność w trybie HDR. Tutaj zmierzyliśmy szczytową jasność ponad 1100 nitów! Podświetlenie wynosi bardzo dobre 92% w obu przypadkach.
Podświetlenie w trybie HDR
Illumination in SDR mode
| |||||||||||||||||||||||||
rozświetlenie: 92 %
na akumulatorze: 359 cd/m²
kontrast: 1714:1 (czerń: 0.21 cd/m²)
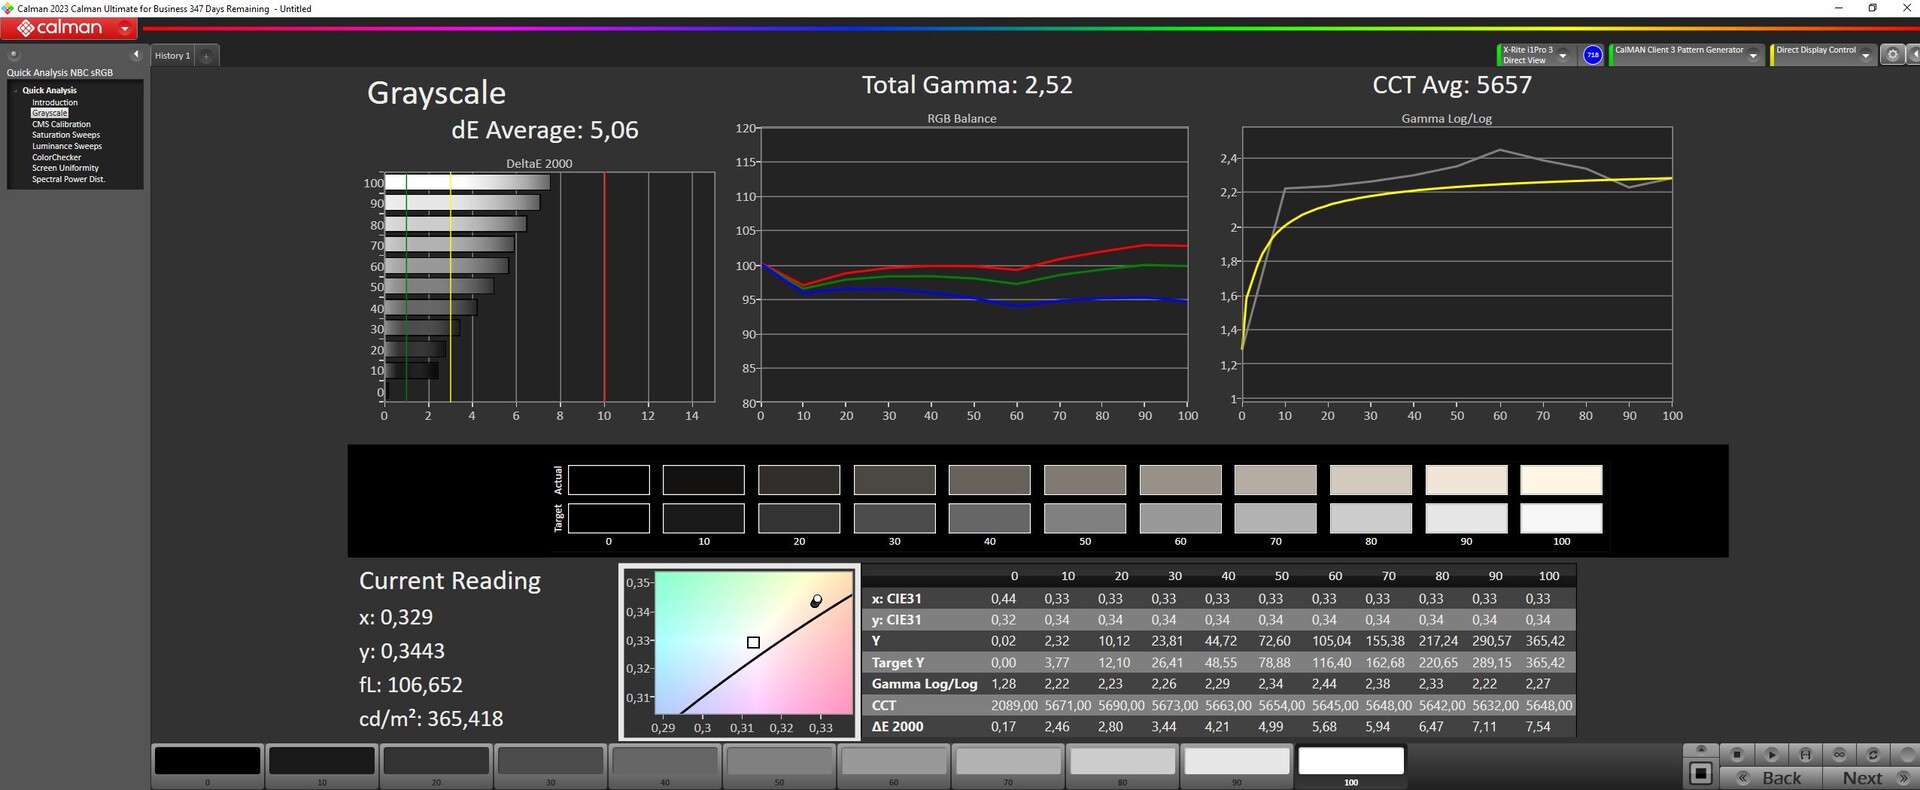
ΔE ColorChecker Calman: 3.82 | ∀{0.5-29.43 Ø4.72}
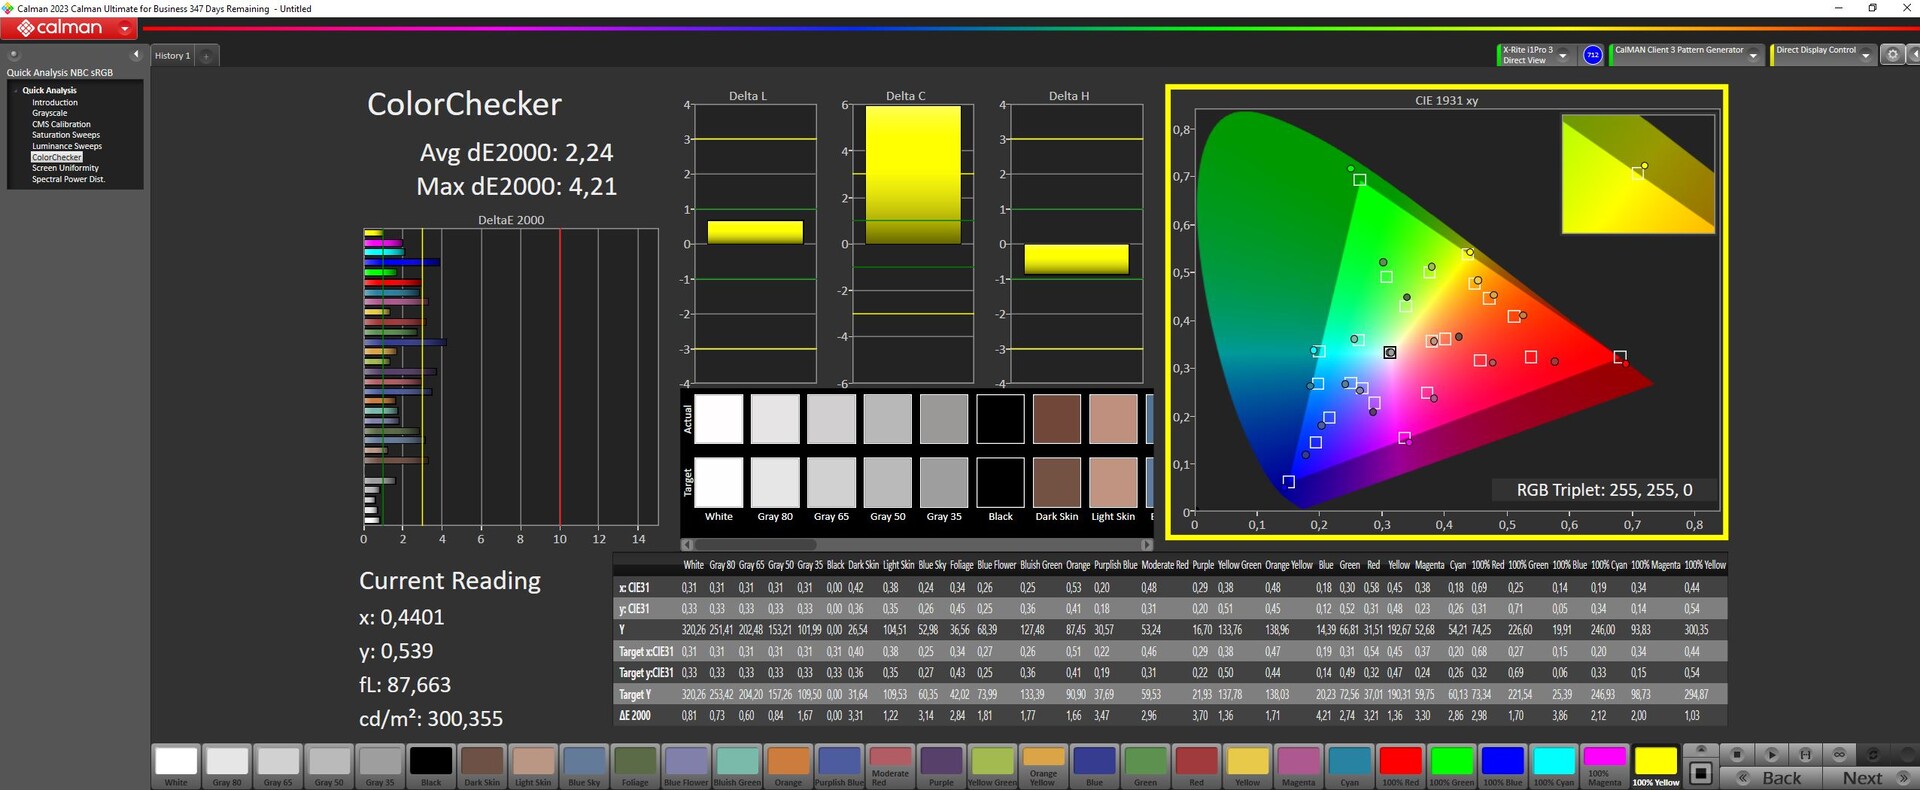
calibrated: 2.24
ΔE Greyscale Calman: 5.06 | ∀{0.09-98 Ø4.97}
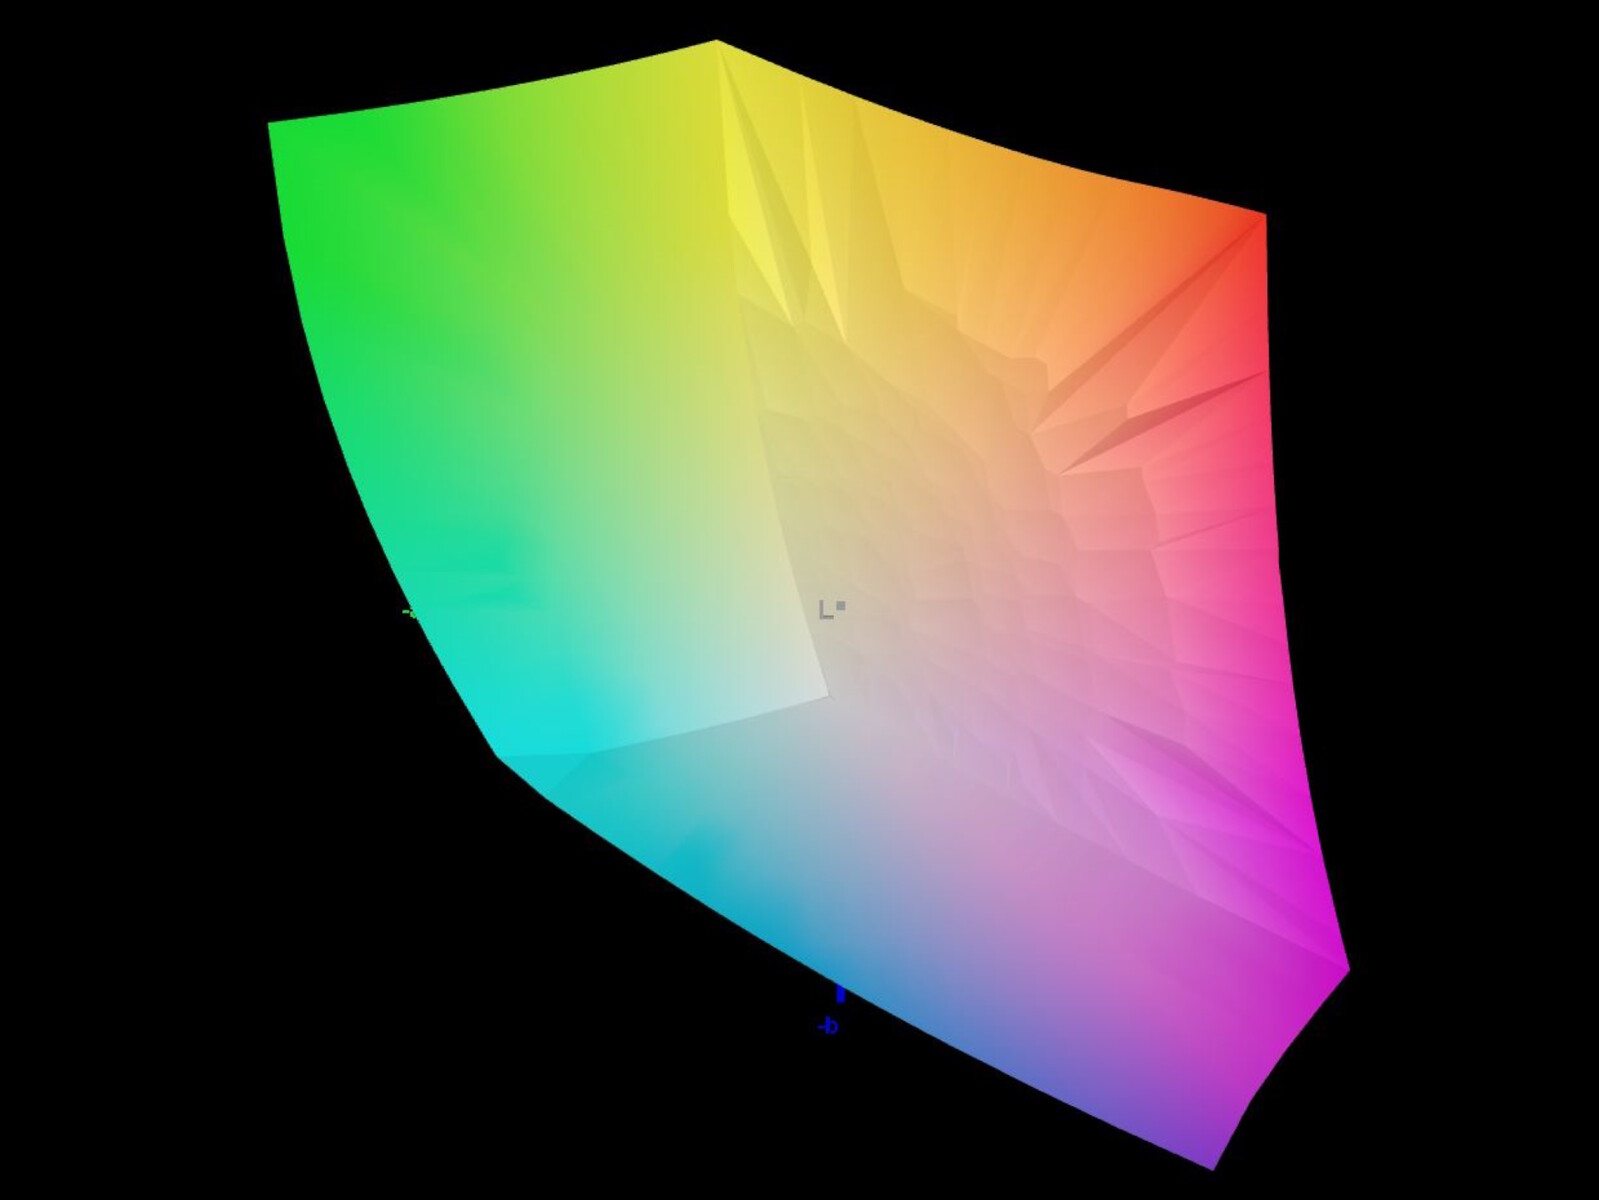
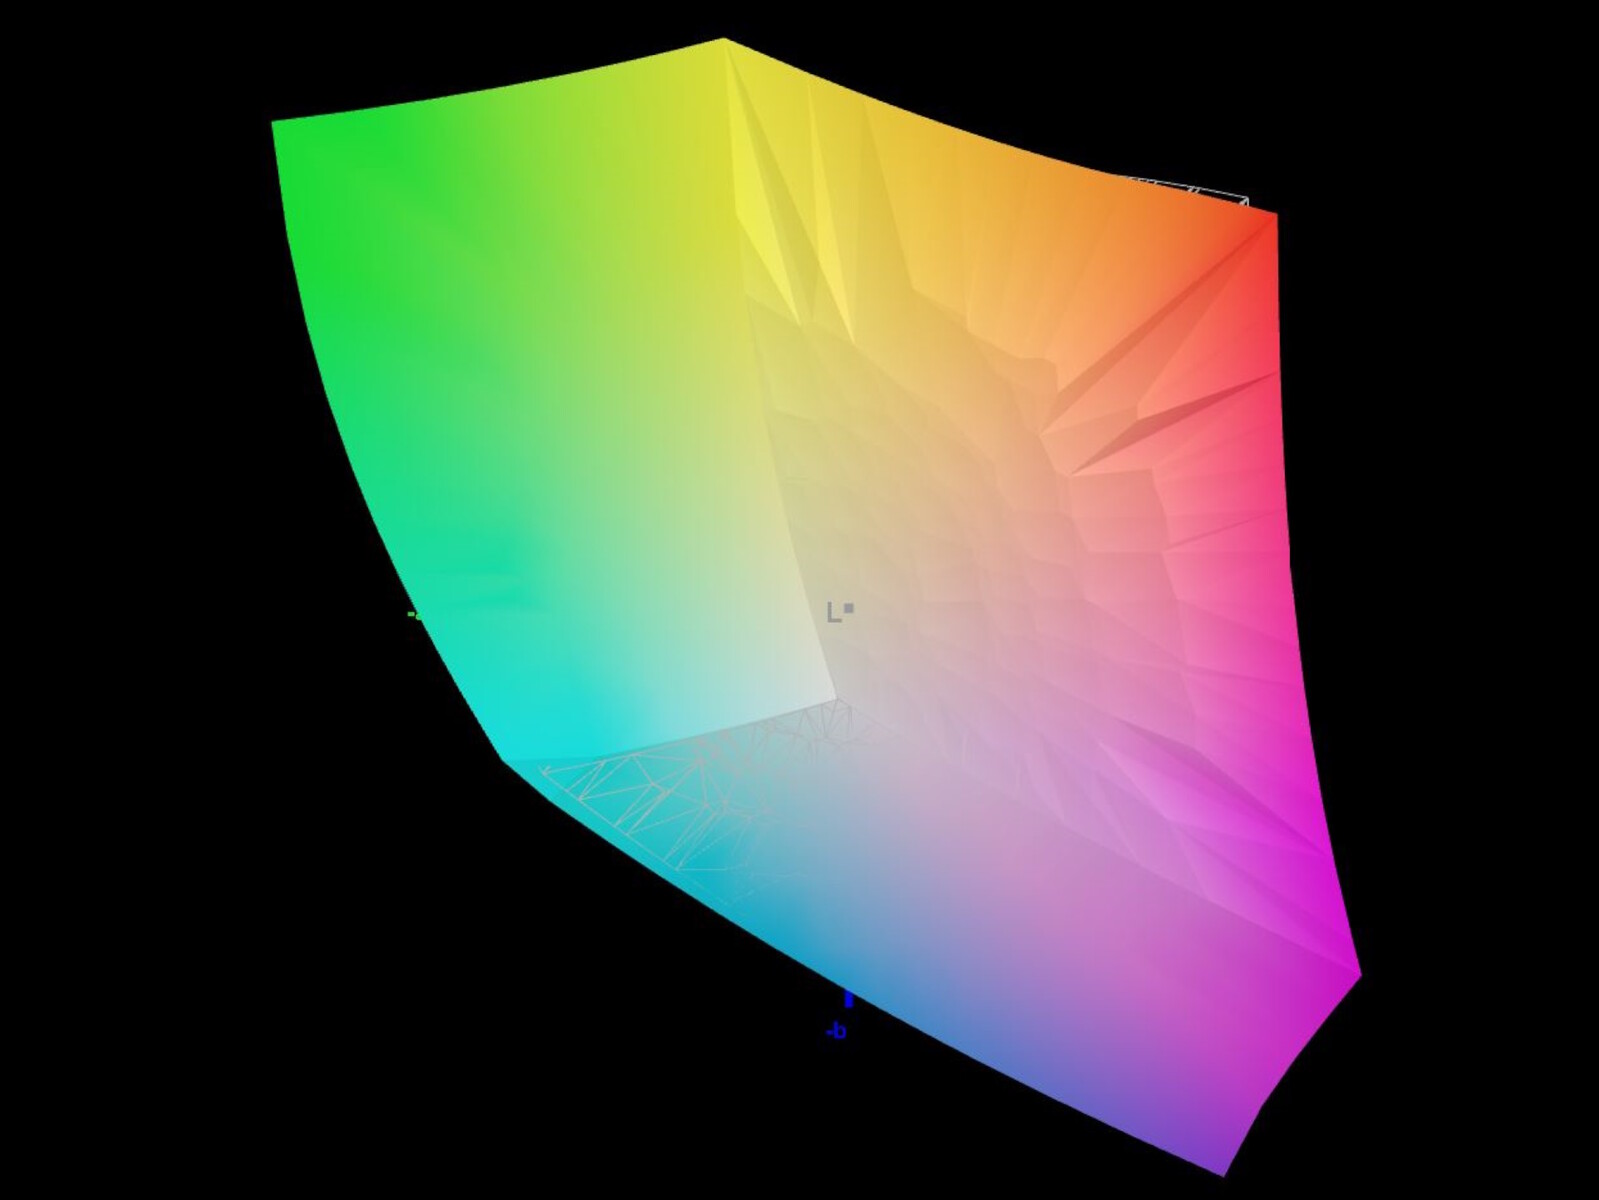
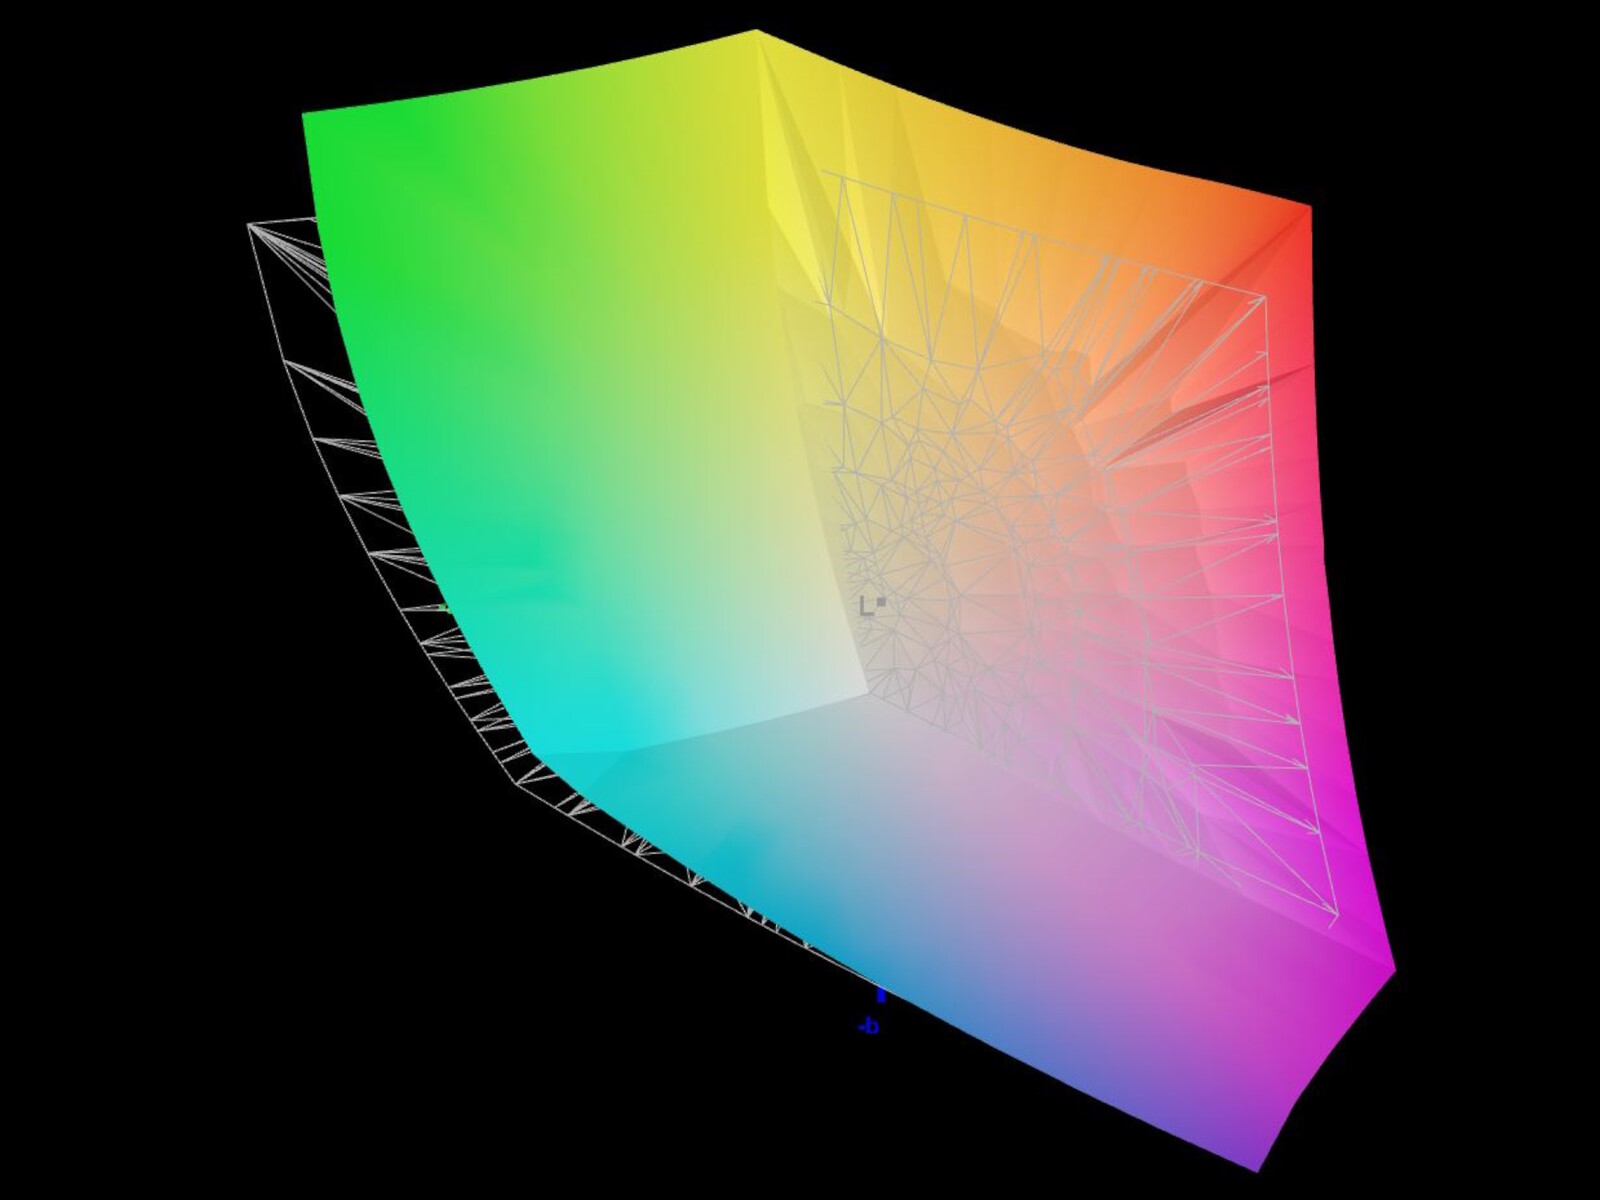
91.8% AdobeRGB 1998 (Argyll 3D)
100% sRGB (Argyll 3D)
99.8% Display P3 (Argyll 3D)
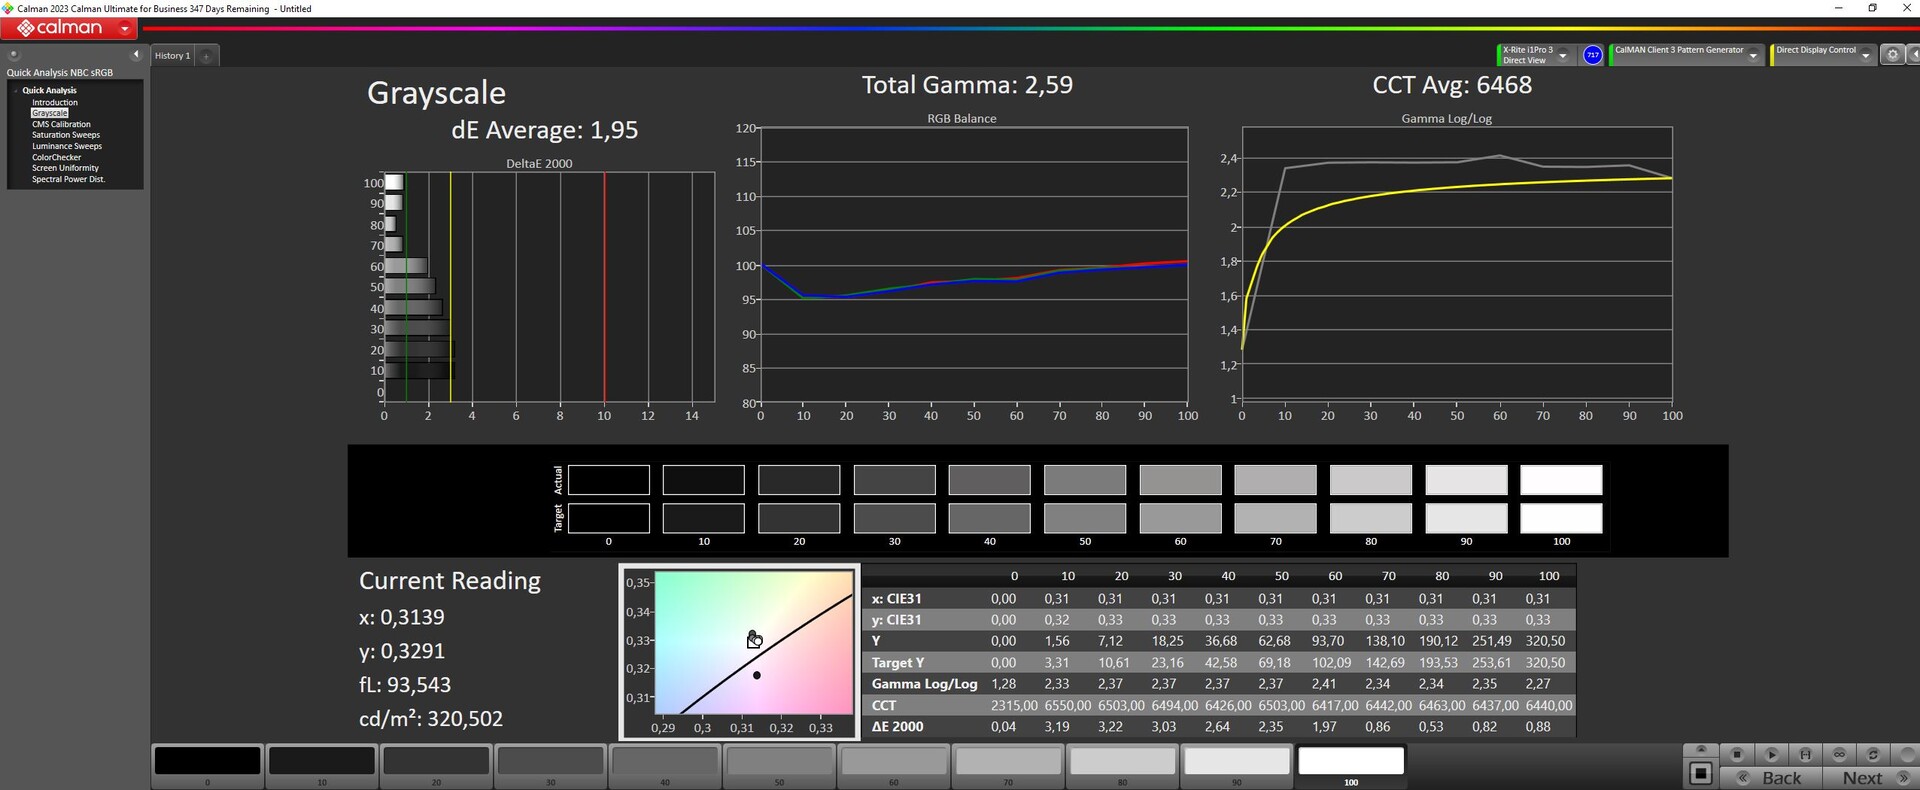
Gamma: 2.52
CCT: 5657 K
| Acer Predator Helios 18 N23Q2 AUO45A8 (B180QAN01.2), IPS, 2560x1600, 18" | MSI GE78HX 13VH-070US AU Optronics B170QAN01.2, IPS, 2560x1600, 17" | HP Omen 17-ck2097ng BOE BOE09BF, IPS, 2560x1440, 17.3" | Alienware m18 R1 Chi Mei 180JME, IPS, 1920x1200, 18" | Asus ROG Strix G18 G814JI NE180QDM-NZ2 (BOE0B35), IPS, 2560x1600, 18" | Razer Blade 18 RTX 4070 AU Optronics B180QAN01.0, IPS, 2560x1600, 18" | |
|---|---|---|---|---|---|---|
| Display | -3% | -19% | -1% | -3% | -3% | |
| Display P3 Coverage (%) | 99.8 | 97.6 -2% | 67.4 -32% | 97.7 -2% | 98.1 -2% | 96.9 -3% |
| sRGB Coverage (%) | 100 | 99.9 0% | 97.6 -2% | 100 0% | 99.9 0% | 99.8 0% |
| AdobeRGB 1998 Coverage (%) | 91.8 | 86.5 -6% | 69.6 -24% | 89.8 -2% | 85.6 -7% | 85.3 -7% |
| Response Times | 55% | -28% | 53% | 38% | 50% | |
| Response Time Grey 50% / Grey 80% * (ms) | 7.6 ? | 4.2 ? 45% | 15.6 ? -105% | 3 ? 61% | 5.6 ? 26% | 4.2 ? 45% |
| Response Time Black / White * (ms) | 17.8 ? | 6.4 ? 64% | 8.9 ? 50% | 9.9 ? 44% | 9 ? 49% | 8 ? 55% |
| PWM Frequency (Hz) | 2509 | |||||
| Screen | -17% | 13% | 20% | 8% | -3% | |
| Brightness middle (cd/m²) | 360 | 398.6 11% | 371 3% | 372.8 4% | 471 31% | 549.6 53% |
| Brightness (cd/m²) | 355 | 384 8% | 350 -1% | 367 3% | 422 19% | 524 48% |
| Brightness Distribution (%) | 92 | 89 -3% | 90 -2% | 97 5% | 83 -10% | 89 -3% |
| Black Level * (cd/m²) | 0.21 | 0.46 -119% | 0.32 -52% | 0.32 -52% | 0.47 -124% | 0.53 -152% |
| Contrast (:1) | 1714 | 867 -49% | 1159 -32% | 1165 -32% | 1002 -42% | 1037 -39% |
| Colorchecker dE 2000 * | 3.82 | 4.05 -6% | 1.74 54% | 1.92 50% | 2.05 46% | 3.32 13% |
| Colorchecker dE 2000 max. * | 7.38 | 8.68 -18% | 3.59 51% | 3.65 51% | 4.15 44% | 6.63 10% |
| Colorchecker dE 2000 calibrated * | 2.24 | 1.02 54% | 1.01 55% | 0.51 77% | 0.8 64% | 2.7 -21% |
| Greyscale dE 2000 * | 5.06 | 6.5 -28% | 2.8 45% | 1.5 70% | 2.8 45% | 2 60% |
| Gamma | 2.52 87% | 2.11 104% | 2.19 100% | 2.34 94% | 2.204 100% | 2.29 96% |
| CCT | 5657 115% | 7518 86% | 6474 100% | 6607 98% | 7122 91% | 6319 103% |
| Całkowita średnia (program / ustawienia) | 12% /
-4% | -11% /
1% | 24% /
20% | 14% /
10% | 15% /
4% |
* ... im mniej tym lepiej
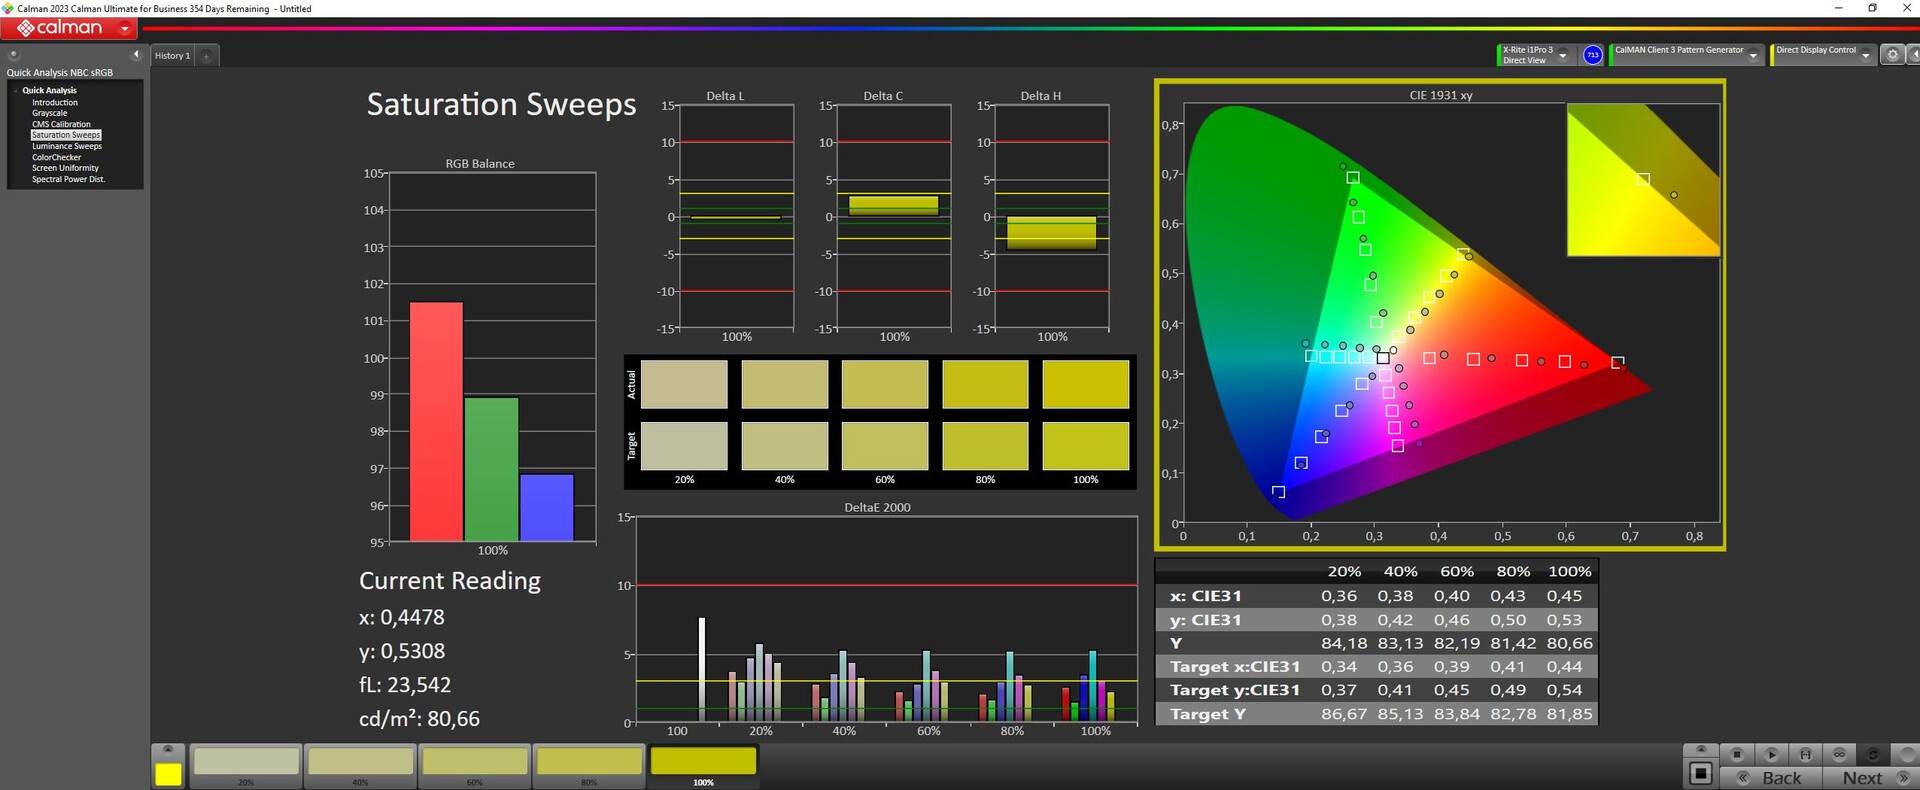
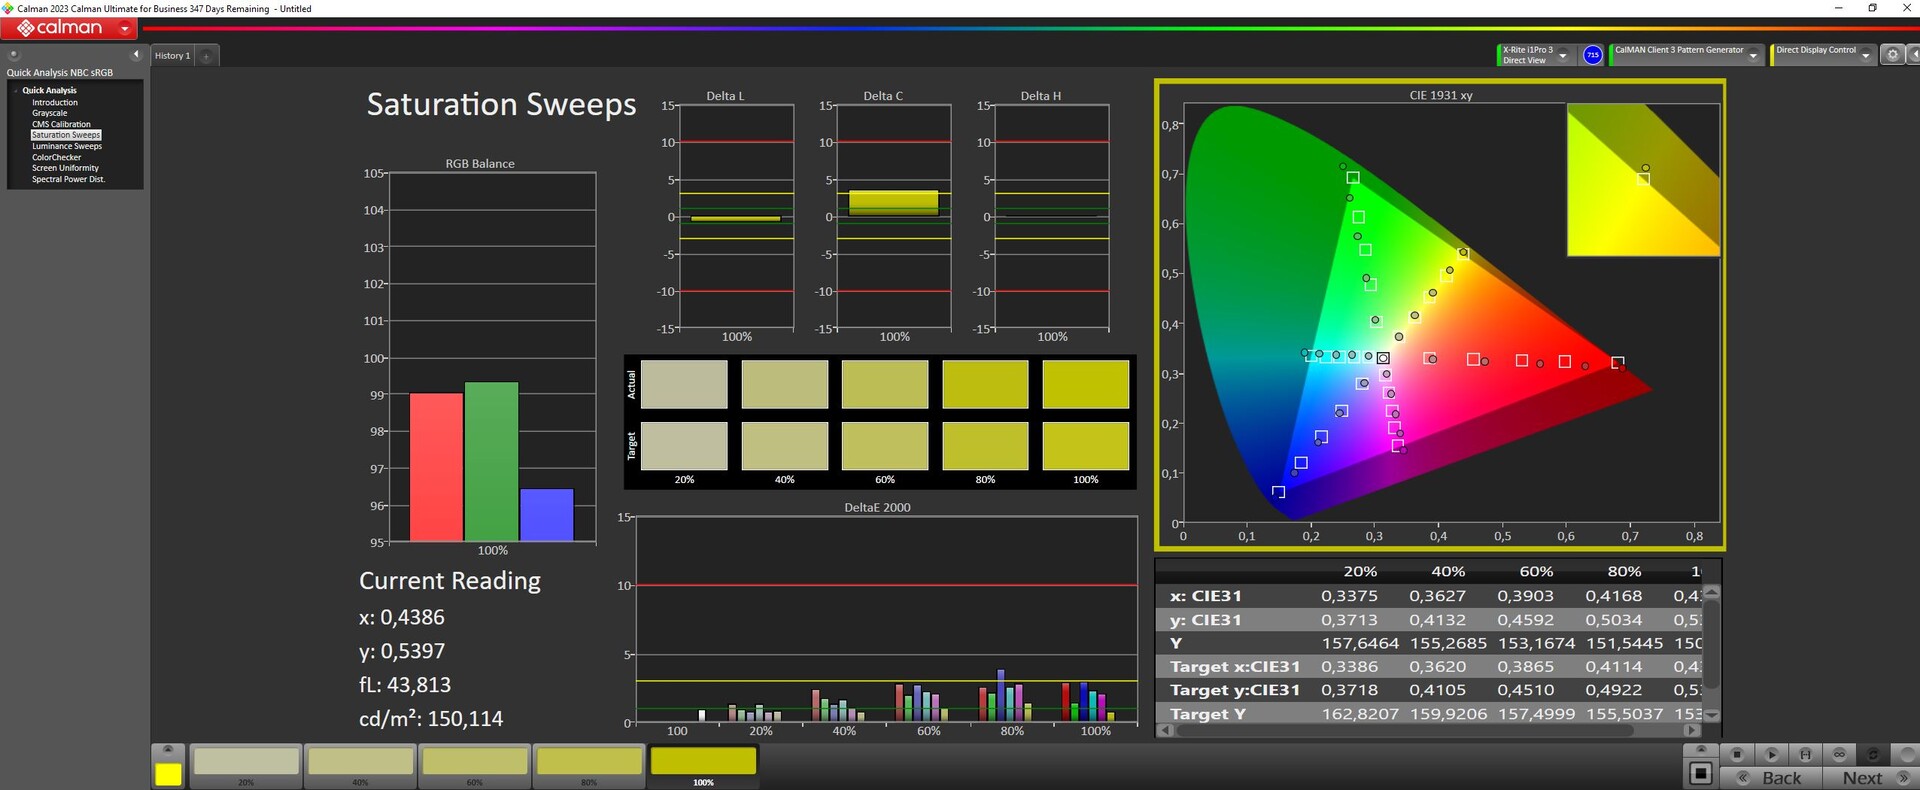
Dokonaliśmy pomiarów w przestrzeni barw P3. Wyświetlacz prawie całkowicie pokrywa sRGB i DisplayP3. AdobeRGB ma 92 procent pokrycia. W szczególności dzięki P3, jasny i kontrastowy ekran nadaje się również do edycji zdjęć i wideo.
Jednak po wyjęciu z pudełka wyświetlacz przekracza ważną wartość DeltaE wynoszącą 3 dla kolorów i skali szarości. Nasza ręczna kalibracja poprawia odchylenia kolorów i spycha wartości DeltaE poniżej progu. Obniżenie jasności do 160 nitów może również przynieść dalszą poprawę. Nasz skalibrowany plik icc można pobrać bezpłatnie powyżej.
Wyświetl czasy reakcji
| ↔ Czas reakcji od czerni do bieli | ||
|---|---|---|
| 17.8 ms ... wzrost ↗ i spadek ↘ łącznie | ↗ 15.6 ms wzrost | 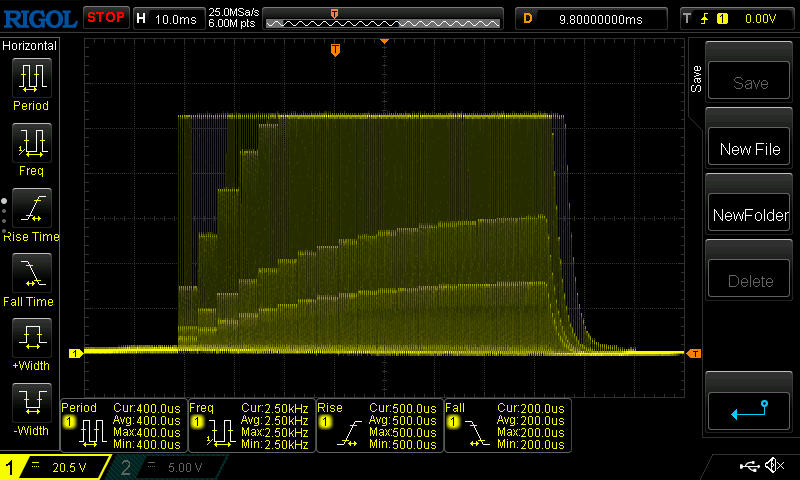 |
| ↘ 2.2 ms upadek | ||
| W naszych testach ekran wykazuje dobry współczynnik reakcji, ale może być zbyt wolny dla graczy rywalizujących ze sobą. Dla porównania, wszystkie testowane urządzenia wahają się od 0.1 (minimum) do 240 (maksimum) ms. » 40 % wszystkich urządzeń jest lepszych. Oznacza to, że zmierzony czas reakcji jest lepszy od średniej wszystkich testowanych urządzeń (19.8 ms). | ||
| ↔ Czas reakcji 50% szarości do 80% szarości | ||
| 7.6 ms ... wzrost ↗ i spadek ↘ łącznie | ↗ 4.4 ms wzrost | 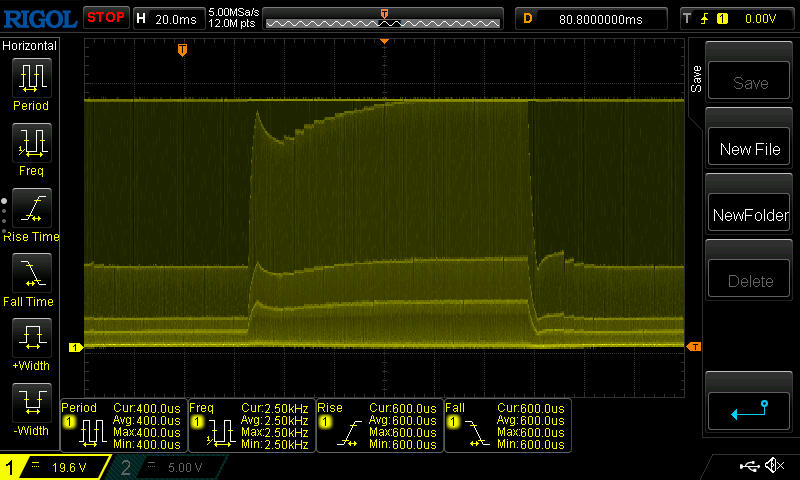 |
| ↘ 3.2 ms upadek | ||
| W naszych testach ekran wykazuje bardzo szybką reakcję i powinien bardzo dobrze nadawać się do szybkich gier. Dla porównania, wszystkie testowane urządzenia wahają się od 0.165 (minimum) do 636 (maksimum) ms. » 20 % wszystkich urządzeń jest lepszych. Oznacza to, że zmierzony czas reakcji jest lepszy od średniej wszystkich testowanych urządzeń (31 ms). | ||
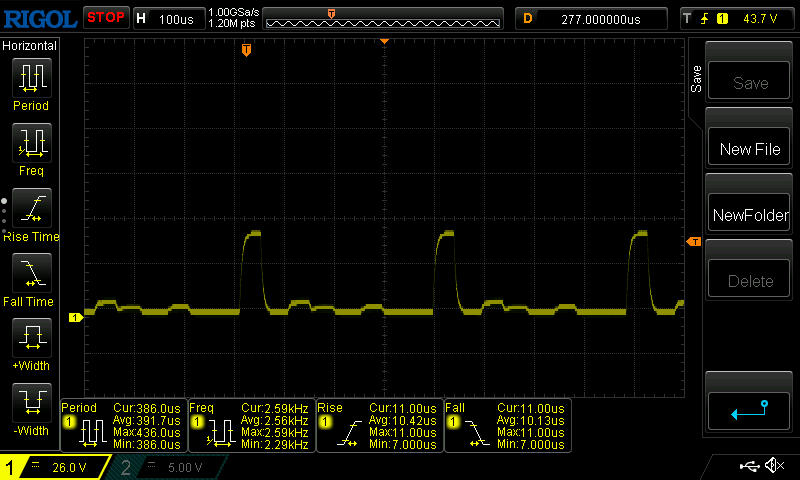
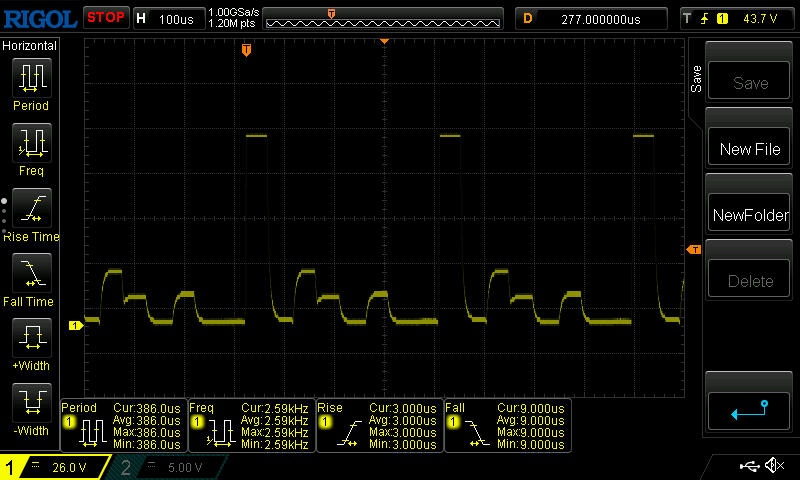
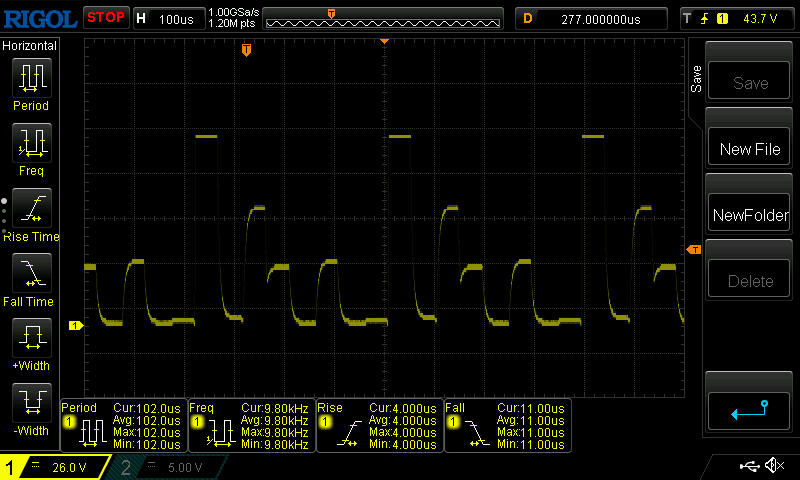
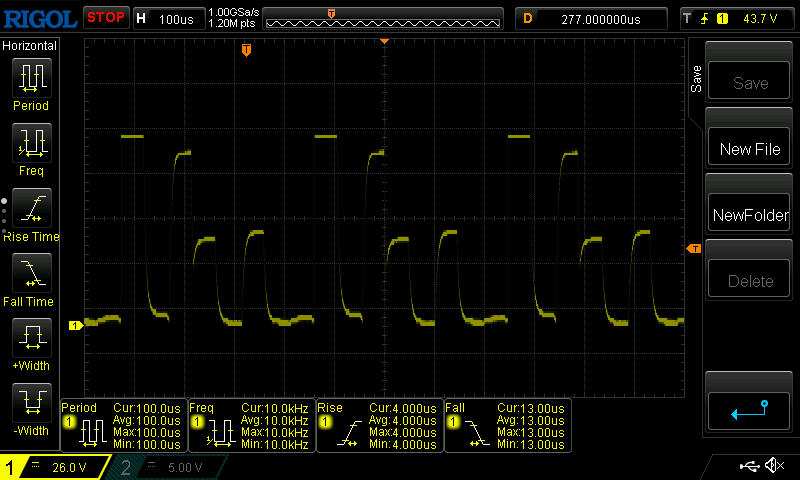
Migotanie ekranu / PWM (modulacja szerokości impulsu)
| Wykryto migotanie ekranu/wykryto PWM | 2509 Hz | 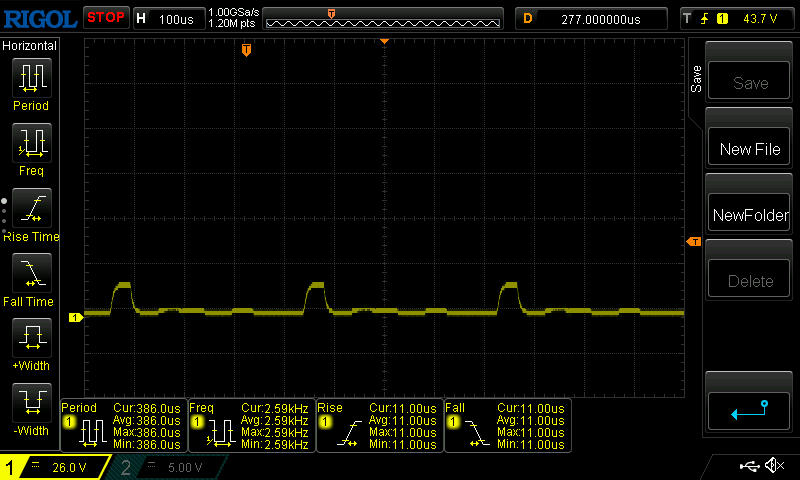 | |
Podświetlenie wyświetlacza miga z częstotliwością 2509 Hz (najgorszy przypadek, np. przy użyciu PWM) . Częstotliwość 2509 Hz jest dość wysoka, więc większość użytkowników wrażliwych na PWM nie powinna zauważyć żadnego migotania. Dla porównania: 52 % wszystkich testowanych urządzeń nie używa PWM do przyciemniania wyświetlacza. Jeśli wykryto PWM, zmierzono średnio 7781 (minimum: 5 - maksimum: 343500) Hz. | |||
PWM służy do sterowania jasnością wyświetlacza. Przy minimalnej jasności częstotliwość jest najniższa i wynosi około 2,5 kHz, ale nadal jest wystarczająco wysoka, aby nie powodować problemów u osób wrażliwych.
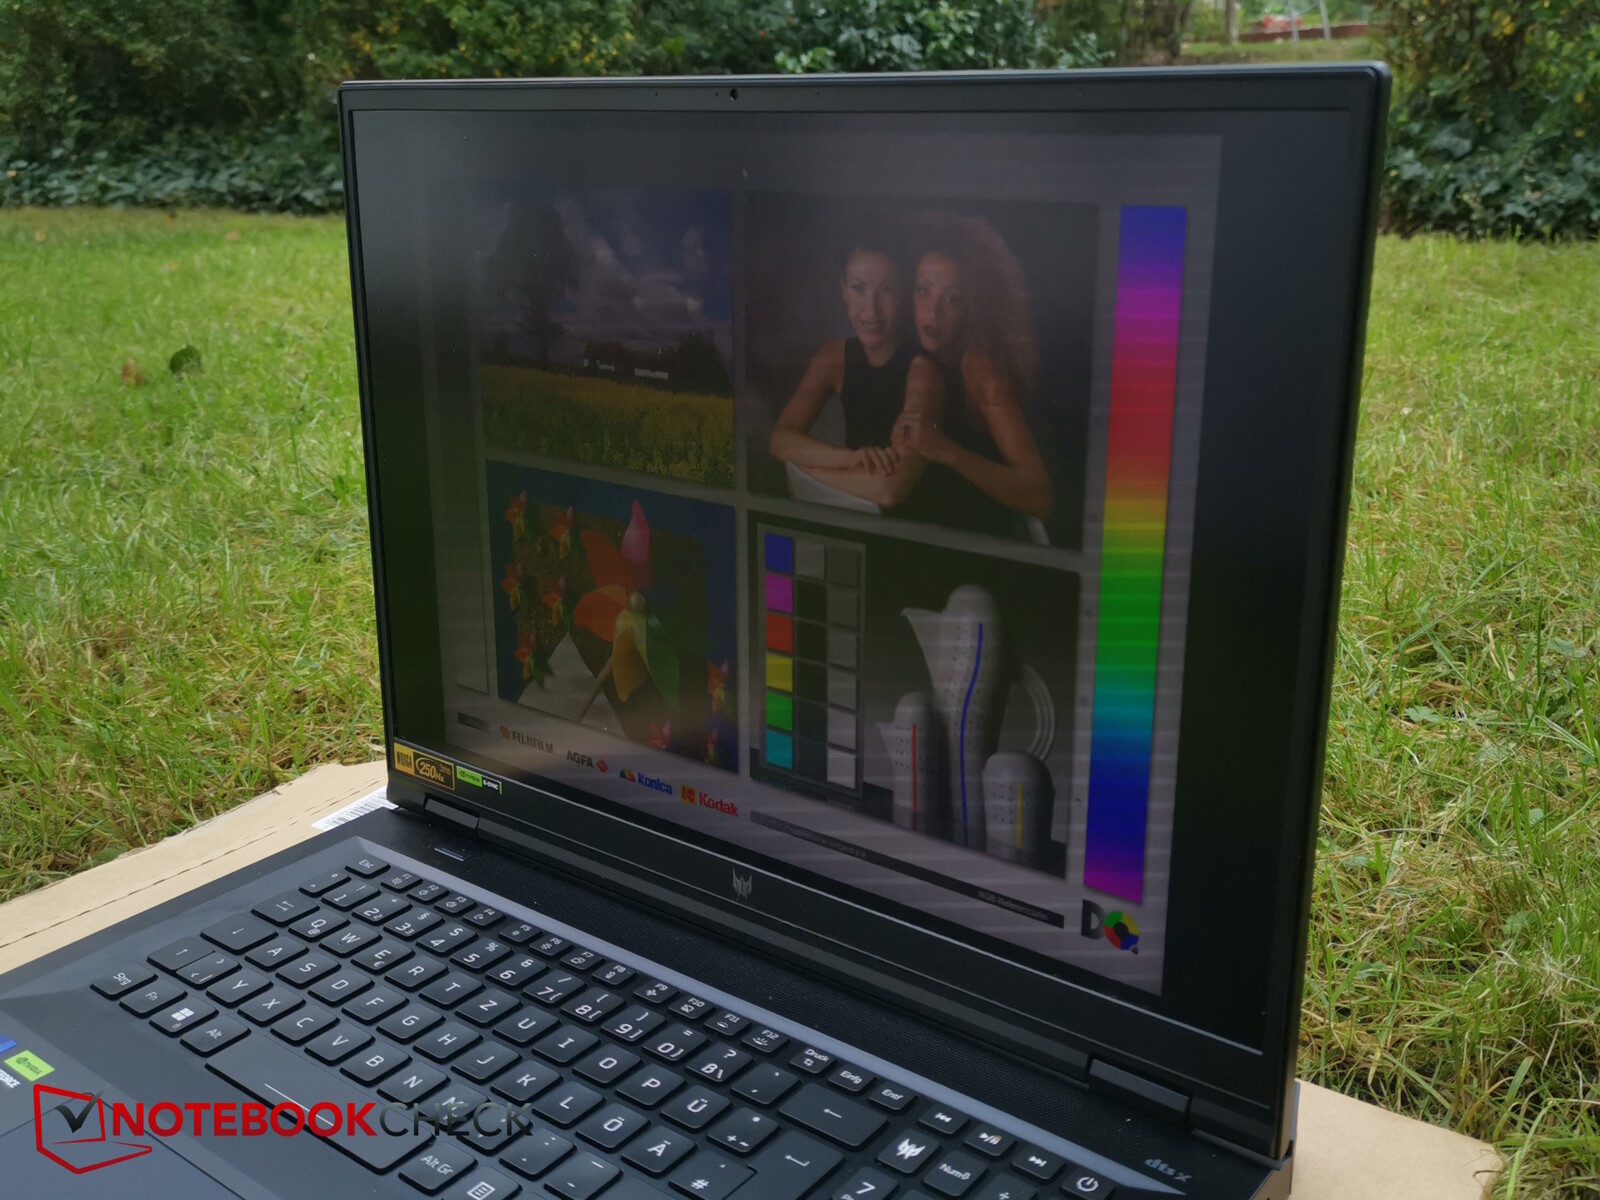
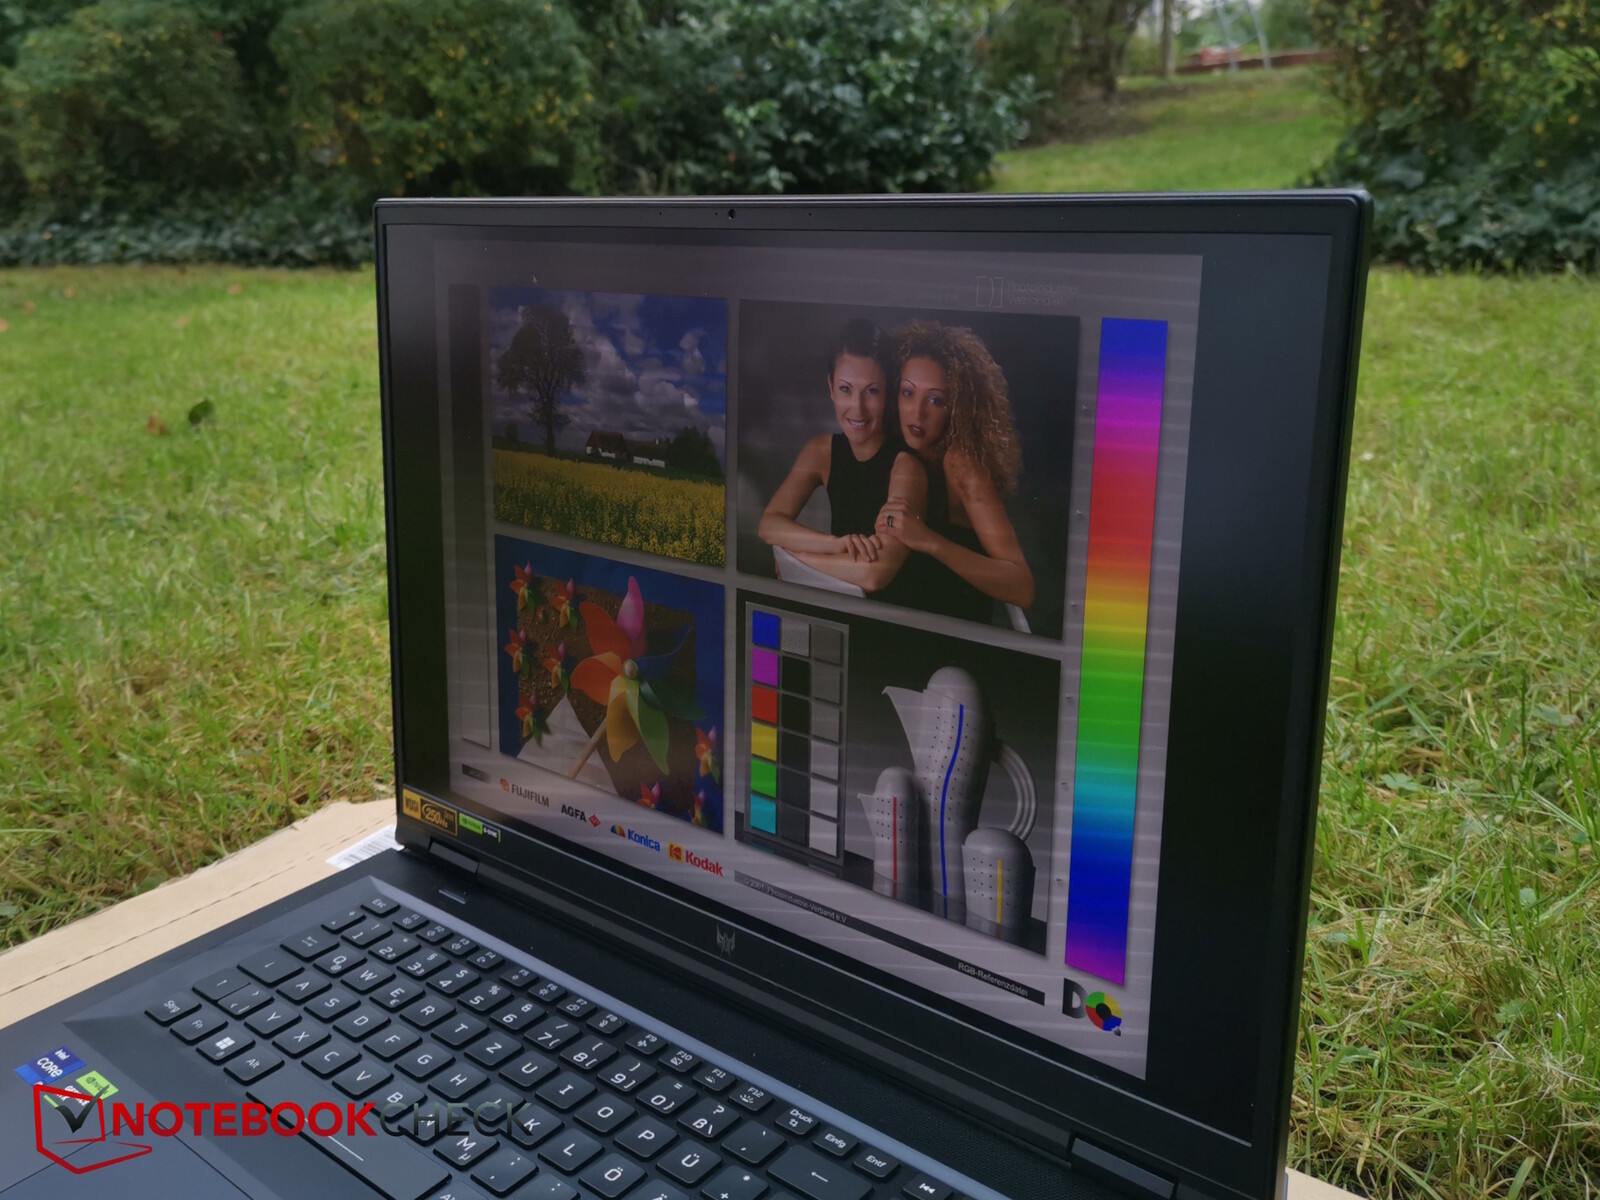
Na zewnątrz warto ustawić ekran na HDR, aby był jeszcze jaśniejszy. W cieniu zawartość jest nadal bardzo dobrze widoczna.

Wydajność - procesor HX i RTX 4080
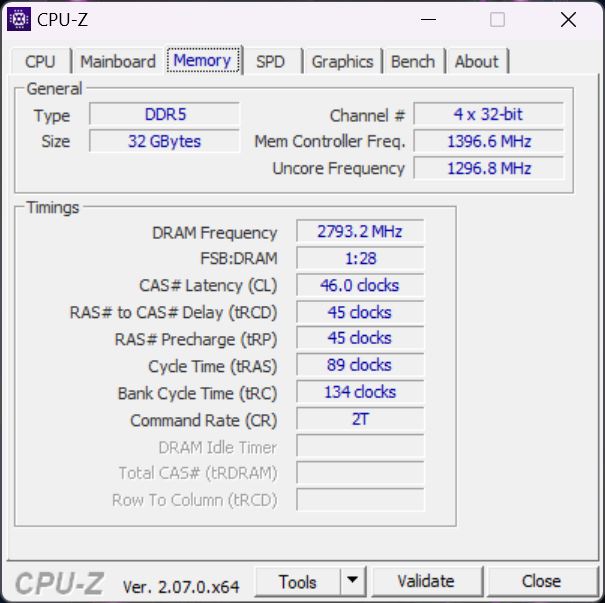
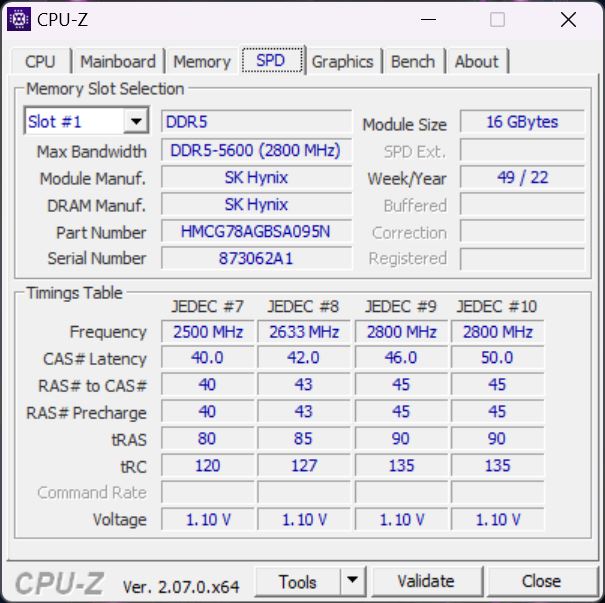
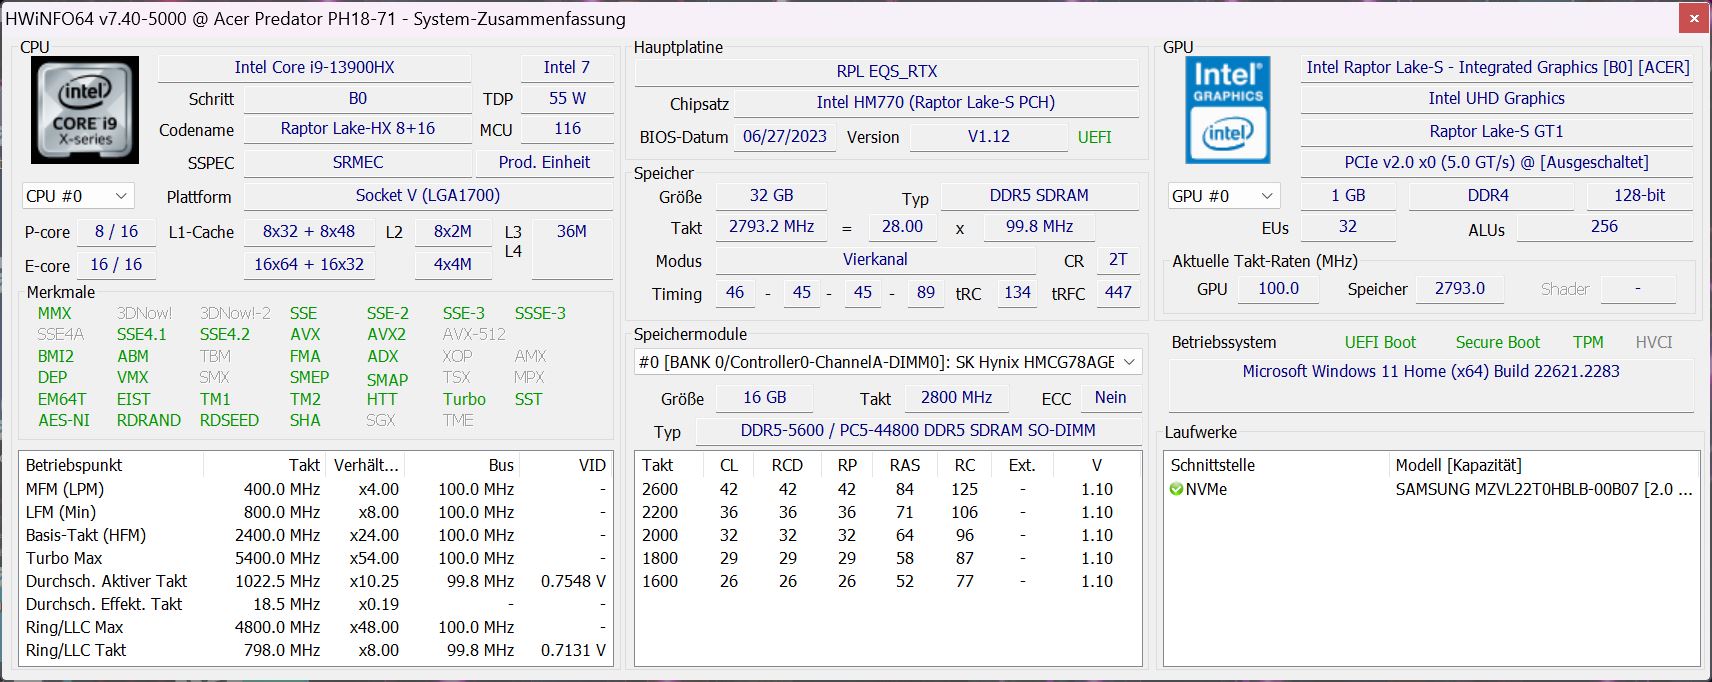
Wyposażony w procesor Intel Core i9-13900HX i kartę graficzną GeForce RTX 4080 Laptop GPUoraz 32 GB pamięci RAM i 18-calowy wyświetlacz MiniLED, otrzymujemy niezwykle wydajny zamiennik komputera stacjonarnego i high-endowego gracza, który powinien płynnie renderować wszystkie obecne gry, nawet w natywnej rozdzielczości WQXGA.
Dzięki dobremu wyświetlaczowi laptop może również służyć jako stacja robocza dla osób kreatywnych.
Warunki testowania
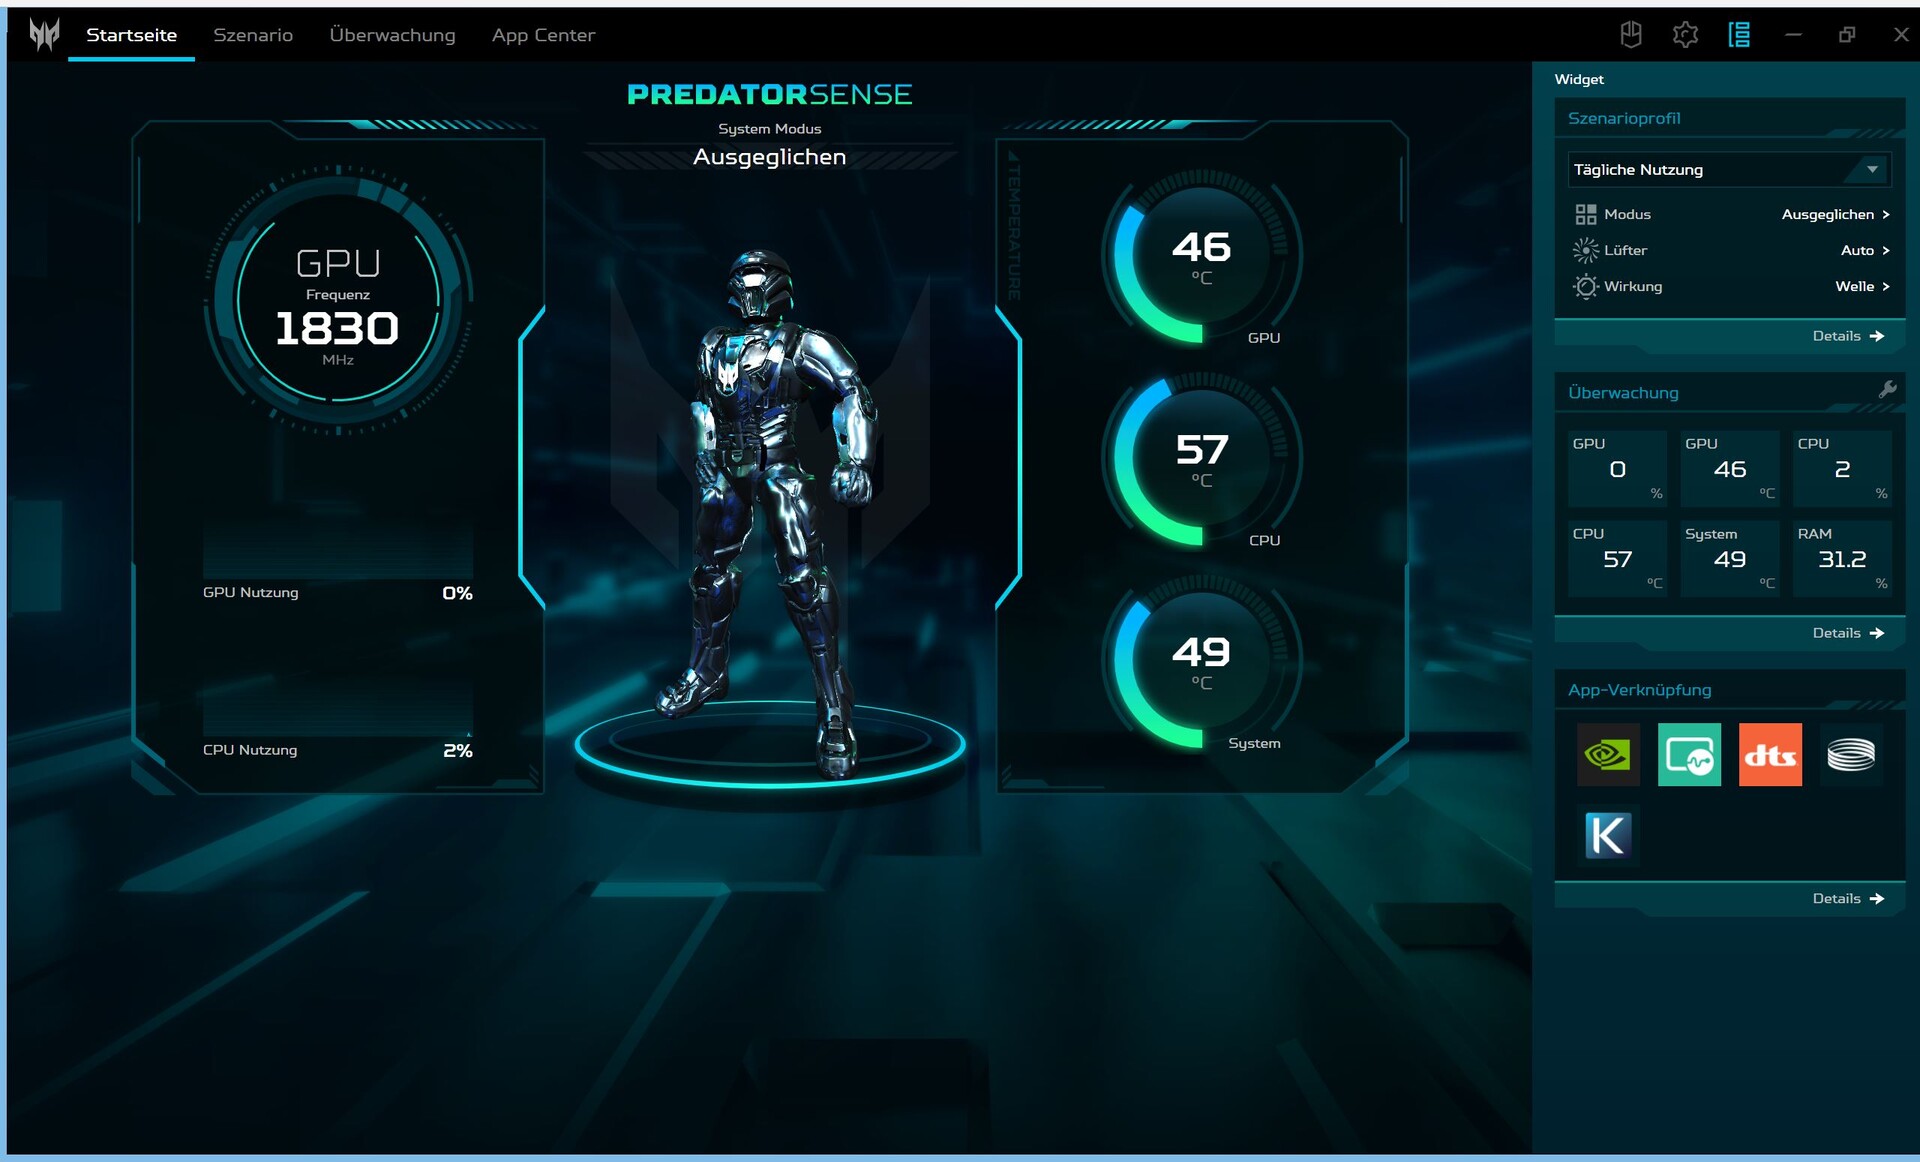
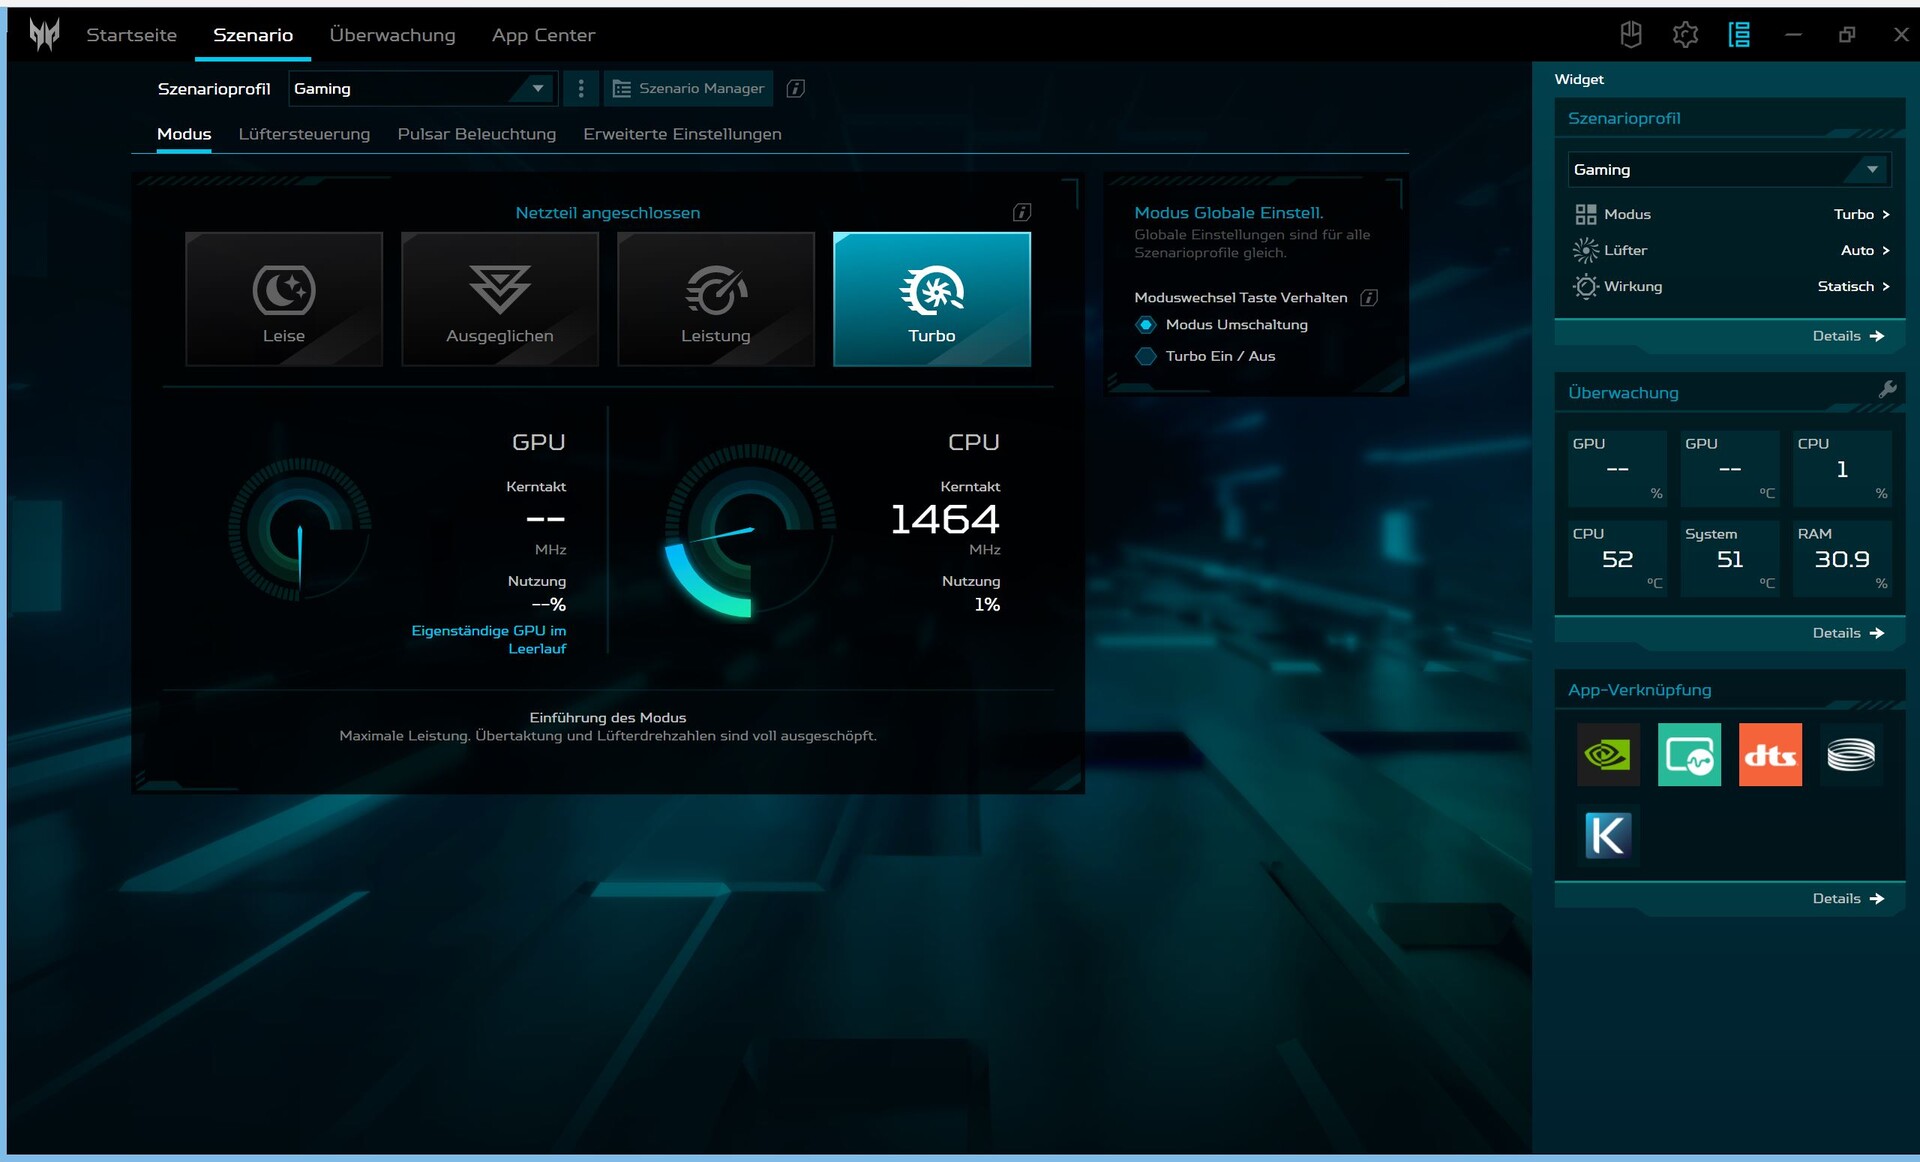
Acer instaluje w swoim gamingowym laptopie między innymi oprogramowanie Predator Sense. Można w nim dostosować cztery tryby wydajności(Eco, Balanced, Performance, Turbo), a także inne opcje (np. podświetlenie klawiatury). Oprogramowanie jest dość przejrzyste, ale nie oferuje tak wielu (ręcznych) ustawień jak konkurencyjne urządzenia. Przykładowo, brakuje nam opcji przełączania GPU, a także ustawień do ręcznego dostosowywania parametrów wydajności.
Niestety, Acer instaluje również inne oprogramowanie, takie jak McAfee lub Acer Care, które dotyczy bardziej wsparcia. Ponadto otrzymaliśmy od firmy Acer niezamówione reklamy. Raz nawet otrzymaliśmy niechcianą prośbę o zainstalowanie przeglądarki Opera. Takie wymuszone reklamy za pośrednictwem obowiązkowego oprogramowania producenta są naprawdę uciążliwe i niestety stają się coraz częstsze, na przykład przez Lenovo w LOQ 16kliknięcie centrum gier "Planet9" w Sense wyzwala żądanie pliku cookie, które zawiera irytujące, różne przyciski "uzasadnionego zainteresowania", które wszystkie muszą być indywidualnie odznaczone, jeśli użytkownicy chcą z nich zrezygnować.
Używaliśmy głównie trybu Turbo , aby uzyskać najlepsze wyniki w testach porównawczych, ale podajemy również informacje o innych trybach.

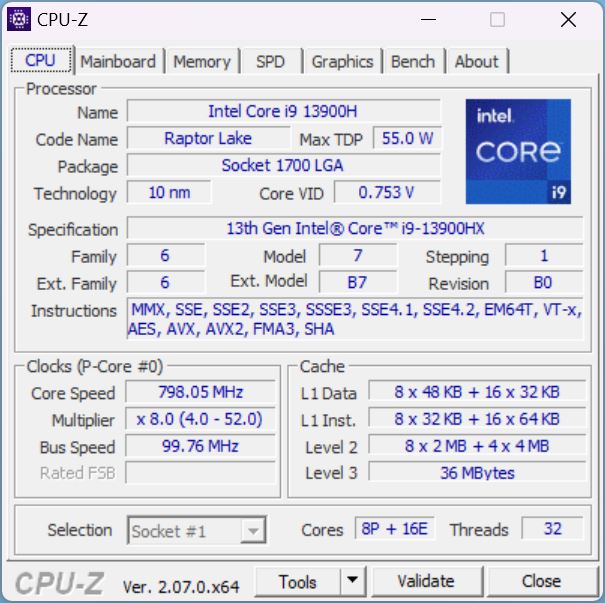
Procesor
Intel Core i9-13900HXto prawdziwie high-endowy procesor z serii Raptor-Lake. Może on obsługiwać 32 wątki z 8 rdzeniami P (w tym hyperthreading) i 16 rdzeniami E. Jego rdzenie mają bazowe taktowanie 1,6 (rdzenie E) i 2,2 GHz (rdzenie P) i osiągają jednordzeniowe turbo 3,9 - 5,4 GHz.
W pętli Cinebench R15 (pętla CB15) Helios zapewnia wysoką i przede wszystkim stałą wydajność, która jest jednak minimalnie lepsza odMSI GE78HX i Alienware m18 R1 z nieco mocniejszym procesorem (i9-13950HX i i9-13980HXhP Omen z tym samym procesorem z łatwością przewyższa Heliosa, podobnie jak konkurencyjne urządzenia z procesorami H zamiast HX.
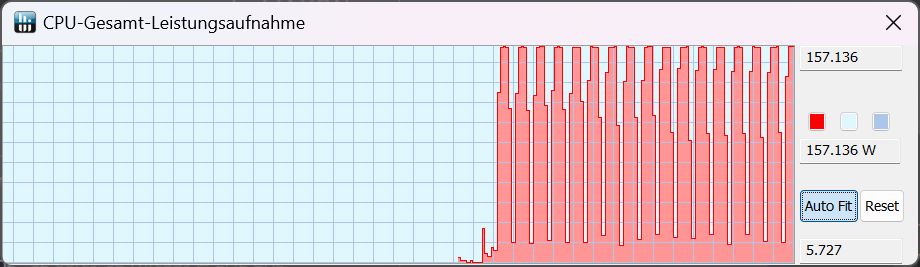
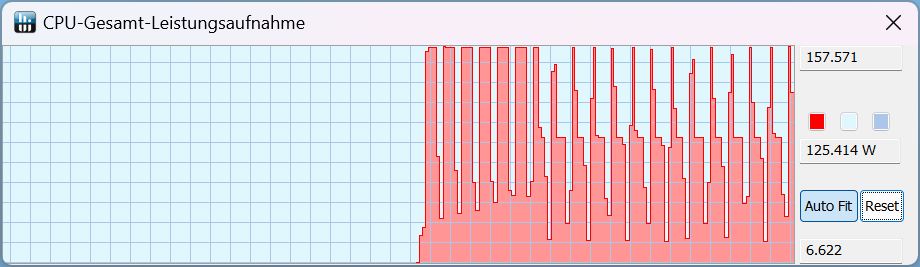
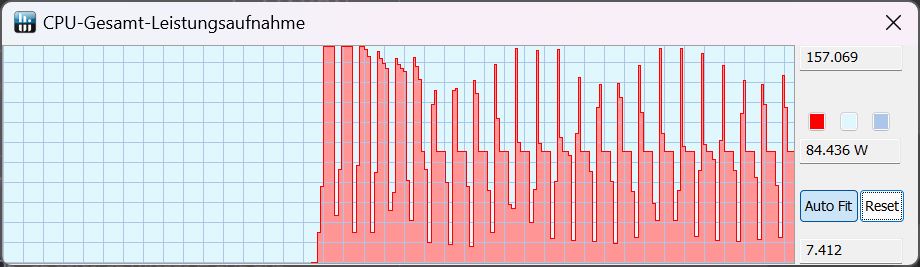
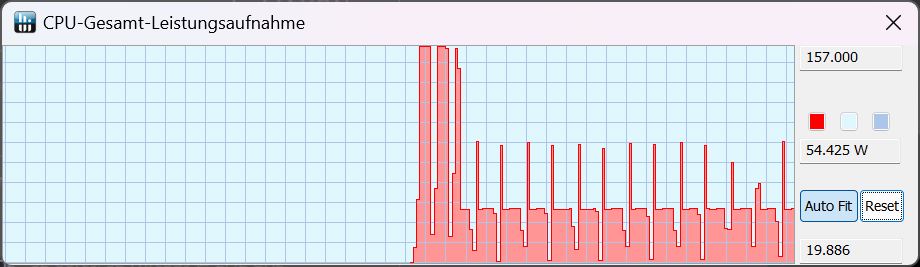
W poniższej tabeli wymieniliśmy wszystkie wartości TDP osiągnięte dla każdego trybu wydajności podczas pętli CB15. W trybie bateryjnym nadal mają Państwo wybór pomiędzy trybami Balanced i Eco . W obu trybach, TDP nadal wynosi 25 W, a CB15 uzyskuje około 1300 punktów, co oznacza spadek o ponad 70%! Tak więc nie ma rzeczywistej różnicy w wydajności między tymi dwoma trybami.
| TDP/Tryb wydajności | Turbo | Wydajność | Zrównoważony | Cichy | Zrównoważony na baterii | Cichy na baterii |
|---|---|---|---|---|---|---|
| Początek CB15 | 157 | 157 | 157 | 157 | 25 | 25 |
| Późniejsza historia CB15 | 157 | 125 | 85 | 25 | 55 | 25 |
Cinebench R15 Multi Sustained Load
Cinebench R23: Multi Core | Single Core
Cinebench R20: CPU (Multi Core) | CPU (Single Core)
Cinebench R15: CPU Multi 64Bit | CPU Single 64Bit
Blender: v2.79 BMW27 CPU
7-Zip 18.03: 7z b 4 | 7z b 4 -mmt1
Geekbench 5.5: Multi-Core | Single-Core
HWBOT x265 Benchmark v2.2: 4k Preset
LibreOffice : 20 Documents To PDF
R Benchmark 2.5: Overall mean
| CPU Performance rating | |
| MSI GE78HX 13VH-070US | |
| Alienware m18 R1 | |
| Acer Predator Helios 18 N23Q2 | |
| Razer Blade 18 RTX 4070 | |
| Przeciętny Intel Core i9-13900HX | |
| HP Omen 17-ck2097ng | |
| Średnia w klasie Gaming | |
| Asus ROG Strix G18 G814JI | |
| Cinebench R23 / Multi Core | |
| MSI GE78HX 13VH-070US | |
| Alienware m18 R1 | |
| Acer Predator Helios 18 N23Q2 | |
| Razer Blade 18 RTX 4070 | |
| Przeciętny Intel Core i9-13900HX (24270 - 32623, n=23) | |
| HP Omen 17-ck2097ng | |
| Średnia w klasie Gaming (10488 - 40970, n=110, ostatnie 2 lata) | |
| Asus ROG Strix G18 G814JI | |
| Cinebench R23 / Single Core | |
| MSI GE78HX 13VH-070US | |
| Alienware m18 R1 | |
| HP Omen 17-ck2097ng | |
| Acer Predator Helios 18 N23Q2 | |
| Razer Blade 18 RTX 4070 | |
| Przeciętny Intel Core i9-13900HX (1867 - 2105, n=20) | |
| Średnia w klasie Gaming (1166 - 2356, n=110, ostatnie 2 lata) | |
| Asus ROG Strix G18 G814JI | |
| Cinebench R20 / CPU (Multi Core) | |
| MSI GE78HX 13VH-070US | |
| Alienware m18 R1 | |
| Acer Predator Helios 18 N23Q2 | |
| Razer Blade 18 RTX 4070 | |
| Przeciętny Intel Core i9-13900HX (9152 - 12541, n=21) | |
| HP Omen 17-ck2097ng | |
| Średnia w klasie Gaming (4029 - 16108, n=109, ostatnie 2 lata) | |
| Asus ROG Strix G18 G814JI | |
| Cinebench R20 / CPU (Single Core) | |
| Alienware m18 R1 | |
| HP Omen 17-ck2097ng | |
| Acer Predator Helios 18 N23Q2 | |
| MSI GE78HX 13VH-070US | |
| Razer Blade 18 RTX 4070 | |
| Przeciętny Intel Core i9-13900HX (722 - 810, n=21) | |
| Średnia w klasie Gaming (442 - 895, n=109, ostatnie 2 lata) | |
| Asus ROG Strix G18 G814JI | |
| Cinebench R15 / CPU Multi 64Bit | |
| MSI GE78HX 13VH-070US | |
| Alienware m18 R1 | |
| Acer Predator Helios 18 N23Q2 | |
| Przeciętny Intel Core i9-13900HX (3913 - 4970, n=22) | |
| Razer Blade 18 RTX 4070 | |
| HP Omen 17-ck2097ng | |
| Średnia w klasie Gaming (1578 - 6271, n=109, ostatnie 2 lata) | |
| Asus ROG Strix G18 G814JI | |
| Cinebench R15 / CPU Single 64Bit | |
| MSI GE78HX 13VH-070US | |
| Alienware m18 R1 | |
| HP Omen 17-ck2097ng | |
| Razer Blade 18 RTX 4070 | |
| Średnia w klasie Gaming (188.8 - 343, n=109, ostatnie 2 lata) | |
| Acer Predator Helios 18 N23Q2 | |
| Przeciętny Intel Core i9-13900HX (247 - 304, n=22) | |
| Asus ROG Strix G18 G814JI | |
| Blender / v2.79 BMW27 CPU | |
| Asus ROG Strix G18 G814JI | |
| HP Omen 17-ck2097ng | |
| Średnia w klasie Gaming (80 - 330, n=107, ostatnie 2 lata) | |
| Przeciętny Intel Core i9-13900HX (101 - 153, n=22) | |
| Razer Blade 18 RTX 4070 | |
| Acer Predator Helios 18 N23Q2 | |
| MSI GE78HX 13VH-070US | |
| Alienware m18 R1 | |
| 7-Zip 18.03 / 7z b 4 | |
| Alienware m18 R1 | |
| MSI GE78HX 13VH-070US | |
| Acer Predator Helios 18 N23Q2 | |
| Razer Blade 18 RTX 4070 | |
| Przeciętny Intel Core i9-13900HX (90675 - 127283, n=21) | |
| HP Omen 17-ck2097ng | |
| Średnia w klasie Gaming (33491 - 148086, n=108, ostatnie 2 lata) | |
| Asus ROG Strix G18 G814JI | |
| 7-Zip 18.03 / 7z b 4 -mmt1 | |
| MSI GE78HX 13VH-070US | |
| Acer Predator Helios 18 N23Q2 | |
| HP Omen 17-ck2097ng | |
| Alienware m18 R1 | |
| Razer Blade 18 RTX 4070 | |
| Przeciętny Intel Core i9-13900HX (6340 - 7177, n=21) | |
| Średnia w klasie Gaming (4199 - 7436, n=108, ostatnie 2 lata) | |
| Asus ROG Strix G18 G814JI | |
| Geekbench 5.5 / Multi-Core | |
| Alienware m18 R1 | |
| MSI GE78HX 13VH-070US | |
| Acer Predator Helios 18 N23Q2 | |
| HP Omen 17-ck2097ng | |
| Razer Blade 18 RTX 4070 | |
| Przeciętny Intel Core i9-13900HX (17614 - 21075, n=22) | |
| Średnia w klasie Gaming (6460 - 27010, n=108, ostatnie 2 lata) | |
| Asus ROG Strix G18 G814JI | |
| Geekbench 5.5 / Single-Core | |
| MSI GE78HX 13VH-070US | |
| HP Omen 17-ck2097ng | |
| Alienware m18 R1 | |
| Acer Predator Helios 18 N23Q2 | |
| Średnia w klasie Gaming (986 - 2474, n=108, ostatnie 2 lata) | |
| Razer Blade 18 RTX 4070 | |
| Przeciętny Intel Core i9-13900HX (1345 - 2093, n=22) | |
| Asus ROG Strix G18 G814JI | |
| HWBOT x265 Benchmark v2.2 / 4k Preset | |
| MSI GE78HX 13VH-070US | |
| Alienware m18 R1 | |
| Razer Blade 18 RTX 4070 | |
| Acer Predator Helios 18 N23Q2 | |
| Przeciętny Intel Core i9-13900HX (23.5 - 34.4, n=22) | |
| Średnia w klasie Gaming (11.5 - 44.3, n=108, ostatnie 2 lata) | |
| HP Omen 17-ck2097ng | |
| Asus ROG Strix G18 G814JI | |
| LibreOffice / 20 Documents To PDF | |
| Asus ROG Strix G18 G814JI | |
| Acer Predator Helios 18 N23Q2 | |
| Średnia w klasie Gaming (19 - 88.8, n=108, ostatnie 2 lata) | |
| MSI GE78HX 13VH-070US | |
| Alienware m18 R1 | |
| HP Omen 17-ck2097ng | |
| Razer Blade 18 RTX 4070 | |
| Przeciętny Intel Core i9-13900HX (32.8 - 51.1, n=21) | |
| R Benchmark 2.5 / Overall mean | |
| Asus ROG Strix G18 G814JI | |
| Średnia w klasie Gaming (0.3439 - 0.759, n=109, ostatnie 2 lata) | |
| Przeciętny Intel Core i9-13900HX (0.375 - 0.4564, n=22) | |
| Acer Predator Helios 18 N23Q2 | |
| Razer Blade 18 RTX 4070 | |
| Alienware m18 R1 | |
| HP Omen 17-ck2097ng | |
| MSI GE78HX 13VH-070US | |
* ... im mniej tym lepiej
AIDA64: FP32 Ray-Trace | FPU Julia | CPU SHA3 | CPU Queen | FPU SinJulia | FPU Mandel | CPU AES | CPU ZLib | FP64 Ray-Trace | CPU PhotoWorxx
| Performance rating | |
| Alienware m18 R1 | |
| Acer Predator Helios 18 N23Q2 | |
| MSI GE78HX 13VH-070US | |
| Razer Blade 18 RTX 4070 | |
| Średnia w klasie Gaming | |
| Przeciętny Intel Core i9-13900HX | |
| HP Omen 17-ck2097ng | |
| Asus ROG Strix G18 G814JI | |
| AIDA64 / FP32 Ray-Trace | |
| Średnia w klasie Gaming (10227 - 85542, n=107, ostatnie 2 lata) | |
| Alienware m18 R1 | |
| MSI GE78HX 13VH-070US | |
| Acer Predator Helios 18 N23Q2 | |
| Razer Blade 18 RTX 4070 | |
| Przeciętny Intel Core i9-13900HX (17589 - 27615, n=22) | |
| Asus ROG Strix G18 G814JI | |
| HP Omen 17-ck2097ng | |
| AIDA64 / FPU Julia | |
| Alienware m18 R1 | |
| MSI GE78HX 13VH-070US | |
| Acer Predator Helios 18 N23Q2 | |
| Średnia w klasie Gaming (51376 - 238426, n=107, ostatnie 2 lata) | |
| Razer Blade 18 RTX 4070 | |
| Przeciętny Intel Core i9-13900HX (88686 - 137015, n=22) | |
| Asus ROG Strix G18 G814JI | |
| HP Omen 17-ck2097ng | |
| AIDA64 / CPU SHA3 | |
| Alienware m18 R1 | |
| MSI GE78HX 13VH-070US | |
| Acer Predator Helios 18 N23Q2 | |
| Razer Blade 18 RTX 4070 | |
| Średnia w klasie Gaming (2180 - 9817, n=107, ostatnie 2 lata) | |
| Przeciętny Intel Core i9-13900HX (4362 - 7029, n=22) | |
| Asus ROG Strix G18 G814JI | |
| HP Omen 17-ck2097ng | |
| AIDA64 / CPU Queen | |
| Alienware m18 R1 | |
| MSI GE78HX 13VH-070US | |
| Razer Blade 18 RTX 4070 | |
| Acer Predator Helios 18 N23Q2 | |
| HP Omen 17-ck2097ng | |
| Przeciętny Intel Core i9-13900HX (125644 - 141385, n=22) | |
| Średnia w klasie Gaming (49785 - 173351, n=98, ostatnie 2 lata) | |
| Asus ROG Strix G18 G814JI | |
| AIDA64 / FPU SinJulia | |
| MSI GE78HX 13VH-070US | |
| Alienware m18 R1 | |
| Razer Blade 18 RTX 4070 | |
| Acer Predator Helios 18 N23Q2 | |
| Przeciętny Intel Core i9-13900HX (12334 - 17179, n=22) | |
| Średnia w klasie Gaming (4424 - 33636, n=107, ostatnie 2 lata) | |
| HP Omen 17-ck2097ng | |
| Asus ROG Strix G18 G814JI | |
| AIDA64 / FPU Mandel | |
| Alienware m18 R1 | |
| Średnia w klasie Gaming (25115 - 128721, n=107, ostatnie 2 lata) | |
| MSI GE78HX 13VH-070US | |
| Acer Predator Helios 18 N23Q2 | |
| Razer Blade 18 RTX 4070 | |
| Przeciętny Intel Core i9-13900HX (43850 - 69202, n=22) | |
| Asus ROG Strix G18 G814JI | |
| HP Omen 17-ck2097ng | |
| AIDA64 / CPU AES | |
| Acer Predator Helios 18 N23Q2 | |
| Przeciętny Intel Core i9-13900HX (89413 - 237881, n=22) | |
| Alienware m18 R1 | |
| MSI GE78HX 13VH-070US | |
| Razer Blade 18 RTX 4070 | |
| Średnia w klasie Gaming (39258 - 247074, n=107, ostatnie 2 lata) | |
| HP Omen 17-ck2097ng | |
| Asus ROG Strix G18 G814JI | |
| AIDA64 / CPU ZLib | |
| MSI GE78HX 13VH-070US | |
| Alienware m18 R1 | |
| Acer Predator Helios 18 N23Q2 | |
| Razer Blade 18 RTX 4070 | |
| Przeciętny Intel Core i9-13900HX (1284 - 1958, n=22) | |
| Średnia w klasie Gaming (574 - 2531, n=107, ostatnie 2 lata) | |
| HP Omen 17-ck2097ng | |
| Asus ROG Strix G18 G814JI | |
| AIDA64 / FP64 Ray-Trace | |
| Średnia w klasie Gaming (5509 - 45446, n=107, ostatnie 2 lata) | |
| Alienware m18 R1 | |
| MSI GE78HX 13VH-070US | |
| Acer Predator Helios 18 N23Q2 | |
| Razer Blade 18 RTX 4070 | |
| Przeciętny Intel Core i9-13900HX (9481 - 15279, n=22) | |
| Asus ROG Strix G18 G814JI | |
| HP Omen 17-ck2097ng | |
| AIDA64 / CPU PhotoWorxx | |
| Alienware m18 R1 | |
| HP Omen 17-ck2097ng | |
| Acer Predator Helios 18 N23Q2 | |
| MSI GE78HX 13VH-070US | |
| Razer Blade 18 RTX 4070 | |
| Przeciętny Intel Core i9-13900HX (42994 - 51994, n=22) | |
| Średnia w klasie Gaming (12271 - 89891, n=107, ostatnie 2 lata) | |
| Asus ROG Strix G18 G814JI | |
Wydajność systemu
Podobnie jak w przypadku wydajności procesora, Helios tylko nieznacznie ustępujeMSI GE78HX i Alienware m18 R1.
Większość aplikacji subiektywnie działa płynnie. Jedynie przełączanie grafiki (Advanced Optimus) jest stałym problemem tego laptopa. Więcej o tym i kwestiach opóźnień w kolejnych sekcjach.
CrossMark: Overall | Productivity | Creativity | Responsiveness
| PCMark 10 / Score | |
| MSI GE78HX 13VH-070US | |
| Alienware m18 R1 | |
| Acer Predator Helios 18 N23Q2 | |
| Średnia w klasie Gaming (5828 - 11574, n=95, ostatnie 2 lata) | |
| Przeciętny Intel Core i9-13900HX, NVIDIA GeForce RTX 4080 Laptop GPU (7609 - 8549, n=3) | |
| Razer Blade 18 RTX 4070 | |
| HP Omen 17-ck2097ng | |
| Asus ROG Strix G18 G814JI | |
| PCMark 10 / Essentials | |
| HP Omen 17-ck2097ng | |
| Razer Blade 18 RTX 4070 | |
| Przeciętny Intel Core i9-13900HX, NVIDIA GeForce RTX 4080 Laptop GPU (10982 - 11824, n=3) | |
| MSI GE78HX 13VH-070US | |
| Alienware m18 R1 | |
| Acer Predator Helios 18 N23Q2 | |
| Średnia w klasie Gaming (8810 - 12600, n=99, ostatnie 2 lata) | |
| Asus ROG Strix G18 G814JI | |
| PCMark 10 / Productivity | |
| Średnia w klasie Gaming (6845 - 18766, n=97, ostatnie 2 lata) | |
| Acer Predator Helios 18 N23Q2 | |
| MSI GE78HX 13VH-070US | |
| Przeciętny Intel Core i9-13900HX, NVIDIA GeForce RTX 4080 Laptop GPU (9976 - 10788, n=3) | |
| Alienware m18 R1 | |
| HP Omen 17-ck2097ng | |
| Razer Blade 18 RTX 4070 | |
| Asus ROG Strix G18 G814JI | |
| PCMark 10 / Digital Content Creation | |
| Alienware m18 R1 | |
| MSI GE78HX 13VH-070US | |
| Acer Predator Helios 18 N23Q2 | |
| Średnia w klasie Gaming (7602 - 19657, n=97, ostatnie 2 lata) | |
| Przeciętny Intel Core i9-13900HX, NVIDIA GeForce RTX 4080 Laptop GPU (10135 - 14720, n=3) | |
| Razer Blade 18 RTX 4070 | |
| HP Omen 17-ck2097ng | |
| Asus ROG Strix G18 G814JI | |
| CrossMark / Overall | |
| Acer Predator Helios 18 N23Q2 | |
| Alienware m18 R1 | |
| Razer Blade 18 RTX 4070 | |
| Przeciętny Intel Core i9-13900HX, NVIDIA GeForce RTX 4080 Laptop GPU (1991 - 2194, n=2) | |
| HP Omen 17-ck2097ng | |
| Średnia w klasie Gaming (1366 - 2409, n=96, ostatnie 2 lata) | |
| MSI GE78HX 13VH-070US | |
| CrossMark / Productivity | |
| Acer Predator Helios 18 N23Q2 | |
| Alienware m18 R1 | |
| Razer Blade 18 RTX 4070 | |
| Przeciętny Intel Core i9-13900HX, NVIDIA GeForce RTX 4080 Laptop GPU (1828 - 2059, n=2) | |
| Średnia w klasie Gaming (1386 - 2254, n=96, ostatnie 2 lata) | |
| MSI GE78HX 13VH-070US | |
| HP Omen 17-ck2097ng | |
| CrossMark / Creativity | |
| Alienware m18 R1 | |
| Acer Predator Helios 18 N23Q2 | |
| Razer Blade 18 RTX 4070 | |
| Przeciętny Intel Core i9-13900HX, NVIDIA GeForce RTX 4080 Laptop GPU (2239 - 2411, n=2) | |
| HP Omen 17-ck2097ng | |
| Średnia w klasie Gaming (1343 - 2729, n=96, ostatnie 2 lata) | |
| MSI GE78HX 13VH-070US | |
| CrossMark / Responsiveness | |
| Acer Predator Helios 18 N23Q2 | |
| Alienware m18 R1 | |
| Przeciętny Intel Core i9-13900HX, NVIDIA GeForce RTX 4080 Laptop GPU (1808 - 1998, n=2) | |
| Razer Blade 18 RTX 4070 | |
| HP Omen 17-ck2097ng | |
| Średnia w klasie Gaming (1226 - 2334, n=96, ostatnie 2 lata) | |
| MSI GE78HX 13VH-070US | |
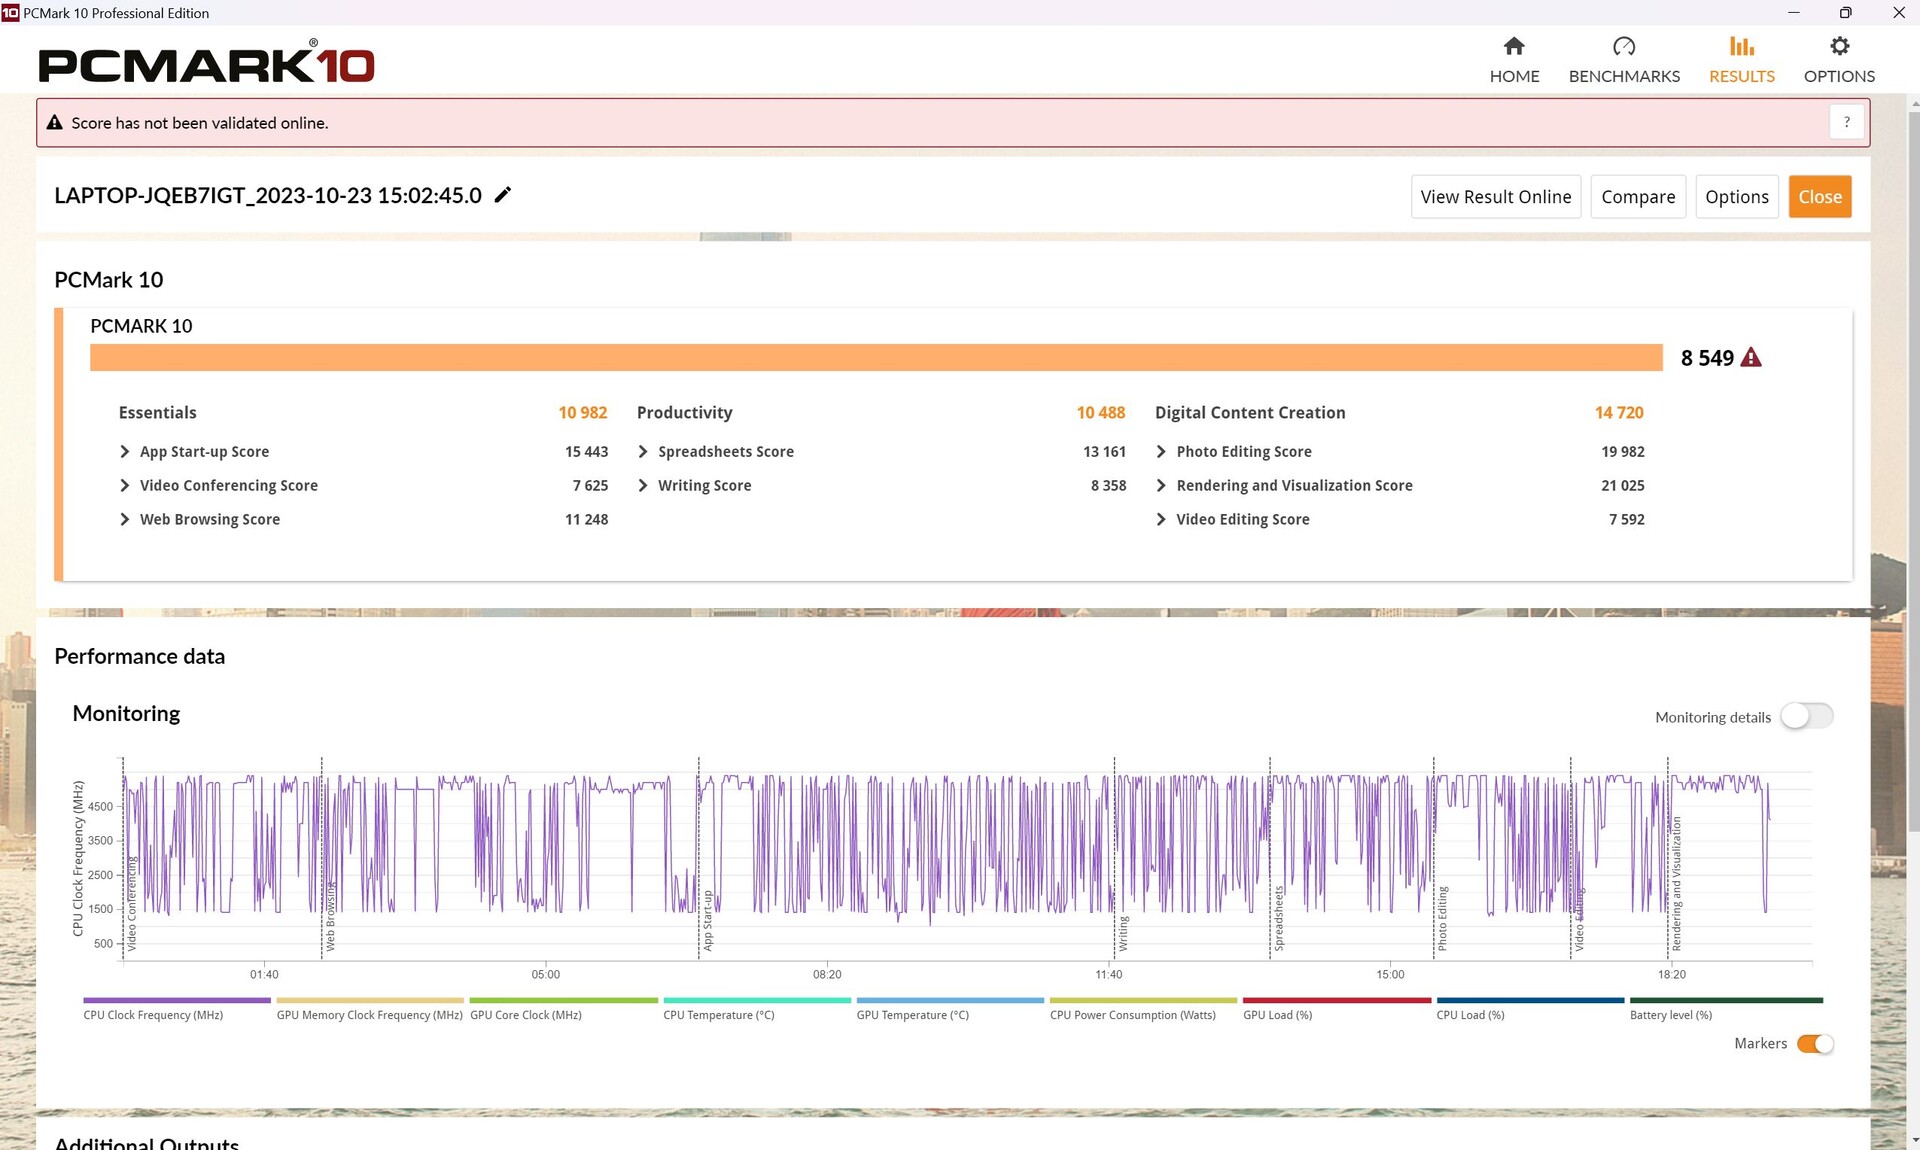
| PCMark 10 Score | 8549 pkt. | |
Pomoc | ||
| AIDA64 / Memory Copy | |
| Alienware m18 R1 | |
| Acer Predator Helios 18 N23Q2 | |
| HP Omen 17-ck2097ng | |
| MSI GE78HX 13VH-070US | |
| Razer Blade 18 RTX 4070 | |
| Przeciętny Intel Core i9-13900HX (67716 - 79193, n=22) | |
| Średnia w klasie Gaming (21750 - 129946, n=107, ostatnie 2 lata) | |
| Asus ROG Strix G18 G814JI | |
| AIDA64 / Memory Read | |
| Alienware m18 R1 | |
| Acer Predator Helios 18 N23Q2 | |
| HP Omen 17-ck2097ng | |
| Razer Blade 18 RTX 4070 | |
| MSI GE78HX 13VH-070US | |
| Przeciętny Intel Core i9-13900HX (73998 - 88462, n=22) | |
| Średnia w klasie Gaming (22956 - 118858, n=107, ostatnie 2 lata) | |
| Asus ROG Strix G18 G814JI | |
| AIDA64 / Memory Write | |
| Alienware m18 R1 | |
| HP Omen 17-ck2097ng | |
| MSI GE78HX 13VH-070US | |
| Średnia w klasie Gaming (22297 - 135096, n=107, ostatnie 2 lata) | |
| Razer Blade 18 RTX 4070 | |
| Acer Predator Helios 18 N23Q2 | |
| Przeciętny Intel Core i9-13900HX (65472 - 77045, n=22) | |
| Asus ROG Strix G18 G814JI | |
| AIDA64 / Memory Latency | |
| Średnia w klasie Gaming (75.3 - 259, n=107, ostatnie 2 lata) | |
| Przeciętny Intel Core i9-13900HX (75.3 - 91.1, n=22) | |
| HP Omen 17-ck2097ng | |
| Razer Blade 18 RTX 4070 | |
| MSI GE78HX 13VH-070US | |
| Asus ROG Strix G18 G814JI | |
| Acer Predator Helios 18 N23Q2 | |
| Alienware m18 R1 | |
* ... im mniej tym lepiej
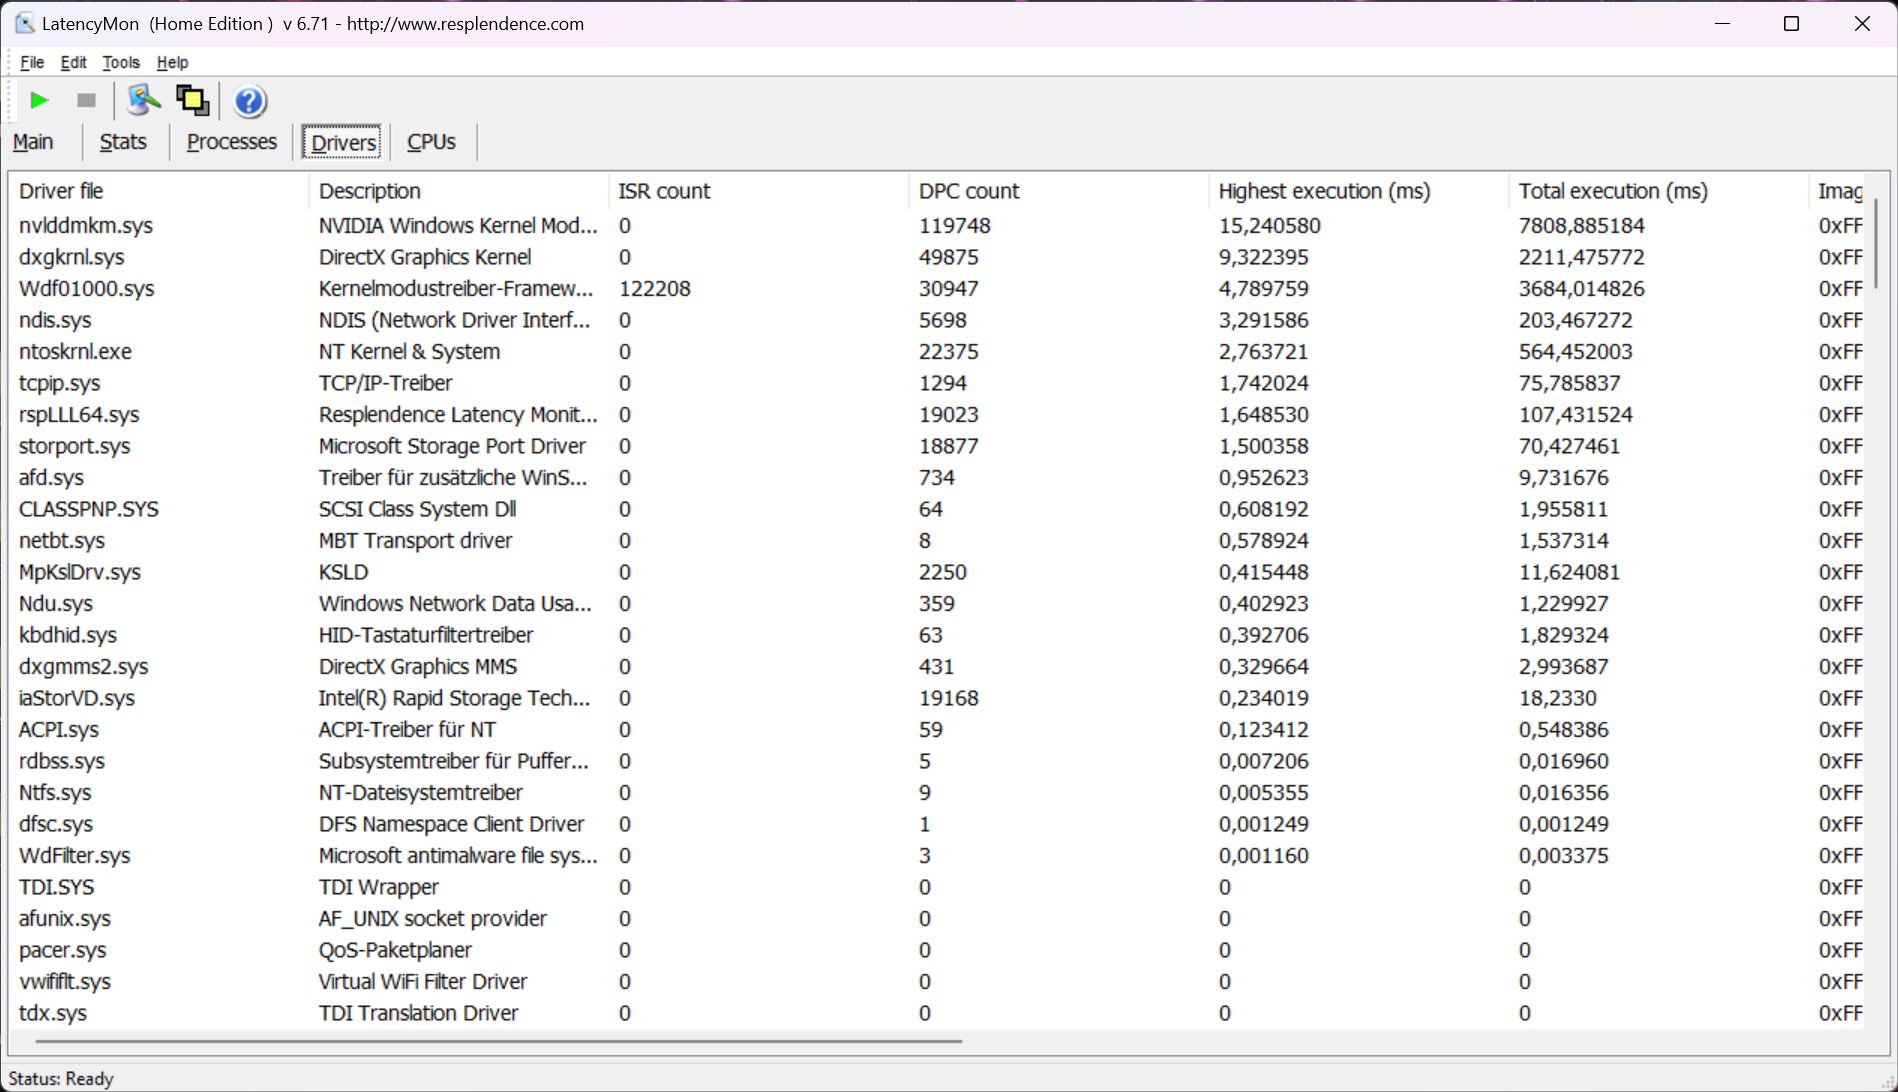
Opóźnienie DPC
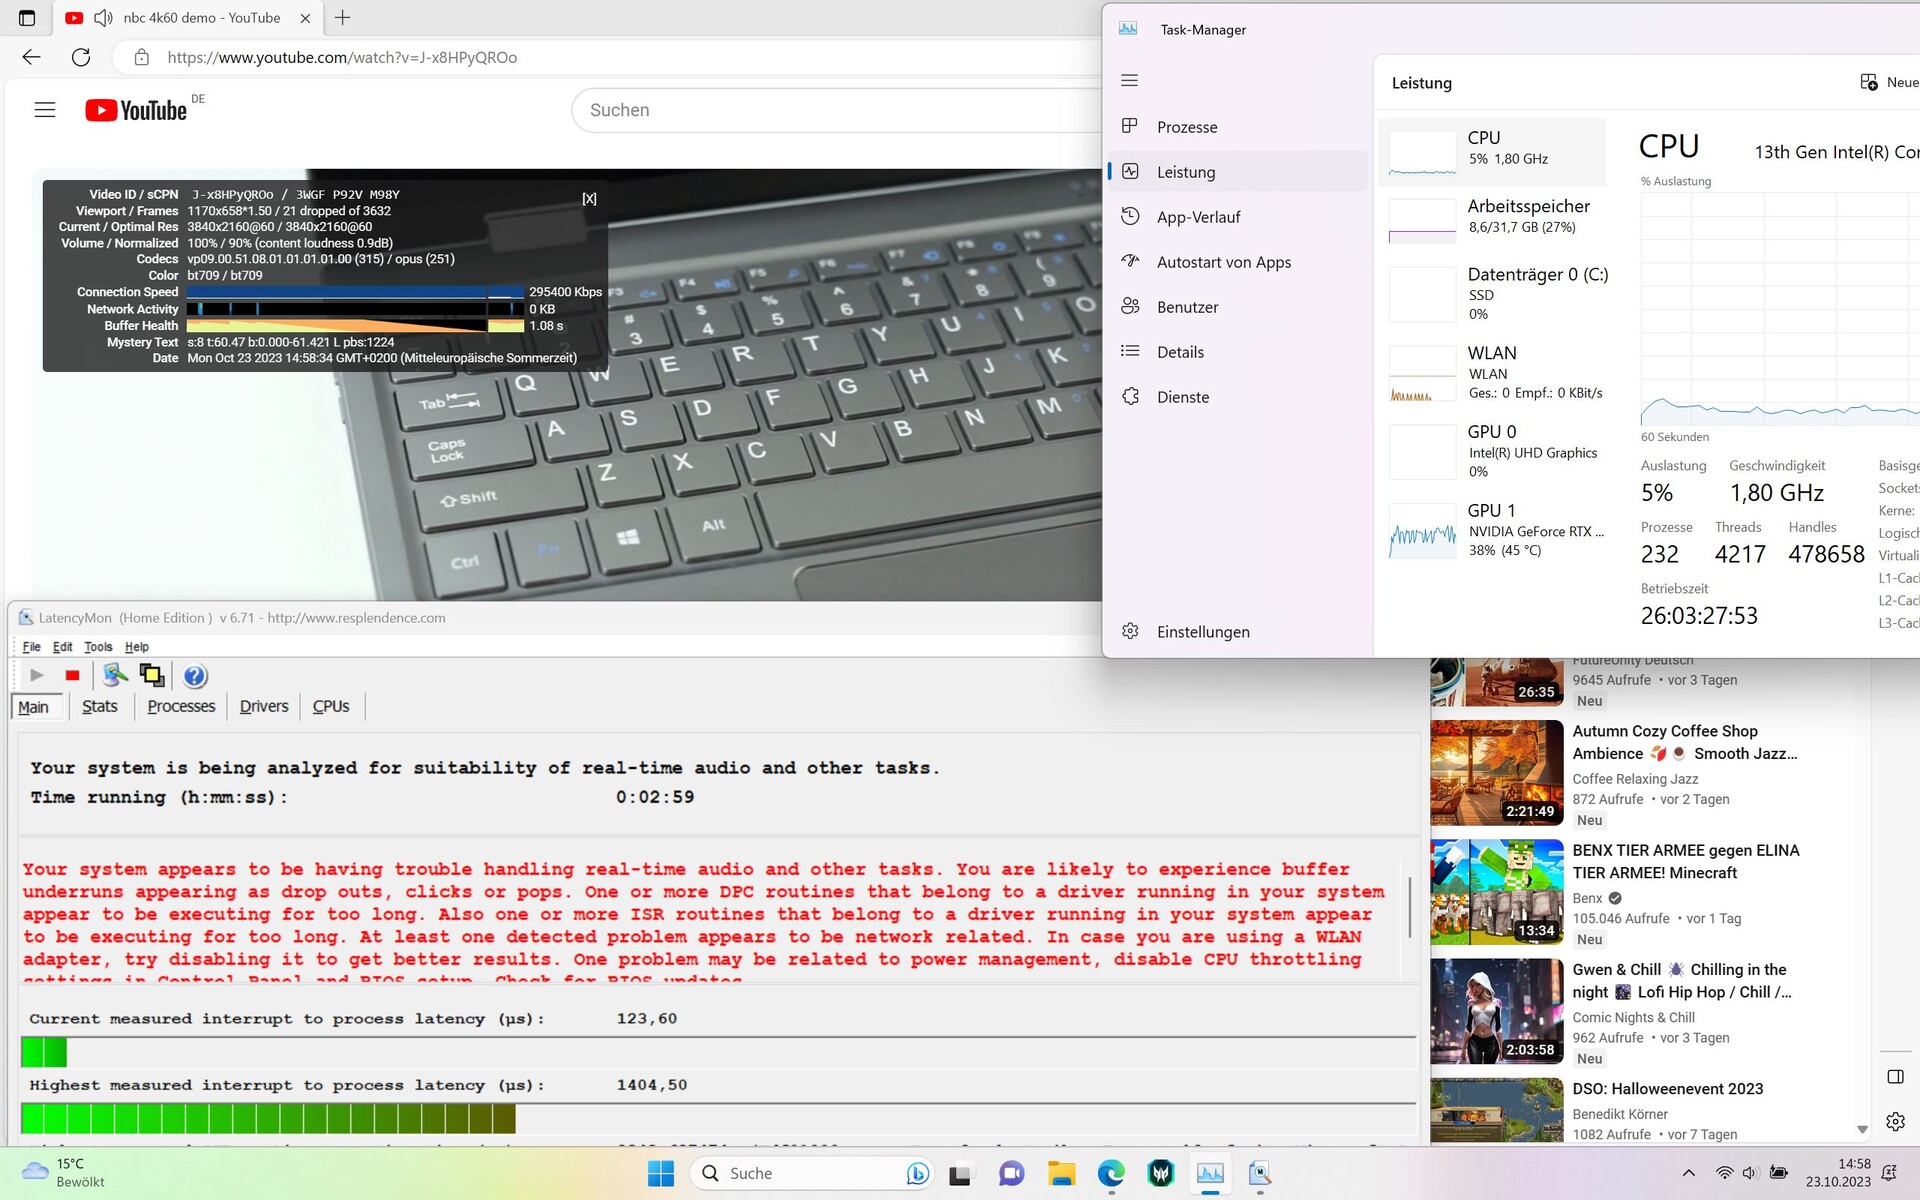
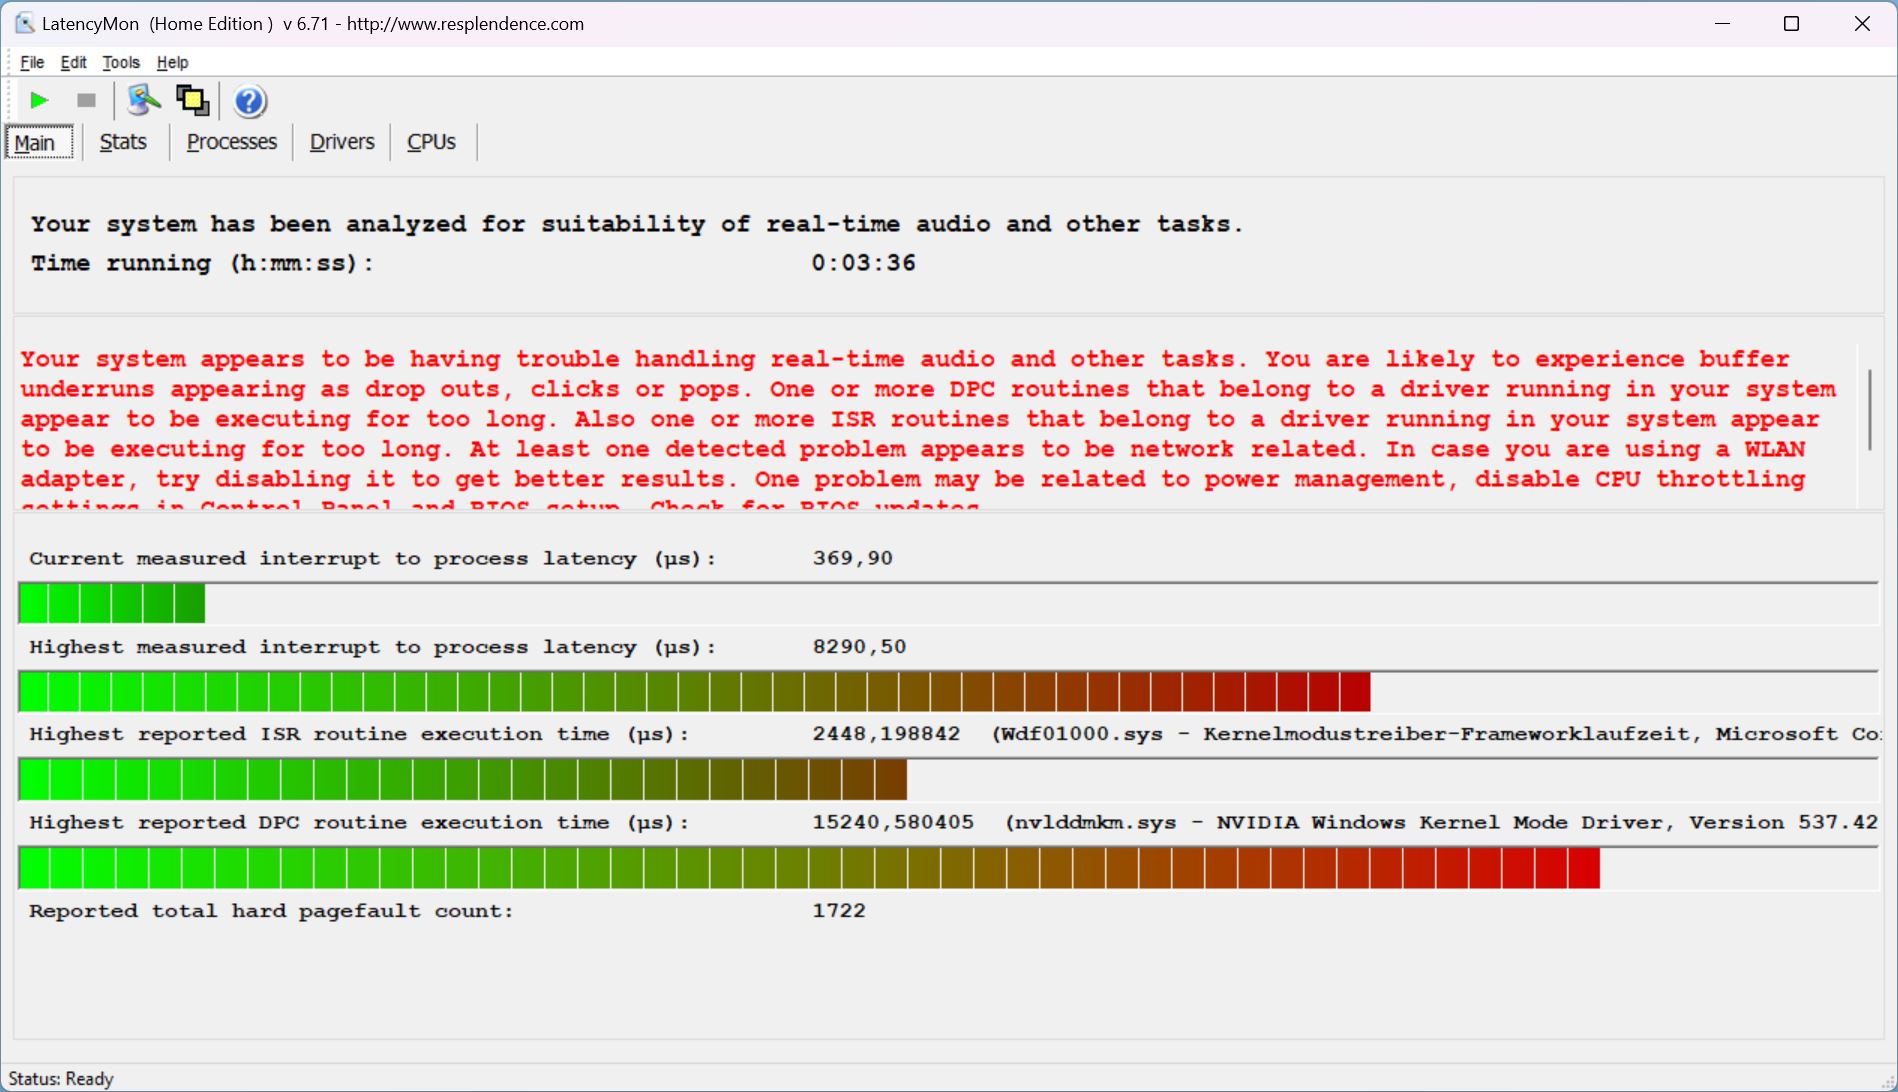
W obecnym stanie sterownika laptop ma poważne problemy z opóźnieniami, co ujawnia LatencyMon. W trybie zrównoważonym opóźnienia występują podczas otwierania przeglądarki lub przesuwania okna pulpitu. Zwiększają się one podczas otwierania wielu kart przeglądarki na naszej stronie internetowej, a nawet odtwarzanie wideo 4K/60 fps na YouTube powoduje pełne 18 pominiętych klatek. Acer musi tutaj poprawić sterownik. Jednak konkurencyjne laptopy również mają podobne problemy.
| DPC Latencies / LatencyMon - interrupt to process latency (max), Web, Youtube, Prime95 | |
| Acer Predator Helios 18 N23Q2 | |
| MSI GE78HX 13VH-070US | |
| Alienware m18 R1 | |
| HP Omen 17-ck2097ng | |
| Razer Blade 18 RTX 4070 | |
| Asus ROG Strix G18 G814JI | |
* ... im mniej tym lepiej
Urządzenia pamięci masowej
Helios 18 jest wyposażony w Samsung PM9A1, jeden z najszybszych dysków SSD w naszym zestawieniu najlepszych dysków SSD.Lista najlepszych dysków SSDniestety, nie radzi on sobie dobrze w Predatorze, a jego wydajność jest bardzo szybko ograniczana, jak pokazuje poniższy wykres. Powtórzyliśmy ten sam test później i uzyskaliśmy ten sam wynik, ponieważ byliśmy zaskoczeni szybkim i silnym spadkiem. Podobne dławienie dysków SSD zaobserwowaliśmy również w poprzednio recenzowanym modelu Predator Helios 16.

* ... im mniej tym lepiej
Sustained Read Performance: DiskSpd Read Loop, Queue Depth 8
Grafikkarte
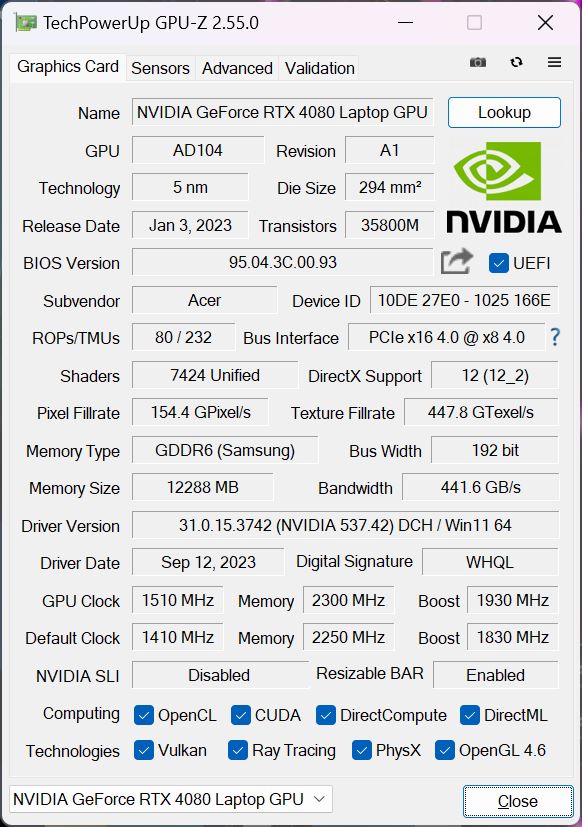
Karta graficzna RTX 4080to wysokiej klasy procesor graficzny, który został wprowadzony na początku 2023 roku. W Helios 18 może pobierać maksymalnie 175 W, w tym Dynamic Boost.
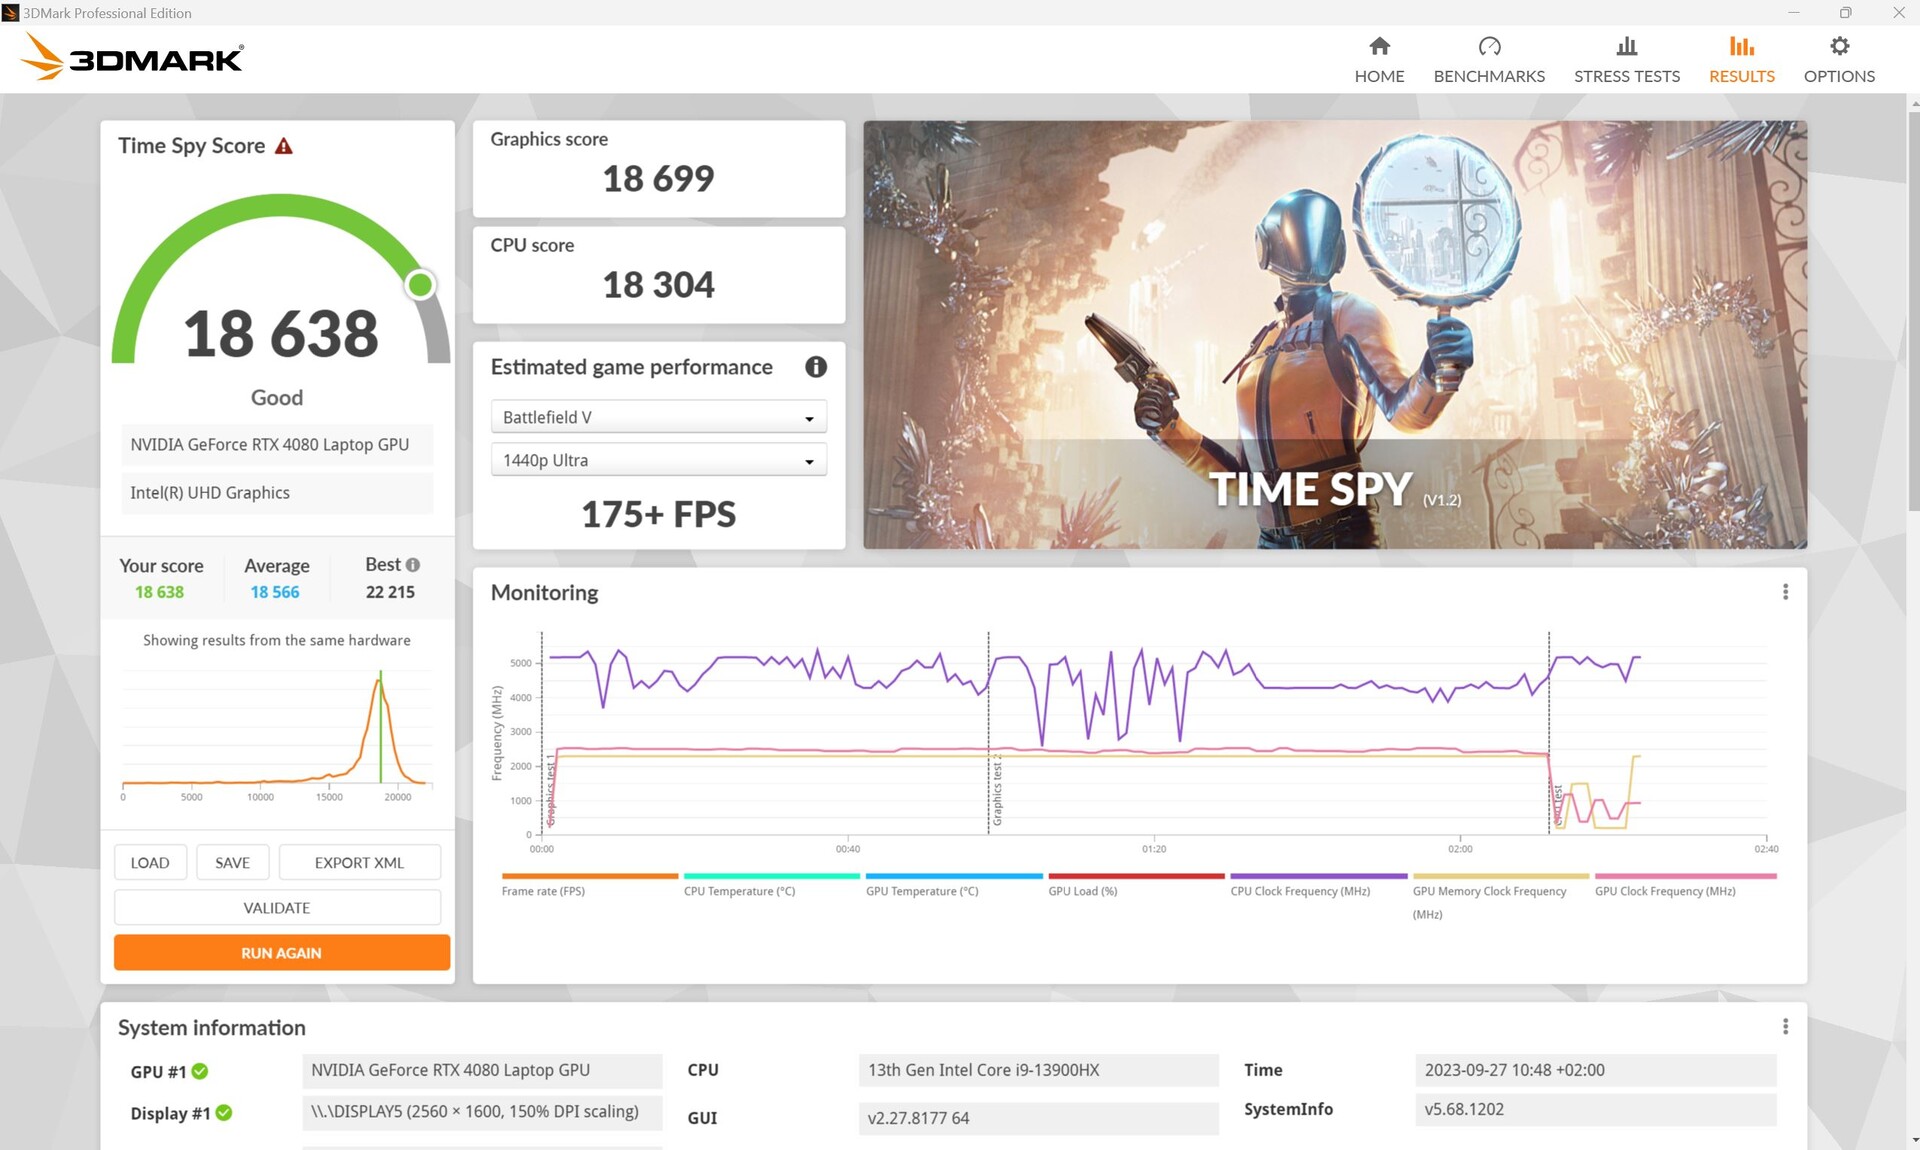
W syntetycznych testach 3DMark, Helios nieznacznie wyprzedził MSI GE78HXz tym samym GPU po raz pierwszy. Wydajność RTX 4080 jest o około 10% wyższa niż średnia wszystkich laptopów z tym samym GPU w naszej bazie danych.
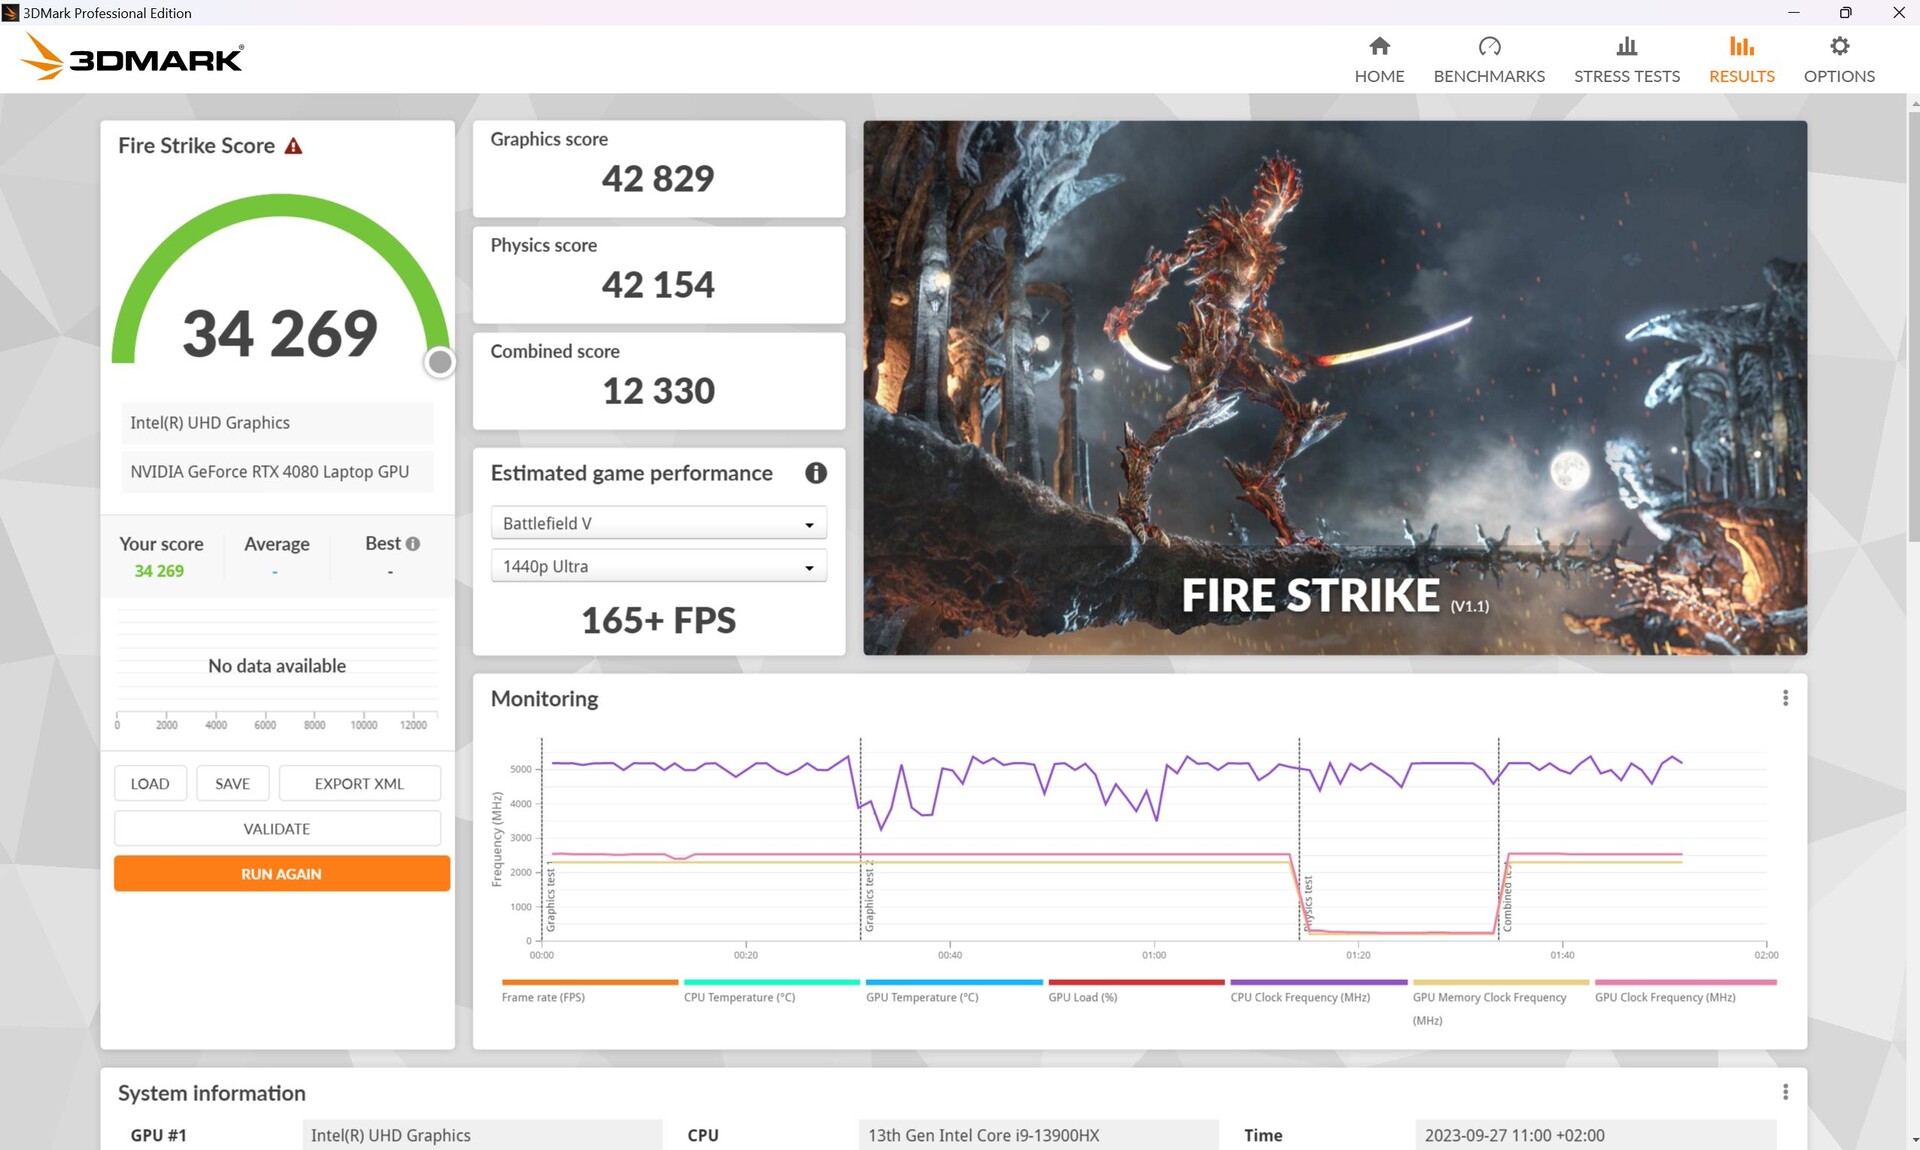
Z dala od gniazda, Predator nadal zarządza 6,897 punktami graficznymi w Fire Strike, co oznacza spadek o 84 procent!
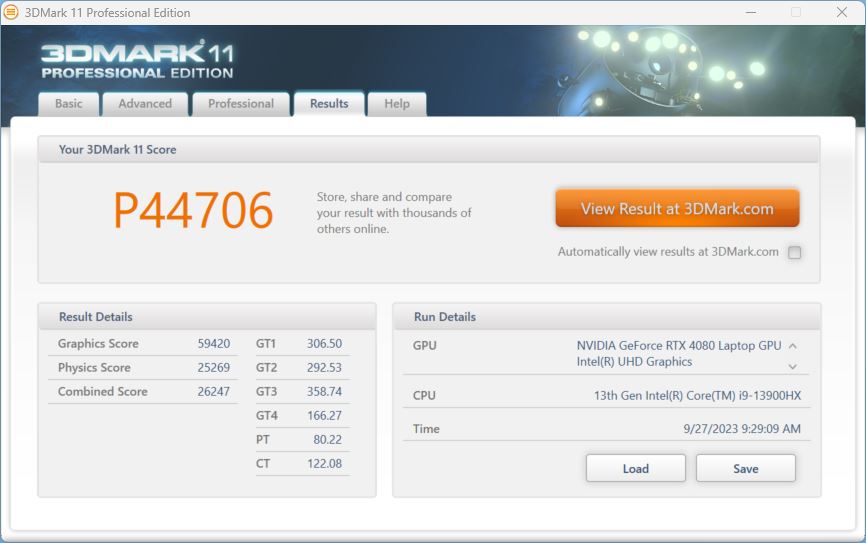
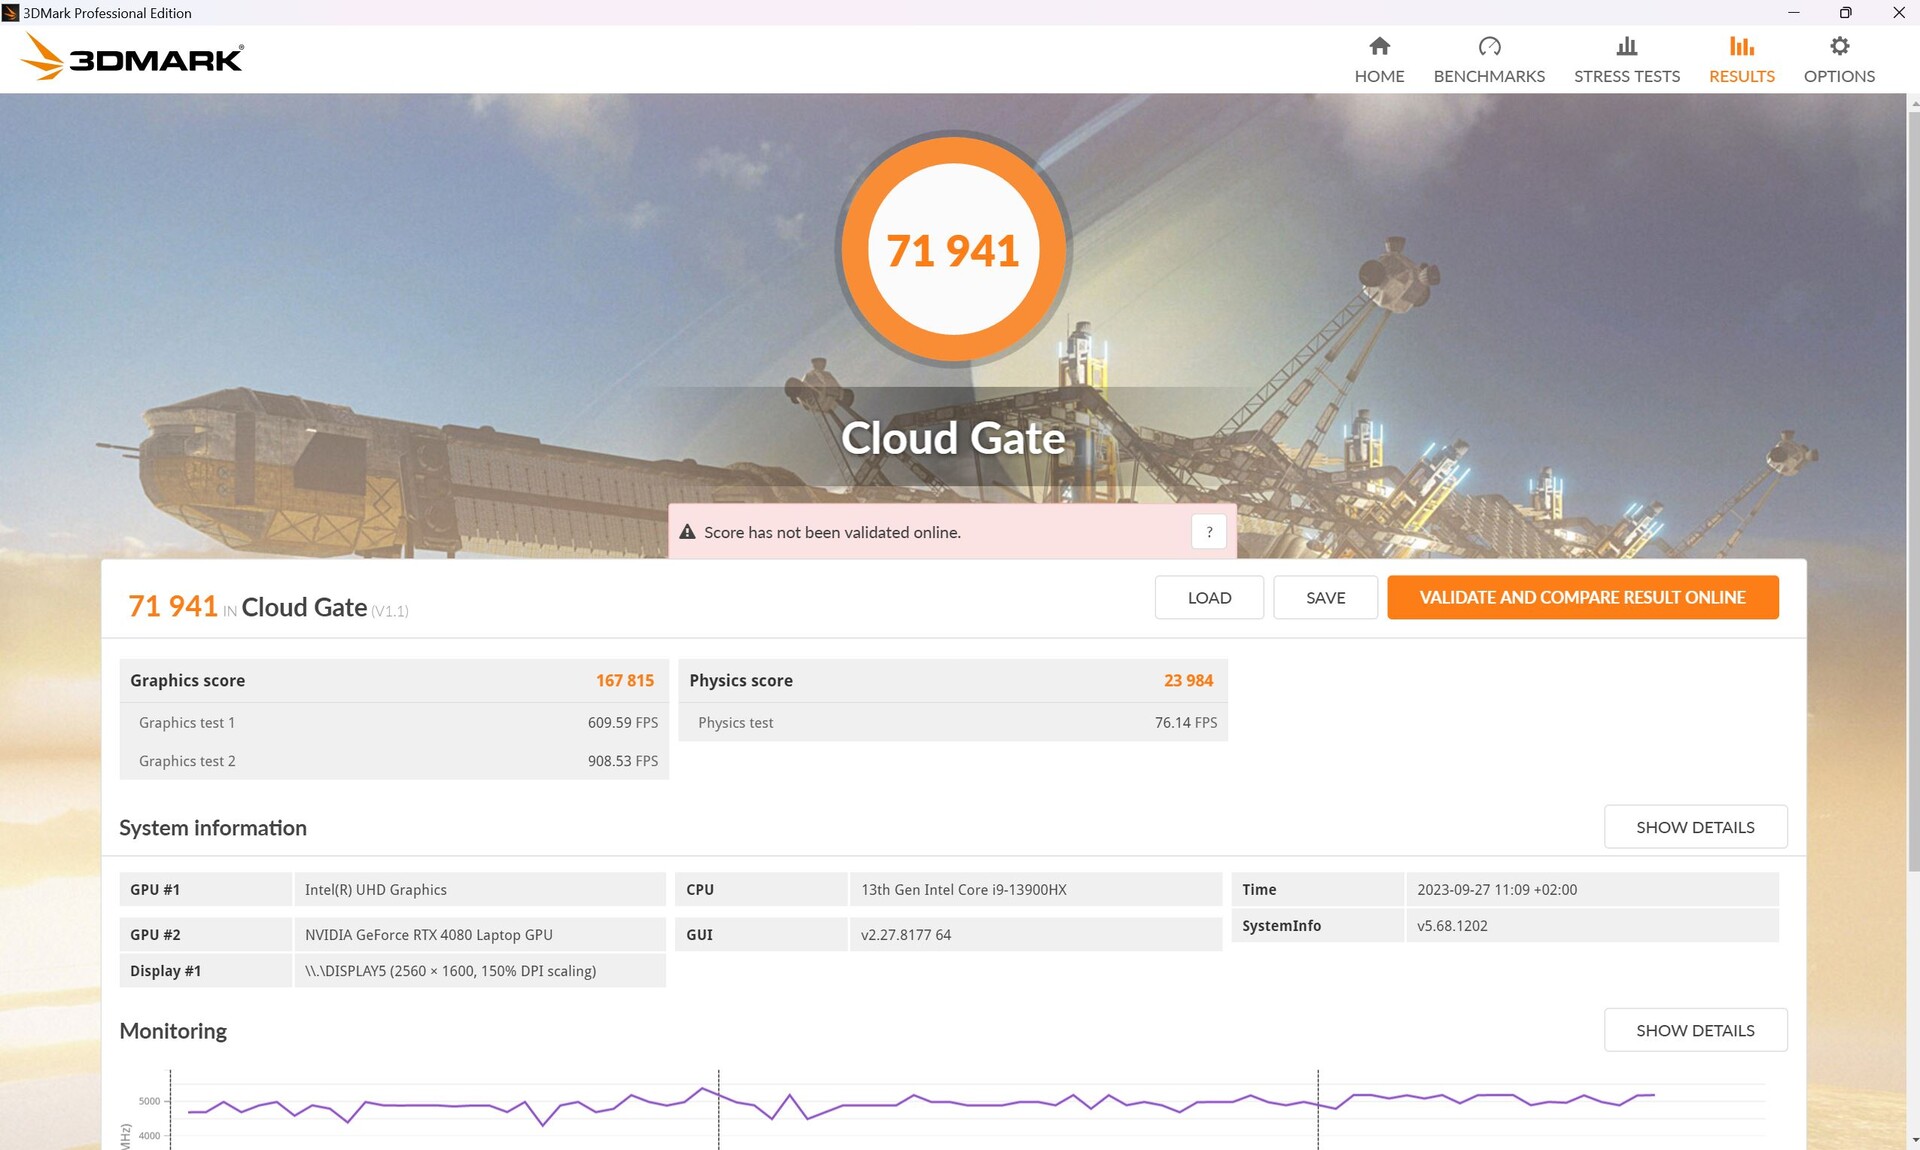
| 3DMark 11 Performance | 44706 pkt. | |
| 3DMark Cloud Gate Standard Score | 71941 pkt. | |
| 3DMark Fire Strike Score | 34269 pkt. | |
| 3DMark Time Spy Score | 18638 pkt. | |
Pomoc | ||
* ... im mniej tym lepiej
Wydajność w grach
Helios 18 również nieznacznie przewyższaMSI GE78HX w grach, ale oba są ostatecznie na równi. Alienware m18 R1 z jego RTX 4090 jest o około 7% szybszy; różnica jest największa w Witcher 3 na poziomie +22%, a nasz Predator prowadzi nawet w GTA V.
| Performance rating - Percent | |
| Alienware m18 R1 | |
| Acer Predator Helios 18 N23Q2 | |
| HP Omen 17-ck2097ng | |
| Średnia w klasie Gaming | |
| MSI GE78HX 13VH-070US | |
| Razer Blade 18 RTX 4070 | |
| Asus ROG Strix G18 G814JI | |
| The Witcher 3 - 1920x1080 Ultra Graphics & Postprocessing (HBAO+) | |
| Alienware m18 R1 | |
| MSI GE78HX 13VH-070US | |
| Acer Predator Helios 18 N23Q2 | |
| Średnia w klasie Gaming (95 - 240, n=8, ostatnie 2 lata) | |
| HP Omen 17-ck2097ng | |
| Asus ROG Strix G18 G814JI | |
| Razer Blade 18 RTX 4070 | |
| GTA V - 1920x1080 Highest AA:4xMSAA + FX AF:16x | |
| Acer Predator Helios 18 N23Q2 | |
| Alienware m18 R1 | |
| Średnia w klasie Gaming (48.3 - 186.9, n=100, ostatnie 2 lata) | |
| Razer Blade 18 RTX 4070 | |
| HP Omen 17-ck2097ng | |
| Asus ROG Strix G18 G814JI | |
| MSI GE78HX 13VH-070US | |
| Final Fantasy XV Benchmark - 1920x1080 High Quality | |
| Alienware m18 R1 | |
| Acer Predator Helios 18 N23Q2 | |
| MSI GE78HX 13VH-070US | |
| HP Omen 17-ck2097ng | |
| Średnia w klasie Gaming (41 - 215, n=101, ostatnie 2 lata) | |
| Asus ROG Strix G18 G814JI | |
| Razer Blade 18 RTX 4070 | |
| Strange Brigade - 1920x1080 ultra AA:ultra AF:16 | |
| Alienware m18 R1 | |
| Acer Predator Helios 18 N23Q2 | |
| Średnia w klasie Gaming (76.3 - 456, n=91, ostatnie 2 lata) | |
| HP Omen 17-ck2097ng | |
| MSI GE78HX 13VH-070US | |
| Asus ROG Strix G18 G814JI | |
| Razer Blade 18 RTX 4070 | |
| Dota 2 Reborn - 1920x1080 ultra (3/3) best looking | |
| Alienware m18 R1 | |
| Acer Predator Helios 18 N23Q2 | |
| Razer Blade 18 RTX 4070 | |
| HP Omen 17-ck2097ng | |
| Asus ROG Strix G18 G814JI | |
| Średnia w klasie Gaming (84.8 - 248, n=110, ostatnie 2 lata) | |
| MSI GE78HX 13VH-070US | |
| The Witcher 3 | |
| 1920x1080 High Graphics & Postprocessing (Nvidia HairWorks Off) | |
| Alienware m18 R1 | |
| MSI GE78HX 13VH-070US | |
| Acer Predator Helios 18 N23Q2 | |
| Przeciętny NVIDIA GeForce RTX 4080 Laptop GPU (246 - 385, n=14) | |
| HP Omen 17-ck2097ng | |
| Średnia w klasie Gaming (181 - 341, n=3, ostatnie 2 lata) | |
| Razer Blade 18 RTX 4070 | |
| Asus ROG Strix G18 G814JI | |
| 1920x1080 Ultra Graphics & Postprocessing (HBAO+) | |
| Alienware m18 R1 | |
| MSI GE78HX 13VH-070US | |
| Acer Predator Helios 18 N23Q2 | |
| Średnia w klasie Gaming (95 - 240, n=8, ostatnie 2 lata) | |
| Przeciętny NVIDIA GeForce RTX 4080 Laptop GPU (130.4 - 186.1, n=20) | |
| HP Omen 17-ck2097ng | |
| Asus ROG Strix G18 G814JI | |
| Razer Blade 18 RTX 4070 | |
| Hogwarts Legacy | |
| 1920x1080 Ultra Preset AA:High T | |
| Przeciętny NVIDIA GeForce RTX 4080 Laptop GPU (108 - 131, n=3) | |
| Acer Predator Helios 18 N23Q2 | |
| Asus ROG Strix G18 G814JI | |
| Średnia w klasie Gaming (76 - 108.3, n=2, ostatnie 2 lata) | |
| 2560x1440 Ultra Preset AA:High T | |
| Przeciętny NVIDIA GeForce RTX 4080 Laptop GPU (76 - 102, n=3) | |
| Acer Predator Helios 18 N23Q2 | |
| Średnia w klasie Gaming (52 - 96.8, n=2, ostatnie 2 lata) | |
| Asus ROG Strix G18 G814JI | |
| 1920x1080 Ultra Preset + Full Ray Tracing AA:High T | |
| Acer Predator Helios 18 N23Q2 | |
| Przeciętny NVIDIA GeForce RTX 4080 Laptop GPU (53 - 66, n=2) | |
| Asus ROG Strix G18 G814JI | |
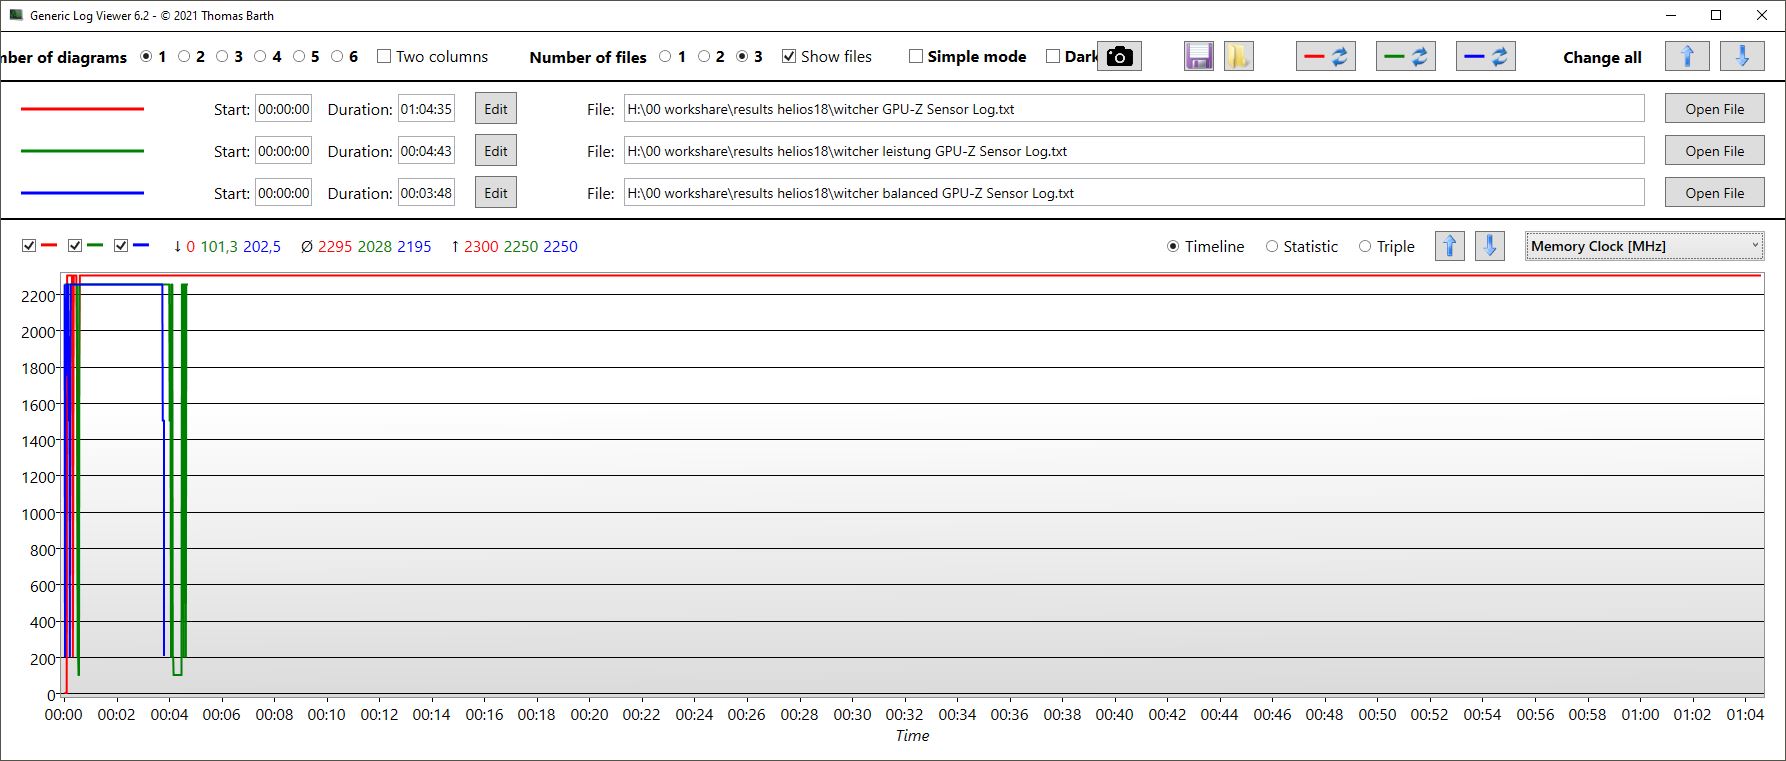
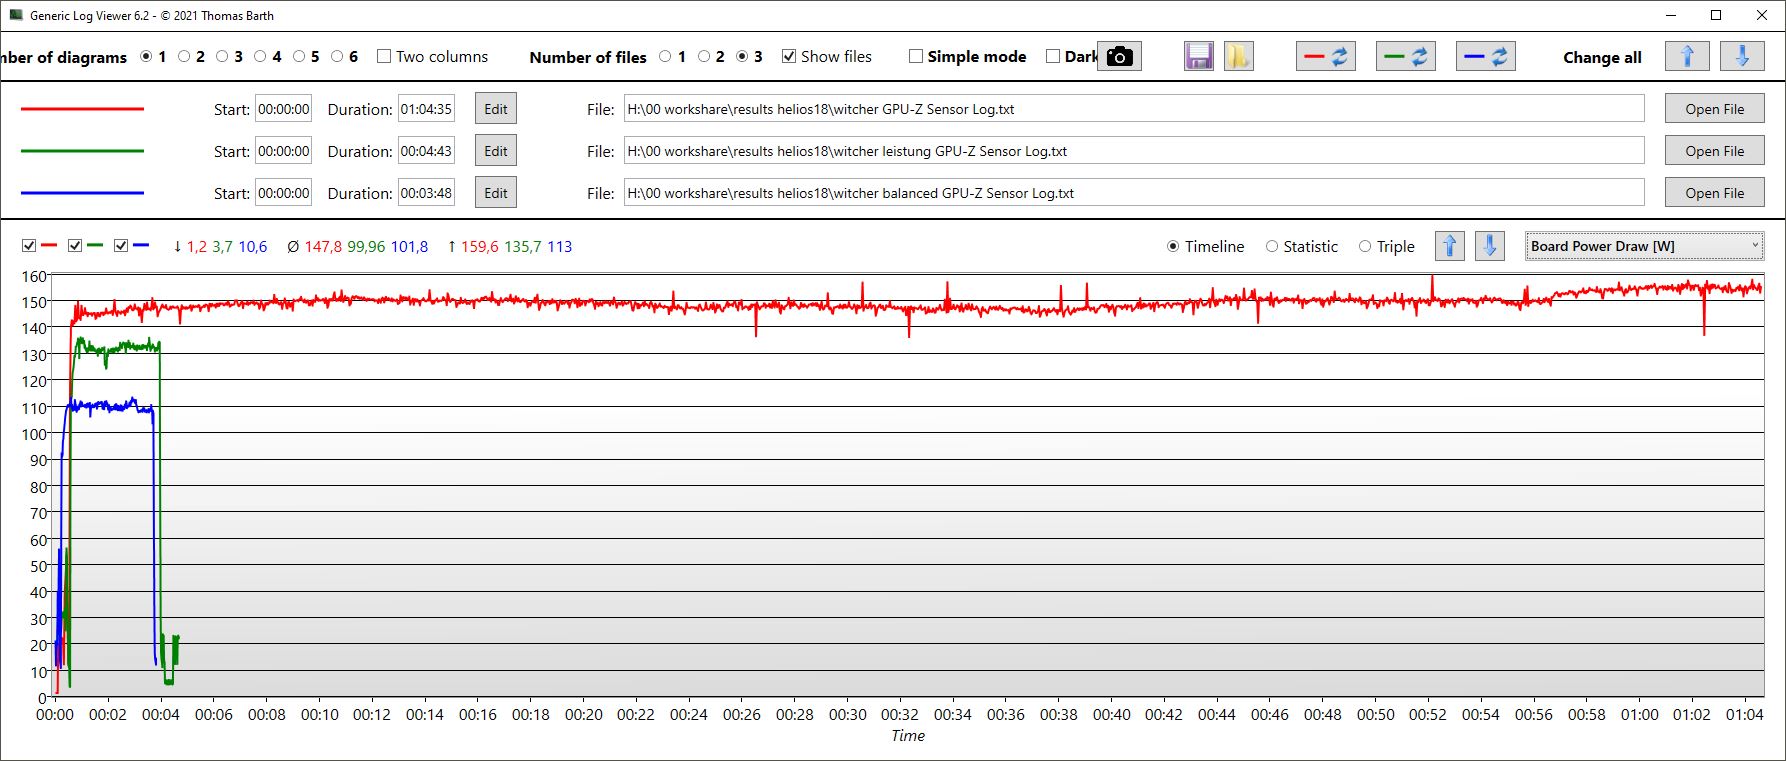
W ciągu godziny liczba klatek na sekundę w Witcher 3 pozostaje dość stabilna; niewielkie wahania wynikają z typowego cyklu dzień/noc w grze.
W przeciwieństwie do benchmarku CPU, teraz jest wyraźna różnica między trybami Balanced i Silent podczas grania. Ten drugi, zgodnie ze swoją nazwą, jest bardzo cichy i zużywa mniej energii. Tabele dotyczące liczby klatek na sekundę, zużycia i głośności poszczególnych trybów wydajności dla Witcher 3 Ultra można znaleźć w poniższych sekcjach Emisja/Temperatura.
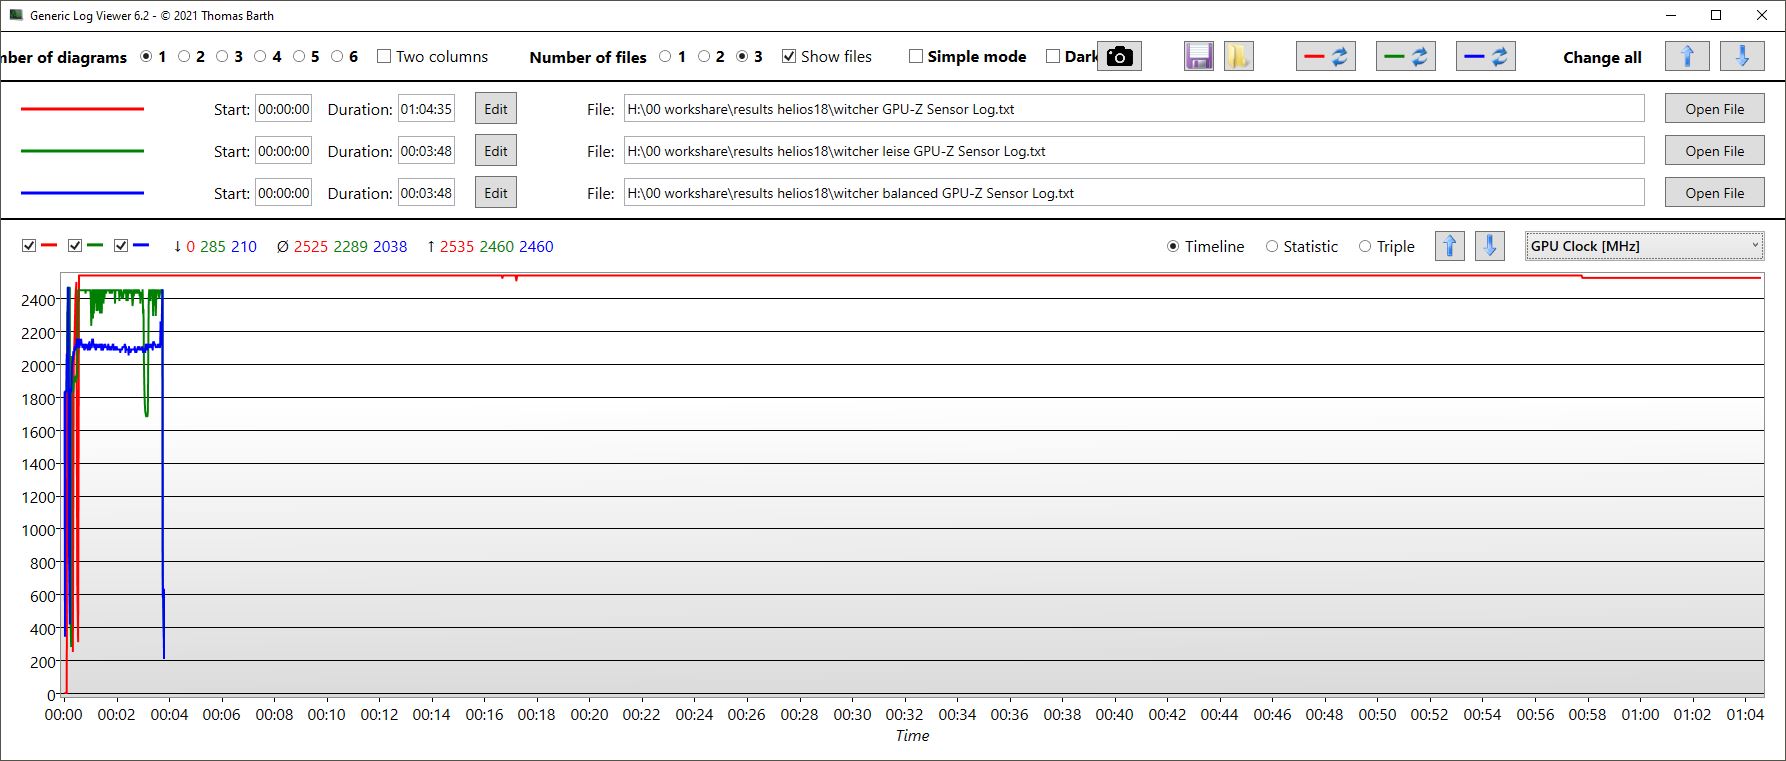
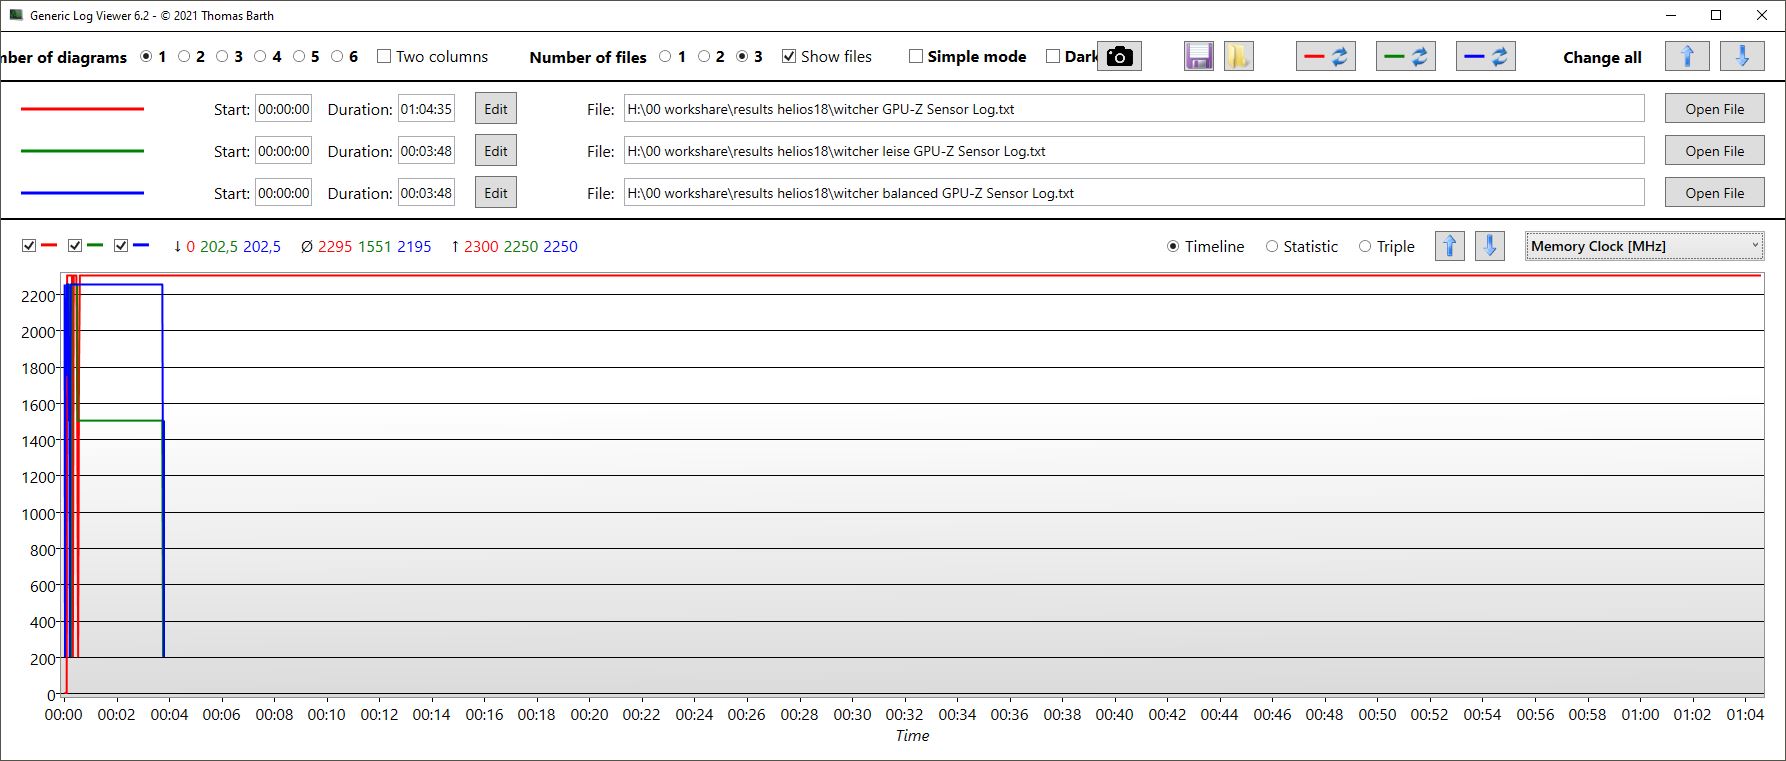
Co ciekawe, taktowanie GPU jest nieco wyższe w trybie Silent niż w Balanced, ale taktowanie pamięci jest znacznie niższe, a pobór mocy również jest niższy.
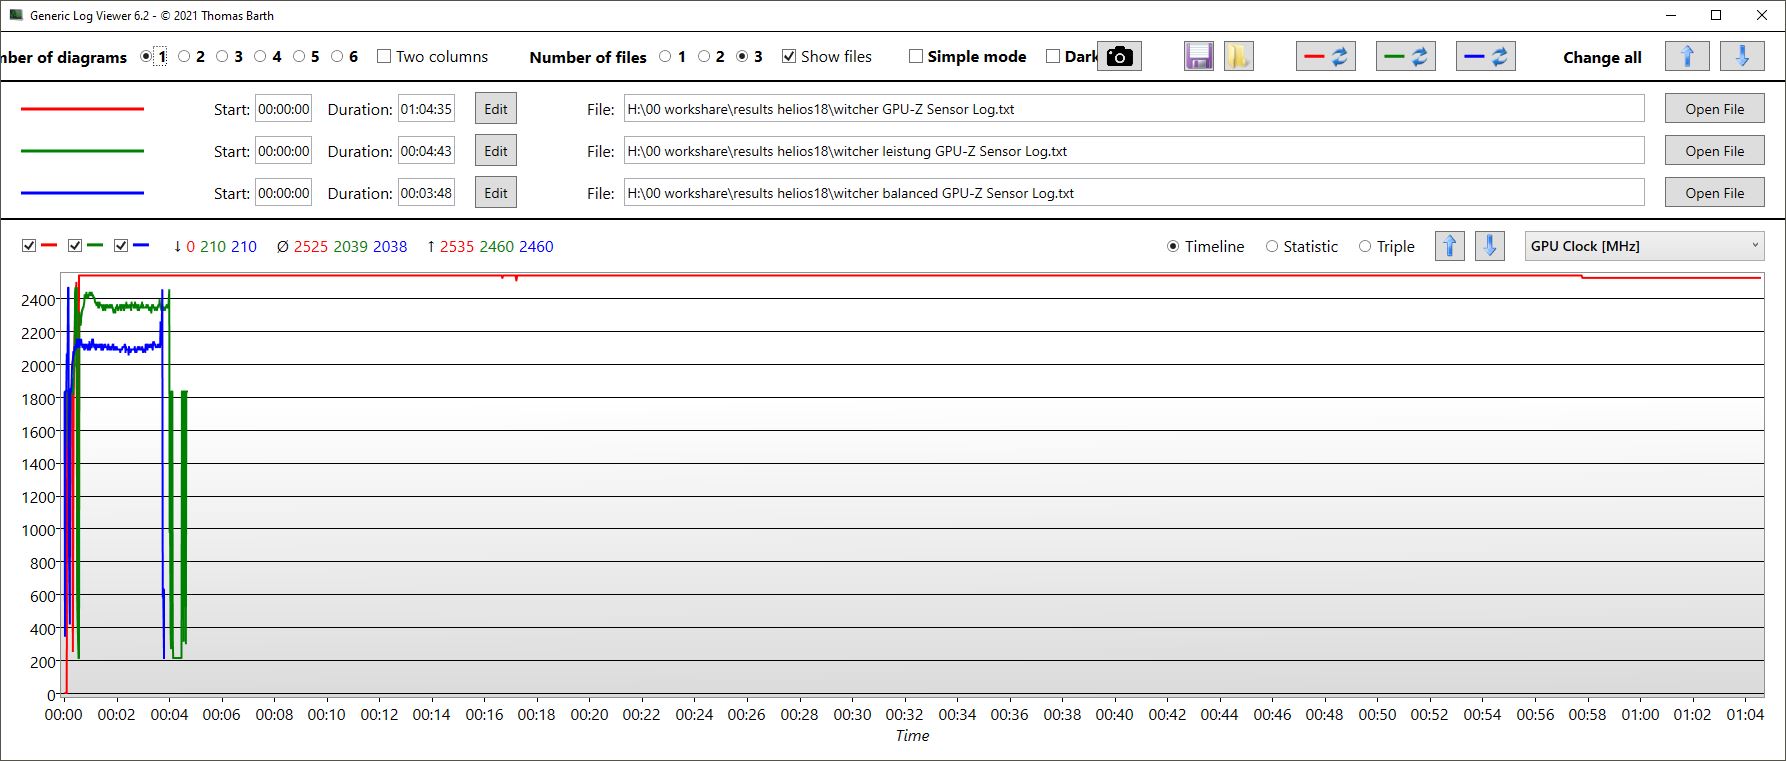
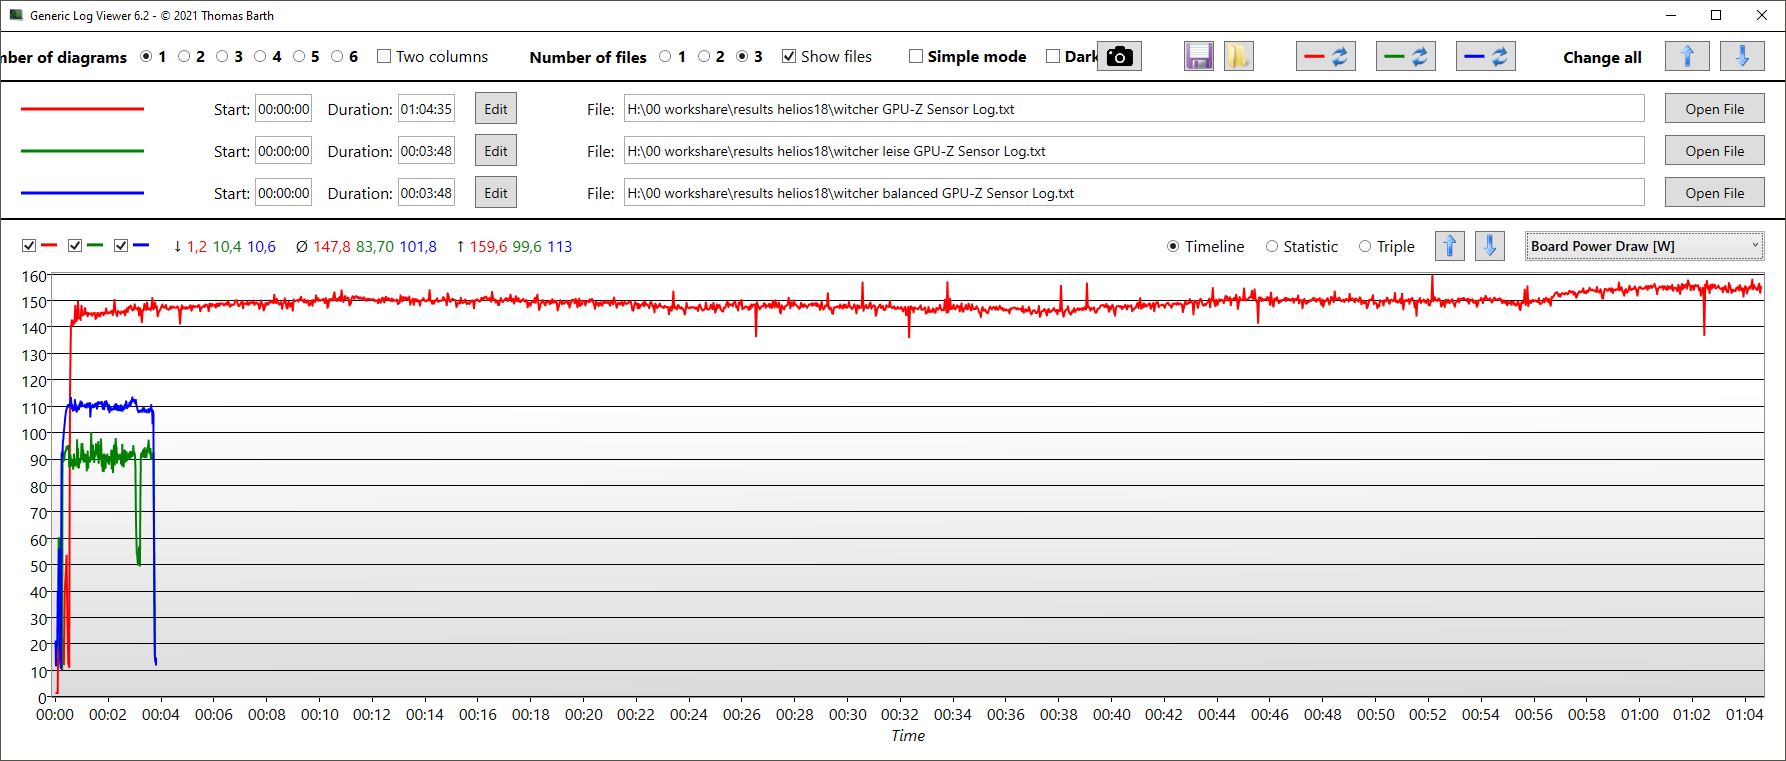
Witcher 3 FPS chart
| low | med. | high | ultra | QHD | 4K | |
|---|---|---|---|---|---|---|
| GTA V (2015) | 187.3 | 187.6 | 186.7 | 152.7 | 140.7 | |
| The Witcher 3 (2015) | 642 | 568 | 368 | 175 | 153 | |
| Dota 2 Reborn (2015) | 234 | 211 | 202 | 186.4 | 131 | |
| Final Fantasy XV Benchmark (2018) | 234 | 225 | 182.1 | 136.6 | 79.4 | |
| X-Plane 11.11 (2018) | 199 | 183.5 | 139.5 | 143.7 | ||
| Far Cry 5 (2018) | 199 | 175 | 168 | 158 | 155 | |
| Strange Brigade (2018) | 562 | 448 | 382 | 339 | 238 | |
| Call of Duty Modern Warfare 2 2022 (2022) | 167 | 124 | ||||
| Hogwarts Legacy (2023) | 173 | 157 | 134 | 108 | 81 | |
| F1 23 (2023) | 329 | 329 | 304 | 111 | 73 | |
| Cyberpunk 2077 (2023) | 127.13 | 77.03 | ||||
| Alan Wake 2 (2023) | 100.7 | 71 |
Emisje - Helios 18 jest bardzo głośny w trybie turbo
Hałas
Hałas wentylatora zależy oczywiście w dużej mierze od wybranego trybu wydajności. W trybie Turbo hałas w tle jest bardzo wysoki pod obciążeniem; zmierzyliśmy maksymalnie nieco poniżej 60 dB, co czyni go najgłośniejszym urządzeniem w polu porównawczym. WentylatorAlienware z RTX 4090 pozostaje cichszy; tylko MSI jest podobnie głośne. Przy maksymalnej głośności obudowa zaczyna nawet lekko wibrować. W związku z tym zalecamy tryb Performance lub niższy. W tym pierwszym rezygnują Państwo tylko z 3 do 5 procent wydajności w Witcher 3, ale głośność spada o prawie 10 dB!
Przynajmniej Helios 18 dobrze reguluje swoje wentylatory w zależności od obciążenia i nie uwalnia natychmiast pełnej głośności na użytkownikach przy średnim obciążeniu. Jednak obroty wentylatora nie pozostają stałe podczas grania, ale zmieniają się cyklicznie, czasami głośniej, a czasami mniej (Witcher 3).
Inne tryby wydajności mogą znacznie zmniejszyć poziom hałasu, patrz tabela poniżej.
| Parametry/tryb wydajności | Turbo | Wydajność | Zrównoważony | Cichy |
|---|---|---|---|---|
| fps | 176 | 171 | 157 | 100 |
| Głośność w dB | 59.82 | 50.74 | 40.77 | 32.36 |
| Zużycie energii w W | 289 | 227 | 182 | 153 |
Hałas
| luz |
| 23 / 23 / 23 dB |
| obciążenie |
| 45.26 / 59.94 dB |
 | ||
30 dB cichy 40 dB(A) słyszalny 50 dB(A) irytujący |
||
min: | ||
| Acer Predator Helios 18 N23Q2 GeForce RTX 4080 Laptop GPU, i9-13900HX, Samsung PM9A1 MZVL22T0HBLB | MSI GE78HX 13VH-070US GeForce RTX 4080 Laptop GPU, i9-13950HX, Samsung PM9A1 MZVL22T0HBLB | HP Omen 17-ck2097ng GeForce RTX 4080 Laptop GPU, i9-13900HX, SK hynix PC801 HFS001TEJ9X101N | Alienware m18 R1 GeForce RTX 4090 Laptop GPU, i9-13980HX, SK hynix PC801 HFS001TEJ9X101N | Asus ROG Strix G18 G814JI GeForce RTX 4070 Laptop GPU, i7-13650HX, Micron 2400 MTFDKBA1T0QFM | Razer Blade 18 RTX 4070 GeForce RTX 4070 Laptop GPU, i9-13950HX, SSSTC CA6-8D1024 | |
|---|---|---|---|---|---|---|
| Noise | -6% | -11% | 6% | -2% | 3% | |
| wyłączone / środowisko * (dB) | 23 | 23.4 -2% | 24 -4% | 22.8 1% | 25 -9% | 23.5 -2% |
| Idle Minimum * (dB) | 23 | 24.2 -5% | 31 -35% | 23 -0% | 26 -13% | 23.8 -3% |
| Idle Average * (dB) | 23 | 25.6 -11% | 32 -39% | 23 -0% | 28 -22% | 23.8 -3% |
| Idle Maximum * (dB) | 23 | 31 -35% | 33 -43% | 23 -0% | 29 -26% | 26.8 -17% |
| Load Average * (dB) | 45.26 | 43.3 4% | 45 1% | 35.6 21% | 41 9% | 37.3 18% |
| Witcher 3 ultra * (dB) | 59.82 | 56.3 6% | 45 25% | 51.3 14% | 44 26% | 48 20% |
| Load Maximum * (dB) | 59.94 | 59.1 1% | 50 17% | 56.7 5% | 46 23% | 53.5 11% |
* ... im mniej tym lepiej
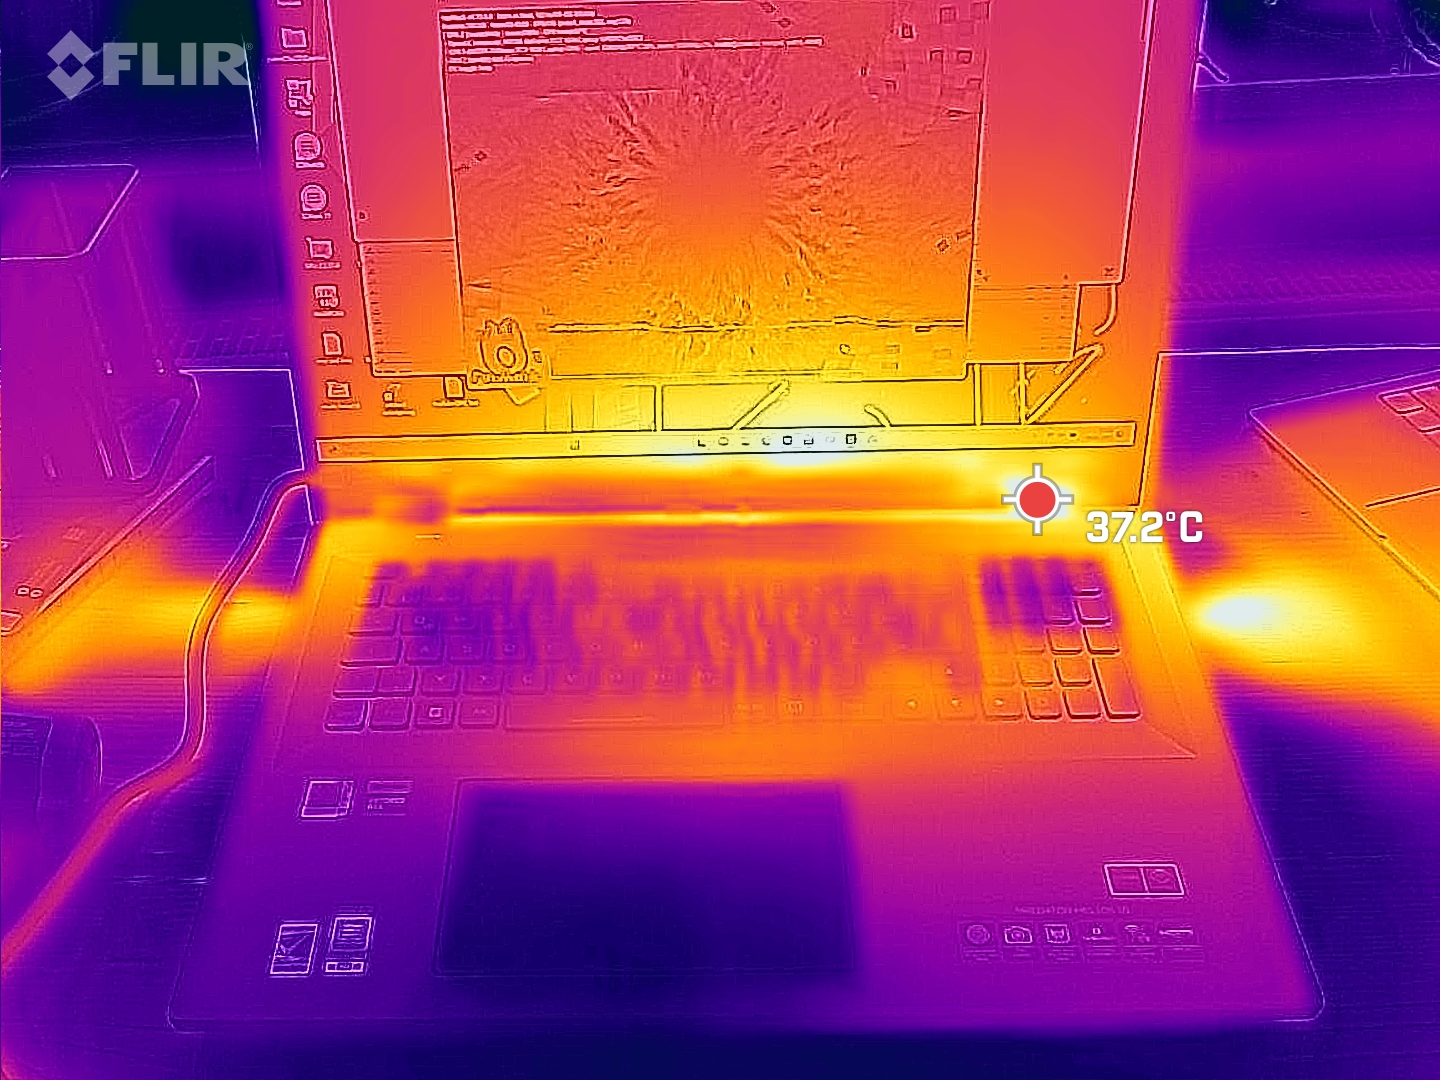
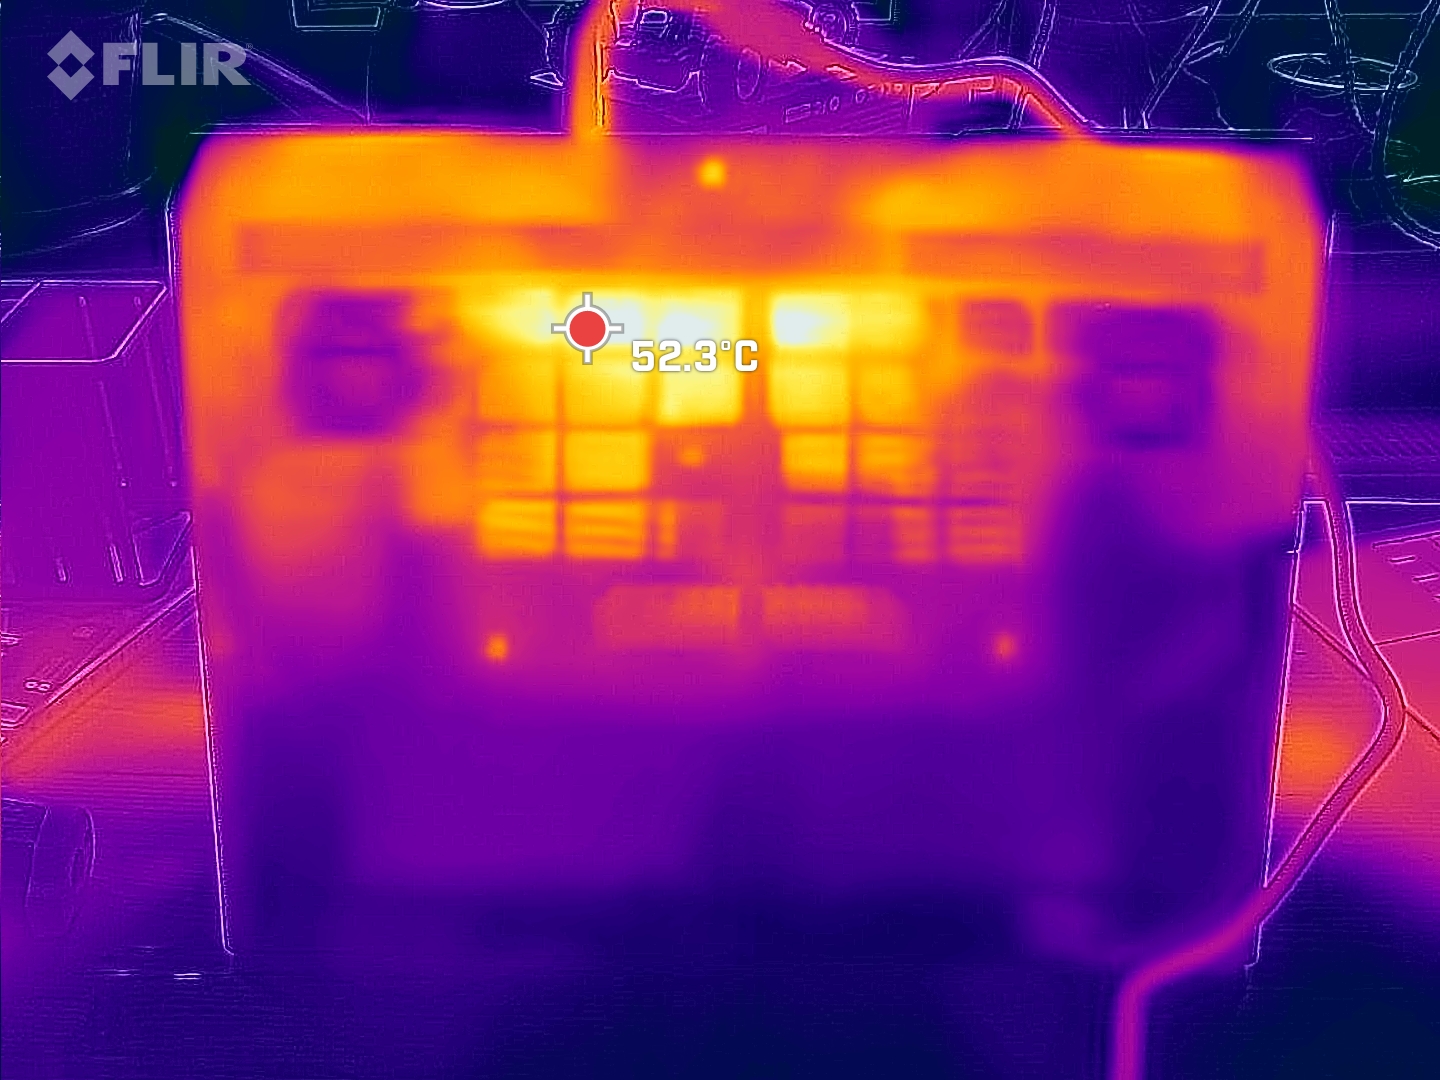
Temperatura
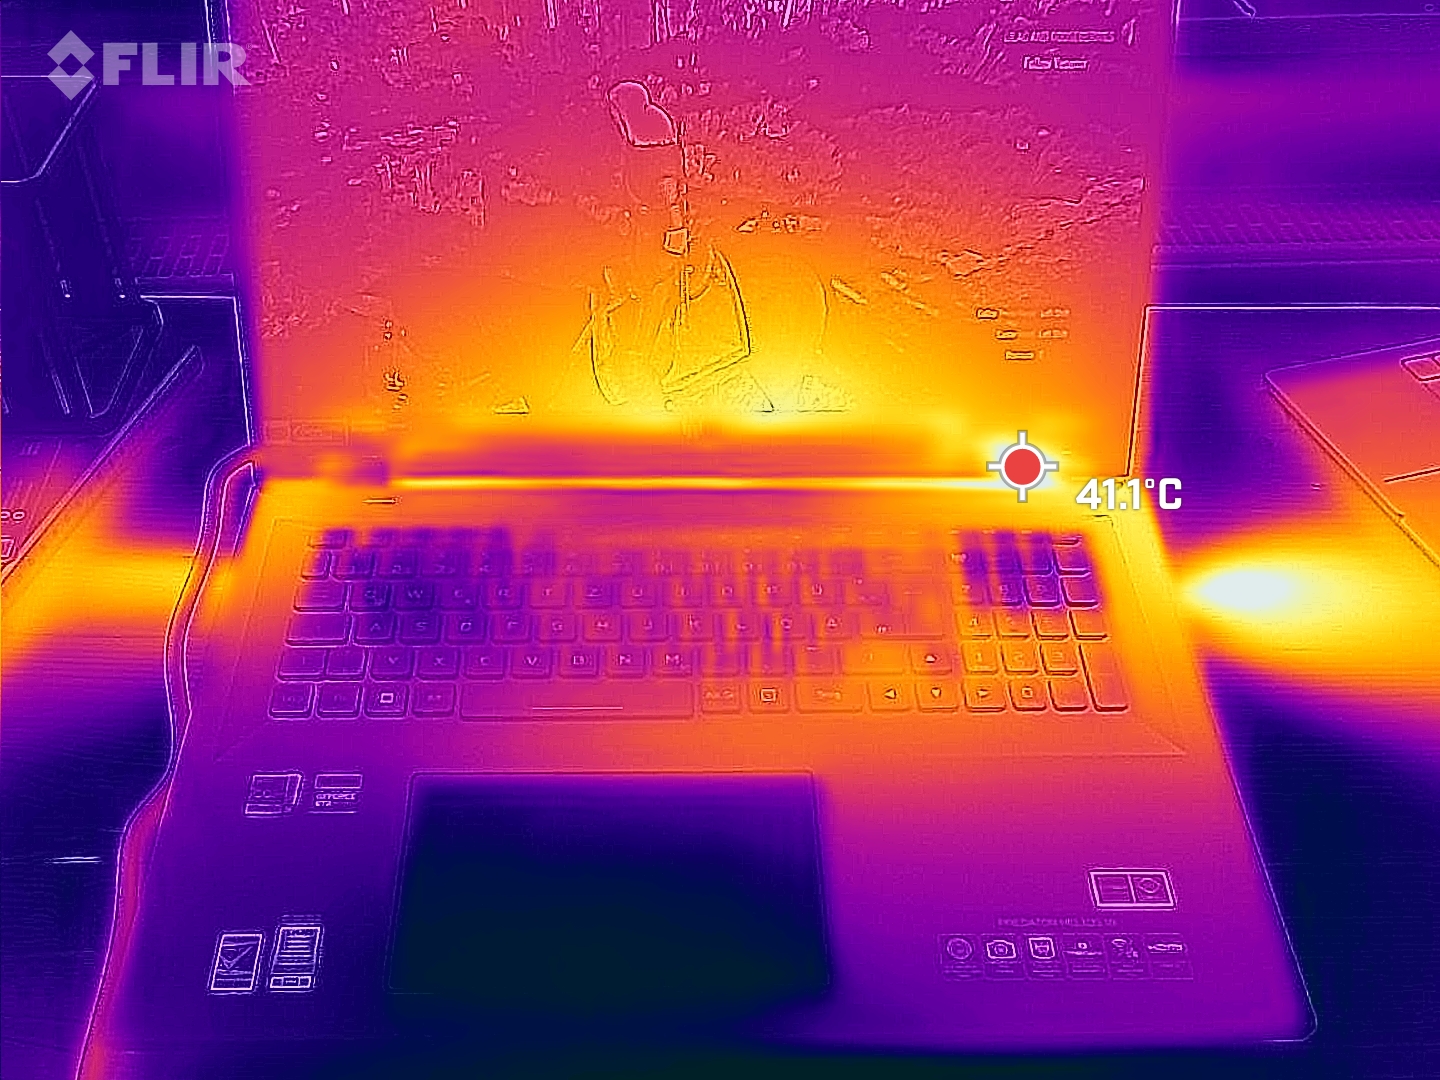
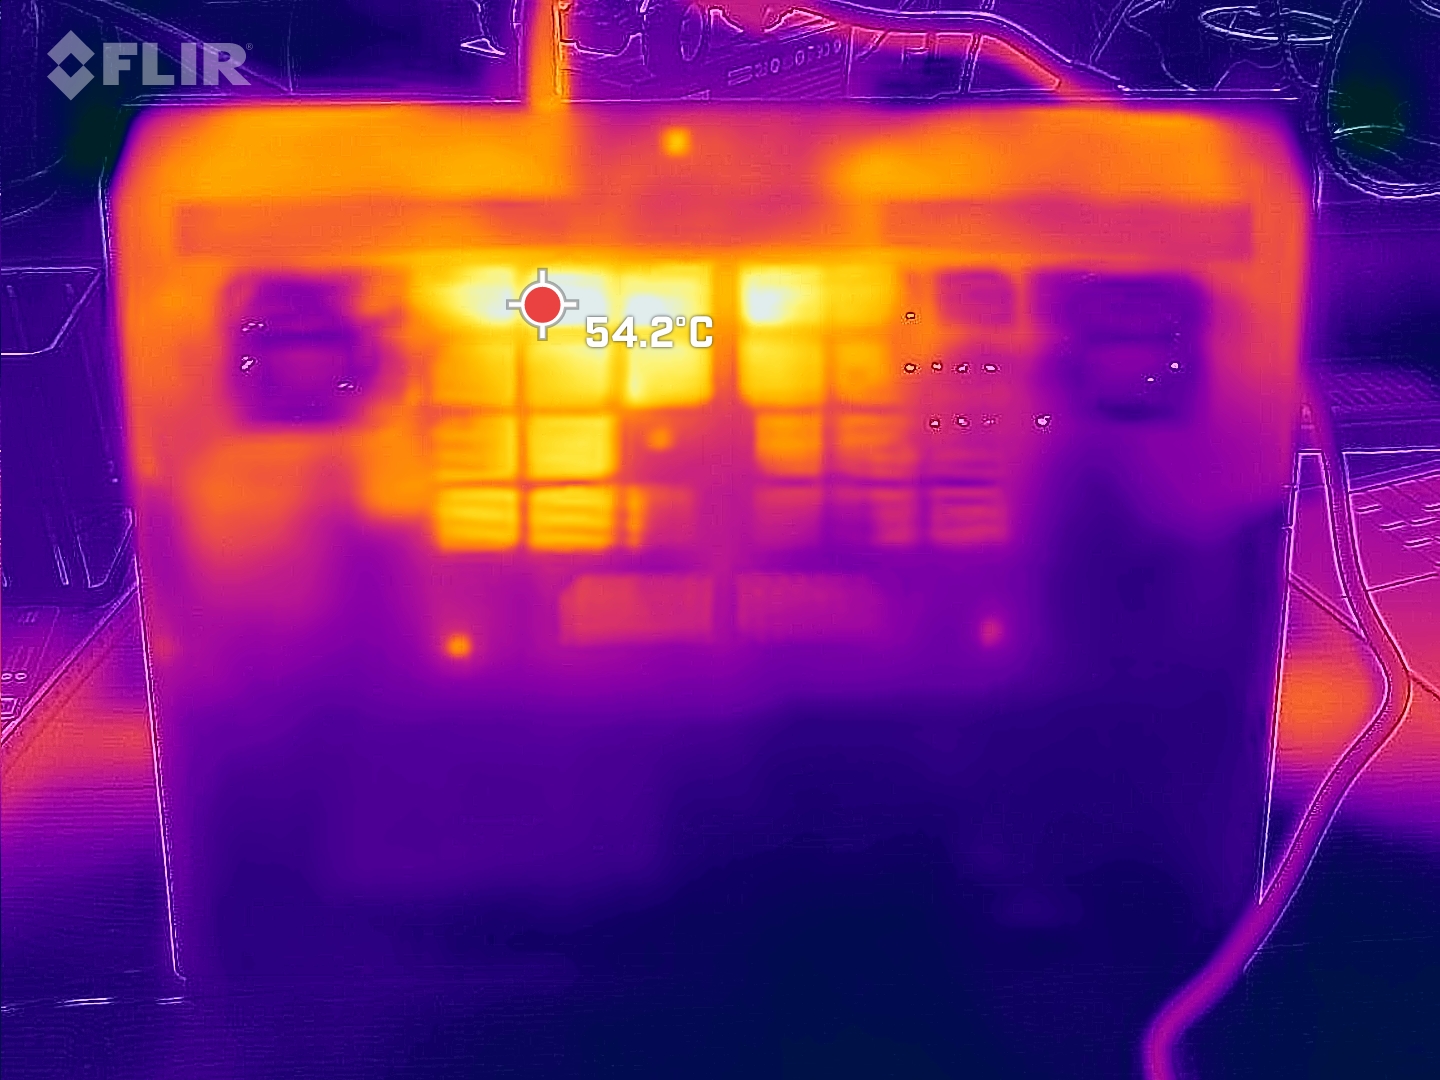
Temperatury powierzchni pokazują, że głośne wentylatory mają również pozytywny aspekt. Helios 18 nagrzewa się tylko bardzo selektywnie (spód centralnie i na lewo od wyświetlacza), ale poza tym pozostaje niemal niezwykle chłodny. Przykładowo, lewa podpórka pod nadgarstki jest wręcz zimna po godzinie grania. Pokazuje to, że z jednej strony głośne wentylatory są zbyt agresywnie skonfigurowane, a z drugiej strony ciepło nie jest dobrze rozprowadzane.
(+) Maksymalna temperatura w górnej części wynosi 35 °C / 95 F, w porównaniu do średniej 40.4 °C / 105 F , począwszy od 21.2 do 68.8 °C dla klasy Gaming.
(-) Dno nagrzewa się maksymalnie do 56 °C / 133 F, w porównaniu do średniej 43.2 °C / 110 F
(+) W stanie bezczynności średnia temperatura górnej części wynosi 31.1 °C / 88 F, w porównaniu ze średnią temperaturą urządzenia wynoszącą 33.9 °C / ### class_avg_f### F.
(+) Podczas gry w Wiedźmina 3 średnia temperatura górnej części wynosi 30.7 °C / 87 F, w porównaniu do średniej temperatury urządzenia wynoszącej 33.9 °C / ## #class_avg_f### F.
(+) Podpórki pod nadgarstki i touchpad są chłodniejsze niż temperatura skóry i maksymalnie 29 °C / 84.2 F i dlatego są chłodne w dotyku.
(±) Średnia temperatura obszaru podparcia dłoni w podobnych urządzeniach wynosiła 28.8 °C / 83.8 F (-0.2 °C / -0.4 F).
| Acer Predator Helios 18 N23Q2 Intel Core i9-13900HX, NVIDIA GeForce RTX 4080 Laptop GPU | MSI GE78HX 13VH-070US Intel Core i9-13950HX, NVIDIA GeForce RTX 4080 Laptop GPU | HP Omen 17-ck2097ng Intel Core i9-13900HX, NVIDIA GeForce RTX 4080 Laptop GPU | Alienware m18 R1 Intel Core i9-13980HX, NVIDIA GeForce RTX 4090 Laptop GPU | Asus ROG Strix G18 G814JI Intel Core i7-13650HX, NVIDIA GeForce RTX 4070 Laptop GPU | Razer Blade 18 RTX 4070 Intel Core i9-13950HX, NVIDIA GeForce RTX 4070 Laptop GPU | |
|---|---|---|---|---|---|---|
| Heat | 11% | 14% | 17% | 7% | 11% | |
| Maximum Upper Side * (°C) | 35 | 37.4 -7% | 41 -17% | 39 -11% | 45 -29% | 39.2 -12% |
| Maximum Bottom * (°C) | 56 | 45 20% | 51 9% | 36.4 35% | 47 16% | 35.6 36% |
| Idle Upper Side * (°C) | 34 | 29.8 12% | 24 29% | 29.2 14% | 28 18% | 31.8 6% |
| Idle Bottom * (°C) | 39 | 32.4 17% | 25 36% | 27.8 29% | 31 21% | 33.2 15% |
* ... im mniej tym lepiej
Testy warunków skrajnych
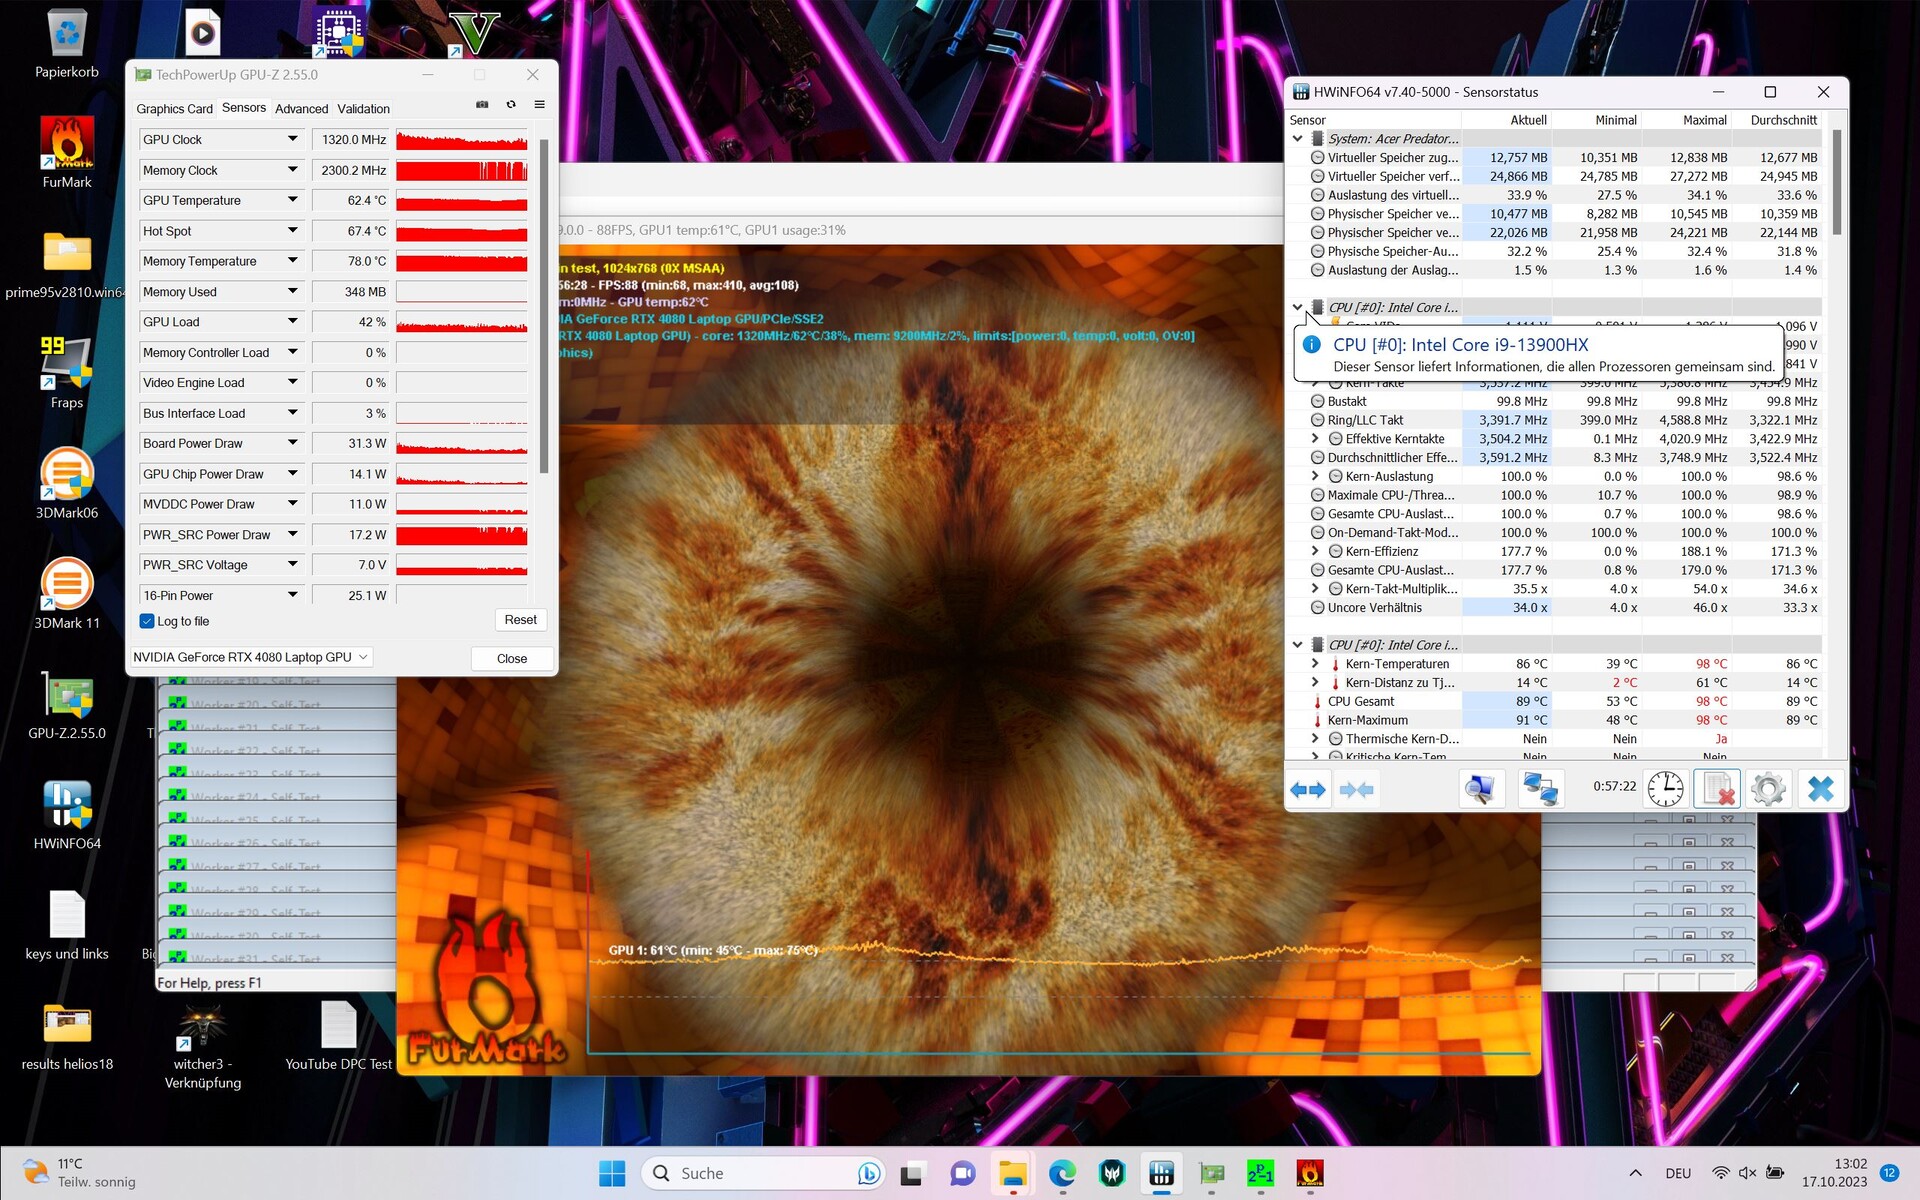
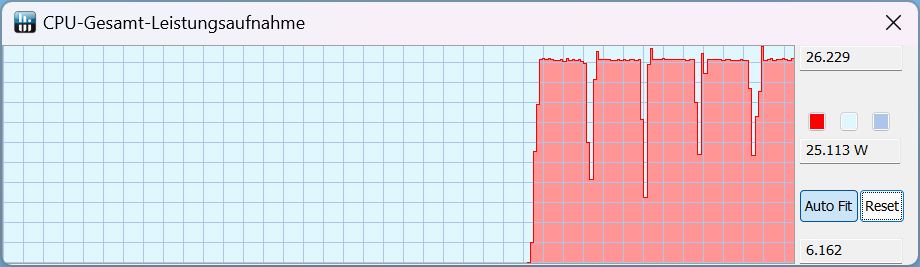
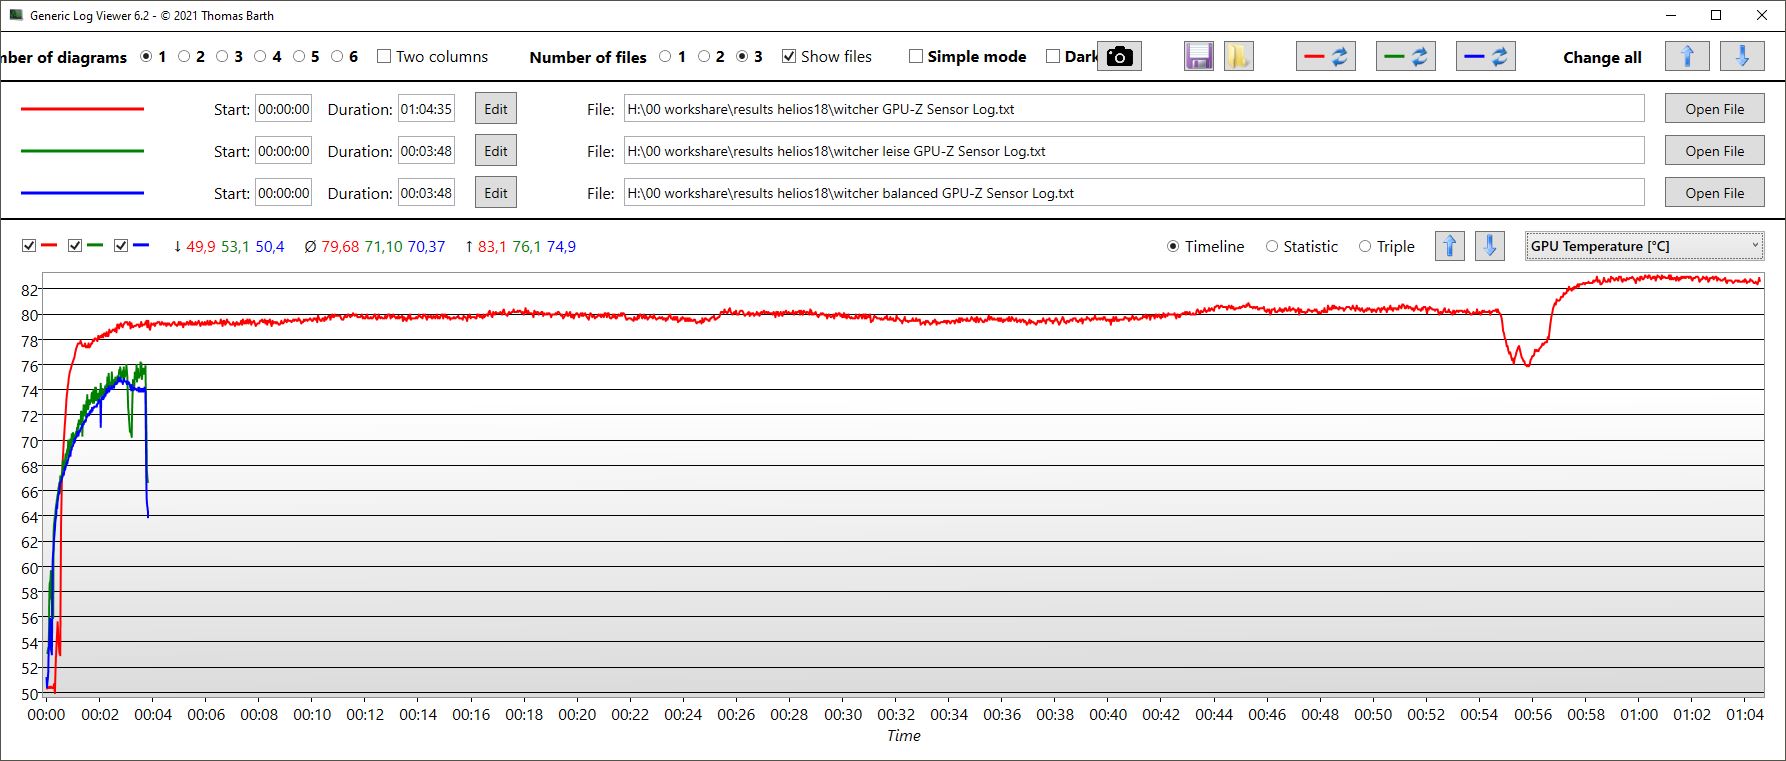
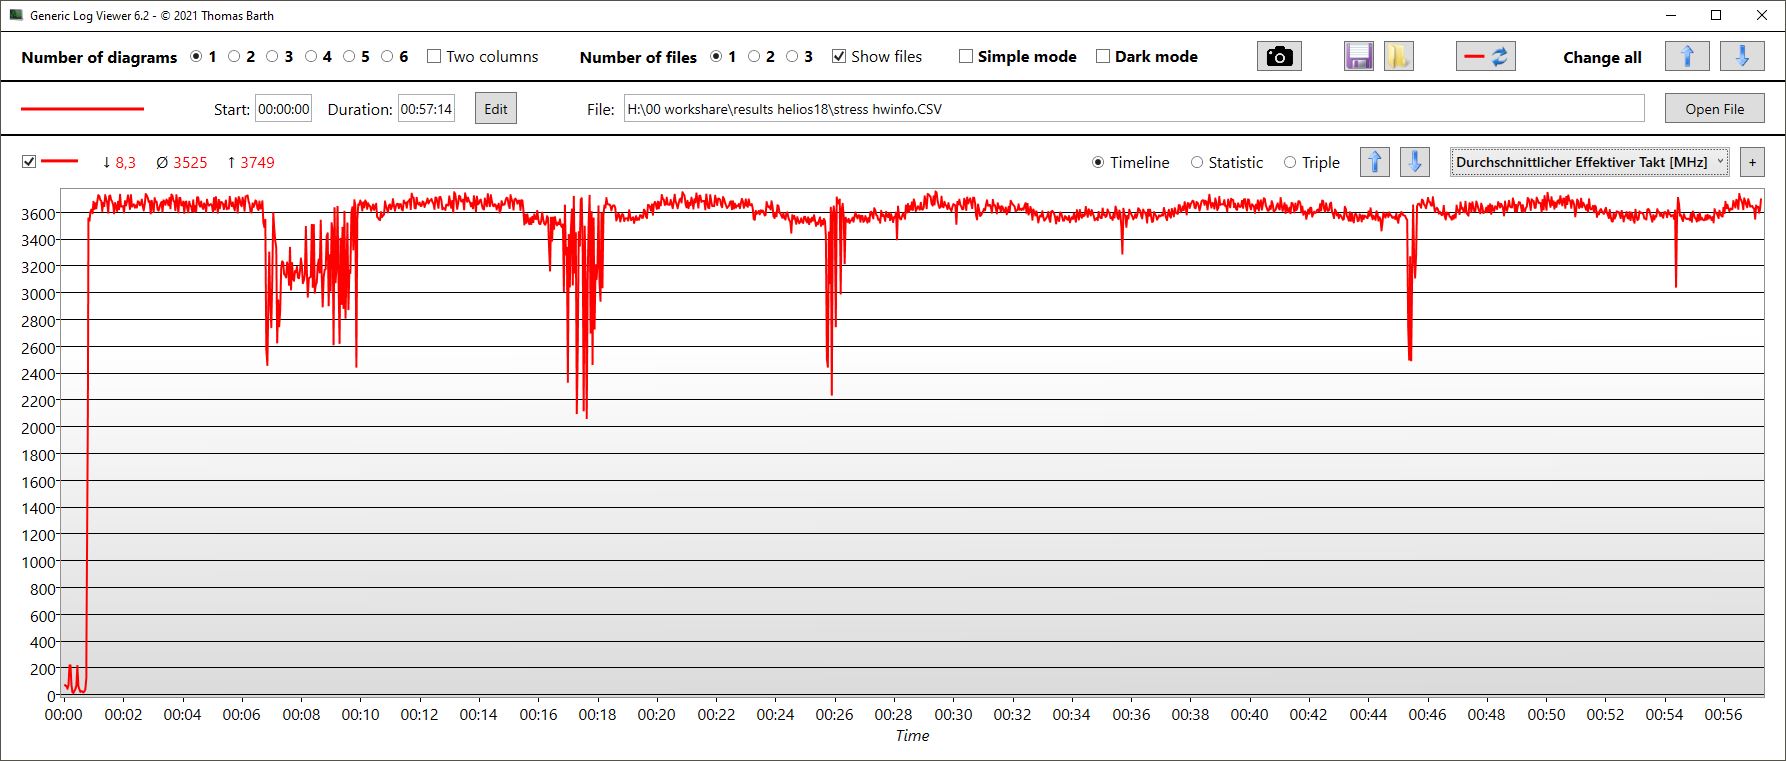
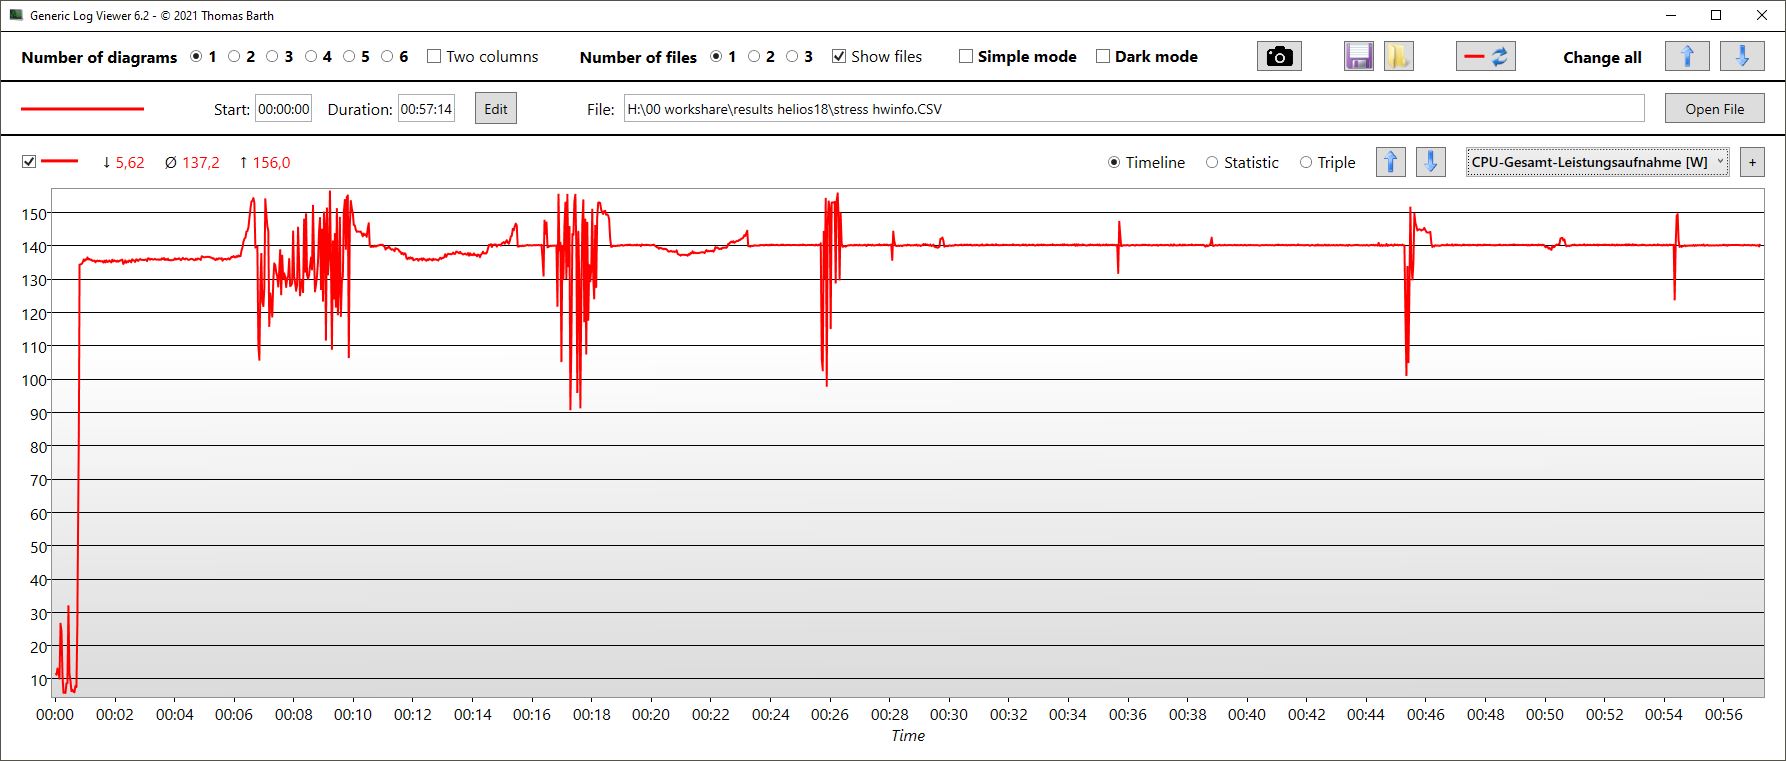
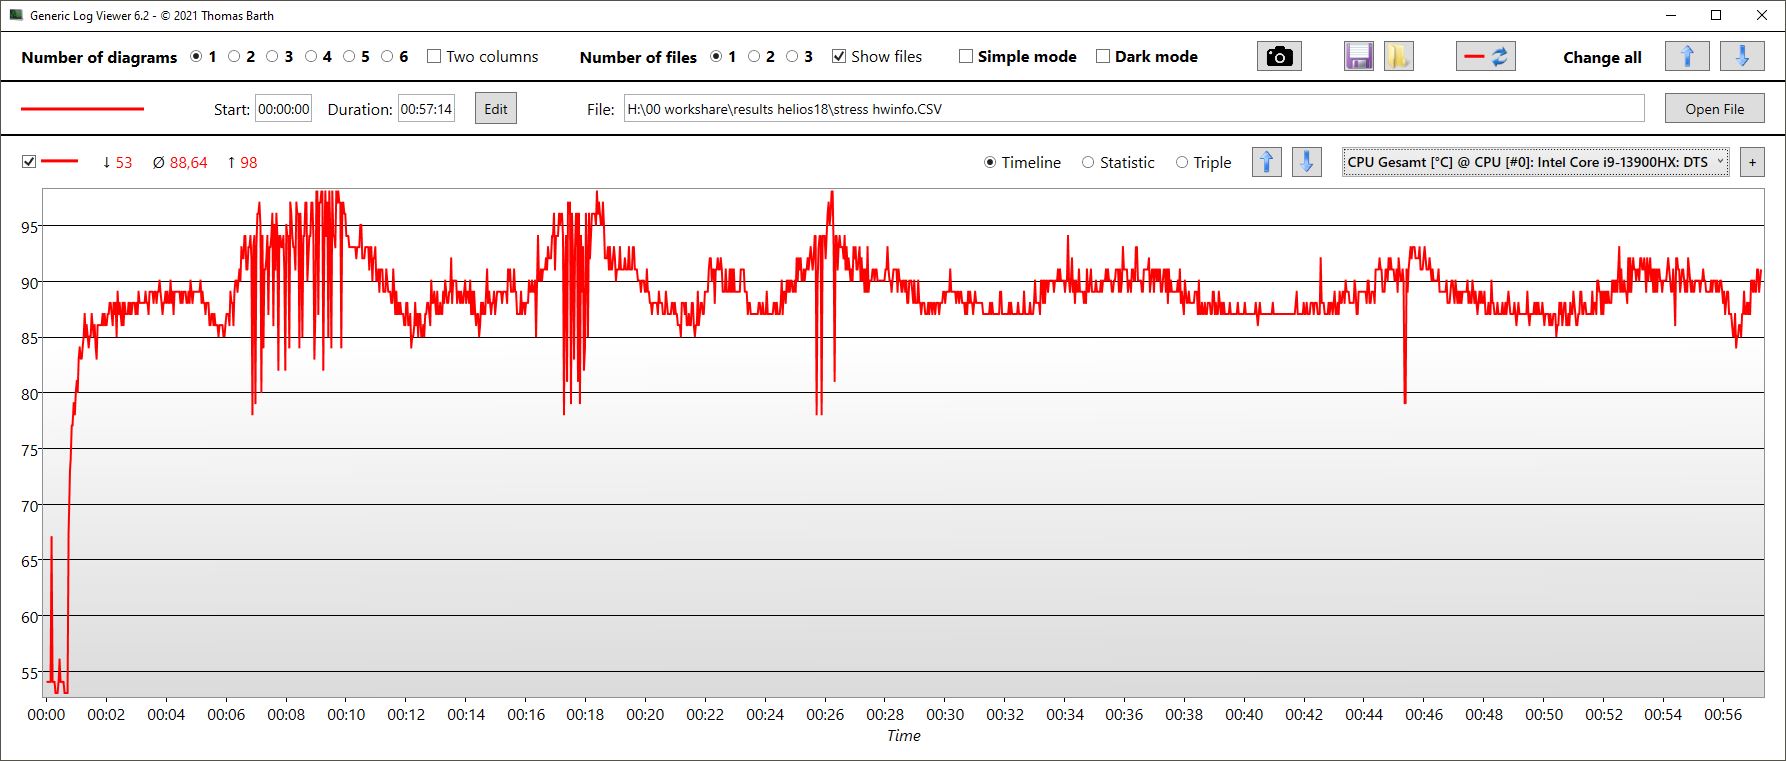
Po uruchomieniu naszego testu obciążeniowego wydajność procesora Predator pozostaje względnie stała, a rdzenie konsekwentnie taktują z częstotliwością od 3,4 do 3,6 GHz. Zawsze występują niewielkie wahania, które znajdują odzwierciedlenie w zużyciu energii, a także temperaturze rdzenia. Temperatura rdzenia procesora wzrasta do 98 °C, ale średnio wynosi 89 °C. Pobór mocy CPU osiąga wartość szczytową 156 W i wynosi średnio 137 W.
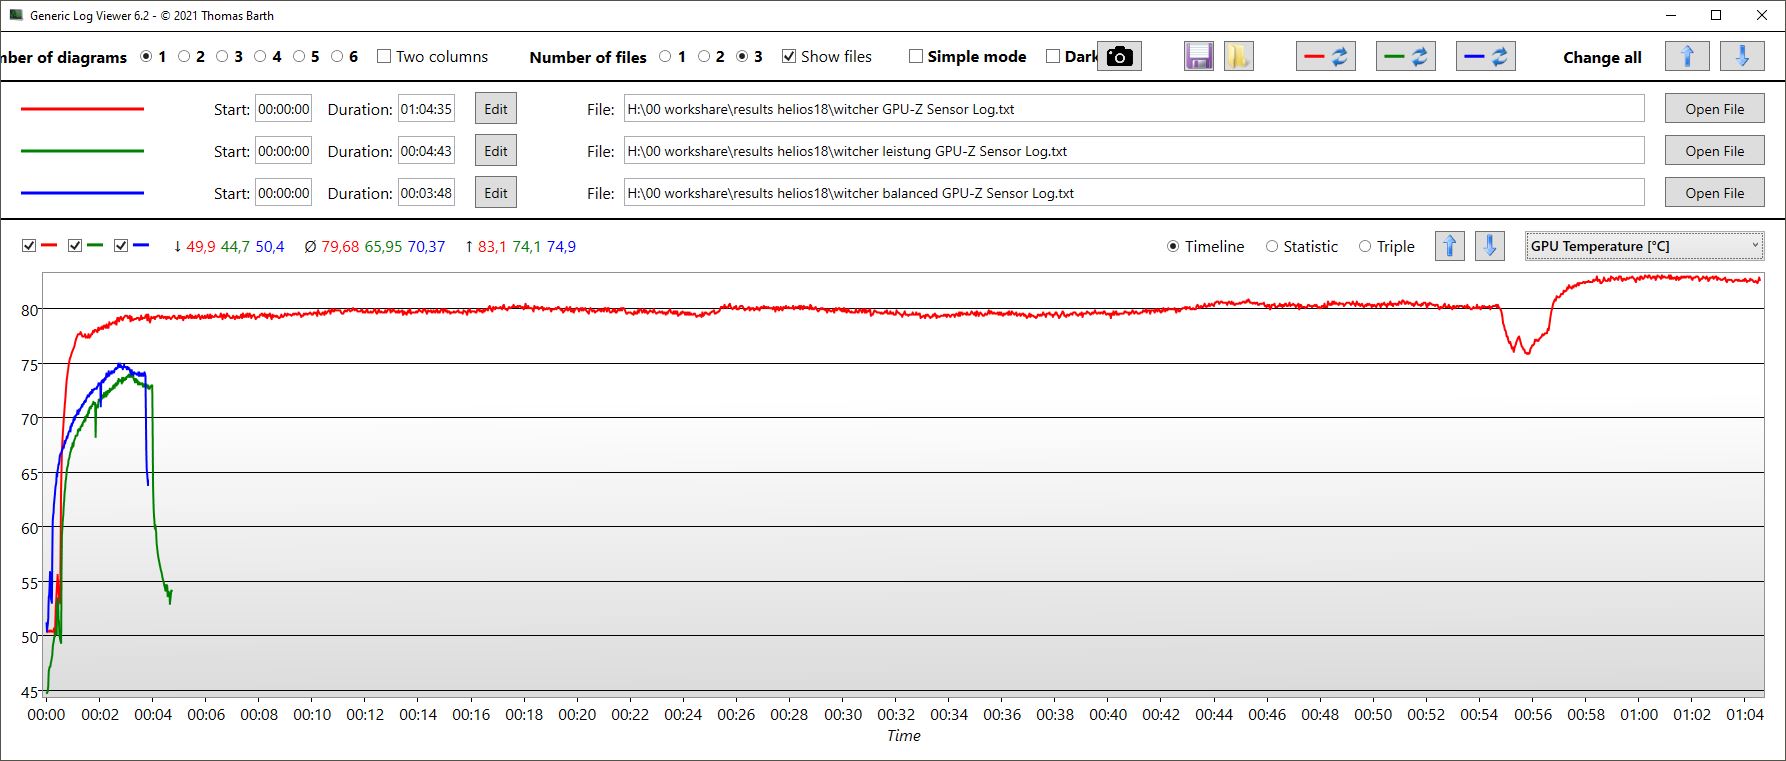
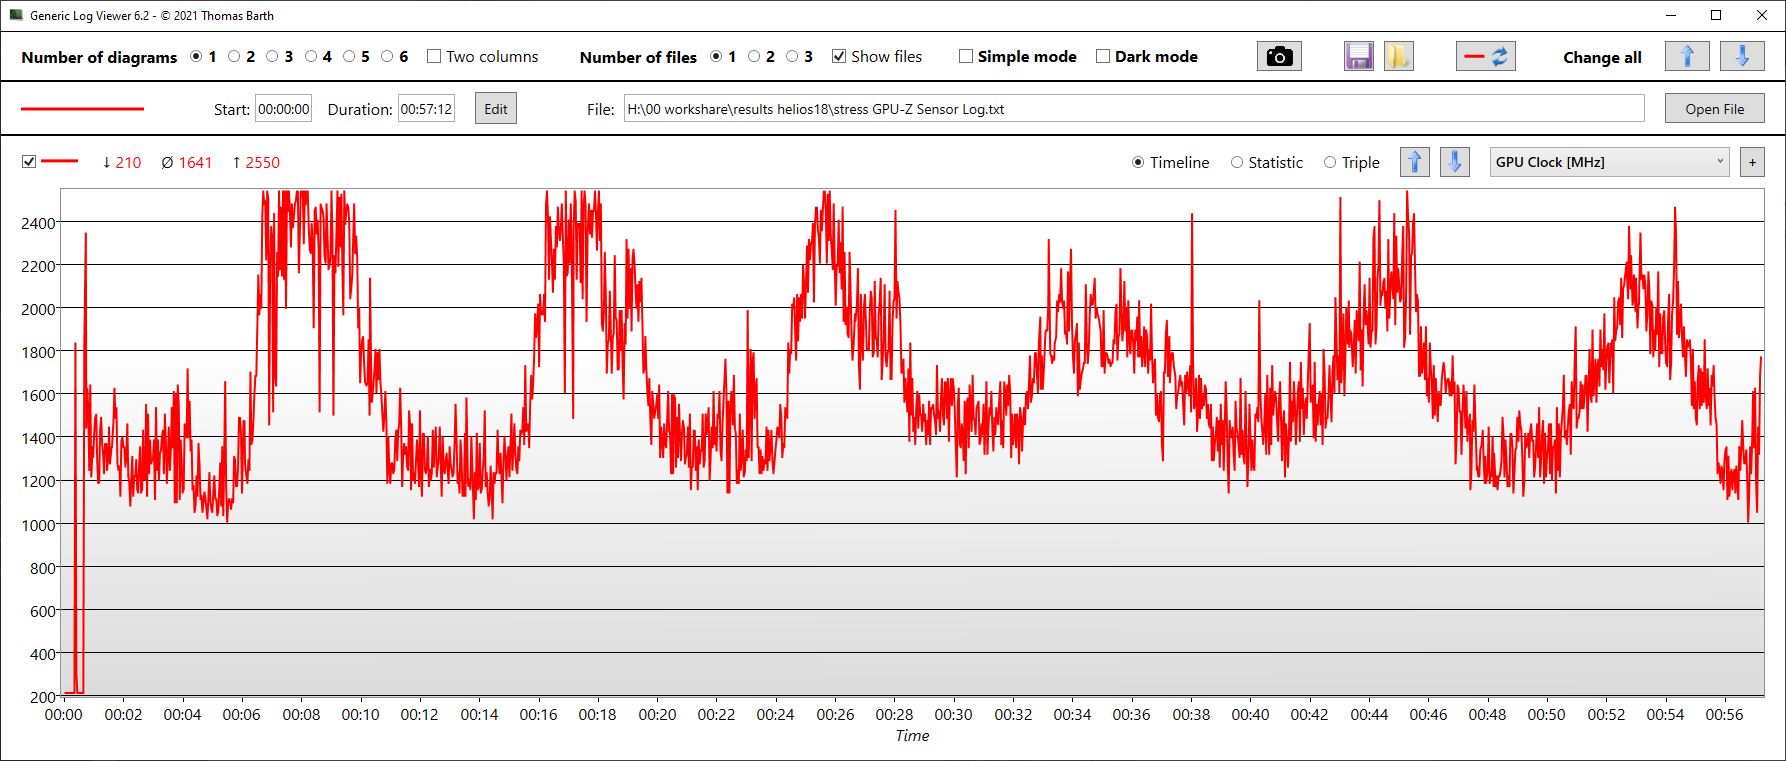
GPU jest znacznie mniej spójny i wykazuje krzywą fali wydajności. Częstotliwość taktowania osiąga cyklicznie powtarzające się maksimum na poziomie 2,5 GHz, a doliny krzywej wynoszą około 1,2 GHz. W tym samym czasie zmierzyliśmy bardzo spontaniczne spadki do zaledwie 200 MHz przez ułamki sekund w skądinąd stałym taktowaniu pamięci wynoszącym 2,3 GHz. Temperatura GPU również ulega wahaniom, ale wynosi średnio tylko 64 °C, a maksymalnie 76 °C. Pobór mocy waha się od 25 W do 90-100 W.
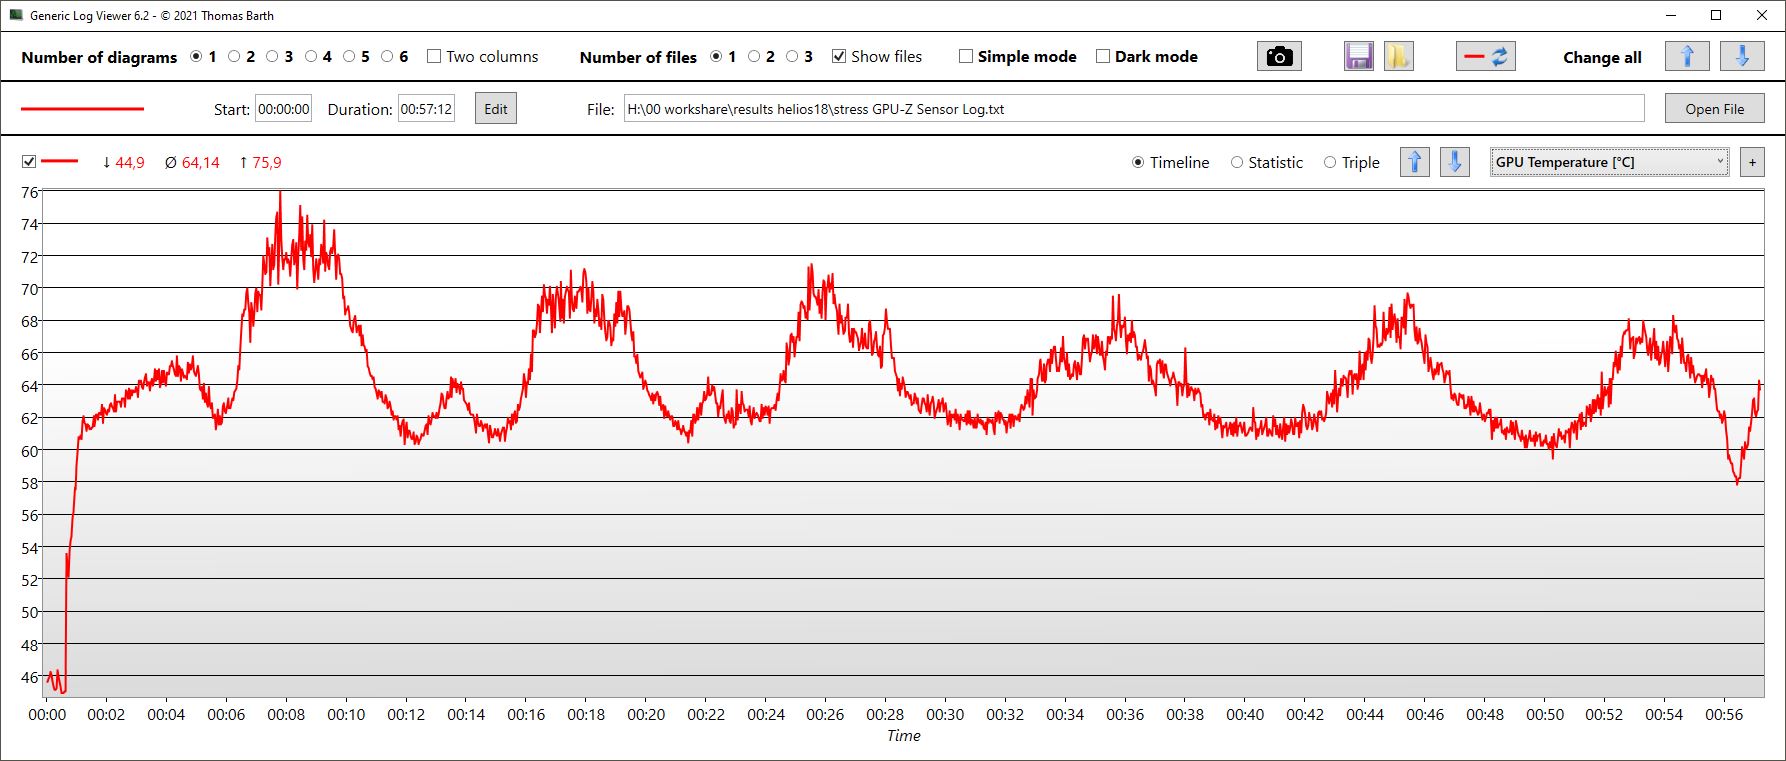
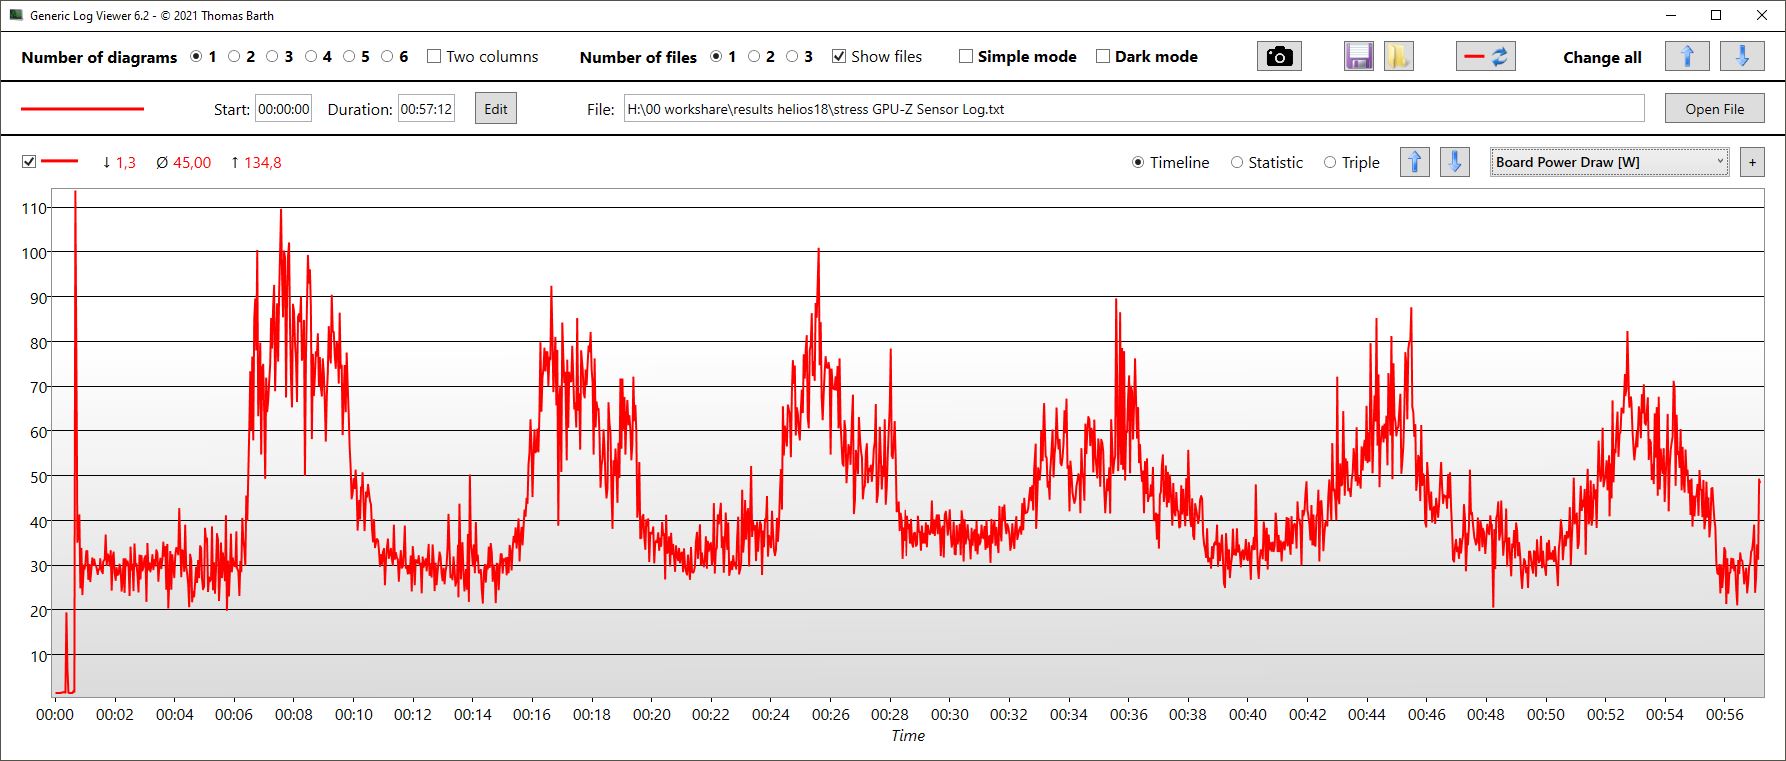
| Taktowanie CPU (GHz) | Taktowanie GPU (MHz) | Średnia temperatura CPU (°C) | Średnia temperatura GPU (°C) | |
| Prime95 + FurMark Stress | 3,5 | 1.640 | 89 | 64 |
| Witcher 3 Obciążenie | 527 | 2.525 | 88.5 | 80 |
Głośniki
Głośniki mogą być dość głośne, ale to wszystko, jeśli chodzi o pozytywne wiadomości. Dźwięk jest cichy, basy praktycznie nie istnieją, a nawet średnie i wysokie tony nie są szczególnie zrównoważone. Spodziewaliśmy się lepszej jakości dźwięku, zwłaszcza po tak dużym laptopie.
Zewnętrzne urządzenia audio można podłączyć między innymi za pomocą połączonego gniazda słuchawkowego. Słuchawki i tak są koniecznością podczas głośnego grania w trybie Turbo .
Acer Predator Helios 18 N23Q2 analiza dźwięku
(+) | głośniki mogą odtwarzać stosunkowo głośno (82.74 dB)
Bas 100 - 315 Hz
(-) | prawie brak basu - średnio 17.6% niższa od mediany
(±) | liniowość basu jest średnia (9.8% delta do poprzedniej częstotliwości)
Średnie 400 - 2000 Hz
(±) | wyższe średnie - średnio 9.1% wyższe niż mediana
(±) | liniowość środka jest średnia (8.8% delta do poprzedniej częstotliwości)
Wysokie 2–16 kHz
(±) | wyższe maksima - średnio 5.3% wyższe od mediany
(+) | wzloty są liniowe (6.4% delta do poprzedniej częstotliwości)
Ogólnie 100 - 16.000 Hz
(±) | liniowość ogólnego dźwięku jest średnia (20.3% różnicy w stosunku do mediany)
W porównaniu do tej samej klasy
» 72% wszystkich testowanych urządzeń w tej klasie było lepszych, 6% podobnych, 23% gorszych
» Najlepszy miał deltę 6%, średnia wynosiła ###średnia###%, najgorsza wynosiła 132%
W porównaniu do wszystkich testowanych urządzeń
» 53% wszystkich testowanych urządzeń było lepszych, 8% podobnych, 39% gorszych
» Najlepszy miał deltę 4%, średnia wynosiła ###średnia###%, najgorsza wynosiła 134%
Apple MacBook Pro 16 2021 M1 Pro analiza dźwięku
(+) | głośniki mogą odtwarzać stosunkowo głośno (84.7 dB)
Bas 100 - 315 Hz
(+) | dobry bas - tylko 3.8% od mediany
(+) | bas jest liniowy (5.2% delta do poprzedniej częstotliwości)
Średnie 400 - 2000 Hz
(+) | zbalansowane środki średnie - tylko 1.3% od mediany
(+) | średnie są liniowe (2.1% delta do poprzedniej częstotliwości)
Wysokie 2–16 kHz
(+) | zrównoważone maksima - tylko 1.9% od mediany
(+) | wzloty są liniowe (2.7% delta do poprzedniej częstotliwości)
Ogólnie 100 - 16.000 Hz
(+) | ogólny dźwięk jest liniowy (4.6% różnicy w stosunku do mediany)
W porównaniu do tej samej klasy
» 0% wszystkich testowanych urządzeń w tej klasie było lepszych, 0% podobnych, 100% gorszych
» Najlepszy miał deltę 5%, średnia wynosiła ###średnia###%, najgorsza wynosiła 45%
W porównaniu do wszystkich testowanych urządzeń
» 0% wszystkich testowanych urządzeń było lepszych, 0% podobnych, 100% gorszych
» Najlepszy miał deltę 4%, średnia wynosiła ###średnia###%, najgorsza wynosiła 134%
Zarządzanie energią - zużycie i czas pracy zgodne z oczekiwaniami
Zużycie energii
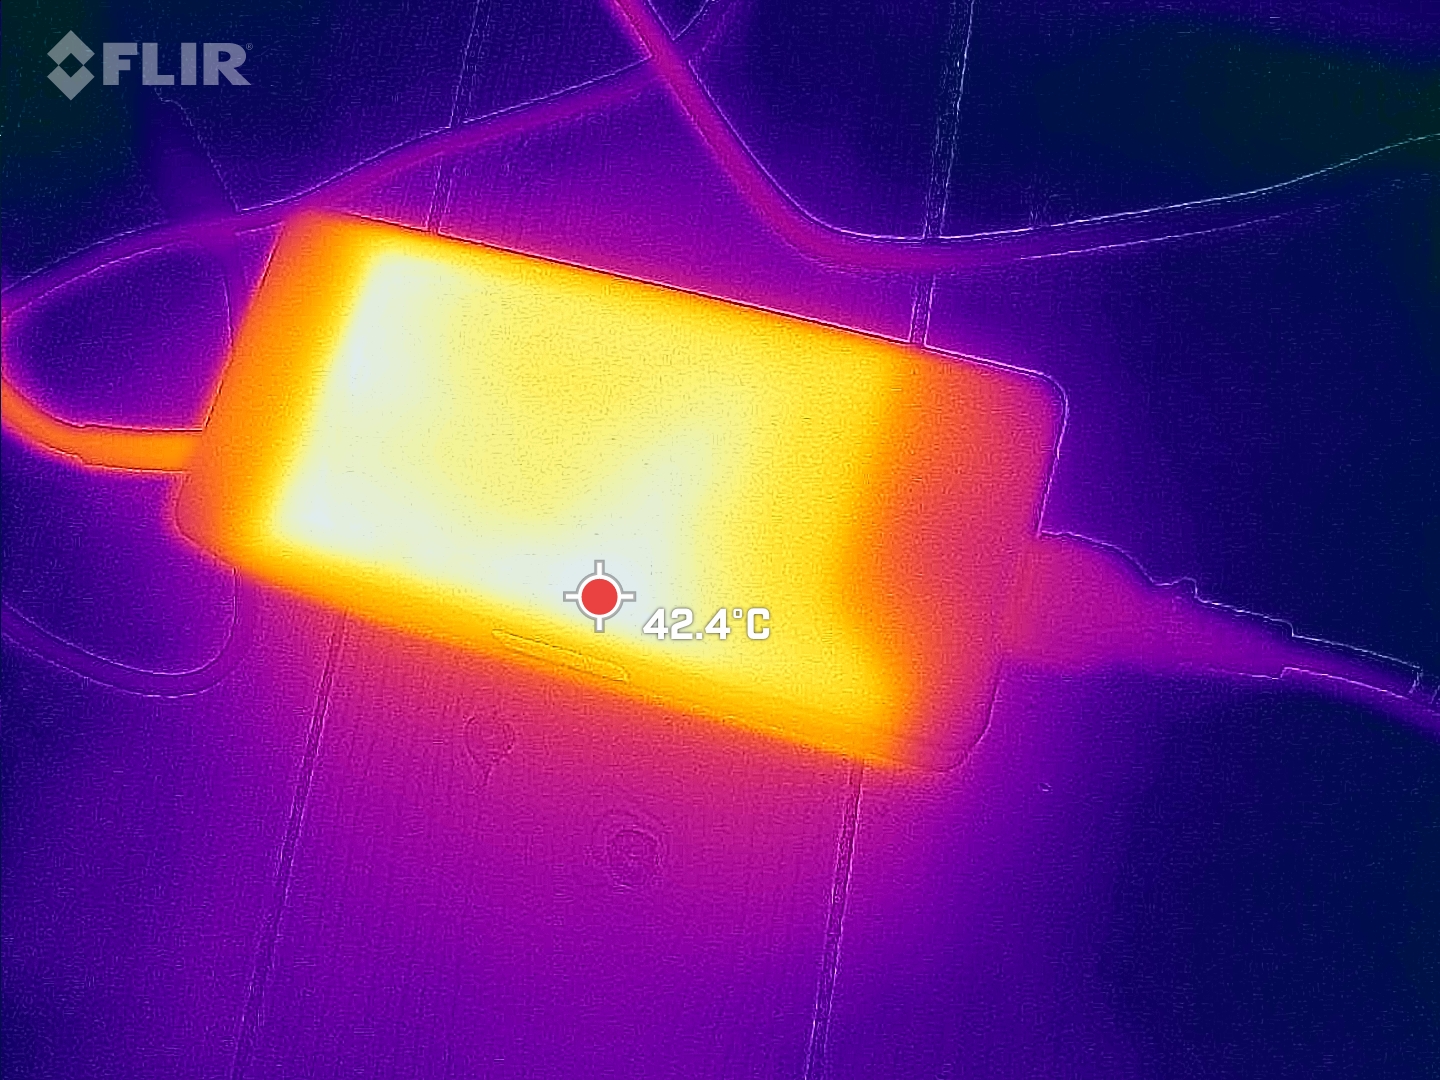
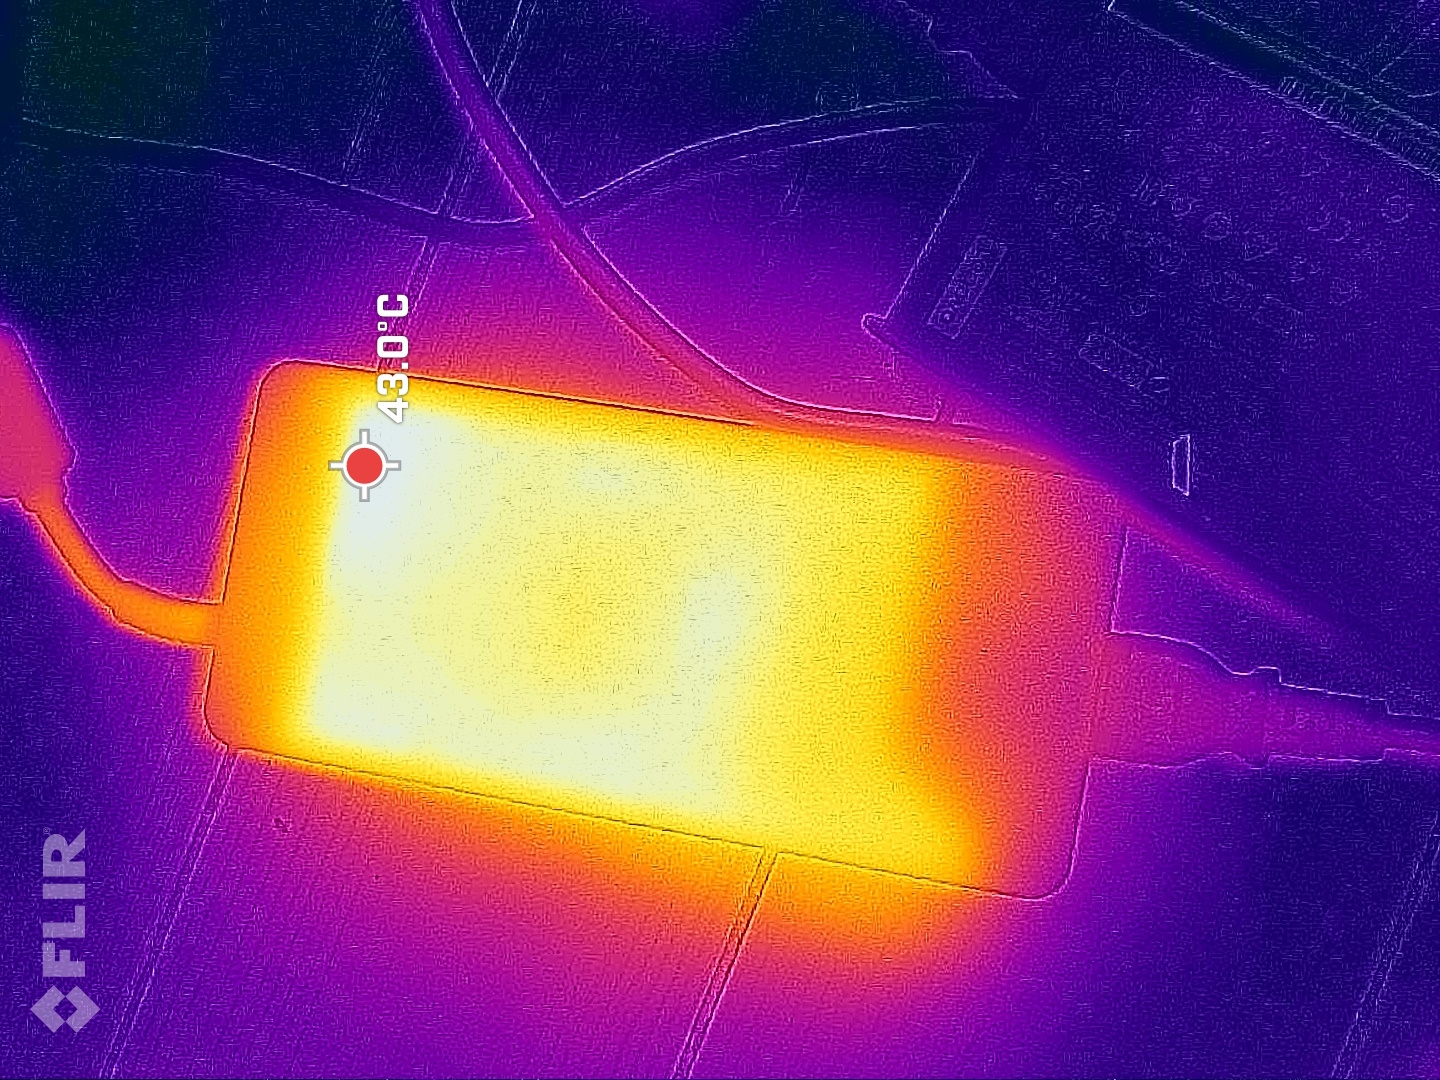
Nikt nie oczekuje oszczędności od procesora HX i RTX 4080, więc Helios 18 nie jest zaskoczeniem. Jest dość oszczędny w trybie bezczynności, ale w grach potrzebuje prawie tyle samo, co mniej więcej równie potężnyMSI GE78HXjedynie krótkoterminowy maksymalny pobór mocy wynoszący 319 W jest wyższy niż w przypadku MSI. Duży i ciężki zasilacz Chicony ma moc znamionową 330 W i powinien być w stanie zapewnić Predatorowi wystarczającą moc przez cały czas, nawet w wymagających scenariuszach.
| wyłączony / stan wstrzymania | |
| luz | |
| obciążenie |
|
Legenda:
min: | |
| Acer Predator Helios 18 N23Q2 i9-13900HX, GeForce RTX 4080 Laptop GPU, Samsung PM9A1 MZVL22T0HBLB, IPS, 2560x1600, 18" | MSI GE78HX 13VH-070US i9-13950HX, GeForce RTX 4080 Laptop GPU, Samsung PM9A1 MZVL22T0HBLB, IPS, 2560x1600, 17" | HP Omen 17-ck2097ng i9-13900HX, GeForce RTX 4080 Laptop GPU, SK hynix PC801 HFS001TEJ9X101N, IPS, 2560x1440, 17.3" | Alienware m18 R1 i9-13980HX, GeForce RTX 4090 Laptop GPU, SK hynix PC801 HFS001TEJ9X101N, IPS, 1920x1200, 18" | Asus ROG Strix G18 G814JI i7-13650HX, GeForce RTX 4070 Laptop GPU, Micron 2400 MTFDKBA1T0QFM, IPS, 2560x1600, 18" | Razer Blade 18 RTX 4070 i9-13950HX, GeForce RTX 4070 Laptop GPU, SSSTC CA6-8D1024, IPS, 2560x1600, 18" | Przeciętny NVIDIA GeForce RTX 4080 Laptop GPU | Średnia w klasie Gaming | |
|---|---|---|---|---|---|---|---|---|
| Power Consumption | -13% | -1% | -47% | 20% | -37% | -14% | 7% | |
| Idle Minimum * (Watt) | 16 | 16.1 -1% | 16 -0% | 21.6 -35% | 8 50% | 24.5 -53% | 16.9 ? -6% | 13.2 ? 17% |
| Idle Average * (Watt) | 19 | 24 -26% | 20 -5% | 25.2 -33% | 15 21% | 34.1 -79% | 22 ? -16% | 18.9 ? 1% |
| Idle Maximum * (Watt) | 21.3 | 34 -60% | 26 -22% | 56.7 -166% | 26 -22% | 47.7 -124% | 34.1 ? -60% | 24.3 ? -14% |
| Load Average * (Watt) | 124 | 123.6 -0% | 135 -9% | 164.1 -32% | 102 18% | 140 -13% | 117.9 ? 5% | 108.3 ? 13% |
| Witcher 3 ultra * (Watt) | 289 | 286 1% | 215 26% | 311 -8% | 178.6 38% | 202 30% | ||
| Load Maximum * (Watt) | 319 | 285.7 10% | 299 6% | 338.9 -6% | 267 16% | 261 18% | 297 ? 7% | 254 ? 20% |
* ... im mniej tym lepiej
Power consumption Witcher 3 / Stress test
Power consumption with an external monitor
Żywotność baterii
Acer instaluje baterię 90 Wh, podczas gdy MSI i Alienware mają odpowiednio 99 i 97 Wh. Użytkownicy powinni zdecydowanie używać trybu SDR dla wyświetlacza w trybie baterii, w przeciwnym razie 1000 nitów HDR znacznie szybciej rozładuje baterię.
Helios 18 wytrzymuje od 4,5 do prawie 5 godzin w teście WiFi i wideo przy zmniejszonej jasności 150 nitów. MSI jest nieco bardziej wytrzymały, a Alienware wytrzymuje podobnie długo w teście WiFi.
| Acer Predator Helios 18 N23Q2 i9-13900HX, GeForce RTX 4080 Laptop GPU, 90 Wh | MSI GE78HX 13VH-070US i9-13950HX, GeForce RTX 4080 Laptop GPU, 99 Wh | HP Omen 17-ck2097ng i9-13900HX, GeForce RTX 4080 Laptop GPU, 83 Wh | Alienware m18 R1 i9-13980HX, GeForce RTX 4090 Laptop GPU, 97 Wh | Asus ROG Strix G18 G814JI i7-13650HX, GeForce RTX 4070 Laptop GPU, 90 Wh | Razer Blade 18 RTX 4070 i9-13950HX, GeForce RTX 4070 Laptop GPU, 91.7 Wh | Średnia w klasie Gaming | |
|---|---|---|---|---|---|---|---|
| Czasy pracy | 14% | -20% | -31% | 28% | -17% | 39% | |
| H.264 (h) | 4.8 | 3.7 -23% | 8.26 ? 72% | ||||
| WiFi v1.3 (h) | 4.4 | 6.1 39% | 3.6 -18% | 4.3 -2% | 8.1 84% | 4 -9% | 7.04 ? 60% |
| Load (h) | 1.7 | 1.5 -12% | 1.4 -18% | 0.7 -59% | 1.2 -29% | 1.3 -24% | 1.47 ? -14% |
| Reader / Idle (h) | 7.3 | 4.2 | 5.6 | 11.7 | 7 | 8.71 ? |
Za
Przeciw
Werdykt - Mocny gracz z potencjałem optymalizacji chłodzenia
Gamer nie wykazuje żadnych słabości pod względem wydajności. Zarówno CPU, jak i GPU radzą sobie nieco lepiej niż przeciętny laptop o tej samej konfiguracji z naszej bazy danych. Jest też jasny i kontrastowy wyświetlacz MiniLED, a jakość wykonania i funkcje są również imponujące.
W przeciwieństwie do dobrze dostrojonego Heliosa 16 z RTX 4060, słabości Heliosa 18 z bardziej wymagającym RTX 4080 stają się widoczne: system chłodzenia jest bardzo głośny w trybie Turbo i nie wydaje się być zoptymalizowany w innych obszarach. Podczas gdy większość obszarów laptopa pozostaje niezwykle chłodna, gorący punkt jest nadal jednym z najgorętszych w tej klasie. Jednocześnie teoretycznie mocny model SSD jest bardzo szybko dławiony. Zalecamy uruchomienie laptopa w cichszym trybie Performance .
Acer Predator Helios 18 to behemot o dużej wydajności, ale głośny układ chłodzenia wymaga optymalizacji.
Do tej pory recenzowaliśmy tylko 18-calowych konkurentów ze słabszymi GPU, dlatego polecanie alternatyw nie jest takie łatwe. Pod względem wydajności, 17-calowy MSI Raider GE78HX może dotrzymać kroku, ale ma słabszy wyświetlacz.
Cena i dostępność
W Stanach Zjednoczonych konfiguracja RTX 4080 karty Acer Predator Helios 18 wydaje się być deficytowa. Best Buy oferuje konfiguracje RTX 4070 i 4060 odpowiednio za 1999,99 USD i 1699,99 USD.
Ceny są aktualne na dzień 27.10.2023 i mogą ulec zmianie.
Acer Predator Helios 18 N23Q2
- 25/10/2023 v7 (old)
Christian Hintze
Przezroczystość
Wyboru urządzeń do recenzji dokonuje nasza redakcja. Próbka testowa została udostępniona autorowi jako pożyczka od producenta lub sprzedawcy detalicznego na potrzeby tej recenzji. Pożyczkodawca nie miał wpływu na tę recenzję, producent nie otrzymał też kopii tej recenzji przed publikacją. Nie było obowiązku publikowania tej recenzji. Jako niezależna firma medialna, Notebookcheck nie podlega władzy producentów, sprzedawców detalicznych ani wydawców.
Tak testuje Notebookcheck
Każdego roku Notebookcheck niezależnie sprawdza setki laptopów i smartfonów, stosując standardowe procedury, aby zapewnić porównywalność wszystkich wyników. Od około 20 lat stale rozwijamy nasze metody badawcze, ustanawiając przy tym standardy branżowe. W naszych laboratoriach testowych doświadczeni technicy i redaktorzy korzystają z wysokiej jakości sprzętu pomiarowego. Testy te obejmują wieloetapowy proces walidacji. Nasz kompleksowy system ocen opiera się na setkach uzasadnionych pomiarów i benchmarków, co pozwala zachować obiektywizm.Price comparison

