Recenzja laptopa HP Omen 16 2023: 145 W GeForce Wydajność RTX 4080

Omen 16 2023 jest następcą zeszłorocznego modelu z szybszymi procesorami Raptor Lake-H 13. generacji, układami GPU Nvidia Ada Lovelace RTX i odświeżoną konstrukcją obudowy. Można go uznać za kilka kroków w górę od bardziej budżetowego HP Pavilion Gaming 16.
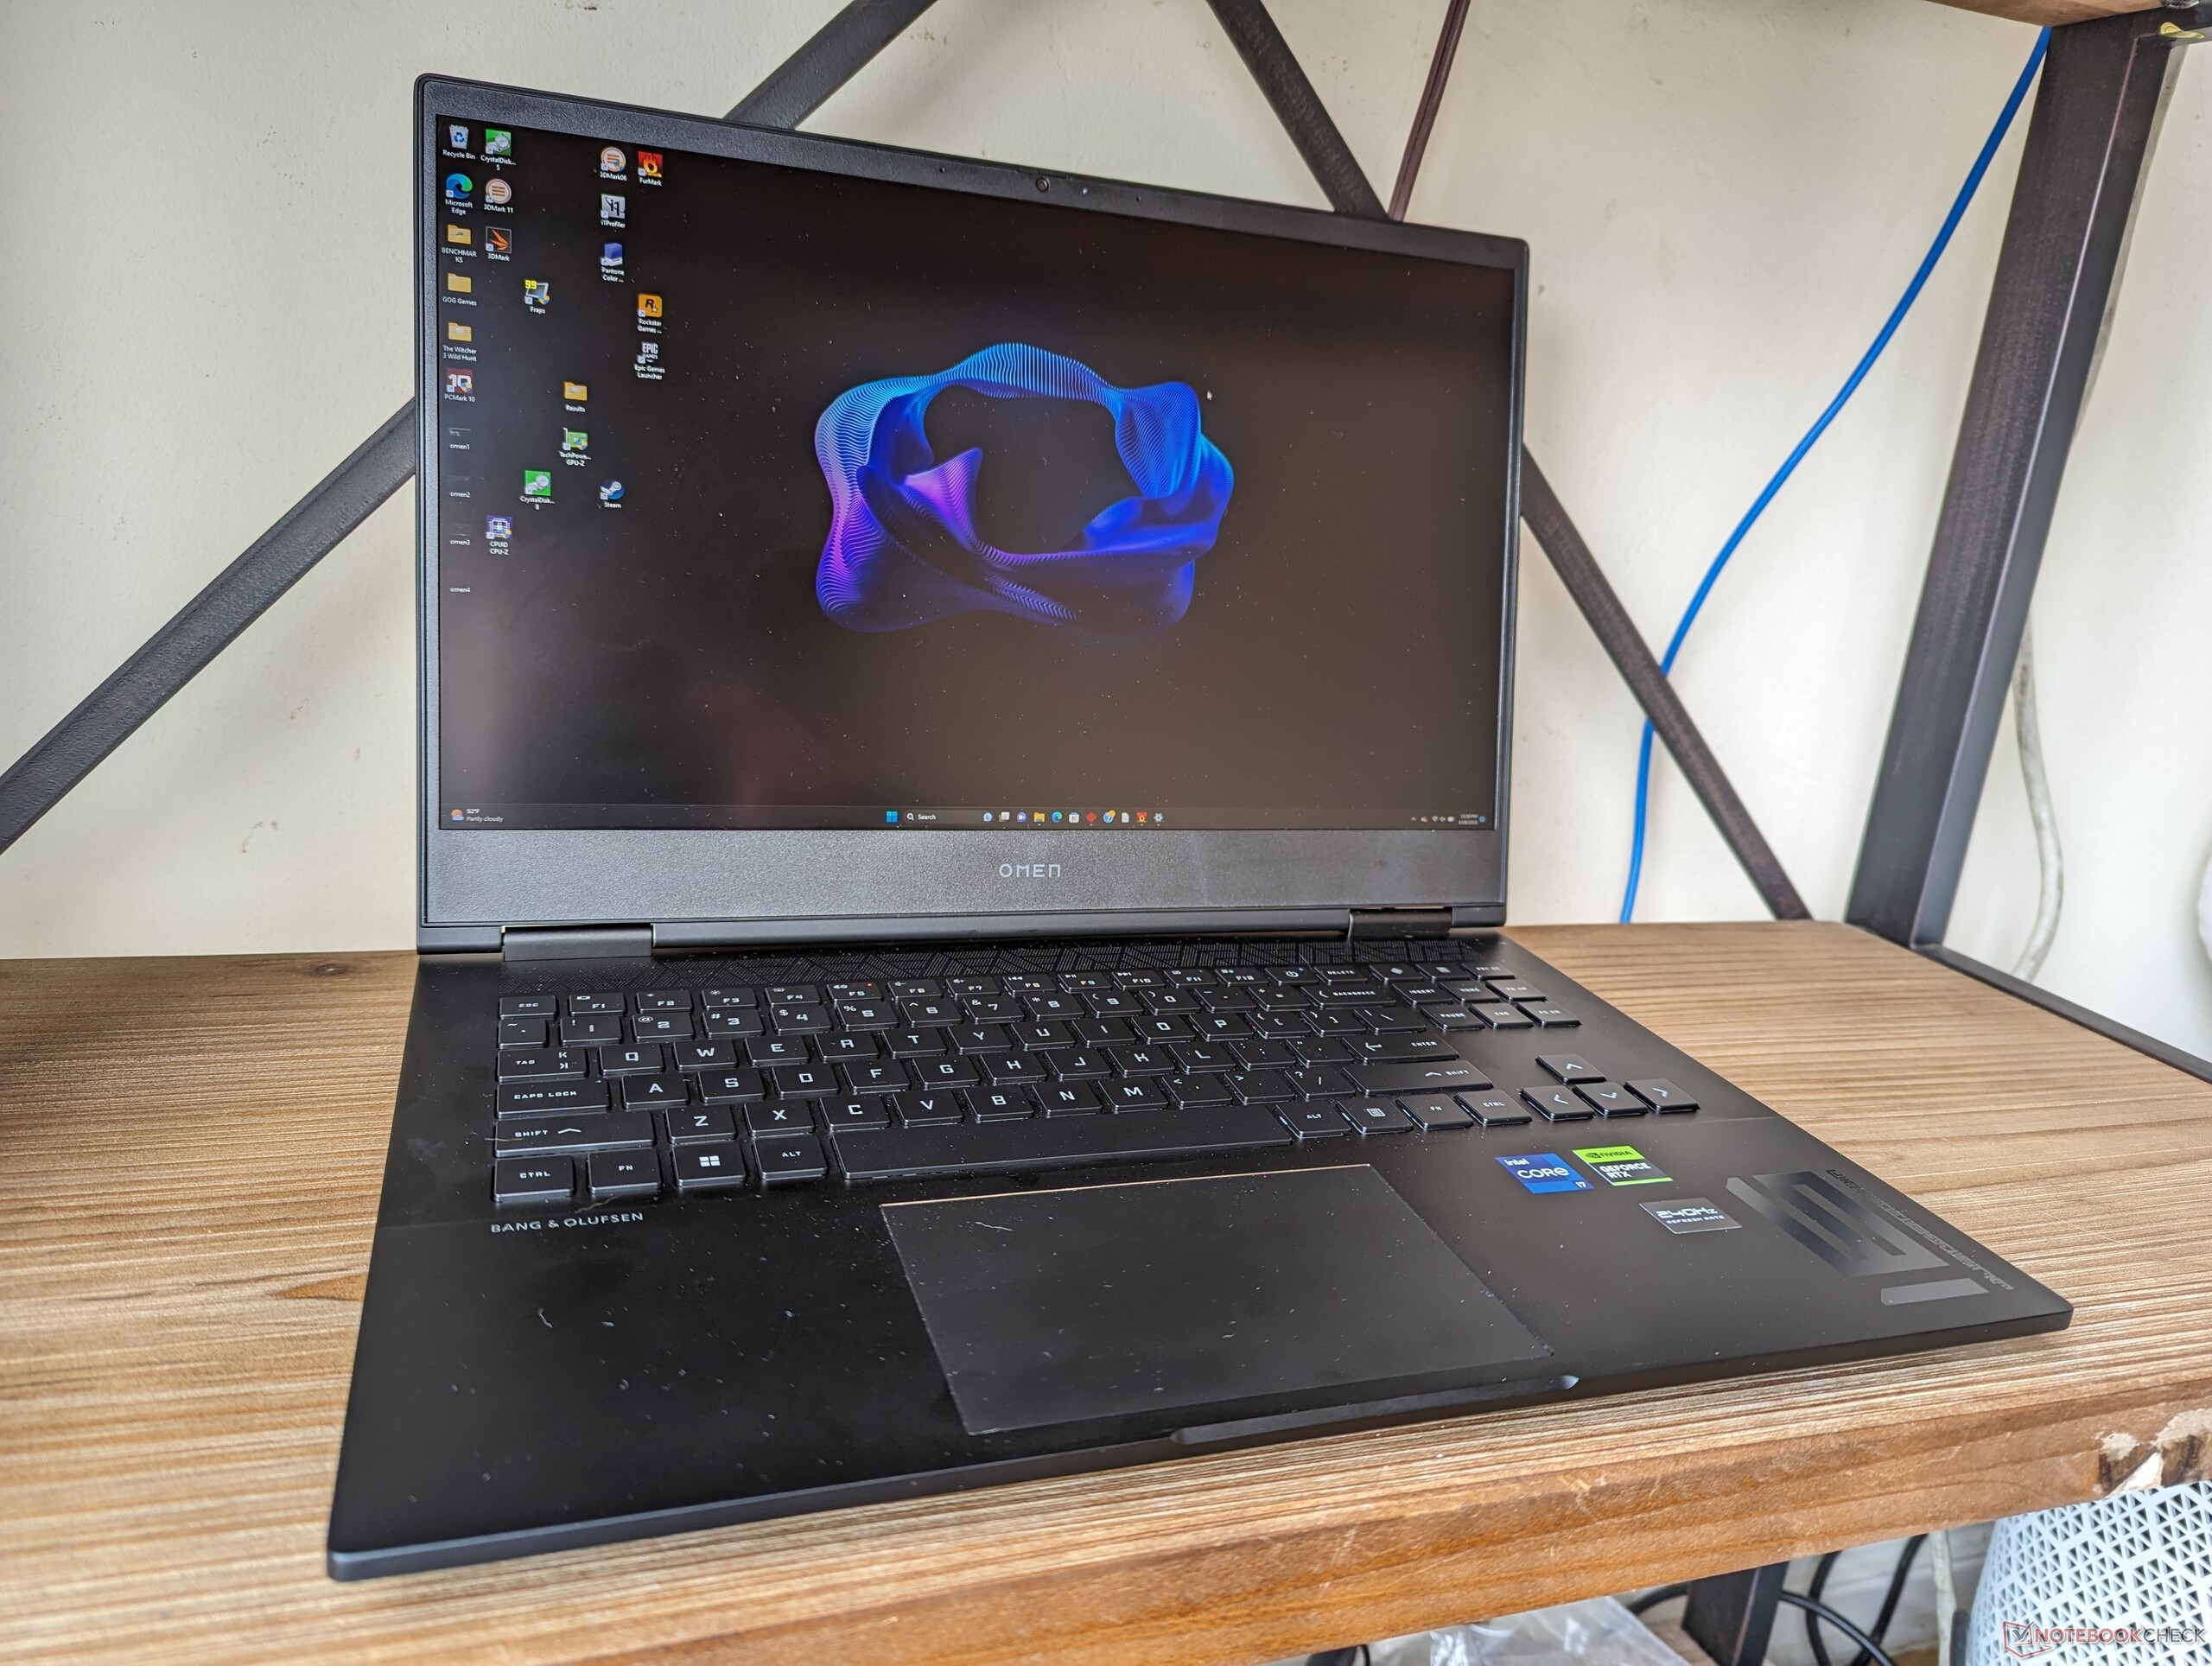
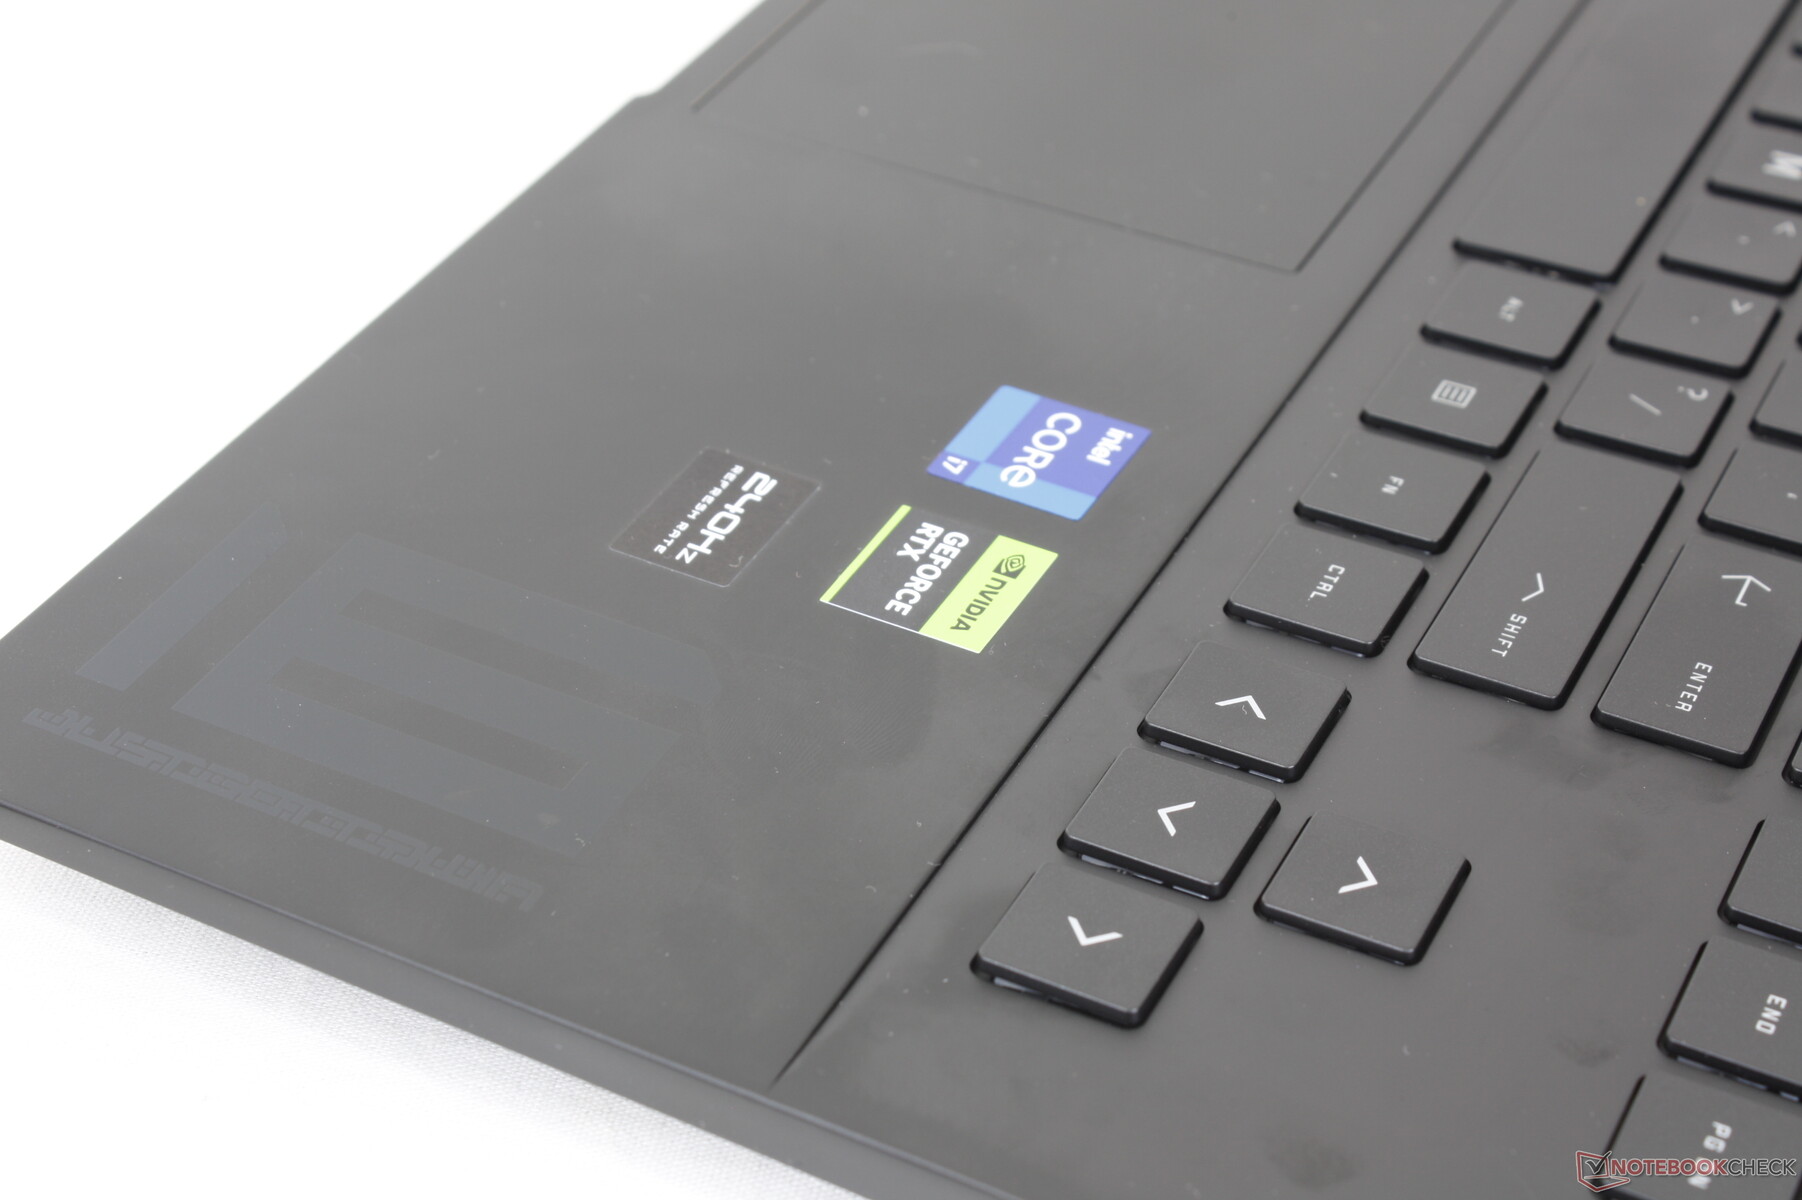
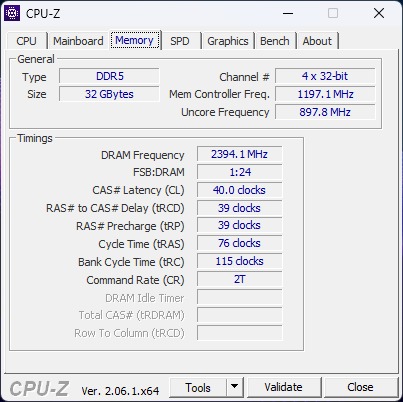
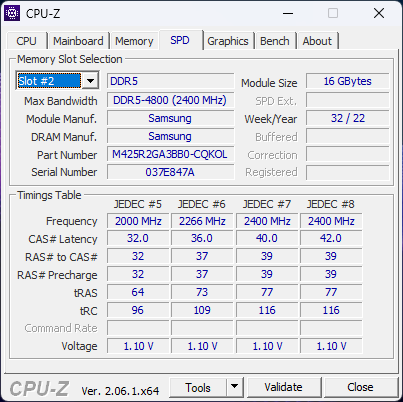
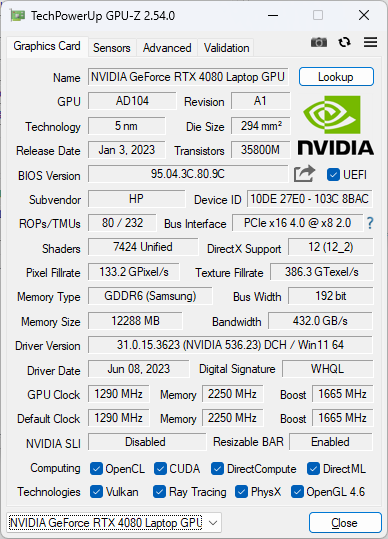
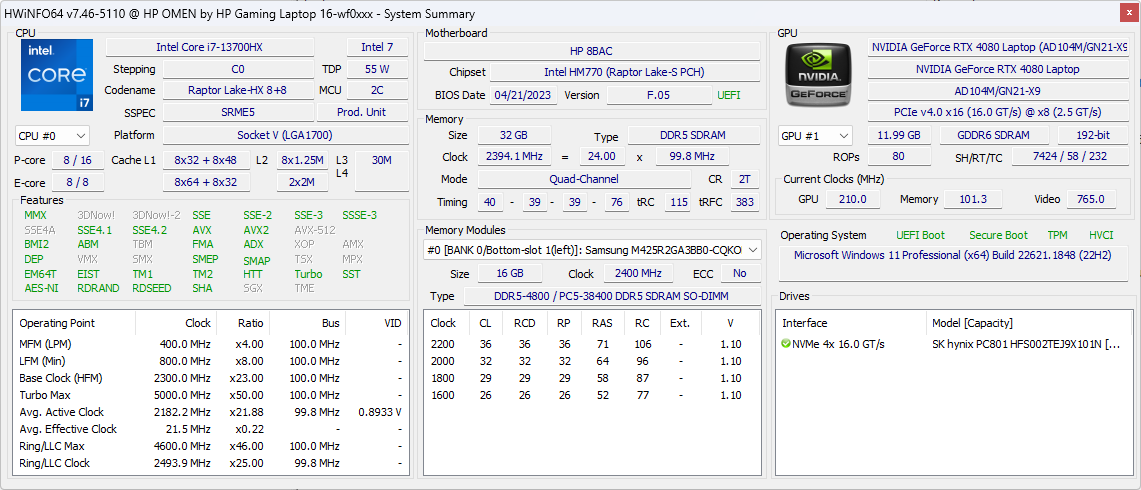
Nasz egzemplarz recenzencki to najwyższa konfiguracja z procesorem Core i7-13700HX 13. generacji Raptor Lake, kartą graficzną RTX 4080 o mocy 145 W GeForce, wyświetlaczem IPS 1440p240, oświetleniem RGB na klawisze i 32 GB pamięci RAM za niecałe 2600 USD. Mniejsze jednostki SKU z RTX 4060, wyświetlaczem IPS 1080p165 i jednostrefowym podświetleniem klawiatury są również dostępne w cenie od 1100 USD. Wszystkie opcje muszą być jednak wyposażone w ten sam procesor Core i7-13700HX. Warto zauważyć, że HP zrezygnowało w tym roku z opcji AMD i Radeon.
Alternatywy dla Omen 16 obejmują inne wysokiej klasy 16-calowe laptopy do gier, takie jak Alienware x16 R1,Lenovo Legion Pro 7 16,Asus ROG Strix G16lub Razer Blade 16.
Więcej recenzji HP:
Potencjalni konkurenci w porównaniu
Ocena | Data | Model | Waga | Wysokość | Rozmiar | Rezolucja | Cena |
|---|---|---|---|---|---|---|---|
| 87.4 % v7 (old) | 07/2023 | HP Omen 16-wf000 i7-13700HX, GeForce RTX 4080 Laptop GPU | 2.4 kg | 23.6 mm | 16.10" | 2560x1440 | |
| 86.4 % v7 (old) | 12/2022 | HP Omen 16-n0033dx R7 6800H, Radeon RX 6650M | 2.4 kg | 22.6 mm | 16.10" | 1920x1080 | |
| 88.4 % v7 (old) | 06/2023 | Alienware x16 R1 i9-13900HK, GeForce RTX 4080 Laptop GPU | 2.6 kg | 18.57 mm | 16.00" | 2560x1600 | |
| 88.8 % v7 (old) | 06/2023 | Lenovo Legion Pro 7 RTX4090 i9-13900HX, GeForce RTX 4090 Laptop GPU | 2.7 kg | 26 mm | 16.00" | 2560x1600 | |
| 88.4 % v7 (old) | 03/2023 | Asus ROG Strix G16 G614JZ i9-13980HX, GeForce RTX 4080 Laptop GPU | 2.4 kg | 30.4 mm | 16.00" | 2560x1600 | |
| 91.2 % v7 (old) | 02/2023 | Razer Blade 16 Early 2023 i9-13950HX, GeForce RTX 4080 Laptop GPU | 2.4 kg | 21.99 mm | 16.00" | 2560x1600 |
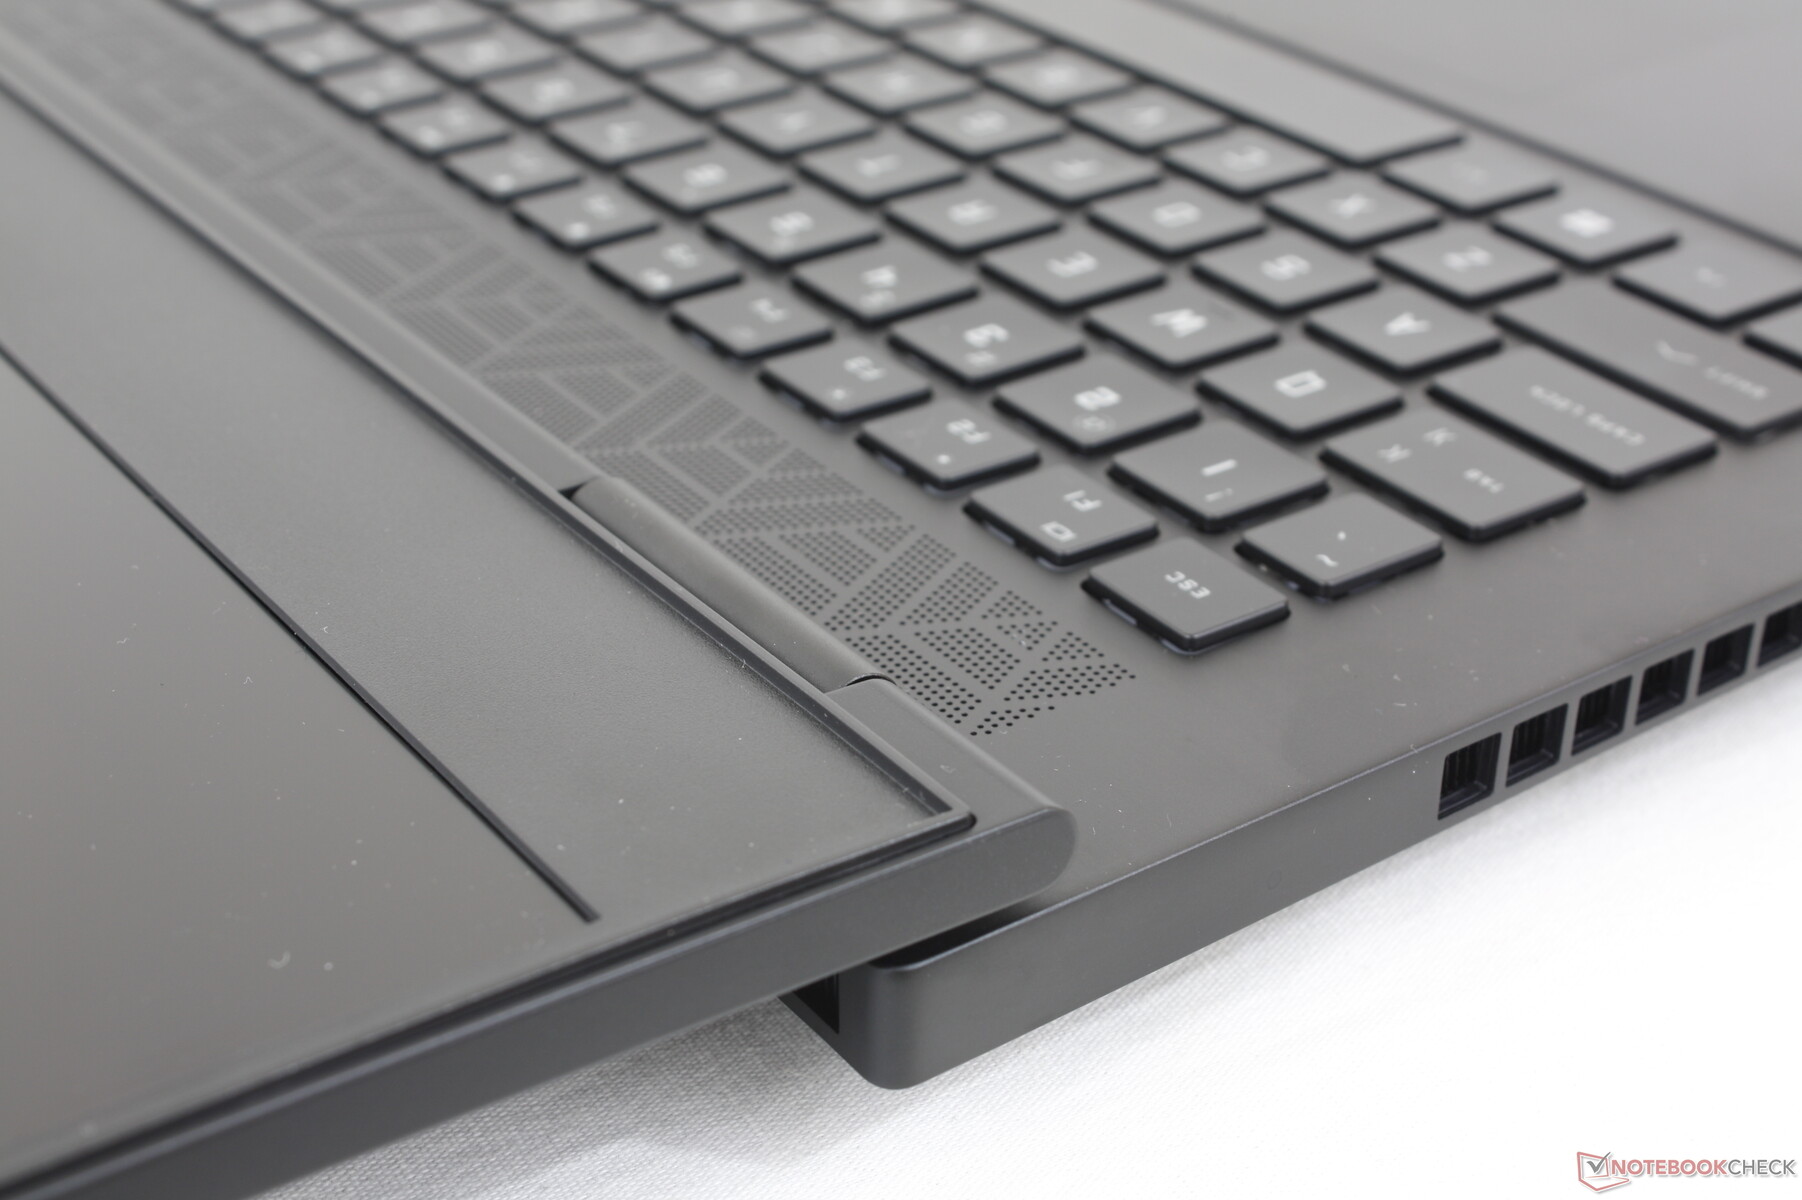
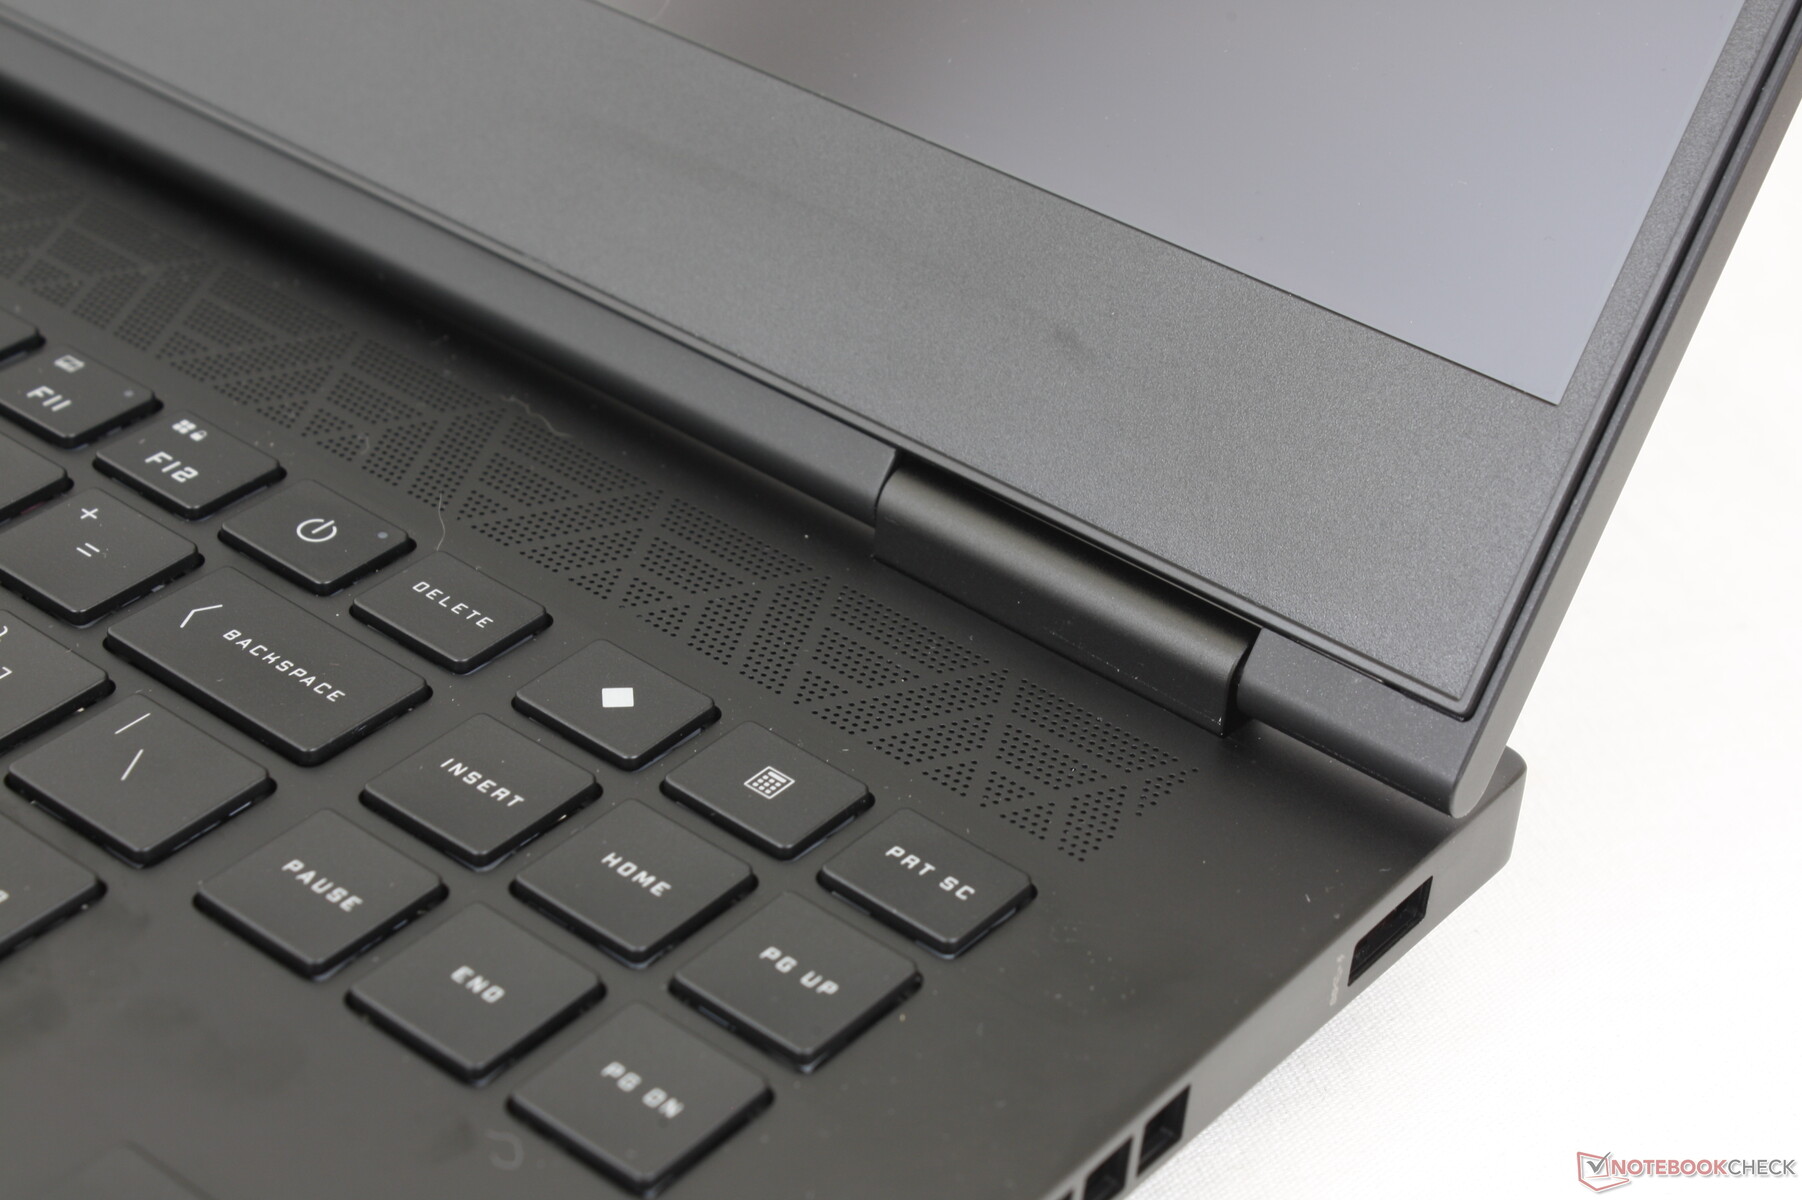
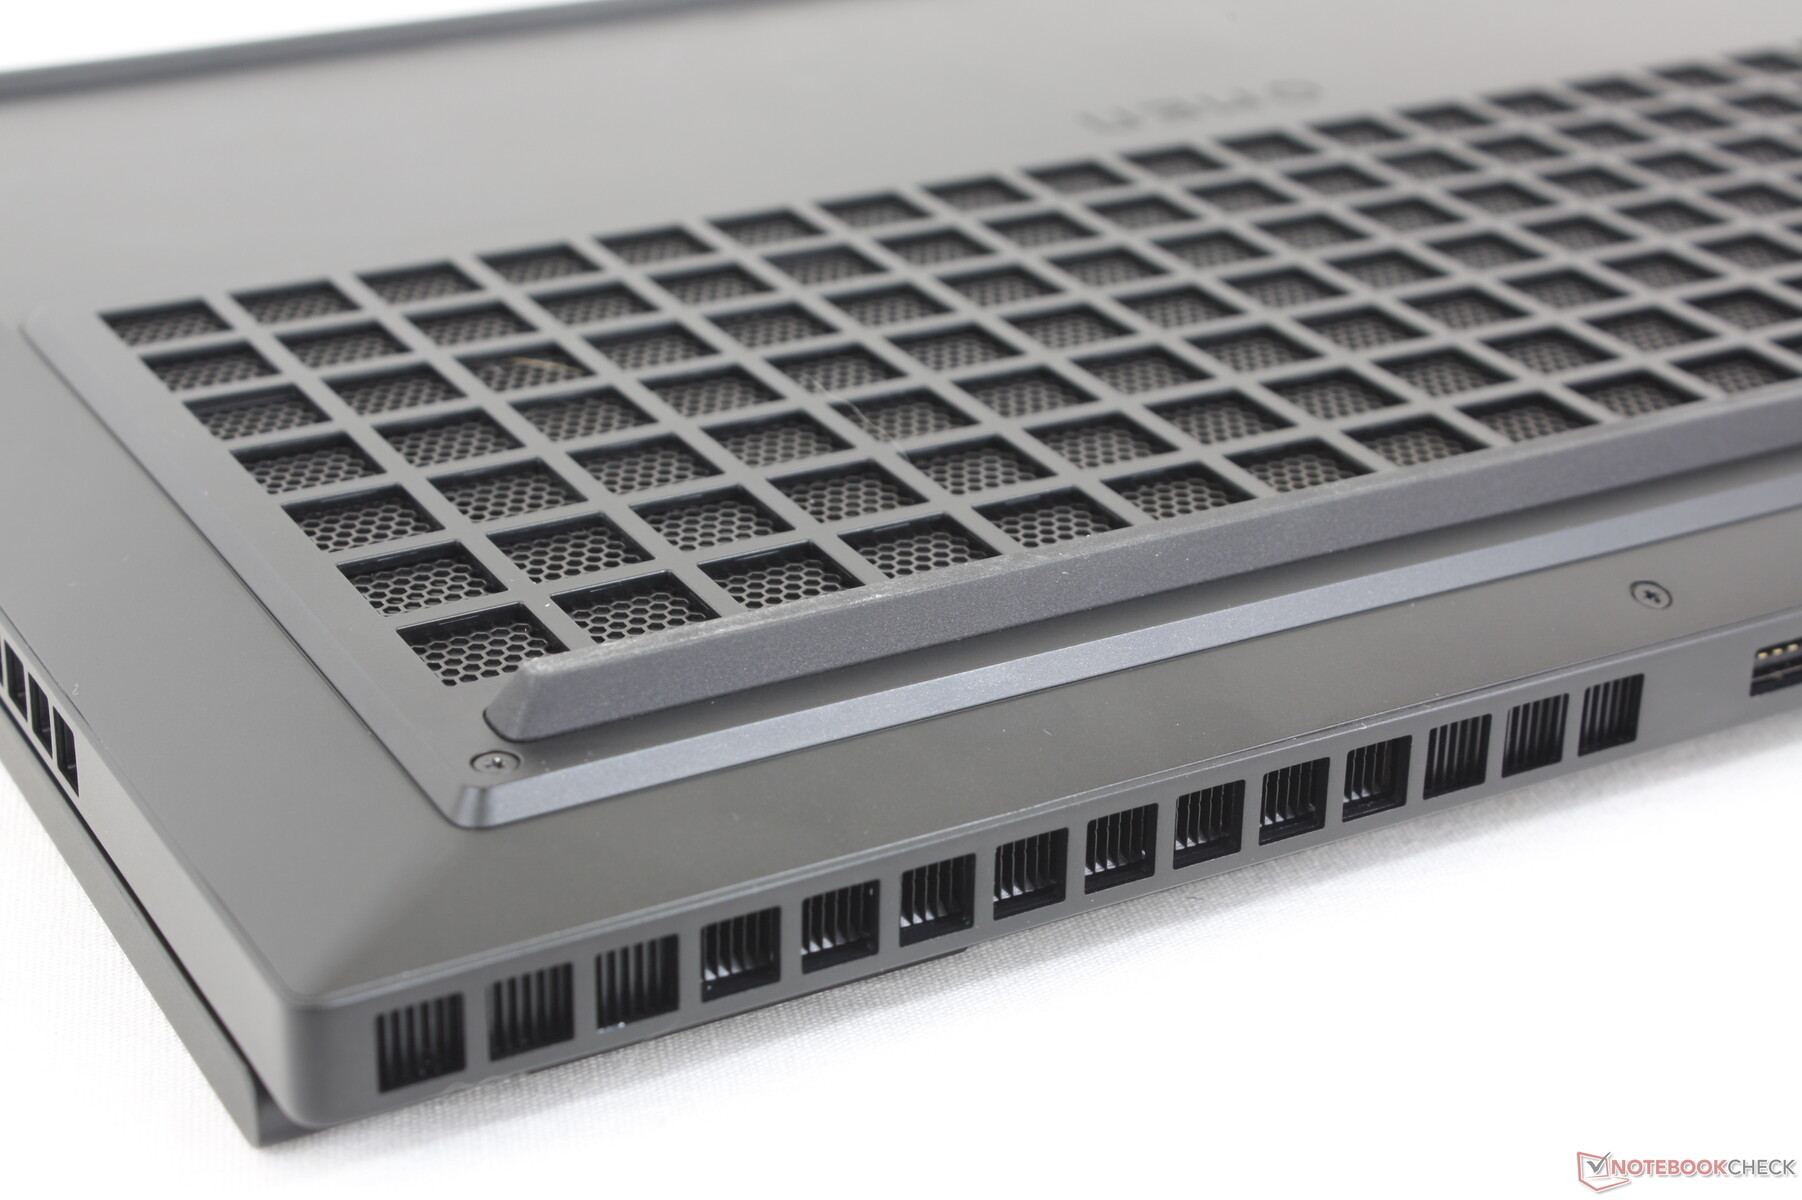
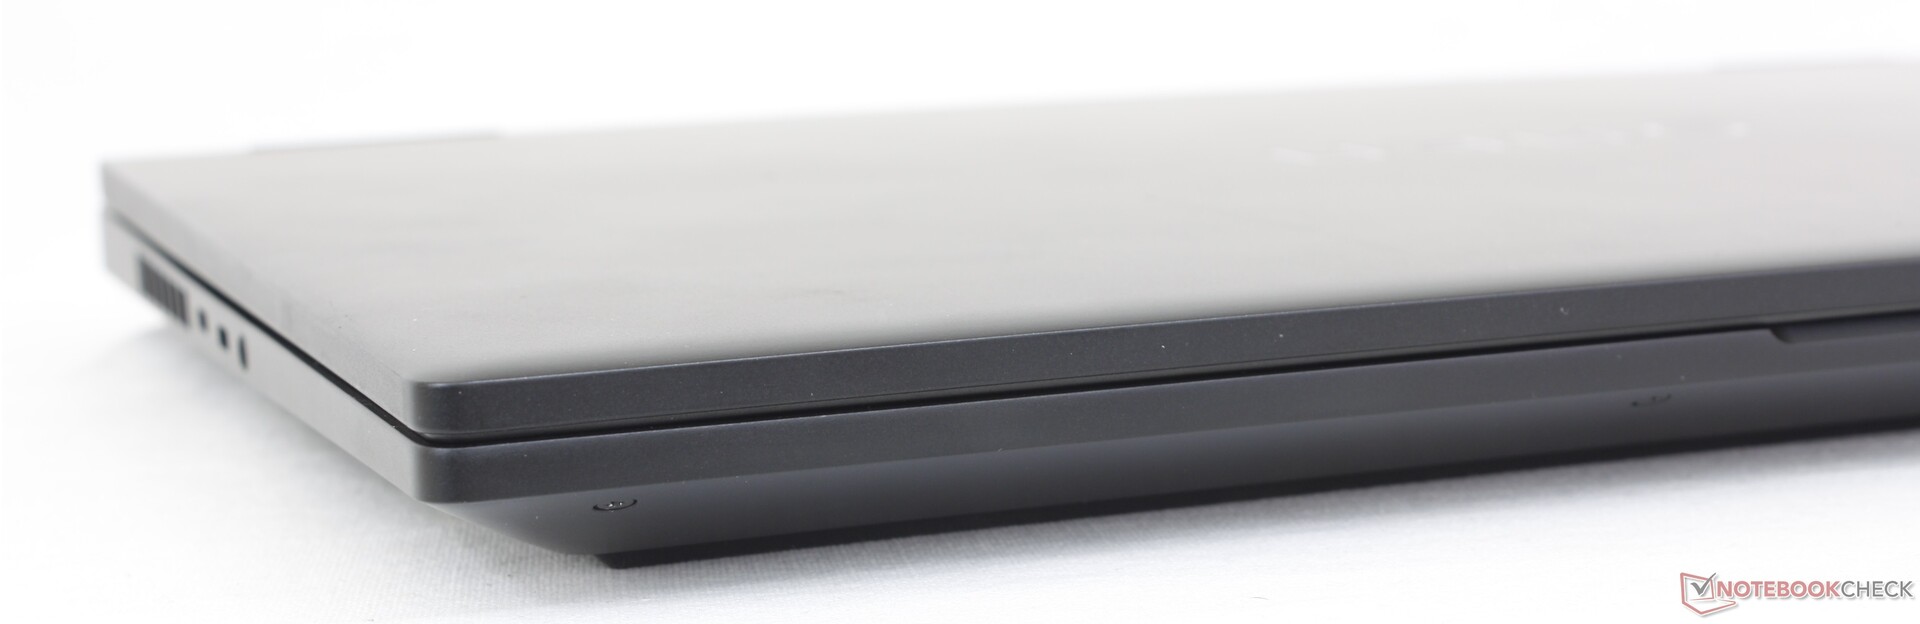
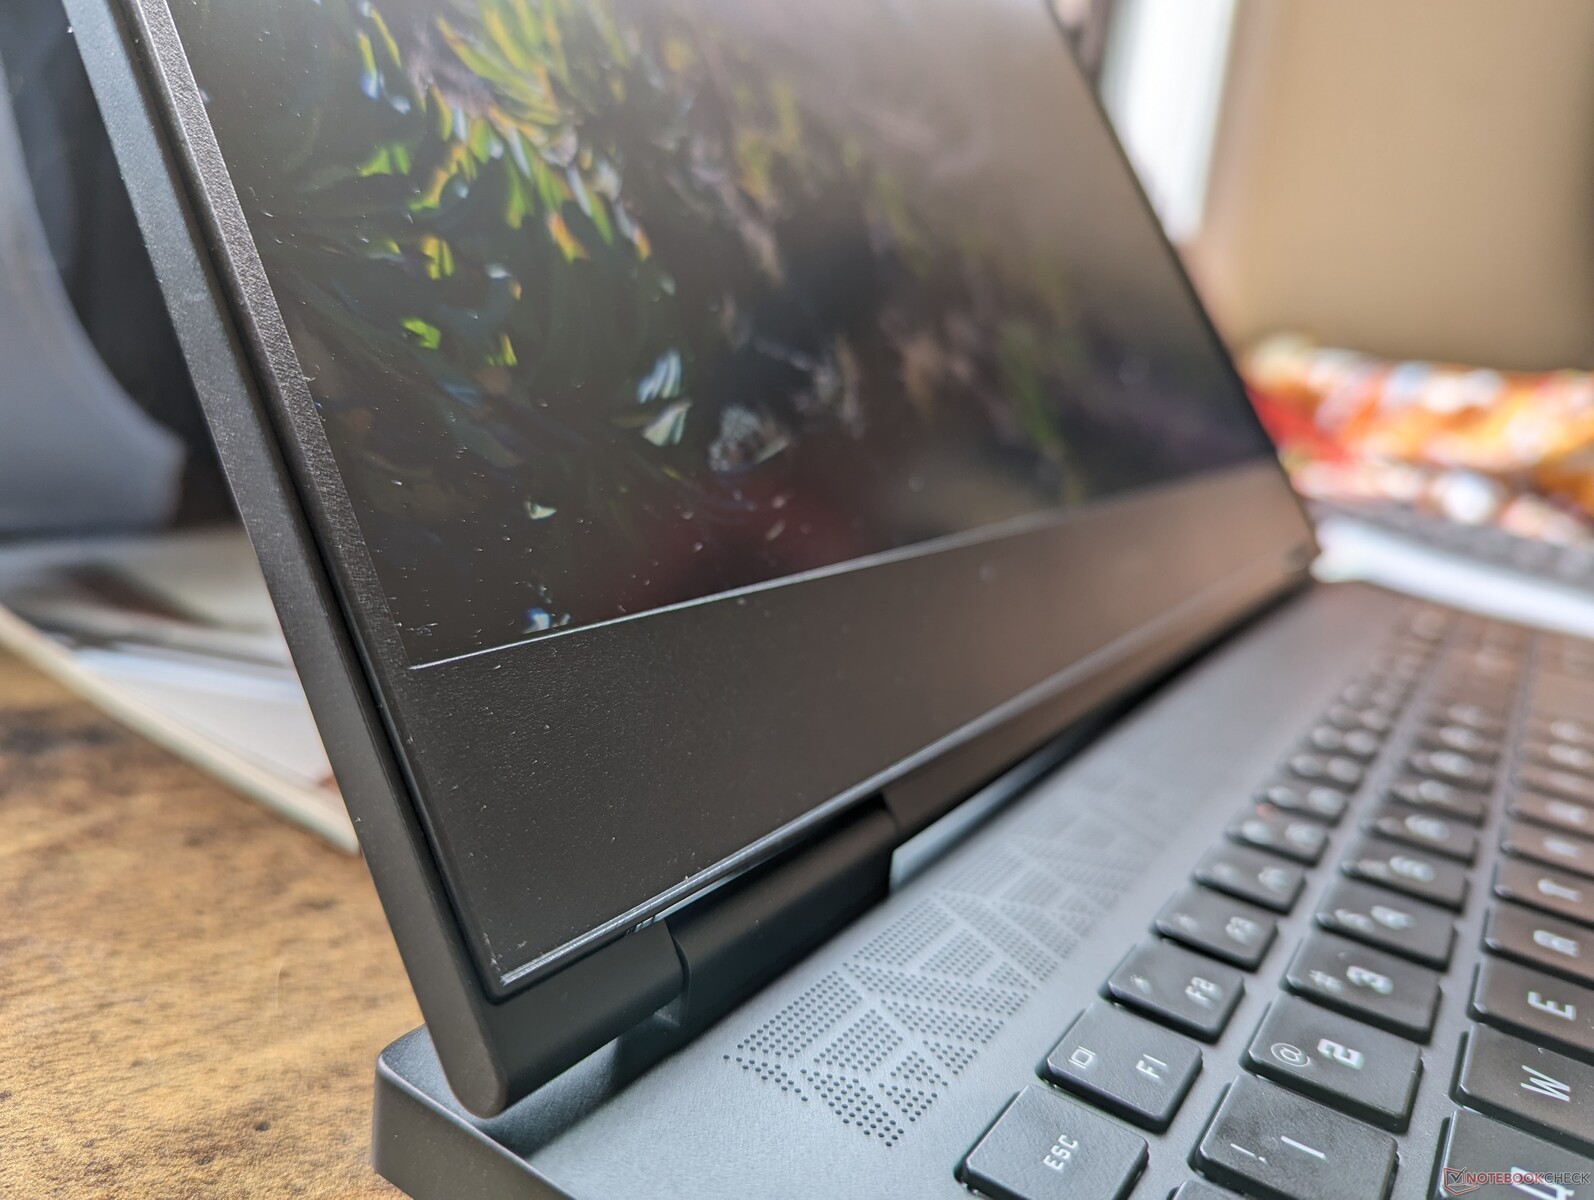
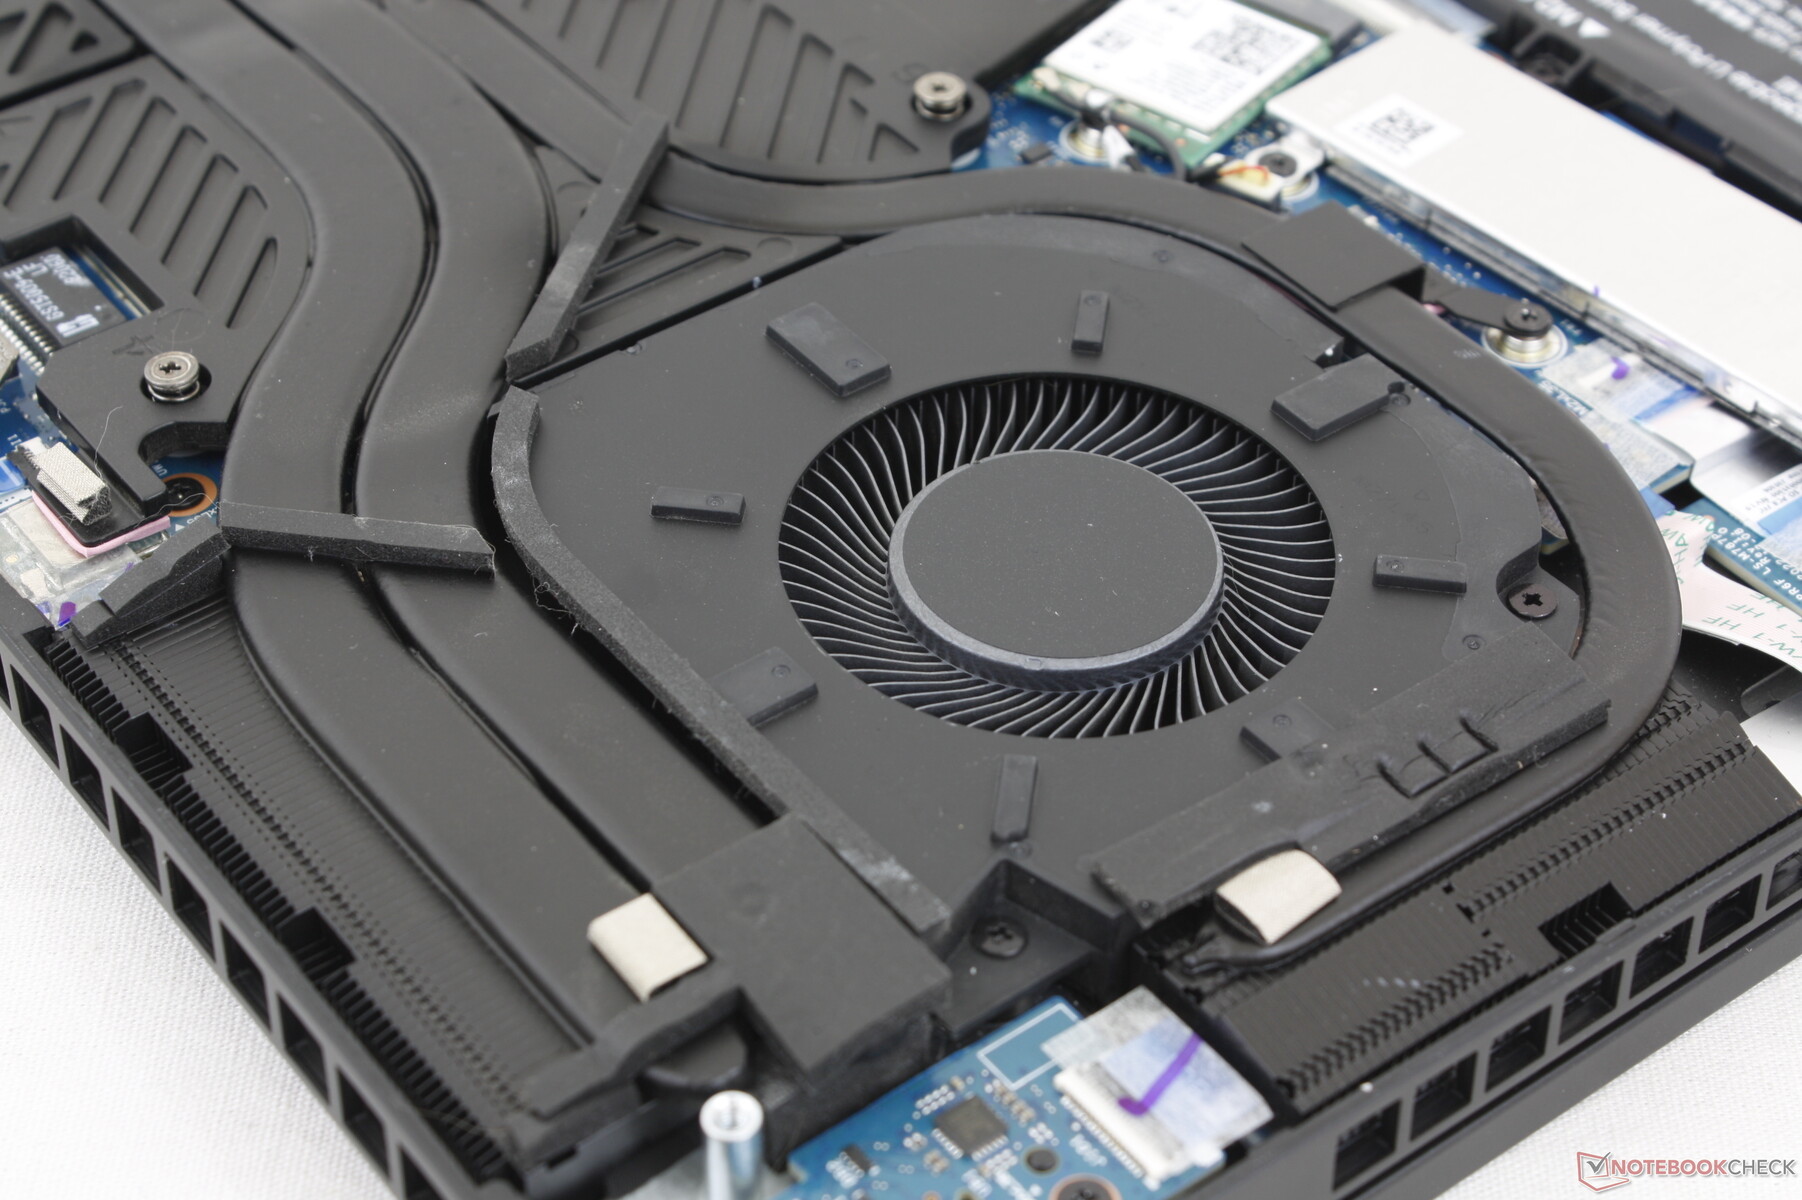
Obudowa - wydłużony tył dla lepszego chłodzenia
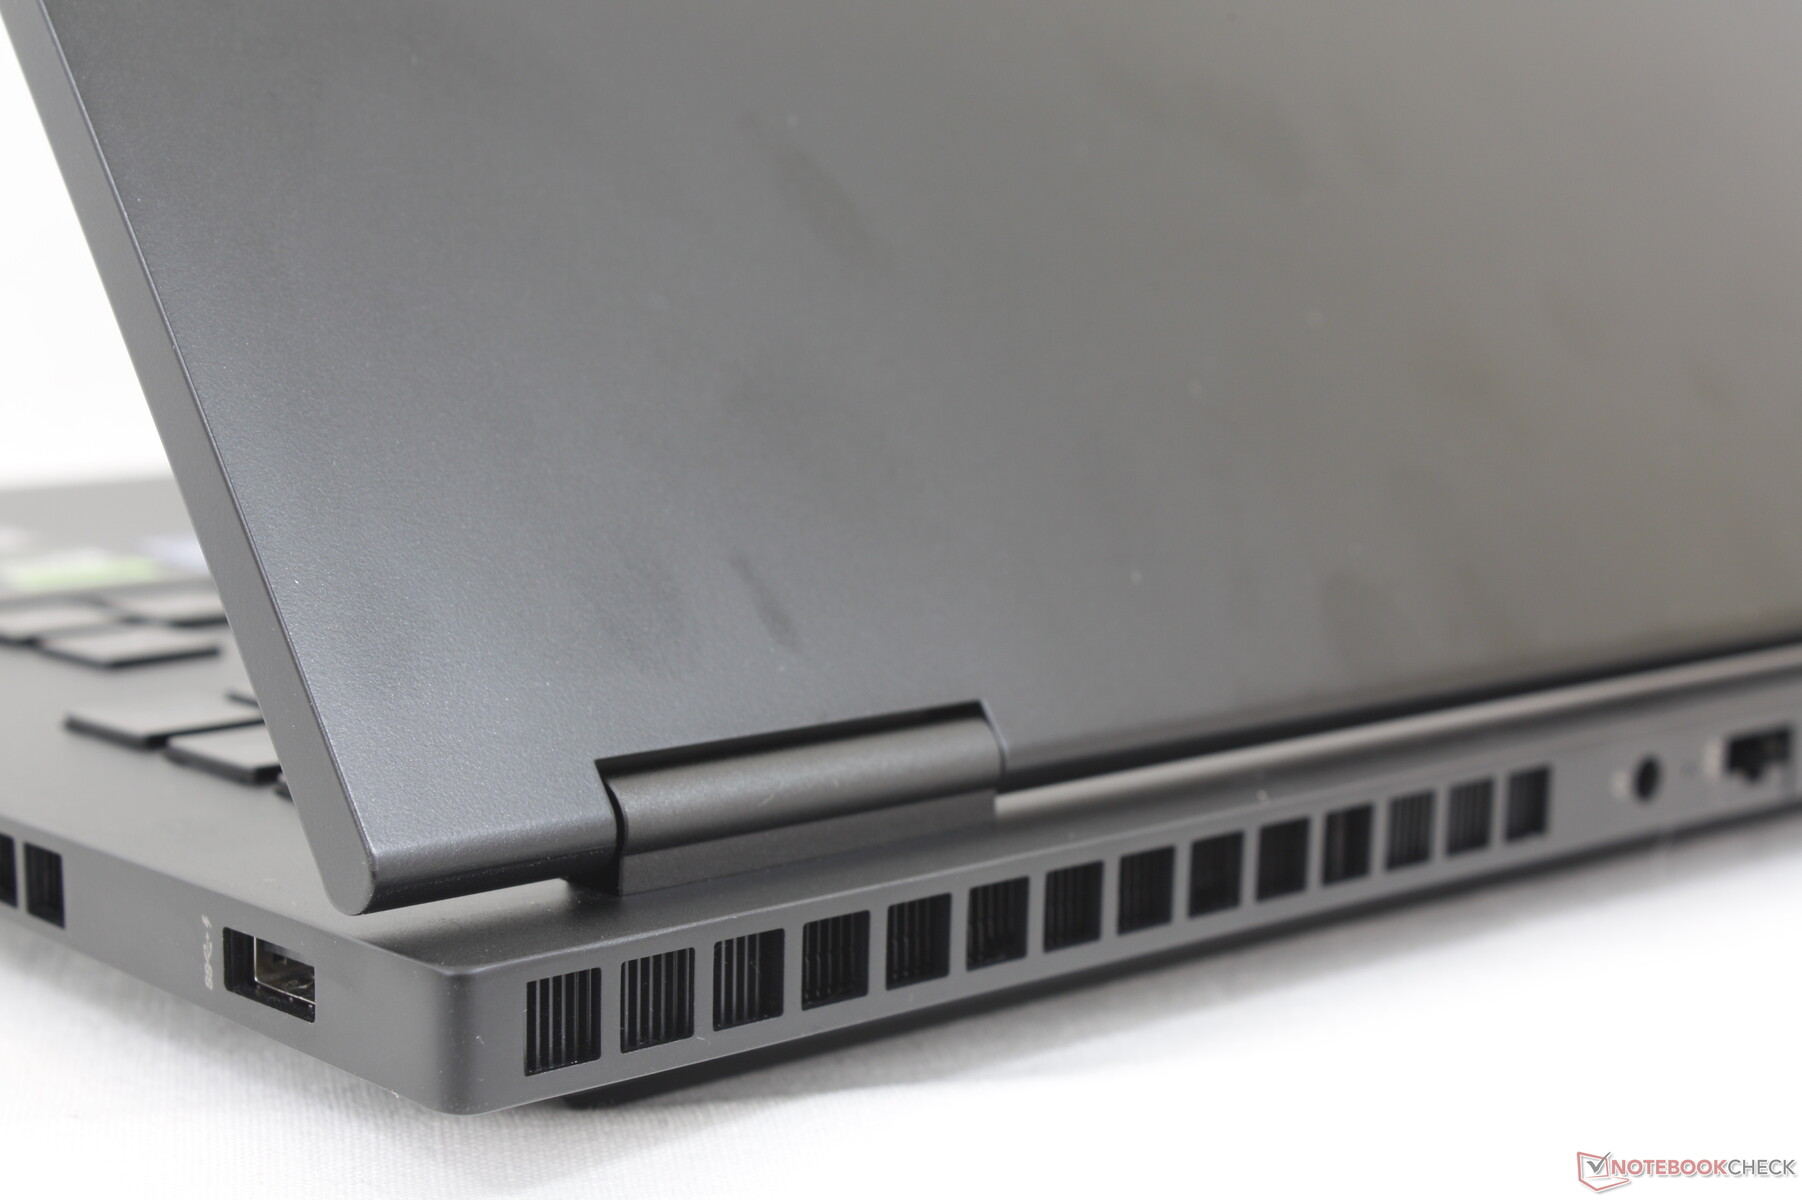
Główne aktualizacje wizualne w tym roku obejmują wydłużony tył i większe kratki wentylacyjne, aby lepiej dostosować się do wyższych celów TGP i szybszych osiągów. Tak więc z przodu model wygląda podobnie do swojego poprzednika, podczas gdy zmiany są znacznie bardziej zauważalne z tyłu. Metalowe materiały i gładkie powierzchnie sprawiają wrażenie identycznych pomiędzy obiema konstrukcjami.
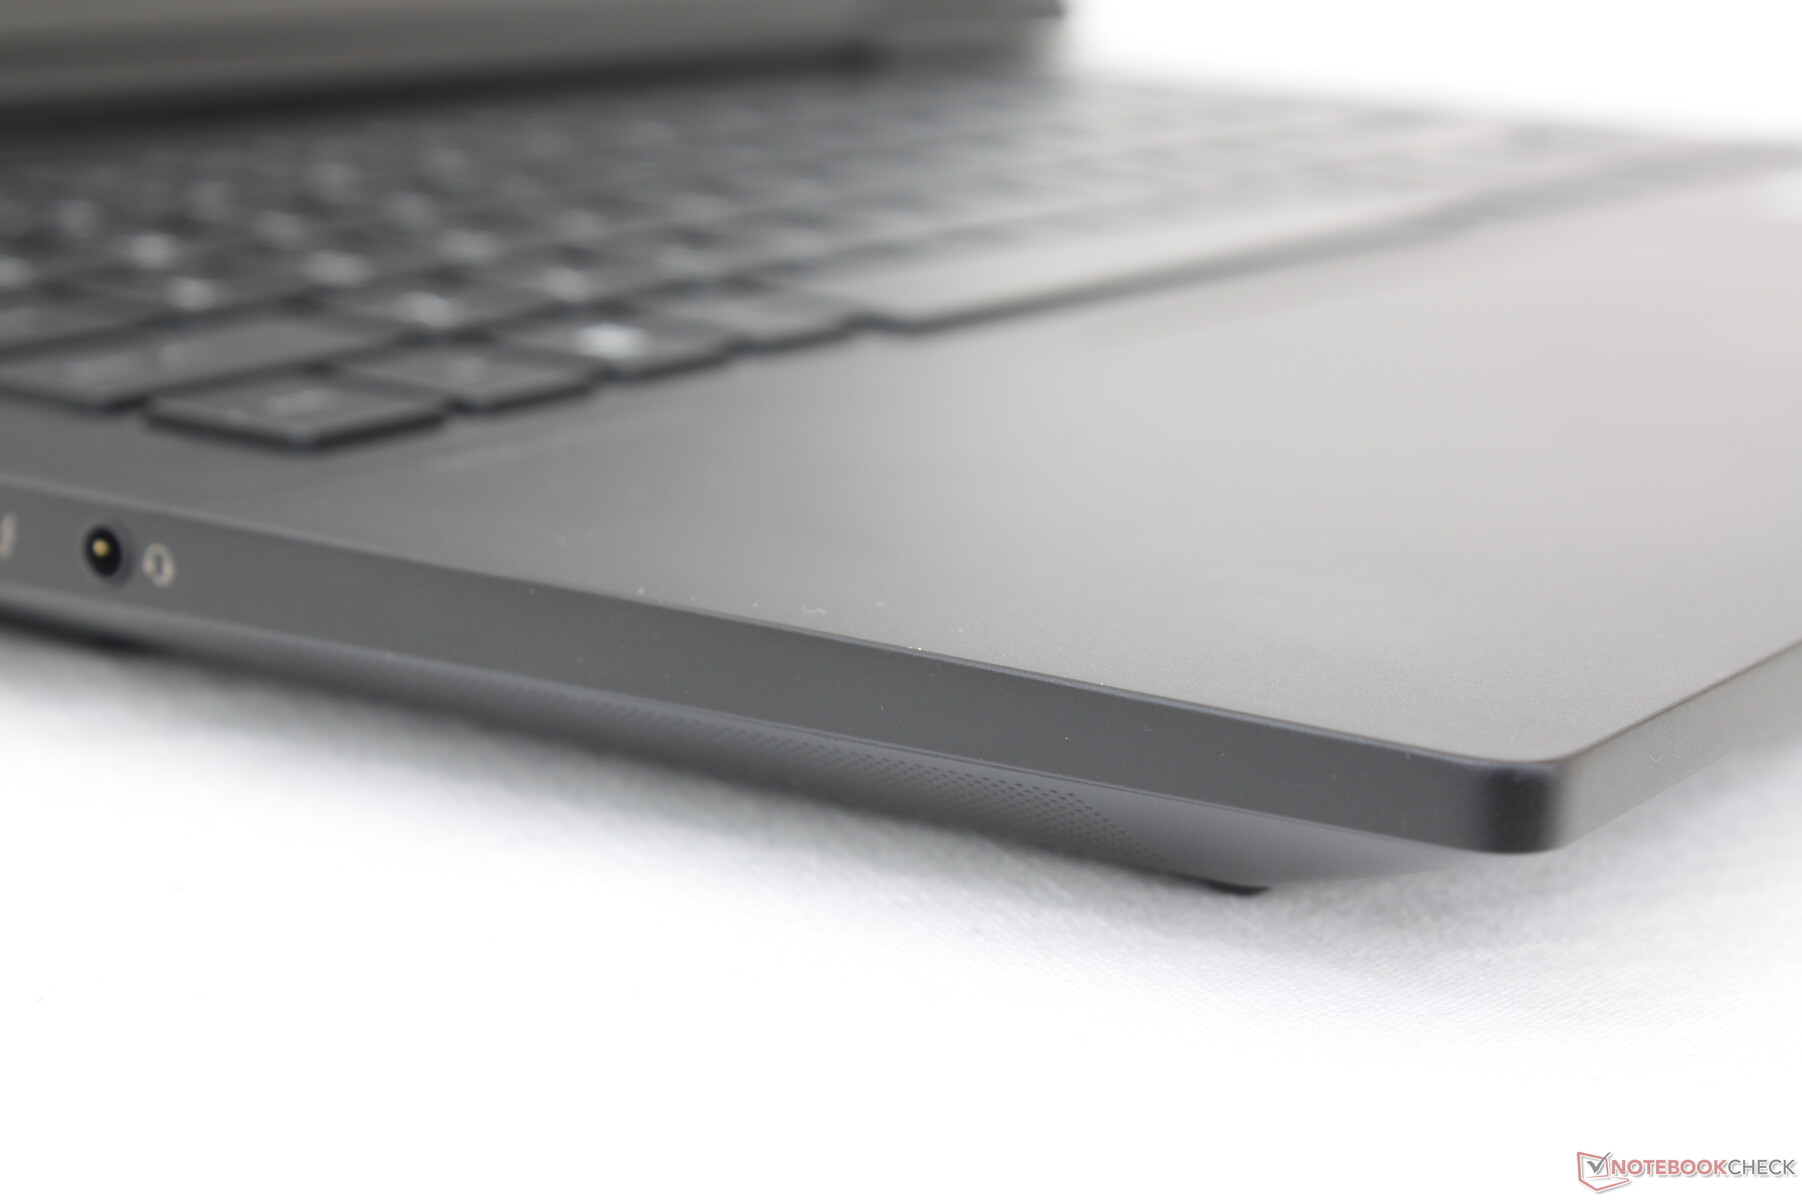
Sztywność obudowy jest bardzo dobra, choć nie tak twarda i nieustępliwa jak w Razer Blade 16. Próba skręcenia podstawy i pokrywy, na przykład, spowodowałaby nieco większe wypaczenie HP w porównaniu. Przynajmniej nie zauważamy skrzypienia ani wad wizualnych na naszym urządzeniu.
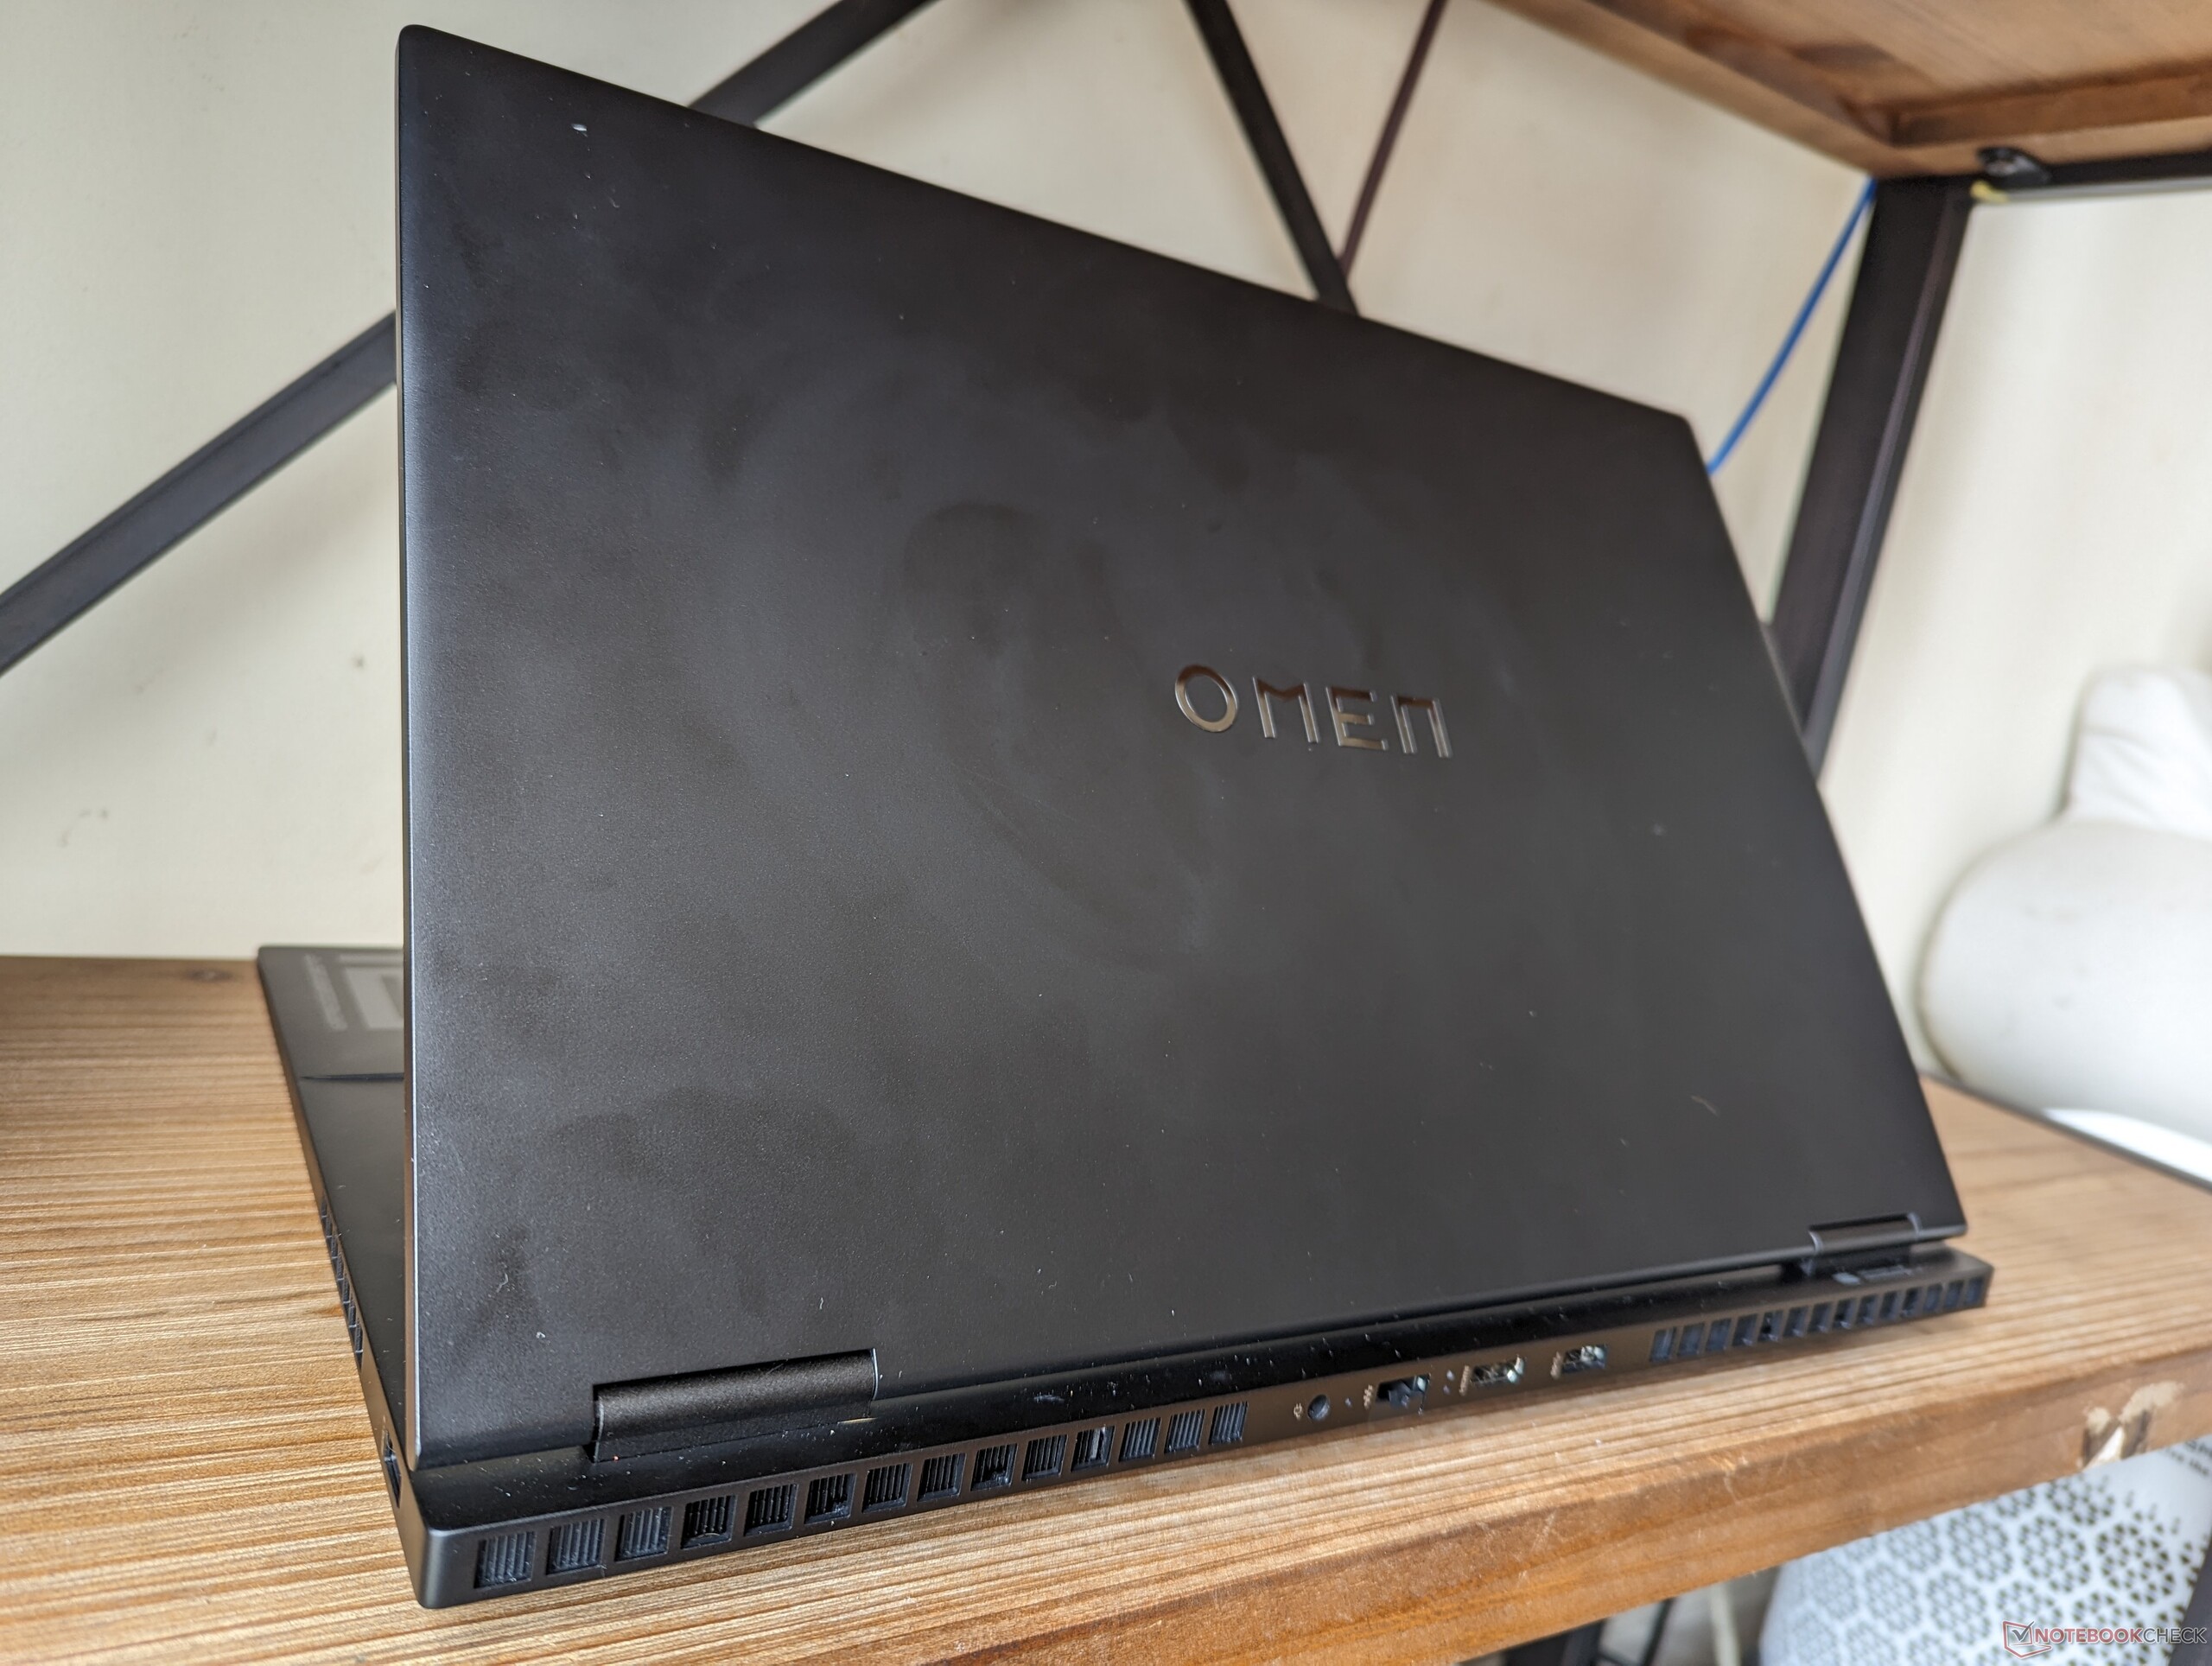
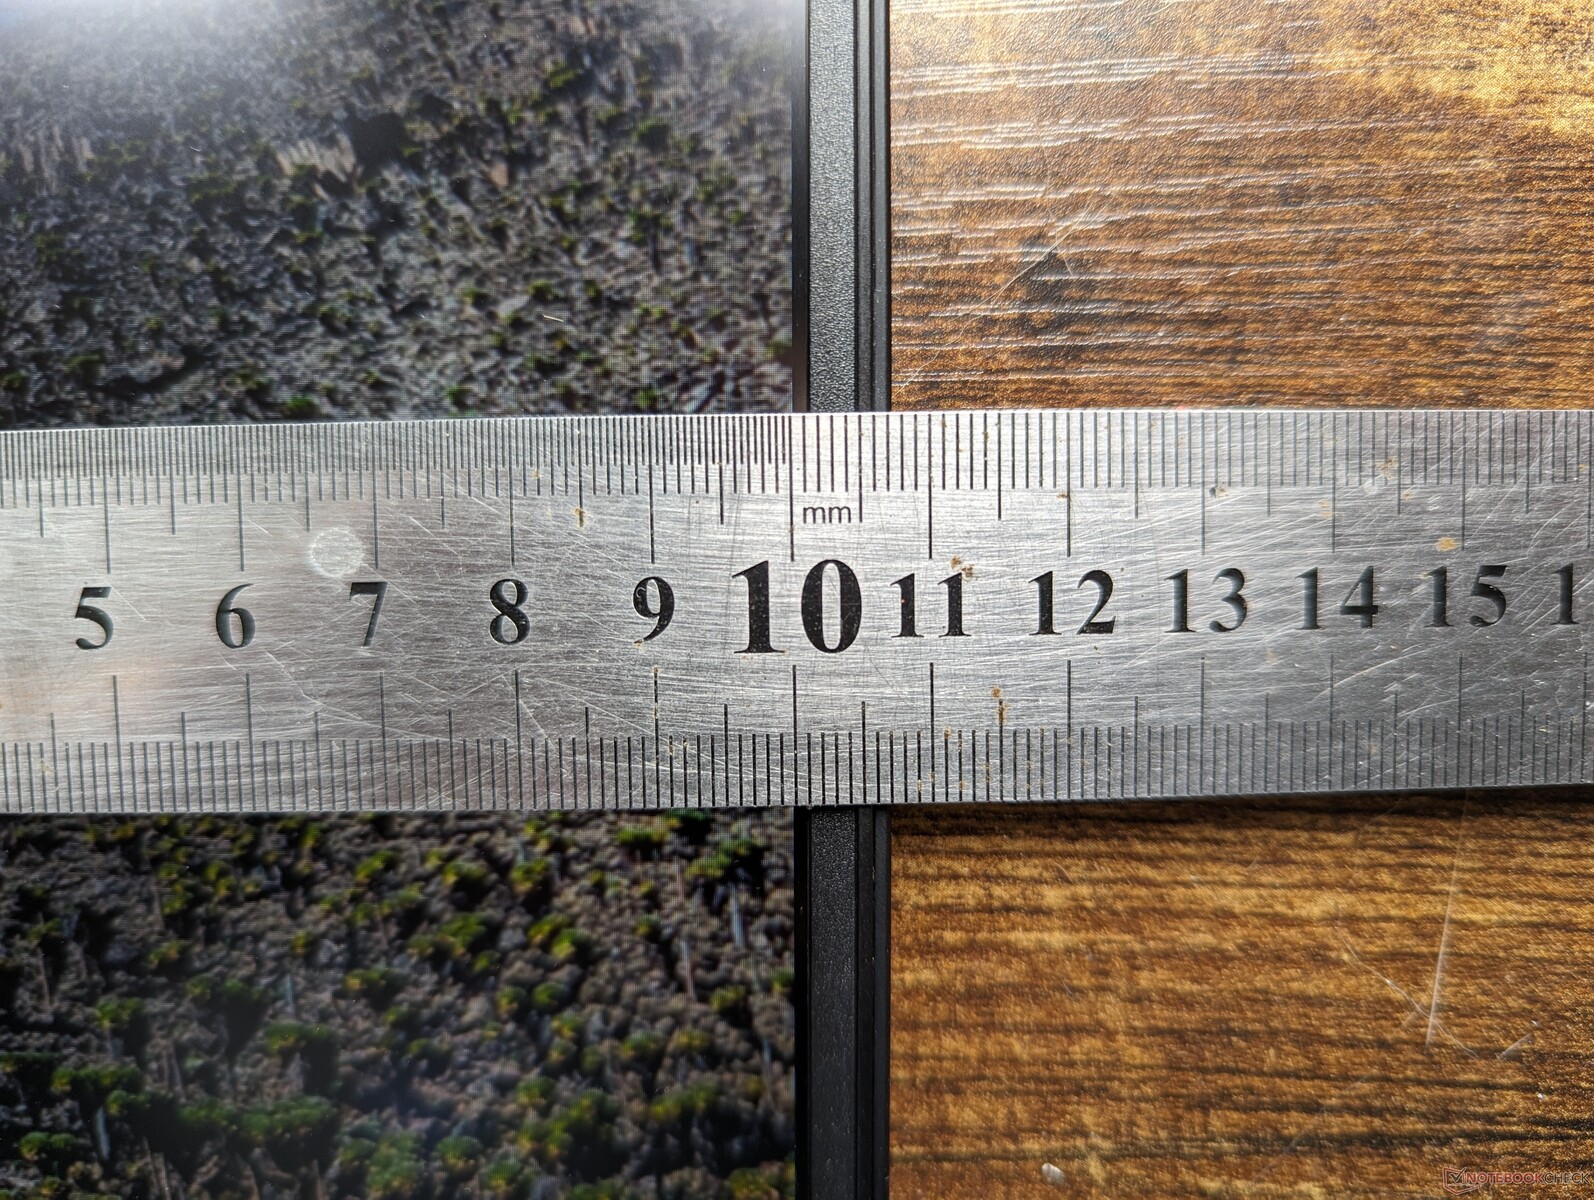
Nowy Omen 16 jest w rzeczywistości dłuższy niż konstrukcja z 2022 roku o około 11 mm ze względu na wydłużony tył wspomniany powyżej. Mimo to ogólna waga pozostaje mniej więcej taka sama, a rozmiar systemu jest nadal mniejszy niż w przypadkuROG Strix G16, Legion Pro 7 16lub Alienware x16 R1.
Łączność
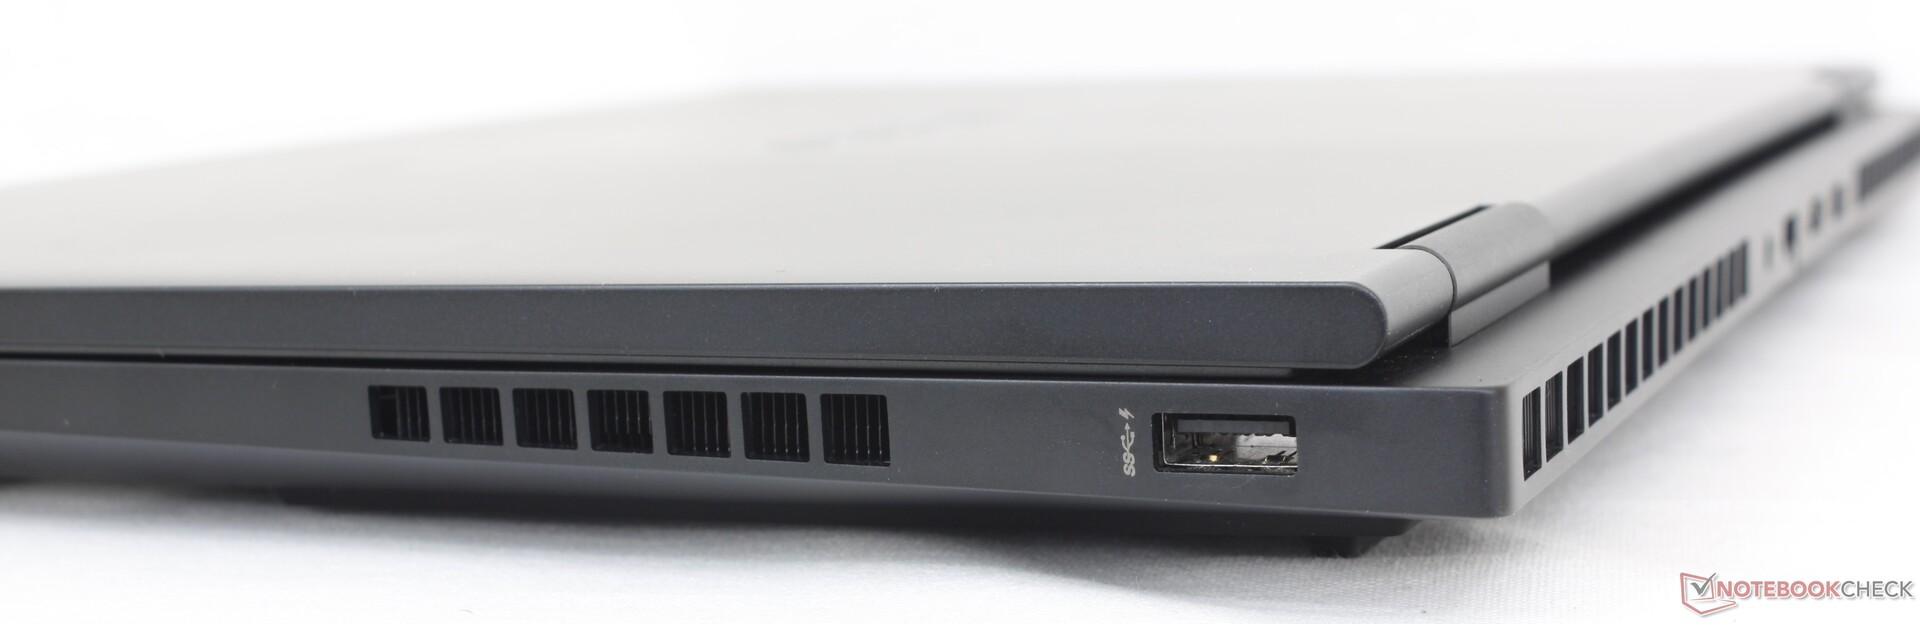
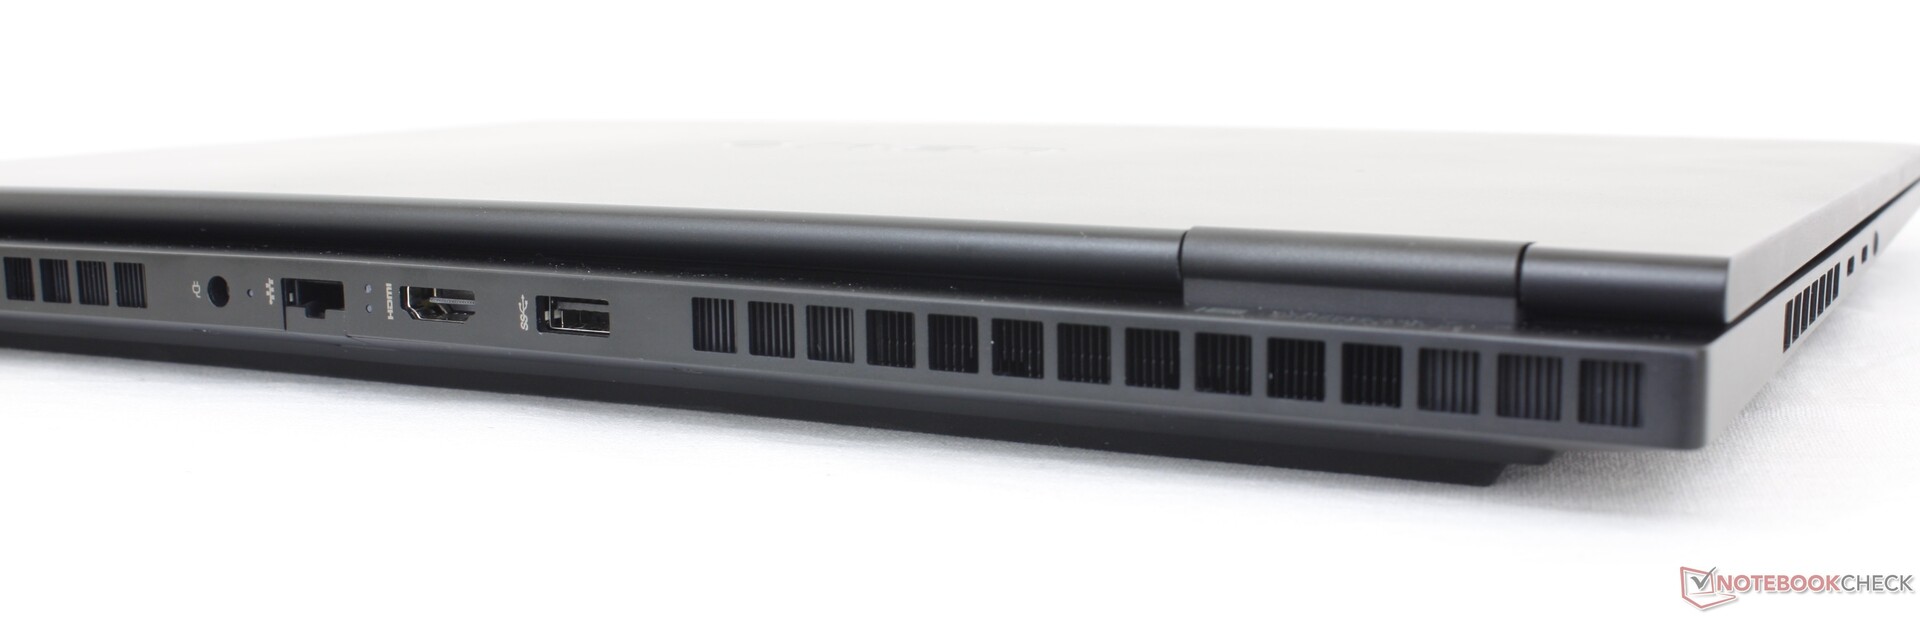
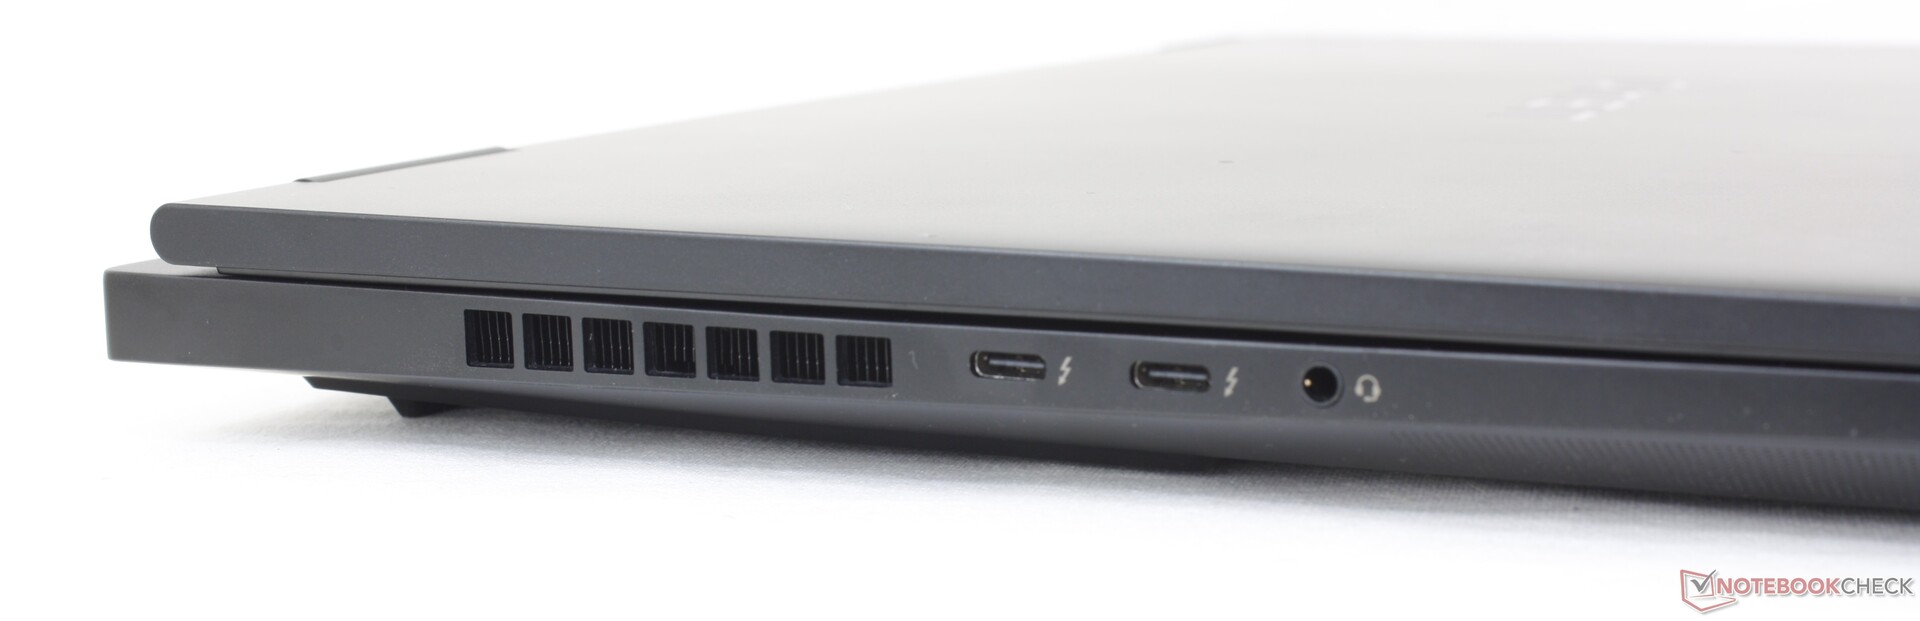
Opcje portów zostały ograniczone w stosunku do zeszłorocznego modelu, ponieważ jest teraz o jeden port USB-A mniej i nie ma już czytnika kart SD. Oba porty USB-C zostały przeniesione z tylnej krawędzi na lewą krawędź dla łatwiejszego dostępu.
Komunikacja
Opcjonalny moduł Intel AX211 zapewnia łączność Wi-Fi6E i Bluetooth 5.3. Nie doświadczyliśmy żadnych problemów po sparowaniu z naszą siecią Asus AXE11000 6 GHz.
| Networking | |
| iperf3 transmit AXE11000 | |
| Lenovo Legion Pro 7 RTX4090 | |
| Asus ROG Strix G16 G614JZ | |
| HP Omen 16-n0033dx | |
| Razer Blade 16 Early 2023 | |
| HP Omen 16-wf000 | |
| Alienware x16 R1 | |
| iperf3 receive AXE11000 | |
| Lenovo Legion Pro 7 RTX4090 | |
| Asus ROG Strix G16 G614JZ | |
| HP Omen 16-n0033dx | |
| Razer Blade 16 Early 2023 | |
| Alienware x16 R1 | |
| HP Omen 16-wf000 | |
| iperf3 transmit AXE11000 6GHz | |
| HP Omen 16-n0033dx | |
| Razer Blade 16 Early 2023 | |
| HP Omen 16-wf000 | |
| Alienware x16 R1 | |
| iperf3 receive AXE11000 6GHz | |
| Razer Blade 16 Early 2023 | |
| HP Omen 16-wf000 | |
| HP Omen 16-n0033dx | |
| Alienware x16 R1 | |
Kamera internetowa - 2 MP
Kamera internetowa 2 MP jest standardem wraz z migawką prywatności, aby zastąpić kamerę internetową 1 MP w 2022 Omen 16. Podczerwień nie jest jednak obsługiwana w tej serii.


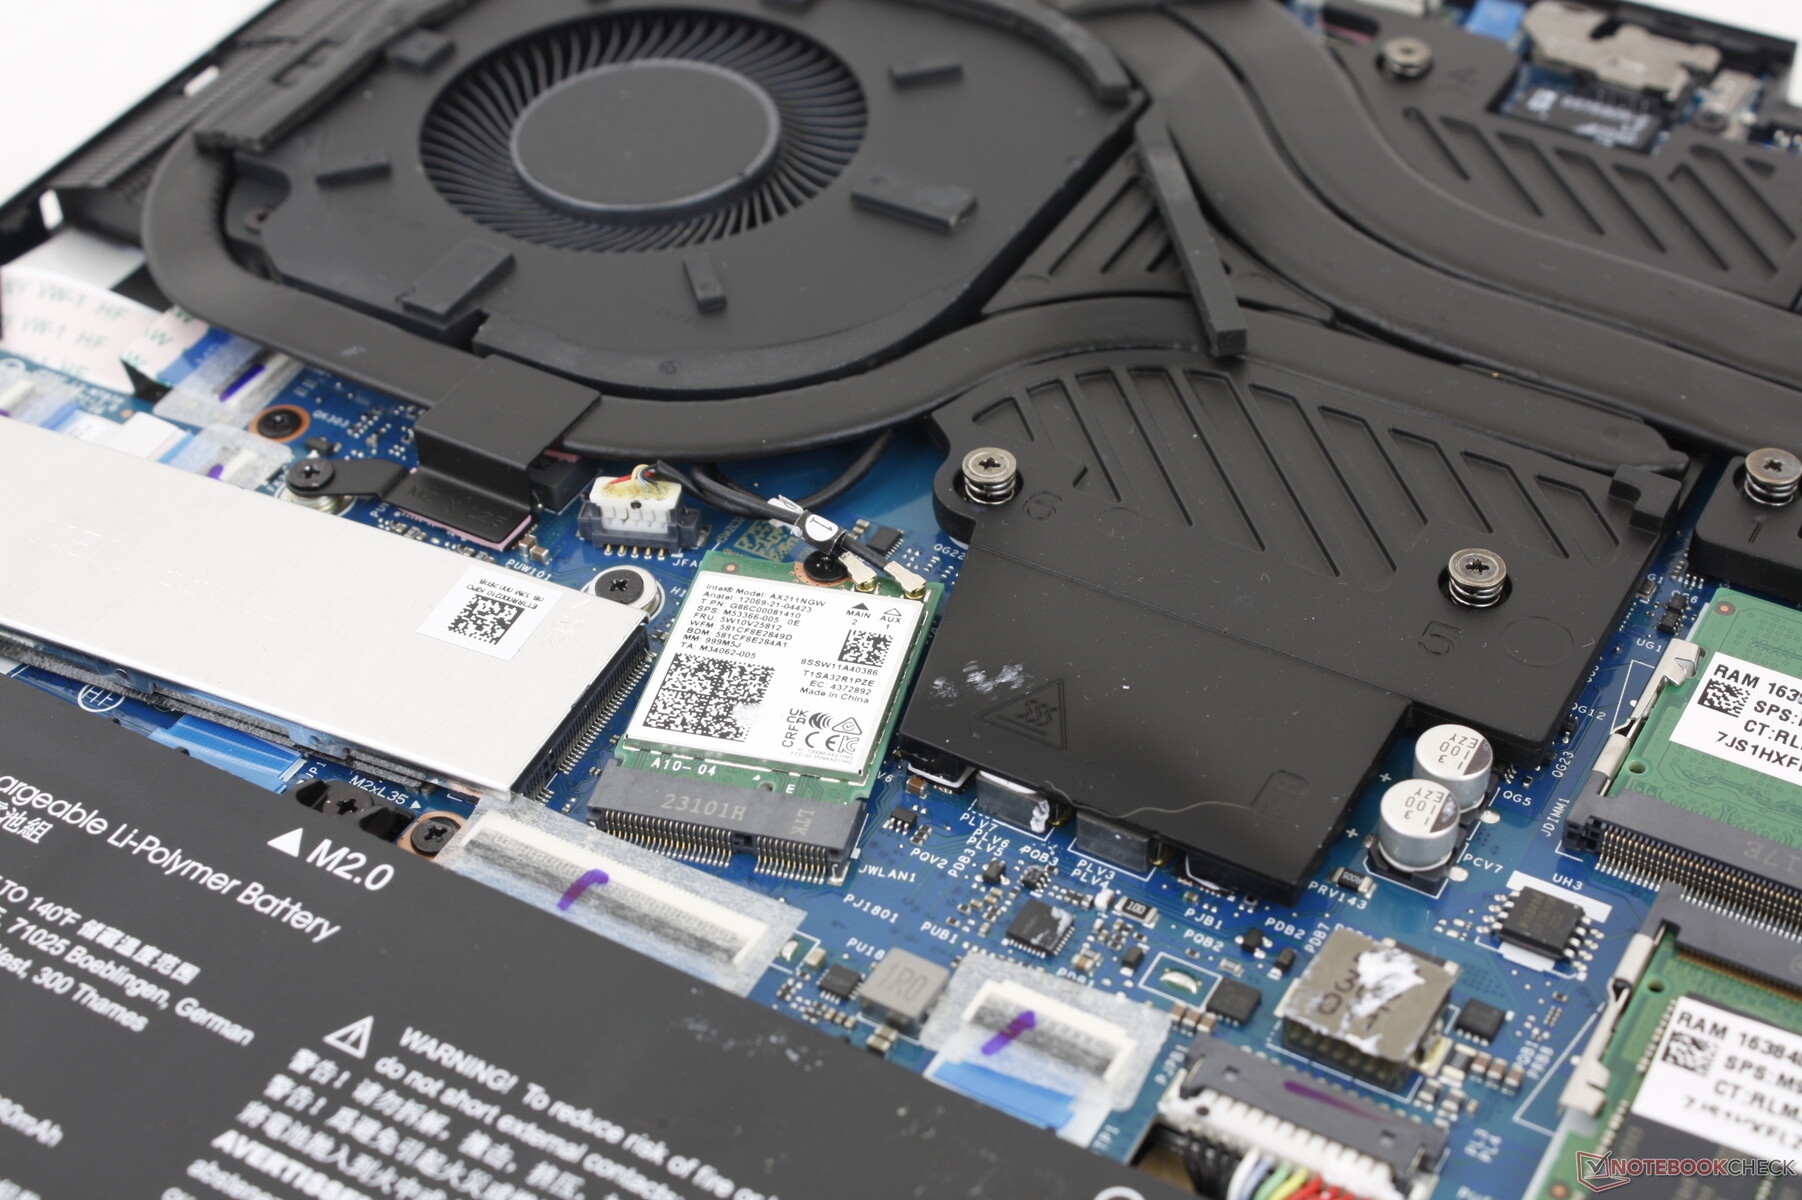
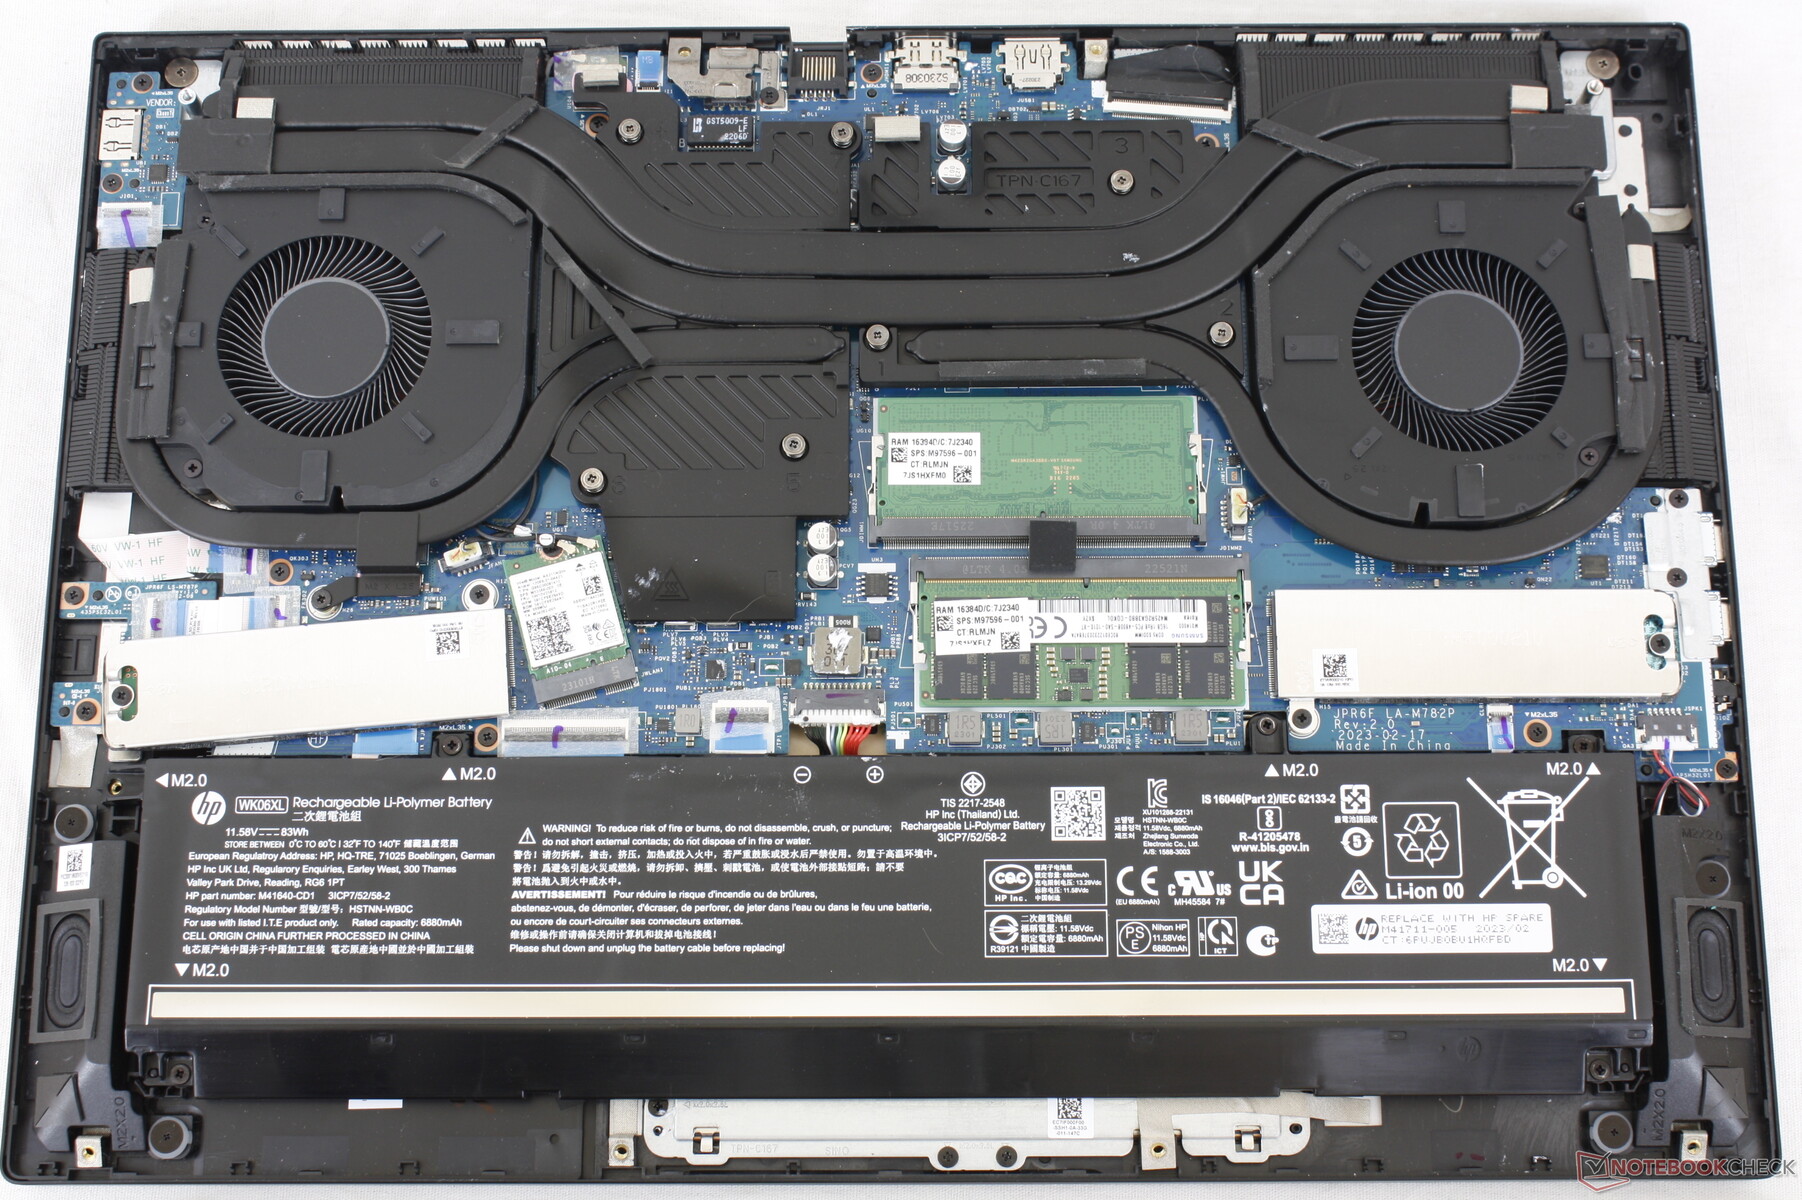
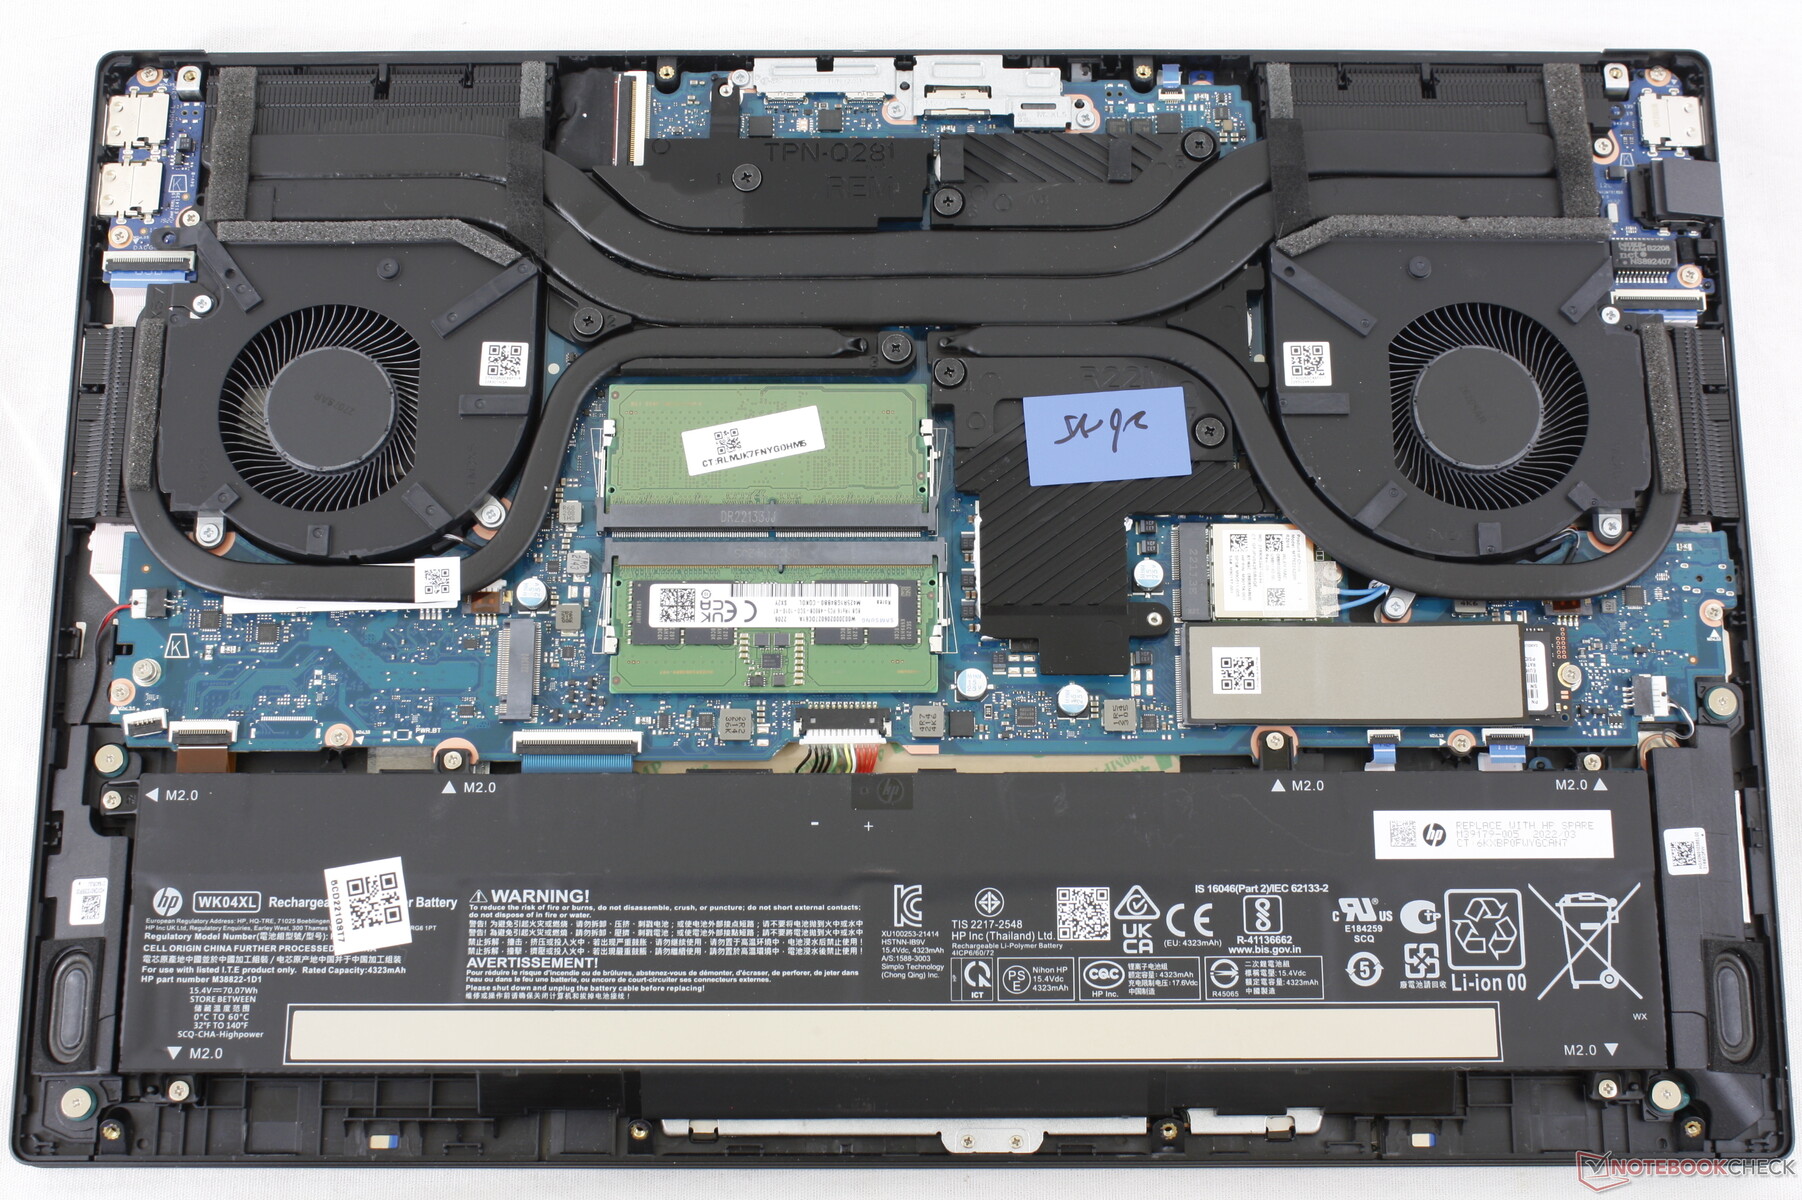
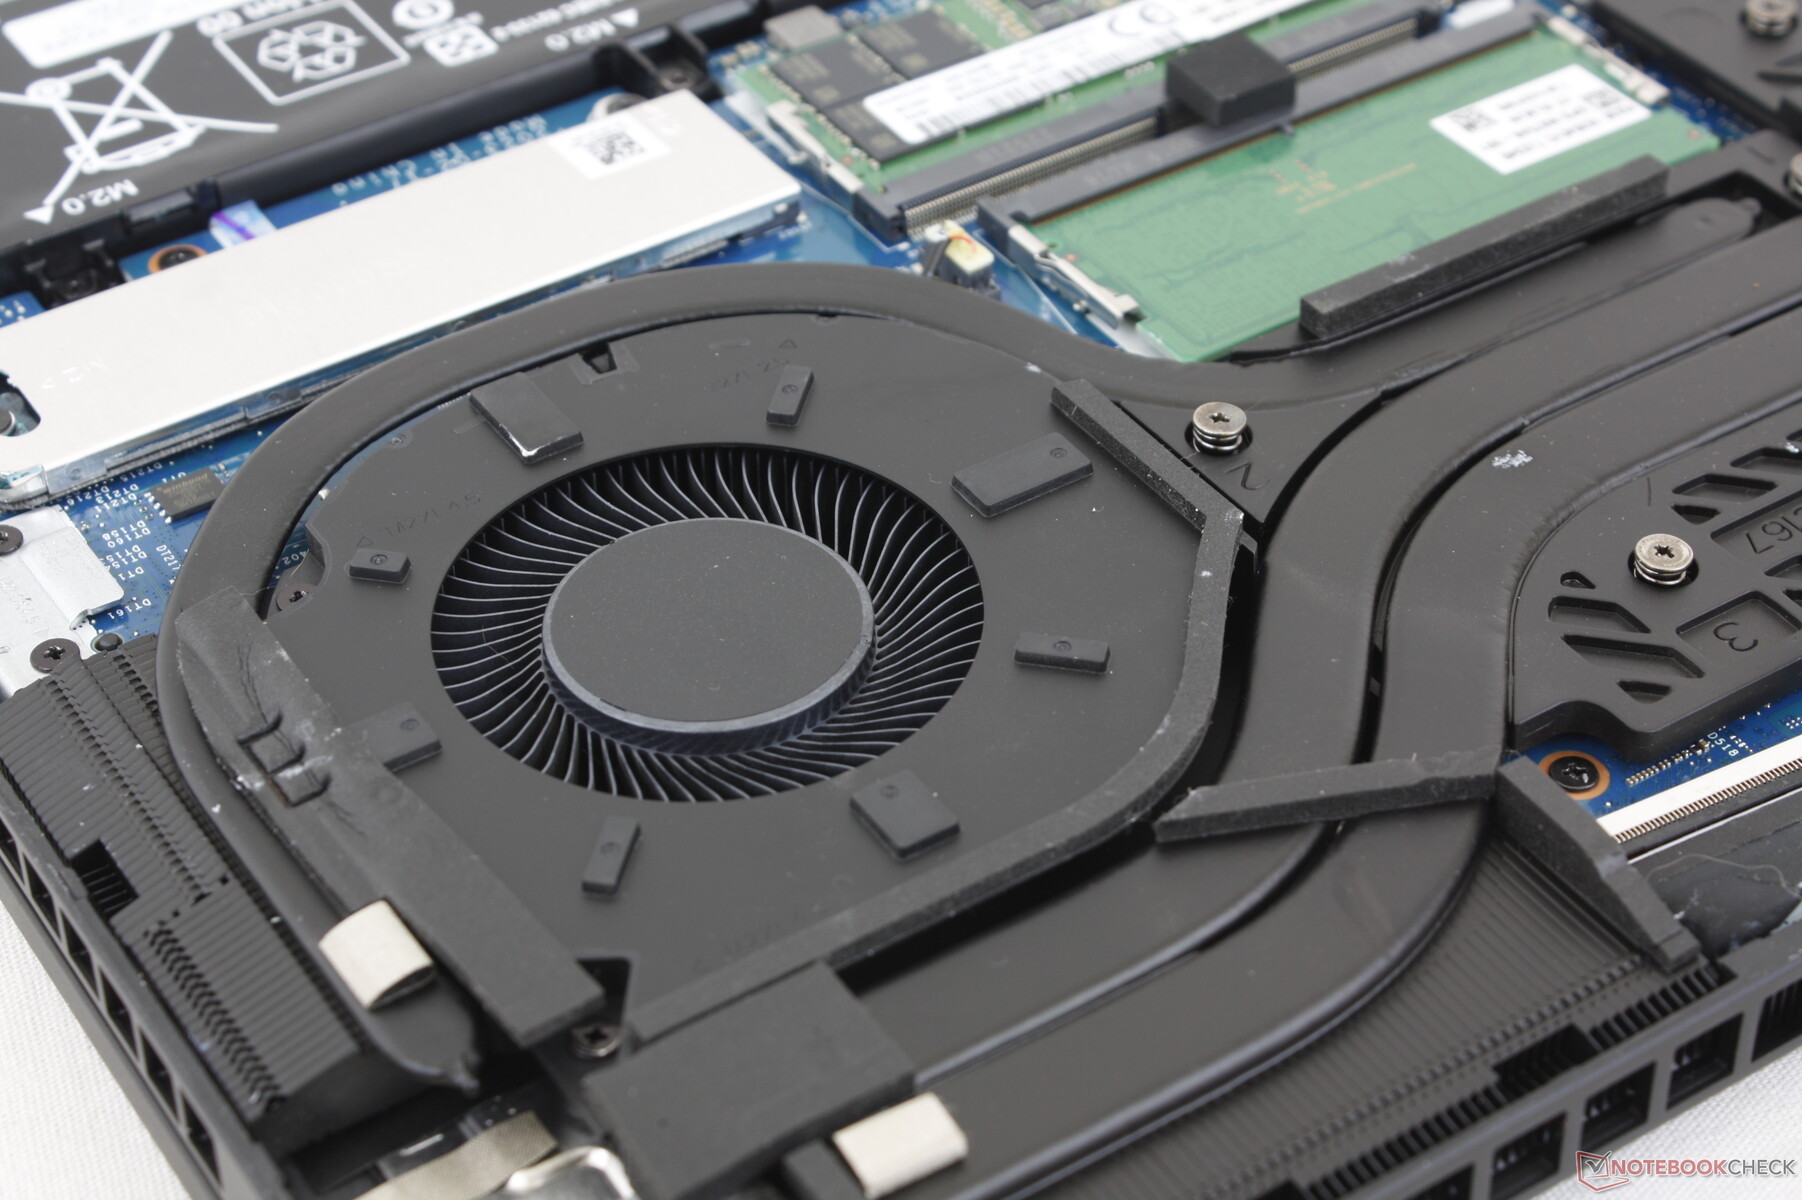
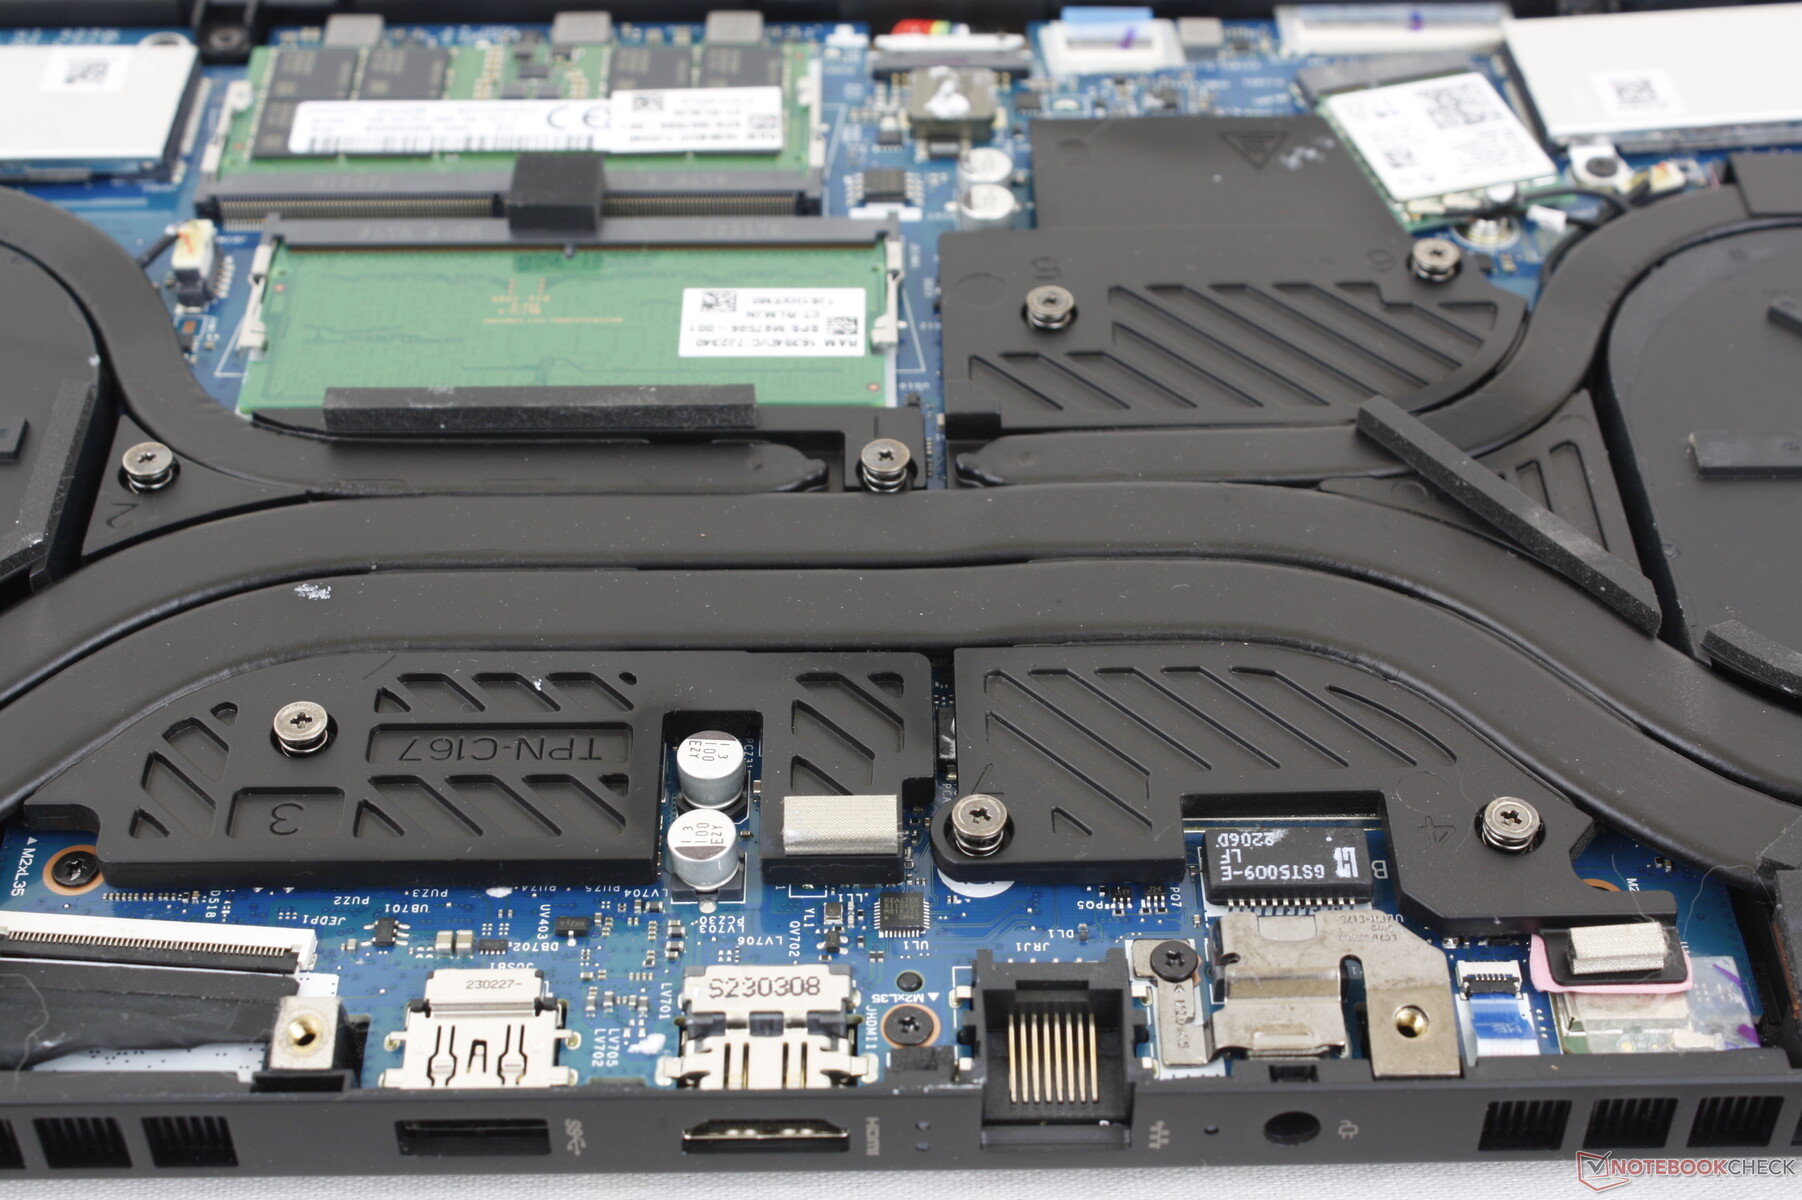
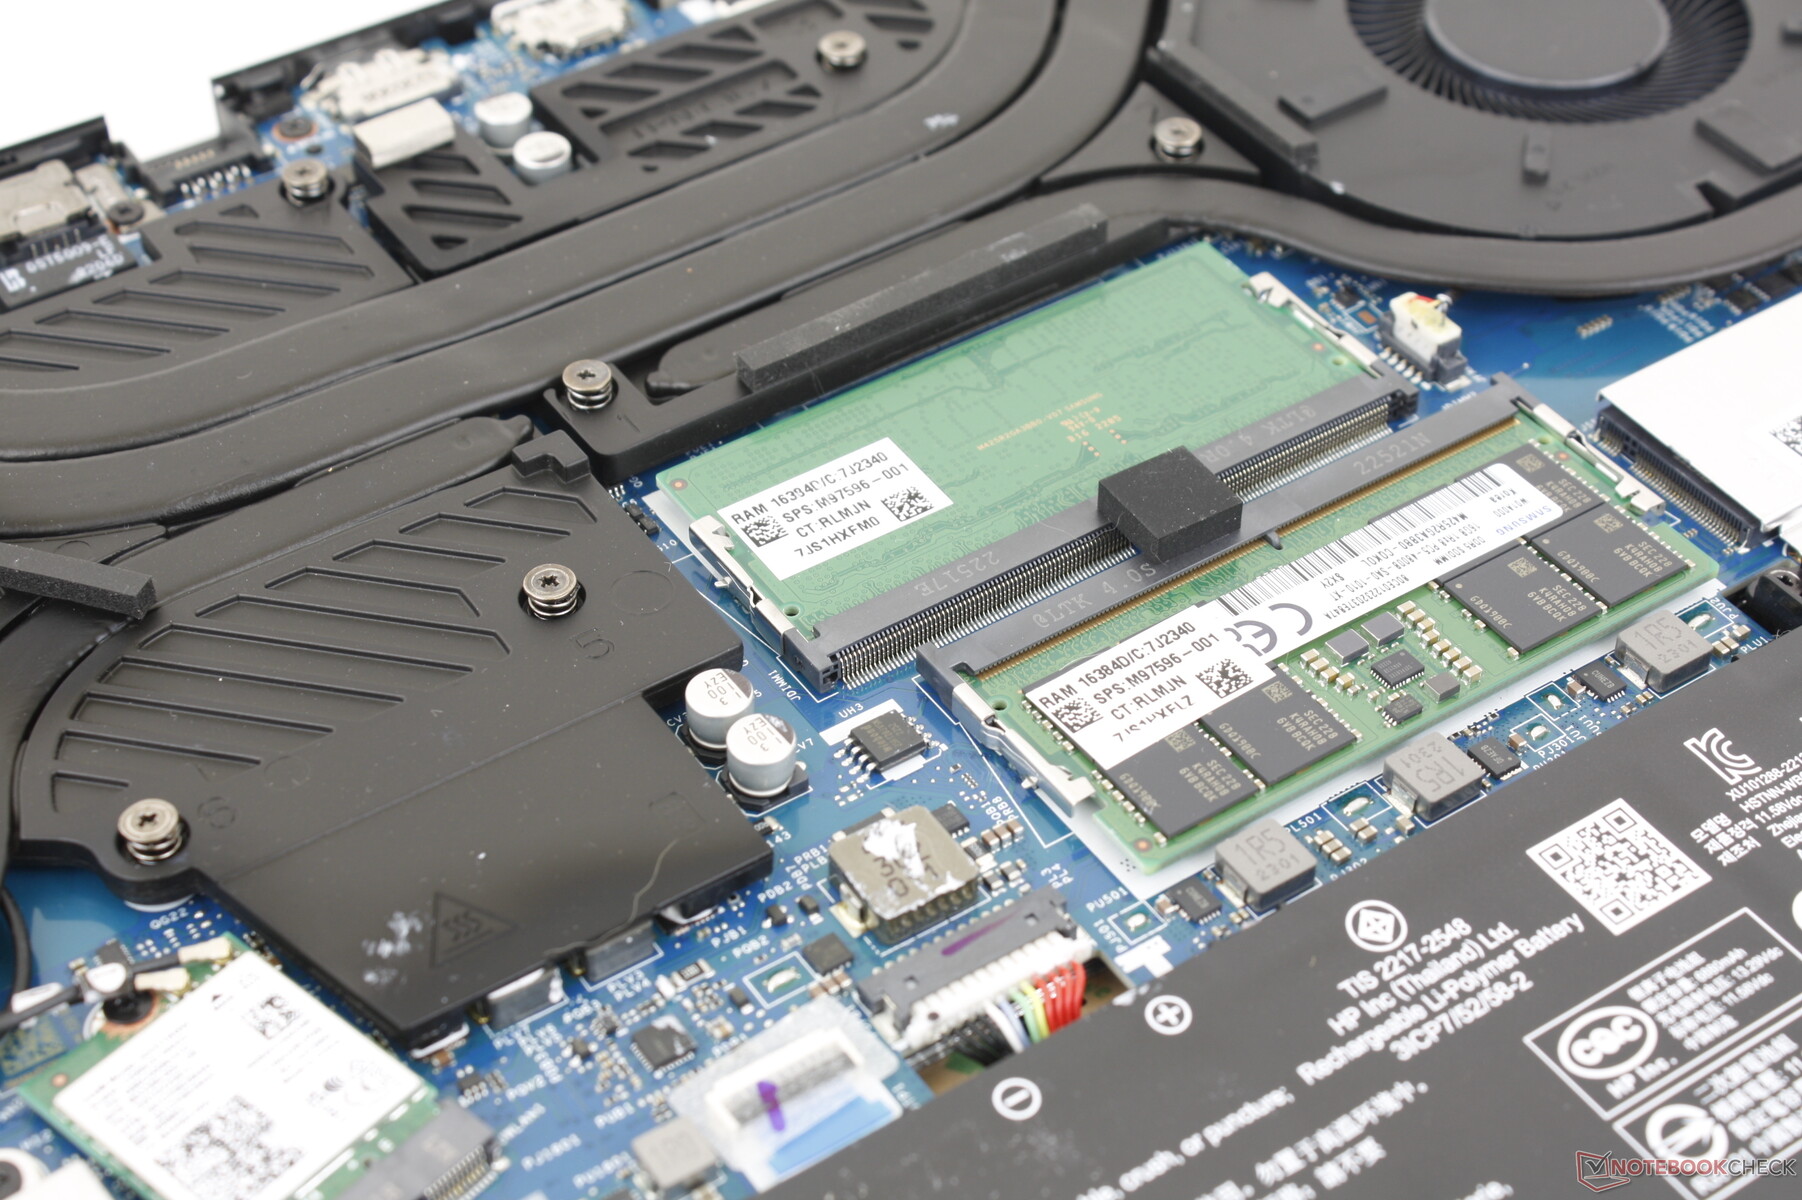
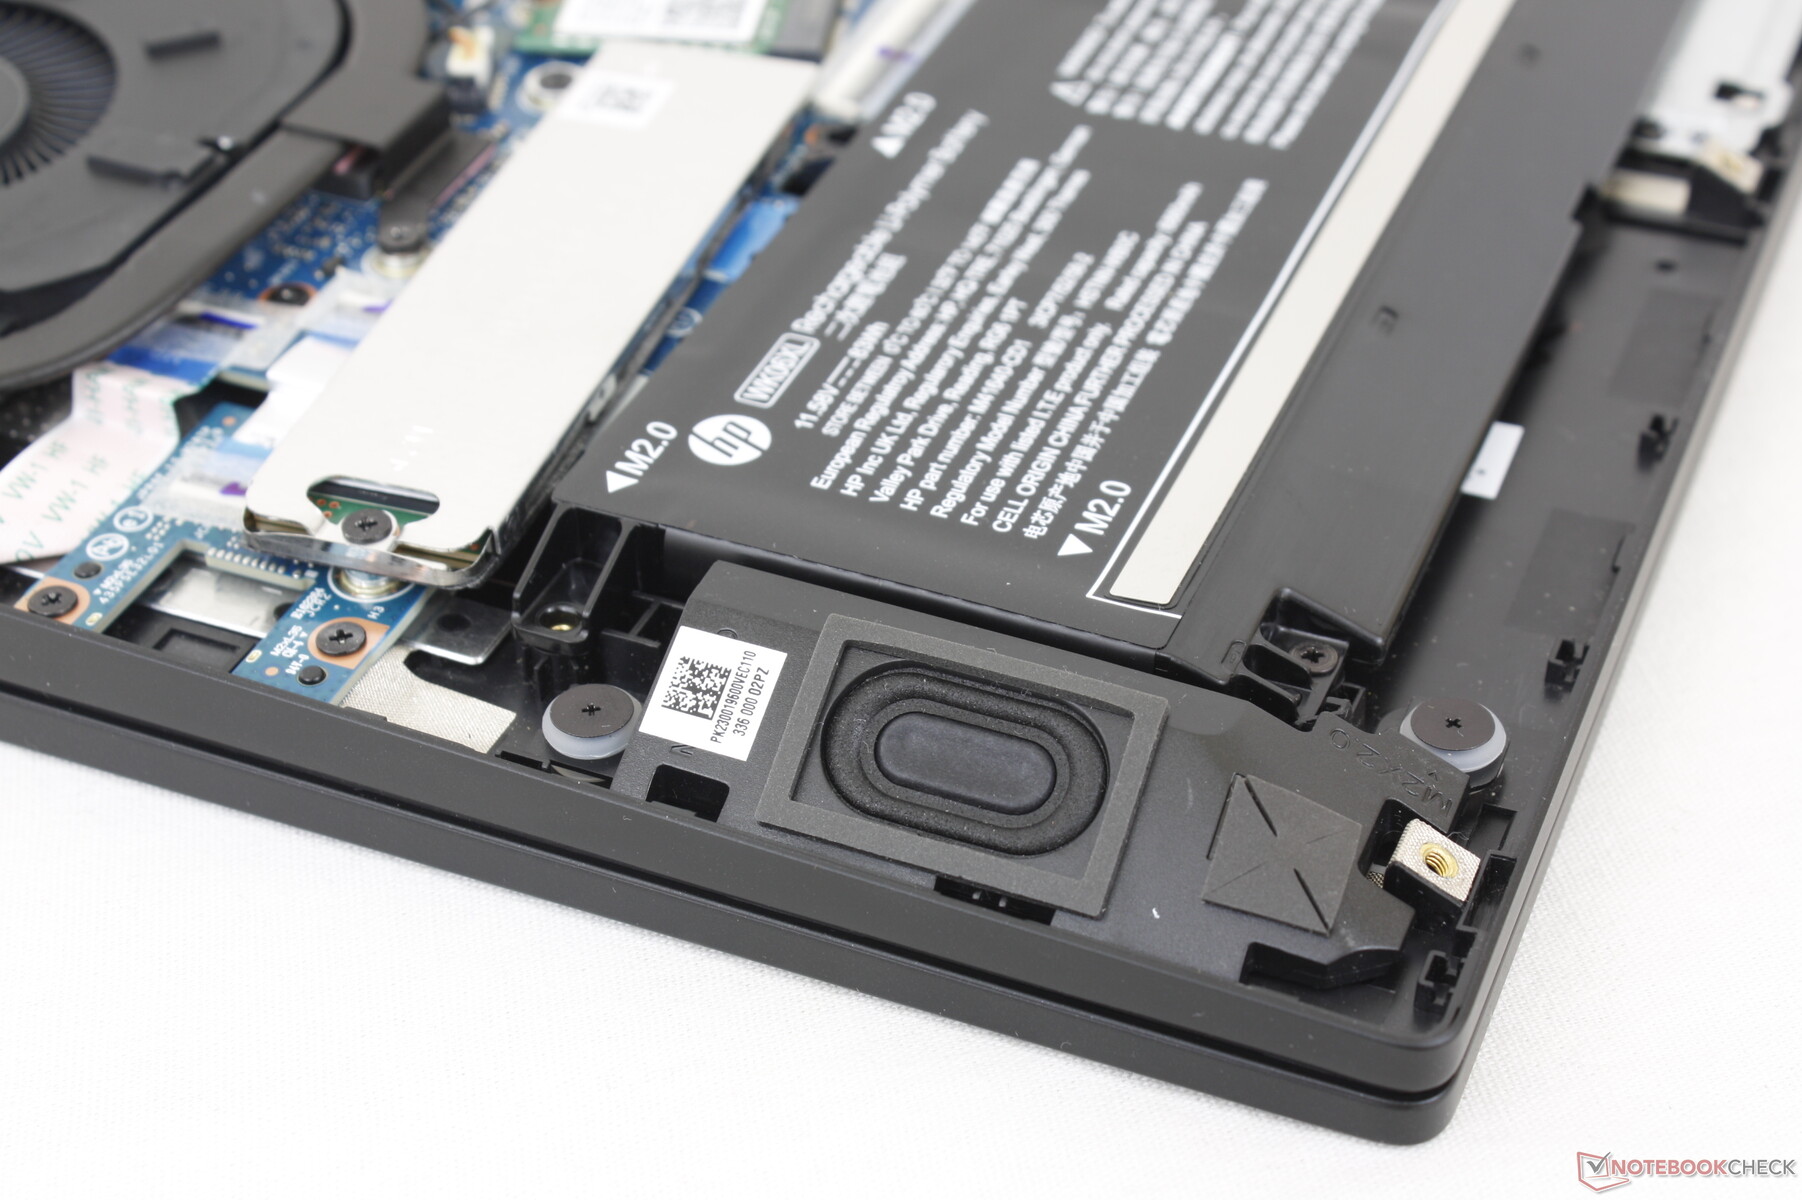
Konserwacja
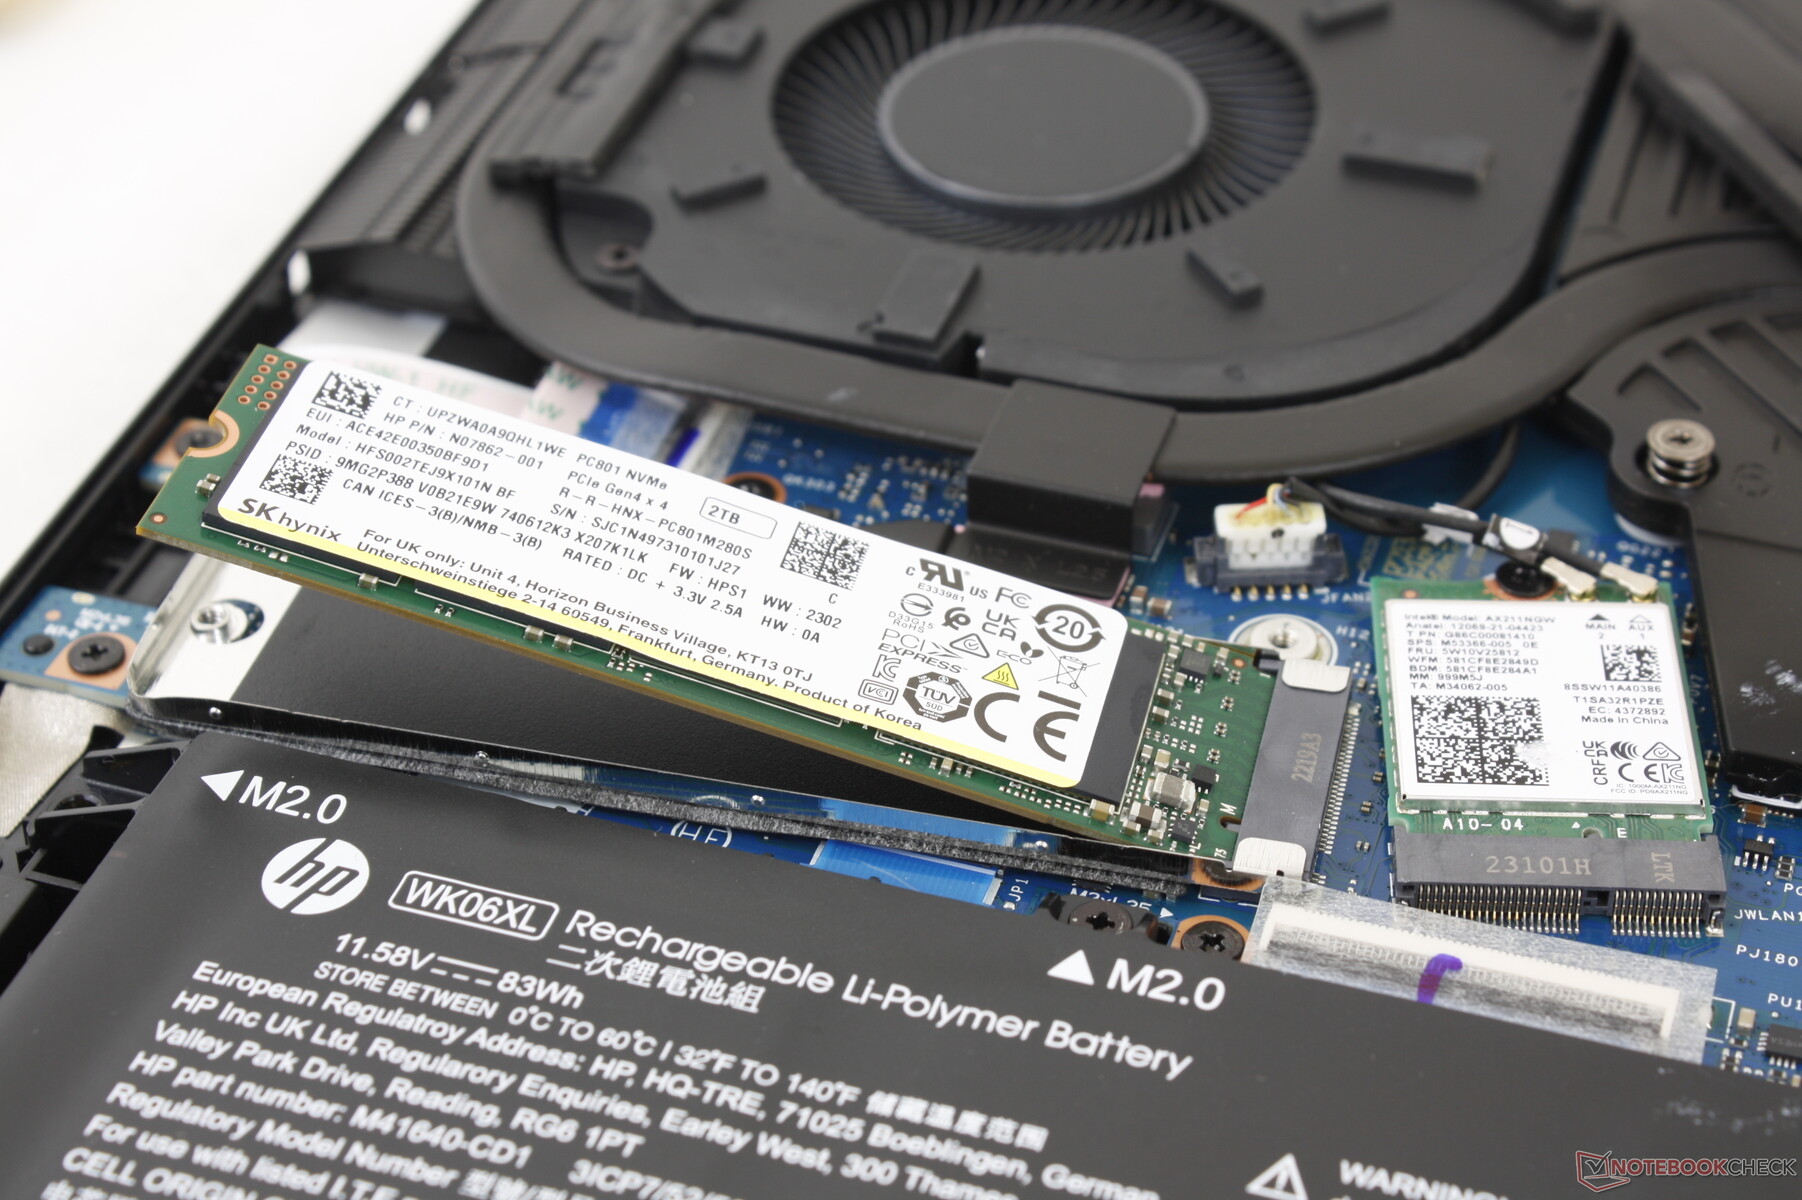
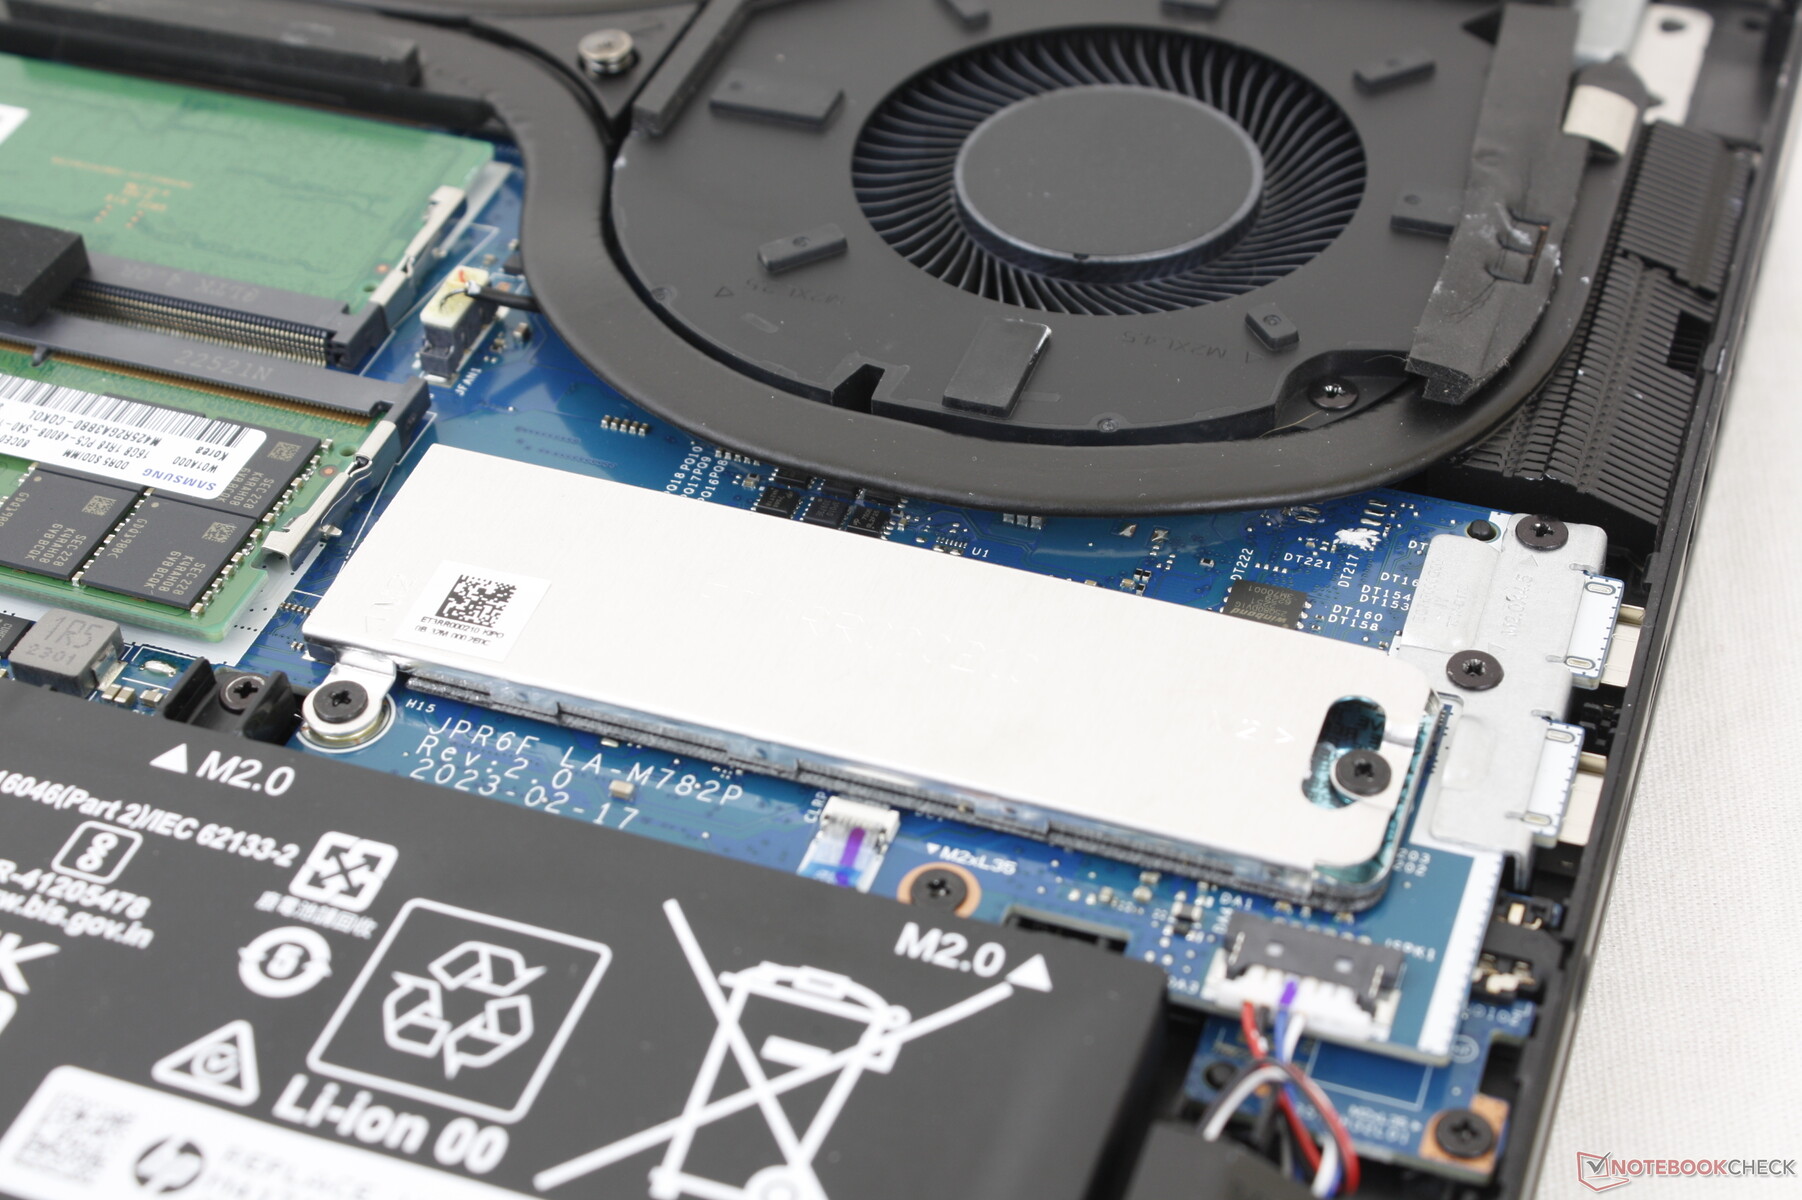
Dolny panel jest zabezpieczony sześcioma śrubami krzyżakowymi, co ułatwia jego demontaż. Właściciele mają bezpośredni dostęp do 2x slotów M.2 PCIe4 x4 2280 SSD, 2x slotów SODIMM, baterii i wyjmowanego modułu WLAN, podobnie jak w konstrukcji 2022.
Akcesoria i gwarancja
Pudełko detaliczne zawiera bezprzewodowy zestaw słuchawkowy HyperX Cloud II Core, jeśli jest skonfigurowany z RTX 4080. W przeciwnym razie pudełko zawiera tylko zwykły zasilacz sieciowy i dokumentację.
Roczna ograniczona gwarancja producenta jest standardem w przypadku zakupu w USA.
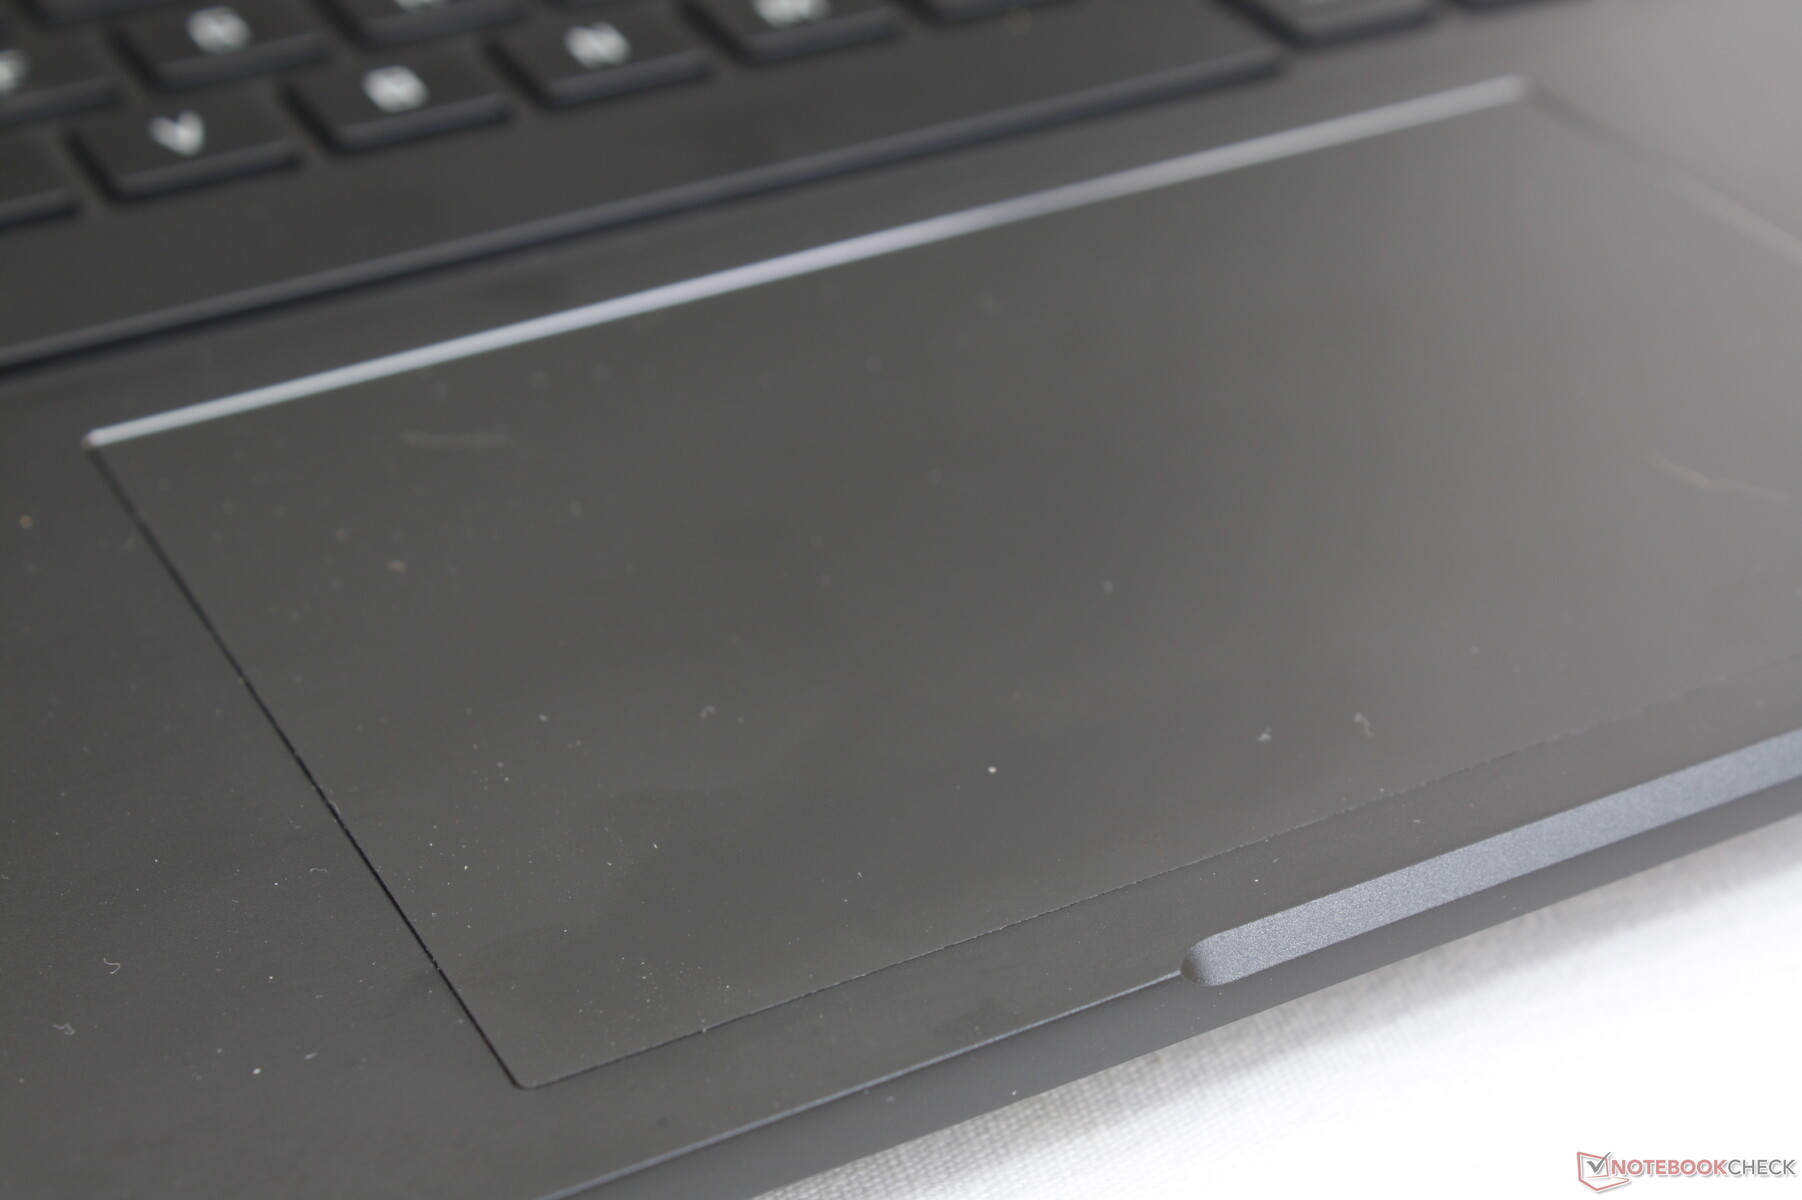
Urządzenia wejściowe - mniejszy, ale lepszy touchpad
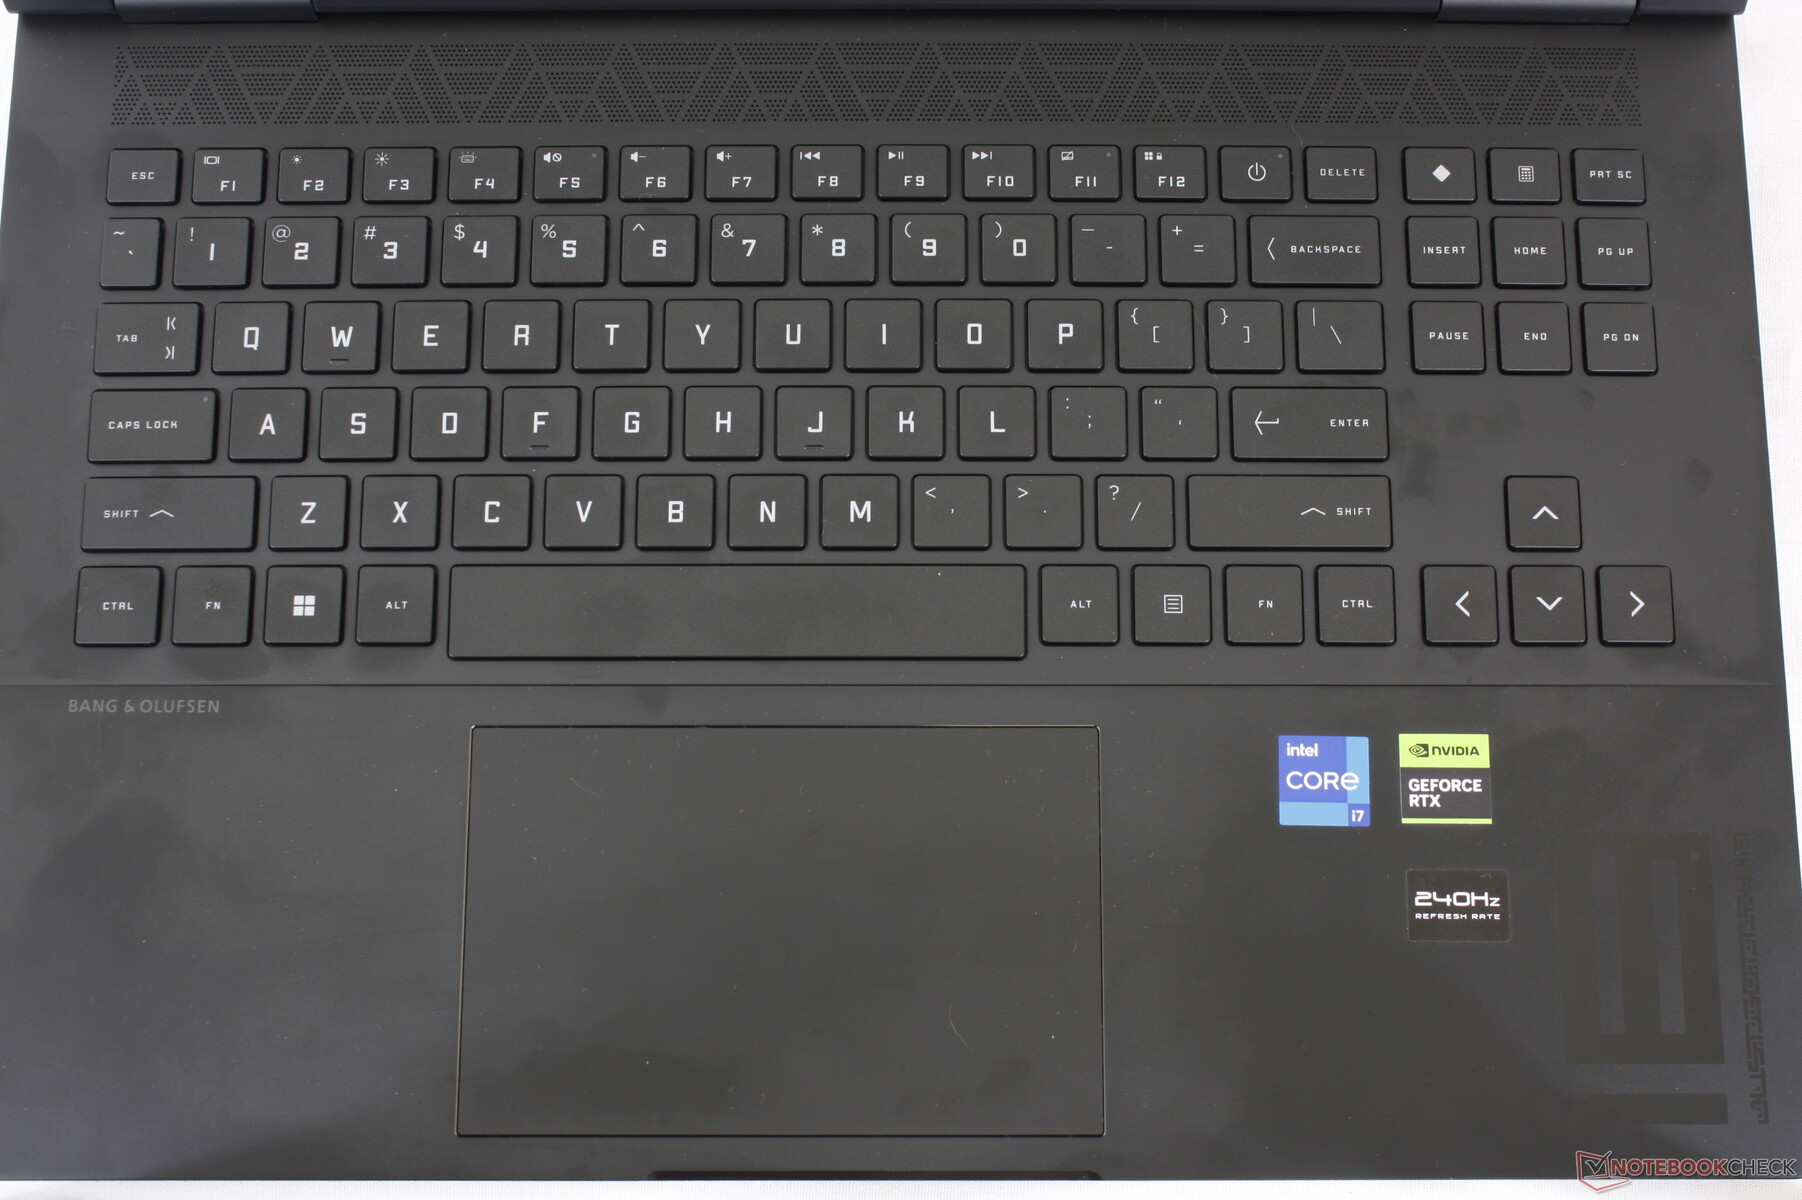
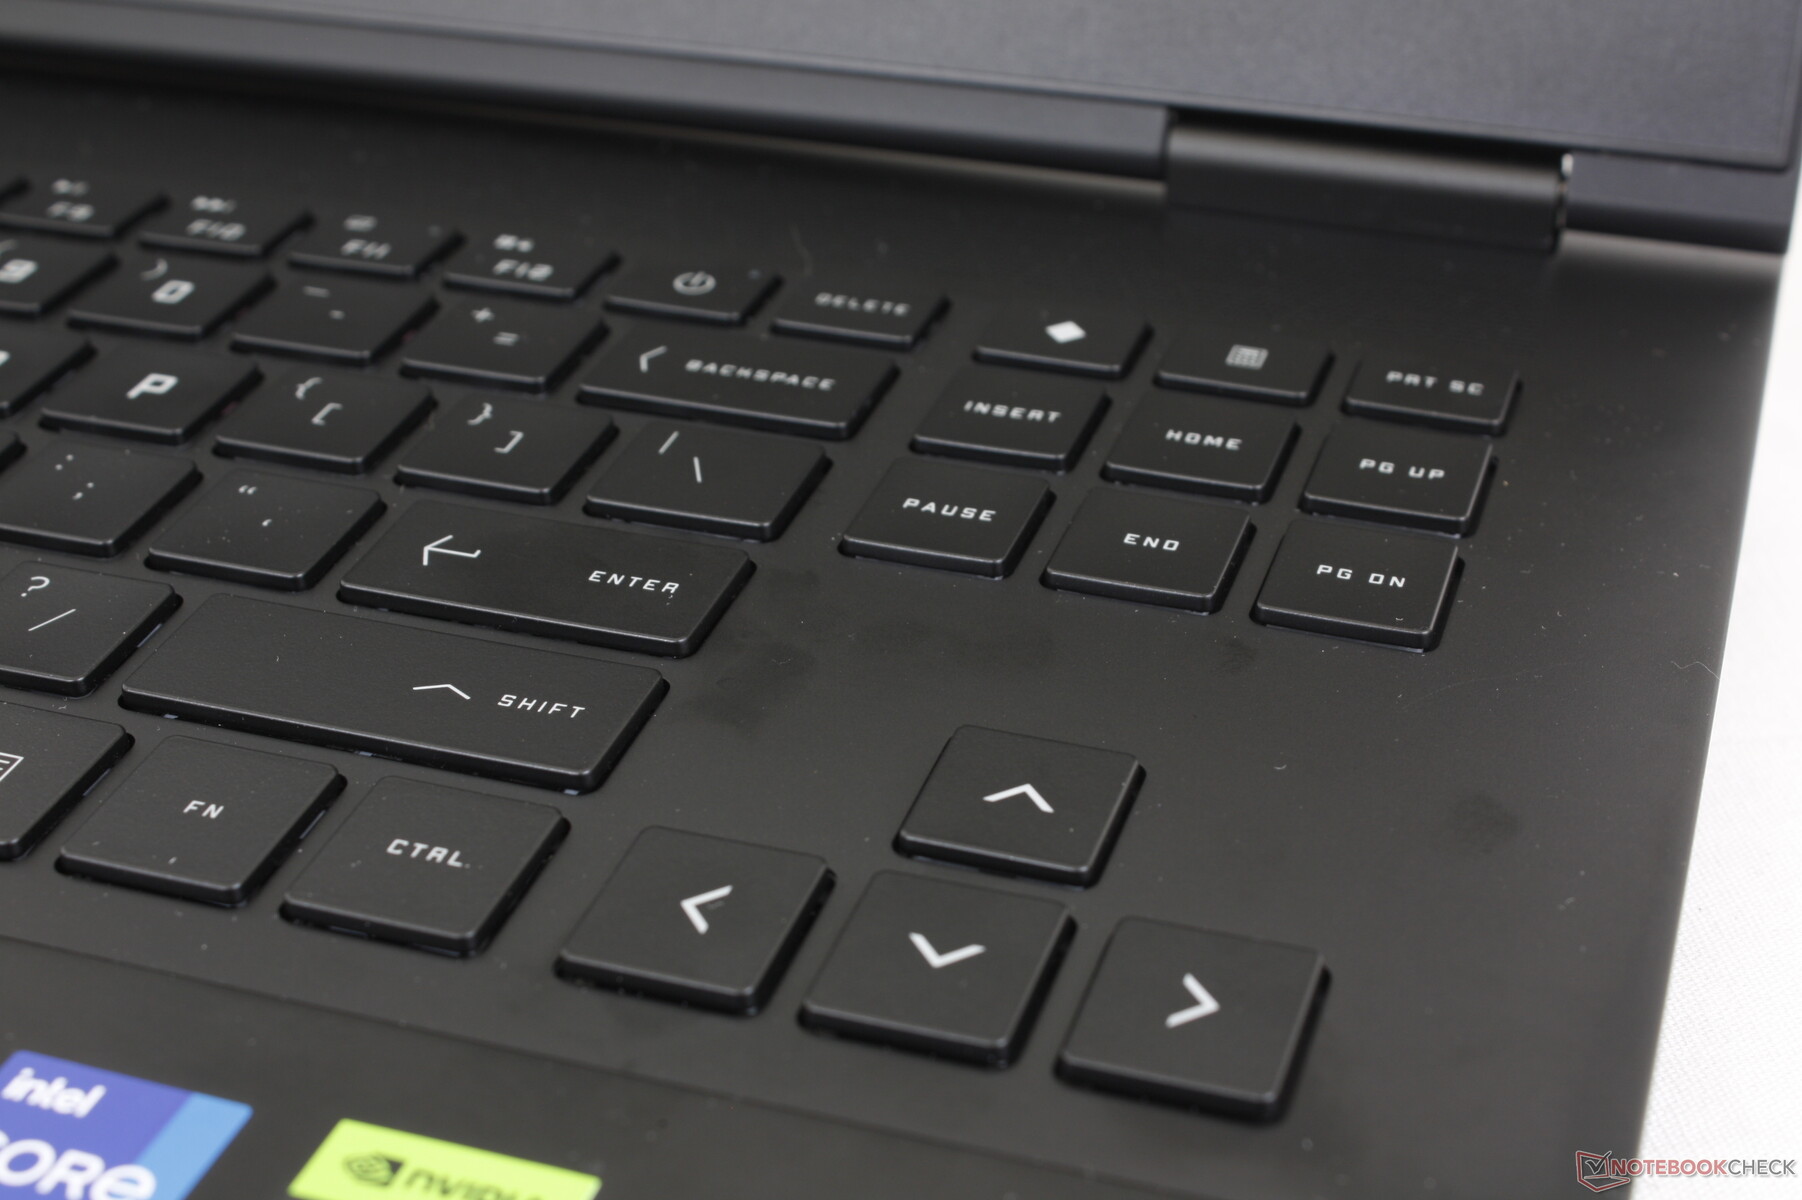
Klawiatura
Podczas gdy obudowa i clickpad zostały poddane przeglądowi, klawiatura nie uległa zmianie, więc wrażenia z pisania pozostają identyczne jak w modelu Omen 16 z 2022 roku. Sprzężenie zwrotne klawiszy jest satysfakcjonujące, zwłaszcza w przypadku klikalnego klawisza spacji, ale klawisz Enter mógłby być mocniejszy. Pisanie wydaje się tutaj bardziej przestronne niż na Blade 16.
Touchpad
Co ciekawe, HP zmniejszyło rozmiar klawiatury z 13 x 8,6 cm w modelu 2022 Omen 16 do zaledwie 12,5 x 8 cm w naszym nowszym modelu 2023. Jednak sprzężenie zwrotne podczas naciskania na jego powierzchnię uległo poprawie, zapewniając bardziej satysfakcjonujące i słyszalne kliknięcie. Dlatego też nie przeszkadza nam zbytnio mniejszy rozmiar.

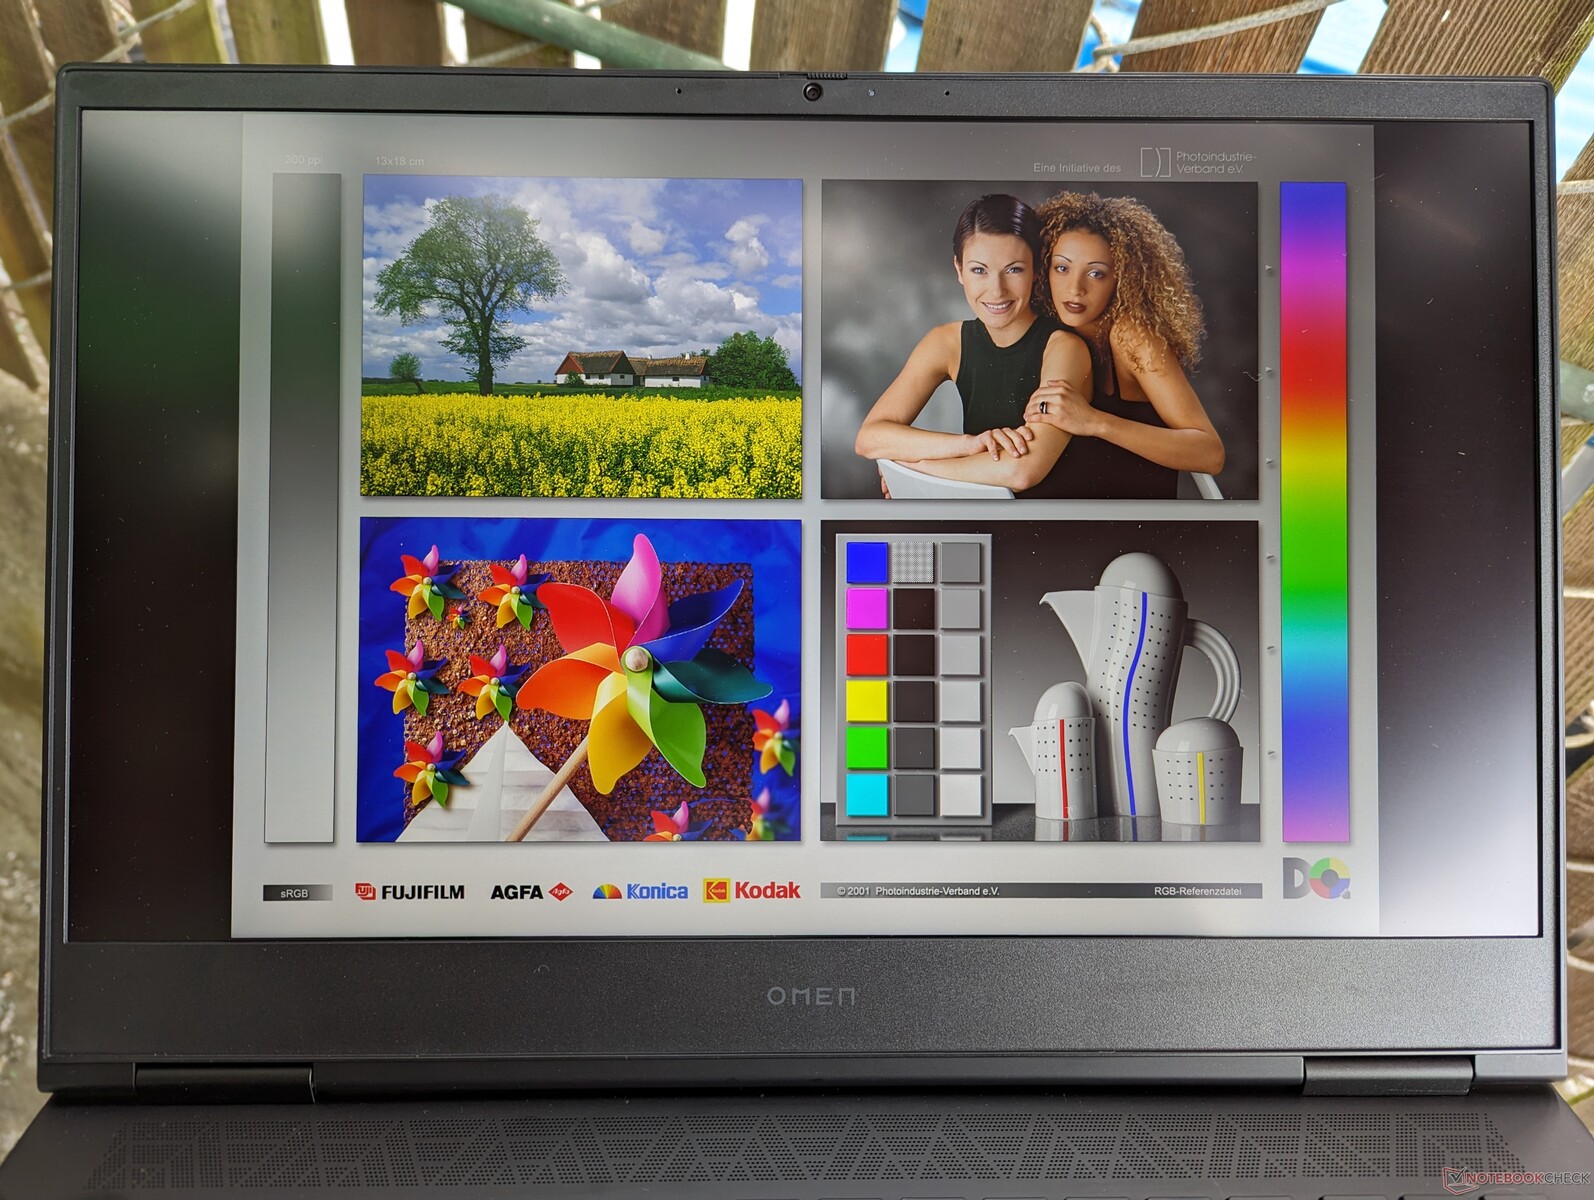
Wyświetlacz - nie ma złych opcji
HP oferuje dwie opcje wyświetlaczy wymienione poniżej. Nasze pomiary odzwierciedlają tylko pogrubiony panel.
- 1920 x 1080, 165 Hz, IPS, czas reakcji 7 ms, matowy, 300 nitów
- 2560 x 1440, 240 Hz, IPS, czas reakcji 3 ms, matowy, 300 nitów
Żadnego z paneli nie można uznać za złą opcję do gier, ale gracze szybkich tytułów, takich jak Overwatch 2 lub Valorant , mogą chcieć rozważyć opcję 1440p ze względu na szybsze czasy reakcji i częstotliwości odświeżania. Pokrycie kolorów jest ograniczone do 100% sRGB, podczas gdy konkurenci tacy jak Legion Pro 7 lub ROG Strix G16 mogą mieć pełniejsze panele DCI-P3.
Należy zauważyć, że Omen 16 jest jednym z niewielu laptopów do gier 16:9 w swojej kategorii rozmiarów, ponieważ większość innych przeszła już na 16:10.


| |||||||||||||||||||||||||
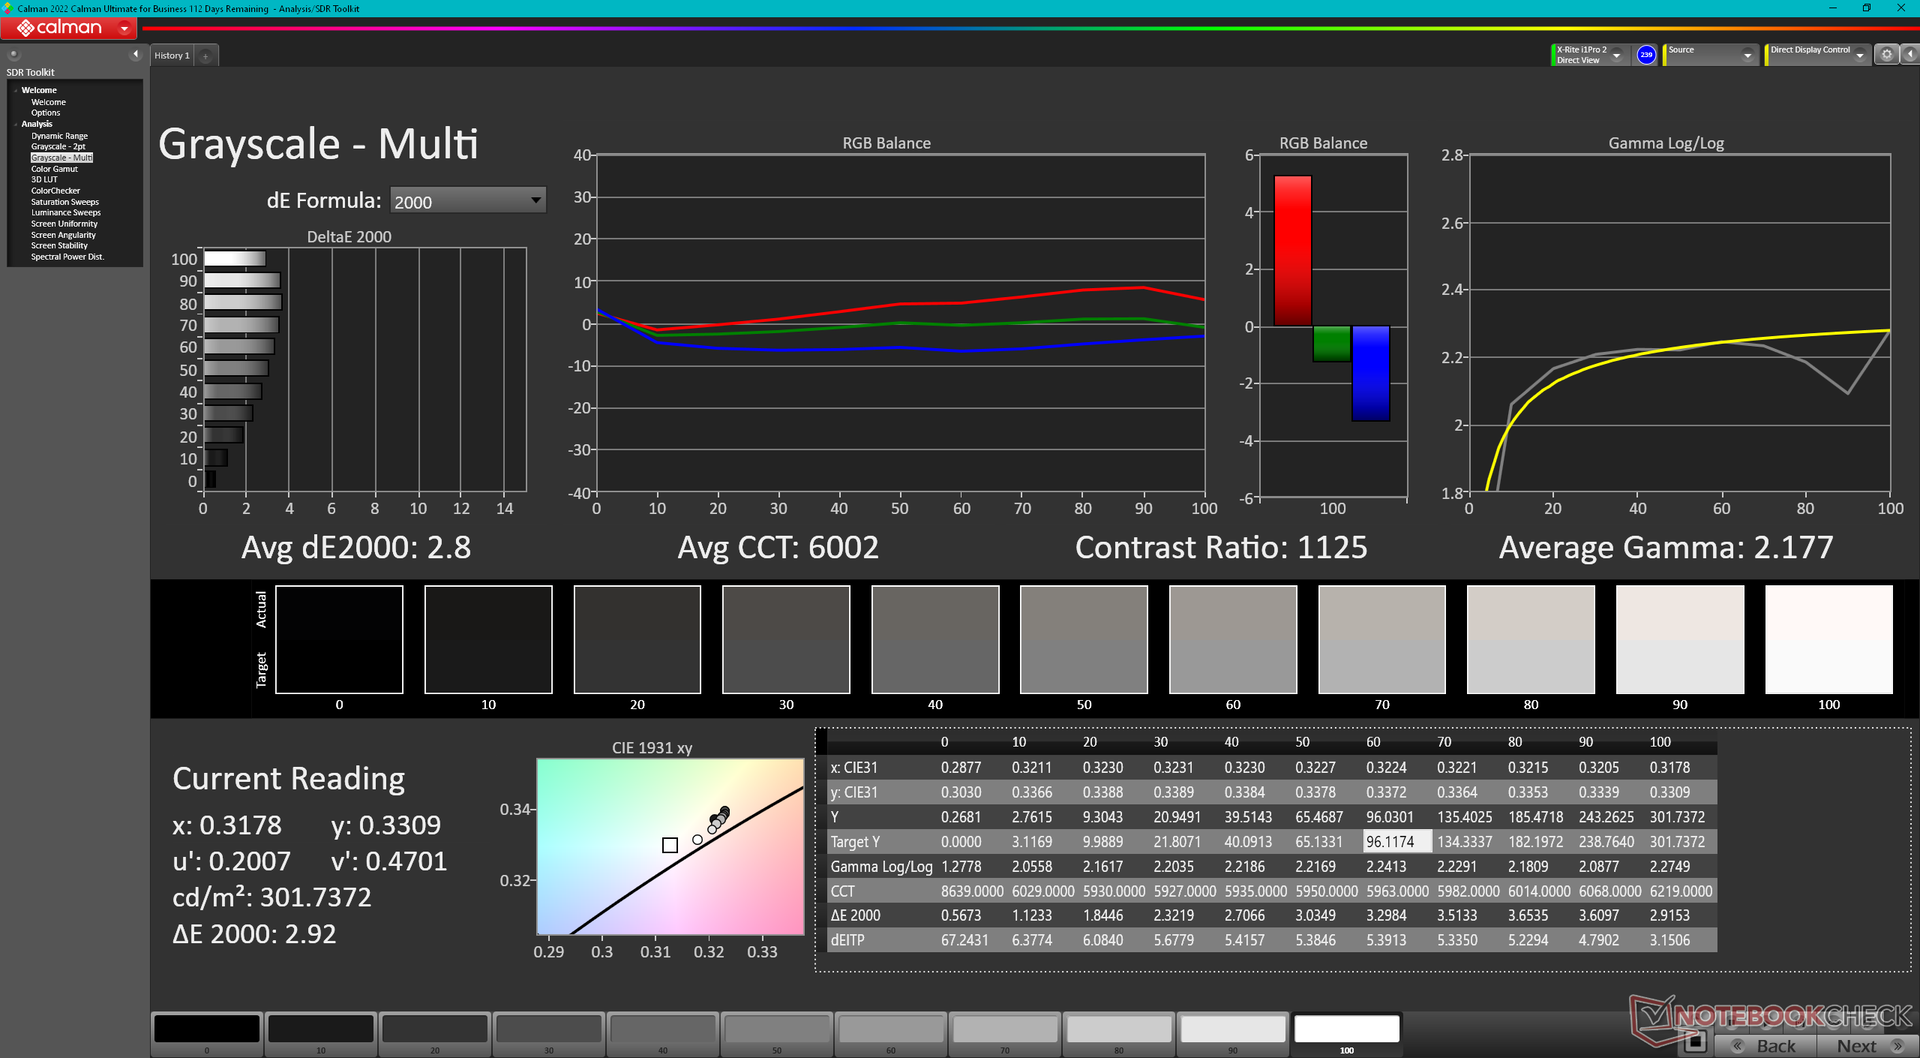
rozświetlenie: 91 %
na akumulatorze: 310.9 cd/m²
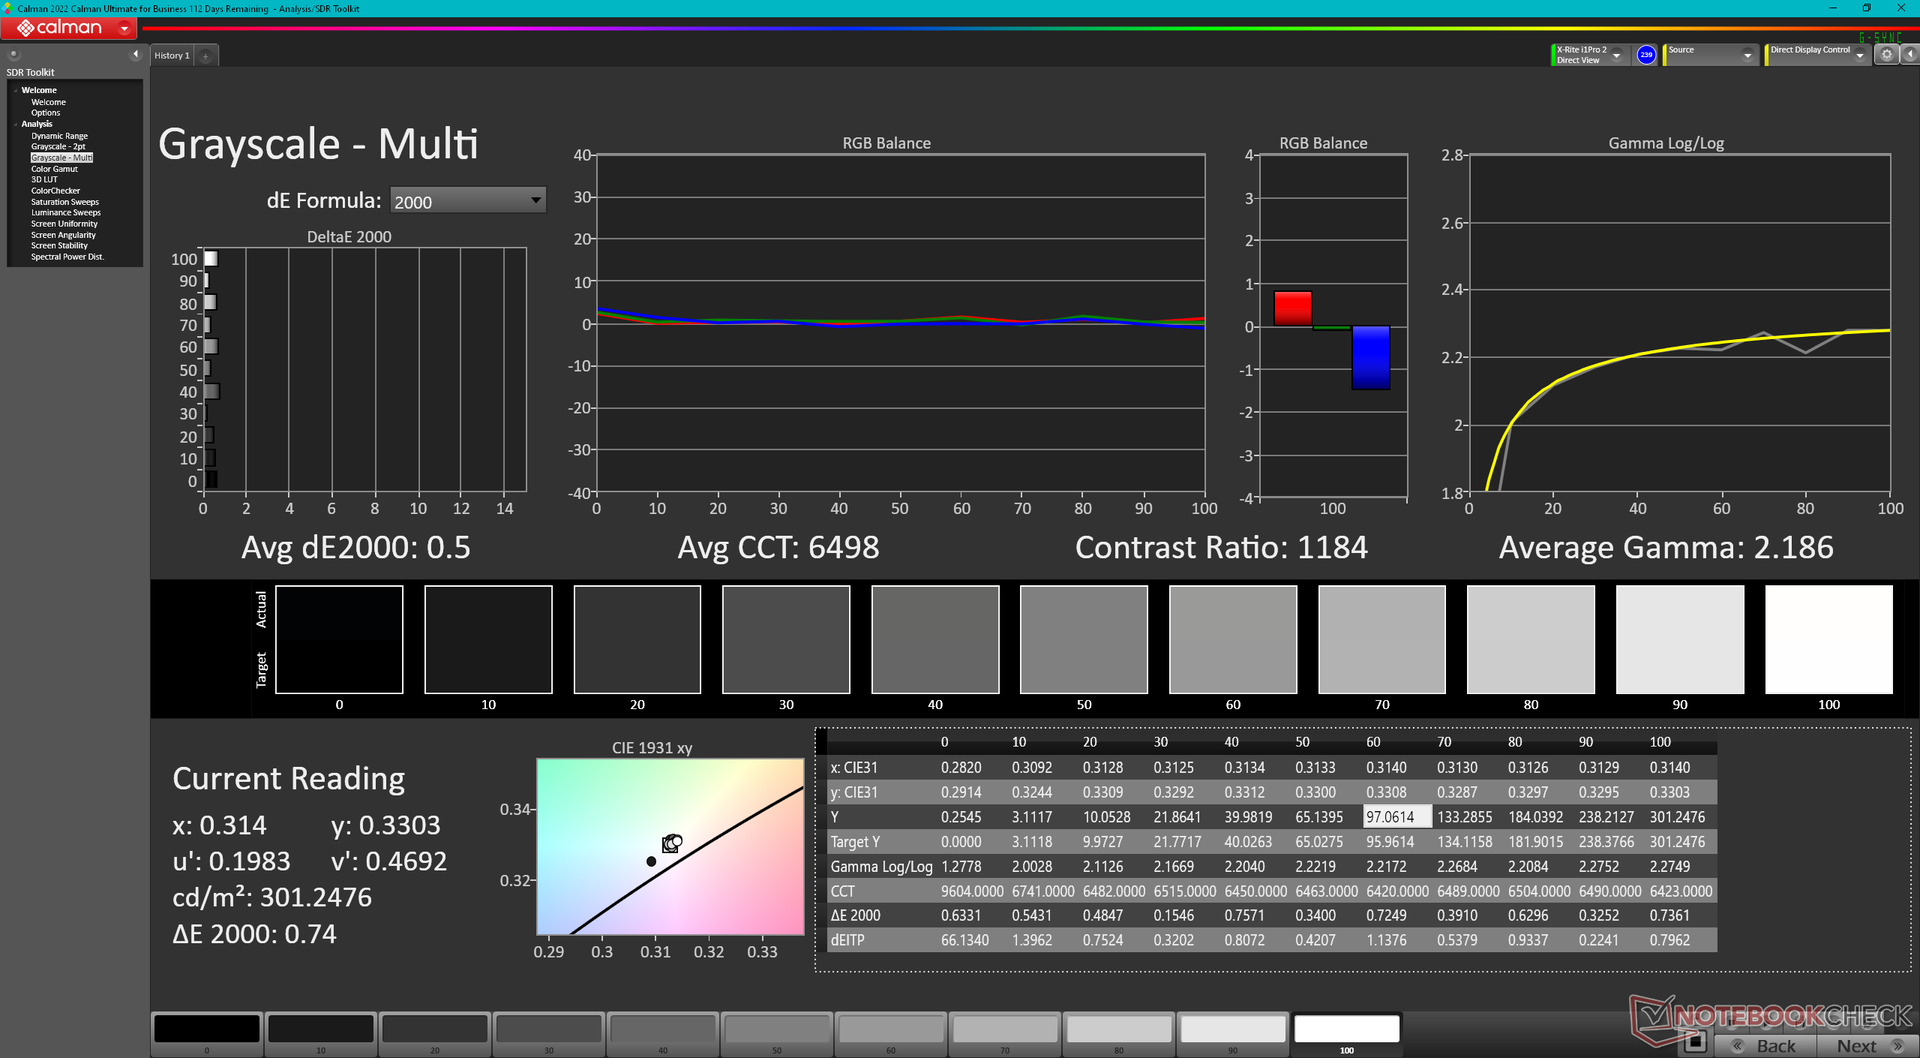
kontrast: 888:1 (czerń: 0.35 cd/m²)
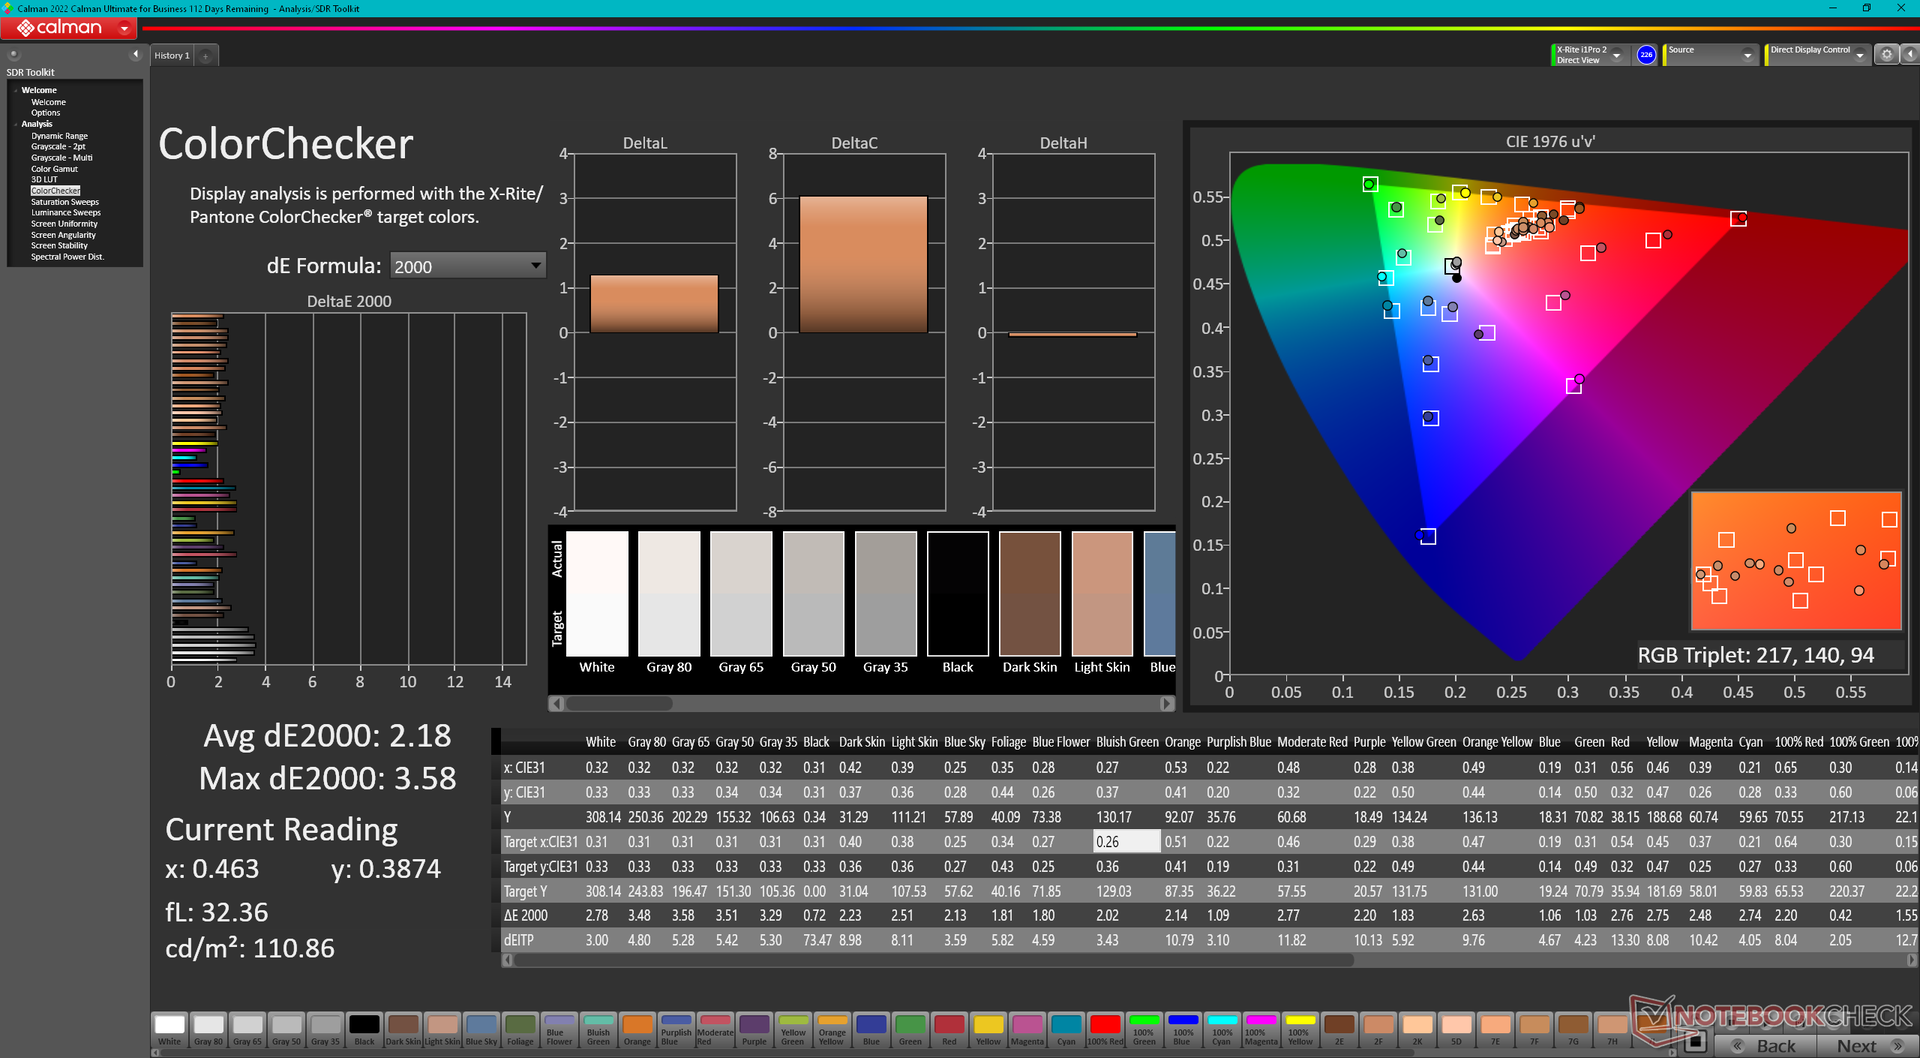
ΔE ColorChecker Calman: 2.18 | ∀{0.5-29.43 Ø4.73}
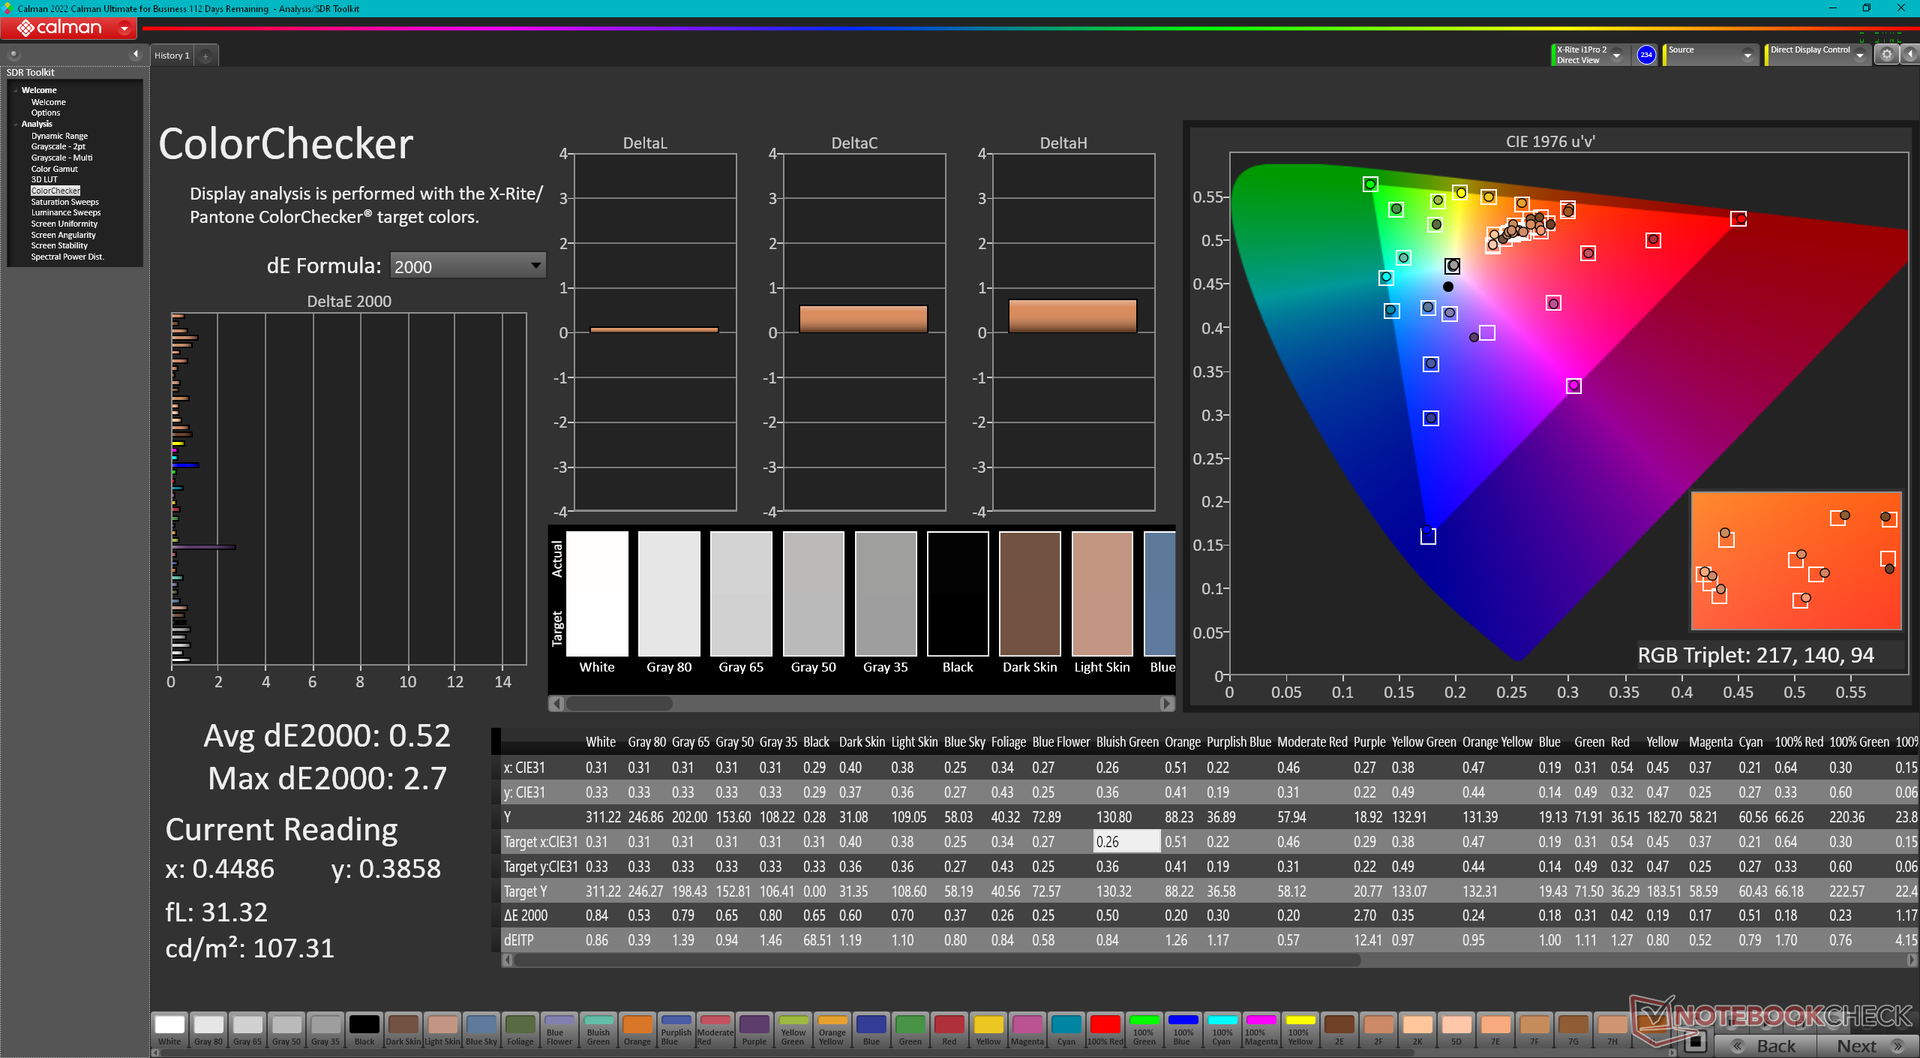
calibrated: 0.52
ΔE Greyscale Calman: 2.8 | ∀{0.09-98 Ø4.97}
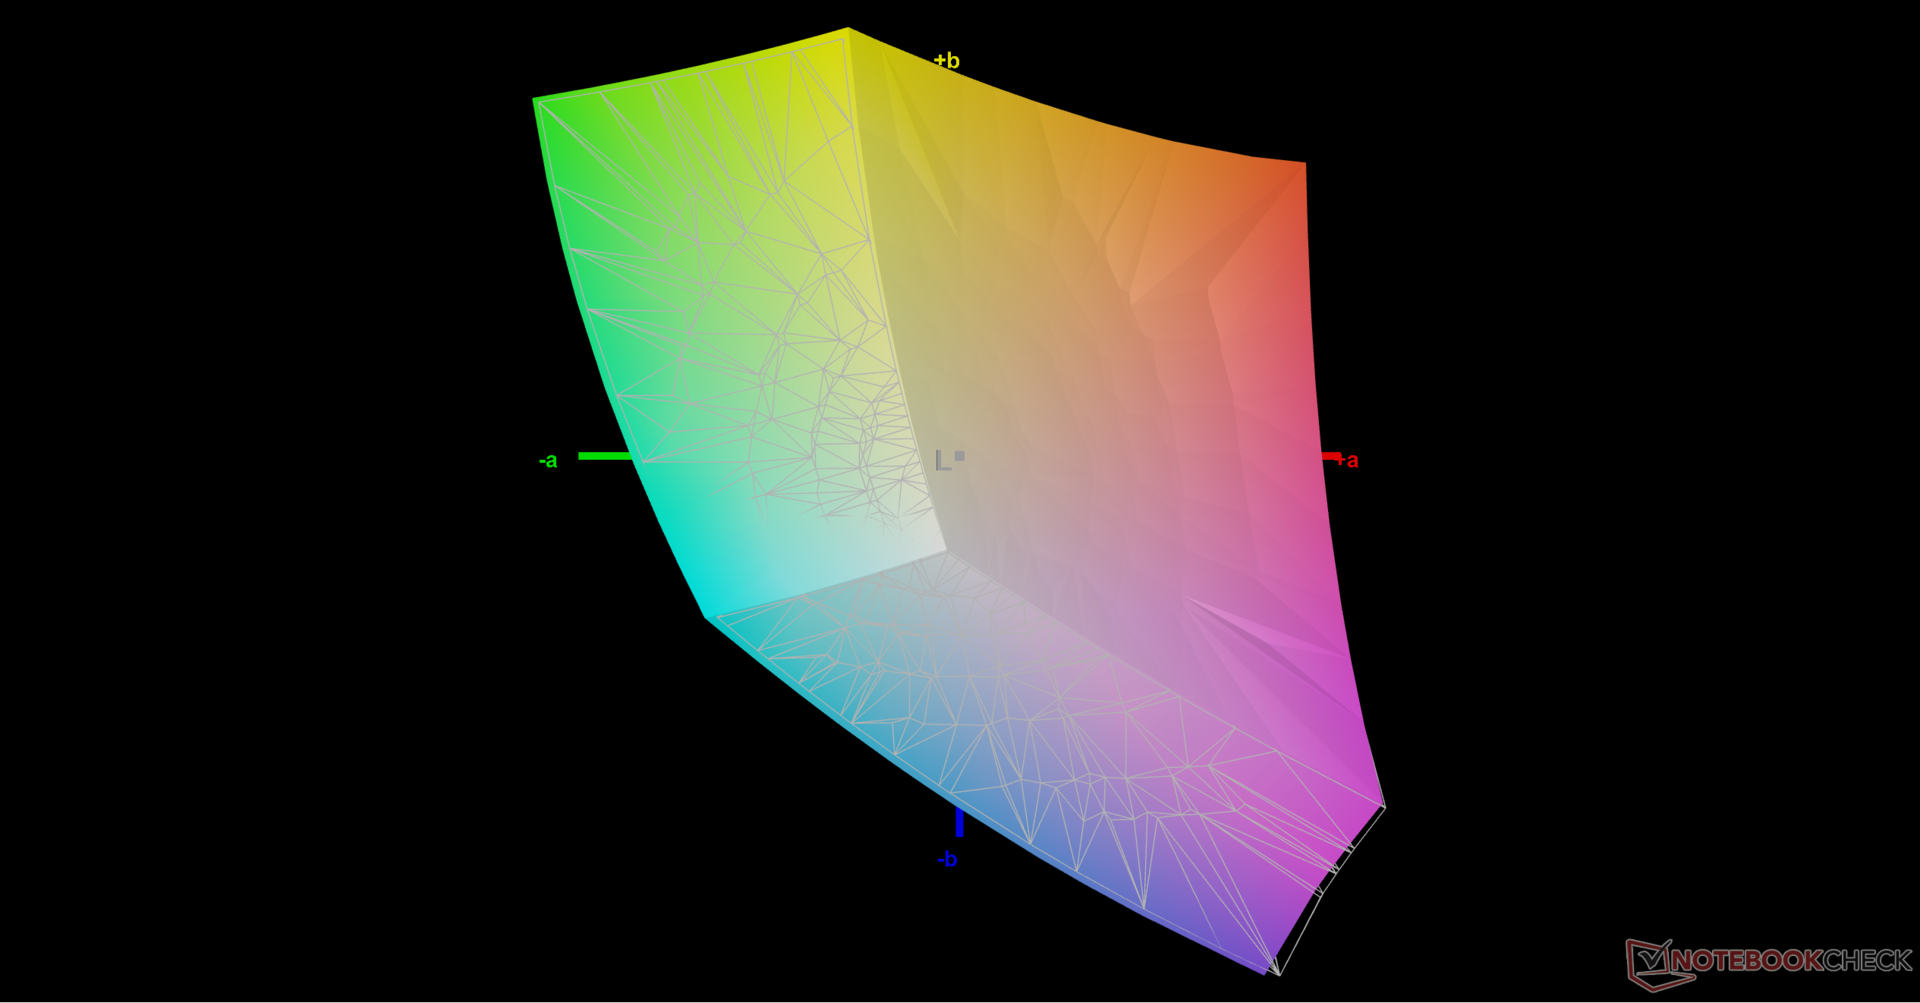
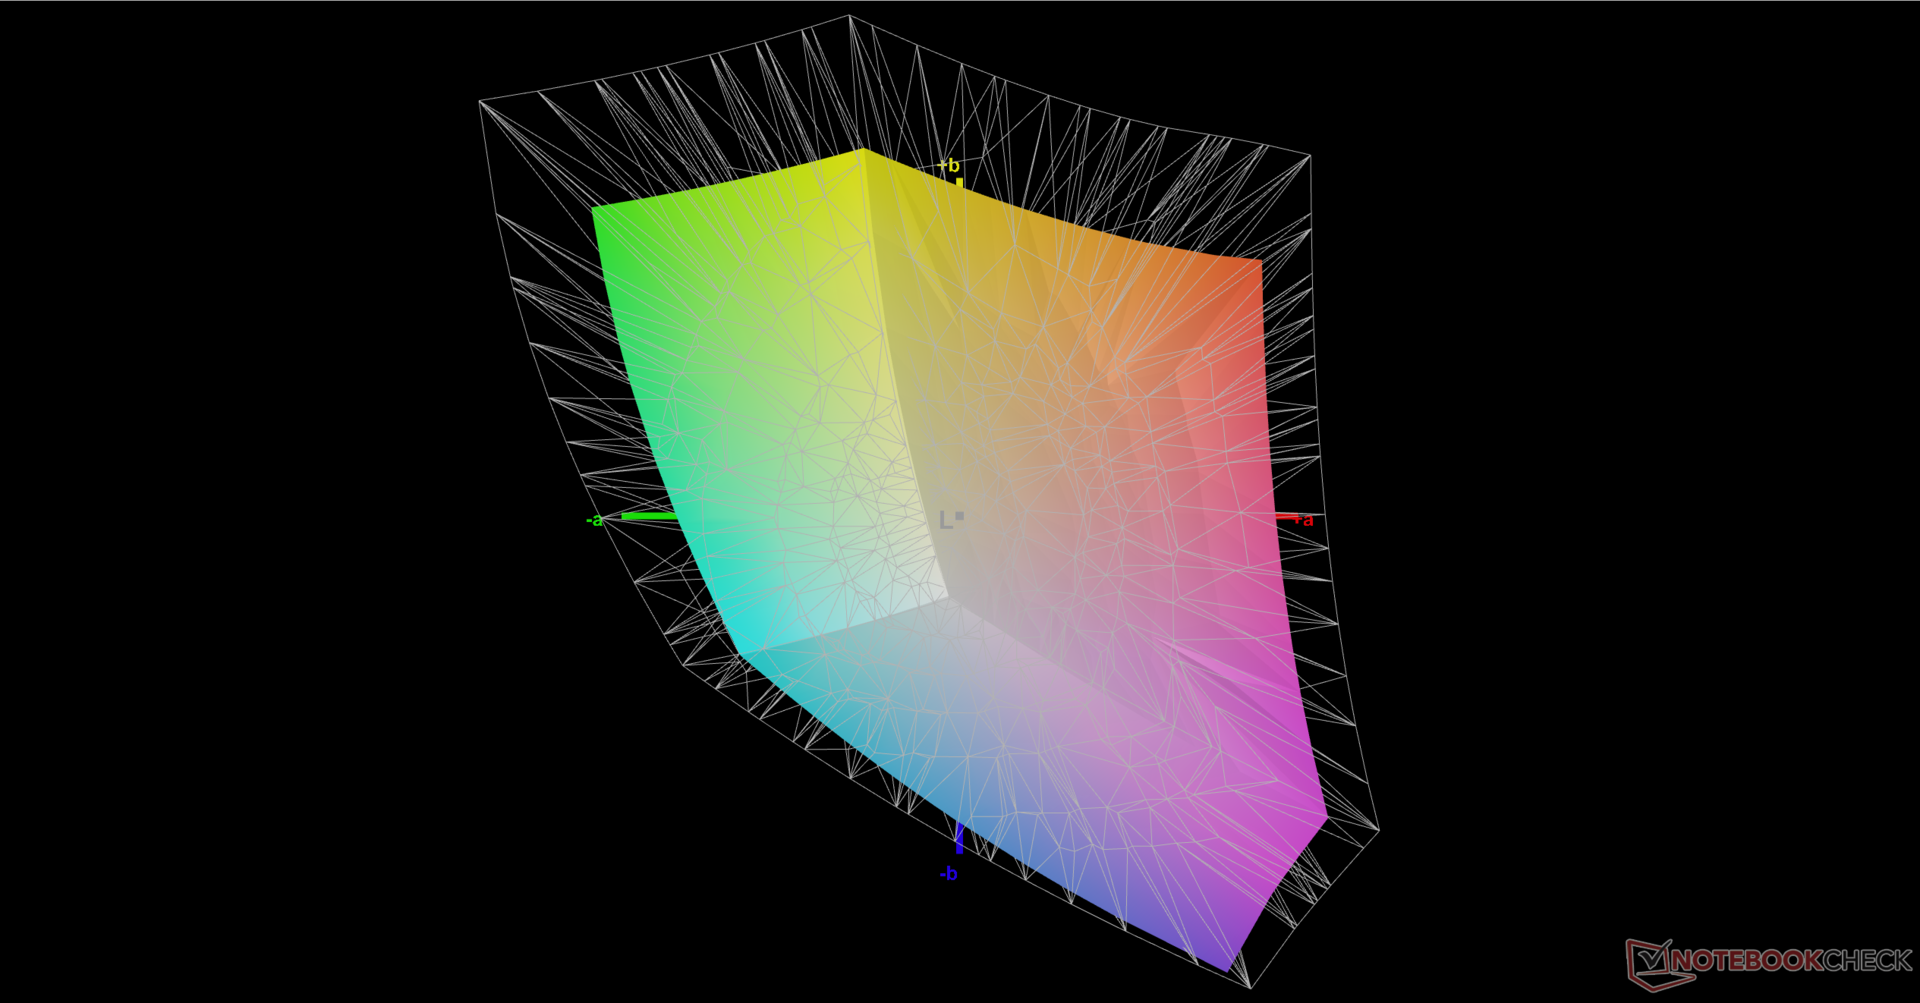
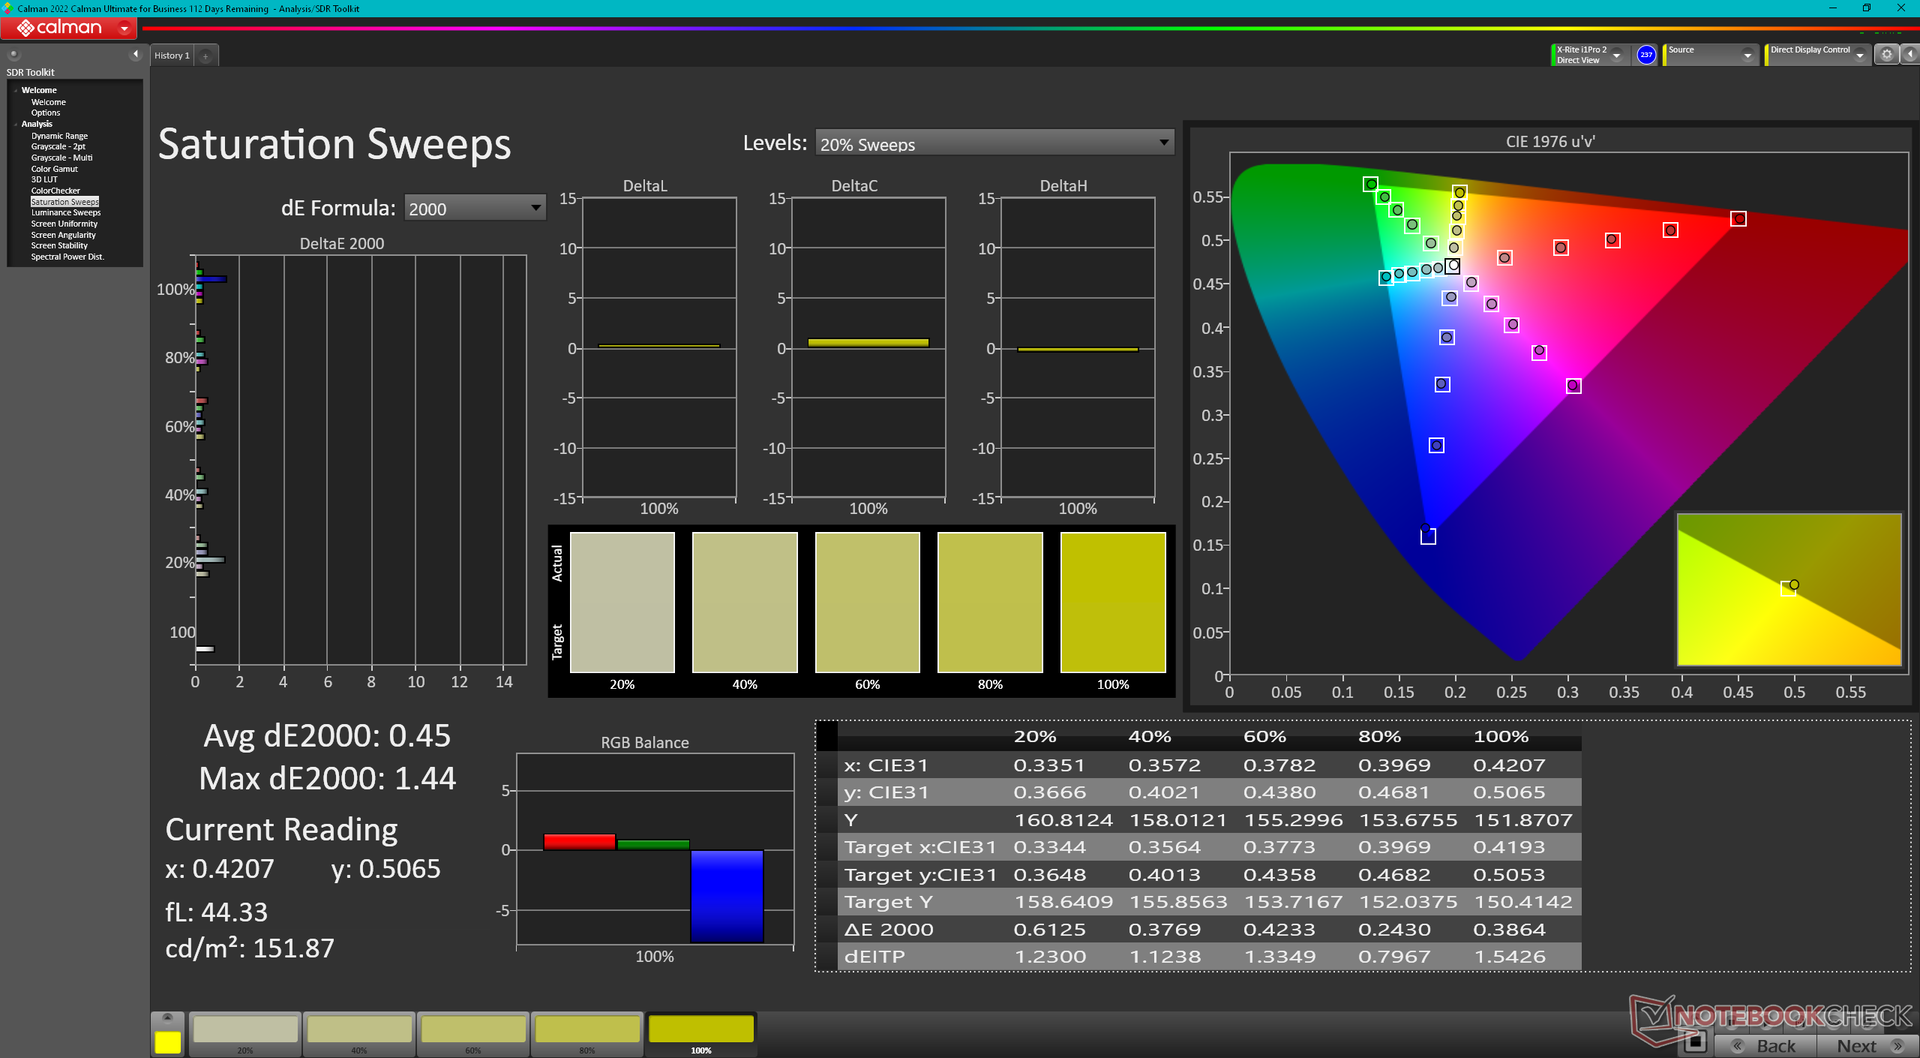
71.2% AdobeRGB 1998 (Argyll 3D)
99.2% sRGB (Argyll 3D)
69% Display P3 (Argyll 3D)
Gamma: 2.18
CCT: 6002 K
| HP Omen 16-wf000 BOE0B7D, IPS, 2560x1440, 16.1" | HP Omen 16-n0033dx BOE0AAE, IPS, 1920x1080, 16.1" | Alienware x16 R1 BOE NE16NZ4, IPS, 2560x1600, 16" | Lenovo Legion Pro 7 RTX4090 MNG007DA2-3 (CSO1628), IPS, 2560x1600, 16" | Asus ROG Strix G16 G614JZ TL160ADMP03-0, IPS, 2560x1600, 16" | Razer Blade 16 Early 2023 CSOT T3 MNG007DA4-1, IPS, 2560x1600, 16" | |
|---|---|---|---|---|---|---|
| Display | 4% | 23% | 1% | 20% | 23% | |
| Display P3 Coverage (%) | 69 | 74.4 8% | 99.2 44% | 69.5 1% | 97 41% | 98.5 43% |
| sRGB Coverage (%) | 99.2 | 99.2 0% | 100 1% | 99.8 1% | 99.9 1% | 100 1% |
| AdobeRGB 1998 Coverage (%) | 71.2 | 73.4 3% | 88.6 24% | 71.6 1% | 84.9 19% | 89.7 26% |
| Response Times | -149% | -9% | -42% | 11% | -34% | |
| Response Time Grey 50% / Grey 80% * (ms) | 4.6 ? | 17.6 ? -283% | 5.1 ? -11% | 10.9 ? -137% | 5.1 ? -11% | 6.6 ? -43% |
| Response Time Black / White * (ms) | 9.7 ? | 11.2 ? -15% | 10.3 ? -6% | 4.6 ? 53% | 6.6 ? 32% | 12 ? -24% |
| PWM Frequency (Hz) | ||||||
| Screen | -38% | -6% | 3% | 5% | -4% | |
| Brightness middle (cd/m²) | 310.9 | 373.3 20% | 302.2 -3% | 491 58% | 470 51% | 456.8 47% |
| Brightness (cd/m²) | 296 | 361 22% | 285 -4% | 472 59% | 459 55% | 437 48% |
| Brightness Distribution (%) | 91 | 79 -13% | 89 -2% | 91 0% | 93 2% | 83 -9% |
| Black Level * (cd/m²) | 0.35 | 0.44 -26% | 0.26 26% | 0.4 -14% | 0.42 -20% | 0.35 -0% |
| Contrast (:1) | 888 | 848 -5% | 1162 31% | 1228 38% | 1119 26% | 1305 47% |
| Colorchecker dE 2000 * | 2.18 | 2.12 3% | 1.63 25% | 1.6 27% | 1.86 15% | 3.7 -70% |
| Colorchecker dE 2000 max. * | 3.58 | 5.62 -57% | 4.13 -15% | 5.15 -44% | 3.87 -8% | 6.42 -79% |
| Colorchecker dE 2000 calibrated * | 0.52 | 2.06 -296% | 1.17 -125% | 0.97 -87% | 0.93 -79% | 0.66 -27% |
| Greyscale dE 2000 * | 2.8 | 2.5 11% | 2.5 11% | 3 -7% | 2.7 4% | 2.6 7% |
| Gamma | 2.18 101% | 2.3 96% | 2.23 99% | 2.211 100% | 2.246 98% | 2.3 96% |
| CCT | 6002 108% | 6408 101% | 6590 99% | 6979 93% | 6711 97% | 6108 106% |
| Całkowita średnia (program / ustawienia) | -61% /
-45% | 3% /
-0% | -13% /
-4% | 12% /
9% | -5% /
-2% |
* ... im mniej tym lepiej
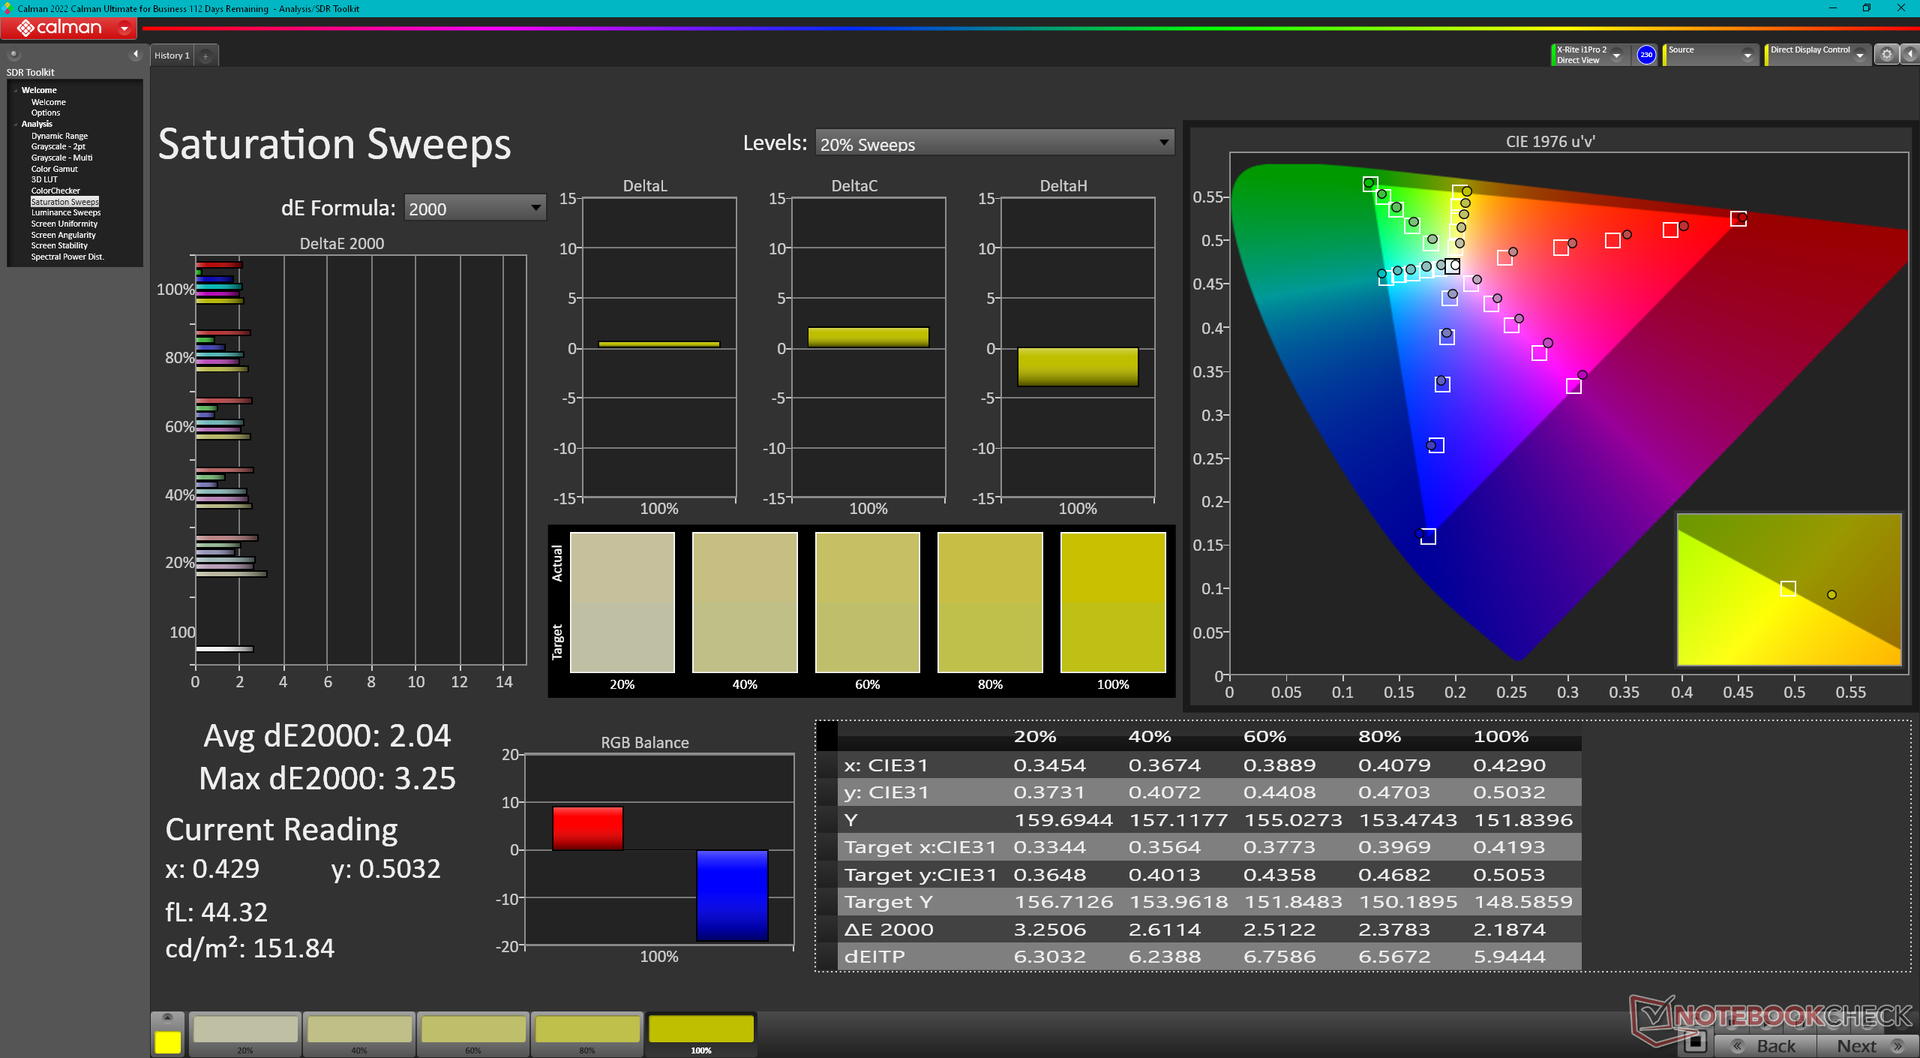
Wyświetlacz jest przyzwoicie skalibrowany po wyjęciu z pudełka ze średnimi wartościami deltaE w skali szarości i kolorów wynoszącymi odpowiednio 2,8 i 2,18. Samodzielna kalibracja panelu za pomocą kolorymetru X-Rite poprawiłaby średnie wartości jeszcze bardziej, odpowiednio do zaledwie 0,5 i 0,52. W razie potrzeby właściciele mogą zastosować nasz skalibrowany profil ICM powyżej.
Wyświetl czasy reakcji
| ↔ Czas reakcji od czerni do bieli | ||
|---|---|---|
| 9.7 ms ... wzrost ↗ i spadek ↘ łącznie | ↗ 4.6 ms wzrost | 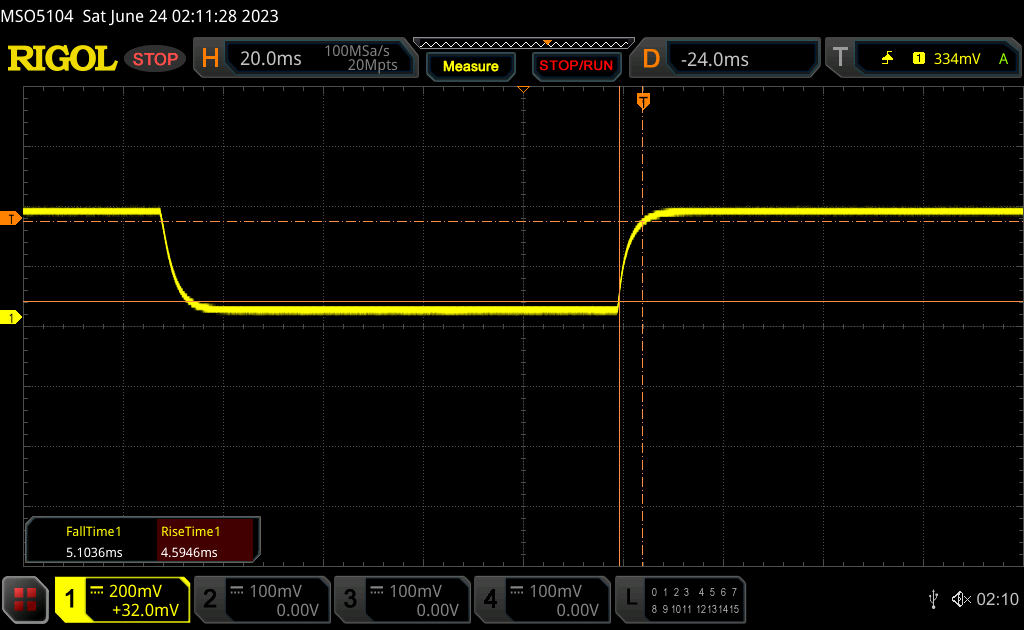 |
| ↘ 5.1 ms upadek | ||
| W naszych testach ekran wykazuje szybki czas reakcji i powinien nadawać się do gier. Dla porównania, wszystkie testowane urządzenia wahają się od 0.1 (minimum) do 240 (maksimum) ms. » 27 % wszystkich urządzeń jest lepszych. Oznacza to, że zmierzony czas reakcji jest lepszy od średniej wszystkich testowanych urządzeń (19.9 ms). | ||
| ↔ Czas reakcji 50% szarości do 80% szarości | ||
| 4.6 ms ... wzrost ↗ i spadek ↘ łącznie | ↗ 2.1 ms wzrost | 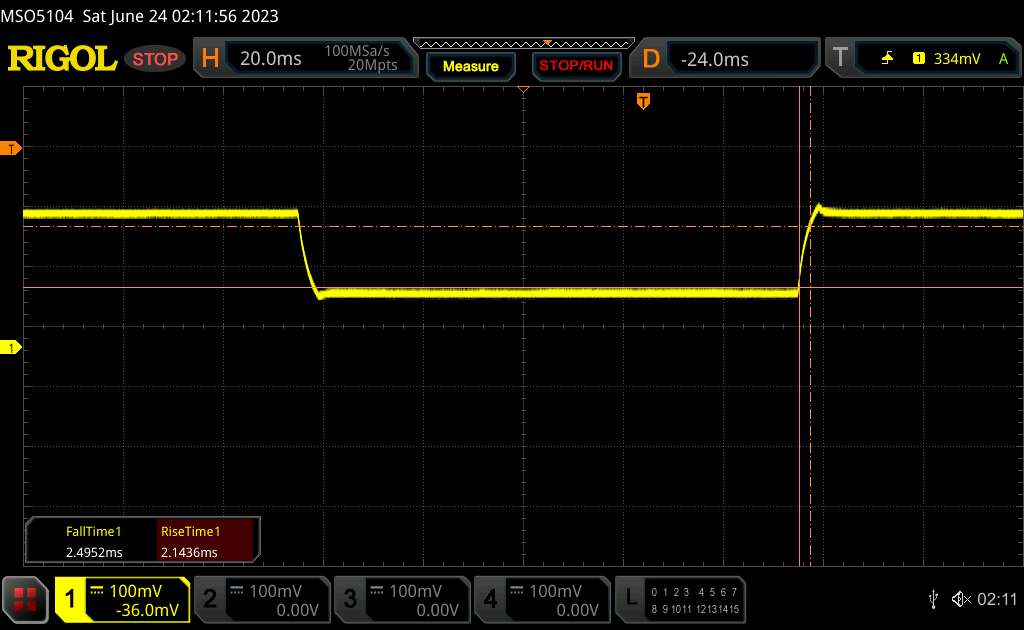 |
| ↘ 2.5 ms upadek | ||
| W naszych testach ekran wykazuje bardzo szybką reakcję i powinien bardzo dobrze nadawać się do szybkich gier. Dla porównania, wszystkie testowane urządzenia wahają się od 0.165 (minimum) do 636 (maksimum) ms. » 16 % wszystkich urządzeń jest lepszych. Oznacza to, że zmierzony czas reakcji jest lepszy od średniej wszystkich testowanych urządzeń (31.1 ms). | ||
Migotanie ekranu / PWM (modulacja szerokości impulsu)
| Migotanie ekranu/nie wykryto PWM | 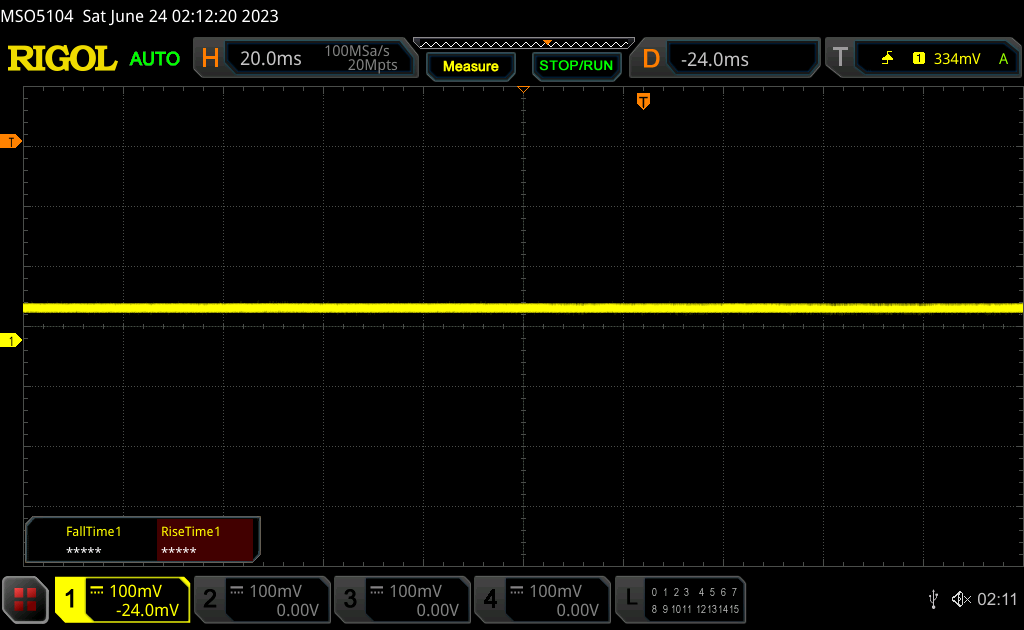 | ||
Dla porównania: 52 % wszystkich testowanych urządzeń nie używa PWM do przyciemniania wyświetlacza. Jeśli wykryto PWM, zmierzono średnio 7801 (minimum: 5 - maksimum: 343500) Hz. | |||
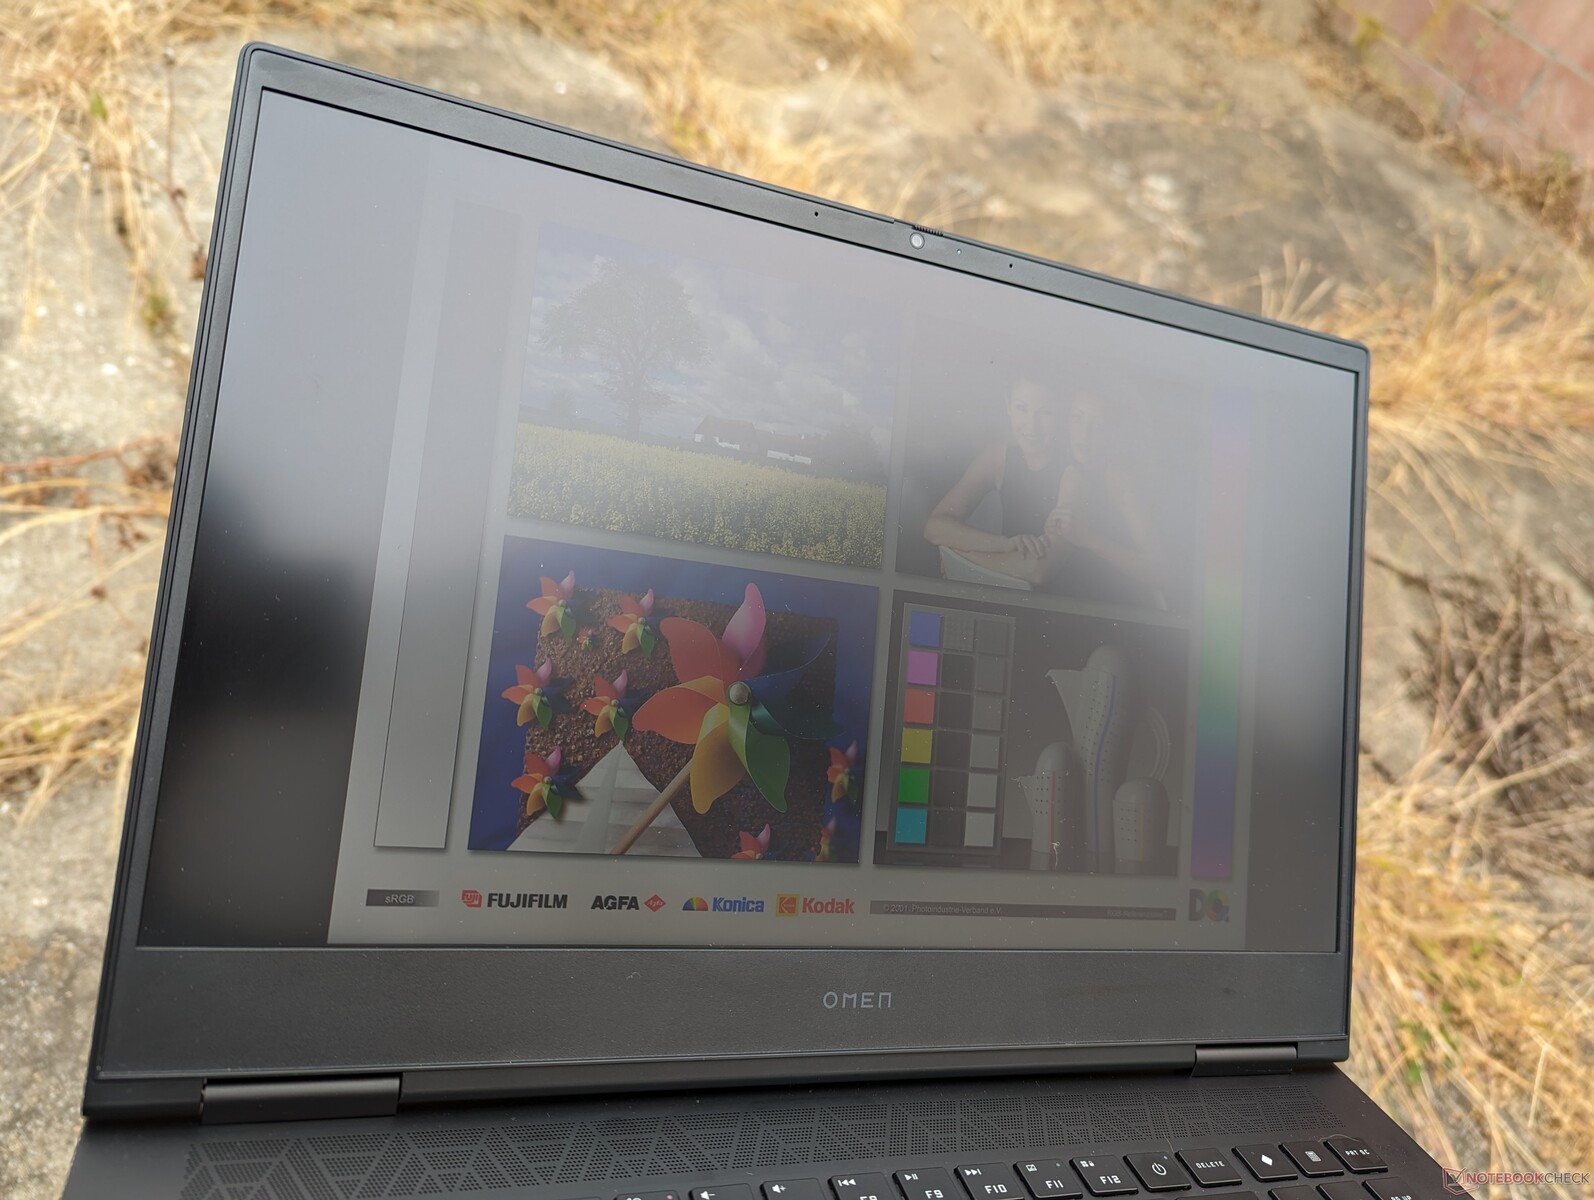
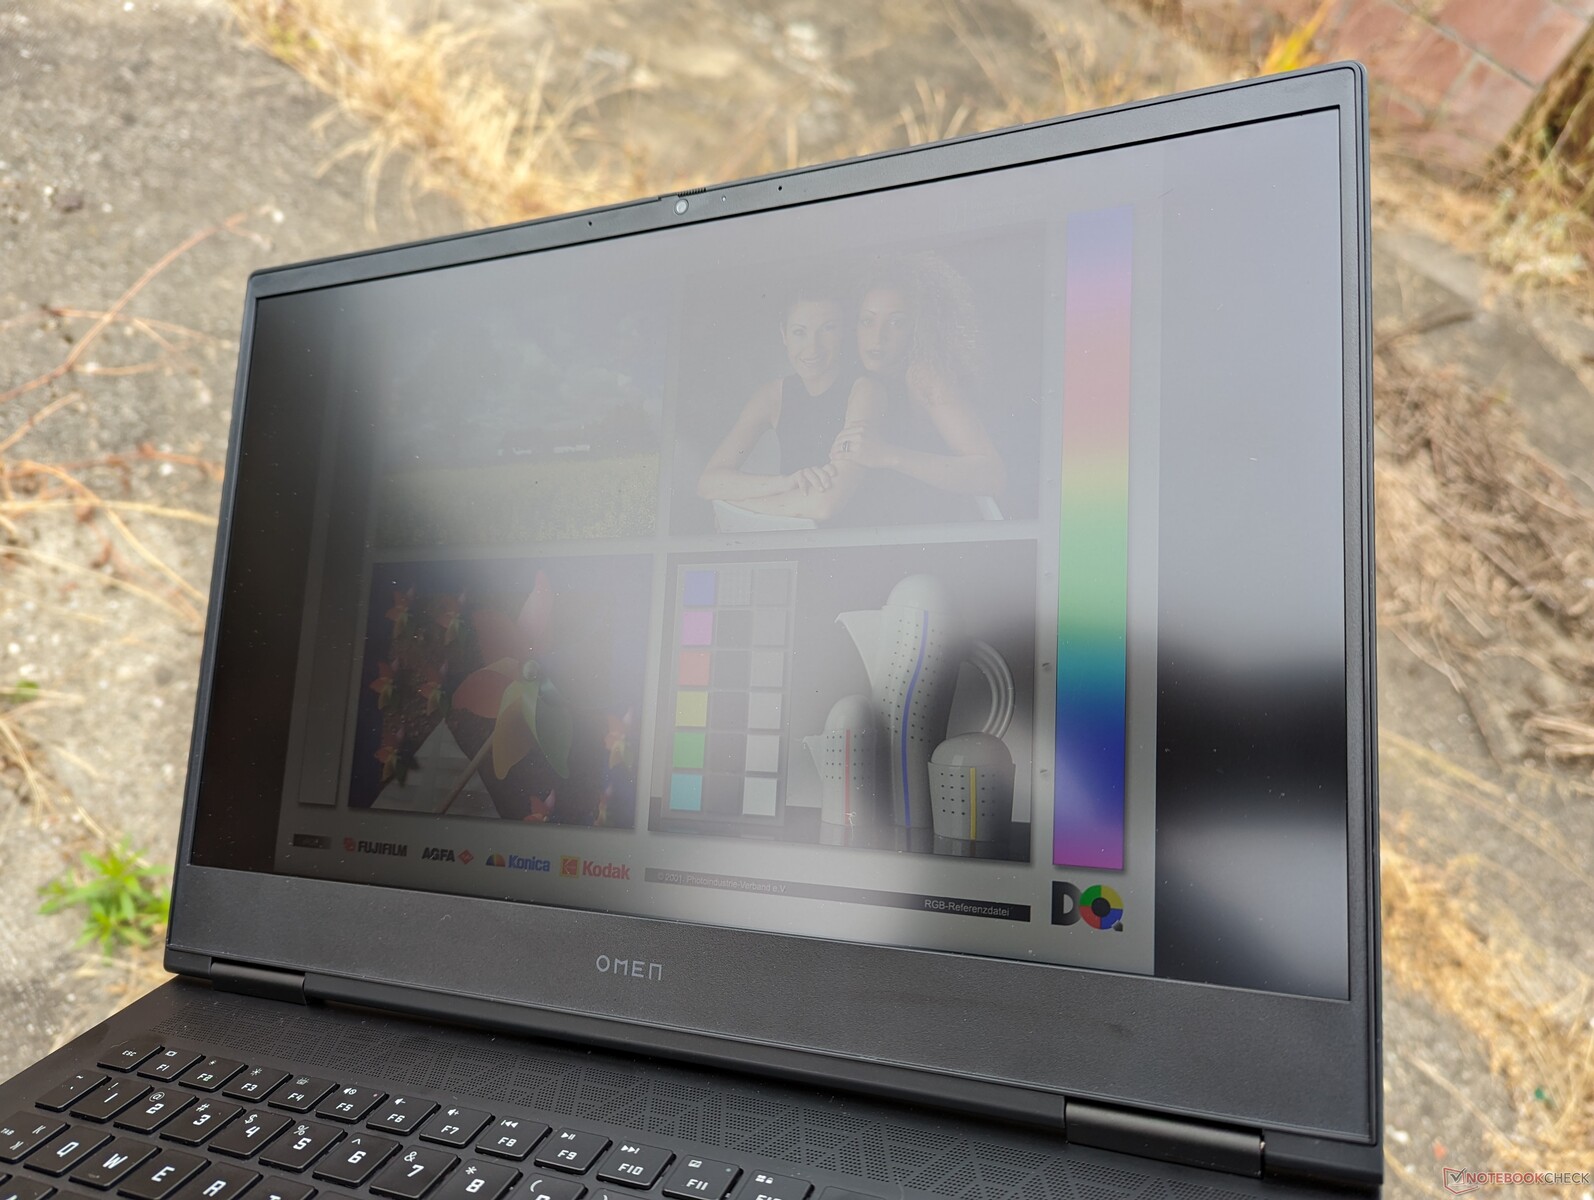
Widoczność na zewnątrz jest akceptowalna tylko w cieniu. Wyświetlacz nie jest tak jasny jak wyświetlacze w Legion Pro 7,ROG Strix G16lubBlade 16 które są lepiej widoczne na zewnątrz.

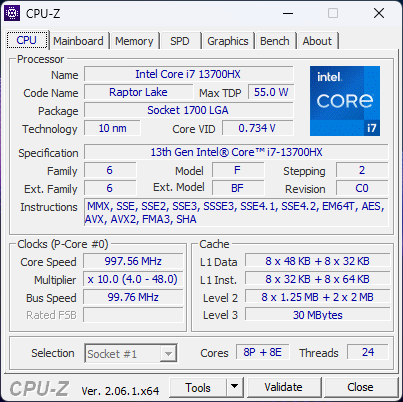
Wydajność - Intel Raptor Lake-H 13. generacji
Warunki testowania
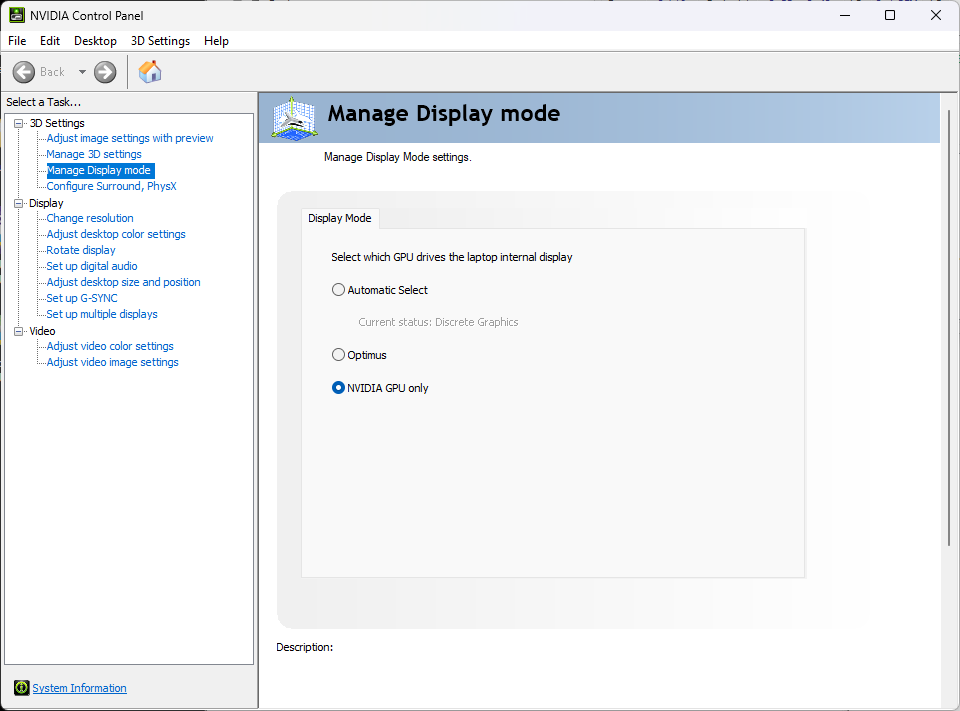
Przed przeprowadzeniem poniższych testów porównawczych ustawiliśmy naszą jednostkę w trybie dGPU za pośrednictwem panelu sterowania Nvidia i w trybie wydajności zarówno za pośrednictwem Omen Gaming Hub, jak i systemu Windows. Oprócz zwykłego trybu wydajności dostępne jest również ustawienie Max Fan. Zalecamy właścicielom zapoznanie się z Omen Gaming Hub, ponieważ jest to centrum sterowania do dostosowywania profili zasilania, oświetlenia RGB, ustawień gier i nie tylko. Irytujące jest to, że ustawienia profili zasilania HP nie są zsynchronizowane ze zwykłymi profilami zasilania systemu Windows.
Advanced Optimus lub MUX i G-Sync są obsługiwane.
Procesor
Wydajność procesora jest taka, jakiej oczekujemy od innych laptopów z tym samym procesorem Core i7-13700HX CPU, co oznacza, że w Omen 16 nie ma znaczącego dławienia wydajności. Warto zauważyć, że procesor dorównuje droższym modelomCore i9-13900HK w Alienware x16 R1, a jednocześnie jest o około 15 do 20 procent szybszy niż wychodzący 12. generacji Core i7-12700H. ProcesorCore i9-13900HX oferuje znacznie bardziej znaczący wzrost wydajności, ale taka opcja nie jest dostępna w tym modelu.
Cinebench R15 Multi Loop
Cinebench R20: CPU (Multi Core) | CPU (Single Core)
Cinebench R23: Multi Core | Single Core
Cinebench R15: CPU Multi 64Bit | CPU Single 64Bit
Blender: v2.79 BMW27 CPU
7-Zip 18.03: 7z b 4 | 7z b 4 -mmt1
Geekbench 5.5: Multi-Core | Single-Core
HWBOT x265 Benchmark v2.2: 4k Preset
LibreOffice : 20 Documents To PDF
R Benchmark 2.5: Overall mean
| CPU Performance rating | |
| Asus Zephyrus Duo 16 GX650PY-NM006W | |
| Lenovo Legion Pro 7 RTX4090 | |
| Asus ROG Strix G16 G614JZ | |
| Razer Blade 16 Early 2023 | |
| Alienware x16 R1 -1! | |
| HP Omen 16-wf000 -1! | |
| MSI GE67 HX 12UGS | |
| Przeciętny Intel Core i7-13700HX | |
| Asus ROG Zephyrus M16 GU603Z | |
| Dell G16 7620 | |
| Razer Blade 15 2022 | |
| Lenovo Legion S7 16ARHA7 | |
| HP Omen 16-n0033dx | |
| Dell Inspiron 16 Plus 7610-MHJ8F | |
| Lenovo Legion C7 15IMH05 82EH0030GE | |
| Cinebench R20 / CPU (Multi Core) | |
| Asus Zephyrus Duo 16 GX650PY-NM006W | |
| Lenovo Legion Pro 7 RTX4090 | |
| Asus ROG Strix G16 G614JZ | |
| Razer Blade 16 Early 2023 | |
| MSI GE67 HX 12UGS | |
| Przeciętny Intel Core i7-13700HX (6160 - 8610, n=11) | |
| HP Omen 16-wf000 | |
| Alienware x16 R1 | |
| Dell G16 7620 | |
| Asus ROG Zephyrus M16 GU603Z | |
| Razer Blade 15 2022 | |
| Lenovo Legion S7 16ARHA7 | |
| HP Omen 16-n0033dx | |
| Dell Inspiron 16 Plus 7610-MHJ8F | |
| Lenovo Legion C7 15IMH05 82EH0030GE | |
| Cinebench R20 / CPU (Single Core) | |
| Asus ROG Strix G16 G614JZ | |
| Lenovo Legion Pro 7 RTX4090 | |
| Asus Zephyrus Duo 16 GX650PY-NM006W | |
| Alienware x16 R1 | |
| Razer Blade 16 Early 2023 | |
| HP Omen 16-wf000 | |
| Asus ROG Zephyrus M16 GU603Z | |
| Przeciętny Intel Core i7-13700HX (644 - 740, n=11) | |
| Razer Blade 15 2022 | |
| MSI GE67 HX 12UGS | |
| Dell G16 7620 | |
| Lenovo Legion S7 16ARHA7 | |
| HP Omen 16-n0033dx | |
| Dell Inspiron 16 Plus 7610-MHJ8F | |
| Lenovo Legion C7 15IMH05 82EH0030GE | |
| Cinebench R23 / Multi Core | |
| Asus Zephyrus Duo 16 GX650PY-NM006W | |
| Lenovo Legion Pro 7 RTX4090 | |
| Asus ROG Strix G16 G614JZ | |
| Razer Blade 16 Early 2023 | |
| MSI GE67 HX 12UGS | |
| Przeciętny Intel Core i7-13700HX (15558 - 22598, n=11) | |
| HP Omen 16-wf000 | |
| Alienware x16 R1 | |
| Dell G16 7620 | |
| Asus ROG Zephyrus M16 GU603Z | |
| Razer Blade 15 2022 | |
| Lenovo Legion S7 16ARHA7 | |
| HP Omen 16-n0033dx | |
| Dell Inspiron 16 Plus 7610-MHJ8F | |
| Lenovo Legion C7 15IMH05 82EH0030GE | |
| Cinebench R23 / Single Core | |
| Asus ROG Strix G16 G614JZ | |
| Lenovo Legion Pro 7 RTX4090 | |
| Razer Blade 16 Early 2023 | |
| Alienware x16 R1 | |
| Asus Zephyrus Duo 16 GX650PY-NM006W | |
| Asus ROG Zephyrus M16 GU603Z | |
| HP Omen 16-wf000 | |
| Przeciętny Intel Core i7-13700HX (1666 - 1933, n=11) | |
| MSI GE67 HX 12UGS | |
| Razer Blade 15 2022 | |
| Dell G16 7620 | |
| Lenovo Legion S7 16ARHA7 | |
| HP Omen 16-n0033dx | |
| Dell Inspiron 16 Plus 7610-MHJ8F | |
| Lenovo Legion C7 15IMH05 82EH0030GE | |
| Cinebench R15 / CPU Multi 64Bit | |
| Asus Zephyrus Duo 16 GX650PY-NM006W | |
| Asus ROG Strix G16 G614JZ | |
| Asus ROG Strix G16 G614JZ | |
| Lenovo Legion Pro 7 RTX4090 | |
| Razer Blade 16 Early 2023 | |
| MSI GE67 HX 12UGS | |
| Przeciętny Intel Core i7-13700HX (2548 - 3482, n=12) | |
| HP Omen 16-wf000 | |
| Alienware x16 R1 | |
| Dell G16 7620 | |
| Asus ROG Zephyrus M16 GU603Z | |
| Lenovo Legion S7 16ARHA7 | |
| Razer Blade 15 2022 | |
| HP Omen 16-n0033dx | |
| Dell Inspiron 16 Plus 7610-MHJ8F | |
| Lenovo Legion C7 15IMH05 82EH0030GE | |
| Cinebench R15 / CPU Single 64Bit | |
| Asus Zephyrus Duo 16 GX650PY-NM006W | |
| Asus ROG Strix G16 G614JZ | |
| Asus ROG Strix G16 G614JZ | |
| Lenovo Legion Pro 7 RTX4090 | |
| Alienware x16 R1 | |
| Razer Blade 16 Early 2023 | |
| Przeciętny Intel Core i7-13700HX (243 - 279, n=11) | |
| HP Omen 16-wf000 | |
| Asus ROG Zephyrus M16 GU603Z | |
| MSI GE67 HX 12UGS | |
| Razer Blade 15 2022 | |
| Lenovo Legion S7 16ARHA7 | |
| Dell G16 7620 | |
| HP Omen 16-n0033dx | |
| Dell Inspiron 16 Plus 7610-MHJ8F | |
| Lenovo Legion C7 15IMH05 82EH0030GE | |
| Blender / v2.79 BMW27 CPU | |
| Lenovo Legion C7 15IMH05 82EH0030GE | |
| Dell Inspiron 16 Plus 7610-MHJ8F | |
| HP Omen 16-n0033dx | |
| Razer Blade 15 2022 | |
| Lenovo Legion S7 16ARHA7 | |
| Asus ROG Zephyrus M16 GU603Z | |
| Dell G16 7620 | |
| Przeciętny Intel Core i7-13700HX (138 - 207, n=10) | |
| MSI GE67 HX 12UGS | |
| Razer Blade 16 Early 2023 | |
| Asus ROG Strix G16 G614JZ | |
| Lenovo Legion Pro 7 RTX4090 | |
| Asus Zephyrus Duo 16 GX650PY-NM006W | |
| 7-Zip 18.03 / 7z b 4 | |
| Asus Zephyrus Duo 16 GX650PY-NM006W | |
| Lenovo Legion Pro 7 RTX4090 | |
| Asus ROG Strix G16 G614JZ | |
| Razer Blade 16 Early 2023 | |
| HP Omen 16-wf000 | |
| Przeciętny Intel Core i7-13700HX (58912 - 89294, n=11) | |
| Alienware x16 R1 | |
| MSI GE67 HX 12UGS | |
| Asus ROG Zephyrus M16 GU603Z | |
| Dell G16 7620 | |
| Lenovo Legion S7 16ARHA7 | |
| Razer Blade 15 2022 | |
| HP Omen 16-n0033dx | |
| Lenovo Legion C7 15IMH05 82EH0030GE | |
| Dell Inspiron 16 Plus 7610-MHJ8F | |
| 7-Zip 18.03 / 7z b 4 -mmt1 | |
| Asus Zephyrus Duo 16 GX650PY-NM006W | |
| Lenovo Legion Pro 7 RTX4090 | |
| Asus ROG Strix G16 G614JZ | |
| Razer Blade 16 Early 2023 | |
| Asus ROG Zephyrus M16 GU603Z | |
| Przeciętny Intel Core i7-13700HX (5552 - 6409, n=11) | |
| Lenovo Legion S7 16ARHA7 | |
| HP Omen 16-wf000 | |
| Alienware x16 R1 | |
| Razer Blade 15 2022 | |
| HP Omen 16-n0033dx | |
| MSI GE67 HX 12UGS | |
| Lenovo Legion C7 15IMH05 82EH0030GE | |
| Dell G16 7620 | |
| Dell Inspiron 16 Plus 7610-MHJ8F | |
| Geekbench 5.5 / Multi-Core | |
| Lenovo Legion Pro 7 RTX4090 | |
| Asus Zephyrus Duo 16 GX650PY-NM006W | |
| Asus ROG Strix G16 G614JZ | |
| Razer Blade 16 Early 2023 | |
| Alienware x16 R1 | |
| HP Omen 16-wf000 | |
| MSI GE67 HX 12UGS | |
| Przeciętny Intel Core i7-13700HX (10156 - 15850, n=12) | |
| Asus ROG Zephyrus M16 GU603Z | |
| Razer Blade 15 2022 | |
| Dell G16 7620 | |
| Lenovo Legion S7 16ARHA7 | |
| HP Omen 16-n0033dx | |
| Lenovo Legion C7 15IMH05 82EH0030GE | |
| Dell Inspiron 16 Plus 7610-MHJ8F | |
| Dell Inspiron 16 Plus 7610-MHJ8F | |
| Dell Inspiron 16 Plus 7610-MHJ8F | |
| Geekbench 5.5 / Single-Core | |
| Asus Zephyrus Duo 16 GX650PY-NM006W | |
| Asus ROG Strix G16 G614JZ | |
| Lenovo Legion Pro 7 RTX4090 | |
| Alienware x16 R1 | |
| HP Omen 16-wf000 | |
| Asus ROG Zephyrus M16 GU603Z | |
| Przeciętny Intel Core i7-13700HX (1666 - 1899, n=12) | |
| Razer Blade 16 Early 2023 | |
| MSI GE67 HX 12UGS | |
| Razer Blade 15 2022 | |
| Dell G16 7620 | |
| Lenovo Legion S7 16ARHA7 | |
| Dell Inspiron 16 Plus 7610-MHJ8F | |
| Dell Inspiron 16 Plus 7610-MHJ8F | |
| Dell Inspiron 16 Plus 7610-MHJ8F | |
| HP Omen 16-n0033dx | |
| Lenovo Legion C7 15IMH05 82EH0030GE | |
| HWBOT x265 Benchmark v2.2 / 4k Preset | |
| Asus Zephyrus Duo 16 GX650PY-NM006W | |
| Lenovo Legion Pro 7 RTX4090 | |
| Asus ROG Strix G16 G614JZ | |
| Razer Blade 16 Early 2023 | |
| MSI GE67 HX 12UGS | |
| Przeciętny Intel Core i7-13700HX (17.1 - 25.5, n=11) | |
| Alienware x16 R1 | |
| HP Omen 16-wf000 | |
| Asus ROG Zephyrus M16 GU603Z | |
| Dell G16 7620 | |
| Lenovo Legion S7 16ARHA7 | |
| Razer Blade 15 2022 | |
| HP Omen 16-n0033dx | |
| Dell Inspiron 16 Plus 7610-MHJ8F | |
| Lenovo Legion C7 15IMH05 82EH0030GE | |
| LibreOffice / 20 Documents To PDF | |
| Asus Zephyrus Duo 16 GX650PY-NM006W | |
| HP Omen 16-n0033dx | |
| Lenovo Legion C7 15IMH05 82EH0030GE | |
| Dell G16 7620 | |
| Razer Blade 15 2022 | |
| Lenovo Legion S7 16ARHA7 | |
| Asus ROG Strix G16 G614JZ | |
| Razer Blade 16 Early 2023 | |
| Dell Inspiron 16 Plus 7610-MHJ8F | |
| HP Omen 16-wf000 | |
| Przeciętny Intel Core i7-13700HX (36.5 - 52.9, n=11) | |
| Alienware x16 R1 | |
| Asus ROG Zephyrus M16 GU603Z | |
| MSI GE67 HX 12UGS | |
| Lenovo Legion Pro 7 RTX4090 | |
| R Benchmark 2.5 / Overall mean | |
| Lenovo Legion C7 15IMH05 82EH0030GE | |
| Dell Inspiron 16 Plus 7610-MHJ8F | |
| Dell G16 7620 | |
| HP Omen 16-n0033dx | |
| Razer Blade 15 2022 | |
| Lenovo Legion S7 16ARHA7 | |
| MSI GE67 HX 12UGS | |
| Przeciętny Intel Core i7-13700HX (0.4274 - 0.513, n=11) | |
| HP Omen 16-wf000 | |
| Asus ROG Zephyrus M16 GU603Z | |
| Alienware x16 R1 | |
| Razer Blade 16 Early 2023 | |
| Lenovo Legion Pro 7 RTX4090 | |
| Asus Zephyrus Duo 16 GX650PY-NM006W | |
| Asus ROG Strix G16 G614JZ | |
Cinebench R20: CPU (Multi Core) | CPU (Single Core)
Cinebench R23: Multi Core | Single Core
Cinebench R15: CPU Multi 64Bit | CPU Single 64Bit
Blender: v2.79 BMW27 CPU
7-Zip 18.03: 7z b 4 | 7z b 4 -mmt1
Geekbench 5.5: Multi-Core | Single-Core
HWBOT x265 Benchmark v2.2: 4k Preset
LibreOffice : 20 Documents To PDF
R Benchmark 2.5: Overall mean
* ... im mniej tym lepiej
AIDA64: FP32 Ray-Trace | FPU Julia | CPU SHA3 | CPU Queen | FPU SinJulia | FPU Mandel | CPU AES | CPU ZLib | FP64 Ray-Trace | CPU PhotoWorxx
| Performance rating | |
| Lenovo Legion Pro 7 RTX4090 | |
| Asus ROG Strix G16 G614JZ | |
| Razer Blade 16 Early 2023 | |
| Alienware x16 R1 | |
| Przeciętny Intel Core i7-13700HX | |
| HP Omen 16-wf000 | |
| HP Omen 16-n0033dx | |
| AIDA64 / FP32 Ray-Trace | |
| Asus ROG Strix G16 G614JZ | |
| Lenovo Legion Pro 7 RTX4090 | |
| Razer Blade 16 Early 2023 | |
| Razer Blade 16 Early 2023 | |
| Razer Blade 16 Early 2023 | |
| Przeciętny Intel Core i7-13700HX (14261 - 21999, n=11) | |
| HP Omen 16-wf000 | |
| Alienware x16 R1 | |
| HP Omen 16-n0033dx | |
| AIDA64 / FPU Julia | |
| Lenovo Legion Pro 7 RTX4090 | |
| Asus ROG Strix G16 G614JZ | |
| Razer Blade 16 Early 2023 | |
| Razer Blade 16 Early 2023 | |
| Razer Blade 16 Early 2023 | |
| HP Omen 16-n0033dx | |
| HP Omen 16-wf000 | |
| Przeciętny Intel Core i7-13700HX (74636 - 109364, n=11) | |
| Alienware x16 R1 | |
| AIDA64 / CPU SHA3 | |
| Lenovo Legion Pro 7 RTX4090 | |
| Asus ROG Strix G16 G614JZ | |
| Razer Blade 16 Early 2023 | |
| Razer Blade 16 Early 2023 | |
| Razer Blade 16 Early 2023 | |
| Przeciętny Intel Core i7-13700HX (3359 - 5053, n=11) | |
| HP Omen 16-wf000 | |
| Alienware x16 R1 | |
| HP Omen 16-n0033dx | |
| AIDA64 / CPU Queen | |
| Asus ROG Strix G16 G614JZ | |
| Lenovo Legion Pro 7 RTX4090 | |
| Razer Blade 16 Early 2023 | |
| Razer Blade 16 Early 2023 | |
| Alienware x16 R1 | |
| Przeciętny Intel Core i7-13700HX (86532 - 114717, n=11) | |
| HP Omen 16-n0033dx | |
| HP Omen 16-wf000 | |
| AIDA64 / FPU SinJulia | |
| Asus ROG Strix G16 G614JZ | |
| Razer Blade 16 Early 2023 | |
| Razer Blade 16 Early 2023 | |
| Razer Blade 16 Early 2023 | |
| Lenovo Legion Pro 7 RTX4090 | |
| HP Omen 16-n0033dx | |
| Przeciętny Intel Core i7-13700HX (9290 - 13519, n=11) | |
| HP Omen 16-wf000 | |
| Alienware x16 R1 | |
| AIDA64 / FPU Mandel | |
| Lenovo Legion Pro 7 RTX4090 | |
| Asus ROG Strix G16 G614JZ | |
| Razer Blade 16 Early 2023 | |
| Razer Blade 16 Early 2023 | |
| Razer Blade 16 Early 2023 | |
| HP Omen 16-n0033dx | |
| HP Omen 16-wf000 | |
| Przeciętny Intel Core i7-13700HX (35751 - 53484, n=11) | |
| Alienware x16 R1 | |
| AIDA64 / CPU AES | |
| Razer Blade 16 Early 2023 | |
| Razer Blade 16 Early 2023 | |
| Razer Blade 16 Early 2023 | |
| HP Omen 16-n0033dx | |
| Lenovo Legion Pro 7 RTX4090 | |
| Asus ROG Strix G16 G614JZ | |
| Przeciętny Intel Core i7-13700HX (67846 - 182575, n=11) | |
| HP Omen 16-wf000 | |
| Alienware x16 R1 | |
| AIDA64 / CPU ZLib | |
| Lenovo Legion Pro 7 RTX4090 | |
| Asus ROG Strix G16 G614JZ | |
| Razer Blade 16 Early 2023 | |
| Razer Blade 16 Early 2023 | |
| Razer Blade 16 Early 2023 | |
| HP Omen 16-wf000 | |
| Przeciętny Intel Core i7-13700HX (981 - 1451, n=11) | |
| Alienware x16 R1 | |
| HP Omen 16-n0033dx | |
| AIDA64 / FP64 Ray-Trace | |
| Asus ROG Strix G16 G614JZ | |
| Lenovo Legion Pro 7 RTX4090 | |
| Razer Blade 16 Early 2023 | |
| Razer Blade 16 Early 2023 | |
| Razer Blade 16 Early 2023 | |
| Przeciętny Intel Core i7-13700HX (7728 - 11837, n=11) | |
| HP Omen 16-wf000 | |
| Alienware x16 R1 | |
| HP Omen 16-n0033dx | |
| AIDA64 / CPU PhotoWorxx | |
| Razer Blade 16 Early 2023 | |
| Razer Blade 16 Early 2023 | |
| Razer Blade 16 Early 2023 | |
| Lenovo Legion Pro 7 RTX4090 | |
| Alienware x16 R1 | |
| HP Omen 16-wf000 | |
| Asus ROG Strix G16 G614JZ | |
| Przeciętny Intel Core i7-13700HX (19678 - 42415, n=11) | |
| HP Omen 16-n0033dx | |
Wydajność systemu
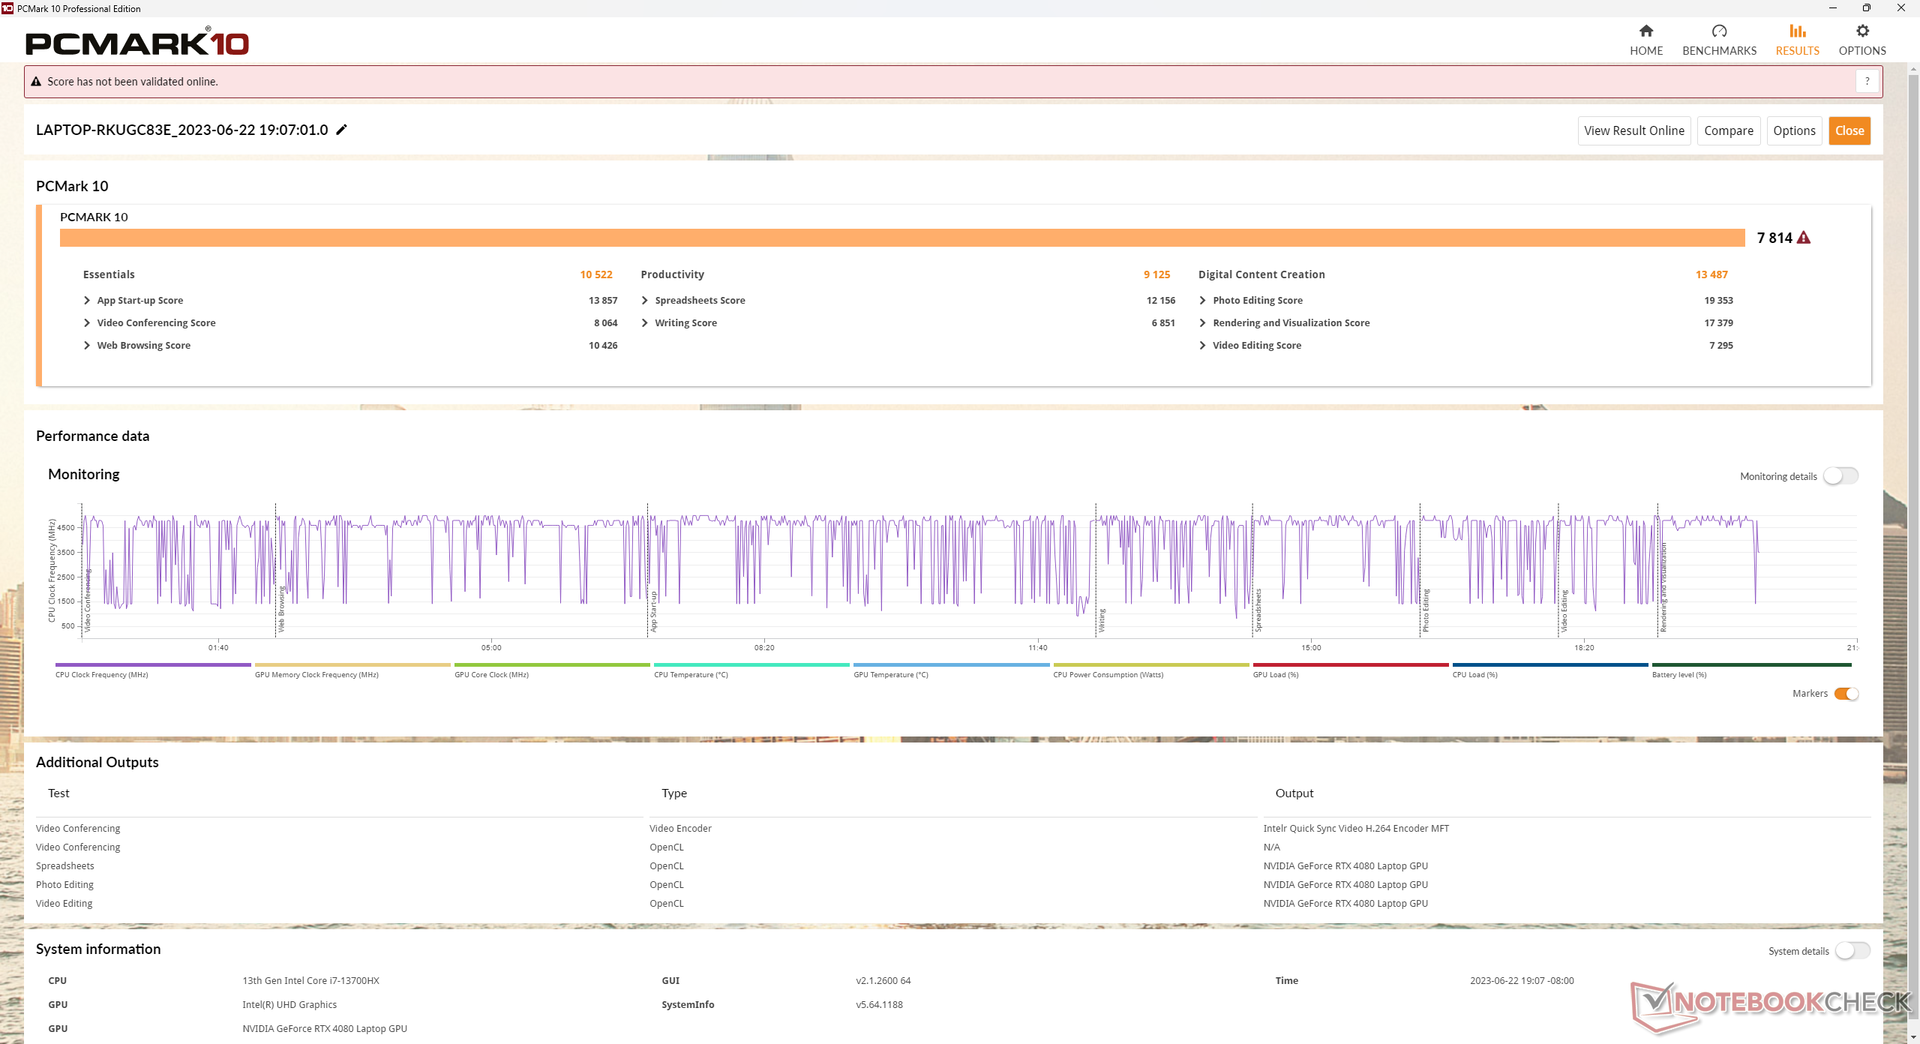
Wyniki PCMark są lepsze od zeszłorocznego Omena 16, zwłaszcza w podteście Digital Content Creation (tworzenie treści cyfrowych na GPU) ze względu na szybszą kartę RTX 4080.
CrossMark: Overall | Productivity | Creativity | Responsiveness
| PCMark 10 / Score | |
| Alienware x16 R1 | |
| Lenovo Legion Pro 7 RTX4090 | |
| Razer Blade 16 Early 2023 | |
| HP Omen 16-wf000 | |
| Przeciętny Intel Core i7-13700HX, NVIDIA GeForce RTX 4080 Laptop GPU (n=1) | |
| Asus ROG Strix G16 G614JZ | |
| HP Omen 16-n0033dx | |
| PCMark 10 / Essentials | |
| Asus ROG Strix G16 G614JZ | |
| Alienware x16 R1 | |
| Lenovo Legion Pro 7 RTX4090 | |
| Razer Blade 16 Early 2023 | |
| HP Omen 16-wf000 | |
| Przeciętny Intel Core i7-13700HX, NVIDIA GeForce RTX 4080 Laptop GPU (n=1) | |
| HP Omen 16-n0033dx | |
| PCMark 10 / Productivity | |
| Alienware x16 R1 | |
| HP Omen 16-n0033dx | |
| HP Omen 16-wf000 | |
| Przeciętny Intel Core i7-13700HX, NVIDIA GeForce RTX 4080 Laptop GPU (n=1) | |
| Lenovo Legion Pro 7 RTX4090 | |
| Razer Blade 16 Early 2023 | |
| Asus ROG Strix G16 G614JZ | |
| PCMark 10 / Digital Content Creation | |
| Lenovo Legion Pro 7 RTX4090 | |
| Razer Blade 16 Early 2023 | |
| Alienware x16 R1 | |
| HP Omen 16-wf000 | |
| Przeciętny Intel Core i7-13700HX, NVIDIA GeForce RTX 4080 Laptop GPU (n=1) | |
| Asus ROG Strix G16 G614JZ | |
| HP Omen 16-n0033dx | |
| CrossMark / Overall | |
| Asus ROG Strix G16 G614JZ | |
| Alienware x16 R1 | |
| HP Omen 16-wf000 | |
| Przeciętny Intel Core i7-13700HX, NVIDIA GeForce RTX 4080 Laptop GPU (n=1) | |
| Razer Blade 16 Early 2023 | |
| HP Omen 16-n0033dx | |
| CrossMark / Productivity | |
| Asus ROG Strix G16 G614JZ | |
| Alienware x16 R1 | |
| HP Omen 16-wf000 | |
| Przeciętny Intel Core i7-13700HX, NVIDIA GeForce RTX 4080 Laptop GPU (n=1) | |
| HP Omen 16-n0033dx | |
| Razer Blade 16 Early 2023 | |
| CrossMark / Creativity | |
| Asus ROG Strix G16 G614JZ | |
| Alienware x16 R1 | |
| HP Omen 16-wf000 | |
| Przeciętny Intel Core i7-13700HX, NVIDIA GeForce RTX 4080 Laptop GPU (n=1) | |
| Razer Blade 16 Early 2023 | |
| HP Omen 16-n0033dx | |
| CrossMark / Responsiveness | |
| Asus ROG Strix G16 G614JZ | |
| Alienware x16 R1 | |
| HP Omen 16-wf000 | |
| Przeciętny Intel Core i7-13700HX, NVIDIA GeForce RTX 4080 Laptop GPU (n=1) | |
| Razer Blade 16 Early 2023 | |
| HP Omen 16-n0033dx | |
| PCMark 10 Score | 7814 pkt. | |
Pomoc | ||
| AIDA64 / Memory Copy | |
| Razer Blade 16 Early 2023 | |
| Razer Blade 16 Early 2023 | |
| Razer Blade 16 Early 2023 | |
| Lenovo Legion Pro 7 RTX4090 | |
| Alienware x16 R1 | |
| HP Omen 16-wf000 | |
| Asus ROG Strix G16 G614JZ | |
| Przeciętny Intel Core i7-13700HX (36125 - 63990, n=11) | |
| HP Omen 16-n0033dx | |
| AIDA64 / Memory Read | |
| Lenovo Legion Pro 7 RTX4090 | |
| Razer Blade 16 Early 2023 | |
| Razer Blade 16 Early 2023 | |
| Razer Blade 16 Early 2023 | |
| Asus ROG Strix G16 G614JZ | |
| Alienware x16 R1 | |
| HP Omen 16-wf000 | |
| Przeciętny Intel Core i7-13700HX (36510 - 69729, n=11) | |
| HP Omen 16-n0033dx | |
| AIDA64 / Memory Write | |
| Alienware x16 R1 | |
| Razer Blade 16 Early 2023 | |
| Razer Blade 16 Early 2023 | |
| Razer Blade 16 Early 2023 | |
| Lenovo Legion Pro 7 RTX4090 | |
| HP Omen 16-wf000 | |
| Asus ROG Strix G16 G614JZ | |
| Przeciętny Intel Core i7-13700HX (33598 - 85675, n=11) | |
| HP Omen 16-n0033dx | |
| AIDA64 / Memory Latency | |
| Alienware x16 R1 | |
| Razer Blade 16 Early 2023 | |
| Razer Blade 16 Early 2023 | |
| Razer Blade 16 Early 2023 | |
| Asus ROG Strix G16 G614JZ | |
| HP Omen 16-n0033dx | |
| HP Omen 16-wf000 | |
| Przeciętny Intel Core i7-13700HX (81.5 - 97.9, n=11) | |
| Lenovo Legion Pro 7 RTX4090 | |
* ... im mniej tym lepiej
Opóźnienie DPC
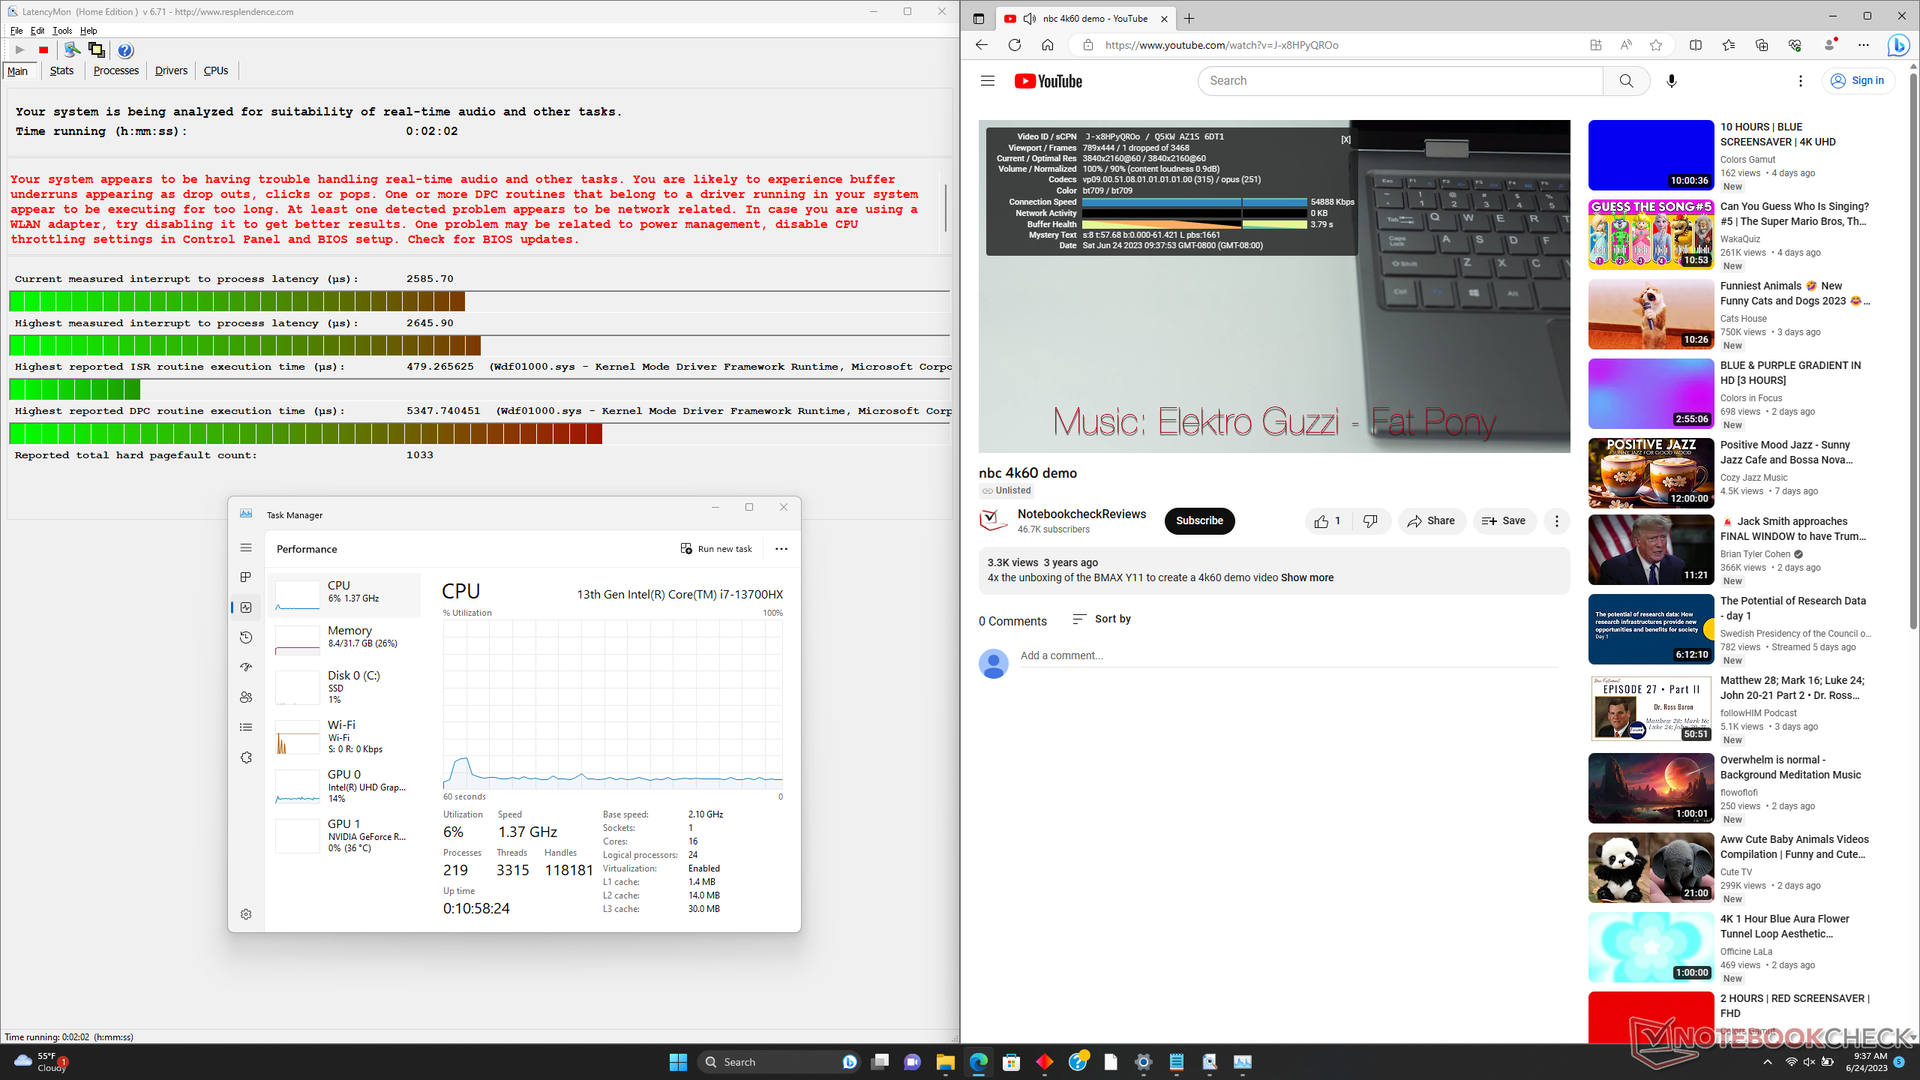
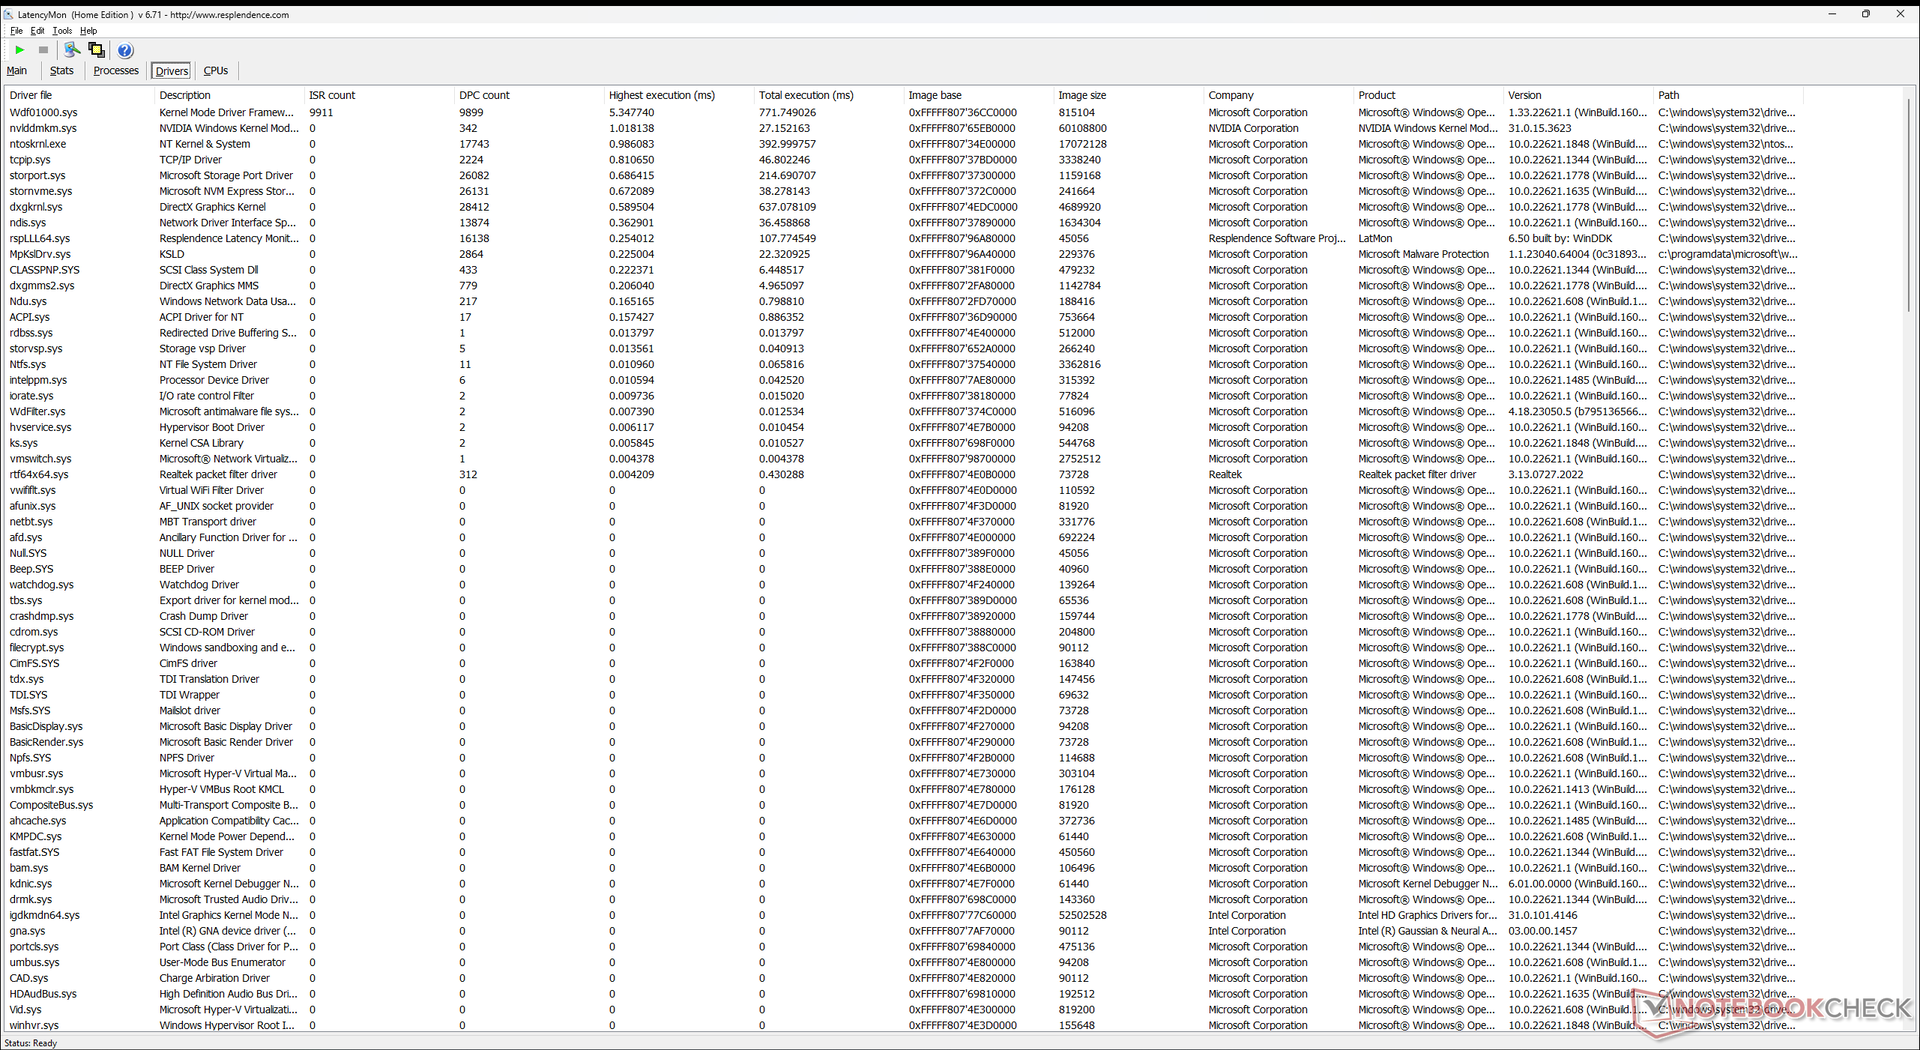
LatencyMon ujawnia problemy z DPC podczas otwierania wielu kart przeglądarki na naszej stronie głównej, podobnie jak w przypadku ROG Strix G16 lub Blade 16. odtwarzanie wideo 4K60 jest poza tym prawie idealne, z tylko jedną utraconą klatką podczas naszego minutowego testu wideo.
| DPC Latencies / LatencyMon - interrupt to process latency (max), Web, Youtube, Prime95 | |
| Lenovo Legion Pro 7 RTX4090 | |
| HP Omen 16-wf000 | |
| Asus ROG Strix G16 G614JZ | |
| Razer Blade 16 Early 2023 | |
| Alienware x16 R1 | |
| HP Omen 16-n0033dx | |
* ... im mniej tym lepiej
Urządzenia pamięci masowej
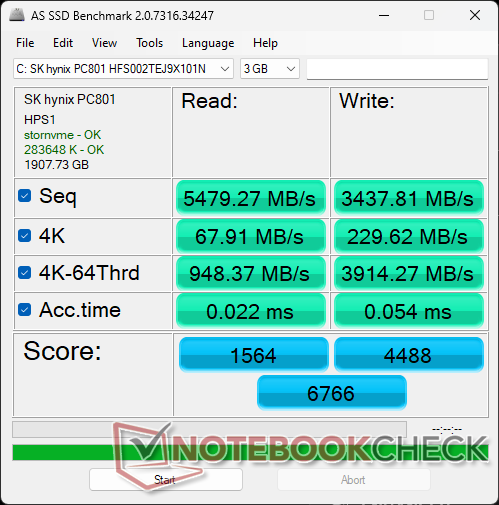
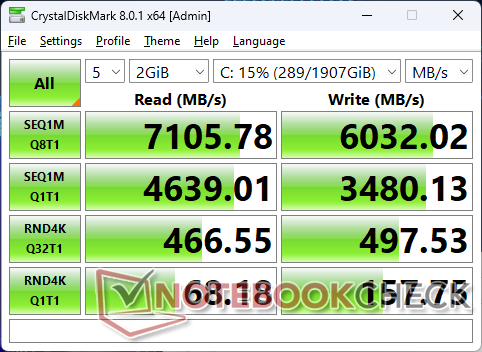
Nasza jednostka testowa jest dostarczana z dyskiem 2 TBSK hynix PC801 NVMe SSD dla sekwencyjnych prędkości odczytu i zapisu do odpowiednio 7100 MB/s i 6000 MB/s, co jest porównywalne z popularnym Samsung PM9A1. Jednak prędkości odczytu i zapisu na mniejszych blokach o rozmiarze 4k q32 są niezwykle wolne, nawet po wielu ponownych testach. Ogólna wydajność jest jednak stabilna, gdy jest obciążona, co sugeruje doskonałe rozpraszanie ciepła.

| Drive Performance rating - Percent | |
| Alienware x16 R1 | |
| Lenovo Legion Pro 7 RTX4090 | |
| HP Omen 16-wf000 | |
| Razer Blade 16 Early 2023 | |
| Asus ROG Strix G16 G614JZ | |
| HP Omen 16-n0033dx | |
* ... im mniej tym lepiej
Disk Throttling: DiskSpd Read Loop, Queue Depth 8
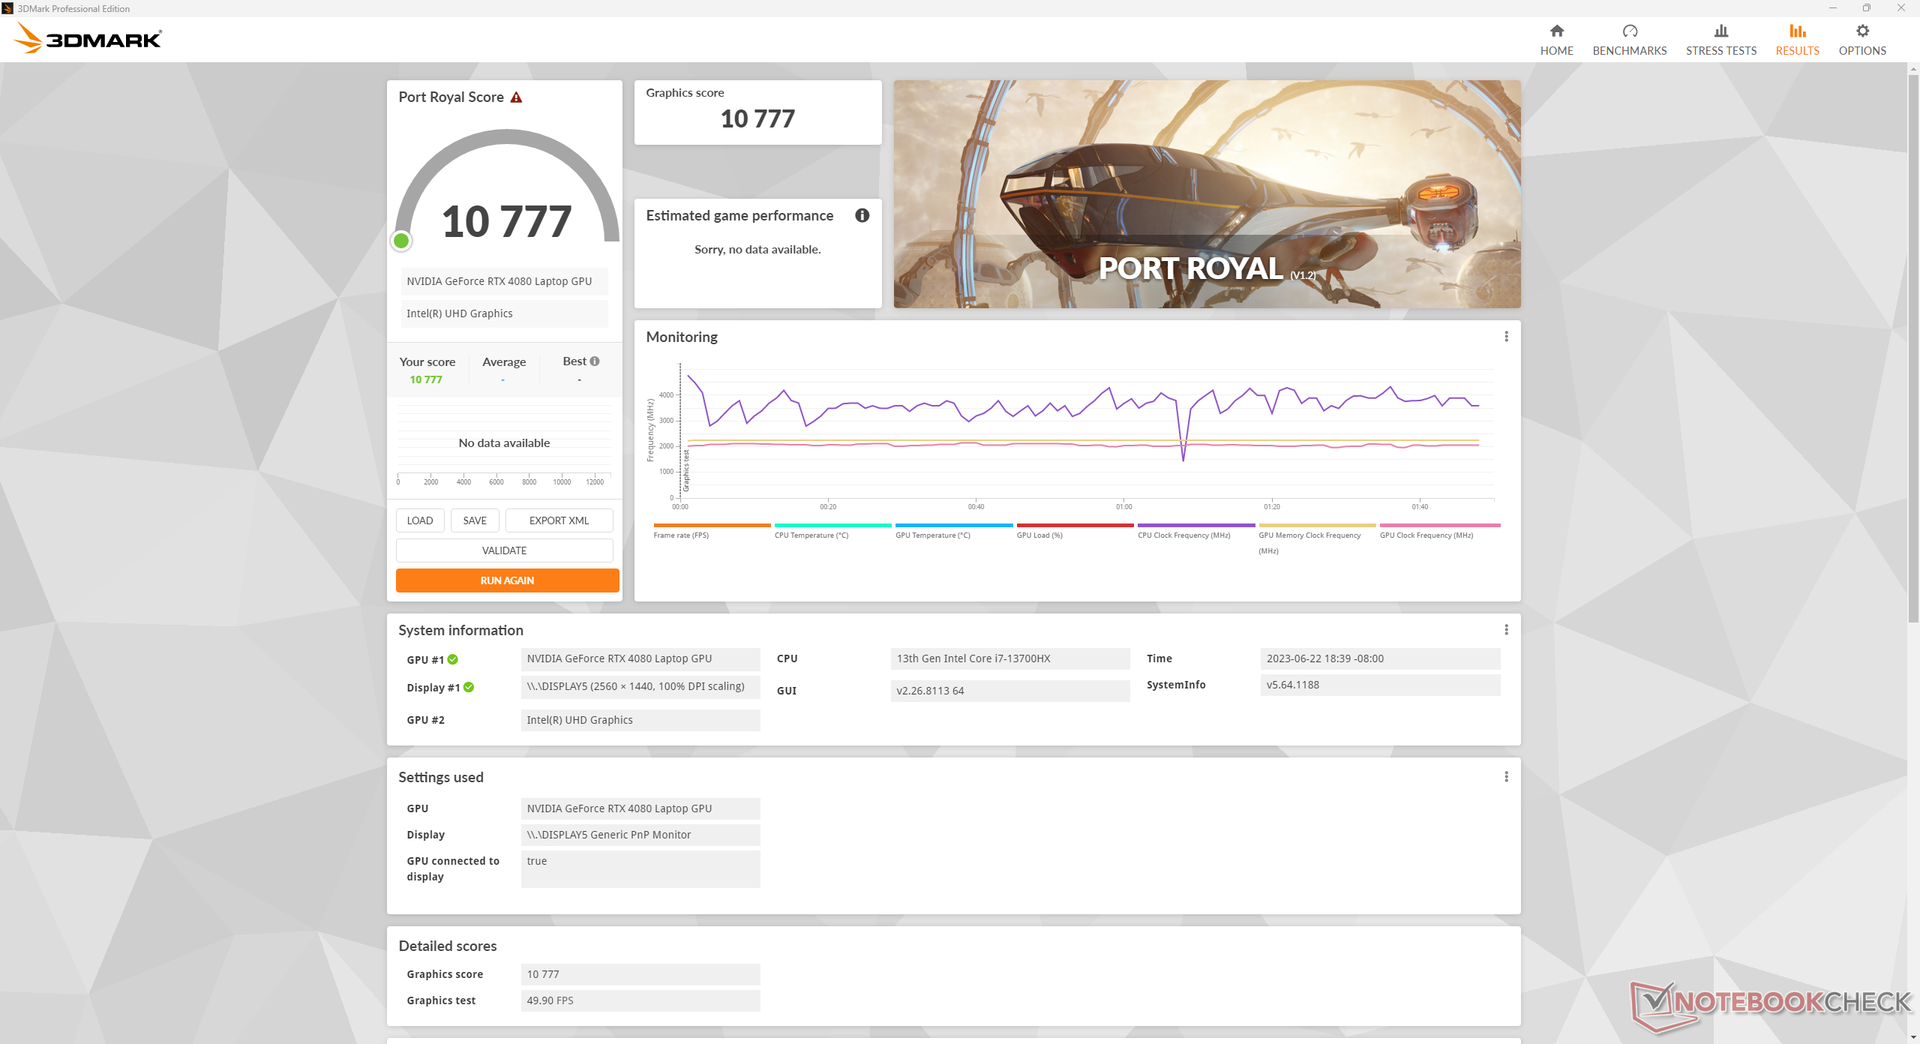
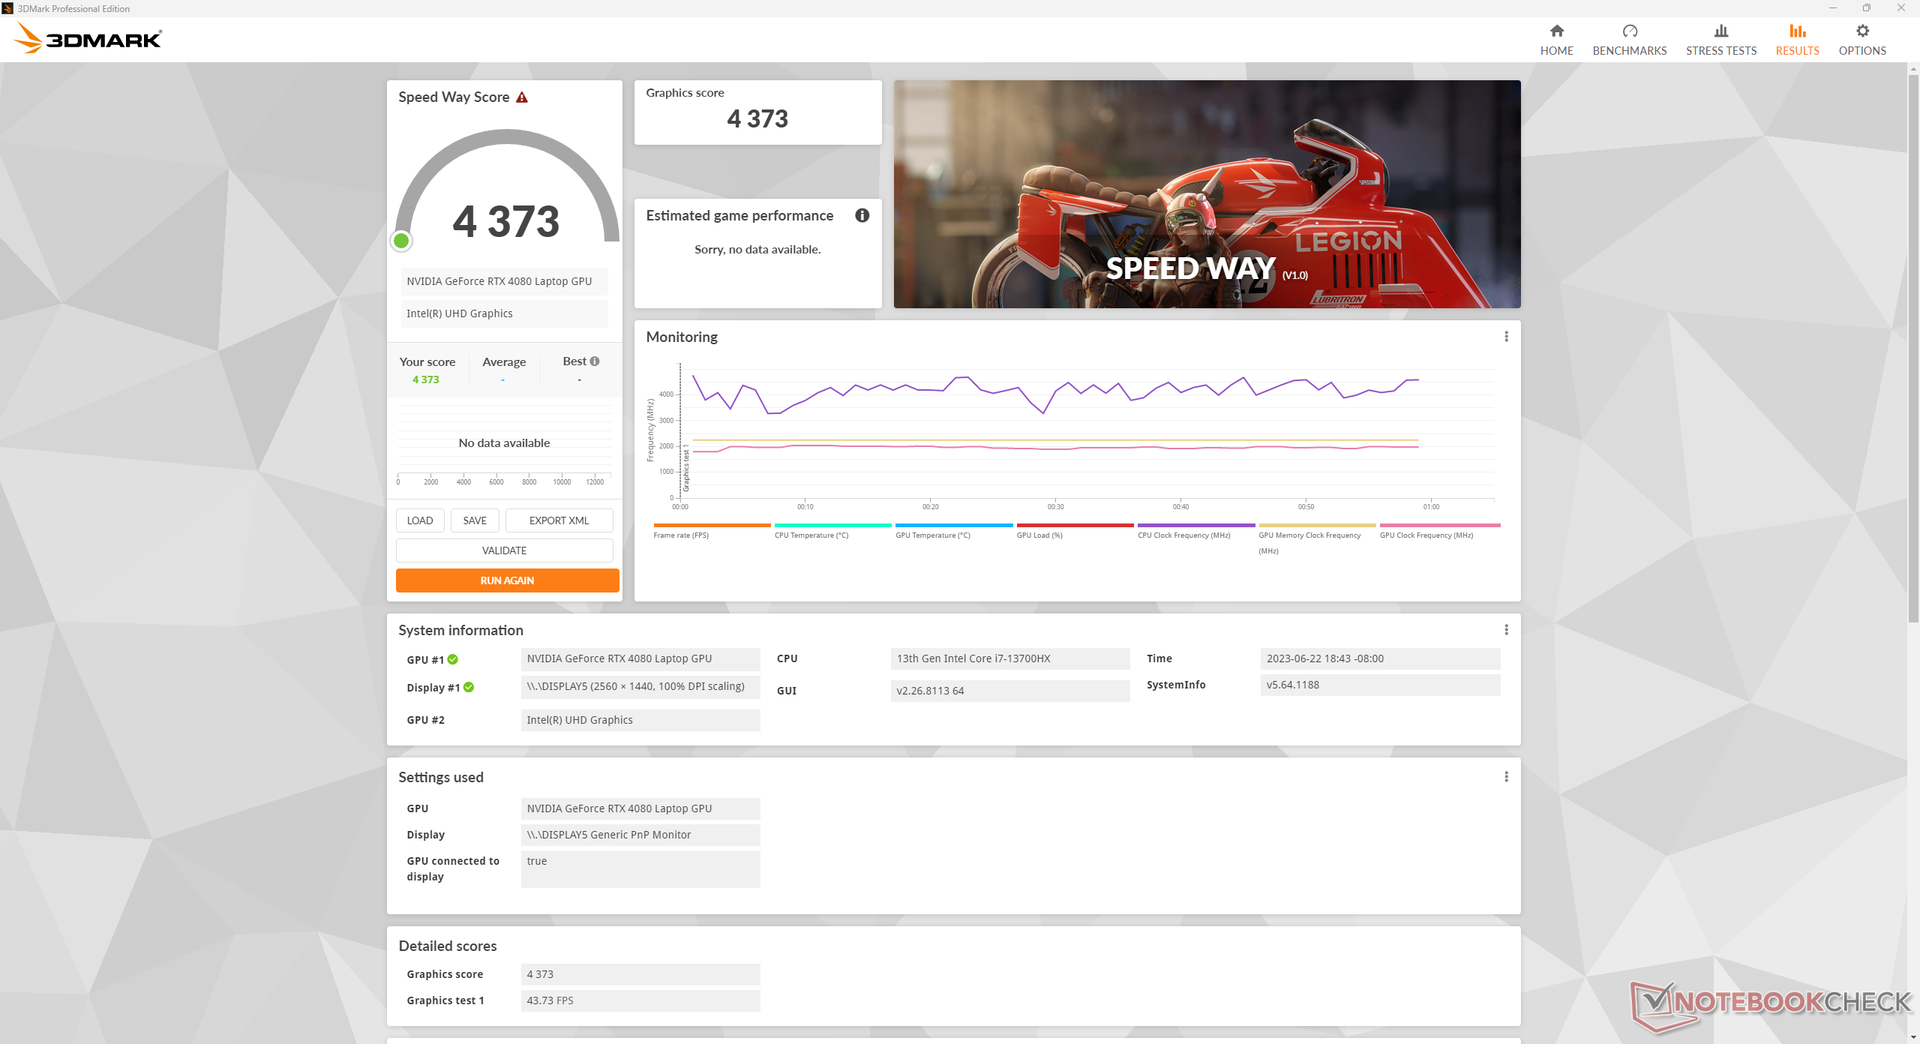
Wydajność GPU - 145 W GeForce RTX 4080
Wydajność graficzna jest doskonała i porównywalna z innymi laptopami do gier z tym samym GeForce RTX 4080 GPU z 5-procentowym marginesem. Obniżenie do RTX 4070 lub RTX 4060 z naszych RTX 4080 powinien obniżyć wydajność graficzną odpowiednio o około 20 procent i 30 procent.
Jeśli tryb Max Fan jest wyłączony, ogólna wydajność spadnie tylko o włos, jak pokazuje poniższa tabela. Wydajność GPU spada o prawie 15 procent, jeśli ustawiony jest tryb zrównoważony, podczas gdy wpływ na wydajność procesora jest znacznie mniejszy.
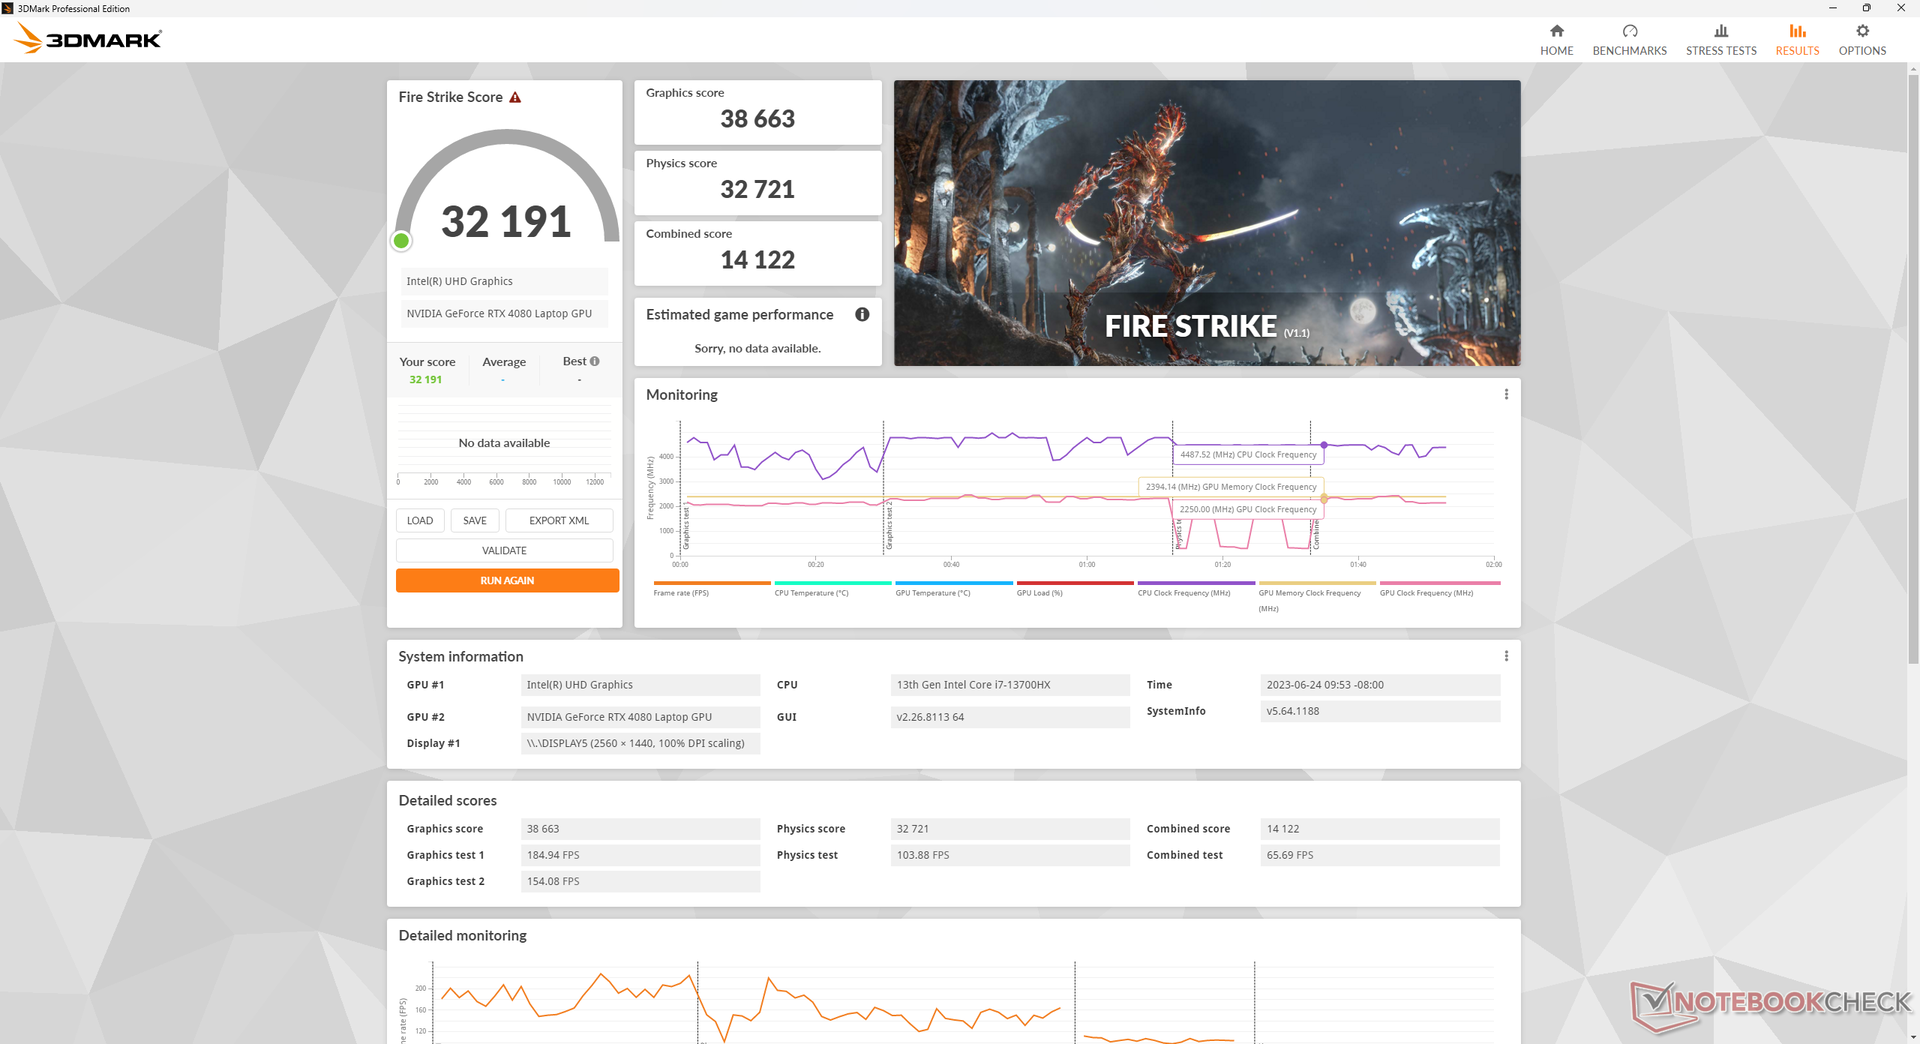
| Ustawienie profilu zasilania | Fire Strike Wynik fizyki | Fire Strike Wynik GPU | Fire Strike Łączny wynik |
| Wydajność + Maksymalnie włączony wentylator | 32721 | 38663 | 14122 |
| Wydajność + maks. wentylator wyłączony | 31314 (-4%) | 38142 (-1%) | 13655 (-3%) |
| Zrównoważony | 31837 (-3%) | 33328 (-14%) | 12426 (-12%) |
| 3DMark Performance rating - Percent | |
| NVIDIA GeForce RTX 4080 Founders Edition | |
| Lenovo Legion Pro 7 RTX4090 -1! | |
| Asus Zephyrus Duo 16 GX650PY-NM006W | |
| Razer Blade 16 Early 2023 | |
| Przeciętny NVIDIA GeForce RTX 4080 Laptop GPU | |
| HP Omen 16-wf000 | |
| MSI GE67 HX 12UGS -1! | |
| Lenovo Legion Pro 5 16ARX8 | |
| Razer Blade 15 2022 -1! | |
| Lenovo Legion Pro 5 16IRX8 | |
| Lenovo Legion S7 16ARHA7 -1! | |
| Asus ROG Zephyrus M16 GU603Z -1! | |
| Lenovo Legion 7 15IMH05-81YT001VGE -1! | |
| HP Omen 16-n0033dx | |
| Lenovo Legion C7 15IMH05 82EH0030GE -1! | |
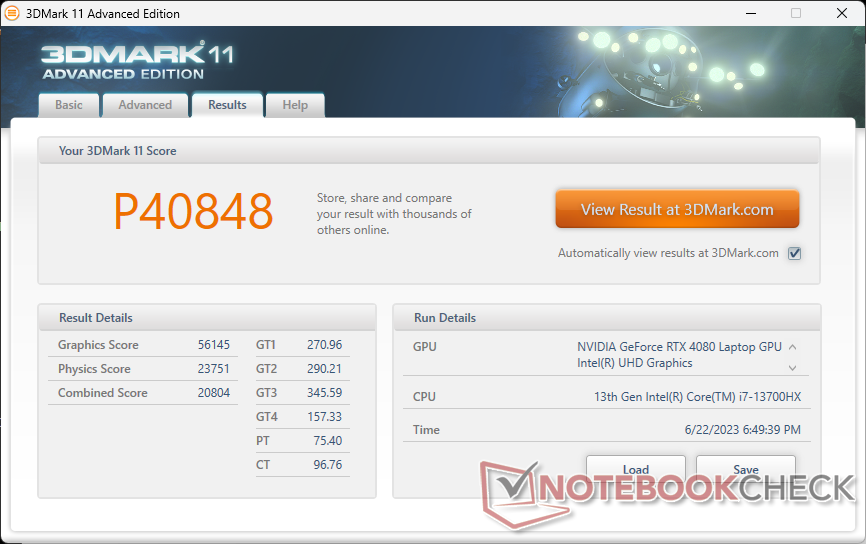
| 3DMark 11 - 1280x720 Performance GPU | |
| NVIDIA GeForce RTX 4080 Founders Edition | |
| Lenovo Legion Pro 7 RTX4090 | |
| Asus Zephyrus Duo 16 GX650PY-NM006W | |
| Przeciętny NVIDIA GeForce RTX 4080 Laptop GPU (45199 - 63128, n=24) | |
| Razer Blade 16 Early 2023 | |
| HP Omen 16-wf000 | |
| MSI GE67 HX 12UGS | |
| Lenovo Legion Pro 5 16ARX8 | |
| Lenovo Legion Pro 5 16IRX8 | |
| Razer Blade 15 2022 | |
| Lenovo Legion S7 16ARHA7 | |
| HP Omen 16-n0033dx | |
| Asus ROG Zephyrus M16 GU603Z | |
| Lenovo Legion 7 15IMH05-81YT001VGE | |
| Lenovo Legion C7 15IMH05 82EH0030GE | |
| 3DMark 11 Performance | 40848 pkt. | |
| 3DMark Fire Strike Score | 32191 pkt. | |
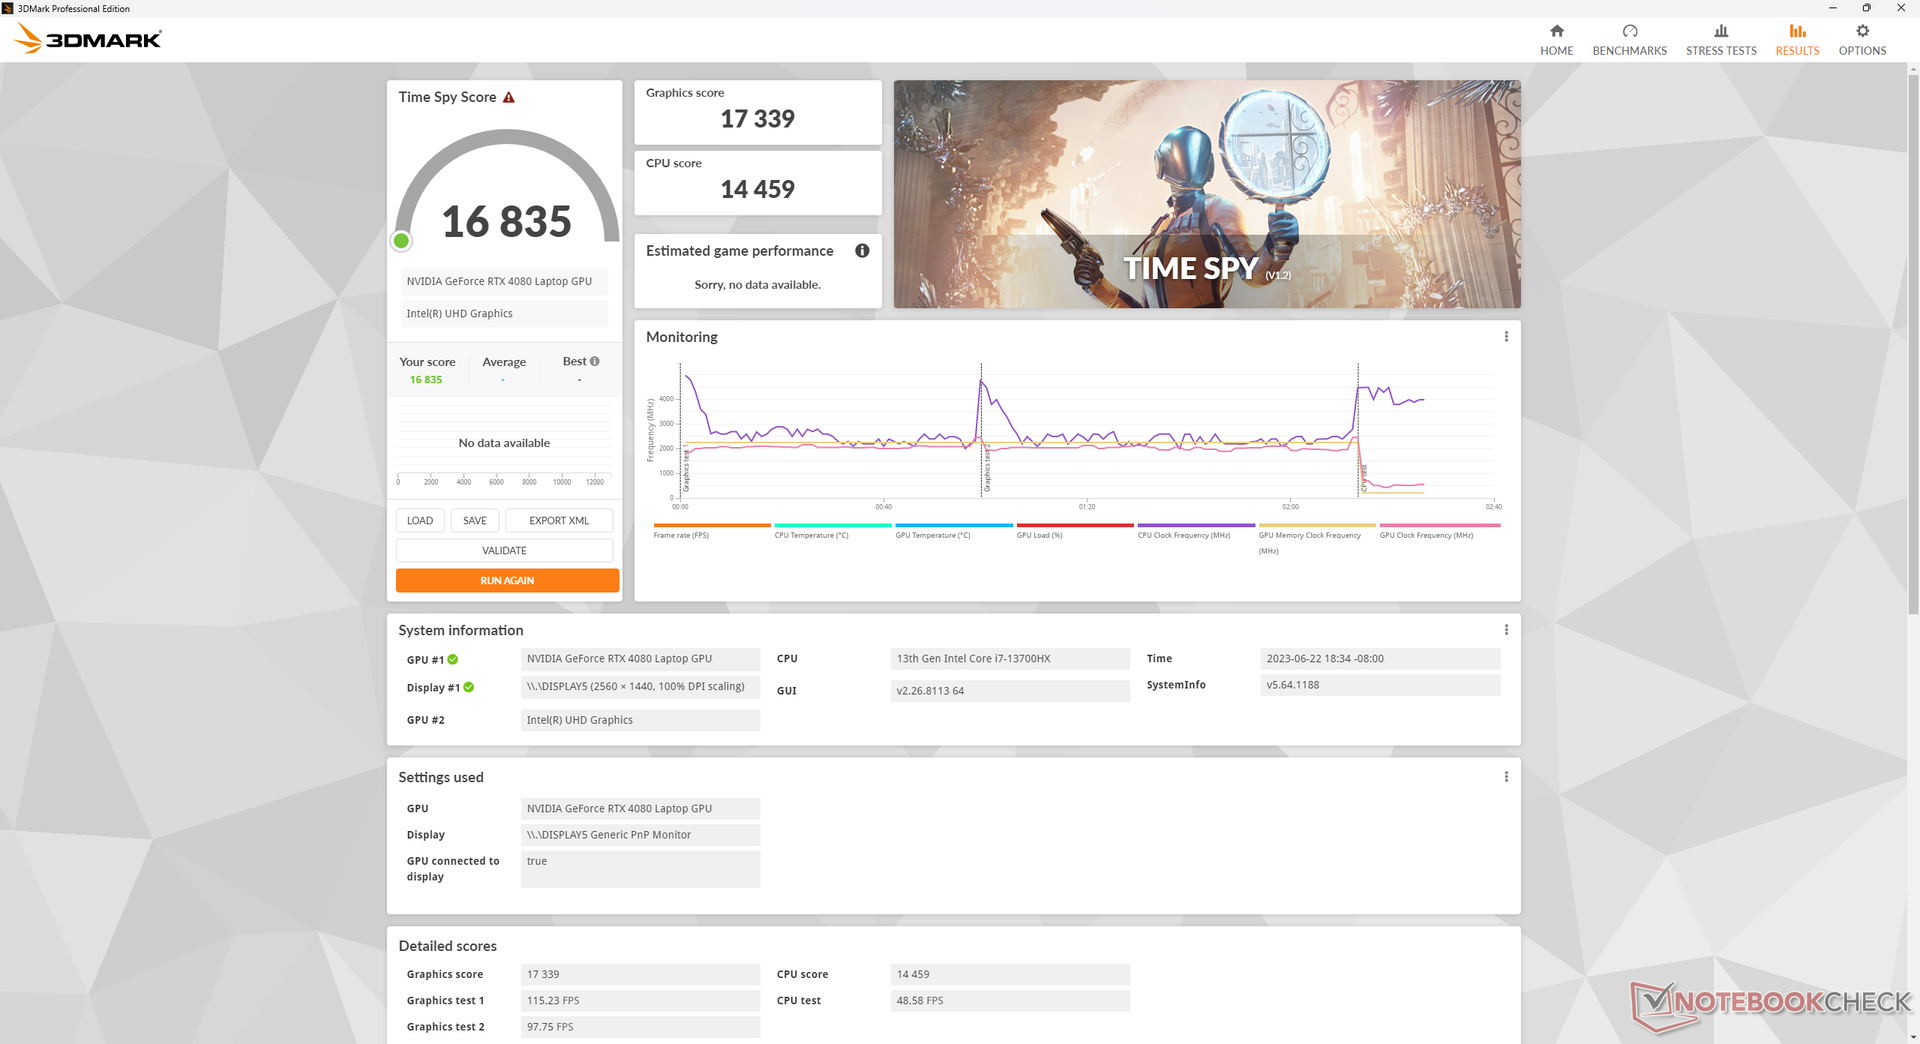
| 3DMark Time Spy Score | 16835 pkt. | |
Pomoc | ||
* ... im mniej tym lepiej
Wydajność w grach
Wszystkie gry są grywalne w natywnej rozdzielczości 1440p ze średnią liczbą klatek na sekundę powyżej 60 FPS, nawet w wymagających grach, takich jak Returnal. Mobilna karta RTX 4080 bardzo dobrze współpracuje z panelem 1440p.
DLSS jest zalecany w przypadku włączenia RT lub grania na zewnętrznym monitorze 4K, ponieważ mobilny RTX 4080 jest znacznie słabszy niż rTX 4080 dla komputerów stacjonarnych. Przykładowo, średnia liczba klatek na sekundę w grze Cyberpunk 2077 w rozdzielczości 4K wzrosła z 35 FPS przy wyłączonym DLSS 2 do 55 FPS przy włączonym DLSS 2.
| Tiny Tina's Wonderlands | |
| 1920x1080 Low Preset (DX12) | |
| Przeciętny NVIDIA GeForce RTX 4080 Laptop GPU (221 - 353, n=6) | |
| HP Omen 16-wf000 | |
| 1920x1080 Medium Preset (DX12) | |
| Przeciętny NVIDIA GeForce RTX 4080 Laptop GPU (199.6 - 297, n=6) | |
| HP Omen 16-wf000 | |
| 1920x1080 High Preset (DX12) | |
| Przeciętny NVIDIA GeForce RTX 4080 Laptop GPU (166.7 - 213, n=6) | |
| HP Omen 16-wf000 | |
| 1920x1080 Badass Preset (DX12) | |
| Asus Zephyrus Duo 16 GX650PY-NM006W | |
| Przeciętny NVIDIA GeForce RTX 4080 Laptop GPU (112.9 - 167.1, n=9) | |
| HP Omen 16-wf000 | |
| 2560x1440 Badass Preset (DX12) | |
| Asus Zephyrus Duo 16 GX650PY-NM006W | |
| Przeciętny NVIDIA GeForce RTX 4080 Laptop GPU (85 - 114.8, n=9) | |
| HP Omen 16-wf000 | |
| 3840x2160 Badass Preset (DX12) | |
| Przeciętny NVIDIA GeForce RTX 4080 Laptop GPU (46.4 - 60.9, n=9) | |
| HP Omen 16-wf000 | |
| Returnal | |
| 1920x1080 Low Preset | |
| HP Omen 16-wf000 | |
| Przeciętny NVIDIA GeForce RTX 4080 Laptop GPU (116 - 150, n=4) | |
| 1920x1080 Medium Preset | |
| HP Omen 16-wf000 | |
| Przeciętny NVIDIA GeForce RTX 4080 Laptop GPU (117 - 148, n=4) | |
| 1920x1080 High Preset | |
| HP Omen 16-wf000 | |
| Przeciętny NVIDIA GeForce RTX 4080 Laptop GPU (114 - 137, n=4) | |
| 1920x1080 Epic Preset | |
| Przeciętny NVIDIA GeForce RTX 4080 Laptop GPU (107 - 121, n=4) | |
| HP Omen 16-wf000 | |
| 2560x1440 Epic Preset | |
| HP Omen 16-wf000 | |
| Przeciętny NVIDIA GeForce RTX 4080 Laptop GPU (79 - 92, n=4) | |
| 3840x2160 Epic Preset | |
| HP Omen 16-wf000 | |
| Przeciętny NVIDIA GeForce RTX 4080 Laptop GPU (43 - 53, n=3) | |
Witcher 3 FPS Chart
| low | med. | high | ultra | QHD | 4K | |
|---|---|---|---|---|---|---|
| GTA V (2015) | 184.7 | 176.8 | 171.6 | 114 | 108.6 | 142.8 |
| The Witcher 3 (2015) | 453.2 | 407 | 296.5 | 163.4 | 113.1 | |
| Dota 2 Reborn (2015) | 187.4 | 173 | 164.2 | 153.7 | 145.7 | |
| Final Fantasy XV Benchmark (2018) | 208 | 194.9 | 153.9 | 120.6 | 71.6 | |
| X-Plane 11.11 (2018) | 172.4 | 151.2 | 118.5 | 102.3 | ||
| Strange Brigade (2018) | 413 | 334 | 320 | 299 | 225 | 116.7 |
| Cyberpunk 2077 1.6 (2022) | 132.3 | 127.1 | 124.4 | 116.7 | 77.6 | 35.3 |
| Tiny Tina's Wonderlands (2022) | 260.2 | 232.5 | 177.1 | 145.2 | 102.6 | 54.4 |
| F1 22 (2022) | 261 | 260 | 245 | 100.7 | 70.7 | 35.5 |
| Returnal (2023) | 148 | 148 | 136 | 107 | 91 | 53 |
Emisje
Hałas systemowy - nadal bardzo głośny w trybie wydajności
Wentylatory są zawsze aktywne przy prawie 30 dB(A) na cichym tle 23 dB(A) bez względu na ustawienie lub obciążenie ekranu. Z drugiej strony, wentylatory nie muszą pulsować tak często, więc hałas wentylatorów jest zwykle w niskim i stosunkowo dyskretnym zakresie od 30 do 33 dB(A) podczas uruchamiania niewymagających obciążeń, takich jak strumieniowanie wideo.
Granie w trybie zrównoważonym zamiast w trybie wydajnościowym skutkuje zauważalnie cichszymi wentylatorami o zaledwie 44,2 dB(A), co może być warte 15-procentowego spadku wydajności graficznej. W przeciwnym razie Omen 16 jest jednym z głośniejszych laptopów do gier na rynku, osiągając ponad 57 dB(A) w trybie wydajności.
| Ustawienie profilu zasilania | Witcher 3 Hałas wentylatora dB(A) |
| Zrównoważony | 44.2 |
| Wydajność + Maksymalnie wyłączony wentylator | 57 |
| Wydajność + wentylator główny włączony | 58.3 |
Hałas
| luz |
| 29.6 / 29.8 / 30.4 dB |
| obciążenie |
| 33.8 / 58.3 dB |
 | ||
30 dB cichy 40 dB(A) słyszalny 50 dB(A) irytujący |
||
min: | ||
| HP Omen 16-wf000 GeForce RTX 4080 Laptop GPU, i7-13700HX, SK hynix PC801 HFS002TEJ9X101N | HP Omen 16-n0033dx Radeon RX 6650M, R7 6800H, Samsung PM9A1 MZVL21T0HCLR | Alienware x16 R1 GeForce RTX 4080 Laptop GPU, i9-13900HK, SK hynix PC801 HFS001TEJ9X101N | Lenovo Legion Pro 7 RTX4090 GeForce RTX 4090 Laptop GPU, i9-13900HX, Samsung PM9A1 MZVL21T0HCLR | Asus ROG Strix G16 G614JZ GeForce RTX 4080 Laptop GPU, i9-13980HX, WD PC SN560 SDDPNQE-1T00 | Razer Blade 16 Early 2023 GeForce RTX 4080 Laptop GPU, i9-13950HX, SSSTC CA6-8D1024 | |
|---|---|---|---|---|---|---|
| Noise | 4% | 8% | -8% | -1% | 10% | |
| wyłączone / środowisko * (dB) | 23 | 24.2 -5% | 22.7 1% | 25 -9% | 25 -9% | 23 -0% |
| Idle Minimum * (dB) | 29.6 | 27.4 7% | 23.1 22% | 28 5% | 26 12% | 23 22% |
| Idle Average * (dB) | 29.8 | 27.4 8% | 25.8 13% | 30 -1% | 28 6% | 23 23% |
| Idle Maximum * (dB) | 30.4 | 28.9 5% | 25.8 15% | 38 -25% | 30 1% | 23.6 22% |
| Load Average * (dB) | 33.8 | 32.3 4% | 39.3 -16% | 48 -42% | 48 -42% | 39 -15% |
| Witcher 3 ultra * (dB) | 57 | 54.1 5% | 49.9 12% | 53 7% | 49 14% | 51.6 9% |
| Load Maximum * (dB) | 58.3 | 57.6 1% | 54.8 6% | 55 6% | 52 11% | 51.3 12% |
* ... im mniej tym lepiej
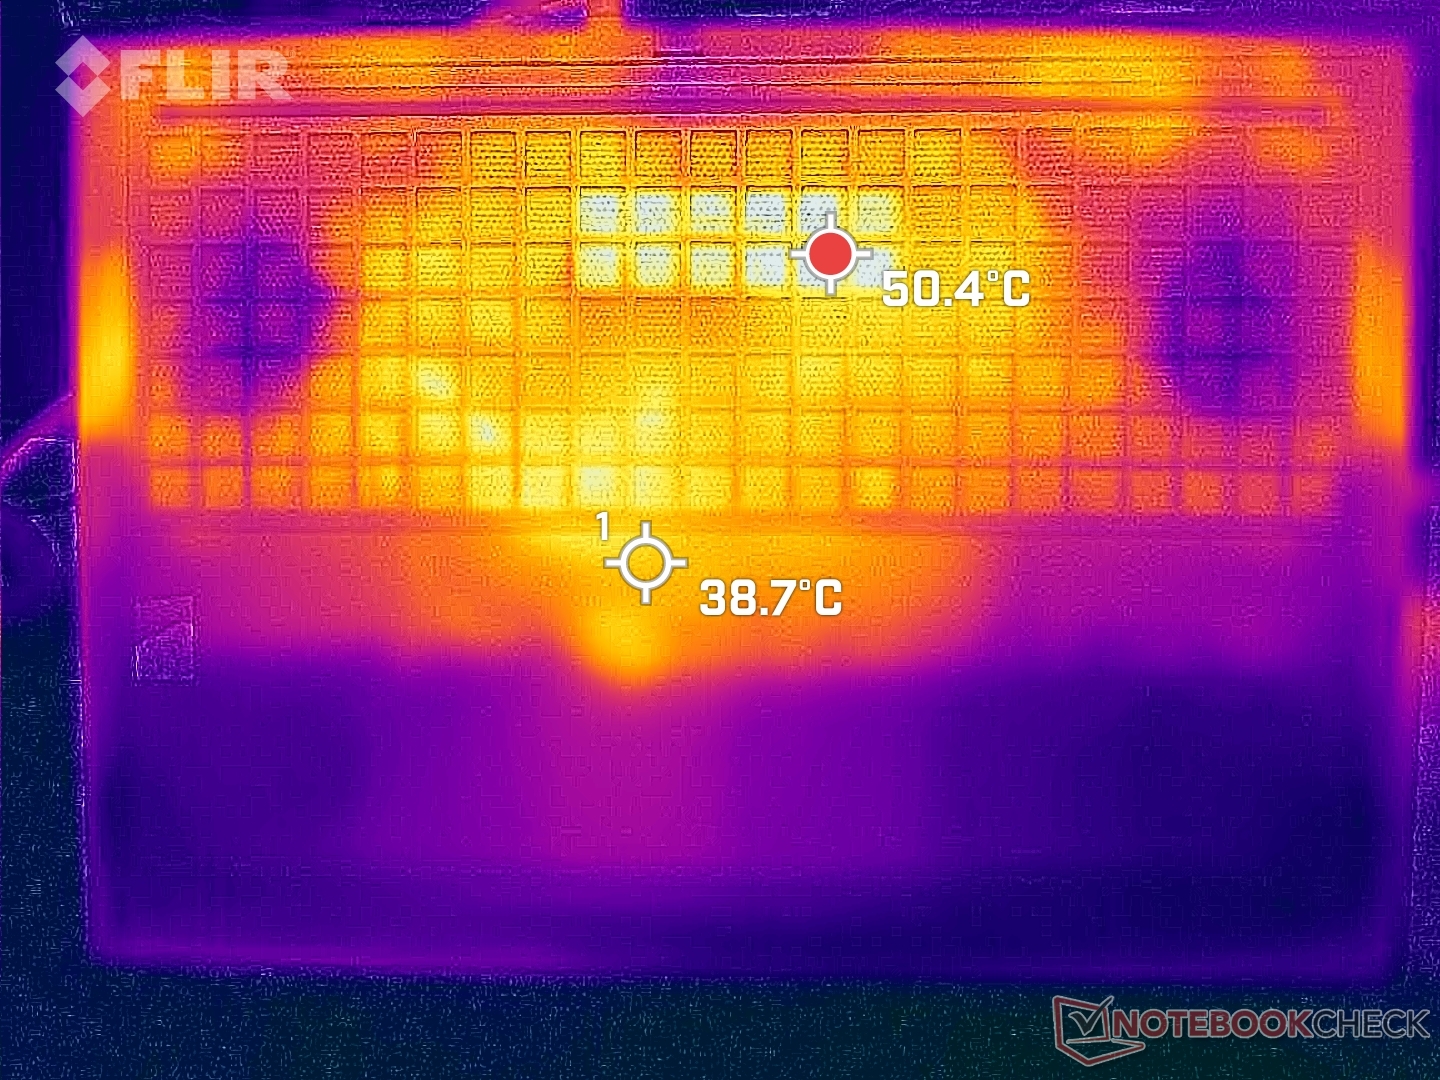
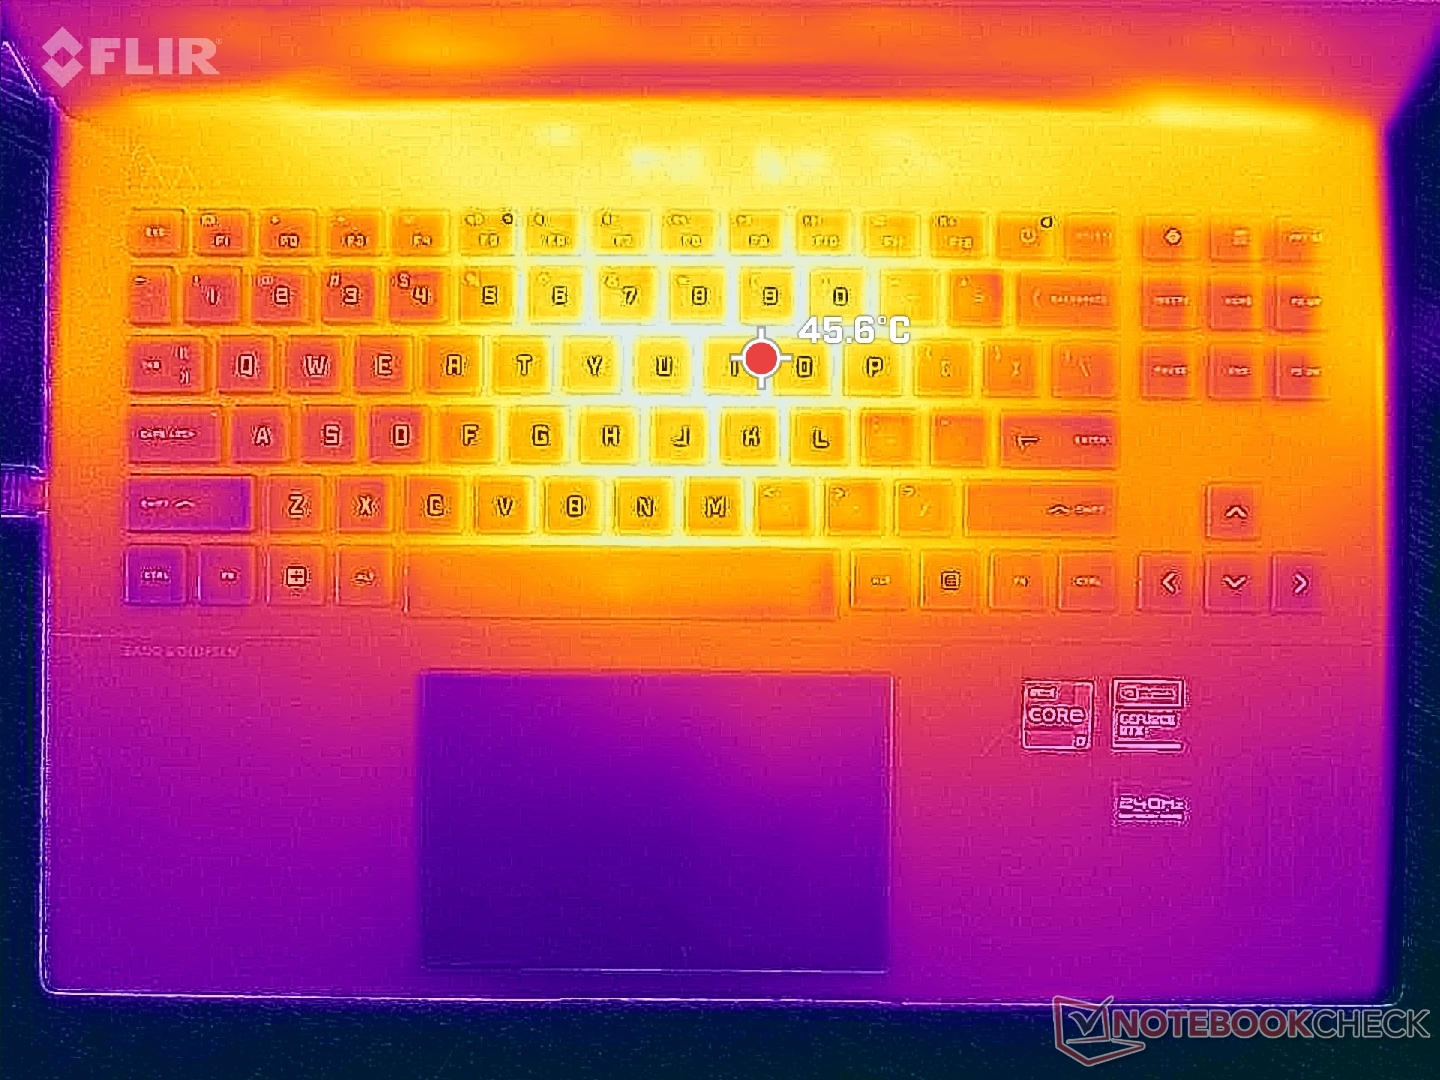
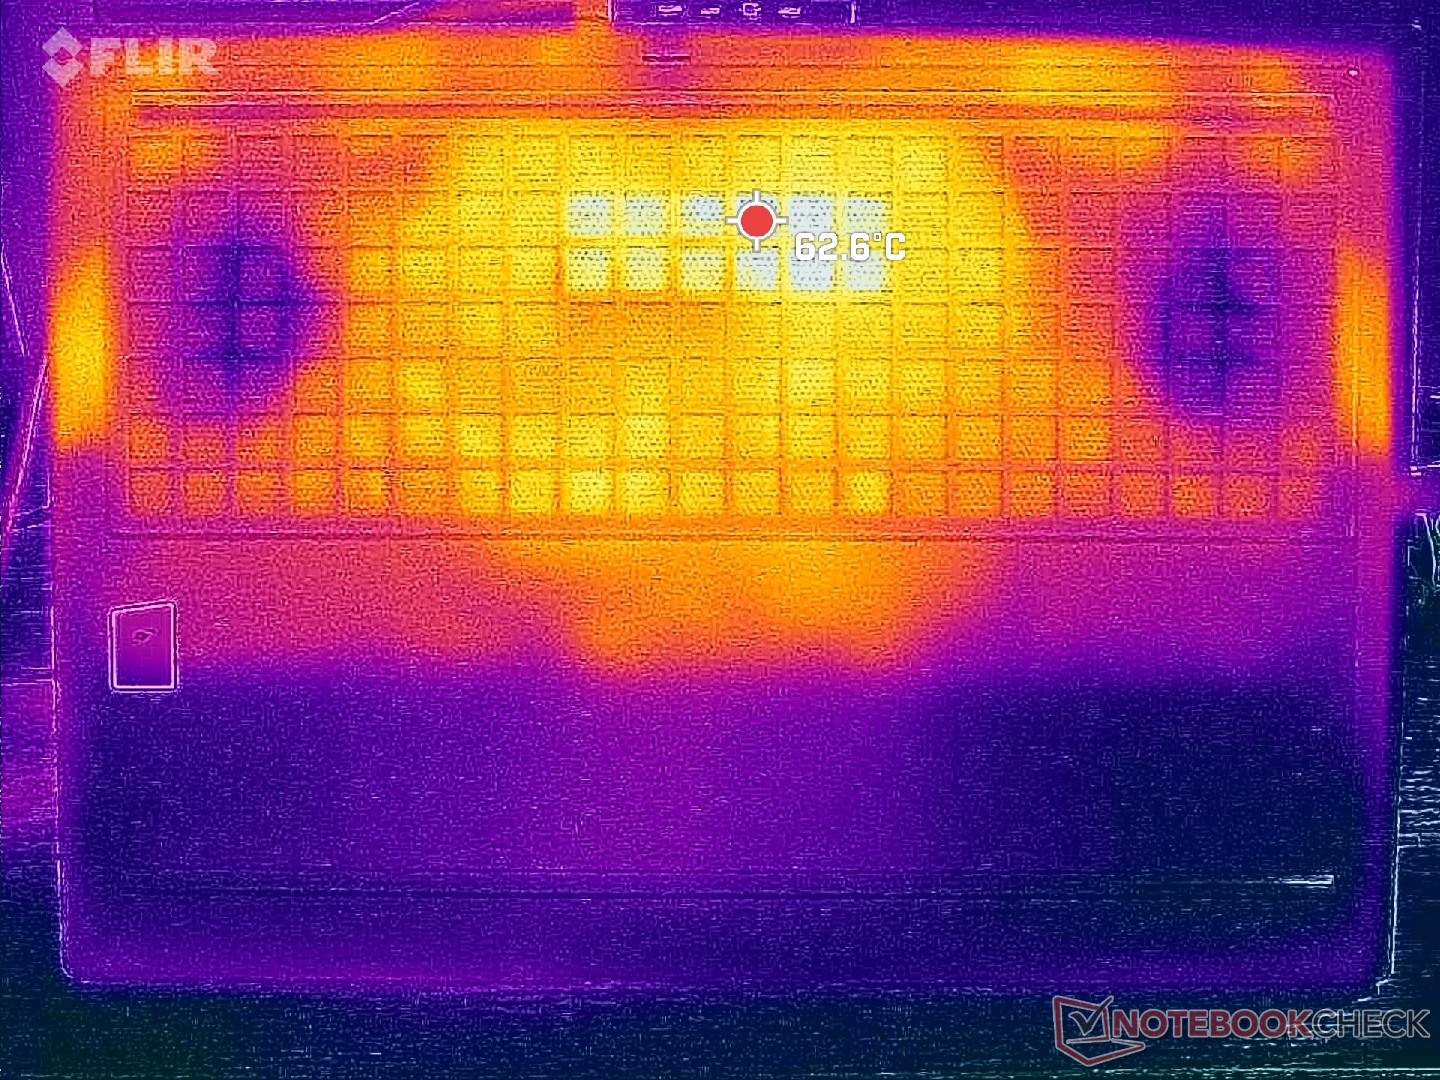
Temperatura
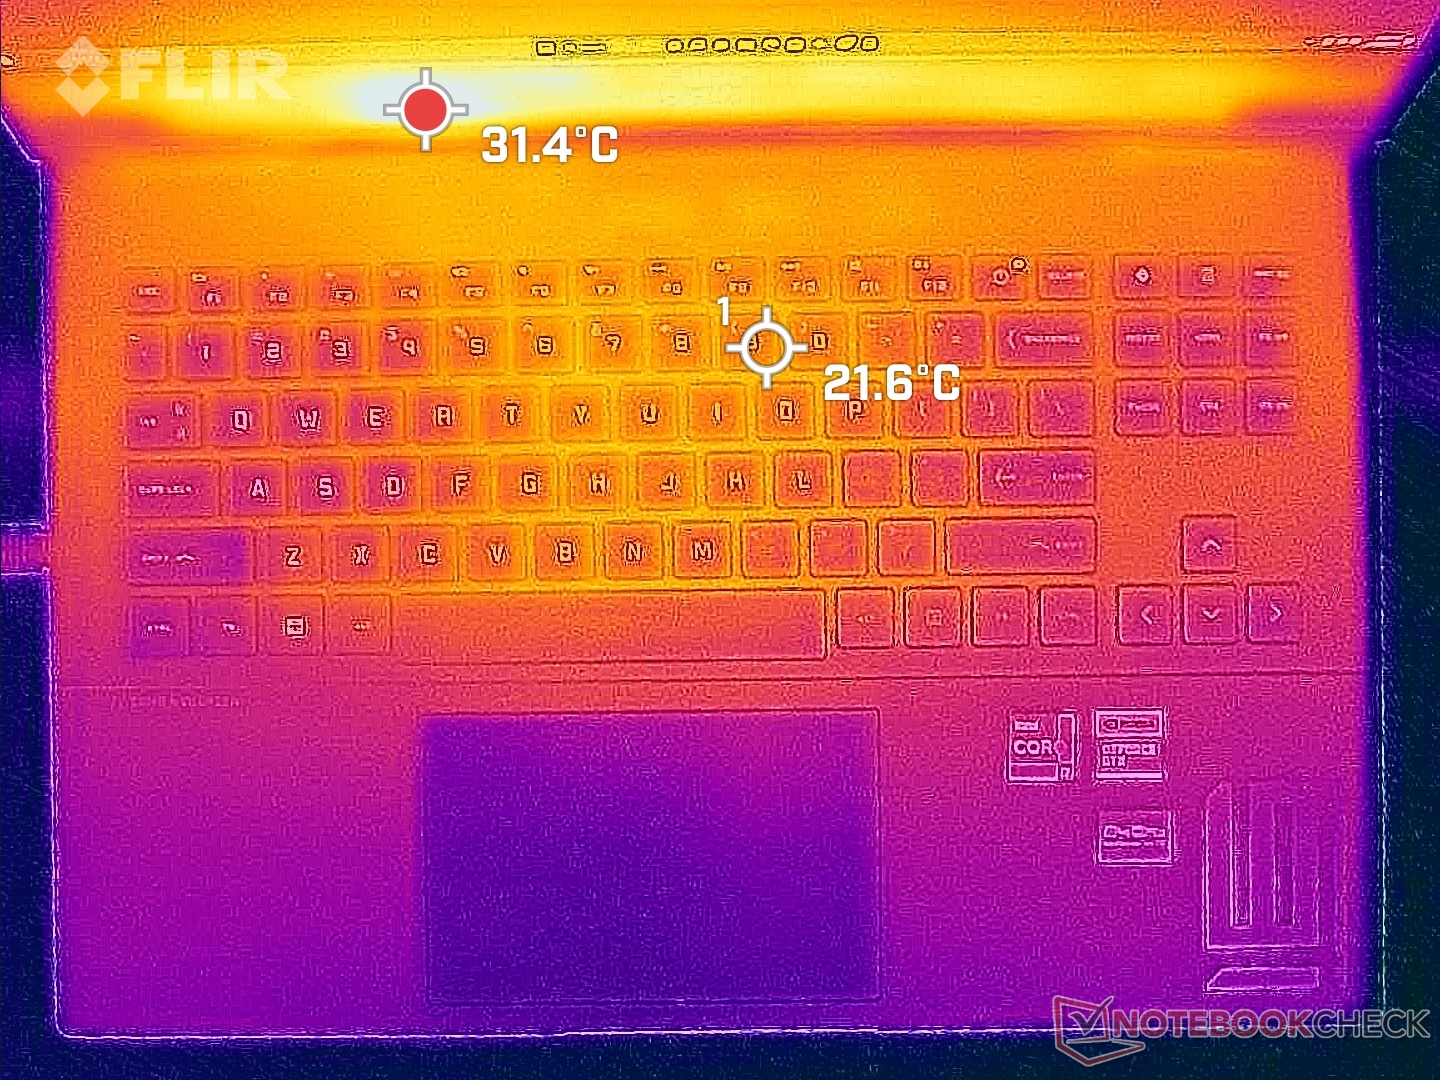
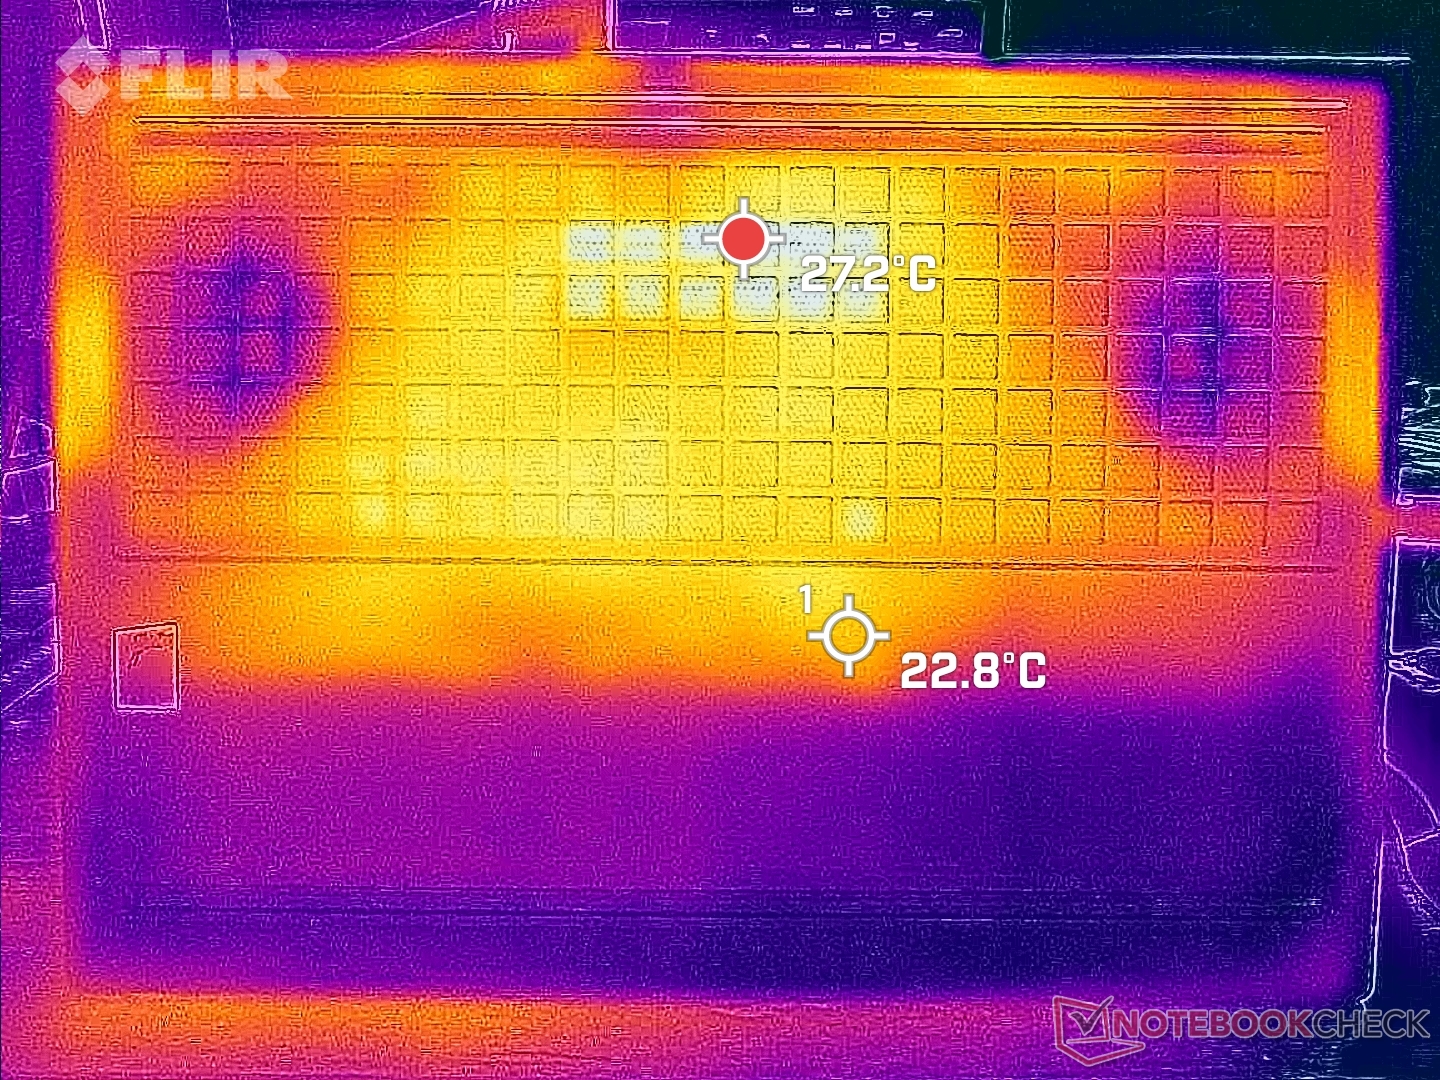
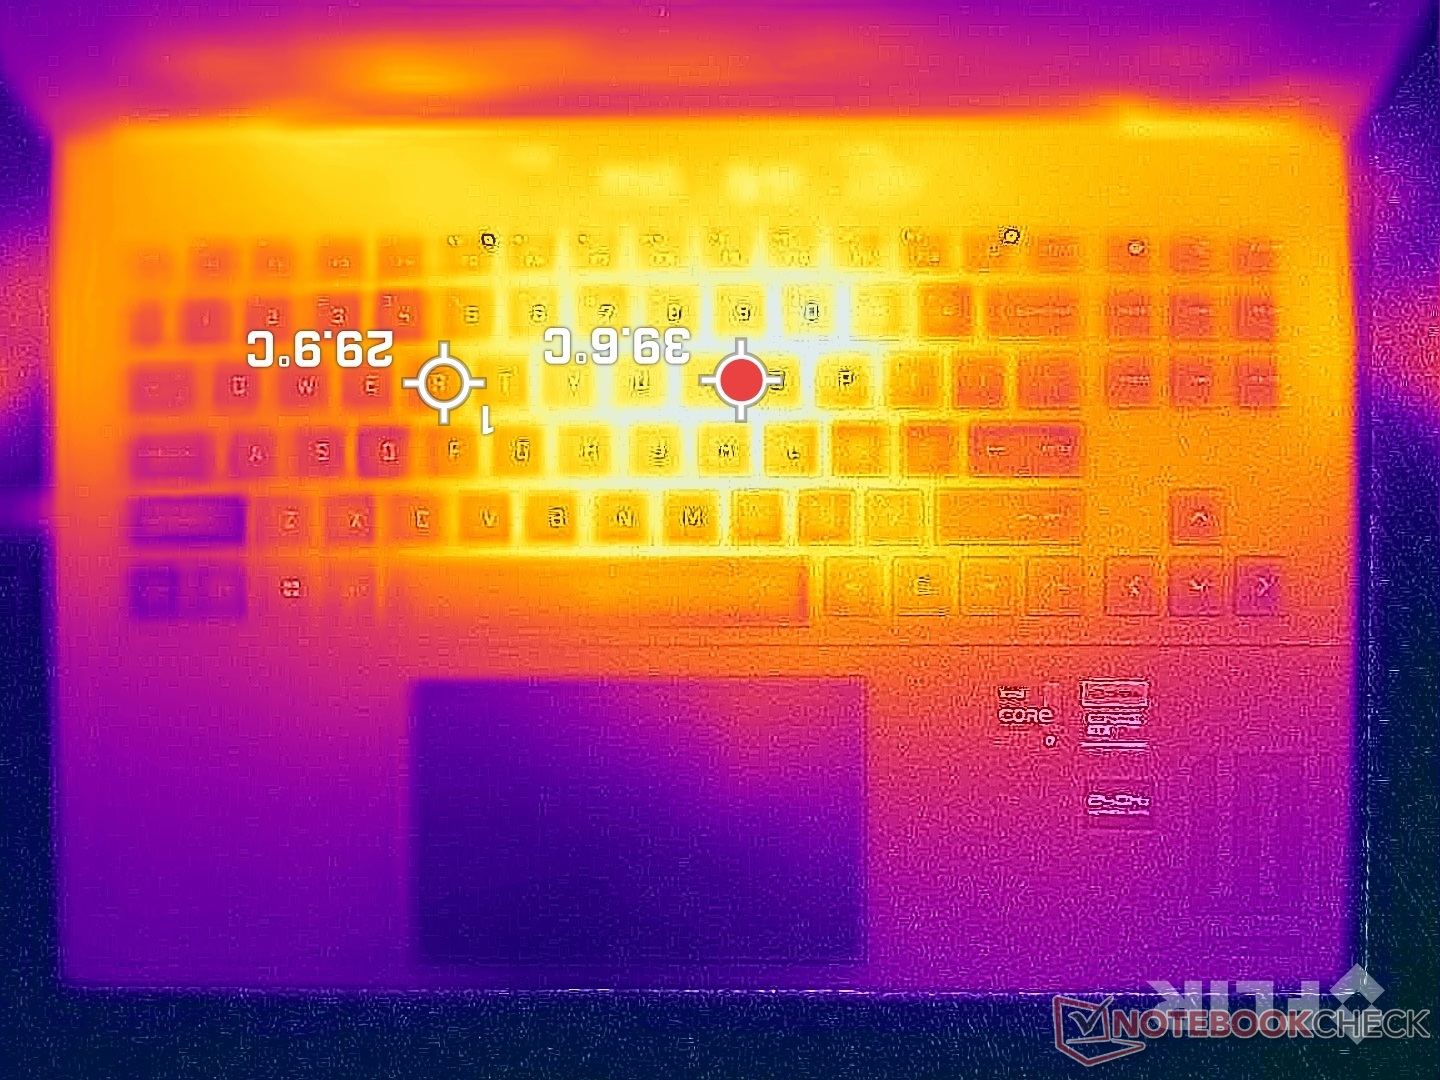
Temperatury powierzchni są symetryczne z gorącymi punktami najbliżej środka klawiatury. Region ten może osiągnąć od 40 do 45 C podczas grania w porównaniu do 55 do 60 C na grubszym, cięższym i szybszym laptopie Lenovo Pro 7 Lenovo Legion Pro 7 16. Ogólnie niższe temperatury powierzchni można przypisać większym kratkom wentylacyjnym i niższemu docelowemu TGP w konstrukcji HP.
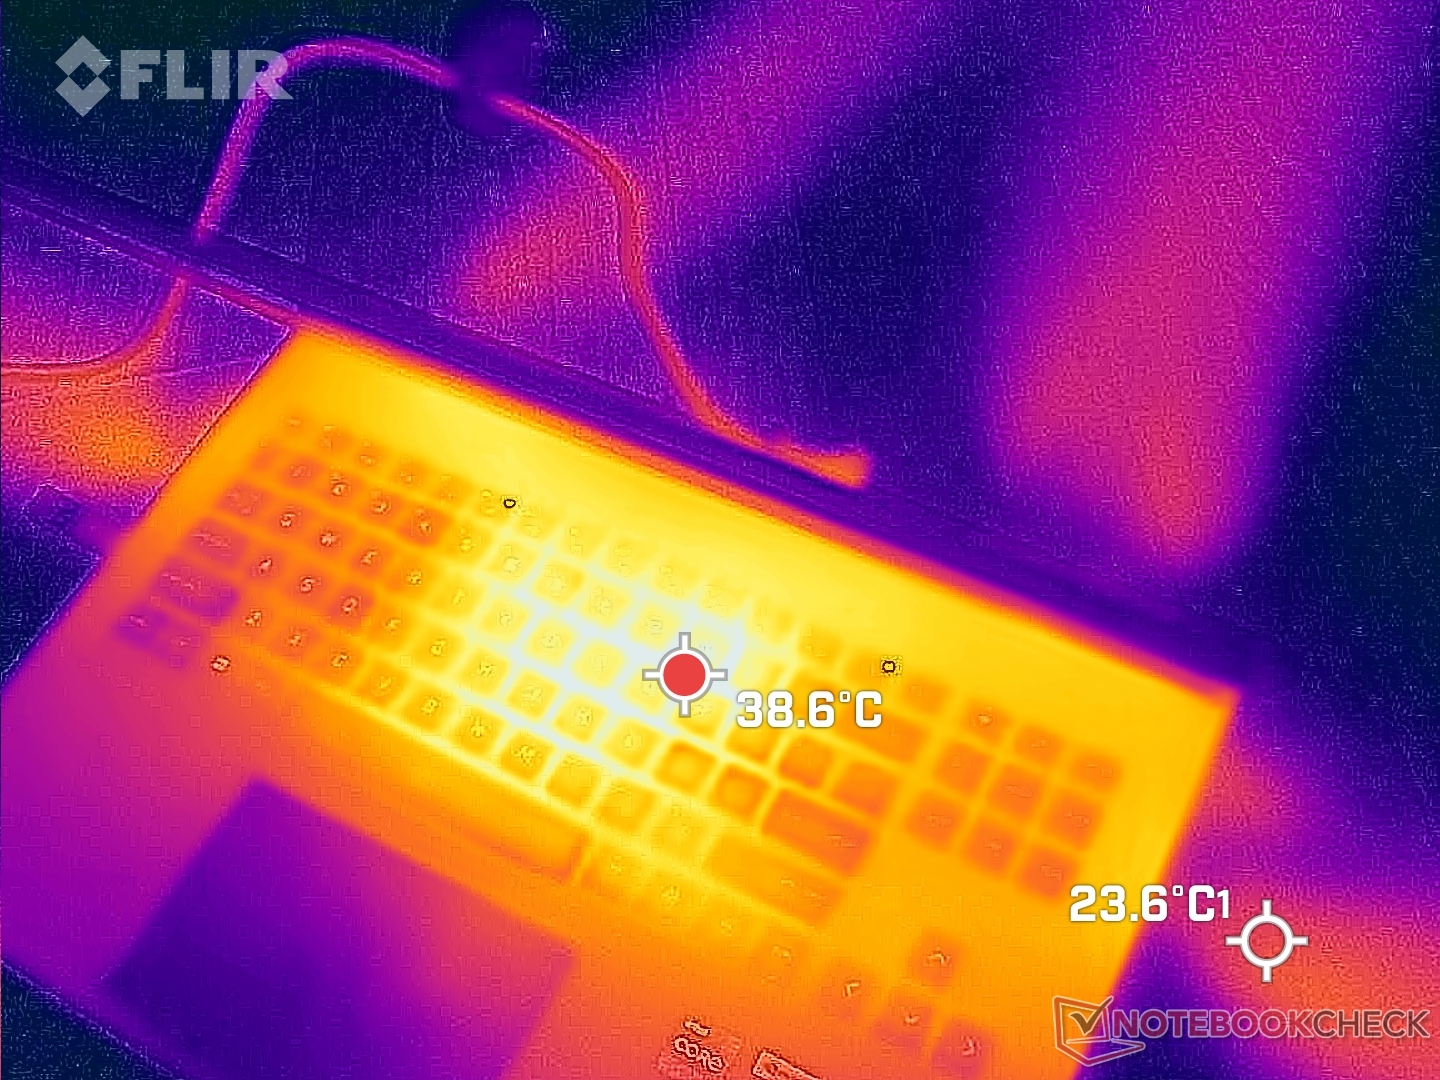
(±) Maksymalna temperatura w górnej części wynosi 45 °C / 113 F, w porównaniu do średniej 40.4 °C / 105 F , począwszy od 21.2 do 68.8 °C dla klasy Gaming.
(-) Dno nagrzewa się maksymalnie do 48.8 °C / 120 F, w porównaniu do średniej 43.2 °C / 110 F
(+) W stanie bezczynności średnia temperatura górnej części wynosi 26.6 °C / 80 F, w porównaniu ze średnią temperaturą urządzenia wynoszącą 33.9 °C / ### class_avg_f### F.
(±) Podczas gry w Wiedźmina 3 średnia temperatura górnej części wynosi 33.9 °C / 93 F, w porównaniu do średniej temperatury urządzenia wynoszącej 33.9 °C / ## #class_avg_f### F.
(+) Podpórki pod nadgarstki i touchpad są chłodniejsze niż temperatura skóry i maksymalnie 31.4 °C / 88.5 F i dlatego są chłodne w dotyku.
(-) Średnia temperatura obszaru podparcia dłoni w podobnych urządzeniach wynosiła 28.8 °C / 83.8 F (-2.6 °C / -4.7 F).
| HP Omen 16-wf000 Intel Core i7-13700HX, NVIDIA GeForce RTX 4080 Laptop GPU | HP Omen 16-n0033dx AMD Ryzen 7 6800H, AMD Radeon RX 6650M | Alienware x16 R1 Intel Core i9-13900HK, NVIDIA GeForce RTX 4080 Laptop GPU | Lenovo Legion Pro 7 RTX4090 Intel Core i9-13900HX, NVIDIA GeForce RTX 4090 Laptop GPU | Asus ROG Strix G16 G614JZ Intel Core i9-13980HX, NVIDIA GeForce RTX 4080 Laptop GPU | Razer Blade 16 Early 2023 Intel Core i9-13950HX, NVIDIA GeForce RTX 4080 Laptop GPU | |
|---|---|---|---|---|---|---|
| Heat | 3% | -13% | -17% | -12% | 4% | |
| Maximum Upper Side * (°C) | 45 | 41.2 8% | 47.2 -5% | 53 -18% | 54 -20% | 40 11% |
| Maximum Bottom * (°C) | 48.8 | 53.2 -9% | 47.8 2% | 59 -21% | 55 -13% | 37.6 23% |
| Idle Upper Side * (°C) | 29.2 | 26.4 10% | 36.8 -26% | 34 -16% | 29 1% | 32.4 -11% |
| Idle Bottom * (°C) | 28.8 | 27.8 3% | 35.8 -24% | 32 -11% | 33 -15% | 31.4 -9% |
* ... im mniej tym lepiej
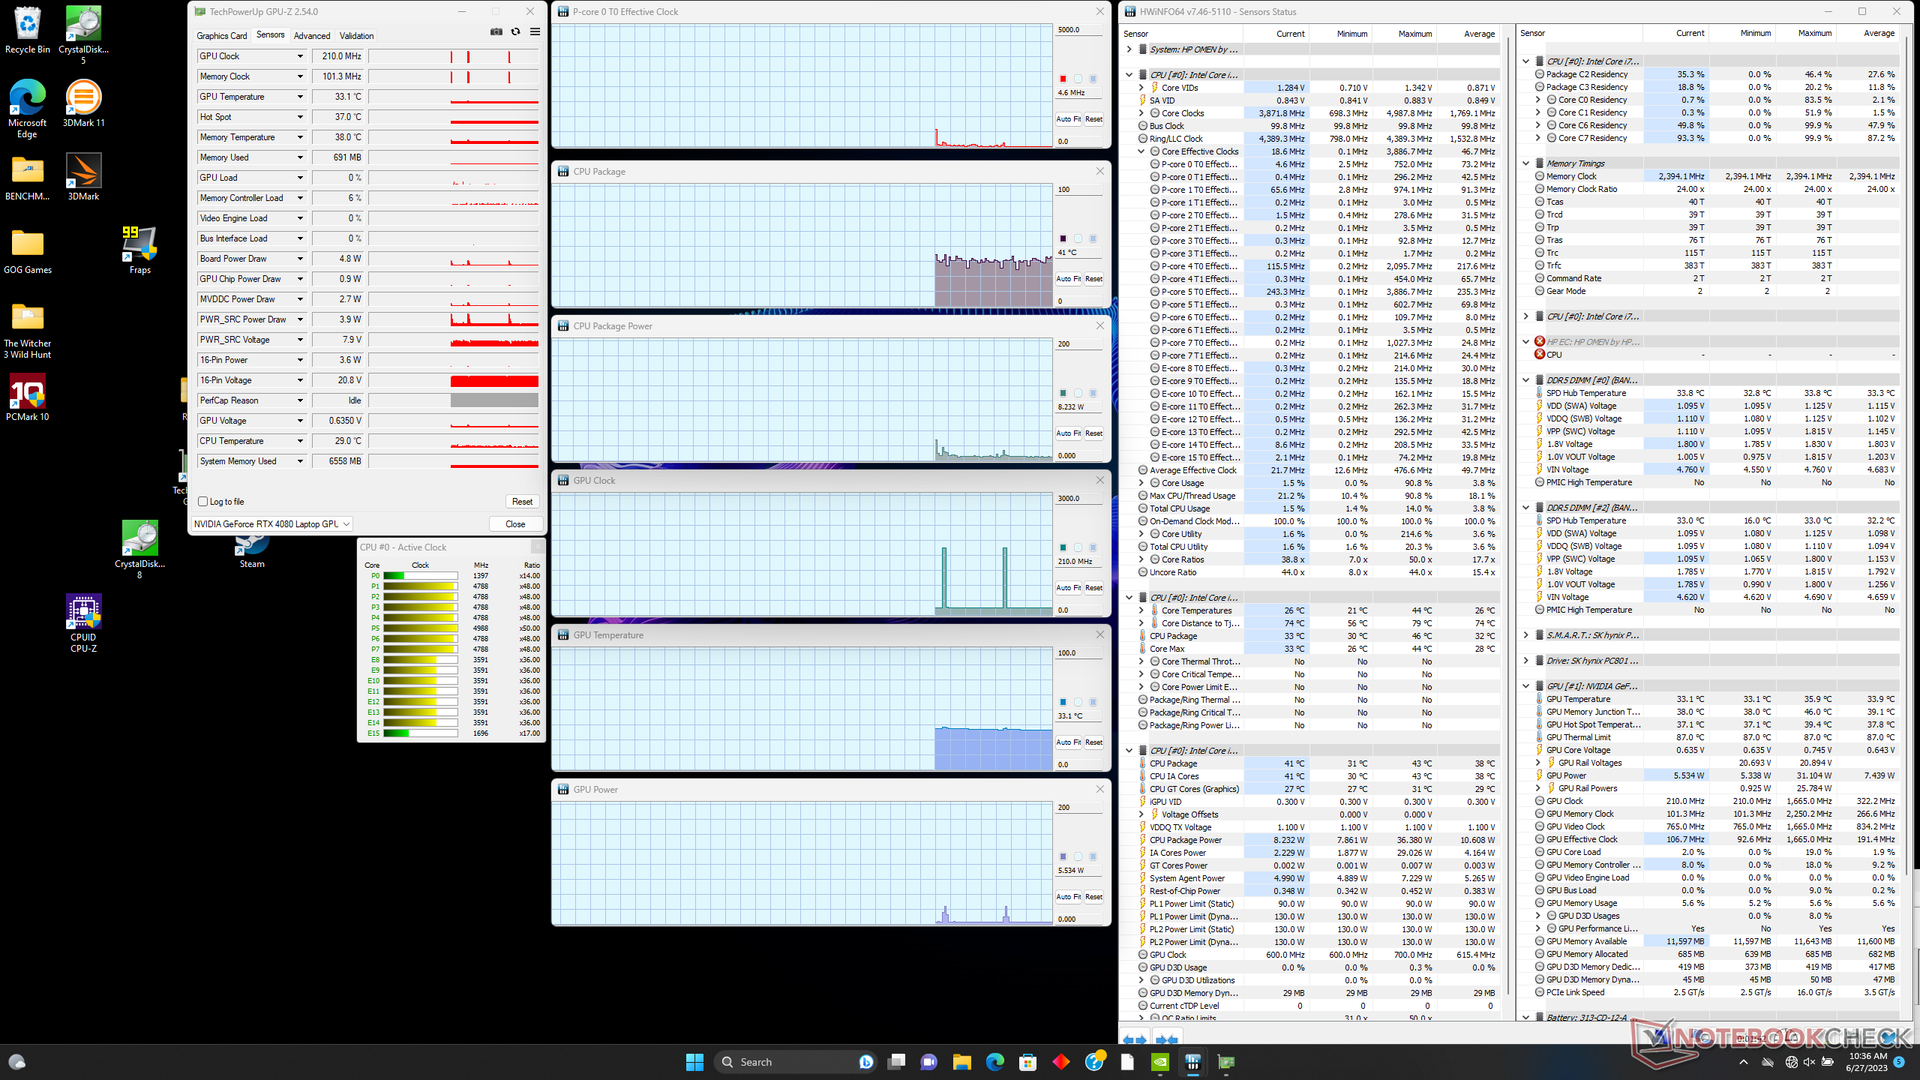
Test warunków skrajnych
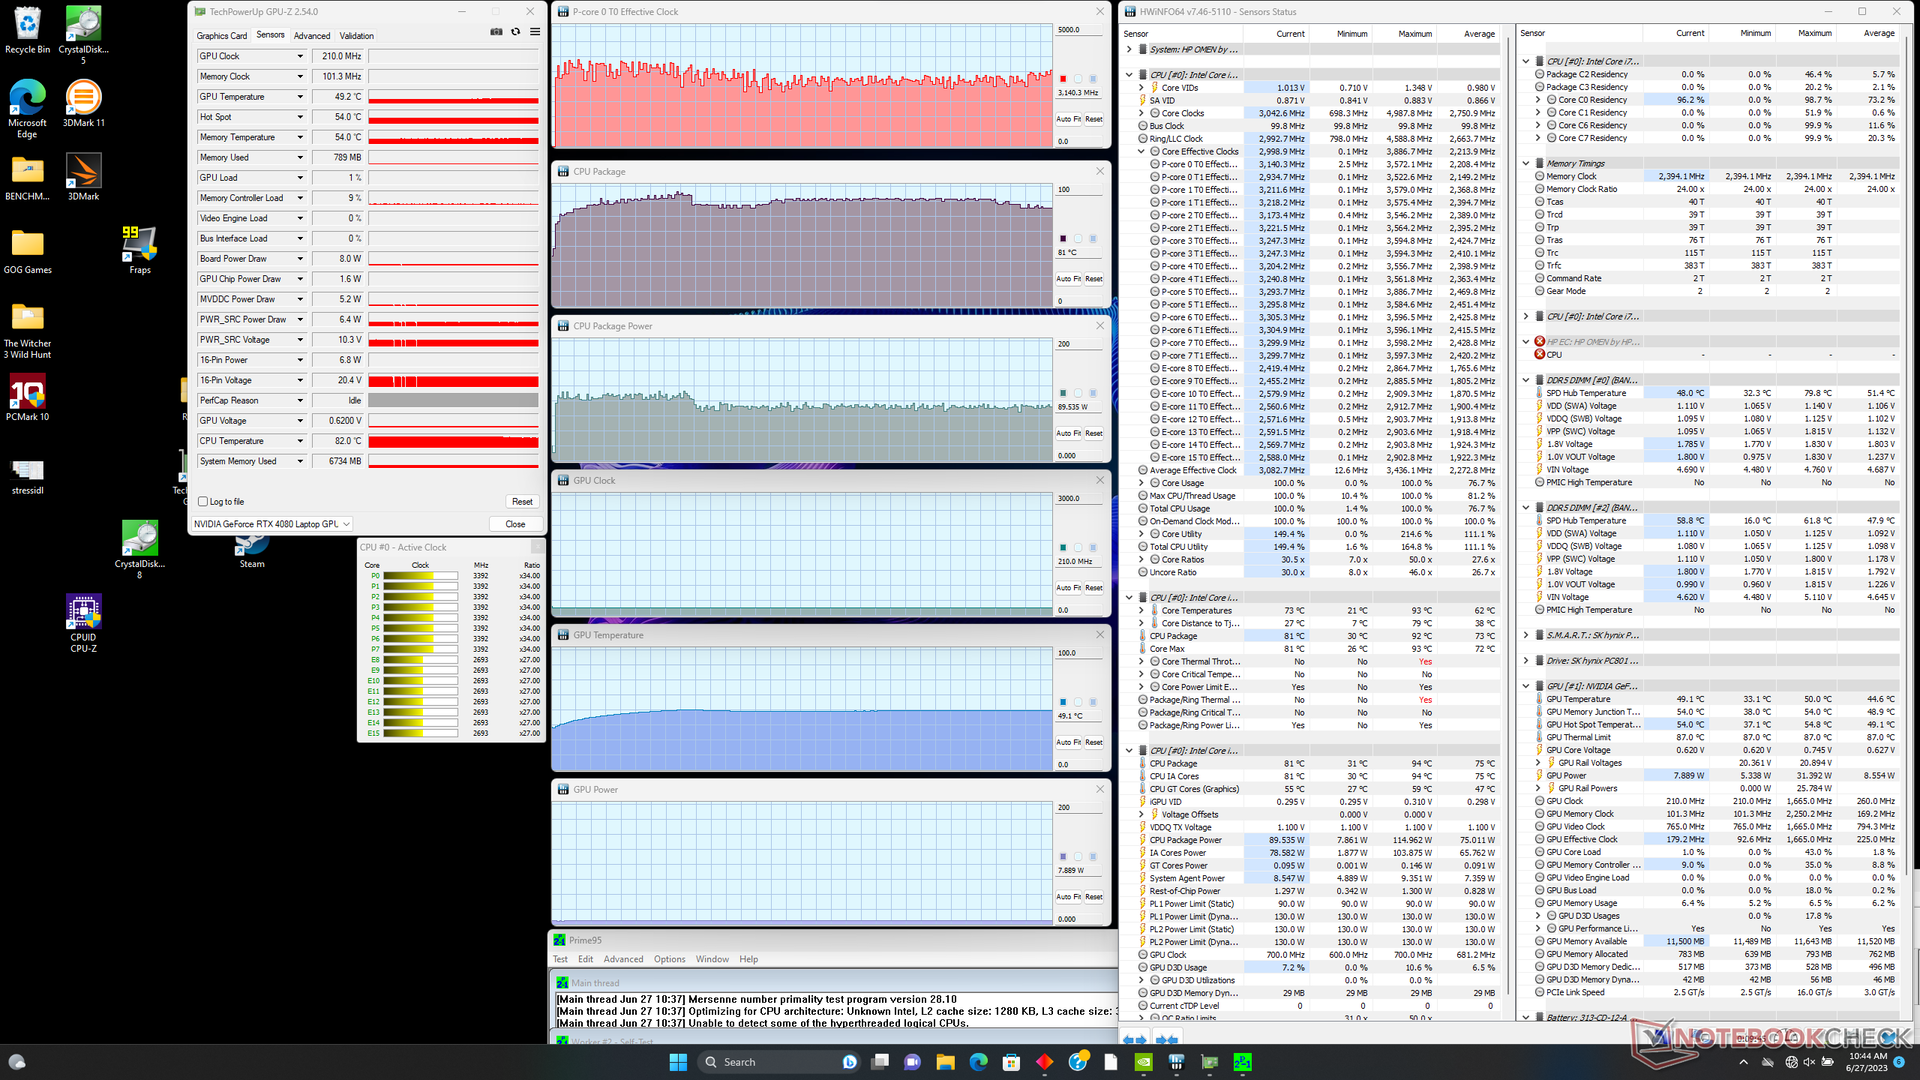
Częstotliwość taktowania procesora i pobór mocy płyty podczas inicjowania stresu Prime95 wzrosłyby odpowiednio do 3,4 GHz i 110 W, utrzymując się przez około dwie minuty lub do momentu, gdy temperatura rdzenia osiągnie 91 C. Następnie procesor osiągnąłby średnią około 3,0 GHz i 90 W, aby utrzymać niższą temperaturę w zakresie od 80 do 90 C. Ten zakres temperatur jest podobny do tego, co zarejestrowaliśmy na zasilanym przez AMD 2022 Omen 16 i szybszym Blade 16.
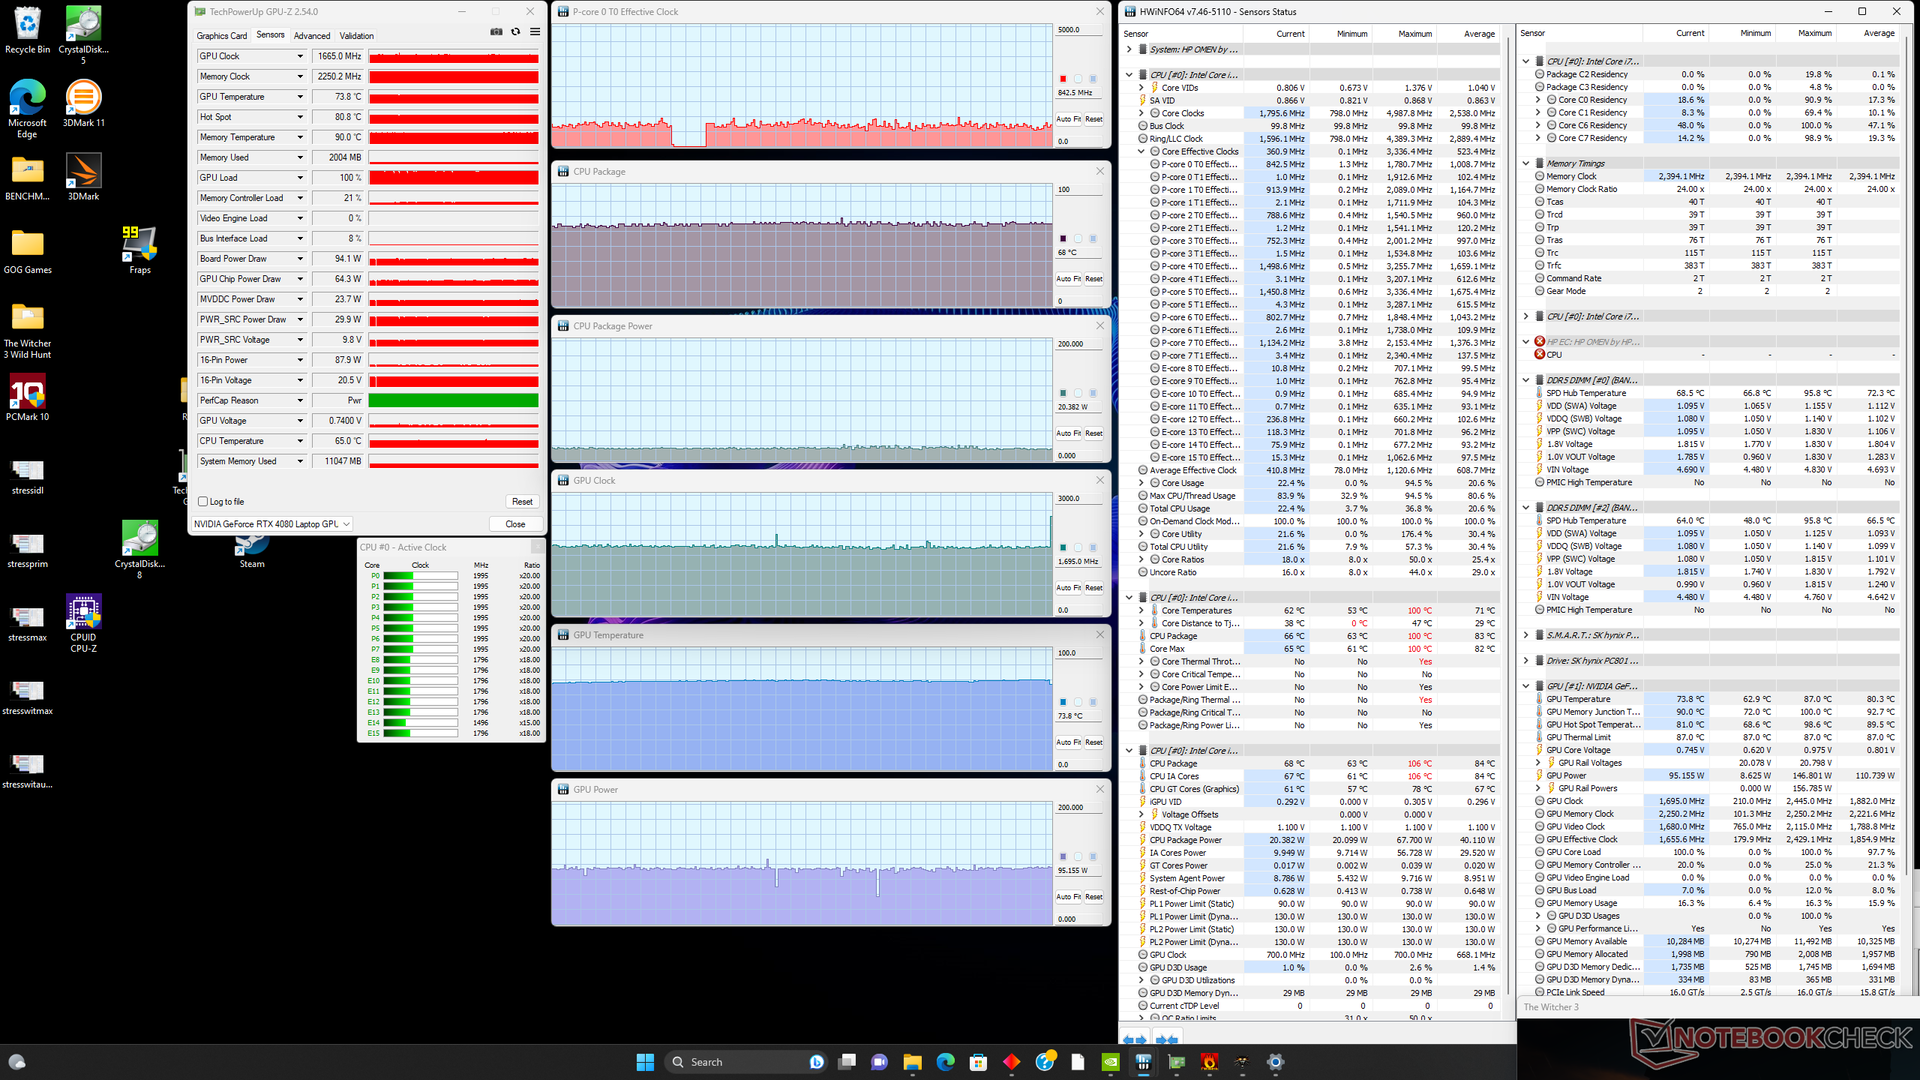
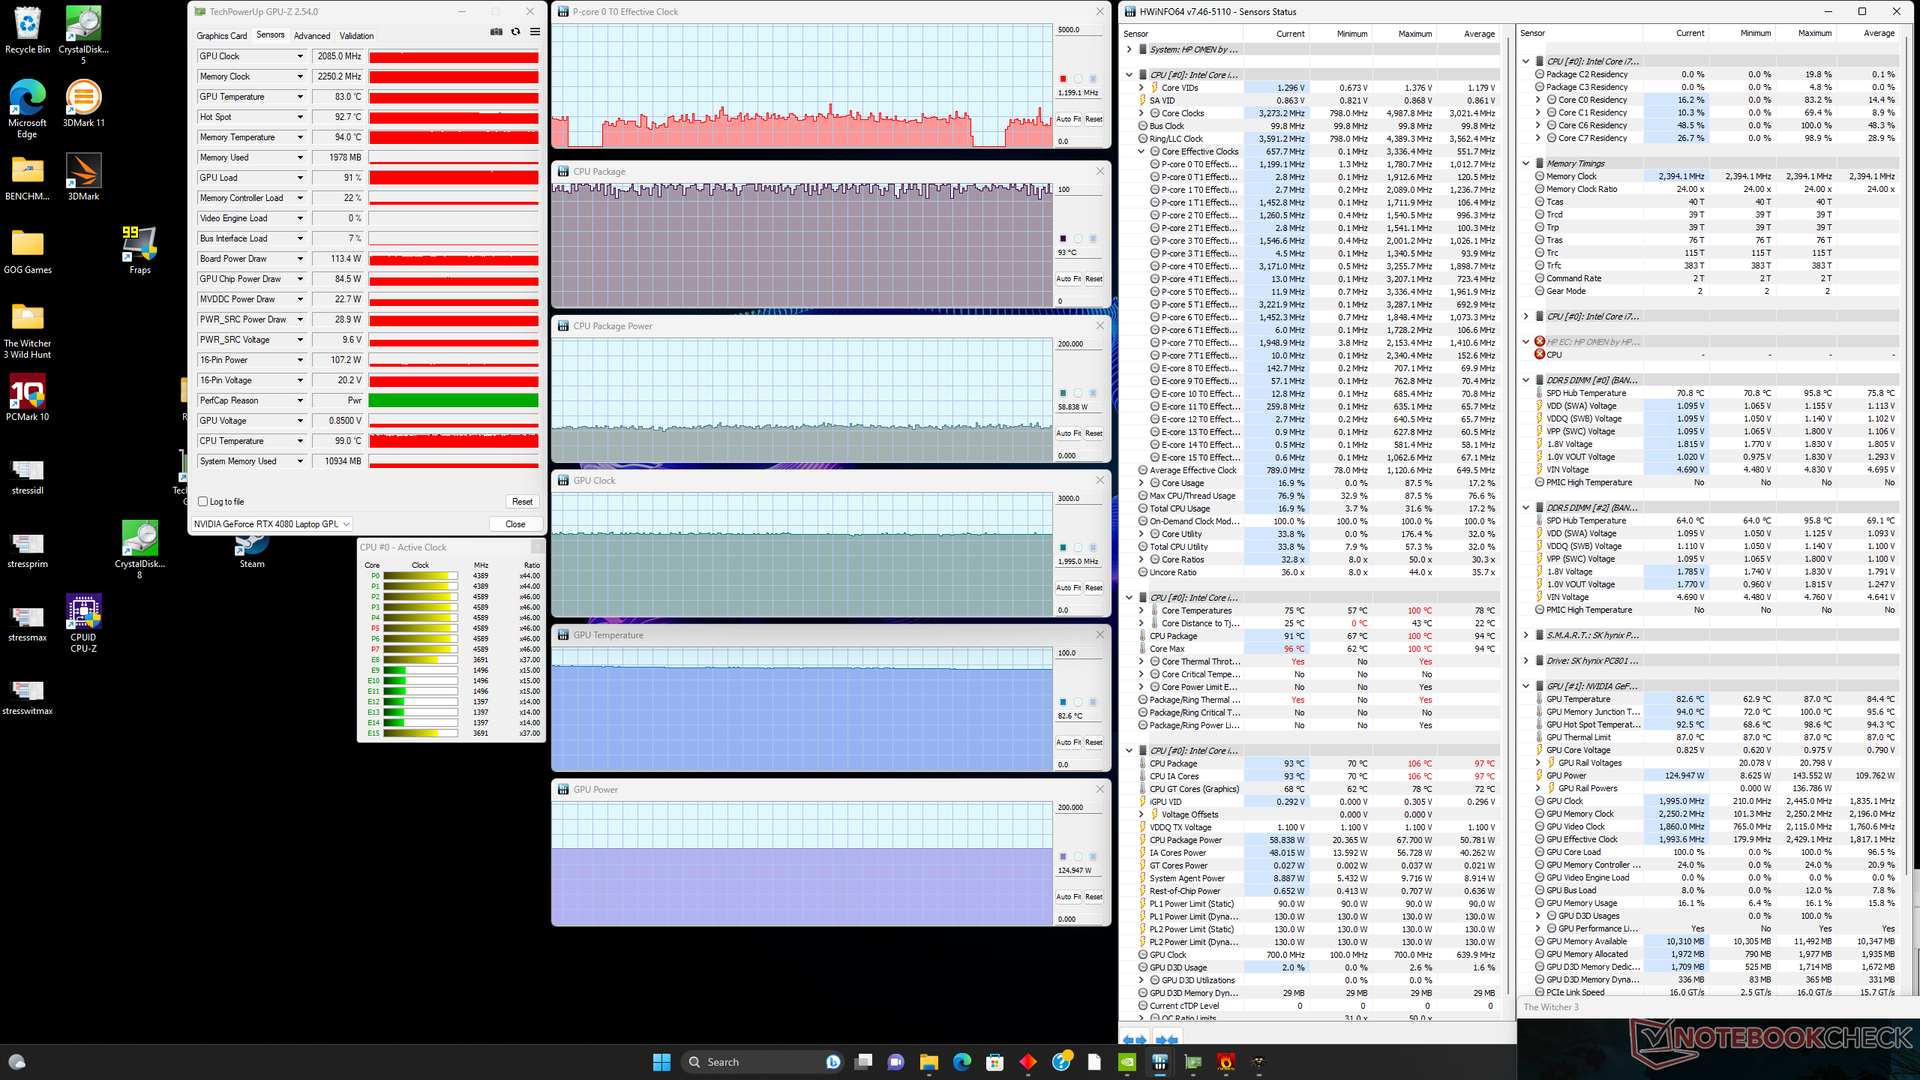
Podczas pracy Witcher 3 w trybie Performance z włączonym wentylatorem Max Fan, częstotliwości taktowania GPU i pobór mocy płyty byłyby nieco wyższe niż w trybie Performance z wyłączonym wentylatorem Max Fan, jak pokazano na poniższych zrzutach ekranu. Wyniki są zgodne z naszymi wynikami Fire Strike powyżej, a temperatury rdzenia byłyby również zauważalnie niższe przy włączonym wentylatorze Max Fan. Dlatego też, jeśli chcesz wycisnąć z laptopa jak najwięcej wydajności, musisz włączyć tryb wentylatora Man Fan.
Uruchomienie Witcher 3 w trybie zrównoważonym ograniczyłoby pobór mocy z płyty głównej do zaledwie 95 W z maksymalnej wartości około 130-145 W. Hałas wentylatora jest oczywiście cichszy, ale kosztem wydajności graficznej.
Praca na zasilaniu bateryjnym poważnie ogranicza wydajność. Test 3DMark 11 na zasilaniu bateryjnym przyniósłby wyniki fizyki i grafiki na poziomie odpowiednio 8347 i 10654 punktów, w porównaniu do 23751 i 56145 punktów przy zasilaniu sieciowym.

| Taktowanie CPU (GHz) | Taktowanie GPU (MHz) | Średnia temperatura CPU (°C) | Średnia temperatura GPU (°C) | |
| System w stanie spoczynku | -- | -- | 41 | 33 |
| Prime95Stress | 2.4 - 3.2 | -- | 81 - 88 | 49 |
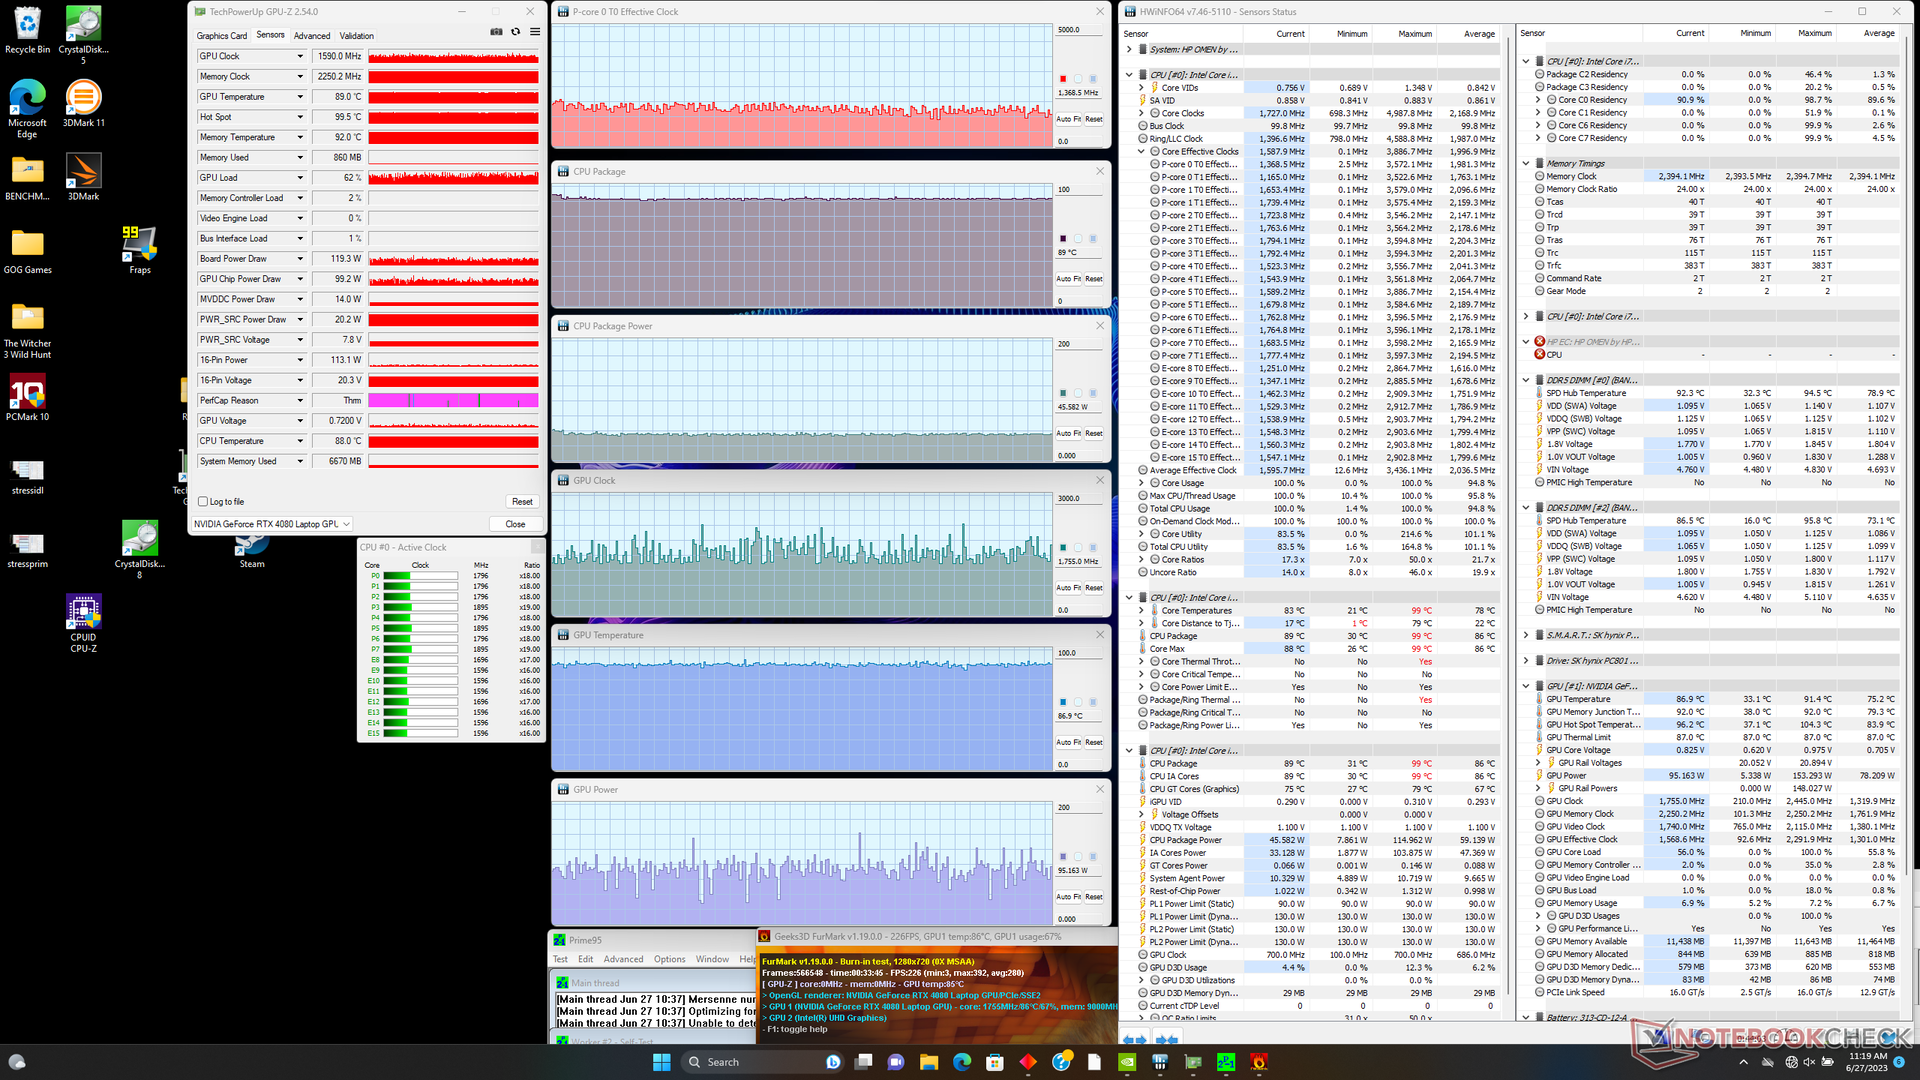
| Prime95+ FurMark Stress | 1.3 - 1.8 | 1300 - 2250 | 89 | 87 |
| Witcher 3 Obciążenie(tryb zrównoważony) | ~0,8 | 1665 | 68 | 74 |
| Witcher 3 Obciążenie (tryb wydajności + maksymalnewyłączenie wentylatora) | ~1,2 | 2085 | ~95 | 83 |
| Witcher 3 Obciążenie (tryb wydajności + maks. włączony wentylator) | ~1,2 | 2160 | 76 | 76 |
Głośniki
Głośniki stereo nie są tak głośne, jak poczwórne głośniki w Alienware x16 R1 Alienware x16 R1ale równowaga jest mimo wszystko przyzwoita. Jakość dźwięku spada zauważalnie podczas grania ze względu na głośne wentylatory.
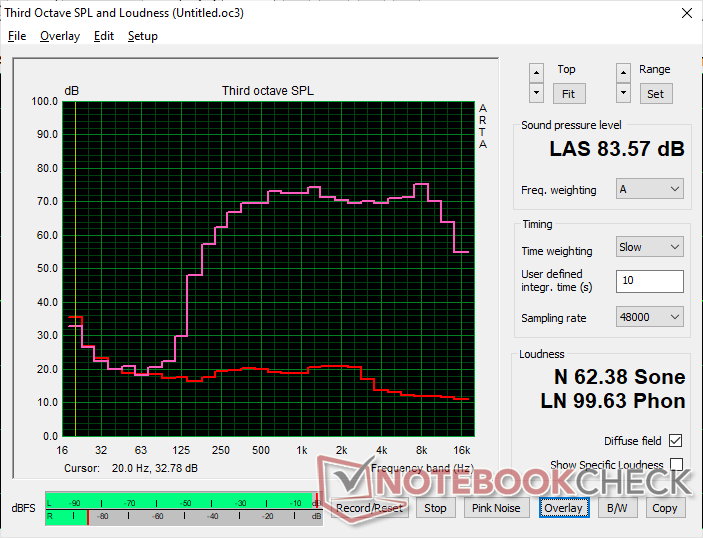
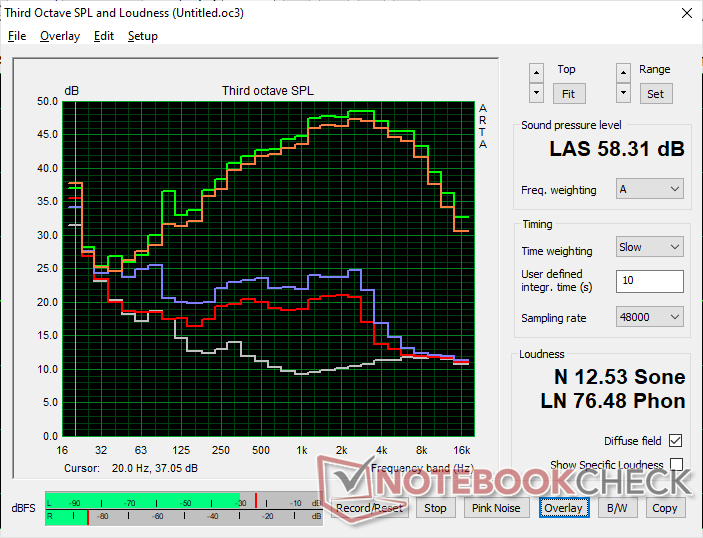
HP Omen 16-wf000 analiza dźwięku
(+) | głośniki mogą odtwarzać stosunkowo głośno (83.6 dB)
Bas 100 - 315 Hz
(-) | prawie brak basu - średnio 21.9% niższa od mediany
(±) | liniowość basu jest średnia (14.7% delta do poprzedniej częstotliwości)
Średnie 400 - 2000 Hz
(+) | zbalansowane środki średnie - tylko 2.1% od mediany
(+) | średnie są liniowe (3% delta do poprzedniej częstotliwości)
Wysokie 2–16 kHz
(+) | zrównoważone maksima - tylko 1.4% od mediany
(+) | wzloty są liniowe (3.5% delta do poprzedniej częstotliwości)
Ogólnie 100 - 16.000 Hz
(±) | liniowość ogólnego dźwięku jest średnia (15.3% różnicy w stosunku do mediany)
W porównaniu do tej samej klasy
» 34% wszystkich testowanych urządzeń w tej klasie było lepszych, 6% podobnych, 60% gorszych
» Najlepszy miał deltę 6%, średnia wynosiła ###średnia###%, najgorsza wynosiła 132%
W porównaniu do wszystkich testowanych urządzeń
» 22% wszystkich testowanych urządzeń było lepszych, 4% podobnych, 74% gorszych
» Najlepszy miał deltę 4%, średnia wynosiła ###średnia###%, najgorsza wynosiła 134%
Apple MacBook Pro 16 2021 M1 Pro analiza dźwięku
(+) | głośniki mogą odtwarzać stosunkowo głośno (84.7 dB)
Bas 100 - 315 Hz
(+) | dobry bas - tylko 3.8% od mediany
(+) | bas jest liniowy (5.2% delta do poprzedniej częstotliwości)
Średnie 400 - 2000 Hz
(+) | zbalansowane środki średnie - tylko 1.3% od mediany
(+) | średnie są liniowe (2.1% delta do poprzedniej częstotliwości)
Wysokie 2–16 kHz
(+) | zrównoważone maksima - tylko 1.9% od mediany
(+) | wzloty są liniowe (2.7% delta do poprzedniej częstotliwości)
Ogólnie 100 - 16.000 Hz
(+) | ogólny dźwięk jest liniowy (4.6% różnicy w stosunku do mediany)
W porównaniu do tej samej klasy
» 0% wszystkich testowanych urządzeń w tej klasie było lepszych, 0% podobnych, 100% gorszych
» Najlepszy miał deltę 5%, średnia wynosiła ###średnia###%, najgorsza wynosiła 45%
W porównaniu do wszystkich testowanych urządzeń
» 0% wszystkich testowanych urządzeń było lepszych, 0% podobnych, 100% gorszych
» Najlepszy miał deltę 4%, średnia wynosiła ###średnia###%, najgorsza wynosiła 134%
Zarządzanie energią - większa bateria, krótsza żywotność
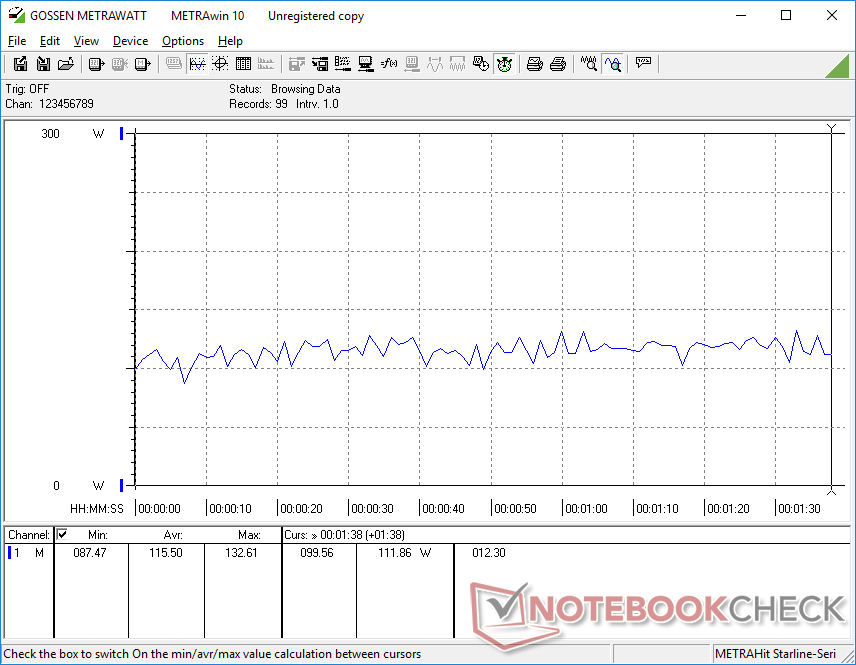
Zużycie energii
Zużycie energii podczas pracy na biegu jałowym jest wyższe niż oczekiwano, nawet w profilu oszczędzania energii z aktywnym iGPU i jasnością ustawioną na minimum. Wysoki poziom może być odpowiedzialny za krótszy czas pracy na baterii w następnej sekcji poniżej.
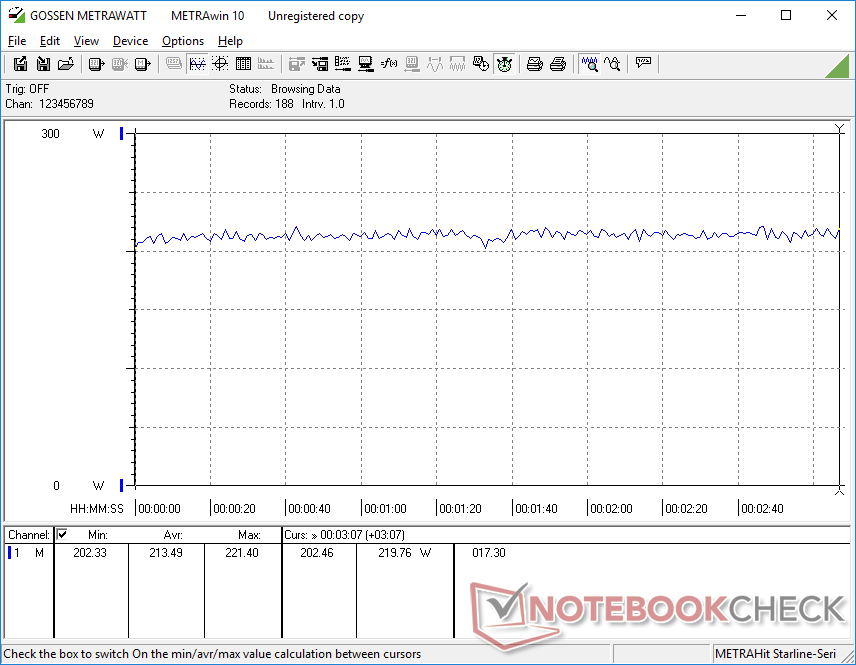
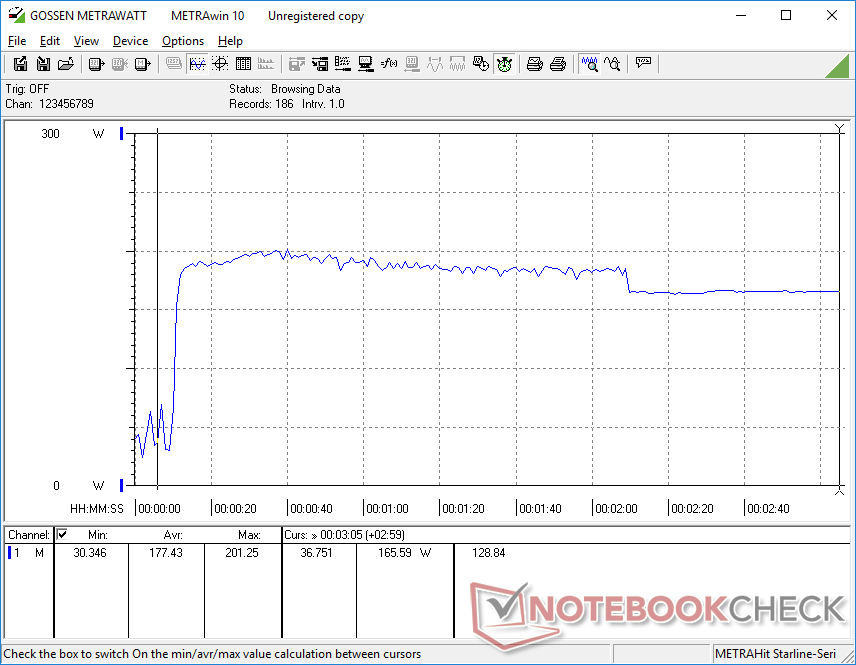
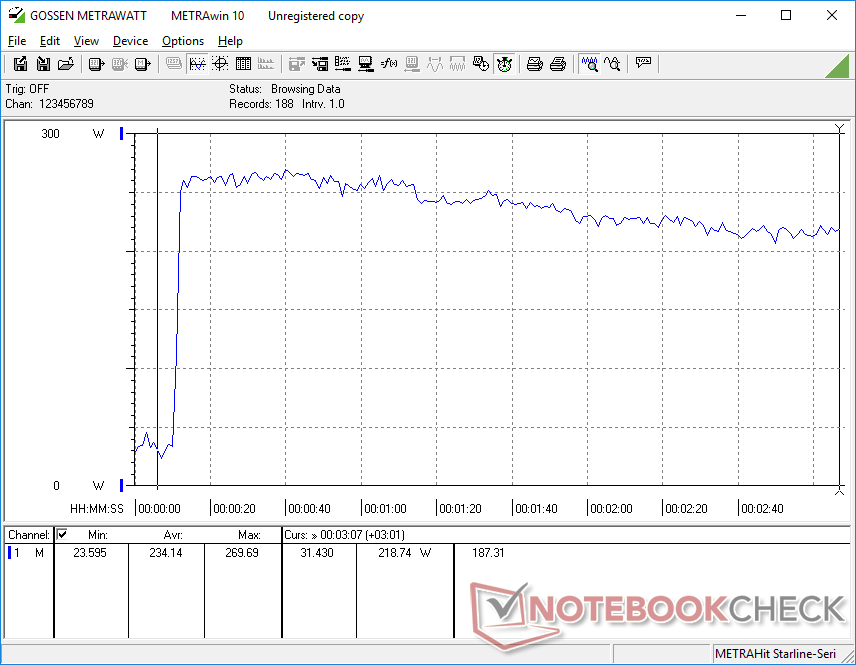
Na szczęście zużycie energii podczas grania wykazuje znaczną poprawę w porównaniu do 2022 Omen 16 z procesorem AMD. Bieganie Witcher 3 pobiera średnio tylko 4 procent więcej energii, zapewniając jednocześnie 1,5x do 2x wyższą wydajność GPU niż Radeon RX 6650M. Już sam ten fakt może wyjaśniać, dlaczego HP zdecydowało się porzucić wszelkie opcje Radeona w tegorocznym Omen 16, ponieważ przewaga wydajności na wat w przypadku Ady Lovelace jest uderzająca.
Konkurencyjne laptopy z tym samym GPU RTX 4080, takie jakROG Strix G16 lub Blade 16, wymagają około 30 W więcej niż nasz system HP podczas uruchamiania tego samego tytułu. Jednak są one również wyposażone w znacznie szybsze procesory Core i9 HX, aby to zrekompensować.
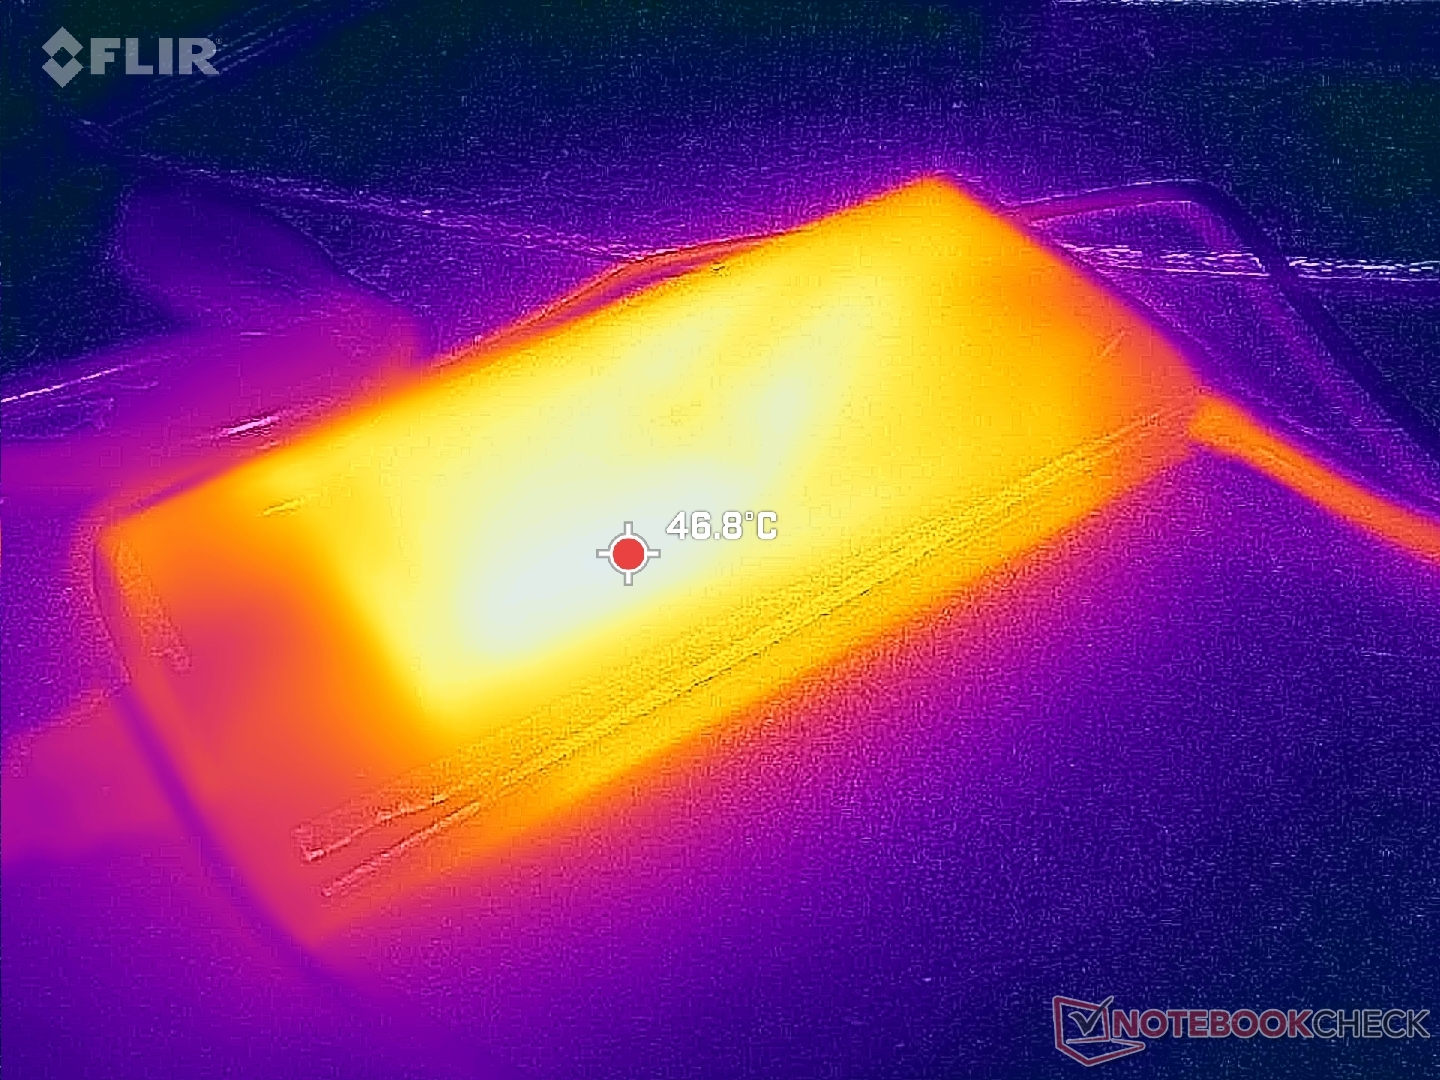
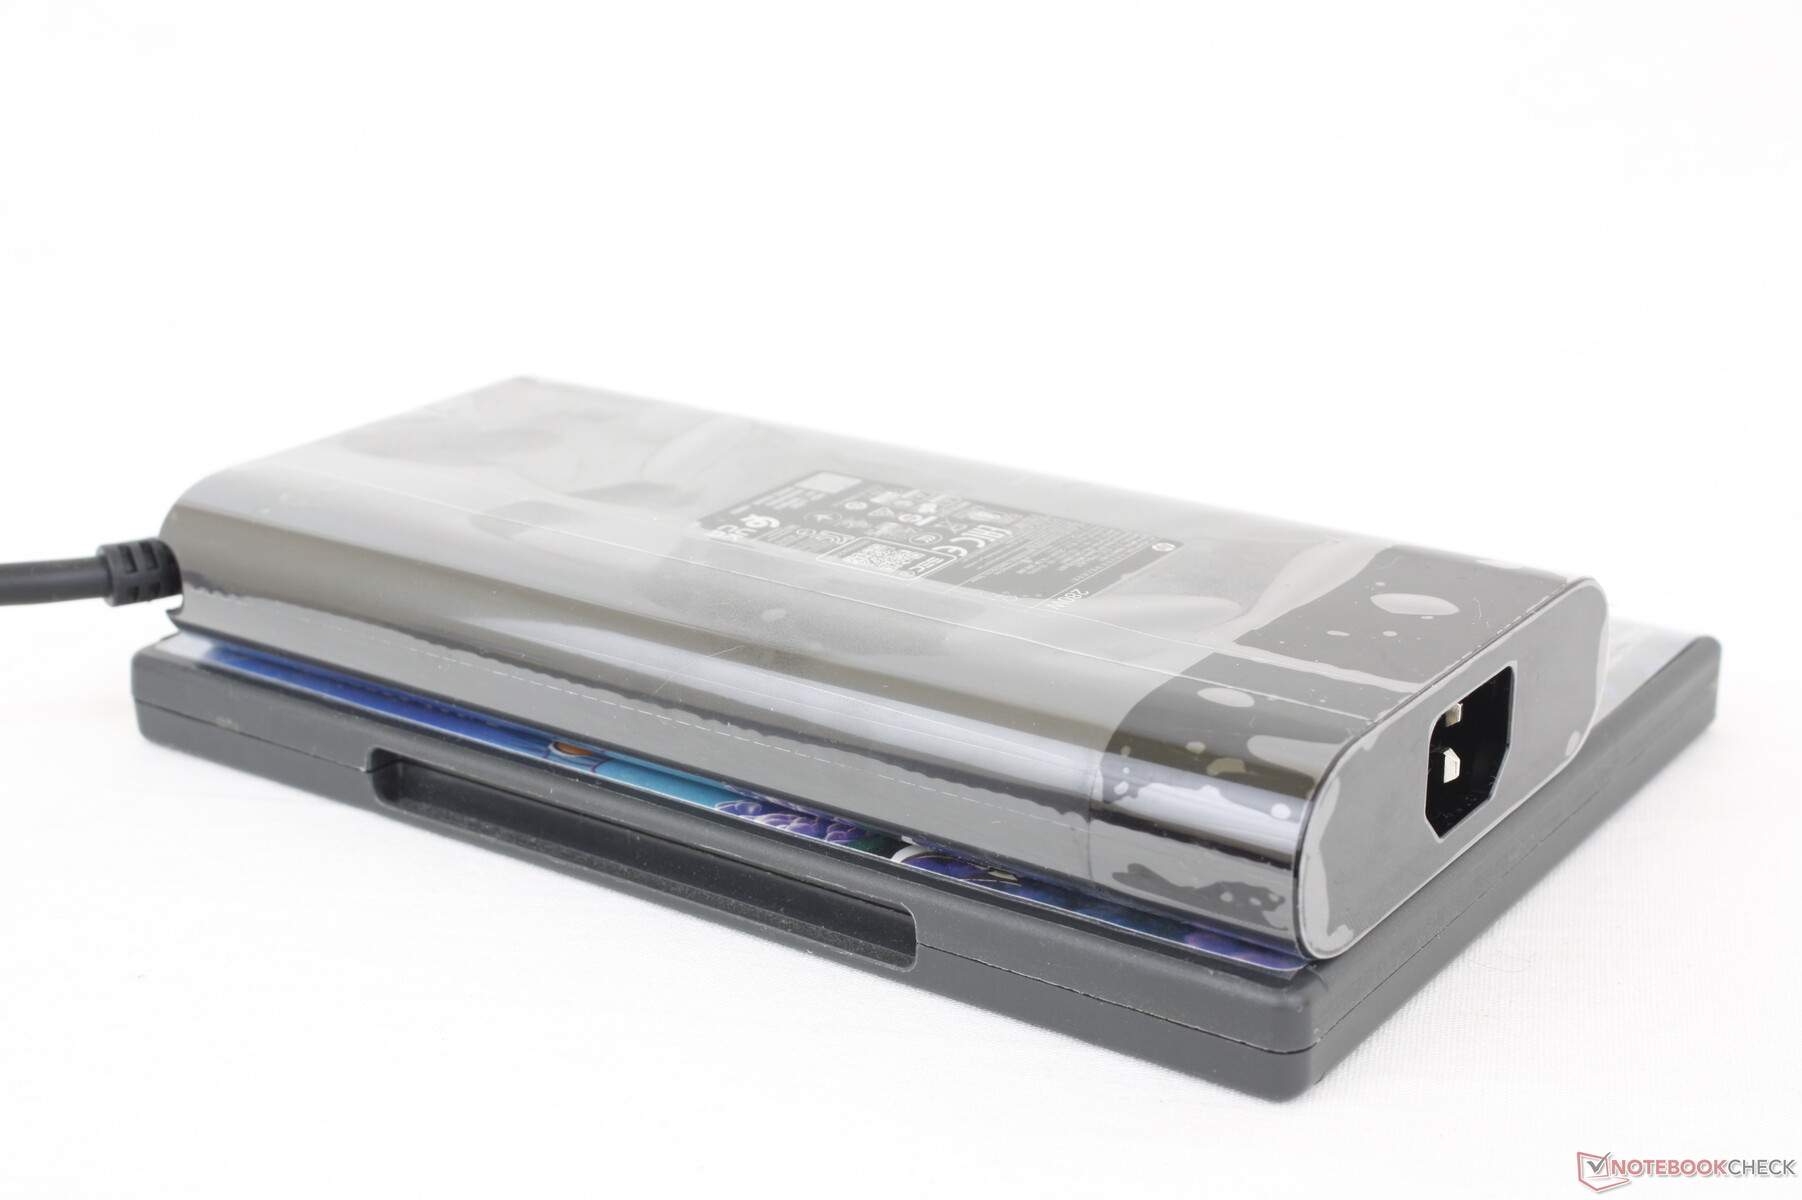
Jesteśmy w stanie zarejestrować tymczasowy maksymalny pobór 270 W ze średniej wielkości (~ 18 x 8,8 x 2,4 cm) zasilacza sieciowego 280 W, gdy procesor i karta graficzna są wykorzystywane w 100 procentach. Większy zasilacz o mocy 330 W byłby prawdopodobnie przesadą.
| wyłączony / stan wstrzymania | |
| luz | |
| obciążenie |
|
Legenda:
min: | |
| HP Omen 16-wf000 i7-13700HX, GeForce RTX 4080 Laptop GPU, SK hynix PC801 HFS002TEJ9X101N, IPS, 2560x1440, 16.1" | HP Omen 16-n0033dx R7 6800H, Radeon RX 6650M, Samsung PM9A1 MZVL21T0HCLR, IPS, 1920x1080, 16.1" | Alienware x16 R1 i9-13900HK, GeForce RTX 4080 Laptop GPU, SK hynix PC801 HFS001TEJ9X101N, IPS, 2560x1600, 16" | Lenovo Legion Pro 7 RTX4090 i9-13900HX, GeForce RTX 4090 Laptop GPU, Samsung PM9A1 MZVL21T0HCLR, IPS, 2560x1600, 16" | Asus ROG Strix G16 G614JZ i9-13980HX, GeForce RTX 4080 Laptop GPU, WD PC SN560 SDDPNQE-1T00, IPS, 2560x1600, 16" | Razer Blade 16 Early 2023 i9-13950HX, GeForce RTX 4080 Laptop GPU, SSSTC CA6-8D1024, IPS, 2560x1600, 16" | |
|---|---|---|---|---|---|---|
| Power Consumption | 34% | -17% | -9% | 11% | -3% | |
| Idle Minimum * (Watt) | 21.8 | 7.9 64% | 25.2 -16% | 20 8% | 10 54% | 15.2 30% |
| Idle Average * (Watt) | 26 | 11.5 56% | 29.9 -15% | 25 4% | 16 38% | 22.8 12% |
| Idle Maximum * (Watt) | 36 | 18.3 49% | 49.8 -38% | 35 3% | 27 25% | 49.8 -38% |
| Load Average * (Watt) | 115.5 | 88.1 24% | 105.4 9% | 136 -18% | 129 -12% | 121.2 -5% |
| Witcher 3 ultra * (Watt) | 214 | 206 4% | 263 -23% | 282 -32% | 247 -15% | 242 -13% |
| Load Maximum * (Watt) | 269.7 | 246.4 9% | 313.8 -16% | 320 -19% | 342 -27% | 273.7 -1% |
* ... im mniej tym lepiej
Power Consumption Witcher 3 / Stresstest
Power Consumption external Monitor
Żywotność baterii
Pojemność baterii wzrosła do 83 Wh z 68 Wh w zeszłorocznym modelu. Niestety, czas pracy na baterii jest krótszy niż poprzednio o prawie 2 pełne godziny. Jesteśmy w stanie zarejestrować czas pracy w sieci WLAN wynoszący nieco ponad 5 godzin, podobnie jak w przypadku Legion Pro 7 nawet przy zrównoważonym profilu zasilania z aktywnym iGPU.
Ładowanie od stanu pustego do pełnej pojemności zajmuje około 90 minut przy użyciu dołączonego zasilacza sieciowego. System może być również ładowany przez USB-C, ale kompatybilność nie jest gwarantowana. Przykładowo, podłączenie zasilacza USB-C Dell o mocy 130 W spowodowałoby wyświetlenie wyskakującego komunikatu o niezgodności, podczas gdy zasilacz USB-C Lenovo o mocy 135 W ładowałby się bez żadnych problemów.
| HP Omen 16-wf000 i7-13700HX, GeForce RTX 4080 Laptop GPU, 83 Wh | HP Omen 16-n0033dx R7 6800H, Radeon RX 6650M, 68 Wh | Alienware x16 R1 i9-13900HK, GeForce RTX 4080 Laptop GPU, 90 Wh | Lenovo Legion Pro 7 RTX4090 i9-13900HX, GeForce RTX 4090 Laptop GPU, 99.9 Wh | Asus ROG Strix G16 G614JZ i9-13980HX, GeForce RTX 4080 Laptop GPU, 90 Wh | Razer Blade 16 Early 2023 i9-13950HX, GeForce RTX 4080 Laptop GPU, 95.2 Wh | |
|---|---|---|---|---|---|---|
| Czasy pracy | 40% | -18% | 0% | 45% | 36% | |
| Reader / Idle (h) | 5.5 | 10 82% | 7.3 33% | 8.9 62% | ||
| WiFi v1.3 (h) | 5.1 | 7 37% | 2.5 -51% | 5.1 0% | 9.7 90% | 6.1 20% |
| Load (h) | 1.1 | 1.1 0% | 0.7 -36% | 1.1 0% | 1.4 27% |
Za
Przeciw
Werdykt - niska bariera wejścia dla cienkiej i atrakcyjnej konstrukcji
Być może najbardziej lukratywnym aspektem 2023 Omen 16 jest jego przystępna cena początkowa wynosząca 1100 USD za konfigurację z procesorem Core i7-13700HX, RTX 4060 i 16 GB pamięci RAM. Jest to obudowa z wyższej półki z lepszą jakością wykonania i bardziej eleganckim wyglądem niż podobnie wycenione budżetowe laptopy do gier, takie jak MSI Katana, Dell G16lub Asus TUF F. Jeśli jesteś na rynku laptopa RTX 4060 bez konieczności zadowalania się tanimi tworzywami sztucznymi, to Omen 16 jest wart rozważenia.
Nowy model jest nieco grubszy i szerszy niż jego poprzednik, a także ma krótszy czas pracy na baterii, ale zmiany są prawdopodobnie warte znacznie szybszej wydajności procesora i karty graficznej. Waga pozostaje mniej więcej taka sama pomimo różnic w rozmiarze, a większość graczy może nie mieć nic przeciwko krótszym czasom pracy.
2023 Omen 16 wygląda i działa lepiej niż sugerowałaby to jego niska cena początkowa.
Dwie godne uwagi funkcje, których brakuje w Omen 16, to obsługa DCI-P3 i zintegrowany czytnik kart SD. Nie mają one wpływu na podstawowe wrażenia z gry, ale gracze, którzy są również twórcami treści, mogą chcieć rozważyćAlienware x16 R1 lub Razer Blade 16 które oferują czytniki kart, szersze kolory i wyższe rozdzielczości natywne. Oczywiście te alternatywy o podwójnym zastosowaniu są również znacznie droższe.
Cena i dostępność
Karta graficzna 2023 Omen 16 jest już dostępna w sprzedaży bezpośrednio od HP w cenie od 1100 USD za podstawową konfigurację RTX 4060 do 2600 USD za naszą konfigurację RTX 4080.
HP Omen 16-wf000
- 13/09/2023 v7 (old)
Allen Ngo
Przezroczystość
Wyboru urządzeń do recenzji dokonuje nasza redakcja. Próbka testowa została udostępniona autorowi jako pożyczka od producenta lub sprzedawcy detalicznego na potrzeby tej recenzji. Pożyczkodawca nie miał wpływu na tę recenzję, producent nie otrzymał też kopii tej recenzji przed publikacją. Nie było obowiązku publikowania tej recenzji. Jako niezależna firma medialna, Notebookcheck nie podlega władzy producentów, sprzedawców detalicznych ani wydawców.
Tak testuje Notebookcheck
Każdego roku Notebookcheck niezależnie sprawdza setki laptopów i smartfonów, stosując standardowe procedury, aby zapewnić porównywalność wszystkich wyników. Od około 20 lat stale rozwijamy nasze metody badawcze, ustanawiając przy tym standardy branżowe. W naszych laboratoriach testowych doświadczeni technicy i redaktorzy korzystają z wysokiej jakości sprzętu pomiarowego. Testy te obejmują wieloetapowy proces walidacji. Nasz kompleksowy system ocen opiera się na setkach uzasadnionych pomiarów i benchmarków, co pozwala zachować obiektywizm.Price comparison

