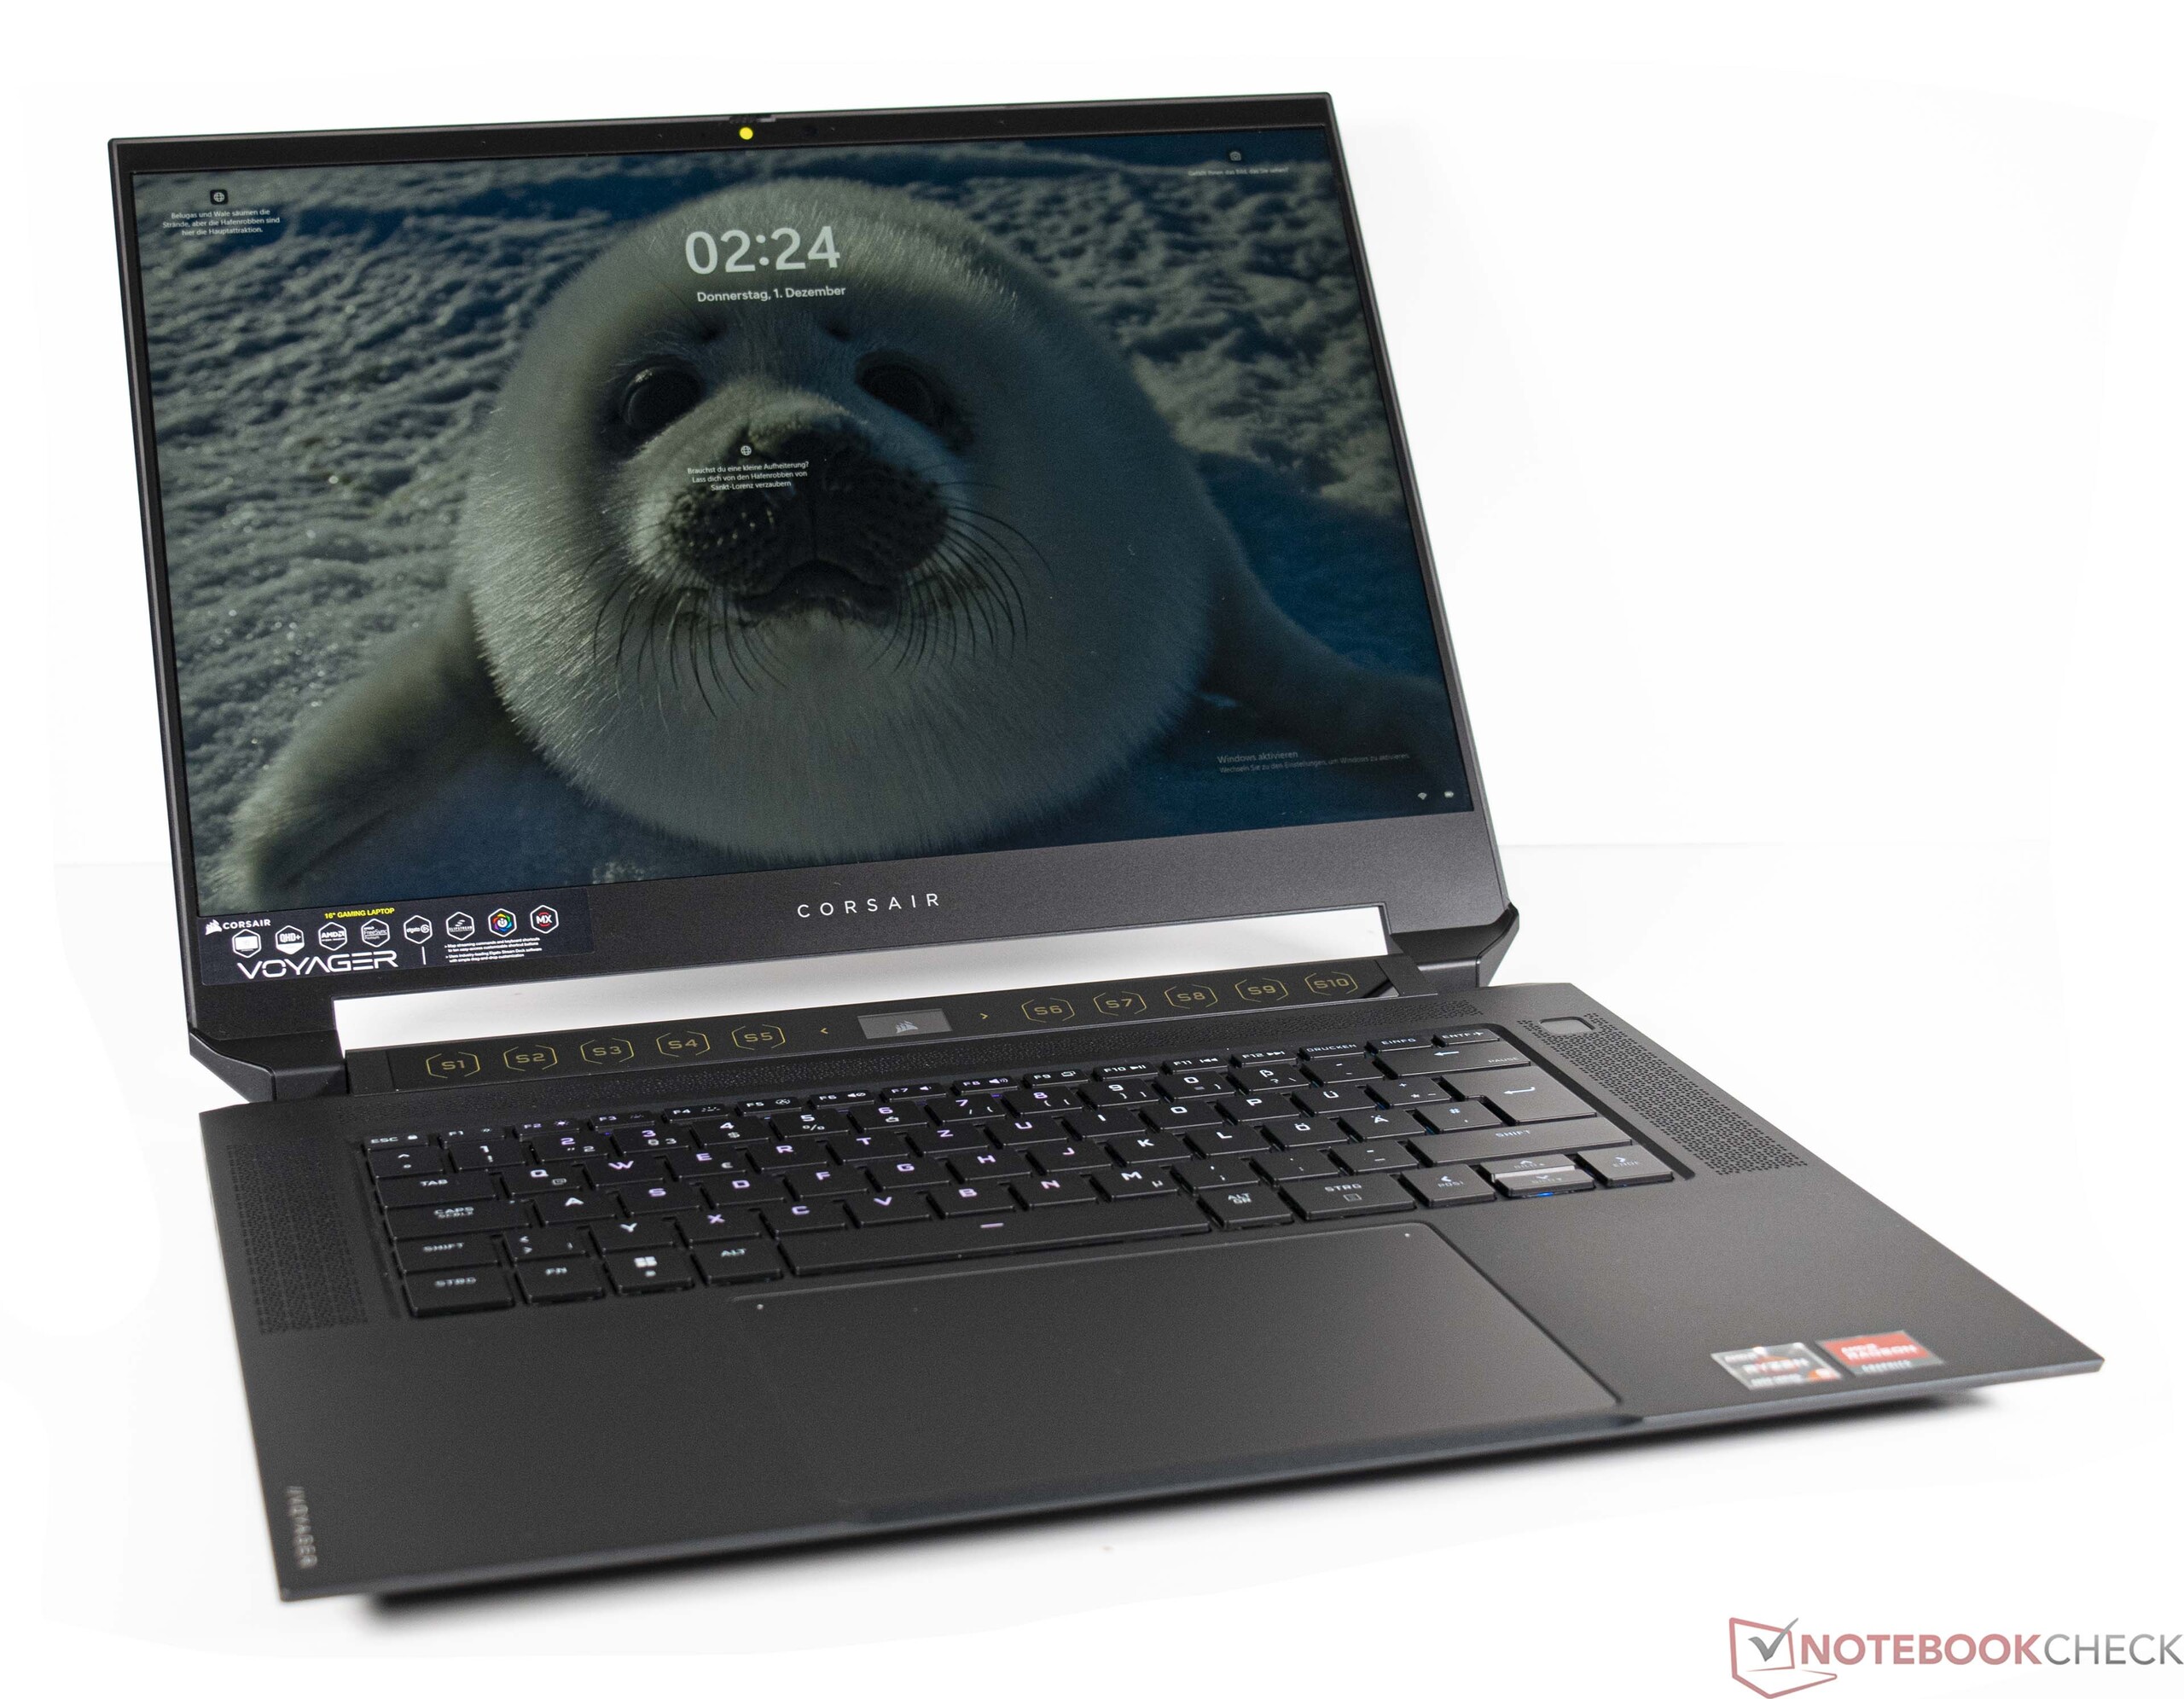
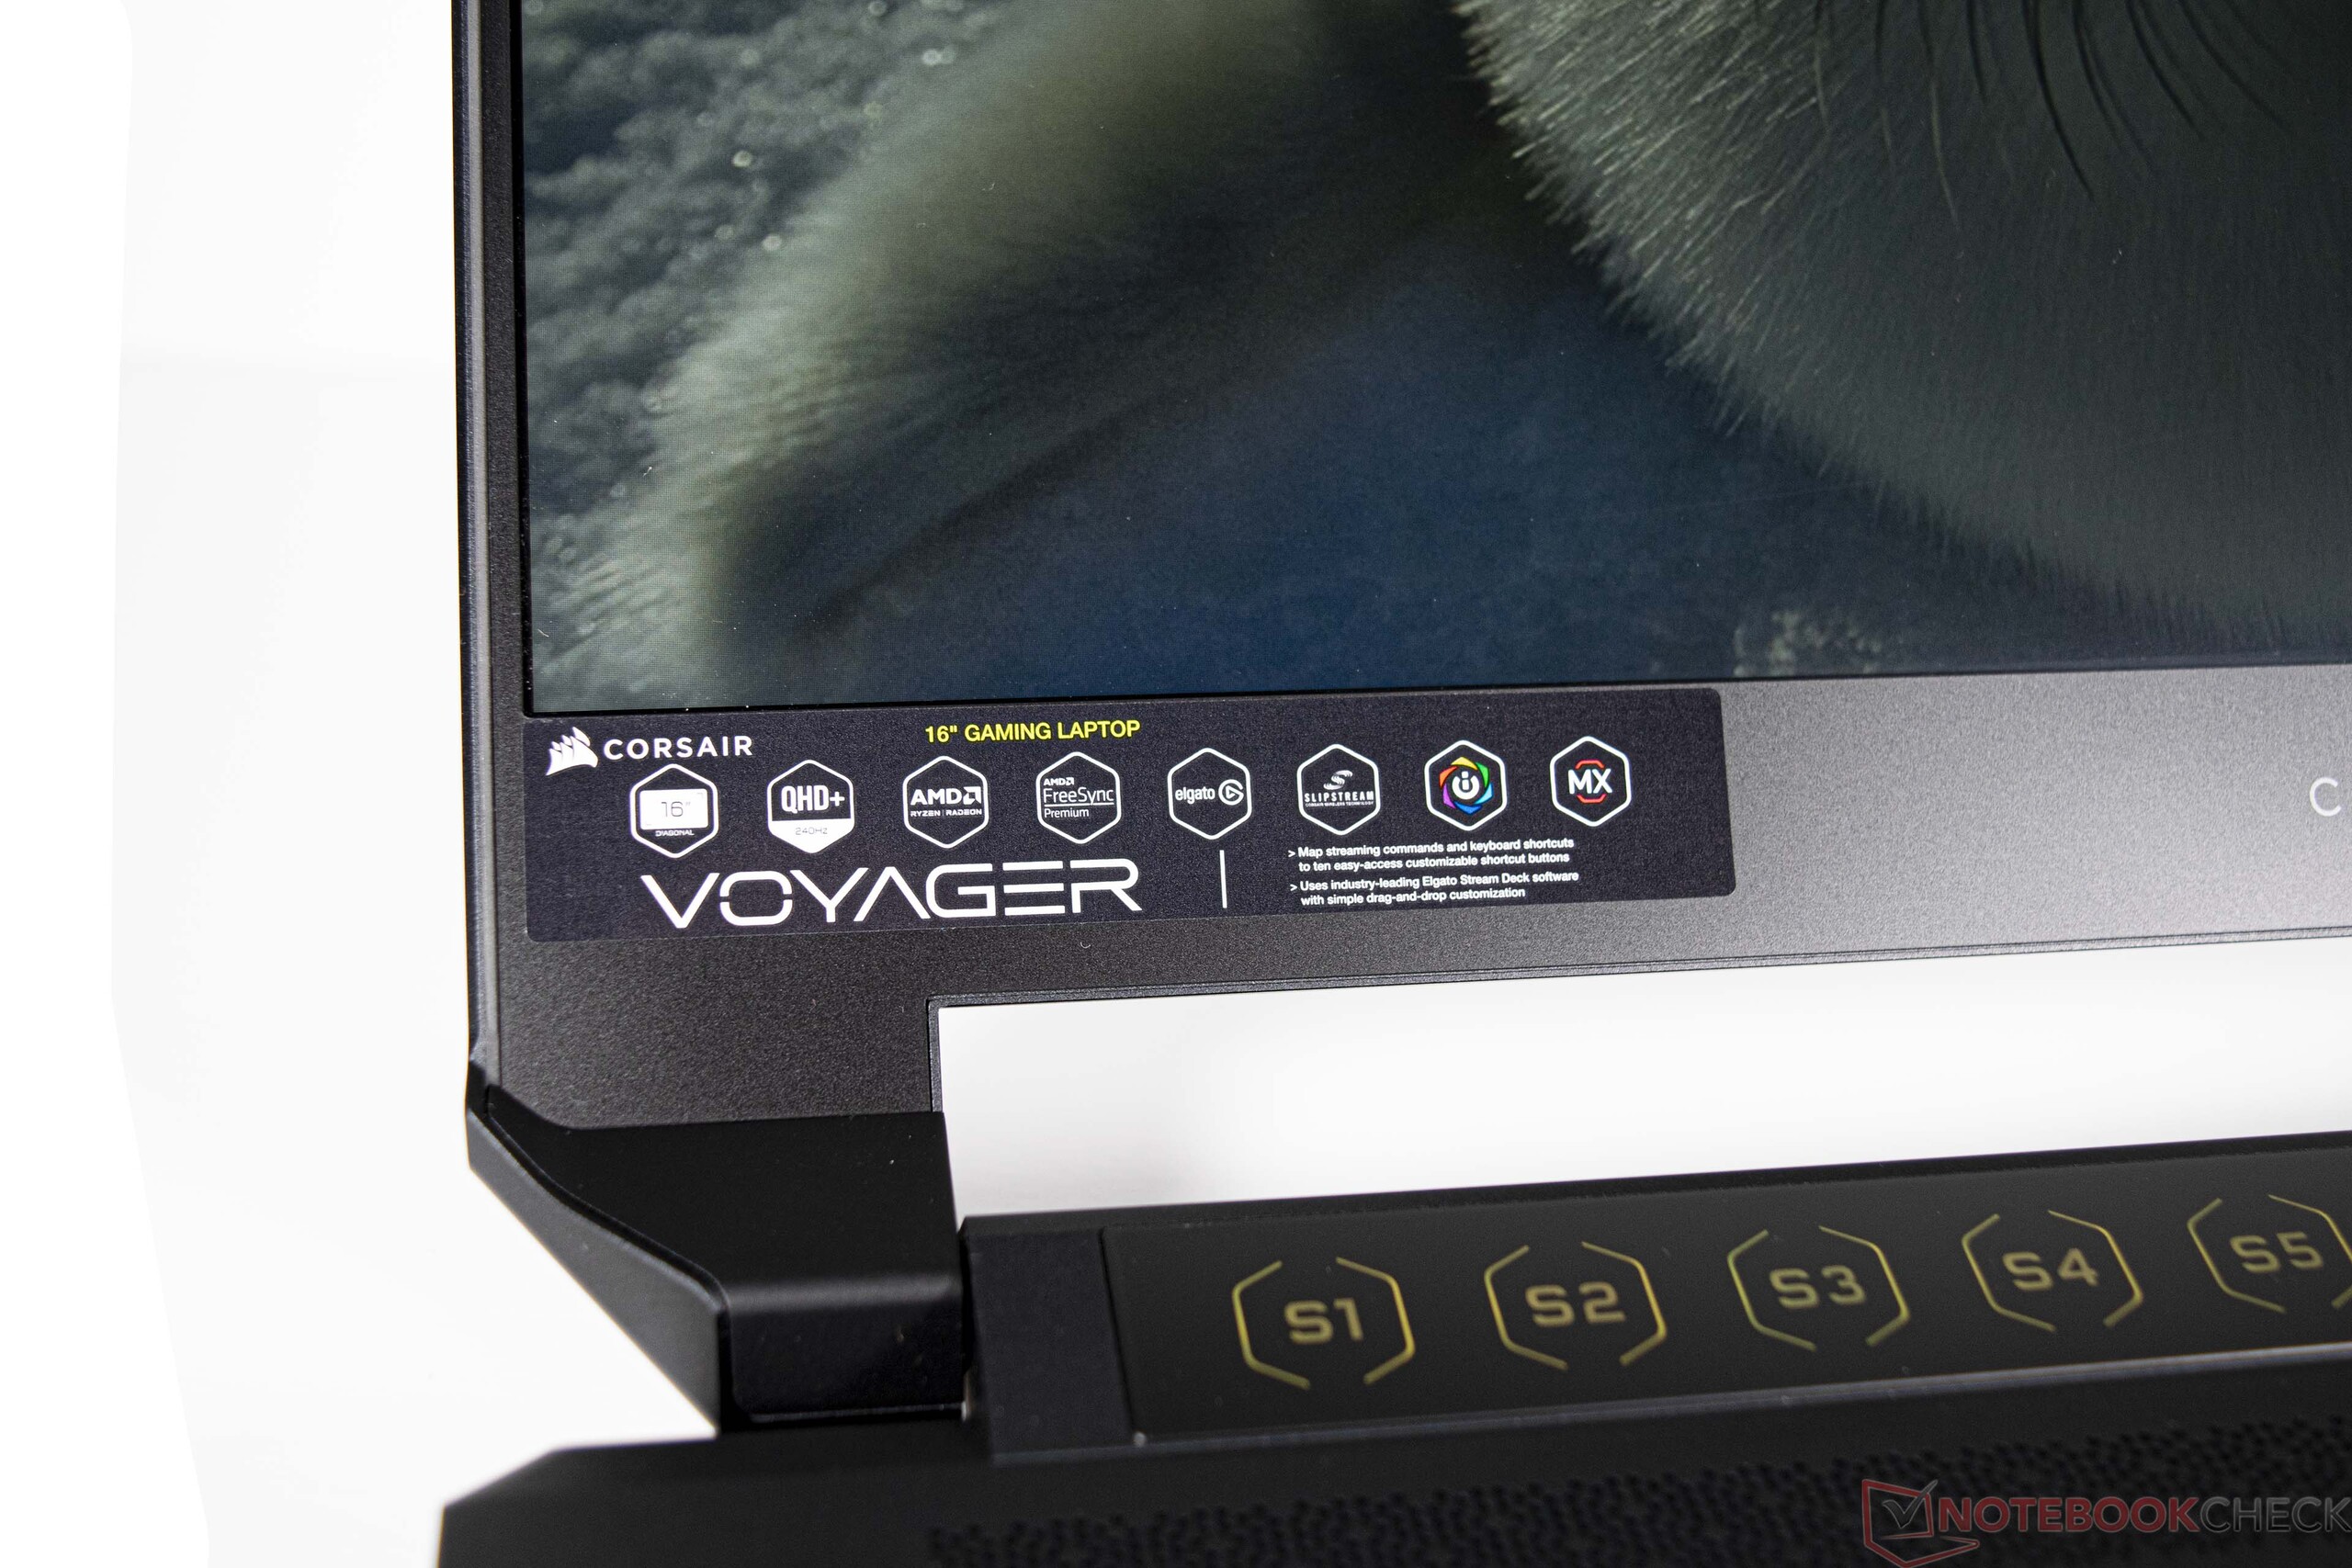
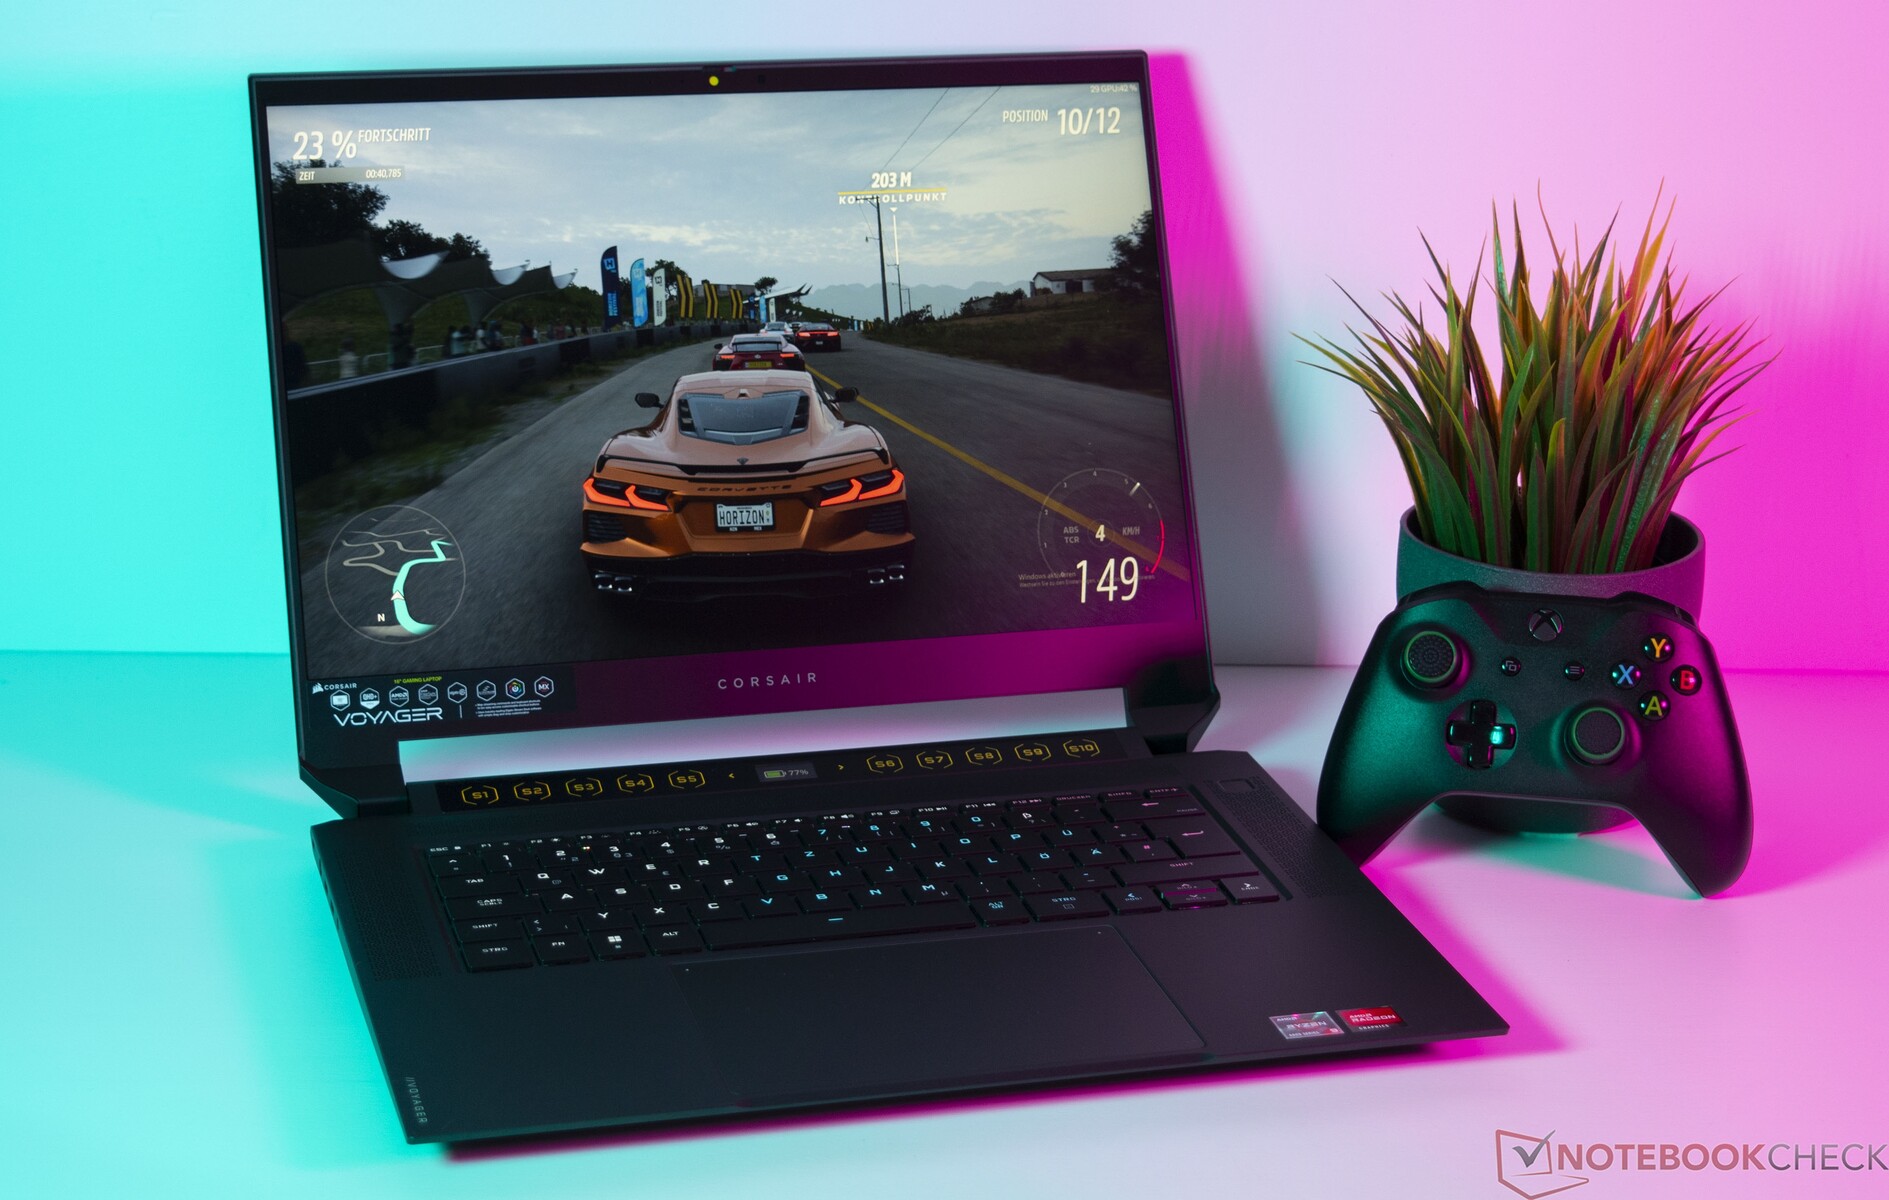
Laptop Corsair Voyager a1600 w recenzji: Pełna moc AMD dla graczy, streamerów i twórców

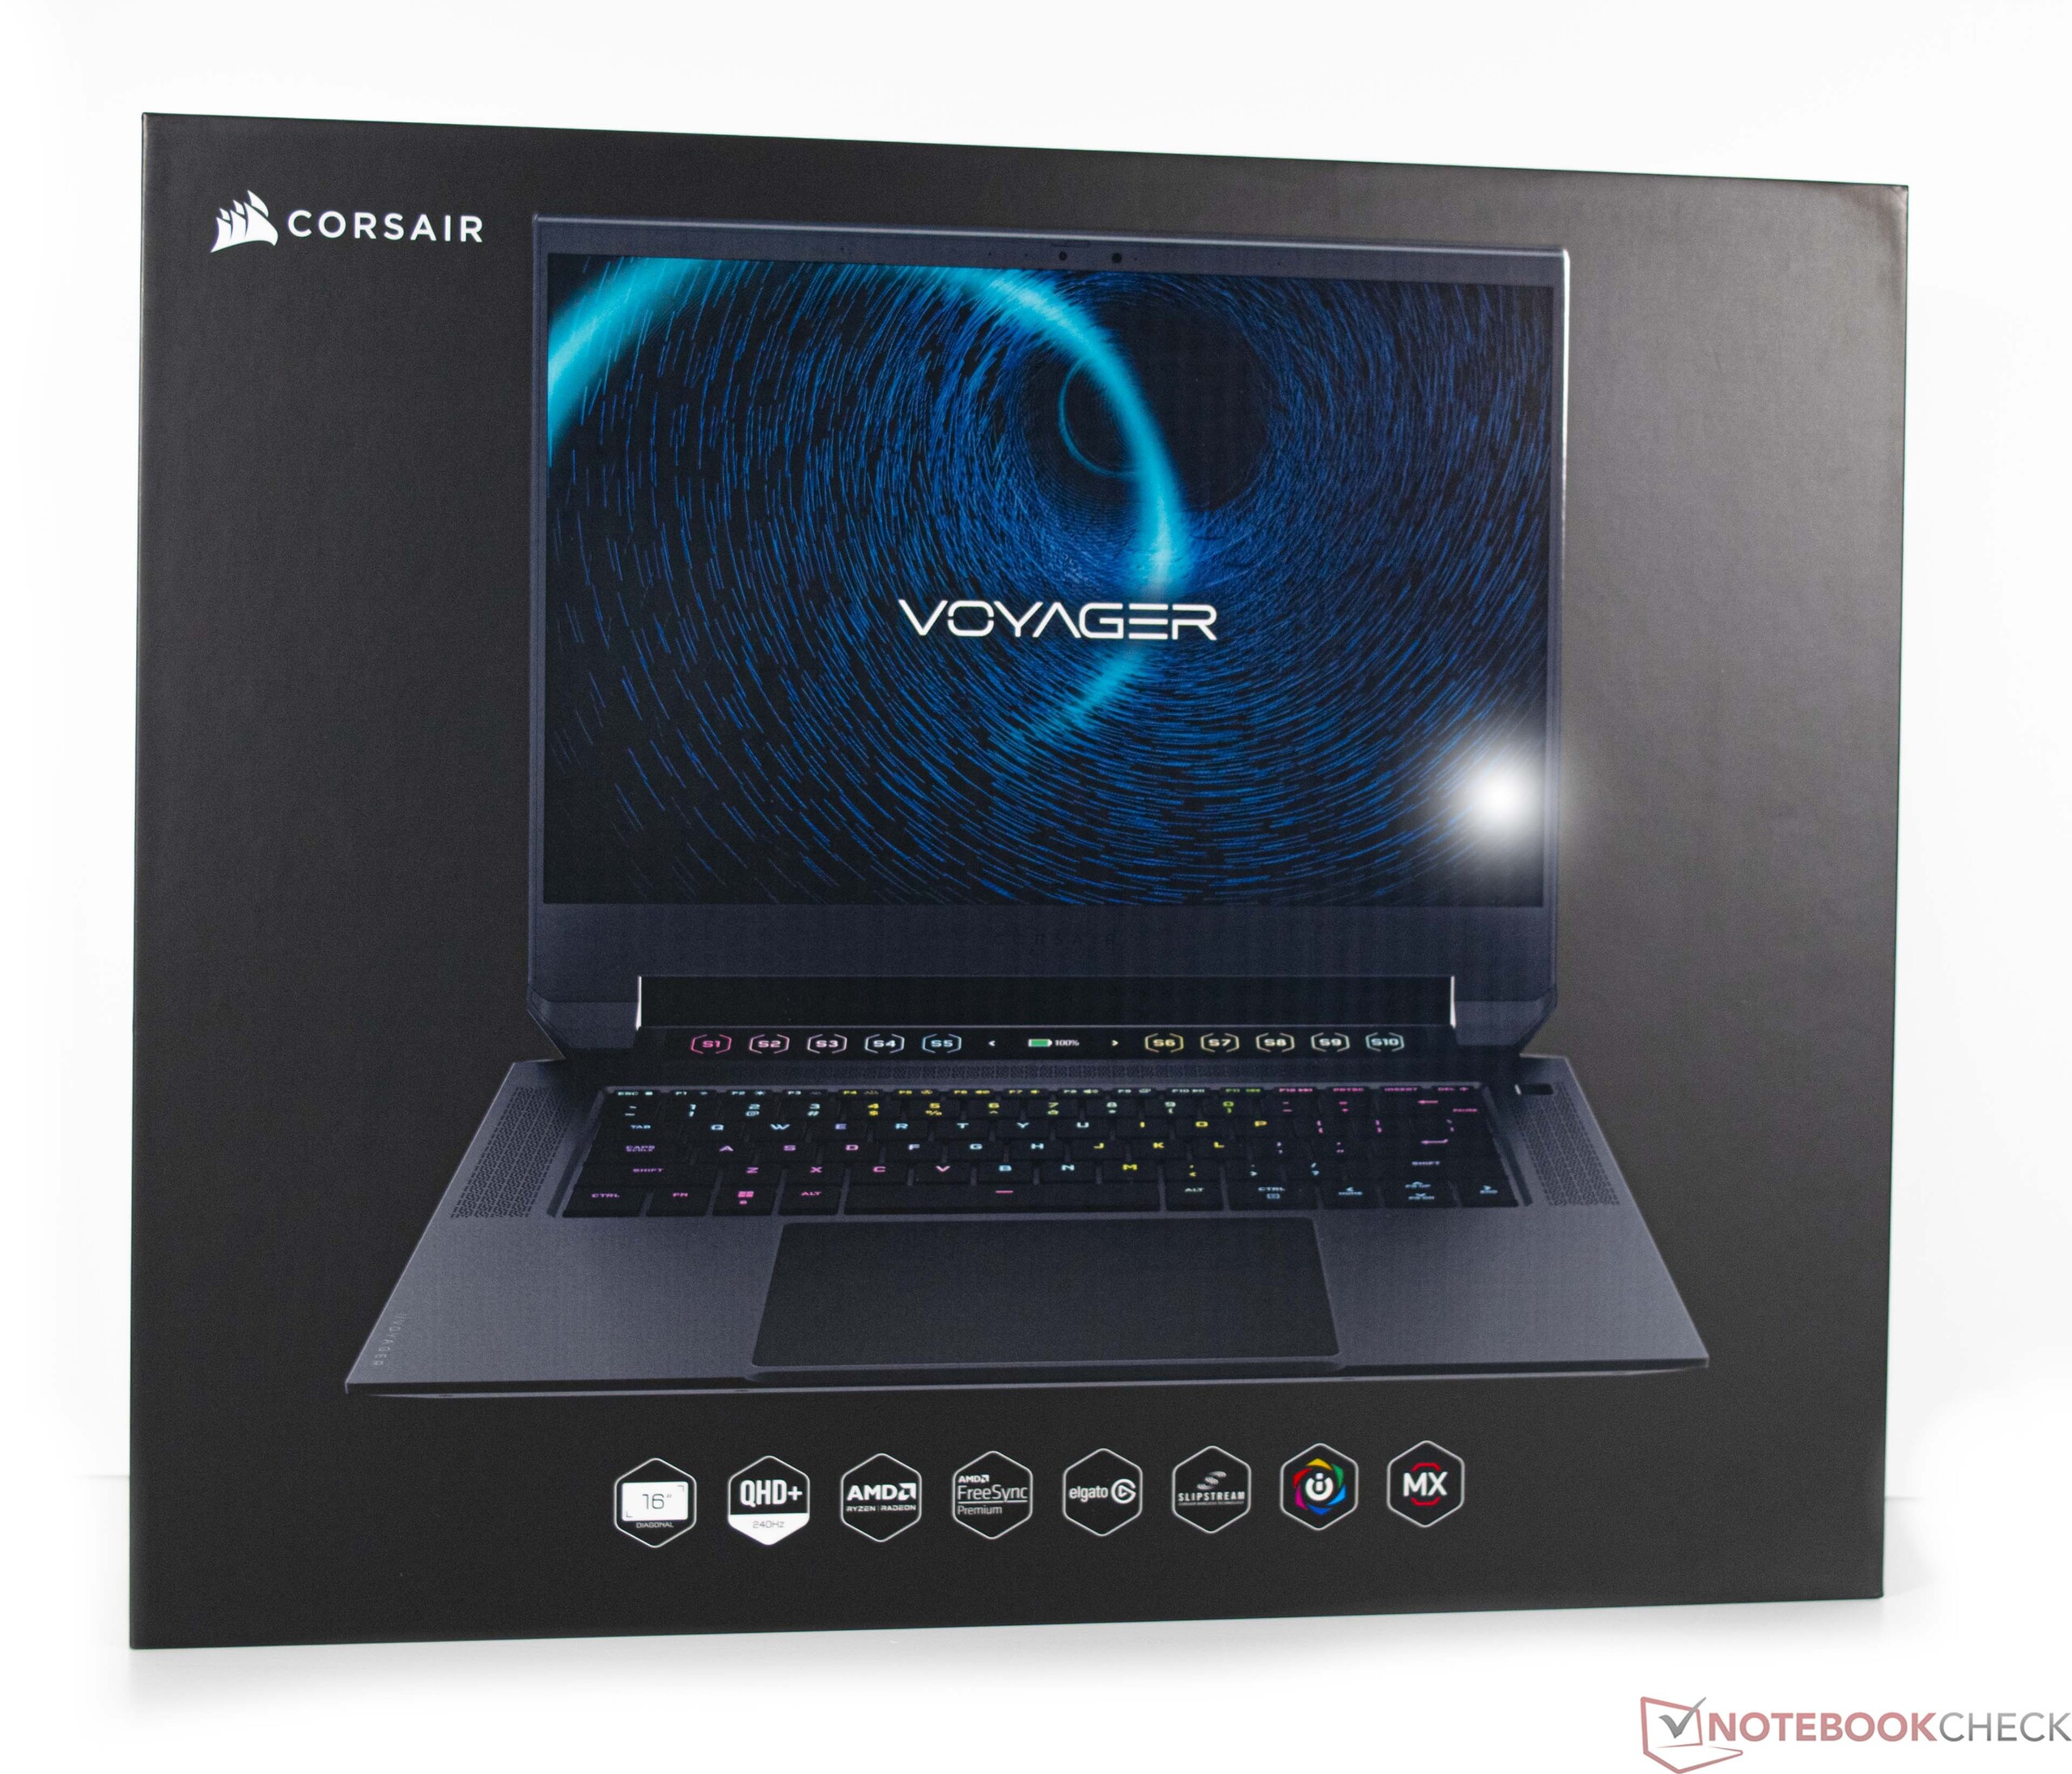
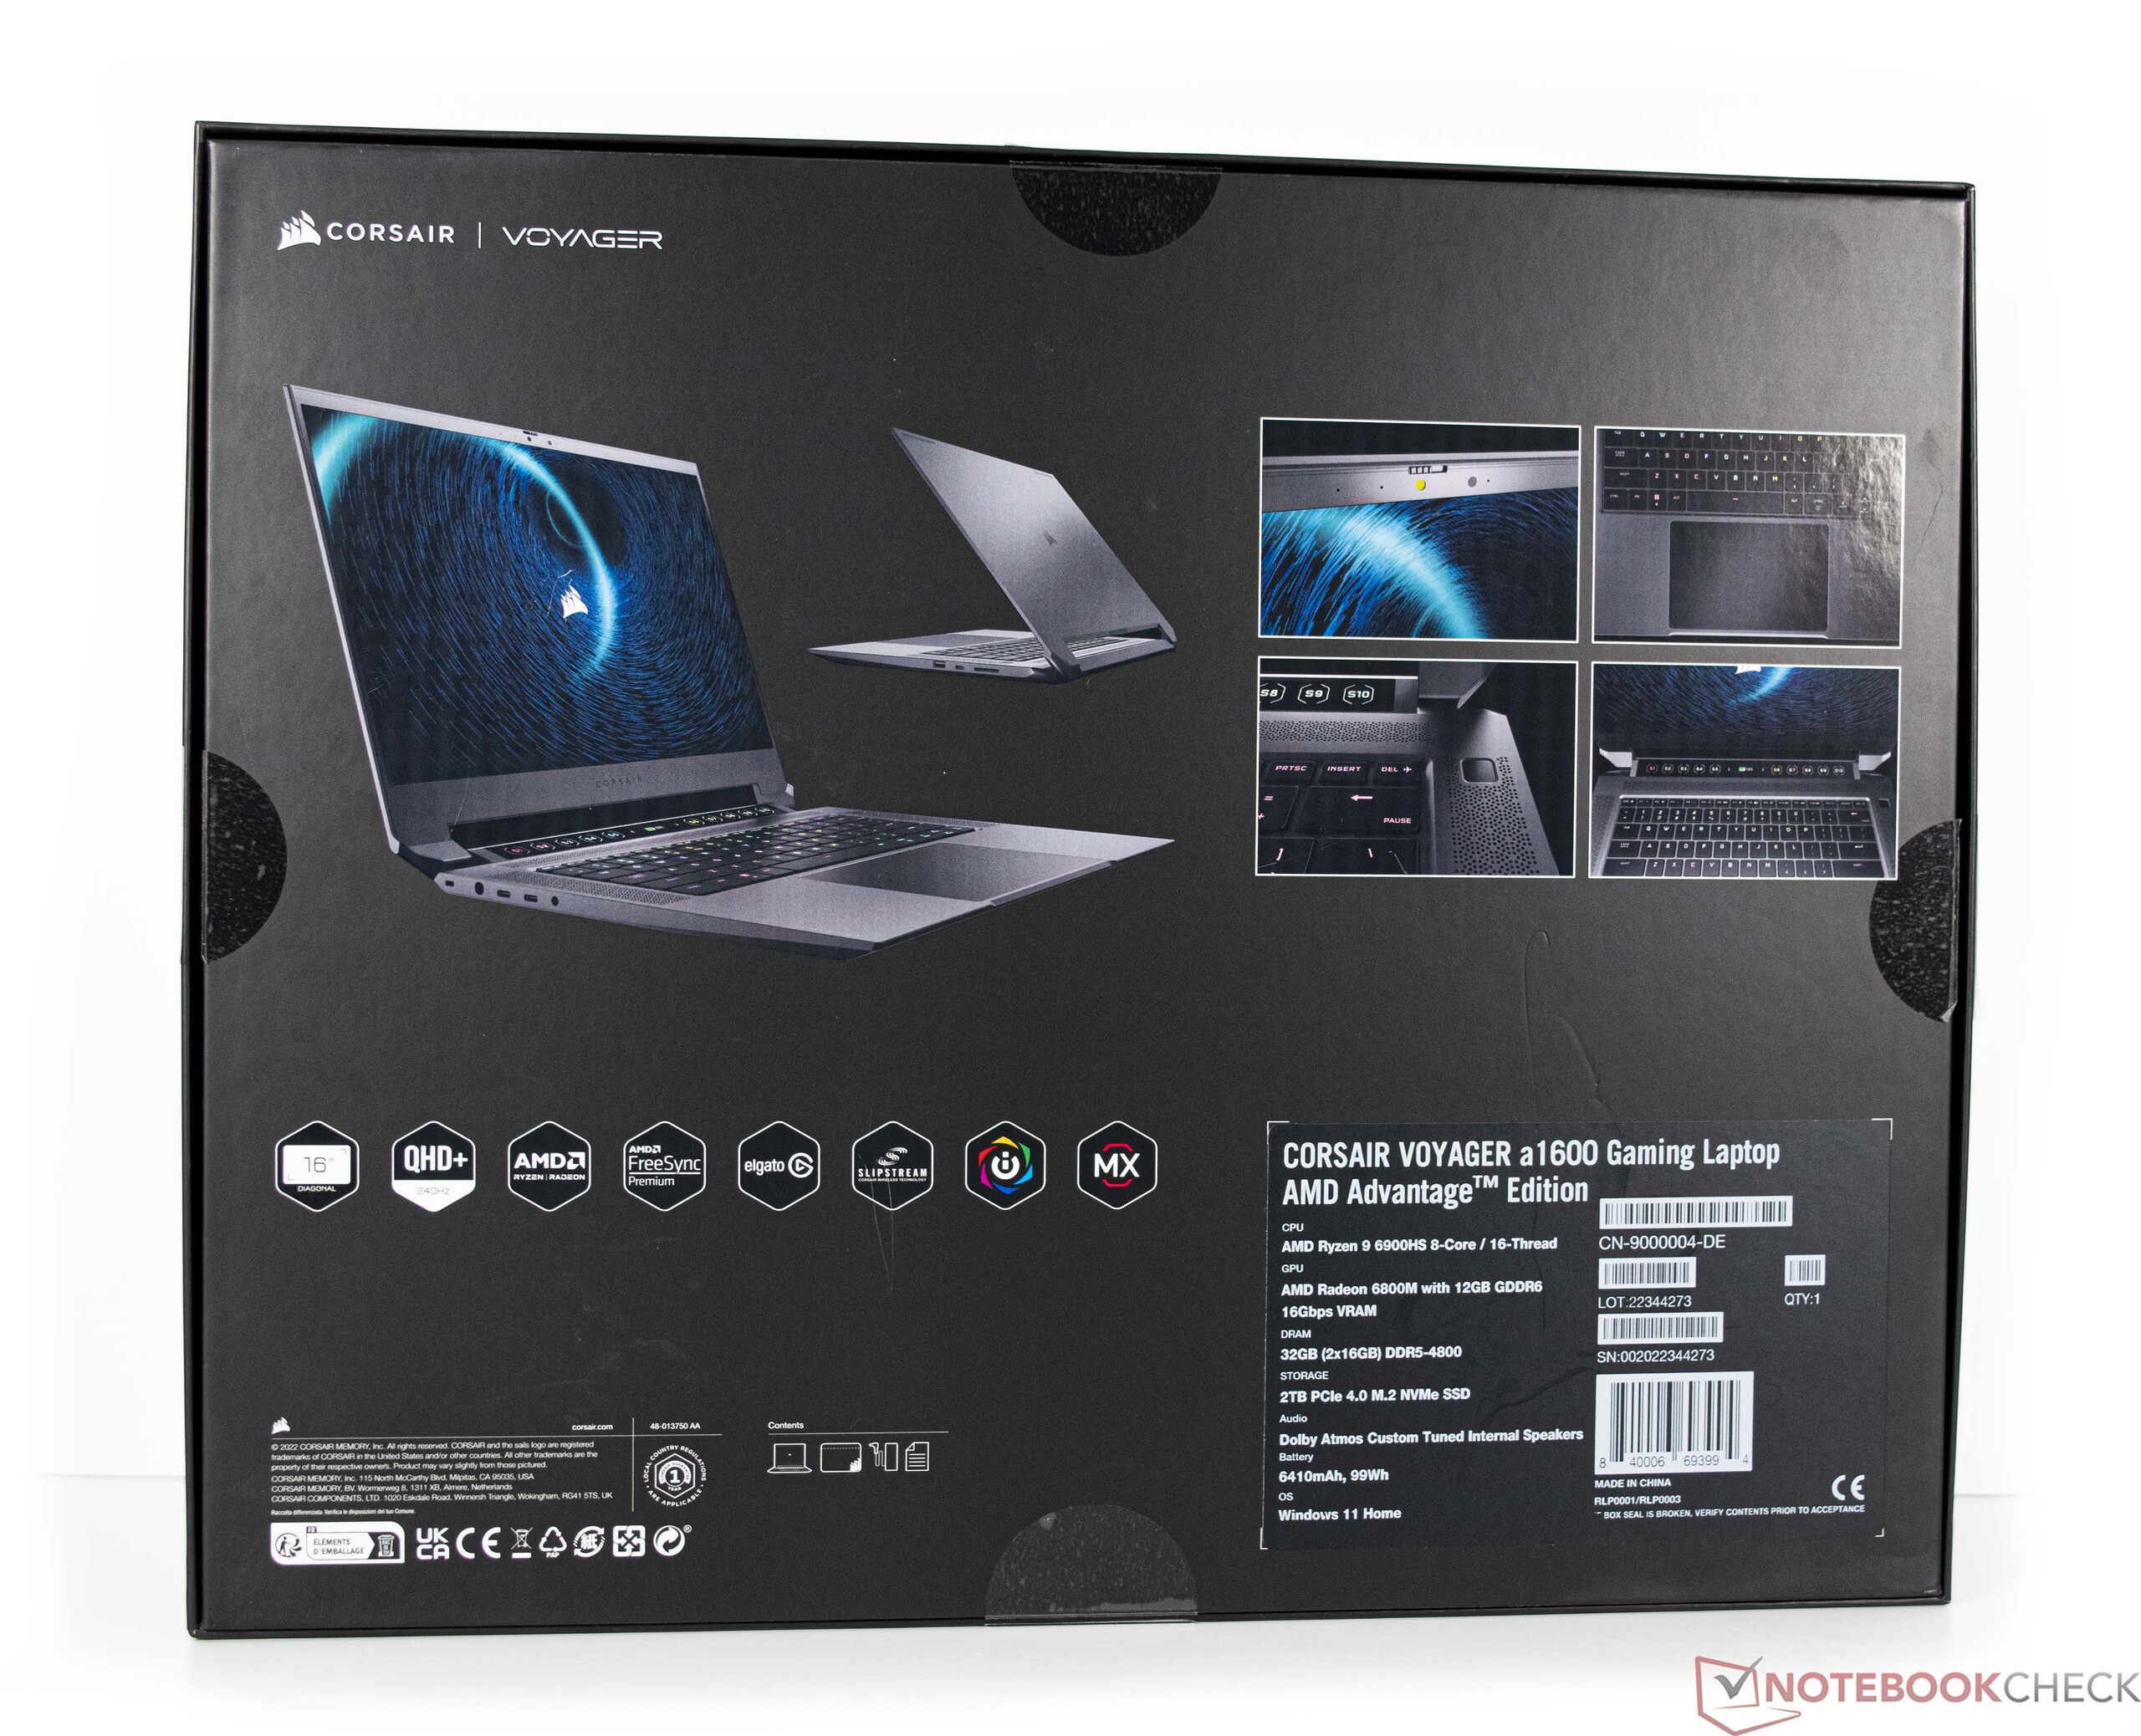
Corsair to dobrze znana nazwa, jeśli chodzi o akcesoria w sektorze PC: urządzenia peryferyjne, zasilacze, dyski SSD, obudowy, monitory, a także gotowe systemy desktopowe, z których część już testowaliśmy, są częścią aktualnej linii producenta. Wraz z serią Voyager, Corsair wchodzi teraz także w segment notebooków i chce uczestniczyć w sektorze gier za sprawą modelu Voyager a1600. Pozycja startowa wcale nie jest zła, bo z m.in AMD Ryzen 9 6900HS oraz dedykowanego AMD Radeon RX 6800M jest obiecująca podstawa. W topowej konfiguracji można też liczyć na 32 GB RAM DDR5 i dysk SSD o pojemności 2 TB. Z kolei panel QHD o częstotliwości 240 Hz to zawsze konieczność. Cena 3 550 euro to jednak wyższa liga.
Może być tańsza, jeśli wybierzecie się z m.in AMD Ryzen 7 6800HSz 16 GB RAM i dyskiem SSD o pojemności 1 TB. Tutaj trzeba obecnie zapłacić 2 600 euro. W teście Corsair Voyager a1600 rywalizuje z mocnymi rywalami z dziedziny obecnych notebooków do gier. Więcej szczegółów można znaleźć w poniższej tabeli.
Potencjalni konkurenci w porównaniu
Ocena | Data | Model | Waga | Wysokość | Rozmiar | Rezolucja | Cena |
|---|---|---|---|---|---|---|---|
| 86.6 % v7 (old) | 12/2022 | Corsair Voyager a1600 R9 6900HS, Radeon RX 6800M | 2.4 kg | 19.9 mm | 16.00" | 2560x1600 | |
| 89.5 % v7 (old) | Asus ROG Flow X16 GV601RW-M5082W R9 6900HS, GeForce RTX 3070 Ti Laptop GPU | 2.1 kg | 19.4 mm | 16.10" | 2560x1600 | ||
| 90.8 % v7 (old) | 10/2022 | Lenovo Legion 7 16ARHA7 R9 6900HX, Radeon RX 6850M XT | 2.6 kg | 19.4 mm | 16.00" | 2560x1600 | |
| 87.2 % v7 (old) | Acer Predator Triton 500 SE PT516-52s-70KX i7-12700H, GeForce RTX 3080 Ti Laptop GPU | 2.3 kg | 19.9 mm | 16.00" | 2560x1600 | ||
| 85.5 % v7 (old) | HP Omen 16-b1090ng i7-12700H, GeForce RTX 3070 Ti Laptop GPU | 2.3 kg | 23 mm | 16.10" | 2560x1440 | ||
| 88.9 % v7 (old) | 10/2022 | Lenovo Legion 7 16IAX7-82TD004SGE i9-12900HX, GeForce RTX 3080 Ti Laptop GPU | 2.6 kg | 20 mm | 16.00" | 2560x1600 |
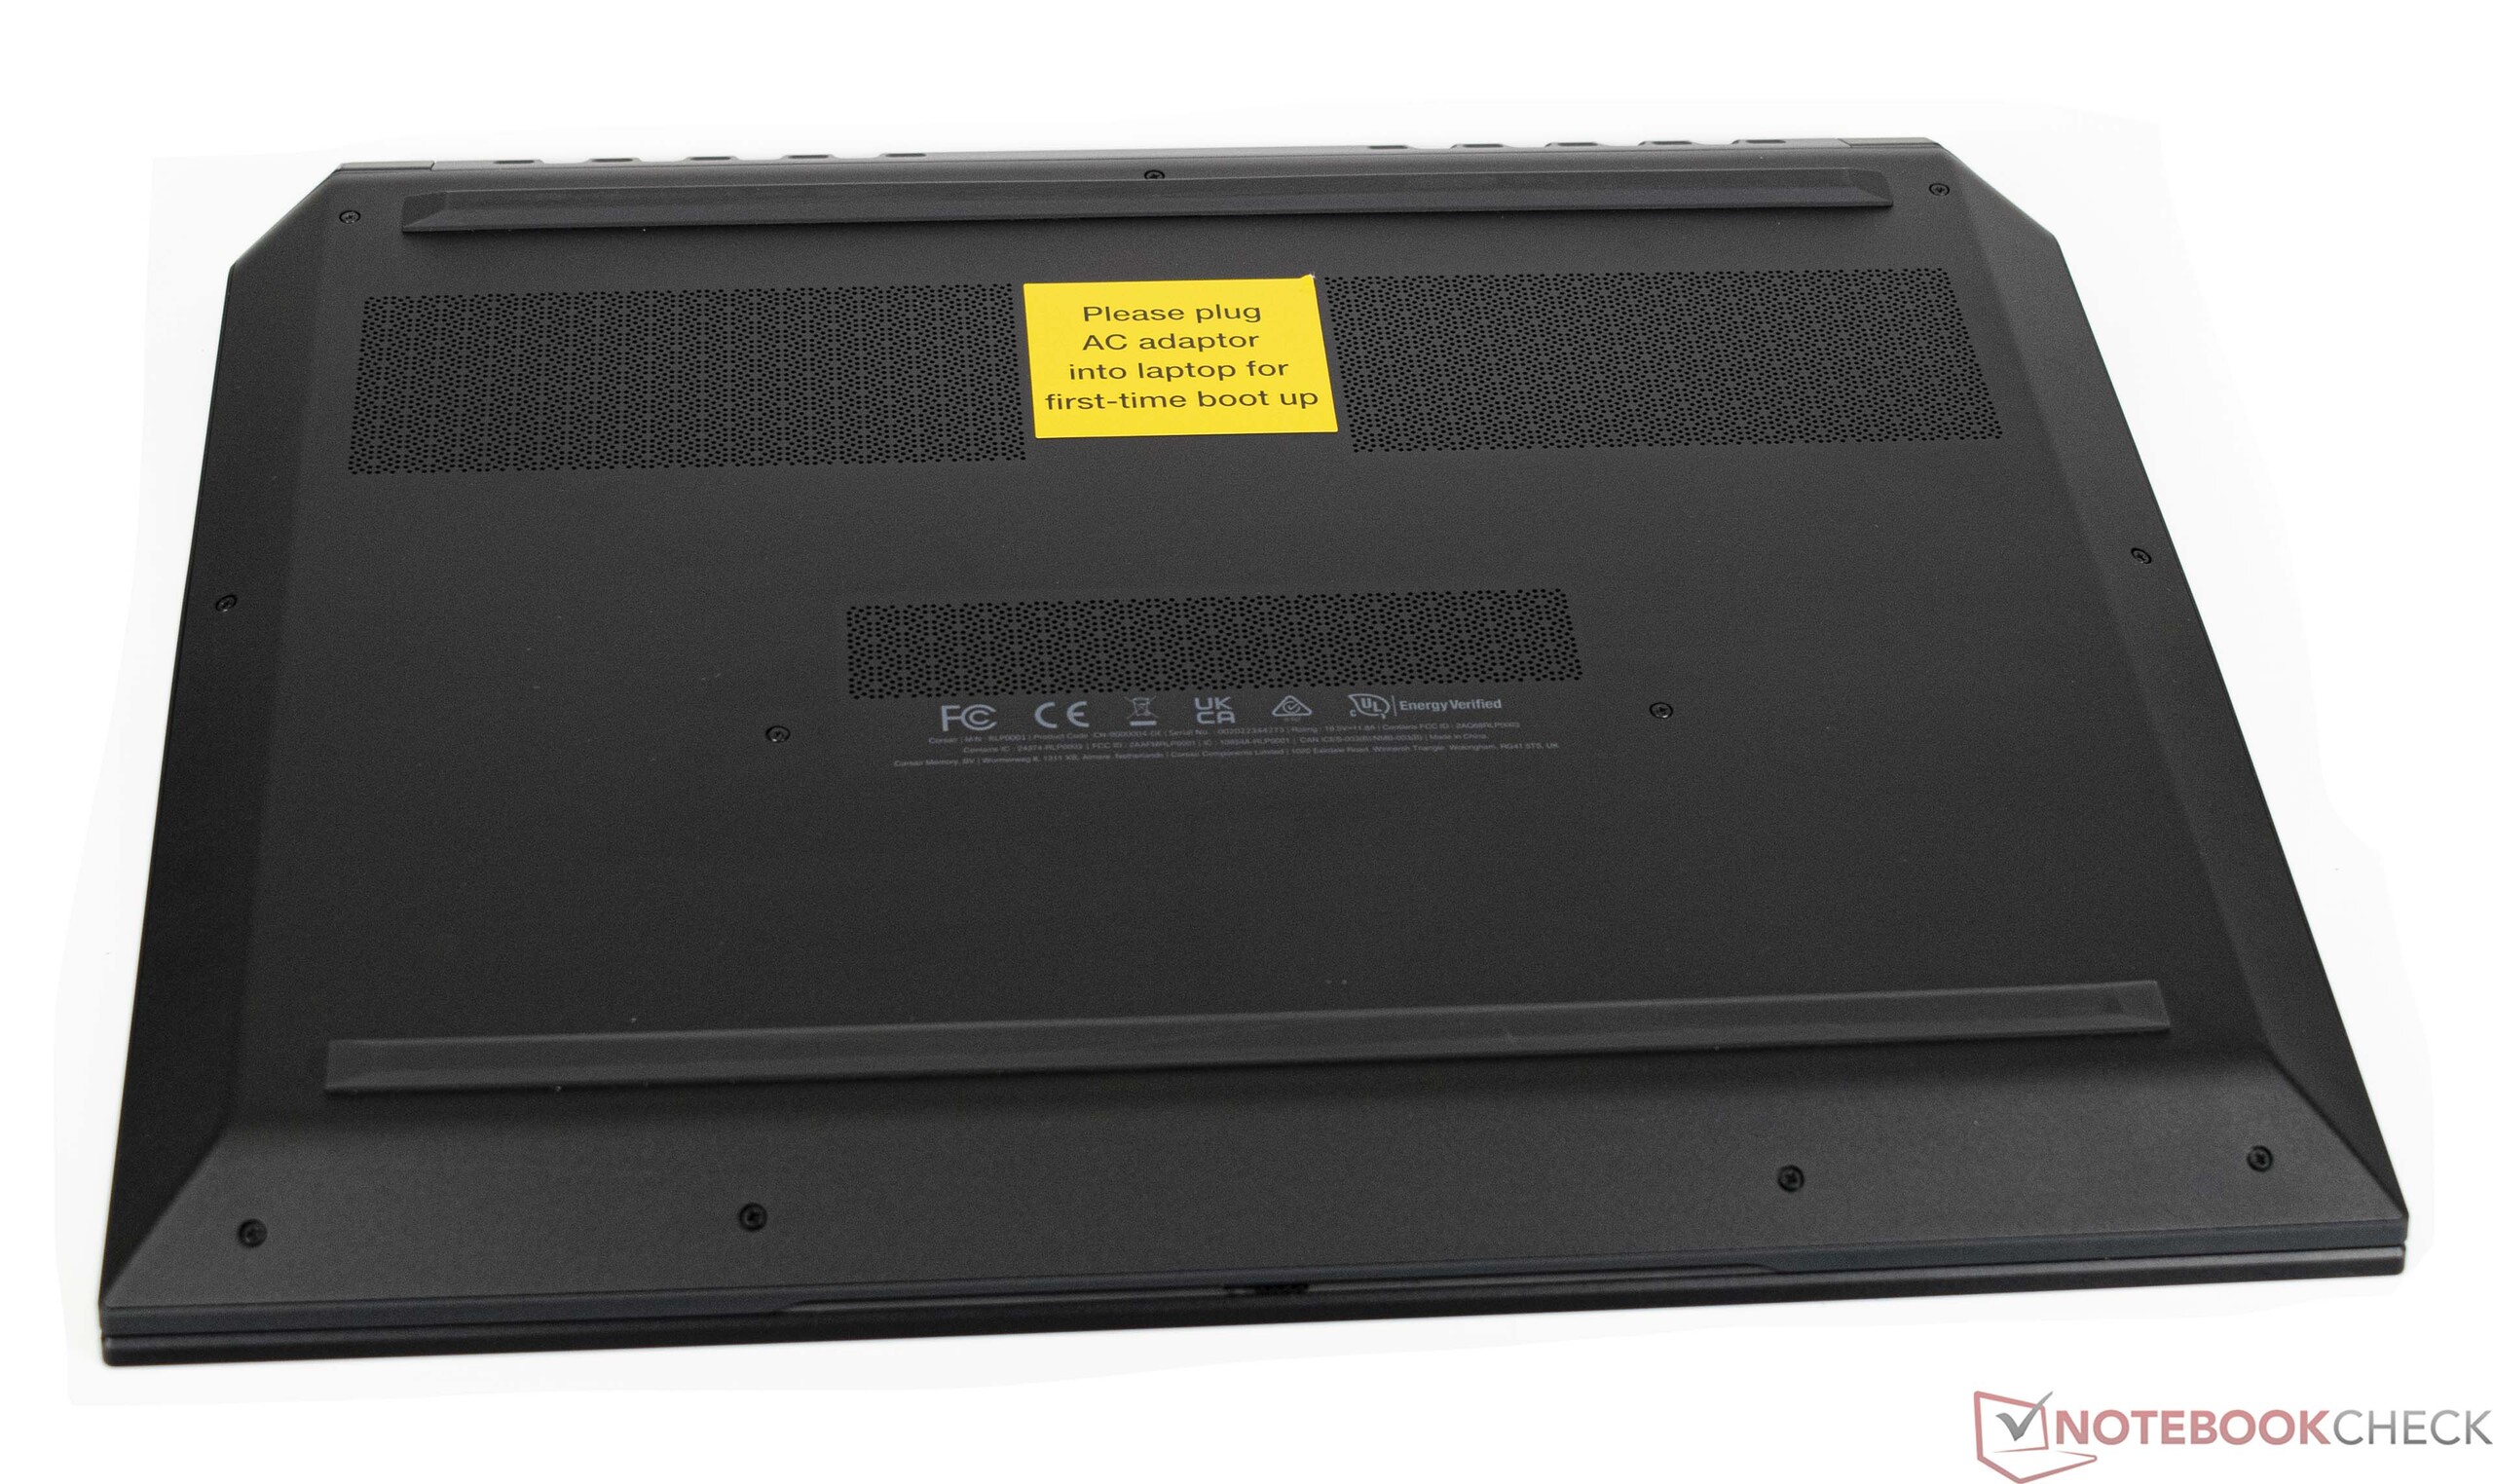
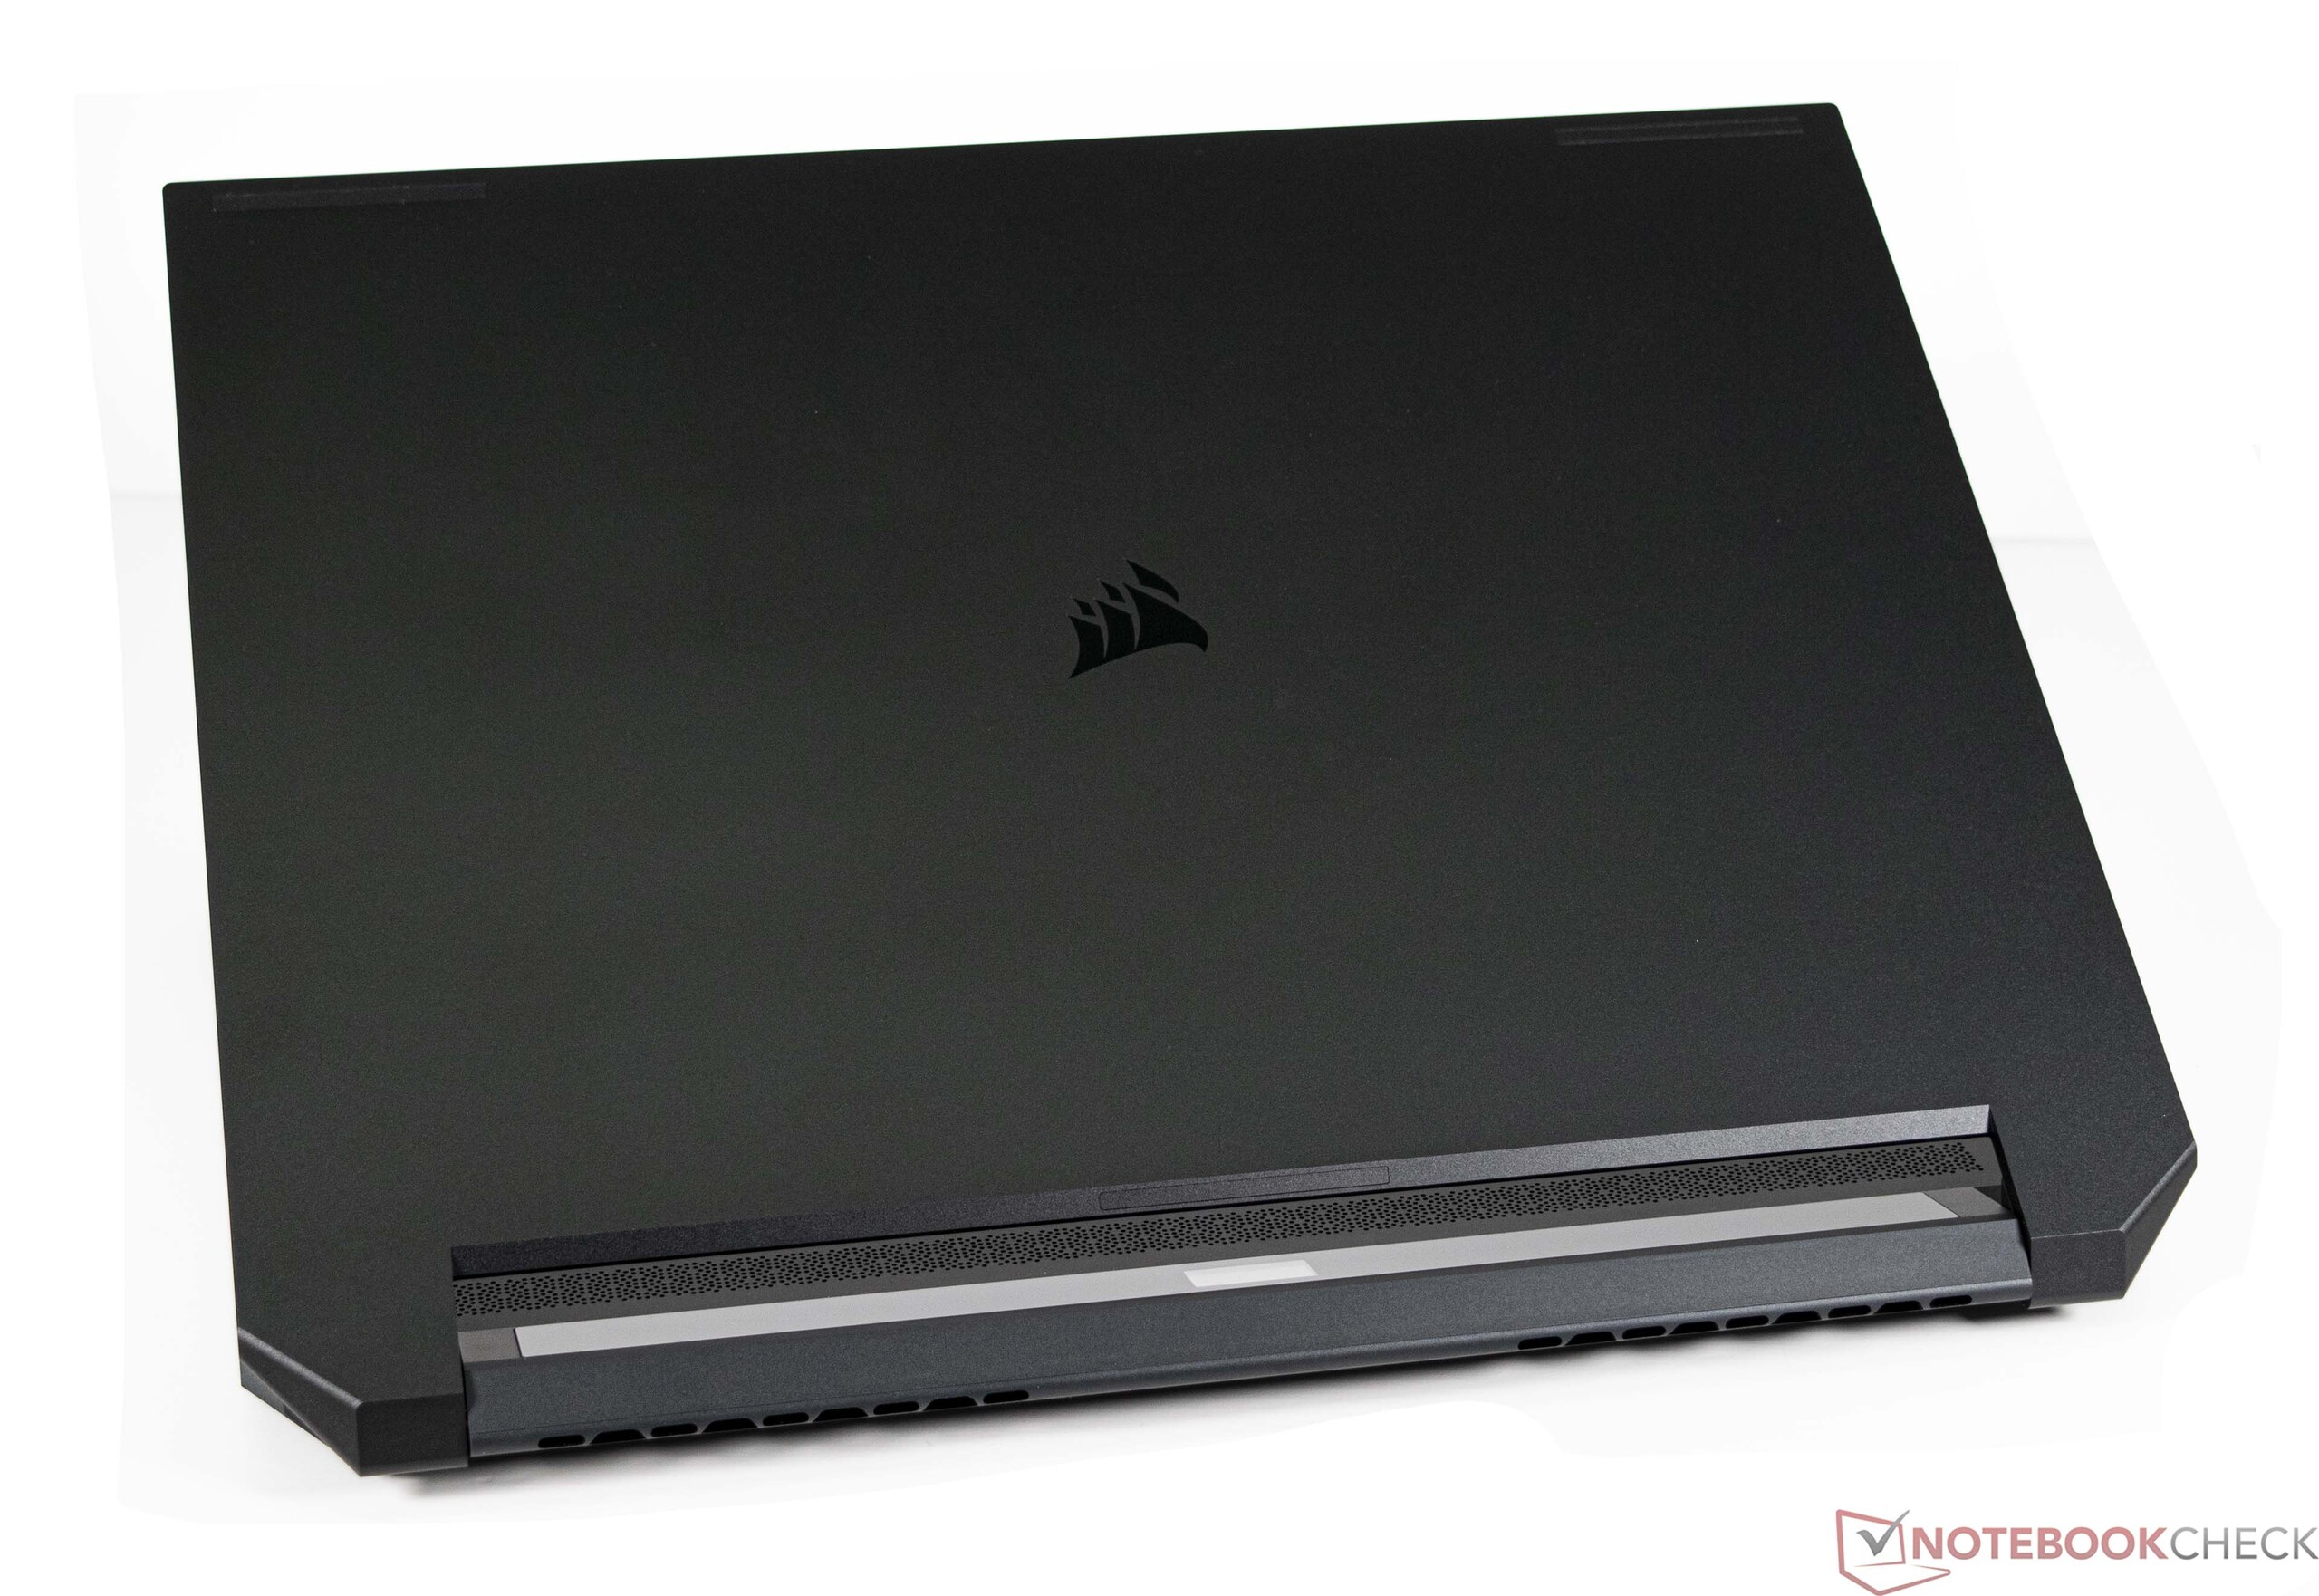
Obudowa i funkcje - cienka, ale wytrzymała
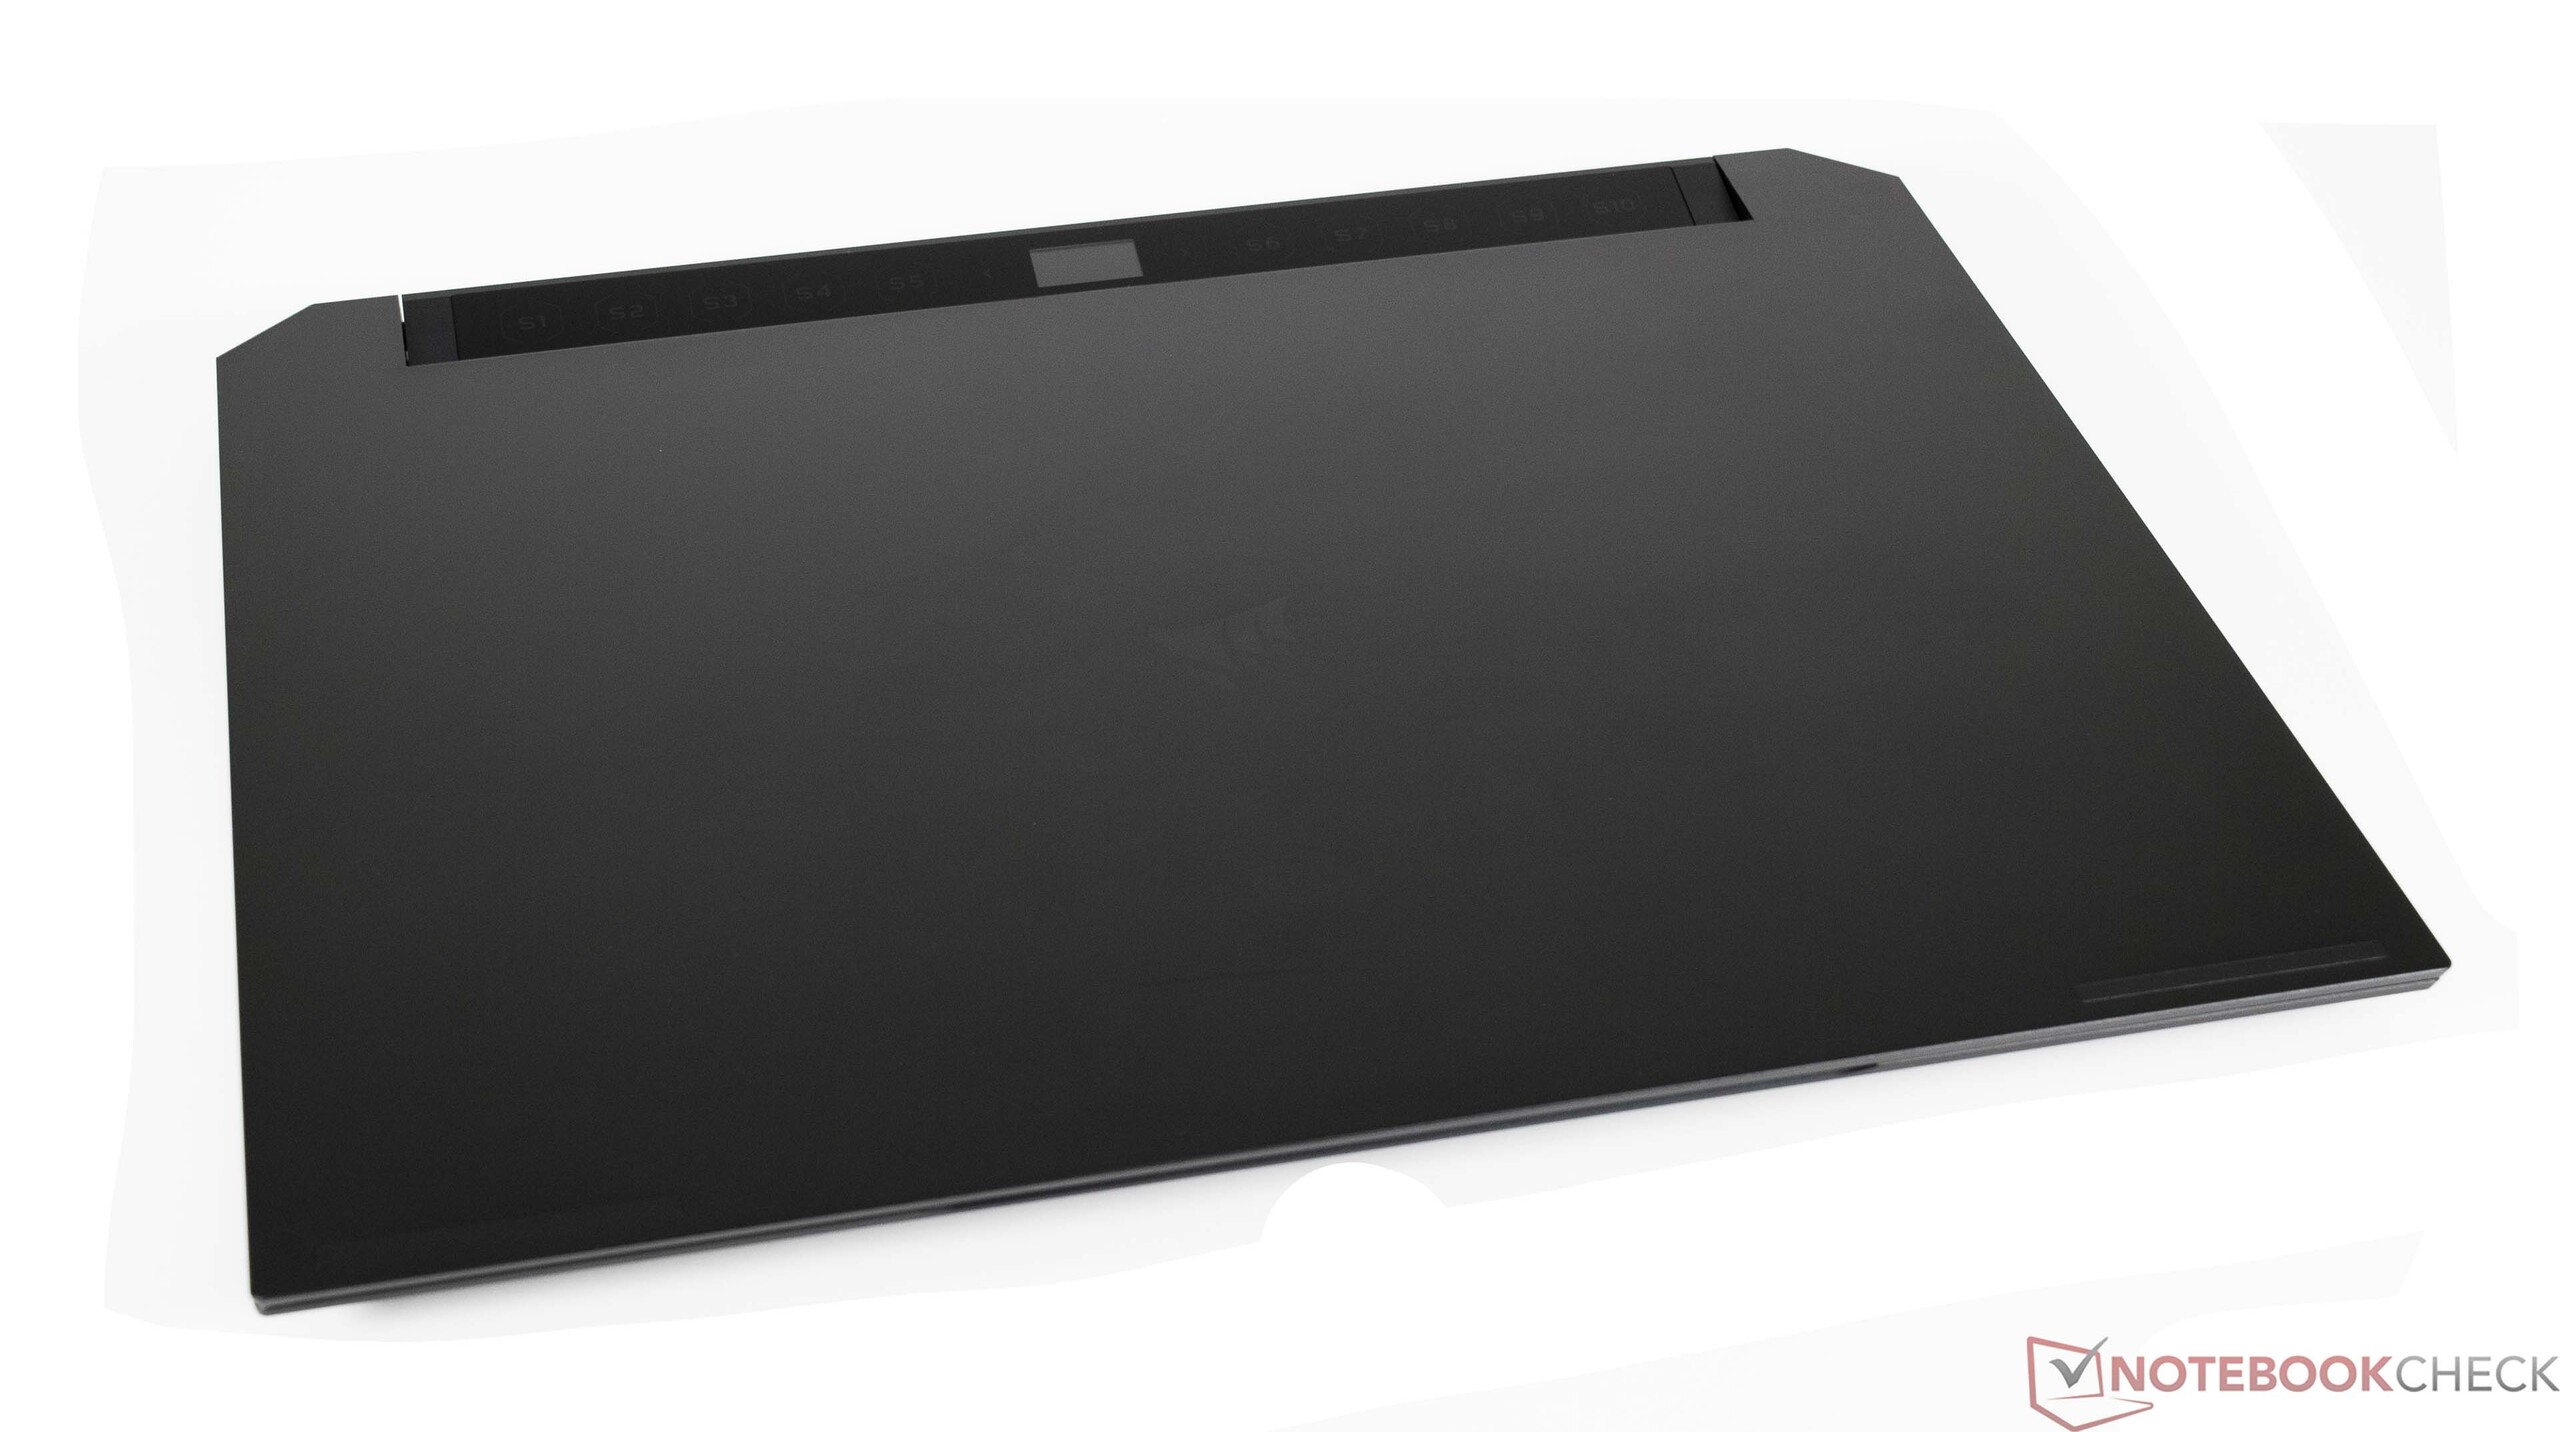
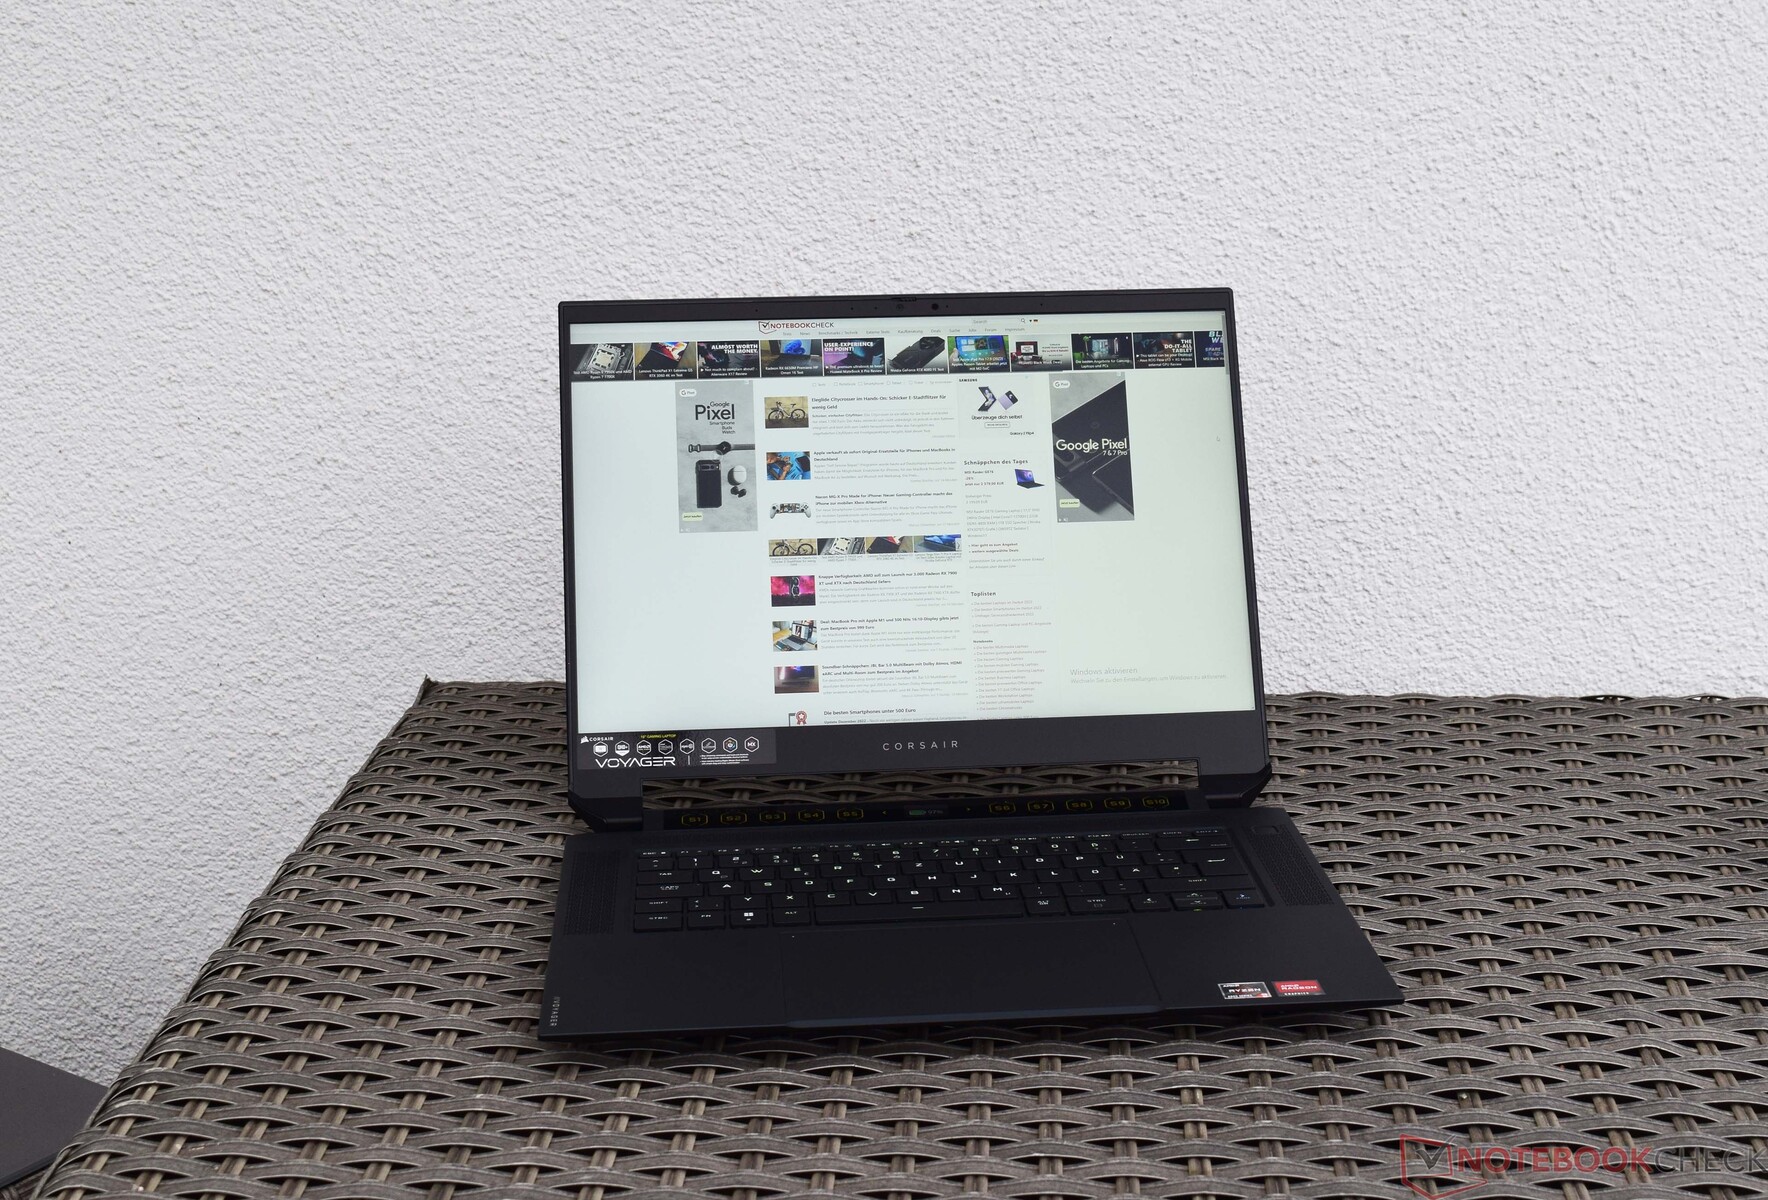
Obudowa Corsair Voyager a1600 jest wykonana z aluminium, co zapewnia urządzeniu bardzo dobrą stabilność. Jedynie pokrywa wyświetlacza lekko się przekręciła podczas naszych testów skręcania. W pozostałych przypadkach notebook gamingowy ma stosunkowo skromny wygląd i obywa się bez podświetlenia RGB, co jest całkiem w porządku. Wyświetlacz jest utrzymywany przez dwa małe zawiasy, które nie mogą całkowicie zapobiec odbijaniu się od podłoża.
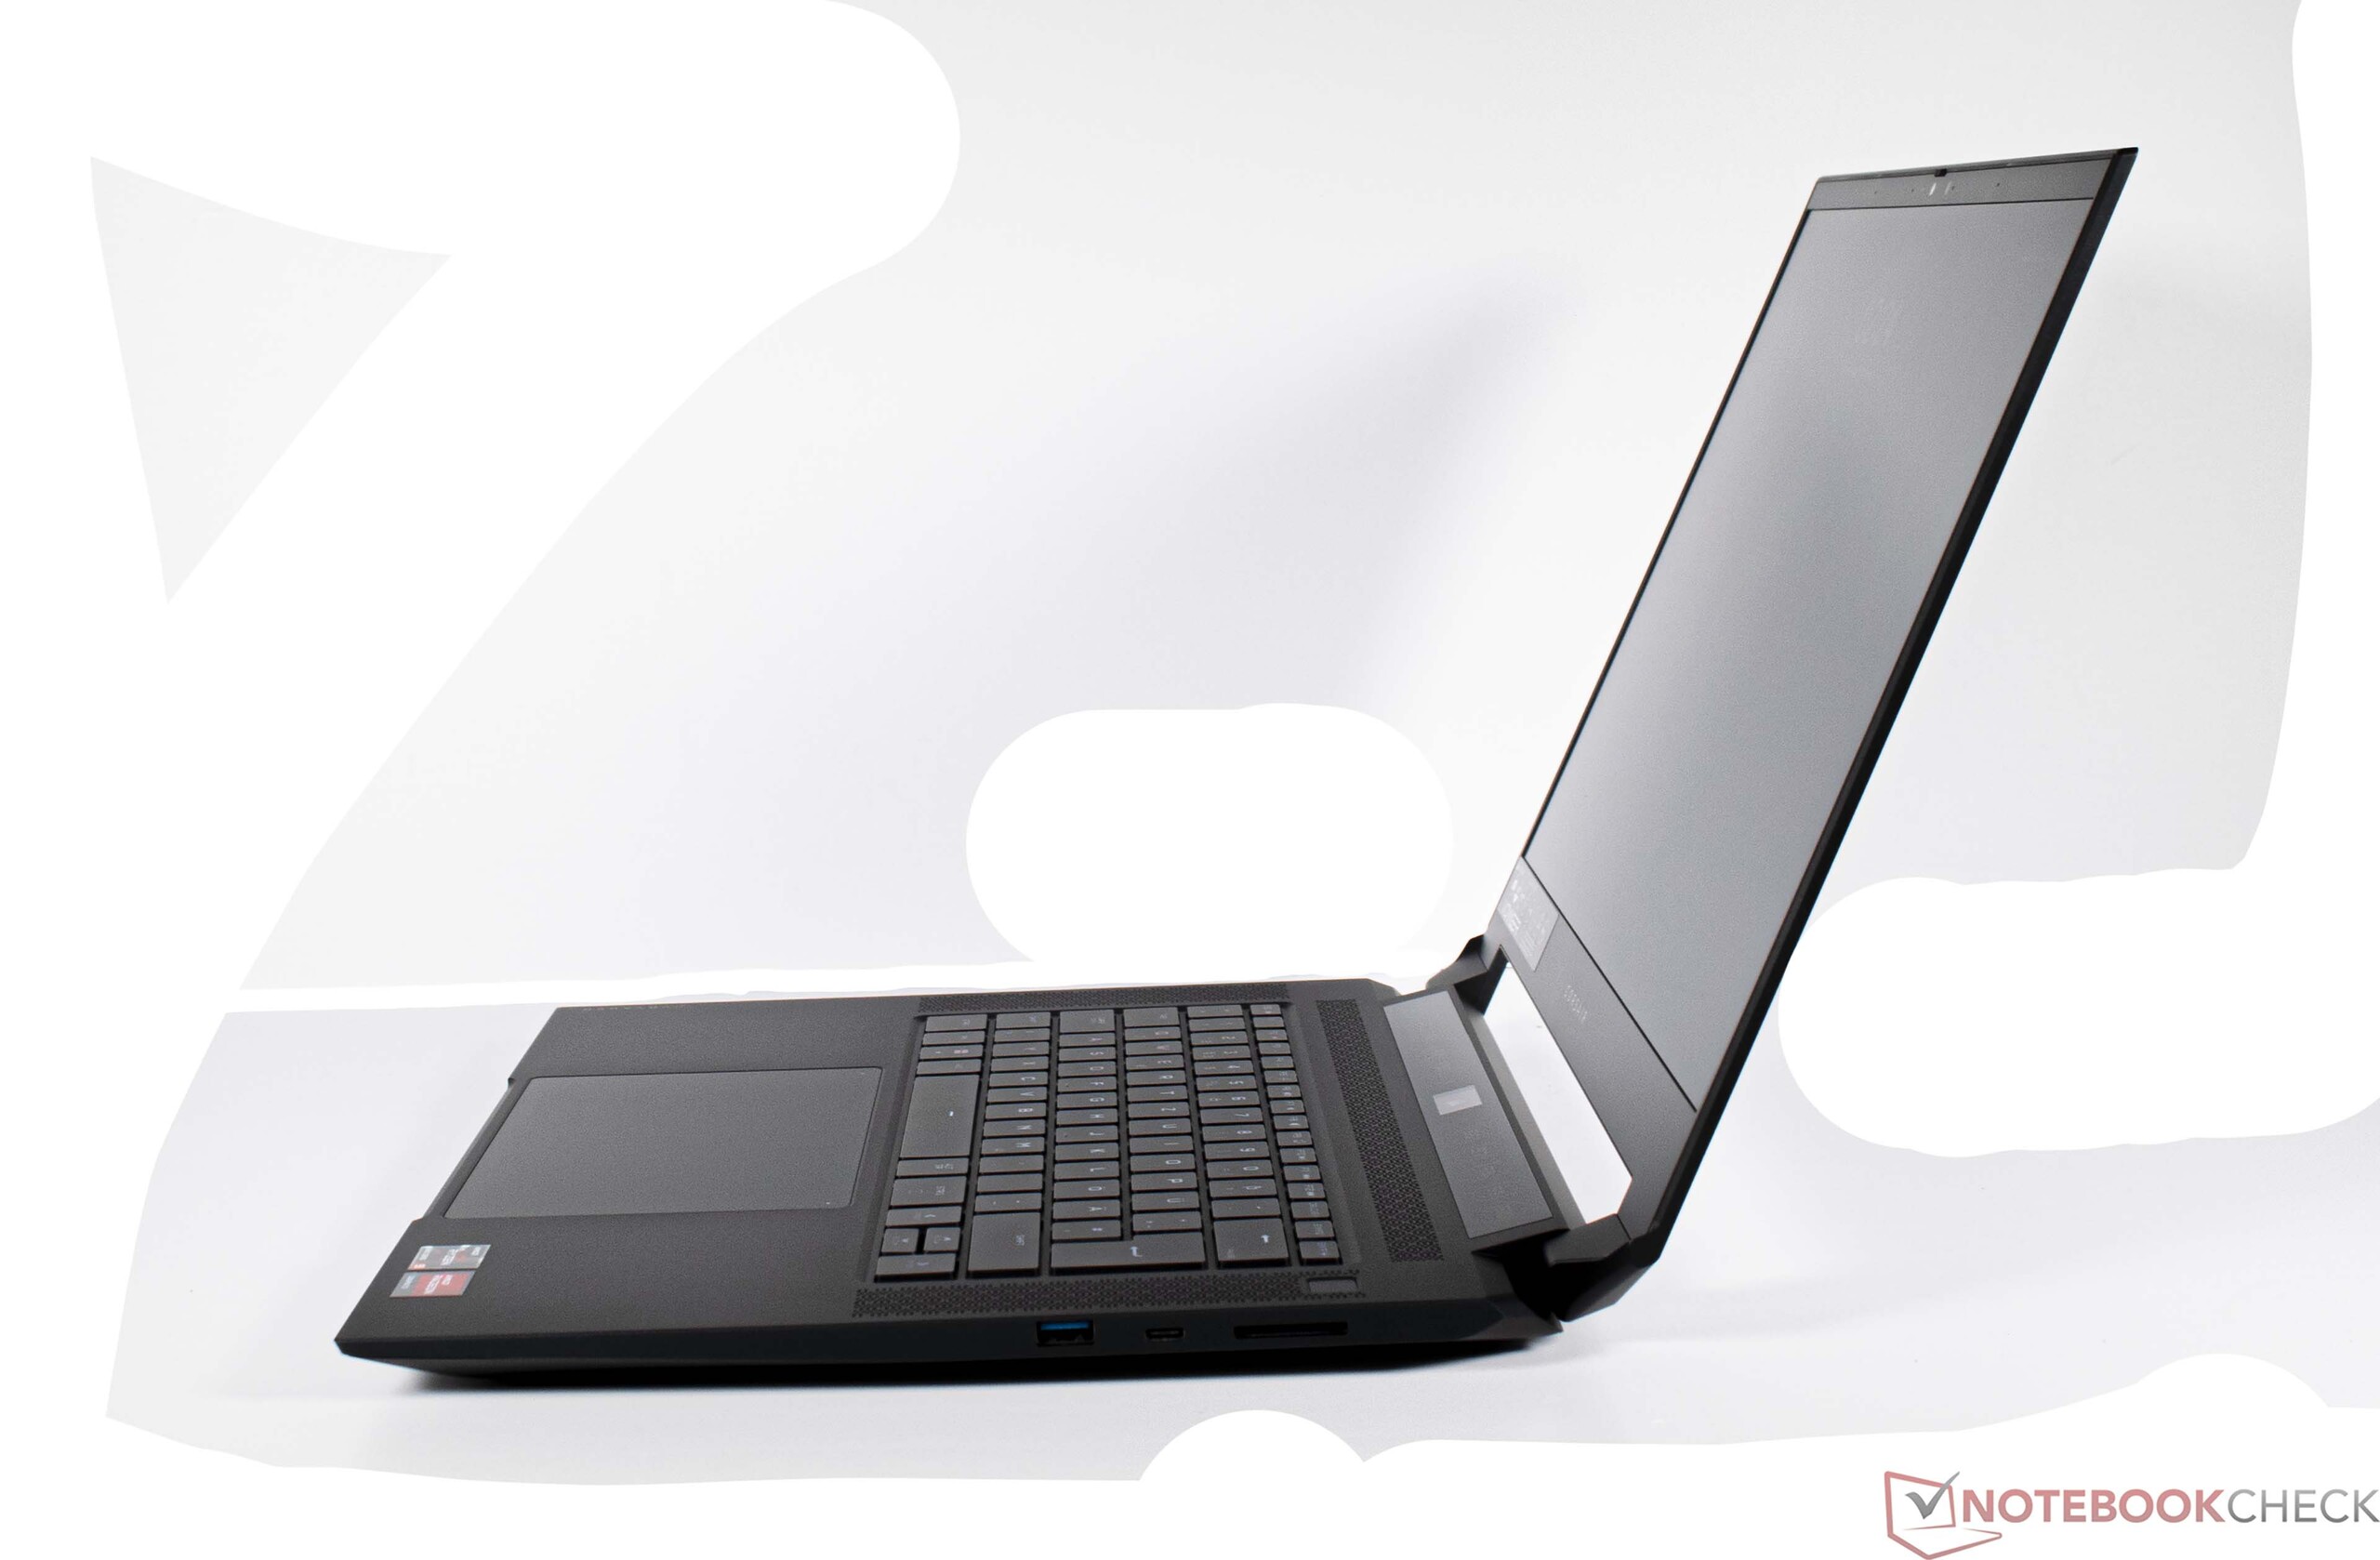
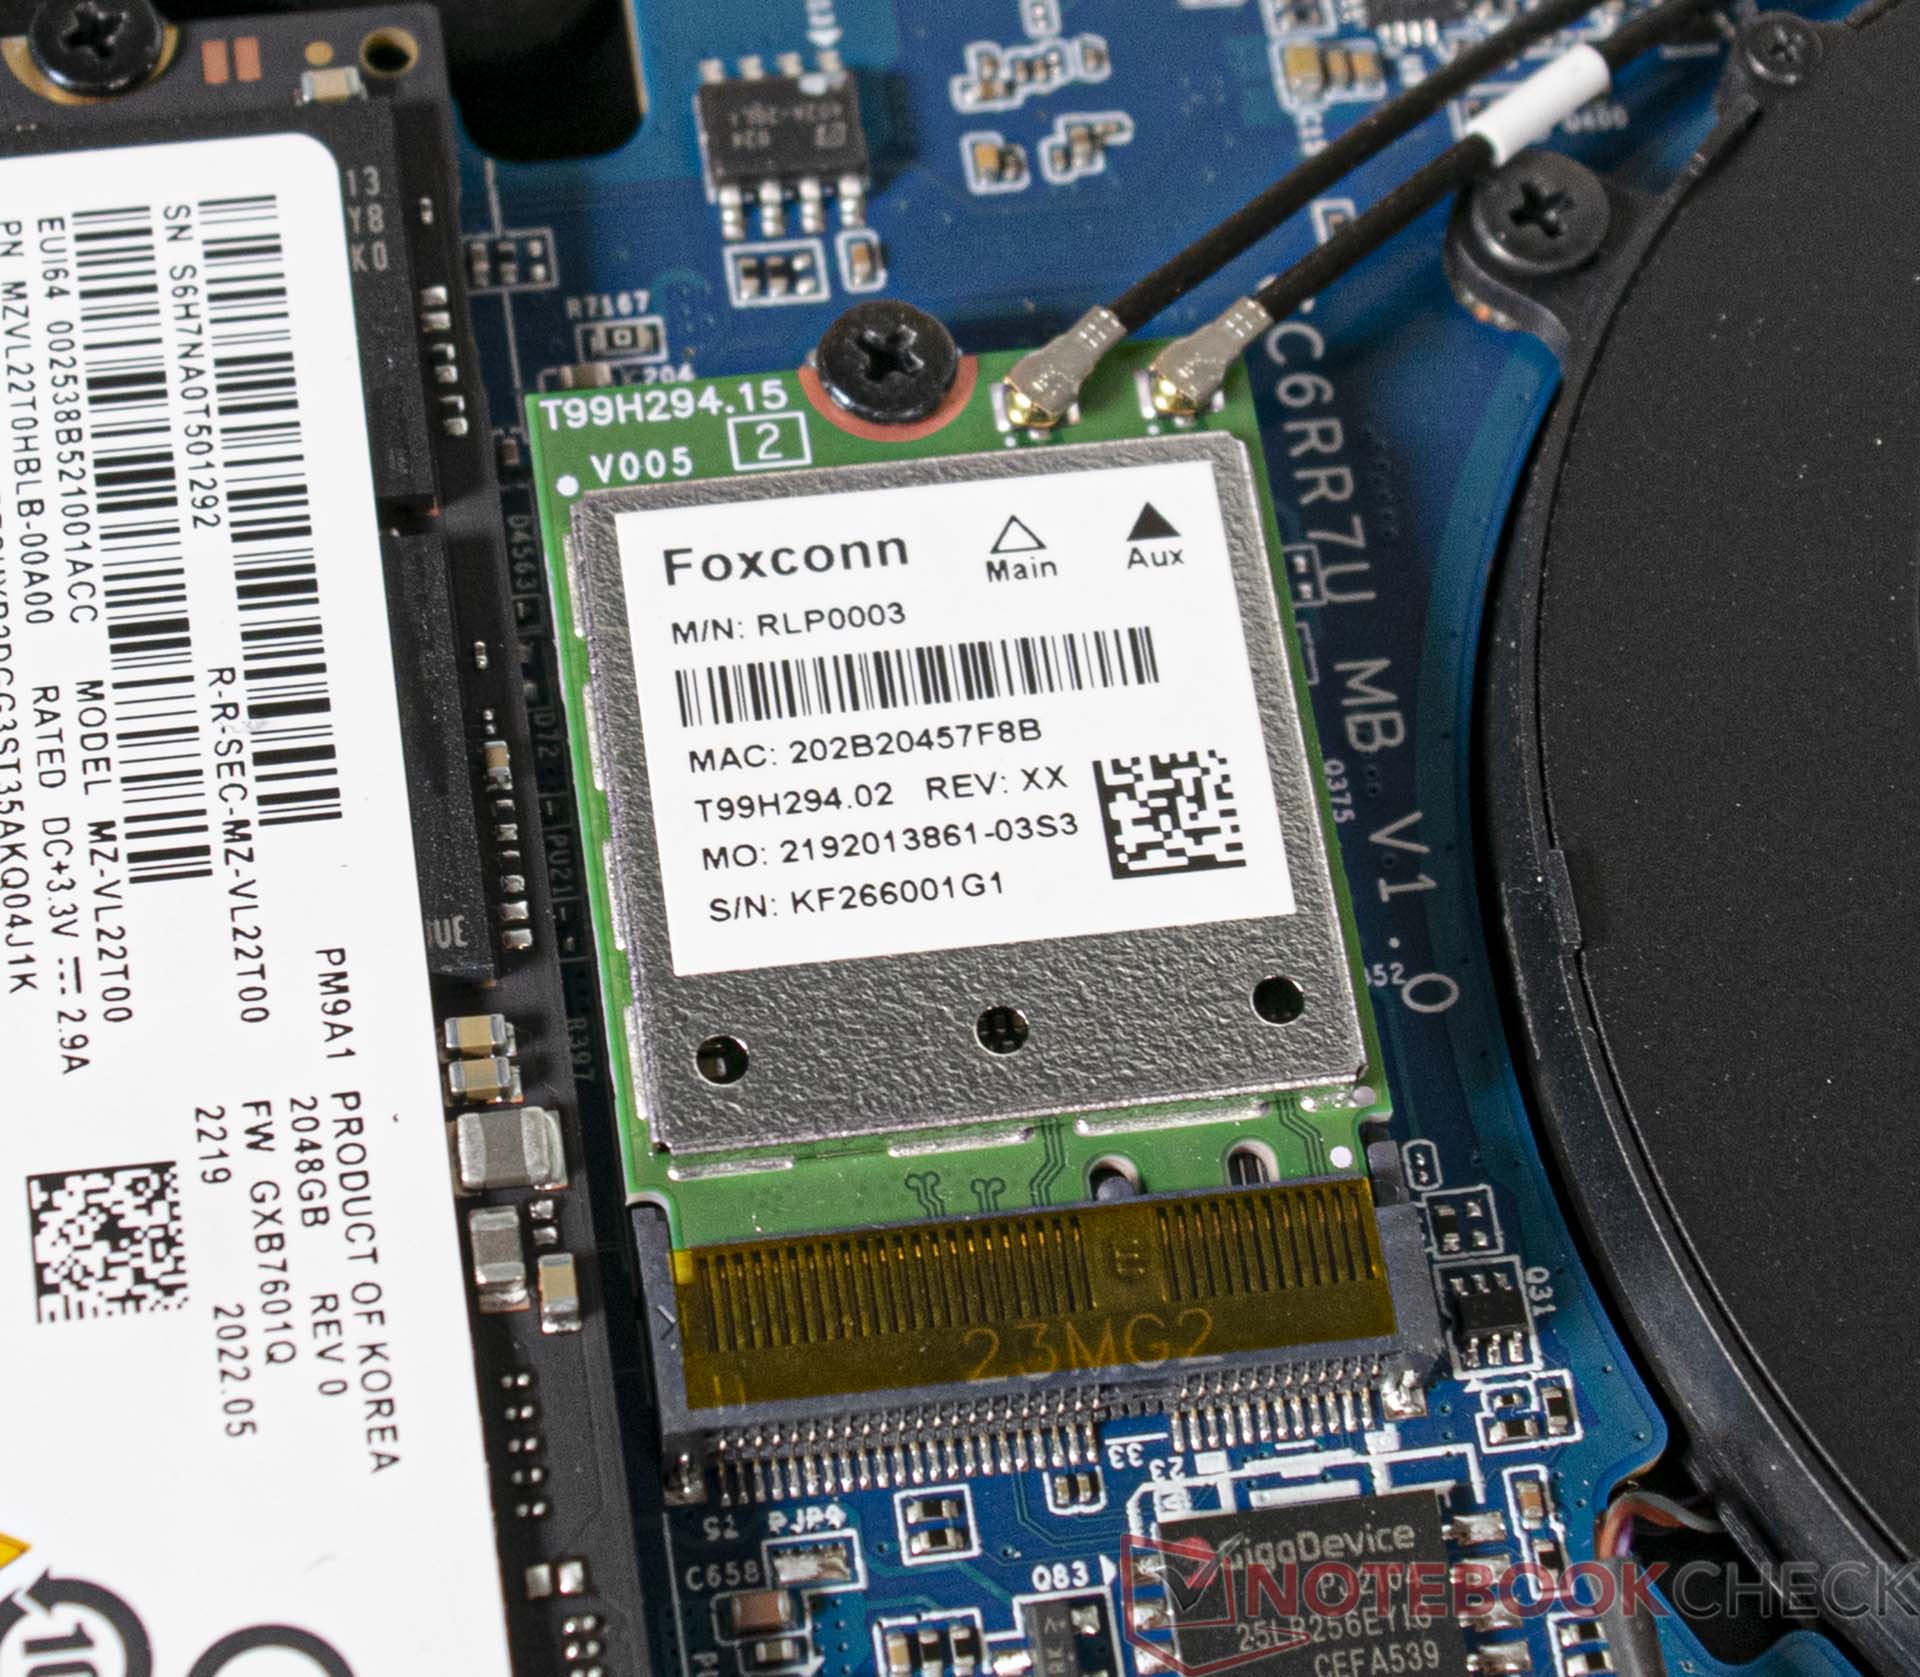
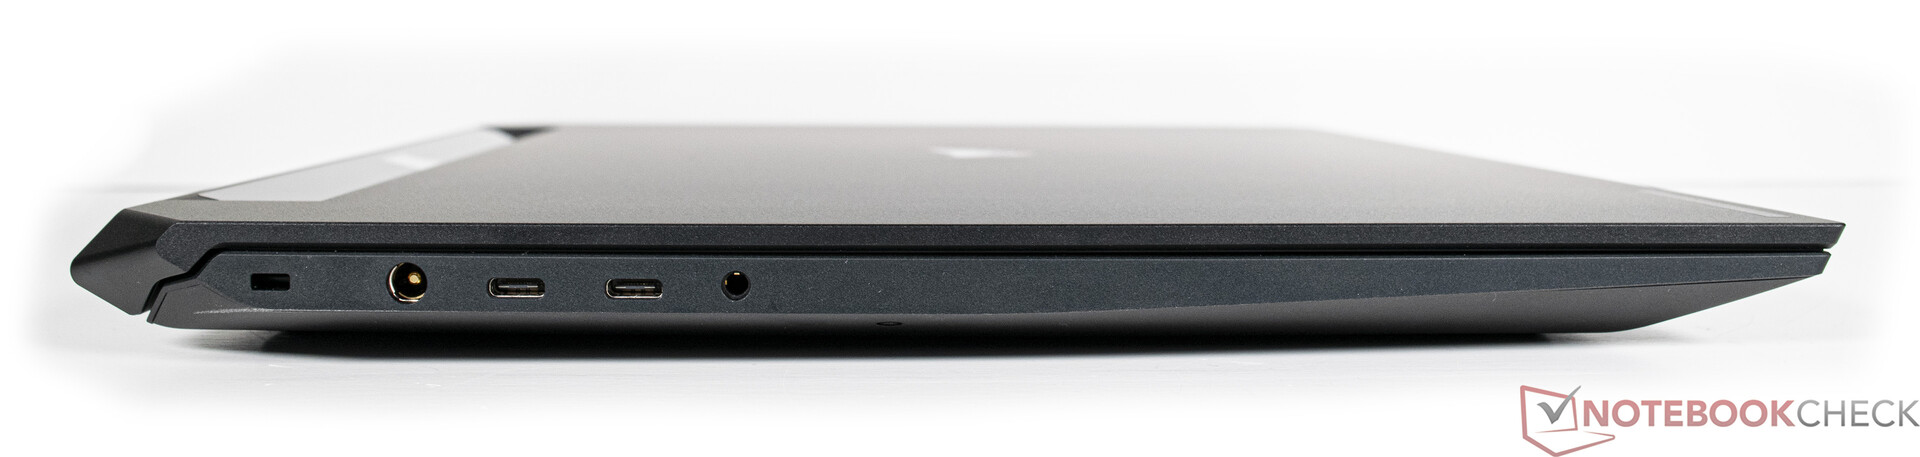
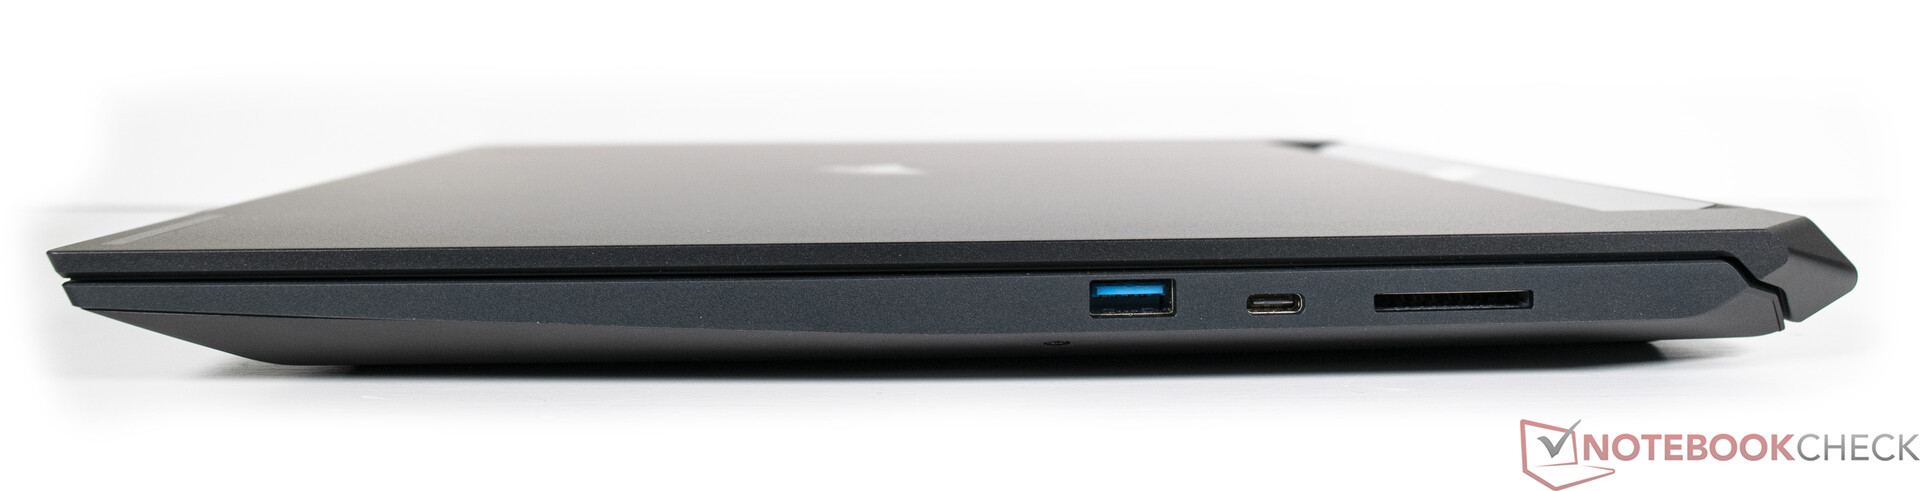
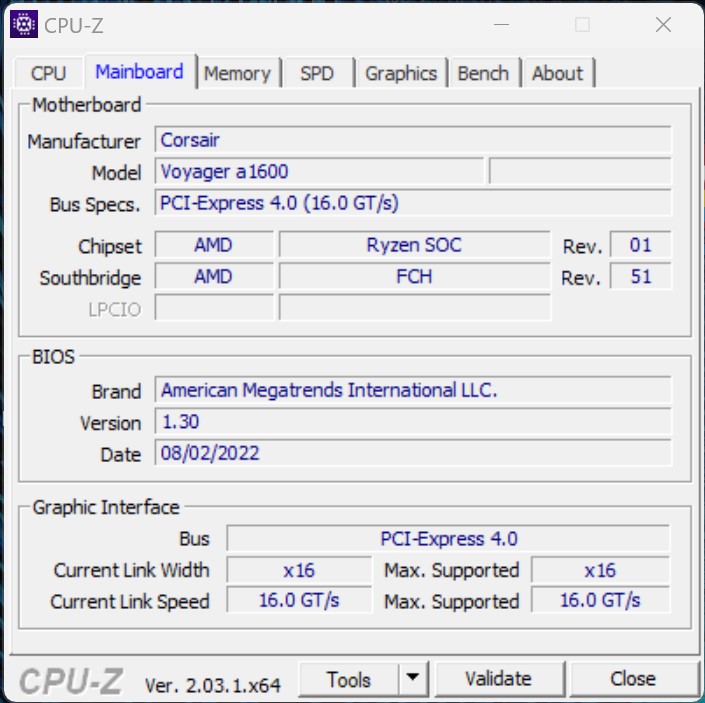
W kwestii łączności Corsair oferuje nowoczesne interfejsy, choć ich liczba jest bardzo przystępna. Szkoda, że mamy tylko jedno USB typu-A, ale są za to trzy porty USB-C z obsługą Thunderbolt. Laptop jest więc dobrze przygotowany na przyszłość. Liczba interfejsów jest zapewne tak skąpa ze względu na funkcję Slipstream, ponieważ różne akcesoria można podłączyć bezpośrednio do notebooka za pośrednictwem tej technologii bezprzewodowej bez dodatkowego dongla. Sam Corsair oferuje do tego własne myszki, klawiatury i zestawy słuchawkowe. Moduł Wi-Fi pochodzi od Foxconna i oferuje aktualny standard Wi-Fi 6E.
Przeznaczenie jako laptopa do streamingu wymaga dobrej kamerki internetowej. Z testu wynika, że wbudowana kamerka 1080p wypada lepiej od konkurencji. Mimo to do użytku stacjonarnego zalecamy stosowanie kamery zewnętrznej. Do zastosowań mobilnych można śmiało oprzeć się na tej zintegrowanej.
| SD Card Reader | |
| average JPG Copy Test (av. of 3 runs) | |
| Asus ROG Flow X16 GV601RW-M5082W (AV Pro SD microSD 128 GB V60) | |
| Średnia w klasie Gaming (20.9 - 210, n=54, ostatnie 2 lata) | |
| Corsair Voyager a1600 (AV Pro SD microSD 128 GB V60) | |
| Acer Predator Triton 500 SE PT516-52s-70KX (AV PRO microSD 128 GB V60) | |
| HP Omen 16-b1090ng (AV PRO microSD 128 GB V60) | |
| maximum AS SSD Seq Read Test (1GB) | |
| Asus ROG Flow X16 GV601RW-M5082W (AV Pro SD microSD 128 GB V60) | |
| Średnia w klasie Gaming (25.5 - 261, n=51, ostatnie 2 lata) | |
| Corsair Voyager a1600 (AV Pro SD microSD 128 GB V60) | |
| Acer Predator Triton 500 SE PT516-52s-70KX (AV PRO microSD 128 GB V60) | |
| Networking | |
| iperf3 receive AXE11000 6GHz | |
| Lenovo Legion 7 16IAX7-82TD004SGE | |
| Przeciętny Qualcomm WCN685x (886 - 1790, n=22) | |
| Średnia w klasie Gaming (975 - 1775, n=37, ostatnie 2 lata) | |
| Lenovo Legion 7 16ARHA7 | |
| Corsair Voyager a1600 | |
| iperf3 receive AXE11000 | |
| Acer Predator Triton 500 SE PT516-52s-70KX | |
| Przeciętny Qualcomm WCN685x (852 - 1777, n=21) | |
| Średnia w klasie Gaming (680 - 1745, n=95, ostatnie 2 lata) | |
| HP Omen 16-b1090ng | |
| Corsair Voyager a1600 | |
| iperf3 transmit AXE11000 6GHz | |
| Corsair Voyager a1600 | |
| Lenovo Legion 7 16IAX7-82TD004SGE | |
| Lenovo Legion 7 16ARHA7 | |
| Przeciętny Qualcomm WCN685x (623 - 1961, n=22) | |
| Średnia w klasie Gaming (723 - 2355, n=38, ostatnie 2 lata) | |
| iperf3 transmit AXE11000 | |
| Corsair Voyager a1600 | |
| Acer Predator Triton 500 SE PT516-52s-70KX | |
| Przeciętny Qualcomm WCN685x (521 - 1838, n=21) | |
| Średnia w klasie Gaming (560 - 1862, n=95, ostatnie 2 lata) | |
| HP Omen 16-b1090ng | |


Urządzenia wejściowe
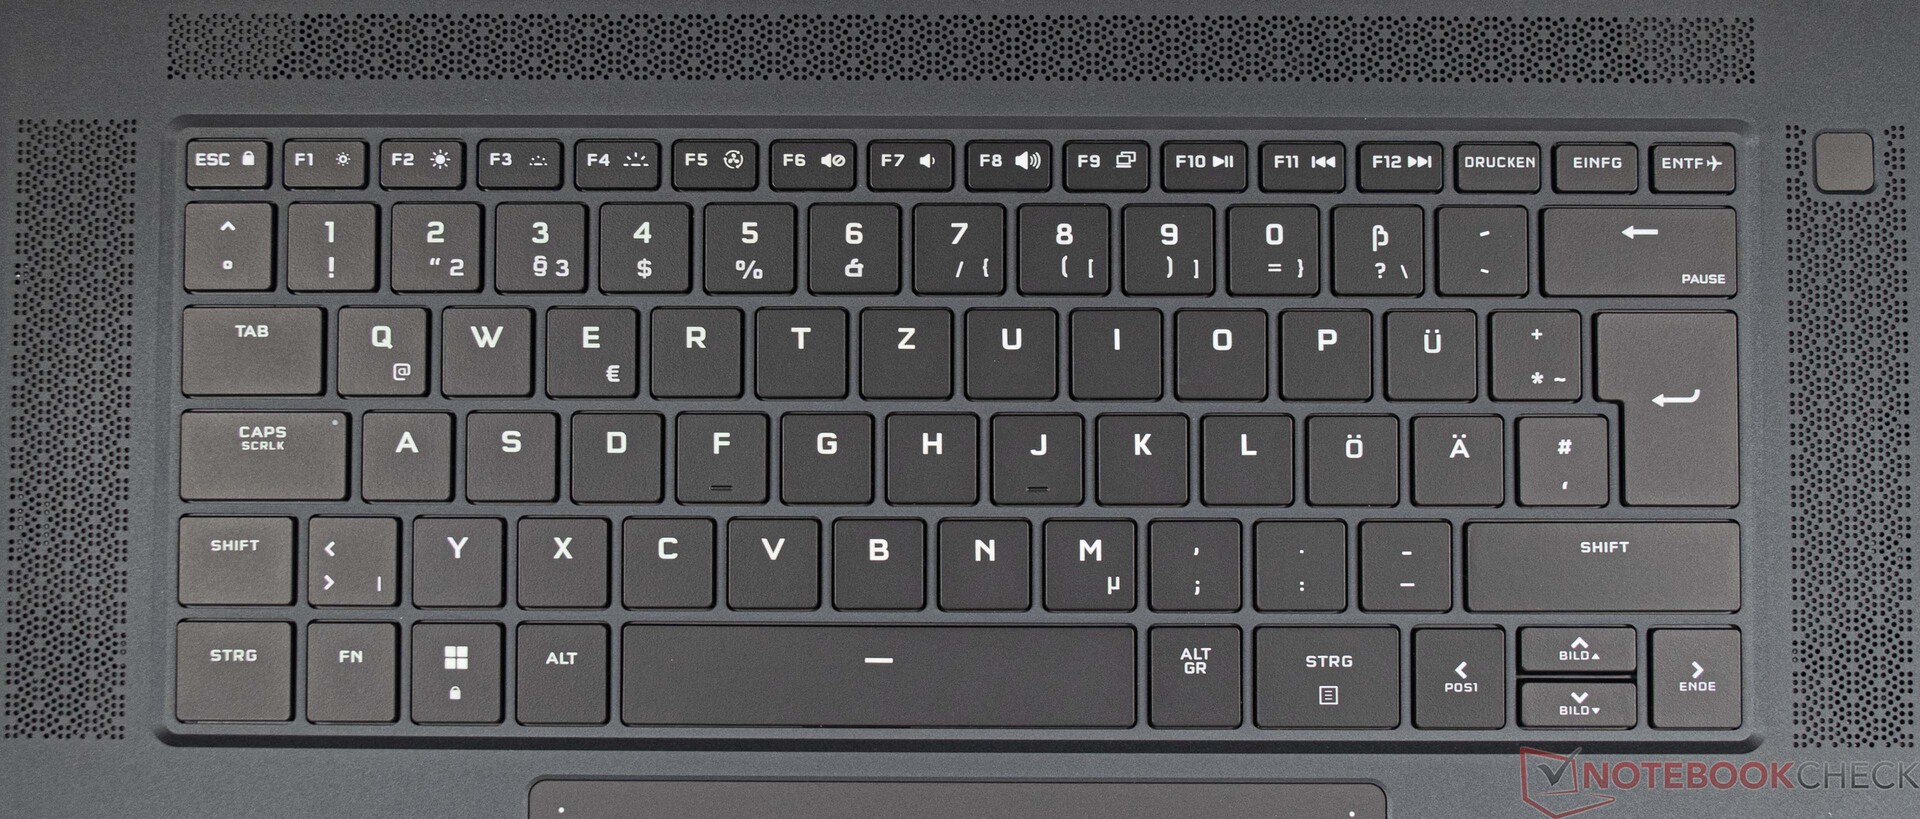
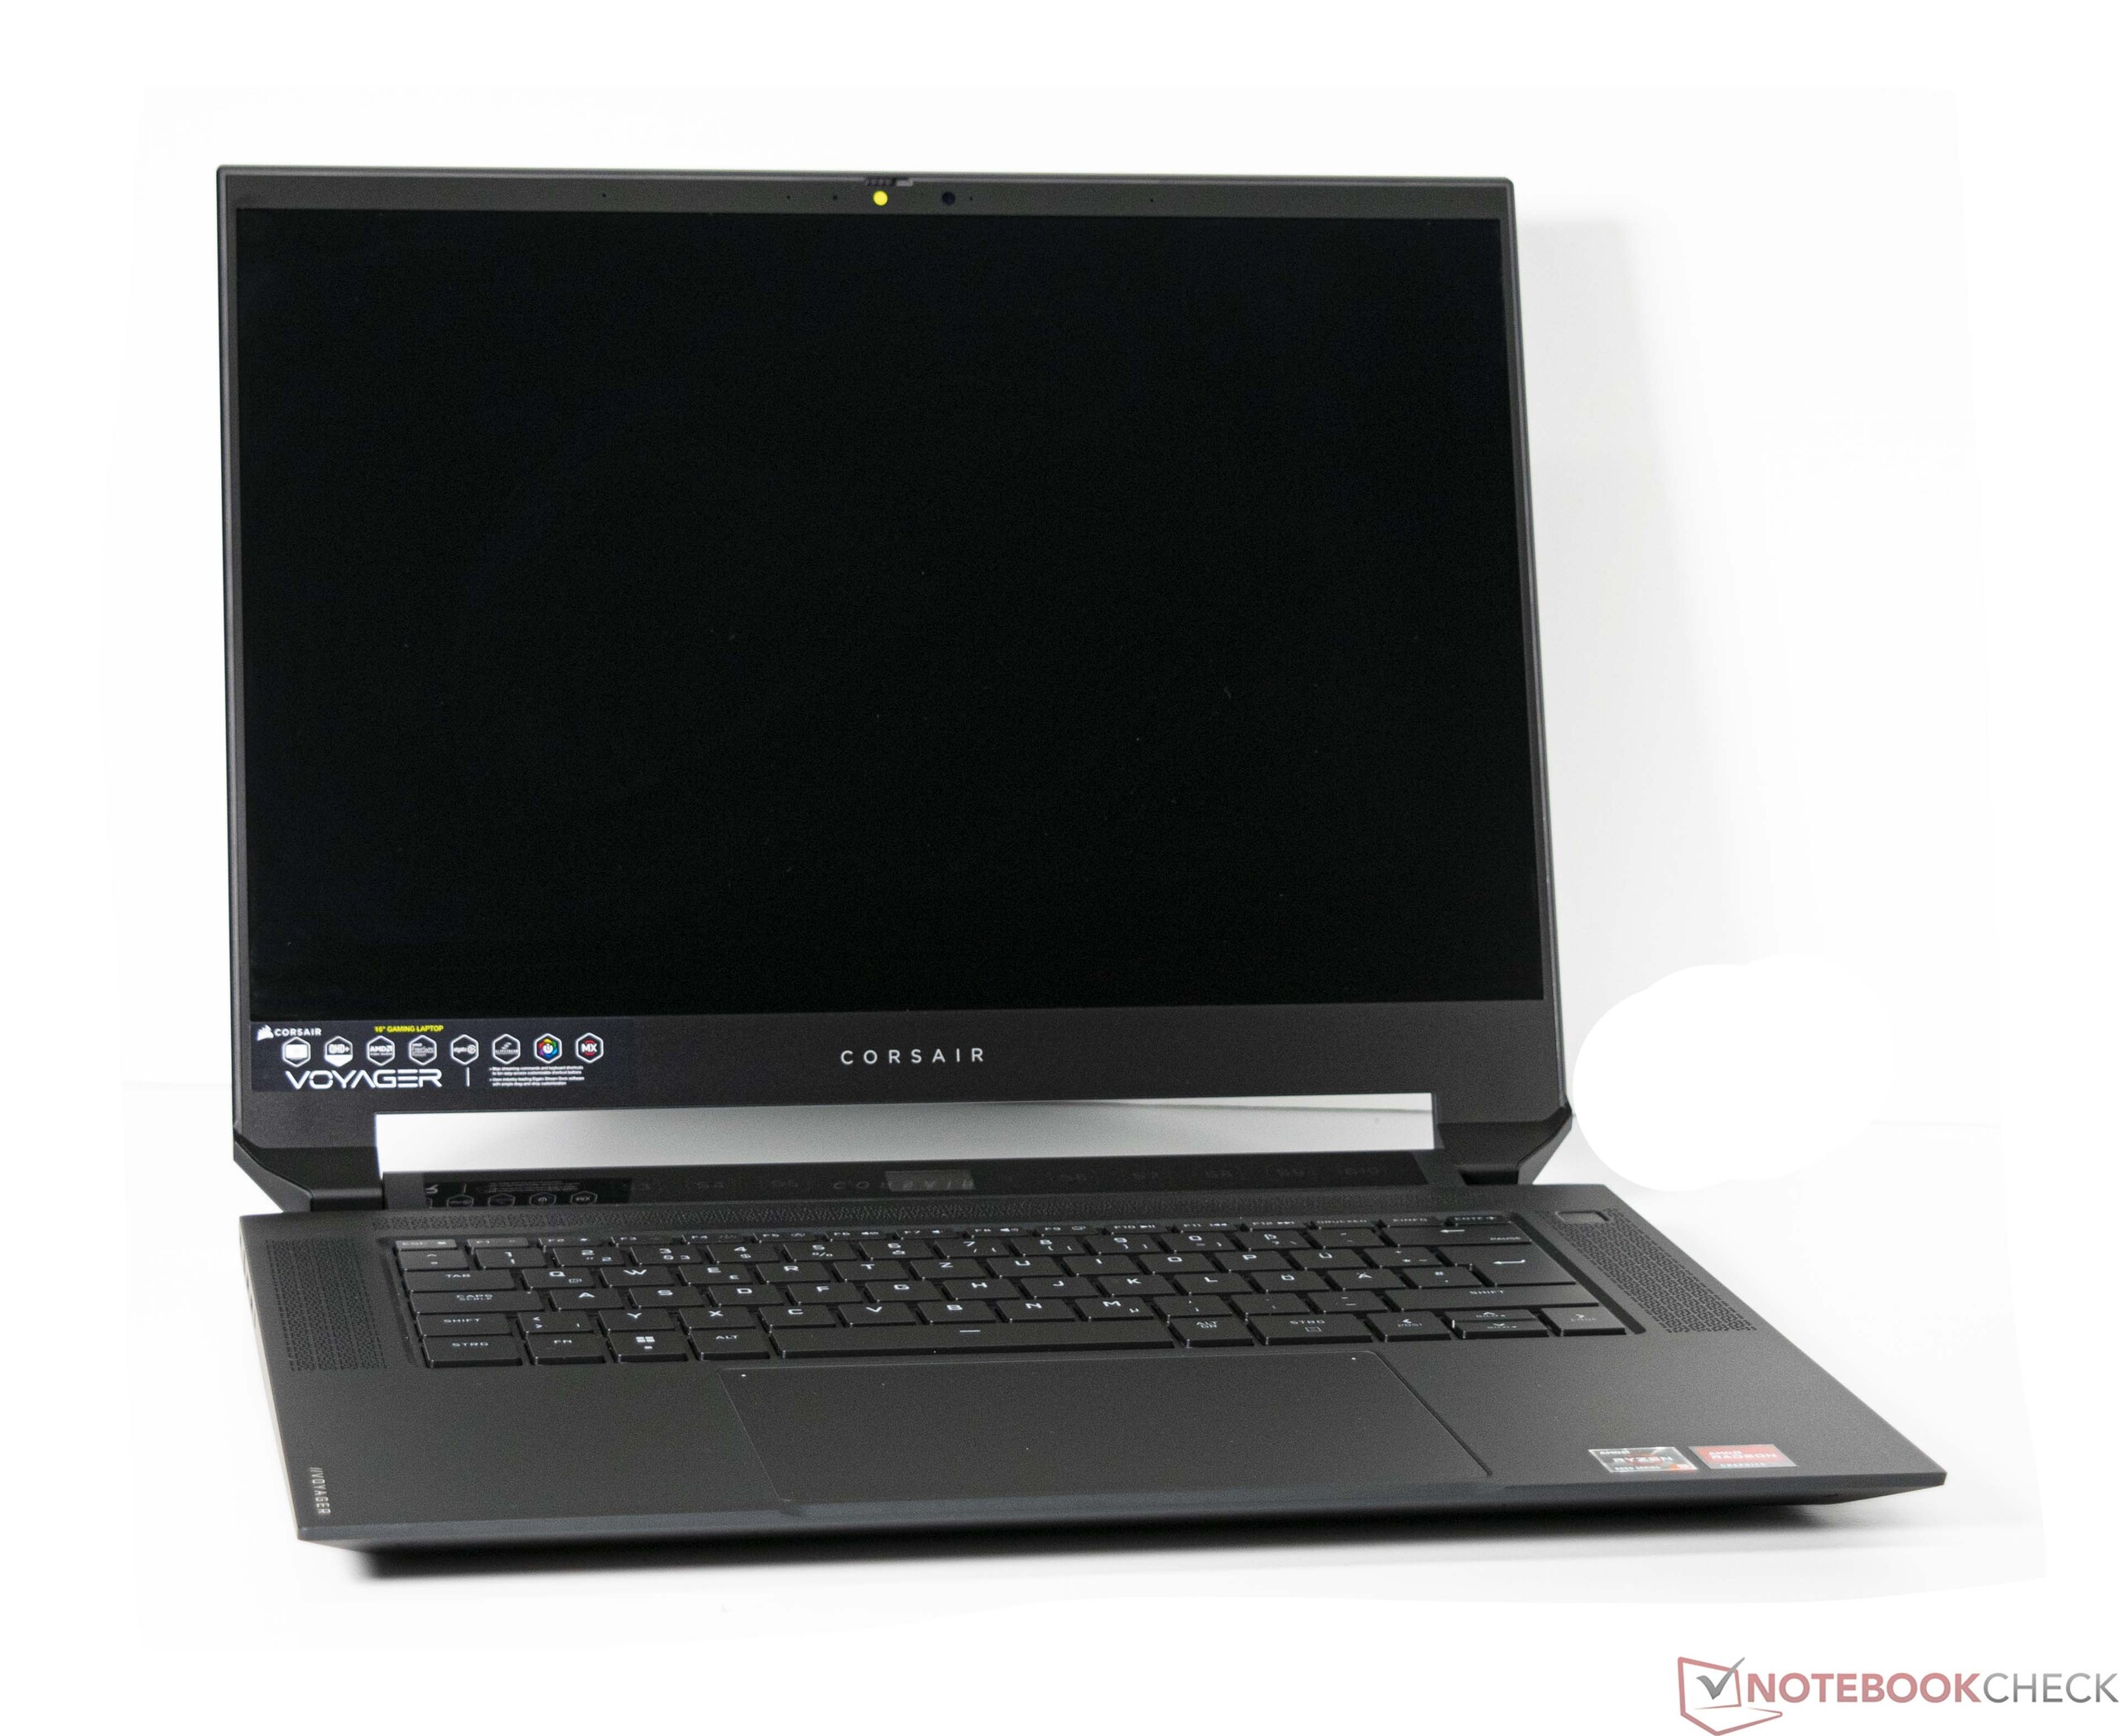
Corsair oddaje do dyspozycji Voyager a1600 mechaniczną klawiaturę opartą na przełącznikach Cherry MX. Są one bardzo wytrzymałe i zaprojektowane z myślą o ekstremalnej trwałości. Bardzo krótki skok i wyraźnie wyczuwalny punkt nacisku dają użytkownikowi dobre dotykowe sprzężenie zwrotne. Dodatkowo skok nie jest tłumiony, co zapobiega gąbczastemu odczuciu przy wprowadzaniu danych.
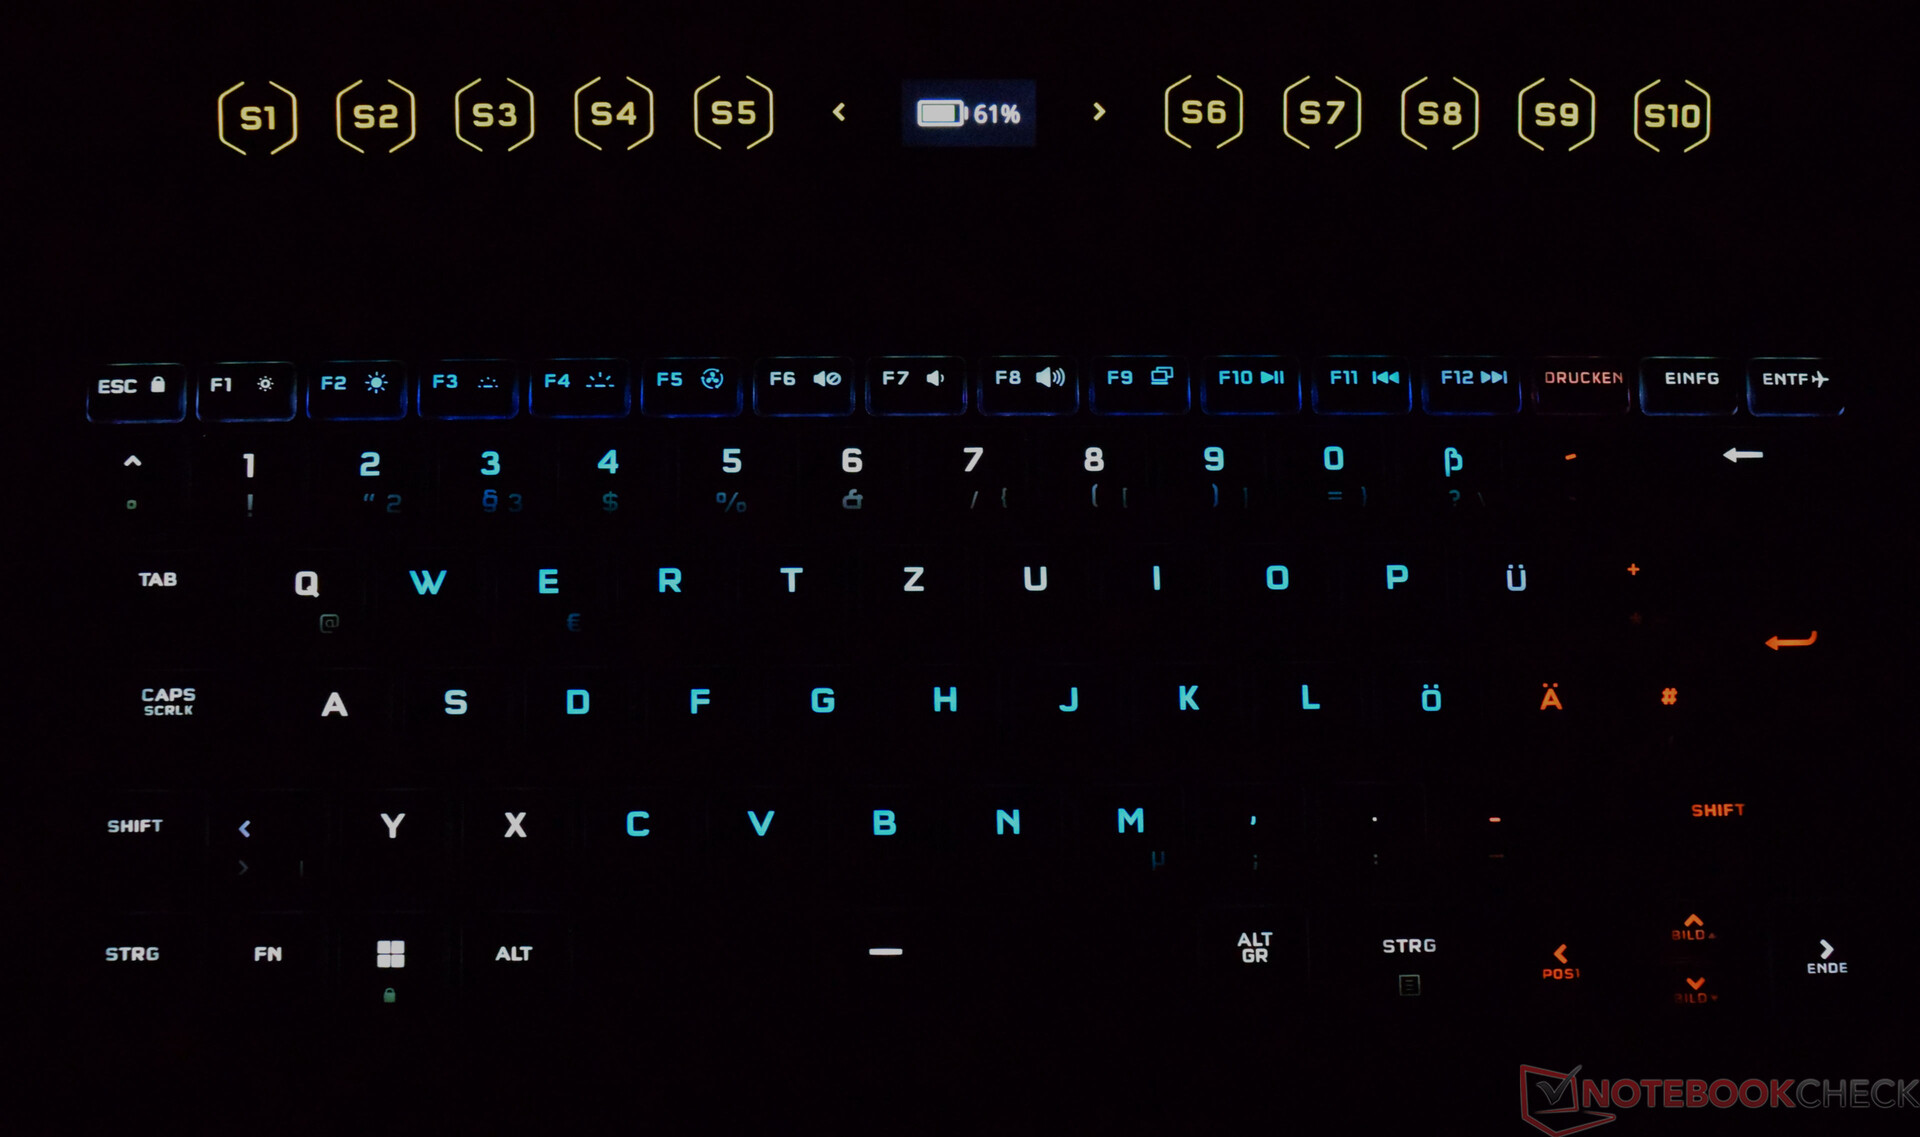
Podświetlenie klawiatury może być dowolnie skonfigurowane za pomocą oprogramowania iCUE. Do dyspozycji użytkownika są różne efekty i pełna paleta kolorów. Dodatkowo, wszystkie klawisze mogą być konfigurowane indywidualnie.
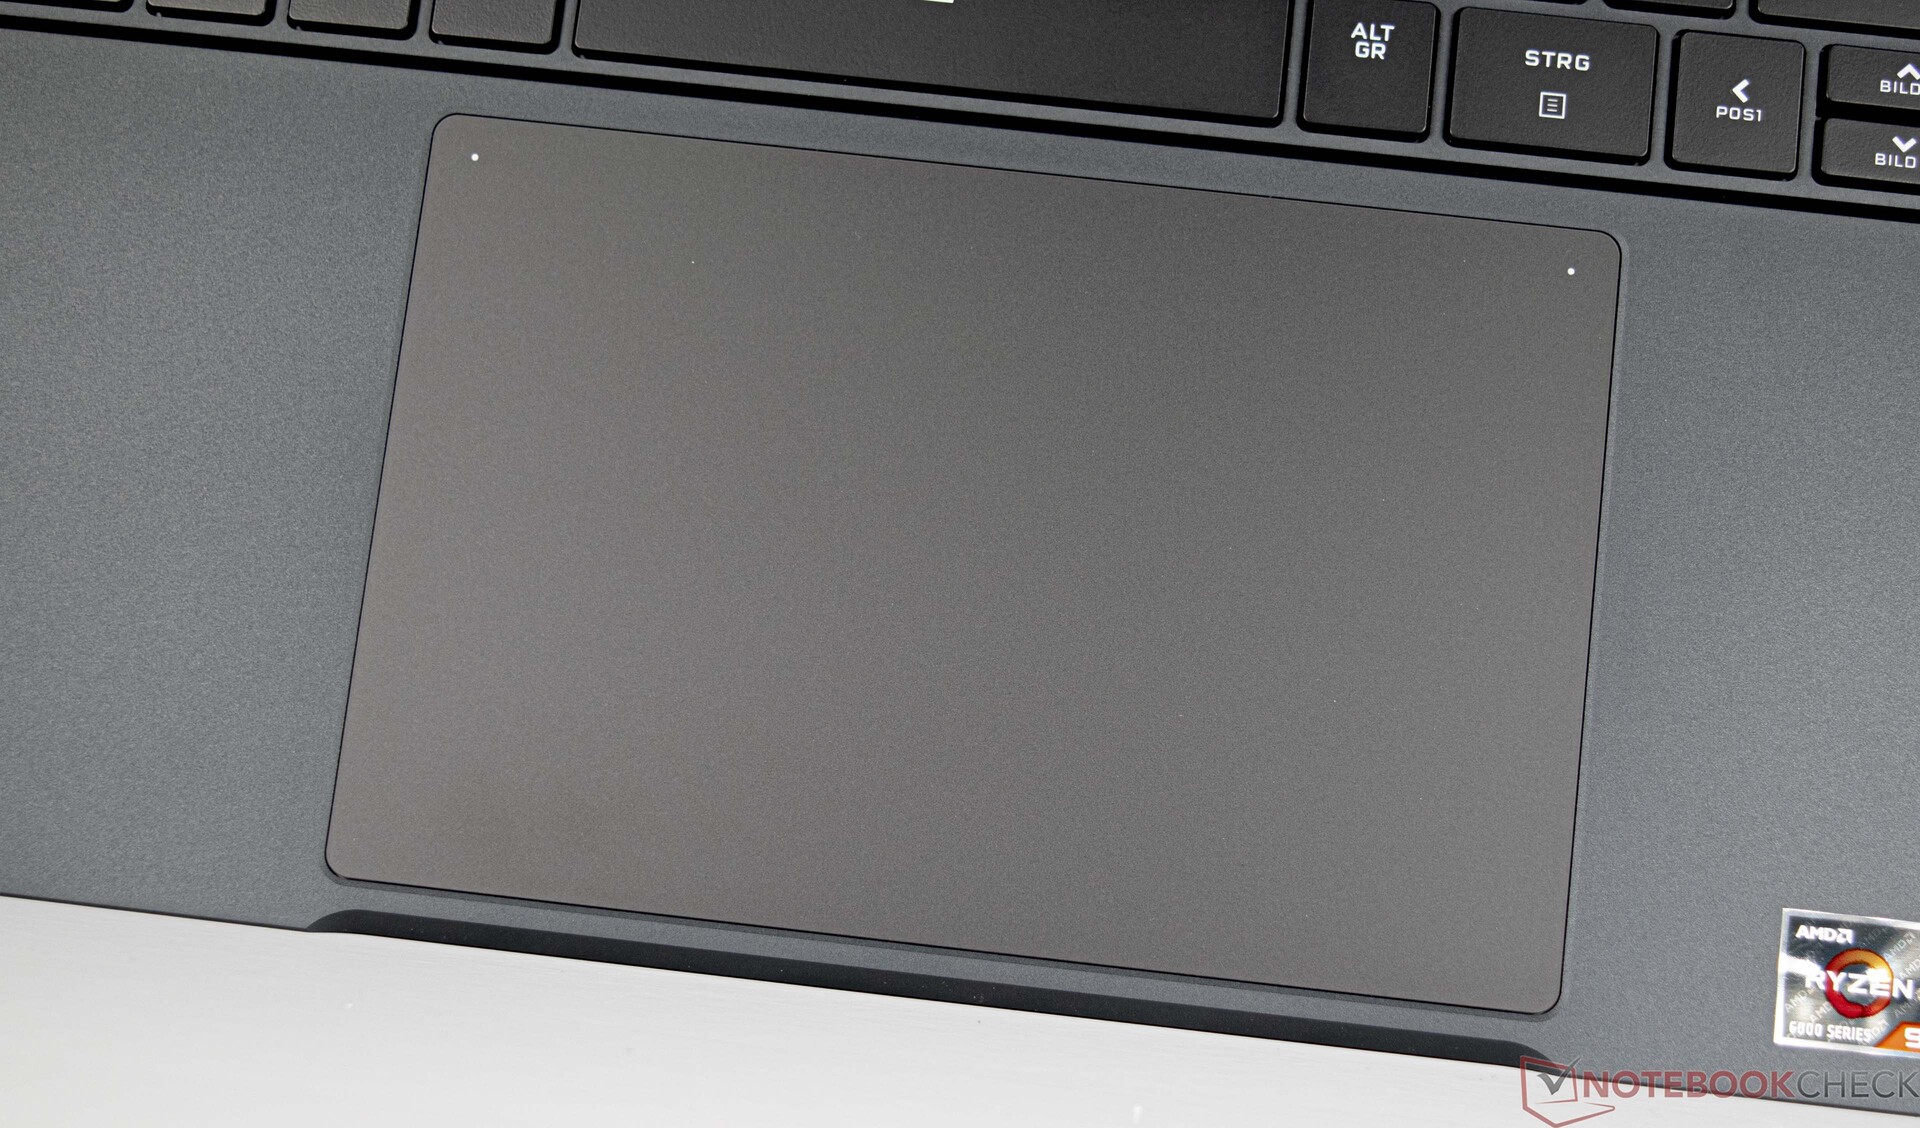
Touchpad mierzy aż 15,5 centymetra szerokości i 10 centymetrów głębokości. ClickPad jest więc bardzo duży i w praktyce najlepiej sprawdza się jako zamiennik myszy. Jeśli aktywny obszar wprowadzania danych jest zbyt duży, można wyłączyć prawą stronę poprzez dwukrotne stuknięcie białej kropki w lewym górnym rogu. Nie ma jednak żadnego optycznego ani haptycznego wskaźnika dla tej funkcji. Szklana powierzchnia ma subtelne satynowe wykończenie, które jest wygodne w obsłudze nawet przy nieco spoconych palcach. Dwa klawisze wejściowe w dolnym obszarze działają dobrze i są dość ciche podczas naciskania.
Wyświetlacz - szybki panel 16:10
Wyświetlacz w Corsair Voyager a1600 to 16-calowy panel IPS o częstotliwości odświeżania 240 Hz. Format 16:10 o rozdzielczości 2 560 x 1 600 pikseli zapewnia obfitą powierzchnię roboczą. Jak na razie nie ma alternatywnych wariantów wyświetlacza dla Voyagera a1600.
W naszych testach zainstalowany panel osiąga dobrą jasność 340 cd/m². Niemniej jednak w porównaniu z nim pretendenci wyraźnie oferują jaśniejsze wyświetlacze. Z powodu stosunkowo wysokiej wartości czerni cierpi na tym znacznie współczynnik kontrastu. Tym samym Voyager a1600 osiąga w naszym teście tylko kontrast 670:1.
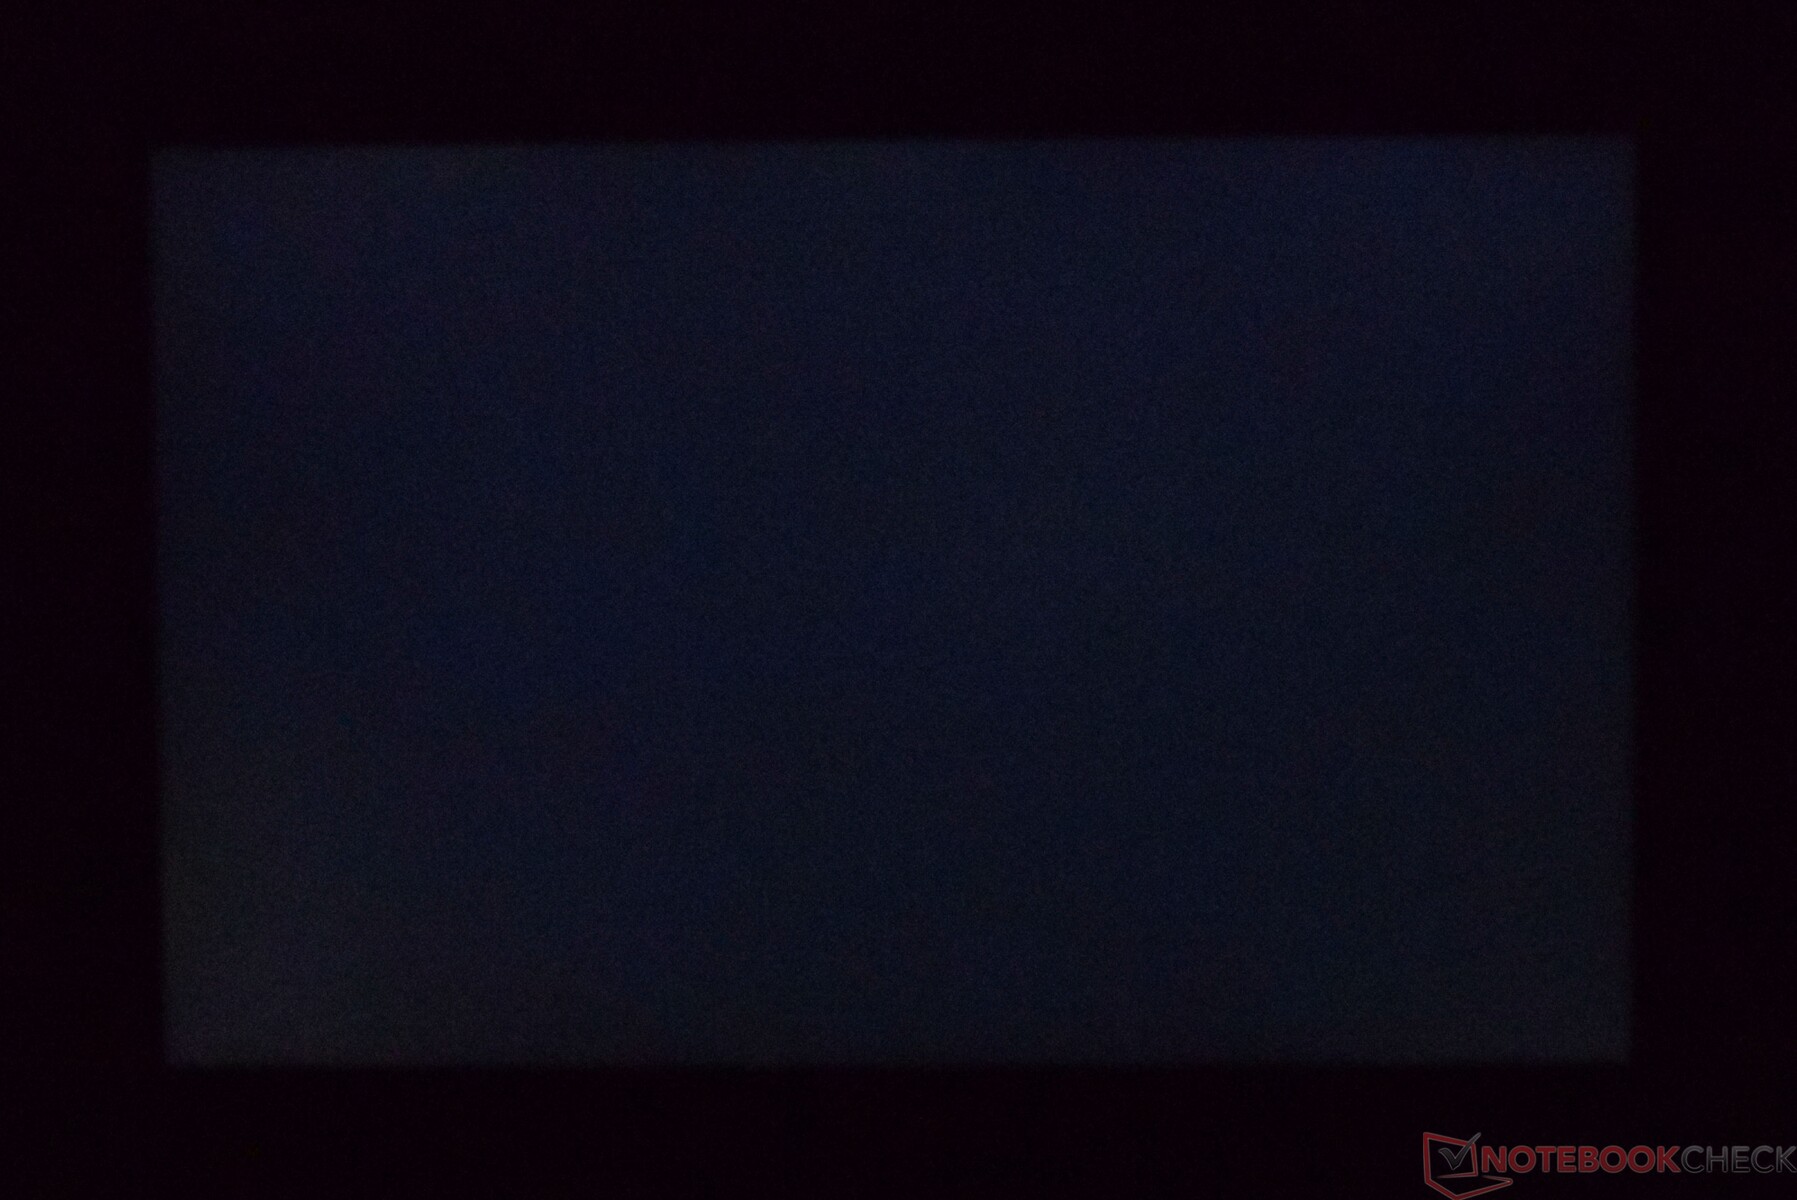
Zmęczenie oczu spowodowane przez PWM nie powinno być problemem w przypadku Corsair Voyager a1600. Backlight bleeding nie był problemem w przypadku naszego urządzenia.
| |||||||||||||||||||||||||
rozświetlenie: 91 %
na akumulatorze: 328 cd/m²
kontrast: 670:1 (czerń: 0.53 cd/m²)
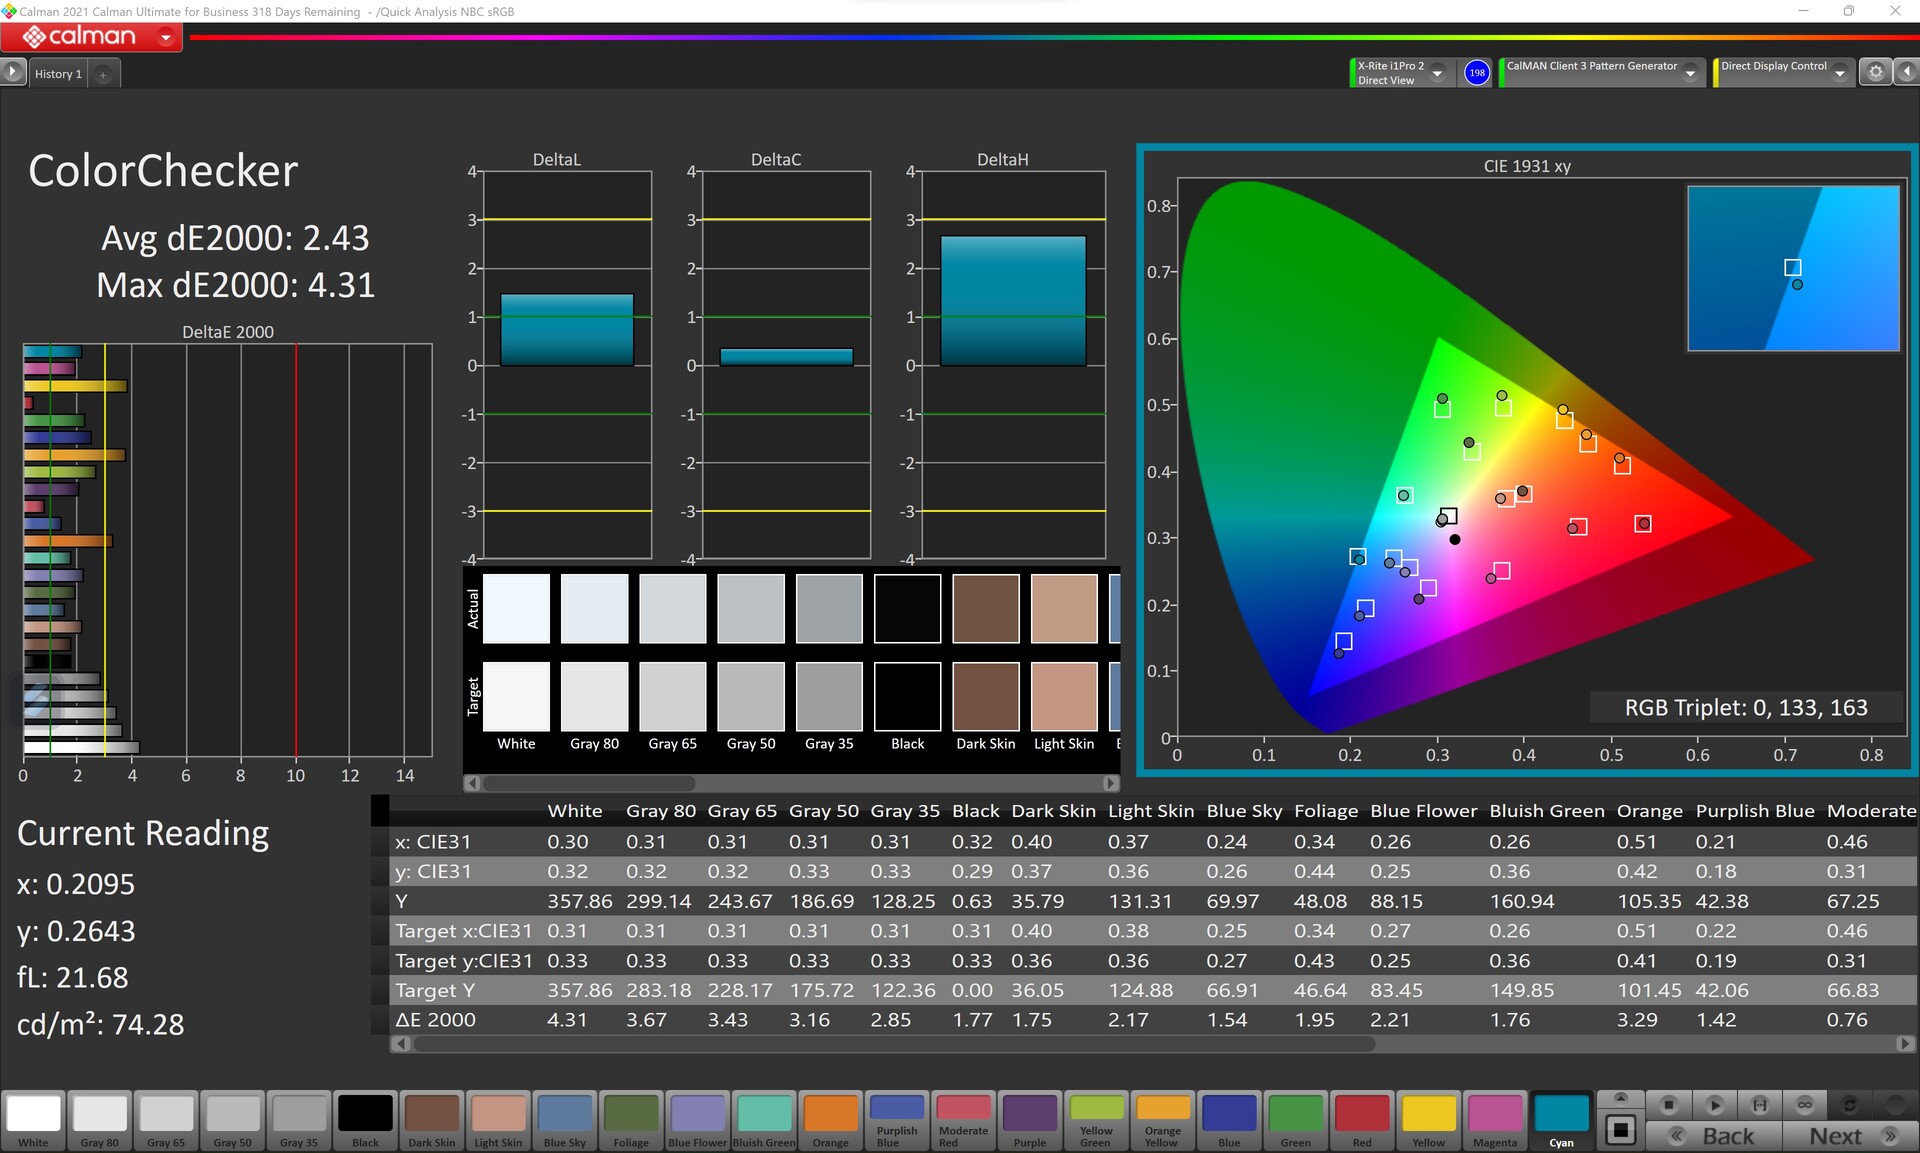
ΔE ColorChecker Calman: 2.43 | ∀{0.5-29.43 Ø4.73}
calibrated: 1.14
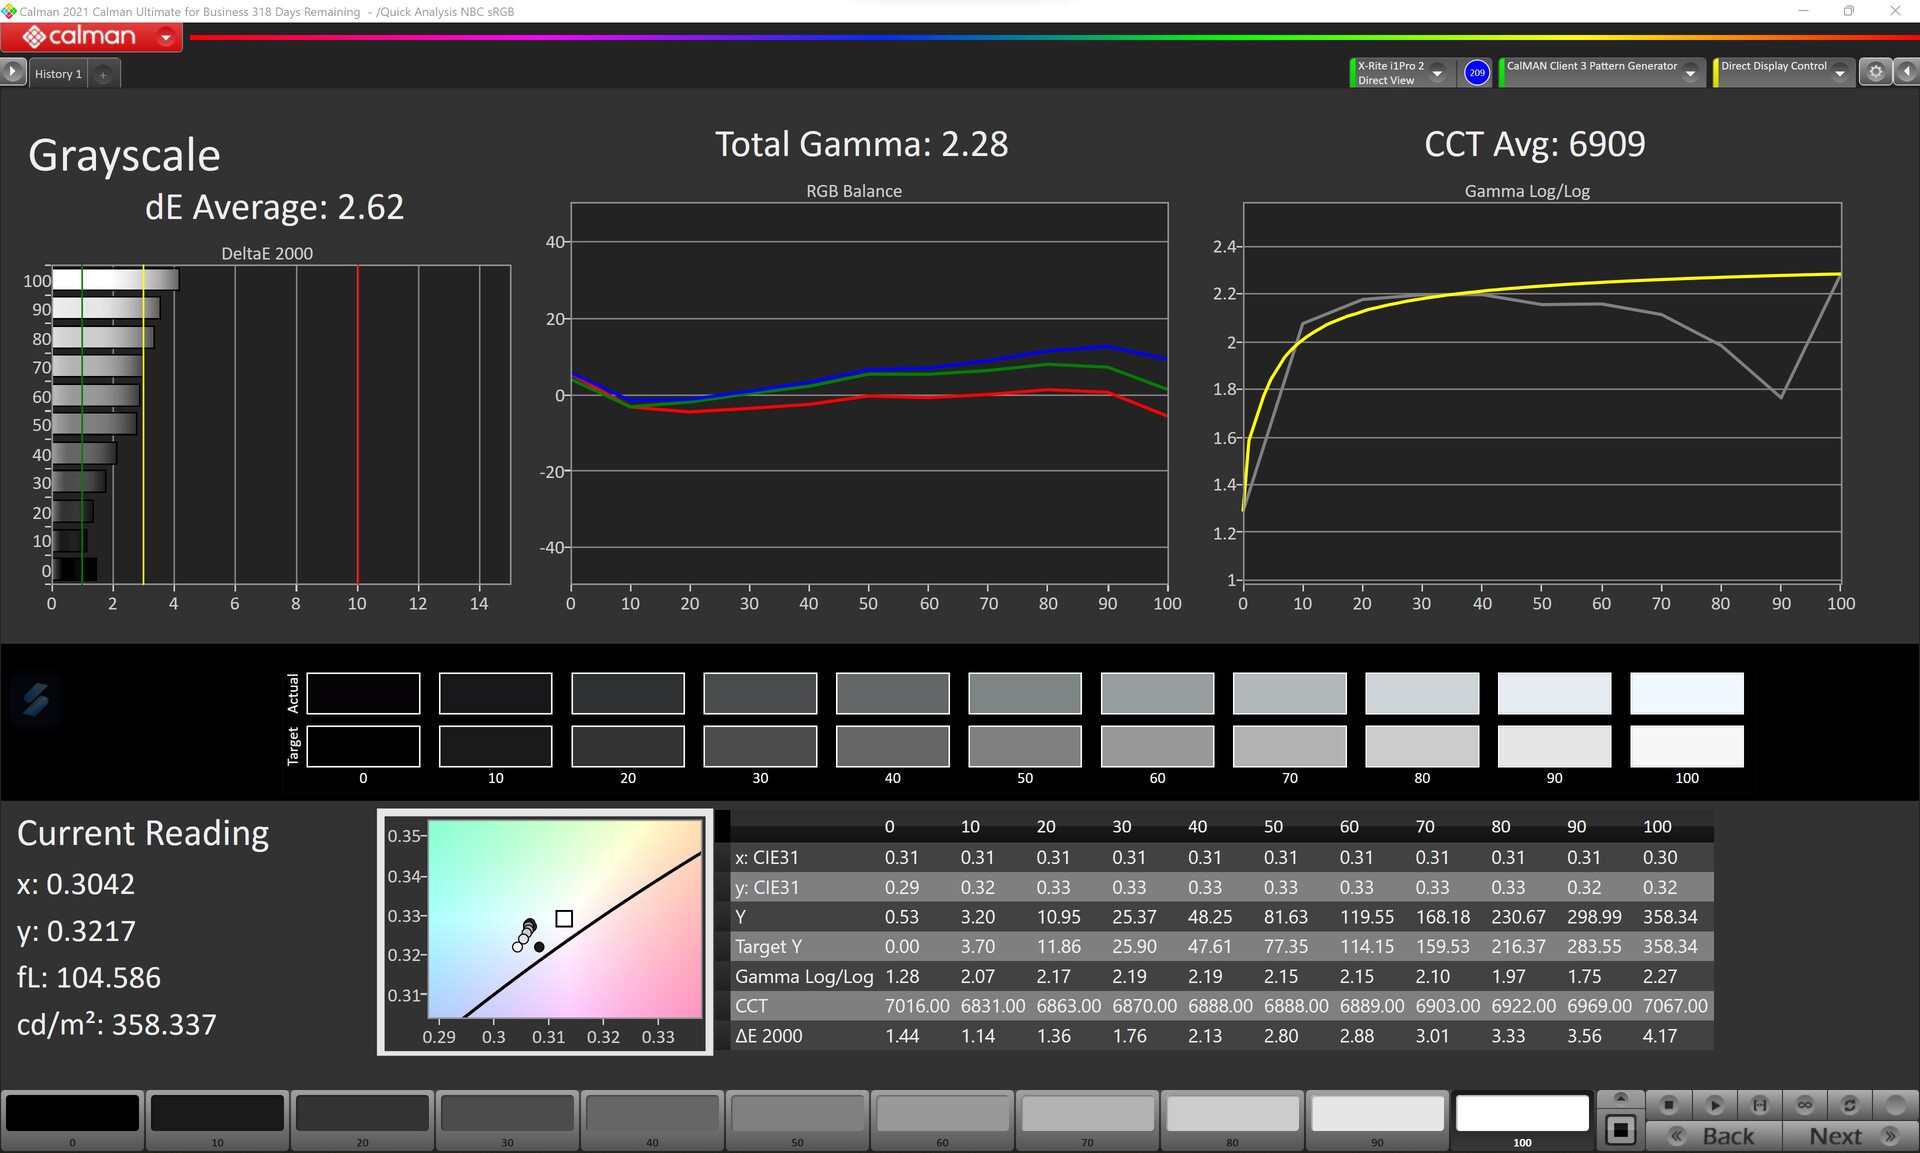
ΔE Greyscale Calman: 2.62 | ∀{0.09-98 Ø4.97}
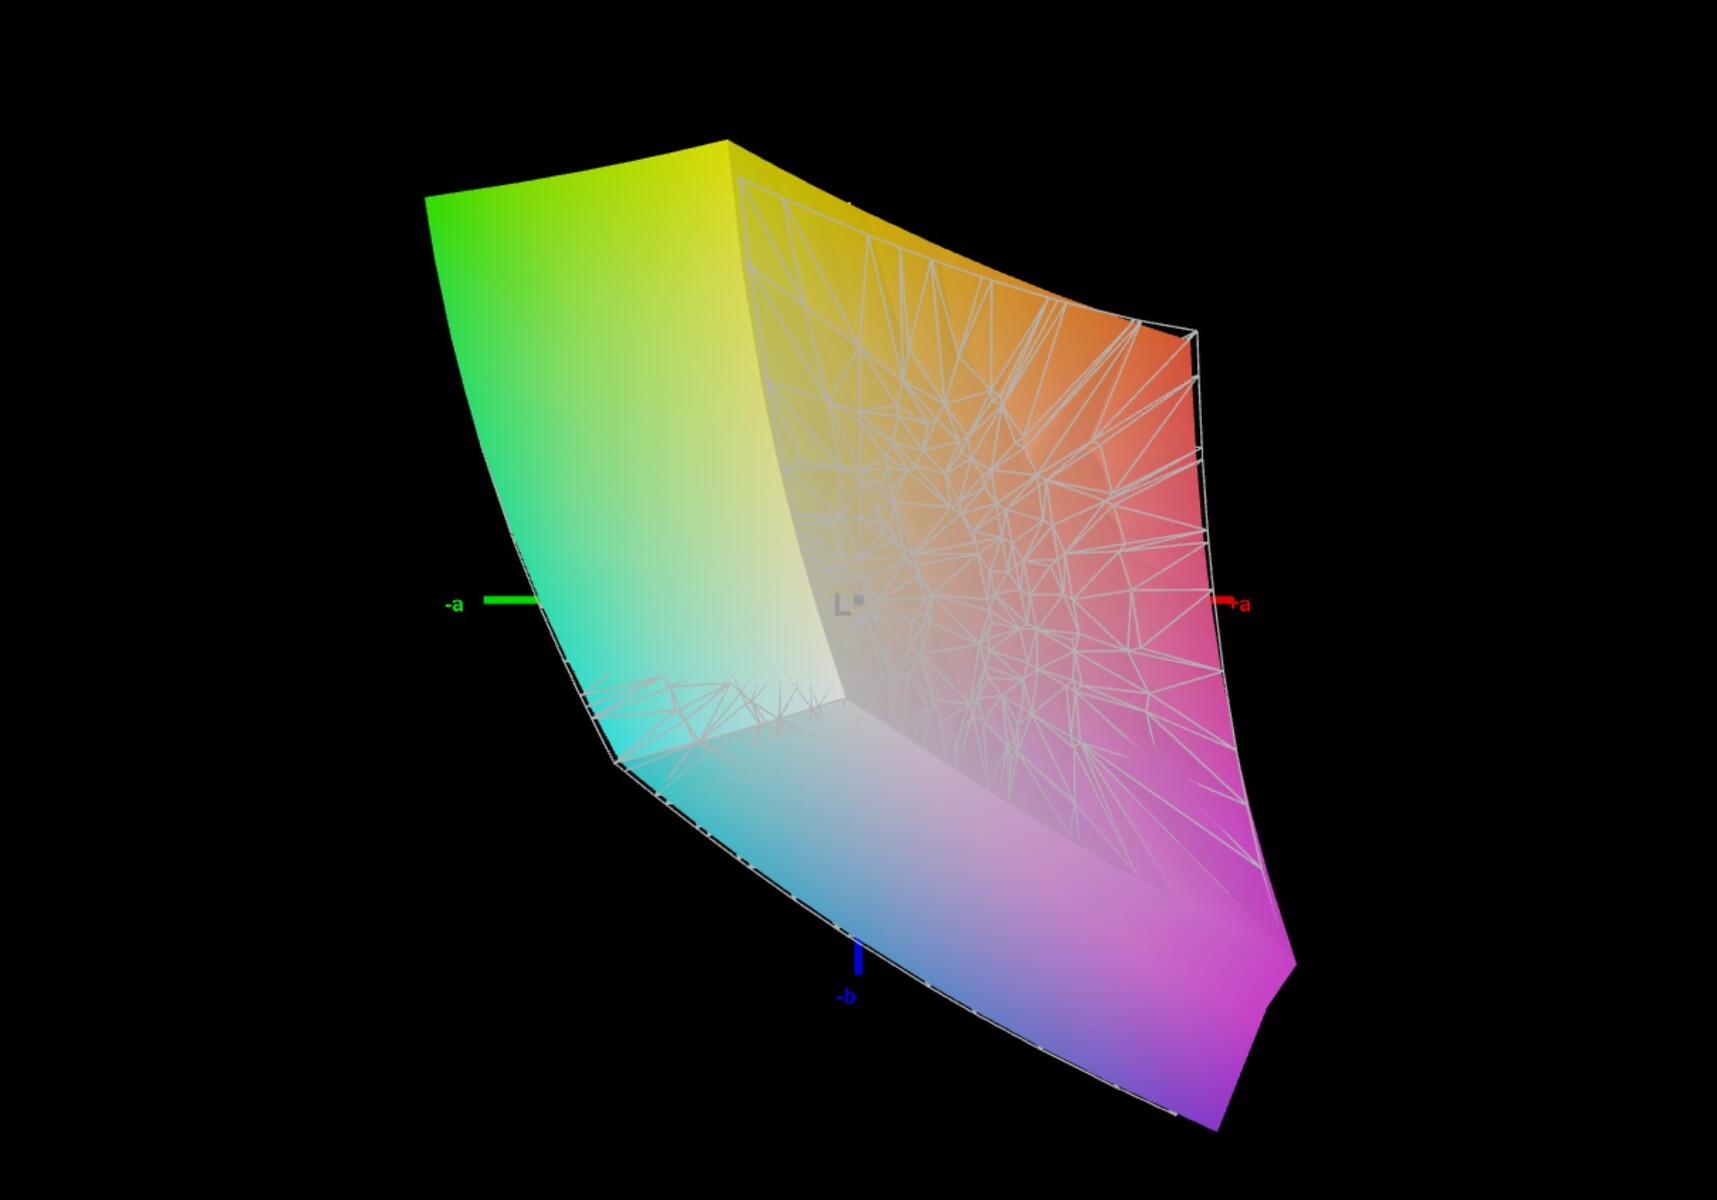
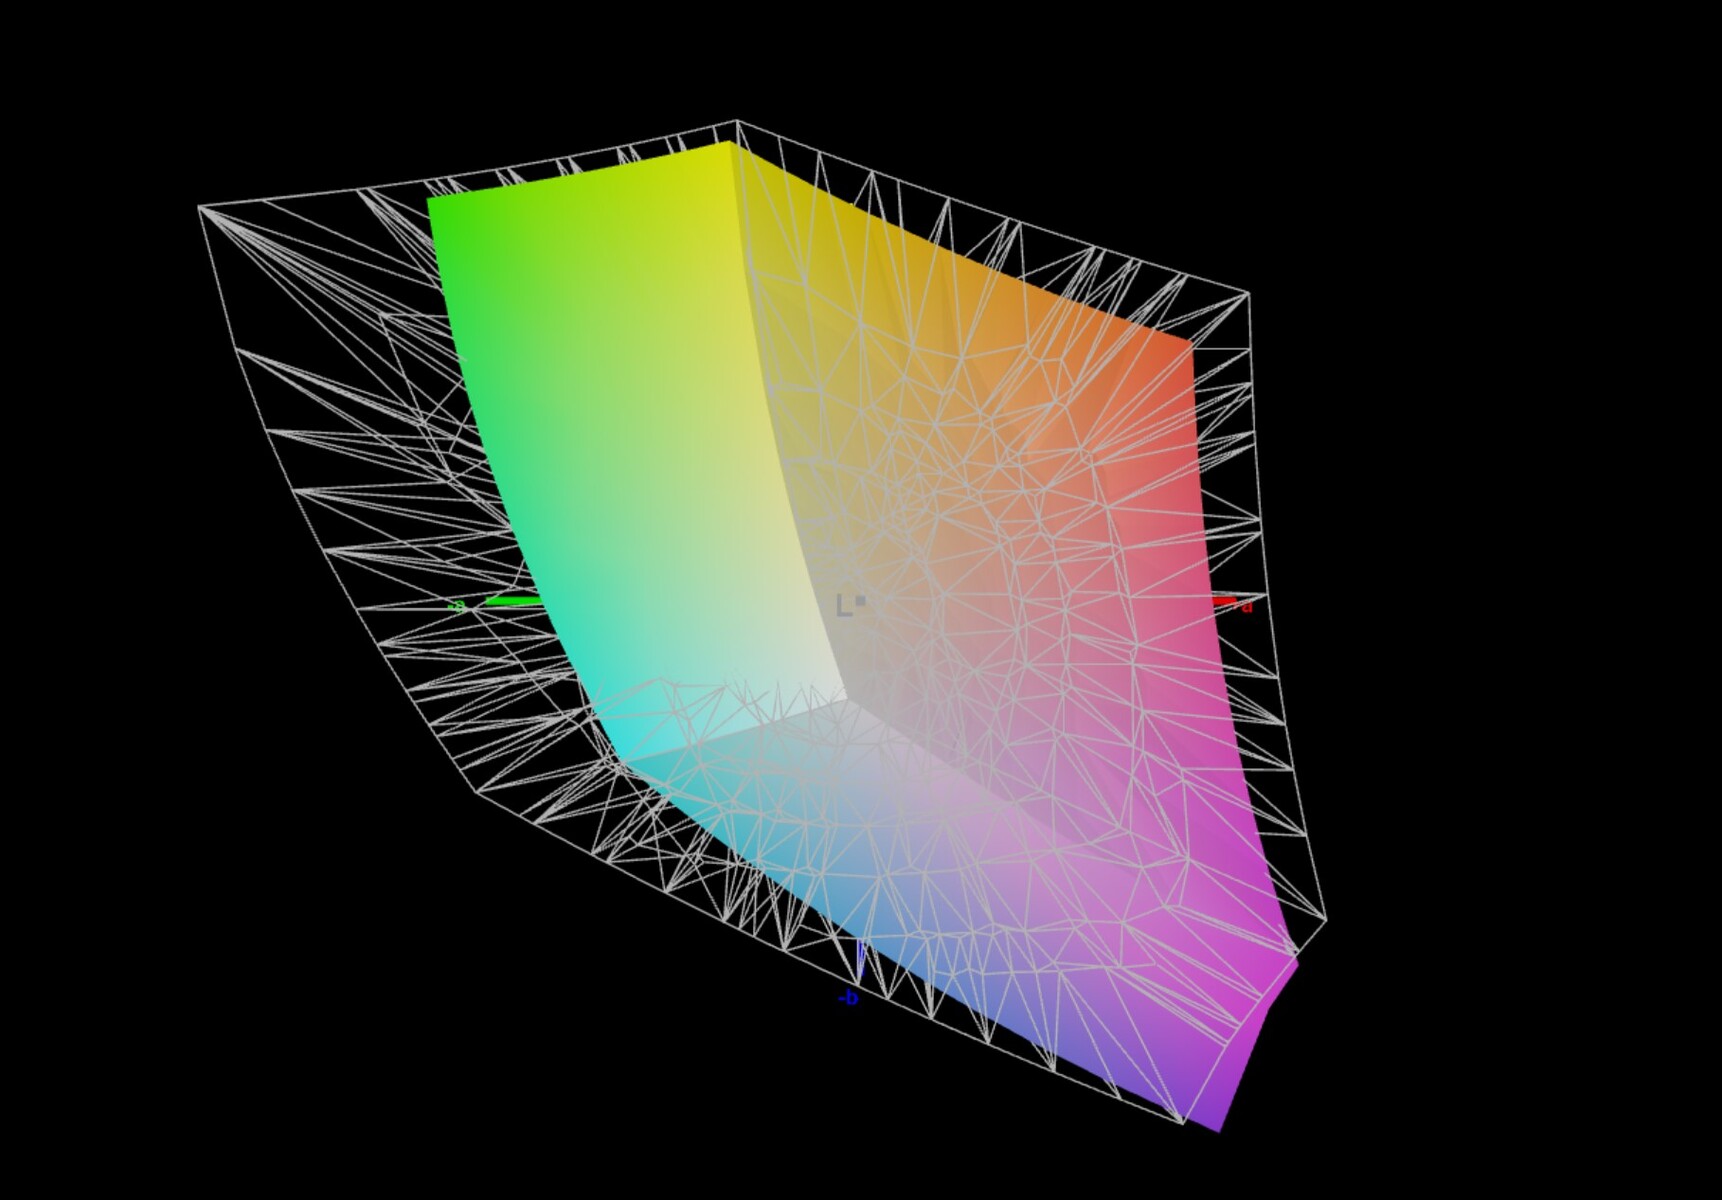
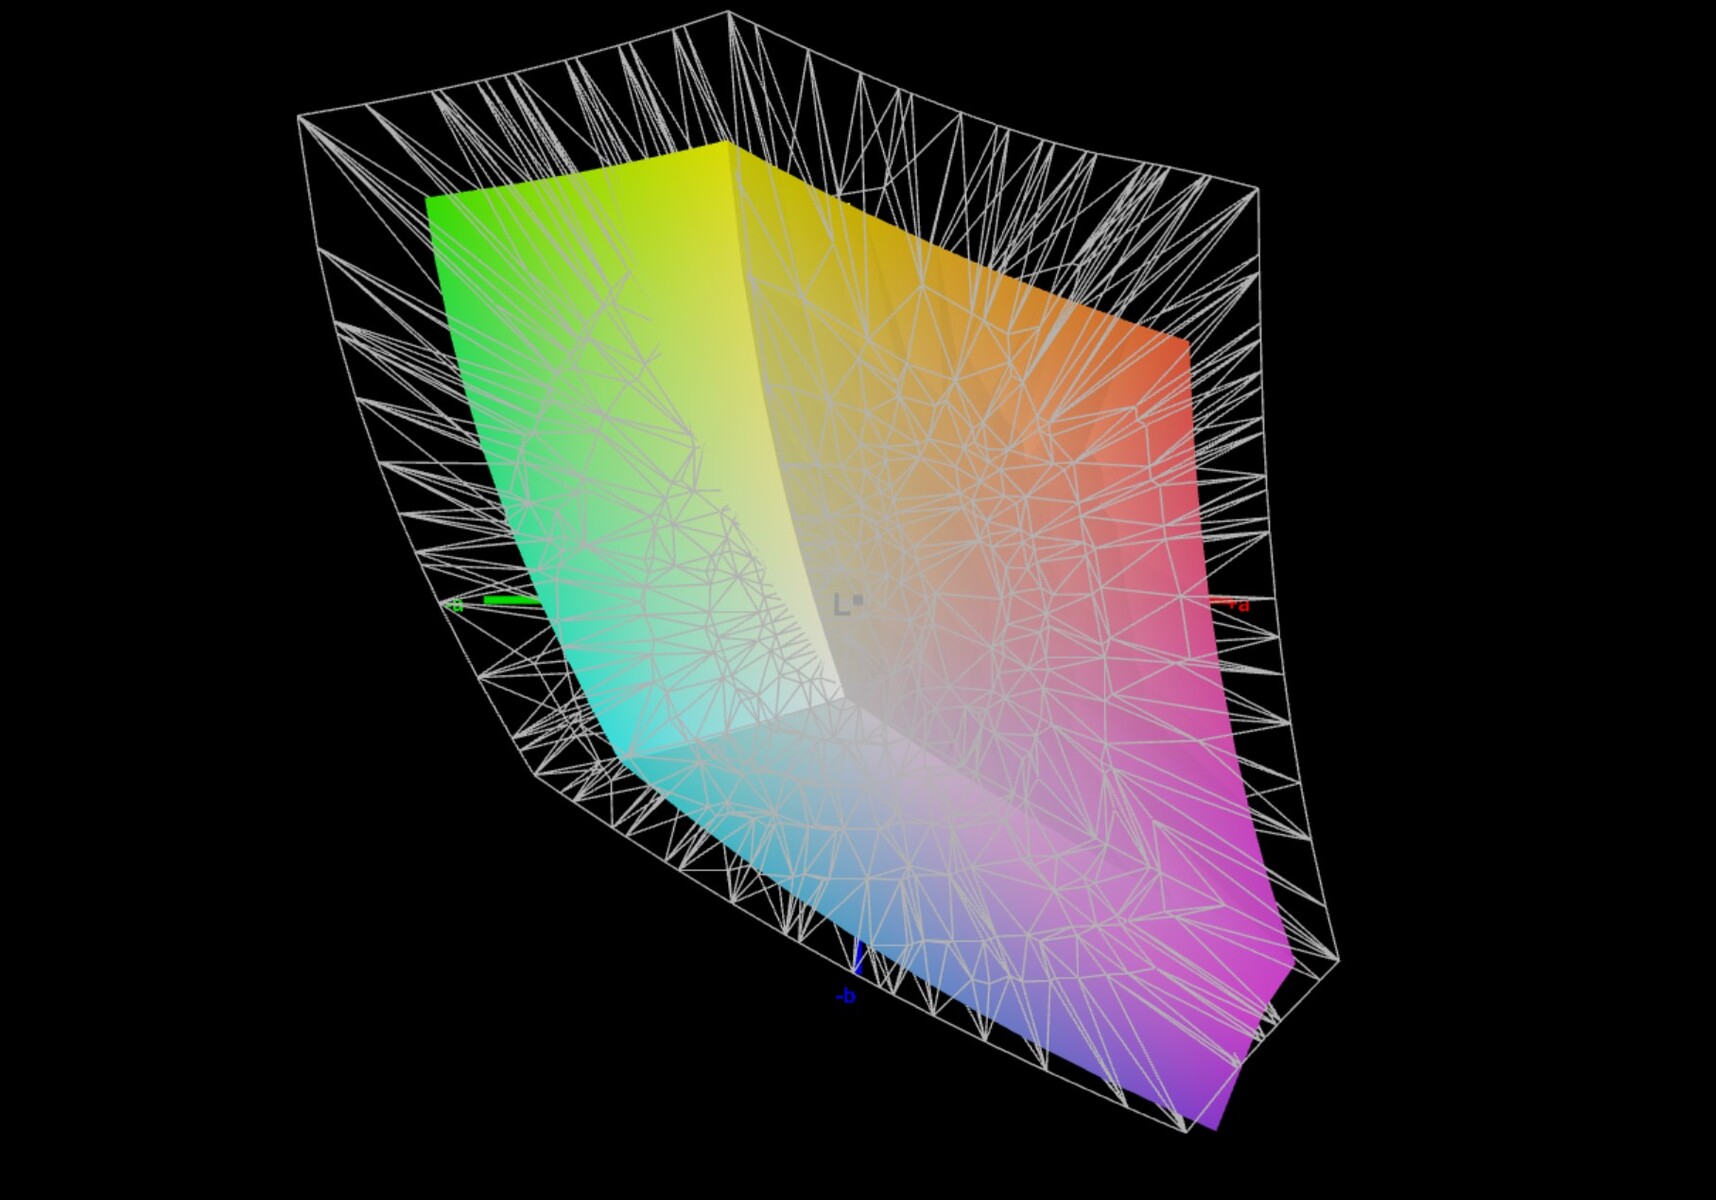
70.1% AdobeRGB 1998 (Argyll 3D)
98.2% sRGB (Argyll 3D)
68.7% Display P3 (Argyll 3D)
Gamma: 2.28
CCT: 6909 K
| Corsair Voyager a1600 BOE0A3B, IPS, 2560x1600, 16" | Asus ROG Flow X16 GV601RW-M5082W AUO B160QAN02.S, Mini LED, 2560x1600, 16.1" | Lenovo Legion 7 16ARHA7 BOE CQ NE160QDM-NY1, IPS, 2560x1600, 16" | Acer Predator Triton 500 SE PT516-52s-70KX NE160QDM-NZ2, IPS LED, 2560x1600, 16" | HP Omen 16-b1090ng BOE09E5, IPS, 2560x1440, 16.1" | Lenovo Legion 7 16IAX7-82TD004SGE NE160QDM-NY1, IPS, 2560x1600, 16" | |
|---|---|---|---|---|---|---|
| Display | 25% | -5% | 22% | 3% | 1% | |
| Display P3 Coverage (%) | 68.7 | 99.82 45% | 63.7 -7% | 97.3 42% | 71 3% | 69.3 1% |
| sRGB Coverage (%) | 98.2 | 99.99 2% | 95.3 -3% | 100 2% | 97.9 0% | 98.2 0% |
| AdobeRGB 1998 Coverage (%) | 70.1 | 90.21 29% | 65.7 -6% | 84.9 21% | 73.3 5% | 70.8 1% |
| Response Times | 3% | 17% | 15% | -3% | 24% | |
| Response Time Grey 50% / Grey 80% * (ms) | 13 ? | 11 ? 15% | 9.2 ? 29% | 13.8 ? -6% | 14.5 ? -12% | 12.6 ? 3% |
| Response Time Black / White * (ms) | 10 ? | 11 ? -10% | 9.6 ? 4% | 6.4 ? 36% | 9.4 ? 6% | 5.6 ? 44% |
| PWM Frequency (Hz) | 7400 ? | |||||
| Screen | 71% | 12% | 29% | -30% | 18% | |
| Brightness middle (cd/m²) | 355 | 498 40% | 478.8 35% | 498 40% | 335 -6% | 547 54% |
| Brightness (cd/m²) | 340 | 502 48% | 477 40% | 468 38% | 319 -6% | 523 54% |
| Brightness Distribution (%) | 91 | 94 3% | 90 -1% | 80 -12% | 90 -1% | 88 -3% |
| Black Level * (cd/m²) | 0.53 | 0.11 79% | 0.43 19% | 0.36 32% | 0.28 47% | 0.44 17% |
| Contrast (:1) | 670 | 4527 576% | 1113 66% | 1383 106% | 1196 79% | 1243 86% |
| Colorchecker dE 2000 * | 2.43 | 1.87 23% | 2.24 8% | 1.77 27% | 4.38 -80% | 2.1 14% |
| Colorchecker dE 2000 max. * | 4.31 | 6.15 -43% | 4.49 -4% | 5.24 -22% | 9.48 -120% | 7 -62% |
| Colorchecker dE 2000 calibrated * | 1.14 | 1.94 -70% | 1.89 -66% | 0.63 45% | 1.33 -17% | 0.9 21% |
| Greyscale dE 2000 * | 2.62 | 3.15 -20% | 2.3 12% | 2.4 8% | 7 -167% | 3.2 -22% |
| Gamma | 2.28 96% | 330.95 1% | 2.25 98% | 2.14 103% | 2.103 105% | 2.23 99% |
| CCT | 6909 94% | 7294 89% | 6955 93% | 7046 92% | 6244 104% | 6979 93% |
| Całkowita średnia (program / ustawienia) | 33% /
51% | 8% /
9% | 22% /
26% | -10% /
-19% | 14% /
15% |
* ... im mniej tym lepiej
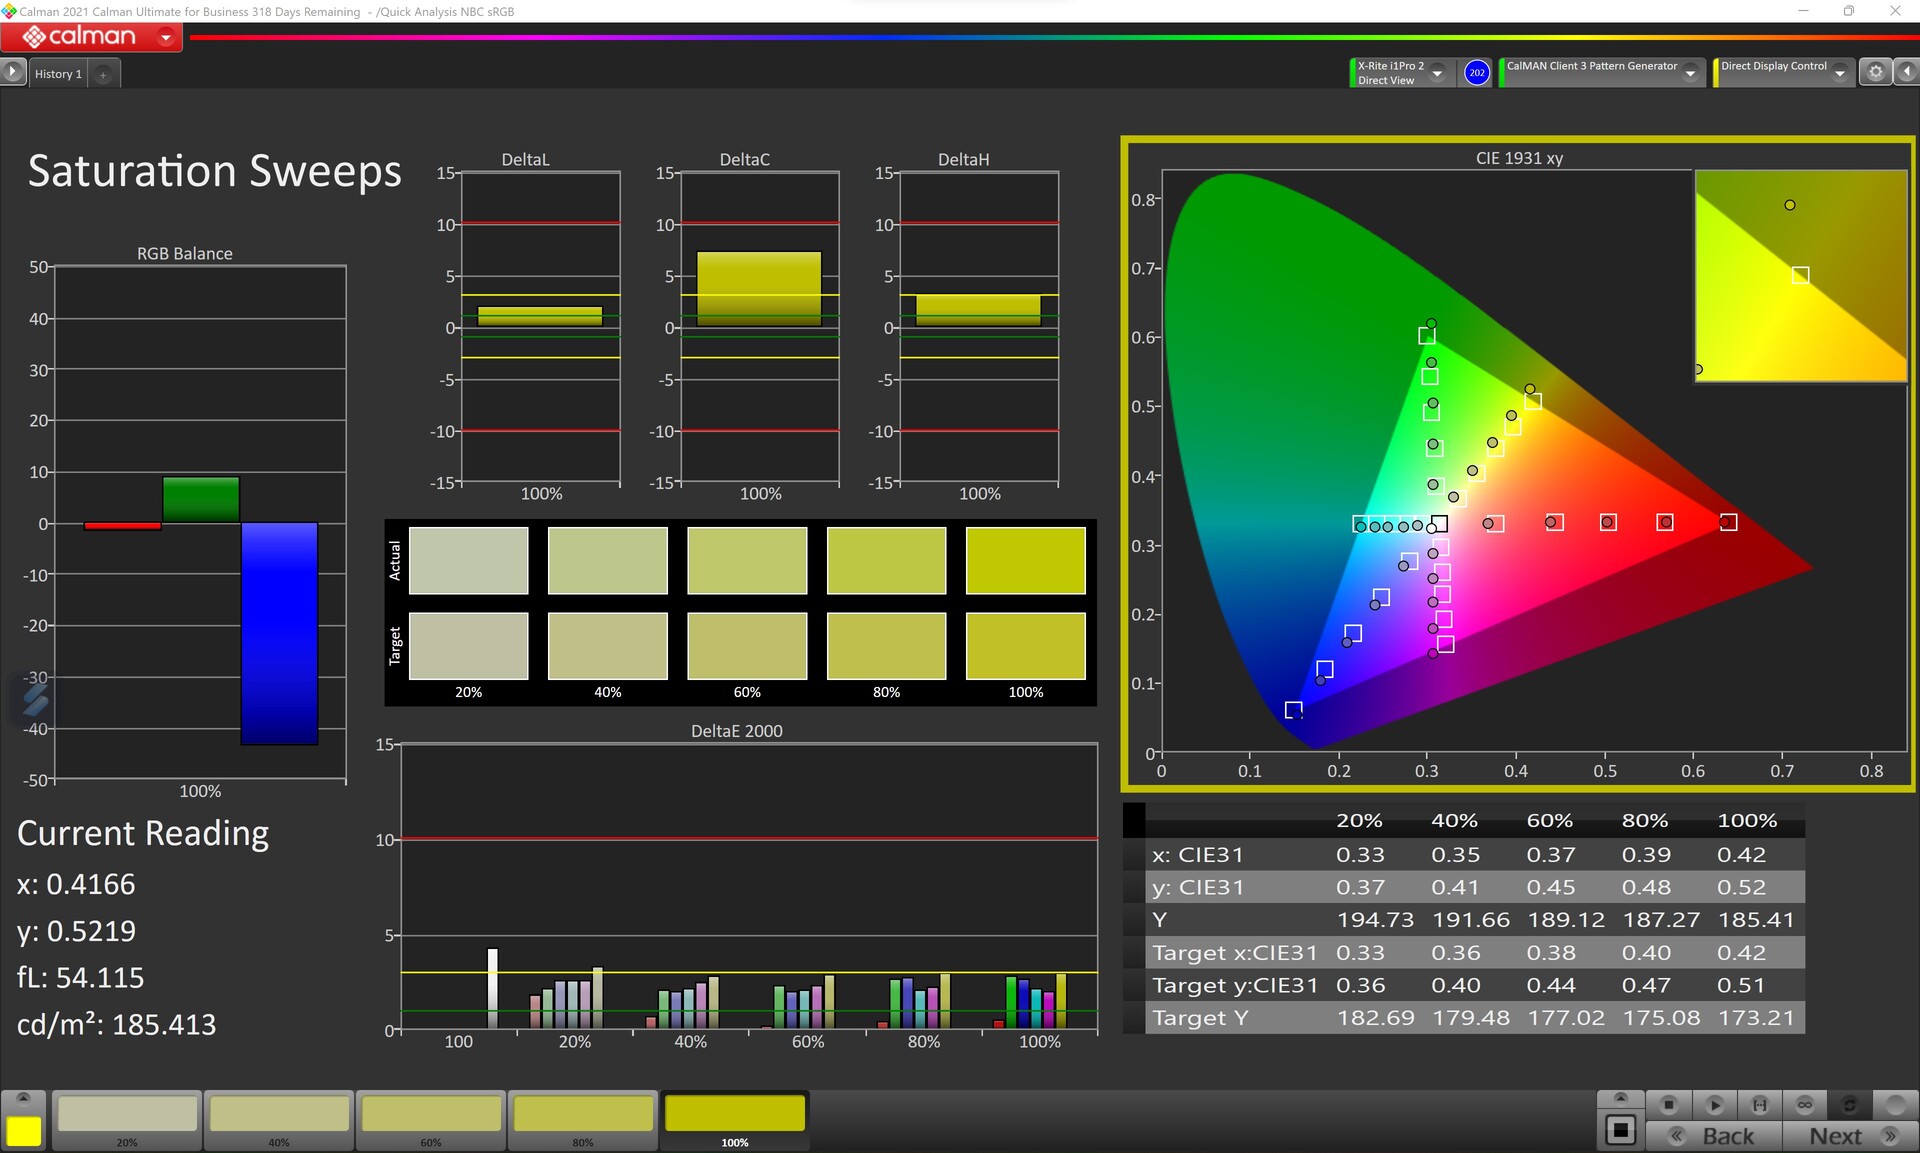
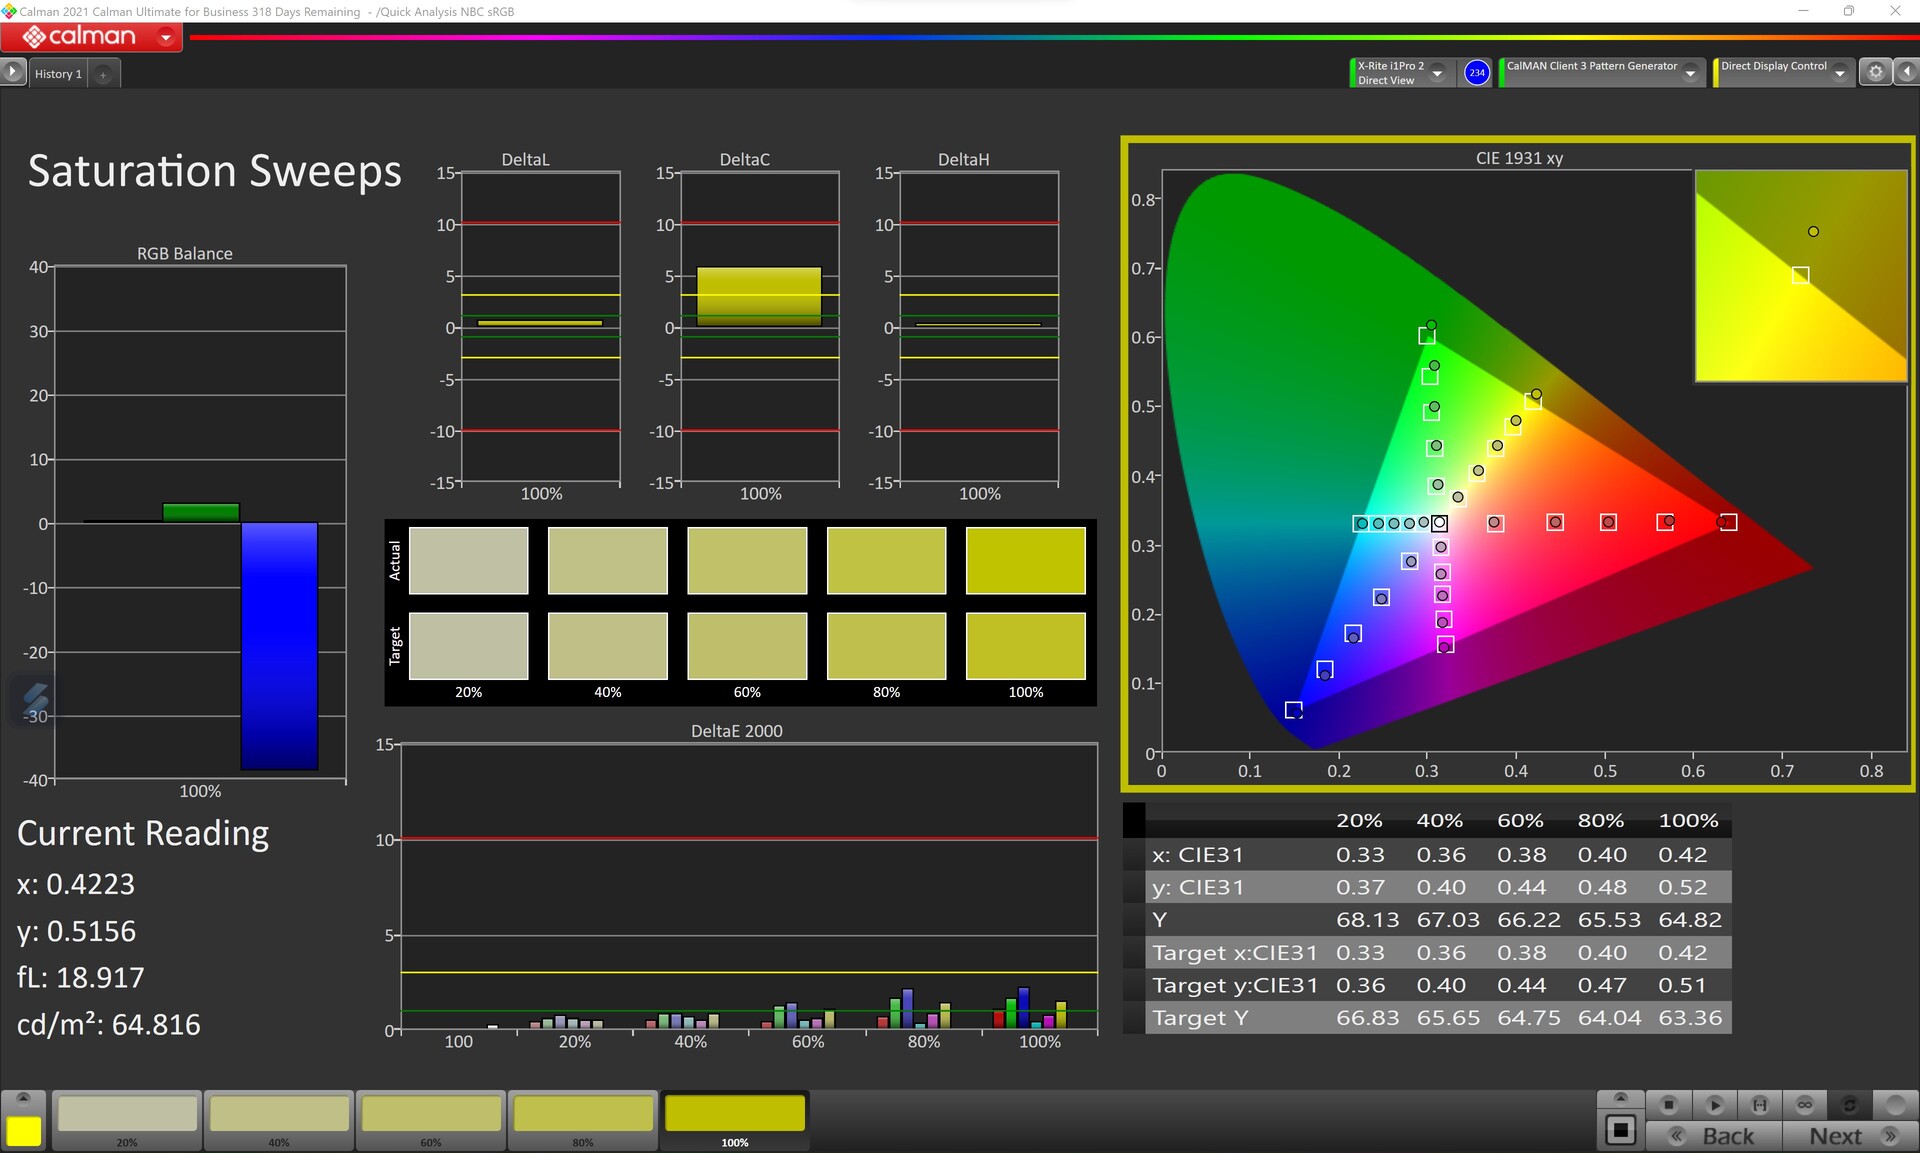
Jakość wyświetlacza jest dobra, a pokrycie przestrzeni barwnej również robi wrażenie. Jednak i w tym porównaniu konkurencja często oferuje lepsze wskaźniki. Nasz egzemplarz recenzencki może w tej dyscyplinie pokonać jedynie Lenovo Legion 7. Ze względu na dobre wartości Delta E-2000 skali szarości i kolorów w porównaniu z przestrzenią barw sRGB zakładamy, że Corsair dostarcza urządzenie ze skalibrowanym wyświetlaczem. Ręczna kalibracja ponownie nieco poprawia wartości Delta E-2000. Niemniej jednak cierpi na tym maksymalna jasność wyświetlacza. Zalecamy pozostawienie wyświetlacza w stanie dostawy. Pokrycie przestrzeni barw jest wystarczające do półprofesjonalnej edycji zdjęć i filmów.


Wyświetl czasy reakcji
| ↔ Czas reakcji od czerni do bieli | ||
|---|---|---|
| 10 ms ... wzrost ↗ i spadek ↘ łącznie | ↗ 5 ms wzrost | 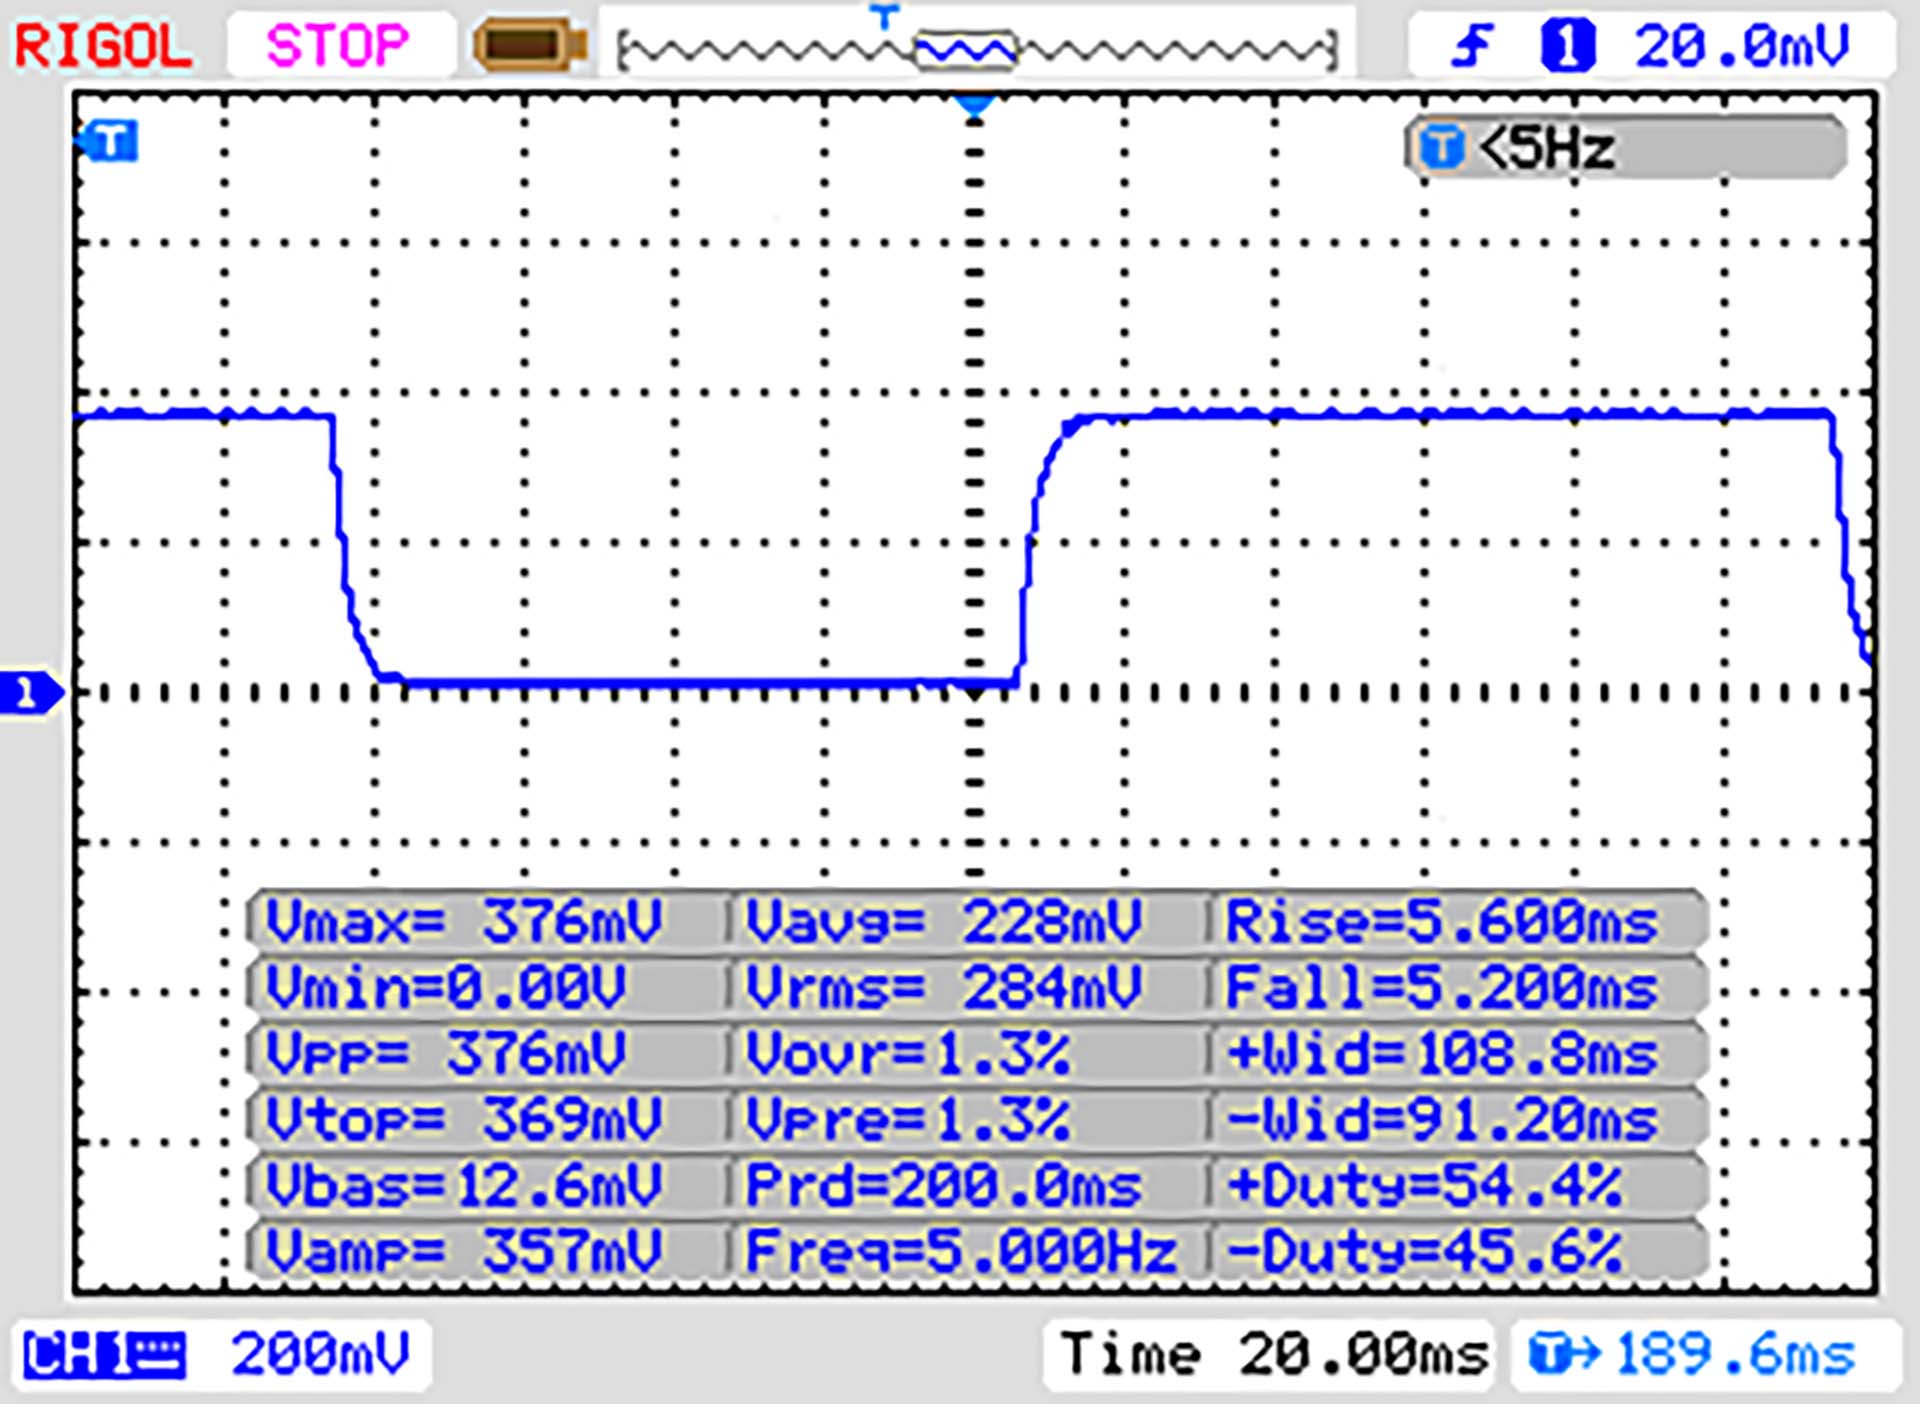 |
| ↘ 5 ms upadek | ||
| W naszych testach ekran wykazuje dobry współczynnik reakcji, ale może być zbyt wolny dla graczy rywalizujących ze sobą. Dla porównania, wszystkie testowane urządzenia wahają się od 0.1 (minimum) do 240 (maksimum) ms. » 27 % wszystkich urządzeń jest lepszych. Oznacza to, że zmierzony czas reakcji jest lepszy od średniej wszystkich testowanych urządzeń (19.9 ms). | ||
| ↔ Czas reakcji 50% szarości do 80% szarości | ||
| 13 ms ... wzrost ↗ i spadek ↘ łącznie | ↗ 7 ms wzrost | 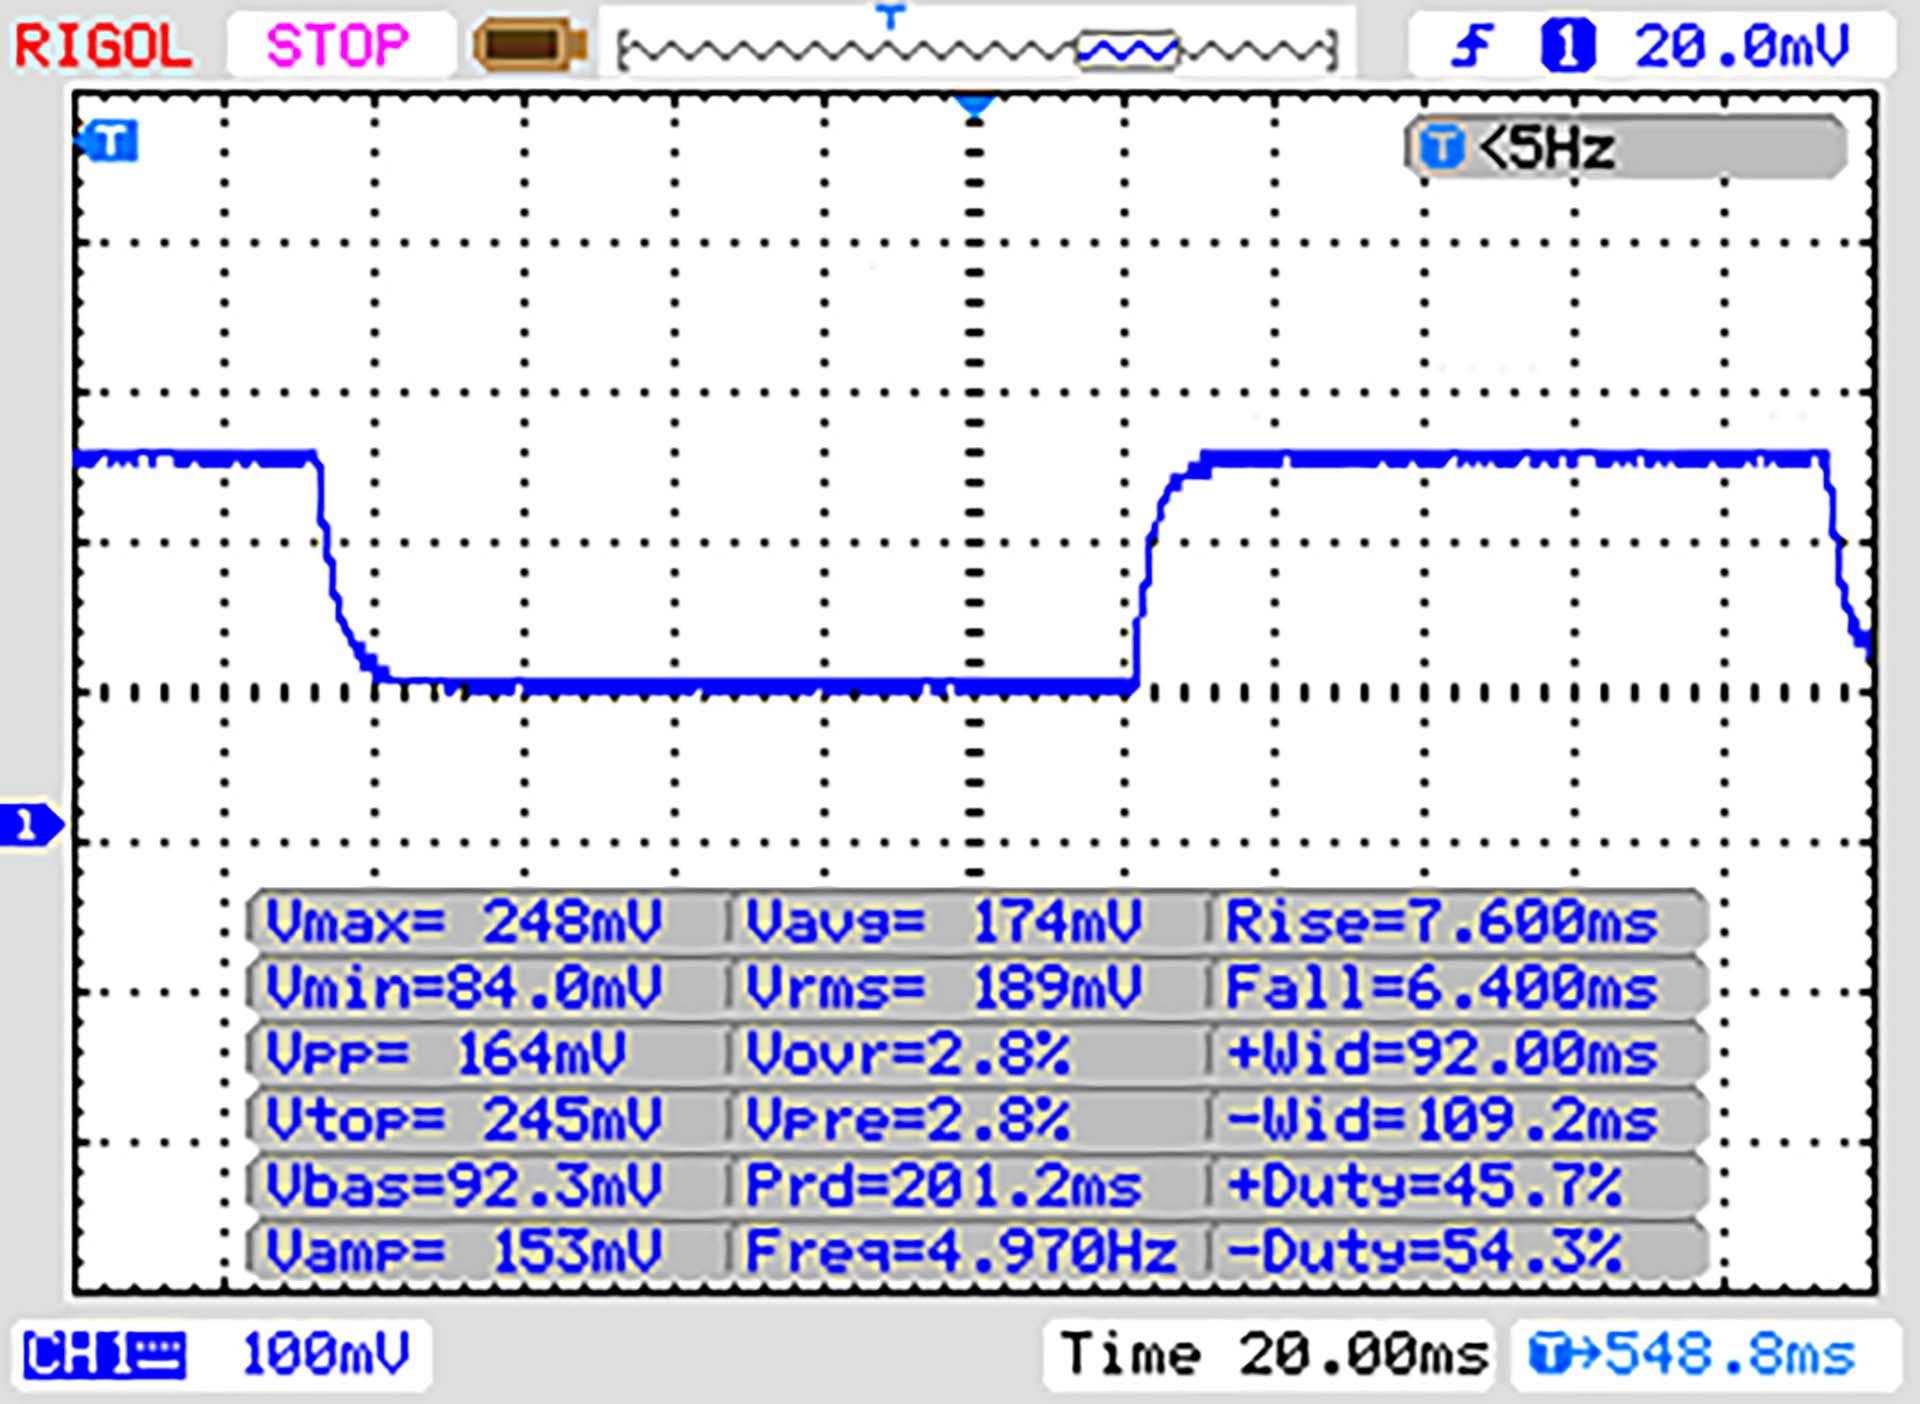 |
| ↘ 6 ms upadek | ||
| W naszych testach ekran wykazuje dobry współczynnik reakcji, ale może być zbyt wolny dla graczy rywalizujących ze sobą. Dla porównania, wszystkie testowane urządzenia wahają się od 0.165 (minimum) do 636 (maksimum) ms. » 26 % wszystkich urządzeń jest lepszych. Oznacza to, że zmierzony czas reakcji jest lepszy od średniej wszystkich testowanych urządzeń (31.1 ms). | ||
Migotanie ekranu / PWM (modulacja szerokości impulsu)
| Migotanie ekranu/nie wykryto PWM | 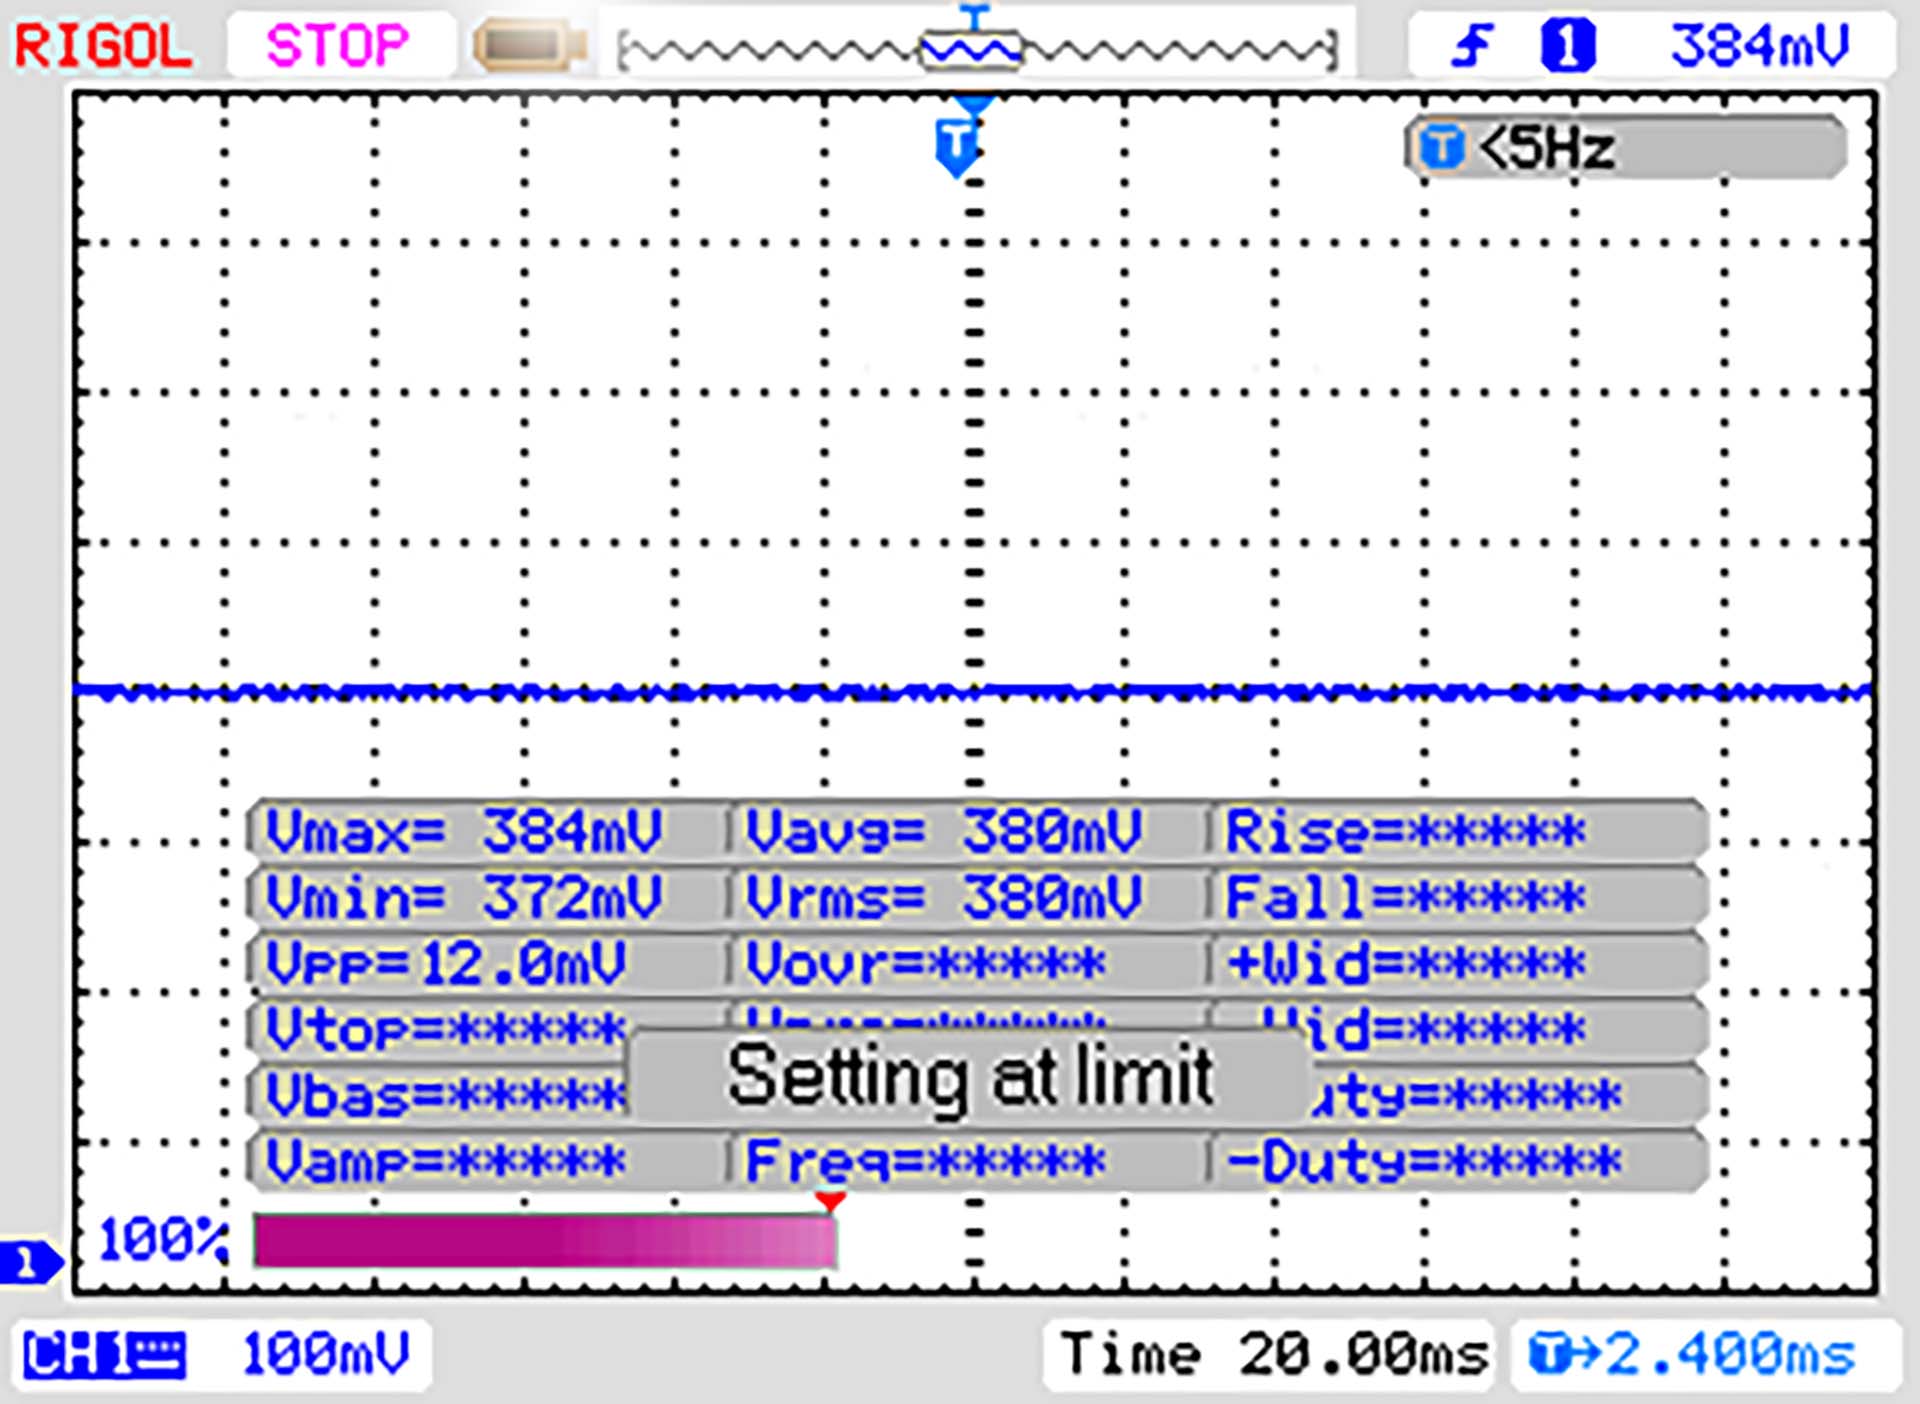 | ||
Dla porównania: 52 % wszystkich testowanych urządzeń nie używa PWM do przyciemniania wyświetlacza. Jeśli wykryto PWM, zmierzono średnio 7794 (minimum: 5 - maksimum: 343500) Hz. | |||
Zasadniczo matowa powierzchnia wyświetlacza nadaje się do użytku na zewnątrz. Na jej niekorzyść przemawia jednak stosunkowo niska jasność wyświetlacza.
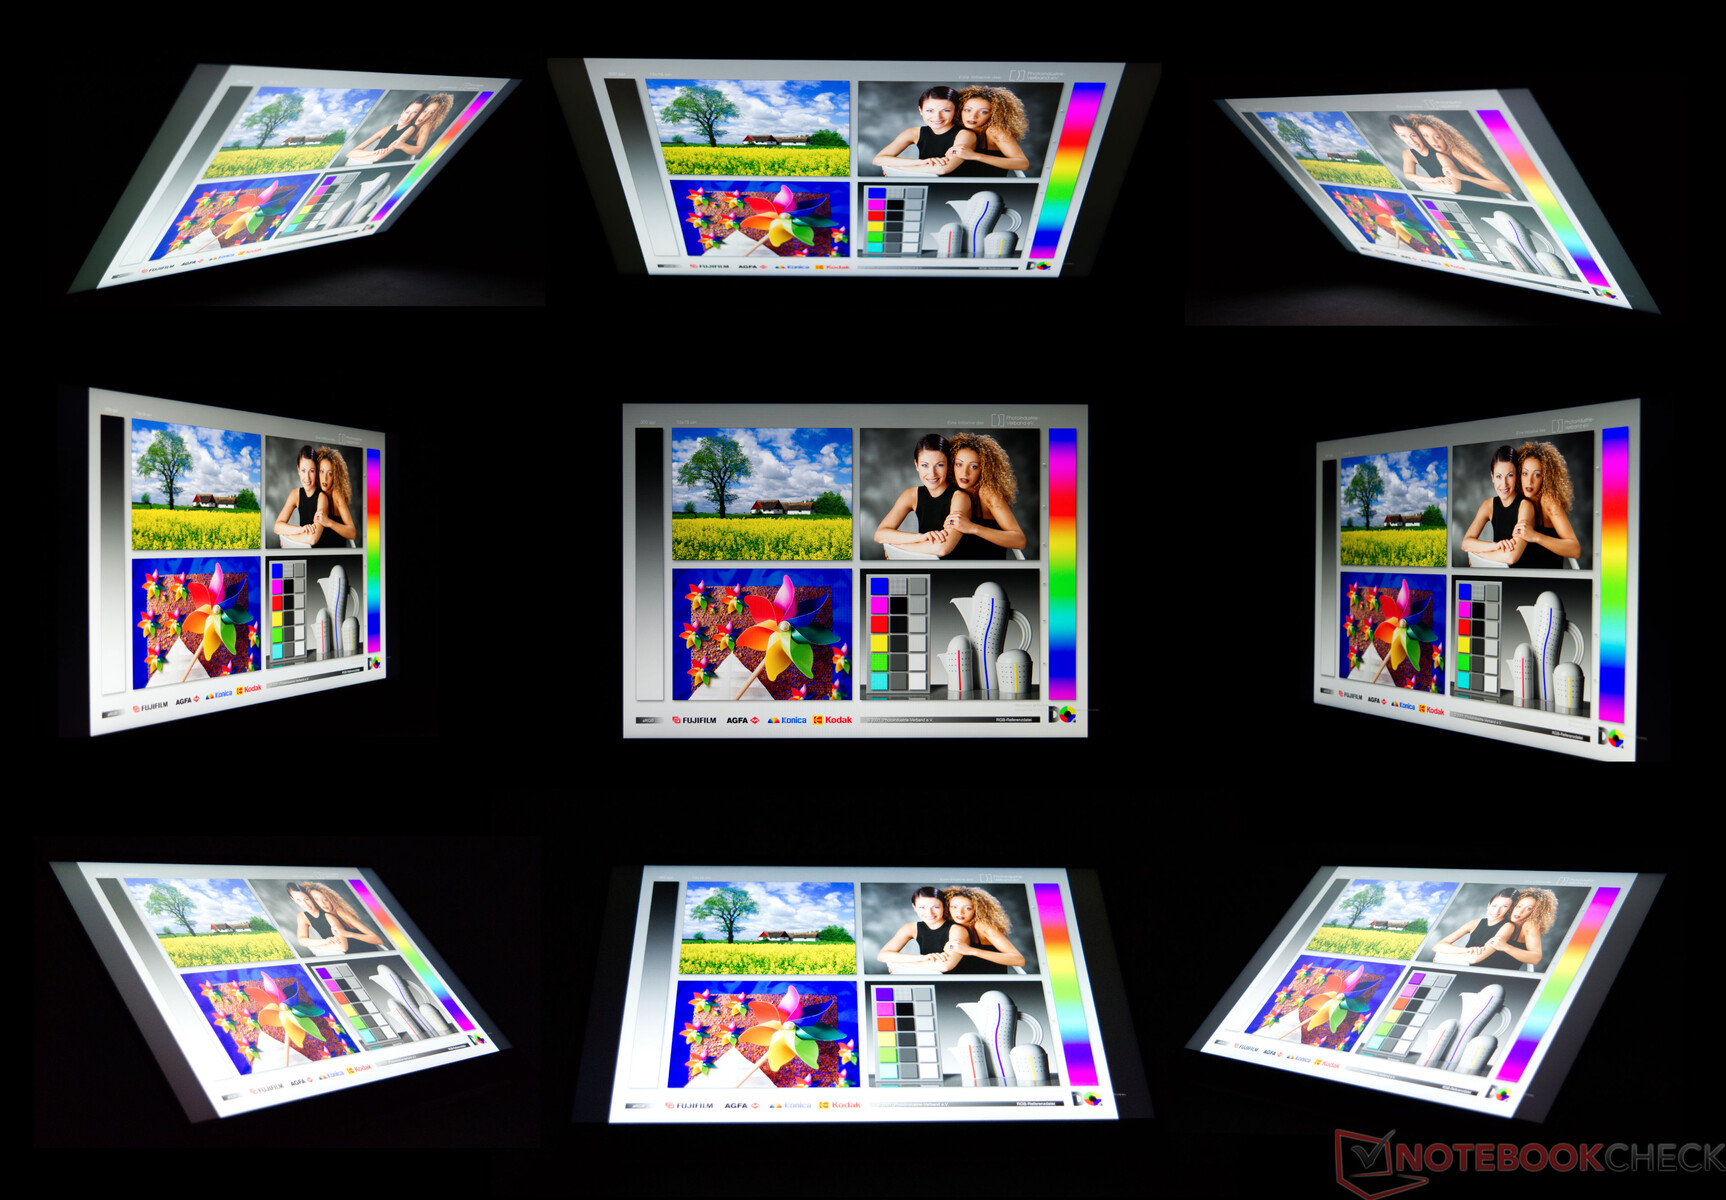
Test kątów widzenia pokazuje wynik typowy dla panelu IPS. Niewielkie zmiany kolorów są widoczne na obrazach w czterech narożnikach, które nie prowadzą do żadnych ograniczeń w normalnym użytkowaniu.
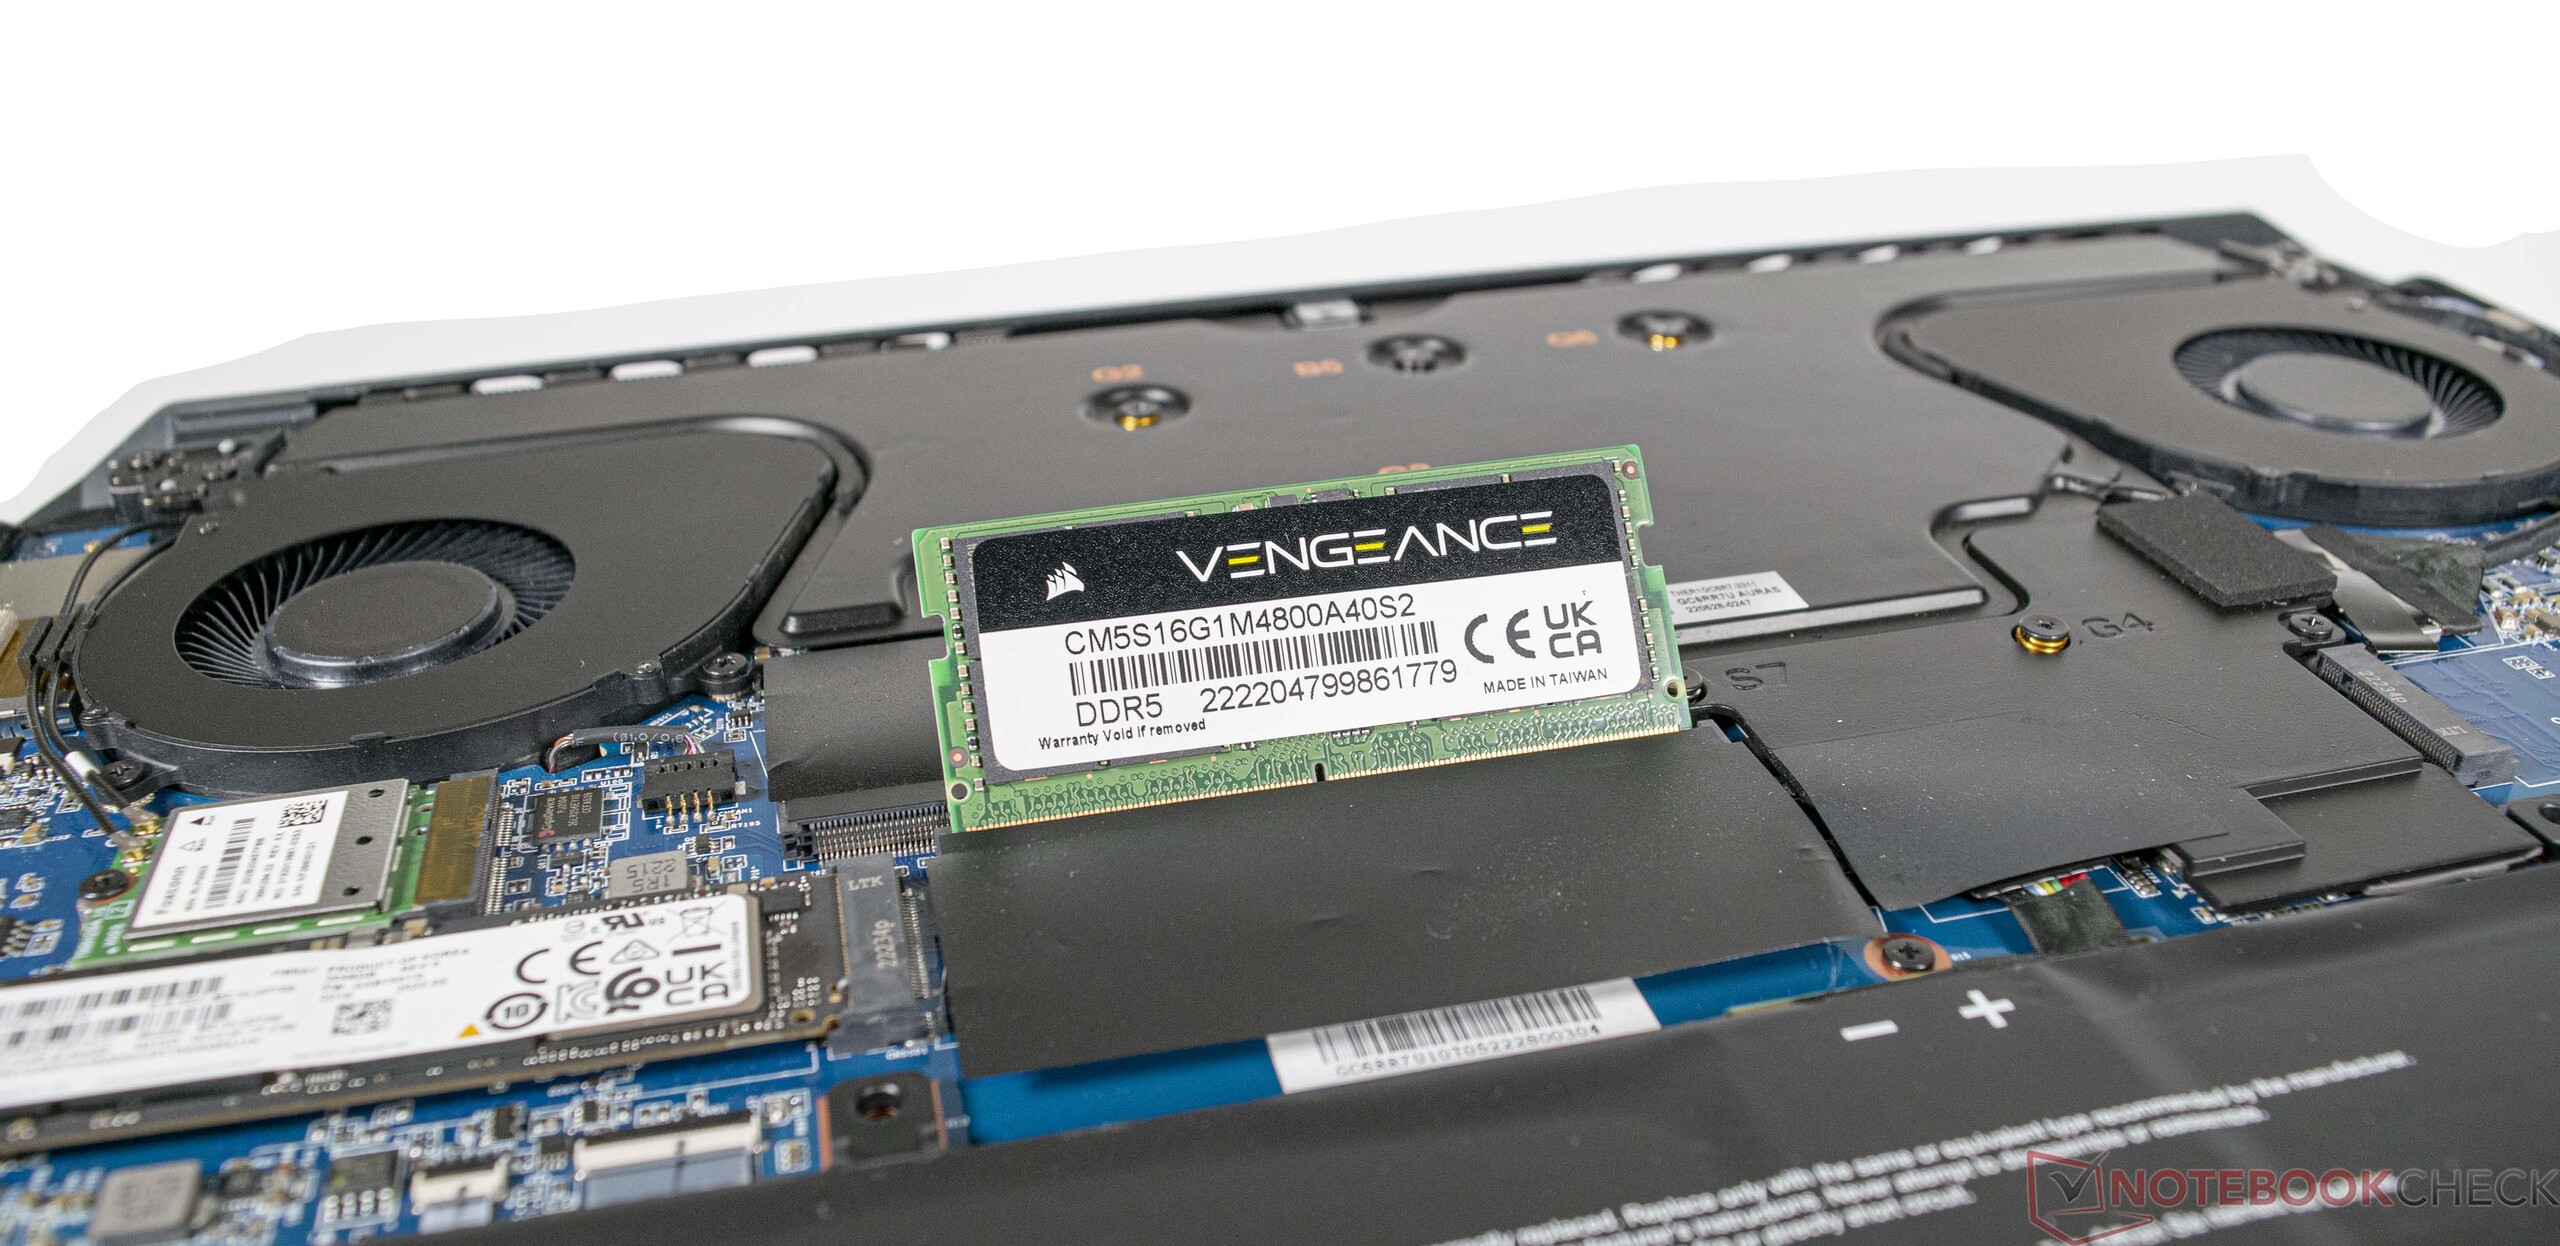
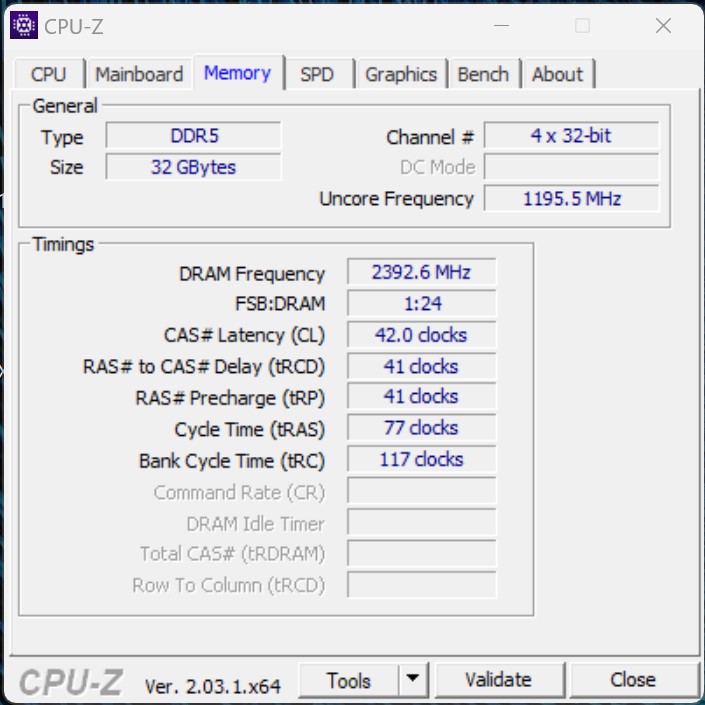
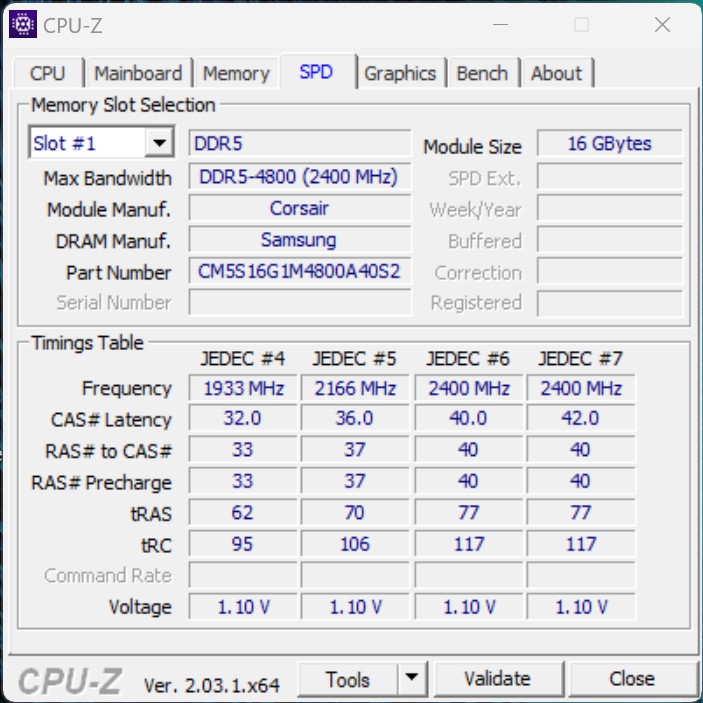
Wydajność - baza Rembrandt z dużą ilością pamięci RAM i przestrzeni dyskowej
Corsair Voyager a1600 z połączeniem m.in.AMD Ryzen 9 6900HSi AMD Radeon RX 6800Moferuje bardzo dobrą podstawę do rozgrywki w aktualne gry o maksymalnych detalach na laptopie. W połączeniu z 32 GB pamięci roboczej i dyskiem SSD o pojemności 2 TB użytkownik otrzymuje tutaj również przyzwoitą wydajność.
Warunki badania
Corsair oferuje możliwość korzystania z urządzenia w trzech różnych trybach, które można przełączać za pomocą oprogramowania iCUE. Dostępne opcje to Quiet
, Balanced
i Extreme.
Różnice polegają na maksymalnej wydajności dostępnej dla CPU i GPU nawet w połączeniu z technologią Smart Shift. Wszystkie testy wydajnościowe zostały przeprowadzone przy użyciu profilu Extreme
.
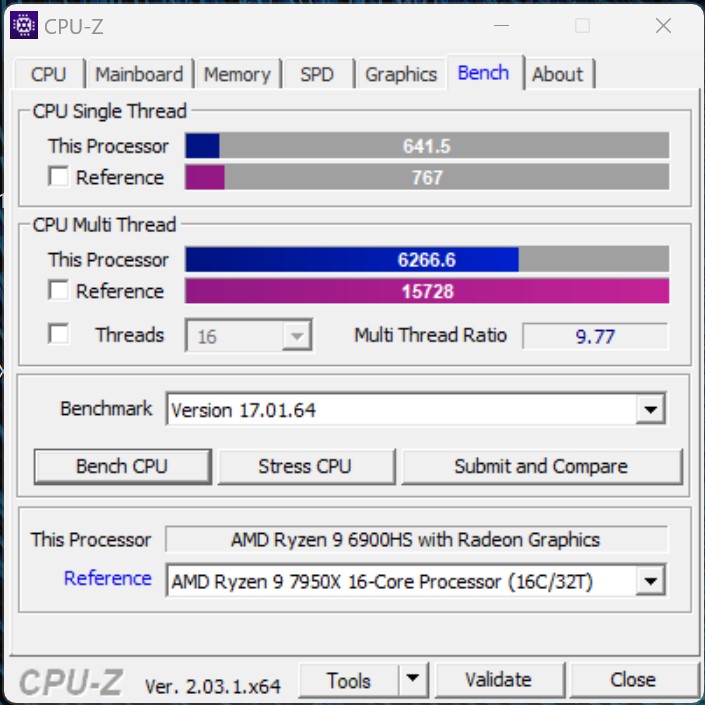
Procesor
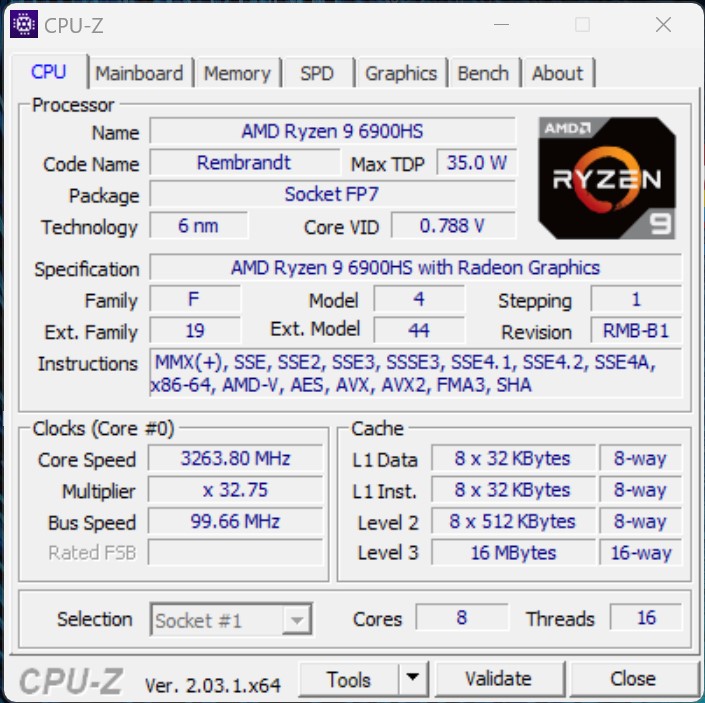
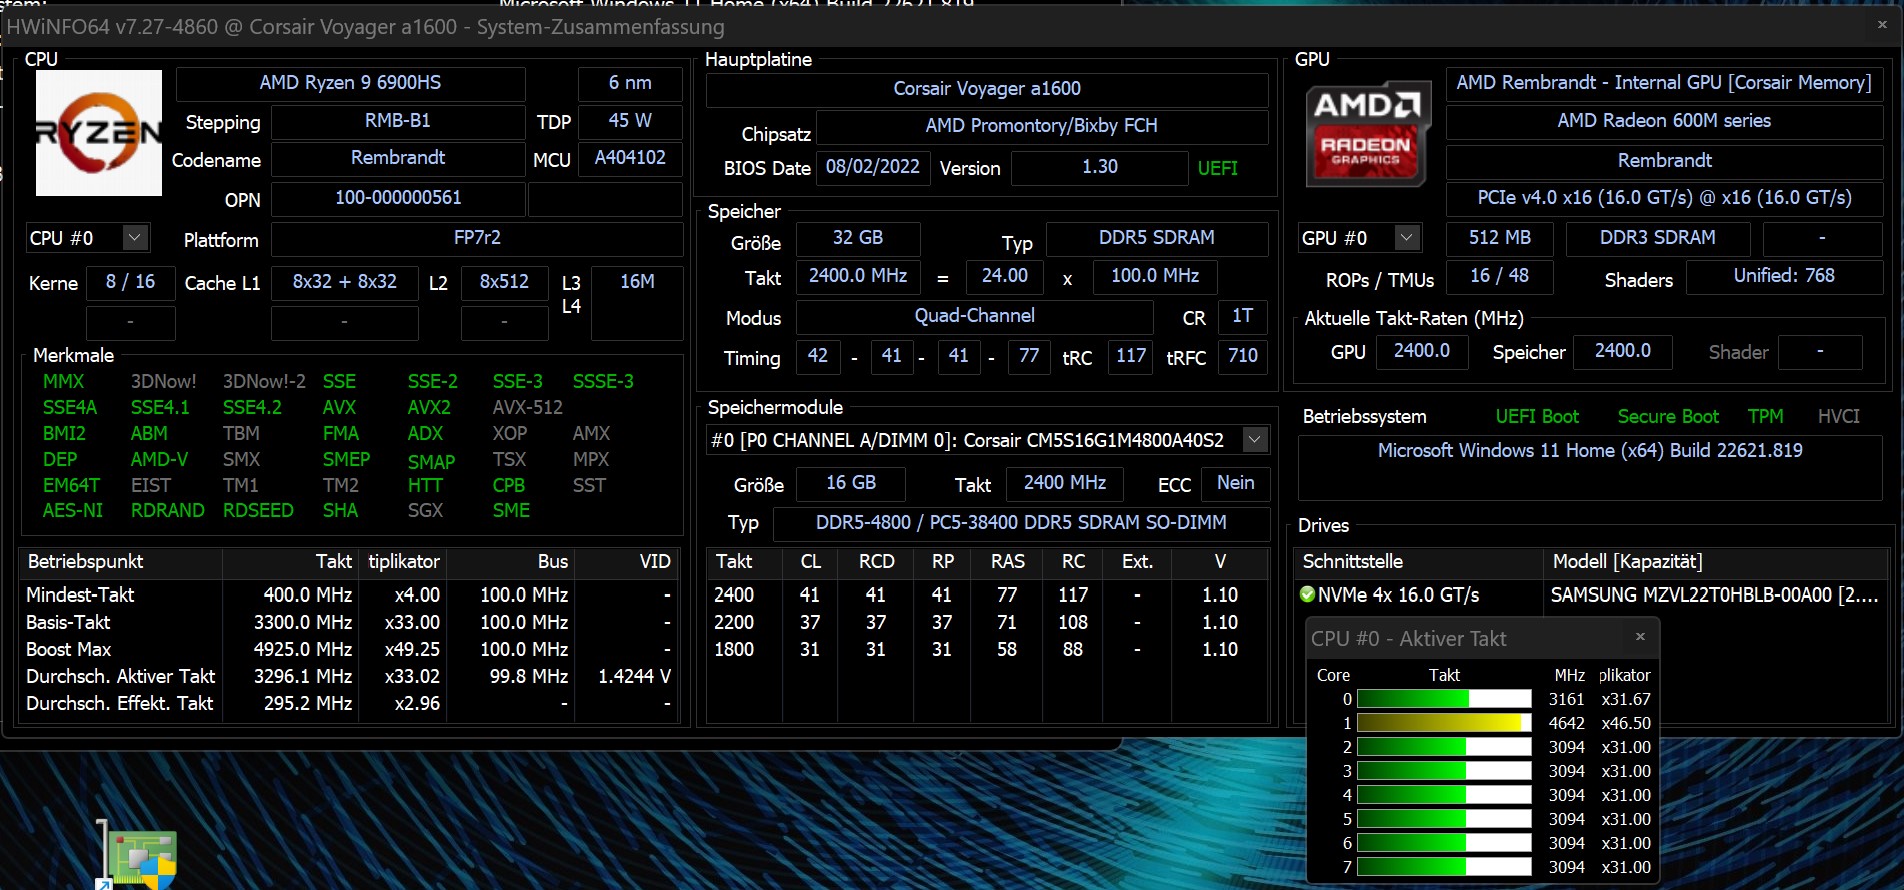
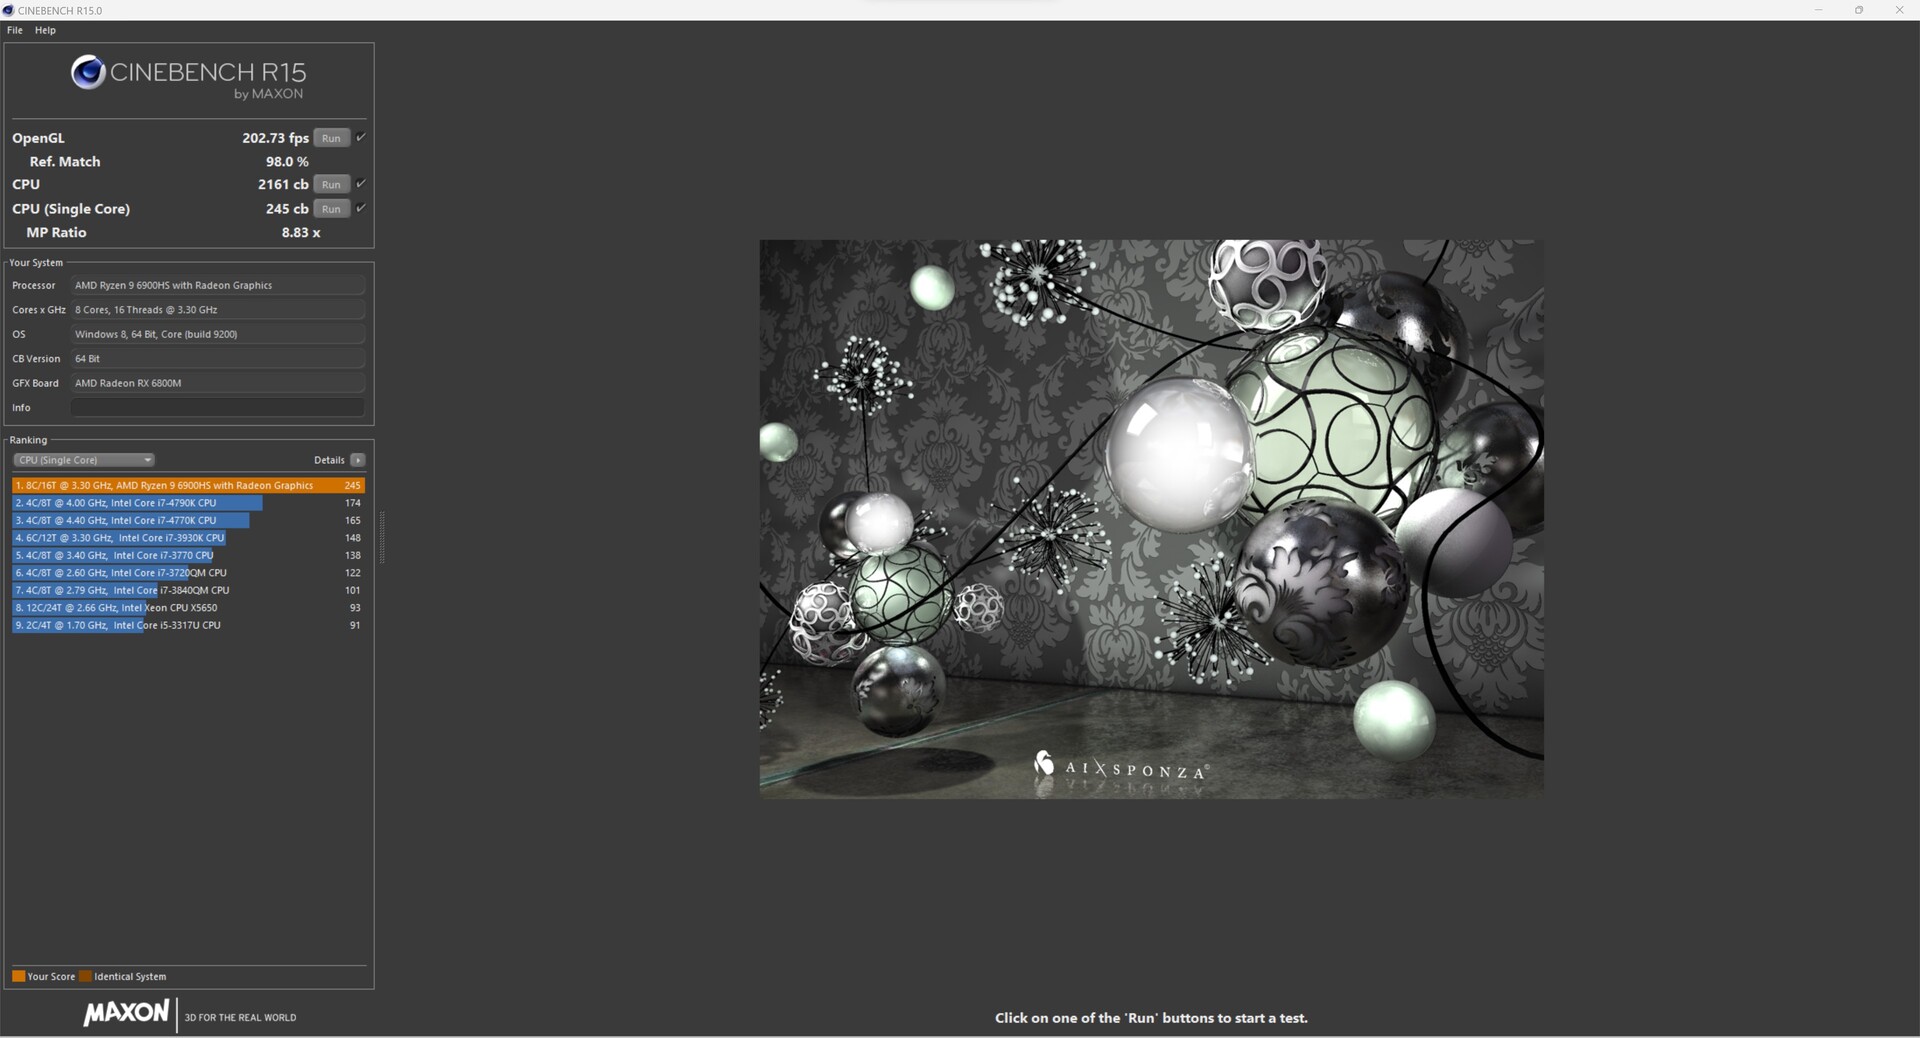
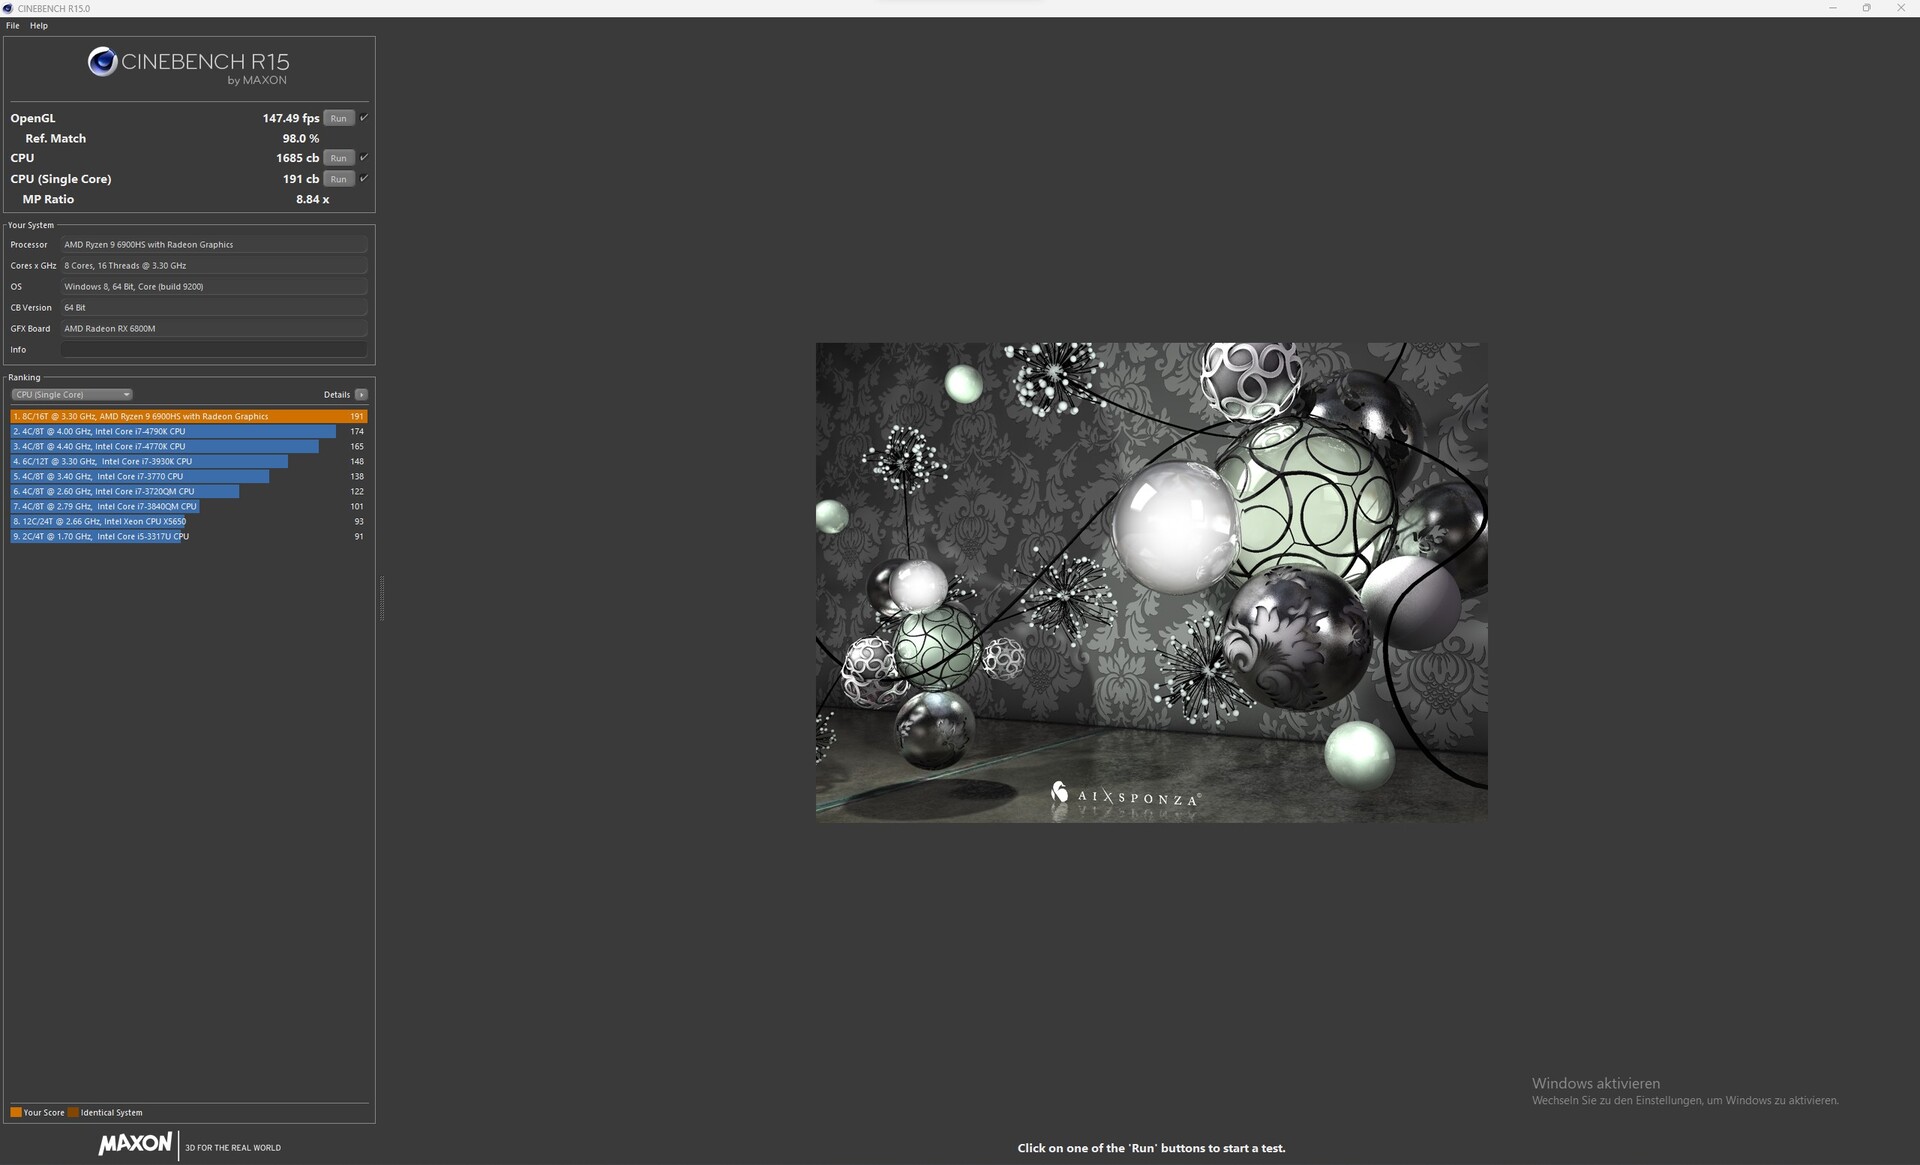
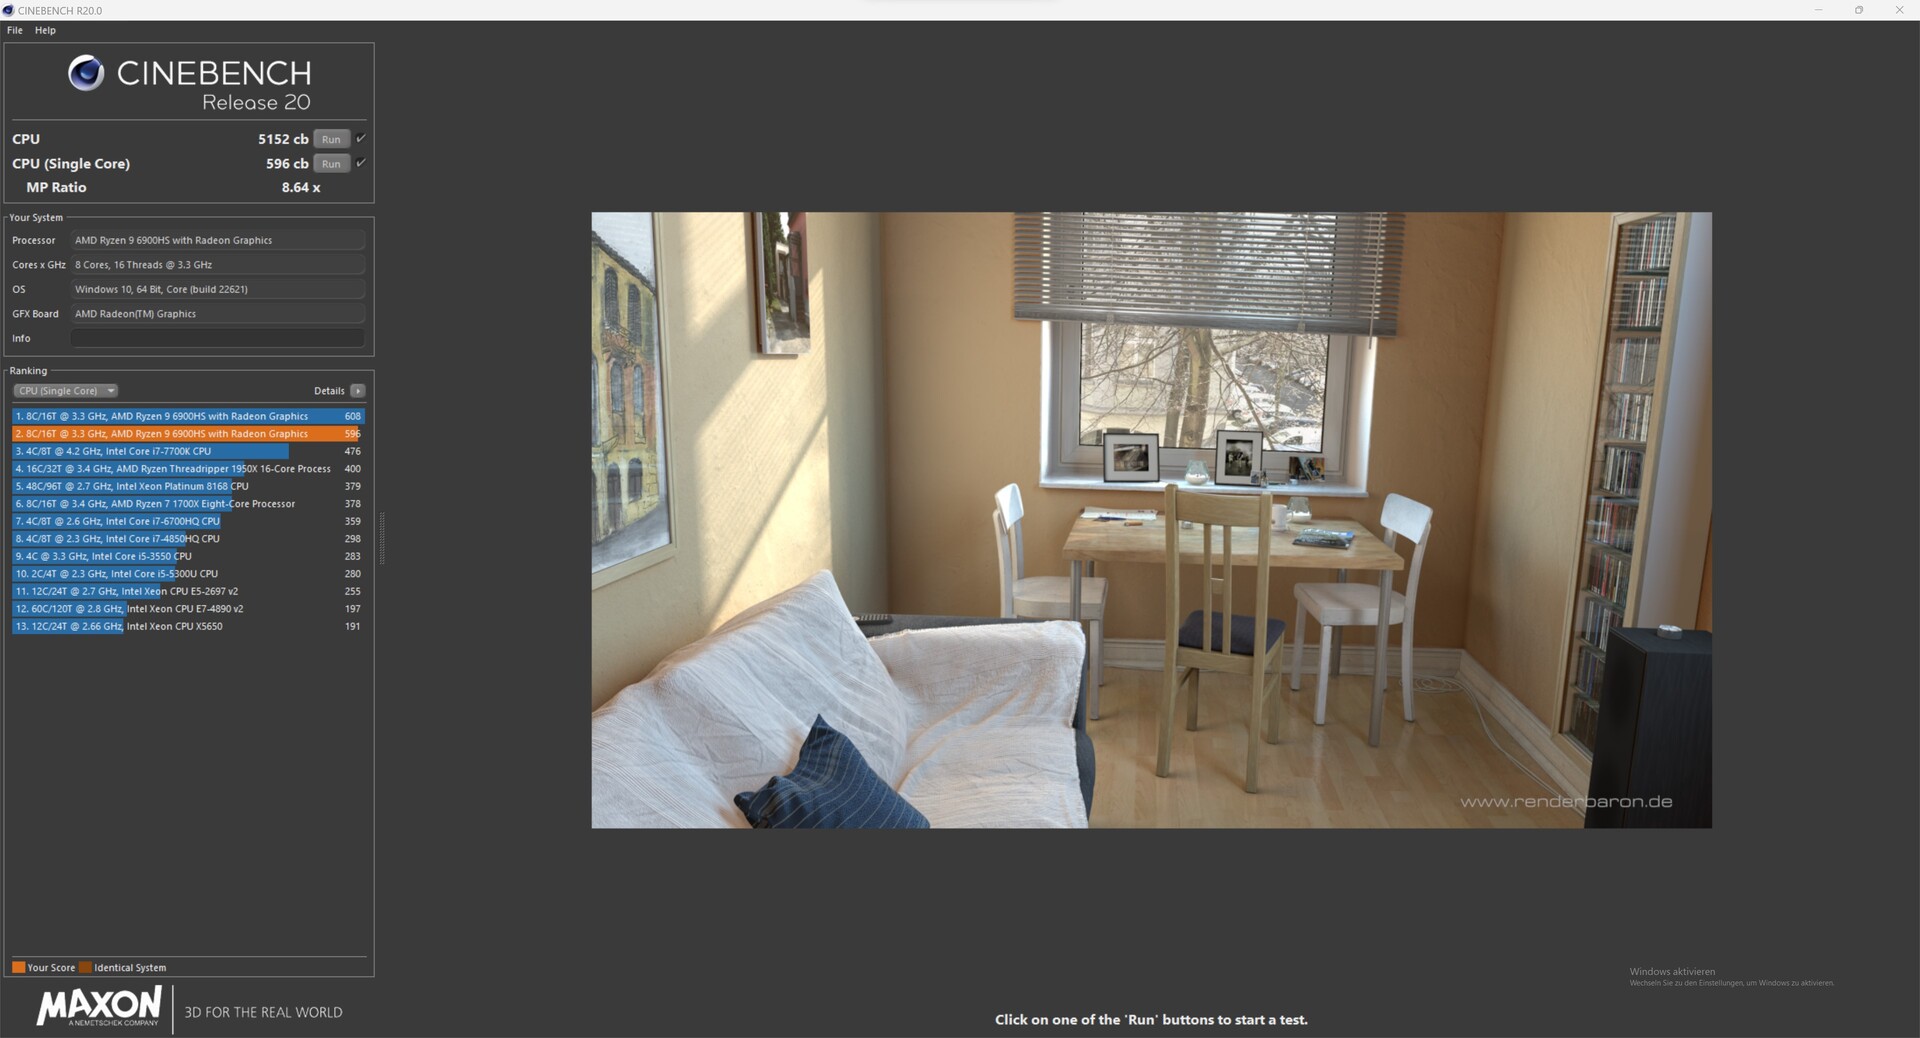
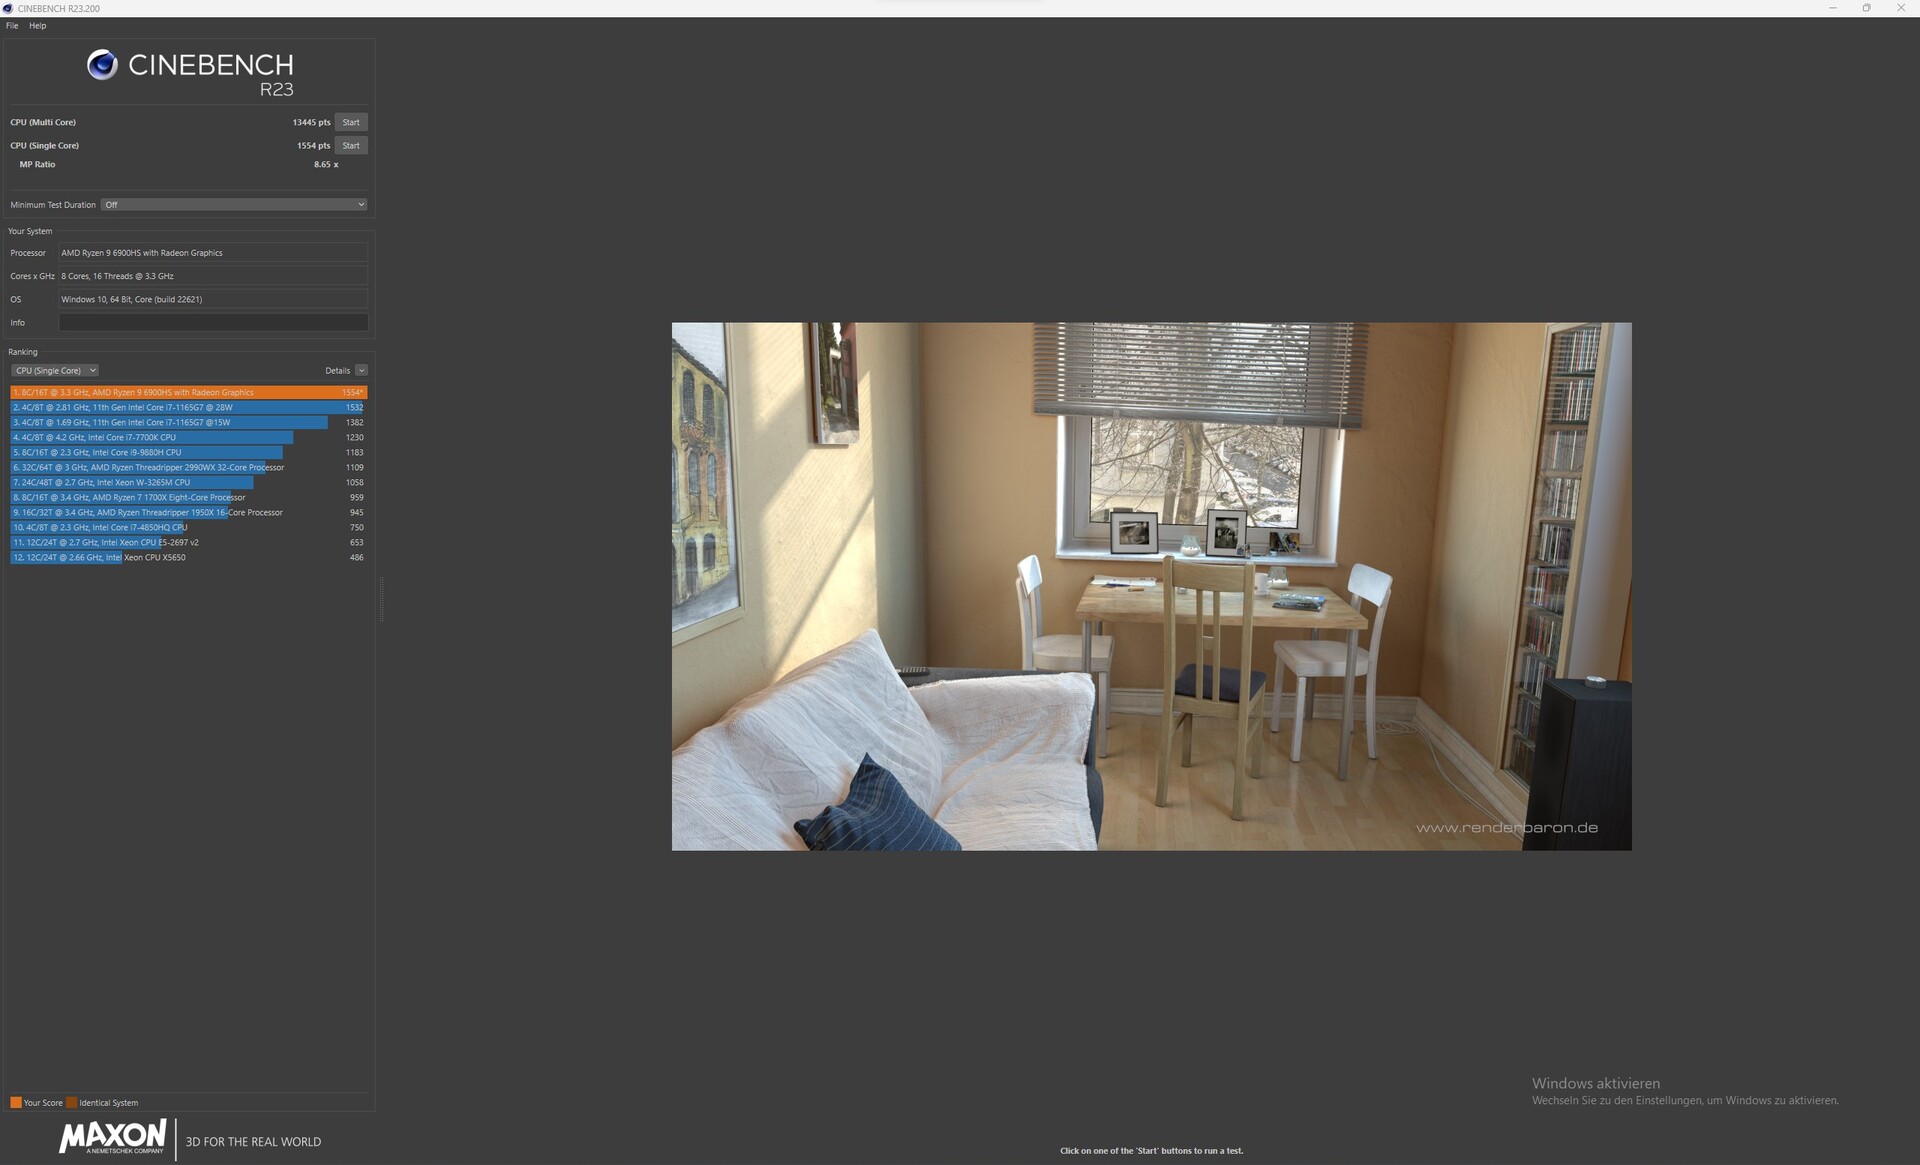
Na stronie .AMD Ryzen 9 6900HS jest procesorem ośmiordzeniowym i bazuje na obecnej architekturze Rembrandt. SoC taktuje z częstotliwością 3,3-4,9 GHz w trybie Boost i obsługuje SMT, dzięki czemu użytkownik ma do dyspozycji łącznie 16 wątków. W bezpośrednim porównaniu z konkurencją opartą na układach Intela, AMD Ryzen 9 6900HS ma trudne zadanie do utrzymania. Testowany egzemplarz nieco lepiej opanowuje jednak testy AIDA64 i zajmuje trzecie miejsce w rankingu.
Po kolejne benchmarki odsyłamy Was do naszegoTabeli porównawczej procesorów.
Cinebench R15 Multi loop
Cinebench R23: Multi Core | Single Core
Cinebench R20: CPU (Multi Core) | CPU (Single Core)
Cinebench R15: CPU Multi 64Bit | CPU Single 64Bit
Blender: v2.79 BMW27 CPU
7-Zip 18.03: 7z b 4 | 7z b 4 -mmt1
Geekbench 5.5: Multi-Core | Single-Core
HWBOT x265 Benchmark v2.2: 4k Preset
LibreOffice : 20 Documents To PDF
R Benchmark 2.5: Overall mean
| CPU Performance rating | |
| Średnia w klasie Gaming | |
| Lenovo Legion 7 16IAX7-82TD004SGE | |
| HP Omen 16-b1090ng | |
| Acer Predator Triton 500 SE PT516-52s-70KX | |
| Lenovo Legion 7 16ARHA7 | |
| Asus ROG Flow X16 GV601RW-M5082W | |
| Przeciętny AMD Ryzen 9 6900HS | |
| Corsair Voyager a1600 | |
| Cinebench R23 / Multi Core | |
| Średnia w klasie Gaming (10488 - 40970, n=112, ostatnie 2 lata) | |
| Lenovo Legion 7 16IAX7-82TD004SGE | |
| Acer Predator Triton 500 SE PT516-52s-70KX | |
| HP Omen 16-b1090ng | |
| Lenovo Legion 7 16ARHA7 | |
| Asus ROG Flow X16 GV601RW-M5082W | |
| Corsair Voyager a1600 | |
| Przeciętny AMD Ryzen 9 6900HS (12606 - 14403, n=5) | |
| Cinebench R23 / Single Core | |
| Średnia w klasie Gaming (1166 - 2356, n=112, ostatnie 2 lata) | |
| Lenovo Legion 7 16IAX7-82TD004SGE | |
| HP Omen 16-b1090ng | |
| Acer Predator Triton 500 SE PT516-52s-70KX | |
| Lenovo Legion 7 16ARHA7 | |
| Corsair Voyager a1600 | |
| Przeciętny AMD Ryzen 9 6900HS (1526 - 1570, n=5) | |
| Asus ROG Flow X16 GV601RW-M5082W | |
| Cinebench R20 / CPU (Multi Core) | |
| Średnia w klasie Gaming (4029 - 16108, n=111, ostatnie 2 lata) | |
| Lenovo Legion 7 16IAX7-82TD004SGE | |
| Acer Predator Triton 500 SE PT516-52s-70KX | |
| HP Omen 16-b1090ng | |
| Lenovo Legion 7 16ARHA7 | |
| Asus ROG Flow X16 GV601RW-M5082W | |
| Przeciętny AMD Ryzen 9 6900HS (4829 - 5552, n=5) | |
| Corsair Voyager a1600 | |
| Cinebench R20 / CPU (Single Core) | |
| Średnia w klasie Gaming (442 - 895, n=111, ostatnie 2 lata) | |
| Lenovo Legion 7 16IAX7-82TD004SGE | |
| HP Omen 16-b1090ng | |
| Acer Predator Triton 500 SE PT516-52s-70KX | |
| Lenovo Legion 7 16ARHA7 | |
| Przeciętny AMD Ryzen 9 6900HS (596 - 620, n=5) | |
| Asus ROG Flow X16 GV601RW-M5082W | |
| Corsair Voyager a1600 | |
| Cinebench R15 / CPU Multi 64Bit | |
| Średnia w klasie Gaming (1578 - 6271, n=111, ostatnie 2 lata) | |
| Lenovo Legion 7 16IAX7-82TD004SGE | |
| HP Omen 16-b1090ng | |
| Acer Predator Triton 500 SE PT516-52s-70KX | |
| Lenovo Legion 7 16ARHA7 | |
| Asus ROG Flow X16 GV601RW-M5082W | |
| Przeciętny AMD Ryzen 9 6900HS (2054 - 2342, n=5) | |
| Corsair Voyager a1600 | |
| Cinebench R15 / CPU Single 64Bit | |
| Średnia w klasie Gaming (188.8 - 343, n=111, ostatnie 2 lata) | |
| Lenovo Legion 7 16IAX7-82TD004SGE | |
| HP Omen 16-b1090ng | |
| Lenovo Legion 7 16ARHA7 | |
| Corsair Voyager a1600 | |
| Przeciętny AMD Ryzen 9 6900HS (218 - 254, n=5) | |
| Asus ROG Flow X16 GV601RW-M5082W | |
| Acer Predator Triton 500 SE PT516-52s-70KX | |
| Blender / v2.79 BMW27 CPU | |
| Przeciętny AMD Ryzen 9 6900HS (220 - 277, n=5) | |
| Corsair Voyager a1600 | |
| Asus ROG Flow X16 GV601RW-M5082W | |
| Lenovo Legion 7 16ARHA7 | |
| Acer Predator Triton 500 SE PT516-52s-70KX | |
| HP Omen 16-b1090ng | |
| Średnia w klasie Gaming (80 - 330, n=109, ostatnie 2 lata) | |
| Lenovo Legion 7 16IAX7-82TD004SGE | |
| 7-Zip 18.03 / 7z b 4 | |
| Średnia w klasie Gaming (33491 - 148086, n=110, ostatnie 2 lata) | |
| Lenovo Legion 7 16IAX7-82TD004SGE | |
| HP Omen 16-b1090ng | |
| Acer Predator Triton 500 SE PT516-52s-70KX | |
| Lenovo Legion 7 16ARHA7 | |
| Corsair Voyager a1600 | |
| Asus ROG Flow X16 GV601RW-M5082W | |
| Przeciętny AMD Ryzen 9 6900HS (52948 - 63591, n=5) | |
| 7-Zip 18.03 / 7z b 4 -mmt1 | |
| Średnia w klasie Gaming (4199 - 7436, n=110, ostatnie 2 lata) | |
| Lenovo Legion 7 16IAX7-82TD004SGE | |
| HP Omen 16-b1090ng | |
| Corsair Voyager a1600 | |
| Przeciętny AMD Ryzen 9 6900HS (5538 - 5958, n=5) | |
| Asus ROG Flow X16 GV601RW-M5082W | |
| Lenovo Legion 7 16ARHA7 | |
| Acer Predator Triton 500 SE PT516-52s-70KX | |
| Geekbench 5.5 / Multi-Core | |
| Średnia w klasie Gaming (6460 - 27010, n=110, ostatnie 2 lata) | |
| Lenovo Legion 7 16IAX7-82TD004SGE | |
| HP Omen 16-b1090ng | |
| Acer Predator Triton 500 SE PT516-52s-70KX | |
| Corsair Voyager a1600 | |
| Lenovo Legion 7 16ARHA7 | |
| Przeciętny AMD Ryzen 9 6900HS (8381 - 10040, n=5) | |
| Asus ROG Flow X16 GV601RW-M5082W | |
| Geekbench 5.5 / Single-Core | |
| Średnia w klasie Gaming (986 - 2474, n=110, ostatnie 2 lata) | |
| Lenovo Legion 7 16IAX7-82TD004SGE | |
| HP Omen 16-b1090ng | |
| Acer Predator Triton 500 SE PT516-52s-70KX | |
| Lenovo Legion 7 16ARHA7 | |
| Przeciętny AMD Ryzen 9 6900HS (1480 - 1614, n=5) | |
| Asus ROG Flow X16 GV601RW-M5082W | |
| Corsair Voyager a1600 | |
| HWBOT x265 Benchmark v2.2 / 4k Preset | |
| Średnia w klasie Gaming (11.5 - 44.3, n=110, ostatnie 2 lata) | |
| Lenovo Legion 7 16IAX7-82TD004SGE | |
| HP Omen 16-b1090ng | |
| Acer Predator Triton 500 SE PT516-52s-70KX | |
| Lenovo Legion 7 16ARHA7 | |
| Corsair Voyager a1600 | |
| Asus ROG Flow X16 GV601RW-M5082W | |
| Przeciętny AMD Ryzen 9 6900HS (14.2 - 17.9, n=5) | |
| LibreOffice / 20 Documents To PDF | |
| Corsair Voyager a1600 | |
| Asus ROG Flow X16 GV601RW-M5082W | |
| Lenovo Legion 7 16ARHA7 | |
| Przeciętny AMD Ryzen 9 6900HS (47.6 - 57.2, n=5) | |
| Średnia w klasie Gaming (19 - 88.8, n=110, ostatnie 2 lata) | |
| Acer Predator Triton 500 SE PT516-52s-70KX | |
| HP Omen 16-b1090ng | |
| Lenovo Legion 7 16IAX7-82TD004SGE | |
| R Benchmark 2.5 / Overall mean | |
| Asus ROG Flow X16 GV601RW-M5082W | |
| Lenovo Legion 7 16ARHA7 | |
| Corsair Voyager a1600 | |
| Przeciętny AMD Ryzen 9 6900HS (0.4672 - 0.502, n=5) | |
| Acer Predator Triton 500 SE PT516-52s-70KX | |
| HP Omen 16-b1090ng | |
| Średnia w klasie Gaming (0.3439 - 0.759, n=111, ostatnie 2 lata) | |
| Lenovo Legion 7 16IAX7-82TD004SGE | |
* ... im mniej tym lepiej
AIDA64: FP32 Ray-Trace | FPU Julia | CPU SHA3 | CPU Queen | FPU SinJulia | FPU Mandel | CPU AES | CPU ZLib | FP64 Ray-Trace | CPU PhotoWorxx
| Performance rating | |
| Średnia w klasie Gaming | |
| Lenovo Legion 7 16ARHA7 | |
| Asus ROG Flow X16 GV601RW-M5082W | |
| Corsair Voyager a1600 | |
| Lenovo Legion 7 16IAX7-82TD004SGE | |
| Przeciętny AMD Ryzen 9 6900HS | |
| Acer Predator Triton 500 SE PT516-52s-70KX | |
| HP Omen 16-b1090ng | |
| AIDA64 / FP32 Ray-Trace | |
| Średnia w klasie Gaming (10227 - 85542, n=109, ostatnie 2 lata) | |
| Lenovo Legion 7 16ARHA7 | |
| Asus ROG Flow X16 GV601RW-M5082W | |
| Corsair Voyager a1600 | |
| Przeciętny AMD Ryzen 9 6900HS (14212 - 16072, n=5) | |
| Lenovo Legion 7 16IAX7-82TD004SGE | |
| Acer Predator Triton 500 SE PT516-52s-70KX | |
| HP Omen 16-b1090ng | |
| AIDA64 / FPU Julia | |
| Średnia w klasie Gaming (51376 - 238426, n=109, ostatnie 2 lata) | |
| Lenovo Legion 7 16ARHA7 | |
| Asus ROG Flow X16 GV601RW-M5082W | |
| Corsair Voyager a1600 | |
| Przeciętny AMD Ryzen 9 6900HS (90523 - 102881, n=5) | |
| Lenovo Legion 7 16IAX7-82TD004SGE | |
| Acer Predator Triton 500 SE PT516-52s-70KX | |
| HP Omen 16-b1090ng | |
| AIDA64 / CPU SHA3 | |
| Średnia w klasie Gaming (2180 - 9817, n=109, ostatnie 2 lata) | |
| Lenovo Legion 7 16IAX7-82TD004SGE | |
| Lenovo Legion 7 16ARHA7 | |
| Asus ROG Flow X16 GV601RW-M5082W | |
| Corsair Voyager a1600 | |
| Acer Predator Triton 500 SE PT516-52s-70KX | |
| Przeciętny AMD Ryzen 9 6900HS (3035 - 3614, n=5) | |
| HP Omen 16-b1090ng | |
| AIDA64 / CPU Queen | |
| Średnia w klasie Gaming (49785 - 173351, n=100, ostatnie 2 lata) | |
| Lenovo Legion 7 16ARHA7 | |
| Corsair Voyager a1600 | |
| Asus ROG Flow X16 GV601RW-M5082W | |
| Przeciętny AMD Ryzen 9 6900HS (97461 - 105203, n=5) | |
| Lenovo Legion 7 16IAX7-82TD004SGE | |
| HP Omen 16-b1090ng | |
| Acer Predator Triton 500 SE PT516-52s-70KX | |
| AIDA64 / FPU SinJulia | |
| Średnia w klasie Gaming (4424 - 33636, n=109, ostatnie 2 lata) | |
| Lenovo Legion 7 16IAX7-82TD004SGE | |
| Corsair Voyager a1600 | |
| Lenovo Legion 7 16ARHA7 | |
| Asus ROG Flow X16 GV601RW-M5082W | |
| Przeciętny AMD Ryzen 9 6900HS (12548 - 13039, n=5) | |
| Acer Predator Triton 500 SE PT516-52s-70KX | |
| HP Omen 16-b1090ng | |
| AIDA64 / FPU Mandel | |
| Średnia w klasie Gaming (25115 - 128721, n=109, ostatnie 2 lata) | |
| Lenovo Legion 7 16ARHA7 | |
| Asus ROG Flow X16 GV601RW-M5082W | |
| Corsair Voyager a1600 | |
| Przeciętny AMD Ryzen 9 6900HS (49657 - 56486, n=5) | |
| Lenovo Legion 7 16IAX7-82TD004SGE | |
| Acer Predator Triton 500 SE PT516-52s-70KX | |
| HP Omen 16-b1090ng | |
| AIDA64 / CPU AES | |
| Asus ROG Flow X16 GV601RW-M5082W | |
| Lenovo Legion 7 16ARHA7 | |
| Corsair Voyager a1600 | |
| Lenovo Legion 7 16IAX7-82TD004SGE | |
| Przeciętny AMD Ryzen 9 6900HS (51791 - 142686, n=5) | |
| Średnia w klasie Gaming (39258 - 247074, n=109, ostatnie 2 lata) | |
| Acer Predator Triton 500 SE PT516-52s-70KX | |
| HP Omen 16-b1090ng | |
| AIDA64 / CPU ZLib | |
| Średnia w klasie Gaming (574 - 2531, n=109, ostatnie 2 lata) | |
| Lenovo Legion 7 16IAX7-82TD004SGE | |
| Acer Predator Triton 500 SE PT516-52s-70KX | |
| HP Omen 16-b1090ng | |
| Lenovo Legion 7 16ARHA7 | |
| Asus ROG Flow X16 GV601RW-M5082W | |
| Corsair Voyager a1600 | |
| Przeciętny AMD Ryzen 9 6900HS (737 - 888, n=5) | |
| AIDA64 / FP64 Ray-Trace | |
| Średnia w klasie Gaming (5509 - 45446, n=109, ostatnie 2 lata) | |
| Lenovo Legion 7 16ARHA7 | |
| Asus ROG Flow X16 GV601RW-M5082W | |
| Corsair Voyager a1600 | |
| Przeciętny AMD Ryzen 9 6900HS (7530 - 8981, n=5) | |
| Lenovo Legion 7 16IAX7-82TD004SGE | |
| Acer Predator Triton 500 SE PT516-52s-70KX | |
| HP Omen 16-b1090ng | |
| AIDA64 / CPU PhotoWorxx | |
| Średnia w klasie Gaming (12271 - 89891, n=109, ostatnie 2 lata) | |
| HP Omen 16-b1090ng | |
| Lenovo Legion 7 16IAX7-82TD004SGE | |
| Acer Predator Triton 500 SE PT516-52s-70KX | |
| Lenovo Legion 7 16ARHA7 | |
| Corsair Voyager a1600 | |
| Asus ROG Flow X16 GV601RW-M5082W | |
| Przeciętny AMD Ryzen 9 6900HS (25757 - 30291, n=5) | |
Wydajność systemu
Wyniki benchmarków pokazują dobrą wydajność systemu, choć ponownie zauważalna jest wyraźna różnica względem notebooków z procesorem Intela. Subiektywnie jednak Corsair Voyager a1600 oferuje bardzo dobrą wydajność systemu, bez zauważalnych opóźnień w codziennym użytkowaniu.
CrossMark: Overall | Productivity | Creativity | Responsiveness
| PCMark 10 / Score | |
| Lenovo Legion 7 16IAX7-82TD004SGE | |
| Średnia w klasie Gaming (5828 - 11574, n=95, ostatnie 2 lata) | |
| Acer Predator Triton 500 SE PT516-52s-70KX | |
| Lenovo Legion 7 16ARHA7 | |
| HP Omen 16-b1090ng | |
| Corsair Voyager a1600 | |
| Przeciętny AMD Ryzen 9 6900HS, AMD Radeon RX 6800M (n=1) | |
| Asus ROG Flow X16 GV601RW-M5082W | |
| PCMark 10 / Essentials | |
| Lenovo Legion 7 16IAX7-82TD004SGE | |
| Acer Predator Triton 500 SE PT516-52s-70KX | |
| Średnia w klasie Gaming (8810 - 12600, n=99, ostatnie 2 lata) | |
| Lenovo Legion 7 16ARHA7 | |
| HP Omen 16-b1090ng | |
| Corsair Voyager a1600 | |
| Przeciętny AMD Ryzen 9 6900HS, AMD Radeon RX 6800M (n=1) | |
| Asus ROG Flow X16 GV601RW-M5082W | |
| PCMark 10 / Productivity | |
| Lenovo Legion 7 16IAX7-82TD004SGE | |
| Średnia w klasie Gaming (6845 - 18766, n=97, ostatnie 2 lata) | |
| Asus ROG Flow X16 GV601RW-M5082W | |
| Acer Predator Triton 500 SE PT516-52s-70KX | |
| HP Omen 16-b1090ng | |
| Lenovo Legion 7 16ARHA7 | |
| Corsair Voyager a1600 | |
| Przeciętny AMD Ryzen 9 6900HS, AMD Radeon RX 6800M (n=1) | |
| PCMark 10 / Digital Content Creation | |
| Lenovo Legion 7 16IAX7-82TD004SGE | |
| Średnia w klasie Gaming (7602 - 19657, n=97, ostatnie 2 lata) | |
| Lenovo Legion 7 16ARHA7 | |
| Corsair Voyager a1600 | |
| Przeciętny AMD Ryzen 9 6900HS, AMD Radeon RX 6800M (n=1) | |
| Acer Predator Triton 500 SE PT516-52s-70KX | |
| HP Omen 16-b1090ng | |
| Asus ROG Flow X16 GV601RW-M5082W | |
| CrossMark / Overall | |
| Lenovo Legion 7 16IAX7-82TD004SGE | |
| Średnia w klasie Gaming (1366 - 2409, n=97, ostatnie 2 lata) | |
| Acer Predator Triton 500 SE PT516-52s-70KX | |
| Asus ROG Flow X16 GV601RW-M5082W | |
| Lenovo Legion 7 16ARHA7 | |
| Corsair Voyager a1600 | |
| Przeciętny AMD Ryzen 9 6900HS, AMD Radeon RX 6800M (n=1) | |
| CrossMark / Productivity | |
| Lenovo Legion 7 16IAX7-82TD004SGE | |
| Średnia w klasie Gaming (1386 - 2254, n=97, ostatnie 2 lata) | |
| Acer Predator Triton 500 SE PT516-52s-70KX | |
| Asus ROG Flow X16 GV601RW-M5082W | |
| Lenovo Legion 7 16ARHA7 | |
| Corsair Voyager a1600 | |
| Przeciętny AMD Ryzen 9 6900HS, AMD Radeon RX 6800M (n=1) | |
| CrossMark / Creativity | |
| Lenovo Legion 7 16IAX7-82TD004SGE | |
| Średnia w klasie Gaming (1343 - 2729, n=97, ostatnie 2 lata) | |
| Acer Predator Triton 500 SE PT516-52s-70KX | |
| Asus ROG Flow X16 GV601RW-M5082W | |
| Lenovo Legion 7 16ARHA7 | |
| Corsair Voyager a1600 | |
| Przeciętny AMD Ryzen 9 6900HS, AMD Radeon RX 6800M (n=1) | |
| CrossMark / Responsiveness | |
| Lenovo Legion 7 16IAX7-82TD004SGE | |
| Acer Predator Triton 500 SE PT516-52s-70KX | |
| Średnia w klasie Gaming (1226 - 2334, n=97, ostatnie 2 lata) | |
| Asus ROG Flow X16 GV601RW-M5082W | |
| Lenovo Legion 7 16ARHA7 | |
| Corsair Voyager a1600 | |
| Przeciętny AMD Ryzen 9 6900HS, AMD Radeon RX 6800M (n=1) | |
| PCMark 10 Score | 7208 pkt. | |
Pomoc | ||
| AIDA64 / Memory Copy | |
| Średnia w klasie Gaming (21750 - 129946, n=109, ostatnie 2 lata) | |
| Lenovo Legion 7 16IAX7-82TD004SGE | |
| HP Omen 16-b1090ng | |
| Acer Predator Triton 500 SE PT516-52s-70KX | |
| Lenovo Legion 7 16ARHA7 | |
| Przeciętny AMD Ryzen 9 6900HS (49150 - 51517, n=5) | |
| Corsair Voyager a1600 | |
| Asus ROG Flow X16 GV601RW-M5082W | |
| AIDA64 / Memory Read | |
| Średnia w klasie Gaming (22956 - 118858, n=109, ostatnie 2 lata) | |
| Lenovo Legion 7 16IAX7-82TD004SGE | |
| Acer Predator Triton 500 SE PT516-52s-70KX | |
| HP Omen 16-b1090ng | |
| Lenovo Legion 7 16ARHA7 | |
| Corsair Voyager a1600 | |
| Asus ROG Flow X16 GV601RW-M5082W | |
| Przeciętny AMD Ryzen 9 6900HS (43646 - 51838, n=5) | |
| AIDA64 / Memory Write | |
| Średnia w klasie Gaming (22297 - 135096, n=109, ostatnie 2 lata) | |
| HP Omen 16-b1090ng | |
| Lenovo Legion 7 16IAX7-82TD004SGE | |
| Lenovo Legion 7 16ARHA7 | |
| Corsair Voyager a1600 | |
| Asus ROG Flow X16 GV601RW-M5082W | |
| Acer Predator Triton 500 SE PT516-52s-70KX | |
| Przeciętny AMD Ryzen 9 6900HS (15975 - 55235, n=5) | |
| AIDA64 / Memory Latency | |
| Acer Predator Triton 500 SE PT516-52s-70KX | |
| Średnia w klasie Gaming (75.3 - 259, n=109, ostatnie 2 lata) | |
| Corsair Voyager a1600 | |
| Asus ROG Flow X16 GV601RW-M5082W | |
| Przeciętny AMD Ryzen 9 6900HS (79.2 - 110.9, n=5) | |
| HP Omen 16-b1090ng | |
| Lenovo Legion 7 16IAX7-82TD004SGE | |
| Lenovo Legion 7 16ARHA7 | |
* ... im mniej tym lepiej
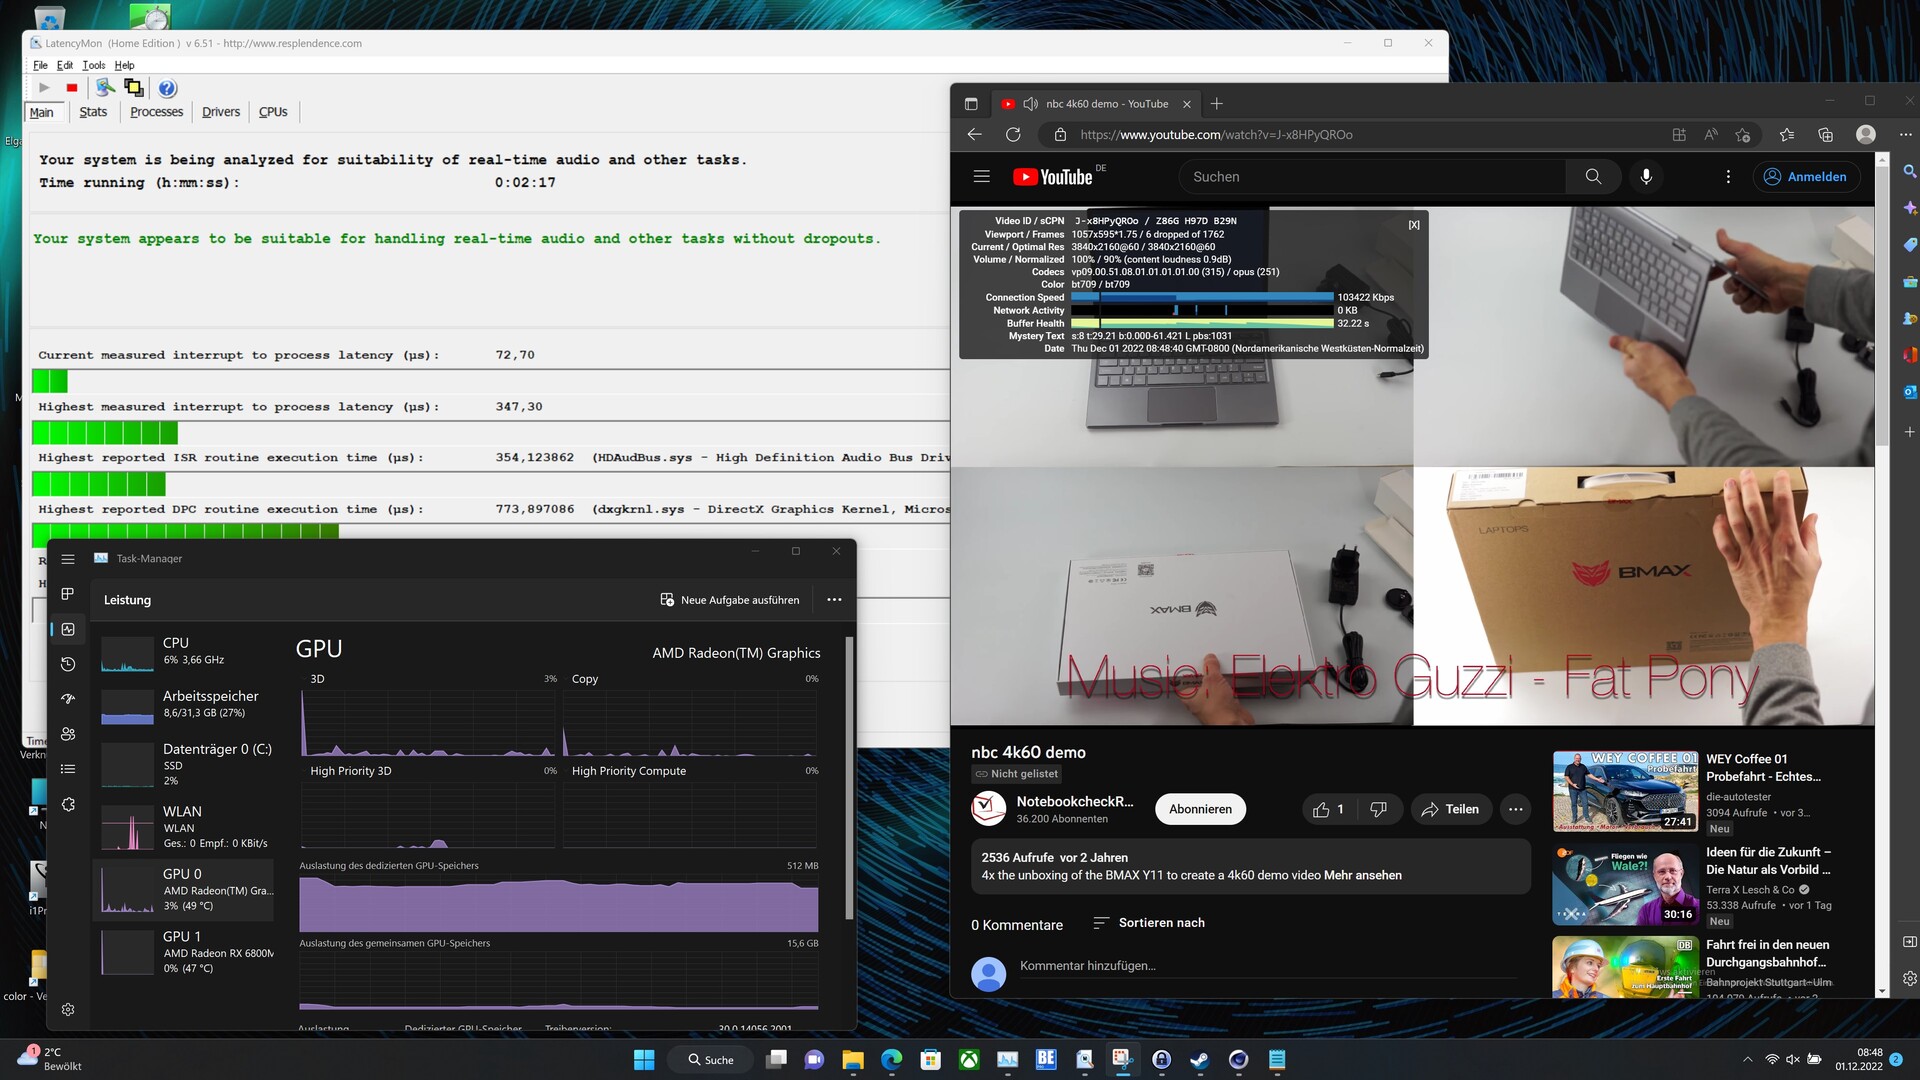
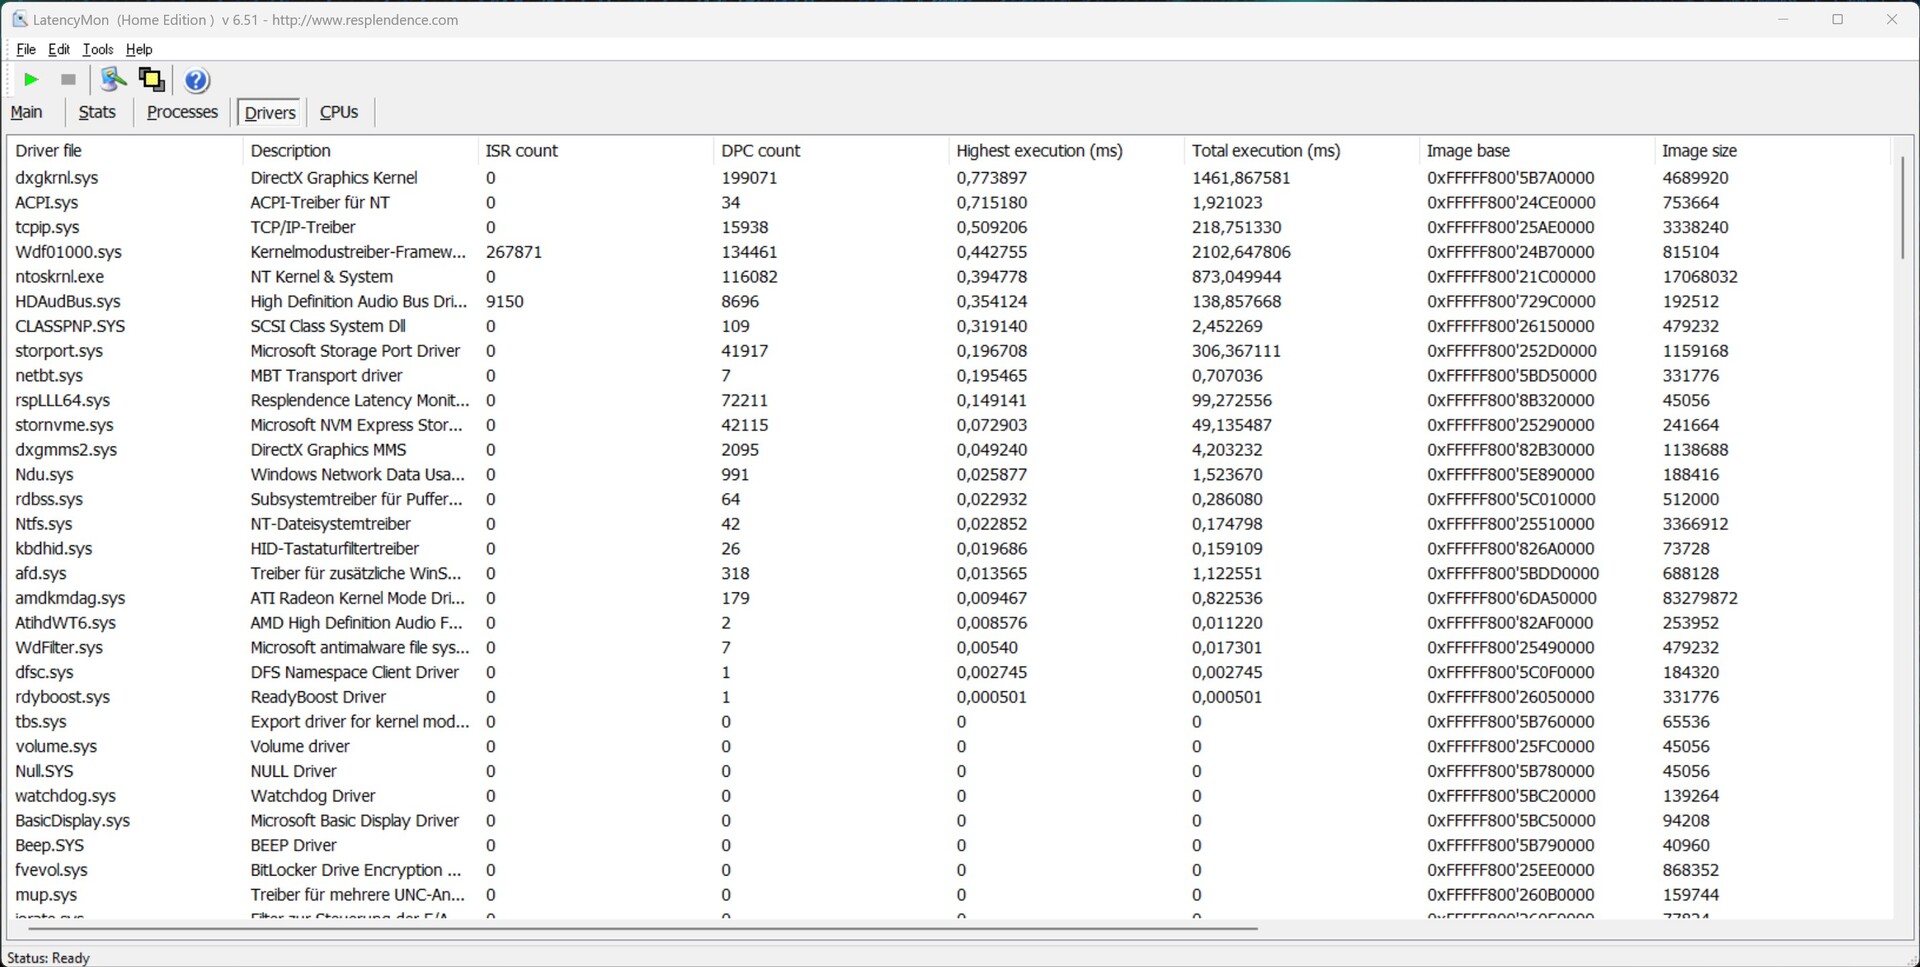
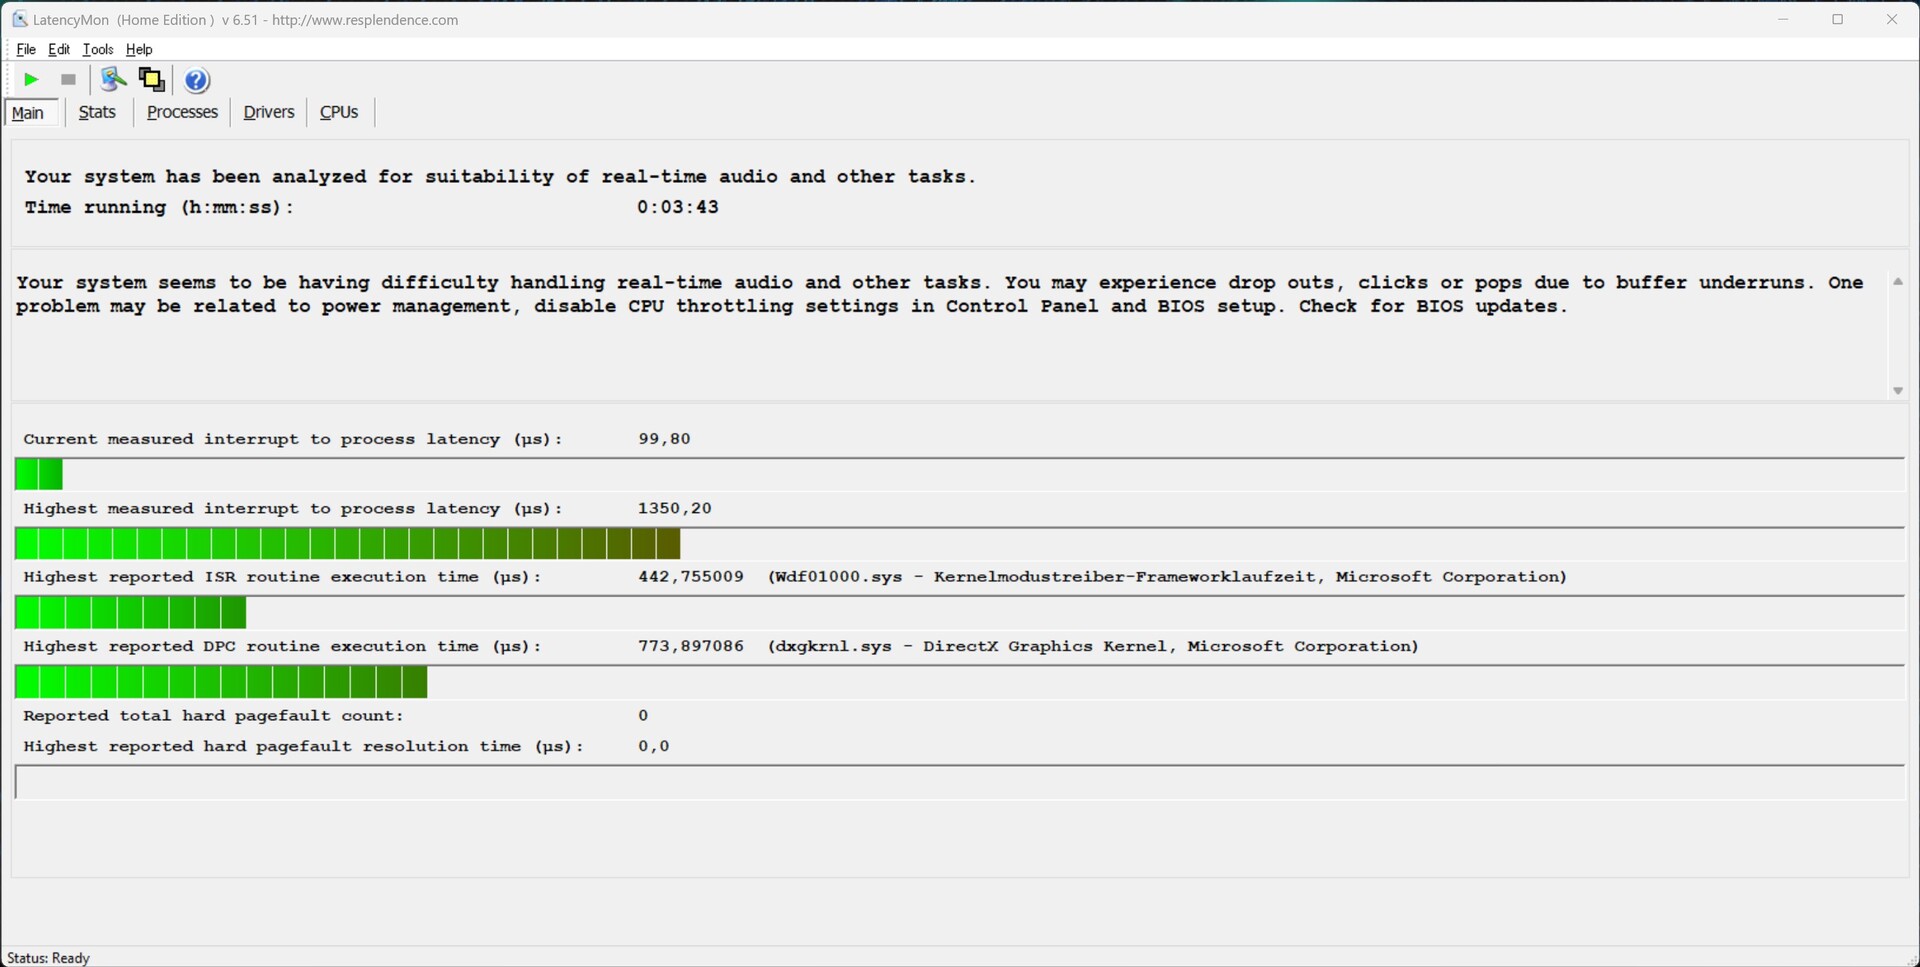
Opóźnienia DPC
Udokumentowane latencje nie ulegają zwiększeniu podczas otwierania wielu kart przeglądarki w Edge. Voyager a1600 bez problemu opanowuje także odtwarzanie filmu 4K z YouTube. Nieco zwiększone latencje obserwujemy jedynie po uruchomieniu Prime95.
| DPC Latencies / LatencyMon - interrupt to process latency (max), Web, Youtube, Prime95 | |
| Acer Predator Triton 500 SE PT516-52s-70KX | |
| Lenovo Legion 7 16ARHA7 | |
| Asus ROG Flow X16 GV601RW-M5082W | |
| Lenovo Legion 7 16IAX7-82TD004SGE | |
| Corsair Voyager a1600 | |
| HP Omen 16-b1090ng | |
* ... im mniej tym lepiej
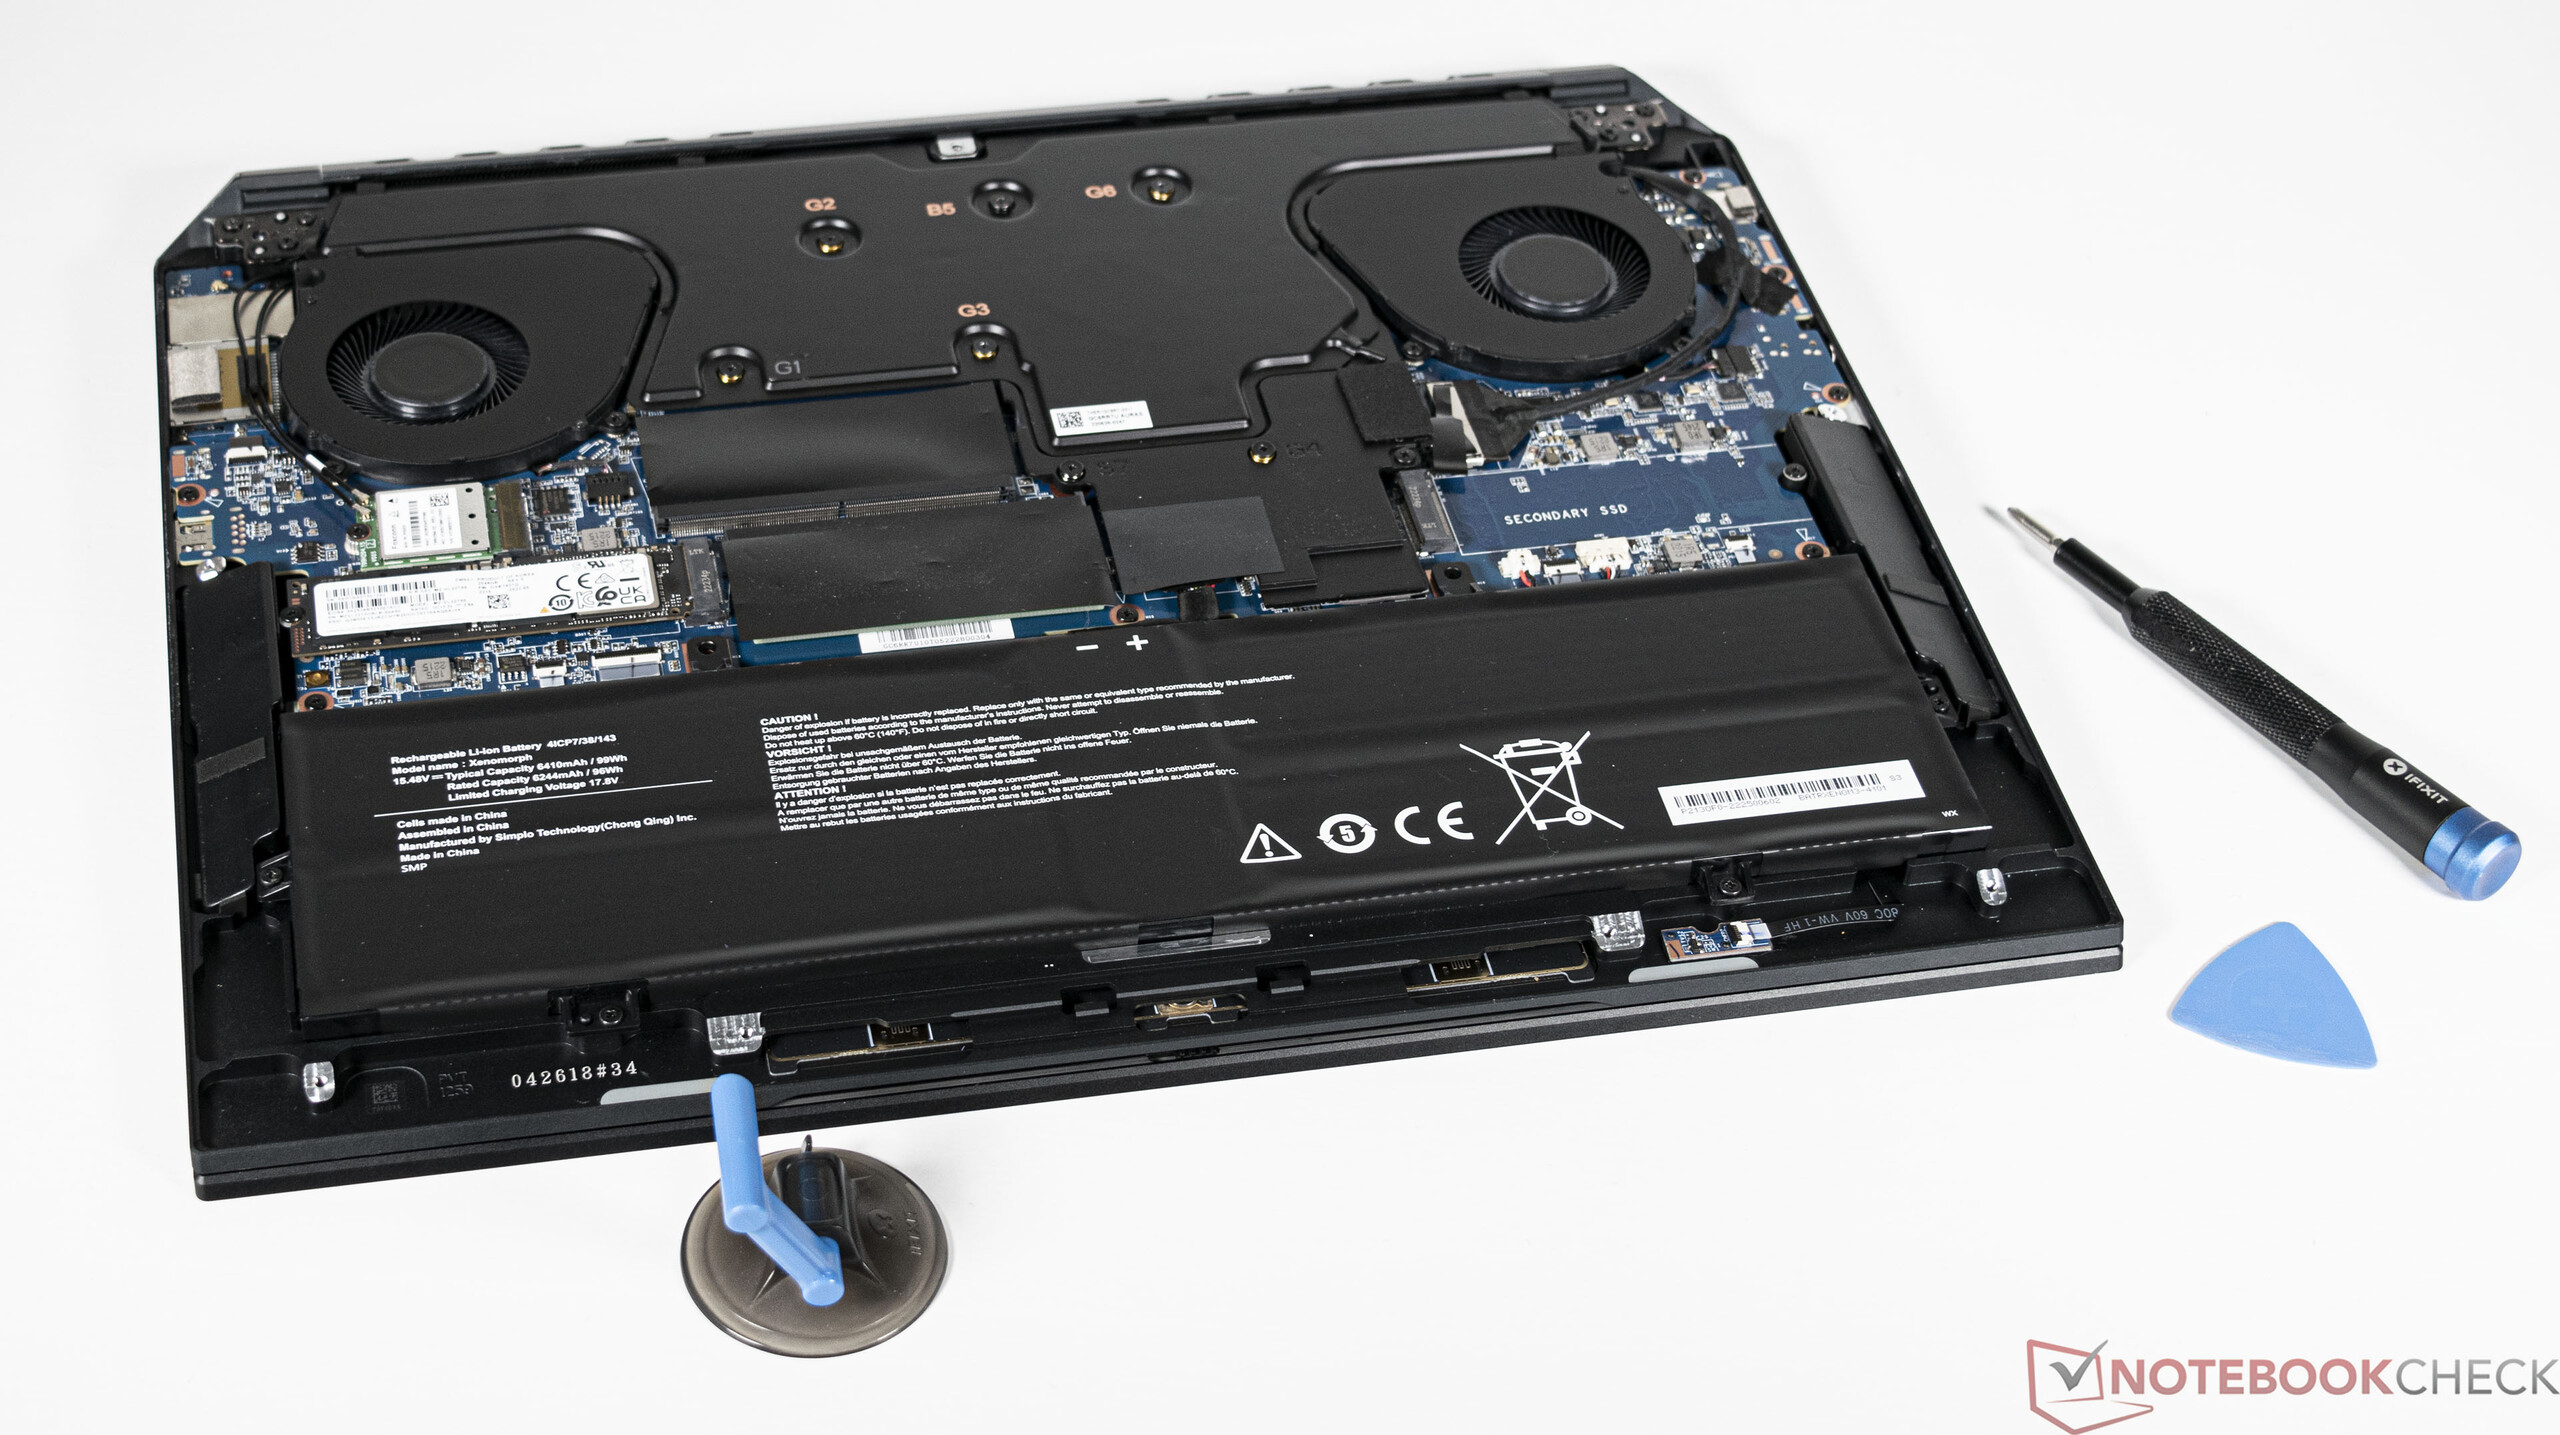
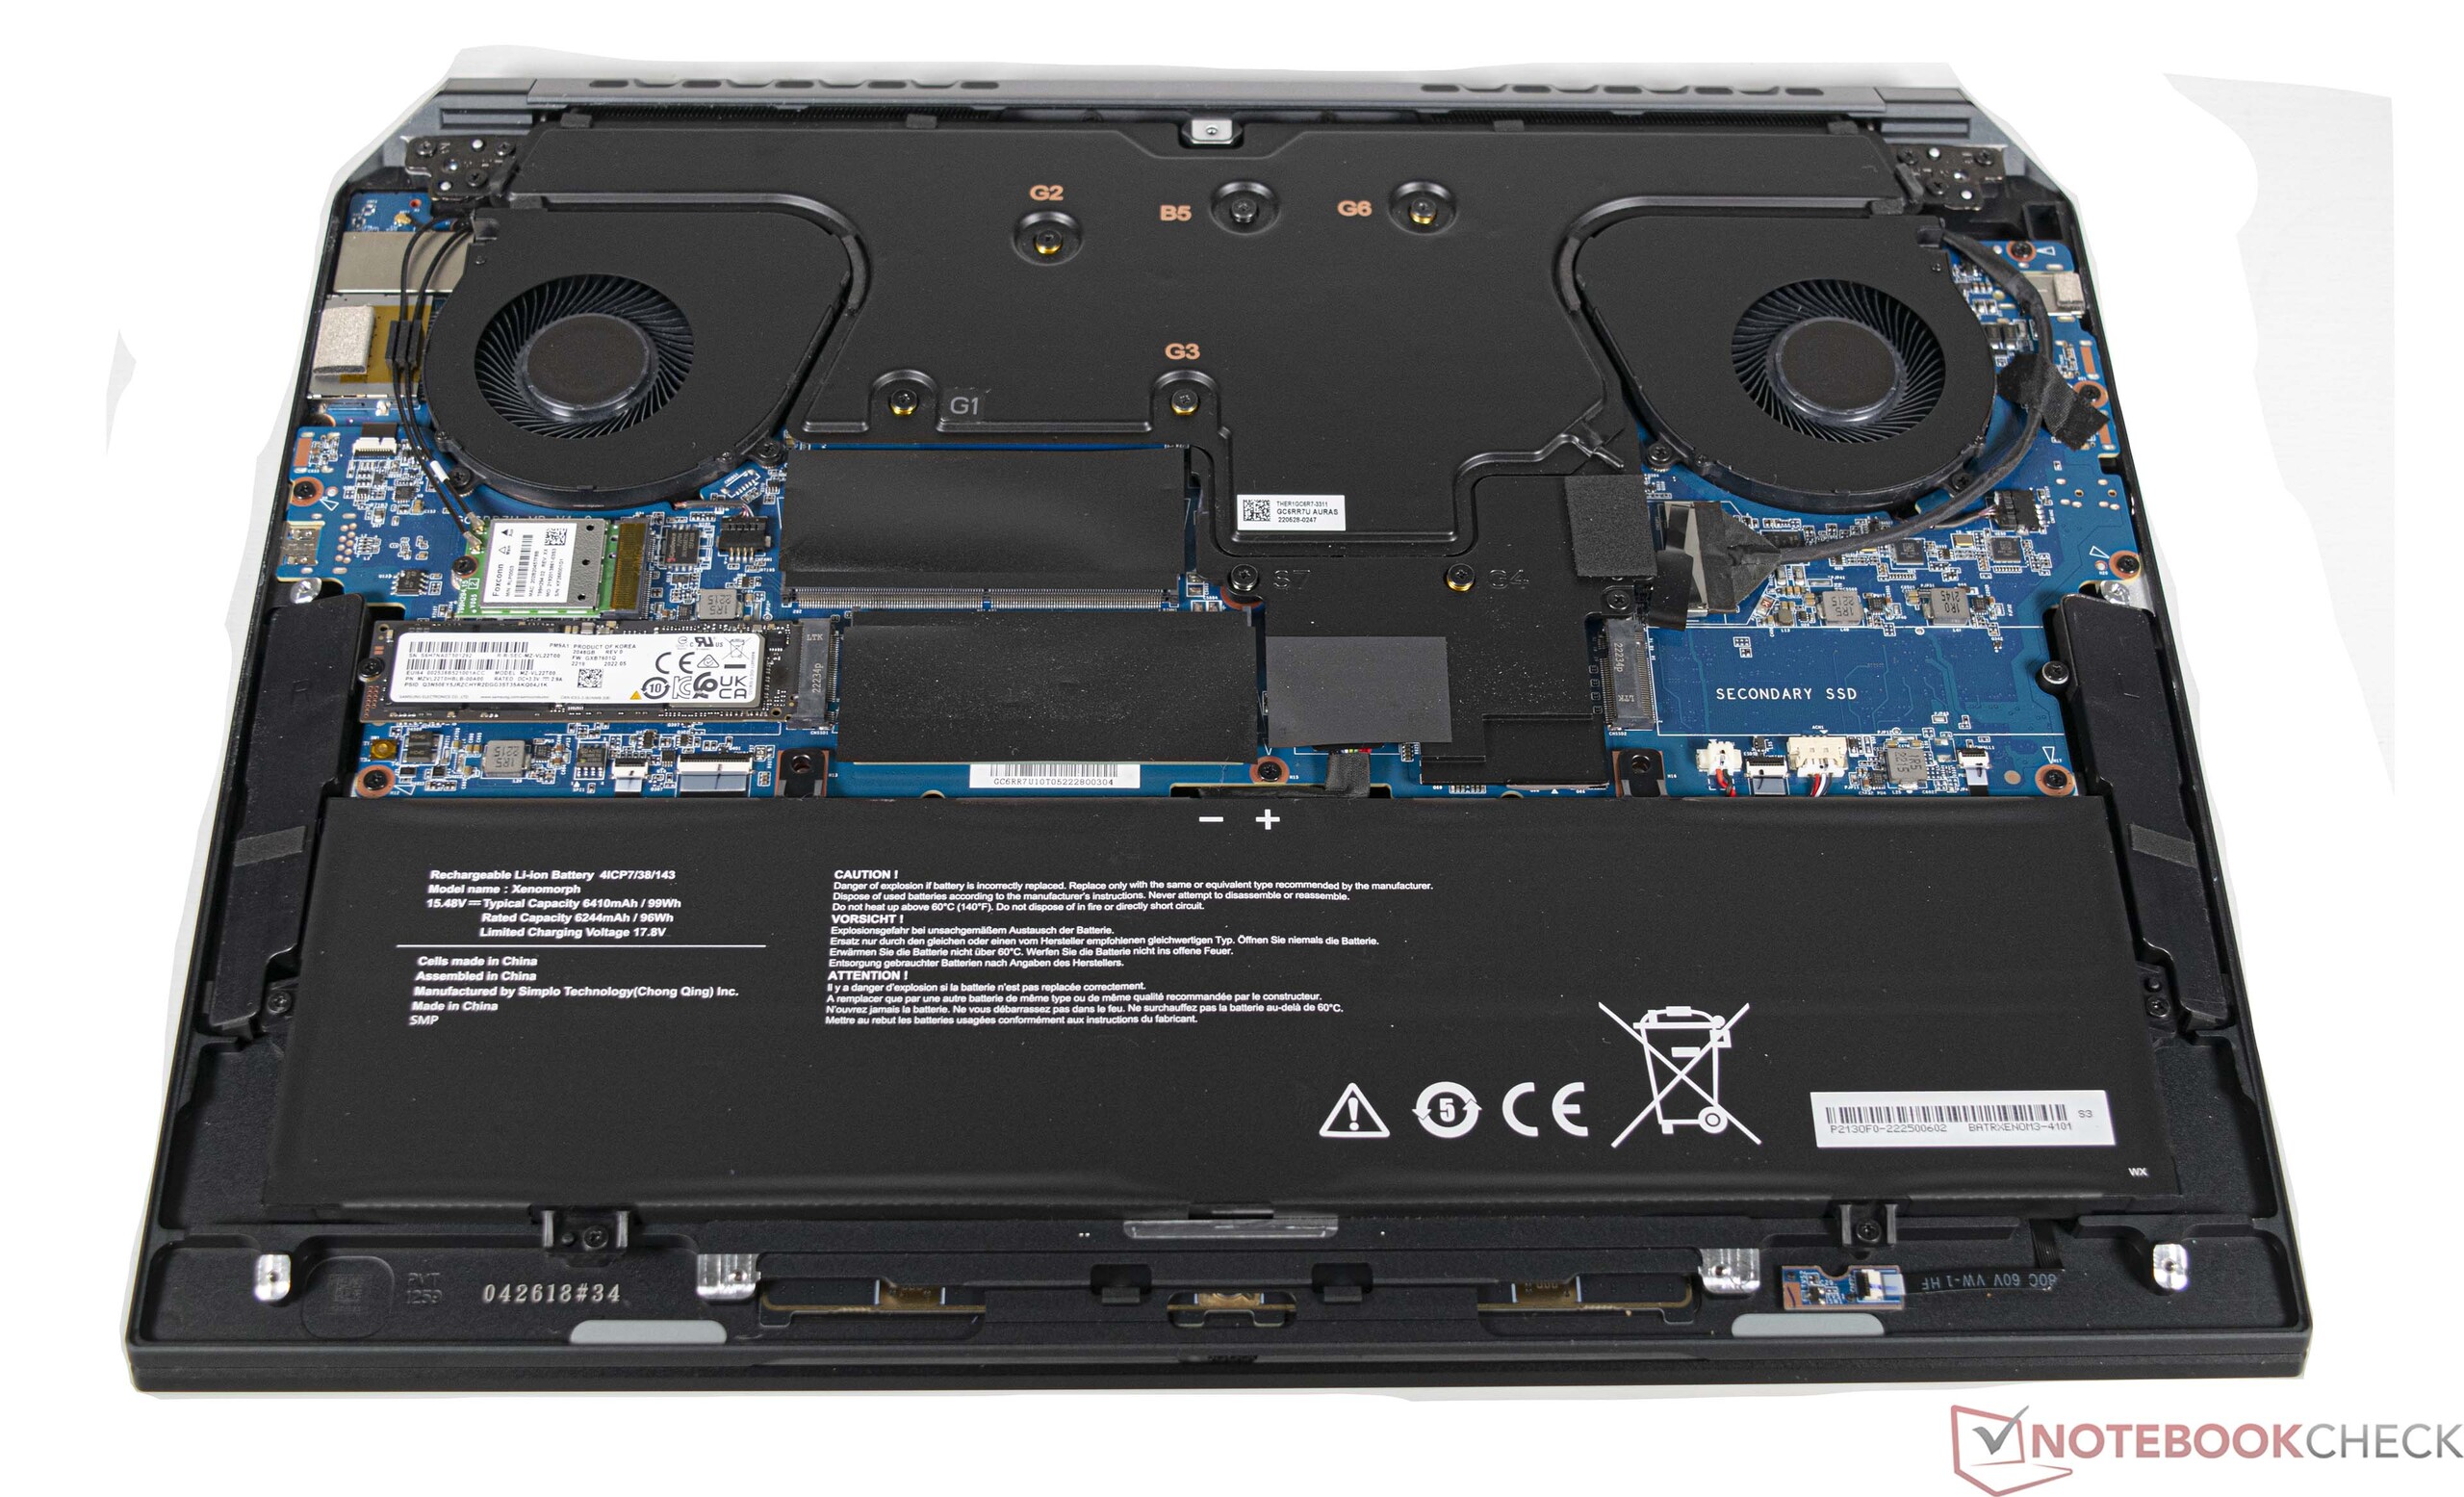
Pamięć masowa
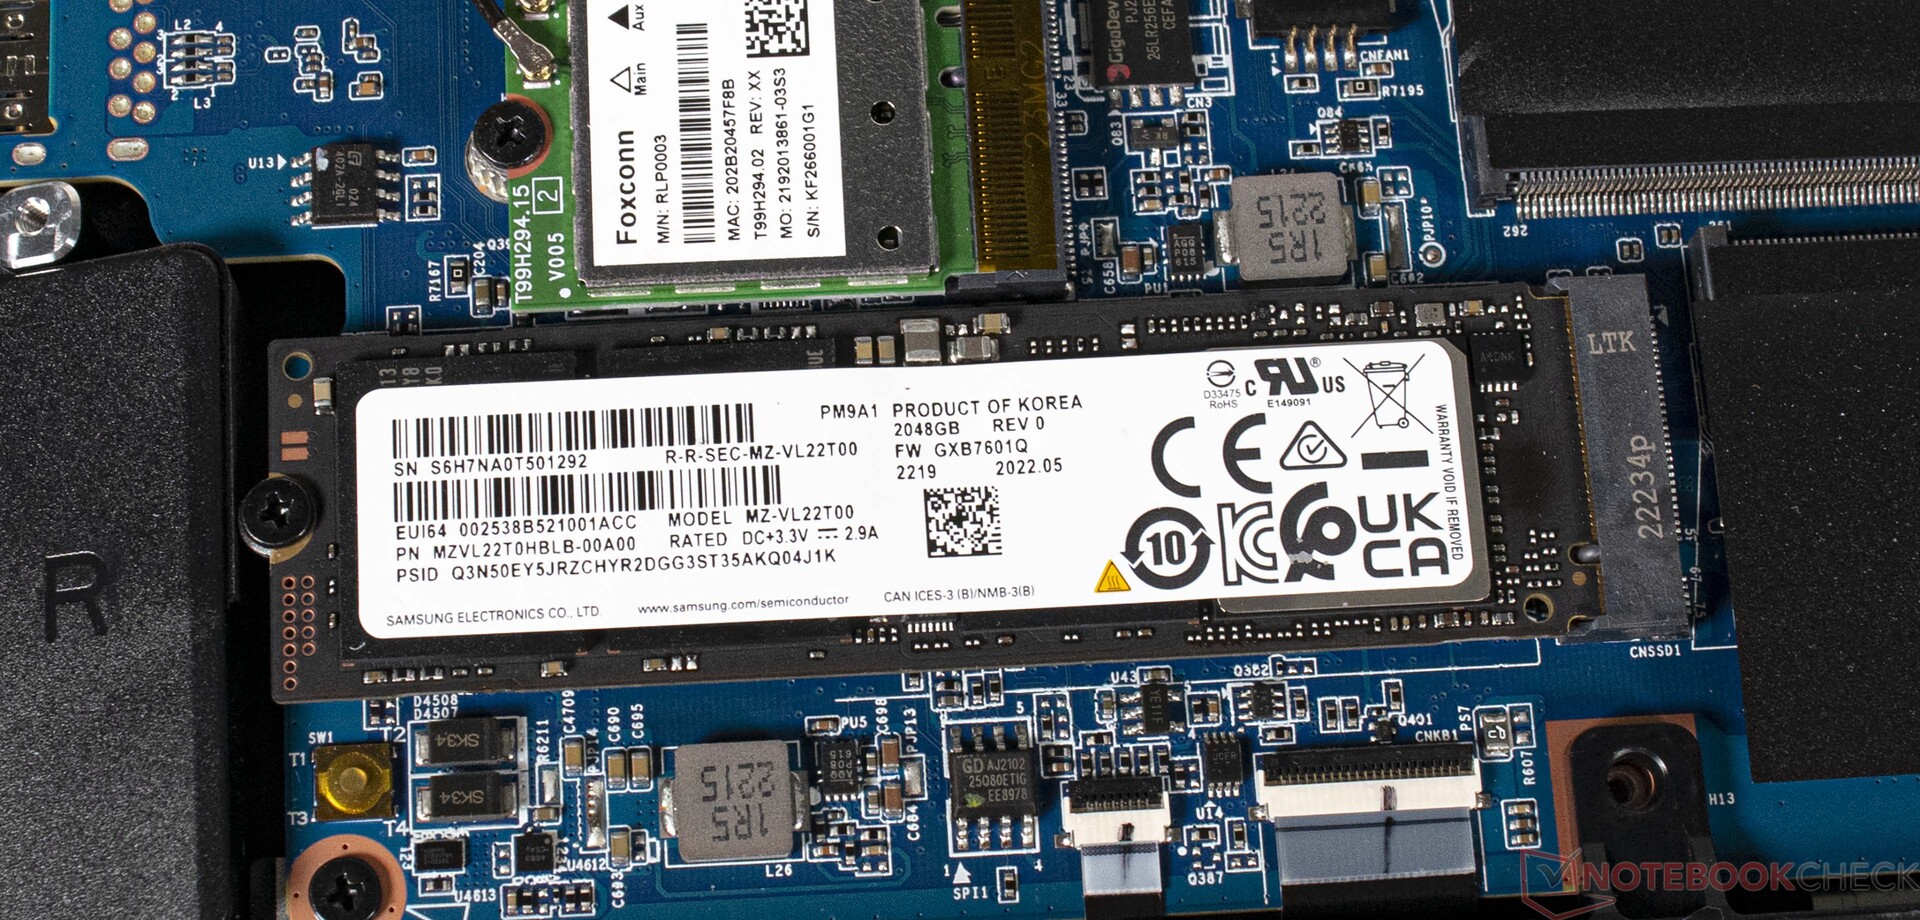
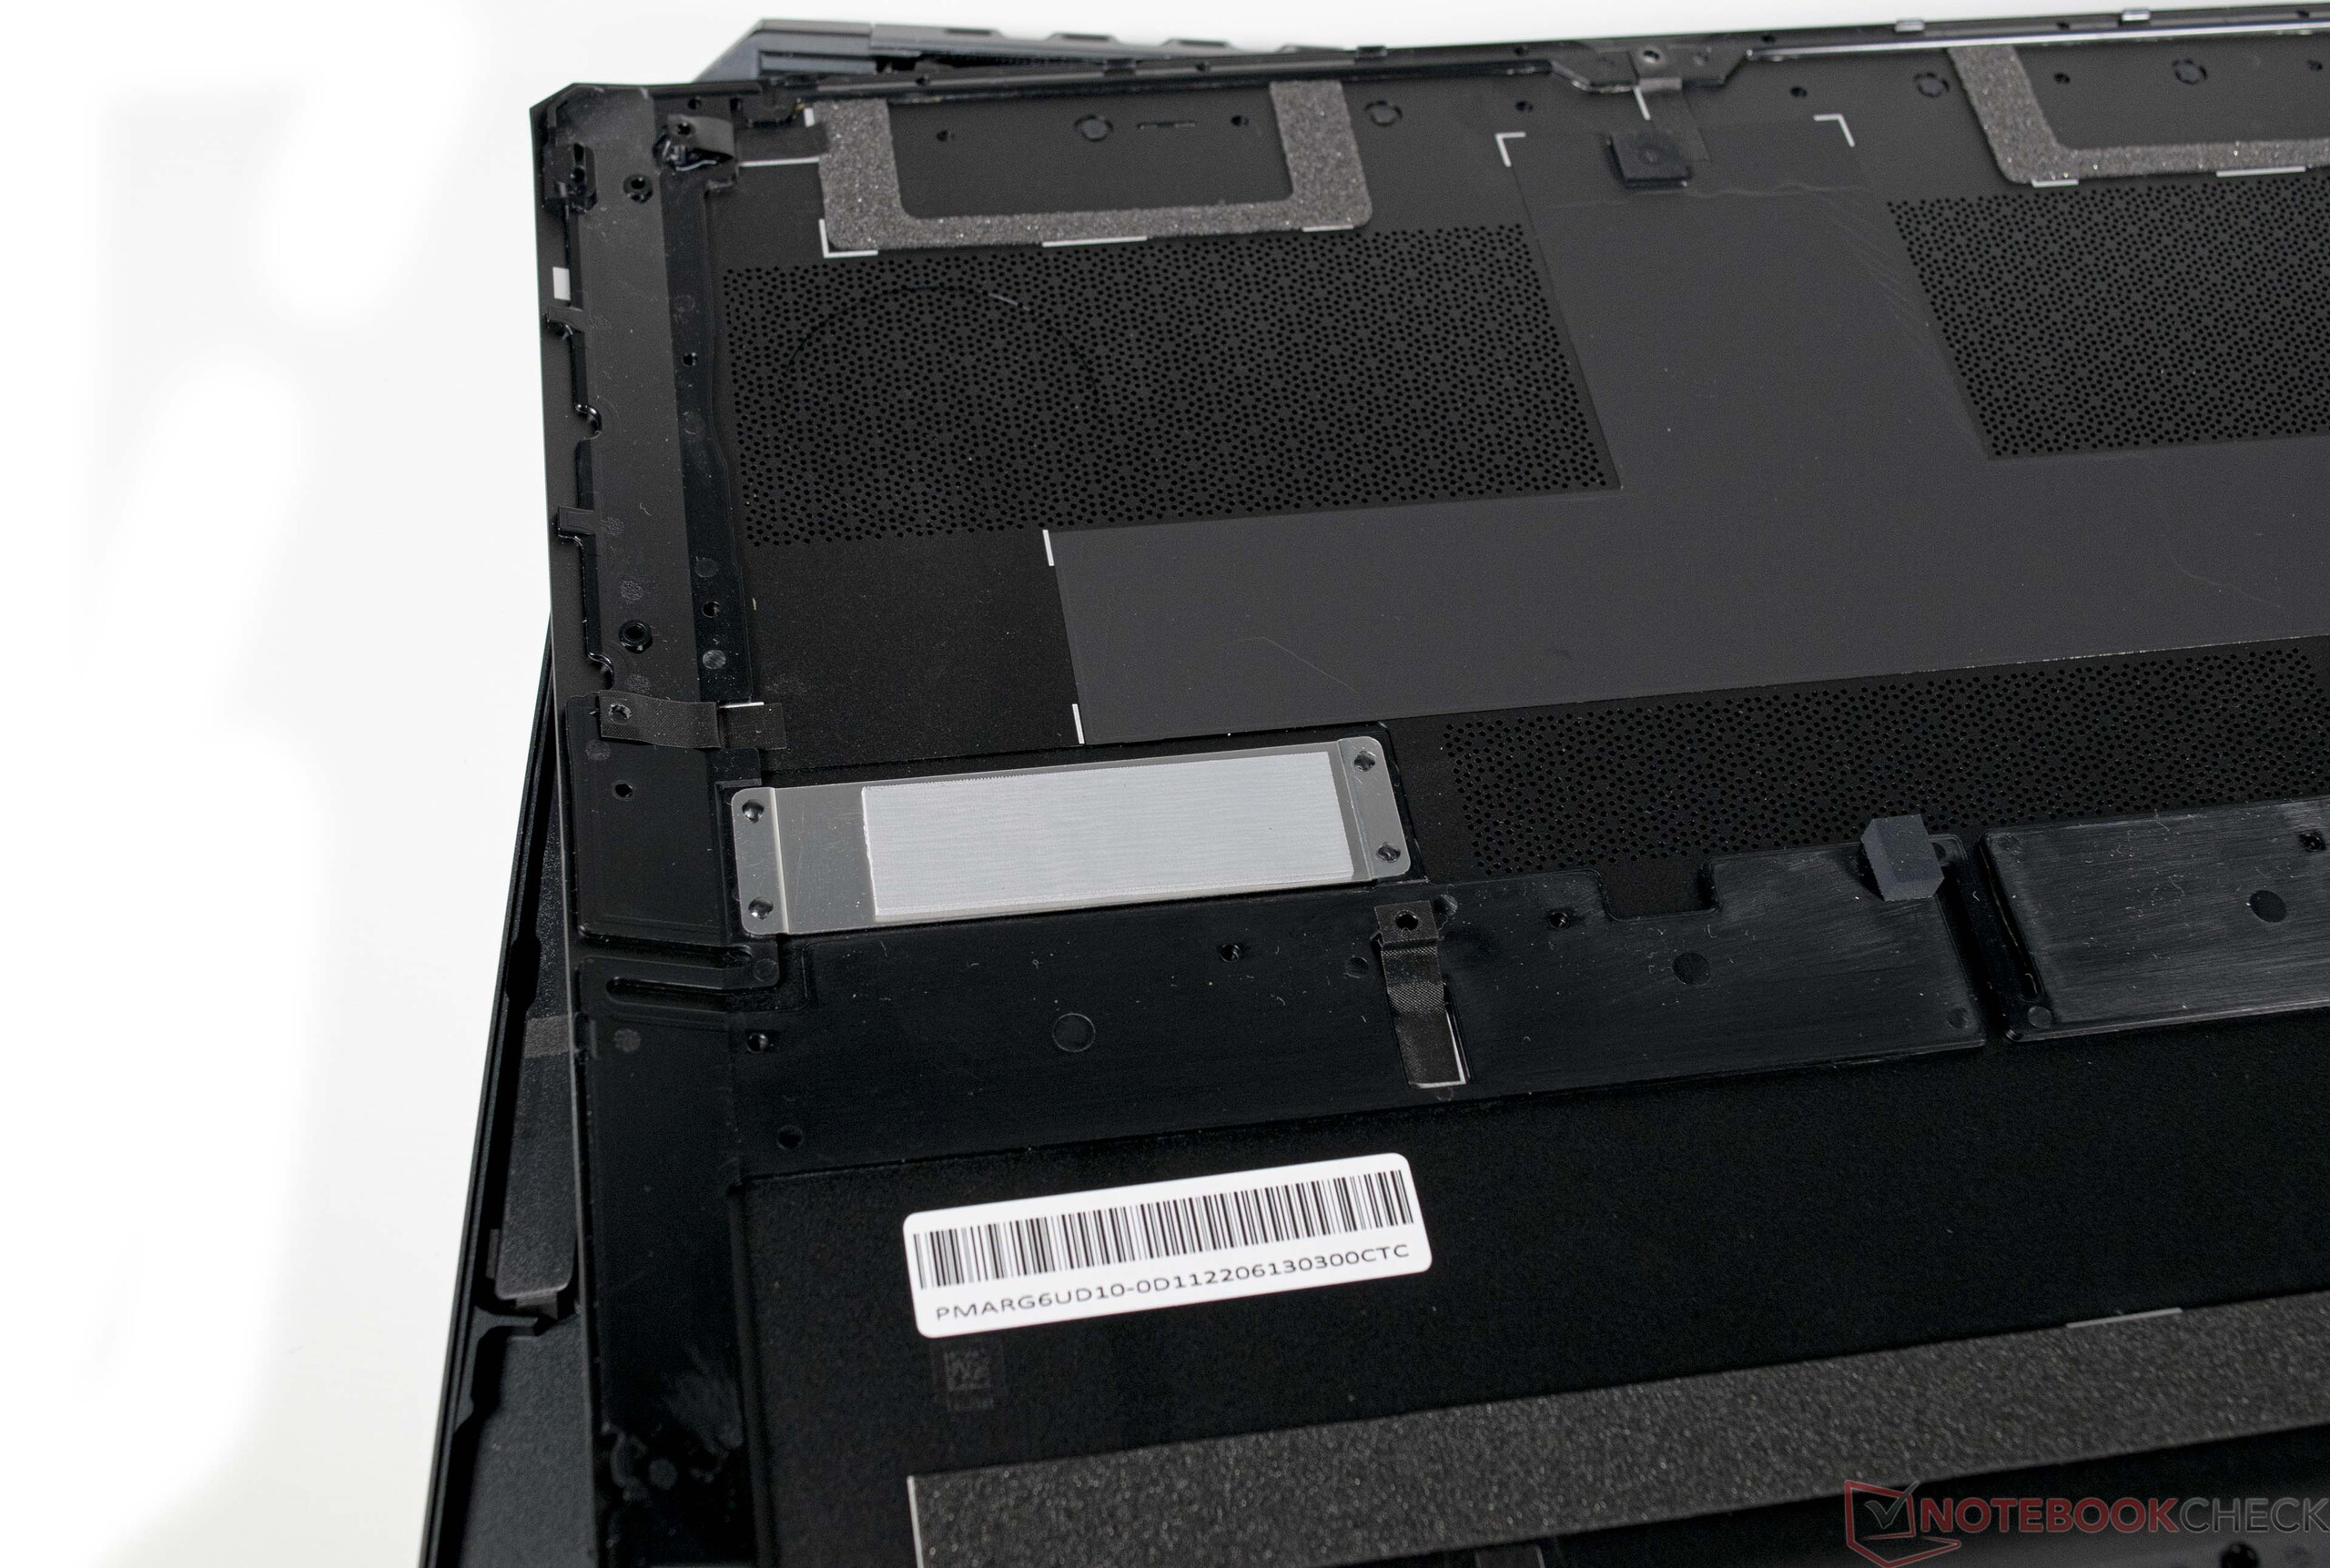
Dzięki dyskowi SSD o pojemności 2 TB Corsair Voyager a1600 oferuje sporo przestrzeni dyskowej, co jest zdecydowanie potrzebne ze względu na jego przeznaczenie. Zainstalowany model nie jest w stanie dotrzymać kroku konkurencji w benchmarkach. Mimo to, prędkości transferu są więcej niż wystarczające dla większości użytkowników. W teście obciążeniowym wydajność dysku SSD jest konsekwentnie dostępna bez ograniczeń. Przy okazji płyta bazowa notebooka służy do odprowadzania ciepła. Można zainstalować łącznie dwa urządzenia pamięci masowej w formacie M.2-2280.
Więcej porównań i benchmarków można znaleźć w naszej tabeli porównawczej SSD/HDD tabela porównawcza.

| Drive Performance rating - Percent | |
| Lenovo Legion 7 16IAX7-82TD004SGE | |
| Acer Predator Triton 500 SE PT516-52s-70KX -1! | |
| Przeciętny Samsung PM9A1 MZVL22T0HBLB | |
| Asus ROG Flow X16 GV601RW-M5082W | |
| Średnia w klasie Gaming | |
| HP Omen 16-b1090ng | |
| Lenovo Legion 7 16ARHA7 | |
| Corsair Voyager a1600 | |
* ... im mniej tym lepiej
Continuous Read: DiskSpd Read Loop, Queue Depth 8
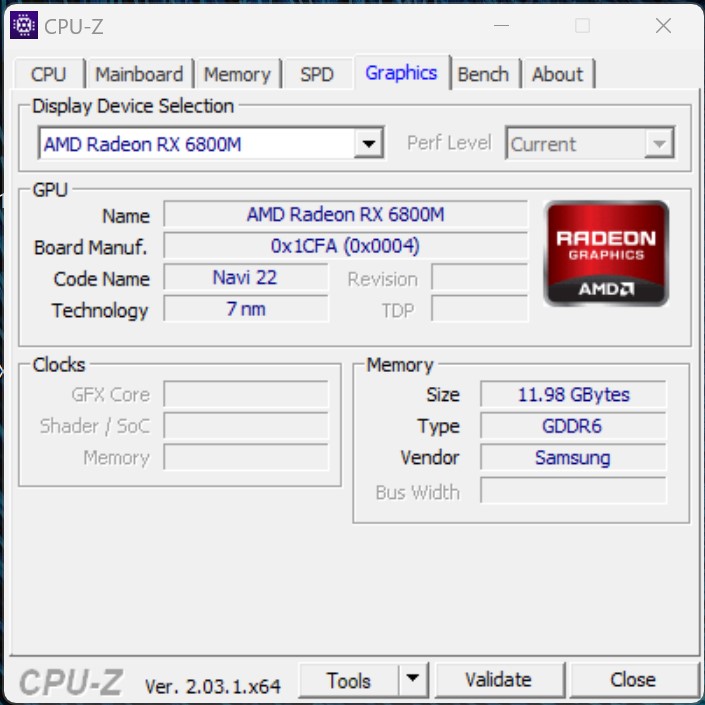
Karta graficzna
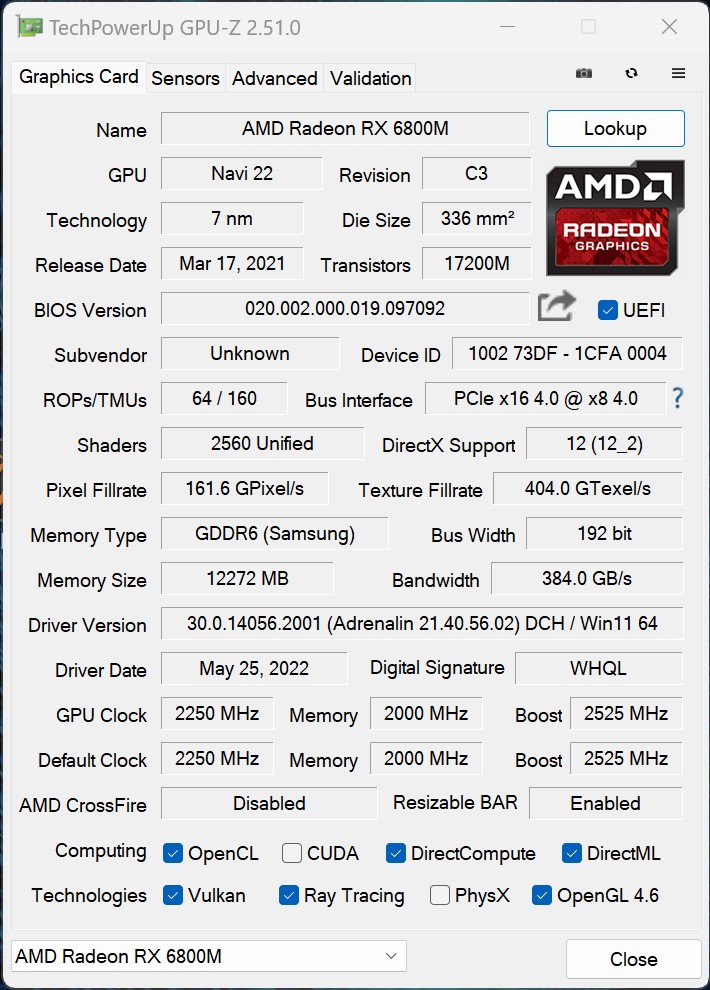
AMD Radeon RX 6800M to szybka dedykowana karta graficzna wyposażona w 12 GB VRAM. Obecna seria 6000 firmy AMD dla notebooków oferuje również oddzielne rdzenie RT do obliczeń ray tracingowych dzięki RDNA2. W teście Corsair Voyager a1600 może wyjść z dobrą wydajnością 3D. Różnica względem konkurentów z układem graficznym GeForce RTX 3080 Ti jest częściowo niewielka. Zasadniczo Corsair Voyager a1600 zapewnia wystarczającą wydajność, która jest obecnie wystarczająca do płynnego przeniesienia na ekran wielu nowoczesnych gier. Procesor zawsze otrzymuje optymalną wydajność od GPU dzięki technologii Smart Shift firmy AMD.
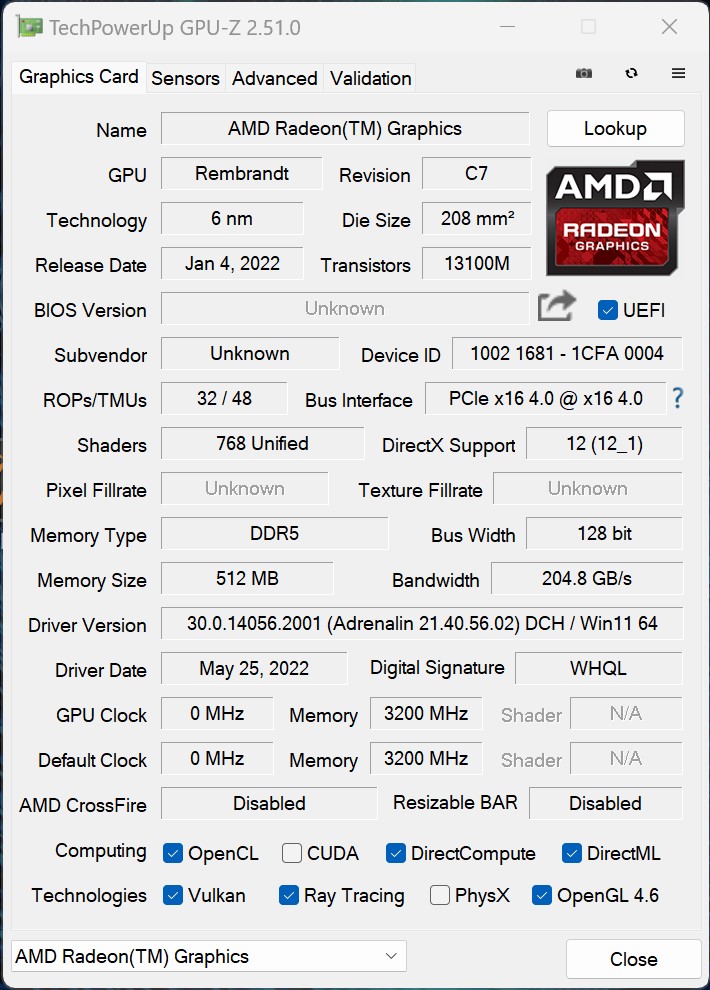
W trybie 2D iGPU w AMD Ryzen 9 6900HS wykonują pracę, a tym samym oszczędzają energię.
Po więcej porównań i benchmarków zapraszamy do naszegoGPU comparison chart.
| 3DMark Performance rating - Percent | |
| Średnia w klasie Gaming | |
| Lenovo Legion 7 16ARHA7 | |
| Corsair Voyager a1600 | |
| Przeciętny AMD Radeon RX 6800M | |
| Acer Predator Triton 500 SE PT516-52s-70KX | |
| HP Omen 16-b1090ng | |
| Asus ROG Flow X16 GV601RW-M5082W | |
| 3DMark 11 - 1280x720 Performance GPU | |
| Średnia w klasie Gaming (21841 - 80022, n=108, ostatnie 2 lata) | |
| Lenovo Legion 7 16ARHA7 | |
| Przeciętny AMD Radeon RX 6800M (39075 - 41706, n=2) | |
| Corsair Voyager a1600 | |
| Acer Predator Triton 500 SE PT516-52s-70KX | |
| Asus ROG Flow X16 GV601RW-M5082W | |
| HP Omen 16-b1090ng | |
| 3DMark | |
| 1280x720 Cloud Gate Standard Graphics | |
| Lenovo Legion 7 16ARHA7 | |
| Corsair Voyager a1600 | |
| Średnia w klasie Gaming (86886 - 223650, n=61, ostatnie 2 lata) | |
| HP Omen 16-b1090ng | |
| Acer Predator Triton 500 SE PT516-52s-70KX | |
| Przeciętny AMD Radeon RX 6800M (91327 - 170020, n=3) | |
| Asus ROG Flow X16 GV601RW-M5082W | |
| 1920x1080 Fire Strike Graphics | |
| Średnia w klasie Gaming (12242 - 62849, n=120, ostatnie 2 lata) | |
| Przeciętny AMD Radeon RX 6800M (30507 - 34993, n=3) | |
| Lenovo Legion 7 16ARHA7 | |
| Corsair Voyager a1600 | |
| Acer Predator Triton 500 SE PT516-52s-70KX | |
| Asus ROG Flow X16 GV601RW-M5082W | |
| HP Omen 16-b1090ng | |
| 2560x1440 Time Spy Graphics | |
| Średnia w klasie Gaming (5012 - 26212, n=119, ostatnie 2 lata) | |
| Lenovo Legion 7 16ARHA7 | |
| Acer Predator Triton 500 SE PT516-52s-70KX | |
| Przeciętny AMD Radeon RX 6800M (10439 - 11316, n=4) | |
| Corsair Voyager a1600 | |
| Asus ROG Flow X16 GV601RW-M5082W | |
| HP Omen 16-b1090ng | |
| 3DMark 05 Standard | 57639 pkt. | |
| 3DMark 06 Standard Score | 46732 pkt. | |
| 3DMark Vantage P Result | 77244 pkt. | |
| 3DMark 11 Performance | 30013 pkt. | |
| 3DMark Ice Storm Standard Score | 209564 pkt. | |
| 3DMark Cloud Gate Standard Score | 59585 pkt. | |
| 3DMark Fire Strike Score | 25639 pkt. | |
| 3DMark Fire Strike Extreme Score | 13599 pkt. | |
| 3DMark Time Spy Score | 10391 pkt. | |
Pomoc | ||
* ... im mniej tym lepiej
| The Witcher 3 | |
| 1920x1080 High Graphics & Postprocessing (Nvidia HairWorks Off) | |
| Średnia w klasie Gaming (181 - 341, n=3, ostatnie 2 lata) | |
| Lenovo Legion 7 16IAX7-82TD004SGE | |
| Lenovo Legion 7 16ARHA7 | |
| Asus ROG Flow X16 GV601RW-M5082W | |
| Przeciętny AMD Radeon RX 6800M (177.8 - 199, n=2) | |
| HP Omen 16-b1090ng | |
| Acer Predator Triton 500 SE PT516-52s-70KX | |
| Corsair Voyager a1600 | |
| 1920x1080 Ultra Graphics & Postprocessing (HBAO+) | |
| Średnia w klasie Gaming (95 - 240, n=8, ostatnie 2 lata) | |
| Lenovo Legion 7 16ARHA7 | |
| Lenovo Legion 7 16IAX7-82TD004SGE | |
| Przeciętny AMD Radeon RX 6800M (108 - 110, n=2) | |
| Corsair Voyager a1600 | |
| Acer Predator Triton 500 SE PT516-52s-70KX | |
| Asus ROG Flow X16 GV601RW-M5082W | |
| HP Omen 16-b1090ng | |
| GTA V | |
| 1920x1080 High/On (Advanced Graphics Off) AA:2xMSAA + FX AF:8x | |
| Lenovo Legion 7 16IAX7-82TD004SGE | |
| Acer Predator Triton 500 SE PT516-52s-70KX | |
| HP Omen 16-b1090ng | |
| Średnia w klasie Gaming (110.7 - 189, n=71, ostatnie 2 lata) | |
| Lenovo Legion 7 16ARHA7 | |
| Asus ROG Flow X16 GV601RW-M5082W | |
| Corsair Voyager a1600 | |
| Przeciętny AMD Radeon RX 6800M (124 - 156.2, n=2) | |
| 1920x1080 Highest AA:4xMSAA + FX AF:16x | |
| Średnia w klasie Gaming (48.3 - 186.9, n=102, ostatnie 2 lata) | |
| Acer Predator Triton 500 SE PT516-52s-70KX | |
| Lenovo Legion 7 16IAX7-82TD004SGE | |
| HP Omen 16-b1090ng | |
| Lenovo Legion 7 16ARHA7 | |
| Asus ROG Flow X16 GV601RW-M5082W | |
| Corsair Voyager a1600 | |
| Przeciętny AMD Radeon RX 6800M (75.1 - 92.8, n=2) | |
| Final Fantasy XV Benchmark | |
| 1920x1080 Standard Quality | |
| Średnia w klasie Gaming (85.7 - 236, n=89, ostatnie 2 lata) | |
| Lenovo Legion 7 16IAX7-82TD004SGE | |
| Lenovo Legion 7 16ARHA7 | |
| Acer Predator Triton 500 SE PT516-52s-70KX | |
| HP Omen 16-b1090ng | |
| Corsair Voyager a1600 | |
| Asus ROG Flow X16 GV601RW-M5082W | |
| Przeciętny AMD Radeon RX 6800M (118 - 125.6, n=2) | |
| 1920x1080 High Quality | |
| Średnia w klasie Gaming (41 - 215, n=103, ostatnie 2 lata) | |
| Lenovo Legion 7 16IAX7-82TD004SGE | |
| Lenovo Legion 7 16ARHA7 | |
| Acer Predator Triton 500 SE PT516-52s-70KX | |
| HP Omen 16-b1090ng | |
| Przeciętny AMD Radeon RX 6800M (97.5 - 99.7, n=2) | |
| Corsair Voyager a1600 | |
| Asus ROG Flow X16 GV601RW-M5082W | |
| F1 2021 | |
| 1920x1080 High Preset AA:T AF:16x | |
| Lenovo Legion 7 16ARHA7 | |
| Acer Predator Triton 500 SE PT516-52s-70KX | |
| Corsair Voyager a1600 | |
| Przeciętny AMD Radeon RX 6800M (187 - 231, n=2) | |
| Lenovo Legion 7 16IAX7-82TD004SGE | |
| 1920x1080 Ultra High Preset + Raytracing AA:T AF:16x | |
| Lenovo Legion 7 16ARHA7 | |
| Corsair Voyager a1600 | |
| Acer Predator Triton 500 SE PT516-52s-70KX | |
| Przeciętny AMD Radeon RX 6800M (114 - 124.1, n=2) | |
| Lenovo Legion 7 16IAX7-82TD004SGE | |
| X-Plane 11.11 | |
| 1920x1080 high (fps_test=3) | |
| Lenovo Legion 7 16IAX7-82TD004SGE | |
| HP Omen 16-b1090ng | |
| Acer Predator Triton 500 SE PT516-52s-70KX | |
| Średnia w klasie Gaming (52.1 - 143.5, n=115, ostatnie 2 lata) | |
| Asus ROG Flow X16 GV601RW-M5082W | |
| Przeciętny AMD Radeon RX 6800M (45.3 - 50.4, n=2) | |
| Corsair Voyager a1600 | |
| Lenovo Legion 7 16ARHA7 | |
| 1920x1080 med (fps_test=2) | |
| Lenovo Legion 7 16IAX7-82TD004SGE | |
| HP Omen 16-b1090ng | |
| Acer Predator Triton 500 SE PT516-52s-70KX | |
| Średnia w klasie Gaming (63.8 - 181.2, n=111, ostatnie 2 lata) | |
| Asus ROG Flow X16 GV601RW-M5082W | |
| Przeciętny AMD Radeon RX 6800M (50.7 - 61.4, n=2) | |
| Lenovo Legion 7 16ARHA7 | |
| Corsair Voyager a1600 | |
| Far Cry 5 | |
| 1920x1080 High Preset AA:T | |
| Lenovo Legion 7 16IAX7-82TD004SGE | |
| Średnia w klasie Gaming (82 - 163, n=10, ostatnie 2 lata) | |
| Asus ROG Flow X16 GV601RW-M5082W | |
| Corsair Voyager a1600 | |
| Przeciętny AMD Radeon RX 6800M (95 - 109, n=2) | |
| 1920x1080 Ultra Preset AA:T | |
| Lenovo Legion 7 16IAX7-82TD004SGE | |
| Średnia w klasie Gaming (70 - 151, n=10, ostatnie 2 lata) | |
| Asus ROG Flow X16 GV601RW-M5082W | |
| Corsair Voyager a1600 | |
| Przeciętny AMD Radeon RX 6800M (89 - 101, n=3) | |
| Strange Brigade | |
| 1920x1080 ultra AA:ultra AF:16 | |
| Średnia w klasie Gaming (76.3 - 456, n=93, ostatnie 2 lata) | |
| Lenovo Legion 7 16ARHA7 | |
| Corsair Voyager a1600 | |
| Przeciętny AMD Radeon RX 6800M (179 - 206, n=3) | |
| Acer Predator Triton 500 SE PT516-52s-70KX | |
| Asus ROG Flow X16 GV601RW-M5082W | |
| HP Omen 16-b1090ng | |
| Lenovo Legion 7 16IAX7-82TD004SGE | |
| 1920x1080 high AA:high AF:8 | |
| Średnia w klasie Gaming (129.5 - 485, n=79, ostatnie 2 lata) | |
| Lenovo Legion 7 16ARHA7 | |
| Corsair Voyager a1600 | |
| Przeciętny AMD Radeon RX 6800M (192 - 229, n=2) | |
| Acer Predator Triton 500 SE PT516-52s-70KX | |
| Asus ROG Flow X16 GV601RW-M5082W | |
| HP Omen 16-b1090ng | |
| Lenovo Legion 7 16IAX7-82TD004SGE | |
| Dota 2 Reborn | |
| 1920x1080 high (2/3) | |
| Lenovo Legion 7 16IAX7-82TD004SGE | |
| Średnia w klasie Gaming (82.8 - 275, n=111, ostatnie 2 lata) | |
| Acer Predator Triton 500 SE PT516-52s-70KX | |
| HP Omen 16-b1090ng | |
| Corsair Voyager a1600 | |
| Przeciętny AMD Radeon RX 6800M (n=1) | |
| Asus ROG Flow X16 GV601RW-M5082W | |
| Lenovo Legion 7 16ARHA7 | |
| 1920x1080 ultra (3/3) best looking | |
| Lenovo Legion 7 16IAX7-82TD004SGE | |
| Średnia w klasie Gaming (84.8 - 248, n=112, ostatnie 2 lata) | |
| HP Omen 16-b1090ng | |
| Acer Predator Triton 500 SE PT516-52s-70KX | |
| Corsair Voyager a1600 | |
| Przeciętny AMD Radeon RX 6800M (n=1) | |
| Asus ROG Flow X16 GV601RW-M5082W | |
| Lenovo Legion 7 16ARHA7 | |
Witcher 3 FPS diagram
| low | med. | high | ultra | QHD | 4K | |
|---|---|---|---|---|---|---|
| GTA V (2015) | 177.1 | 172 | 156.2 | 92.8 | 84 | 85.4 |
| The Witcher 3 (2015) | 309 | 236 | 177.8 | 108 | 59.5 | |
| Dota 2 Reborn (2015) | 146.1 | 126.2 | 125.5 | 114.8 | 95.2 | |
| Final Fantasy XV Benchmark (2018) | 160.8 | 125.6 | 97.5 | 71 | 41.3 | |
| X-Plane 11.11 (2018) | 60 | 50.7 | 45.3 | 28.8 | ||
| Far Cry 5 (2018) | 129 | 113 | 109 | 101 | 100 | 61 |
| Strange Brigade (2018) | 394 | 258 | 229 | 206 | 145 | 77.2 |
| Shadow of the Tomb Raider (2018) | 143.9 | 119.7 | 112.8 | 106.1 | 80.5 | 43.2 |
| Far Cry New Dawn (2019) | 111 | 97 | 94 | 86 | 82 | 62 |
| Metro Exodus (2019) | 205 | 137.4 | 99.8 | 78.7 | 61.4 | 37.1 |
| Borderlands 3 (2019) | 116.1 | 100.1 | 89.2 | 77.6 | 57 | 30.3 |
| F1 2020 (2020) | 305 | 247 | 228 | 172.4 | 127.4 | 70.2 |
| Dirt 5 (2020) | 242 | 154 | 121 | 95 | 76 | 47 |
| F1 2021 (2021) | 342 | 277 | 231 | 124.1 | 88.2 | 47.6 |
| New World (2021) | 122.5 | 103 | 83.7 | 66.2 | 34.1 | |
| Forza Horizon 5 (2021) | 213 | 165 | 159 | 97 | 79 | 50 |
| God of War (2022) | 88.6 | 88.3 | 85.4 | 68.4 | 53 | 33.8 |
| GRID Legends (2022) | 233 | 205 | 171.2 | 144.1 | 115.8 | 72.8 |
| Cyberpunk 2077 1.6 (2022) | 122.5 | 95.5 | 82 | 76.9 | 48.1 | 22.1 |
| Tiny Tina's Wonderlands (2022) | 196.7 | 161.5 | 104.6 | 80.5 | 54.9 | 28.2 |
| F1 22 (2022) | 226 | 226 | 192.3 | 49.7 | 29.9 | 13.8 |
| A Plague Tale Requiem (2022) | 104.9 | 82.5 | 61.4 | 46 | 32.8 | 17.9 |
| Uncharted Legacy of Thieves Collection (2022) | 93.4 | 87.9 | 80.7 | 76.3 | 59.2 | 33.7 |
| Spider-Man Miles Morales (2022) | 90.8 | 94.2 | 88.6 | 82.5 | 63.2 | 38.1 |
Emisje i energia - nie do pominięcia
Emisja hałasu
Zmierzona emisja hałasu wykazuje niemal typowy wynik dla laptopa do gier. Niemniej jednak zmierzone 51,1 dB(A) jest głośne i subiektywnie odbierane jako znacznie głośniejsze. Powodem jest szum wentylatora o bardzo wysokiej częstotliwości. Jedynym remedium jest wybranie profilu Balanced
lub Quiet
. W teście obciążeniowym natężenie hałasu spada odpowiednio do 46 i 36 dB(A).
Hałas
| luz |
| 30.5 / 30.6 / 30.7 dB |
| obciążenie |
| 44.5 / 51.1 dB |
 | ||
30 dB cichy 40 dB(A) słyszalny 50 dB(A) irytujący |
||
min: | ||
| Corsair Voyager a1600 Radeon RX 6800M, R9 6900HS, Samsung PM9A1 MZVL22T0HBLB | Asus ROG Flow X16 GV601RW-M5082W GeForce RTX 3070 Ti Laptop GPU, R9 6900HS, Micron 3400 1TB MTFDKBA1T0TFH | Lenovo Legion 7 16ARHA7 Radeon RX 6850M XT, R9 6900HX, Samsung PM9A1 MZVL22T0HBLB | Acer Predator Triton 500 SE PT516-52s-70KX GeForce RTX 3080 Ti Laptop GPU, i7-12700H, Micron 3400 1TB MTFDKBA1T0TFH | HP Omen 16-b1090ng GeForce RTX 3070 Ti Laptop GPU, i7-12700H, WDC PC SN810 1TB | Lenovo Legion 7 16IAX7-82TD004SGE GeForce RTX 3080 Ti Laptop GPU, i9-12900HX, Micron 3400 1TB MTFDKBA1T0TFH | |
|---|---|---|---|---|---|---|
| Noise | 7% | 22% | 0% | -3% | 5% | |
| wyłączone / środowisko * (dB) | 29.9 | 25.5 15% | 22.8 24% | 26 13% | 26 13% | 24.5 18% |
| Idle Minimum * (dB) | 30.5 | 25.5 16% | 23 25% | 26 15% | 30 2% | 24.5 20% |
| Idle Average * (dB) | 30.6 | 25.5 17% | 23 25% | 29 5% | 31 -1% | 30 2% |
| Idle Maximum * (dB) | 30.7 | 27.4 11% | 23 25% | 34 -11% | 33 -7% | 32.5 -6% |
| Load Average * (dB) | 44.5 | 49.9 -12% | 26.8 40% | 50 -12% | 49 -10% | 43.9 1% |
| Load Maximum * (dB) | 51.1 | 55 -8% | 54.2 -6% | 56 -10% | 57 -12% | 54.2 -6% |
| Witcher 3 ultra * (dB) | 54.3 | 53 | 53 | 48.8 |
* ... im mniej tym lepiej
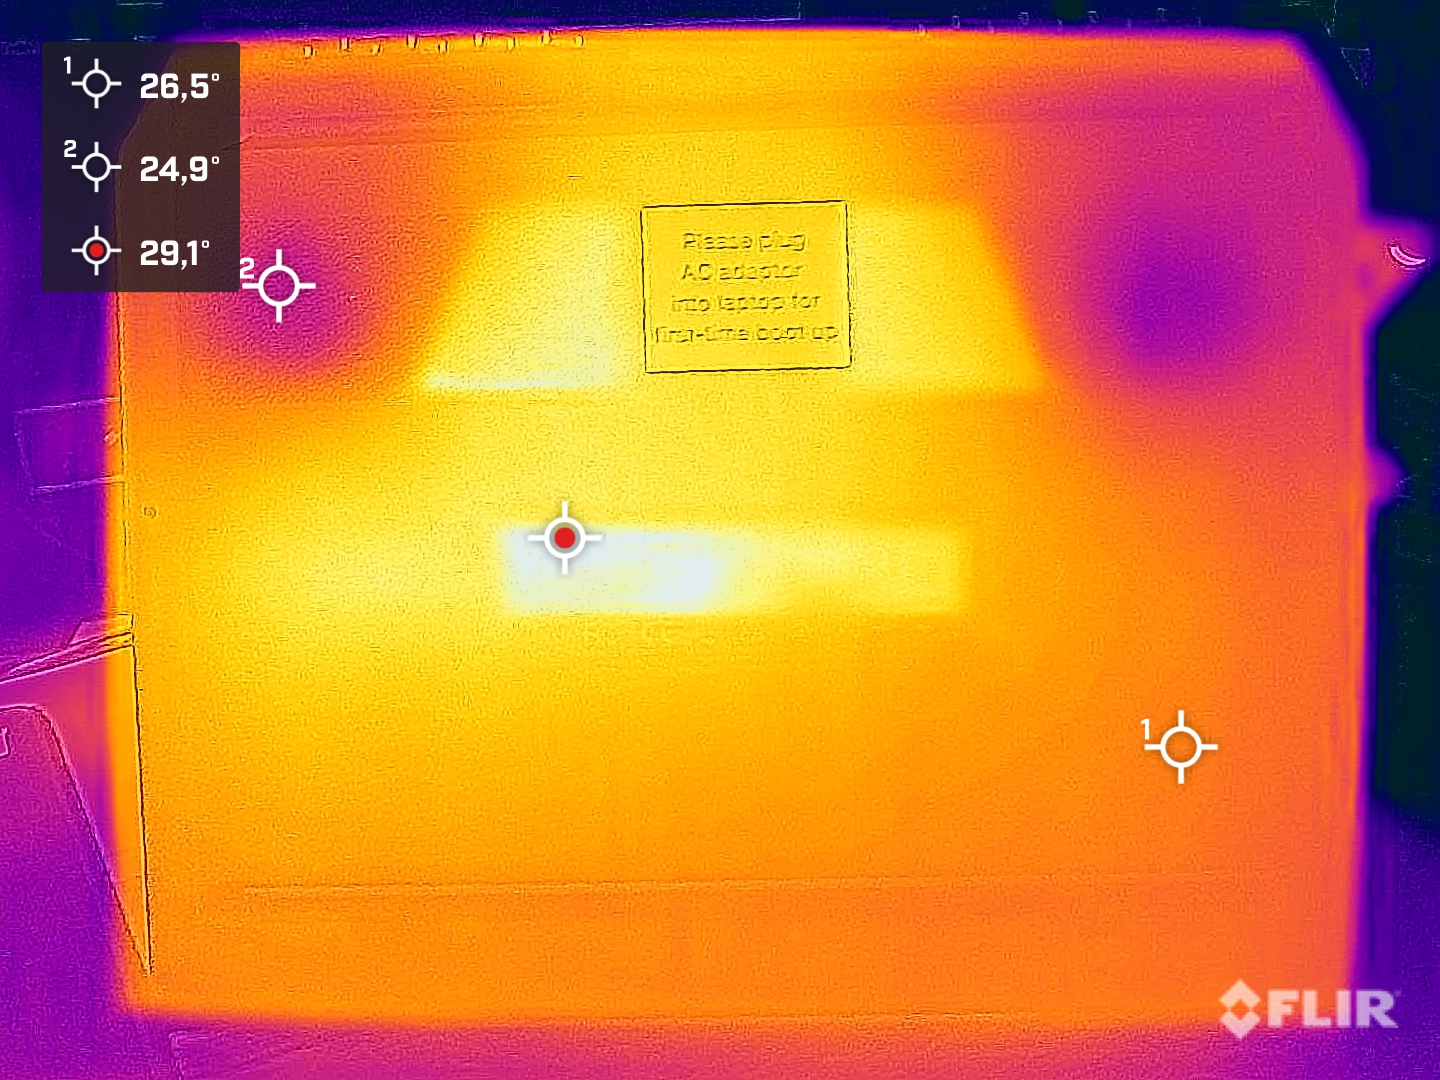
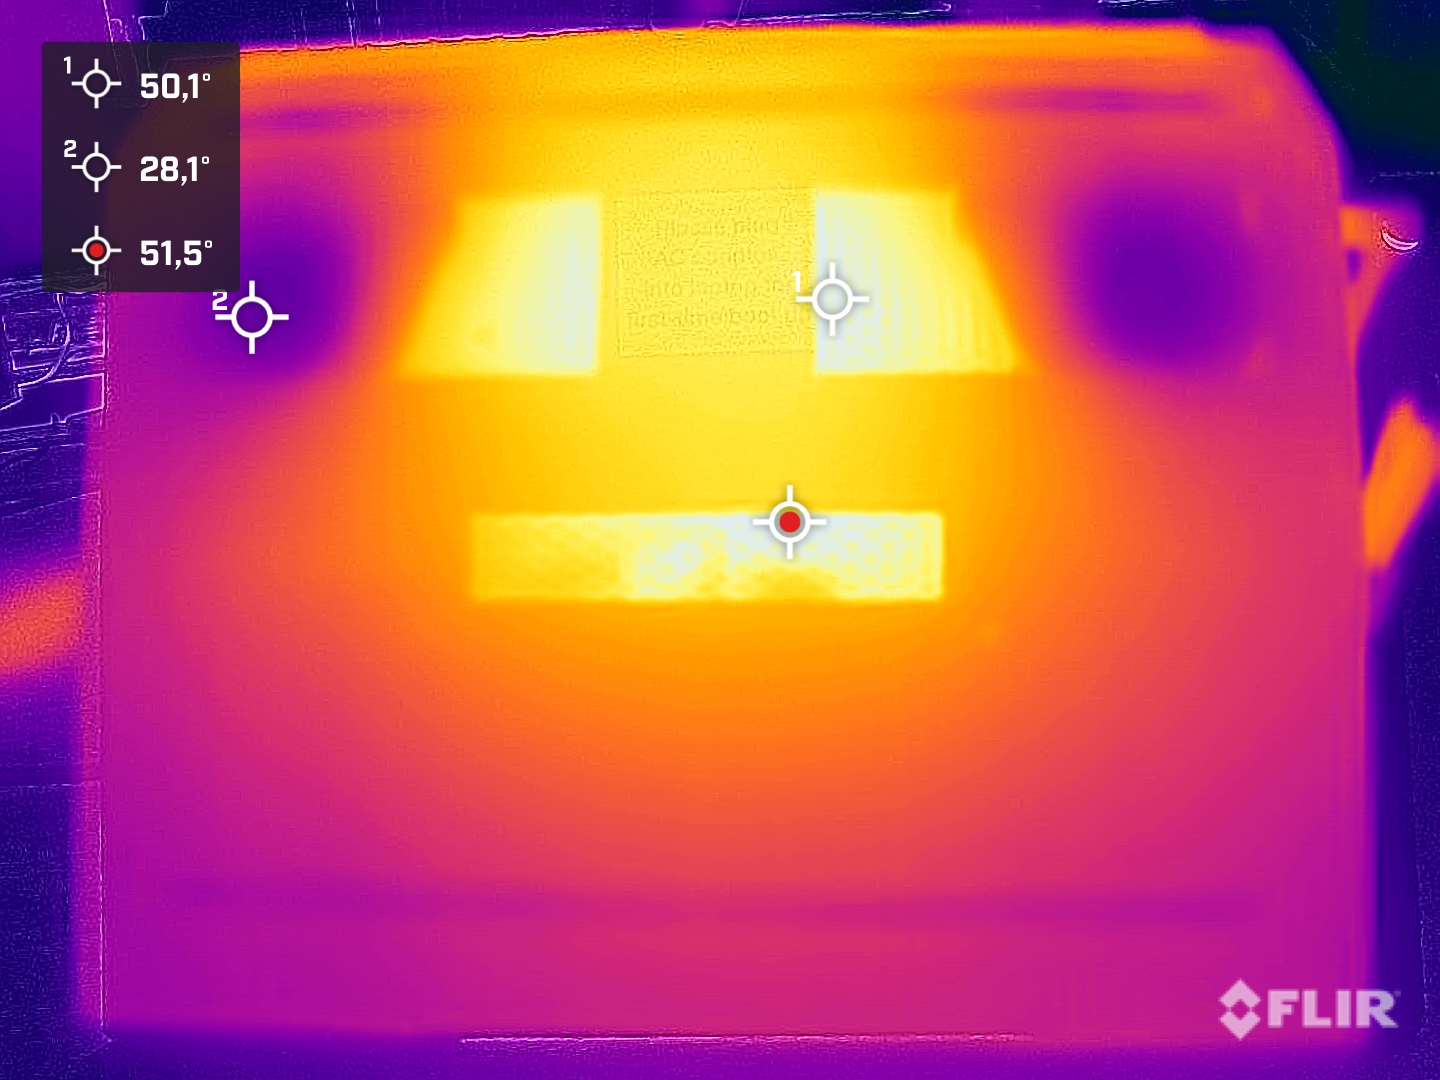
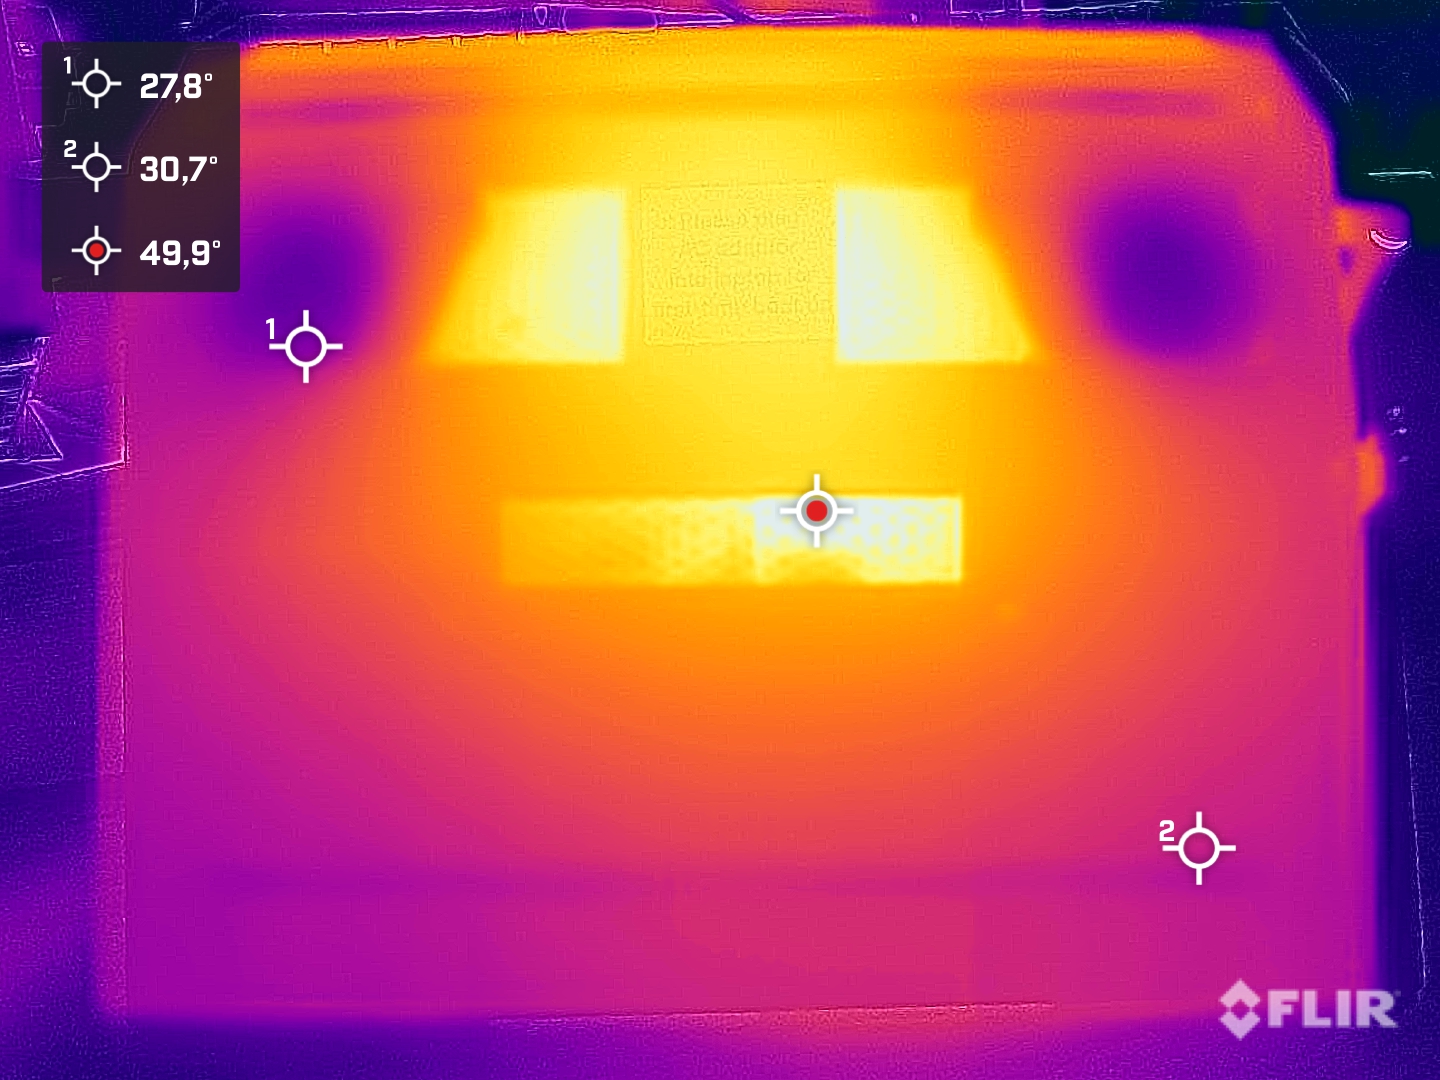
Temperatura
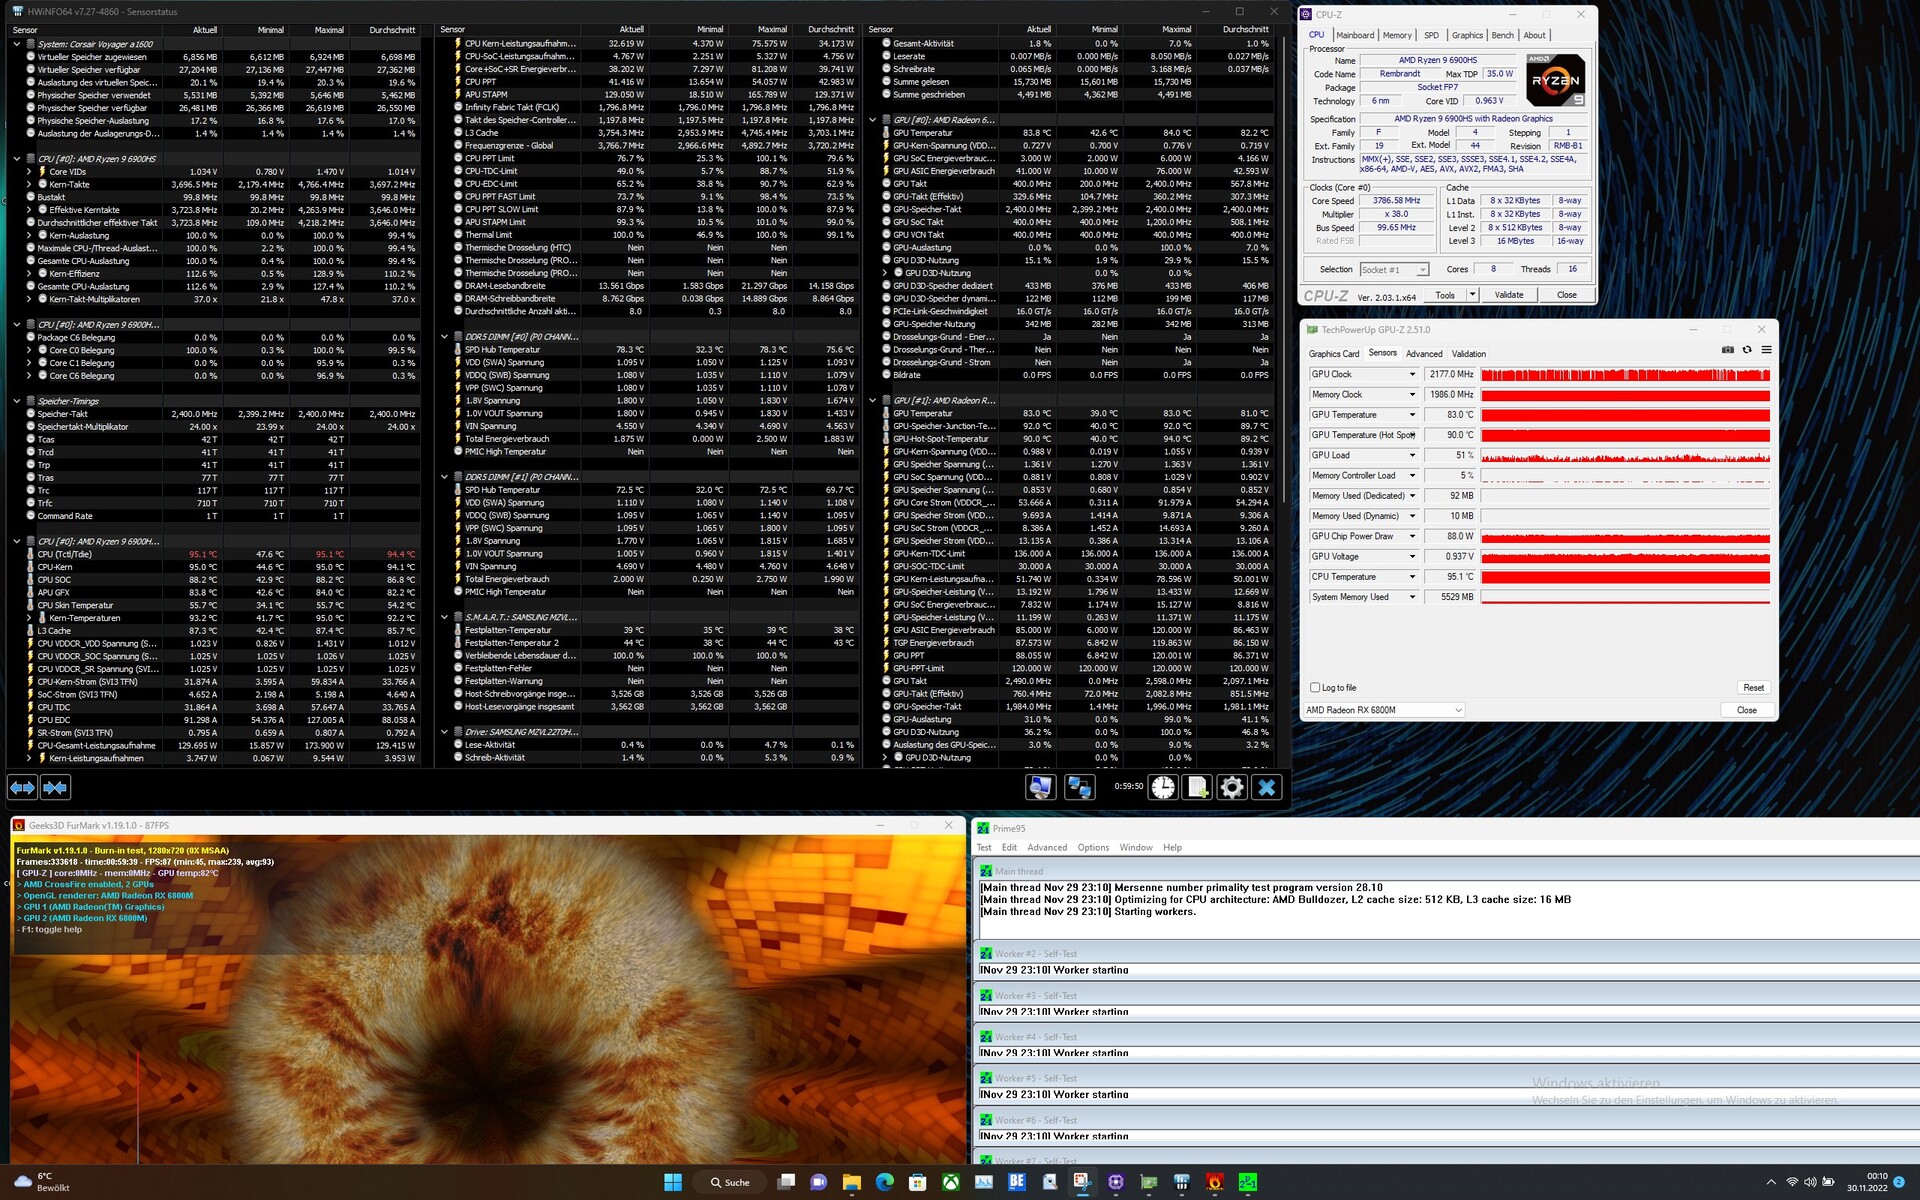
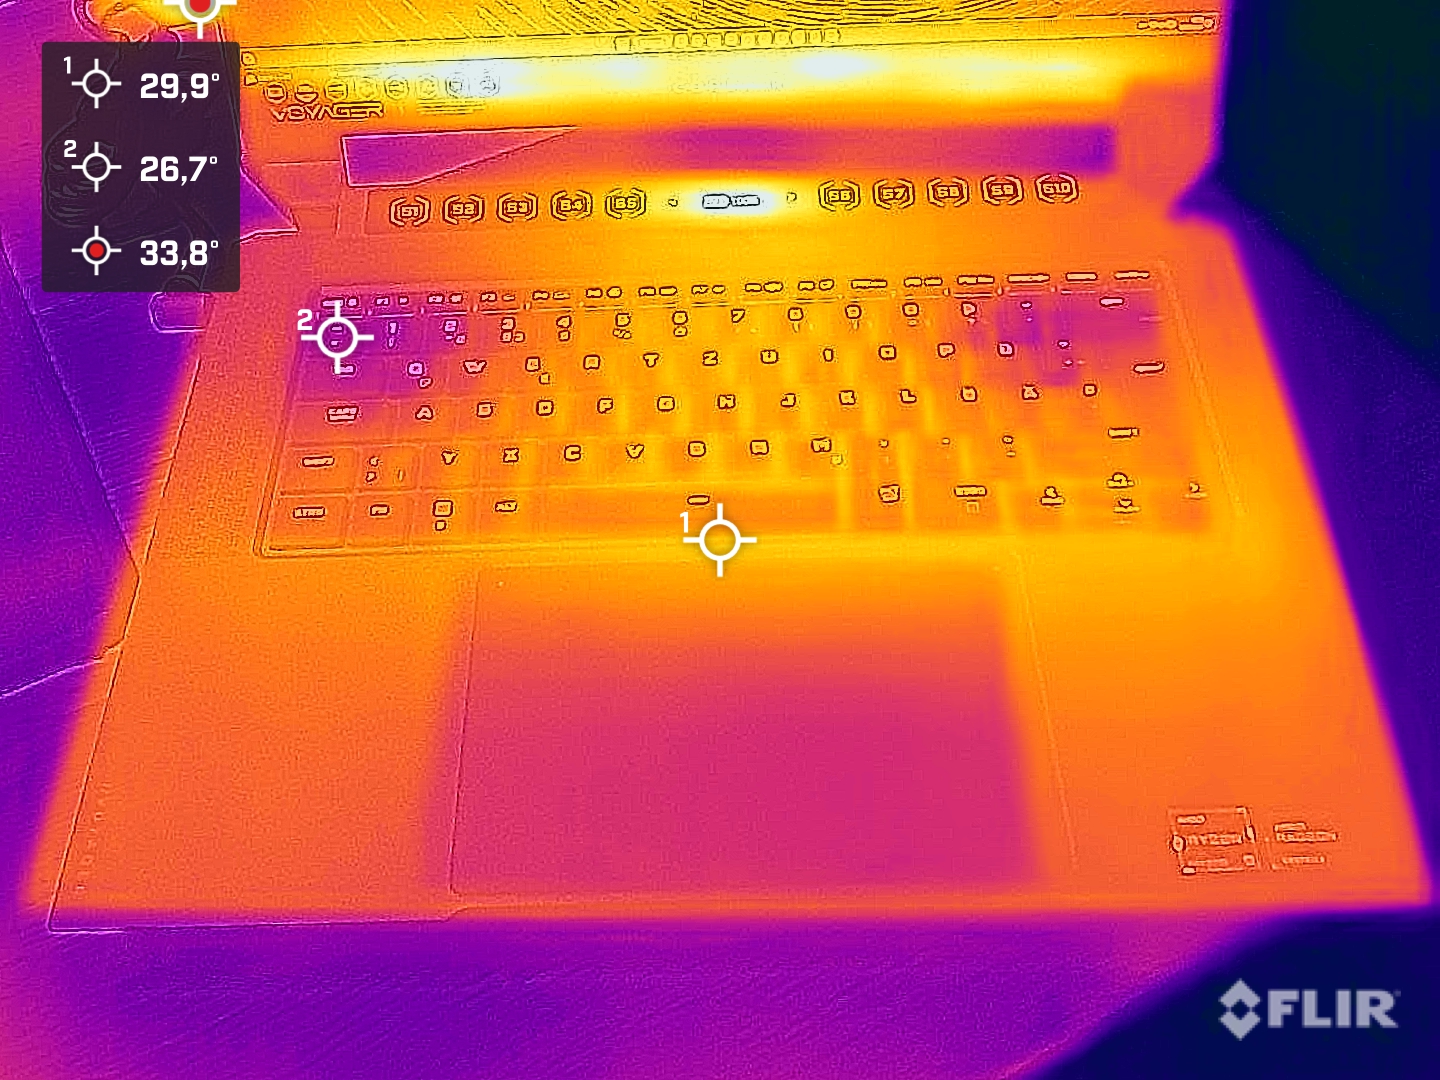
W teście obciążeniowym najcieplejszy punkt zmierzyliśmy na spodzie obudowy - 54 °C. Również górna część obudowy jest dość ciepła i wynosi nieco ponad 50 °C. Podczas gry temperatura obudowy spada nieznacznie o 1 do 2 °C.
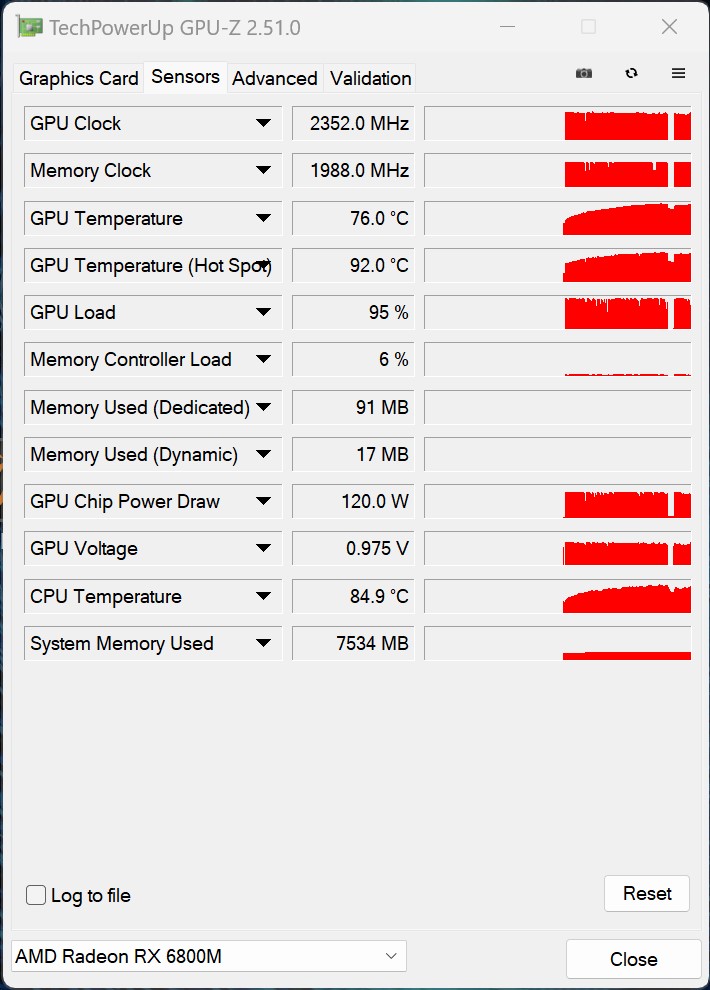
W teście obciążeniowym temperatury CPU i GPU wzrosły odpowiednio do 95 i 83 °C. SoC nadal jednak taktuje ze średnią częstotliwością 3,7 GHz. GPU AMD również osiąga wysokie taktowanie, osiągając nieco poniżej 2,2 GHz. Corsair stosuje duży system chłodzenia z komorą parową i dwoma wentylatorami.
(-) Maksymalna temperatura w górnej części wynosi 50.7 °C / 123 F, w porównaniu do średniej 40.4 °C / 105 F , począwszy od 21.2 do 68.8 °C dla klasy Gaming.
(-) Dno nagrzewa się maksymalnie do 54.2 °C / 130 F, w porównaniu do średniej 43.2 °C / 110 F
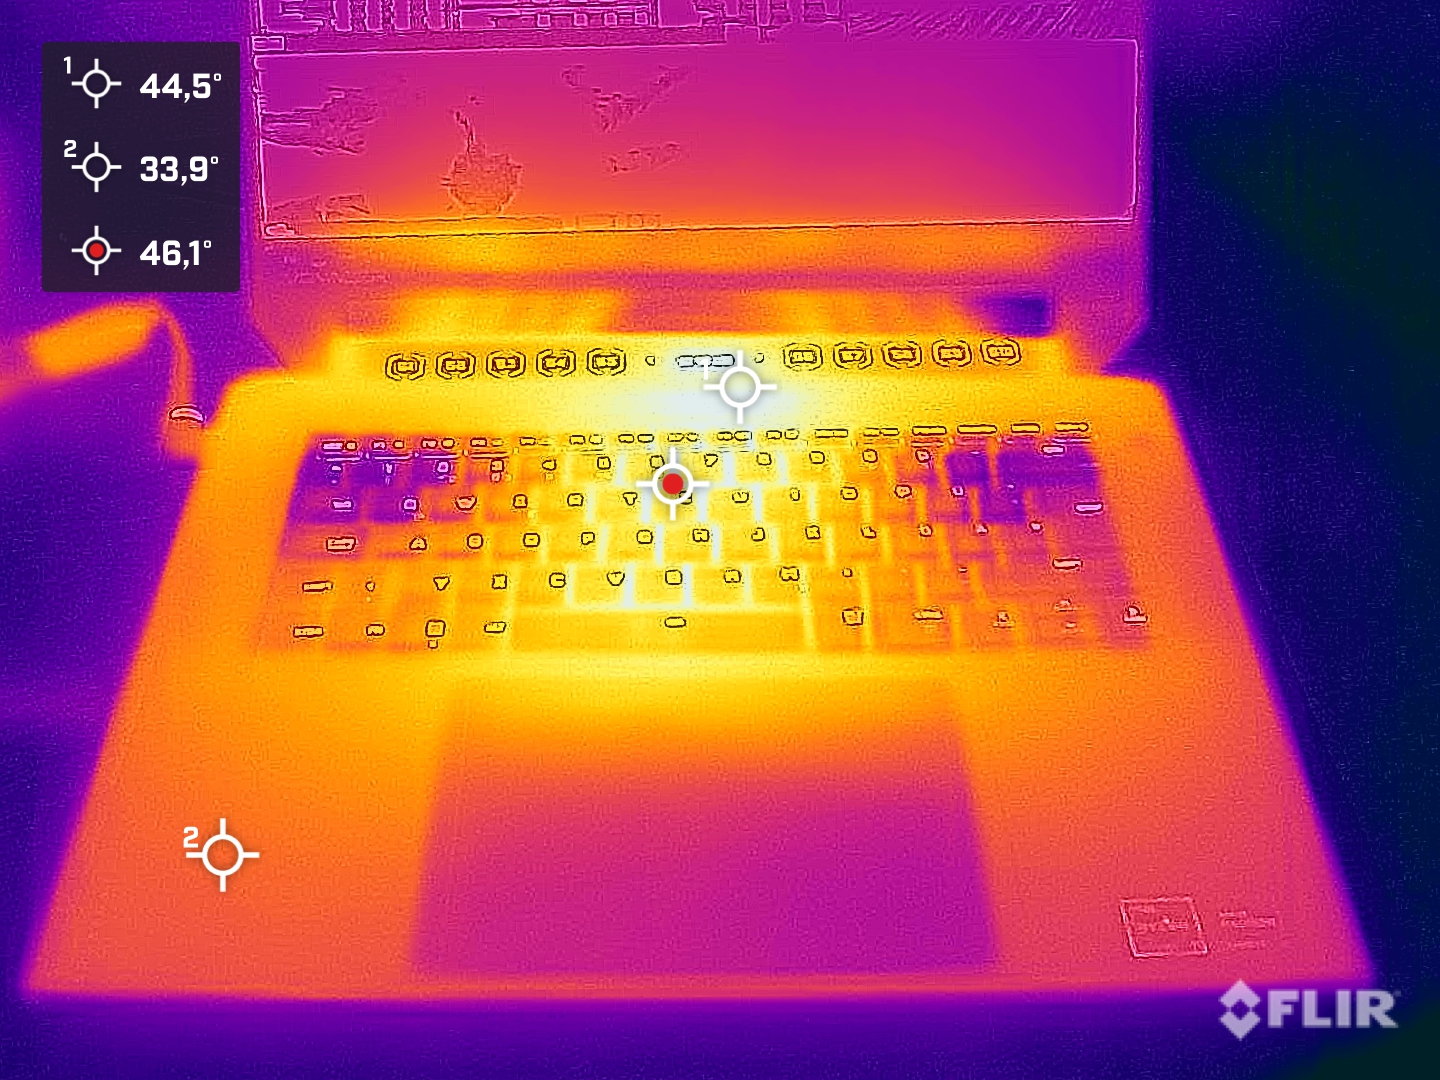
(+) W stanie bezczynności średnia temperatura górnej części wynosi 31.5 °C / 89 F, w porównaniu ze średnią temperaturą urządzenia wynoszącą 33.9 °C / ### class_avg_f### F.
(±) Podczas gry w Wiedźmina 3 średnia temperatura górnej części wynosi 36.6 °C / 98 F, w porównaniu do średniej temperatury urządzenia wynoszącej 33.9 °C / ## #class_avg_f### F.
(+) Podparcia dłoni i touchpad osiągają maksymalną temperaturę skóry (34 °C / 93.2 F) i dlatego nie są gorące.
(-) Średnia temperatura obszaru podparcia dłoni w podobnych urządzeniach wynosiła 28.8 °C / 83.8 F (-5.2 °C / -9.4 F).
| Corsair Voyager a1600 AMD Ryzen 9 6900HS, AMD Radeon RX 6800M | Asus ROG Flow X16 GV601RW-M5082W AMD Ryzen 9 6900HS, NVIDIA GeForce RTX 3070 Ti Laptop GPU | Lenovo Legion 7 16ARHA7 AMD Ryzen 9 6900HX, AMD Radeon RX 6850M XT | Acer Predator Triton 500 SE PT516-52s-70KX Intel Core i7-12700H, NVIDIA GeForce RTX 3080 Ti Laptop GPU | HP Omen 16-b1090ng Intel Core i7-12700H, NVIDIA GeForce RTX 3070 Ti Laptop GPU | Lenovo Legion 7 16IAX7-82TD004SGE Intel Core i9-12900HX, NVIDIA GeForce RTX 3080 Ti Laptop GPU | |
|---|---|---|---|---|---|---|
| Heat | -3% | 14% | 8% | 14% | -3% | |
| Maximum Upper Side * (°C) | 50.7 | 55.1 -9% | 37.2 27% | 47 7% | 41 19% | 44.4 12% |
| Maximum Bottom * (°C) | 54.2 | 50.3 7% | 43 21% | 49 10% | 62 -14% | 60.8 -12% |
| Idle Upper Side * (°C) | 35.8 | 35.5 1% | 34 5% | 31 13% | 25 30% | 33.8 6% |
| Idle Bottom * (°C) | 33 | 36.1 -9% | 32.8 1% | 32 3% | 26 21% | 38.8 -18% |
* ... im mniej tym lepiej
Mówca
Dwa głośniki znajdują się pod oparciami dłoni. Dźwięk kierowany jest jednak do góry z maskownic głośników obok klawiatury. Jak to często bywa, w obu głośnikach brakuje basów, więc wyraźnie dominują tony średnie i wysokie. Do gier zalecamy jednak używanie zestawu słuchawkowego. Można go podłączyć do laptopa przez USB za pomocą gniazda 3,5 mm lub przez Slipstream.
Corsair Voyager a1600 analiza dźwięku
(-) | niezbyt głośne głośniki (###wartość### dB)
Bas 100 - 315 Hz
(±) | zredukowany bas - średnio 10.2% niższy od mediany
(±) | liniowość basu jest średnia (13.7% delta do poprzedniej częstotliwości)
Średnie 400 - 2000 Hz
(±) | wyższe średnie - średnio 7.8% wyższe niż mediana
(±) | liniowość środka jest średnia (7% delta do poprzedniej częstotliwości)
Wysokie 2–16 kHz
(+) | zrównoważone maksima - tylko 1.8% od mediany
(±) | liniowość wysokich wartości jest średnia (11.4% delta do poprzedniej częstotliwości)
Ogólnie 100 - 16.000 Hz
(±) | liniowość ogólnego dźwięku jest średnia (25.5% różnicy w stosunku do mediany)
W porównaniu do tej samej klasy
» 91% wszystkich testowanych urządzeń w tej klasie było lepszych, 2% podobnych, 7% gorszych
» Najlepszy miał deltę 6%, średnia wynosiła ###średnia###%, najgorsza wynosiła 132%
W porównaniu do wszystkich testowanych urządzeń
» 78% wszystkich testowanych urządzeń było lepszych, 4% podobnych, 17% gorszych
» Najlepszy miał deltę 4%, średnia wynosiła ###średnia###%, najgorsza wynosiła 134%
Asus ROG Flow X16 GV601RW-M5082W analiza dźwięku
(±) | głośność głośnika jest średnia, ale dobra (80.7 dB)
Bas 100 - 315 Hz
(±) | zredukowany bas - średnio 12.7% niższy od mediany
(±) | liniowość basu jest średnia (13.8% delta do poprzedniej częstotliwości)
Średnie 400 - 2000 Hz
(+) | zbalansowane środki średnie - tylko 1.3% od mediany
(+) | średnie są liniowe (4.7% delta do poprzedniej częstotliwości)
Wysokie 2–16 kHz
(±) | wyższe maksima - średnio 6.4% wyższe od mediany
(+) | wzloty są liniowe (6.8% delta do poprzedniej częstotliwości)
Ogólnie 100 - 16.000 Hz
(+) | ogólny dźwięk jest liniowy (12.9% różnicy w stosunku do mediany)
W porównaniu do tej samej klasy
» 17% wszystkich testowanych urządzeń w tej klasie było lepszych, 4% podobnych, 79% gorszych
» Najlepszy miał deltę 6%, średnia wynosiła ###średnia###%, najgorsza wynosiła 132%
W porównaniu do wszystkich testowanych urządzeń
» 12% wszystkich testowanych urządzeń było lepszych, 3% podobnych, 85% gorszych
» Najlepszy miał deltę 4%, średnia wynosiła ###średnia###%, najgorsza wynosiła 134%
Pobór mocy
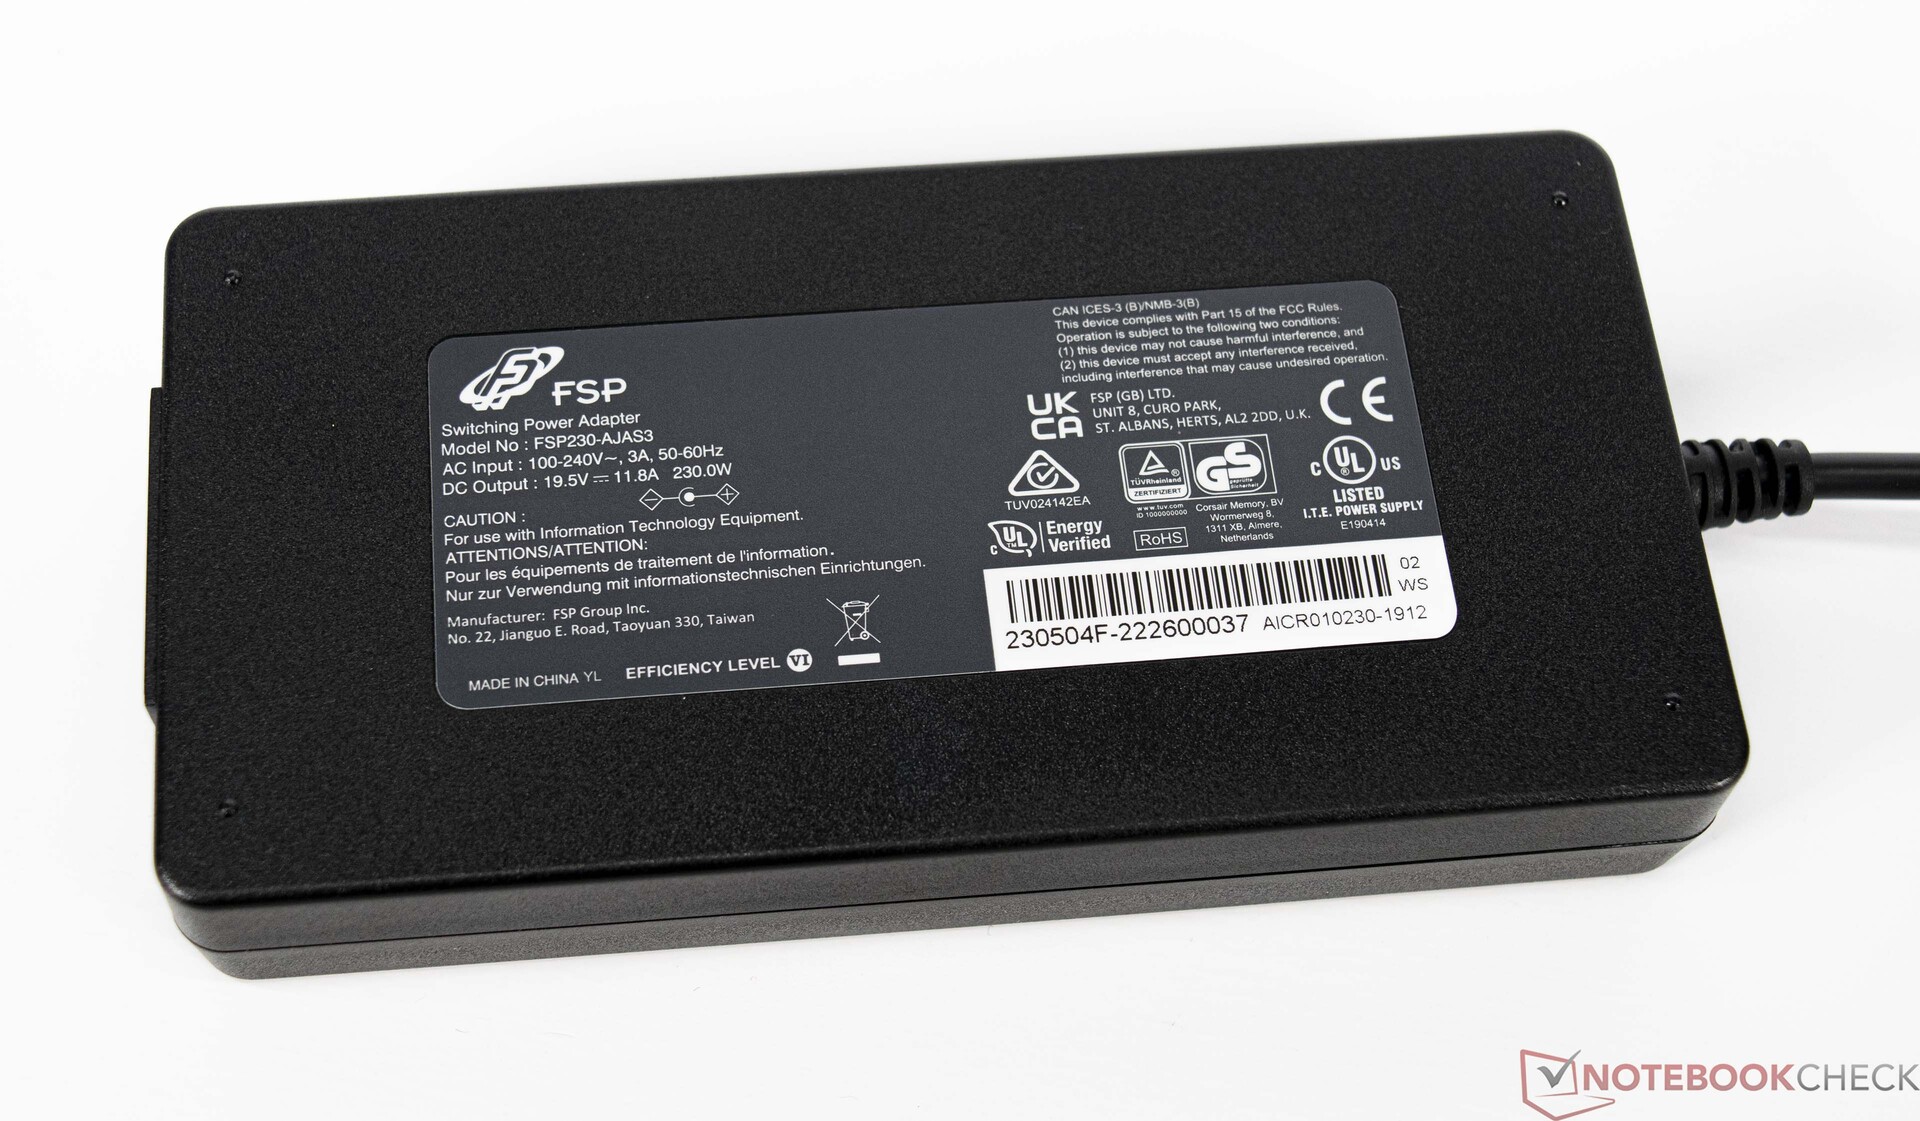
Jeśli chodzi o zużycie energii, zmierzyliśmy około 16 do 22 watów w stanie spoczynku. Pod średnim obciążeniem zarejestrowaliśmy około 133 watów, choć osiągane są szczyty do 258 watów. Według specyfikacji, zasilacz może dostarczyć 230 watów. Wyższe szczyty obciążenia nie doprowadziły jednak do problemów w teście. Akumulator nie został dodatkowo rozładowany podczas stress testu.
| wyłączony / stan wstrzymania | |
| luz | |
| obciążenie |
|
Legenda:
min: | |
Energy consumption Witcher 3 / stress test
Energy consumption with an external monitor
Żywotność baterii
Z wynikiem 99 Wh Corsair wyczerpuje maksimum, jeśli chodzi o pojemność akumulatora. Ze względu na stosunkowo wysokie zużycie energii w stanie spoczynku urządzenie pozostaje w tyle za konkurencją. Lenovo Legion 7 osiąga jednak jeszcze gorsze wyniki. Mając to na uwadze, Voyager a1600 osiąga w teście WLAN przelotny czas pracy, wynoszący nieco poniżej 6 godzin. Jasność wyświetlacza wyniosła w tym teście 52 procent, co odpowiada warunkom ogólnym 150 cd/m². Corsair dławi też zauważalnie wydajność CPU i GPU w trybie akumulatorowym.

| Corsair Voyager a1600 R9 6900HS, Radeon RX 6800M, 99 Wh | Asus ROG Flow X16 GV601RW-M5082W R9 6900HS, GeForce RTX 3070 Ti Laptop GPU, 90 Wh | Lenovo Legion 7 16ARHA7 R9 6900HX, Radeon RX 6850M XT, 99 Wh | Acer Predator Triton 500 SE PT516-52s-70KX i7-12700H, GeForce RTX 3080 Ti Laptop GPU, 99.98 Wh | HP Omen 16-b1090ng i7-12700H, GeForce RTX 3070 Ti Laptop GPU, 83 Wh | Lenovo Legion 7 16IAX7-82TD004SGE i9-12900HX, GeForce RTX 3080 Ti Laptop GPU, 99 Wh | Średnia w klasie Gaming | |
|---|---|---|---|---|---|---|---|
| Czasy pracy | -30% | -6% | 13% | 10% | -35% | 13% | |
| Reader / Idle (h) | 7 | 4.9 -30% | 10.1 44% | 8.71 ? 24% | |||
| H.264 (h) | 6 | 8.2 37% | 5.1 -15% | 8.26 ? 38% | |||
| WiFi v1.3 (h) | 5.8 | 5.7 -2% | 7.3 26% | 5.7 -2% | 5.6 -3% | 4.5 -22% | 7.02 ? 21% |
| Load (h) | 2.1 | 0.9 -57% | 1.8 -14% | 2.2 5% | 1.9 -10% | 0.7 -67% | 1.47 ? -30% |
| Witcher 3 ultra (h) | 0.9 | 0.9 |
Za
Przeciw
Werdykt - Wszechstronny notebook dla graczy i streamerów
Corsair stworzył naprawdę świetne urządzenie z modelem Voyager a1600. Połączenie SoC i GPU AMD jest dobre i wypada w testach dość przekonująco. Często musi przyznać się do porażki w bezpośrednim pojedynku z obecnym SoC Intela. Różnice w wydajności nie są jednak naprawdę zauważalne. Voyager a1600 wygląda szczególnie high-endowo ze względu na dobór materiałów, co daje też bardzo dobrą stabilność urządzenia. Urządzenie wcale nie wygląda topornie
Łączność okazuje się na pierwszy rzut oka nieco spartańska. Jednak ci, którzy polegają na technologii Slipstream do podłączenia urządzeń peryferyjnych, nie będą tęsknić za nieobecnymi portami USB typu A.
Ryzen 9 6900HS firmy AMD działa dobrze i niezmiennie szybko, bez większych spadków wydajności pod obciążeniem. To samo możemy zaświadczyć o Radeonie RX 6800M firmy AMD. Podobał nam się wyświetlacz w formacie 16:10. Jedyne wady to nieco niska jasność i nie do końca doskonałe pokrycie przestrzeni barw AdobeRGB i P3, które wykluczają profesjonalne zastosowanie do edycji wideo czy zdjęć. Jako laptop do gier Corsair Voyager a1600 może się jednak bez nich spokojnie obejść.
Corsair Voyager a1600 to coś więcej niż tylko czysty notebook do gier, ponieważ jego wspaniałe funkcje sprawiają, że jest to idealne urządzenie dla streamerów i twórców treści.
Jednak dzięki wyjątkowym funkcjom streamingowym Voyager a1600 zostanie zapamiętany. Przyciski szybkiego uruchamiania, które można dowolnie przypisywać, odpowiadają streamerom i można się obejść bez dodatkowego pokładu strumieniowego. Z tego względu, ze względu na przeznaczenie, życzylibyśmy sobie wyższej jakości kamery, która nie ma służyć tylko jako mobilne rozwiązanie awaryjne. Największą wadą Corsair Voyager a1600 jest wbudowana jednostka chłodząca. Pod obciążeniem temperatury pozostają w granicach, bez dwóch zdań, ale mimo to zmierzony poziom hałasu jest zbyt wysoki przy maksymalnej wydajności. Osoby, które odpuszczą sobie tryb Extreme, zostaną nagrodzone niską emisją, ale jednocześnie oddadzą trochę wydajności.
Cena i dostępność
Corsair Voyager a1600 jest dostępny bezpośrednio w sklepie Corsair gdzie za testowaną konfigurację trzeba zapłacić 3,550 euro. Alternatywnie, Amazon sprzedaje ten sam model za aktualnie 3,540 euro. Tańsza konfiguracja z procesorem Ryzen 7 6800HS i 16 GB RAM jest również dostępna w sklepie Amazon za 2,725 Euro.
Corsair Voyager a1600
- 05/12/2022 v7 (old)
Sebastian Bade
Price comparison
