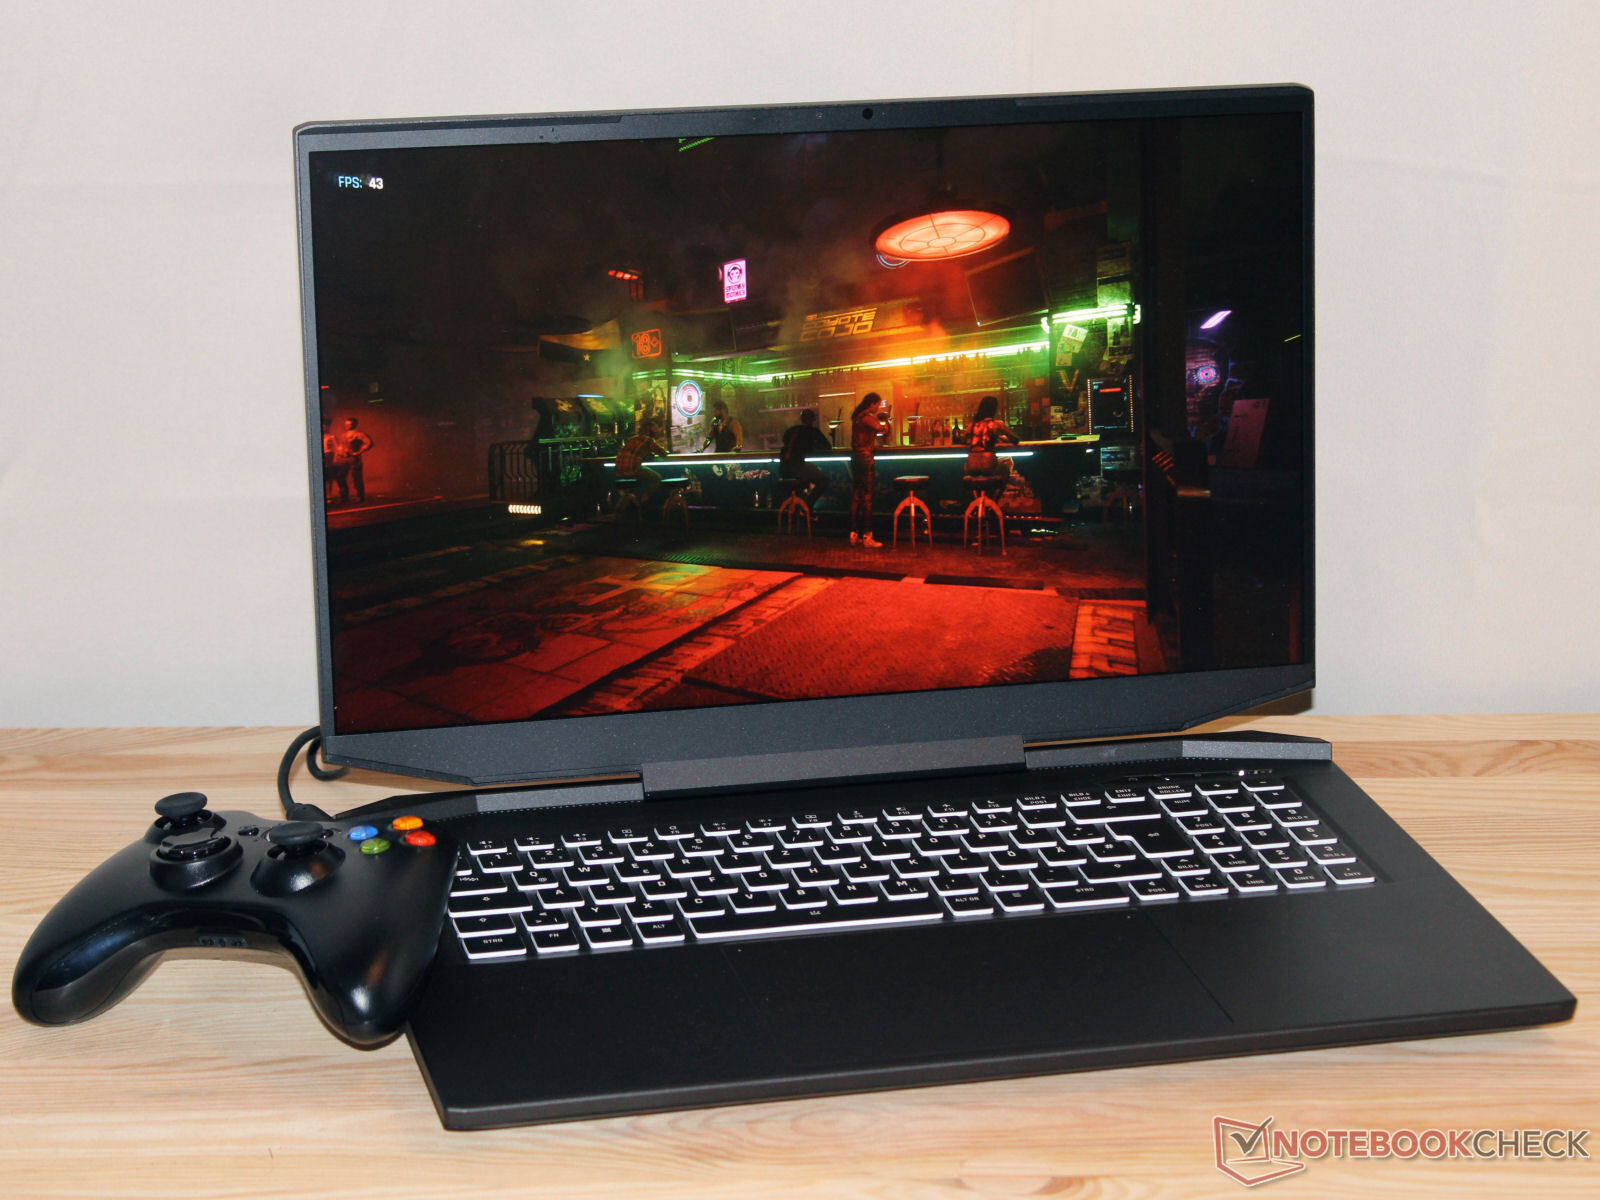
Recenzja XMG Apex 17 (late 23): gamingowy laptop QHD z RTX 4060
XMG Apex 17 (pod koniec 23 roku) to średniej klasy laptop do gier QHD oparty na barebone TongFang (GM7XG0) i jest dostępny w tym wariancie za niecałe 1800 euro. Pakiet składa się z Ryzen 7 7840HS, GeForce RTX 4060 (alternatywnie: RTX 4050), 32 GB pamięci RAM i dysk SSD o pojemności 1 TB. Konkurencję można znaleźć w postaciAcer Nitro 17 AN17-51iAlienware m16 R1, LenovoLenovo Legion Pro 5 16IRX8,MSI Katana 17 B13VFKorazMedion Erazer Defender P40.
Potencjalni konkurenci w porównaniu
Ocena | Data | Model | Waga | Wysokość | Rozmiar | Rezolucja | Cena |
|---|---|---|---|---|---|---|---|
| 87.1 % v7 (old) | 10/2023 | Schenker XMG Apex 17 (Late 23) R7 7840HS, GeForce RTX 4060 Laptop GPU | 2.5 kg | 24.9 mm | 17.30" | 2560x1440 | |
| 88.3 % v7 (old) | 09/2023 | Alienware m16 R1 Intel i7-13700HX, GeForce RTX 4060 Laptop GPU | 3 kg | 25.4 mm | 16.00" | 2560x1600 | |
| 87.9 % v7 (old) | 05/2023 | Lenovo Legion Pro 5 16IRX8 i7-13700HX, GeForce RTX 4060 Laptop GPU | 2.5 kg | 26.8 mm | 16.00" | 2560x1600 | |
| 87.2 % v7 (old) | 07/2023 | Acer Nitro 17 AN17-51-71ER i7-13700H, GeForce RTX 4060 Laptop GPU | 3 kg | 30.3 mm | 17.30" | 2560x1440 | |
| 84.6 % v7 (old) | 05/2023 | Medion Erazer Defender P40 i7-13700HX, GeForce RTX 4060 Laptop GPU | 2.9 kg | 33 mm | 17.30" | 2560x1440 | |
| 82.1 % v7 (old) | 02/2023 | MSI Katana 17 B13VFK i7-13620H, GeForce RTX 4060 Laptop GPU | 2.8 kg | 25.2 mm | 17.30" | 1920x1080 |
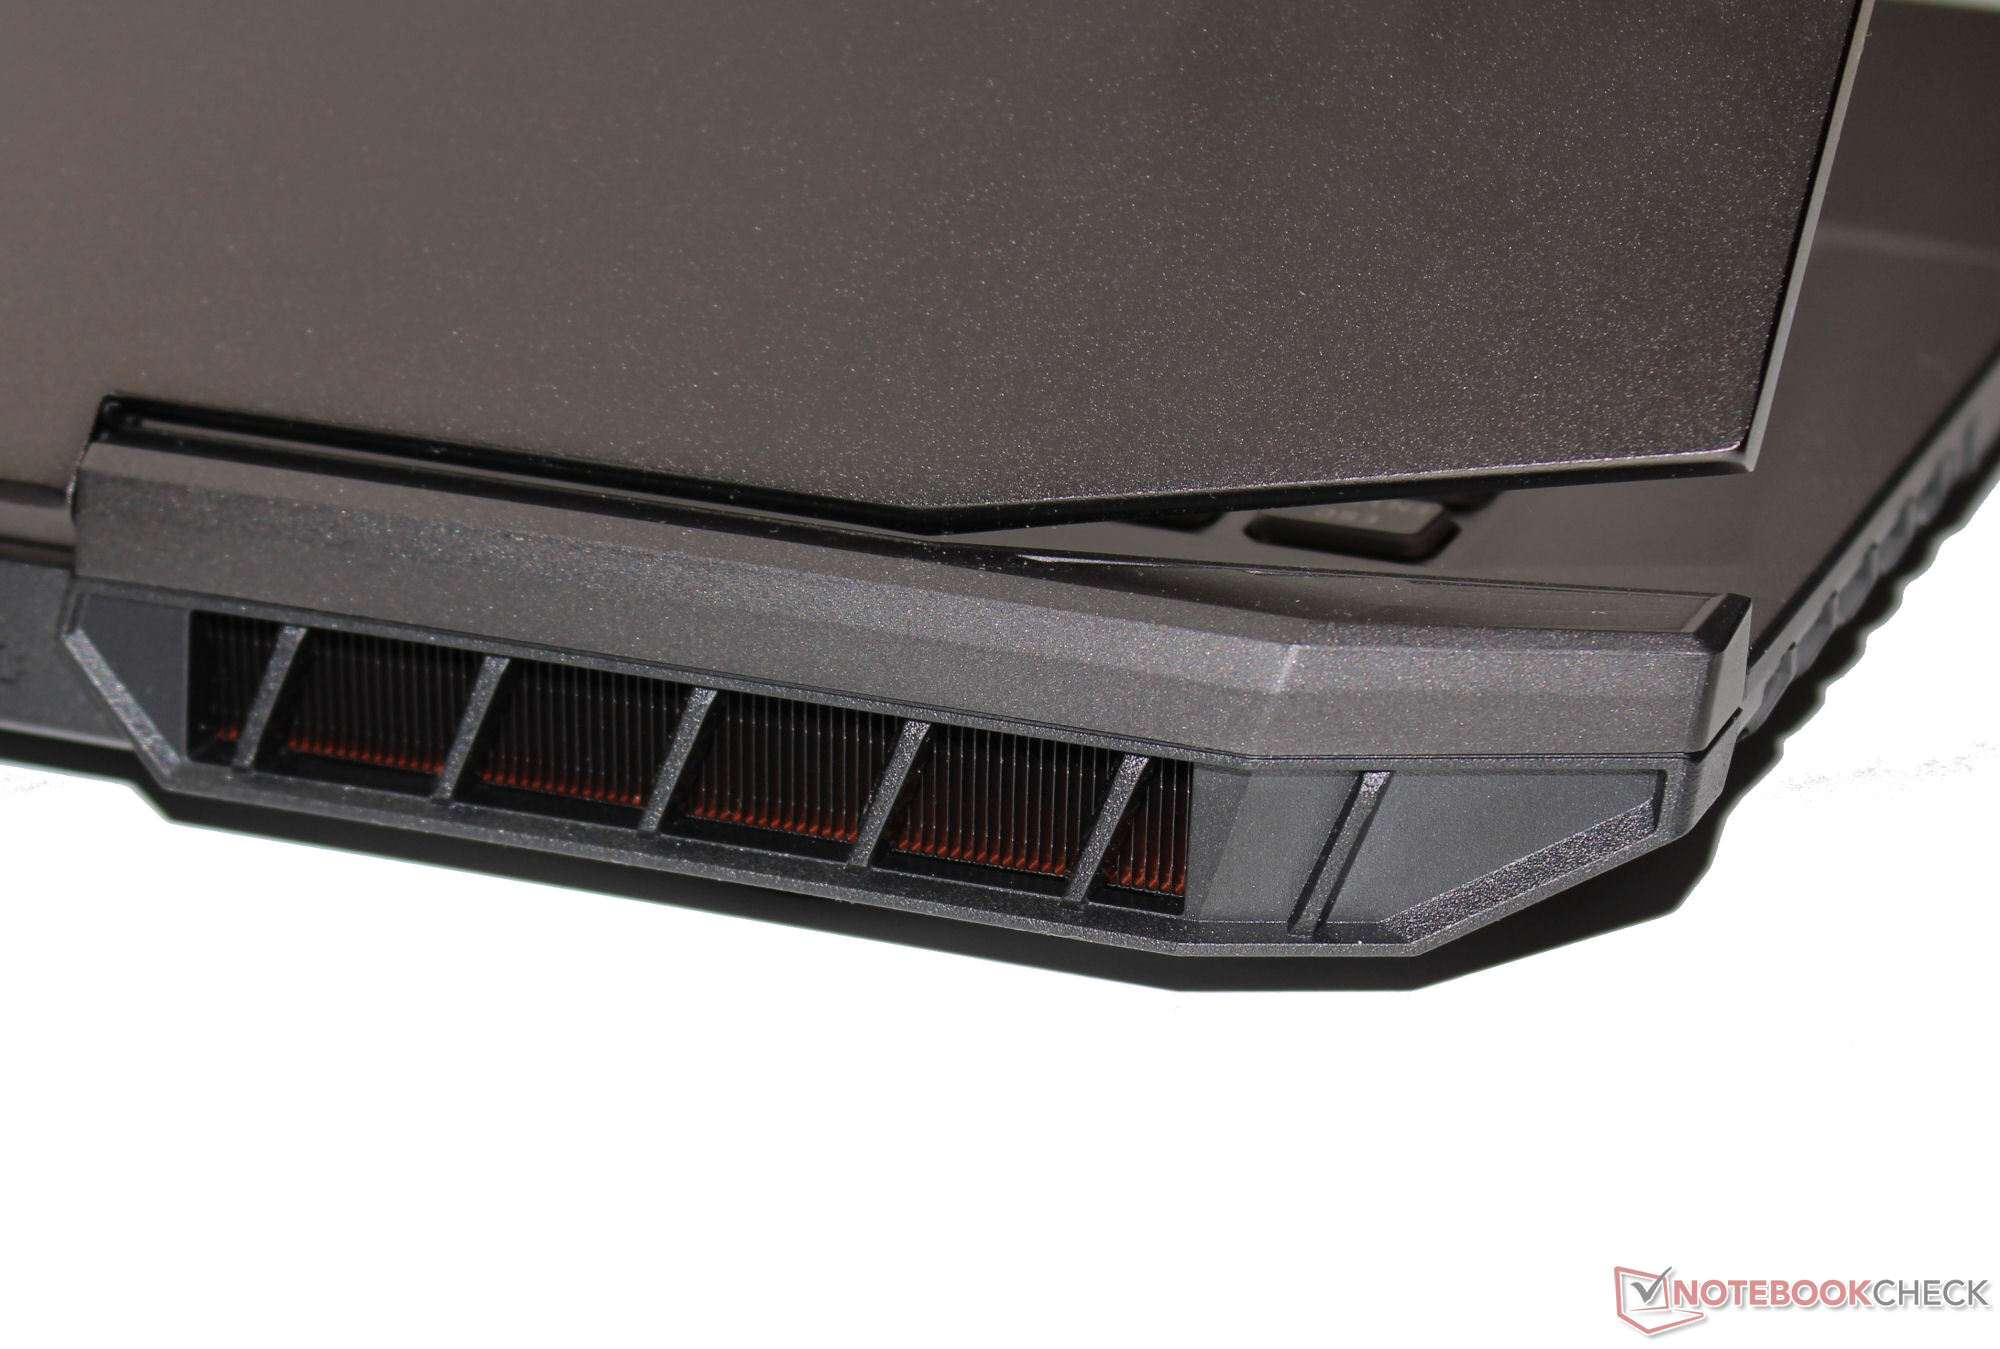
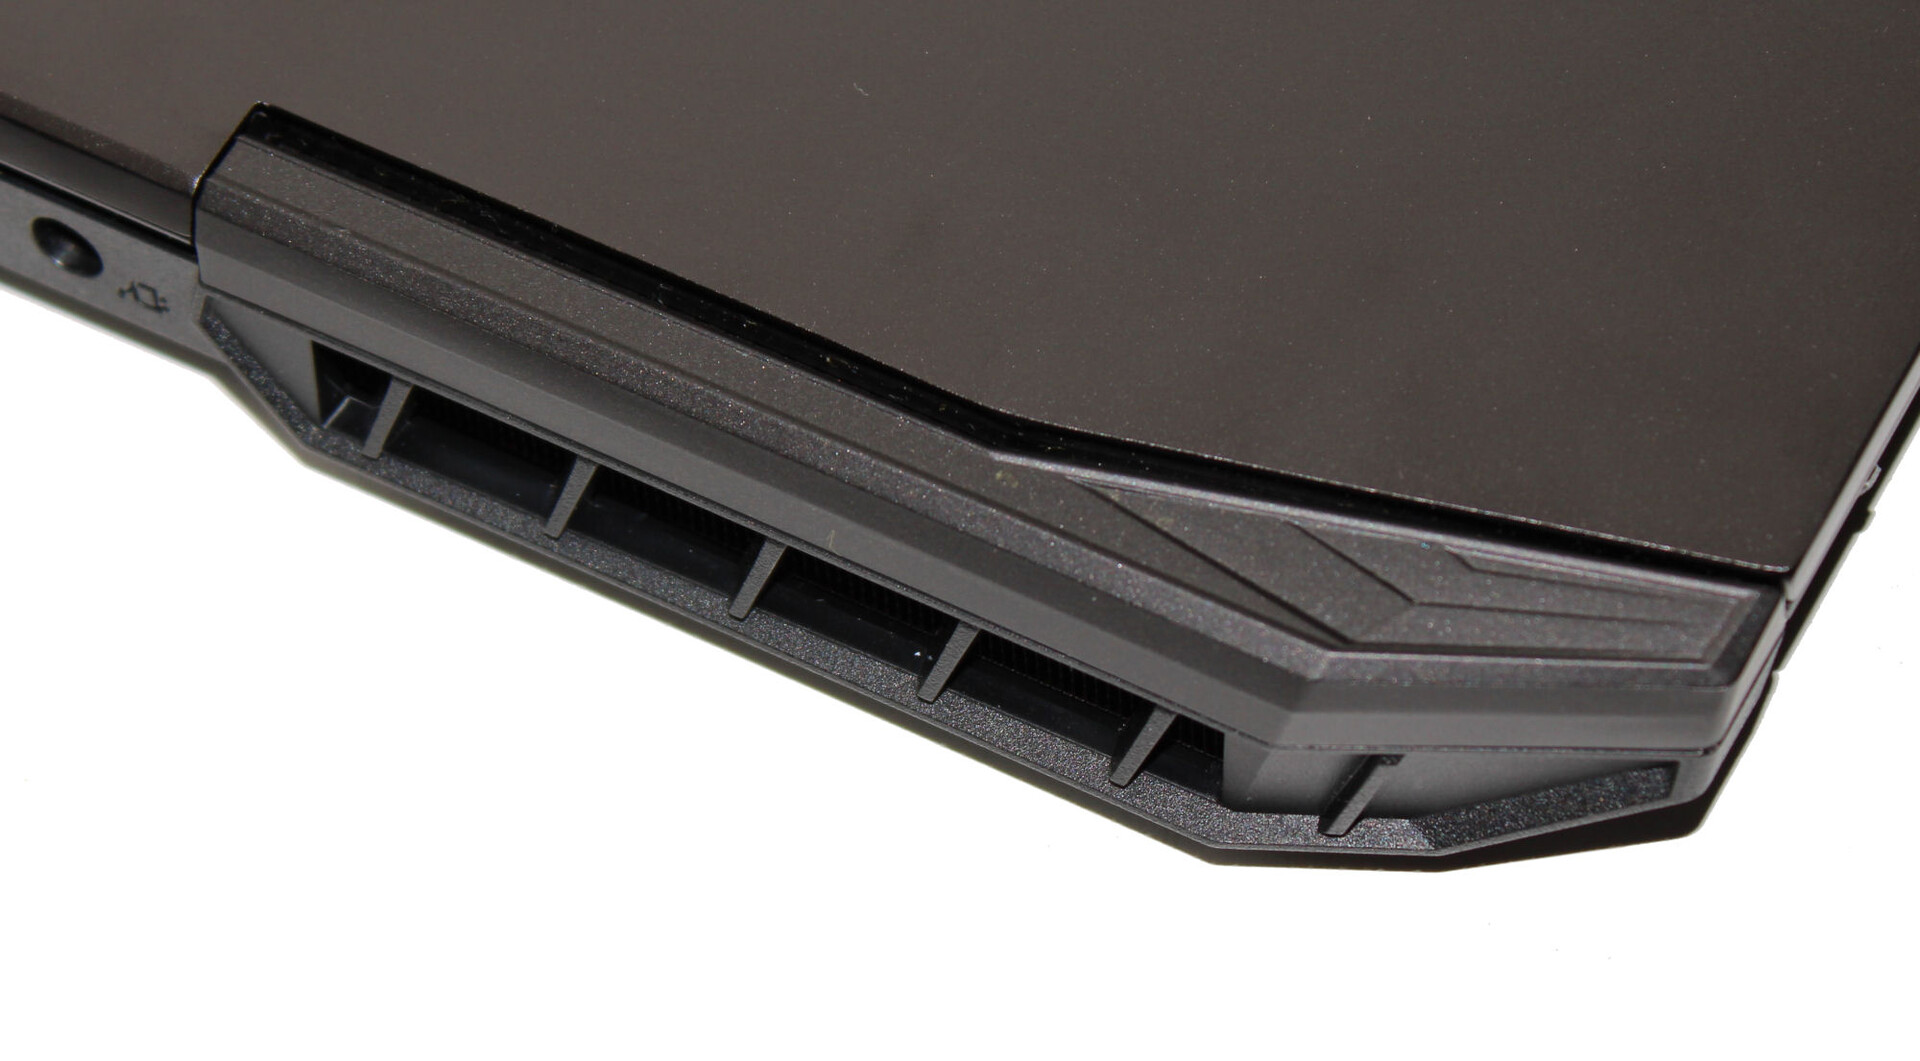
Obudowa - tylna część obudowy jest wykonana z aluminium
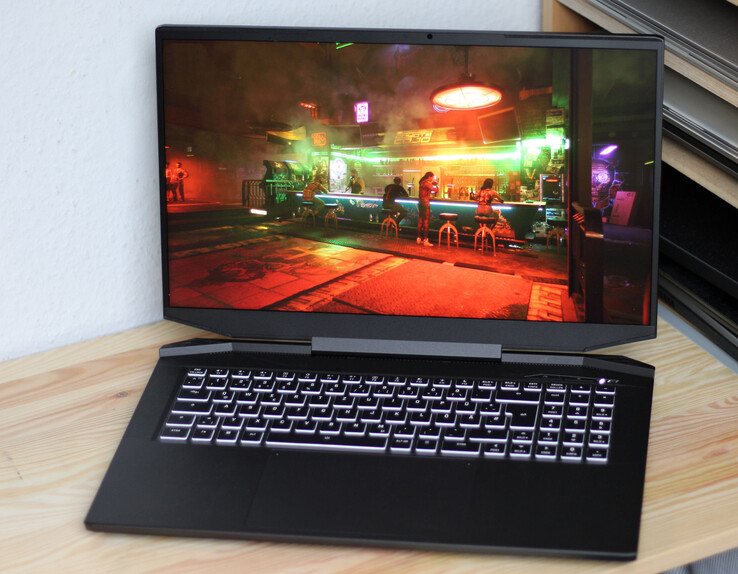
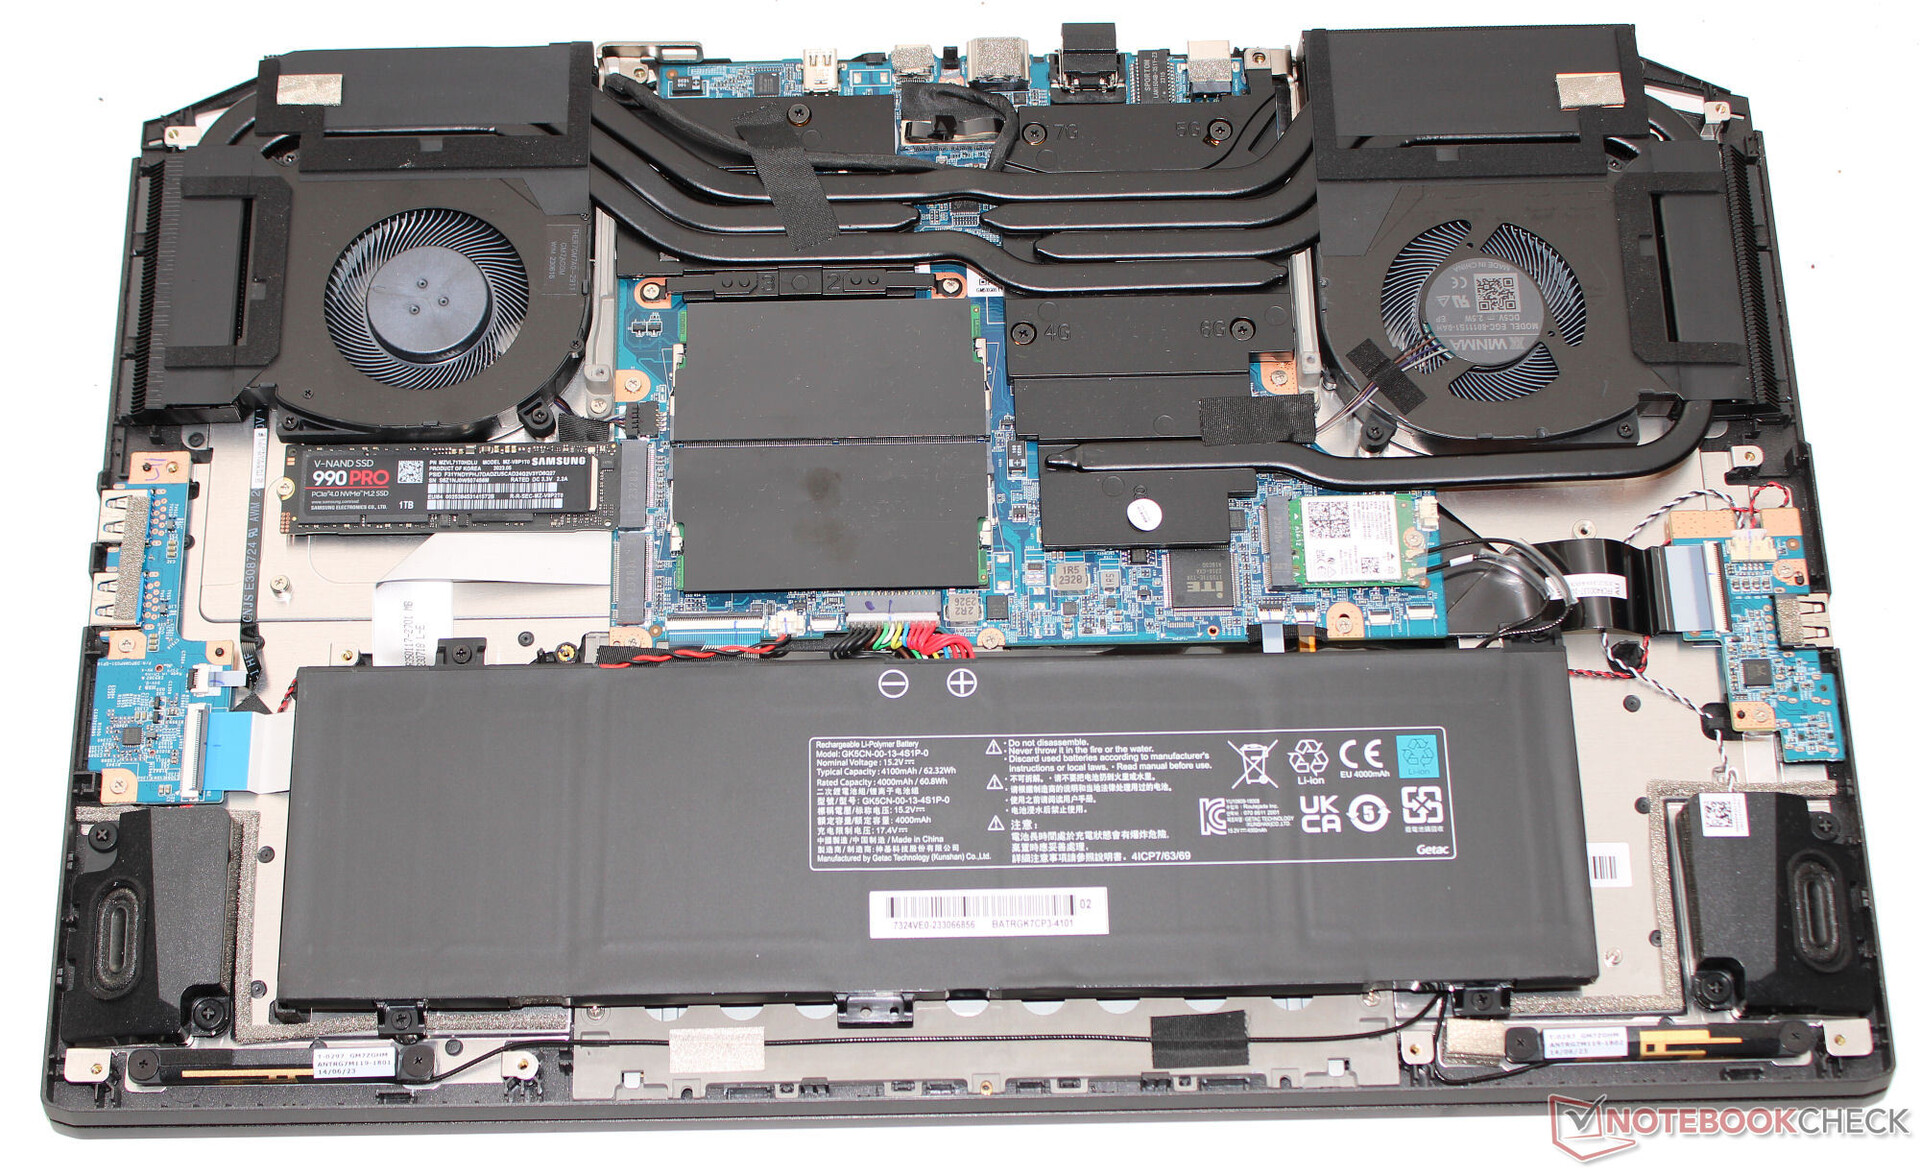
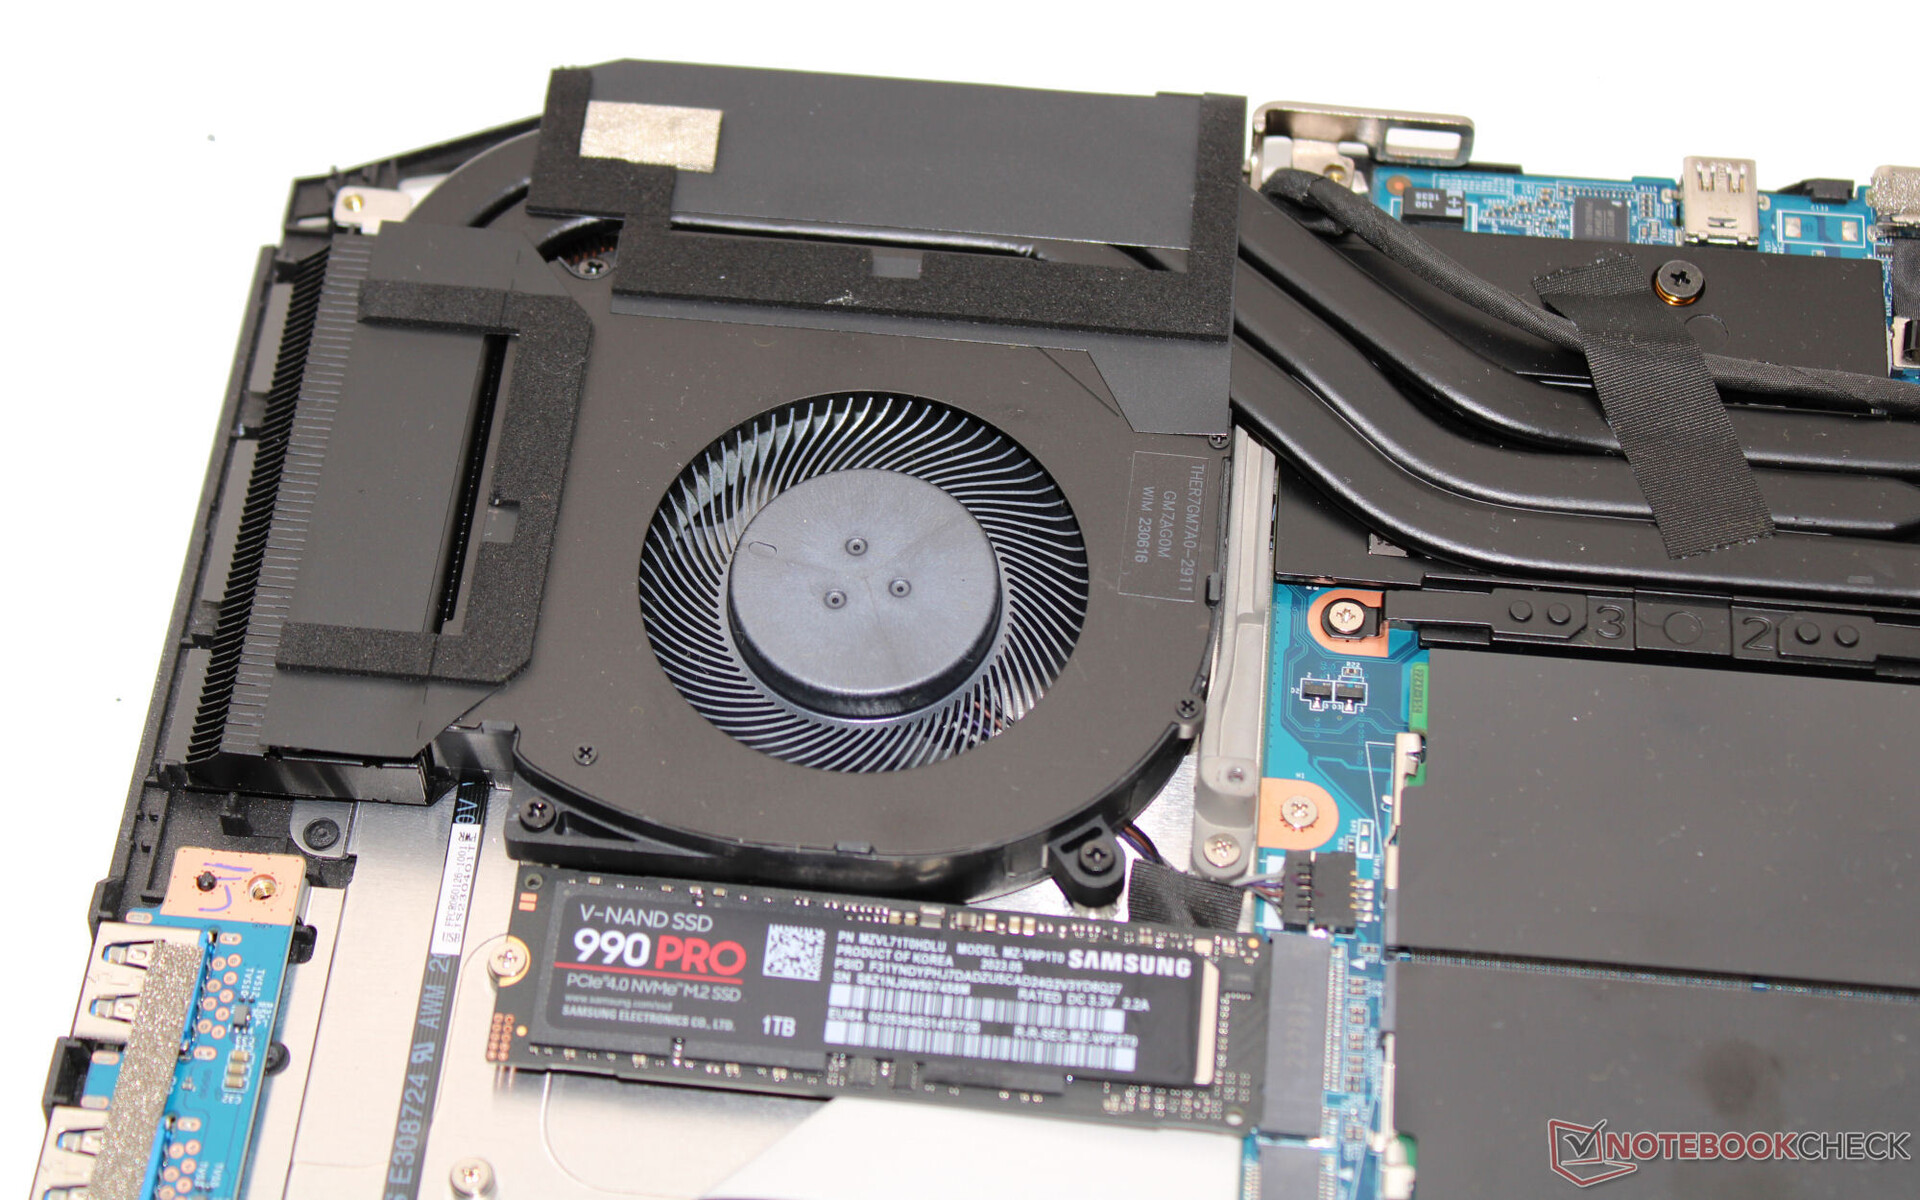
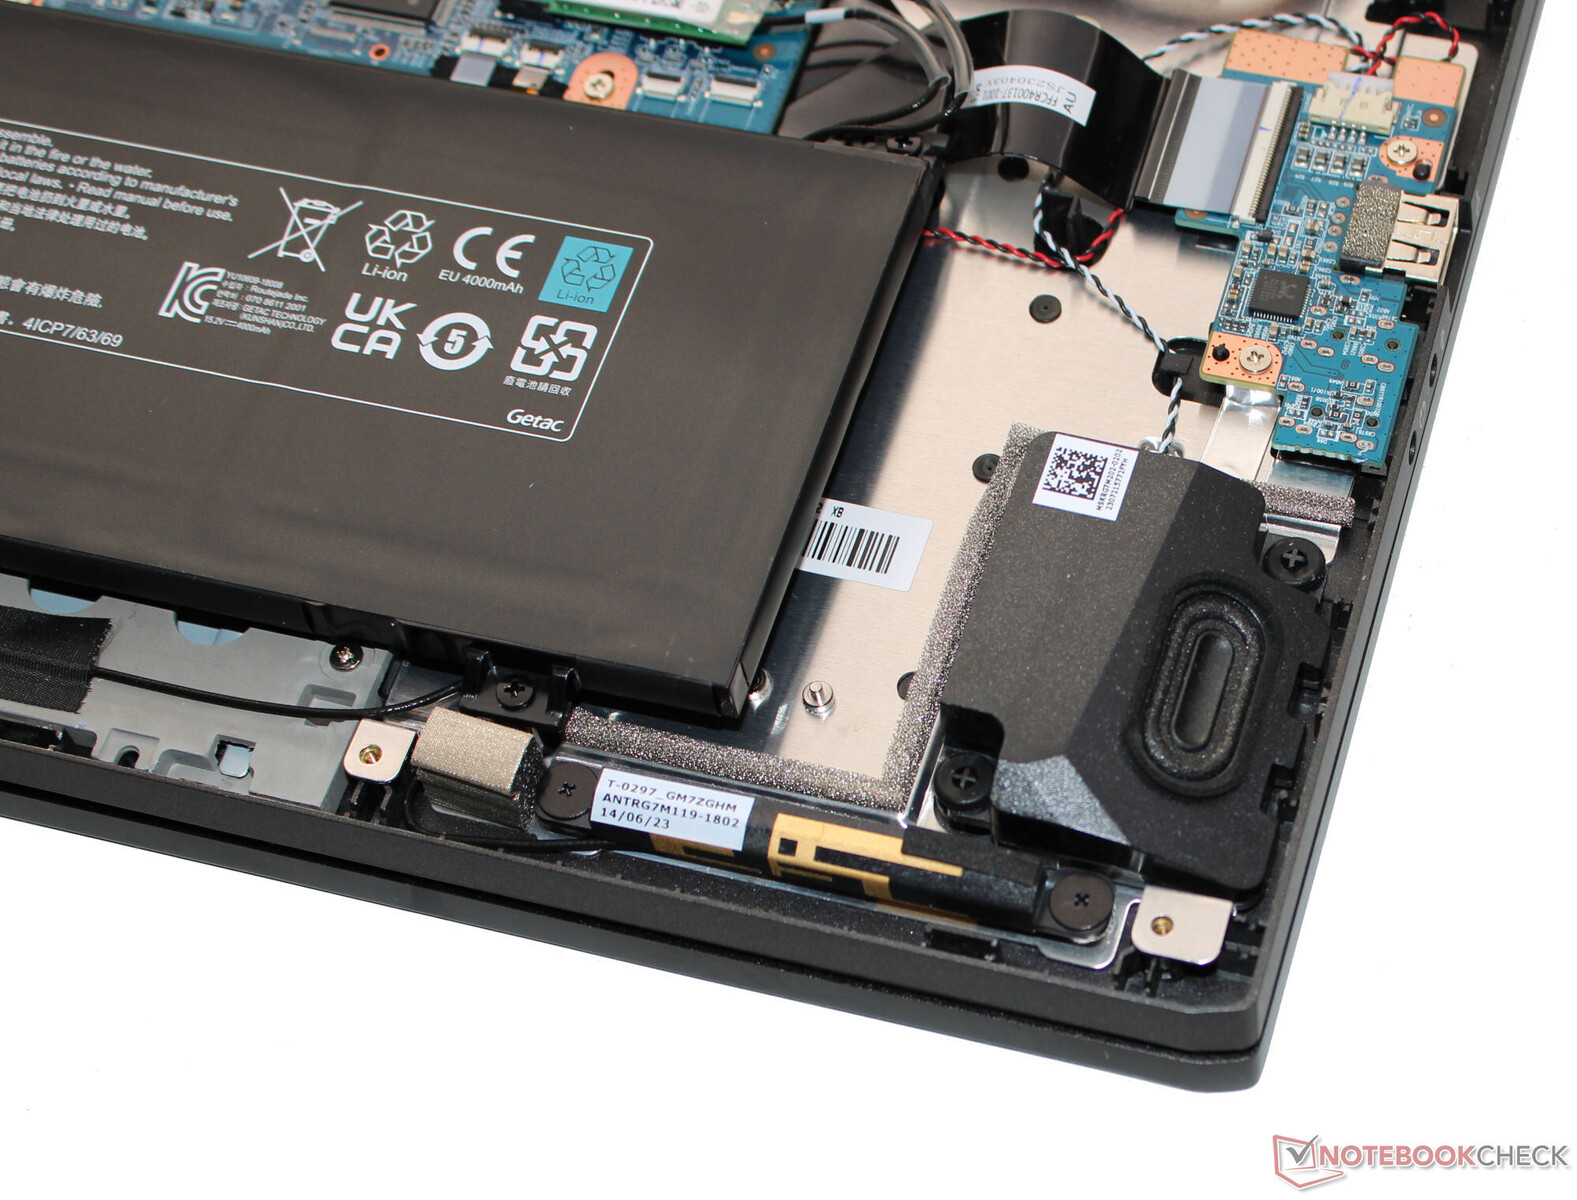
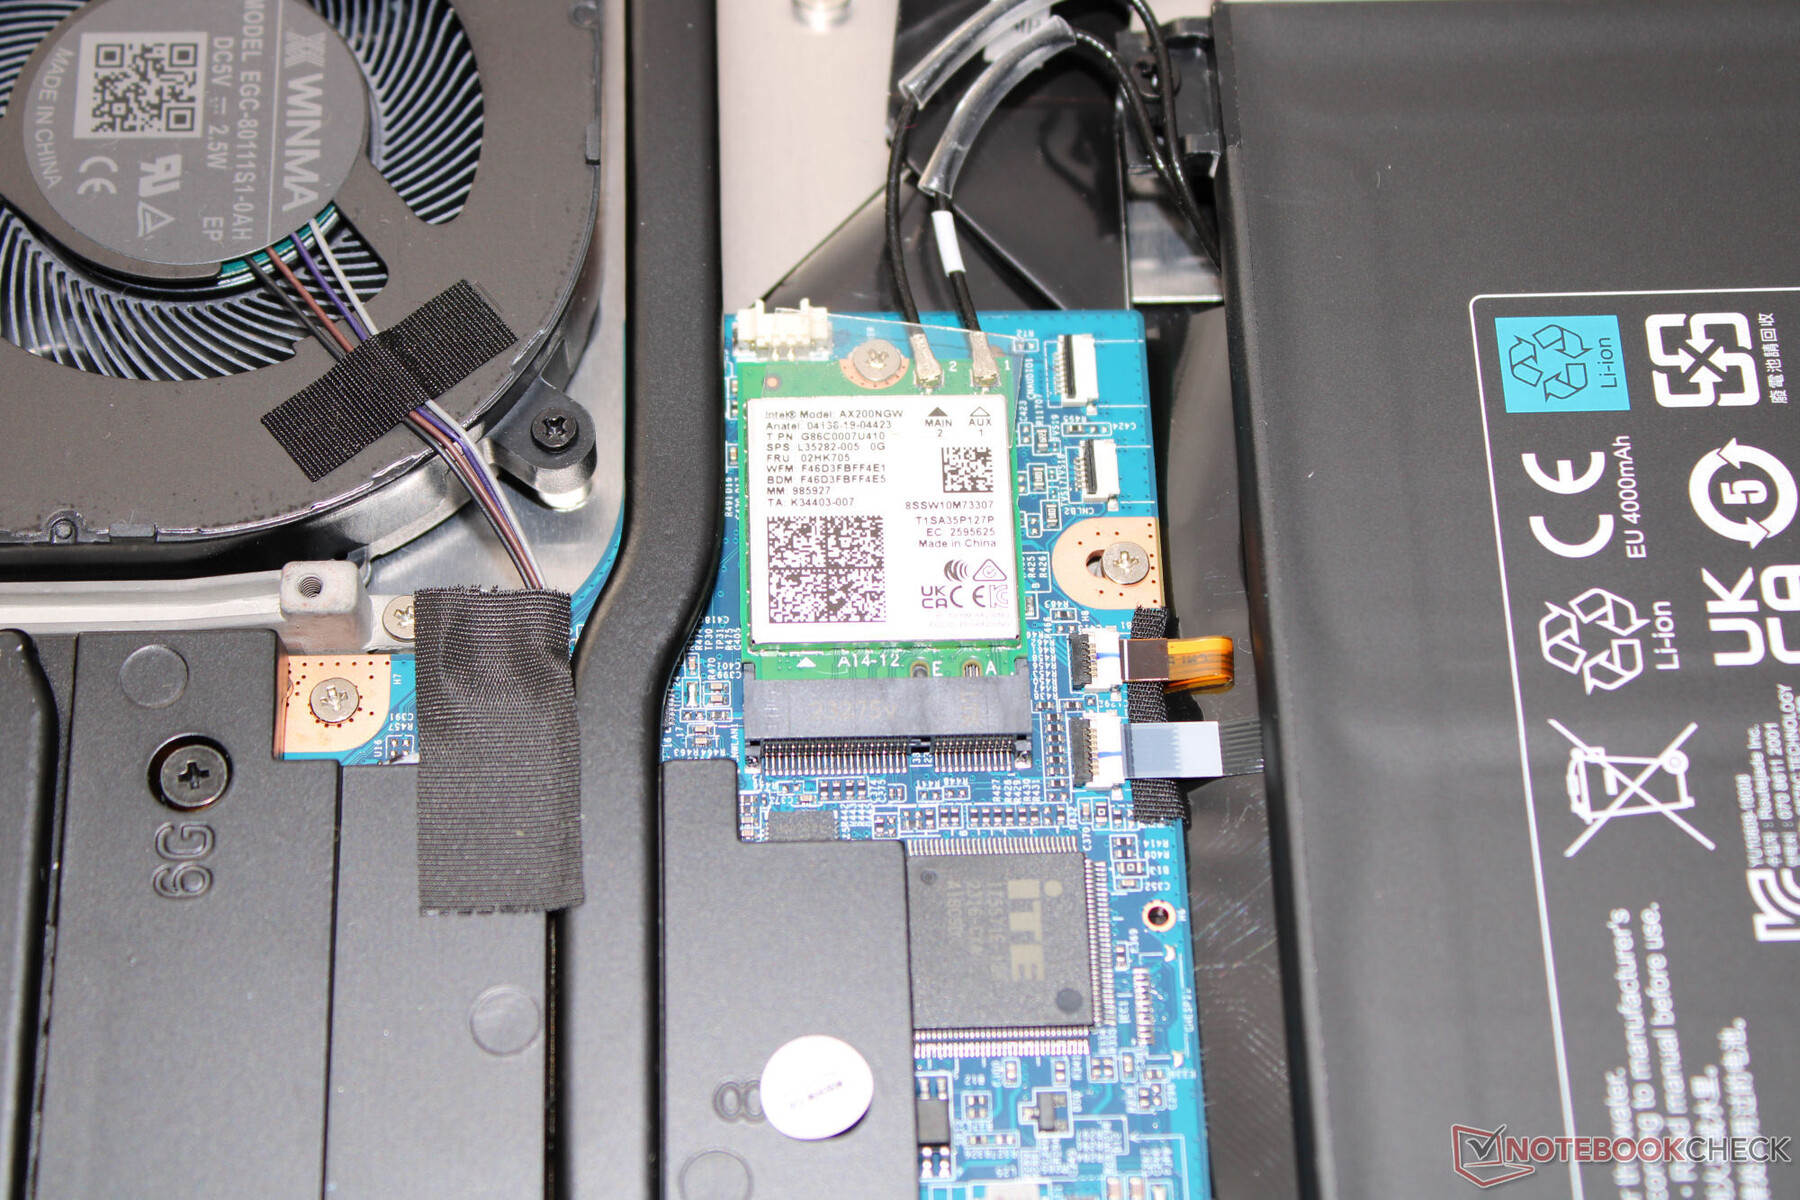
Matowo-czarna obudowa ma gładkie powierzchnie (z wyjątkiem jednostki bazowej) i nie ma krzykliwych elementów konstrukcyjnych. Elementy świetlne LED nie są obecne - z wyjątkiem podświetlenia klawiszy. Schenker postawił na mieszankę materiałów: Tylna część aluminiowej pokrywy jest również uzupełniona elementami z tworzywa sztucznego. Po zdemontowaniu jednostki bazowej, bateria (przykręcona, a nie przyklejona), a także zwykły sprzęt są odsłonięte.
Wady produkcyjne nie są zauważalne, a wymiary szczelin są dobre. Pokrywa i podstawa mogą być lekko skręcone, ale wszystko w akceptowalnym zakresie. Jakikolwiek nacisk wywierany na pokrywę nie prowadzi do zniekształceń obrazu. Zawiasy utrzymują pokrywę bezpiecznie na miejscu, ale nieco się chwieją. Maksymalny kąt otwarcia wynosi 140 stopni. Otwieranie laptopa jedną ręką jest możliwe.
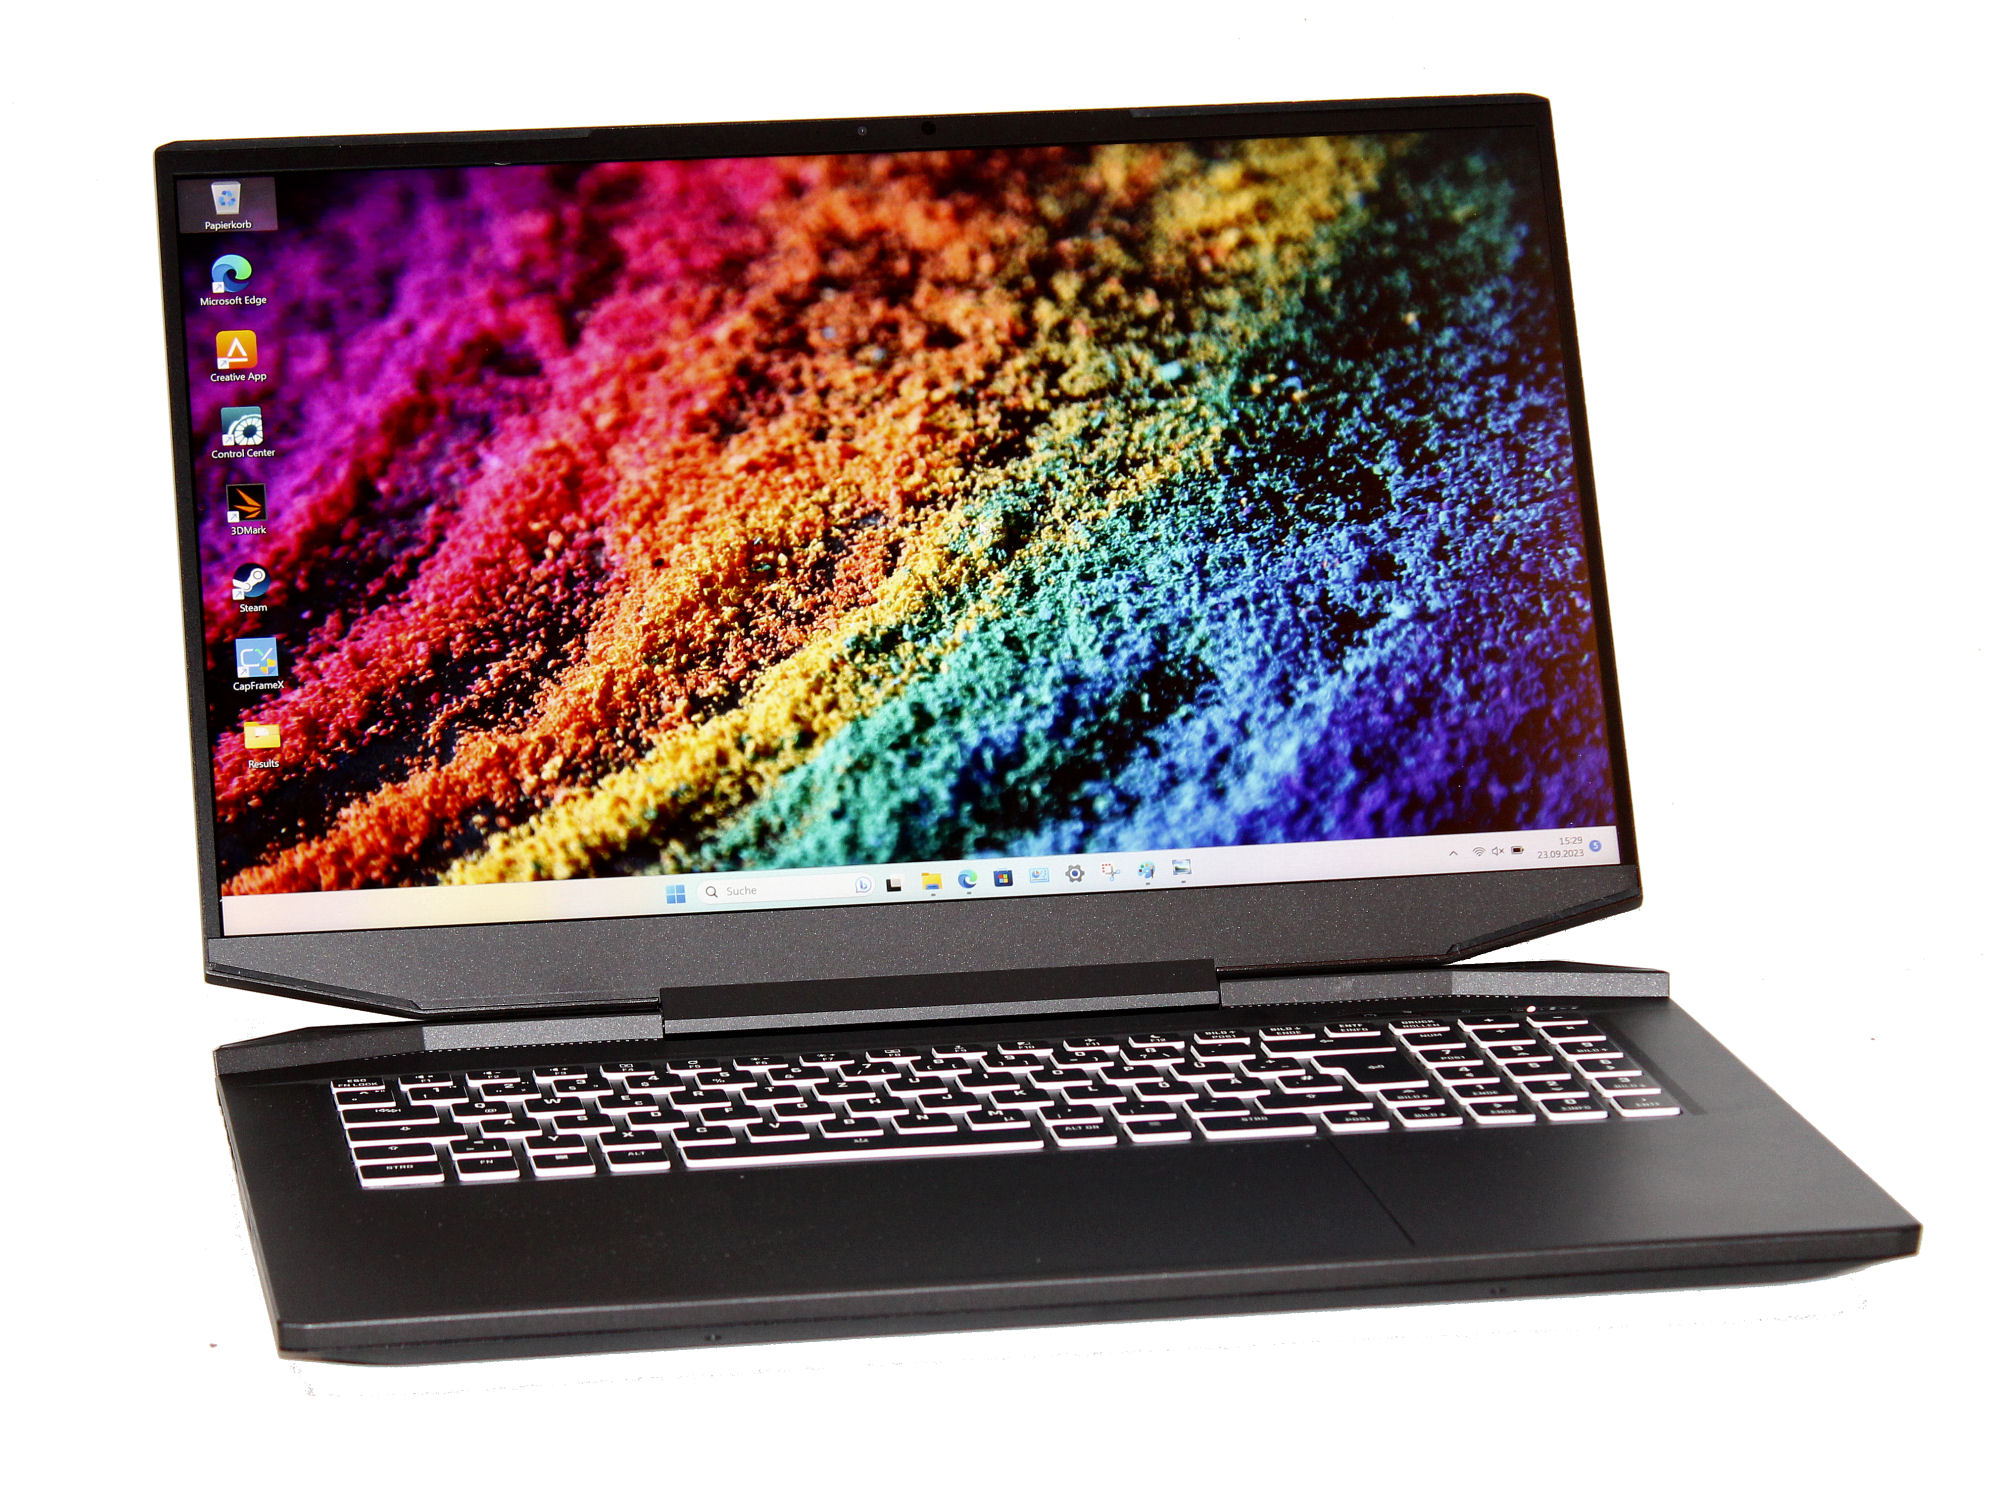
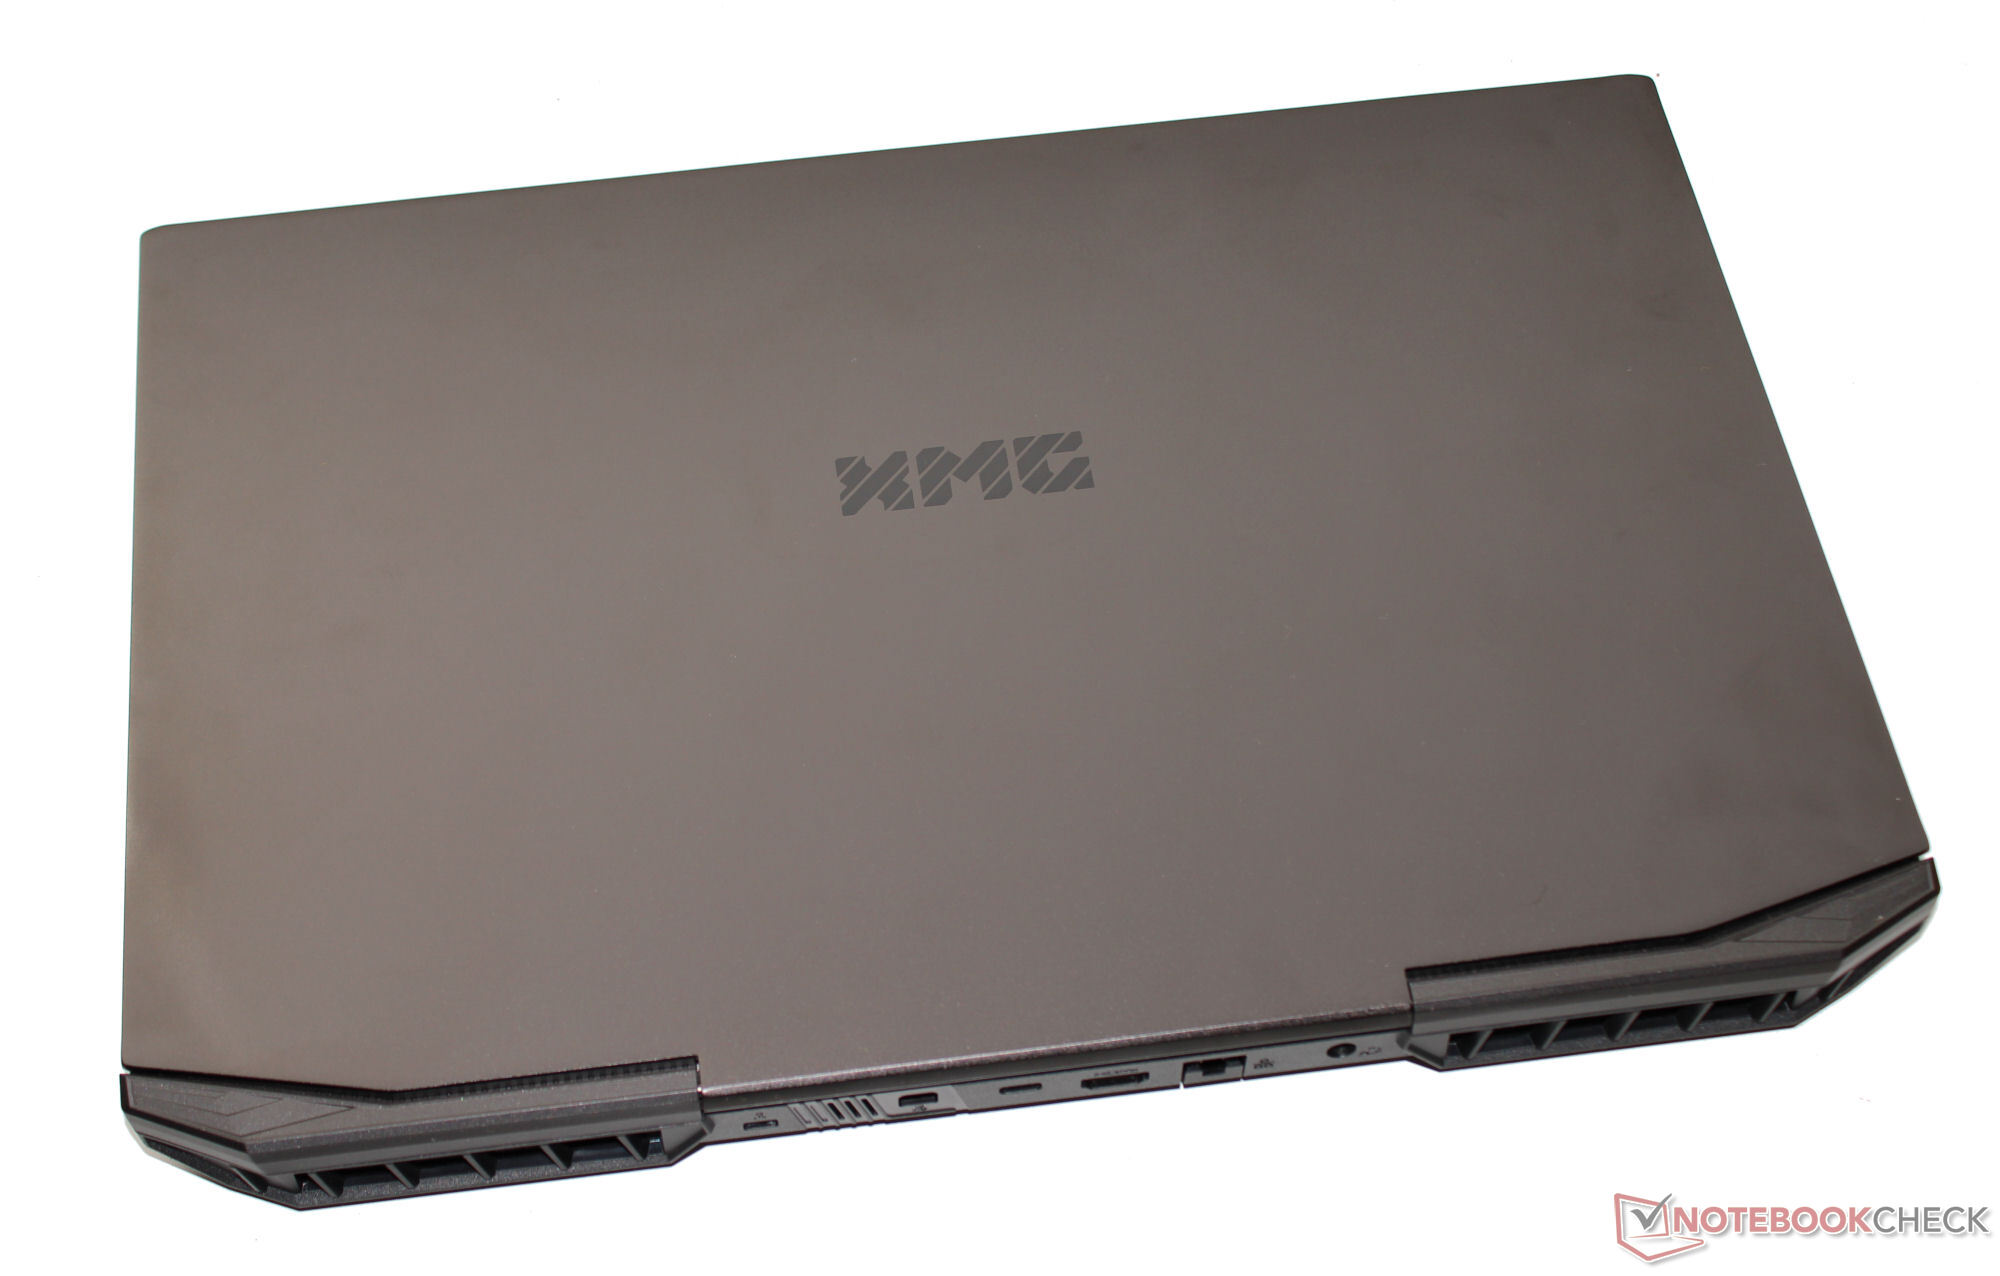
Komputer XMG jest najlżejszym i najbardziej kompaktowym spośród konkurencyjnych 17,3-calowych laptopów. Ważąc około 2,5 kg, generalnie należy do najlżejszych przedstawicieli tego rodzaju.
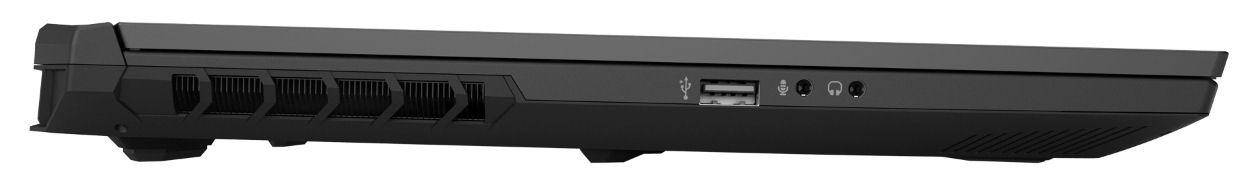
Cechy - laptop XMG jest dostarczany bez złącza Thunderbolt
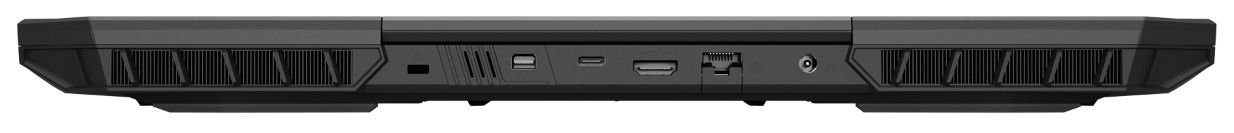
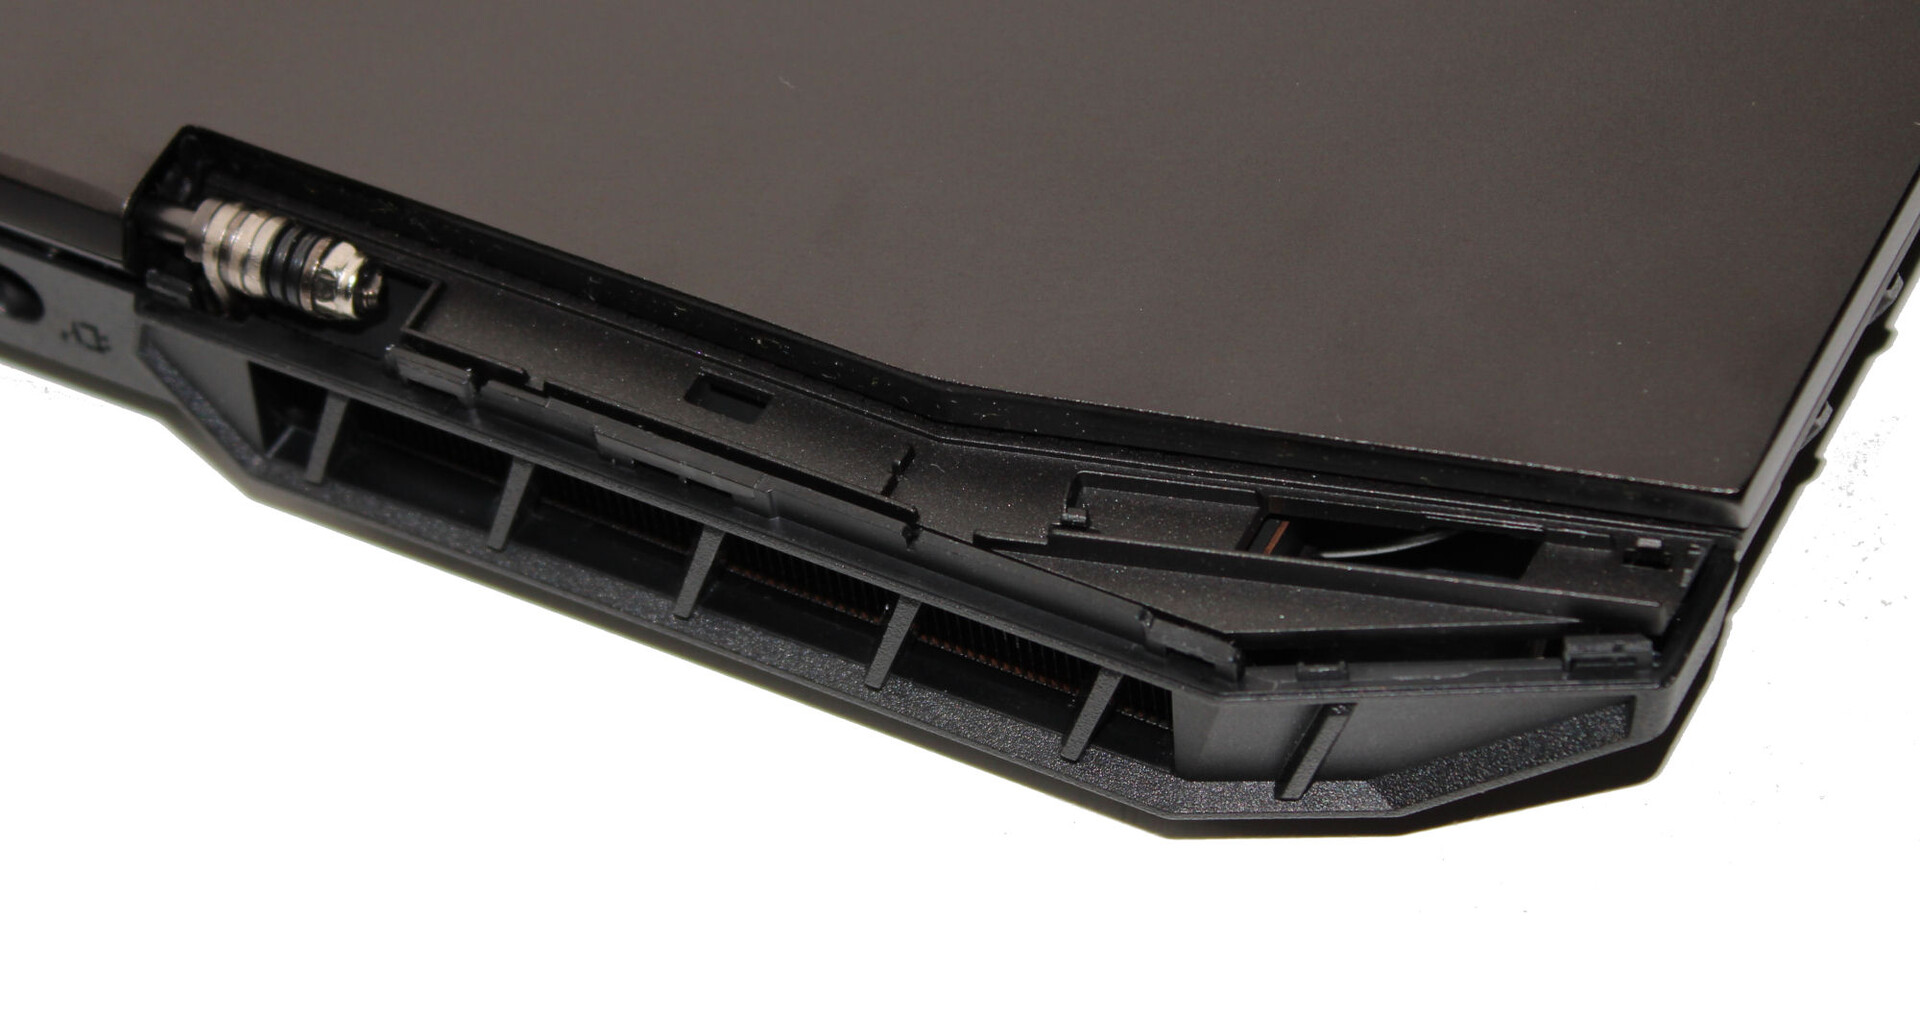
Apex posiada trzy porty USB-A (1x USB 2.0, 2x USB 3.2 Gen 1) i port USB-C (USB 3.2 Gen 2). Ten ostatni nie może ani wyprowadzać sygnału Displayport, ani nie oferuje obsługi Power Delivery. Pakiet uzupełniają dwa wyjścia wideo (HDMI 2.1, DP 1.4a), gniazda audio i port Gigabit Ethernet.
Wyjścia wideo, złącze zasilania i port LAN znajdują się z tyłu urządzenia. Odpowiadające im kable biegną z tyłu, dzięki czemu nie przeszkadzają.
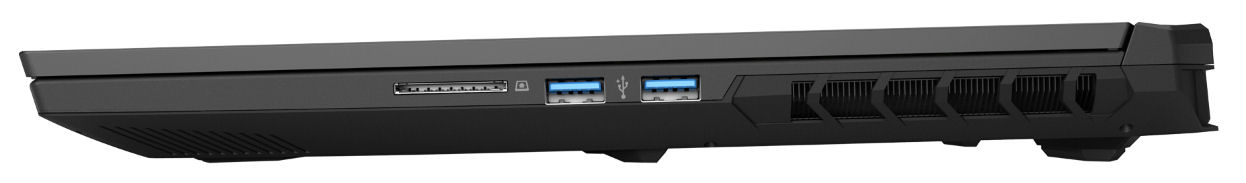
Czytnik kart SD
Z maksymalną prędkością transferu na poziomie 35 MB/s (transfer 250 plików graficznych jpg, po około 5 MB każdy) i 36 MB/s (kopiowanie dużych bloków danych), czytnik kart pamięci (karta referencyjna: AV PRO microSD 128 GB V60) należy do powolnych modeli. Pod tym względem konkurencja oferuje więcej.
| SD Card Reader | |
| average JPG Copy Test (av. of 3 runs) | |
| Alienware m16 R1 Intel (AV PRO microSD 128 GB V60) | |
| Średnia w klasie Gaming (20.9 - 210, n=55, ostatnie 2 lata) | |
| Medion Erazer Defender P40 (AV PRO microSD 128 GB V60) | |
| Acer Nitro 17 AN17-51-71ER | |
| Schenker XMG Apex 17 (Late 23) (AV PRO microSD 128 GB V60) | |
| maximum AS SSD Seq Read Test (1GB) | |
| Alienware m16 R1 Intel (AV PRO microSD 128 GB V60) | |
| Średnia w klasie Gaming (25.5 - 261, n=52, ostatnie 2 lata) | |
| Medion Erazer Defender P40 (AV PRO microSD 128 GB V60) | |
| Acer Nitro 17 AN17-51-71ER | |
| Schenker XMG Apex 17 (Late 23) (AV PRO microSD 128 GB V60) | |
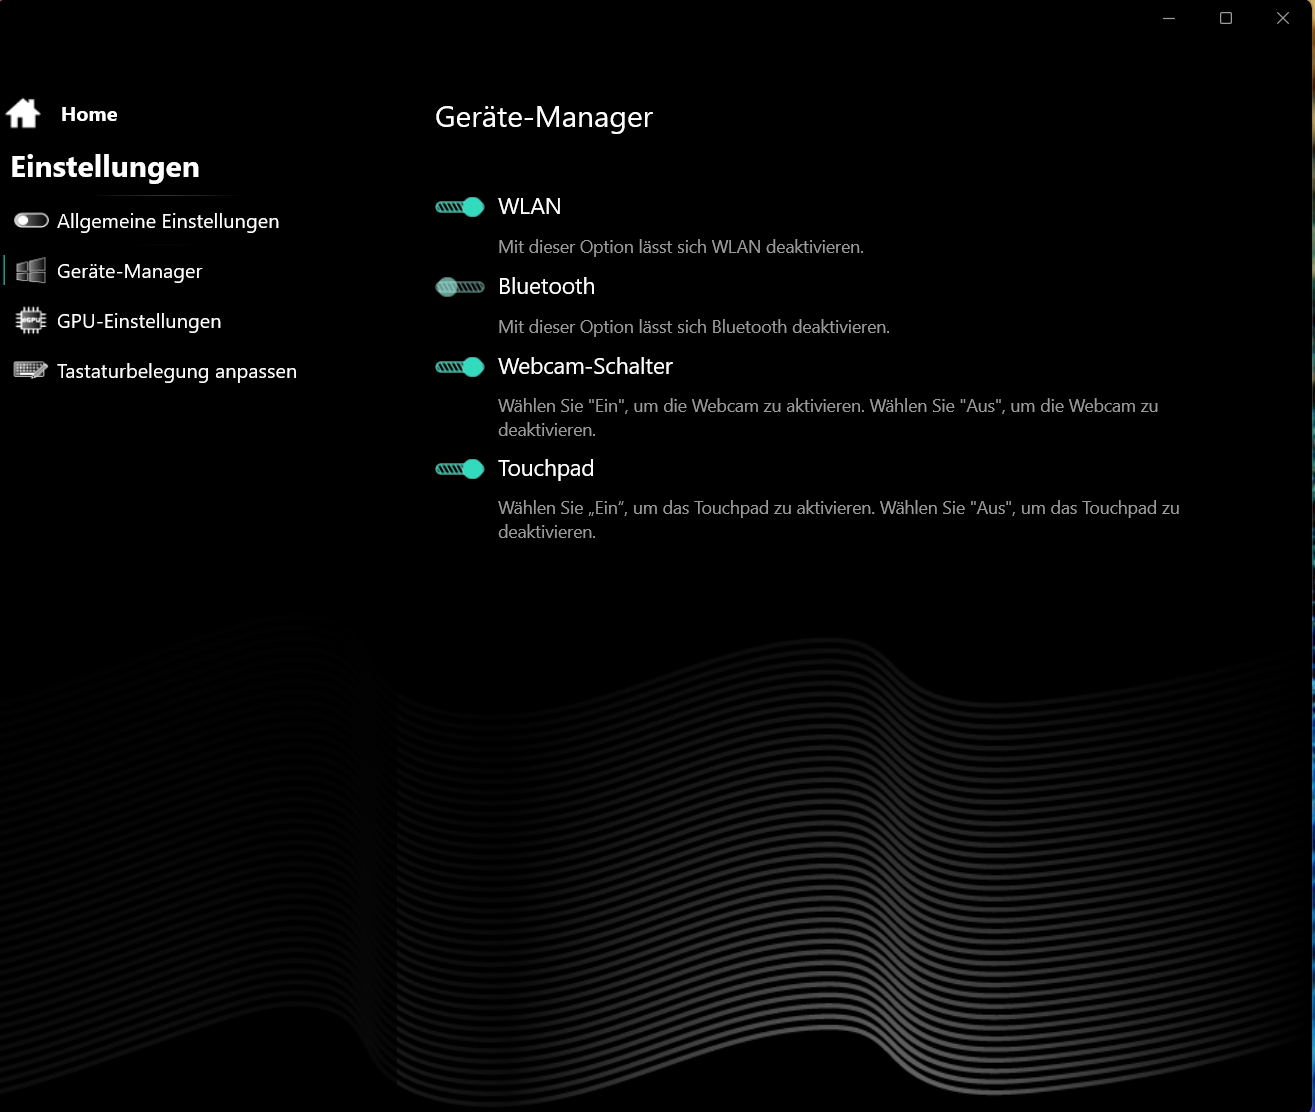
Komunikacja
W optymalnych warunkach (brak urządzeń Wi-Fi w pobliżu, niewielka odległość między laptopem a komputerem serwera) możliwe jest osiągnięcie dobrych lub bardzo dobrych prędkości transmisji danych Wi-Fi. Laptop Schenker wykorzystuje układ Wi-Fi 6E (Intel AX200). Za połączenia przewodowe odpowiada kontroler Realtek (RTL8168/8111; 1 GBit/s).
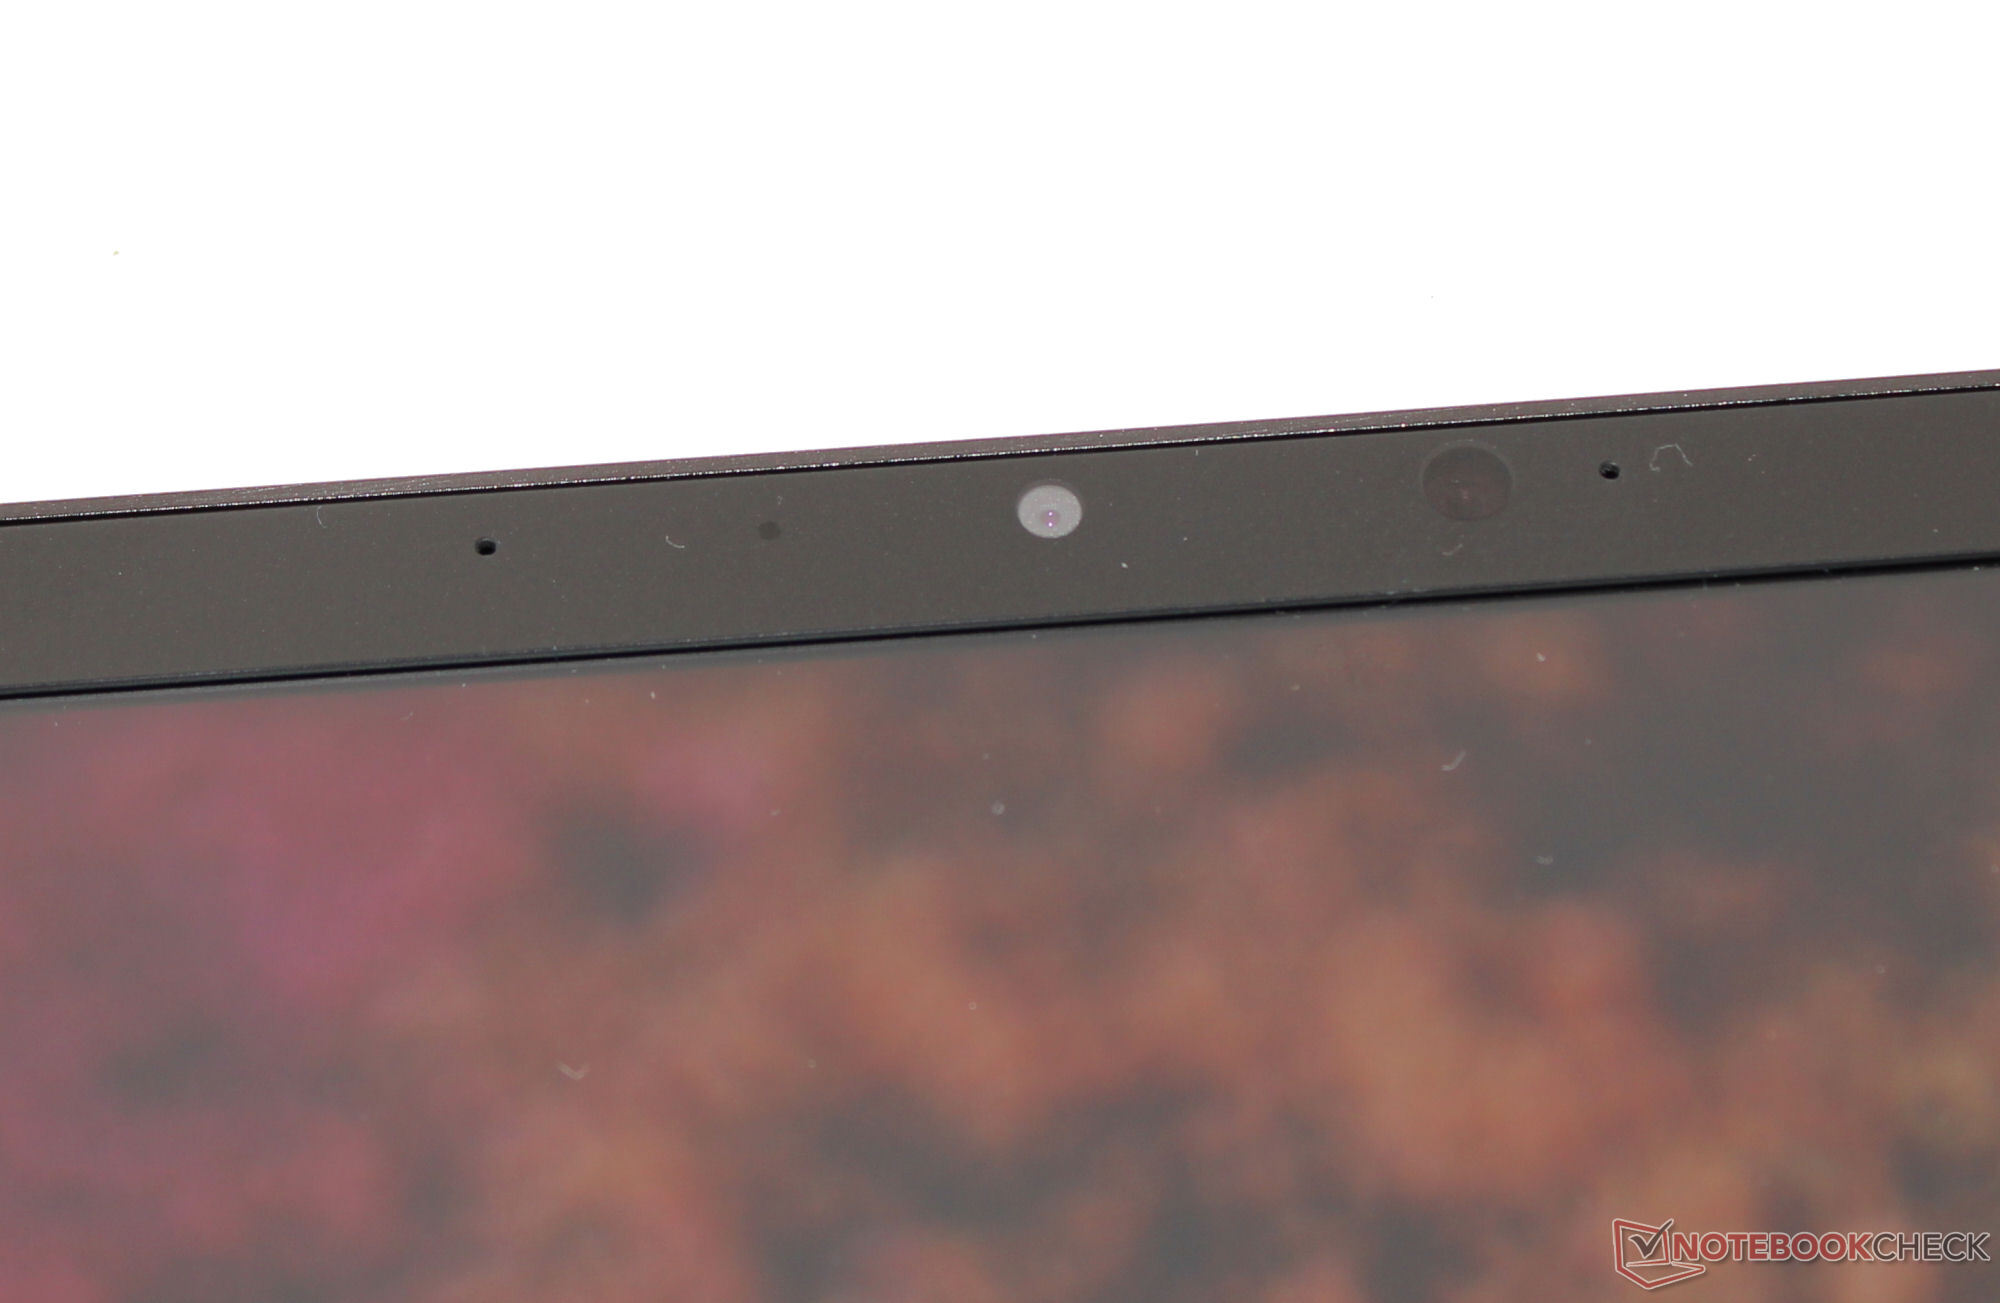
Kamera internetowa
Pod względem jakości, kamera internetowa zapewnia (2,1 MP, maks. 1,920 x 1,080 pikseli) standardową taryfę. Odchylenie kolorów wynoszące około 8,7 (cel: DeltaE < 3) jest całkiem przyzwoite. Kamera nie oferuje mechanicznej migawki.

 GeForce RTX 4060 Laptop GPU, R7 7840HS, Samsung 990 Pro 1 TB")
 GeForce RTX 4060 Laptop GPU, R7 7840HS, Samsung 990 Pro 1 TB")
Akcesoria
Oprócz zwykłych dokumentów, laptop jest dostarczany z pamięcią USB (sterowniki, oprogramowanie), brelokiem do kluczy zawierającym otwieracz do butelek i dużą podkładką pod mysz.
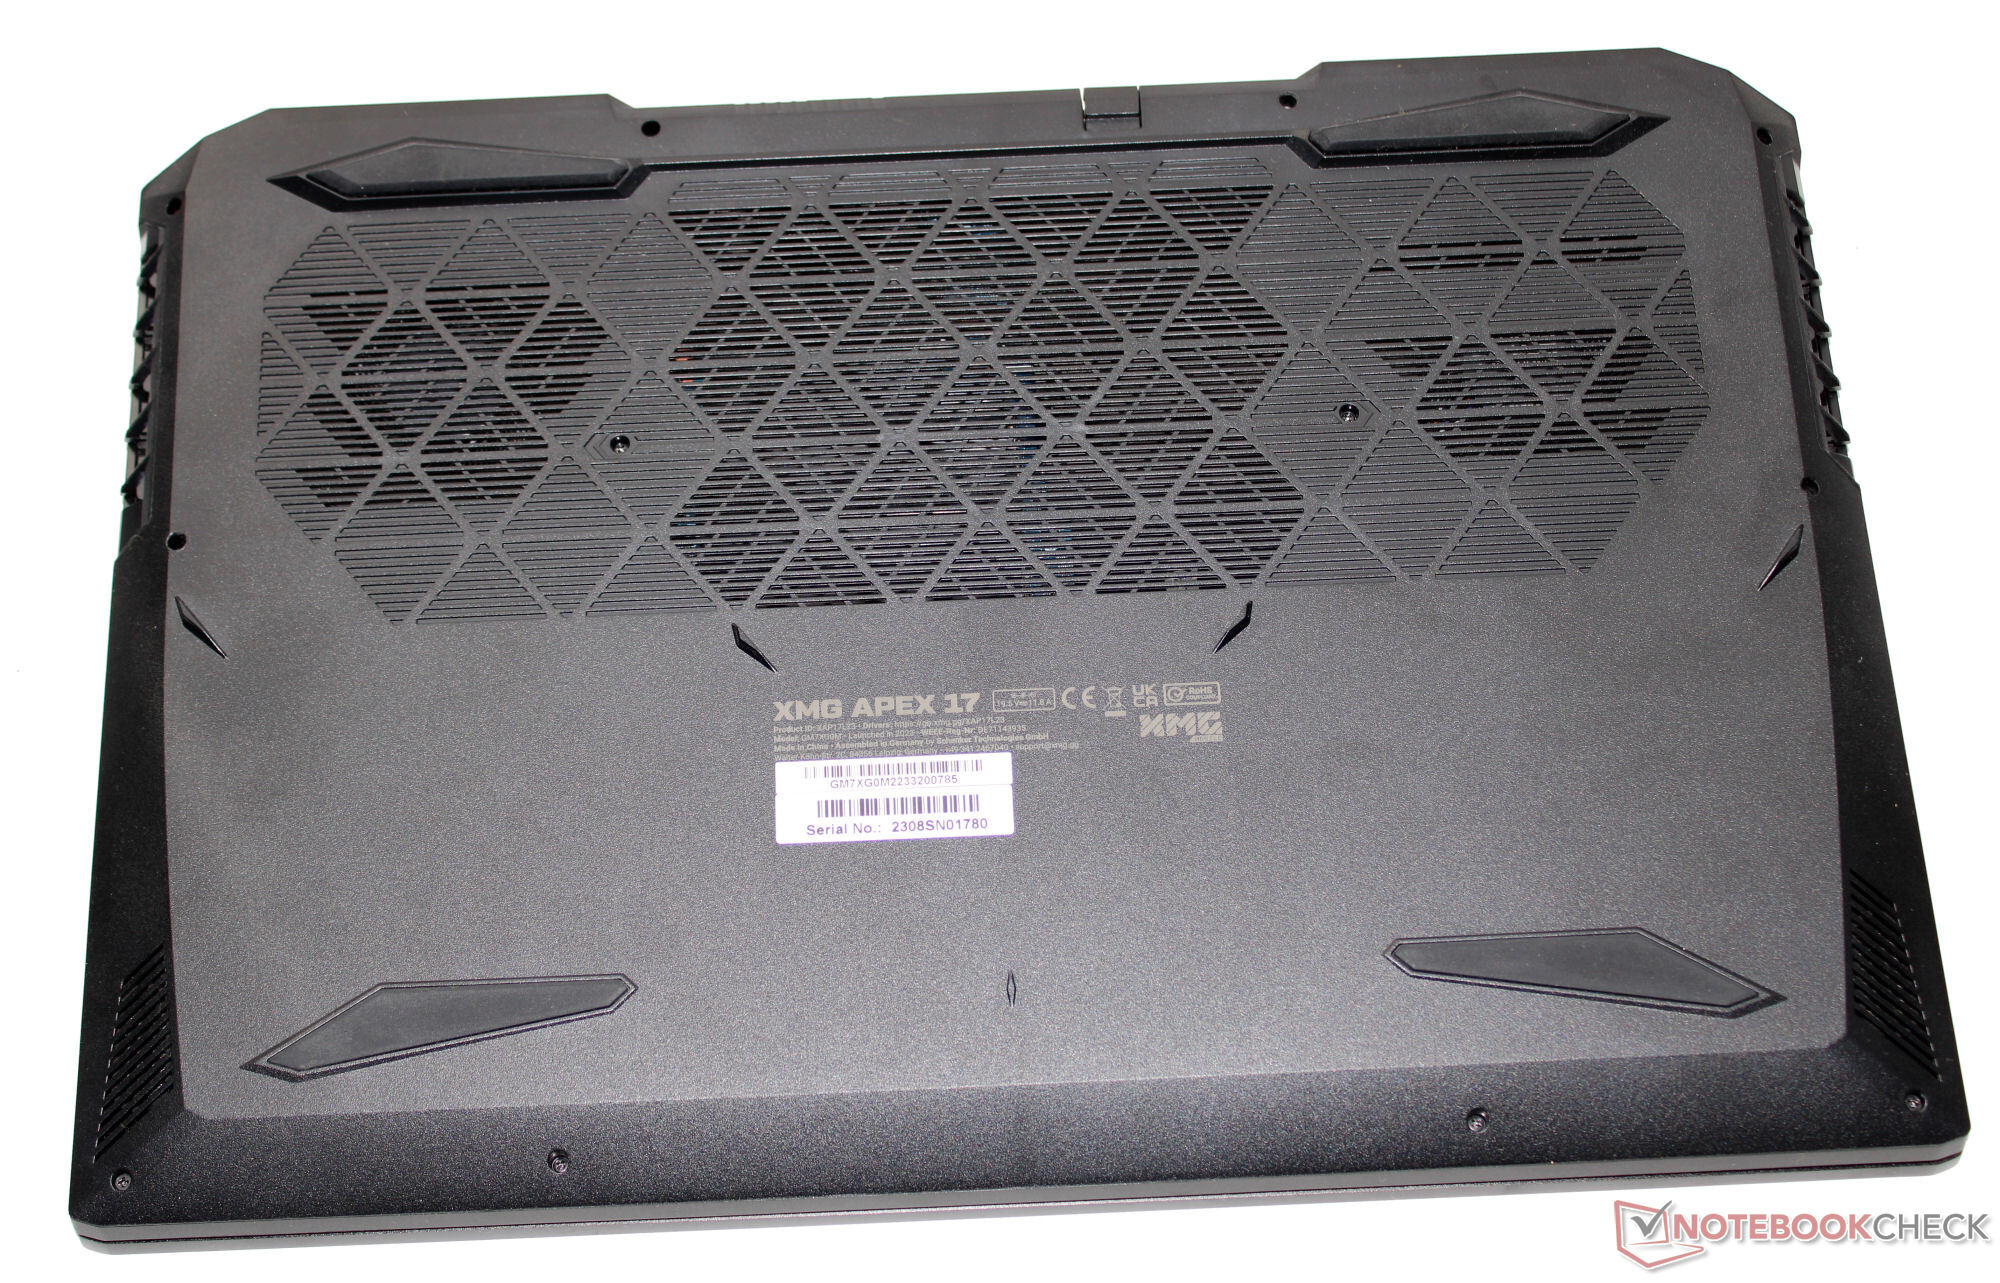
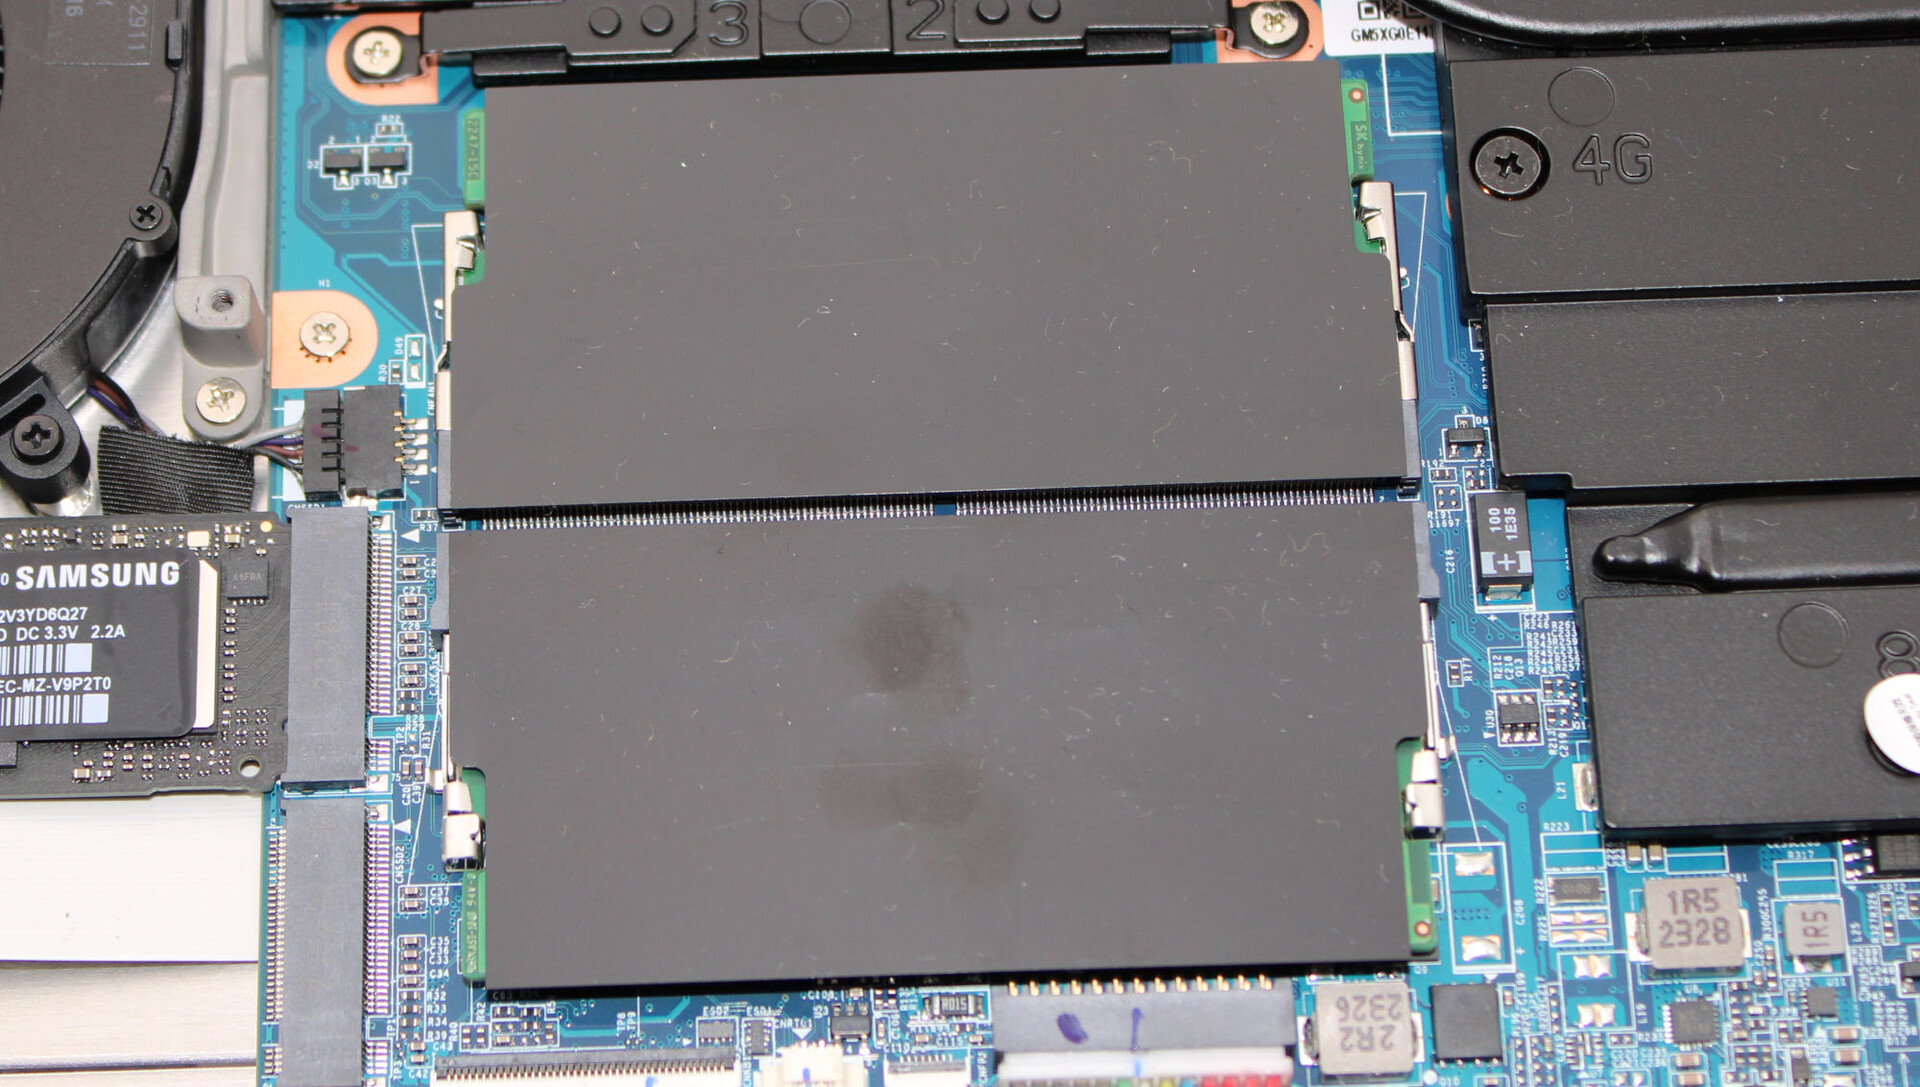
Konserwacja
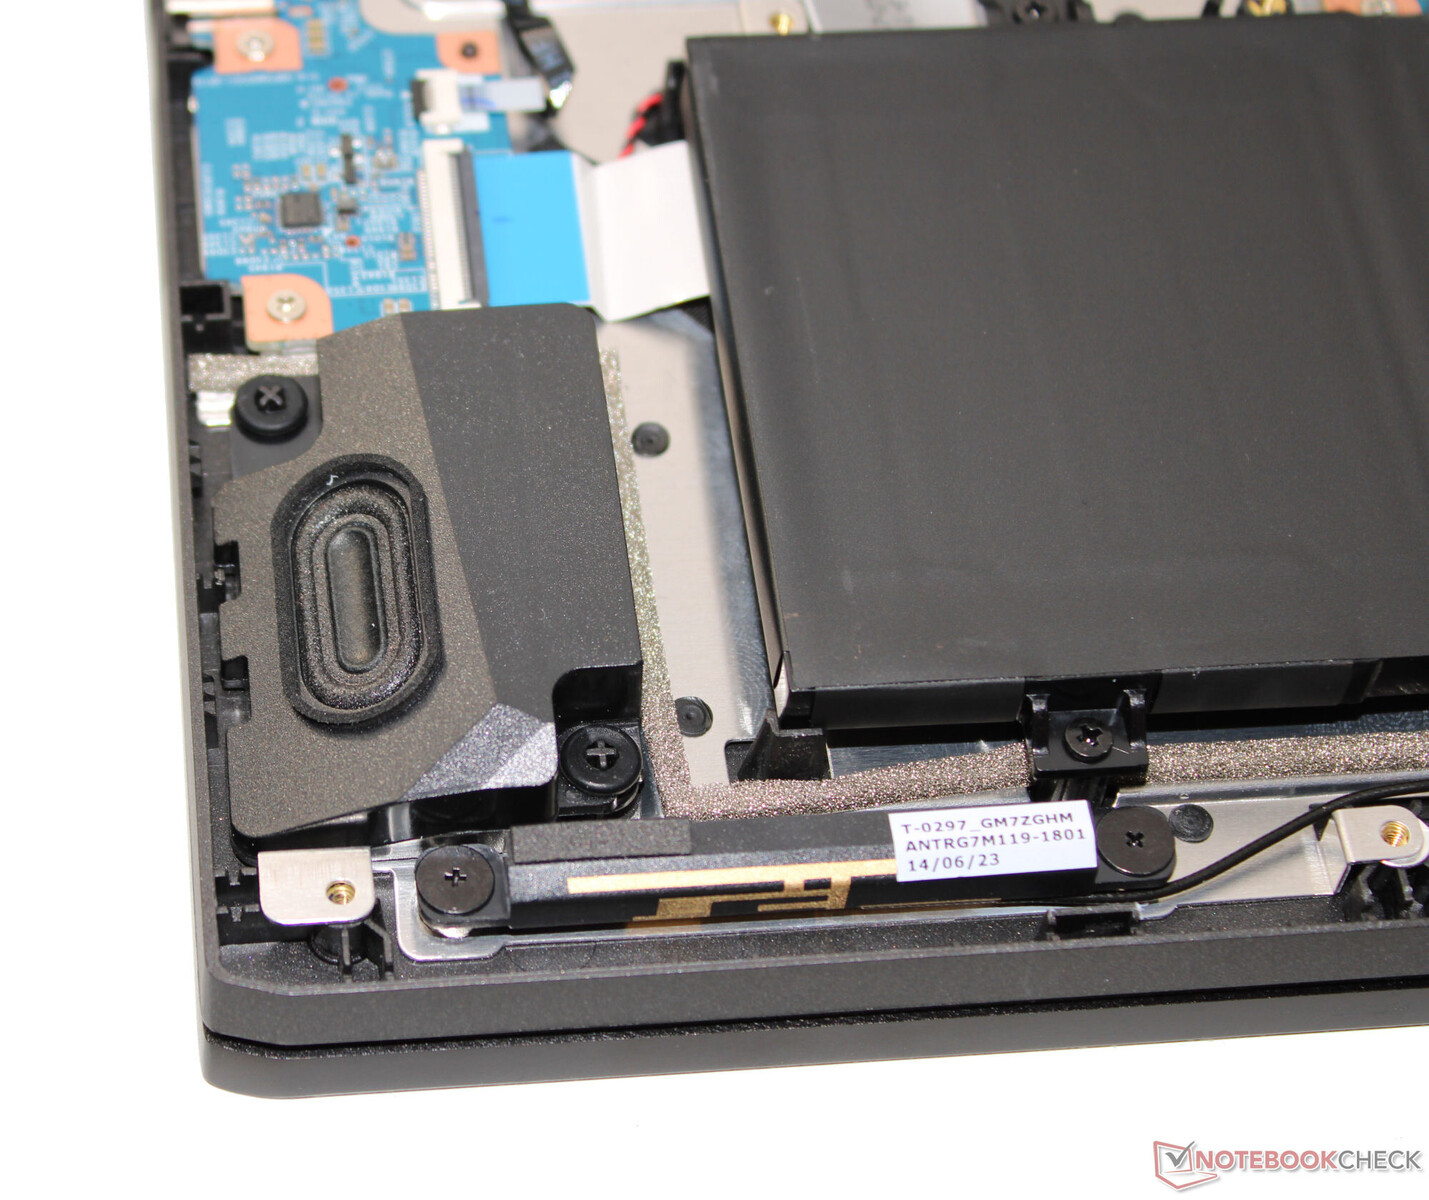
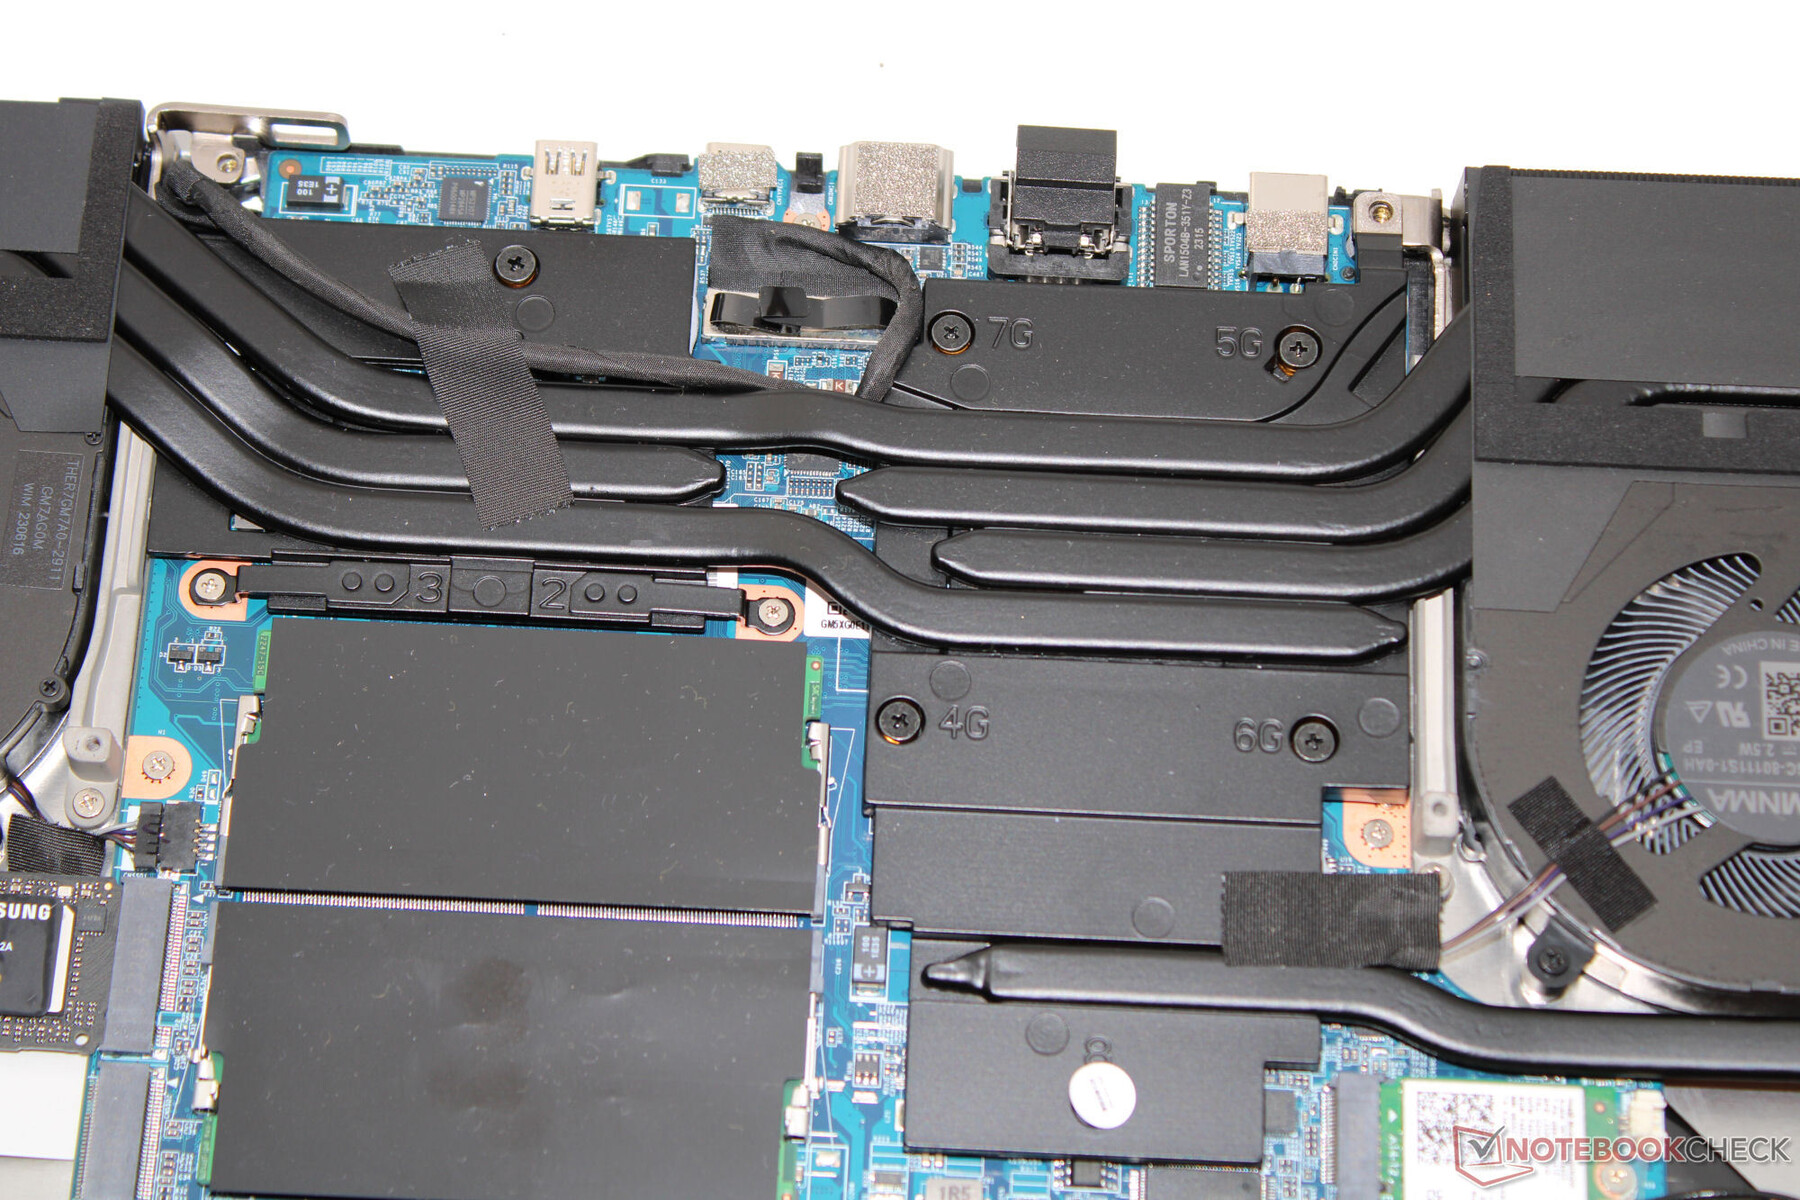
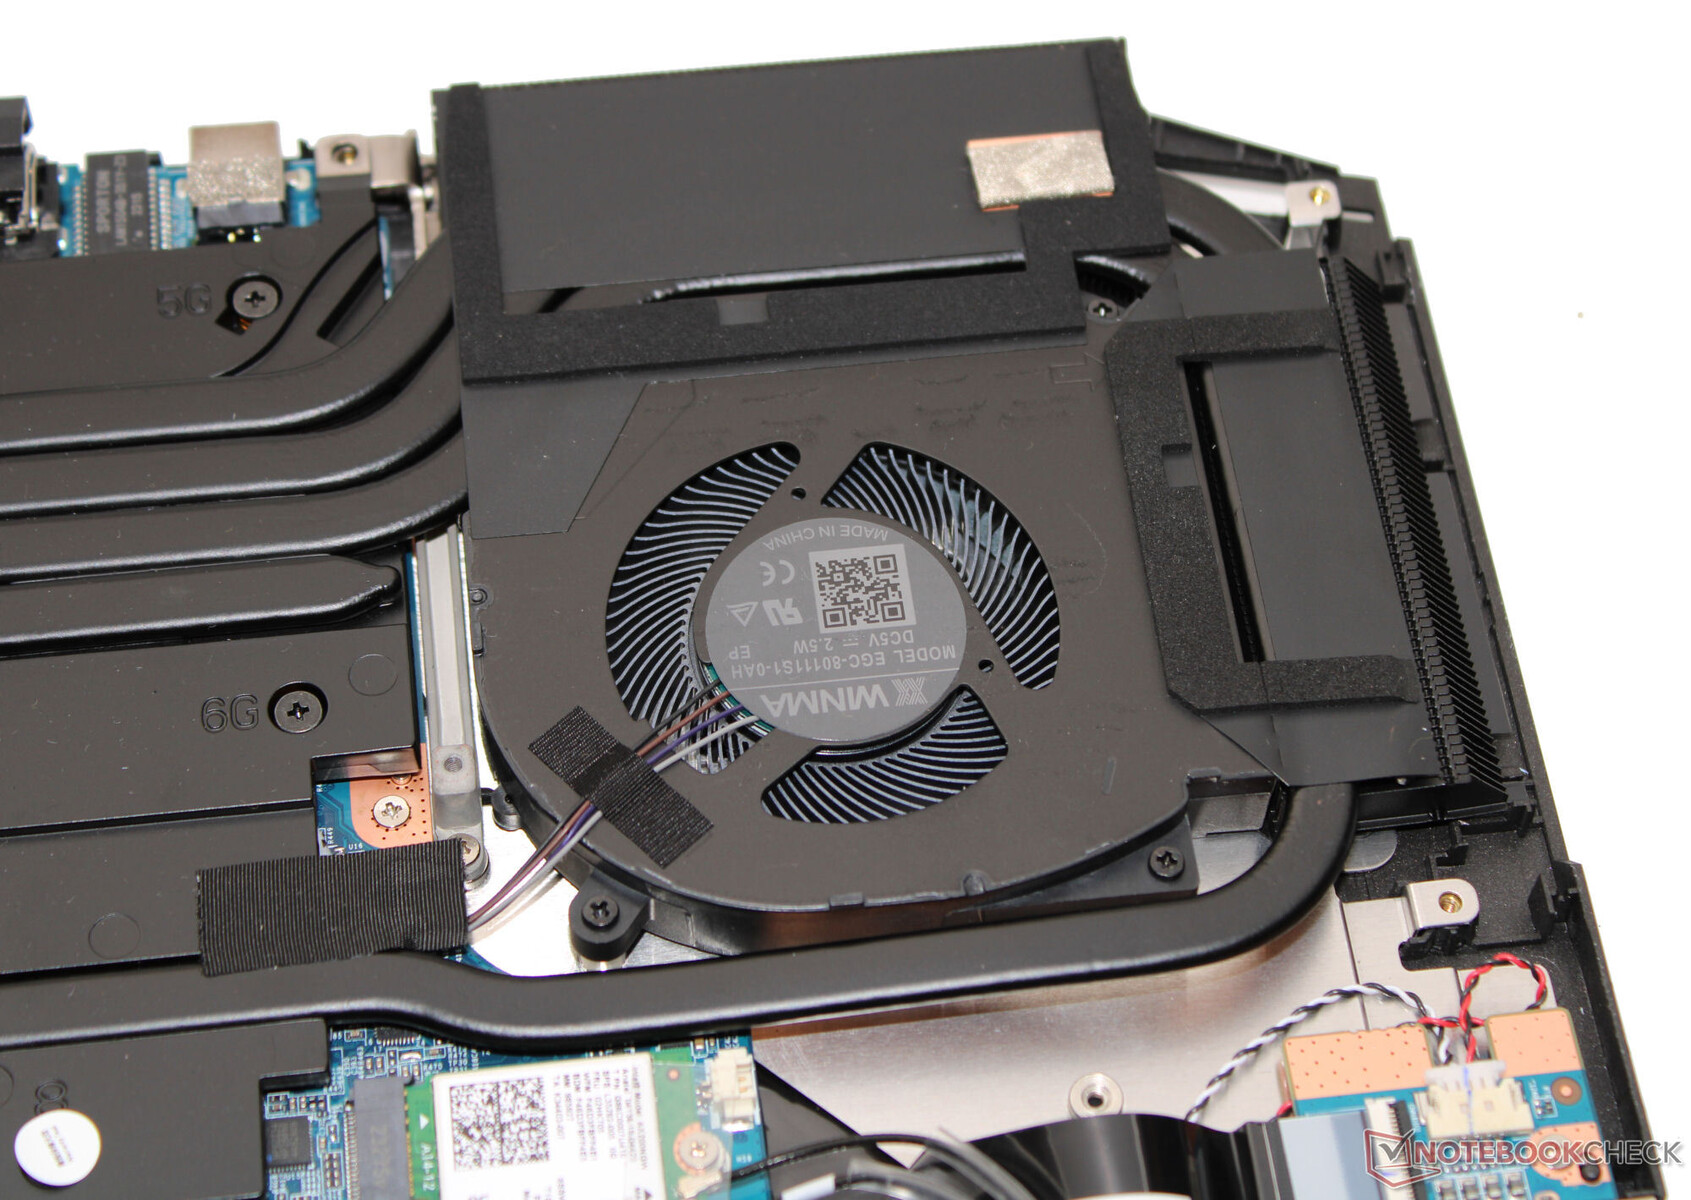
Po zdemontowaniu płyty bazowej można uzyskać dostęp do osprzętu. Pierwszym krokiem na tej drodze jest usunięcie osłon zawiasów (nad otworami wentylacyjnymi). Są one tylko szczelinowe i nie są przykręcone. Po tym, usunięcie wszystkich śrub na spodzie urządzenia oznacza, że podstawa może zostać oddzielona od reszty urządzenia za pomocą cienkiej szpatułki lub plectrum. Umożliwia to dostęp do banków pamięci (oba zajęte), dysku SSD (PCIe 4, M.2 2280), drugiego gniazda SSD (PCIe 4, M.2 2280), modułu Wi-Fi, baterii BIOS, wentylatorów i baterii.
Gwarancja
Podstawowa gwarancja obejmuje dwa lata - w tym usługę odbioru i sześć miesięcy szybkiej naprawy (naprawa w ciągu 48 godzin). W Niemczech cena wywoławcza za 36-miesięczną gwarancję wynosi od 80 do 119 euro - w zależności od wybranego okresu szybkiej naprawy.
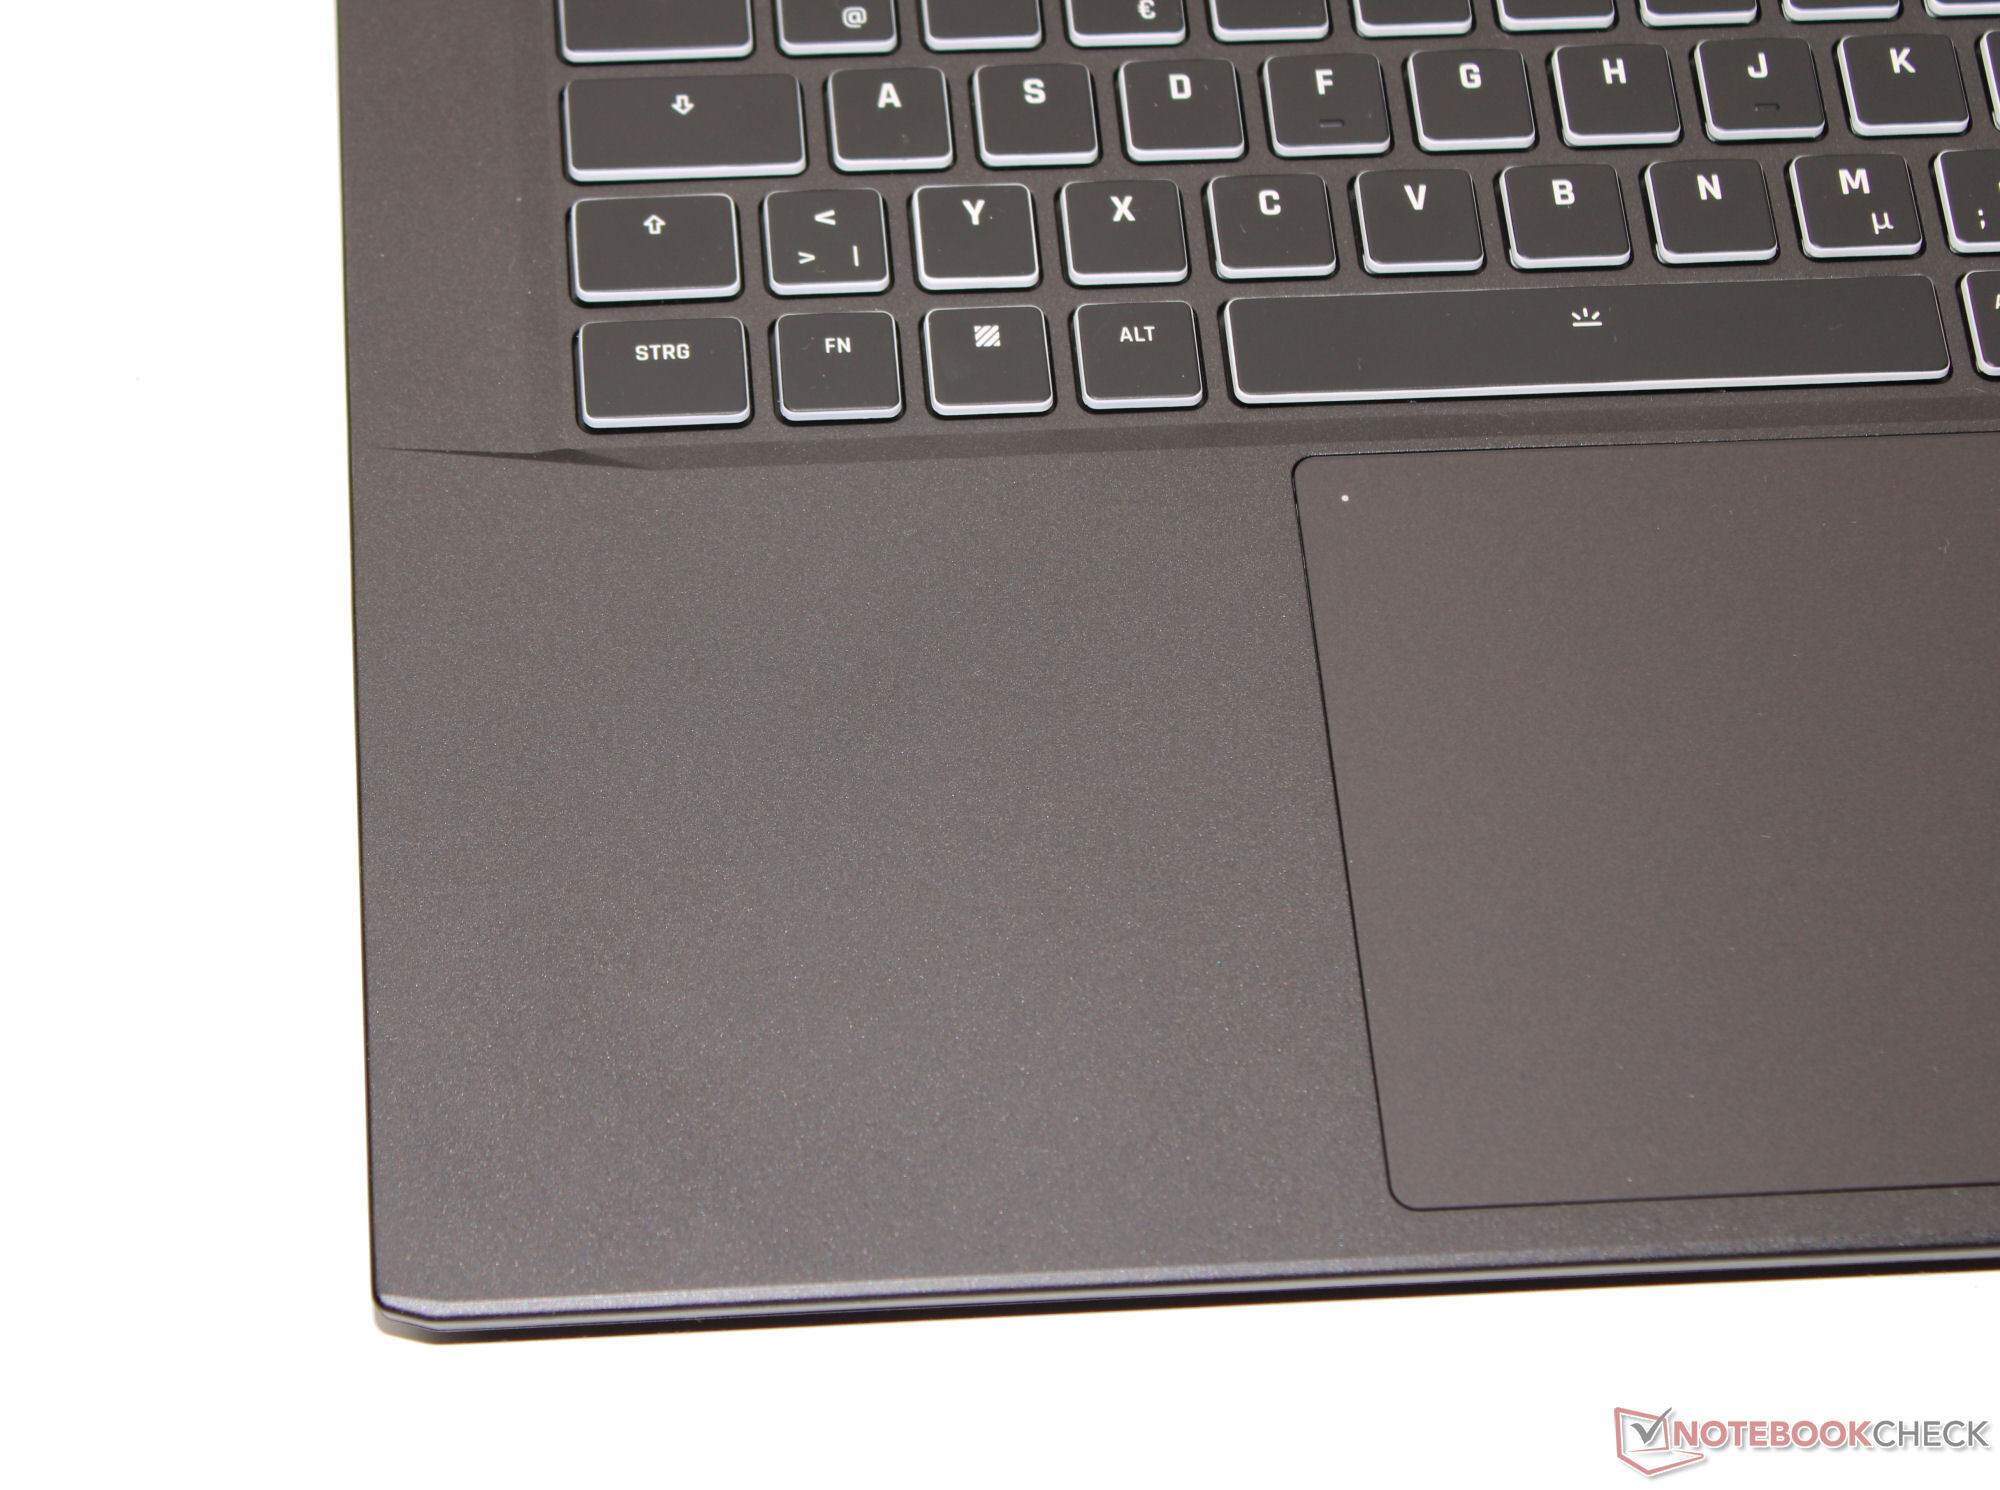
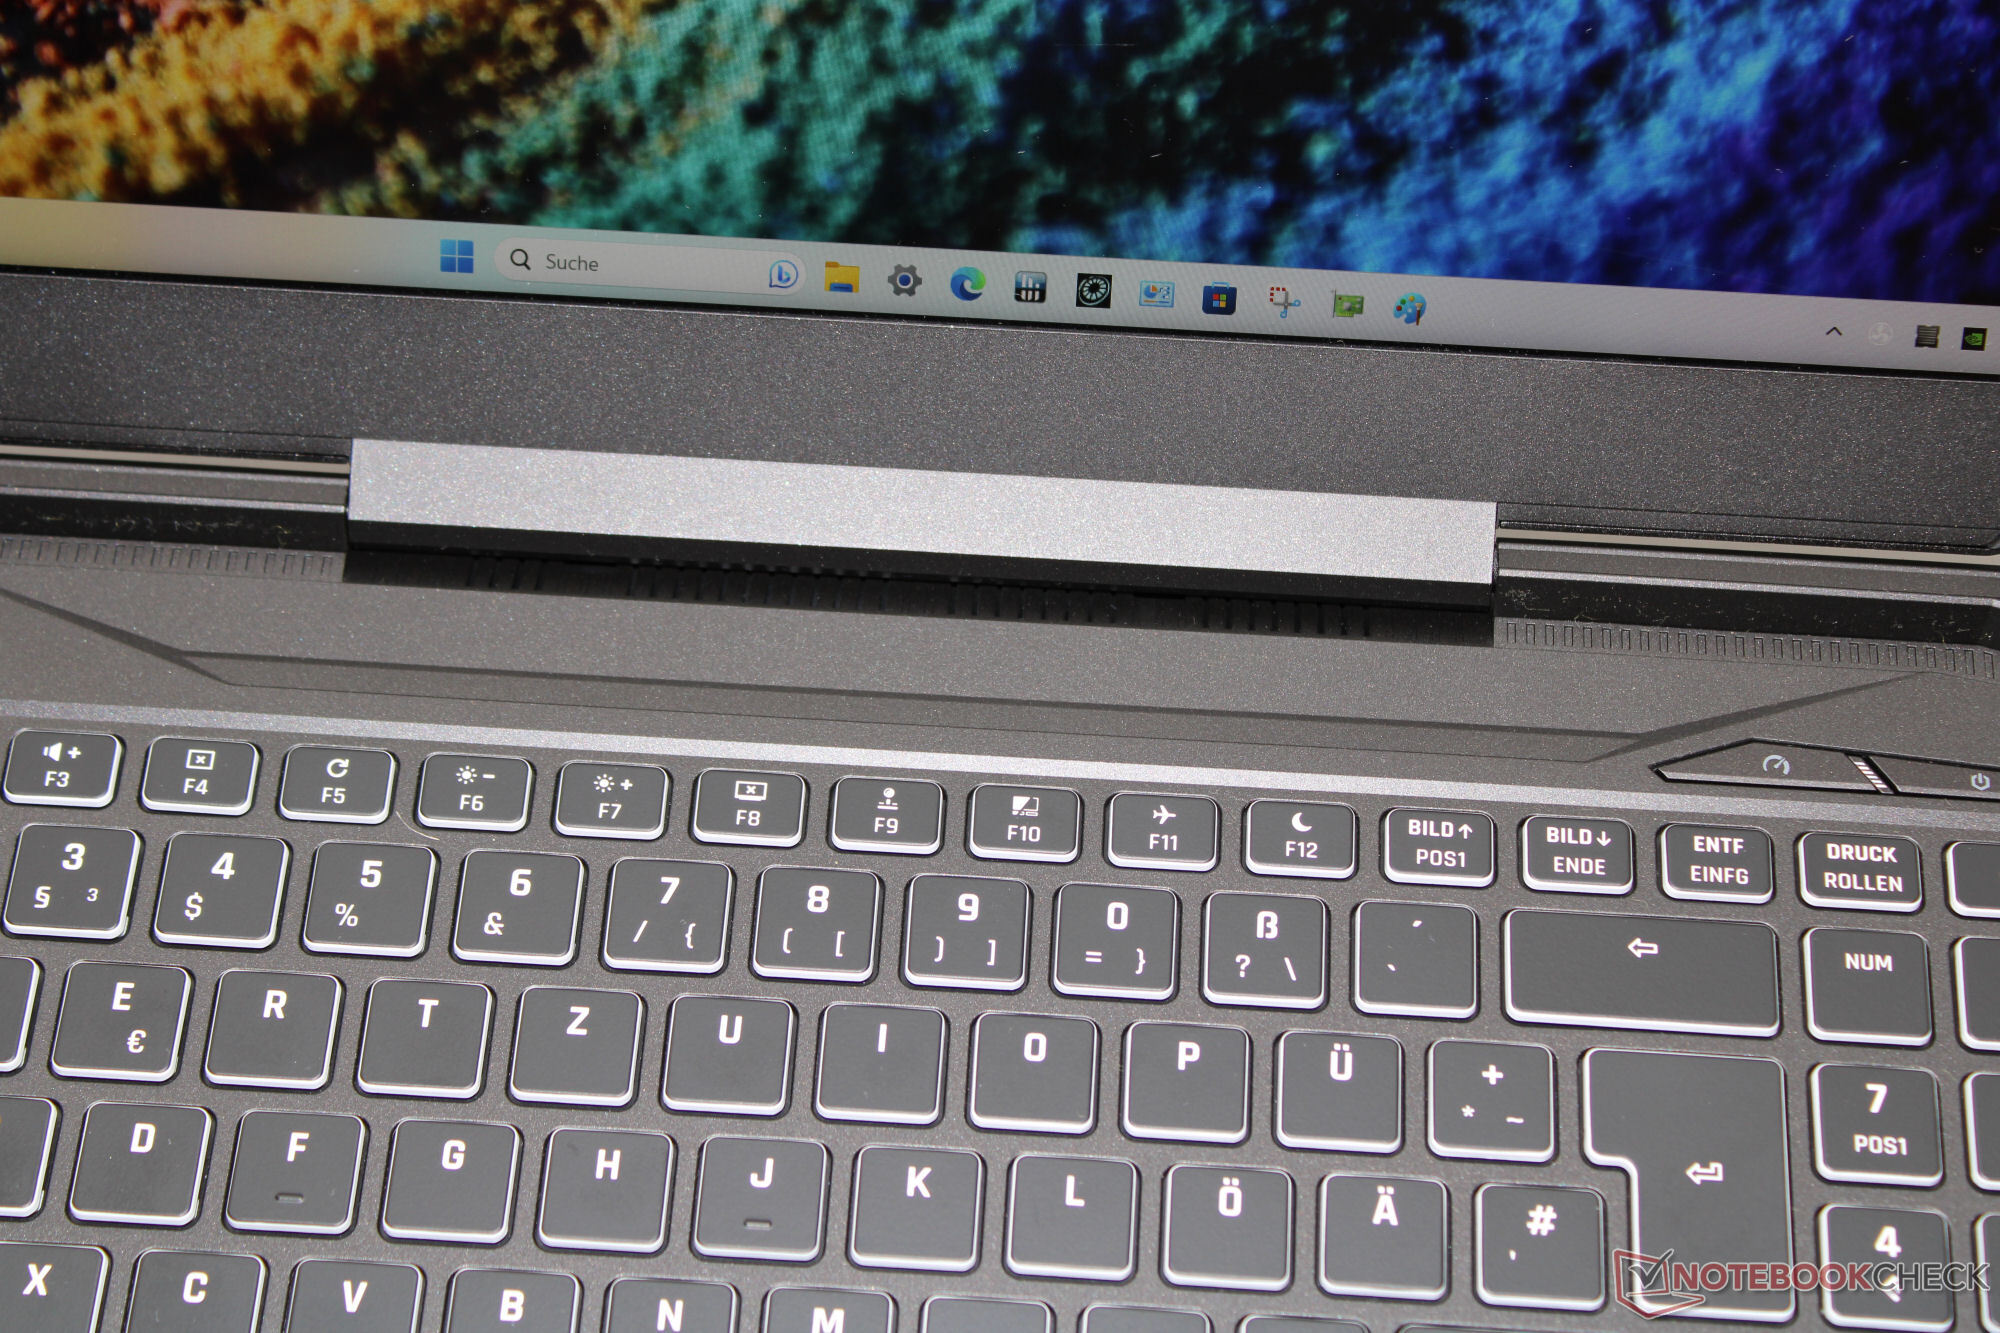
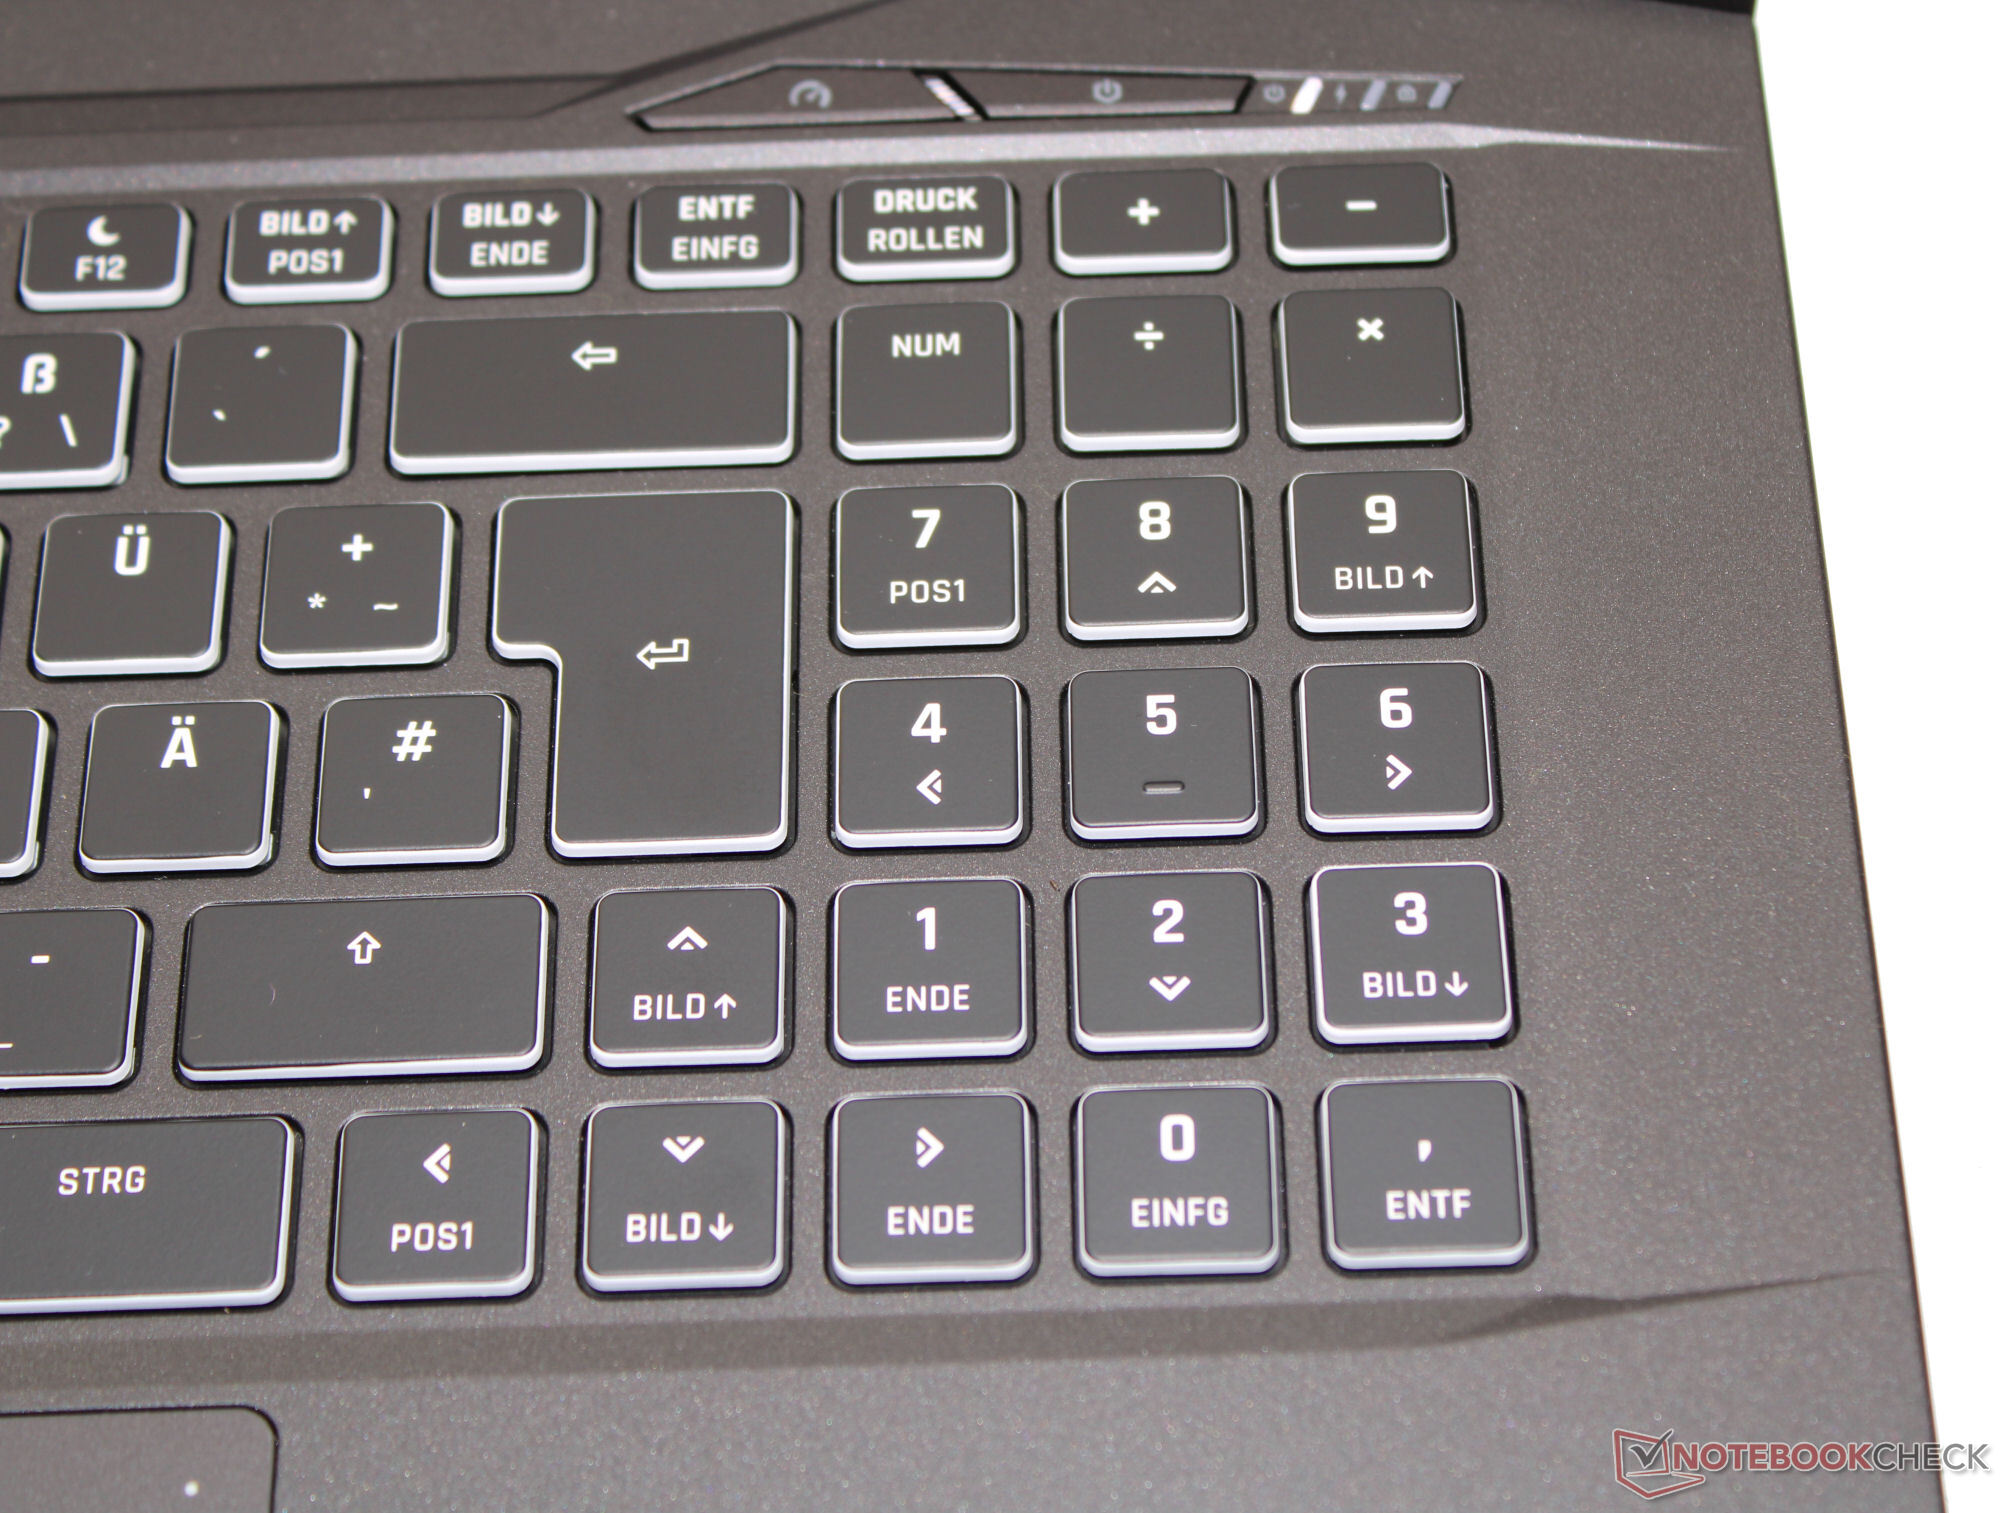
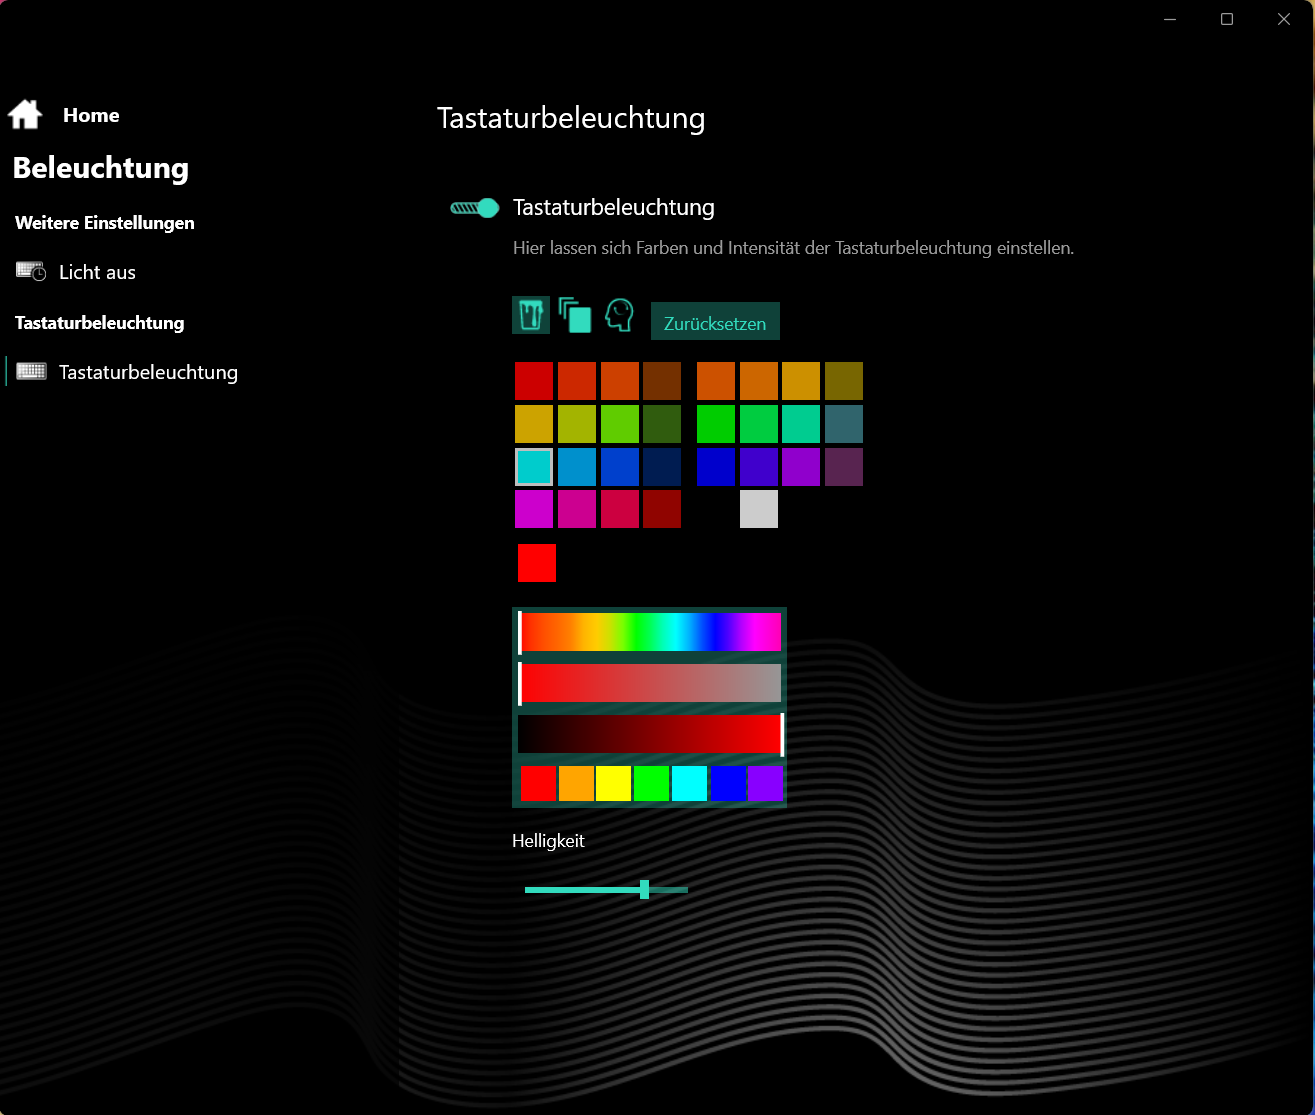
Urządzenia wejściowe - Apex 17 ma podświetlenie klawiszy RGB
Klawiatura
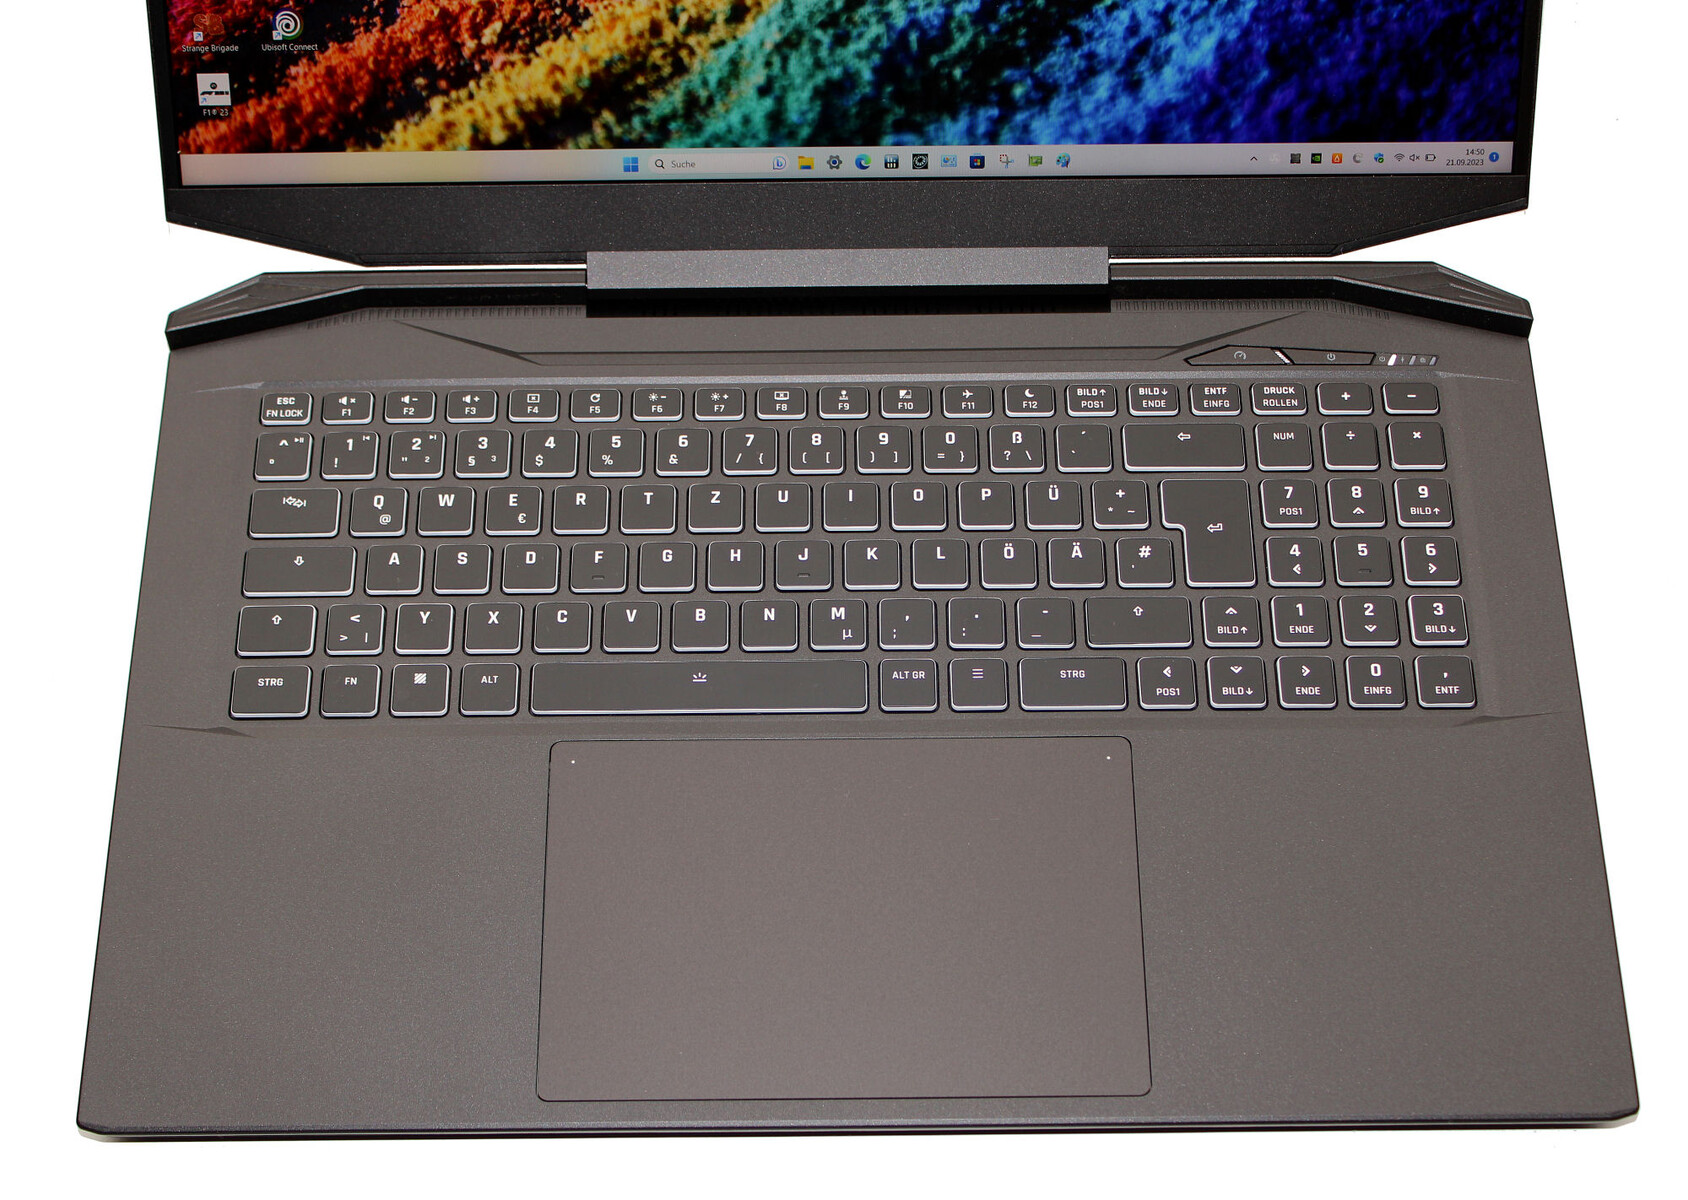
Podświetlana klawiatura typu chiclet (RGB) ma płaskie, gładkie klawisze o średnim skoku, a także wyraźny punkt nacisku i przyjemny opór. Podczas pisania klawiatura nie ugina się. Podsumowując, otrzymujemy klawiaturę nadającą się do codziennego użytku.
Touchpad
Namiastkę myszy zapewnia Clickpad (około 15,4 x 10 cm), który ma krótki skok i wyraźny punkt nacisku. Dotknięcie diody LED w lewym górnym rogu wyłącza lub włącza całą podkładkę. Stuknięcie diody LED w prawym górnym rogu wyłącza lub włącza prawą stronę podkładki.
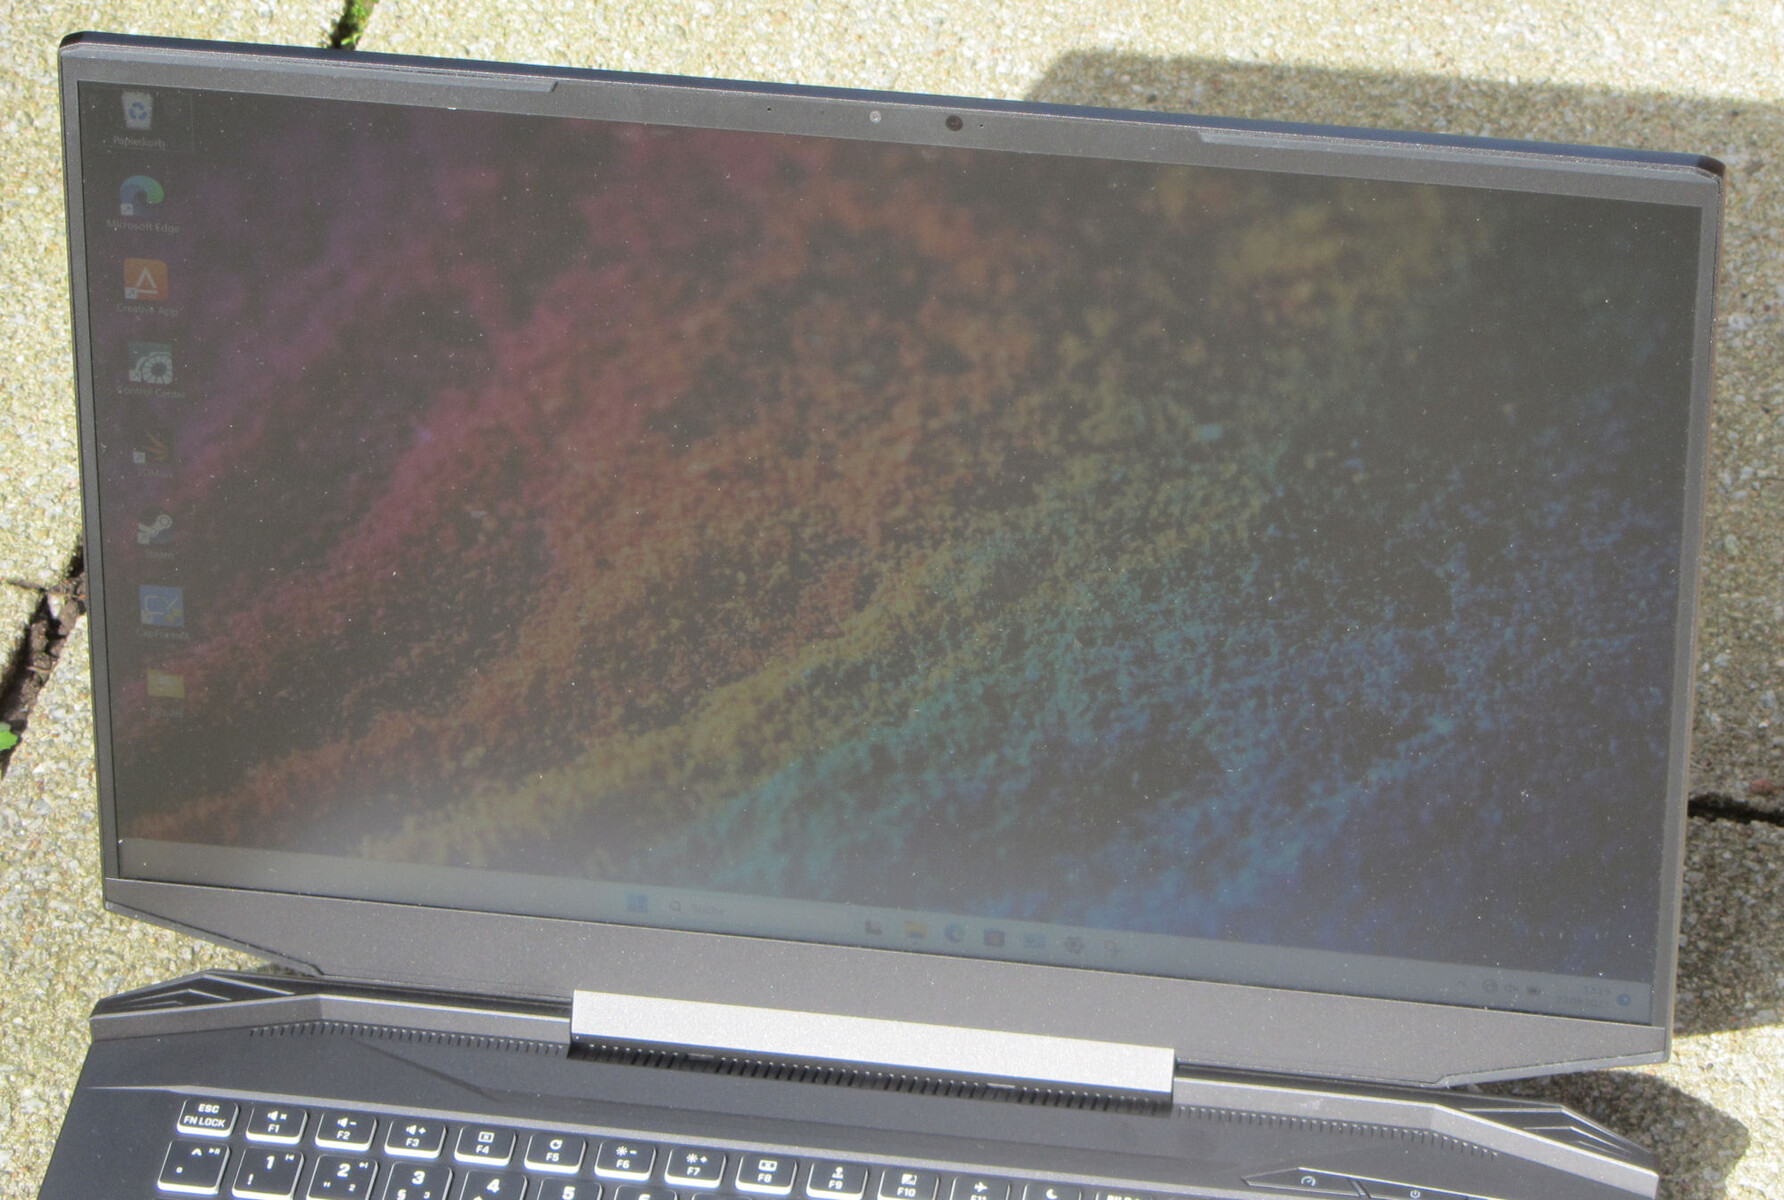
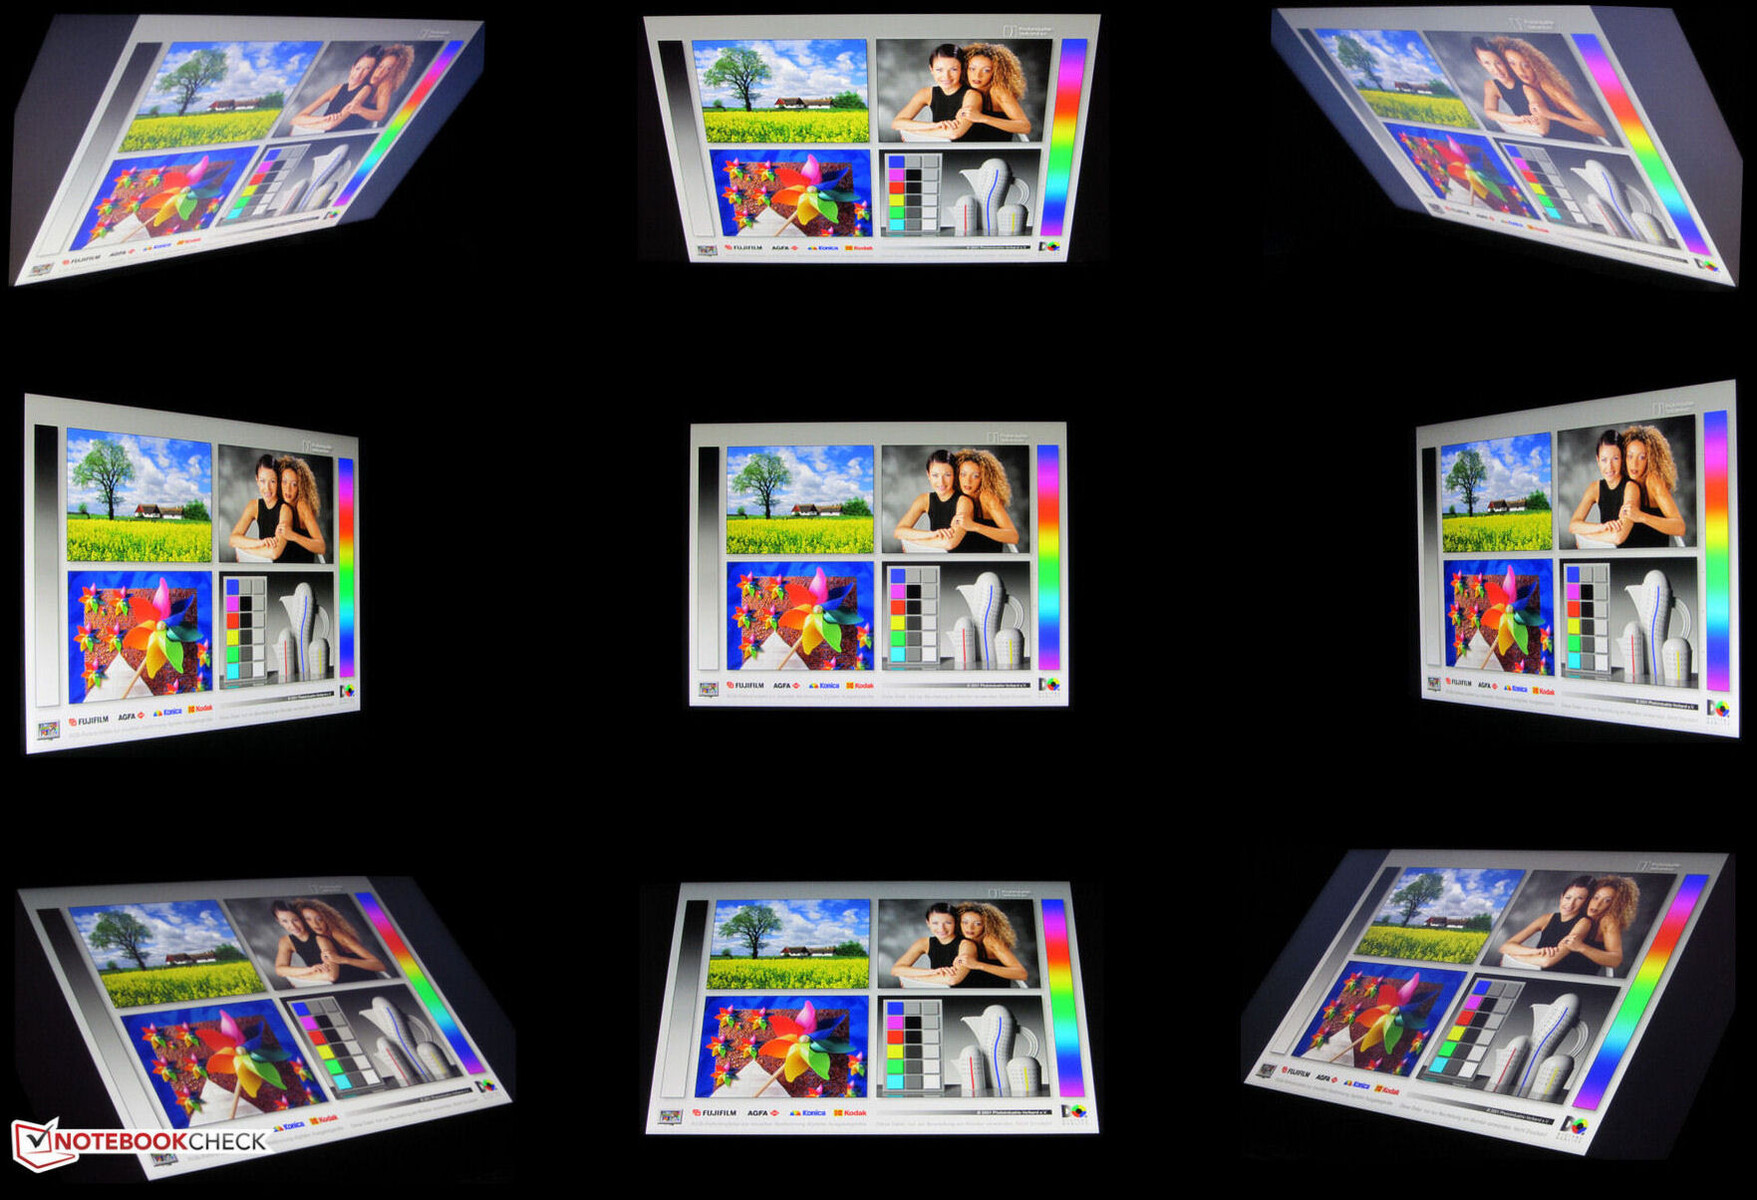
Wyświetlacz - panel QHD z pokryciem palety sRGB
Czuły panel o proporcjach 16:9 i częstotliwości odświeżania 240 Hz nie wykazuje migotania PWM, niezależnie od ustawienia jasności. Jasność i kontrast matowego, 17,3-calowego ekranu (2560 x 1440 pikseli) spełniają swoje cele (> 300 cd/m² i 1000:1).
Oprócz wyświetlacza QHD w recenzowanym urządzeniu, Schenker oferuje Apex 17 z alternatywnym panelem FHD (1,920 x 1,080 pikseli, 144 Hz, IPS).
| |||||||||||||||||||||||||
rozświetlenie: 90 %
na akumulatorze: 403 cd/m²
kontrast: 1089:1 (czerń: 0.37 cd/m²)
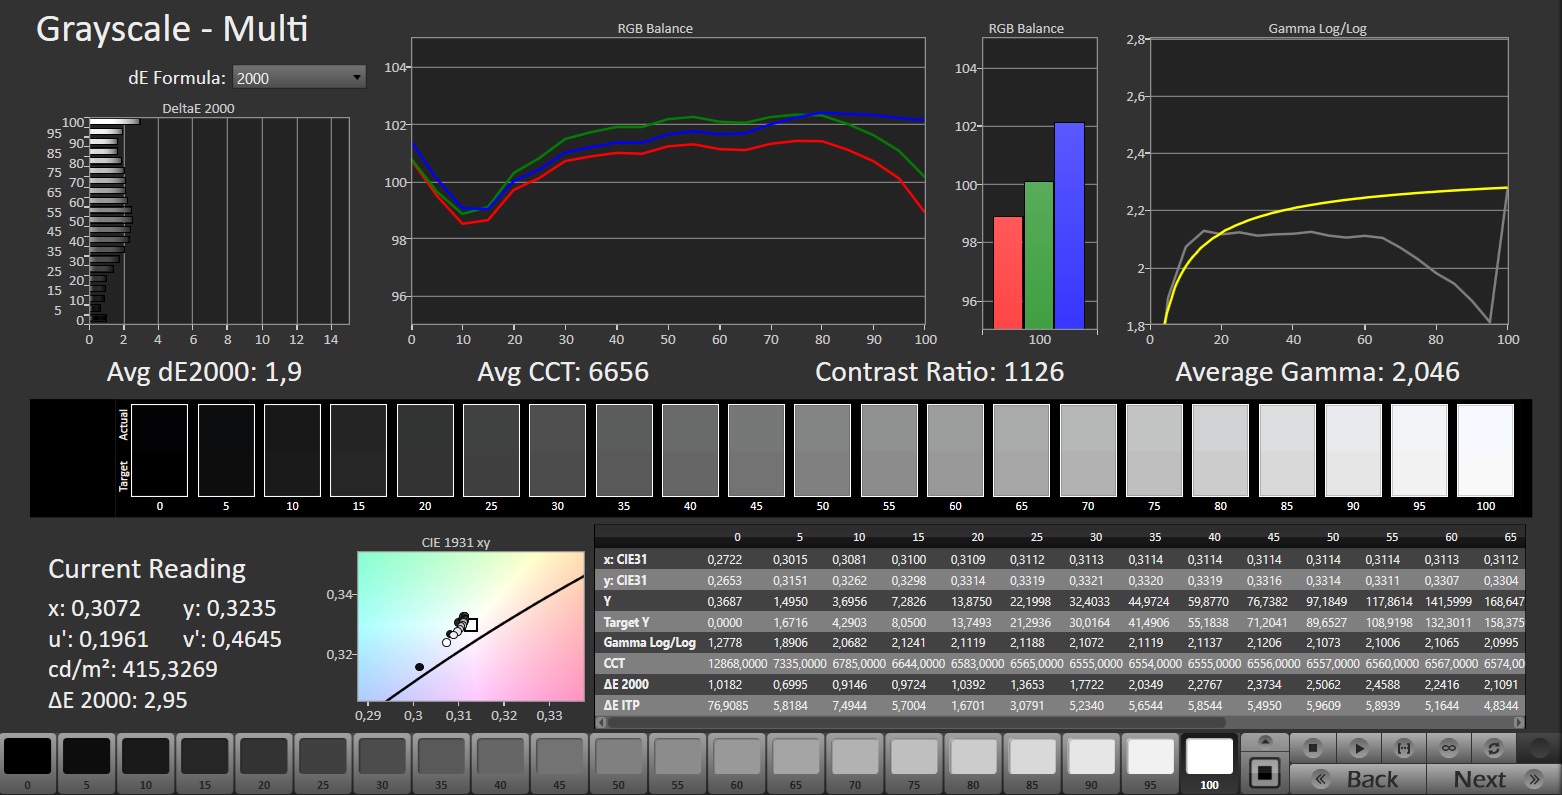
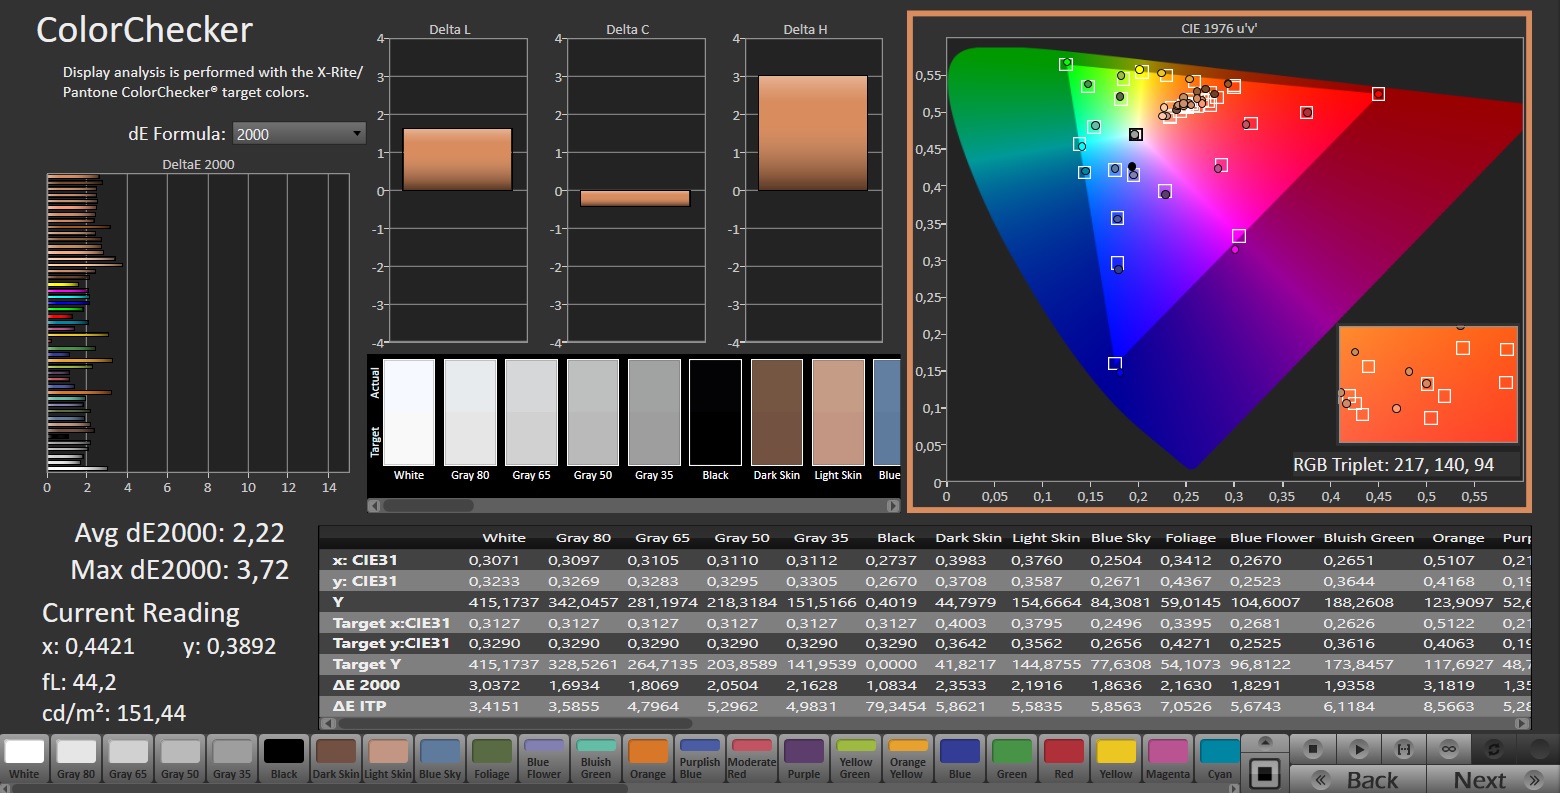
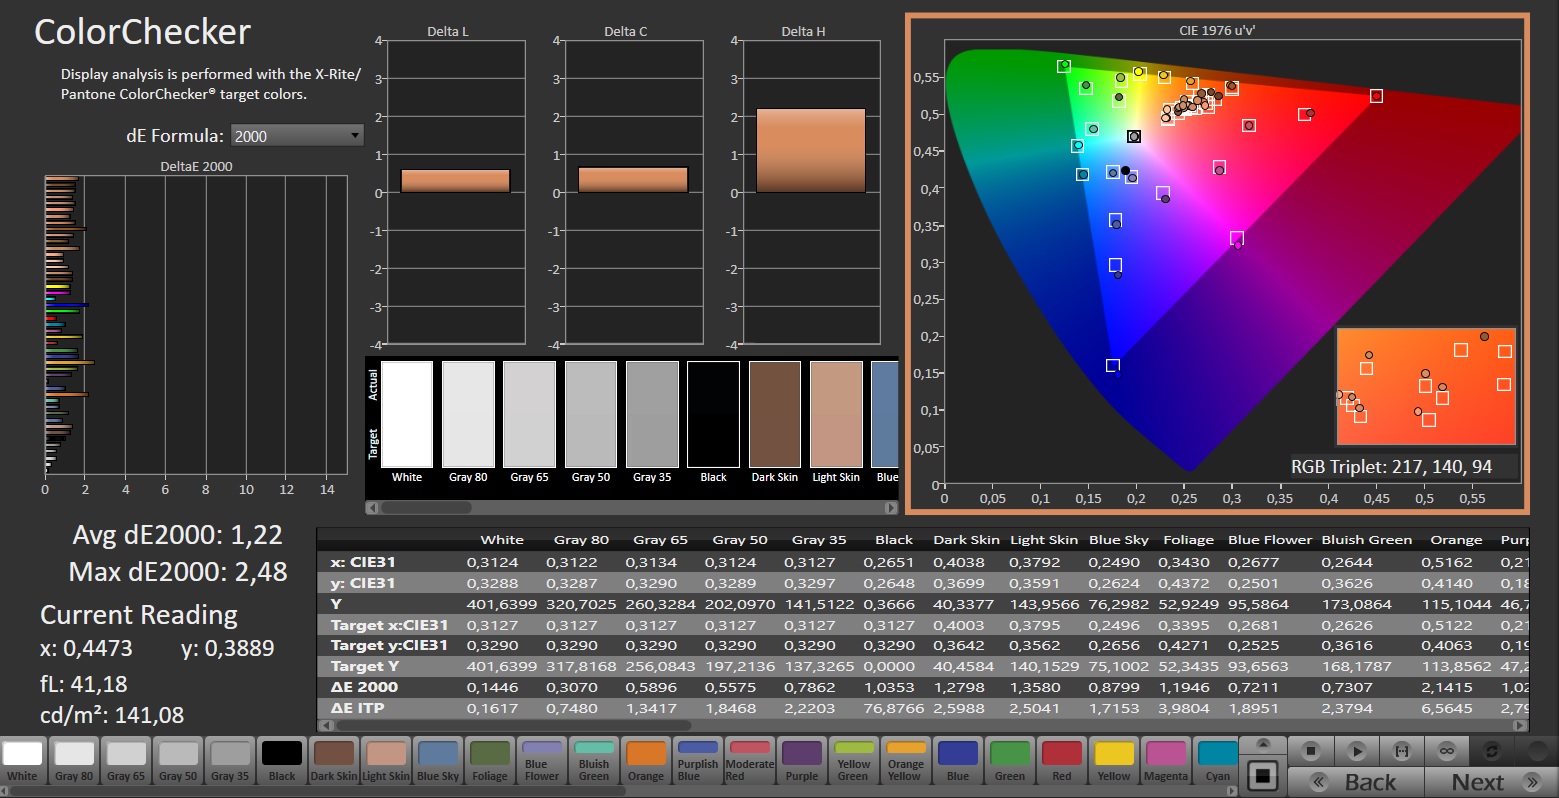
ΔE ColorChecker Calman: 2.22 | ∀{0.5-29.43 Ø4.73}
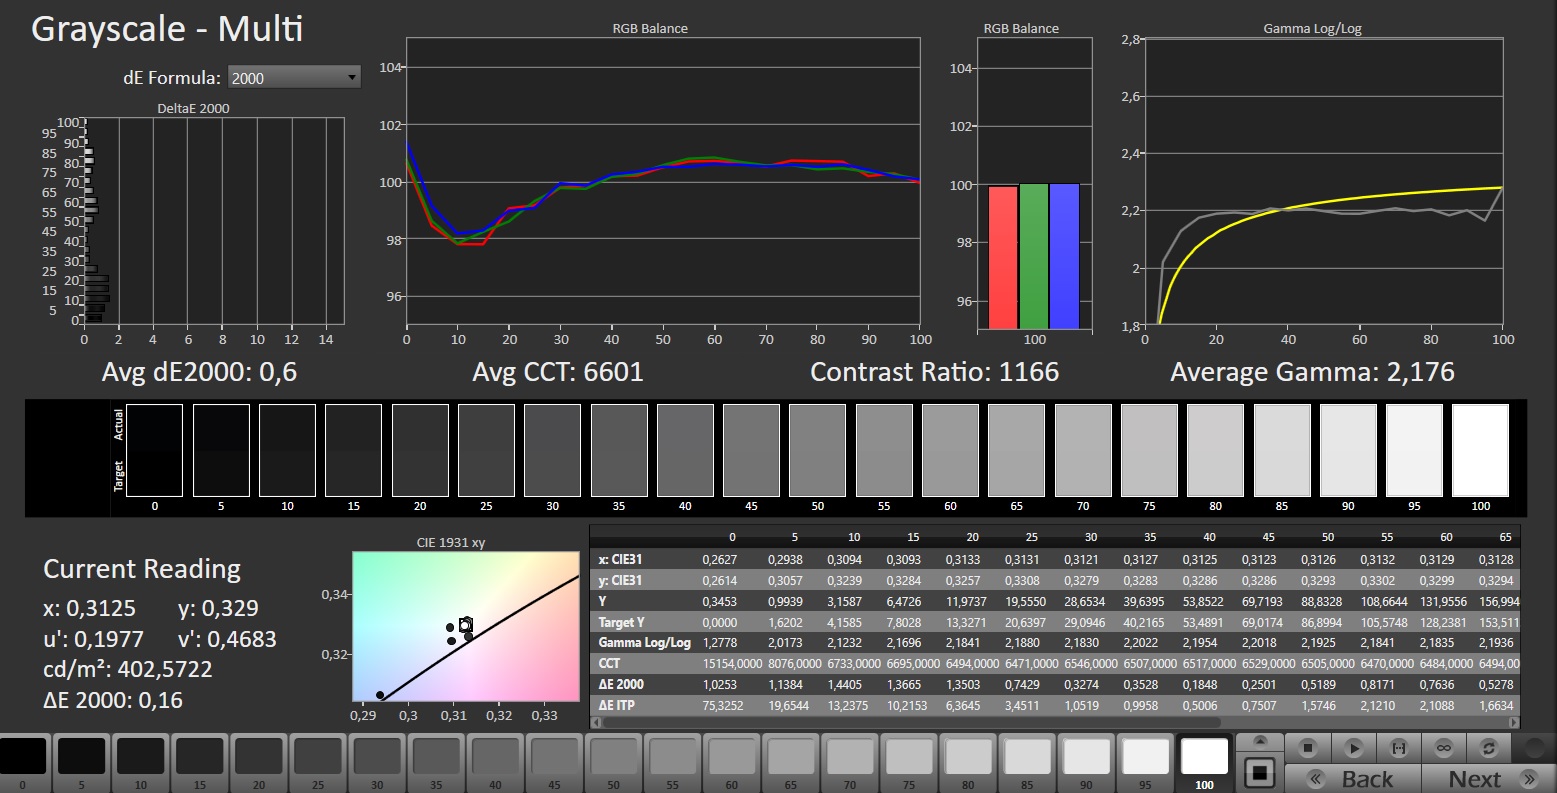
calibrated: 1.22
ΔE Greyscale Calman: 1.9 | ∀{0.09-98 Ø4.97}
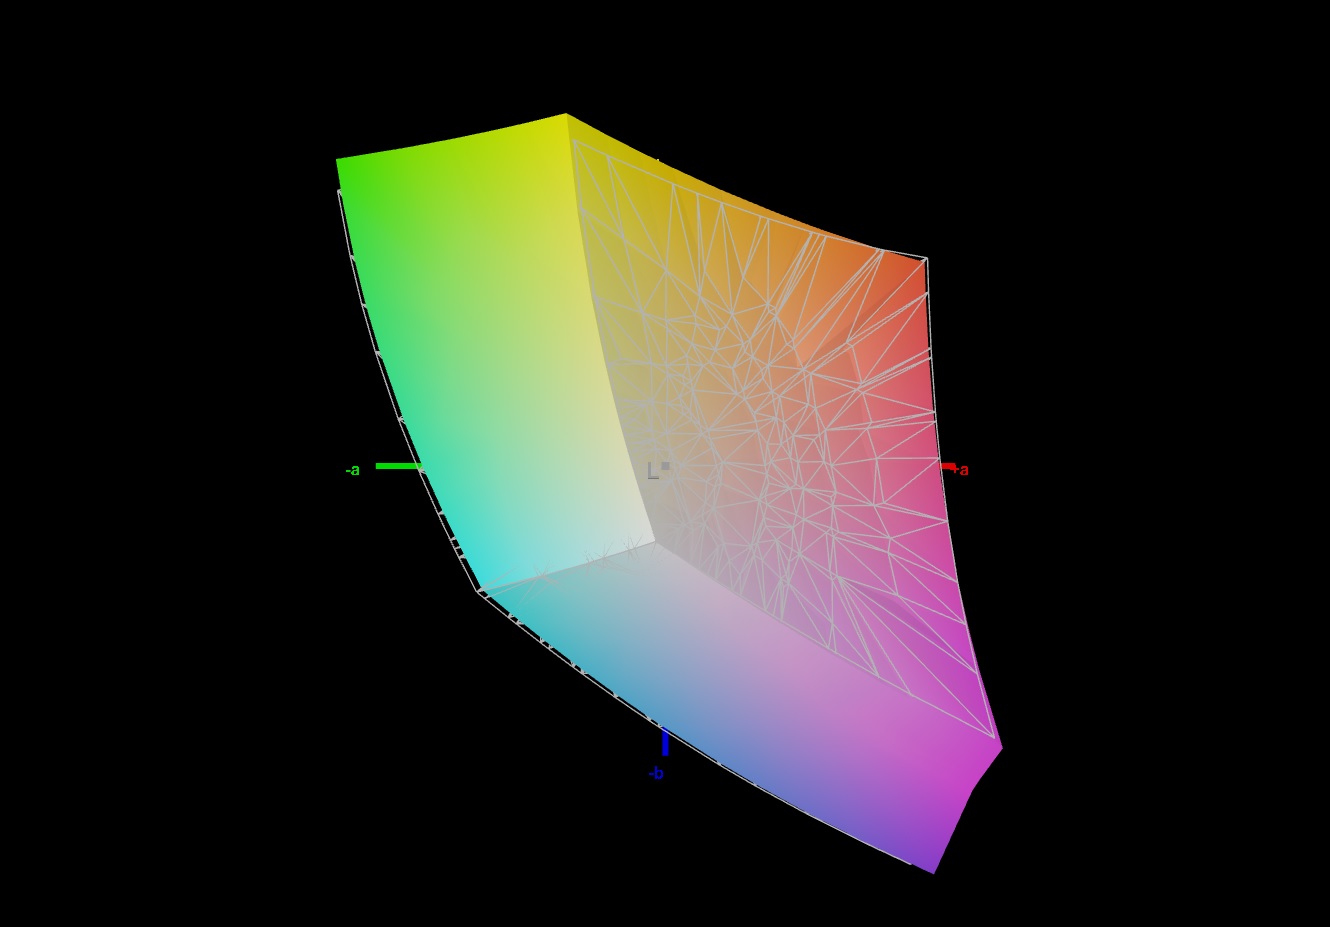
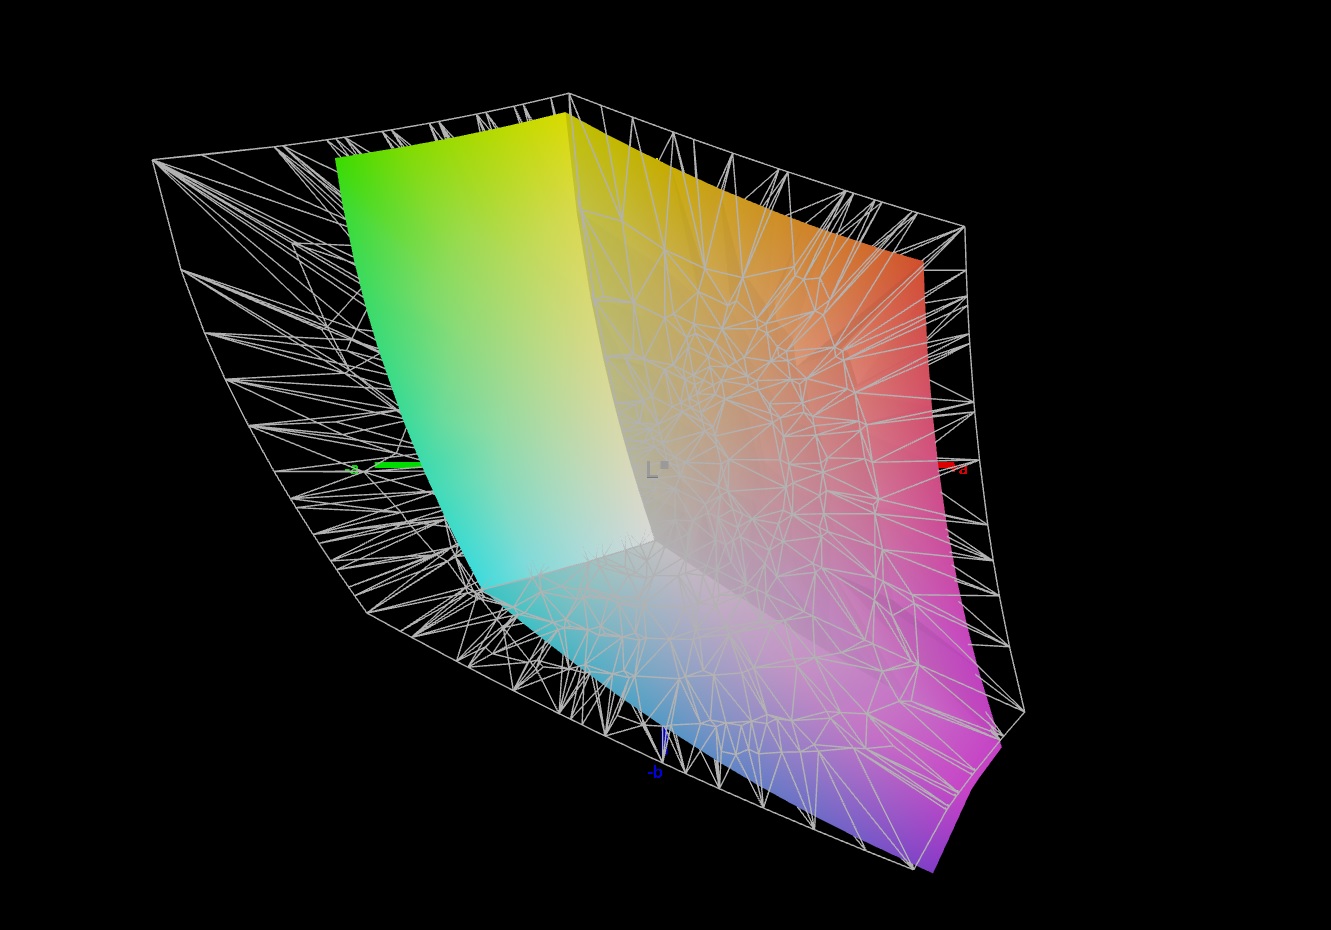
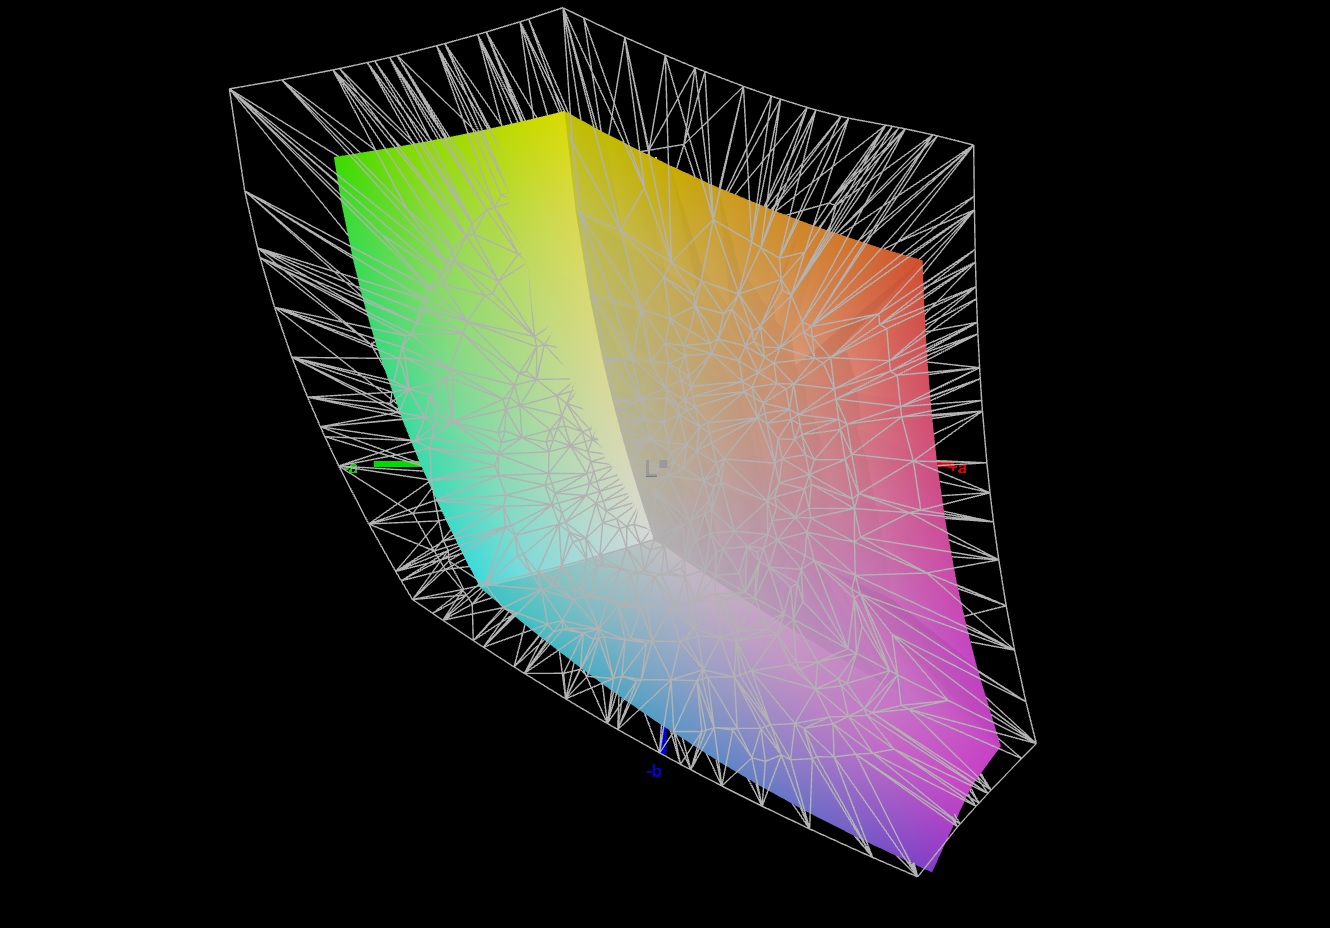
69.5% AdobeRGB 1998 (Argyll 3D)
97.7% sRGB (Argyll 3D)
68.1% Display P3 (Argyll 3D)
Gamma: 2.046
CCT: 6656 K
| Schenker XMG Apex 17 (Late 23) BOE CQ NE173QHM-NZ3, IPS, 2560x1440, 17.3" | Alienware m16 R1 Intel BOE NE16NYB, IPS, 2560x1600, 16" | Lenovo Legion Pro 5 16IRX8 AU Optronics B160QAN03.1, IPS, 2560x1600, 16" | Acer Nitro 17 AN17-51-71ER BOE0B7C NE173QHM-NY6, , 2560x1440, 17.3" | Medion Erazer Defender P40 BOE CQ NE173QHM-NZ3, IPS, 2560x1440, 17.3" | MSI Katana 17 B13VFK B173HAN04.9, IPS LED, 1920x1080, 17.3" | |
|---|---|---|---|---|---|---|
| Display | -0% | 4% | 23% | 0% | -39% | |
| Display P3 Coverage (%) | 68.1 | 67.7 -1% | 71.2 5% | 98.3 44% | 68.3 0% | 40.8 -40% |
| sRGB Coverage (%) | 97.7 | 97.2 -1% | 98.8 1% | 100 2% | 98.1 0% | 61 -38% |
| AdobeRGB 1998 Coverage (%) | 69.5 | 70 1% | 73.3 5% | 85.7 23% | 69.8 0% | 42.2 -39% |
| Response Times | 39% | -20% | -6% | -9% | -187% | |
| Response Time Grey 50% / Grey 80% * (ms) | 13.5 ? | 4 ? 70% | 14.5 ? -7% | 14.8 ? -10% | 14.6 ? -8% | 33 ? -144% |
| Response Time Black / White * (ms) | 7.9 ? | 7.3 ? 8% | 10.4 ? -32% | 8 ? -1% | 8.7 ? -10% | 26 ? -229% |
| PWM Frequency (Hz) | ||||||
| Screen | -12% | 11% | -57% | 11% | -90% | |
| Brightness middle (cd/m²) | 403 | 306 -24% | 405.7 1% | 361 -10% | 364 -10% | 267 -34% |
| Brightness (cd/m²) | 381 | 302 -21% | 368 -3% | 326 -14% | 343 -10% | 256 -33% |
| Brightness Distribution (%) | 90 | 89 -1% | 87 -3% | 87 -3% | 86 -4% | 93 3% |
| Black Level * (cd/m²) | 0.37 | 0.3 19% | 0.38 -3% | 0.6 -62% | 0.28 24% | 0.21 43% |
| Contrast (:1) | 1089 | 1020 -6% | 1068 -2% | 602 -45% | 1300 19% | 1271 17% |
| Colorchecker dE 2000 * | 2.22 | 2.57 -16% | 1.65 26% | 3.83 -73% | 1.67 25% | 4.7 -112% |
| Colorchecker dE 2000 max. * | 3.76 | 4.26 -13% | 4.2 -12% | 5.71 -52% | 2.78 26% | 20.4 -443% |
| Colorchecker dE 2000 calibrated * | 1.22 | 0.85 30% | 0.53 57% | 3.48 -185% | 1.14 7% | 4.5 -269% |
| Greyscale dE 2000 * | 1.9 | 3.3 -74% | 1.2 37% | 3.29 -73% | 1.4 26% | 1.5 21% |
| Gamma | 2.046 108% | 1.997 110% | 2.3 96% | 2.29 96% | 2.091 105% | 2.12 104% |
| CCT | 6656 98% | 6895 94% | 6453 101% | 6679 97% | 6568 99% | 6552 99% |
| Całkowita średnia (program / ustawienia) | 9% /
-2% | -2% /
5% | -13% /
-33% | 1% /
6% | -105% /
-93% |
* ... im mniej tym lepiej
Po wyjęciu z pudełka wyświetlacz wykazuje dobre odwzorowanie kolorów. Przy odchyleniu około 2,2 osiągana jest wartość docelowa (DeltaE < 3). Kalibracja zmniejsza odchylenie do 1,2 i zapewnia zrównoważone skale szarości. Panel niemal w całości pokrywa przestrzeń barw sRGB, ale nie AdobeRGB i DCI P3. Większość wyświetlaczy konkurencyjnych urządzeń prezentuje podobny obraz. TylkoNitro 17pokrywa przestrzeń kolorów P3.

Wyświetl czasy reakcji
| ↔ Czas reakcji od czerni do bieli | ||
|---|---|---|
| 7.9 ms ... wzrost ↗ i spadek ↘ łącznie | ↗ 3 ms wzrost | 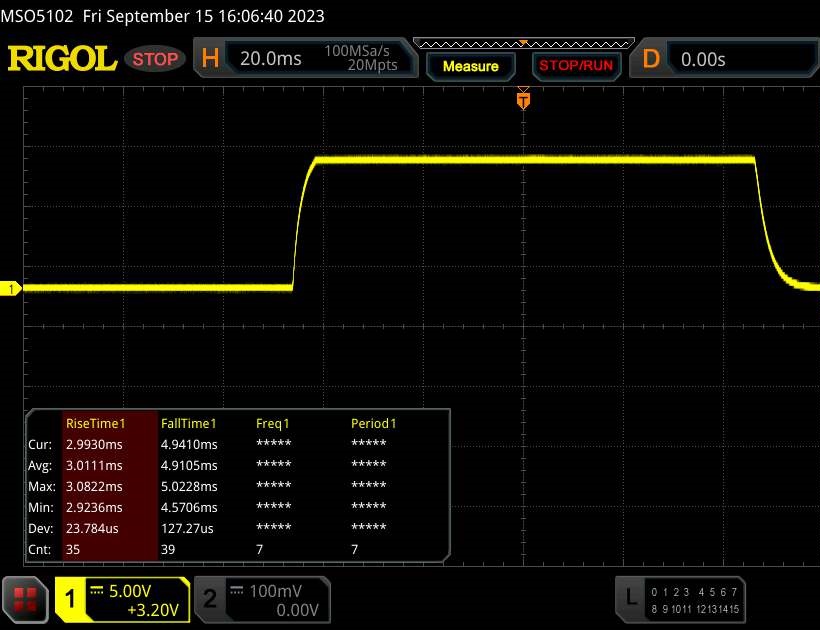 |
| ↘ 4.9 ms upadek | ||
| W naszych testach ekran wykazuje bardzo szybką reakcję i powinien bardzo dobrze nadawać się do szybkich gier. Dla porównania, wszystkie testowane urządzenia wahają się od 0.1 (minimum) do 240 (maksimum) ms. » 22 % wszystkich urządzeń jest lepszych. Oznacza to, że zmierzony czas reakcji jest lepszy od średniej wszystkich testowanych urządzeń (19.9 ms). | ||
| ↔ Czas reakcji 50% szarości do 80% szarości | ||
| 13.5 ms ... wzrost ↗ i spadek ↘ łącznie | ↗ 6.4 ms wzrost | 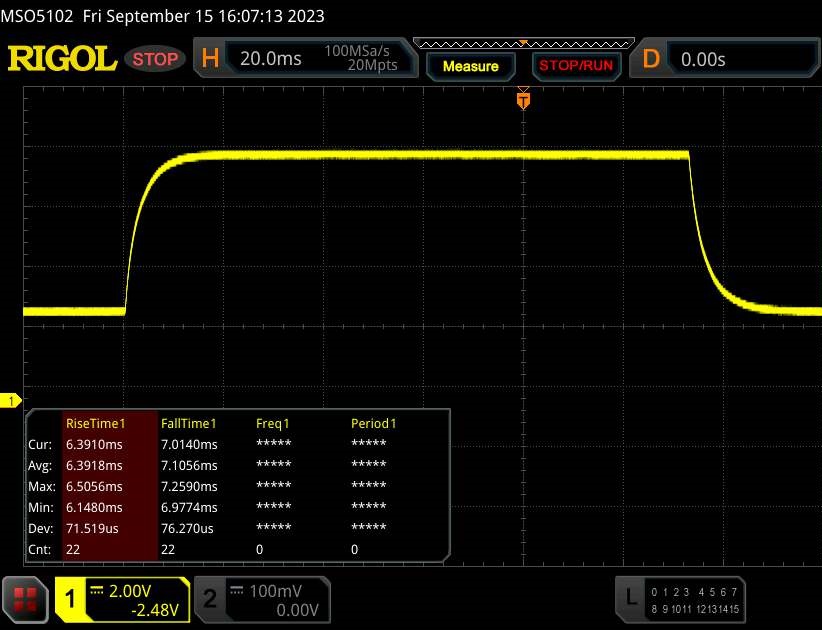 |
| ↘ 7.1 ms upadek | ||
| W naszych testach ekran wykazuje dobry współczynnik reakcji, ale może być zbyt wolny dla graczy rywalizujących ze sobą. Dla porównania, wszystkie testowane urządzenia wahają się od 0.165 (minimum) do 636 (maksimum) ms. » 27 % wszystkich urządzeń jest lepszych. Oznacza to, że zmierzony czas reakcji jest lepszy od średniej wszystkich testowanych urządzeń (31.1 ms). | ||
Migotanie ekranu / PWM (modulacja szerokości impulsu)
| Migotanie ekranu/nie wykryto PWM | 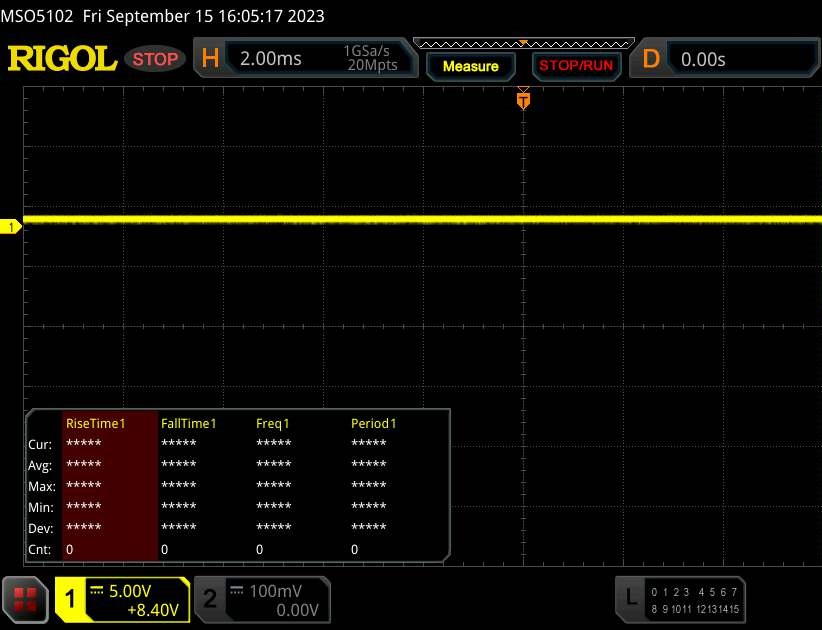 | ||
Dla porównania: 52 % wszystkich testowanych urządzeń nie używa PWM do przyciemniania wyświetlacza. Jeśli wykryto PWM, zmierzono średnio 7798 (minimum: 5 - maksimum: 343500) Hz. | |||
Panel IPS ma dobrą stabilność kąta widzenia i jest czytelny z każdej pozycji. Na zewnątrz ekran jest czytelny, o ile światło słoneczne nie jest zbyt jasne.
Wydajność - Phoenix i Ada Lovelace zasilają laptop Schenker
Schenker Apex 17 to średniej klasy laptop do gier z rozdzielczością QHD, którego moc obliczeniową zapewniają Phoenix i Ada Lovelace. Laptop można skonfigurować i zakupić na Bestware.com. Nasze recenzowane urządzenie można kupić za 1750 euro, a ceny zaczynają się od około 1200 euro.
Warunki testowe
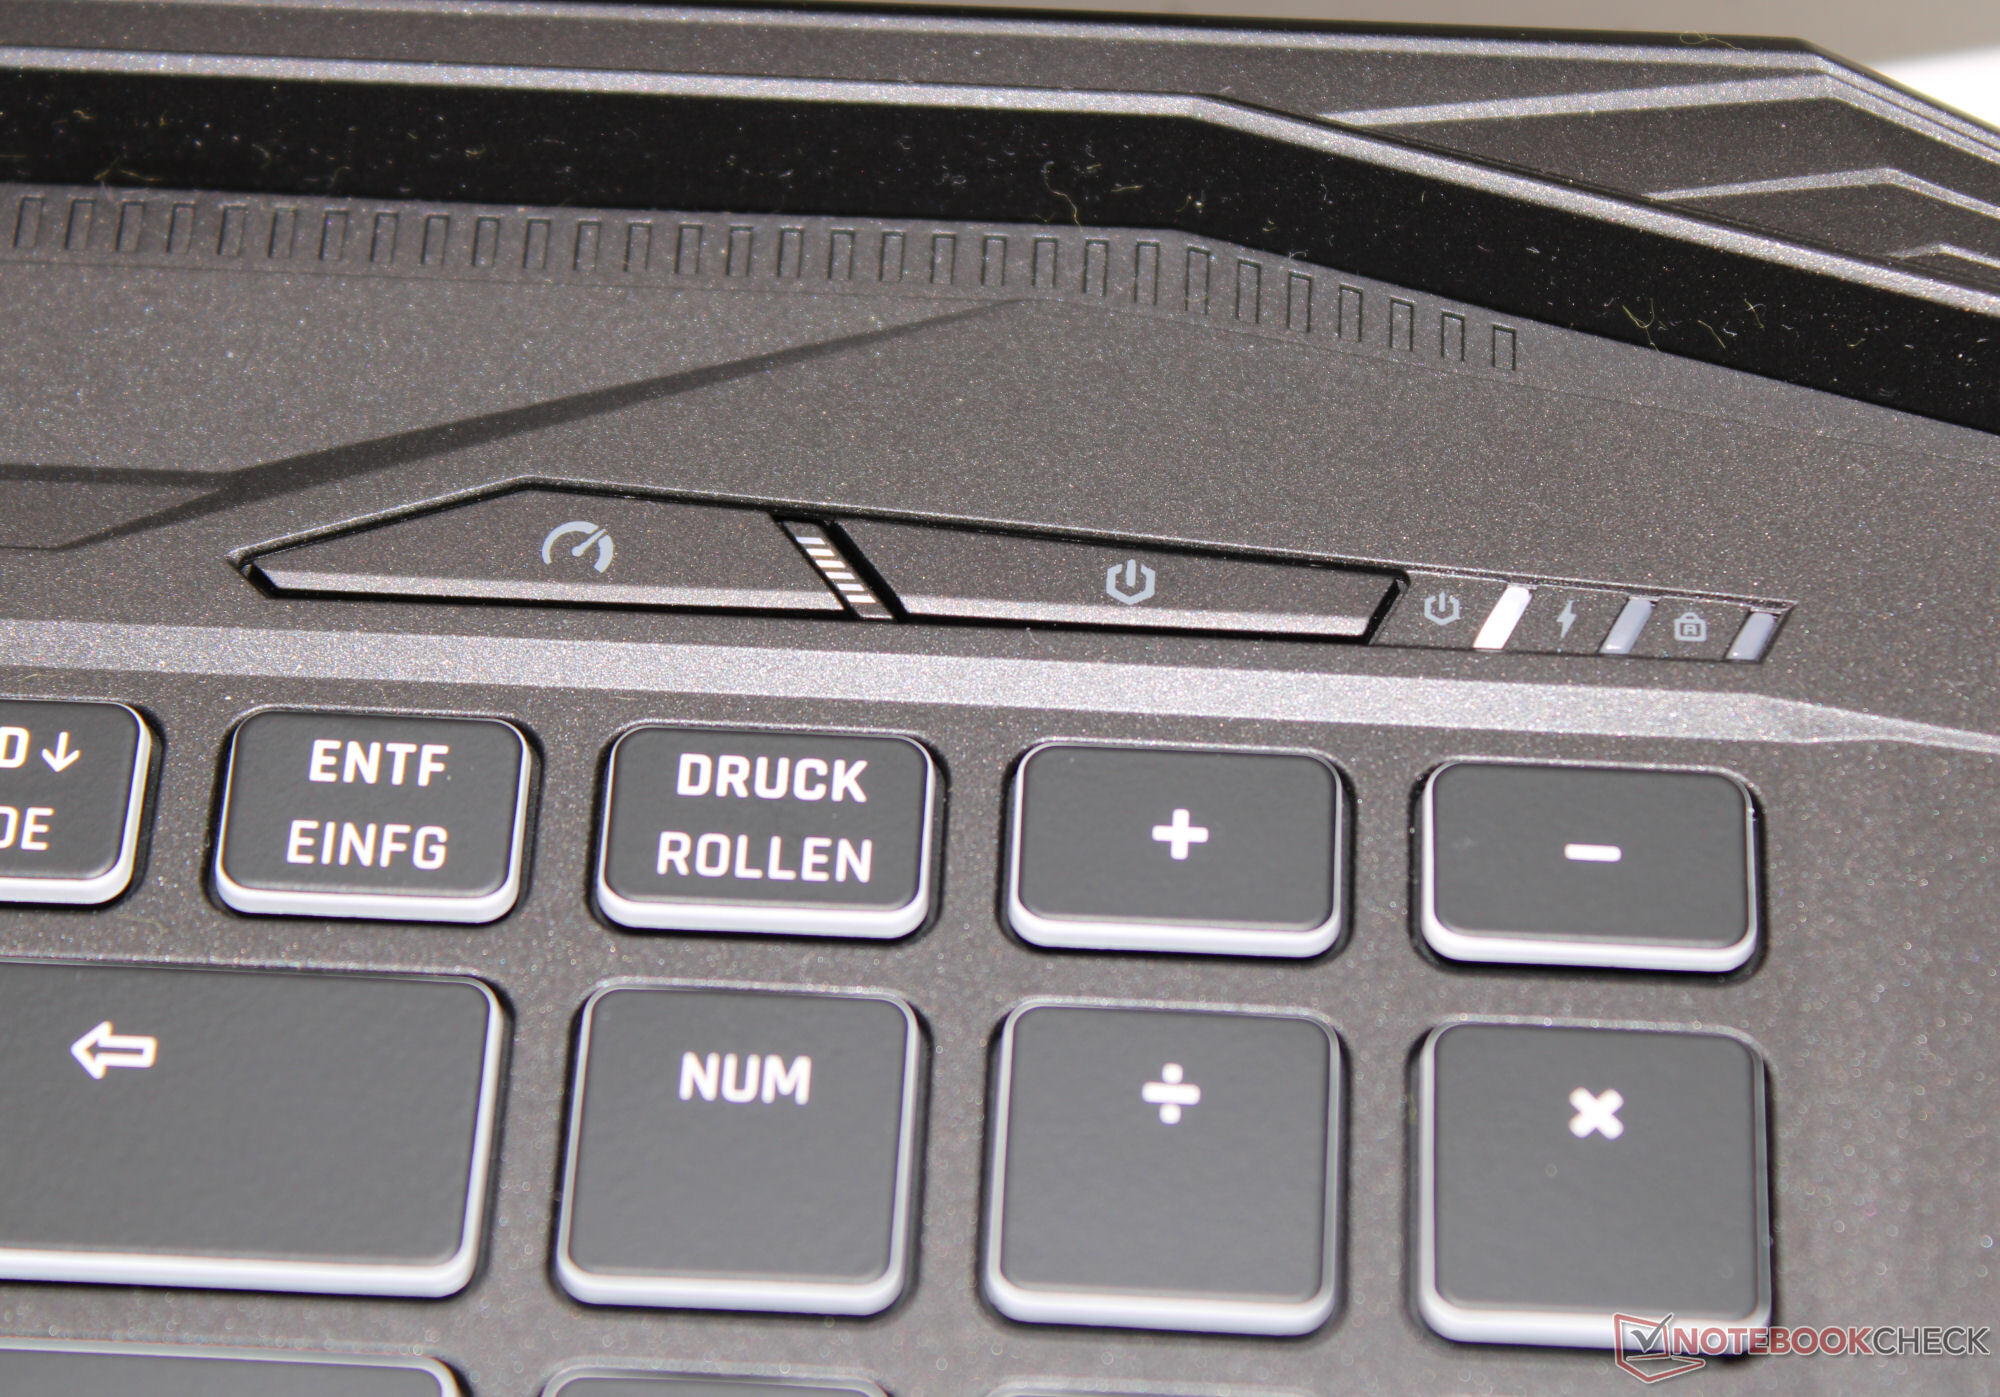
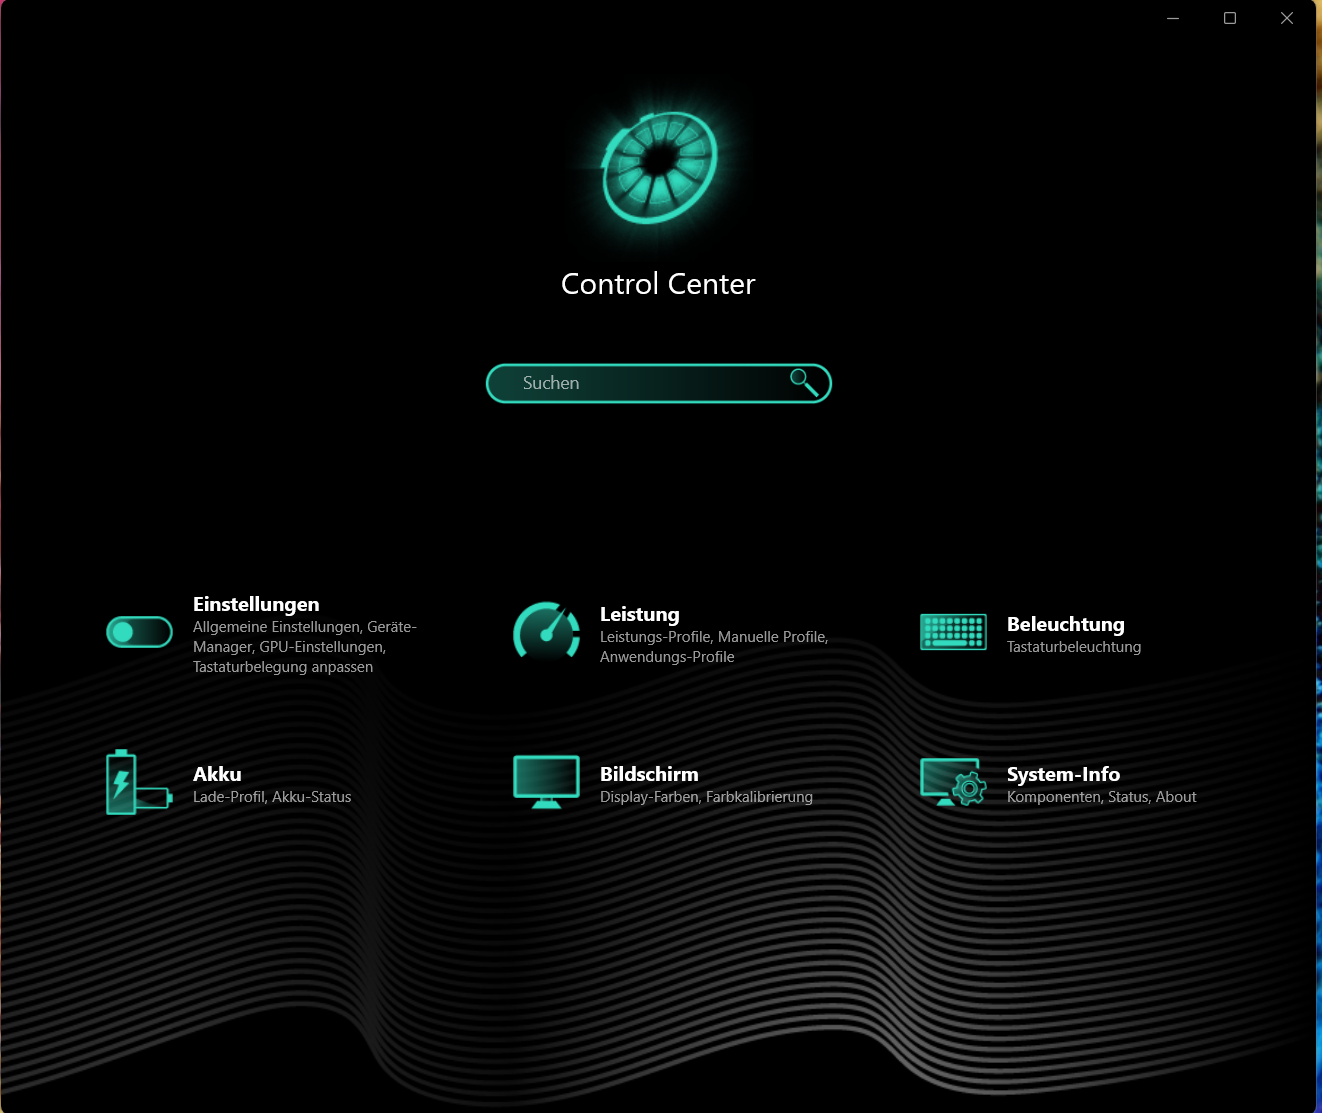
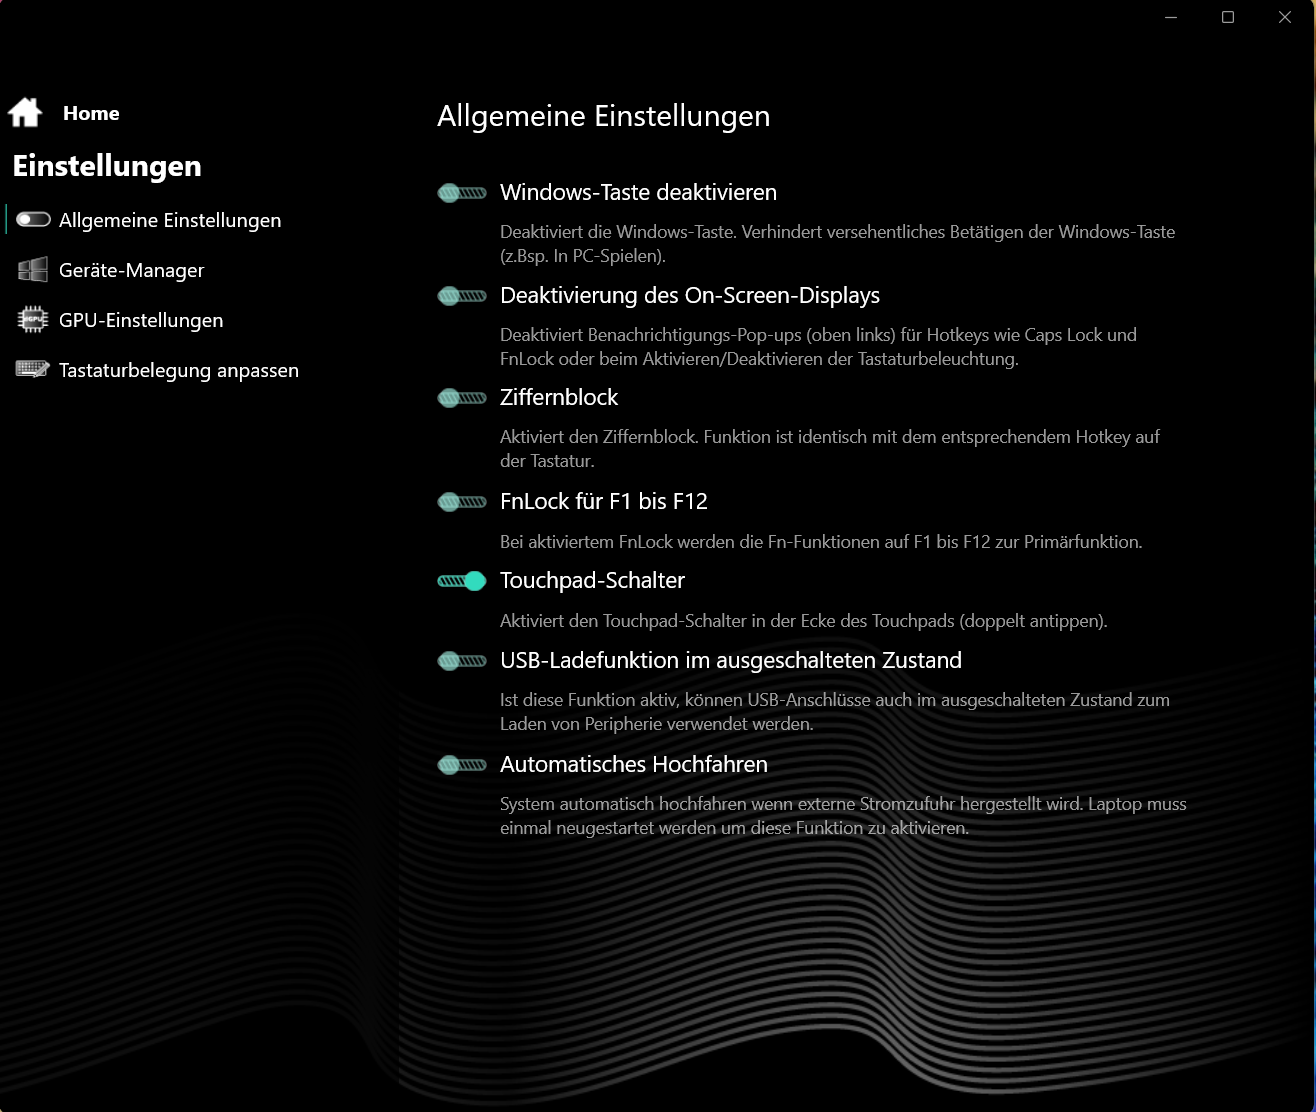
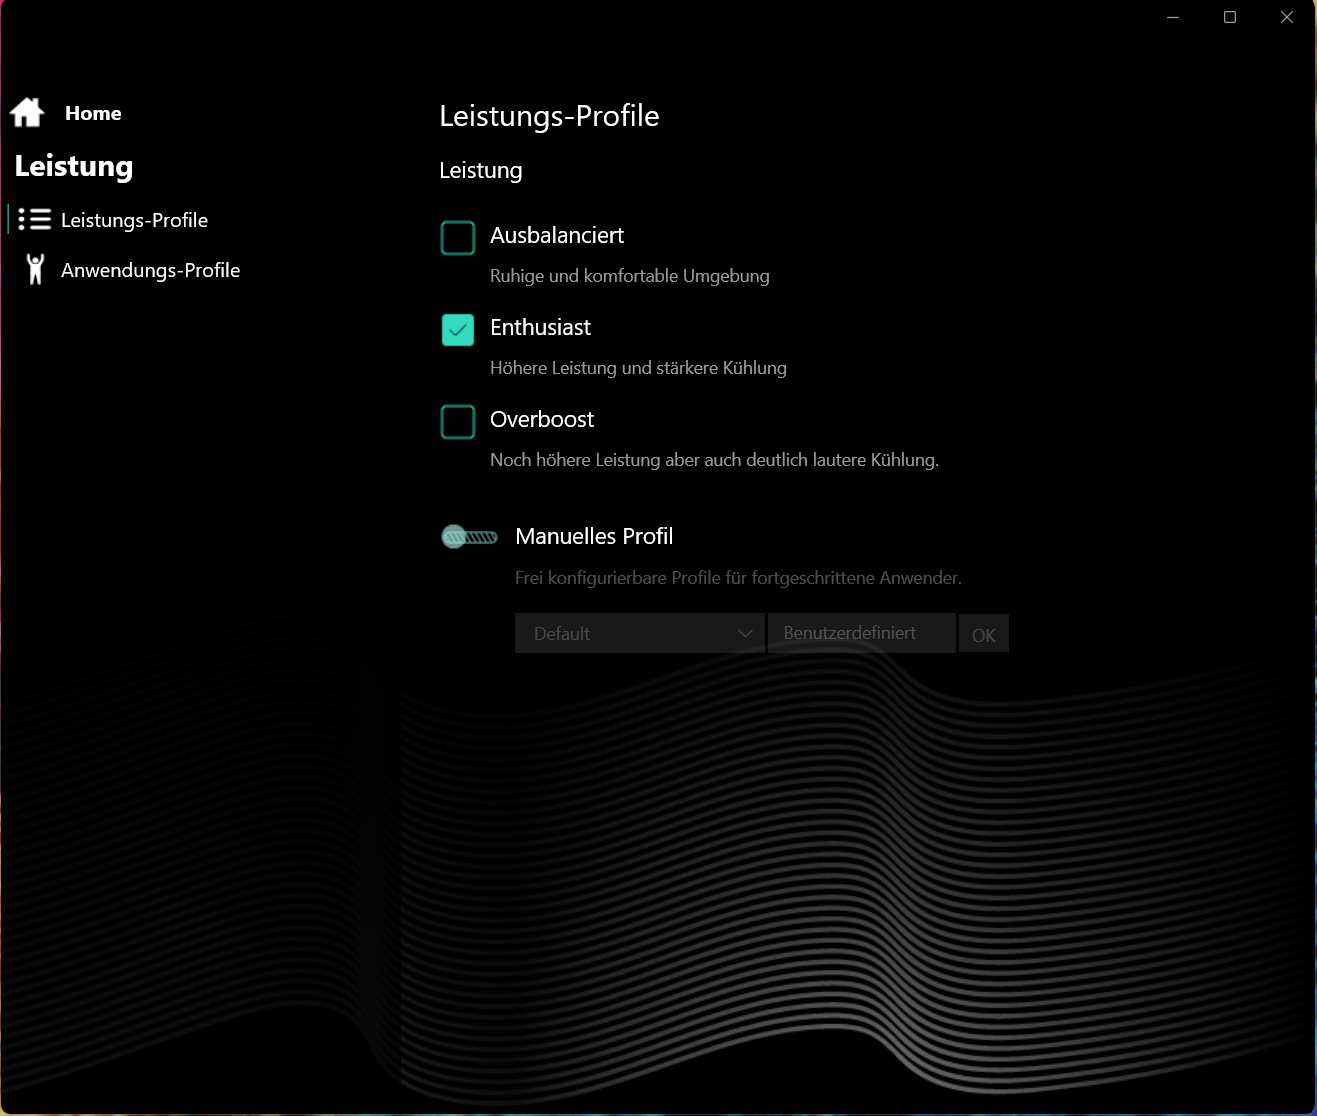
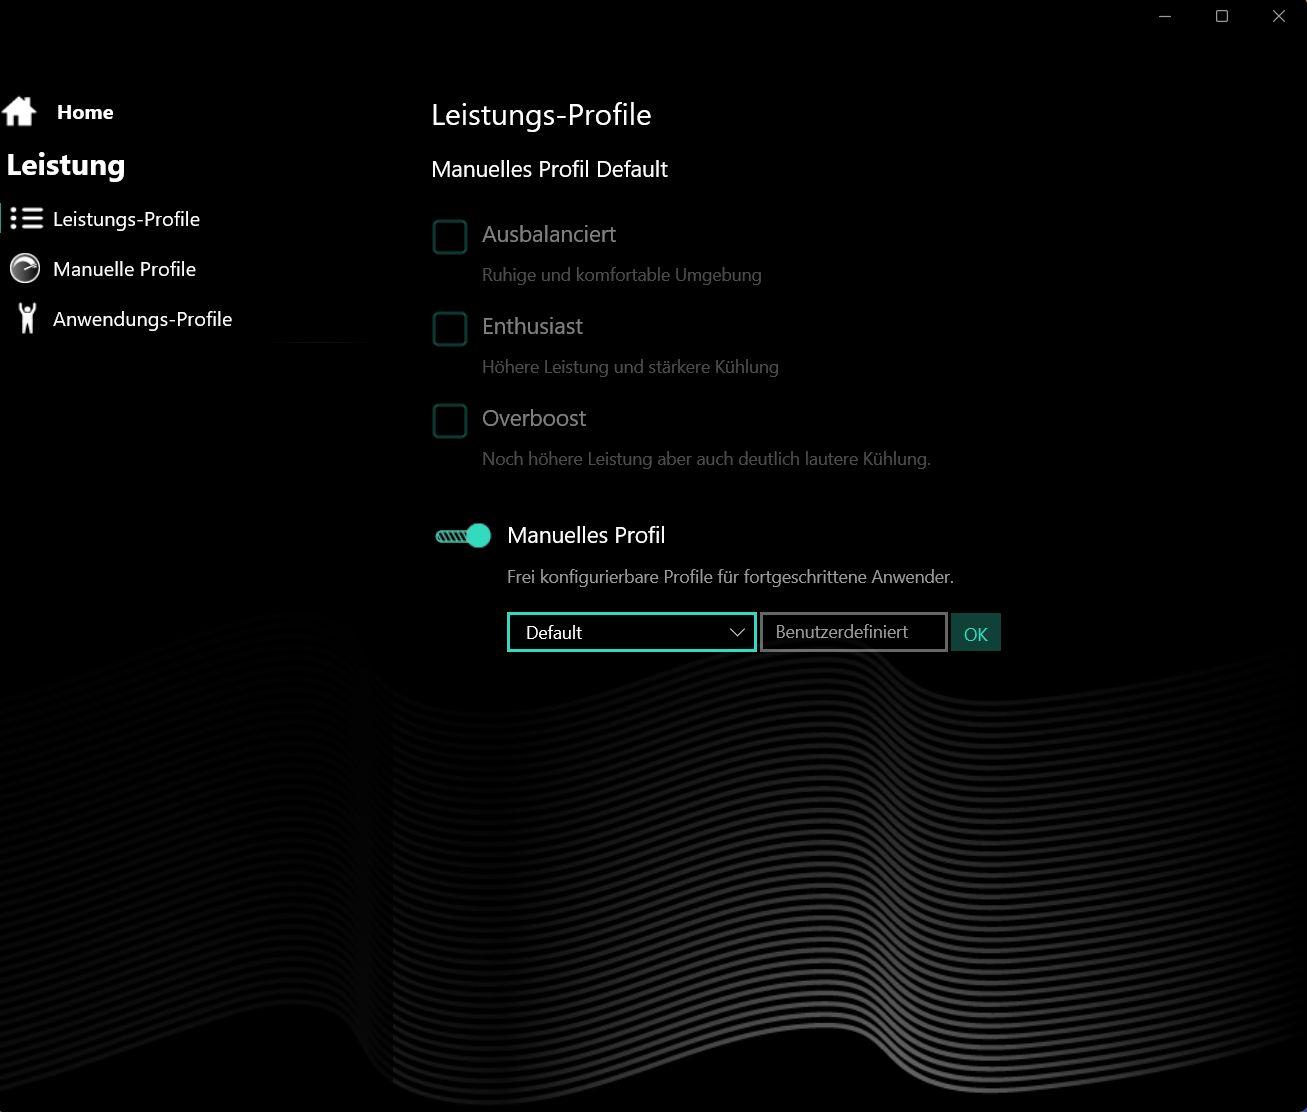
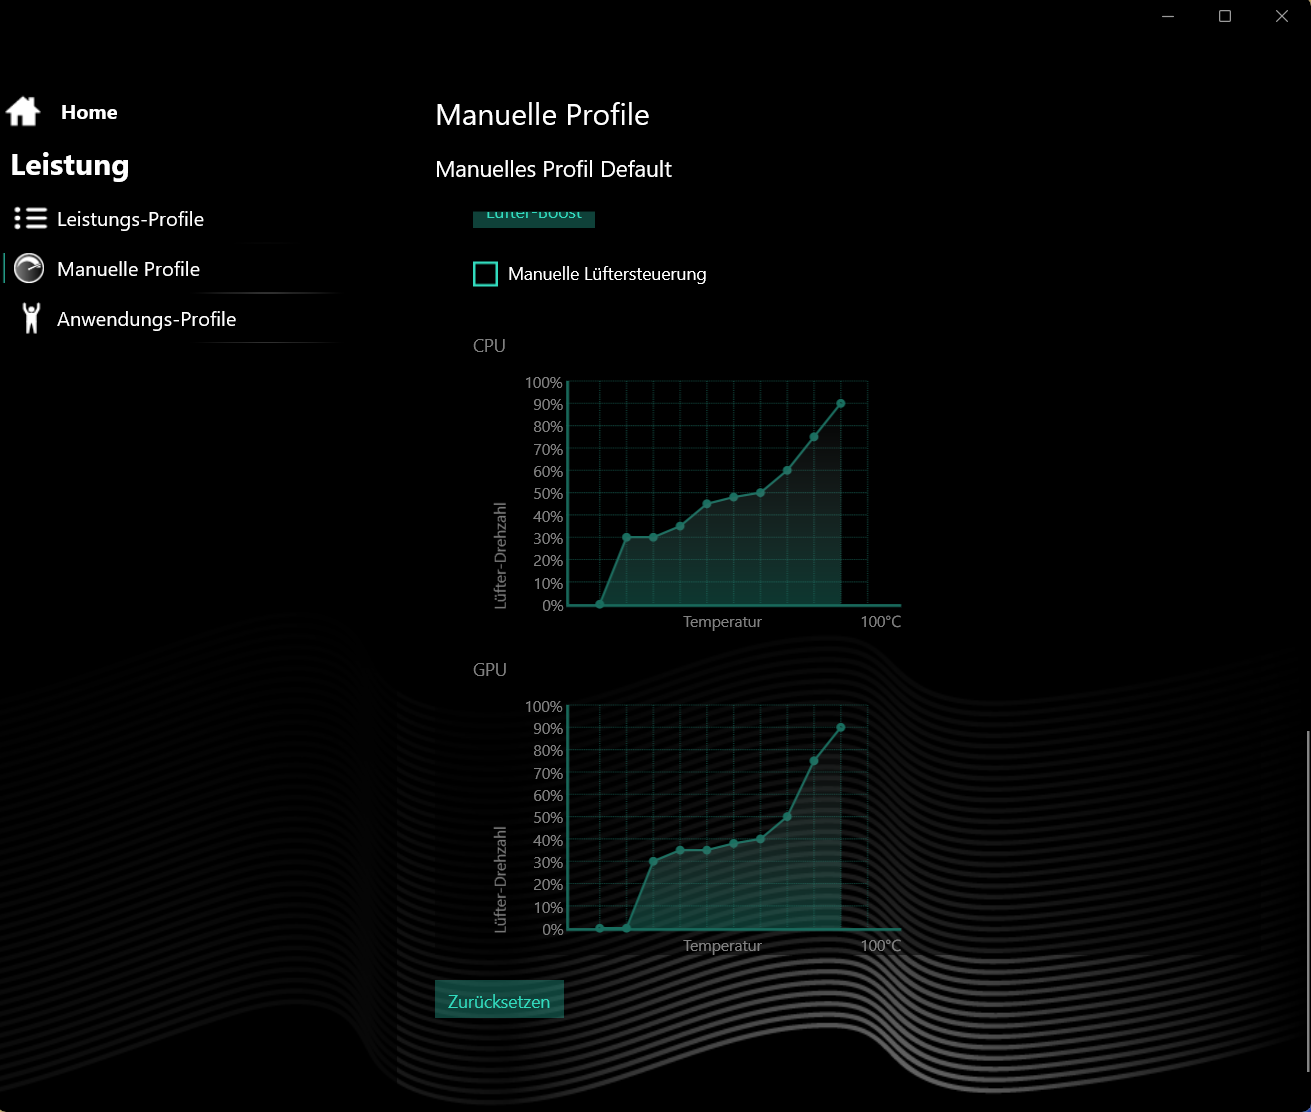
Apex oferuje trzy tryby wydajności specyficzne dla producenta (patrz tabela), między którymi można przełączać się za pomocą osobnego przycisku (obok przycisku zasilania). Dioda LED stanu wskazuje, który tryb jest aktywny. My korzystaliśmy z trybów "enthusiast" (benchmarki) i "balanced" (testy baterii). Optimus był aktywny.
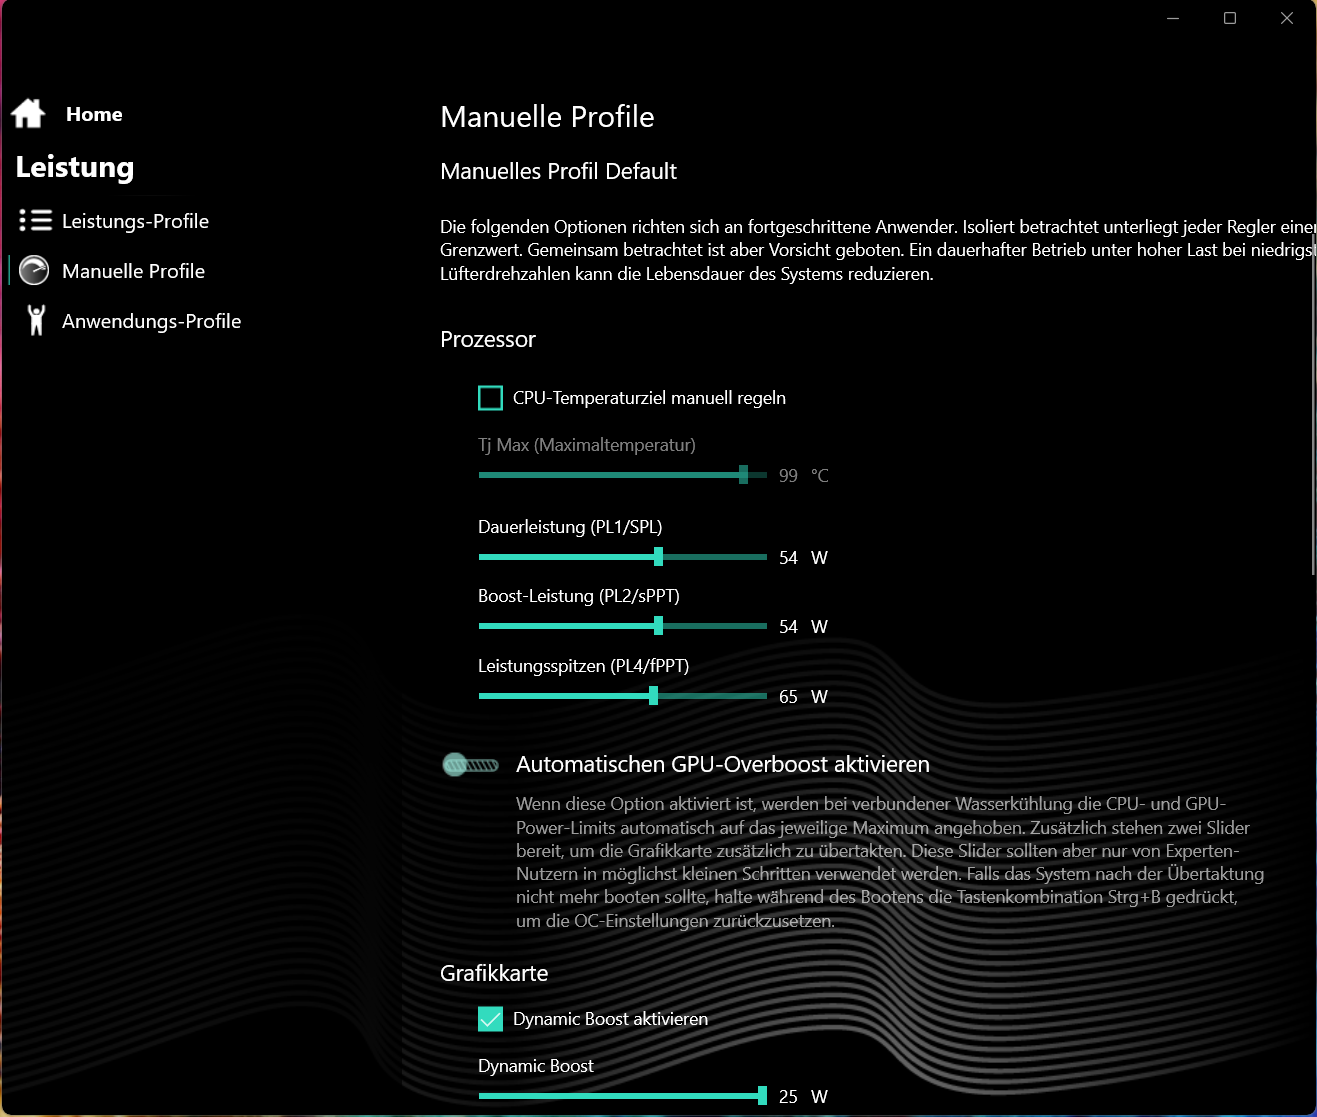
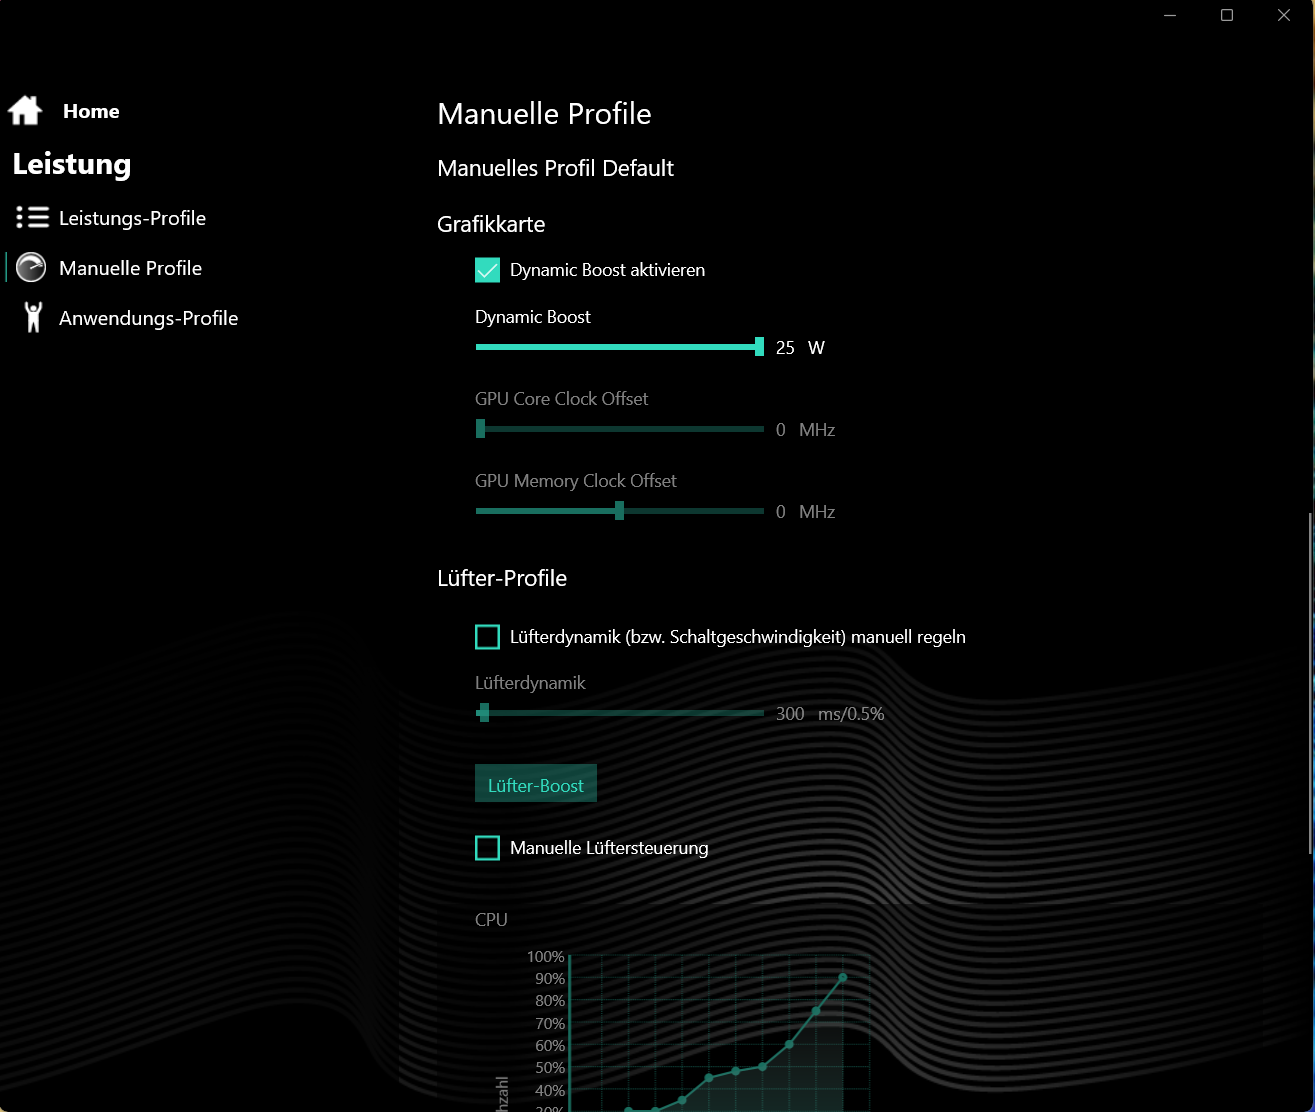
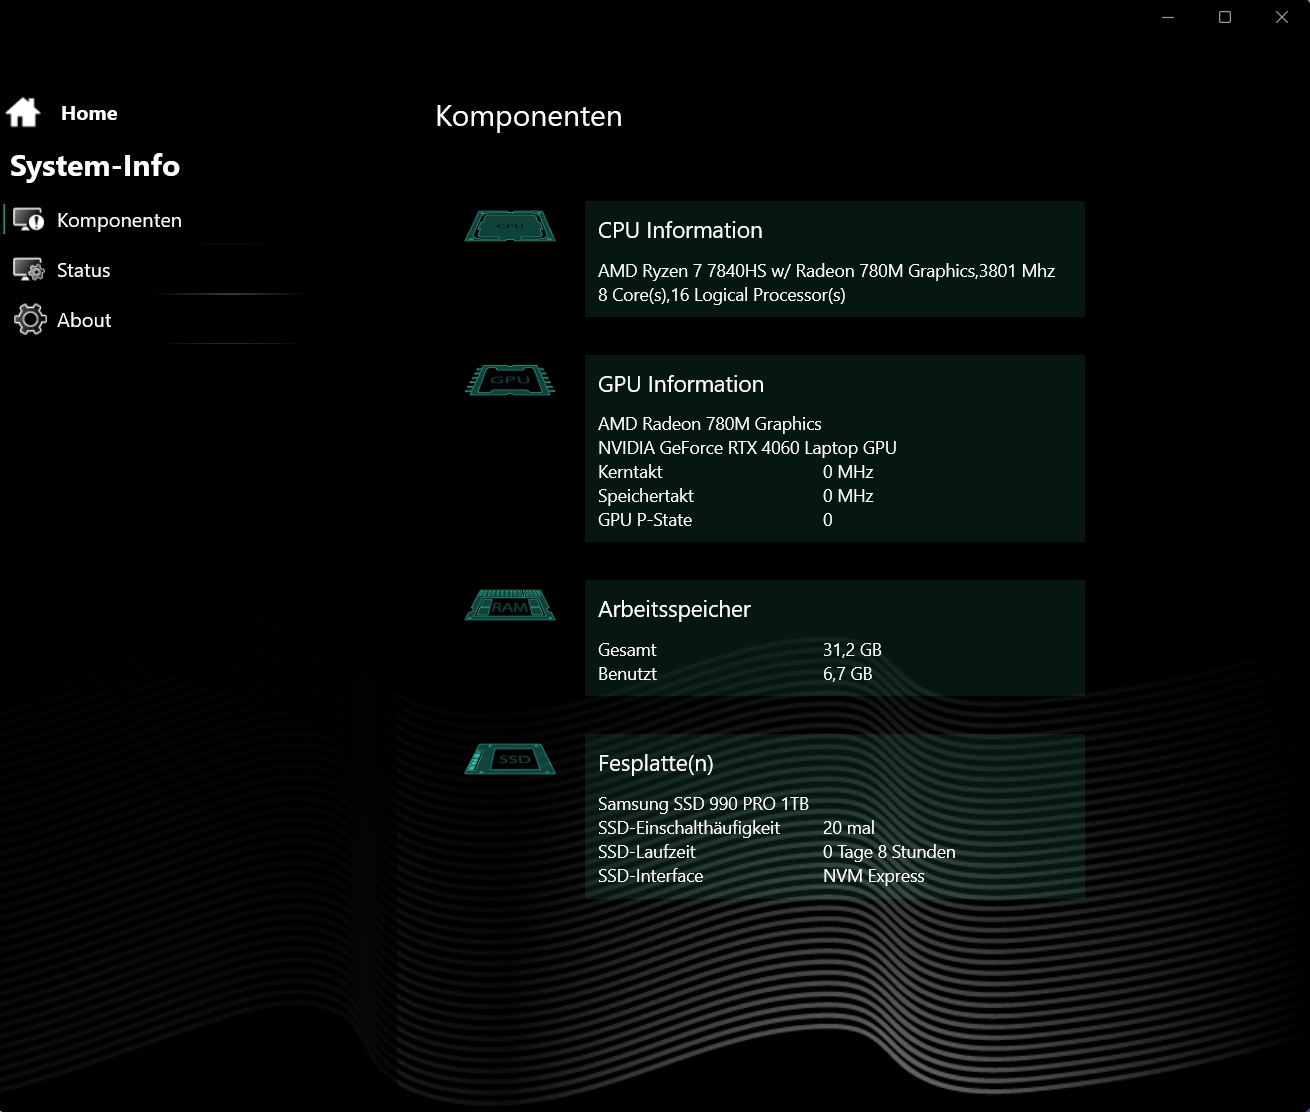
Preinstalowane Centrum Sterowania umożliwia tworzenie indywidualnych profili: Umożliwia to dostosowanie, na przykład, limitów mocy procesora, TGP GPU i/lub kontroli wentylatora.
| Entuzjasta | Overboost | Zrównoważony | |
|---|---|---|---|
| Limit mocy 1 (HWInfo) | 54 waty | 80 watów | 35 watów |
| Limit mocy 2 (HWInfo) | 65 watów | 80 watów | 65 watów |
| Hałas (Witcher 3) | ~50 dB(A) | ~54 dB(A) | ~34 dB(A) |
| Wydajność (Witcher 3) | ~102 fps | ~105 fps | ~60 fps |
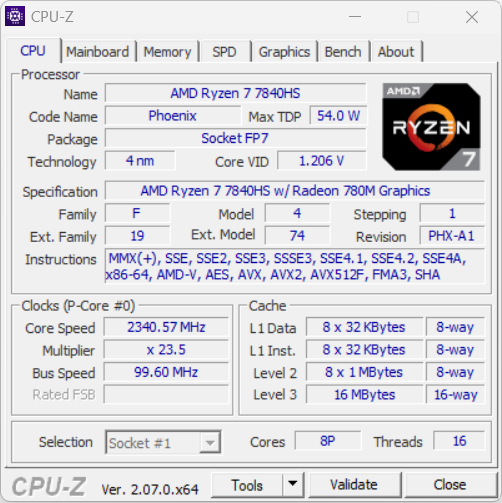
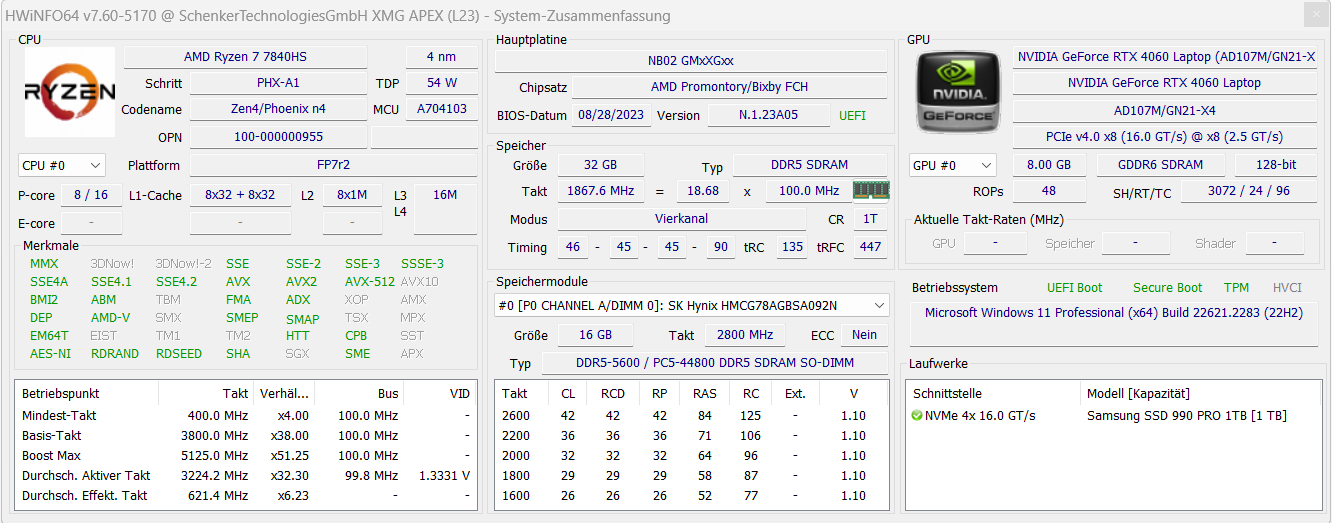
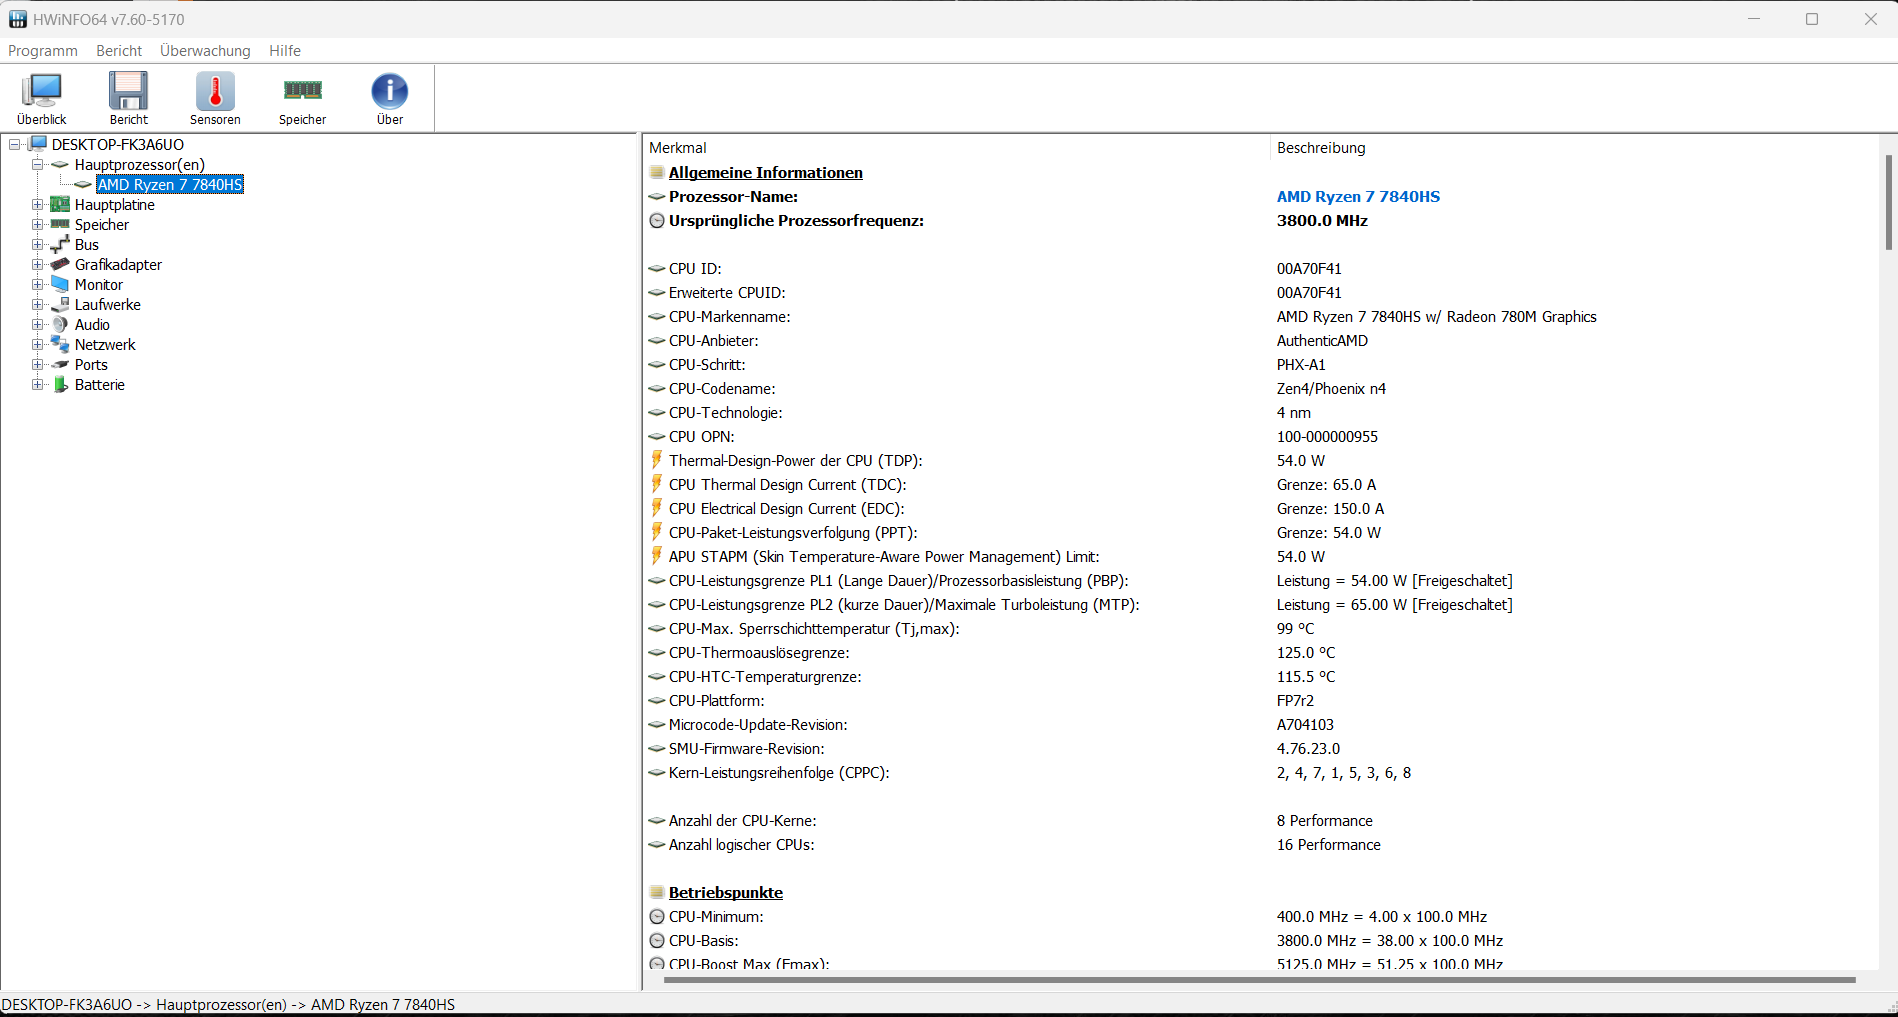
Procesor
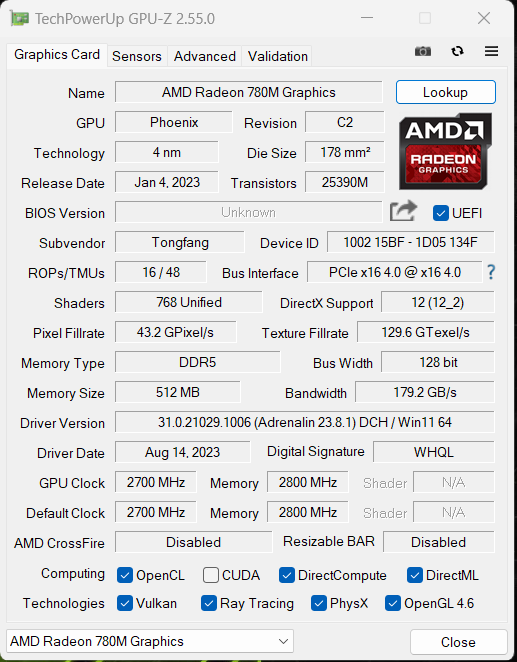
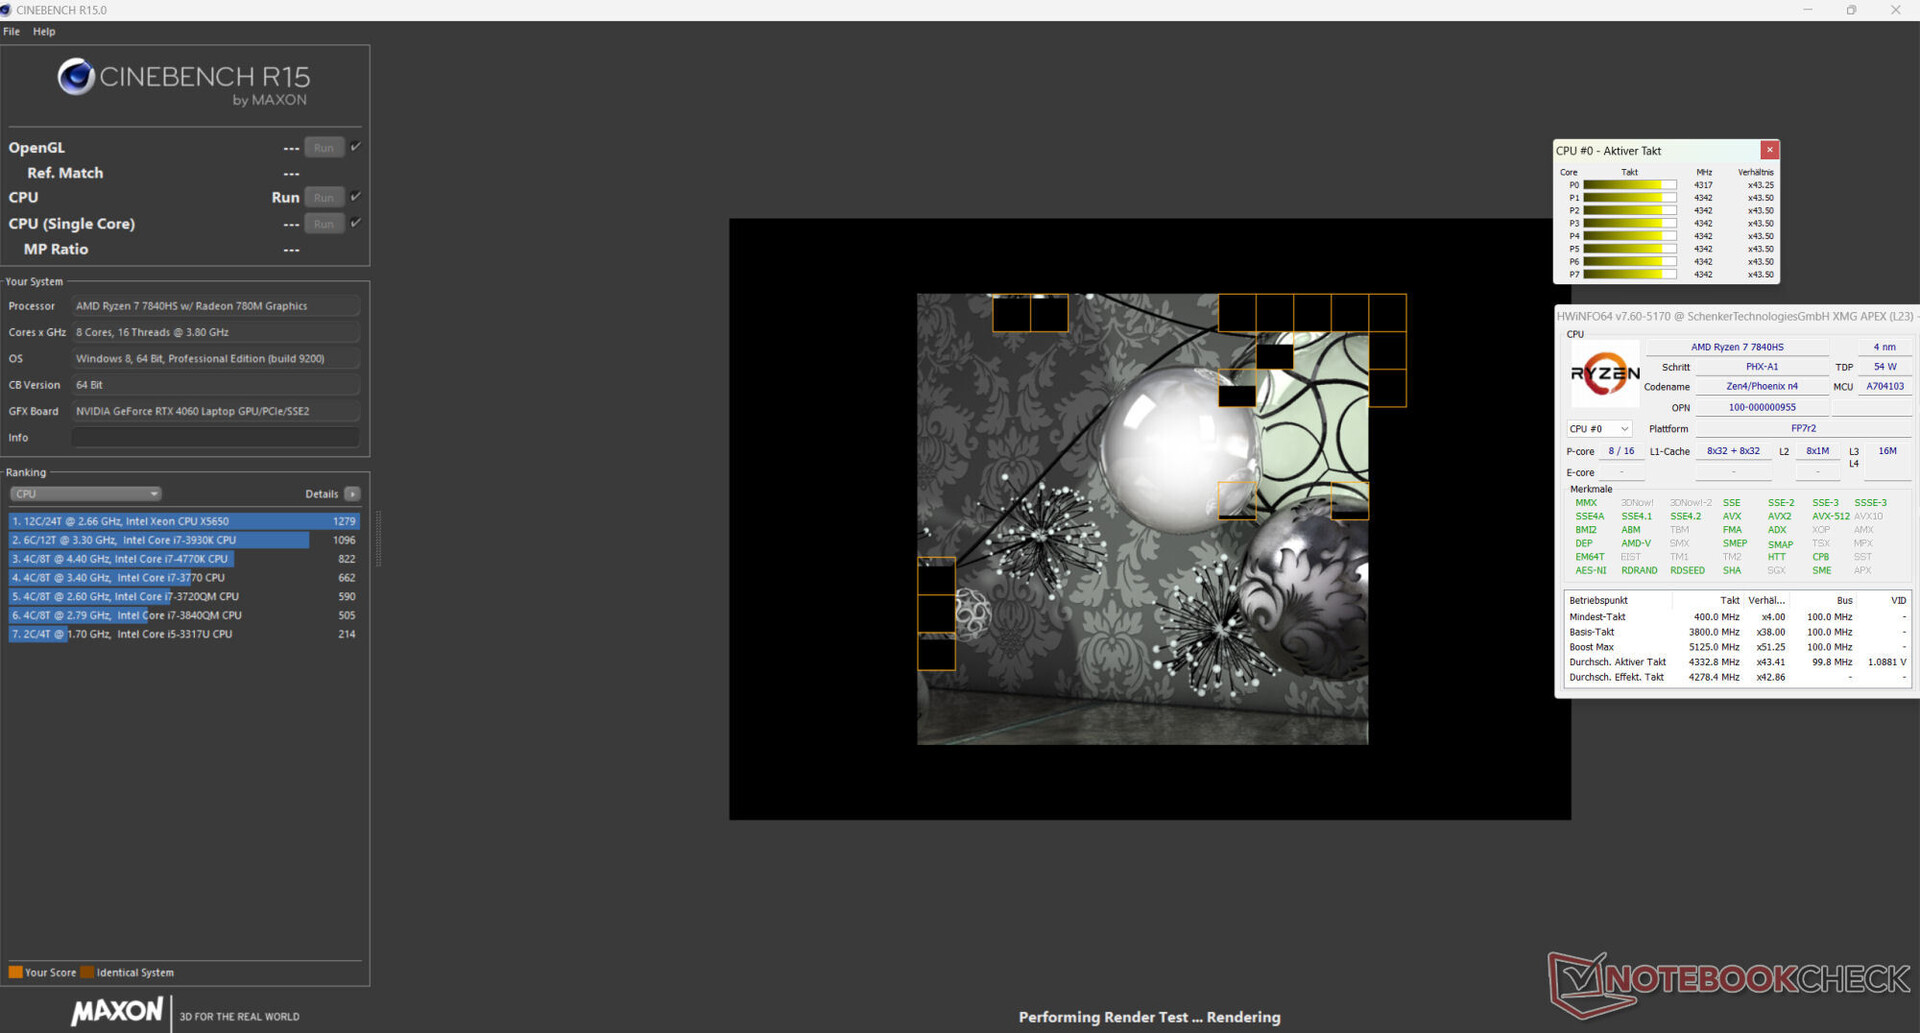
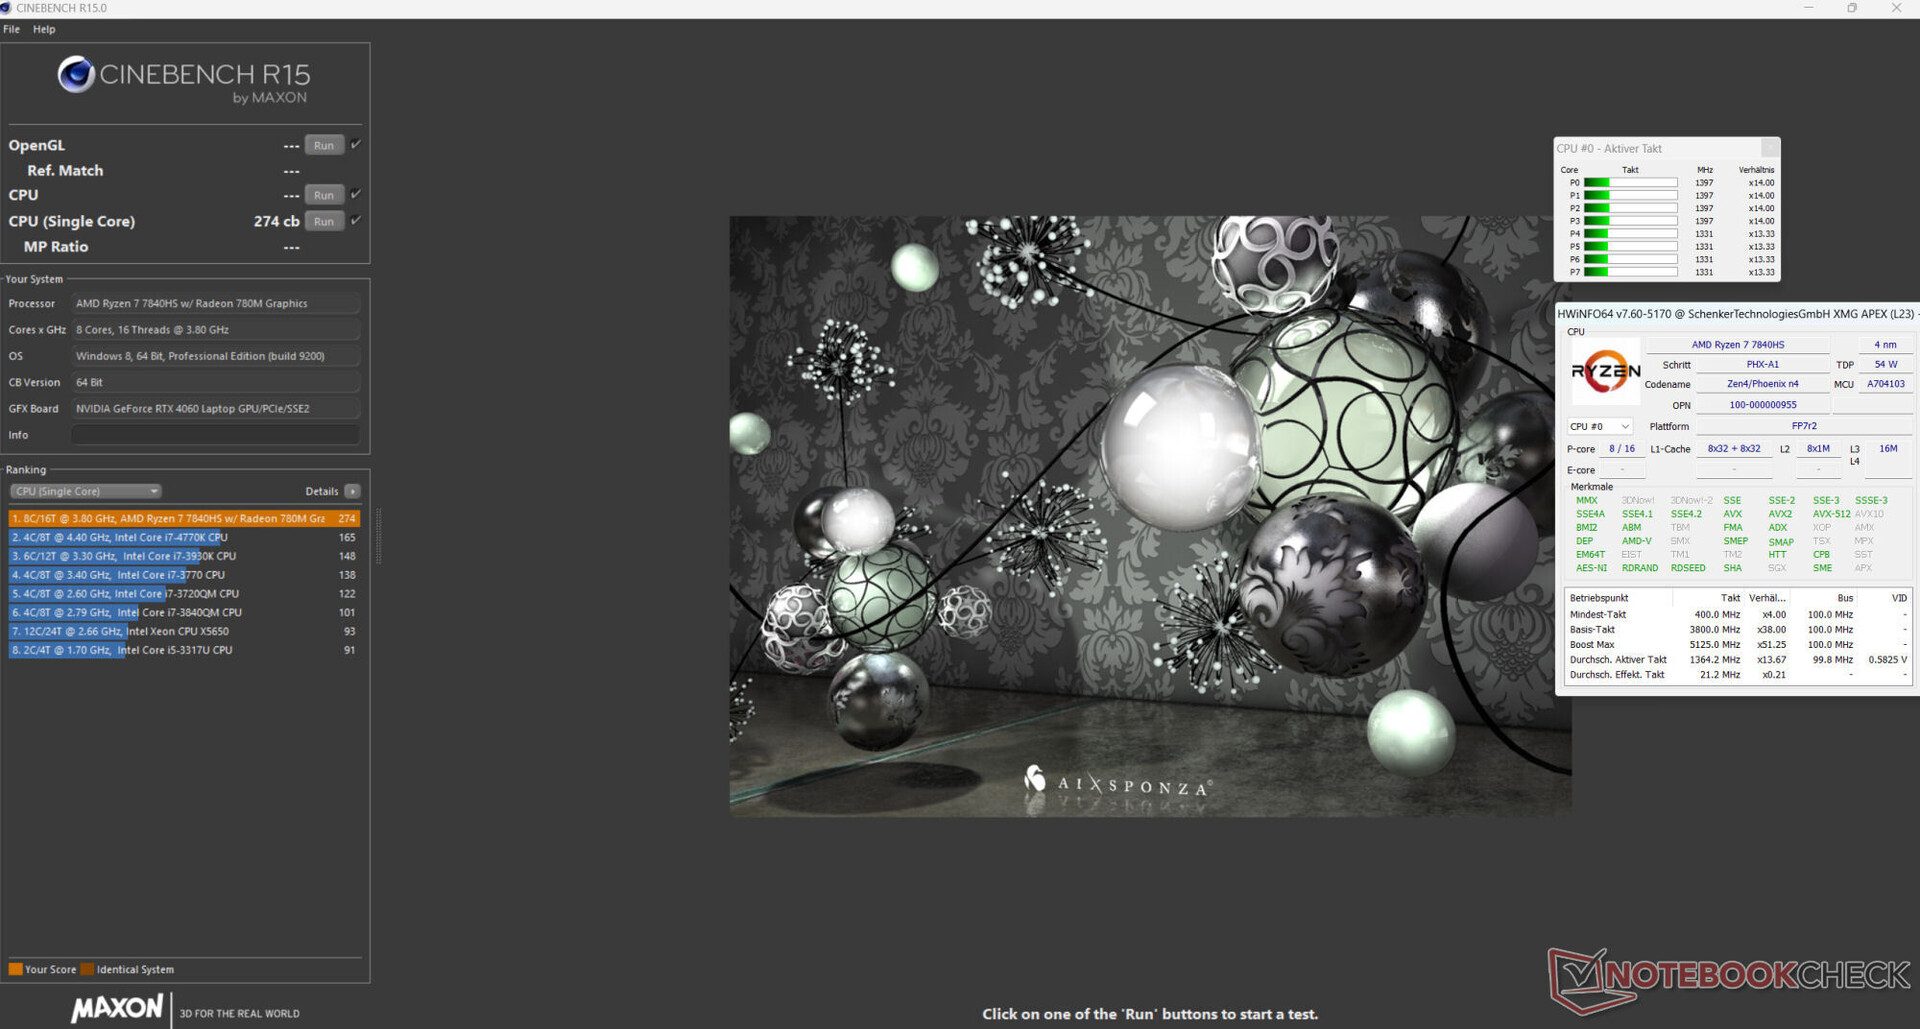
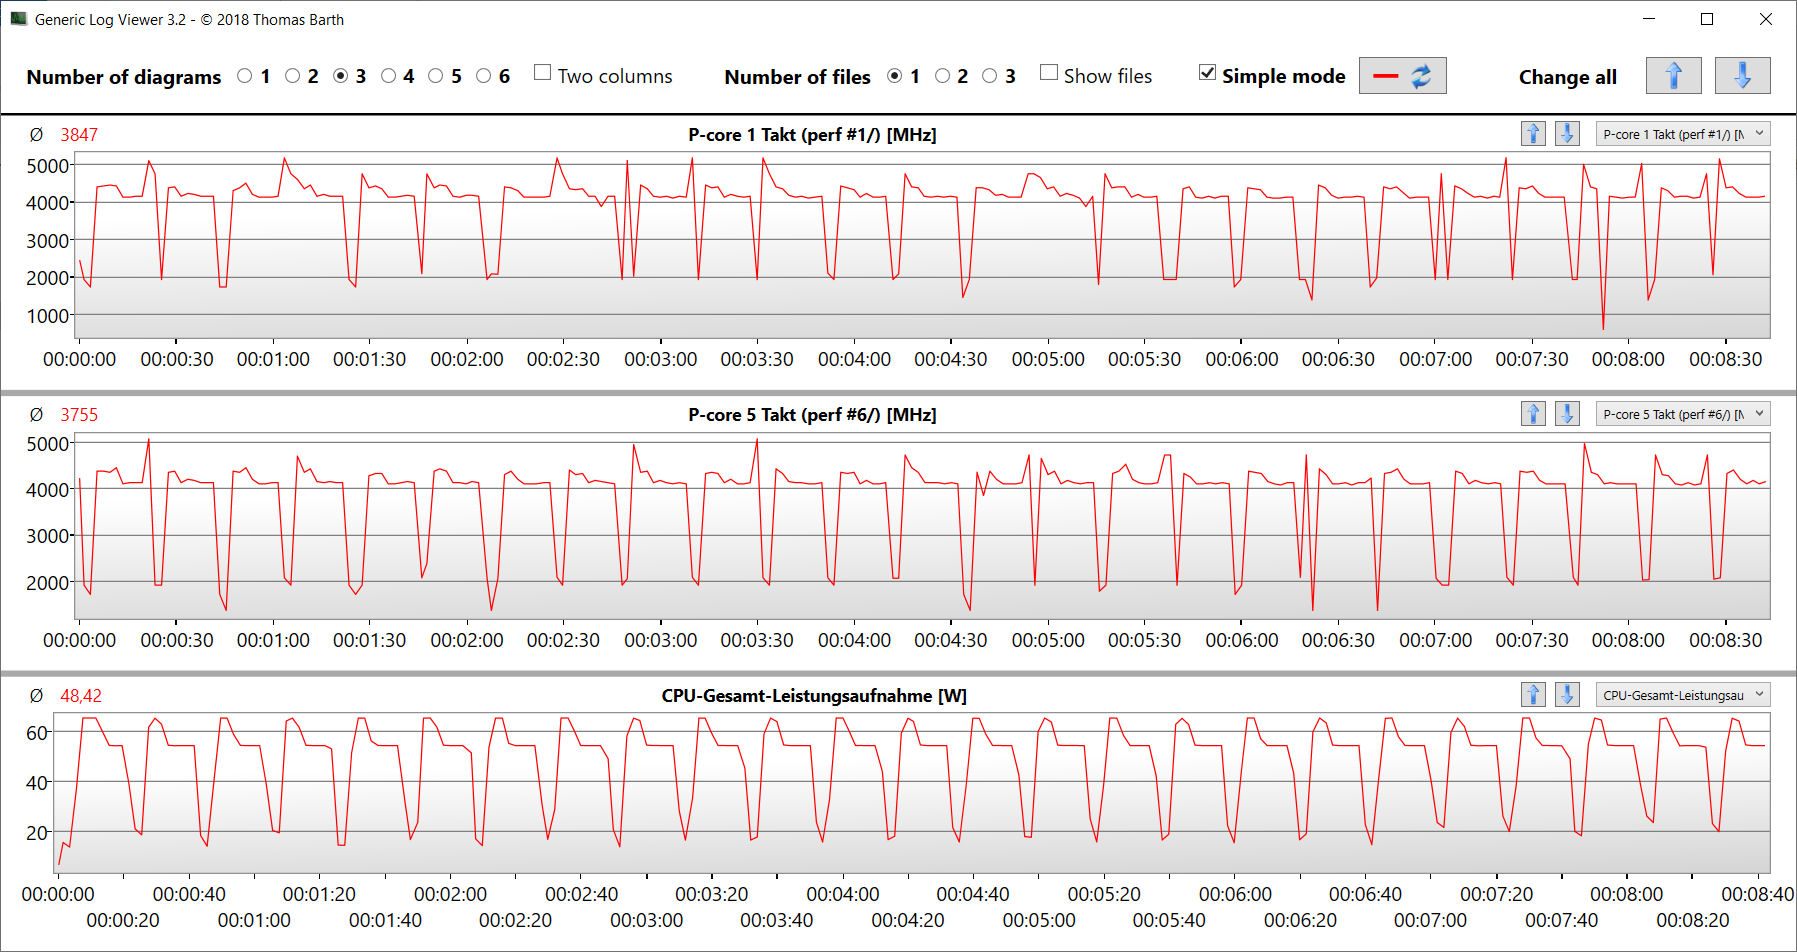
RyzenRyzen 7 7840HSaPU (Phoenix, Zen 4) oferuje 8 rdzeni CPU z łącznie 16 wątkami przy maksymalnej częstotliwości taktowania 5,1 GHz (jeden rdzeń). Procesor rozpoznaje ciągłe obciążenie wielowątkowe (pętla CB15) ze stałą wysoką prędkością turbo - niezależnie od wybranego trybu wydajności.
W trybie zasilania sieciowego wyniki benchmarków oscylują wokół średniej CPU. W trybie bateryjnym bardziej istotna wydajność jednowątkowa (216 punktów) spada w mniejszym stopniu niż wydajność wielowątkowa (1715 punktów).
Uwaga: Bardziej szczegółowe informacje dotyczące architektury Zen 4 można znaleźć w powiązanym artykule analitycznym Analiza AMD Ryzen 9 7940HS - Zen4 Phoenix jest idealnie wydajny jak Apple .
Cinebench R15 Multi Continuous Test
* ... im mniej tym lepiej
AIDA64: FP32 Ray-Trace | FPU Julia | CPU SHA3 | CPU Queen | FPU SinJulia | FPU Mandel | CPU AES | CPU ZLib | FP64 Ray-Trace | CPU PhotoWorxx
| Performance rating | |
| Średnia w klasie Gaming | |
| Przeciętny AMD Ryzen 7 7840HS | |
| Schenker XMG Apex 17 (Late 23) | |
| Alienware m16 R1 Intel | |
| Lenovo Legion Pro 5 16IRX8 | |
| Acer Nitro 17 AN17-51-71ER | |
| Medion Erazer Defender P40 | |
| MSI Katana 17 B13VFK | |
| AIDA64 / FP32 Ray-Trace | |
| Średnia w klasie Gaming (10227 - 85542, n=110, ostatnie 2 lata) | |
| Przeciętny AMD Ryzen 7 7840HS (22845 - 28921, n=21) | |
| Schenker XMG Apex 17 (Late 23) | |
| Lenovo Legion Pro 5 16IRX8 | |
| Alienware m16 R1 Intel | |
| Acer Nitro 17 AN17-51-71ER | |
| Medion Erazer Defender P40 | |
| MSI Katana 17 B13VFK | |
| AIDA64 / FPU Julia | |
| Średnia w klasie Gaming (51376 - 238426, n=110, ostatnie 2 lata) | |
| Przeciętny AMD Ryzen 7 7840HS (97164 - 123167, n=21) | |
| Schenker XMG Apex 17 (Late 23) | |
| Lenovo Legion Pro 5 16IRX8 | |
| Alienware m16 R1 Intel | |
| Acer Nitro 17 AN17-51-71ER | |
| Medion Erazer Defender P40 | |
| MSI Katana 17 B13VFK | |
| AIDA64 / CPU SHA3 | |
| Średnia w klasie Gaming (2180 - 9817, n=110, ostatnie 2 lata) | |
| Alienware m16 R1 Intel | |
| Przeciętny AMD Ryzen 7 7840HS (4293 - 5155, n=21) | |
| Lenovo Legion Pro 5 16IRX8 | |
| Schenker XMG Apex 17 (Late 23) | |
| Acer Nitro 17 AN17-51-71ER | |
| Medion Erazer Defender P40 | |
| MSI Katana 17 B13VFK | |
| AIDA64 / CPU Queen | |
| Średnia w klasie Gaming (49785 - 173351, n=101, ostatnie 2 lata) | |
| Przeciętny AMD Ryzen 7 7840HS (102271 - 125820, n=21) | |
| Schenker XMG Apex 17 (Late 23) | |
| Alienware m16 R1 Intel | |
| Lenovo Legion Pro 5 16IRX8 | |
| Medion Erazer Defender P40 | |
| Acer Nitro 17 AN17-51-71ER | |
| MSI Katana 17 B13VFK | |
| AIDA64 / FPU SinJulia | |
| Przeciętny AMD Ryzen 7 7840HS (13767 - 15525, n=21) | |
| Schenker XMG Apex 17 (Late 23) | |
| Średnia w klasie Gaming (4424 - 33636, n=110, ostatnie 2 lata) | |
| Alienware m16 R1 Intel | |
| Lenovo Legion Pro 5 16IRX8 | |
| Acer Nitro 17 AN17-51-71ER | |
| Medion Erazer Defender P40 | |
| MSI Katana 17 B13VFK | |
| AIDA64 / FPU Mandel | |
| Średnia w klasie Gaming (25115 - 128721, n=110, ostatnie 2 lata) | |
| Przeciętny AMD Ryzen 7 7840HS (52084 - 65812, n=21) | |
| Schenker XMG Apex 17 (Late 23) | |
| Lenovo Legion Pro 5 16IRX8 | |
| Alienware m16 R1 Intel | |
| Acer Nitro 17 AN17-51-71ER | |
| Medion Erazer Defender P40 | |
| MSI Katana 17 B13VFK | |
| AIDA64 / CPU AES | |
| Alienware m16 R1 Intel | |
| Schenker XMG Apex 17 (Late 23) | |
| Acer Nitro 17 AN17-51-71ER | |
| Przeciętny AMD Ryzen 7 7840HS (67389 - 177158, n=21) | |
| Średnia w klasie Gaming (39258 - 247074, n=110, ostatnie 2 lata) | |
| Lenovo Legion Pro 5 16IRX8 | |
| Medion Erazer Defender P40 | |
| MSI Katana 17 B13VFK | |
| AIDA64 / CPU ZLib | |
| Średnia w klasie Gaming (574 - 2531, n=110, ostatnie 2 lata) | |
| Alienware m16 R1 Intel | |
| Lenovo Legion Pro 5 16IRX8 | |
| Acer Nitro 17 AN17-51-71ER | |
| Przeciętny AMD Ryzen 7 7840HS (944 - 1123, n=21) | |
| Schenker XMG Apex 17 (Late 23) | |
| Medion Erazer Defender P40 | |
| MSI Katana 17 B13VFK | |
| AIDA64 / FP64 Ray-Trace | |
| Średnia w klasie Gaming (5509 - 45446, n=110, ostatnie 2 lata) | |
| Przeciętny AMD Ryzen 7 7840HS (12248 - 15599, n=21) | |
| Schenker XMG Apex 17 (Late 23) | |
| Lenovo Legion Pro 5 16IRX8 | |
| Alienware m16 R1 Intel | |
| Acer Nitro 17 AN17-51-71ER | |
| Medion Erazer Defender P40 | |
| MSI Katana 17 B13VFK | |
| AIDA64 / CPU PhotoWorxx | |
| Średnia w klasie Gaming (12271 - 89891, n=110, ostatnie 2 lata) | |
| Acer Nitro 17 AN17-51-71ER | |
| Przeciętny AMD Ryzen 7 7840HS (17615 - 41516, n=21) | |
| Lenovo Legion Pro 5 16IRX8 | |
| Schenker XMG Apex 17 (Late 23) | |
| Medion Erazer Defender P40 | |
| Alienware m16 R1 Intel | |
| MSI Katana 17 B13VFK | |
Wydajność systemu
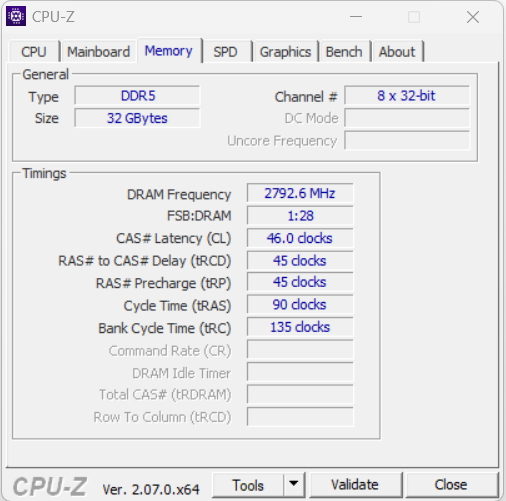
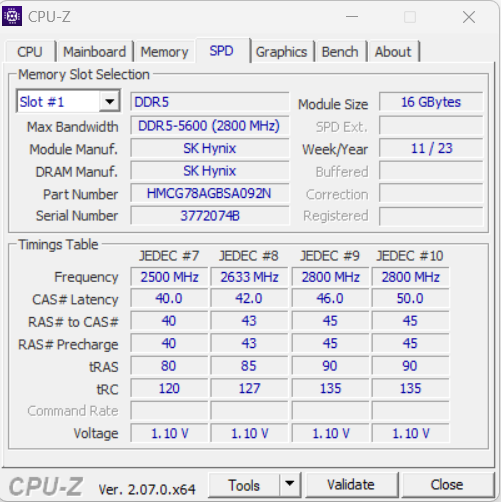
Płynnie działający system został zaprojektowany do obsługi scenariuszy wymagających dużej wydajności, takich jak renderowanie i gry - potwierdzają to dobre wyniki PC Mark. Transfery pamięci RAM są na normalnym poziomie dla pamięci DDR5 5600 RAM.
CrossMark: Overall | Productivity | Creativity | Responsiveness
| PCMark 10 / Score | |
| Średnia w klasie Gaming (5828 - 11574, n=96, ostatnie 2 lata) | |
| Schenker XMG Apex 17 (Late 23) | |
| Przeciętny AMD Ryzen 7 7840HS, NVIDIA GeForce RTX 4060 Laptop GPU (7502 - 7946, n=4) | |
| Lenovo Legion Pro 5 16IRX8 | |
| Alienware m16 R1 Intel | |
| MSI Katana 17 B13VFK | |
| Acer Nitro 17 AN17-51-71ER | |
| Medion Erazer Defender P40 | |
| PCMark 10 / Essentials | |
| Lenovo Legion Pro 5 16IRX8 | |
| Przeciętny AMD Ryzen 7 7840HS, NVIDIA GeForce RTX 4060 Laptop GPU (10441 - 11169, n=4) | |
| MSI Katana 17 B13VFK | |
| Alienware m16 R1 Intel | |
| Schenker XMG Apex 17 (Late 23) | |
| Średnia w klasie Gaming (8810 - 12600, n=100, ostatnie 2 lata) | |
| Acer Nitro 17 AN17-51-71ER | |
| Medion Erazer Defender P40 | |
| PCMark 10 / Productivity | |
| Średnia w klasie Gaming (6845 - 18766, n=98, ostatnie 2 lata) | |
| Schenker XMG Apex 17 (Late 23) | |
| Przeciętny AMD Ryzen 7 7840HS, NVIDIA GeForce RTX 4060 Laptop GPU (9575 - 10273, n=4) | |
| Medion Erazer Defender P40 | |
| Alienware m16 R1 Intel | |
| MSI Katana 17 B13VFK | |
| Lenovo Legion Pro 5 16IRX8 | |
| Acer Nitro 17 AN17-51-71ER | |
| PCMark 10 / Digital Content Creation | |
| Średnia w klasie Gaming (7602 - 19657, n=98, ostatnie 2 lata) | |
| Lenovo Legion Pro 5 16IRX8 | |
| Schenker XMG Apex 17 (Late 23) | |
| Przeciętny AMD Ryzen 7 7840HS, NVIDIA GeForce RTX 4060 Laptop GPU (11464 - 12418, n=4) | |
| Acer Nitro 17 AN17-51-71ER | |
| Alienware m16 R1 Intel | |
| MSI Katana 17 B13VFK | |
| Medion Erazer Defender P40 | |
| CrossMark / Overall | |
| Alienware m16 R1 Intel | |
| Średnia w klasie Gaming (1366 - 2409, n=98, ostatnie 2 lata) | |
| MSI Katana 17 B13VFK | |
| Przeciętny AMD Ryzen 7 7840HS, NVIDIA GeForce RTX 4060 Laptop GPU (1800 - 1866, n=3) | |
| Schenker XMG Apex 17 (Late 23) | |
| Medion Erazer Defender P40 | |
| Lenovo Legion Pro 5 16IRX8 | |
| Acer Nitro 17 AN17-51-71ER | |
| CrossMark / Productivity | |
| Alienware m16 R1 Intel | |
| Średnia w klasie Gaming (1386 - 2254, n=98, ostatnie 2 lata) | |
| Przeciętny AMD Ryzen 7 7840HS, NVIDIA GeForce RTX 4060 Laptop GPU (1743 - 1821, n=3) | |
| MSI Katana 17 B13VFK | |
| Schenker XMG Apex 17 (Late 23) | |
| Medion Erazer Defender P40 | |
| Lenovo Legion Pro 5 16IRX8 | |
| Acer Nitro 17 AN17-51-71ER | |
| CrossMark / Creativity | |
| Alienware m16 R1 Intel | |
| Średnia w klasie Gaming (1343 - 2729, n=98, ostatnie 2 lata) | |
| MSI Katana 17 B13VFK | |
| Medion Erazer Defender P40 | |
| Przeciętny AMD Ryzen 7 7840HS, NVIDIA GeForce RTX 4060 Laptop GPU (1908 - 1966, n=3) | |
| Schenker XMG Apex 17 (Late 23) | |
| Lenovo Legion Pro 5 16IRX8 | |
| Acer Nitro 17 AN17-51-71ER | |
| CrossMark / Responsiveness | |
| Alienware m16 R1 Intel | |
| MSI Katana 17 B13VFK | |
| Średnia w klasie Gaming (1226 - 2334, n=98, ostatnie 2 lata) | |
| Schenker XMG Apex 17 (Late 23) | |
| Lenovo Legion Pro 5 16IRX8 | |
| Przeciętny AMD Ryzen 7 7840HS, NVIDIA GeForce RTX 4060 Laptop GPU (1522 - 1776, n=3) | |
| Acer Nitro 17 AN17-51-71ER | |
| Medion Erazer Defender P40 | |
| PCMark 10 Score | 7854 pkt. | |
Pomoc | ||
| AIDA64 / Memory Copy | |
| Średnia w klasie Gaming (21750 - 129946, n=110, ostatnie 2 lata) | |
| Schenker XMG Apex 17 (Late 23) | |
| Przeciętny AMD Ryzen 7 7840HS (30937 - 72158, n=21) | |
| Lenovo Legion Pro 5 16IRX8 | |
| Acer Nitro 17 AN17-51-71ER | |
| Medion Erazer Defender P40 | |
| Alienware m16 R1 Intel | |
| MSI Katana 17 B13VFK | |
| AIDA64 / Memory Read | |
| Średnia w klasie Gaming (22956 - 118858, n=110, ostatnie 2 lata) | |
| Lenovo Legion Pro 5 16IRX8 | |
| Medion Erazer Defender P40 | |
| Alienware m16 R1 Intel | |
| Acer Nitro 17 AN17-51-71ER | |
| Schenker XMG Apex 17 (Late 23) | |
| MSI Katana 17 B13VFK | |
| Przeciętny AMD Ryzen 7 7840HS (30497 - 62147, n=21) | |
| AIDA64 / Memory Write | |
| Schenker XMG Apex 17 (Late 23) | |
| Przeciętny AMD Ryzen 7 7840HS (34590 - 93323, n=21) | |
| Średnia w klasie Gaming (22297 - 135096, n=110, ostatnie 2 lata) | |
| Lenovo Legion Pro 5 16IRX8 | |
| Acer Nitro 17 AN17-51-71ER | |
| Alienware m16 R1 Intel | |
| Medion Erazer Defender P40 | |
| MSI Katana 17 B13VFK | |
| AIDA64 / Memory Latency | |
| Acer Nitro 17 AN17-51-71ER | |
| Średnia w klasie Gaming (75.3 - 259, n=110, ostatnie 2 lata) | |
| MSI Katana 17 B13VFK | |
| Medion Erazer Defender P40 | |
| Przeciętny AMD Ryzen 7 7840HS (85.1 - 112, n=21) | |
| Alienware m16 R1 Intel | |
| Schenker XMG Apex 17 (Late 23) | |
| Lenovo Legion Pro 5 16IRX8 | |
* ... im mniej tym lepiej
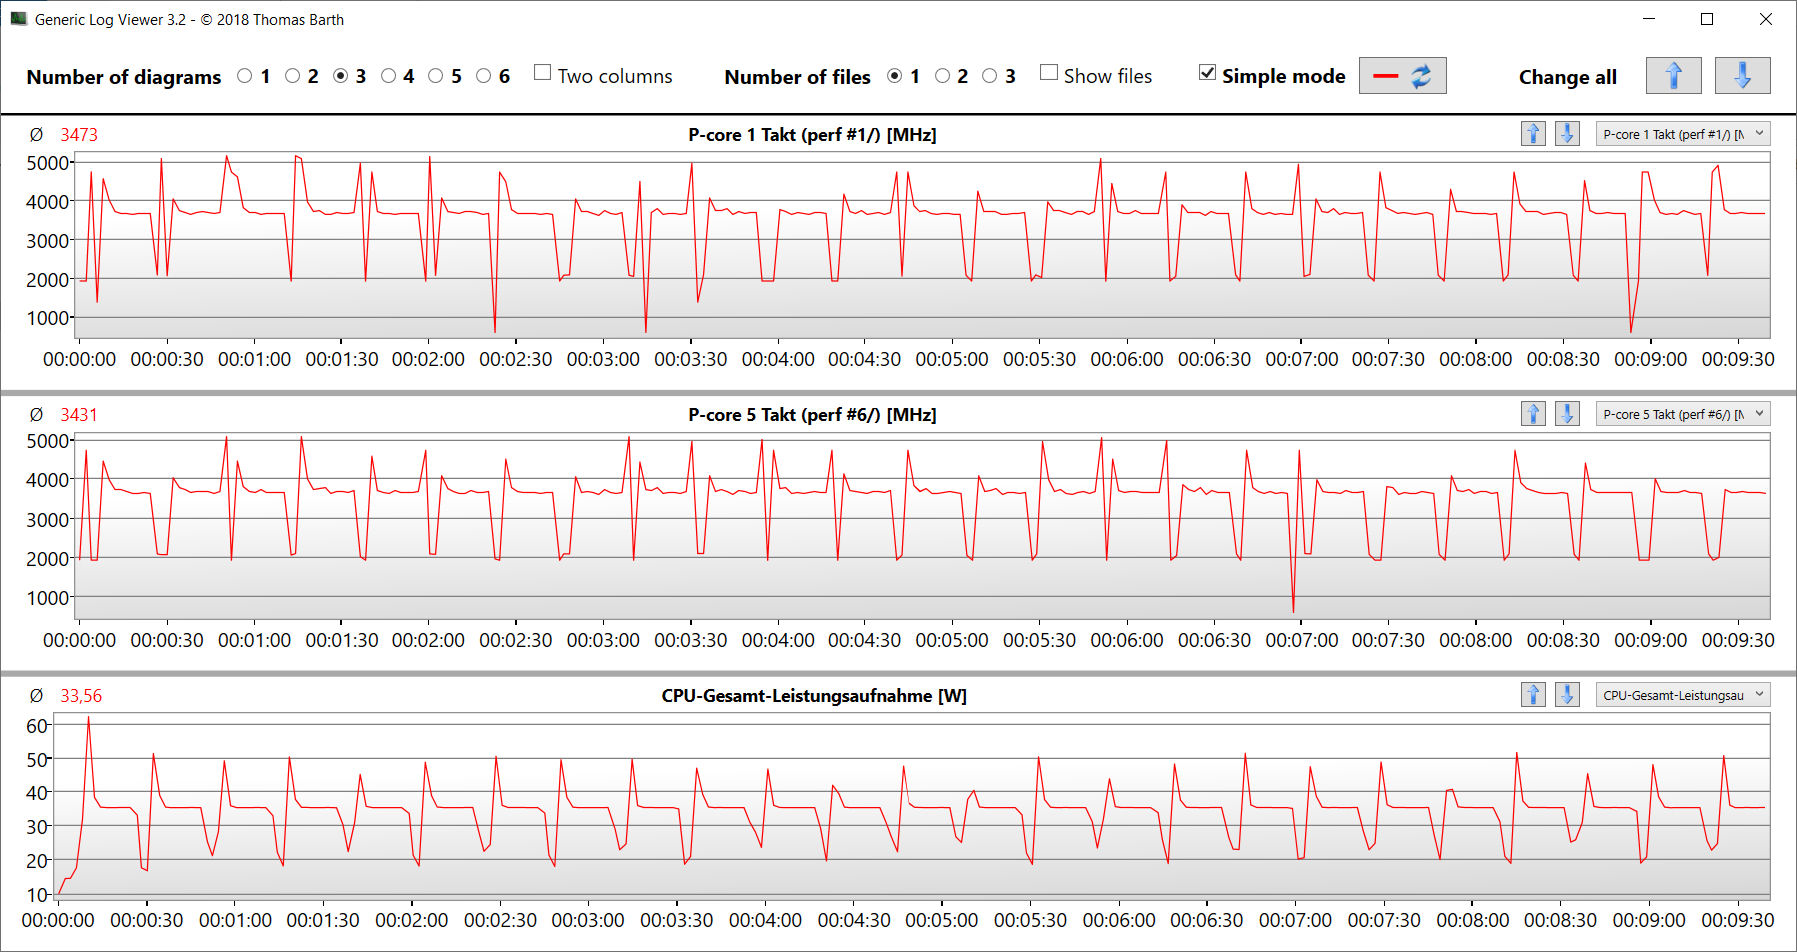
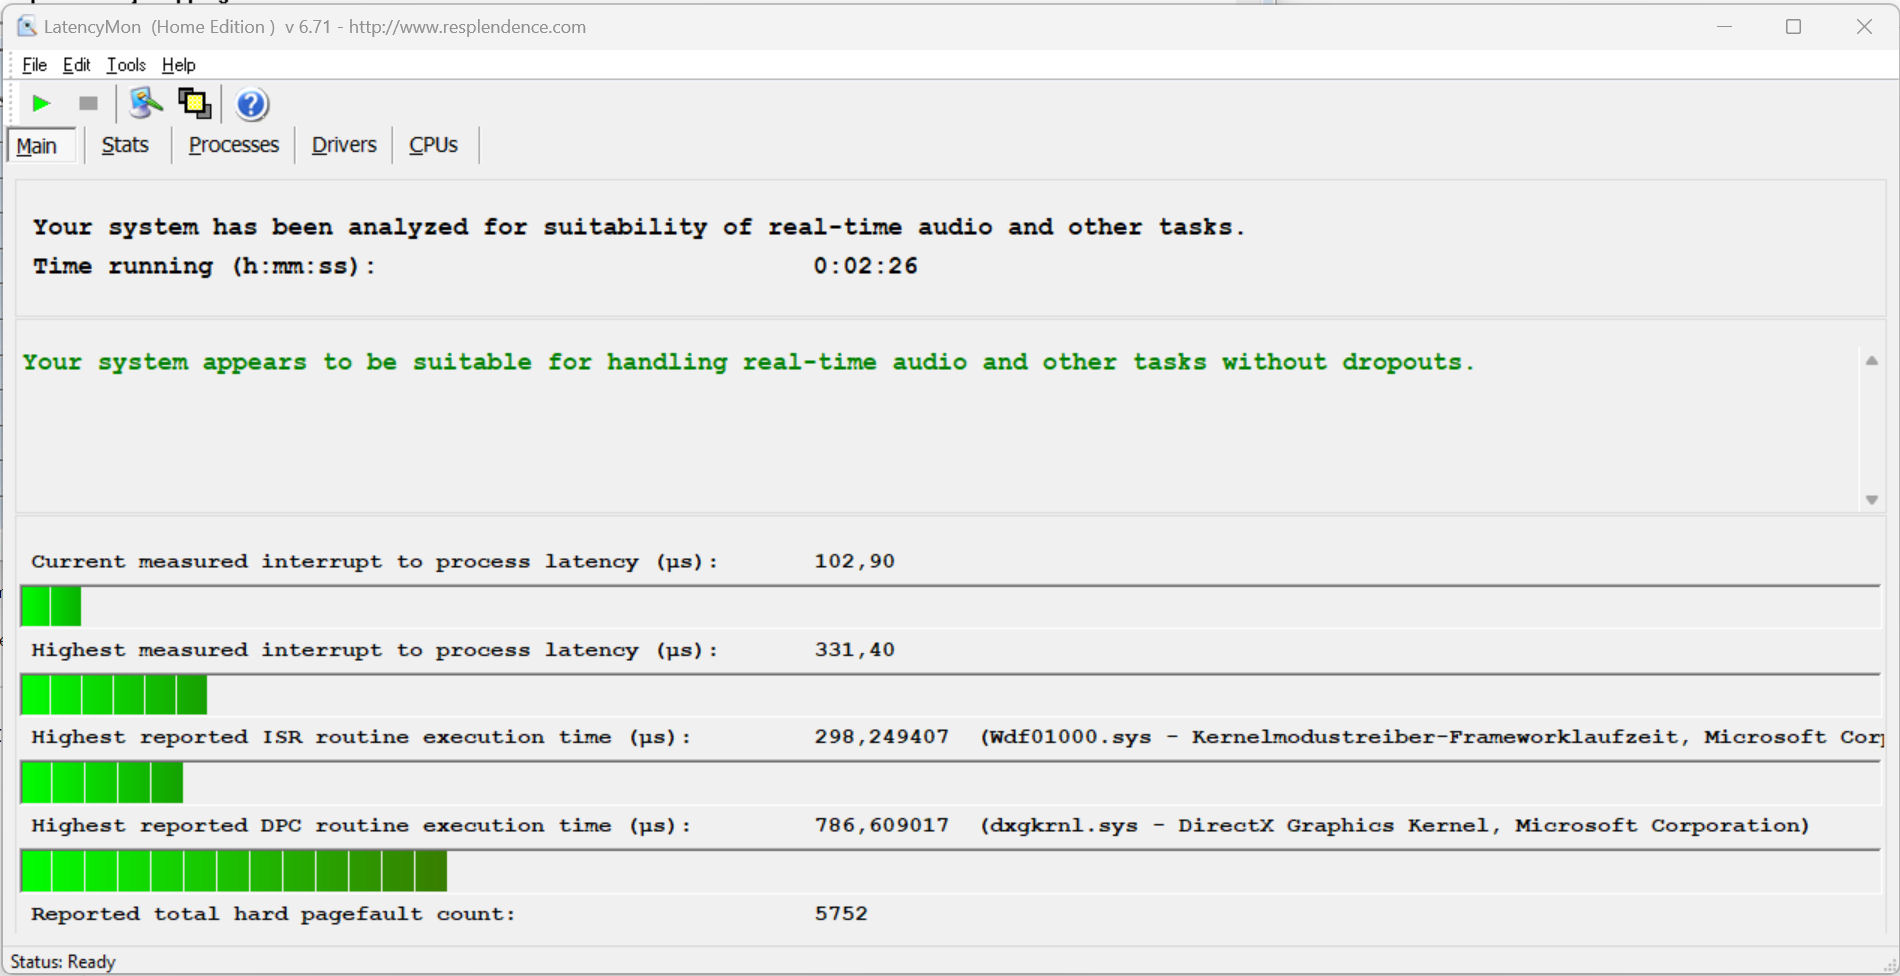
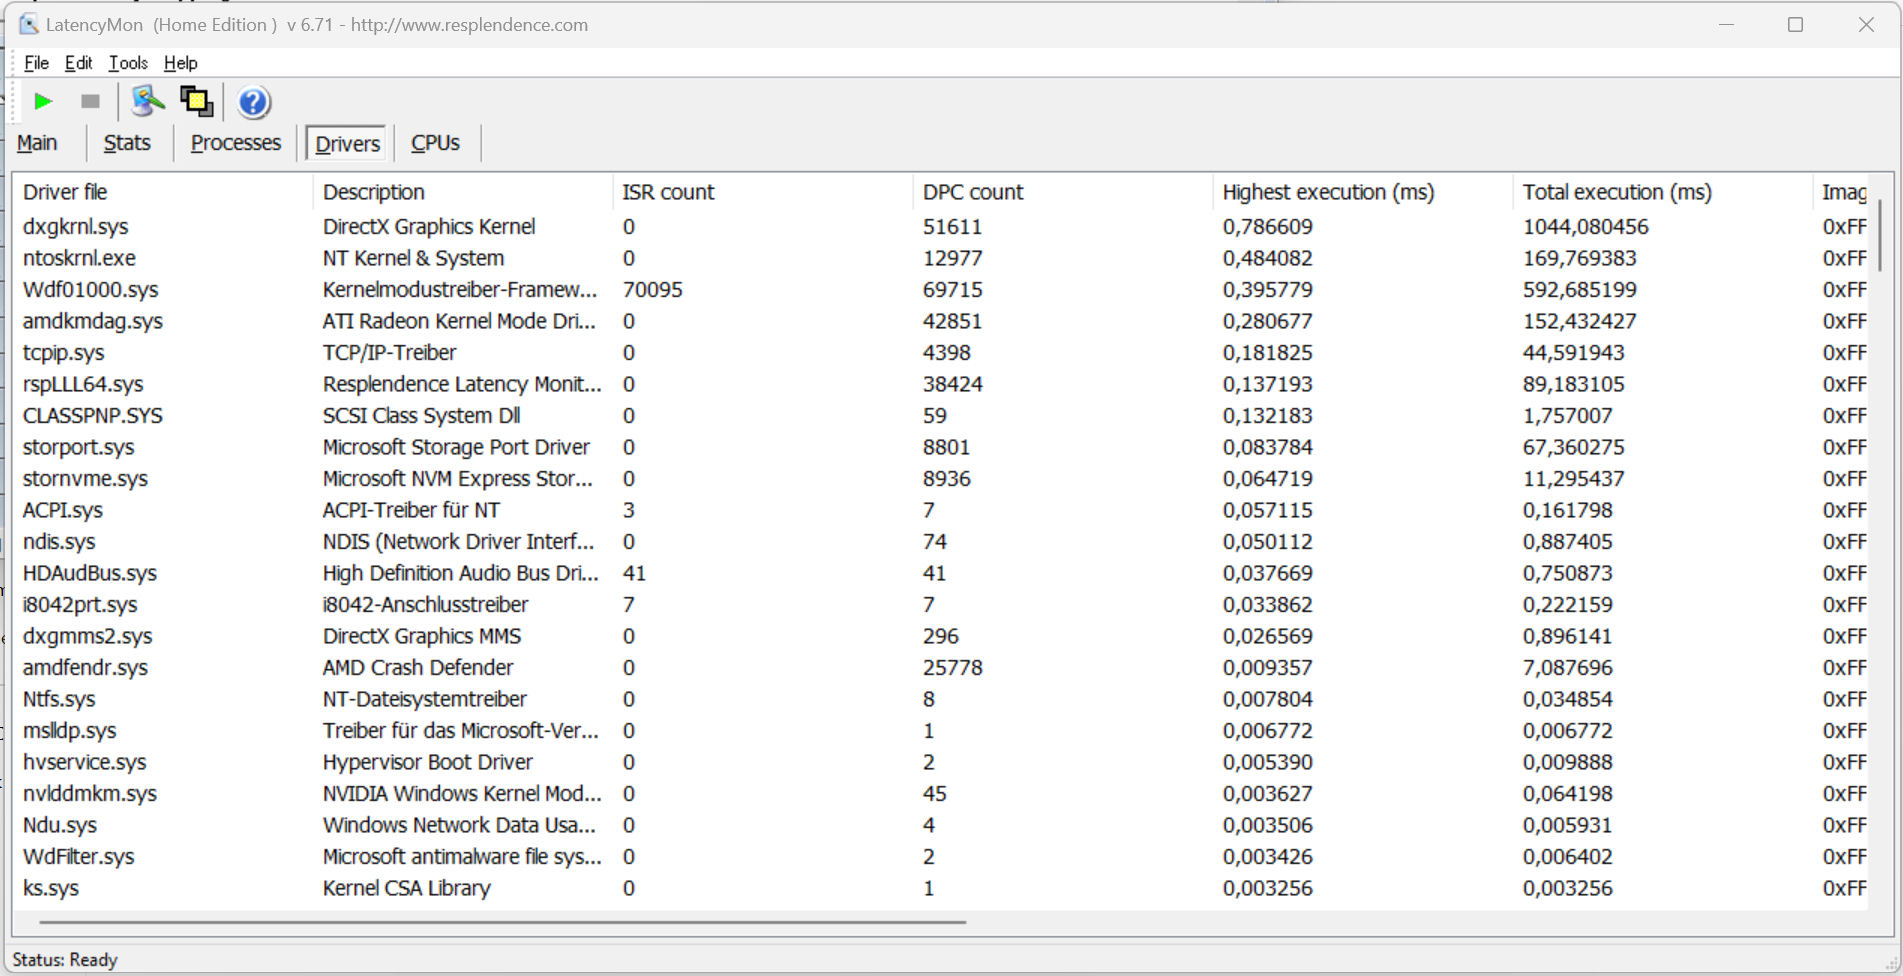
Opóźnienia DPC
Standardowy test Latency Monitor (surfowanie po Internecie, odtwarzanie wideo 4k, wysokie obciążenie Prime95) nie wykazał żadnych nieprawidłowości. System wydaje się być odpowiedni do edycji wideo i audio w czasie rzeczywistym. Przyszłe aktualizacje oprogramowania mogą poprawić lub pogorszyć ten obszar wydajności.
| DPC Latencies / LatencyMon - interrupt to process latency (max), Web, Youtube, Prime95 | |
| Medion Erazer Defender P40 | |
| Alienware m16 R1 Intel | |
| MSI Katana 17 B13VFK | |
| Acer Nitro 17 AN17-51-71ER | |
| Lenovo Legion Pro 5 16IRX8 | |
| Schenker XMG Apex 17 (Late 23) | |
* ... im mniej tym lepiej
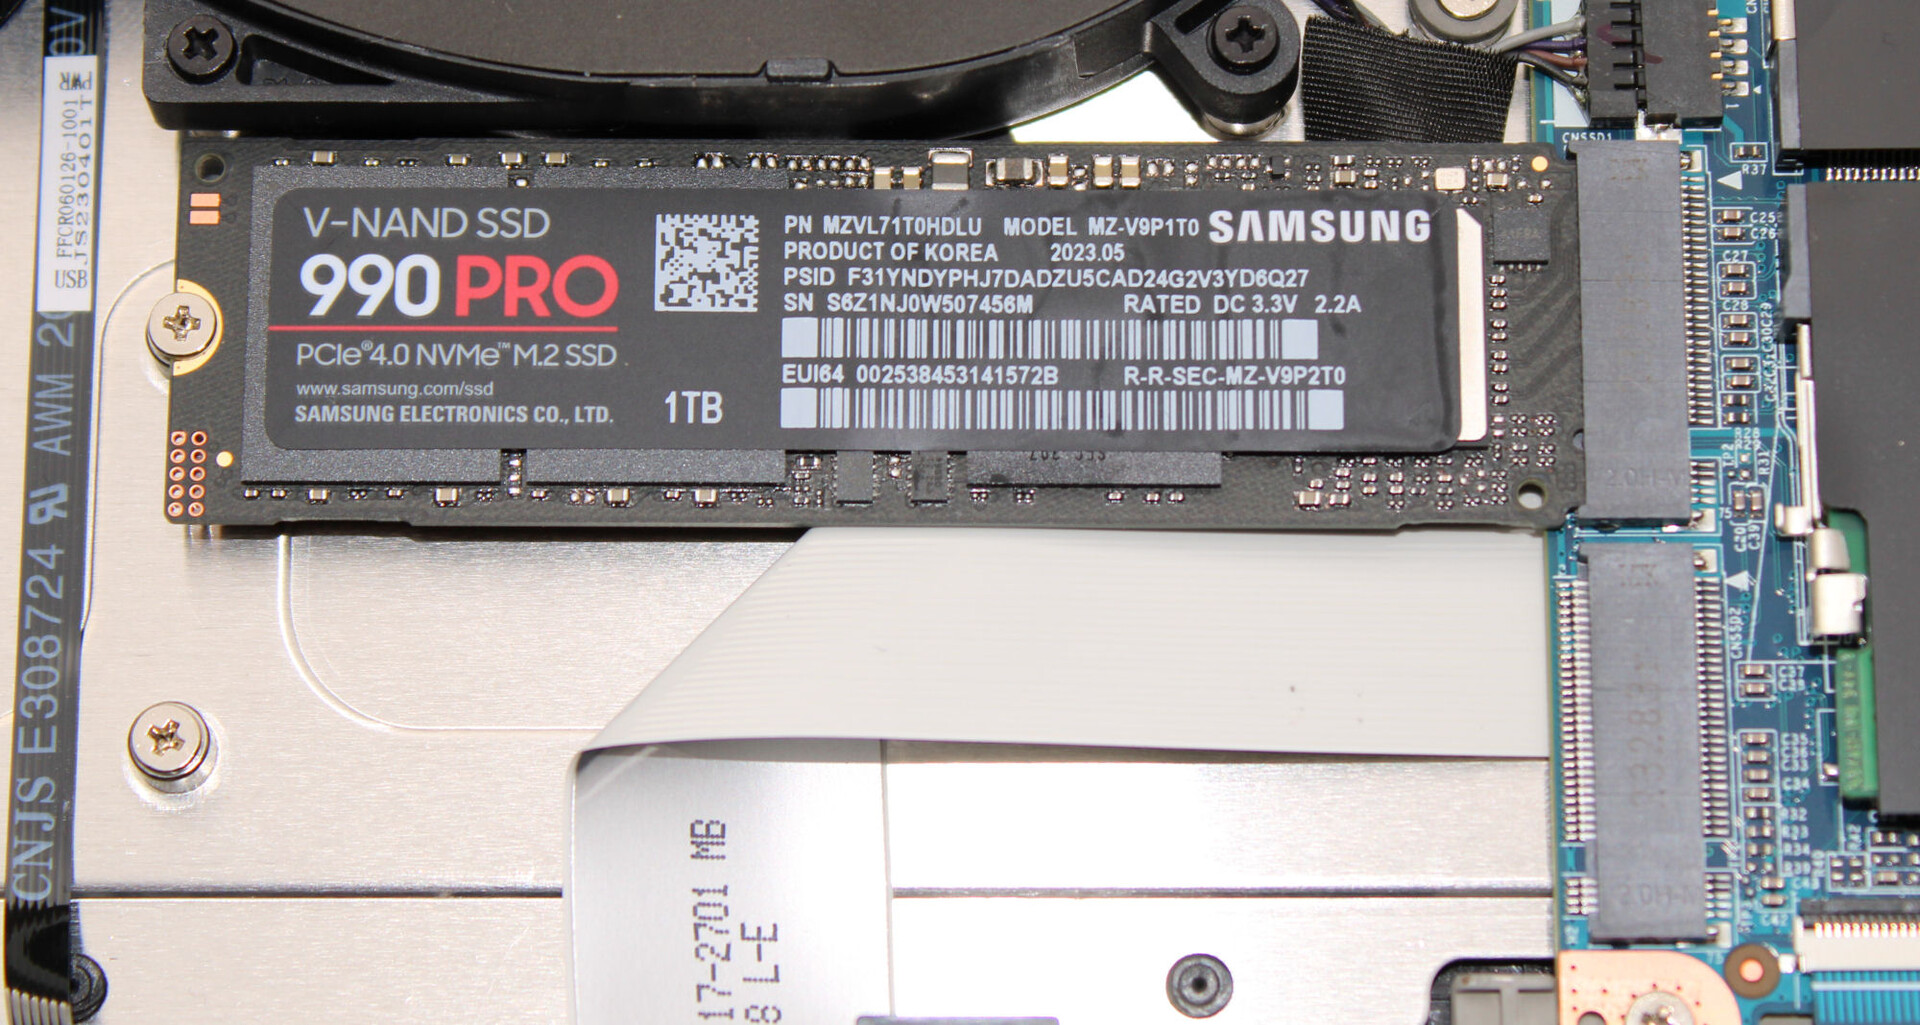
Pamięć masowa
Apex może pomieścić łącznie dwa dyski SSD PCIe 4 w formacie M.2 2280. Obsługiwany jest RAID-0/1. Dostarczone nam urządzenie testowe ma na pokładzie dysk SSD Samsung 1 TB (PCIe 4, M.2 2280), który zapewnia doskonałe prędkości transferu. Pozytywne: Nie wystąpił throttling związany z temperaturą.

* ... im mniej tym lepiej
Continuous Performance Read: DiskSpd Read Loop, Queue Depth 8
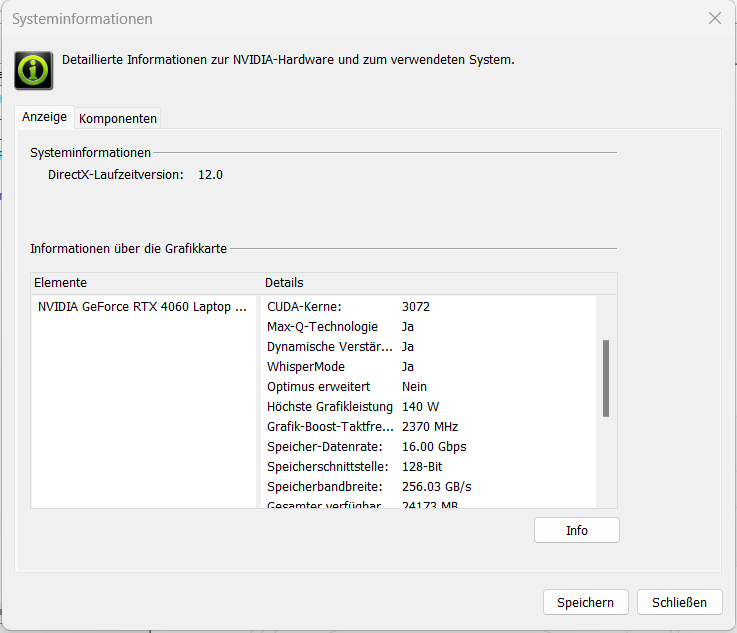
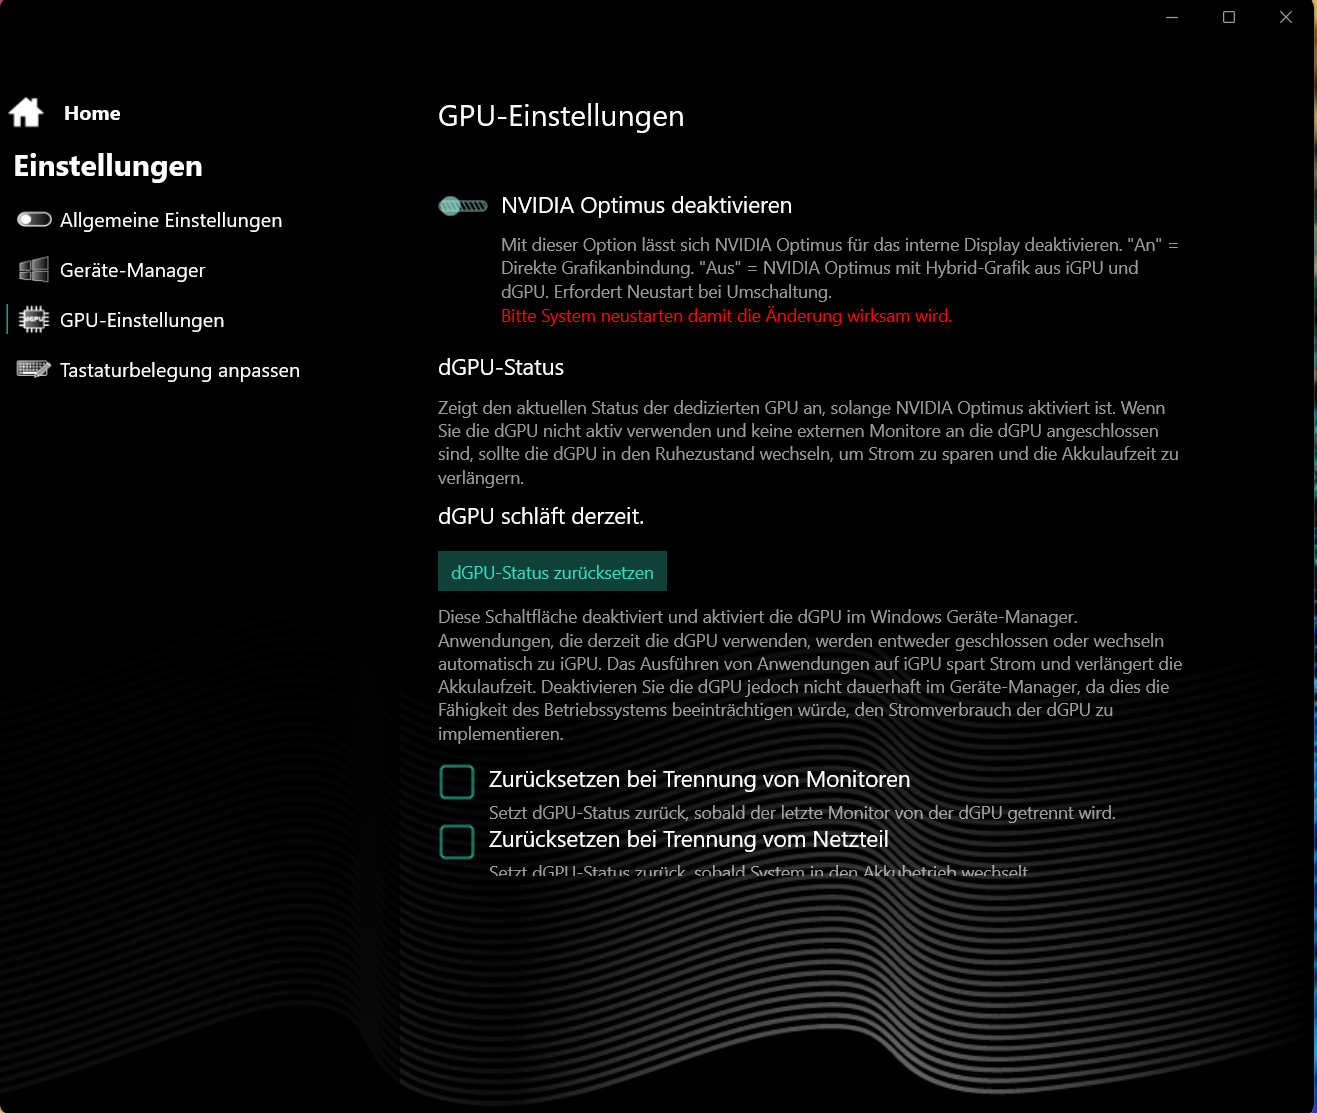
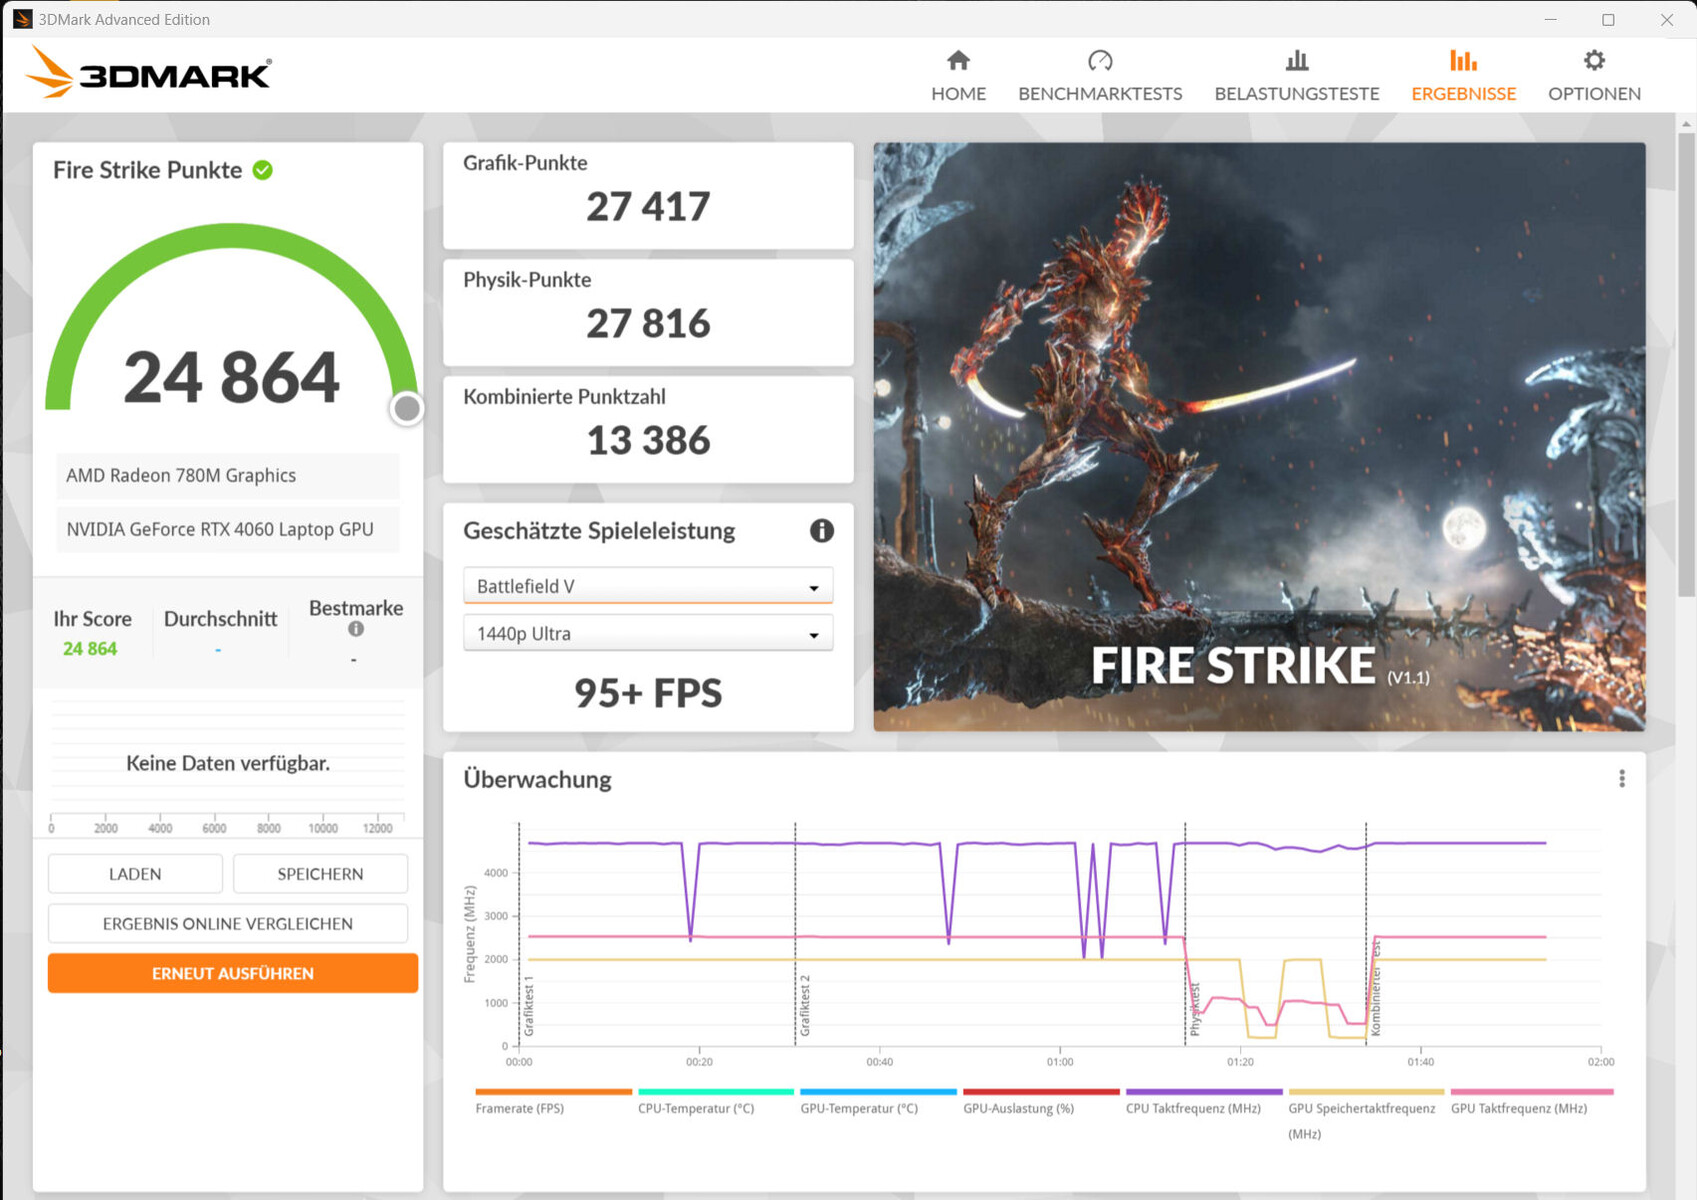
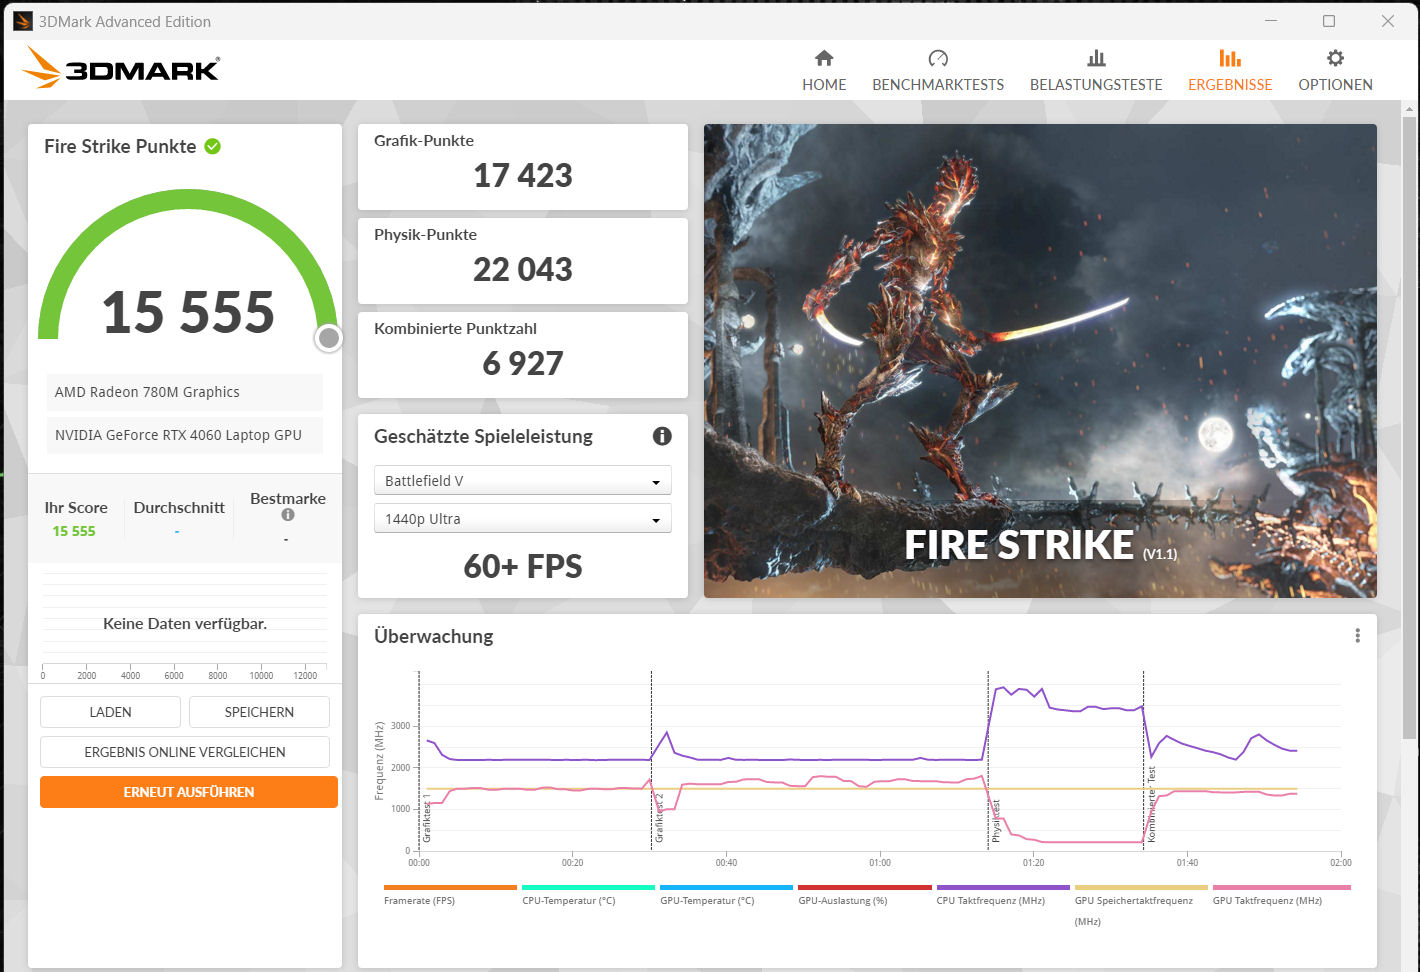
Karta graficzna
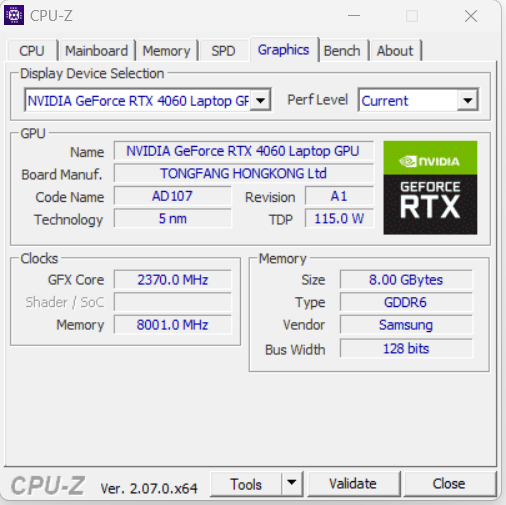
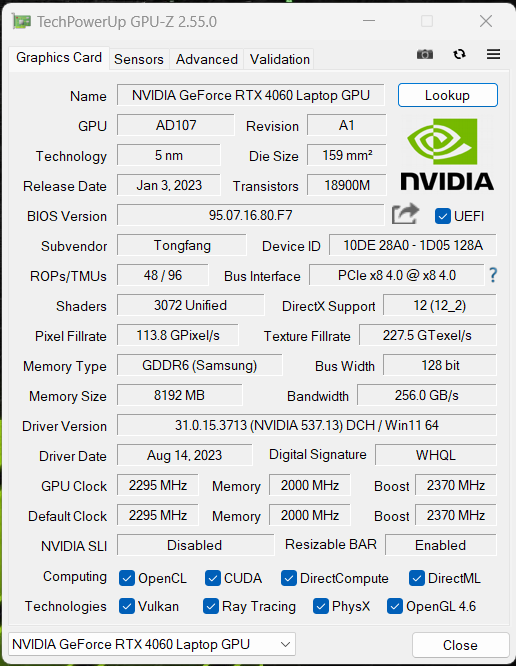
Karta graficznaGeForce RTX 4060 oferuje 3 072 shadery, magistralę o szerokości 128 bitów i szybką pamięć RAM GDDR6 (8 192 MB). Schenker ustawił maksymalne TGP na wartość 140 W (115 W + 25 W dynamicznego boostu) - więcej się nie da. Według testu Witcher 3, TGP nie jest maksymalne.
Wyniki benchmarków są wyższe od poprzedniej średniej RTX 4060. Tryb dGPU nie powoduje żadnego wzrostu wydajności. Przełączanie między dGPU a Optimusem wymaga restartu - Advanced Optimus nie jest obsługiwany.
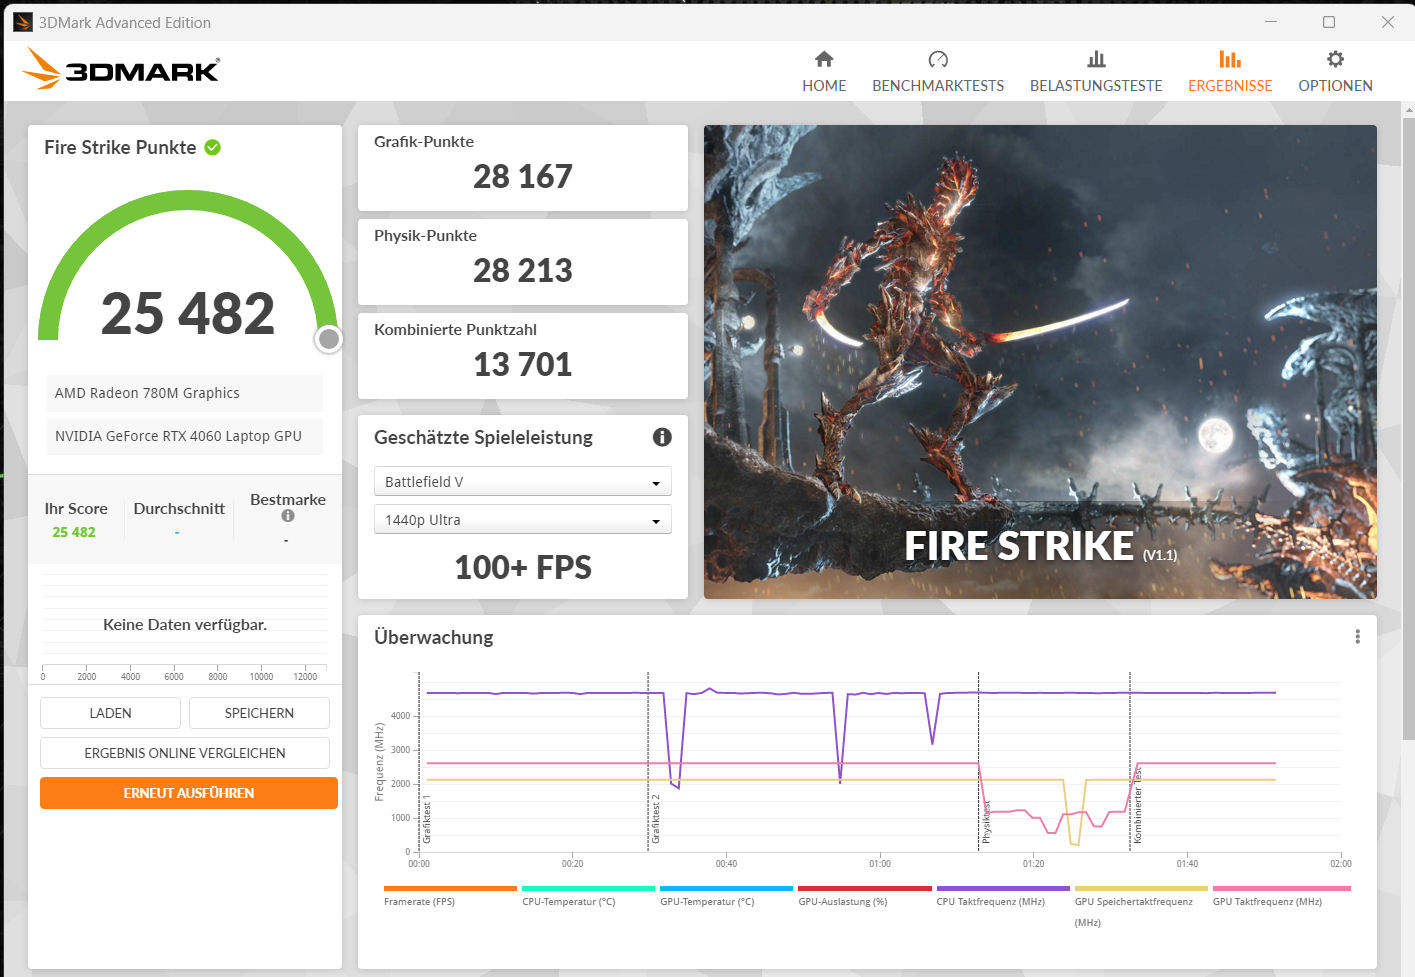
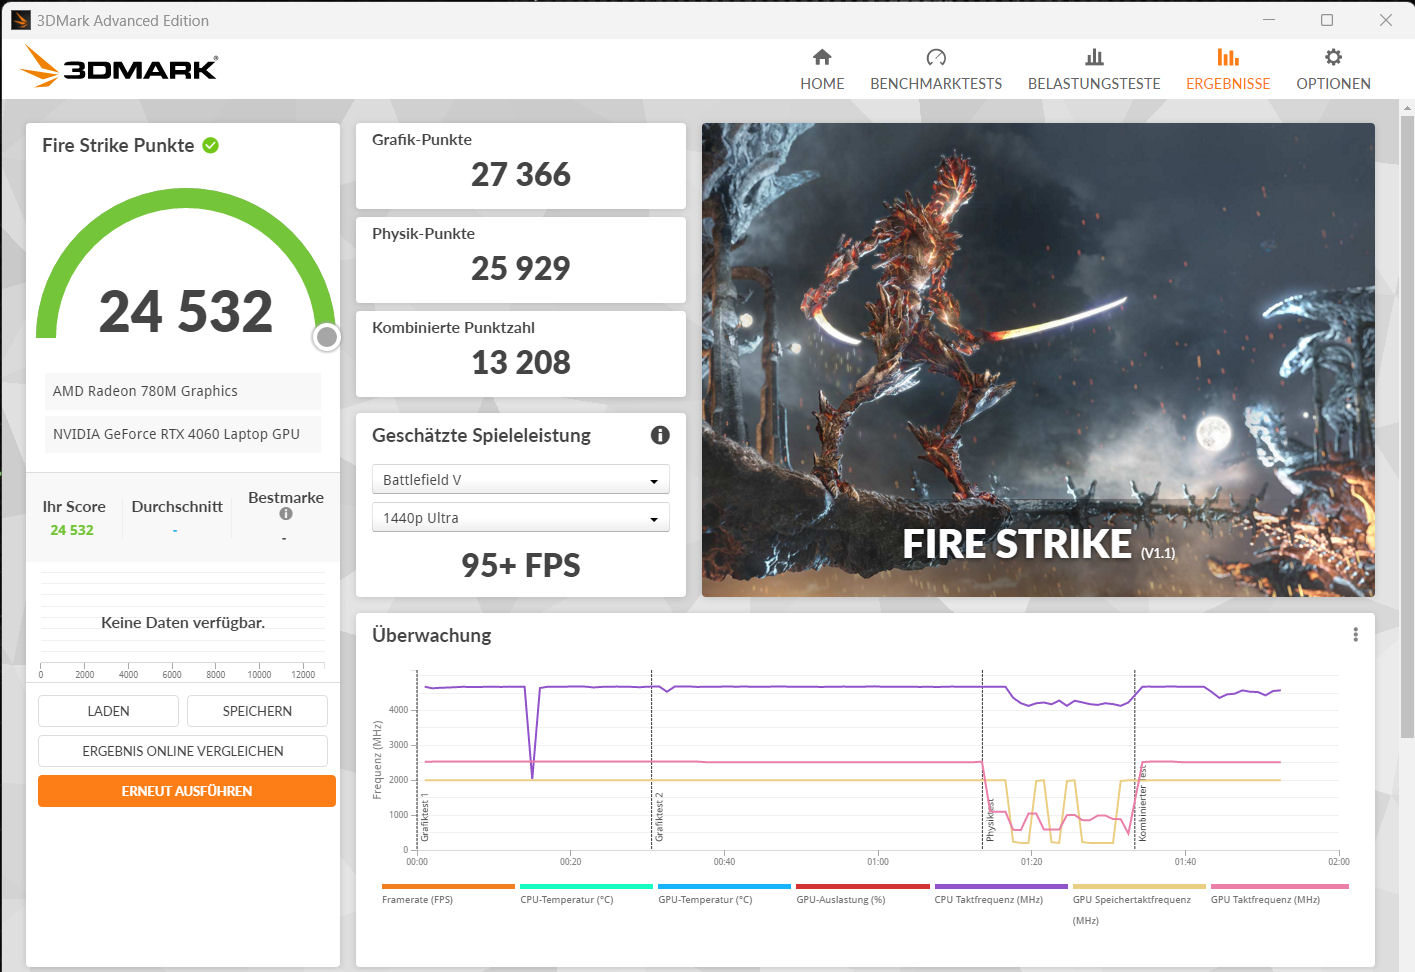
| 3DMark 06 Standard Score | 49011 pkt. | |
| 3DMark 11 Performance | 32639 pkt. | |
| 3DMark Cloud Gate Standard Score | 64881 pkt. | |
| 3DMark Fire Strike Score | 24864 pkt. | |
| 3DMark Time Spy Score | 10640 pkt. | |
Pomoc | ||
* ... im mniej tym lepiej
Wydajność w grach
Komputer Schenker został zaprojektowany do grania w rozdzielczości QHD przy wysokich i maksymalnych ustawieniach. Wyższe rozdzielczości będą użyteczne przy czasami zredukowanych ustawieniach po podłączeniu do odpowiedniego monitora. Można osiągnąć liczbę klatek na sekundę typową dla średniej RTX 4060. Ogólnie rzecz biorąc, tryb dGP nie powoduje wzrostu wydajności. Jedynie w grze "X Plane 11" odnotowano 10-20 procentowy wzrost liczby klatek na sekundę.
| The Witcher 3 - 1920x1080 Ultra Graphics & Postprocessing (HBAO+) | |
| Średnia w klasie Gaming (95 - 240, n=8, ostatnie 2 lata) | |
| Lenovo Legion Pro 5 16IRX8 | |
| Alienware m16 R1 Intel | |
| Acer Nitro 17 AN17-51-71ER | |
| MSI Katana 17 B13VFK | |
| Schenker XMG Apex 17 (Late 23) | |
| Medion Erazer Defender P40 | |
| Przeciętny NVIDIA GeForce RTX 4060 Laptop GPU (77 - 159.7, n=42) | |
| Cyberpunk 2077 1.6 - 1920x1080 Ultra Preset | |
| Lenovo Legion Pro 5 16IRX8 | |
| Alienware m16 R1 Intel | |
| Schenker XMG Apex 17 (Late 23) | |
| Acer Nitro 17 AN17-51-71ER | |
| Przeciętny NVIDIA GeForce RTX 4060 Laptop GPU (57.9 - 93.2, n=18) | |
| MSI Katana 17 B13VFK | |
| Ratchet & Clank Rift Apart | |
| 1920x1080 Very High Preset AA:T | |
| Alienware m16 R1 Intel | |
| Schenker XMG Apex 17 (Late 23) | |
| Przeciętny NVIDIA GeForce RTX 4060 Laptop GPU (51.6 - 54.8, n=4) | |
| 2560x1440 Very High Preset AA:T | |
| Alienware m16 R1 Intel | |
| Przeciętny NVIDIA GeForce RTX 4060 Laptop GPU (45.6 - 46.6, n=3) | |
| Schenker XMG Apex 17 (Late 23) | |
| 1920x1080 Very High Preset + Very High Raytracing AA:T | |
| Alienware m16 R1 Intel | |
| Przeciętny NVIDIA GeForce RTX 4060 Laptop GPU (39.1 - 44.5, n=3) | |
| Schenker XMG Apex 17 (Late 23) | |
| Atlas Fallen | |
| 1920x1080 High Preset | |
| Schenker XMG Apex 17 (Late 23) | |
| Alienware m16 R1 Intel | |
| Przeciętny NVIDIA GeForce RTX 4060 Laptop GPU (88.8 - 133.3, n=3) | |
| 2560x1440 Very High Preset | |
| Alienware m16 R1 Intel | |
| Schenker XMG Apex 17 (Late 23) | |
| Przeciętny NVIDIA GeForce RTX 4060 Laptop GPU (75 - 79.2, n=3) | |
| Immortals of Aveum | |
| 1920x1080 Ultra AF:16x | |
| Alienware m16 R1 Intel | |
| Schenker XMG Apex 17 (Late 23) | |
| Przeciętny NVIDIA GeForce RTX 4060 Laptop GPU (33 - 48.9, n=4) | |
| 2560x1440 Ultra AF:16x | |
| Alienware m16 R1 Intel | |
| Schenker XMG Apex 17 (Late 23) | |
| Przeciętny NVIDIA GeForce RTX 4060 Laptop GPU (20.5 - 32.8, n=4) | |
| Armored Core 6 | |
| 1920x1080 Maximum Preset | |
| Schenker XMG Apex 17 (Late 23) | |
| Przeciętny NVIDIA GeForce RTX 4060 Laptop GPU (95.6 - 100.8, n=3) | |
| Średnia w klasie Gaming (n=1ostatnie 2 lata) | |
| 2560x1440 Maximum Preset | |
| Schenker XMG Apex 17 (Late 23) | |
| Przeciętny NVIDIA GeForce RTX 4060 Laptop GPU (73.2 - 74.6, n=3) | |
| Średnia w klasie Gaming (n=1ostatnie 2 lata) | |
| Starfield | |
| 1920x1080 Ultra Preset | |
| Przeciętny NVIDIA GeForce RTX 4060 Laptop GPU (39.7 - 41, n=3) | |
| Schenker XMG Apex 17 (Late 23) | |
| 2560x1440 Ultra Preset | |
| Schenker XMG Apex 17 (Late 23) | |
| Przeciętny NVIDIA GeForce RTX 4060 Laptop GPU (32.5 - 32.6, n=2) | |
| Lies of P | |
| 1920x1080 Best Preset | |
| Schenker XMG Apex 17 (Late 23) | |
| Przeciętny NVIDIA GeForce RTX 4060 Laptop GPU (106.2 - 126.6, n=3) | |
| 2560x1440 Best Preset | |
| Schenker XMG Apex 17 (Late 23) | |
| Przeciętny NVIDIA GeForce RTX 4060 Laptop GPU (83.6 - 85.6, n=2) | |
Aby sprawdzić, czy liczba klatek na sekundę utrzymywała się na stałym poziomie przez dłuższy czas, uruchomiliśmy grę "The Witcher 3" na około 60 minut w rozdzielczości Full HD i maksymalnych ustawieniach jakości. Postać w grze nie była poruszana. Nie zauważyliśmy spadku liczby klatek na sekundę.
Witcher 3 FPS diagram
| low | med. | high | ultra | QHD | |
|---|---|---|---|---|---|
| The Witcher 3 (2015) | 401.8 | 316.1 | 198.2 | 103.4 | 76.3 |
| Dota 2 Reborn (2015) | 169.4 | 154.1 | 147.6 | 139.8 | |
| Final Fantasy XV Benchmark (2018) | 223 | 148.4 | 103.4 | 76.8 | |
| X-Plane 11.11 (2018) | 127.3 | 110.9 | 88.2 | ||
| Far Cry 5 (2018) | 163 | 145 | 139 | 130 | 106 |
| Strange Brigade (2018) | 399 | 279 | 221 | 190.1 | 126.9 |
| Gears Tactics (2020) | 320.2 | 255 | 180.5 | 125.9 | 85.8 |
| GRID Legends (2022) | 152.8 | 141.6 | 132.4 | 120.6 | 103.2 |
| Cyberpunk 2077 1.6 (2022) | 129.9 | 101 | 87.5 | 79.8 | 49.1 |
| Spider-Man Miles Morales (2022) | 123.7 | 115.9 | 110.3 | 103.8 | 77.8 |
| F1 23 (2023) | 249 | 244 | 186.2 | 60.1 | 37.8 |
| Ratchet & Clank Rift Apart (2023) | 85.4 | 74.7 | 60.6 | 54.6 | 45.6 |
| Atlas Fallen (2023) | 146 | 143.2 | 133.3 | 112.6 | 79.1 |
| Immortals of Aveum (2023) | 65.7 | 53.1 | 44 | 30.2 | |
| Armored Core 6 (2023) | 111.1 | 108.7 | 109.4 | 100.8 | 74.6 |
| Starfield (2023) | 70.3 | 62.5 | 47.1 | 39.7 | 32.6 |
| The Crew Motorfest (2023) | 60 | 60 | 60 | 60 | 54 |
| Lies of P (2023) | 186.6 | 163.8 | 141.9 | 126.6 | 85.6 |
Emisje - laptop do gier może pracować cicho
Emisja hałasu
Ogólnie rzecz biorąc, oceniamy Apexa jako posiadającego niski do umiarkowanego poziom hałasu. W codziennym użytkowaniu (biuro, Internet, bankowość...) wentylatory często obracają się powoli lub nawet stoją w miejscu. Nie hałasują również przy średnim obciążeniu. Inaczej jest w przypadku gier: Poziom ciśnienia akustycznego może wzrosnąć do 54 dB(A) ("overboost"). W trybie "entuzjasty", przy 50 dB(A), poziom hałasu można określić jako dość niski. Tryb "zrównoważony" jest znacznie cichszy: jednak poziom 34 dB(A) powoduje znaczną utratę wydajności GPU.
Wentylatory emitują przede wszystkim dźwięczny szum. Irytujące odgłosy tła są niezauważalne.
Hałas
| luz |
| 25 / 29 / 33 dB |
| obciążenie |
| 37 / 54 dB |
 | ||
30 dB cichy 40 dB(A) słyszalny 50 dB(A) irytujący |
||
min: | ||
| Schenker XMG Apex 17 (Late 23) R7 7840HS, GeForce RTX 4060 Laptop GPU | Alienware m16 R1 Intel i7-13700HX, GeForce RTX 4060 Laptop GPU | Lenovo Legion Pro 5 16IRX8 i7-13700HX, GeForce RTX 4060 Laptop GPU | Acer Nitro 17 AN17-51-71ER i7-13700H, GeForce RTX 4060 Laptop GPU | Medion Erazer Defender P40 i7-13700HX, GeForce RTX 4060 Laptop GPU | MSI Katana 17 B13VFK i7-13620H, GeForce RTX 4060 Laptop GPU | |
|---|---|---|---|---|---|---|
| Noise | -2% | 9% | 2% | -10% | -8% | |
| wyłączone / środowisko * (dB) | 24 | 25 -4% | 23 4% | 24 -0% | 25 -4% | 24.5 -2% |
| Idle Minimum * (dB) | 25 | 25 -0% | 23.1 8% | 24 4% | 26 -4% | 24.5 2% |
| Idle Average * (dB) | 29 | 26 10% | 23.1 20% | 24 17% | 27 7% | 24.5 16% |
| Idle Maximum * (dB) | 33 | 27 18% | 26.6 19% | 32.32 2% | 32 3% | 40 -21% |
| Load Average * (dB) | 37 | 52 -41% | 34.7 6% | 35.18 5% | 53 -43% | 48.3 -31% |
| Witcher 3 ultra * (dB) | 50 | 51 -2% | 47.6 5% | 54.78 -10% | 56 -12% | 56 -12% |
| Load Maximum * (dB) | 54 | 53 2% | 54.8 -1% | 54.78 -1% | 64 -19% | 59.1 -9% |
* ... im mniej tym lepiej
Temperatura
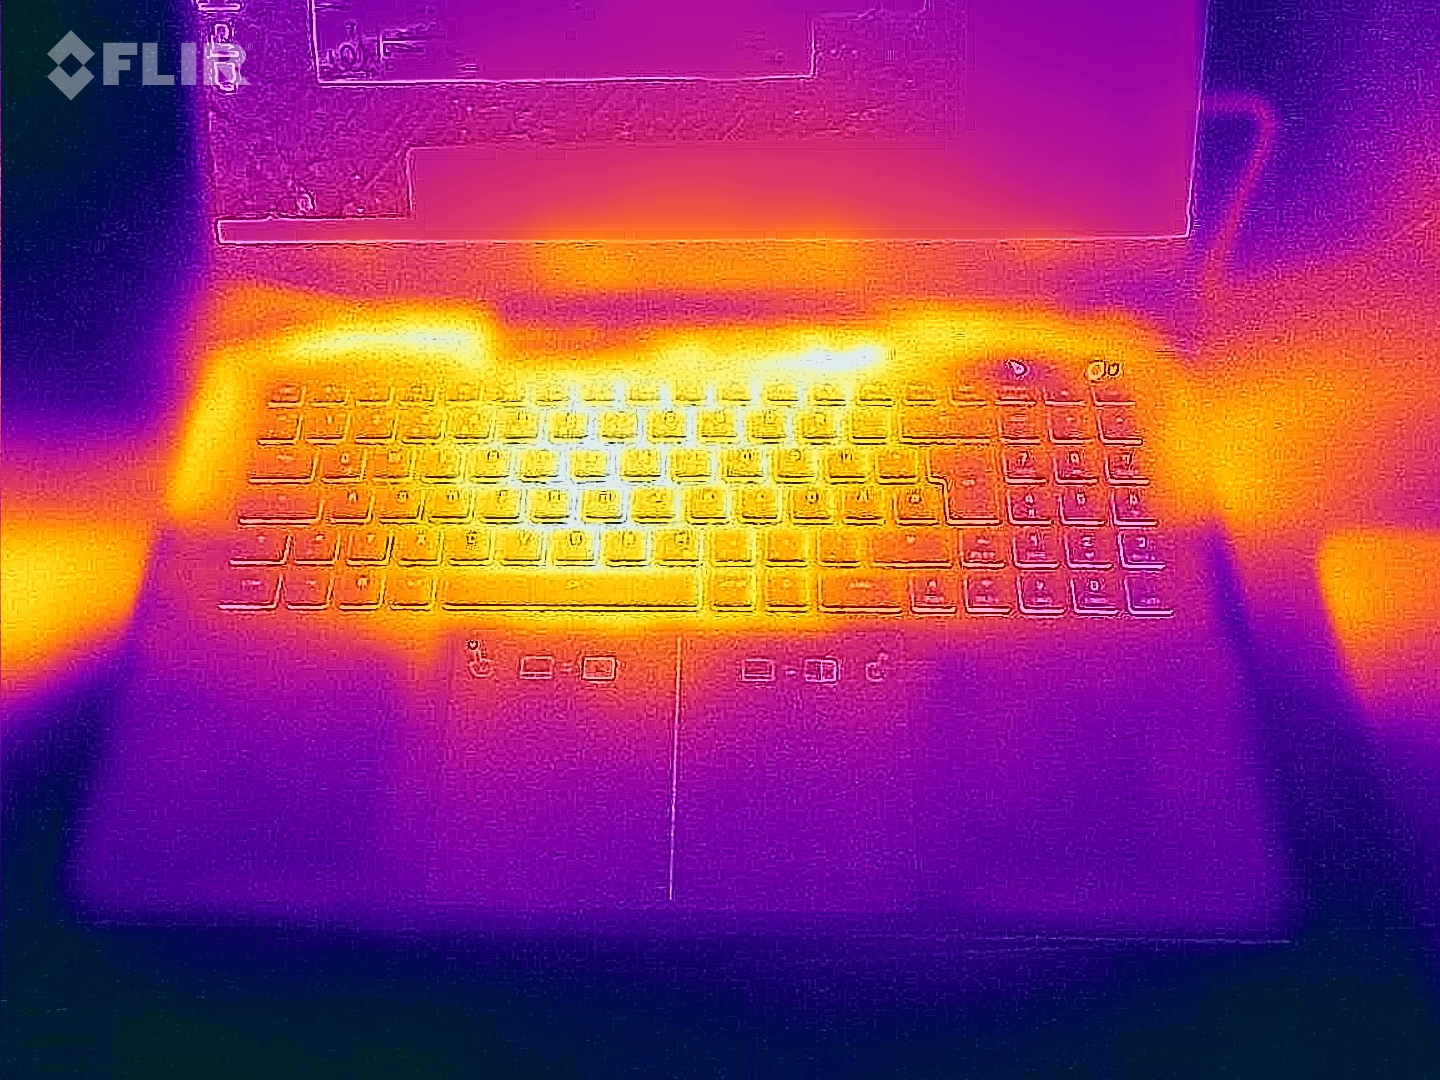
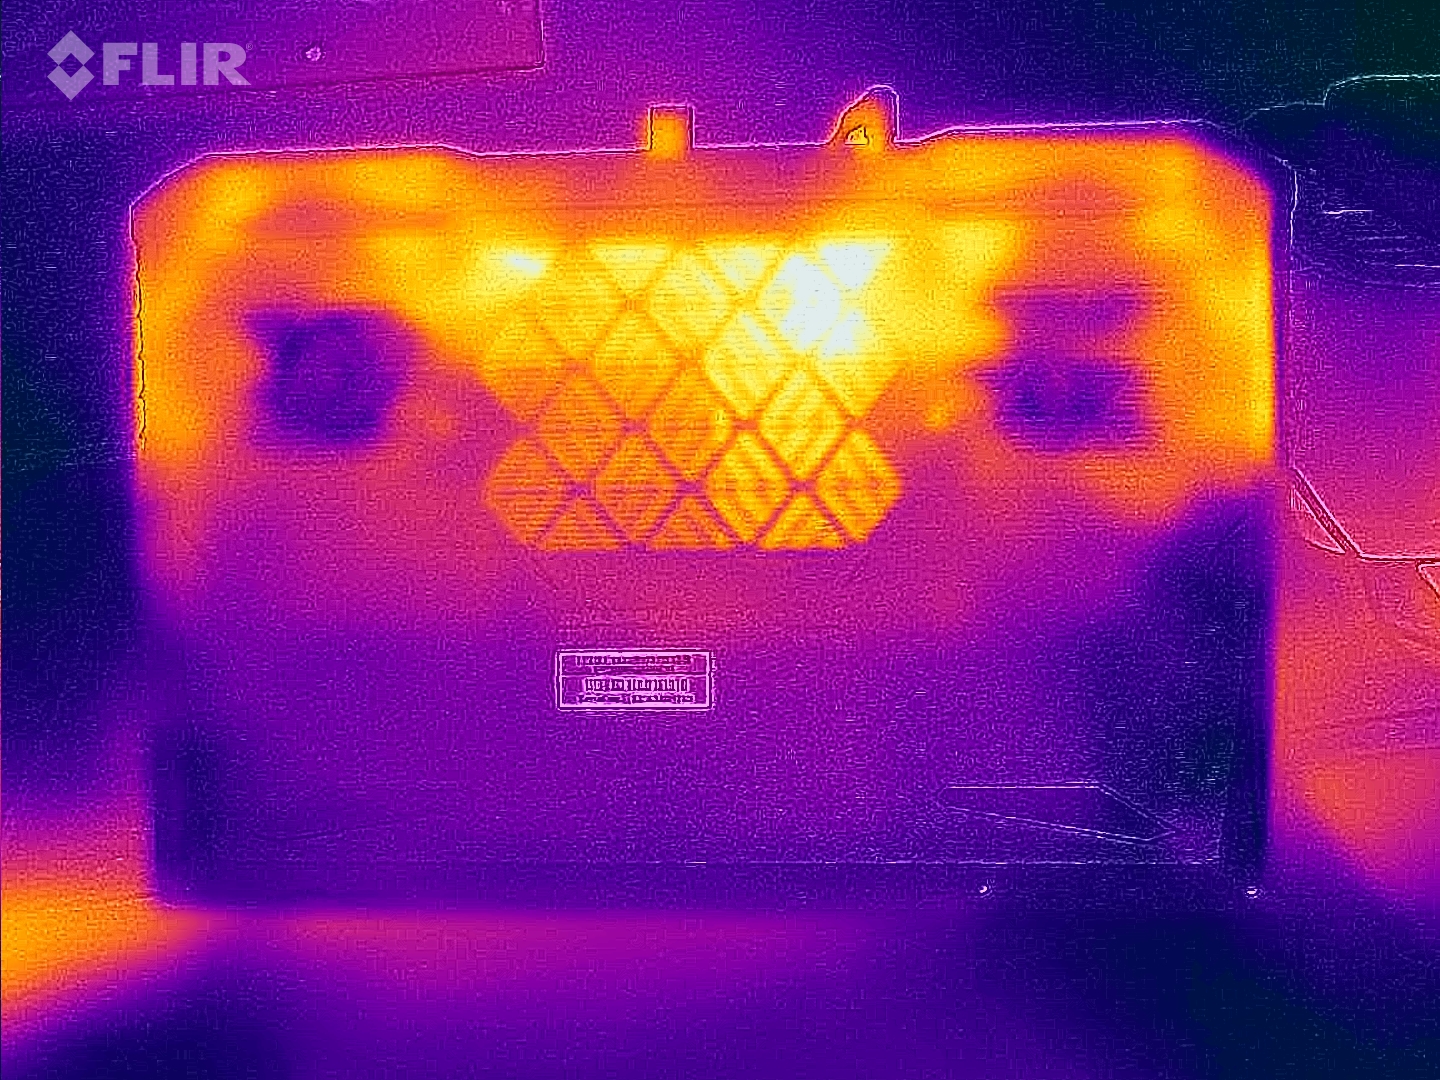
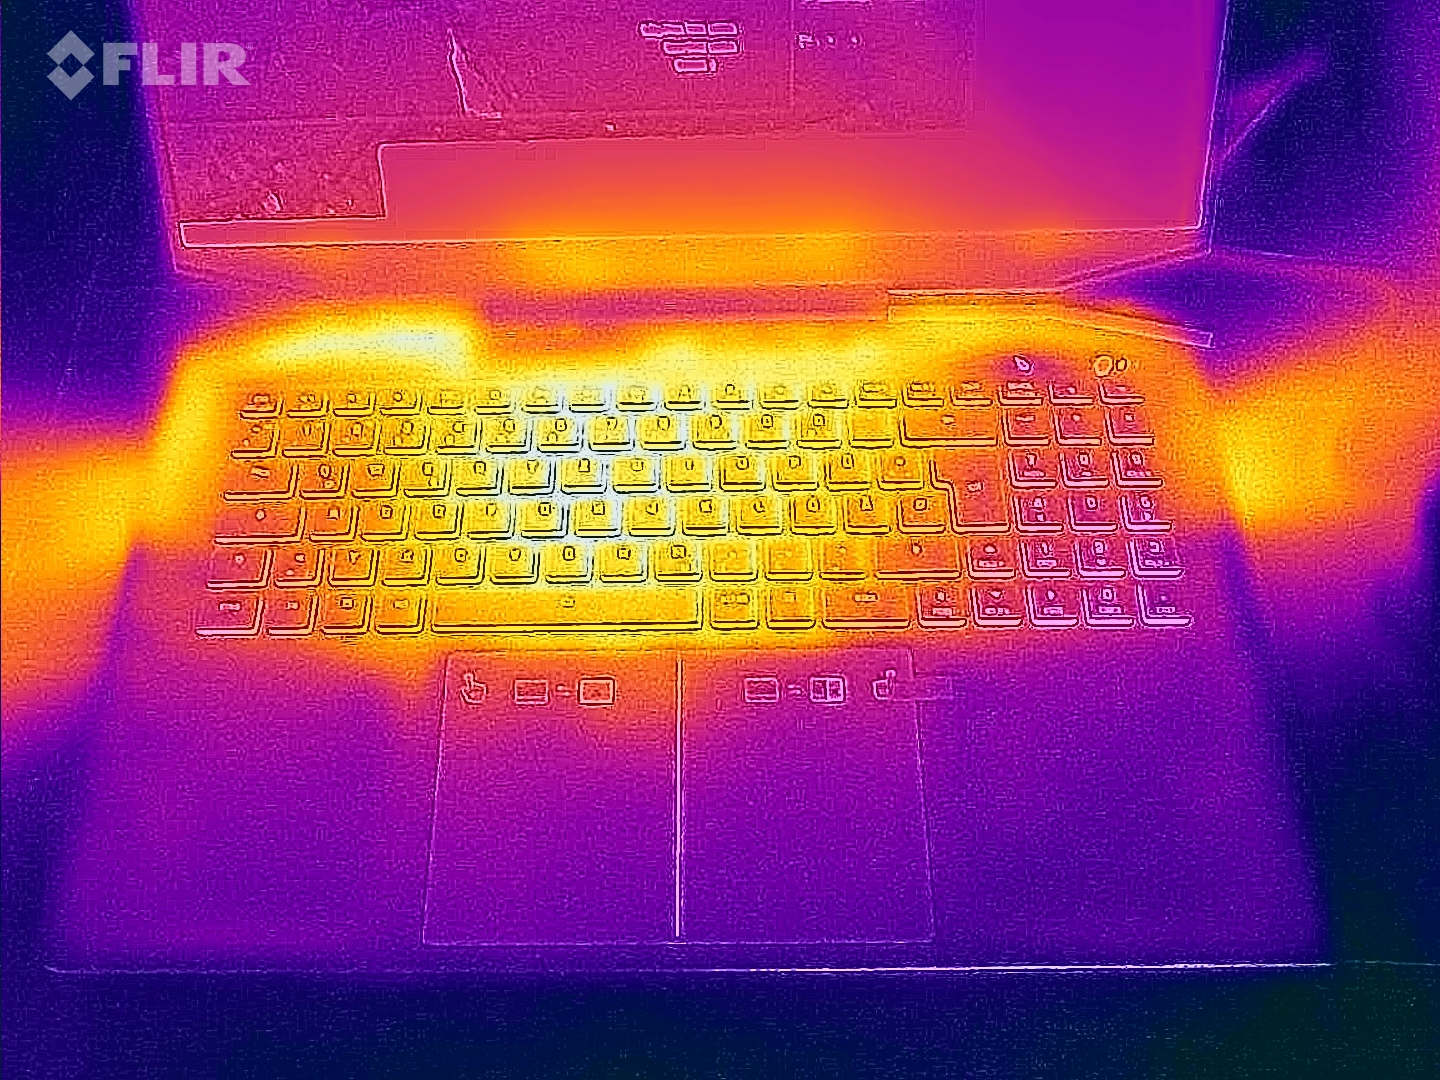
Test obciążeniowy i test Witcher 3 spowodowały, że laptop wyraźnie się nagrzał w niektórych miejscach. Wszystko jednak nadal w akceptowalnych wymiarach. W codziennym użytkowaniu (biuro, internet) temperatury obudowy utrzymują się w zielonej strefie.
(-) Maksymalna temperatura w górnej części wynosi 51 °C / 124 F, w porównaniu do średniej 40.4 °C / 105 F , począwszy od 21.2 do 68.8 °C dla klasy Gaming.
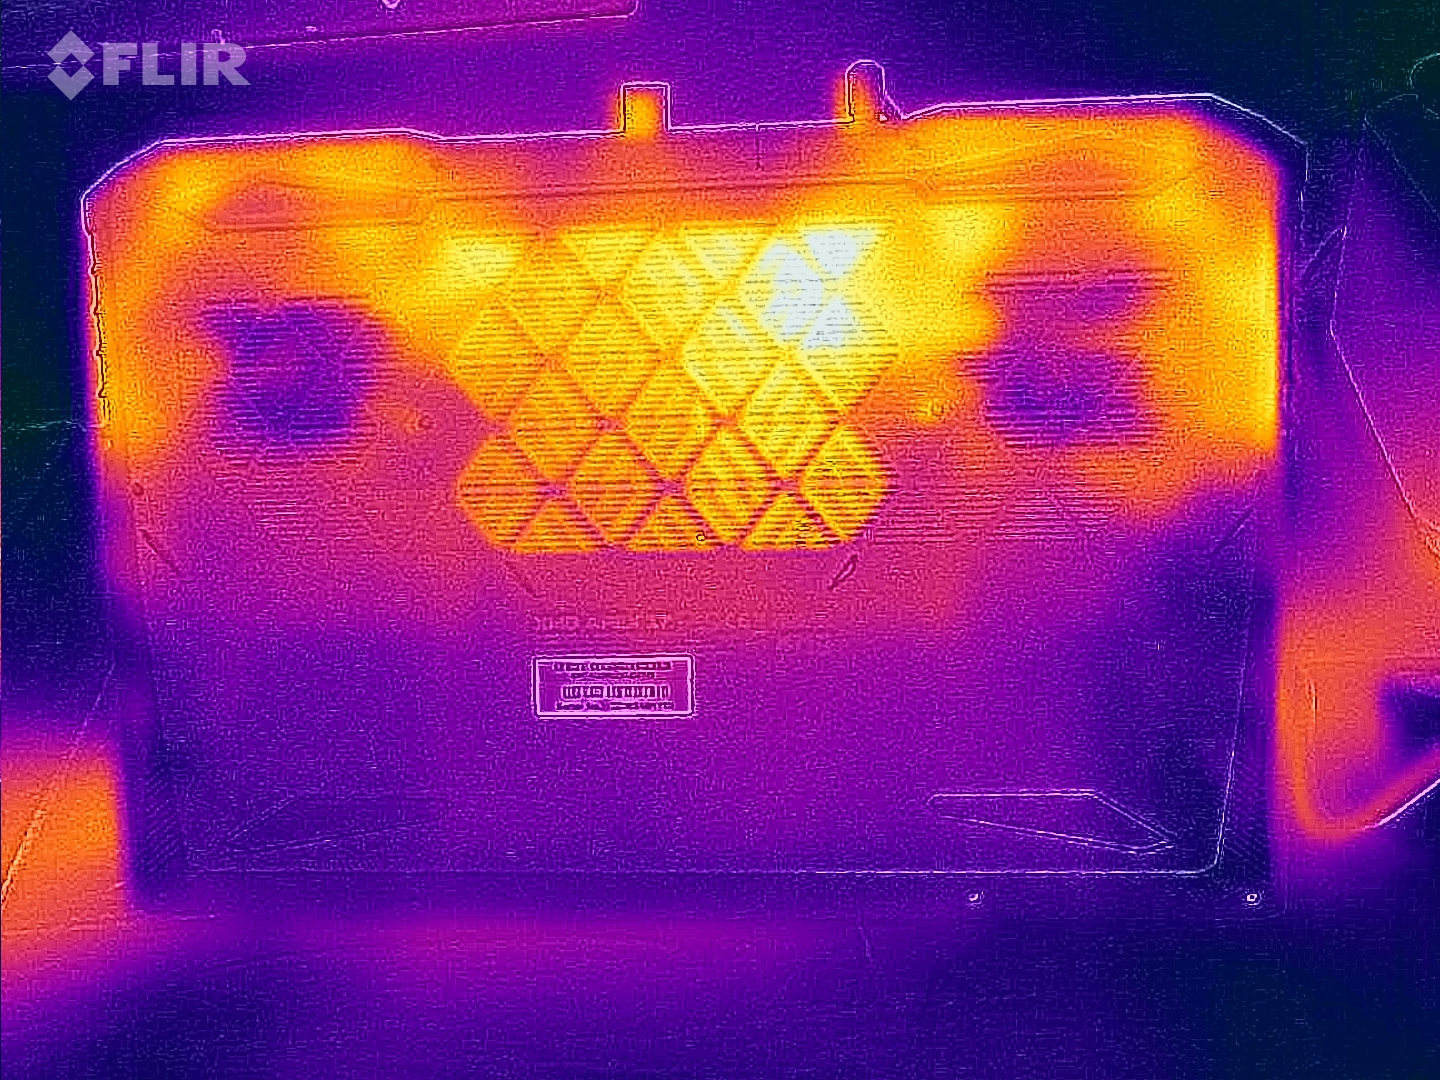
(-) Dno nagrzewa się maksymalnie do 54 °C / 129 F, w porównaniu do średniej 43.2 °C / 110 F
(+) W stanie bezczynności średnia temperatura górnej części wynosi 30.3 °C / 87 F, w porównaniu ze średnią temperaturą urządzenia wynoszącą 33.9 °C / ### class_avg_f### F.
(-) Podczas gry w Wiedźmina 3 średnia temperatura górnej części wynosi 38.2 °C / 101 F, w porównaniu do średniej temperatury urządzenia wynoszącej 33.9 °C / ## #class_avg_f### F.
(+) Podpórki pod nadgarstki i touchpad są chłodniejsze niż temperatura skóry i maksymalnie 31 °C / 87.8 F i dlatego są chłodne w dotyku.
(-) Średnia temperatura obszaru podparcia dłoni w podobnych urządzeniach wynosiła 28.8 °C / 83.8 F (-2.2 °C / -4 F).
| Schenker XMG Apex 17 (Late 23) AMD Ryzen 7 7840HS, NVIDIA GeForce RTX 4060 Laptop GPU | Alienware m16 R1 Intel Intel Core i7-13700HX, NVIDIA GeForce RTX 4060 Laptop GPU | Lenovo Legion Pro 5 16IRX8 Intel Core i7-13700HX, NVIDIA GeForce RTX 4060 Laptop GPU | Acer Nitro 17 AN17-51-71ER Intel Core i7-13700H, NVIDIA GeForce RTX 4060 Laptop GPU | Medion Erazer Defender P40 Intel Core i7-13700HX, NVIDIA GeForce RTX 4060 Laptop GPU | MSI Katana 17 B13VFK Intel Core i7-13620H, NVIDIA GeForce RTX 4060 Laptop GPU | |
|---|---|---|---|---|---|---|
| Heat | -5% | 8% | 4% | 16% | 9% | |
| Maximum Upper Side * (°C) | 51 | 49 4% | 42.8 16% | 46 10% | 42 18% | 41.6 18% |
| Maximum Bottom * (°C) | 54 | 48 11% | 50 7% | 51 6% | 45 17% | 43.1 20% |
| Idle Upper Side * (°C) | 33 | 40 -21% | 29.6 10% | 34 -3% | 28 15% | 32 3% |
| Idle Bottom * (°C) | 34 | 39 -15% | 34 -0% | 33 3% | 30 12% | 35.8 -5% |
* ... im mniej tym lepiej
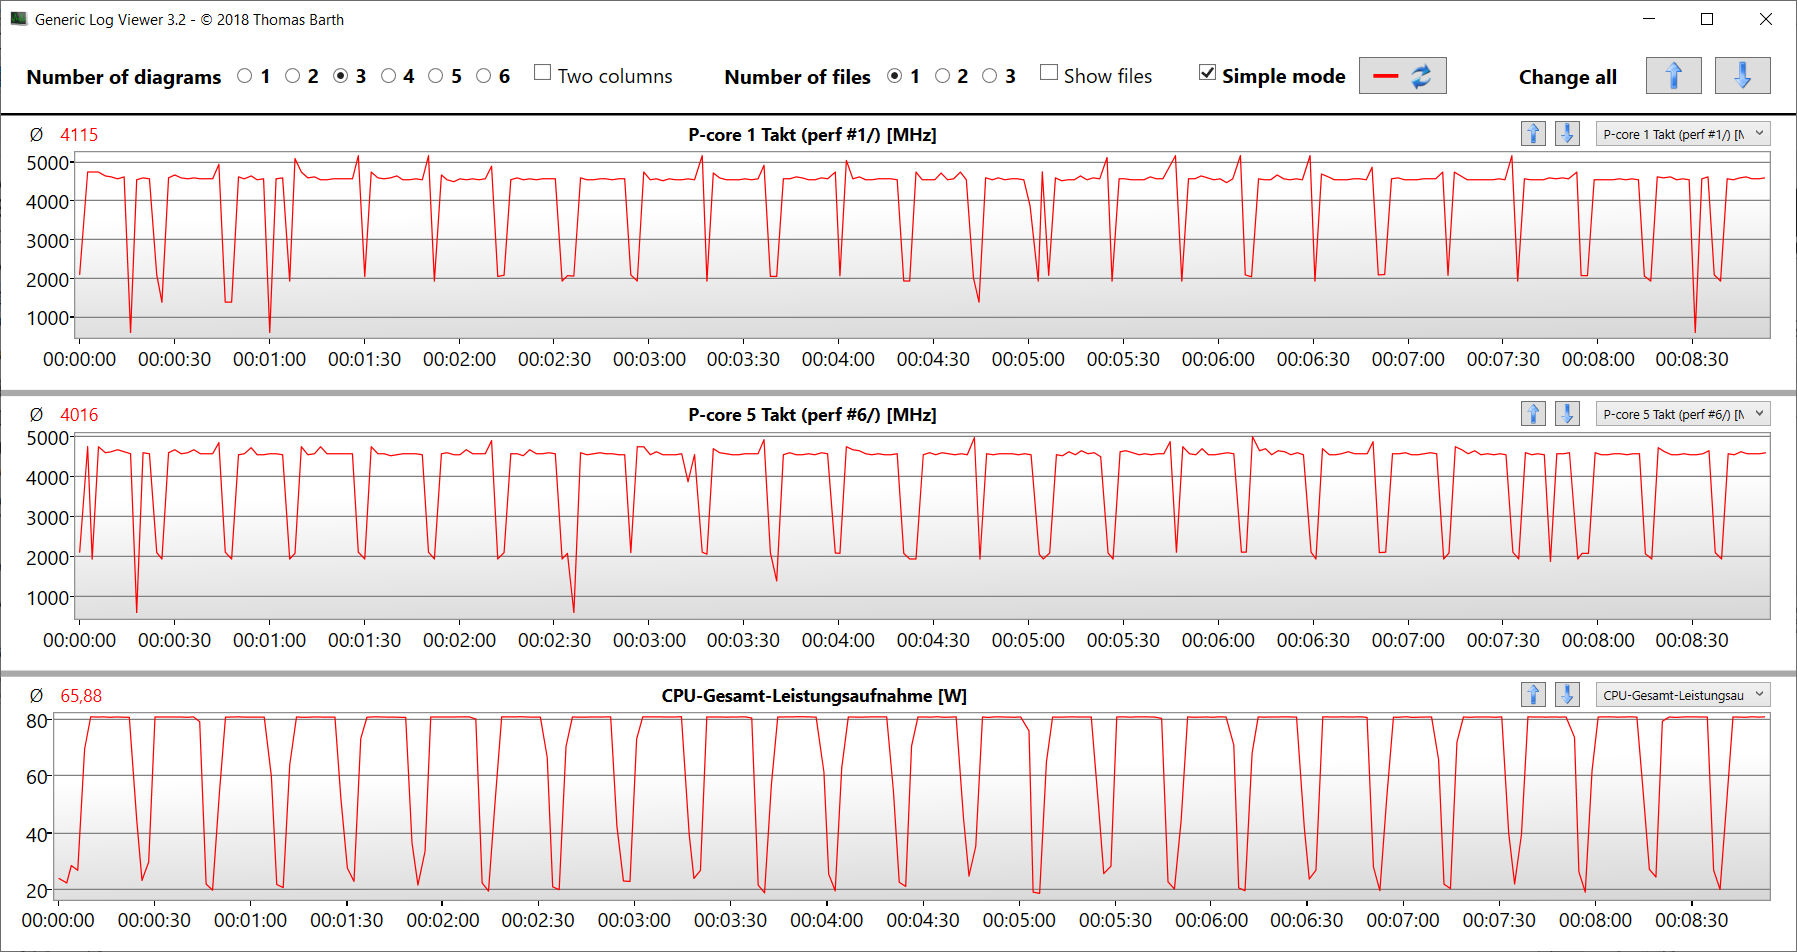
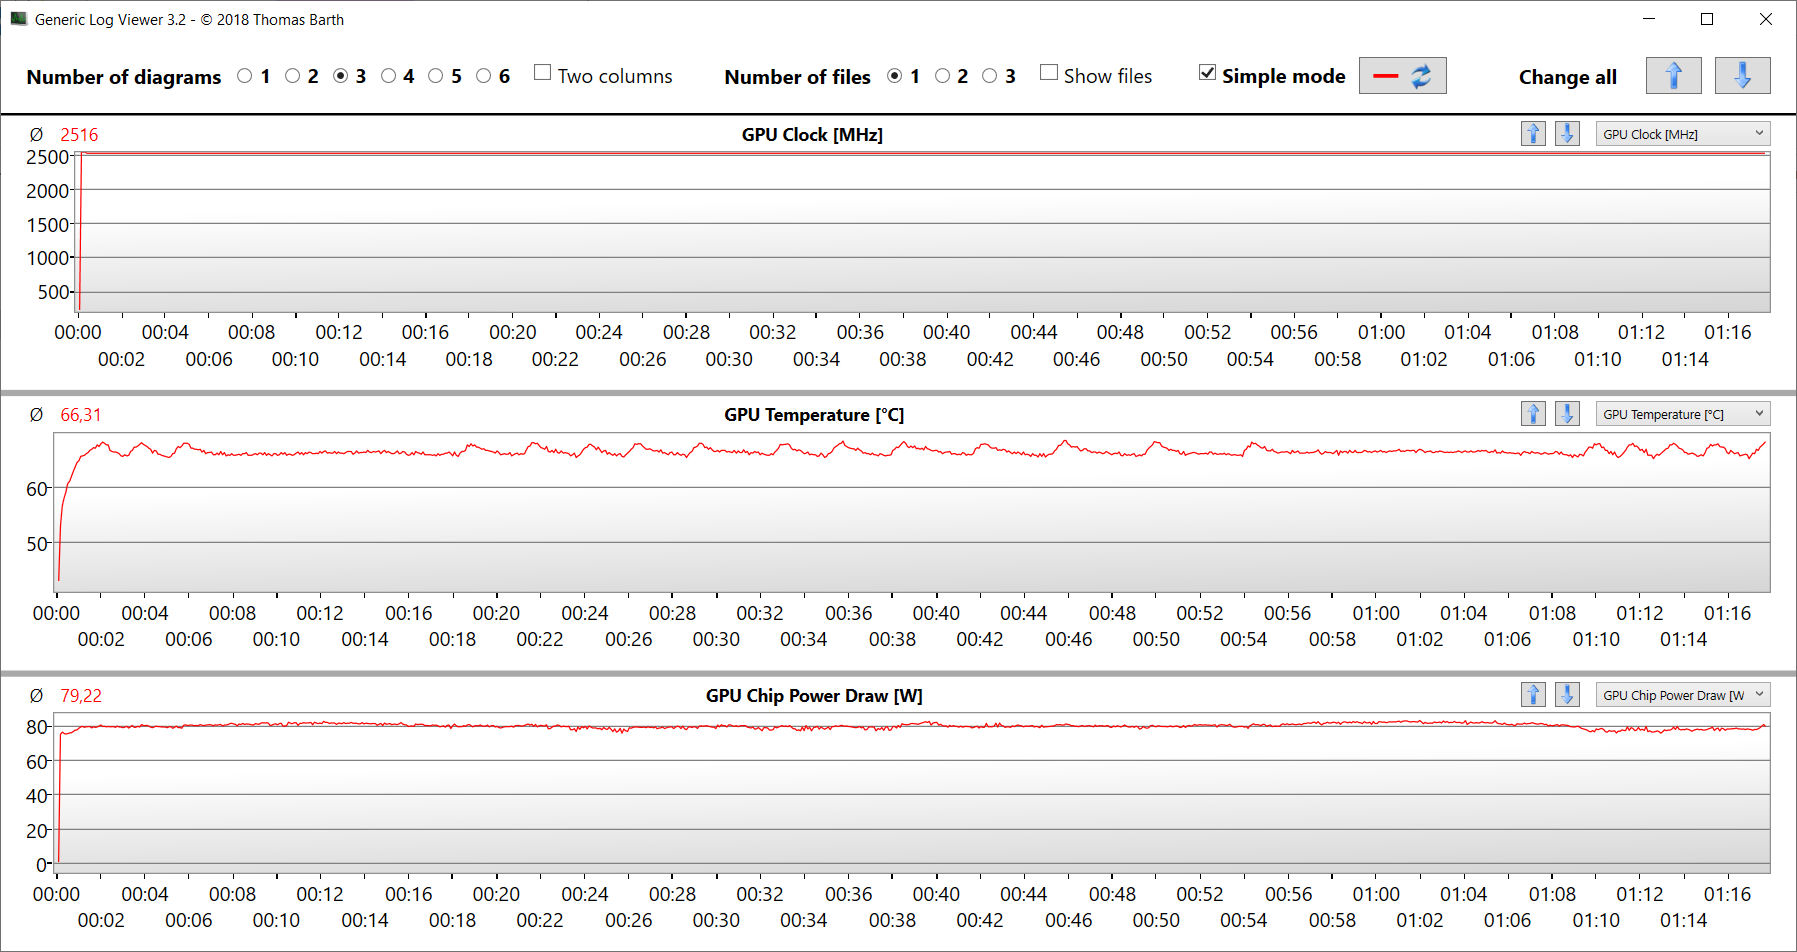
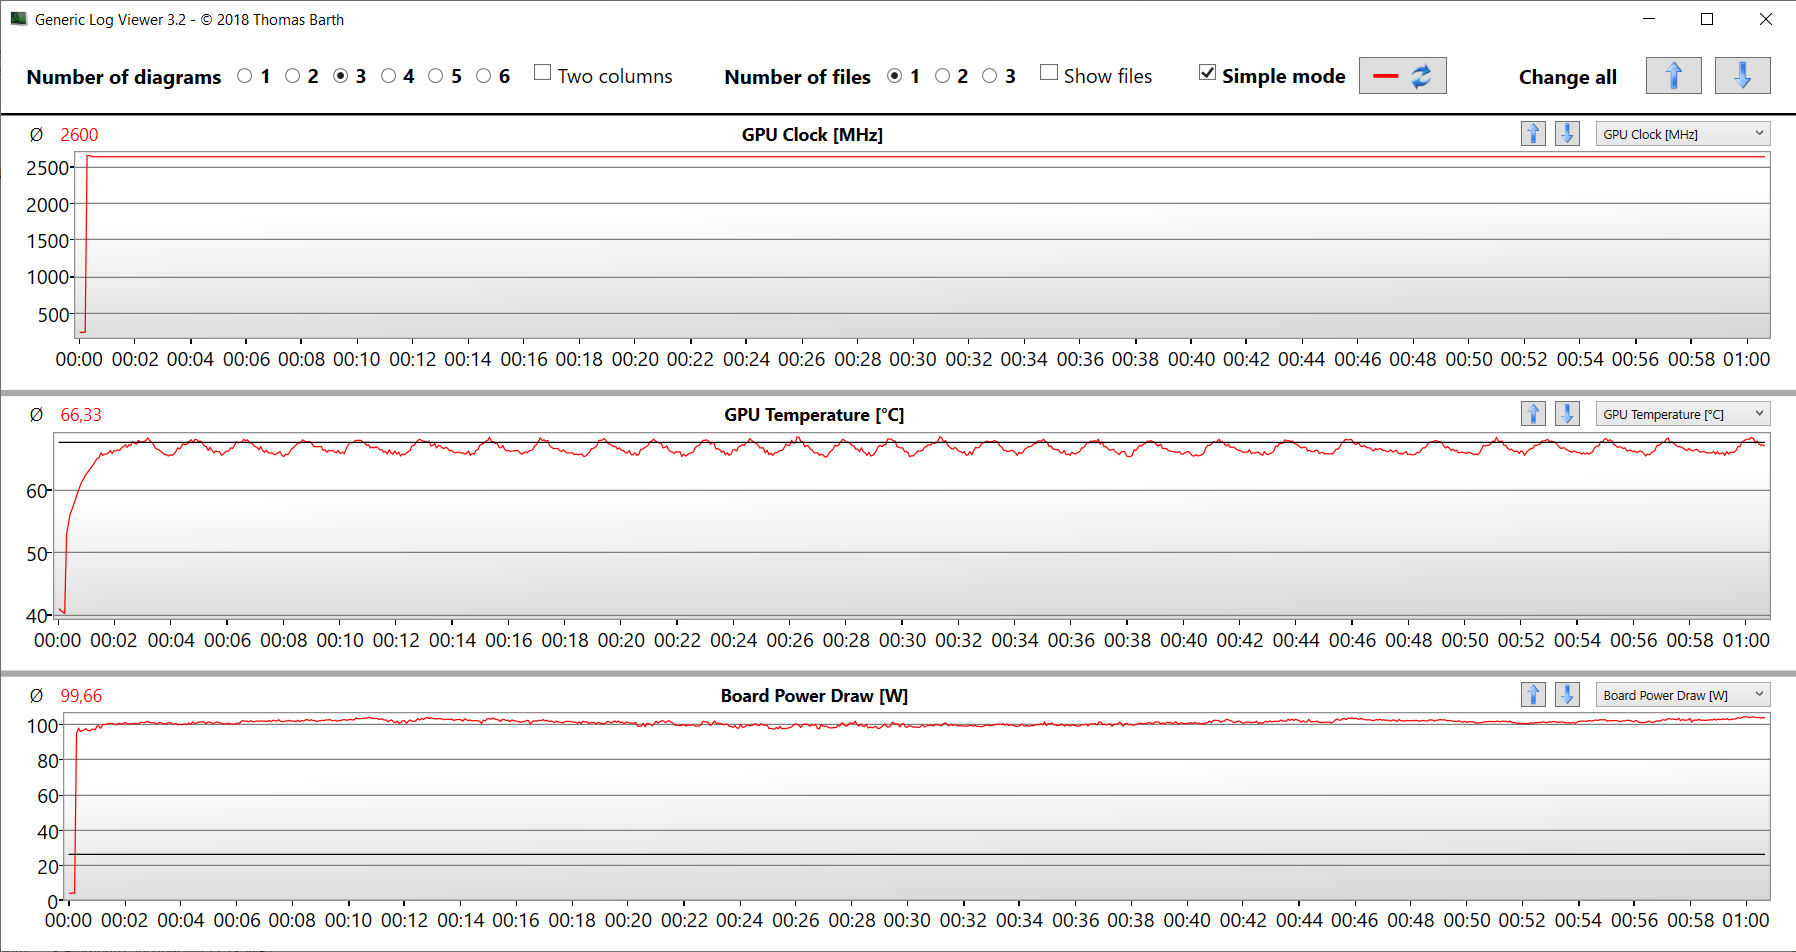
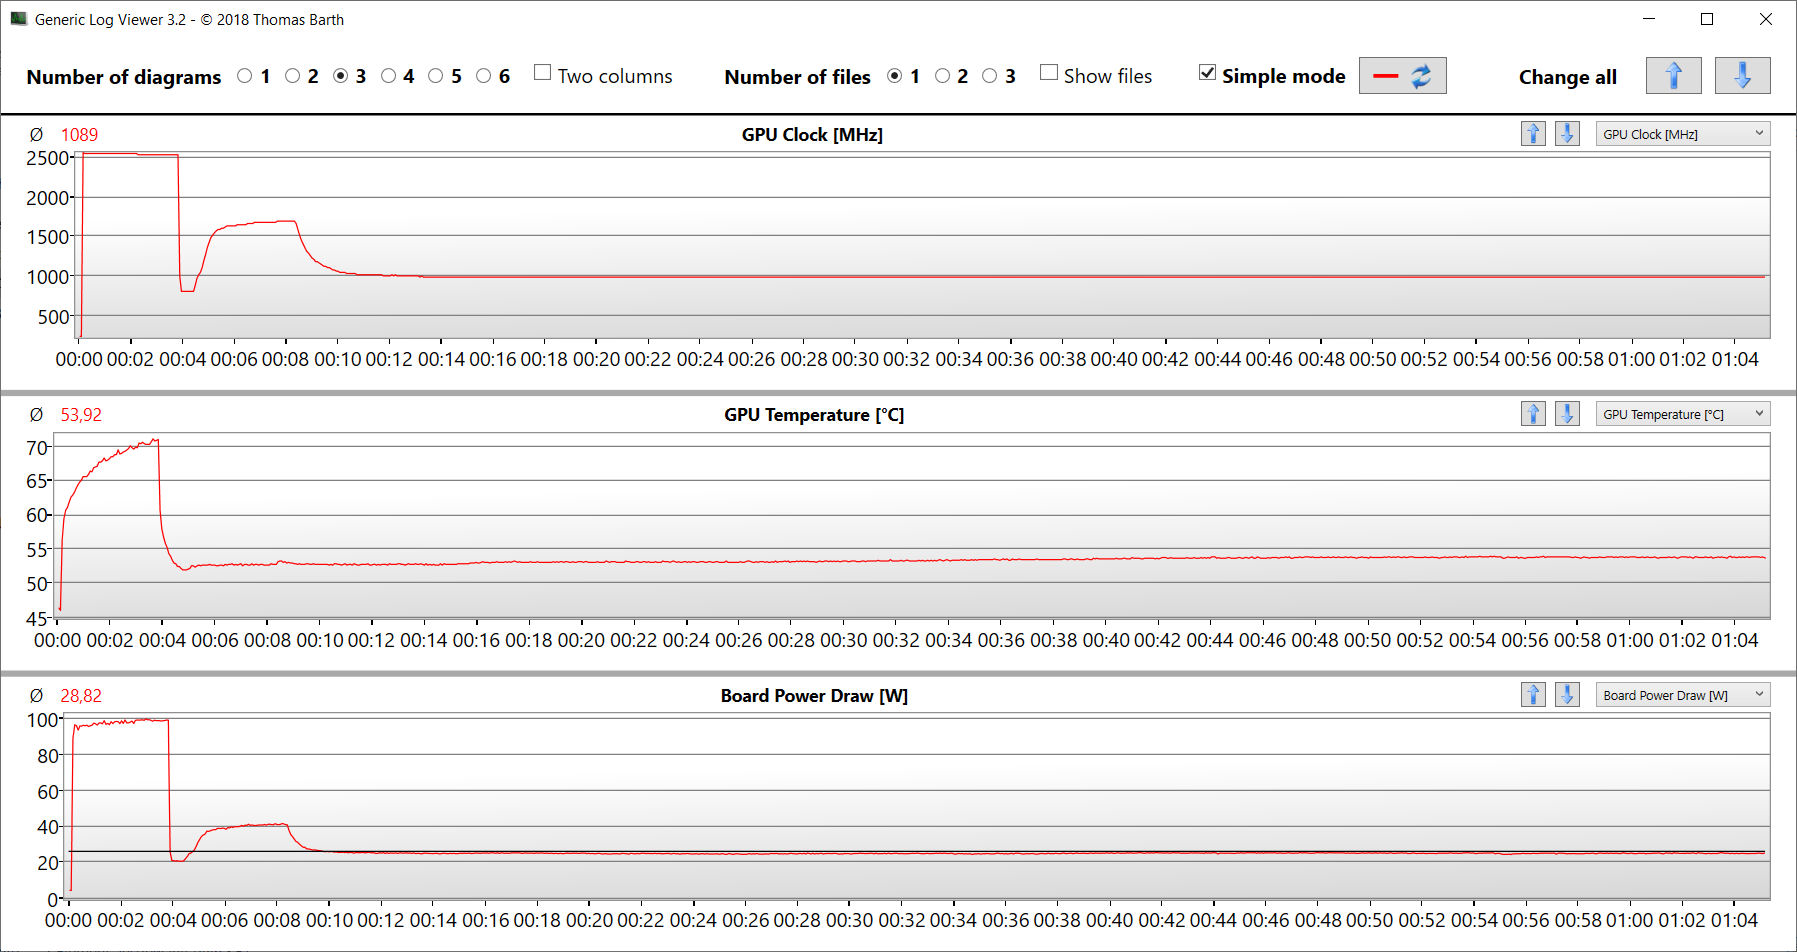
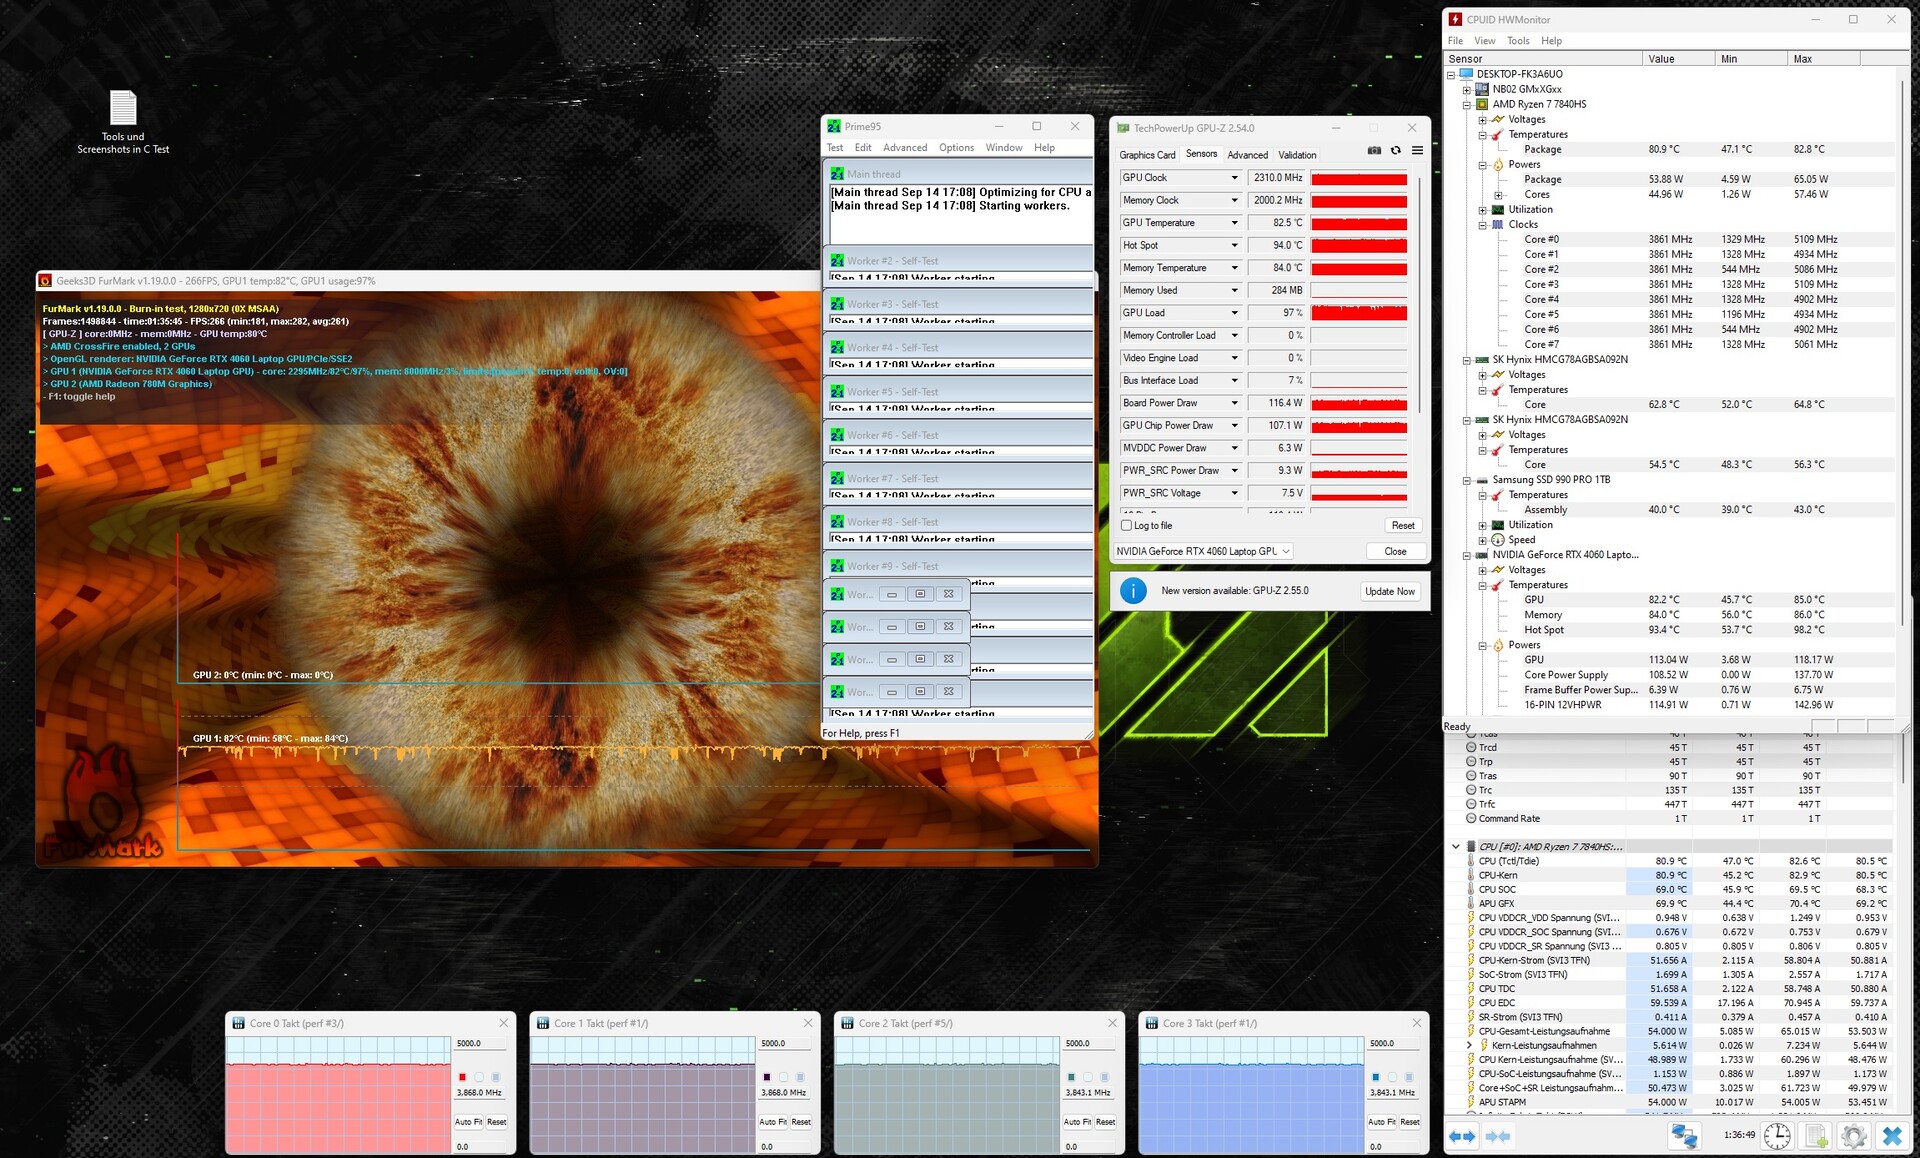
Test warunków skrajnych
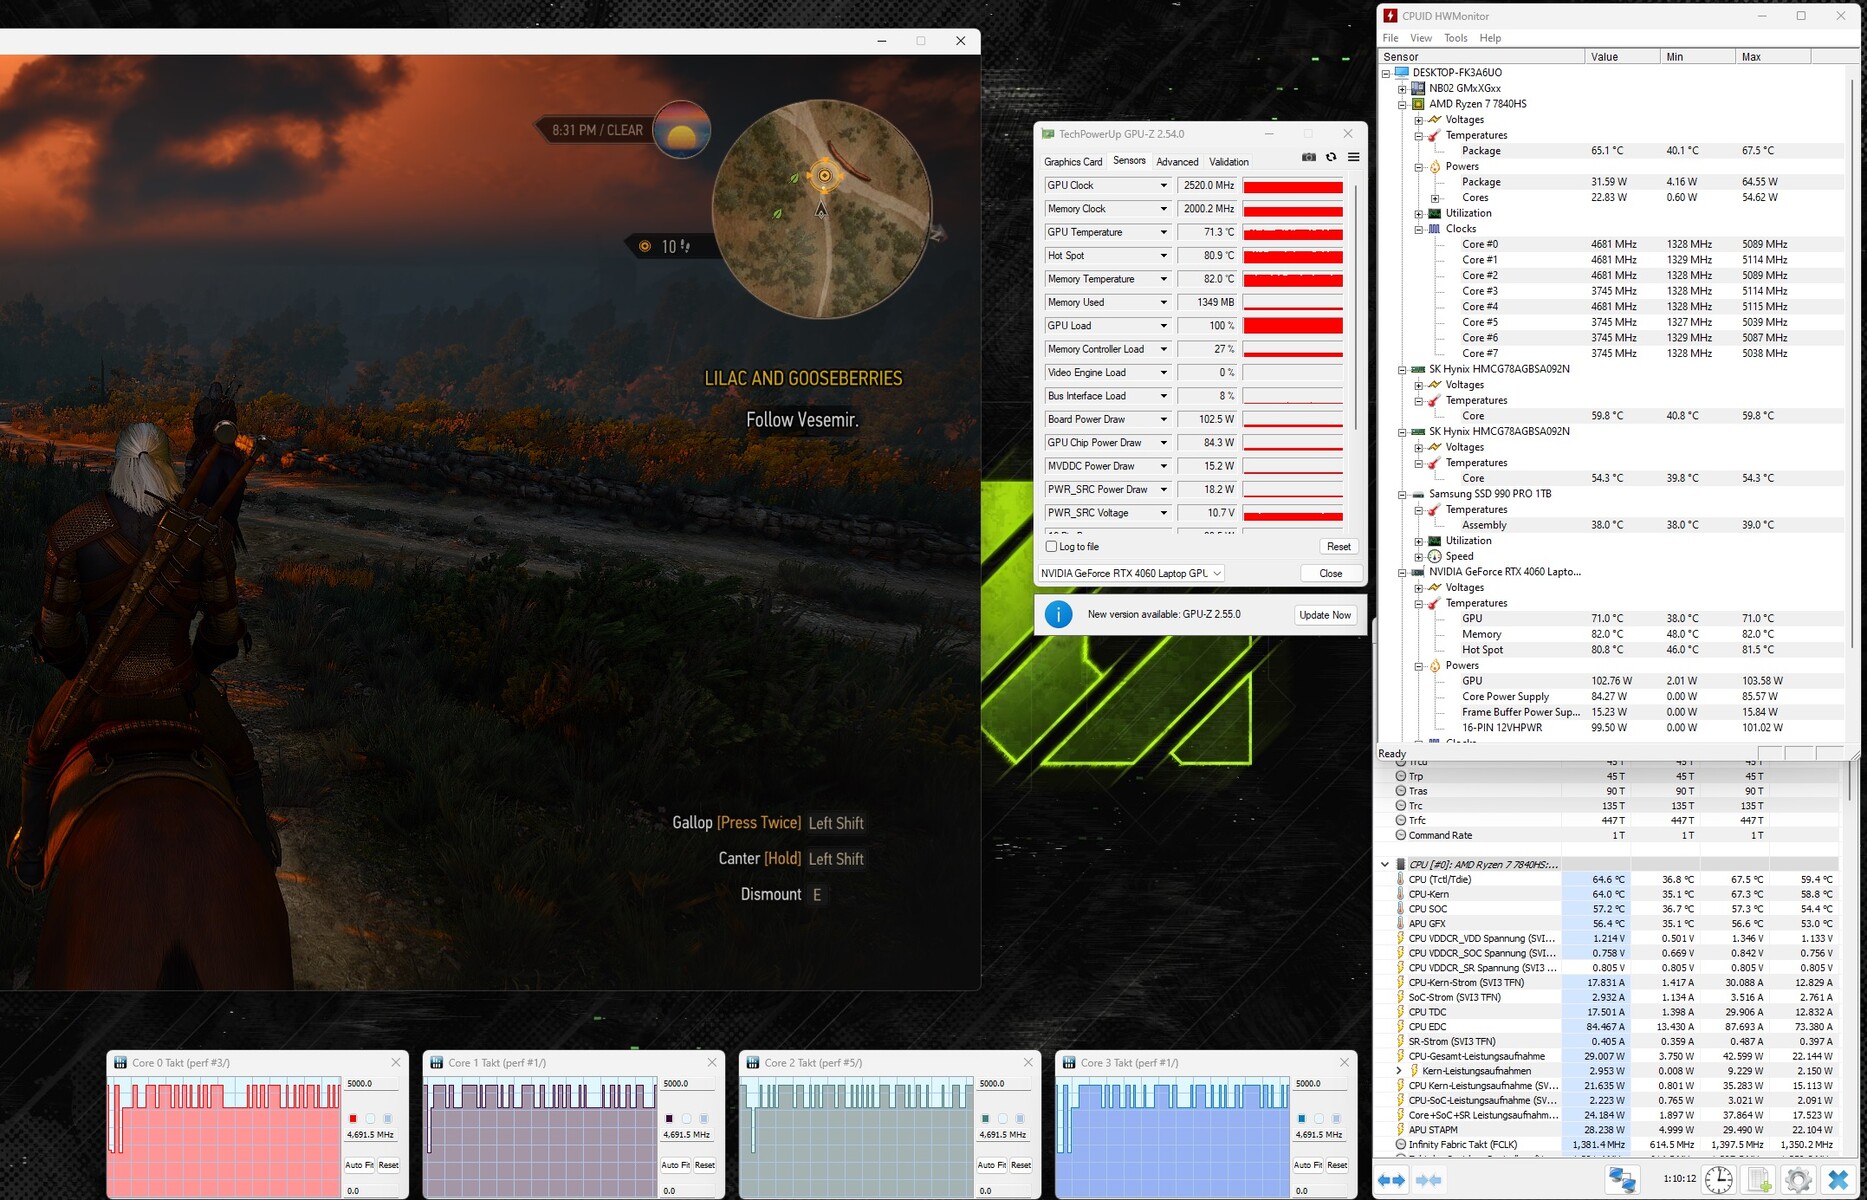
Test obciążeniowy (Prime95 i Furmark w trybie ciągłym) reprezentuje ekstremalny scenariusz, który pozwala nam sprawdzić stabilność systemu pod pełnym obciążeniem. Procesor pracował przez cały test z taktowaniem od 3,8 do 3,9 GHz, a rdzenie graficzne działały z częstotliwością od 2,2 do 2,4 GHz.
Głośniki
Głośniki stereo generują przyzwoity dźwięk, ale brakuje im basów. Aby uzyskać lepsze wrażenia dźwiękowe, zalecamy korzystanie ze słuchawek lub głośników zewnętrznych.
Schenker XMG Apex 17 (Late 23) analiza dźwięku
(±) | głośność głośnika jest średnia, ale dobra (80 dB)
Bas 100 - 315 Hz
(-) | prawie brak basu - średnio 29% niższa od mediany
(±) | liniowość basu jest średnia (10.4% delta do poprzedniej częstotliwości)
Średnie 400 - 2000 Hz
(+) | zbalansowane środki średnie - tylko 2.7% od mediany
(+) | średnie są liniowe (4.7% delta do poprzedniej częstotliwości)
Wysokie 2–16 kHz
(+) | zrównoważone maksima - tylko 2.1% od mediany
(+) | wzloty są liniowe (4.9% delta do poprzedniej częstotliwości)
Ogólnie 100 - 16.000 Hz
(±) | liniowość ogólnego dźwięku jest średnia (18.3% różnicy w stosunku do mediany)
W porównaniu do tej samej klasy
» 58% wszystkich testowanych urządzeń w tej klasie było lepszych, 9% podobnych, 33% gorszych
» Najlepszy miał deltę 6%, średnia wynosiła ###średnia###%, najgorsza wynosiła 132%
W porównaniu do wszystkich testowanych urządzeń
» 40% wszystkich testowanych urządzeń było lepszych, 8% podobnych, 52% gorszych
» Najlepszy miał deltę 4%, średnia wynosiła ###średnia###%, najgorsza wynosiła 134%
Alienware m16 R1 Intel analiza dźwięku
(+) | głośniki mogą odtwarzać stosunkowo głośno (87 dB)
Bas 100 - 315 Hz
(-) | prawie brak basu - średnio 24% niższa od mediany
(±) | liniowość basu jest średnia (13.5% delta do poprzedniej częstotliwości)
Średnie 400 - 2000 Hz
(+) | zbalansowane środki średnie - tylko 1.4% od mediany
(+) | średnie są liniowe (3.3% delta do poprzedniej częstotliwości)
Wysokie 2–16 kHz
(+) | zrównoważone maksima - tylko 3.5% od mediany
(+) | wzloty są liniowe (4.6% delta do poprzedniej częstotliwości)
Ogólnie 100 - 16.000 Hz
(+) | ogólny dźwięk jest liniowy (13.4% różnicy w stosunku do mediany)
W porównaniu do tej samej klasy
» 19% wszystkich testowanych urządzeń w tej klasie było lepszych, 7% podobnych, 74% gorszych
» Najlepszy miał deltę 6%, średnia wynosiła ###średnia###%, najgorsza wynosiła 132%
W porównaniu do wszystkich testowanych urządzeń
» 14% wszystkich testowanych urządzeń było lepszych, 4% podobnych, 83% gorszych
» Najlepszy miał deltę 4%, średnia wynosiła ###średnia###%, najgorsza wynosiła 134%
Zarządzanie energią - Schenker XMG zapewnia przyzwoitą żywotność baterii
Zużycie energii
Godny pochwały: Wśród porównywanych urządzeń Apex 17 jest najbardziej ekonomicznym laptopem. Ogólnie rzecz biorąc, konkurenci mają znacznie większe zapotrzebowanie na moc. Test obciążeniowy i Witcher 3 przebiegły ze stałym poborem mocy. Zasilacz (230 W) jest odpowiedniej wielkości.
| wyłączony / stan wstrzymania | |
| luz | |
| obciążenie |
|
Legenda:
min: | |
| Schenker XMG Apex 17 (Late 23) R7 7840HS, GeForce RTX 4060 Laptop GPU | Alienware m16 R1 Intel i7-13700HX, GeForce RTX 4060 Laptop GPU | Lenovo Legion Pro 5 16IRX8 i7-13700HX, GeForce RTX 4060 Laptop GPU | Acer Nitro 17 AN17-51-71ER i7-13700H, GeForce RTX 4060 Laptop GPU | Medion Erazer Defender P40 i7-13700HX, GeForce RTX 4060 Laptop GPU | MSI Katana 17 B13VFK i7-13620H, GeForce RTX 4060 Laptop GPU | Przeciętny NVIDIA GeForce RTX 4060 Laptop GPU | Średnia w klasie Gaming | |
|---|---|---|---|---|---|---|---|---|
| Power Consumption | -38% | -90% | -8% | -20% | -16% | -28% | -51% | |
| Idle Minimum * (Watt) | 9 | 10 -11% | 24.5 -172% | 8.3 8% | 8 11% | 12.2 -36% | 11.5 ? -28% | 13.3 ? -48% |
| Idle Average * (Watt) | 12 | 14 -17% | 29.2 -143% | 13.5 -13% | 12 -0% | 14.9 -24% | 16 ? -33% | 19 ? -58% |
| Idle Maximum * (Watt) | 14 | 21 -50% | 34.3 -145% | 14.8 -6% | 18 -29% | 15.8 -13% | 20.3 ? -45% | 24.5 ? -75% |
| Load Average * (Watt) | 67 | 119 -78% | 98.7 -47% | 77 -15% | 101 -51% | 85.22 -27% | 92.9 ? -39% | 108.1 ? -61% |
| Witcher 3 ultra * (Watt) | 147.6 | 186.7 -26% | 178.6 -21% | 154 -4% | 180.8 -22% | 151.1 -2% | ||
| Load Maximum * (Watt) | 223 | 323 -45% | 249.6 -12% | 263 -18% | 284 -27% | 212.8 5% | 210 ? 6% | 254 ? -14% |
* ... im mniej tym lepiej
Power consumption Witcher 3 / stress test
Power consumption with an external monitor
Żywotność baterii
W teście Wi-Fi (przy użyciu skryptu do ładowania stron internetowych) i teście wideo (krótki film Big Buck Bunny (kodowanie H.264, FHD), 17,3-calowe urządzenie osiągnęło czasy pracy wynoszące odpowiednio 5,06 i 6,51 godziny. Podczas testów funkcje oszczędzania energii laptopa były wyłączone, a jasność wyświetlacza ustawiona na około 150 cd/m². Ponadto test wideo został przeprowadzony przy wyłączonych modułach radiowych.
Chociaż Apex ma stosunkowo niską pojemność baterii, osiąga bardzo przyzwoite czasy pracy. Komputer pozostawia w tyle niektórych konkurentów z większymi bateriami.
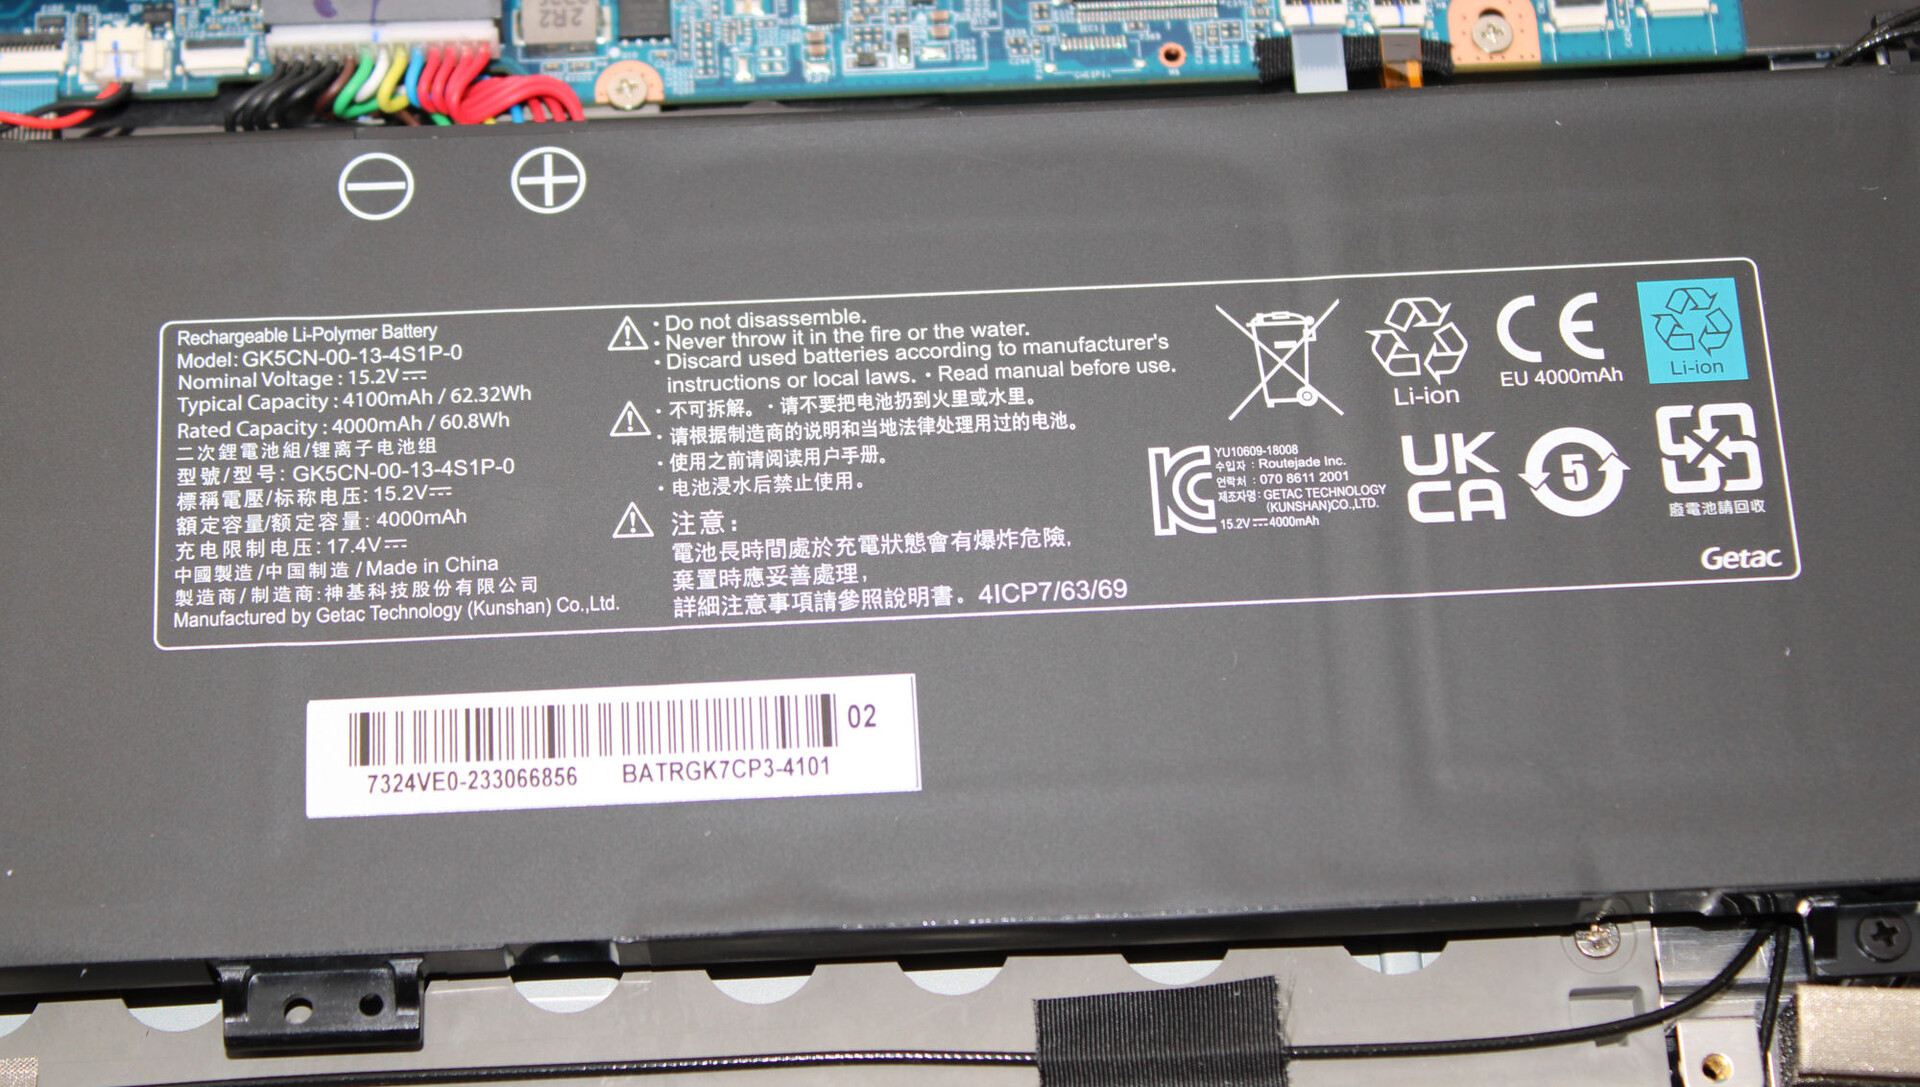
| Schenker XMG Apex 17 (Late 23) R7 7840HS, GeForce RTX 4060 Laptop GPU, 62.32 Wh | Alienware m16 R1 Intel i7-13700HX, GeForce RTX 4060 Laptop GPU, 86 Wh | Lenovo Legion Pro 5 16IRX8 i7-13700HX, GeForce RTX 4060 Laptop GPU, 80 Wh | Acer Nitro 17 AN17-51-71ER i7-13700H, GeForce RTX 4060 Laptop GPU, 90 Wh | Medion Erazer Defender P40 i7-13700HX, GeForce RTX 4060 Laptop GPU, 73 Wh | MSI Katana 17 B13VFK i7-13620H, GeForce RTX 4060 Laptop GPU, 53.5 Wh | Średnia w klasie Gaming | |
|---|---|---|---|---|---|---|---|
| Czasy pracy | -20% | -34% | 31% | -0% | -40% | 15% | |
| Reader / Idle (h) | 7.8 | 6.4 -18% | 6.7 -14% | 8.8 13% | 8.71 ? 12% | ||
| H.264 (h) | 6.9 | 5.6 -19% | 6.9 0% | 5.7 -17% | 8.26 ? 20% | ||
| WiFi v1.3 (h) | 5.1 | 4.8 -6% | 3.4 -33% | 8.2 61% | 6.2 22% | 2.9 -43% | 7.01 ? 37% |
| Load (h) | 1.6 | 1 -37% | 0.7 -56% | 1.3 -19% | 1 -37% | 1.47 ? -8% | |
| Witcher 3 ultra (h) | 2.5 |
Za
Przeciw
Werdykt - skromna maszyna do gier średniej klasy
Das Apex 17 bez trudu spełnia swoje zadania (granie w rozdzielczości QHD, renderowanie, edycja wideo).Ryzen 7 7840HSi GeForce RTX 4060 sprawiają, że jest to możliwe. Oba układy mogą pracować ze stałymi, wysokimi taktowaniami.
Wraz z XMG Apex 17 (późno 23), Schenker dostarczył dobrze zaokrąglony, średniej klasy laptop QHD.
Komputer nie generuje dużego hałasu podczas codziennego użytkowania, ale podczas grania można osiągnąć kompromis między wydajnością a hałasem, wybierając odpowiedni profil. Rzeczywisty czas pracy na baterii wynoszący około 5 do 7 godzin - mierzony w stosunku do pojemności baterii - jest całkowicie akceptowalny. Baterii nie można ładować przez port USB-C (USB 3.2 Gen 2).
Laptop oferuje miejsce na dwa dyski SSD PCIe 4 (M.2 2280). Obsługiwany jest RAID 0/1. Sklep internetowy Schenker umożliwia wybór preferowanego dysku SSD lub dysków SSD. Recenzowane urządzenie jest wyposażone w niesamowicie szybki dysk SSD PCIe 4 (1 TB). Ogólnie rzecz biorąc, zainstalowany wyświetlacz QHD (17,3 cala, 2560 x 1440 pikseli, sRGB, IPS, 240 Hz) zrobił dobre wrażenie. Alternatywnie dostępny jest tańszy panel FHD.
Medion Erazer Defender PMedion Erazer Defender P40 byłby alternatywą o porównywalnej wydajności i specyfikacji. W przeciwieństwie do Apexa, P40 ma na pokładzie port Thunderbolt 4.
Notebookcheck.com wkrótce opublikuje recenzję 15,6-calowego modelu siostrzanego, XMG Apex 15 (pod koniec 23 roku) w wariancie z procesorem Ryzen 7 7840HS i kartą graficzną GeForce RTX 4050.
Cena i dostępność
Wariant podobny do naszego recenzowanego urządzenia (16 zamiast 32 GB pamięci RAM) jest dostępny za 1739 euro w Notebooksbilliger.de. Oferują oni również tańszy, podstawowy model z kartą GeForce RTX 4050 za 1399 euro. Alternatywnie, możliwe jest skonfigurowanie własnego urządzenia w sklepie internetowym Schenker.
Schenker XMG Apex 17 (Late 23)
- 04/10/2023 v7 (old)
Sascha Mölck
Przezroczystość
Wyboru urządzeń do recenzji dokonuje nasza redakcja. Próbka testowa została udostępniona autorowi jako pożyczka od producenta lub sprzedawcy detalicznego na potrzeby tej recenzji. Pożyczkodawca nie miał wpływu na tę recenzję, producent nie otrzymał też kopii tej recenzji przed publikacją. Nie było obowiązku publikowania tej recenzji. Jako niezależna firma medialna, Notebookcheck nie podlega władzy producentów, sprzedawców detalicznych ani wydawców.
Tak testuje Notebookcheck
Każdego roku Notebookcheck niezależnie sprawdza setki laptopów i smartfonów, stosując standardowe procedury, aby zapewnić porównywalność wszystkich wyników. Od około 20 lat stale rozwijamy nasze metody badawcze, ustanawiając przy tym standardy branżowe. W naszych laboratoriach testowych doświadczeni technicy i redaktorzy korzystają z wysokiej jakości sprzętu pomiarowego. Testy te obejmują wieloetapowy proces walidacji. Nasz kompleksowy system ocen opiera się na setkach uzasadnionych pomiarów i benchmarków, co pozwala zachować obiektywizm.Price comparison

