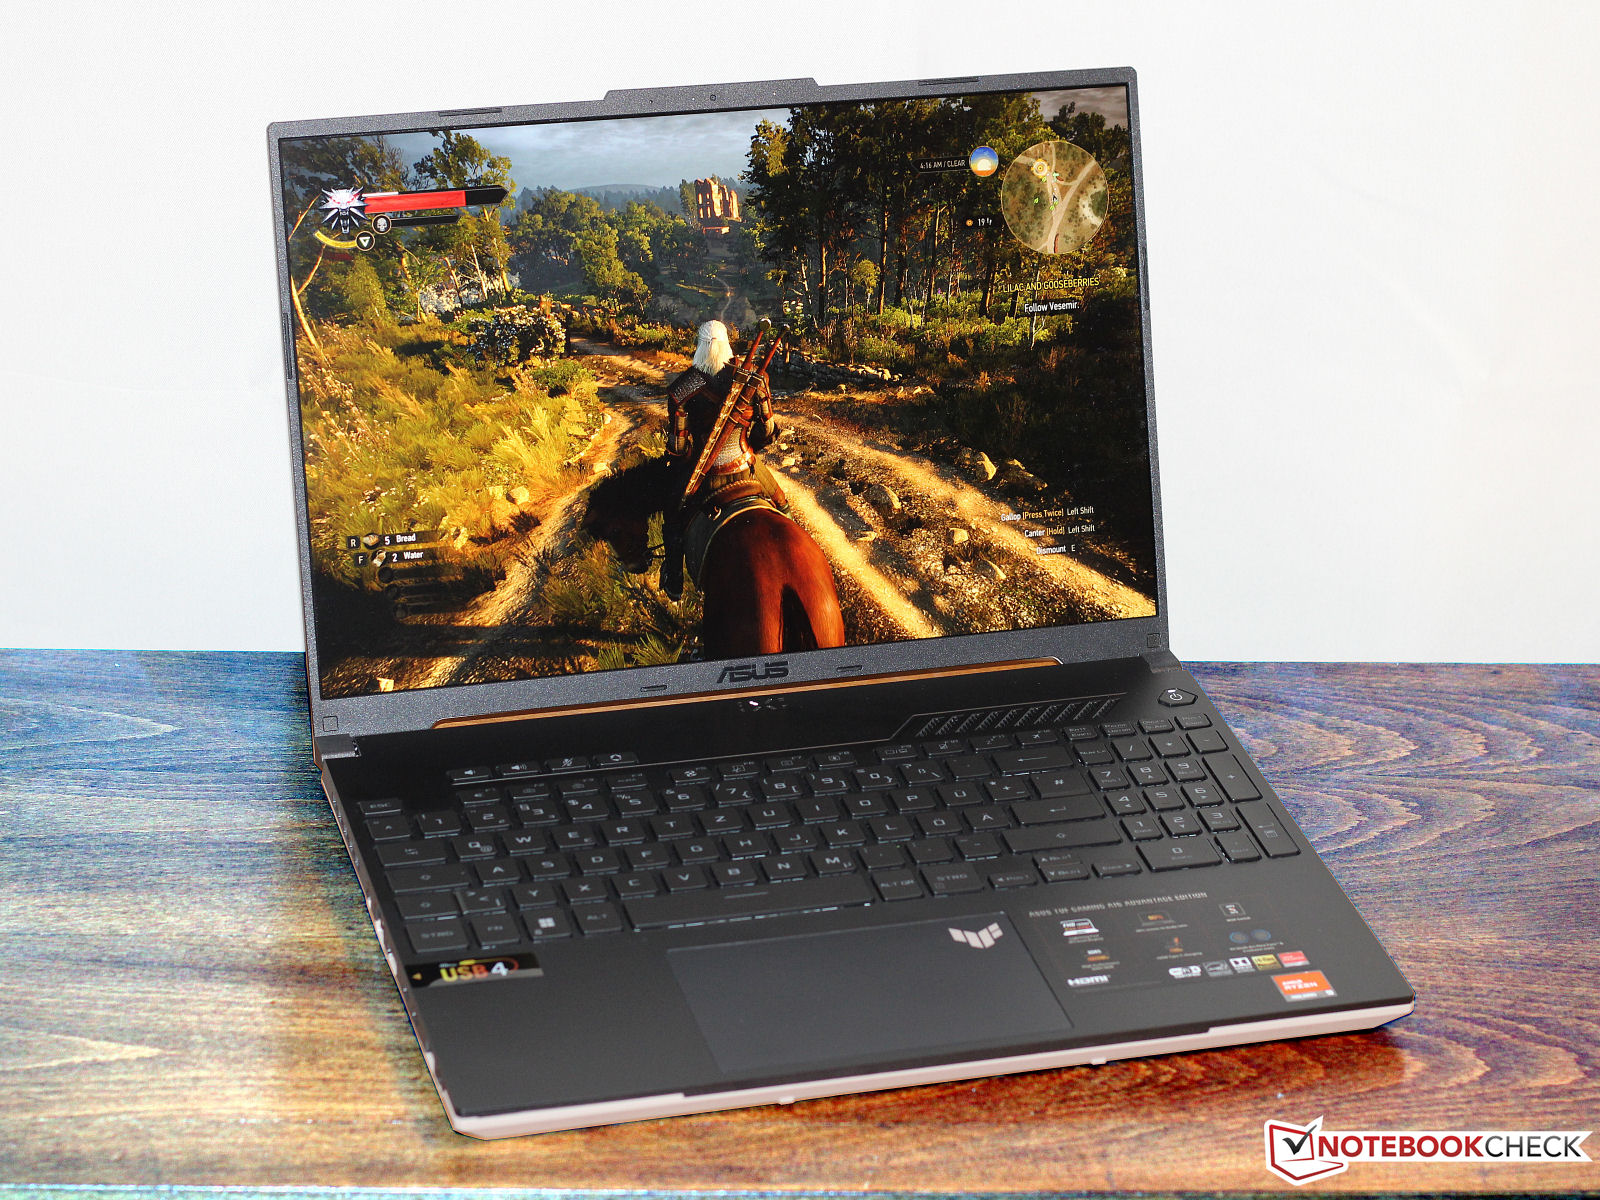
Recenzja Asus TUF Gaming A16 Advantage Edition FA617XS: Laptop AMD z czasem pracy do 20 godzin
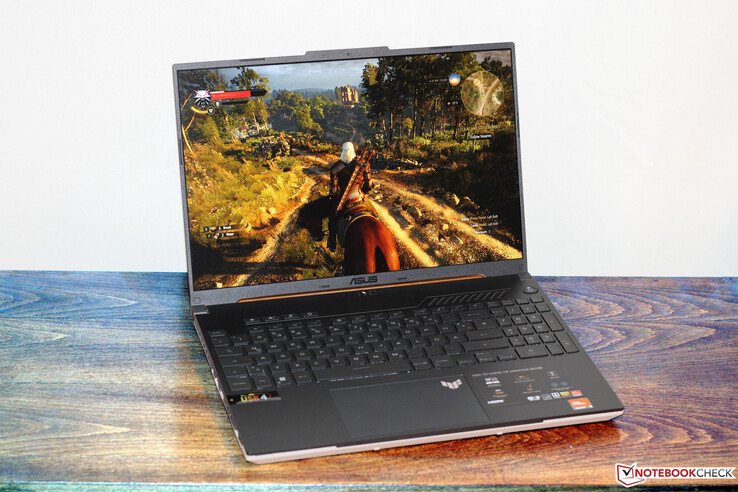
Asus TUF Gaming A16 Advantage Edition - średniej klasy laptop do gier - opiera się na sprzęcie AMD: ARyzen-9-7940HSaPU iRadeon-RX-7600SgPU. Konkurenci to między innymiLenovo Legion Pro 5 16IRX8iMSI Katana 15 B12VEK, MedionMedion Erazer Defender P40i Gigabyte G5 KE.
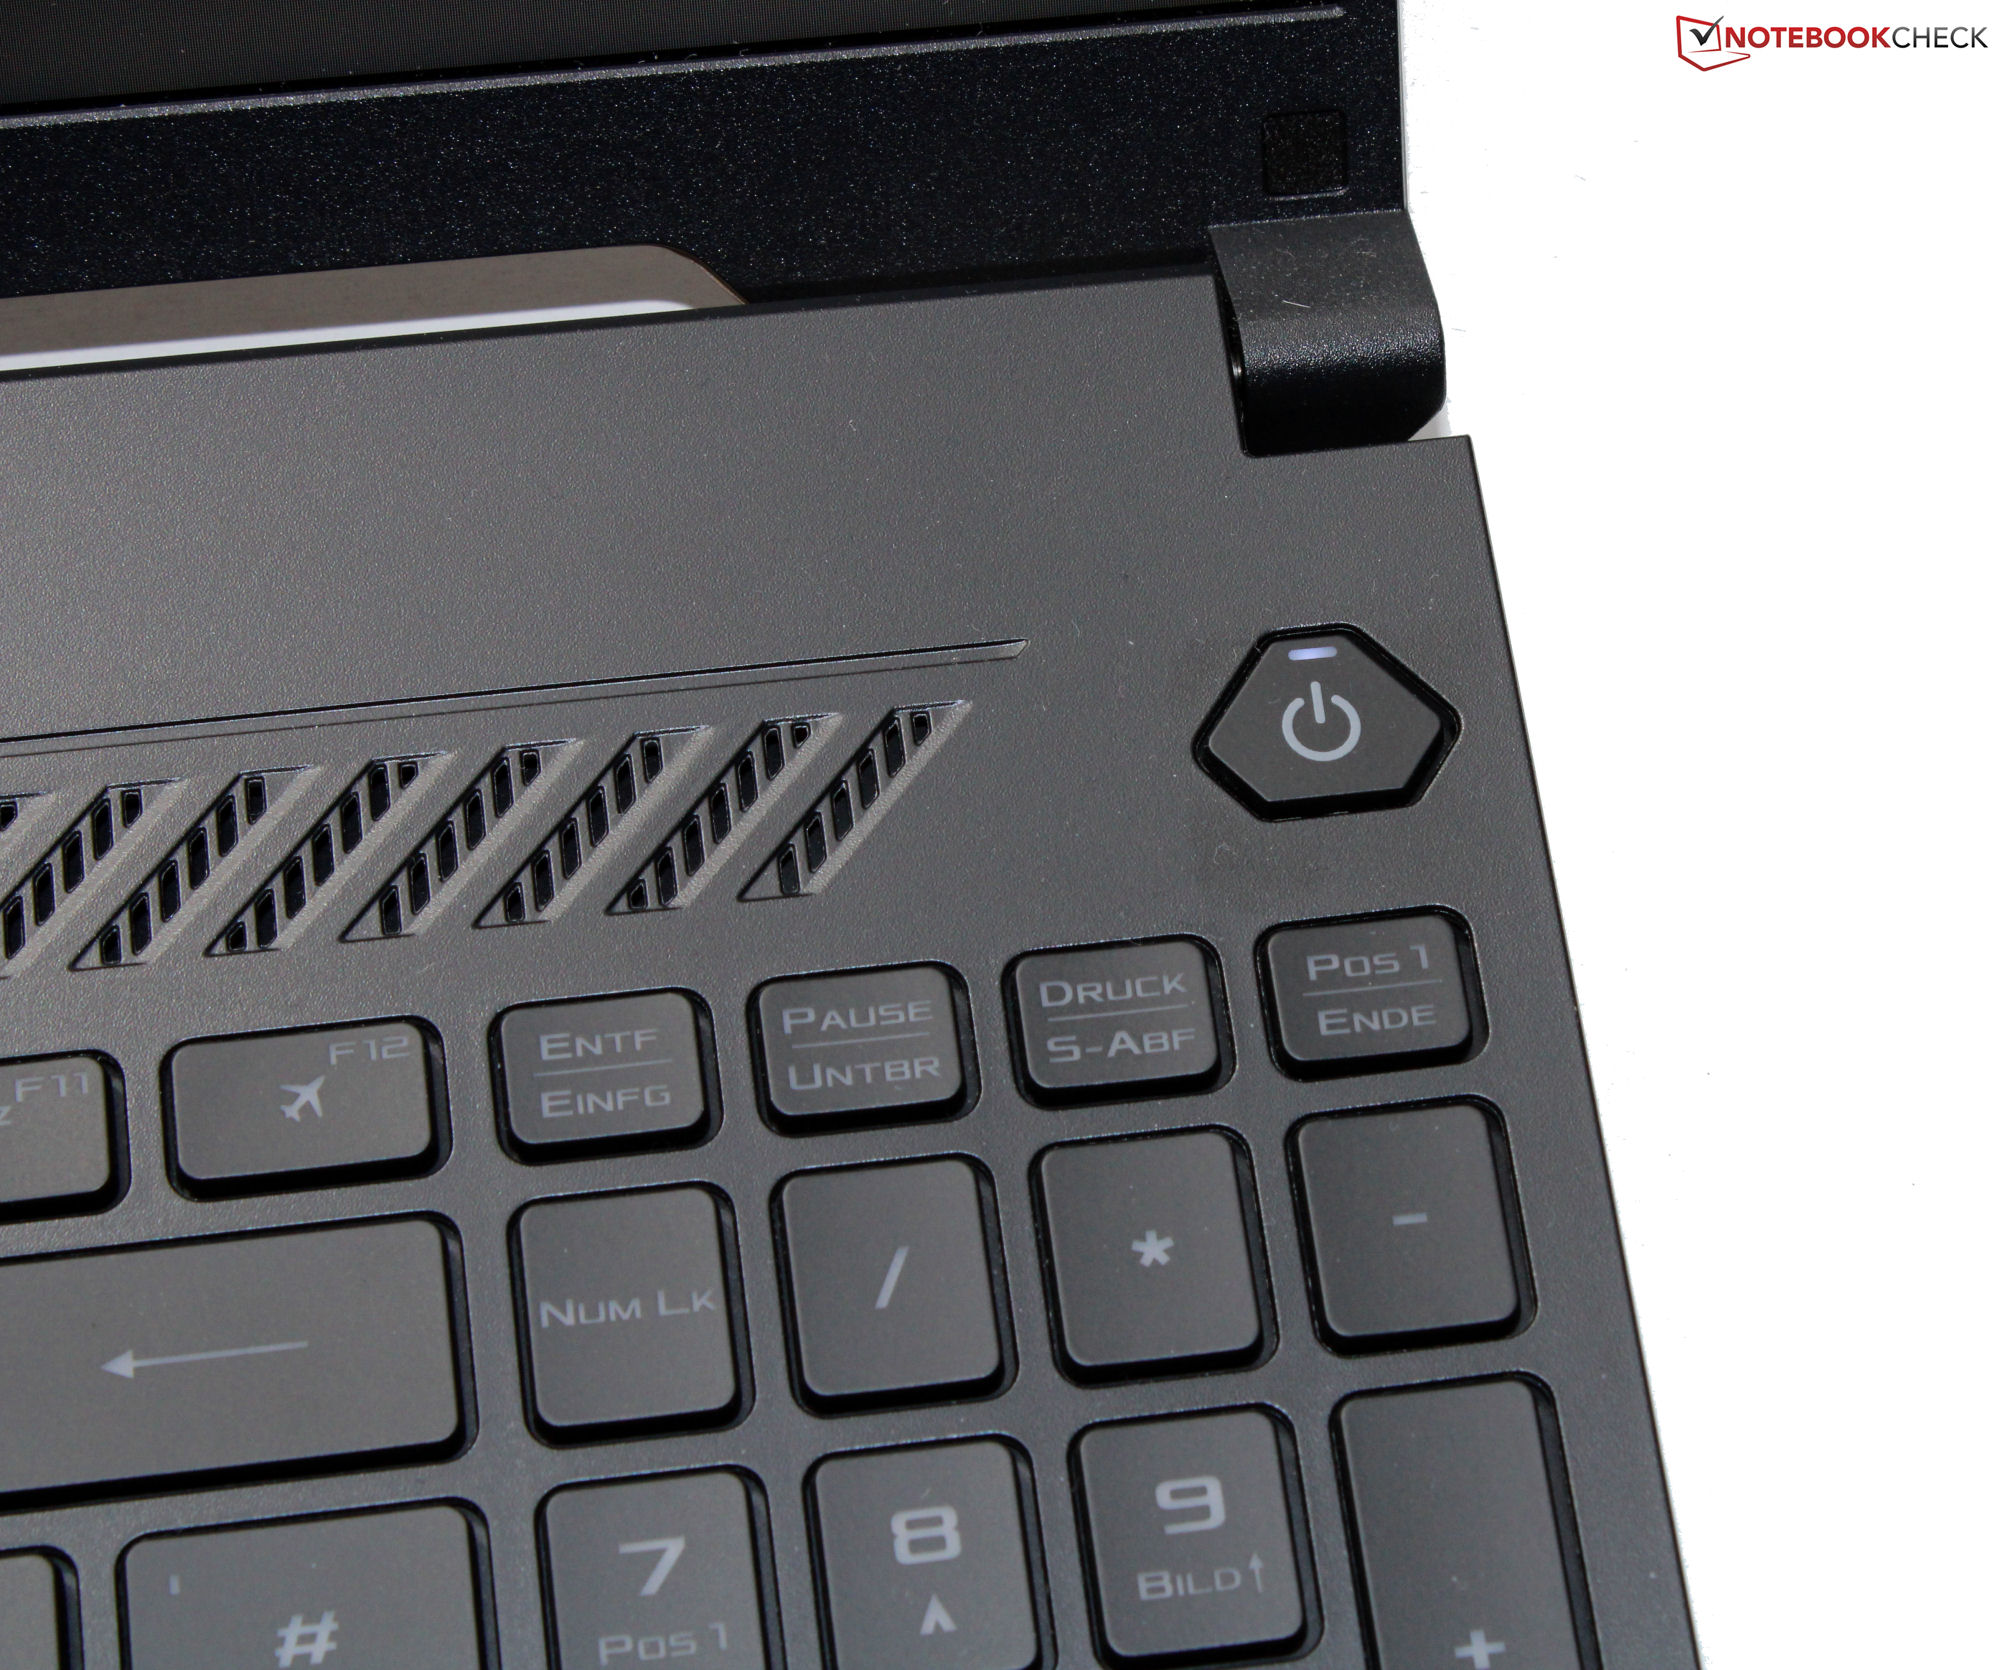
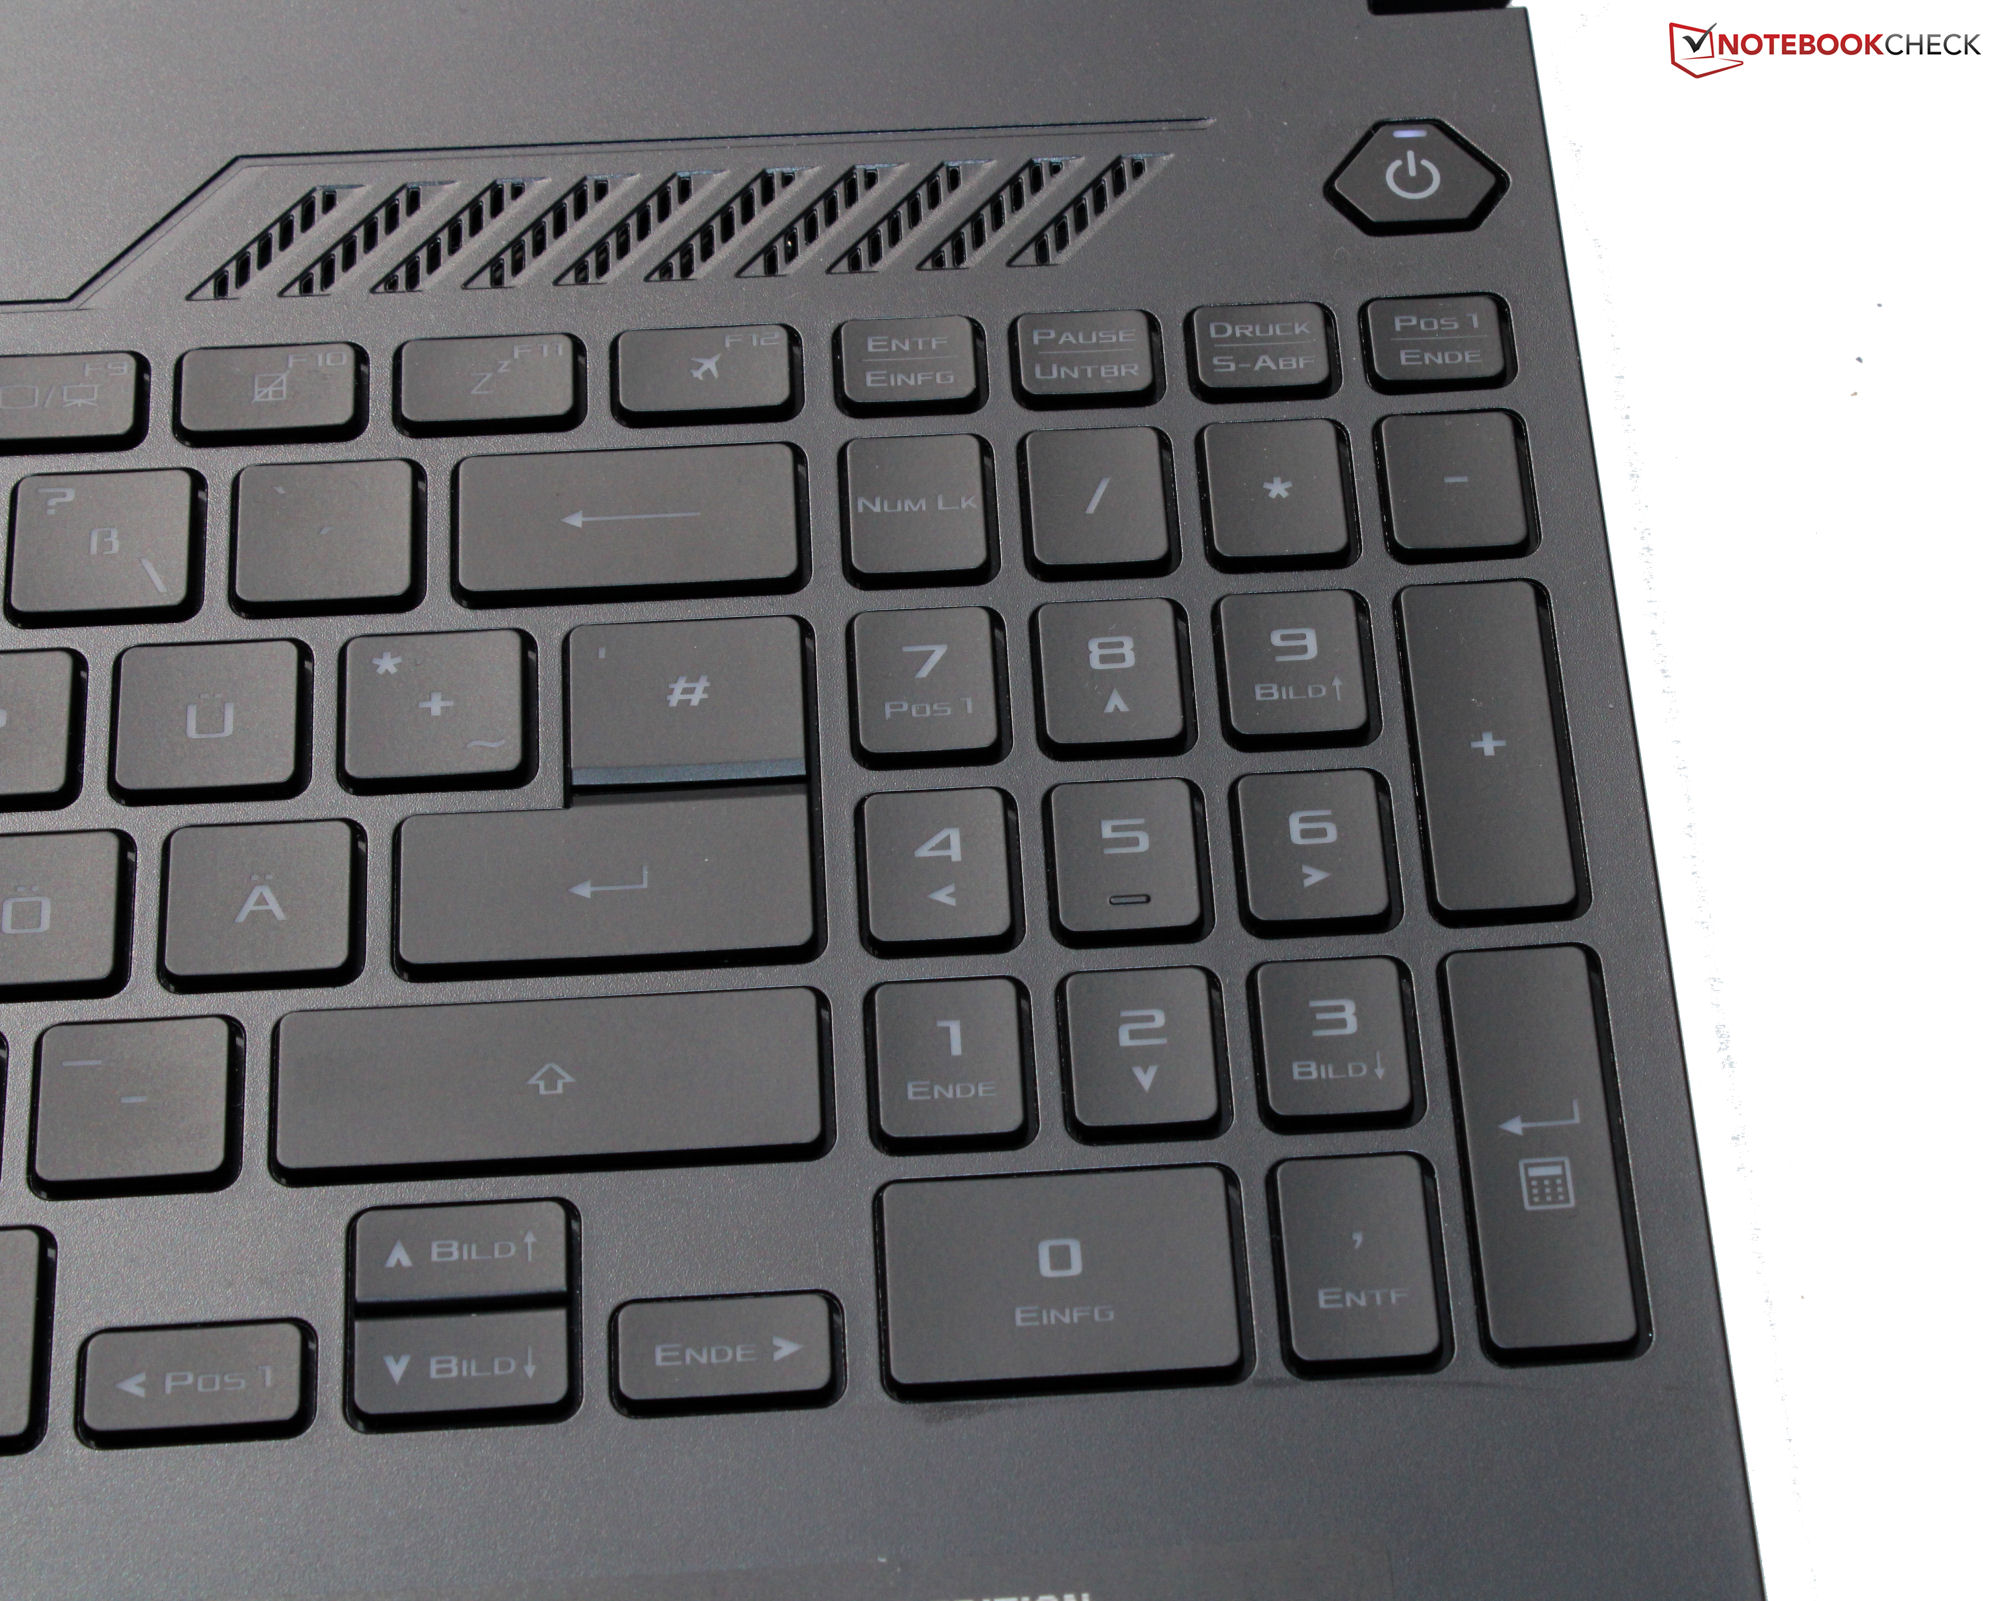
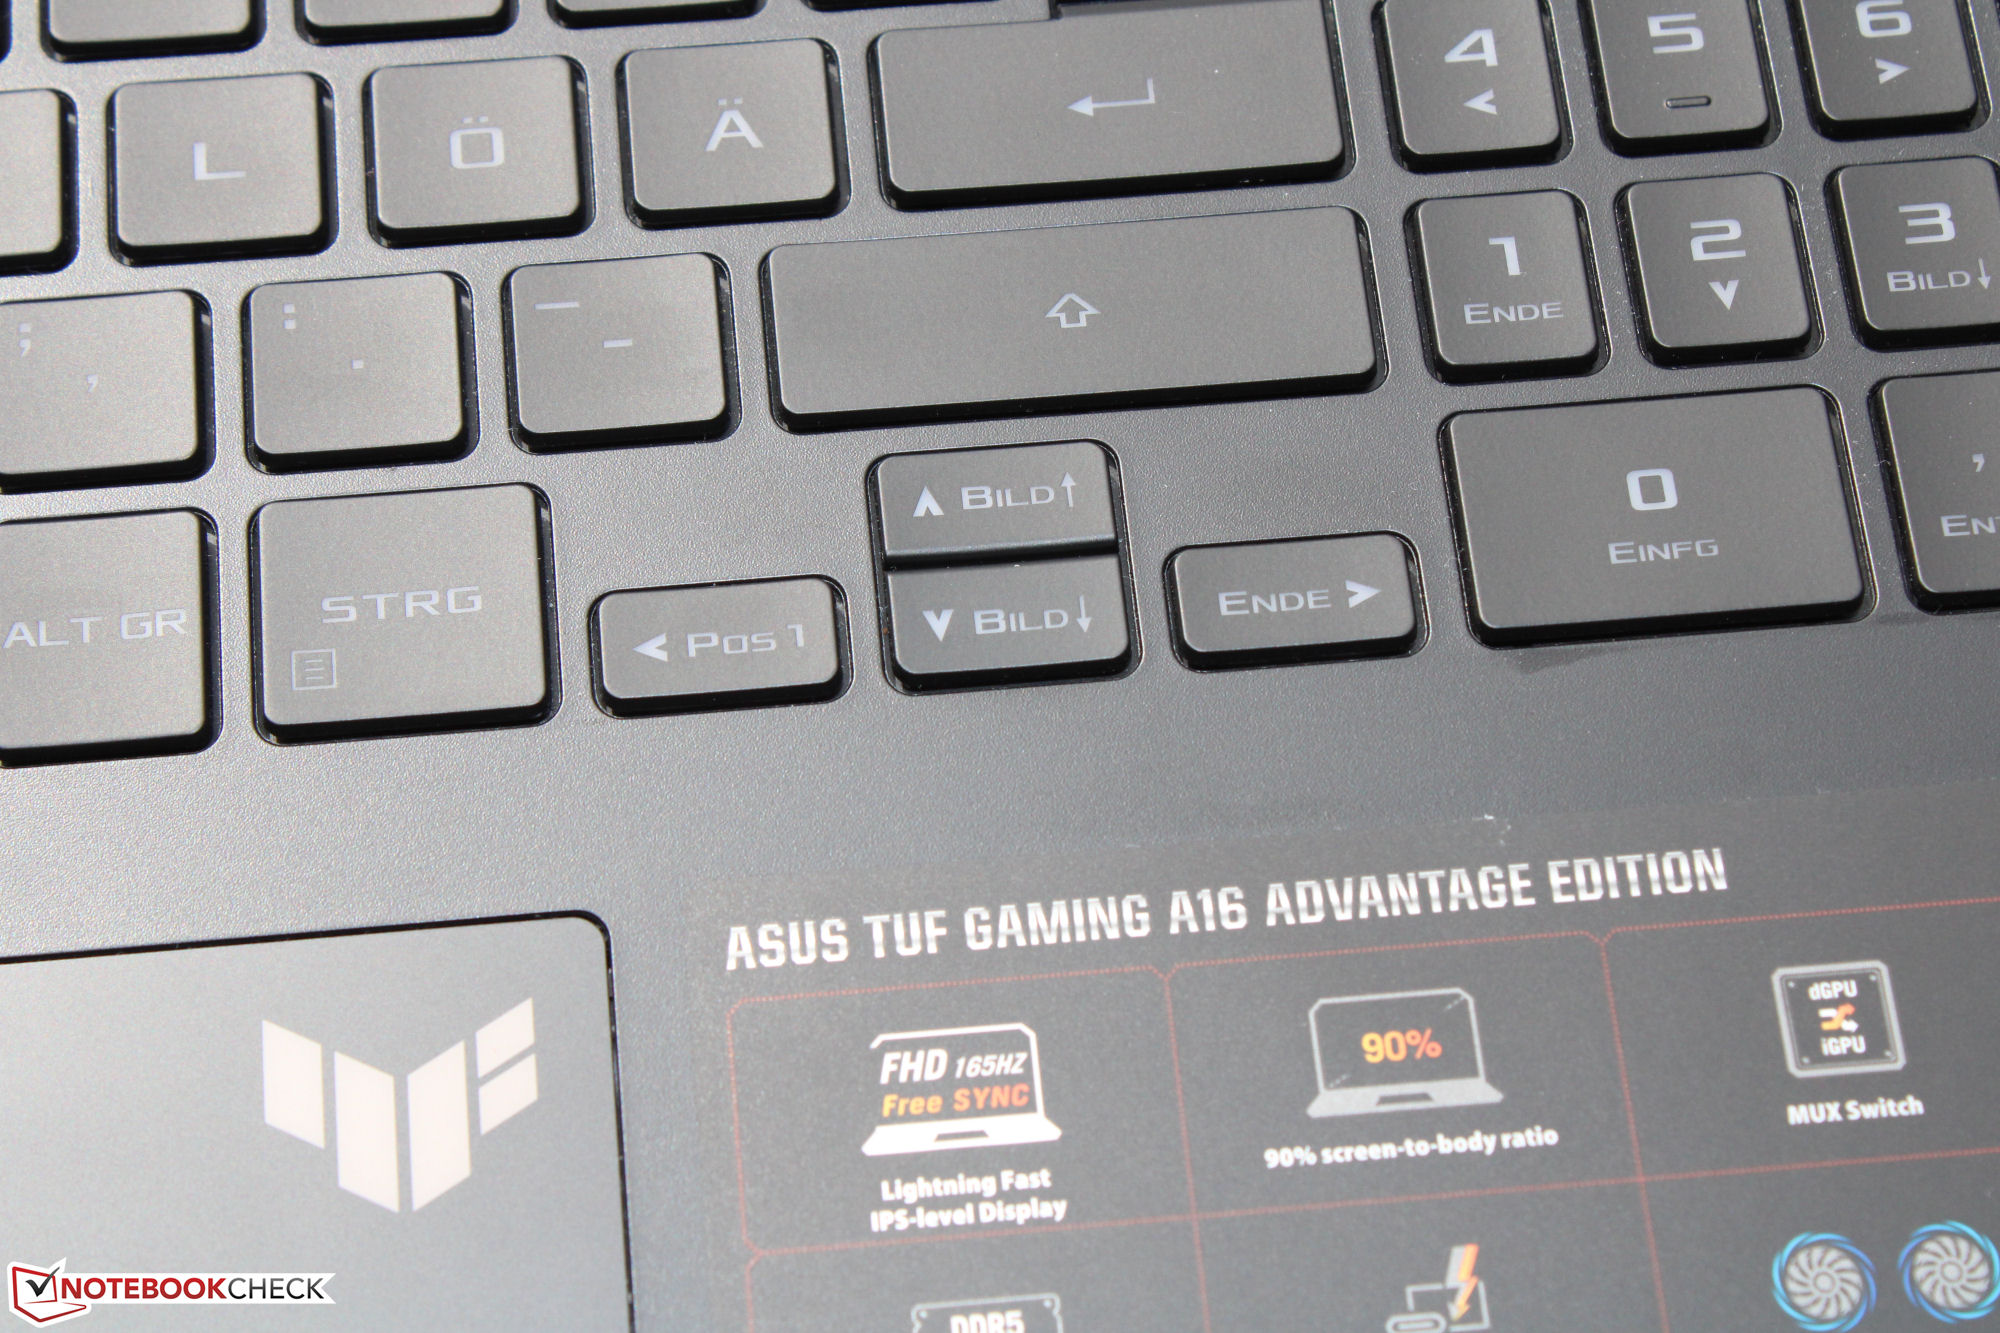
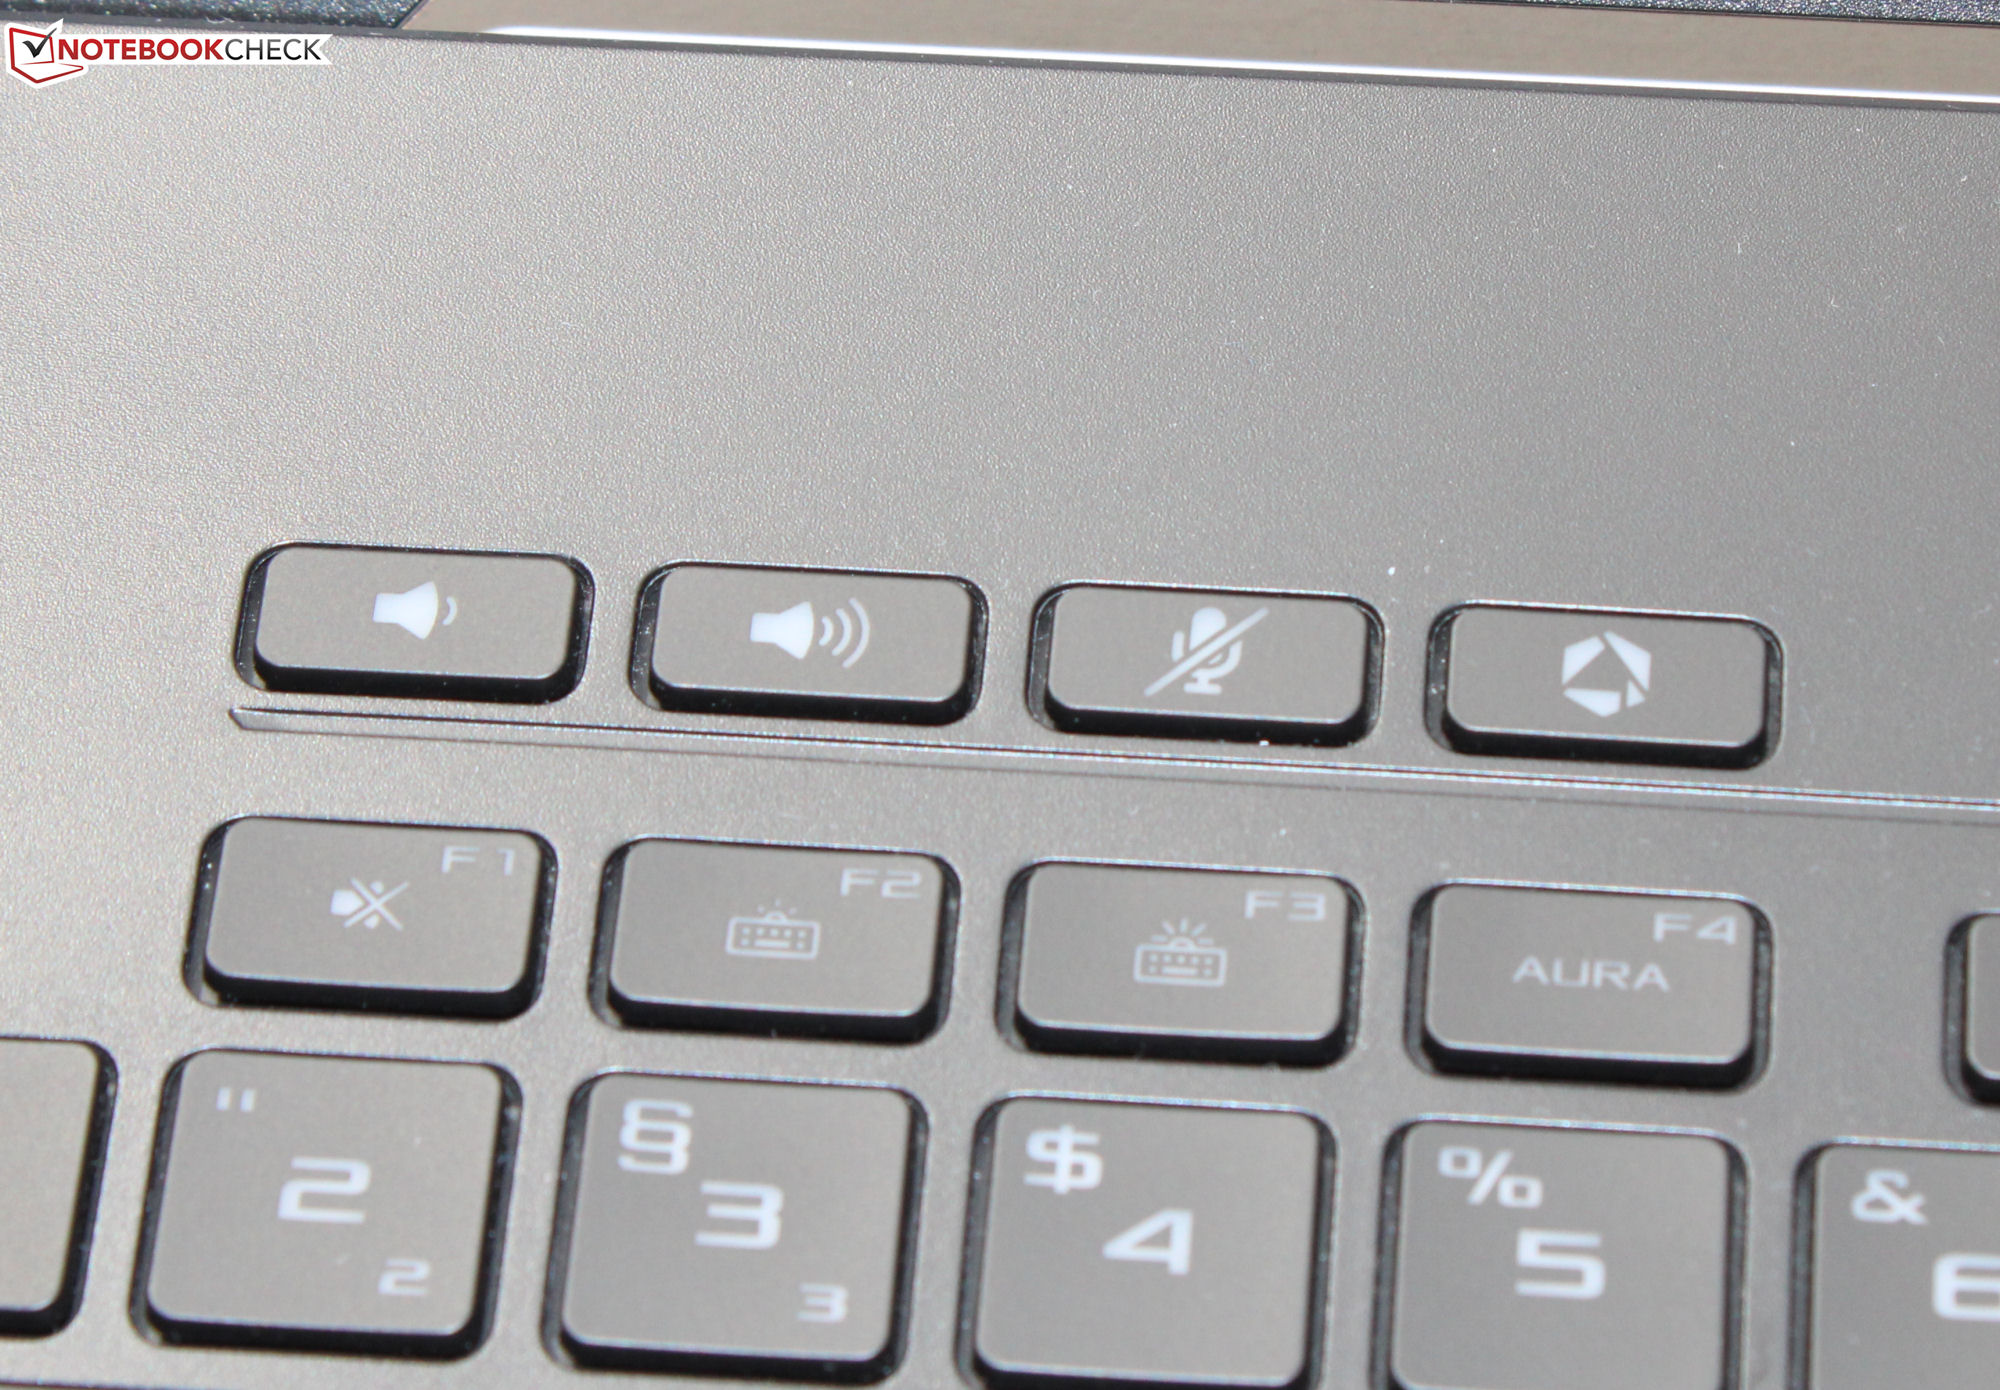
Aby uzyskać bardziej szczegółowe informacje na temat obudowy laptopa, łączności i urządzeń wejściowych, zapoznaj się z naszą recenzją identycznie zbudowanego siostrzanego modelu A16 Asus TUF Gaming A16 Advantage Edition w recenzji: Notebook AMD pod patronatem 7 .
Potencjalni konkurenci w porównaniu
Ocena | Data | Model | Waga | Wysokość | Rozmiar | Rezolucja | Cena |
|---|---|---|---|---|---|---|---|
| 86.9 % v7 (old) | 06/2023 | Asus TUF Gaming A16 FA617XS R9 7940HS, Radeon RX 7600S | 2.2 kg | 22.1 mm | 16.00" | 1920x1200 | |
| 87.9 % v7 (old) | 05/2023 | Lenovo Legion Pro 5 16IRX8 i7-13700HX, GeForce RTX 4060 Laptop GPU | 2.5 kg | 26.8 mm | 16.00" | 2560x1600 | |
| 82.9 % v7 (old) | 03/2023 | MSI Katana 15 B12VEK i7-12650H, GeForce RTX 4050 Laptop GPU | 2.3 kg | 24.9 mm | 15.60" | 1920x1080 | |
| 84.6 % v7 (old) | 05/2023 | Medion Erazer Defender P40 i7-13700HX, GeForce RTX 4060 Laptop GPU | 2.9 kg | 33 mm | 17.30" | 2560x1440 | |
| 81.8 % v7 (old) | 04/2023 | Gigabyte G5 KE i5-12500H, GeForce RTX 3060 Laptop GPU | 2 kg | 23.9 mm | 15.60" | 1920x1080 |
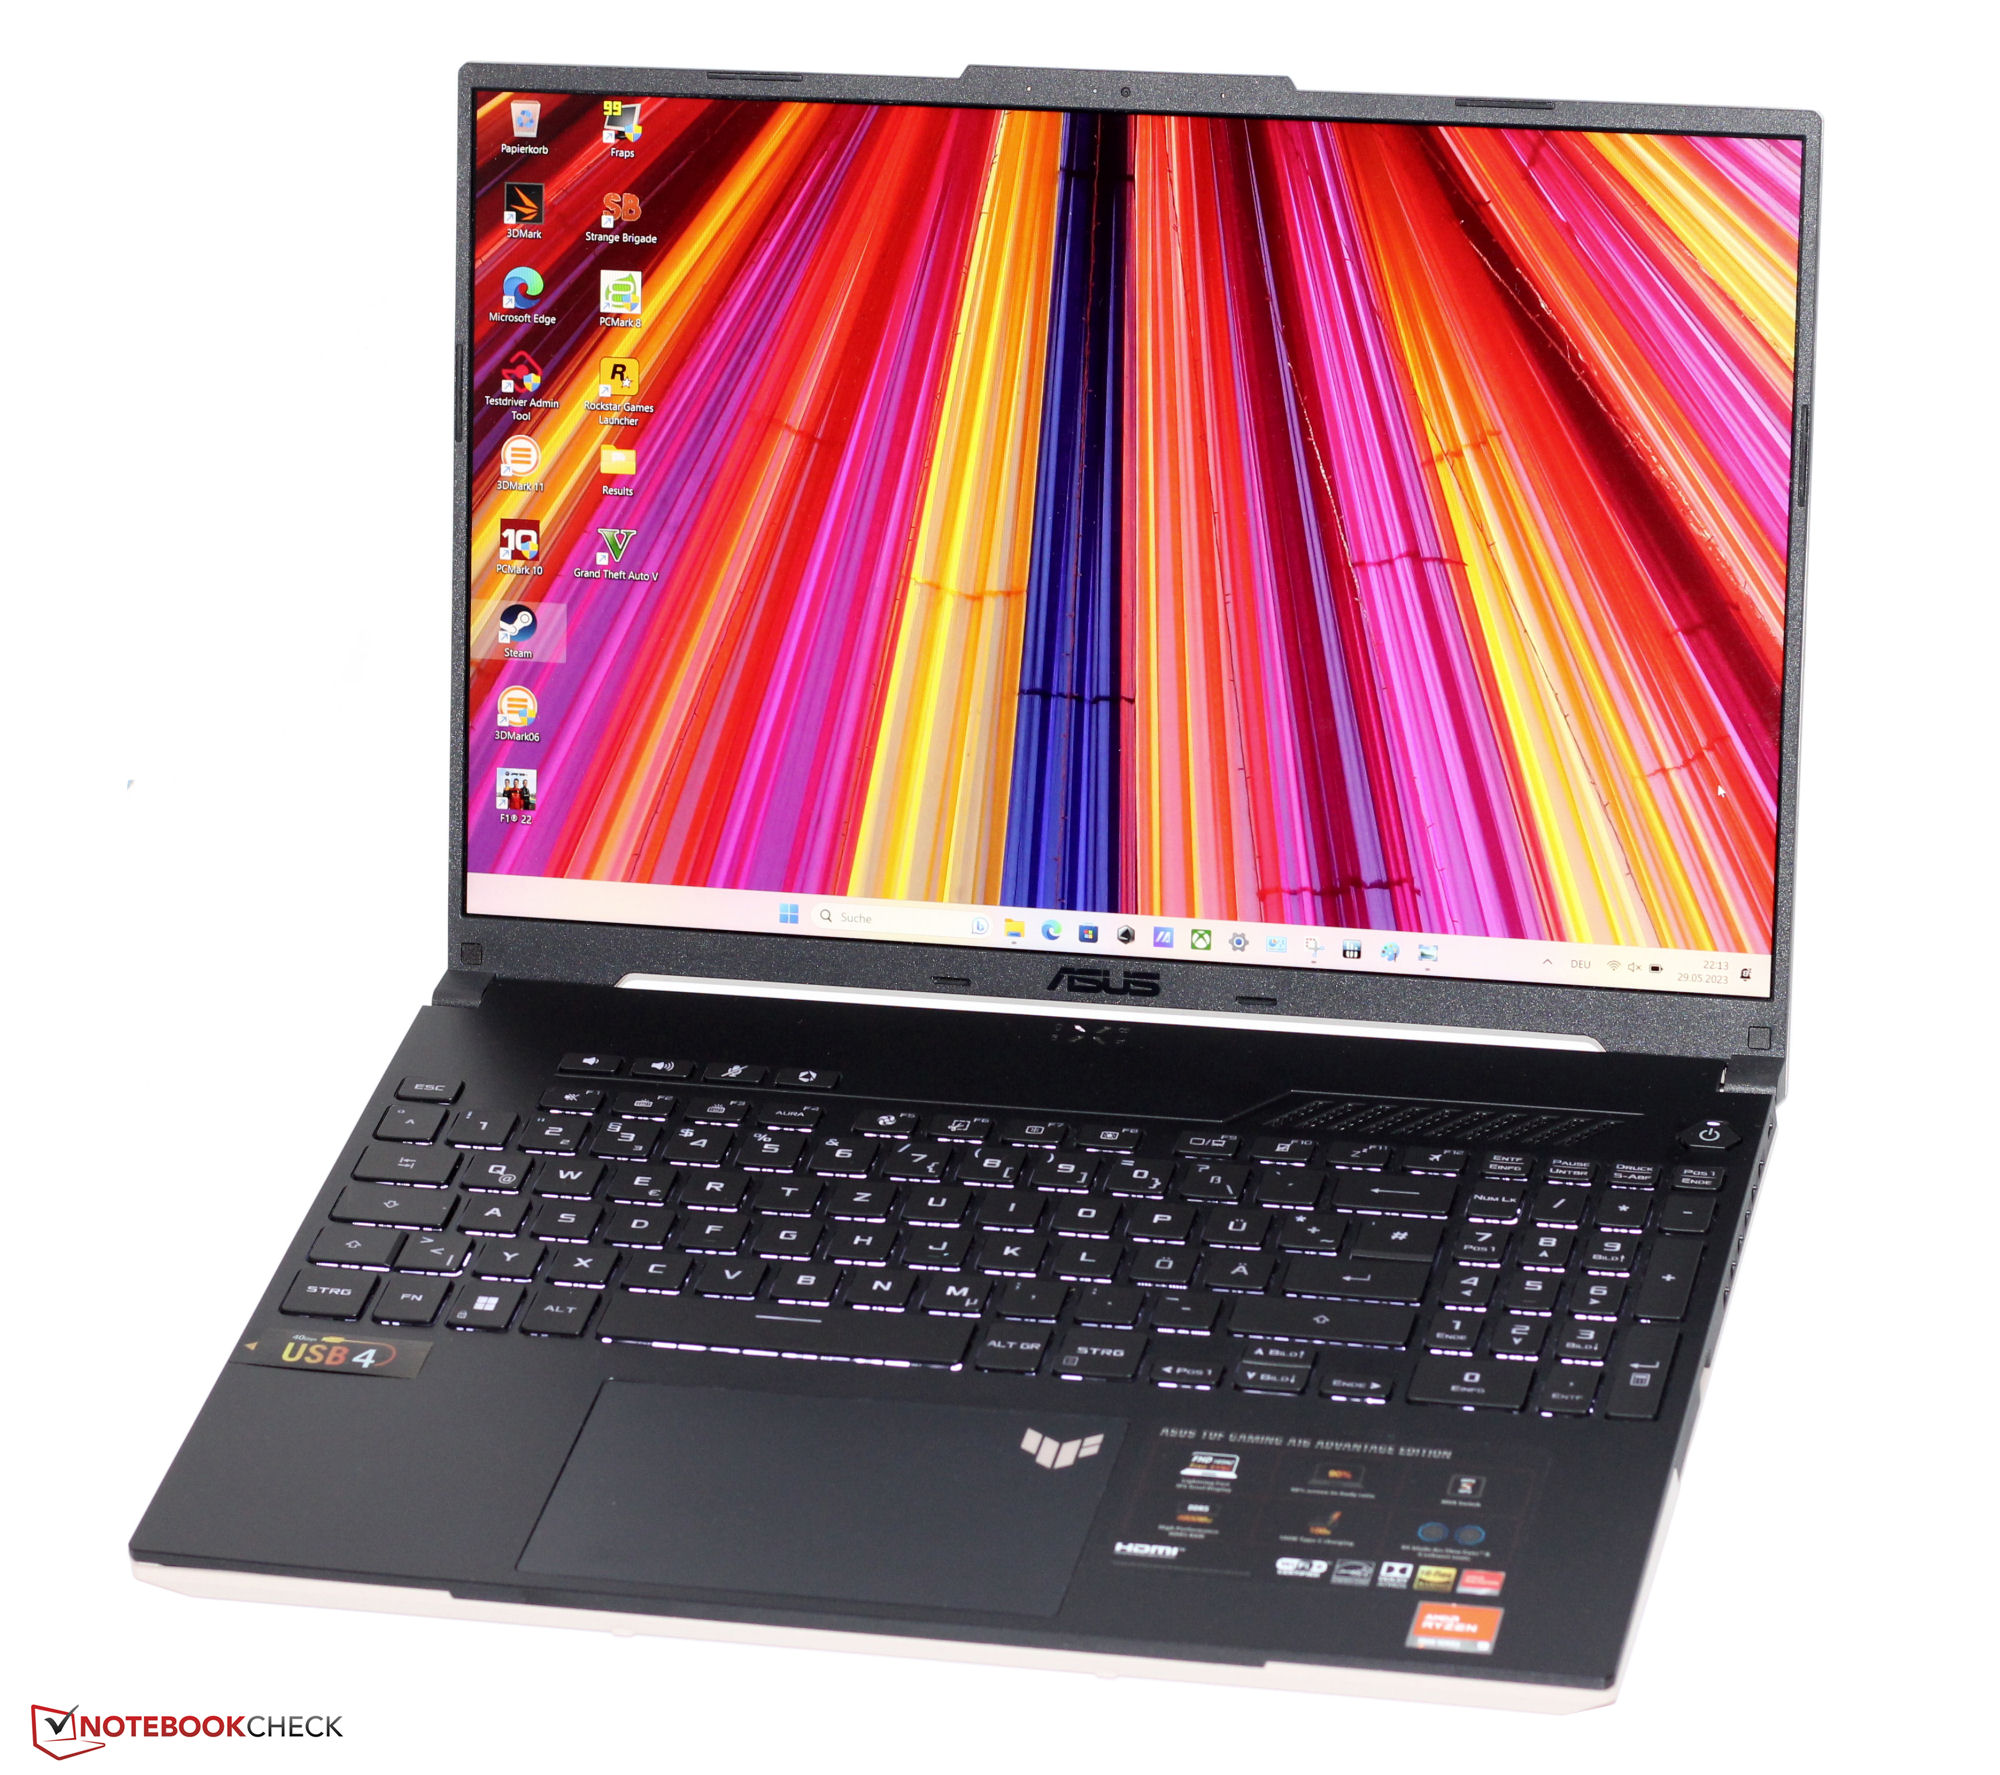
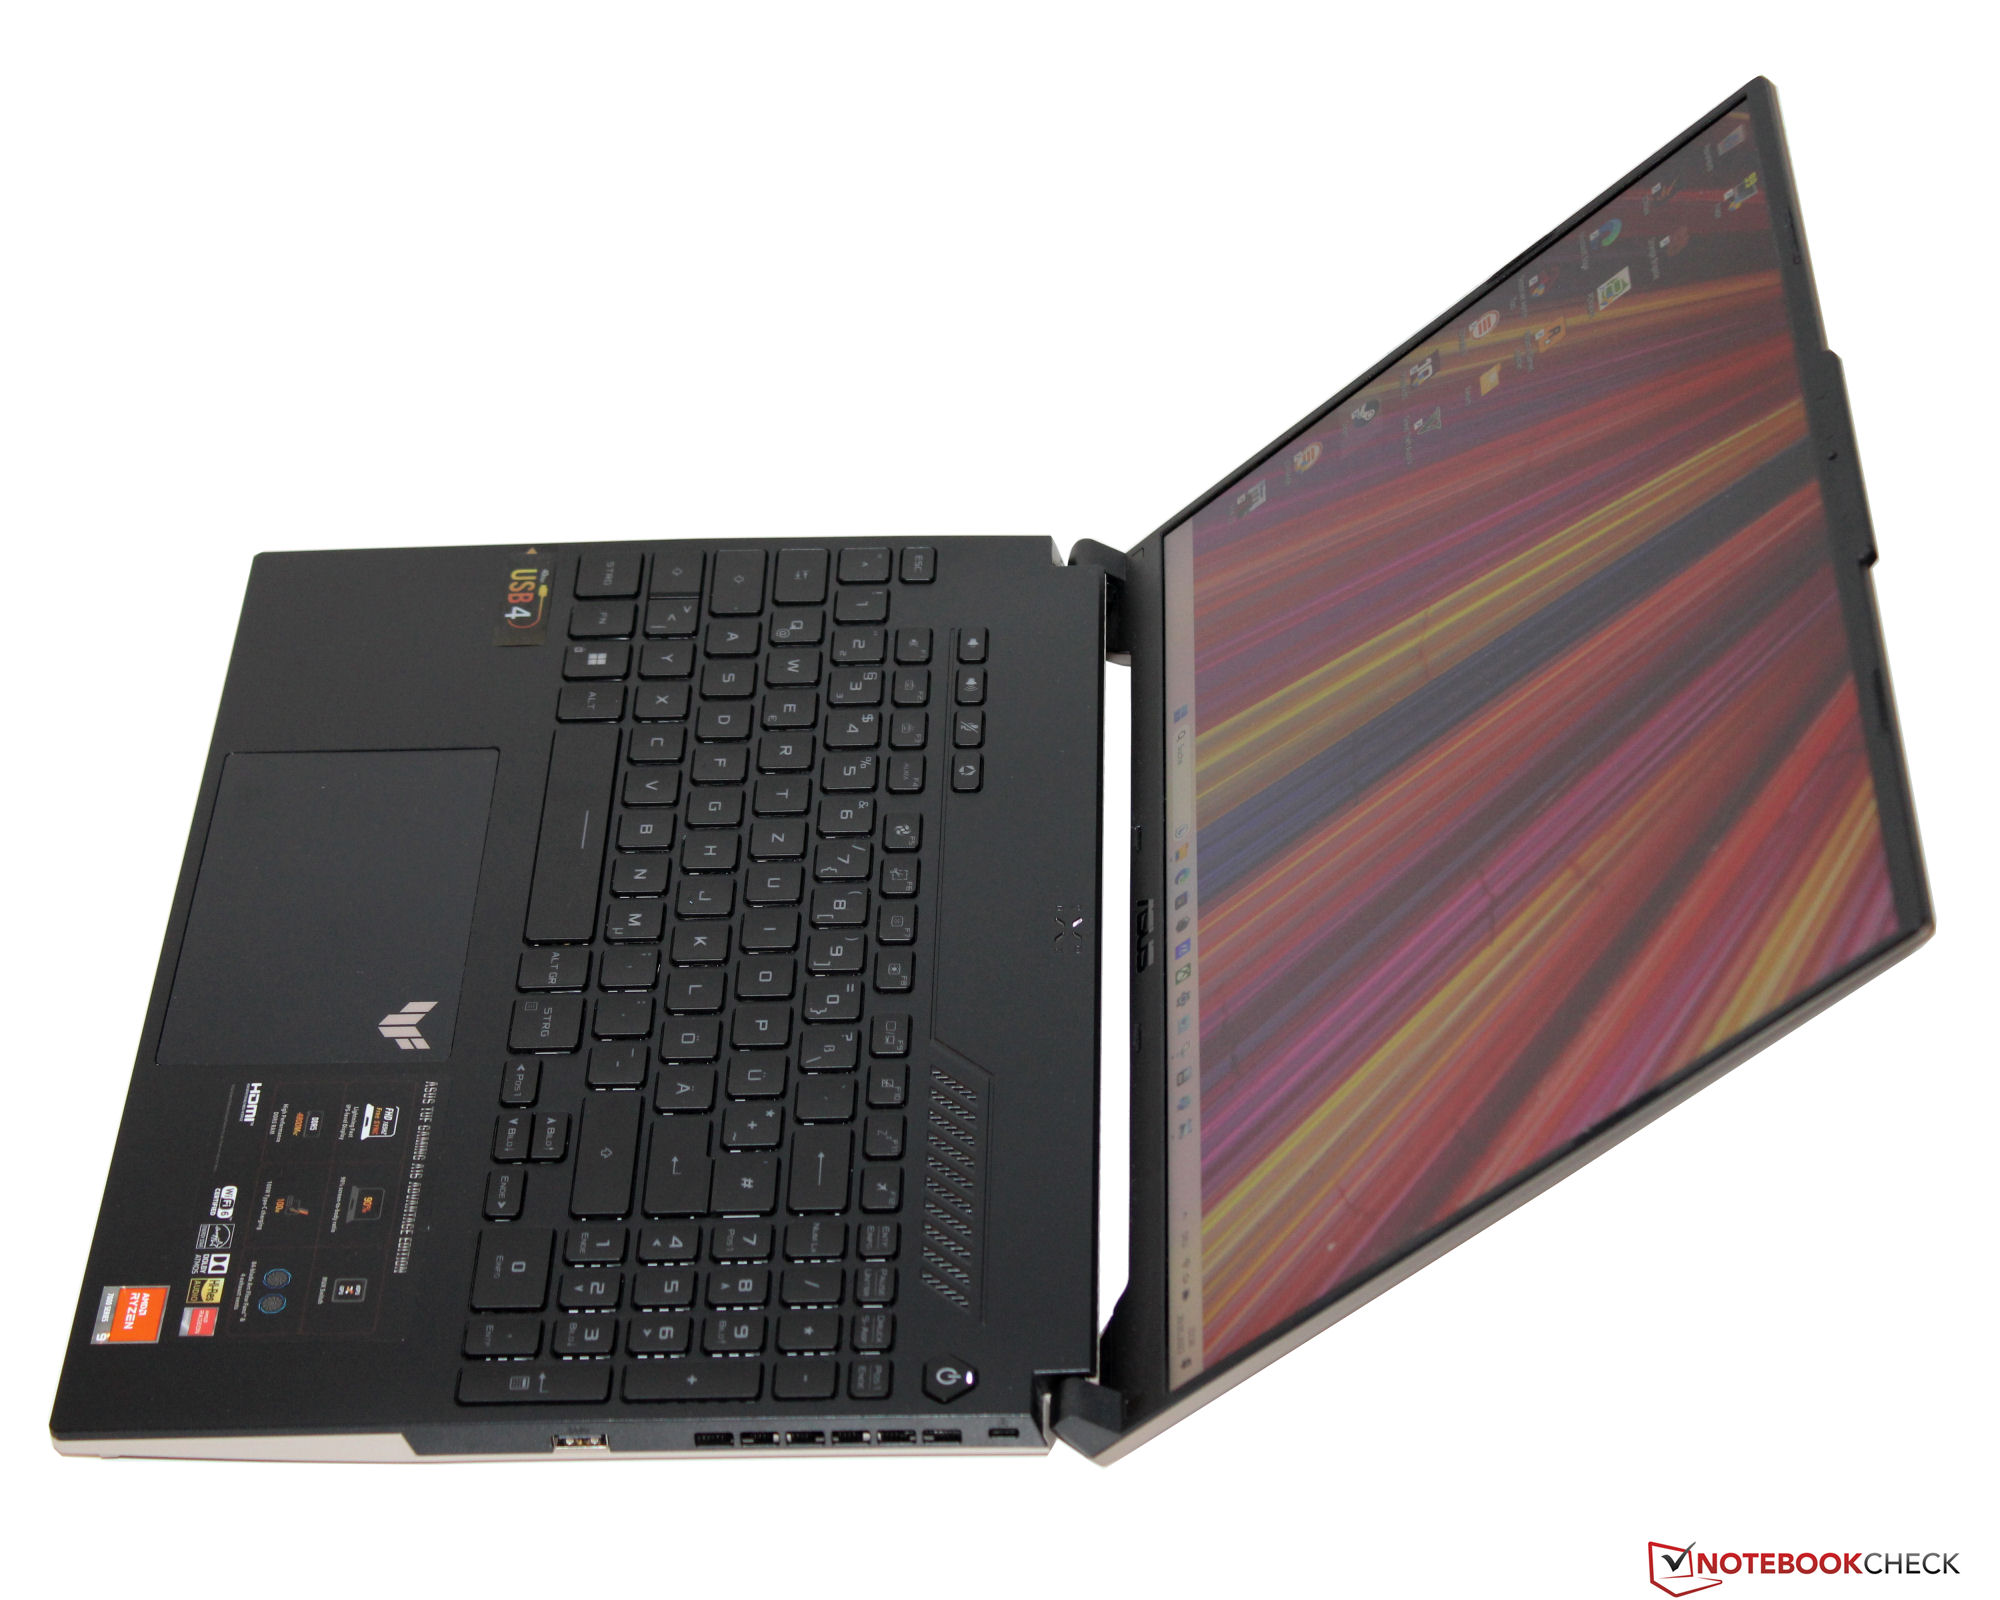
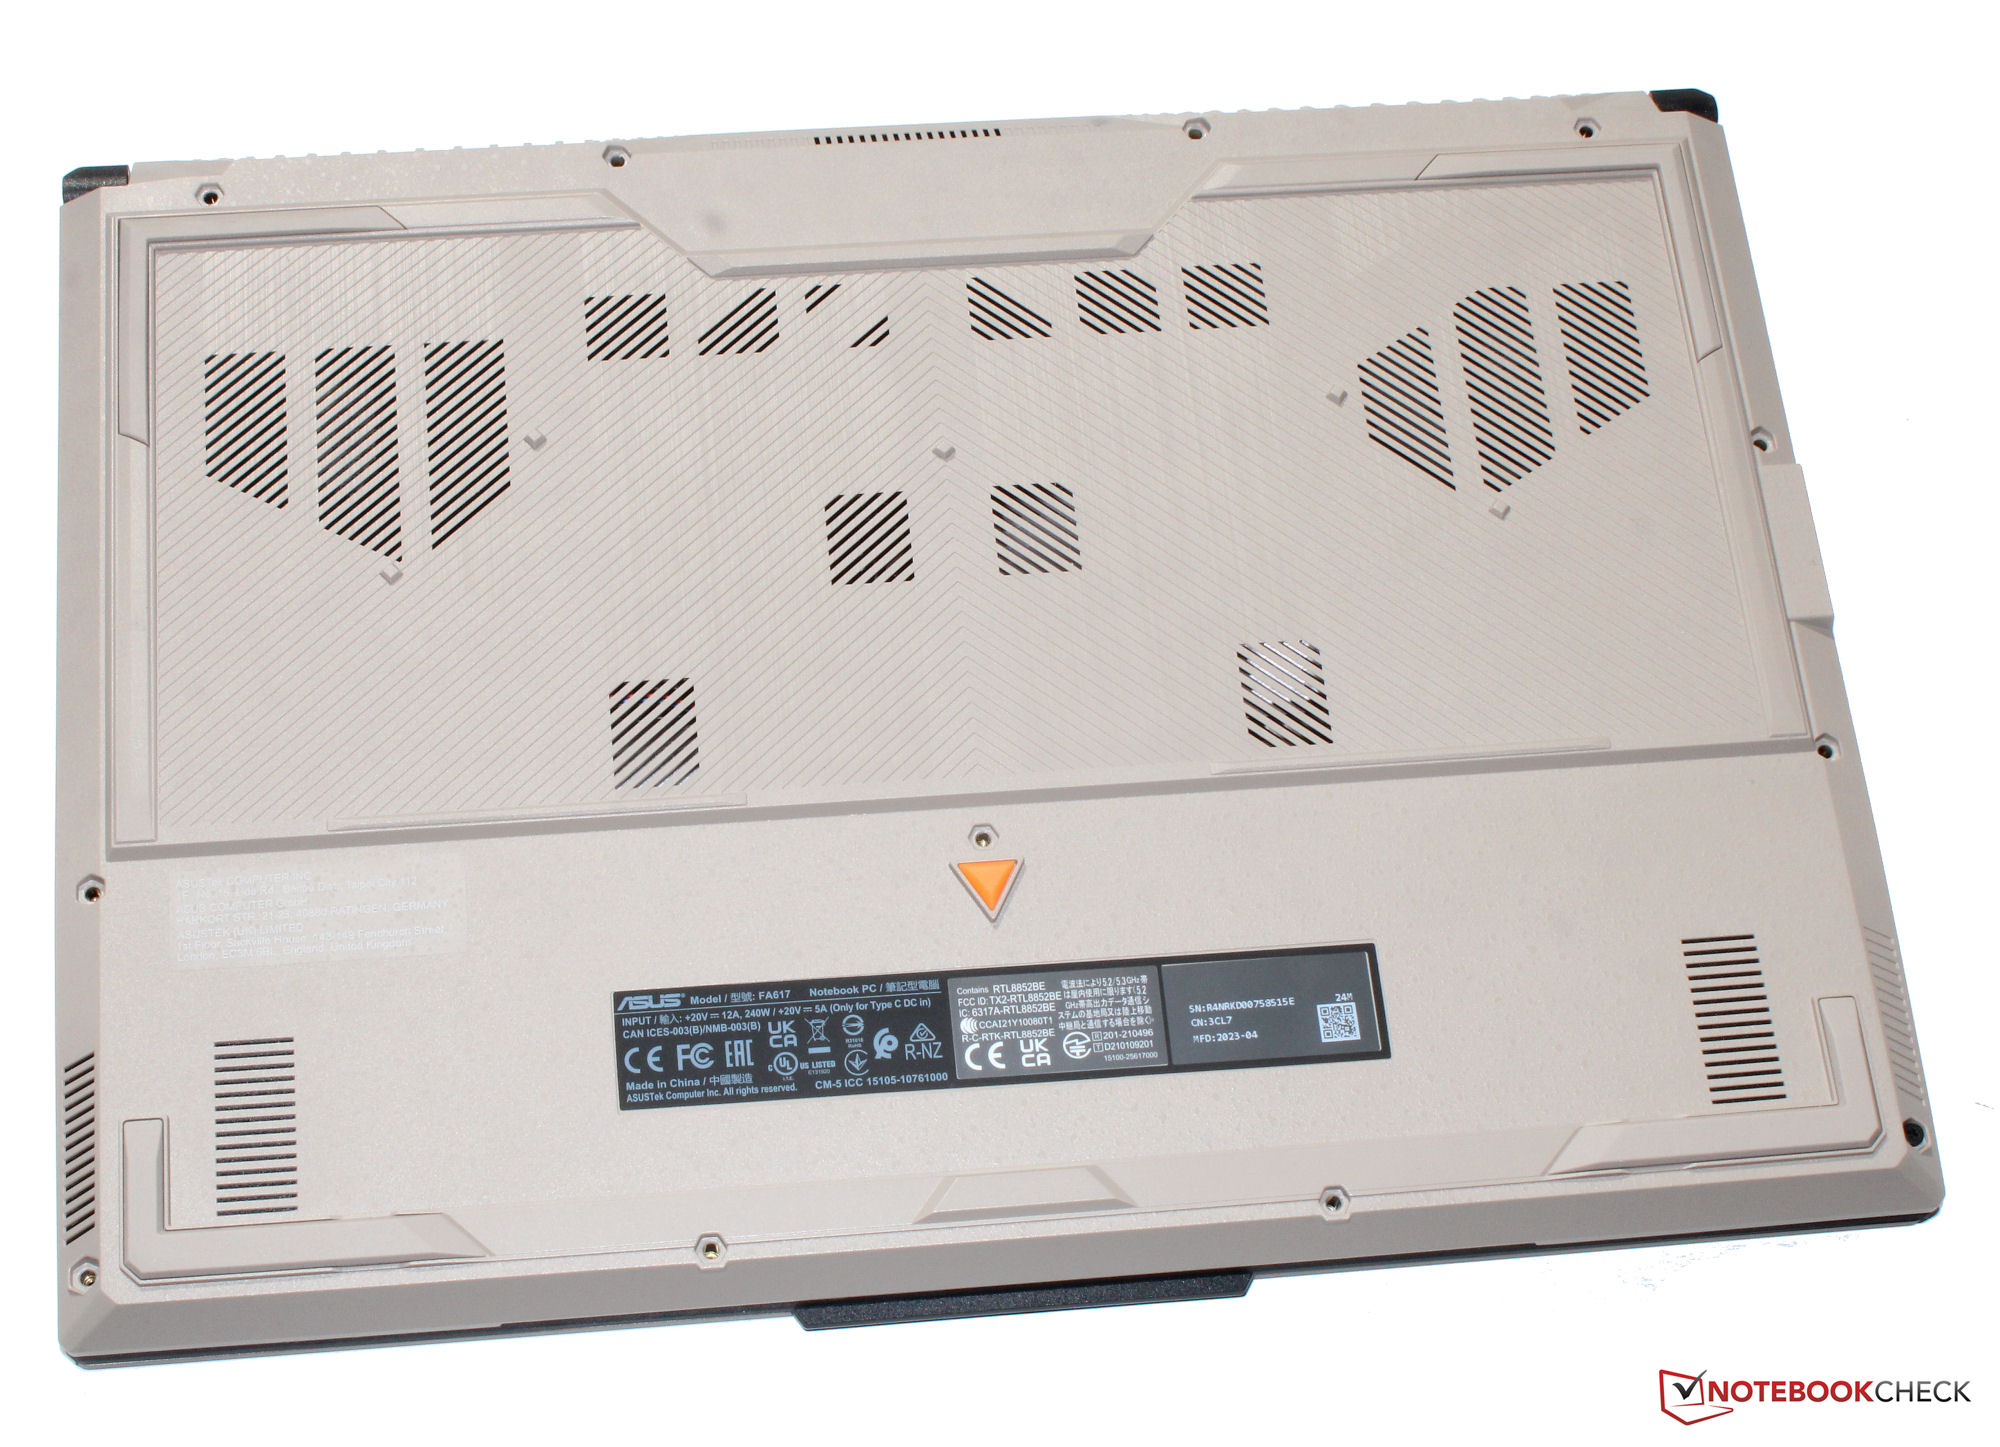
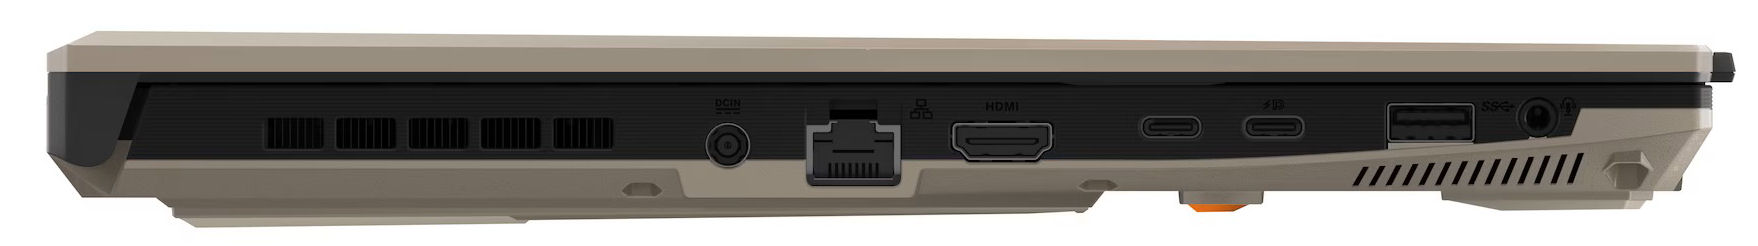
Obudowa i łączność - niewielkie zmiany w porównaniu do siostrzanego modelu
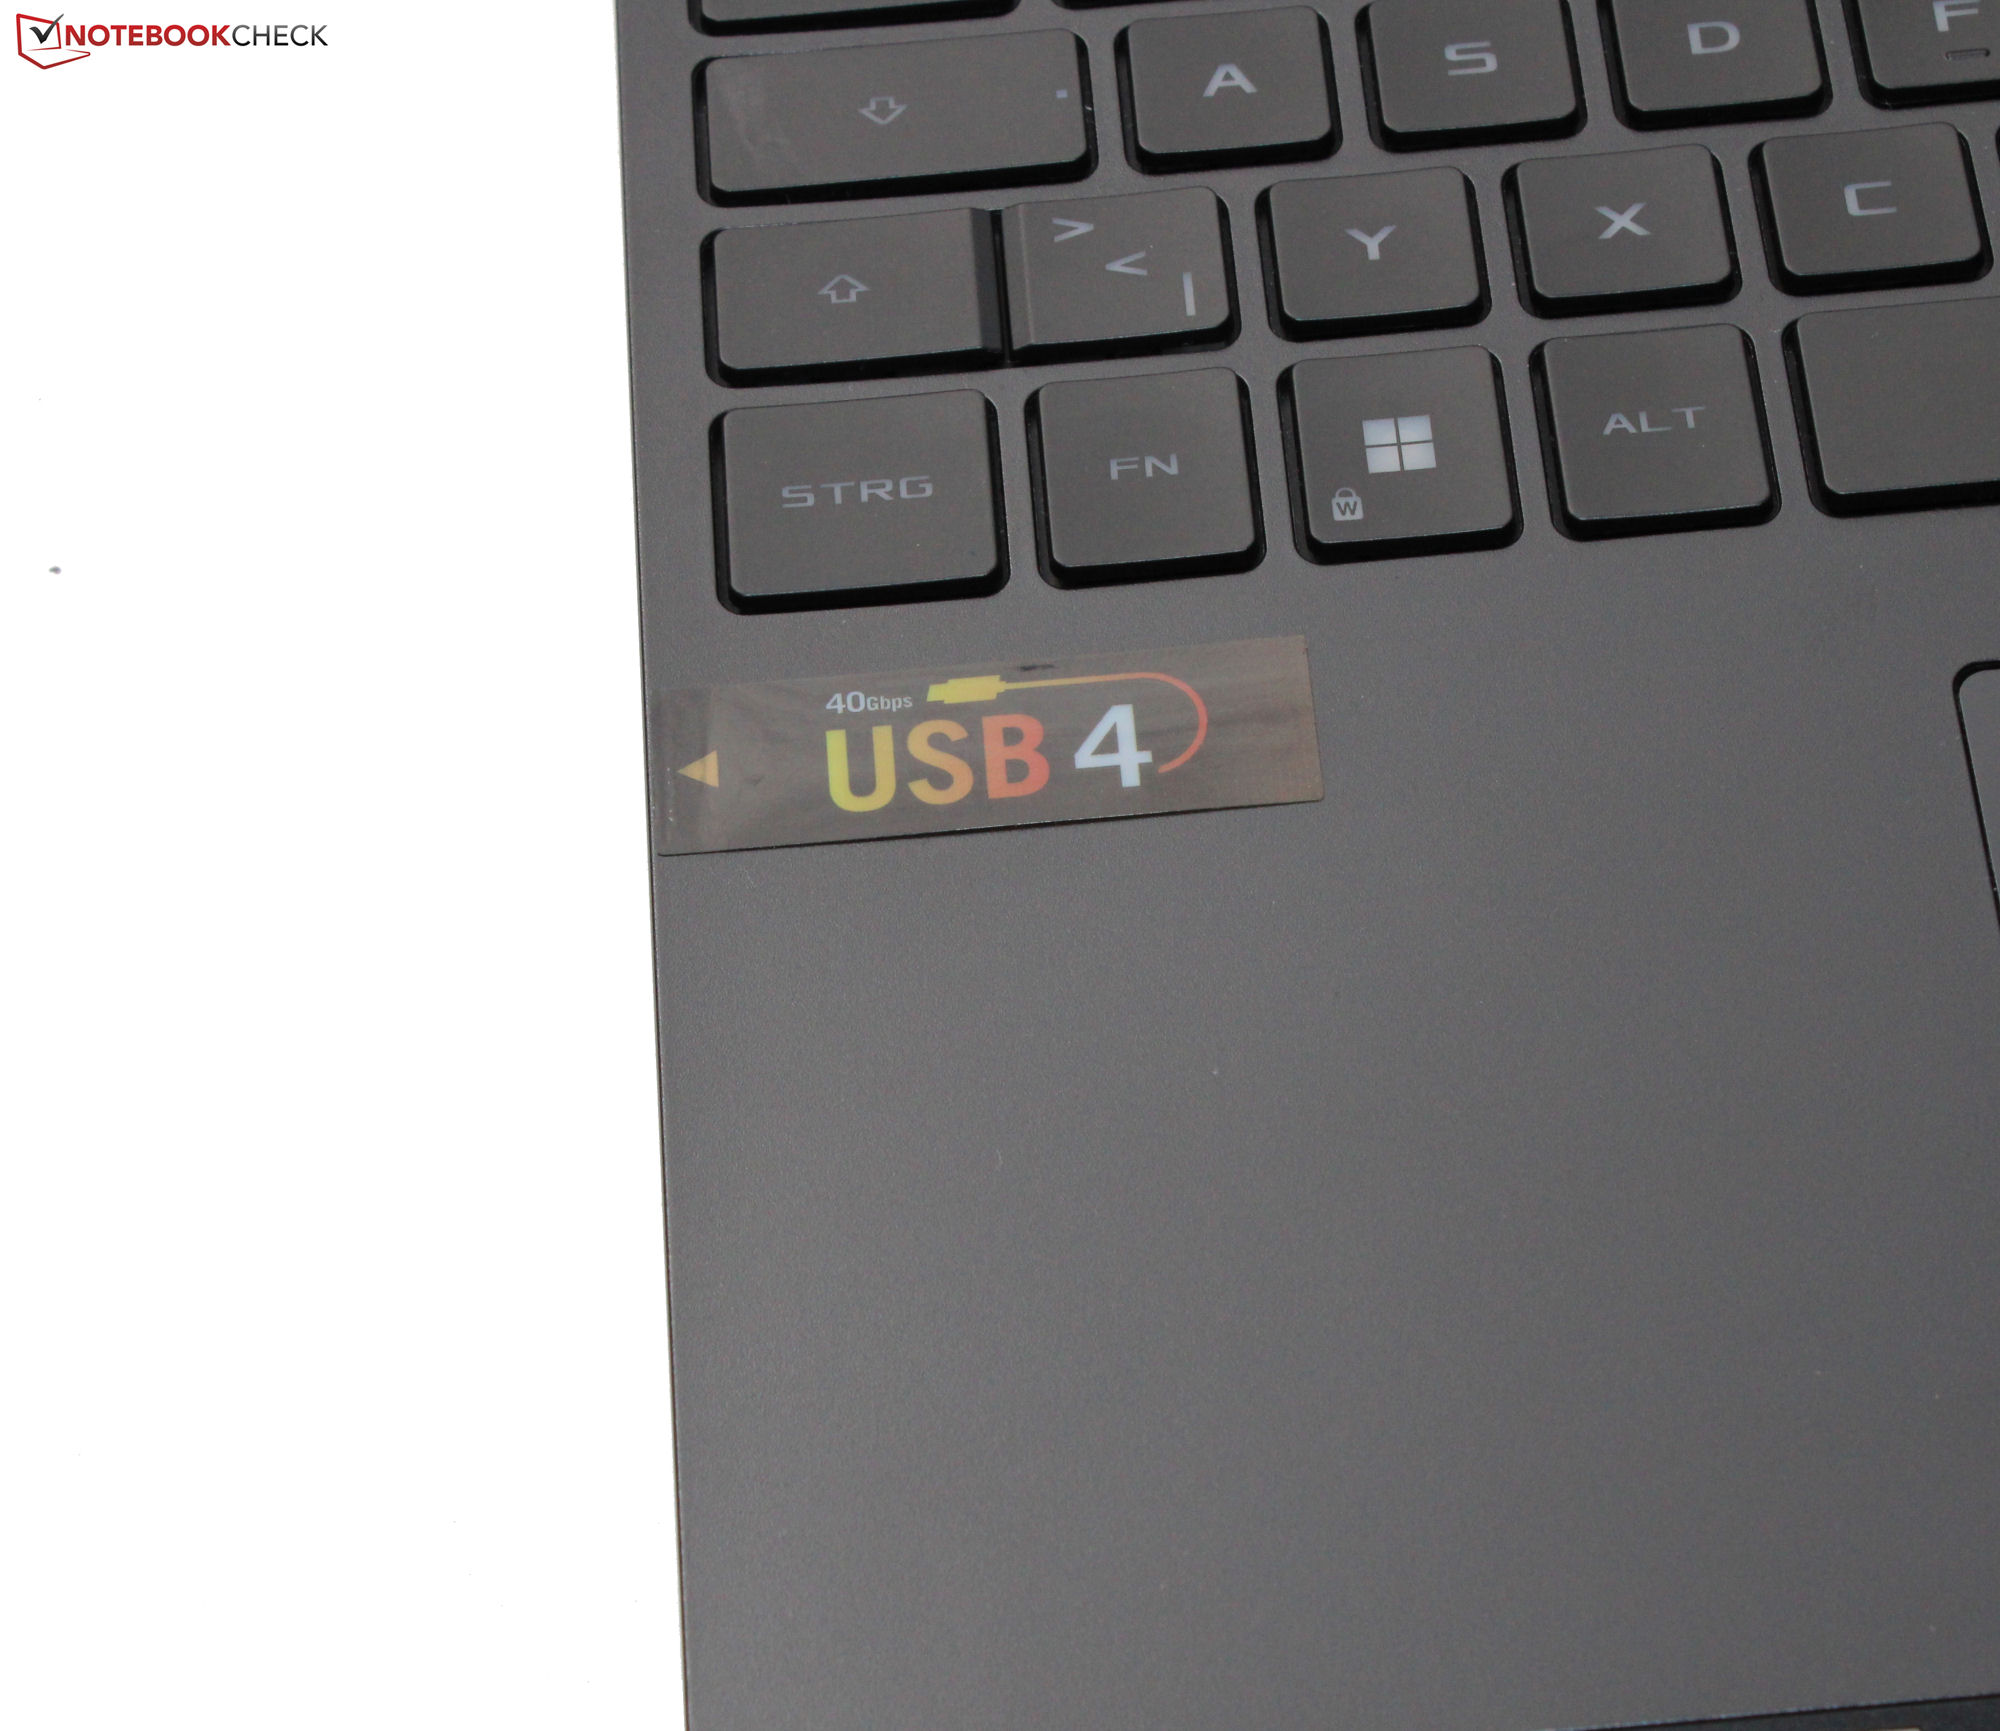
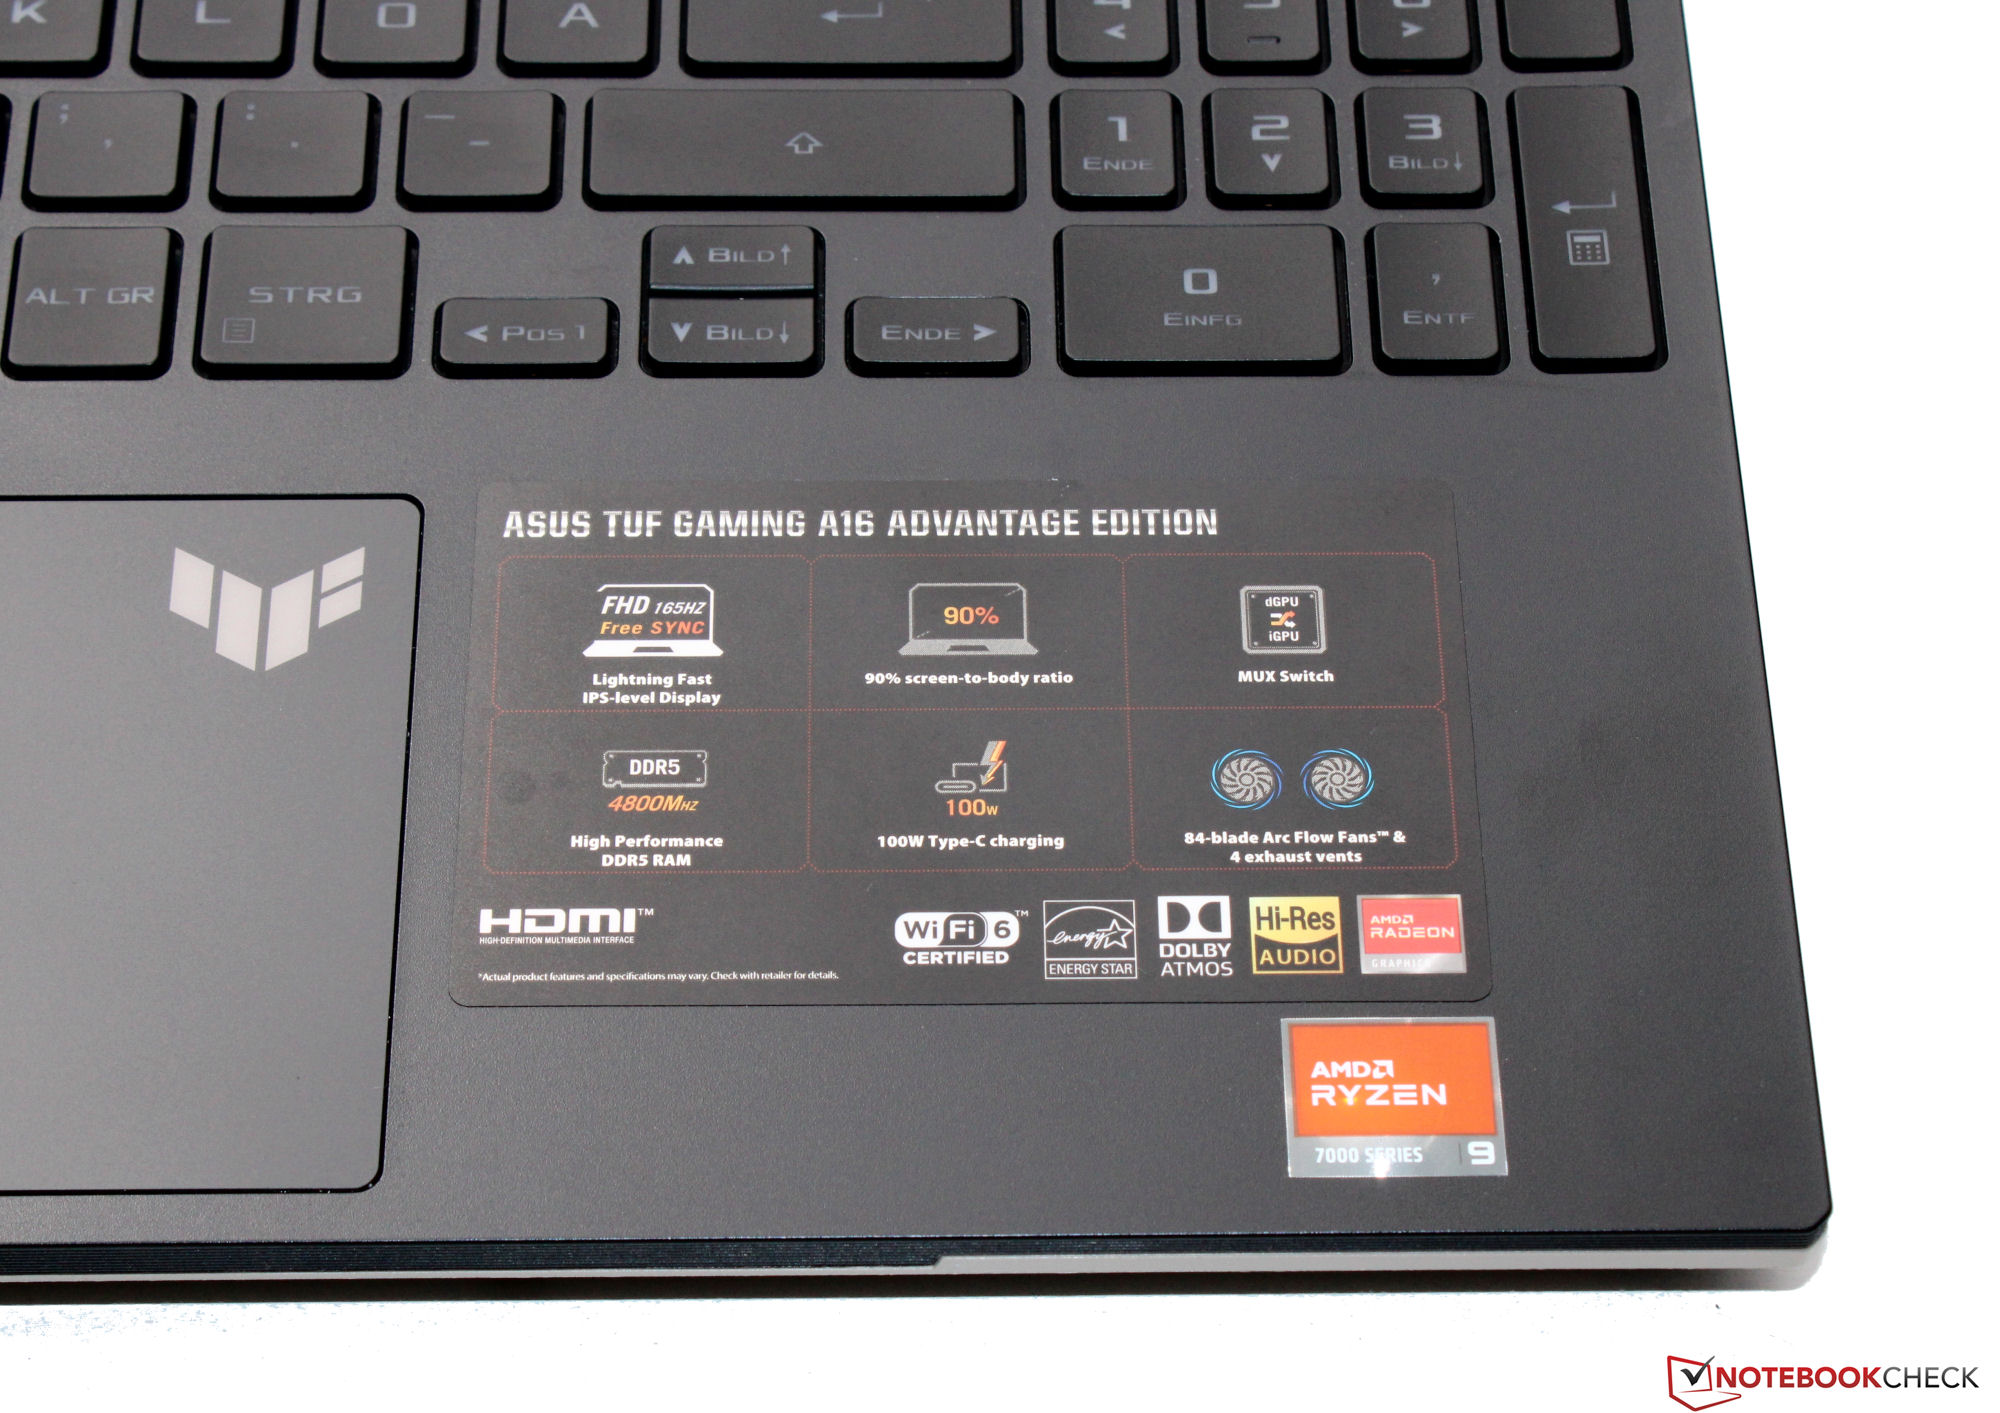
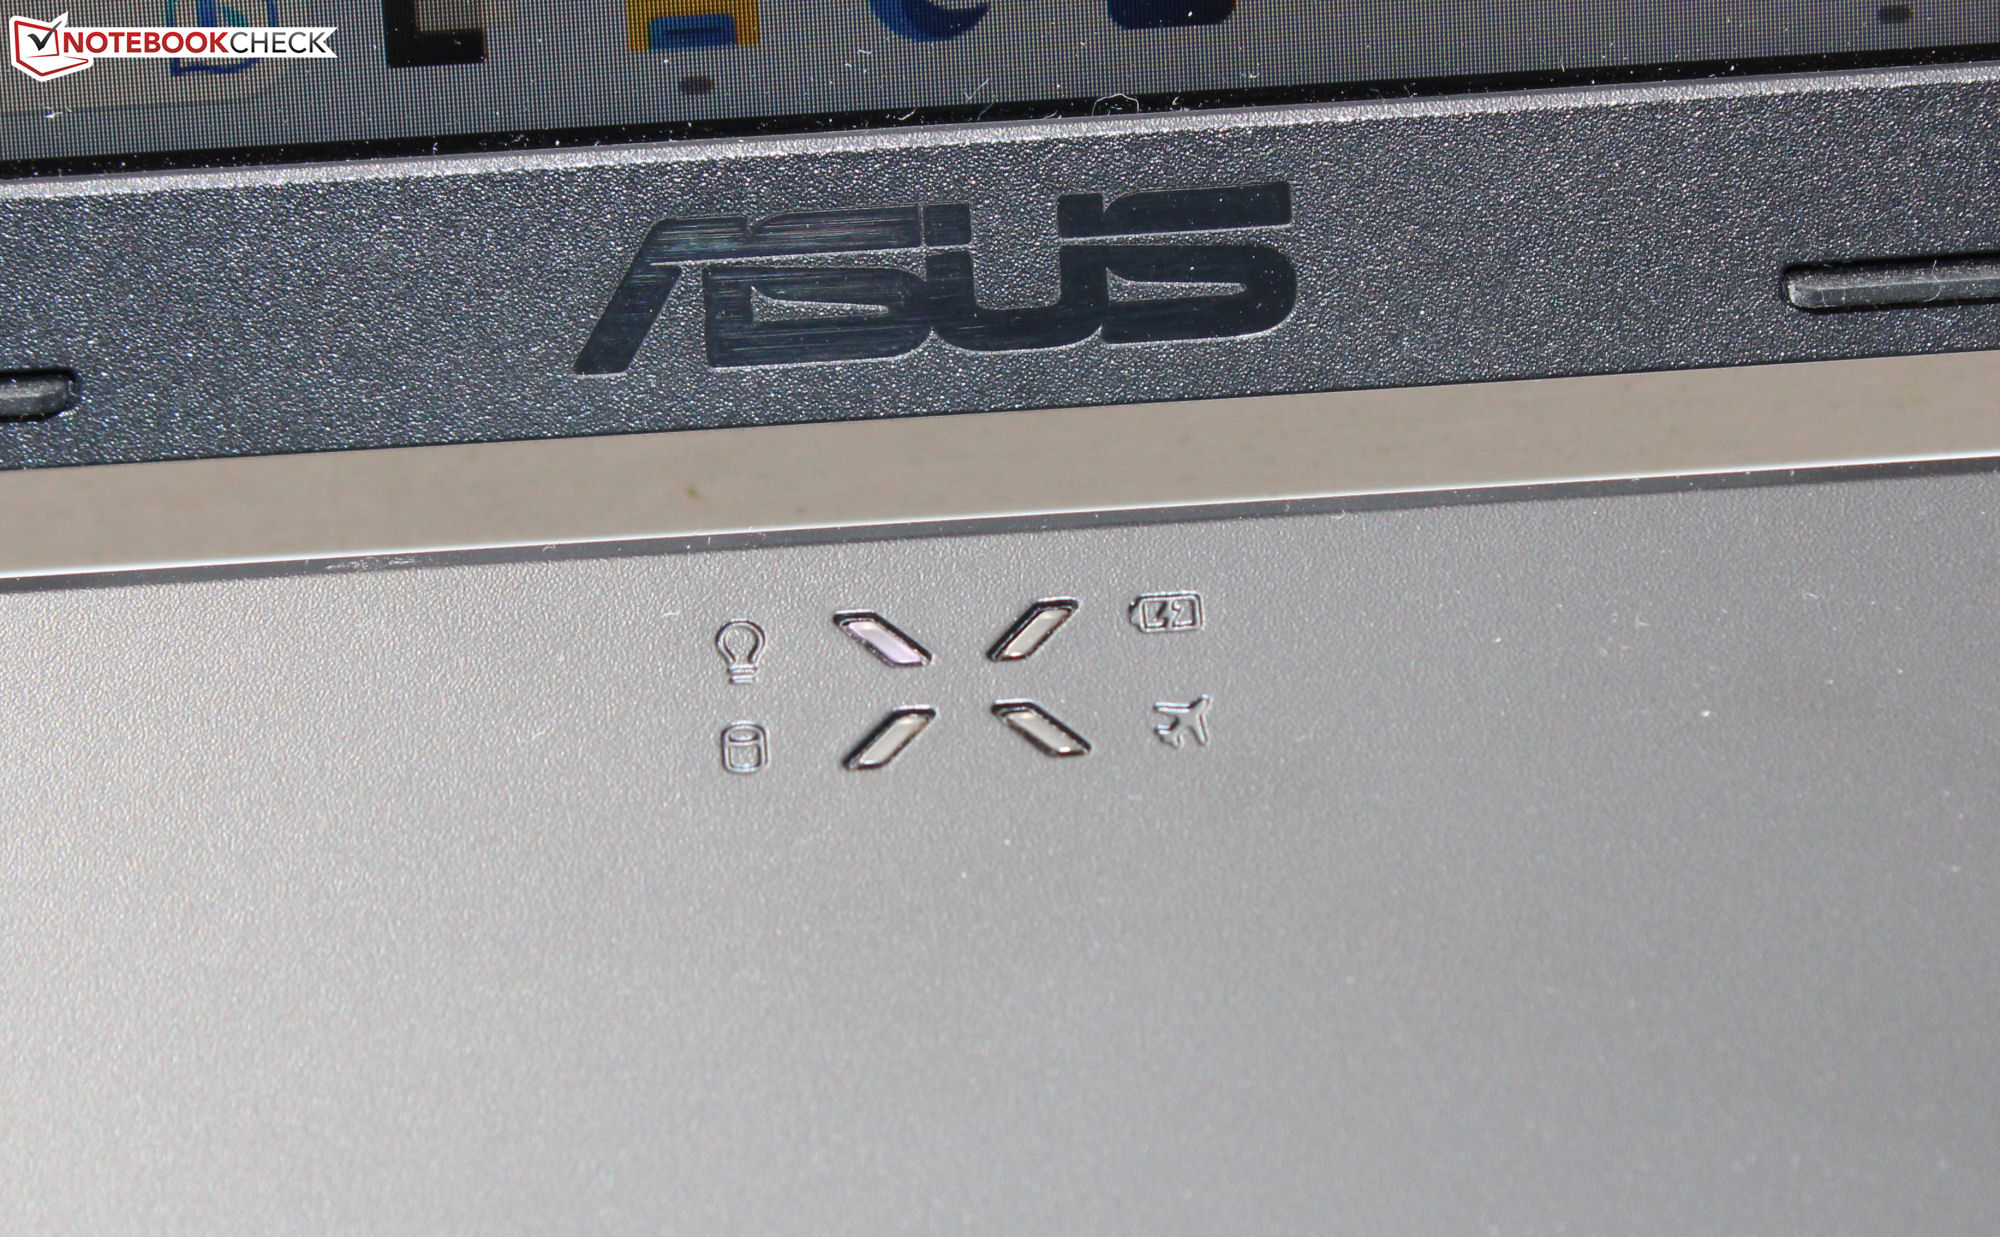
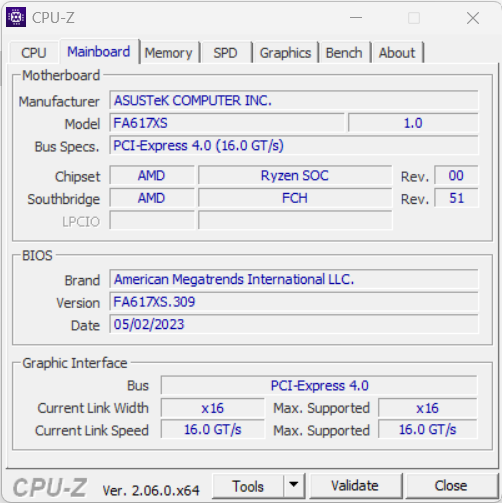
W porównaniu do siostrzanego modelua16 ma dwukolorową obudowę. Tył pokrywy i spód obudowy mają kolor piaskowy ("Sandstorm"). Opcje łączności są również nieco inne: Jeden z dwóch portów USB-C został ulepszony do standardu USB-4.


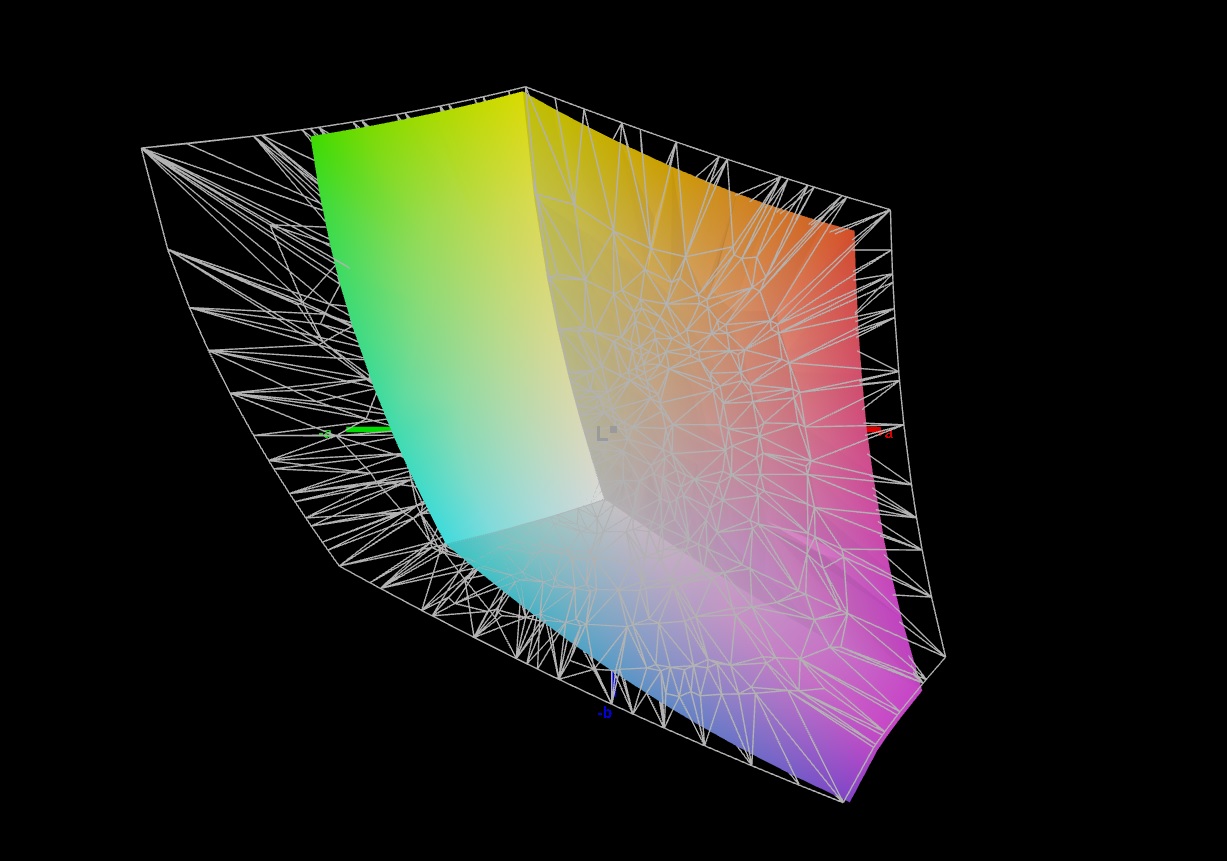
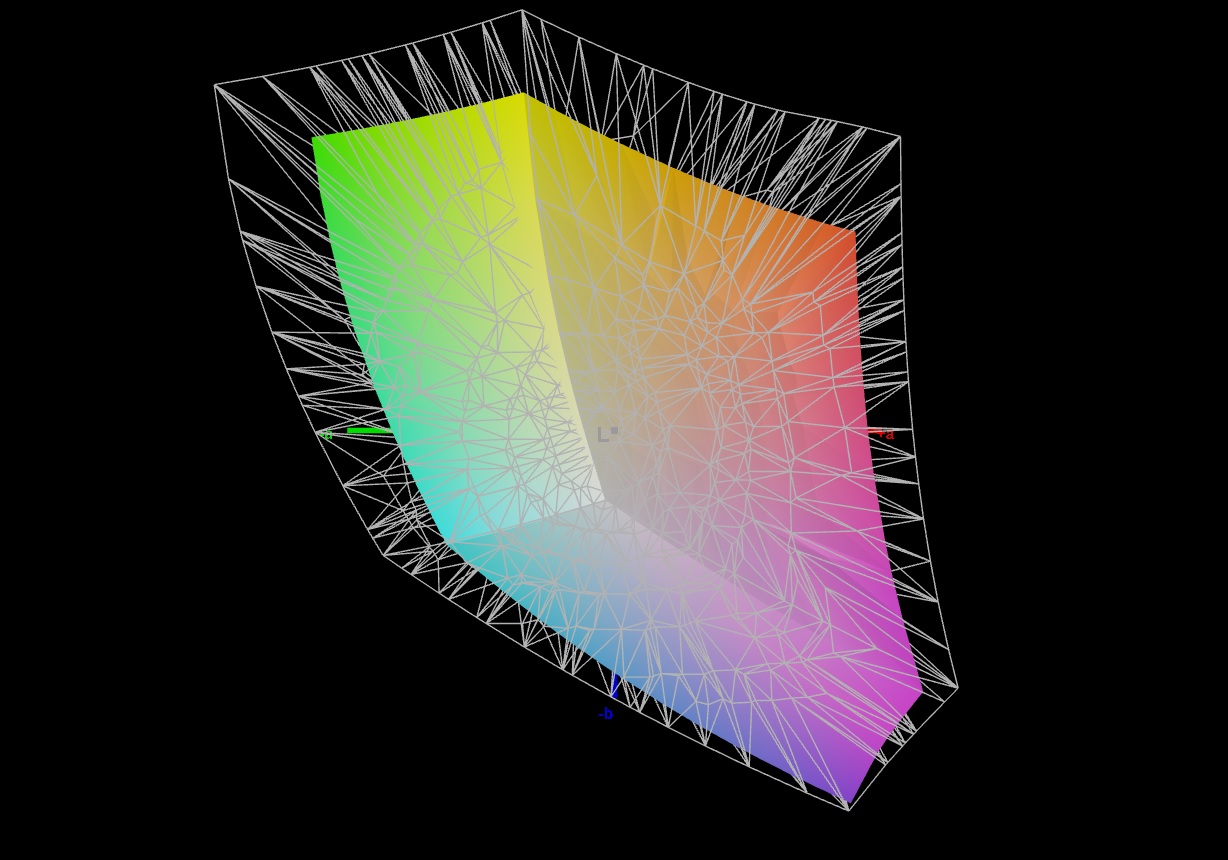
Wyświetlacz - panel 16:10 z pokryciem sRGB
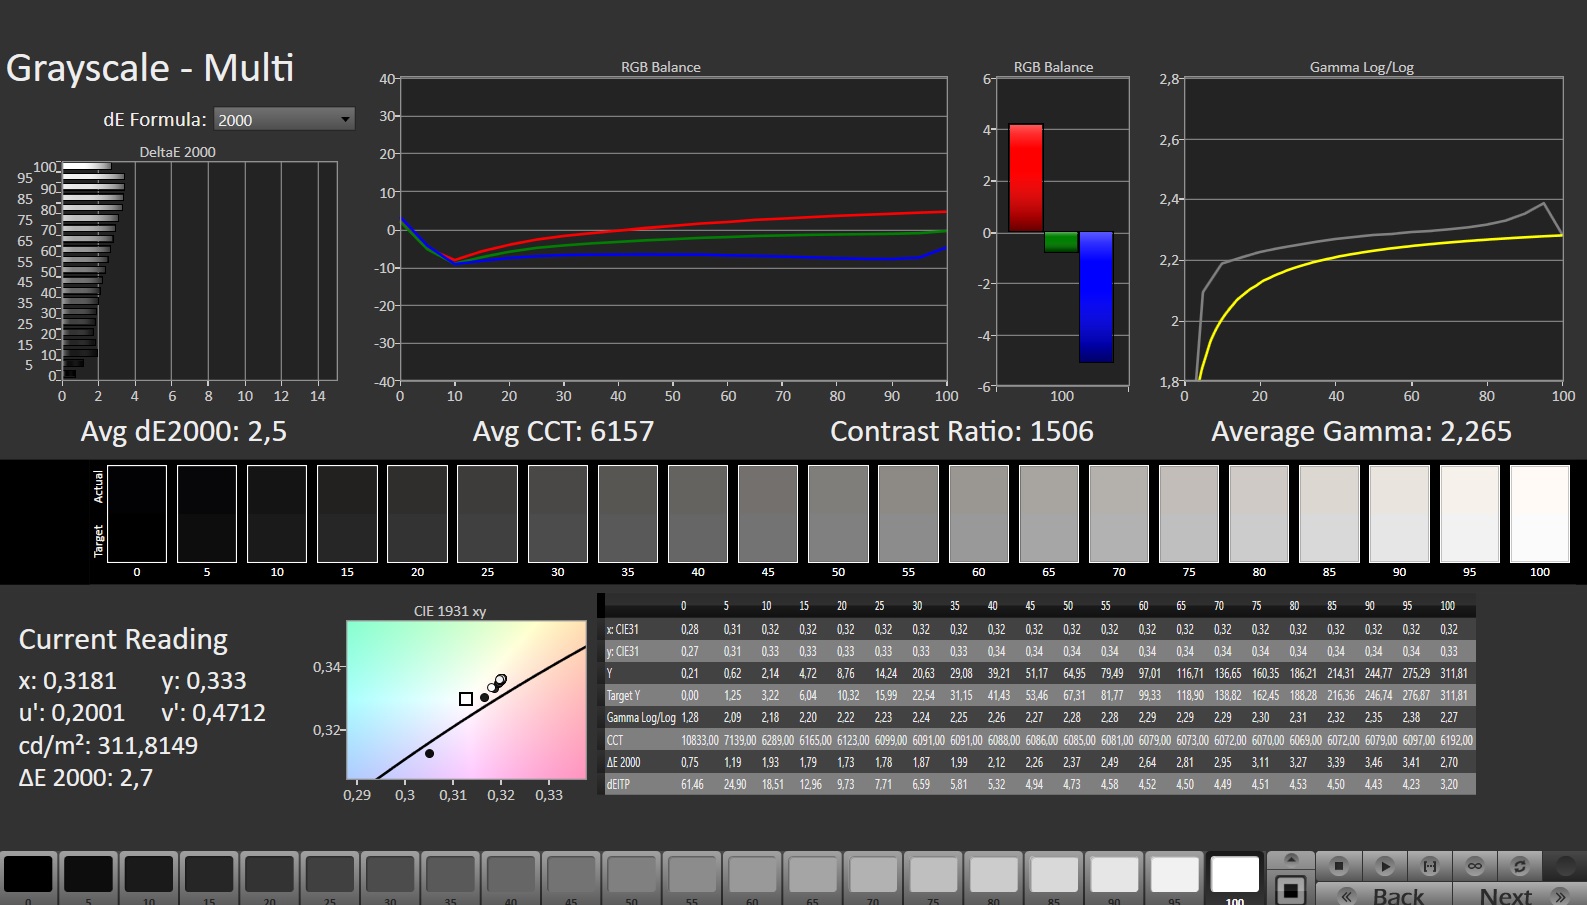
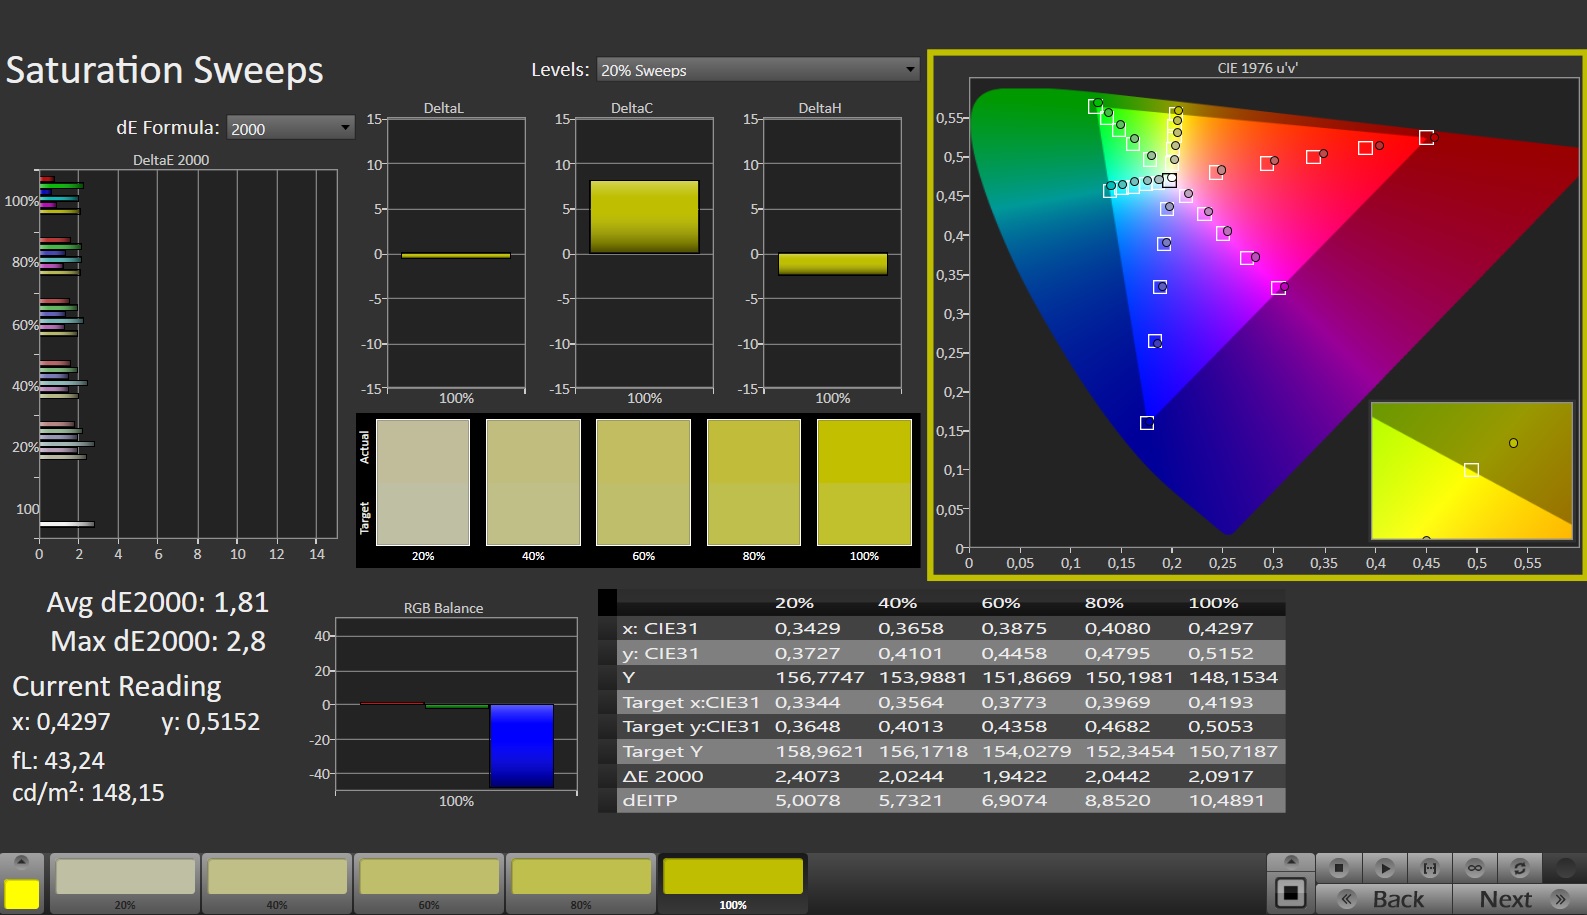
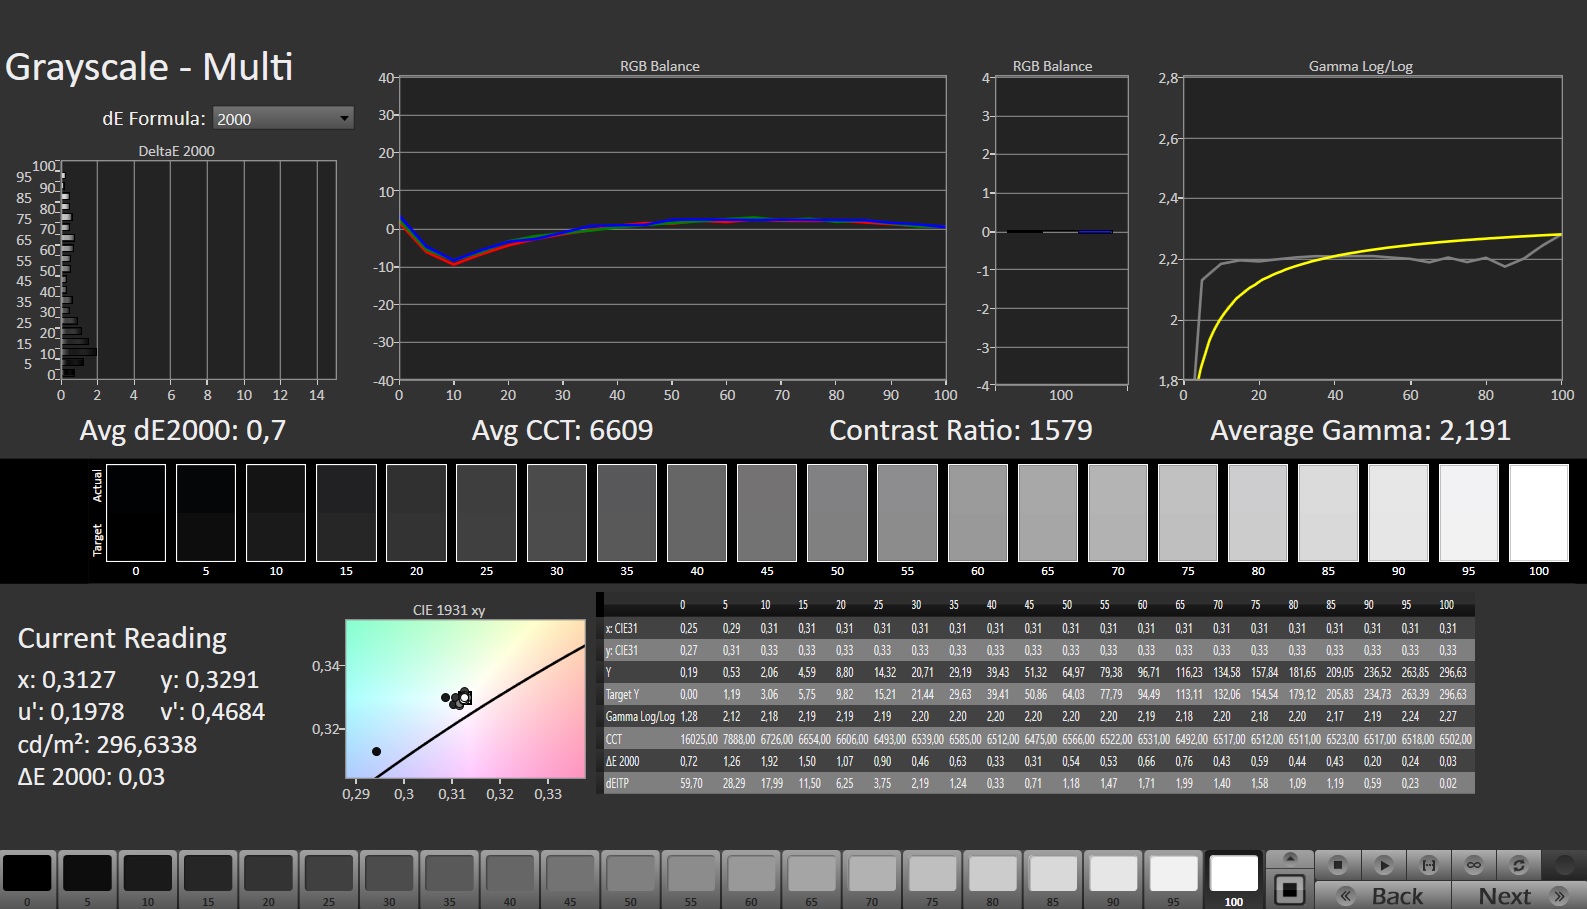
A16 jest wyposażony w ten sam panel 165 Hz, który można znaleźć w jego siostrzanym modelu siostrzanym modelu. Jego matowy 16-calowy wyświetlacz (1920 x 1200 pikseli, IPS) ma format 16:10 i zdobywa punkty dzięki obsłudze FreeSync, braku migotania PWM i szybkiej reakcji. Kontrast jest akceptowalny, ale jasność mogłaby być nieco lepsza.
| |||||||||||||||||||||||||
rozświetlenie: 94 %
na akumulatorze: 301 cd/m²
kontrast: 1433:1 (czerń: 0.21 cd/m²)
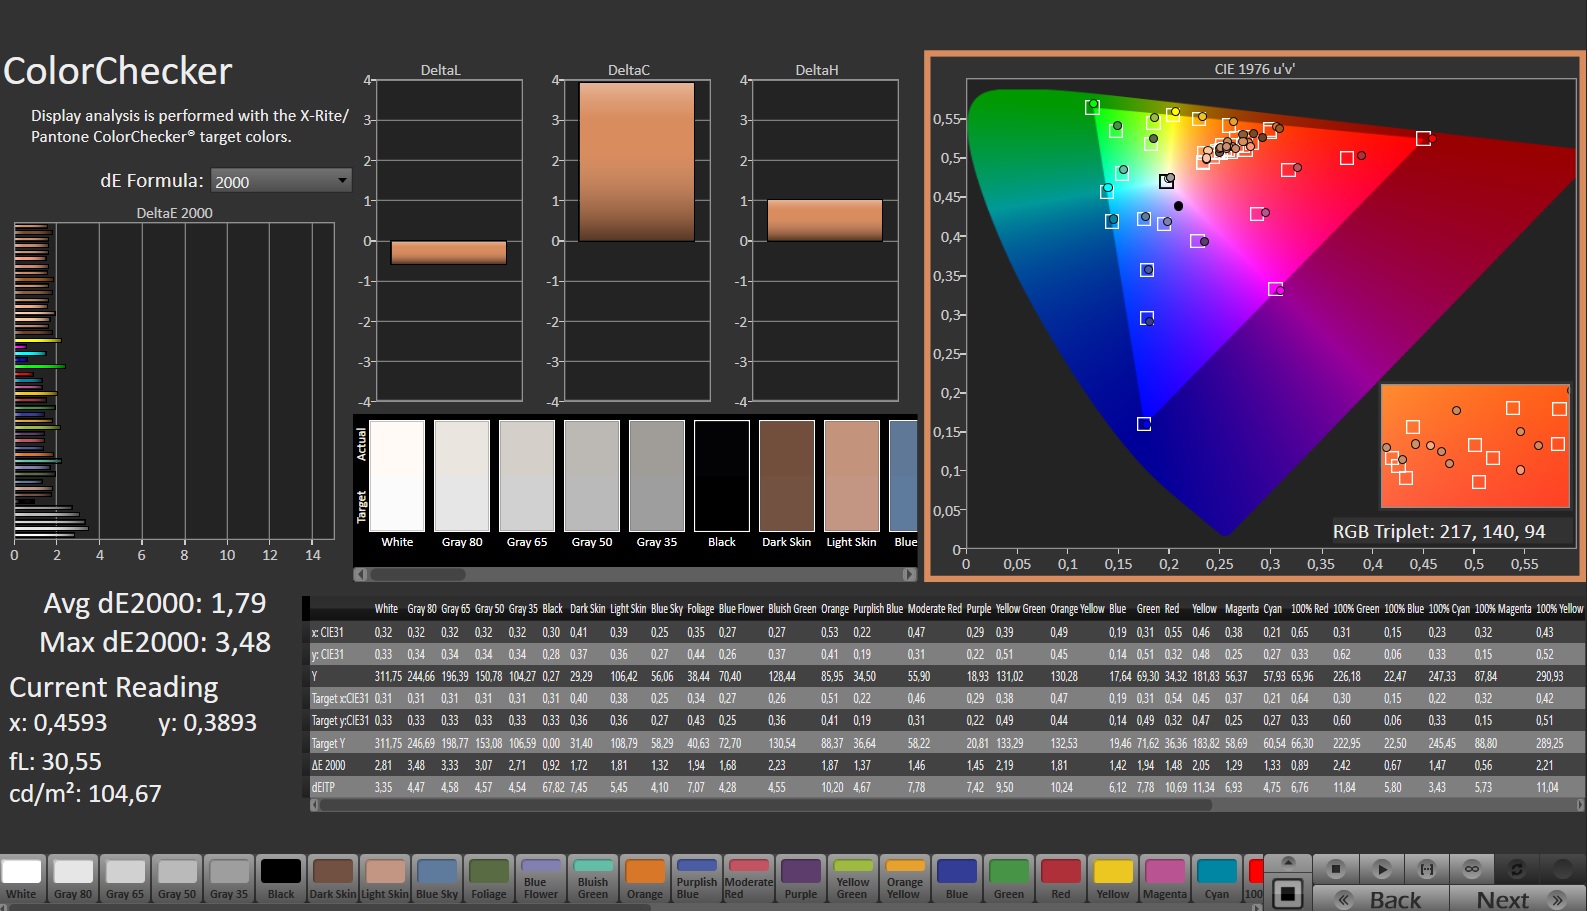
ΔE ColorChecker Calman: 1.79 | ∀{0.5-29.43 Ø4.71}
calibrated: 1.2
ΔE Greyscale Calman: 2.5 | ∀{0.09-98 Ø4.96}
70.7% AdobeRGB 1998 (Argyll 3D)
97.3% sRGB (Argyll 3D)
69.3% Display P3 (Argyll 3D)
Gamma: 2.265
CCT: 6157 K
| Asus TUF Gaming A16 FA617XS BOE NE160WUM-NX2, IPS, 1920x1200, 16" | Lenovo Legion Pro 5 16IRX8 AU Optronics B160QAN03.1, IPS, 2560x1600, 16" | MSI Katana 15 B12VEK AUOAF90 (B156HAN08.4), IPS, 1920x1080, 15.6" | Medion Erazer Defender P40 BOE CQ NE173QHM-NZ3, IPS, 2560x1440, 17.3" | Gigabyte G5 KE Chi Mei N156HRA-EA1, IPS, 1920x1080, 15.6" | Asus TUF Gaming A16 FA617 NE160WUM-NX2 (BOE0B33), IPS-Level, 1920x1200, 16" | |
|---|---|---|---|---|---|---|
| Display | 3% | -44% | -0% | -39% | 0% | |
| Display P3 Coverage (%) | 69.3 | 71.2 3% | 38.1 -45% | 68.3 -1% | 40.7 -41% | 69.4 0% |
| sRGB Coverage (%) | 97.3 | 98.8 2% | 56.8 -42% | 98.1 1% | 61 -37% | 97.8 1% |
| AdobeRGB 1998 Coverage (%) | 70.7 | 73.3 4% | 39.3 -44% | 69.8 -1% | 42.1 -40% | 70.9 0% |
| Response Times | 2% | -159% | 10% | -79% | -5% | |
| Response Time Grey 50% / Grey 80% * (ms) | 15.6 ? | 14.5 ? 7% | 38.8 ? -149% | 14.6 ? 6% | 26.64 ? -71% | 17 ? -9% |
| Response Time Black / White * (ms) | 10 ? | 10.4 ? -4% | 26.8 ? -168% | 8.7 ? 13% | 18.65 ? -86% | 10.1 ? -1% |
| PWM Frequency (Hz) | ||||||
| Screen | 5% | -115% | 7% | -113% | 4% | |
| Brightness middle (cd/m²) | 301 | 405.7 35% | 261 -13% | 364 21% | 269 -11% | 308 2% |
| Brightness (cd/m²) | 294 | 368 25% | 258 -12% | 343 17% | 248 -16% | 293 0% |
| Brightness Distribution (%) | 94 | 87 -7% | 92 -2% | 86 -9% | 85 -10% | 90 -4% |
| Black Level * (cd/m²) | 0.21 | 0.38 -81% | 0.19 10% | 0.28 -33% | 0.5 -138% | 0.23 -10% |
| Contrast (:1) | 1433 | 1068 -25% | 1374 -4% | 1300 -9% | 538 -62% | 1339 -7% |
| Colorchecker dE 2000 * | 1.79 | 1.65 8% | 5.57 -211% | 1.67 7% | 4.54 -154% | 1.47 18% |
| Colorchecker dE 2000 max. * | 3.48 | 4.2 -21% | 20.6 -492% | 2.78 20% | 17.28 -397% | 2.98 14% |
| Colorchecker dE 2000 calibrated * | 1.2 | 0.53 56% | 4.63 -286% | 1.14 5% | 3.34 -178% | 1.02 15% |
| Greyscale dE 2000 * | 2.5 | 1.2 52% | 3.19 -28% | 1.4 44% | 3.8 -52% | 2.2 12% |
| Gamma | 2.265 97% | 2.3 96% | 2.45 90% | 2.091 105% | 2.17 101% | 2.228 99% |
| CCT | 6157 106% | 6453 101% | 6146 106% | 6568 99% | 7408 88% | 6228 104% |
| Całkowita średnia (program / ustawienia) | 3% /
4% | -106% /
-106% | 6% /
6% | -77% /
-92% | -0% /
2% |
* ... im mniej tym lepiej
Ex działa, ekran ma dobre odwzorowanie kolorów: Odchylenie około 1,8 jest akceptowalne (DeltaE < 3). Kalibracja obniża ten wskaźnik do 1,2 i prowadzi do bardziej zrównoważonych odcieni szarości. Panel jest w stanie odwzorować całą przestrzeń kolorów sRGB, ale nie AdobeRGB i DCI P3. Jest to podobne do większości wyświetlaczy konkurencji.
Wyświetl czasy reakcji
| ↔ Czas reakcji od czerni do bieli | ||
|---|---|---|
| 10 ms ... wzrost ↗ i spadek ↘ łącznie | ↗ 5.7 ms wzrost | 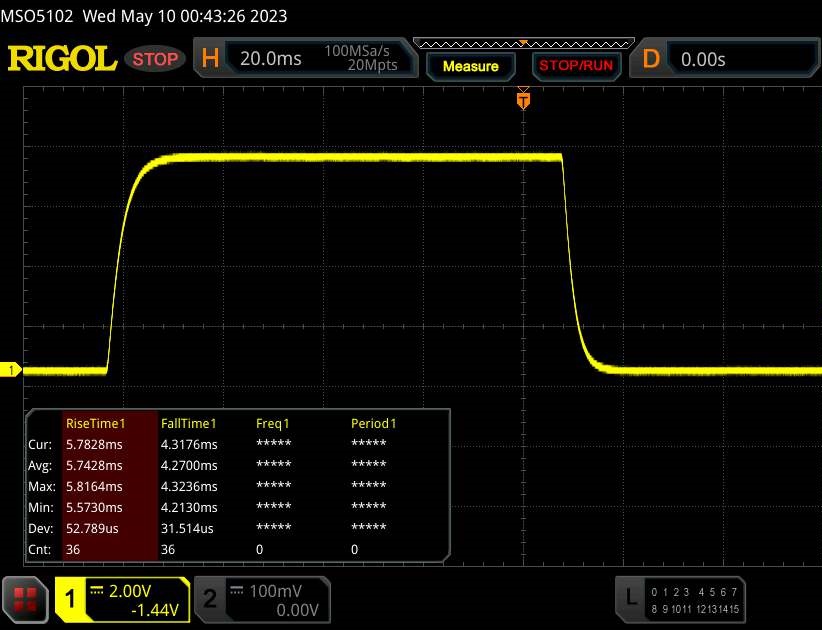 |
| ↘ 4.3 ms upadek | ||
| W naszych testach ekran wykazuje dobry współczynnik reakcji, ale może być zbyt wolny dla graczy rywalizujących ze sobą. Dla porównania, wszystkie testowane urządzenia wahają się od 0.1 (minimum) do 240 (maksimum) ms. » 27 % wszystkich urządzeń jest lepszych. Oznacza to, że zmierzony czas reakcji jest lepszy od średniej wszystkich testowanych urządzeń (19.8 ms). | ||
| ↔ Czas reakcji 50% szarości do 80% szarości | ||
| 15.6 ms ... wzrost ↗ i spadek ↘ łącznie | ↗ 7.3 ms wzrost | 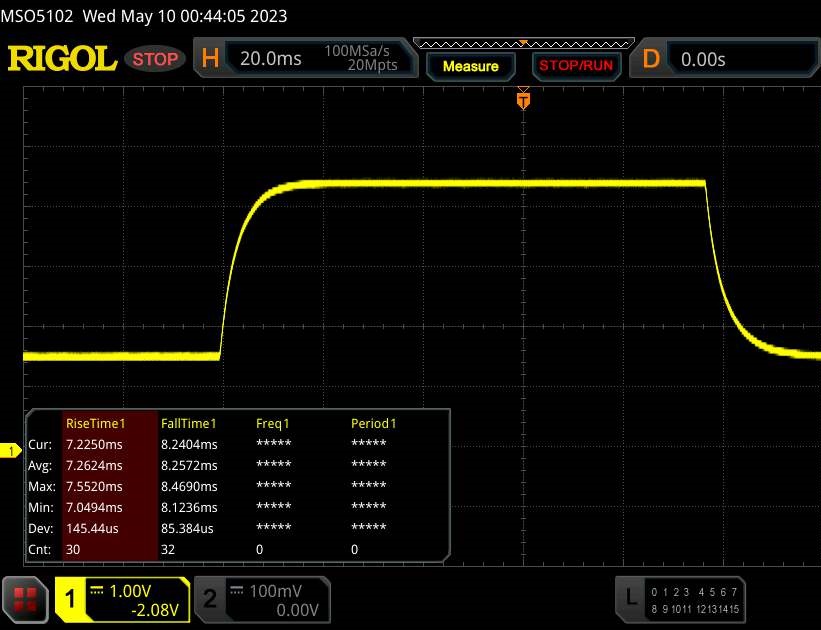 |
| ↘ 8.3 ms upadek | ||
| W naszych testach ekran wykazuje dobry współczynnik reakcji, ale może być zbyt wolny dla graczy rywalizujących ze sobą. Dla porównania, wszystkie testowane urządzenia wahają się od 0.165 (minimum) do 636 (maksimum) ms. » 30 % wszystkich urządzeń jest lepszych. Oznacza to, że zmierzony czas reakcji jest lepszy od średniej wszystkich testowanych urządzeń (30.9 ms). | ||
Migotanie ekranu / PWM (modulacja szerokości impulsu)
| Migotanie ekranu/nie wykryto PWM | 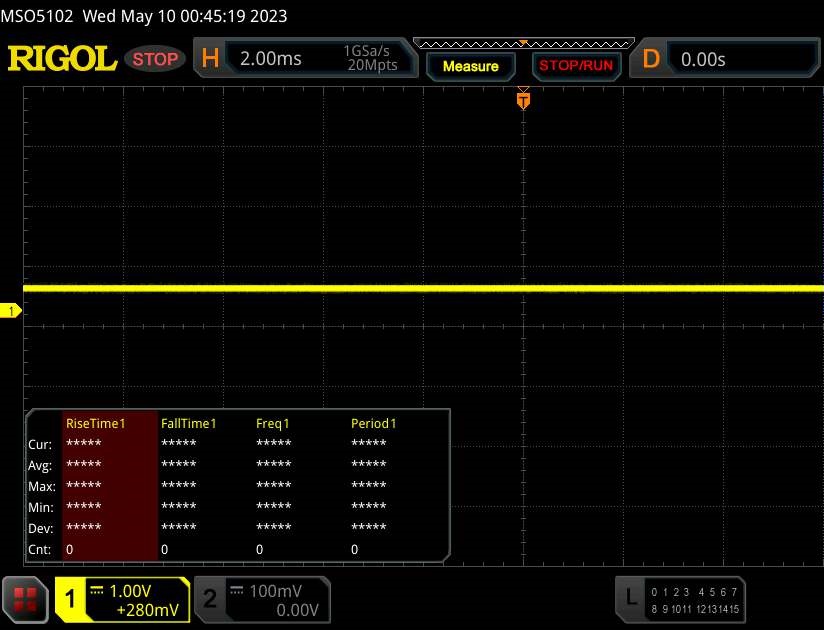 | ||
Dla porównania: 52 % wszystkich testowanych urządzeń nie używa PWM do przyciemniania wyświetlacza. Jeśli wykryto PWM, zmierzono średnio 7741 (minimum: 5 - maksimum: 343500) Hz. | |||
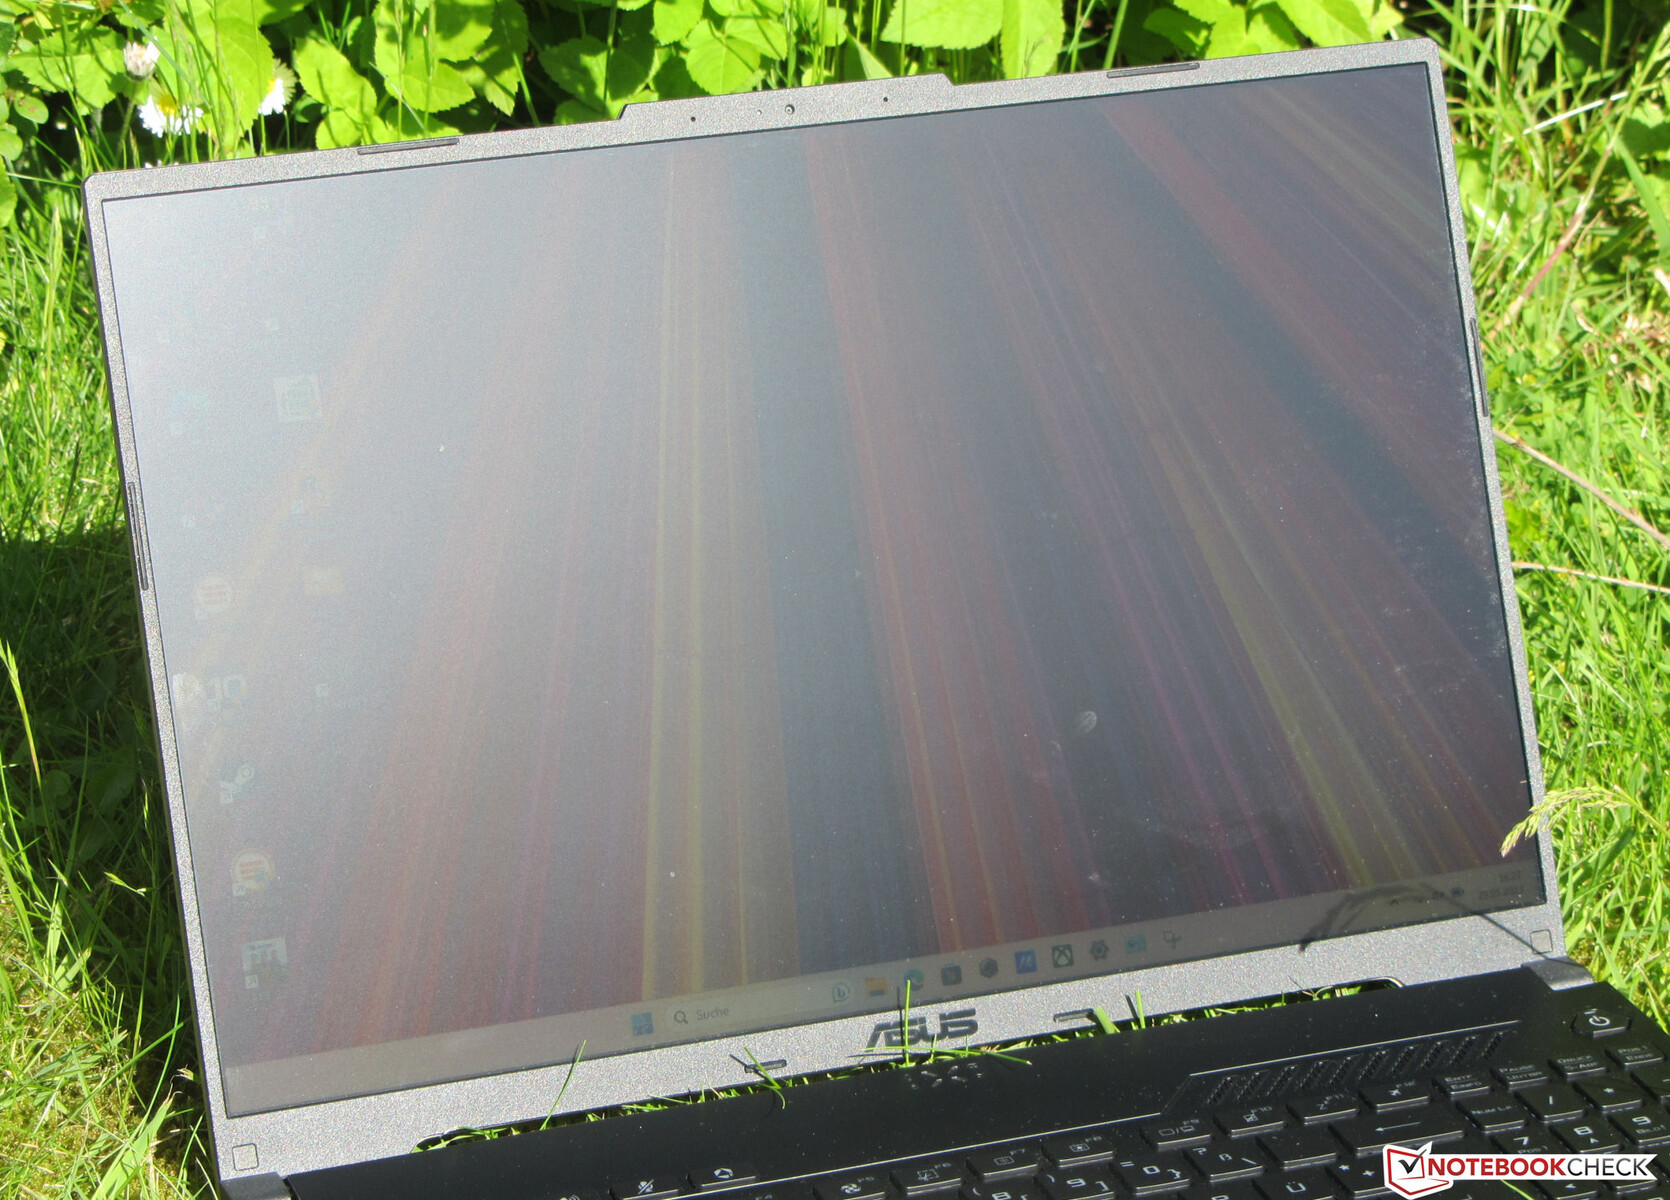
Stabilny pod kątem widzenia panel IPS laptopa pozostaje czytelny pod każdym kątem. Możliwe jest oglądanie panelu na zewnątrz - o ile słońce nie świeci zbyt mocno.

Wydajność - Asus wykorzystuje moc AMD
Asus TUF Gaming A16 Advantage Edition FA617XS to średniej klasy laptop do gier. Sprzęt AMD zapewnia niezbędną moc obliczeniową. Obecny model można nabyć za około 1700 dolarów.
Warunki testowania
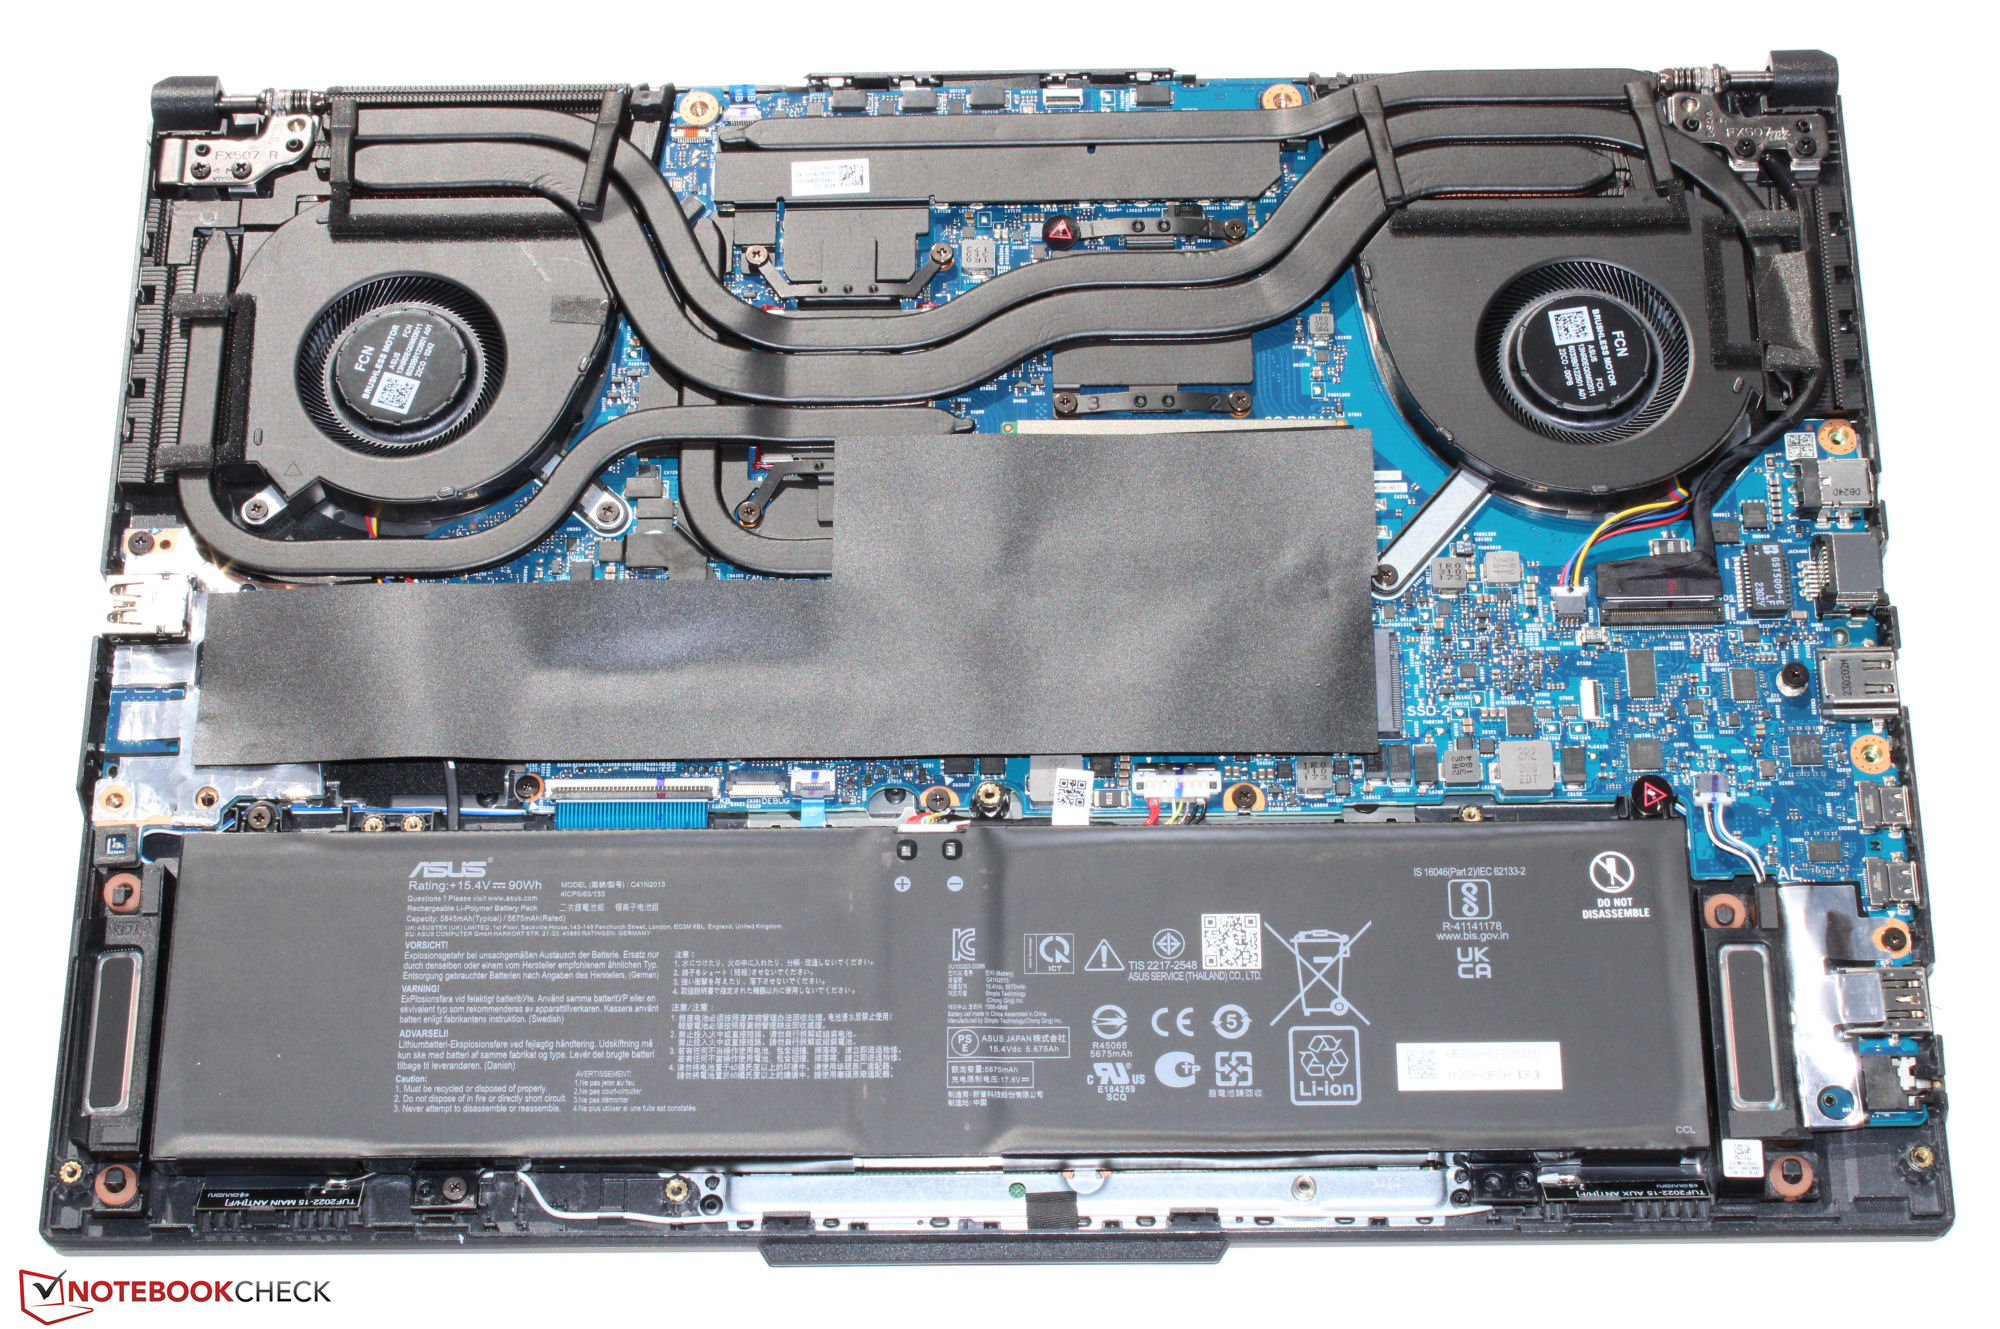
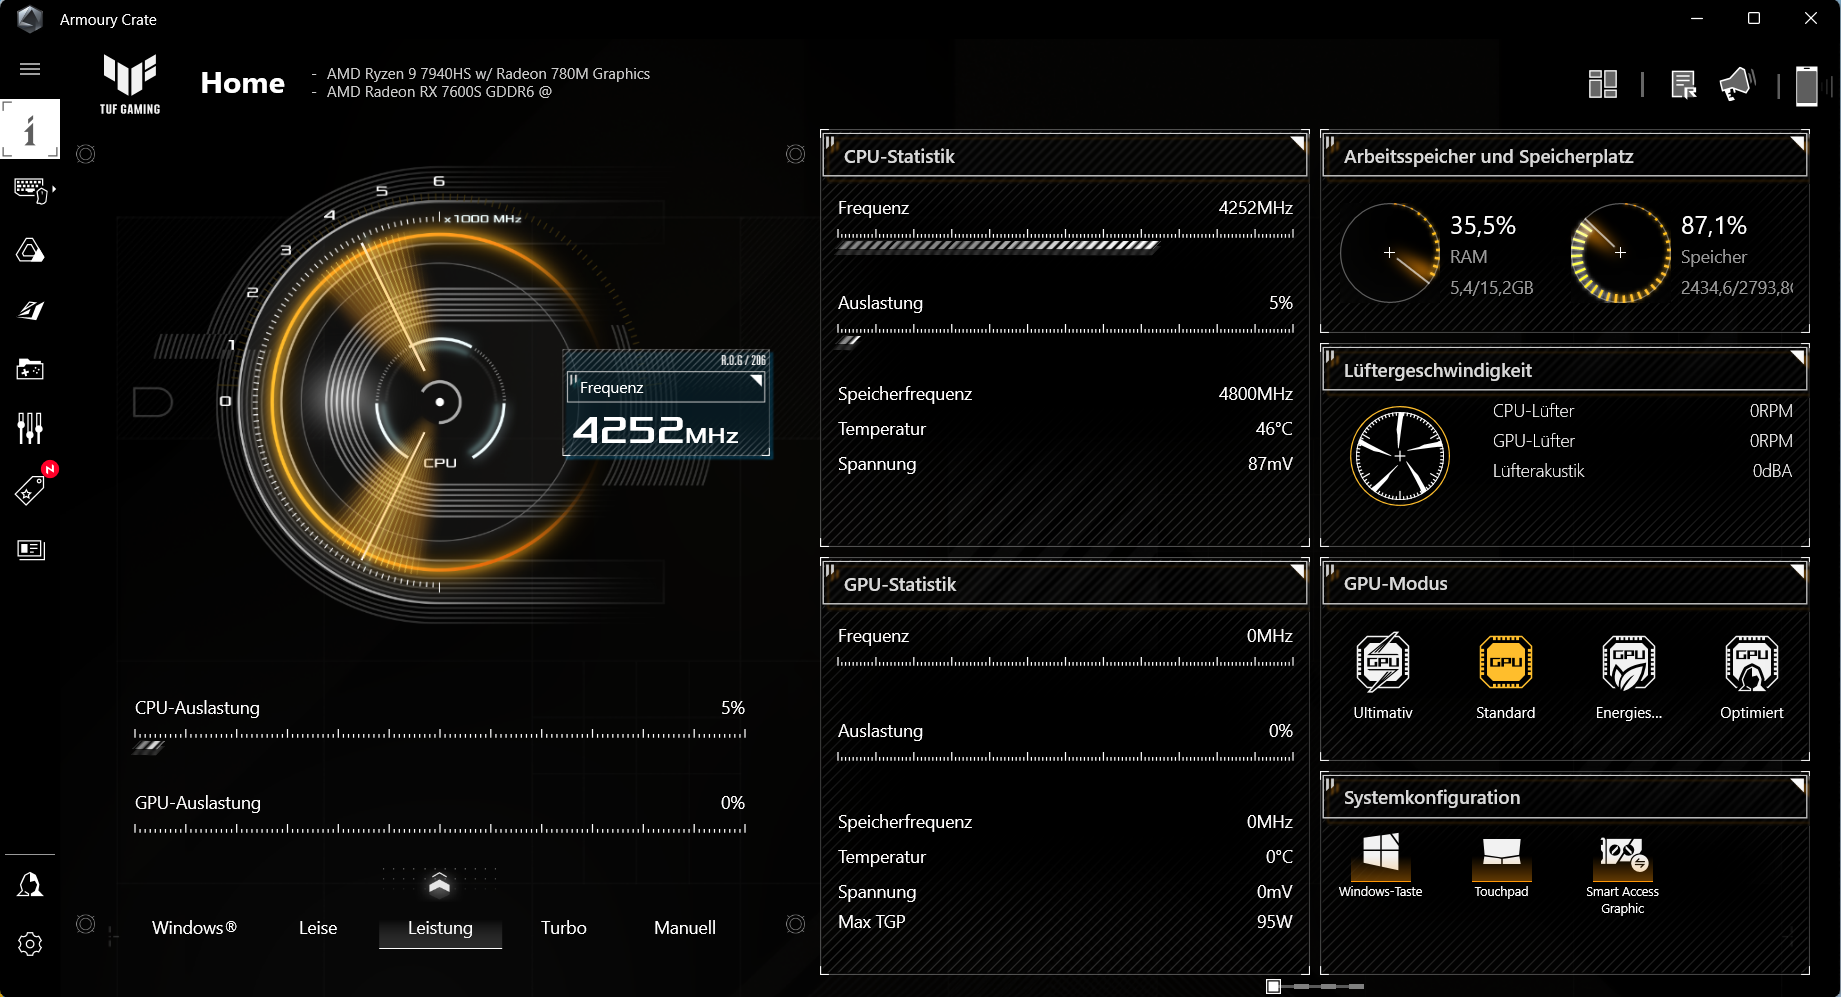
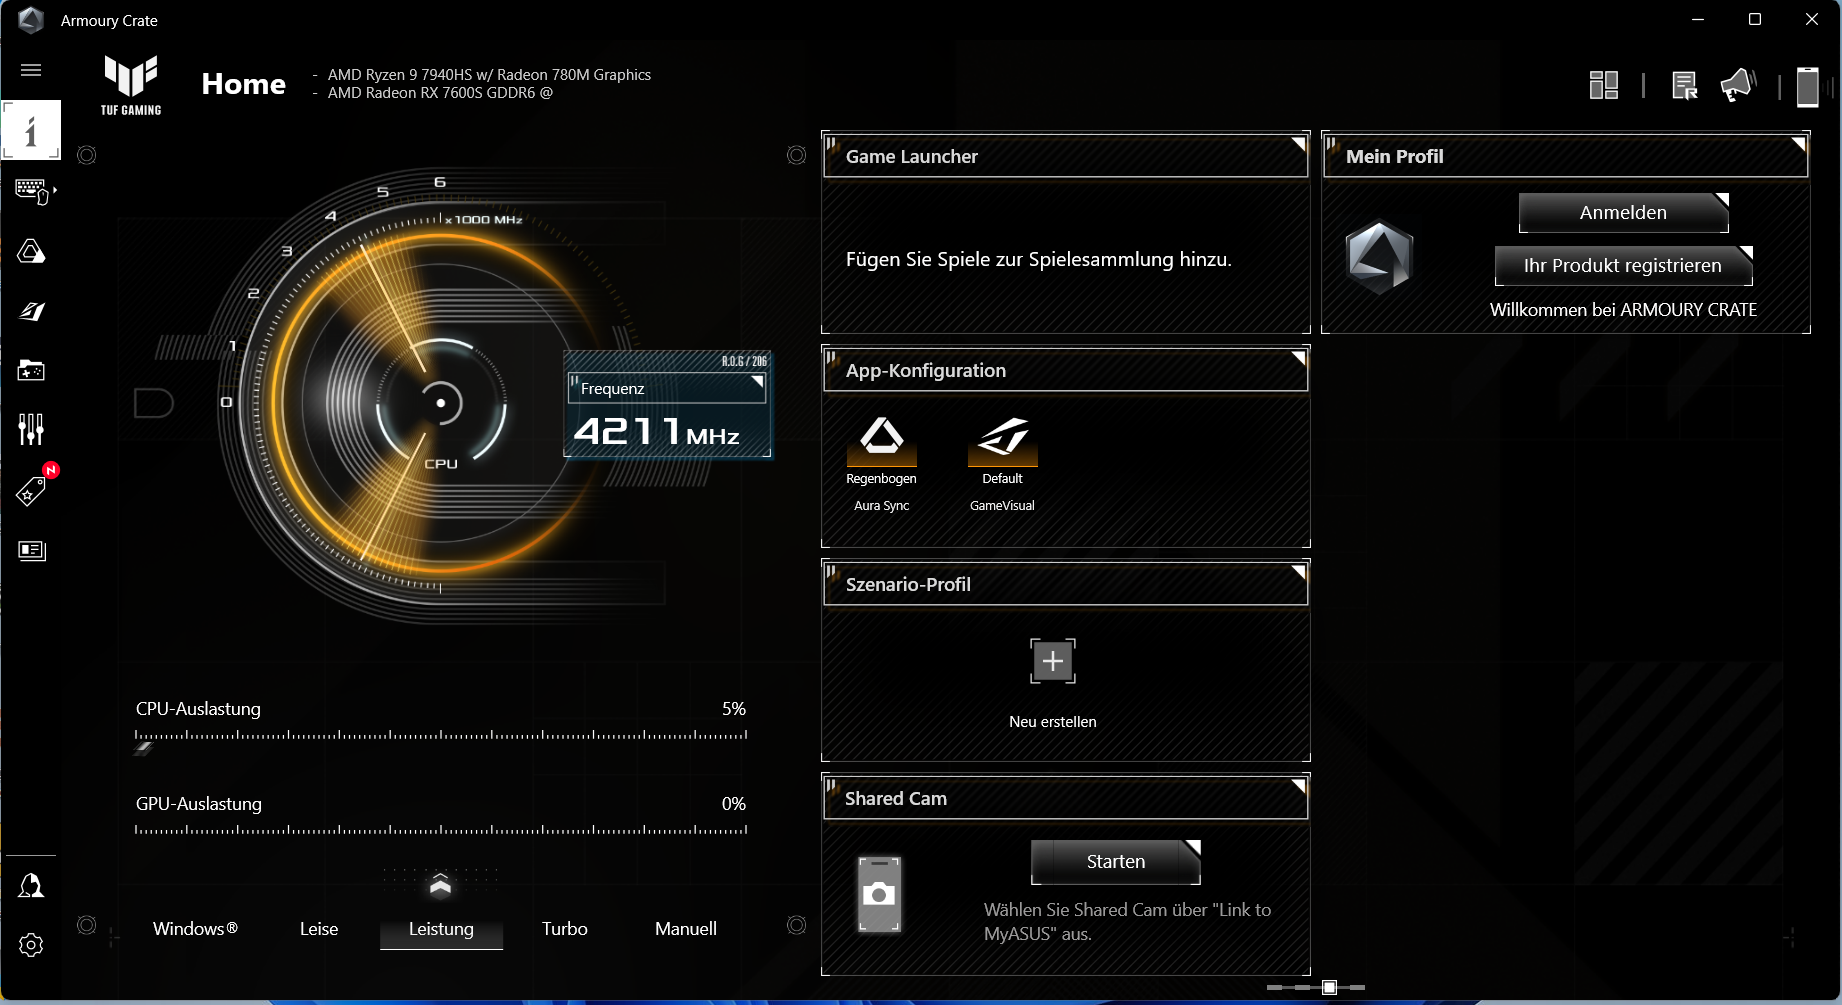
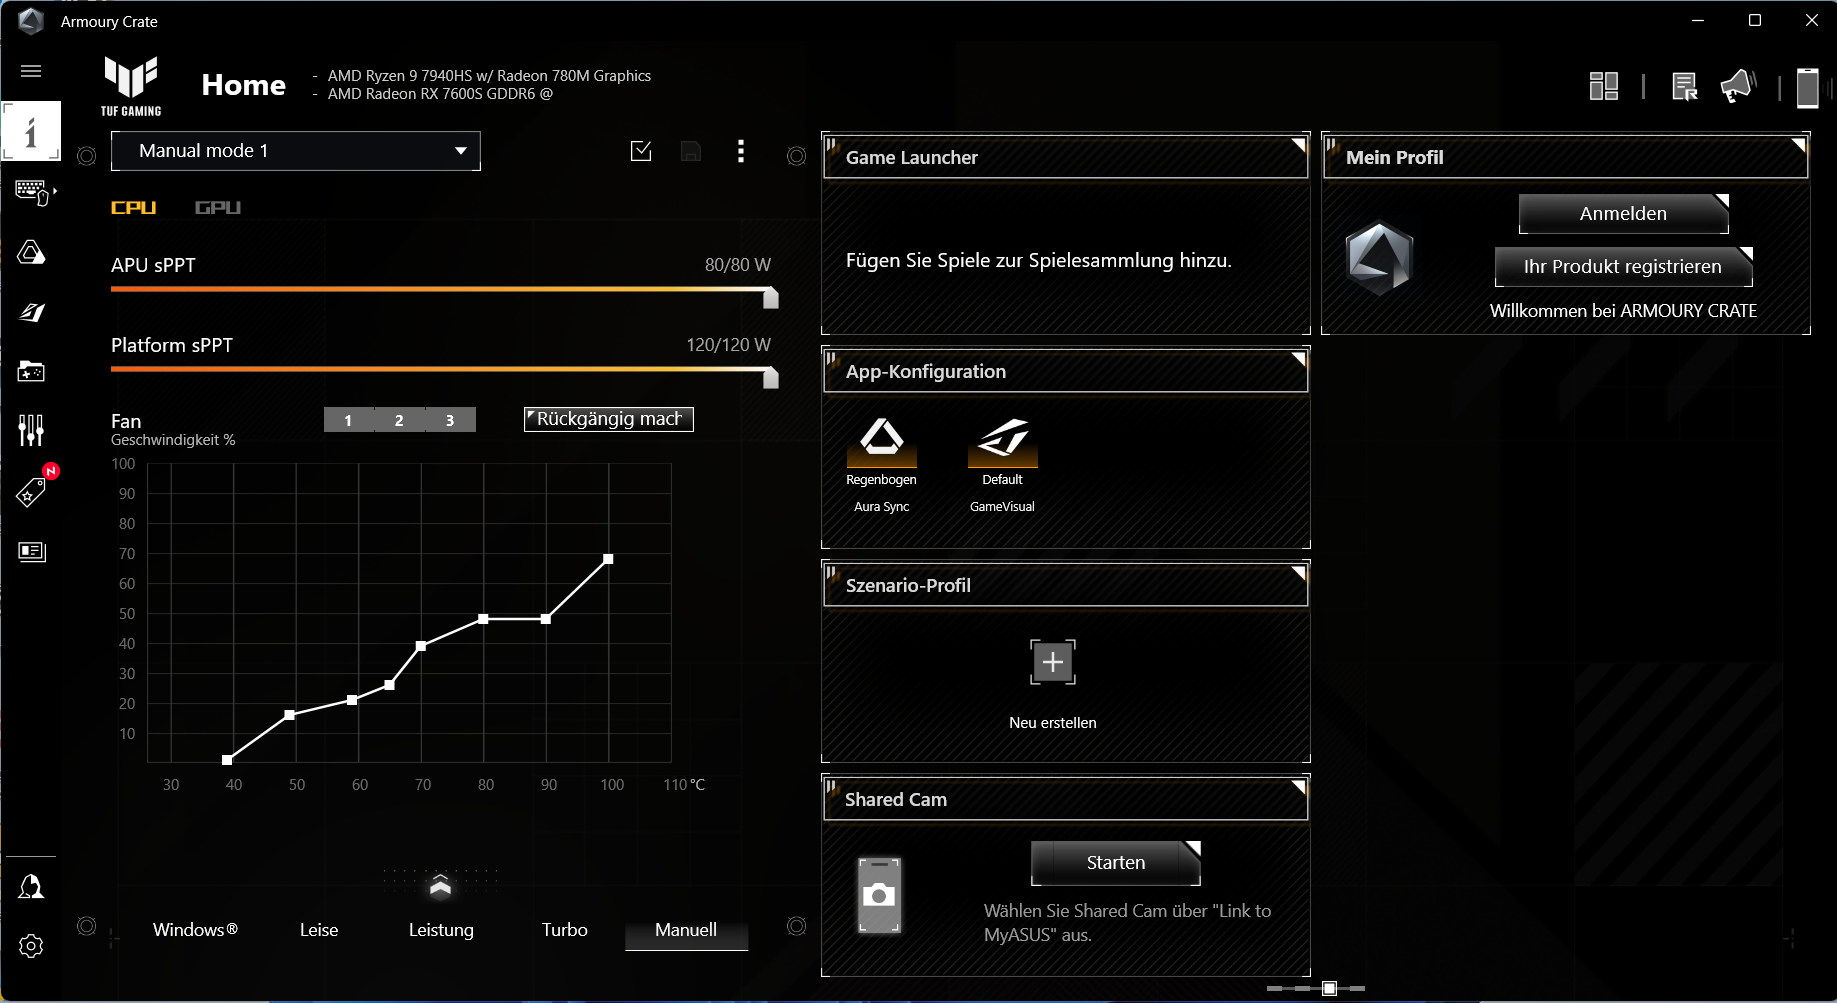
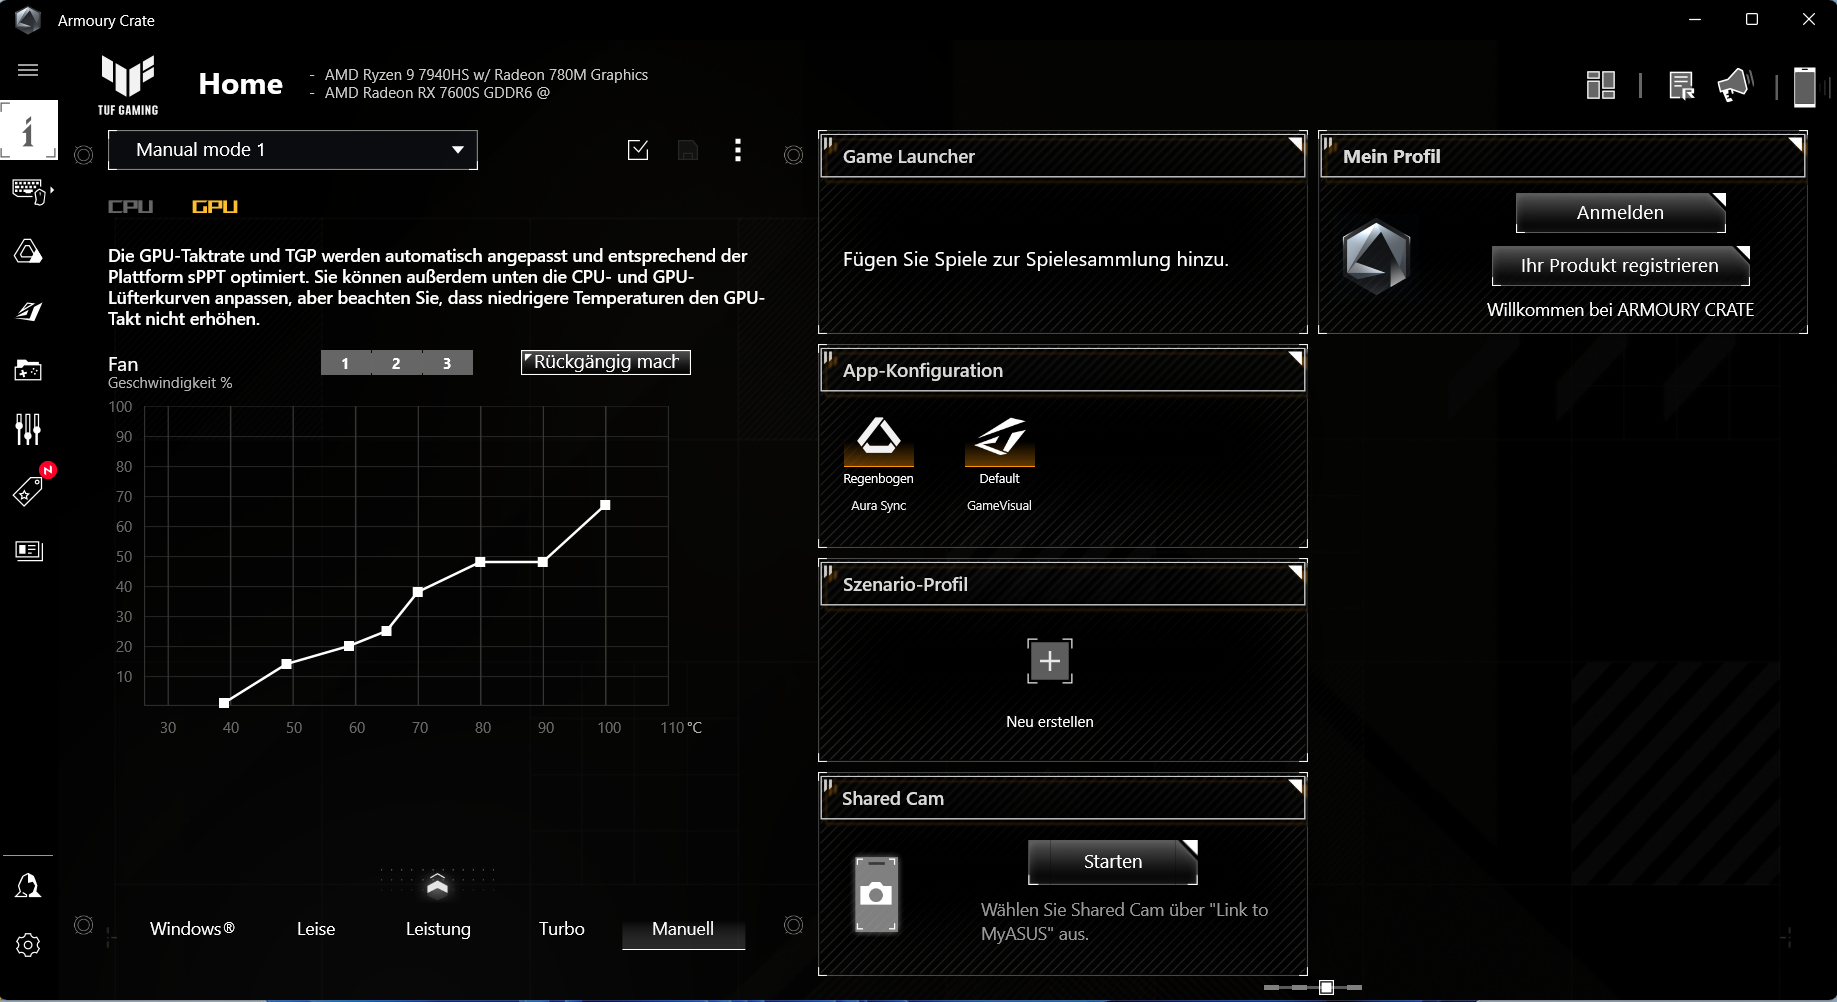
Można przełączać się między trzema profilami wydajności specyficznymi dla producenta (patrz tabela) za pomocą kombinacji klawiszy "Fn" + "F5". Użyto profili "Wydajność" (benchmarki) i "Cichy" (testy baterii). Tryb GPU był ustawiony na "Standardowy" (= przełączanie grafiki). Centrum sterowania notebooka ("Armoury Crate") umożliwia tworzenie indywidualnych profili ("Manual"), które obejmują ustawienie krzywych PPT i wentylatora.
| Turbo | Wydajność | Cisza | |
|---|---|---|---|
| Limit mocy 1 (HWInfo) | 120 watów | 105 watów | 75 watów |
| Limit mocy 2 (HWInfo) | 144 waty | 114 watów | 90 watów |
| Hałas (Wichter 3) | 53 dB(A) | 51 dB(A) | 46 dB(A) |
| Wydajność (Witcher 3) | ~100 fps | ~100 fps | ~94 fps |
Procesor
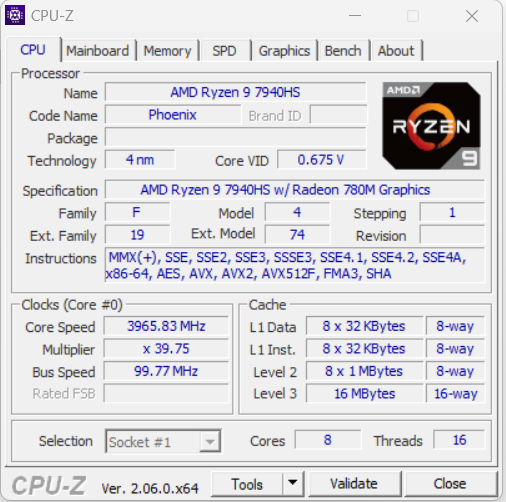
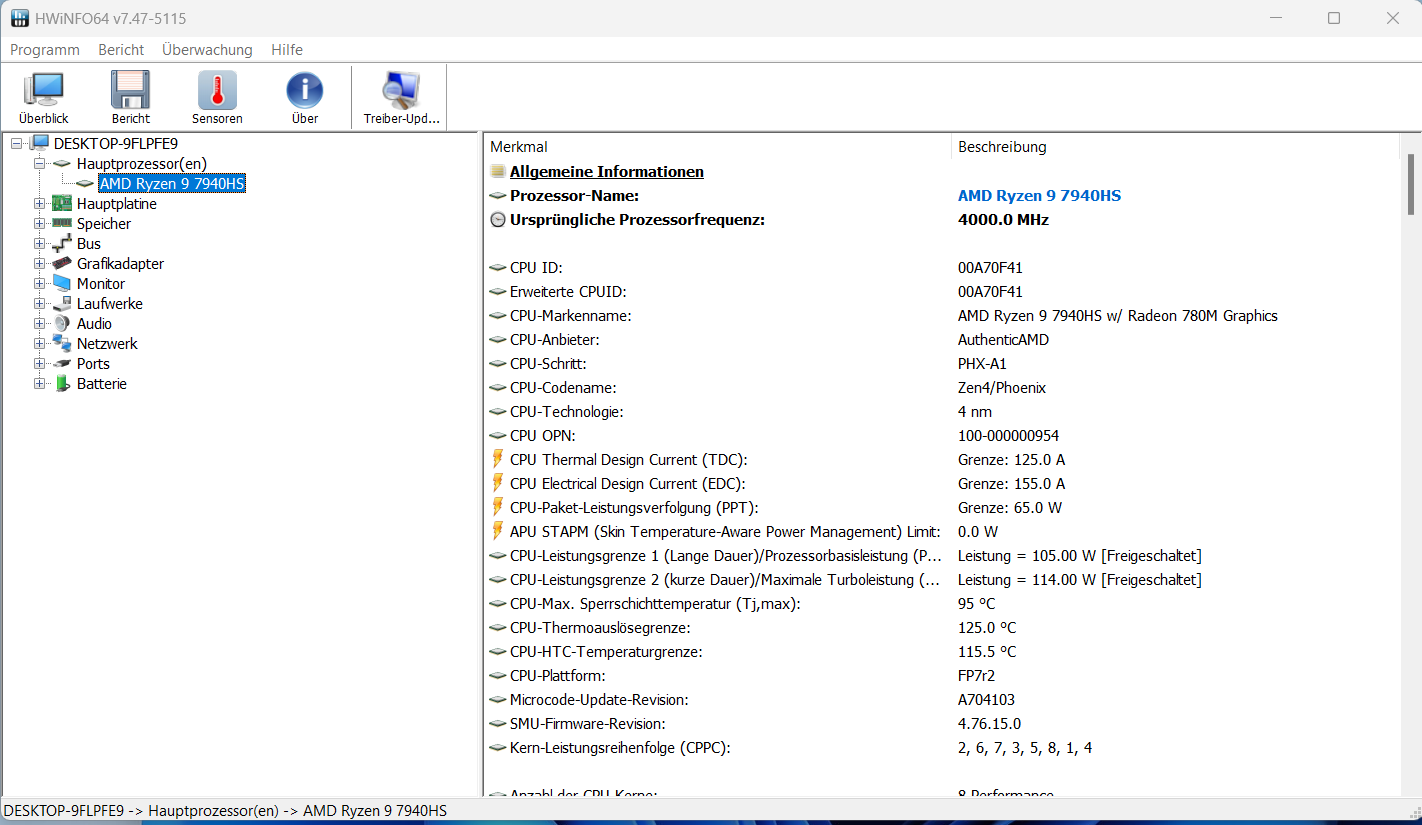
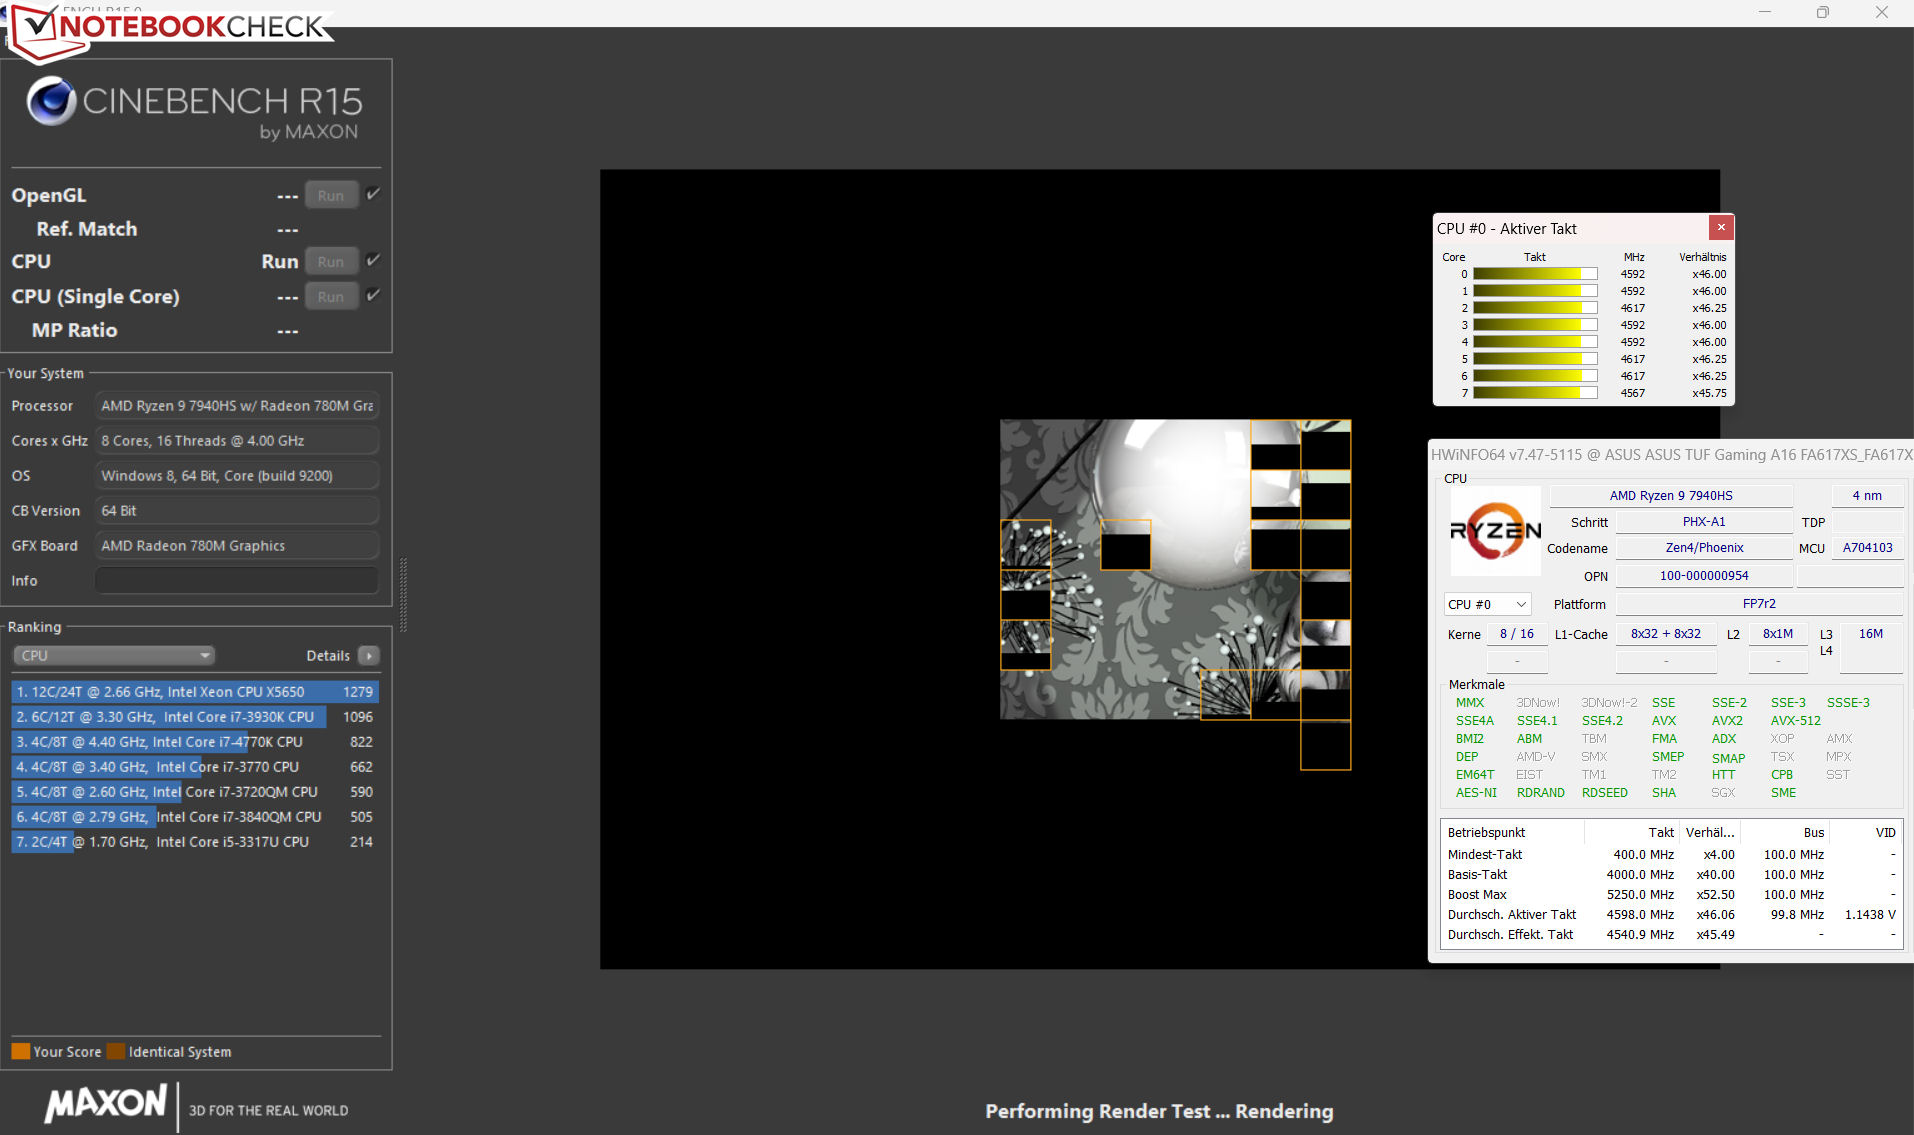
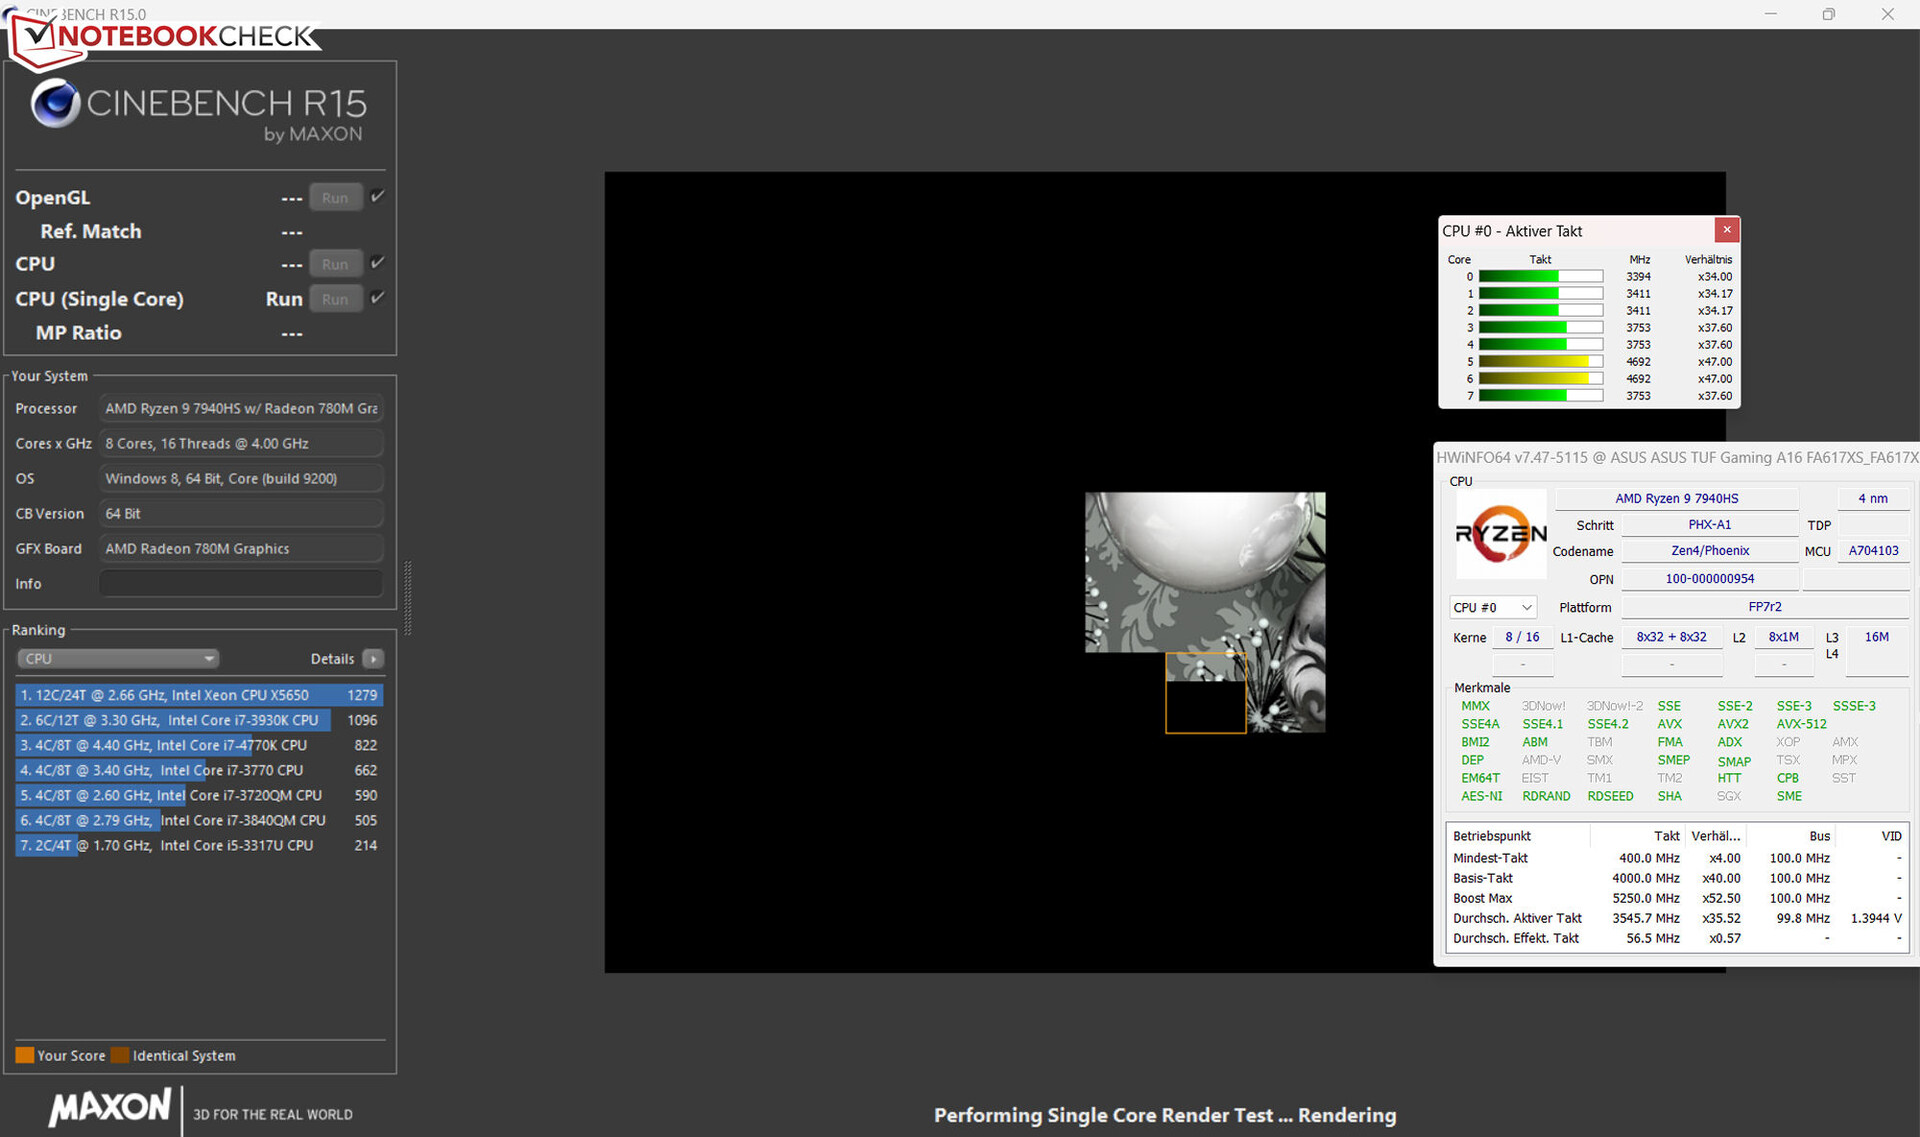
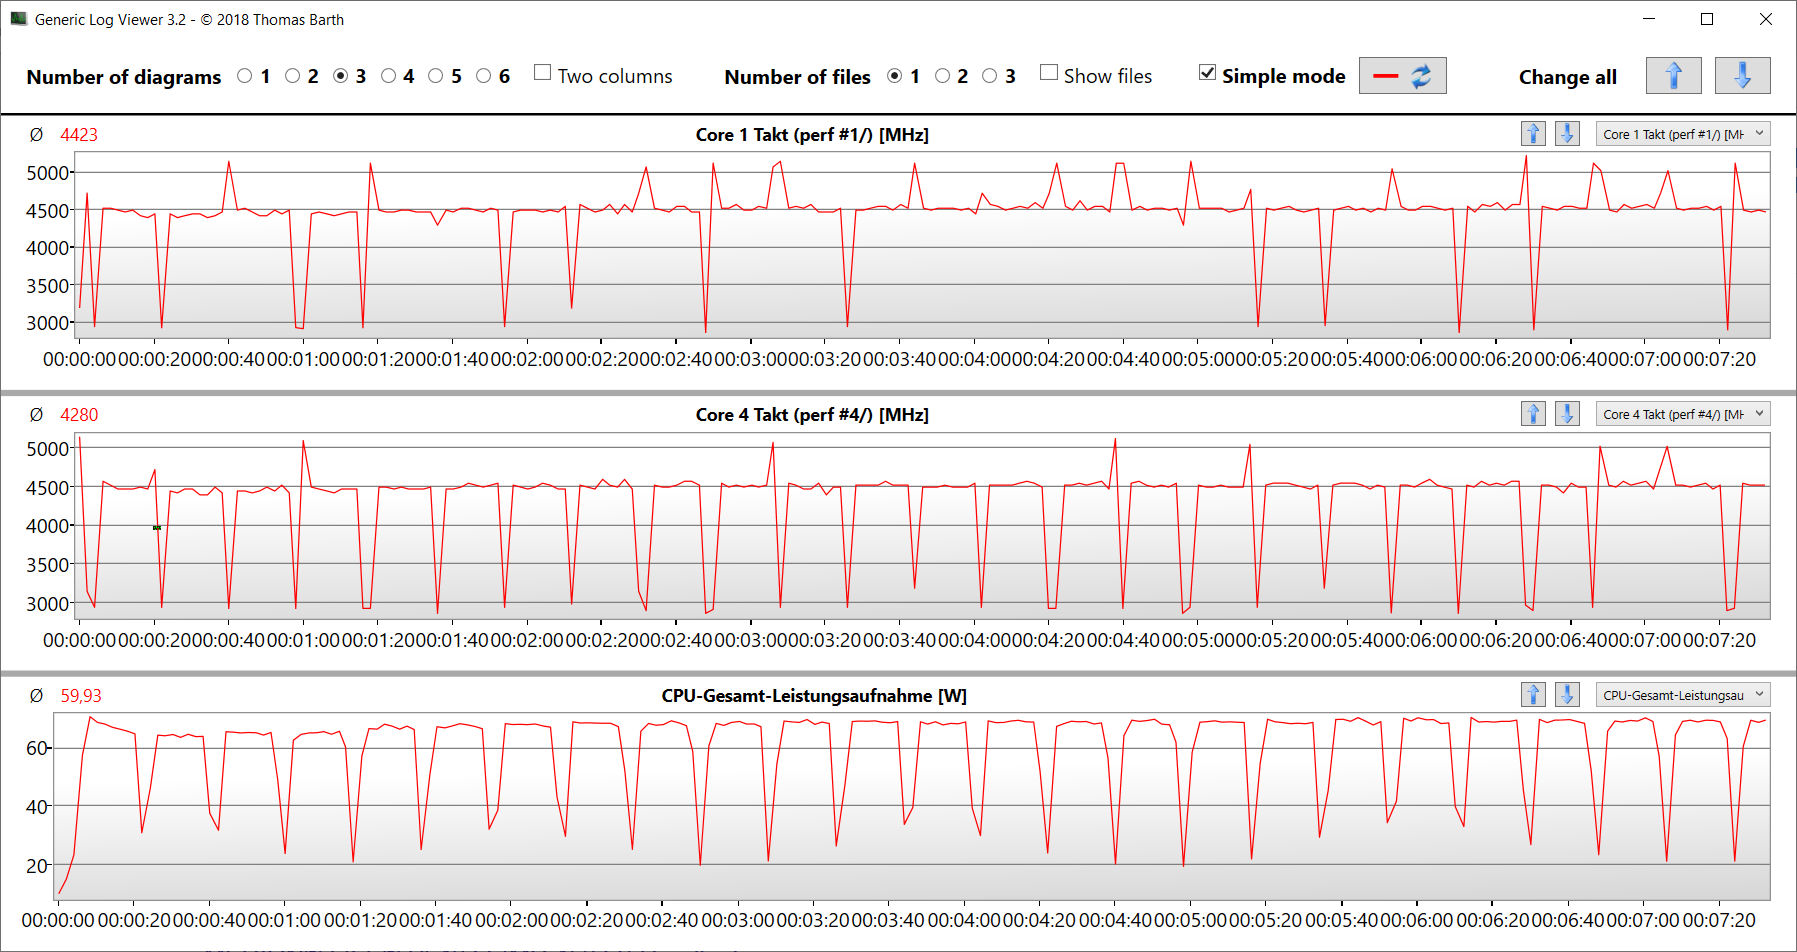
Część procesoraRyzen-9-7940HS-APU (Phoenix, Zen 4) posiada osiem rdzeni obliczeniowych z 16 wątkami. Bazowa częstotliwość taktowania 4 GHz może zostać zwiększona do 5,25 GHz (jeden rdzeń). Zmierzone przez nas wyniki benchmarków są mniej więcej takie same, jak w przypadku wcześniej testowanych laptopów 7940HS. Użycie profilu "Turbo" prowadzi do nieco lepszej wydajności (4-5 procent).
Siostrzany model Asus TUF Gaming A16 Advantage Edition w recenzji: Notebook AMD pod patronatem 7 Ryzen-7-7735HS-APU (Rembrandt R, Zen 3+) jest wyraźnie pokonany przez Ryzena 9, nawet przy tej samej liczbie rdzeni i tych samych limitach mocy. Dzięki lepszej architekturze i wyższym częstotliwościom taktowania, jego wydajność w przeliczeniu na wat jest wyższa.
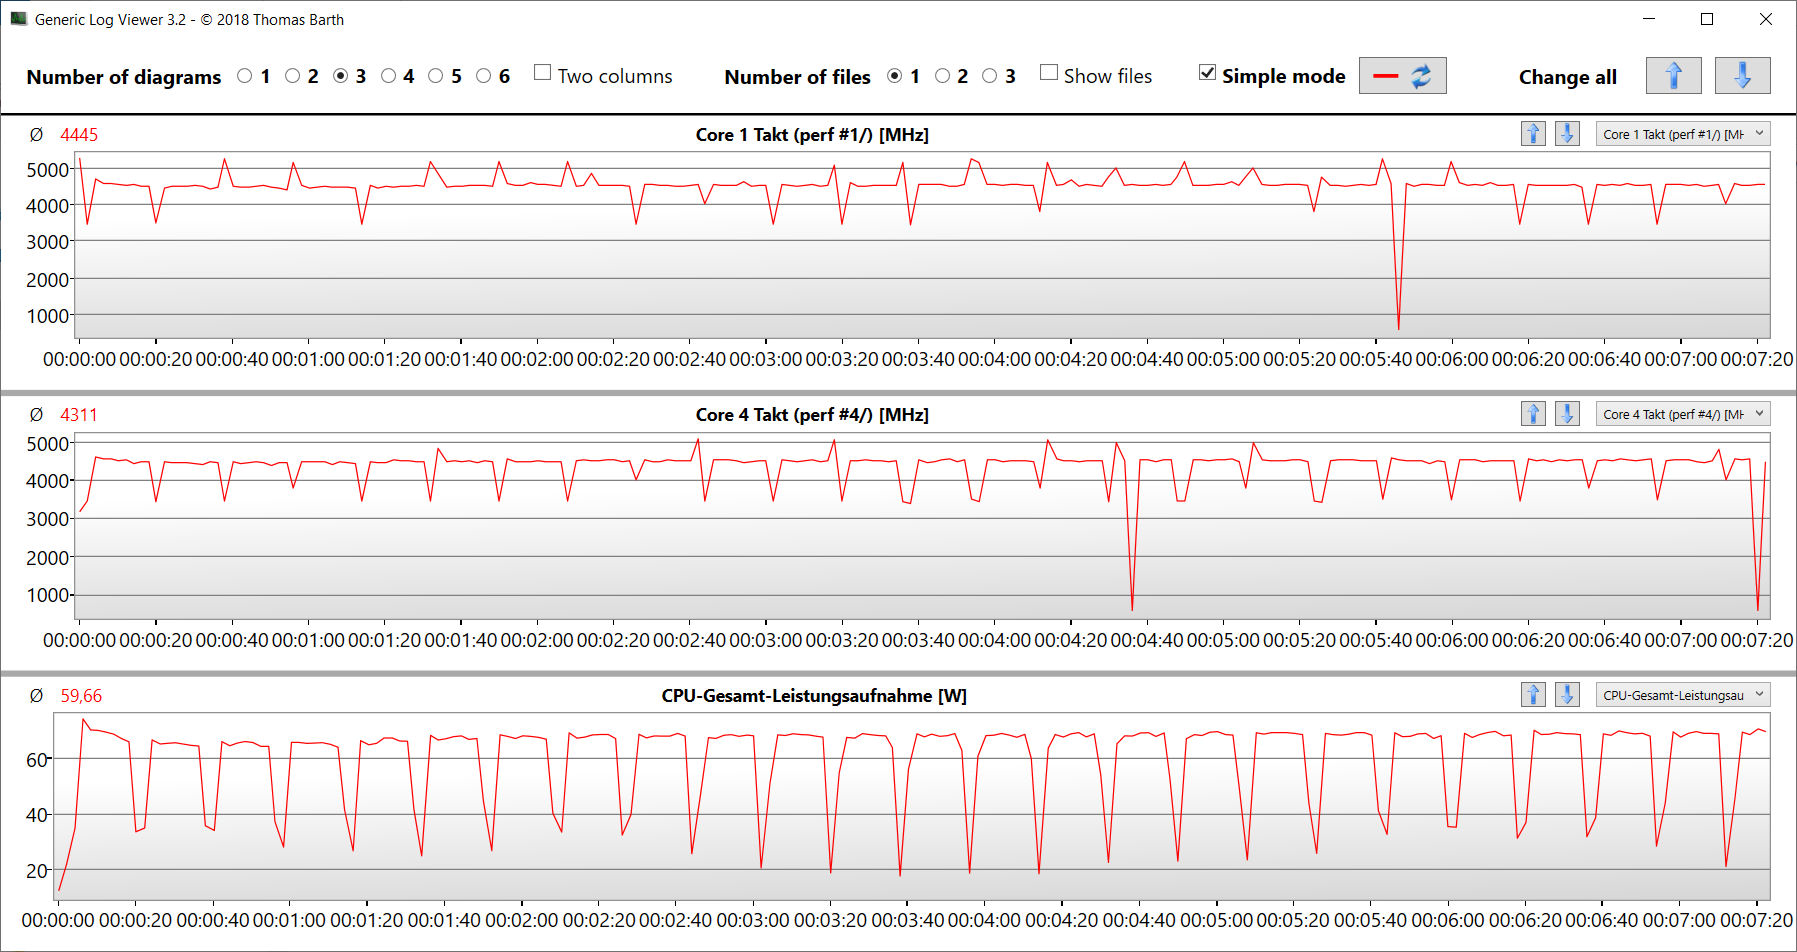
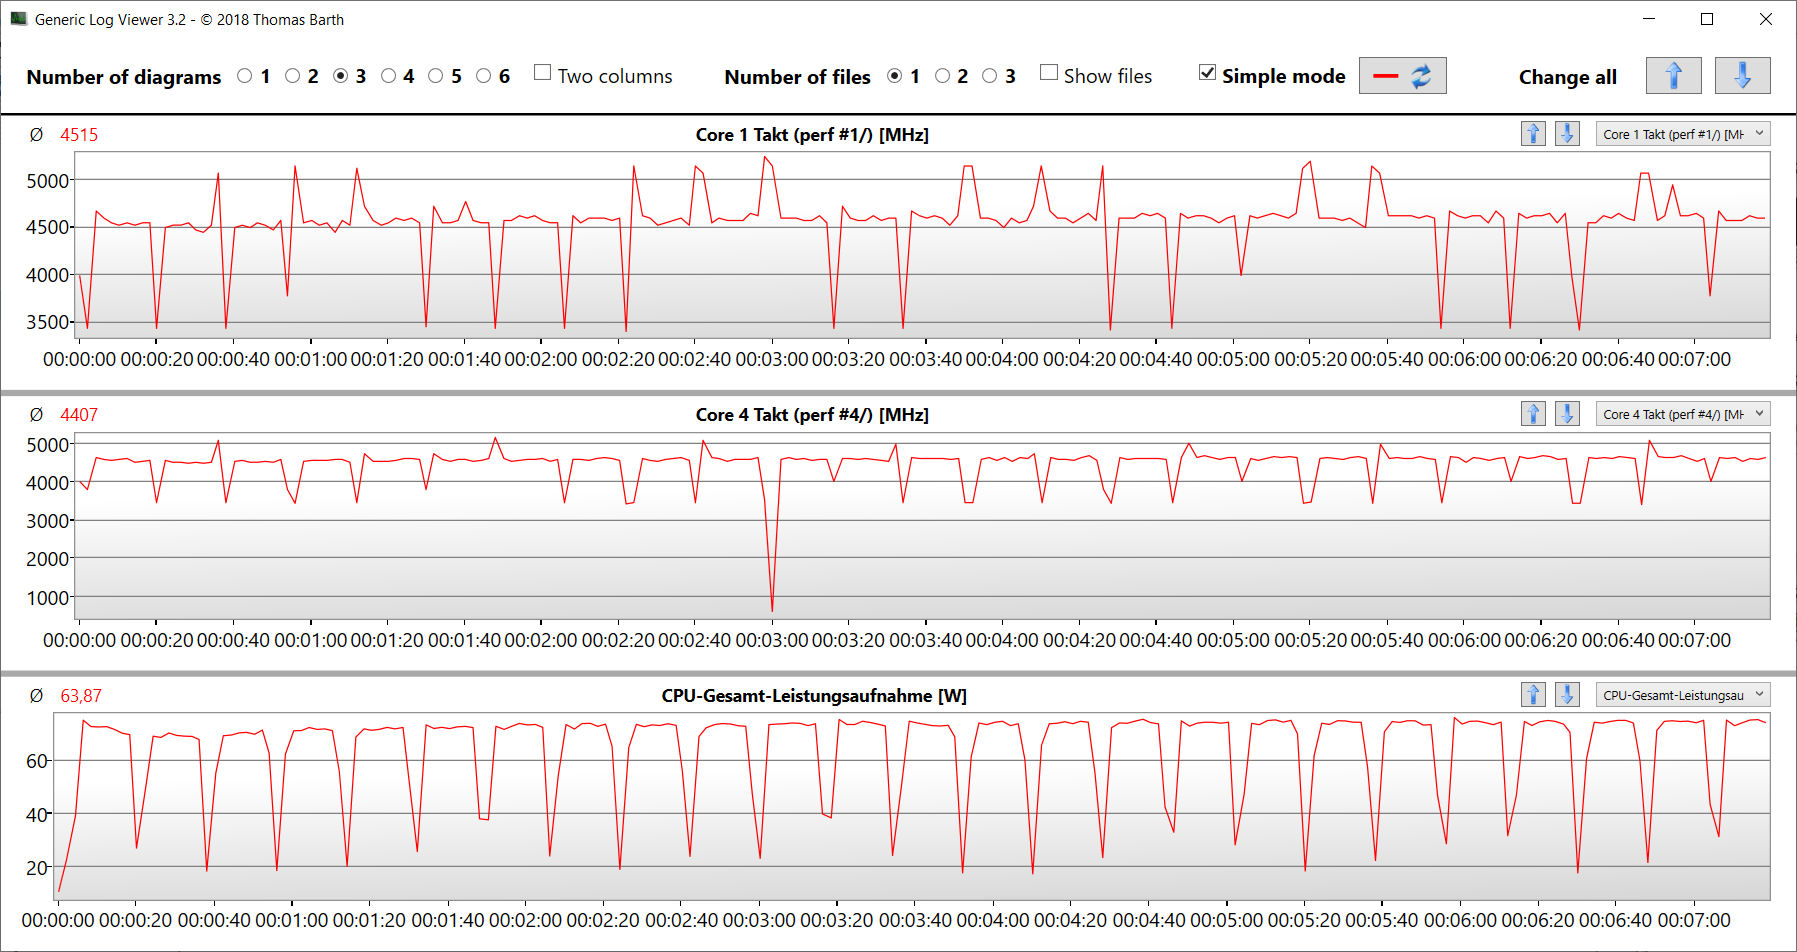
Pokazuje to test pętli CB15: Ciągłe obciążenie wielowątkowe prowadzi procesor do pracy z niezmiennie wysokimi częstotliwościami taktowania turbo - niezależnie od wybranego profilu wydajności.
Uwaga: Szczegółowe informacje na temat zainstalowanego APU i jego architektury można przeczytać w naszym artykule analitycznymZen4.
Cinebench R15 multi continuous test
* ... im mniej tym lepiej
AIDA64: FP32 Ray-Trace | FPU Julia | CPU SHA3 | CPU Queen | FPU SinJulia | FPU Mandel | CPU AES | CPU ZLib | FP64 Ray-Trace | CPU PhotoWorxx
| Performance rating | |
| Średnia w klasie Gaming | |
| Przeciętny AMD Ryzen 9 7940HS | |
| Asus TUF Gaming A16 FA617XS | |
| Lenovo Legion Pro 5 16IRX8 | |
| Asus TUF Gaming A16 FA617 | |
| Medion Erazer Defender P40 | |
| MSI Katana 15 B12VEK | |
| Gigabyte G5 KE | |
| AIDA64 / FP32 Ray-Trace | |
| Średnia w klasie Gaming (10227 - 85542, n=102, ostatnie 2 lata) | |
| Asus TUF Gaming A16 FA617XS (v6.75.6100) | |
| Przeciętny AMD Ryzen 9 7940HS (25226 - 29109, n=10) | |
| Lenovo Legion Pro 5 16IRX8 (v6.85.6300) | |
| Asus TUF Gaming A16 FA617 (v6.85.6300) | |
| MSI Katana 15 B12VEK (v6.85.6300) | |
| Medion Erazer Defender P40 (v6.75.6100) | |
| Gigabyte G5 KE (v6.75.6100) | |
| AIDA64 / FPU Julia | |
| Średnia w klasie Gaming (51376 - 372155, n=102, ostatnie 2 lata) | |
| Asus TUF Gaming A16 FA617XS (v6.75.6100) | |
| Przeciętny AMD Ryzen 9 7940HS (106512 - 123214, n=10) | |
| Lenovo Legion Pro 5 16IRX8 (v6.85.6300) | |
| Asus TUF Gaming A16 FA617 (v6.85.6300) | |
| Medion Erazer Defender P40 (v6.75.6100) | |
| MSI Katana 15 B12VEK (v6.85.6300) | |
| Gigabyte G5 KE (v6.75.6100) | |
| AIDA64 / CPU SHA3 | |
| Średnia w klasie Gaming (2180 - 10115, n=102, ostatnie 2 lata) | |
| Przeciętny AMD Ryzen 9 7940HS (4566 - 5119, n=10) | |
| Lenovo Legion Pro 5 16IRX8 (v6.85.6300) | |
| Asus TUF Gaming A16 FA617XS (v6.75.6100) | |
| Asus TUF Gaming A16 FA617 (v6.85.6300) | |
| Medion Erazer Defender P40 (v6.75.6100) | |
| MSI Katana 15 B12VEK (v6.85.6300) | |
| Gigabyte G5 KE (v6.75.6100) | |
| AIDA64 / CPU Queen | |
| Asus TUF Gaming A16 FA617XS (v6.75.6100) | |
| Przeciętny AMD Ryzen 9 7940HS (118174 - 124783, n=10) | |
| Średnia w klasie Gaming (49785 - 173351, n=86, ostatnie 2 lata) | |
| Lenovo Legion Pro 5 16IRX8 (v6.85.6300) | |
| Medion Erazer Defender P40 (v6.75.6100) | |
| Asus TUF Gaming A16 FA617 (v6.85.6300) | |
| MSI Katana 15 B12VEK (v6.85.6300) | |
| Gigabyte G5 KE (v6.75.6100) | |
| AIDA64 / FPU SinJulia | |
| Asus TUF Gaming A16 FA617XS (v6.75.6100) | |
| Przeciętny AMD Ryzen 9 7940HS (14663 - 15551, n=10) | |
| Średnia w klasie Gaming (4424 - 33636, n=102, ostatnie 2 lata) | |
| Lenovo Legion Pro 5 16IRX8 (v6.85.6300) | |
| Asus TUF Gaming A16 FA617 (v6.85.6300) | |
| Medion Erazer Defender P40 (v6.75.6100) | |
| MSI Katana 15 B12VEK (v6.85.6300) | |
| Gigabyte G5 KE (v6.75.6100) | |
| AIDA64 / FPU Mandel | |
| Średnia w klasie Gaming (25115 - 196829, n=102, ostatnie 2 lata) | |
| Asus TUF Gaming A16 FA617XS (v6.75.6100) | |
| Przeciętny AMD Ryzen 9 7940HS (56839 - 66238, n=10) | |
| Asus TUF Gaming A16 FA617 (v6.85.6300) | |
| Lenovo Legion Pro 5 16IRX8 (v6.85.6300) | |
| Medion Erazer Defender P40 (v6.75.6100) | |
| MSI Katana 15 B12VEK (v6.85.6300) | |
| Gigabyte G5 KE (v6.75.6100) | |
| AIDA64 / CPU AES | |
| Przeciętny AMD Ryzen 9 7940HS (86309 - 171350, n=10) | |
| Gigabyte G5 KE (v6.75.6100) | |
| Średnia w klasie Gaming (39258 - 247074, n=102, ostatnie 2 lata) | |
| Lenovo Legion Pro 5 16IRX8 (v6.85.6300) | |
| Asus TUF Gaming A16 FA617XS (v6.75.6100) | |
| Medion Erazer Defender P40 (v6.75.6100) | |
| MSI Katana 15 B12VEK (v6.85.6300) | |
| Asus TUF Gaming A16 FA617 (v6.85.6300) | |
| AIDA64 / CPU ZLib | |
| Średnia w klasie Gaming (574 - 2531, n=102, ostatnie 2 lata) | |
| Lenovo Legion Pro 5 16IRX8 (v6.85.6300) | |
| Asus TUF Gaming A16 FA617XS (v6.75.6100) | |
| Przeciętny AMD Ryzen 9 7940HS (866 - 1152, n=10) | |
| Medion Erazer Defender P40 (v6.75.6100) | |
| Gigabyte G5 KE (v6.75.6100) | |
| Asus TUF Gaming A16 FA617 (v6.85.6300) | |
| MSI Katana 15 B12VEK (v6.85.6300) | |
| AIDA64 / FP64 Ray-Trace | |
| Średnia w klasie Gaming (5509 - 45446, n=102, ostatnie 2 lata) | |
| Asus TUF Gaming A16 FA617XS (v6.75.6100) | |
| Przeciętny AMD Ryzen 9 7940HS (13175 - 15675, n=10) | |
| Lenovo Legion Pro 5 16IRX8 (v6.85.6300) | |
| Asus TUF Gaming A16 FA617 (v6.85.6300) | |
| MSI Katana 15 B12VEK (v6.85.6300) | |
| Medion Erazer Defender P40 (v6.75.6100) | |
| Gigabyte G5 KE (v6.75.6100) | |
| AIDA64 / CPU PhotoWorxx | |
| Średnia w klasie Gaming (12271 - 89891, n=102, ostatnie 2 lata) | |
| MSI Katana 15 B12VEK (v6.85.6300) | |
| Lenovo Legion Pro 5 16IRX8 (v6.85.6300) | |
| Medion Erazer Defender P40 (v6.75.6100) | |
| Przeciętny AMD Ryzen 9 7940HS (22477 - 41567, n=10) | |
| Asus TUF Gaming A16 FA617XS (v6.75.6100) | |
| Gigabyte G5 KE (v6.75.6100) | |
| Asus TUF Gaming A16 FA617 (v6.85.6300) | |
Wydajność systemu
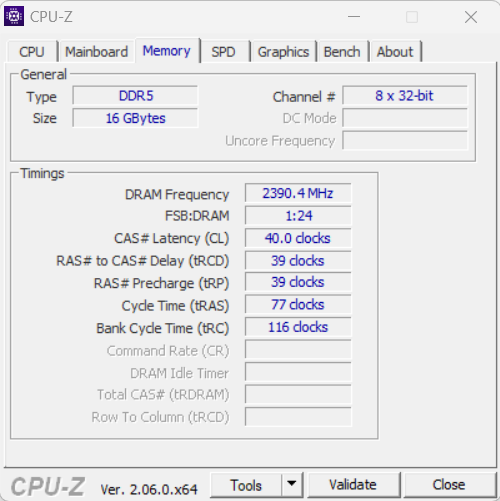
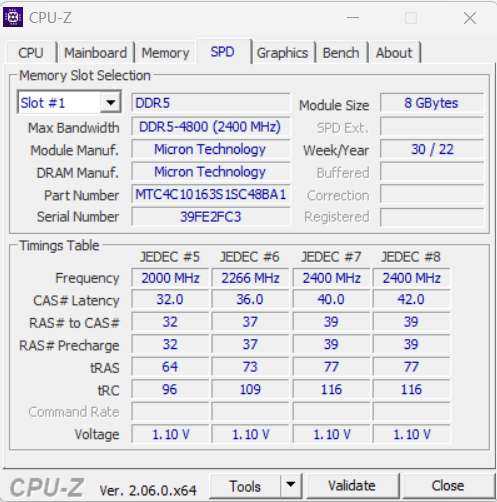
Płynnie działający system zapewnia wystarczającą wydajność dla wymagających obszarów zastosowań, takich jak renderowanie, edycja wideo i gry - dobre wyniki PCMark mogą to potwierdzić. Transfery pamięci RAM są na normalnym poziomie dla pamięci DDR5 4800 RAM. Co ważne: automatyczne przełączanie pomiędzy dGPU i iGPU (Smart Access Graphic) zawsze trwa sekundę lub dwie. W tym czasie system zawiesza się.
CrossMark: Overall | Productivity | Creativity | Responsiveness
| PCMark 10 / Score | |
| Średnia w klasie Gaming (5828 - 12414, n=93, ostatnie 2 lata) | |
| Asus TUF Gaming A16 FA617XS | |
| Przeciętny AMD Ryzen 9 7940HS, AMD Radeon RX 7600S (n=1) | |
| Lenovo Legion Pro 5 16IRX8 | |
| Asus TUF Gaming A16 FA617 | |
| Gigabyte G5 KE | |
| Medion Erazer Defender P40 | |
| MSI Katana 15 B12VEK | |
| PCMark 10 / Essentials | |
| Gigabyte G5 KE | |
| Lenovo Legion Pro 5 16IRX8 | |
| Asus TUF Gaming A16 FA617XS | |
| Przeciętny AMD Ryzen 9 7940HS, AMD Radeon RX 7600S (n=1) | |
| Średnia w klasie Gaming (8810 - 11935, n=97, ostatnie 2 lata) | |
| Asus TUF Gaming A16 FA617 | |
| MSI Katana 15 B12VEK | |
| Medion Erazer Defender P40 | |
| PCMark 10 / Productivity | |
| Średnia w klasie Gaming (6845 - 25323, n=95, ostatnie 2 lata) | |
| Asus TUF Gaming A16 FA617XS | |
| Przeciętny AMD Ryzen 9 7940HS, AMD Radeon RX 7600S (n=1) | |
| Medion Erazer Defender P40 | |
| MSI Katana 15 B12VEK | |
| Gigabyte G5 KE | |
| Asus TUF Gaming A16 FA617 | |
| Lenovo Legion Pro 5 16IRX8 | |
| PCMark 10 / Digital Content Creation | |
| Średnia w klasie Gaming (7602 - 19954, n=95, ostatnie 2 lata) | |
| Lenovo Legion Pro 5 16IRX8 | |
| Asus TUF Gaming A16 FA617XS | |
| Przeciętny AMD Ryzen 9 7940HS, AMD Radeon RX 7600S (n=1) | |
| Asus TUF Gaming A16 FA617 | |
| Gigabyte G5 KE | |
| Medion Erazer Defender P40 | |
| MSI Katana 15 B12VEK | |
| CrossMark / Overall | |
| Średnia w klasie Gaming (1366 - 2409, n=94, ostatnie 2 lata) | |
| Medion Erazer Defender P40 | |
| Asus TUF Gaming A16 FA617XS | |
| Przeciętny AMD Ryzen 9 7940HS, AMD Radeon RX 7600S (n=1) | |
| Gigabyte G5 KE | |
| MSI Katana 15 B12VEK | |
| Lenovo Legion Pro 5 16IRX8 | |
| CrossMark / Productivity | |
| Średnia w klasie Gaming (1386 - 2254, n=94, ostatnie 2 lata) | |
| Gigabyte G5 KE | |
| Asus TUF Gaming A16 FA617XS | |
| Przeciętny AMD Ryzen 9 7940HS, AMD Radeon RX 7600S (n=1) | |
| MSI Katana 15 B12VEK | |
| Medion Erazer Defender P40 | |
| Lenovo Legion Pro 5 16IRX8 | |
| CrossMark / Creativity | |
| Średnia w klasie Gaming (1343 - 2786, n=94, ostatnie 2 lata) | |
| Medion Erazer Defender P40 | |
| Asus TUF Gaming A16 FA617XS | |
| Przeciętny AMD Ryzen 9 7940HS, AMD Radeon RX 7600S (n=1) | |
| MSI Katana 15 B12VEK | |
| Gigabyte G5 KE | |
| Lenovo Legion Pro 5 16IRX8 | |
| CrossMark / Responsiveness | |
| Gigabyte G5 KE | |
| Średnia w klasie Gaming (1226 - 2334, n=94, ostatnie 2 lata) | |
| Lenovo Legion Pro 5 16IRX8 | |
| Medion Erazer Defender P40 | |
| MSI Katana 15 B12VEK | |
| Asus TUF Gaming A16 FA617XS | |
| Przeciętny AMD Ryzen 9 7940HS, AMD Radeon RX 7600S (n=1) | |
| PCMark 8 Home Score Accelerated v2 | 5937 pkt. | |
| PCMark 8 Work Score Accelerated v2 | 6458 pkt. | |
| PCMark 10 Score | 7927 pkt. | |
Pomoc | ||
| AIDA64 / Memory Copy | |
| Średnia w klasie Gaming (21750 - 129946, n=102, ostatnie 2 lata) | |
| Przeciętny AMD Ryzen 9 7940HS (35327 - 78739, n=10) | |
| Asus TUF Gaming A16 FA617XS | |
| Lenovo Legion Pro 5 16IRX8 | |
| Medion Erazer Defender P40 | |
| MSI Katana 15 B12VEK | |
| Asus TUF Gaming A16 FA617 | |
| Gigabyte G5 KE | |
| AIDA64 / Memory Read | |
| Średnia w klasie Gaming (22956 - 118858, n=102, ostatnie 2 lata) | |
| Lenovo Legion Pro 5 16IRX8 | |
| Medion Erazer Defender P40 | |
| MSI Katana 15 B12VEK | |
| Asus TUF Gaming A16 FA617XS | |
| Przeciętny AMD Ryzen 9 7940HS (30769 - 61836, n=10) | |
| Asus TUF Gaming A16 FA617 | |
| Gigabyte G5 KE | |
| AIDA64 / Memory Write | |
| Przeciętny AMD Ryzen 9 7940HS (42217 - 91567, n=10) | |
| Średnia w klasie Gaming (22297 - 135096, n=102, ostatnie 2 lata) | |
| Asus TUF Gaming A16 FA617XS | |
| Lenovo Legion Pro 5 16IRX8 | |
| Medion Erazer Defender P40 | |
| MSI Katana 15 B12VEK | |
| Asus TUF Gaming A16 FA617 | |
| Gigabyte G5 KE | |
| AIDA64 / Memory Latency | |
| Średnia w klasie Gaming (75.3 - 165.4, n=102, ostatnie 2 lata) | |
| Gigabyte G5 KE | |
| MSI Katana 15 B12VEK | |
| Medion Erazer Defender P40 | |
| Przeciętny AMD Ryzen 9 7940HS (87.6 - 111.1, n=10) | |
| Asus TUF Gaming A16 FA617XS | |
| Asus TUF Gaming A16 FA617 | |
| Lenovo Legion Pro 5 16IRX8 | |
* ... im mniej tym lepiej
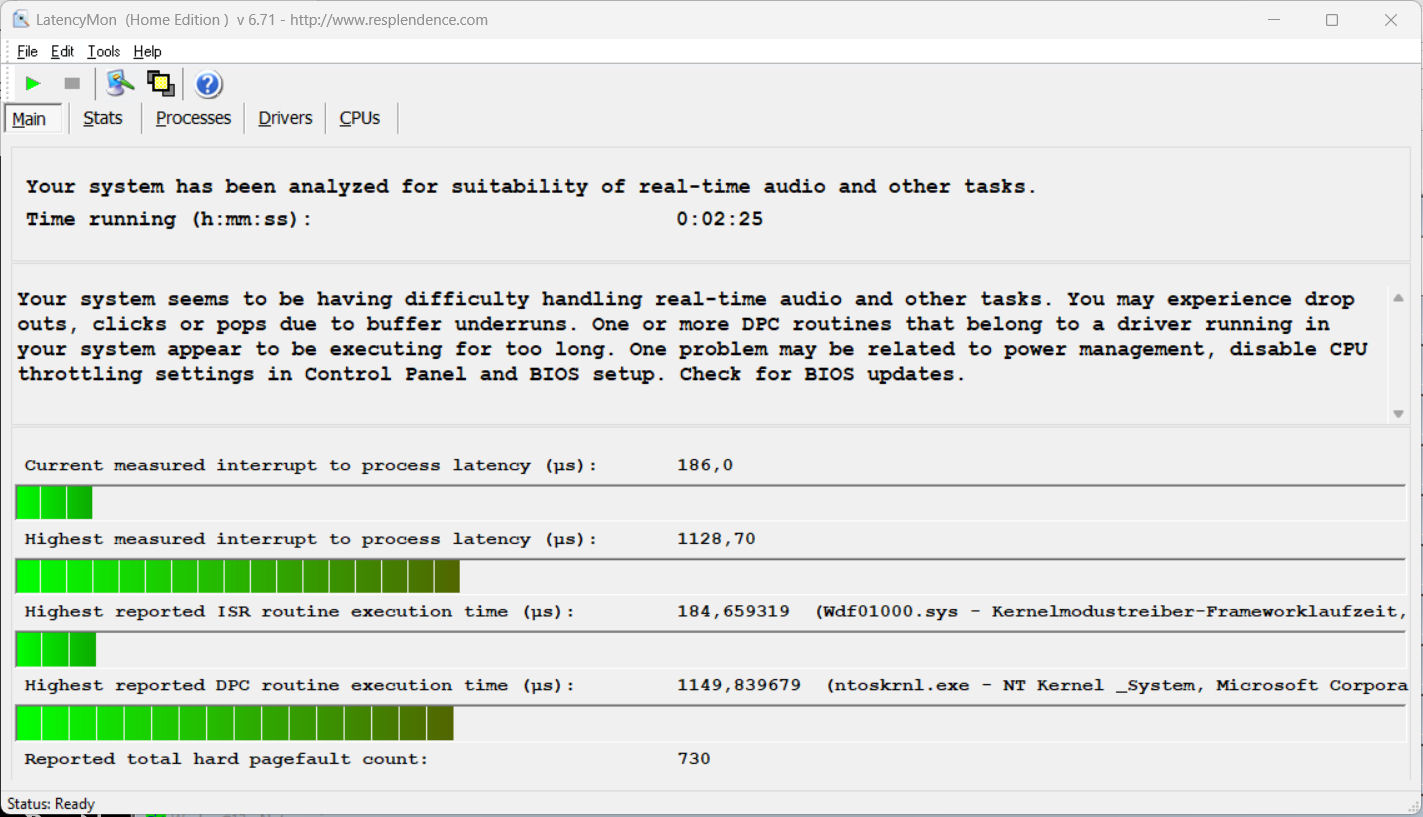
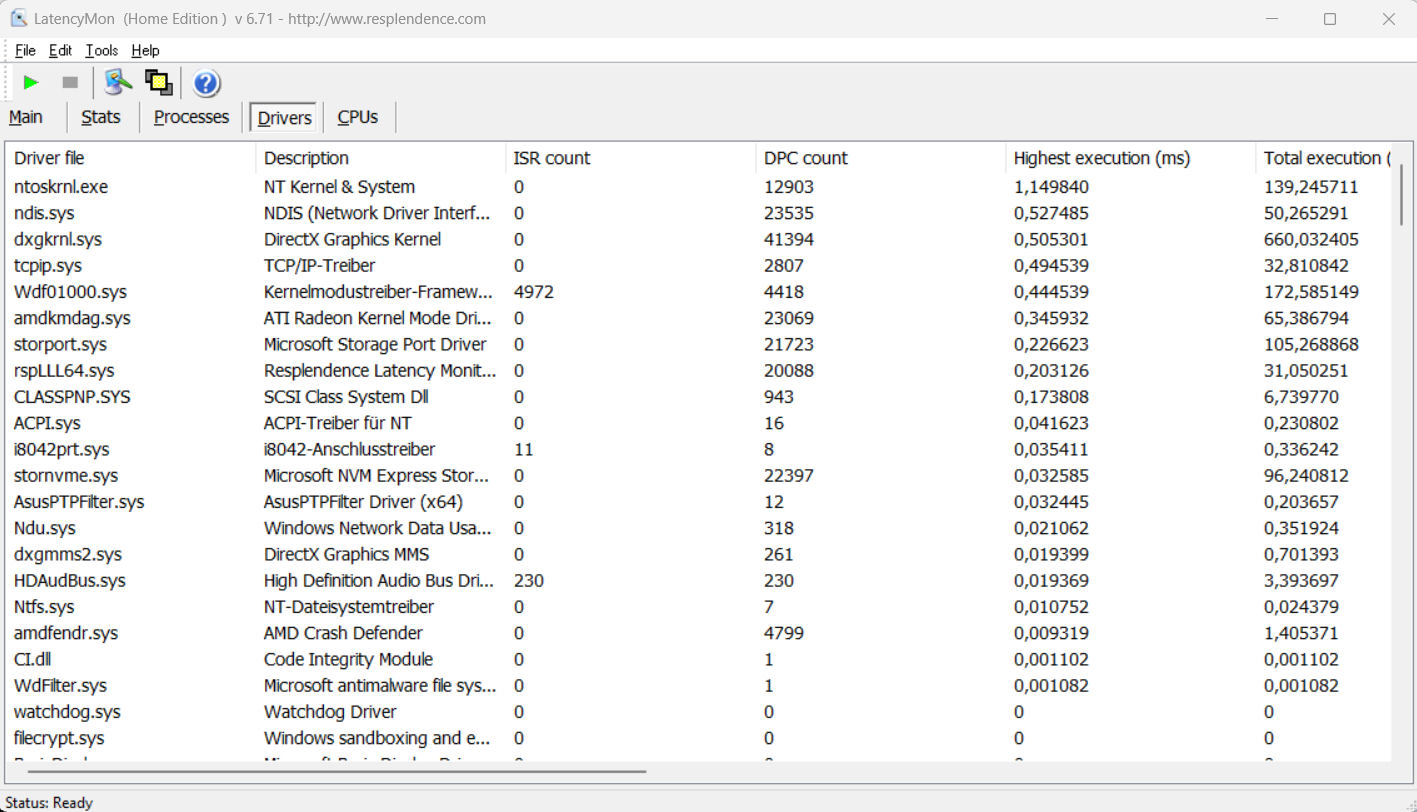
Opóźnienie DPC
Standardowy test monitora opóźnień (surfowanie po sieci, odtwarzanie wideo 4k, wysokie obciążenie Prime95) ujawnił pewne anomalie. System nie wydaje się być odpowiedni do edycji wideo i audio w czasie rzeczywistym. Przyszłe aktualizacje oprogramowania mogą doprowadzić do poprawy lub nawet pogorszenia wydajności.
| DPC Latencies / LatencyMon - interrupt to process latency (max), Web, Youtube, Prime95 | |
| MSI Katana 15 B12VEK | |
| Medion Erazer Defender P40 | |
| Asus TUF Gaming A16 FA617XS | |
| Gigabyte G5 KE | |
| Lenovo Legion Pro 5 16IRX8 | |
| Asus TUF Gaming A16 FA617 | |
* ... im mniej tym lepiej
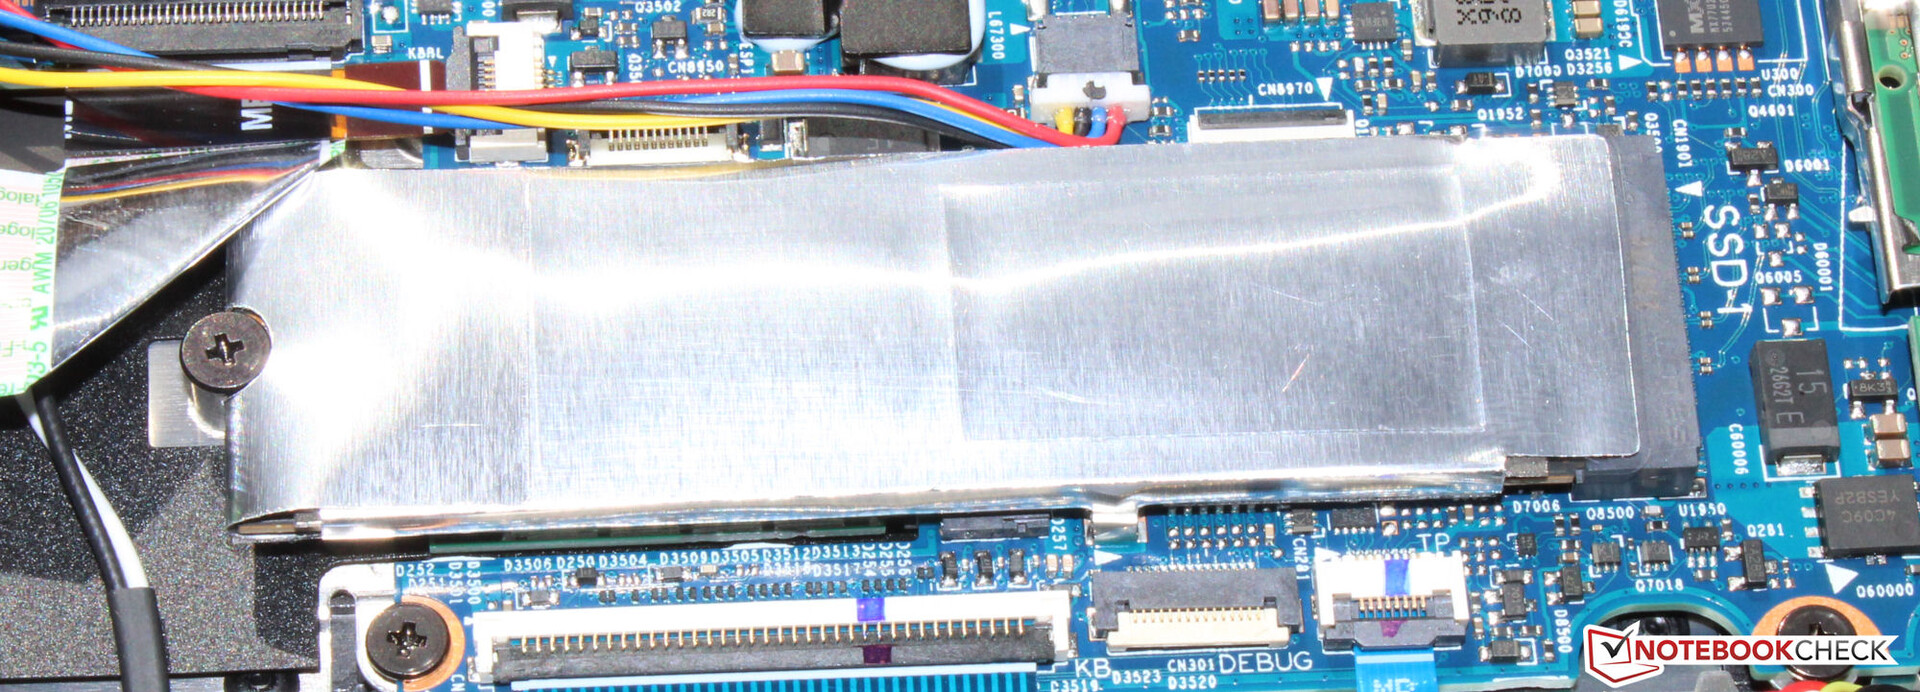
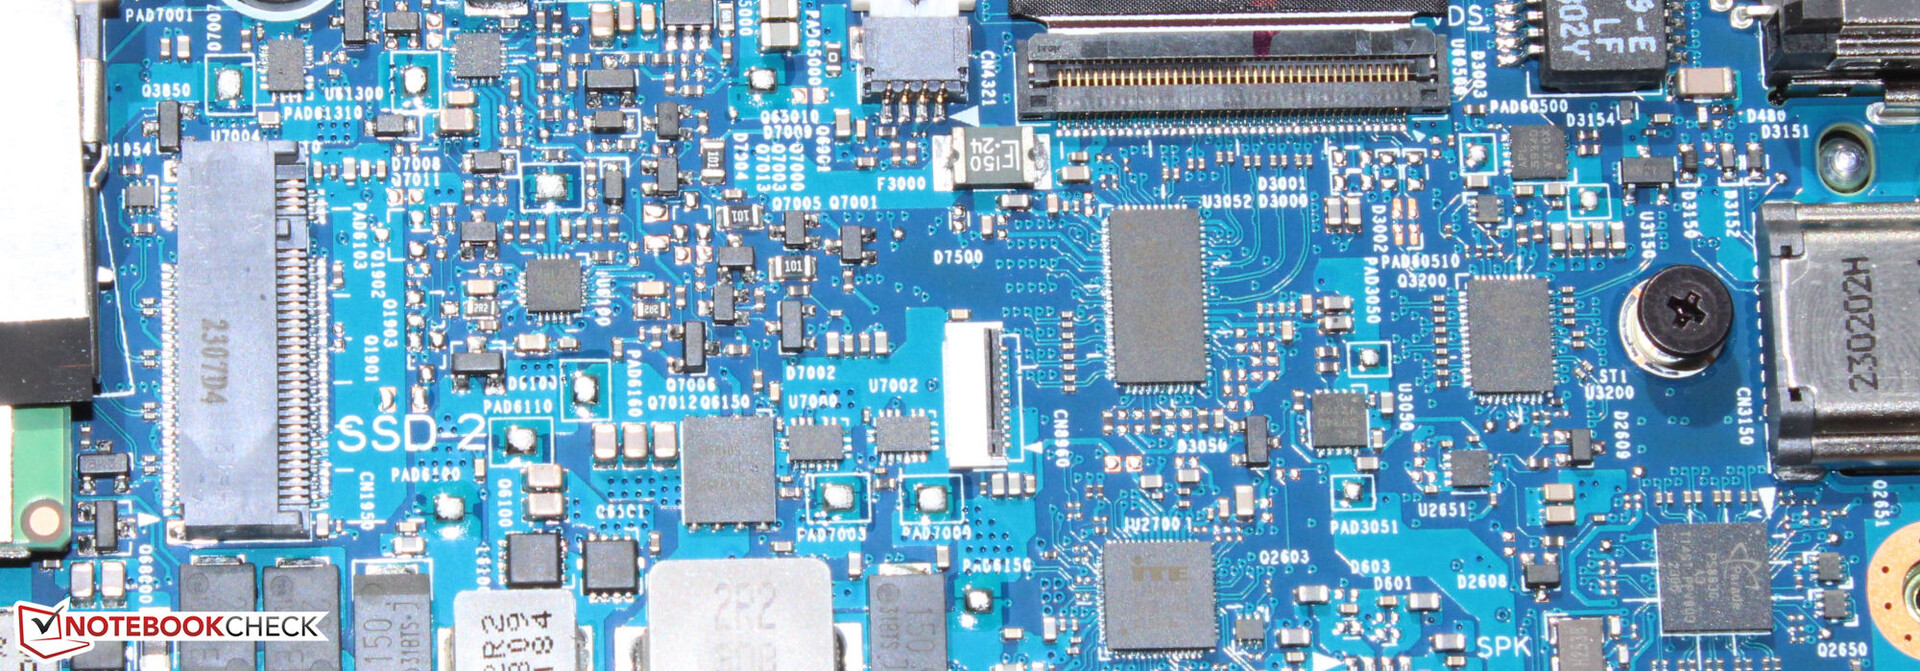
Urządzenia pamięci masowej
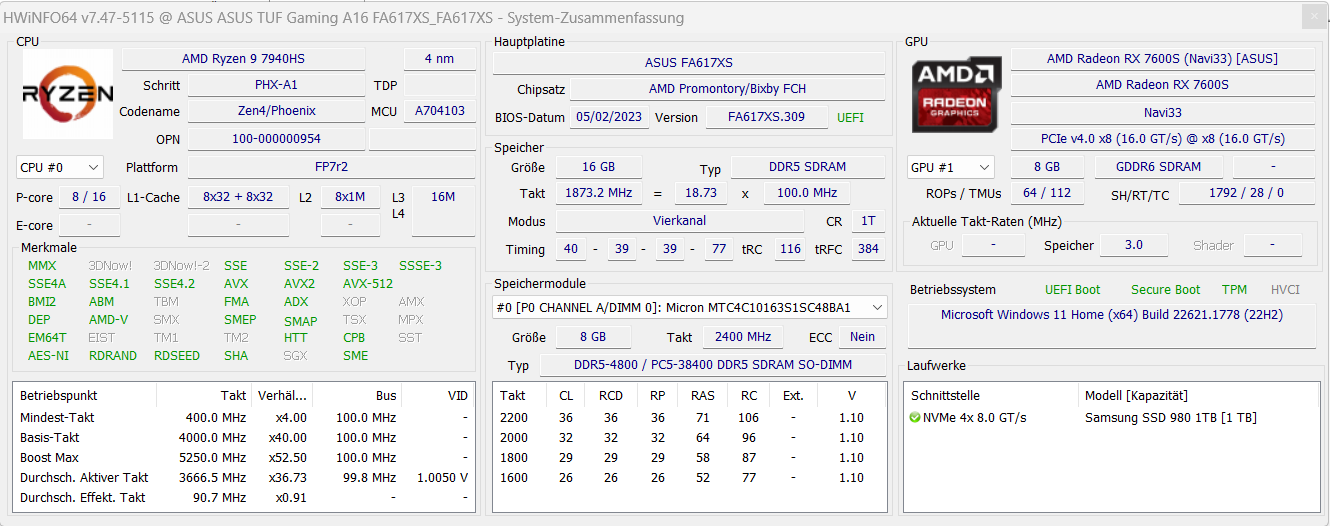
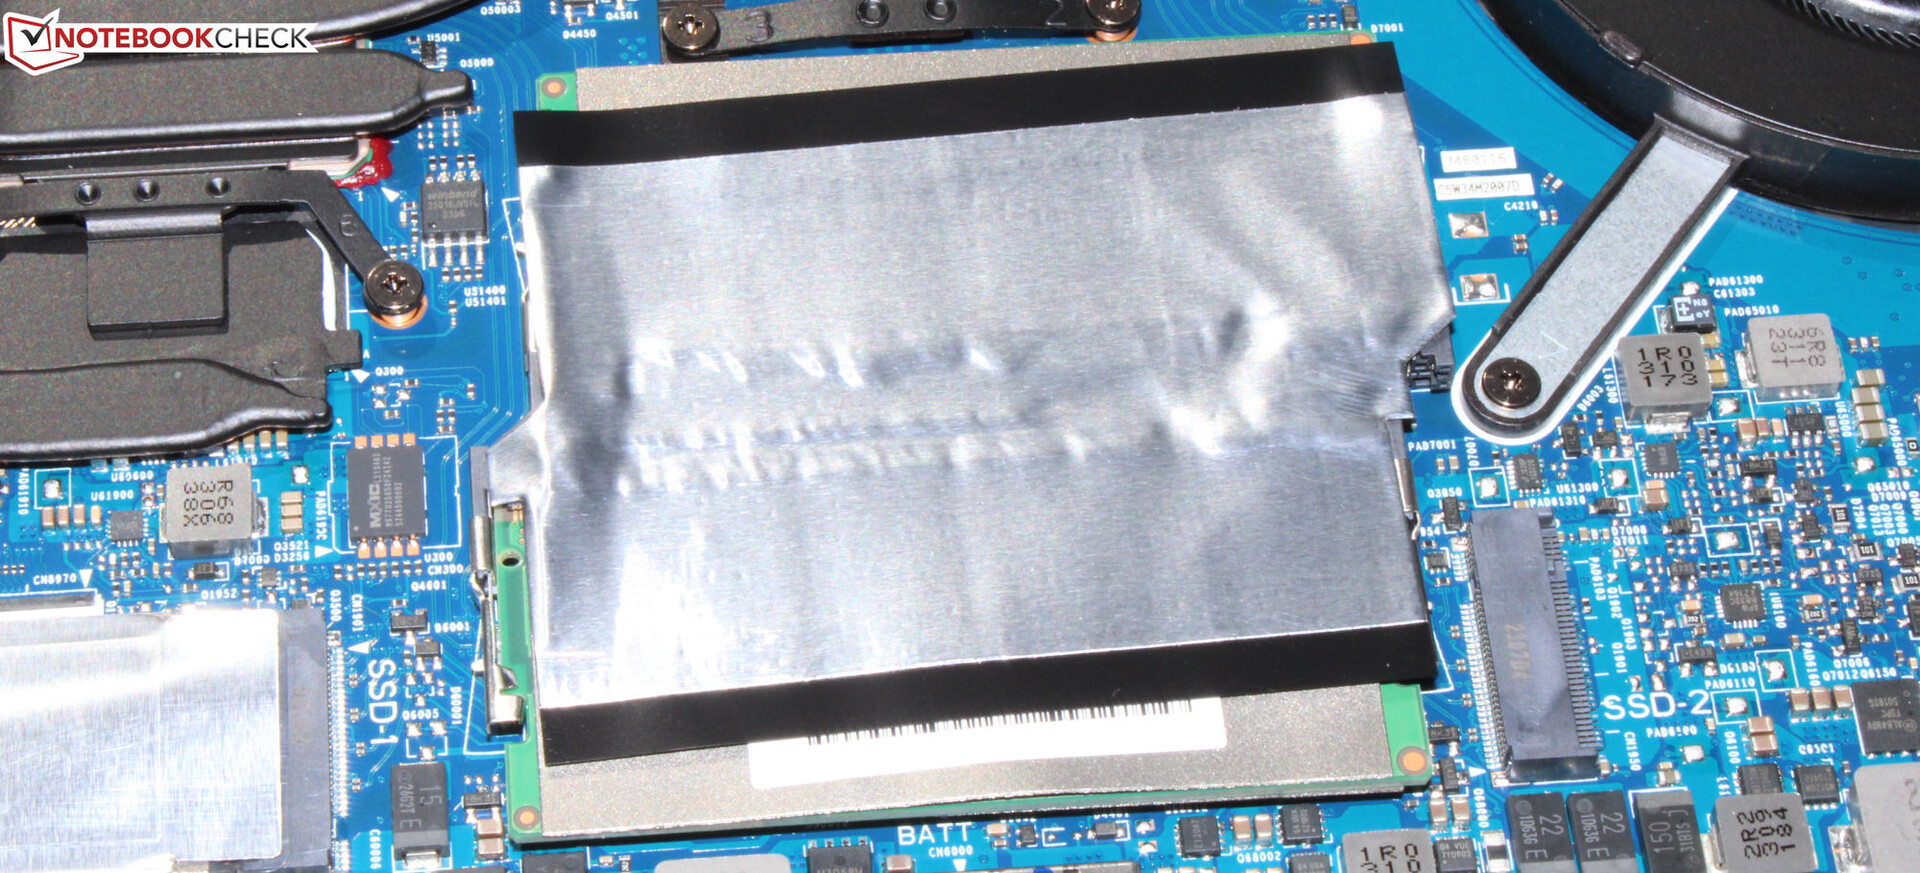
Asus wyposażył A16 w dysk SSD o pojemności 512 GB (PCIe 4, M.2-2280) firmy Micron - (zbyt) mało przestrzeni dyskowej jak na notebooka do gier. Zapewnia on przyzwoite prędkości przesyłu danych, ale nie jest jednym z najlepszych modeli wśród wszystkich dostępnych dysków SSD. Zwłaszcza szybkość zapisu jest znacznie poniżej dzisiejszych możliwości.

* ... im mniej tym lepiej
reading continuous performance: DiskSpd Read Loop, Queue Depth 8
Karta graficzna
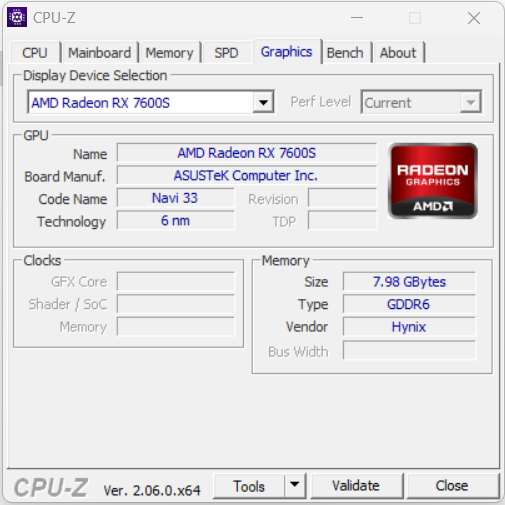
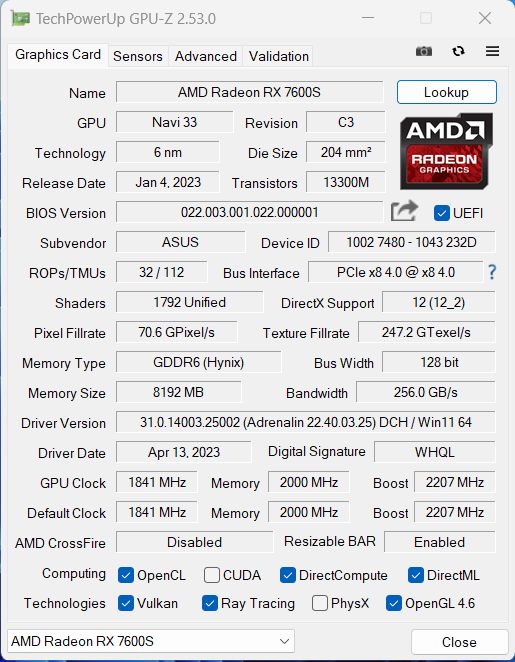
AMD Radeon RX 7600Soferuje 1792 shadery, jedną magistralę o szerokości 128 bitów i szybką pamięć GDDR6 (8 192 MB). Jego maksymalne TGP (95 watów) nie jest w pełni wykorzystywane zgodnie z testem Witcher 3 testu. Wyniki benchmarków są dokładnie takie, jak oczekiwano, a użycie profilu "Turbo" nie prowadzi do poprawy wydajności.
Konkurentów GPU średniej klasy można znaleźć w modelach GeForce RTX 4060,RTX 4050i RTX 3060w pełnych konfiguracjach (= maksymalne TGP). Choć nie jest w stanie dotrzymać kroku RTX 4060, to i tak w benchmarkach 3DMark poradziła sobie lepiej niż oba pozostałe modele GeForce. W praktycznym zastosowaniu w grach nie mogliśmy uzyskać spójnego obrazu: W zależności od gry, czasami jeden GPU radził sobie lepiej, czasami drugi - przynajmniej w testowanych przez nas grach.

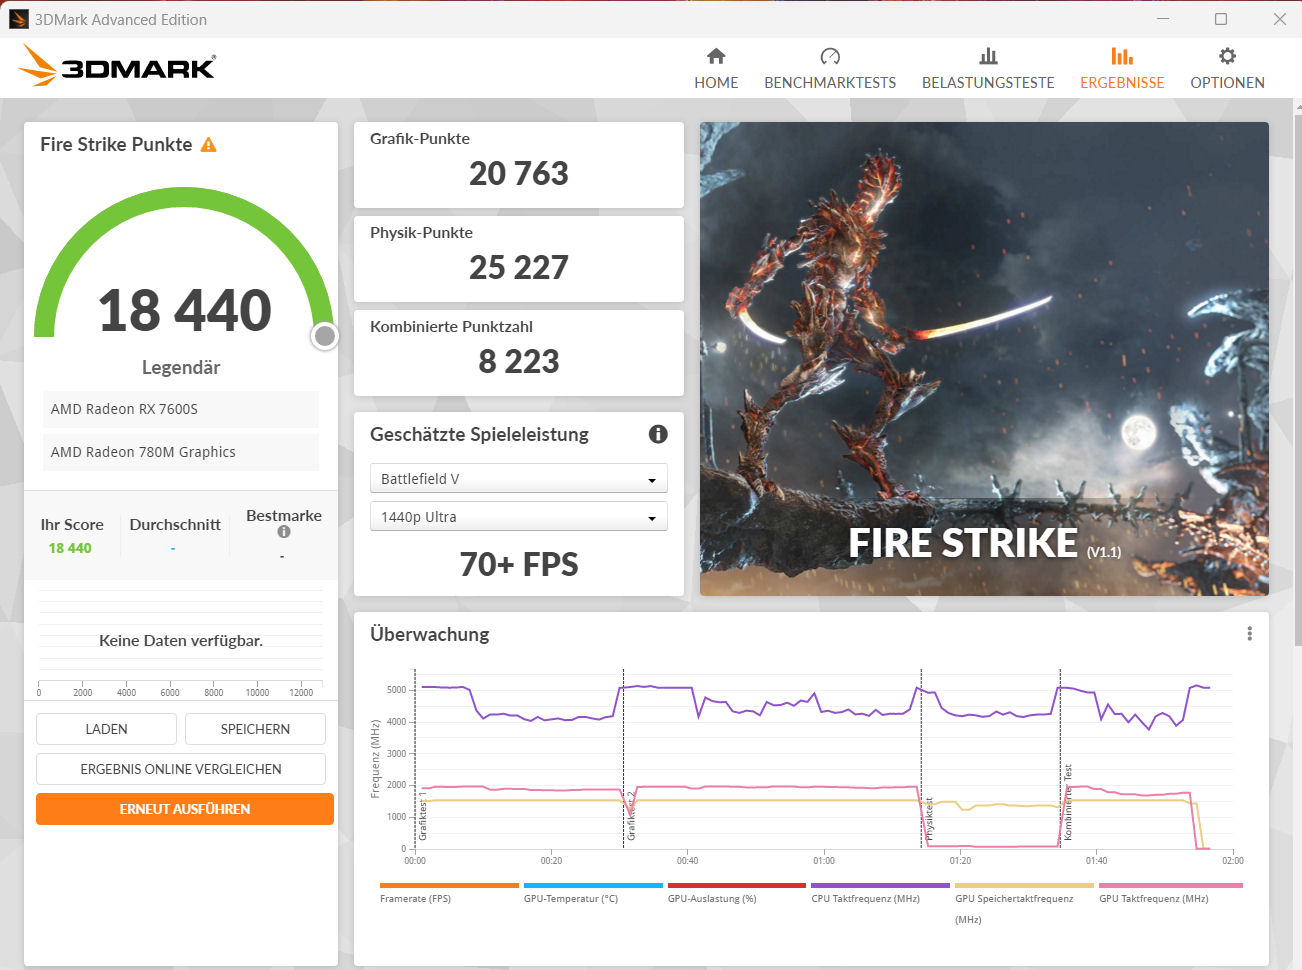


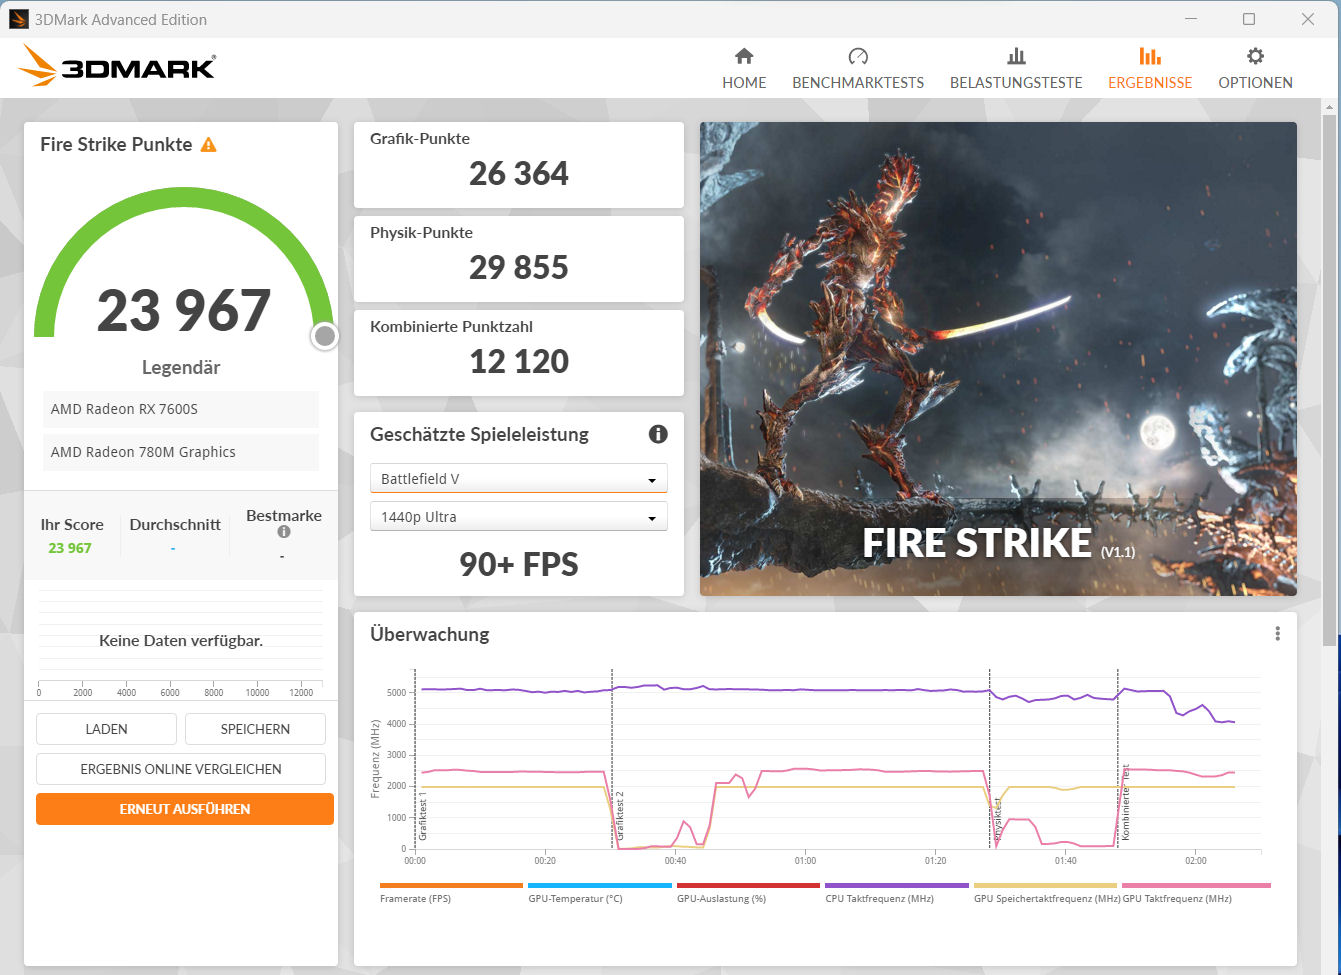
| 3DMark 06 Standard Score | 55435 pkt. | |
| 3DMark 11 Performance | 28721 pkt. | |
| 3DMark Cloud Gate Standard Score | 64441 pkt. | |
| 3DMark Fire Strike Score | 23346 pkt. | |
| 3DMark Time Spy Score | 9530 pkt. | |
Pomoc | ||
| V-Ray 5 Benchmark | |
| GPU RTX | |
| Średnia w klasie Gaming (1524 - 4363, n=29, ostatnie 2 lata) | |
| Lenovo Legion Pro 5 16IRX8 (5.0.1) | |
| Medion Erazer Defender P40 (5.0.1) | |
| Gigabyte G7 KE (5.0.1) | |
| GPU CUDA | |
| Średnia w klasie Gaming (1202 - 3288, n=29, ostatnie 2 lata) | |
| Lenovo Legion Pro 5 16IRX8 (5.0.1) | |
| Medion Erazer Defender P40 (5.0.1) | |
| Gigabyte G7 KE (5.0.1) | |
| Asus TUF Gaming A16 FA617XS (5.0.1) | |
| Przeciętny AMD Radeon RX 7600S (n=1) | |
| CPU | |
| Średnia w klasie Gaming (5864 - 30302, n=28, ostatnie 2 lata) | |
| Lenovo Legion Pro 5 16IRX8 (5.0.1) | |
| Medion Erazer Defender P40 (5.0.1) | |
| Asus TUF Gaming A16 FA617XS (5.0.1) | |
| Przeciętny AMD Radeon RX 7600S (n=1) | |
| Gigabyte G7 KE (5.0.1) | |
| V-Ray Benchmark Next 4.10 | |
| GPU | |
| Średnia w klasie Gaming (427 - 1627, n=96, ostatnie 2 lata) | |
| Medion Erazer Defender P40 (v4.10.07 ) | |
| MSI Katana 15 B12VEK (v4.10.07 ) | |
| Gigabyte G5 KE (v4.10.07 ) | |
| Gigabyte G7 KE (v4.10.07 ) | |
| Asus TUF Gaming A16 FA617XS (v4.10.07 ) | |
| Przeciętny AMD Radeon RX 7600S (83 - 96, n=2) | |
| Asus TUF Gaming A16 FA617 (v4.10.07 ) | |
| CPU | |
| Średnia w klasie Gaming (10048 - 45327, n=94, ostatnie 2 lata) | |
| Medion Erazer Defender P40 (v4.10.07 ) | |
| Asus TUF Gaming A16 FA617XS (v4.10.07 ) | |
| Przeciętny AMD Radeon RX 7600S (14759 - 17623, n=2) | |
| Asus TUF Gaming A16 FA617 (v4.10.07 ) | |
| Gigabyte G7 KE (v4.10.07 ) | |
| Gigabyte G5 KE (v4.10.07 ) | |
| MSI Katana 15 B12VEK (v4.10.07 ) | |
Wydajność w grach
FA617 jest przeznaczony do gier na wysokich i maksymalnych ustawieniach. Rozdzielczość pełnego ekranu (1,920 x 1,200 pikseli) może być używana. Wyższe rozdzielczości będą użyteczne po podłączeniu odpowiedniego wyświetlacza - z częściowo zredukowanymi ustawieniami. Profil "Turbo" nie zwiększa liczby klatek na sekundę.
| The Witcher 3 - 1920x1080 Ultra Graphics & Postprocessing (HBAO+) | |
| Średnia w klasie Gaming (104.7 - 240, n=7, ostatnie 2 lata) | |
| Lenovo Legion Pro 5 16IRX8 | |
| Medion Erazer Defender P40 | |
| Asus TUF Gaming A16 FA617XS (neu) | |
| Przeciętny AMD Radeon RX 7600S (91 - 98.1, n=2) | |
| Asus TUF Gaming A16 FA617 | |
| Gigabyte G5 KE | |
| MSI Katana 15 B12VEK | |
| Final Fantasy XV Benchmark - 1920x1080 High Quality | |
| Średnia w klasie Gaming (64.2 - 215, n=91, ostatnie 2 lata) | |
| Lenovo Legion Pro 5 16IRX8 (1.3) | |
| Medion Erazer Defender P40 (1.3) | |
| Gigabyte G5 KE (1.3) | |
| Asus TUF Gaming A16 FA617XS (1.3) | |
| MSI Katana 15 B12VEK (1.3) | |
| Przeciętny AMD Radeon RX 7600S (78.2 - 85.2, n=2) | |
| Asus TUF Gaming A16 FA617 (1.3) | |
| Strange Brigade - 1920x1080 ultra AA:ultra AF:16 | |
| Średnia w klasie Gaming (113.6 - 458, n=83, ostatnie 2 lata) | |
| Medion Erazer Defender P40 (1.47.22.14 D3D12) | |
| Asus TUF Gaming A16 FA617XS (1.47.22.14 D3D12) | |
| Przeciętny AMD Radeon RX 7600S (162.7 - 163.3, n=2) | |
| Asus TUF Gaming A16 FA617 (1.47.22.14 D3D12) | |
| Gigabyte G5 KE (1.47.22.14 D3D12) | |
| MSI Katana 15 B12VEK (1.47.22.14 D3D12) | |
| Returnal | |
| 1920x1080 Epic Preset | |
| Lenovo Legion Pro 5 16IRX8 | |
| Asus TUF Gaming A16 FA617XS | |
| Przeciętny AMD Radeon RX 7600S (n=1) | |
| 1920x1080 Epic Preset + Epic Ray-Tracing | |
| Asus TUF Gaming A16 FA617XS | |
| Przeciętny AMD Radeon RX 7600S (n=1) | |
| Atomic Heart - 1920x1080 Atomic Preset | |
| Asus TUF Gaming A16 FA617XS | |
| Przeciętny AMD Radeon RX 7600S (n=1) | |
| Sons of the Forest - 1920x1080 Ultra Preset AA:T | |
| Asus TUF Gaming A16 FA617XS | |
| Przeciętny AMD Radeon RX 7600S (n=1) | |
| Resident Evil 4 Remake - 1920x1080 Max Preset | |
| Medion Erazer Defender P40 | |
| Asus TUF Gaming A16 FA617XS | |
| Przeciętny AMD Radeon RX 7600S (n=1) | |
| The Last of Us - 1920x1080 Ultra Preset | |
| Asus TUF Gaming A16 FA617XS | |
| Przeciętny AMD Radeon RX 7600S (n=1) | |
| Hogwarts Legacy | |
| 1920x1080 Ultra Preset AA:High T | |
| Średnia w klasie Gaming (n=1ostatnie 2 lata) | |
| Asus TUF Gaming A16 FA617XS | |
| Przeciętny AMD Radeon RX 7600S (n=1) | |
| 1920x1080 Ultra Preset + Full Ray Tracing AA:High T | |
| Asus TUF Gaming A16 FA617XS | |
| Przeciętny AMD Radeon RX 7600S (n=1) | |
| Company of Heroes 3 - 1920x1080 Maximum Settings | |
| Asus TUF Gaming A16 FA617XS | |
| Przeciętny AMD Radeon RX 7600S (n=1) | |
| Dead Island 2 - 1920x1080 Ultra Preset AA:High T | |
| Medion Erazer Defender P40 | |
| Asus TUF Gaming A16 FA617XS | |
| Przeciętny AMD Radeon RX 7600S (n=1) | |
| Flight Simulator 2020 - 1920x1080 Ultra AA:TAA AF:16x | |
| Asus TUF Gaming A16 FA617XS | |
| Przeciętny AMD Radeon RX 7600S (n=1) | |
| Far Cry 6 | |
| 1920x1080 Ultra Graphics Quality + HD Textures AA:T | |
| Średnia w klasie Gaming (n=1ostatnie 2 lata) | |
| Asus TUF Gaming A16 FA617XS | |
| Przeciętny AMD Radeon RX 7600S (n=1) | |
| 1920x1080 Ultra Graphics Quality + HD Textures + DXR AA:T | |
| Średnia w klasie Gaming (n=1ostatnie 2 lata) | |
| Asus TUF Gaming A16 FA617XS | |
| Przeciętny AMD Radeon RX 7600S (n=1) | |
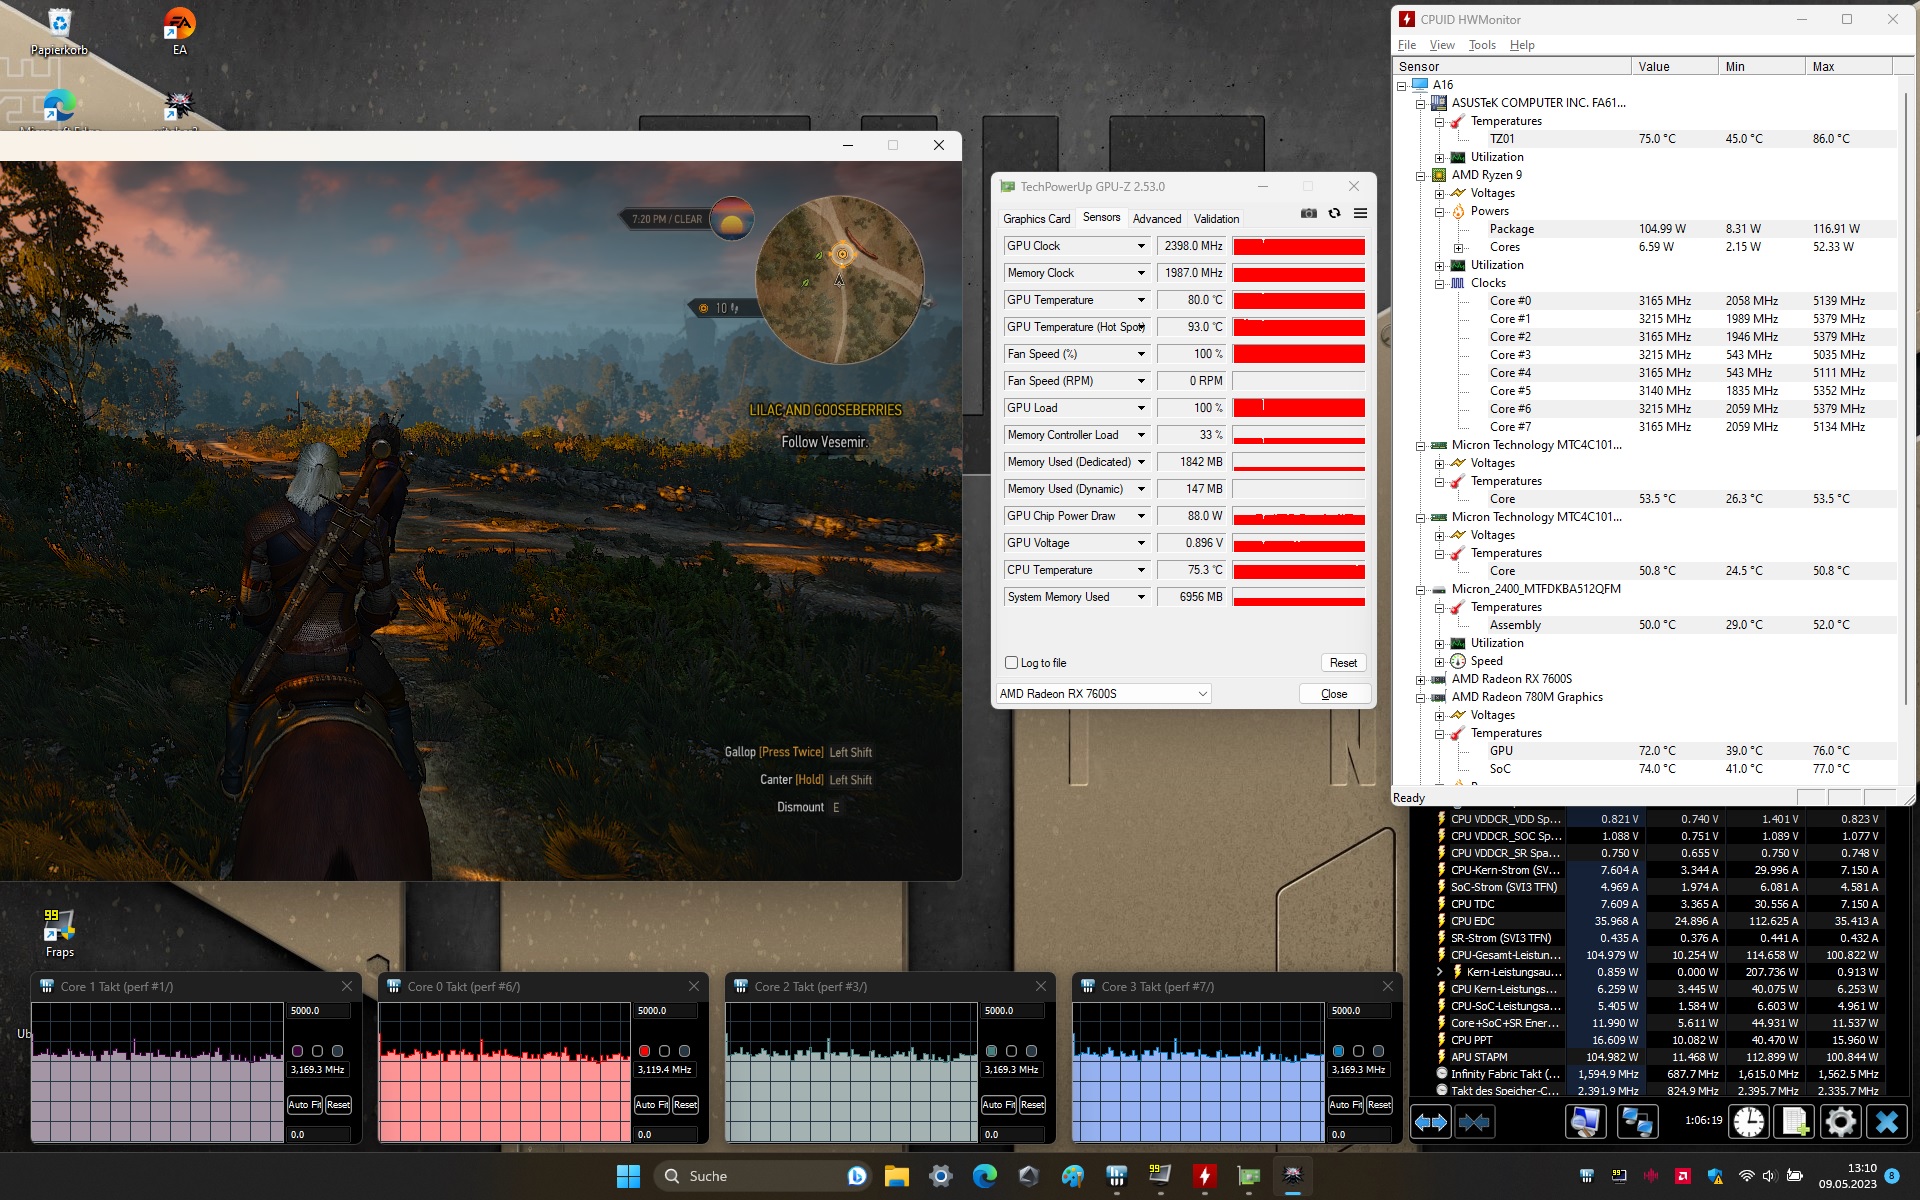
Aby sprawdzić, czy liczba klatek na sekundę pozostaje w dużej mierze stała przez dłuższy czas, uruchomiliśmy grę The Witcher 3 na około 60 minut w rozdzielczości Full HD i maksymalnych ustawieniach jakości. Postać w grze nie była poruszana. Nie odnotowaliśmy spadku wydajności.
Witcher 3 FPS diagram
| low | med. | high | ultra | |
|---|---|---|---|---|
| GTA V (2015) | 184.7 | 171.7 | 92.9 | |
| The Witcher 3 (2015) | 382 | 166.5 | 98.1 | |
| Dota 2 Reborn (2015) | 157.5 | 143.1 | 132.2 | 121.6 |
| Final Fantasy XV Benchmark (2018) | 215 | 117.2 | 85.2 | |
| X-Plane 11.11 (2018) | 85.1 | 72 | 57.3 | |
| Far Cry 5 (2018) | 135 | 120 | 115 | 108 |
| Strange Brigade (2018) | 440 | 228 | 190.8 | 163.3 |
| Metro Exodus (2019) | 187.3 | 116.5 | ||
| The Division 2 (2019) | 232 | 167 | 131 | 95 |
| Control (2019) | 235 | 116.6 | 83.5 | |
| Doom Eternal (2020) | 376 | 209 | 184.3 | 179 |
| Gears Tactics (2020) | 381.4 | 216.1 | 138.1 | 95.4 |
| Death Stranding (2020) | 189.5 | 144.1 | 133.6 | 129.6 |
| Flight Simulator 2020 (2020) | 134.9 | 85.5 | 60.1 | 42.7 |
| Crysis Remastered (2020) | 294 | 190.9 | 90.6 | 38.6 |
| Watch Dogs Legion (2020) | 122.6 | 118.5 | 106.6 | 69.5 |
| Assassin´s Creed Valhalla (2020) | 203 | 124 | 102 | 88 |
| Hitman 3 (2021) | 270 | 178.2 | 157.4 | 145.7 |
| Far Cry 6 (2021) | 151 | 133 | 119 | 104.7 |
| Forza Horizon 5 (2021) | 197 | 144 | 135 | 74 |
| GRID Legends (2022) | 214.9 | 182.8 | 156.5 | 129.3 |
| Tiny Tina's Wonderlands (2022) | 198.1 | 156.8 | 105.7 | 82.2 |
| F1 22 (2022) | 263 | 244 | 190 | 50.5 |
| A Plague Tale Requiem (2022) | 98.2 | 78 | 66.1 | 55.4 |
| Hogwarts Legacy (2023) | 118.4 | 88.7 | 72 | 55.4 |
| Returnal (2023) | 91 | 88 | 78 | 67 |
| Atomic Heart (2023) | 167.1 | 125.5 | 71.6 | 56.6 |
| Company of Heroes 3 (2023) | 143.4 | 125.9 | 97.4 | 97.2 |
| Sons of the Forest (2023) | 93.2 | 81.4 | 78 | 76.7 |
| Resident Evil 4 Remake (2023) | 107.4 | 83.2 | 78.9 | 52.3 |
| The Last of Us (2023) | 81.4 | 67.6 | 60.2 | 51.5 |
| Dead Island 2 (2023) | 201 | 168.1 | 122.7 | 113.1 |
Emisje - FA617XS może być dość głośny
Emisja hałasu
W codziennym użytkowaniu (biuro, Internet itp.), A16 zazwyczaj pracuje cicho, często bezgłośnie - niezależnie od wybranego profilu. Poziom ciśnienia akustycznego może wzrosnąć do 53 dB(A) ("Turbo") lub 51 dB(A) ("Performance") w trybie gry. Ogólnie niższą emisję hałasu można uzyskać korzystając z profilu "Quiet". Moc obliczeniowa jest wtedy zmniejszona tylko w bardzo niewielkim stopniu.
Hałas
| luz |
| 25 / 26 / 28 dB |
| obciążenie |
| 43 / 53 dB |
 | ||
30 dB cichy 40 dB(A) słyszalny 50 dB(A) irytujący |
||
min: | ||
| Asus TUF Gaming A16 FA617XS R9 7940HS, Radeon RX 7600S | Lenovo Legion Pro 5 16IRX8 i7-13700HX, GeForce RTX 4060 Laptop GPU | MSI Katana 15 B12VEK i7-12650H, GeForce RTX 4050 Laptop GPU | Medion Erazer Defender P40 i7-13700HX, GeForce RTX 4060 Laptop GPU | Gigabyte G5 KE i5-12500H, GeForce RTX 3060 Laptop GPU | Asus TUF Gaming A16 FA617 R7 7735HS, Radeon RX 7600S | |
|---|---|---|---|---|---|---|
| Noise | 8% | 7% | -11% | -11% | 3% | |
| wyłączone / środowisko * (dB) | 25 | 23 8% | 24 4% | 25 -0% | 19.52 22% | 24 4% |
| Idle Minimum * (dB) | 25 | 23.1 8% | 24 4% | 26 -4% | 31.05 -24% | 24 4% |
| Idle Average * (dB) | 26 | 23.1 11% | 24 8% | 27 -4% | 31.05 -19% | 25 4% |
| Idle Maximum * (dB) | 28 | 26.6 5% | 24 14% | 32 -14% | 31.05 -11% | 28 -0% |
| Load Average * (dB) | 43 | 34.7 19% | 37.71 12% | 53 -23% | 55.66 -29% | 42 2% |
| Witcher 3 ultra * (dB) | 51 | 47.6 7% | 45.75 10% | 56 -10% | 55.7 -9% | 50 2% |
| Load Maximum * (dB) | 53 | 54.8 -3% | 54.55 -3% | 64 -21% | 55.51 -5% | 50 6% |
* ... im mniej tym lepiej
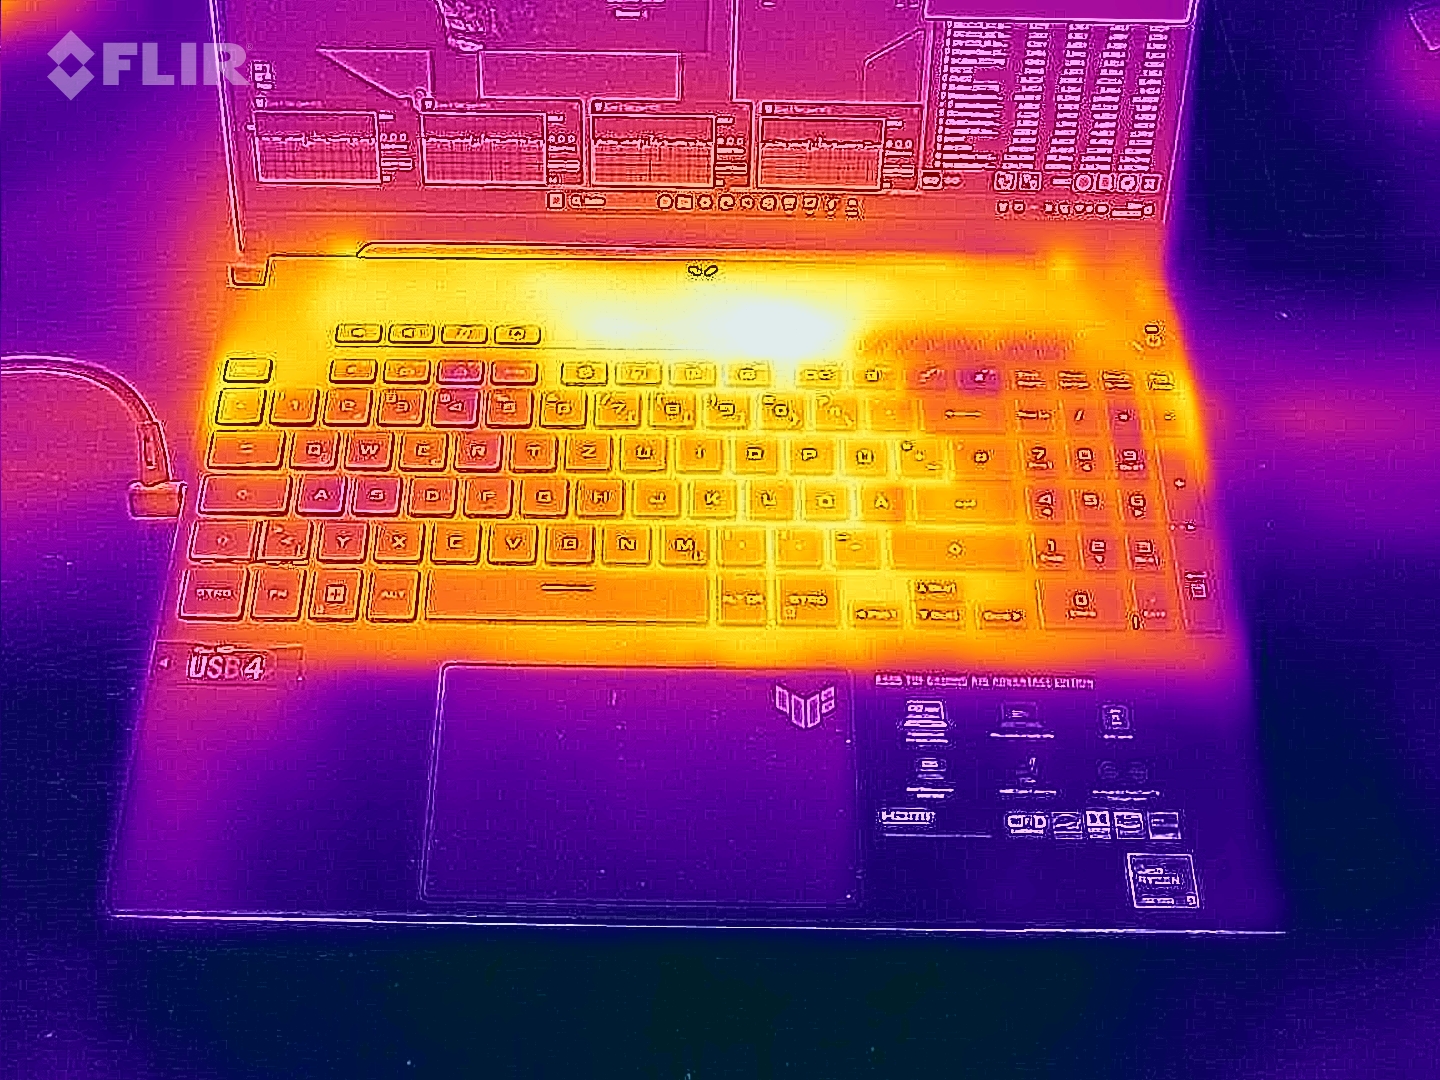
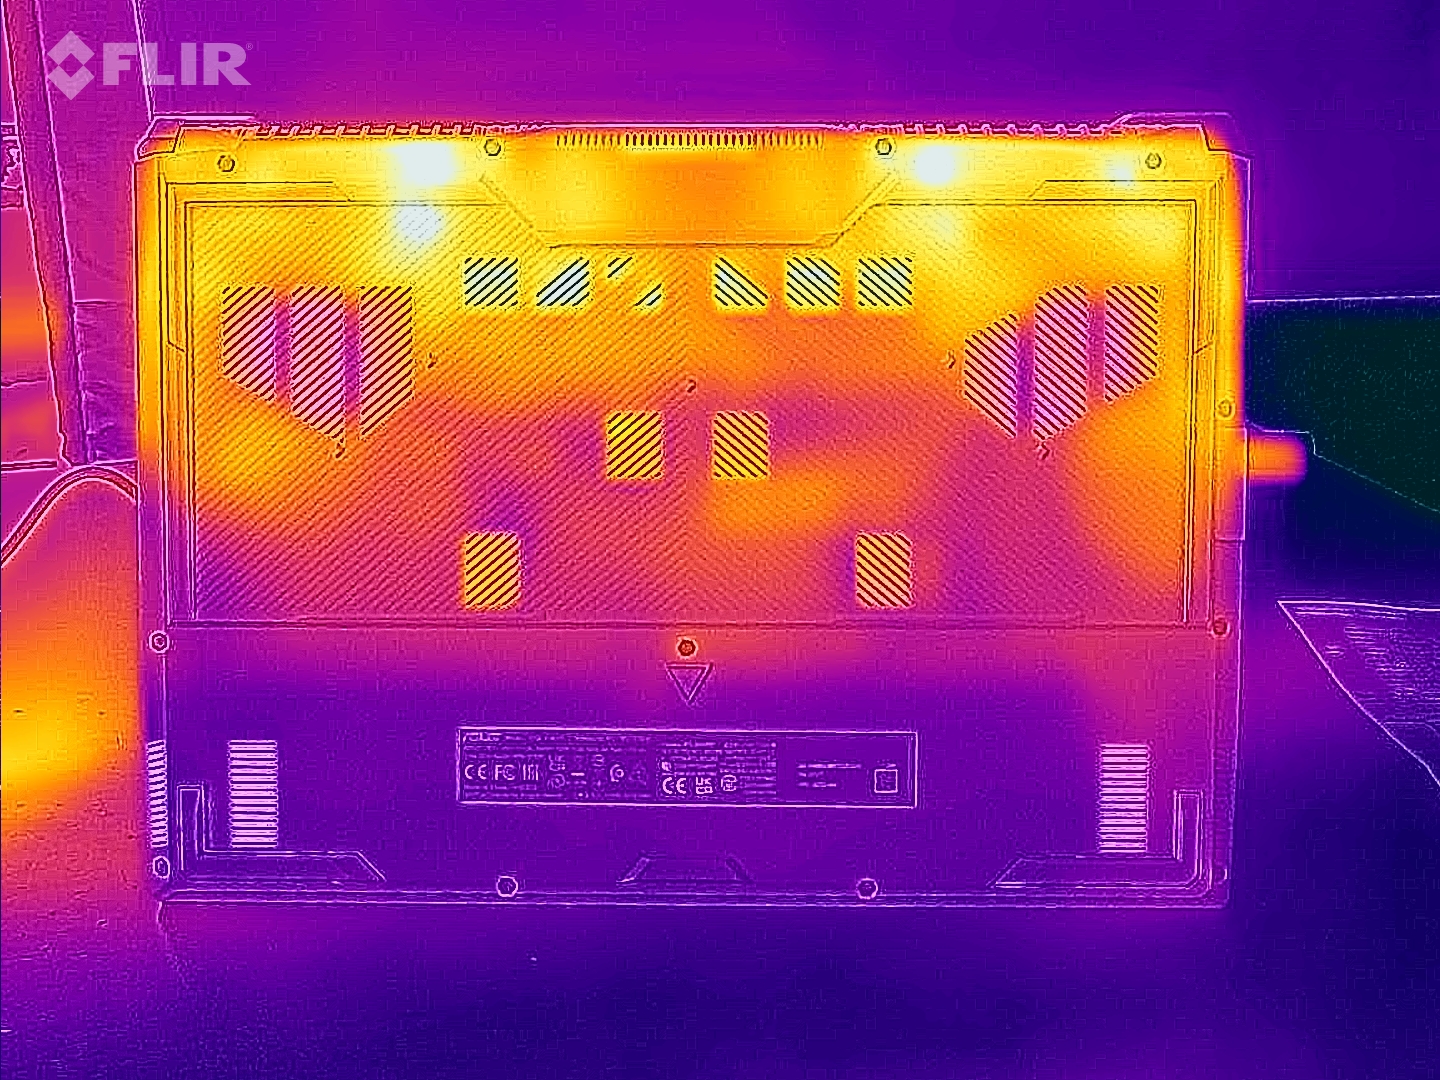
Temperatura
Notebook nagrzewa się zauważalnie pod obciążeniem, ale nie nadmiernie. W codziennym użytkowaniu temperatury mieszczą się w zielonej strefie. To ostatnie nie miało miejsca w siostrzanym modelu- zakładamy błąd/wadę urządzenia.
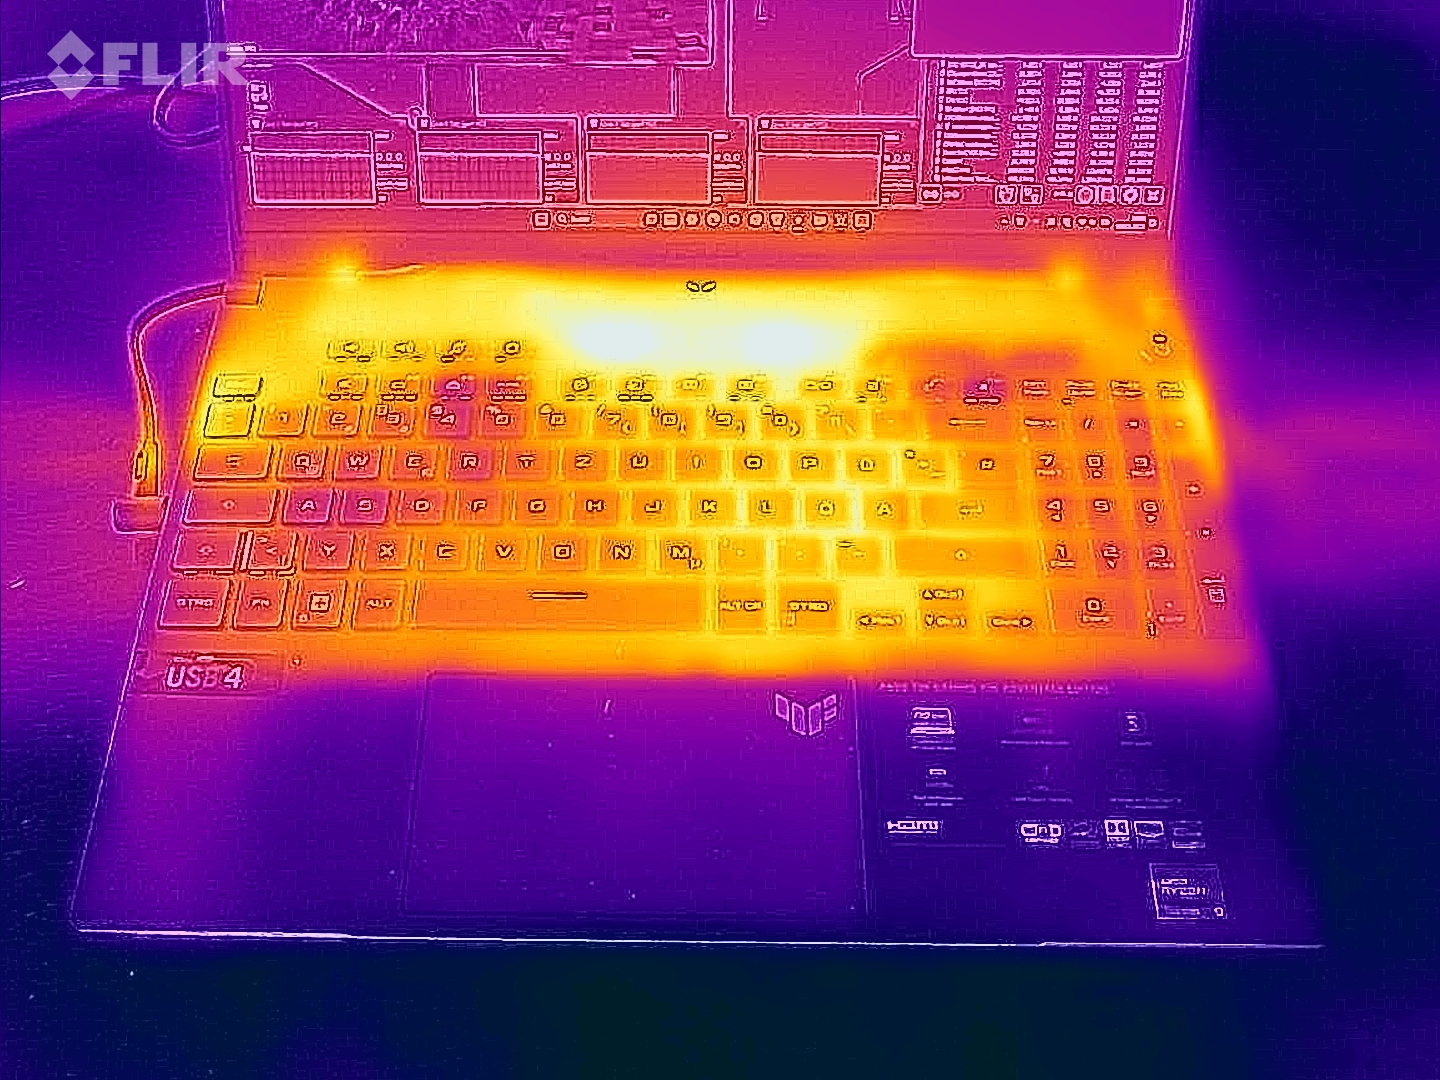
(-) Maksymalna temperatura w górnej części wynosi 53 °C / 127 F, w porównaniu do średniej 40.4 °C / 105 F , począwszy od 21.2 do 68.8 °C dla klasy Gaming.
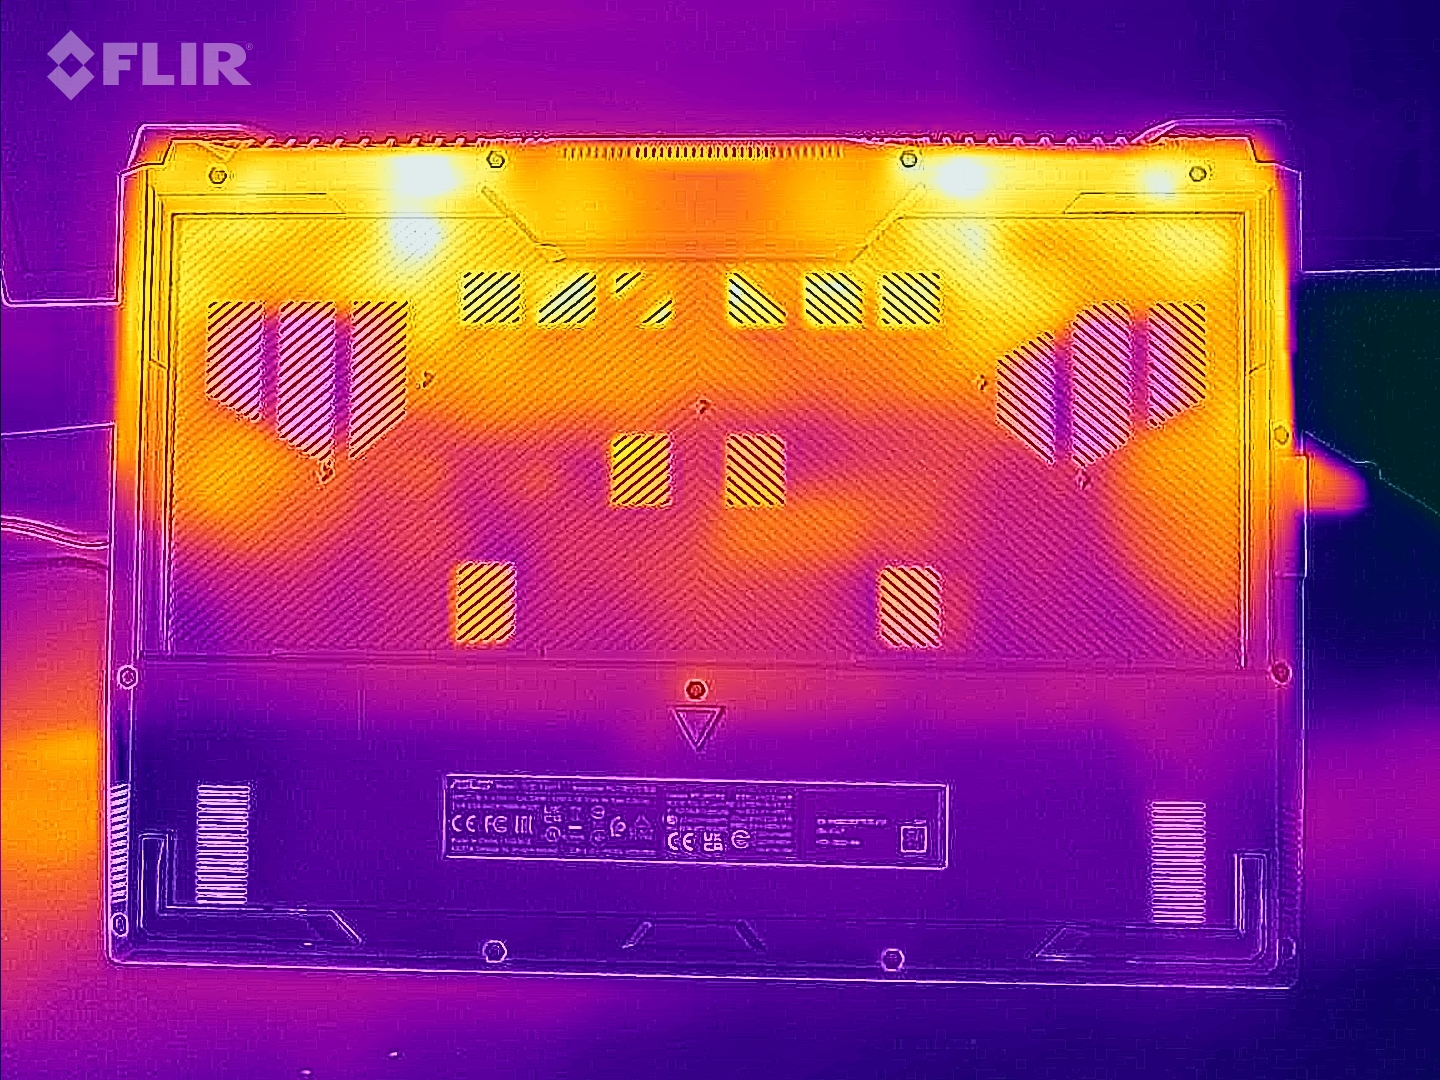
(-) Dno nagrzewa się maksymalnie do 48 °C / 118 F, w porównaniu do średniej 43.2 °C / 110 F
(+) W stanie bezczynności średnia temperatura górnej części wynosi 28.8 °C / 84 F, w porównaniu ze średnią temperaturą urządzenia wynoszącą 33.9 °C / ### class_avg_f### F.
(-) Podczas gry w Wiedźmina 3 średnia temperatura górnej części wynosi 40 °C / 104 F, w porównaniu do średniej temperatury urządzenia wynoszącej 33.9 °C / ## #class_avg_f### F.
(±) Podpórki pod nadgarstki i touchpad mogą się bardzo nagrzać w dotyku, maksymalnie do 38 °C / 100.4 F.
(-) Średnia temperatura obszaru podparcia dłoni w podobnych urządzeniach wynosiła 28.8 °C / 83.8 F (-9.2 °C / -16.6 F).
| Asus TUF Gaming A16 FA617XS AMD Ryzen 9 7940HS, AMD Radeon RX 7600S | Lenovo Legion Pro 5 16IRX8 Intel Core i7-13700HX, NVIDIA GeForce RTX 4060 Laptop GPU | MSI Katana 15 B12VEK Intel Core i7-12650H, NVIDIA GeForce RTX 4050 Laptop GPU | Medion Erazer Defender P40 Intel Core i7-13700HX, NVIDIA GeForce RTX 4060 Laptop GPU | Gigabyte G5 KE Intel Core i5-12500H, NVIDIA GeForce RTX 3060 Laptop GPU | Asus TUF Gaming A16 FA617 AMD Ryzen 7 7735HS, AMD Radeon RX 7600S | |
|---|---|---|---|---|---|---|
| Heat | 1% | -8% | 9% | -14% | -17% | |
| Maximum Upper Side * (°C) | 53 | 42.8 19% | 47 11% | 42 21% | 52.6 1% | 54 -2% |
| Maximum Bottom * (°C) | 48 | 50 -4% | 48 -0% | 45 6% | 62.4 -30% | 47 2% |
| Idle Upper Side * (°C) | 30 | 29.6 1% | 35 -17% | 28 7% | 33.6 -12% | 40 -33% |
| Idle Bottom * (°C) | 30 | 34 -13% | 38 -27% | 30 -0% | 34.8 -16% | 40 -33% |
* ... im mniej tym lepiej
Test warunków skrajnych
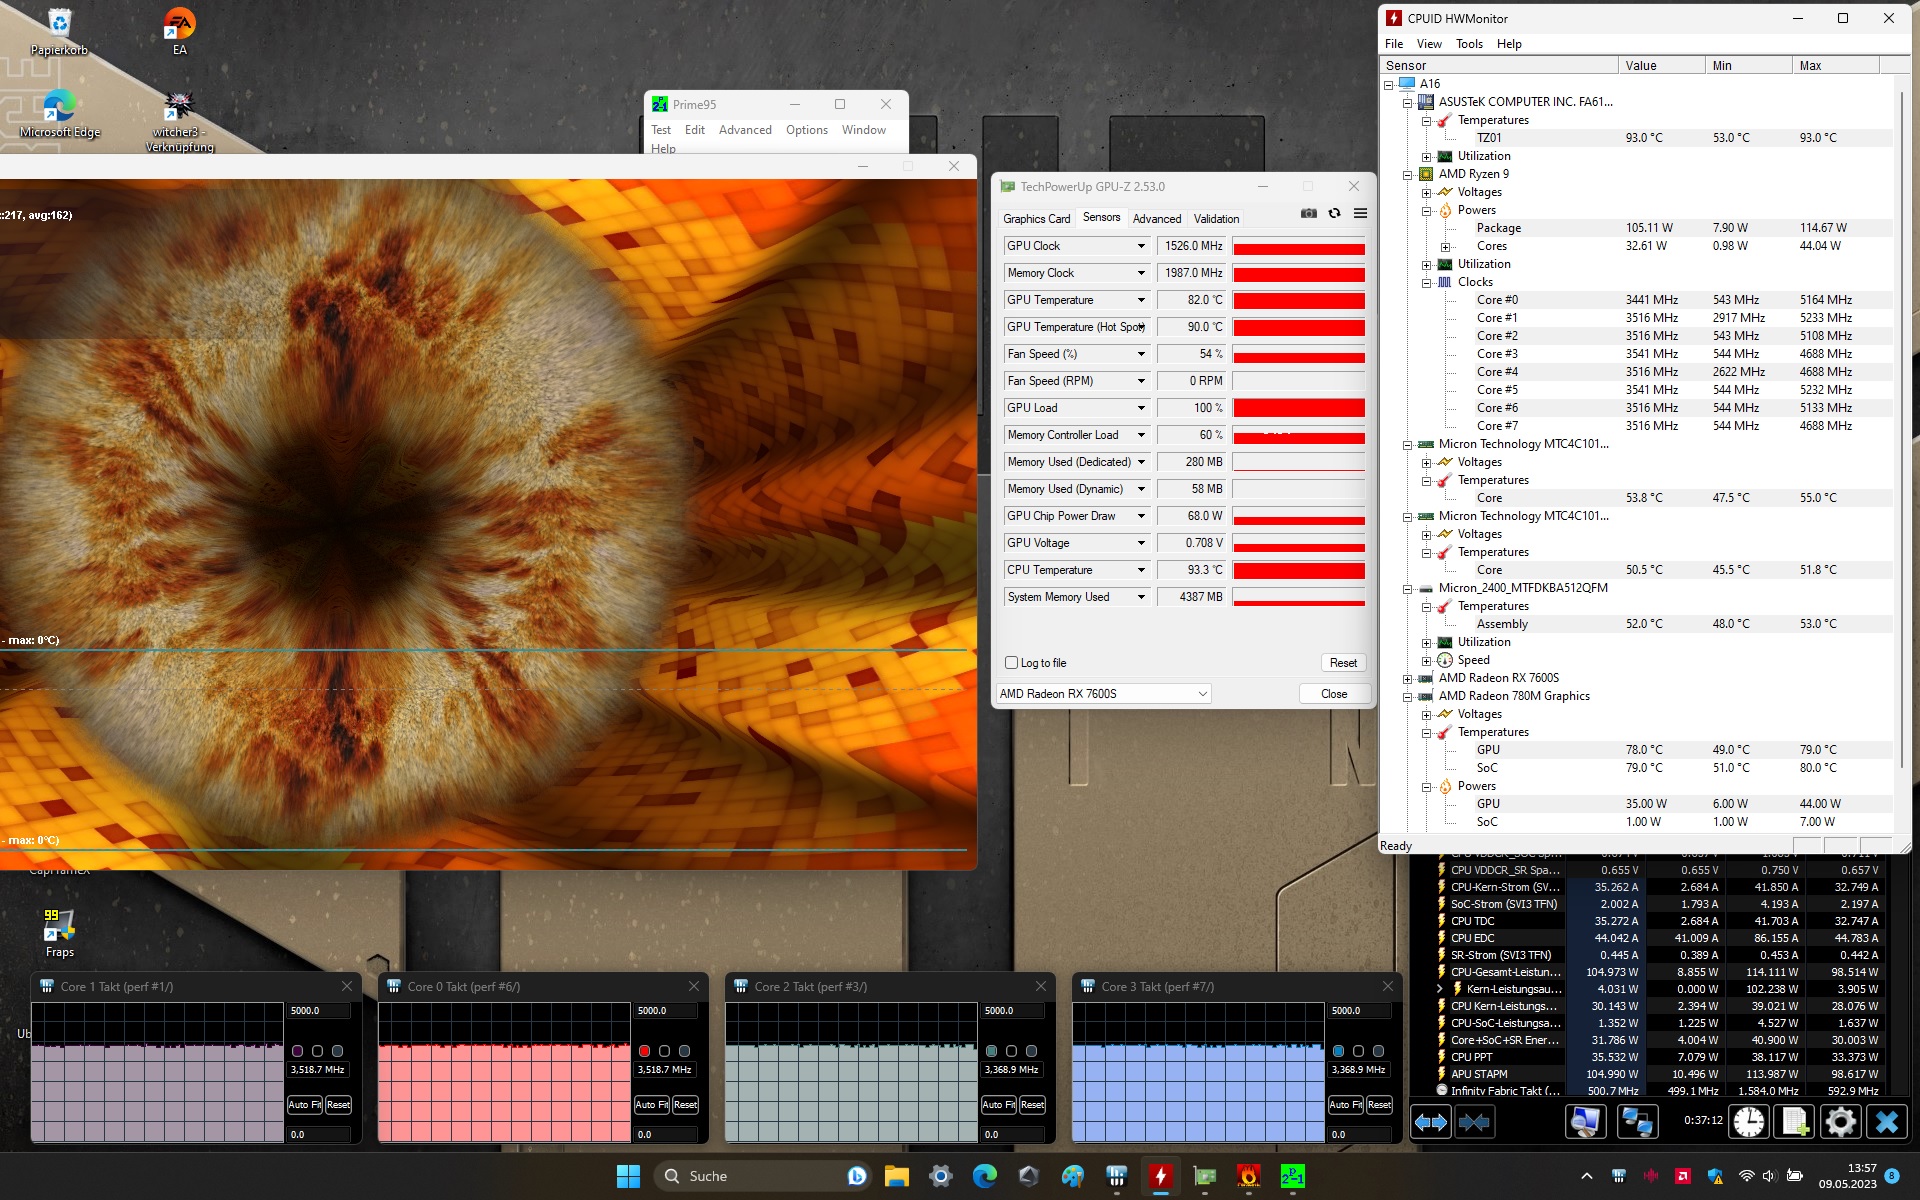
Test obciążeniowy (Prime95 i Furmark w trybie ciągłym) symuluje ekstremalny scenariusz w celu przetestowania stabilności systemu pod pełnym obciążeniem. Procesor (3,4 do 3,5 GHz) i karta graficzna (~1500 MHz) przeszły test z częstotliwościami taktowania poniżej odpowiedniego zegara bazowego.
Głośniki
Głośniki stereo generują ogólnie przyzwoity dźwięk.
Asus TUF Gaming A16 FA617XS analiza dźwięku
(±) | głośność głośnika jest średnia, ale dobra (79 dB)
Bas 100 - 315 Hz
(±) | zredukowany bas - średnio 11.6% niższy od mediany
(±) | liniowość basu jest średnia (7% delta do poprzedniej częstotliwości)
Średnie 400 - 2000 Hz
(±) | wyższe średnie - średnio 5.7% wyższe niż mediana
(+) | średnie są liniowe (3.8% delta do poprzedniej częstotliwości)
Wysokie 2–16 kHz
(+) | zrównoważone maksima - tylko 2.6% od mediany
(+) | wzloty są liniowe (6.5% delta do poprzedniej częstotliwości)
Ogólnie 100 - 16.000 Hz
(±) | liniowość ogólnego dźwięku jest średnia (15.4% różnicy w stosunku do mediany)
W porównaniu do tej samej klasy
» 34% wszystkich testowanych urządzeń w tej klasie było lepszych, 7% podobnych, 59% gorszych
» Najlepszy miał deltę 6%, średnia wynosiła ###średnia###%, najgorsza wynosiła 132%
W porównaniu do wszystkich testowanych urządzeń
» 23% wszystkich testowanych urządzeń było lepszych, 4% podobnych, 73% gorszych
» Najlepszy miał deltę 4%, średnia wynosiła ###średnia###%, najgorsza wynosiła 134%
Lenovo Legion Pro 5 16IRX8 analiza dźwięku
(±) | głośność głośnika jest średnia, ale dobra (72.7 dB)
Bas 100 - 315 Hz
(-) | prawie brak basu - średnio 23.7% niższa od mediany
(±) | liniowość basu jest średnia (10.7% delta do poprzedniej częstotliwości)
Średnie 400 - 2000 Hz
(+) | zbalansowane środki średnie - tylko 3.8% od mediany
(±) | liniowość środka jest średnia (7.1% delta do poprzedniej częstotliwości)
Wysokie 2–16 kHz
(+) | zrównoważone maksima - tylko 3.7% od mediany
(+) | wzloty są liniowe (6.7% delta do poprzedniej częstotliwości)
Ogólnie 100 - 16.000 Hz
(±) | liniowość ogólnego dźwięku jest średnia (21.9% różnicy w stosunku do mediany)
W porównaniu do tej samej klasy
» 79% wszystkich testowanych urządzeń w tej klasie było lepszych, 6% podobnych, 16% gorszych
» Najlepszy miał deltę 6%, średnia wynosiła ###średnia###%, najgorsza wynosiła 132%
W porównaniu do wszystkich testowanych urządzeń
» 63% wszystkich testowanych urządzeń było lepszych, 7% podobnych, 30% gorszych
» Najlepszy miał deltę 4%, średnia wynosiła ###średnia###%, najgorsza wynosiła 134%
Zarządzanie energią - laptop do gier o świetnych czasach pracy
Zużycie energii
Nie ma żadnych nieprawidłowości pod względem zużycia energii. Wskaźniki są na normalnym poziomie dla zainstalowanego sprzętu. Test warunków skrajnych i Witcher 3 zostały przeprowadzone przy stałym zużyciu energii. Moc zasilacza (240 W) jest więcej niż wystarczająca.
| wyłączony / stan wstrzymania | |
| luz | |
| obciążenie |
|
Legenda:
min: | |
| Asus TUF Gaming A16 FA617XS R9 7940HS, Radeon RX 7600S | Lenovo Legion Pro 5 16IRX8 i7-13700HX, GeForce RTX 4060 Laptop GPU | MSI Katana 15 B12VEK i7-12650H, GeForce RTX 4050 Laptop GPU | Medion Erazer Defender P40 i7-13700HX, GeForce RTX 4060 Laptop GPU | Gigabyte G5 KE i5-12500H, GeForce RTX 3060 Laptop GPU | Asus TUF Gaming A16 FA617 R7 7735HS, Radeon RX 7600S | Przeciętny AMD Radeon RX 7600S | Średnia w klasie Gaming | |
|---|---|---|---|---|---|---|---|---|
| Power Consumption | -107% | 2% | -25% | -16% | -7% | -4% | -64% | |
| Idle Minimum * (Watt) | 7 | 24.5 -250% | 8.5 -21% | 8 -14% | 7.66 -9% | 8 -14% | 7.5 ? -7% | 13.1 ? -87% |
| Idle Average * (Watt) | 10 | 29.2 -192% | 10.2 -2% | 12 -20% | 10.3 -3% | 11 -10% | 10.5 ? -5% | 19 ? -90% |
| Idle Maximum * (Watt) | 15 | 34.3 -129% | 11.3 25% | 18 -20% | 16.05 -7% | 16 -7% | 15.5 ? -3% | 24.6 ? -64% |
| Load Average * (Watt) | 86 | 98.7 -15% | 84 2% | 101 -17% | 115.8 -35% | 97 -13% | 91.5 ? -6% | 111.3 ? -29% |
| Witcher 3 ultra * (Watt) | 160.6 | 178.6 -11% | 128 20% | 180.8 -13% | 168.7 -5% | 161.5 -1% | ||
| Load Maximum * (Watt) | 172 | 249.6 -45% | 189 -10% | 284 -65% | 234.6 -36% | 168 2% | 170 ? 1% | 260 ? -51% |
* ... im mniej tym lepiej
power consumption Witcher 3 / stress test
power consumption with external monitor
Żywotność baterii
16-calowe urządzenie osiągnęło czasy pracy wynoszące odpowiednio 12:25 h i 12:26 h w naszym teście WLAN (wywoływanie stron internetowych za pomocą skryptu) i teście wideo (krótki film Big Buck Bunny (kodowanie H.264, FHD) w pętli). Podczas obu testów funkcje oszczędzania energii laptopa były wyłączone, a jasność wyświetlacza ustawiona na około 150 cd/m². Moduły łączności bezprzewodowej również były wyłączone na czas testu wideo
FA617 zapewnił doskonałe czasy pracy i pozostawił konkurencję w kurzu. Połączenie oszczędnego APU i dużej pojemności baterii zdecydowanie się tutaj opłaca.
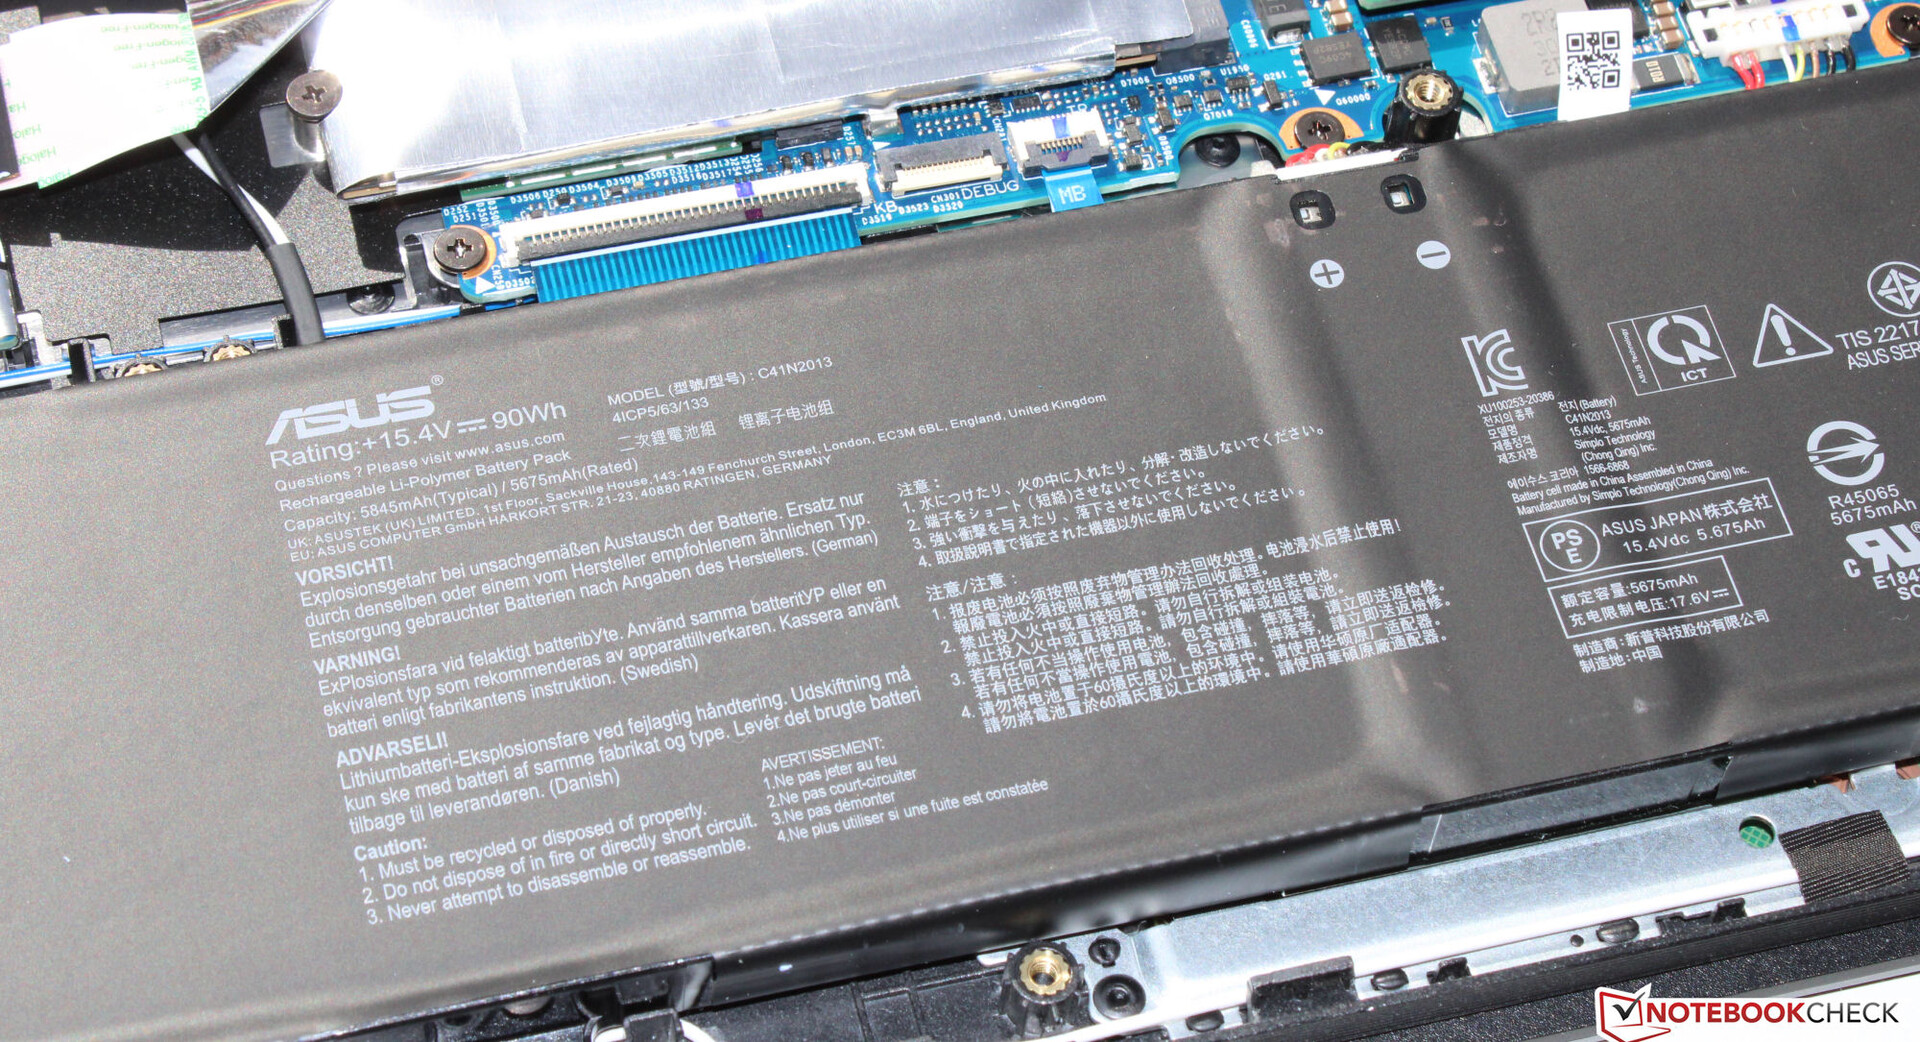
| Asus TUF Gaming A16 FA617XS R9 7940HS, Radeon RX 7600S, 90 Wh | Lenovo Legion Pro 5 16IRX8 i7-13700HX, GeForce RTX 4060 Laptop GPU, 80 Wh | MSI Katana 15 B12VEK i7-12650H, GeForce RTX 4050 Laptop GPU, 53.5 Wh | Medion Erazer Defender P40 i7-13700HX, GeForce RTX 4060 Laptop GPU, 73 Wh | Gigabyte G5 KE i5-12500H, GeForce RTX 3060 Laptop GPU, 54 Wh | Asus TUF Gaming A16 FA617 R7 7735HS, Radeon RX 7600S, 90 Wh | Średnia w klasie Gaming | |
|---|---|---|---|---|---|---|---|
| Czasy pracy | -54% | -21% | -29% | -42% | 22% | -18% | |
| Reader / Idle (h) | 20.3 | 6.7 -67% | 8.8 -57% | 20.2 0% | 7.84 ? -61% | ||
| H.264 (h) | 12.4 | 4.4 -65% | 5.7 -54% | 2.2 -82% | 8.27 ? -33% | ||
| WiFi v1.3 (h) | 12.4 | 3.4 -73% | 4.3 -65% | 6.2 -50% | 5.7 -54% | 12.1 -2% | 7.08 ? -43% |
| Load (h) | 0.9 | 0.7 -22% | 1.5 67% | 1.3 44% | 1 11% | 1.5 67% | 1.496 ? 66% |
| Witcher 3 ultra (h) | 1.3 |
Za
Przeciw
Werdykt - laptop Asusa z (zbyt) małą ilością pamięci masowej
A16 jest skonfigurowany do gier w rozdzielczości WUXGA przy wysokich i maksymalnych ustawieniach, ale powinien być przydatny w wielu innych dziedzinach, takich jak edycja wideo i renderowanie. Zespół AMD składający się zRyzen 9 7940HSiRadeon RX 7600Szapewniają laptopowi niezbędną wydajność. Oba podzespoły pracują z niezmiennie wysokimi częstotliwościami taktowania.
Asus TUF Gaming A16 Advantage Edition to dobrze zaokrąglony laptop do gier średniej klasy, którego imponujące czasy pracy na baterii są jego dumą i radością.
W porównaniu doRyzen-7-7735HSaPU znajdującym się w jegosiostrzanym modelu, 7940HS-APU ma do zaoferowania znacznie lepszą wydajność procesora, pomimo posiadania tej samej liczby rdzeni i tych samych limitów mocy. Tutaj daje o sobie znać nowoczesna architektura (Zen 4 vs. Zen 3+) i wyższe częstotliwości taktowania.
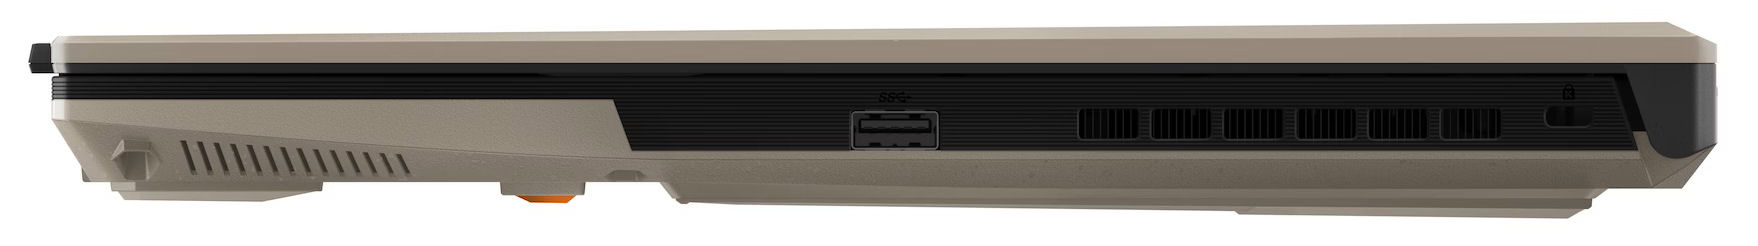
Niesamowite czasy pracy urządzenia są z pewnością jego wyjątkową zaletą: jego praktyczne pomiary wynoszące około 12,5 godziny nie są generalnie osiągane przez wiele innych laptopów biurowych. Pozytyw: Baterię można ładować za pomocą zasilacza USB-C (min. 65 W, 20 V) - jeden port USB-C obsługuje Power Delivery. Własny zasilacz niekoniecznie musiałby być noszony przy sobie.
Zainstalowany wyświetlacz IPS (16 cali, 1920 x 1200 pikseli) ma przyjazne dla pracy proporcje 16:10 i ogólnie pozostawił na nas dobre wrażenie - jeśli już, to jasność mogłaby być nieco większa. Zainstalowany dysk SSD klasy podstawowej idealnie nadawałby się do prostego laptopa biurowego - ale nie do laptopa do gier za 1700 USD. Oferowana pamięć masowa (512 GB) i dane ani nie spełniają wymagań użytkowników, ani nie spełniają ich oczekiwań.
TheLegion Pro 5 16IRX8może być odpowiednią alternatywą. Charakteryzuje się lepszą wydajnością i jaśniejszym ekranem niż A16 - ale wyraźnie nie ma do zaoferowania tak imponujących czasów pracy. TheGigabyte G5 KEmoże być dobrą budżetową alternatywą: Otrzymujesz podobny poziom wydajności graficznej za znacznie niższą cenę. Chociaż: Ten laptop nie jest dostarczany z preinstalowanym systemem operacyjnym Windows.
Cena i dostępność
Wersję A16 z 16 GB pamięci RAM i 512 GB dyskiem SSD można kupić na stronie Asusa za około 1371 dolarów.
Asus TUF Gaming A16 FA617XS
- 05/06/2023 v7 (old)
Sascha Mölck
Przezroczystość
Wyboru urządzeń do recenzji dokonuje nasza redakcja. Próbka testowa została udostępniona autorowi jako pożyczka od producenta lub sprzedawcy detalicznego na potrzeby tej recenzji. Pożyczkodawca nie miał wpływu na tę recenzję, producent nie otrzymał też kopii tej recenzji przed publikacją. Nie było obowiązku publikowania tej recenzji. Jako niezależna firma medialna, Notebookcheck nie podlega władzy producentów, sprzedawców detalicznych ani wydawców.
Tak testuje Notebookcheck
Każdego roku Notebookcheck niezależnie sprawdza setki laptopów i smartfonów, stosując standardowe procedury, aby zapewnić porównywalność wszystkich wyników. Od około 20 lat stale rozwijamy nasze metody badawcze, ustanawiając przy tym standardy branżowe. W naszych laboratoriach testowych doświadczeni technicy i redaktorzy korzystają z wysokiej jakości sprzętu pomiarowego. Testy te obejmują wieloetapowy proces walidacji. Nasz kompleksowy system ocen opiera się na setkach uzasadnionych pomiarów i benchmarków, co pozwala zachować obiektywizm.Price comparison

