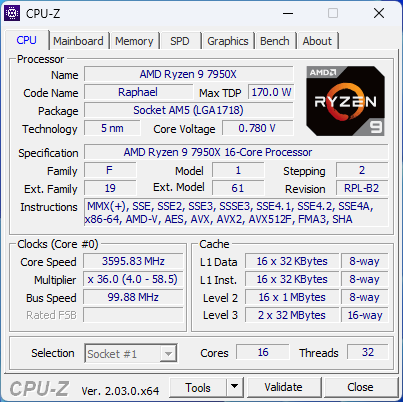
Recenzja AMD Ryzen 9 7950X i AMD Ryzen 7 7700X: Superlatywna wydajność i wzrost efektywności, które dają Raptor Lake przewagę
Po utrzymaniu platformy AM4 przez ponad pół dekady, Zen 4 oznacza pierwszą zmianę pokoleniową AMD w kierunku nowej ery obliczeń PC. Linia Raphael Zen 4, która jak dotąd obejmuje cztery jednostki SKU, przynosi ze sobą natywną obsługę technologii DDR5 i PCIe Gen 5. Oprócz tego, procesory Zen 4 wyposażone są w obsługę instrukcji AVX-512, wbudowane RDNA 2 iGPU oraz obietnicę zwiększonego zysku IPC i wydajności energetycznej.
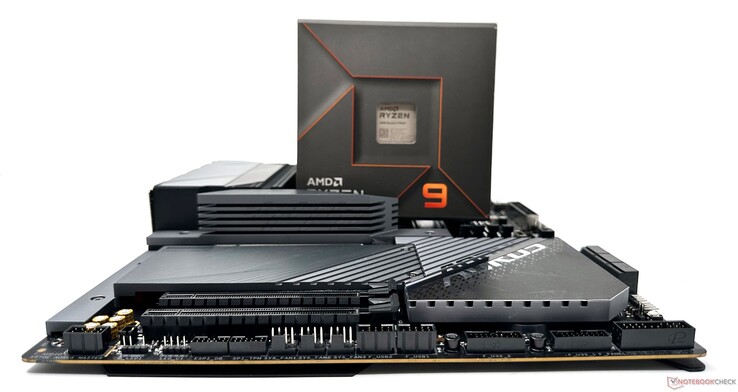
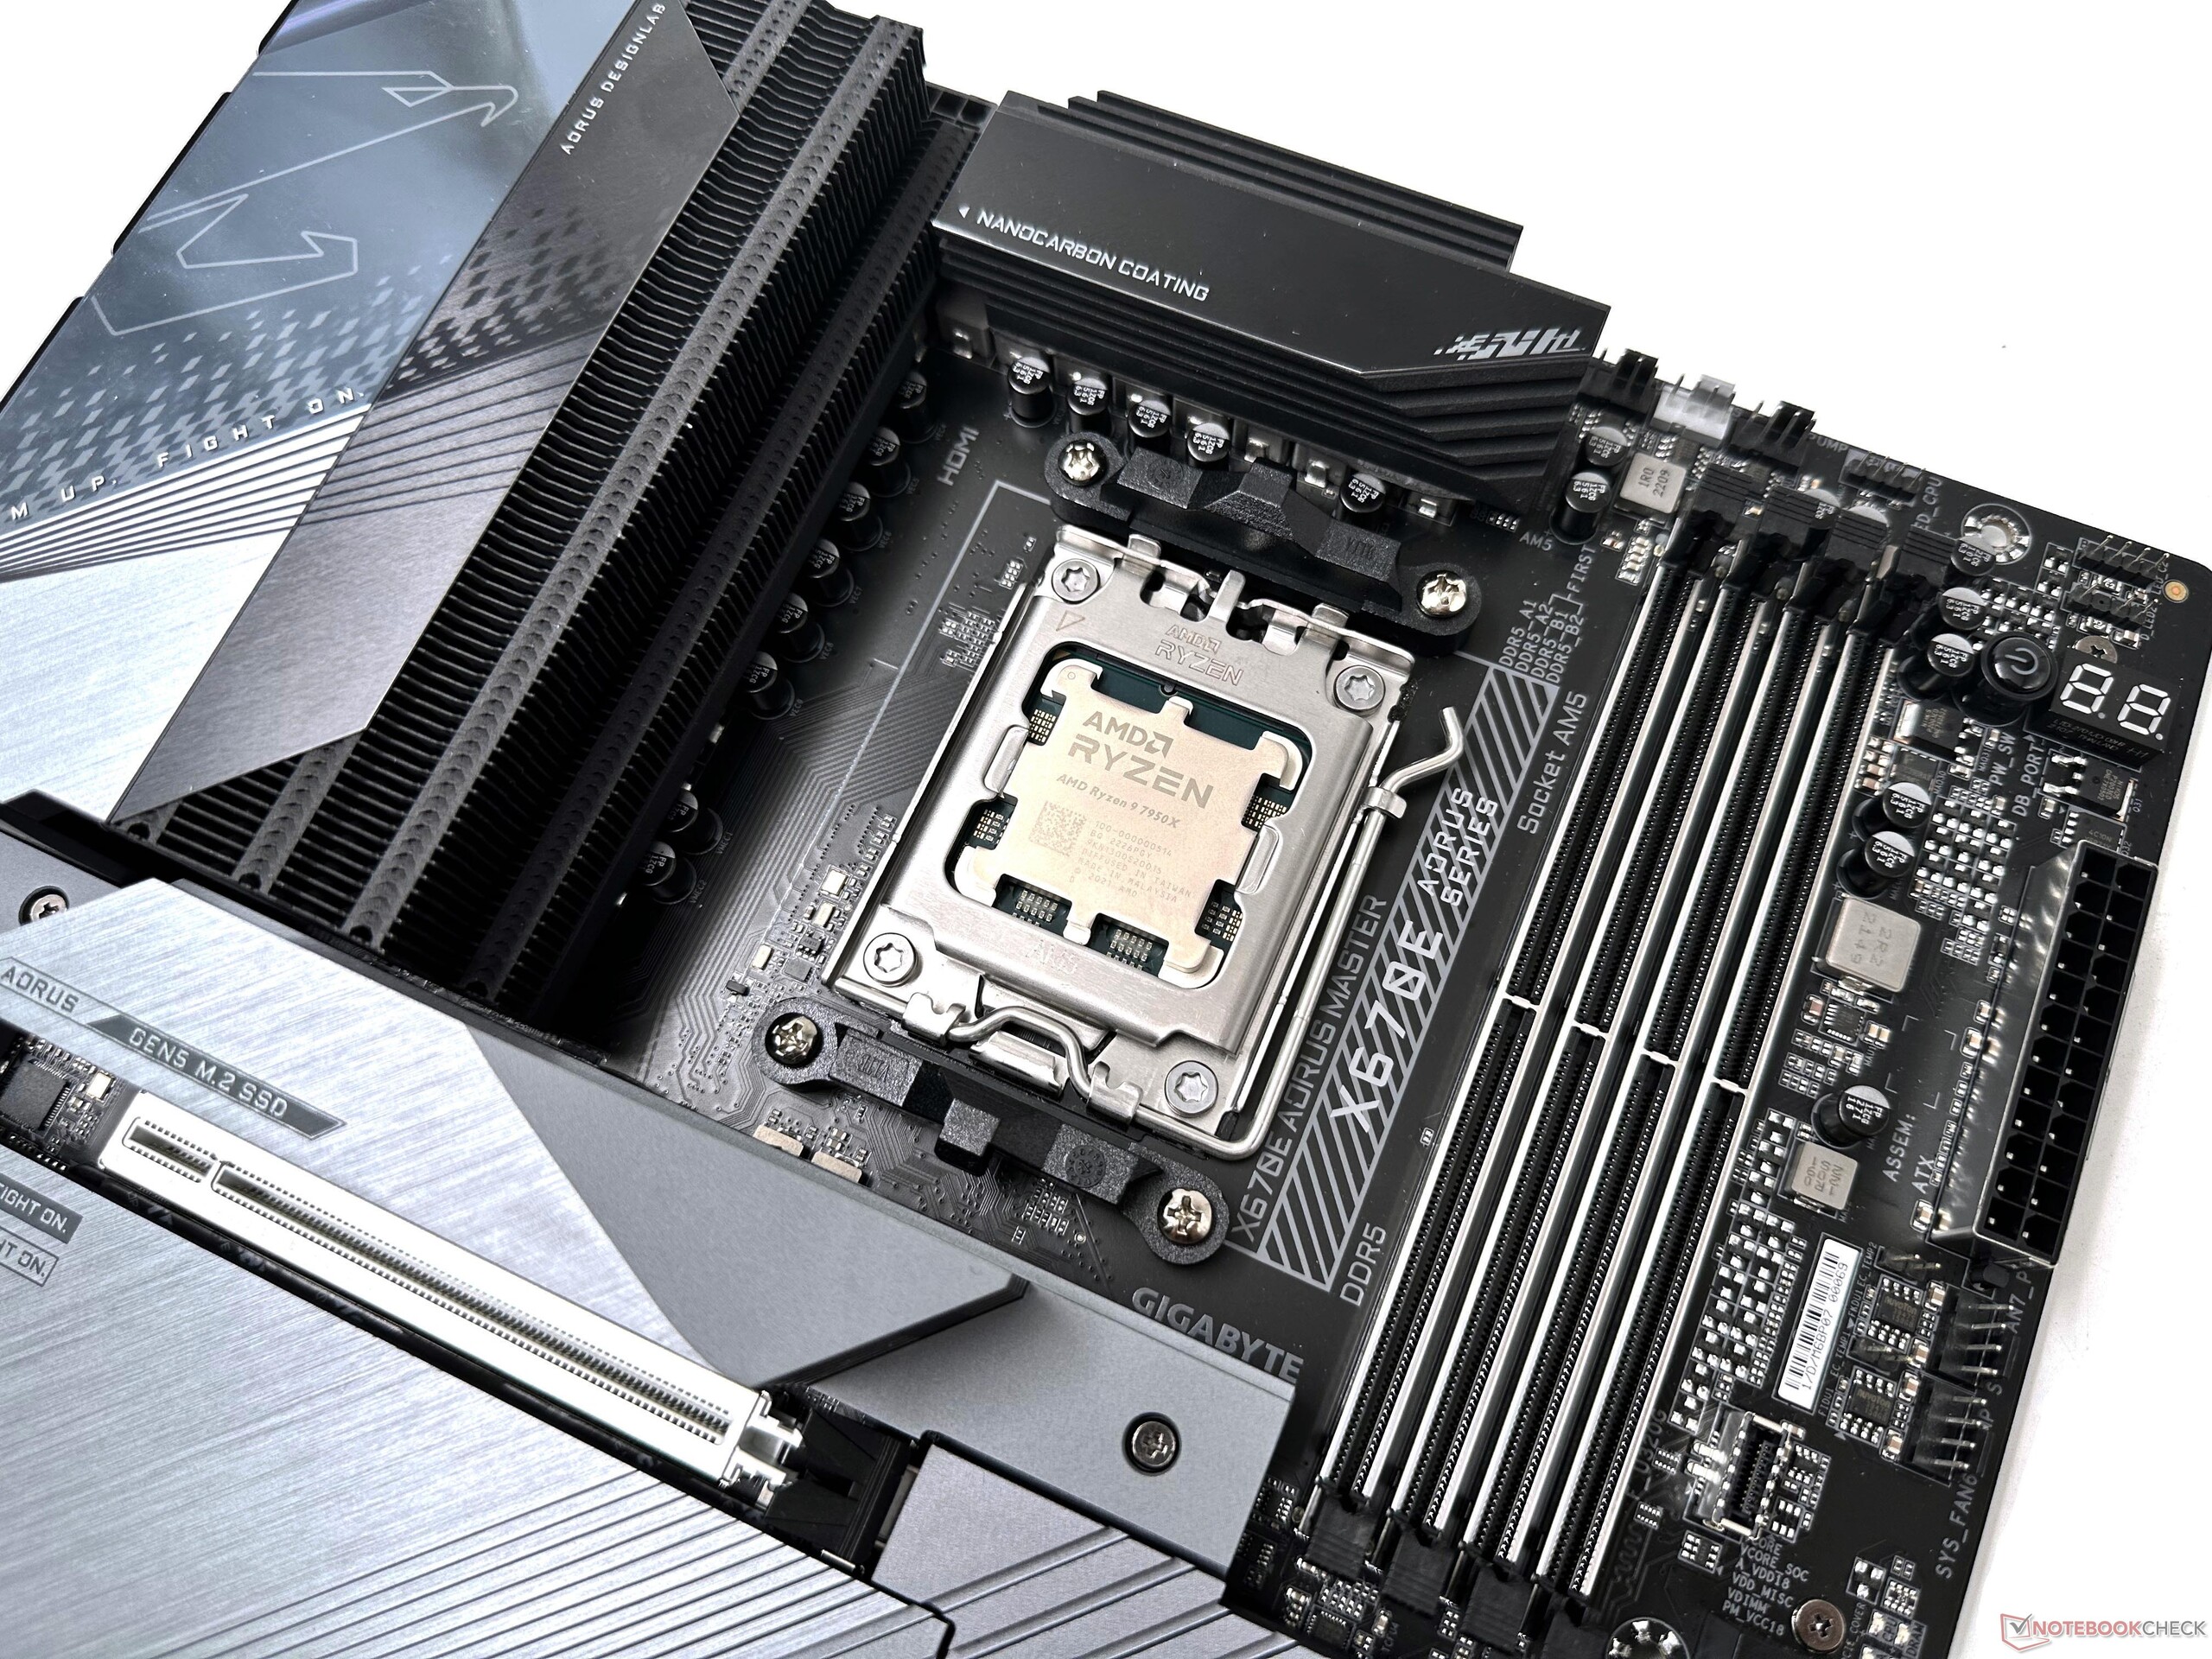
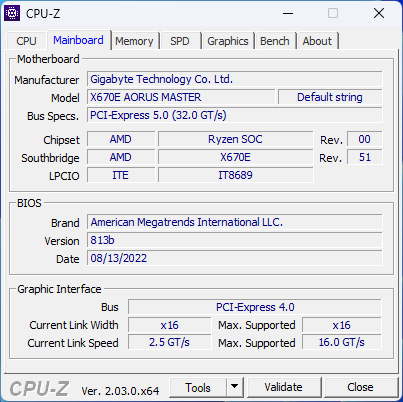
Seria Zen 4 Ryzen 7000 wymaga nowych płyt głównych opartych o socket AM5, przy czym flagowe płyty X670E wyposażone są nawet w układy daisy-chained dual-PROM21. Nowe gniazdo LGA 1718 pozwala na zwiększenie limitów mocy do 230 W PPT, co może pomieścić procesory o TDP do 170 W.
Złożone matryce rdzeniowe (CCD) w Zen 4 są wytwarzane w technologii TSMC 5 nm, natomiast matryca I/O, w której znajduje się 2-CU RDNA 2 iGPU, szyny PCIe Gen 5 oraz kontroler pamięci DDR5, jest wykonana w technologii TSMC 6 nm. W przeciwieństwie do Intel Raptor Lake, który obsługuje zarówno DDR4, jak i DDR5, AM5 obsługuje tylko pamięć DDR5
Chociaż przynosi to kilka korzyści inżynieryjnych, to jednak w krótkim okresie czasu konsumenci mogą odczuć czkawkę, ponieważ ceny DDR5 pozostają po wyższej stronie w porównaniu do DDR4
W przypadku AM4, użytkownicy musieli skonfigurować tkaninę, kontroler pamięci i zegary pamięci, aby działały w stosunku 1:1:1, co oznaczało, że DDR4-3600 RAM było słodkim miejscem dla Ryzen 5000. W Ryzen 7000, zegar fabric może być ustawiony na Auto, podczas gdy kontroler pamięci i zegary pamięci mogą działać w stosunku 1:1
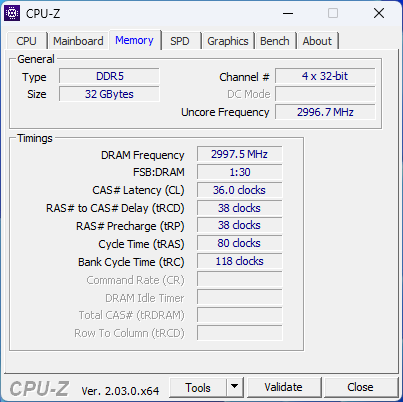
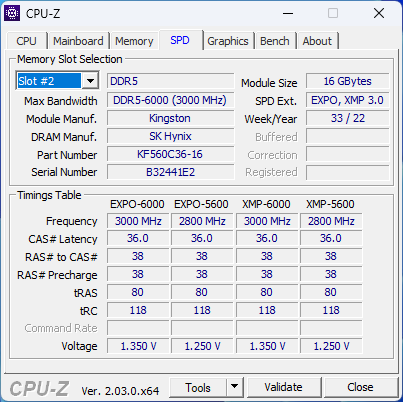
AMD rekomenduje pamięć DDR5-6000 RAM jako najlepszy wybór dla Ryzen 7000. Użytkownicy mogą wybierać spośród predefiniowanych profili EXPO, co jest w zasadzie wolnym od opłat sposobem AMD na definiowanie OC pamięci jednym kliknięciem, podobnym pod wieloma względami do XMP Intela. Nasza platforma testowa potrzebowała niezwykle dużo czasu na dostosowanie się do nowych profili EXPO, ale nowsze aktualizacje BIOS-u powinny umożliwić szybsze zmiany.
Wcześniej recenzowaliśmy m.in AMD Ryzen 9 7900X i Ryzen 5 7600X i wyszliśmy całkiem pod wrażeniem tego, co jest w ofercie. W tej recenzji uzupełniamy obecny stos Zen 4 Ryzen 7000, testując szczegółowo Ryzen 9 7950X i Ryzen 7 7700X. Teraz, gdy dostępna jest również linia Raptor Lake Intela, porównania stają się jeszcze bardziej interesujące.
Przegląd desktopowych procesorów AMD "Raphael" Zen 4 Ryzen 7000
| SKU | Rdzenie/wątki | Zegar bazowy | Zegar turbo | Pamięć podręczna L2 | Pamięć podręczna L3 | TDP | PPT | Cena premiery |
|---|---|---|---|---|---|---|---|---|
| Ryzen 9 7950X | 16/32 | 4,5 GHz | 5,7 GHz | 16x 1 MB | 64 MB | 170 W | 230 W | US$699 / €849 |
| Ryzen 9 7900X | 12/24 | 4,7 GHz | 5,6 GHz | 12x 1 MB | 64 MB | 170 W | 230 W | US$549 / €669 |
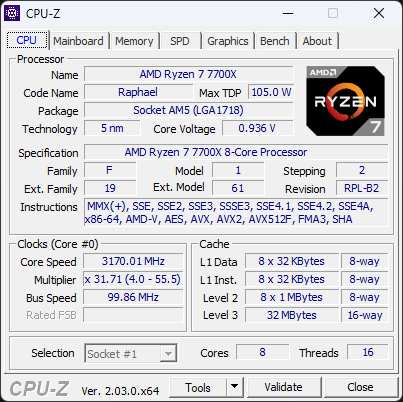
| Ryzen 7 7700X | 8/16 | 4,5 GHz | 5,4 GHz | 8x 1 MB | 32 MB | 105 W | 142 W | US$399 / €479 |
| Ryzen 5 7600X | 6/12 | 4,7 GHz | 5,3 GHz | 6x 1 MB | 32 MB | 105 W | 142 W | US$299 / €359 |
Stanowisko testowe: Zen 4 zostaje sparowany z RTX 3090
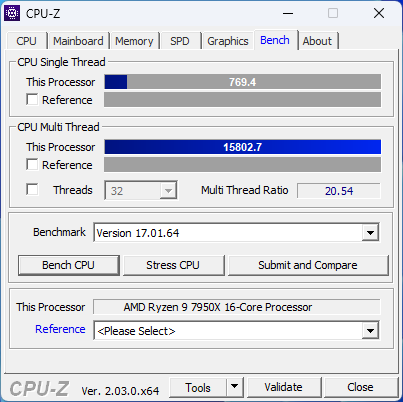
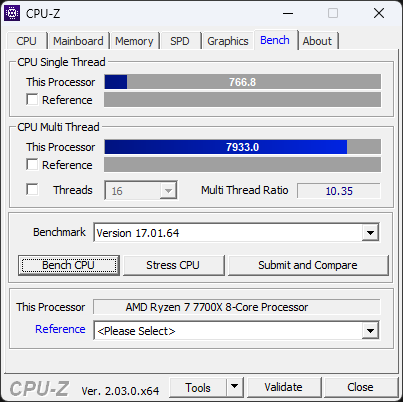
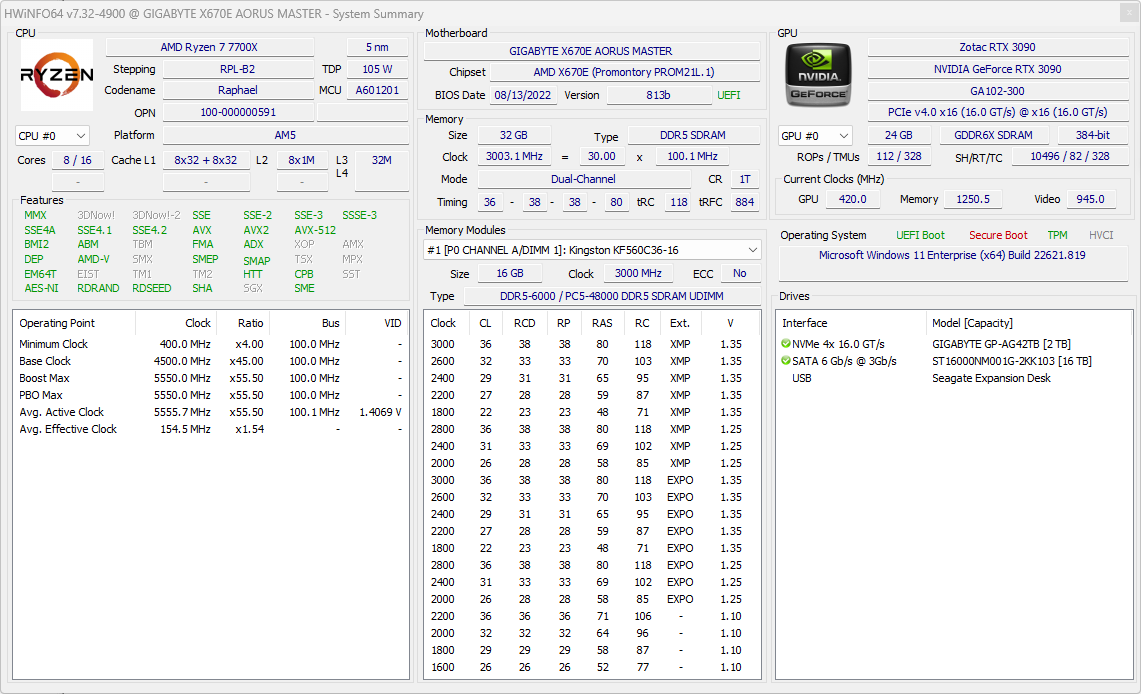
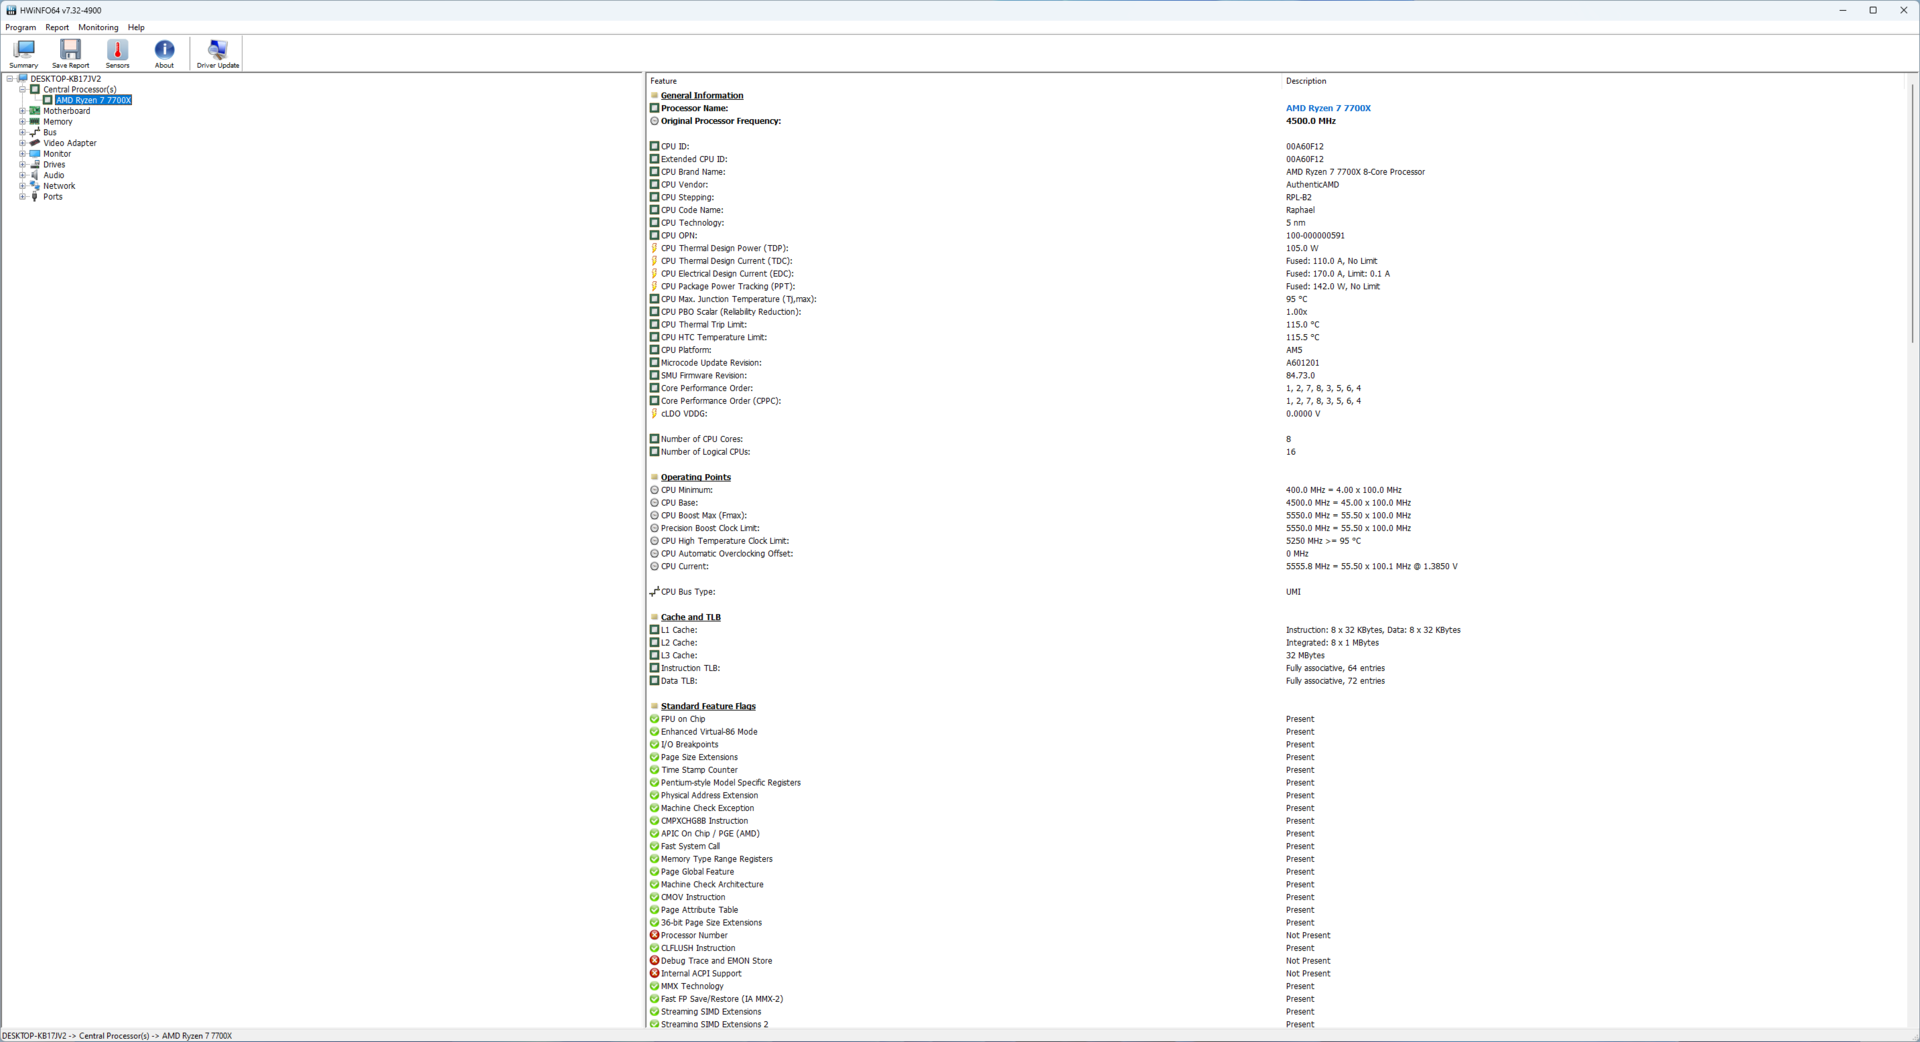
Do testów Ryzen 7 7700X i Ryzen 9 7950X wykorzystaliśmy następujące komponenty
- Stanowisko testowe Cooler Master MasterFrame 700
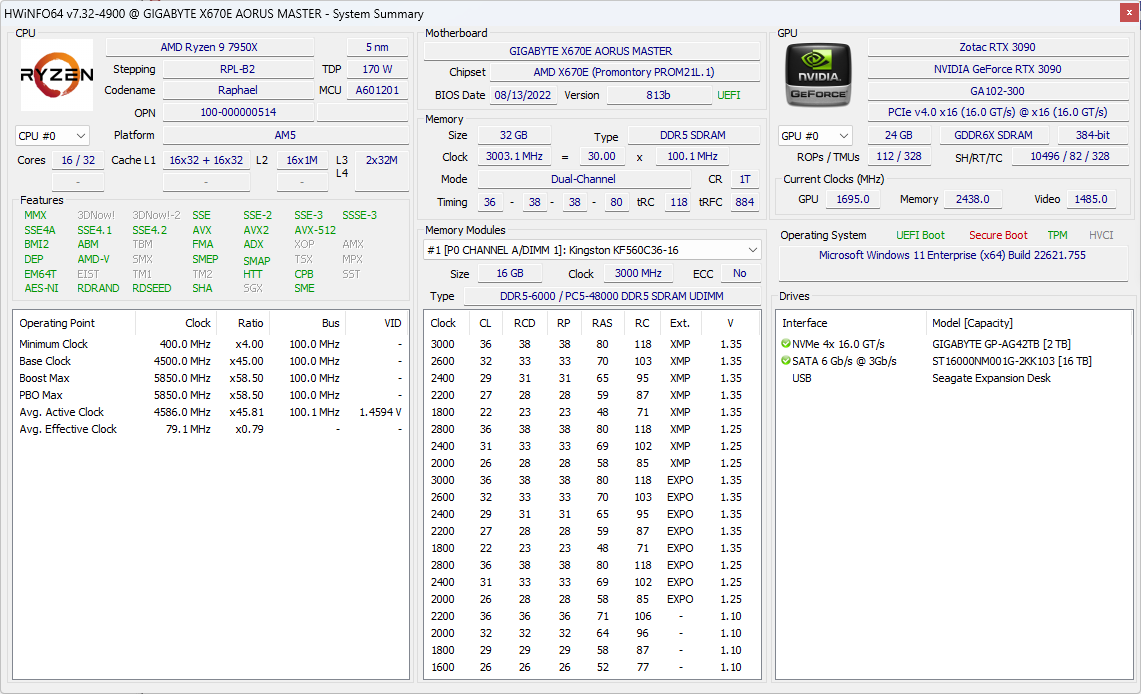
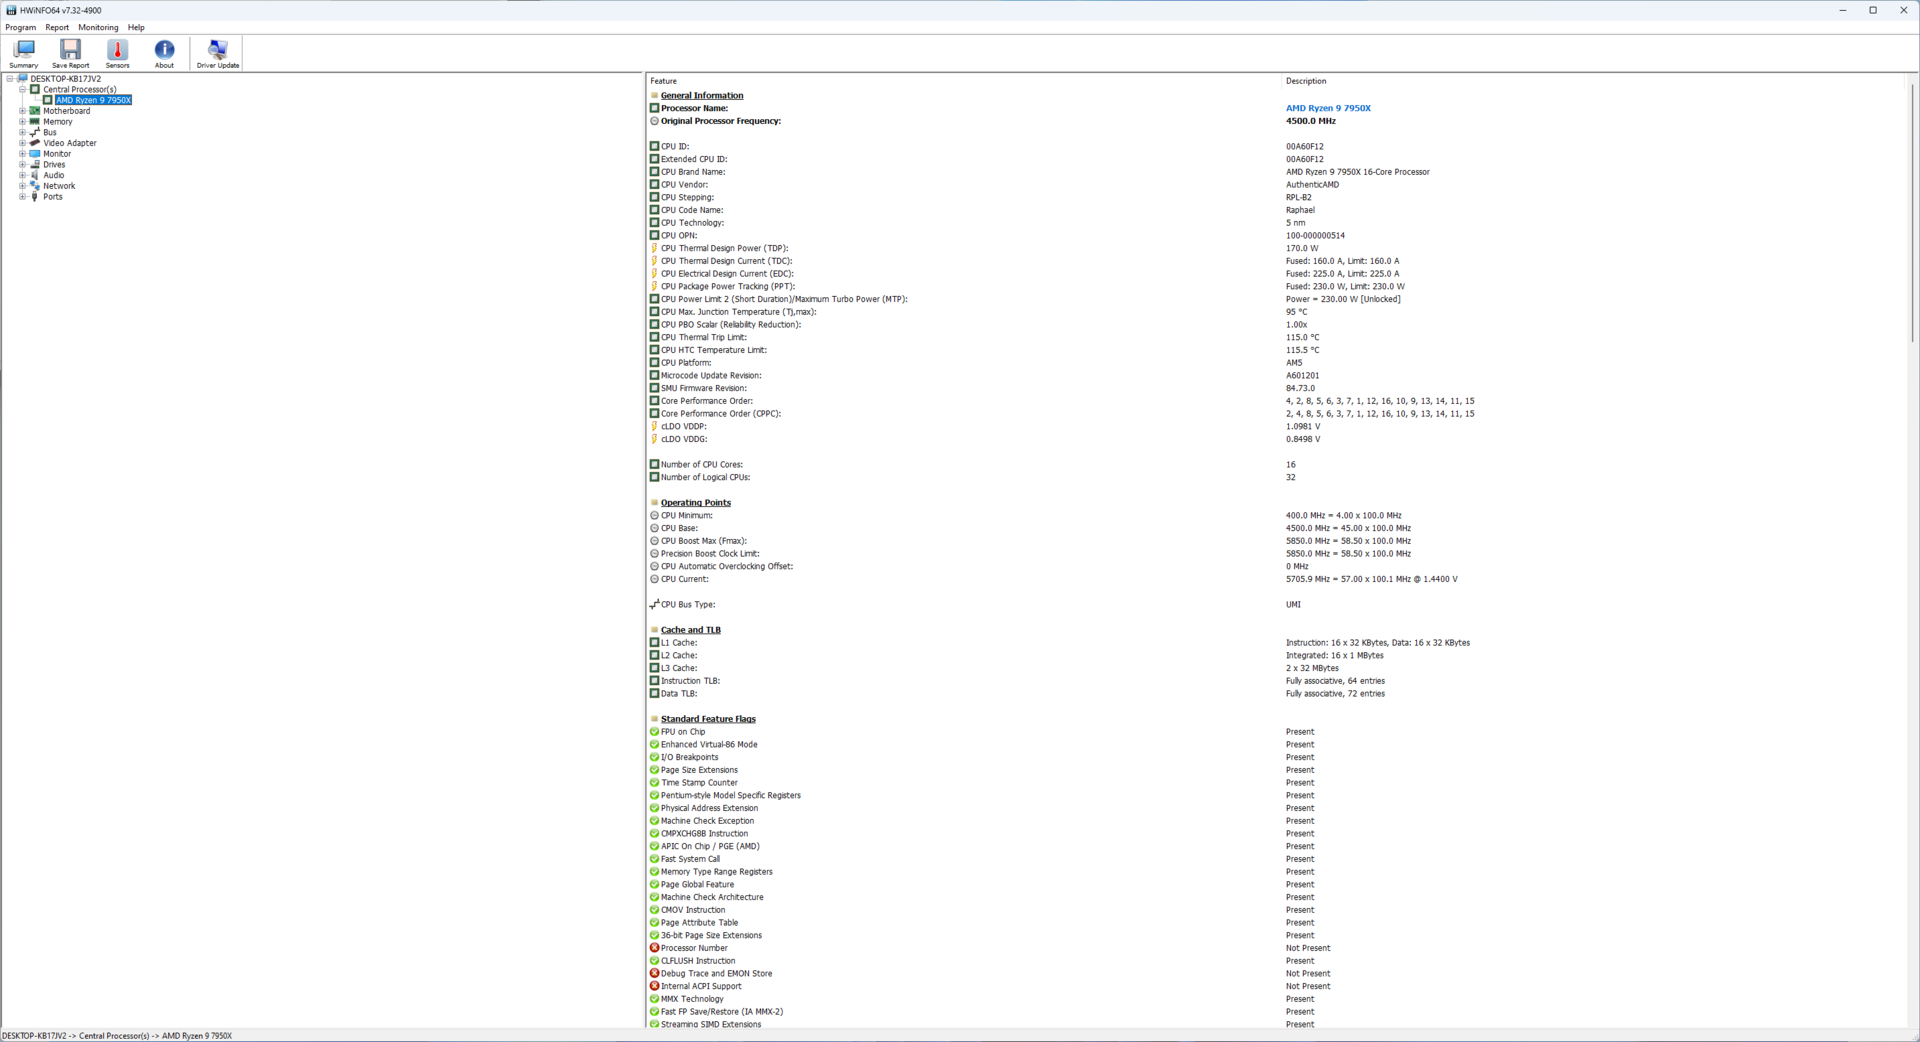
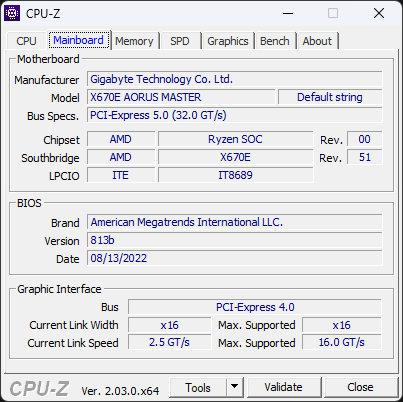
- Płyta główna Gigabyte X670E Aorus Master z referencyjnym BIOS-em w wersji 813b
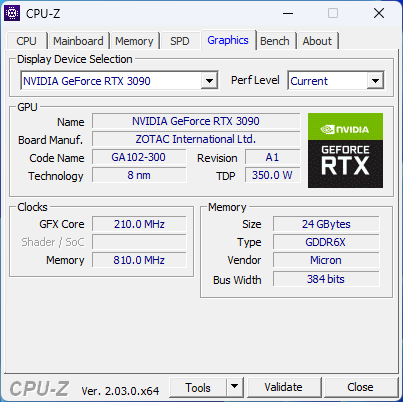
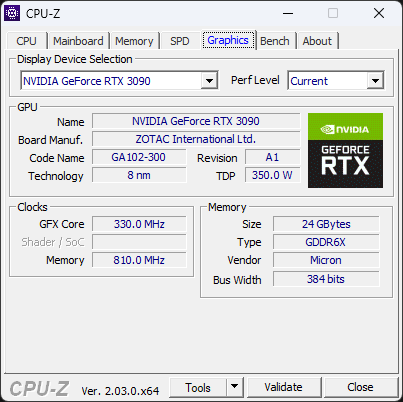
- Zotac Gaming GeForce RTX 3090 Karta graficzna Trinity
- Dysk SSD Gigabyte Aorus Gen 4 2 TB NVMe do benchmarków i gier
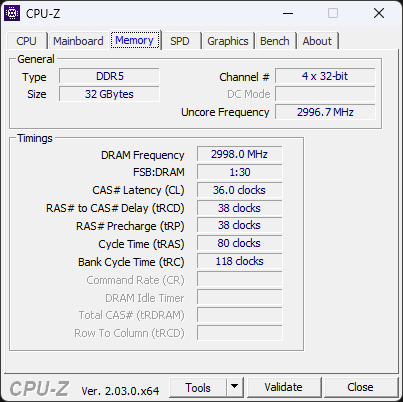
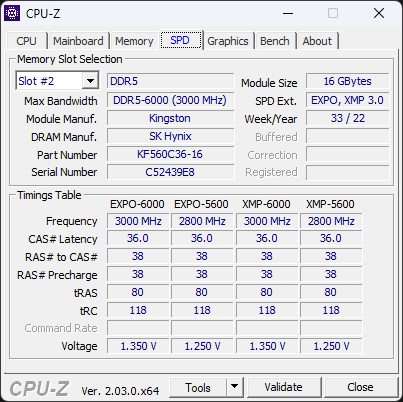
- 2x 16 GB RAM Kingston Fury Beast DDR5-6000 z timingami 36-38-38-80 przy 1,35 V
- Monitor Gigabyte M28U 4K 144 Hz
- Chłodnica Cooler Master MasterLiquid ML360L V2 ARGB AIO
- W pełni modularny zasilacz Cooler Master MVE Gold 1250 V2
Chcielibyśmy podziękować firmie AMD za dostarczenie procesorów Ryzen 7 7700X i Ryzen 9 7950X, płyty głównej X670E Aorus Master oraz zestawu pamięci Kingston DDR5. Chcielibyśmy również podziękować firmie Zotac za kartę graficzną RTX 3090 Trinity, firmie Gigabyte za monitor M28U i dysk SSD Aorus NVMe, i wreszcie firmie Cooler Master za stanowisko testowe, chłodnicę AIO i zasilacz.
Benchmarki procesorów: Rywalizacja na ścięcie z Raptor Lake
Podczas gdy w łącznych wynikach flagowce Intela i AMD remisują ze sobą, w poszczególnych benchmarkach widać pewne różnice. Na przykład Ryzen 9 7950X jest o 11% wolniejszy w jednordzeniowym Cinebench R23 w porównaniu do Core i9-13900K.
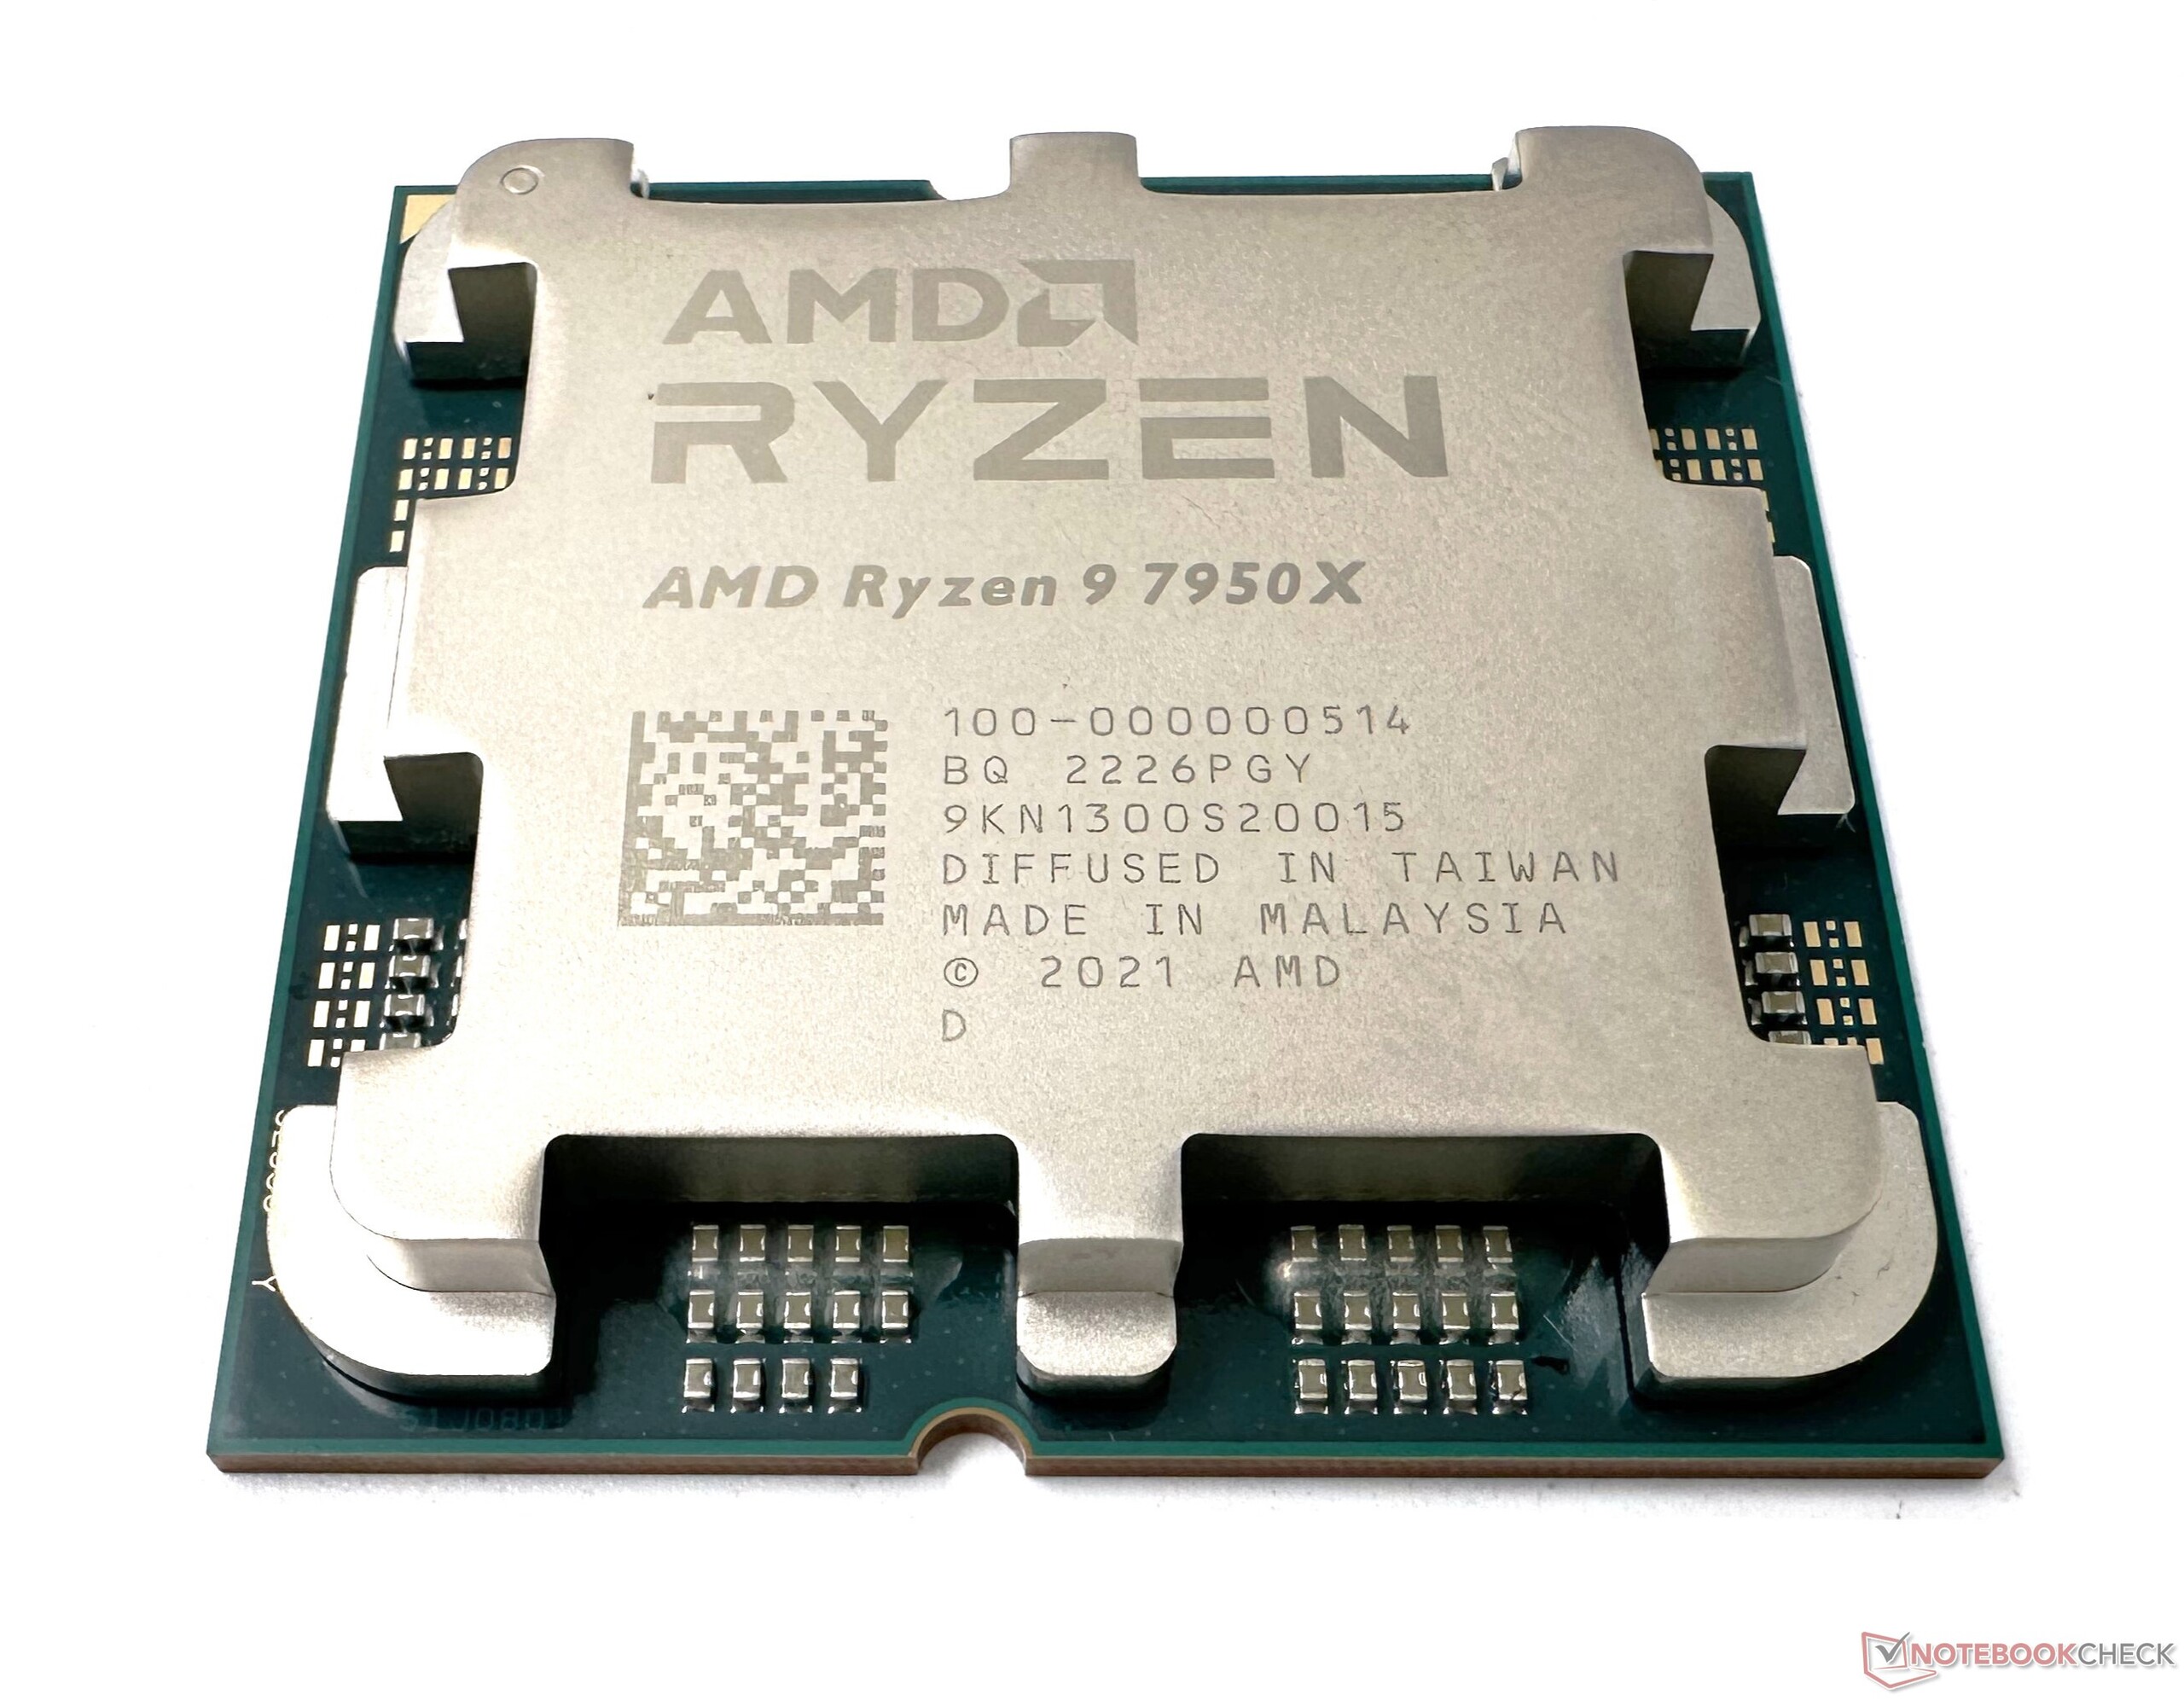
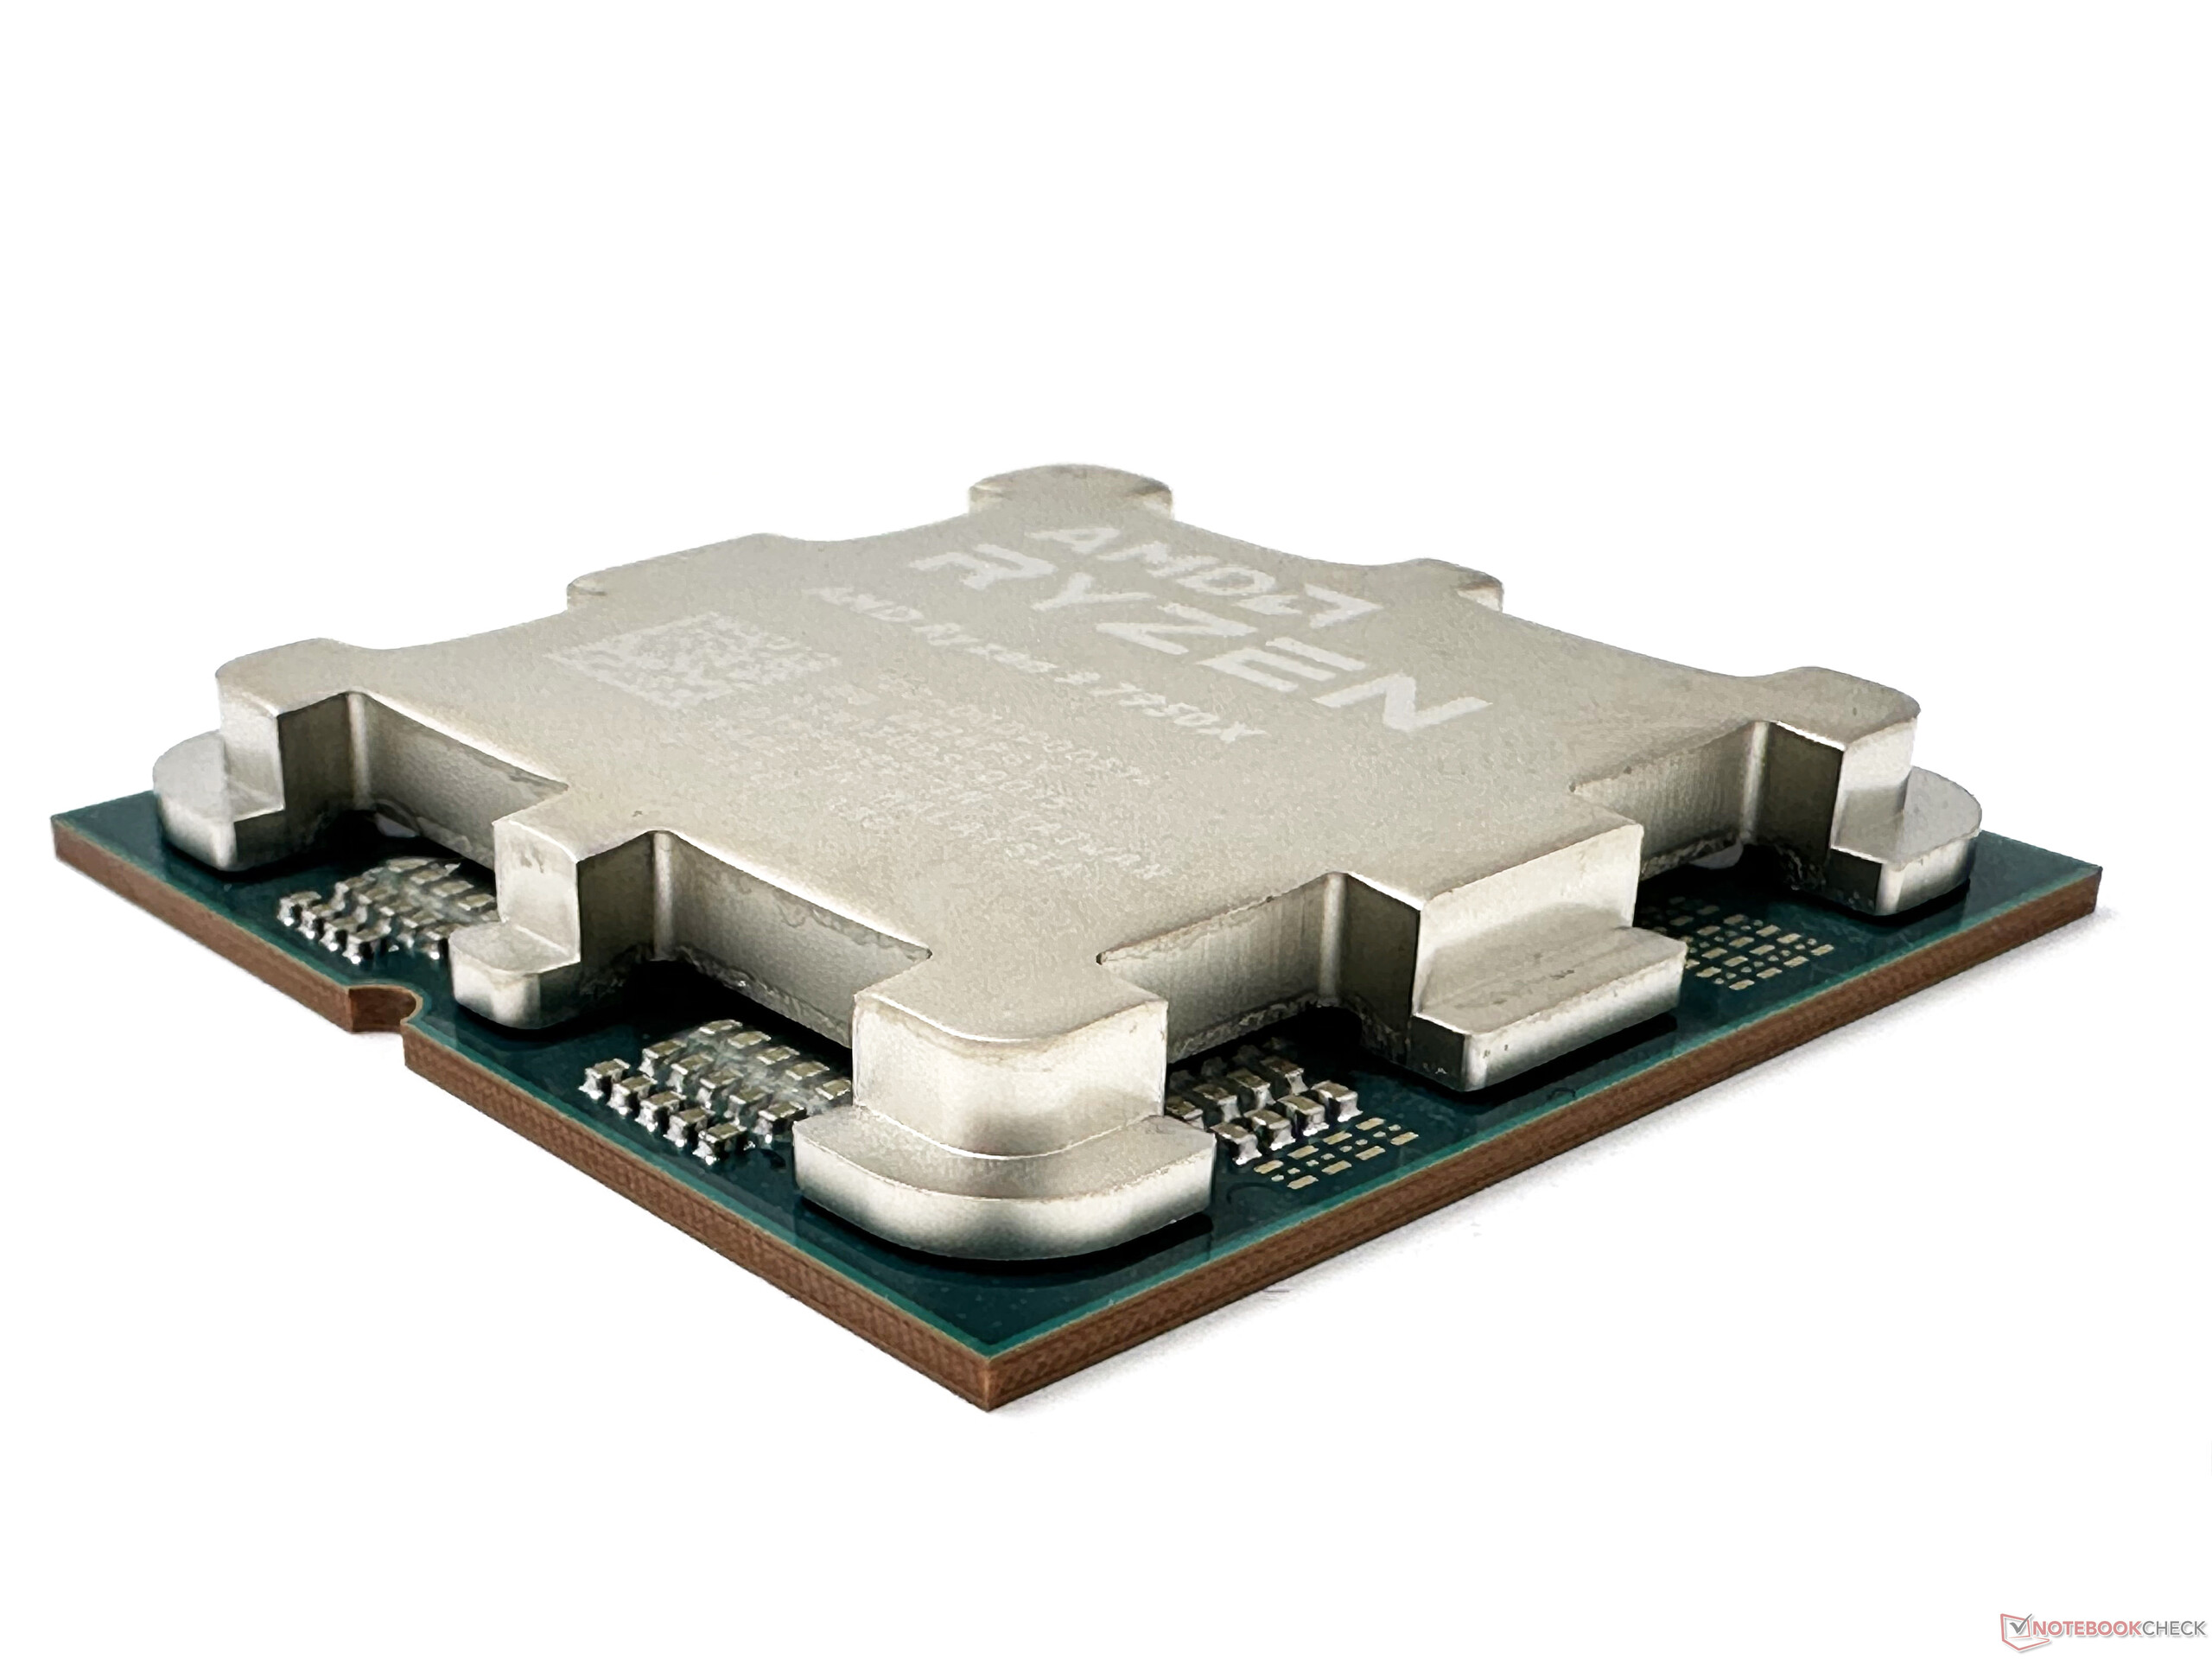
AMD Ryzen 9 7950X
Delta między Ryzenem 9 7950X a Core i9-13900K nie ma większego znaczenia w testach jednordzeniowych Cinebench R20, Cinebench R15 i Geekbench.
Ryzen 9 7950X ma jednak 20% przewagi nad Core i9-13900K w TrueCrypt i jest w stanie pokonać flagowca z Raptor Lake o włos w HWBOT x264 4K i 7-Zip multi. W większości pozostałych przypadków osiągi zarówno Ryzena 9 7950X, jak i Core i9-13900K są praktycznie identyczne.
Core i9-13900K wydaje się mieć niewielką przewagę w uruchomieniach wielordzeniowych, ale ogólne wyniki są zgodne z tym, co uznalibyśmy za różnice między poszczególnymi uruchomieniami
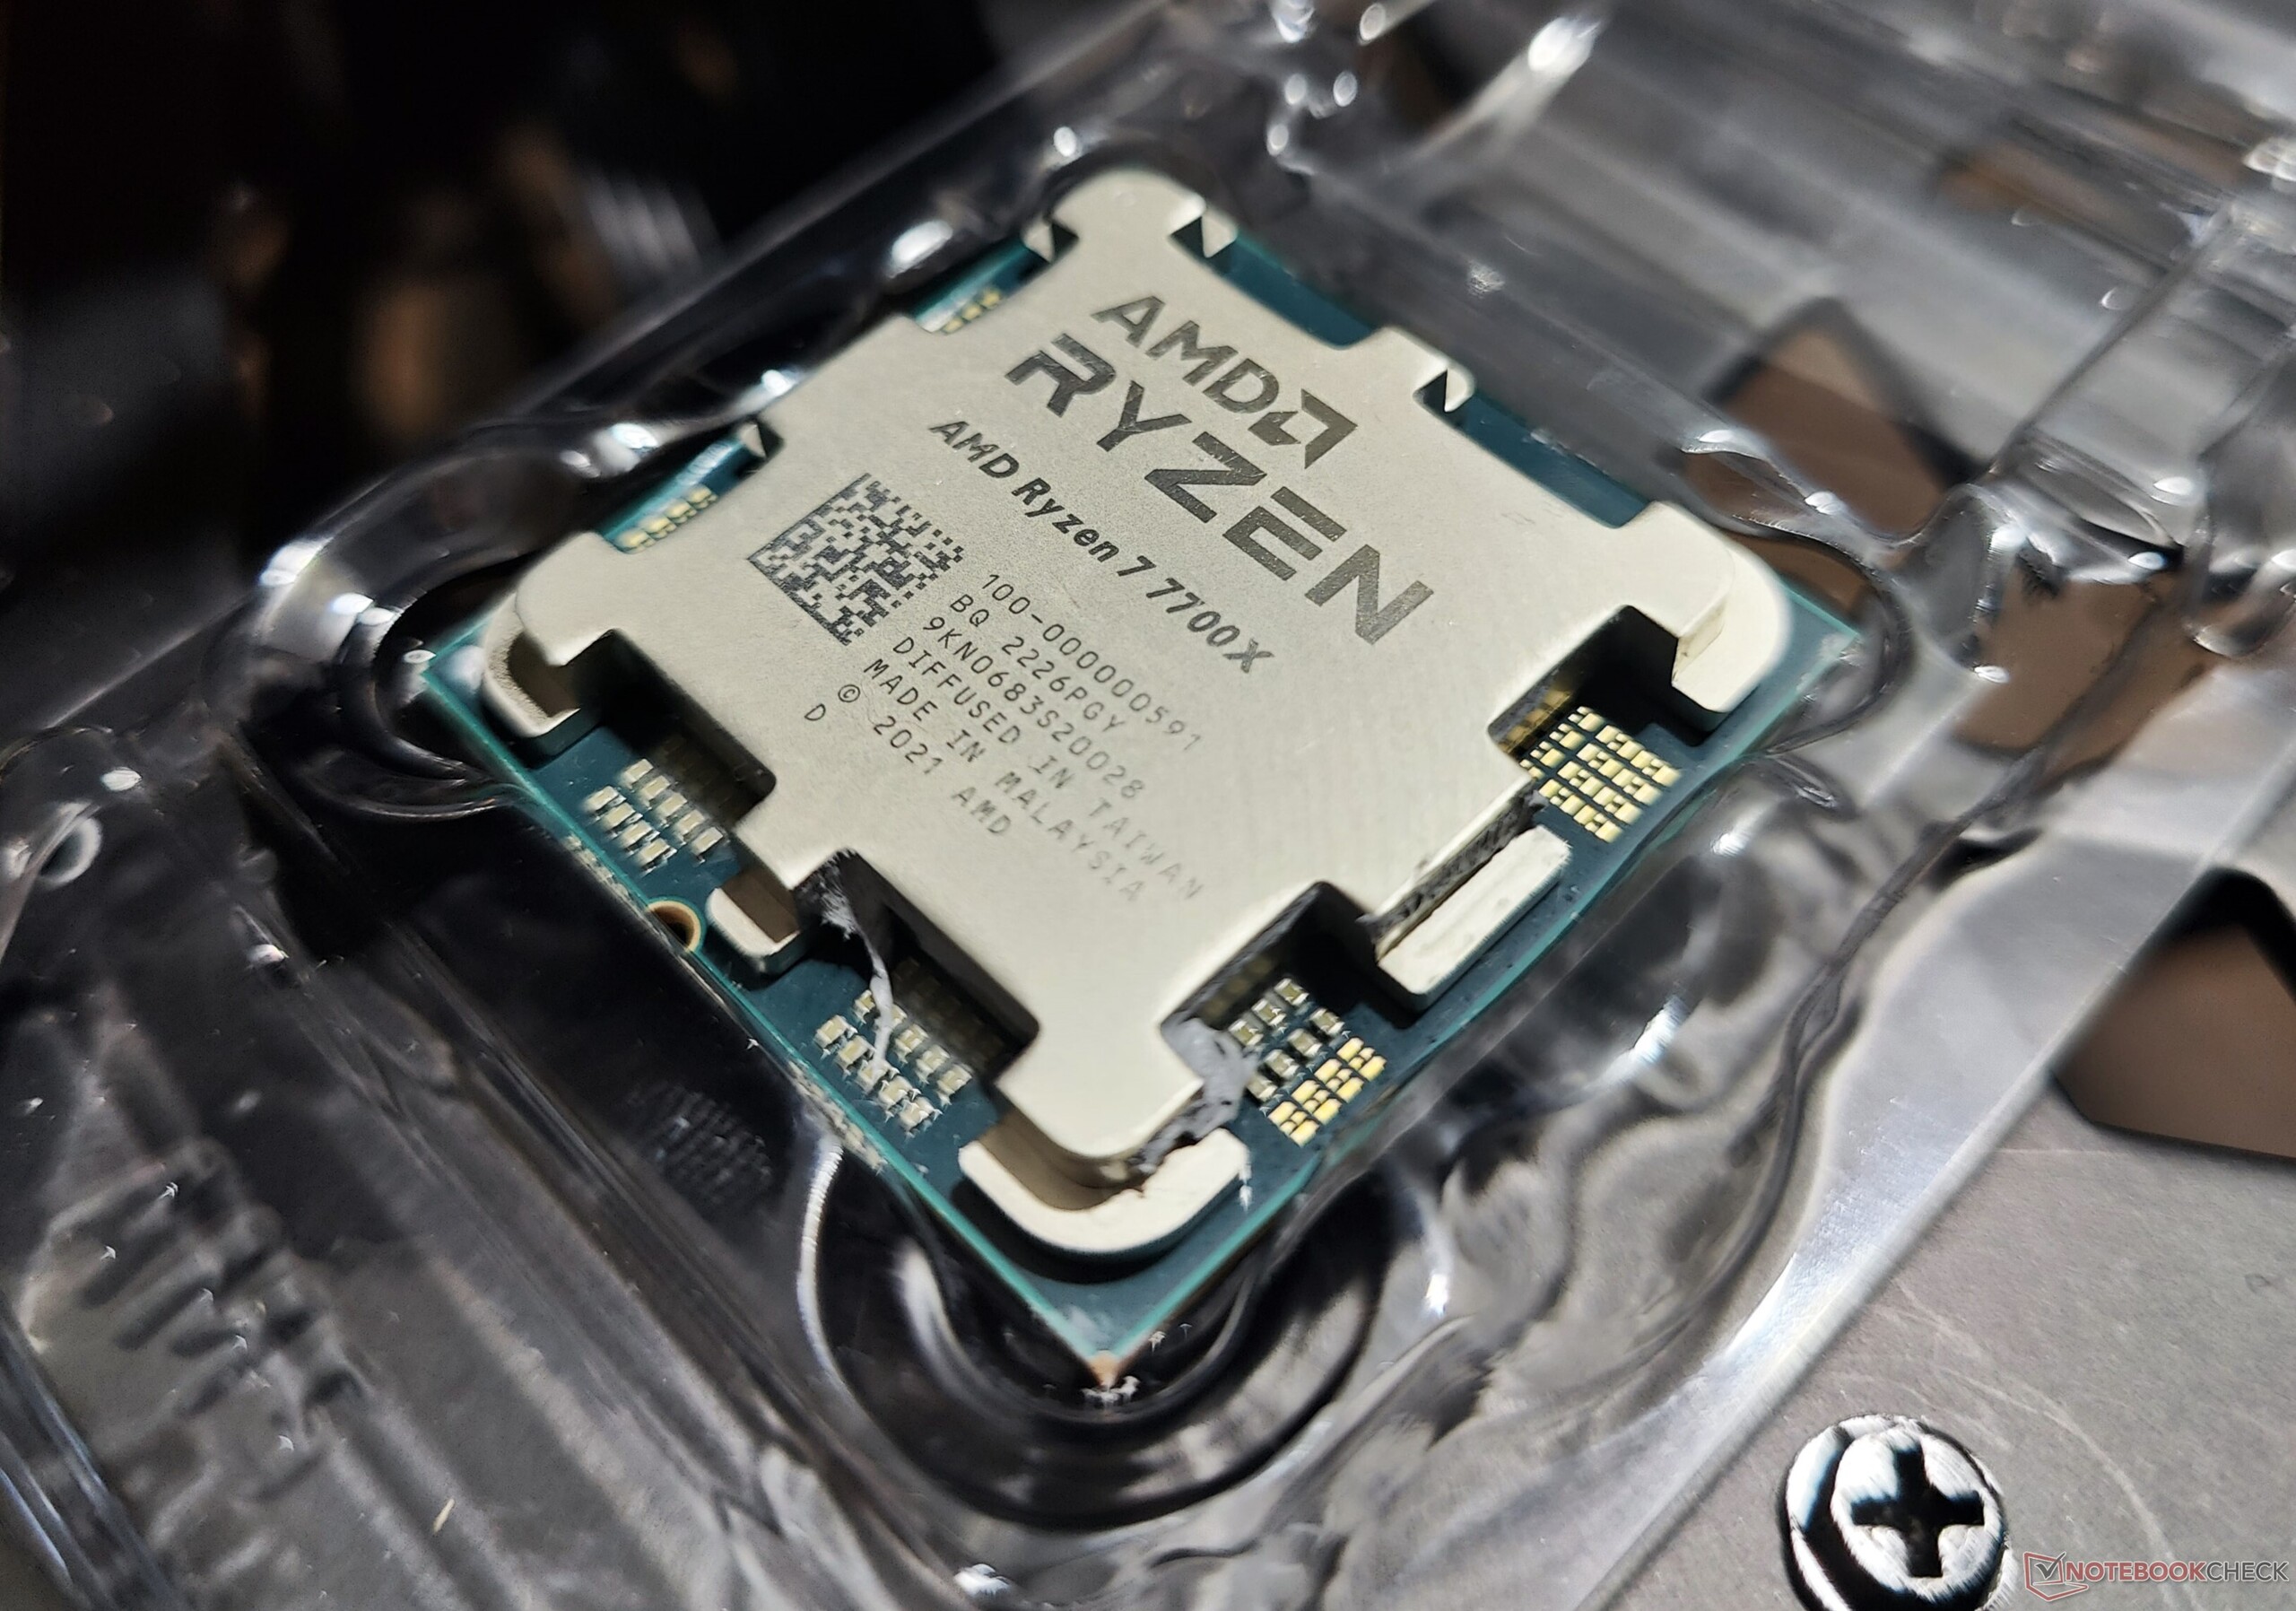
AMD Ryzen 7 7700X
Co ciekawe, 8C/16T Ryzen 7 7700X może uzyskać przewagę nad 14C/20T Core i5-13600K w łącznych wynikach wszystkich testów. Podczas gdy Core i5-13600K i Ryzen 7 7700X wykazują niemal identyczną wydajność jednordzeniową, ten pierwszy może prowadzić nawet o 24% w testach wielordzeniowych Cinebench
Procesory Ryzen 7000 w ogóle wydają się osiągać lepsze wyniki od swoich odpowiedników Intela w teście jednordzeniowym 7-Zip, przy czym Ryzen 7 7700X prowadzi nad Core i5-13600K aż o 23%. Ryzen 7 7700X zajął też najmniej czasu spośród wszystkich procesorów w porównaniu w naszym benchmarku konwersji 20-dokumentowego pliku PDF w LibreOffice.
| Performance rating - Percent | |
| AMD Ryzen 9 7950X | |
| Intel Core i9-13900K | |
| AMD Ryzen 9 7900X | |
| AMD Ryzen 9 5950X | |
| AMD Ryzen 7 7700X | |
| Intel Core i5-13600K | |
| Intel Core i9-12900K | |
| AMD Ryzen 9 5900X -2! | |
| AMD Ryzen 5 7600X | |
| AMD Ryzen 7 5800X | |
| Intel Core i5-12600K | |
| AMD Ryzen 7 5800X3D | |
| AMD Ryzen 5 5600X | |
| Cinebench R23 | |
| Single Core | |
| Intel Core i9-13900K | |
| AMD Ryzen 9 7900X | |
| AMD Ryzen 9 7950X | |
| Intel Core i5-13600K | |
| Intel Core i9-12900K | |
| AMD Ryzen 7 7700X | |
| AMD Ryzen 5 7600X | |
| Intel Core i5-12600K | |
| AMD Ryzen 9 5950X | |
| AMD Ryzen 9 5900X | |
| AMD Ryzen 7 5800X | |
| AMD Ryzen 5 5600X | |
| AMD Ryzen 7 5800X3D | |
| Multi Core | |
| Intel Core i9-13900K | |
| AMD Ryzen 9 7950X | |
| AMD Ryzen 9 7900X | |
| AMD Ryzen 9 5950X | |
| Intel Core i9-12900K | |
| Intel Core i5-13600K | |
| AMD Ryzen 9 5900X | |
| AMD Ryzen 7 7700X | |
| Intel Core i5-12600K | |
| AMD Ryzen 5 7600X | |
| AMD Ryzen 7 5800X | |
| AMD Ryzen 7 5800X3D | |
| AMD Ryzen 5 5600X | |
| Cinebench R20 | |
| CPU (Single Core) | |
| Intel Core i9-13900K | |
| AMD Ryzen 9 7900X | |
| AMD Ryzen 9 7950X | |
| Intel Core i5-13600K | |
| AMD Ryzen 7 7700X | |
| Intel Core i9-12900K | |
| AMD Ryzen 5 7600X | |
| Intel Core i5-12600K | |
| AMD Ryzen 9 5950X | |
| AMD Ryzen 9 5900X | |
| AMD Ryzen 7 5800X | |
| AMD Ryzen 5 5600X | |
| AMD Ryzen 7 5800X3D | |
| CPU (Multi Core) | |
| Intel Core i9-13900K | |
| AMD Ryzen 9 7950X | |
| AMD Ryzen 9 7900X | |
| AMD Ryzen 9 5950X | |
| Intel Core i9-12900K | |
| Intel Core i5-13600K | |
| AMD Ryzen 9 5900X | |
| AMD Ryzen 7 7700X | |
| Intel Core i5-12600K | |
| AMD Ryzen 7 5800X | |
| AMD Ryzen 5 7600X | |
| AMD Ryzen 7 5800X3D | |
| AMD Ryzen 5 5600X | |
| Cinebench R15 | |
| CPU Single 64Bit | |
| Intel Core i9-13900K | |
| AMD Ryzen 9 7900X | |
| AMD Ryzen 9 7950X | |
| AMD Ryzen 5 7600X | |
| AMD Ryzen 7 7700X | |
| Intel Core i5-13600K | |
| Intel Core i9-12900K | |
| Intel Core i5-12600K | |
| AMD Ryzen 9 5950X | |
| AMD Ryzen 9 5900X | |
| AMD Ryzen 7 5800X | |
| AMD Ryzen 5 5600X | |
| AMD Ryzen 7 5800X3D | |
| CPU Multi 64Bit | |
| AMD Ryzen 9 7950X | |
| Intel Core i9-13900K | |
| AMD Ryzen 9 7900X | |
| AMD Ryzen 9 5950X | |
| Intel Core i9-12900K | |
| AMD Ryzen 9 5900X | |
| Intel Core i5-13600K | |
| AMD Ryzen 7 7700X | |
| AMD Ryzen 7 5800X | |
| Intel Core i5-12600K | |
| AMD Ryzen 5 7600X | |
| AMD Ryzen 7 5800X3D | |
| AMD Ryzen 5 5600X | |
| Blender - v2.79 BMW27 CPU | |
| AMD Ryzen 5 5600X | |
| AMD Ryzen 7 5800X3D | |
| AMD Ryzen 5 7600X | |
| AMD Ryzen 7 5800X | |
| Intel Core i5-12600K | |
| AMD Ryzen 7 7700X | |
| AMD Ryzen 9 5900X | |
| Intel Core i5-13600K | |
| Intel Core i9-12900K | |
| AMD Ryzen 9 5950X | |
| AMD Ryzen 9 7900X | |
| AMD Ryzen 9 7950X | |
| Intel Core i9-13900K | |
| wPrime 2.10 | |
| 32m | |
| Intel Core i9-12900K | |
| Intel Core i5-12600K | |
| AMD Ryzen 5 5600X | |
| AMD Ryzen 7 5800X3D | |
| AMD Ryzen 7 5800X | |
| AMD Ryzen 5 7600X | |
| AMD Ryzen 9 5950X | |
| Intel Core i5-13600K | |
| AMD Ryzen 7 7700X | |
| Intel Core i9-13900K | |
| AMD Ryzen 9 7900X | |
| AMD Ryzen 9 7950X | |
| 1024m | |
| Intel Core i5-12600K | |
| Intel Core i9-12900K | |
| Intel Core i5-13600K | |
| AMD Ryzen 5 5600X | |
| AMD Ryzen 7 5800X3D | |
| AMD Ryzen 7 5800X | |
| Intel Core i9-13900K | |
| AMD Ryzen 5 7600X | |
| AMD Ryzen 9 5950X | |
| AMD Ryzen 7 7700X | |
| AMD Ryzen 9 7900X | |
| AMD Ryzen 9 7950X | |
| X264 HD Benchmark 4.0 | |
| Pass 1 | |
| Intel Core i9-13900K | |
| Intel Core i5-13600K | |
| AMD Ryzen 9 7950X | |
| AMD Ryzen 9 7900X | |
| AMD Ryzen 7 7700X | |
| Intel Core i9-12900K | |
| AMD Ryzen 5 7600X | |
| AMD Ryzen 7 5800X | |
| AMD Ryzen 9 5950X | |
| AMD Ryzen 9 5900X | |
| Intel Core i5-12600K | |
| AMD Ryzen 5 5600X | |
| AMD Ryzen 7 5800X3D | |
| Pass 2 | |
| AMD Ryzen 9 7950X | |
| Intel Core i9-13900K | |
| AMD Ryzen 9 7900X | |
| AMD Ryzen 9 5950X | |
| Intel Core i9-12900K | |
| Intel Core i5-13600K | |
| AMD Ryzen 9 5900X | |
| AMD Ryzen 7 7700X | |
| AMD Ryzen 7 5800X | |
| Intel Core i5-12600K | |
| AMD Ryzen 5 7600X | |
| AMD Ryzen 7 5800X3D | |
| AMD Ryzen 5 5600X | |
| WinRAR - Result | |
| AMD Ryzen 9 7900X | |
| AMD Ryzen 5 7600X | |
| AMD Ryzen 7 5800X | |
| AMD Ryzen 9 7950X | |
| AMD Ryzen 7 7700X | |
| Intel Core i9-13900K | |
| AMD Ryzen 7 5800X3D | |
| AMD Ryzen 9 5900X | |
| AMD Ryzen 5 5600X | |
| AMD Ryzen 9 5950X | |
| Intel Core i5-13600K | |
| Intel Core i9-12900K | |
| Intel Core i5-12600K | |
| TrueCrypt | |
| AES Mean 100MB | |
| AMD Ryzen 9 7950X | |
| Intel Core i9-13900K | |
| AMD Ryzen 9 5950X | |
| AMD Ryzen 9 5900X | |
| Intel Core i5-13600K | |
| Intel Core i9-12900K | |
| AMD Ryzen 7 7700X | |
| AMD Ryzen 7 5800X | |
| AMD Ryzen 9 7900X | |
| AMD Ryzen 7 5800X3D | |
| AMD Ryzen 5 7600X | |
| Intel Core i5-12600K | |
| AMD Ryzen 5 5600X | |
| Twofish Mean 100MB | |
| Intel Core i9-13900K | |
| AMD Ryzen 9 7950X | |
| AMD Ryzen 9 5950X | |
| Intel Core i9-12900K | |
| Intel Core i5-13600K | |
| AMD Ryzen 9 5900X | |
| AMD Ryzen 9 7900X | |
| AMD Ryzen 7 7700X | |
| Intel Core i5-12600K | |
| AMD Ryzen 7 5800X | |
| AMD Ryzen 7 5800X3D | |
| AMD Ryzen 5 7600X | |
| AMD Ryzen 5 5600X | |
| Serpent Mean 100MB | |
| Intel Core i9-13900K | |
| AMD Ryzen 9 7950X | |
| AMD Ryzen 9 5950X | |
| Intel Core i9-12900K | |
| AMD Ryzen 9 5900X | |
| Intel Core i5-13600K | |
| AMD Ryzen 9 7900X | |
| AMD Ryzen 7 7700X | |
| AMD Ryzen 7 5800X | |
| Intel Core i5-12600K | |
| AMD Ryzen 7 5800X3D | |
| AMD Ryzen 5 7600X | |
| AMD Ryzen 5 5600X | |
| Geekbench 5.5 | |
| Single-Core | |
| Intel Core i9-13900K | |
| AMD Ryzen 9 7900X | |
| AMD Ryzen 9 7950X | |
| AMD Ryzen 7 7700X | |
| AMD Ryzen 5 7600X | |
| Intel Core i9-12900K | |
| Intel Core i5-13600K | |
| Intel Core i5-12600K | |
| AMD Ryzen 9 5950X | |
| AMD Ryzen 9 5900X | |
| AMD Ryzen 7 5800X | |
| AMD Ryzen 5 5600X | |
| AMD Ryzen 7 5800X3D | |
| Multi-Core | |
| Intel Core i9-13900K | |
| AMD Ryzen 9 7950X | |
| AMD Ryzen 9 7900X | |
| Intel Core i9-12900K | |
| AMD Ryzen 9 5950X | |
| Intel Core i5-13600K | |
| AMD Ryzen 7 7700X | |
| AMD Ryzen 9 5900X | |
| Intel Core i5-12600K | |
| AMD Ryzen 5 7600X | |
| AMD Ryzen 7 5800X | |
| AMD Ryzen 7 5800X3D | |
| AMD Ryzen 5 5600X | |
| Geekbench 5.0 | |
| 5.0 Single-Core | |
| Intel Core i9-13900K | |
| AMD Ryzen 9 7900X | |
| AMD Ryzen 9 7950X | |
| AMD Ryzen 5 7600X | |
| AMD Ryzen 7 7700X | |
| Intel Core i9-12900K | |
| Intel Core i5-13600K | |
| Intel Core i5-12600K | |
| AMD Ryzen 9 5950X | |
| AMD Ryzen 7 5800X | |
| AMD Ryzen 9 5900X | |
| AMD Ryzen 5 5600X | |
| AMD Ryzen 7 5800X3D | |
| 5.0 Multi-Core | |
| Intel Core i9-13900K | |
| AMD Ryzen 9 7950X | |
| AMD Ryzen 9 7900X | |
| Intel Core i9-12900K | |
| Intel Core i5-13600K | |
| AMD Ryzen 9 5950X | |
| AMD Ryzen 7 7700X | |
| AMD Ryzen 9 5900X | |
| Intel Core i5-12600K | |
| AMD Ryzen 5 7600X | |
| AMD Ryzen 7 5800X | |
| AMD Ryzen 7 5800X3D | |
| AMD Ryzen 5 5600X | |
| Geekbench 4.4 | |
| 64 Bit Single-Core Score | |
| Intel Core i9-13900K | |
| AMD Ryzen 9 7900X | |
| AMD Ryzen 9 7950X | |
| AMD Ryzen 7 7700X | |
| AMD Ryzen 5 7600X | |
| Intel Core i9-12900K | |
| Intel Core i5-13600K | |
| Intel Core i5-12600K | |
| AMD Ryzen 7 5800X | |
| AMD Ryzen 9 5900X | |
| AMD Ryzen 9 5950X | |
| AMD Ryzen 7 5800X3D | |
| AMD Ryzen 5 5600X | |
| 64 Bit Multi-Core Score | |
| Intel Core i9-13900K | |
| AMD Ryzen 9 7950X | |
| AMD Ryzen 9 7900X | |
| Intel Core i9-12900K | |
| AMD Ryzen 9 5950X | |
| Intel Core i5-13600K | |
| AMD Ryzen 7 7700X | |
| AMD Ryzen 9 5900X | |
| AMD Ryzen 5 7600X | |
| Intel Core i5-12600K | |
| AMD Ryzen 7 5800X | |
| AMD Ryzen 7 5800X3D | |
| AMD Ryzen 5 5600X | |
| 7-Zip 18.03 | |
| 7z b 4 | |
| AMD Ryzen 9 7950X | |
| Intel Core i9-13900K | |
| AMD Ryzen 9 5950X | |
| AMD Ryzen 9 7900X | |
| Intel Core i9-12900K | |
| AMD Ryzen 9 5900X | |
| Intel Core i5-13600K | |
| AMD Ryzen 7 7700X | |
| AMD Ryzen 7 5800X | |
| AMD Ryzen 7 5800X3D | |
| AMD Ryzen 5 7600X | |
| Intel Core i5-12600K | |
| AMD Ryzen 5 5600X | |
| 7z b 4 -mmt1 | |
| AMD Ryzen 9 7900X | |
| AMD Ryzen 9 7950X | |
| AMD Ryzen 7 7700X | |
| AMD Ryzen 5 7600X | |
| Intel Core i9-13900K | |
| AMD Ryzen 9 5950X | |
| AMD Ryzen 7 5800X | |
| AMD Ryzen 7 5800X3D | |
| AMD Ryzen 9 5900X | |
| AMD Ryzen 5 5600X | |
| Intel Core i9-12900K | |
| Intel Core i5-13600K | |
| Intel Core i5-12600K | |
| HWBOT x265 Benchmark v2.2 - 4k Preset | |
| AMD Ryzen 9 7950X | |
| Intel Core i9-13900K | |
| AMD Ryzen 9 7900X | |
| AMD Ryzen 9 5950X | |
| Intel Core i5-12600K | |
| Intel Core i9-12900K | |
| Intel Core i5-13600K | |
| AMD Ryzen 7 7700X | |
| AMD Ryzen 9 5900X | |
| AMD Ryzen 5 7600X | |
| AMD Ryzen 7 5800X | |
| AMD Ryzen 7 5800X3D | |
| AMD Ryzen 5 5600X | |
| R Benchmark 2.5 - Overall mean | |
| AMD Ryzen 7 5800X3D | |
| AMD Ryzen 5 5600X | |
| AMD Ryzen 9 5950X | |
| AMD Ryzen 9 5900X | |
| AMD Ryzen 7 5800X | |
| Intel Core i5-12600K | |
| Intel Core i9-12900K | |
| Intel Core i5-13600K | |
| AMD Ryzen 9 7950X | |
| AMD Ryzen 7 7700X | |
| AMD Ryzen 5 7600X | |
| AMD Ryzen 9 7900X | |
| Intel Core i9-13900K | |
| LibreOffice - 20 Documents To PDF | |
| Intel Core i5-12600K | |
| AMD Ryzen 7 5800X3D | |
| AMD Ryzen 9 5900X | |
| AMD Ryzen 9 5950X | |
| AMD Ryzen 5 5600X | |
| AMD Ryzen 7 5800X | |
| Intel Core i9-12900K | |
| AMD Ryzen 5 7600X | |
| Intel Core i9-13900K | |
| AMD Ryzen 9 7950X | |
| Intel Core i5-13600K | |
| AMD Ryzen 9 7900X | |
| AMD Ryzen 7 7700X | |
* ... im mniej tym lepiej
Ogólnie rzecz biorąc, zarówno Ryzen 9 7950X, jak i Ryzen 7 7700X osiągają godne podziwu wyniki w naszym zestawie benchmarków CPU. 16-rdzeniowy flagowy procesor AMD Zen 4 zrównał się z procesorem Intel Raptor Lake Core i9-13900K w ogólnej wydajności procesora, podczas gdy różnice między Ryzenem 7 7700X a Core i5-13600K mieszczą się w marginesie błędu.
Ryzen 9 7950X oferuje przyzwoity 29% wzrost łącznej wydajności procesora w stosunku do Ryzen 9 5950X. Użytkownicy wymieniający procesory z Alder Lake Core i9-12900K znajdą znaczący 36% wzrost ogólnej wydajności, przy czym korzyści dotyczą głównie wielowątkowych obciążeń roboczych.
Ryzen 7 7700X jest w stanie wygodnie uplasować się przed jednordzeniowym Core i9-12900K, co czyni go dobrą propozycją dla mocno jednowątkowych przepływów pracy, takich jak gry.
Cinebench R15 Multi Loop
AMD nie dostarcza w pudełku coolera ani dla Ryzen 9 7950X, ani dla Ryzen 7 7700X, więc trzeba będzie polegać na zdolnej opcji firm trzecich. Procesory Ryzen 7000 otrzymały trochę krytyki za 95 °C TjMax, ale AMD zapewnia, że nie jest to problem
Według firmy, układy z serii Ryzen 7000 zostały zaprojektowane tak, aby mogły pracować w temperaturze 95 °C TjMax 24/7 bez ryzyka uszkodzenia. Tak wysoka maksymalna bezpieczna temperatura pracy pozwala algorytmowi boost Precision Boost Overdrive wycisnąć z procesora największą wydajność. Istnieje możliwość podkręcenia go do jeszcze wyższych wartości (maksymalnie do 115 °C) lub przełączenia w tryb Eco w celu uzyskania chłodniejszej pracy (więcej na ten temat wkrótce).
Zarówno Ryzen 9 7950X, jak i Ryzen 7 7700X oferują dobrze zrównoważoną, pozbawioną dławienia pracę dzięki świetnemu chłodzeniu Cooler Master MasterLiquid ML360L V2 ARGB AIO.
Wydajność systemu: Znaczący wzrost wydajności w porównaniu z Zen 3
Ryzen 9 7950X i Ryzen 7 7700X bez problemu radzą sobie z większością aplikacji produkcyjnych. W testach AIDA64 Ryzen 9 7950X konsekwentnie prowadzi w rankingach, często ze znaczną przewagą nad Core i9-13900K. Podobna sytuacja ma miejsce w przypadku Ryzena 7 7700X i Core i5-13600K. W teście CPU PhotoWorxx widać jednak dominację Intela.
PCMark 10 z jakiegoś powodu nie chciał się uruchomić w domyślnych ustawieniach Ryzena 7 7700X, choć mogliśmy uruchomić benchmark w trybie Eco procesora. Stąd nie uwzględniamy 7700X w poniższym wykresie.
Z kolei CrossMark widzi Ryzena 9 7950X niemal na równi z Core i9-13900K, co ma miejsce również w przypadku pary Ryzen 7 7700X i Core i5-13600K.
Podobnie jak to, co widzieliśmy wcześniej w benchmarkach procesorów, seria Ryzen 7000 prezentuje znaczny zysk gen-on-gen również w testach wydajności. Na przykład Ryzen 9 7950X wykazuje ogromny 69-procentowy wzrost w ogólnych wynikach CrossMark, jednocześnie wykazując przytłaczającą przewagę wydajności w większości testów CPU AIDA64.
W testach 3DMark CPU, Core i9-13900K ma niewielką przewagę nad Ryzenem 9 7950X w Fire Strike Physics, podczas gdy Ryzen 7 7700X i Core i5-13600K są remisowe. Time Spy W testach CPU procesory Intela prowadzą w ogóle, a Ryzen 9 7950X ustępuje Core i9-13900K o 18%.
| 3DMark 11 - 1280x720 Performance Physics | |
| AMD Ryzen 9 7950X | |
| Intel Core i9-13900K | |
| AMD Ryzen 7 7700X | |
| Intel Core i5-13600K | |
| AMD Ryzen 9 7900X | |
| Intel Core i9-12900K | |
| AMD Ryzen 7 5800X3D | |
| AMD Ryzen 5 7600X | |
| AMD Ryzen 9 5950X | |
| Intel Core i5-12600K | |
| AMD Ryzen 9 5900X | |
| AMD Ryzen 7 5800X | |
| AMD Ryzen 5 5600X | |
| 3DMark | |
| 1920x1080 Fire Strike Physics | |
| Intel Core i9-13900K | |
| AMD Ryzen 9 7950X | |
| AMD Ryzen 9 7900X | |
| AMD Ryzen 9 5950X | |
| Intel Core i9-12900K | |
| AMD Ryzen 9 5900X | |
| Intel Core i5-13600K | |
| AMD Ryzen 7 7700X | |
| AMD Ryzen 7 5800X | |
| AMD Ryzen 5 7600X | |
| Intel Core i5-12600K | |
| AMD Ryzen 7 5800X3D | |
| AMD Ryzen 5 5600X | |
| 2560x1440 Time Spy CPU | |
| Intel Core i9-13900K | |
| Intel Core i9-12900K | |
| Intel Core i5-13600K | |
| AMD Ryzen 9 7900X | |
| AMD Ryzen 9 7950X | |
| AMD Ryzen 7 7700X | |
| Intel Core i5-12600K | |
| AMD Ryzen 9 5950X | |
| AMD Ryzen 9 5900X | |
| AMD Ryzen 7 5800X3D | |
| AMD Ryzen 7 5800X | |
| AMD Ryzen 5 7600X | |
| AMD Ryzen 5 5600X | |
| CrossMark | |
| Overall | |
| Intel Core i9-13900K | |
| AMD Ryzen 9 7950X | |
| AMD Ryzen 9 7900X | |
| AMD Ryzen 7 7700X | |
| Intel Core i5-13600K | |
| AMD Ryzen 5 7600X | |
| AMD Ryzen 7 5800X3D | |
| AMD Ryzen 9 5950X | |
| AMD Ryzen 5 5600X | |
| Productivity | |
| Intel Core i9-13900K | |
| AMD Ryzen 9 7950X | |
| AMD Ryzen 9 7900X | |
| AMD Ryzen 7 7700X | |
| Intel Core i5-13600K | |
| AMD Ryzen 5 7600X | |
| AMD Ryzen 7 5800X3D | |
| AMD Ryzen 9 5950X | |
| Creativity | |
| AMD Ryzen 9 7950X | |
| Intel Core i9-13900K | |
| AMD Ryzen 9 7900X | |
| AMD Ryzen 7 7700X | |
| AMD Ryzen 5 7600X | |
| Intel Core i5-13600K | |
| AMD Ryzen 7 5800X3D | |
| AMD Ryzen 9 5950X | |
| Responsiveness | |
| Intel Core i9-13900K | |
| Intel Core i5-13600K | |
| AMD Ryzen 9 7950X | |
| AMD Ryzen 9 7900X | |
| AMD Ryzen 5 7600X | |
| AMD Ryzen 7 7700X | |
| AMD Ryzen 7 5800X3D | |
| AMD Ryzen 9 5950X | |
| PCMark 10 | |
| Score | |
| AMD Ryzen 9 7950X | |
| AMD Ryzen 9 7900X | |
| Intel Core i9-13900K | |
| AMD Ryzen 5 7600X | |
| Intel Core i5-13600K | |
| AMD Ryzen 9 5950X | |
| Intel Core i9-12900K | |
| AMD Ryzen 9 5900X | |
| AMD Ryzen 5 5600X | |
| Intel Core i5-12600K | |
| AMD Ryzen 7 5800X | |
| AMD Ryzen 7 5800X3D | |
| Essentials | |
| Intel Core i9-13900K | |
| AMD Ryzen 9 7900X | |
| AMD Ryzen 9 7950X | |
| Intel Core i5-13600K | |
| AMD Ryzen 5 7600X | |
| AMD Ryzen 7 5800X | |
| AMD Ryzen 5 5600X | |
| AMD Ryzen 9 5950X | |
| Intel Core i9-12900K | |
| AMD Ryzen 9 5900X | |
| Intel Core i5-12600K | |
| AMD Ryzen 7 5800X3D | |
| Productivity | |
| AMD Ryzen 5 7600X | |
| AMD Ryzen 9 7950X | |
| AMD Ryzen 9 7900X | |
| Intel Core i5-13600K | |
| Intel Core i9-13900K | |
| AMD Ryzen 9 5950X | |
| AMD Ryzen 7 5800X | |
| Intel Core i5-12600K | |
| AMD Ryzen 5 5600X | |
| Intel Core i9-12900K | |
| AMD Ryzen 9 5900X | |
| AMD Ryzen 7 5800X3D | |
| Digital Content Creation | |
| AMD Ryzen 9 7950X | |
| AMD Ryzen 9 7900X | |
| Intel Core i9-13900K | |
| Intel Core i5-13600K | |
| AMD Ryzen 5 7600X | |
| AMD Ryzen 9 5950X | |
| Intel Core i9-12900K | |
| AMD Ryzen 9 5900X | |
| AMD Ryzen 7 5800X3D | |
| AMD Ryzen 7 5800X | |
| Intel Core i5-12600K | |
| AMD Ryzen 5 5600X | |
| PCMark 10 Score | 10153 pkt. | |
Pomoc | ||
| Performance rating - Percent | |
| Intel Core i9-12900K -1! | |
| Intel Core i5-12600K -1! | |
| AMD Ryzen 9 7900X | |
| Intel Core i9-13900K | |
| AMD Ryzen 9 7950X | |
| Intel Core i5-13600K | |
| AMD Ryzen 5 7600X | |
| AMD Ryzen 9 5900X | |
| AMD Ryzen 7 7700X | |
| AMD Ryzen 9 5950X | |
| AMD Ryzen 7 5800X | |
| AMD Ryzen 5 5600X | |
| AMD Ryzen 7 5800X3D | |
| AIDA64 | |
| Memory Copy | |
| Intel Core i9-13900K | |
| Intel Core i9-12900K | |
| Intel Core i5-13600K | |
| Intel Core i5-12600K | |
| AMD Ryzen 9 7900X | |
| AMD Ryzen 9 7950X | |
| AMD Ryzen 9 5900X | |
| AMD Ryzen 5 7600X | |
| AMD Ryzen 7 7700X | |
| AMD Ryzen 9 5950X | |
| AMD Ryzen 7 5800X | |
| AMD Ryzen 5 5600X | |
| AMD Ryzen 7 5800X3D | |
| Memory Latency | |
| Intel Core i5-13600K | |
| Intel Core i9-13900K | |
| AMD Ryzen 7 5800X3D | |
| AMD Ryzen 9 5950X | |
| AMD Ryzen 7 7700X | |
| AMD Ryzen 9 7950X | |
| AMD Ryzen 5 5600X | |
| AMD Ryzen 5 7600X | |
| AMD Ryzen 9 7900X | |
| AMD Ryzen 7 5800X | |
| AMD Ryzen 9 5900X | |
| Memory Read | |
| Intel Core i9-13900K | |
| Intel Core i9-12900K | |
| Intel Core i5-12600K | |
| Intel Core i5-13600K | |
| AMD Ryzen 9 7950X | |
| AMD Ryzen 9 7900X | |
| AMD Ryzen 9 5900X | |
| AMD Ryzen 7 5800X | |
| AMD Ryzen 9 5950X | |
| AMD Ryzen 5 5600X | |
| AMD Ryzen 7 7700X | |
| AMD Ryzen 5 7600X | |
| AMD Ryzen 7 5800X3D | |
| Memory Write | |
| AMD Ryzen 5 7600X | |
| AMD Ryzen 7 7700X | |
| AMD Ryzen 9 7900X | |
| AMD Ryzen 9 7950X | |
| Intel Core i9-13900K | |
| Intel Core i5-12600K | |
| Intel Core i9-12900K | |
| Intel Core i5-13600K | |
| AMD Ryzen 9 5900X | |
| AMD Ryzen 9 5950X | |
| AMD Ryzen 7 5800X | |
| AMD Ryzen 5 5600X | |
| AMD Ryzen 7 5800X3D | |
* ... im mniej tym lepiej
Tryb Eco: 65 W Ryzen 9 7950X przewyższa Core i9-12900K
Tryb Eco jest w zasadzie określeniem AMD na pracę procesora przy niższym TDP. W przypadku Zen 4 firma chwali się znacznymi oszczędnościami energii przy niewielkim wpływie na wydajność. Oferowane wartości TDP zależą od SKU - procesor o mocy 170 W może być skonfigurowany do pracy z mocą 105 W lub 65 W, podczas gdy układ 105 W może być obniżony do 65 W
Nasza testowa płyta Gigabyte X670E Aorus Master mogła być uruchomiona tylko z referencyjnym BIOS-em AMD 813b. Oznaczało to, że nasza konfiguracja nie oferowała opcji włączenia trybu Eco jednym kliknięciem, choć jednostki detaliczne powinny mieć możliwość aktualizacji do nowszych wersji, które oferują bardziej proste podejście. Ustawienia te można włączyć także z poziomu najnowszej wersji Ryzen Master.
Niemniej jednak, użyliśmy następujących wartości dostarczonych przez AMD w ustawieniach PBO firmware'u, aby włączyć odpowiednie TDP
- 65 W TDP = 88,000 PPT; 75,000 TDC; 150,000 EDC
- 105 W TDP = 142,000 PPT; 110,000 TDC; 170,000 EDC
- 170 W TDP = 230,000 PPT; 160,000 TDC; 225,000 EDC
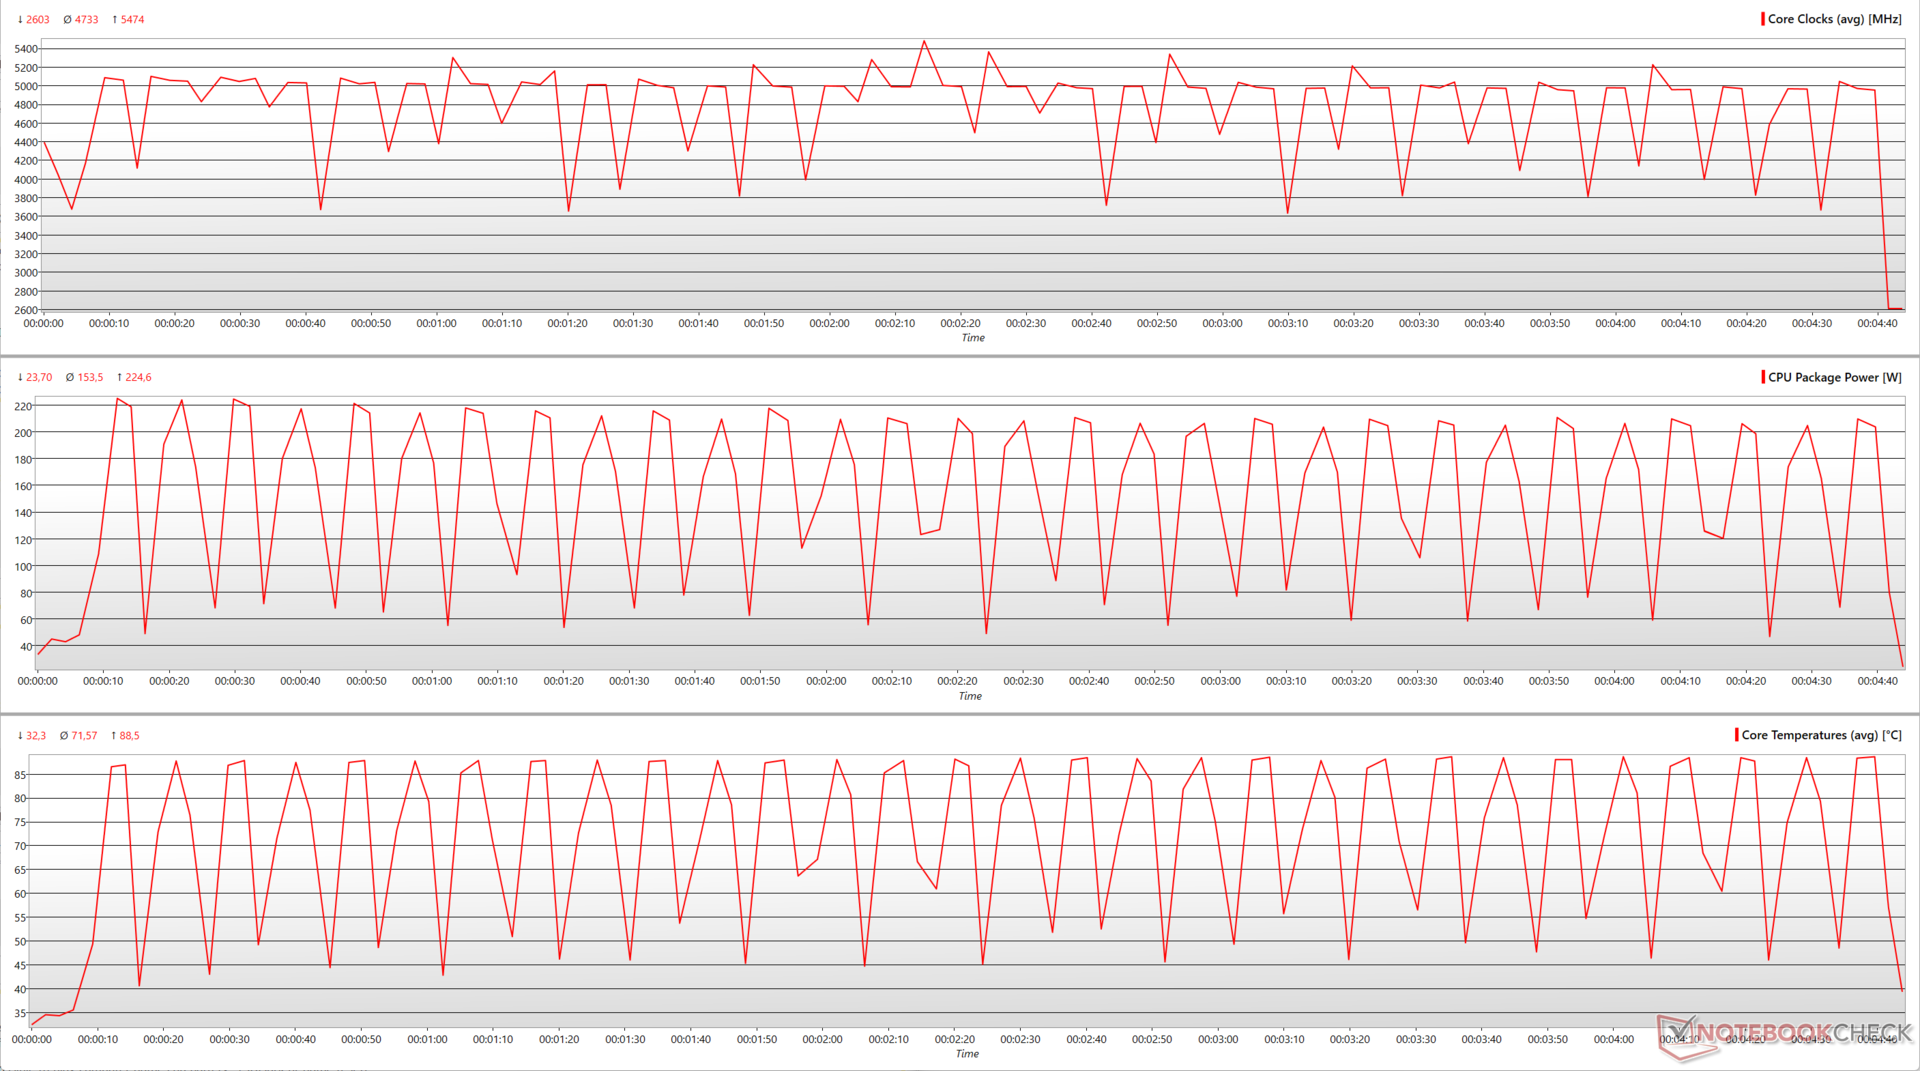
Korzyści z obniżenia TDP Ryzena 9 7950X widzimy od razu w wielordzeniowym 30-pętlowym teście Cinebench R15. Przy TDP wynoszącym 105 W Ryzen 9 7950X traci zaledwie około 7% wydajności, przy czym maksymalne taktowanie spadło nieznacznie z 5,47 GHz do 5,43 GHz. Szczytowe temperatury rdzeni również odnotowują znaczący, 22-procentowy spadek z 88,5°C do 68,3°C.
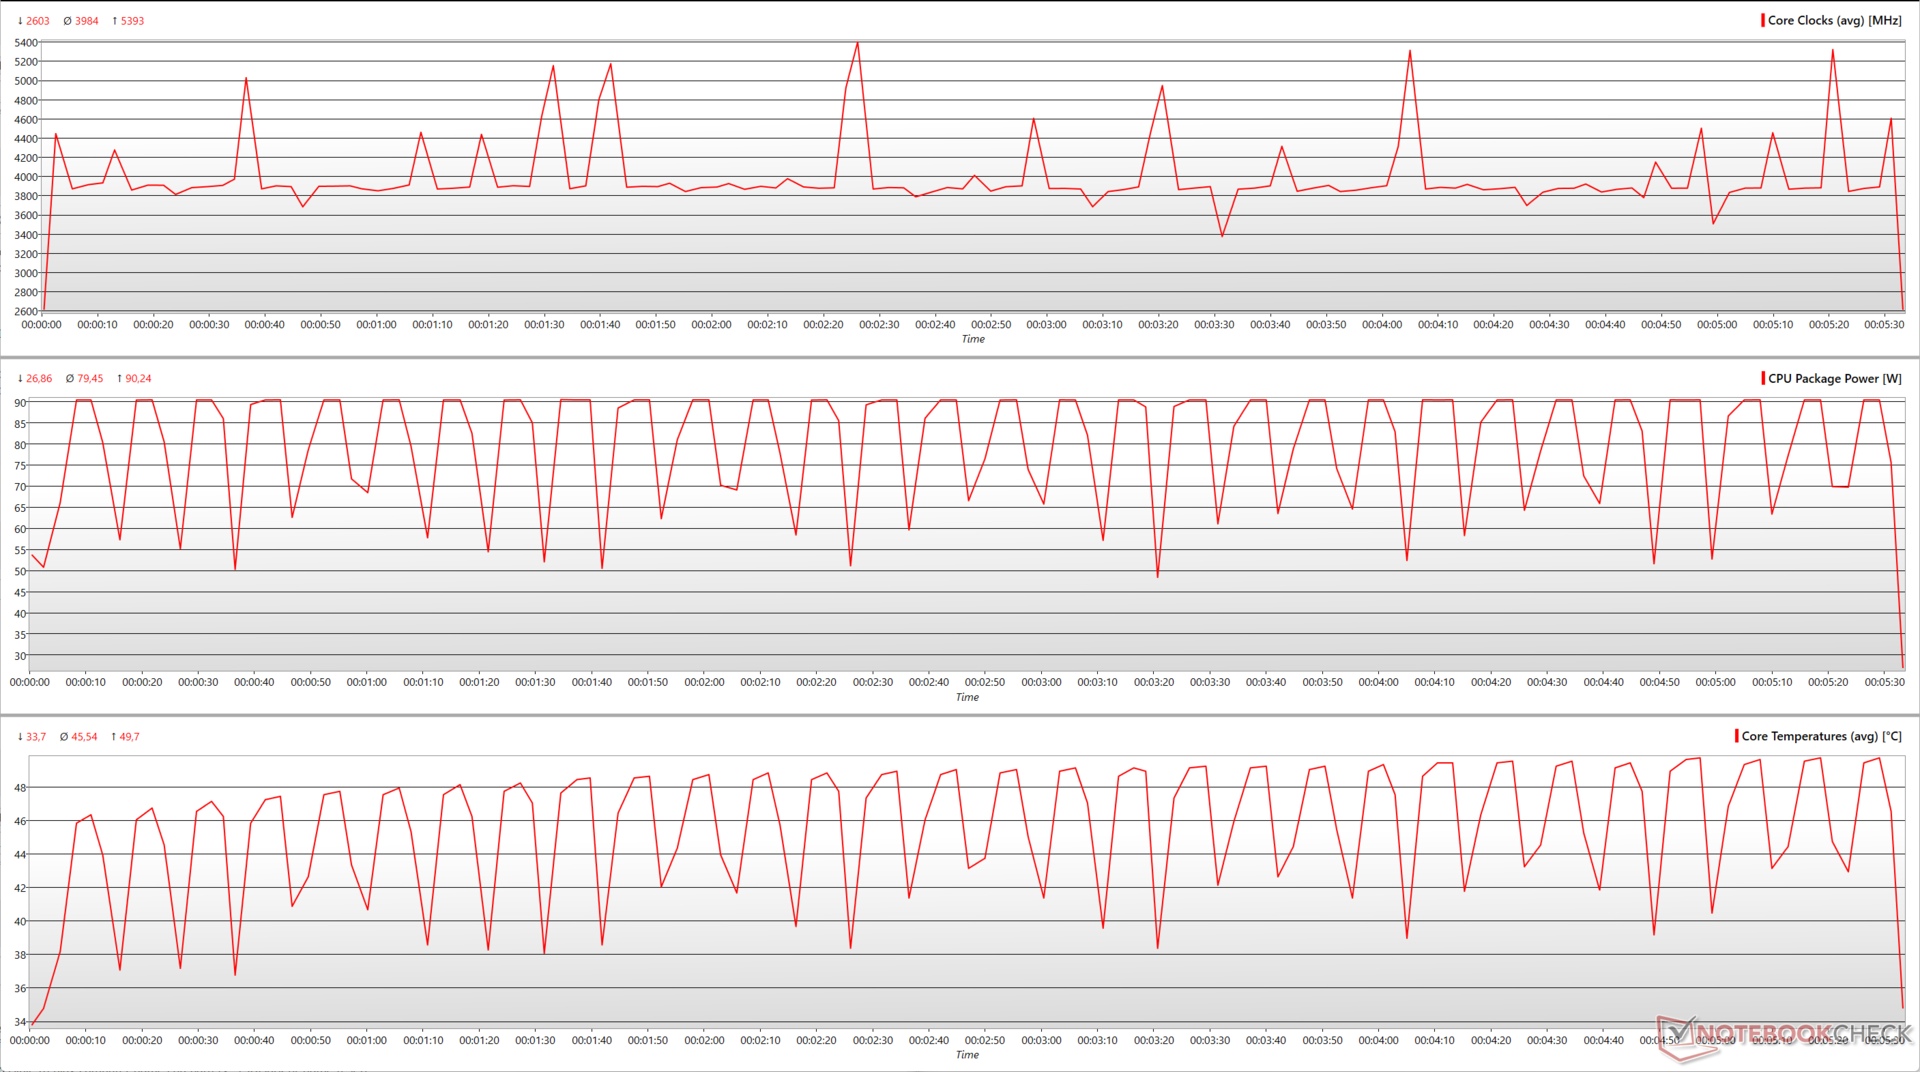
Przy 65 W Ryzen 9 7950X traci około 22,4% wydajności w benchmarku, biorąc pod uwagę wyraźne obniżenie taktowania rdzenia. Procesor ma jednak teraz znacznie niższą temperaturę rdzenia, wynoszącą zaledwie około 50 °C, przy maksymalnej mocy pakietu na poziomie zaledwie 90 W.
| Ryzen 9 7950X TDP | CB R15 Multi-Core Score | Average Core Clock (GHz) | Max. Core Clock (GHz) | Max. Moc pakietu (W) | Maks. Temperatura rdzenia (°C) |
|---|---|---|---|---|---|
| 170 W | 6,236 | 4,77 | 5,47 | 224,6 | 88,5 |
| 105 W | 5 800 (-7%) | 4,54 -(4,82%) | 5,43 (-0,73%) | 145,6 (-35,17%) | 68,3 (-22,82%) |
| 65 W | 4 836 (-22,4%) | 3,98 (-16,56%) | 5,39 (-1,46%) | 90,24 (-59,82%) | 49,7 (-43,84%) |

Ogólny spadek wydajności przy przejściu z 170 W na 105 W jest w większości przypadków nieistotny, choć w przypadku bardzo intensywnych obciążeń wielordzeniowych może on być nieco większy. Różnica między 170 W a 65 W jest bardziej odczuwalna - w testach odnotowano około 9% spadek.
Liczba klatek na sekundę w Witcher 3 przy 1080p Ultra nie wydaje się być dotknięta przez redukcję TDP. Zauważyliśmy co prawda marginalnie wyższe średnie fps przy niższych TDP, ale maksymalne wartości fps były niższe w porównaniu z domyślnym TDP.
| Performance rating - Percent | |
| Intel Core i9-13900K | |
| AMD Ryzen 9 7950X | |
| AMD Ryzen 9 7950X ECO 105 W | |
| AMD Ryzen 9 7900X | |
| AMD Ryzen 9 7950X ECO 65 W | |
| Intel Core i9-12900K | |
| Intel Core i5-13600K | |
| AMD Ryzen 7 7700X | |
| AMD Ryzen 7 7700X ECO 65 W | |
| AMD Ryzen 9 5950X | |
| AMD Ryzen 5 7600X | |
| AMD Ryzen 9 5900X | |
| Intel Core i5-12600K | |
| AMD Ryzen 7 5800X | |
| AMD Ryzen 7 5800X3D | |
| AMD Ryzen 5 5600X | |
| Cinebench R23 | |
| Single Core | |
| Intel Core i9-13900K | |
| AMD Ryzen 9 7900X | |
| AMD Ryzen 9 7950X | |
| Intel Core i5-13600K | |
| AMD Ryzen 9 7950X ECO 65 W | |
| AMD Ryzen 9 7950X ECO 105 W | |
| Intel Core i9-12900K | |
| AMD Ryzen 7 7700X ECO 65 W | |
| AMD Ryzen 7 7700X | |
| AMD Ryzen 5 7600X | |
| Intel Core i5-12600K | |
| AMD Ryzen 9 5950X | |
| AMD Ryzen 9 5900X | |
| AMD Ryzen 7 5800X | |
| AMD Ryzen 5 5600X | |
| AMD Ryzen 7 5800X3D | |
| Multi Core | |
| Intel Core i9-13900K | |
| AMD Ryzen 9 7950X | |
| AMD Ryzen 9 7950X ECO 105 W | |
| AMD Ryzen 9 7950X ECO 65 W | |
| AMD Ryzen 9 7900X | |
| AMD Ryzen 9 5950X | |
| Intel Core i9-12900K | |
| Intel Core i5-13600K | |
| AMD Ryzen 9 5900X | |
| AMD Ryzen 7 7700X | |
| AMD Ryzen 7 7700X ECO 65 W | |
| Intel Core i5-12600K | |
| AMD Ryzen 5 7600X | |
| AMD Ryzen 7 5800X | |
| AMD Ryzen 7 5800X3D | |
| AMD Ryzen 5 5600X | |
| Cinebench R20 | |
| CPU (Single Core) | |
| Intel Core i9-13900K | |
| AMD Ryzen 9 7900X | |
| AMD Ryzen 9 7950X | |
| AMD Ryzen 9 7950X ECO 65 W | |
| AMD Ryzen 9 7950X ECO 105 W | |
| Intel Core i5-13600K | |
| AMD Ryzen 7 7700X ECO 65 W | |
| AMD Ryzen 7 7700X | |
| Intel Core i9-12900K | |
| AMD Ryzen 5 7600X | |
| Intel Core i5-12600K | |
| AMD Ryzen 9 5950X | |
| AMD Ryzen 9 5900X | |
| AMD Ryzen 7 5800X | |
| AMD Ryzen 5 5600X | |
| AMD Ryzen 7 5800X3D | |
| CPU (Multi Core) | |
| Intel Core i9-13900K | |
| AMD Ryzen 9 7950X | |
| AMD Ryzen 9 7950X ECO 105 W | |
| AMD Ryzen 9 7950X ECO 65 W | |
| AMD Ryzen 9 7900X | |
| AMD Ryzen 9 5950X | |
| Intel Core i9-12900K | |
| Intel Core i5-13600K | |
| AMD Ryzen 9 5900X | |
| AMD Ryzen 7 7700X | |
| AMD Ryzen 7 7700X ECO 65 W | |
| Intel Core i5-12600K | |
| AMD Ryzen 7 5800X | |
| AMD Ryzen 5 7600X | |
| AMD Ryzen 7 5800X3D | |
| AMD Ryzen 5 5600X | |
| Cinebench R15 | |
| CPU Single 64Bit | |
| Intel Core i9-13900K | |
| AMD Ryzen 9 7900X | |
| AMD Ryzen 9 7950X | |
| AMD Ryzen 9 7950X ECO 105 W | |
| AMD Ryzen 7 7700X ECO 65 W | |
| AMD Ryzen 5 7600X | |
| AMD Ryzen 9 7950X ECO 65 W | |
| AMD Ryzen 7 7700X | |
| Intel Core i5-13600K | |
| Intel Core i9-12900K | |
| Intel Core i5-12600K | |
| AMD Ryzen 9 5950X | |
| AMD Ryzen 9 5900X | |
| AMD Ryzen 7 5800X | |
| AMD Ryzen 5 5600X | |
| AMD Ryzen 7 5800X3D | |
| CPU Multi 64Bit | |
| AMD Ryzen 9 7950X | |
| Intel Core i9-13900K | |
| AMD Ryzen 9 7950X ECO 105 W | |
| AMD Ryzen 9 7900X | |
| AMD Ryzen 9 7950X ECO 65 W | |
| AMD Ryzen 9 5950X | |
| Intel Core i9-12900K | |
| AMD Ryzen 9 5900X | |
| Intel Core i5-13600K | |
| AMD Ryzen 7 7700X | |
| AMD Ryzen 7 7700X ECO 65 W | |
| AMD Ryzen 7 5800X | |
| Intel Core i5-12600K | |
| AMD Ryzen 5 7600X | |
| AMD Ryzen 7 5800X3D | |
| AMD Ryzen 5 5600X | |
| Blender - v2.79 BMW27 CPU | |
| AMD Ryzen 5 5600X | |
| AMD Ryzen 7 5800X3D | |
| AMD Ryzen 5 7600X | |
| AMD Ryzen 7 5800X | |
| Intel Core i5-12600K | |
| AMD Ryzen 7 7700X ECO 65 W | |
| AMD Ryzen 7 7700X | |
| AMD Ryzen 9 5900X | |
| Intel Core i5-13600K | |
| Intel Core i9-12900K | |
| AMD Ryzen 9 5950X | |
| AMD Ryzen 9 7900X | |
| AMD Ryzen 9 7950X ECO 65 W | |
| AMD Ryzen 9 7950X ECO 105 W | |
| AMD Ryzen 9 7950X | |
| Intel Core i9-13900K | |
| Geekbench 5.5 | |
| Single-Core | |
| Intel Core i9-13900K | |
| AMD Ryzen 9 7900X | |
| AMD Ryzen 9 7950X ECO 65 W | |
| AMD Ryzen 9 7950X ECO 105 W | |
| AMD Ryzen 9 7950X | |
| AMD Ryzen 7 7700X | |
| AMD Ryzen 7 7700X ECO 65 W | |
| AMD Ryzen 5 7600X | |
| Intel Core i9-12900K | |
| Intel Core i5-13600K | |
| Intel Core i5-12600K | |
| AMD Ryzen 9 5950X | |
| AMD Ryzen 9 5900X | |
| AMD Ryzen 7 5800X | |
| AMD Ryzen 5 5600X | |
| AMD Ryzen 7 5800X3D | |
| Multi-Core | |
| Intel Core i9-13900K | |
| AMD Ryzen 9 7950X | |
| AMD Ryzen 9 7950X ECO 105 W | |
| AMD Ryzen 9 7950X ECO 65 W | |
| AMD Ryzen 9 7900X | |
| Intel Core i9-12900K | |
| AMD Ryzen 9 5950X | |
| Intel Core i5-13600K | |
| AMD Ryzen 7 7700X | |
| AMD Ryzen 7 7700X ECO 65 W | |
| AMD Ryzen 9 5900X | |
| Intel Core i5-12600K | |
| AMD Ryzen 5 7600X | |
| AMD Ryzen 7 5800X | |
| AMD Ryzen 7 5800X3D | |
| AMD Ryzen 5 5600X | |
| HWBOT x265 Benchmark v2.2 - 4k Preset | |
| AMD Ryzen 9 7950X | |
| Intel Core i9-13900K | |
| AMD Ryzen 9 7950X ECO 105 W | |
| AMD Ryzen 9 7900X | |
| AMD Ryzen 9 7950X ECO 65 W | |
| AMD Ryzen 9 5950X | |
| Intel Core i5-12600K | |
| Intel Core i9-12900K | |
| Intel Core i5-13600K | |
| AMD Ryzen 7 7700X | |
| AMD Ryzen 9 5900X | |
| AMD Ryzen 7 7700X ECO 65 W | |
| AMD Ryzen 5 7600X | |
| AMD Ryzen 7 5800X | |
| AMD Ryzen 7 5800X3D | |
| AMD Ryzen 5 5600X | |
| R Benchmark 2.5 - Overall mean | |
| AMD Ryzen 7 5800X3D | |
| AMD Ryzen 5 5600X | |
| AMD Ryzen 9 5950X | |
| AMD Ryzen 9 5900X | |
| AMD Ryzen 7 5800X | |
| Intel Core i5-12600K | |
| Intel Core i9-12900K | |
| Intel Core i5-13600K | |
| AMD Ryzen 7 7700X ECO 65 W | |
| AMD Ryzen 9 7950X | |
| AMD Ryzen 9 7950X ECO 65 W | |
| AMD Ryzen 9 7950X ECO 105 W | |
| AMD Ryzen 7 7700X | |
| AMD Ryzen 5 7600X | |
| AMD Ryzen 9 7900X | |
| Intel Core i9-13900K | |
| LibreOffice - 20 Documents To PDF | |
| Intel Core i5-12600K | |
| AMD Ryzen 7 5800X3D | |
| AMD Ryzen 9 5900X | |
| AMD Ryzen 9 5950X | |
| AMD Ryzen 5 5600X | |
| AMD Ryzen 7 5800X | |
| Intel Core i9-12900K | |
| AMD Ryzen 5 7600X | |
| Intel Core i9-13900K | |
| AMD Ryzen 9 7950X | |
| Intel Core i5-13600K | |
| AMD Ryzen 9 7900X | |
| AMD Ryzen 7 7700X ECO 65 W | |
| AMD Ryzen 7 7700X | |
| AMD Ryzen 9 7950X ECO 65 W | |
| AMD Ryzen 9 7950X ECO 105 W | |
| The Witcher 3 - 1920x1080 Ultra Graphics & Postprocessing (HBAO+) | |
| AMD Ryzen 7 5800X3D | |
| AMD Ryzen 9 7900X | |
| AMD Ryzen 5 7600X | |
| Intel Core i5-13600K | |
| Intel Core i9-13900K | |
| AMD Ryzen 9 7950X ECO 105 W | |
| AMD Ryzen 9 7950X ECO 65 W | |
| AMD Ryzen 9 7950X | |
| AMD Ryzen 7 7700X | |
| AMD Ryzen 7 7700X ECO 65 W | |
| Intel Core i5-12600K | |
| AMD Ryzen 9 5900X | |
| AMD Ryzen 9 5950X | |
| AMD Ryzen 7 5800X | |
| AMD Ryzen 5 5600X | |
| Intel Core i9-12900K | |
* ... im mniej tym lepiej
| Ryzen 7 7700X TDP | CB R15 Multi-Core Score | Average Core Clock (GHz) | Max. Core Clock (GHz) | Max. Moc pakietu (W) | Maks. Temperatura rdzenia (°C) |
|---|---|---|---|---|---|
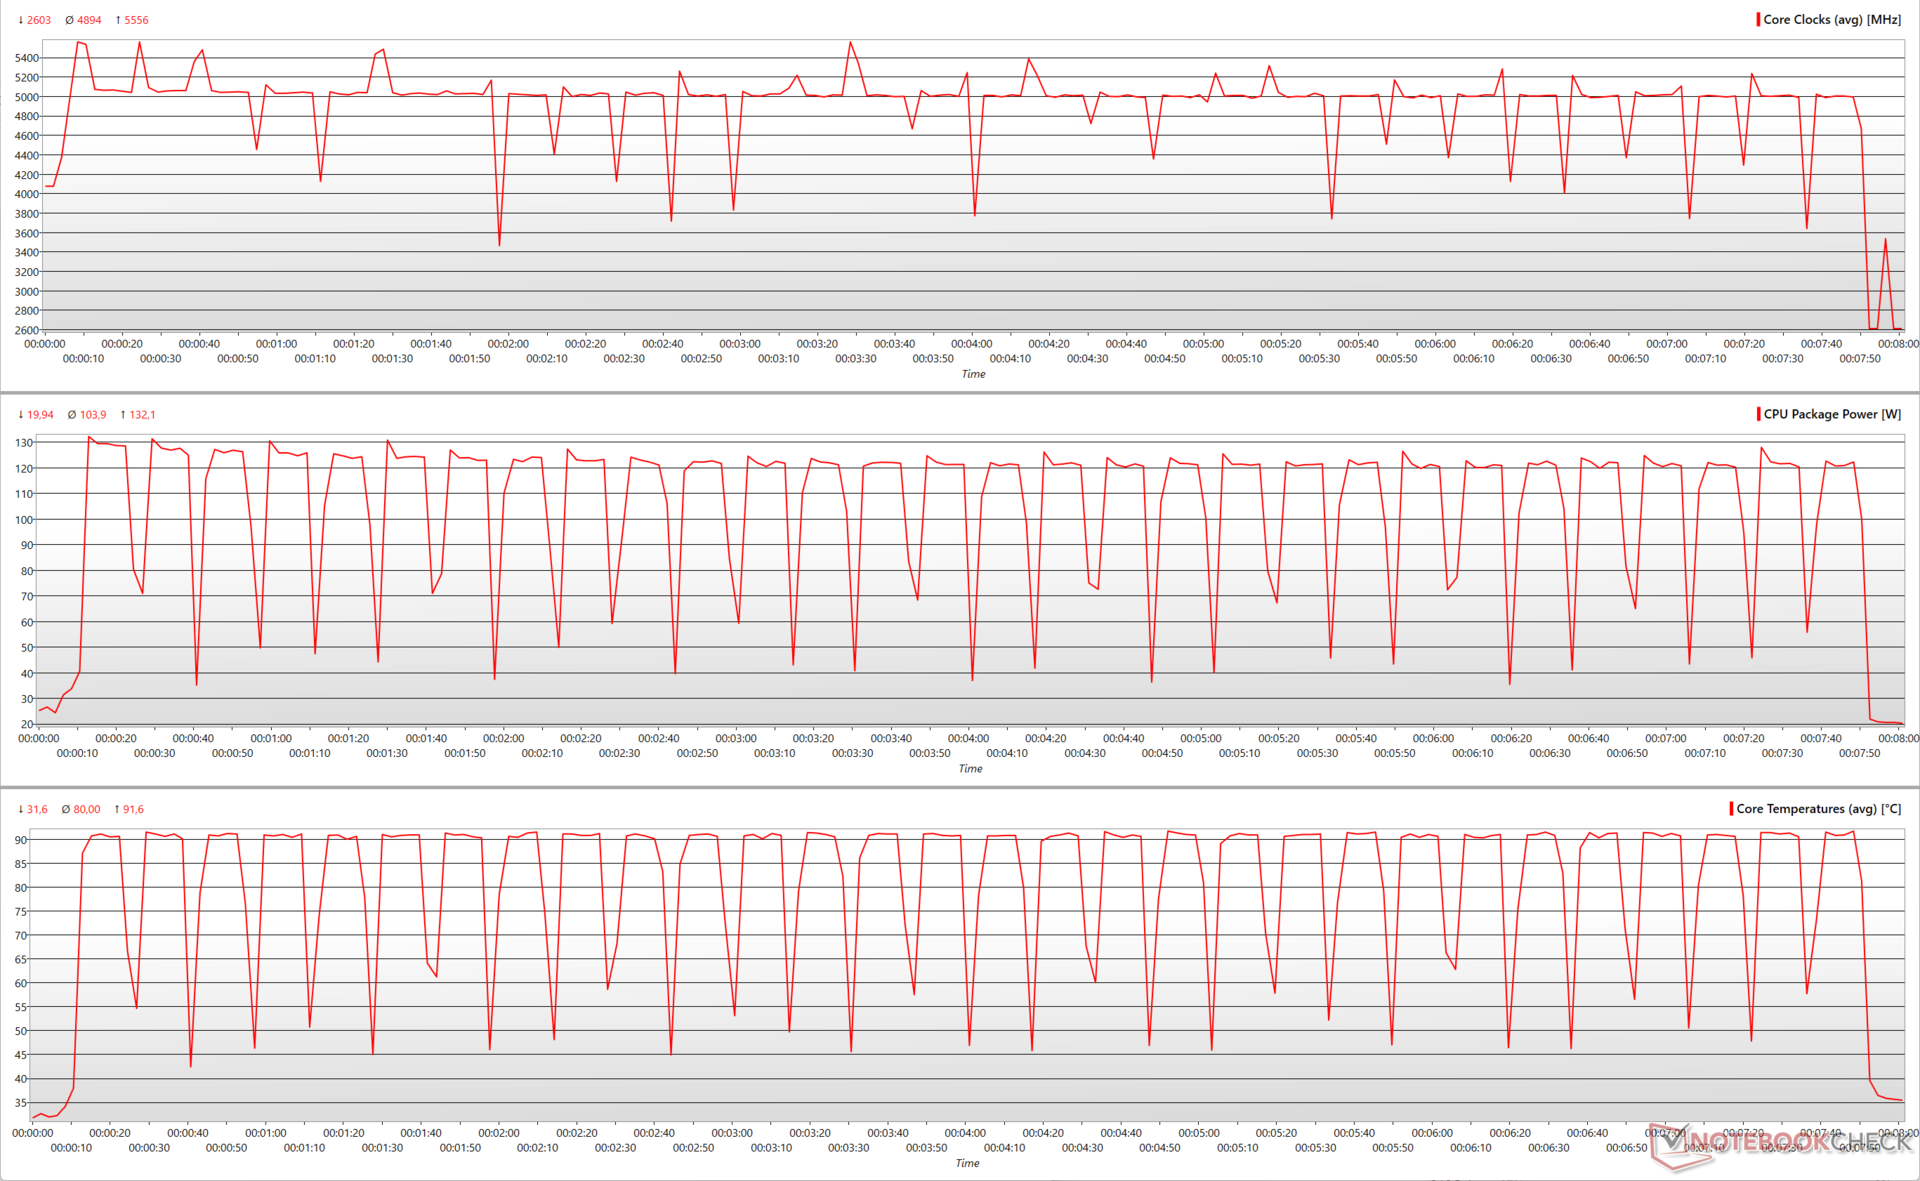
| 105 W | 3191 | 4,89 | 5,55 | 132,1 | 91,6 |
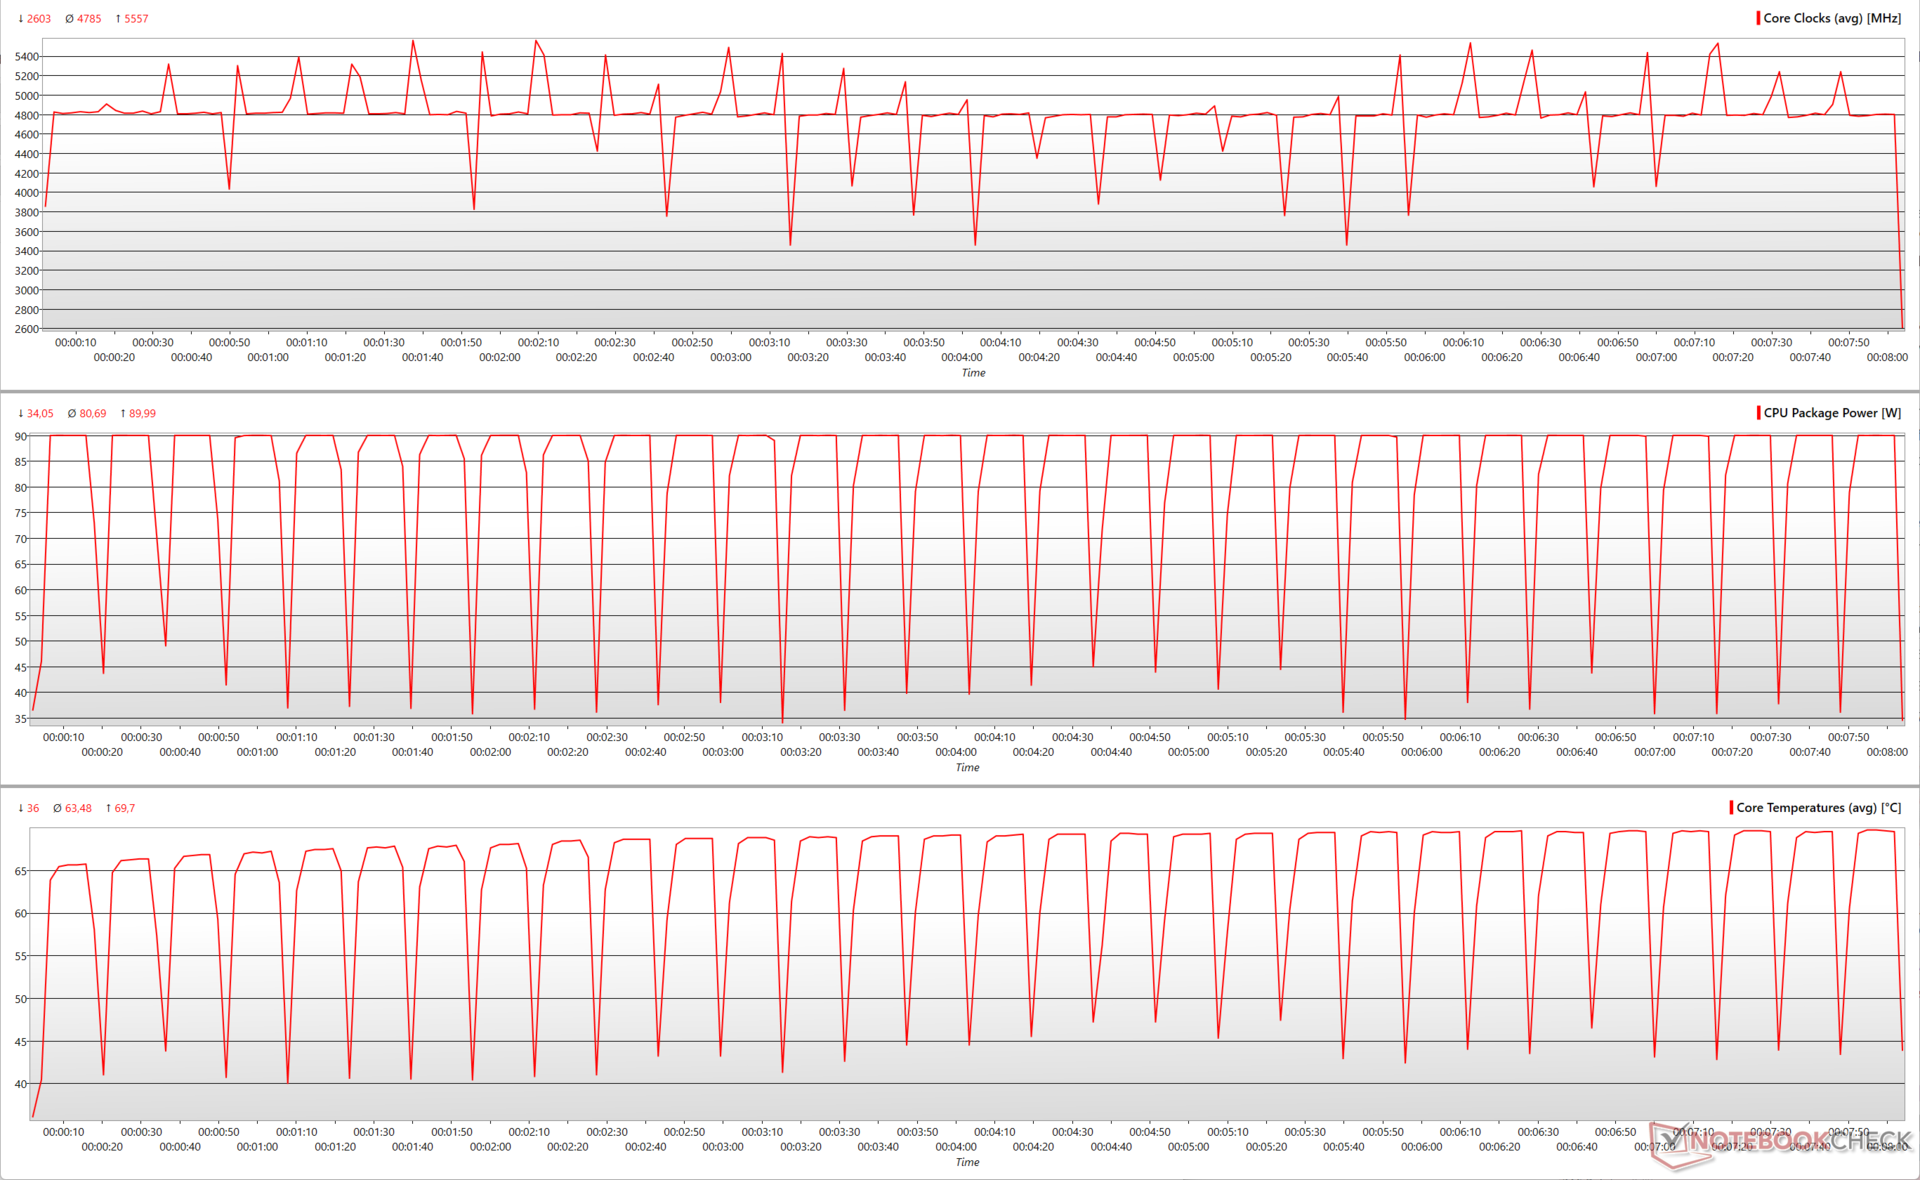
| 65 W | 3036 (-4,85%) | 4,78 (-2,24%) | 5,55 | 90 (-31,86%) | 69,7 (-23,9%) |
Obniżenie mocy do 65 W z 105 W w przypadku Ryzena 7 7700X jest mniej drastyczne, a wynik wielordzeniowy w Cinebench R15 spadł tylko o blisko 5%. Choć widzimy lekką redukcję średnich zegarów rdzenia, maksymalne taktowanie nadal osiąga 5,55 GHz podczas biegu
Maksymalna temperatura rdzenia przy 65 W wynosi teraz blisko 70 °C, co stanowi 24% spadek w stosunku do ustawień domyślnych, które mogą powodować temperatury bliskie 92 °C.
W ujęciu łącznym Ryzen 7 7700X nie traci wiele, jeśli pracuje przy TDP na poziomie 65 W. Na stronie Witcher 3 w 1080p Ultra ponownie widać marginalnie wyższe klatki, ale można to uznać za mieszczące się w marginesie błędu.
Ogólnie rzecz biorąc, Ryzen 9 7950X przy 65 W jest nadal o 14% szybszy od Core i9-12900K pracującego przy PL1=PL2 na poziomie 241 W, co jest świetną wydajnością. W porównaniu z Core i9-13900K, Ryzen 9 7950X przy 105 W pozostaje w tyle o zaledwie 5%.
Podobnie Ryzen 7 7700X przy 65 W praktycznie remisuje z Ryzenem 9 5950X pracującym przy domyślnym TDP 105 W (142 W PL2), będąc jednocześnie o 6% wolniejszym od domyślnego Core i5-13600K (125 W PL1, 181 W PL2).
Zalecamy uruchomienie procesorów Ryzen 9 7950X i Ryzen 7 7700X w trybie Eco, chyba że chcesz wykorzystać pełną moc tych procesorów do wymagających zadań.
3D i wydajność w grach: Bliska rywalizacja z najlepszym Intelem
Ryzen 9 7950X i Ryzen 7 7700X wykazują lekki regres w wydajności GPU w 3DMarku w porównaniu z Ryzenem 5 7600X i Ryzenem 9 7900X. Wydajność dorównuje jednak wydajności procesorów Core i5-13600K i Core i9-13900K.
| Performance rating - Percent | |
| AMD Ryzen 5 7600X | |
| AMD Ryzen 9 7900X | |
| Intel Core i5-13600K | |
| Intel Core i9-13900K | |
| AMD Ryzen 9 7950X | |
| AMD Ryzen 7 7700X | |
| 3DMark | |
| 1920x1080 Fire Strike Graphics | |
| AMD Ryzen 5 7600X | |
| AMD Ryzen 9 7900X | |
| Intel Core i5-13600K | |
| Intel Core i9-13900K | |
| AMD Ryzen 9 7950X | |
| AMD Ryzen 7 7700X | |
| 2560x1440 Time Spy Graphics | |
| AMD Ryzen 9 7900X | |
| AMD Ryzen 5 7600X | |
| Intel Core i9-13900K | |
| Intel Core i5-13600K | |
| AMD Ryzen 7 7700X | |
| AMD Ryzen 9 7950X | |
| 3DMark 11 - 1280x720 Performance GPU | |
| AMD Ryzen 5 7600X | |
| AMD Ryzen 9 7900X | |
| Intel Core i5-13600K | |
| Intel Core i9-13900K | |
| AMD Ryzen 9 7950X | |
| AMD Ryzen 7 7700X | |
| 3DMark 11 Performance | 48825 pkt. | |
| 3DMark Fire Strike Score | 42285 pkt. | |
| 3DMark Time Spy Score | 18279 pkt. | |
Pomoc | ||
Nieczęsto zdarza się, że procesory Intela i AMD rywalizują ze sobą w grach. Zarówno Ryzen 9 7950X, jak i Ryzen 7 7700X to doskonałe procesory do gier, zwłaszcza w połączeniu z szybkimi układami graficznymi, takimi jak seria GeForce RTX 30 lub Radeon RX 6000 i nowsze. Łączna różnica w wydajności pomiędzy procesorami Intel Raptor Lake i odpowiadającymi im procesorami AMD Zen 4 wydaje się nieistotna.
To powiedziawszy, poszczególne gry mogą faworyzować jedną platformę nad drugą. Na przykład widzimy, że Ryzen 9 7950X osiąga 21% przewagę nad Core i9-13900K w Final Fantasy XV 1080p High, podczas gdy ten ostatni wyprzedza 7950X o 13% w Far Cry 5 przy 1080p Ultra. Na stronie Ryzen 9 7900Xz drugiej strony, prowadzi Ryzen 9 7950X o 7% w grze The Witcher 3 przy 1080p Ultra
Ogólnie rzecz biorąc, zarówno Ryzen 9 7950X jak i Ryzen 7 7700X są równe sobie w grach. Jeśli jesteś przede wszystkim graczem, możesz zaoszczędzić sporo pieniędzy decydując się na Ryzen 7 7700X lub nawet Ryzen 5 7600X.
| Performance rating - Percent | |
| Intel Core i9-13900K | |
| AMD Ryzen 9 7900X | |
| AMD Ryzen 5 7600X | |
| Średnia w klasie Desktop | |
| AMD Ryzen 9 7950X | |
| AMD Ryzen 7 7700X | |
| Intel Core i5-13600K | |
| The Witcher 3 | |
| 1920x1080 Ultra Graphics & Postprocessing (HBAO+) | |
| Średnia w klasie Desktop (7.8 - 369, n=48, ostatnie 2 lata) | |
| AMD Ryzen 9 7900X | |
| AMD Ryzen 5 7600X | |
| Intel Core i5-13600K | |
| Intel Core i9-13900K | |
| AMD Ryzen 9 7950X | |
| AMD Ryzen 7 7700X | |
| 1024x768 Low Graphics & Postprocessing | |
| AMD Ryzen 9 7900X | |
| Intel Core i9-13900K | |
| AMD Ryzen 7 7700X | |
| AMD Ryzen 5 7600X | |
| AMD Ryzen 9 7950X | |
| Średnia w klasie Desktop (39.3 - 841, n=30, ostatnie 2 lata) | |
| Intel Core i5-13600K | |
| GTA V | |
| 1920x1080 Highest AA:4xMSAA + FX AF:16x | |
| Intel Core i9-13900K | |
| AMD Ryzen 9 7900X | |
| AMD Ryzen 7 7700X | |
| AMD Ryzen 9 7950X | |
| AMD Ryzen 5 7600X | |
| Intel Core i5-13600K | |
| Średnia w klasie Desktop (9.61 - 172.5, n=13, ostatnie 2 lata) | |
| 1920x1080 Lowest Settings possible | |
| AMD Ryzen 9 7950X | |
| AMD Ryzen 7 7700X | |
| Intel Core i9-13900K | |
| Intel Core i5-13600K | |
| AMD Ryzen 9 7900X | |
| AMD Ryzen 5 7600X | |
| Średnia w klasie Desktop (61.3 - 188.2, n=13, ostatnie 2 lata) | |
| Cyberpunk 2077 1.6 | |
| 3840x2160 Ultra Preset | |
| AMD Ryzen 9 7950X | |
| AMD Ryzen 7 7700X | |
| AMD Ryzen 9 7900X | |
| AMD Ryzen 5 7600X | |
| 2560x1440 Ultra Preset | |
| AMD Ryzen 9 7950X | |
| AMD Ryzen 7 7700X | |
| AMD Ryzen 9 7900X | |
| AMD Ryzen 5 7600X | |
| 1920x1080 Ultra Preset | |
| AMD Ryzen 9 7900X | |
| AMD Ryzen 7 7700X | |
| AMD Ryzen 9 7950X | |
| AMD Ryzen 5 7600X | |
| F1 22 | |
| 3840x2160 Ultra High Preset AA:T AF:16x | |
| Średnia w klasie Desktop (31.1 - 113.3, n=14, ostatnie 2 lata) | |
| AMD Ryzen 5 7600X | |
| AMD Ryzen 9 7900X | |
| Intel Core i5-13600K | |
| AMD Ryzen 9 7950X | |
| AMD Ryzen 7 7700X | |
| Intel Core i9-13900K | |
| 2560x1440 Ultra High Preset AA:T AF:16x | |
| Średnia w klasie Desktop (64.1 - 194.3, n=14, ostatnie 2 lata) | |
| AMD Ryzen 5 7600X | |
| Intel Core i5-13600K | |
| AMD Ryzen 7 7700X | |
| AMD Ryzen 9 7900X | |
| AMD Ryzen 9 7950X | |
| Intel Core i9-13900K | |
| 1920x1080 Ultra High Preset AA:T AF:16x | |
| Średnia w klasie Desktop (100.2 - 219, n=14, ostatnie 2 lata) | |
| Intel Core i5-13600K | |
| AMD Ryzen 9 7950X | |
| AMD Ryzen 7 7700X | |
| AMD Ryzen 5 7600X | |
| AMD Ryzen 9 7900X | |
| Intel Core i9-13900K | |
| Far Cry 6 | |
| 3840x2160 Ultra Graphics Quality + HD Textures AA:T | |
| Średnia w klasie Desktop (31.7 - 190.9, n=16, ostatnie 2 lata) | |
| Intel Core i9-13900K | |
| Intel Core i5-13600K | |
| AMD Ryzen 9 7950X | |
| AMD Ryzen 7 7700X | |
| 2560x1440 Ultra Graphics Quality + HD Textures AA:T | |
| Średnia w klasie Desktop (106.2 - 248, n=16, ostatnie 2 lata) | |
| AMD Ryzen 9 7950X | |
| Intel Core i9-13900K | |
| Intel Core i5-13600K | |
| AMD Ryzen 7 7700X | |
| 1920x1080 Ultra Graphics Quality + HD Textures AA:T | |
| Średnia w klasie Desktop (134.7 - 254, n=16, ostatnie 2 lata) | |
| Intel Core i9-13900K | |
| Intel Core i5-13600K | |
| AMD Ryzen 9 7950X | |
| AMD Ryzen 7 7700X | |
| Borderlands 3 | |
| 3840x2160 Badass Overall Quality (DX11) | |
| Średnia w klasie Desktop (76.7 - 168, n=13, ostatnie 2 lata) | |
| AMD Ryzen 9 7900X | |
| AMD Ryzen 5 7600X | |
| Intel Core i5-13600K | |
| Intel Core i9-13900K | |
| AMD Ryzen 9 7950X | |
| AMD Ryzen 7 7700X | |
| 2560x1440 Badass Overall Quality (DX11) | |
| Średnia w klasie Desktop (129.5 - 223, n=13, ostatnie 2 lata) | |
| AMD Ryzen 9 7900X | |
| AMD Ryzen 5 7600X | |
| Intel Core i9-13900K | |
| Intel Core i5-13600K | |
| AMD Ryzen 9 7950X | |
| AMD Ryzen 7 7700X | |
| 1920x1080 Badass Overall Quality (DX11) | |
| Średnia w klasie Desktop (6.4 - 248, n=14, ostatnie 2 lata) | |
| AMD Ryzen 9 7900X | |
| Intel Core i9-13900K | |
| AMD Ryzen 5 7600X | |
| Intel Core i5-13600K | |
| AMD Ryzen 9 7950X | |
| AMD Ryzen 7 7700X | |
AMD Ryzen 9 7950X with Nvidia GeForce RTX 3090
| low | med. | high | ultra | QHD | 4K | |
|---|---|---|---|---|---|---|
| GTA V (2015) | 187.8 | 187.8 | 187.3 | 155.4 | 150.1 | 181.9 |
| The Witcher 3 (2015) | 703 | 551 | 358 | 175.2 | 150.9 | |
| Dota 2 Reborn (2015) | 293.2 | 259.3 | 248.5 | 222.3 | 208.1 | |
| Final Fantasy XV Benchmark (2018) | 235 | 229 | 229 | 142.4 | 86.8 | |
| X-Plane 11.11 (2018) | 216 | 187.9 | 141 | 122.5 | ||
| Far Cry 5 (2018) | 216 | 196 | 189 | 176 | 169 | 105 |
| Strange Brigade (2018) | 694 | 503 | 404 | 351 | 265 | 158.1 |
| Shadow of the Tomb Raider (2018) | 304 | 255 | 247 | 232 | 169 | 96 |
| Far Cry New Dawn (2019) | 176 | 160 | 156 | 142 | 139 | 105 |
| Metro Exodus (2019) | 281 | 215 | 170.4 | 137 | 112.5 | 73.5 |
| Borderlands 3 (2019) | 219 | 201 | 179.4 | 156.3 | 126.3 | 72.6 |
| F1 2021 (2021) | 619 | 542 | 436 | 225 | 172.8 | 101.8 |
| Far Cry 6 (2021) | 205 | 189 | 169 | 151 | 134 | 84 |
| Forza Horizon 5 (2021) | 337 | 223 | 202 | 129 | 114 | 84 |
| Cyberpunk 2077 1.6 (2022) | 209 | 175.6 | 149.8 | 137.5 | 93.1 | 46.5 |
| Tiny Tina's Wonderlands (2022) | 349 | 289 | 209 | 165.9 | 122 | 69 |
| F1 22 (2022) | 412 | 424 | 355 | 127.9 | 83.3 | 42 |
AMD Ryzen 7 7700X with Nvidia GeForce RTX 3090
| low | med. | high | ultra | QHD | 4K | |
|---|---|---|---|---|---|---|
| GTA V (2015) | 187.8 | 187.6 | 186.4 | 155.8 | 148.3 | 180 |
| The Witcher 3 (2015) | 726 | 529 | 344 | 172.4 | 148.3 | |
| Dota 2 Reborn (2015) | 292.3 | 256.4 | 249.8 | 231.1 | 203.5 | |
| Final Fantasy XV Benchmark (2018) | 237 | 237 | 178.3 | 138.4 | 84.3 | |
| X-Plane 11.11 (2018) | 224 | 190.7 | 145.9 | 124 | ||
| Far Cry 5 (2018) | 233 | 201 | 194 | 177 | 168 | 104 |
| Strange Brigade (2018) | 797 | 509 | 404 | 352 | 263 | 157.6 |
| Shadow of the Tomb Raider (2018) | 307 | 252 | 240 | 223 | 168 | 96 |
| Far Cry New Dawn (2019) | 192 | 169 | 162 | 144 | 138 | 104 |
| Metro Exodus (2019) | 317 | 219 | 171.6 | 136.6 | 112.1 | 73.3 |
| Borderlands 3 (2019) | 230 | 197.3 | 174.9 | 153 | 122.6 | 70.3 |
| F1 2021 (2021) | 663 | 543 | 453 | 222 | 169.3 | 101.1 |
| Far Cry 6 (2021) | 196 | 183 | 163 | 149 | 127 | 82 |
| Forza Horizon 5 (2021) | 295 | 205 | 193 | 129 | 114 | 84 |
| Cyberpunk 2077 1.6 (2022) | 205 | 172.1 | 151.3 | 137.7 | 92.8 | 46.2 |
| Tiny Tina's Wonderlands (2022) | 359 | 287 | 204 | 161.8 | 118.8 | 67.5 |
| F1 22 (2022) | 400 | 415 | 352 | 127.2 | 83.9 | 42 |
Zużycie energii: Znaczący wzrost wydajności wielordzeniowej w trybie Eco
AMD 'Raphael' Zen 4 wydaje się być dość energooszczędny w porównaniu do konkurencji z Raptor Lake. Całkowite zużycie energii przez system w teście wielordzeniowym Cinebench R15 w przypadku układu opartego na Ryzen 9 7950X jest o 24% mniejsze w porównaniu do komputera z procesorem Core i9-13900K, choć jest też o 12% wyższe w porównaniu do Core i9-12900K.
Konfiguracja oparta na Ryzen 7 7700X łyka ze ściany 16% mniej energii w wielordzeniowym Cinebench R15 w porównaniu z Core i5-13600K i jest mniej więcej podobna do systemu zasilanego Ryzen 9 5900X.
Tryb Eco dodatkowo pomaga w osiągnięciu znacznego wzrostu efektywności energetycznej. W przypadku Ryzena 9 7950X przebiegi 105 W i 65 W są odpowiednio o 29% i 47% wydajniejsze od domyślnego 170 W TDP w Cinebench R15 multi-core.
Podobnie, Ryzen 7700X o mocy 65 W może sobie pozwolić na 17% wyższą wydajność w tym samym benchmarku w porównaniu z domyślnym TDP procesora wynoszącym 105 W.
Ponieważ wydajność jednordzeniowa jest względnie nienaruszona zmianą TDP, wydaje się, że nie ma dostrzegalnej przewagi wydajności w grach, co widać na wykresach wydajności The Witcher 3 1080p Ultra. Mimo to, praca tych układów przy niższym TDP skutkuje ogólnym zmniejszeniem zużycia energii.
Power Consumption: External Monitor
| Power Consumption / Cinebench R15 Multi Efficiency (external Monitor) | |
| AMD Ryzen 9 7950X ECO 65 W, NVIDIA GeForce RTX 3090 | |
| Średnia w klasie Desktop (13.7 - 41.2, n=14, ostatnie 2 lata) | |
| AMD Ryzen 9 7950X ECO 105 W, NVIDIA GeForce RTX 3090 | |
| AMD Ryzen 9 5950X, NVIDIA Titan RTX | |
| AMD Ryzen 9 7950X, NVIDIA GeForce RTX 3090 | |
| Przeciętny NVIDIA GeForce RTX 3090 (11.7 - 25.2, n=13) | |
| AMD Ryzen 9 5900X, NVIDIA Titan RTX | |
| AMD Ryzen 9 7900X, NVIDIA GeForce RTX 3090 | |
| AMD Ryzen 7 7700X ECO 65 W, NVIDIA GeForce RTX 3090 | |
| AMD Ryzen 7 7700X, NVIDIA GeForce RTX 3090 | |
| Intel Core i9-13900K, NVIDIA GeForce RTX 3090 | |
| Intel Core i5-13600K, NVIDIA GeForce RTX 3090 | |
| Intel Core i9-12900K, NVIDIA Titan RTX | |
| Intel Core i5-12600K, NVIDIA Titan RTX | |
| AMD Ryzen 7 5800X, NVIDIA Titan RTX | |
| AMD Ryzen 5 7600X, NVIDIA GeForce RTX 3090 | |
| AMD Ryzen 5 5600X, NVIDIA Titan RTX | |
| AMD Ryzen 7 5800X3D, NVIDIA GeForce RTX 3090 Ti | |
| Power Consumption / Witcher 3 ultra Efficiency (external Monitor) | |
| Średnia w klasie Desktop (0.113 - 0.653, n=44, ostatnie 2 lata) | |
| Intel Core i5-13600K, NVIDIA GeForce RTX 3090 | |
| AMD Ryzen 5 7600X, NVIDIA GeForce RTX 3090 | |
| Intel Core i5-12600K, NVIDIA Titan RTX | |
| Przeciętny NVIDIA GeForce RTX 3090 (0.268 - 0.3954, n=15) | |
| AMD Ryzen 7 5800X3D, NVIDIA GeForce RTX 3090 Ti | |
| AMD Ryzen 5 5600X, NVIDIA Titan RTX | |
| AMD Ryzen 9 7900X, NVIDIA GeForce RTX 3090 | |
| Intel Core i9-13900K, NVIDIA GeForce RTX 3090 | |
| AMD Ryzen 7 7700X, NVIDIA GeForce RTX 3090 | |
| AMD Ryzen 7 5800X, NVIDIA Titan RTX | |
| AMD Ryzen 9 7950X ECO 105 W, NVIDIA GeForce RTX 3090 | |
| AMD Ryzen 9 7950X ECO 65 W, NVIDIA GeForce RTX 3090 | |
| AMD Ryzen 9 7950X, NVIDIA GeForce RTX 3090 | |
| AMD Ryzen 7 7700X ECO 65 W, NVIDIA GeForce RTX 3090 | |
| AMD Ryzen 9 5900X, NVIDIA Titan RTX | |
| AMD Ryzen 9 5950X, NVIDIA Titan RTX | |
| Intel Core i9-12900K, NVIDIA Titan RTX | |
| Power Consumption / Cinebench R15 Multi (external Monitor) | |
| Intel Core i9-13900K, NVIDIA GeForce RTX 3090 | |
| AMD Ryzen 9 7950X, NVIDIA GeForce RTX 3090 (Idle: 95.2 W) | |
| Intel Core i9-12900K, NVIDIA Titan RTX (Idle: 70.5 W) | |
| AMD Ryzen 9 7900X, NVIDIA GeForce RTX 3090 | |
| Intel Core i5-13600K, NVIDIA GeForce RTX 3090 | |
| Przeciętny NVIDIA GeForce RTX 3090 (Idle: 149.4 - 480, n=14 W) | |
| AMD Ryzen 9 7950X ECO 105 W, NVIDIA GeForce RTX 3090 (Idle: 93.4 W) | |
| AMD Ryzen 7 7700X, NVIDIA GeForce RTX 3090 (Idle: 89.8 W) | |
| AMD Ryzen 9 5900X, NVIDIA Titan RTX (Idle: 78.1 W) | |
| Średnia w klasie Desktop (Idle: 78.9 - 356, n=14, ostatnie 2 lata W) | |
| AMD Ryzen 9 5950X, NVIDIA Titan RTX (Idle: 78 W) | |
| AMD Ryzen 7 5800X, NVIDIA Titan RTX (Idle: 77.5 W) | |
| AMD Ryzen 5 7600X, NVIDIA GeForce RTX 3090 | |
| AMD Ryzen 7 5800X3D, NVIDIA GeForce RTX 3090 Ti (Idle: 102 W) | |
| Intel Core i5-12600K, NVIDIA Titan RTX (Idle: 70.45 W) | |
| AMD Ryzen 7 7700X ECO 65 W, NVIDIA GeForce RTX 3090 | |
| AMD Ryzen 9 7950X ECO 65 W, NVIDIA GeForce RTX 3090 (Idle: 93.1 W) | |
| AMD Ryzen 5 5600X, NVIDIA Titan RTX (Idle: 79.23 W) | |
| Power Consumption / Prime95 V2810 Stress (external Monitor) | |
| Intel Core i9-13900K, NVIDIA GeForce RTX 3090 | |
| Intel Core i5-13600K, NVIDIA GeForce RTX 3090 | |
| AMD Ryzen 9 7950X, NVIDIA GeForce RTX 3090 (Idle: 95.2 W) | |
| AMD Ryzen 9 7900X, NVIDIA GeForce RTX 3090 | |
| Intel Core i9-12900K, NVIDIA Titan RTX (Idle: 70.5 W) | |
| Przeciętny NVIDIA GeForce RTX 3090 (Idle: 163.2 - 471, n=14 W) | |
| Intel Core i5-12600K, NVIDIA Titan RTX (Idle: 70.45 W) | |
| AMD Ryzen 9 7950X ECO 105 W, NVIDIA GeForce RTX 3090 (Idle: 93.4 W) | |
| AMD Ryzen 9 5950X, NVIDIA Titan RTX (Idle: 78 W) | |
| AMD Ryzen 7 5800X, NVIDIA Titan RTX (Idle: 77.5 W) | |
| AMD Ryzen 9 5900X, NVIDIA Titan RTX (Idle: 78.1 W) | |
| Średnia w klasie Desktop (Idle: 75.3 - 379, n=14, ostatnie 2 lata W) | |
| AMD Ryzen 7 7700X, NVIDIA GeForce RTX 3090 (Idle: 89.8 W) | |
| AMD Ryzen 5 7600X, NVIDIA GeForce RTX 3090 | |
| AMD Ryzen 7 5800X3D, NVIDIA GeForce RTX 3090 Ti (Idle: 102 W) | |
| AMD Ryzen 7 7700X ECO 65 W, NVIDIA GeForce RTX 3090 | |
| AMD Ryzen 9 7950X ECO 65 W, NVIDIA GeForce RTX 3090 (Idle: 93.1 W) | |
| AMD Ryzen 5 5600X, NVIDIA Titan RTX (Idle: 79.23 W) | |
| Power Consumption / The Witcher 3 ultra (external Monitor) | |
| AMD Ryzen 7 5800X3D, NVIDIA GeForce RTX 3090 Ti (Idle: 102 W) | |
| AMD Ryzen 9 7900X, NVIDIA GeForce RTX 3090 | |
| AMD Ryzen 9 7950X, NVIDIA GeForce RTX 3090 (Idle: 95.2 W) | |
| AMD Ryzen 9 7950X ECO 105 W, NVIDIA GeForce RTX 3090 (Idle: 93.4 W) | |
| AMD Ryzen 9 7950X ECO 65 W, NVIDIA GeForce RTX 3090 (Idle: 93.1 W) | |
| Intel Core i9-13900K, NVIDIA GeForce RTX 3090 | |
| AMD Ryzen 7 7700X ECO 65 W, NVIDIA GeForce RTX 3090 | |
| Przeciętny NVIDIA GeForce RTX 3090 (Idle: 464 - 597, n=18 W) | |
| AMD Ryzen 5 7600X, NVIDIA GeForce RTX 3090 | |
| AMD Ryzen 7 7700X, NVIDIA GeForce RTX 3090 (Idle: 89.8 W) | |
| Intel Core i5-13600K, NVIDIA GeForce RTX 3090 | |
| Intel Core i9-12900K, NVIDIA Titan RTX (Idle: 70.5 W) | |
| AMD Ryzen 9 5950X, NVIDIA Titan RTX (Idle: 78 W) | |
| AMD Ryzen 9 5900X, NVIDIA Titan RTX (Idle: 78.1 W) | |
| Średnia w klasie Desktop (Idle: 69 - 692, n=44, ostatnie 2 lata W) | |
| AMD Ryzen 7 5800X, NVIDIA Titan RTX (Idle: 77.5 W) | |
| AMD Ryzen 5 5600X, NVIDIA Titan RTX (Idle: 79.23 W) | |
| Intel Core i5-12600K, NVIDIA Titan RTX (Idle: 70.45 W) | |
* ... im mniej tym lepiej
Za
Przeciw
Werdykt: Nie można się pomylić z Zen 4


rok 2022 okazał się bardzo interesujący dla entuzjastów PC. Widzieliśmy, jak Nvidia i AMD wprowadzają swoje architektury GPU Ada Lovelace i RDNA 3, podczas gdy Intel i AMD biorą się za łby ze swoimi liniami Raptor Lake i Zen 4 Raphael.
AMD Ryzen 9 7950X stanowi przekonującą opcję dla każdego, kto poszukuje flagowego procesora do komputerów stacjonarnych głównego nurtu, który będzie zasilał jego kreatywne projekty i nie będzie stanowił wąskiego gardła w grach. Ryzen 9 7950X działa na równi z Core i9-13900K w ogólnych benchmarkach CPU. Poszczególne testy faworyzują flagowca z serii Raptor Lake, ale różnice nie są na tyle drastyczne, by były odczuwalne w realnym świecie.
Porównawczo Ryzen 7 7700X pozostaje w tyle za Ryzenem 9 7950X o 25%. Ten układ 8C/16T może jednak osiągać lepsze wyniki niż np Core i5-13600K lub nawet Core i9-12900K, co zasługuje na uznanie.
AMD Ryzen 9 7950X i Ryzen 7 7700X prezentują znaczną aktualizację w stosunku do Zen 3 i gwarantują, że oferta Raptor Lake firmy Intel nie pozostanie bez echa. Opcja wykorzystania trybu Eco bez znaczących kar za wydajność jest wisienką na torcie."
Zarówno Ryzen 9 7950X, jak i Ryzen 7 7700X świetnie sprawdzą się w ogólnej wydajności. Ryzen 9 7950X wydaje się być lepszą opcją w porównaniu z Core i9-13900K, jeśli twój przepływ pracy obejmuje dużo matematyki zmiennoprzecinkowej, co potwierdzają nasze testy AIDA64.
Eco to tryb jest prawdopodobnie najlepszym punktem sprzedaży tej generacji procesorów AMD. Fakt, że można uzyskać dość znaczny zysk z 65 W Ryzen 9 7950X nad 241 W Core i9-12900K nie jest niczym, z czego można by szydzić. Użytkownicy poszukujący zwiększonej wydajności energetycznej do mniej wymagających zadań przekonają się, że praca Ryzena 9 7950X przy 65 W może być nawet o 47% bardziej wydajna niż przy ustawieniach fabrycznych.
Ryzen 7 7700X już sam w sobie jest dość wydajnym układem, ale obniżenie TDP do 65 W nadal skutkuje odczuwalnymi oszczędnościami energii. Gracze nie muszą się martwić o utratę dużej wydajności przy niższym TDP, ponieważ wydajność jednordzeniowa pozostaje względnie niezagrożona.
Socket AM4 został wyparty przez nową platformę AM5, która przynosi ze sobą natywną obsługę DDR5 i PCIe Gen 5. W przeciwieństwie do Intela, AMD postanowiło uczynić AM5 DDR5-exclusive. DDR5 jest obecnie w cenie i minie trochę czasu zanim ceny staną się bardziej stabilne i porównywalne z cenami DDR4.
Należy również wziąć pod uwagę koszty aktualizacji płyty głównej - płyty główne X670 często zaczynają się od 400 USD, a w pełni obciążone flagowce X670E przekraczają nawet 1200 USD za samą płytę. Dobra wiadomość jest jednak taka, że Twój obecny system chłodzenia najprawdopodobniej będzie pasował, a platforma będzie wspierana co najmniej do 2025 roku.
W przypadku Ryzen 9 7950X i Ryzen 7 7700X, a także m.in Ryzen 9 7900X i Ryzen 5 7600X, AMD rozwiało obawy, że "Raphaelowe" układy Zen 4 mogą nie dorównać Raptor Lake Intela. Zen 4 to atrakcyjny upgrade, niezależnie od początkowej inwestycji w platformę AM5.
Nieuchronne nadejście Ryzen 7000 X3D w najbliższych miesiącach stanowi jeszcze bardziej kuszącą perspektywę, a dalej może być już tylko lepiej.
Cena i dostępność
Intel tym razem ma przewagę w cenach maksymalnych. Core i9-13900K wystartował w cenie 589 USD MSRP, ale obecnie jego cena detaliczna wynosi 660 USD. Z kolei AMD Ryzen 9 7950X wystartował w cenie 699 USD, ale obecnie można go dostać za 574 USD na stronie Best Buy oraz Newegg. Ceny w sklepie Amazon USwydaje się jednak, że wzrosła do 748 USD
W Indiach, Ryzen 9 7950X wystartował z MSRP ₹67,999, ale jest teraz dostępny za ₹62,749 na Amazon India i za około ₹58,000 u innych sprzedawców.
AMD Ryzen 7 7700X jest również dostępny w obniżonej cenie 350 USD na stronie Best Buy oraz Newegg. W Indiach cena startowa procesora wynosiła 39 499 USD, ale można go nabyć za około 34 000 USD na stronie Amazon India i innych sklepach.
Price comparison

