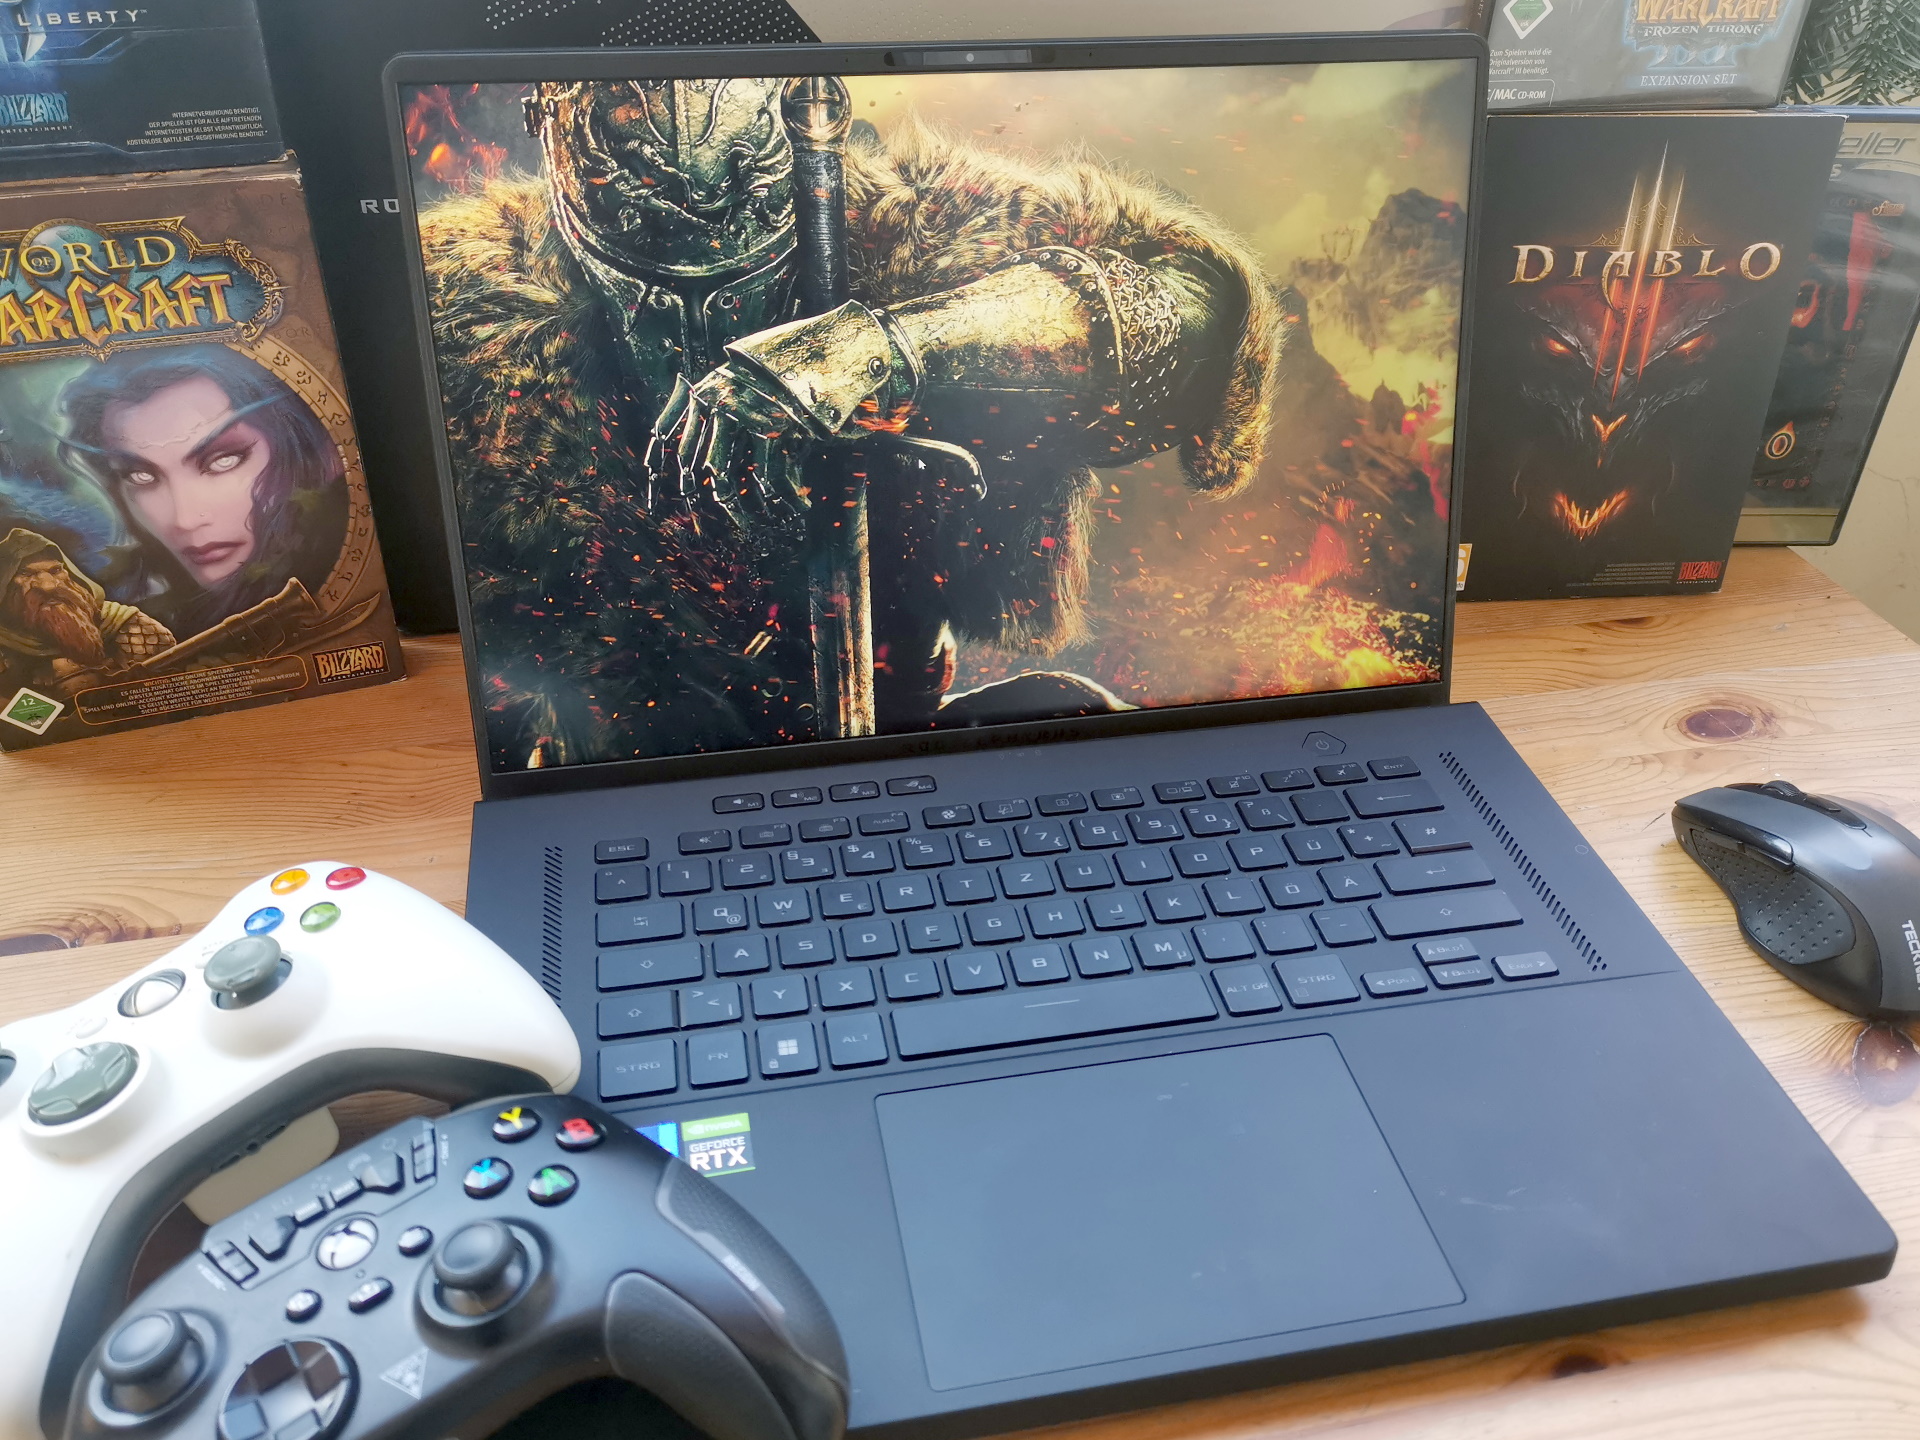
Recenzja laptopa Asus ROG Zephyrus M16: Dobrze dopracowany pakiet do gier

M16 (2022) GU603zw dziedziczy po swoim poprzedniku o tej samej nazwie, wzbogacając pakiet o wydajny procesor i9 Alder Lake i RTX 3070 Ti. Wszystko to mieści się w dość smukłej i kompaktowej 16-calowej obudowie z wyświetlaczem 16:10 (2 560 x 1 500 pikseli), która ledwie omija naszą listę najlepszych mobilnych laptopów do gier, ponieważ waży tylko 75 gramów (~2,6 oz) za dużo (>2 kg = 4,4 lb). Byłoby to pierwsze 16-calowe urządzenie w zestawieniu.
Ponieważ 16-calowe laptopy do gier z wyświetlaczem 16:10 to wciąż mniejszość, w naszym porównaniu uwzględniamy także "konwencjonalne" urządzenia 16:9 z podobnym sprzętem. Opróczpoprzednika, są to w szczególności.Schenker Vision 16 ProorazLenovo Legion 5 Pro, ale także Schenker XMG Focus 16oraz Corsair Voyager a1600.
Potencjalni konkurenci w porównaniu
Ocena | Data | Model | Waga | Wysokość | Rozmiar | Rezolucja | Cena |
|---|---|---|---|---|---|---|---|
| 87.8 % v7 (old) | 02/2023 | Asus ROG Zephyrus M16 GU603Z i9-12900H, GeForce RTX 3070 Ti Laptop GPU | 2.1 kg | 19.9 mm | 16.00" | 2560x1600 | |
| 85.6 % v7 (old) | Asus ROG Zephyrus M16 GU603H i9-11900H, GeForce RTX 3070 Laptop GPU | 2 kg | 20 mm | 16.00" | 2560x1600 | ||
| 87.8 % v7 (old) | 11/2022 | Schenker Vision 16 Pro RTX 3070 Ti i7-12700H, GeForce RTX 3070 Ti Laptop GPU | 1.7 kg | 17.1 mm | 16.00" | 2560x1600 | |
| 87.7 % v7 (old) | 10/2022 | Lenovo Legion 5 Pro 16ARH7H RTX 3070 Ti R7 6800H, GeForce RTX 3070 Ti Laptop GPU | 2.6 kg | 26.6 mm | 16.00" | 2560x1600 | |
| 87 % v7 (old) | 01/2023 | Schenker XMG Focus 16 (i7-12700H, RTX 3060) i7-12700H, GeForce RTX 3060 Laptop GPU | 2.2 kg | 24.3 mm | 16.00" | 2560x1600 | |
| 86.6 % v7 (old) | 12/2022 | Corsair Voyager a1600 R9 6900HS, Radeon RX 6800M | 2.4 kg | 19.9 mm | 16.00" | 2560x1600 |
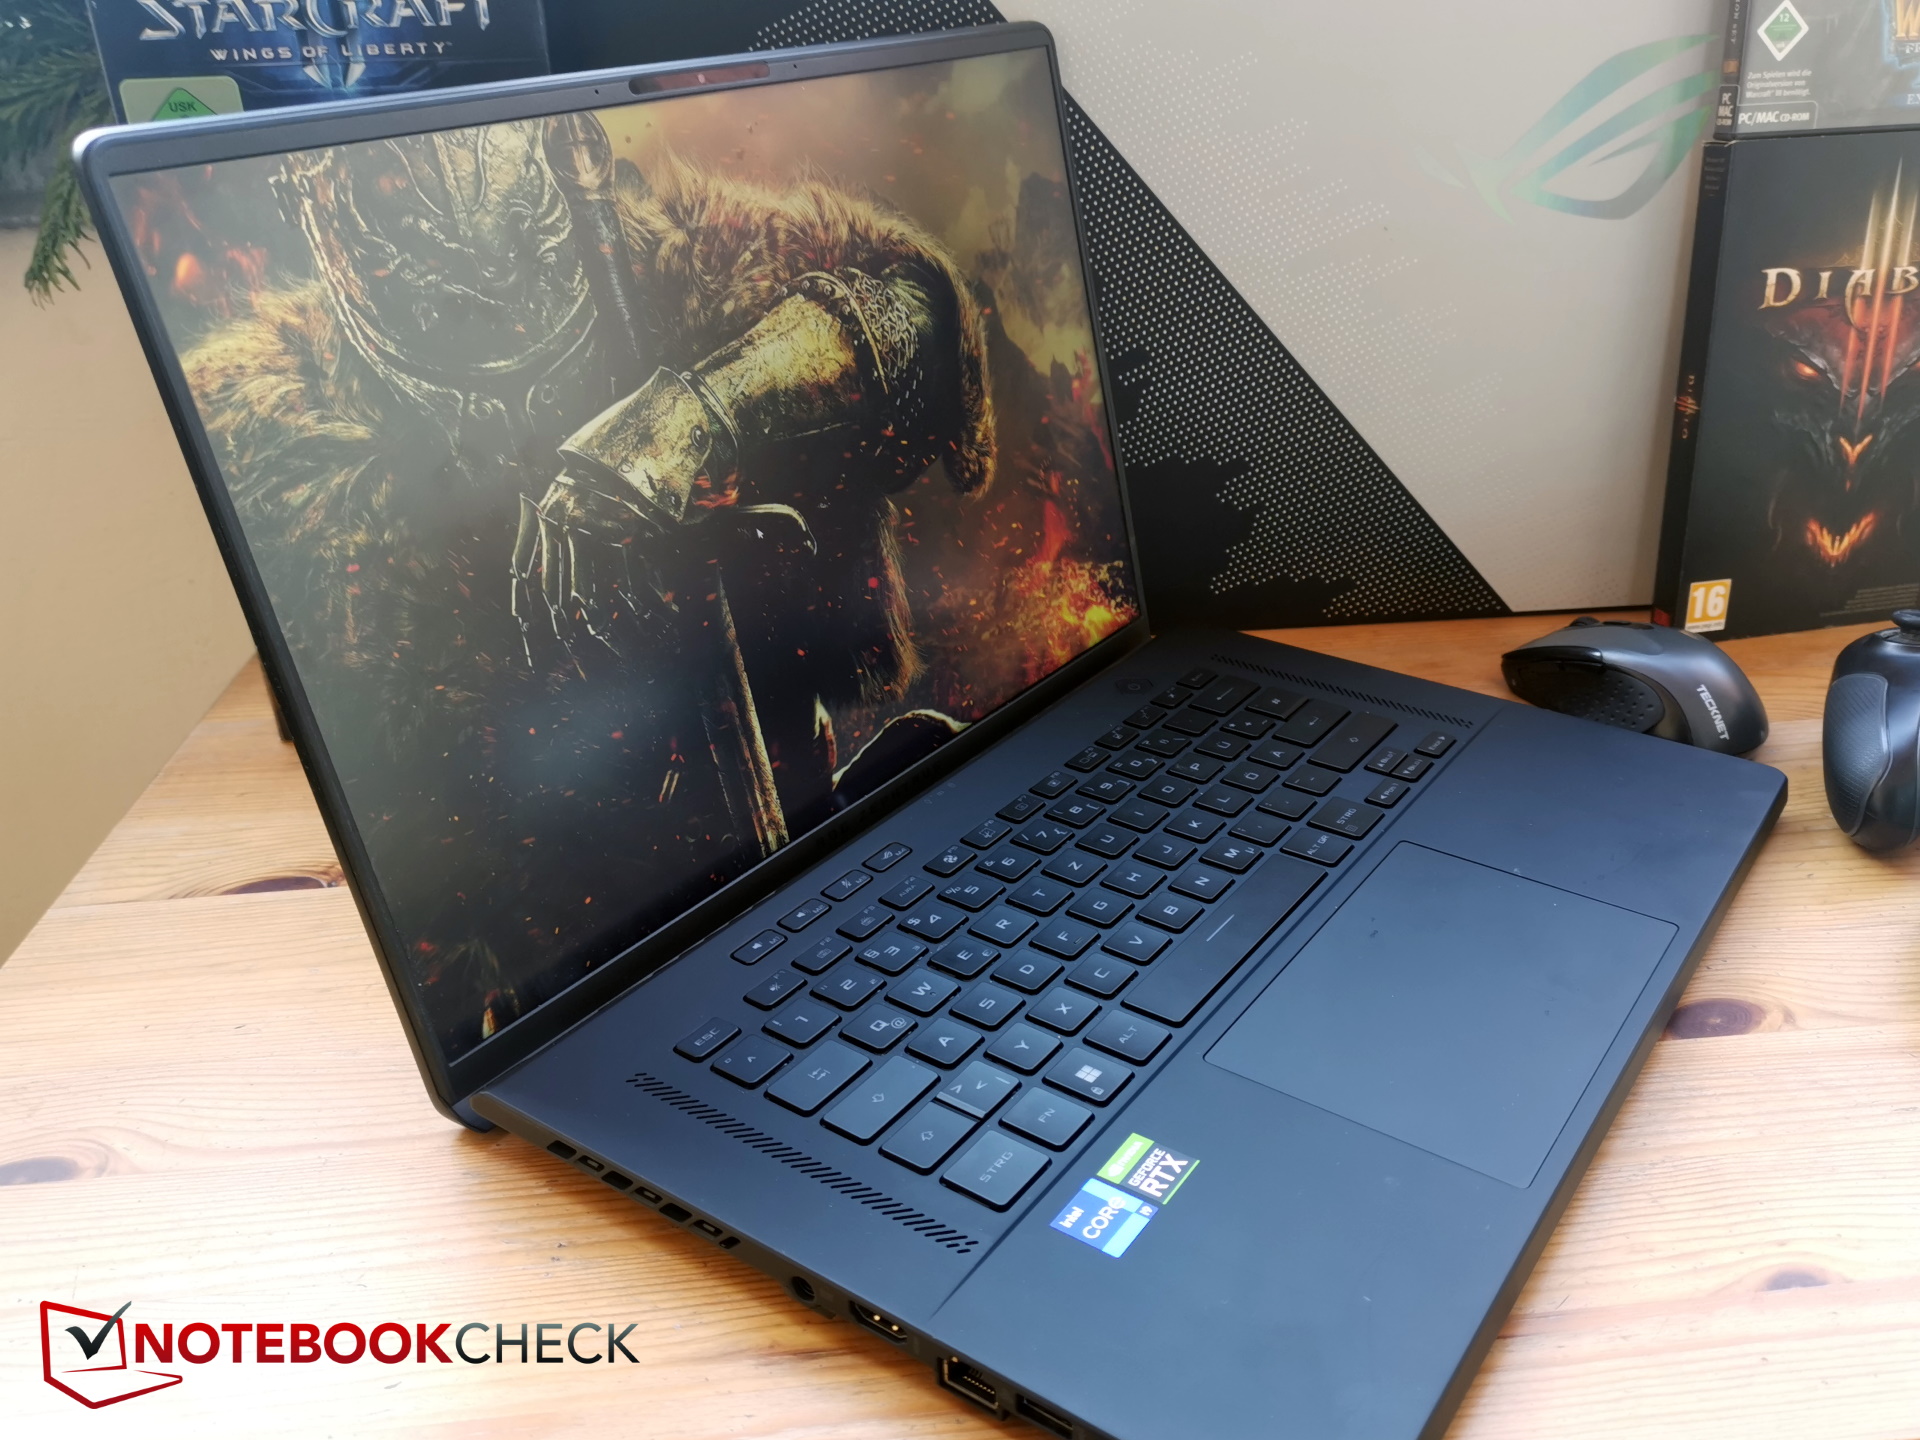
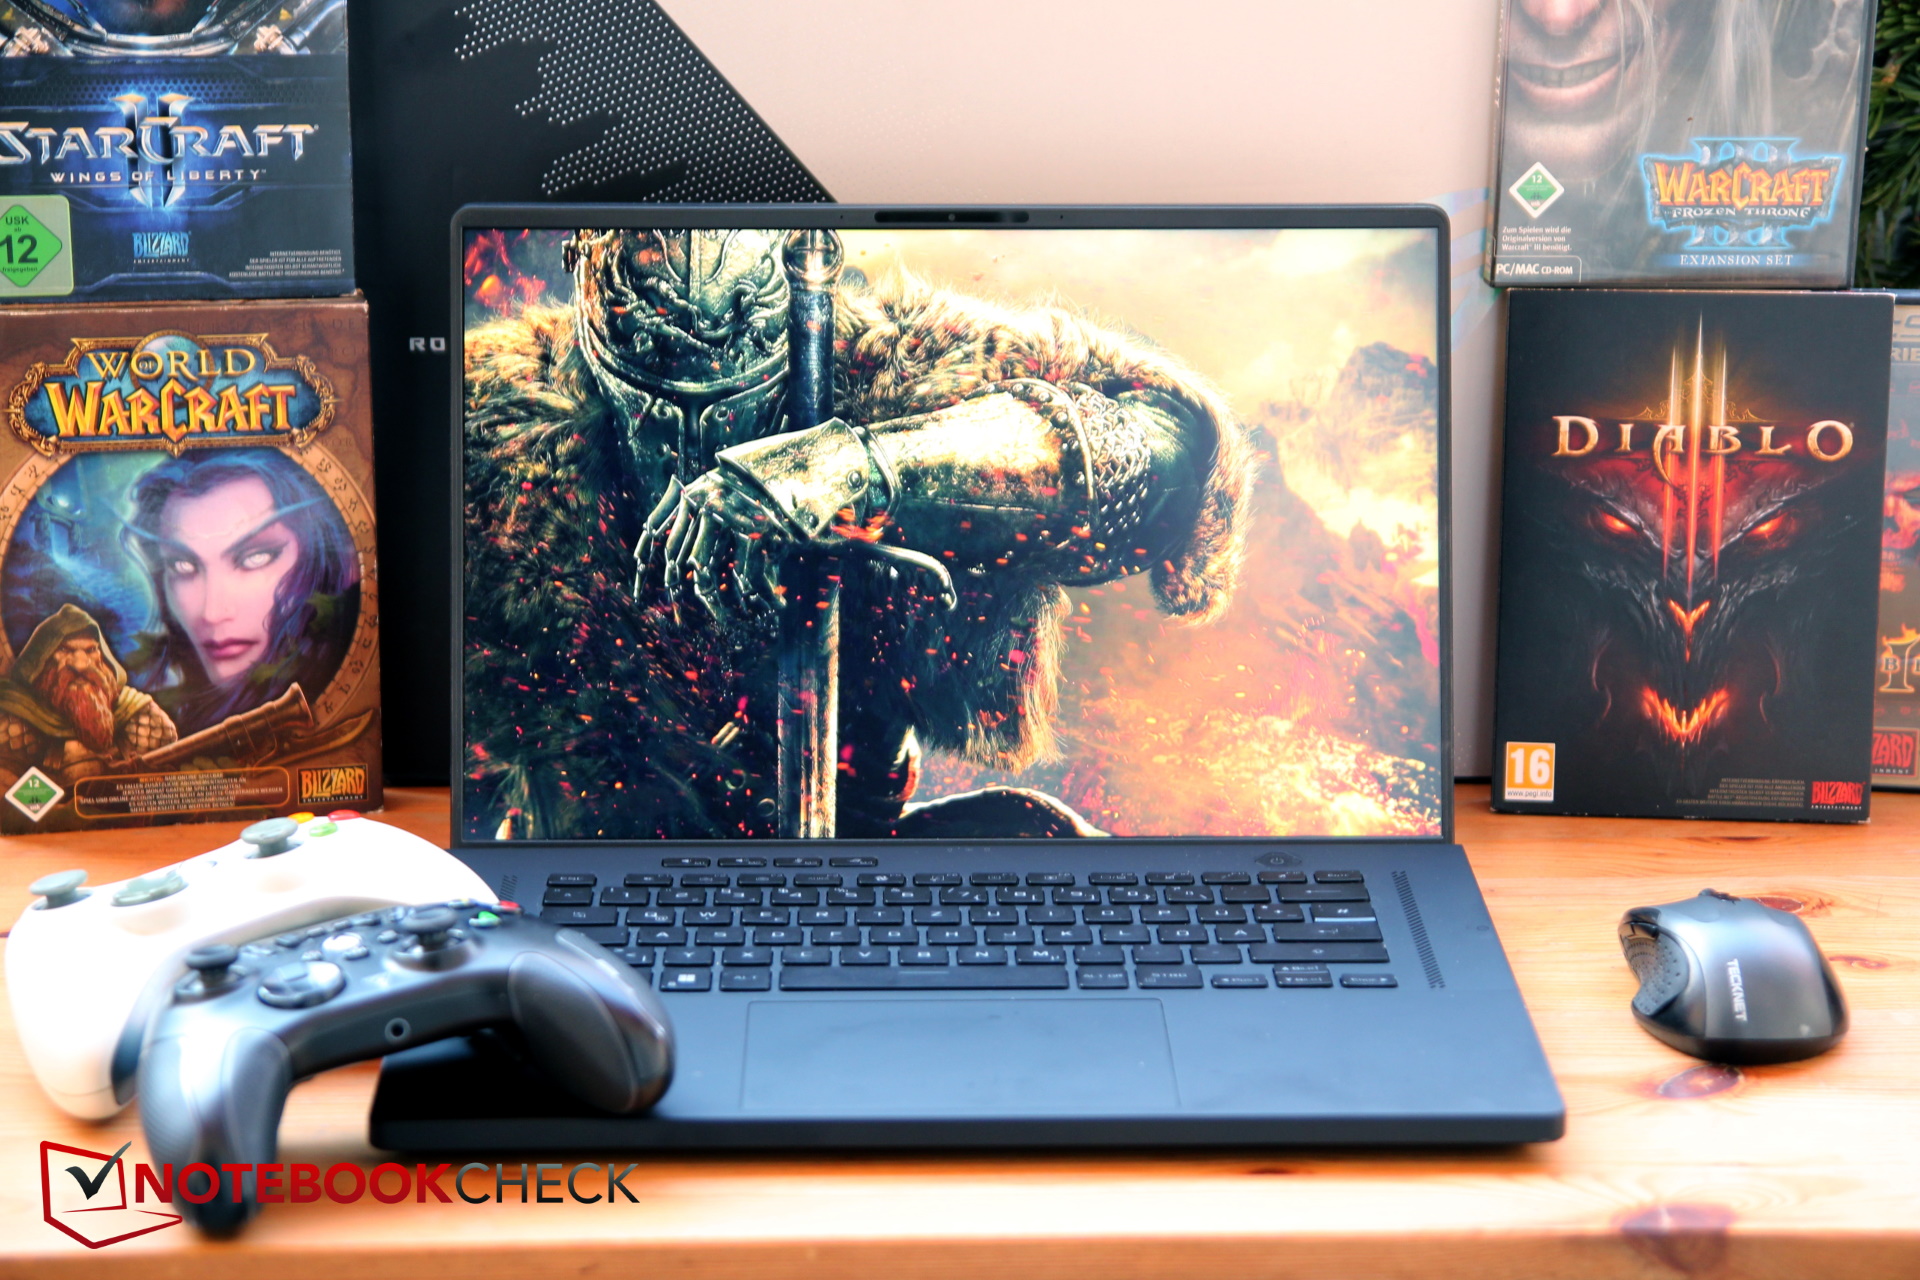
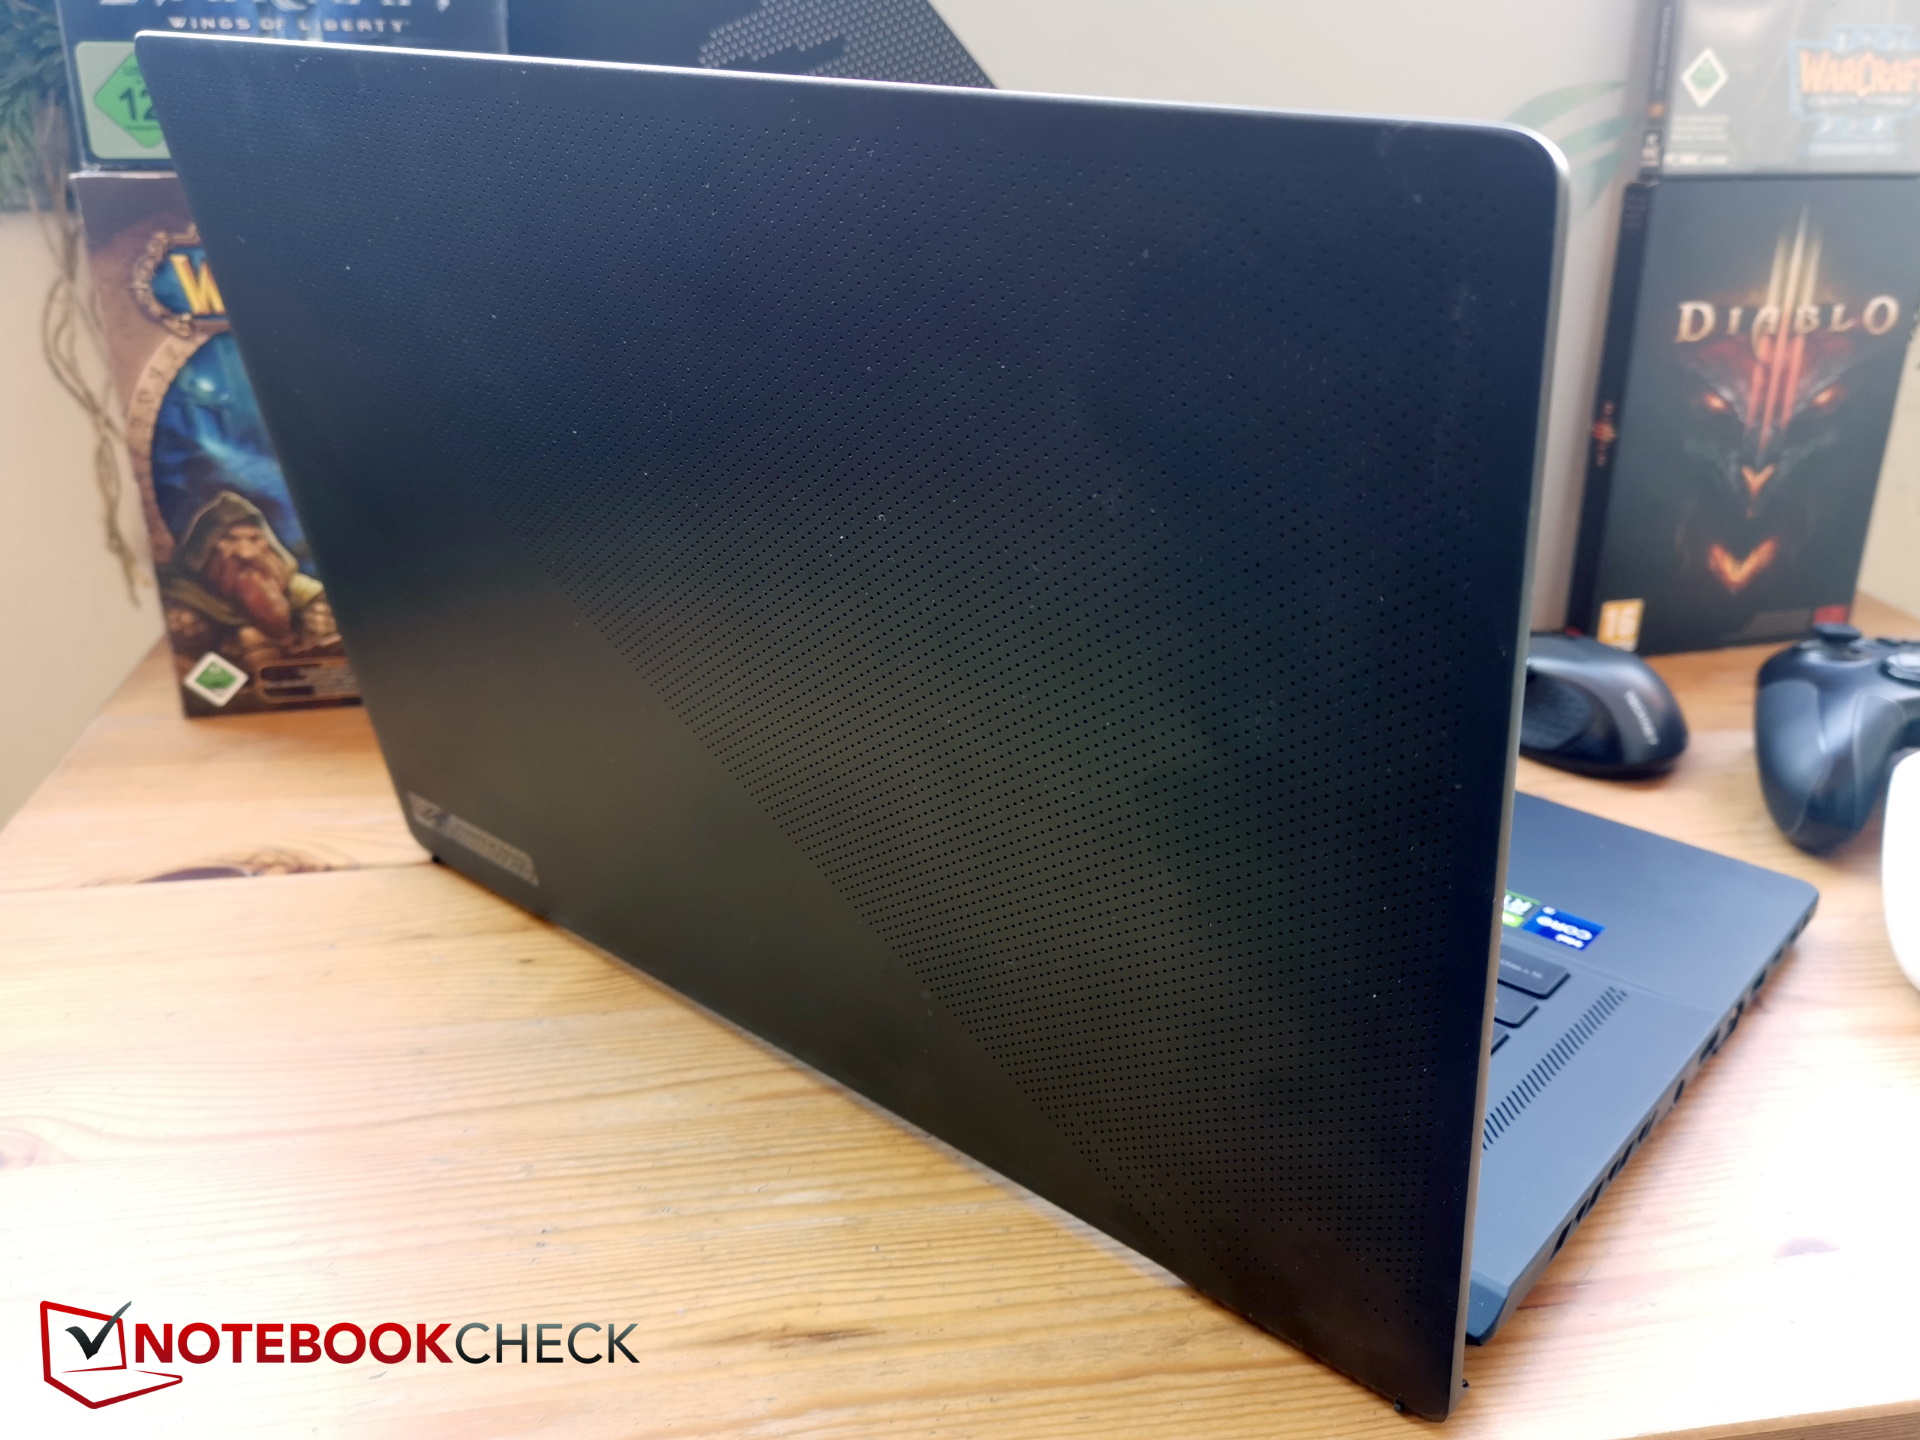
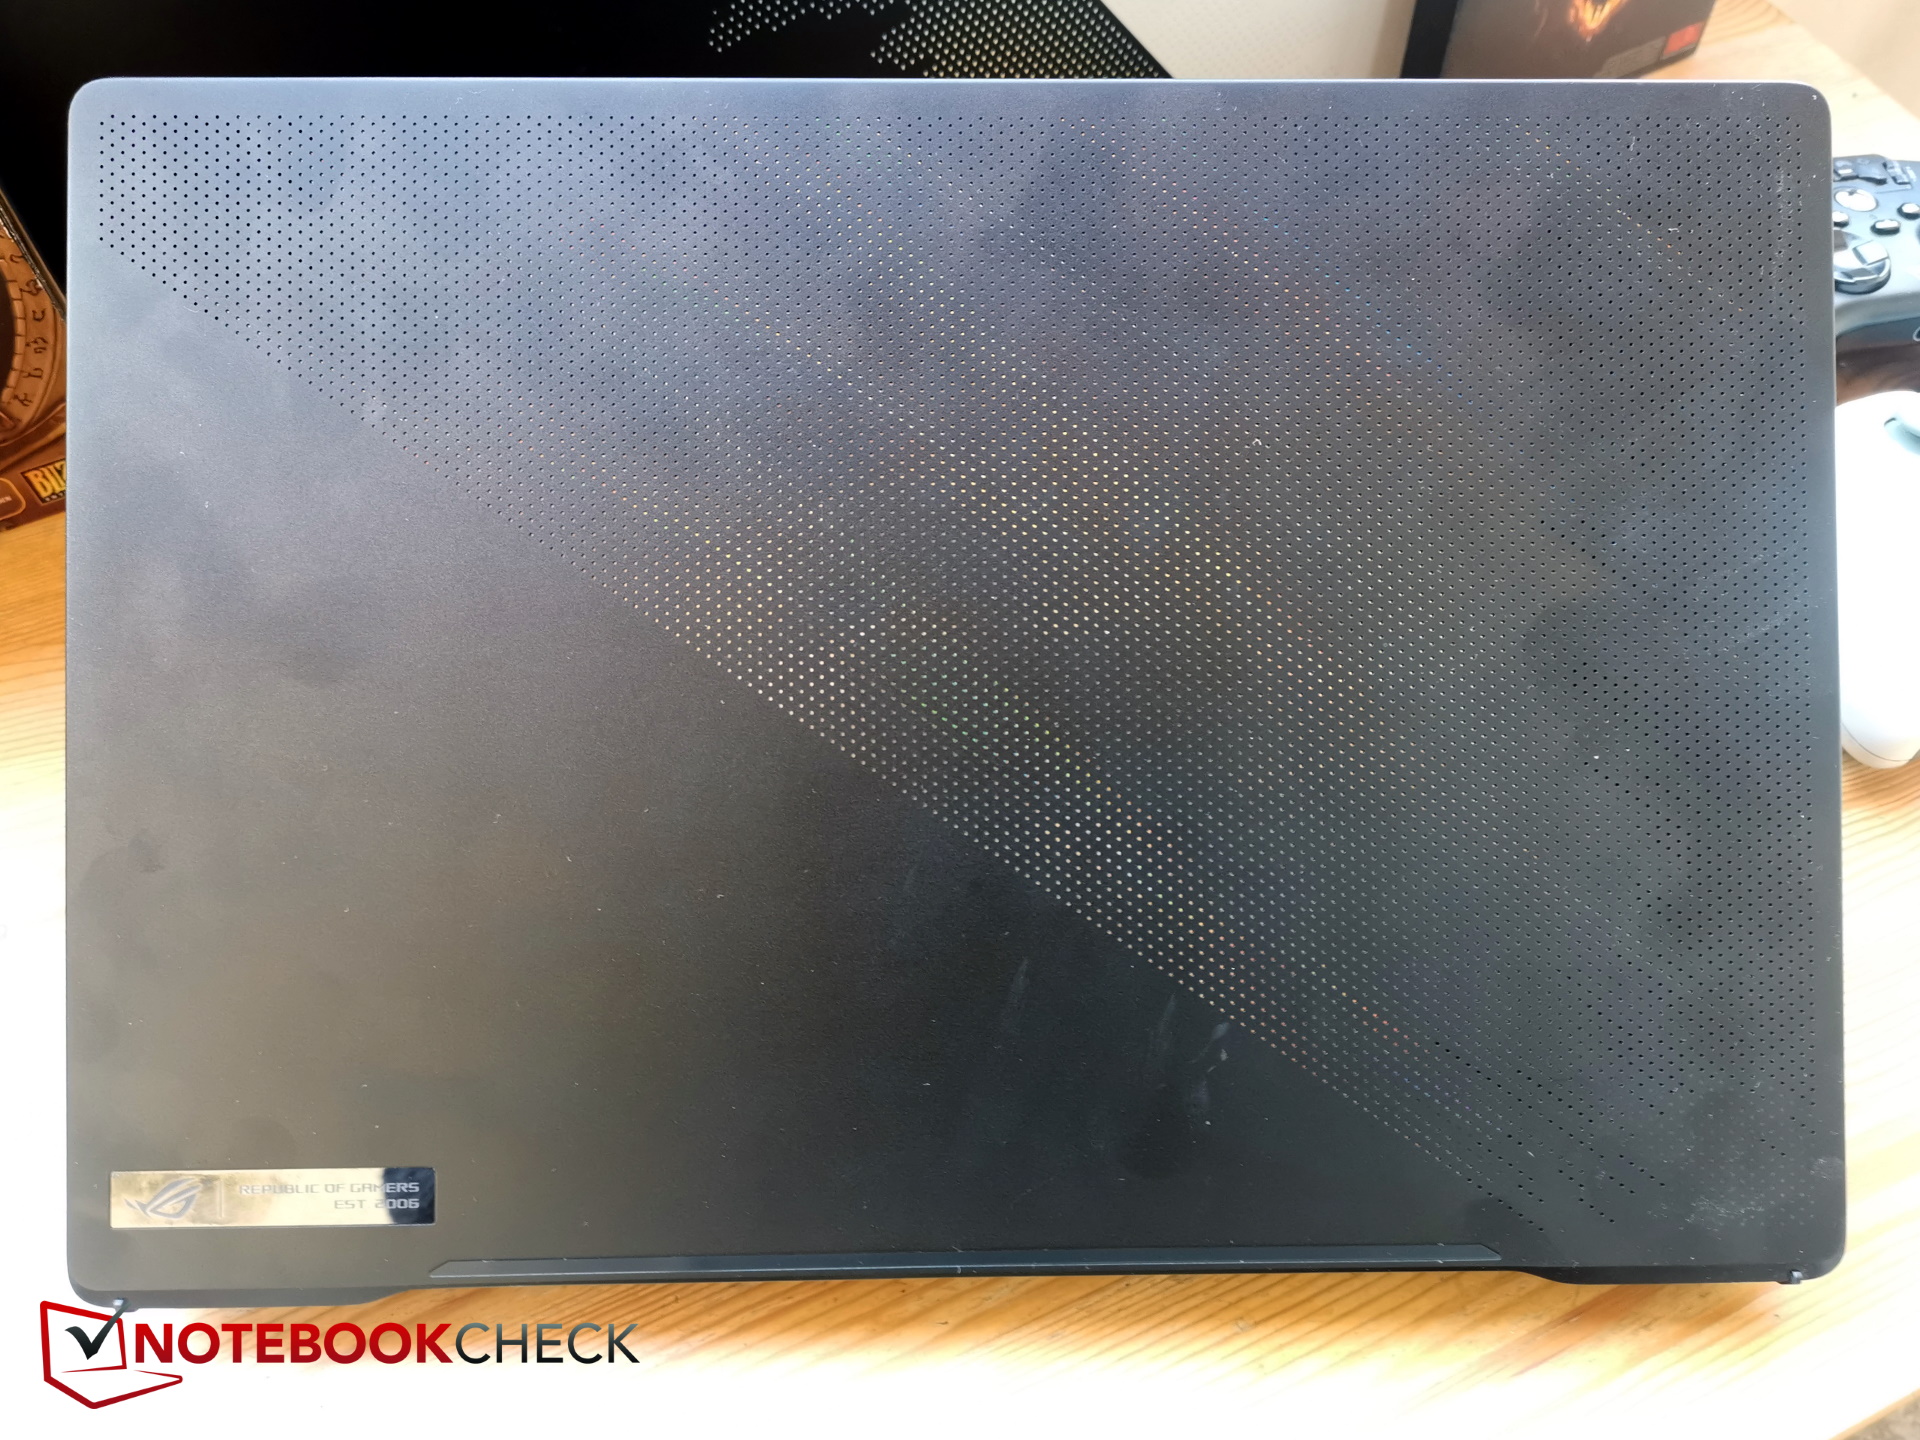
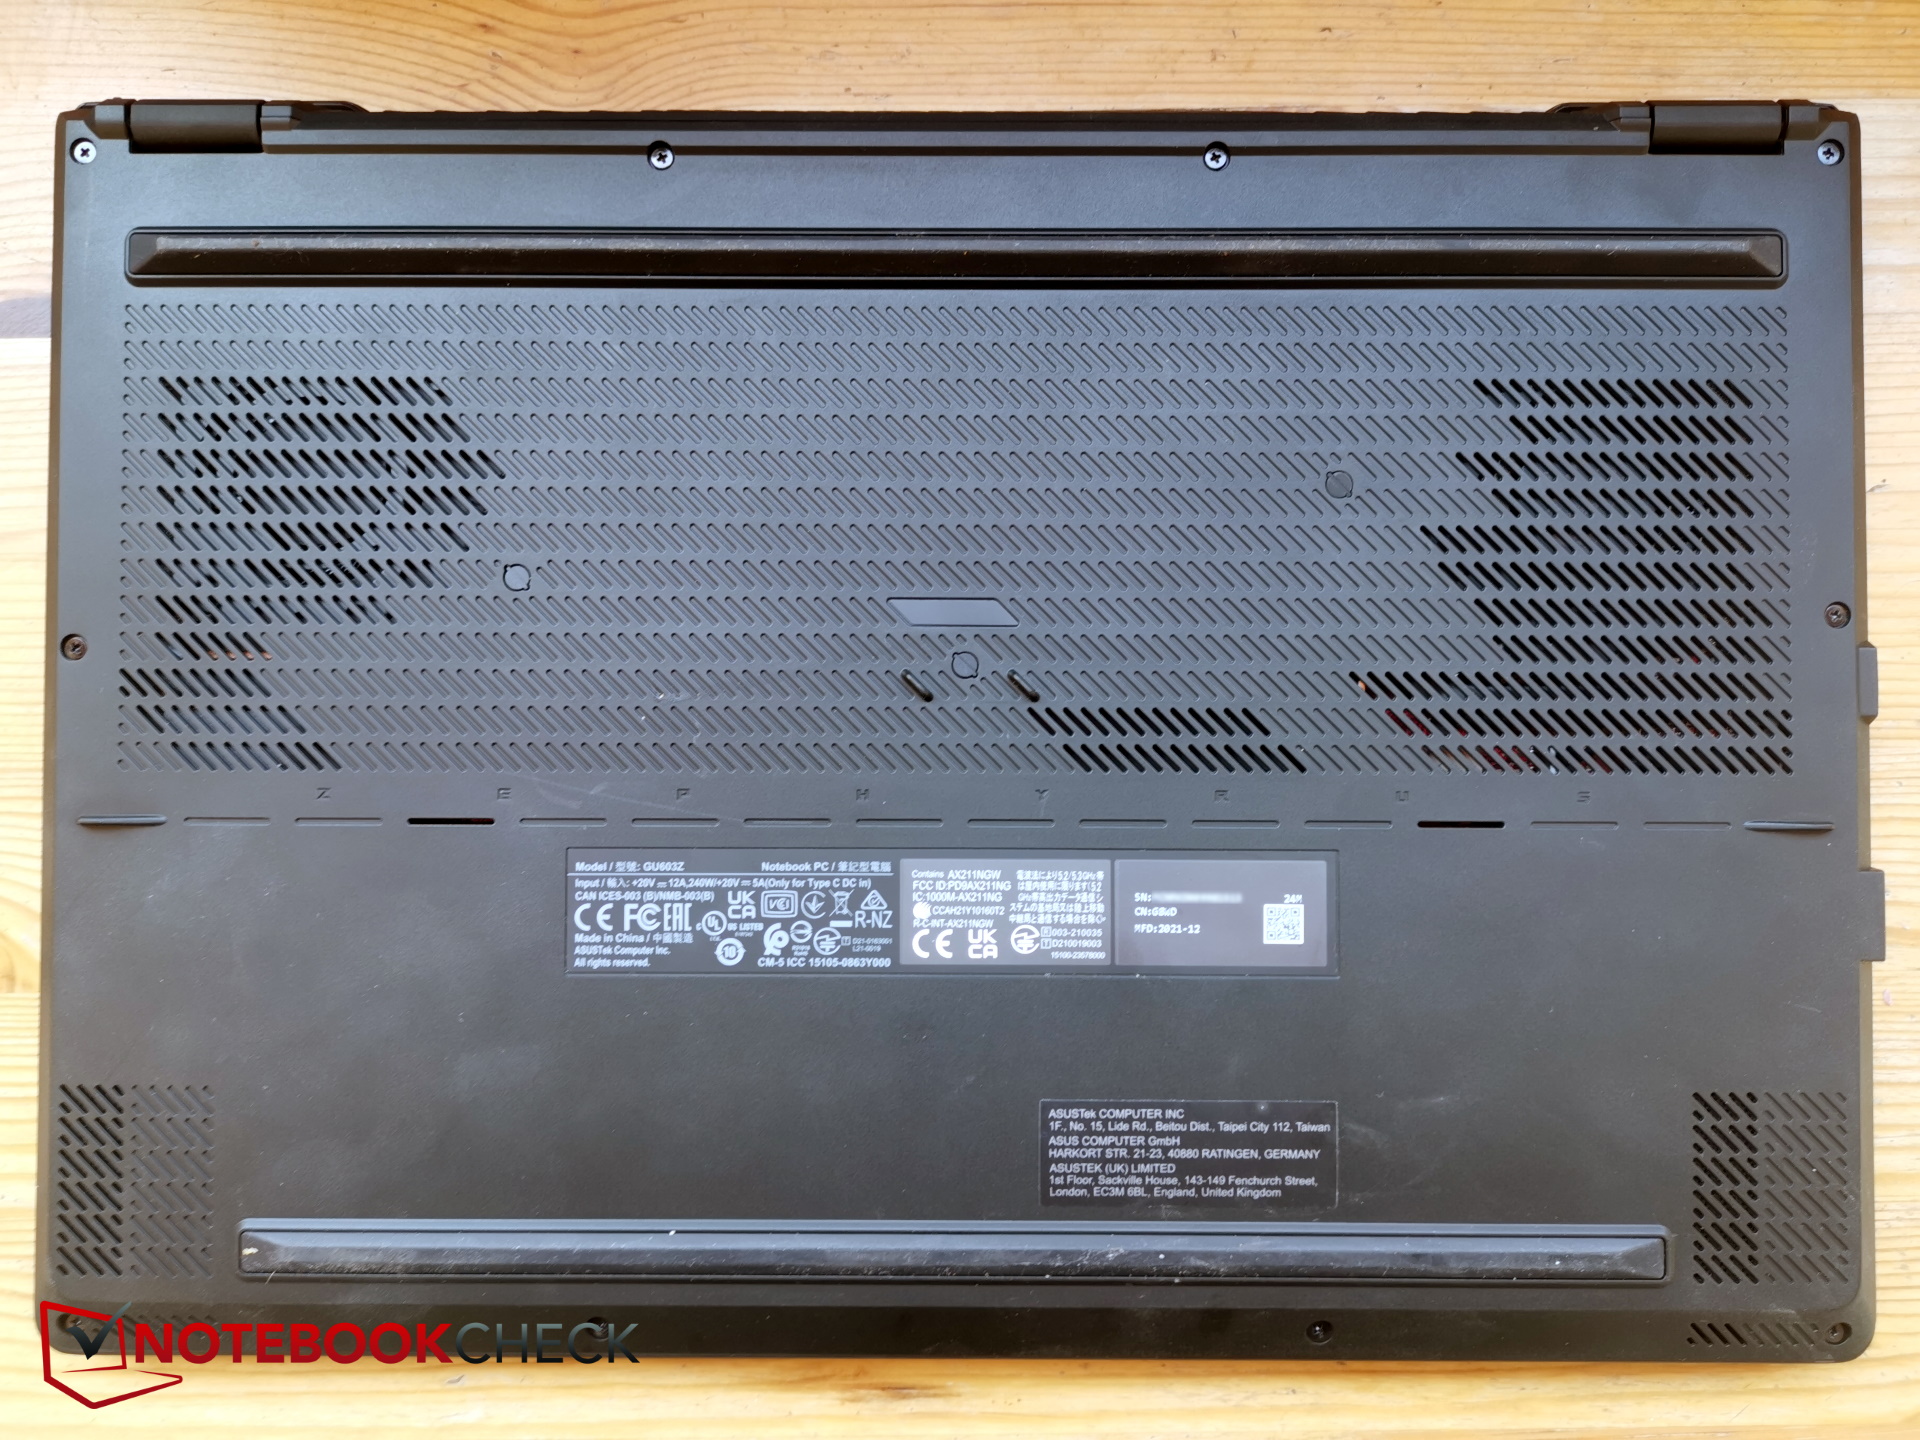
Obudowa - Slim 16-calowego laptopa do gier
Ponieważ w sprawie nie zmieniło się praktycznie nic, odsyłamy do naszego testu M16 z 2021 r, w którym znajdują się szczegółowe opisy obudowy, opcji serwisowych oraz urządzeń wejściowych.
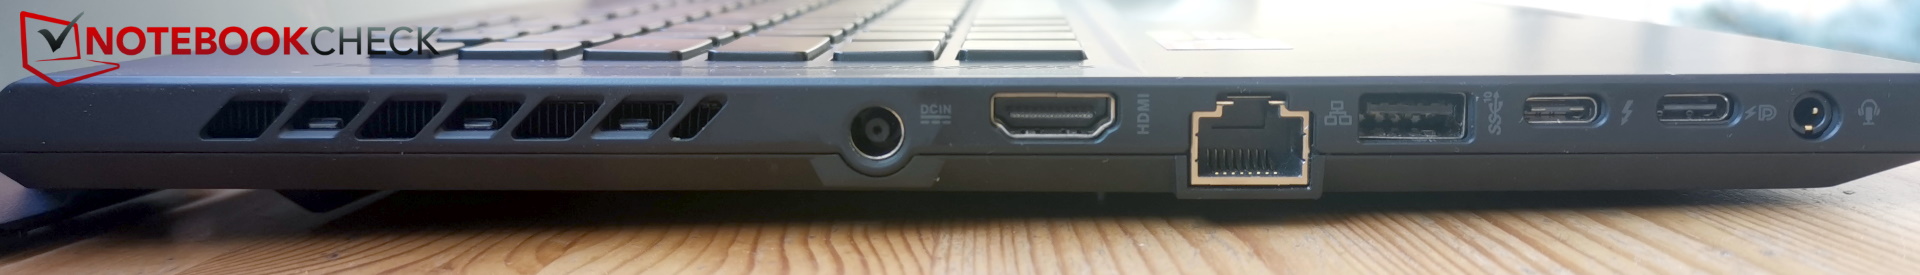
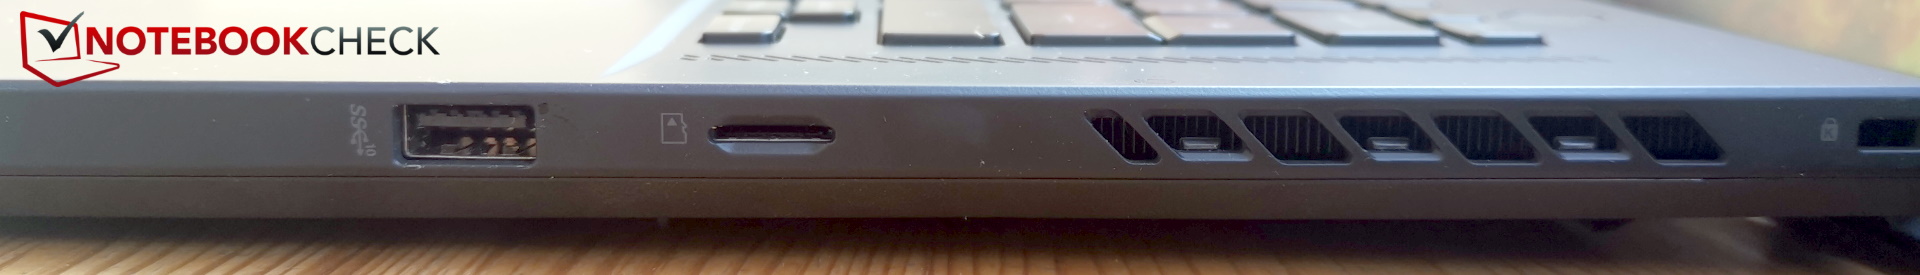
Urządzenia łączące - HDMI 2.1 i Thunderbolt 4
Czytnik kart SD
Czytnik kart SC jest ograniczony do kart microSD, ale przynajmniej nasz AV PRO microSD 128 GB V60 mieści się zgrabnie, nie wystając. W porównaniu do poprzednika, który już dobrze się spisywał, prędkość jest ponownie nieco zwiększona.
| SD Card Reader | |
| average JPG Copy Test (av. of 3 runs) | |
| Asus ROG Zephyrus M16 GU603Z | |
| Średnia w klasie Gaming (20.9 - 210, n=54, ostatnie 2 lata) | |
| Asus ROG Zephyrus M16 GU603H (AV PRO microSD 128 GB V60) | |
| Corsair Voyager a1600 (AV Pro SD microSD 128 GB V60) | |
| Schenker Vision 16 Pro RTX 3070 Ti (AV Pro V60) | |
| Schenker XMG Focus 16 (i7-12700H, RTX 3060) (AV Pro SD microSD 128 GB V60) | |
| maximum AS SSD Seq Read Test (1GB) | |
| Asus ROG Zephyrus M16 GU603Z | |
| Asus ROG Zephyrus M16 GU603H (AV PRO microSD 128 GB V60) | |
| Średnia w klasie Gaming (25.5 - 261, n=51, ostatnie 2 lata) | |
| Corsair Voyager a1600 (AV Pro SD microSD 128 GB V60) | |
| Schenker XMG Focus 16 (i7-12700H, RTX 3060) (AV Pro SD microSD 128 GB V60) | |
| Schenker Vision 16 Pro RTX 3070 Ti (AV Pro V60) | |
Komunikacja
Asus zastosował moduł Intel AX211, który obsługuje również sieć 6-Ghz. W porównaniu z modułem MediaTek z poprzednika, prędkości transferu znacznie wzrastają. Wydajność jest bardzo stała.
Kamera internetowa


Wyświetlacz - 16 cali o rozdzielczości QHD+ i częstotliwości 165 Hz
Mimo że dzieli z poprzednikiem tę samą podstawową specyfikację (16 cali, IPS, 16:10, 2 560 x 1 600, 165 Hz), Asus stosuje teraz inny panel. Zamiast korzystać z panelu od AU Optronics, tym razem pochodzi on od BOE. Co prawda panel jest nawet nieco jaśniejszy (481 nitów), ale rozkład jasności jest bardziej nierównomierny, a jasność znacznie spada zwłaszcza w kierunku lewego dolnego rogu. Dzięki znacznie poprawionej wartości czerni, pozytywnie wzrasta wartość kontrastu.
Czasy reakcji są stosunkowo szybkie, choć poprzednik reagował tu jeszcze szybciej. PWM nie jest wykorzystywany do regulacji jasności, a pewien lekki bleeding ekranu jest widoczny tylko w ciemnych scenach.

| |||||||||||||||||||||||||
rozświetlenie: 82 %
na akumulatorze: 484 cd/m²
kontrast: 2367:1 (czerń: 0.21 cd/m²)
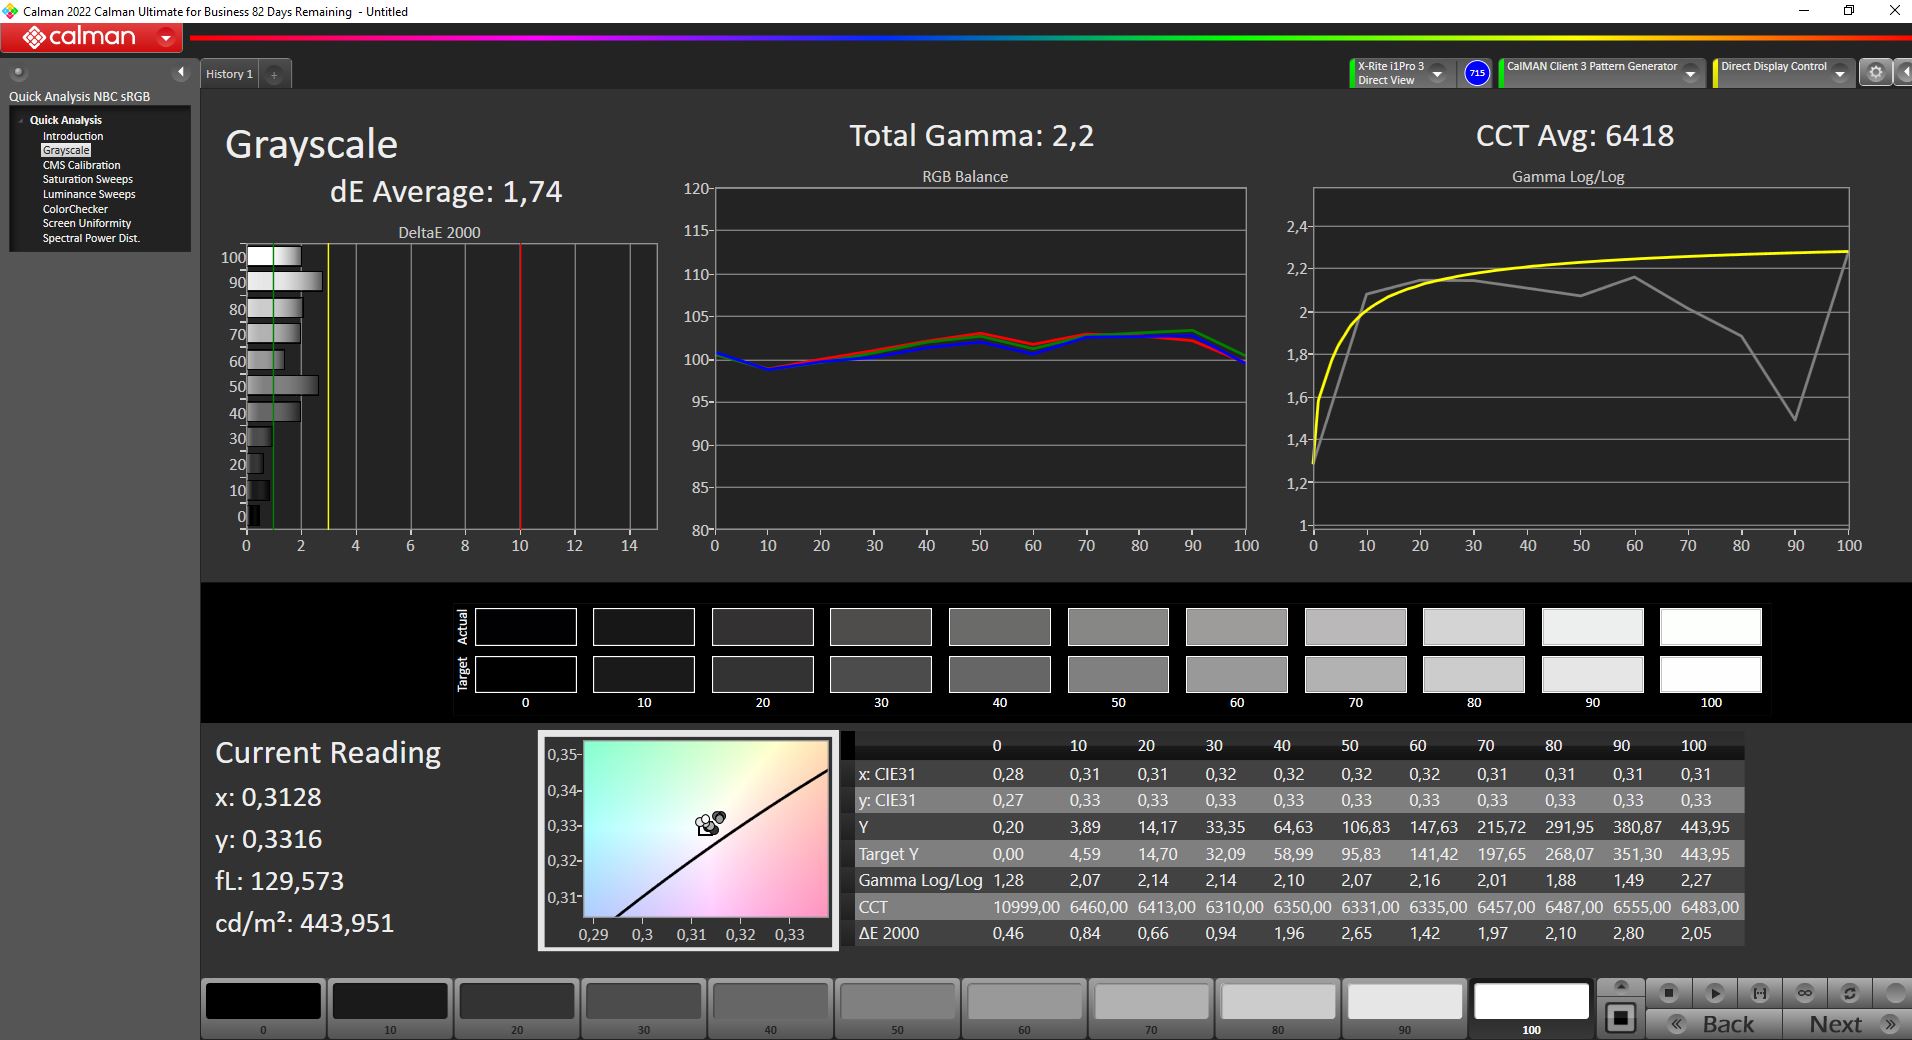
ΔE ColorChecker Calman: 3.53 | ∀{0.5-29.43 Ø4.73}
calibrated: 3.53
ΔE Greyscale Calman: 1.74 | ∀{0.09-98 Ø4.97}
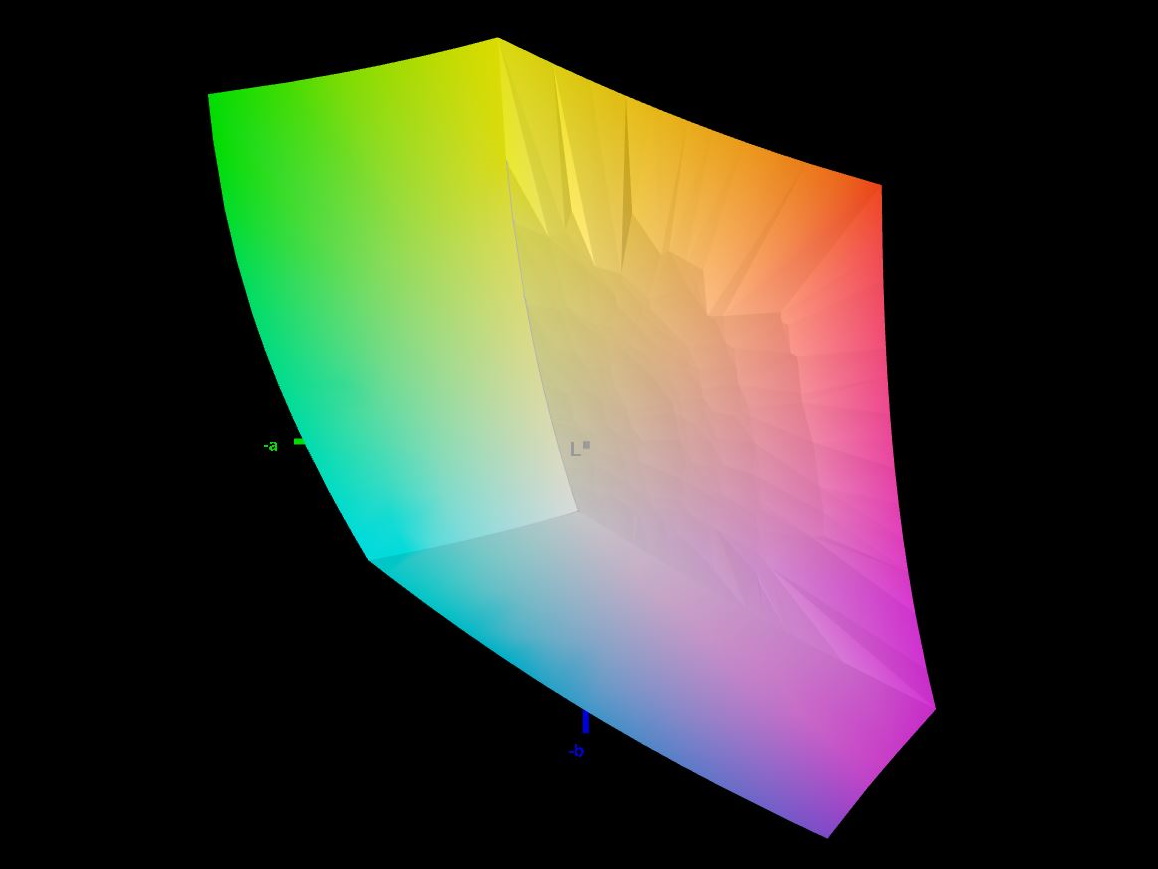
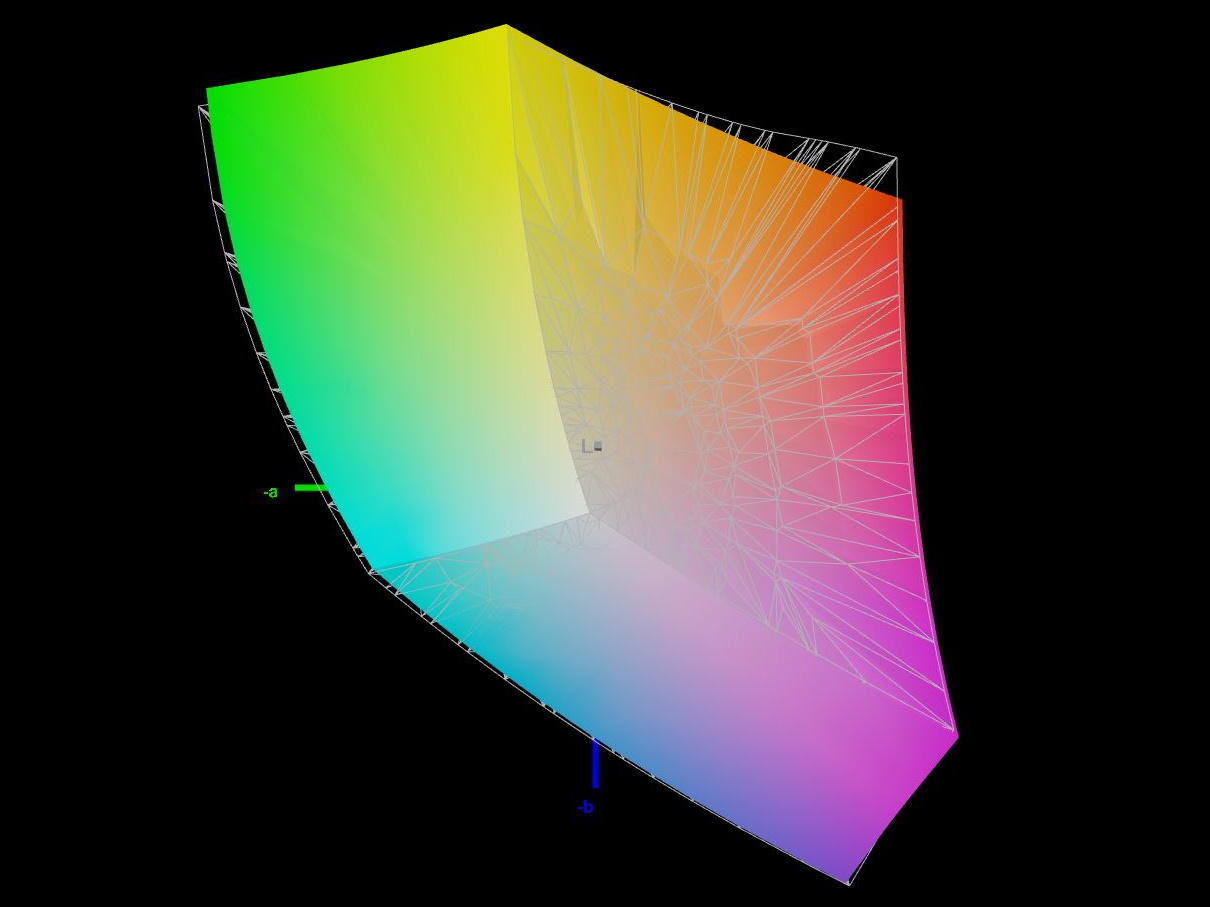
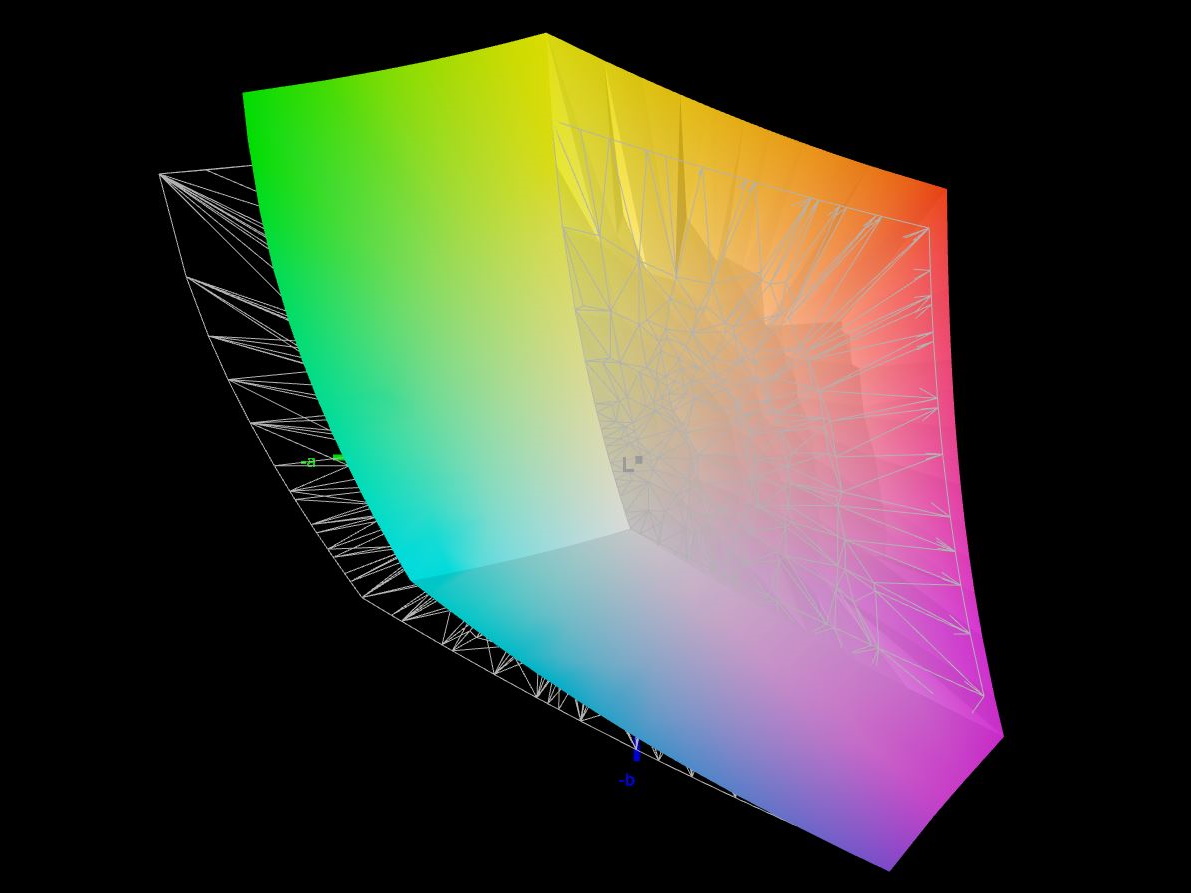
83.1% AdobeRGB 1998 (Argyll 3D)
98.5% sRGB (Argyll 3D)
92.8% Display P3 (Argyll 3D)
Gamma: 2.2
CCT: 6418 K
| Asus ROG Zephyrus M16 GU603Z BOE0A0B (BOE CQ NE160QDM-NY3), IPS, 2560x1600, 16" | Asus ROG Zephyrus M16 GU603H AU Optronics AUOC199, IPS, 2560x1600, 16" | Schenker Vision 16 Pro RTX 3070 Ti N160QDM-NZ1, IPS, 2560x1600, 16" | Lenovo Legion 5 Pro 16ARH7H RTX 3070 Ti BOE CQ NE160QDM-NY1, IPS, 2560x1600, 16" | Schenker XMG Focus 16 (i7-12700H, RTX 3060) BOE NE16oQDM-NY1, IPS, 2560x1600, 16" | Corsair Voyager a1600 BOE0A3B, IPS, 2560x1600, 16" | |
|---|---|---|---|---|---|---|
| Display | -15% | -15% | -14% | -14% | ||
| Display P3 Coverage (%) | 92.8 | 68.7 -26% | 67.3 -27% | 68.3 -26% | 68.7 -26% | |
| sRGB Coverage (%) | 98.5 | 96.7 -2% | 96.1 -2% | 96.6 -2% | 98.2 0% | |
| AdobeRGB 1998 Coverage (%) | 83.1 | 70 -16% | 69.5 -16% | 70.6 -15% | 70.1 -16% | |
| Response Times | 39% | -37% | -51% | -62% | -36% | |
| Response Time Grey 50% / Grey 80% * (ms) | 7.6 ? | 4.8 ? 37% | 14.3 ? -88% | 14.4 ? -89% | 16.4 ? -116% | 13 ? -71% |
| Response Time Black / White * (ms) | 10 ? | 6 ? 40% | 8.6 ? 14% | 11.2 ? -12% | 10.8 ? -8% | 10 ? -0% |
| PWM Frequency (Hz) | ||||||
| Screen | -28% | -34% | -11% | -40% | -21% | |
| Brightness middle (cd/m²) | 497 | 448 -10% | 364 -27% | 522.8 5% | 460 -7% | 355 -29% |
| Brightness (cd/m²) | 481 | 446 -7% | 347 -28% | 503 5% | 442 -8% | 340 -29% |
| Brightness Distribution (%) | 82 | 86 5% | 89 9% | 84 2% | 89 9% | 91 11% |
| Black Level * (cd/m²) | 0.21 | 0.48 -129% | 0.3 -43% | 0.41 -95% | 0.32 -52% | 0.53 -152% |
| Contrast (:1) | 2367 | 933 -61% | 1213 -49% | 1275 -46% | 1438 -39% | 670 -72% |
| Colorchecker dE 2000 * | 3.53 | 2.76 22% | 3.3 7% | 2.47 30% | 3.65 -3% | 2.43 31% |
| Colorchecker dE 2000 max. * | 6.15 | 7.09 -15% | 6.6 -7% | 6.56 -7% | 7.49 -22% | 4.31 30% |
| Colorchecker dE 2000 calibrated * | 3.53 | 2.86 19% | 2.5 29% | 0.61 83% | 3.65 -3% | 1.14 68% |
| Greyscale dE 2000 * | 1.74 | 3.1 -78% | 5.2 -199% | 3 -72% | 5.87 -237% | 2.62 -51% |
| Gamma | 2.2 100% | 2.153 102% | 2.14 103% | 2.27 97% | 2.42 91% | 2.28 96% |
| CCT | 6418 101% | 6826 95% | 6331 103% | 6719 97% | 6711 97% | 6909 94% |
| Color Space (Percent of AdobeRGB 1998) (%) | 87 | |||||
| Color Space (Percent of sRGB) (%) | 100 | |||||
| Całkowita średnia (program / ustawienia) | 6% /
-16% | -29% /
-30% | -26% /
-17% | -39% /
-38% | -24% /
-22% |
* ... im mniej tym lepiej
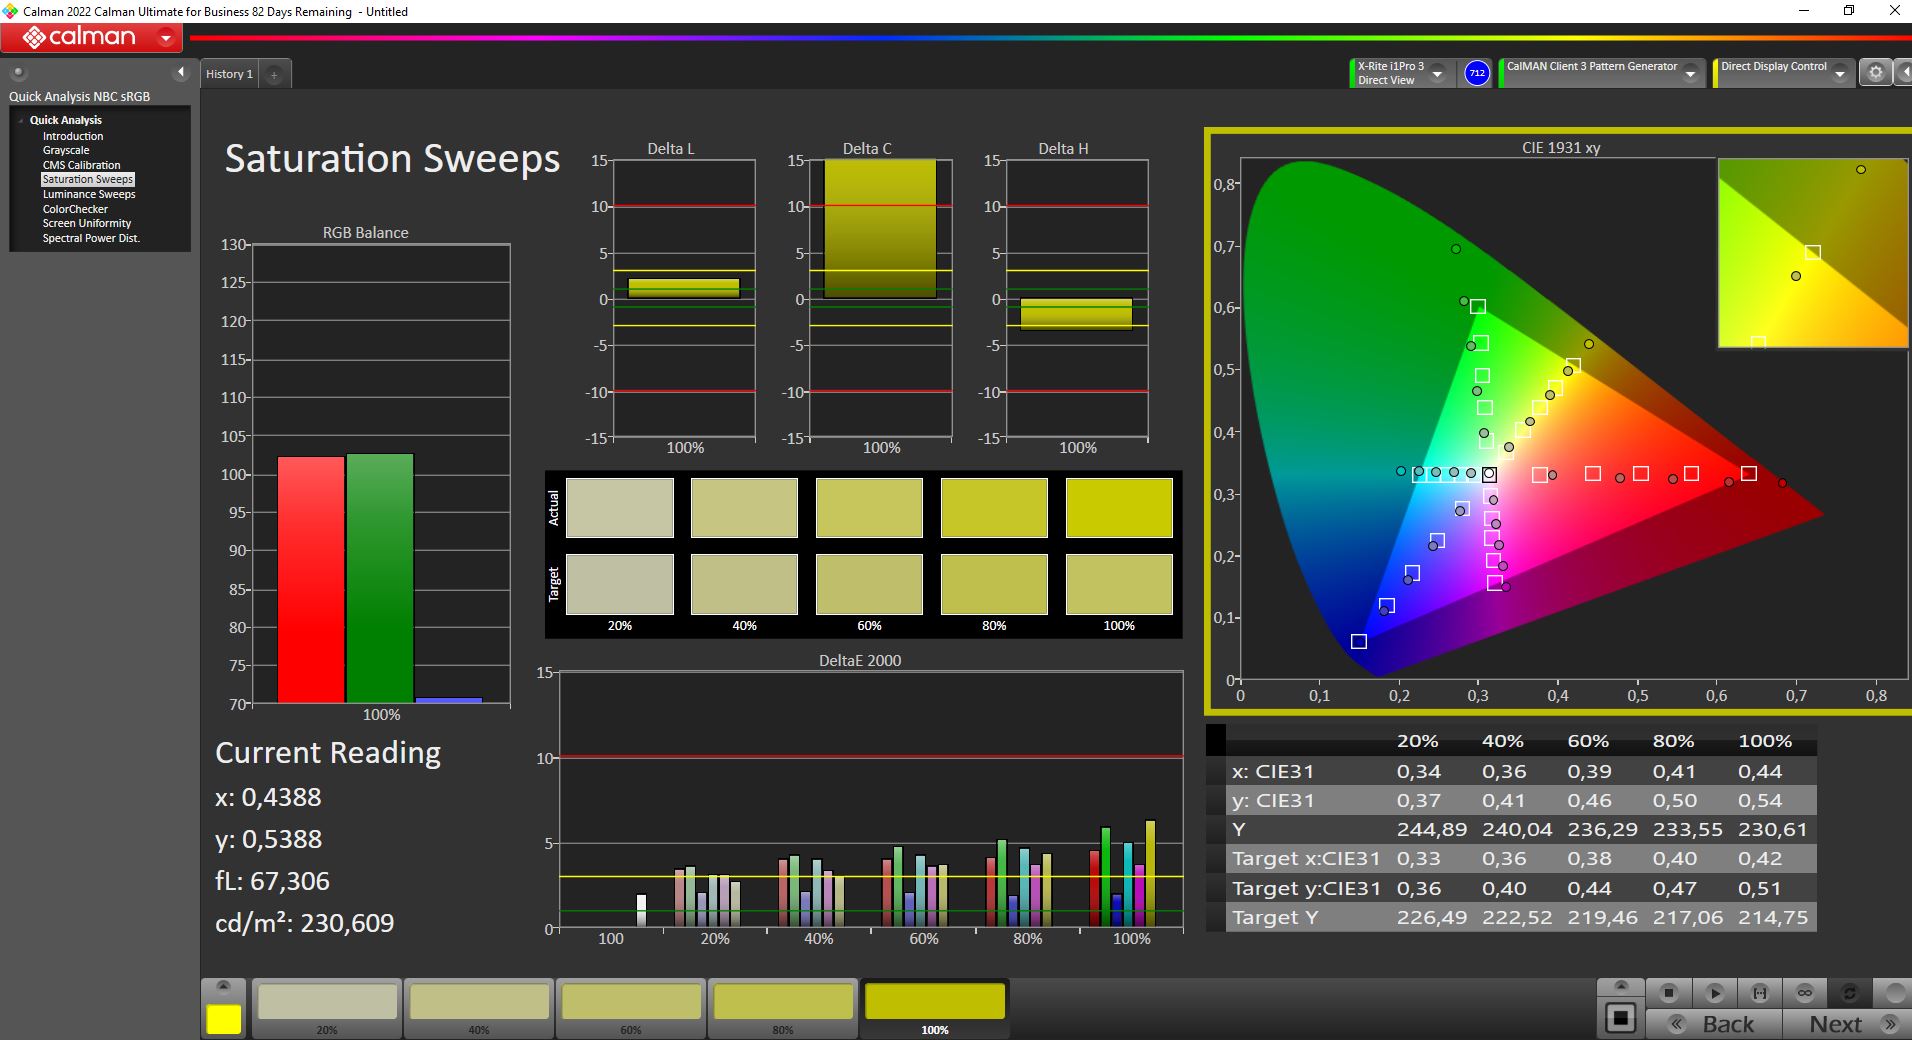
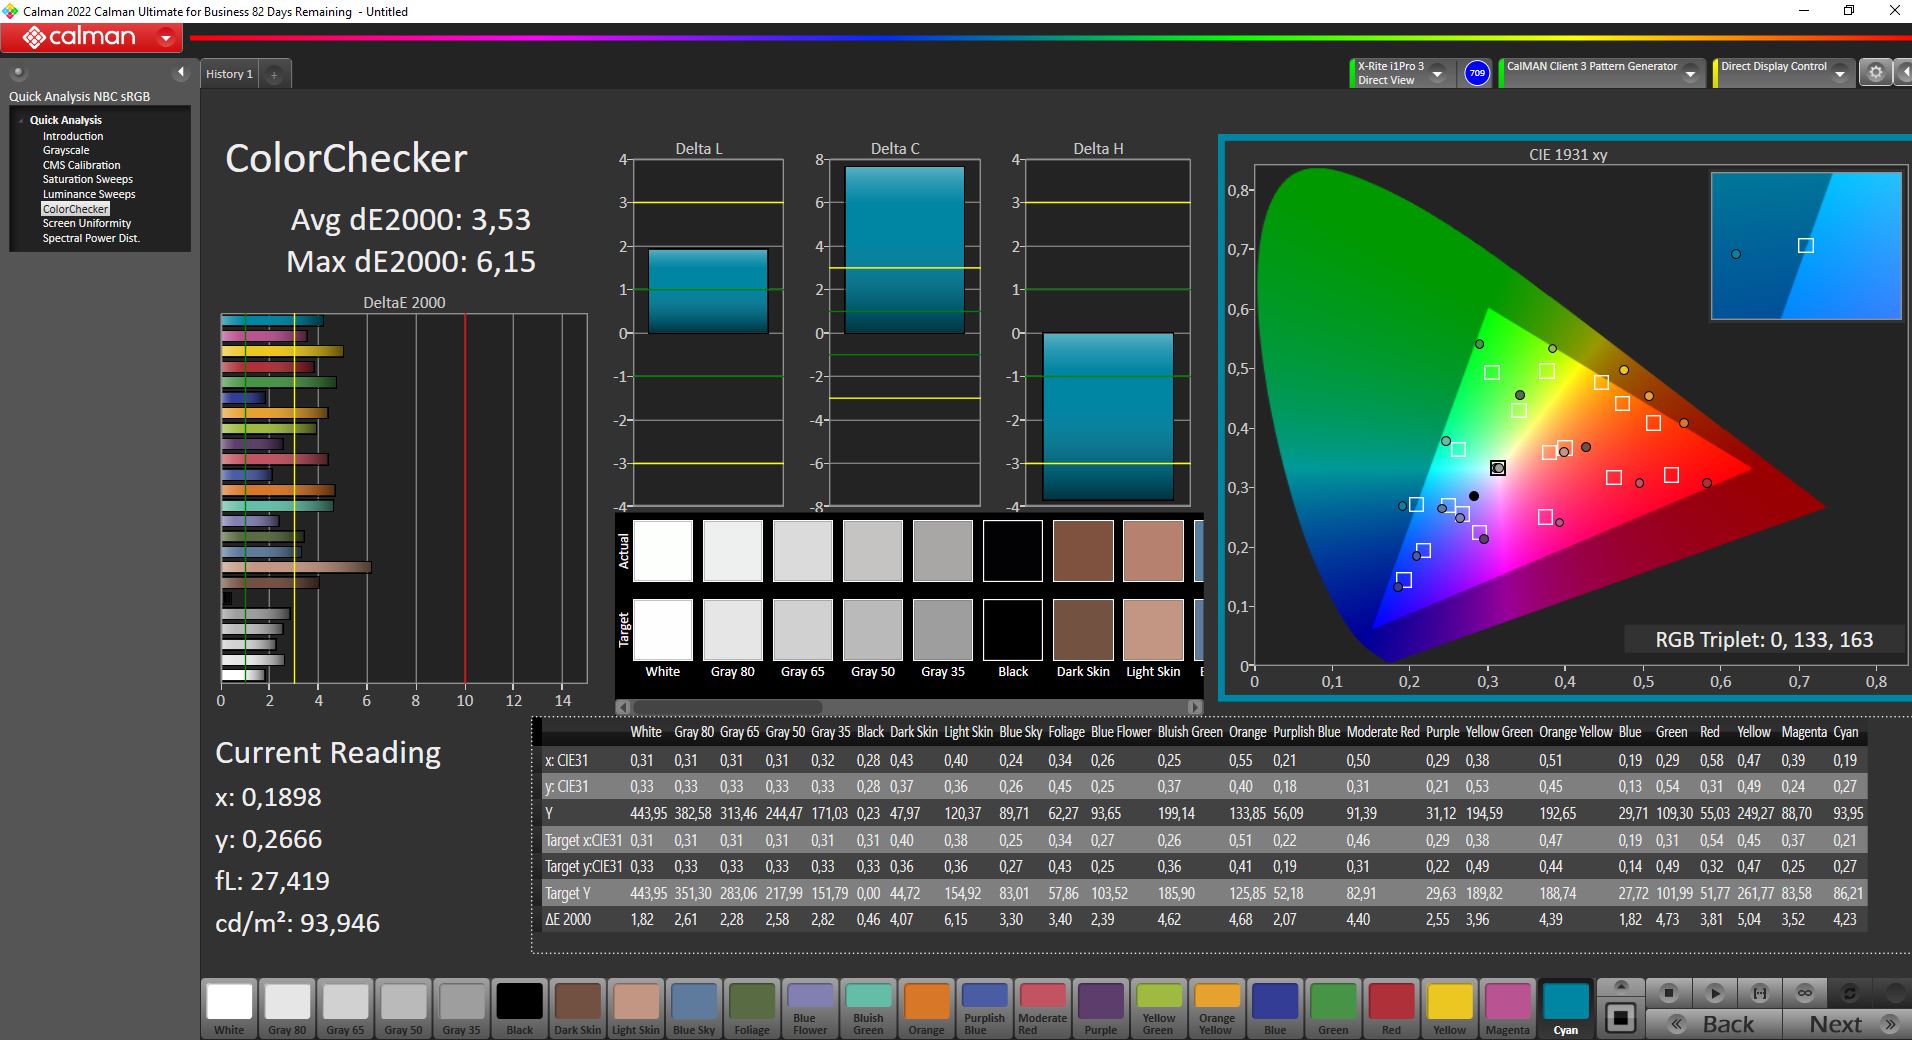
Asus reklamuje 100% pokrycie przestrzeni barw DCI-P3, ale mierzymy "tylko" 92,8%. Przestrzeń barw AdobeRGB jest jeszcze pokryta w 83%. Przynajmniej na polu testowym naszych wybranych konkurentów skutkuje to wciąż najwyższą pozycją. Ogólnie rzecz biorąc, wyświetlacz nadaje się również do profesjonalnej edycji zdjęć i filmów.
W stanie dostawy panel jest już dobrze skalibrowany. Przy wartości zaledwie 1,74, wartość DeltaE skali szarości jest szczególnie niska. W programie ColorChecker nasze narzędzie Portrait Display Calman Color Calibration mierzy nieco wyższe odchylenia. Dodatkowa kalibracja nie poprawia tych wartości, a raczej psuje i tak już bardzo dobrą skalę szarości.
Wyświetl czasy reakcji
| ↔ Czas reakcji od czerni do bieli | ||
|---|---|---|
| 10 ms ... wzrost ↗ i spadek ↘ łącznie | ↗ 4.6 ms wzrost | 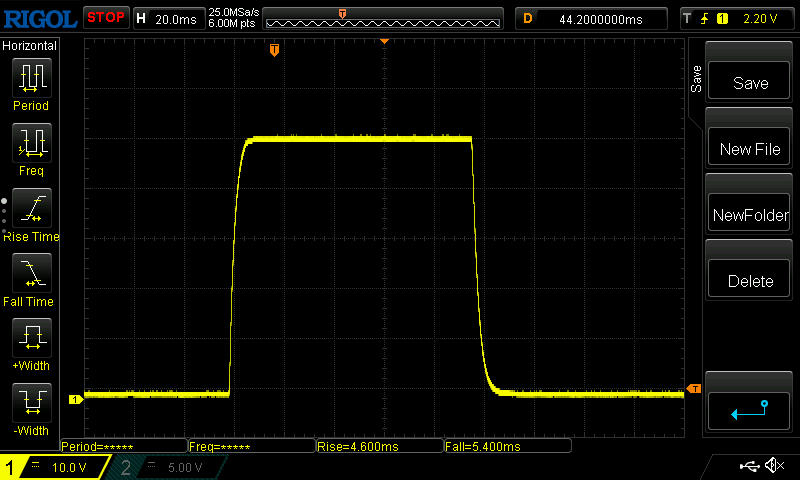 |
| ↘ 5.4 ms upadek | ||
| W naszych testach ekran wykazuje dobry współczynnik reakcji, ale może być zbyt wolny dla graczy rywalizujących ze sobą. Dla porównania, wszystkie testowane urządzenia wahają się od 0.1 (minimum) do 240 (maksimum) ms. » 27 % wszystkich urządzeń jest lepszych. Oznacza to, że zmierzony czas reakcji jest lepszy od średniej wszystkich testowanych urządzeń (19.9 ms). | ||
| ↔ Czas reakcji 50% szarości do 80% szarości | ||
| 7.6 ms ... wzrost ↗ i spadek ↘ łącznie | ↗ 3.4 ms wzrost | 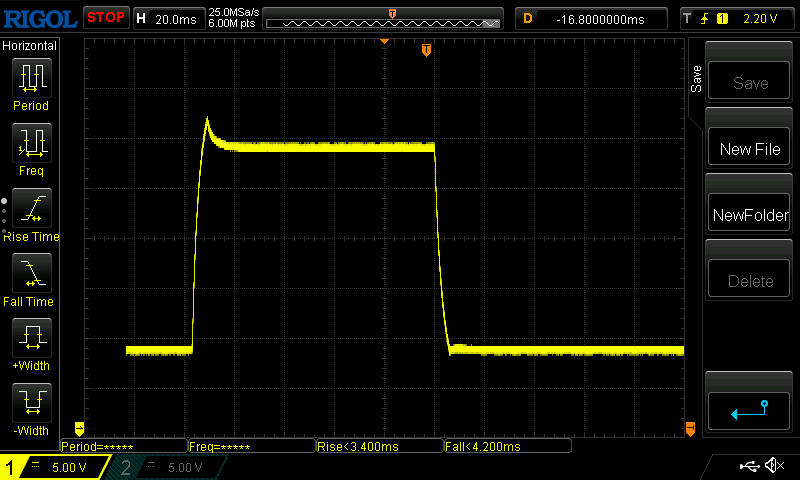 |
| ↘ 4.2 ms upadek | ||
| W naszych testach ekran wykazuje bardzo szybką reakcję i powinien bardzo dobrze nadawać się do szybkich gier. Dla porównania, wszystkie testowane urządzenia wahają się od 0.165 (minimum) do 636 (maksimum) ms. » 20 % wszystkich urządzeń jest lepszych. Oznacza to, że zmierzony czas reakcji jest lepszy od średniej wszystkich testowanych urządzeń (31.1 ms). | ||
Migotanie ekranu / PWM (modulacja szerokości impulsu)
| Migotanie ekranu/nie wykryto PWM |  | ||
Dla porównania: 52 % wszystkich testowanych urządzeń nie używa PWM do przyciemniania wyświetlacza. Jeśli wykryto PWM, zmierzono średnio 7791 (minimum: 5 - maksimum: 343500) Hz. | |||
Pomimo dobrej jasności wyświetlacza, nadal należy unikać bezpośredniego światła słonecznego na zewnątrz i upewnić się, że patrzysz na ekran prosto z przodu, ponieważ w przeciwnym razie widoczność szybko spada.

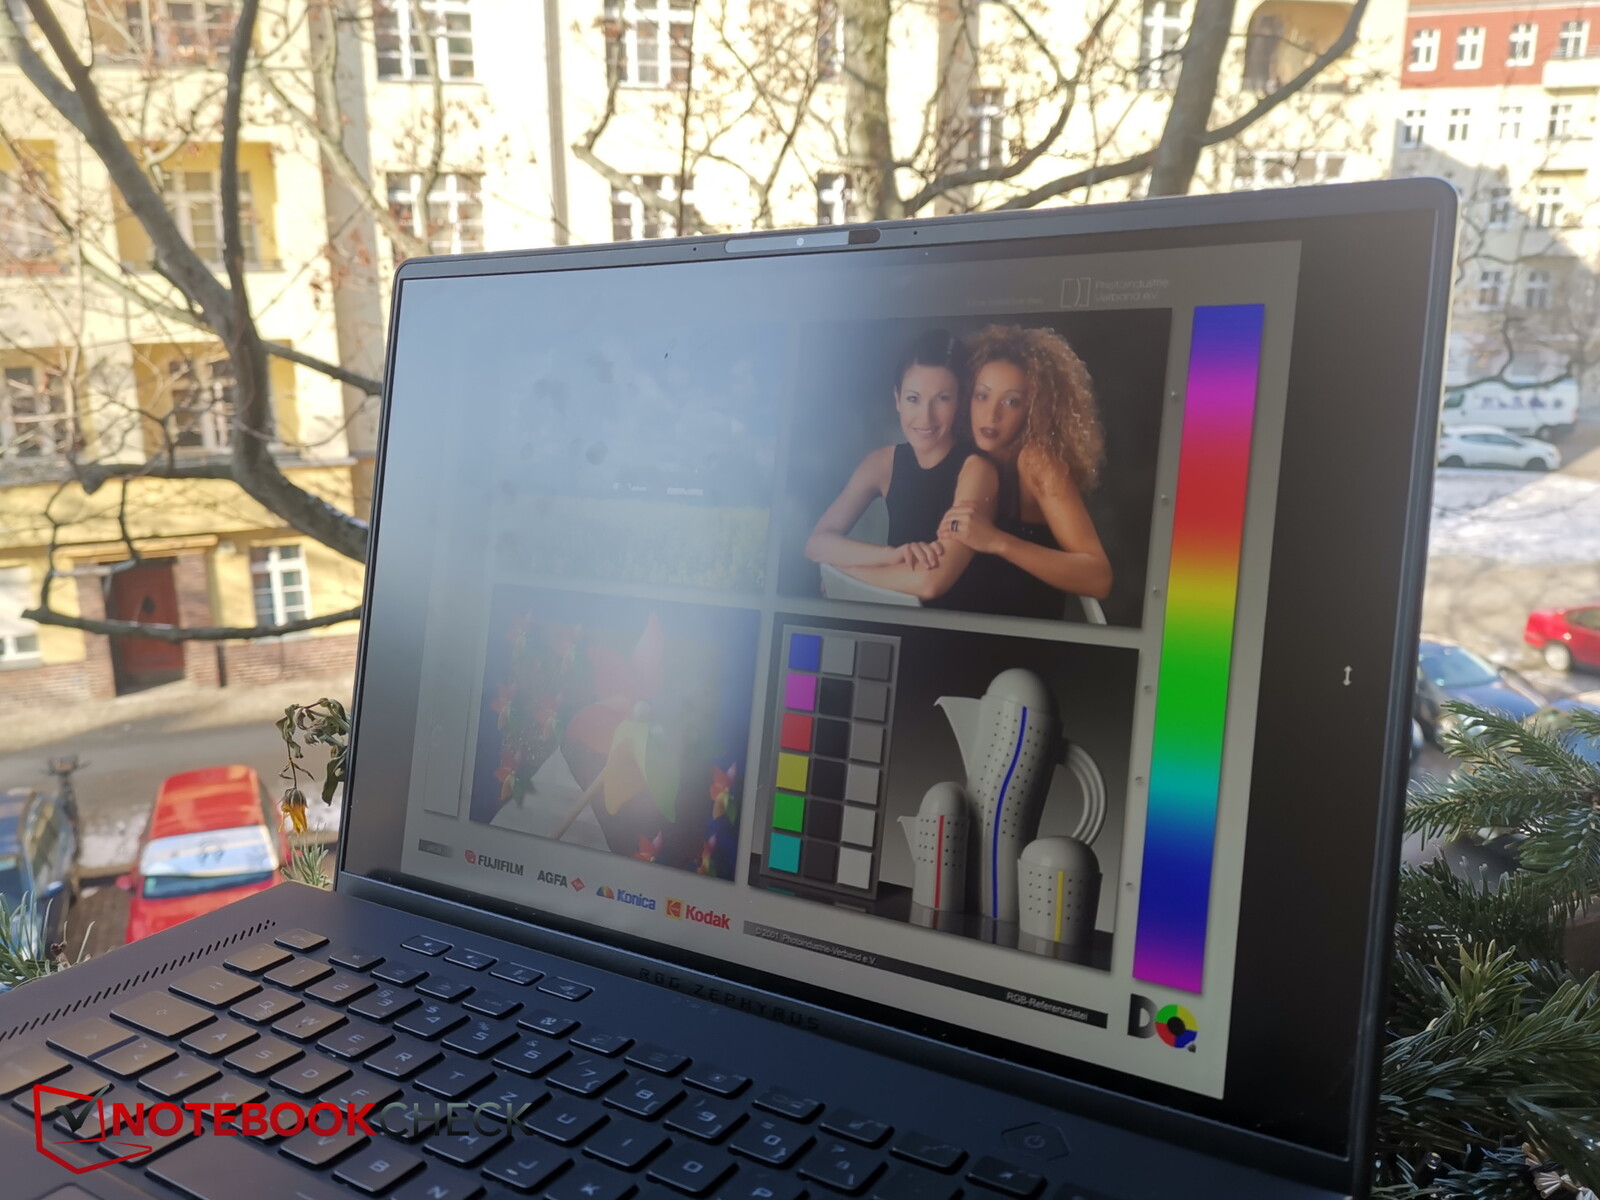
Zawartość wyświetlacza można łatwo odczytać nawet pod skrajnymi kątami widzenia. W przypadku patrzenia na ekran z boku jasność jest niższa niż w przypadku patrzenia z góry lub z dołu.

Wydajność - 120-watowy RTX 3070-Ti nieco poniżej średniej
ROG Zephyrus jest dostępny w różnych konfiguracjach sprzętowych. Model M16 ma być wkrótce dostępny także z procesorem Intela 13. generacji i RTX 40xx, natomiast nasz testowy egzemplarz nadal korzysta z m.in.Core i9-12900HorazRTX 3070 Ti.
Ewentualnie możliwe jest niemal wszystko, począwszy od.RTX 3050 Tiaż do RTX 3080 Ti. Jeśli chodzi o procesor, to obecnie masz do wyboru m.in i7-12700Ha naszym topowym modelem. Wyposażenie uzupełnia 32 GB pamięci RAM, ale i tutaj dostępne są liczne opcje.

Warunki badania
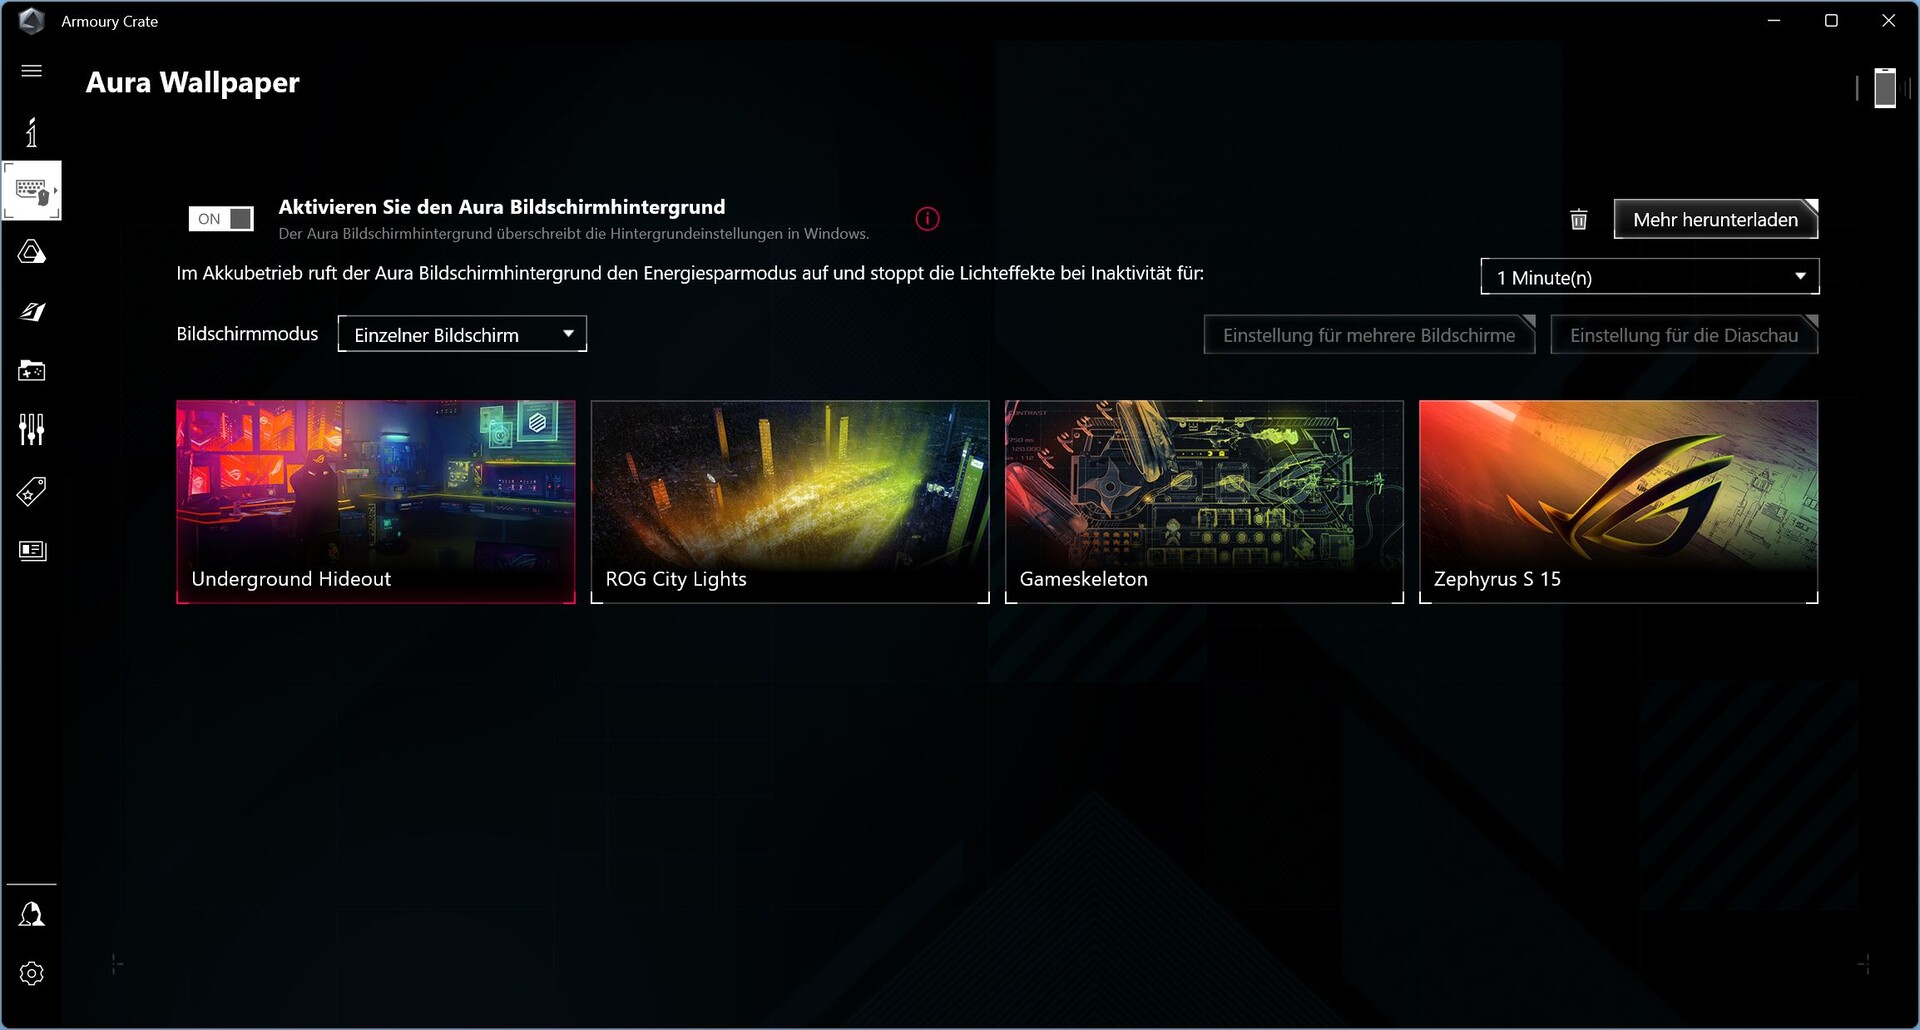
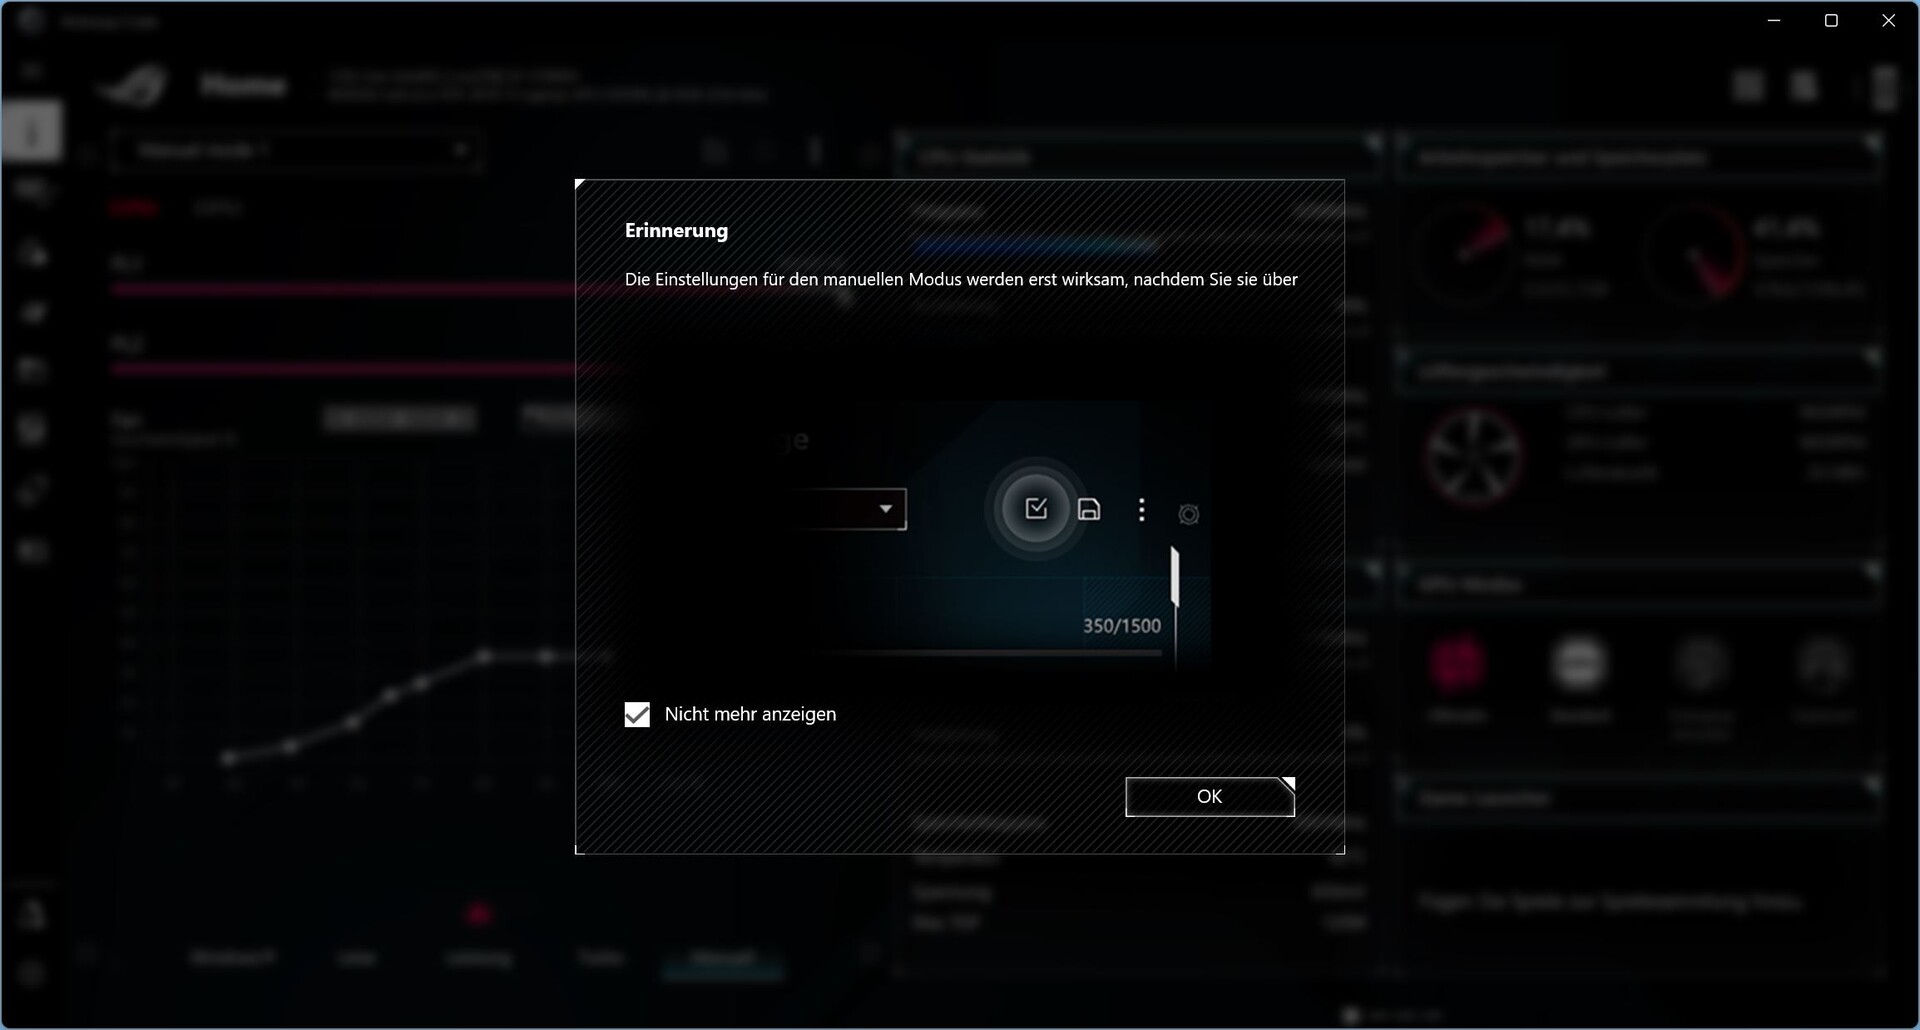
Oprogramowanie Asus Armoury Crate pozwala na dostosowanie różnych ustawień w laptopie, więc użytkownik powinien się z nim zapoznać. Oferuje ono opcje wyszukiwania aktualizacji urządzenia, wyboru kolorowych i dynamicznych tapet Aura, czy też kontroli wydajności.
Producent oferuje trzy tryby wydajności (Quiet, Performance i Turbo), a także daje możliwość kontrolowania wydajności za pomocą trybów wydajności systemu Windows lub nawet samodzielnego ustawienia kilku limitów mocy w trybie ręcznym - opcji, których brakuje u wielu innych producentów.
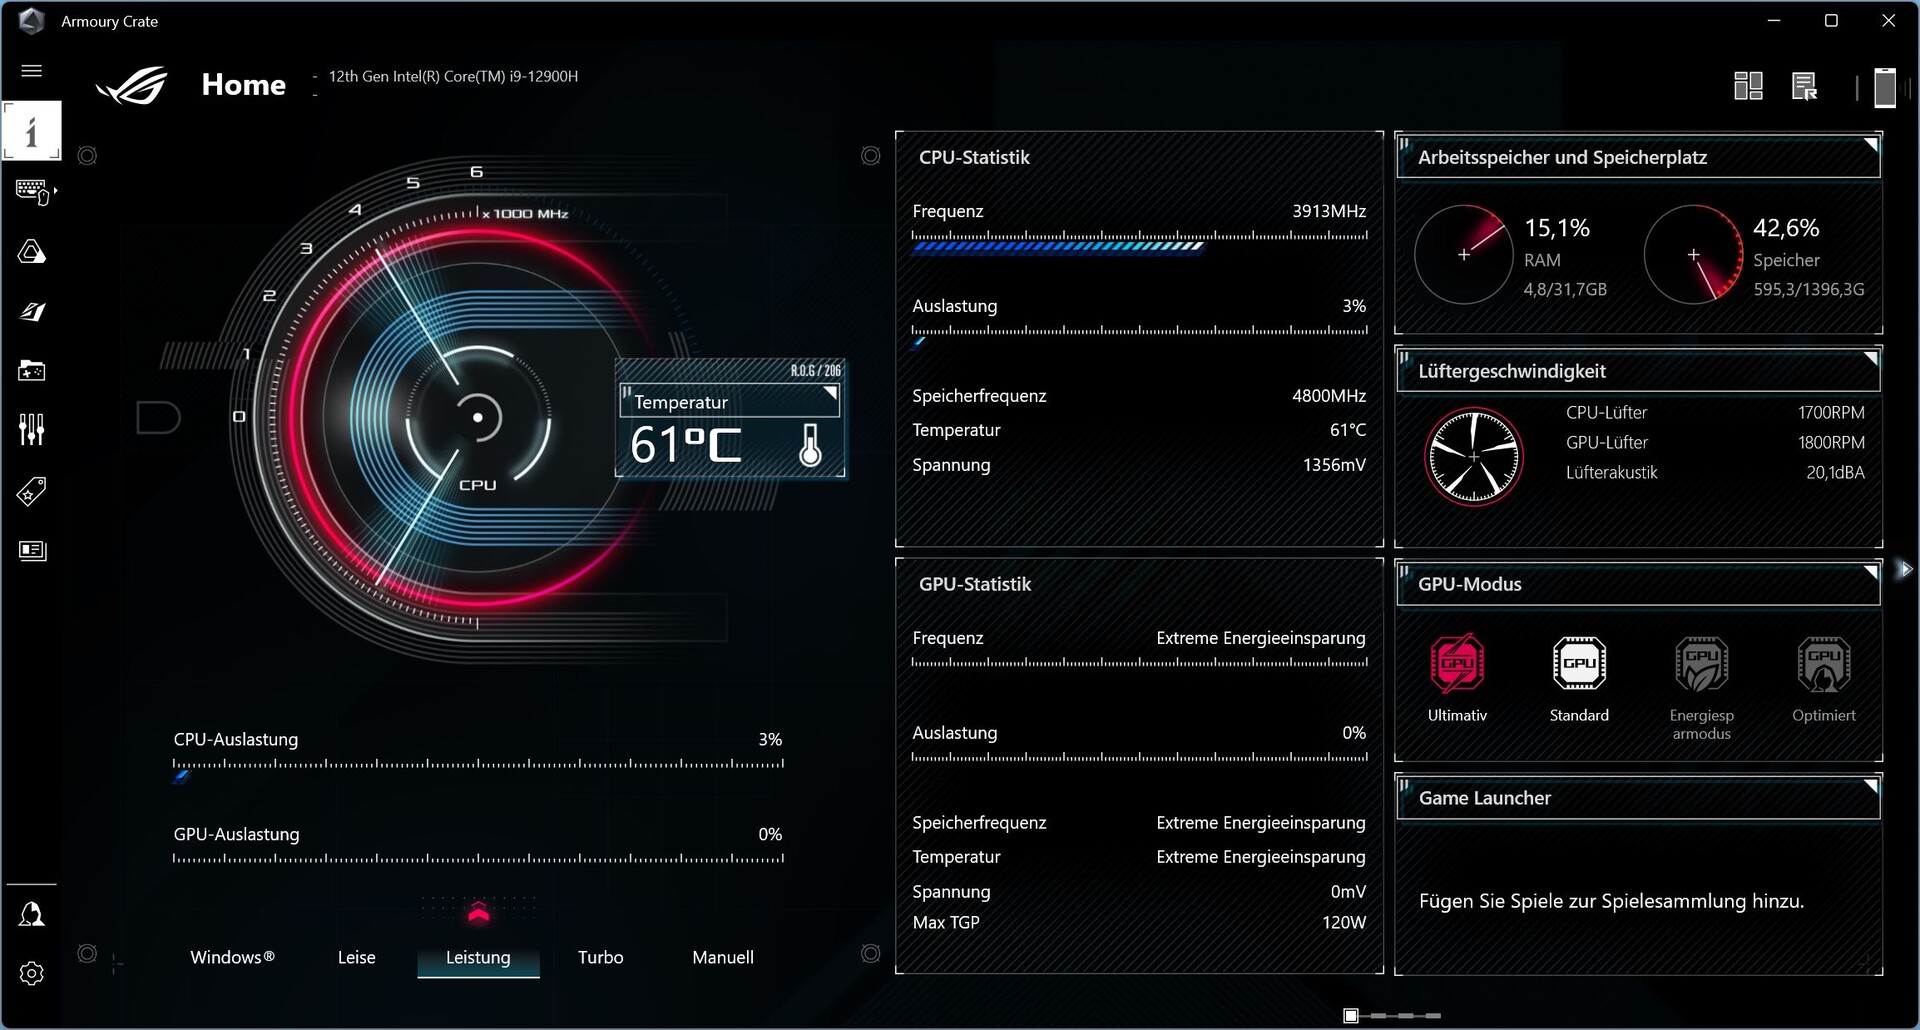
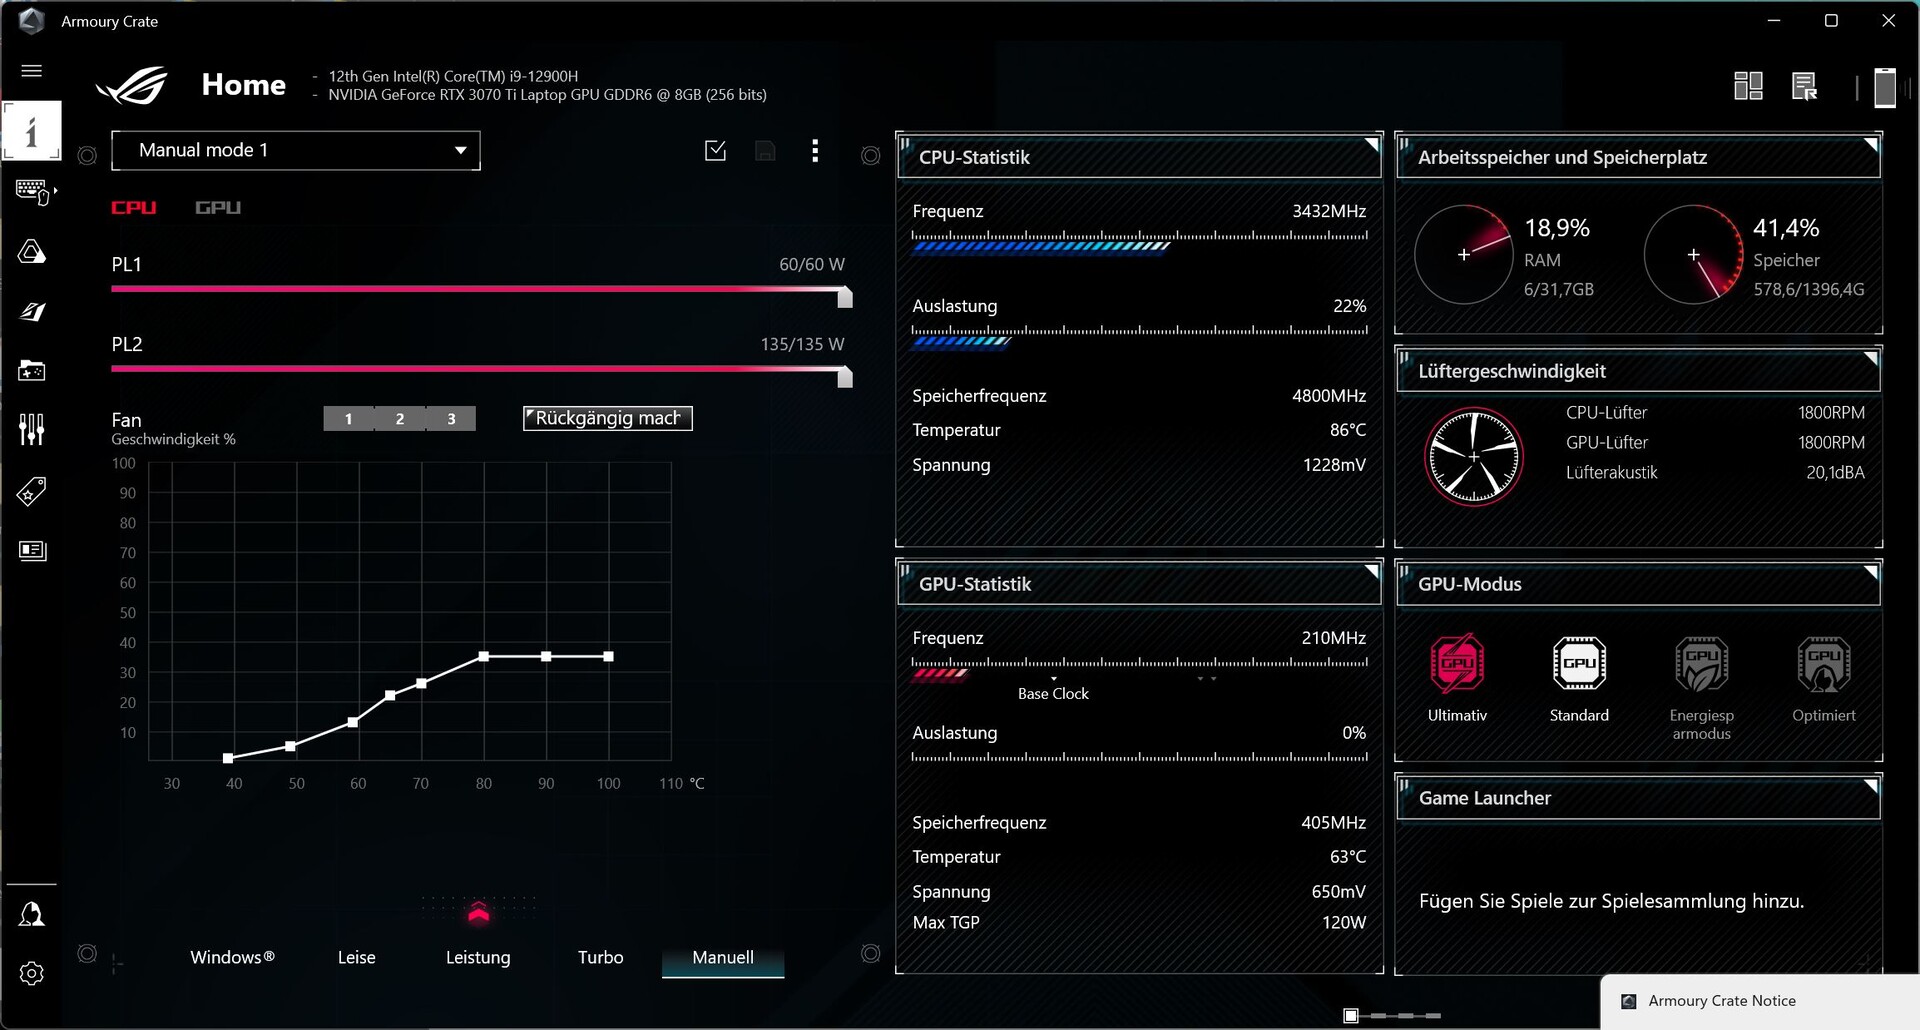
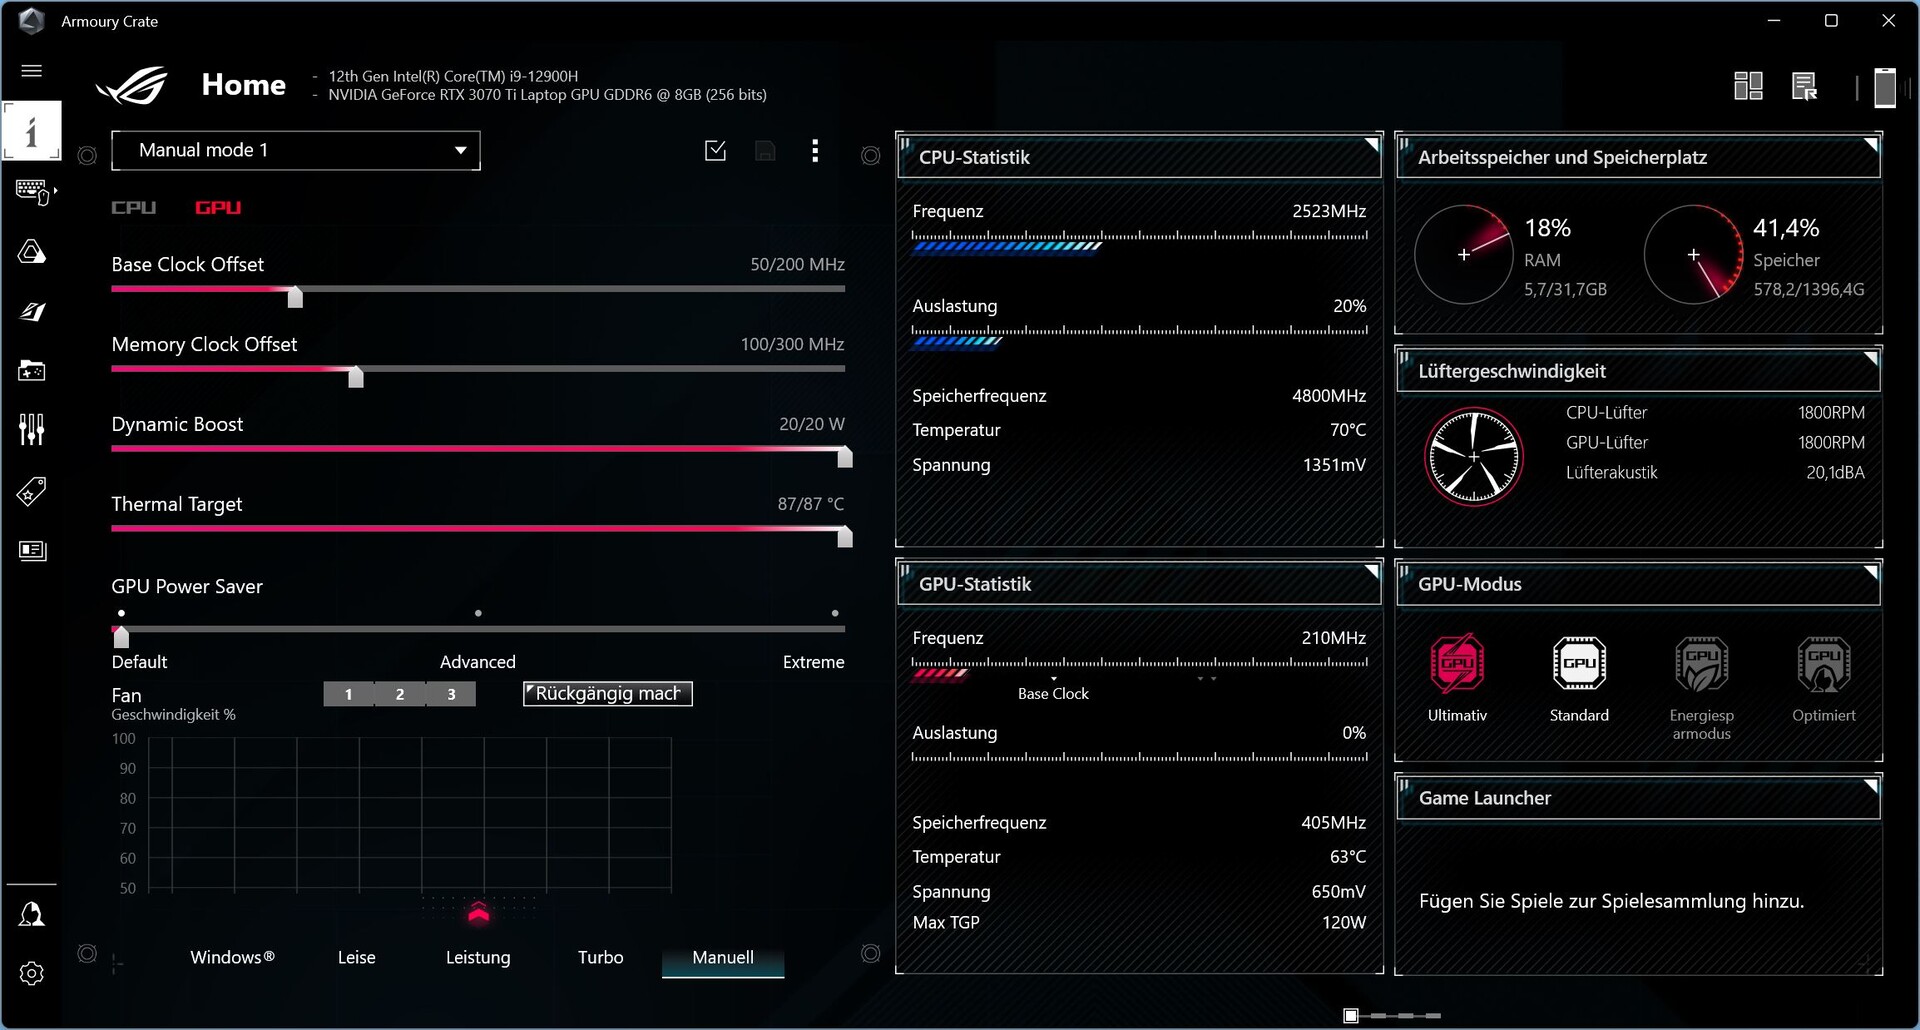
Jako że w trybie Turbo laptop jest już bardzo głośny w czasie bezczynności, wszystkie benchmarki uruchamiamy w trybie "Performance". Tryb "Quiet" jest wykorzystywany tylko do testów akumulatora - nie ma osobnego trybu oszczędzania energii.
Choć samo oprogramowanie jest dobrze zorganizowane, różne błędy w tłumaczeniu czy niekompletne zdania (w niemieckiej wersji językowej) wciąż uniemożliwiają dobre ogólne wrażenie.

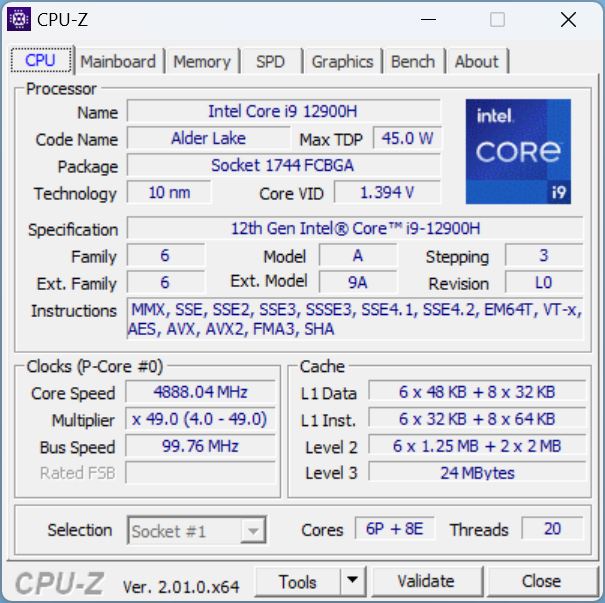
Procesor


Asus zapowiedział już model M16 z Intel Gen13. Dopóki nie będzie to dostępne, obecnie wciąż używamy Intel Core i9-12900Hw naszej jednostce testowej. Ten high-endowy procesor oferuje 6 rdzeni Performance i 8 Efficiency. Rdzenie Performance mają taktowanie do 5 GHz, a podstawowe taktowanie rdzeni Efficiency wynosi 1,8 GHz. Ponieważ tylko rdzenie P obsługują hyperthreading, otrzymujemy łącznie 12 wątków.
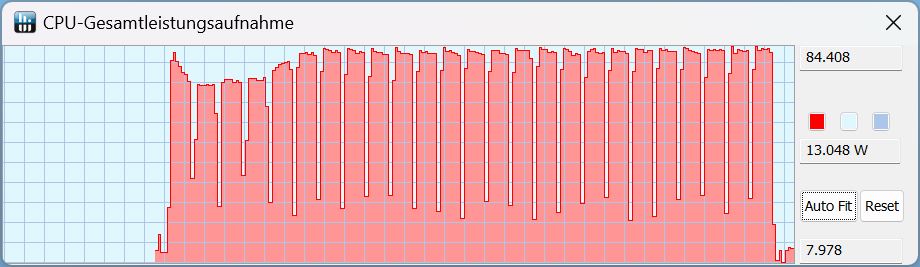
W pętli Cinebench stała wydajność jest bardzo stabilna, a maksymalne TDP sięga około 84 W w trybie Performance. Wydajność proc.i7-12700H w bardzo wydajnymXMG Focus 16okazuje się na początku nawet nieco lepsza. Jednak po 4. biegu najpóźniej jego wydajność spada poniżej wydajności naszego M16, który pokonuje także m.in.Ryzen 7 6800 wLegion 5.
Przy okazji, zamiast 84 W, w trybie Turbo do dyspozycji jest potężne 99 W! Podczas pracy na baterii jest to tylko około 40 W, przy czym wydajność odpowiednio spada.
We wszystkich testach 2022 M16 jest o około 20% szybszy od poprzednika z procesoremi9-11900H.
Cinebench R15 Multi Constant Load Test
Cinebench R23: Multi Core | Single Core
Cinebench R20: CPU (Multi Core) | CPU (Single Core)
Cinebench R15: CPU Multi 64Bit | CPU Single 64Bit
Blender: v2.79 BMW27 CPU
7-Zip 18.03: 7z b 4 | 7z b 4 -mmt1
Geekbench 5.5: Multi-Core | Single-Core
HWBOT x265 Benchmark v2.2: 4k Preset
LibreOffice : 20 Documents To PDF
R Benchmark 2.5: Overall mean
| CPU Performance rating | |
| Średnia w klasie Gaming | |
| Asus ROG Zephyrus M16 GU603Z | |
| Schenker XMG Focus 16 (i7-12700H, RTX 3060) | |
| Przeciętny Intel Core i9-12900H | |
| Schenker Vision 16 Pro RTX 3070 Ti | |
| Lenovo Legion 5 Pro 16ARH7H RTX 3070 Ti | |
| Corsair Voyager a1600 | |
| Asus ROG Zephyrus M16 GU603H -2! | |
| Cinebench R23 / Multi Core | |
| Średnia w klasie Gaming (10488 - 40970, n=110, ostatnie 2 lata) | |
| Schenker XMG Focus 16 (i7-12700H, RTX 3060) | |
| Asus ROG Zephyrus M16 GU603Z | |
| Przeciętny Intel Core i9-12900H (7359 - 19648, n=28) | |
| Lenovo Legion 5 Pro 16ARH7H RTX 3070 Ti | |
| Corsair Voyager a1600 | |
| Schenker Vision 16 Pro RTX 3070 Ti | |
| Cinebench R23 / Single Core | |
| Średnia w klasie Gaming (1166 - 2356, n=110, ostatnie 2 lata) | |
| Asus ROG Zephyrus M16 GU603Z | |
| Przeciętny Intel Core i9-12900H (1634 - 1930, n=28) | |
| Schenker Vision 16 Pro RTX 3070 Ti | |
| Schenker XMG Focus 16 (i7-12700H, RTX 3060) | |
| Corsair Voyager a1600 | |
| Lenovo Legion 5 Pro 16ARH7H RTX 3070 Ti | |
| Cinebench R20 / CPU (Multi Core) | |
| Średnia w klasie Gaming (4029 - 16108, n=109, ostatnie 2 lata) | |
| Schenker XMG Focus 16 (i7-12700H, RTX 3060) | |
| Asus ROG Zephyrus M16 GU603Z | |
| Przeciętny Intel Core i9-12900H (2681 - 7471, n=28) | |
| Lenovo Legion 5 Pro 16ARH7H RTX 3070 Ti | |
| Asus ROG Zephyrus M16 GU603H | |
| Corsair Voyager a1600 | |
| Schenker Vision 16 Pro RTX 3070 Ti | |
| Cinebench R20 / CPU (Single Core) | |
| Średnia w klasie Gaming (442 - 895, n=109, ostatnie 2 lata) | |
| Asus ROG Zephyrus M16 GU603Z | |
| Przeciętny Intel Core i9-12900H (624 - 738, n=28) | |
| Schenker Vision 16 Pro RTX 3070 Ti | |
| Schenker XMG Focus 16 (i7-12700H, RTX 3060) | |
| Asus ROG Zephyrus M16 GU603H | |
| Lenovo Legion 5 Pro 16ARH7H RTX 3070 Ti | |
| Corsair Voyager a1600 | |
| Cinebench R15 / CPU Multi 64Bit | |
| Średnia w klasie Gaming (1578 - 6271, n=109, ostatnie 2 lata) | |
| Schenker Vision 16 Pro RTX 3070 Ti | |
| Schenker Vision 16 Pro RTX 3070 Ti | |
| Schenker XMG Focus 16 (i7-12700H, RTX 3060) | |
| Asus ROG Zephyrus M16 GU603Z | |
| Przeciętny Intel Core i9-12900H (1395 - 3077, n=28) | |
| Lenovo Legion 5 Pro 16ARH7H RTX 3070 Ti | |
| Asus ROG Zephyrus M16 GU603H | |
| Corsair Voyager a1600 | |
| Cinebench R15 / CPU Single 64Bit | |
| Średnia w klasie Gaming (188.8 - 343, n=109, ostatnie 2 lata) | |
| Asus ROG Zephyrus M16 GU603Z | |
| Przeciętny Intel Core i9-12900H (235 - 277, n=29) | |
| Schenker Vision 16 Pro RTX 3070 Ti | |
| Schenker XMG Focus 16 (i7-12700H, RTX 3060) | |
| Lenovo Legion 5 Pro 16ARH7H RTX 3070 Ti | |
| Corsair Voyager a1600 | |
| Asus ROG Zephyrus M16 GU603H | |
| Blender / v2.79 BMW27 CPU | |
| Schenker Vision 16 Pro RTX 3070 Ti | |
| Asus ROG Zephyrus M16 GU603H | |
| Przeciętny Intel Core i9-12900H (160 - 451, n=28) | |
| Corsair Voyager a1600 | |
| Lenovo Legion 5 Pro 16ARH7H RTX 3070 Ti | |
| Schenker XMG Focus 16 (i7-12700H, RTX 3060) | |
| Asus ROG Zephyrus M16 GU603Z | |
| Średnia w klasie Gaming (80 - 330, n=107, ostatnie 2 lata) | |
| 7-Zip 18.03 / 7z b 4 | |
| Średnia w klasie Gaming (33491 - 148086, n=108, ostatnie 2 lata) | |
| Asus ROG Zephyrus M16 GU603Z | |
| Lenovo Legion 5 Pro 16ARH7H RTX 3070 Ti | |
| Schenker XMG Focus 16 (i7-12700H, RTX 3060) | |
| Corsair Voyager a1600 | |
| Przeciętny Intel Core i9-12900H (34684 - 76677, n=28) | |
| Asus ROG Zephyrus M16 GU603H | |
| Schenker Vision 16 Pro RTX 3070 Ti | |
| 7-Zip 18.03 / 7z b 4 -mmt1 | |
| Średnia w klasie Gaming (4199 - 7436, n=108, ostatnie 2 lata) | |
| Asus ROG Zephyrus M16 GU603Z | |
| Schenker Vision 16 Pro RTX 3070 Ti | |
| Przeciętny Intel Core i9-12900H (5302 - 6289, n=28) | |
| Corsair Voyager a1600 | |
| Lenovo Legion 5 Pro 16ARH7H RTX 3070 Ti | |
| Schenker XMG Focus 16 (i7-12700H, RTX 3060) | |
| Asus ROG Zephyrus M16 GU603H | |
| Geekbench 5.5 / Multi-Core | |
| Średnia w klasie Gaming (6460 - 27010, n=108, ostatnie 2 lata) | |
| Asus ROG Zephyrus M16 GU603Z | |
| Schenker XMG Focus 16 (i7-12700H, RTX 3060) | |
| Przeciętny Intel Core i9-12900H (8519 - 14376, n=31) | |
| Schenker Vision 16 Pro RTX 3070 Ti | |
| Lenovo Legion 5 Pro 16ARH7H RTX 3070 Ti | |
| Corsair Voyager a1600 | |
| Asus ROG Zephyrus M16 GU603H | |
| Geekbench 5.5 / Single-Core | |
| Średnia w klasie Gaming (986 - 2474, n=108, ostatnie 2 lata) | |
| Asus ROG Zephyrus M16 GU603Z | |
| Schenker Vision 16 Pro RTX 3070 Ti | |
| Przeciętny Intel Core i9-12900H (1631 - 1897, n=31) | |
| Schenker XMG Focus 16 (i7-12700H, RTX 3060) | |
| Asus ROG Zephyrus M16 GU603H | |
| Lenovo Legion 5 Pro 16ARH7H RTX 3070 Ti | |
| Corsair Voyager a1600 | |
| HWBOT x265 Benchmark v2.2 / 4k Preset | |
| Średnia w klasie Gaming (11.5 - 44.3, n=108, ostatnie 2 lata) | |
| Asus ROG Zephyrus M16 GU603Z | |
| Lenovo Legion 5 Pro 16ARH7H RTX 3070 Ti | |
| Schenker XMG Focus 16 (i7-12700H, RTX 3060) | |
| Przeciętny Intel Core i9-12900H (8.05 - 22.5, n=28) | |
| Corsair Voyager a1600 | |
| Asus ROG Zephyrus M16 GU603H | |
| Schenker Vision 16 Pro RTX 3070 Ti | |
| LibreOffice / 20 Documents To PDF | |
| Corsair Voyager a1600 | |
| Lenovo Legion 5 Pro 16ARH7H RTX 3070 Ti | |
| Średnia w klasie Gaming (19 - 88.8, n=108, ostatnie 2 lata) | |
| Schenker XMG Focus 16 (i7-12700H, RTX 3060) | |
| Schenker Vision 16 Pro RTX 3070 Ti | |
| Przeciętny Intel Core i9-12900H (36.8 - 59.8, n=28) | |
| Asus ROG Zephyrus M16 GU603Z | |
| Asus ROG Zephyrus M16 GU603H | |
| R Benchmark 2.5 / Overall mean | |
| Asus ROG Zephyrus M16 GU603H | |
| Corsair Voyager a1600 | |
| Lenovo Legion 5 Pro 16ARH7H RTX 3070 Ti | |
| Schenker XMG Focus 16 (i7-12700H, RTX 3060) | |
| Schenker Vision 16 Pro RTX 3070 Ti | |
| Przeciętny Intel Core i9-12900H (0.4218 - 0.506, n=28) | |
| Asus ROG Zephyrus M16 GU603Z | |
| Średnia w klasie Gaming (0.3439 - 0.759, n=109, ostatnie 2 lata) | |
* ... im mniej tym lepiej
AIDA64: FP32 Ray-Trace | FPU Julia | CPU SHA3 | CPU Queen | FPU SinJulia | FPU Mandel | CPU AES | CPU ZLib | FP64 Ray-Trace | CPU PhotoWorxx
| Performance rating | |
| Średnia w klasie Gaming | |
| Lenovo Legion 5 Pro 16ARH7H RTX 3070 Ti | |
| Corsair Voyager a1600 | |
| Asus ROG Zephyrus M16 GU603Z | |
| Schenker XMG Focus 16 (i7-12700H, RTX 3060) | |
| Przeciętny Intel Core i9-12900H | |
| Schenker Vision 16 Pro RTX 3070 Ti | |
| Asus ROG Zephyrus M16 GU603H -9! | |
| AIDA64 / FP32 Ray-Trace | |
| Średnia w klasie Gaming (10227 - 85542, n=107, ostatnie 2 lata) | |
| Lenovo Legion 5 Pro 16ARH7H RTX 3070 Ti | |
| Corsair Voyager a1600 | |
| Asus ROG Zephyrus M16 GU603Z | |
| Schenker XMG Focus 16 (i7-12700H, RTX 3060) | |
| Schenker Vision 16 Pro RTX 3070 Ti | |
| Przeciętny Intel Core i9-12900H (4074 - 18289, n=29) | |
| AIDA64 / FPU Julia | |
| Średnia w klasie Gaming (51376 - 238426, n=107, ostatnie 2 lata) | |
| Lenovo Legion 5 Pro 16ARH7H RTX 3070 Ti | |
| Corsair Voyager a1600 | |
| Schenker XMG Focus 16 (i7-12700H, RTX 3060) | |
| Asus ROG Zephyrus M16 GU603Z | |
| Schenker Vision 16 Pro RTX 3070 Ti | |
| Przeciętny Intel Core i9-12900H (22307 - 93236, n=29) | |
| AIDA64 / CPU SHA3 | |
| Średnia w klasie Gaming (2180 - 9817, n=107, ostatnie 2 lata) | |
| Schenker XMG Focus 16 (i7-12700H, RTX 3060) | |
| Lenovo Legion 5 Pro 16ARH7H RTX 3070 Ti | |
| Asus ROG Zephyrus M16 GU603Z | |
| Corsair Voyager a1600 | |
| Przeciętny Intel Core i9-12900H (1378 - 4215, n=29) | |
| Schenker Vision 16 Pro RTX 3070 Ti | |
| AIDA64 / CPU Queen | |
| Średnia w klasie Gaming (49785 - 173351, n=98, ostatnie 2 lata) | |
| Lenovo Legion 5 Pro 16ARH7H RTX 3070 Ti | |
| Asus ROG Zephyrus M16 GU603Z | |
| Corsair Voyager a1600 | |
| Schenker XMG Focus 16 (i7-12700H, RTX 3060) | |
| Przeciętny Intel Core i9-12900H (78172 - 111241, n=28) | |
| Schenker Vision 16 Pro RTX 3070 Ti | |
| AIDA64 / FPU SinJulia | |
| Średnia w klasie Gaming (4424 - 33636, n=107, ostatnie 2 lata) | |
| Corsair Voyager a1600 | |
| Lenovo Legion 5 Pro 16ARH7H RTX 3070 Ti | |
| Schenker XMG Focus 16 (i7-12700H, RTX 3060) | |
| Asus ROG Zephyrus M16 GU603Z | |
| Przeciętny Intel Core i9-12900H (5709 - 10410, n=29) | |
| Schenker Vision 16 Pro RTX 3070 Ti | |
| AIDA64 / FPU Mandel | |
| Średnia w klasie Gaming (25115 - 128721, n=107, ostatnie 2 lata) | |
| Lenovo Legion 5 Pro 16ARH7H RTX 3070 Ti | |
| Corsair Voyager a1600 | |
| Schenker XMG Focus 16 (i7-12700H, RTX 3060) | |
| Asus ROG Zephyrus M16 GU603Z | |
| Schenker Vision 16 Pro RTX 3070 Ti | |
| Przeciętny Intel Core i9-12900H (11257 - 45581, n=29) | |
| AIDA64 / CPU AES | |
| Lenovo Legion 5 Pro 16ARH7H RTX 3070 Ti | |
| Corsair Voyager a1600 | |
| Asus ROG Zephyrus M16 GU603Z | |
| Średnia w klasie Gaming (39258 - 247074, n=107, ostatnie 2 lata) | |
| Przeciętny Intel Core i9-12900H (31935 - 151546, n=29) | |
| Schenker XMG Focus 16 (i7-12700H, RTX 3060) | |
| Schenker Vision 16 Pro RTX 3070 Ti | |
| AIDA64 / CPU ZLib | |
| Średnia w klasie Gaming (574 - 2531, n=107, ostatnie 2 lata) | |
| Schenker XMG Focus 16 (i7-12700H, RTX 3060) | |
| Asus ROG Zephyrus M16 GU603Z | |
| Przeciętny Intel Core i9-12900H (449 - 1193, n=29) | |
| Lenovo Legion 5 Pro 16ARH7H RTX 3070 Ti | |
| Corsair Voyager a1600 | |
| Schenker Vision 16 Pro RTX 3070 Ti | |
| Asus ROG Zephyrus M16 GU603H | |
| AIDA64 / FP64 Ray-Trace | |
| Średnia w klasie Gaming (5509 - 45446, n=107, ostatnie 2 lata) | |
| Lenovo Legion 5 Pro 16ARH7H RTX 3070 Ti | |
| Corsair Voyager a1600 | |
| Asus ROG Zephyrus M16 GU603Z | |
| Schenker XMG Focus 16 (i7-12700H, RTX 3060) | |
| Schenker Vision 16 Pro RTX 3070 Ti | |
| Przeciętny Intel Core i9-12900H (2235 - 10511, n=29) | |
| AIDA64 / CPU PhotoWorxx | |
| Średnia w klasie Gaming (12271 - 89891, n=107, ostatnie 2 lata) | |
| Schenker Vision 16 Pro RTX 3070 Ti | |
| Asus ROG Zephyrus M16 GU603Z | |
| Przeciętny Intel Core i9-12900H (20960 - 48269, n=30) | |
| Lenovo Legion 5 Pro 16ARH7H RTX 3070 Ti | |
| Schenker XMG Focus 16 (i7-12700H, RTX 3060) | |
| Corsair Voyager a1600 | |
Wydajność systemu
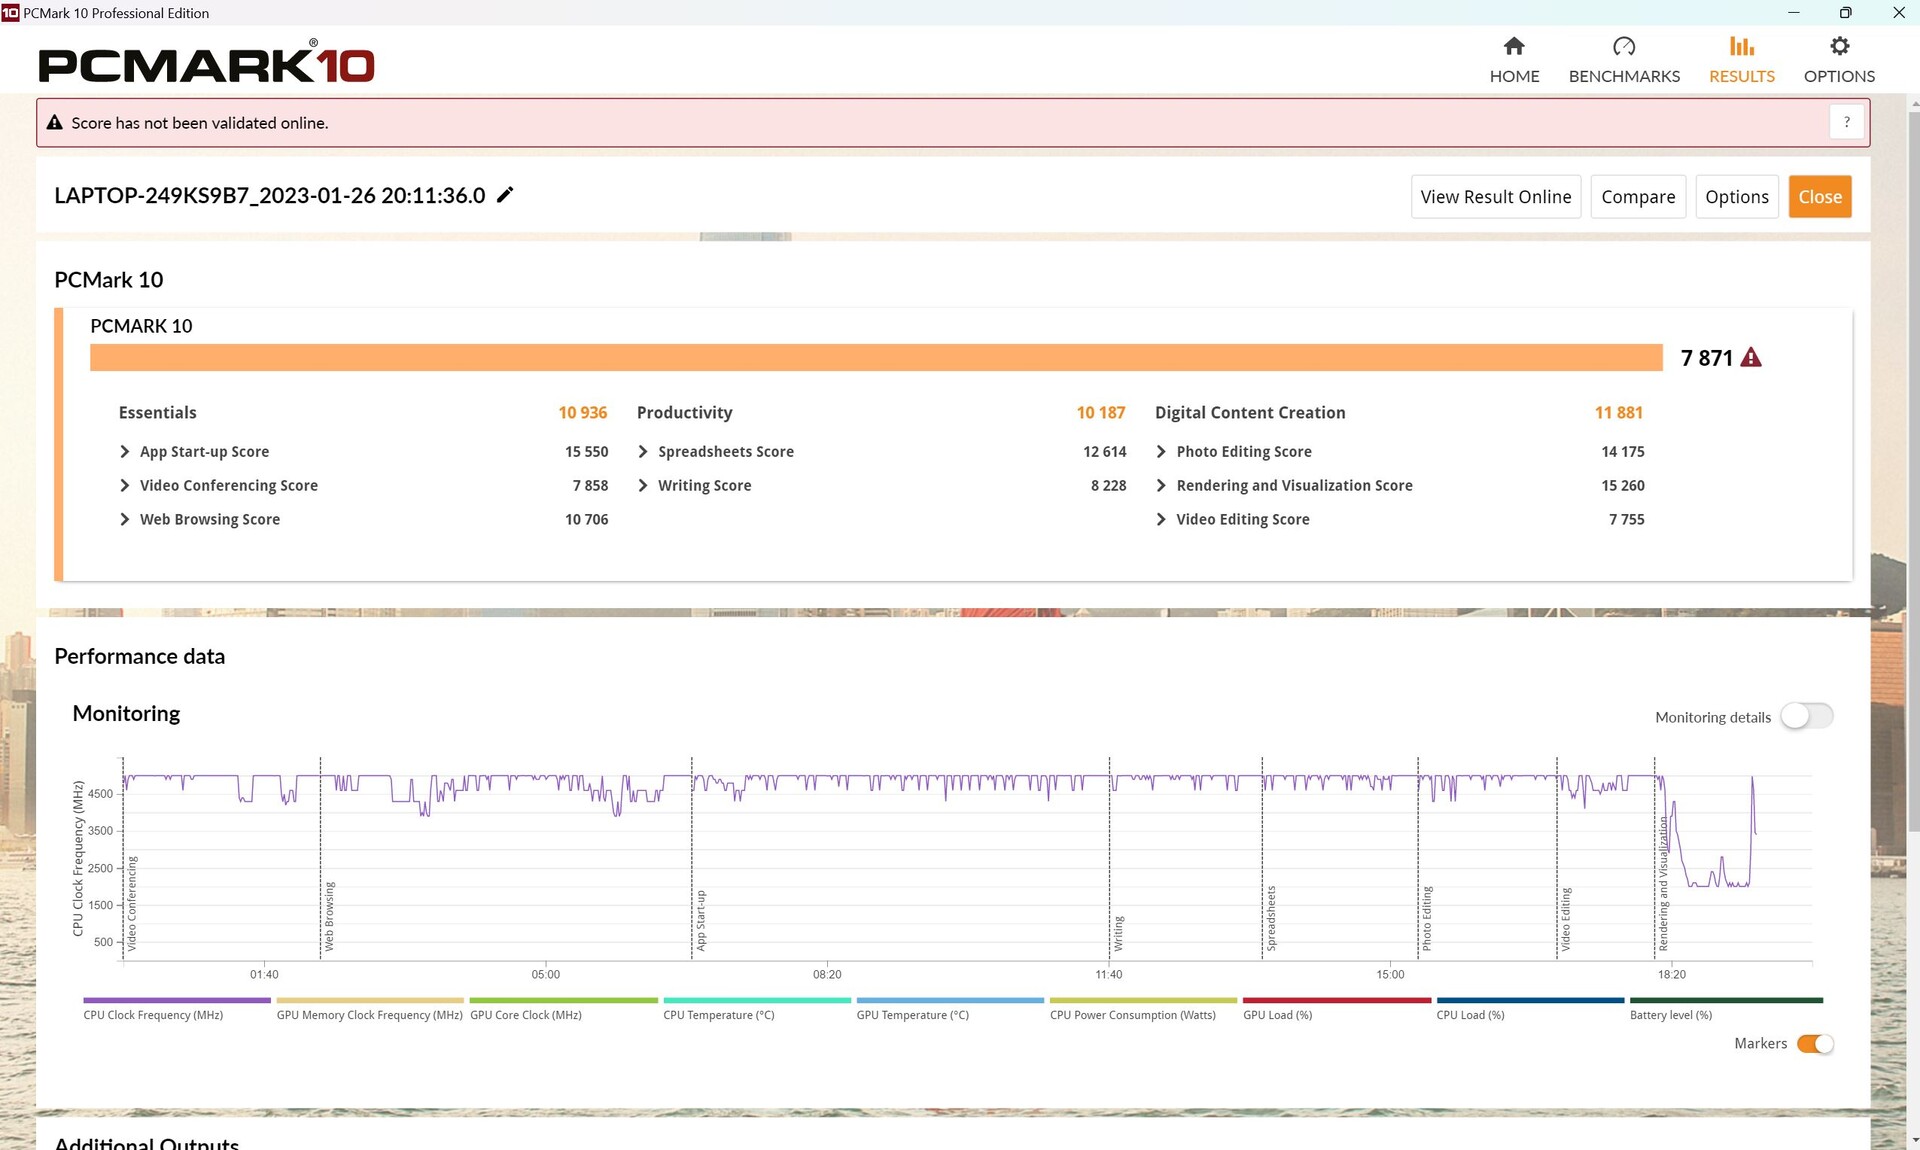
W PCMark, połączenie i9 i RTX 3070 Tiwysuwa się na prowadzenie we wszystkich benchmarkach, ale i tego poziomu wydajności można się spodziewać. To samo dotyczy benchmarków CrossMark.
CrossMark: Overall | Productivity | Creativity | Responsiveness
| PCMark 10 / Score | |
| Średnia w klasie Gaming (5828 - 11574, n=94, ostatnie 2 lata) | |
| Asus ROG Zephyrus M16 GU603Z | |
| Przeciętny Intel Core i9-12900H, NVIDIA GeForce RTX 3070 Ti Laptop GPU (7087 - 8072, n=6) | |
| Lenovo Legion 5 Pro 16ARH7H RTX 3070 Ti | |
| Corsair Voyager a1600 | |
| Schenker XMG Focus 16 (i7-12700H, RTX 3060) | |
| Asus ROG Zephyrus M16 GU603H | |
| PCMark 10 / Essentials | |
| Asus ROG Zephyrus M16 GU603Z | |
| Przeciętny Intel Core i9-12900H, NVIDIA GeForce RTX 3070 Ti Laptop GPU (10266 - 11663, n=6) | |
| Średnia w klasie Gaming (8810 - 12600, n=98, ostatnie 2 lata) | |
| Asus ROG Zephyrus M16 GU603H | |
| Lenovo Legion 5 Pro 16ARH7H RTX 3070 Ti | |
| Schenker XMG Focus 16 (i7-12700H, RTX 3060) | |
| Corsair Voyager a1600 | |
| PCMark 10 / Productivity | |
| Średnia w klasie Gaming (6845 - 18766, n=96, ostatnie 2 lata) | |
| Asus ROG Zephyrus M16 GU603Z | |
| Przeciętny Intel Core i9-12900H, NVIDIA GeForce RTX 3070 Ti Laptop GPU (9402 - 10742, n=6) | |
| Schenker XMG Focus 16 (i7-12700H, RTX 3060) | |
| Lenovo Legion 5 Pro 16ARH7H RTX 3070 Ti | |
| Asus ROG Zephyrus M16 GU603H | |
| Corsair Voyager a1600 | |
| PCMark 10 / Digital Content Creation | |
| Średnia w klasie Gaming (7602 - 19657, n=96, ostatnie 2 lata) | |
| Asus ROG Zephyrus M16 GU603Z | |
| Lenovo Legion 5 Pro 16ARH7H RTX 3070 Ti | |
| Przeciętny Intel Core i9-12900H, NVIDIA GeForce RTX 3070 Ti Laptop GPU (10009 - 12541, n=6) | |
| Corsair Voyager a1600 | |
| Asus ROG Zephyrus M16 GU603H | |
| Schenker XMG Focus 16 (i7-12700H, RTX 3060) | |
| CrossMark / Overall | |
| Średnia w klasie Gaming (1366 - 2409, n=96, ostatnie 2 lata) | |
| Asus ROG Zephyrus M16 GU603Z | |
| Przeciętny Intel Core i9-12900H, NVIDIA GeForce RTX 3070 Ti Laptop GPU (1664 - 2044, n=6) | |
| Schenker XMG Focus 16 (i7-12700H, RTX 3060) | |
| Schenker Vision 16 Pro RTX 3070 Ti | |
| Lenovo Legion 5 Pro 16ARH7H RTX 3070 Ti | |
| Corsair Voyager a1600 | |
| CrossMark / Productivity | |
| Średnia w klasie Gaming (1386 - 2254, n=96, ostatnie 2 lata) | |
| Asus ROG Zephyrus M16 GU603Z | |
| Przeciętny Intel Core i9-12900H, NVIDIA GeForce RTX 3070 Ti Laptop GPU (1591 - 1968, n=6) | |
| Lenovo Legion 5 Pro 16ARH7H RTX 3070 Ti | |
| Schenker XMG Focus 16 (i7-12700H, RTX 3060) | |
| Schenker Vision 16 Pro RTX 3070 Ti | |
| Corsair Voyager a1600 | |
| CrossMark / Creativity | |
| Średnia w klasie Gaming (1343 - 2729, n=96, ostatnie 2 lata) | |
| Asus ROG Zephyrus M16 GU603Z | |
| Przeciętny Intel Core i9-12900H, NVIDIA GeForce RTX 3070 Ti Laptop GPU (1797 - 2148, n=6) | |
| Schenker Vision 16 Pro RTX 3070 Ti | |
| Schenker XMG Focus 16 (i7-12700H, RTX 3060) | |
| Lenovo Legion 5 Pro 16ARH7H RTX 3070 Ti | |
| Corsair Voyager a1600 | |
| CrossMark / Responsiveness | |
| Asus ROG Zephyrus M16 GU603Z | |
| Przeciętny Intel Core i9-12900H, NVIDIA GeForce RTX 3070 Ti Laptop GPU (1514 - 2069, n=6) | |
| Średnia w klasie Gaming (1226 - 2334, n=96, ostatnie 2 lata) | |
| Lenovo Legion 5 Pro 16ARH7H RTX 3070 Ti | |
| Schenker XMG Focus 16 (i7-12700H, RTX 3060) | |
| Schenker Vision 16 Pro RTX 3070 Ti | |
| Corsair Voyager a1600 | |
| PCMark 10 Score | 7871 pkt. | |
Pomoc | ||
| AIDA64 / Memory Copy | |
| Średnia w klasie Gaming (21750 - 129946, n=107, ostatnie 2 lata) | |
| Asus ROG Zephyrus M16 GU603Z | |
| Schenker Vision 16 Pro RTX 3070 Ti | |
| Przeciętny Intel Core i9-12900H (34438 - 74264, n=29) | |
| Lenovo Legion 5 Pro 16ARH7H RTX 3070 Ti | |
| Corsair Voyager a1600 | |
| Schenker XMG Focus 16 (i7-12700H, RTX 3060) | |
| AIDA64 / Memory Read | |
| Średnia w klasie Gaming (22956 - 118858, n=107, ostatnie 2 lata) | |
| Asus ROG Zephyrus M16 GU603Z | |
| Schenker Vision 16 Pro RTX 3070 Ti | |
| Przeciętny Intel Core i9-12900H (36365 - 74642, n=29) | |
| Lenovo Legion 5 Pro 16ARH7H RTX 3070 Ti | |
| Corsair Voyager a1600 | |
| Schenker XMG Focus 16 (i7-12700H, RTX 3060) | |
| AIDA64 / Memory Write | |
| Średnia w klasie Gaming (22297 - 135096, n=107, ostatnie 2 lata) | |
| Asus ROG Zephyrus M16 GU603Z | |
| Schenker Vision 16 Pro RTX 3070 Ti | |
| Przeciętny Intel Core i9-12900H (32276 - 67858, n=29) | |
| Lenovo Legion 5 Pro 16ARH7H RTX 3070 Ti | |
| Corsair Voyager a1600 | |
| Schenker XMG Focus 16 (i7-12700H, RTX 3060) | |
| AIDA64 / Memory Latency | |
| Średnia w klasie Gaming (75.3 - 259, n=107, ostatnie 2 lata) | |
| Corsair Voyager a1600 | |
| Schenker Vision 16 Pro RTX 3070 Ti | |
| Schenker XMG Focus 16 (i7-12700H, RTX 3060) | |
| Asus ROG Zephyrus M16 GU603Z | |
| Lenovo Legion 5 Pro 16ARH7H RTX 3070 Ti | |
| Przeciętny Intel Core i9-12900H (74.7 - 118.1, n=28) | |
| Asus ROG Zephyrus M16 GU603H | |
* ... im mniej tym lepiej
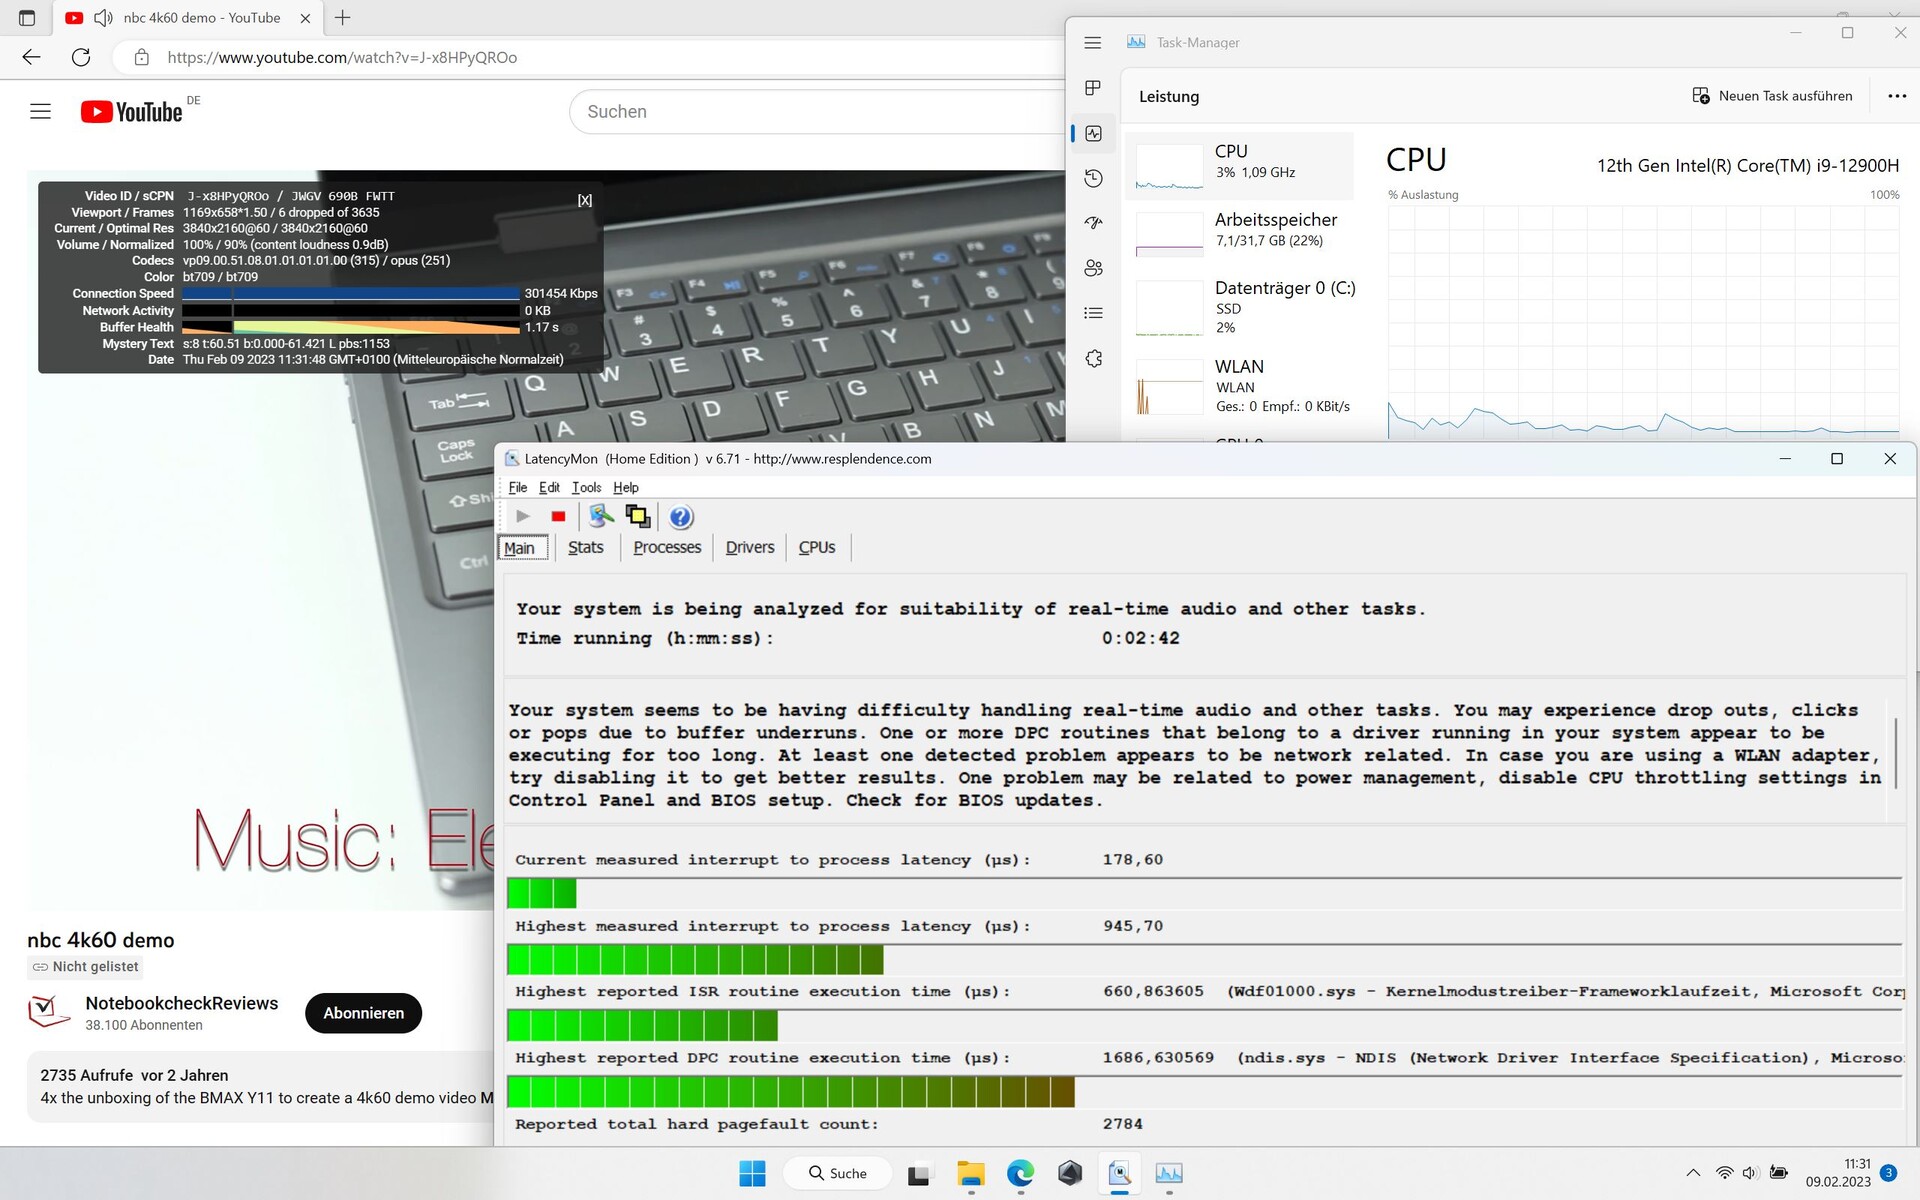
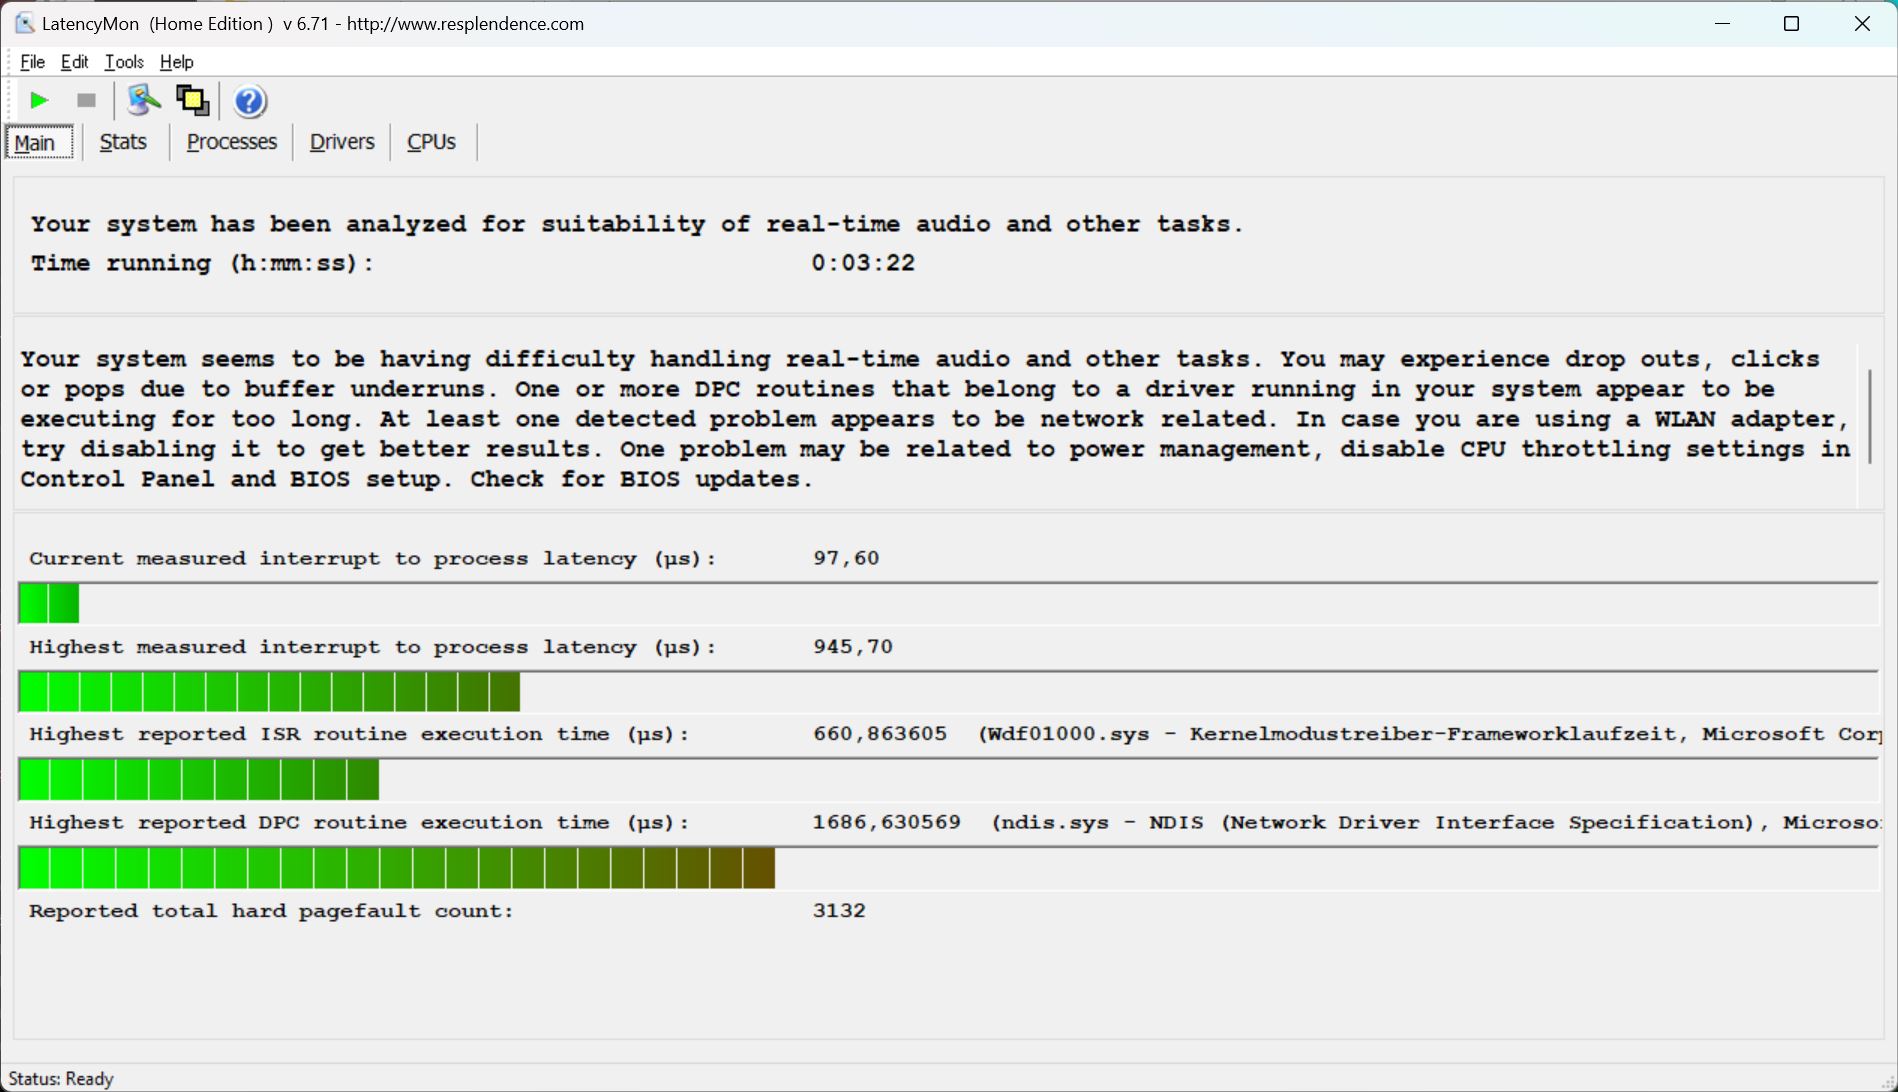
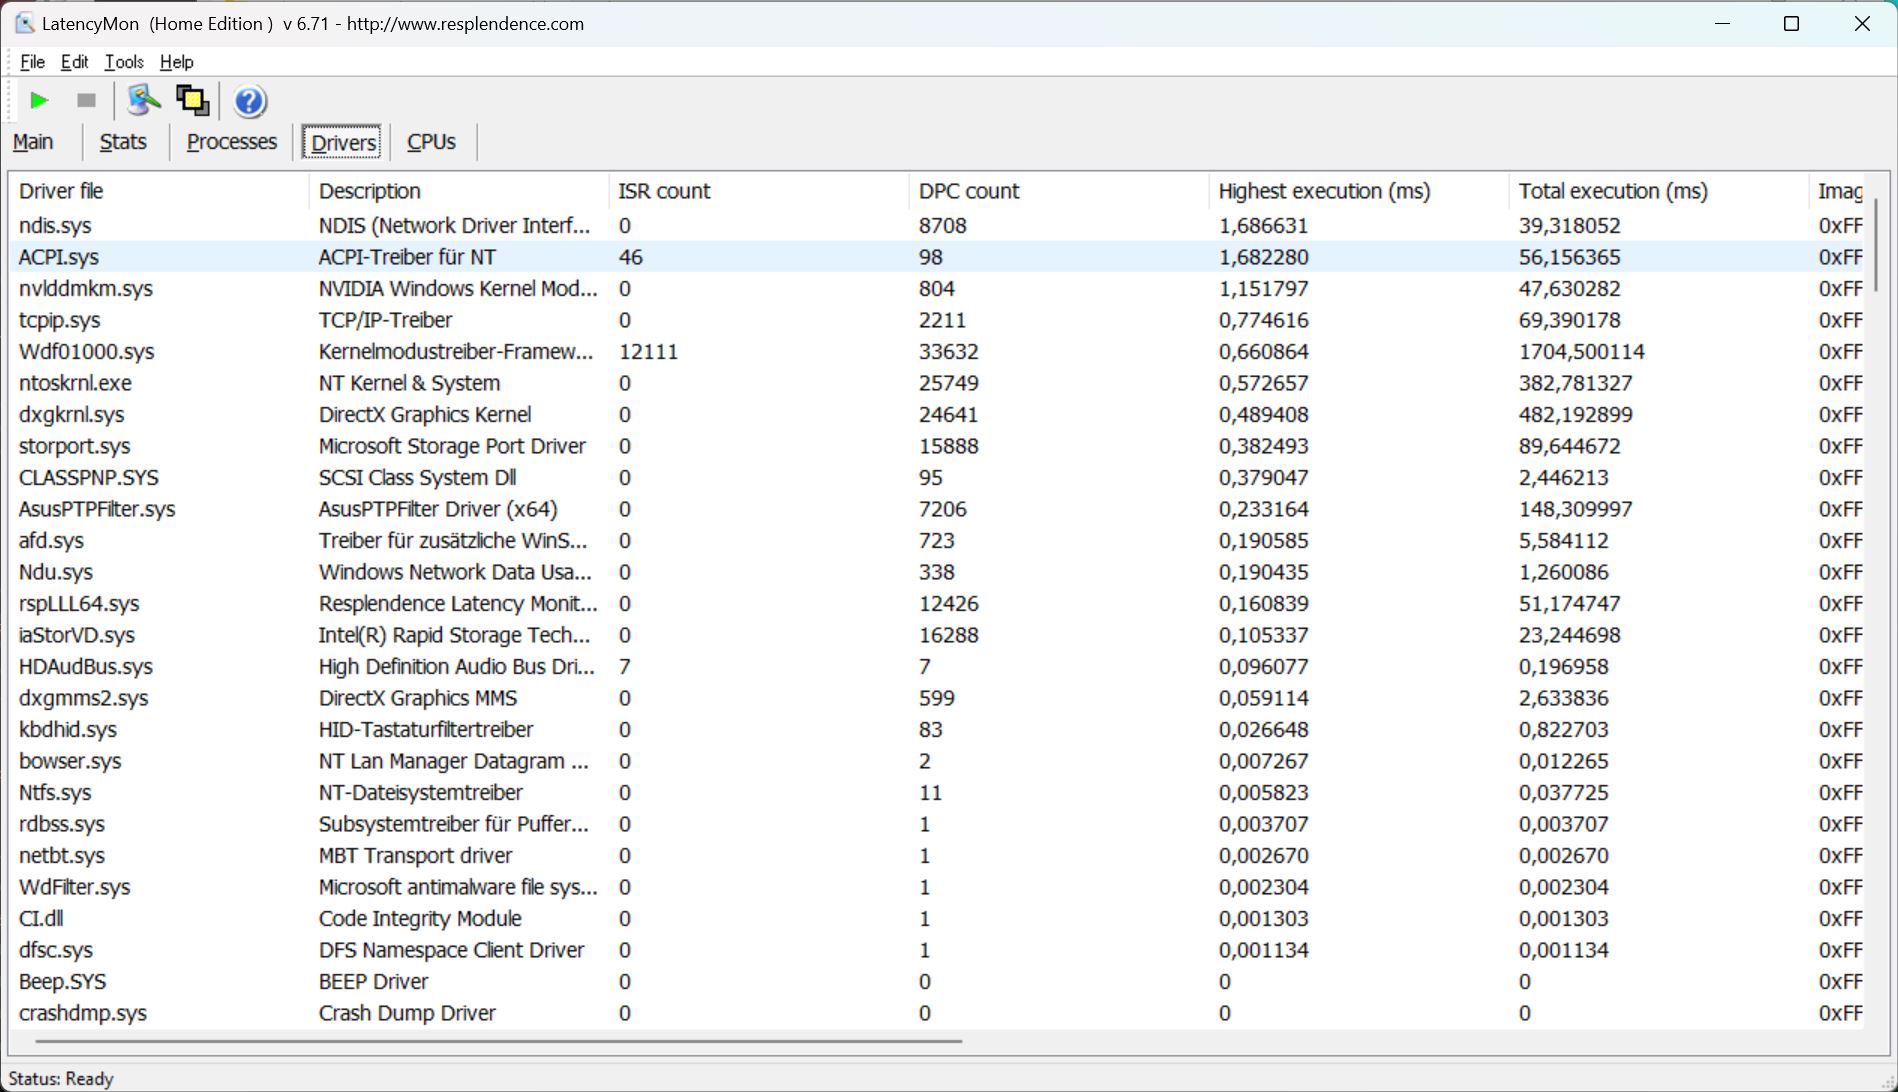
Opóźnienia DPC
LatencyMon niestety znajduje już pierwsze latencje podczas uruchamiania programu, nawet jeśli nie ma żadnych dodatkowych akcji. Podczas otwierania przeglądarki z wieloma zakładkami latencje jeszcze bardziej rosną.
Nasz film 4K/60-fps z YouTube również nie jest odtwarzany bez żadnych zrzuconych klatek (6). Wartości opóźnień nie są jednak ogólnie szczególnie wysokie i są niższe niż w przypadku XMG Focus 16, na przykład. Z drugiej strony stają się one widoczne wcześniej.
| DPC Latencies / LatencyMon - interrupt to process latency (max), Web, Youtube, Prime95 | |
| Schenker XMG Focus 16 (i7-12700H, RTX 3060) | |
| Asus ROG Zephyrus M16 GU603H | |
| Asus ROG Zephyrus M16 GU603Z | |
| Lenovo Legion 5 Pro 16ARH7H RTX 3070 Ti | |
| Corsair Voyager a1600 | |
| Schenker Vision 16 Pro RTX 3070 Ti | |
* ... im mniej tym lepiej
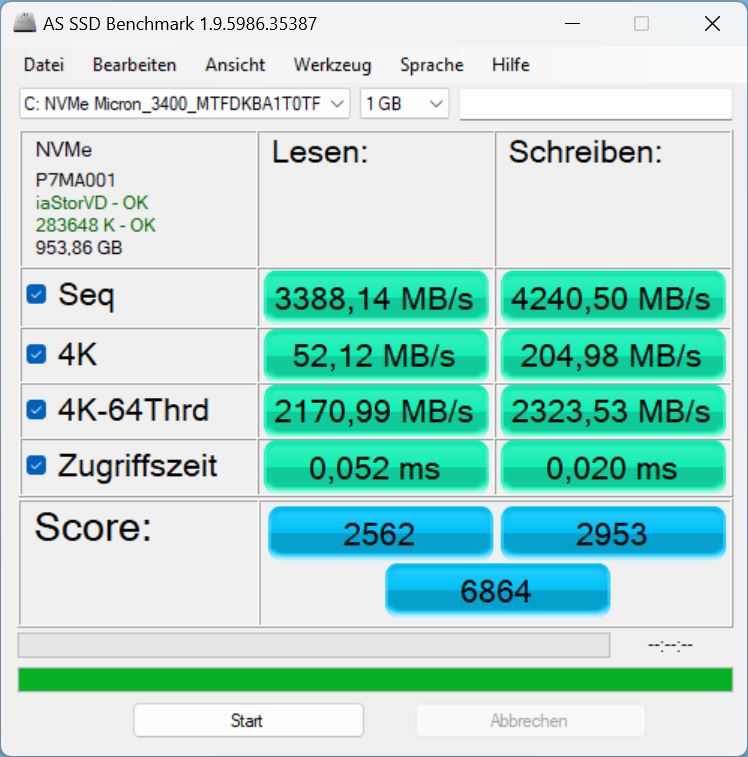
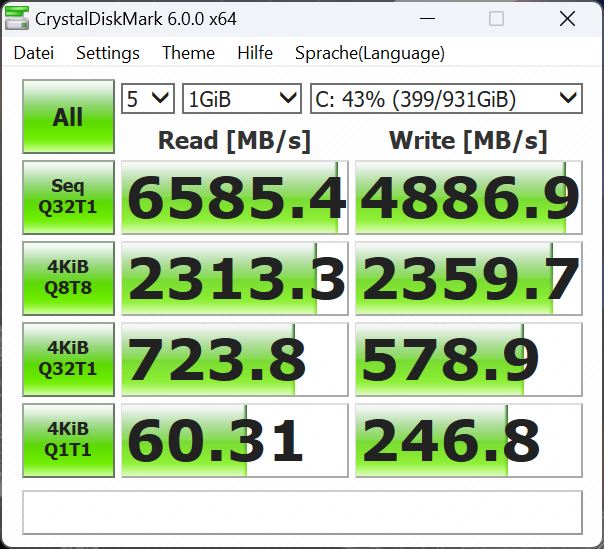
Rozwiązanie w zakresie przechowywania
W naszym modelu testowym zastosowano dysk SSD PCIe Gen4 firmy Micron o pojemności 1 TB. W naszym liście najlepszych dysków SSD, plasuje się on na pozycji 74, więc jest też wiele szybszych modeli. Benchmarki potwierdzają przyzwoite wartości dla rozwiązania pamięci masowej. Zmierzone wartości pamięci masowej Samsunga w poprzedniku czy np Legion 5, są szybsze.
Dysk SSD nie jest w stanie utrzymać swojej wydajności na dłuższą metę, ale spadek wydajności jest tylko niewielki.


| Drive Performance rating - Percent | |
| Lenovo Legion 5 Pro 16ARH7H RTX 3070 Ti | |
| Asus ROG Zephyrus M16 GU603H | |
| Asus ROG Zephyrus M16 GU603Z | |
| Schenker XMG Focus 16 (i7-12700H, RTX 3060) | |
| Średnia w klasie Gaming | |
| Przeciętny Micron 3400 1TB MTFDKBA1T0TFH | |
| Schenker Vision 16 Pro RTX 3070 Ti | |
| Corsair Voyager a1600 | |
* ... im mniej tym lepiej
Disk Throttling: DiskSpd Read Loop, Queue Depth 8
Karta graficzna
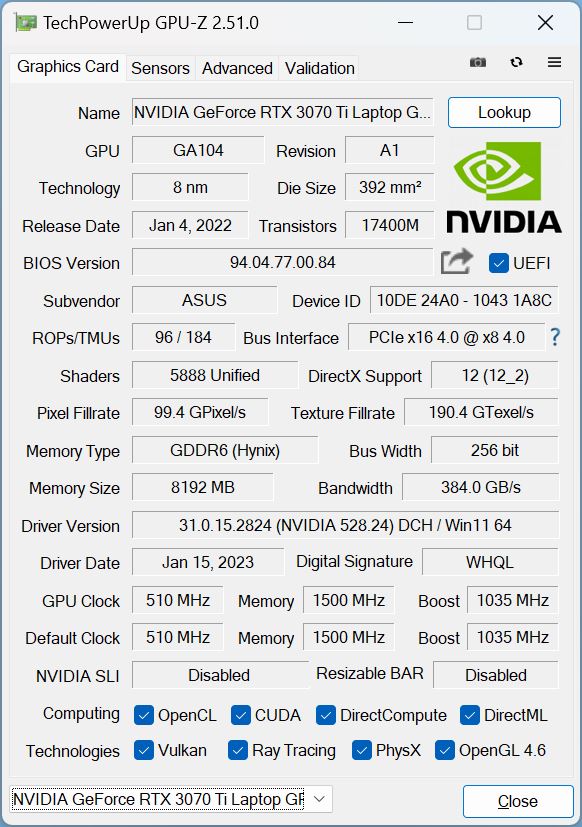
Nasz system testowy wykorzystujeRTX 3070 Timimo że jest to naprawdę jedno z najmocniejszych GPU do laptopów, w M16 może ono wykorzystywać "tylko" 100 W plus 20 W Dynamic Boost. Nie jest zbyt zaskakujące, że kiedy pozwala się na wykorzystanie 150 W, tosamo GPU jest szybsze w Legion 5 Pro, nawet o 27%!
Co najmniej, poprzednik z RTX 3070 (bez "Ti") przewyższa go o 38%. Na stronie .XMG Vision 16 Propozwala tylko na maksymalnie 95 W dla GPU, więc to również pozostaje znacząco za M16.
Ogólnie rzecz biorąc, szybkość działania karty graficznej 120-W jest o około 7 do 12% wolniejsza od przeciętnego RTX 3070 Ti w naszej bazie danych.
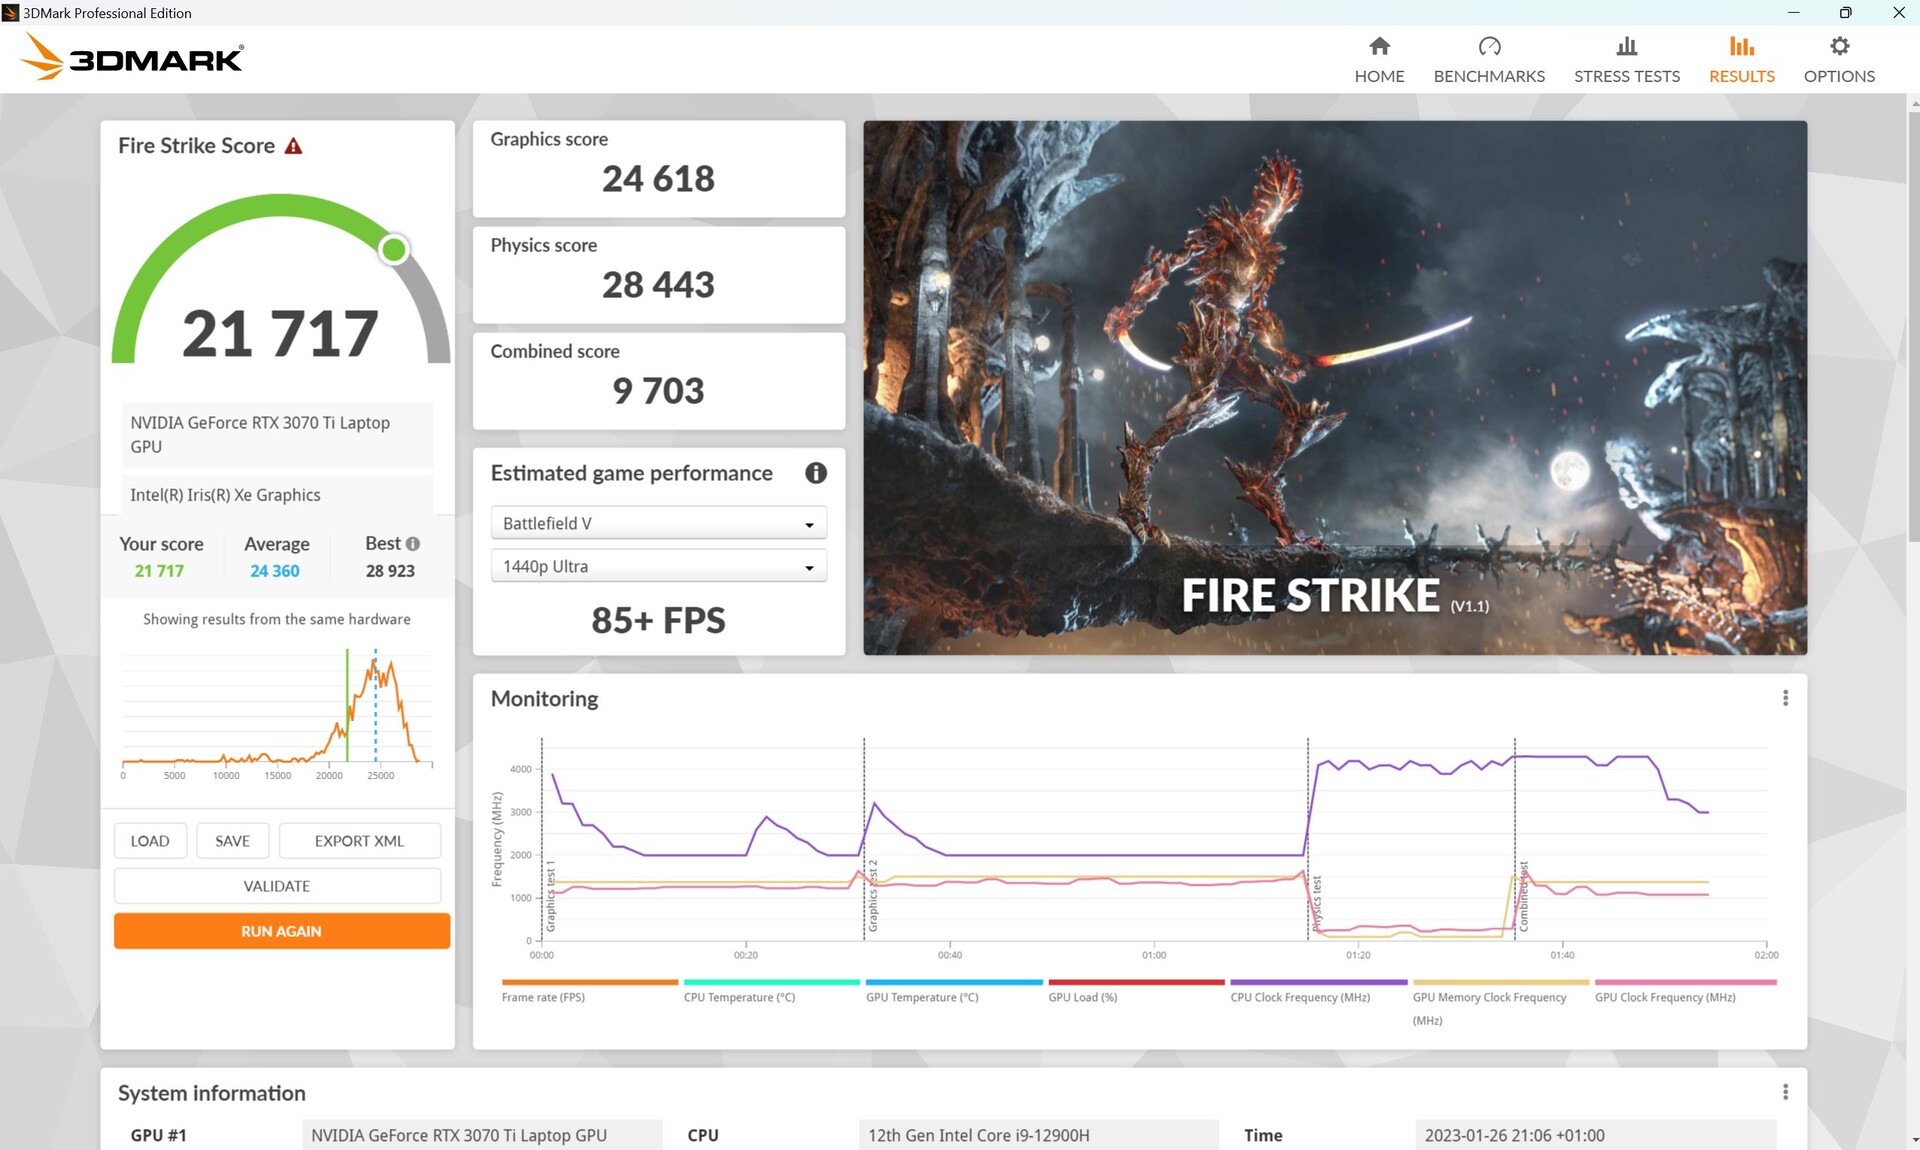
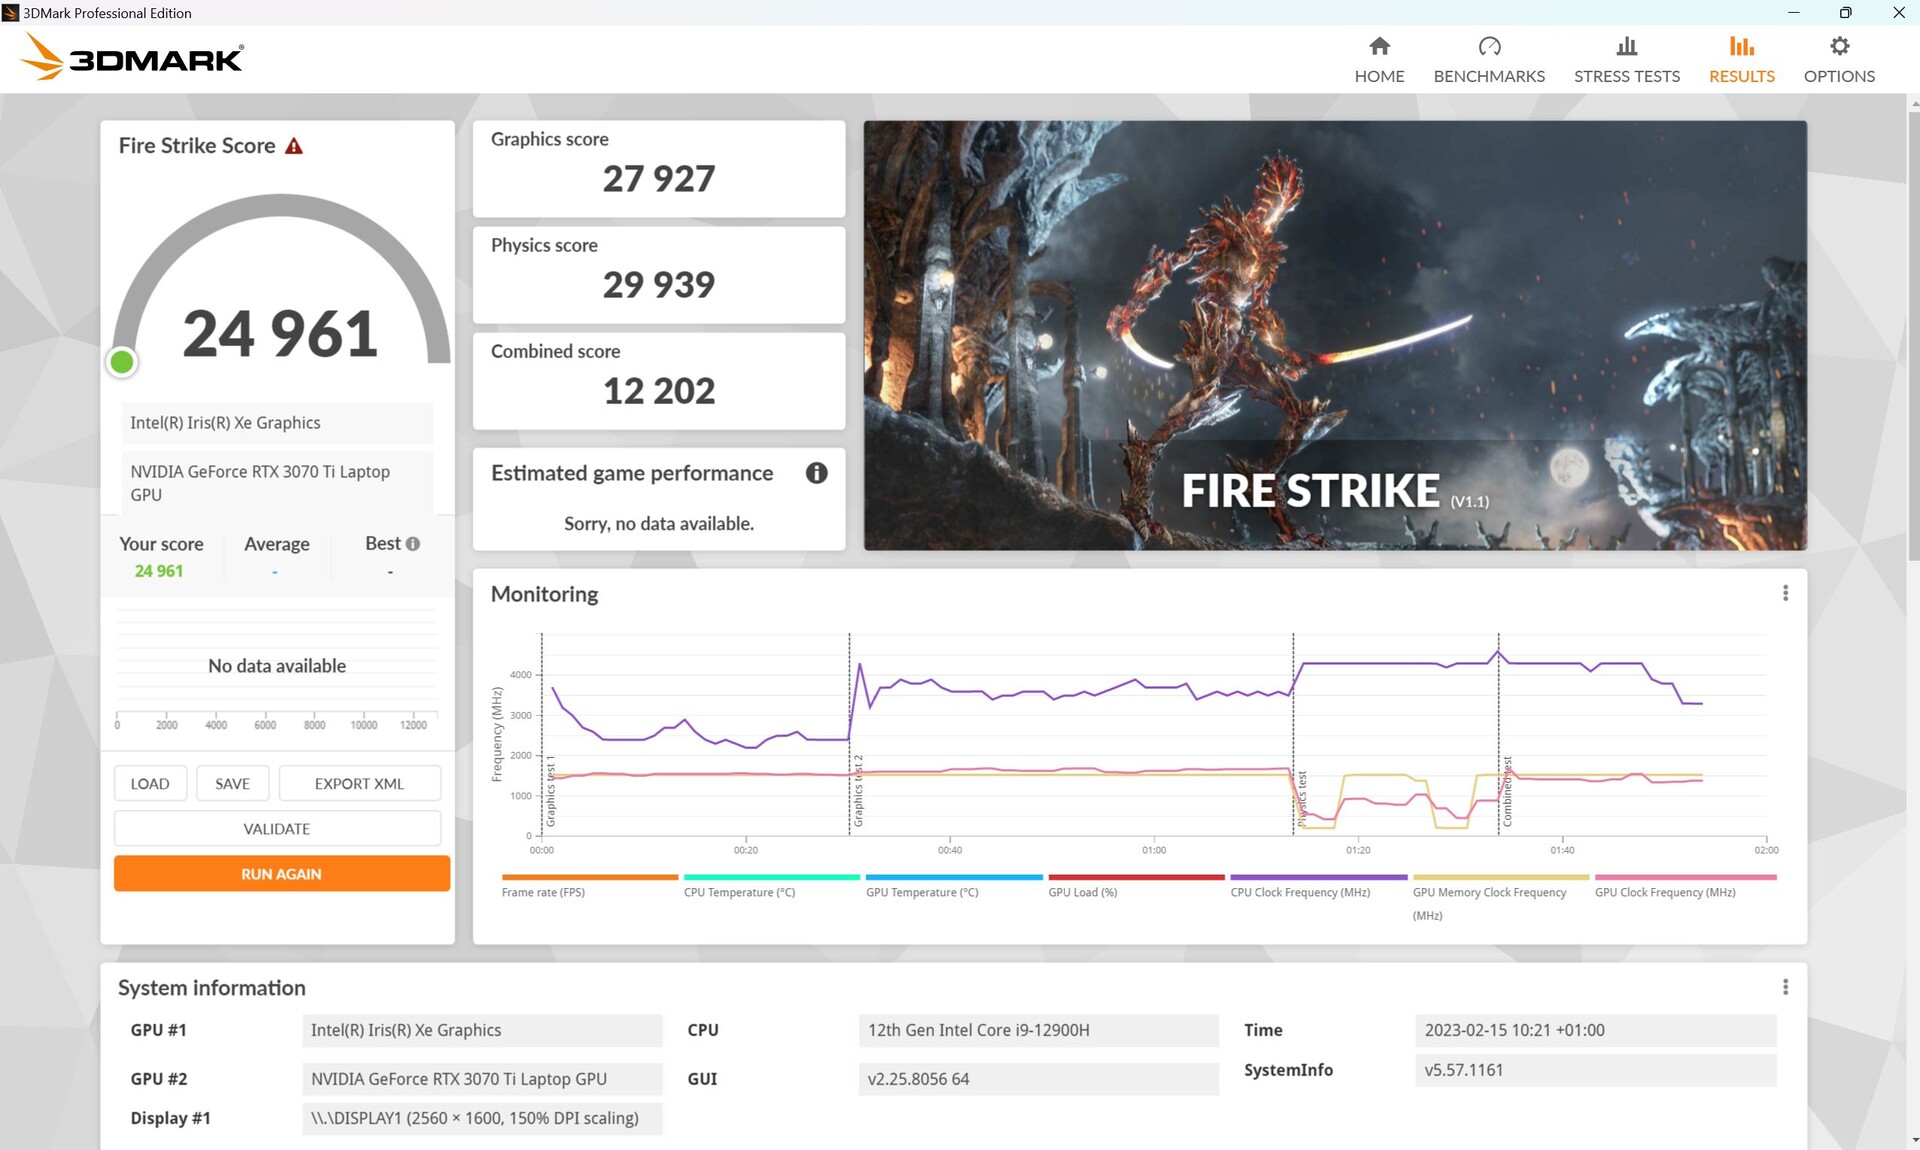
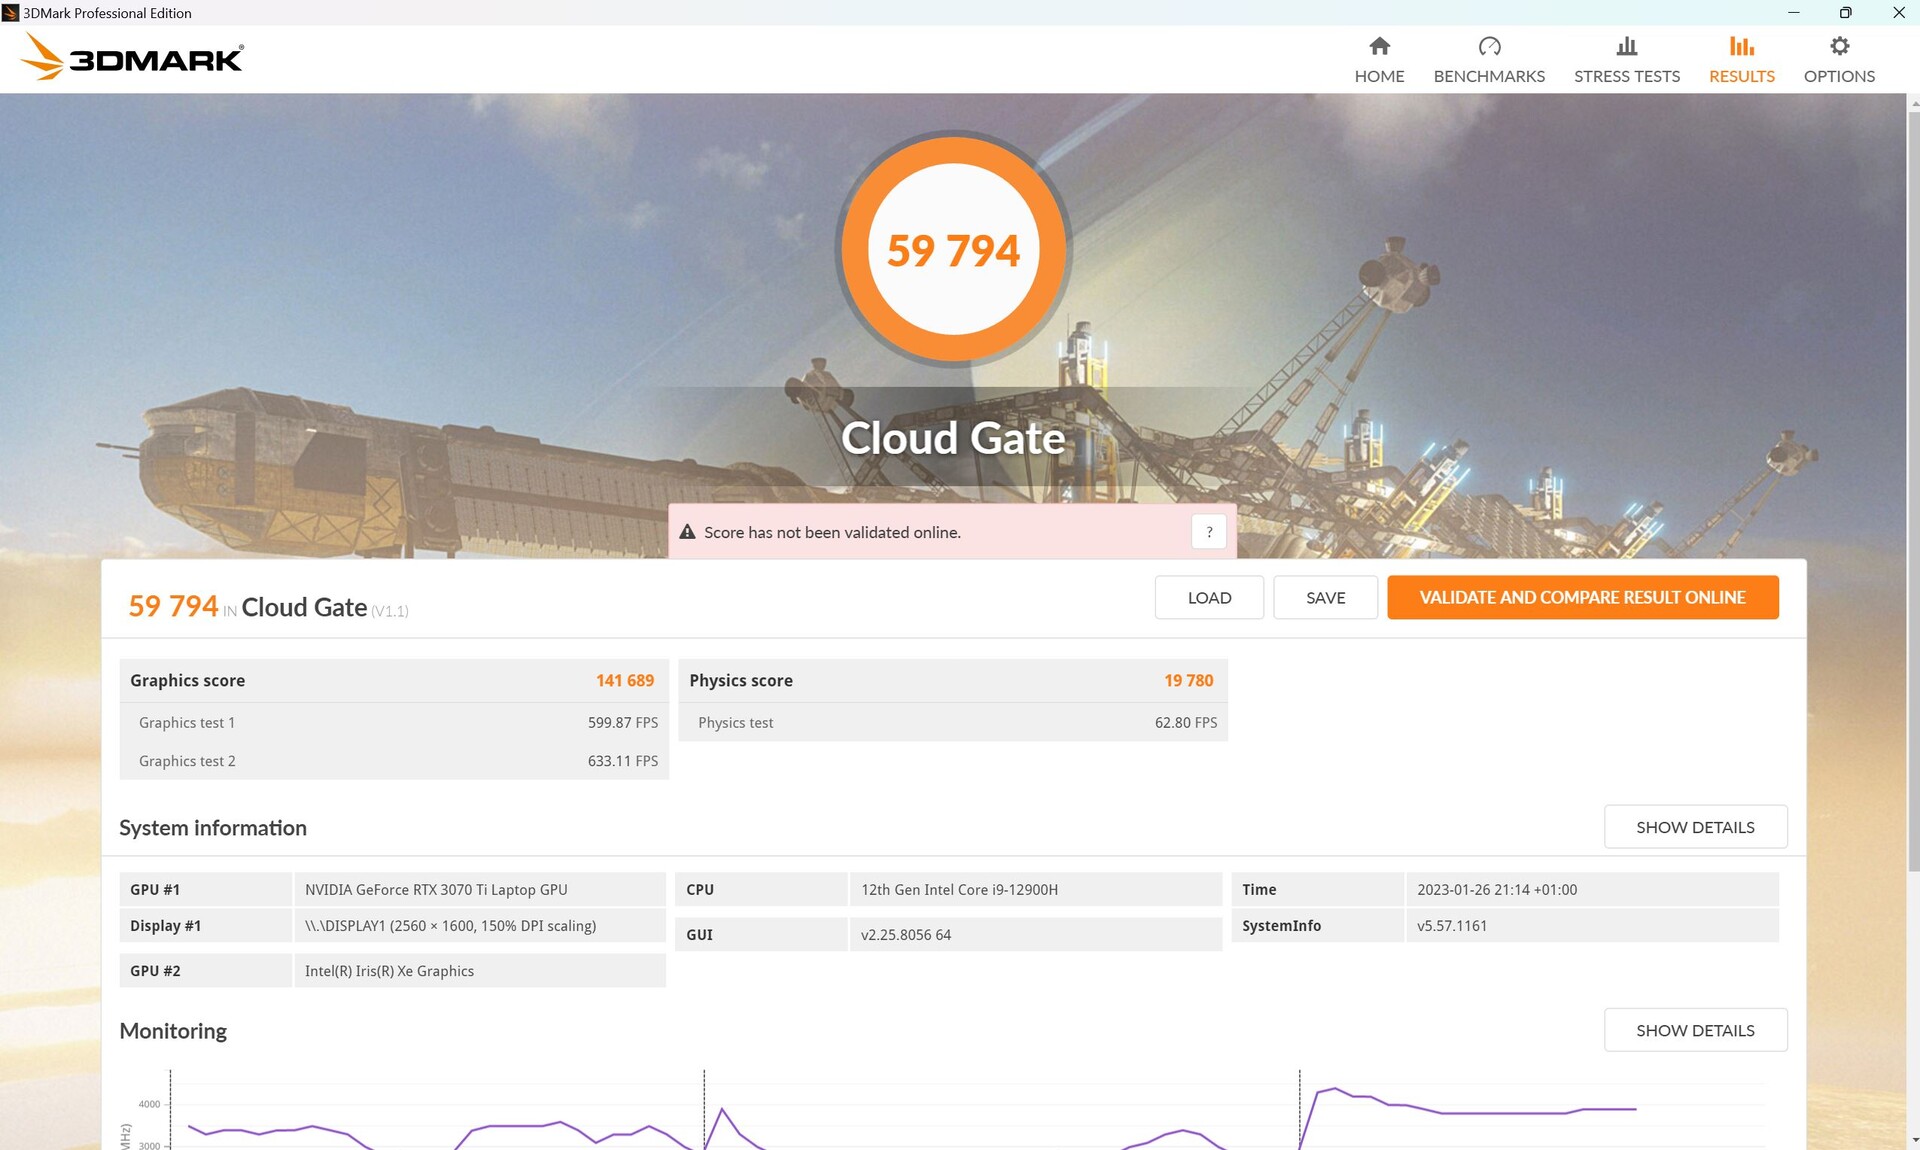
W trybie Turbo wydajność i zużycie energii rosną nieznacznie, a kolejny test Fire-Strike daje wynik graficzny wyższy o około 13%.
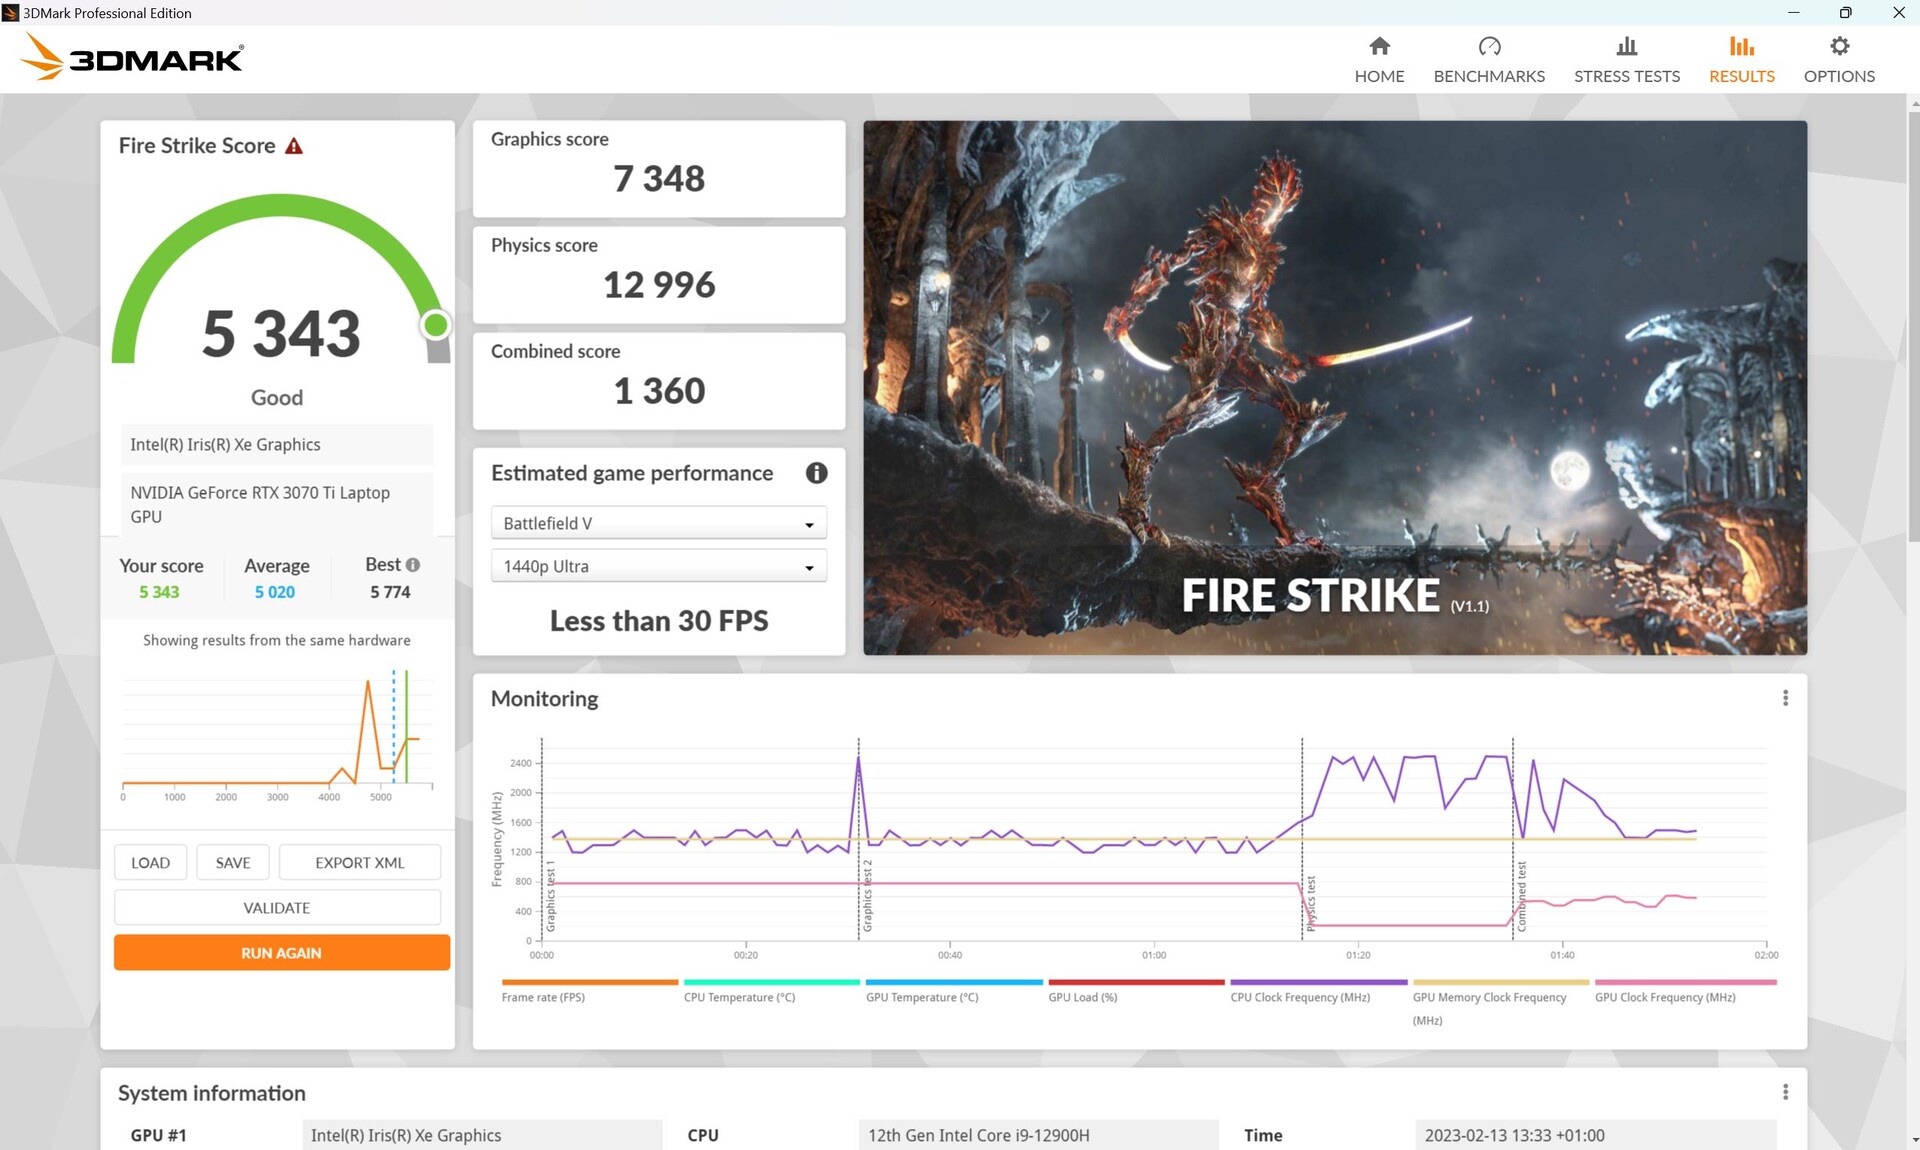
Podczas pracy na baterii wydajność 3D znacząco spada. W porównaniu do 24 618 punktów graficznych w Fire Strike podczas pracy w sieci, podczas pracy na baterii pozostaje tylko 7 348 punktów 3D, co odpowiada spadkowi o 70%!
| 3DMark Performance rating - Percent | |
| Średnia w klasie Gaming | |
| Lenovo Legion 5 Pro 16ARH7H RTX 3070 Ti | |
| Corsair Voyager a1600 | |
| Przeciętny NVIDIA GeForce RTX 3070 Ti Laptop GPU | |
| Asus ROG Zephyrus M16 GU603Z | |
| Schenker Vision 16 Pro RTX 3070 Ti -1! | |
| Schenker XMG Focus 16 (i7-12700H, RTX 3060) | |
| Asus ROG Zephyrus M16 GU603H | |
| 3DMark 11 Performance | 29169 pkt. | |
| 3DMark Cloud Gate Standard Score | 59794 pkt. | |
| 3DMark Fire Strike Score | 21717 pkt. | |
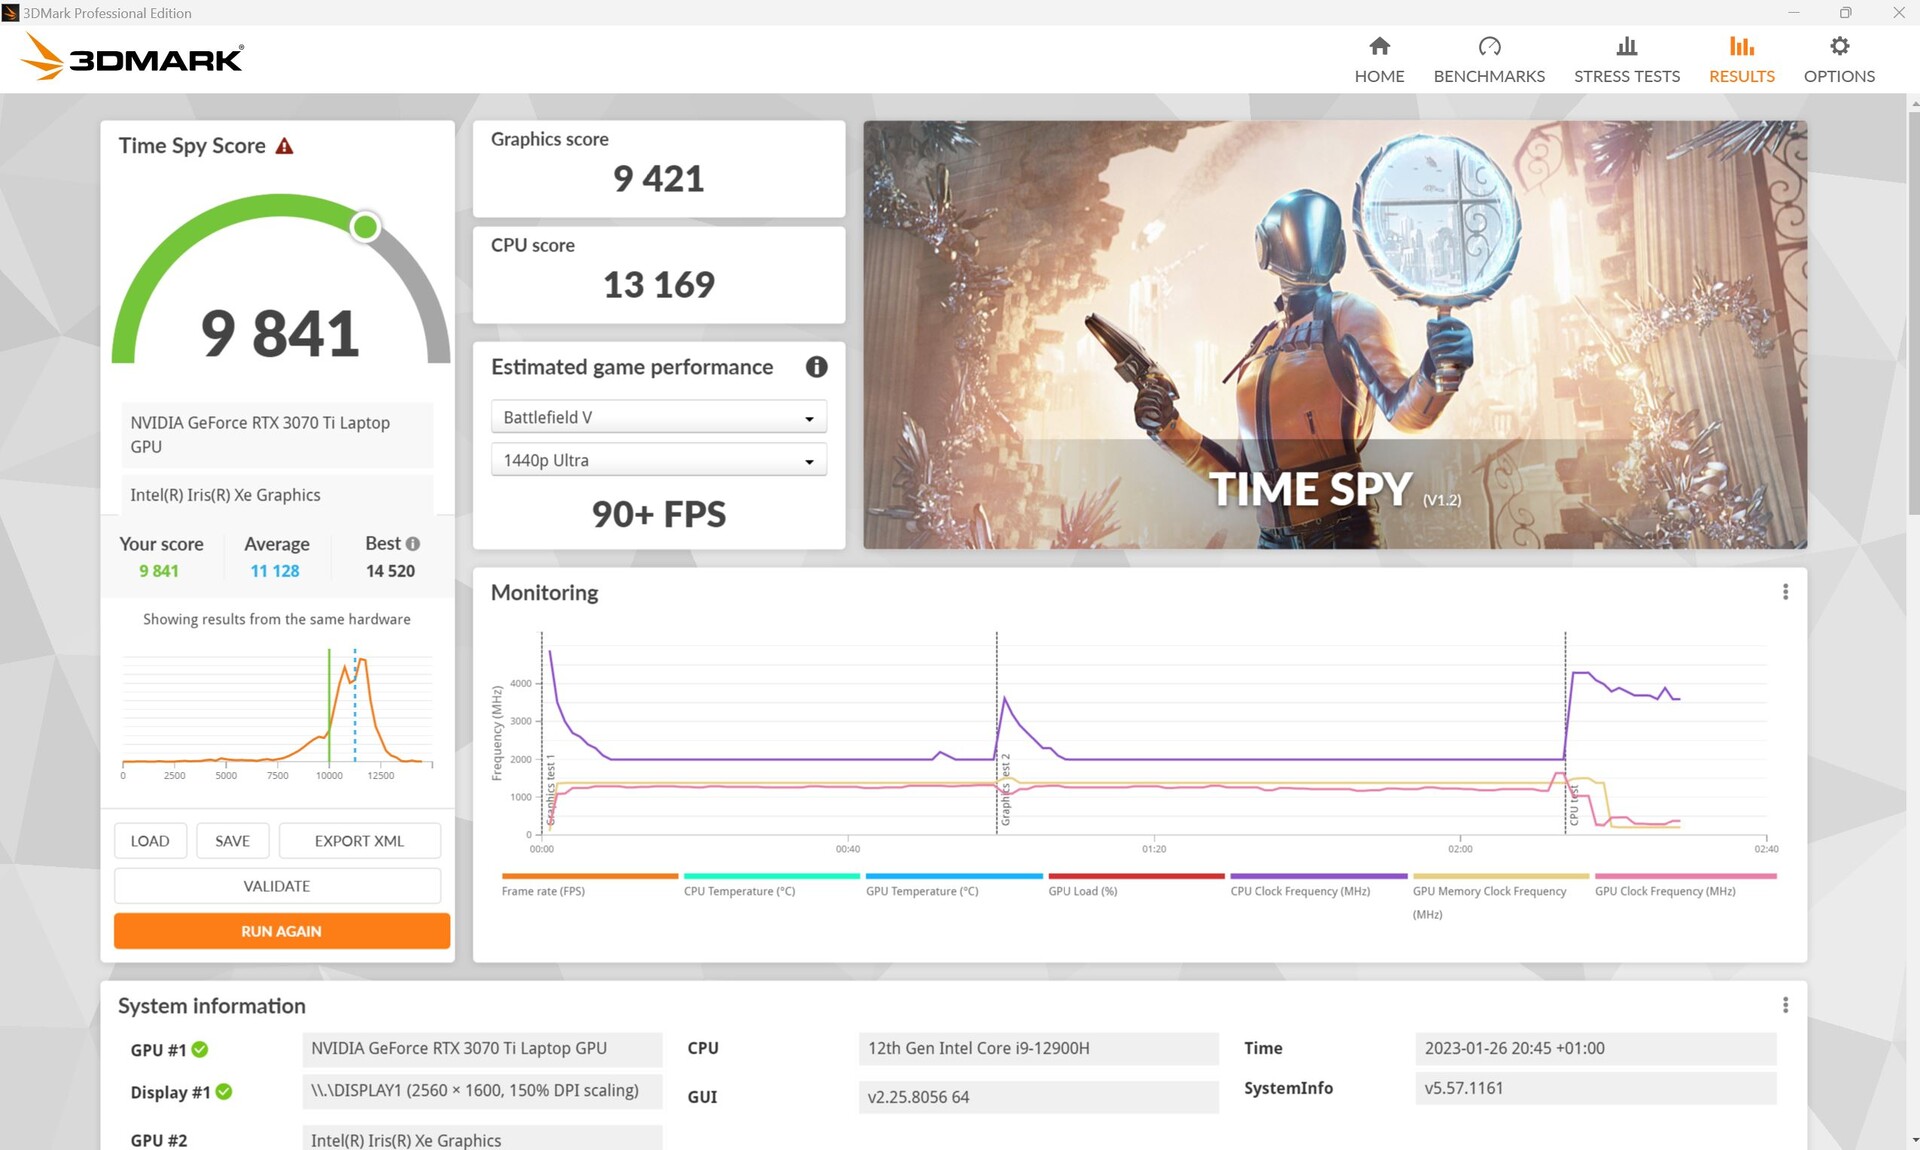
| 3DMark Time Spy Score | 9841 pkt. | |
Pomoc | ||
* ... im mniej tym lepiej
Wydajność w grach
W grach różnica nie jest aż tak duża, także dlatego, że mocny procesor jest w stanie nadrobić zaległości w grach wymagających użycia procesora. W grach wykorzystujących GPU, takich jak The Witcher 3 czy Strange Brigade, 5 ProLegion 5 Proze swoim 150-W RTX 3070-Ti jest wyraźnie do przodu. W DOTA 2 Reborn lub X-Plane 11.11, M16 jest w stanie uplasować się na szczycie.
| Performance rating - Percent | |
| Średnia w klasie Gaming | |
| Asus ROG Zephyrus M16 GU603Z | |
| Lenovo Legion 5 Pro 16ARH7H RTX 3070 Ti | |
| Schenker Vision 16 Pro RTX 3070 Ti | |
| Schenker XMG Focus 16 (i7-12700H, RTX 3060) | |
| Corsair Voyager a1600 | |
| Asus ROG Zephyrus M16 GU603H | |
| The Witcher 3 - 1920x1080 Ultra Graphics & Postprocessing (HBAO+) | |
| Średnia w klasie Gaming (95 - 240, n=8, ostatnie 2 lata) | |
| Lenovo Legion 5 Pro 16ARH7H RTX 3070 Ti | |
| Corsair Voyager a1600 | |
| Asus ROG Zephyrus M16 GU603Z | |
| Asus ROG Zephyrus M16 GU603H | |
| Schenker Vision 16 Pro RTX 3070 Ti | |
| Schenker XMG Focus 16 (i7-12700H, RTX 3060) | |
| GTA V - 1920x1080 Highest AA:4xMSAA + FX AF:16x | |
| Średnia w klasie Gaming (48.3 - 186.9, n=100, ostatnie 2 lata) | |
| Schenker Vision 16 Pro RTX 3070 Ti | |
| Asus ROG Zephyrus M16 GU603Z | |
| Lenovo Legion 5 Pro 16ARH7H RTX 3070 Ti | |
| Schenker XMG Focus 16 (i7-12700H, RTX 3060) | |
| Corsair Voyager a1600 | |
| Asus ROG Zephyrus M16 GU603H | |
| Final Fantasy XV Benchmark - 1920x1080 High Quality | |
| Średnia w klasie Gaming (41 - 215, n=101, ostatnie 2 lata) | |
| Lenovo Legion 5 Pro 16ARH7H RTX 3070 Ti | |
| Corsair Voyager a1600 | |
| Asus ROG Zephyrus M16 GU603Z | |
| Schenker Vision 16 Pro RTX 3070 Ti | |
| Schenker XMG Focus 16 (i7-12700H, RTX 3060) | |
| Asus ROG Zephyrus M16 GU603H | |
| Strange Brigade - 1920x1080 ultra AA:ultra AF:16 | |
| Średnia w klasie Gaming (76.3 - 456, n=91, ostatnie 2 lata) | |
| Lenovo Legion 5 Pro 16ARH7H RTX 3070 Ti | |
| Corsair Voyager a1600 | |
| Asus ROG Zephyrus M16 GU603Z | |
| Schenker Vision 16 Pro RTX 3070 Ti | |
| Schenker XMG Focus 16 (i7-12700H, RTX 3060) | |
| Asus ROG Zephyrus M16 GU603H | |
| Dota 2 Reborn - 1920x1080 ultra (3/3) best looking | |
| Asus ROG Zephyrus M16 GU603Z | |
| Średnia w klasie Gaming (84.8 - 248, n=110, ostatnie 2 lata) | |
| Schenker Vision 16 Pro RTX 3070 Ti | |
| Asus ROG Zephyrus M16 GU603H | |
| Schenker XMG Focus 16 (i7-12700H, RTX 3060) | |
| Lenovo Legion 5 Pro 16ARH7H RTX 3070 Ti | |
| Corsair Voyager a1600 | |
| X-Plane 11.11 - 1920x1080 high (fps_test=3) | |
| Asus ROG Zephyrus M16 GU603Z | |
| Schenker Vision 16 Pro RTX 3070 Ti | |
| Schenker XMG Focus 16 (i7-12700H, RTX 3060) | |
| Średnia w klasie Gaming (52.1 - 143.5, n=113, ostatnie 2 lata) | |
| Asus ROG Zephyrus M16 GU603H | |
| Lenovo Legion 5 Pro 16ARH7H RTX 3070 Ti | |
| Corsair Voyager a1600 | |
Laptop nie obsługuje Advanced Optimus, ale zamiast tego zwykły Optimus, a ponadto oferuje przełącznik MUX, pozwalający aktywnie przełączać się między zintegrowanym (lub w trybie hybrydowym) a dedykowanym GPU.
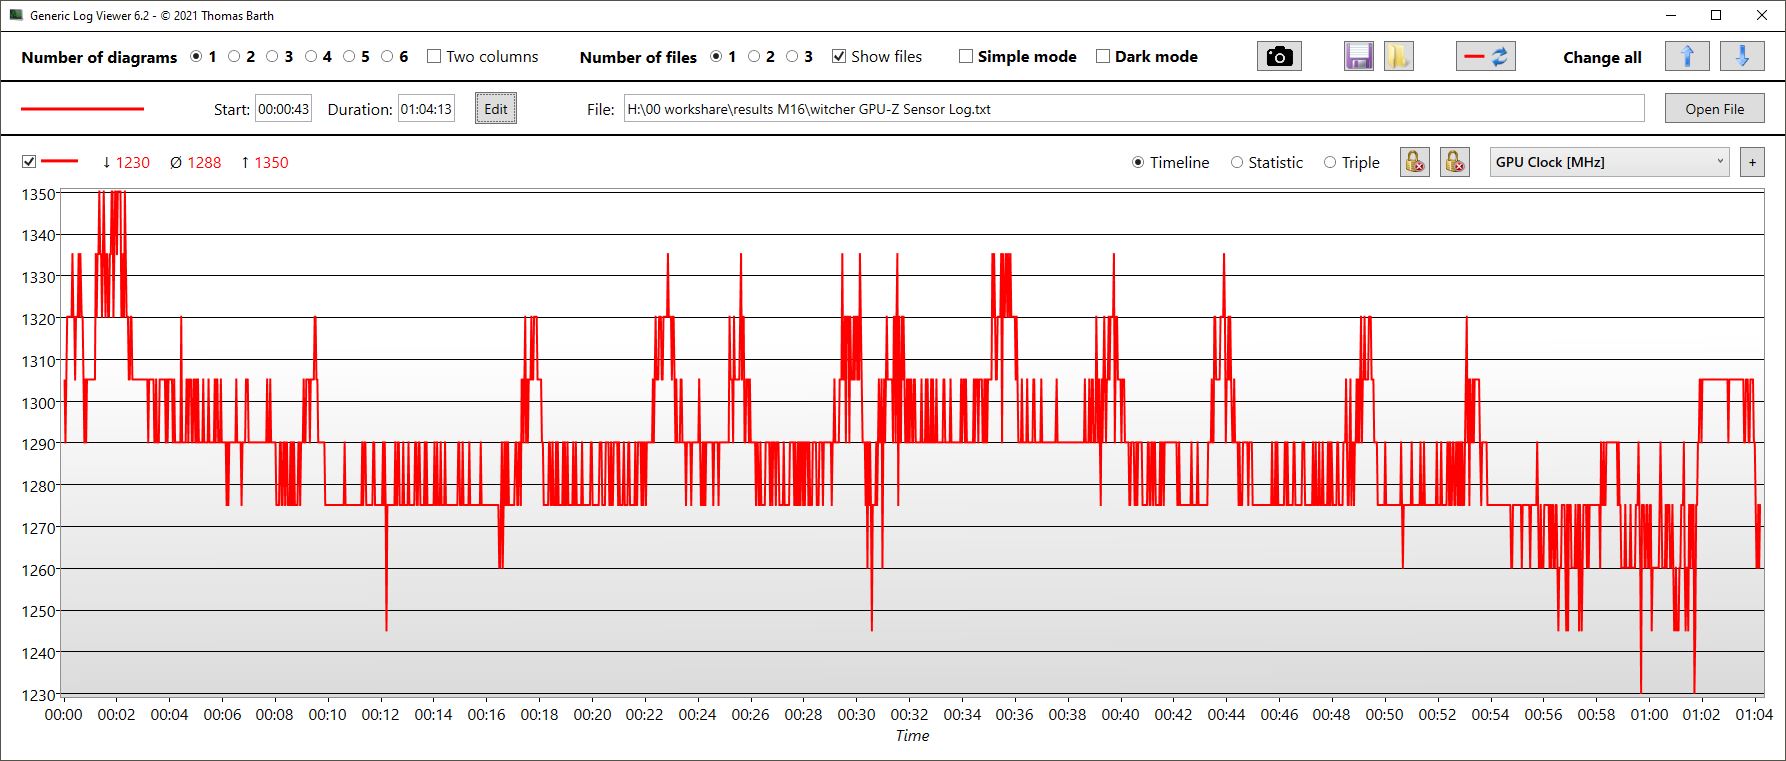
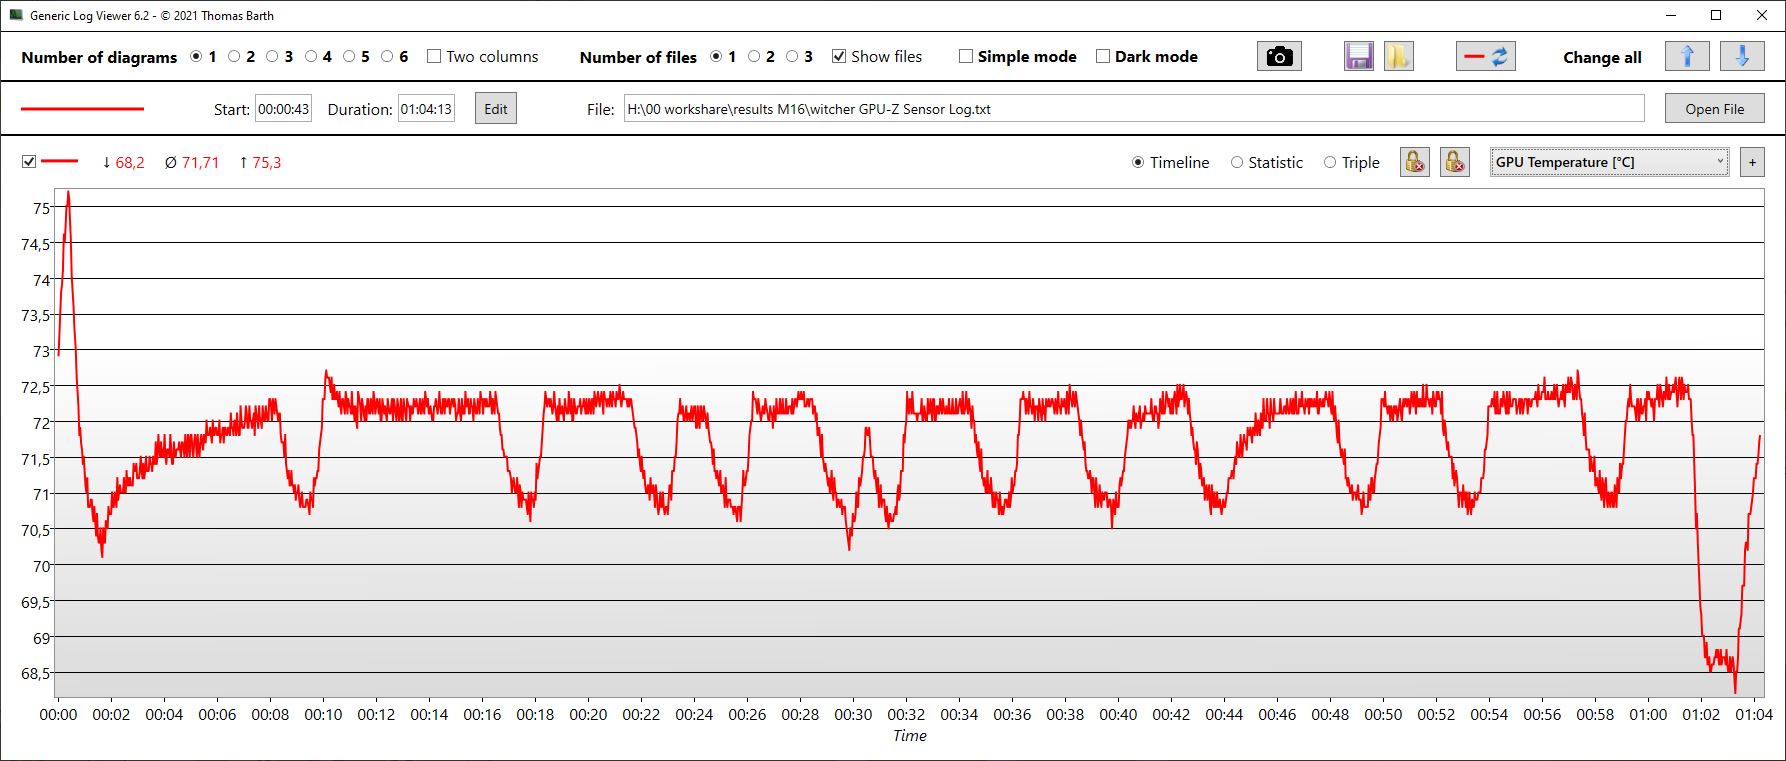
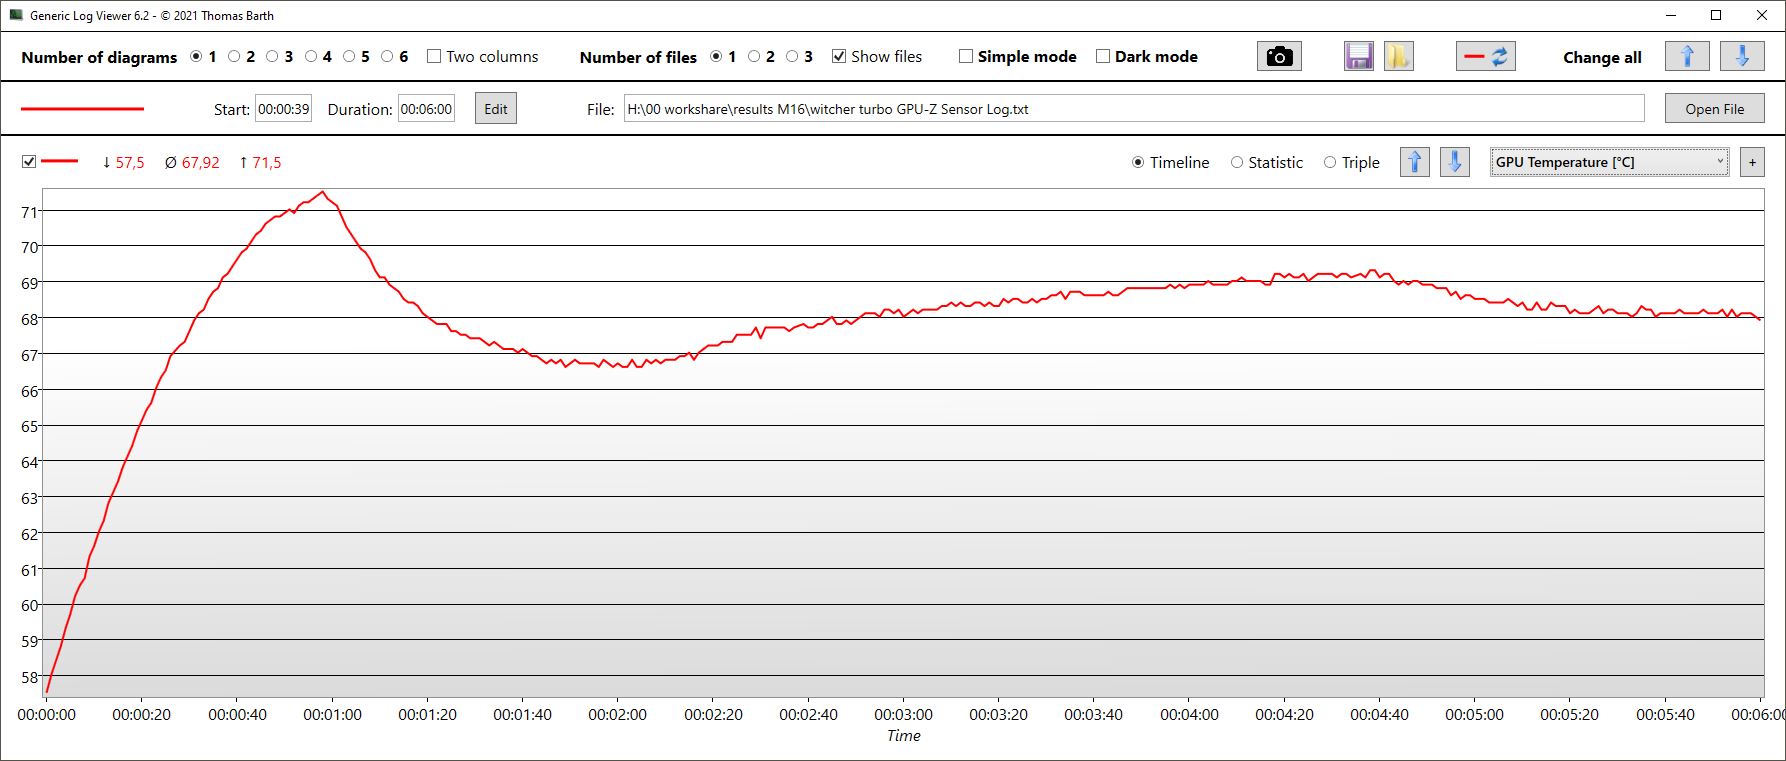
Nasza Pętla Witcher 3 skutkuje względnie stałą liczbą klatek na sekundę. Różnice w wydajności pomiędzy konkurentami stają się tutaj łatwo widoczne: podczas gdyLegion 5 Pro jest znacznie szybszy, to Schenker Vision 16 Projest ledwie prześcignięty.
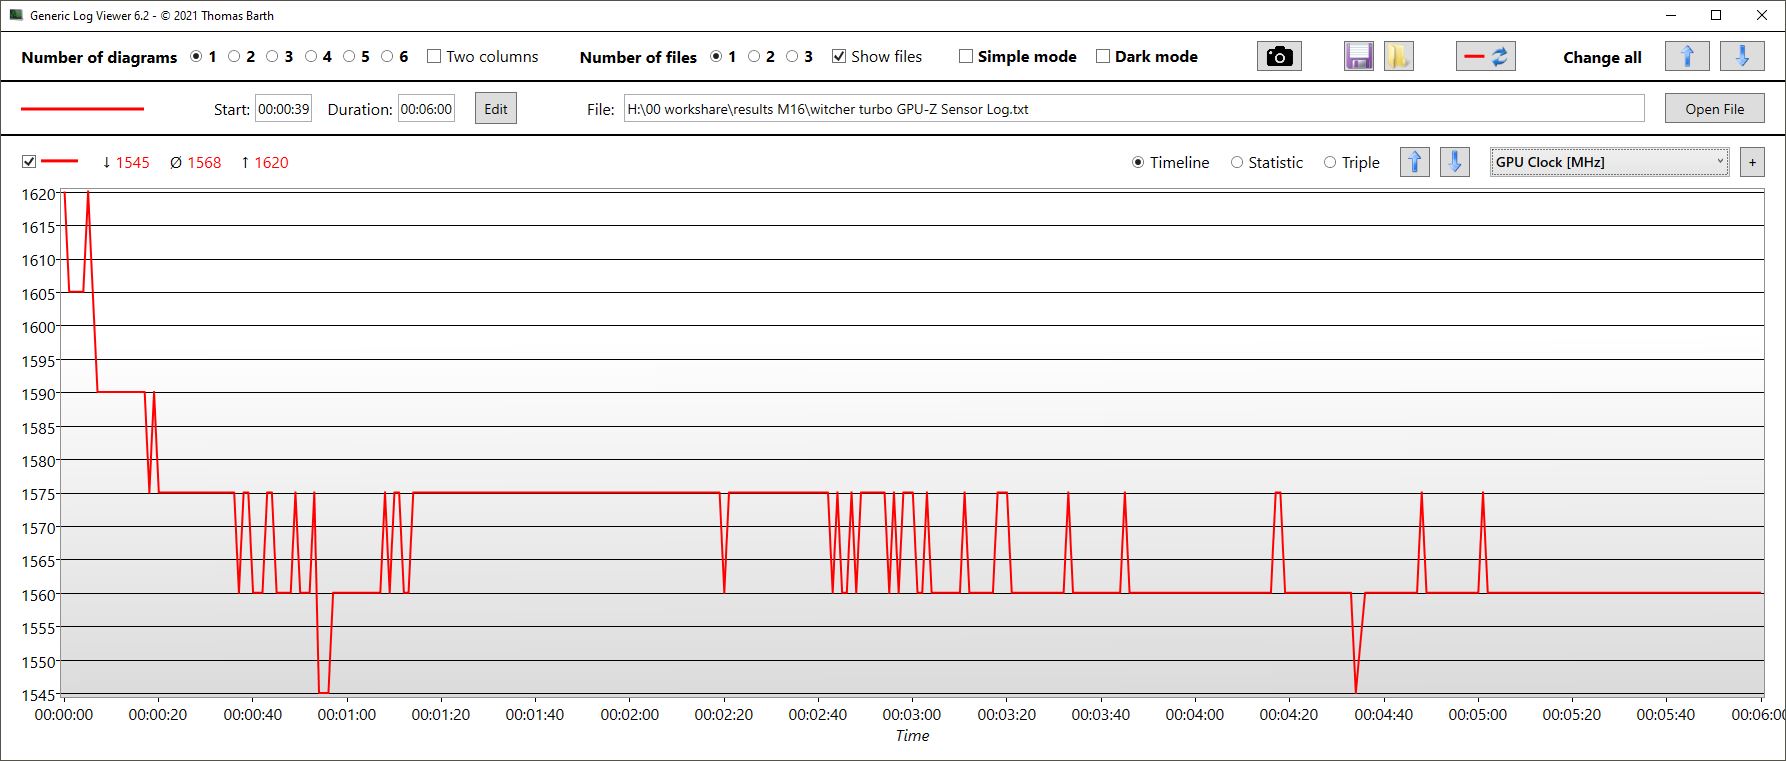
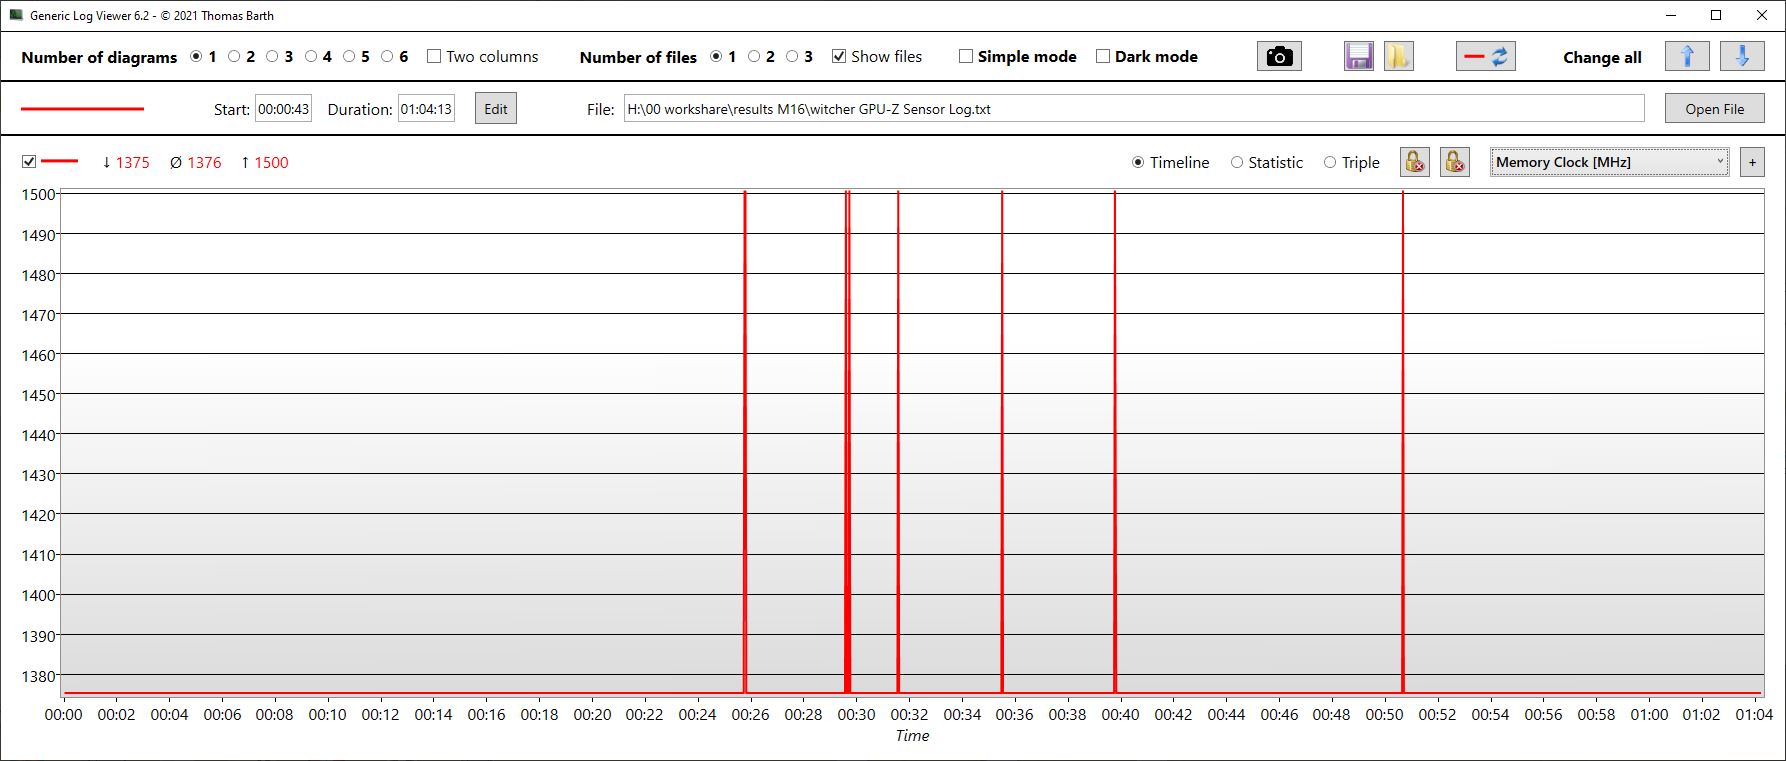
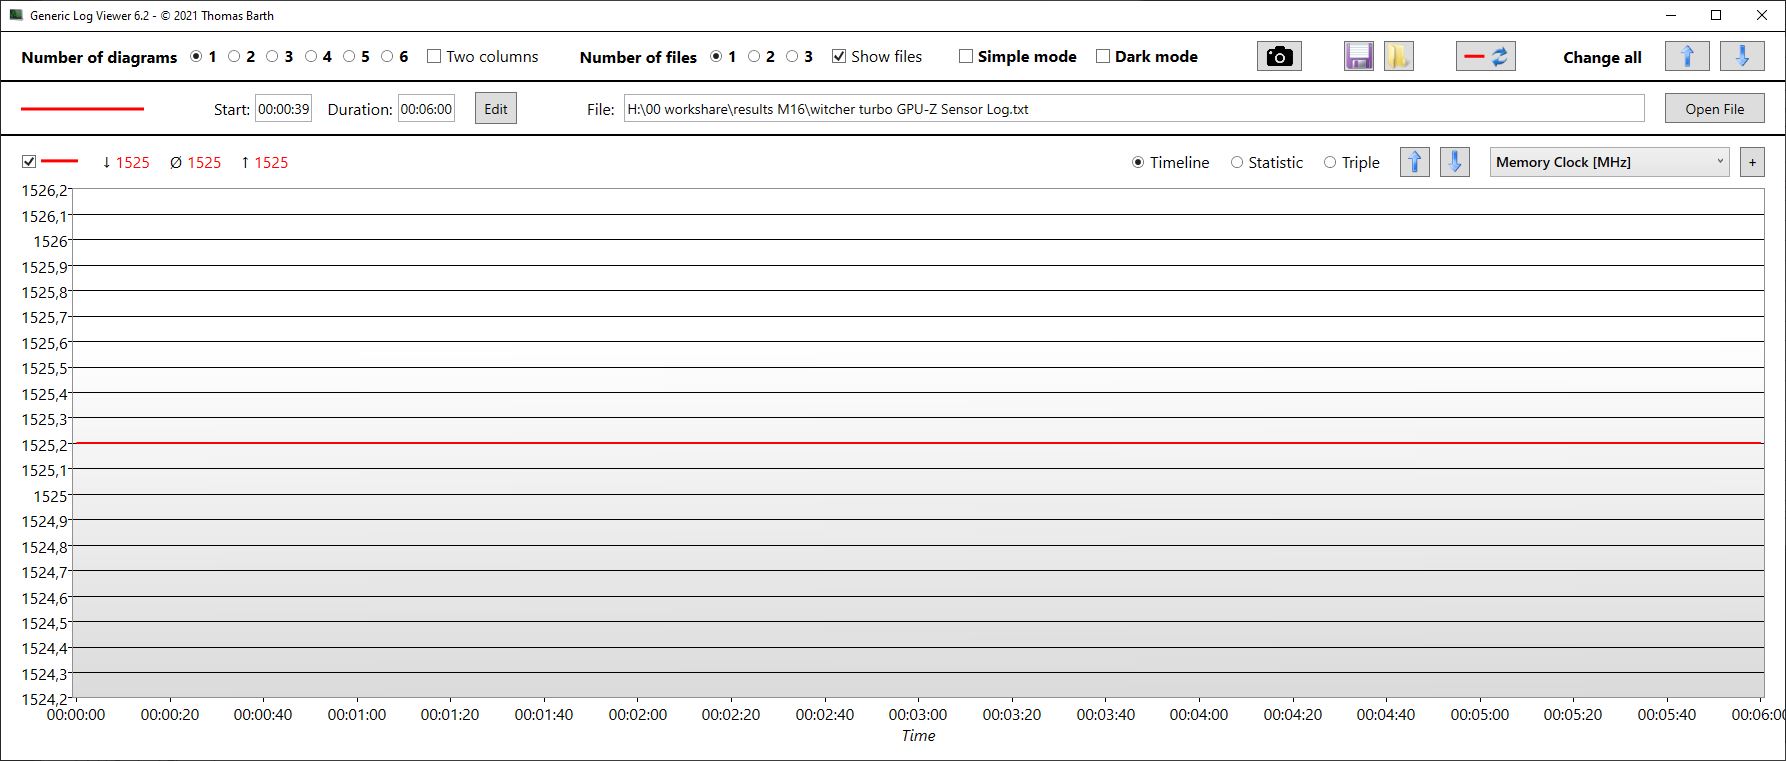
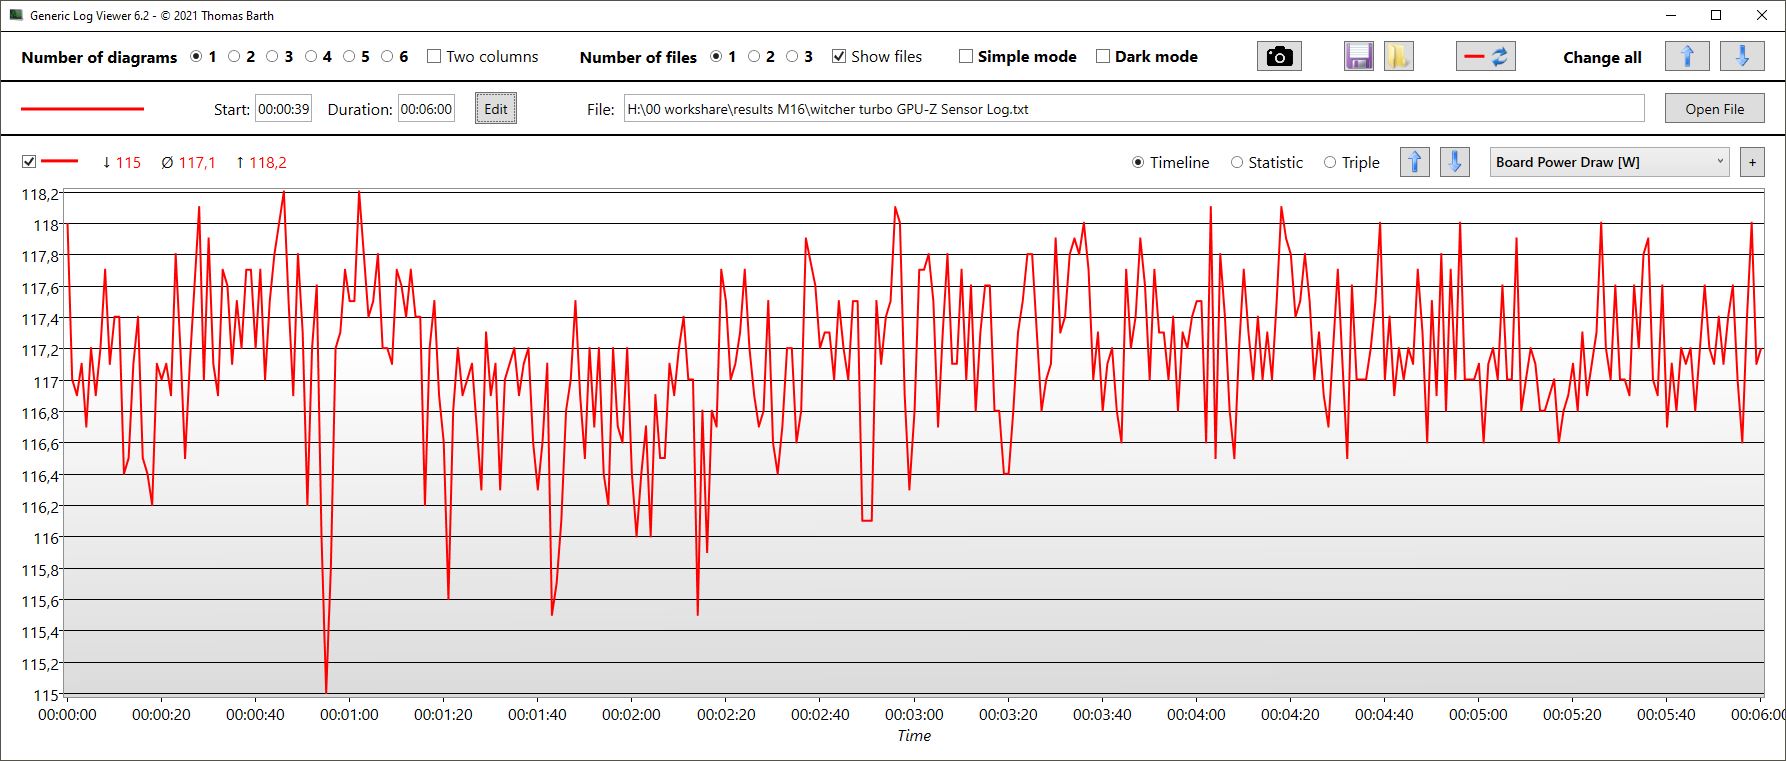
W trybie Turbo (wykres niebieski, mierzony przez 6 minut) wydajność znacznie wzrasta, zbliżając się w niektórych fragmentach do wydajności modelu Legion 5 Pro. Hałas wytwarzany przez laptop jest wtedy podobnie głośny, co widać też w sekcji Emisja poniżej. Zwiększa się prędkość obrotowa GPU i pamięci masowej, a pobór mocy wzrasta do prawie 120 W.
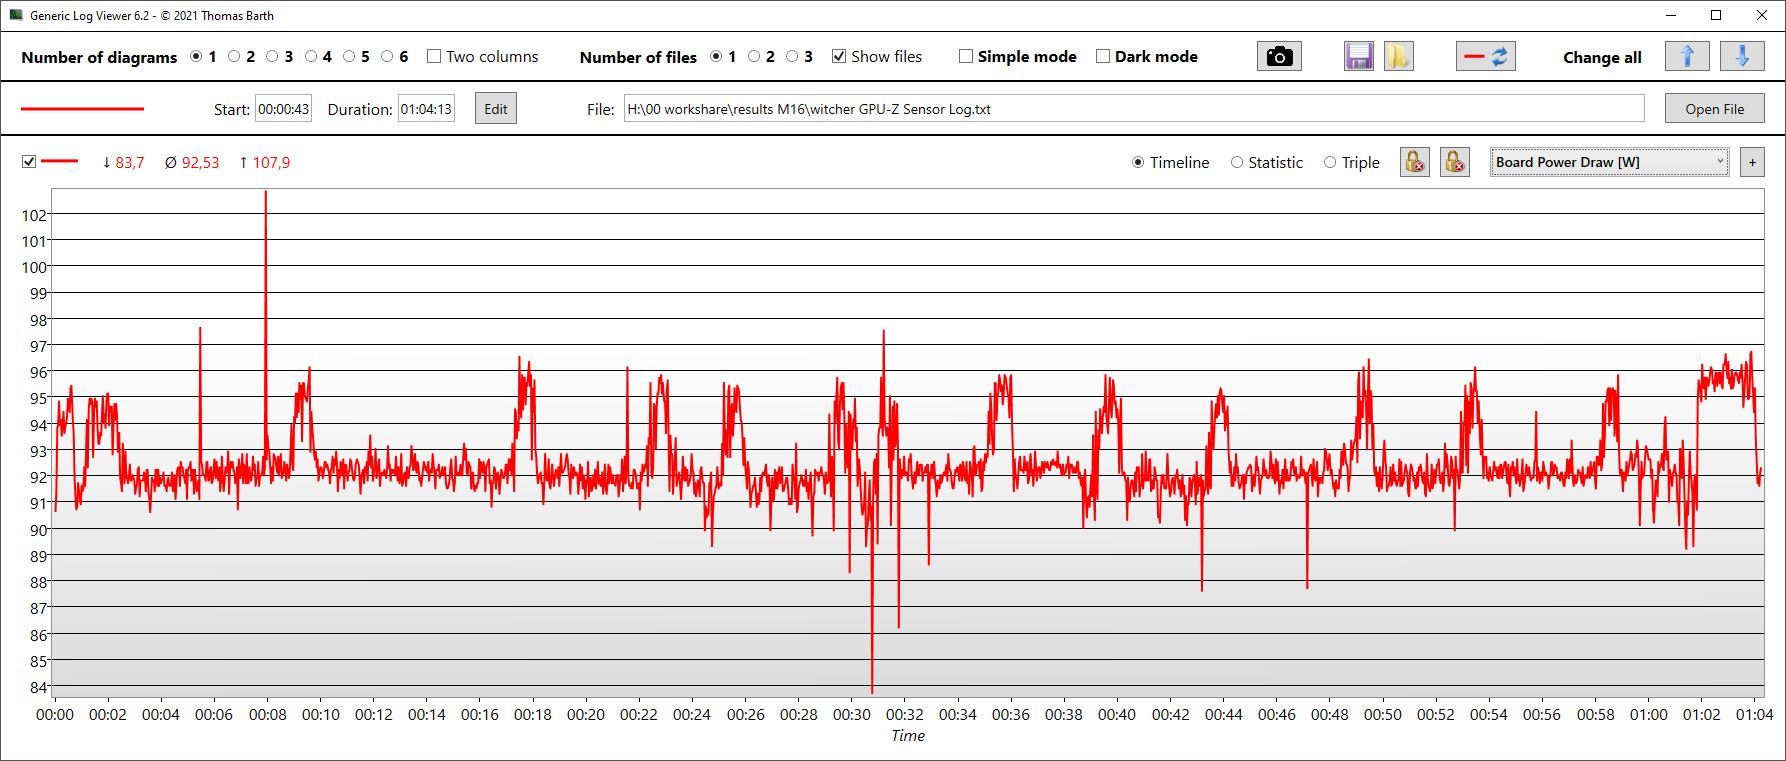
Z czasem prędkość taktowania GPU jeszcze nieco spada, kończąc się średnio na 1 288 MHz. Karta nagrzewa się do około 72 °C (162 °F), podczas gdy karta zużywa średnio tylko 93 W, co nadal jest dalekie od jej wartości docelowej TGP.
The Witcher 3 FPS Chart
| low | med. | high | ultra | QHD | 4K | |
|---|---|---|---|---|---|---|
| GTA V (2015) | 184.6 | 171.4 | 108.1 | |||
| The Witcher 3 (2015) | 370.2 | 273.2 | 171 | 99.5 | ||
| Dota 2 Reborn (2015) | 195.2 | 174.7 | 170.2 | 160.5 | ||
| Final Fantasy XV Benchmark (2018) | 123.8 | 94.8 | 72.1 | 43 | ||
| X-Plane 11.11 (2018) | 166.8 | 145.7 | 115 | |||
| Far Cry 5 (2018) | 174 | 128 | 128 | 124 | 90 | |
| Strange Brigade (2018) | 376 | 227 | 187.9 | 163.8 | ||
| Dying Light 2 (2022) | 98.5 | 79 | 66 | 46.7 |
Emisja - umiarkowana Asus M16
Poziomy hałasu
Podczas pracy w trybie jałowym wentylatory są często wyłączane - ale nie konsekwentnie. Od czasu do czasu potrafią bez problemu rozkręcić się do 47 dB, np. zaraz po restarcie, kiedy startuje Windows.
Podczas pierwszej sceny benchmarku 3DMark 06 wentylatory pozostają w większości ciche na poziomie 34 dB, a hałas wentylatorów wzrasta do 47 dB dopiero tuż przed końcem. Schenker Vision 16 Pro oraz Legion 5 Pro są w stanie zachować ciszę jeszcze dłużej.
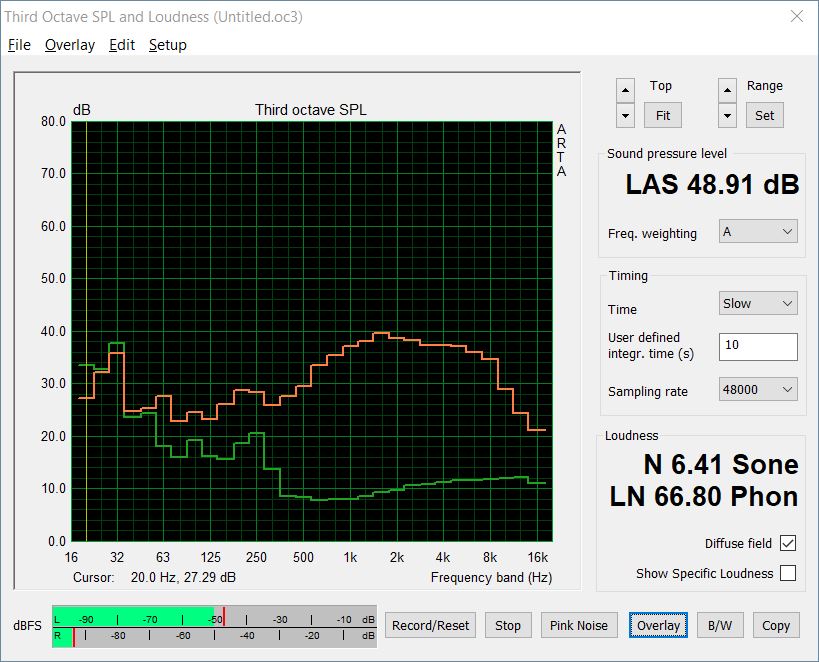
Podczas gry praca M16 pozostaje raczej cicha w porównaniu z konkurentami, z których niektórzy wytwarzają hałas znacznie powyżej 50 dB, podczas gdy M16 pozostaje poniżej tego poziomu. Dotyczy to jednak tylko trybu Performance. Jeśli skorzystamy z trybu Turbo, wentylatory rozkręcają się do prawie 55 dB, czyli na tym samym poziomie co Legion 5 Pro i znacznie głośniej niż Vision 16 Pro.
Hałas
| luz |
| 23 / 24 / 47 dB |
| obciążenie |
| 47.91 / 50.25 dB |
 | ||
30 dB cichy 40 dB(A) słyszalny 50 dB(A) irytujący |
||
min: | ||
| Asus ROG Zephyrus M16 GU603Z GeForce RTX 3070 Ti Laptop GPU, i9-12900H, Micron 3400 1TB MTFDKBA1T0TFH | Asus ROG Zephyrus M16 GU603H GeForce RTX 3070 Laptop GPU, i9-11900H, Samsung PM9A1 MZVL22T0HBLB | Schenker Vision 16 Pro RTX 3070 Ti GeForce RTX 3070 Ti Laptop GPU, i7-12700H, Samsung SSD 980 Pro 1TB MZ-V8P1T0BW | Lenovo Legion 5 Pro 16ARH7H RTX 3070 Ti GeForce RTX 3070 Ti Laptop GPU, R7 6800H, Samsung PM9A1 MZVL21T0HCLR | Schenker XMG Focus 16 (i7-12700H, RTX 3060) GeForce RTX 3060 Laptop GPU, i7-12700H, Samsung SSD 980 Pro 1TB MZ-V8P1T0BW | Corsair Voyager a1600 Radeon RX 6800M, R9 6900HS, Samsung PM9A1 MZVL22T0HBLB | |
|---|---|---|---|---|---|---|
| Noise | -8% | 8% | -1% | 0% | -9% | |
| wyłączone / środowisko * (dB) | 23 | 25 -9% | 22.9 -0% | 23.5 -2% | 23 -0% | 29.9 -30% |
| Idle Minimum * (dB) | 23 | 25 -9% | 24.3 -6% | 23.7 -3% | 23 -0% | 30.5 -33% |
| Idle Average * (dB) | 24 | 31 -29% | 24.3 -1% | 31.1 -30% | 23 4% | 30.6 -28% |
| Idle Maximum * (dB) | 47 | 42 11% | 24.3 48% | 32.2 31% | 32.07 32% | 30.7 35% |
| Load Average * (dB) | 47.91 | 48 -0% | 38.5 20% | 38.4 20% | 53.7 -12% | 44.5 7% |
| Witcher 3 ultra * (dB) | 48.91 | 52 -6% | 51 -4% | 54.8 -12% | 54.58 -12% | |
| Load Maximum * (dB) | 50.25 | 56 -11% | 51 -1% | 54.8 -9% | 54.58 -9% | 51.1 -2% |
* ... im mniej tym lepiej
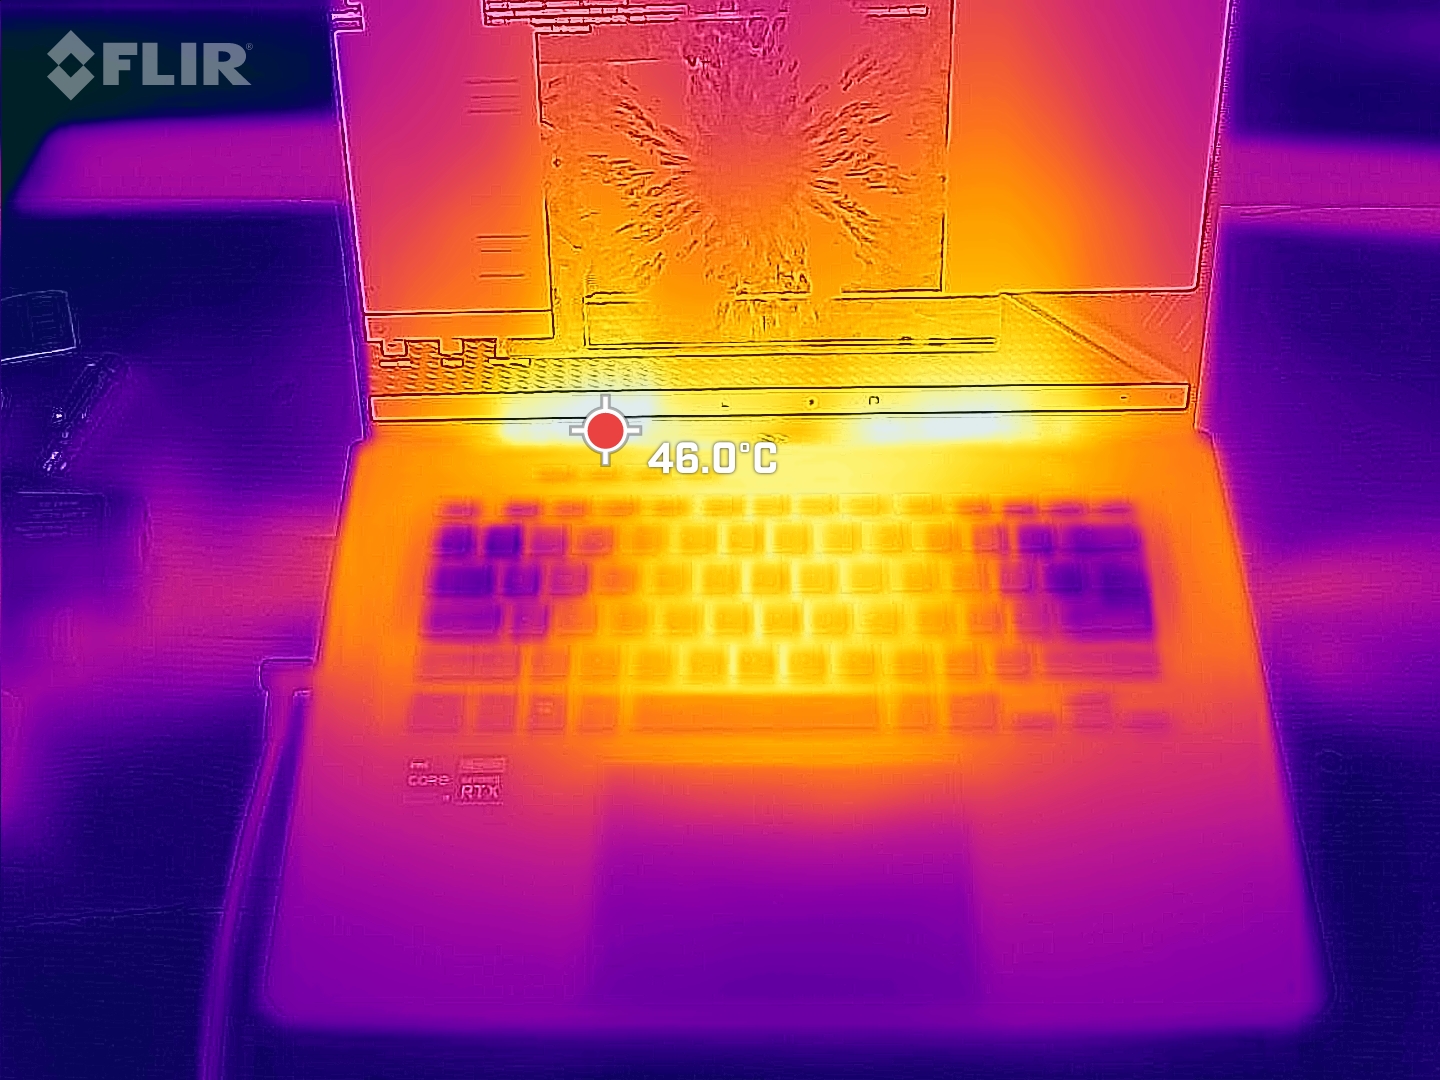
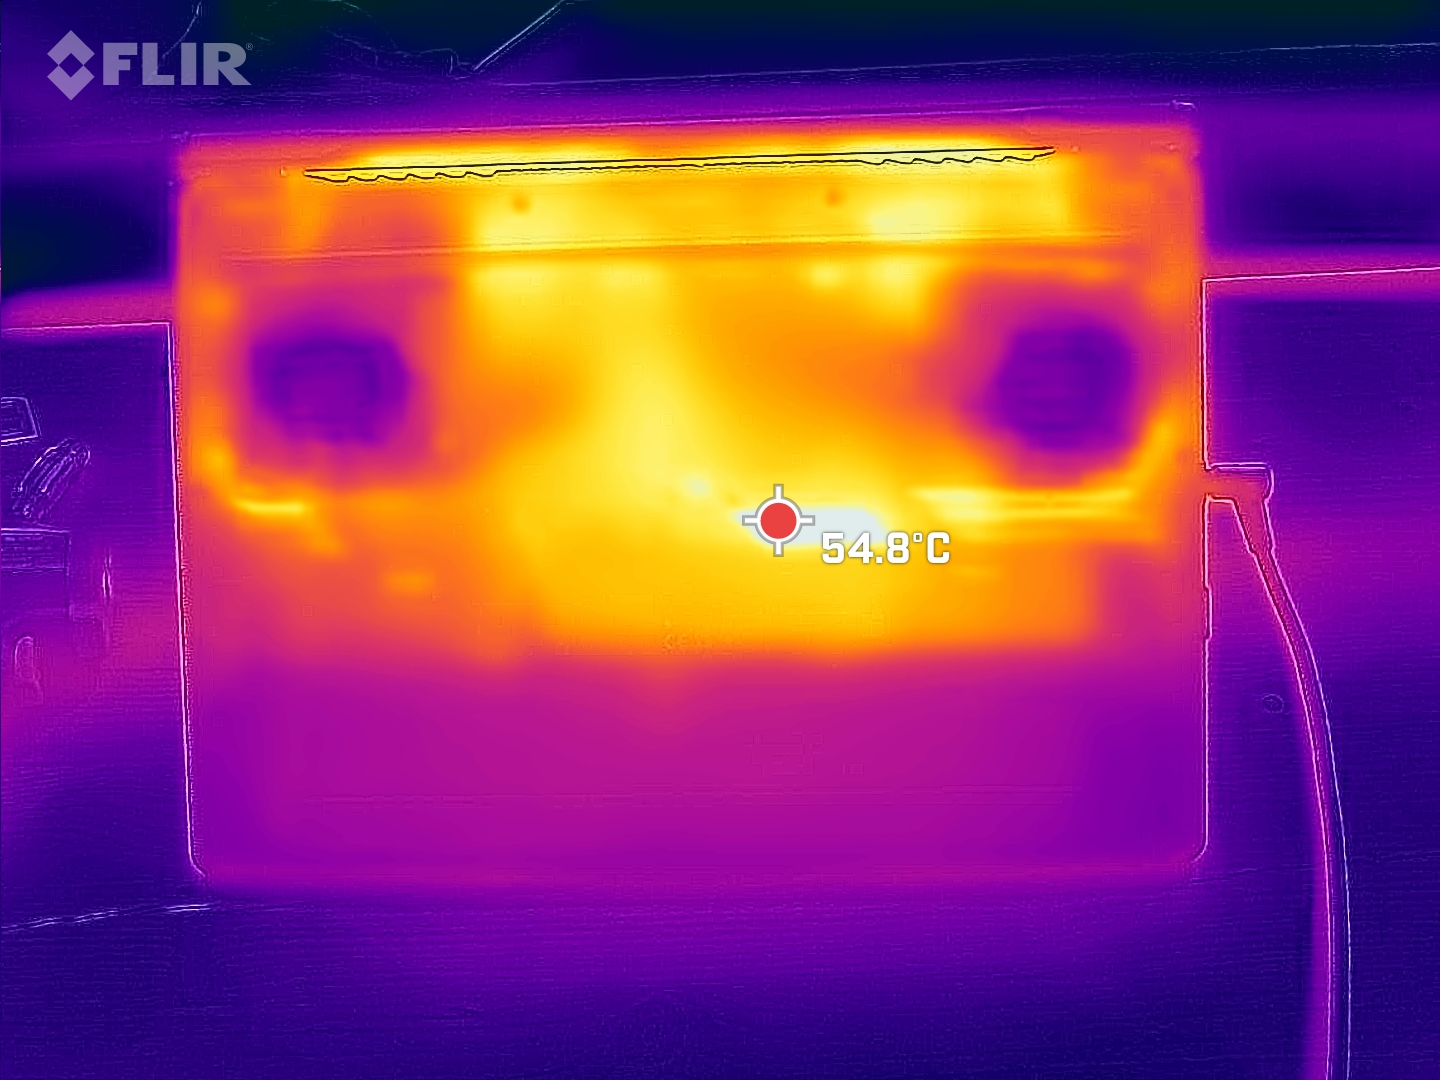
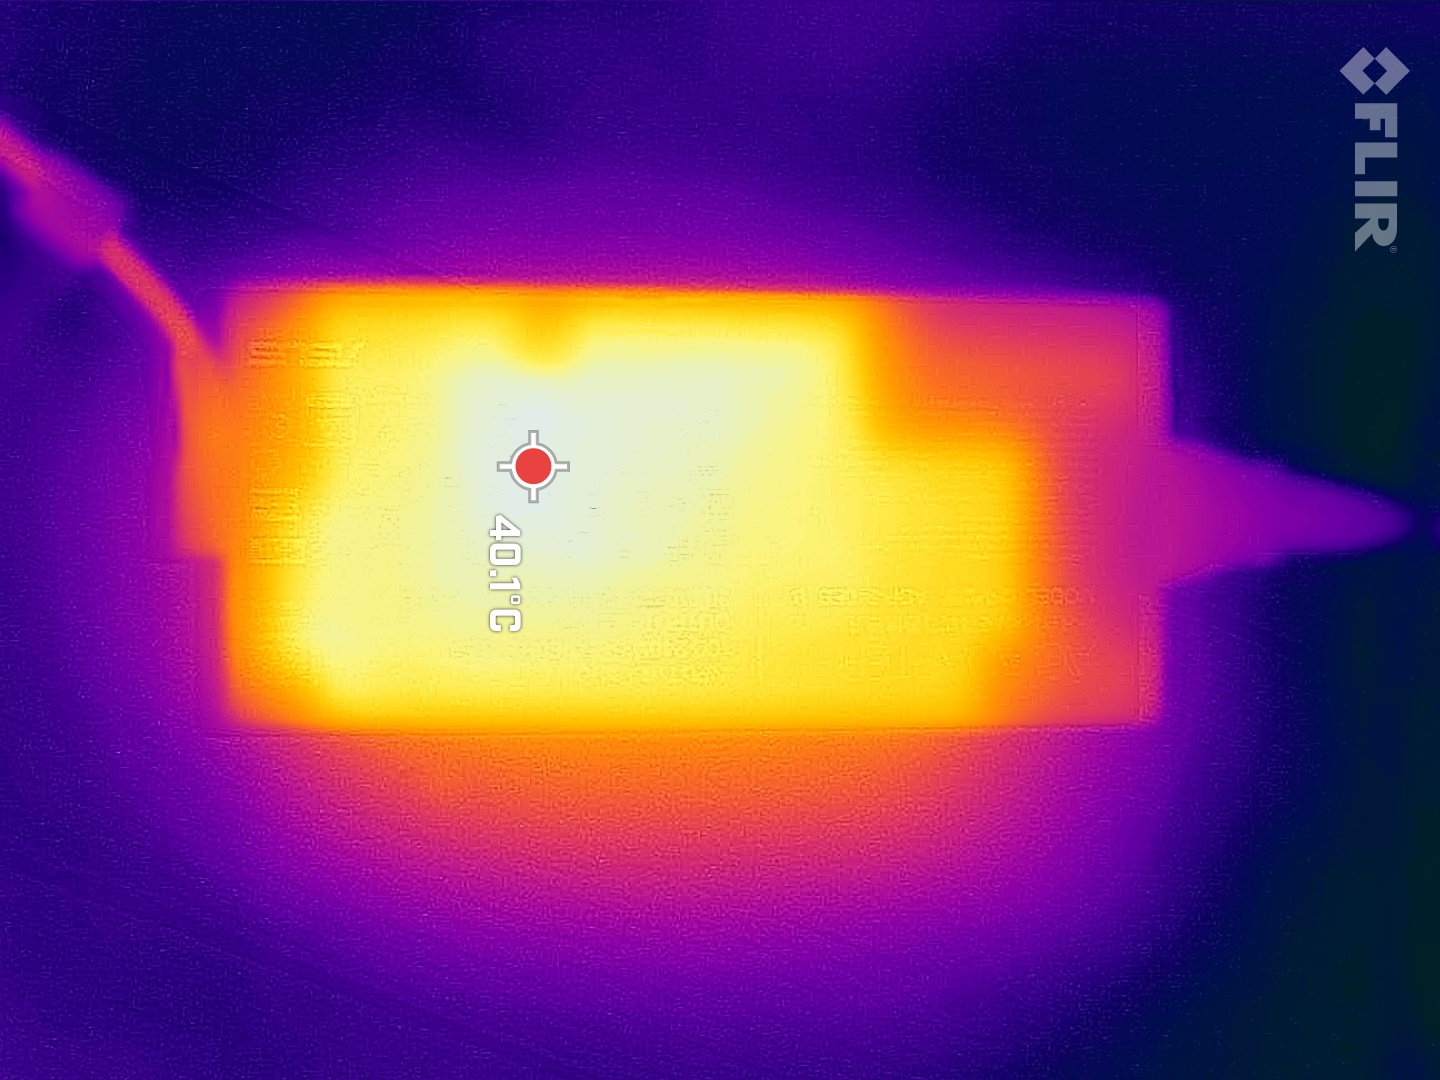
Temperatury
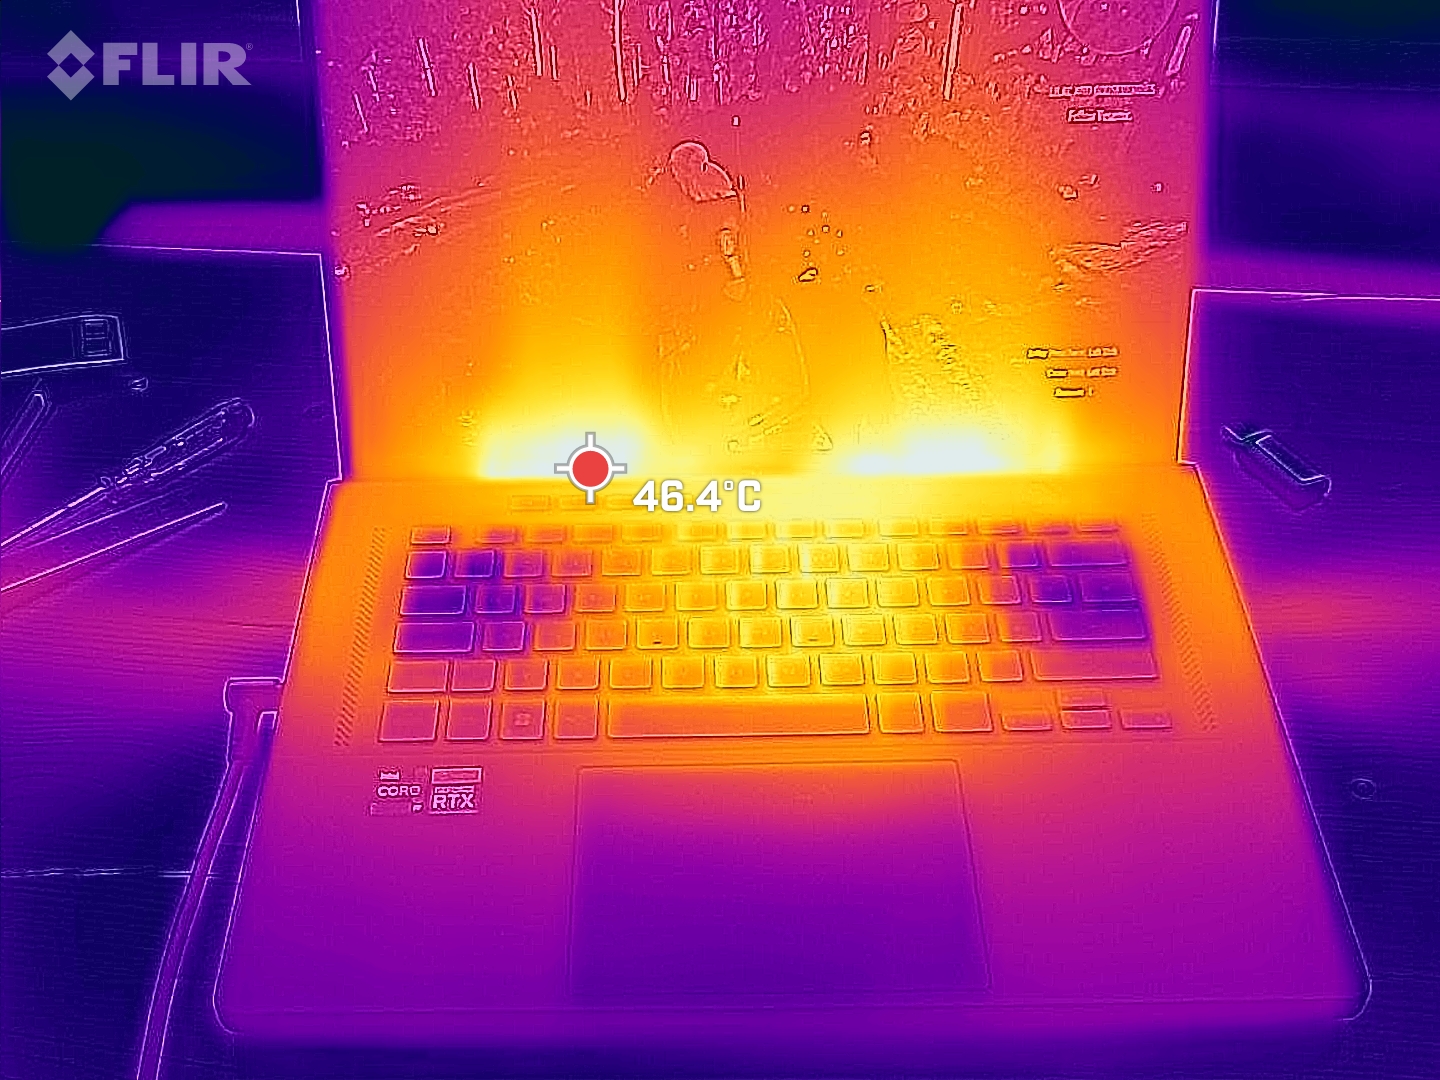
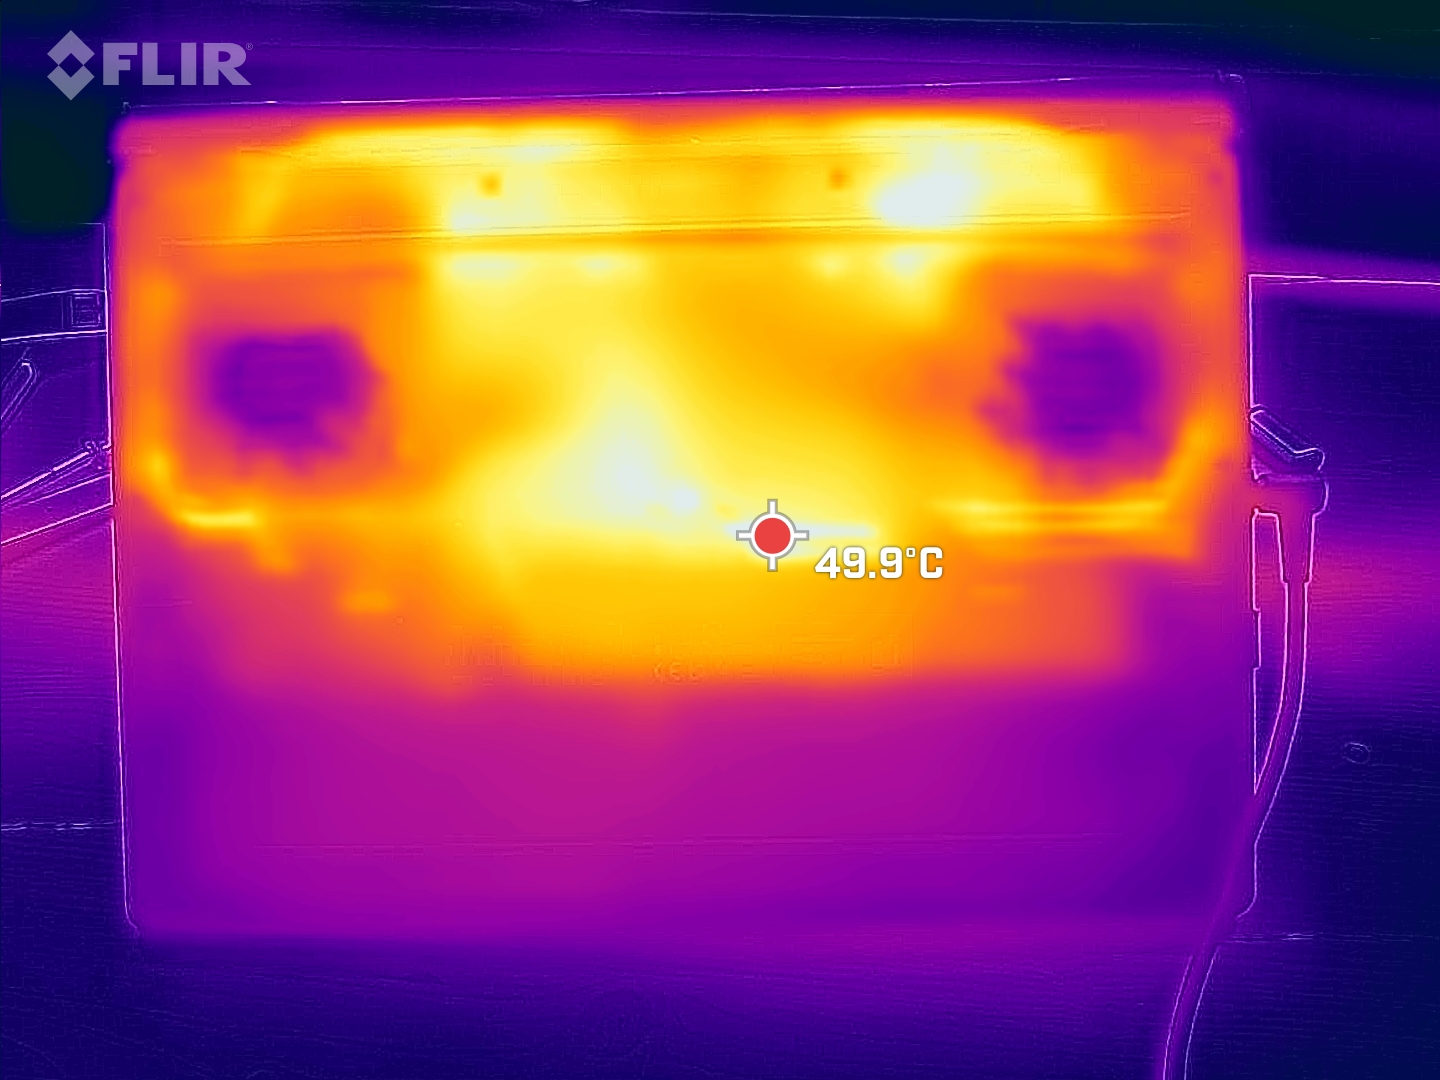
Pod dużym obciążeniem góra i spód obudowy nagrzewają się do nieco ponad 50°C ( 122°F) . Pozostaje to w granicach normy i jest nawet nieco lepsze od poprzednika. Na stronie Legion 5 Pro pozostaje nieco chłodniejszy na górze, a Vision 16 Pro jest nieco chłodniejszy na dole.
(-) Maksymalna temperatura w górnej części wynosi 52 °C / 126 F, w porównaniu do średniej 40.4 °C / 105 F , począwszy od 21.2 do 68.8 °C dla klasy Gaming.
(-) Dno nagrzewa się maksymalnie do 51 °C / 124 F, w porównaniu do średniej 43.2 °C / 110 F
(+) W stanie bezczynności średnia temperatura górnej części wynosi 26.4 °C / 80 F, w porównaniu ze średnią temperaturą urządzenia wynoszącą 33.9 °C / ### class_avg_f### F.
(-) Podczas gry w Wiedźmina 3 średnia temperatura górnej części wynosi 40.2 °C / 104 F, w porównaniu do średniej temperatury urządzenia wynoszącej 33.9 °C / ## #class_avg_f### F.
(+) Podparcia dłoni i touchpad osiągają maksymalną temperaturę skóry (32 °C / 89.6 F) i dlatego nie są gorące.
(-) Średnia temperatura obszaru podparcia dłoni w podobnych urządzeniach wynosiła 28.8 °C / 83.8 F (-3.2 °C / -5.8 F).
| Asus ROG Zephyrus M16 GU603Z Intel Core i9-12900H, NVIDIA GeForce RTX 3070 Ti Laptop GPU | Asus ROG Zephyrus M16 GU603H Intel Core i9-11900H, NVIDIA GeForce RTX 3070 Laptop GPU | Schenker Vision 16 Pro RTX 3070 Ti Intel Core i7-12700H, NVIDIA GeForce RTX 3070 Ti Laptop GPU | Lenovo Legion 5 Pro 16ARH7H RTX 3070 Ti AMD Ryzen 7 6800H, NVIDIA GeForce RTX 3070 Ti Laptop GPU | Schenker XMG Focus 16 (i7-12700H, RTX 3060) Intel Core i7-12700H, NVIDIA GeForce RTX 3060 Laptop GPU | Corsair Voyager a1600 AMD Ryzen 9 6900HS, AMD Radeon RX 6800M | |
|---|---|---|---|---|---|---|
| Heat | -15% | 9% | 3% | 4% | -7% | |
| Maximum Upper Side * (°C) | 52 | 52 -0% | 50.8 2% | 43.8 16% | 50 4% | 50.7 2% |
| Maximum Bottom * (°C) | 51 | 53 -4% | 46.3 9% | 53 -4% | 48 6% | 54.2 -6% |
| Idle Upper Side * (°C) | 29 | 38 -31% | 27.2 6% | 30 -3% | 28 3% | 35.8 -23% |
| Idle Bottom * (°C) | 33 | 41 -24% | 26.6 19% | 31.8 4% | 32 3% | 33 -0% |
* ... im mniej tym lepiej
Stress Test
Rdzenie CPU rozpoczynają nasz stress test krótko, z częstotliwością 3,5 GHz. Po kilku sekundach taktowanie zaczyna spadać, wyrównując się w okolicach 2,4 GHz. Temperatura waha się, osiągając maksymalnie 97°C ( 207°F) a średnio83°C ( 181°F). TDP procesora wynosi średnio 44 W.
Szybkość grafiki waha się znacznie między 500 a 1600 MHz, a średnio wynosi 838 MHz. Prędkość pamięci masowej oscyluje wokół 1,4 GHz, a GPU nagrzewa się do około 70°C (158 °F ). Mierzymy pobór mocy na poziomie około 66 W.
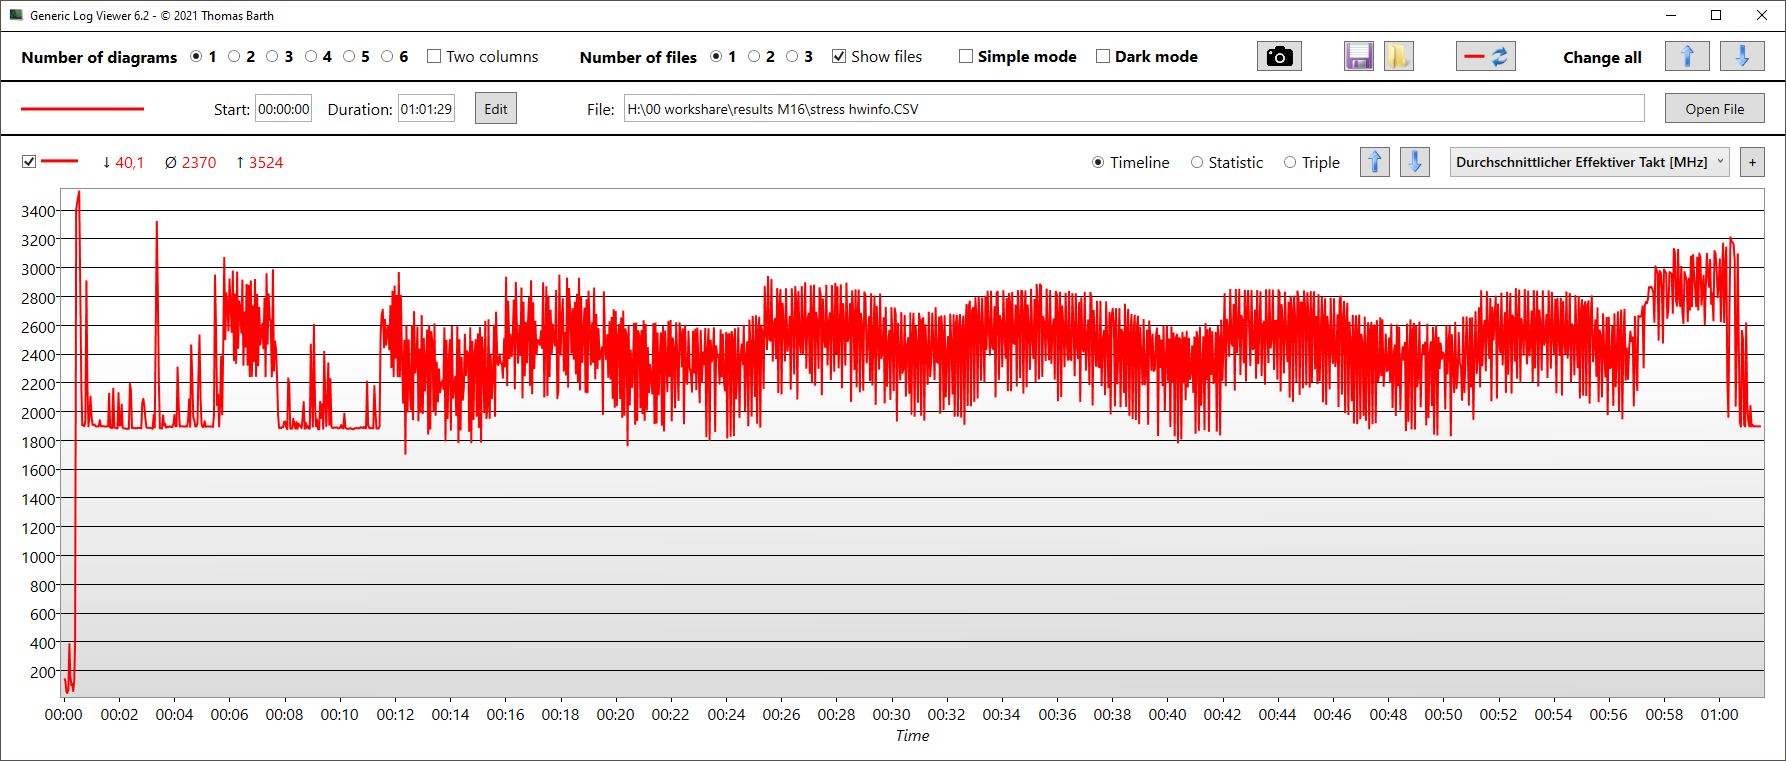
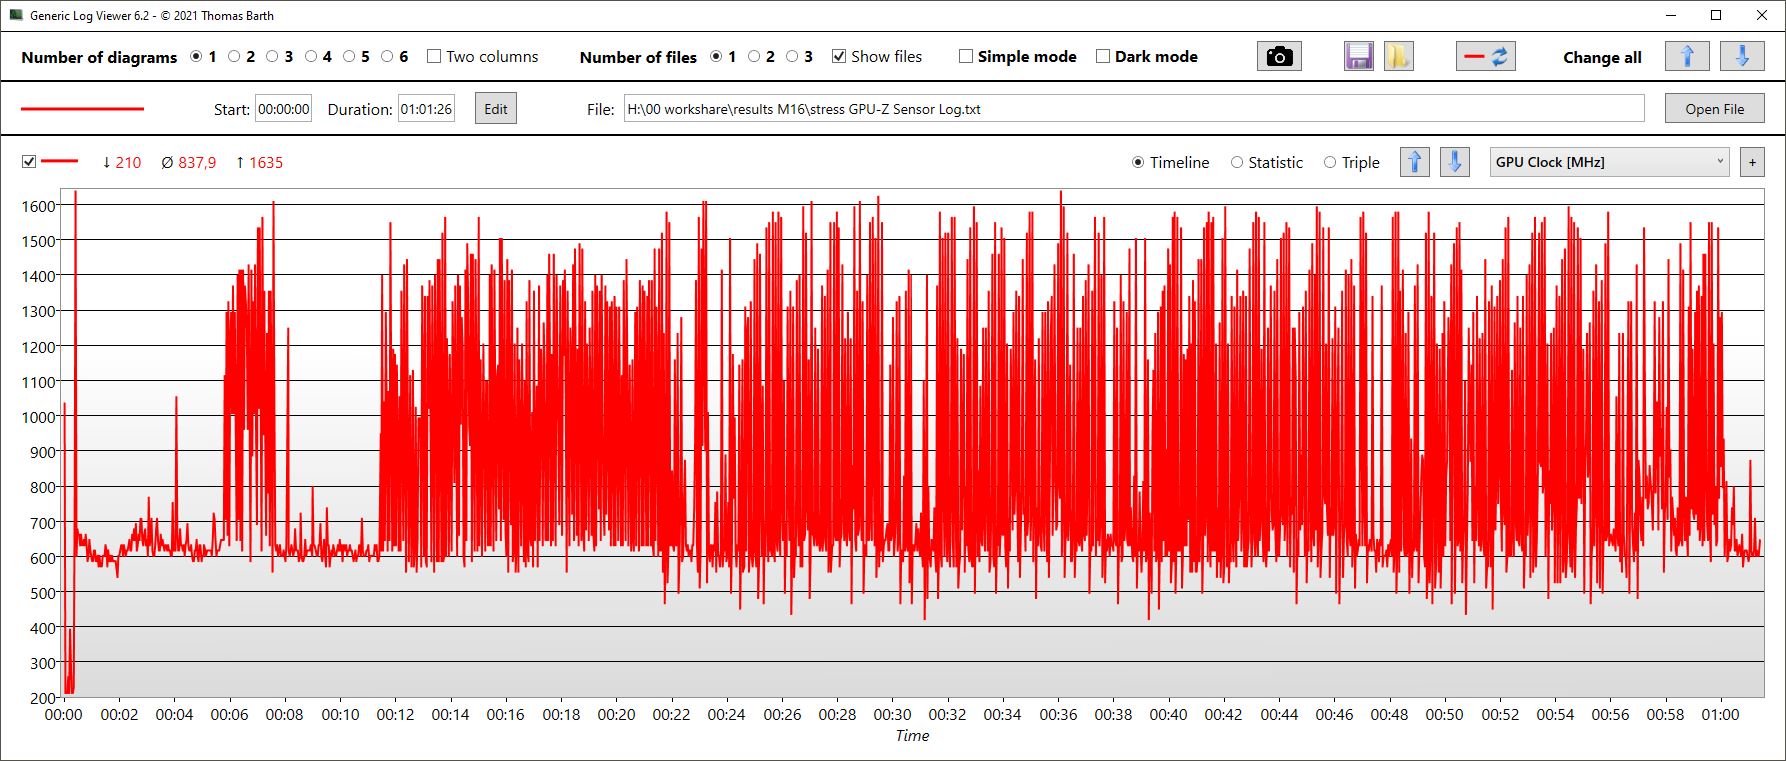
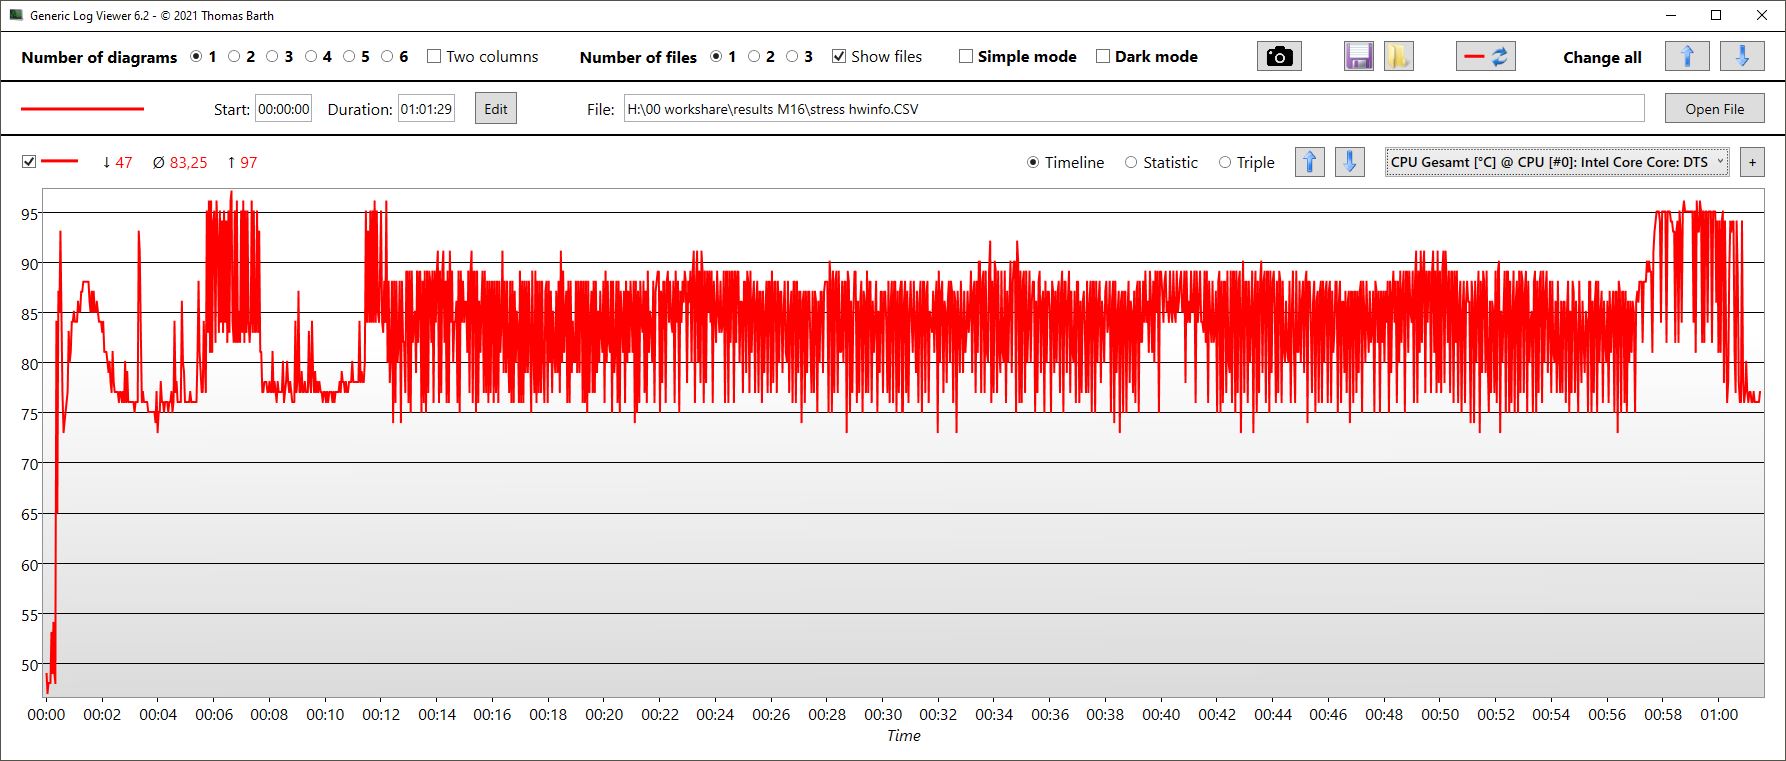
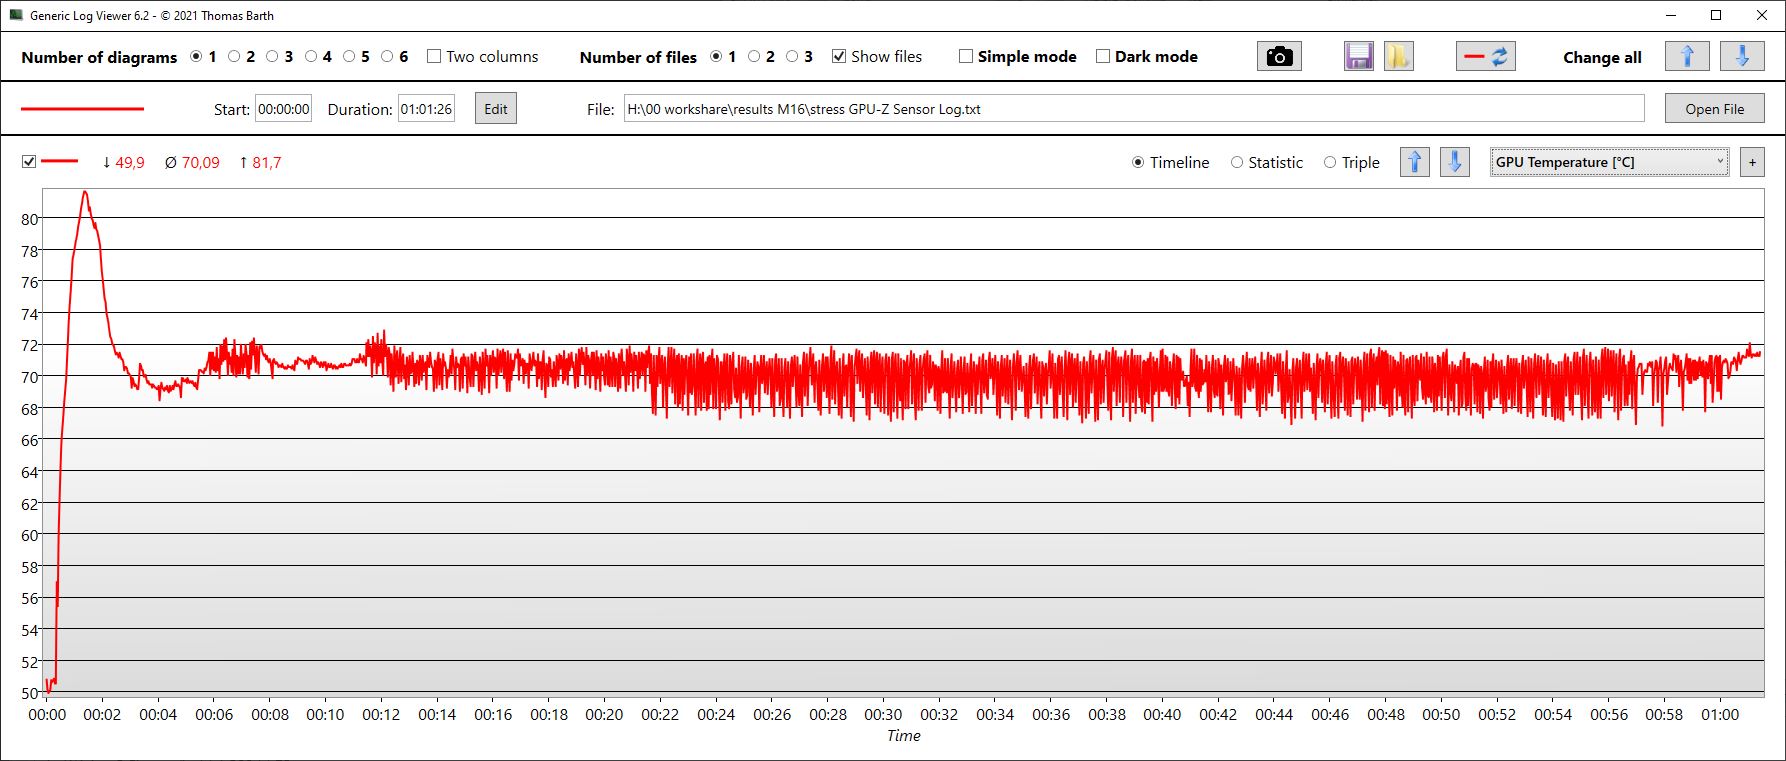
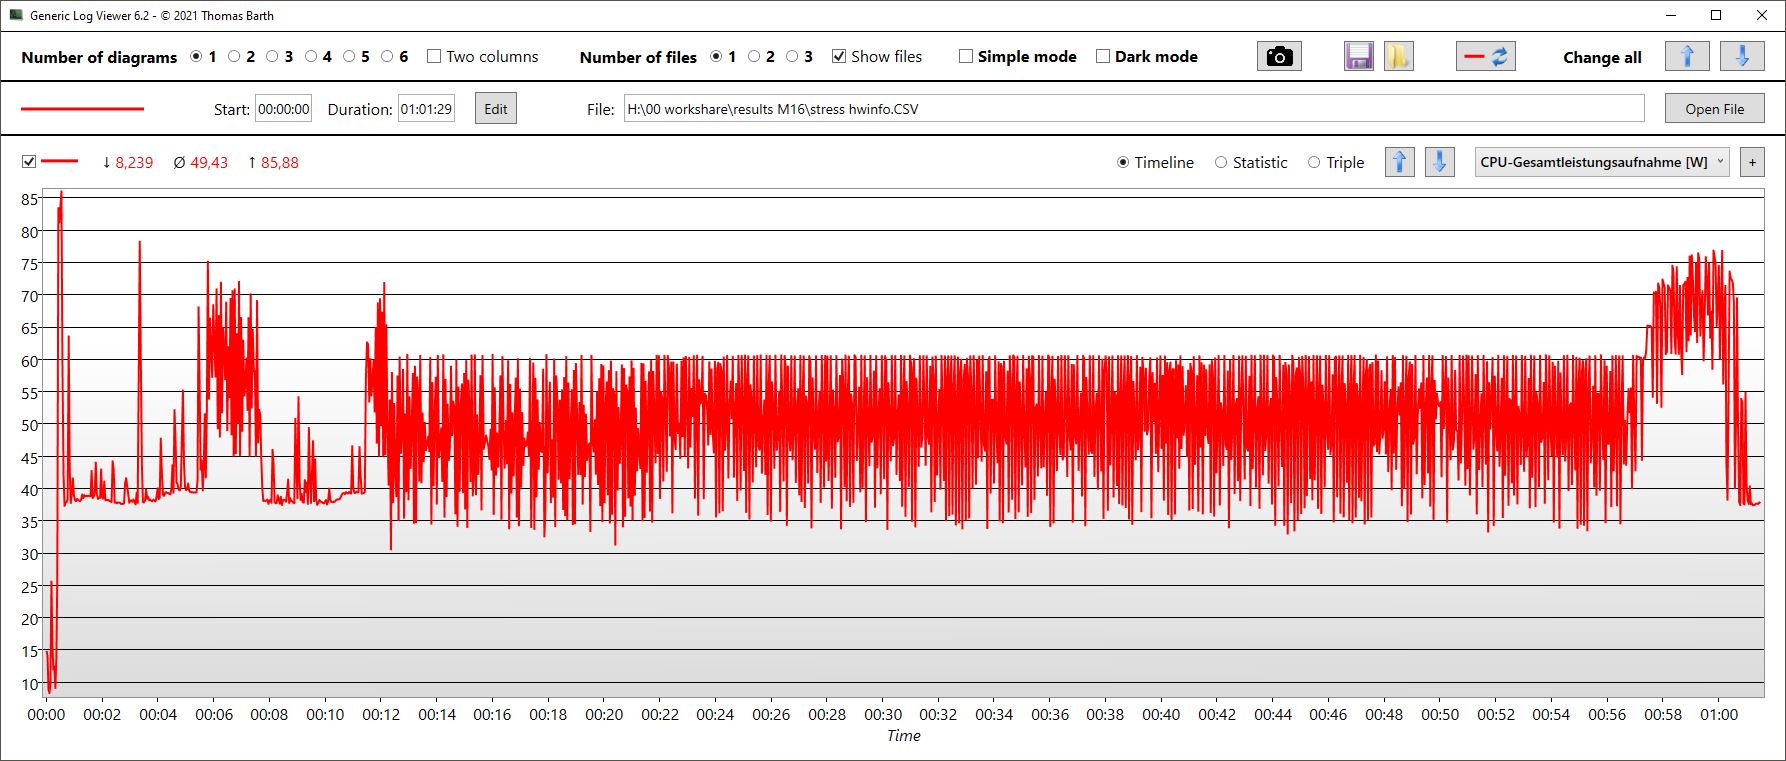
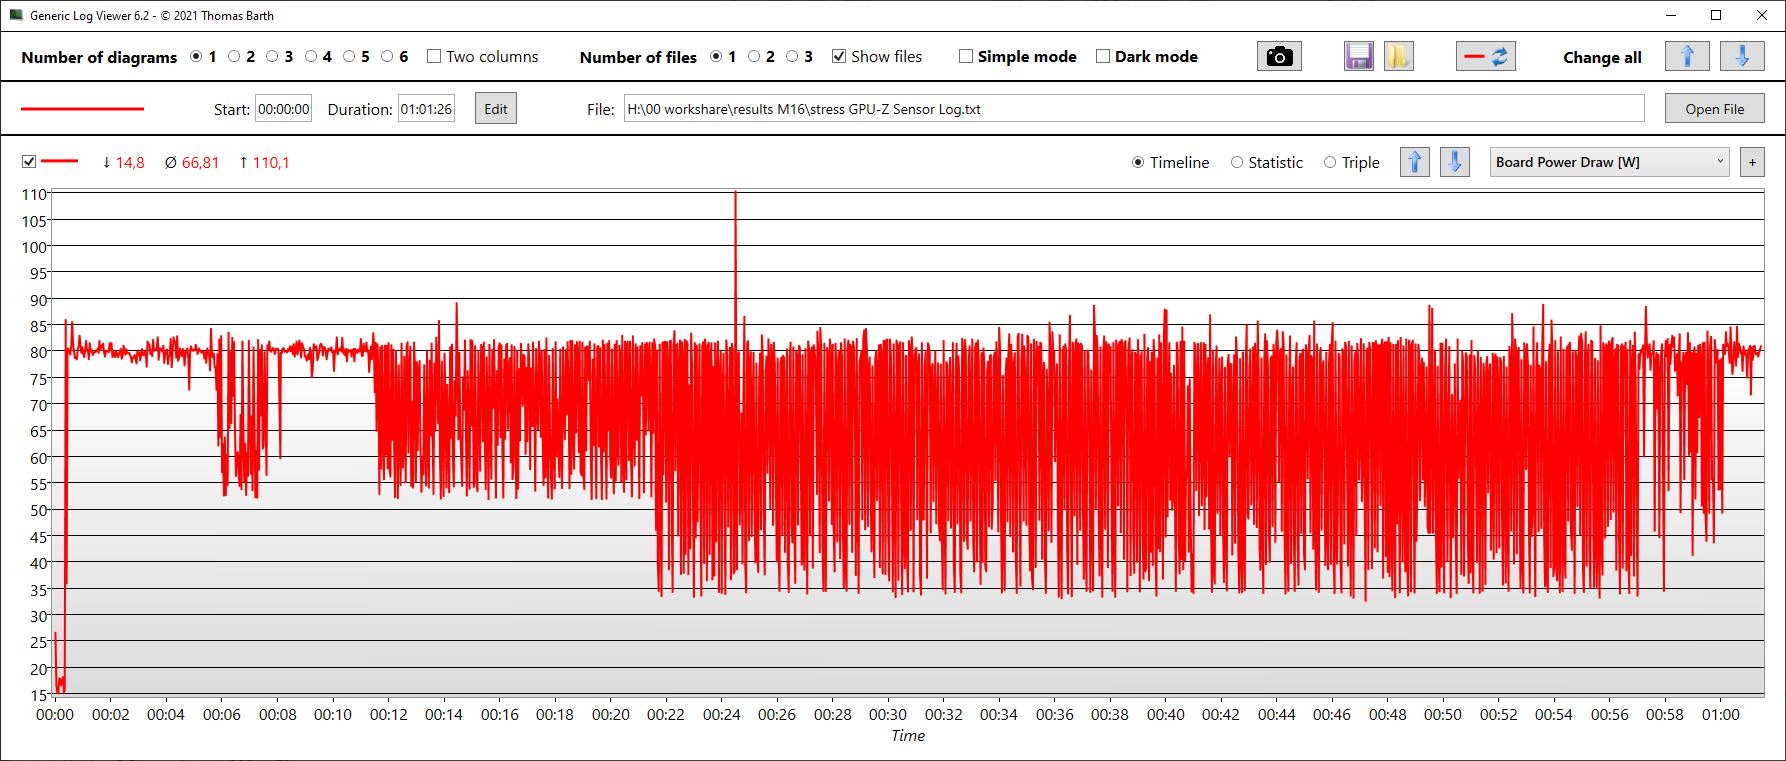
| ZegarCPU (GHz) | Zegar GPU (MHz) | Średnia temperatura CPU (°C) | Średnia temperatura GPU (°C) | |
| Prime95 + FurMark Stress | 2,4 | 838 | 83 | 70 |
| Stres Witcher 3 | 1,1 | 1,288 | 68 | 72 |
Mówcy
Asus obiera szczególną drogę z głośnikami w M16: zamiast zwykłych głośników stereo producent zastosował cztery głośniki o mocy 2 W każdy, dwa dla wysokich częstotliwości i dwa dla niższych tonów. Staje się to dość zauważalne, a kolumny są nie tylko relatywnie głośne, ale oferują też zrównoważone średnie i wysokie tony, a nawet bas nie jest tak niedoreprezentowany jak u wielu konkurentów.
Nadal jednak nie są one w stanie zastąpić półprzyzwoitych głośników zewnętrznych. Do podłączenia analogowych urządzeń audio można wykorzystać kombinowany port audio.
Asus ROG Zephyrus M16 GU603Z analiza dźwięku
(+) | głośniki mogą odtwarzać stosunkowo głośno (82.96 dB)
Bas 100 - 315 Hz
(±) | zredukowany bas - średnio 11.6% niższy od mediany
(±) | liniowość basu jest średnia (9.2% delta do poprzedniej częstotliwości)
Średnie 400 - 2000 Hz
(+) | zbalansowane środki średnie - tylko 4.3% od mediany
(+) | średnie są liniowe (5.7% delta do poprzedniej częstotliwości)
Wysokie 2–16 kHz
(+) | zrównoważone maksima - tylko 1.6% od mediany
(+) | wzloty są liniowe (3.9% delta do poprzedniej częstotliwości)
Ogólnie 100 - 16.000 Hz
(+) | ogólny dźwięk jest liniowy (10.1% różnicy w stosunku do mediany)
W porównaniu do tej samej klasy
» 5% wszystkich testowanych urządzeń w tej klasie było lepszych, 2% podobnych, 93% gorszych
» Najlepszy miał deltę 6%, średnia wynosiła ###średnia###%, najgorsza wynosiła 132%
W porównaniu do wszystkich testowanych urządzeń
» 5% wszystkich testowanych urządzeń było lepszych, 1% podobnych, 94% gorszych
» Najlepszy miał deltę 4%, średnia wynosiła ###średnia###%, najgorsza wynosiła 134%
Lenovo Legion 5 Pro 16ARH7H RTX 3070 Ti analiza dźwięku
(±) | głośność głośnika jest średnia, ale dobra (72.5 dB)
Bas 100 - 315 Hz
(-) | prawie brak basu - średnio 22.3% niższa od mediany
(-) | bas nie jest liniowy (15.4% delta do poprzedniej częstotliwości)
Średnie 400 - 2000 Hz
(±) | wyższe średnie - średnio 7.1% wyższe niż mediana
(±) | liniowość środka jest średnia (9.5% delta do poprzedniej częstotliwości)
Wysokie 2–16 kHz
(+) | zrównoważone maksima - tylko 1.9% od mediany
(+) | wzloty są liniowe (3.6% delta do poprzedniej częstotliwości)
Ogólnie 100 - 16.000 Hz
(-) | ogólny dźwięk nie jest liniowy (30.3% różnicy w stosunku do mediany)
W porównaniu do tej samej klasy
» 96% wszystkich testowanych urządzeń w tej klasie było lepszych, 2% podobnych, 3% gorszych
» Najlepszy miał deltę 6%, średnia wynosiła ###średnia###%, najgorsza wynosiła 132%
W porównaniu do wszystkich testowanych urządzeń
» 89% wszystkich testowanych urządzeń było lepszych, 3% podobnych, 9% gorszych
» Najlepszy miał deltę 4%, średnia wynosiła ###średnia###%, najgorsza wynosiła 134%
Zarządzanie energią - wydajne podczas gry, ale niespójne w stanie spoczynku
Pobór mocy
Niestety zużycie energii w stanie bezczynności mocno się waha i robi się dość wysokie, mimo że menedżer zadań nie pokazuje żadnych utrudniających pracę procesów. Dzieje się tak również po dłuższej pracy. Mile widziane byłyby tutaj jakieś aktualizacje sterowników od Asusa.
Podczas grania zużycie energii przez M16 jest zaskakująco niskie (144 W). Model Vision 16 Pro zużywa około 8% więcej, a mocniejszy Legion 5 Pro nawet 45%! Biorąc pod uwagę dodatkową wydajność Legion 5, nie jest to bardzo zaskakujące, ale skala różnicy jest, ponieważ nawet znacznie słabszy poprzednik Asus ROG Zephyrus M16 Gaming Laptop Review: Gaming in 16:10 zużywał więcej energii podczas grania.
Jeśli wybierzemy dla M16 tryb Turbo, to podczas grania zużywa on 175 W(The Witcher 3 )zamiast 144 W (wykres niebieski). Jest to wtedy nieco więcej niż w przypadku Vision 16 Pro, ale wciąż mniej niż 209 W w przypadku Legion 5 Pro
.Mierzymy chwilowe skoki obciążenia do 220 W z 240-W zasilacza, więc powinno to być wystarczające wyposażenie dla wszystkich scenariuszy użytkowania.
| wyłączony / stan wstrzymania | |
| luz | |
| obciążenie |
|
Legenda:
min: | |
| Asus ROG Zephyrus M16 GU603Z i9-12900H, GeForce RTX 3070 Ti Laptop GPU, Micron 3400 1TB MTFDKBA1T0TFH, IPS, 2560x1600, 16" | Asus ROG Zephyrus M16 GU603H i9-11900H, GeForce RTX 3070 Laptop GPU, Samsung PM9A1 MZVL22T0HBLB, IPS, 2560x1600, 16" | Schenker Vision 16 Pro RTX 3070 Ti i7-12700H, GeForce RTX 3070 Ti Laptop GPU, Samsung SSD 980 Pro 1TB MZ-V8P1T0BW, IPS, 2560x1600, 16" | Lenovo Legion 5 Pro 16ARH7H RTX 3070 Ti R7 6800H, GeForce RTX 3070 Ti Laptop GPU, Samsung PM9A1 MZVL21T0HCLR, IPS, 2560x1600, 16" | Schenker XMG Focus 16 (i7-12700H, RTX 3060) i7-12700H, GeForce RTX 3060 Laptop GPU, Samsung SSD 980 Pro 1TB MZ-V8P1T0BW, IPS, 2560x1600, 16" | Corsair Voyager a1600 R9 6900HS, Radeon RX 6800M, Samsung PM9A1 MZVL22T0HBLB, IPS, 2560x1600, 16" | Przeciętny NVIDIA GeForce RTX 3070 Ti Laptop GPU | Średnia w klasie Gaming | |
|---|---|---|---|---|---|---|---|---|
| Power Consumption | -14% | 14% | -30% | -16% | -32% | -23% | -16% | |
| Idle Minimum * (Watt) | 10.8 | 11 -2% | 9 17% | 9.7 10% | 14.7 -36% | 16.9 -56% | 14.2 ? -31% | 13.2 ? -22% |
| Idle Average * (Watt) | 17 | 20 -18% | 13.3 22% | 14.8 13% | 18.6 -9% | 20.3 -19% | 19.9 ? -17% | 18.9 ? -11% |
| Idle Maximum * (Watt) | 17.8 | 30 -69% | 14.3 20% | 45.8 -157% | 21.2 -19% | 22.2 -25% | 26.2 ? -47% | 24.3 ? -37% |
| Load Average * (Watt) | 116 | 111 4% | 107 8% | 87.2 25% | 121 -4% | 133.4 -15% | 125.8 ? -8% | 108.3 ? 7% |
| Witcher 3 ultra * (Watt) | 144 | 156 -8% | 155.2 -8% | 209 -45% | 174 -21% | 206 -43% | ||
| Load Maximum * (Watt) | 220 | 197 10% | 172 22% | 275.3 -25% | 235 -7% | 248 ? -13% | 254 ? -15% |
* ... im mniej tym lepiej
Power Consumption The Witcher 3 / Stress Test
Power Consumption with External Monitor
Czas pracy na baterii
Asus nie wymienia w opcjach wydajności żadnego trybu oszczędzania energii z prawdziwego zdarzenia. Jeżeli wyciągniemy wtyczkę, M16 automatycznie przechodzi w tryb Quiet.
Pojemność akumulatora wynosi 90 Wh, co jest przyzwoitym wynikiem w porównaniu. Vision 16 Pro i Legion 5 oferują jedynie pojemność 80 Wh. Dzięki temu M16 wytrzymuje odpowiednio dłużej.
W zależności od jasności wyświetlacza czasy pracy różnią się znacznie. W naszym teście WiFi M16 wytrzymuje od 5 godzin (przy pełnej jasności) do około 7,5 godziny (przy 150 nitach).
Mniej więcej tego samego można się spodziewać podczas oglądania filmów.
| Asus ROG Zephyrus M16 GU603Z i9-12900H, GeForce RTX 3070 Ti Laptop GPU, 90 Wh | Asus ROG Zephyrus M16 GU603H i9-11900H, GeForce RTX 3070 Laptop GPU, 90 Wh | Schenker Vision 16 Pro RTX 3070 Ti i7-12700H, GeForce RTX 3070 Ti Laptop GPU, 80 Wh | Lenovo Legion 5 Pro 16ARH7H RTX 3070 Ti R7 6800H, GeForce RTX 3070 Ti Laptop GPU, 80 Wh | Schenker XMG Focus 16 (i7-12700H, RTX 3060) i7-12700H, GeForce RTX 3060 Laptop GPU, 54 Wh | Corsair Voyager a1600 R9 6900HS, Radeon RX 6800M, 99 Wh | Średnia w klasie Gaming | |
|---|---|---|---|---|---|---|---|
| Czasy pracy | 9% | -14% | -41% | -18% | 3% | 4% | |
| H.264 (h) | 7.3 | 6.1 -16% | 6 -18% | 8.26 ? 13% | |||
| WiFi v1.3 (h) | 7.4 | 7.7 4% | 6 -19% | 4.4 -41% | 4.8 -35% | 5.8 -22% | 7.04 ? -5% |
| Load (h) | 1.4 | 1.6 14% | 1.3 -7% | 1.4 0% | 2.1 50% | 1.47 ? 5% | |
| Reader / Idle (h) | 13.3 | 7 | 8.71 ? |
Za
Przeciw
Werdykt - dobrze dopracowany laptop do gier z wyświetlaczem 16:10
Asus ROG Zephyrus M16 to ogólnie dobrze zoptymalizowany laptop do gier, bez znaczących obszarów problematycznych. Poza bardzo dobrą wydajnością procesora i przyzwoitymi czasami pracy na akumulatorze duży, 16-calowy wyświetlacz QHD+ w formacie 16:10 również potrafi zadowolić mocnymi kontrastami i dość wysokim pokryciem przestrzeni barw.
Biorąc pod uwagę fakt, że wielu konkurentów zupełnie nie posiada czytnika kart SD, jesteśmy w stanie wybaczyć, że Asus zastosował tylko czytnik kart microSD, zwłaszcza że zastosowane tu urządzenie jest dość szybkie.KartaRTX 3070 Tima tylko TGP o mocy 120 W, ale to również oznacza, że laptop nie nagrzewa się zbytnio, a poziom hałasu również pozostaje w granicach. Z drugiej strony Asus mógłby zoptymalizować sterowanie wentylatorami, gdyż od czasu do czasu potrafią one nagle rozkręcić się do 47 dB nawet podczas pracy jałowej.
M16 prezentuje się przede wszystkim jako dobrze zaokrąglony pakiet do gier. Nawet jeśli nie oferuje on maksymalnej wydajności, to pakiet jest spójny z umiarkowanymi temperaturami i poziomem hałasu.
Ci, którzy potrzebują wyższej wydajności, mogą spojrzeć na Lenovo Legion 5 Promożna też po prostu włączyć podobnie głośny tryb Turbo w M16, co prowadzi do zauważalnego i wymiernego wzrostu wydajności również w tym przypadku.
Cena i dostępność
Amazon wymienia różne konfiguracje modelu 2022 Asus ROG Zephyrus M16 zaczynające się od 2249 dolarów.
Asus ROG Zephyrus M16 GU603Z
- 14/02/2023 v7 (old)
Christian Hintze
Przezroczystość
Wyboru urządzeń do recenzji dokonuje nasza redakcja. Próbka testowa została udostępniona autorowi jako pożyczka od producenta lub sprzedawcy detalicznego na potrzeby tej recenzji. Pożyczkodawca nie miał wpływu na tę recenzję, producent nie otrzymał też kopii tej recenzji przed publikacją. Nie było obowiązku publikowania tej recenzji. Jako niezależna firma medialna, Notebookcheck nie podlega władzy producentów, sprzedawców detalicznych ani wydawców.
Tak testuje Notebookcheck
Każdego roku Notebookcheck niezależnie sprawdza setki laptopów i smartfonów, stosując standardowe procedury, aby zapewnić porównywalność wszystkich wyników. Od około 20 lat stale rozwijamy nasze metody badawcze, ustanawiając przy tym standardy branżowe. W naszych laboratoriach testowych doświadczeni technicy i redaktorzy korzystają z wysokiej jakości sprzętu pomiarowego. Testy te obejmują wieloetapowy proces walidacji. Nasz kompleksowy system ocen opiera się na setkach uzasadnionych pomiarów i benchmarków, co pozwala zachować obiektywizm.Price comparison

