Debiut wydajności Radeon RX 6650M: Recenzja laptopa HP Omen 16 2022
Choć seria HP Omen 16 ma ledwie rok, to najnowszy model z 2022 roku jest już znaczącym odświeżeniem względem pierwowzoru zarówno wewnątrz, jak i na zewnątrz. Najnowsza wersja dodaje opcje procesorów Intel 12th gen Alder Lake-H i AMD Zen 3+, opcje GPU GeForce RTX 3070 Ti i Radeon RX 6000M oraz kilka zmian zewnętrznych.
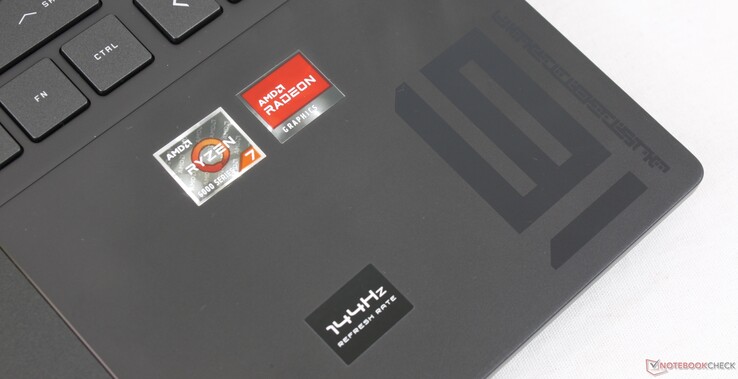
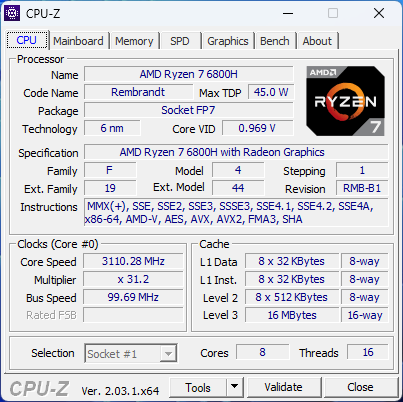
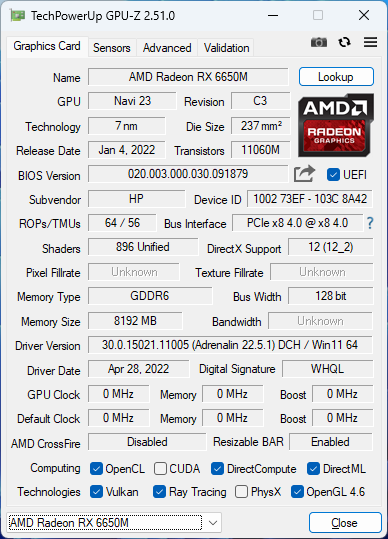
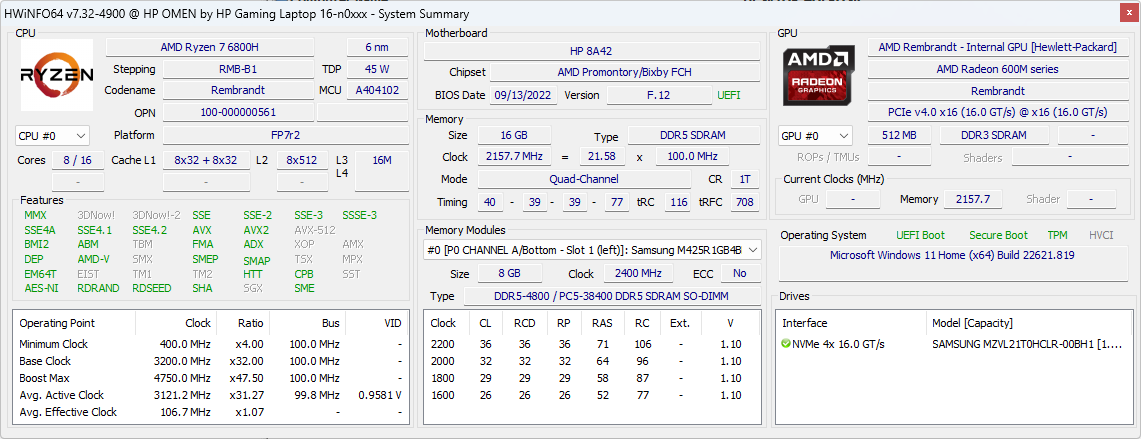
Nasza recenzowana konfiguracja to SKU z procesorem Ryzen 7 6800H, 105 W TGP Radeon RX 6650M i wyświetlaczem IPS 144 Hz 1080p w cenie około 1600 USD. Jest to również jeden z niewielu laptopów wyposażonych w grafikę Radeon RX 6650M.
Omen 16 konkuruje bezpośrednio z innymi 16-calowymi laptopami do gier z wyższej półki, takimi jak Dell G16 7620, Lenovo Legion S7 16, czy Asus Zephyrus M16. Aby uzyskać bardziej przyjazną dla budżetu alternatywę, użytkownicy mogą rozważyć niższej klasy HP Victus 16.
Więcej recenzji HP:
Potencjalni konkurenci w porównaniu
Ocena | Data | Model | Waga | Wysokość | Rozmiar | Rezolucja | Cena |
|---|---|---|---|---|---|---|---|
| 86.4 % v7 (old) | 12/2022 | HP Omen 16-n0033dx R7 6800H, Radeon RX 6650M | 2.4 kg | 22.6 mm | 16.10" | 1920x1080 | |
| 86.9 % v7 (old) | 09/2022 | HP Envy 16 h0112nr i7-12700H, GeForce RTX 3060 Laptop GPU | 2.3 kg | 19.8 mm | 16.00" | 3840x2400 | |
| 85.5 % v7 (old) | HP Omen 16-b1090ng i7-12700H, GeForce RTX 3070 Ti Laptop GPU | 2.3 kg | 23 mm | 16.10" | 2560x1440 | ||
| 82.3 % v7 (old) | 03/2025 | HP Victus 16-e0145ng R5 5600H, GeForce RTX 3050 Ti Laptop GPU | 2.4 kg | 23.5 mm | 16.10" | 1920x1080 | |
| 89.3 % v7 (old) | Lenovo Legion S7 16ARHA7 R9 6900HX, Radeon RX 6800S | 2.2 kg | 16.9 mm | 16.00" | 2560x1600 | ||
| 86.1 % v7 (old) | 10/2022 | Dell G16 7620 i7-12700H, GeForce RTX 3060 Laptop GPU | 2.6 kg | 26.9 mm | 16.00" | 2560x1600 |
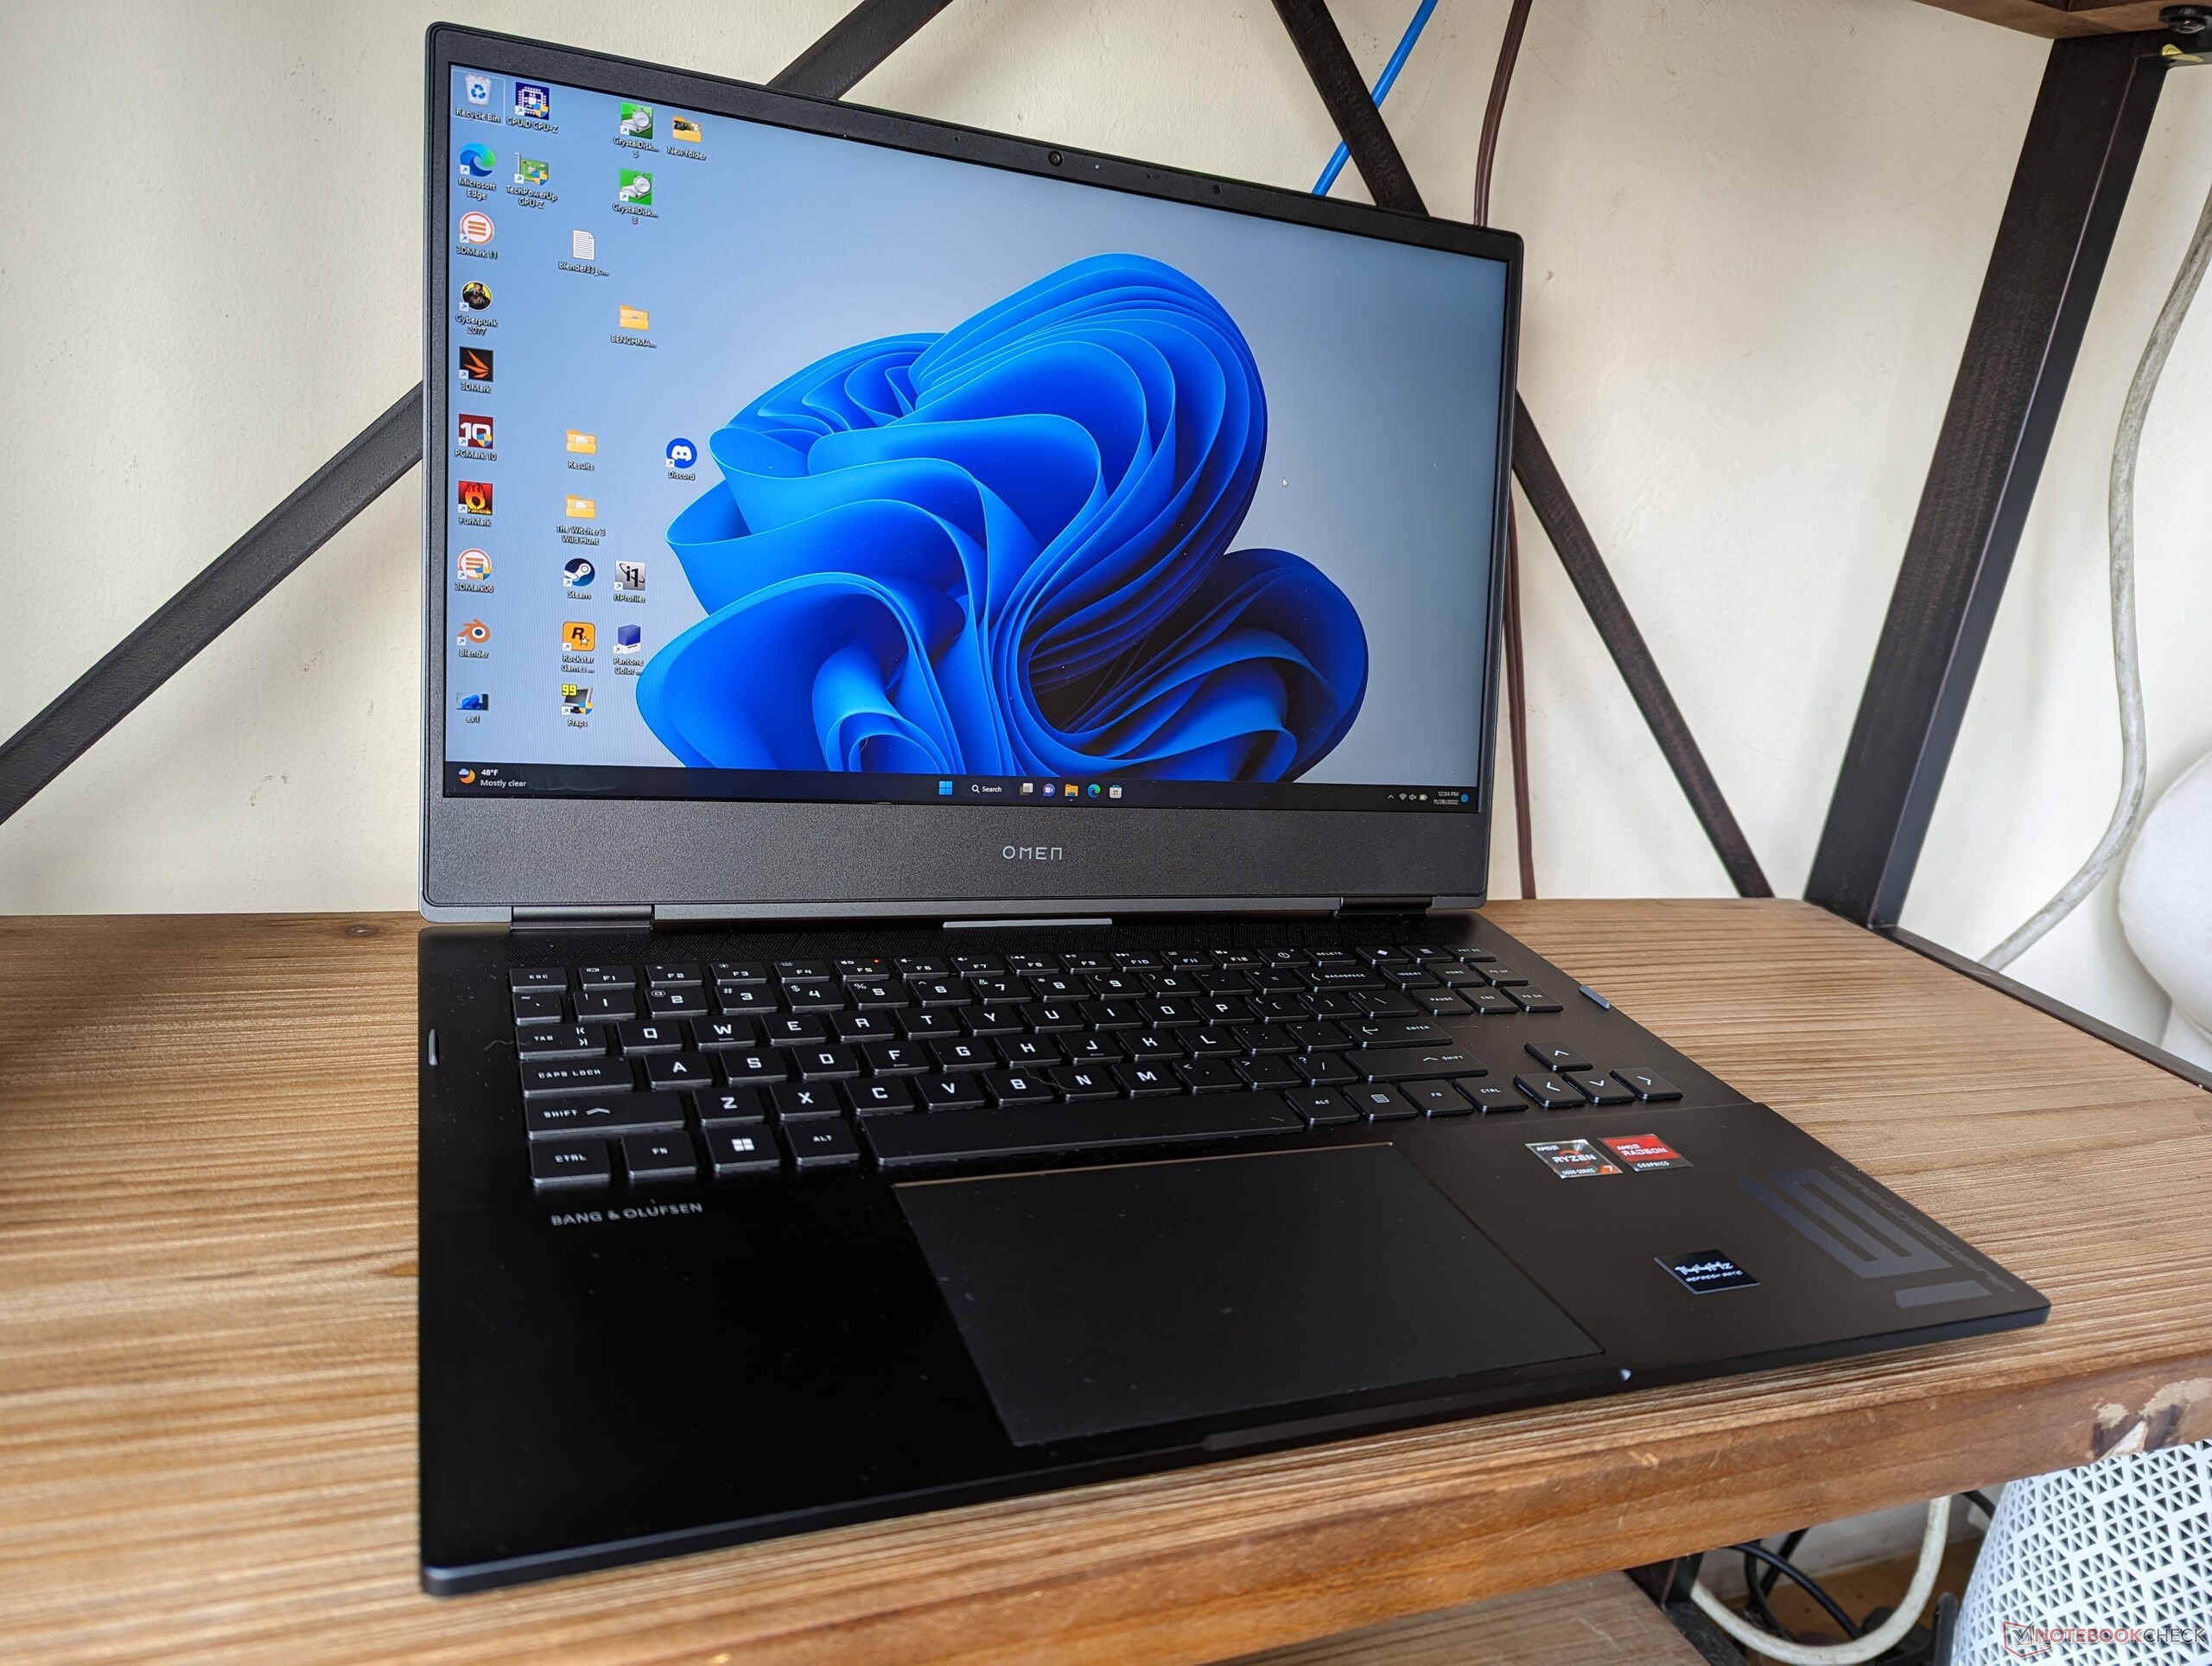
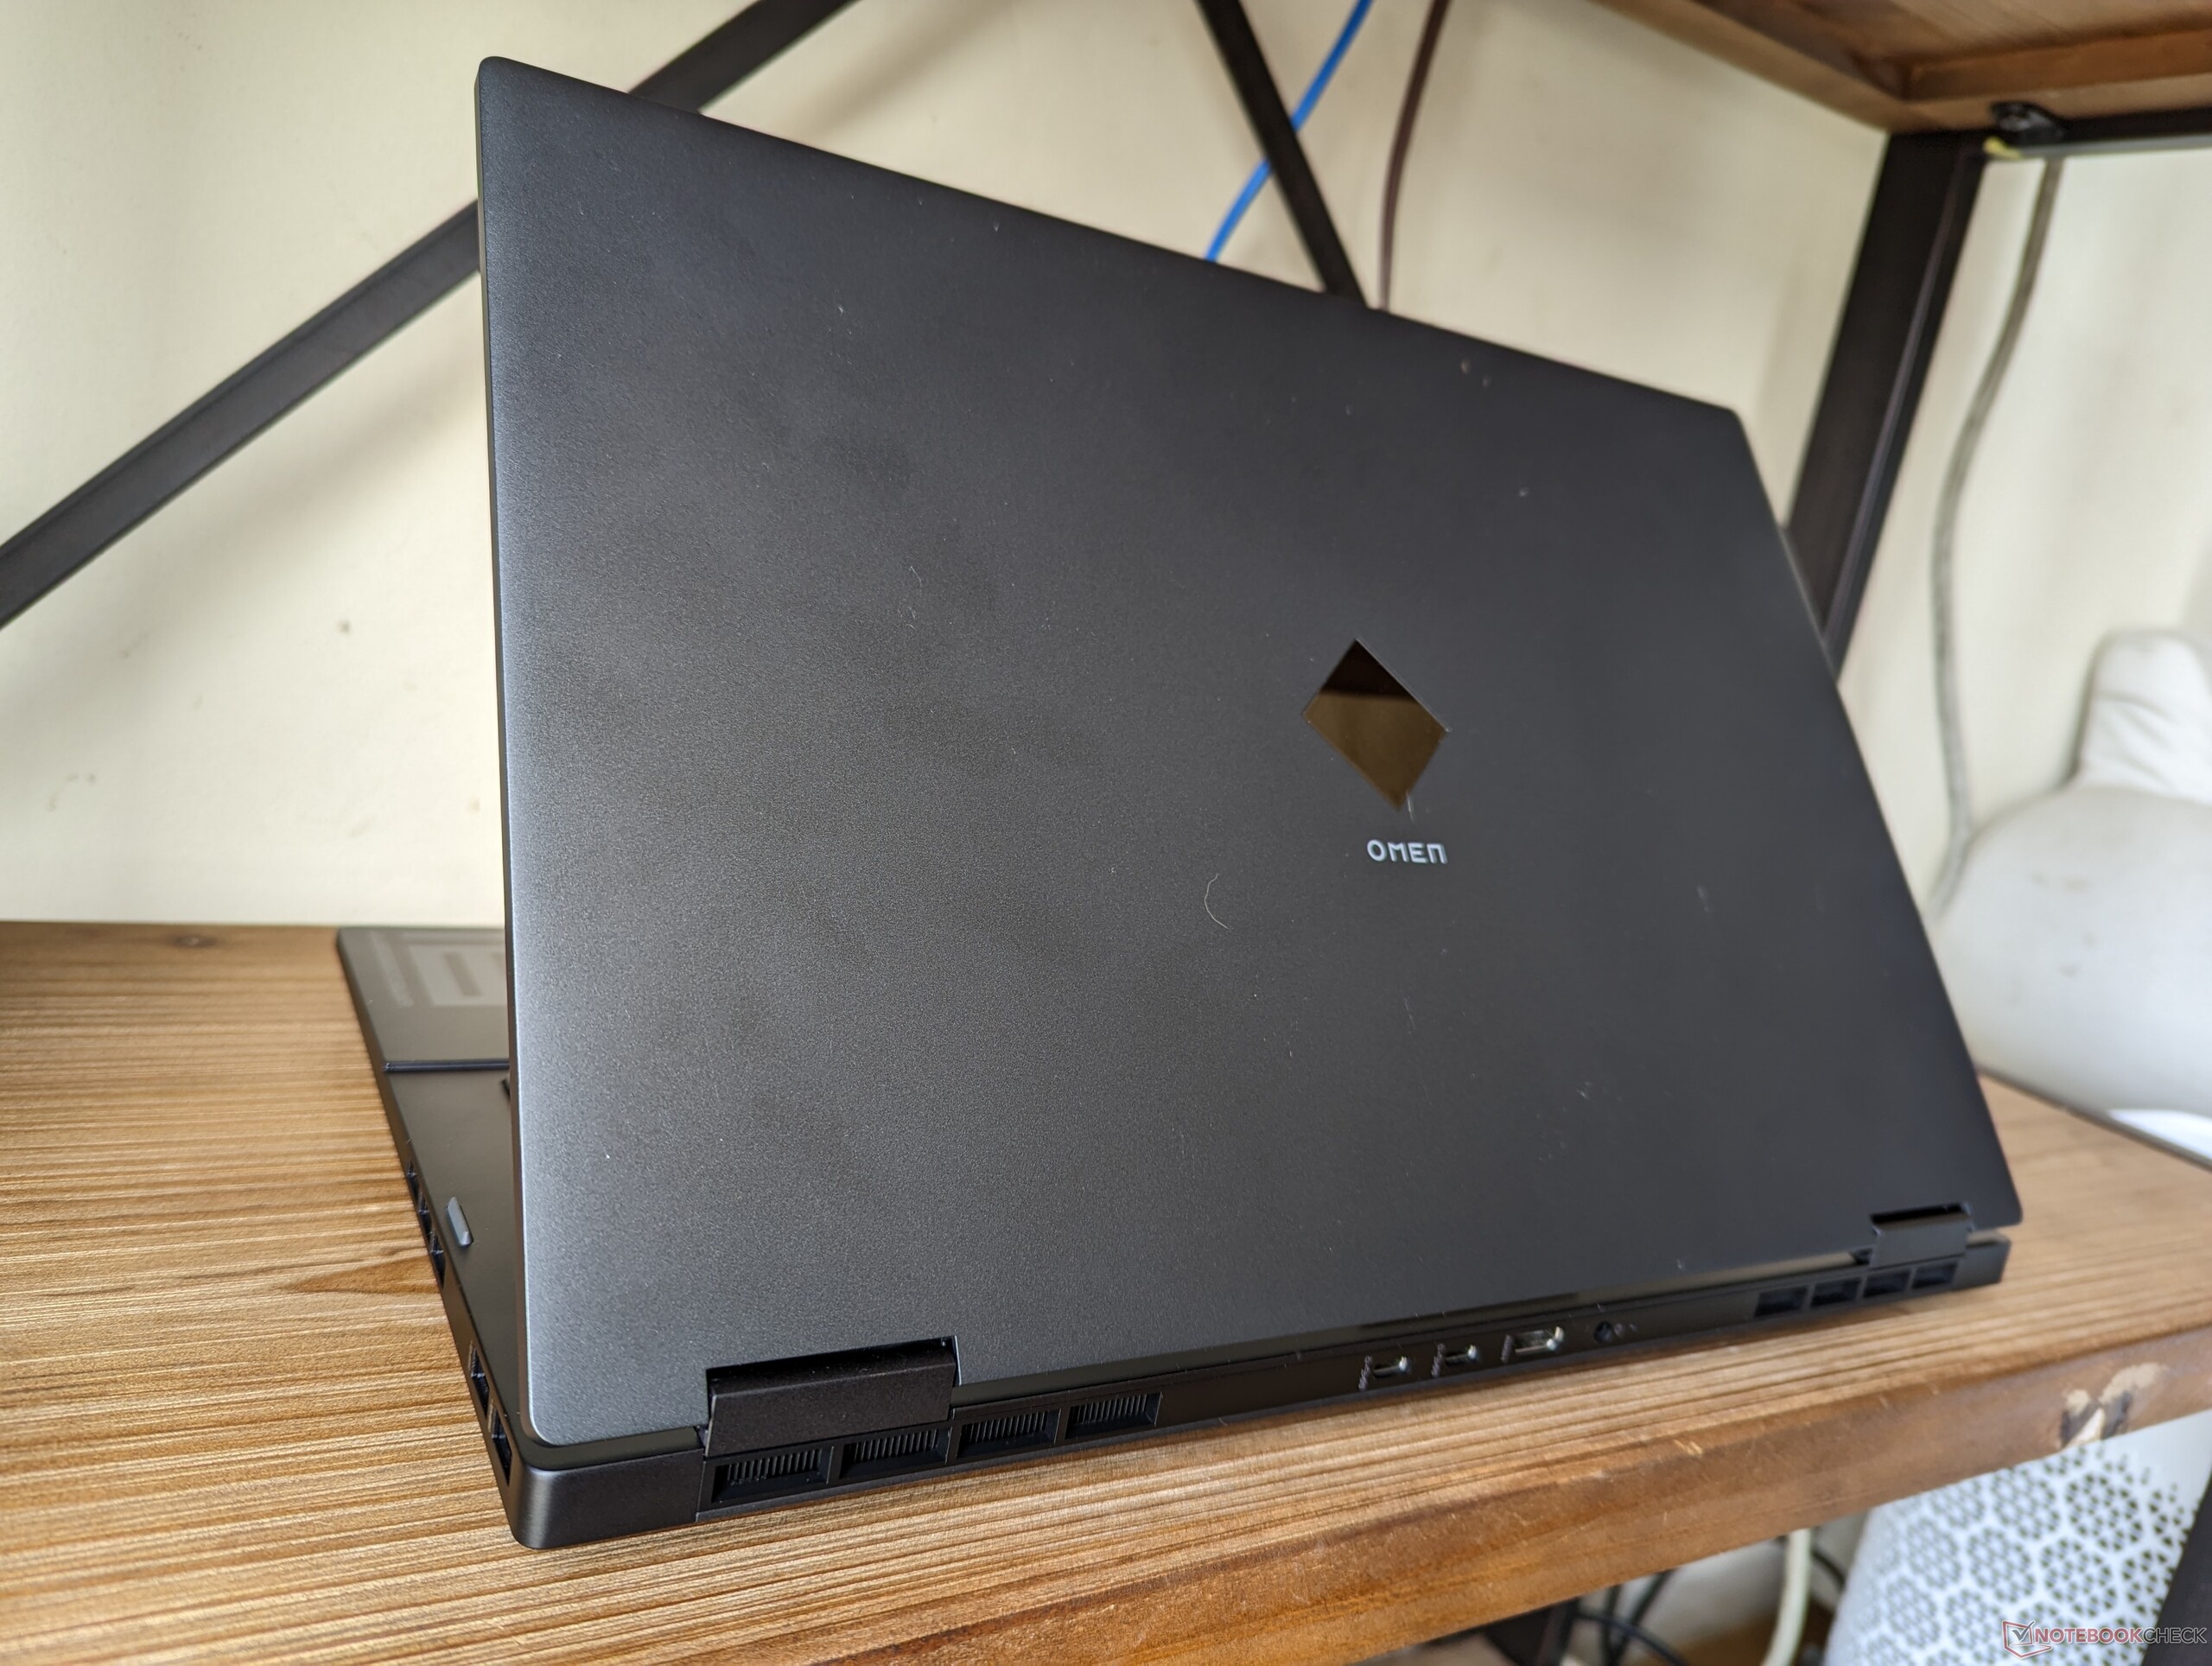
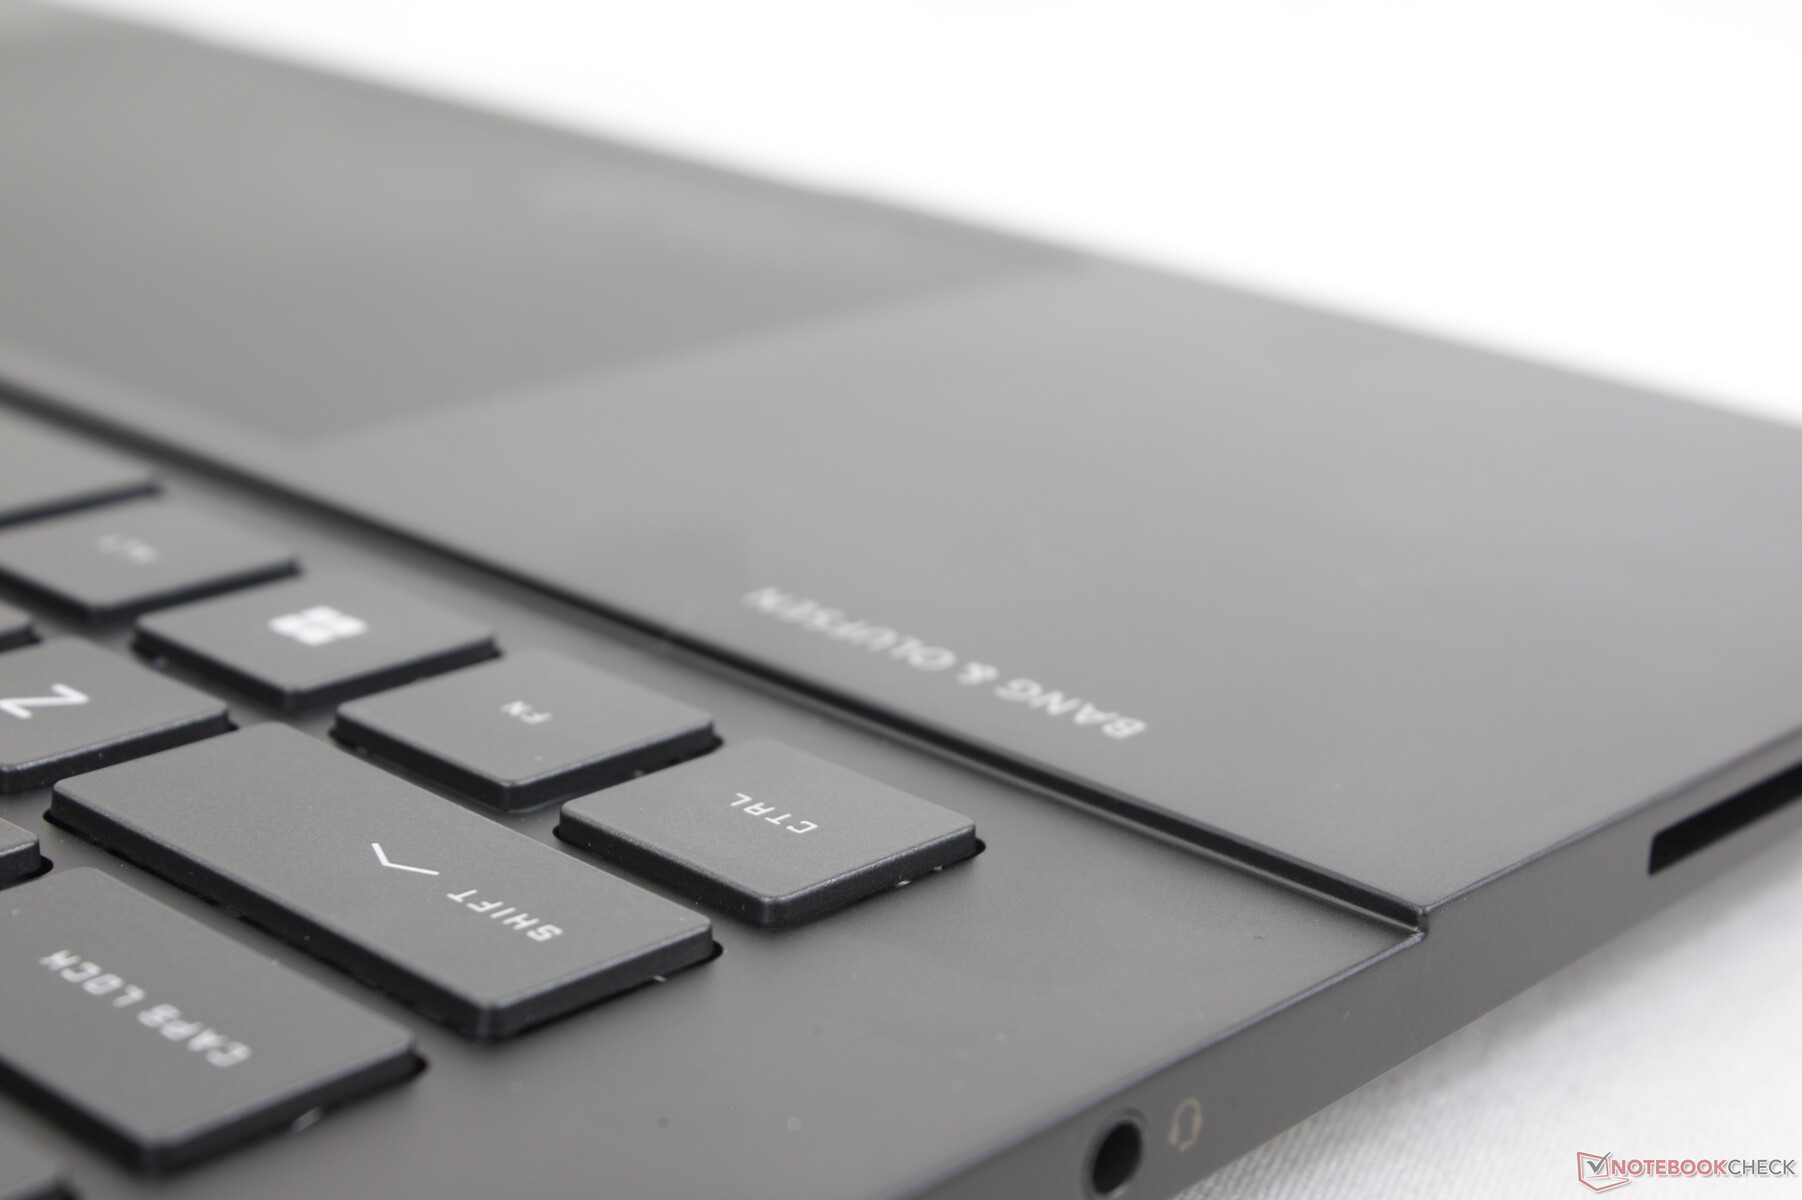
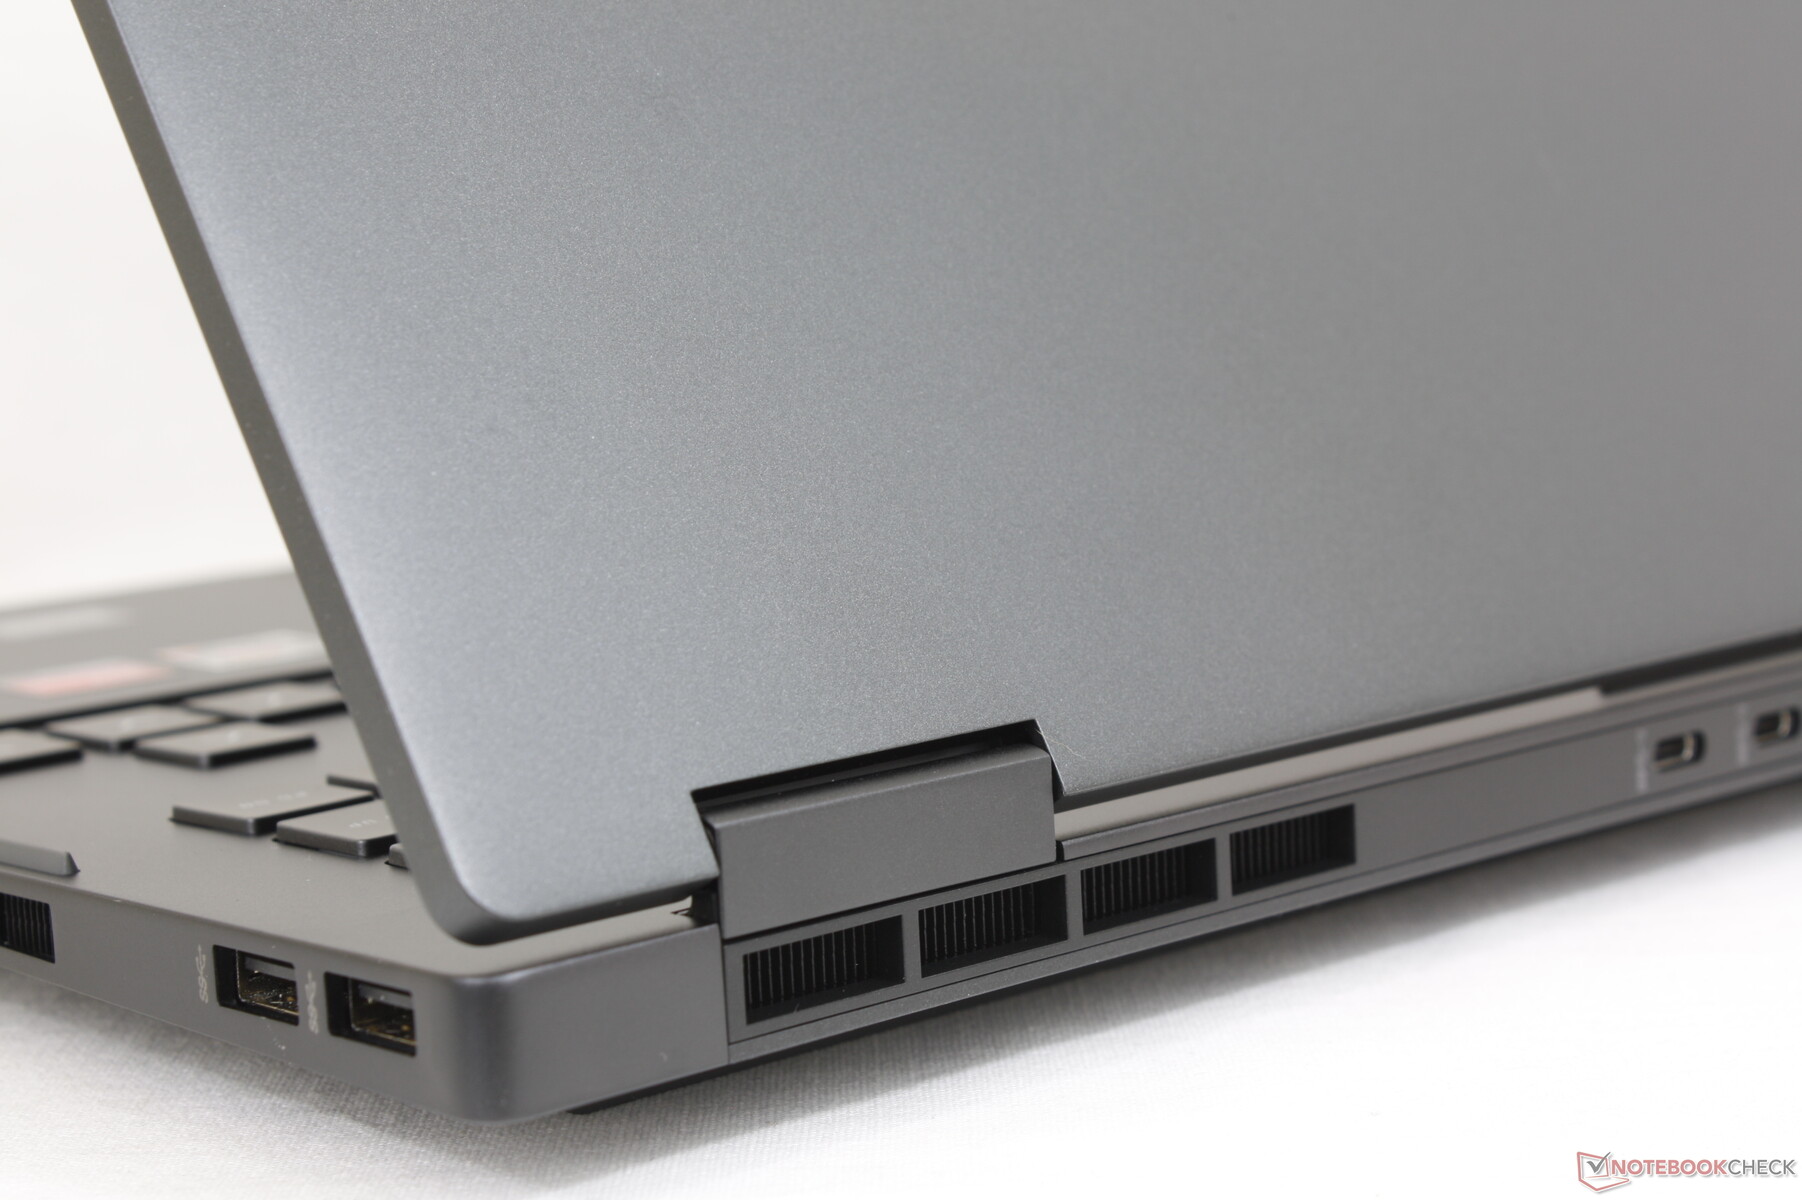
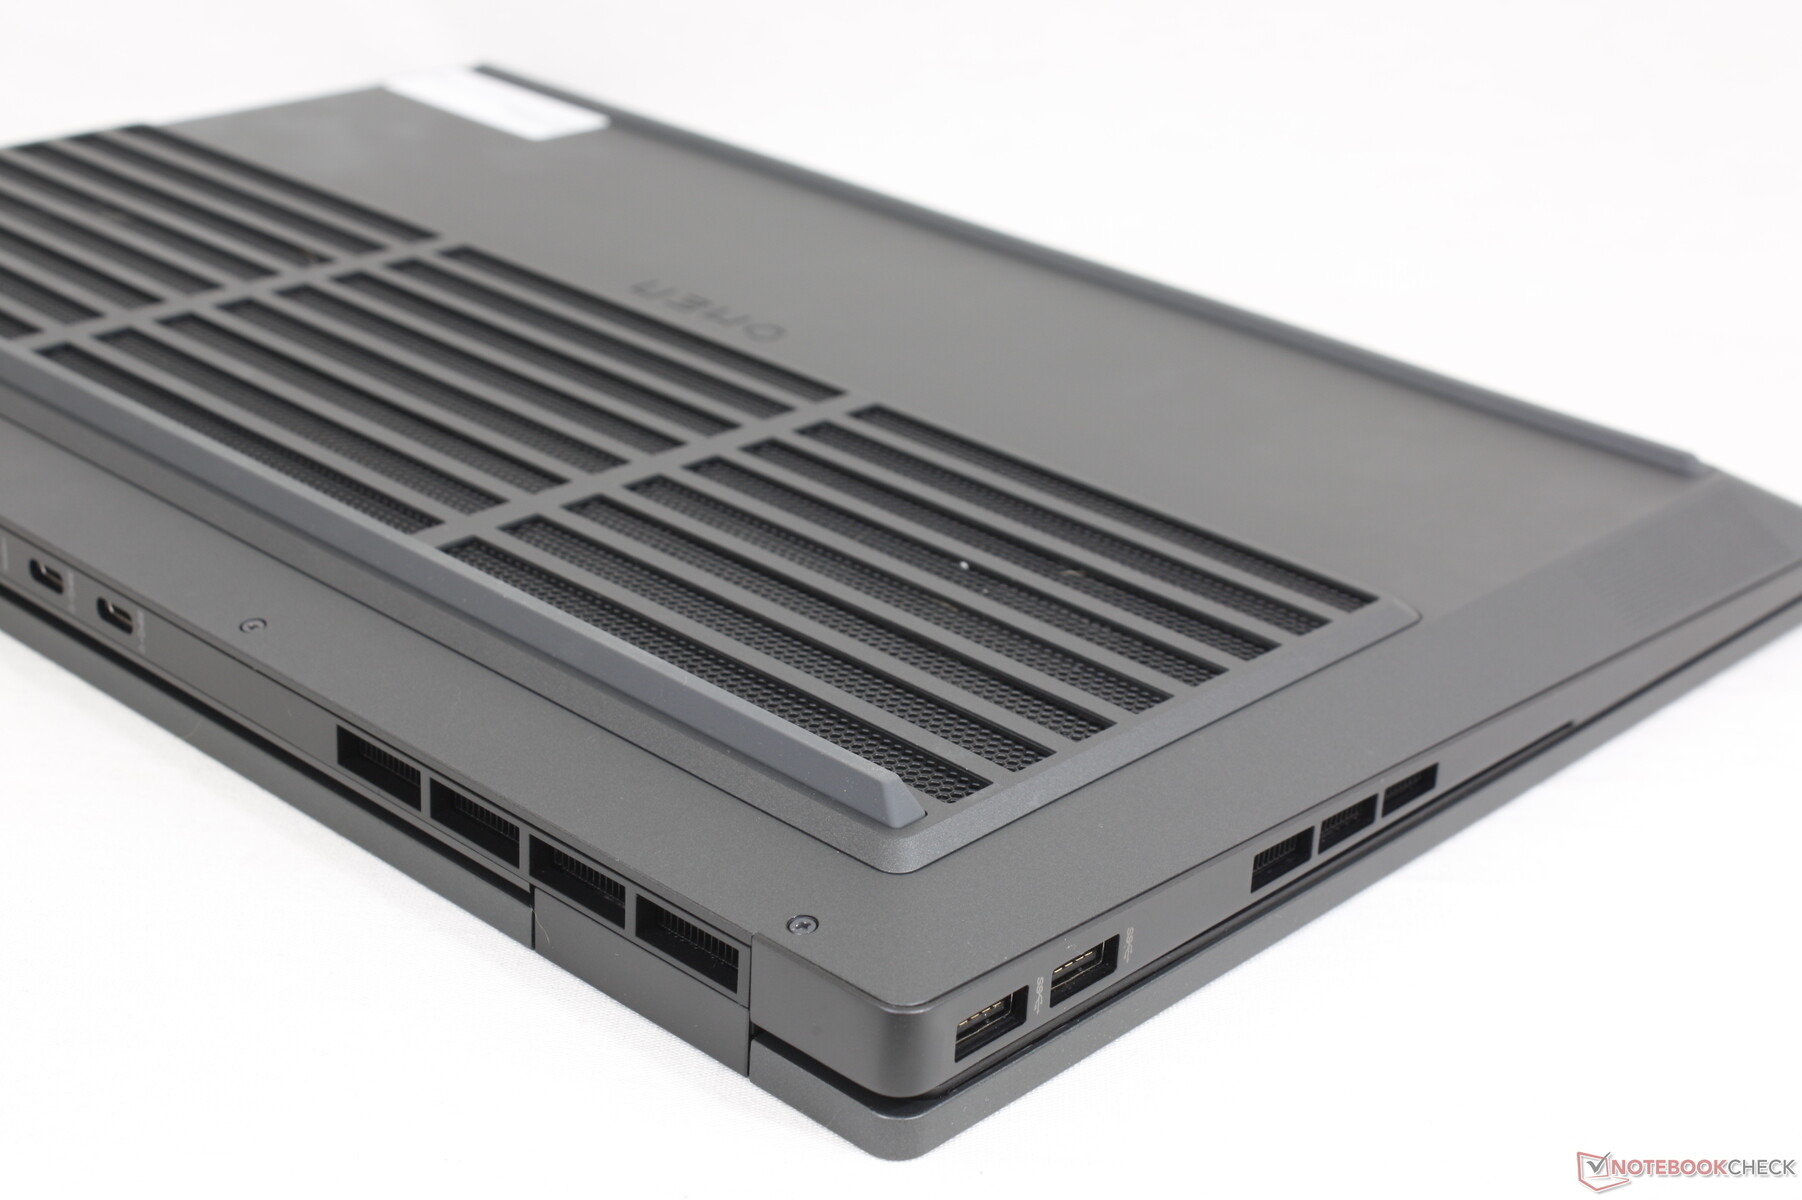
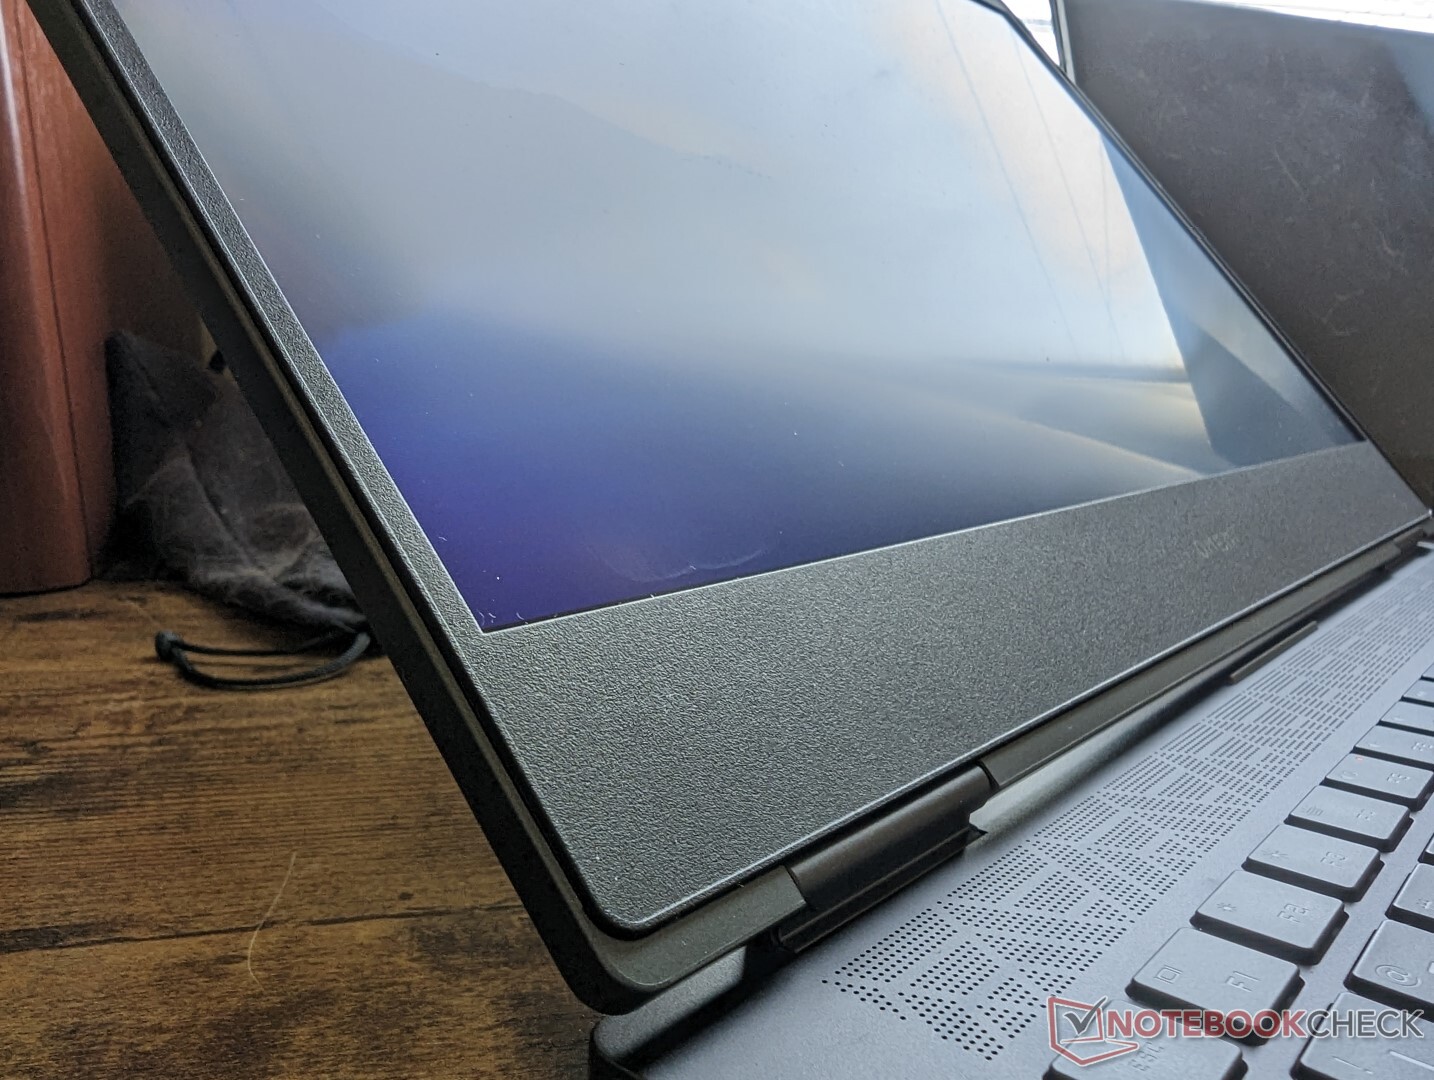
Case - Inspired By The Envy 16
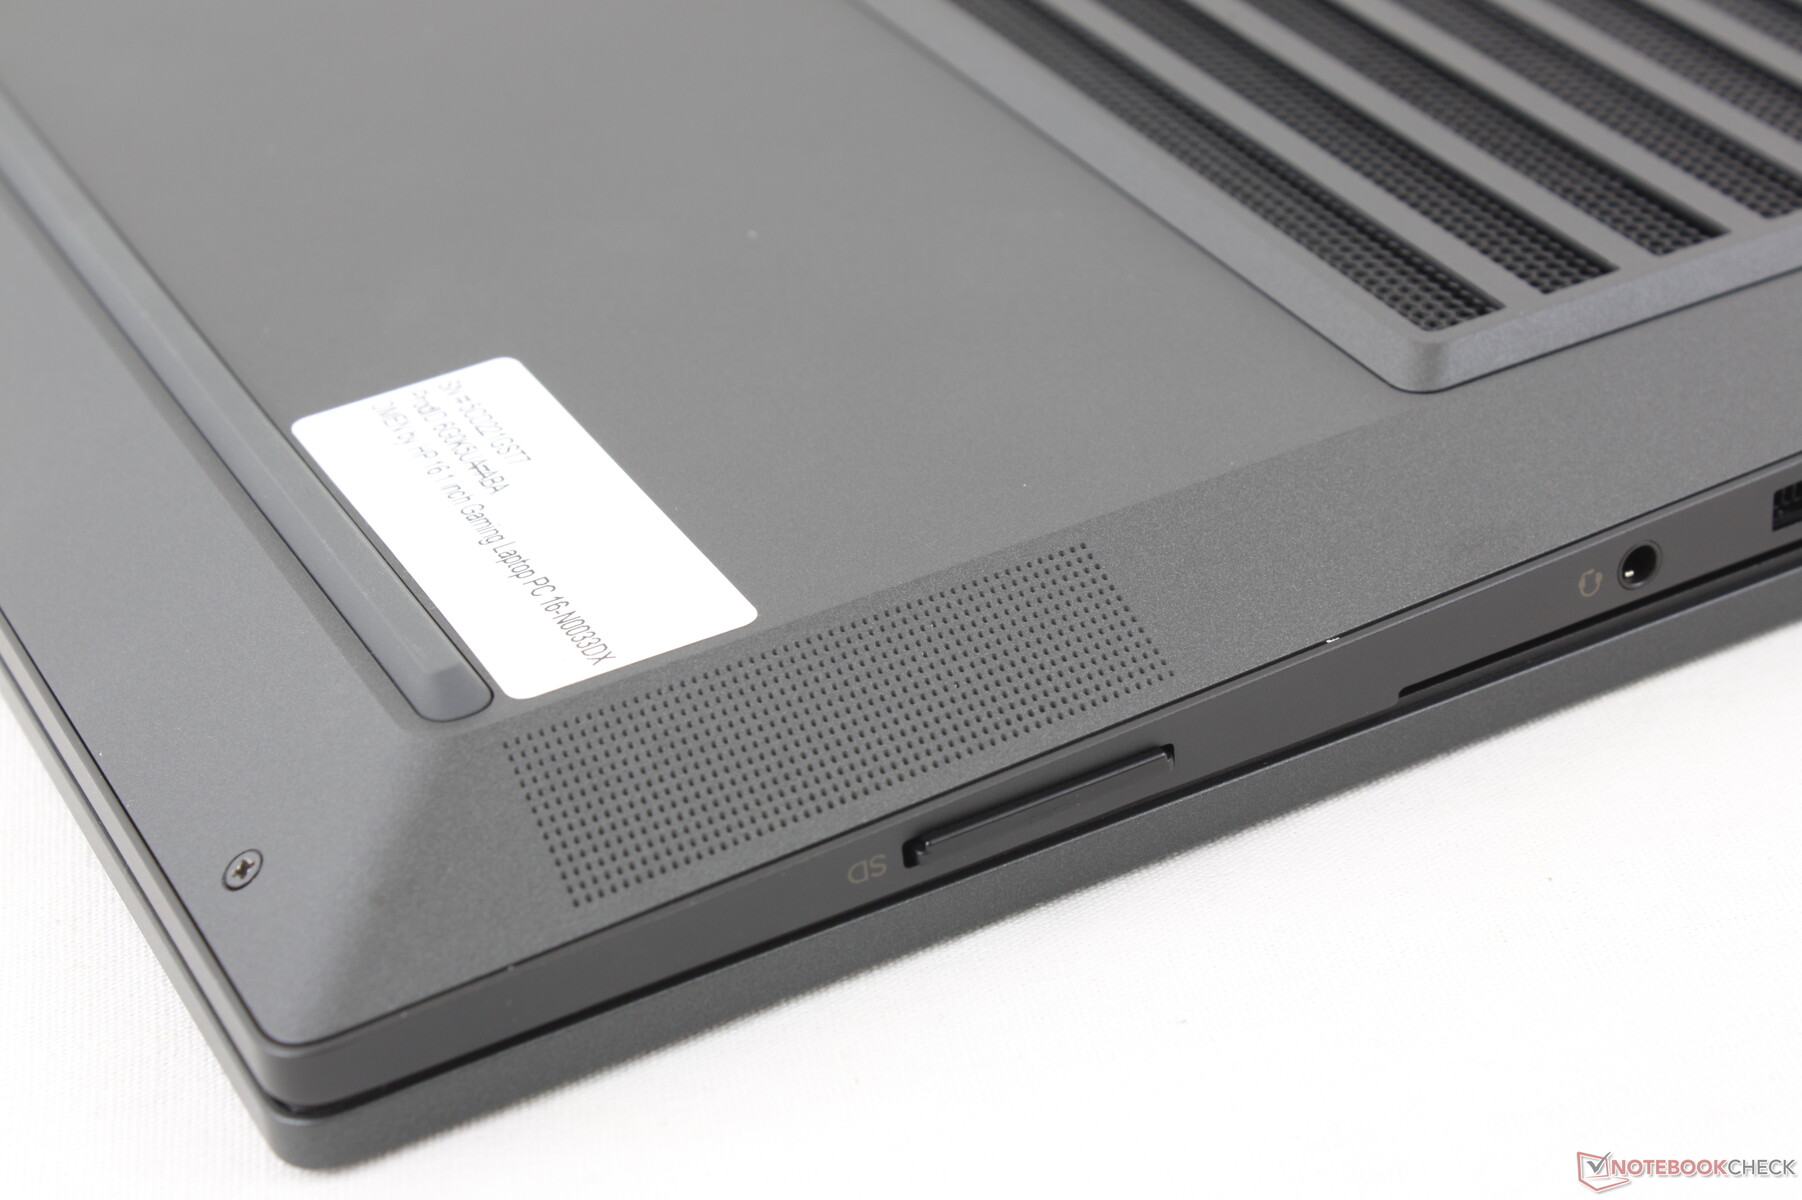
Omen 16 2022 wygląda z przodu niemal dokładnie jak model 2021, ale zmieniły się szczegóły w okolicach tyłu i dołu. Porty nie są już na przykład tam, gdzie były wcześniej, podczas gdy tylne rogi są teraz bardziej okrągłe niż wcześniej. Przeprojektowano także kratki wentylacyjne i głośnikowe, a w szczególności dolna płyta ma jeszcze większy otwór wentylacyjny
Metalowe materiały obudowy są poza tym takie same jak w zeszłorocznym modelu, co zapewnia podobne odczucia i wrażenie. Podstawa jest nadal sztywna i prawie jak w Envy 16, ale pokrywa ma tendencję do chwiania się podczas regulacji kątów. Małe zawiasy są też podatne na złamanie przy maksymalnym otwarciu. Zawiasy w Dell G16 sprawiają wrażenie mocniejszych.
Wymiary i waga są prawie niezmienione w stosunku do zeszłorocznego modelu pomimo wszystkich zewnętrznych aktualizacji. Model ten leży wygodnie pomiędzy cieńszym i lżejszym Lenovo Legion S7 16 a grubszym i cięższym Dellem G16. Asus Zephyrus M16 jest znacznie lżejszy o pół kilograma, jeśli użytkownicy chcą mieć bardziej przenośny 16-calowy laptop do gier.
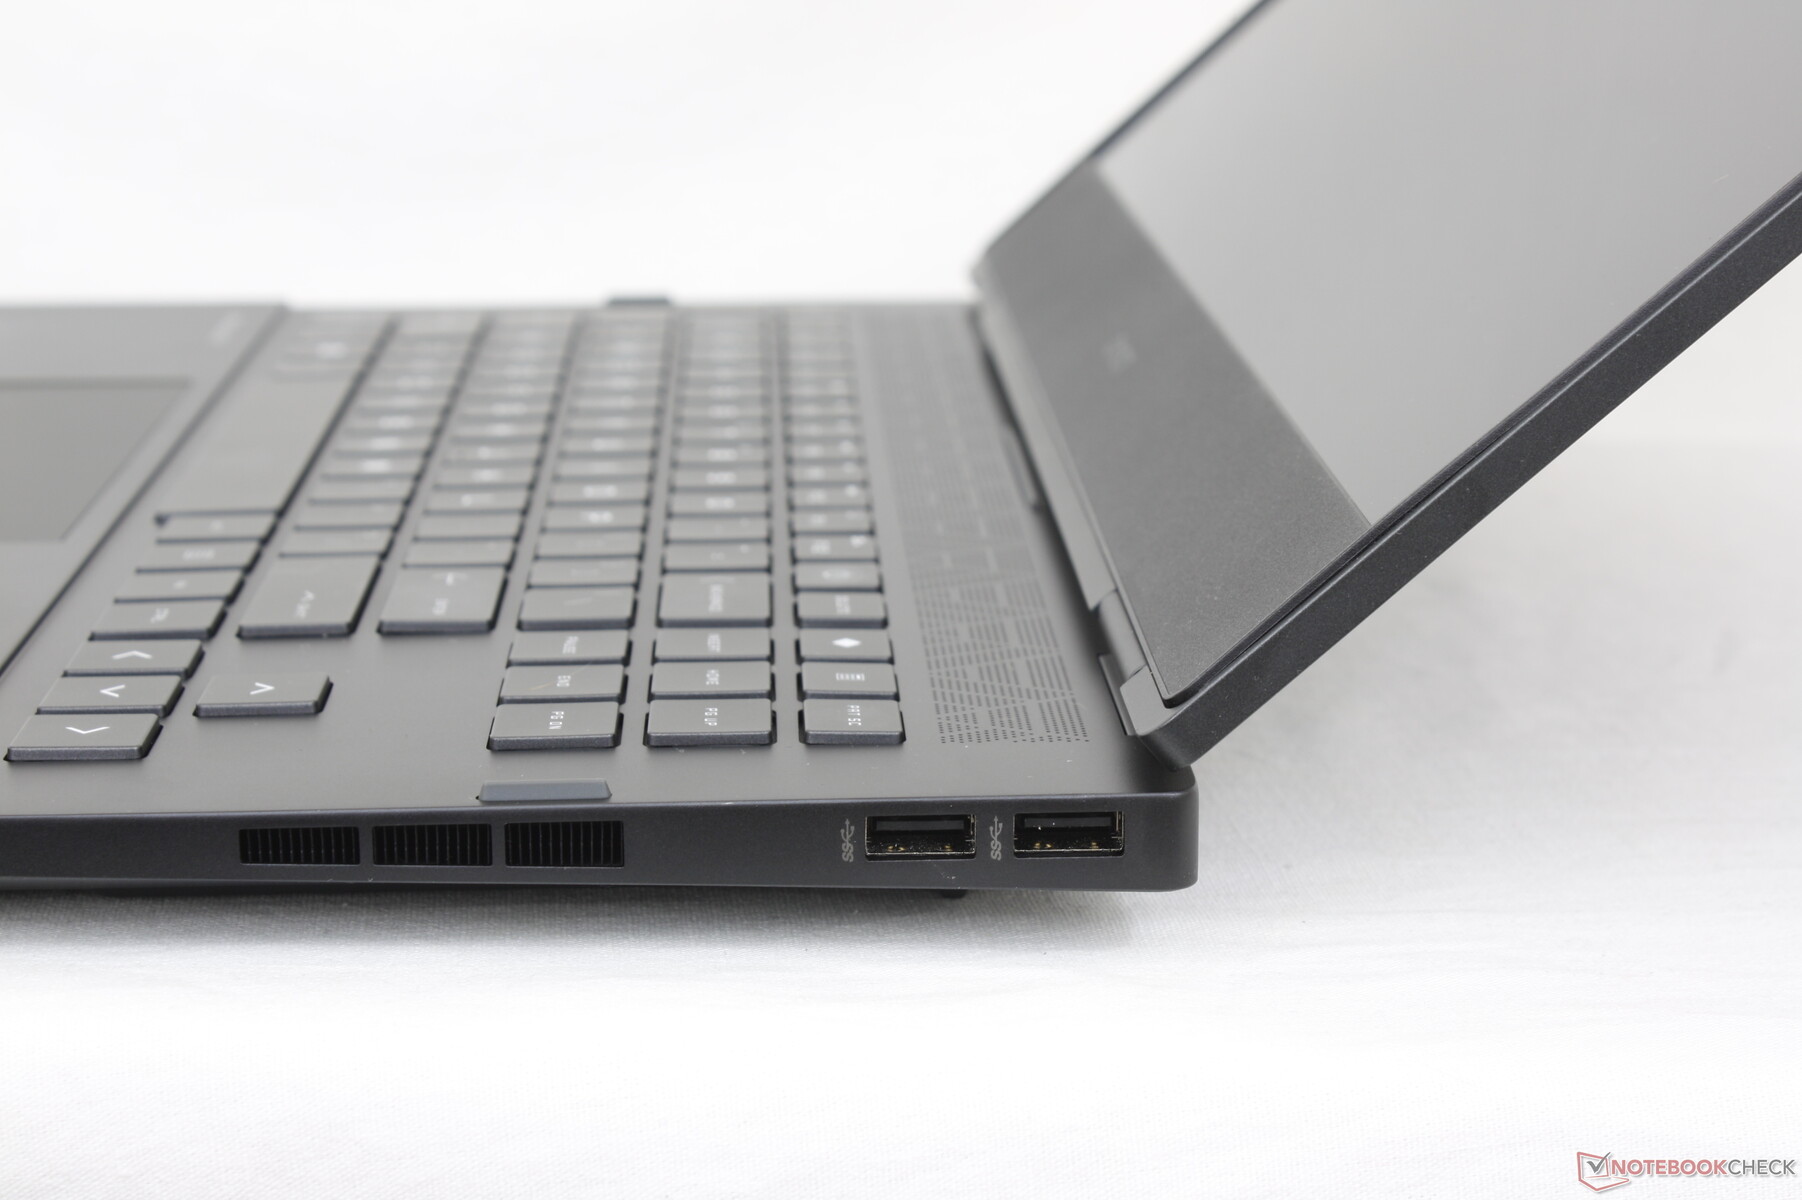
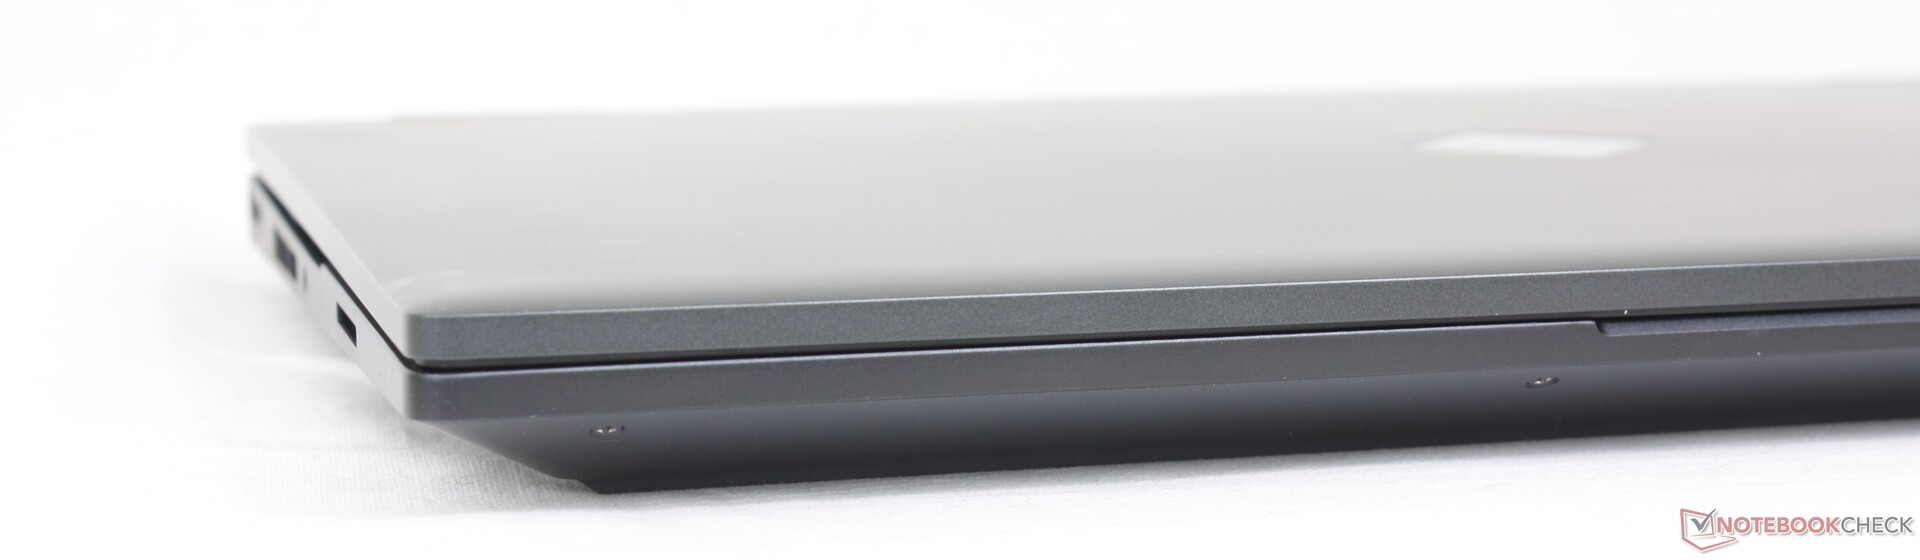
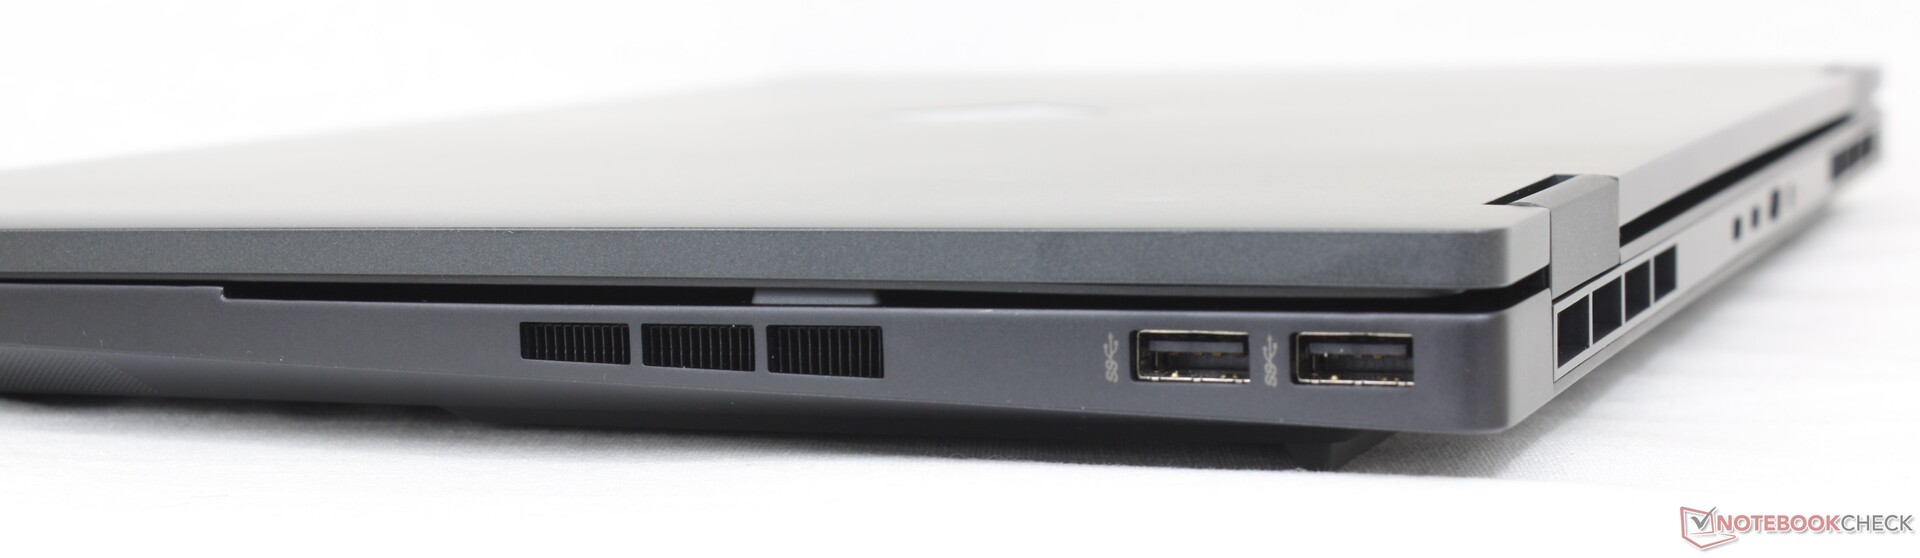
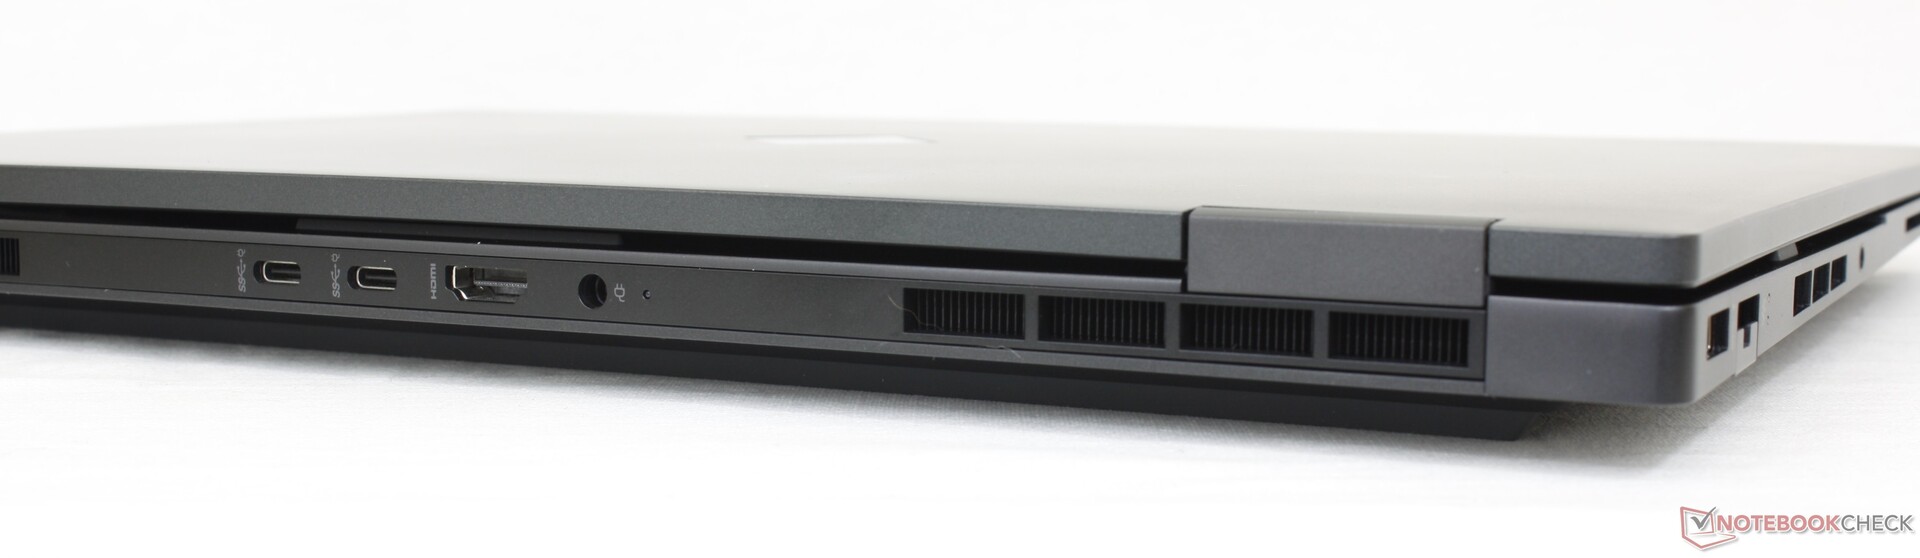
Łączność - Brak obsługi Thunderbolt
W tegorocznym modelu wymieniono mini-DisplayPort na rzecz drugiego portu USB-C w porównaniu z modelem z 2021 roku. Opcje portów są poza tym zasadniczo takie same w obu modelach
Najbardziej zauważalna zmiana w skali roku dotyczy rozmieszczenia portów. Porty w zeszłorocznym modelu były zbyt stłoczone wzdłuż lewej krawędzi, więc część z nich została przeniesiona na tylną krawędź. Choć nie jest to rozwiązanie szczególnie idealne, to i tak jest lepsze niż posiadanie mniejszej ilości portów.
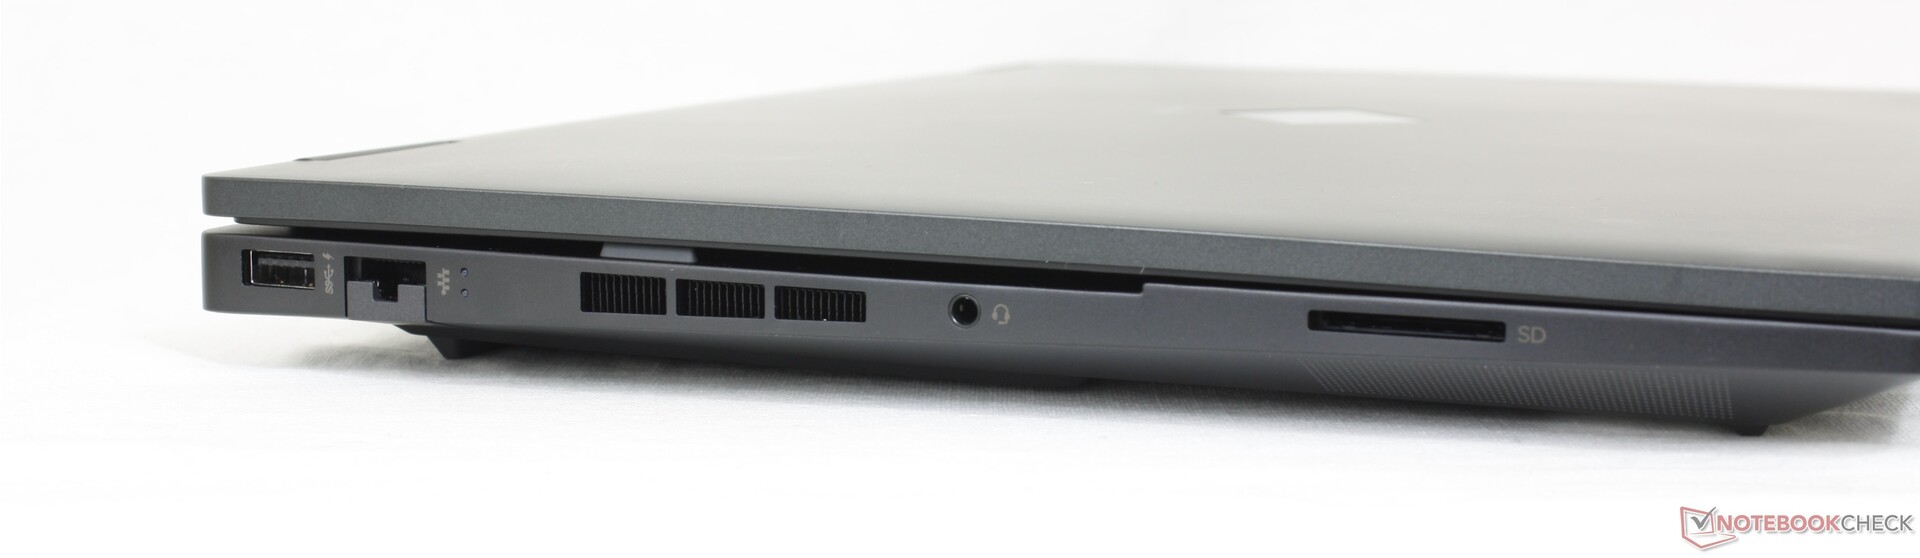
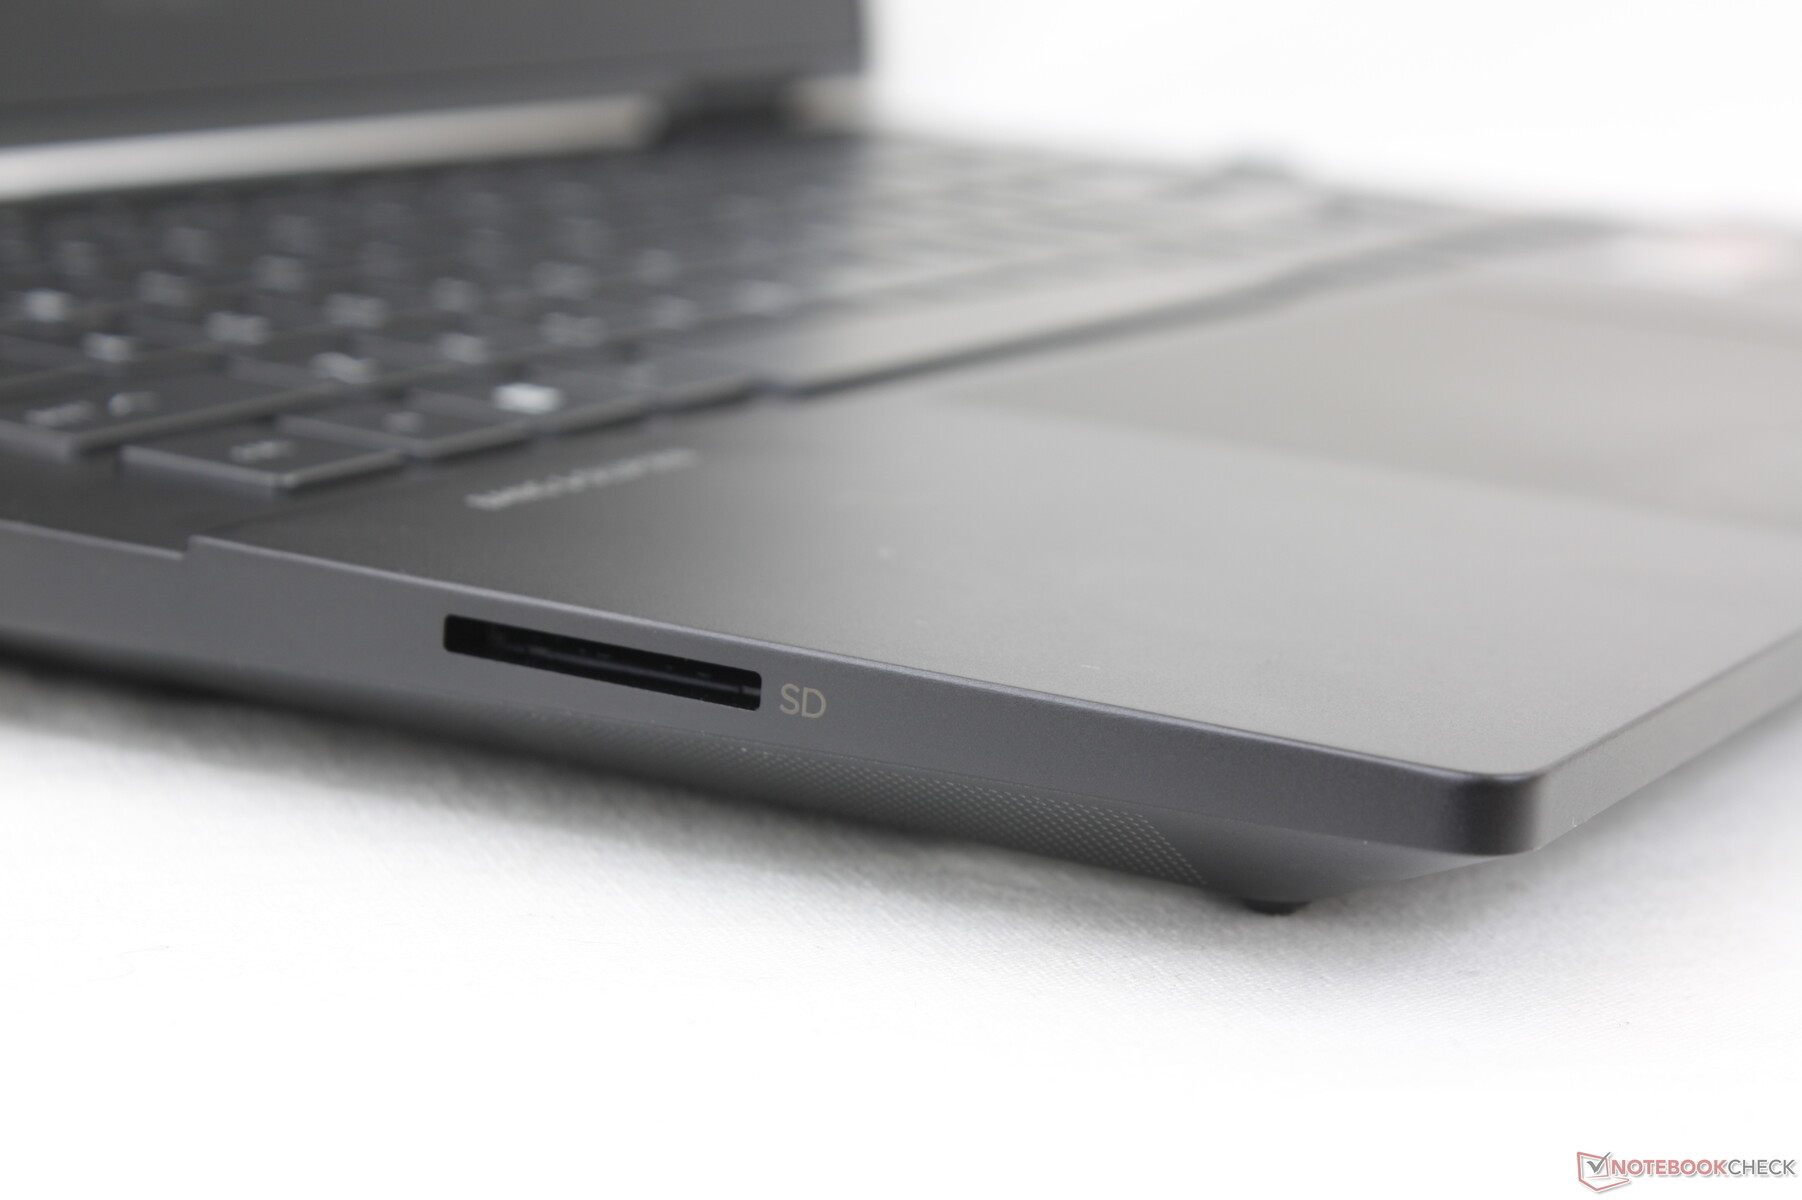
Czytnik kart SD
Szybkość transferu przy użyciu czytnika SD pozostała bez zmian w stosunku do zeszłorocznego modelu. Wiele konkurencyjnych laptopów do gier, jak np. Dell G16, całkowicie pomija czytnik kart. Tymczasem czytnik SD w modelu Razer Blade 15 oferuje 2x większą wydajność.
| SD Card Reader | |
| average JPG Copy Test (av. of 3 runs) | |
| Lenovo Legion S7 16ARHA7 (AV PRO microSD 128 GB V60) | |
| HP Omen 16-n0033dx (AV PRO microSD 128 GB V60) | |
| HP Victus 16-e0145ng (AV PRO microSD 128 GB V60) | |
| HP Envy 16 h0112nr (AV Pro SD microSD 128 GB V60) | |
| HP Omen 16-b1090ng (AV PRO microSD 128 GB V60) | |
| maximum AS SSD Seq Read Test (1GB) | |
| Lenovo Legion S7 16ARHA7 (AV PRO microSD 128 GB V60) | |
| HP Omen 16-n0033dx (AV PRO microSD 128 GB V60) | |
| HP Envy 16 h0112nr (AV Pro SD microSD 128 GB V60) | |
Komunikacja
MediaTek MT7922 zapewnia standardowo łączność Wi-Fi 6E i Bluetooth 5.2. Większość innych laptopów do gier posiada zamiast tego serię Intel AX201/210, ale rozwiązanie MediaTek jest prawdopodobnie bardziej przystępną opcją. Szybkość transferu jest doskonała i nie ma żadnych problemów z wydajnością, gdy jest podłączona do naszej sieci 6 GHz.
| Networking | |
| iperf3 receive AXE11000 6GHz | |
| Lenovo Legion S7 16ARHA7 | |
| HP Omen 16-n0033dx | |
| HP Envy 16 h0112nr | |
| iperf3 receive AXE11000 | |
| HP Omen 16-n0033dx | |
| Dell G16 7620 | |
| HP Omen 16-b1090ng | |
| HP Victus 16-e0145ng | |
| iperf3 transmit AXE11000 | |
| HP Omen 16-n0033dx | |
| HP Omen 16-b1090ng | |
| Dell G16 7620 | |
| HP Victus 16-e0145ng | |
| iperf3 transmit AXE11000 6GHz | |
| Lenovo Legion S7 16ARHA7 | |
| HP Omen 16-n0033dx | |
| HP Envy 16 h0112nr | |
Kamera internetowa
Kamera internetowa jest rozczarowująca - ma tylko 720p lub 1 MP, podczas gdy inne laptopy do gier, takie jak Razer Blade 15, mają kamery 1080p lub 2 MP. Ponadto w modelu tym brakuje zarówno migawki kamery internetowej, jak i czujnika podczerwieni.


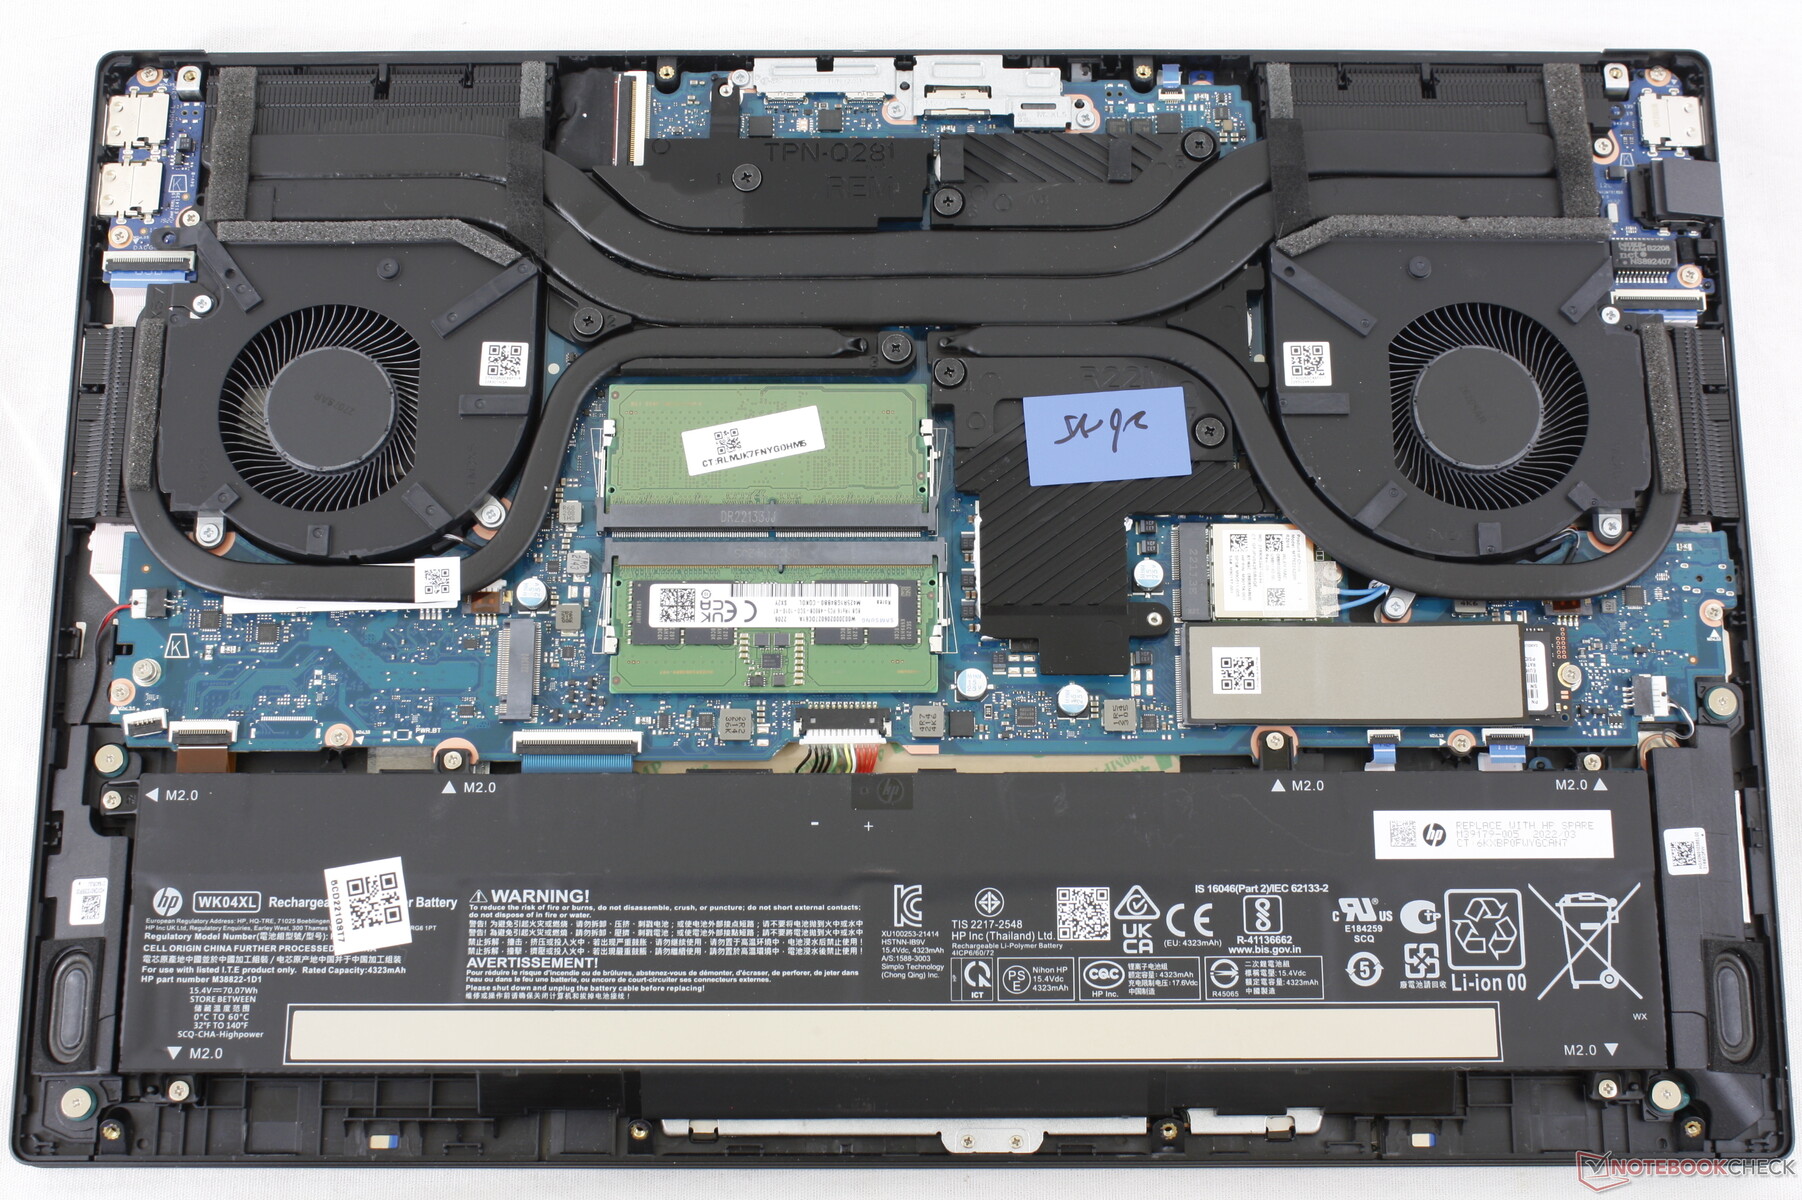
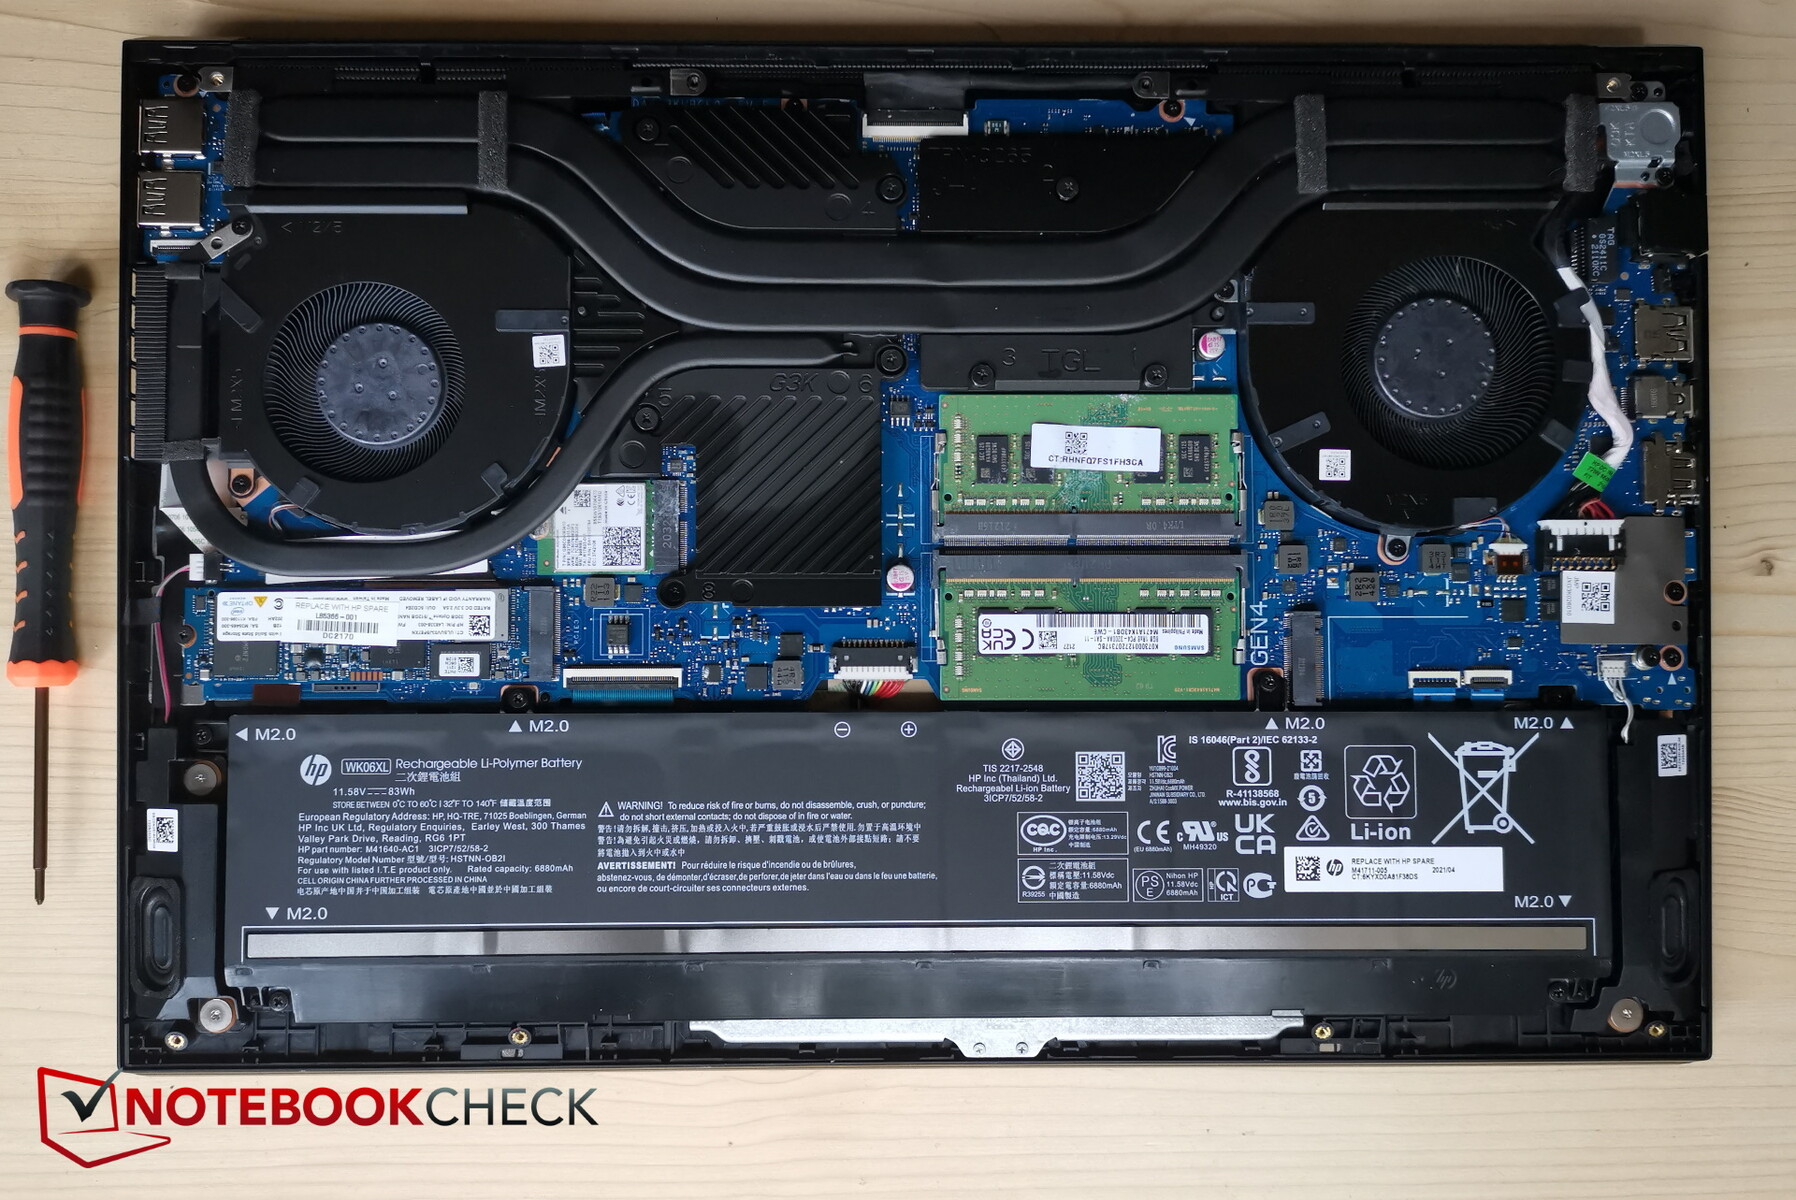
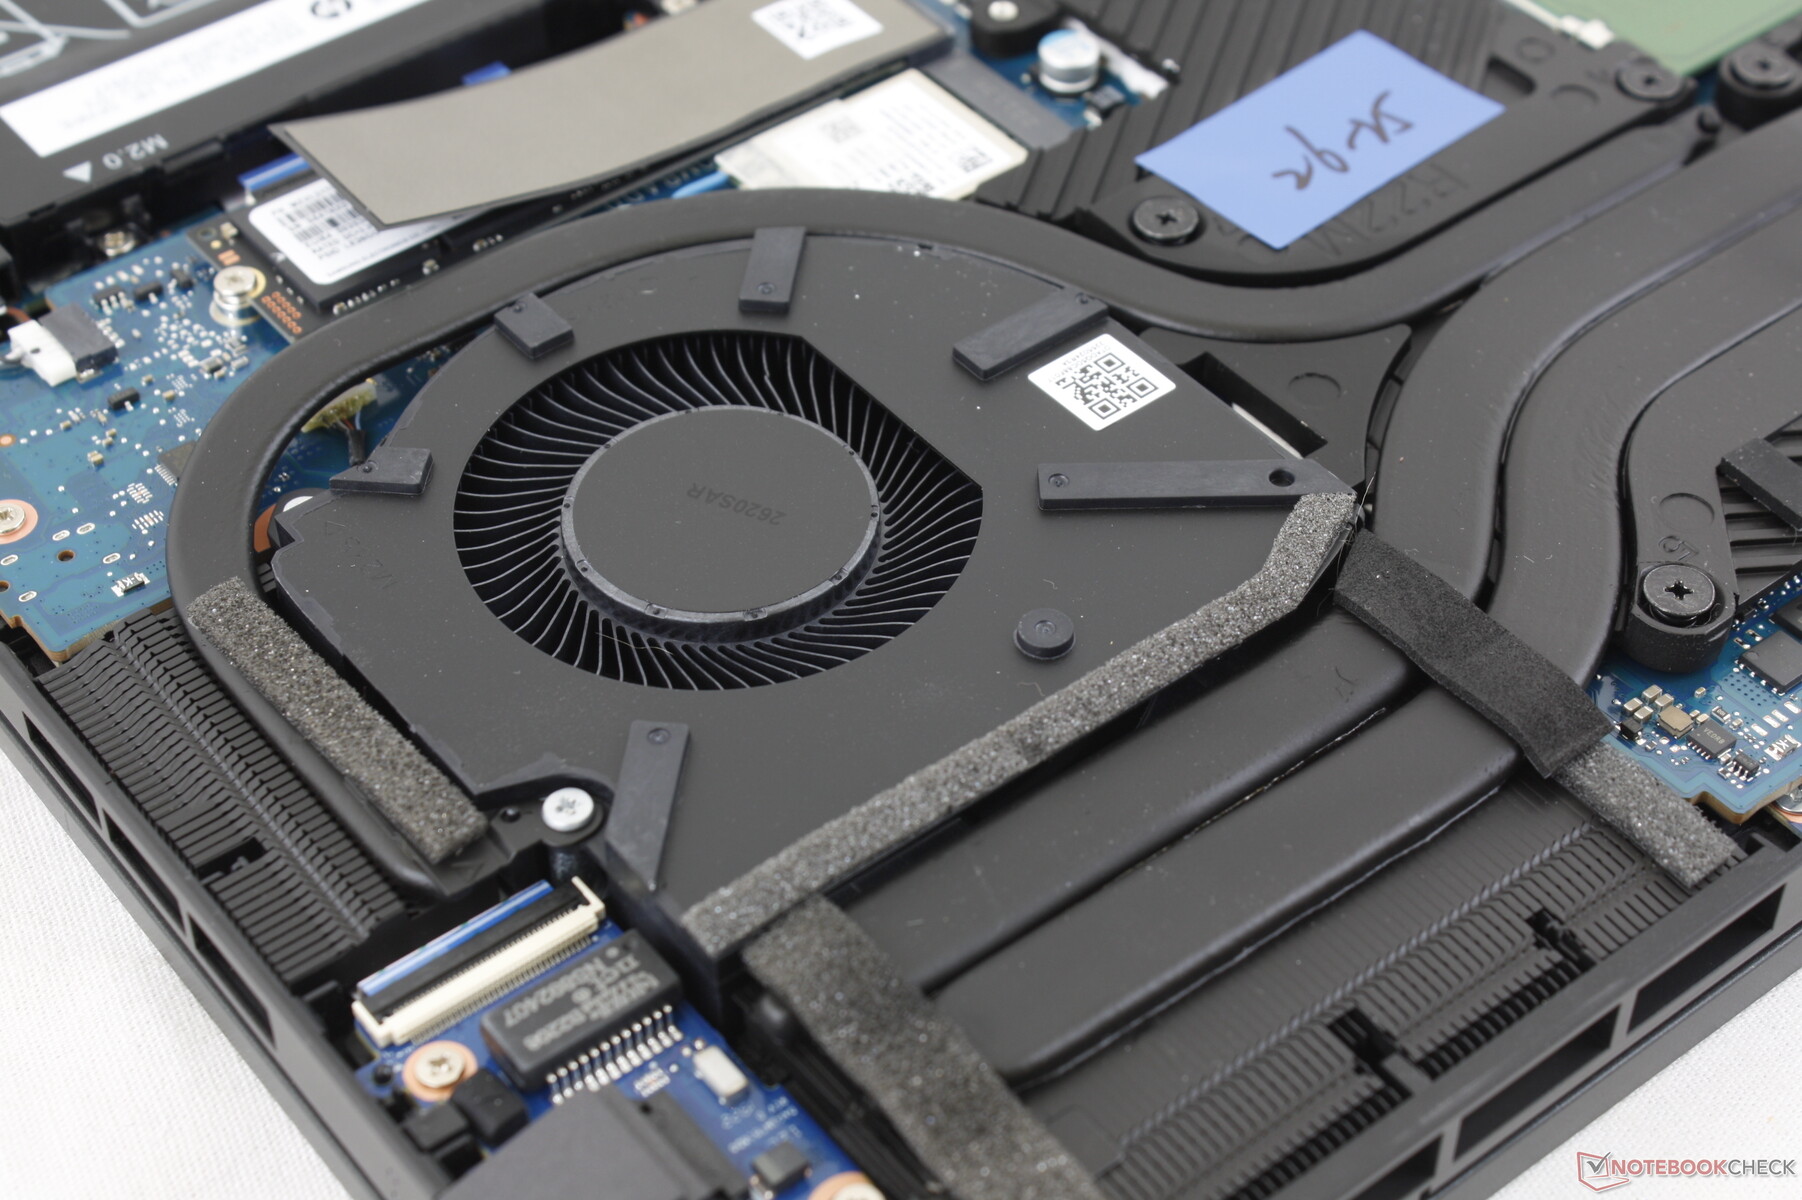
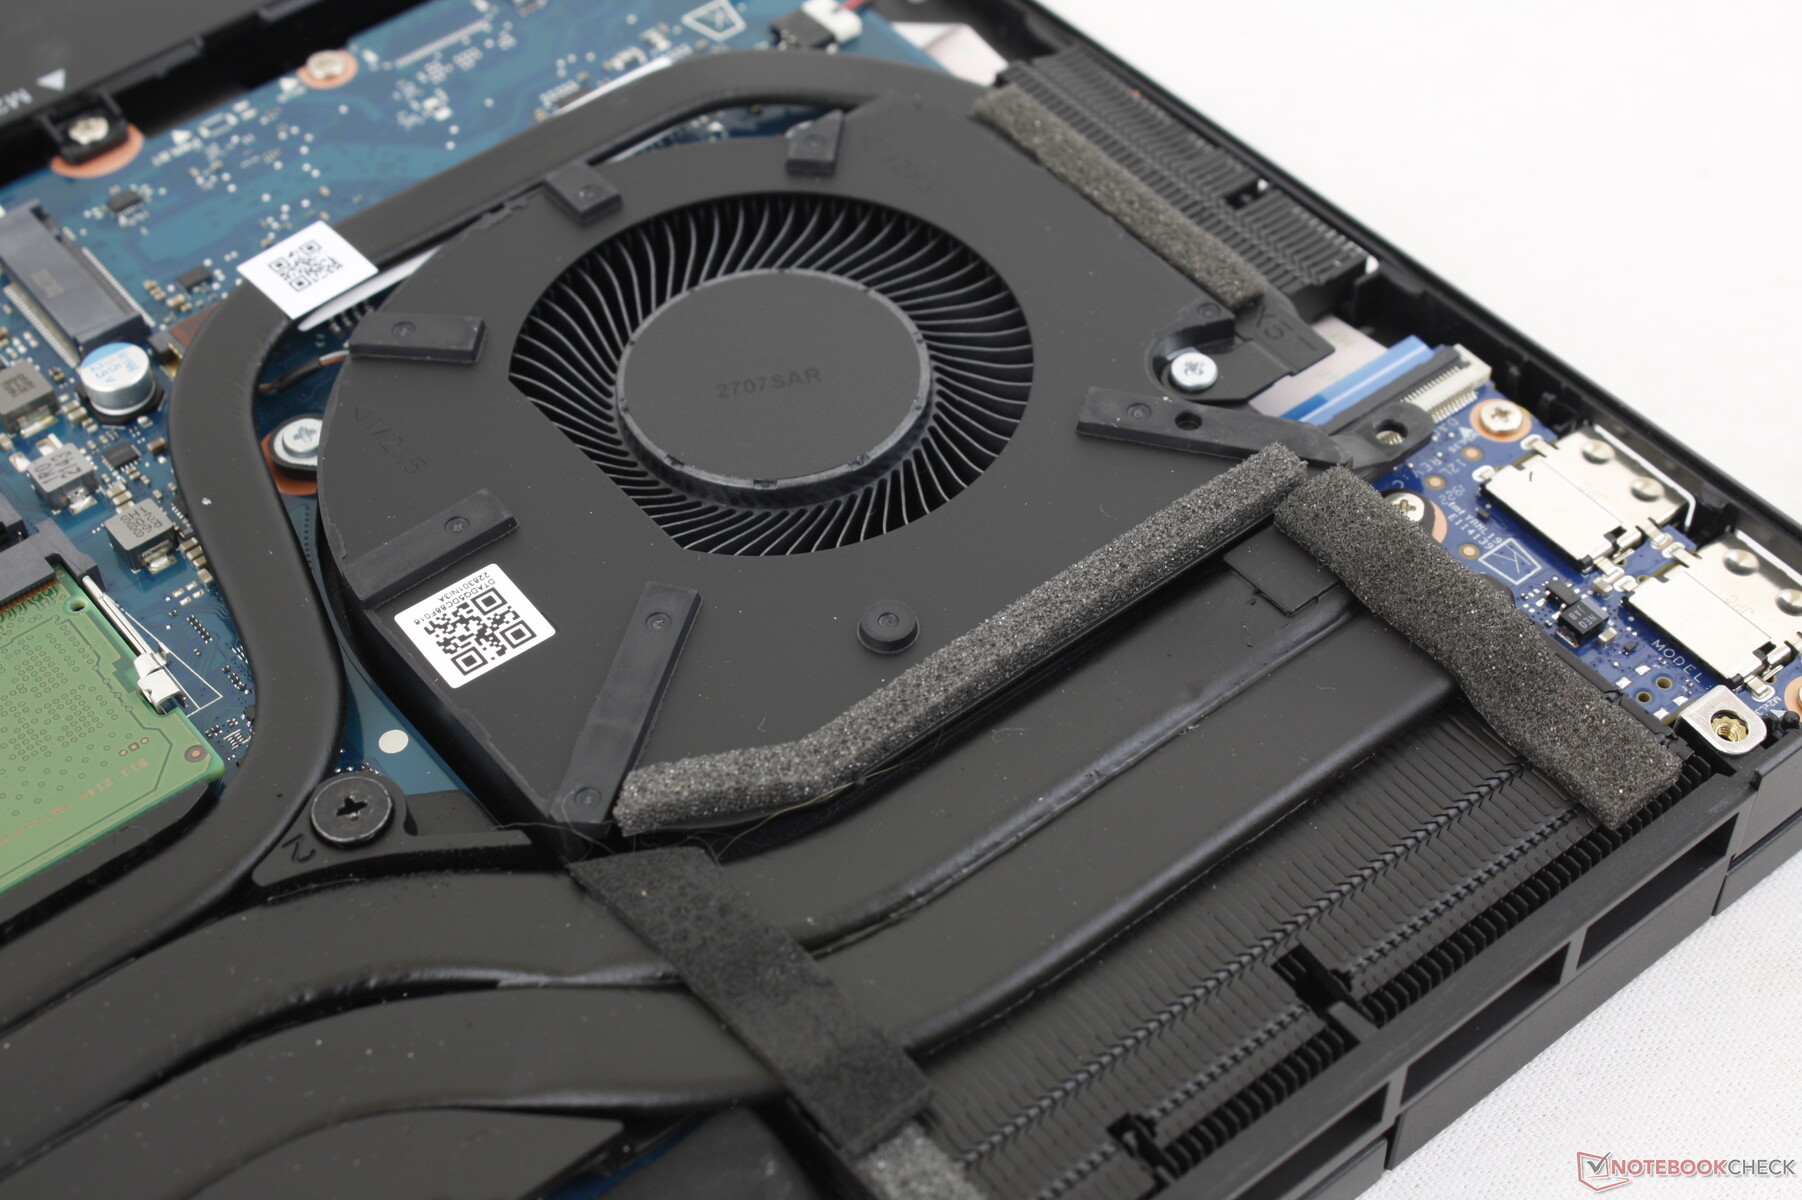
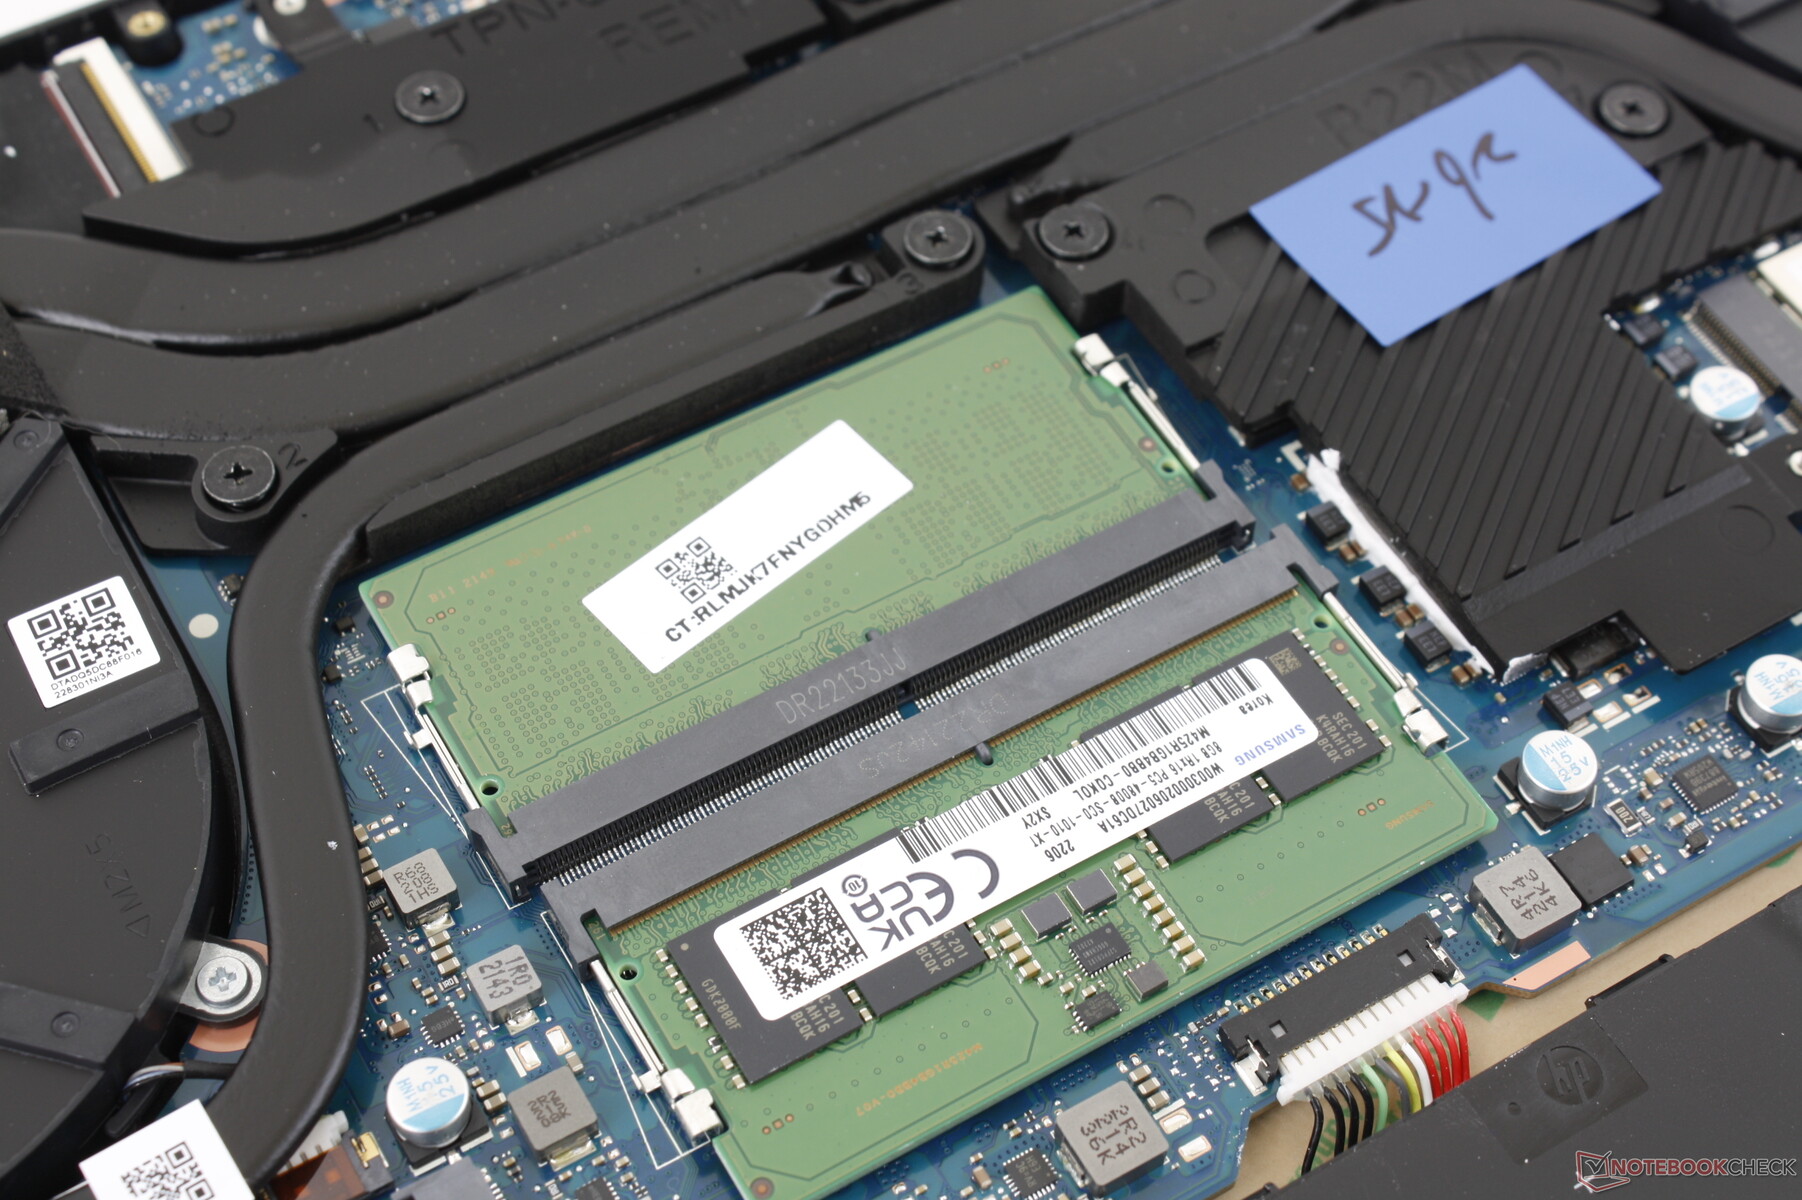
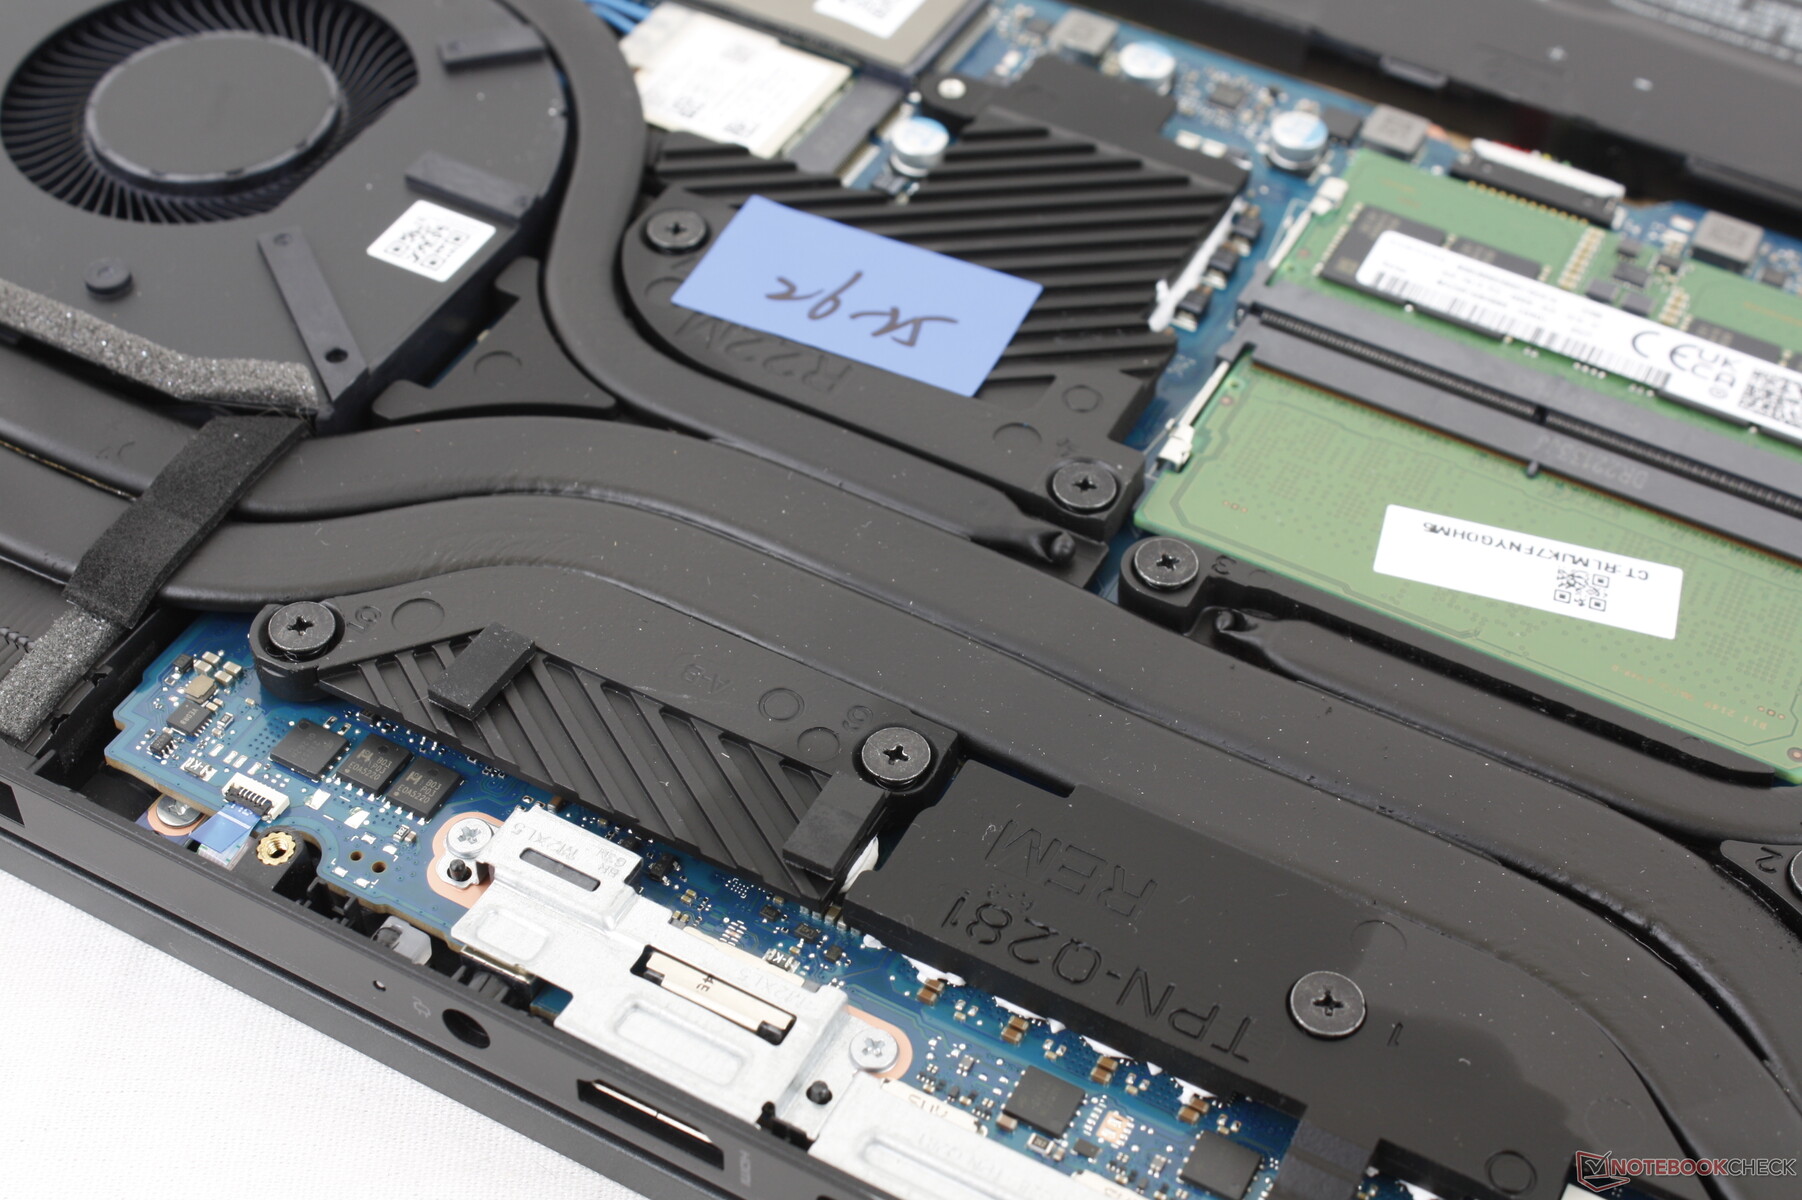
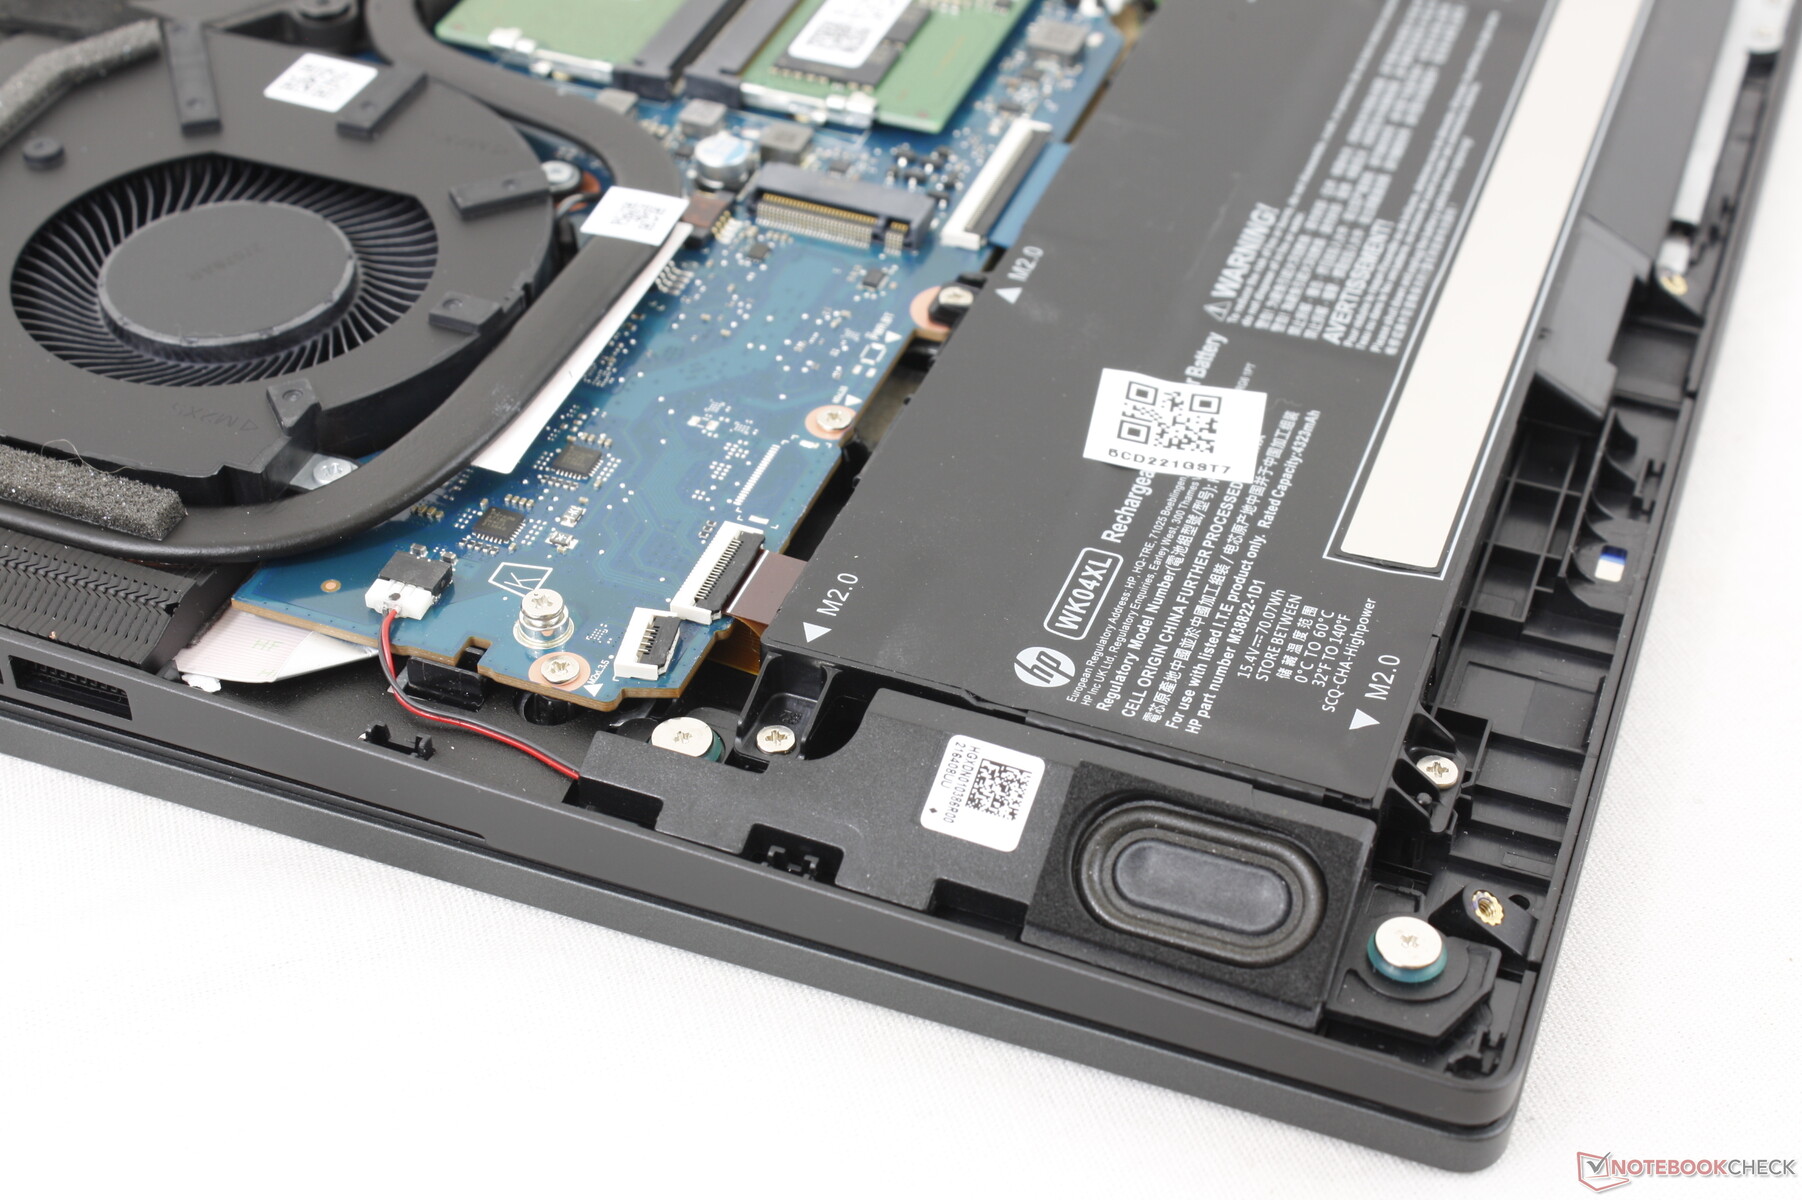
Konserwacja
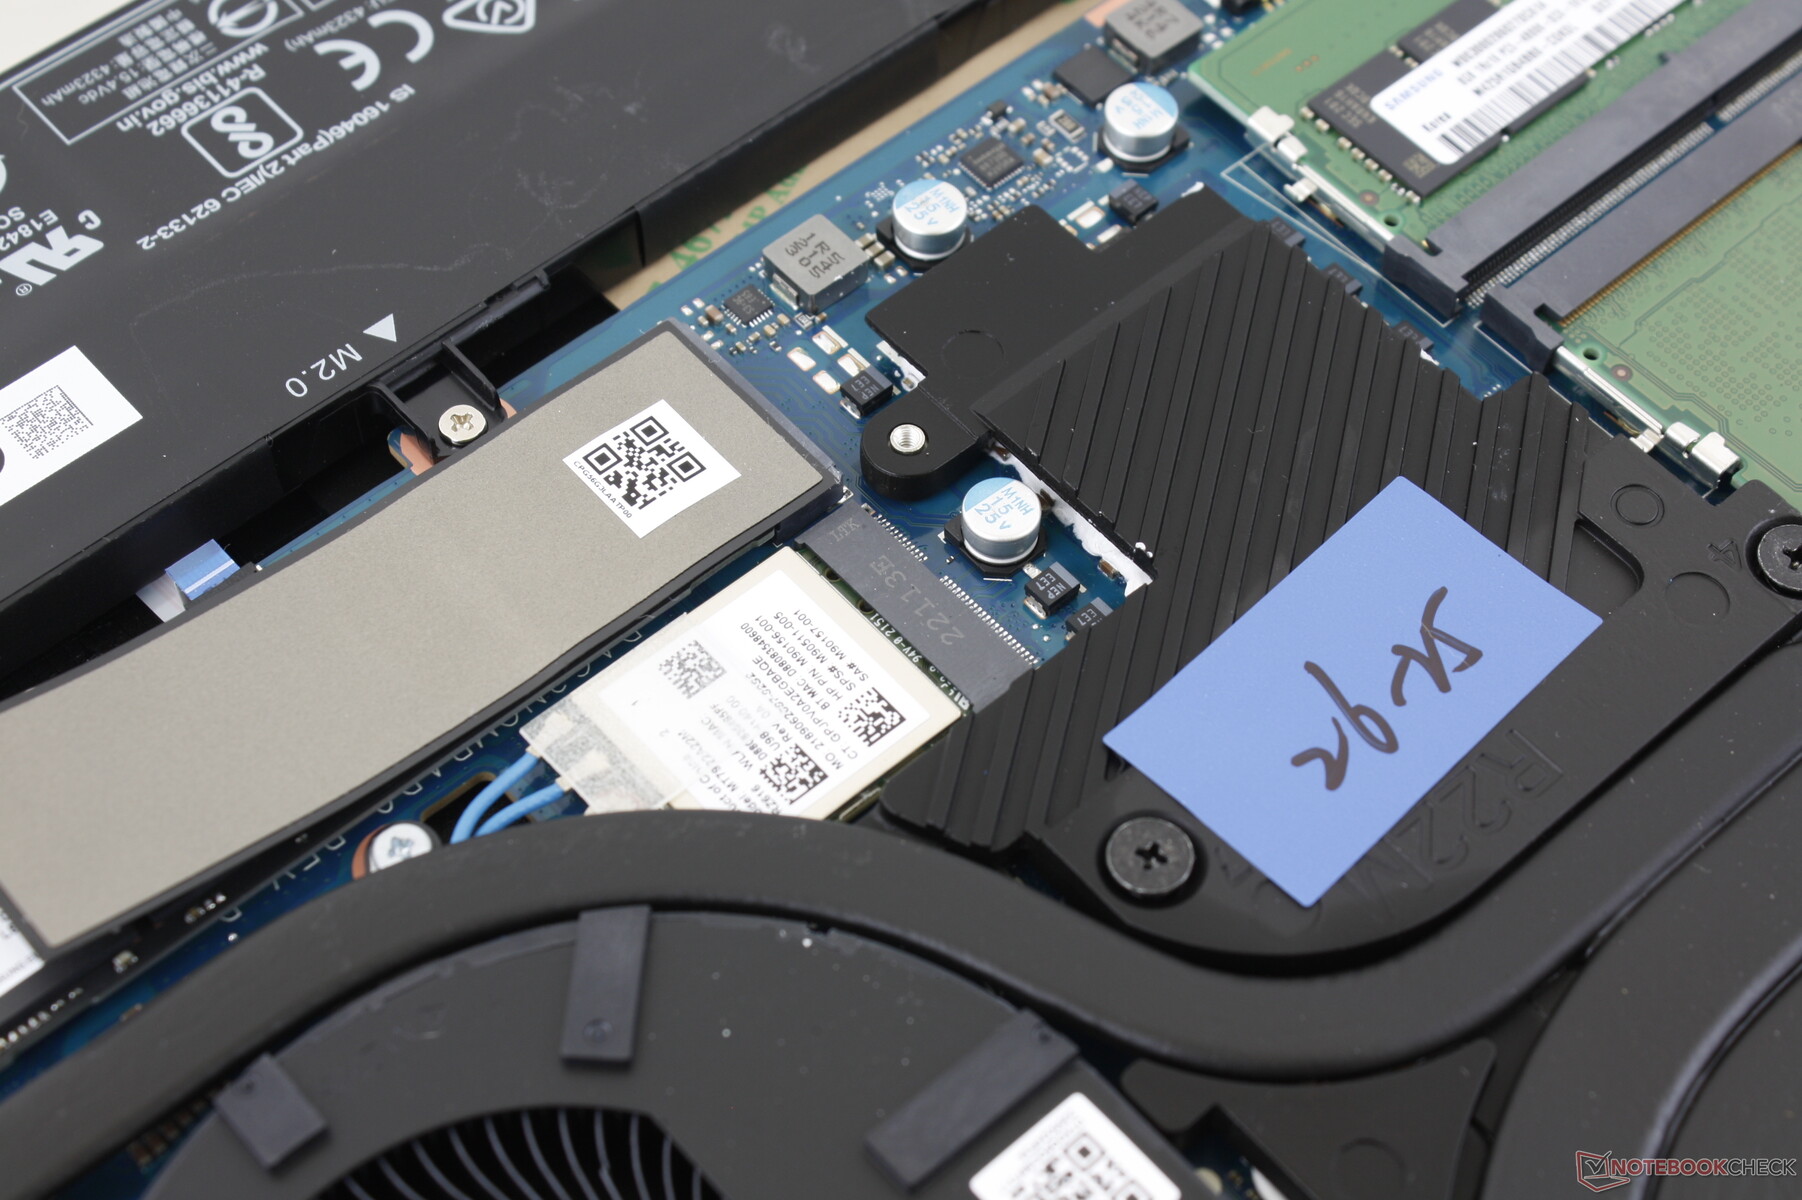
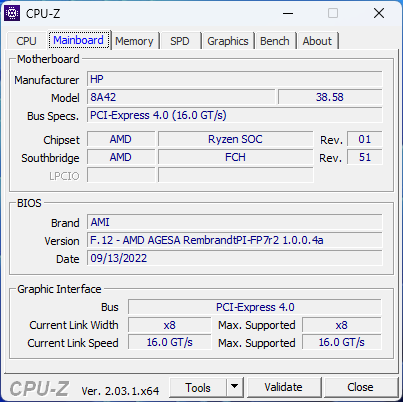
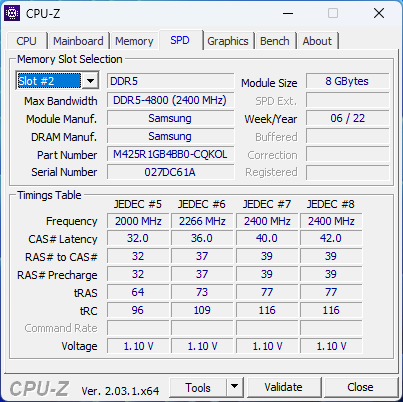
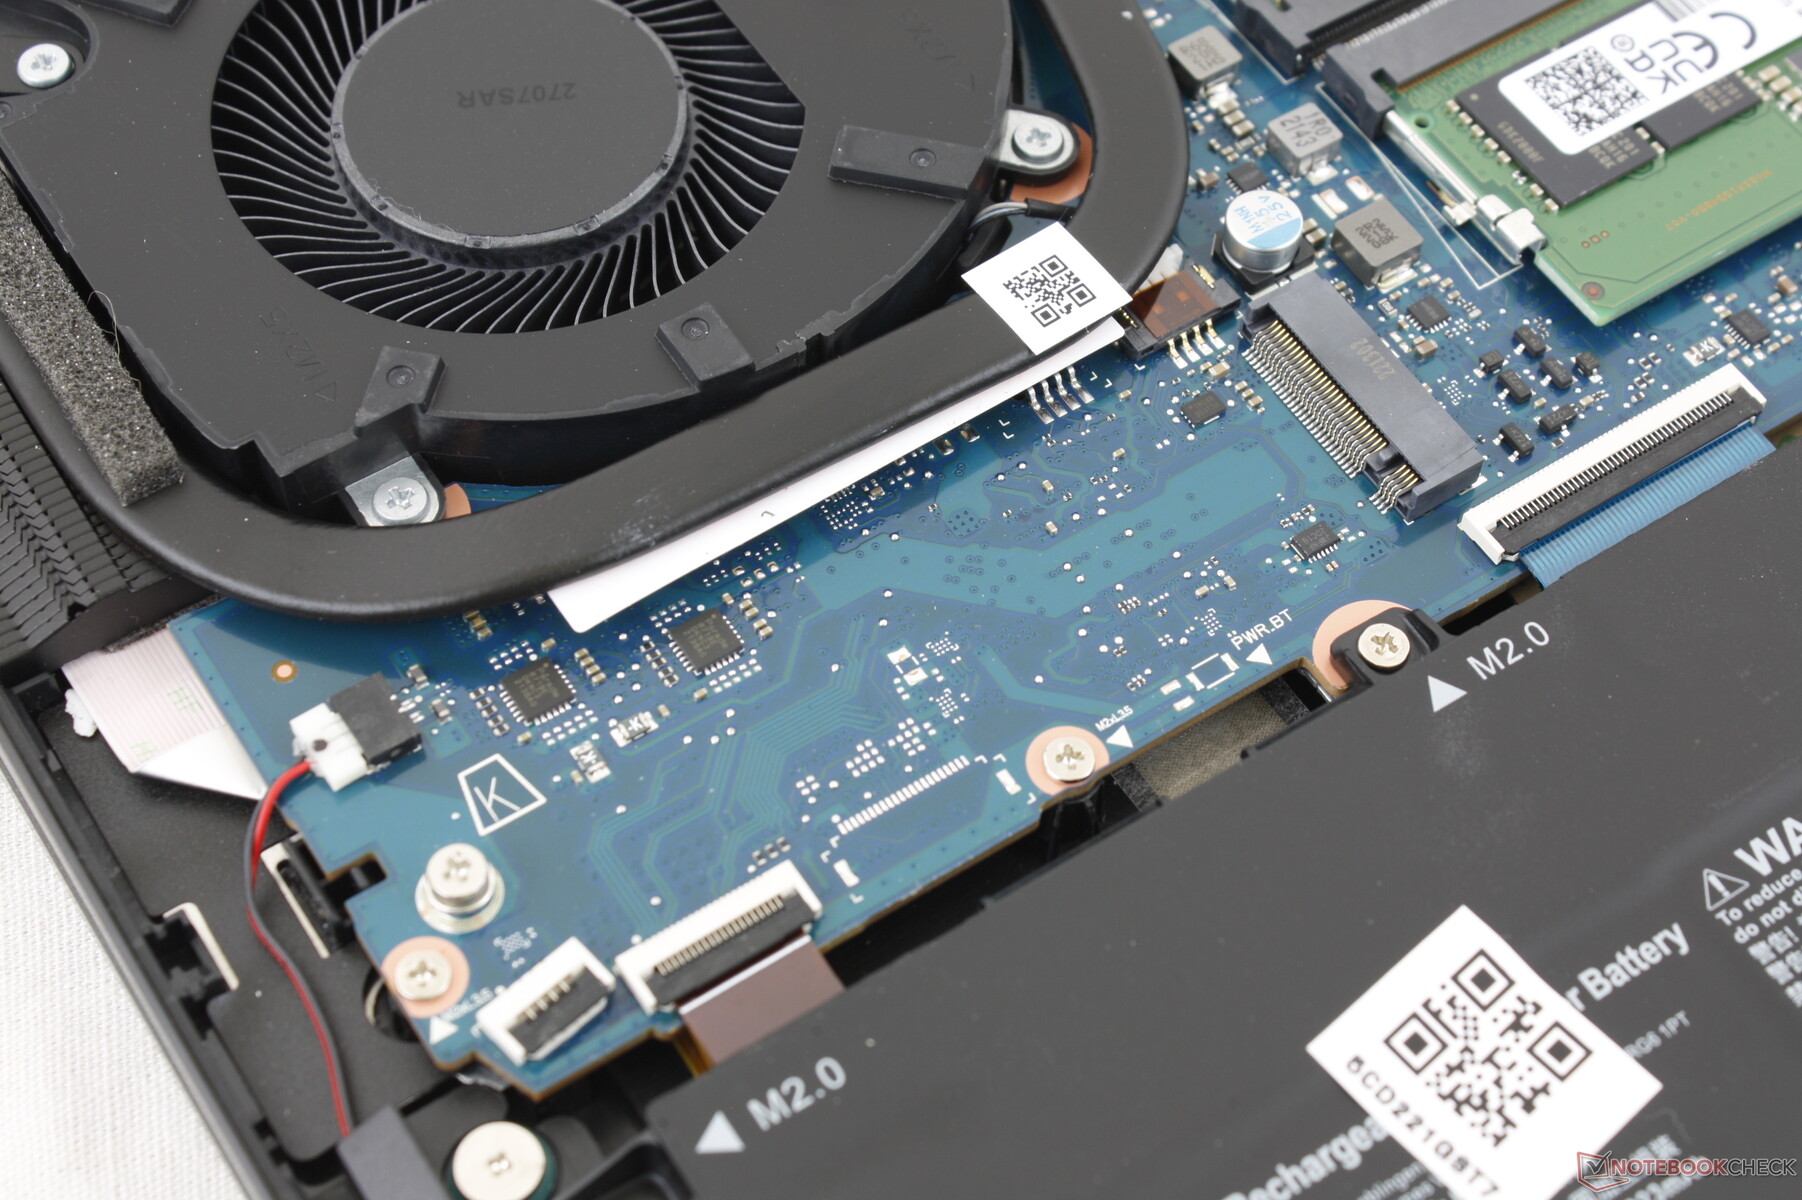
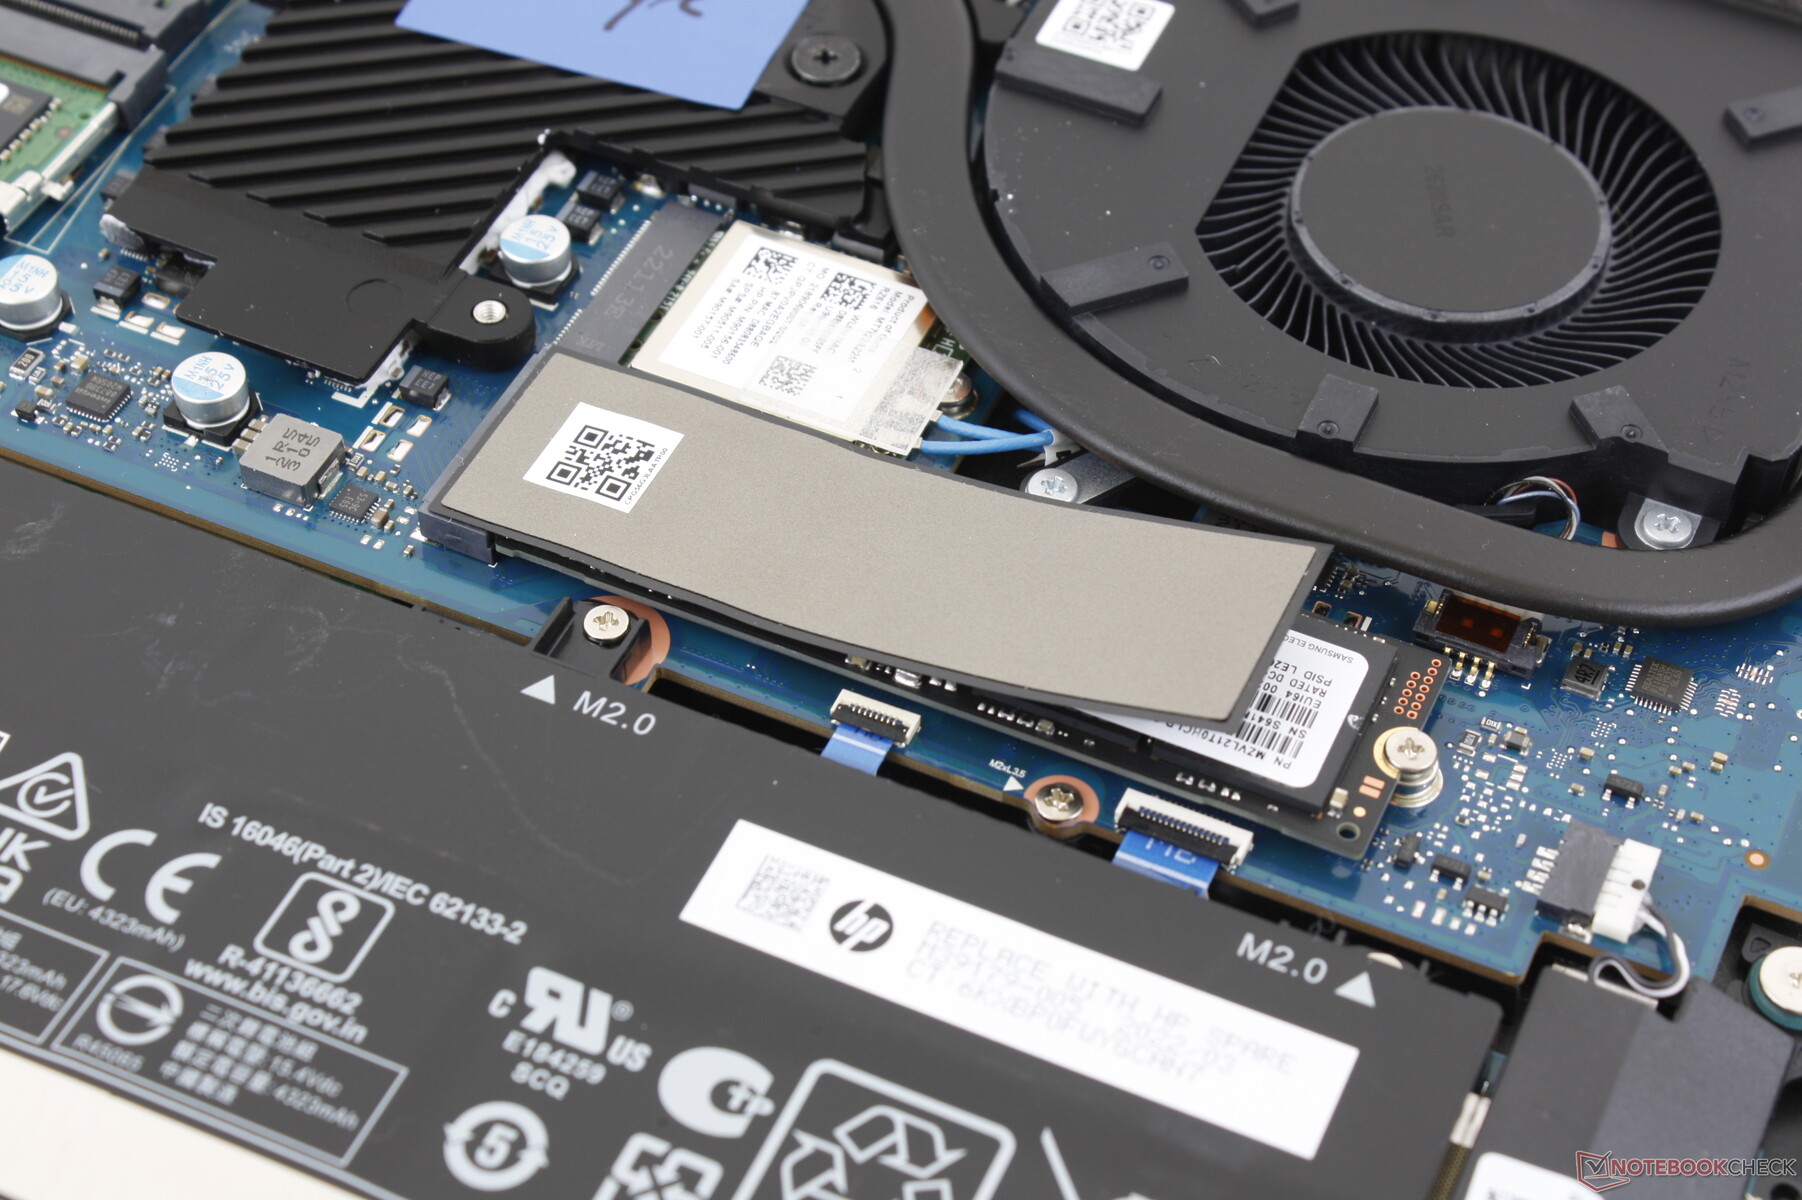
Dolny panel jest zabezpieczony ośmioma śrubkami Philipsa, co ułatwia serwisowanie. Użytkownicy mają bezpośredni dostęp do 2x zatok pamięci masowej M.2, 2x gniazd DDR5 SODIMM, wymiennego modułu WLAN oraz głównej baterii.
Akcesoria i gwarancja
W pudełku nie ma żadnych dodatków poza zasilaczem sieciowym i dokumentacją. Obowiązuje zwykła roczna ograniczona gwarancja.
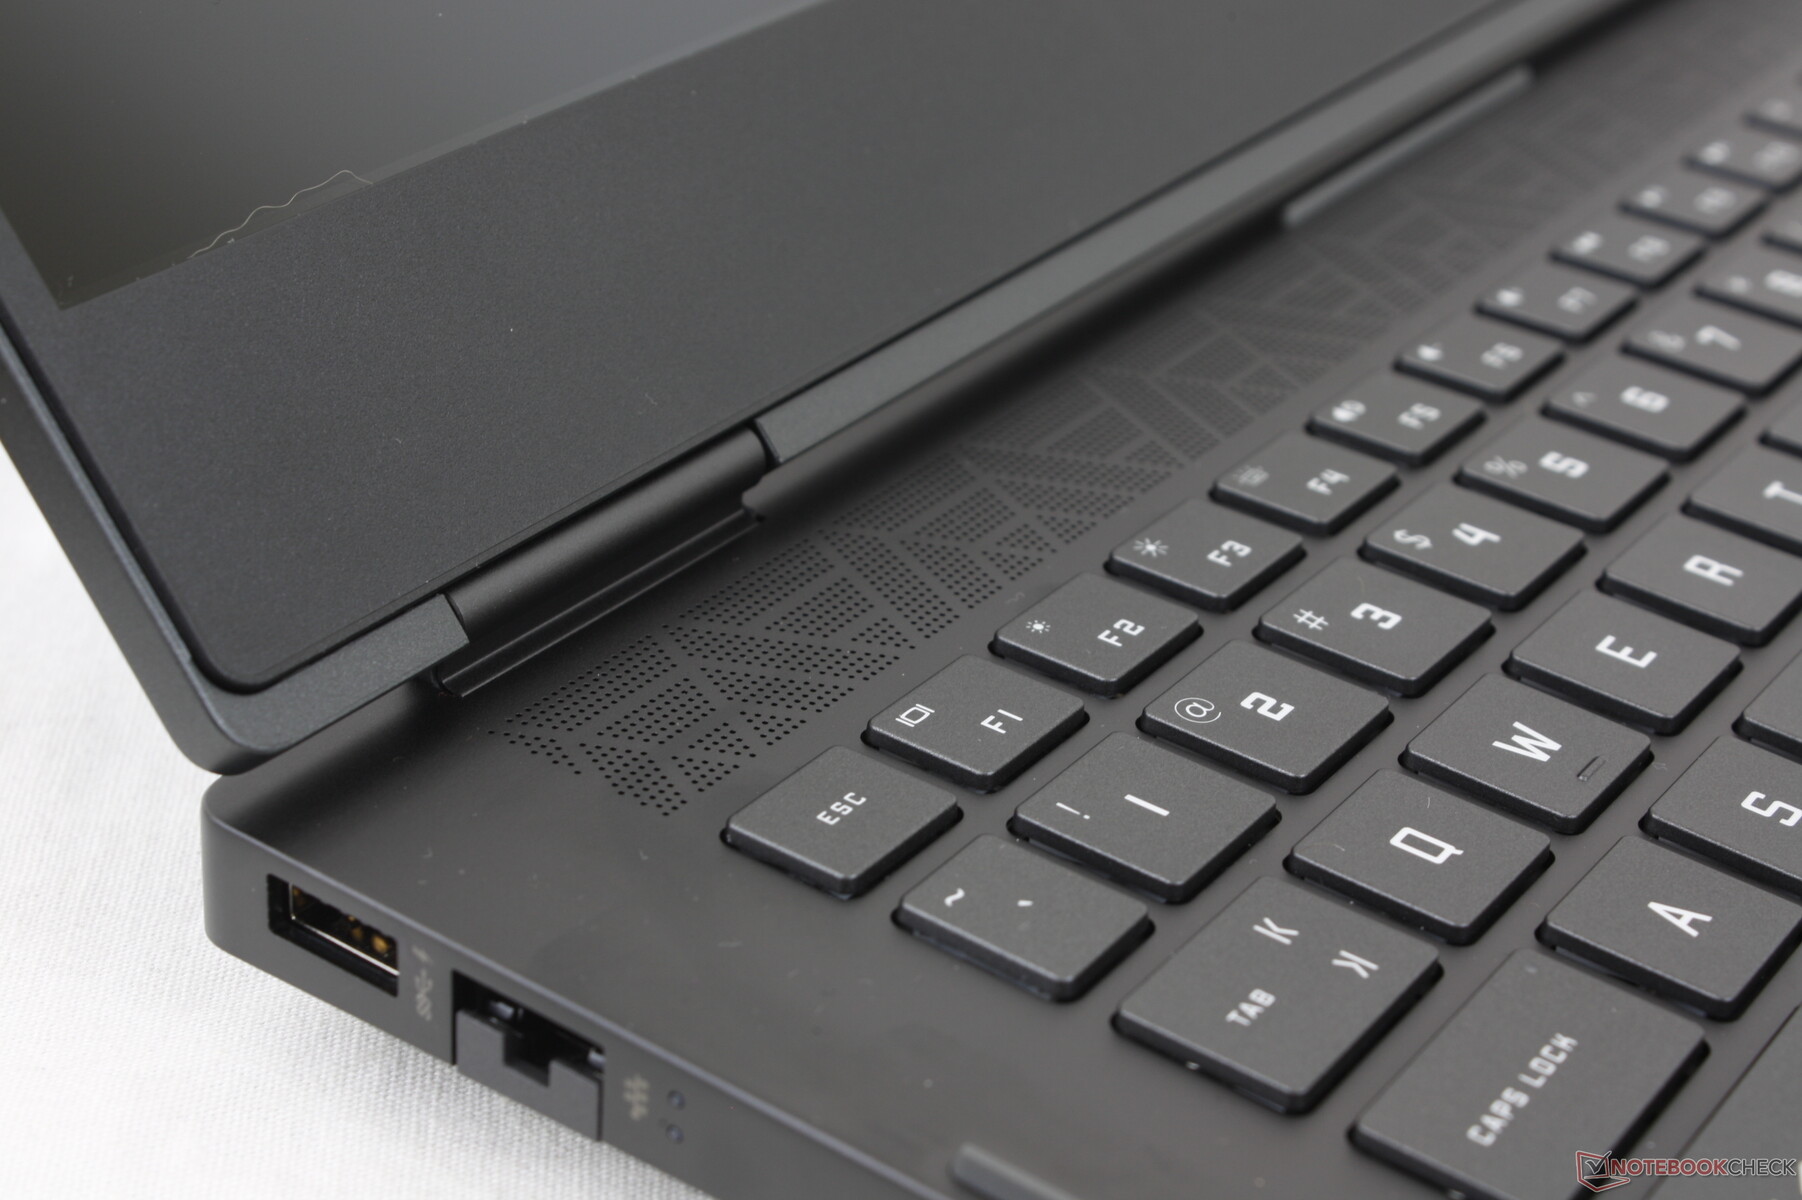
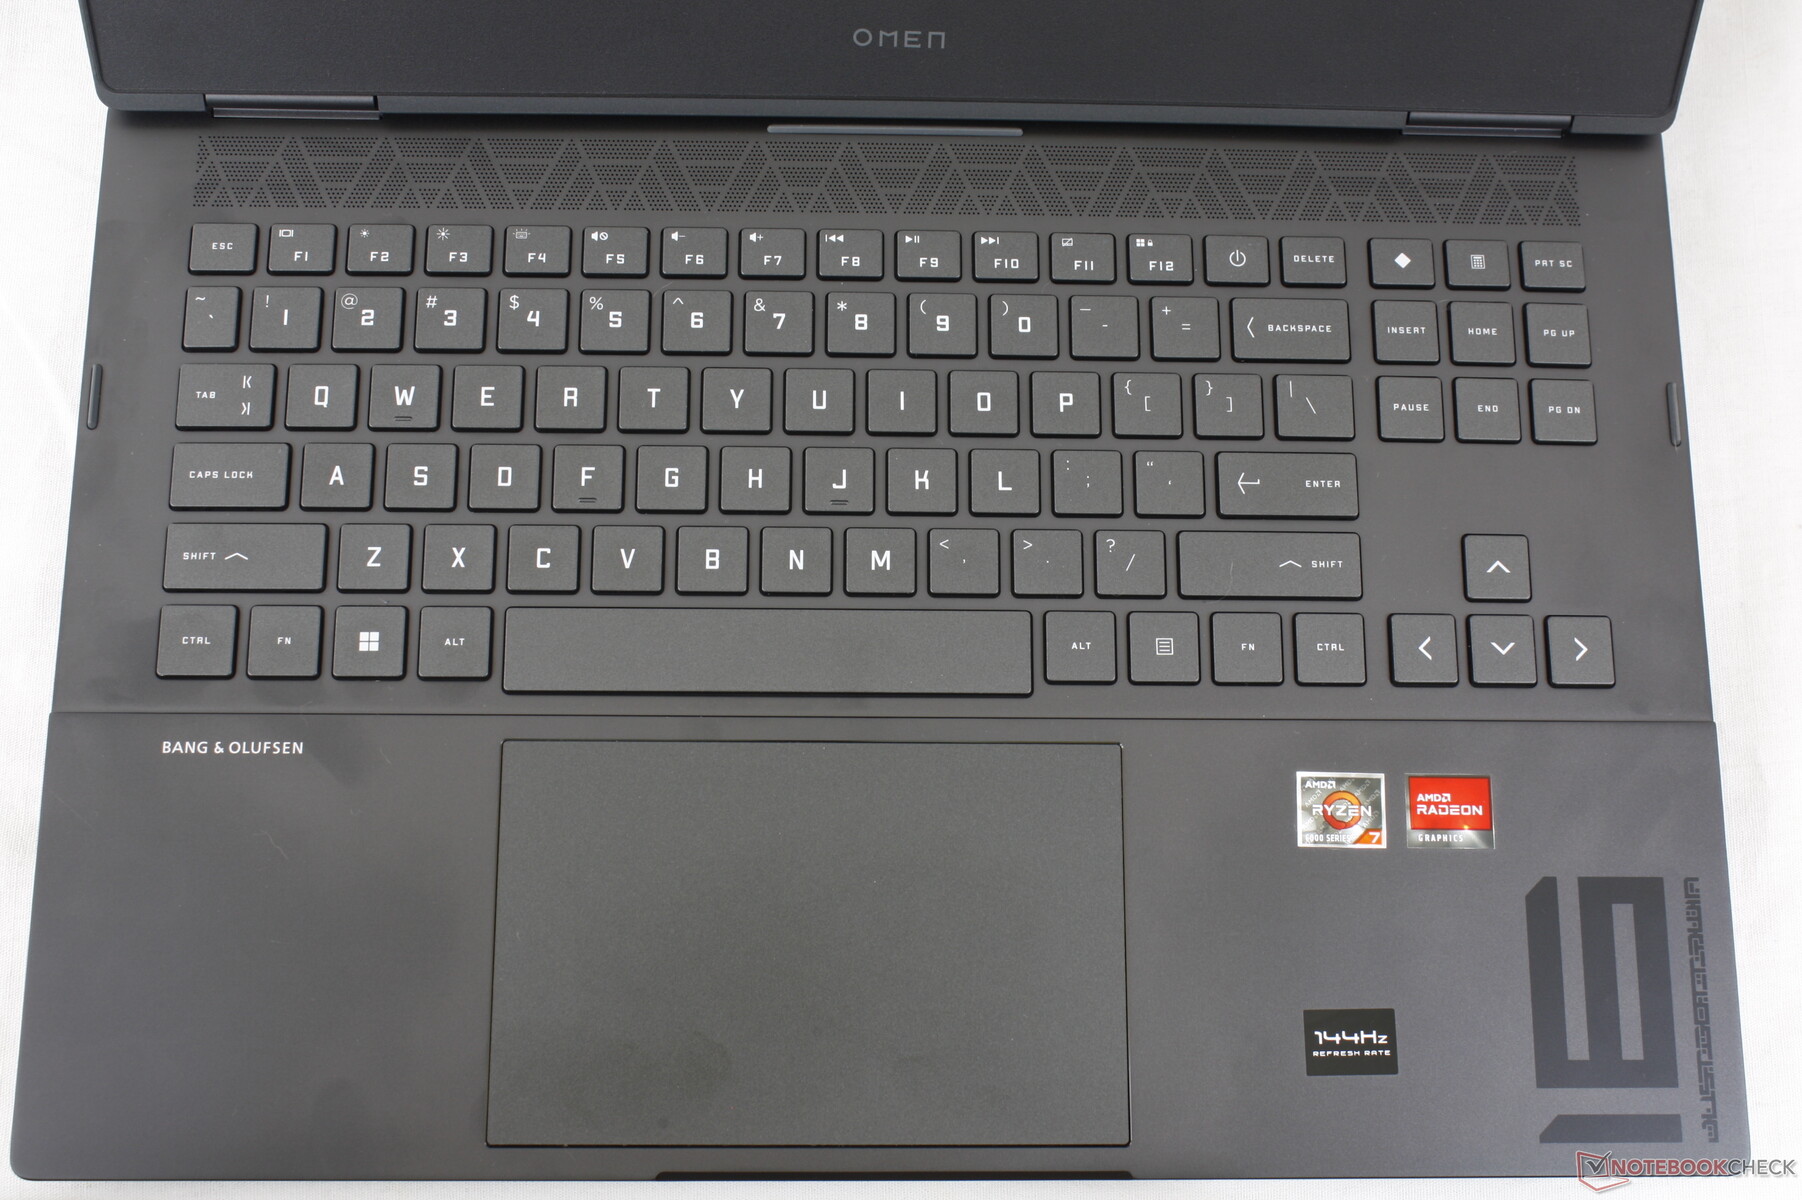
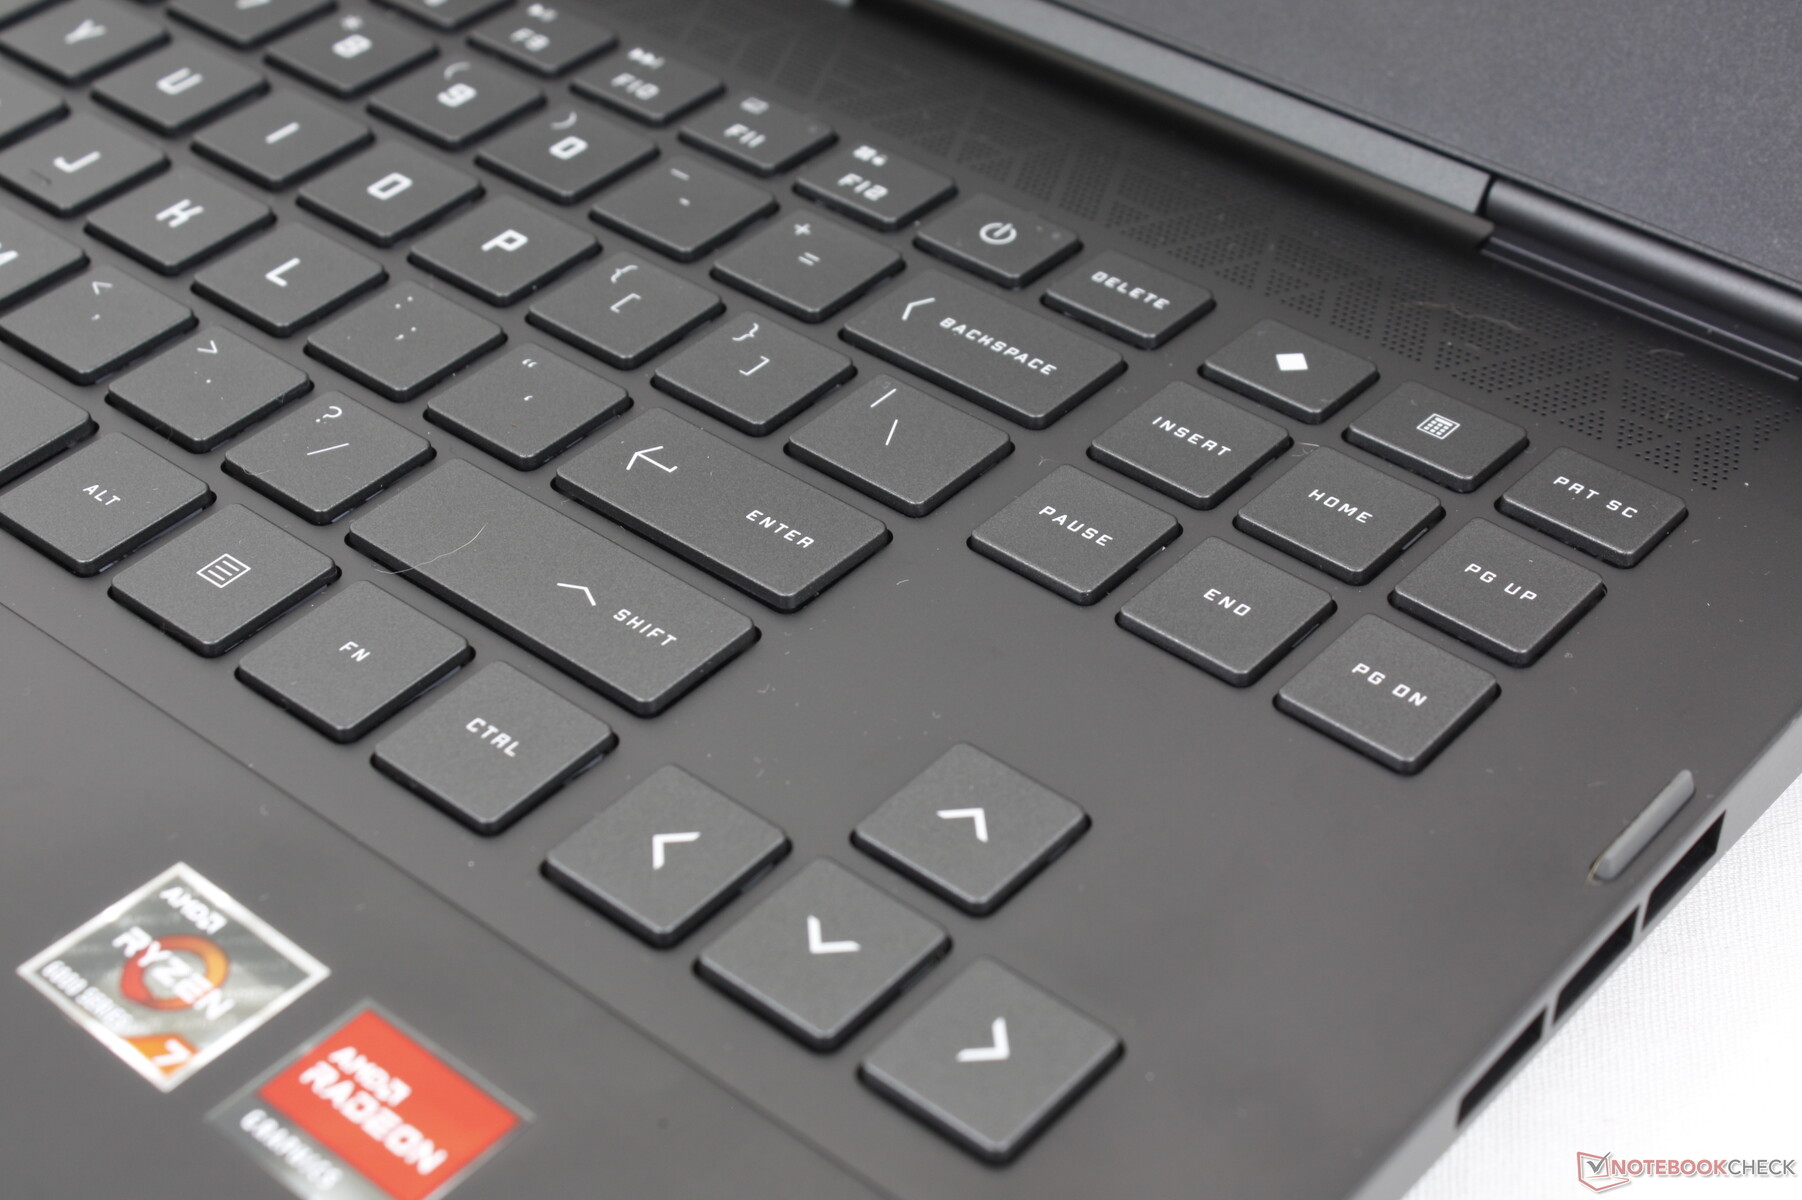
Urządzenia wejściowe - wygodna klawiatura, niewygodny clickpad
Klawiatura
Wrażenia z pisania są identyczne jak w przypadku zeszłorocznego modelu Omen 16, gdyż nie wprowadzono żadnych zmian w klawiaturze. Skok klawiszy jest płytki i podobny do tego z Ultrabooków, ale twarde sprzężenie zwrotne i bardzo duży klawisz Spacji to rekompensują. Chcielibyśmy, aby przycisk Power został przeniesiony w inne miejsce w przyszłych wersjach, ponieważ jego obecne położenie obok klawiszy Backspace i Del sprawia, że łatwo go przypadkowo nacisnąć.
Podświetlenie klawiatury jest podzielone na cztery różne strefy, a nie na klawisze RGB, co jest rozczarowujące, biorąc pod uwagę wysoką cenę i poziom wydajności Omen 16.
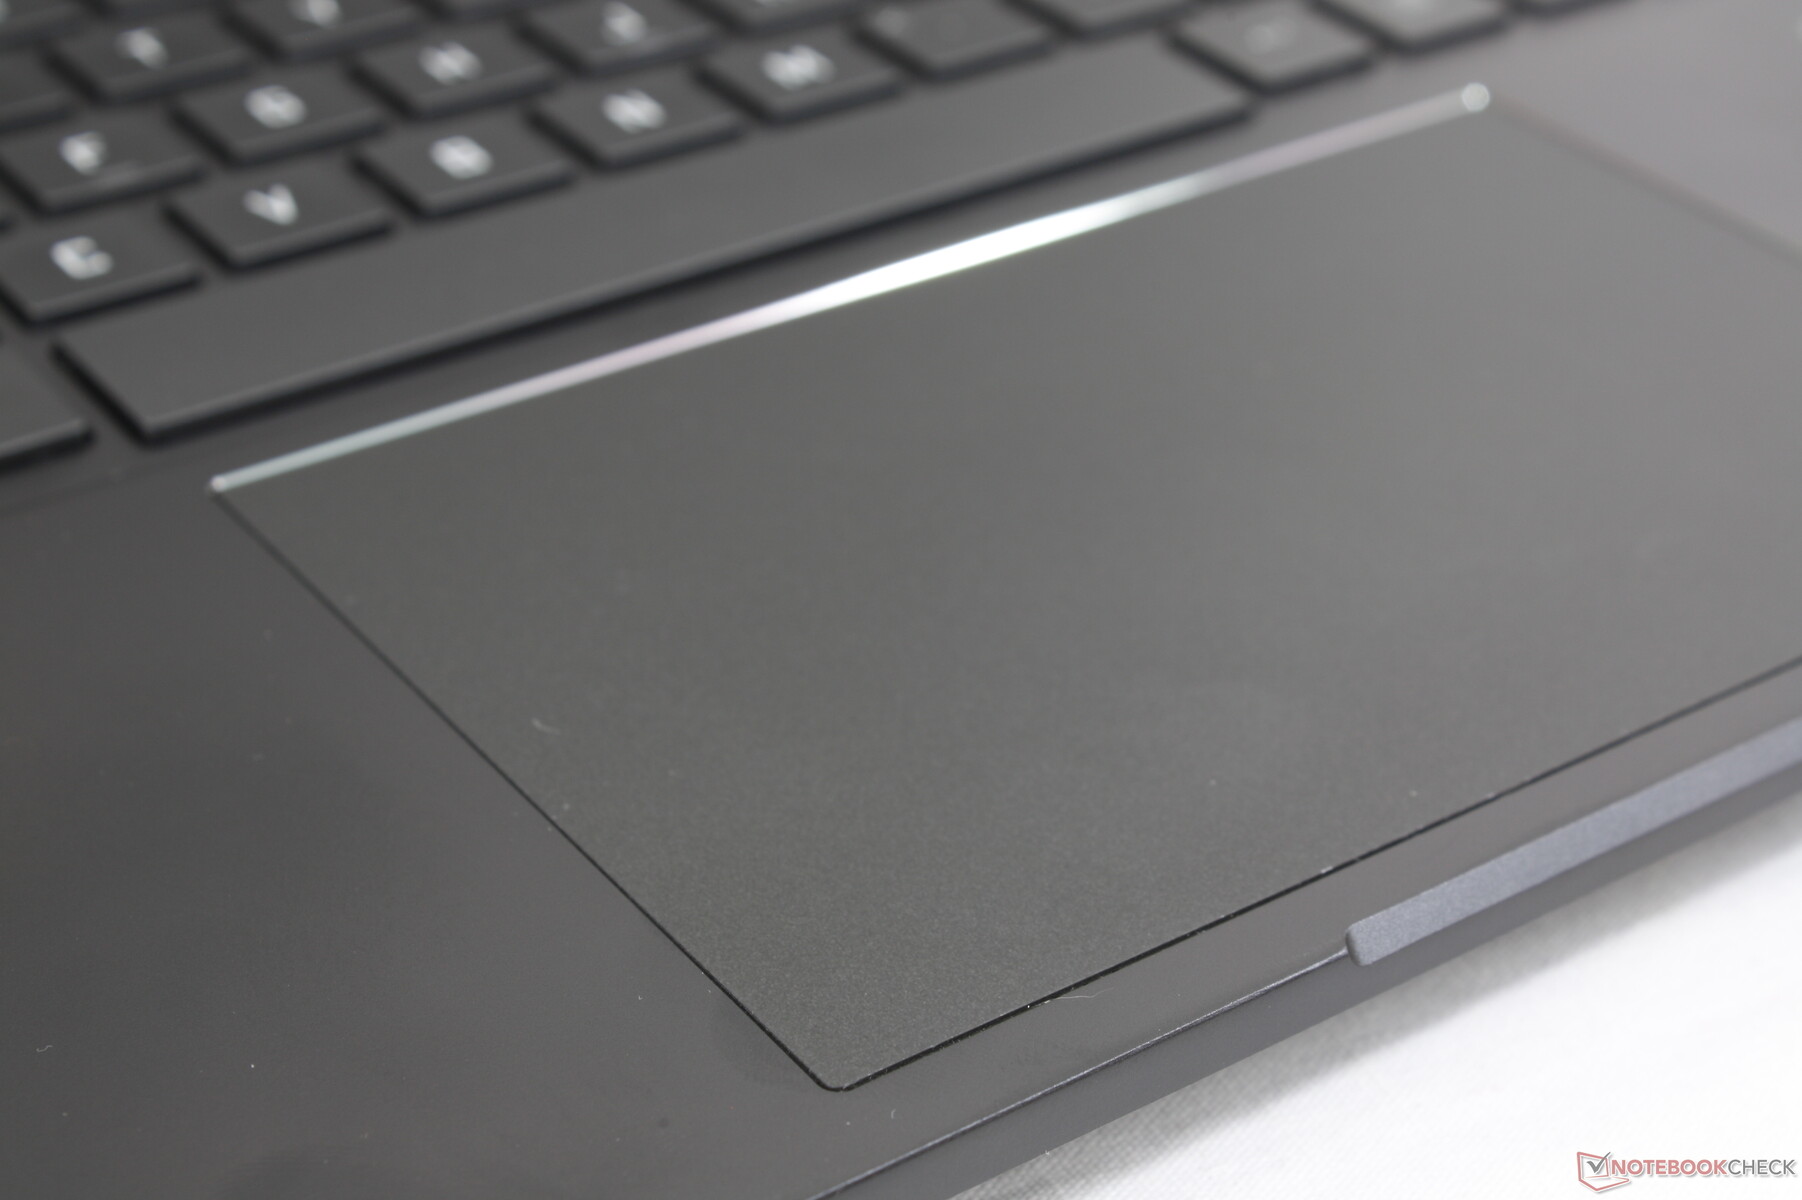
Touchpad
Płytka dotykowa jest dużo większa, niż w Dellu G16 (13 x 8,6 cm vs. 10,5 x 6 cm), co ułatwia wprowadzanie wielodotyku. Ślad po nim jest gładki i minimalnie lepki, podobnie jak po zewnętrznej stronie pokrywy czy w okolicach podpórek pod dłonie
Niestety, główną wadą gładzika jest jego nadmierna wrażliwość na nacisk. Na przykład podczas przewijania palcem zbyt łatwo jest przypadkowo wprowadzić kliknięcie, co sprawia, że cały laptop jest bardzo irytujący w użyciu bez zewnętrznej myszy. W porównaniu z tym clickpady w innych laptopach do gier są znacznie mniej czułe.

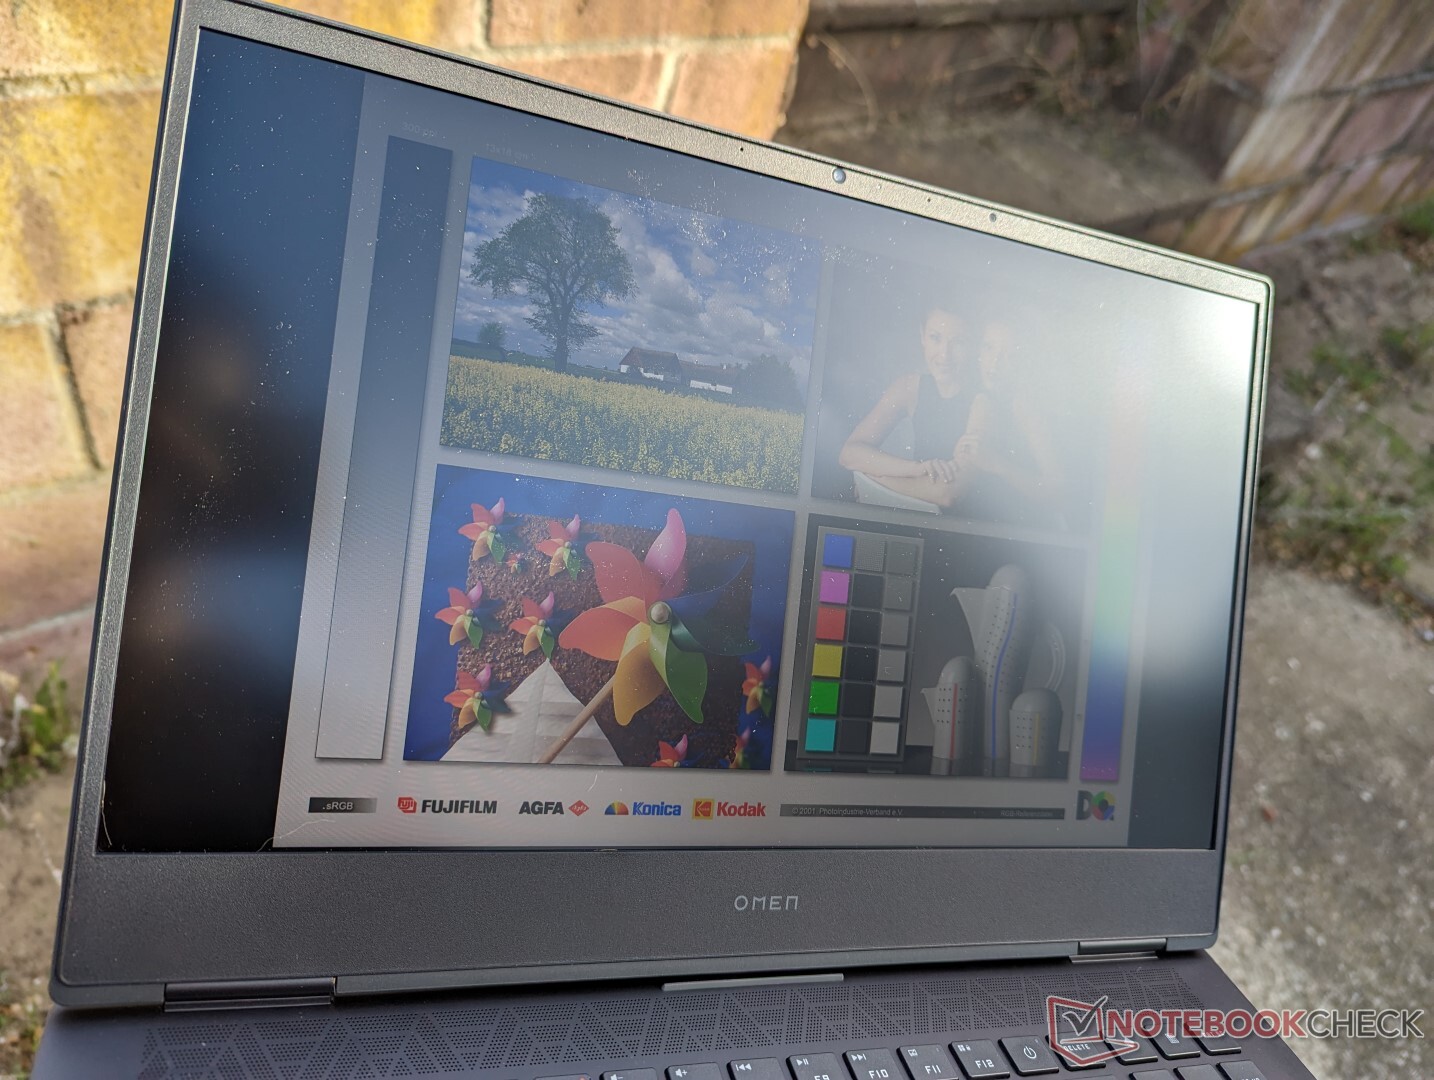
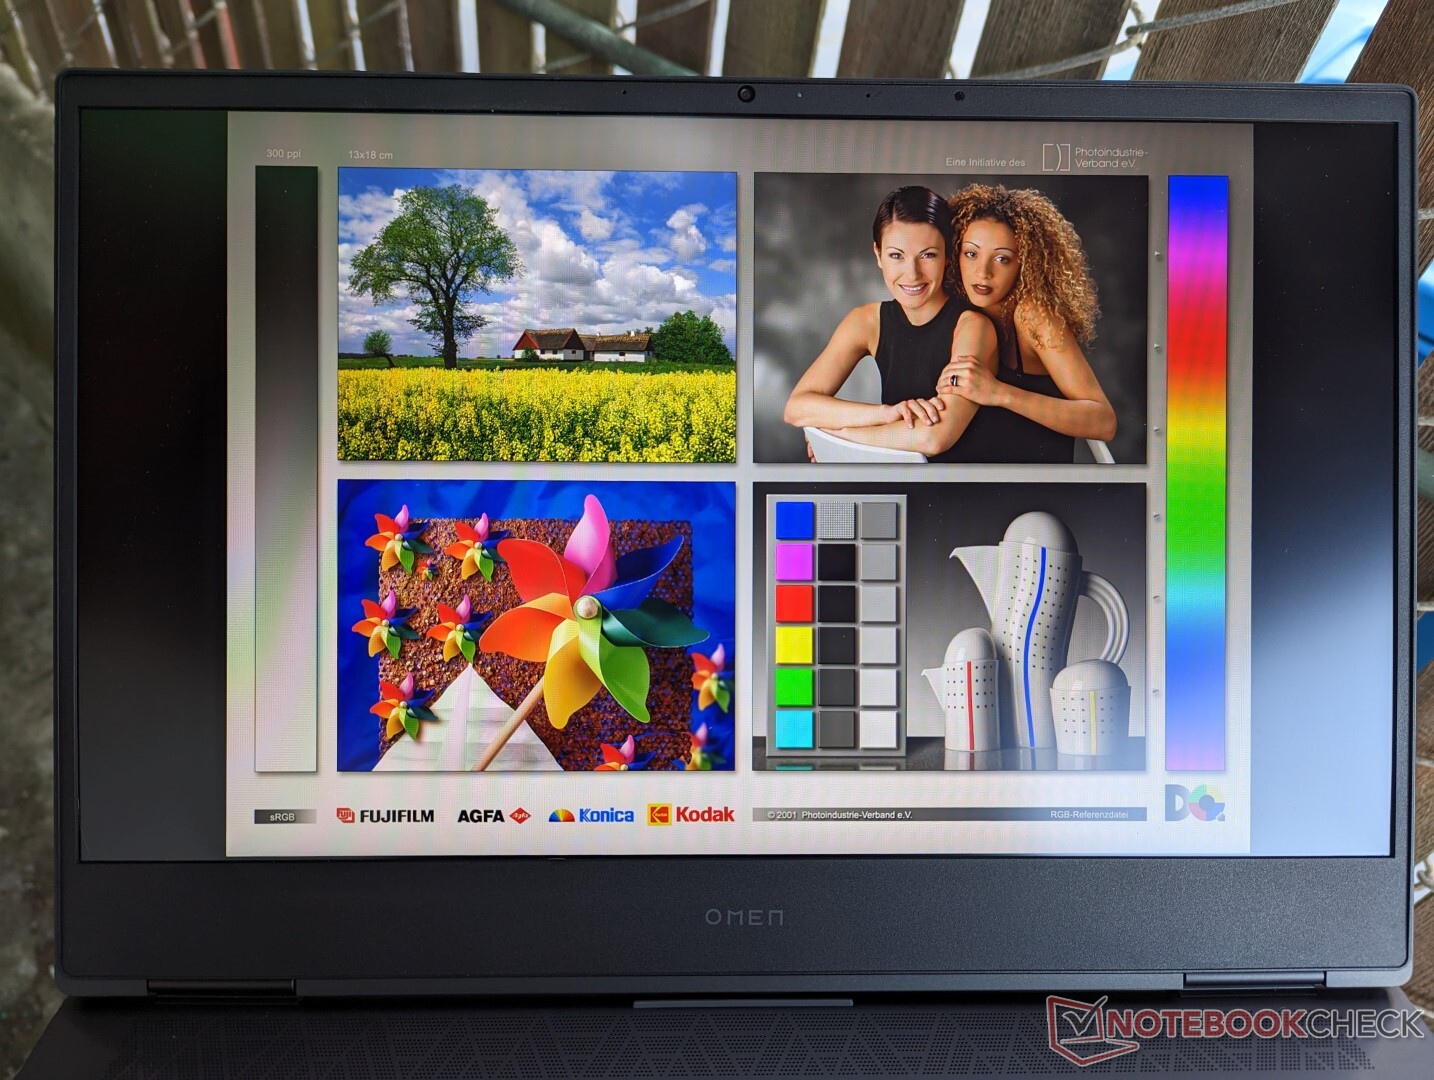
Wyświetlacz - FreeSync z 144 Hz i 100% sRGB
Do wyboru są trzy opcje wyświetlania, które przedstawiają się następująco:
- 1080p, 144 Hz, 250 nitów
- 1080p, 144 Hz, 300 nitów
- 1440p, 165 Hz, 300 nitów
Nasze pomiary wyświetlacza odzwierciedlają tylko pogrubioną opcję powyżej. Najwyższa opcja 165 Hz jest dostępna zarówno dla procesorów Intel, jak i AMD Omen 16 SKU.
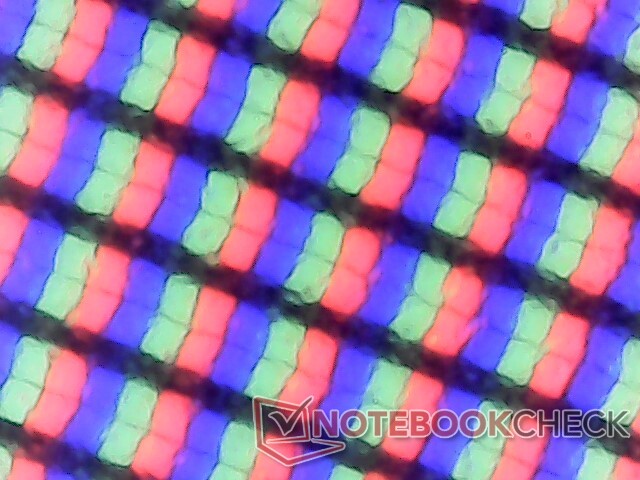
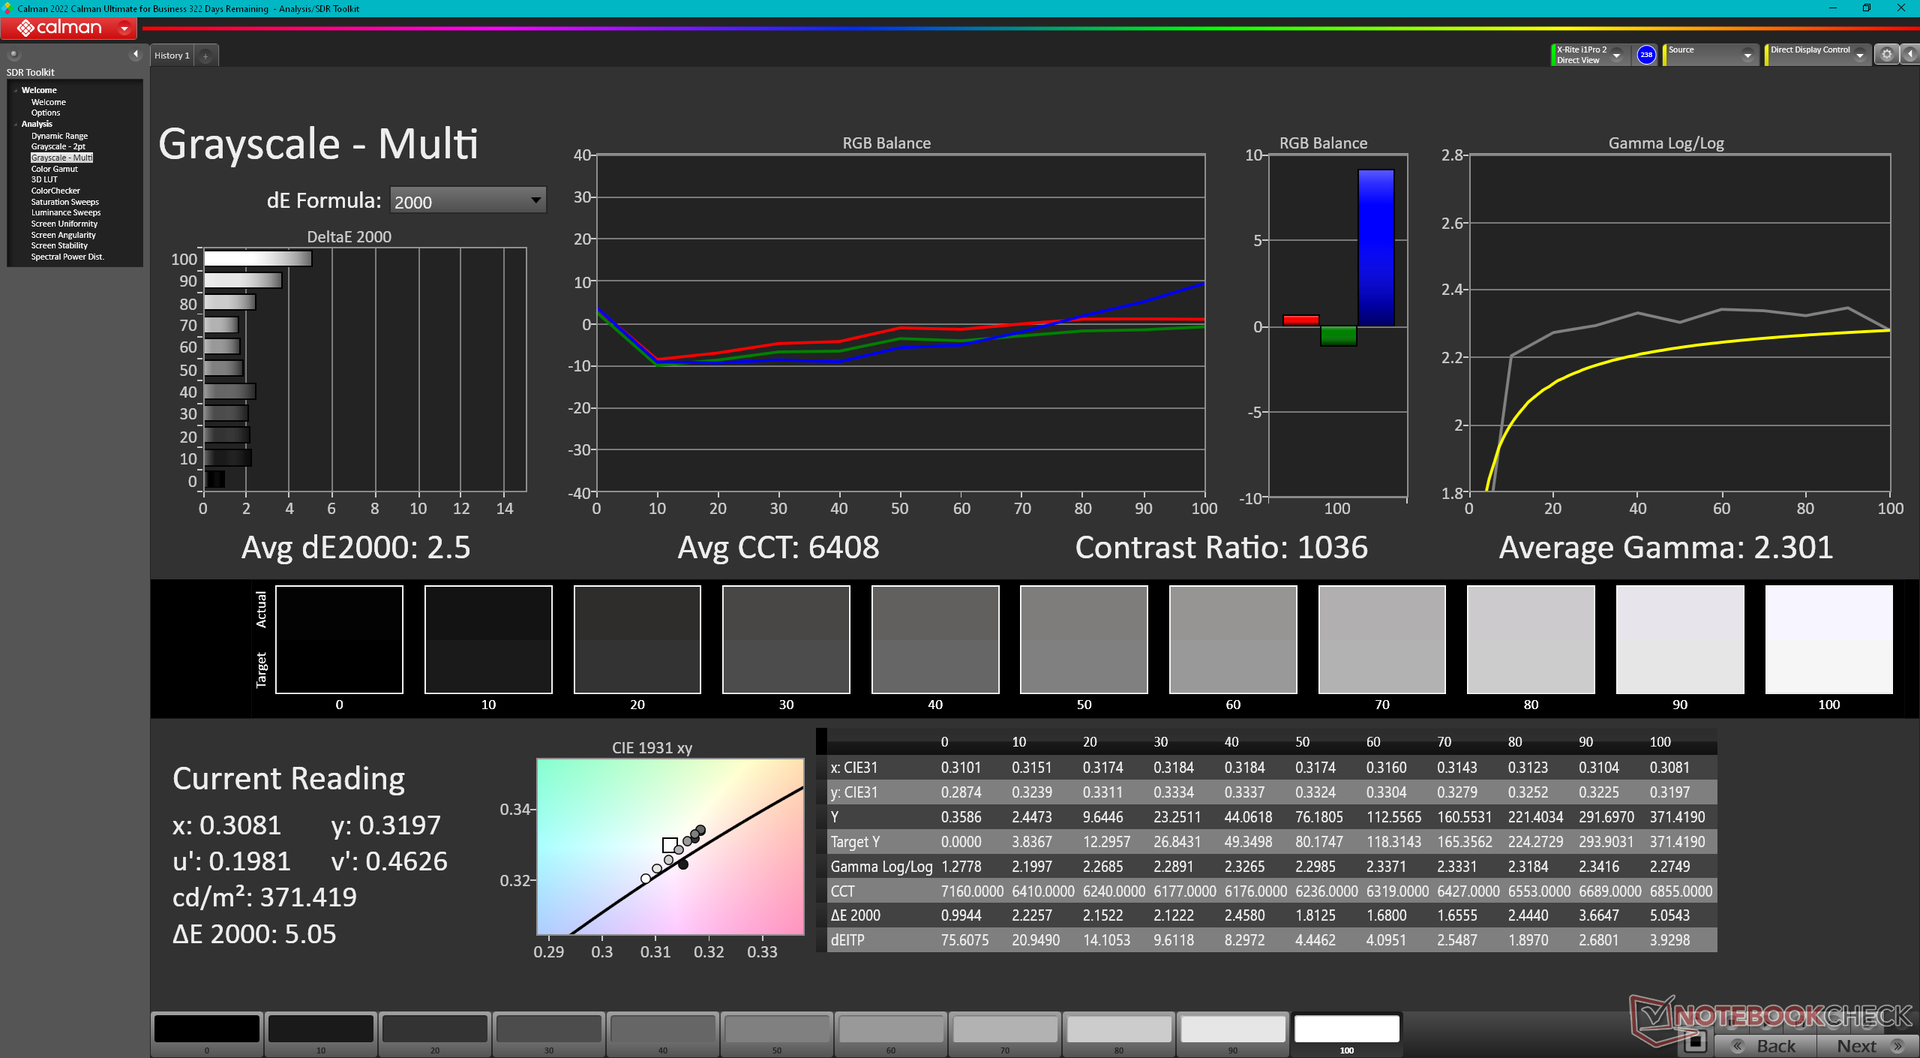
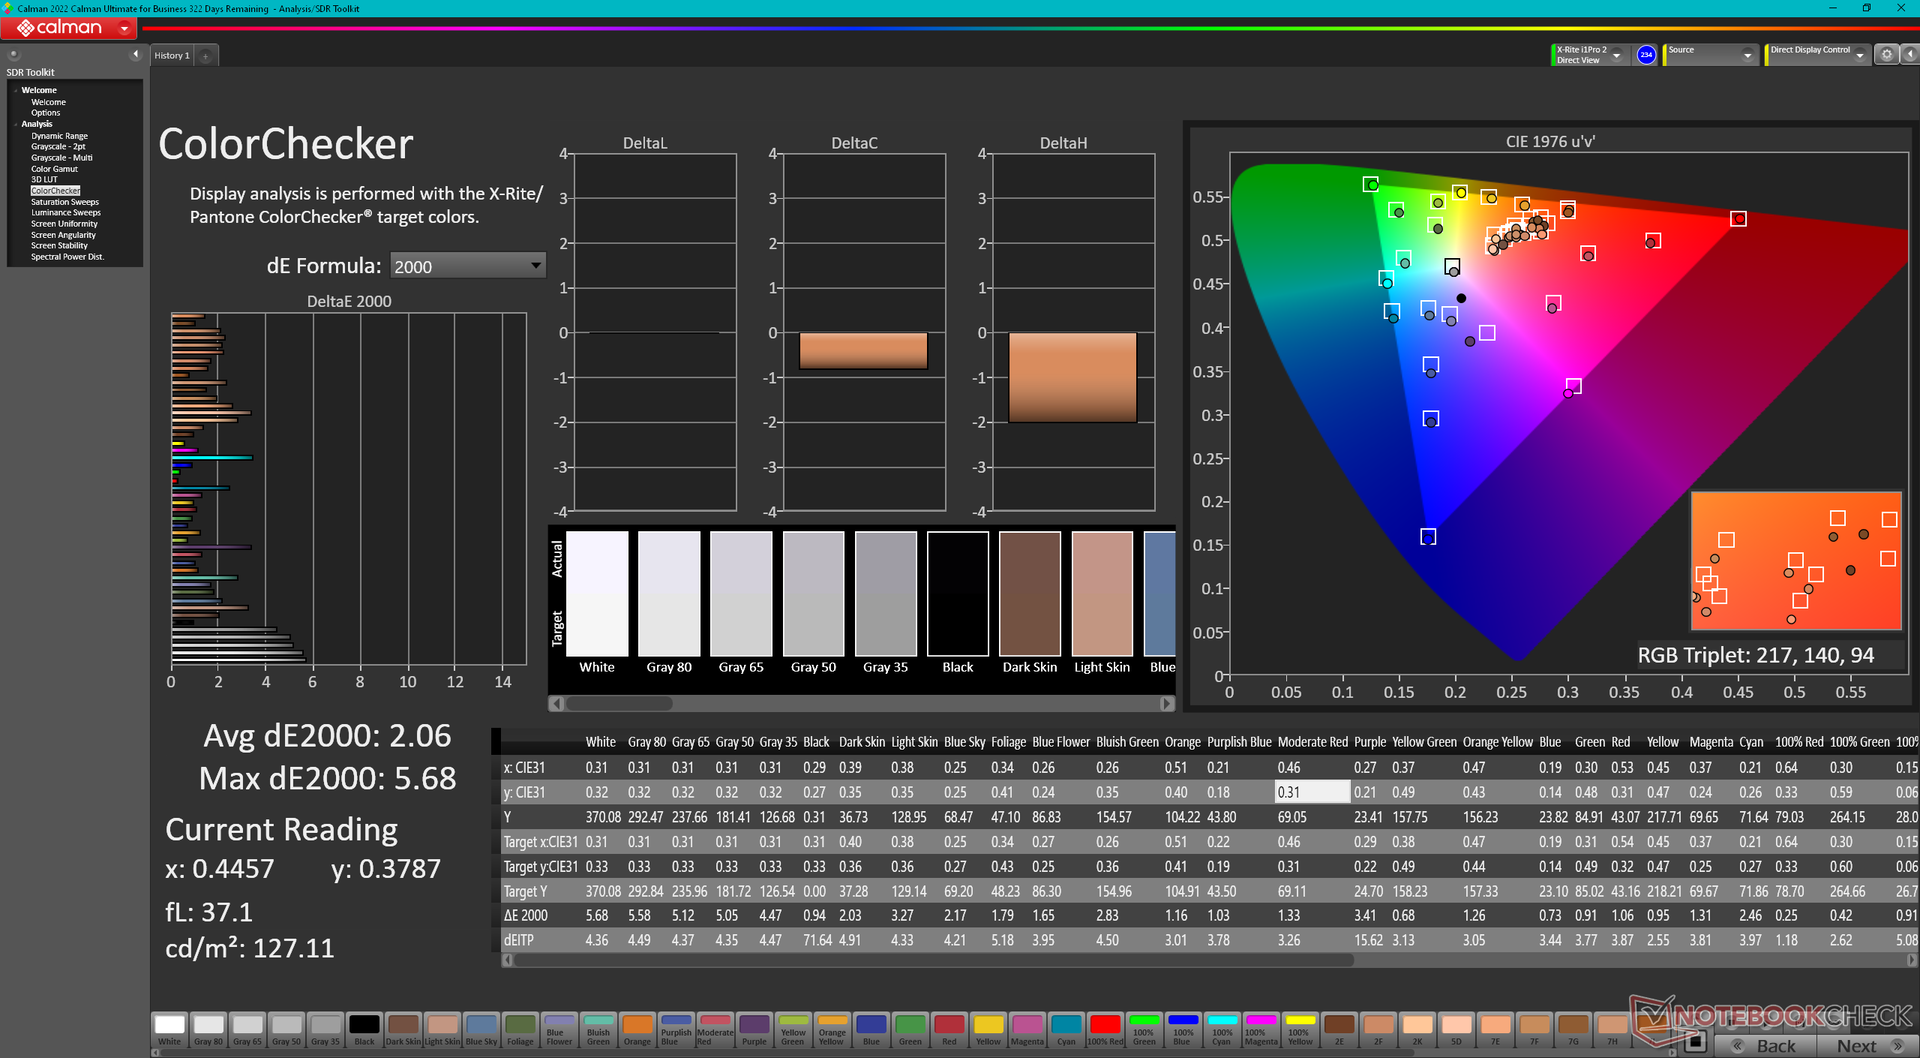
Panel IPS w naszym egzemplarzu AMD jest mimo wszystko bardzo dobry, ze swoim pełnym pokryciem sRGB, przyzwoitym współczynnikiem kontrastu i przyzwoitymi czasami reakcji czerni i bieli. Nawet maksymalna jasność wyświetlacza jest o 20 procent wyższa niż ta, którą reklamuje HP, według naszego własnego kolorymetru X-Rite. Ogólna jakość obrazu jest znacznie lepsza niż w tańszym HP Victus 16, który wykorzystuje znacznie tańszy panel Chi Mei o gorszych kolorach i bardziej zauważalnym ghostingu.


| |||||||||||||||||||||||||
rozświetlenie: 79 %
na akumulatorze: 373.3 cd/m²
kontrast: 848:1 (czerń: 0.44 cd/m²)
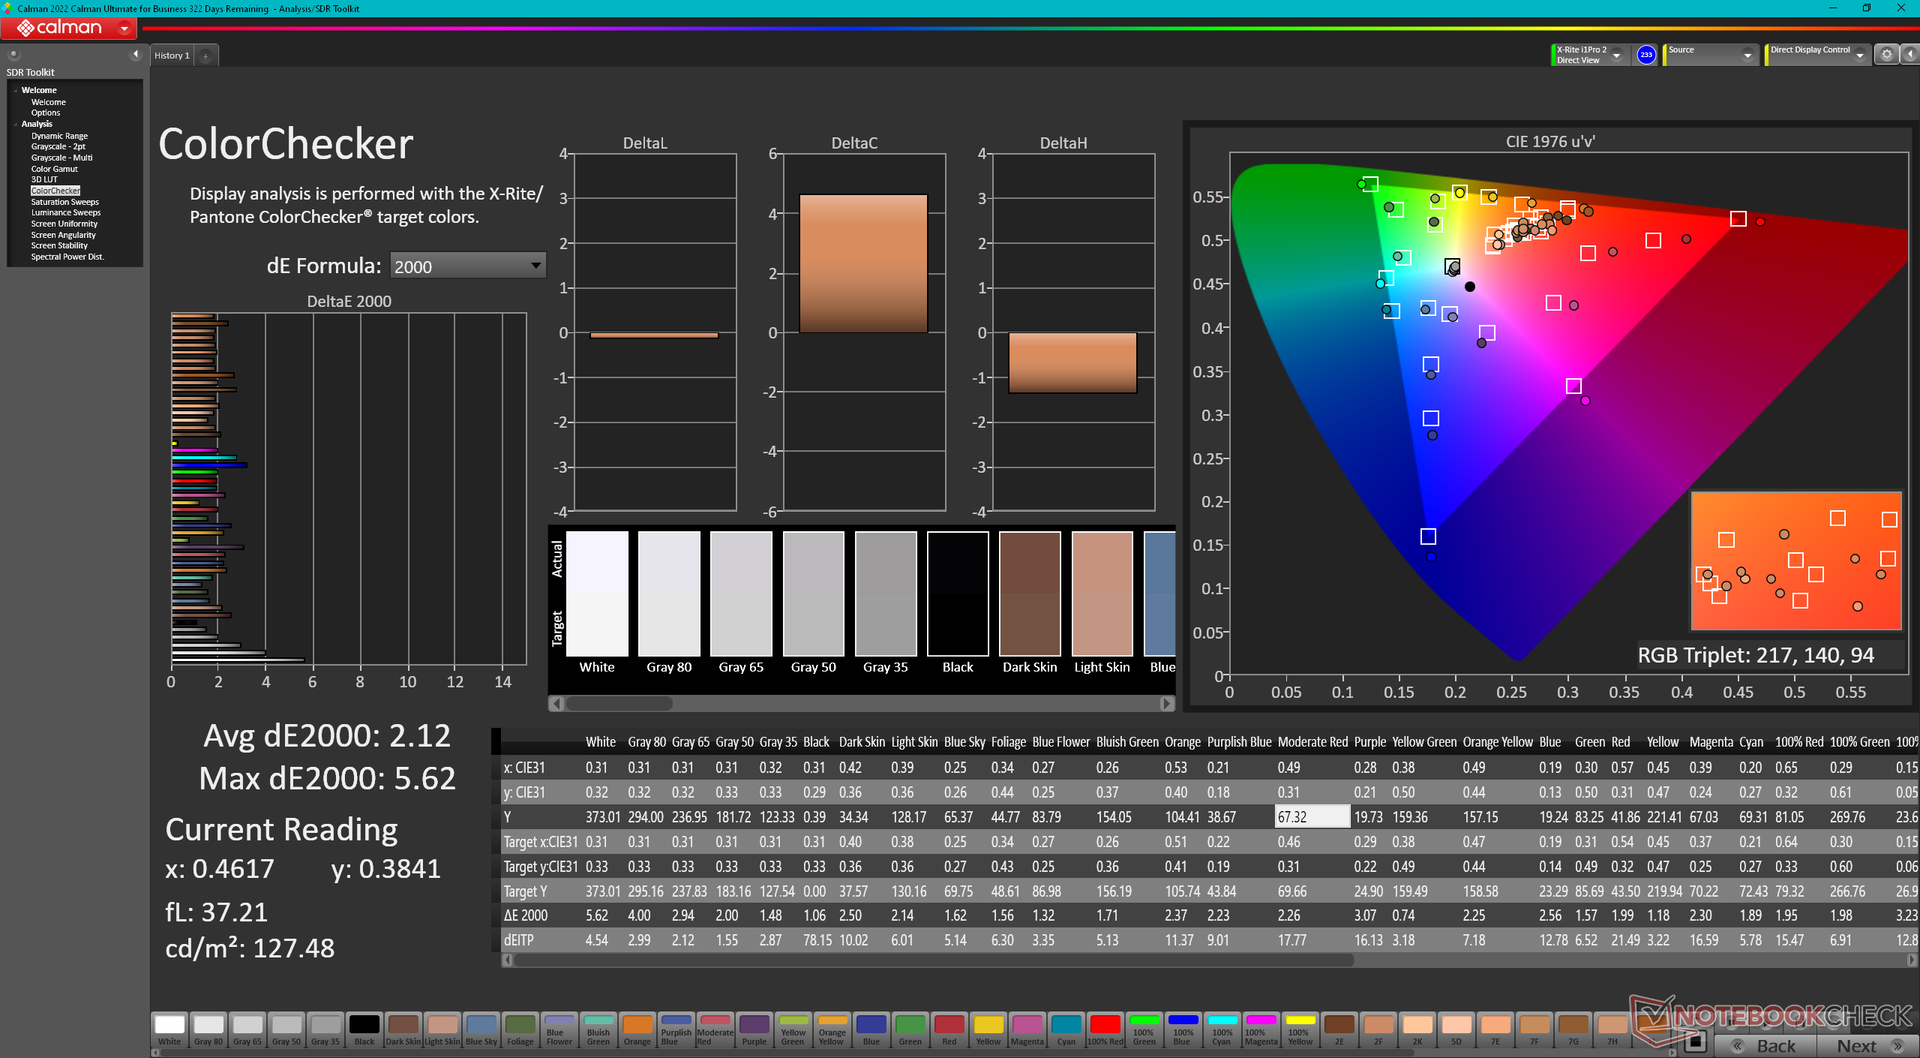
ΔE ColorChecker Calman: 2.12 | ∀{0.5-29.43 Ø4.73}
calibrated: 2.06
ΔE Greyscale Calman: 2.5 | ∀{0.09-98 Ø4.97}
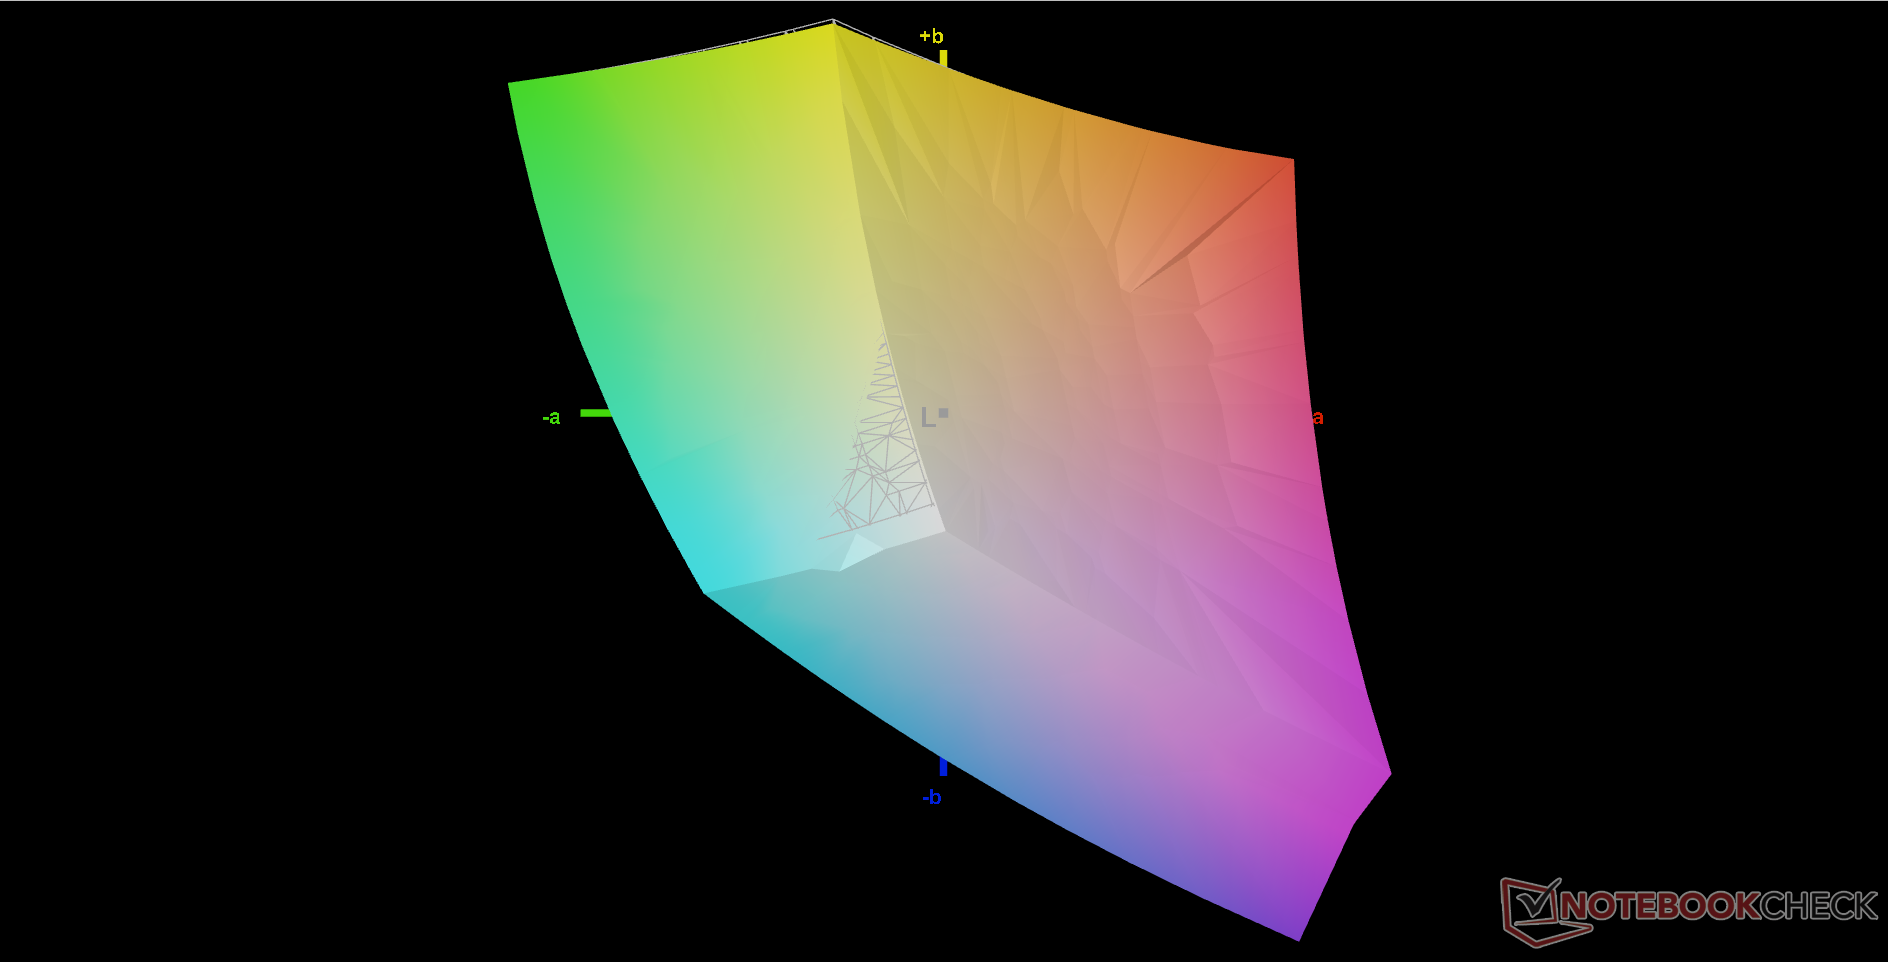
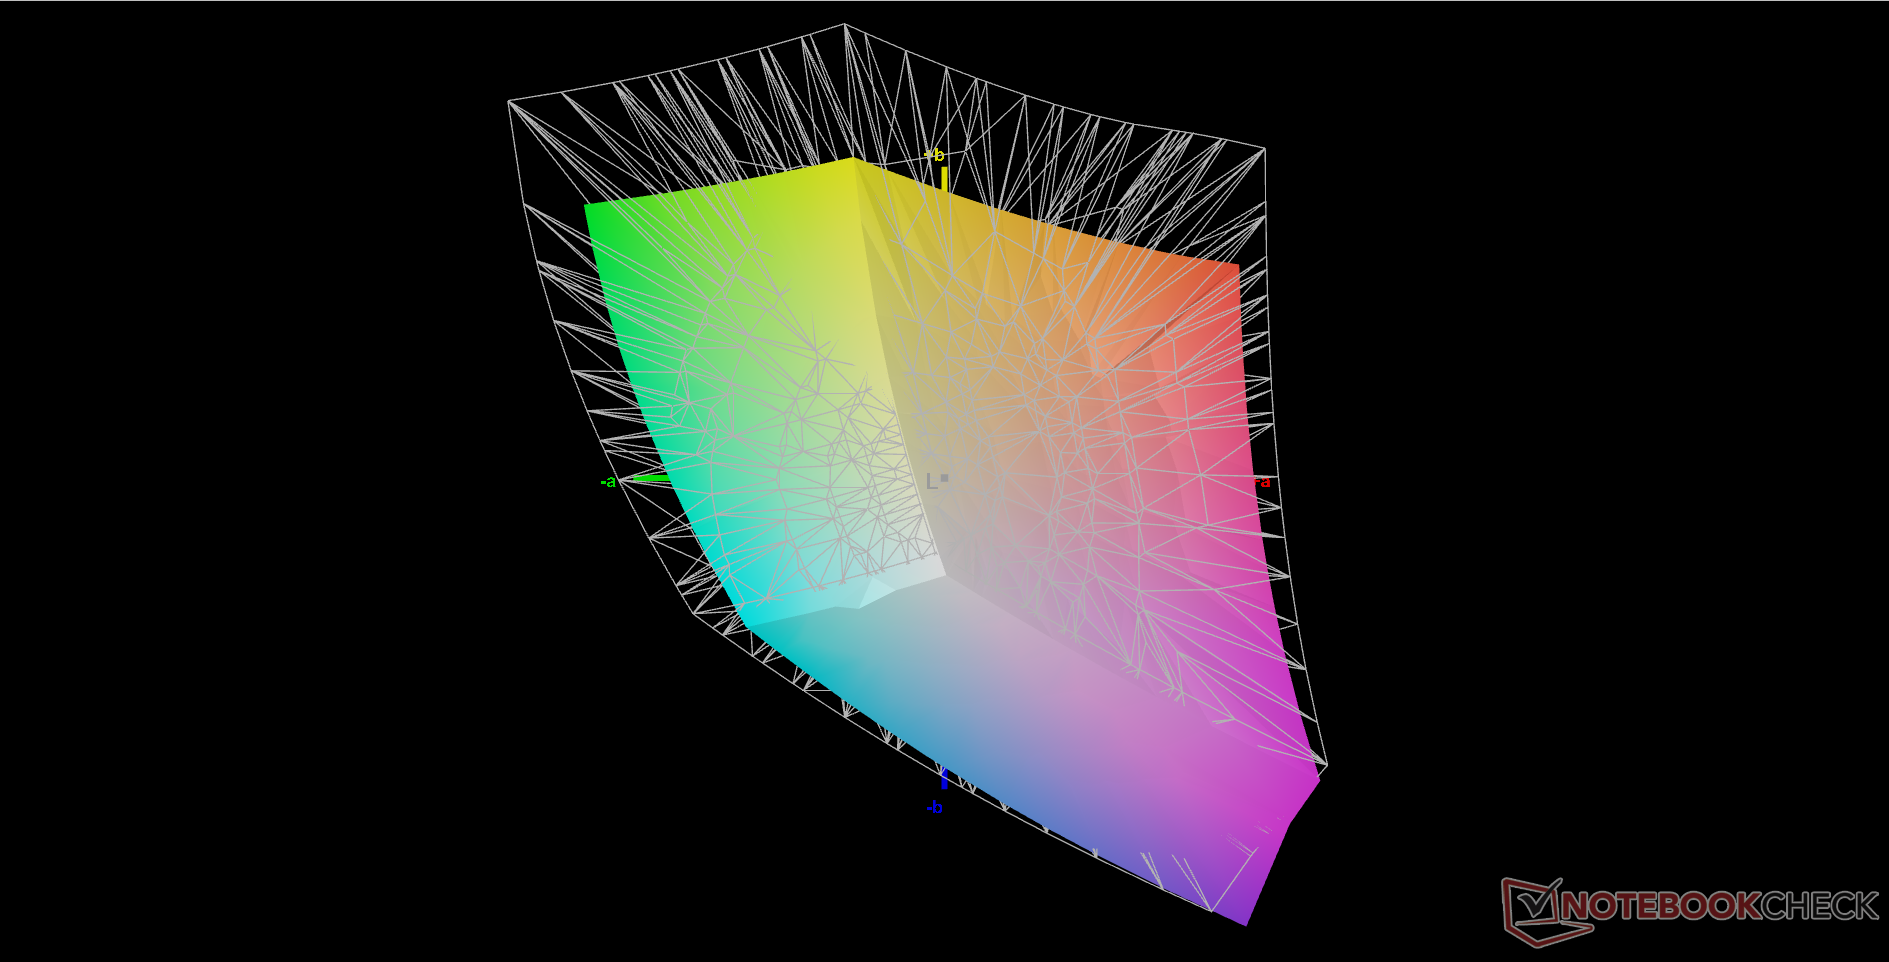
73.4% AdobeRGB 1998 (Argyll 3D)
99.2% sRGB (Argyll 3D)
74.4% Display P3 (Argyll 3D)
Gamma: 2.3
CCT: 6408 K
| HP Omen 16-n0033dx BOE0AAE, IPS, 1920x1080, 16.1" | HP Envy 16 h0112nr Samsung SDC4174, OLED, 3840x2400, 16" | HP Omen 16-b1090ng BOE09E5, IPS, 2560x1440, 16.1" | HP Victus 16-e0145ng CMN1609, IPS, 1920x1080, 16.1" | Lenovo Legion S7 16ARHA7 BOE CQ NE160QDM-NY1, IPS, 2560x1600, 16" | Dell G16 7620 BOE NE16QDM, IPS, 2560x1600, 16" | |
|---|---|---|---|---|---|---|
| Display | 18% | -2% | -41% | -3% | -4% | |
| Display P3 Coverage (%) | 74.4 | 99.3 33% | 71 -5% | 41.6 -44% | 69.8 -6% | 68.3 -8% |
| sRGB Coverage (%) | 99.2 | 100 1% | 97.9 -1% | 61.9 -38% | 98.1 -1% | 98 -1% |
| AdobeRGB 1998 Coverage (%) | 73.4 | 88 20% | 73.3 0% | 43 -41% | 71.9 -2% | 70.5 -4% |
| Response Times | 86% | 17% | -71% | 15% | 29% | |
| Response Time Grey 50% / Grey 80% * (ms) | 17.6 ? | 2 ? 89% | 14.5 ? 18% | 29.6 ? -68% | 10 ? 43% | 8.6 ? 51% |
| Response Time Black / White * (ms) | 11.2 ? | 1.9 ? 83% | 9.4 ? 16% | 19.4 ? -73% | 12.8 ? -14% | 10.4 ? 7% |
| PWM Frequency (Hz) | 240.4 ? | |||||
| Screen | 12% | -28% | -87% | 28% | 13% | |
| Brightness middle (cd/m²) | 373.3 | 328.8 -12% | 335 -10% | 257 -31% | 492.4 32% | 369.4 -1% |
| Brightness (cd/m²) | 361 | 332 -8% | 319 -12% | 239 -34% | 471 30% | 348 -4% |
| Brightness Distribution (%) | 79 | 97 23% | 90 14% | 88 11% | 90 14% | 83 5% |
| Black Level * (cd/m²) | 0.44 | 0.28 36% | 0.25 43% | 0.4 9% | 0.32 27% | |
| Contrast (:1) | 848 | 1196 41% | 1028 21% | 1231 45% | 1154 36% | |
| Colorchecker dE 2000 * | 2.12 | 1.53 28% | 4.38 -107% | 6.91 -226% | 1.9 10% | 1.78 16% |
| Colorchecker dE 2000 max. * | 5.62 | 6.04 -7% | 9.48 -69% | 22.27 -296% | 3.81 32% | 4.41 22% |
| Colorchecker dE 2000 calibrated * | 2.06 | 1.33 35% | 3.61 -75% | 0.99 52% | 1.22 41% | |
| Greyscale dE 2000 * | 2.5 | 1.3 48% | 7 -180% | 7.5 -200% | 1.7 32% | 3.2 -28% |
| Gamma | 2.3 96% | 2.18 101% | 2.103 105% | 2.125 104% | 2.36 93% | 2.2 100% |
| CCT | 6408 101% | 6362 102% | 6244 104% | 6025 108% | 6497 100% | 6750 96% |
| Całkowita średnia (program / ustawienia) | 39% /
27% | -4% /
-16% | -66% /
-75% | 13% /
20% | 13% /
11% |
* ... im mniej tym lepiej
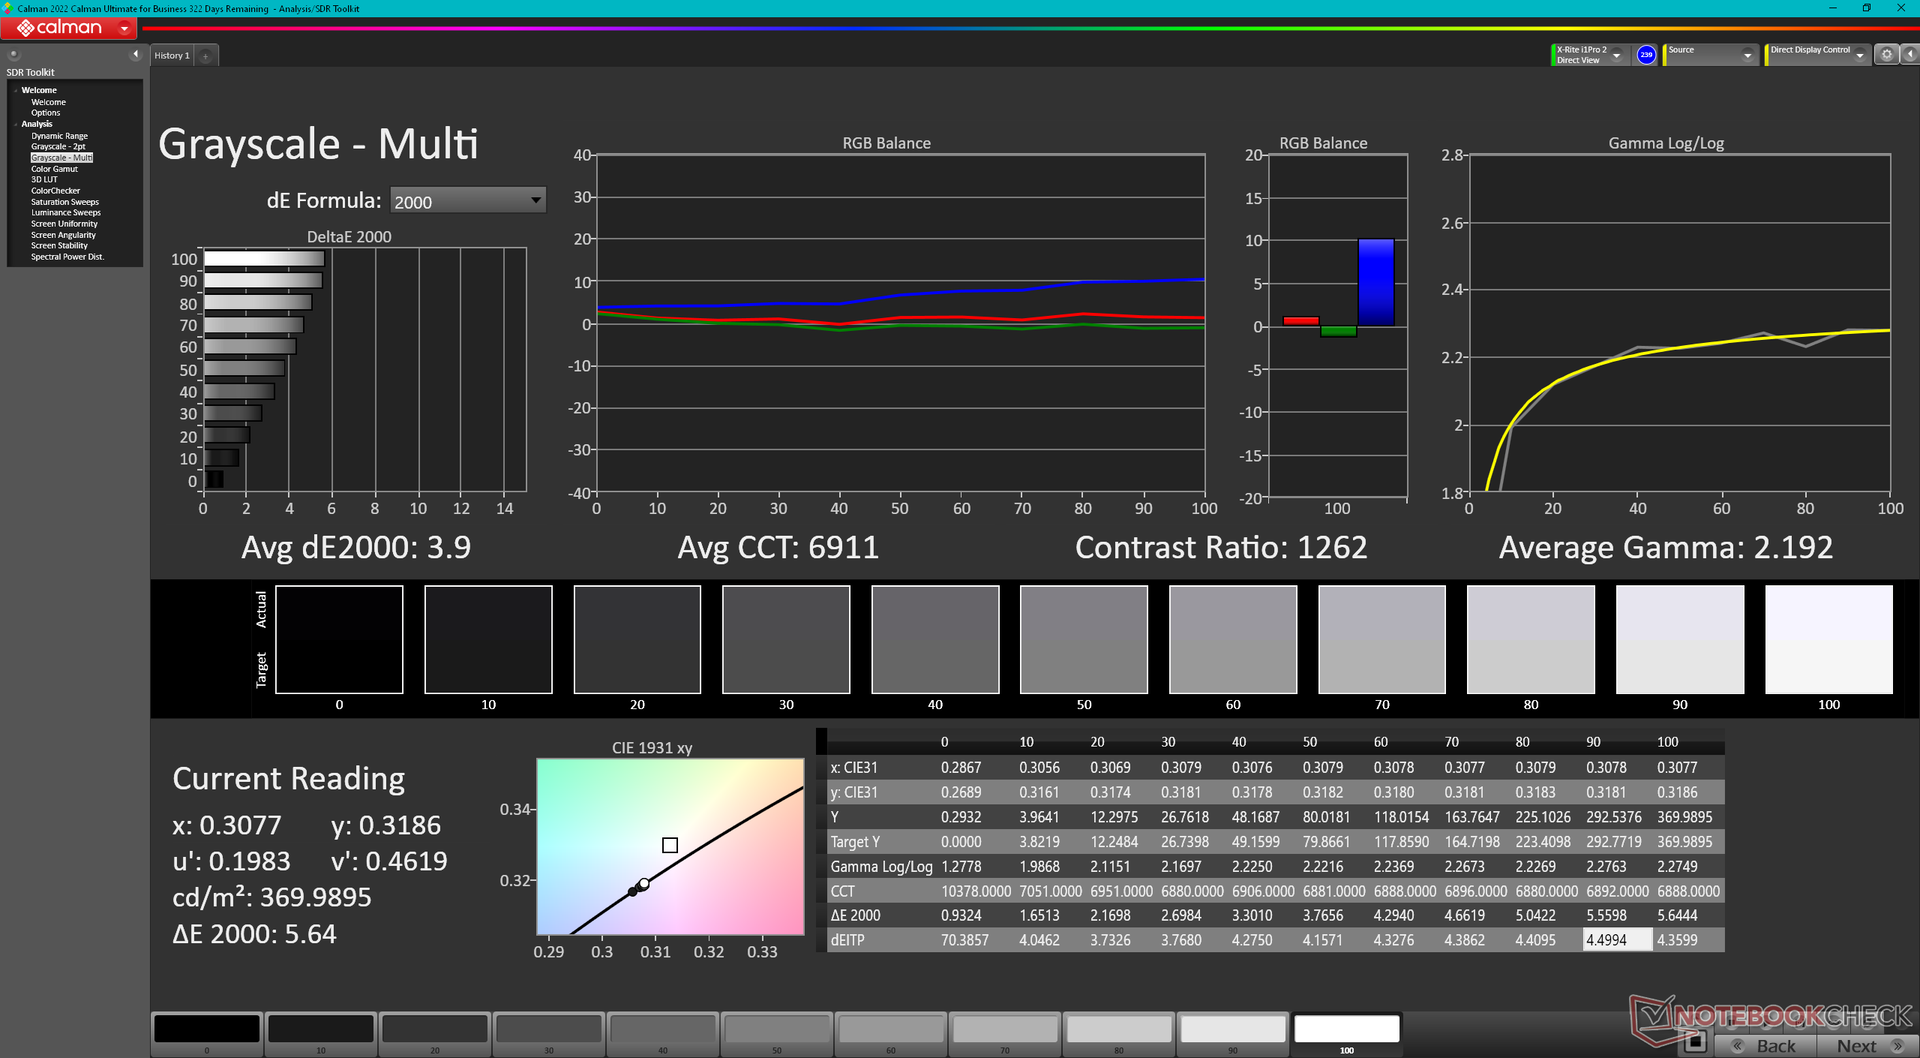
Wyświetlacz jest już przyzwoicie skalibrowany po wyjęciu z pudełka, a średnie wartości deltaE dla skali szarości i koloru wynoszą odpowiednio 2,5 i 2,12. Próba dalszej kalibracji za pomocą kolorymetru X-Rite poprawiłaby nieco kolory, ale nie na tyle, by kalibracja przez użytkownika końcowego była niezbędna.

Wyświetl czasy reakcji
| ↔ Czas reakcji od czerni do bieli | ||
|---|---|---|
| 11.2 ms ... wzrost ↗ i spadek ↘ łącznie | ↗ 6.8 ms wzrost | 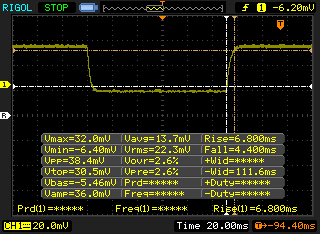 |
| ↘ 4.4 ms upadek | ||
| W naszych testach ekran wykazuje dobry współczynnik reakcji, ale może być zbyt wolny dla graczy rywalizujących ze sobą. Dla porównania, wszystkie testowane urządzenia wahają się od 0.1 (minimum) do 240 (maksimum) ms. » 30 % wszystkich urządzeń jest lepszych. Oznacza to, że zmierzony czas reakcji jest lepszy od średniej wszystkich testowanych urządzeń (19.9 ms). | ||
| ↔ Czas reakcji 50% szarości do 80% szarości | ||
| 17.6 ms ... wzrost ↗ i spadek ↘ łącznie | ↗ 10 ms wzrost | 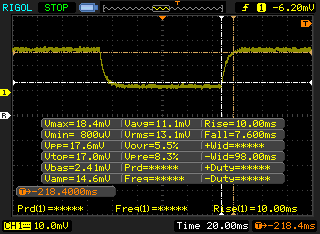 |
| ↘ 7.6 ms upadek | ||
| W naszych testach ekran wykazuje dobry współczynnik reakcji, ale może być zbyt wolny dla graczy rywalizujących ze sobą. Dla porównania, wszystkie testowane urządzenia wahają się od 0.165 (minimum) do 636 (maksimum) ms. » 31 % wszystkich urządzeń jest lepszych. Oznacza to, że zmierzony czas reakcji jest lepszy od średniej wszystkich testowanych urządzeń (31.1 ms). | ||
Migotanie ekranu / PWM (modulacja szerokości impulsu)
| Migotanie ekranu/nie wykryto PWM | 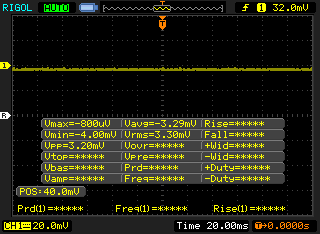 | ||
Dla porównania: 52 % wszystkich testowanych urządzeń nie używa PWM do przyciemniania wyświetlacza. Jeśli wykryto PWM, zmierzono średnio 7798 (minimum: 5 - maksimum: 343500) Hz. | |||
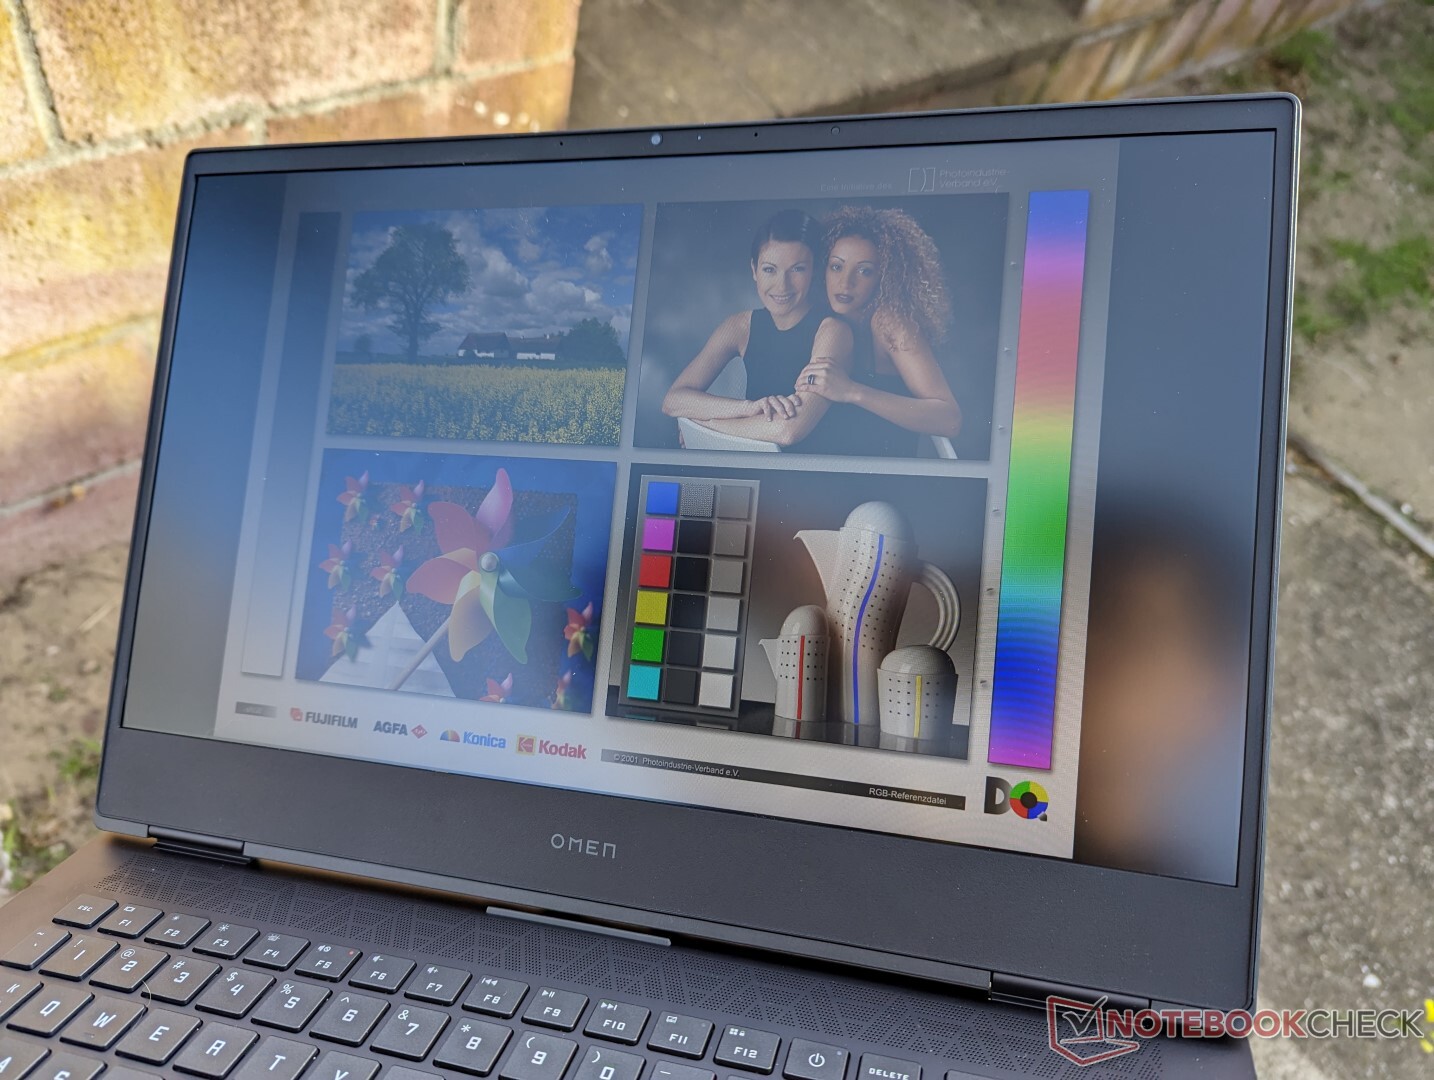
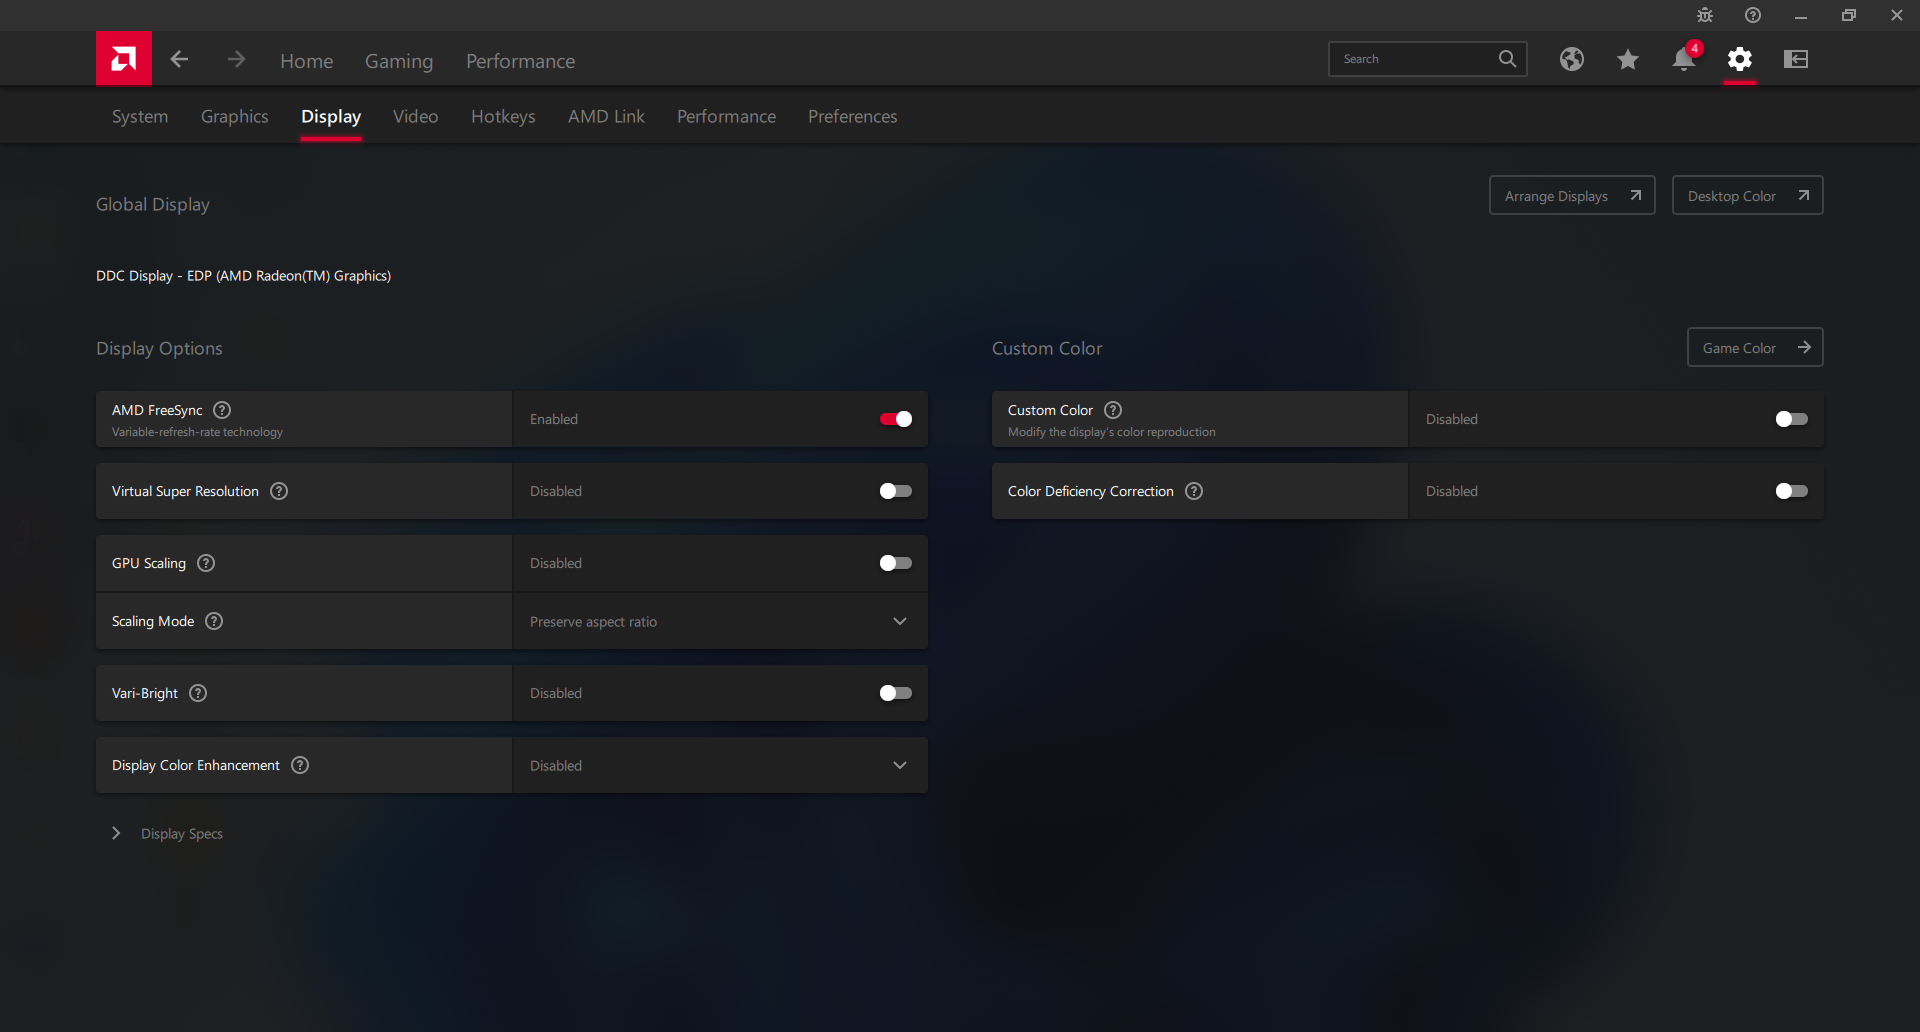
Widoczność na zewnątrz jest dobra w cieniu, natomiast wszystko, co jaśniejsze, wypłukuje ekran. Wyświetlacz w Lenovo Legion S7 16 może osiągnąć prawie 500 nitów w porównaniu z 370 nitami w naszym HP, co jest lepszym rozwiązaniem, jeśli chodzi o widoczność na zewnątrz. Pamiętaj, by wyłączyć funkcję AMD Vari-Bright w HP, w przeciwnym razie maksymalna jasność będzie automatycznie spadać podczas pracy na baterii.

Wydajność
Warunki badania
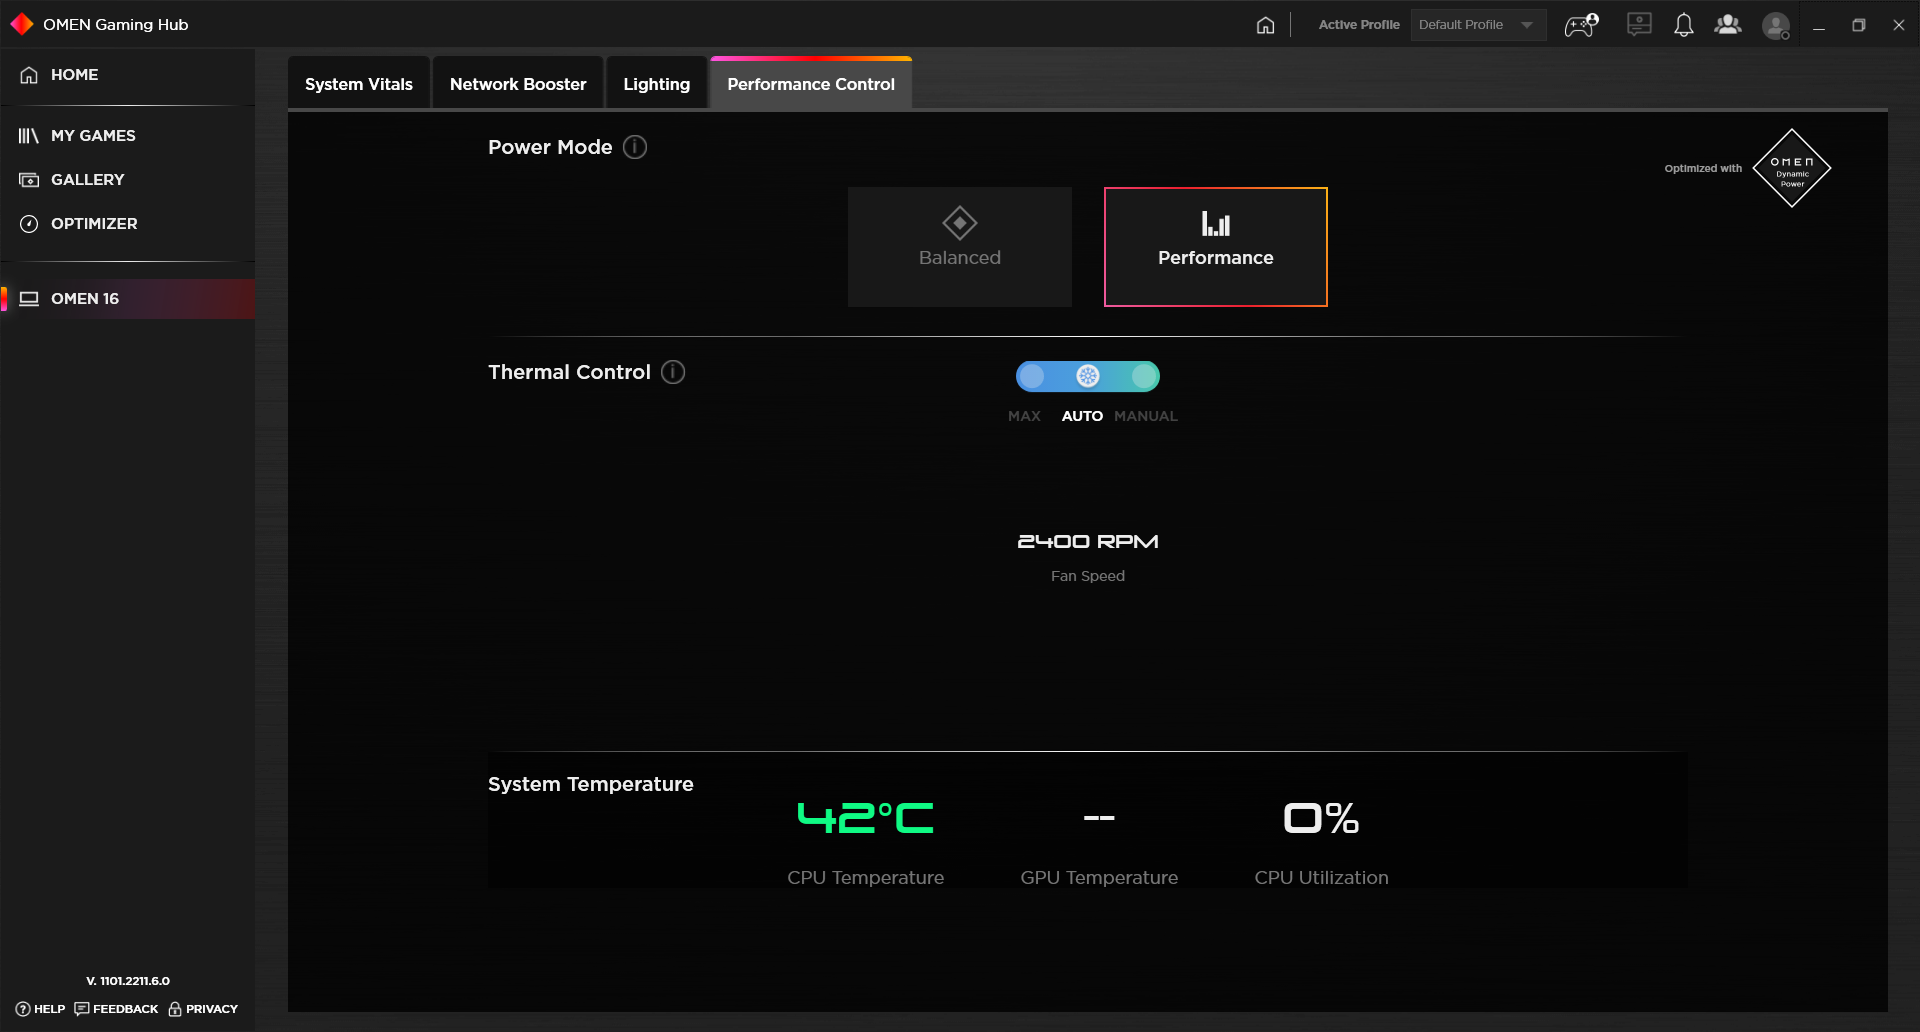
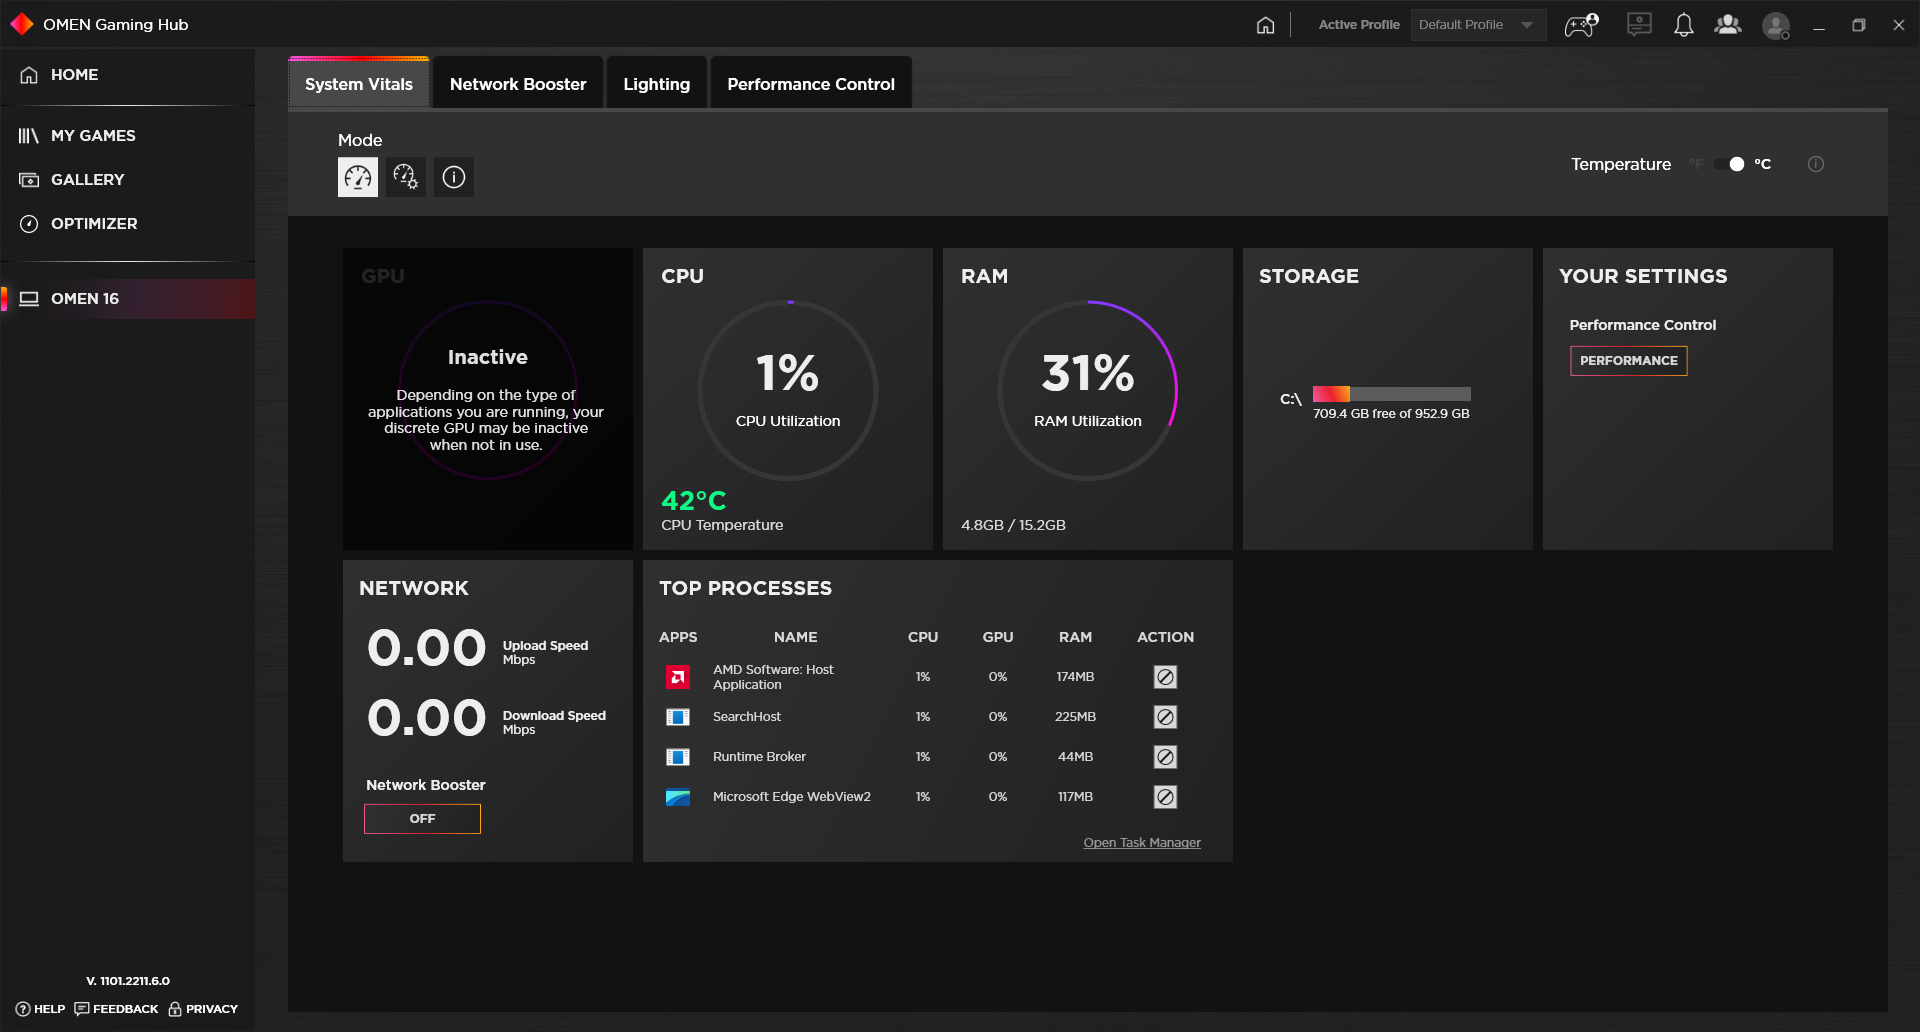
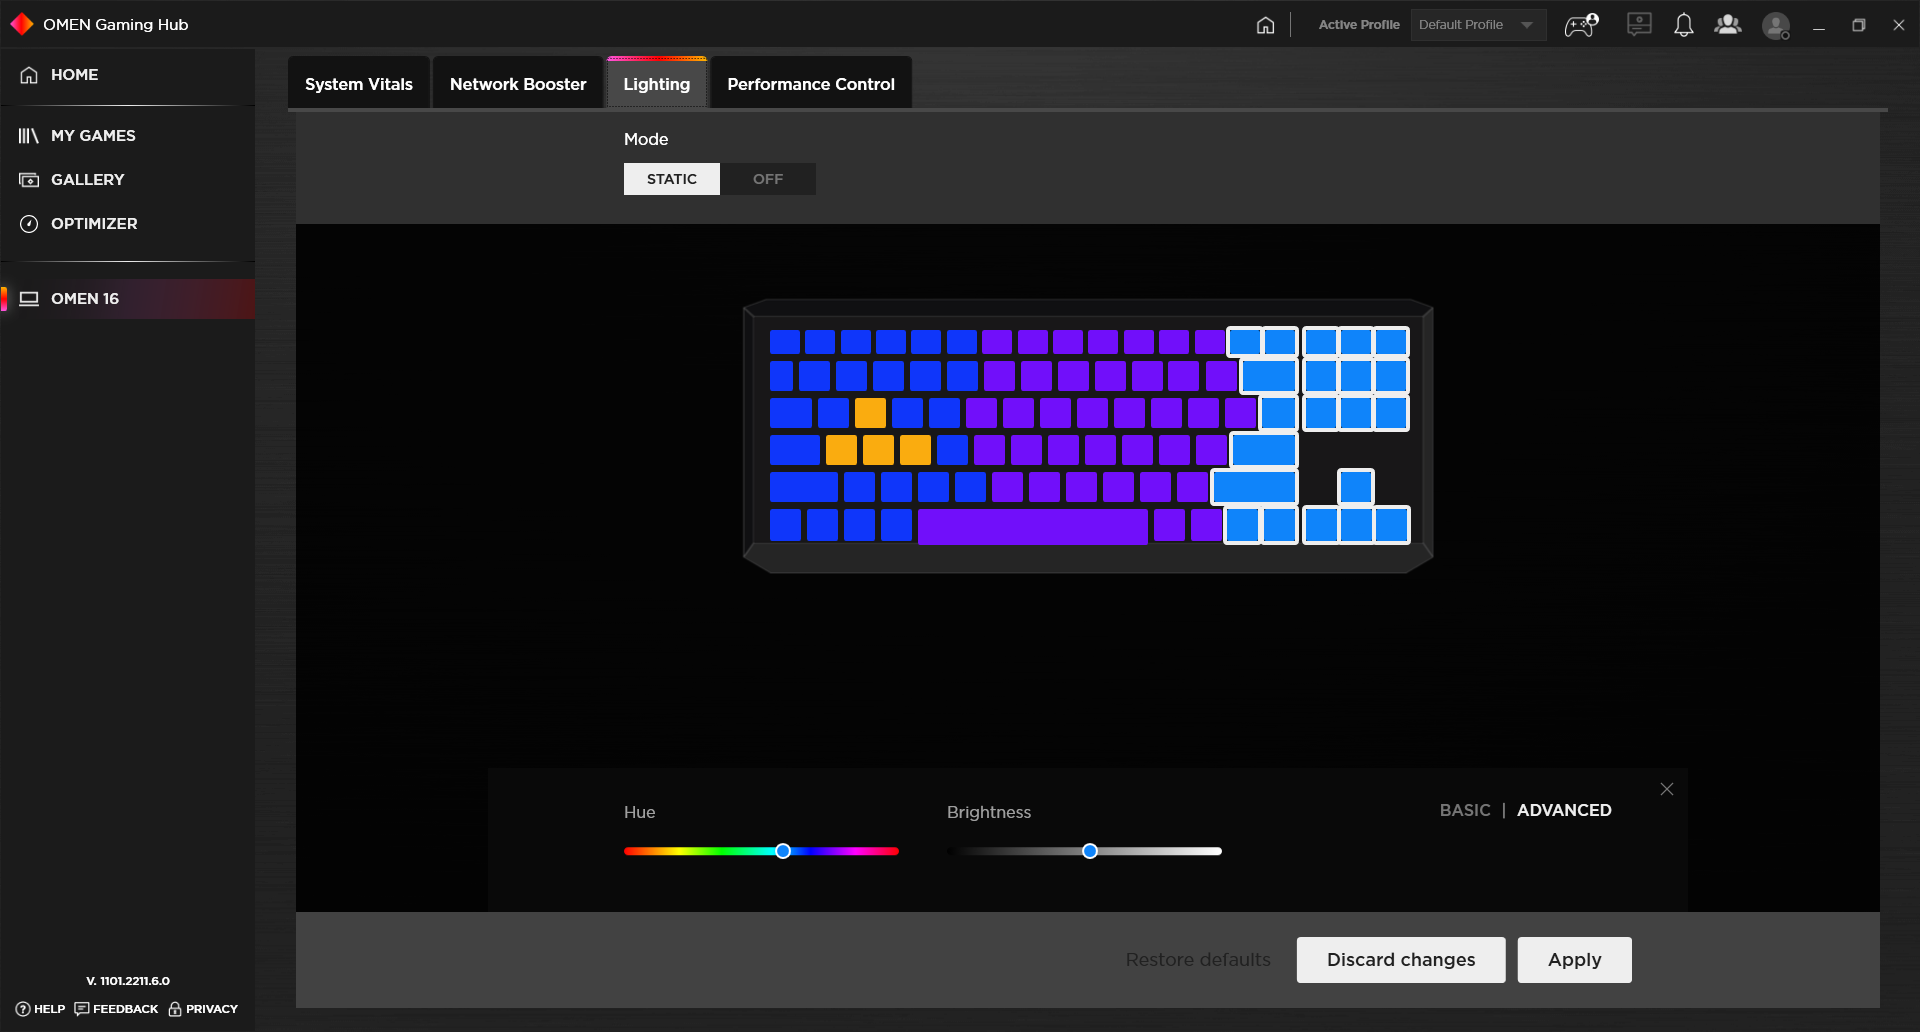
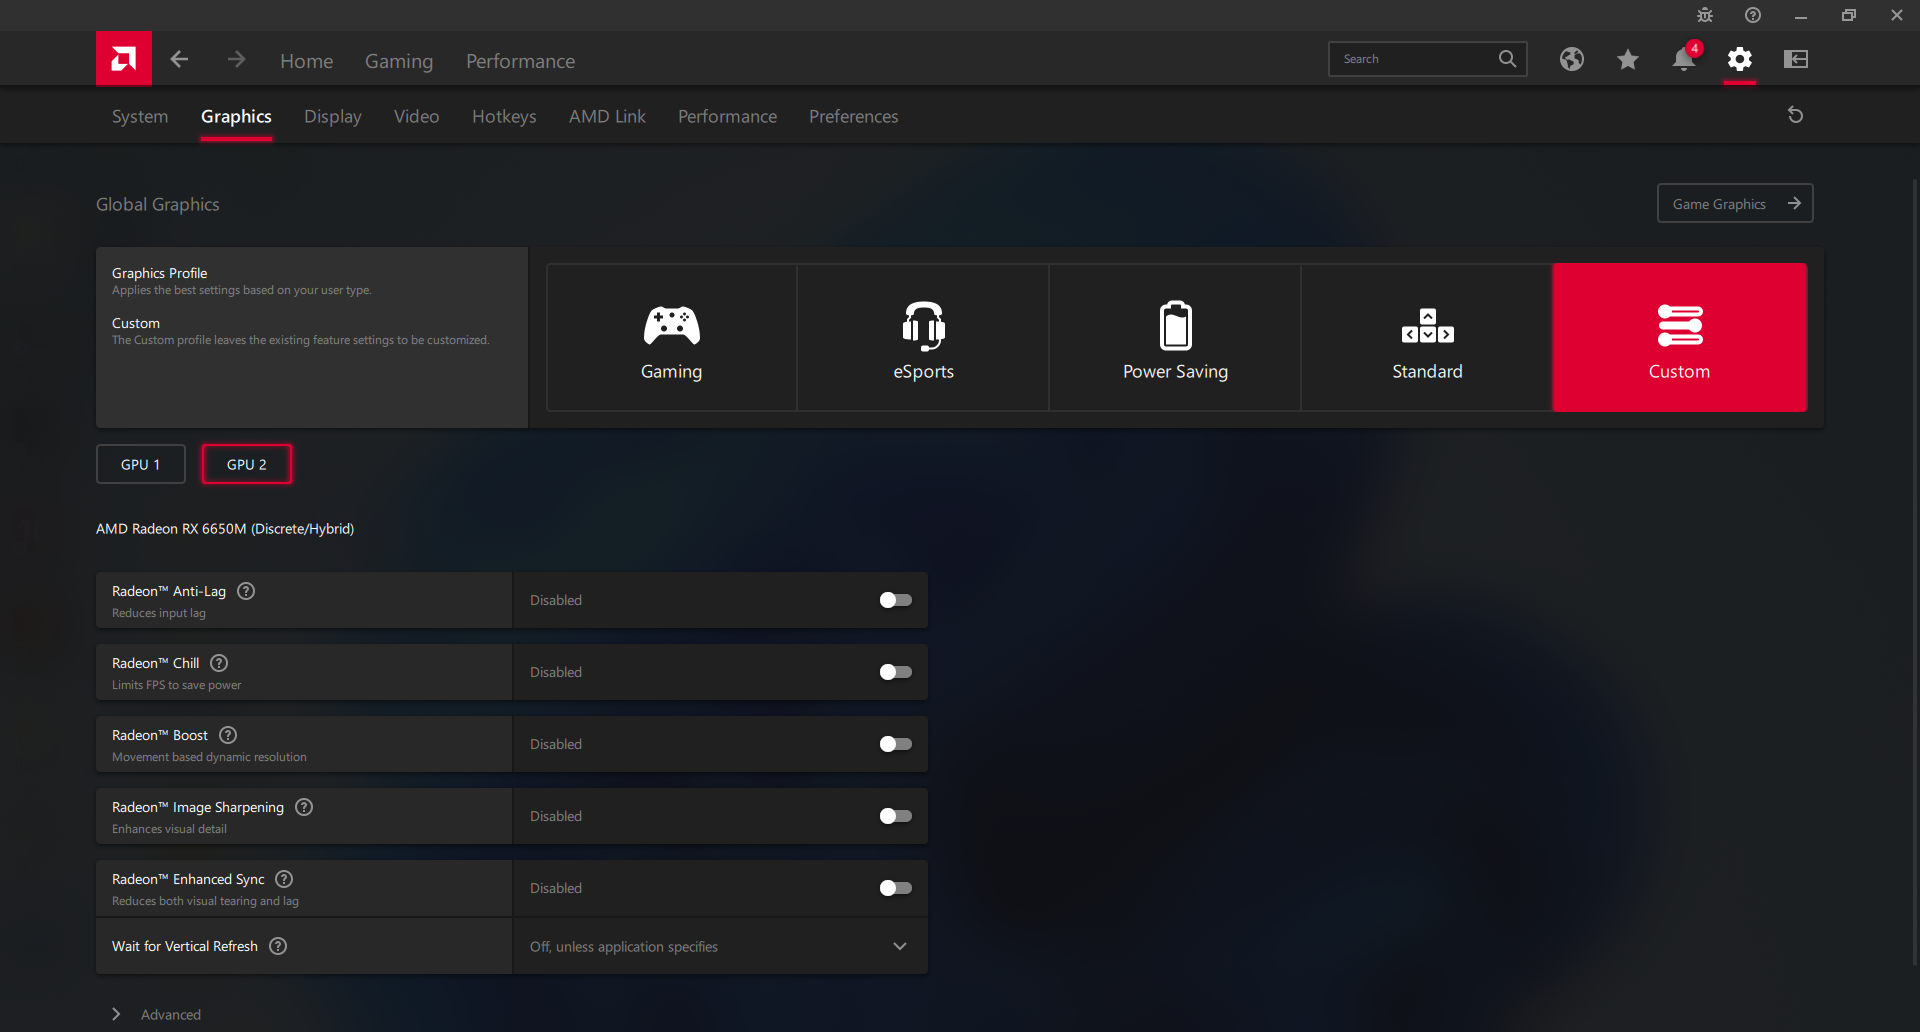
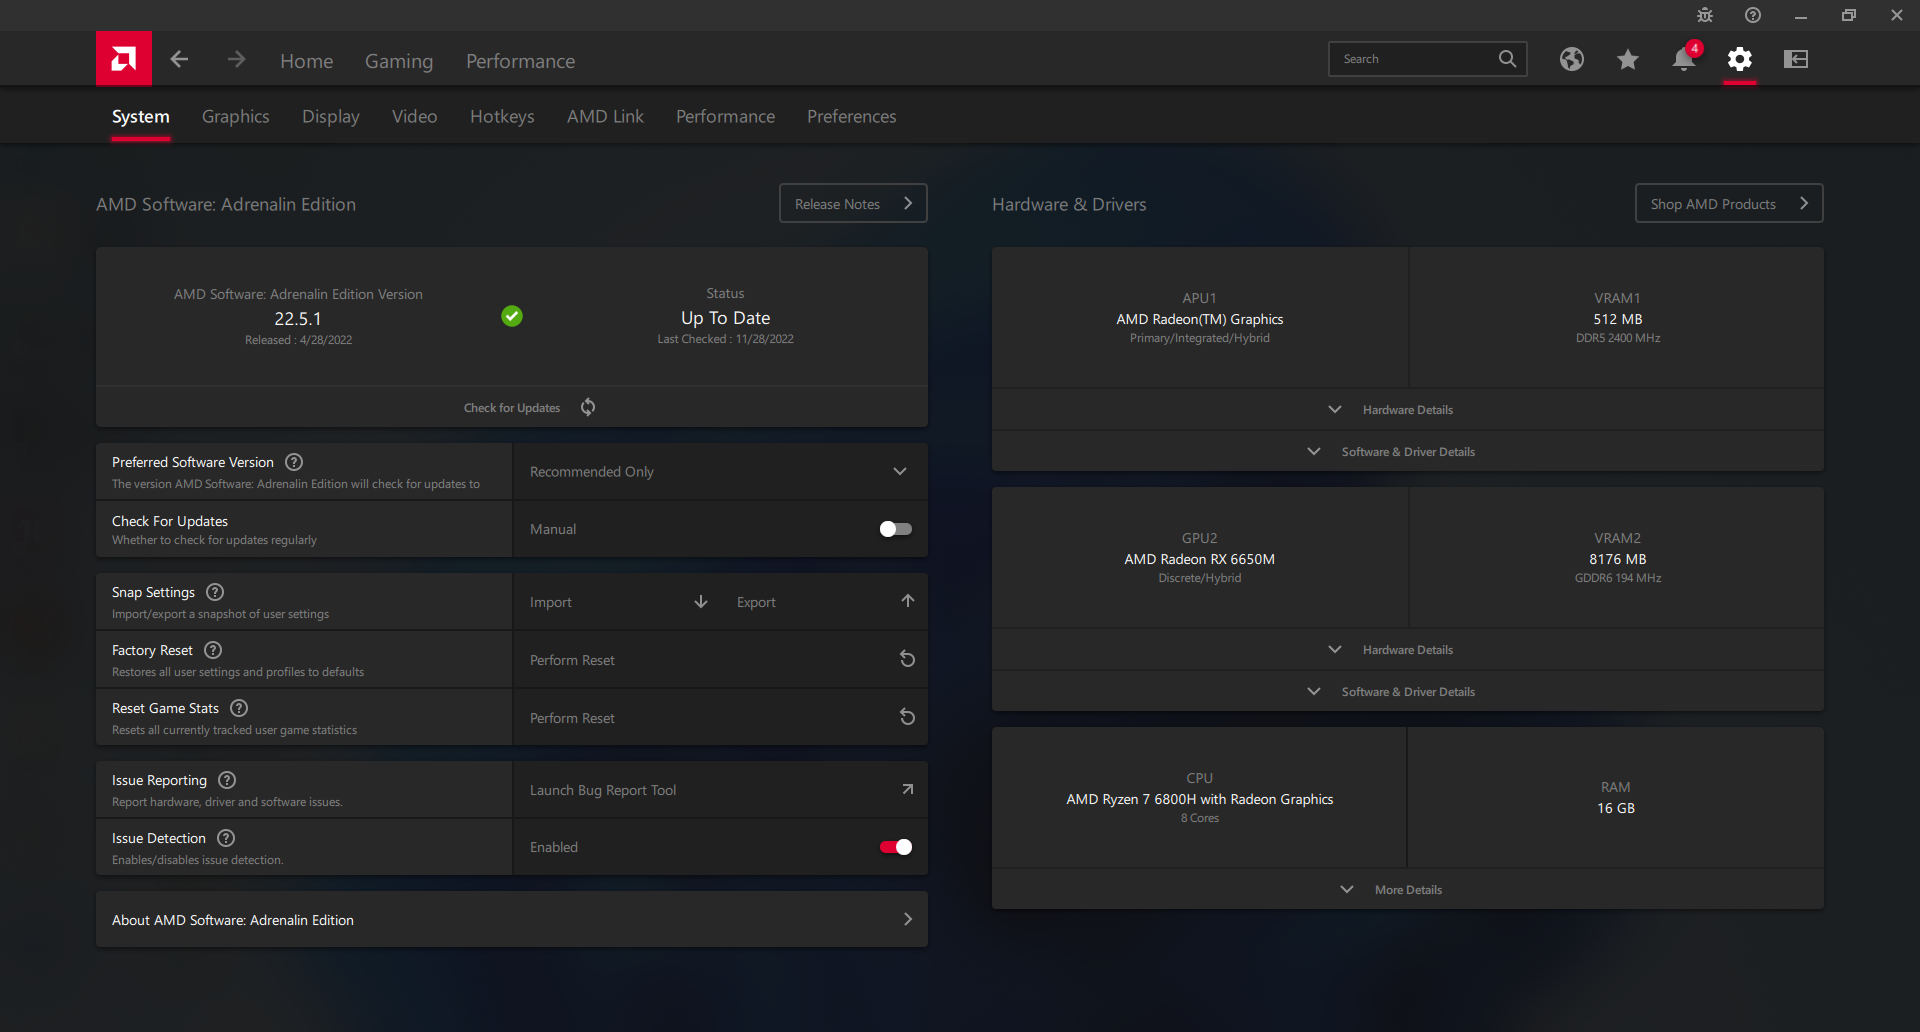
Przed przeprowadzeniem poniższych testów wydajnościowych ustawiliśmy nasze urządzenie w trybie "Best Performance" za pośrednictwem systemu Windows oraz w trybie "Performance" za pośrednictwem oprogramowania Omen Gaming Hub. Zalecamy zapoznanie się z oprogramowaniem Omen Gaming Hub oraz aplikacjami Radeon Adrenalin, ponieważ są to centra kontroli umożliwiające dostosowanie profili zasilania, podświetlenia klawiatury, adaptacyjnej synchronizacji, Vari-Bright i innych elementów, jak pokazują poniższe zrzuty ekranu.
Nigdzie na laptopie nie możemy znaleźć przełącznika MUX, czy to na ekranie BIOS-u, czy w oprogramowaniu Omen Gaming Hub.
Procesor
Surowa wydajność procesora jest o około 5 procent wolniejsza od przeciętnego laptopa w naszej bazie wyposażonego w ten sam Ryzen 7 6800H procesor. Nasz procesor jest więc tylko o około 10 procent szybszy od ubiegłorocznego Ryzen 7 5800H co ma być marginalną aktualizacją w skali roku. Największa różnica między mobilnymi Zen 3 i Zen 3+ leży w zintegrowanych rozwiązaniach graficznych, ale w laptopach do gier, takich jak Omen 16, nie ma to prawie żadnego znaczenia, gdyż prawie zawsze są one wyposażone w szybsze dedykowane GPU.
Wydajność jednowątkowa i wielowątkowa jest o około 10 i 25 procent wolniejsza od konkurencyjnego Core i7-12700H w Dellu G16 7620. Decydując się na droższy Core i9-12900H Omen 16 zwiększyłby wydajność o 30 do 35% w porównaniu z naszymi jednostkami Ryzen.
Cinebench R15 Multi Loop
Cinebench R23: Multi Core | Single Core
Cinebench R15: CPU Multi 64Bit | CPU Single 64Bit
Blender: v2.79 BMW27 CPU
7-Zip 18.03: 7z b 4 | 7z b 4 -mmt1
Geekbench 5.5: Multi-Core | Single-Core
HWBOT x265 Benchmark v2.2: 4k Preset
LibreOffice : 20 Documents To PDF
R Benchmark 2.5: Overall mean
| Cinebench R20 / CPU (Multi Core) | |
| Lenovo Legion 7 16IAX7-82TD004SGE | |
| Alienware x15 R2 P111F | |
| Dell G16 7620 | |
| Lenovo Legion S7 16ARHA7 | |
| Asus ROG Zephyrus M16 GU603H | |
| Przeciętny AMD Ryzen 7 6800H (4460 - 5661, n=9) | |
| HP Omen 16-n0033dx | |
| HP Envy 16 h0112nr | |
| Asus ROG Zephyrus G14 GA402RK | |
| HP Omen 16-c0077ng | |
| HP Victus 16-e0145ng | |
| Razer Blade 15 Advanced Model Early 2022 | |
| HP Pavilion Gaming 16-a0242ng | |
| Cinebench R20 / CPU (Single Core) | |
| Lenovo Legion 7 16IAX7-82TD004SGE | |
| Alienware x15 R2 P111F | |
| Razer Blade 15 Advanced Model Early 2022 | |
| HP Envy 16 h0112nr | |
| Dell G16 7620 | |
| Lenovo Legion S7 16ARHA7 | |
| Asus ROG Zephyrus G14 GA402RK | |
| Asus ROG Zephyrus M16 GU603H | |
| HP Omen 16-n0033dx | |
| Przeciętny AMD Ryzen 7 6800H (580 - 605, n=9) | |
| HP Omen 16-c0077ng | |
| HP Victus 16-e0145ng | |
| HP Pavilion Gaming 16-a0242ng | |
| Cinebench R23 / Multi Core | |
| Lenovo Legion 7 16IAX7-82TD004SGE | |
| Dell G16 7620 | |
| Alienware x15 R2 P111F | |
| Lenovo Legion S7 16ARHA7 | |
| HP Envy 16 h0112nr | |
| HP Omen 16-n0033dx | |
| Przeciętny AMD Ryzen 7 6800H (11481 - 14660, n=11) | |
| Asus ROG Zephyrus G14 GA402RK | |
| HP Omen 16-c0077ng | |
| Razer Blade 15 Advanced Model Early 2022 | |
| HP Victus 16-e0145ng | |
| Cinebench R23 / Single Core | |
| Lenovo Legion 7 16IAX7-82TD004SGE | |
| Alienware x15 R2 P111F | |
| Razer Blade 15 Advanced Model Early 2022 | |
| HP Envy 16 h0112nr | |
| Dell G16 7620 | |
| Lenovo Legion S7 16ARHA7 | |
| Asus ROG Zephyrus G14 GA402RK | |
| Przeciętny AMD Ryzen 7 6800H (1500 - 1552, n=9) | |
| HP Omen 16-n0033dx | |
| HP Omen 16-c0077ng | |
| HP Victus 16-e0145ng | |
| Cinebench R15 / CPU Multi 64Bit | |
| Lenovo Legion 7 16IAX7-82TD004SGE | |
| Alienware x15 R2 P111F | |
| Dell G16 7620 | |
| HP Envy 16 h0112nr | |
| Lenovo Legion S7 16ARHA7 | |
| Asus ROG Zephyrus M16 GU603H | |
| HP Omen 16-n0033dx | |
| Przeciętny AMD Ryzen 7 6800H (1585 - 2366, n=10) | |
| Asus ROG Zephyrus G14 GA402RK | |
| HP Omen 16-c0077ng | |
| HP Victus 16-e0145ng | |
| Razer Blade 15 Advanced Model Early 2022 | |
| HP Pavilion Gaming 16-a0242ng | |
| Cinebench R15 / CPU Single 64Bit | |
| Lenovo Legion 7 16IAX7-82TD004SGE | |
| Alienware x15 R2 P111F | |
| Lenovo Legion S7 16ARHA7 | |
| HP Envy 16 h0112nr | |
| Asus ROG Zephyrus G14 GA402RK | |
| Dell G16 7620 | |
| HP Omen 16-n0033dx | |
| Razer Blade 15 Advanced Model Early 2022 | |
| Asus ROG Zephyrus M16 GU603H | |
| Przeciętny AMD Ryzen 7 6800H (182.7 - 250, n=10) | |
| HP Omen 16-c0077ng | |
| HP Victus 16-e0145ng | |
| HP Pavilion Gaming 16-a0242ng | |
| Blender / v2.79 BMW27 CPU | |
| HP Pavilion Gaming 16-a0242ng | |
| HP Victus 16-e0145ng | |
| Razer Blade 15 Advanced Model Early 2022 | |
| HP Omen 16-c0077ng | |
| HP Envy 16 h0112nr | |
| Asus ROG Zephyrus G14 GA402RK | |
| Asus ROG Zephyrus M16 GU603H | |
| Przeciętny AMD Ryzen 7 6800H (213 - 268, n=8) | |
| HP Omen 16-n0033dx | |
| Lenovo Legion S7 16ARHA7 | |
| Alienware x15 R2 P111F | |
| Dell G16 7620 | |
| Lenovo Legion 7 16IAX7-82TD004SGE | |
| 7-Zip 18.03 / 7z b 4 | |
| Lenovo Legion 7 16IAX7-82TD004SGE | |
| Alienware x15 R2 P111F | |
| Dell G16 7620 | |
| Lenovo Legion S7 16ARHA7 | |
| Asus ROG Zephyrus G14 GA402RK | |
| Przeciętny AMD Ryzen 7 6800H (55067 - 64817, n=8) | |
| HP Omen 16-n0033dx | |
| HP Envy 16 h0112nr | |
| Asus ROG Zephyrus M16 GU603H | |
| HP Victus 16-e0145ng | |
| Razer Blade 15 Advanced Model Early 2022 | |
| HP Pavilion Gaming 16-a0242ng | |
| 7-Zip 18.03 / 7z b 4 -mmt1 | |
| Lenovo Legion 7 16IAX7-82TD004SGE | |
| Lenovo Legion S7 16ARHA7 | |
| Razer Blade 15 Advanced Model Early 2022 | |
| Asus ROG Zephyrus G14 GA402RK | |
| Alienware x15 R2 P111F | |
| Przeciętny AMD Ryzen 7 6800H (5521 - 5803, n=8) | |
| HP Envy 16 h0112nr | |
| HP Omen 16-n0033dx | |
| Asus ROG Zephyrus M16 GU603H | |
| HP Omen 16-c0077ng | |
| HP Victus 16-e0145ng | |
| Dell G16 7620 | |
| HP Pavilion Gaming 16-a0242ng | |
| Geekbench 5.5 / Multi-Core | |
| Lenovo Legion 7 16IAX7-82TD004SGE | |
| Alienware x15 R2 P111F | |
| HP Envy 16 h0112nr | |
| Dell G16 7620 | |
| Asus ROG Zephyrus G14 GA402RK | |
| Lenovo Legion S7 16ARHA7 | |
| Asus ROG Zephyrus M16 GU603H | |
| Razer Blade 15 Advanced Model Early 2022 | |
| Przeciętny AMD Ryzen 7 6800H (8898 - 10355, n=10) | |
| HP Omen 16-n0033dx | |
| HP Omen 16-c0077ng | |
| HP Victus 16-e0145ng | |
| HP Pavilion Gaming 16-a0242ng | |
| HP Pavilion Gaming 16-a0242ng | |
| Geekbench 5.5 / Single-Core | |
| Lenovo Legion 7 16IAX7-82TD004SGE | |
| Alienware x15 R2 P111F | |
| Razer Blade 15 Advanced Model Early 2022 | |
| HP Envy 16 h0112nr | |
| Dell G16 7620 | |
| Lenovo Legion S7 16ARHA7 | |
| Asus ROG Zephyrus M16 GU603H | |
| Asus ROG Zephyrus G14 GA402RK | |
| Przeciętny AMD Ryzen 7 6800H (1518 - 1568, n=10) | |
| HP Omen 16-n0033dx | |
| HP Victus 16-e0145ng | |
| HP Omen 16-c0077ng | |
| HP Pavilion Gaming 16-a0242ng | |
| HP Pavilion Gaming 16-a0242ng | |
| HWBOT x265 Benchmark v2.2 / 4k Preset | |
| Lenovo Legion 7 16IAX7-82TD004SGE | |
| Alienware x15 R2 P111F | |
| Dell G16 7620 | |
| Lenovo Legion S7 16ARHA7 | |
| HP Omen 16-n0033dx | |
| Przeciętny AMD Ryzen 7 6800H (14.9 - 18.5, n=9) | |
| Asus ROG Zephyrus G14 GA402RK | |
| HP Omen 16-c0077ng | |
| Asus ROG Zephyrus M16 GU603H | |
| HP Envy 16 h0112nr | |
| HP Victus 16-e0145ng | |
| Razer Blade 15 Advanced Model Early 2022 | |
| HP Pavilion Gaming 16-a0242ng | |
| LibreOffice / 20 Documents To PDF | |
| HP Omen 16-c0077ng | |
| HP Victus 16-e0145ng | |
| HP Omen 16-n0033dx | |
| Przeciętny AMD Ryzen 7 6800H (48.7 - 79.5, n=8) | |
| HP Pavilion Gaming 16-a0242ng | |
| Dell G16 7620 | |
| Lenovo Legion S7 16ARHA7 | |
| Asus ROG Zephyrus G14 GA402RK | |
| Alienware x15 R2 P111F | |
| HP Envy 16 h0112nr | |
| Razer Blade 15 Advanced Model Early 2022 | |
| Asus ROG Zephyrus M16 GU603H | |
| Lenovo Legion 7 16IAX7-82TD004SGE | |
| R Benchmark 2.5 / Overall mean | |
| HP Pavilion Gaming 16-a0242ng | |
| Asus ROG Zephyrus M16 GU603H | |
| HP Victus 16-e0145ng | |
| HP Omen 16-c0077ng | |
| Dell G16 7620 | |
| HP Omen 16-n0033dx | |
| Przeciętny AMD Ryzen 7 6800H (0.4783 - 0.515, n=8) | |
| Asus ROG Zephyrus G14 GA402RK | |
| Lenovo Legion S7 16ARHA7 | |
| HP Envy 16 h0112nr | |
| Razer Blade 15 Advanced Model Early 2022 | |
| Alienware x15 R2 P111F | |
| Lenovo Legion 7 16IAX7-82TD004SGE | |
Cinebench R23: Multi Core | Single Core
Cinebench R15: CPU Multi 64Bit | CPU Single 64Bit
Blender: v2.79 BMW27 CPU
7-Zip 18.03: 7z b 4 | 7z b 4 -mmt1
Geekbench 5.5: Multi-Core | Single-Core
HWBOT x265 Benchmark v2.2: 4k Preset
LibreOffice : 20 Documents To PDF
R Benchmark 2.5: Overall mean
* ... im mniej tym lepiej
AIDA64: FP32 Ray-Trace | FPU Julia | CPU SHA3 | CPU Queen | FPU SinJulia | FPU Mandel | CPU AES | CPU ZLib | FP64 Ray-Trace | CPU PhotoWorxx
| Performance rating | |
| Lenovo Legion S7 16ARHA7 | |
| HP Omen 16-n0033dx | |
| Przeciętny AMD Ryzen 7 6800H | |
| Dell G16 7620 | |
| HP Envy 16 h0112nr | |
| HP Omen 16-b1090ng | |
| HP Victus 16-e0145ng | |
| AIDA64 / FP32 Ray-Trace | |
| Lenovo Legion S7 16ARHA7 | |
| HP Omen 16-n0033dx | |
| Przeciętny AMD Ryzen 7 6800H (12876 - 17031, n=8) | |
| Dell G16 7620 | |
| HP Envy 16 h0112nr | |
| HP Victus 16-e0145ng | |
| HP Omen 16-b1090ng | |
| AIDA64 / FPU Julia | |
| Lenovo Legion S7 16ARHA7 | |
| HP Omen 16-n0033dx | |
| Przeciętny AMD Ryzen 7 6800H (82673 - 105987, n=8) | |
| Dell G16 7620 | |
| HP Victus 16-e0145ng | |
| HP Envy 16 h0112nr | |
| HP Omen 16-b1090ng | |
| AIDA64 / CPU SHA3 | |
| Dell G16 7620 | |
| Lenovo Legion S7 16ARHA7 | |
| HP Omen 16-n0033dx | |
| Przeciętny AMD Ryzen 7 6800H (2886 - 3634, n=8) | |
| HP Envy 16 h0112nr | |
| HP Omen 16-b1090ng | |
| HP Victus 16-e0145ng | |
| AIDA64 / CPU Queen | |
| Lenovo Legion S7 16ARHA7 | |
| HP Omen 16-n0033dx | |
| Dell G16 7620 | |
| HP Envy 16 h0112nr | |
| HP Omen 16-b1090ng | |
| Przeciętny AMD Ryzen 7 6800H (75117 - 106322, n=8) | |
| HP Victus 16-e0145ng | |
| AIDA64 / FPU SinJulia | |
| Lenovo Legion S7 16ARHA7 | |
| HP Omen 16-n0033dx | |
| Przeciętny AMD Ryzen 7 6800H (11771 - 13120, n=8) | |
| Dell G16 7620 | |
| HP Omen 16-b1090ng | |
| HP Victus 16-e0145ng | |
| HP Envy 16 h0112nr | |
| AIDA64 / FPU Mandel | |
| Lenovo Legion S7 16ARHA7 | |
| HP Omen 16-n0033dx | |
| Przeciętny AMD Ryzen 7 6800H (45287 - 58327, n=8) | |
| HP Victus 16-e0145ng | |
| Dell G16 7620 | |
| HP Envy 16 h0112nr | |
| HP Omen 16-b1090ng | |
| AIDA64 / CPU AES | |
| Lenovo Legion S7 16ARHA7 | |
| HP Omen 16-n0033dx | |
| Przeciętny AMD Ryzen 7 6800H (67816 - 137383, n=8) | |
| HP Envy 16 h0112nr | |
| HP Omen 16-b1090ng | |
| Dell G16 7620 | |
| HP Victus 16-e0145ng | |
| AIDA64 / CPU ZLib | |
| Dell G16 7620 | |
| HP Omen 16-b1090ng | |
| Lenovo Legion S7 16ARHA7 | |
| HP Omen 16-n0033dx | |
| Przeciętny AMD Ryzen 7 6800H (732 - 901, n=8) | |
| HP Envy 16 h0112nr | |
| HP Victus 16-e0145ng | |
| AIDA64 / FP64 Ray-Trace | |
| Lenovo Legion S7 16ARHA7 | |
| HP Omen 16-n0033dx | |
| Przeciętny AMD Ryzen 7 6800H (6917 - 8980, n=8) | |
| Dell G16 7620 | |
| HP Envy 16 h0112nr | |
| HP Victus 16-e0145ng | |
| HP Omen 16-b1090ng | |
| AIDA64 / CPU PhotoWorxx | |
| HP Omen 16-b1090ng | |
| HP Envy 16 h0112nr | |
| Dell G16 7620 | |
| Przeciętny AMD Ryzen 7 6800H (26496 - 30360, n=8) | |
| Lenovo Legion S7 16ARHA7 | |
| HP Omen 16-n0033dx | |
| HP Victus 16-e0145ng | |
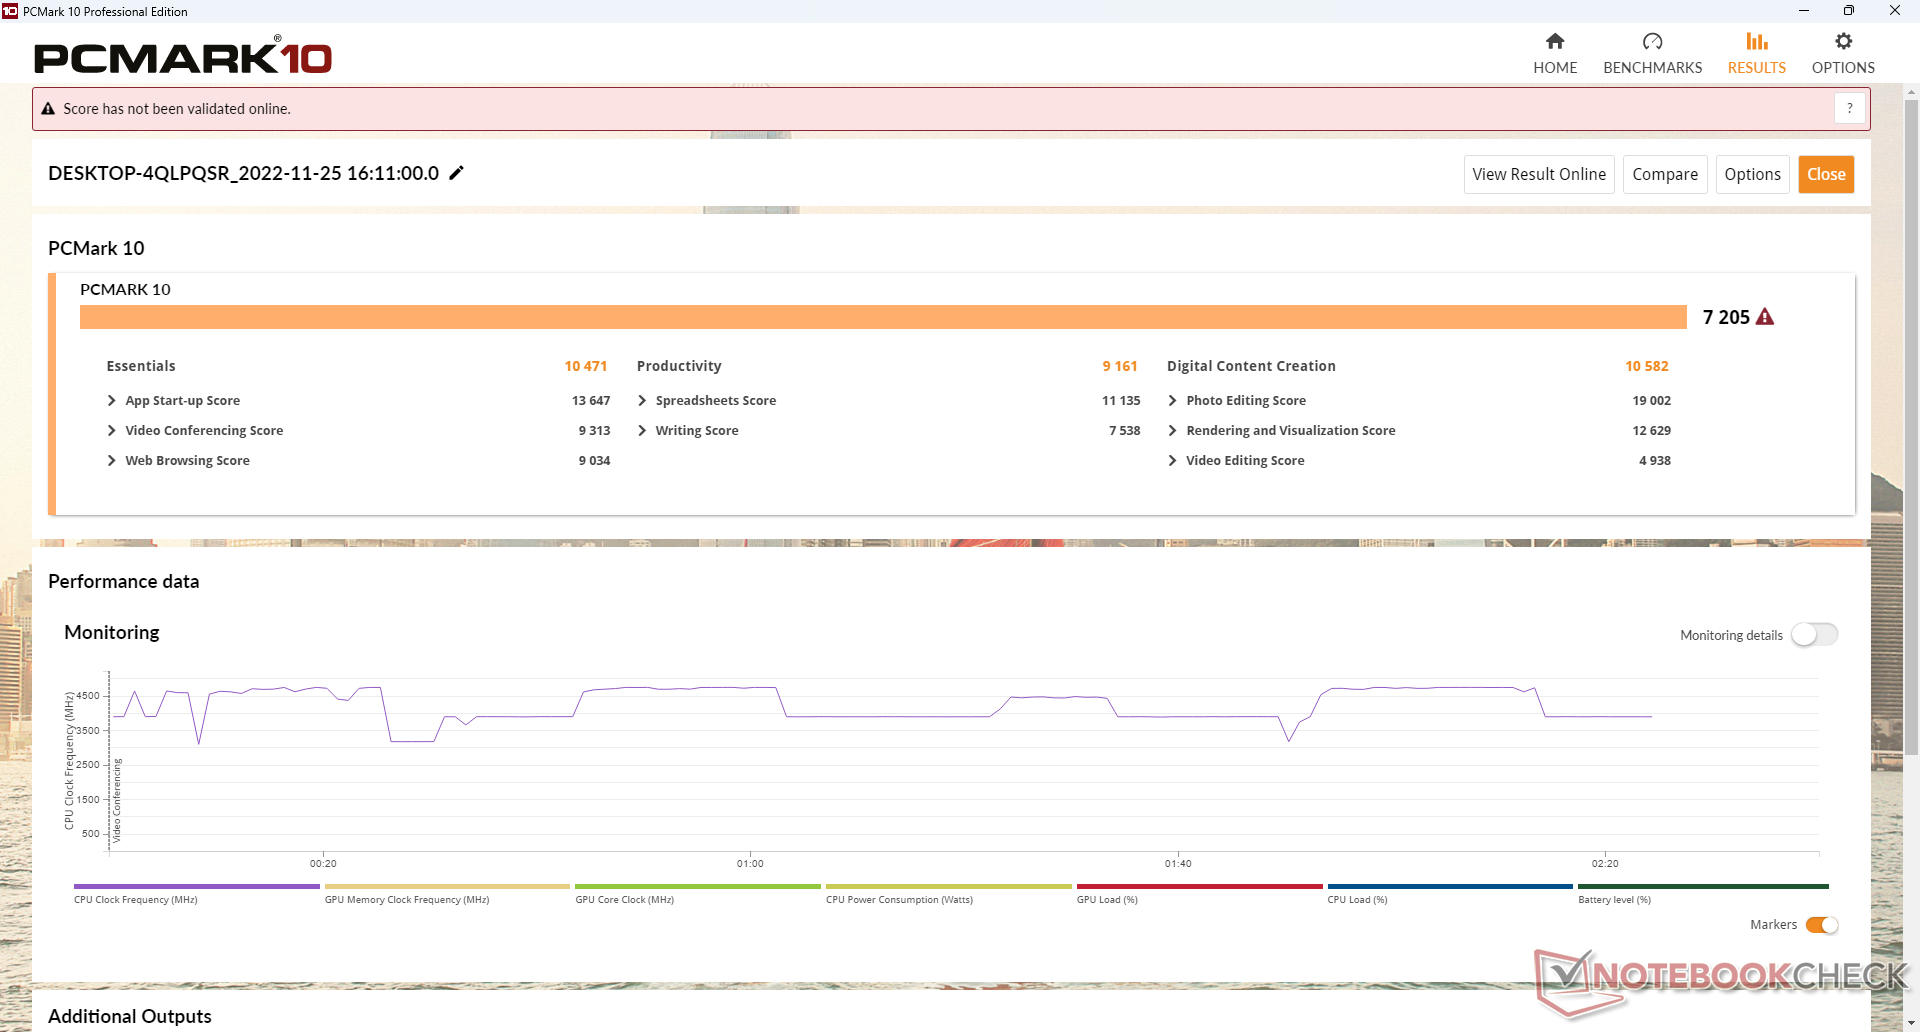
Wydajność systemu
Wyniki w programie PCMark są porównywalne z najnowszymi laptopami do gier działającymi na procesorach Intel 12. generacji i układach graficznych Nvidia GeForce RTX. Wyniki konsekwentnie wyprzedzają Victus 16 który jest bardziej przyjazną dla budżetu serią gamingową od HP.
CrossMark: Overall | Productivity | Creativity | Responsiveness
| PCMark 10 / Score | |
| Lenovo Legion S7 16ARHA7 | |
| HP Envy 16 h0112nr | |
| HP Omen 16-b1090ng | |
| Dell G16 7620 | |
| HP Omen 16-n0033dx | |
| HP Victus 16-e0145ng | |
| PCMark 10 / Essentials | |
| HP Envy 16 h0112nr | |
| Lenovo Legion S7 16ARHA7 | |
| HP Omen 16-n0033dx | |
| Dell G16 7620 | |
| HP Omen 16-b1090ng | |
| HP Victus 16-e0145ng | |
| PCMark 10 / Productivity | |
| Lenovo Legion S7 16ARHA7 | |
| HP Omen 16-b1090ng | |
| HP Envy 16 h0112nr | |
| HP Omen 16-n0033dx | |
| Dell G16 7620 | |
| HP Victus 16-e0145ng | |
| PCMark 10 / Digital Content Creation | |
| Lenovo Legion S7 16ARHA7 | |
| Dell G16 7620 | |
| HP Omen 16-b1090ng | |
| HP Envy 16 h0112nr | |
| HP Omen 16-n0033dx | |
| HP Victus 16-e0145ng | |
| CrossMark / Overall | |
| HP Envy 16 h0112nr | |
| Dell G16 7620 | |
| Lenovo Legion S7 16ARHA7 | |
| HP Omen 16-n0033dx | |
| CrossMark / Productivity | |
| HP Envy 16 h0112nr | |
| Dell G16 7620 | |
| Lenovo Legion S7 16ARHA7 | |
| HP Omen 16-n0033dx | |
| CrossMark / Creativity | |
| HP Envy 16 h0112nr | |
| Dell G16 7620 | |
| Lenovo Legion S7 16ARHA7 | |
| HP Omen 16-n0033dx | |
| CrossMark / Responsiveness | |
| Dell G16 7620 | |
| HP Envy 16 h0112nr | |
| Lenovo Legion S7 16ARHA7 | |
| HP Omen 16-n0033dx | |
| PCMark 10 Score | 7205 pkt. | |
Pomoc | ||
| AIDA64 / Memory Copy | |
| HP Omen 16-b1090ng | |
| HP Envy 16 h0112nr | |
| Dell G16 7620 | |
| Przeciętny AMD Ryzen 7 6800H (48209 - 51186, n=8) | |
| Lenovo Legion S7 16ARHA7 | |
| HP Omen 16-n0033dx | |
| HP Victus 16-e0145ng | |
| AIDA64 / Memory Read | |
| HP Omen 16-b1090ng | |
| HP Envy 16 h0112nr | |
| Dell G16 7620 | |
| Lenovo Legion S7 16ARHA7 | |
| HP Omen 16-n0033dx | |
| Przeciętny AMD Ryzen 7 6800H (43828 - 51778, n=8) | |
| HP Victus 16-e0145ng | |
| AIDA64 / Memory Write | |
| HP Omen 16-b1090ng | |
| HP Envy 16 h0112nr | |
| Dell G16 7620 | |
| Lenovo Legion S7 16ARHA7 | |
| HP Omen 16-n0033dx | |
| Przeciętny AMD Ryzen 7 6800H (51116 - 55307, n=8) | |
| HP Victus 16-e0145ng | |
| AIDA64 / Memory Latency | |
| Dell G16 7620 | |
| HP Envy 16 h0112nr | |
| HP Omen 16-b1090ng | |
| Przeciętny AMD Ryzen 7 6800H (83.1 - 104.1, n=8) | |
| HP Omen 16-n0033dx | |
| Lenovo Legion S7 16ARHA7 | |
| HP Victus 16-e0145ng | |
* ... im mniej tym lepiej
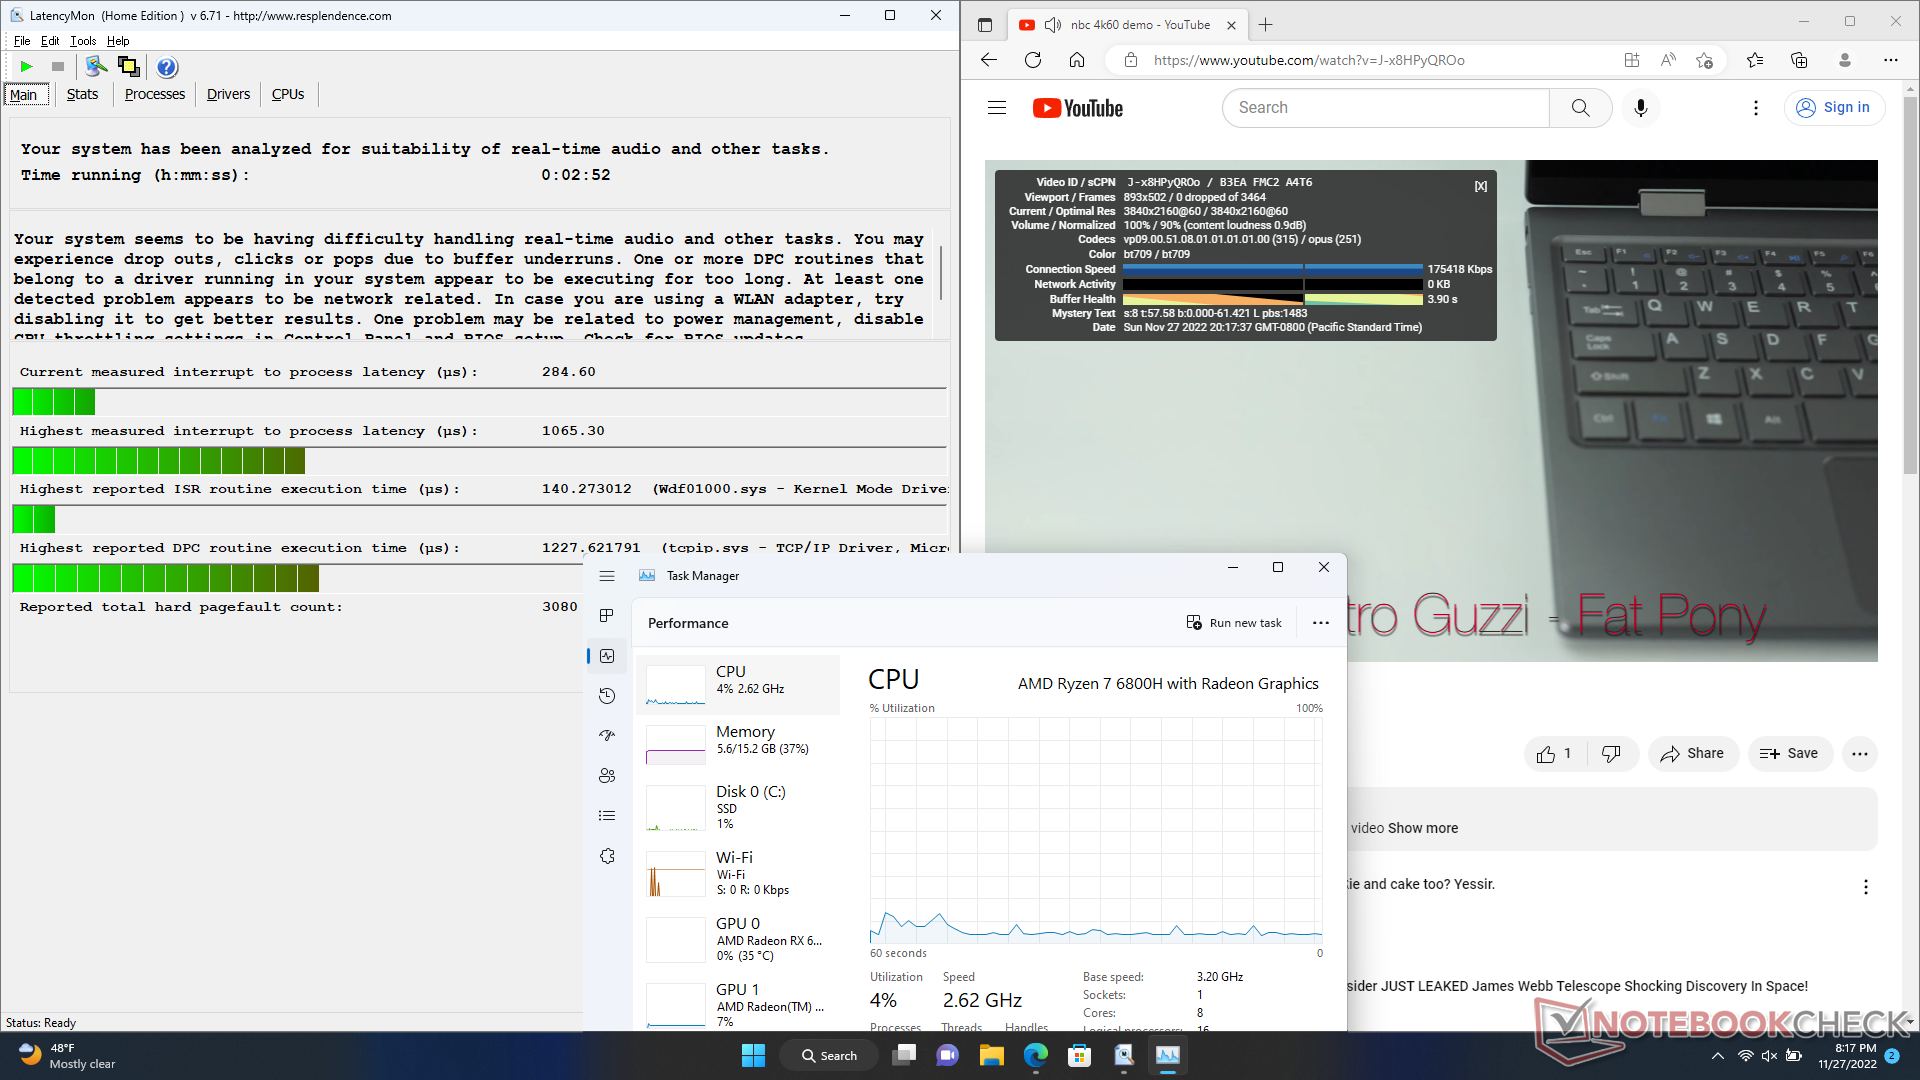
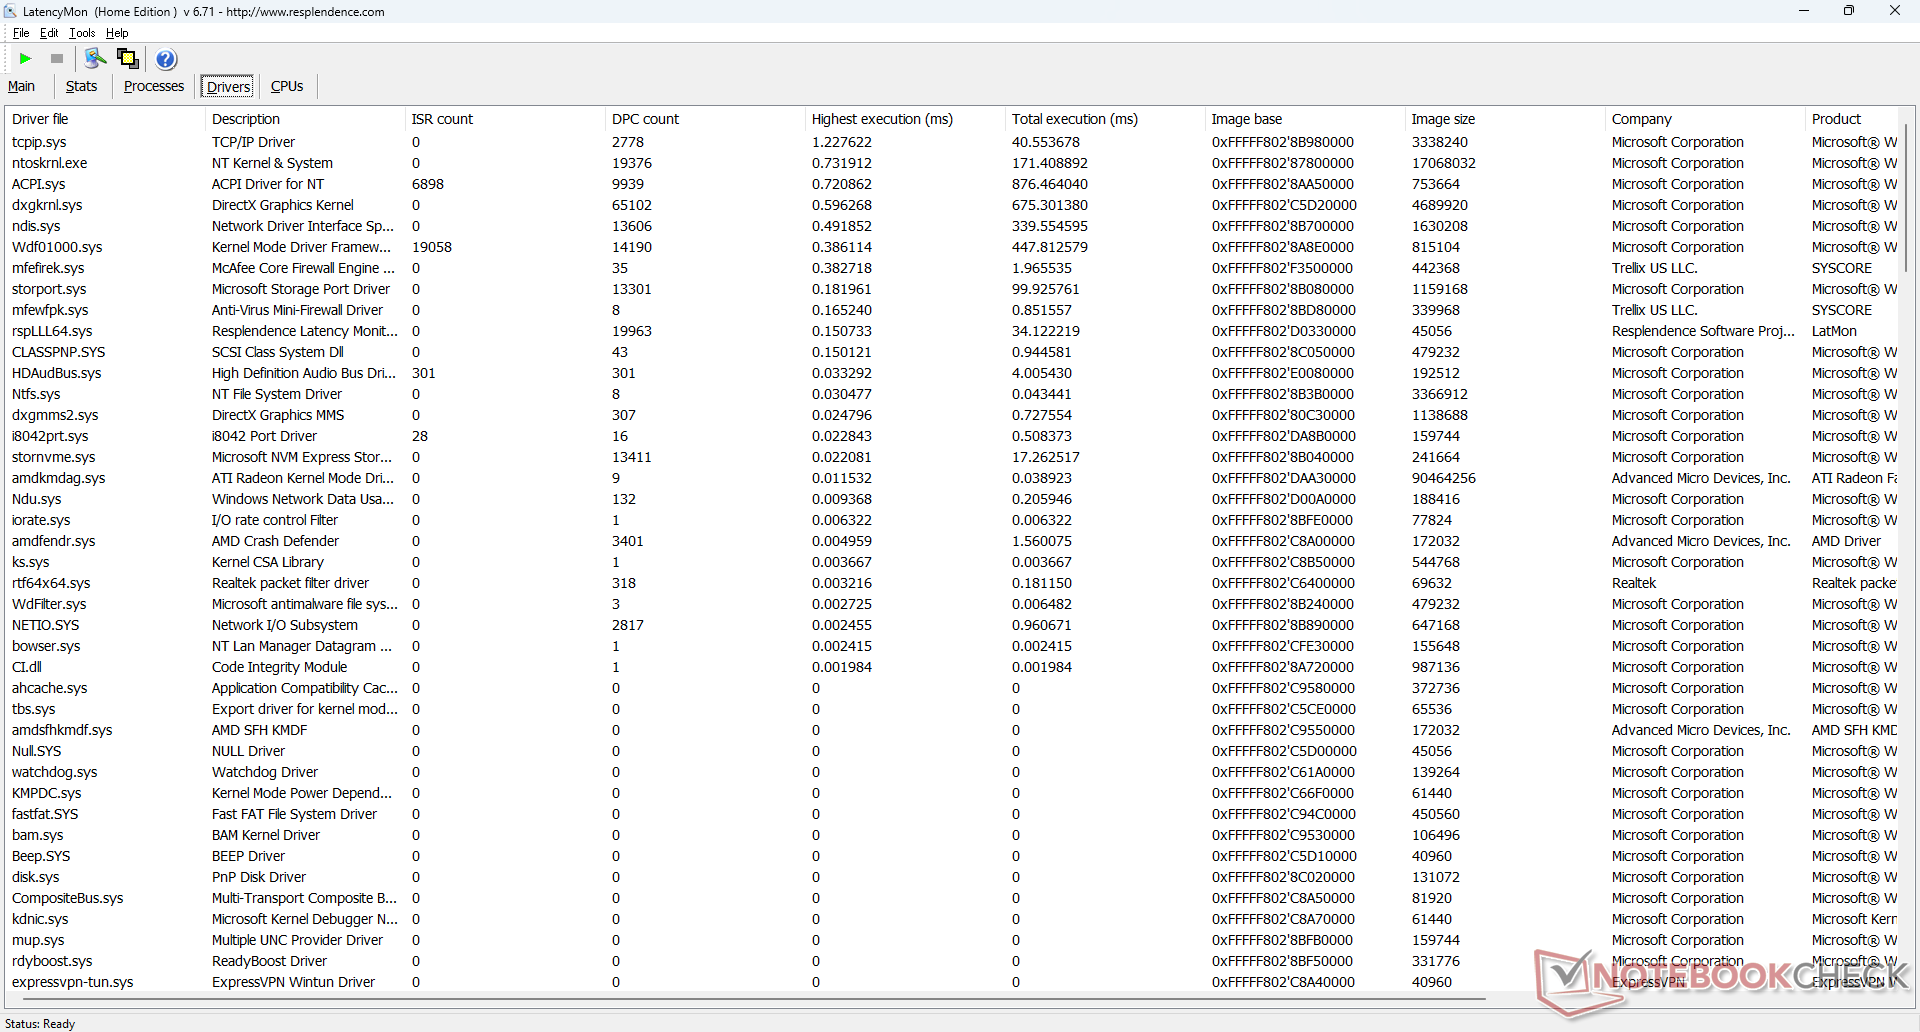
Opóźnienie DPC
LatencyMon ujawnia problemy z DPC podczas otwierania wielu kart przeglądarki na naszej stronie głównej. odtwarzanie wideo w rozdzielczości 4K przy 60 FPS jest poza tym perfekcyjne, z niskim wykorzystaniem CPU/GPU i brakiem opuszczonych klatek.
| DPC Latencies / LatencyMon - interrupt to process latency (max), Web, Youtube, Prime95 | |
| HP Omen 16-n0033dx | |
| Lenovo Legion S7 16ARHA7 | |
| Dell G16 7620 | |
| HP Victus 16-e0145ng | |
| HP Envy 16 h0112nr | |
| HP Omen 16-b1090ng | |
* ... im mniej tym lepiej
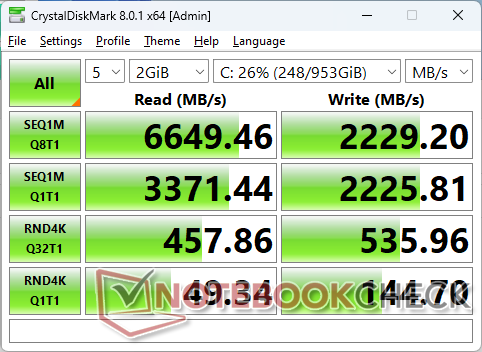
Urządzenia pamięci masowej - do dwóch dysków SSD PCIe4 x4 NVMe
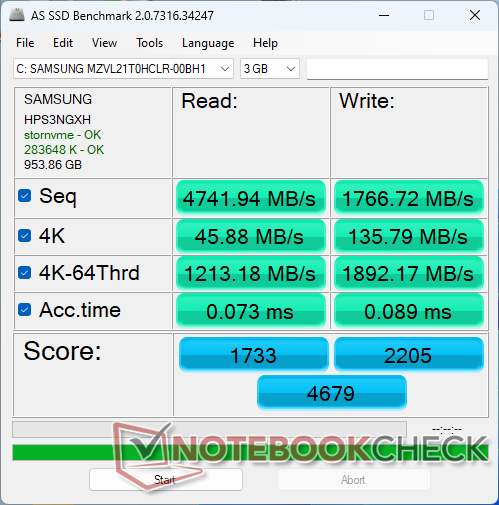
Nasz testowy egzemplarz dostarczany jest z dyskiem 1 TB Samsung PM9A1 SSD obiecujący sekwencyjny odczyt i zapis na poziomie odpowiednio 7000 MB/s i 5100 MB/s. System jest w stanie utrzymać rzeczywistą szybkość odczytu na poziomie około 6700 MB/s w nieskończoność, ale dysk od czasu do czasu spada do poziomu 3000 MB/s, po czym wraca do normy, jak pokazują wyniki naszych testów w pętli poniżej. Jest to prawdopodobnie błąd w systemie, a nie środek dławiący wydajność. Każde z dwóch gniazd M.2 2280 ma własną podkładkę termiczną, która odprowadza ciepło na metalowy panel dolny, więc przegrzewanie się dysków SSD nie powinno być problemem.

| Drive Performance rating - Percent | |
| Dell G16 7620 | |
| HP Omen 16-b1090ng | |
| Lenovo Legion S7 16ARHA7 | |
| HP Envy 16 h0112nr | |
| HP Victus 16-e0145ng | |
| HP Omen 16-n0033dx | |
* ... im mniej tym lepiej
Disk Throttling: DiskSpd Read Loop, Queue Depth 8
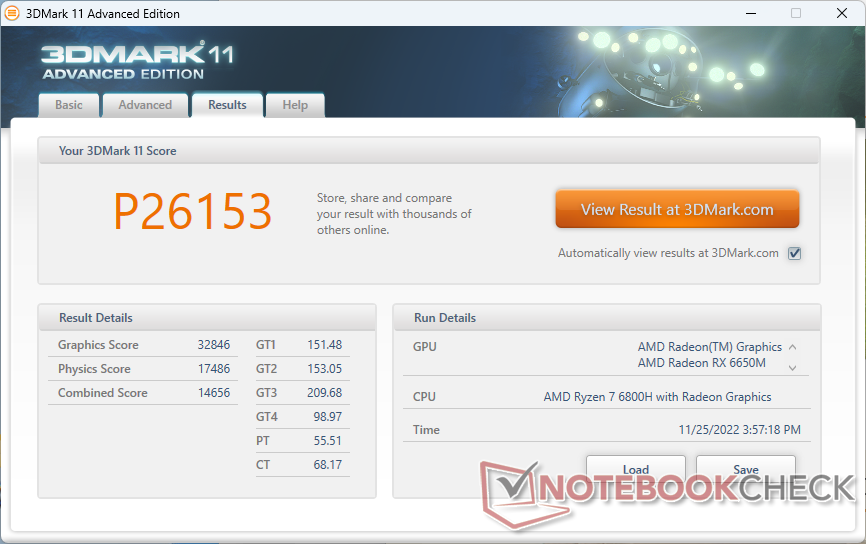
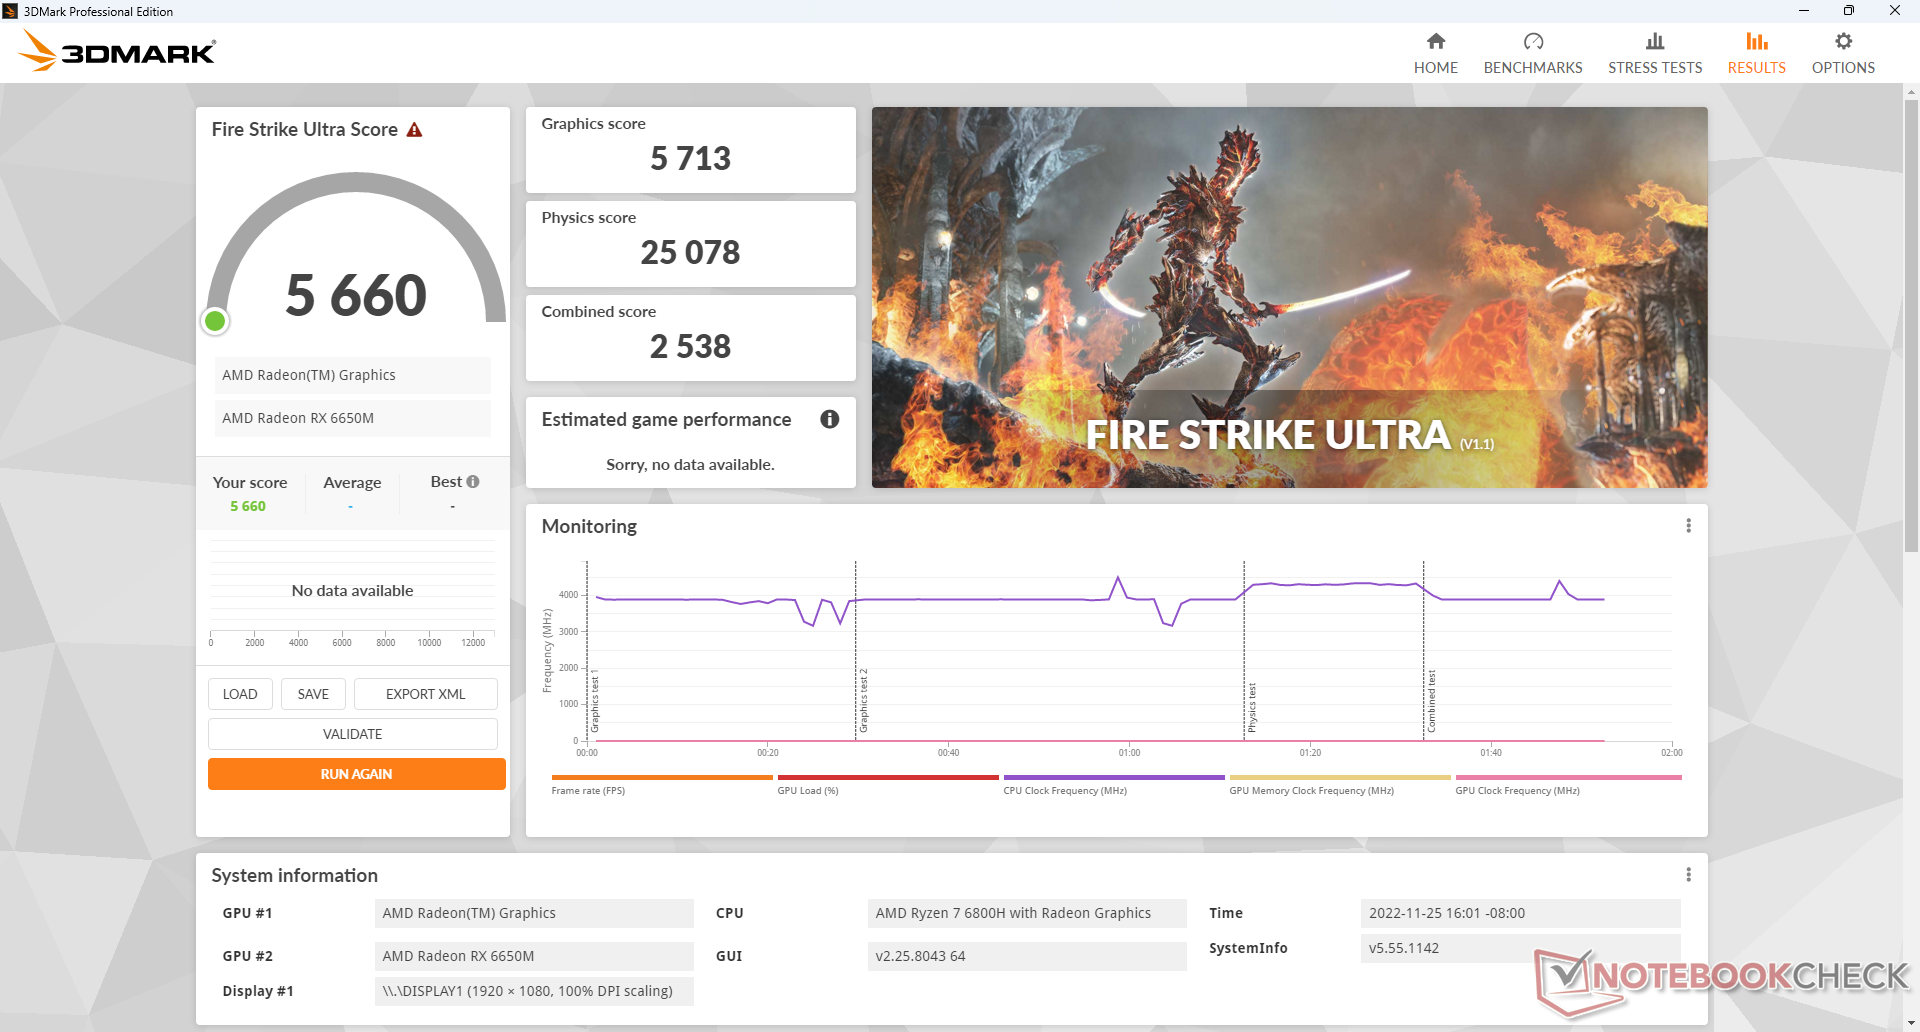
Wydajność procesora graficznego - przewaga nad GeForce RTX 3060
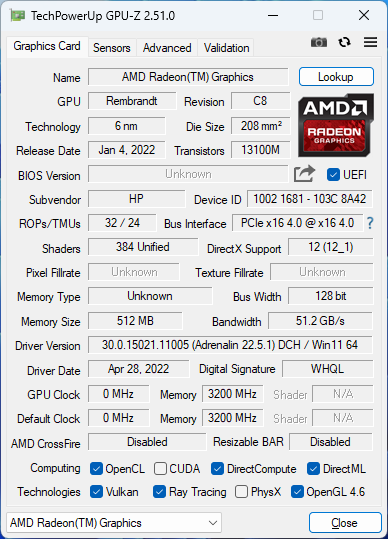
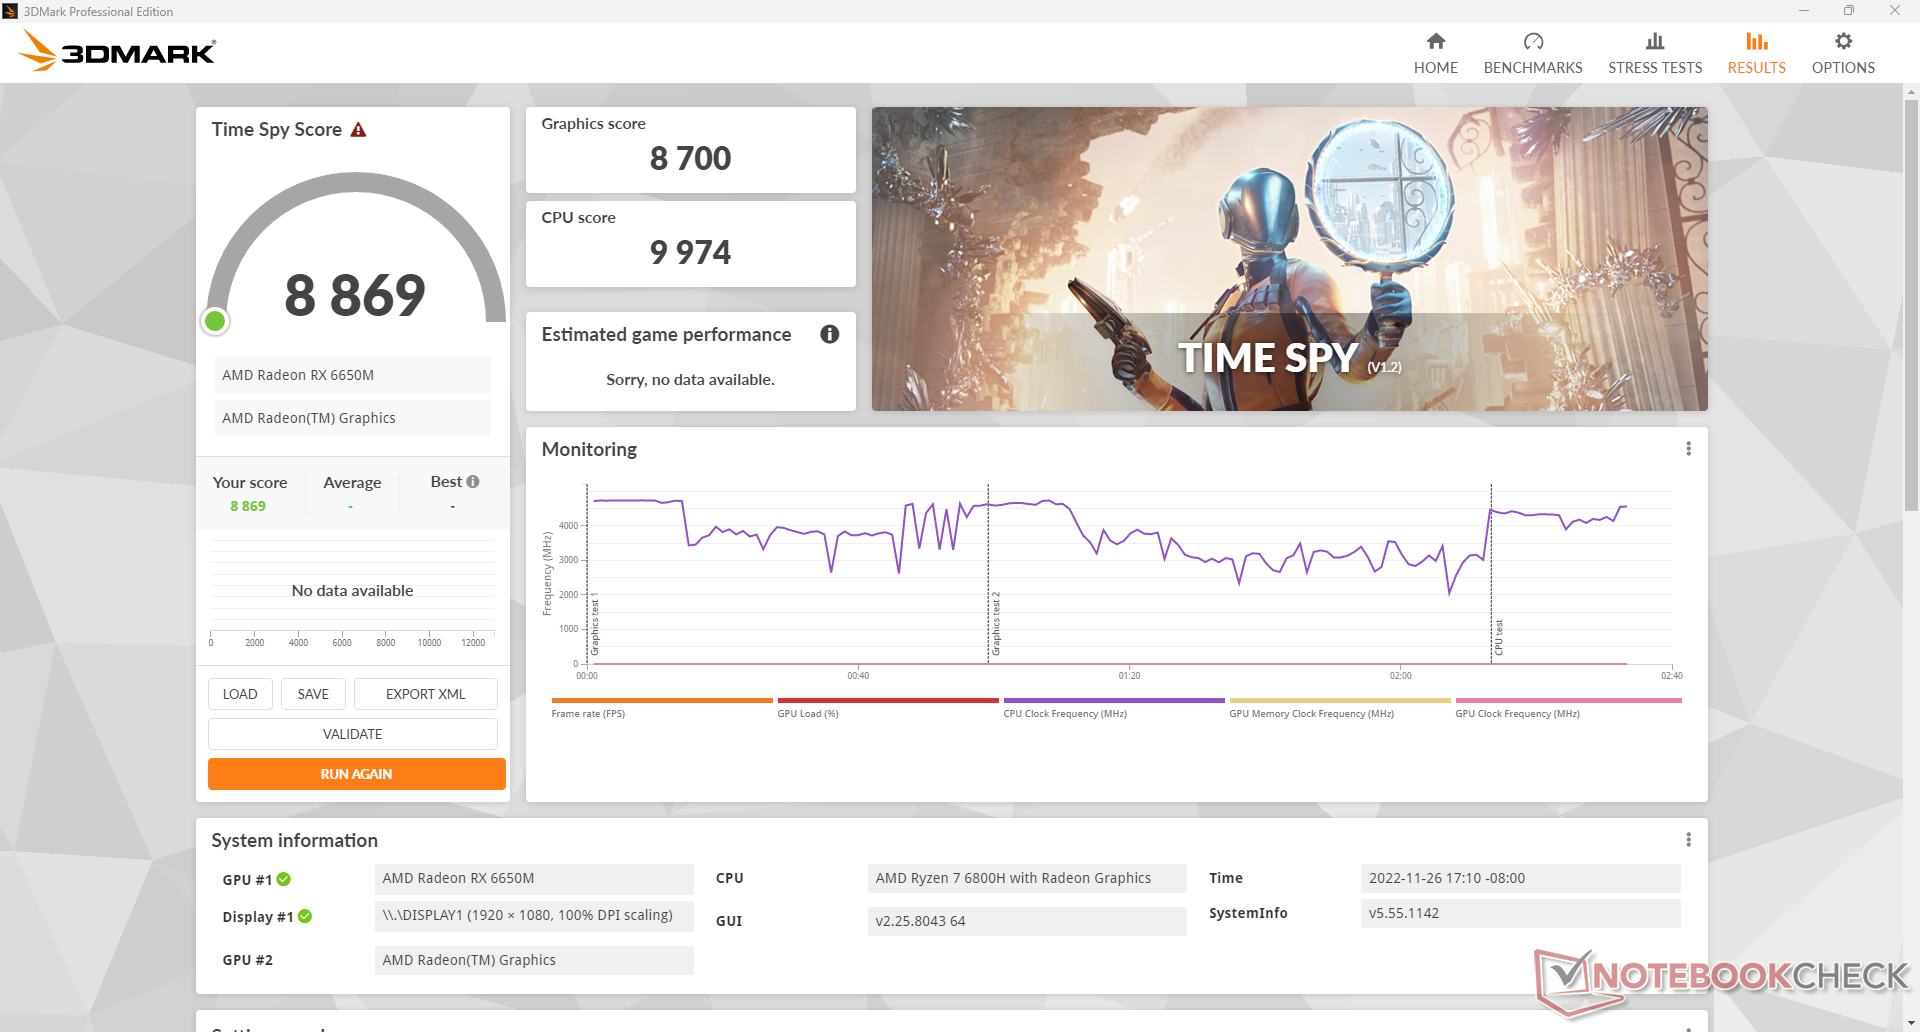
Radeon RX 6650M plasuje się pomiędzy mobilnym GeForce RTX 3060 a mobilnym GeForce RTX 3070 jeśli chodzi o wydajność. Niestety bliżej mu jednak do RTX 3060 niż do RTX 3070, a więc użytkownicy powinni spodziewać się podczas grania w większość gier liczby klatek na sekundę wyższej o zaledwie 5 do 10 procent od przeciętnego laptopa z RTX 3060.
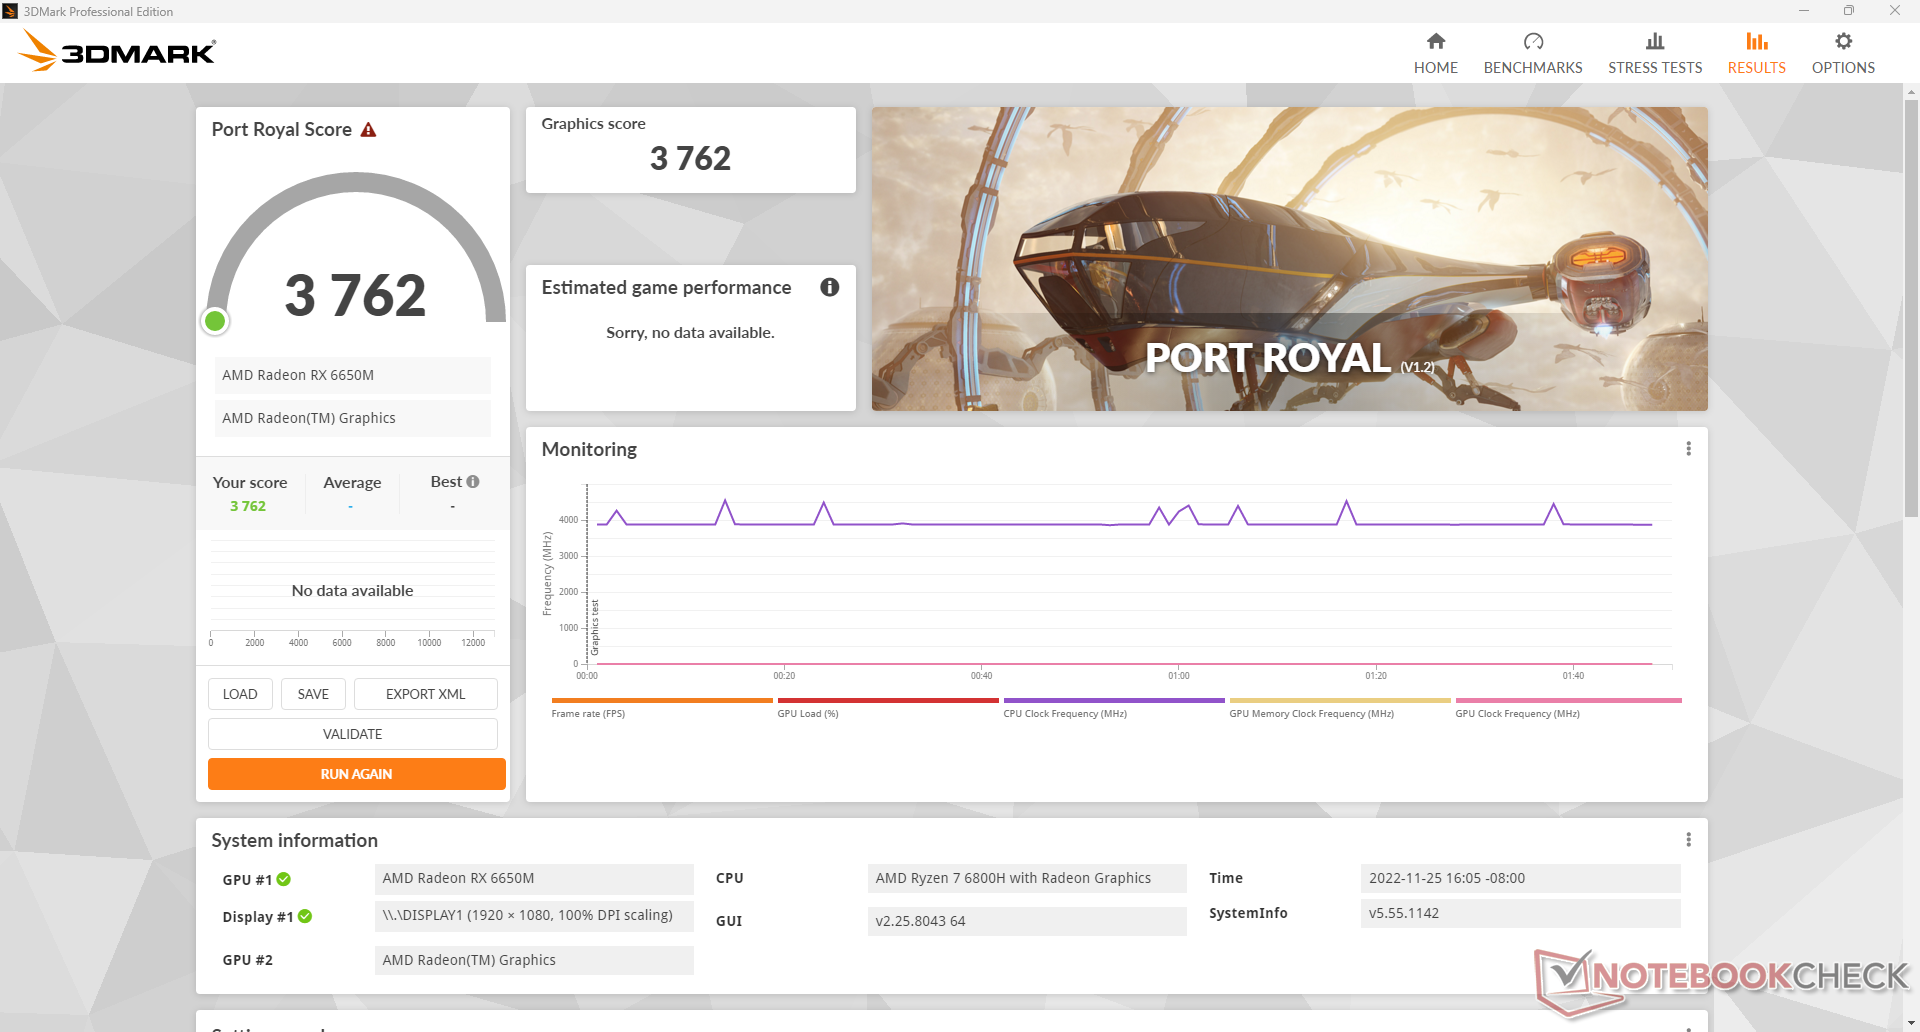
Choć Radeon RX 6650M nieznacznie przewyższa laptopy z RTX 3060, jeśli chodzi o wydajność rasteryzacji, jest znacznie wolniejszy, jeśli chodzi o wydajność ray-tracingu w czasie rzeczywistym. wyniki 3DMark Port Royal są o prawie 30 procent niższe niż na Dellu G16 napędzanym przez RTX 3060. Aby sprawdzić to w rzeczywistej grze, uruchomiliśmy F1 22 na ustawieniach 1080p z i bez RT na naszym zasilanym przez AMD laptopie HP. Gdy RT jest wyłączony, liczba klatek na sekundę konsekwentnie wyprzedzała każdy laptop z RTX 3060. Gdy RT jest wyłączony, liczba klatek na sekundę spada o około 15 procent wolniej niż na tych samych laptopach z RTX 3060. Jeśli wydajność RT jest dla Ciebie ważna, to na pewno warto rozważyć jednostkę SKU Nvidii.
Uruchomienie trybu Balanced zamiast trybu Performance obniży wydajność GPU o około 11 procent.
Procesor graficzny nie jest niestety pozbawiony kilku problemów. Na przykład renderowanie Blendera HIP i Horizon Zero Dawn powodowały zawieszanie się programu i problemy z uruchamianiem, mimo że w czasie pisania recenzji korzystaliśmy z najnowszych sterowników graficznych.
Więcej szczegółów technicznych i benchmarków można znaleźć na naszej dedykowanej stronie Radeon RX 6650M tutaj.
| 3DMark | |
| 1920x1080 Fire Strike Graphics | |
| Lenovo Legion 7 16IAX7-82TD004SGE | |
| MSI Delta 15 A5EFK | |
| Asus ROG Zephyrus G14 GA402RK | |
| HP Omen 16-n0033dx | |
| Przeciętny AMD Radeon RX 6650M (n=1) | |
| Razer Blade 15 Advanced Model Early 2022 | |
| HP Omen 16-c0077ng | |
| Dell G16 7620 | |
| Dell G5 15 SE 5505 P89F | |
| HP Envy 16 h0112nr | |
| Asus ROG Zephyrus M16 GU603H | |
| HP Victus 16-e0145ng | |
| HP Pavilion Gaming 16-a0242ng | |
| 2560x1440 Time Spy Graphics | |
| Lenovo Legion 7 16IAX7-82TD004SGE | |
| Razer Blade 15 Advanced Model Early 2022 | |
| MSI Delta 15 A5EFK | |
| Asus ROG Zephyrus G14 GA402RK | |
| Dell G16 7620 | |
| HP Omen 16-n0033dx | |
| Przeciętny AMD Radeon RX 6650M (n=1) | |
| HP Omen 16-c0077ng | |
| HP Envy 16 h0112nr | |
| Dell G5 15 SE 5505 P89F | |
| Asus ROG Zephyrus M16 GU603H | |
| HP Victus 16-e0145ng | |
| HP Pavilion Gaming 16-a0242ng | |
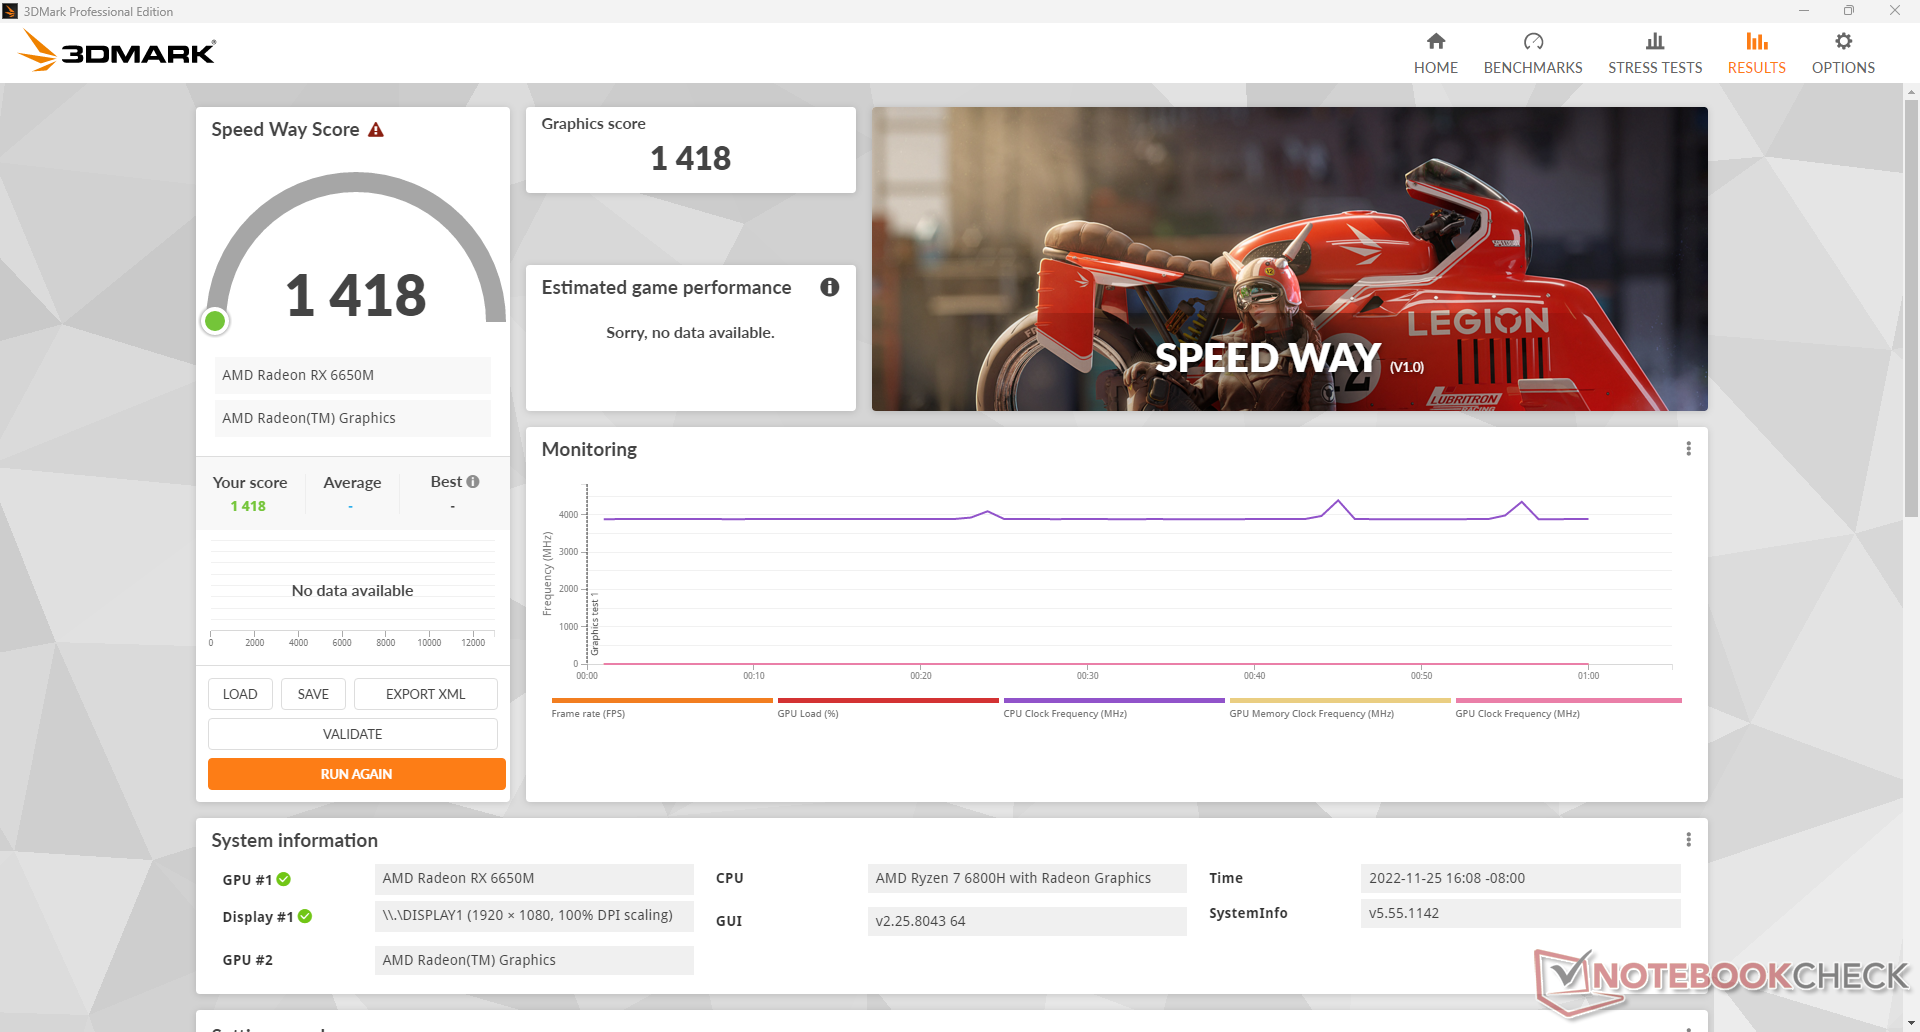
| 2560x1440 Speed Way Score | |
| HP Omen 16-n0033dx | |
| Przeciętny AMD Radeon RX 6650M (n=1) | |
| 2560x1440 Port Royal Graphics | |
| Razer Blade 15 Advanced Model Early 2022 | |
| Dell G16 7620 | |
| HP Omen 16-n0033dx | |
| Przeciętny AMD Radeon RX 6650M (n=1) | |
| HP Victus 16-e0145ng | |
| 3DMark 11 - 1280x720 Performance GPU | |
| Lenovo Legion 7 16IAX7-82TD004SGE | |
| Asus ROG Zephyrus G14 GA402RK | |
| MSI Delta 15 A5EFK | |
| HP Omen 16-n0033dx | |
| Przeciętny AMD Radeon RX 6650M (n=1) | |
| HP Omen 16-c0077ng | |
| Razer Blade 15 Advanced Model Early 2022 | |
| Dell G16 7620 | |
| HP Envy 16 h0112nr | |
| Dell G5 15 SE 5505 P89F | |
| Asus ROG Zephyrus M16 GU603H | |
| HP Victus 16-e0145ng | |
| HP Pavilion Gaming 16-a0242ng | |
| 3DMark 11 Performance | 26153 pkt. | |
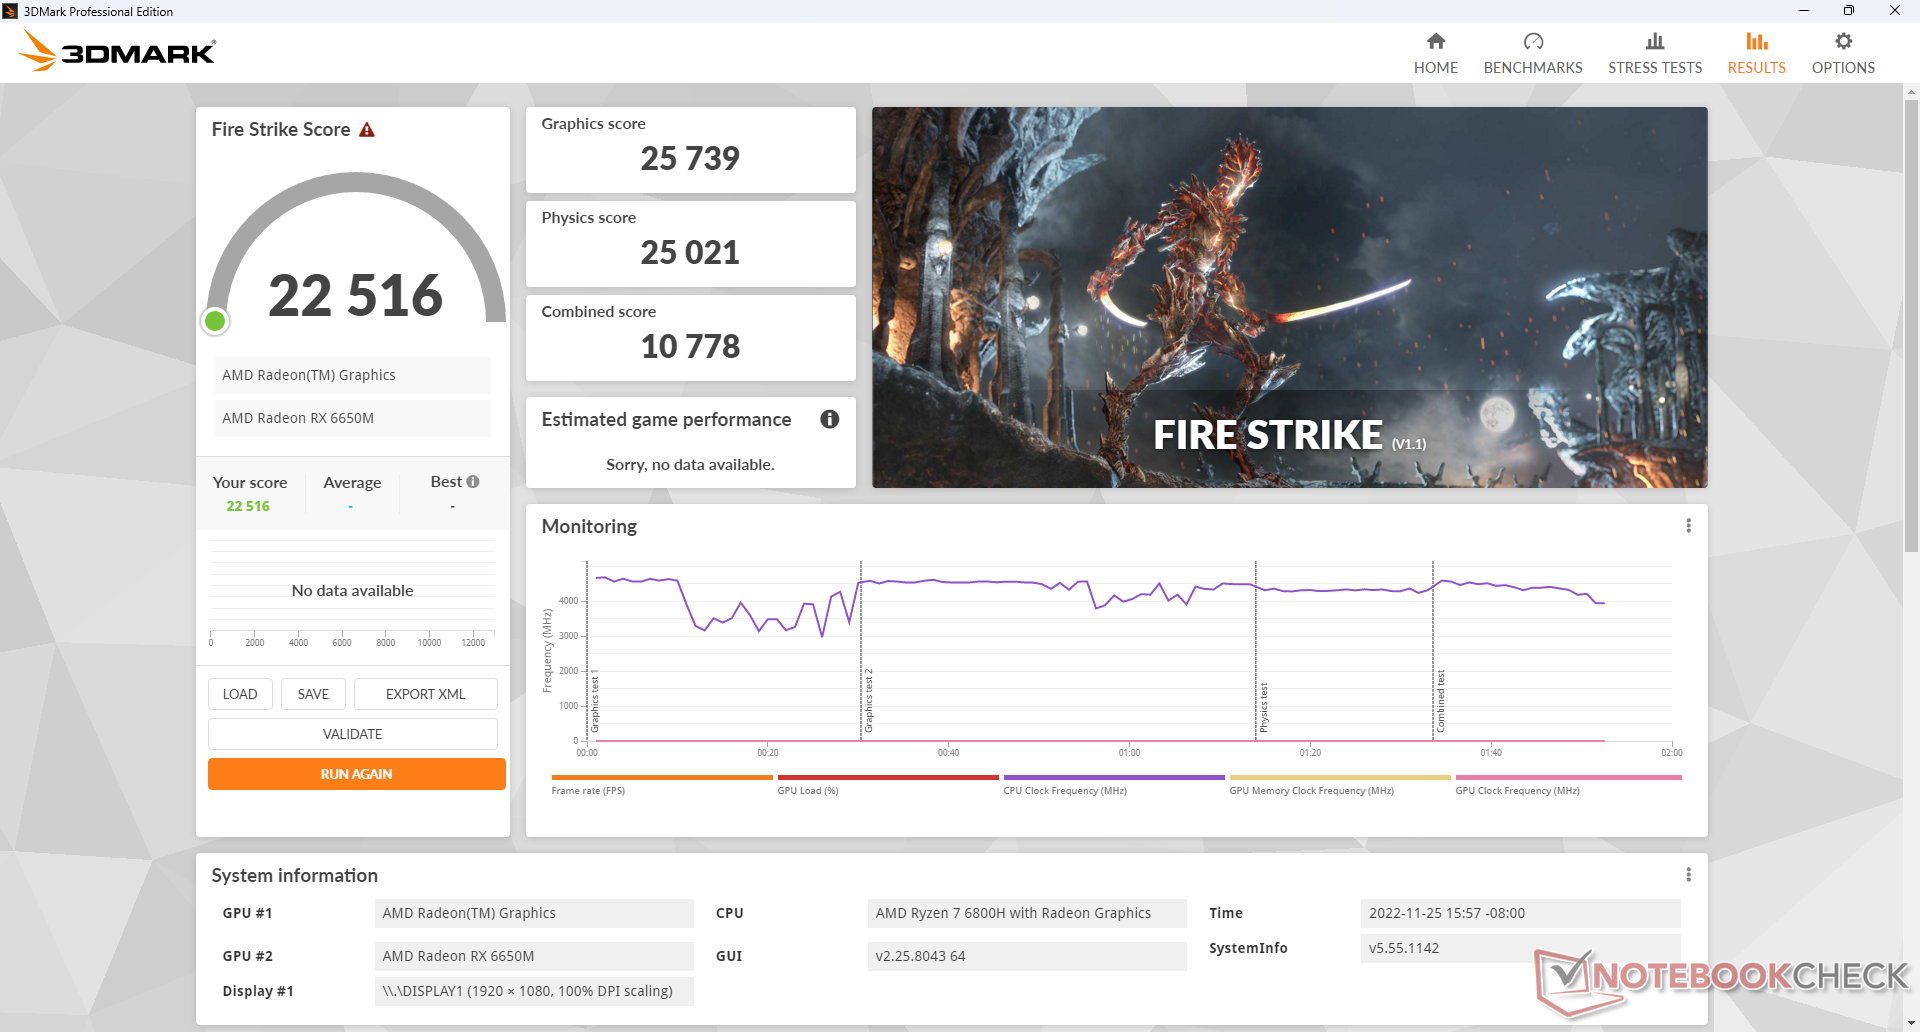
| 3DMark Fire Strike Score | 22516 pkt. | |
| 3DMark Time Spy Score | 8869 pkt. | |
Pomoc | ||
| Blender - v3.3 Classroom CPU | |
| HP Envy 16 h0112nr | |
| HP Omen 16-n0033dx | |
| Lenovo Legion S7 16ARHA7 | |
| Dell G16 7620 | |
| Lenovo Legion 7 16IAX7-82TD004SGE | |
* ... im mniej tym lepiej
| Performance rating - Percent | |
| Lenovo Legion 7 16IAX7-82TD004SGE | |
| Dell G16 7620 | |
| HP Envy 16 h0112nr | |
| Asus ROG Zephyrus G14 GA402RK | |
| Lenovo Legion S7 16ARHA7 | |
| Razer Blade 15 Advanced Model Early 2022 | |
| Asus ROG Zephyrus M16 GU603H | |
| HP Omen 16-n0033dx | |
| HP Omen 16-c0077ng | |
| HP Victus 16-e0145ng | |
| HP Pavilion Gaming 16-a0242ng | |
| The Witcher 3 - 1920x1080 Ultra Graphics & Postprocessing (HBAO+) | |
| Lenovo Legion 7 16IAX7-82TD004SGE | |
| Asus ROG Zephyrus G14 GA402RK | |
| Lenovo Legion S7 16ARHA7 | |
| HP Omen 16-n0033dx | |
| Razer Blade 15 Advanced Model Early 2022 | |
| Asus ROG Zephyrus M16 GU603H | |
| Dell G16 7620 | |
| HP Omen 16-c0077ng | |
| HP Envy 16 h0112nr | |
| HP Victus 16-e0145ng | |
| HP Pavilion Gaming 16-a0242ng | |
| Final Fantasy XV Benchmark - 1920x1080 High Quality | |
| Lenovo Legion 7 16IAX7-82TD004SGE | |
| Razer Blade 15 Advanced Model Early 2022 | |
| Asus ROG Zephyrus G14 GA402RK | |
| Dell G16 7620 | |
| Lenovo Legion S7 16ARHA7 | |
| HP Envy 16 h0112nr | |
| HP Omen 16-n0033dx | |
| HP Omen 16-c0077ng | |
| Asus ROG Zephyrus M16 GU603H | |
| HP Victus 16-e0145ng | |
| HP Pavilion Gaming 16-a0242ng | |
| Strange Brigade - 1920x1080 ultra AA:ultra AF:16 | |
| Asus ROG Zephyrus G14 GA402RK | |
| Lenovo Legion S7 16ARHA7 | |
| HP Omen 16-n0033dx | |
| Dell G16 7620 | |
| HP Omen 16-c0077ng | |
| Razer Blade 15 Advanced Model Early 2022 | |
| HP Envy 16 h0112nr | |
| Lenovo Legion 7 16IAX7-82TD004SGE | |
| Asus ROG Zephyrus M16 GU603H | |
| HP Victus 16-e0145ng | |
| HP Pavilion Gaming 16-a0242ng | |
| Dota 2 Reborn - 1920x1080 ultra (3/3) best looking | |
| Lenovo Legion 7 16IAX7-82TD004SGE | |
| Dell G16 7620 | |
| Asus ROG Zephyrus M16 GU603H | |
| HP Envy 16 h0112nr | |
| HP Pavilion Gaming 16-a0242ng | |
| HP Victus 16-e0145ng | |
| Asus ROG Zephyrus G14 GA402RK | |
| HP Omen 16-c0077ng | |
| HP Omen 16-n0033dx | |
| Lenovo Legion S7 16ARHA7 | |
| Razer Blade 15 Advanced Model Early 2022 | |
| X-Plane 11.11 - 1920x1080 high (fps_test=3) | |
| Lenovo Legion 7 16IAX7-82TD004SGE | |
| HP Envy 16 h0112nr | |
| Dell G16 7620 | |
| Razer Blade 15 Advanced Model Early 2022 | |
| Asus ROG Zephyrus M16 GU603H | |
| HP Victus 16-e0145ng | |
| HP Pavilion Gaming 16-a0242ng | |
| Lenovo Legion S7 16ARHA7 | |
| Asus ROG Zephyrus G14 GA402RK | |
| HP Omen 16-n0033dx | |
| HP Omen 16-c0077ng | |
Liczba klatek na sekundę w stanie spoczynku na stronie Witcher 3 jest generalnie stała, z wyjątkiem krótkotrwałego spadku do 13 FPS. Może to być spowodowane błędem lub niskim priorytetem aktywności w tle, podobnie jak spadki wydajności, które zaobserwowaliśmy powyżej podczas testów obciążeniowych dysku SSD.
Witcher 3 FPS Chart
| low | med. | high | ultra | |
|---|---|---|---|---|
| The Witcher 3 (2015) | 276.5 | 217.4 | 167 | 90.1 |
| Dota 2 Reborn (2015) | 141 | 130.7 | 118 | 100 |
| Overwatch (2016) | 507.9 | 481.9 | 350.9 | 150 |
| Fortnite (2018) | 95.5 | 54.1 | 46 | 40.4 |
| Final Fantasy XV Benchmark (2018) | 164.7 | 113.3 | 83.2 | |
| X-Plane 11.11 (2018) | 66.4 | 52.7 | 46.4 | |
| Strange Brigade (2018) | 337 | 222 | 190 | 167.2 |
| Metro Exodus (2019) | 138.8 | 111.5 | 81 | 65.8 |
| Borderlands 3 (2019) | 110.4 | 95.9 | 85.2 | 67.4 |
| Gears Tactics (2020) | 162.8 | 205.9 | 124.2 | 100.4 |
| Watch Dogs Legion (2020) | 109 | 104 | 94 | 62 |
| Dirt 5 (2020) | 236.6 | 135.4 | 109.1 | 83.6 |
| Hitman 3 (2021) | 224.8 | 178.8 | 165.5 | 156.3 |
| F1 2021 (2021) | 315 | 247 | 216 | 100 |
| Far Cry 6 (2021) | 111 | 105 | 96 | 88 |
| Guardians of the Galaxy (2021) | 117 | 110 | 111 | 105 |
| God of War (2022) | 69.3 | 68.4 | 64.3 | 51.5 |
| Cyberpunk 2077 1.6 (2022) | 126.8 | 106.3 | 78.9 | 63.8 |
| F1 22 (2022) | 217 | 215 | 178.2 | 40.6 |
Emisje
Szum systemu - głośny w trybie wydajności
Wewnętrzne wentylatory są zawsze aktywne i osiągają niski poziom 27 dB(A) na tle cichego tła 24 dB(A). Są one jednak dobre w zachowywaniu ciszy przez dłuższe okresy stresu i dlatego impulsy obrotów występują znacznie rzadziej podczas przeglądania stron internetowych czy strumieniowania wideo.
Szum wentylatora jest powiązany z profilem zasilania podczas grania. Uruchomienie Witcher 3 na przykład w trybie zrównoważonym szum wentylatora wynosi 39,4 dB(A), a w trybie wydajności 54,1 dB(A). W zakresie średnich 50 dB(A) jest zauważalnie głośniej, niż w Dellu G16 w podobnych warunkach. Użytkownicy muszą znosić znacznie głośniejsze wentylatory, jeśli chcą uruchomić procesor graficzny na najwyższym poziomie TGP.
Hałas
| luz |
| 27.4 / 27.4 / 28.9 dB |
| obciążenie |
| 32.3 / 57.6 dB |
 | ||
30 dB cichy 40 dB(A) słyszalny 50 dB(A) irytujący |
||
min: | ||
| HP Omen 16-n0033dx Radeon RX 6650M, R7 6800H, Samsung PM9A1 MZVL21T0HCLR | HP Envy 16 h0112nr GeForce RTX 3060 Laptop GPU, i7-12700H, Micron 3400 1TB MTFDKBA1T0TFH | HP Omen 16-b1090ng GeForce RTX 3070 Ti Laptop GPU, i7-12700H, WDC PC SN810 1TB | HP Victus 16-e0145ng GeForce RTX 3050 Ti Laptop GPU, R5 5600H, Samsung SSD PM981a MZVLB512HBJQ | Lenovo Legion S7 16ARHA7 Radeon RX 6800S, R9 6900HX, SK Hynix HFS001TEJ9X115N | Dell G16 7620 GeForce RTX 3060 Laptop GPU, i7-12700H, WDC PC SN810 512GB | |
|---|---|---|---|---|---|---|
| Noise | 3% | -13% | -6% | 11% | 3% | |
| wyłączone / środowisko * (dB) | 24.2 | 22.8 6% | 26 -7% | 26 -7% | 23.1 5% | 23.2 4% |
| Idle Minimum * (dB) | 27.4 | 22.9 16% | 30 -9% | 26 5% | 23.1 16% | 28.3 -3% |
| Idle Average * (dB) | 27.4 | 22.9 16% | 31 -13% | 28 -2% | 23.1 16% | 28.8 -5% |
| Idle Maximum * (dB) | 28.9 | 30.5 -6% | 33 -14% | 34 -18% | 23.1 20% | 28.9 -0% |
| Load Average * (dB) | 32.3 | 41.4 -28% | 49 -52% | 44 -36% | 31.4 3% | 32.4 -0% |
| Witcher 3 ultra * (dB) | 54.1 | 51.1 6% | 53 2% | 48 11% | 51.4 5% | 48.3 11% |
| Load Maximum * (dB) | 57.6 | 51.4 11% | 57 1% | 53 8% | 51.2 11% | 48.1 16% |
* ... im mniej tym lepiej
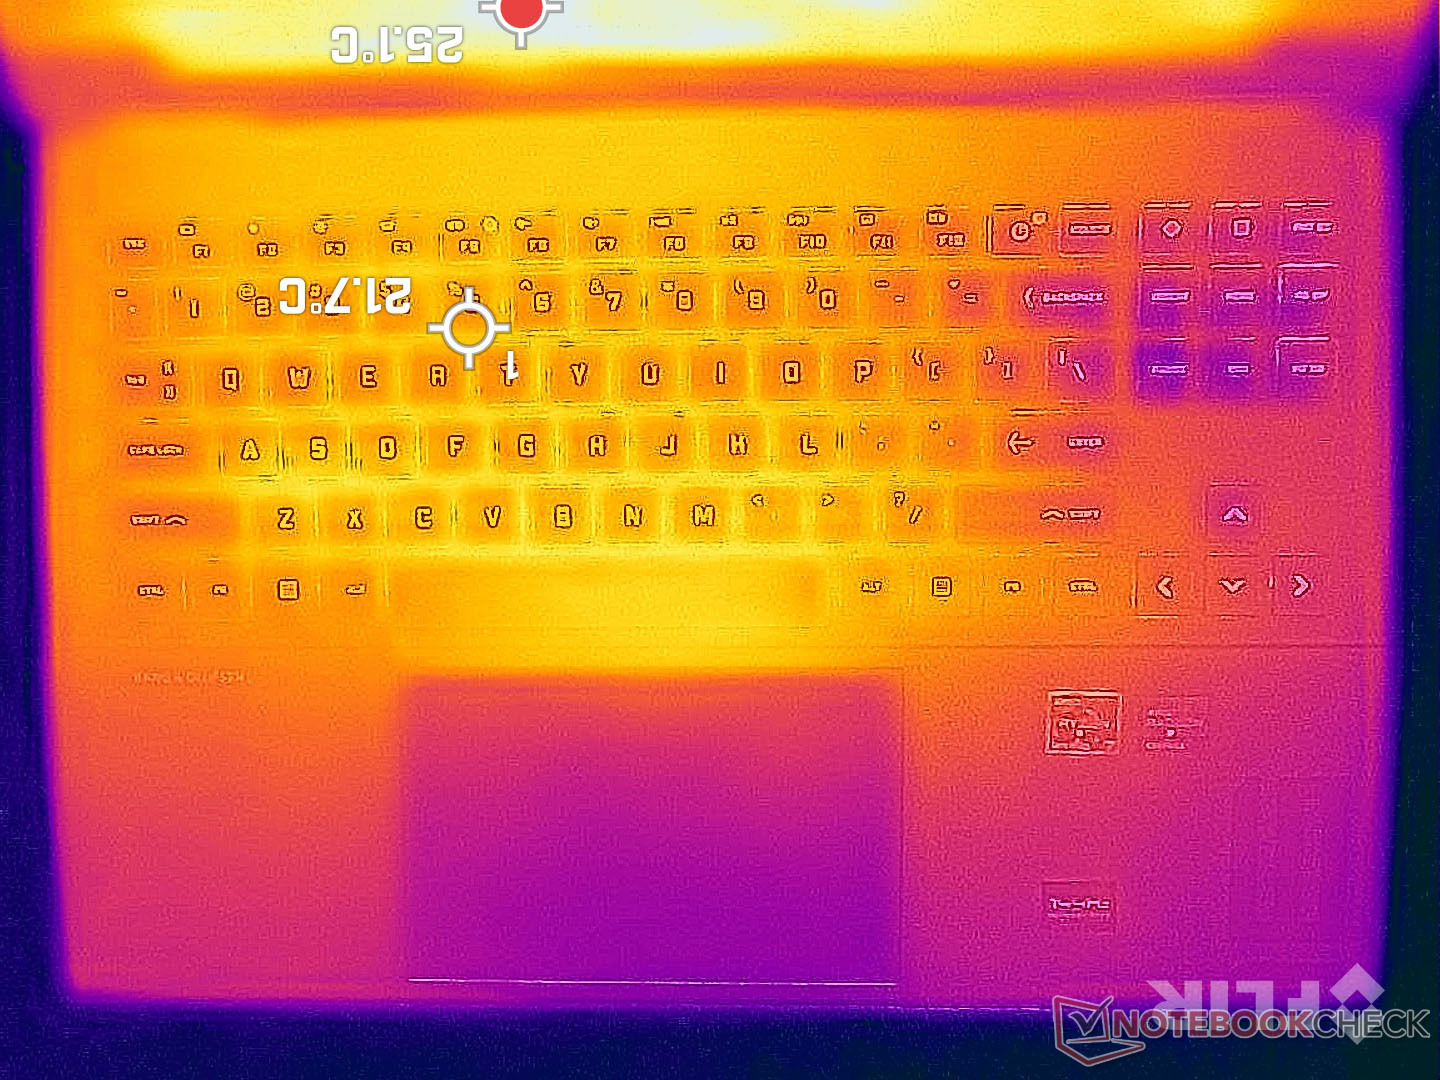
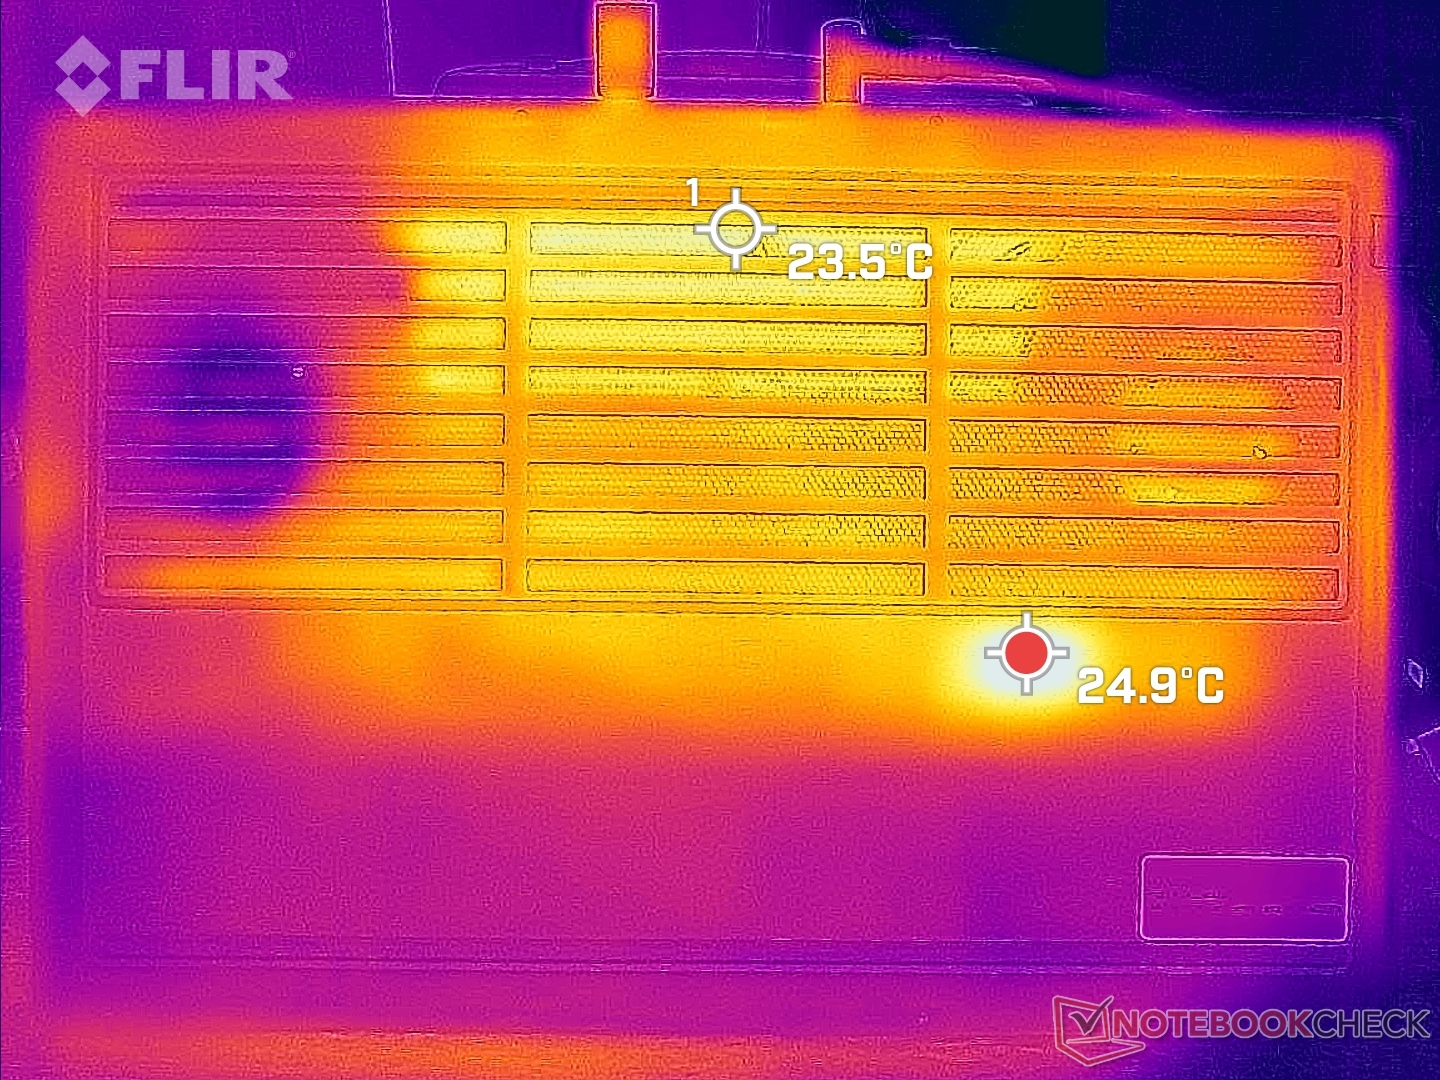
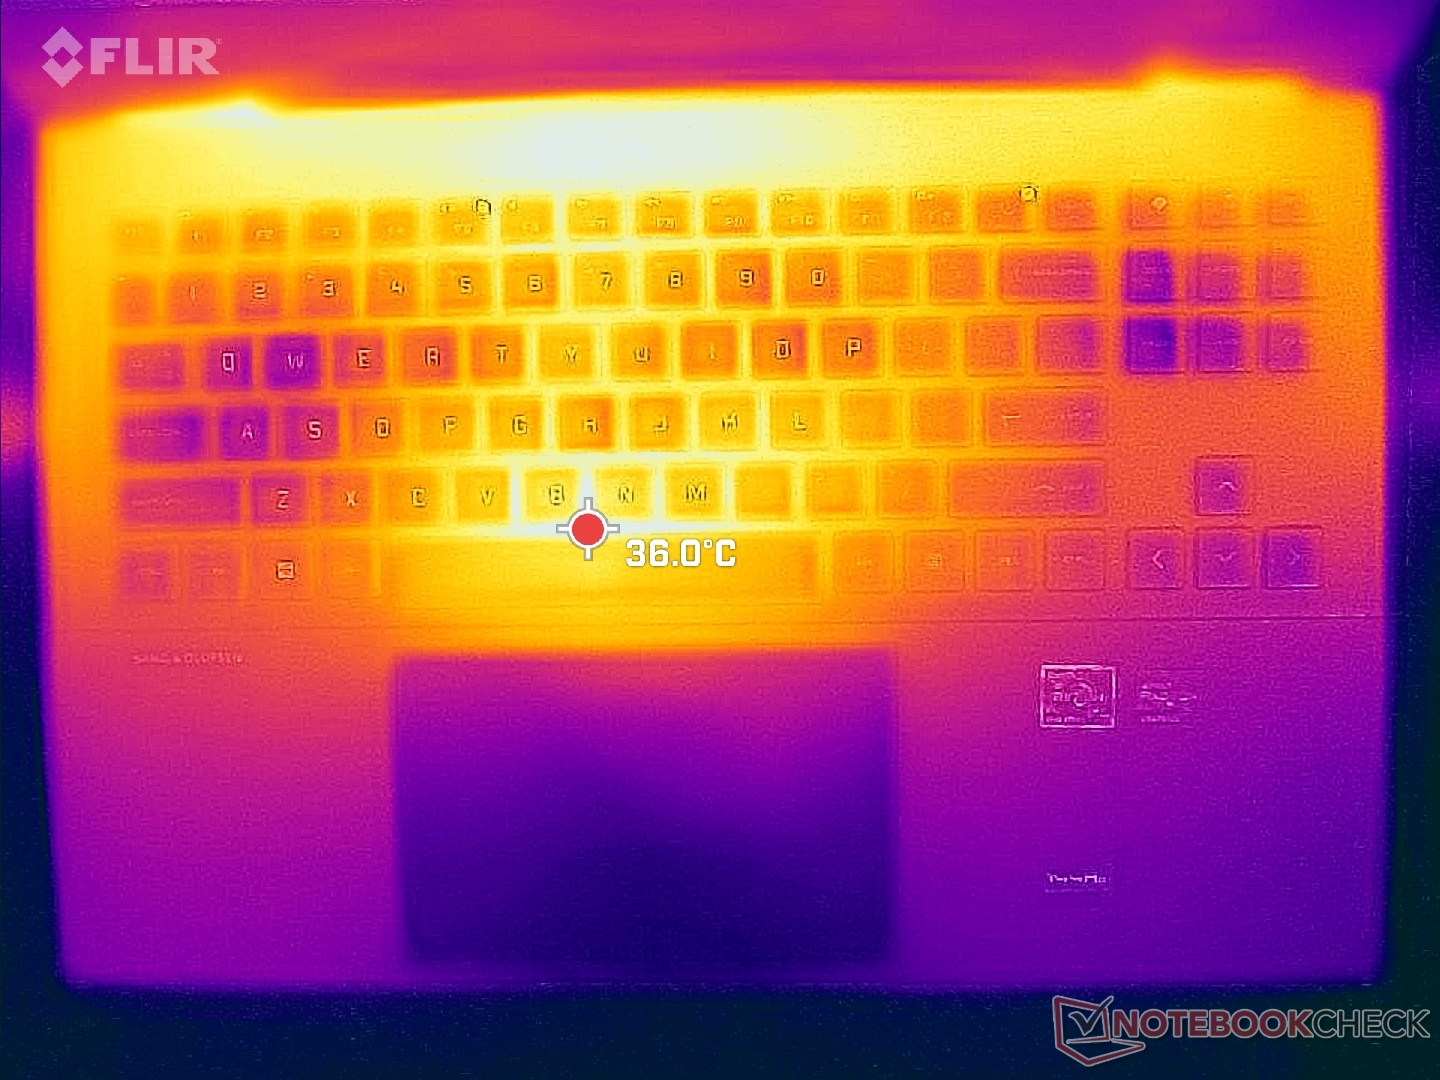
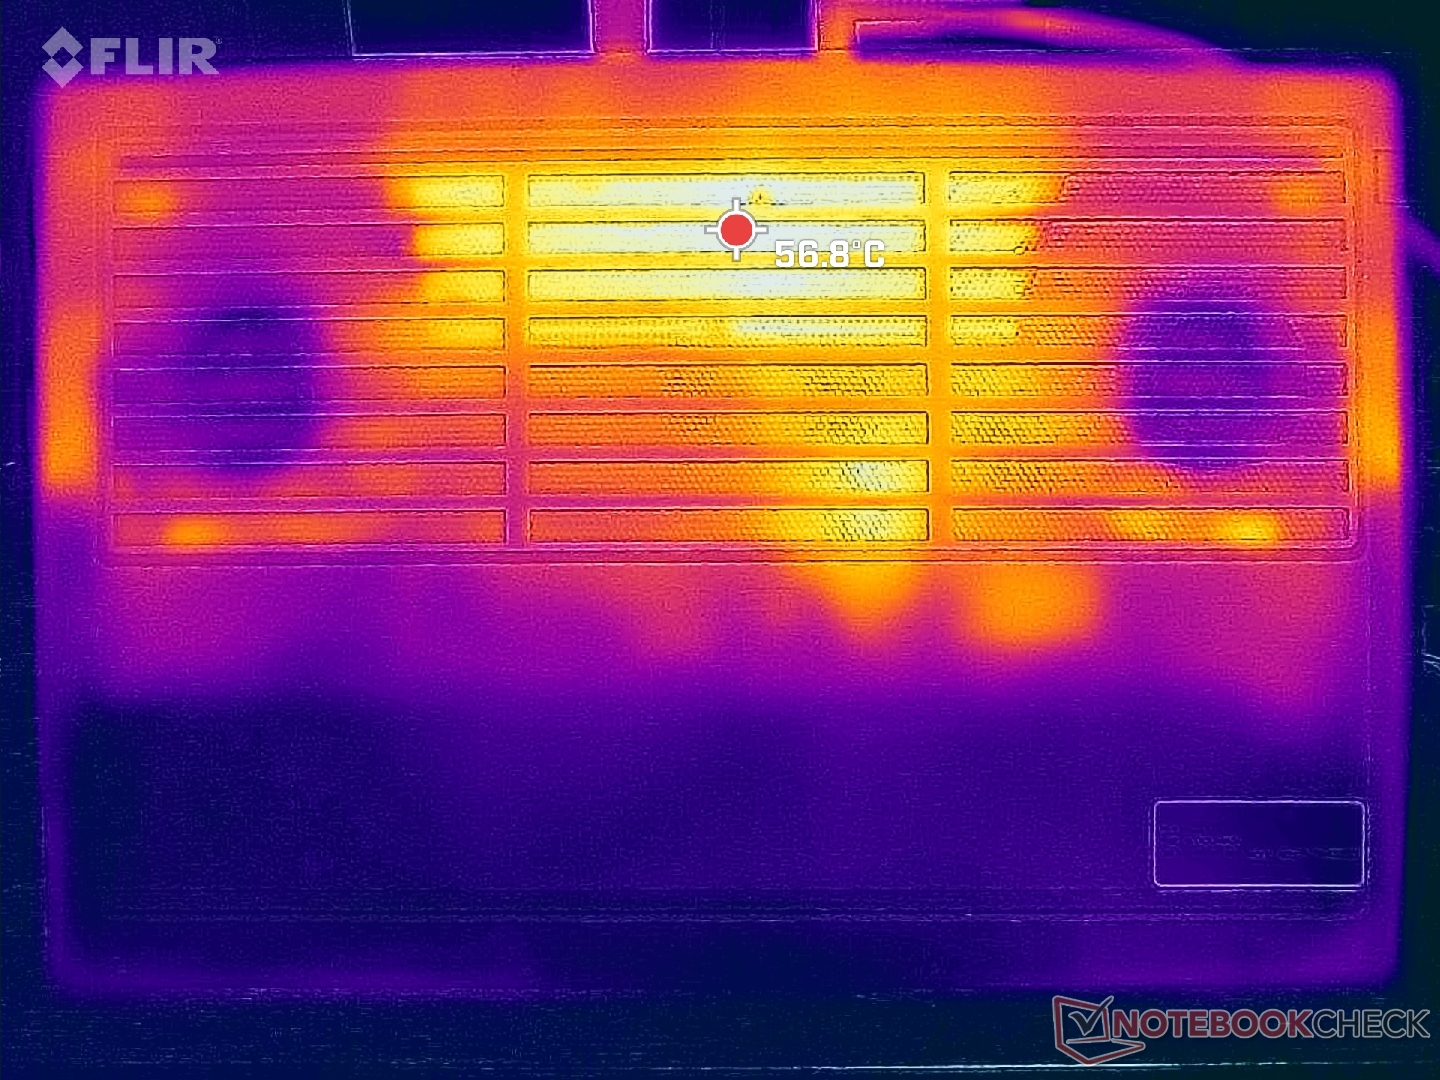
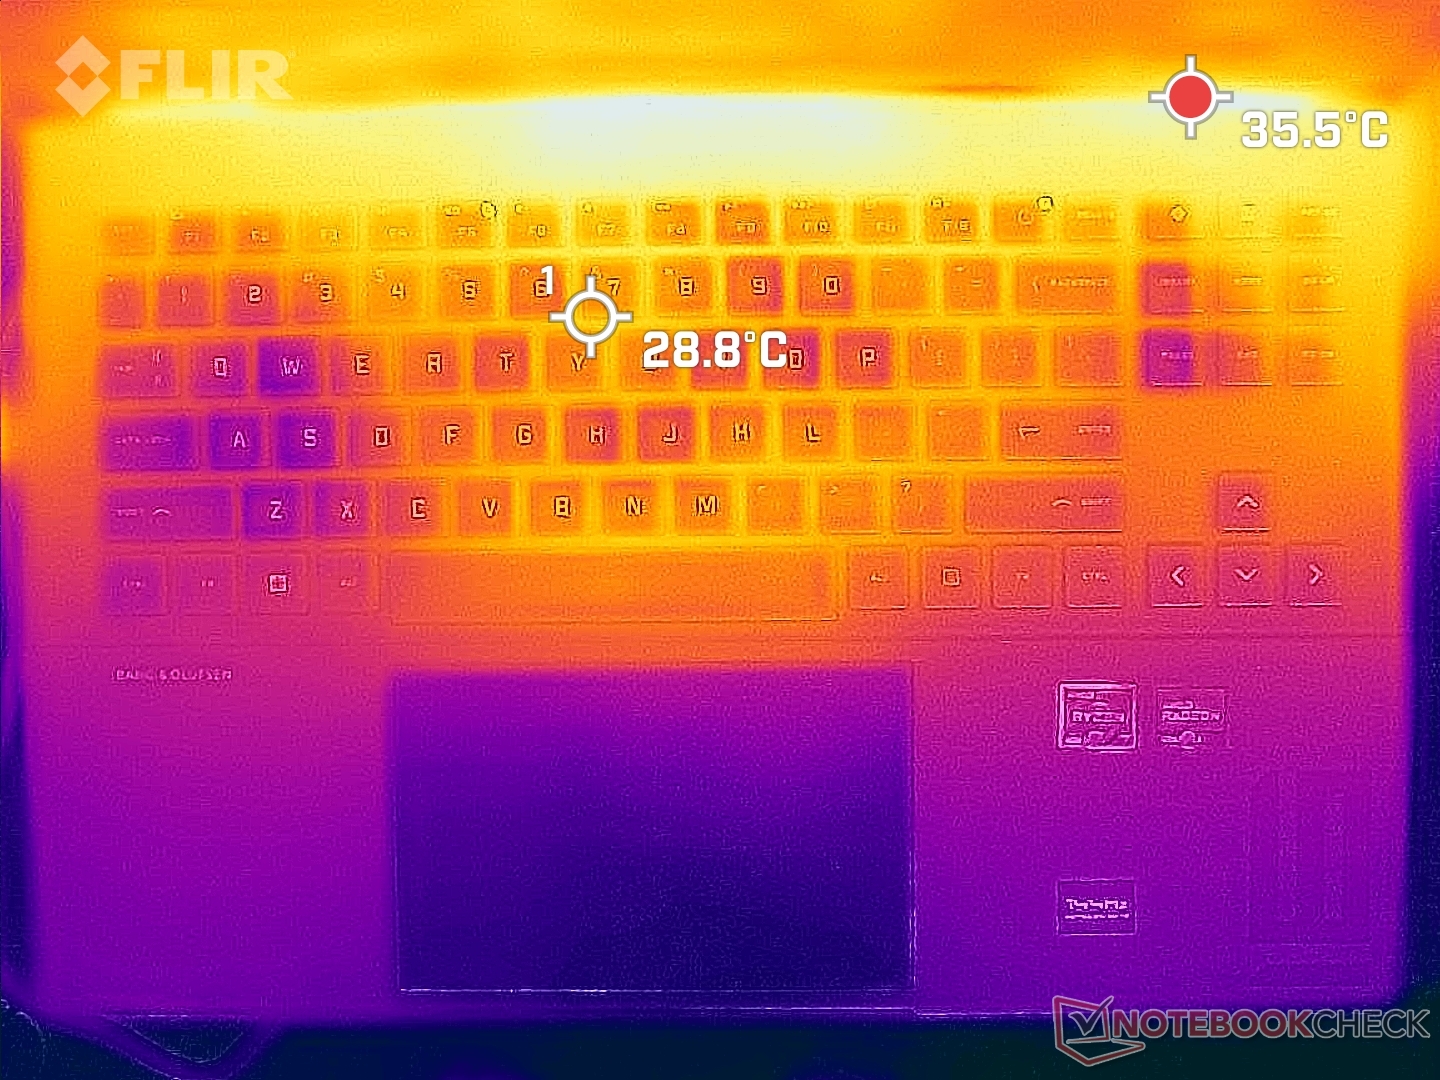
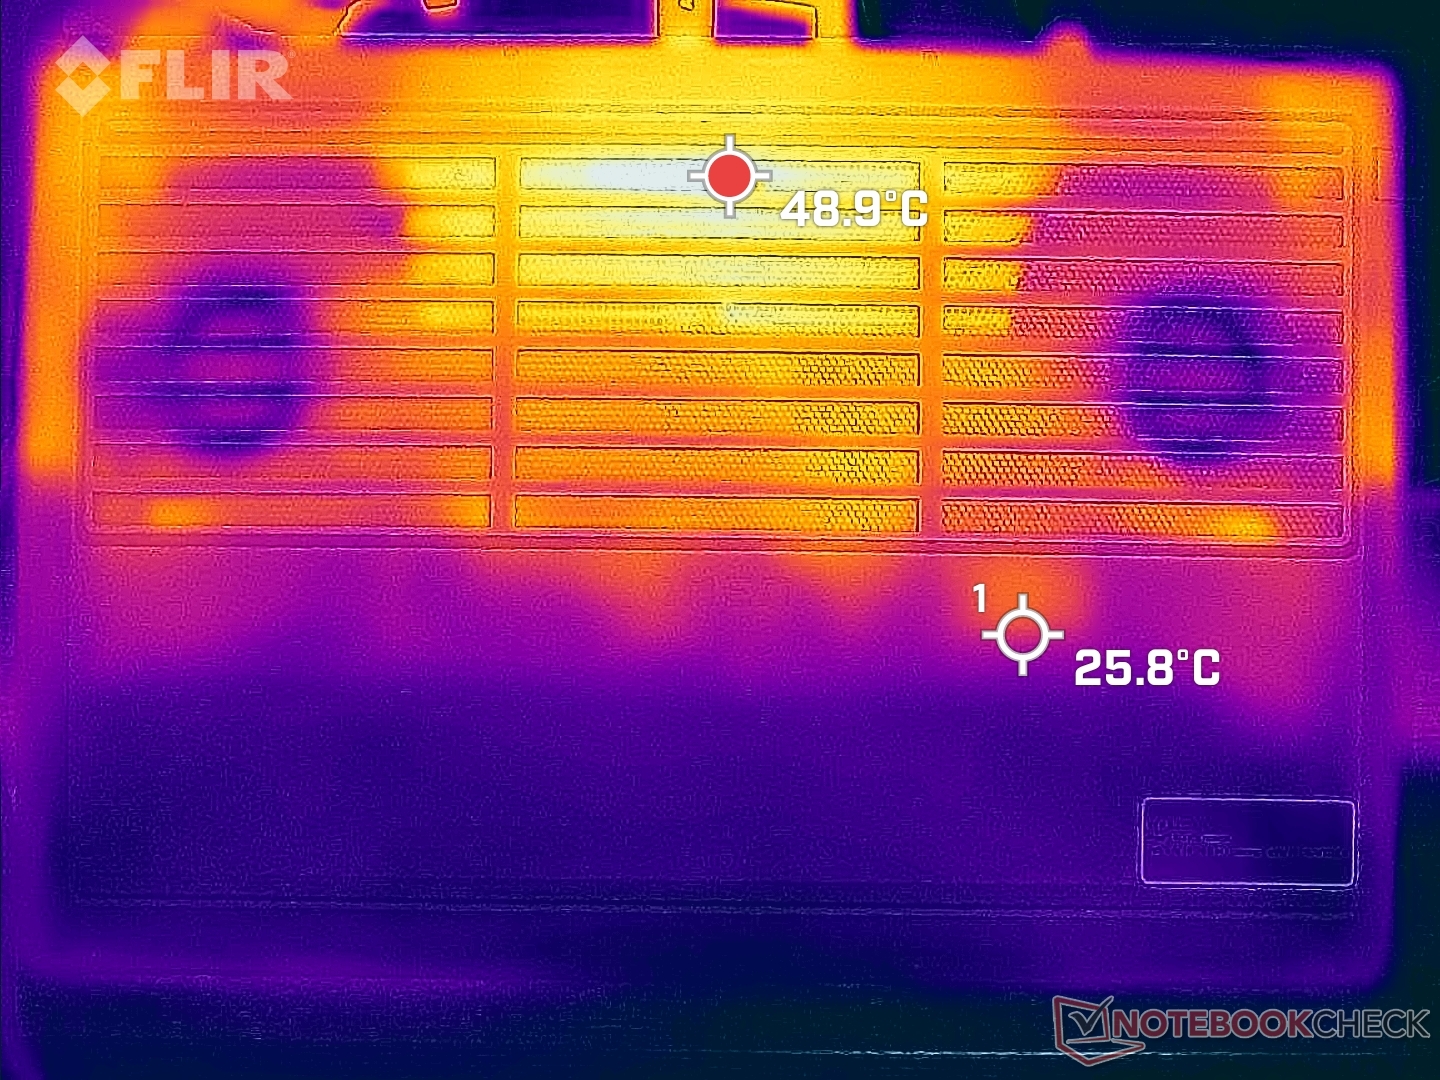
Temperatura
Temperatury powierzchni są znacznie chłodniejsze na pokładzie klawiatury w porównaniu z pokładem pod spodem. Gorące miejsca na wierzchu osiągają około 40 C podczas gry w porównaniu z ponad 50 C na spodzie. Na stronie Omen 16 z procesorem Intel może być jeszcze cieplejszy - do 60°C w podobnych warunkach. Te ciepłe miejsca znajdują się w kierunku tylnej części obudowy, gdzie palce i dłonie raczej nie będą dotykać.
Należy pamiętać, że większość spodu i tyłu modelu jest przeznaczona na chłodzenie. może być łatwo przypadkowo zablokować kratki wentylacyjne, jeśli nie będziesz ostrożny.
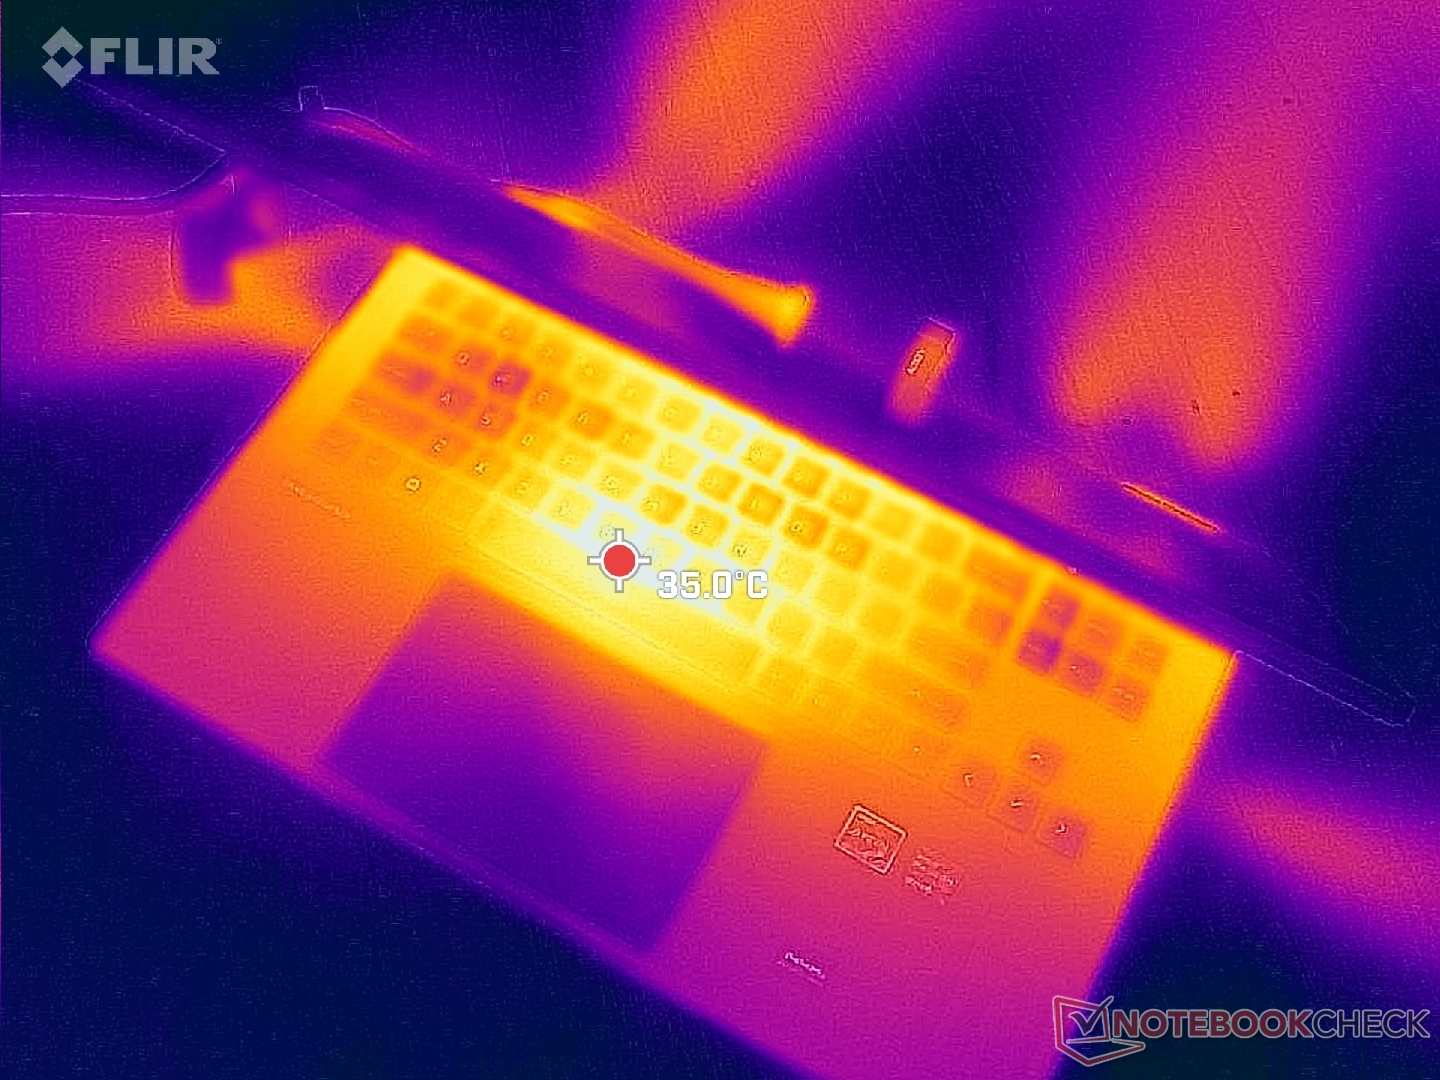
(±) Maksymalna temperatura w górnej części wynosi 41.2 °C / 106 F, w porównaniu do średniej 40.4 °C / 105 F , począwszy od 21.2 do 68.8 °C dla klasy Gaming.
(-) Dno nagrzewa się maksymalnie do 53.2 °C / 128 F, w porównaniu do średniej 43.2 °C / 110 F
(+) W stanie bezczynności średnia temperatura górnej części wynosi 24.4 °C / 76 F, w porównaniu ze średnią temperaturą urządzenia wynoszącą 33.9 °C / ### class_avg_f### F.
(±) Podczas gry w Wiedźmina 3 średnia temperatura górnej części wynosi 32.3 °C / 90 F, w porównaniu do średniej temperatury urządzenia wynoszącej 33.9 °C / ## #class_avg_f### F.
(+) Podpórki pod nadgarstki i touchpad są chłodniejsze niż temperatura skóry i maksymalnie 26.2 °C / 79.2 F i dlatego są chłodne w dotyku.
(+) Średnia temperatura obszaru podparcia dłoni w podobnych urządzeniach wynosiła 28.8 °C / 83.8 F (+2.6 °C / 4.6 F).
| HP Omen 16-n0033dx AMD Ryzen 7 6800H, AMD Radeon RX 6650M | HP Envy 16 h0112nr Intel Core i7-12700H, NVIDIA GeForce RTX 3060 Laptop GPU | HP Omen 16-b1090ng Intel Core i7-12700H, NVIDIA GeForce RTX 3070 Ti Laptop GPU | HP Victus 16-e0145ng AMD Ryzen 5 5600H, NVIDIA GeForce RTX 3050 Ti Laptop GPU | Lenovo Legion S7 16ARHA7 AMD Ryzen 9 6900HX, AMD Radeon RX 6800S | Dell G16 7620 Intel Core i7-12700H, NVIDIA GeForce RTX 3060 Laptop GPU | |
|---|---|---|---|---|---|---|
| Heat | -9% | -2% | -22% | -2% | 2% | |
| Maximum Upper Side * (°C) | 41.2 | 45.2 -10% | 41 -0% | 54 -31% | 46.6 -13% | 47.6 -16% |
| Maximum Bottom * (°C) | 53.2 | 44 17% | 62 -17% | 47 12% | 50.8 5% | 54 -2% |
| Idle Upper Side * (°C) | 26.4 | 33.6 -27% | 25 5% | 41 -55% | 26.4 -0% | 23 13% |
| Idle Bottom * (°C) | 27.8 | 32.6 -17% | 26 6% | 31 -12% | 27.2 2% | 24.6 12% |
* ... im mniej tym lepiej
Stress Test
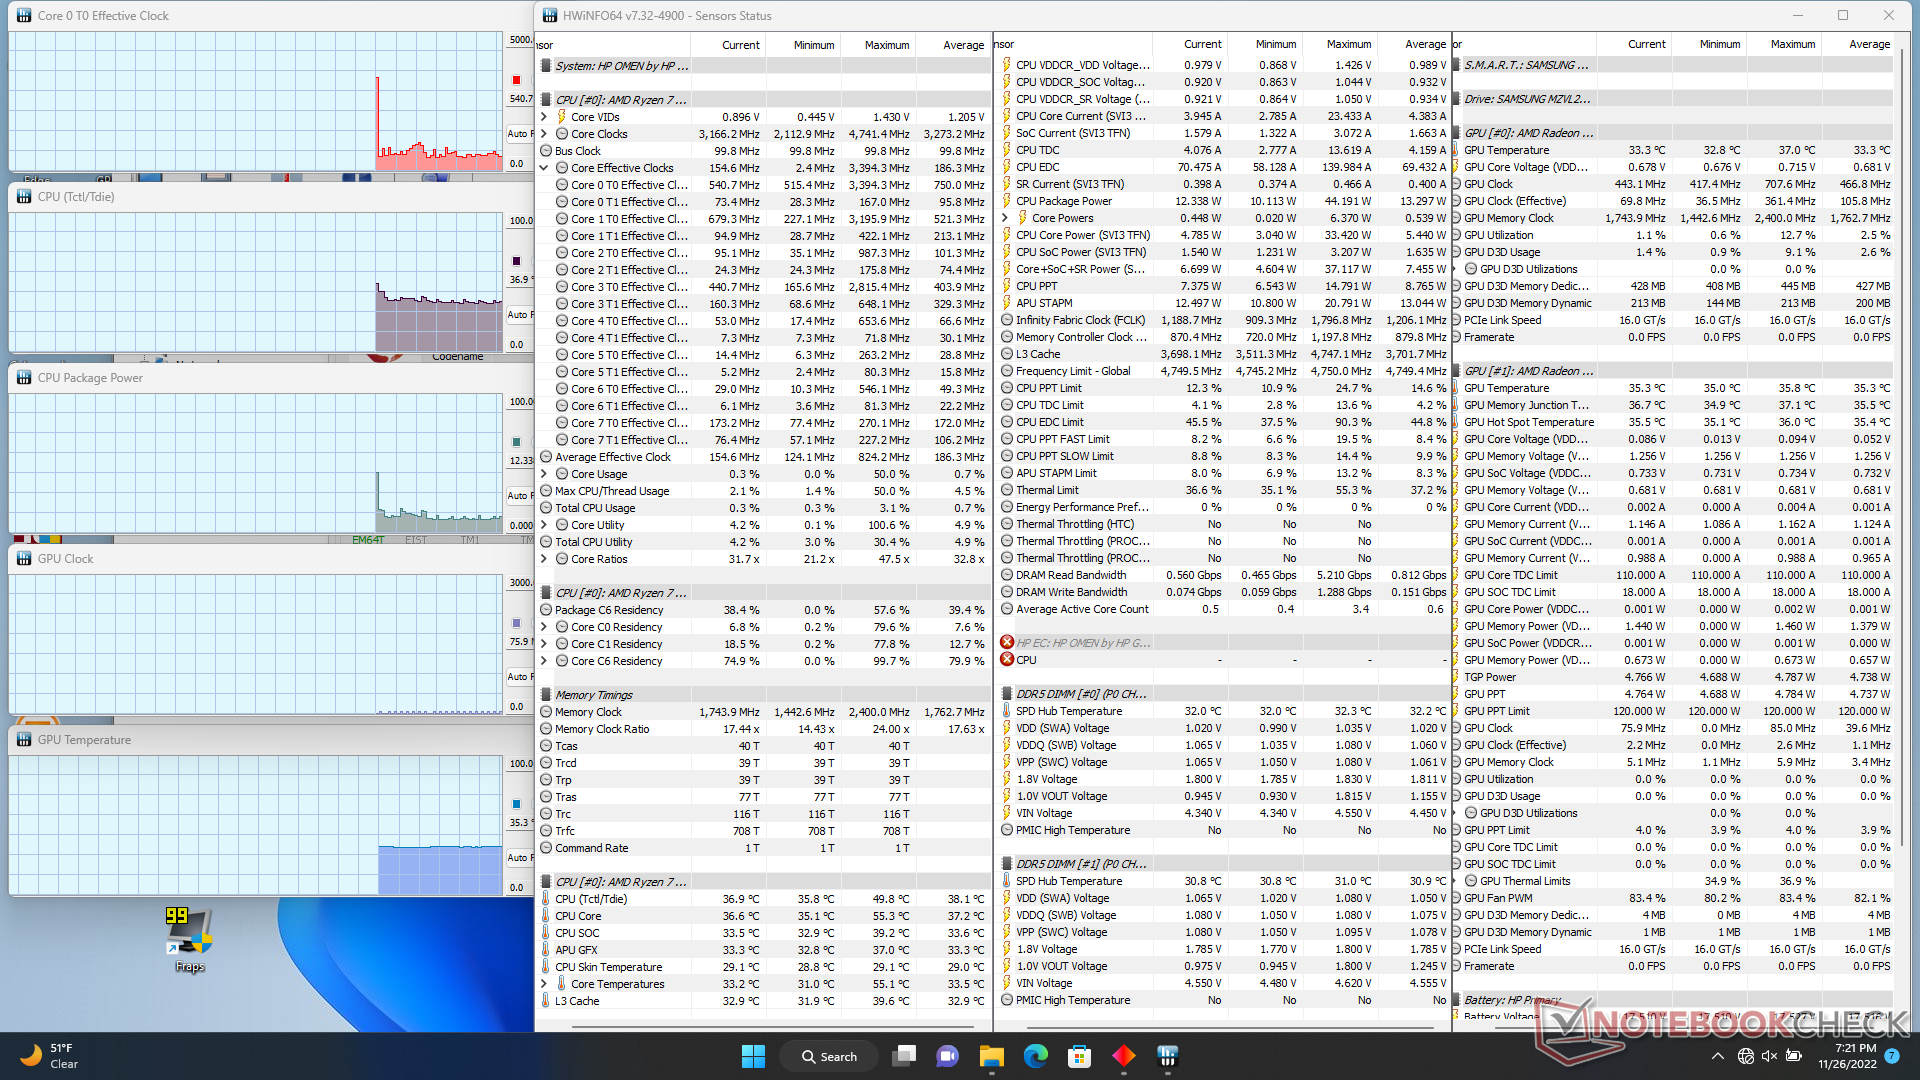
W teście Prime95 procesor podkręcał się do 4,4 GHz i 93 W przez kilka sekund, po czym spadał i stabilizował się na poziomie 3,7 GHz i 64 W. Maksymalne podbicie zegara jest więc na Omen 16 krótkotrwałe. Powtarzając ten sam test naLenovo Legion 5 Pro Gen 7 z tym samym procesorem Ryzen 7 6800H przyniosłoby wyższą stabilną częstotliwość taktowania i temperaturę, odpowiednio 4,1 GHz i 93 C, w porównaniu z zaledwie 3,7 GHz i 78 C na naszym HP.
Podczas pracy Witcher 3 w trybie Performance, który reprezentuje typowe obciążenia w grach, GPU ustabilizowałoby się na poziomie 2516 MHz, 80 C i 103 W. Zejście do trybu Balanced zaowocowało niższym taktowaniem GPU (2178 MHz) i niższym TGP (72 W), ale bez znaczących zmian w temperaturze rdzenia. Użytkownicy muszą więc pamiętać o włączeniu trybu Performance poprzez oprogramowanie Omen Gaming Hub, aby w pełni wykorzystać możliwości GPU.
Praca na zasilaniu akumulatorowym ogranicza wydajność. Test Fire Strike na baterii przyniósłby wyniki w zakresie fizyki i grafiki na poziomie odpowiednio 21063 i 5722 punktów, w porównaniu do 25021 i 25739 punktów na zasilaniu sieciowym.
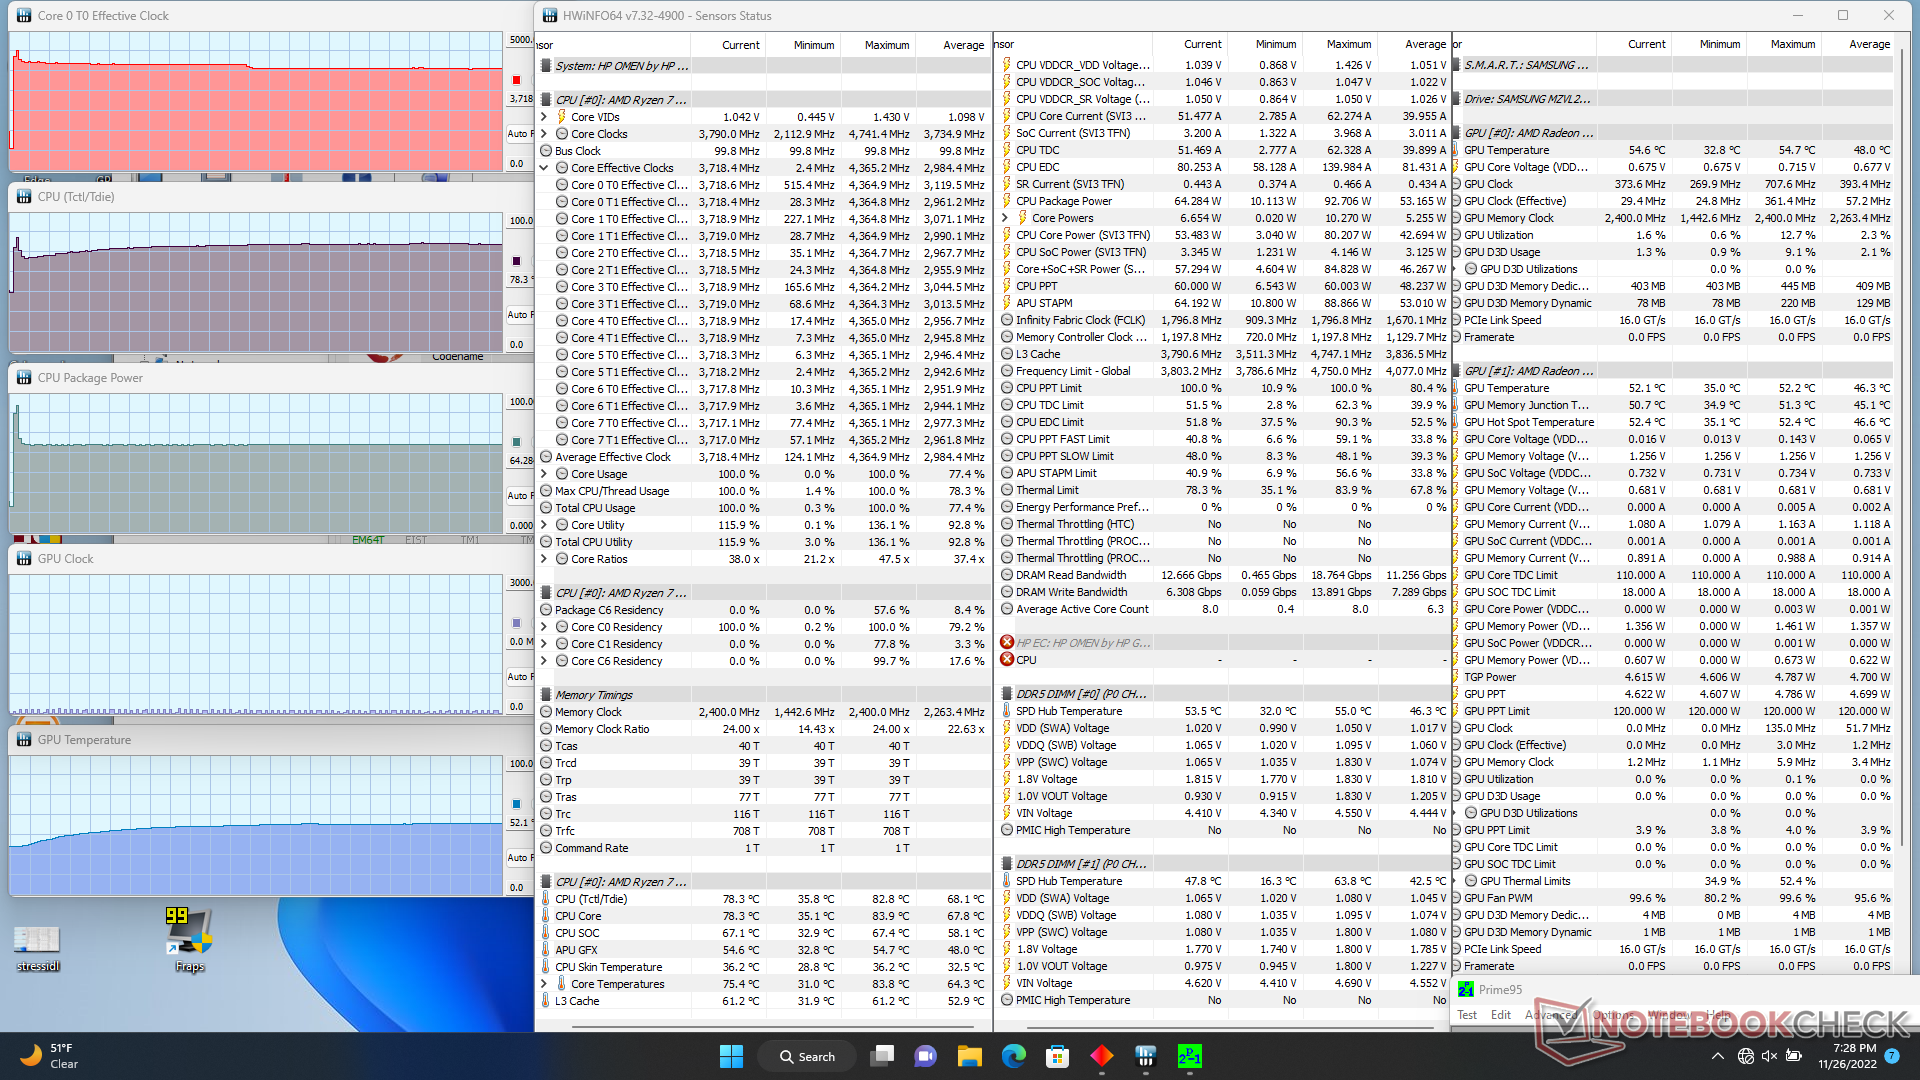
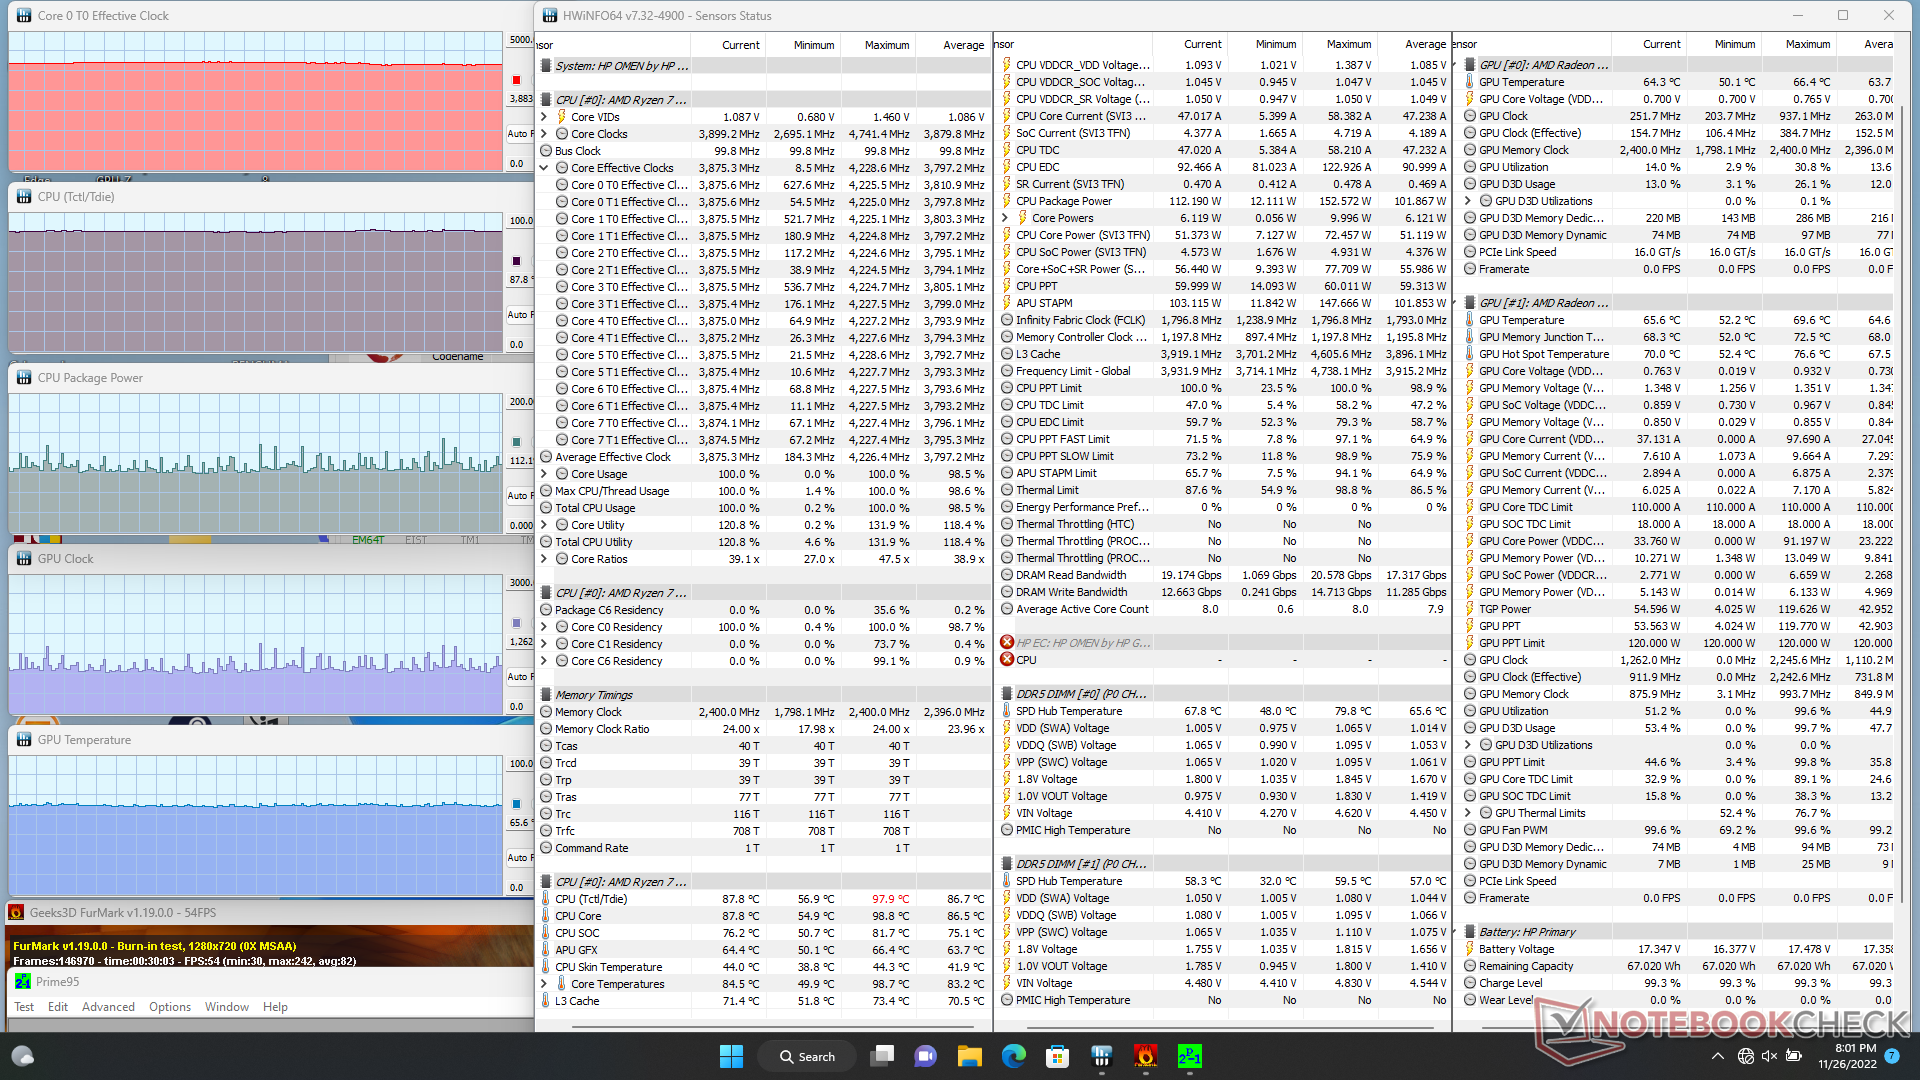
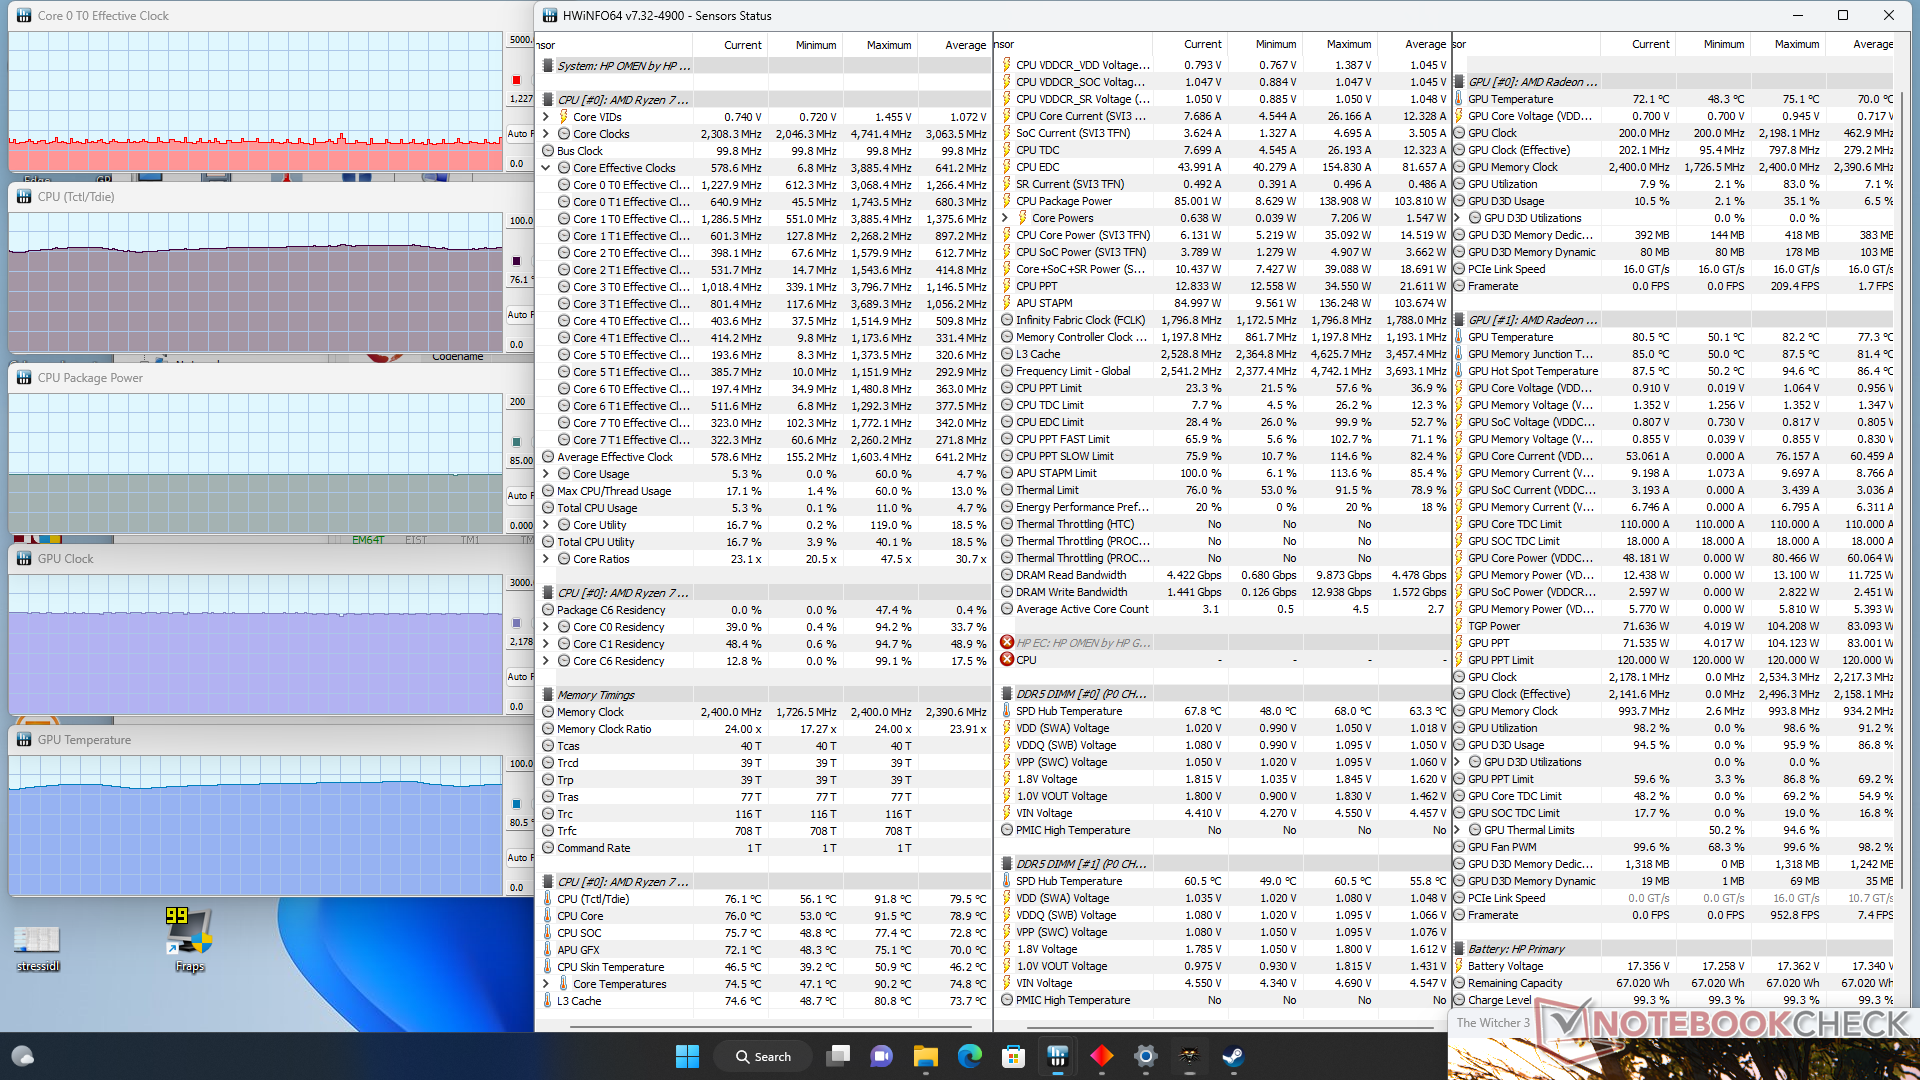
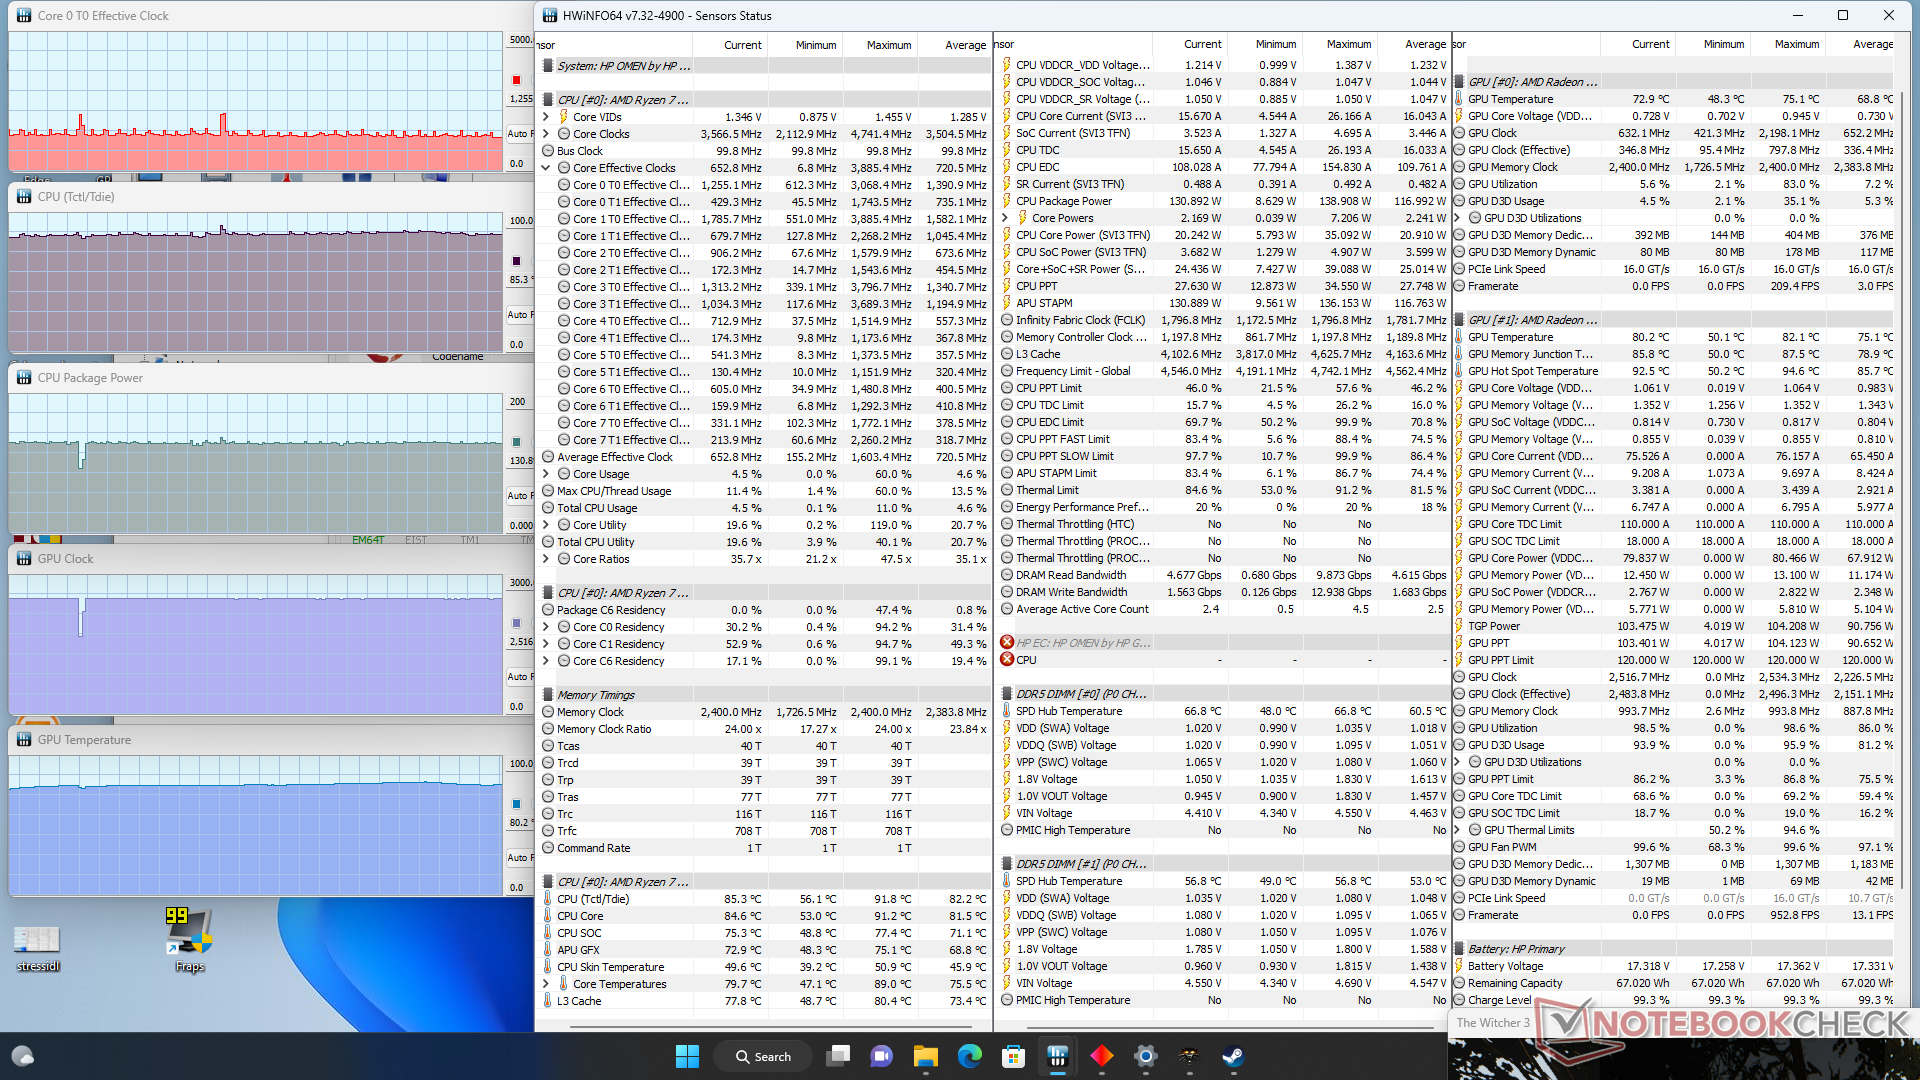
| ZegarCPU (GHz) | Zegar GPU (MHz) | Średnia temperatura CPU (°C) | Średnia temperatura GPU (°C) | |
| System w stanie bezczynności | -- | -- | 37 | 35 |
| Prime95 Stress | 3.7 | -- | 79 | 52 |
| Prime95 + FurMark Stress | 3.9 | ~1262 | 88 | 66 |
| Witcher 3 Stres(tryb zrównoważony) | ~1,1 | 2178 | 76 | 81 |
| Witcher 3 Stres(tryb wydajnościowy) | ~1,1 | 2516 | 85 | 80 |
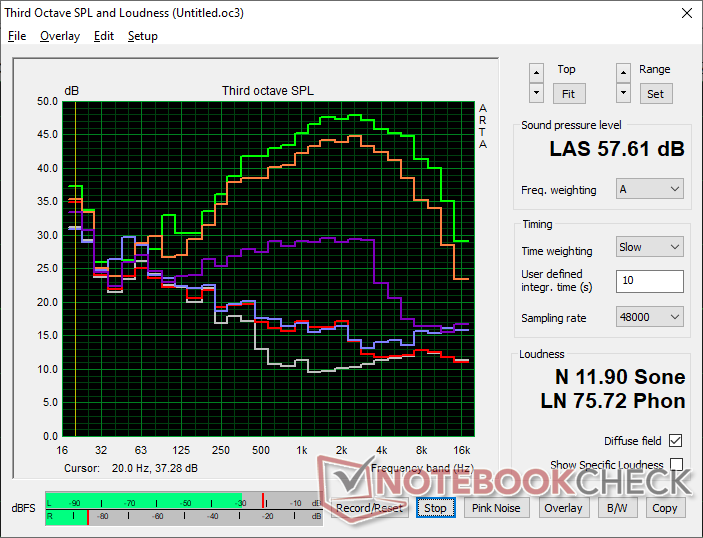
Mówcy
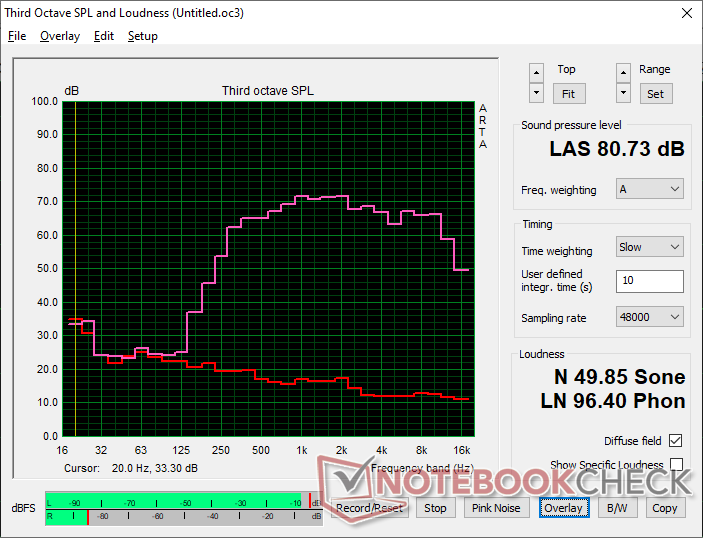
HP Omen 16-n0033dx analiza dźwięku
(±) | głośność głośnika jest średnia, ale dobra (80.7 dB)
Bas 100 - 315 Hz
(-) | prawie brak basu - średnio 24.7% niższa od mediany
(±) | liniowość basu jest średnia (13% delta do poprzedniej częstotliwości)
Średnie 400 - 2000 Hz
(+) | zbalansowane środki średnie - tylko 3.4% od mediany
(+) | średnie są liniowe (2.8% delta do poprzedniej częstotliwości)
Wysokie 2–16 kHz
(+) | zrównoważone maksima - tylko 1.3% od mediany
(+) | wzloty są liniowe (4.4% delta do poprzedniej częstotliwości)
Ogólnie 100 - 16.000 Hz
(±) | liniowość ogólnego dźwięku jest średnia (19.3% różnicy w stosunku do mediany)
W porównaniu do tej samej klasy
» 65% wszystkich testowanych urządzeń w tej klasie było lepszych, 8% podobnych, 27% gorszych
» Najlepszy miał deltę 6%, średnia wynosiła ###średnia###%, najgorsza wynosiła 132%
W porównaniu do wszystkich testowanych urządzeń
» 47% wszystkich testowanych urządzeń było lepszych, 8% podobnych, 46% gorszych
» Najlepszy miał deltę 4%, średnia wynosiła ###średnia###%, najgorsza wynosiła 134%
Apple MacBook Pro 16 2021 M1 Pro analiza dźwięku
(+) | głośniki mogą odtwarzać stosunkowo głośno (84.7 dB)
Bas 100 - 315 Hz
(+) | dobry bas - tylko 3.8% od mediany
(+) | bas jest liniowy (5.2% delta do poprzedniej częstotliwości)
Średnie 400 - 2000 Hz
(+) | zbalansowane środki średnie - tylko 1.3% od mediany
(+) | średnie są liniowe (2.1% delta do poprzedniej częstotliwości)
Wysokie 2–16 kHz
(+) | zrównoważone maksima - tylko 1.9% od mediany
(+) | wzloty są liniowe (2.7% delta do poprzedniej częstotliwości)
Ogólnie 100 - 16.000 Hz
(+) | ogólny dźwięk jest liniowy (4.6% różnicy w stosunku do mediany)
W porównaniu do tej samej klasy
» 0% wszystkich testowanych urządzeń w tej klasie było lepszych, 0% podobnych, 100% gorszych
» Najlepszy miał deltę 5%, średnia wynosiła ###średnia###%, najgorsza wynosiła 45%
W porównaniu do wszystkich testowanych urządzeń
» 0% wszystkich testowanych urządzeń było lepszych, 0% podobnych, 100% gorszych
» Najlepszy miał deltę 4%, średnia wynosiła ###średnia###%, najgorsza wynosiła 134%
Zarządzanie energią - wymagający gracz
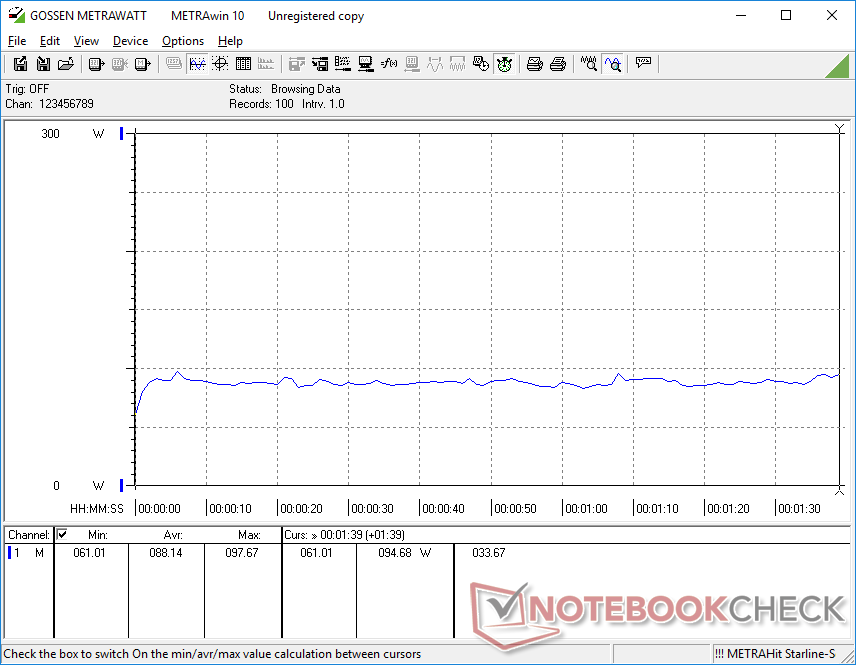
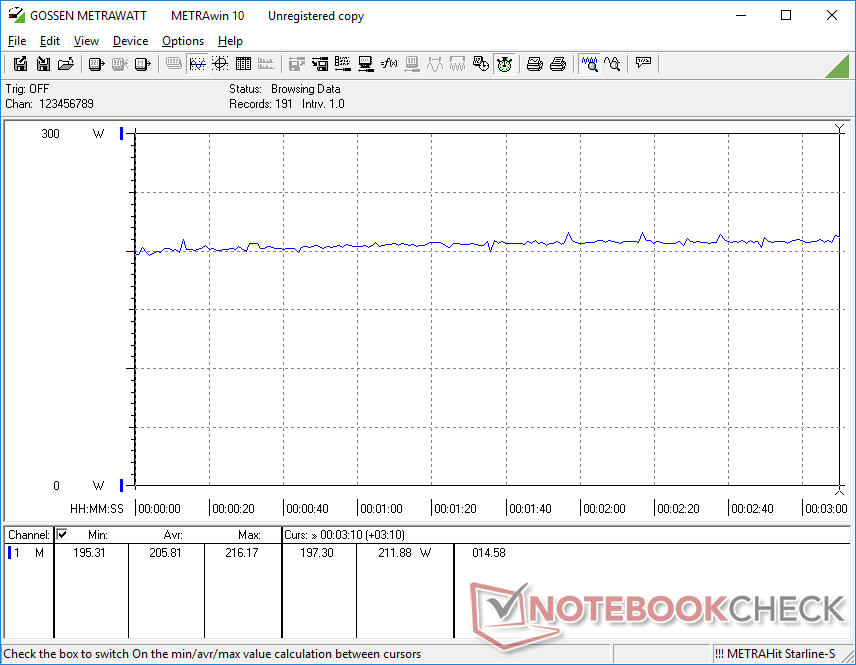
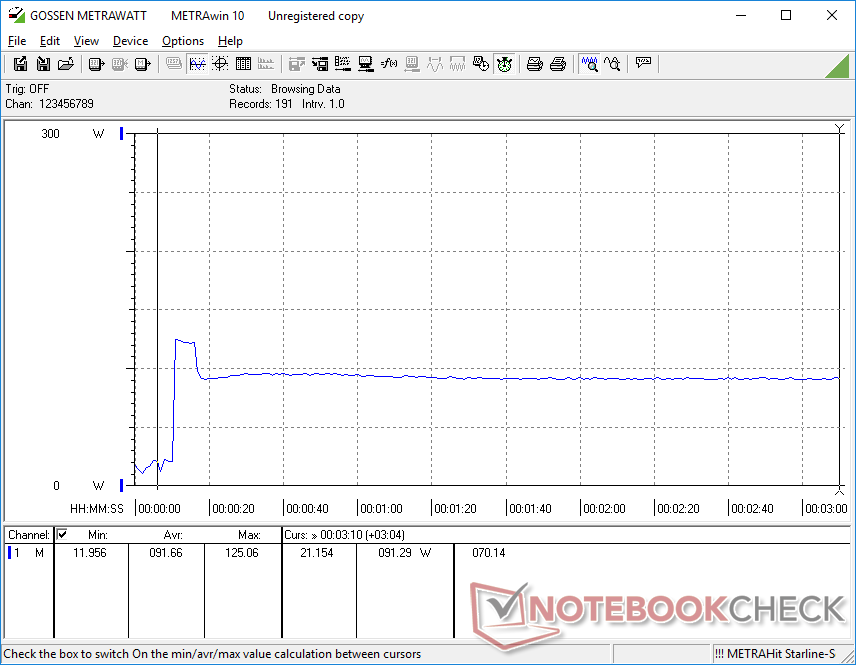
Pobór mocy
Ponieważ Radeon RX 6650M jest nieco szybszy od RTX 3060, powinniśmy oczekiwać, że średni pobór mocy również będzie nieco wyższy. Niestety dla AMD, rzeczywistość jest taka, że nasz Omen 16 może być znacznie bardziej energochłonny niż większość innych laptopów z RTX 2060 podczas gier. Uruchomienie Witcher 3wymaga na przykład 206 W, w porównaniu do 177 W, 187 W i 155 W na zasilanym RTX 3060 Dellu G16,Lenovo Legion 5 15i Lenovo Legion Slim 7 16, odpowiednio. Te same alternatywy mogą nawet zaoferować szybszą wydajność CPU dzięki procesorom Intel 12. generacji
Na szczęście zużycie energii jest porównywalne z wieloma laptopami z układami Intel-Nvidia, gdy nie są uruchamiane żadne wymagające aplikacje. Oznacza to, że czas pracy na baterii nie będzie dramatycznie krótszy od większości alternatyw Intel-Nvidii podczas przeglądania stron internetowych lub strumieniowania, mimo że laptop może być bardzo wymagający podczas gry
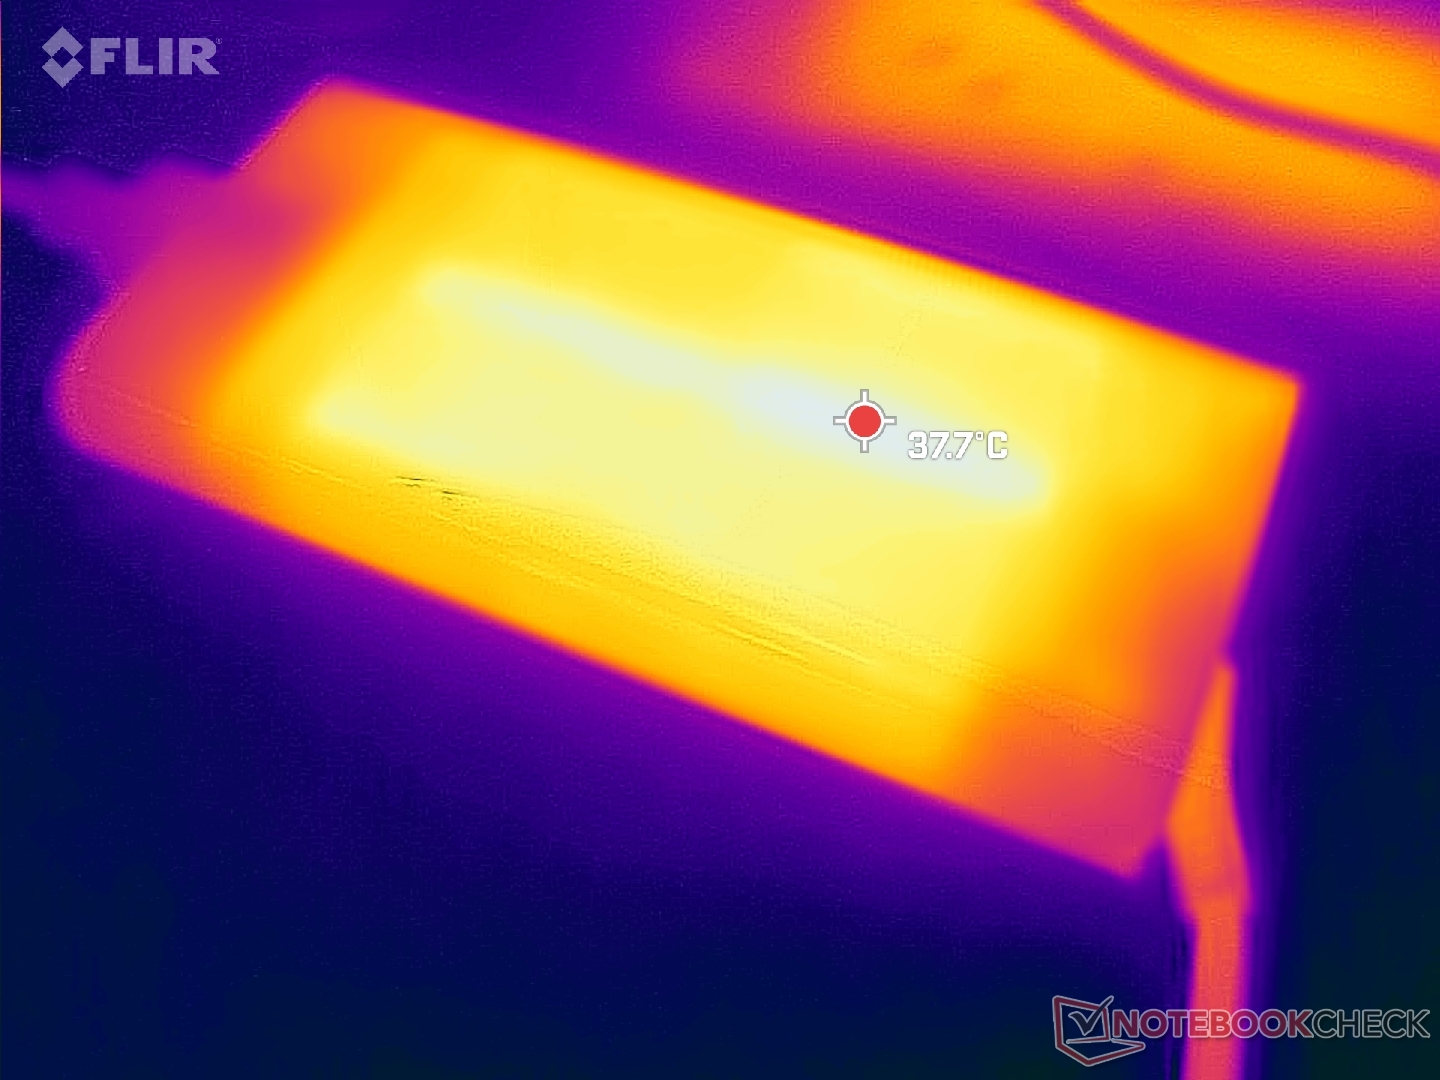
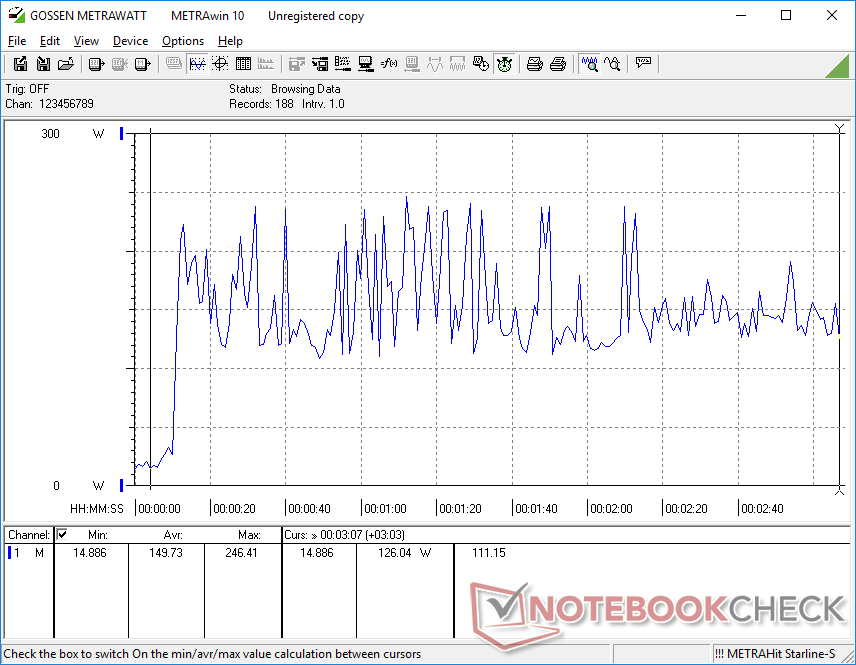
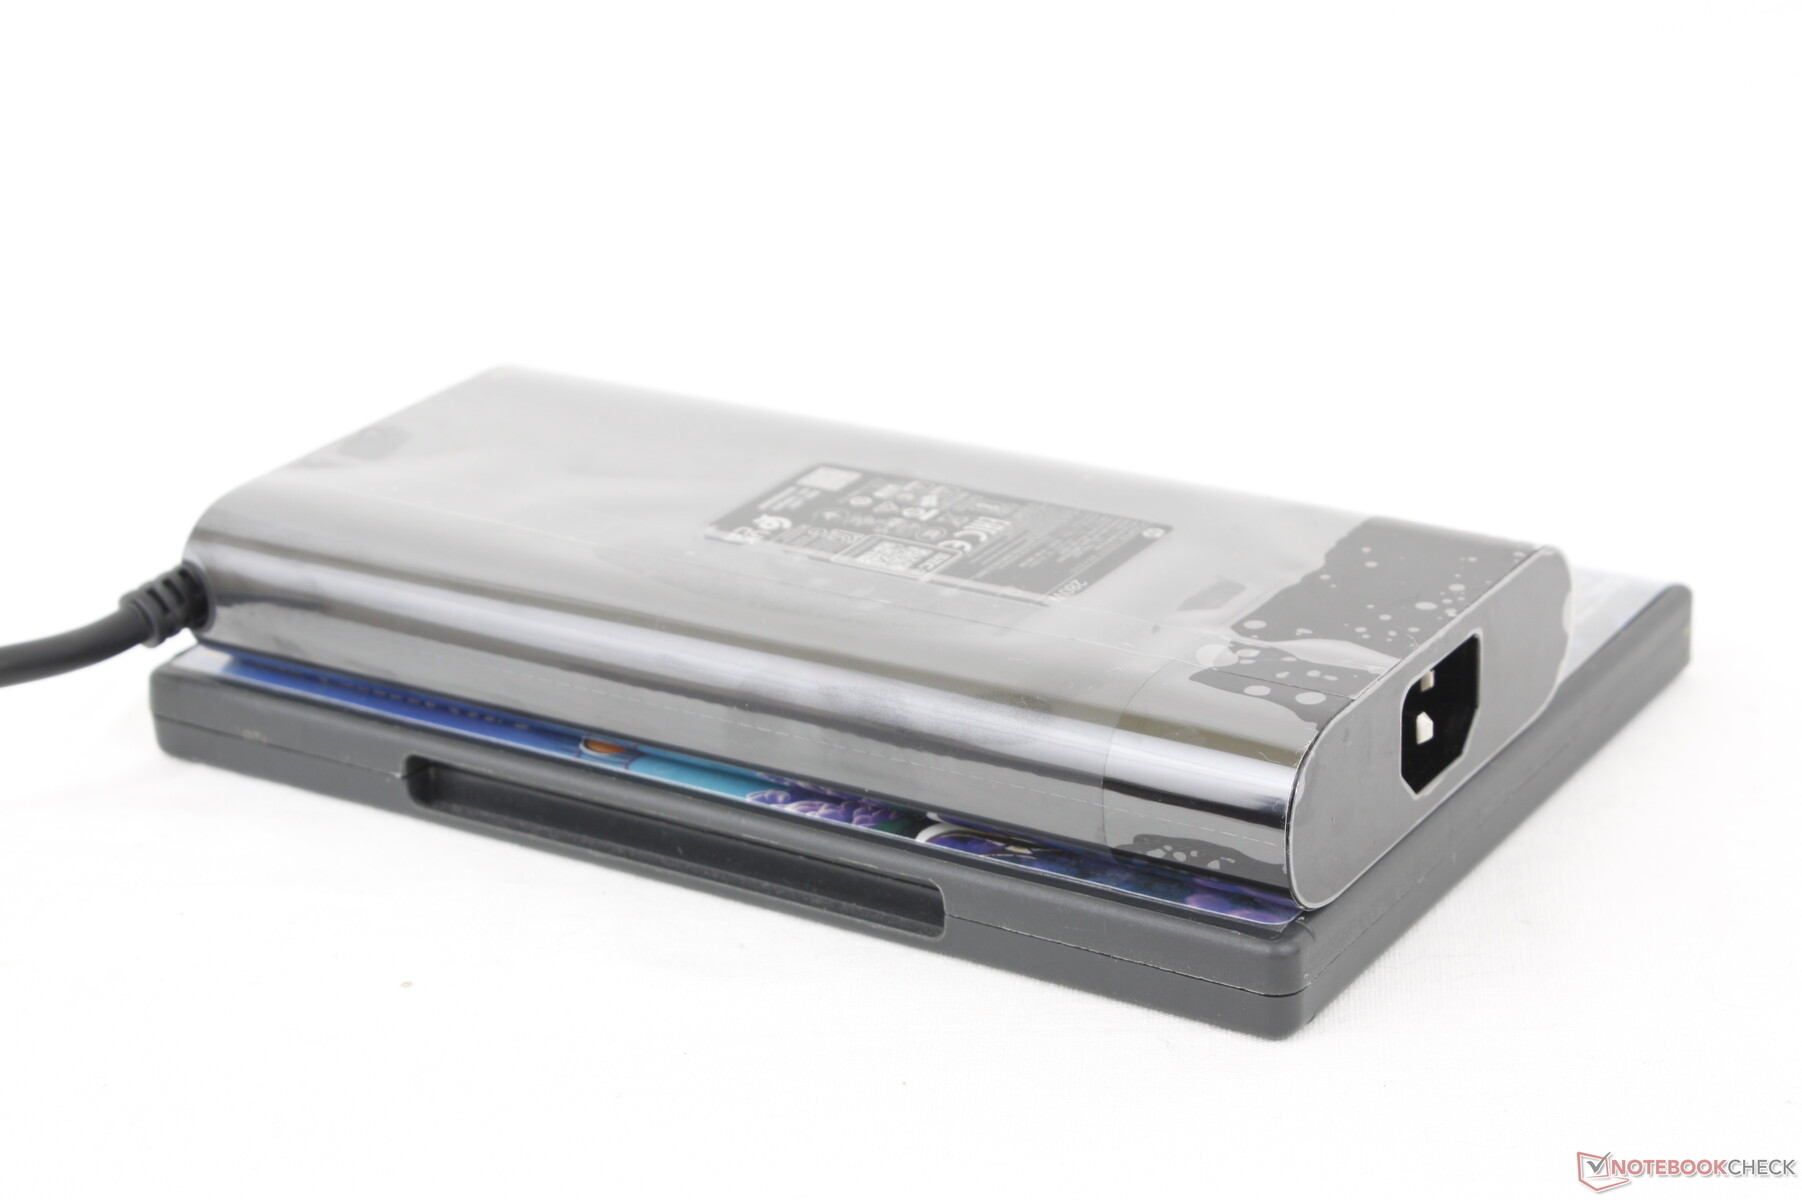
Udało nam się zarejestrować chwilowy maksymalny pobór mocy 246 W z dużego (~17,9 x 8,5 x 2,5 cm) zasilacza sieciowego o mocy 280 W, gdy zarówno CPU, jak i GPU są wykorzystywane w 100 procentach.
| wyłączony / stan wstrzymania | |
| luz | |
| obciążenie |
|
Legenda:
min: | |
| HP Omen 16-n0033dx R7 6800H, Radeon RX 6650M, Samsung PM9A1 MZVL21T0HCLR, IPS, 1920x1080, 16.1" | HP Envy 16 h0112nr i7-12700H, GeForce RTX 3060 Laptop GPU, Micron 3400 1TB MTFDKBA1T0TFH, OLED, 3840x2400, 16" | HP Omen 16-b1090ng i7-12700H, GeForce RTX 3070 Ti Laptop GPU, WDC PC SN810 1TB, IPS, 2560x1440, 16.1" | HP Victus 16-e0145ng R5 5600H, GeForce RTX 3050 Ti Laptop GPU, Samsung SSD PM981a MZVLB512HBJQ, IPS, 1920x1080, 16.1" | Lenovo Legion S7 16ARHA7 R9 6900HX, Radeon RX 6800S, SK Hynix HFS001TEJ9X115N, IPS, 2560x1600, 16" | Dell G16 7620 i7-12700H, GeForce RTX 3060 Laptop GPU, WDC PC SN810 512GB, IPS, 2560x1600, 16" | |
|---|---|---|---|---|---|---|
| Power Consumption | -9% | 8% | 18% | -3% | -35% | |
| Idle Minimum * (Watt) | 7.9 | 10 -27% | 4 49% | 7 11% | 8.8 -11% | 14.4 -82% |
| Idle Average * (Watt) | 11.5 | 10.9 5% | 10 13% | 9 22% | 14.7 -28% | 17.8 -55% |
| Idle Maximum * (Watt) | 18.3 | 27.8 -52% | 19 -4% | 15 18% | 19.8 -8% | 31.5 -72% |
| Load Average * (Watt) | 88.1 | 116.4 -32% | 114 -29% | 93 -6% | 85.3 3% | 101.2 -15% |
| Witcher 3 ultra * (Watt) | 206 | 133.7 35% | 183.2 11% | 134.5 35% | 167.5 19% | 176.9 14% |
| Load Maximum * (Watt) | 246.4 | 209.8 15% | 221 10% | 185 25% | 230.7 6% | 242.9 1% |
* ... im mniej tym lepiej
Power Consumption Witcher 3 / Stresstest
Power Consumption external Monitor
Czas pracy na baterii
Pojemność akumulatora jest wyraźnie mniejsza, niż w intelowskich wersjach starszego Omena 16 (68 Wh vs. 83 Wh). Mimo to ogólne czasy pracy nie są znacząco krótsze w modelu AMD. Na zrównoważonym profilu zasilania udało nam się odnotować prawie 7 godzin pracy w sieci WLAN, co jest wynikiem ponadprzeciętnym dla laptopa do gier
Ładowanie od stanu pustego do pełnego przy użyciu dołączonego zasilacza sieciowego jest stosunkowo wolne i trwa od 2 do 2,5 godziny w porównaniu z 1,5 godziny w większości laptopów. Dodatkowo laptop nie jest kompatybilny z większością ładowarek AC USB-C innych firm. HP reklamuje, że model ten obsługuje USB-C Power Delivery, ale podłączenie naszego własnego adaptera AC USB-C o mocy 100 W spowodowałoby wyświetlenie komunikatu ostrzegawczego "Adapter AC nie jest kompatybilny z systemem". Dla porównania, obsługujące PD gamingowe laptopy od Razera, MSI czy Asusa działałyby ze wszystkimi przetestowanymi przez nas adapterami USB-C AC.
| HP Omen 16-n0033dx R7 6800H, Radeon RX 6650M, 68 Wh | HP Envy 16 h0112nr i7-12700H, GeForce RTX 3060 Laptop GPU, 83 Wh | HP Omen 16-b1090ng i7-12700H, GeForce RTX 3070 Ti Laptop GPU, 83 Wh | HP Victus 16-e0145ng R5 5600H, GeForce RTX 3050 Ti Laptop GPU, 70 Wh | Lenovo Legion S7 16ARHA7 R9 6900HX, Radeon RX 6800S, 71 Wh | Dell G16 7620 i7-12700H, GeForce RTX 3060 Laptop GPU, 84 Wh | |
|---|---|---|---|---|---|---|
| Czasy pracy | 45% | 18% | 1% | -11% | -31% | |
| Reader / Idle (h) | 10 | 17.8 78% | 10.1 1% | 7.1 -29% | ||
| WiFi v1.3 (h) | 7 | 7.9 13% | 5.6 -20% | 7.1 1% | 6.2 -11% | 5 -29% |
| Load (h) | 1.1 | 1.6 45% | 1.9 73% | 0.7 -36% |
Za
Przeciw
Werdykt - kompetentna alternatywa dla GeForce RTX 3060
Jak większość laptopów z procesorami AMD, AMD Omen 16 sprzedaje się za kilkaset dolarów mniej niż równoważny laptop z procesorem Intel Core i7 i GeForce RTX. Ryzen 7 6800H nie może konkurować z najnowszymi procesorami Core 12. generacji w zakresie surowej wydajności, ale Radeon RX 6650M utrzymuje się lepiej niż oczekiwano w stosunku do RTX 3060. Ponieważ większość gier jest związana z GPU, deficyt CPU między Intelem a AMD w tym przypadku ma znacznie mniejsze znaczenie podczas uruchamiania rzeczywistych gier. Właściciele otrzymają nieco lepszą wydajność w grach niż RTX 3060 za zauważalnie mniejszą kwotę, co jest główną zaletą AMD Omen 16.
Inne pozytywy to wygodna klawiatura, szeroki wybór portów, dobrej jakości wyświetlacz 144 Hz i gładka obudowa przypominająca Envy 16. Niektórzy użytkownicy mogą docenić brak diod LED lub powierzchownych wzorów dla graczy, w przeciwieństwie do większości alternatyw MSI lub Asusa.
AMD Omen 16 oferuje lepszą wydajność za dolara niż większość laptopów napędzanych przez GeForce RTX 3060. Jeśli jednak cenisz sobie wyższą wydajność procesora i potencjał ray-tracingu, to i tak będziesz chciał zainwestować w rozwiązanie Intel-Nvidia.
Mimo wszystko jest jeszcze sporo do poprawienia. Na przykład ramka podbródka jest zbyt gruba, co prowadzi do większej powierzchni i cięższej wagi niż u takich konkurentów jakAsus Zephyrus M16 lub Lenovo Legion S7. Klawiatura jest zbyt czuła, a w trybie Performance wentylatory są nadal głośniejsze niż przeciętnie. Użytkownicy mogą rozważyć grę w trybie Balanced ze względu na znacznie cichsze wentylatory, nawet jeśli wiąże się to z niewielkim spadkiem wydajności.
Cena i dostępność
Nasz egzemplarz recenzencki w konfiguracji jest teraz dostępny w Best Buy za 1580 USD. Jednak HP prowadzi wyprzedaż tej samej konfiguracji za w cenie nawet 900 USD w momencie publikacji. Szeroko dostępne są również warianty Intel-Nvidia modelu Omen 16.
HP Omen 16-n0033dx
- 29/11/2022 v7 (old)
Allen Ngo
Price comparison

