Recenzja Asus ROG Strix Scar 18 2023 G834JY - laptop gamingowy z RTX 4090
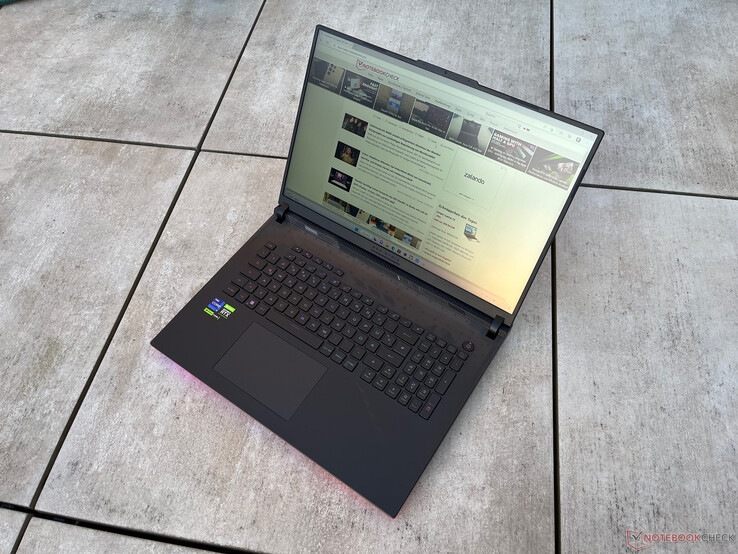
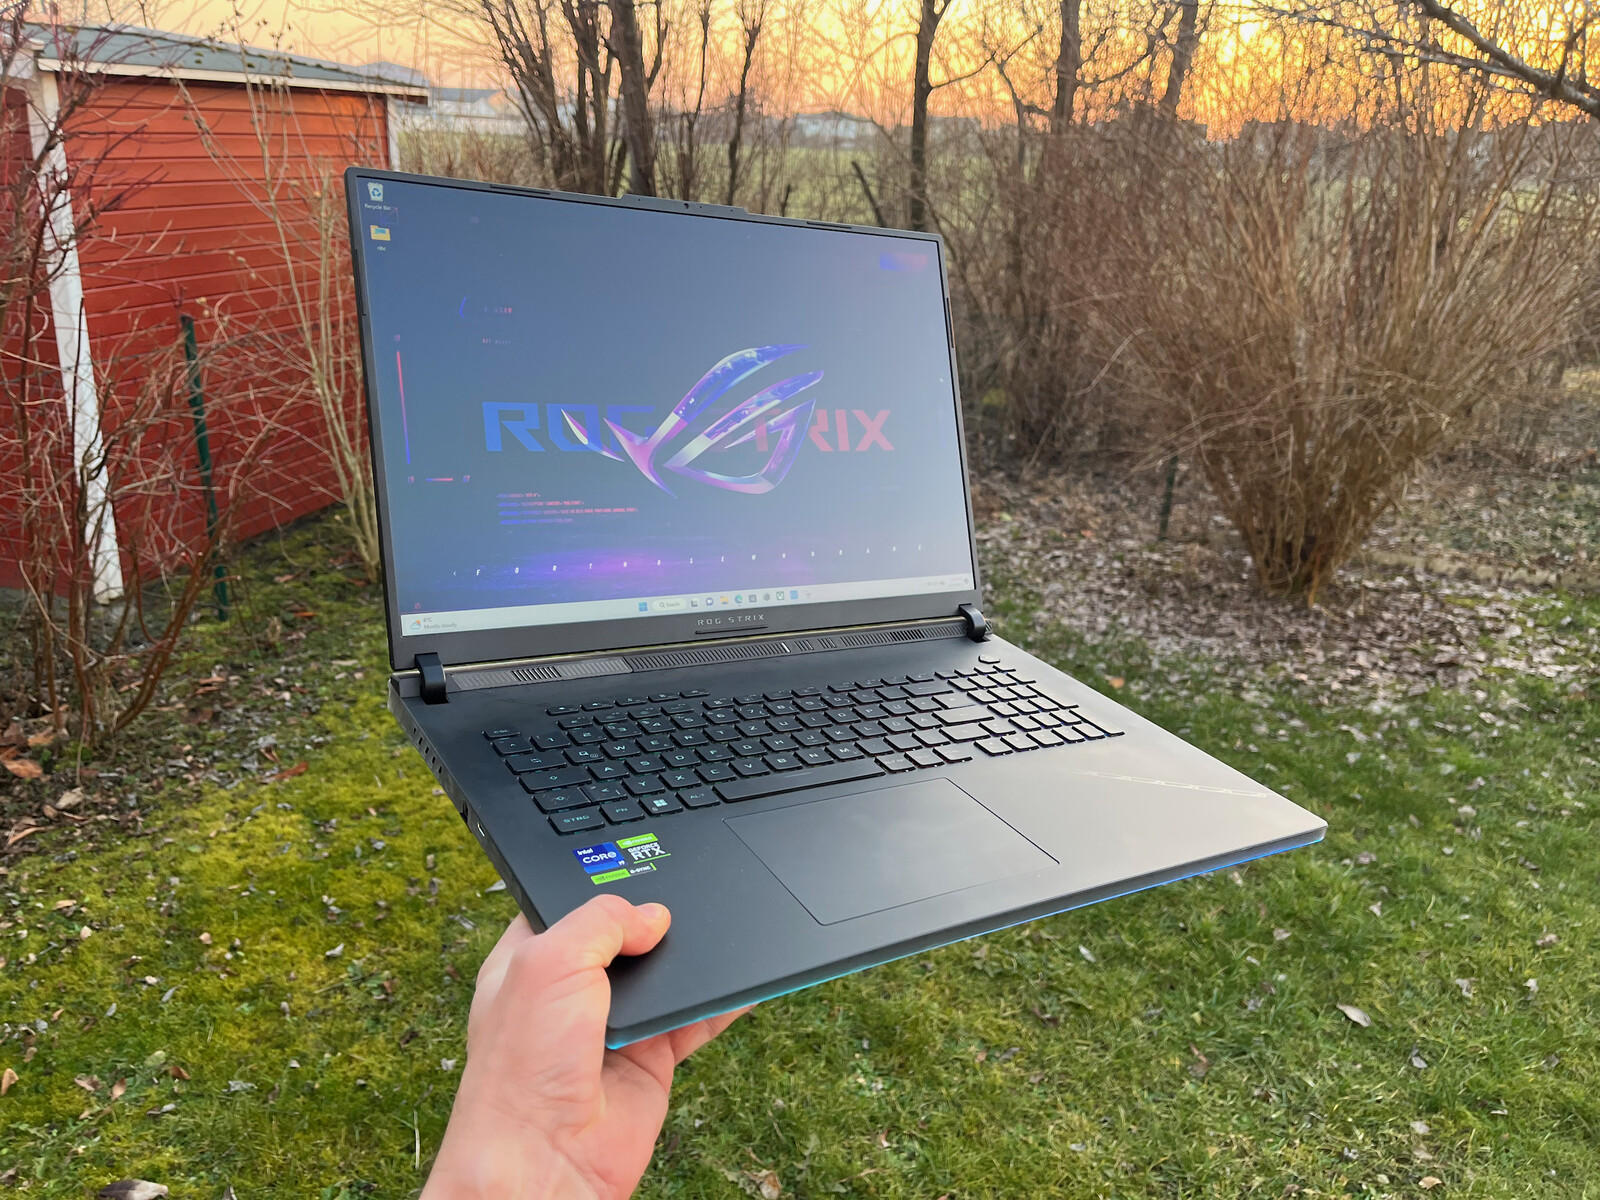
Wraz z modelem ROG Strix Scar 18, Asus również włącza się w trend odrodzenia 18-calowych gamingowych potworów. Z okazji premiery pojawiła się nowa obudowa z m.in RTX 4080oraz RTX 4090 Laptop GPUz których korzystała nasza jednostka testowa. W kwestii procesorów Asus korzysta z nowej serii HX, co oznacza, że otrzymujemy najszybsze podzespoły do laptopa dostępne obecnie na rynku. Duża obudowa jest nie tylko w pełni wykorzystywana przez 18-calowy wyświetlacz QHD+, ale mieści też nowy system chłodzenia z trzema wentylatorami, który ma trzymać w ryzach żądne mocy podzespoły. W poniższym teście przyglądamy się szczegółowo modelowi G834JY-N6005W z RTX 4090, 32 GB pamięci RAM GDDR5 i 2x 1-TB SSD, który jest obecnie dostępny w Anglii.
Potencjalni konkurenci w porównaniu
Ocena | Data | Model | Waga | Wysokość | Rozmiar | Rezolucja | Cena |
|---|---|---|---|---|---|---|---|
| 86.6 % v7 (old) | 02/2023 | Asus ROG Strix Scar 18 2023 G834JY-N6005W i9-13980HX, GeForce RTX 4090 Laptop GPU | 3.1 kg | 30.8 mm | 18.00" | 2560x1600 | |
| 89 % v7 (old) | 02/2023 | MSI Titan GT77 HX 13VI i9-13950HX, GeForce RTX 4090 Laptop GPU | 3.5 kg | 23 mm | 17.30" | 3840x2160 | |
| 89.4 % v7 (old) | 02/2023 | Lenovo Legion Pro 7 16IRX8H i9-13900HX, GeForce RTX 4080 Laptop GPU | 2.7 kg | 26 mm | 16.00" | 2560x1600 | |
| 91.2 % v7 (old) | 02/2023 | Razer Blade 16 Early 2023 i9-13950HX, GeForce RTX 4080 Laptop GPU | 2.4 kg | 21.99 mm | 16.00" | 2560x1600 | |
| 86.9 % v7 (old) | 11/2022 | Asus ROG Strix Scar 17 SE G733CX-LL014W i9-12950HX, GeForce RTX 3080 Ti Laptop GPU | 2.9 kg | 28.3 mm | 17.30" | 2560x1440 | |
| 88.3 % v7 (old) | MSI Titan GT77 12UHS i9-12900HX, GeForce RTX 3080 Ti Laptop GPU | 3.3 kg | 23 mm | 17.30" | 1920x1080 | ||
| 85.4 % v7 (old) | 03/2023 | HP Omen 17-ck2097ng i9-13900HX, GeForce RTX 4080 Laptop GPU | 2.8 kg | 27 mm | 17.30" | 2560x1440 |
Sprawa
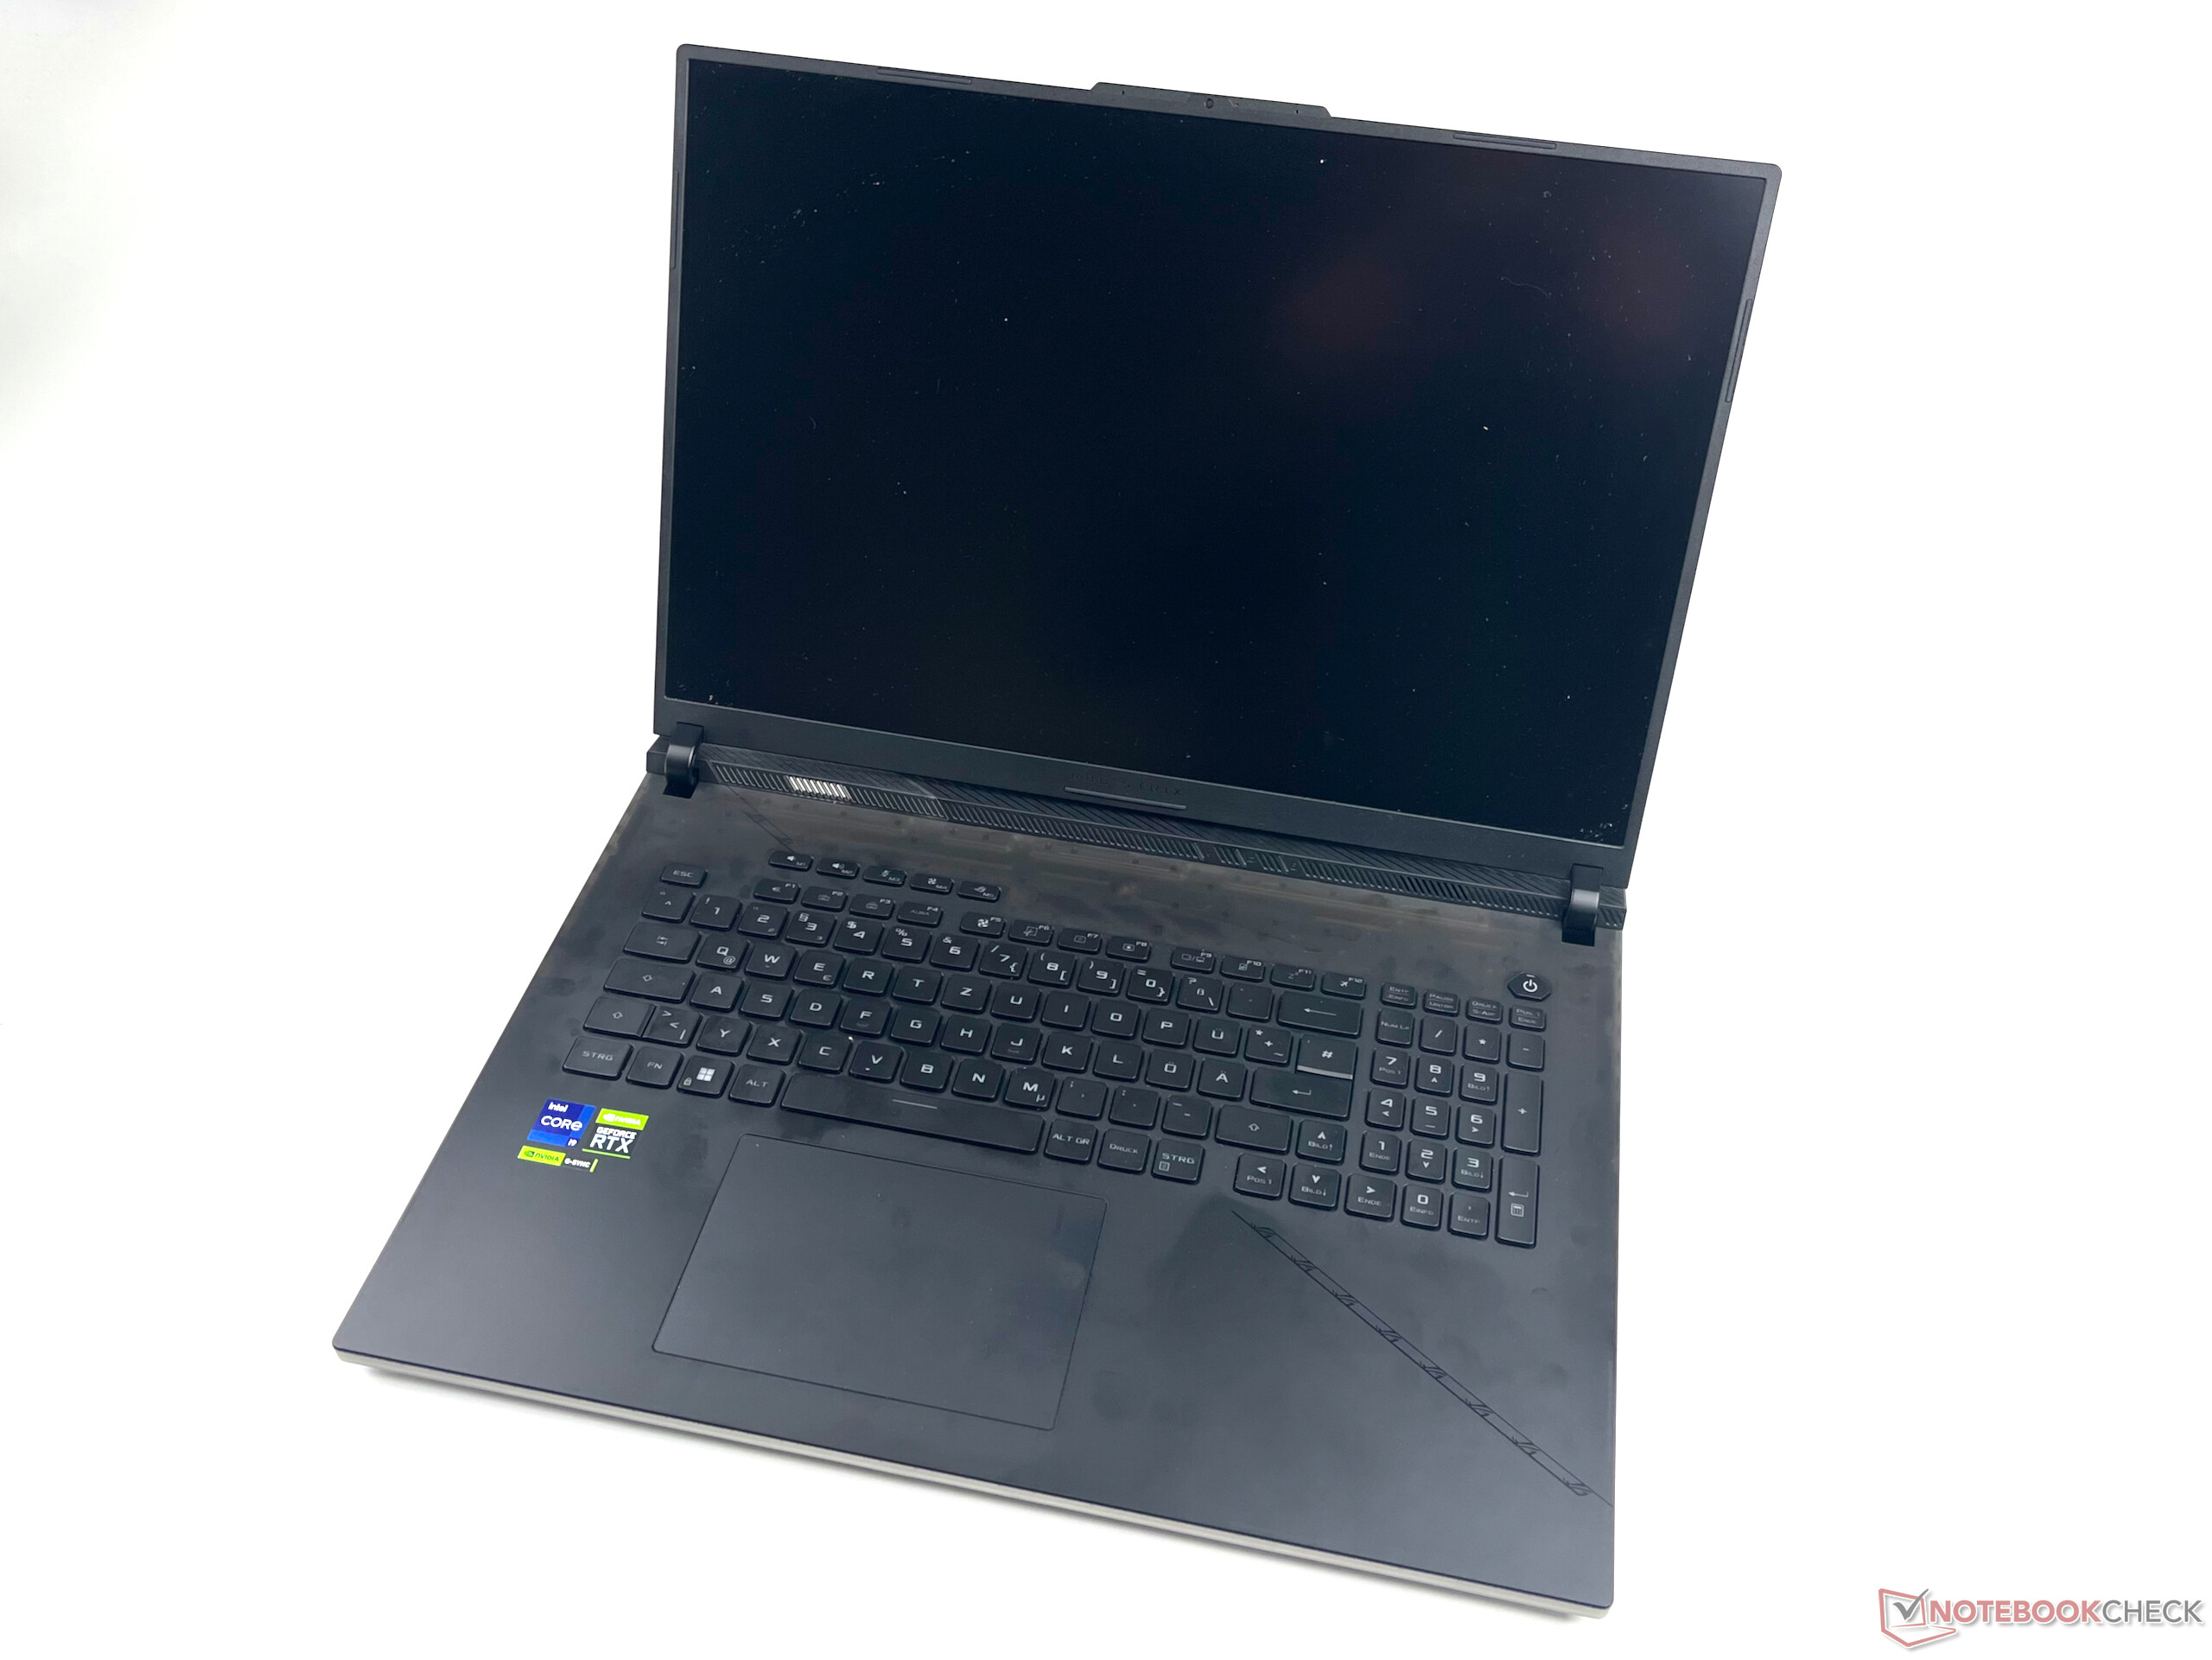
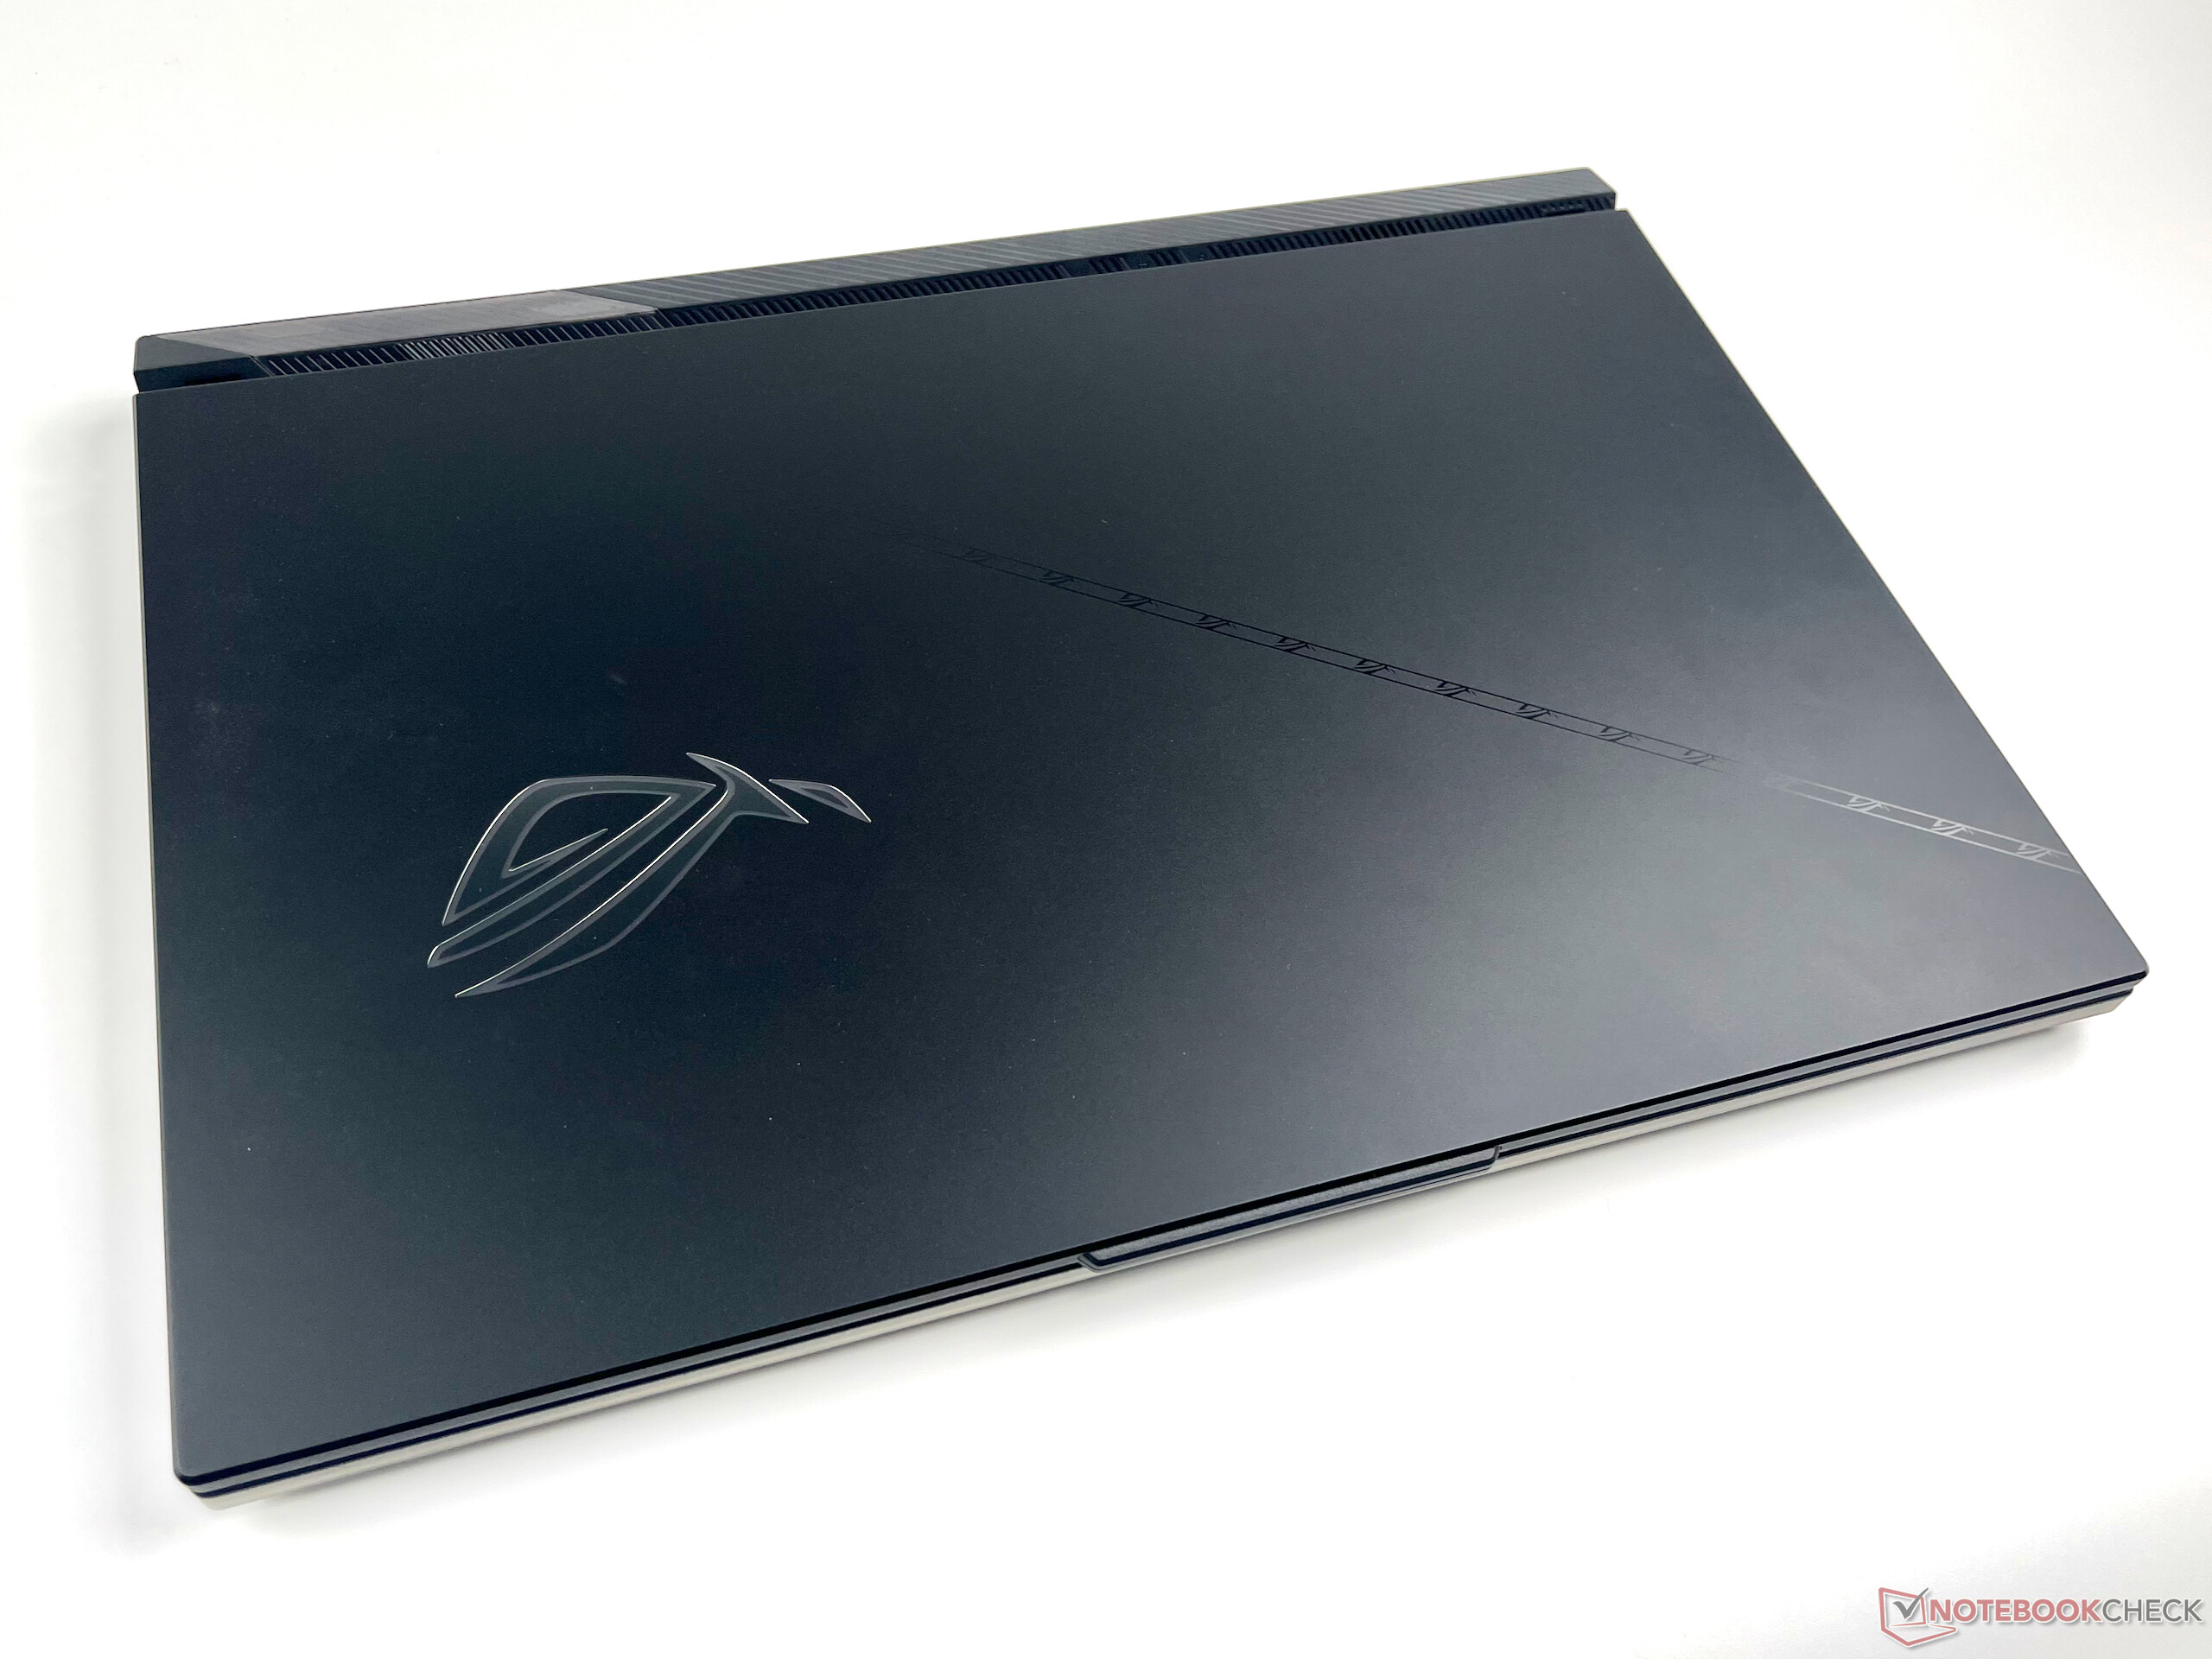
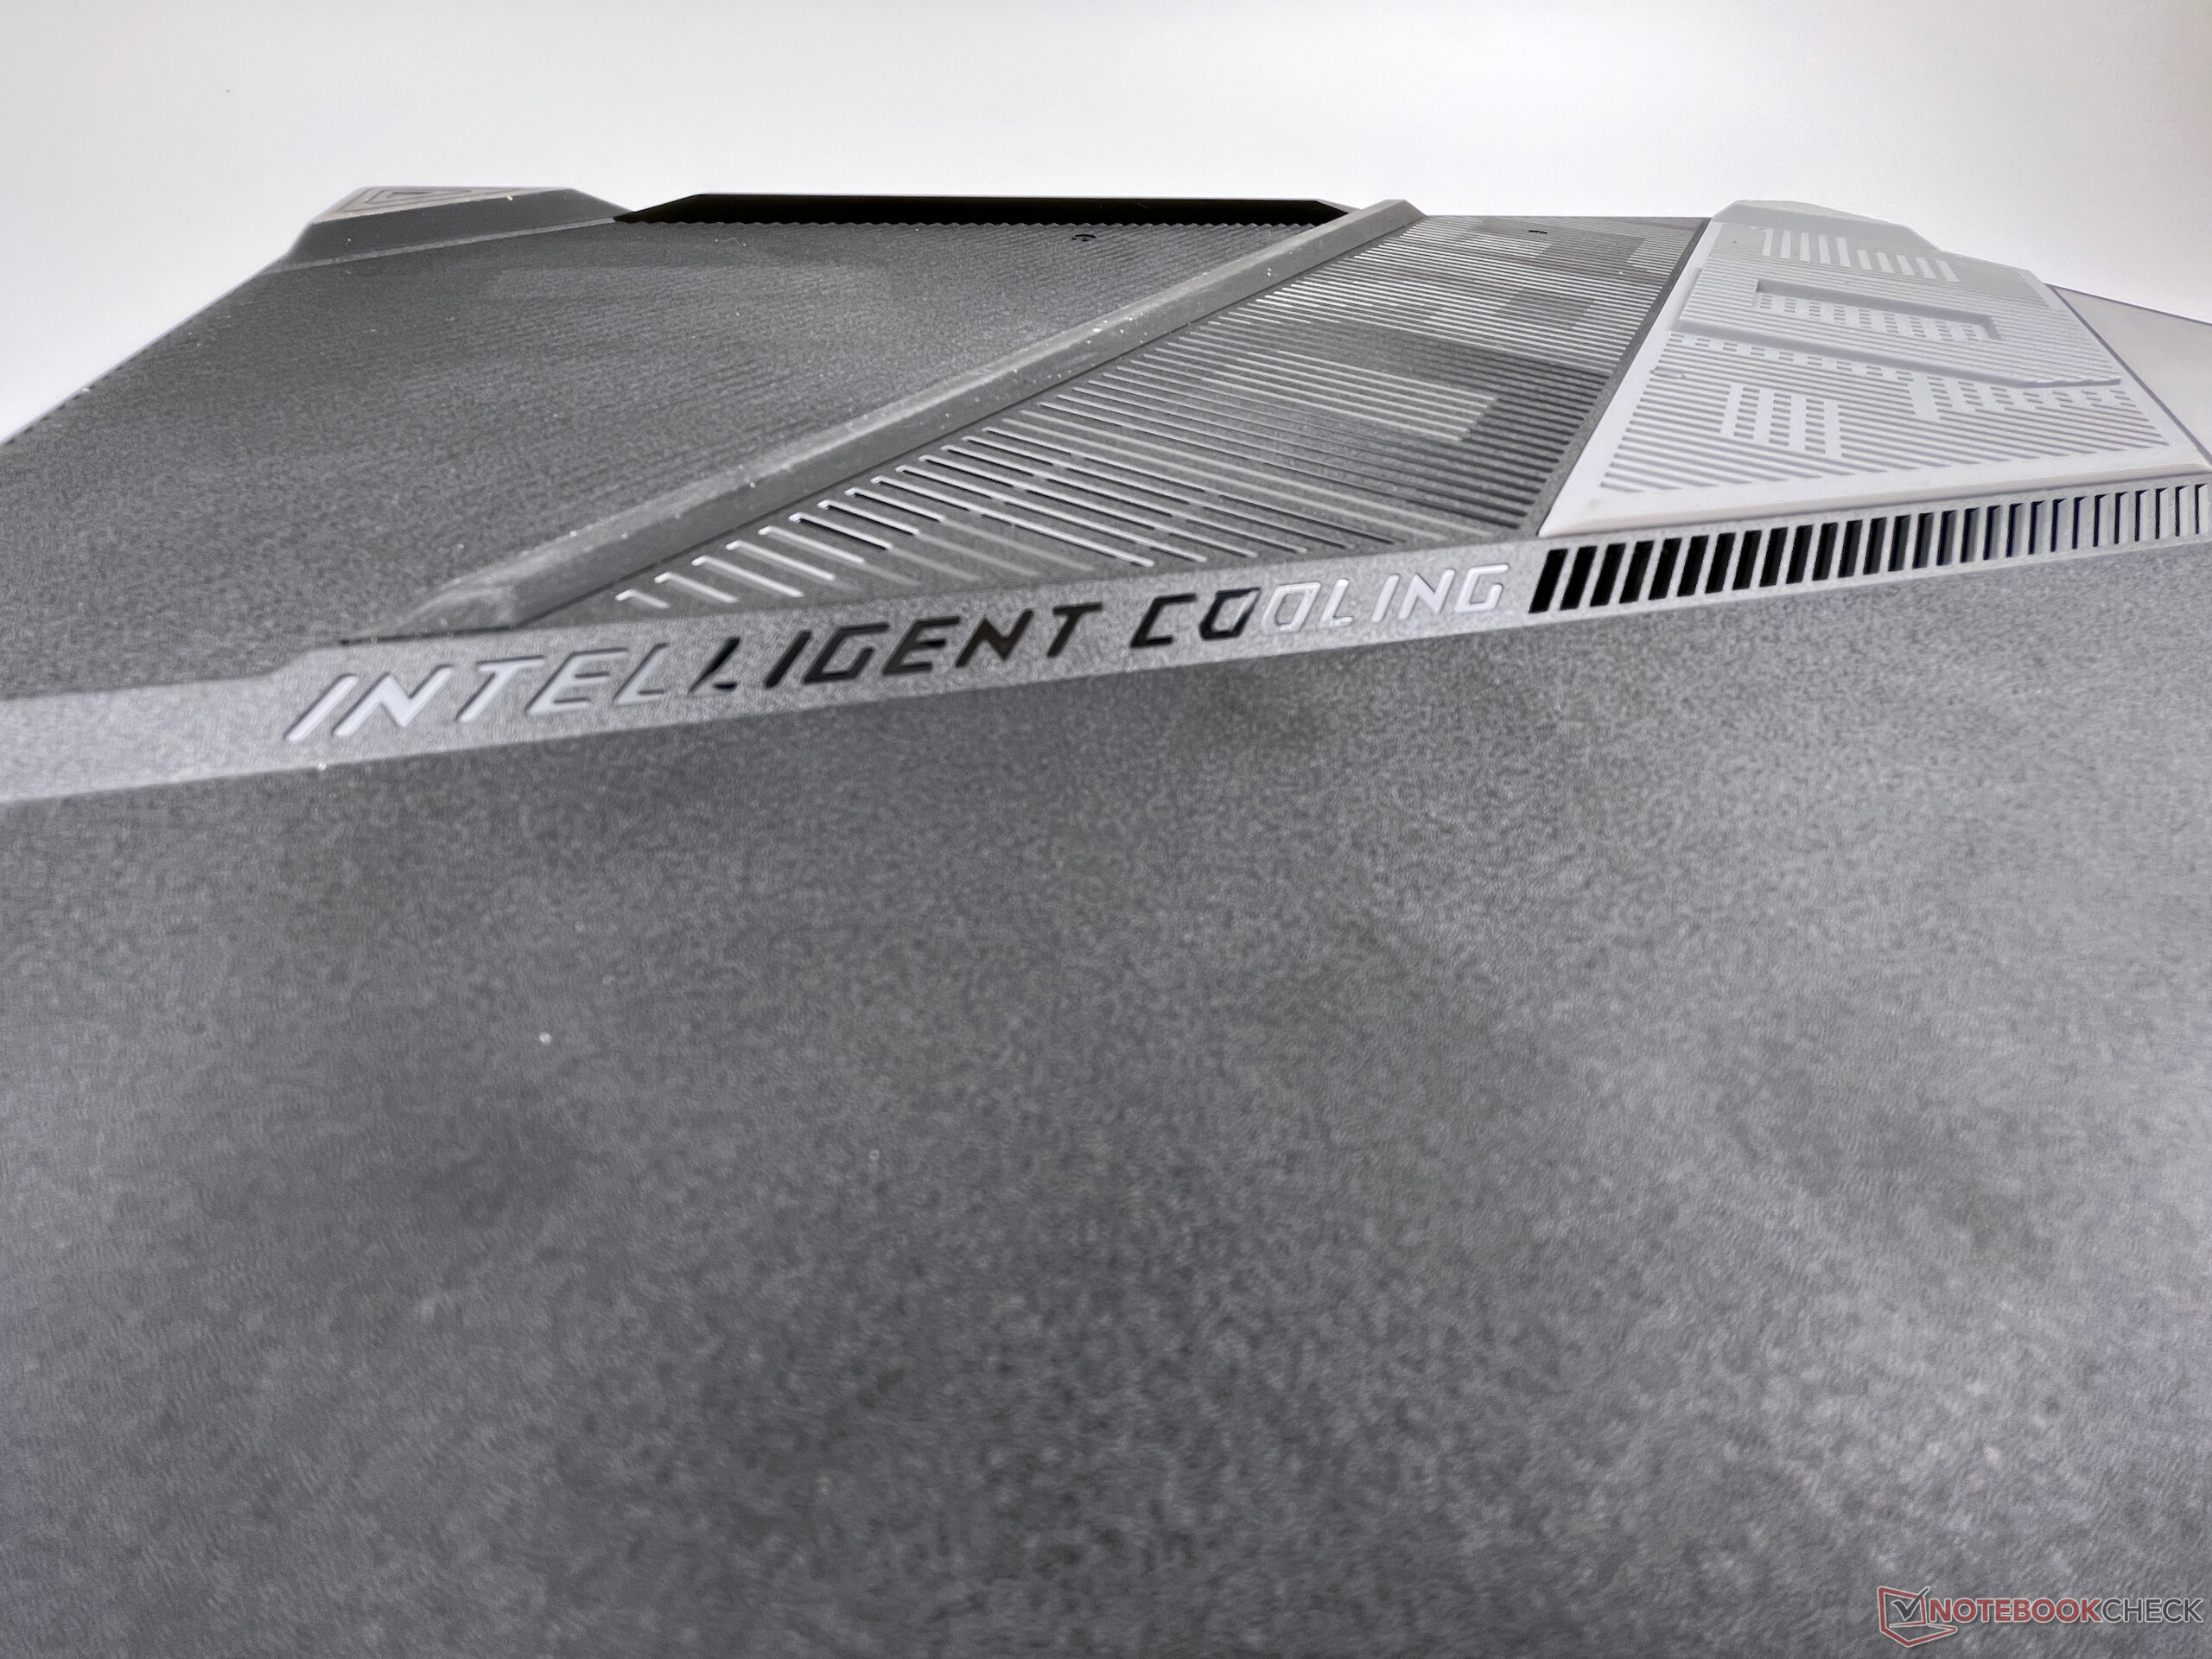
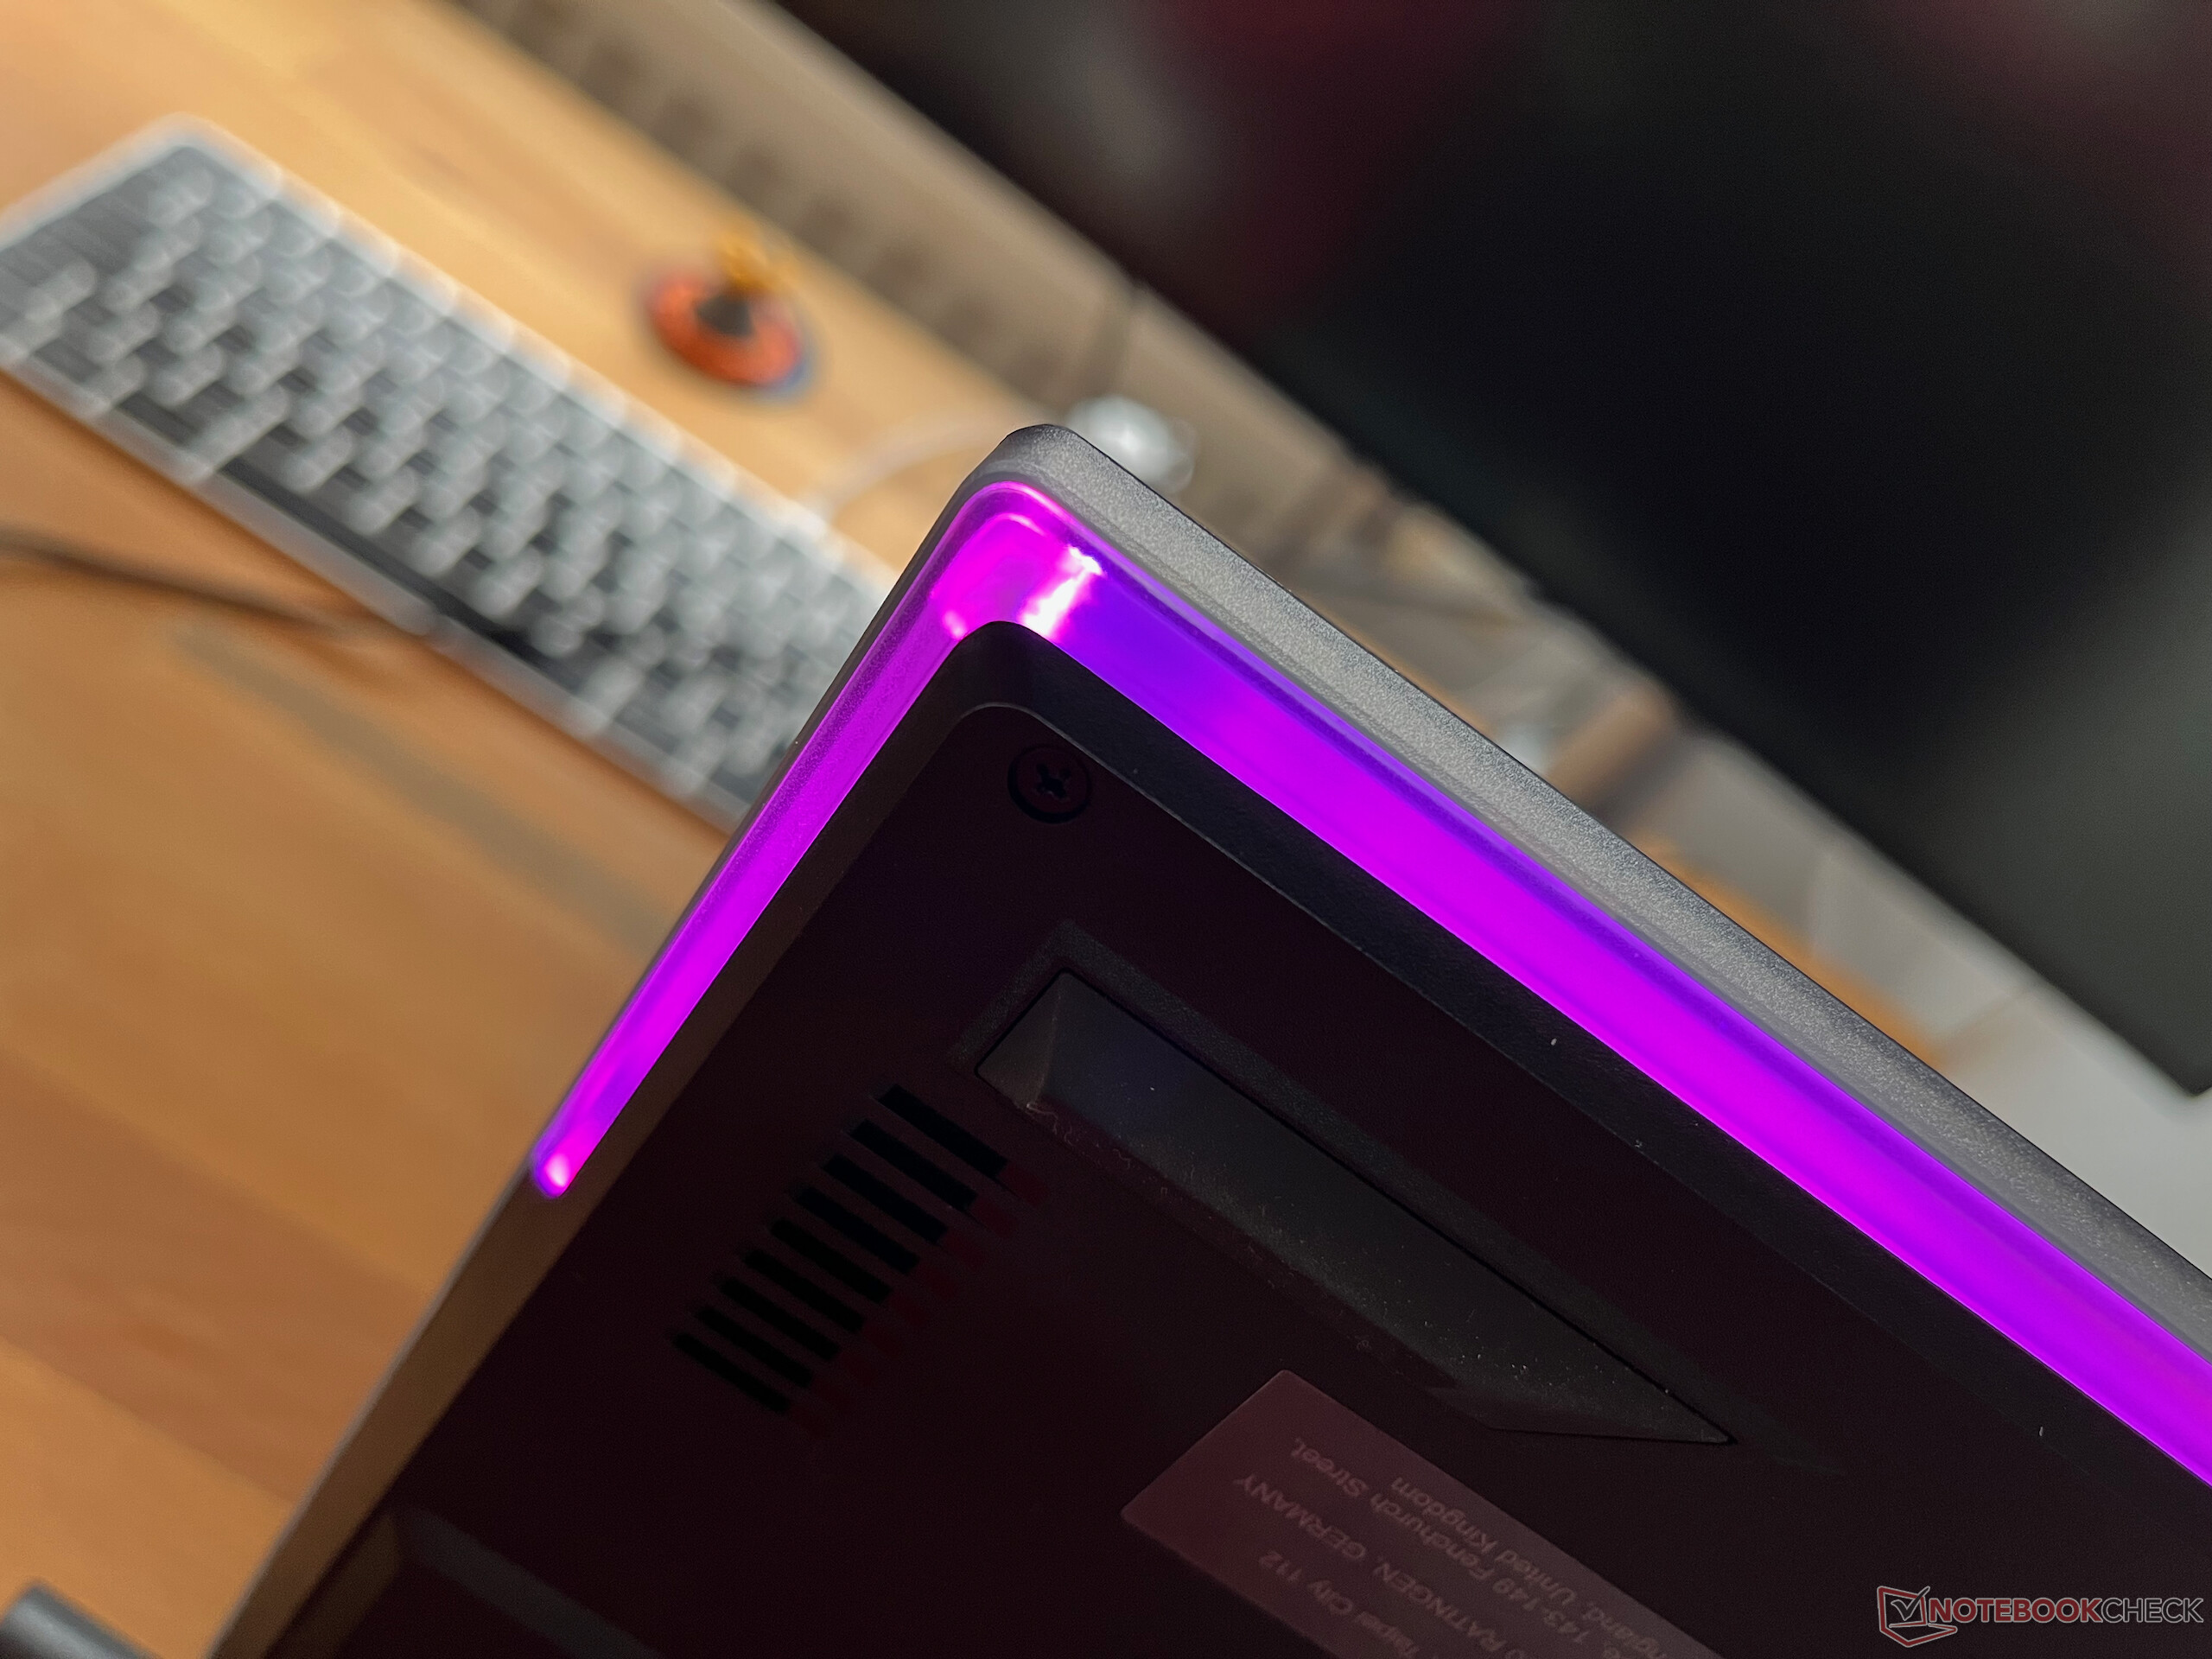
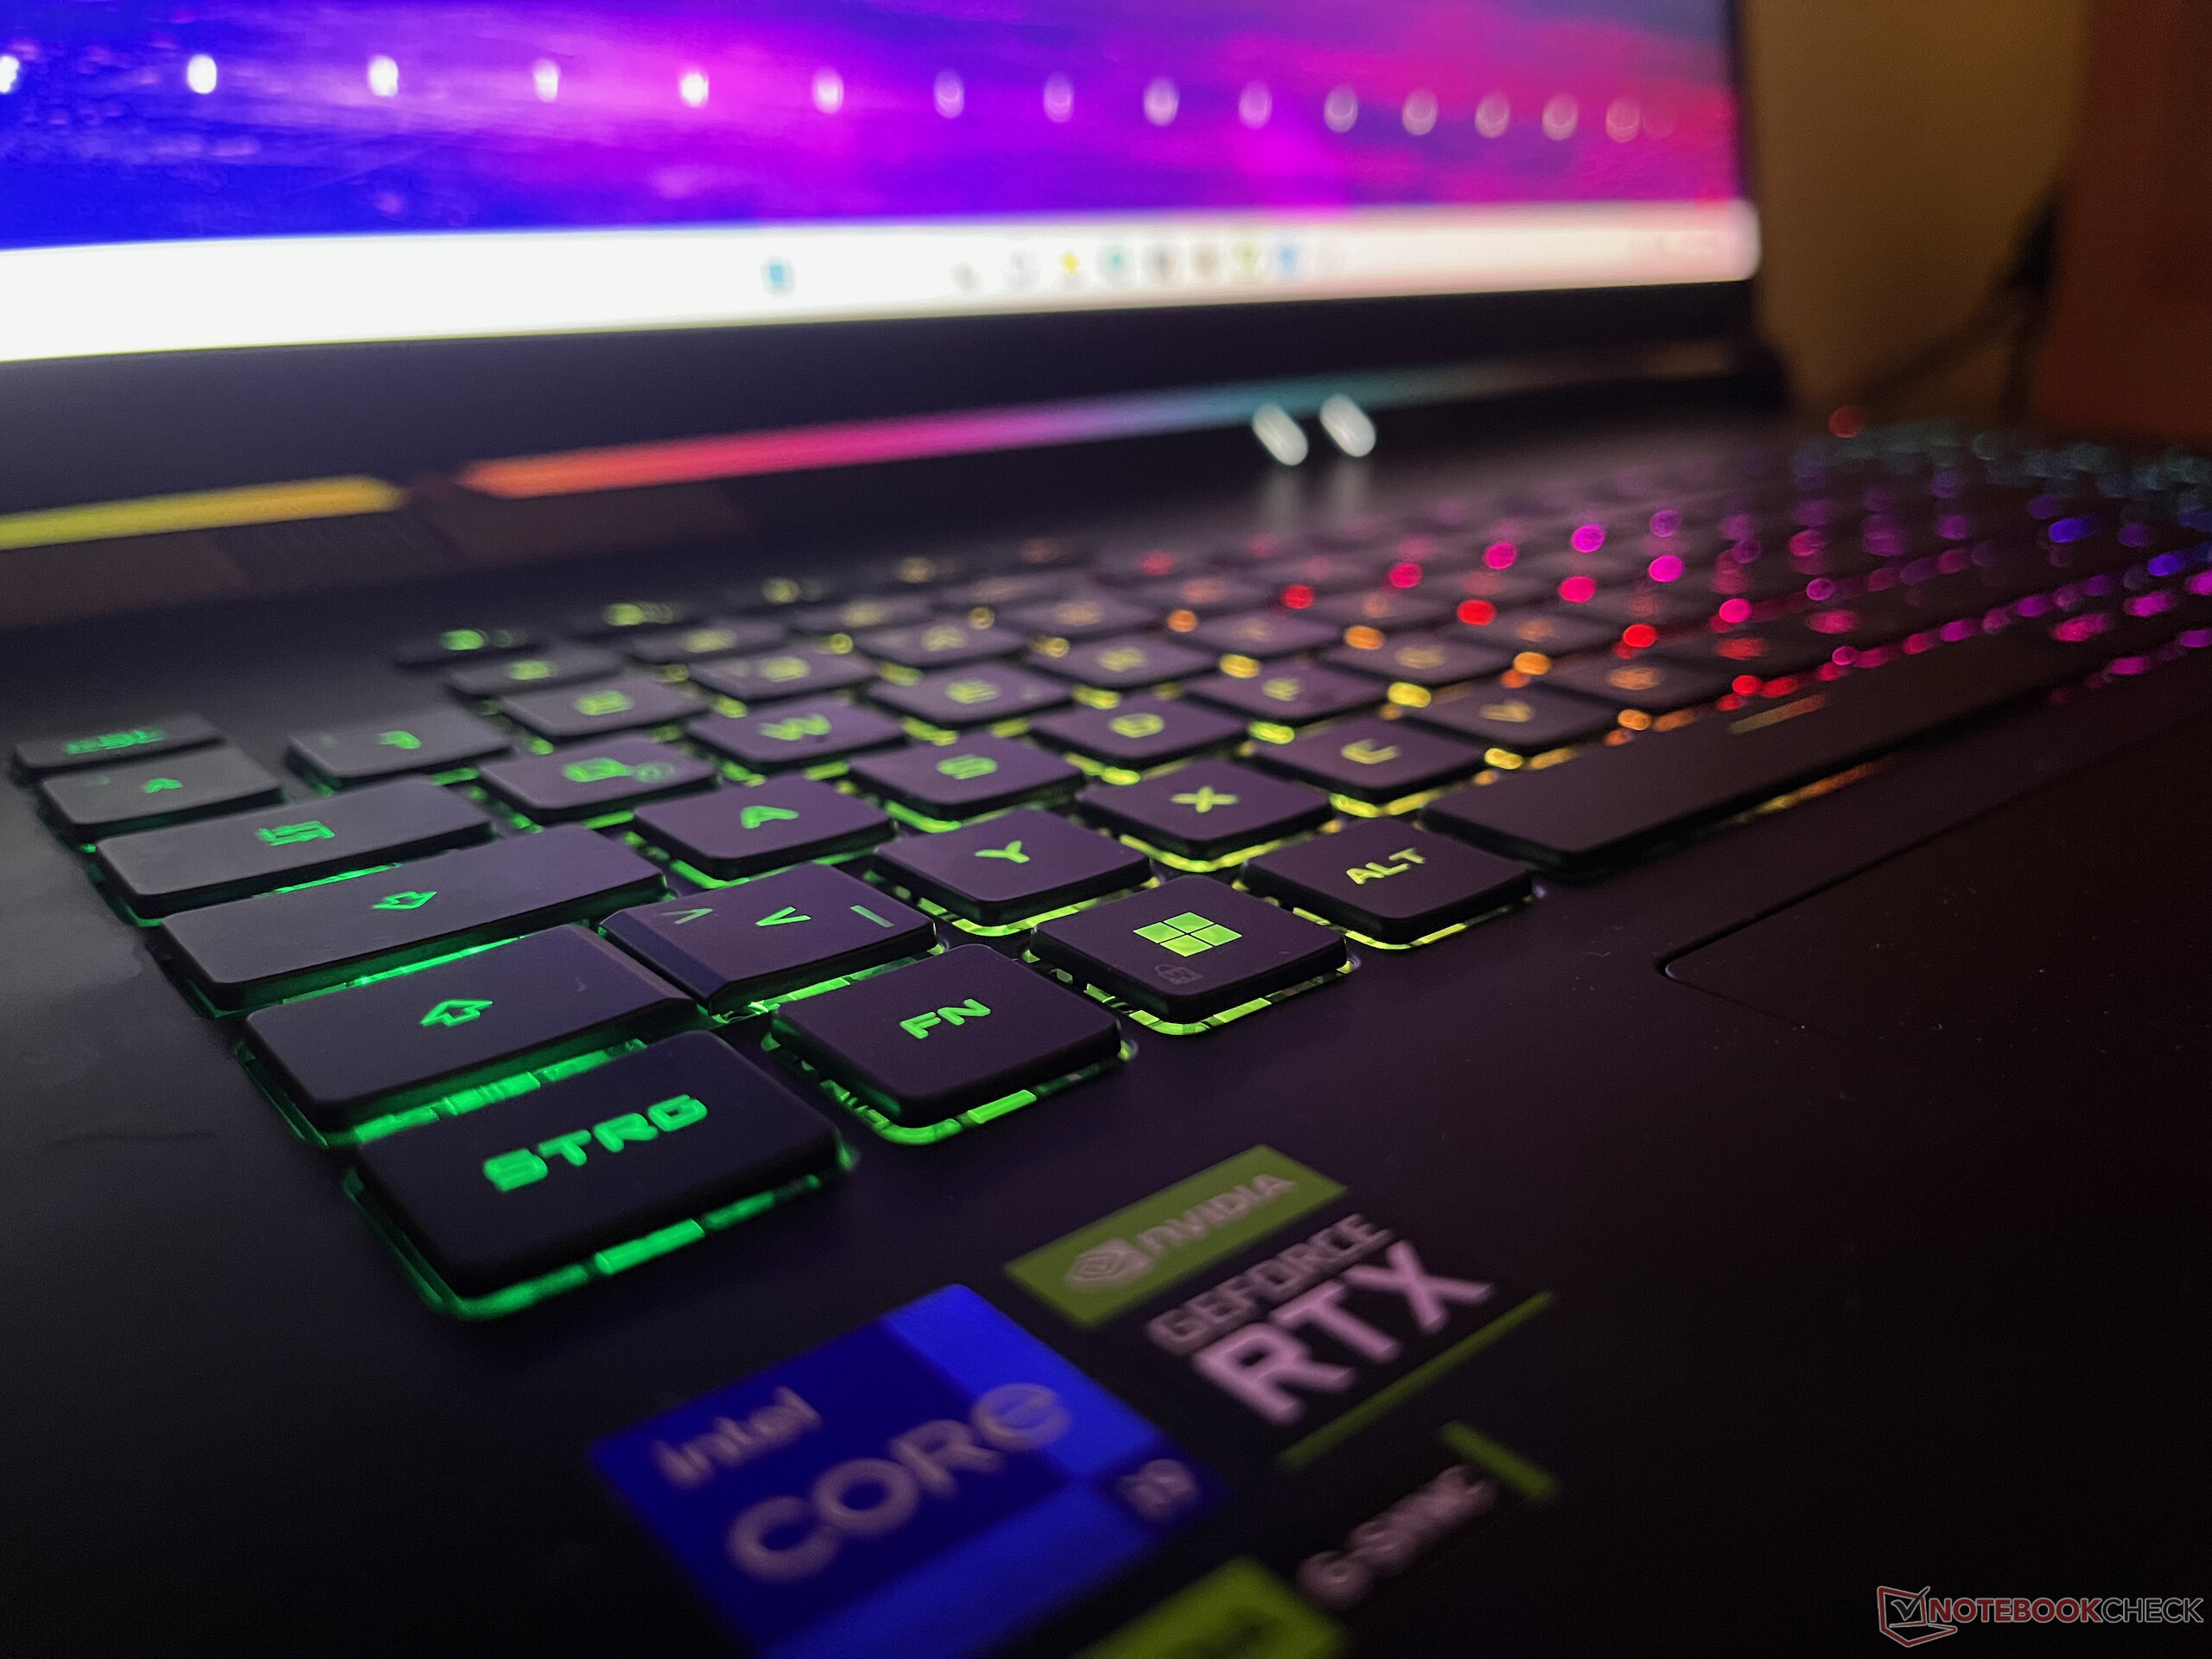
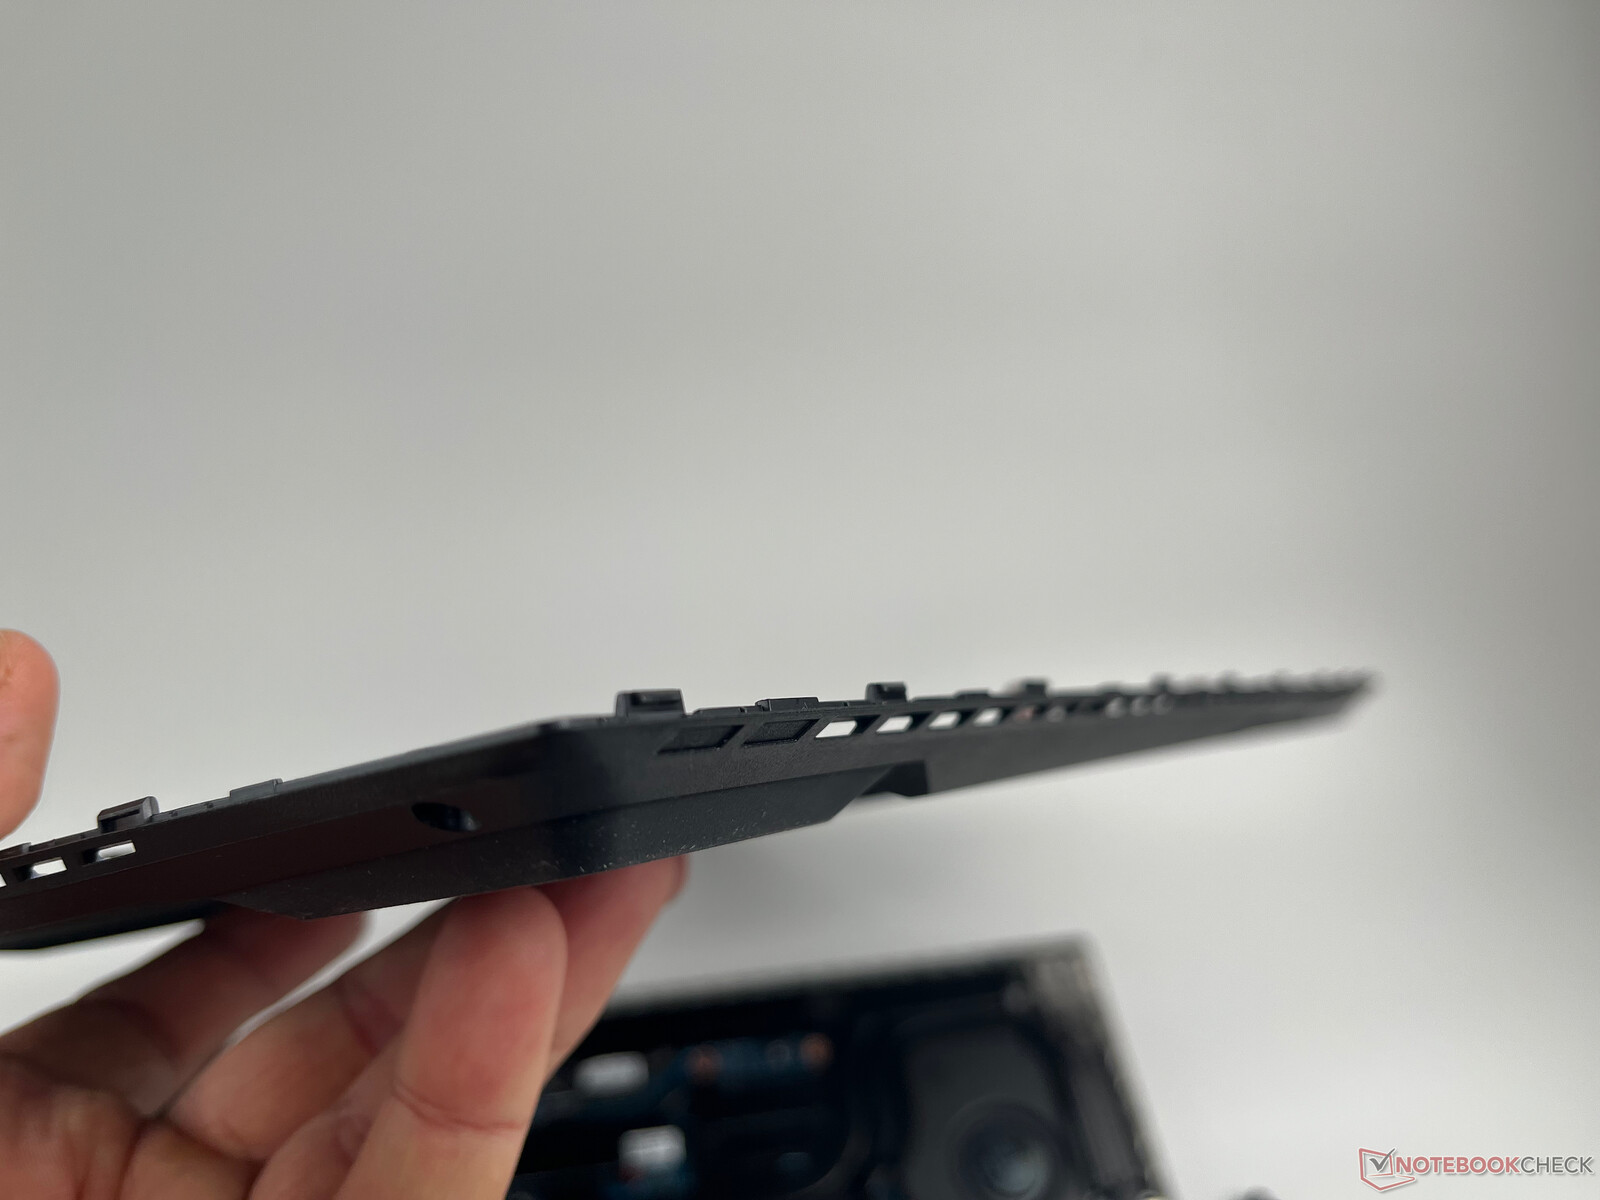
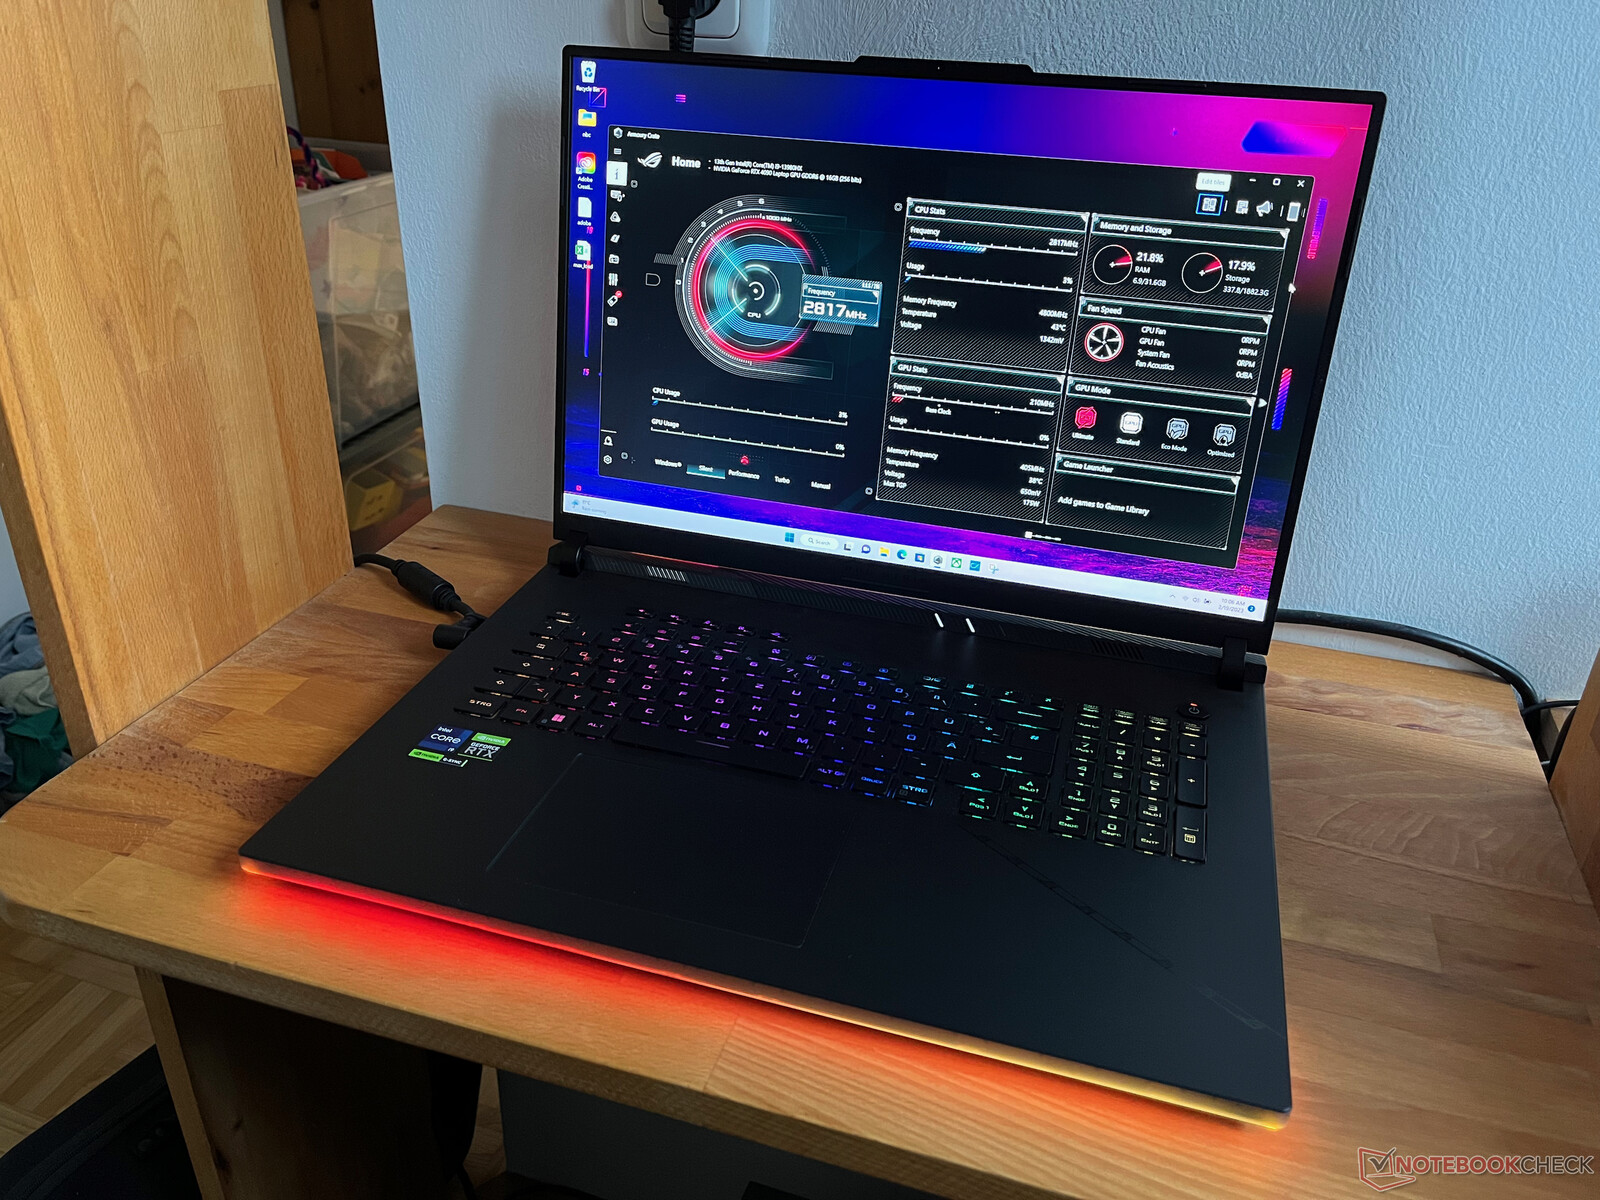
Obudowa ma punktować masywnym wykorzystaniem diod LED RGB oraz przezroczystych elementów obudowy. Jednocześnie podstawowy design jest stosunkowo dyskretny i całkiem atrakcyjny. Jedynie przezroczyste powierzchnie na bokach wyglądają nieco tanio. Sama jednostka bazowa jest wykonana z plastiku i nie daje zbyt wiele wrażenia wysokiej jakości. Odkształca się też nieco przy podnoszeniu jej do góry. Z drugiej strony, aluminiowa pokrywa wyświetlacza jest znacznie stabilniejsza, dając również wystarczającą ochronę dla wyświetlacza.

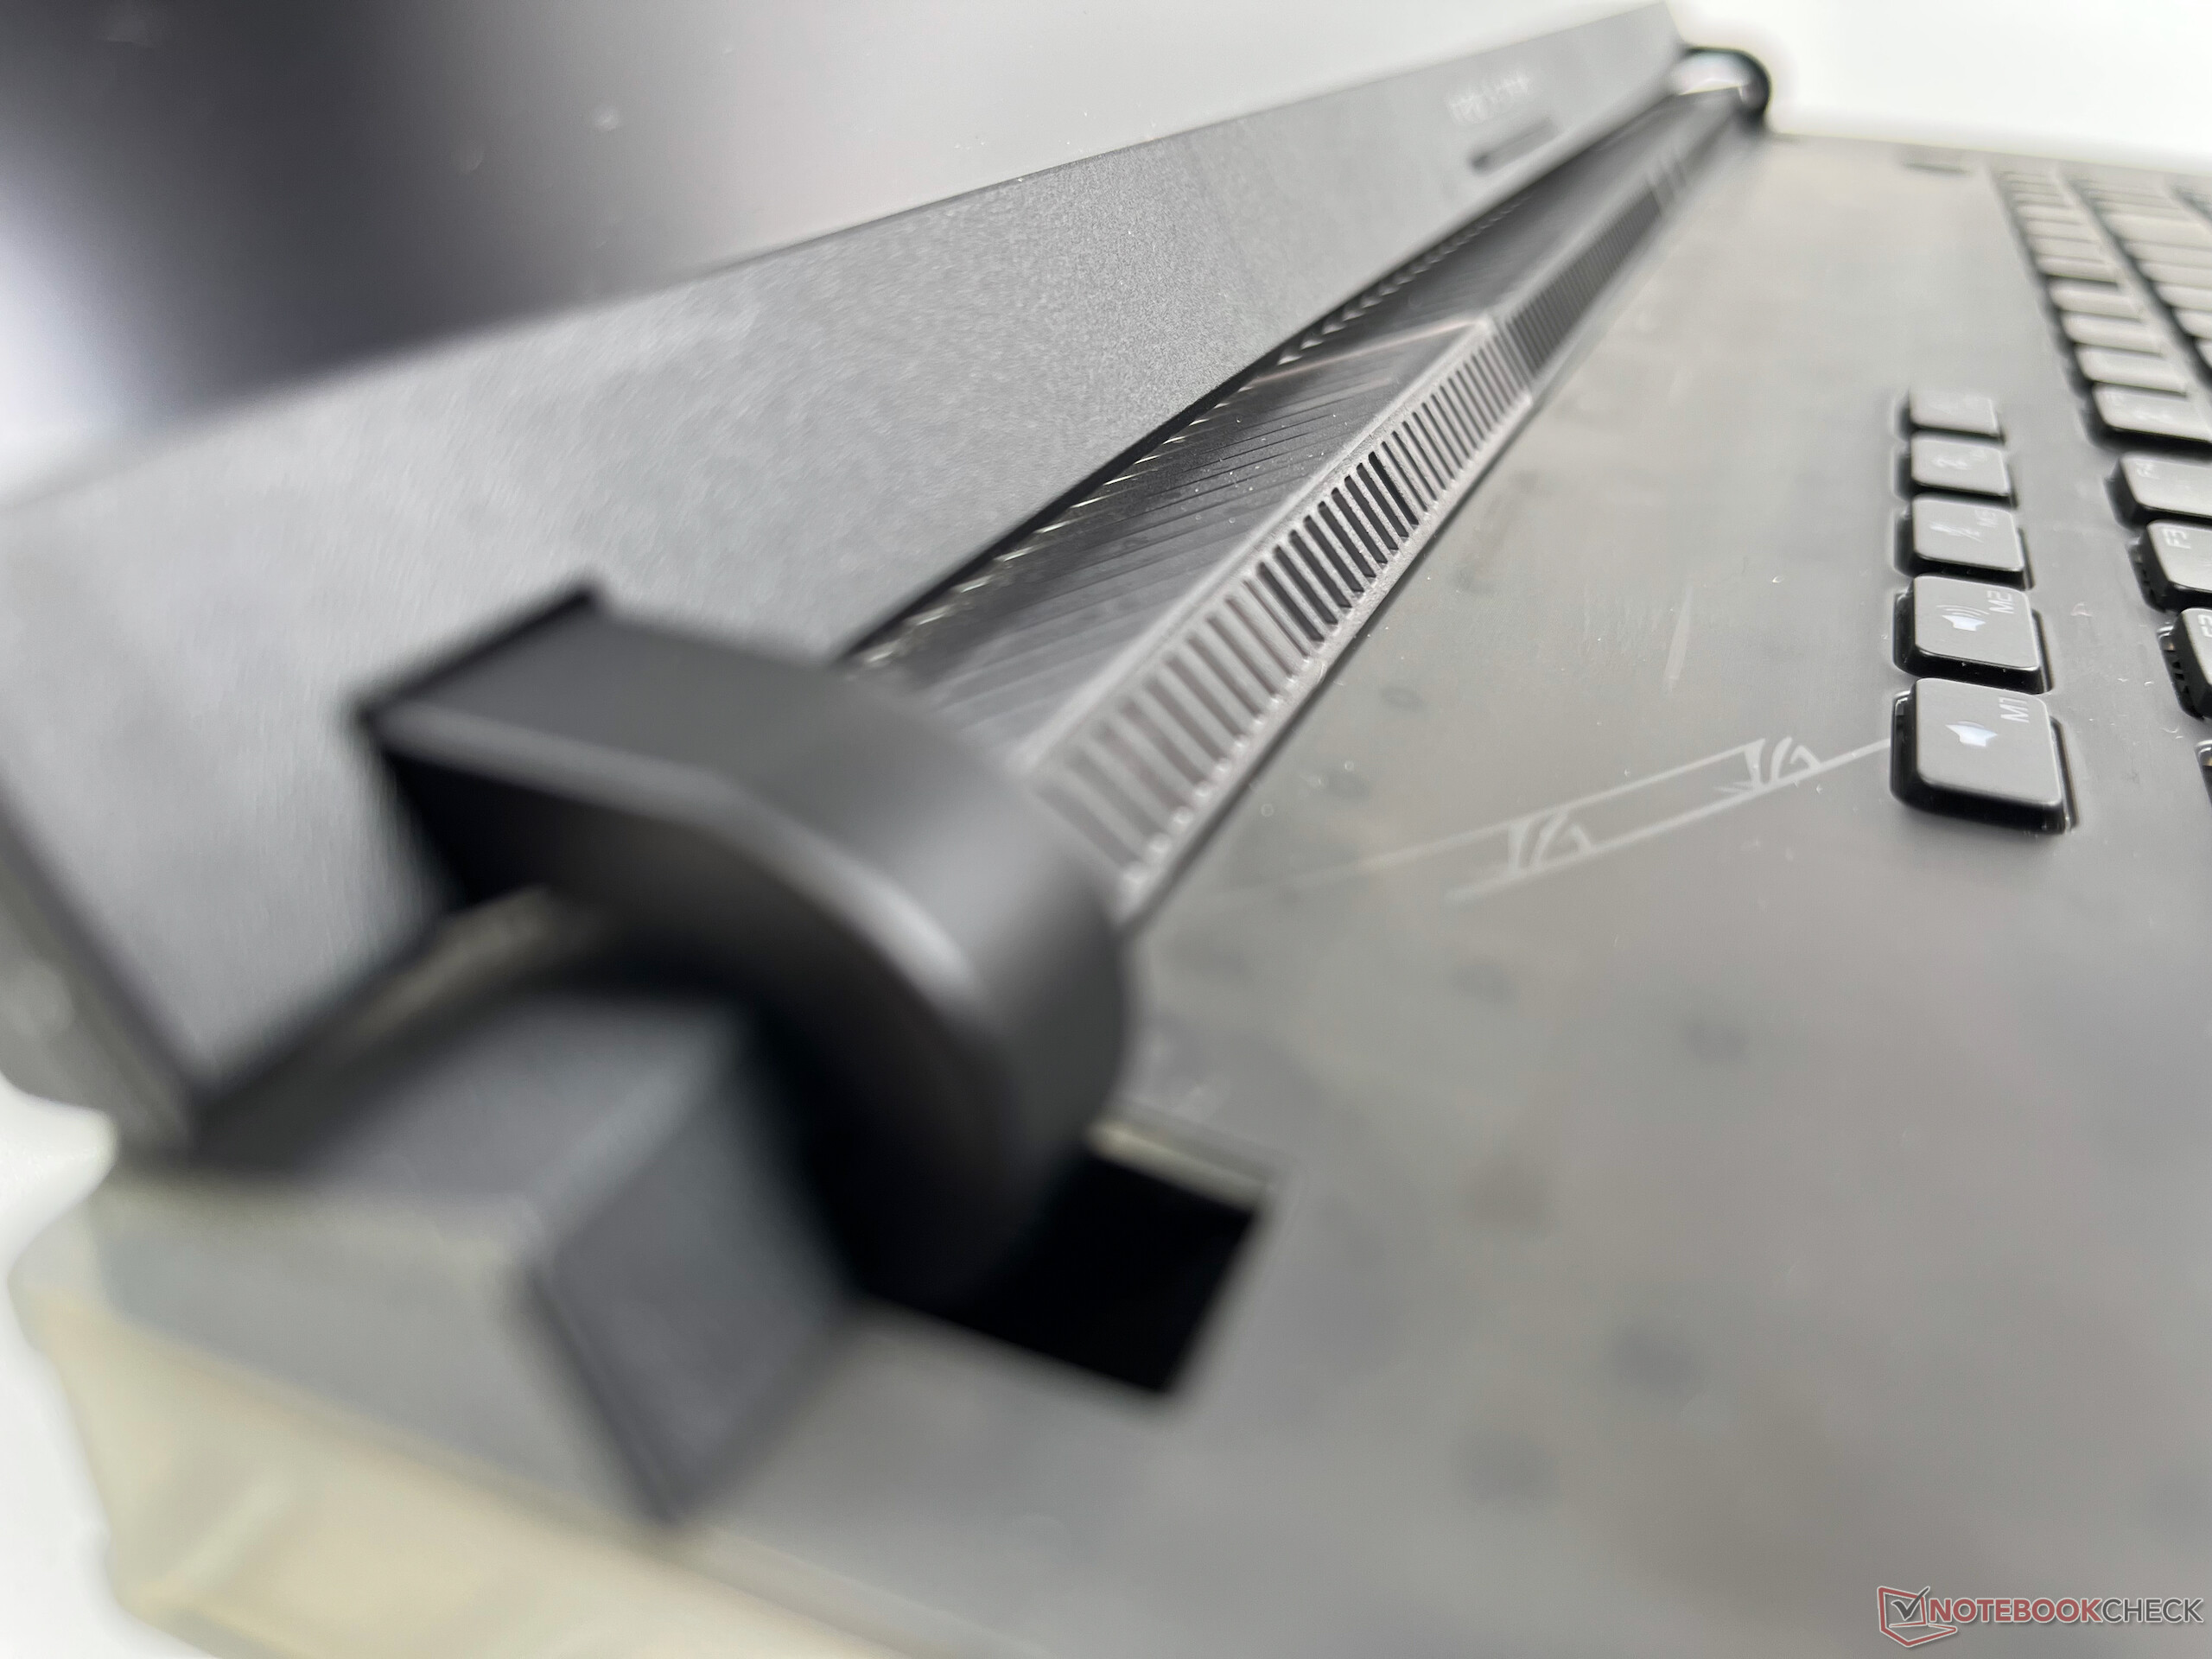
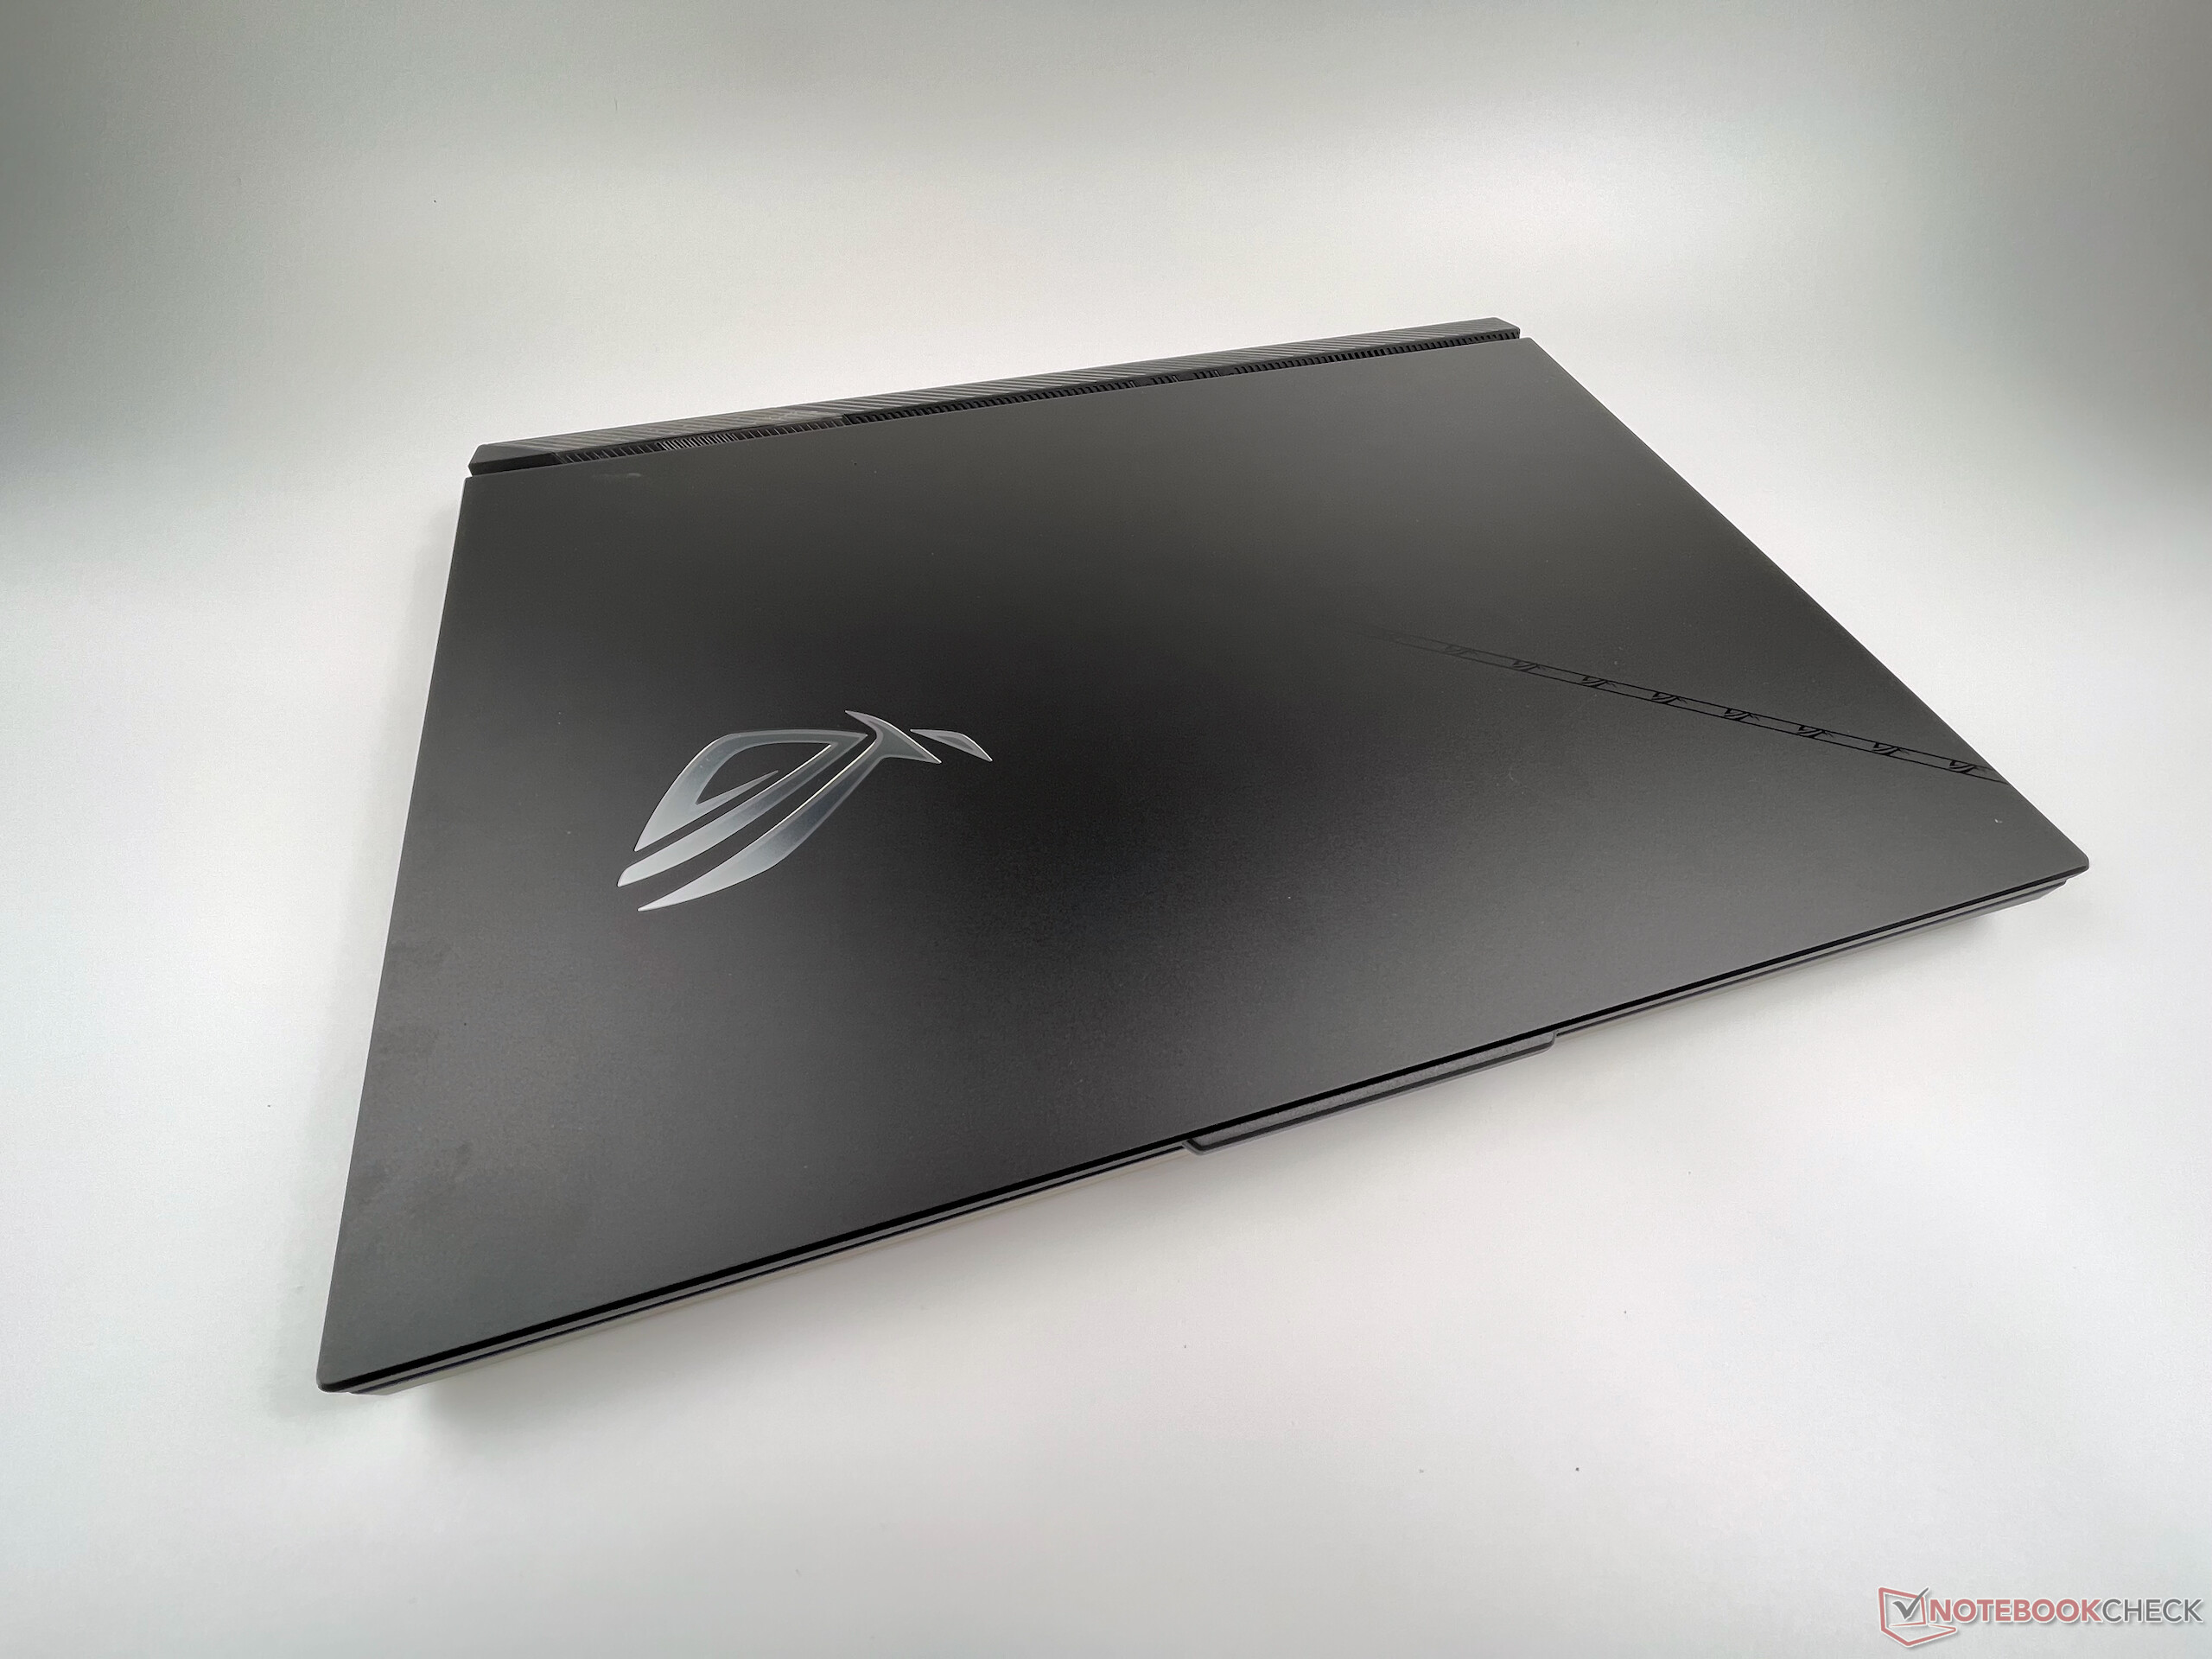
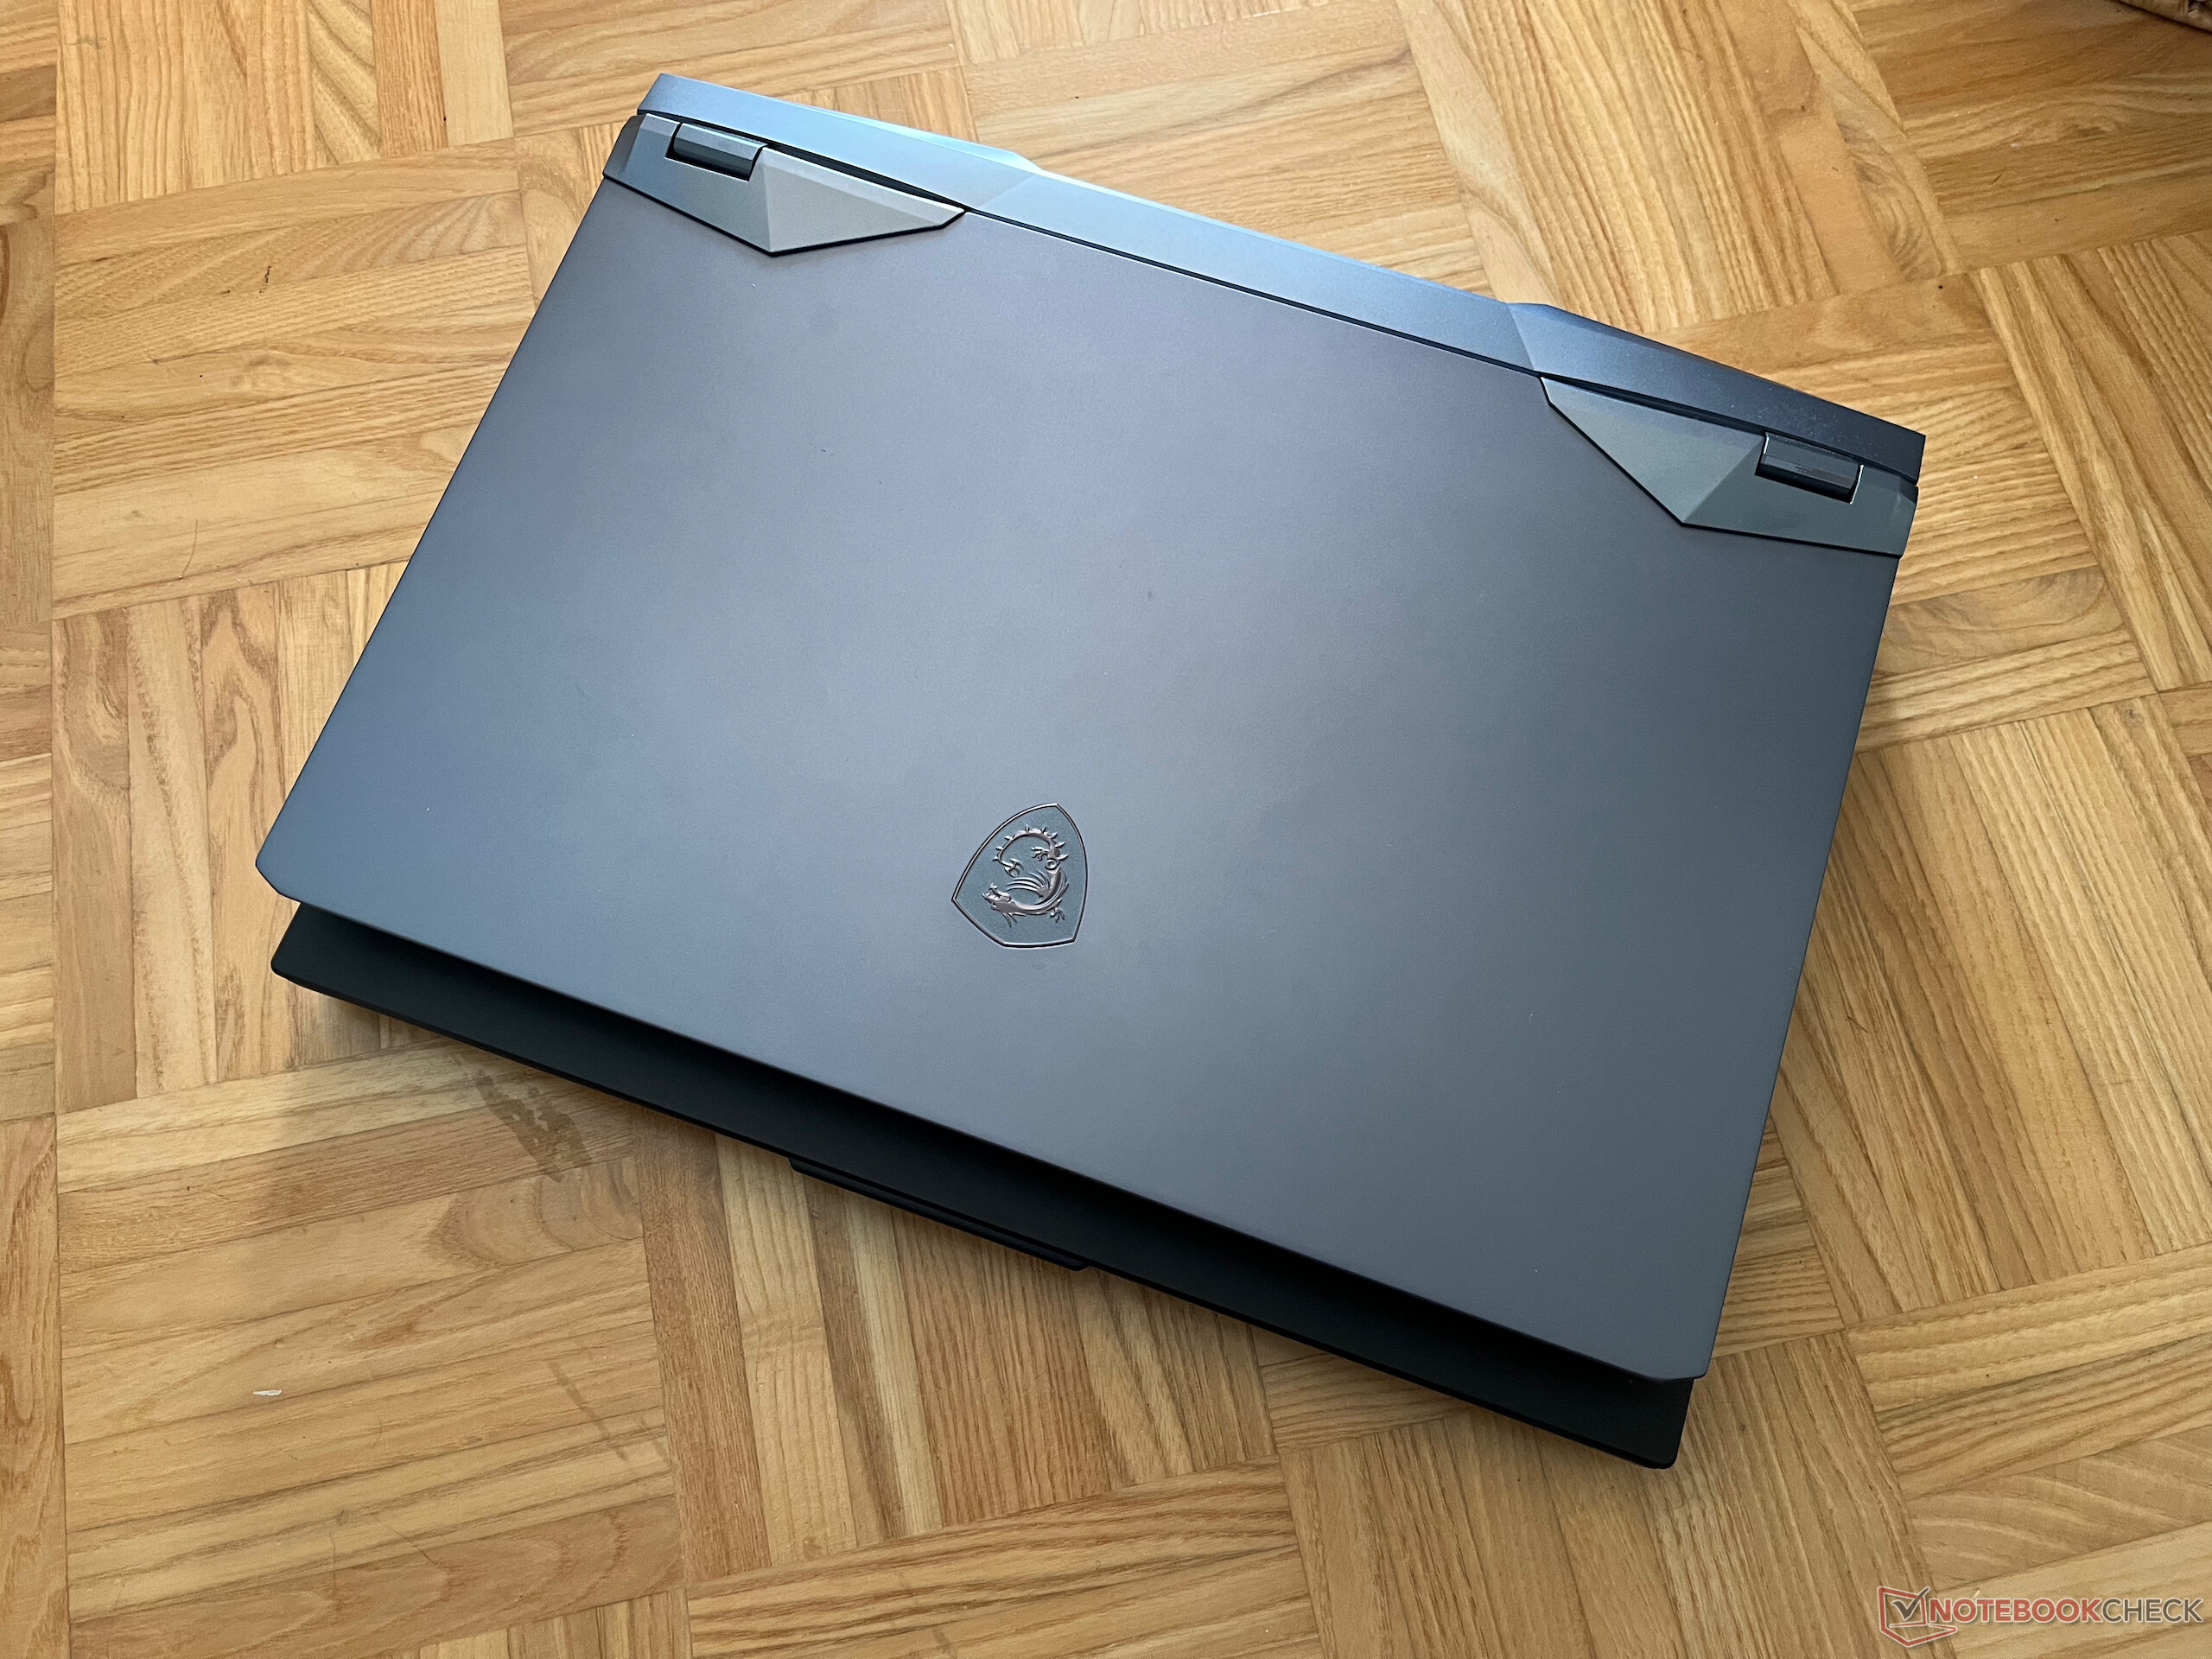
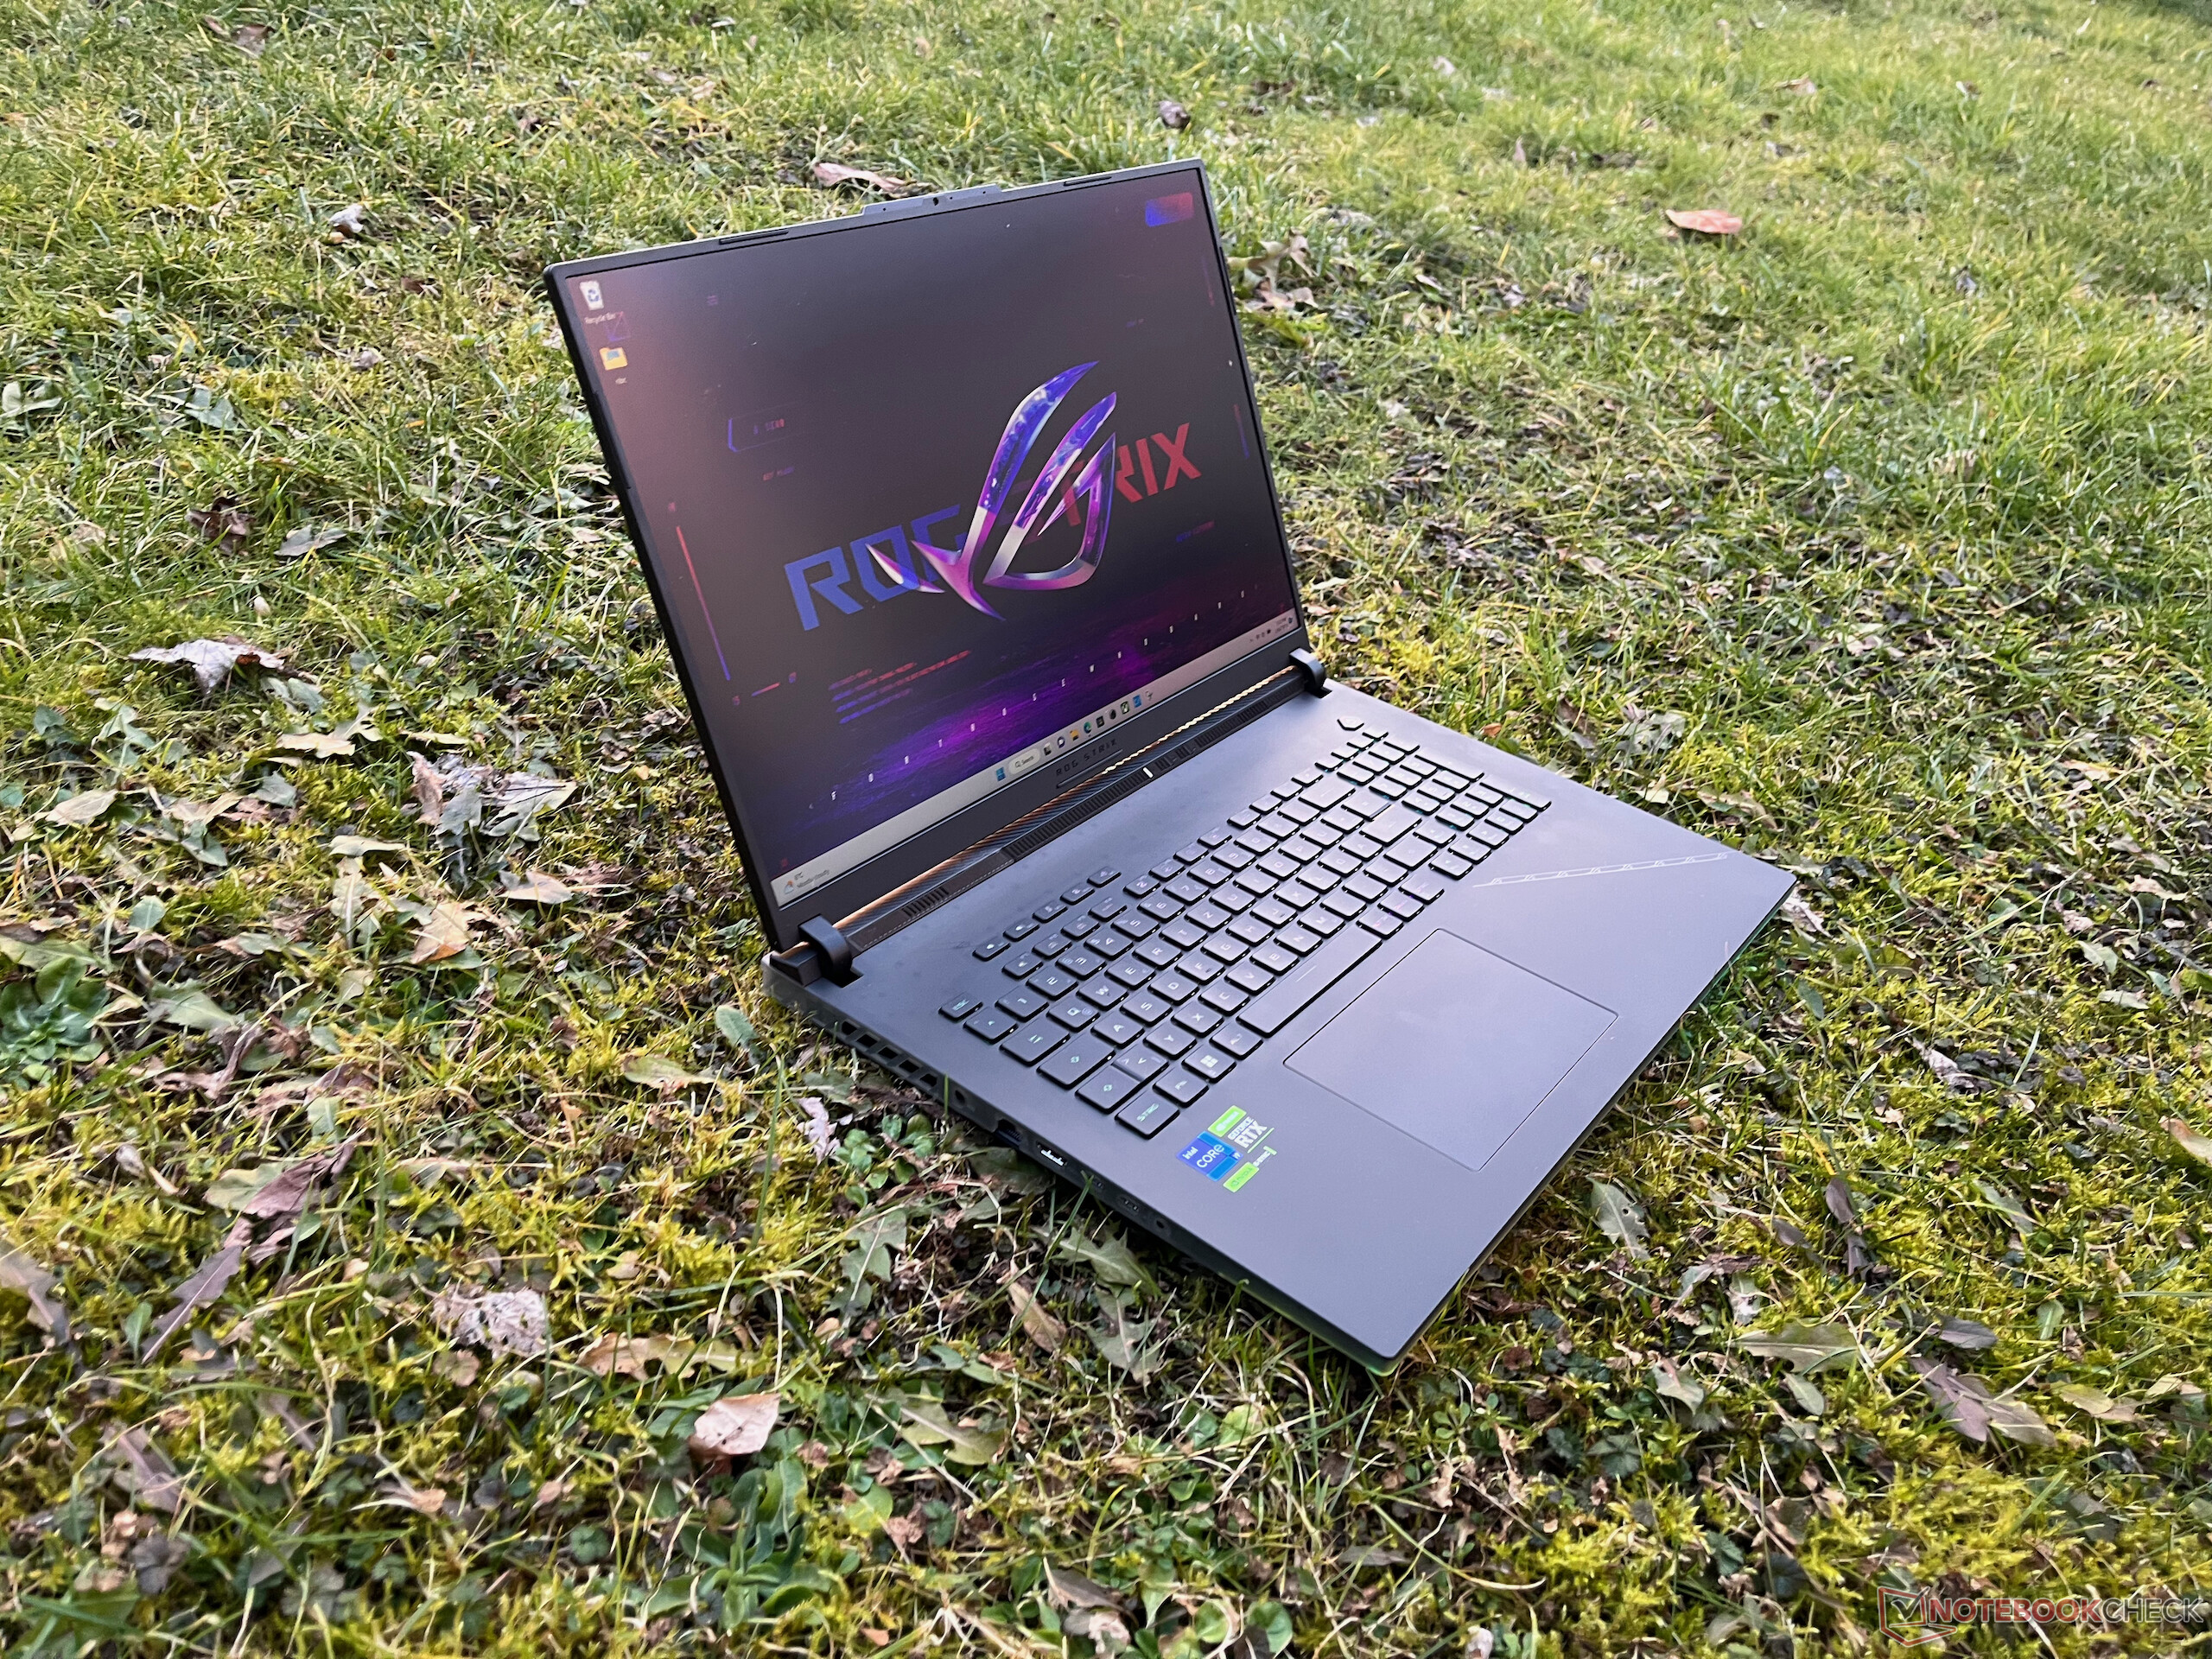
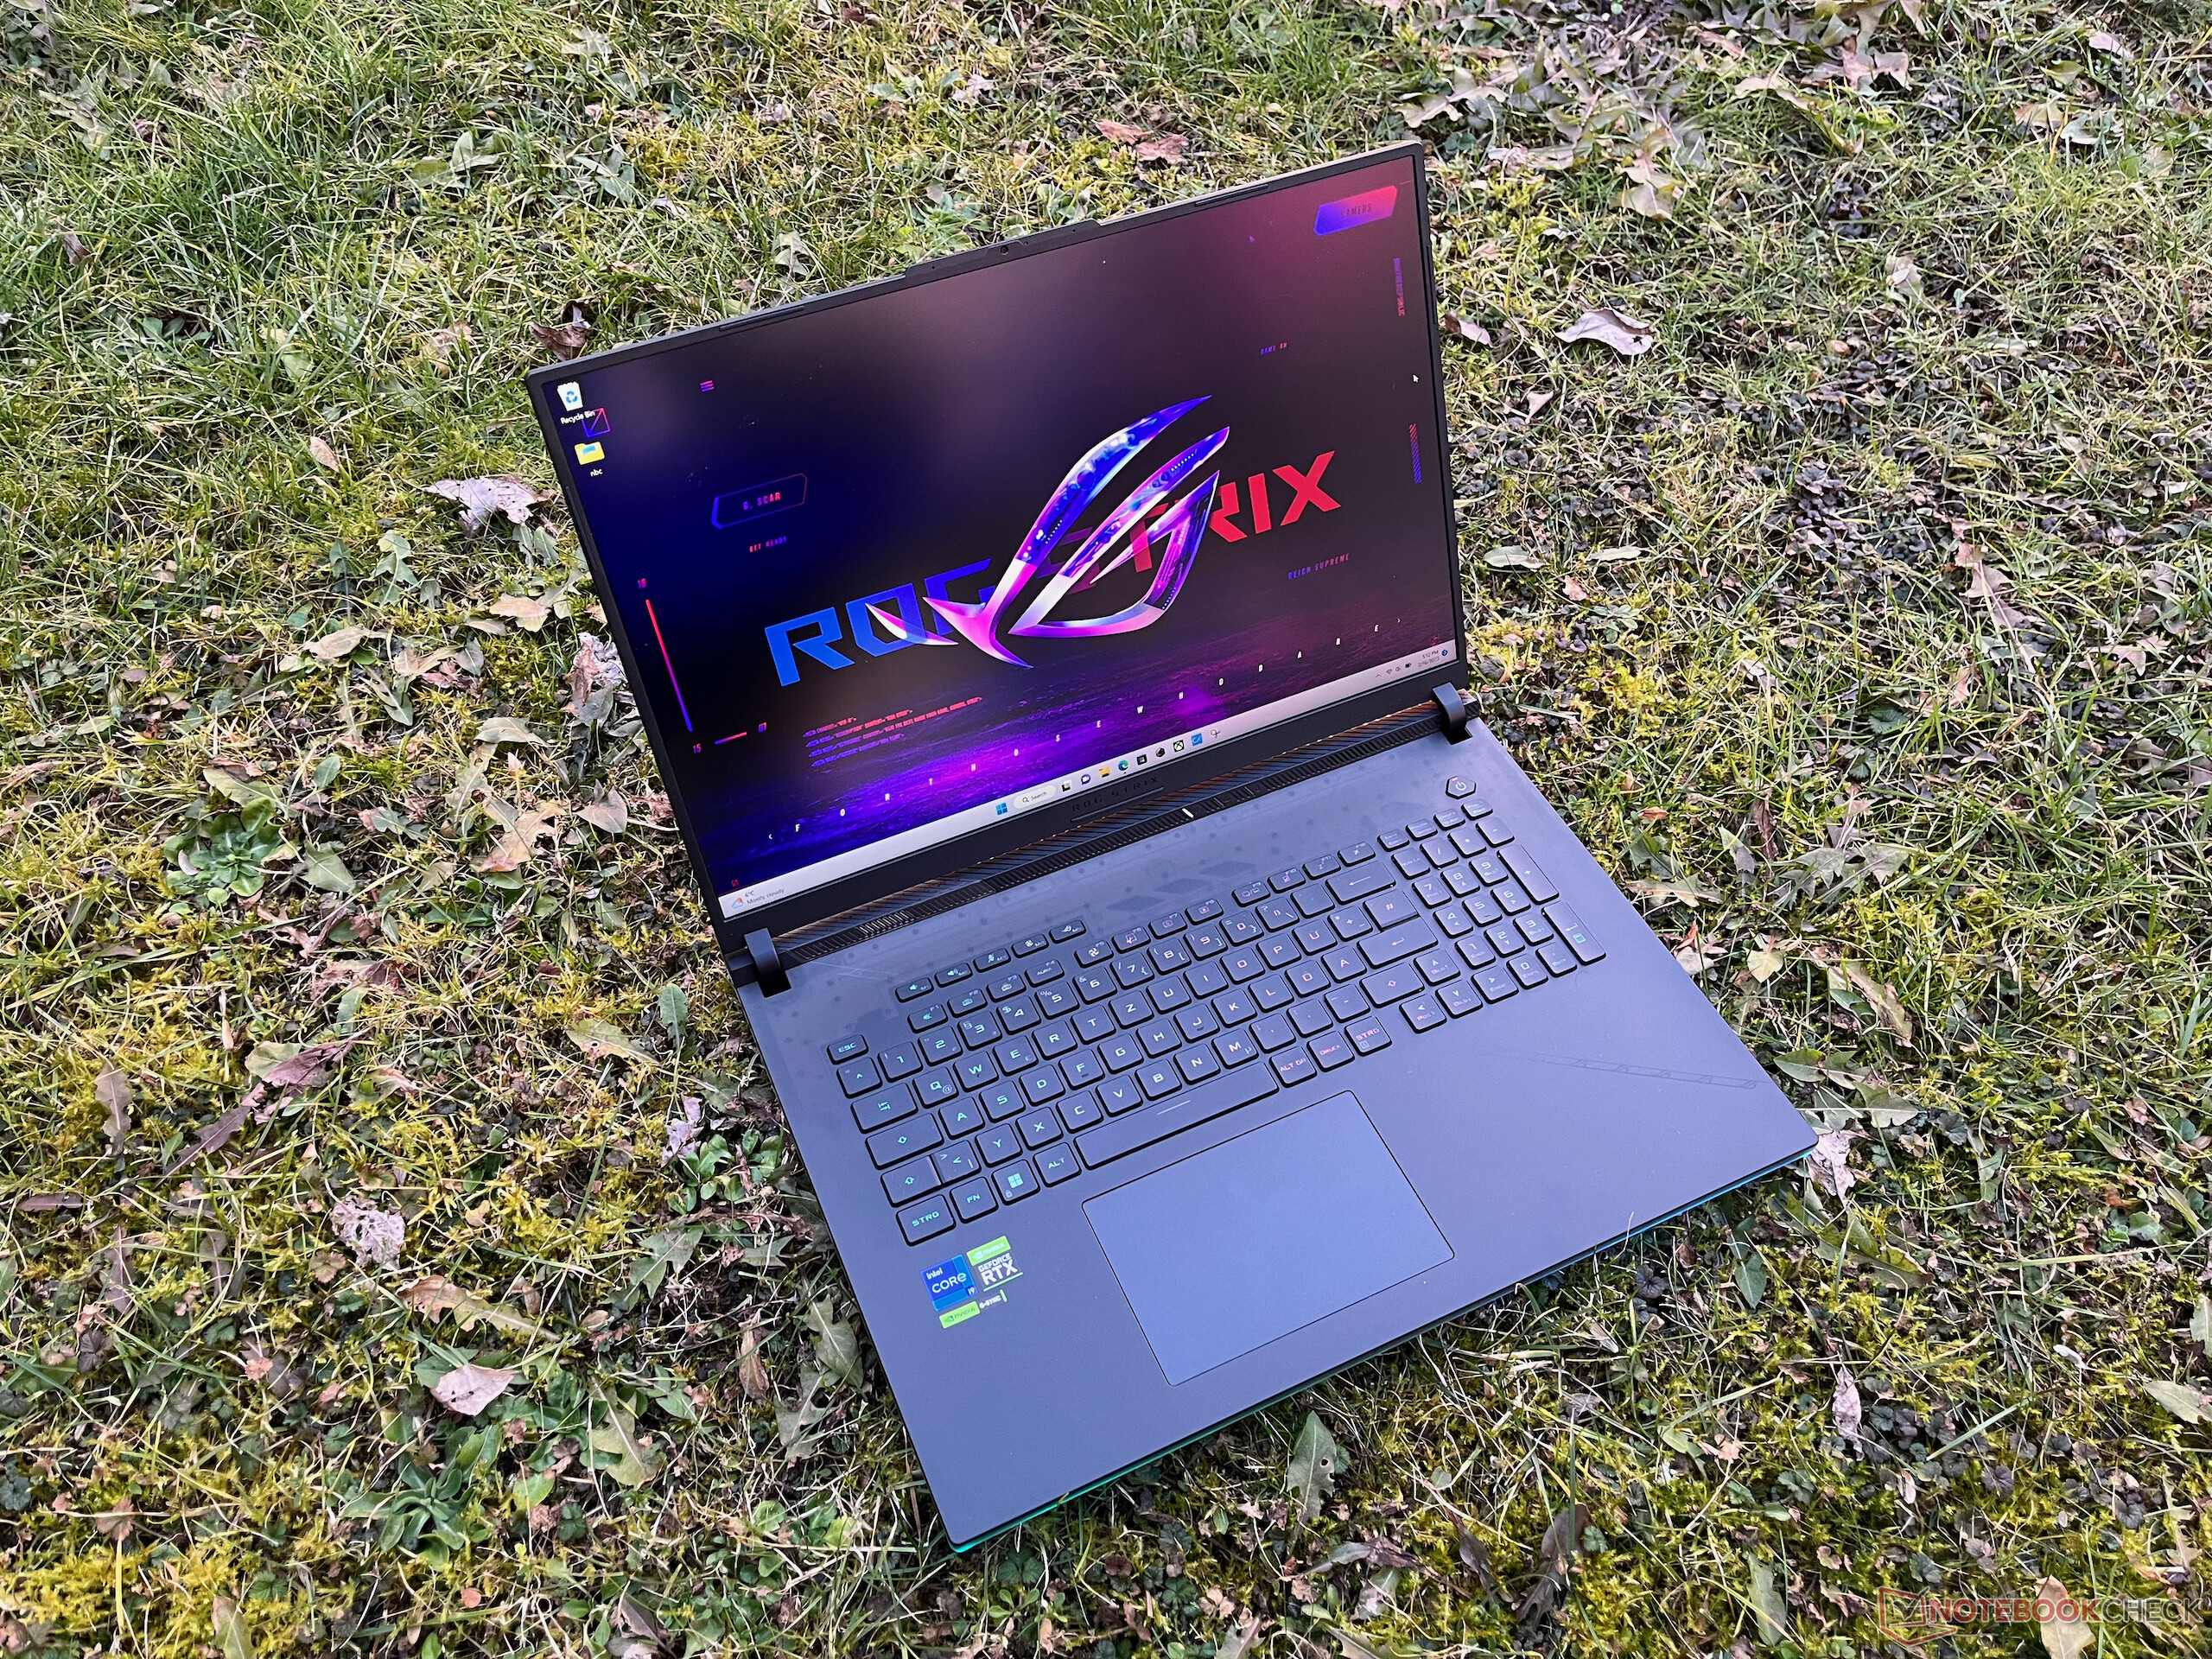
O wielkości obudowy decyduje gigantyczny, 18-calowy wyświetlacz, znacznie przewyższający większość laptopów 17-calowych. Z drugiej strony jednostka zasadnicza nie jest tak masywna, przez co laptop wydaje się nieco mniejszy niż jest w rzeczywistości.
Sprzęt
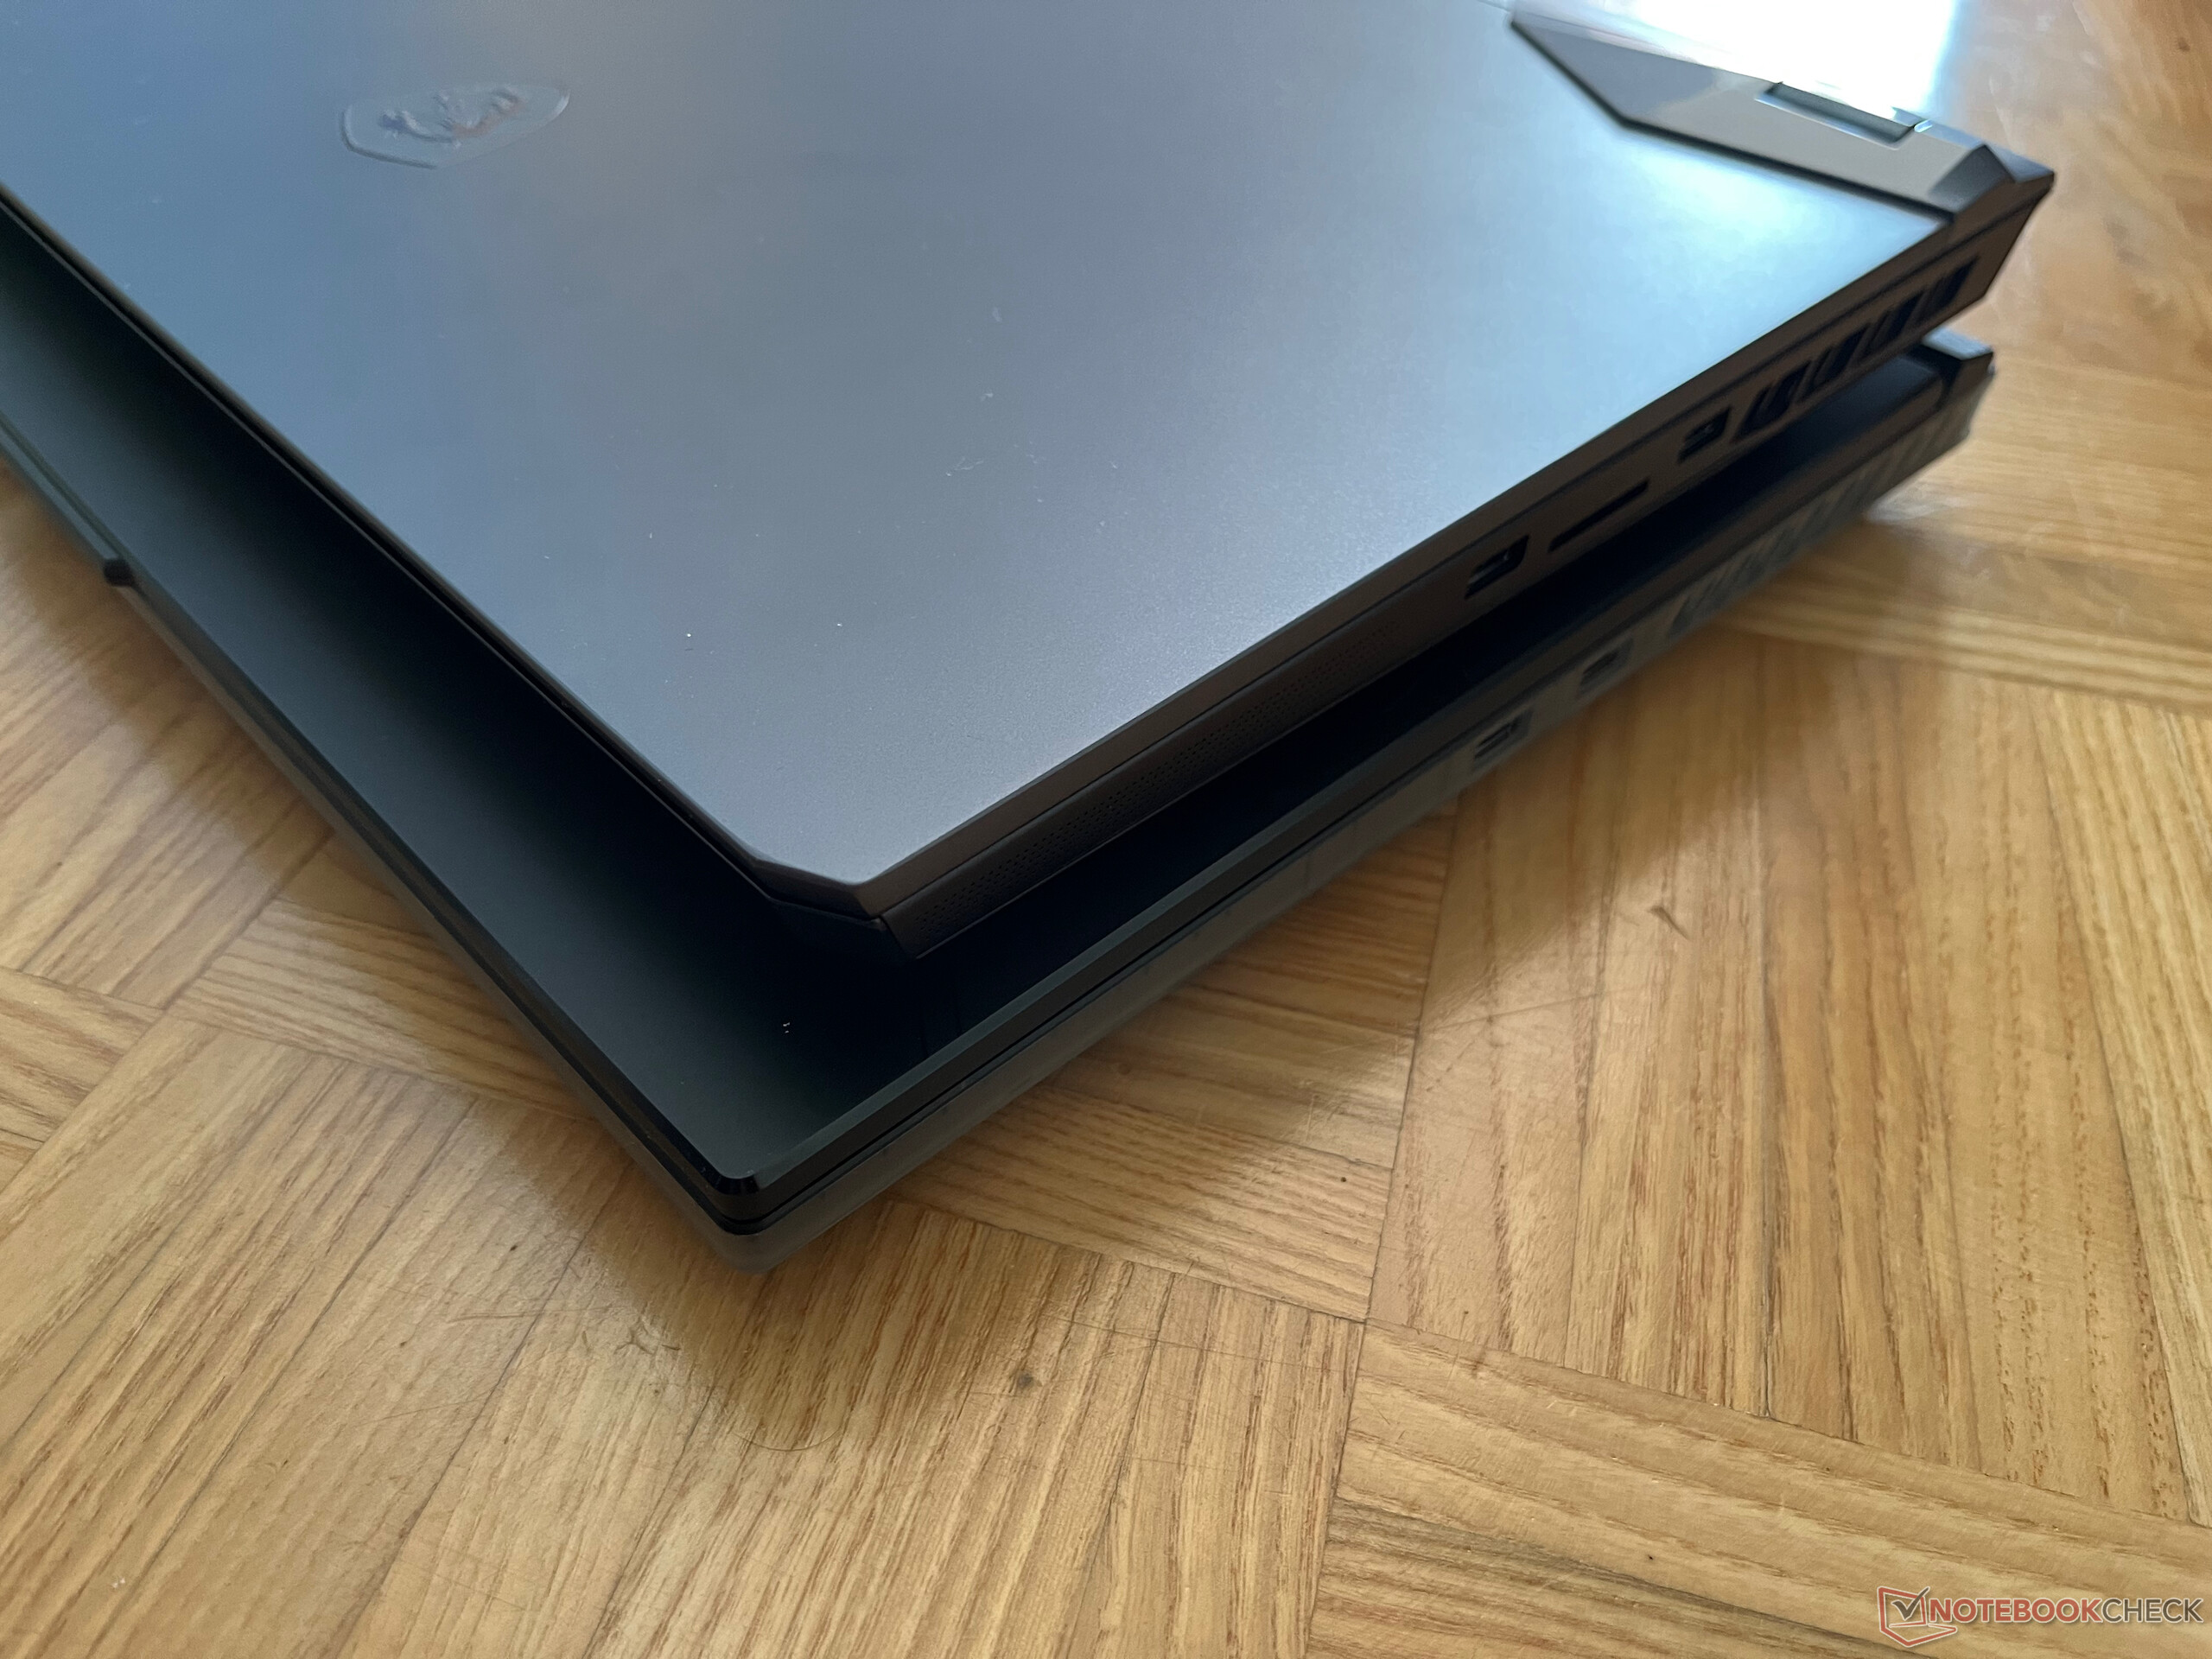
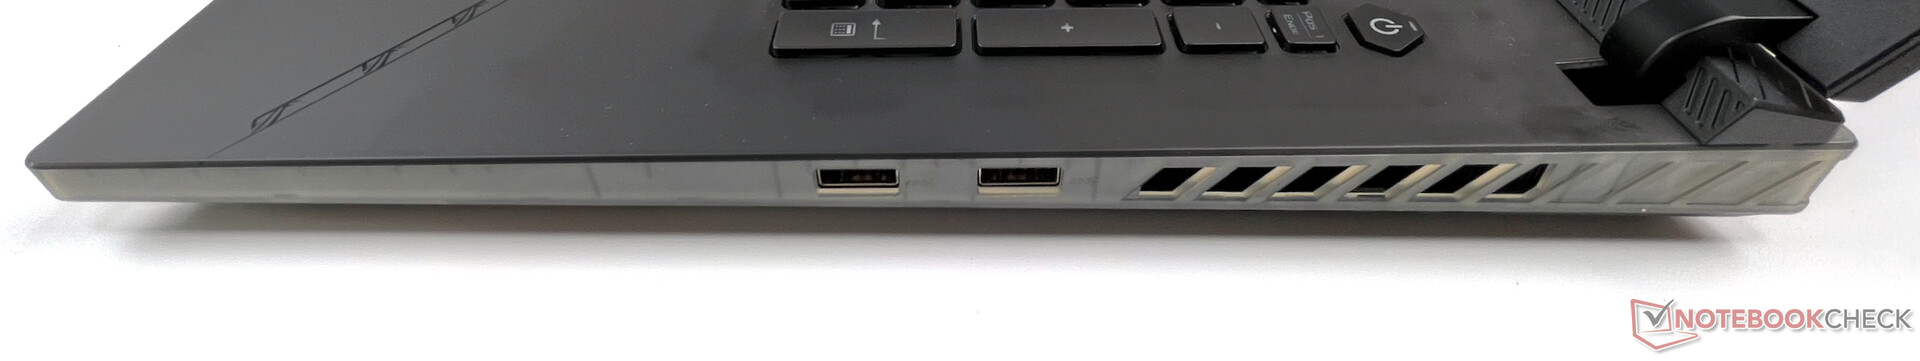
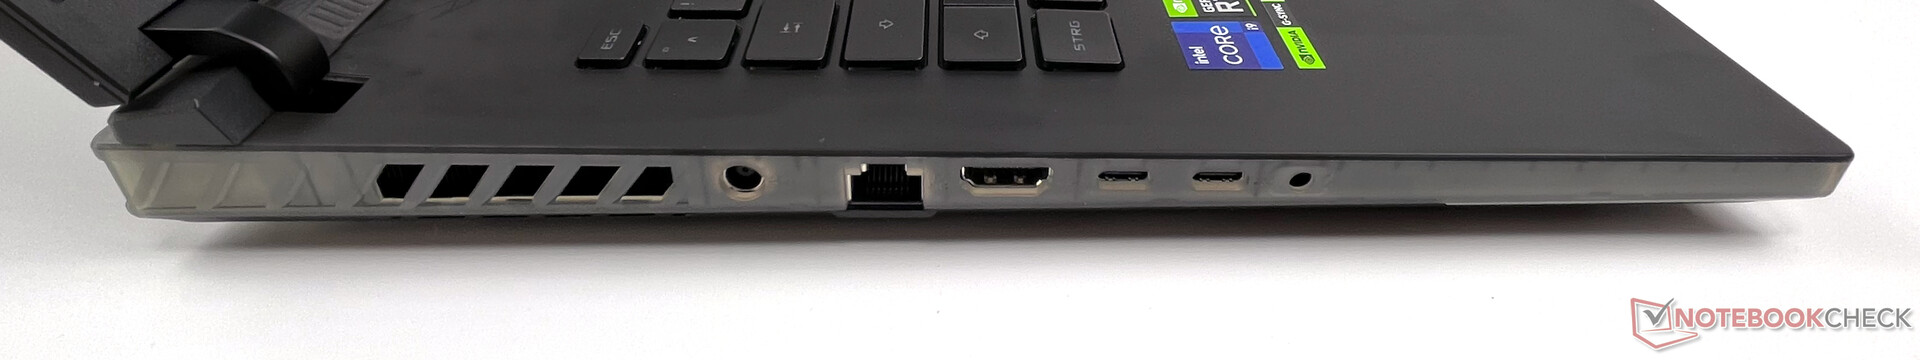
Wszystkie porty znajdują się po lewej i prawej stronie obudowy. Niestety, jest to mniej niż optymalne w przypadku pracy na biurku, ponieważ zawsze widać kable. Ponadto oba złącza USB-A są umieszczone po prawej stronie w kierunku środka, co sprawia, że położenie kabli jest mniej niż idealne dla praworęcznych użytkowników myszy. Dla użytkowników leworęcznych kabel sieciowy będzie przeszkadzał.
Mamy też kilka skarg na wyposażenie w złącza. Tylko jeden z dwóch portów USB-C obsługuje Thunderbolt, a drugi obsługuje Power Delivery z pewnymi ograniczeniami. W naszym teście ładowarka MacBook Air M1 była w stanie naładować laptopa z mocą 30 W, ale bez powiadomienia w systemie Windows. 45-watowy Anker Nano 2 w ogóle nie ładował laptopa. Po stronie pozytywów chcemy też wspomnieć o połączeniu sieciowym 2,5-Gbit.
Komunikacja
Jeśli chodzi o opcje łączności, Asus oferuje szybką kartę Intel Wi-Fi 6E AX211 w formacie M.2 do połączeń bezprzewodowych oraz układ Realtek RTL8125 do przewodowych połączeń LAN 2,5-Gbit. Oba działały bez zakłóceń w naszym teście, ale karta AX211 nie znalazła w sieci 6-GHz naszego routera Asus ROG Rapture GT-AX11000. Niestety, Wi-Fi 6E nadal jest w naszym teście strzałem w dziesiątkę przy odnajdywaniu sieci.
Z drugiej strony, prędkości danych w sieci Wi-Fi 6 są doskonałe i bez żadnych spadków.
Kamera internetowa
Wbudowana kamerka internetowa 720p HD niestety spełnia tylko najniższe wymagania w zakresie wideotelefonii. Ważne są tutaj dobre warunki oświetleniowe, gdyż wyniki, które otrzymujemy przy podświetleniu lub w ciemności są mało użyteczne.


")
")
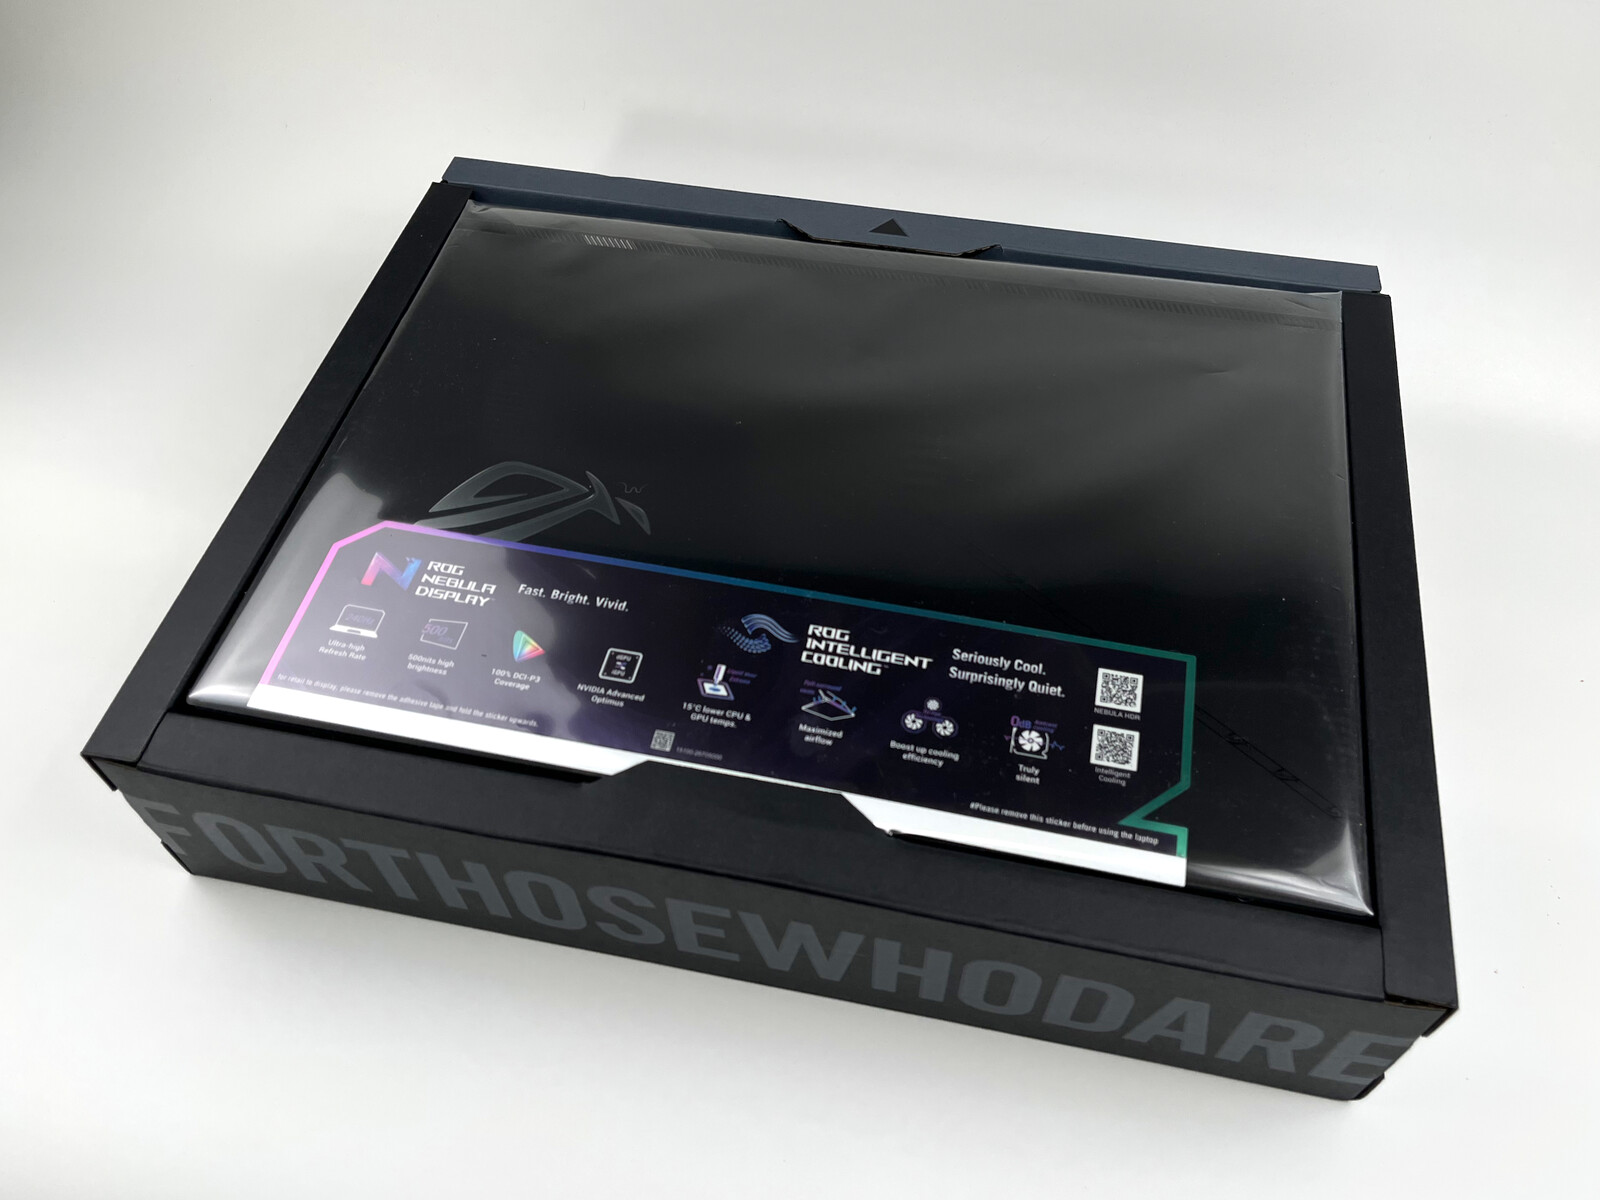
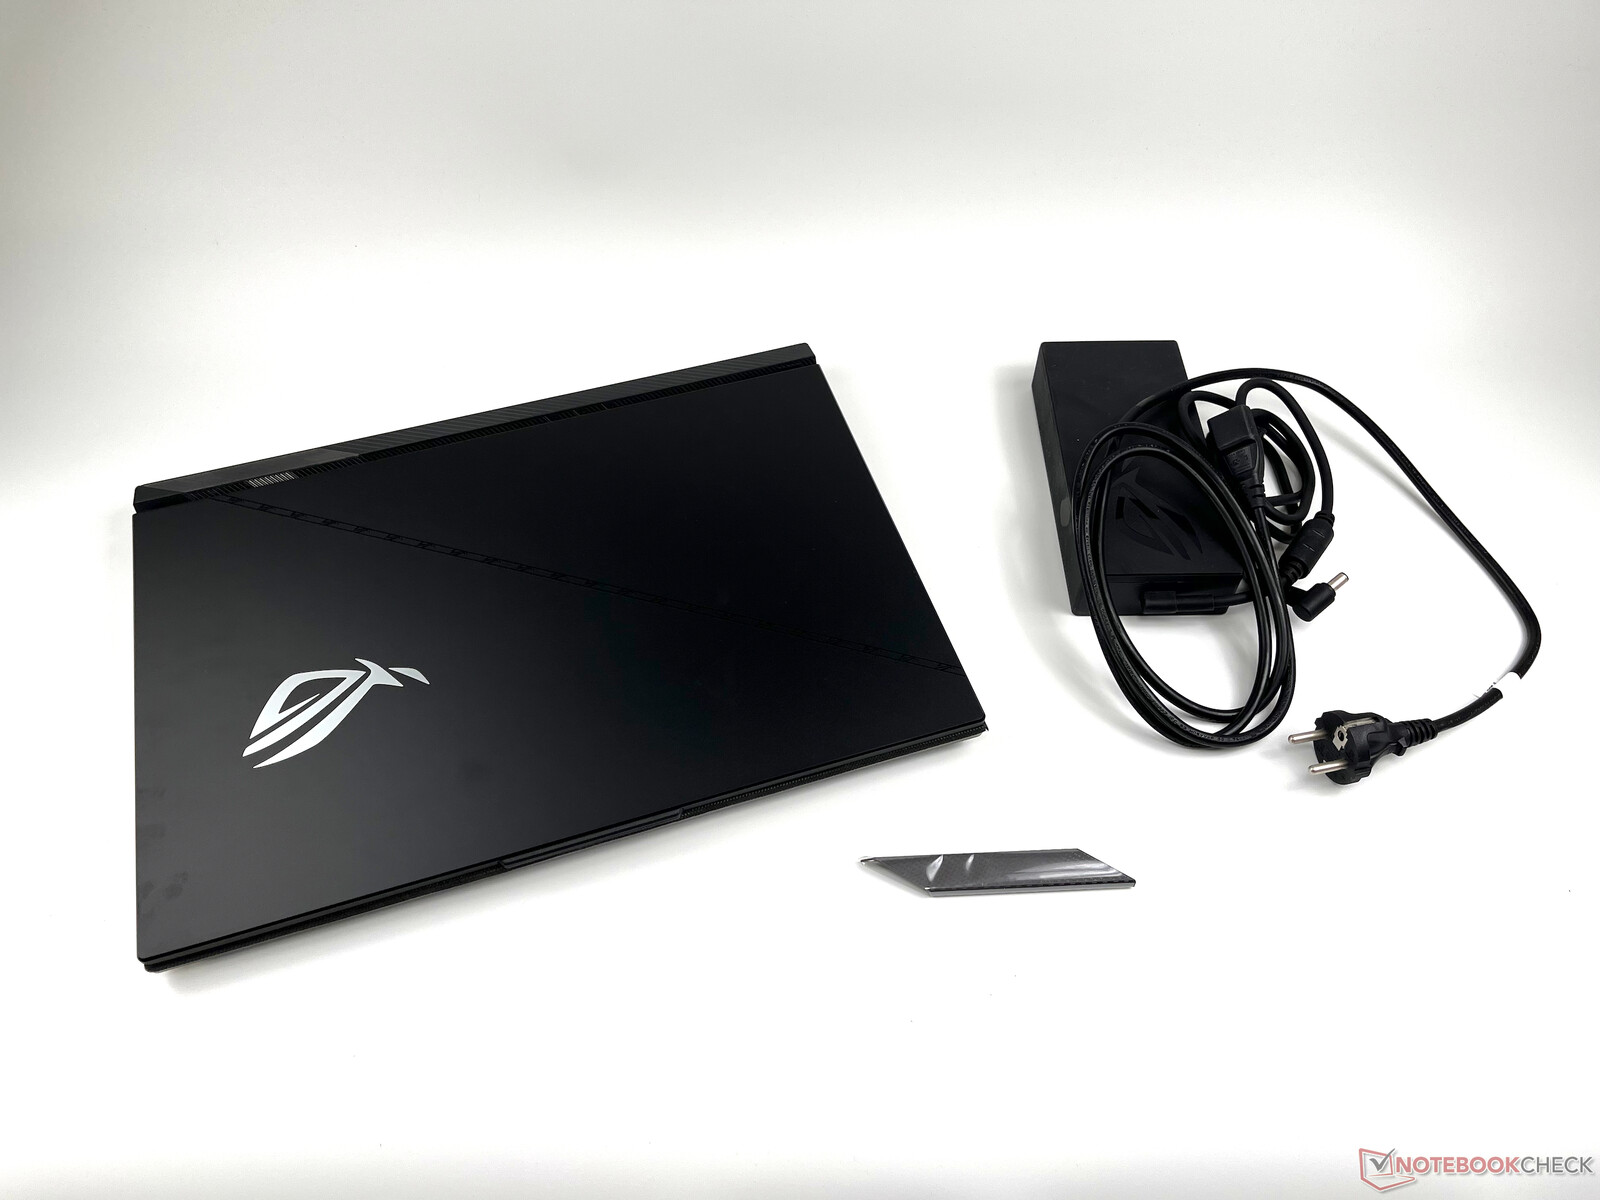
Akcesoria
W pudełku znajdziemy jedynie dodatkową "Armor Cap", którą można wymienić po lewej stronie pod wyświetlaczem. Nakładka mocowana jest magnetycznie i być może ma dać możliwość personalizacji urządzenia.
Konserwacja
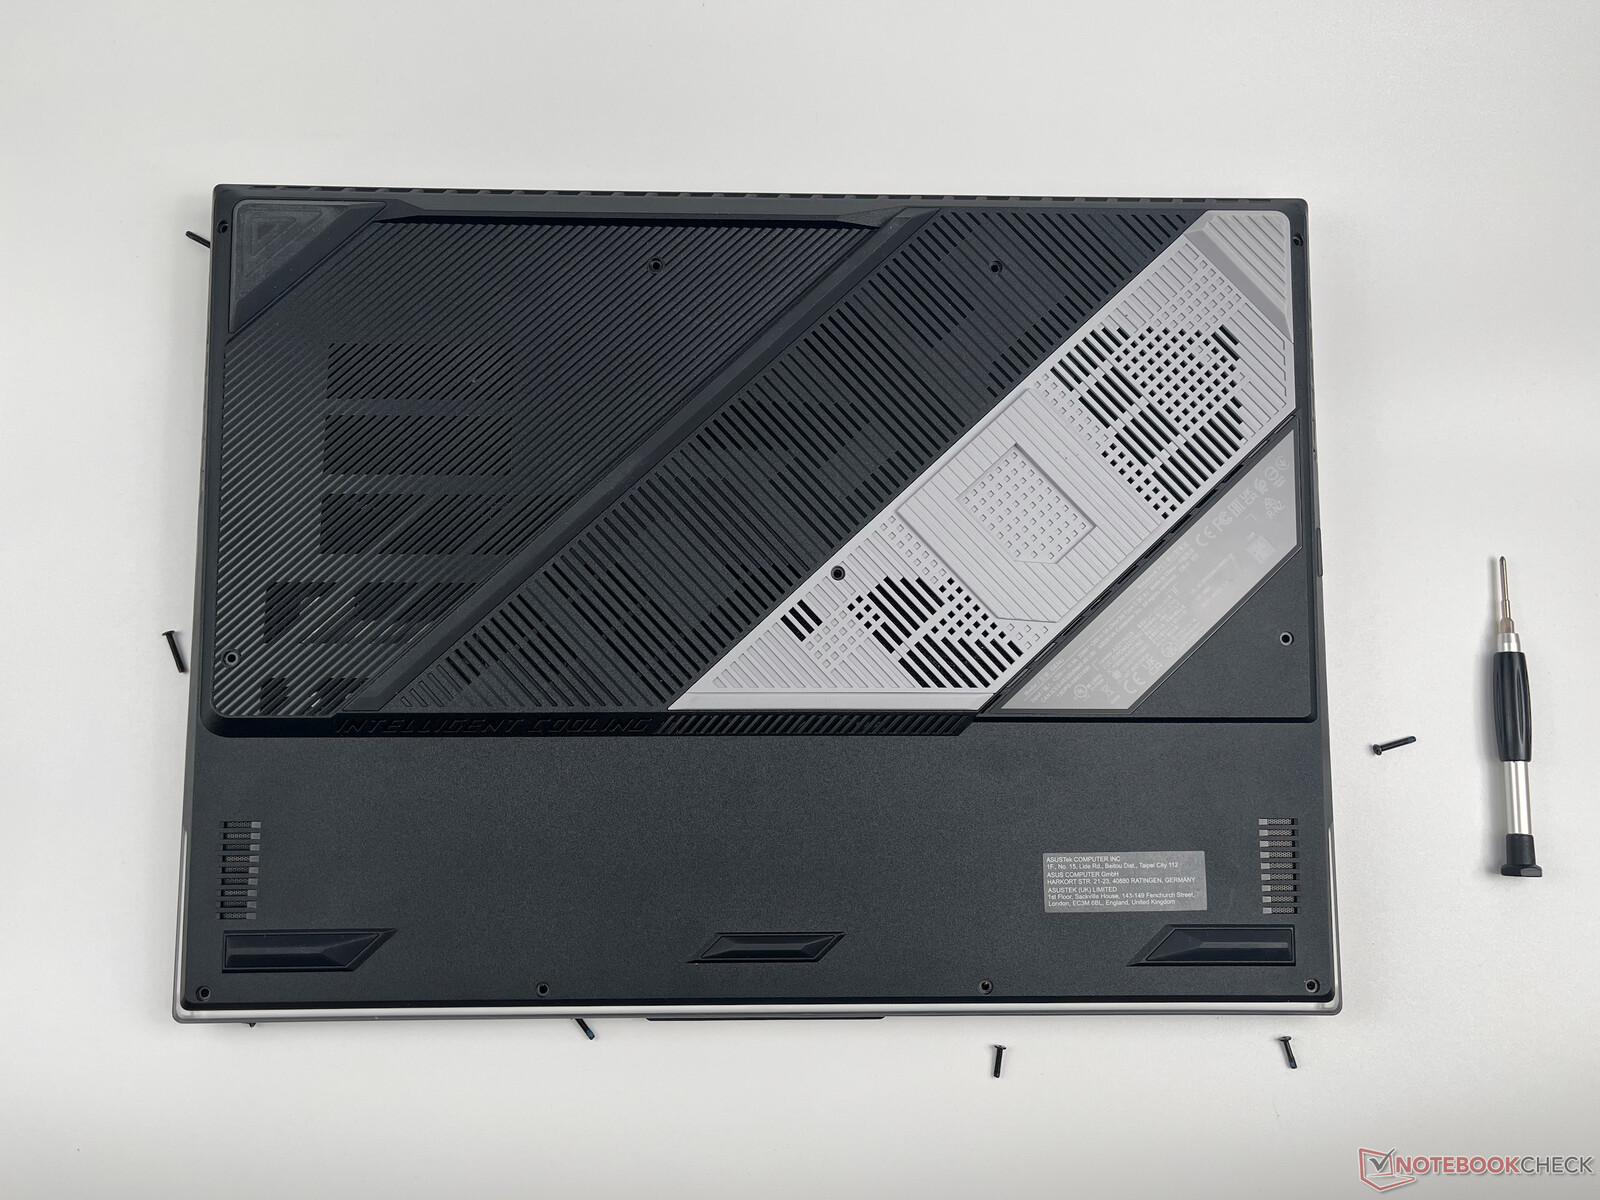
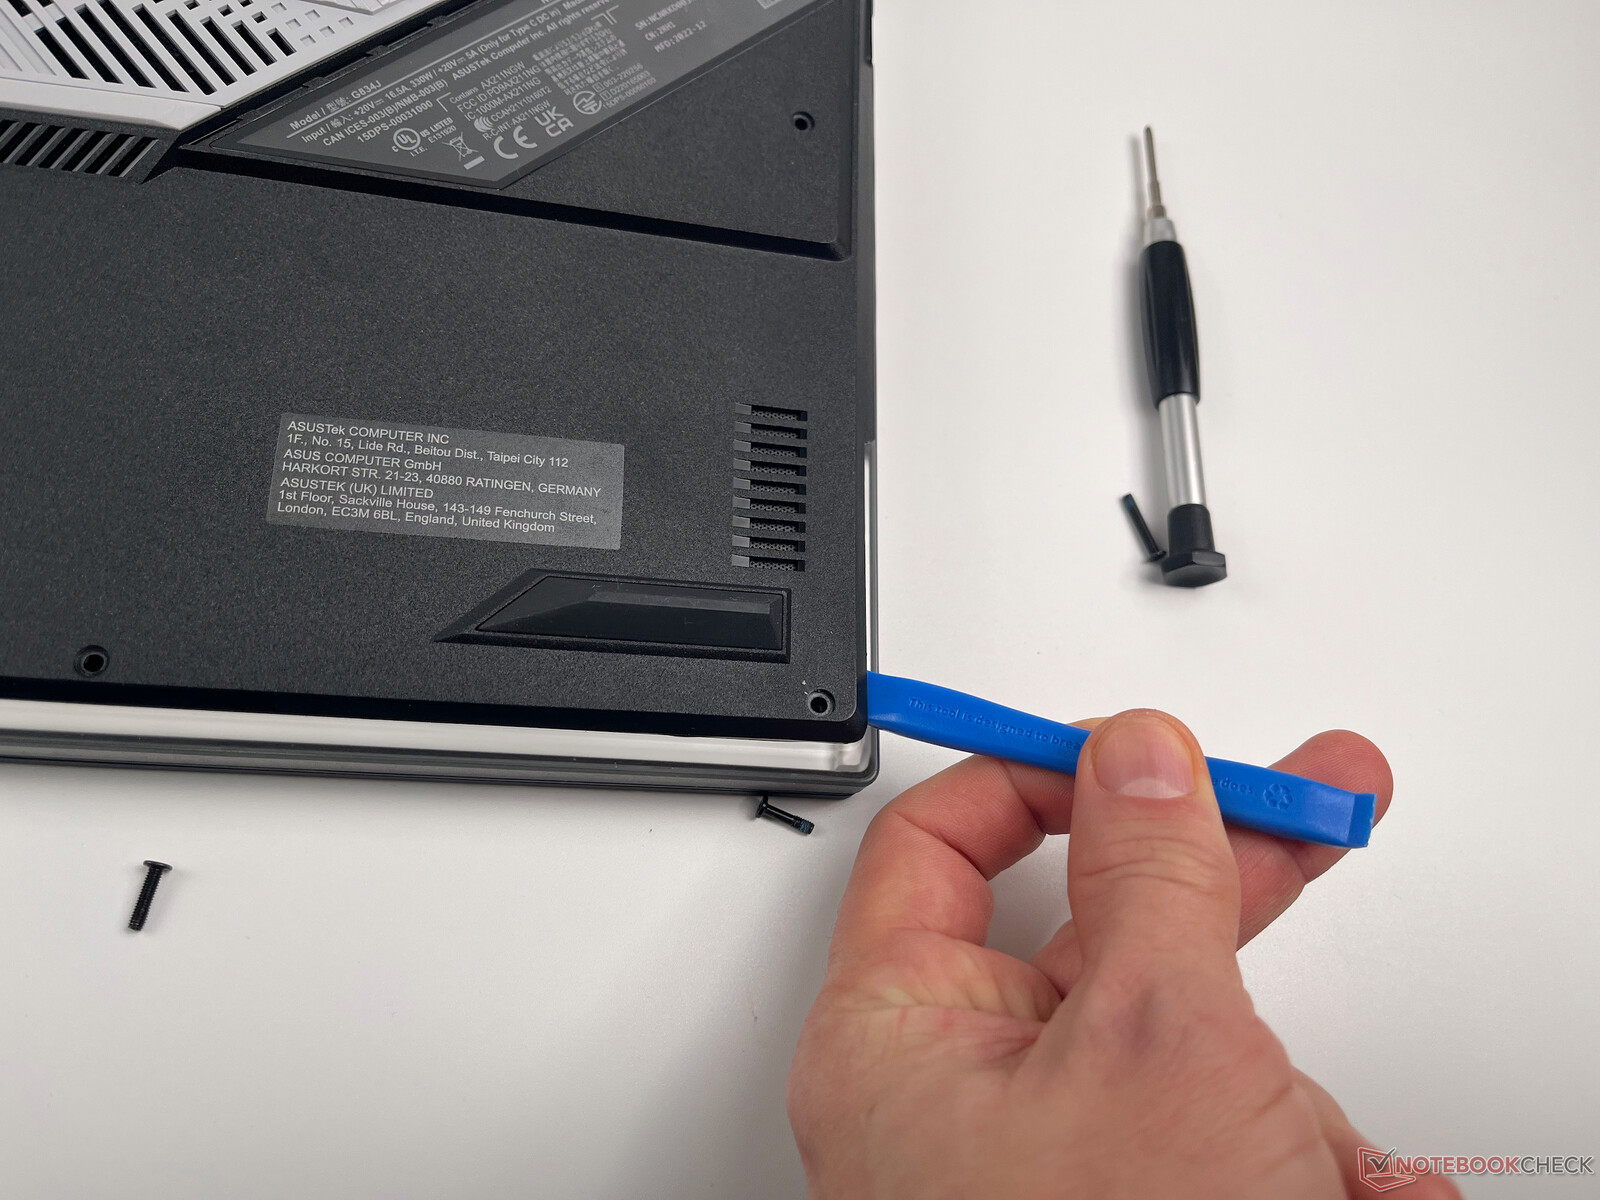
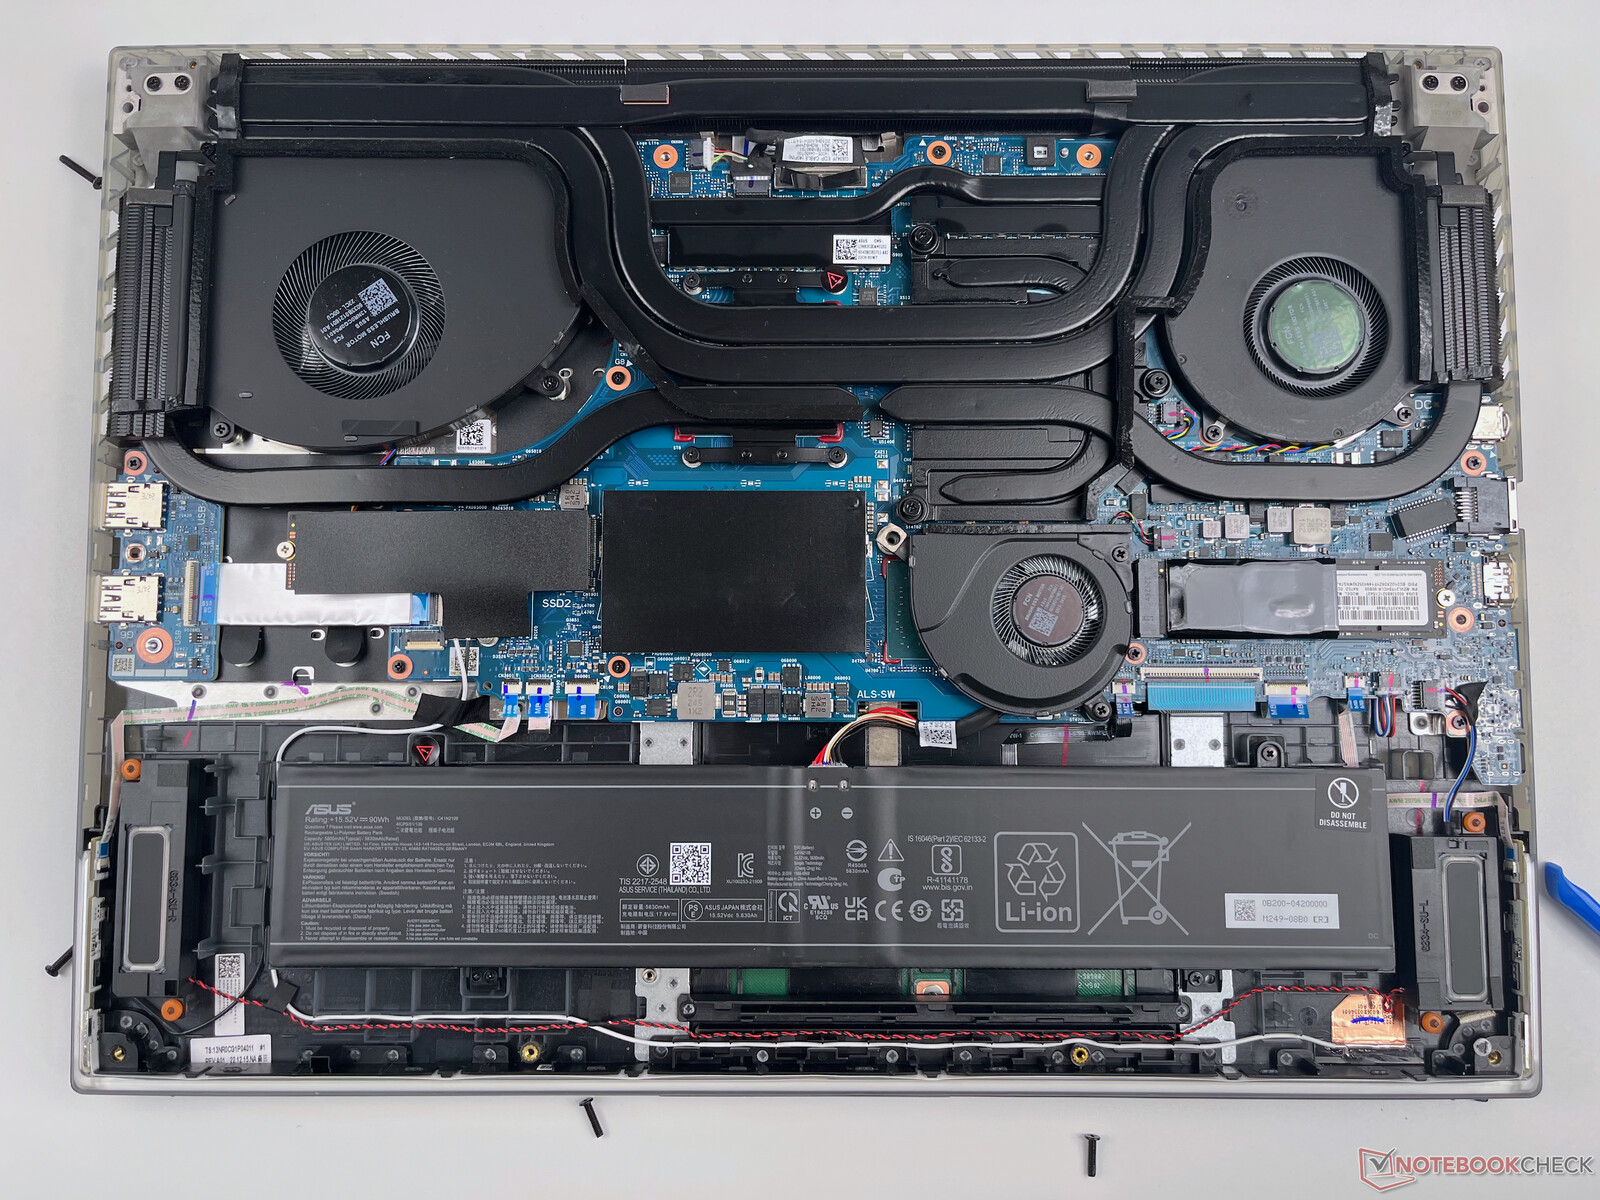
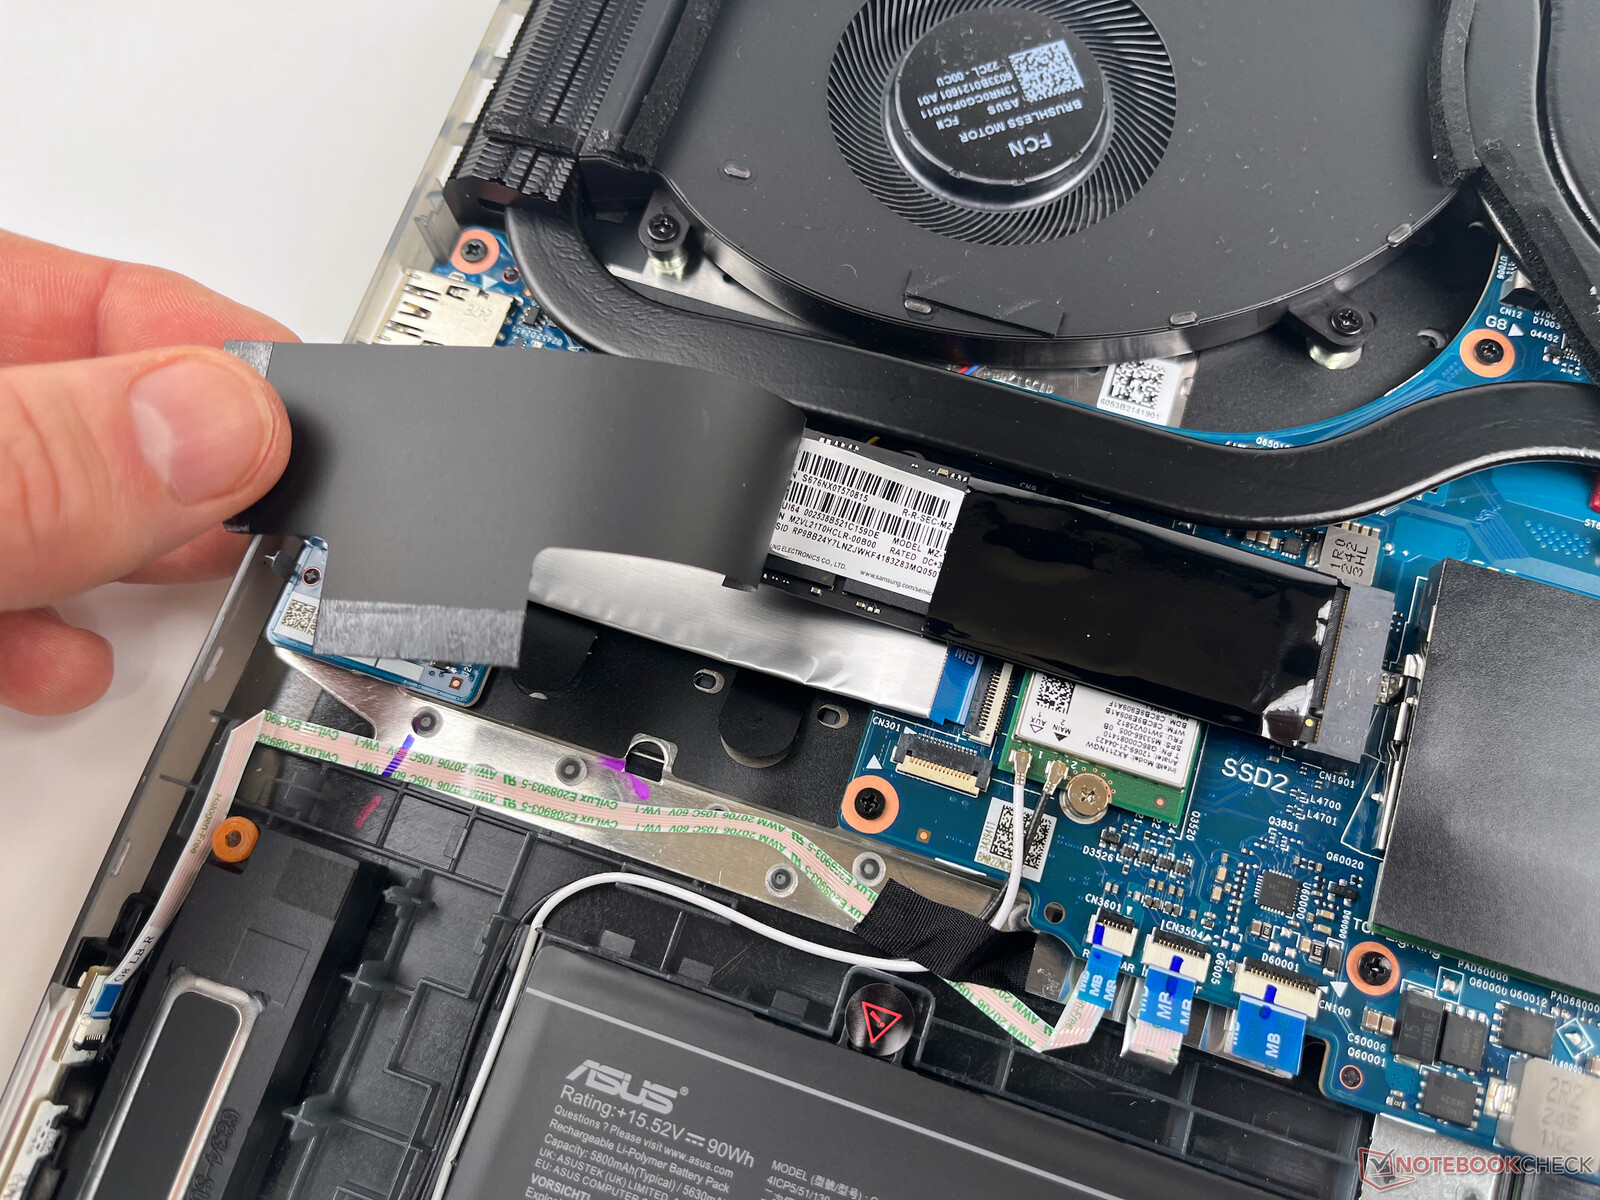
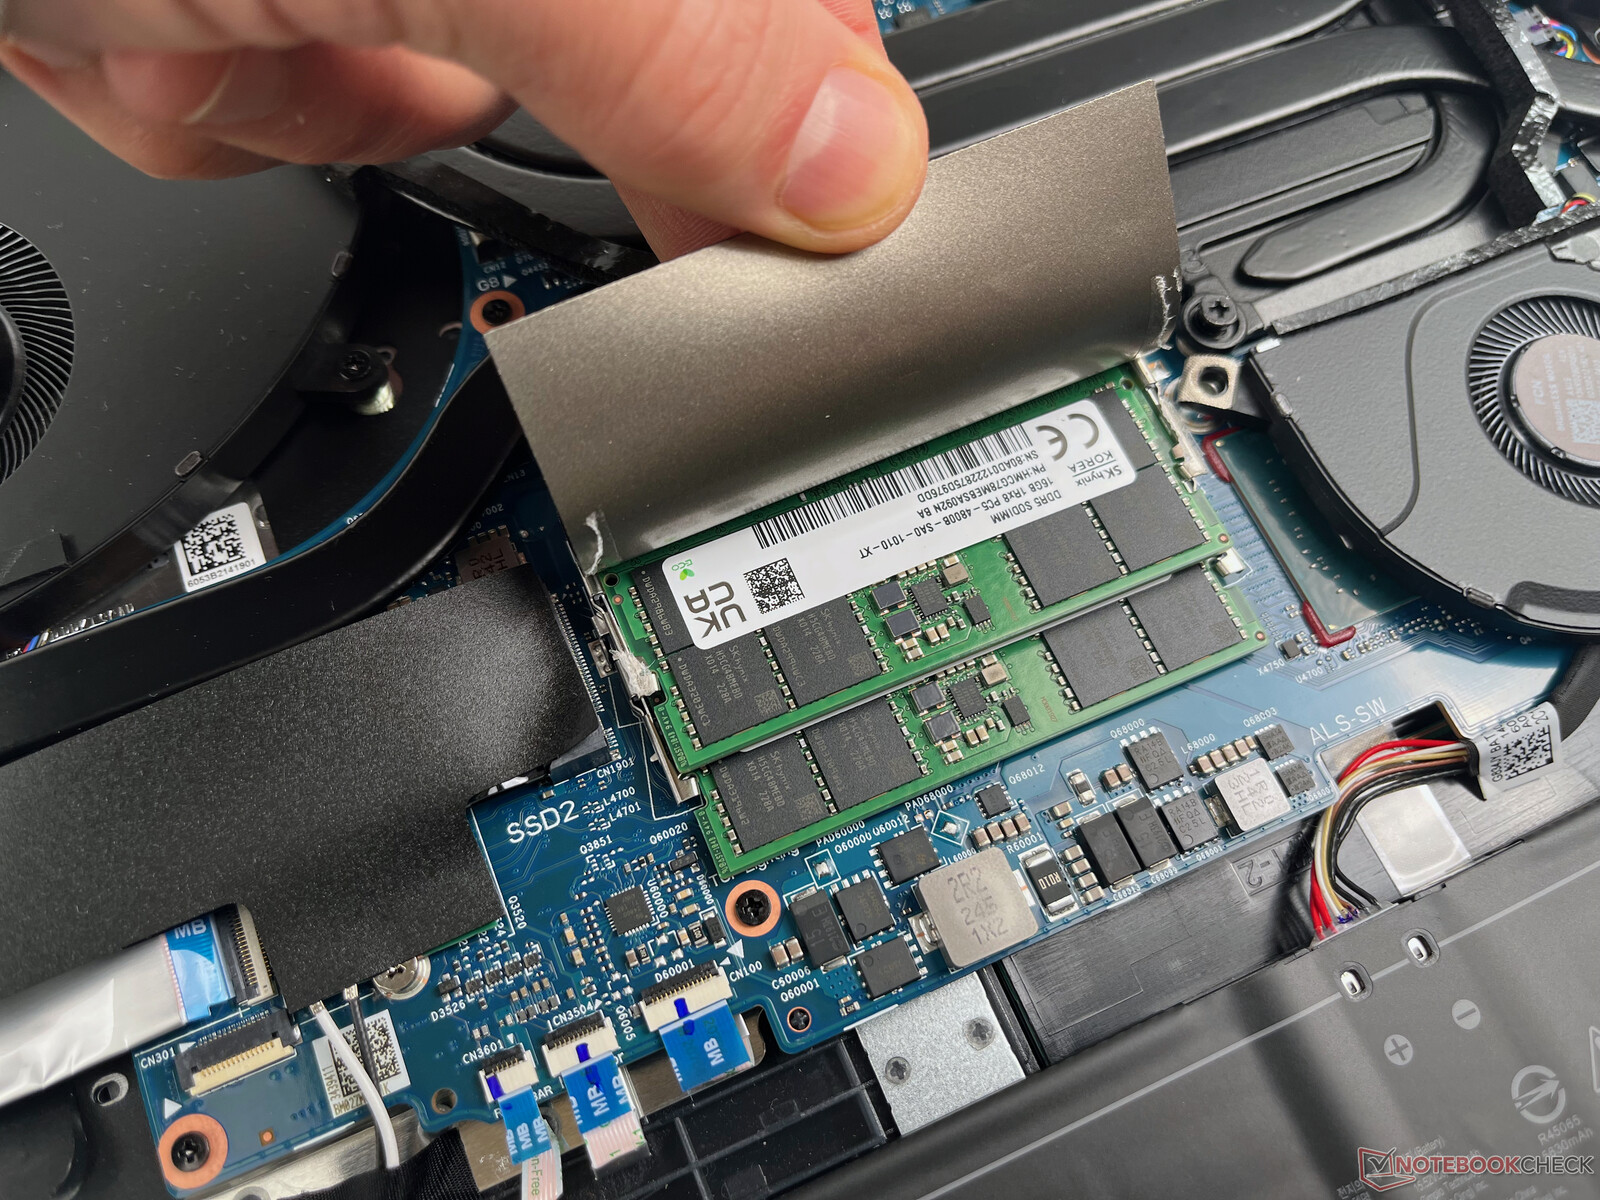
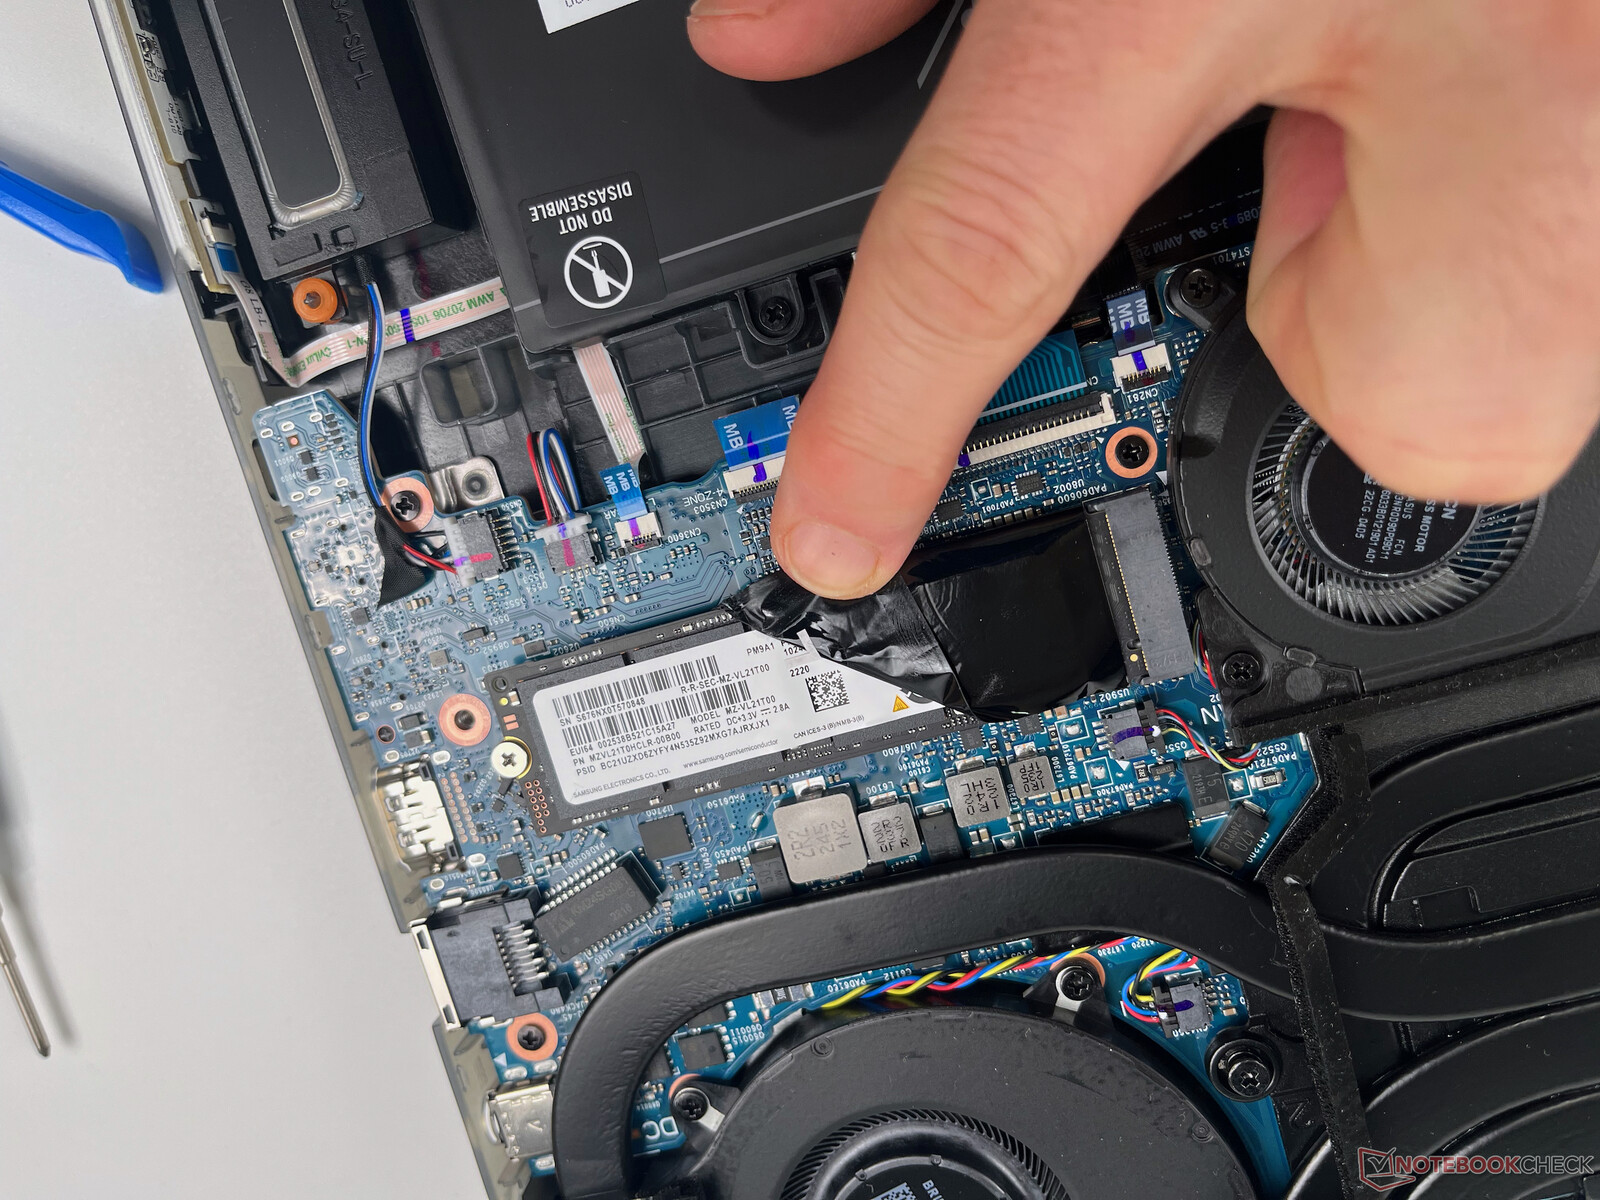
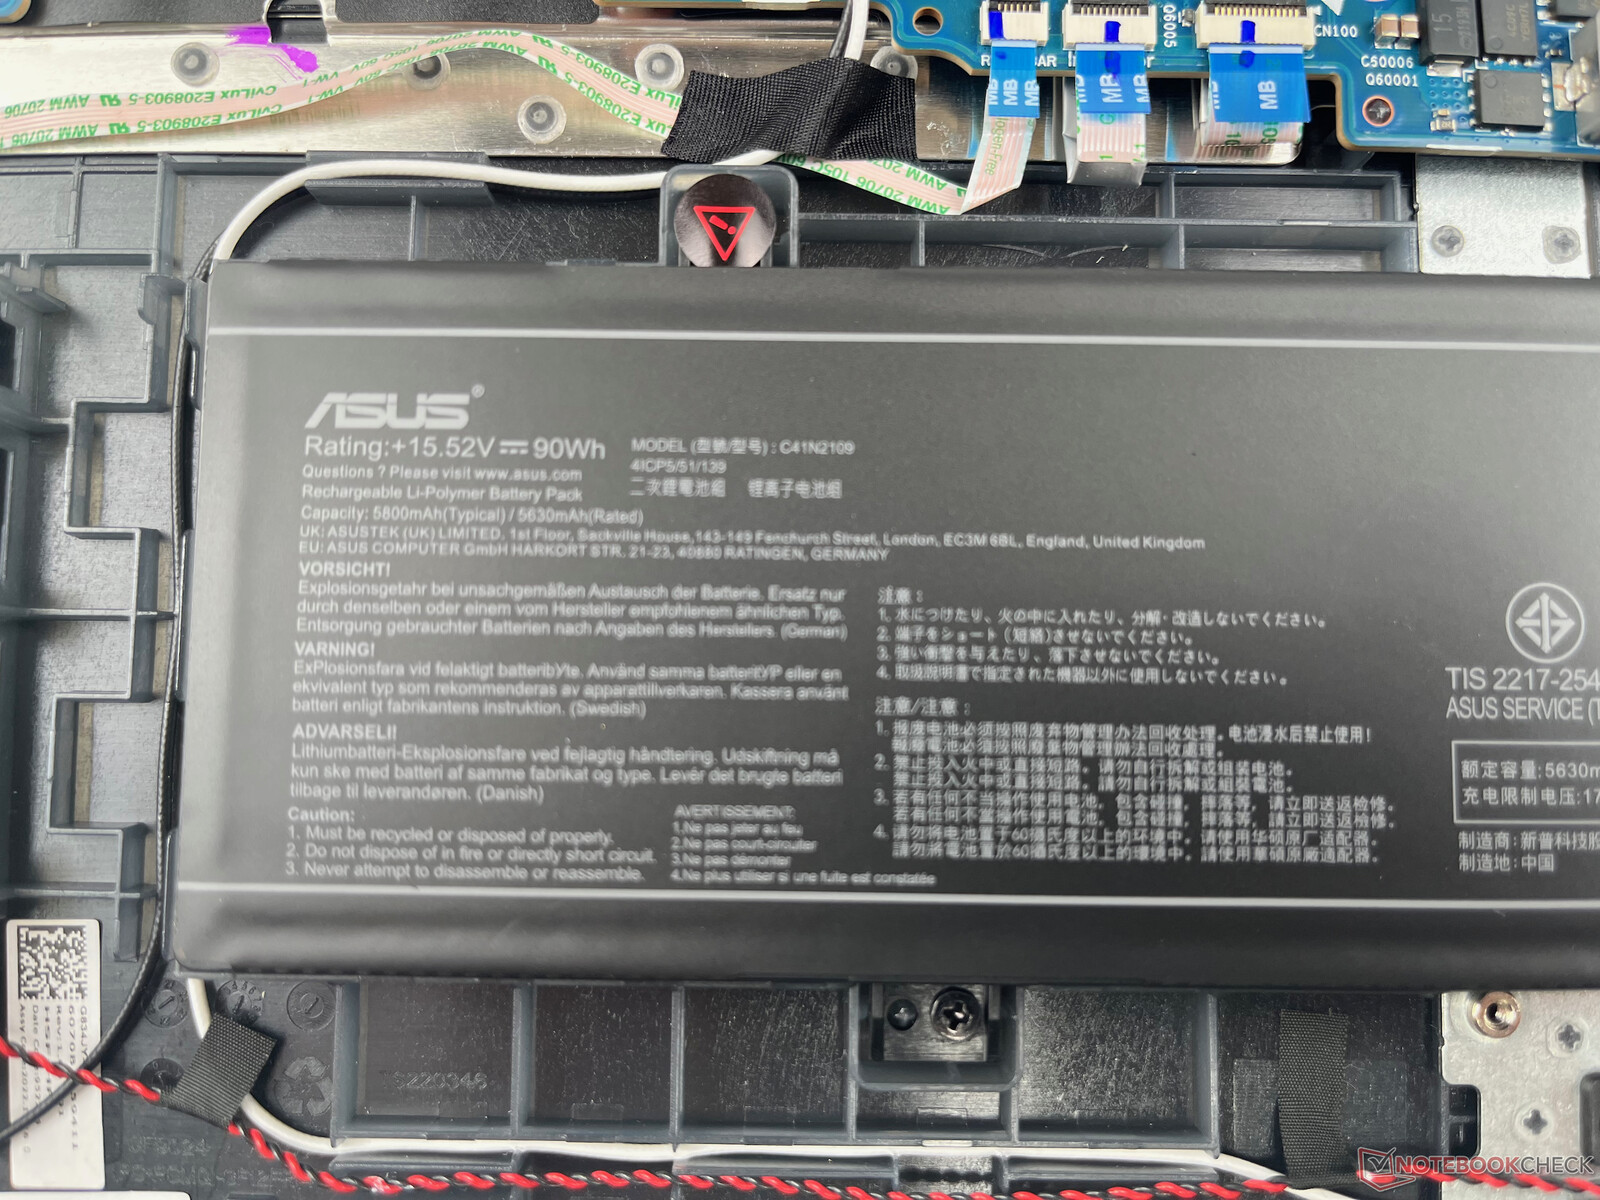
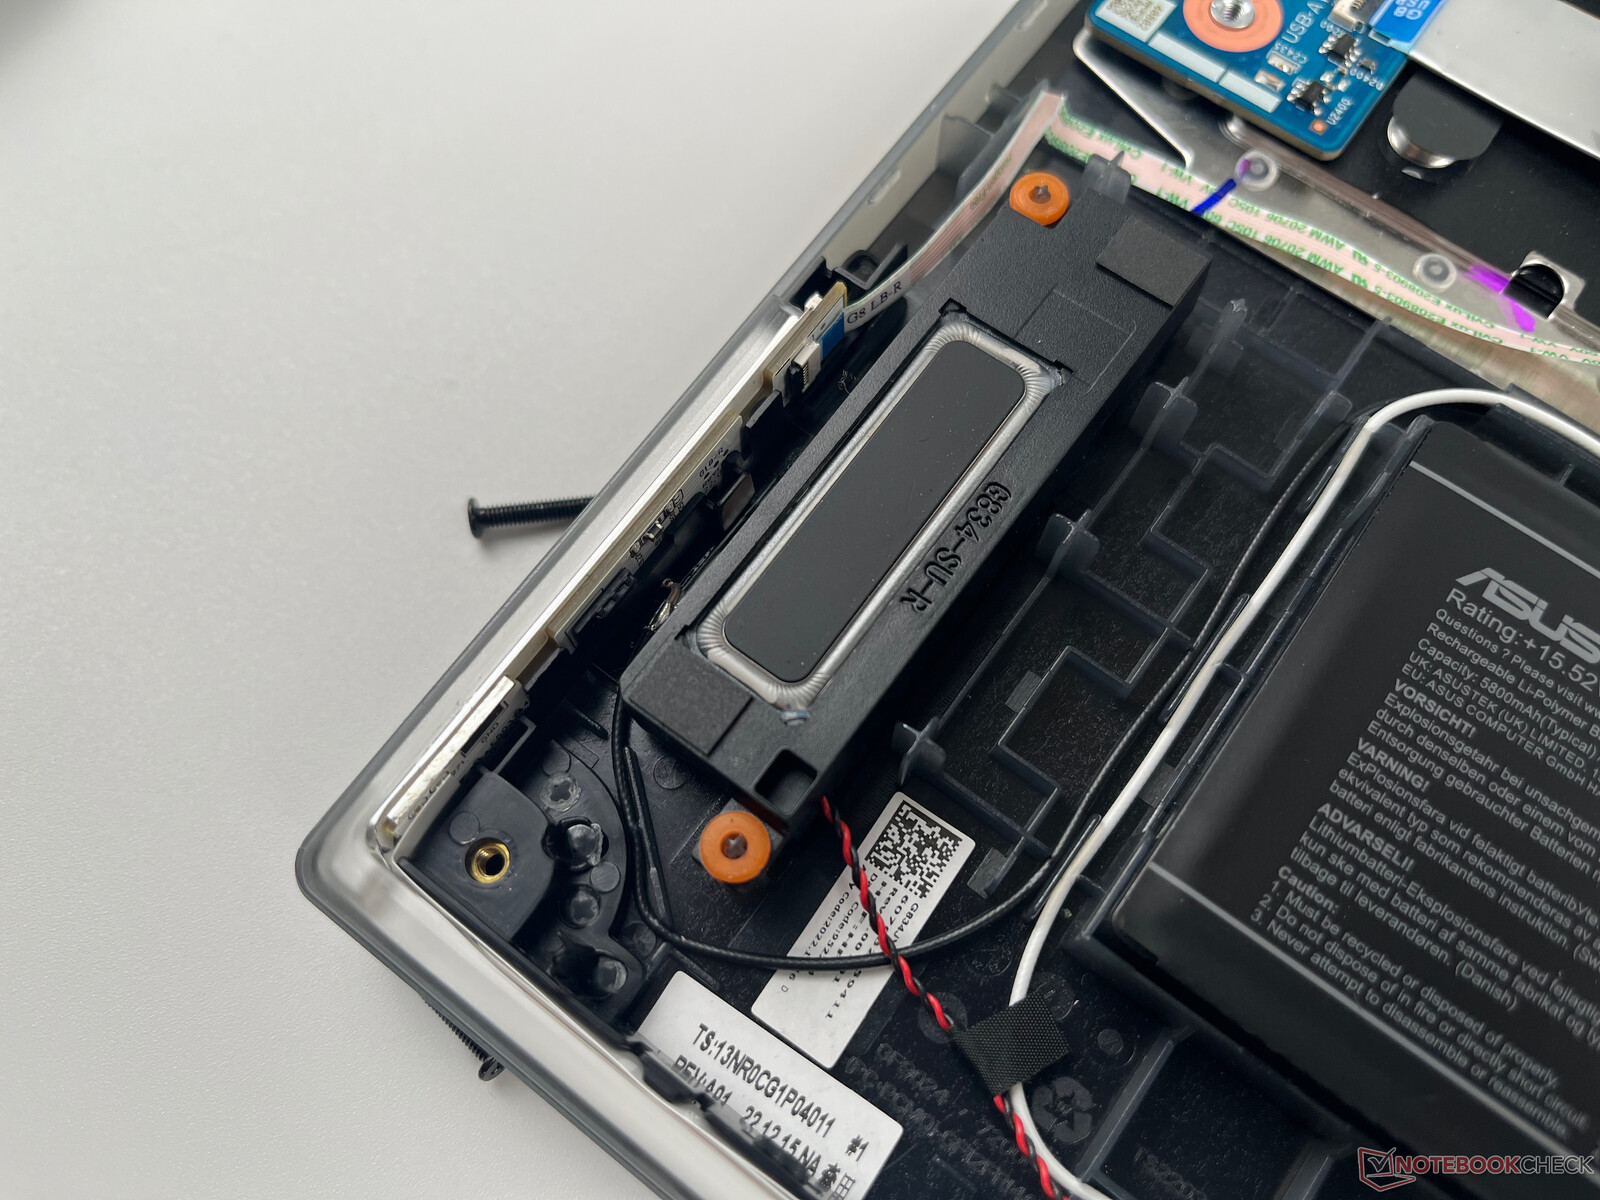
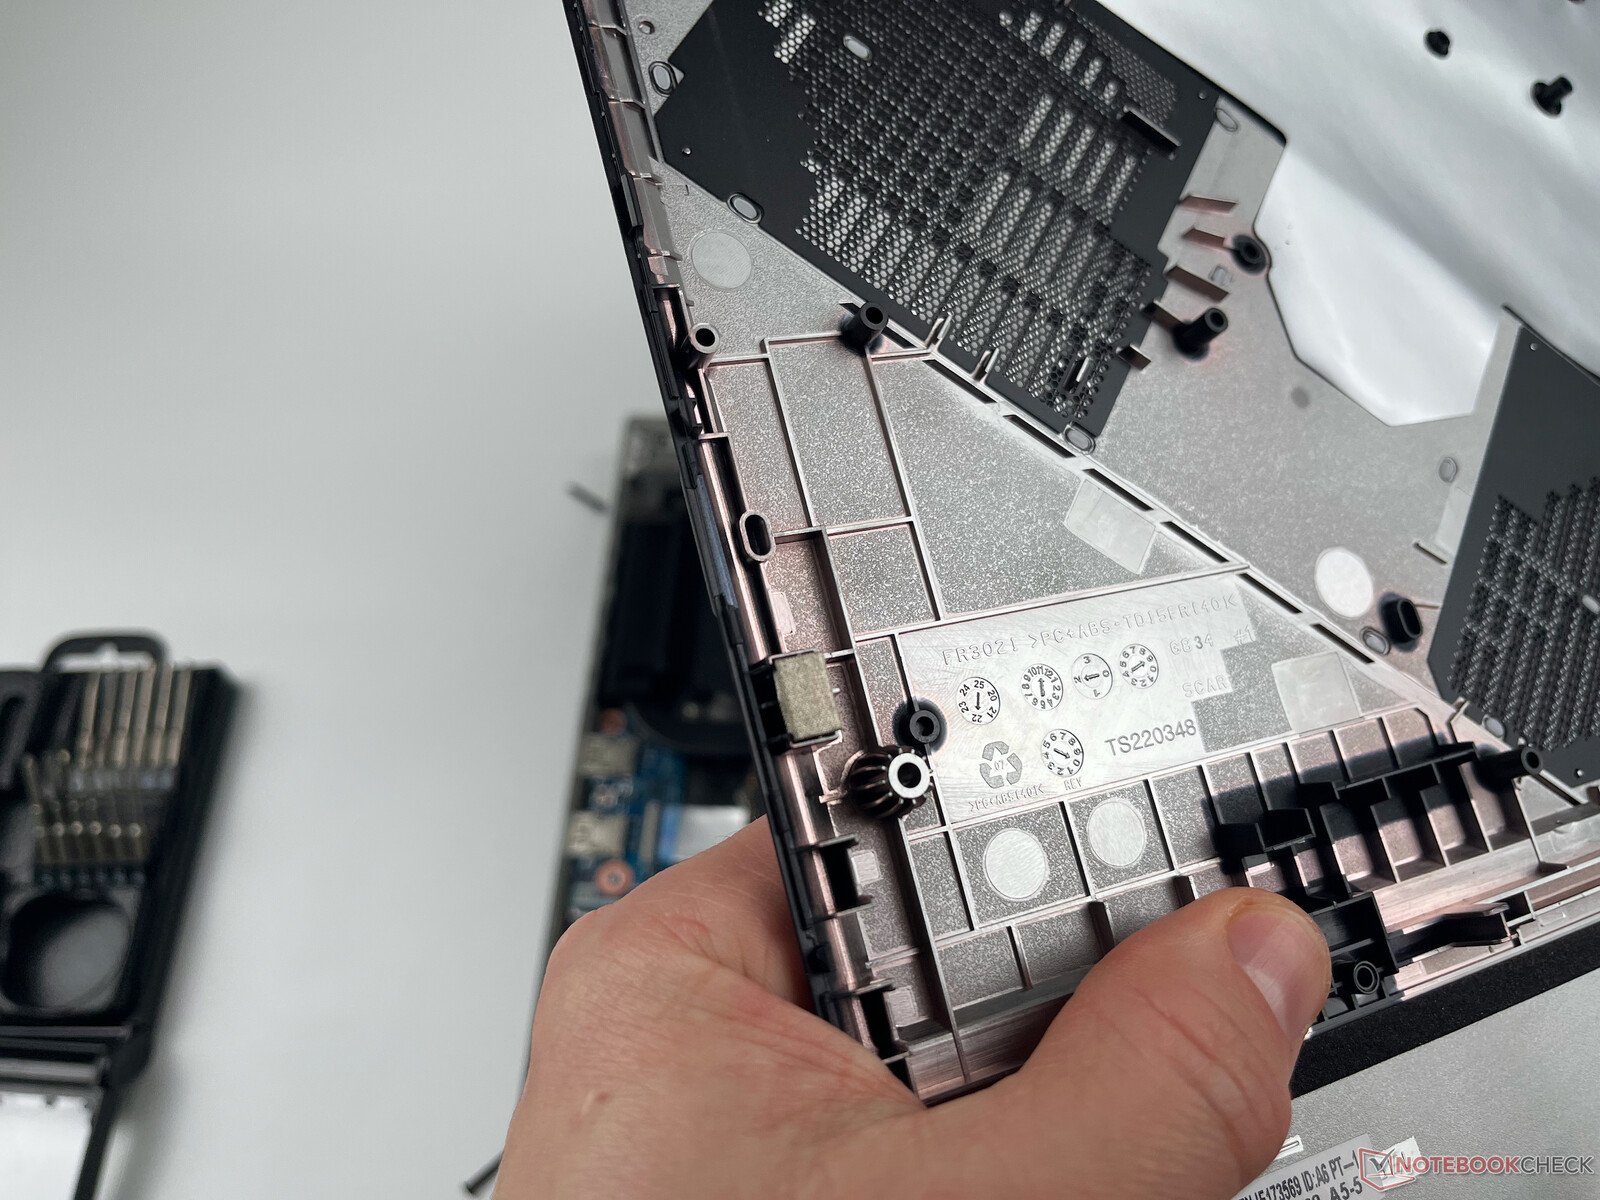
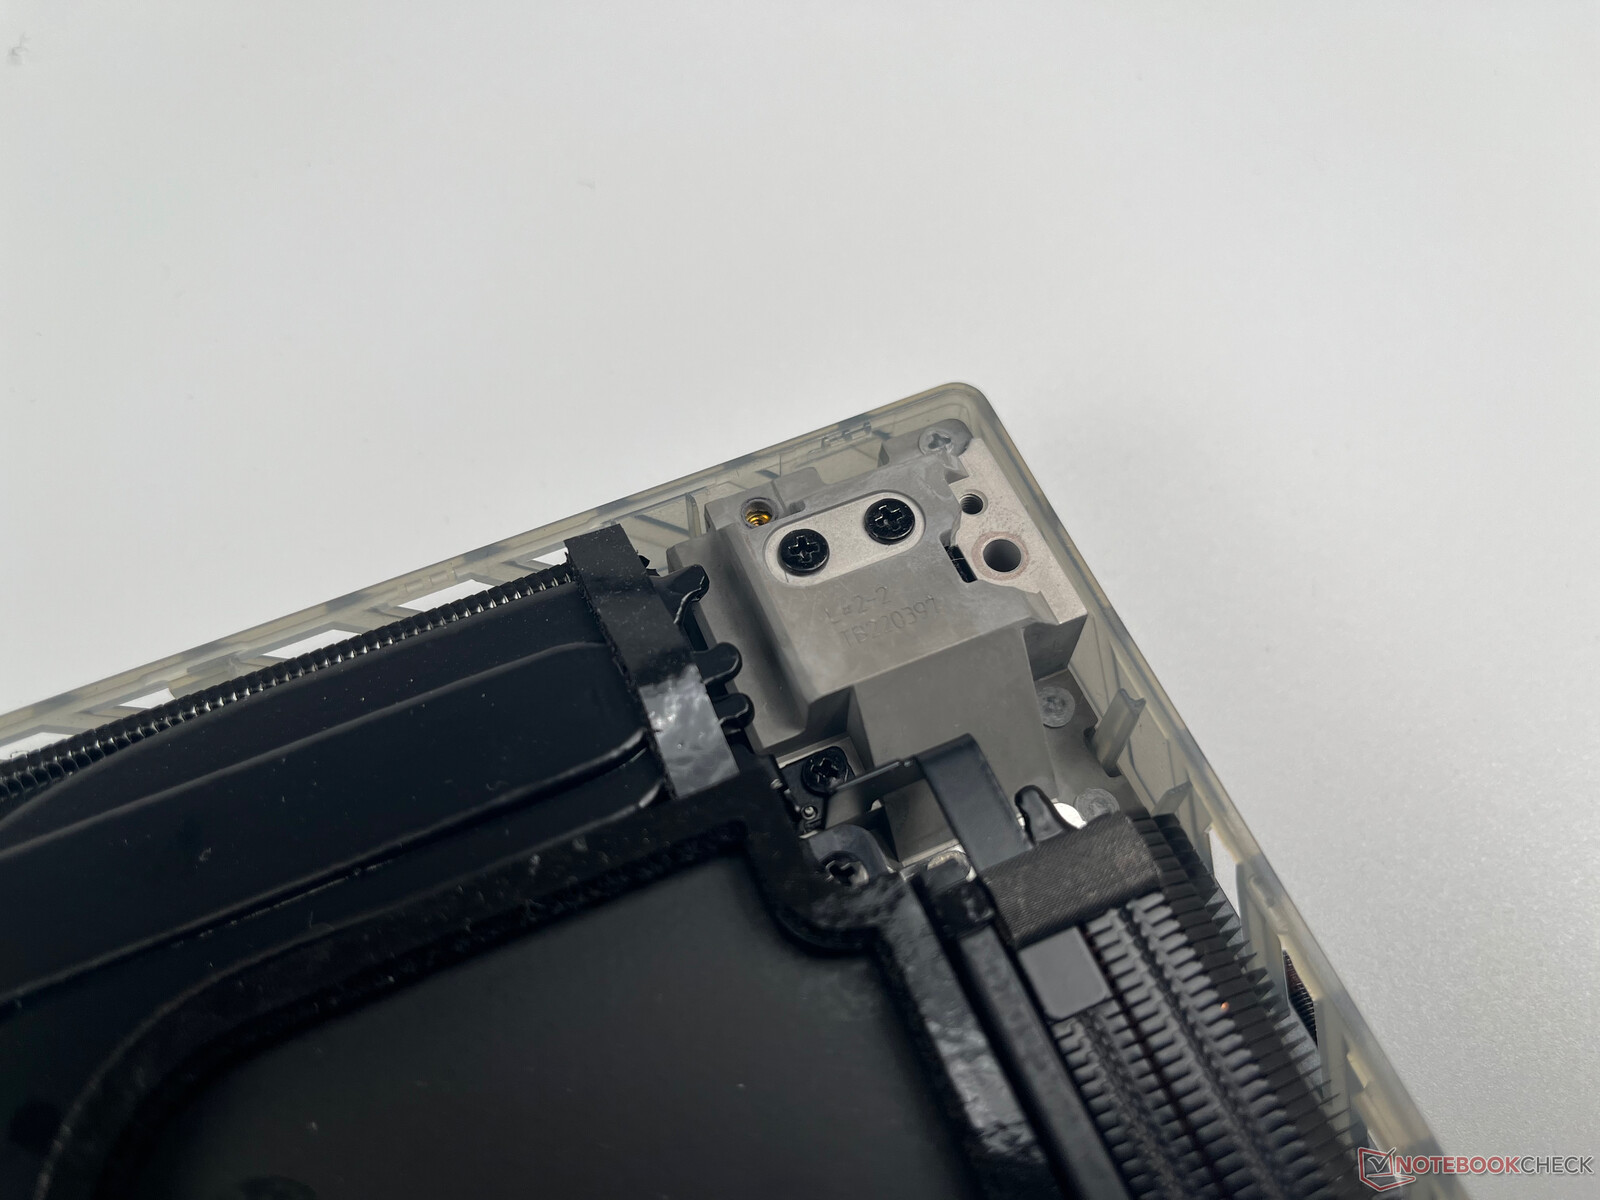
Wnętrza obudowy ROG Strix z serii G18 są stosunkowo łatwo dostępne od spodu. Najpierw trzeba odkręcić liczne śrubki Philipsa, a następnie poluzować plastikowe klipsy na krawędziach za pomocą wścibskiego narzędzia. W przypadku naszego testowego egzemplarza było to stosunkowo łatwe do wykonania (zaczynając od przednich narożników) i na szczęście żaden z plastikowych klipsów nie pękł podczas otwierania obudowy.
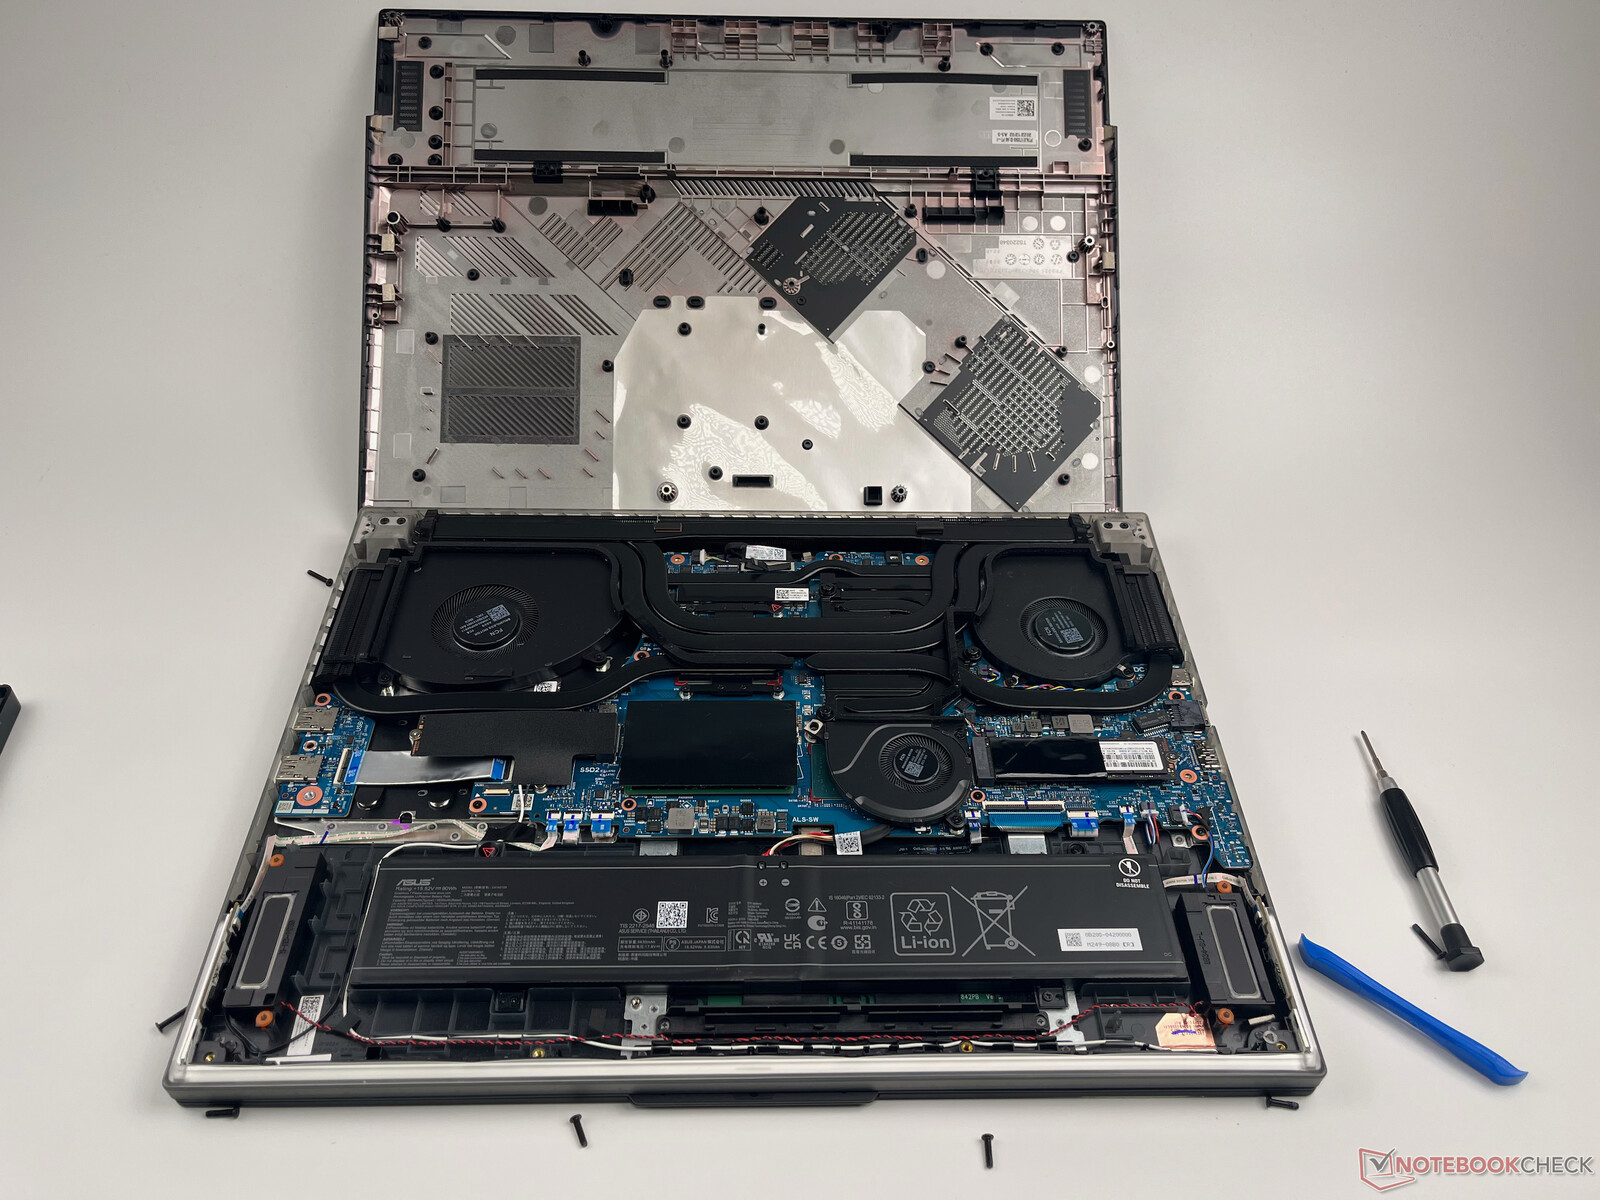
Wewnątrz laptopa widzimy dwa gniazda M.2-2280 dla dysków SSD PCIe (oba zajęte na potrzeby systemu RAID-0), jedno gniazdo M.2 dla karty WLAN oraz dwa gniazda pamięci (również oba zajęte) dla maksymalnie 64 GB RAM GDDR5. Wszystkie wentylatory są również dostępne i można je łatwo wyczyścić. Bateria jest przykręcona do obudowy, więc jej wymiana również powinna być stosunkowo łatwa.
Gwarancja
Asus oferuje tylko zwykłą gwarancję na jeden rok (dwa lata w przypadku modeli oferowanych w Niemczech). O gwarancji na części zamienne lub cokolwiek podobnego nie ma mowy.
Input Devices
Klawiatura
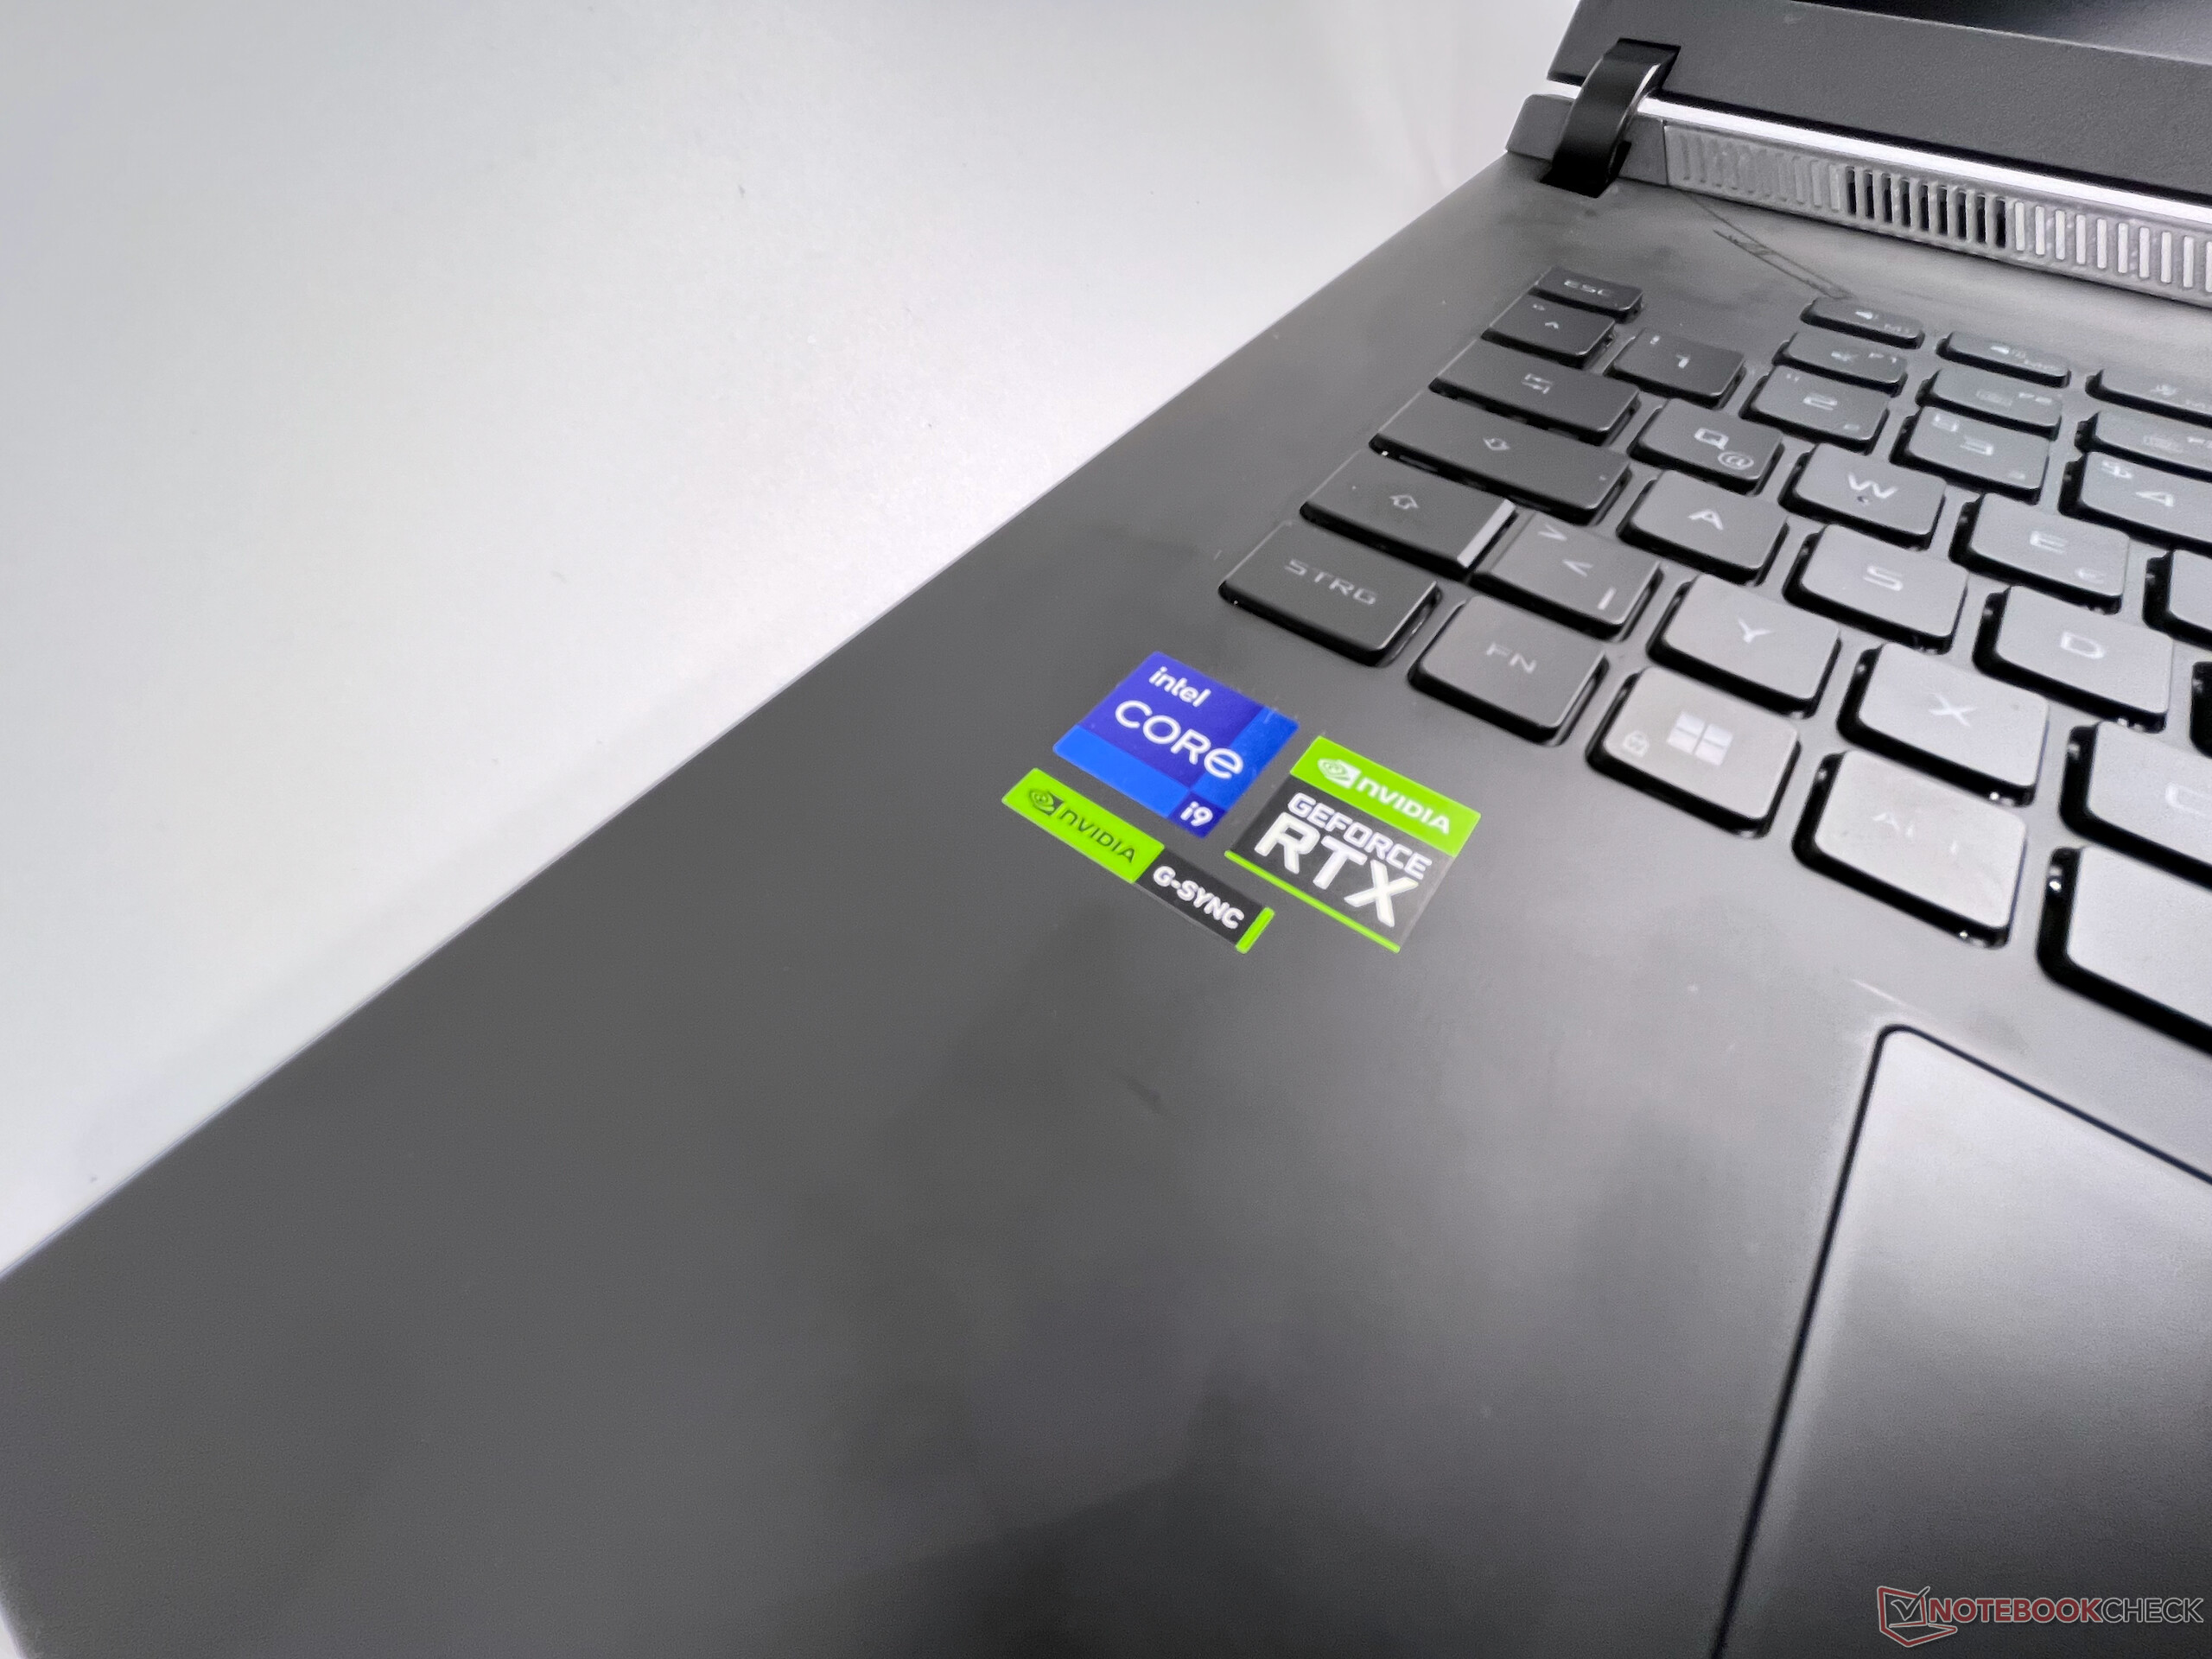
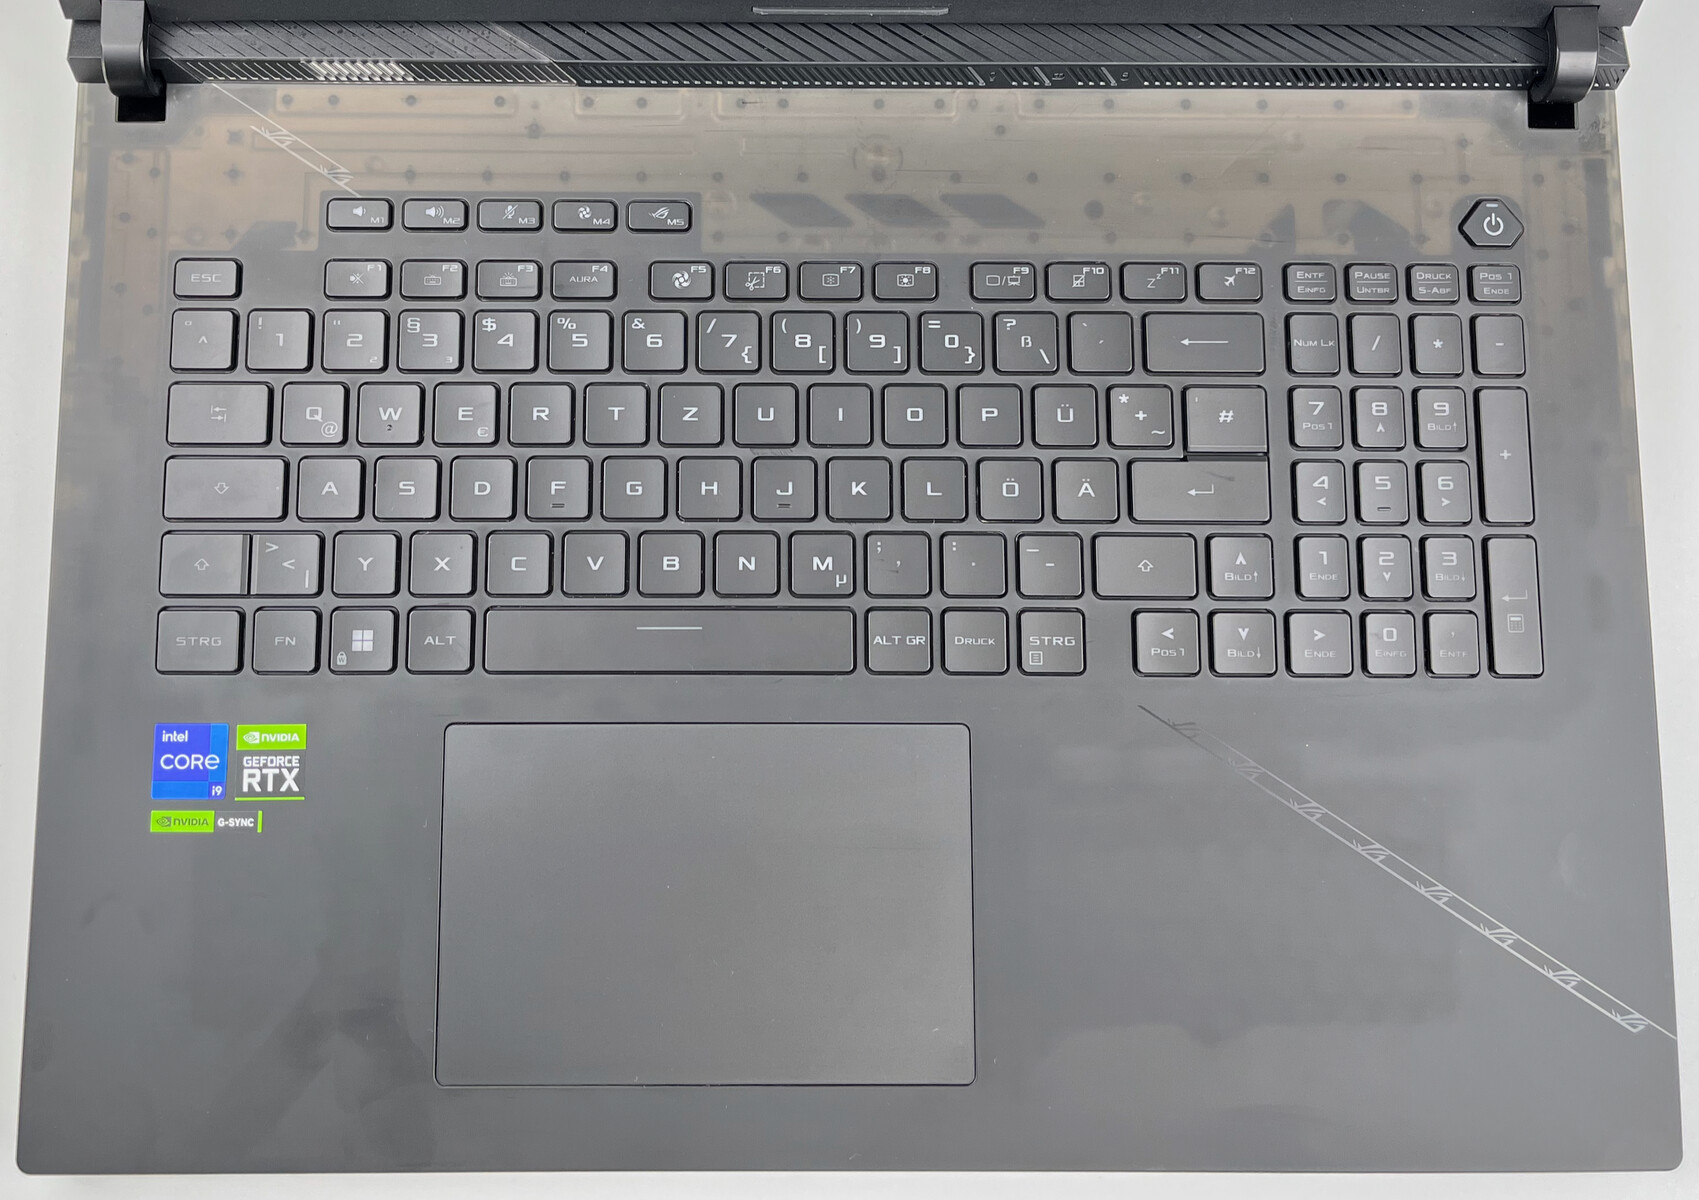
Oprócz bloku numerycznego zastosowana tu pełnowymiarowa klawiatura zawiera także pięć klawiszy specjalnych nad rzędem F1-F12 o podwójnym zastosowaniu. Klawisze szylkretowe oferują wystarczający skok klawiszy i cichy skok. Podczas pierwszego testu pisania na klawiaturze autor osiągnął dobre 85 słów na minutę z 96% dokładnością. Wbudowane podświetlenie RGB oddzielnych klawiszy można spersonalizować dzięki licznym animacjom. W teście przewijania n-klawiszy nie widzimy żadnych ograniczeń (osiągnięto maks. 24 jednoczesne klawisze).
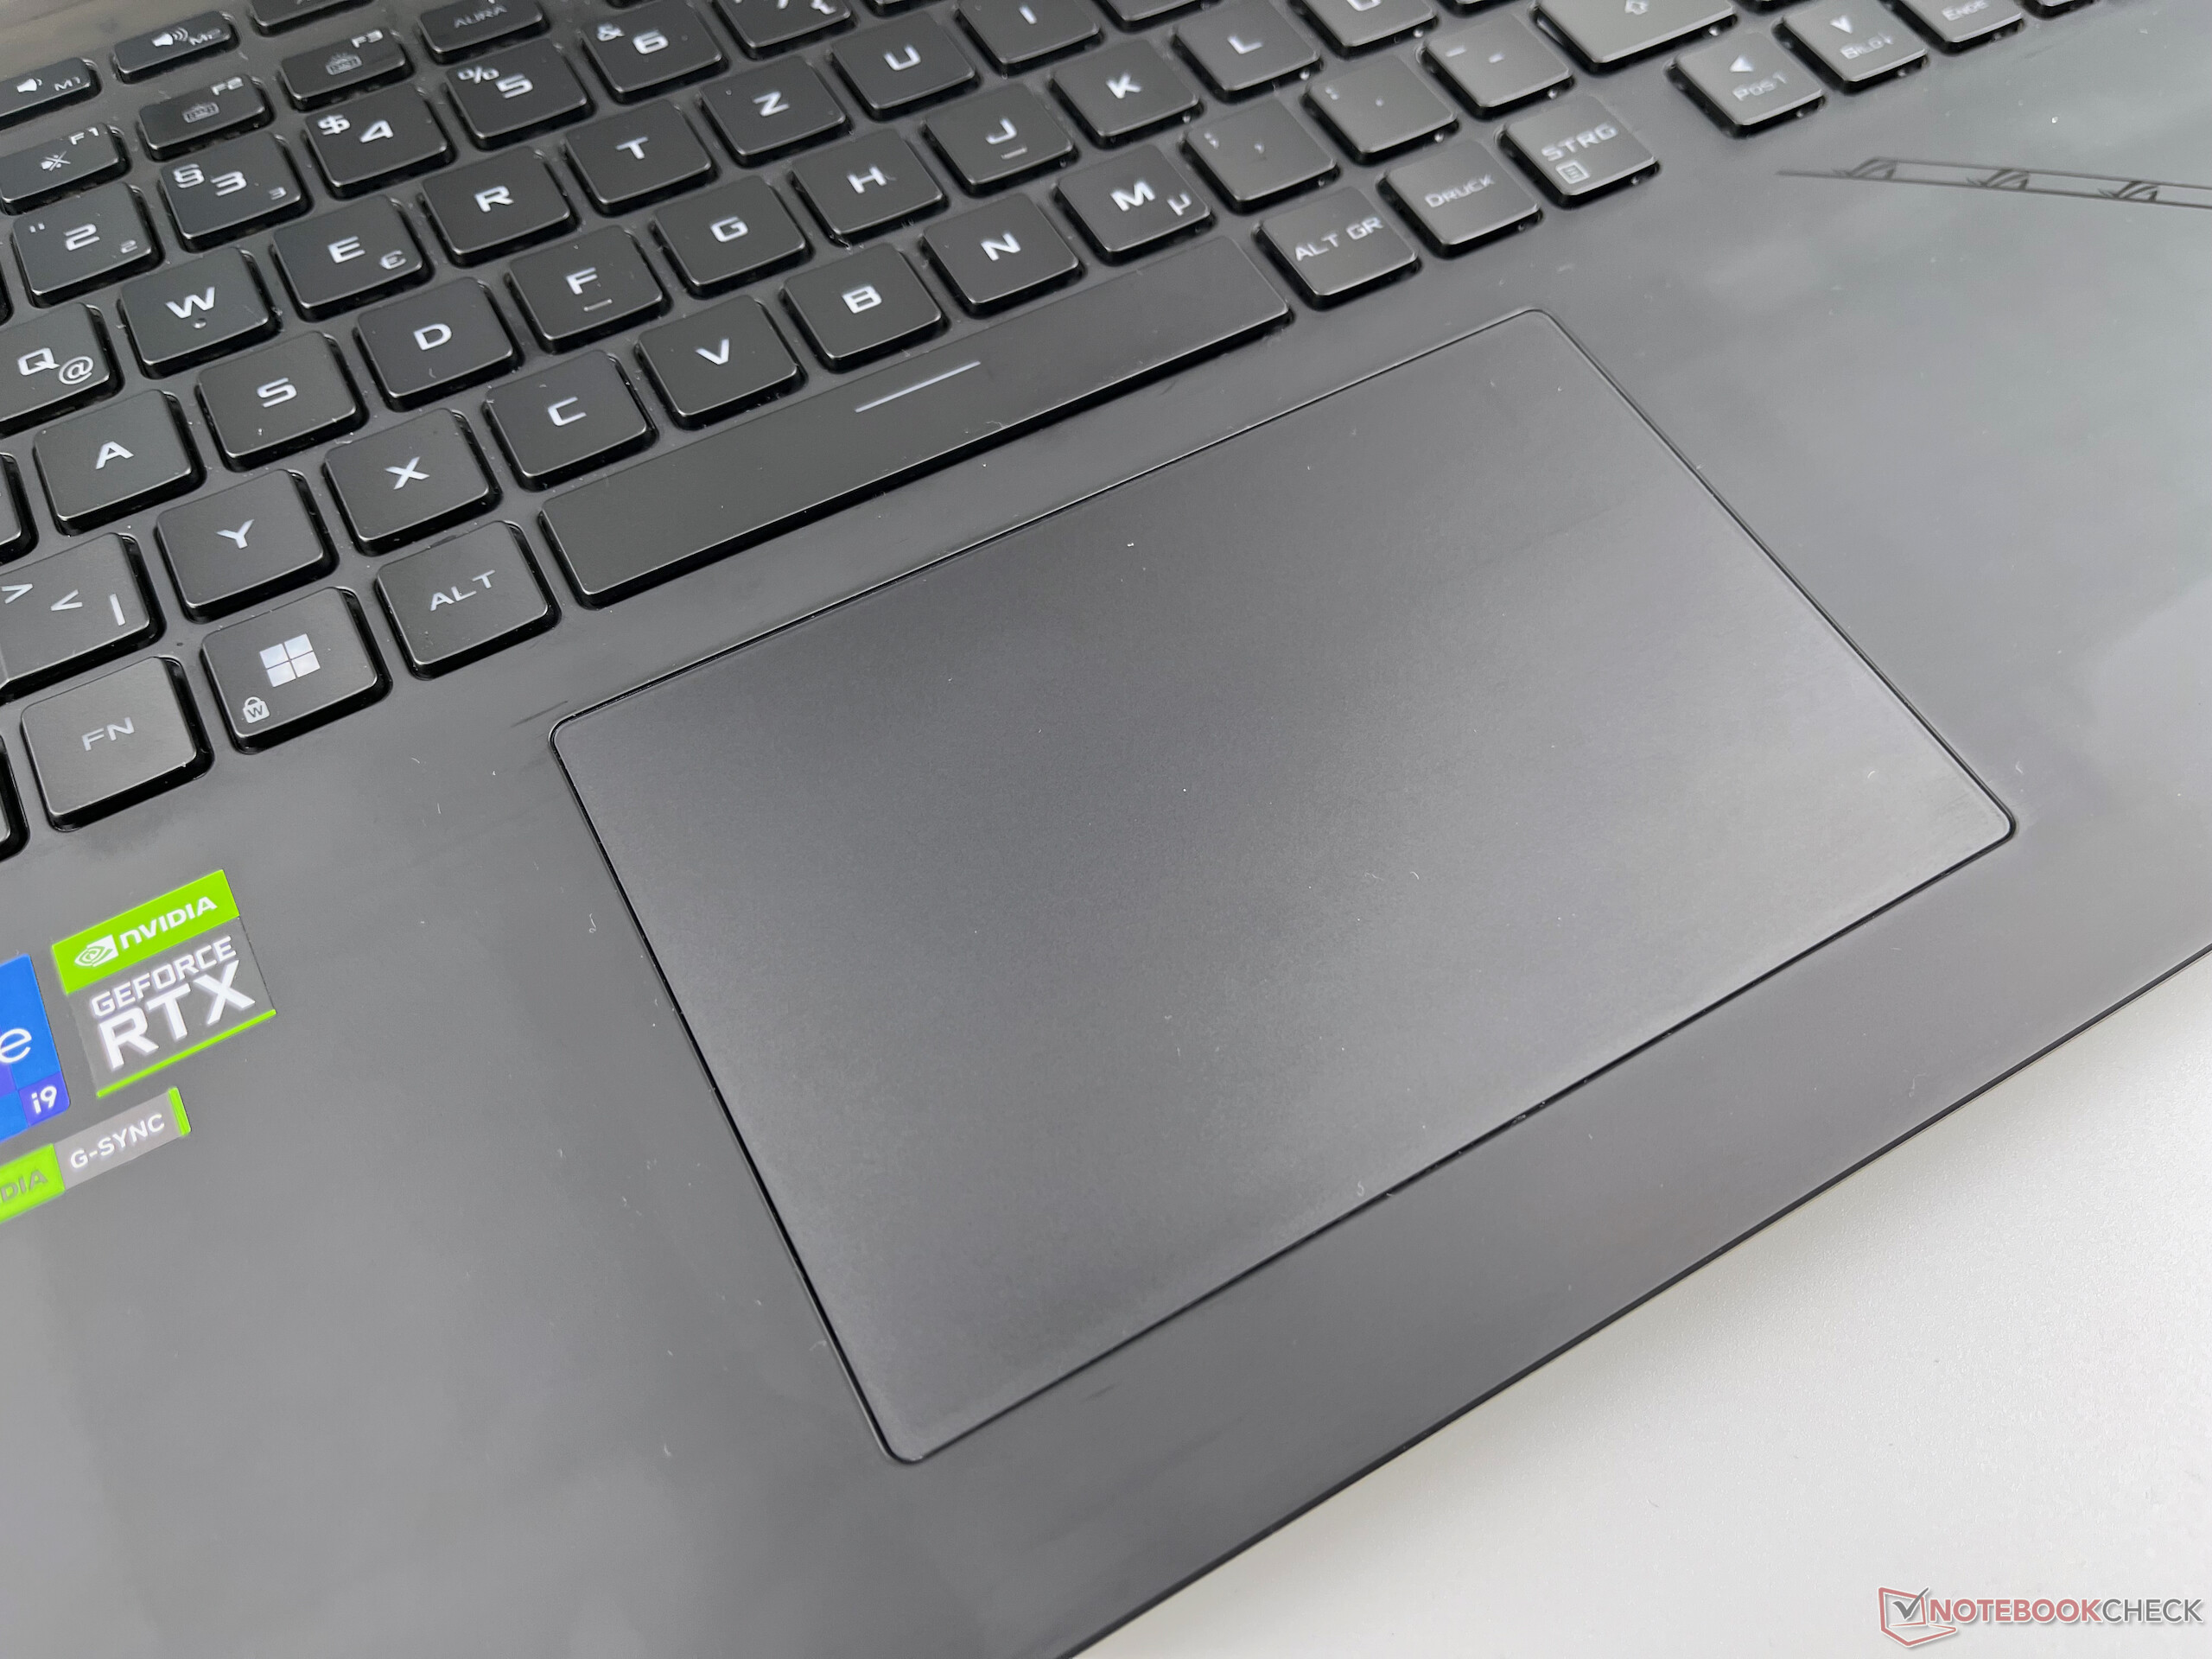
Touchpad
Duży touchpad oferuje szklaną powierzchnię i doskonałe właściwości ślizgowe. Multitouch działał w naszym teście bez zarzutu, a dolne 4/5 obszaru można wygodnie kliknąć. Kliknięcie w prawym dolnym rogu jest jednak często rozpoznawane jako naciśnięcie prawego klawisza myszy, co prowadzi do błędnych danych.
Wyświetl
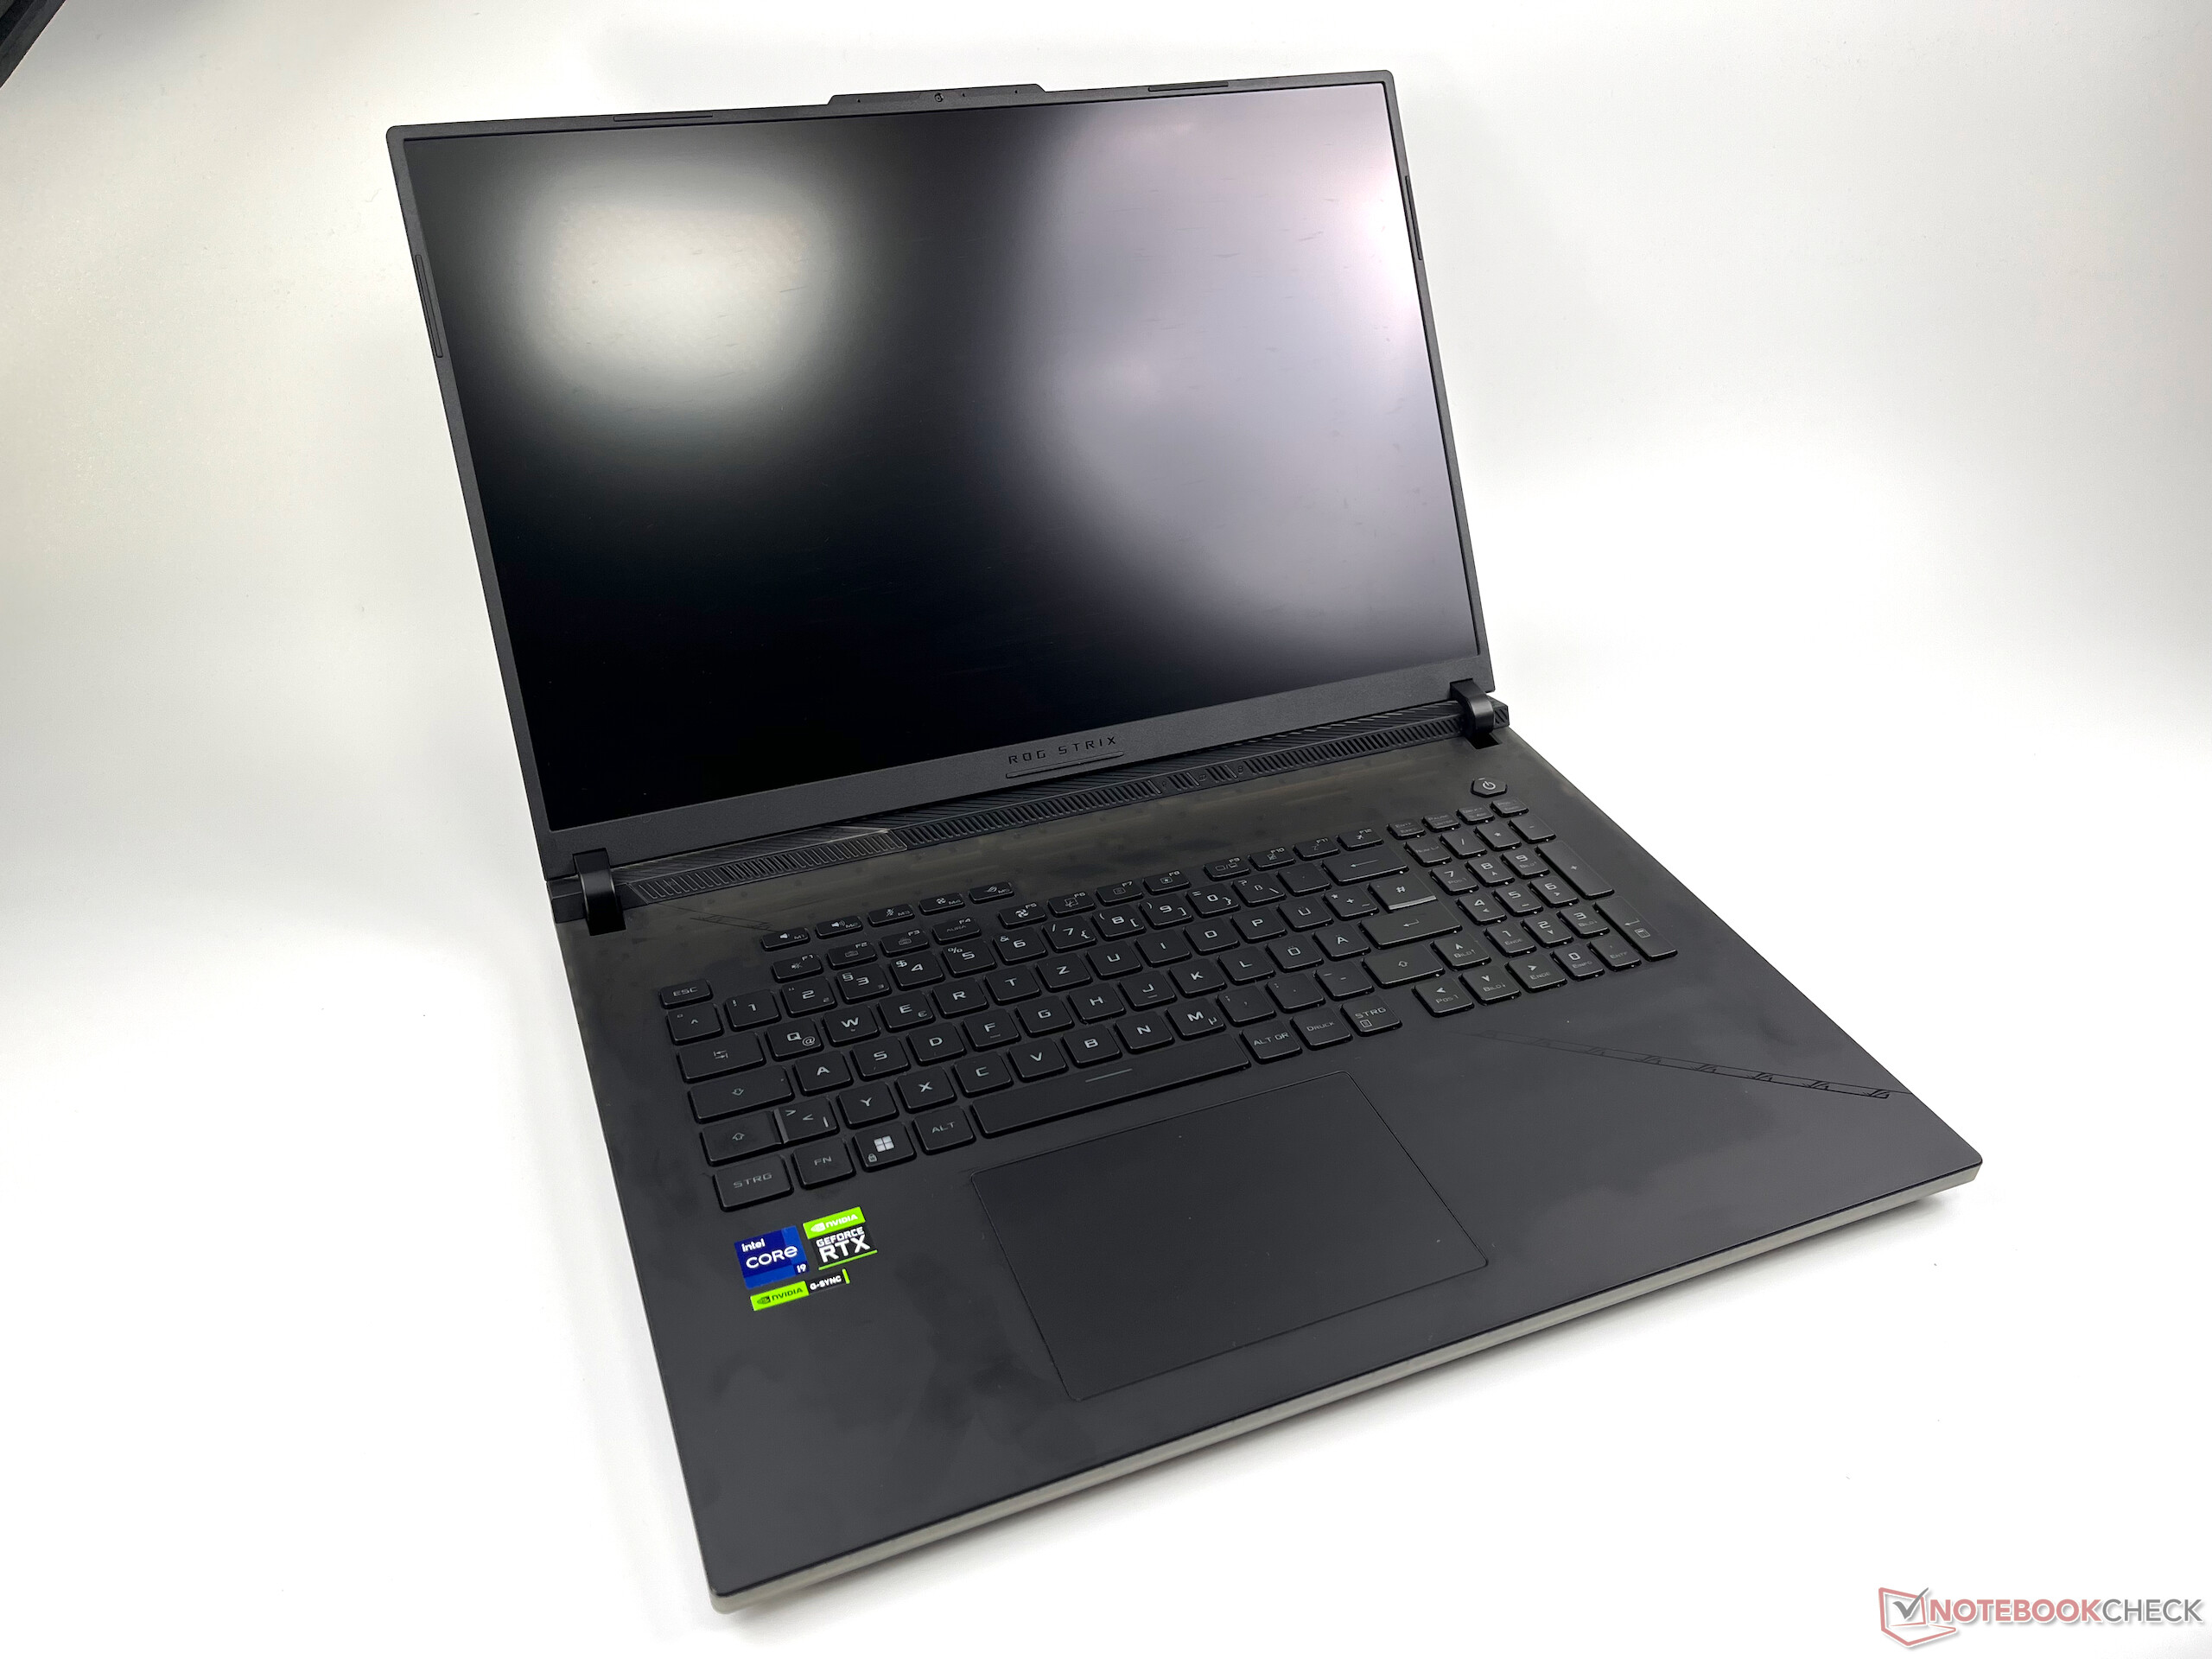
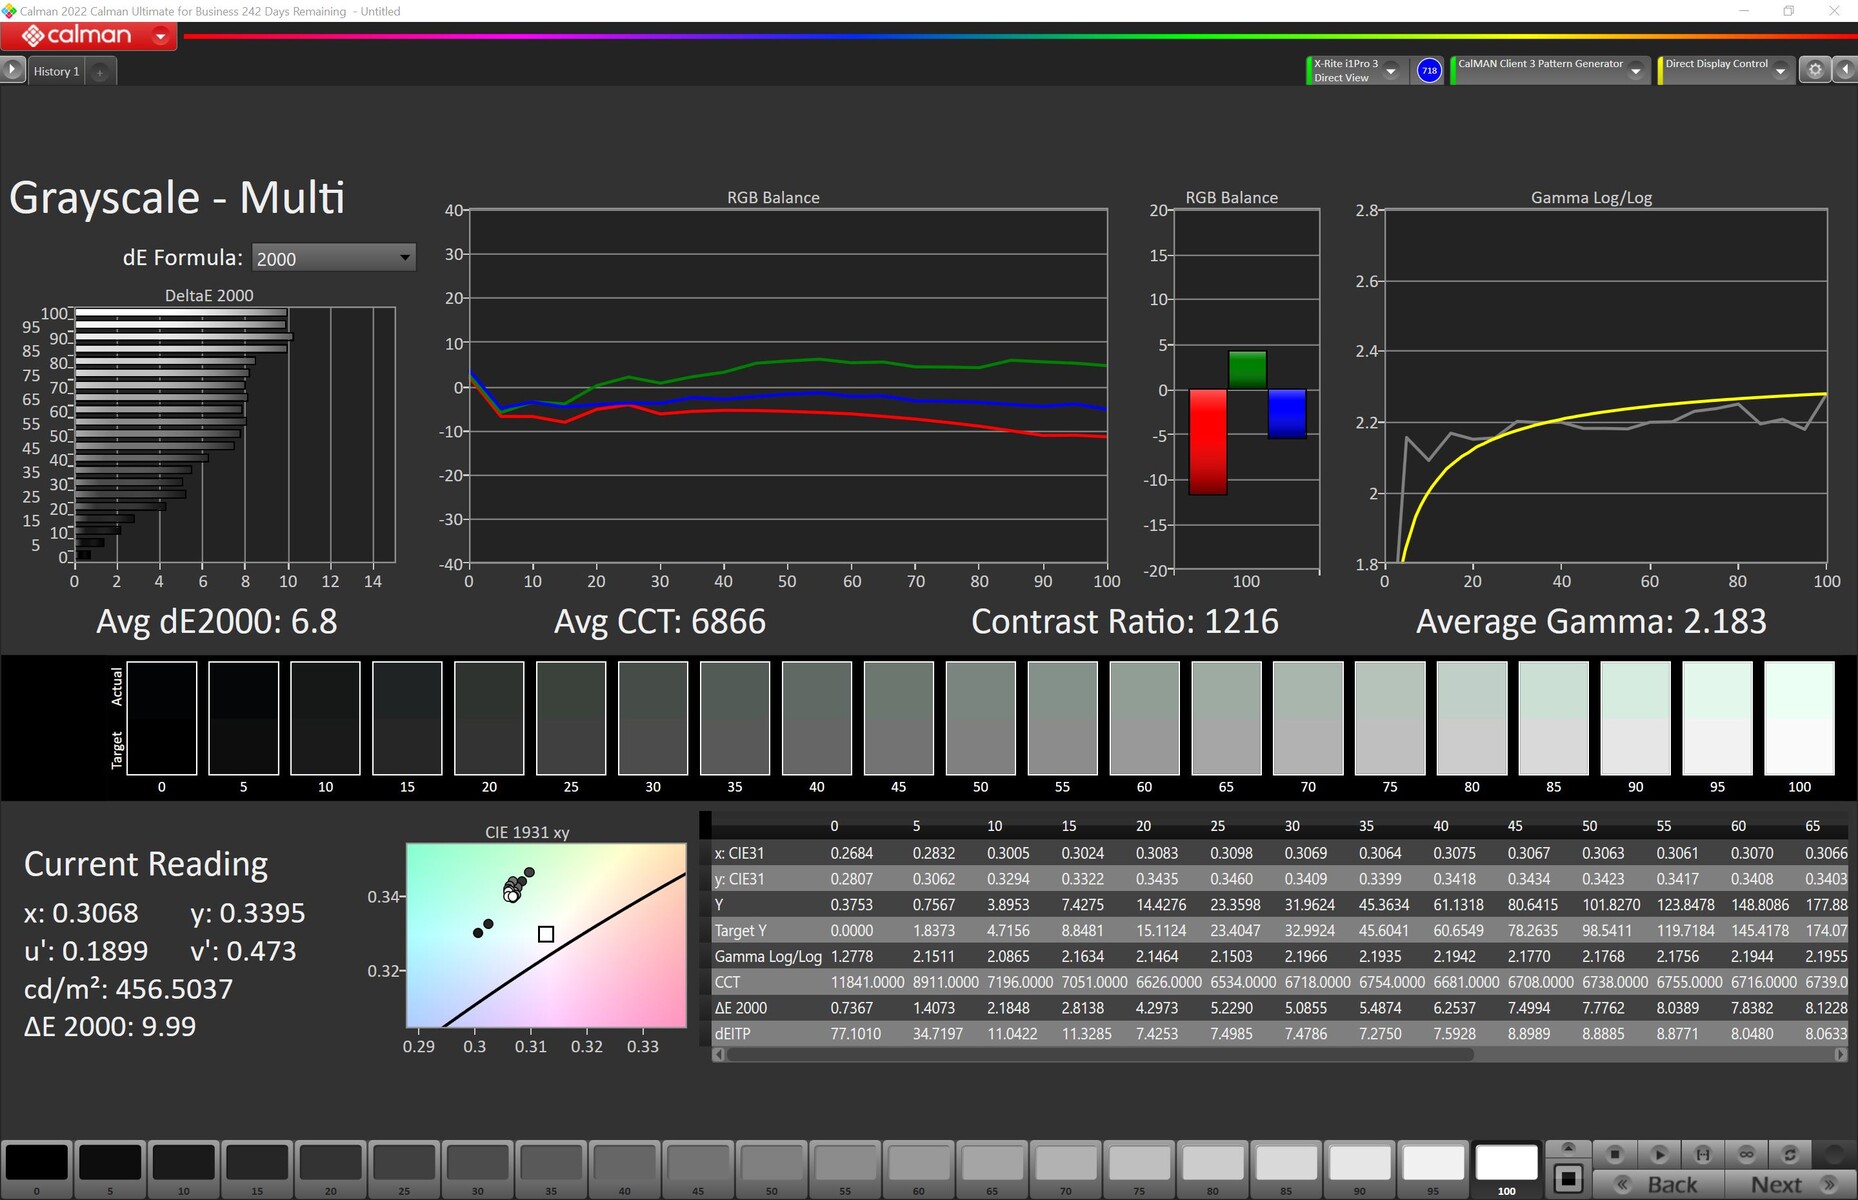
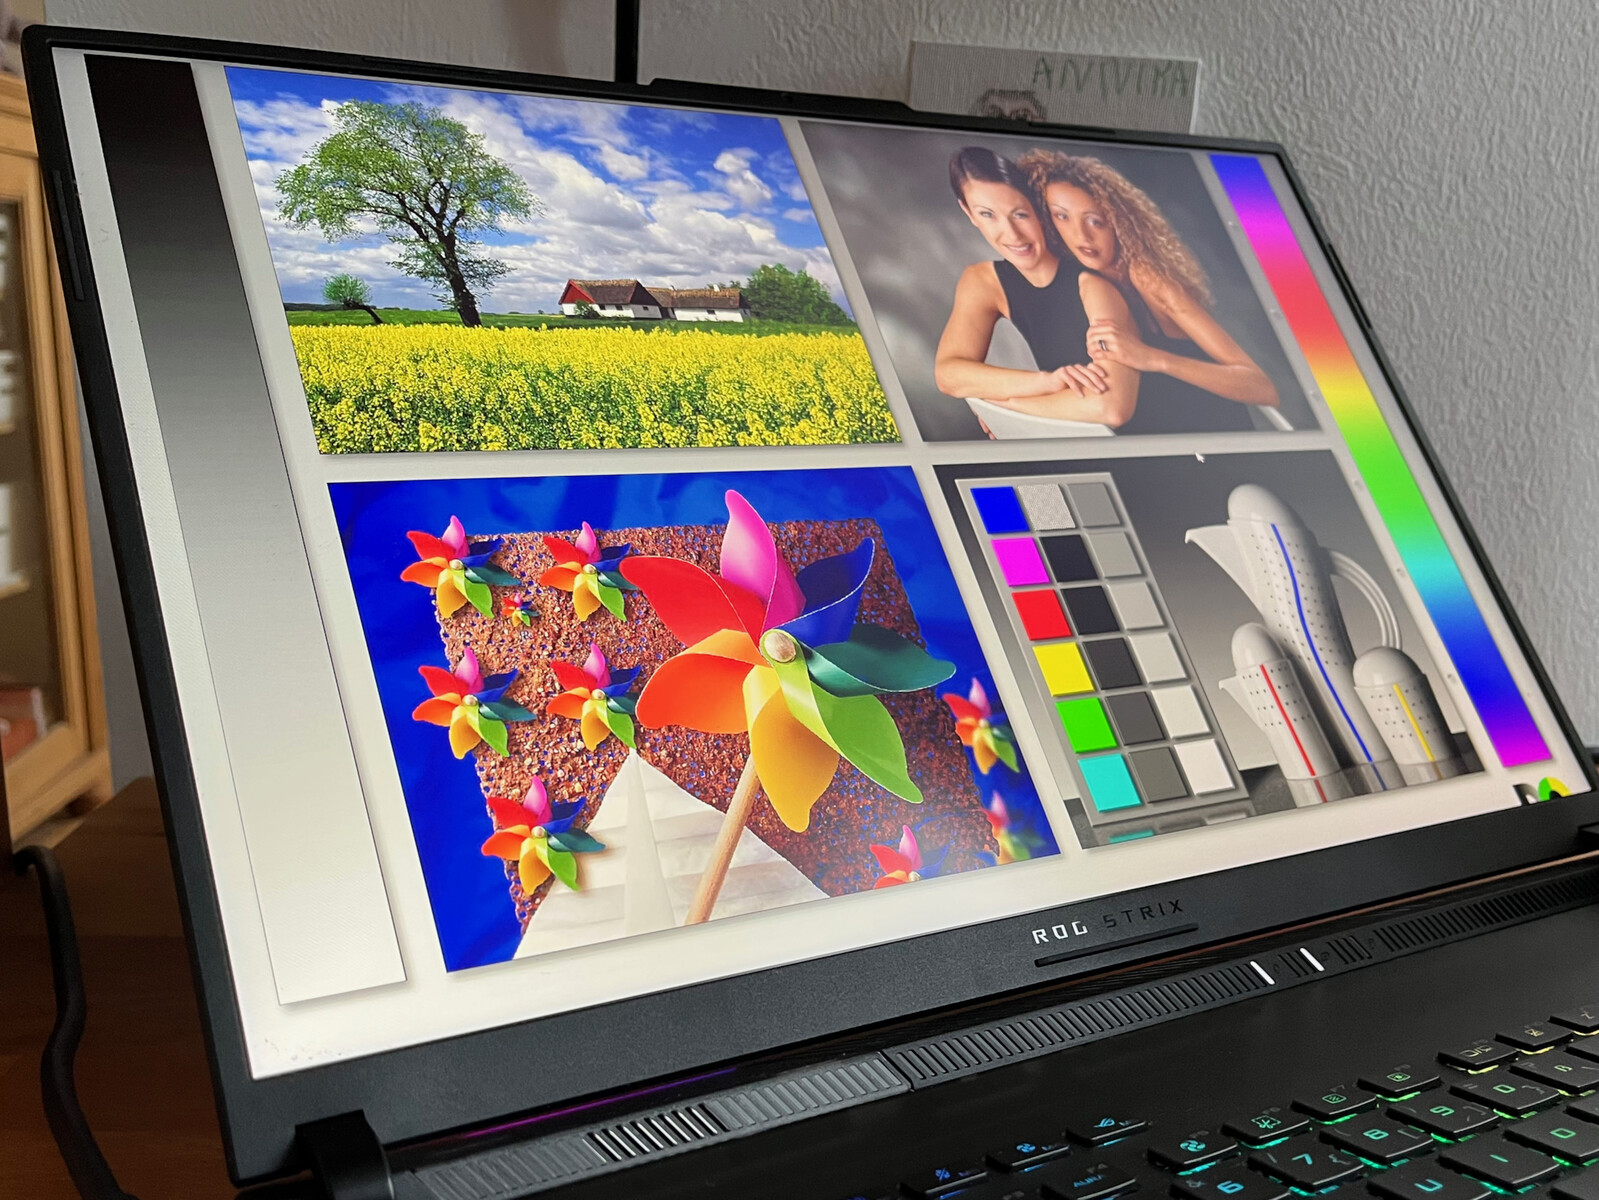
Nowy 18-calowy wyświetlacz posiada liczne funkcje, takie jak G-Sync, 240 Hz, QHD+, szybki 3-ms czas reakcji i pokrycie przestrzeni kolorów DCI-P3, zgodnie z arkuszem specyfikacji. Pod względem jasności, duży 18-calowy wyświetlacz nie osiąga obiecanych 500 nitów. Jednak jasność jest zdecydowanie zawsze wystarczająca w pomieszczeniach, a rozkład jasności jest również dobry na poziomie 86%. Nasz egzemplarz testowy nie wykazuje widocznego krwawienia podświetlenia.
| |||||||||||||||||||||||||
rozświetlenie: 86 %
na akumulatorze: 490 cd/m²
kontrast: 907:1 (czerń: 0.54 cd/m²)
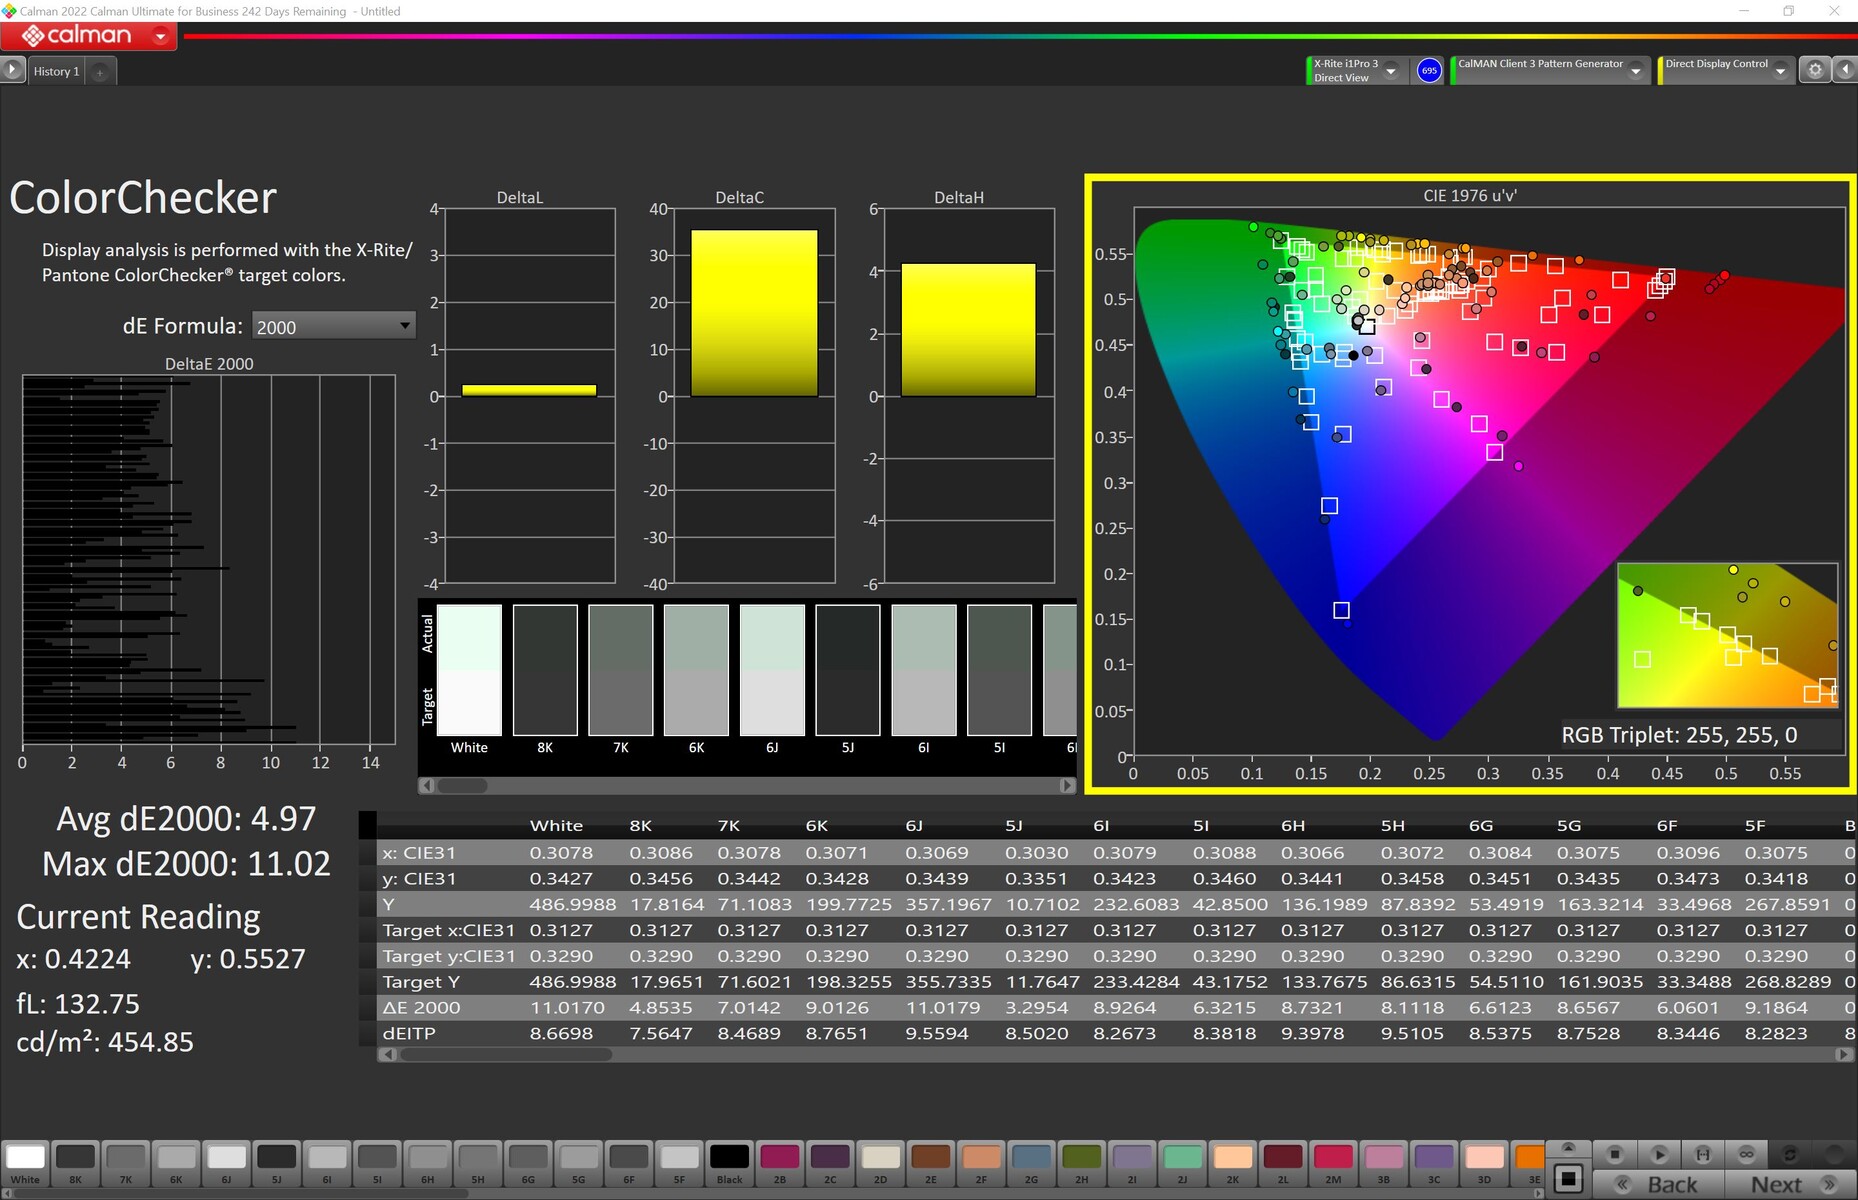
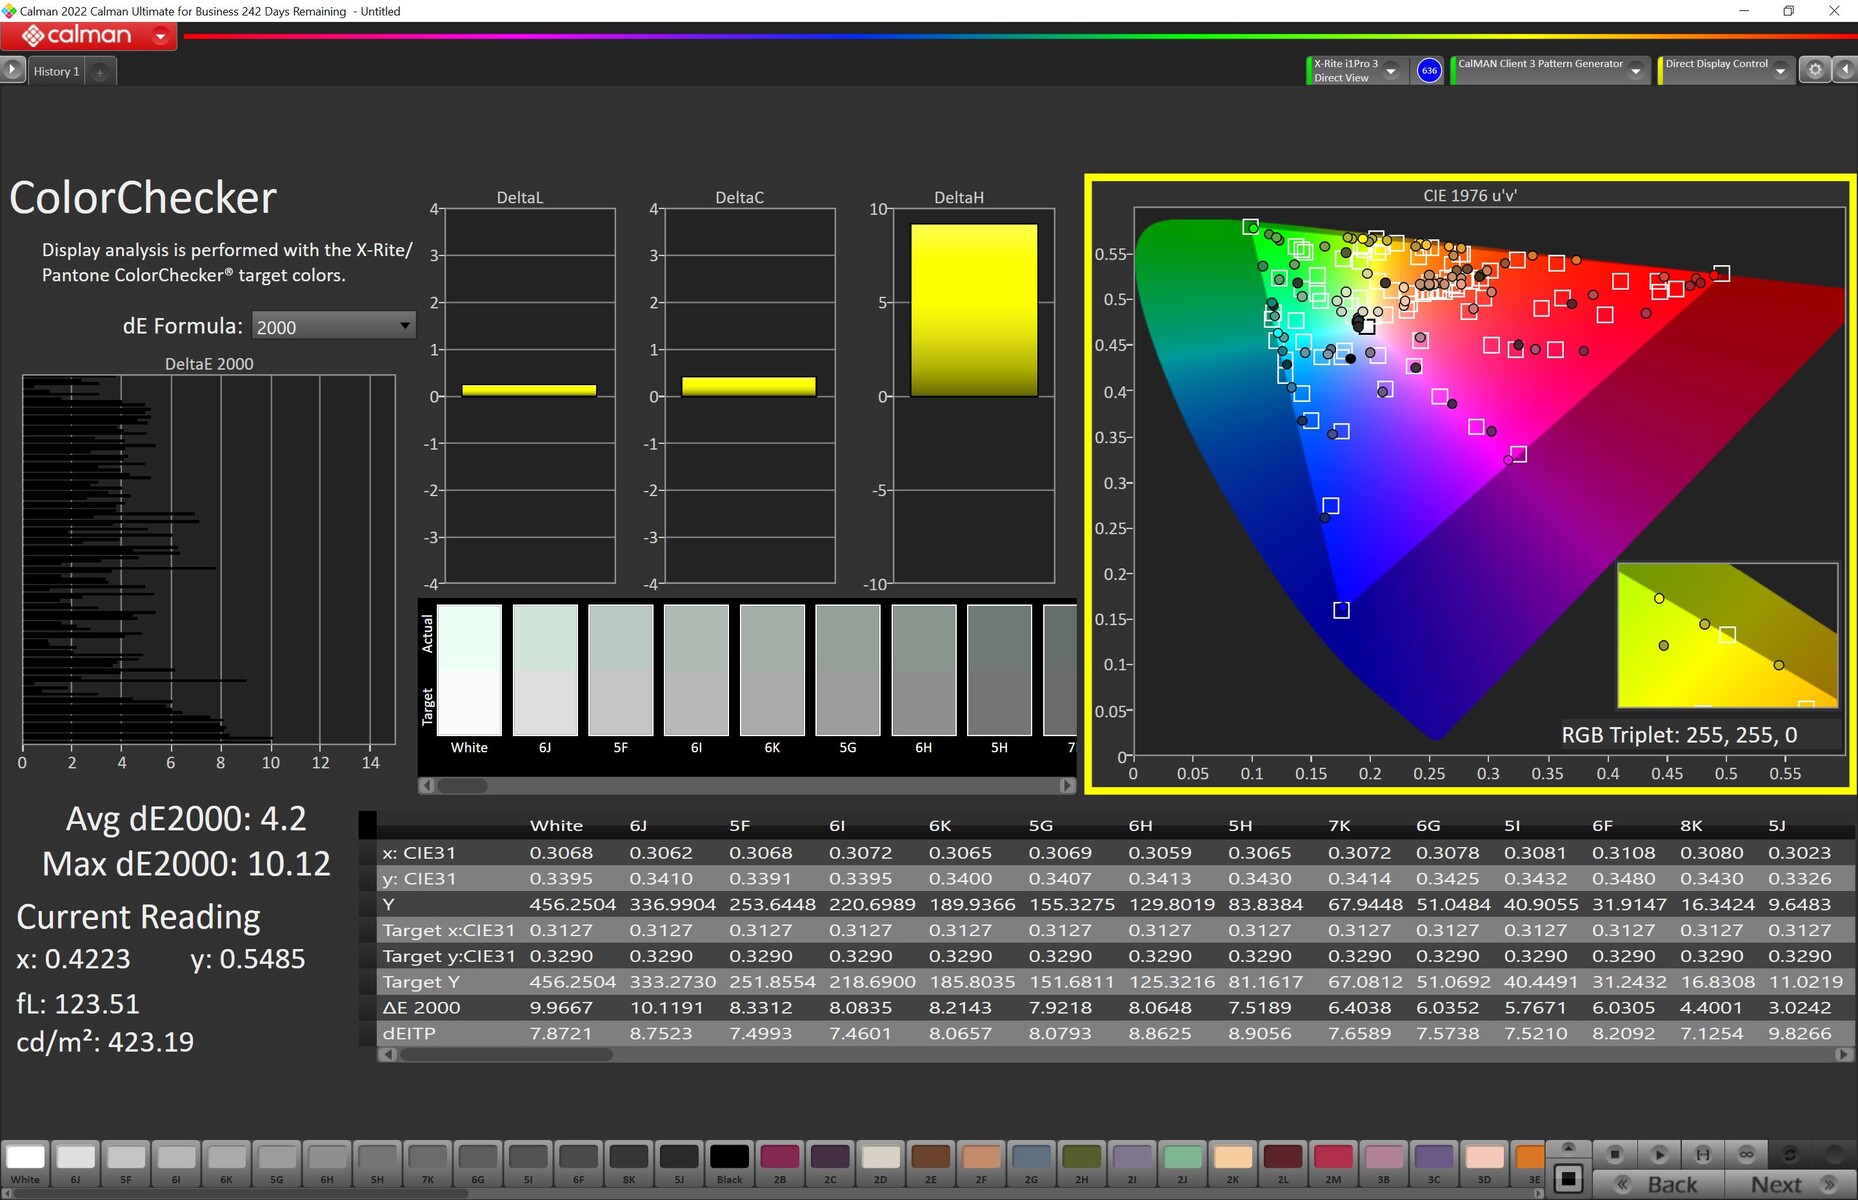
ΔE ColorChecker Calman: 4.97 | ∀{0.5-29.43 Ø4.73}
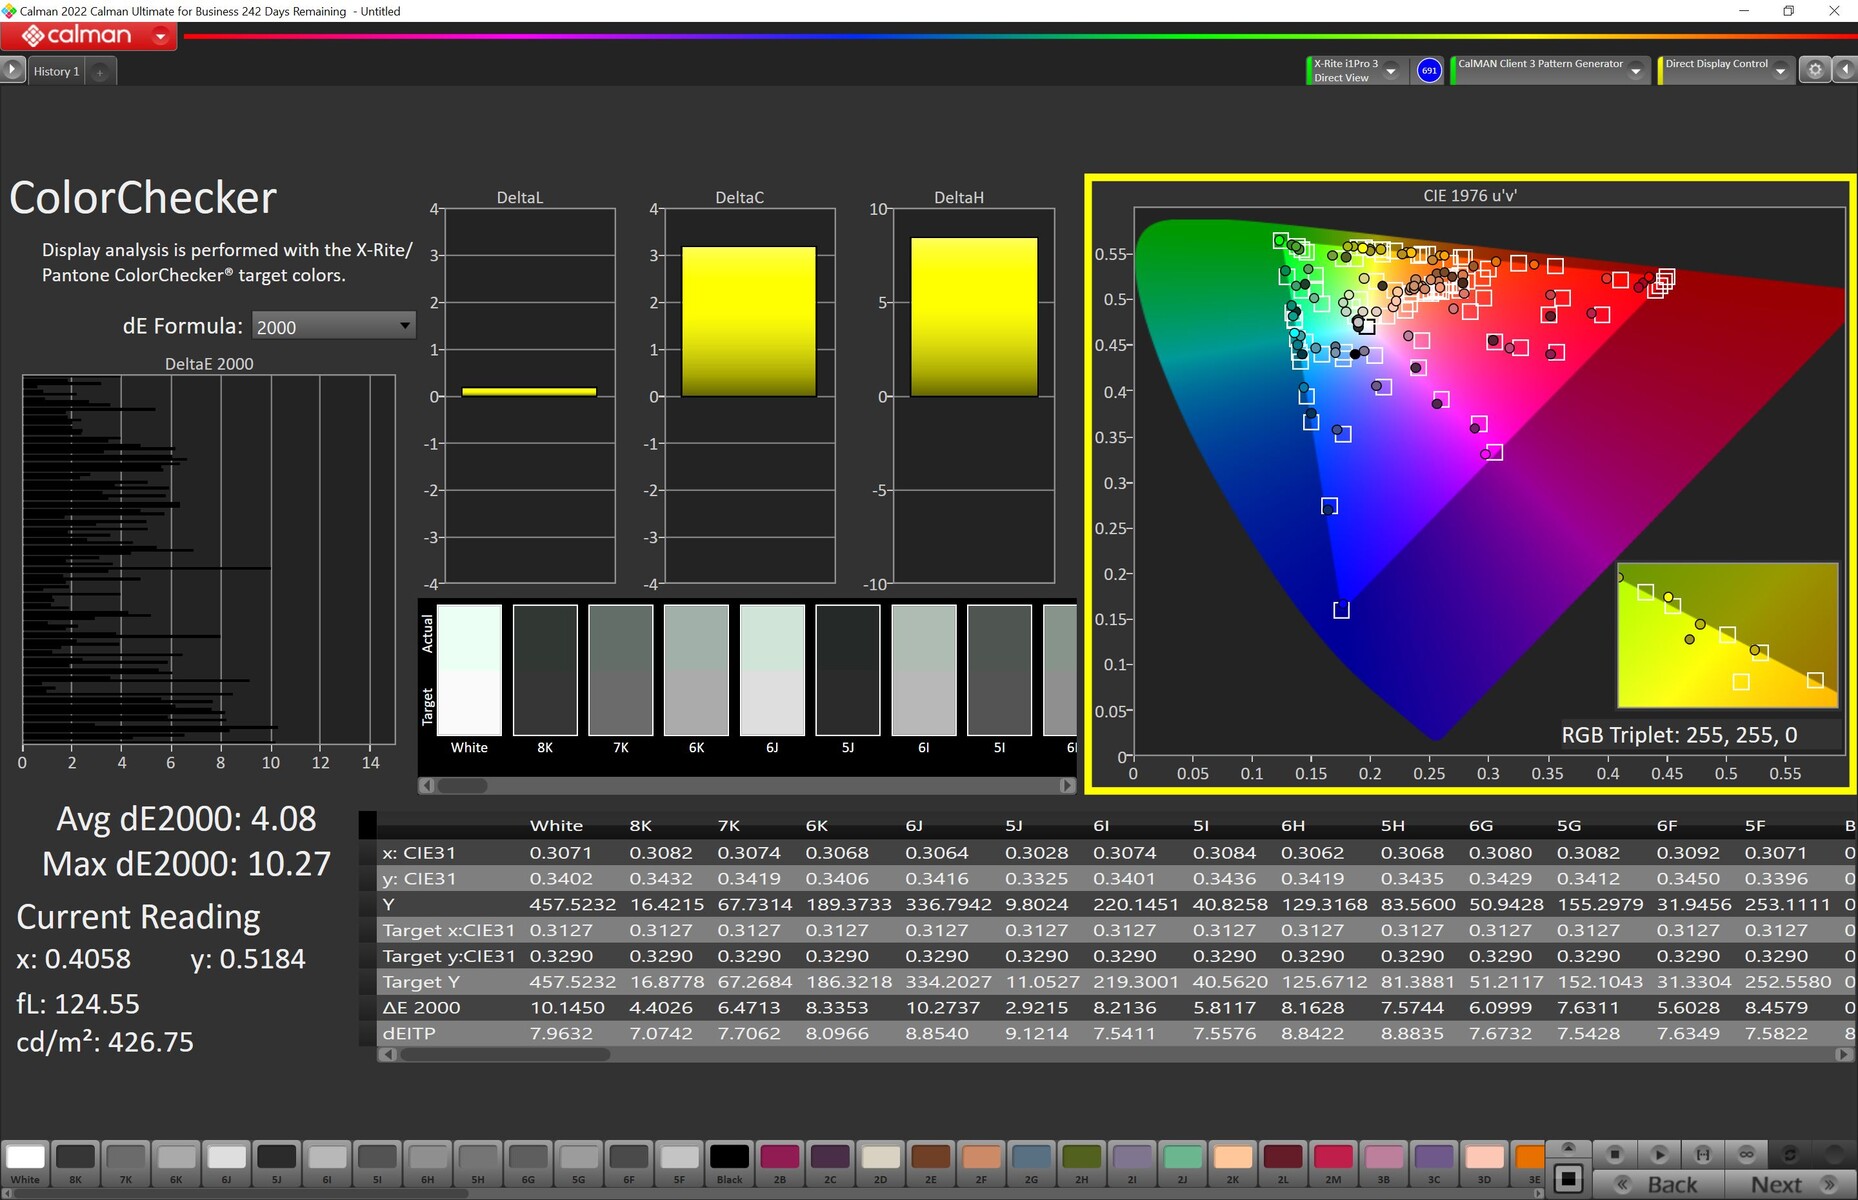
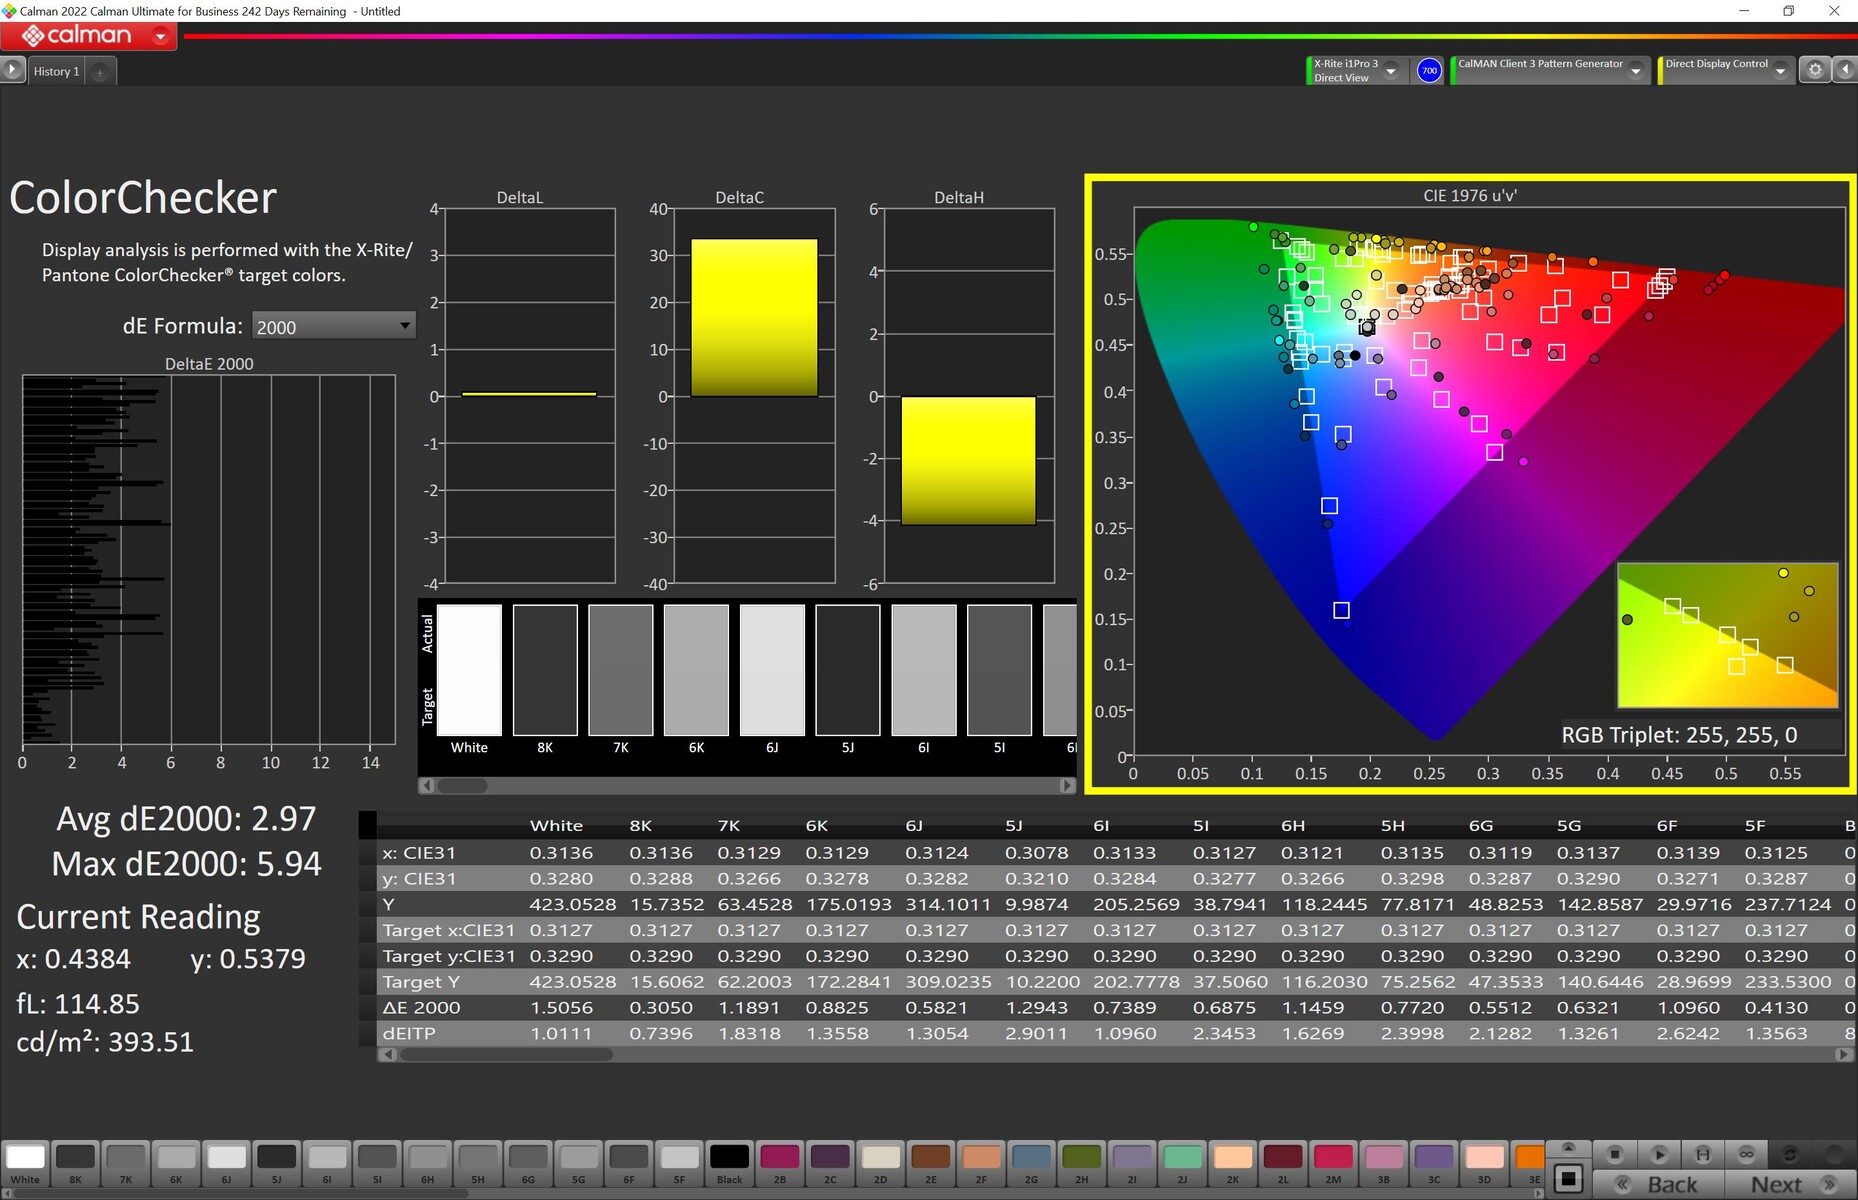
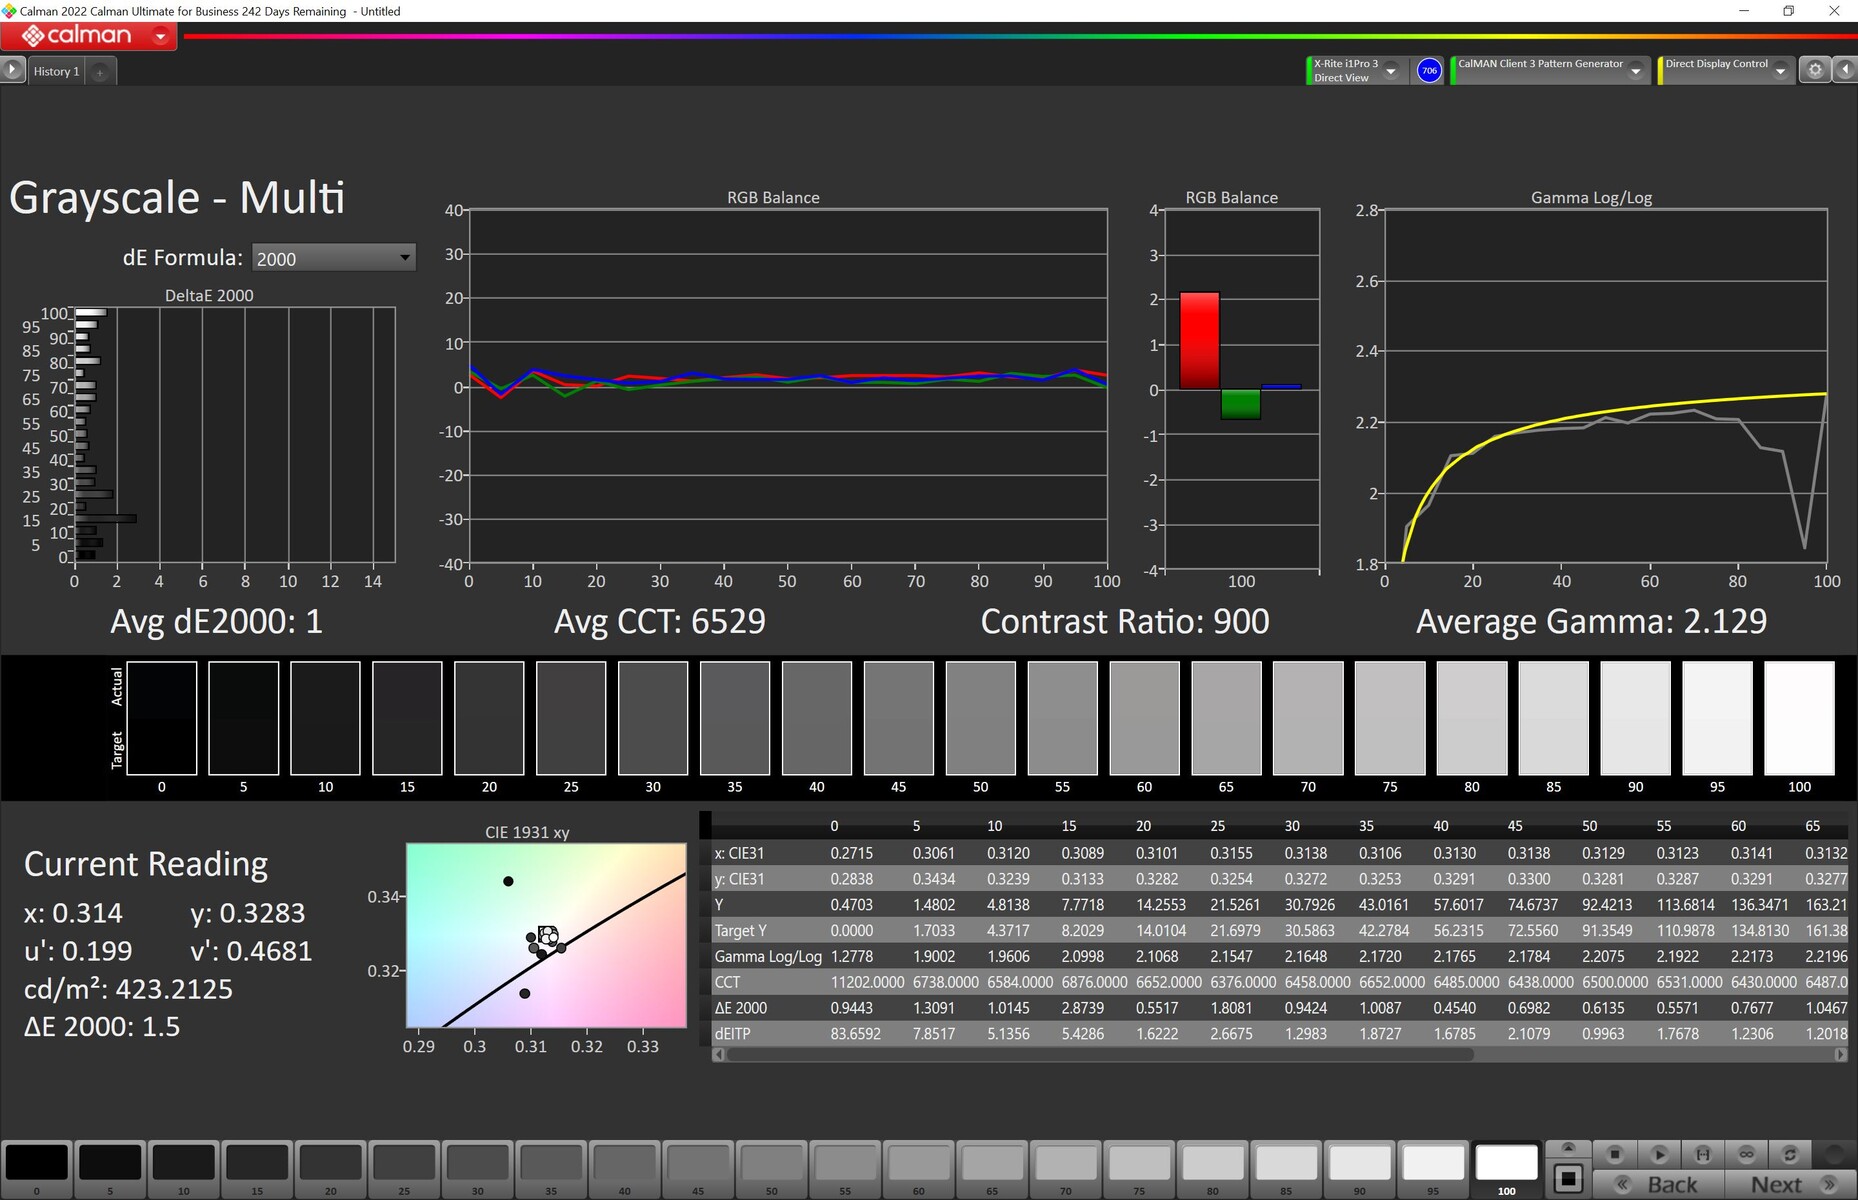
calibrated: 2.97
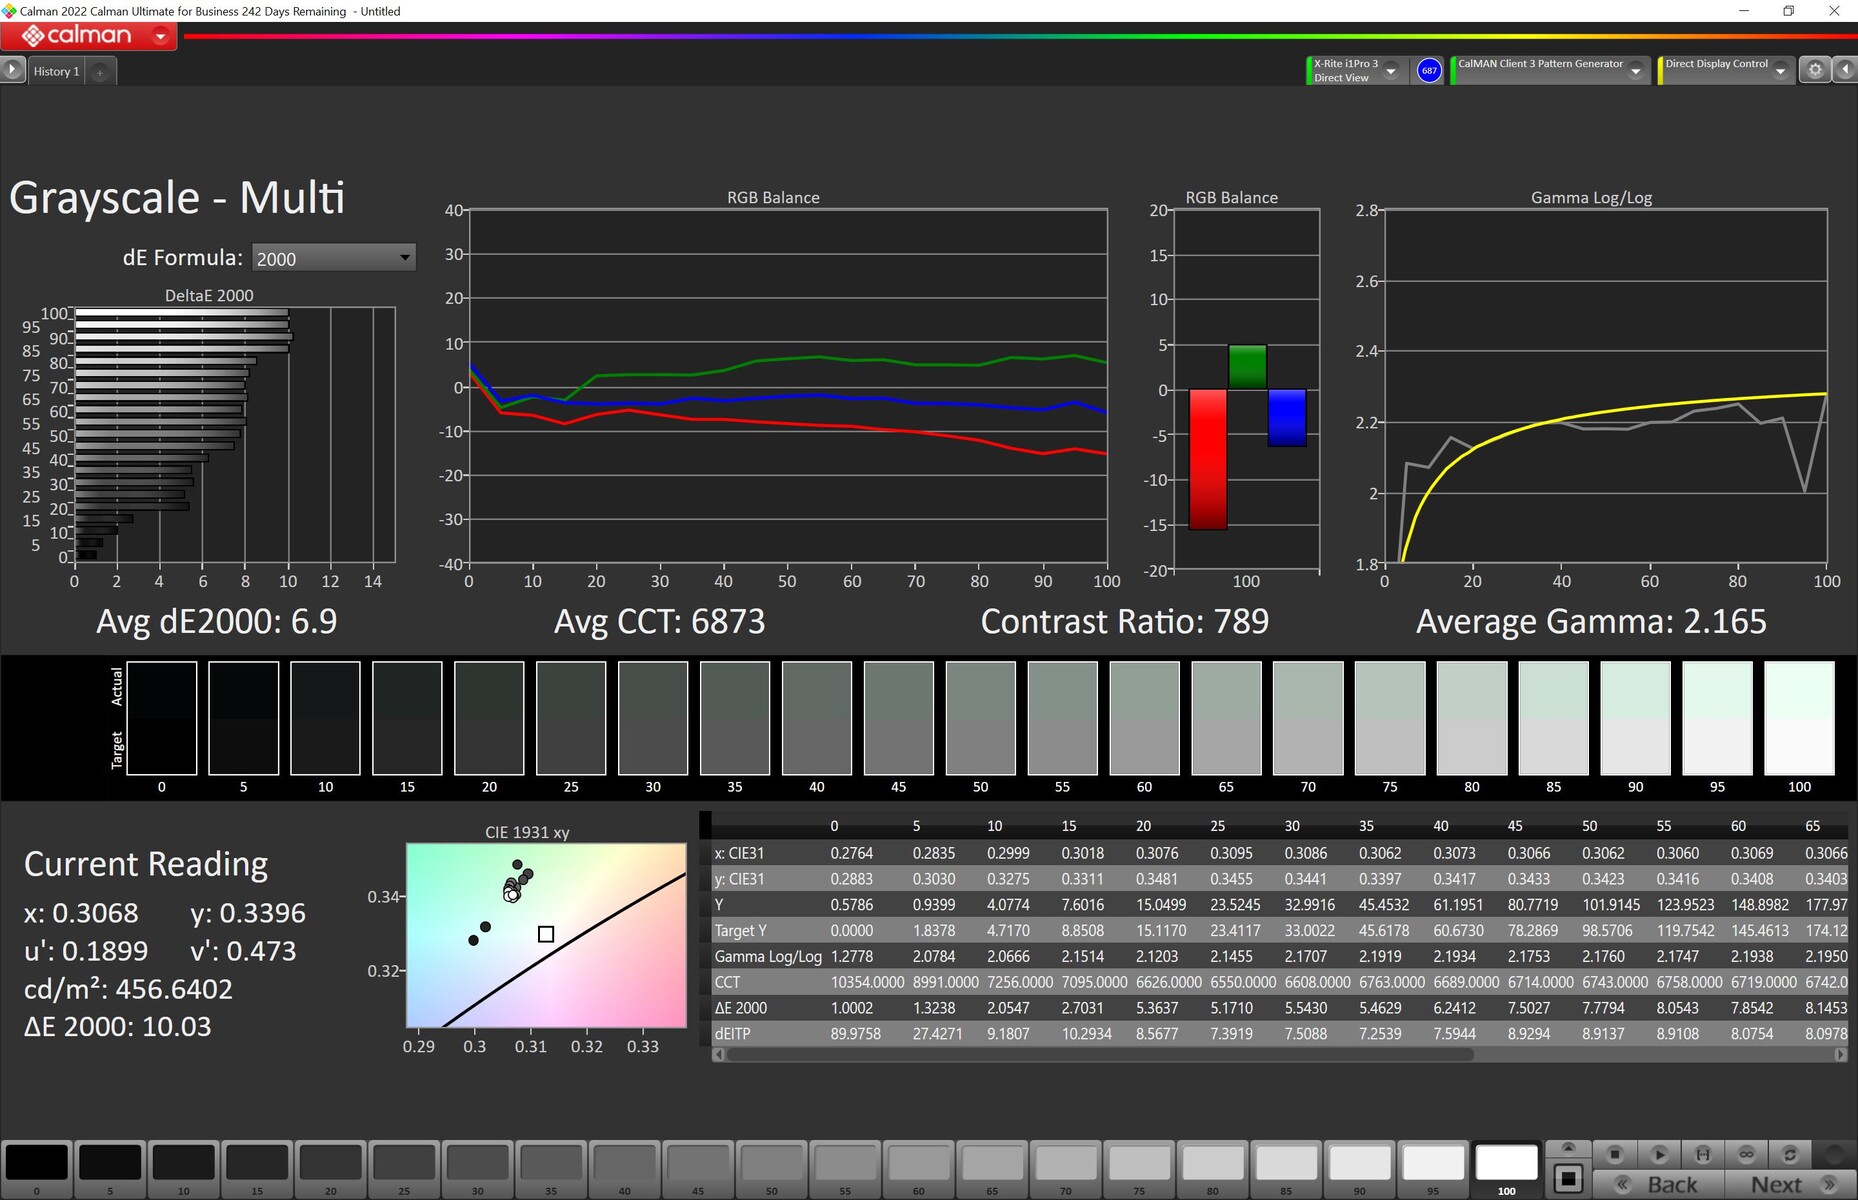
ΔE Greyscale Calman: 7.2 | ∀{0.09-98 Ø4.97}
100% sRGB (Calman 2D)
84.9% AdobeRGB 1998 (Argyll 3D)
99.9% sRGB (Argyll 3D)
97.2% Display P3 (Argyll 3D)
Gamma: 2.161
CCT: 6515 K
| Asus ROG Strix Scar 18 2023 G834JY-N6005W NE180QDM-NZ2, IPS, 2560x1600, 18" | Razer Blade 18 RTX 4070 AU Optronics B180QAN01.0, IPS, 2560x1600, 18" | MSI Titan GT77 HX 13VI B173ZAN06.C, Mini-LED, 3840x2160, 17.3" | Asus ROG Strix Scar 17 SE G733CX-LL014W NE173QHM-NZ2, IPS, 2560x1440, 17.3" | |
|---|---|---|---|---|
| Display | 0% | 2% | 0% | |
| Display P3 Coverage (%) | 97.2 | 96.9 0% | 94.9 -2% | 97.1 0% |
| sRGB Coverage (%) | 99.9 | 99.8 0% | 99.9 0% | 99.9 0% |
| AdobeRGB 1998 Coverage (%) | 84.9 | 85.3 0% | 92.4 9% | 84.8 0% |
| Response Times | 15% | -410% | -11% | |
| Response Time Grey 50% / Grey 80% * (ms) | 5.41 ? | 4.2 ? 22% | 38.4 ? -610% | 5.7 ? -5% |
| Response Time Black / White * (ms) | 8.62 ? | 8 ? 7% | 26.6 ? -209% | 10.1 ? -17% |
| PWM Frequency (Hz) | 2380 ? | |||
| Screen | 22% | 74253% | 29% | |
| Brightness middle (cd/m²) | 490 | 549.6 12% | 606 24% | 320 -35% |
| Brightness (cd/m²) | 468 | 524 12% | 602 29% | 303 -35% |
| Brightness Distribution (%) | 86 | 89 3% | 93 8% | 87 1% |
| Black Level * (cd/m²) | 0.54 | 0.53 2% | 0.0001 100% | 0.3 44% |
| Contrast (:1) | 907 | 1037 14% | 6060000 668037% | 1067 18% |
| Colorchecker dE 2000 * | 4.97 | 3.32 33% | 4.8 3% | 1.1 78% |
| Colorchecker dE 2000 max. * | 11.02 | 6.63 40% | 8.2 26% | 2.7 75% |
| Colorchecker dE 2000 calibrated * | 2.97 | 2.7 9% | 1.8 39% | |
| Greyscale dE 2000 * | 7.2 | 2 72% | 6.5 10% | 1.1 85% |
| Gamma | 2.161 102% | 2.29 96% | 2.63 84% | 2.13 103% |
| CCT | 6515 100% | 6319 103% | 6596 99% | 6599 98% |
| Całkowita średnia (program / ustawienia) | 12% /
16% | 24615% /
47676% | 6% /
16% |
* ... im mniej tym lepiej
Zmierzona przestrzeń barw pokrywa przestrzeń barw Display-P3 w 97% i dlatego nadaje się również do wymagających zadań (po kalibracji). Jeśli chodzi o dokładność kolorów, wynik zależy od zastosowanego presetu. W narzędziu Armory Crate Asus oferuje cztery różne tryby pod GameVisual: Native, sRGB, DCI-P3 i Display P3. W trybie Native wyświetlacz naszego testowego egzemplarza miał łatwo zauważalny i mierzalny niebieski odcień, który objawił się także wartością ΔE wynoszącą prawie 5. Po kalibracji za pomocą naszego i1Pro 3 uzyskaliśmy znacznie lepszy wynik - szczególnie również w skrajnych wartościach. Po kalibracji wyświetlacz nadaje się również do obróbki zdjęć.


W zastosowanym tu panelu NE180QDM-NZ2 jasność wyświetlacza nie jest sterowana poprzez PWM, a przy pomocy naszego urządzenia pomiarowego nie zauważyliśmy żadnego migotania (na wszystkich poziomach jasności). Udało nam się potwierdzić obiecany czas reakcji 3 ms podczas zmian szarości. Aby to osiągnąć, Asus stosuje minimalne przesterowanie, ale nie zauważyliśmy żadnych negatywnych efektów. W połączeniu z częstotliwością odświeżania 240 Hz, wyświetlacz jest więc idealny do gier.
Wyświetl czasy reakcji
| ↔ Czas reakcji od czerni do bieli | ||
|---|---|---|
| 8.62 ms ... wzrost ↗ i spadek ↘ łącznie | ↗ 3.68 ms wzrost | 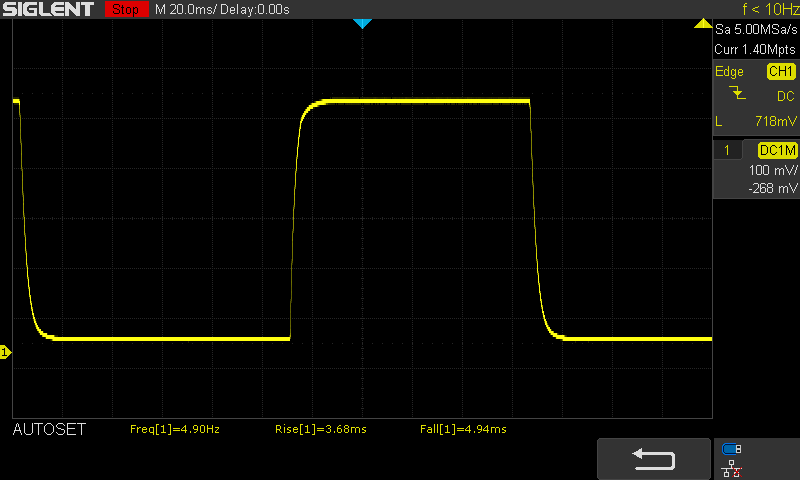 |
| ↘ 4.94 ms upadek | ||
| W naszych testach ekran wykazuje szybki czas reakcji i powinien nadawać się do gier. Dla porównania, wszystkie testowane urządzenia wahają się od 0.1 (minimum) do 240 (maksimum) ms. » 24 % wszystkich urządzeń jest lepszych. Oznacza to, że zmierzony czas reakcji jest lepszy od średniej wszystkich testowanych urządzeń (19.9 ms). | ||
| ↔ Czas reakcji 50% szarości do 80% szarości | ||
| 5.41 ms ... wzrost ↗ i spadek ↘ łącznie | ↗ 2.57 ms wzrost | 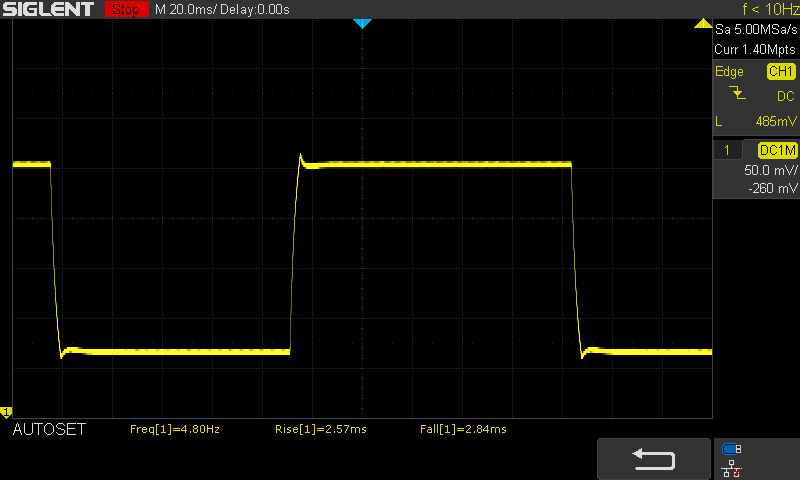 |
| ↘ 2.84 ms upadek | ||
| W naszych testach ekran wykazuje bardzo szybką reakcję i powinien bardzo dobrze nadawać się do szybkich gier. Dla porównania, wszystkie testowane urządzenia wahają się od 0.165 (minimum) do 636 (maksimum) ms. » 18 % wszystkich urządzeń jest lepszych. Oznacza to, że zmierzony czas reakcji jest lepszy od średniej wszystkich testowanych urządzeń (31.1 ms). | ||
Migotanie ekranu / PWM (modulacja szerokości impulsu)
| Migotanie ekranu/nie wykryto PWM | 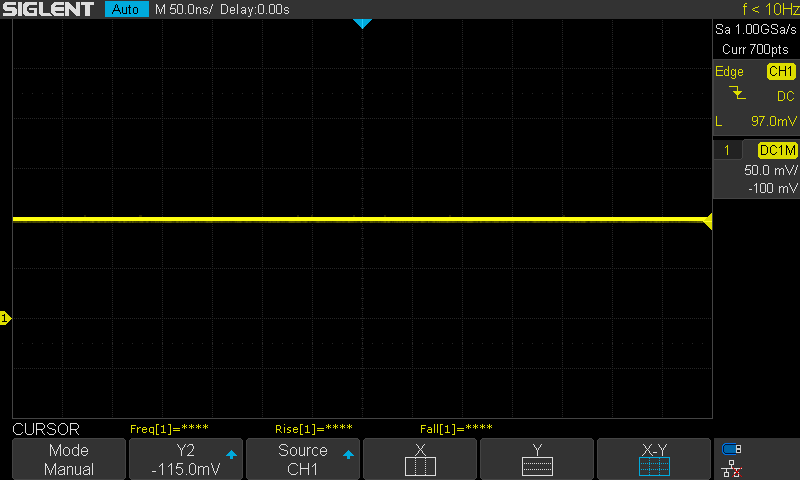 | ||
Dla porównania: 52 % wszystkich testowanych urządzeń nie używa PWM do przyciemniania wyświetlacza. Jeśli wykryto PWM, zmierzono średnio 7794 (minimum: 5 - maksimum: 343500) Hz. | |||
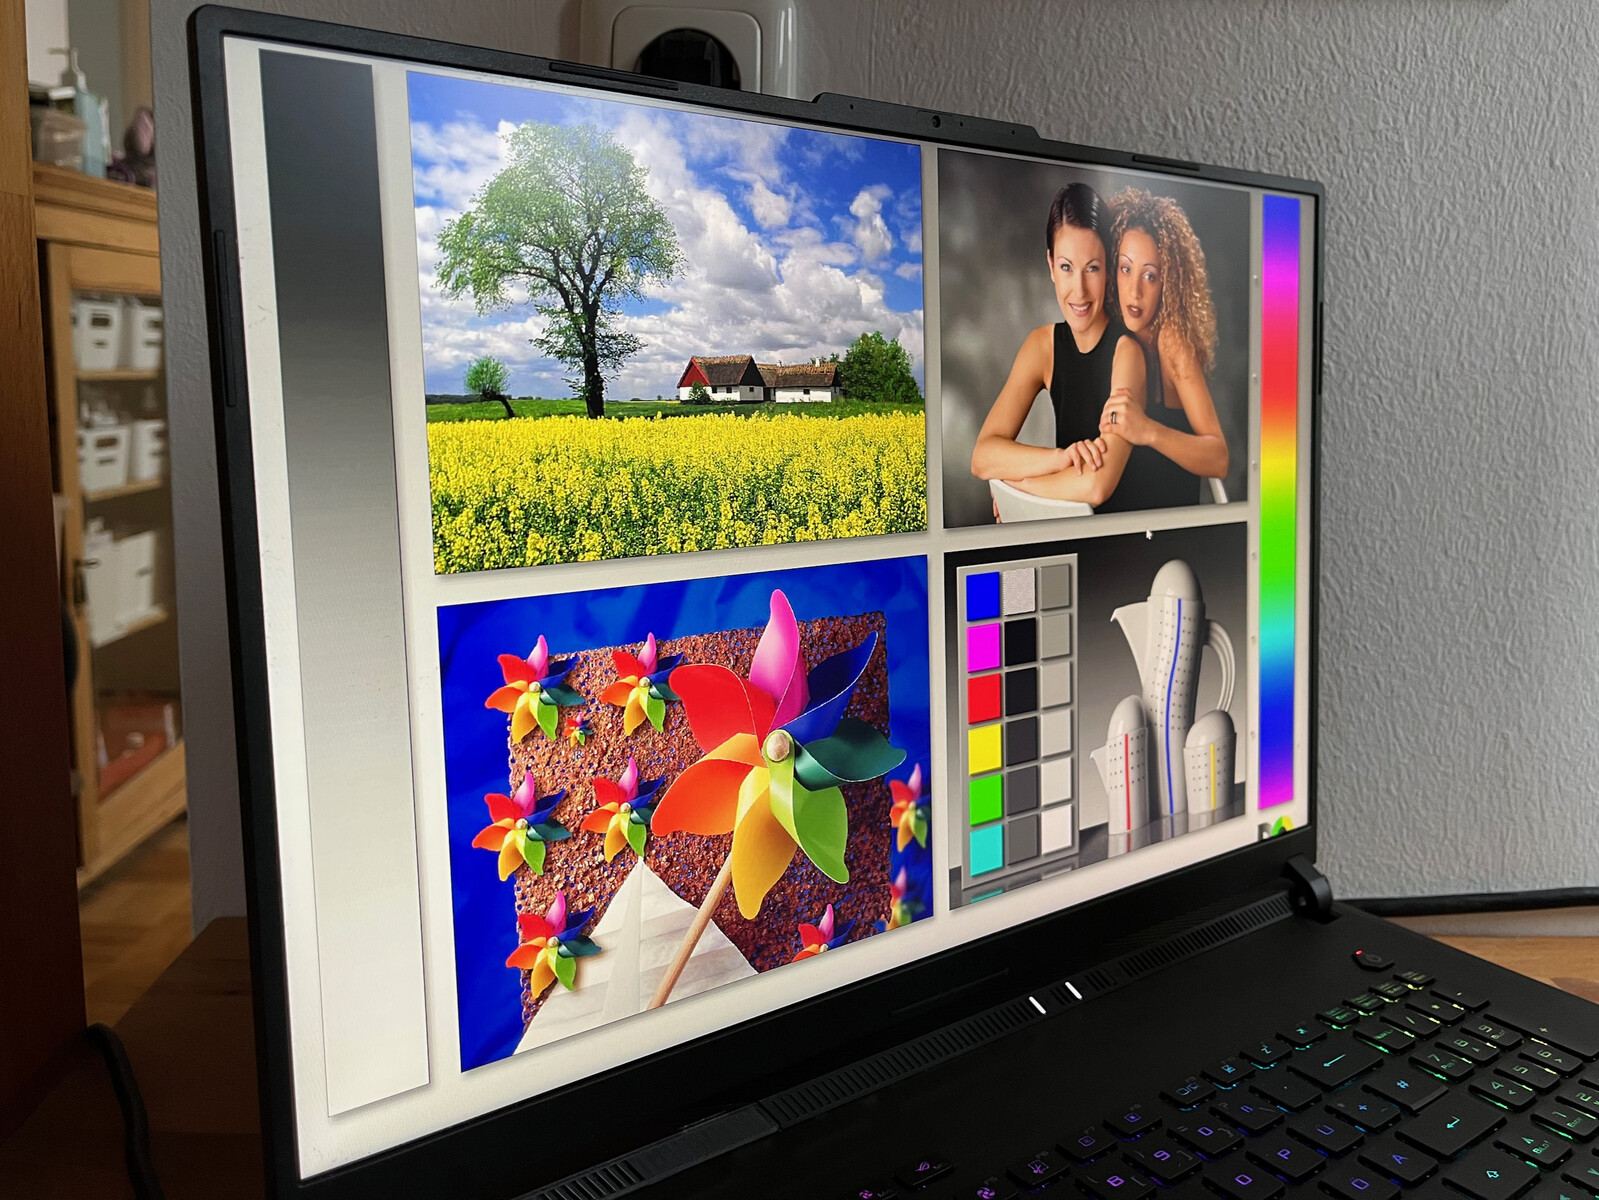
Dzięki matowej powierzchni wyświetlacza i dobrej jasności maksymalnej, ROG Strix Scar 18 można teoretycznie bez problemu używać także na zewnątrz. Wprawdzie prawie 500 nitów to za mało na jaskrawe letnie słońce, ale w cieniu czy wieczornym słońcu, jak na naszym zdjęciu, jest całkiem wystarczające.
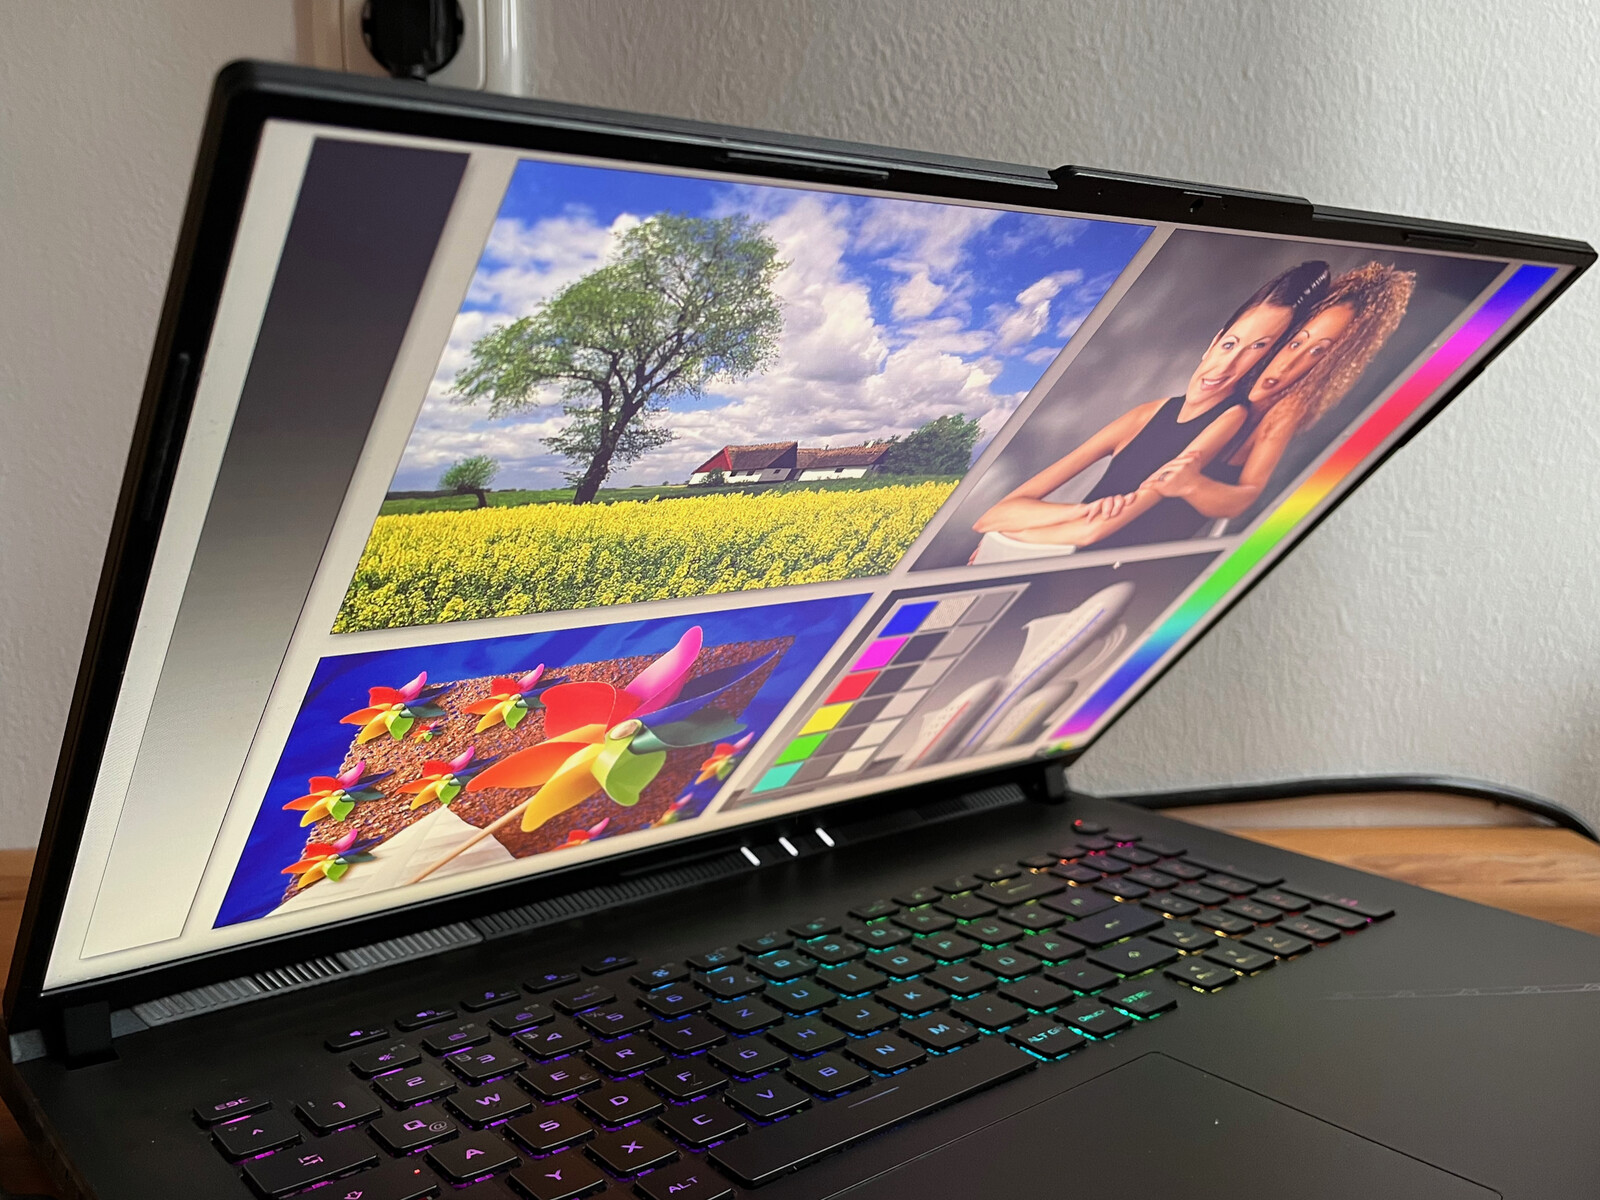
Dzięki panelowi na poziomie IPS kąty widzenia są znakomite. Utrata jasności przy stromych kątach widzenia pozostaje w granicach, a zniekształcenia kolorów nie są subiektywnie zauważalne.

Wydajność
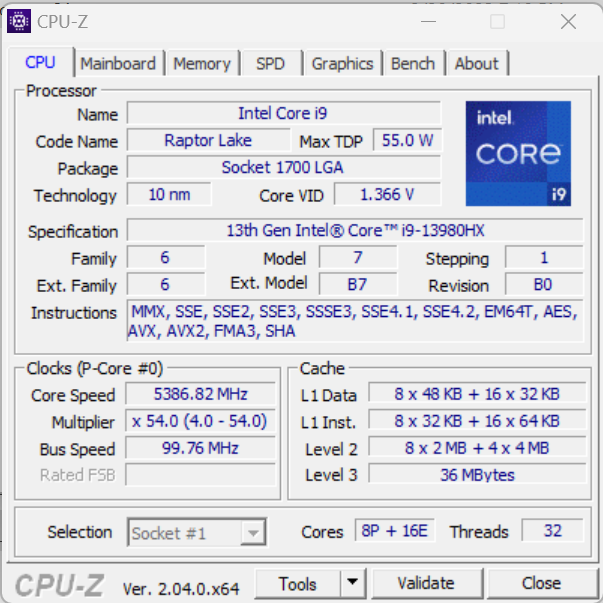
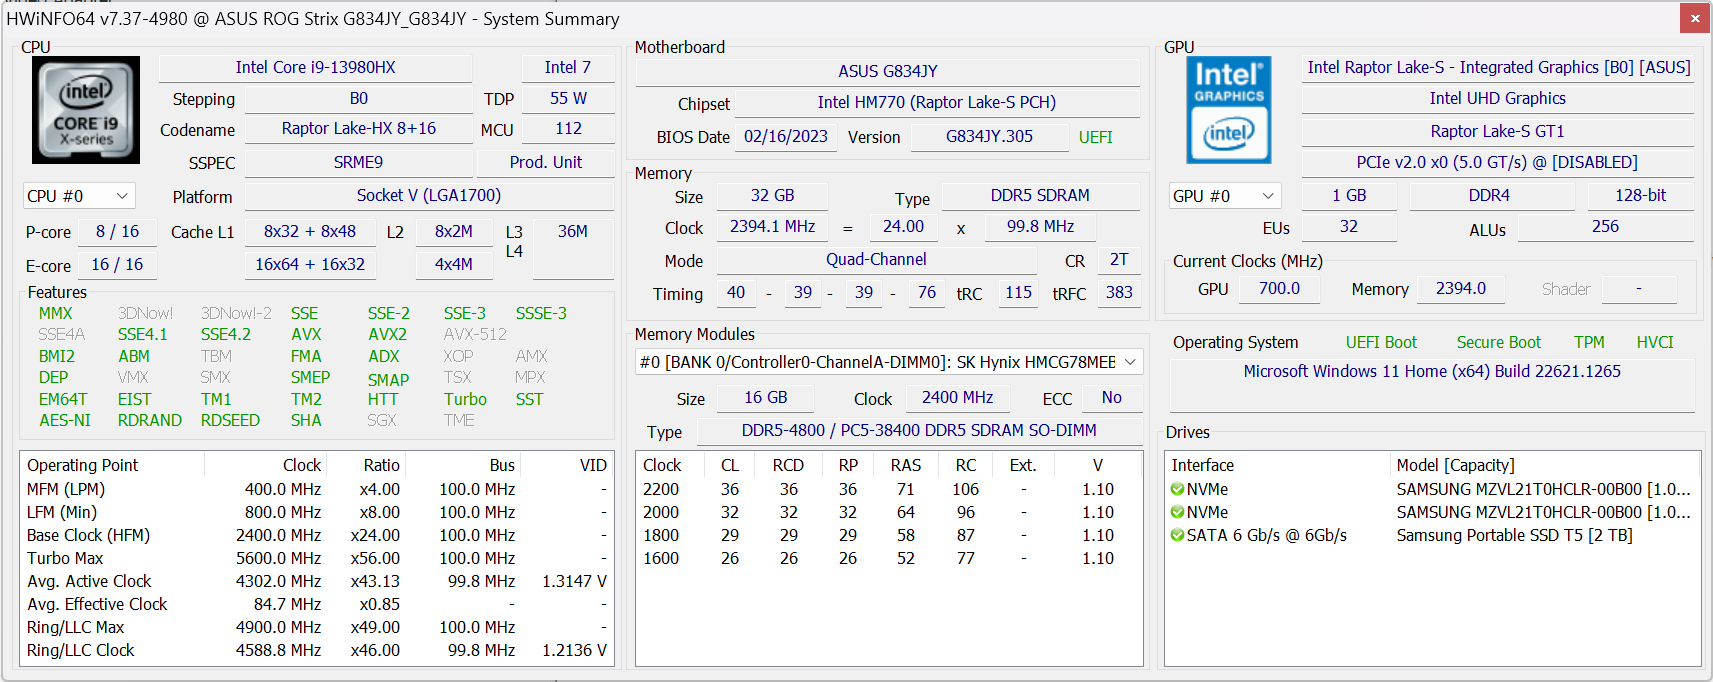
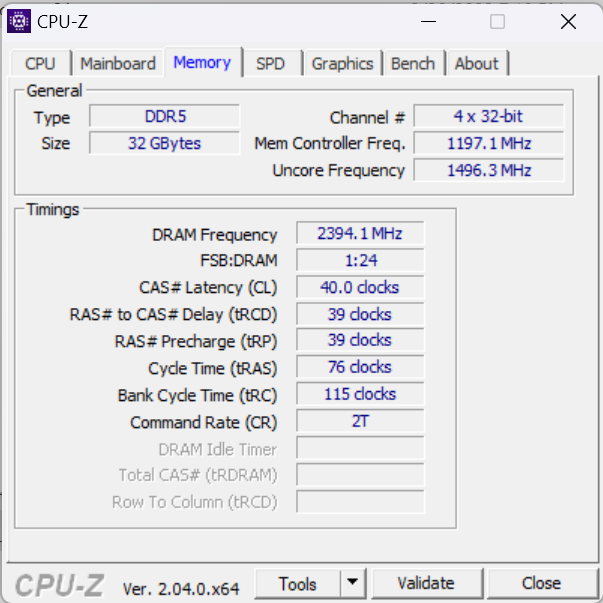
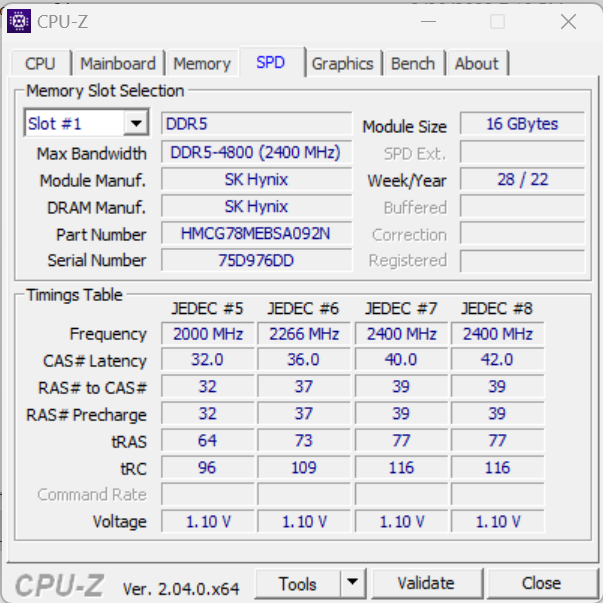
Nasz testowy egzemplarz Scar 18 jest w stanie uzyskać kilkukrotny wynik w pomiarach wydajności. Asus zastosował najszybszą obecnie mobilną kartę graficzną, GeForce RTX 4090, umożliwiając również maksymalny pobór mocy na poziomie 175 W. Asus nie poszedł na skróty również w przypadku procesora, stosując mobilny topowy model od Intela. Na stronieIntel Core i9-13980HXbazuje na nowej serii Raptor Lake, oferując 24 rdzenie i maksymalne podbicie do niebagatelnych 5,6 GHz. Ilość pamięci operacyjnej również jest spora, dzięki 32 GB pamięci RAM DDR5. Jednak przy 4800 MB/s prędkość zapisu jest nieco niższa niż w niektórych modelach konkurencji. I wreszcie są też dwa 1-TB dyski SSD w systemie RAID-0.
Warunki badania
Testy wydajności przeprowadziliśmy w trybie Turbo i trybie Ultimate GPU. Korzystając z niego, połączenie RTX 4090 jest ustalone przez MUX i podkręcone minimalnie o 50 MHz. Oprócz tego przetestowaliśmy również tryb Performance (domyślny w stanie dostawy) oraz tryb Standard GPU (przełączanie MSHybrid Optimus).
Procesor
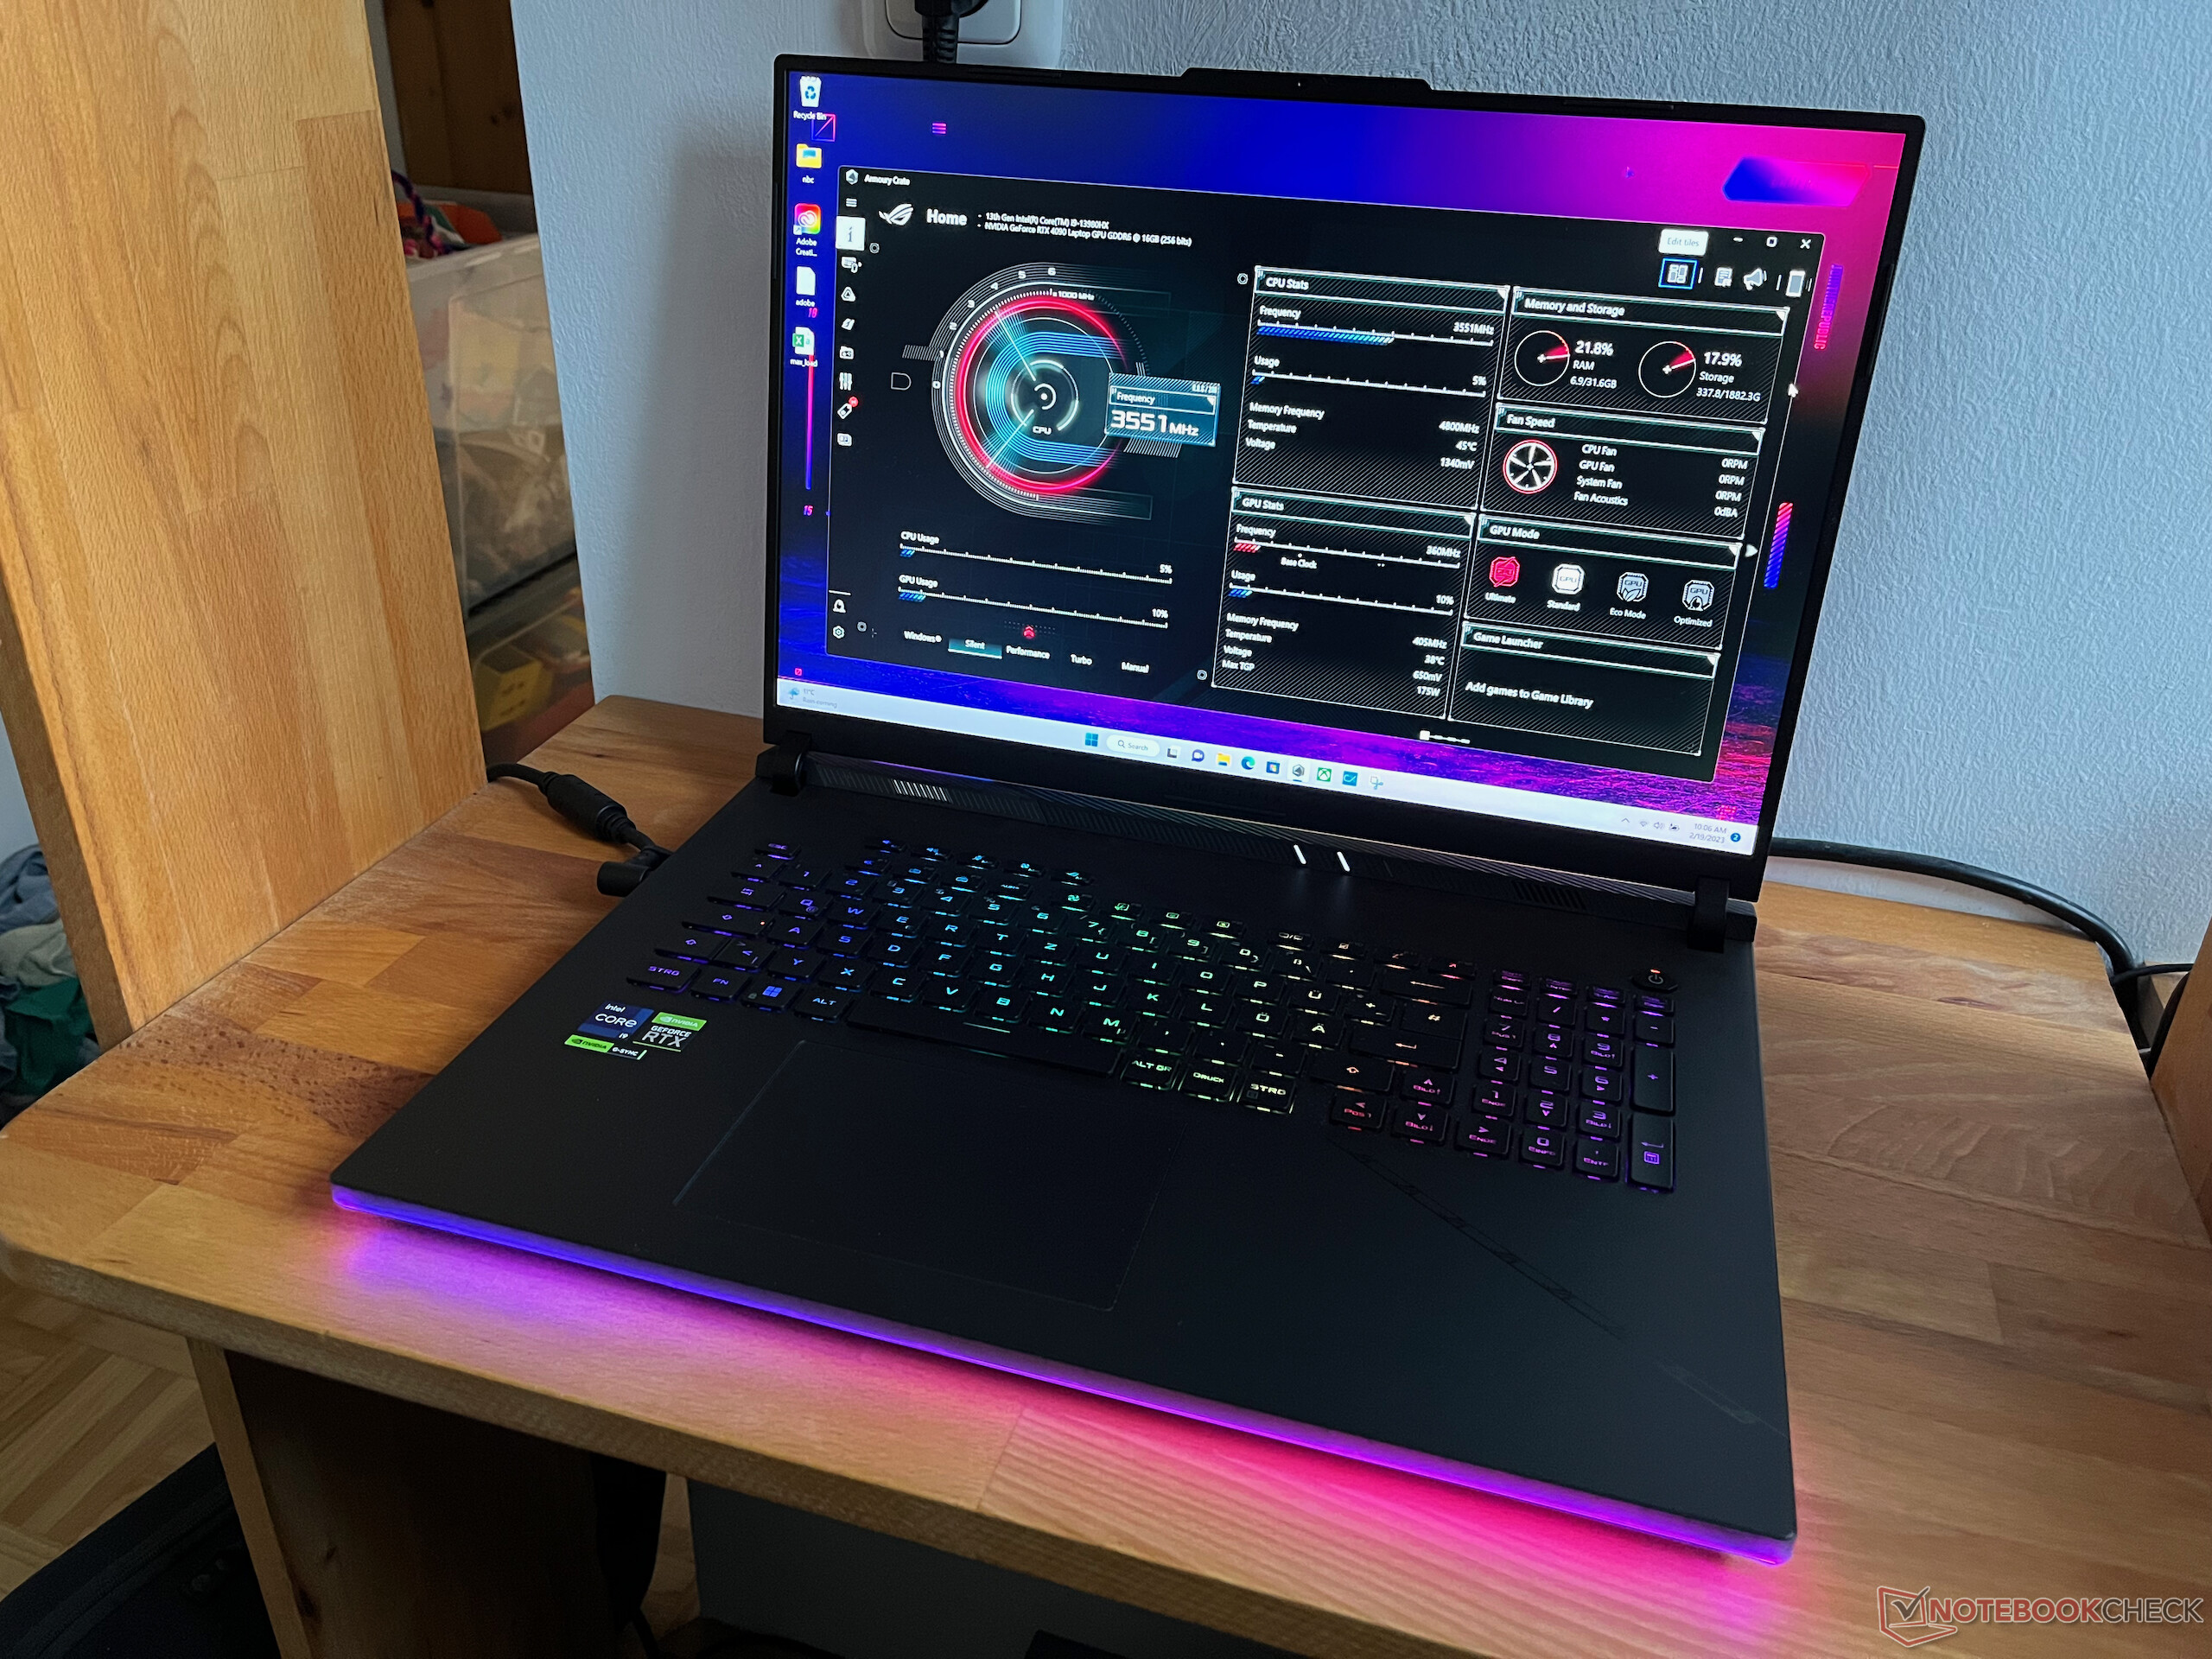
Na stronie .Intel Core i9-13980HX to aktualnie topowy model od Intela przeznaczony do laptopów. Bazuje on na nowej serii Raptor Lake i jest technicznie porównywalny z m.in Core i9-13900K - procesorem do komputerów stacjonarnych. Procesor zawiera 8 rdzeni Raptor Cove Performance z Hyper-Threading i taktowaniem do 5,6 GHz. Mniejsze rdzenie Gracemont Efficiency nie oferują Hyper-Threading i mają prędkość zegara do 4 GHz. W sumie procesor może korzystać z 32 MB pamięci podręcznej 2 poziomu i jest określony przez Intela na 157 W (PL2) i 55 W (PL1) TDP. Asus podaje, że procesor pracuje z mocą 65 W (PL1), ale wartości PL1 i PL2 w HWInfo64 wskazują na 175 W. W benchmarkach procesor zaczyna od 175 W, a następnie w 96°C (205°F) osiąga limit termiczny, po którym TDP zostaje obniżone do 135 W. W trybie Silent TDP jest obniżane do 100W / 65W, co prowadzi również do znacznie obniżonej wydajności.
W naszych benchmarkach procesorów, i9-13980HX w ROG Strix 18 jest również w stanie uplasować się ledwo przed procesorami 13900HX i 13950HX konkurencji. Dotyczy to jednak tylko trybu Turbo, a w trybie Performance Strix Scar 18 plasuje się jedynie w środku pola nowych procesorów 13000HX. Ale nawet wtedy wyraźnie ustępuje starszym urządzeniom z procesorami i9-12950HX.
Cinebench R15 Multi Constant Load Test
Cinebench R23: Multi Core | Single Core
Cinebench R20: CPU (Multi Core) | CPU (Single Core)
Cinebench R15: CPU Multi 64Bit | CPU Single 64Bit
Blender: v2.79 BMW27 CPU
7-Zip 18.03: 7z b 4 | 7z b 4 -mmt1
Geekbench 5.5: Multi-Core | Single-Core
HWBOT x265 Benchmark v2.2: 4k Preset
LibreOffice : 20 Documents To PDF
R Benchmark 2.5: Overall mean
| CPU Performance rating | |
| Intel Core i9-13900K @253W | |
| Intel NUC13 Raptor Canyon | |
| Asus ROG Strix Scar 18 2023 G834JY-N6005W | |
| MSI Titan GT77 HX 13VI | |
| Lenovo Legion Pro 7 16IRX8H | |
| Przeciętny Intel Core i9-13980HX | |
| Razer Blade 18 RTX 4070 | |
| Schenker XMG Neo 16 Raptor Lake | |
| Asus ROG Strix Scar 18 2023 G834JY-N6005W | |
| Razer Blade 16 Early 2023 | |
| Średnia w klasie Gaming | |
| MSI Raider GE77 HX 12UHS | |
| Asus ROG Strix Scar 17 SE G733CX-LL014W | |
| Dell Precision 7000 7670 Performance | |
| Cinebench R23 / Multi Core | |
| Intel Core i9-13900K @253W | |
| MSI Titan GT77 HX 13VI | |
| Intel NUC13 Raptor Canyon | |
| Asus ROG Strix Scar 18 2023 G834JY-N6005W | |
| Przeciętny Intel Core i9-13980HX (28301 - 33052, n=11) | |
| Lenovo Legion Pro 7 16IRX8H | |
| Schenker XMG Neo 16 Raptor Lake | |
| Schenker XMG Neo 16 Raptor Lake | |
| Schenker XMG Neo 16 Raptor Lake | |
| Razer Blade 18 RTX 4070 | |
| Asus ROG Strix Scar 18 2023 G834JY-N6005W | |
| Razer Blade 16 Early 2023 | |
| Średnia w klasie Gaming (10488 - 40970, n=112, ostatnie 2 lata) | |
| MSI Raider GE77 HX 12UHS | |
| Asus ROG Strix Scar 17 SE G733CX-LL014W | |
| Dell Precision 7000 7670 Performance | |
| Cinebench R23 / Single Core | |
| Intel Core i9-13900K @253W | |
| Intel NUC13 Raptor Canyon | |
| Asus ROG Strix Scar 18 2023 G834JY-N6005W | |
| MSI Titan GT77 HX 13VI | |
| Asus ROG Strix Scar 18 2023 G834JY-N6005W | |
| Przeciętny Intel Core i9-13980HX (1825 - 2169, n=9) | |
| Razer Blade 18 RTX 4070 | |
| Schenker XMG Neo 16 Raptor Lake | |
| Lenovo Legion Pro 7 16IRX8H | |
| Razer Blade 16 Early 2023 | |
| Średnia w klasie Gaming (1166 - 2356, n=112, ostatnie 2 lata) | |
| MSI Raider GE77 HX 12UHS | |
| Asus ROG Strix Scar 17 SE G733CX-LL014W | |
| Dell Precision 7000 7670 Performance | |
| Cinebench R20 / CPU (Multi Core) | |
| Intel Core i9-13900K @253W | |
| Intel NUC13 Raptor Canyon | |
| MSI Titan GT77 HX 13VI | |
| Asus ROG Strix Scar 18 2023 G834JY-N6005W | |
| Przeciętny Intel Core i9-13980HX (10353 - 12437, n=10) | |
| Lenovo Legion Pro 7 16IRX8H | |
| Schenker XMG Neo 16 Raptor Lake | |
| Razer Blade 18 RTX 4070 | |
| Asus ROG Strix Scar 18 2023 G834JY-N6005W | |
| Średnia w klasie Gaming (4029 - 16108, n=111, ostatnie 2 lata) | |
| MSI Raider GE77 HX 12UHS | |
| Razer Blade 16 Early 2023 | |
| Asus ROG Strix Scar 17 SE G733CX-LL014W | |
| Dell Precision 7000 7670 Performance | |
| Cinebench R20 / CPU (Single Core) | |
| Intel Core i9-13900K @253W | |
| Intel NUC13 Raptor Canyon | |
| Asus ROG Strix Scar 18 2023 G834JY-N6005W | |
| MSI Titan GT77 HX 13VI | |
| Asus ROG Strix Scar 18 2023 G834JY-N6005W | |
| Razer Blade 18 RTX 4070 | |
| Przeciętny Intel Core i9-13980HX (717 - 825, n=10) | |
| Lenovo Legion Pro 7 16IRX8H | |
| Średnia w klasie Gaming (442 - 895, n=111, ostatnie 2 lata) | |
| Schenker XMG Neo 16 Raptor Lake | |
| MSI Raider GE77 HX 12UHS | |
| Razer Blade 16 Early 2023 | |
| Asus ROG Strix Scar 17 SE G733CX-LL014W | |
| Dell Precision 7000 7670 Performance | |
| Cinebench R15 / CPU Multi 64Bit | |
| Intel Core i9-13900K @253W | |
| Intel NUC13 Raptor Canyon | |
| MSI Titan GT77 HX 13VI | |
| Schenker XMG Neo 16 Raptor Lake | |
| Schenker XMG Neo 16 Raptor Lake | |
| Lenovo Legion Pro 7 16IRX8H | |
| Asus ROG Strix Scar 18 2023 G834JY-N6005W | |
| Przeciętny Intel Core i9-13980HX (4358 - 5172, n=11) | |
| Razer Blade 16 Early 2023 | |
| Razer Blade 18 RTX 4070 | |
| Asus ROG Strix Scar 18 2023 G834JY-N6005W | |
| Średnia w klasie Gaming (1578 - 6271, n=111, ostatnie 2 lata) | |
| MSI Raider GE77 HX 12UHS | |
| Asus ROG Strix Scar 17 SE G733CX-LL014W | |
| Dell Precision 7000 7670 Performance | |
| Cinebench R15 / CPU Single 64Bit | |
| Intel Core i9-13900K @253W | |
| Intel NUC13 Raptor Canyon | |
| Asus ROG Strix Scar 18 2023 G834JY-N6005W | |
| Asus ROG Strix Scar 18 2023 G834JY-N6005W | |
| Przeciętny Intel Core i9-13980HX (289 - 312, n=11) | |
| Lenovo Legion Pro 7 16IRX8H | |
| MSI Titan GT77 HX 13VI | |
| Razer Blade 18 RTX 4070 | |
| Schenker XMG Neo 16 Raptor Lake | |
| Schenker XMG Neo 16 Raptor Lake | |
| Średnia w klasie Gaming (188.8 - 343, n=111, ostatnie 2 lata) | |
| MSI Raider GE77 HX 12UHS | |
| Asus ROG Strix Scar 17 SE G733CX-LL014W | |
| Razer Blade 16 Early 2023 | |
| Dell Precision 7000 7670 Performance | |
| Blender / v2.79 BMW27 CPU | |
| Dell Precision 7000 7670 Performance | |
| Asus ROG Strix Scar 17 SE G733CX-LL014W | |
| Średnia w klasie Gaming (80 - 330, n=109, ostatnie 2 lata) | |
| MSI Raider GE77 HX 12UHS | |
| Razer Blade 16 Early 2023 | |
| Asus ROG Strix Scar 18 2023 G834JY-N6005W | |
| Schenker XMG Neo 16 Raptor Lake | |
| Razer Blade 18 RTX 4070 | |
| Przeciętny Intel Core i9-13980HX (97 - 136, n=10) | |
| Lenovo Legion Pro 7 16IRX8H | |
| Asus ROG Strix Scar 18 2023 G834JY-N6005W | |
| Intel NUC13 Raptor Canyon | |
| MSI Titan GT77 HX 13VI | |
| Intel Core i9-13900K @253W | |
| 7-Zip 18.03 / 7z b 4 | |
| Intel Core i9-13900K @253W | |
| MSI Titan GT77 HX 13VI | |
| Intel NUC13 Raptor Canyon | |
| Asus ROG Strix Scar 18 2023 G834JY-N6005W | |
| Lenovo Legion Pro 7 16IRX8H | |
| Schenker XMG Neo 16 Raptor Lake | |
| Przeciętny Intel Core i9-13980HX (104616 - 129804, n=10) | |
| Razer Blade 18 RTX 4070 | |
| Asus ROG Strix Scar 18 2023 G834JY-N6005W | |
| Razer Blade 16 Early 2023 | |
| Średnia w klasie Gaming (33491 - 148086, n=110, ostatnie 2 lata) | |
| MSI Raider GE77 HX 12UHS | |
| Asus ROG Strix Scar 17 SE G733CX-LL014W | |
| Dell Precision 7000 7670 Performance | |
| 7-Zip 18.03 / 7z b 4 -mmt1 | |
| Intel Core i9-13900K @253W | |
| Intel NUC13 Raptor Canyon | |
| Asus ROG Strix Scar 18 2023 G834JY-N6005W | |
| Lenovo Legion Pro 7 16IRX8H | |
| Asus ROG Strix Scar 18 2023 G834JY-N6005W | |
| Przeciętny Intel Core i9-13980HX (6230 - 7163, n=10) | |
| MSI Titan GT77 HX 13VI | |
| Razer Blade 18 RTX 4070 | |
| Schenker XMG Neo 16 Raptor Lake | |
| Razer Blade 16 Early 2023 | |
| Średnia w klasie Gaming (4199 - 7436, n=110, ostatnie 2 lata) | |
| MSI Raider GE77 HX 12UHS | |
| Asus ROG Strix Scar 17 SE G733CX-LL014W | |
| Dell Precision 7000 7670 Performance | |
| Geekbench 5.5 / Multi-Core | |
| Intel Core i9-13900K @253W | |
| Intel NUC13 Raptor Canyon | |
| Lenovo Legion Pro 7 16IRX8H | |
| Asus ROG Strix Scar 18 2023 G834JY-N6005W | |
| Schenker XMG Neo 16 Raptor Lake | |
| MSI Titan GT77 HX 13VI | |
| Przeciętny Intel Core i9-13980HX (18475 - 22200, n=10) | |
| Razer Blade 18 RTX 4070 | |
| Asus ROG Strix Scar 18 2023 G834JY-N6005W | |
| Razer Blade 16 Early 2023 | |
| Średnia w klasie Gaming (6460 - 27010, n=110, ostatnie 2 lata) | |
| MSI Raider GE77 HX 12UHS | |
| Asus ROG Strix Scar 17 SE G733CX-LL014W | |
| Dell Precision 7000 7670 Performance | |
| Geekbench 5.5 / Single-Core | |
| Intel Core i9-13900K @253W | |
| Asus ROG Strix Scar 18 2023 G834JY-N6005W | |
| Intel NUC13 Raptor Canyon | |
| Asus ROG Strix Scar 18 2023 G834JY-N6005W | |
| Przeciętny Intel Core i9-13980HX (1796 - 2139, n=10) | |
| Średnia w klasie Gaming (986 - 2474, n=110, ostatnie 2 lata) | |
| MSI Titan GT77 HX 13VI | |
| Razer Blade 18 RTX 4070 | |
| Lenovo Legion Pro 7 16IRX8H | |
| Schenker XMG Neo 16 Raptor Lake | |
| MSI Raider GE77 HX 12UHS | |
| Dell Precision 7000 7670 Performance | |
| Asus ROG Strix Scar 17 SE G733CX-LL014W | |
| Razer Blade 16 Early 2023 | |
| HWBOT x265 Benchmark v2.2 / 4k Preset | |
| Intel Core i9-13900K @253W | |
| Intel NUC13 Raptor Canyon | |
| Asus ROG Strix Scar 18 2023 G834JY-N6005W | |
| MSI Titan GT77 HX 13VI | |
| Lenovo Legion Pro 7 16IRX8H | |
| Przeciętny Intel Core i9-13980HX (27 - 33.4, n=9) | |
| Razer Blade 18 RTX 4070 | |
| Schenker XMG Neo 16 Raptor Lake | |
| Asus ROG Strix Scar 18 2023 G834JY-N6005W | |
| Razer Blade 16 Early 2023 | |
| Średnia w klasie Gaming (11.5 - 44.3, n=110, ostatnie 2 lata) | |
| MSI Raider GE77 HX 12UHS | |
| Asus ROG Strix Scar 17 SE G733CX-LL014W | |
| Dell Precision 7000 7670 Performance | |
| LibreOffice / 20 Documents To PDF | |
| Średnia w klasie Gaming (19 - 88.8, n=110, ostatnie 2 lata) | |
| Razer Blade 16 Early 2023 | |
| MSI Titan GT77 HX 13VI | |
| Schenker XMG Neo 16 Raptor Lake | |
| Lenovo Legion Pro 7 16IRX8H | |
| Dell Precision 7000 7670 Performance | |
| Razer Blade 18 RTX 4070 | |
| Przeciętny Intel Core i9-13980HX (35 - 51.4, n=10) | |
| MSI Raider GE77 HX 12UHS | |
| Intel NUC13 Raptor Canyon | |
| Asus ROG Strix Scar 18 2023 G834JY-N6005W | |
| Asus ROG Strix Scar 18 2023 G834JY-N6005W | |
| Asus ROG Strix Scar 17 SE G733CX-LL014W | |
| Intel Core i9-13900K @253W | |
| R Benchmark 2.5 / Overall mean | |
| Dell Precision 7000 7670 Performance | |
| Średnia w klasie Gaming (0.3439 - 0.759, n=111, ostatnie 2 lata) | |
| Asus ROG Strix Scar 17 SE G733CX-LL014W | |
| MSI Raider GE77 HX 12UHS | |
| Razer Blade 16 Early 2023 | |
| MSI Titan GT77 HX 13VI | |
| Lenovo Legion Pro 7 16IRX8H | |
| Przeciętny Intel Core i9-13980HX (0.3793 - 0.4462, n=10) | |
| Razer Blade 18 RTX 4070 | |
| Asus ROG Strix Scar 18 2023 G834JY-N6005W | |
| Intel NUC13 Raptor Canyon | |
| Schenker XMG Neo 16 Raptor Lake | |
| Asus ROG Strix Scar 18 2023 G834JY-N6005W | |
| Intel Core i9-13900K @253W | |
Cinebench R23: Multi Core | Single Core
Cinebench R20: CPU (Multi Core) | CPU (Single Core)
Cinebench R15: CPU Multi 64Bit | CPU Single 64Bit
Blender: v2.79 BMW27 CPU
7-Zip 18.03: 7z b 4 | 7z b 4 -mmt1
Geekbench 5.5: Multi-Core | Single-Core
HWBOT x265 Benchmark v2.2: 4k Preset
LibreOffice : 20 Documents To PDF
R Benchmark 2.5: Overall mean
* ... im mniej tym lepiej
AIDA64: FP32 Ray-Trace | FPU Julia | CPU SHA3 | CPU Queen | FPU SinJulia | FPU Mandel | CPU AES | CPU ZLib | FP64 Ray-Trace | CPU PhotoWorxx
| Performance rating | |
| Intel Core i9-13900K @253W | |
| Intel NUC13 Raptor Canyon | |
| Asus ROG Strix Scar 18 2023 G834JY-N6005W | |
| MSI Titan GT77 HX 13VI | |
| Lenovo Legion Pro 7 16IRX8H | |
| Przeciętny Intel Core i9-13980HX | |
| Schenker XMG Neo 16 Raptor Lake | |
| Razer Blade 18 RTX 4070 | |
| Asus ROG Strix Scar 18 2023 G834JY-N6005W | |
| Średnia w klasie Gaming | |
| Razer Blade 16 Early 2023 | |
| MSI Raider GE77 HX 12UHS | |
| Asus ROG Strix Scar 17 SE G733CX-LL014W | |
| Dell Precision 7000 7670 Performance | |
| AIDA64 / FP32 Ray-Trace | |
| Intel Core i9-13900K @253W | |
| Średnia w klasie Gaming (10227 - 85542, n=109, ostatnie 2 lata) | |
| MSI Titan GT77 HX 13VI | |
| Asus ROG Strix Scar 18 2023 G834JY-N6005W | |
| Intel NUC13 Raptor Canyon | |
| Schenker XMG Neo 16 Raptor Lake | |
| Lenovo Legion Pro 7 16IRX8H | |
| Przeciętny Intel Core i9-13980HX (21332 - 29553, n=9) | |
| Razer Blade 18 RTX 4070 | |
| Razer Blade 16 Early 2023 | |
| Razer Blade 16 Early 2023 | |
| Razer Blade 16 Early 2023 | |
| Asus ROG Strix Scar 18 2023 G834JY-N6005W | |
| MSI Raider GE77 HX 12UHS | |
| Asus ROG Strix Scar 17 SE G733CX-LL014W | |
| Dell Precision 7000 7670 Performance | |
| AIDA64 / FPU Julia | |
| Intel Core i9-13900K @253W | |
| MSI Titan GT77 HX 13VI | |
| Intel NUC13 Raptor Canyon | |
| Asus ROG Strix Scar 18 2023 G834JY-N6005W | |
| Średnia w klasie Gaming (51376 - 238426, n=109, ostatnie 2 lata) | |
| Lenovo Legion Pro 7 16IRX8H | |
| Przeciętny Intel Core i9-13980HX (108001 - 148168, n=9) | |
| Razer Blade 18 RTX 4070 | |
| Schenker XMG Neo 16 Raptor Lake | |
| Asus ROG Strix Scar 18 2023 G834JY-N6005W | |
| Razer Blade 16 Early 2023 | |
| Razer Blade 16 Early 2023 | |
| Razer Blade 16 Early 2023 | |
| MSI Raider GE77 HX 12UHS | |
| Asus ROG Strix Scar 17 SE G733CX-LL014W | |
| Dell Precision 7000 7670 Performance | |
| AIDA64 / CPU SHA3 | |
| Intel Core i9-13900K @253W | |
| MSI Titan GT77 HX 13VI | |
| Asus ROG Strix Scar 18 2023 G834JY-N6005W | |
| Intel NUC13 Raptor Canyon | |
| Lenovo Legion Pro 7 16IRX8H | |
| Schenker XMG Neo 16 Raptor Lake | |
| Przeciętny Intel Core i9-13980HX (5264 - 7142, n=9) | |
| Razer Blade 16 Early 2023 | |
| Razer Blade 16 Early 2023 | |
| Razer Blade 16 Early 2023 | |
| Razer Blade 18 RTX 4070 | |
| Asus ROG Strix Scar 18 2023 G834JY-N6005W | |
| Średnia w klasie Gaming (2180 - 9817, n=109, ostatnie 2 lata) | |
| MSI Raider GE77 HX 12UHS | |
| Asus ROG Strix Scar 17 SE G733CX-LL014W | |
| Dell Precision 7000 7670 Performance | |
| AIDA64 / CPU Queen | |
| Intel Core i9-13900K @253W | |
| Intel NUC13 Raptor Canyon | |
| Asus ROG Strix Scar 18 2023 G834JY-N6005W | |
| Asus ROG Strix Scar 18 2023 G834JY-N6005W | |
| MSI Titan GT77 HX 13VI | |
| Przeciętny Intel Core i9-13980HX (126758 - 143409, n=9) | |
| Razer Blade 18 RTX 4070 | |
| Schenker XMG Neo 16 Raptor Lake | |
| Razer Blade 16 Early 2023 | |
| Razer Blade 16 Early 2023 | |
| Lenovo Legion Pro 7 16IRX8H | |
| Średnia w klasie Gaming (49785 - 173351, n=100, ostatnie 2 lata) | |
| Asus ROG Strix Scar 17 SE G733CX-LL014W | |
| Dell Precision 7000 7670 Performance | |
| MSI Raider GE77 HX 12UHS | |
| AIDA64 / FPU SinJulia | |
| Intel Core i9-13900K @253W | |
| Intel NUC13 Raptor Canyon | |
| Asus ROG Strix Scar 18 2023 G834JY-N6005W | |
| MSI Titan GT77 HX 13VI | |
| Schenker XMG Neo 16 Raptor Lake | |
| Przeciętny Intel Core i9-13980HX (13785 - 17117, n=9) | |
| Razer Blade 18 RTX 4070 | |
| Asus ROG Strix Scar 18 2023 G834JY-N6005W | |
| Razer Blade 16 Early 2023 | |
| Razer Blade 16 Early 2023 | |
| Razer Blade 16 Early 2023 | |
| Lenovo Legion Pro 7 16IRX8H | |
| Średnia w klasie Gaming (4424 - 33636, n=109, ostatnie 2 lata) | |
| MSI Raider GE77 HX 12UHS | |
| Asus ROG Strix Scar 17 SE G733CX-LL014W | |
| Dell Precision 7000 7670 Performance | |
| AIDA64 / FPU Mandel | |
| Intel Core i9-13900K @253W | |
| MSI Titan GT77 HX 13VI | |
| Średnia w klasie Gaming (25115 - 128721, n=109, ostatnie 2 lata) | |
| Asus ROG Strix Scar 18 2023 G834JY-N6005W | |
| Intel NUC13 Raptor Canyon | |
| Lenovo Legion Pro 7 16IRX8H | |
| Przeciętny Intel Core i9-13980HX (53398 - 73758, n=9) | |
| Schenker XMG Neo 16 Raptor Lake | |
| Razer Blade 18 RTX 4070 | |
| Asus ROG Strix Scar 18 2023 G834JY-N6005W | |
| Razer Blade 16 Early 2023 | |
| Razer Blade 16 Early 2023 | |
| Razer Blade 16 Early 2023 | |
| MSI Raider GE77 HX 12UHS | |
| Asus ROG Strix Scar 17 SE G733CX-LL014W | |
| Dell Precision 7000 7670 Performance | |
| AIDA64 / CPU AES | |
| Intel Core i9-13900K @253W | |
| MSI Raider GE77 HX 12UHS | |
| Asus ROG Strix Scar 17 SE G733CX-LL014W | |
| Razer Blade 16 Early 2023 | |
| Razer Blade 16 Early 2023 | |
| Razer Blade 16 Early 2023 | |
| MSI Titan GT77 HX 13VI | |
| Asus ROG Strix Scar 18 2023 G834JY-N6005W | |
| Intel NUC13 Raptor Canyon | |
| Lenovo Legion Pro 7 16IRX8H | |
| Przeciętny Intel Core i9-13980HX (105169 - 136520, n=9) | |
| Schenker XMG Neo 16 Raptor Lake | |
| Razer Blade 18 RTX 4070 | |
| Asus ROG Strix Scar 18 2023 G834JY-N6005W | |
| Średnia w klasie Gaming (39258 - 247074, n=109, ostatnie 2 lata) | |
| Dell Precision 7000 7670 Performance | |
| AIDA64 / CPU ZLib | |
| Intel Core i9-13900K @253W | |
| MSI Titan GT77 HX 13VI | |
| Asus ROG Strix Scar 18 2023 G834JY-N6005W | |
| Intel NUC13 Raptor Canyon | |
| Lenovo Legion Pro 7 16IRX8H | |
| Przeciętny Intel Core i9-13980HX (1513 - 2039, n=9) | |
| Schenker XMG Neo 16 Raptor Lake | |
| Razer Blade 16 Early 2023 | |
| Razer Blade 16 Early 2023 | |
| Razer Blade 16 Early 2023 | |
| Razer Blade 18 RTX 4070 | |
| Asus ROG Strix Scar 18 2023 G834JY-N6005W | |
| Średnia w klasie Gaming (574 - 2531, n=109, ostatnie 2 lata) | |
| MSI Raider GE77 HX 12UHS | |
| Asus ROG Strix Scar 17 SE G733CX-LL014W | |
| Dell Precision 7000 7670 Performance | |
| AIDA64 / FP64 Ray-Trace | |
| Intel Core i9-13900K @253W | |
| Średnia w klasie Gaming (5509 - 45446, n=109, ostatnie 2 lata) | |
| MSI Titan GT77 HX 13VI | |
| Asus ROG Strix Scar 18 2023 G834JY-N6005W | |
| Intel NUC13 Raptor Canyon | |
| Lenovo Legion Pro 7 16IRX8H | |
| Przeciętny Intel Core i9-13980HX (11431 - 16325, n=9) | |
| Schenker XMG Neo 16 Raptor Lake | |
| Razer Blade 18 RTX 4070 | |
| Razer Blade 16 Early 2023 | |
| Razer Blade 16 Early 2023 | |
| Razer Blade 16 Early 2023 | |
| Asus ROG Strix Scar 18 2023 G834JY-N6005W | |
| MSI Raider GE77 HX 12UHS | |
| Asus ROG Strix Scar 17 SE G733CX-LL014W | |
| Dell Precision 7000 7670 Performance | |
| AIDA64 / CPU PhotoWorxx | |
| Razer Blade 16 Early 2023 | |
| Razer Blade 16 Early 2023 | |
| Razer Blade 16 Early 2023 | |
| Razer Blade 18 RTX 4070 | |
| Intel Core i9-13900K @253W | |
| Lenovo Legion Pro 7 16IRX8H | |
| MSI Raider GE77 HX 12UHS | |
| Przeciętny Intel Core i9-13980HX (37069 - 52949, n=9) | |
| Intel NUC13 Raptor Canyon | |
| Schenker XMG Neo 16 Raptor Lake | |
| Średnia w klasie Gaming (12271 - 89891, n=109, ostatnie 2 lata) | |
| Asus ROG Strix Scar 18 2023 G834JY-N6005W | |
| Asus ROG Strix Scar 18 2023 G834JY-N6005W | |
| Dell Precision 7000 7670 Performance | |
| Asus ROG Strix Scar 17 SE G733CX-LL014W | |
| MSI Titan GT77 HX 13VI | |
AIDA64: FP32 Ray-Trace | FPU Julia | CPU SHA3 | CPU Queen | FPU SinJulia | FPU Mandel | CPU AES | CPU ZLib | FP64 Ray-Trace | CPU PhotoWorxx
Wydajność systemu
Mocny sprzęt jest w stanie zapunktować również w ogólnej wydajności systemu. W PCMark 10 Scar 18 osiąga najwyższą pozycję, którą obecnie ledwo przebijają potężne desktopy oraz MSI Titan GT77 HX 13VI. W CrossMarku wynik również należy do najwyższej klasy. Choć niektóre laptopy są w stanie uplasować się przed Strixem Scar 18, dystans ten jest bardzo niewielki i wynosi maksymalnie 4% (przy czym najszybszym laptopem jest obecnie MSI Titan GT77 12UHS, a najszybszy desktop osiąga wynik o 24% wyższy).
W benchmarku pamięci masowej łatwo można dostrzec wpływ pamięci DDR5-4800. Systemy z szybszą pamięcią główną DDR5-5600, takie jak Razer Blade 16, nadal są w stanie osiągnąć znaczną przewagę. Jest to jeden z niewielu obszarów, w których Asus nie stosuje najszybszych dostępnych komponentów, ale w praktyce wpływ ten jest stosunkowo niewielki.
CrossMark: Overall | Productivity | Creativity | Responsiveness
| PCMark 10 / Score | |
| Intel NUC13 Raptor Canyon | |
| MSI Titan GT77 HX 13VI | |
| Przeciętny Intel Core i9-13980HX, NVIDIA GeForce RTX 4090 Laptop GPU (8650 - 9068, n=4) | |
| Asus ROG Strix Scar 18 2023 G834JY-N6005W | |
| Średnia w klasie Gaming (5828 - 11574, n=95, ostatnie 2 lata) | |
| Razer Blade 16 Early 2023 | |
| Lenovo Legion Pro 7 16IRX8H | |
| Razer Blade 18 RTX 4070 | |
| Asus ROG Strix Scar 17 SE G733CX-LL014W | |
| MSI Raider GE77 HX 12UHS | |
| Dell Precision 7000 7670 Performance | |
| PCMark 10 / Essentials | |
| MSI Titan GT77 HX 13VI | |
| Lenovo Legion Pro 7 16IRX8H | |
| Razer Blade 18 RTX 4070 | |
| Intel NUC13 Raptor Canyon | |
| Dell Precision 7000 7670 Performance | |
| Przeciętny Intel Core i9-13980HX, NVIDIA GeForce RTX 4090 Laptop GPU (11215 - 11644, n=3) | |
| Razer Blade 16 Early 2023 | |
| Średnia w klasie Gaming (8810 - 12600, n=99, ostatnie 2 lata) | |
| Asus ROG Strix Scar 17 SE G733CX-LL014W | |
| MSI Raider GE77 HX 12UHS | |
| PCMark 10 / Productivity | |
| Intel NUC13 Raptor Canyon | |
| Lenovo Legion Pro 7 16IRX8H | |
| Średnia w klasie Gaming (6845 - 18766, n=97, ostatnie 2 lata) | |
| Przeciętny Intel Core i9-13980HX, NVIDIA GeForce RTX 4090 Laptop GPU (10125 - 11067, n=3) | |
| Asus ROG Strix Scar 17 SE G733CX-LL014W | |
| MSI Titan GT77 HX 13VI | |
| MSI Raider GE77 HX 12UHS | |
| Razer Blade 18 RTX 4070 | |
| Razer Blade 16 Early 2023 | |
| Dell Precision 7000 7670 Performance | |
| PCMark 10 / Digital Content Creation | |
| MSI Titan GT77 HX 13VI | |
| Intel NUC13 Raptor Canyon | |
| Przeciętny Intel Core i9-13980HX, NVIDIA GeForce RTX 4090 Laptop GPU (15052 - 16012, n=3) | |
| Razer Blade 16 Early 2023 | |
| Średnia w klasie Gaming (7602 - 19657, n=97, ostatnie 2 lata) | |
| Razer Blade 18 RTX 4070 | |
| Lenovo Legion Pro 7 16IRX8H | |
| Asus ROG Strix Scar 17 SE G733CX-LL014W | |
| MSI Raider GE77 HX 12UHS | |
| Dell Precision 7000 7670 Performance | |
| CrossMark / Overall | |
| Intel Core i9-13900K @253W | |
| Intel NUC13 Raptor Canyon | |
| MSI Raider GE77 HX 12UHS | |
| MSI Titan GT77 HX 13VI | |
| Razer Blade 18 RTX 4070 | |
| Asus ROG Strix Scar 17 SE G733CX-LL014W | |
| Asus ROG Strix Scar 18 2023 G834JY-N6005W | |
| Przeciętny Intel Core i9-13980HX, NVIDIA GeForce RTX 4090 Laptop GPU (1935 - 2176, n=4) | |
| Asus ROG Strix Scar 18 2023 G834JY-N6005W | |
| Schenker XMG Neo 16 Raptor Lake | |
| Średnia w klasie Gaming (1366 - 2409, n=97, ostatnie 2 lata) | |
| Dell Precision 7000 7670 Performance | |
| Razer Blade 16 Early 2023 | |
| CrossMark / Productivity | |
| Intel Core i9-13900K @253W | |
| Intel NUC13 Raptor Canyon | |
| MSI Raider GE77 HX 12UHS | |
| MSI Titan GT77 HX 13VI | |
| Razer Blade 18 RTX 4070 | |
| Asus ROG Strix Scar 17 SE G733CX-LL014W | |
| Asus ROG Strix Scar 18 2023 G834JY-N6005W | |
| Przeciętny Intel Core i9-13980HX, NVIDIA GeForce RTX 4090 Laptop GPU (1764 - 2005, n=4) | |
| Asus ROG Strix Scar 18 2023 G834JY-N6005W | |
| Średnia w klasie Gaming (1386 - 2254, n=97, ostatnie 2 lata) | |
| Schenker XMG Neo 16 Raptor Lake | |
| Dell Precision 7000 7670 Performance | |
| Razer Blade 16 Early 2023 | |
| CrossMark / Creativity | |
| Intel Core i9-13900K @253W | |
| Intel NUC13 Raptor Canyon | |
| Asus ROG Strix Scar 18 2023 G834JY-N6005W | |
| MSI Titan GT77 HX 13VI | |
| Przeciętny Intel Core i9-13980HX, NVIDIA GeForce RTX 4090 Laptop GPU (2267 - 2469, n=4) | |
| Razer Blade 18 RTX 4070 | |
| Asus ROG Strix Scar 18 2023 G834JY-N6005W | |
| Schenker XMG Neo 16 Raptor Lake | |
| Asus ROG Strix Scar 17 SE G733CX-LL014W | |
| MSI Raider GE77 HX 12UHS | |
| Średnia w klasie Gaming (1343 - 2729, n=97, ostatnie 2 lata) | |
| Dell Precision 7000 7670 Performance | |
| Razer Blade 16 Early 2023 | |
| CrossMark / Responsiveness | |
| Intel Core i9-13900K @253W | |
| MSI Raider GE77 HX 12UHS | |
| Asus ROG Strix Scar 17 SE G733CX-LL014W | |
| Intel NUC13 Raptor Canyon | |
| Razer Blade 18 RTX 4070 | |
| MSI Titan GT77 HX 13VI | |
| Średnia w klasie Gaming (1226 - 2334, n=97, ostatnie 2 lata) | |
| Przeciętny Intel Core i9-13980HX, NVIDIA GeForce RTX 4090 Laptop GPU (1556 - 1904, n=4) | |
| Asus ROG Strix Scar 18 2023 G834JY-N6005W | |
| Asus ROG Strix Scar 18 2023 G834JY-N6005W | |
| Schenker XMG Neo 16 Raptor Lake | |
| Dell Precision 7000 7670 Performance | |
| Razer Blade 16 Early 2023 | |
CrossMark: Overall | Productivity | Creativity | Responsiveness
| PCMark 10 Score | 8764 pkt. | |
Pomoc | ||
| AIDA64 / Memory Copy | |
| Razer Blade 16 Early 2023 | |
| Razer Blade 16 Early 2023 | |
| Razer Blade 16 Early 2023 | |
| Lenovo Legion Pro 7 16IRX8H | |
| Razer Blade 18 RTX 4070 | |
| Intel Core i9-13900K @253W | |
| Średnia w klasie Gaming (21750 - 129946, n=109, ostatnie 2 lata) | |
| Przeciętny Intel Core i9-13980HX (62189 - 80776, n=9) | |
| MSI Raider GE77 HX 12UHS | |
| Intel NUC13 Raptor Canyon | |
| Asus ROG Strix Scar 18 2023 G834JY-N6005W | |
| Schenker XMG Neo 16 Raptor Lake | |
| Asus ROG Strix Scar 18 2023 G834JY-N6005W | |
| Dell Precision 7000 7670 Performance | |
| MSI Titan GT77 HX 13VI | |
| Asus ROG Strix Scar 17 SE G733CX-LL014W | |
| AIDA64 / Memory Read | |
| Razer Blade 16 Early 2023 | |
| Razer Blade 16 Early 2023 | |
| Razer Blade 16 Early 2023 | |
| Razer Blade 18 RTX 4070 | |
| Lenovo Legion Pro 7 16IRX8H | |
| Intel Core i9-13900K @253W | |
| Przeciętny Intel Core i9-13980HX (62624 - 89096, n=9) | |
| Schenker XMG Neo 16 Raptor Lake | |
| Asus ROG Strix Scar 18 2023 G834JY-N6005W | |
| Asus ROG Strix Scar 18 2023 G834JY-N6005W | |
| Średnia w klasie Gaming (22956 - 118858, n=109, ostatnie 2 lata) | |
| Intel NUC13 Raptor Canyon | |
| MSI Raider GE77 HX 12UHS | |
| Asus ROG Strix Scar 17 SE G733CX-LL014W | |
| Dell Precision 7000 7670 Performance | |
| MSI Titan GT77 HX 13VI | |
| AIDA64 / Memory Write | |
| Razer Blade 16 Early 2023 | |
| Razer Blade 16 Early 2023 | |
| Razer Blade 16 Early 2023 | |
| Średnia w klasie Gaming (22297 - 135096, n=109, ostatnie 2 lata) | |
| Razer Blade 18 RTX 4070 | |
| Intel Core i9-13900K @253W | |
| Lenovo Legion Pro 7 16IRX8H | |
| Przeciętny Intel Core i9-13980HX (59912 - 79917, n=9) | |
| Intel NUC13 Raptor Canyon | |
| Schenker XMG Neo 16 Raptor Lake | |
| Asus ROG Strix Scar 18 2023 G834JY-N6005W | |
| MSI Raider GE77 HX 12UHS | |
| Asus ROG Strix Scar 18 2023 G834JY-N6005W | |
| Asus ROG Strix Scar 17 SE G733CX-LL014W | |
| Dell Precision 7000 7670 Performance | |
| MSI Titan GT77 HX 13VI | |
| AIDA64 / Memory Latency | |
| Średnia w klasie Gaming (75.3 - 259, n=109, ostatnie 2 lata) | |
| Razer Blade 16 Early 2023 | |
| Razer Blade 16 Early 2023 | |
| Razer Blade 16 Early 2023 | |
| Intel NUC13 Raptor Canyon | |
| MSI Titan GT77 HX 13VI | |
| Schenker XMG Neo 16 Raptor Lake | |
| Asus ROG Strix Scar 18 2023 G834JY-N6005W | |
| Asus ROG Strix Scar 18 2023 G834JY-N6005W | |
| Przeciętny Intel Core i9-13980HX (79.4 - 93.2, n=9) | |
| Asus ROG Strix Scar 17 SE G733CX-LL014W | |
| Dell Precision 7000 7670 Performance | |
| Razer Blade 18 RTX 4070 | |
| MSI Raider GE77 HX 12UHS | |
| Lenovo Legion Pro 7 16IRX8H | |
| Intel Core i9-13900K @253W | |
* ... im mniej tym lepiej
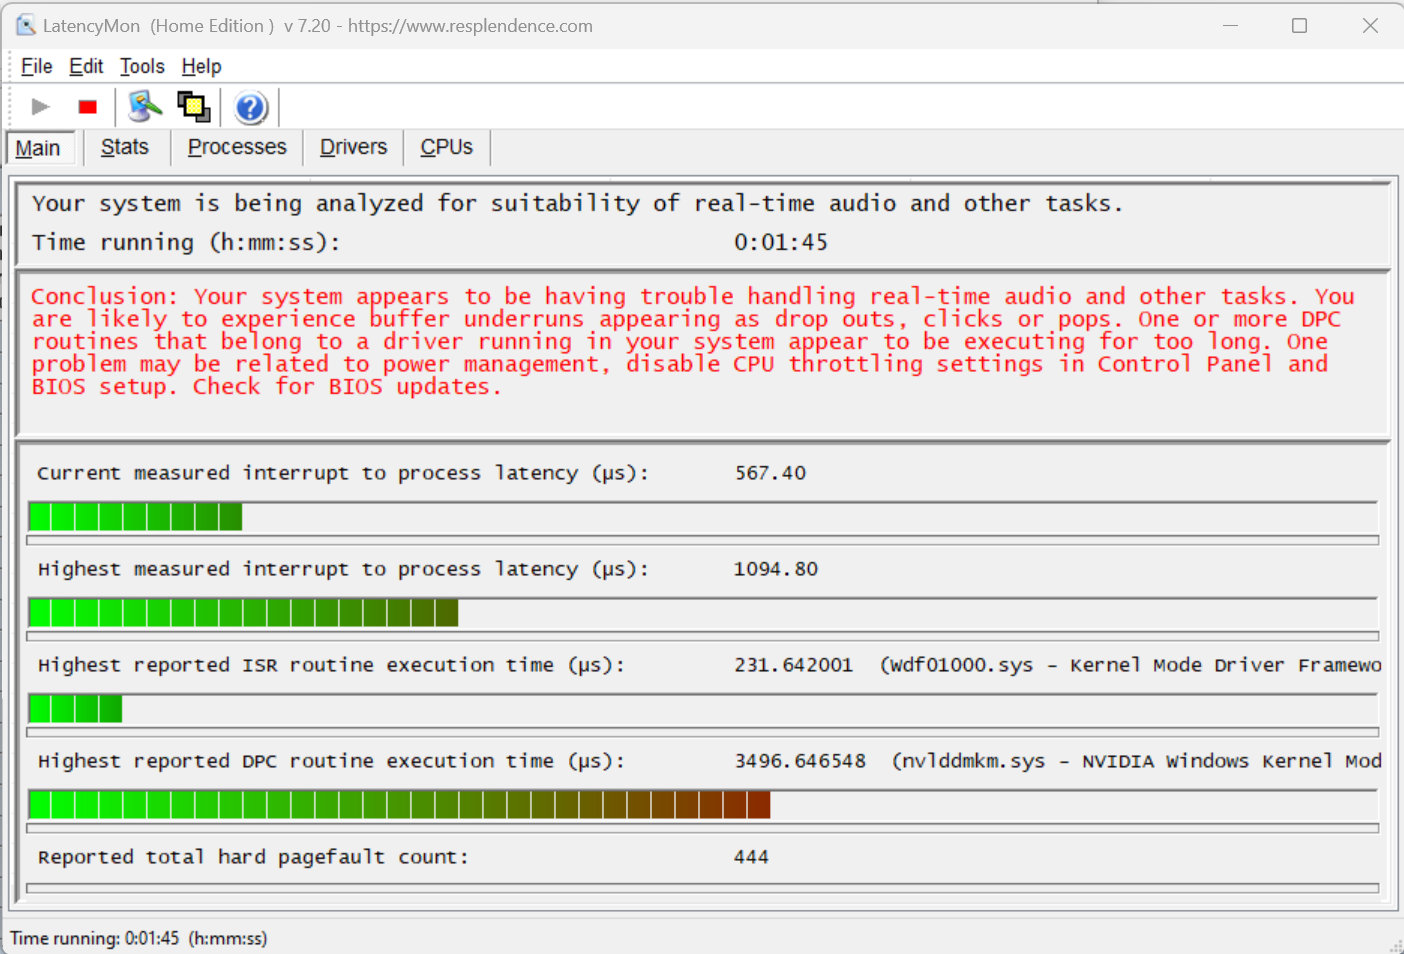
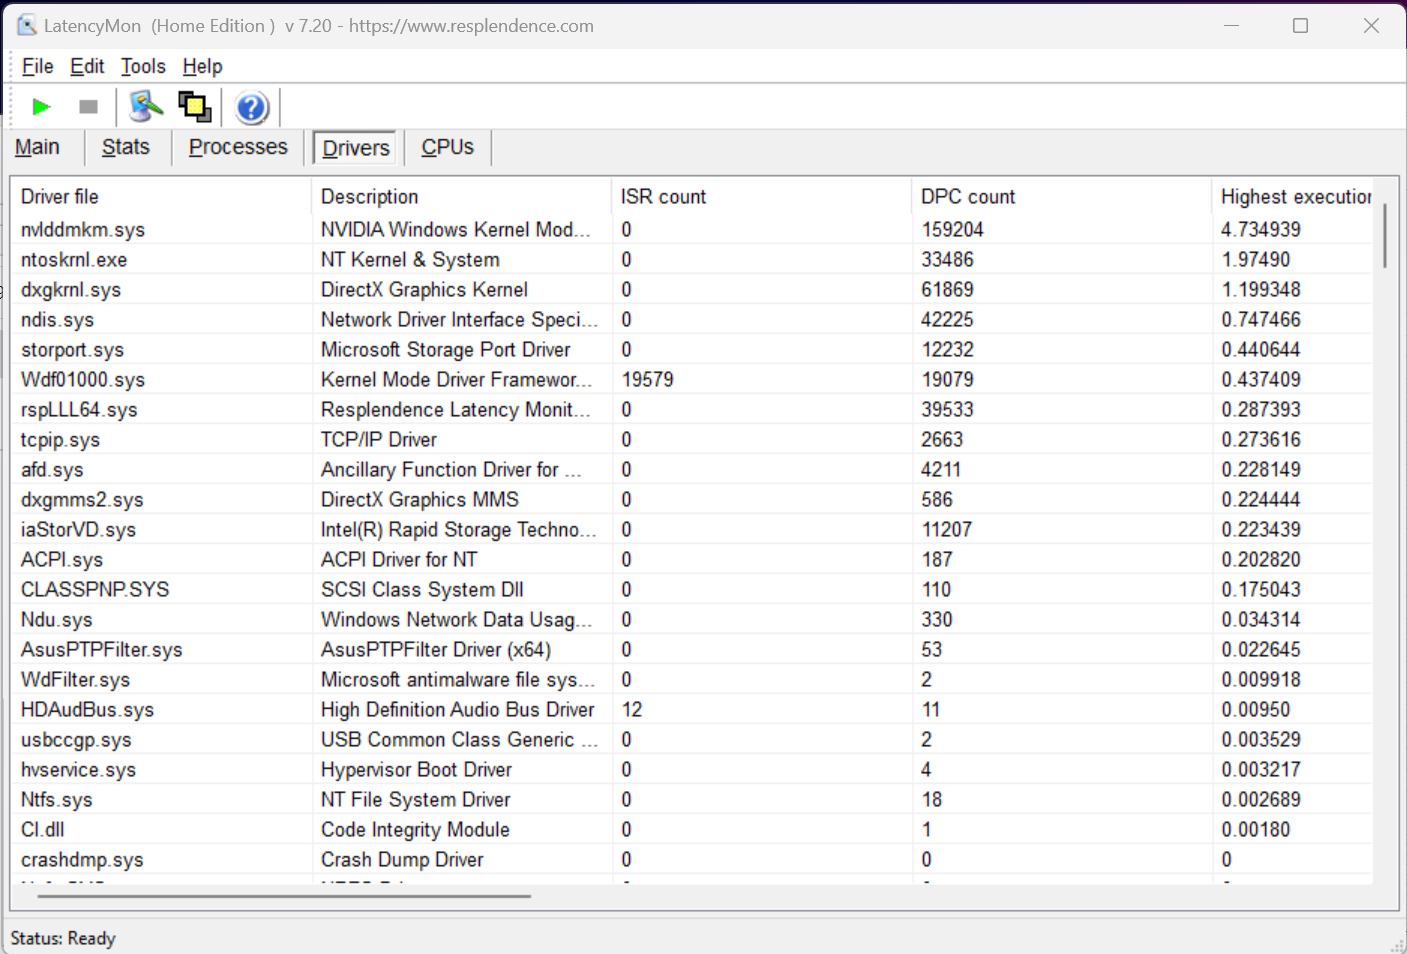
Opóźnienia DPC
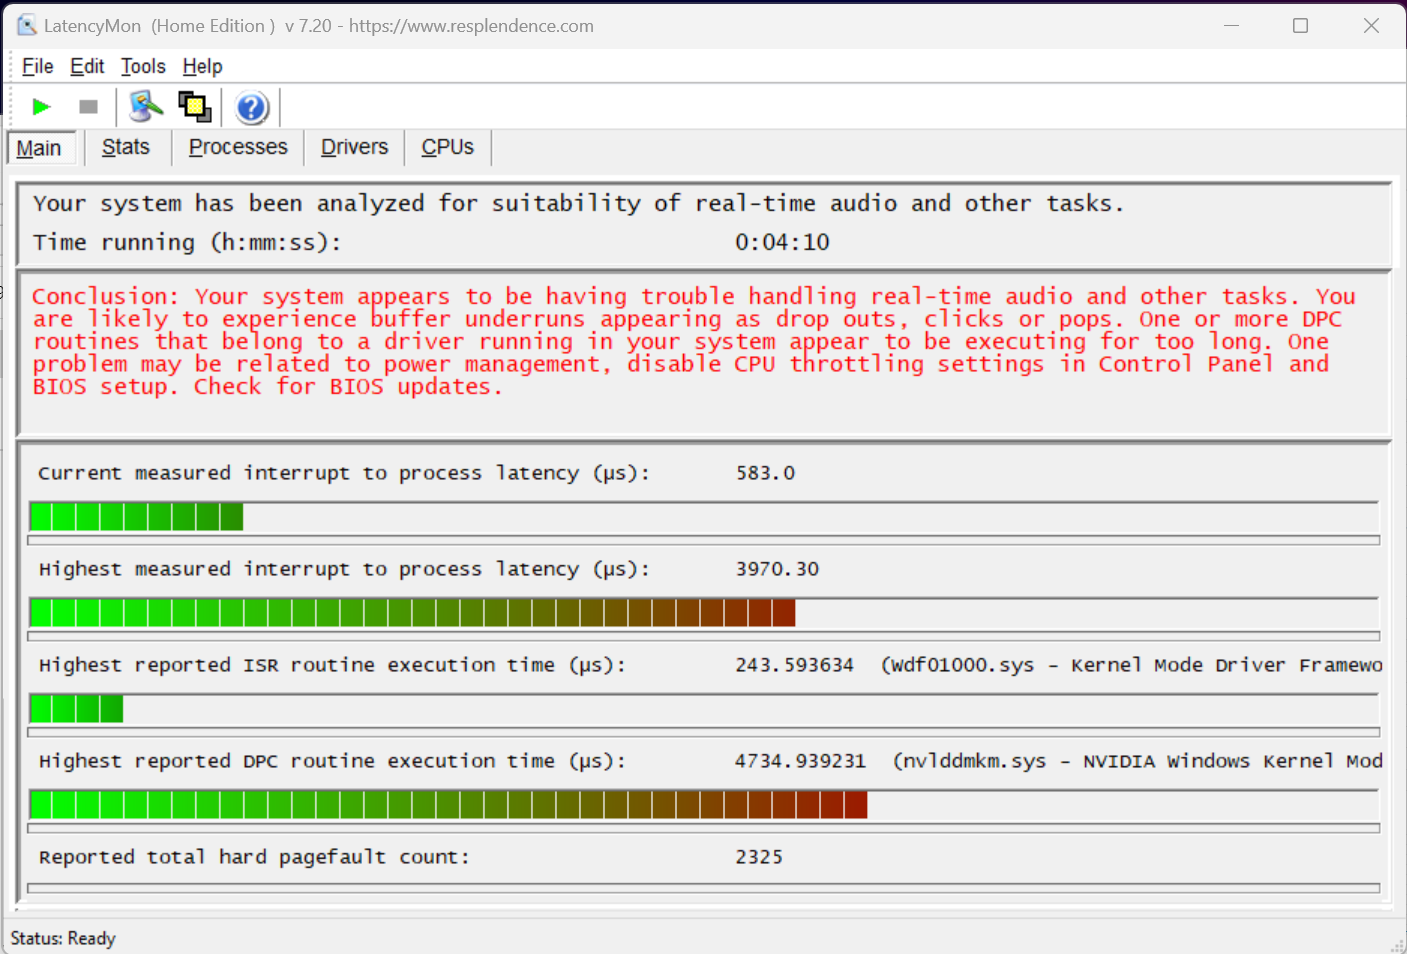
W latencjach DPC laptop Asusa plasuje się tylko w środku pola spośród wszystkich przetestowanych laptopów. Według LatencyMon zawinił tutaj sterownik Nvidii, co może powodować pewne problemy w aplikacjach działających w czasie rzeczywistym. Nasze testy przeprowadziliśmy w trybie Turbo z GPU Ultimate (bez Optimusa), który jest teoretycznie lepszym rozwiązaniem, niż tryb hybrydowy czy tryb oszczędzania energii. Niestety słaba wydajność DPC nie jest wyjątkiem w tej klasie urządzeń.
| DPC Latencies / LatencyMon - interrupt to process latency (max), Web, Youtube, Prime95 | |
| MSI Titan GT77 HX 13VI | |
| Asus ROG Strix Scar 17 SE G733CX-LL014W | |
| Razer Blade 16 Early 2023 | |
| Dell Precision 7000 7670 Performance | |
| MSI Raider GE77 HX 12UHS | |
| Razer Blade 18 RTX 4070 | |
| Asus ROG Strix Scar 18 2023 G834JY-N6005W | |
| Lenovo Legion Pro 7 16IRX8H | |
* ... im mniej tym lepiej
Rozwiązanie w zakresie przechowywania
Asus zastosował w Scar 18 G834JY-N6005W dwa szybkie dyski SSD Samsung PM9A1, każdy o pojemności 1 TB, w systemie RAID-0. Choć prędkość jest dzięki temu nieco zwiększona, rośnie też prawdopodobieństwo awarii i pobór mocy. W porównaniu z Legion 5 Pro 16IAH7H z tym samym systemem RAID Asus Scar zostaje jednak prześcignięty - nawet ze znacznym marginesem. Nie wynika to jednak z problemów termicznych, a wydajność pozostaje niezmienna pod stałym obciążeniem.

| Drive Performance rating - Percent | |
| Asus ROG Strix Scar 17 SE G733CX-LL014W | |
| Lenovo Legion 5 Pro 16IAH7H | |
| MSI Raider GE77 HX 12UHS | |
| Lenovo Legion Pro 7 16IRX8H | |
| Razer Blade 18 RTX 4070 | |
| MSI Titan GT77 HX 13VI | |
| Intel NUC13 Raptor Canyon | |
| Średnia w klasie Gaming | |
| Przeciętny 2x Samsung PM9A1 MZVL21T0HCLR (RAID 0) | |
| Razer Blade 16 Early 2023 | |
| Intel Core i9-13900K @253W -11! | |
| Asus ROG Strix Scar 18 2023 G834JY-N6005W | |
| Asus ROG Strix Scar 18 2023 G834JY-N6005W | |
| Dell Precision 7000 7670 Performance | |
| Schenker XMG Neo 16 Raptor Lake -11! | |
* ... im mniej tym lepiej
Disk Throttling: DiskSpd Read Loop, Queue Depth 8
Karta graficzna
Wizytówką Asusa ROG Strix Scar 18 jest bez wątpienia Nvidia GeForce RTX 4090 Laptop GPU. Chociaż nazwa sugeruje podobieństwo do RTX 4090 Desktop GPU, wersja mobilna jest związana z Desktop RTX 4080 (ten sam układ), a wydajność pozostaje niższa niż w przypadku desktopowego RTX 4070 Ti. Ale przynajmniej Asus oferuje najszybszą wersję RTX 4090 Mobile z 175 W TGP (150 W + 25 W Dynamic Boost), a nawet podkręca nieco GPU o 50 MHz.
W porównaniu z RTX 4090 w.MSI Titan GT77 HX 13VI, Strix G18 nadal plasuje się ledwo w tyle, mimo podkręcenia. Laptopy z RTX 4080 są również wyraźnie prześcignięte, a laptopy ze starym RTX 3080 Ti Laptop GPUtopowy model pozostają daleko w tyle.
| 3DMark Performance rating - Percent | |
| MSI Titan GT77 HX 13VI | |
| Schenker XMG Neo 16 Raptor Lake | |
| Asus ROG Strix Scar 18 2023 G834JY-N6005W | |
| Przeciętny NVIDIA GeForce RTX 4090 Laptop GPU | |
| Asus ROG Strix Scar 18 2023 G834JY-N6005W | |
| Intel NUC13 Raptor Canyon | |
| Intel Core i9-13900K @253W | |
| Lenovo Legion Pro 7 16IRX8H | |
| Razer Blade 16 Early 2023 | |
| Średnia w klasie Gaming | |
| Asus ROG Strix Scar 17 SE G733CX-LL014W | |
| MSI Raider GE77 HX 12UHS | |
| Razer Blade 18 RTX 4070 | |
| Dell Precision 7000 7670 Performance | |
| 3DMark 11 - 1280x720 Performance GPU | |
| Schenker XMG Neo 16 Raptor Lake | |
| MSI Titan GT77 HX 13VI | |
| Przeciętny NVIDIA GeForce RTX 4090 Laptop GPU (54073 - 73027, n=42) | |
| Asus ROG Strix Scar 18 2023 G834JY-N6005W | |
| Asus ROG Strix Scar 18 2023 G834JY-N6005W | |
| Lenovo Legion Pro 7 16IRX8H | |
| Intel NUC13 Raptor Canyon | |
| Intel Core i9-13900K @253W | |
| Razer Blade 16 Early 2023 | |
| Średnia w klasie Gaming (21841 - 80022, n=108, ostatnie 2 lata) | |
| MSI Raider GE77 HX 12UHS | |
| Asus ROG Strix Scar 17 SE G733CX-LL014W | |
| Razer Blade 18 RTX 4070 | |
| Dell Precision 7000 7670 Performance | |
| 3DMark 06 Standard Score | 67702 pkt. | |
| 3DMark 11 Performance | 46985 pkt. | |
| 3DMark Ice Storm Standard Score | 277937 pkt. | |
| 3DMark Cloud Gate Standard Score | 70984 pkt. | |
| 3DMark Fire Strike Score | 36408 pkt. | |
| 3DMark Fire Strike Extreme Score | 24278 pkt. | |
| 3DMark Time Spy Score | 20166 pkt. | |
Pomoc | ||
| Blender - v3.3 Classroom OPTIX/RTX | |
| Dell Precision 7000 7670 Performance | |
| MSI Raider GE77 HX 12UHS | |
| Asus ROG Strix Scar 17 SE G733CX-LL014W | |
| Razer Blade 18 RTX 4070 | |
| Średnia w klasie Gaming (9 - 32, n=111, ostatnie 2 lata) | |
| Intel NUC13 Raptor Canyon | |
| Razer Blade 16 Early 2023 | |
| Lenovo Legion Pro 7 16IRX8H | |
| Intel Core i9-13900K @253W | |
| Przeciętny NVIDIA GeForce RTX 4090 Laptop GPU (9 - 19, n=39) | |
| Asus ROG Strix Scar 18 2023 G834JY-N6005W | |
| MSI Titan GT77 HX 13VI | |
| Schenker XMG Neo 16 Raptor Lake | |
| Asus ROG Strix Scar 18 2023 G834JY-N6005W | |
| V-Ray Benchmark Next 4.10 - GPU | |
| Asus ROG Strix Scar 18 2023 G834JY-N6005W | |
| MSI Titan GT77 HX 13VI | |
| Asus ROG Strix Scar 18 2023 G834JY-N6005W | |
| Przeciętny NVIDIA GeForce RTX 4090 Laptop GPU (873 - 1334, n=30) | |
| Schenker XMG Neo 16 Raptor Lake | |
| Lenovo Legion Pro 7 16IRX8H | |
| Intel Core i9-13900K @253W | |
| Intel NUC13 Raptor Canyon | |
| Średnia w klasie Gaming (427 - 1333, n=105, ostatnie 2 lata) | |
| MSI Raider GE77 HX 12UHS | |
| Asus ROG Strix Scar 17 SE G733CX-LL014W | |
| V-Ray 5 Benchmark | |
| GPU RTX | |
| Schenker XMG Neo 16 Raptor Lake | |
| Asus ROG Strix Scar 18 2023 G834JY-N6005W | |
| Asus ROG Strix Scar 18 2023 G834JY-N6005W | |
| MSI Titan GT77 HX 13VI | |
| Przeciętny NVIDIA GeForce RTX 4090 Laptop GPU (1982 - 3824, n=29) | |
| Intel Core i9-13900K @253W | |
| Intel NUC13 Raptor Canyon | |
| Średnia w klasie Gaming (1146 - 4363, n=37, ostatnie 2 lata) | |
| Razer Blade 16 Early 2023 | |
| Asus ROG Strix Scar 17 SE G733CX-LL014W | |
| MSI Raider GE77 HX 12UHS | |
| Razer Blade 18 RTX 4070 | |
| GPU CUDA | |
| Asus ROG Strix Scar 18 2023 G834JY-N6005W | |
| Schenker XMG Neo 16 Raptor Lake | |
| MSI Titan GT77 HX 13VI | |
| Asus ROG Strix Scar 18 2023 G834JY-N6005W | |
| Przeciętny NVIDIA GeForce RTX 4090 Laptop GPU (1454 - 2797, n=29) | |
| Intel Core i9-13900K @253W | |
| Intel NUC13 Raptor Canyon | |
| Średnia w klasie Gaming (887 - 3288, n=37, ostatnie 2 lata) | |
| Razer Blade 16 Early 2023 | |
| MSI Raider GE77 HX 12UHS | |
| Asus ROG Strix Scar 17 SE G733CX-LL014W | |
| Razer Blade 18 RTX 4070 | |
* ... im mniej tym lepiej
Wydajność w grach
Benchmarki dla gier ujawniają podobny obraz, jak już w benchmarkach syntetycznych. Jako cecha szczególna, seria RTX 4000 oferuje teraz także wsparcie dla DLSS 3 z generowaniem klatek. W obsługiwanych grach RTX 4090 jest w stanie uzyskać tutaj znaczny wzrost liczby klatek na sekundę. Dzięki temu również efekty raytracingu w 4K są możliwe przy płynnym odświeżaniu. Częstotliwość odświeżania 240 Hz może być jednak w pełni wykorzystana tylko w mniej wymagających grach w natywnej rozdzielczości 2 560 x 1 600 pikseli.
| Performance rating - Percent | |
| Intel NUC13 Raptor Canyon | |
| Asus ROG Strix Scar 18 2023 G834JY-N6005W | |
| MSI Titan GT77 HX 13VI | |
| Asus ROG Strix Scar 18 2023 G834JY-N6005W | |
| Schenker XMG Neo 16 Raptor Lake | |
| Razer Blade 16 Early 2023 | |
| Lenovo Legion Pro 7 16IRX8H | |
| MSI Raider GE77 HX 12UHS | |
| Średnia w klasie Gaming | |
| Razer Blade 18 RTX 4070 | |
| Asus ROG Strix Scar 17 SE G733CX-LL014W | |
| Dell Precision 7000 7670 Performance | |
| GTA V - 1920x1080 Highest AA:4xMSAA + FX AF:16x | |
| Intel NUC13 Raptor Canyon | |
| Lenovo Legion Pro 7 16IRX8H | |
| Asus ROG Strix Scar 18 2023 G834JY-N6005W | |
| Asus ROG Strix Scar 18 2023 G834JY-N6005W | |
| MSI Titan GT77 HX 13VI | |
| Razer Blade 16 Early 2023 | |
| Schenker XMG Neo 16 Raptor Lake | |
| MSI Raider GE77 HX 12UHS | |
| Średnia w klasie Gaming (48.3 - 186.9, n=102, ostatnie 2 lata) | |
| Asus ROG Strix Scar 17 SE G733CX-LL014W | |
| Razer Blade 18 RTX 4070 | |
| Dell Precision 7000 7670 Performance | |
| Final Fantasy XV Benchmark - 1920x1080 High Quality | |
| MSI Titan GT77 HX 13VI | |
| Schenker XMG Neo 16 Raptor Lake | |
| Intel NUC13 Raptor Canyon | |
| Asus ROG Strix Scar 18 2023 G834JY-N6005W | |
| Asus ROG Strix Scar 18 2023 G834JY-N6005W | |
| Lenovo Legion Pro 7 16IRX8H | |
| Razer Blade 16 Early 2023 | |
| Średnia w klasie Gaming (41 - 215, n=103, ostatnie 2 lata) | |
| MSI Raider GE77 HX 12UHS | |
| Asus ROG Strix Scar 17 SE G733CX-LL014W | |
| Razer Blade 18 RTX 4070 | |
| Dell Precision 7000 7670 Performance | |
| Strange Brigade - 1920x1080 ultra AA:ultra AF:16 | |
| MSI Titan GT77 HX 13VI | |
| Asus ROG Strix Scar 18 2023 G834JY-N6005W | |
| Intel NUC13 Raptor Canyon | |
| Schenker XMG Neo 16 Raptor Lake | |
| Asus ROG Strix Scar 18 2023 G834JY-N6005W | |
| Razer Blade 16 Early 2023 | |
| Lenovo Legion Pro 7 16IRX8H | |
| Średnia w klasie Gaming (76.3 - 456, n=93, ostatnie 2 lata) | |
| Asus ROG Strix Scar 17 SE G733CX-LL014W | |
| MSI Raider GE77 HX 12UHS | |
| Razer Blade 18 RTX 4070 | |
| Dell Precision 7000 7670 Performance | |
| Dota 2 Reborn - 1920x1080 ultra (3/3) best looking | |
| Intel NUC13 Raptor Canyon | |
| Razer Blade 16 Early 2023 | |
| Asus ROG Strix Scar 18 2023 G834JY-N6005W | |
| Asus ROG Strix Scar 18 2023 G834JY-N6005W | |
| MSI Titan GT77 HX 13VI | |
| Lenovo Legion Pro 7 16IRX8H | |
| Razer Blade 18 RTX 4070 | |
| Schenker XMG Neo 16 Raptor Lake | |
| Asus ROG Strix Scar 17 SE G733CX-LL014W | |
| MSI Raider GE77 HX 12UHS | |
| Dell Precision 7000 7670 Performance | |
| Średnia w klasie Gaming (84.8 - 248, n=112, ostatnie 2 lata) | |
| X-Plane 11.11 - 1920x1080 high (fps_test=3) | |
| Intel NUC13 Raptor Canyon | |
| Asus ROG Strix Scar 18 2023 G834JY-N6005W | |
| Asus ROG Strix Scar 18 2023 G834JY-N6005W | |
| Razer Blade 18 RTX 4070 | |
| Razer Blade 16 Early 2023 | |
| Schenker XMG Neo 16 Raptor Lake | |
| Schenker XMG Neo 16 Raptor Lake | |
| Schenker XMG Neo 16 Raptor Lake | |
| MSI Titan GT77 HX 13VI | |
| MSI Titan GT77 HX 13VI | |
| Lenovo Legion Pro 7 16IRX8H | |
| MSI Raider GE77 HX 12UHS | |
| Asus ROG Strix Scar 17 SE G733CX-LL014W | |
| Dell Precision 7000 7670 Performance | |
| Średnia w klasie Gaming (52.1 - 143.5, n=115, ostatnie 2 lata) | |
W naszym teście obciążeniowym z The Witcher 3, a także w teście obciążeniowym 3DMark Time Spy, Asus G834JY utrzymuje stabilną wydajność bez żadnych spadków. Widoczne wahania w The Witcher 3 wynikają ze zmian między dniem a nocą.
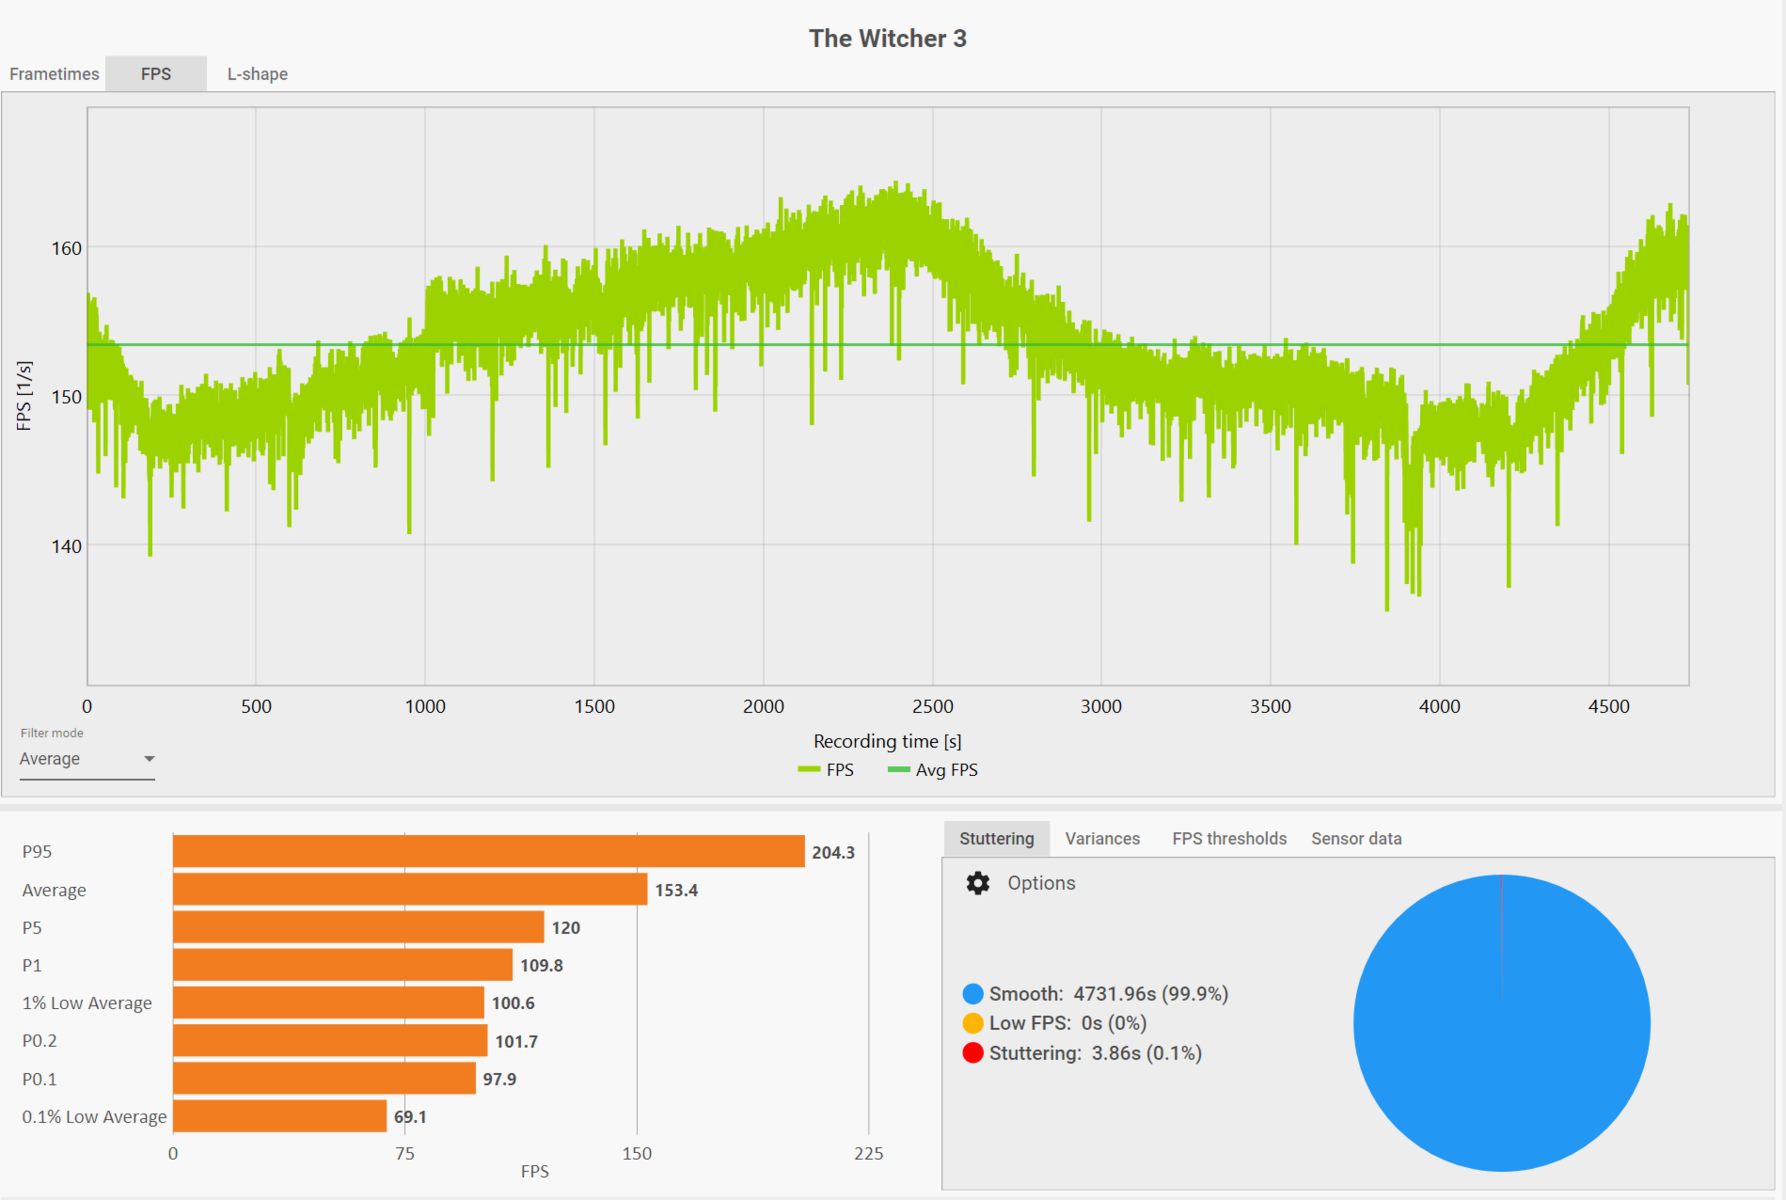
The Witcher 3 FPS Chart
| low | med. | high | ultra | QHD | 4K DLSS | 4K | |
|---|---|---|---|---|---|---|---|
| Counter-Strike: GO (2012) | 516 | 314 | |||||
| GTA V (2015) | 187.4 | 185.7 | 184.8 | 141.3 | 139.1 | 175.7 | |
| Dota 2 Reborn (2015) | 237 | 207.7 | 201.75 | 190.2 | 178.6 | ||
| Deus Ex Mankind Divided (2016) | 169 | ||||||
| Final Fantasy XV Benchmark (2018) | 224 | 208 | 177.6 | 146.7 | 90.1 | ||
| X-Plane 11.11 (2018) | 211 | 186.8 | 142.8 | ||||
| Far Cry 5 (2018) | 197 | 181 | 172 | 158 | 153 | 107 | |
| Strange Brigade (2018) | 496 | 403 | 386 | 366 | 292 | 154.7 | |
| Shadow of the Tomb Raider (2018) | 143.7 | 121.2 | 87.3 | ||||
| Control (2019) | 184.4 | 123.2 | 72.6 | ||||
| Horizon Zero Dawn (2020) | 184 | 154 | 145 | 127 | 92 | ||
| Flight Simulator 2020 (2020) | 74 | 74 | 96.8 | 51.2 | |||
| Battlefield 2042 (2021) | 172.6 | 138.9 | 85.4 | ||||
| Halo Infinite (2021) | 128.9 | 77 | 57.3 | ||||
| Elden Ring (2022) | 60 | 60 | 60 | 60 | 60 | 60 | |
| Cyberpunk 2077 1.6 (2022) | 119.7 | 94.5 | |||||
| Vampire Bloodhunt (2022) | 290 | 242 | 138.3 | ||||
| F1 22 (2022) | 319 | 308 | 273 | 124.5 | 75 | 42.4 | |
| FIFA 23 (2022) | 183.7 | 182.6 | 162.4 | ||||
| A Plague Tale Requiem (2022) | 96.8 | 72 | 82.3 | 41 | |||
| Uncharted Legacy of Thieves Collection (2022) | 108.2 | 103.1 | 62.9 | ||||
| Call of Duty Modern Warfare 2 2022 (2022) | 170 | 127 | 112 | 81 | |||
| Spider-Man Miles Morales (2022) | 109.1 | 103.8 | 73.2 | ||||
| Need for Speed Unbound (2022) | 124.2 | 111.8 | 84.3 | ||||
| High On Life (2023) | 180.3 | 120.2 | 52 | ||||
| The Witcher 3 v4 (2023) | 137.6 | 96.6 | 49 |
Emisje
Poziomy hałasu
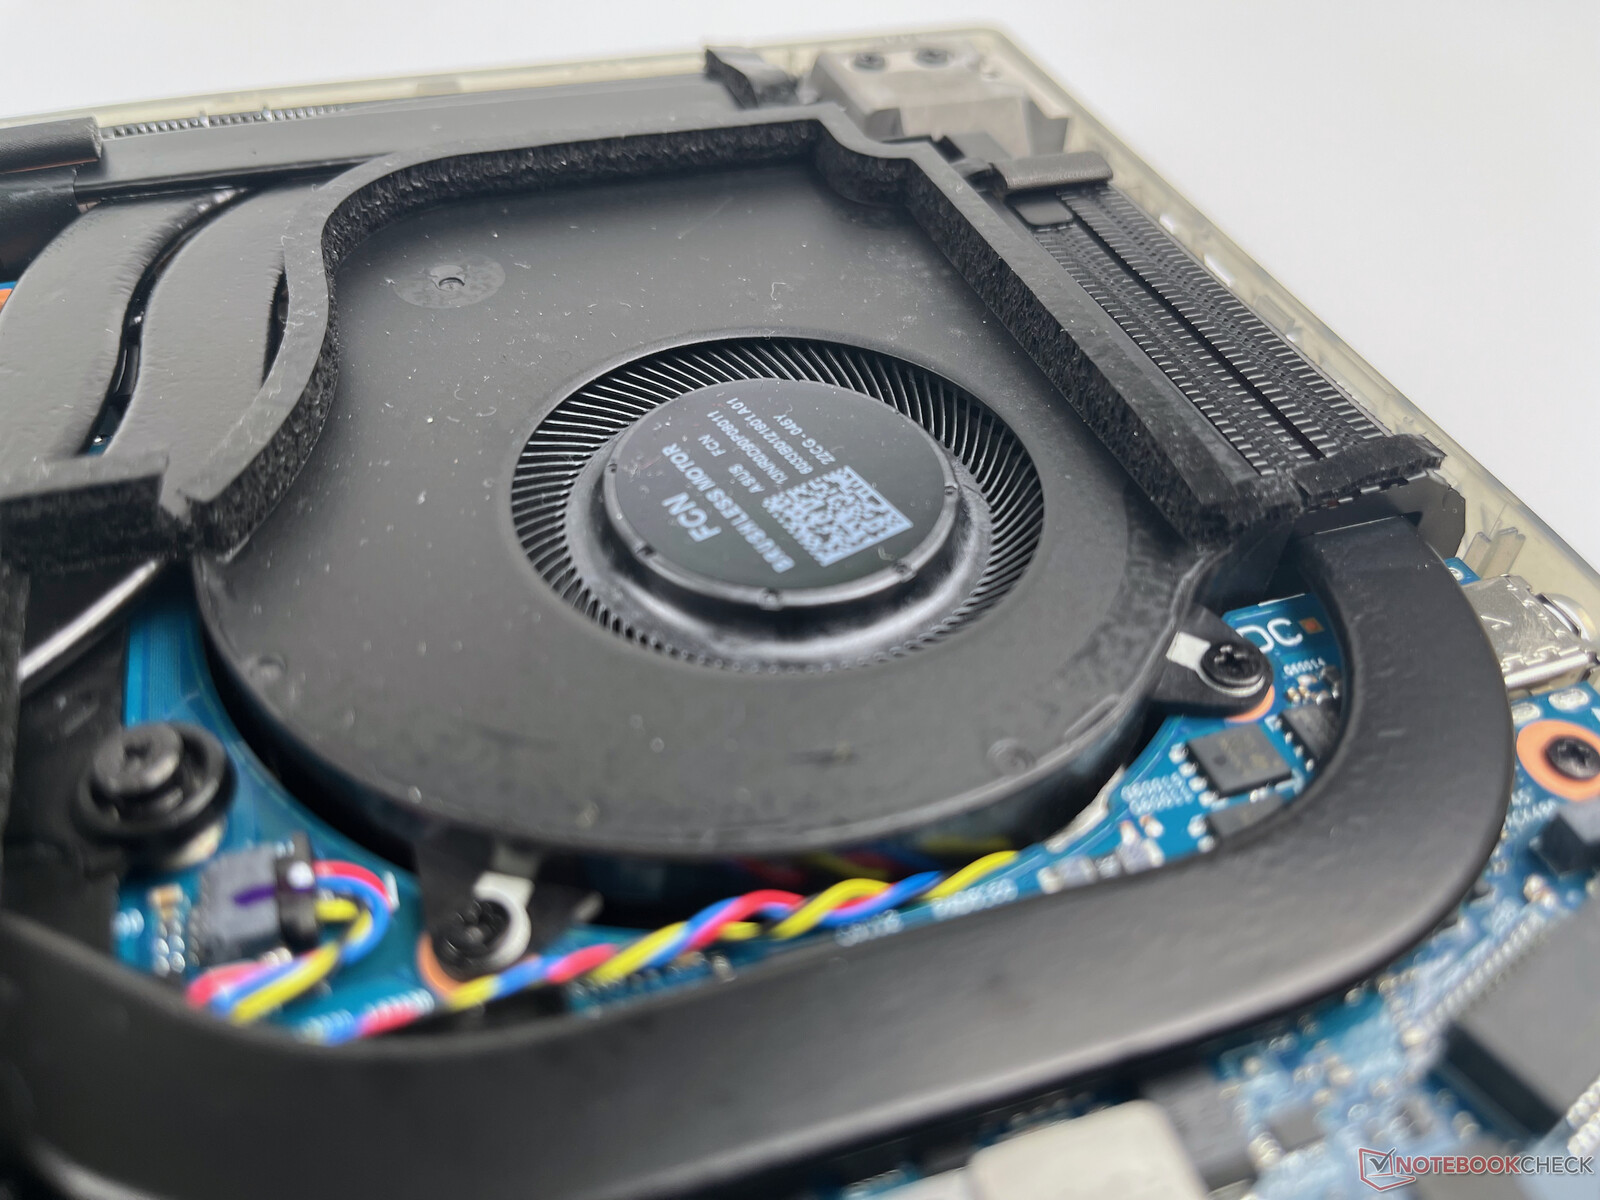
Pod obciążeniem trzy wbudowane wentylatory w słyszalny sposób walczą z potężnymi podzespołami. Choć charakterystyka hałasu pozostaje bardzo komfortowa, to nawet 55,8 dB (wentylatory przy 4900, 5500 i 6400 obr/min) to i tak bardzo głośno. Podczas grania dźwięk z dobrych głośników może być nieco zagłuszony, co sugeruje zastosowanie tutaj słuchawek. Jeżeli w grach korzystamy z wyświetlacza o częstotliwości 240 Hz i osiąga on wysoką liczbę klatek na sekundę, nasz testowy egzemplarz wytwarza niestety wyraźnie wyczuwalne wycie cewek. Jest to słyszalne już od 100 fps i w zależności od gry może stać się nieco irytujące.
Podczas bezczynności trzy wentylatory mogą również pozostać wyłączone przez dłuższy czas, ale tylko w trybie Silent i podczas korzystania ze zintegrowanego GPU. W większości przypadków jednak nie pozostają one całkowicie wyłączone podczas surfowania, ale najniższe poziomy wentylatorów przy 2000 - 3000 RPM są komfortowo ciche i wynoszą mniej niż 33 dB(A).
Hałas
| luz |
| 23.9 / 32.6 / 32.6 dB |
| obciążenie |
| 35.9 / 55.8 dB |
 | ||
30 dB cichy 40 dB(A) słyszalny 50 dB(A) irytujący |
||
min: | ||
| Asus ROG Strix Scar 18 2023 G834JY-N6005W GeForce RTX 4090 Laptop GPU, i9-13980HX, 2x Samsung PM9A1 MZVL21T0HCLR (RAID 0) | Razer Blade 18 RTX 4070 GeForce RTX 4070 Laptop GPU, i9-13950HX, SSSTC CA6-8D1024 | Lenovo Legion Pro 7 16IRX8H GeForce RTX 4080 Laptop GPU, i9-13900HX, Samsung PM9A1 MZVL21T0HCLR | Razer Blade 16 Early 2023 GeForce RTX 4080 Laptop GPU, i9-13950HX, SSSTC CA6-8D1024 | MSI Titan GT77 HX 13VI GeForce RTX 4090 Laptop GPU, i9-13950HX, Samsung PM9A1 MZVL22T0HBLB | MSI Raider GE77 HX 12UHS GeForce RTX 3080 Ti Laptop GPU, i9-12900HX, Samsung PM9A1 MZVL22T0HBLB | Asus ROG Strix Scar 17 SE G733CX-LL014W GeForce RTX 3080 Ti Laptop GPU, i9-12950HX, Samsung PM9A1 MZVL22T0HBLB | |
|---|---|---|---|---|---|---|---|
| Noise | 8% | -5% | 11% | -9% | -17% | 13% | |
| wyłączone / środowisko * (dB) | 23.9 | 23.5 2% | 24 -0% | 23 4% | 24.6 -3% | 26 -9% | 23.9 -0% |
| Idle Minimum * (dB) | 23.9 | 23.8 -0% | 26 -9% | 23 4% | 29.2 -22% | 26 -9% | 23.9 -0% |
| Idle Average * (dB) | 32.6 | 23.8 27% | 28 14% | 23 29% | 29.2 10% | 34 -4% | 23.9 27% |
| Idle Maximum * (dB) | 32.6 | 26.8 18% | 34 -4% | 23.6 28% | 29.2 10% | 46 -41% | 23.9 27% |
| Load Average * (dB) | 35.9 | 37.3 -4% | 47 -31% | 39 -9% | 50.7 -41% | 50 -39% | 34.3 4% |
| Load Maximum * (dB) | 55.8 | 53.5 4% | 56 -0% | 51.3 8% | 61 -9% | 57 -2% | 45.9 18% |
| Witcher 3 ultra * (dB) | 48 | 55 | 51.6 | 53.3 | 55 |
* ... im mniej tym lepiej
Temperatury
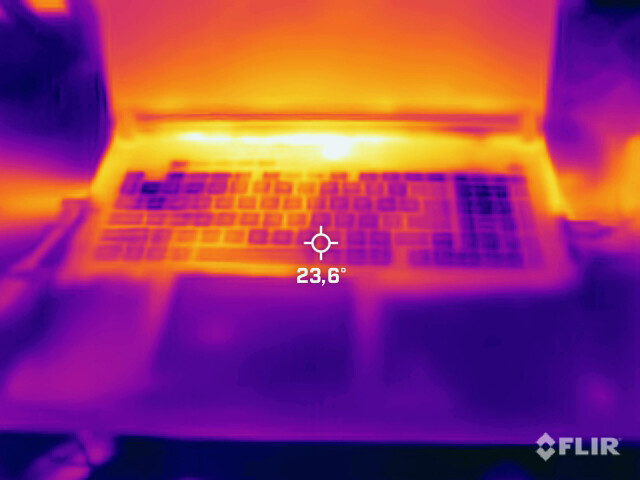
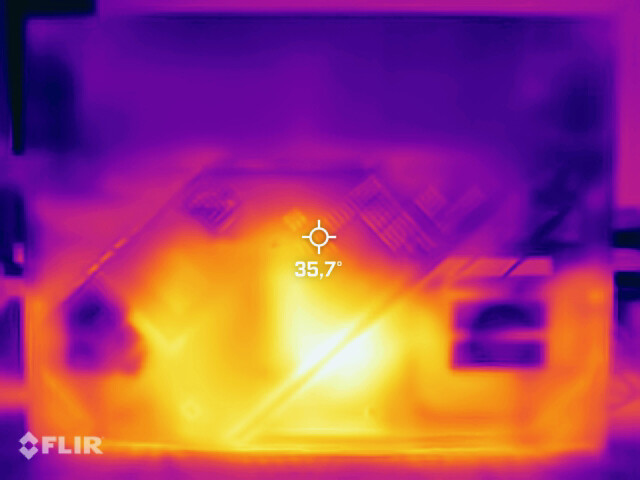
W przypadku temperatur mamy do czynienia z mieszanymi wynikami. Dotykane obszary obudowy, takie jak podpórki pod nadgarstki i klawiatura, pozostają komfortowo chłodne, nawet podczas dłuższych scenariuszy stresowych. Jednak podczas gry gorący punkt w górnej części obudowy nagrzewa się do 55°C (131°F).
(-) Maksymalna temperatura w górnej części wynosi 54 °C / 129 F, w porównaniu do średniej 40.4 °C / 105 F , począwszy od 21.2 do 68.8 °C dla klasy Gaming.
(-) Dno nagrzewa się maksymalnie do 46 °C / 115 F, w porównaniu do średniej 43.2 °C / 110 F
(+) W stanie bezczynności średnia temperatura górnej części wynosi 27.2 °C / 81 F, w porównaniu ze średnią temperaturą urządzenia wynoszącą 33.9 °C / ### class_avg_f### F.
(±) Podczas gry w Wiedźmina 3 średnia temperatura górnej części wynosi 36 °C / 97 F, w porównaniu do średniej temperatury urządzenia wynoszącej 33.9 °C / ## #class_avg_f### F.
(+) Podpórki pod nadgarstki i touchpad są chłodniejsze niż temperatura skóry i maksymalnie 28 °C / 82.4 F i dlatego są chłodne w dotyku.
(±) Średnia temperatura obszaru podparcia dłoni w podobnych urządzeniach wynosiła 28.8 °C / 83.8 F (+0.8 °C / 1.4 F).
| Asus ROG Strix Scar 18 2023 G834JY-N6005W Intel Core i9-13980HX, NVIDIA GeForce RTX 4090 Laptop GPU | Razer Blade 16 Early 2023 Intel Core i9-13950HX, NVIDIA GeForce RTX 4080 Laptop GPU | MSI Titan GT77 HX 13VI Intel Core i9-13950HX, NVIDIA GeForce RTX 4090 Laptop GPU | MSI Raider GE77 HX 12UHS Intel Core i9-12900HX, NVIDIA GeForce RTX 3080 Ti Laptop GPU | Asus ROG Strix Scar 17 SE G733CX-LL014W Intel Core i9-12950HX, NVIDIA GeForce RTX 3080 Ti Laptop GPU | |
|---|---|---|---|---|---|
| Heat | 9% | 13% | -23% | -4% | |
| Maximum Upper Side * (°C) | 54 | 40 26% | 40.6 25% | 53 2% | 48.8 10% |
| Maximum Bottom * (°C) | 46 | 37.6 18% | 41.1 11% | 58 -26% | 52.4 -14% |
| Idle Upper Side * (°C) | 30 | 32.4 -8% | 26.2 13% | 38 -27% | 30.4 -1% |
| Idle Bottom * (°C) | 31 | 31.4 -1% | 30.3 2% | 43 -39% | 34.1 -10% |
* ... im mniej tym lepiej
Stress Test
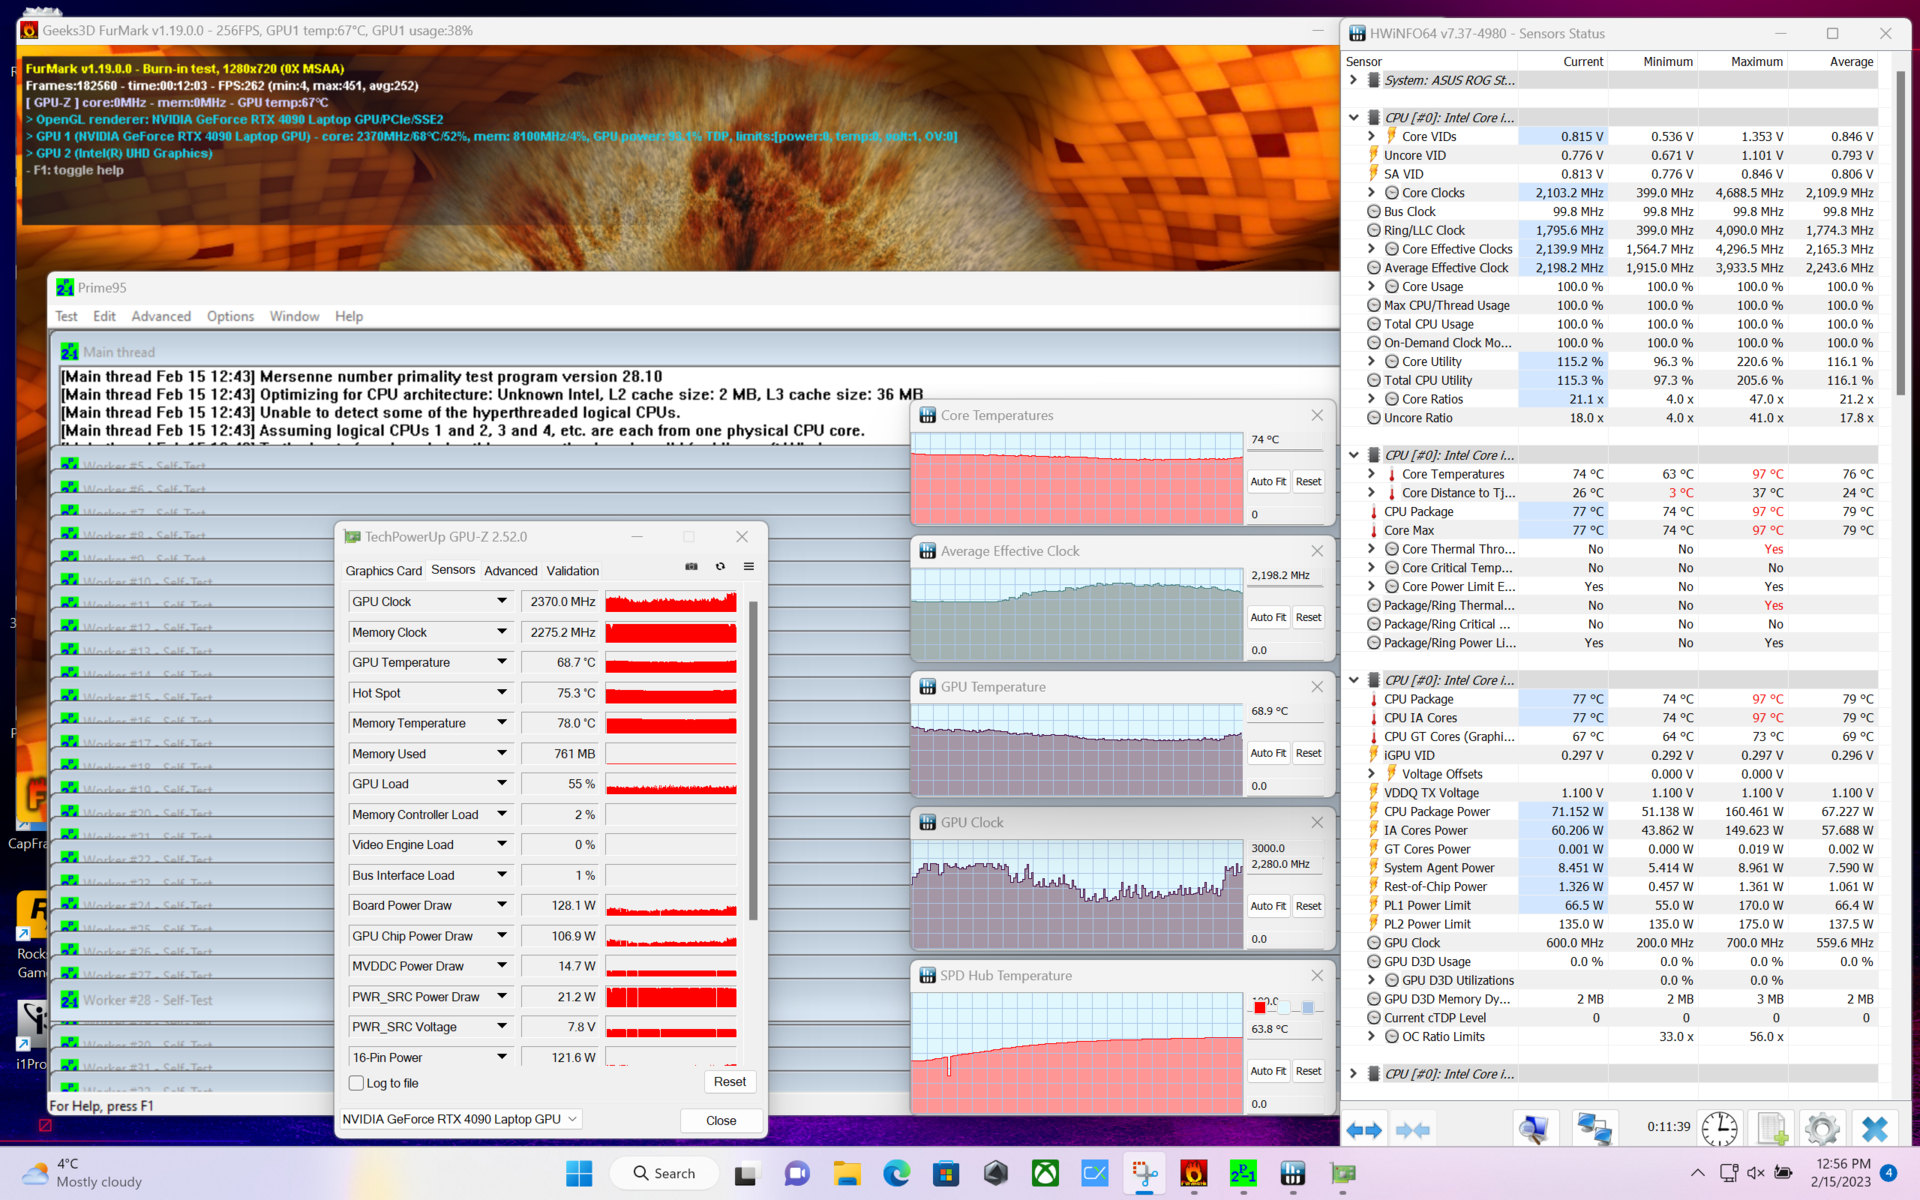
W teście obciążeniowym wewnętrzne temperatury procesora ulegają silnym wahaniom. Można to przypisać stale dostosowywanym prędkościom taktowania, które stale popychają CPU w pobliże granicy 100°C (212 °F). W GPU sytuacja jest znacznie mniej krytyczna, a RTX 4090 osiąga tylko maksymalną temperaturę 70 °C (158 °F).
Podczas gry, temperatury CPU pozostają nieco mniej ekstremalne. Mierzymy między 81 °C (178 °F, Cyberpunk 2077) a 90 °C (194 °F, The Witcher 3). Z drugiej strony, w zakresie od 72°C (162°F, Cyberpunk 2077) do 77°C (171°F, The Witcher 3), GPU staje się nieco cieplejsze, niż podczas testu obciążeniowego.
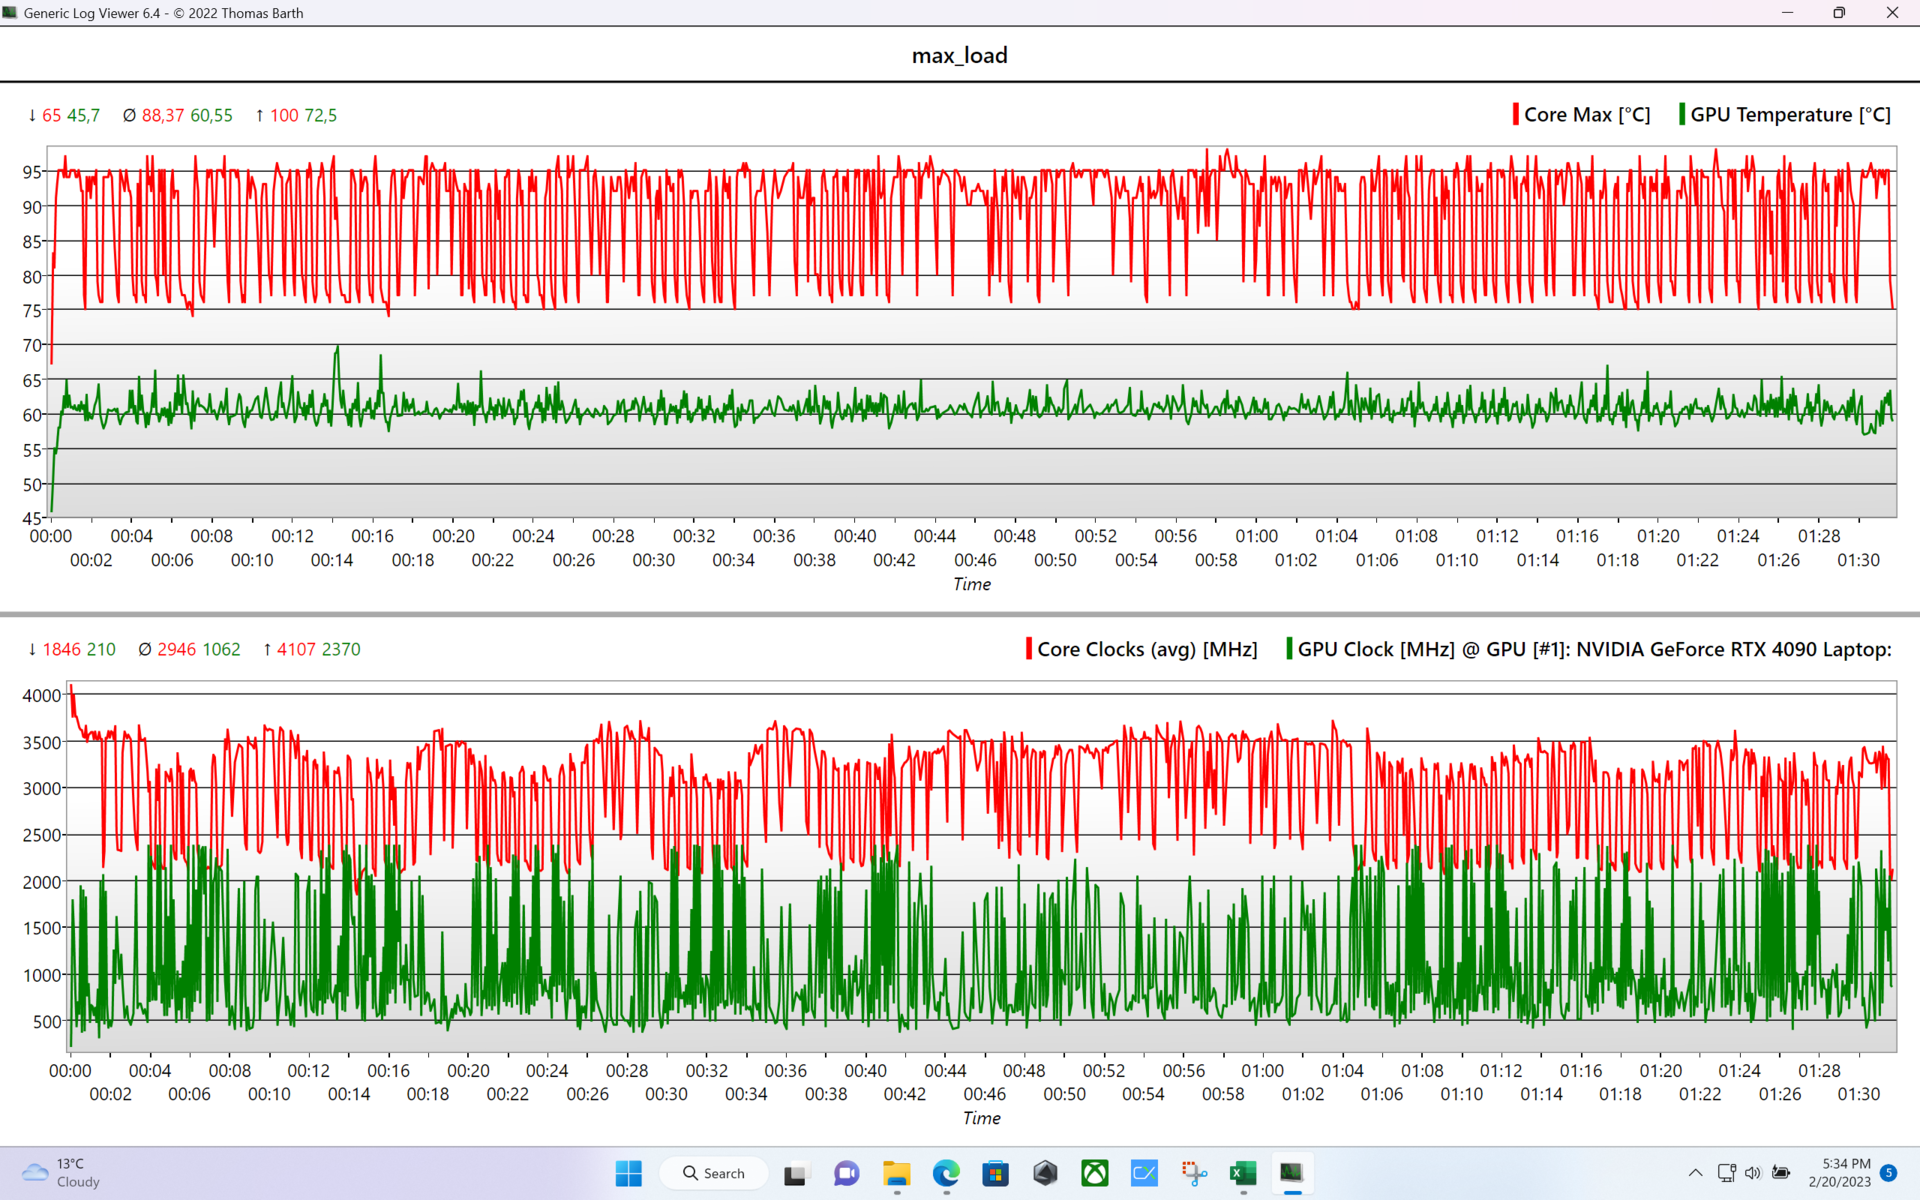
| ZegarCPU E-Cores (GHz) | Zegar CPU P-Cores (GHz) | Zegar GPU (MHz) | Średnia temperatura CPU (°C) | Średnia temperatura GPU (°C) | |
| System w stanie bezczynności (Silent) | 1,4 | 1,8 | 0 | 42 | 0 |
| System Idle (Turbo) | 1.6 | 2.1 | 210 | 44 | 39 |
| Prime95 Stress (Turbo) | 3 | 3.5 | 210 | 92 | 56 |
| Prime95 + FurMark Stress (Turbo) | 1.6 | 2.1 | 2260 | 80 | 73 |
| Witcher 3 Stress | 3,7 | 4,6 | 1995 | 90 | 77 |
Mówcy
Wbudowane głośniki są stosunkowo basowe, ale oferują subiektywnie atrakcyjne parametry, które są odpowiednie do gamingowego przeznaczenia laptopa. W codziennych warunkach maksymalna głośność jest również wystarczająco duża.
Asus ROG Strix Scar 18 2023 G834JY-N6005W analiza dźwięku
(+) | głośniki mogą odtwarzać stosunkowo głośno (82.7 dB)
Bas 100 - 315 Hz
(+) | dobry bas - tylko 4.8% od mediany
(±) | liniowość basu jest średnia (7% delta do poprzedniej częstotliwości)
Średnie 400 - 2000 Hz
(±) | wyższe średnie - średnio 9% wyższe niż mediana
(+) | średnie są liniowe (5% delta do poprzedniej częstotliwości)
Wysokie 2–16 kHz
(+) | zrównoważone maksima - tylko 3.7% od mediany
(+) | wzloty są liniowe (6.1% delta do poprzedniej częstotliwości)
Ogólnie 100 - 16.000 Hz
(±) | liniowość ogólnego dźwięku jest średnia (19% różnicy w stosunku do mediany)
W porównaniu do tej samej klasy
» 63% wszystkich testowanych urządzeń w tej klasie było lepszych, 8% podobnych, 29% gorszych
» Najlepszy miał deltę 6%, średnia wynosiła ###średnia###%, najgorsza wynosiła 132%
W porównaniu do wszystkich testowanych urządzeń
» 45% wszystkich testowanych urządzeń było lepszych, 7% podobnych, 48% gorszych
» Najlepszy miał deltę 4%, średnia wynosiła ###średnia###%, najgorsza wynosiła 134%
Apple MacBook Pro 16 2021 M1 Pro analiza dźwięku
(+) | głośniki mogą odtwarzać stosunkowo głośno (84.7 dB)
Bas 100 - 315 Hz
(+) | dobry bas - tylko 3.8% od mediany
(+) | bas jest liniowy (5.2% delta do poprzedniej częstotliwości)
Średnie 400 - 2000 Hz
(+) | zbalansowane środki średnie - tylko 1.3% od mediany
(+) | średnie są liniowe (2.1% delta do poprzedniej częstotliwości)
Wysokie 2–16 kHz
(+) | zrównoważone maksima - tylko 1.9% od mediany
(+) | wzloty są liniowe (2.7% delta do poprzedniej częstotliwości)
Ogólnie 100 - 16.000 Hz
(+) | ogólny dźwięk jest liniowy (4.6% różnicy w stosunku do mediany)
W porównaniu do tej samej klasy
» 0% wszystkich testowanych urządzeń w tej klasie było lepszych, 0% podobnych, 100% gorszych
» Najlepszy miał deltę 5%, średnia wynosiła ###średnia###%, najgorsza wynosiła 45%
W porównaniu do wszystkich testowanych urządzeń
» 0% wszystkich testowanych urządzeń było lepszych, 0% podobnych, 100% gorszych
» Najlepszy miał deltę 4%, średnia wynosiła ###średnia###%, najgorsza wynosiła 134%
Zarządzanie energią
Pobór mocy
Ze względu na potężny sprzęt, pobór mocy przez system jest bardzo duży. Wyróżnia się bardzo wysoki pobór w trybie standby, który zawsze wynosi na przemian 5 i 10 watów. Winne może być również podświetlenie LED z animacją nawet w trybie standby.
| wyłączony / stan wstrzymania | |
| luz | |
| obciążenie |
|
Legenda:
min: | |
| Asus ROG Strix Scar 18 2023 G834JY-N6005W i9-13980HX, GeForce RTX 4090 Laptop GPU, 2x Samsung PM9A1 MZVL21T0HCLR (RAID 0), IPS, 2560x1600, 18" | Razer Blade 16 Early 2023 i9-13950HX, GeForce RTX 4080 Laptop GPU, SSSTC CA6-8D1024, IPS, 2560x1600, 16" | MSI Titan GT77 HX 13VI i9-13950HX, GeForce RTX 4090 Laptop GPU, Samsung PM9A1 MZVL22T0HBLB, Mini-LED, 3840x2160, 17.3" | MSI Raider GE77 HX 12UHS i9-12900HX, GeForce RTX 3080 Ti Laptop GPU, Samsung PM9A1 MZVL22T0HBLB, IPS, 3840x2160, 17.3" | Asus ROG Strix Scar 17 SE G733CX-LL014W i9-12950HX, GeForce RTX 3080 Ti Laptop GPU, Samsung PM9A1 MZVL22T0HBLB, IPS, 2560x1440, 17.3" | Średnia w klasie Gaming | |
|---|---|---|---|---|---|---|
| Power Consumption | 9% | 13% | 15% | 6% | 29% | |
| Idle Minimum * (Watt) | 17.3 | 15.2 12% | 14 19% | 13 25% | 19.3 -12% | 13.2 ? 24% |
| Idle Average * (Watt) | 27 | 22.8 16% | 21.6 20% | 19 30% | 26.5 2% | 18.9 ? 30% |
| Idle Maximum * (Watt) | 46 | 49.8 -8% | 24.8 46% | 29 37% | 27.1 41% | 24.3 ? 47% |
| Load Average * (Watt) | 133 | 121.2 9% | 122.5 8% | 143 -8% | 141 -6% | 108 ? 19% |
| Load Maximum * (Watt) | 329 | 273.7 17% | 418 -27% | 352 -7% | 307.9 6% | 254 ? 23% |
| Witcher 3 ultra * (Watt) | 242 | 265 | 247 | 225 |
* ... im mniej tym lepiej
Power Consumption The Witcher 3 / Stress Test
Power Consumption with External Monitor
Czas pracy na baterii
Ze względu na energochłonne podzespoły akumulator o pojemności 90 Wh nie jest w stanie wygenerować żadnych rekordowych wartości. W trybie Optimus (z wyłączonym GPU), profilu Silent i z jasnością obniżoną do 150 cd/m² można jeszcze pracować przez kilka godzin poza siecią. Nasz test WLAN trwał w tym trybie nieco ponad 7 godzin. Jeżeli jednak chcemy grać w gry na zasilaniu akumulatorowym, nie tylko musimy się zadowolić znacznie obniżoną wydajnością, ale czas pracy na baterii nadal trwał w naszym teście tylko około godziny (bez ograniczenia liczby klatek na sekundę) w grze The Witcher 3.
Całkowite naładowanie baterii nastąpiło po 1h 40min z wyłączonym systemem lub 1h 45min w trybie bezczynności. Zasilacz dostarczał w tym czasie maksymalnie 117 W.
| Asus ROG Strix Scar 18 2023 G834JY-N6005W i9-13980HX, GeForce RTX 4090 Laptop GPU, 90 Wh | Razer Blade 16 Early 2023 i9-13950HX, GeForce RTX 4080 Laptop GPU, 95.2 Wh | MSI Titan GT77 HX 13VI i9-13950HX, GeForce RTX 4090 Laptop GPU, 99.9 Wh | MSI Raider GE77 HX 12UHS i9-12900HX, GeForce RTX 3080 Ti Laptop GPU, 99.99 Wh | Asus ROG Strix Scar 17 SE G733CX-LL014W i9-12950HX, GeForce RTX 3080 Ti Laptop GPU, 90 Wh | Średnia w klasie Gaming | |
|---|---|---|---|---|---|---|
| Czasy pracy | 21% | 6% | 30% | -41% | 27% | |
| H.264 (h) | 7 | 6 -14% | 6.5 -7% | 8.26 ? 18% | ||
| WiFi v1.3 (h) | 7.1 | 6.1 -14% | 5.3 -25% | 5.4 -24% | 4.2 -41% | 7.02 ? -1% |
| Witcher 3 ultra (h) | 0.9 | |||||
| Load (h) | 0.9 | 1.4 56% | 1.4 56% | 2 122% | 1.47 ? 63% | |
| Reader / Idle (h) | 8.9 | 9.8 | 8.71 ? |
Za
Przeciw
Werdykt
Asus ROG Strix SCAR 18 (2023) G834JY to wysokiej klasy laptop gamingowy, który Asus wyposażył w najmocniejsze obecnie dostępne podzespoły mobilne. W dużej obudowie mieści się bardzo dobry 18-calowy wyświetlacz, który zapewnia graczom szybki czas reakcji, G-SYNC i dobrą jakość obrazu. Jednak najważniejszym punktem G834JY jest z pewnością potężny sprzęt z procesorem Core i9-13980HX, procesorem graficznym GeForce RTX 4090 Laptop (175 W TGP) oraz dyskiem SSD RAID-0 NVMe. Podczas gdy te komponenty wytwarzają ogromne ilości ciepła pod obciążeniem, Asus utrzymuje je w ryzach dzięki potrójnemu systemowi chłodzenia z wentylatorem, rurką cieplną z komorą parową oraz pastą z płynnego metalu.
ROG Strix SCAR 18 to dobrze zaokrąglony pakiet z imponującą wydajnością w wysokiej cenie.
Nasze jedyne zastrzeżenia są niewielkie, jak np. wycie cewek w naszym testowym egzemplarzu przy wysokiej liczbie klatek na sekundę, kiepska kamera internetowa czy rozmieszczenie portów, które w niektórych przypadkach może być mniej optymalne.
Jako alternatywy można dostać 18-calowe modele z GPU RTX 4090 od Alienware (m18 R1) i Razera (Blade 18). MSI oferuje minimalnie szybszy Titan GT77 HX 13VI z 17-calowym wyświetlaczem. Osoby, które mogą się zadowolić nieco mniejszą wydajnością, mogą przyjrzeć się modelom opartym na RTX 4080, które są znacznie bardziej przystępne cenowo. Ciekawą alternatywą może być tutaj również Scar 18 w wersji G834JZ.
Cena i dostępność
Testowany przez nas model G834JY-N6000W jest obecnie dostępny tylko w Anglii w cenie £3999.99 (cena katalogowa). Niektóre sklepy w USA oferują G834JY-XS97 obecnie za 3899,99 dol(wyczerpane zapasy u Asusa), a Amazon oferuje G834JY-XS97 za 5390 dolarów.
Asus ROG Strix Scar 18 2023 G834JY-N6005W
- 07/03/2023 v7 (old)
Klaus Hinum
Przezroczystość
Wyboru urządzeń do recenzji dokonuje nasza redakcja. Próbka testowa została udostępniona autorowi jako pożyczka od producenta lub sprzedawcy detalicznego na potrzeby tej recenzji. Pożyczkodawca nie miał wpływu na tę recenzję, producent nie otrzymał też kopii tej recenzji przed publikacją. Nie było obowiązku publikowania tej recenzji. Jako niezależna firma medialna, Notebookcheck nie podlega władzy producentów, sprzedawców detalicznych ani wydawców.
Tak testuje Notebookcheck
Każdego roku Notebookcheck niezależnie sprawdza setki laptopów i smartfonów, stosując standardowe procedury, aby zapewnić porównywalność wszystkich wyników. Od około 20 lat stale rozwijamy nasze metody badawcze, ustanawiając przy tym standardy branżowe. W naszych laboratoriach testowych doświadczeni technicy i redaktorzy korzystają z wysokiej jakości sprzętu pomiarowego. Testy te obejmują wieloetapowy proces walidacji. Nasz kompleksowy system ocen opiera się na setkach uzasadnionych pomiarów i benchmarków, co pozwala zachować obiektywizm.Price comparison

