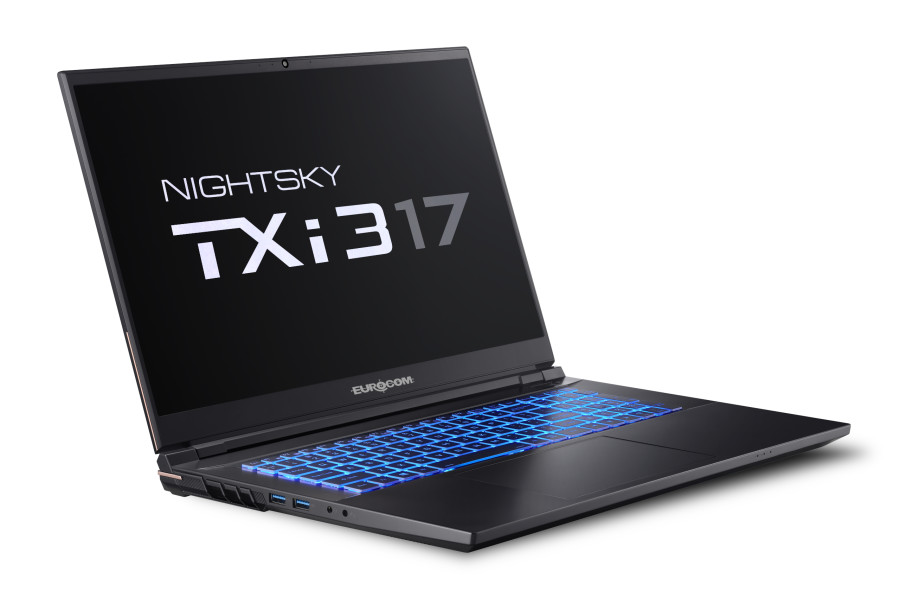
Recenzja laptopa Eurocom Nightsky TXi317: 125 W GeForce RTX 3080 Ti speedster
")
Nightsky TXi317 to najnowszy 17,3-calowy laptop do gier od Eurocom wykorzystujący procesory Intel 12 gen Alder Lake-H i do 155 W TGP GeForce RTX 3080 Ti GPU, aby być jednym z najszybszych laptopów do gier obecnie dostępnych. Dzieli on ten sam projekt obudowy Tongfang, co Schenker XMG Pro 17 E22 i dlatego zalecamy sprawdzenie naszej istniejąca recenzja tutaj aby uzyskać więcej szczegółów na temat obudowy i jej fizycznych cech.
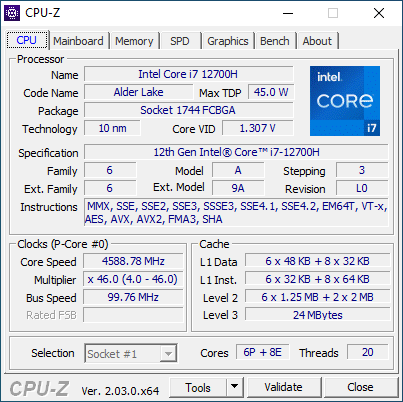
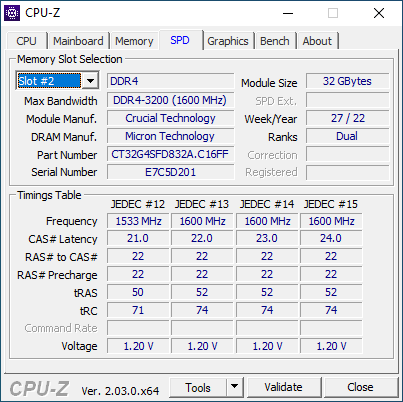
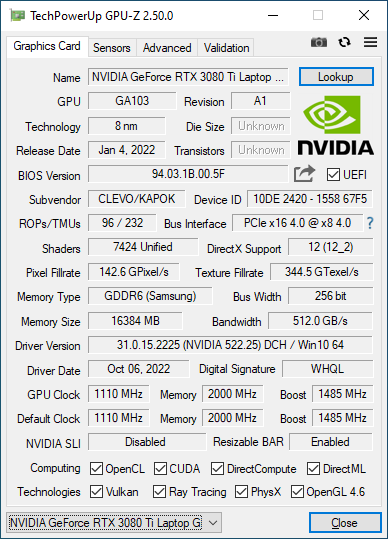
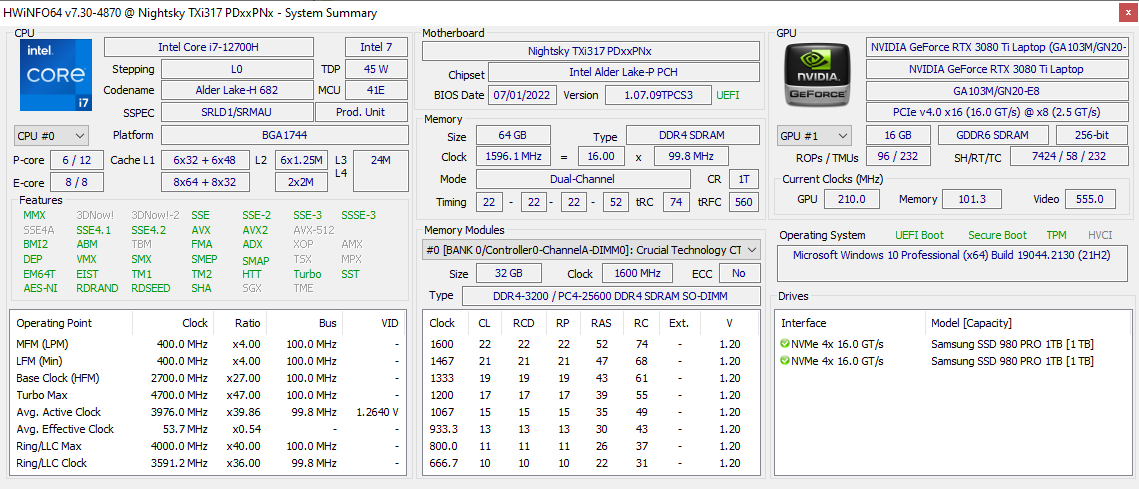
Nasza recenzowana konfiguracja jest wyposażona w procesor Core i7-12700H, wyświetlacz IPS 144 Hz 1080p, kartę graficzną GeForce RTX 3080 Ti oraz 64 GB pamięci RAM za około 4100 USD. Najniższa opcja procesora graficznego to GeForce RTX 3070 Ti, co stawia Nightsky TXi317 na rynku laptopów do gier dla entuzjastów.
Bezpośredni konkurenci obejmują inne wysokowydajne 17-calowe laptopy do gier, takie jak Aorus 17X,MSI Raider GE77lubAlienware x17 R2.
Więcej recenzji Eurocom:
Potencjalni konkurenci w porównaniu
Ocena | Data | Model | Waga | Wysokość | Rozmiar | Rezolucja | Cena |
|---|---|---|---|---|---|---|---|
| 85.3 % v7 (old) | 10/2022 | Eurocom Nightsky TXi317 i7-12700H, GeForce RTX 3080 Ti Laptop GPU | 2.9 kg | 27 mm | 17.30" | 1920x1080 | |
| 85.4 % v7 (old) | Schenker XMG Pro 17 E22 i9-12900H, GeForce RTX 3080 Ti Laptop GPU | 2.8 kg | 27 mm | 17.30" | 2560x1440 | ||
| 83.7 % v7 (old) | Aorus 17X XES i9-12900HX, GeForce RTX 3070 Ti Laptop GPU | 2.7 kg | 30 mm | 17.30" | 1920x1080 | ||
| 86.8 % v7 (old) | MSI Raider GE77 HX 12UHS i9-12900HX, GeForce RTX 3080 Ti Laptop GPU | 3.1 kg | 25.9 mm | 17.30" | 3840x2160 | ||
| 89.9 % v7 (old) | Razer Blade 17 Early 2022 i9-12900H, GeForce RTX 3080 Ti Laptop GPU | 2.8 kg | 19.9 mm | 17.30" | 3840x2160 | ||
| 89.2 % v7 (old) | Alienware x17 R2 P48E i9-12900HK, GeForce RTX 3080 Ti Laptop GPU | 3.1 kg | 20.9 mm | 17.30" | 1920x1080 |
Sprawa
Między Nightsky TXi317 a XMG Pro 17 E22 jest jedna powierzchowna różnica: w tylnych narożnikach konstrukcji Eurocomu zastosowano błyszczące wykończenia w kolorze brązowym, a w konstrukcji Schenkera nie. Poza tym ich obudowy są identyczne.
Czytnik kart SD
| SD Card Reader | |
| average JPG Copy Test (av. of 3 runs) | |
| Alienware x17 R2 P48E (AV Pro V60) | |
| Razer Blade 17 Early 2022 (AV PRO microSD 128 GB V60) | |
| Schenker XMG Pro 17 E22 (AV PRO microSD 128 GB V60) | |
| MSI Raider GE77 HX 12UHS (AV PRO microSD 128 GB V60) | |
| Eurocom Nightsky TXi317 (AV Pro V60) | |
| maximum AS SSD Seq Read Test (1GB) | |
| Alienware x17 R2 P48E (AV Pro V60) | |
| Eurocom Nightsky TXi317 (AV Pro V60) | |
| Schenker XMG Pro 17 E22 (AV PRO microSD 128 GB V60) | |
Komunikacja
Wi-Fi 6 jest w standardzie, bez opcji Wi-Fi 6E ze strony producenta, pomimo wysokiej ceny modelu. Szybkość transferu jest mimo wszystko stała i bez problemów z łącznością.
| Networking | |
| iperf3 transmit AX12 | |
| Alienware x17 R2 P48E | |
| iperf3 receive AX12 | |
| Alienware x17 R2 P48E | |
| iperf3 receive AXE11000 6GHz | |
| Aorus 17X XES | |
| MSI Raider GE77 HX 12UHS | |
| iperf3 receive AXE11000 | |
| Schenker XMG Pro 17 E22 | |
| Razer Blade 17 Early 2022 | |
| Eurocom Nightsky TXi317 | |
| iperf3 transmit AXE11000 6GHz | |
| Aorus 17X XES | |
| iperf3 transmit AXE11000 | |
| Eurocom Nightsky TXi317 | |
Kamera internetowa
Aparat jest tylko 1 MP bez opcji 2 MP, co znów jest rozczarowujące, biorąc pod uwagę wysoki przedział cenowy modelu.


Konserwacja
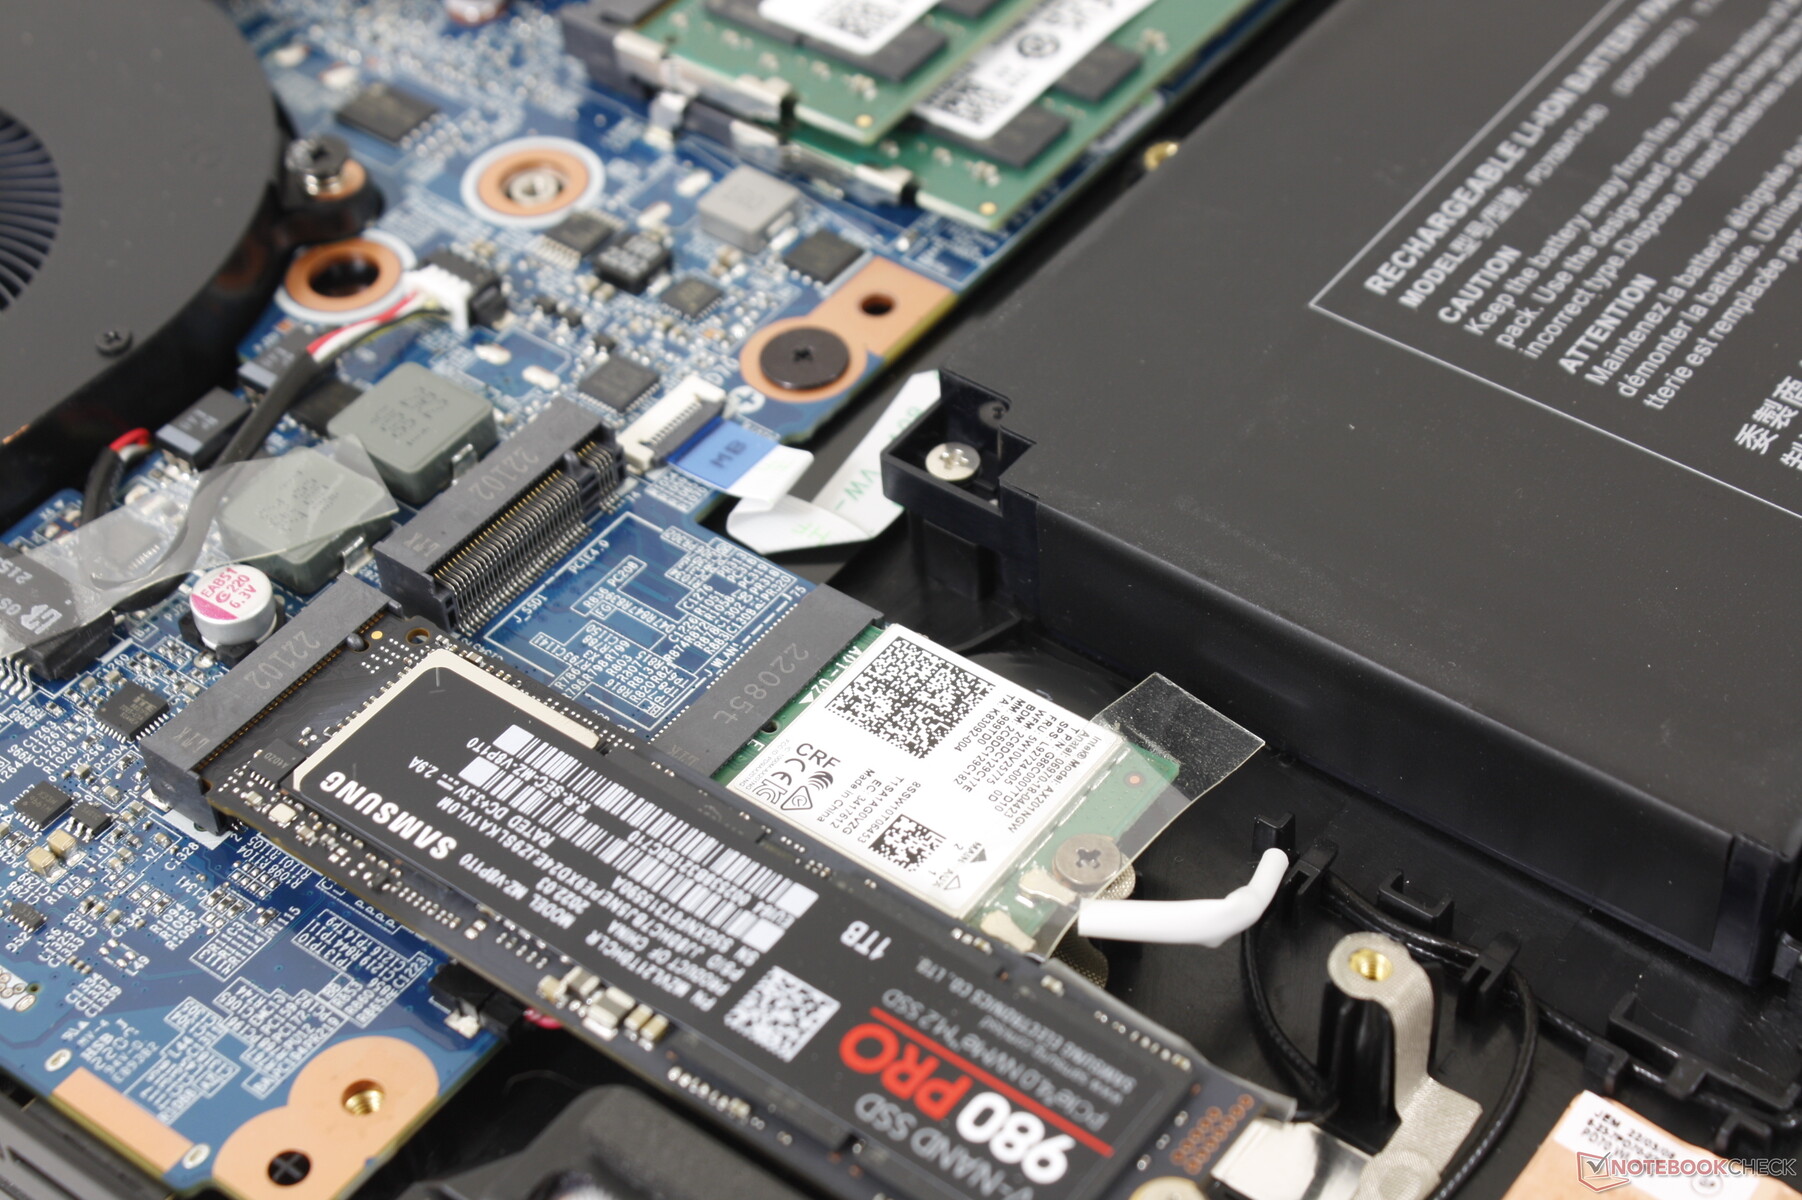
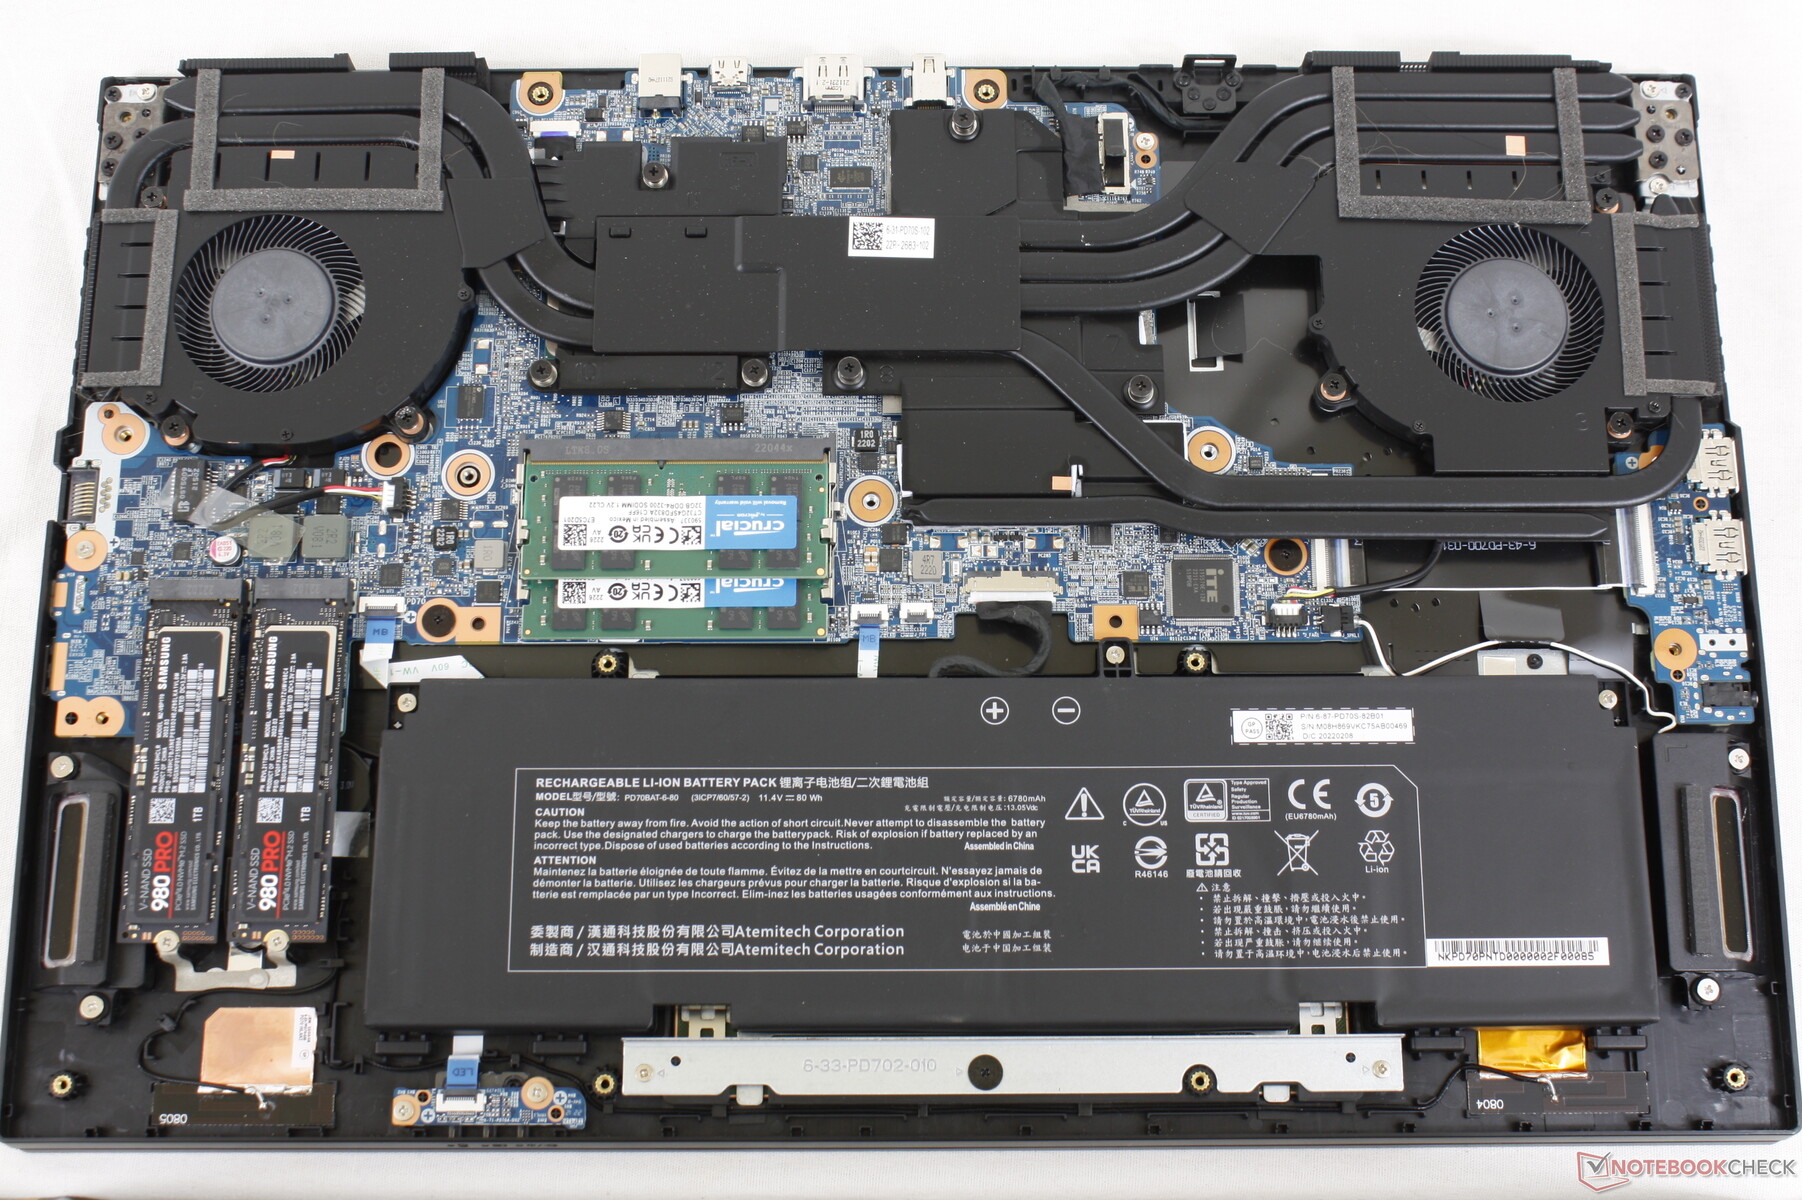
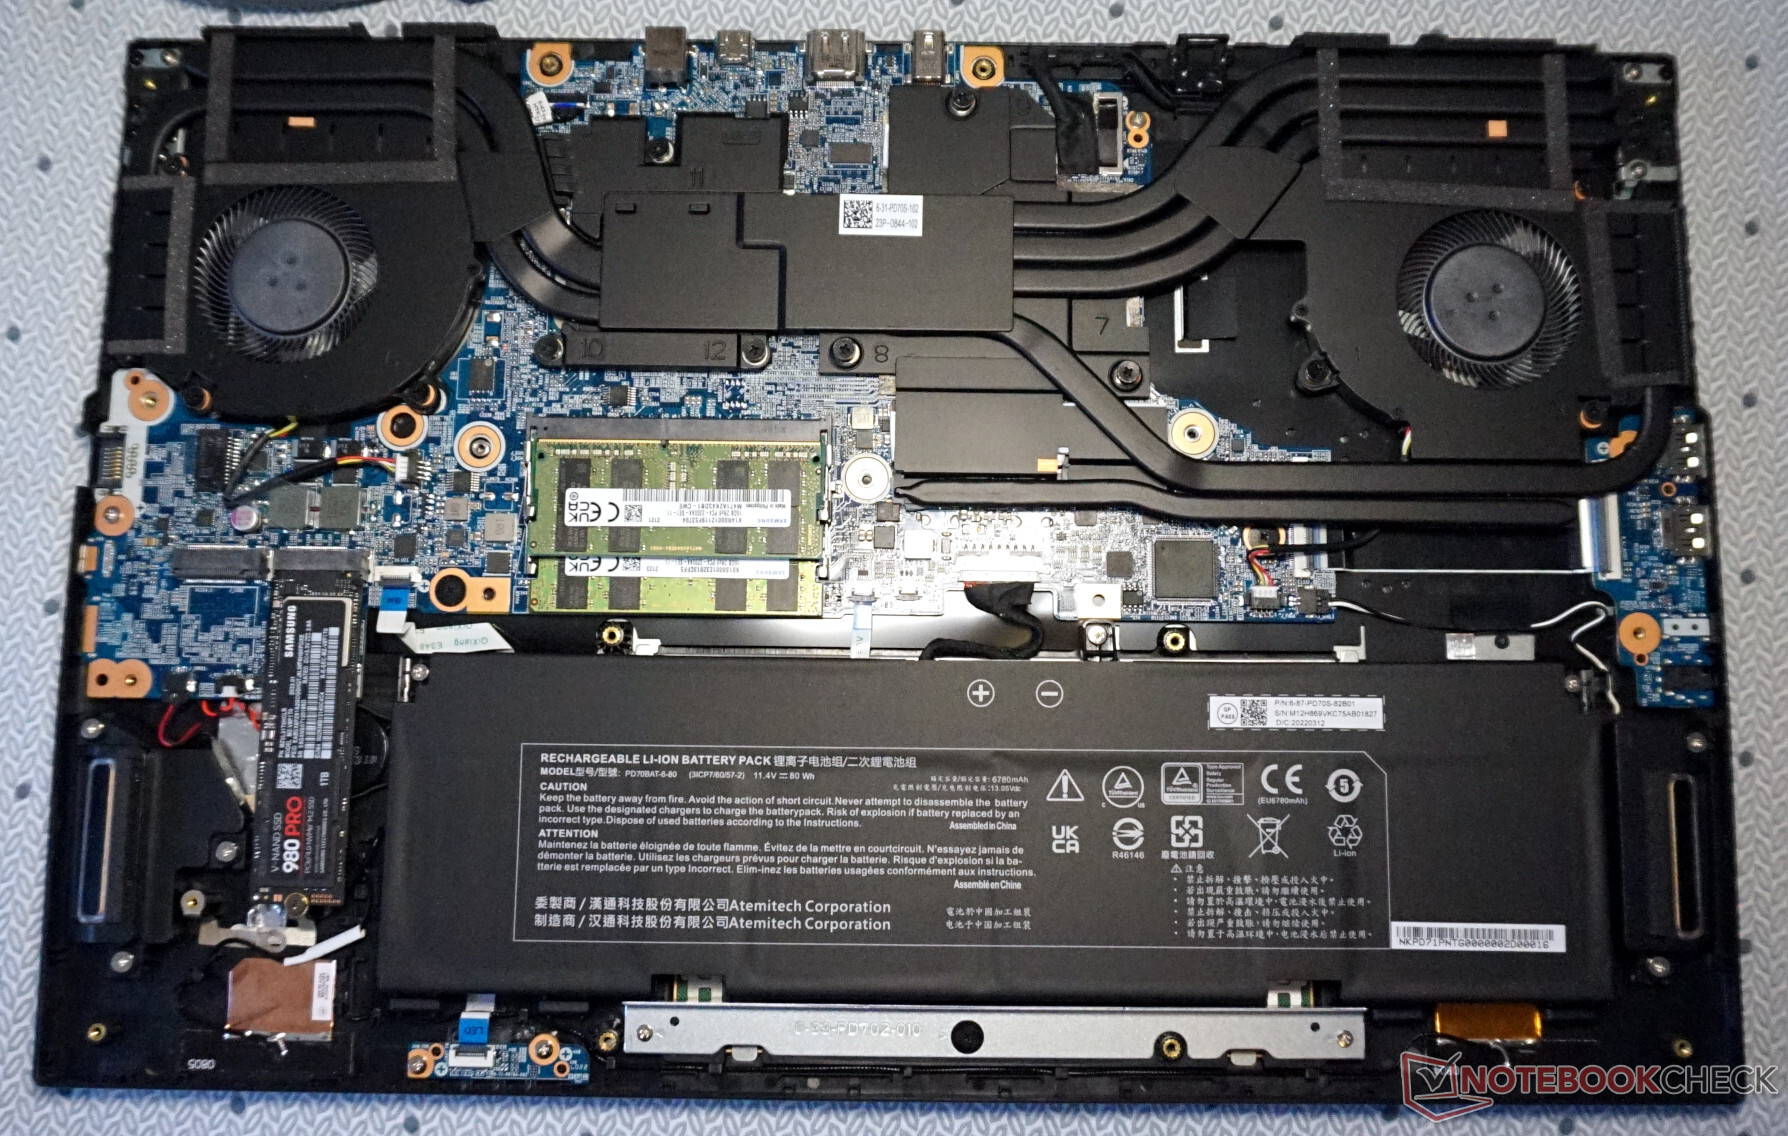
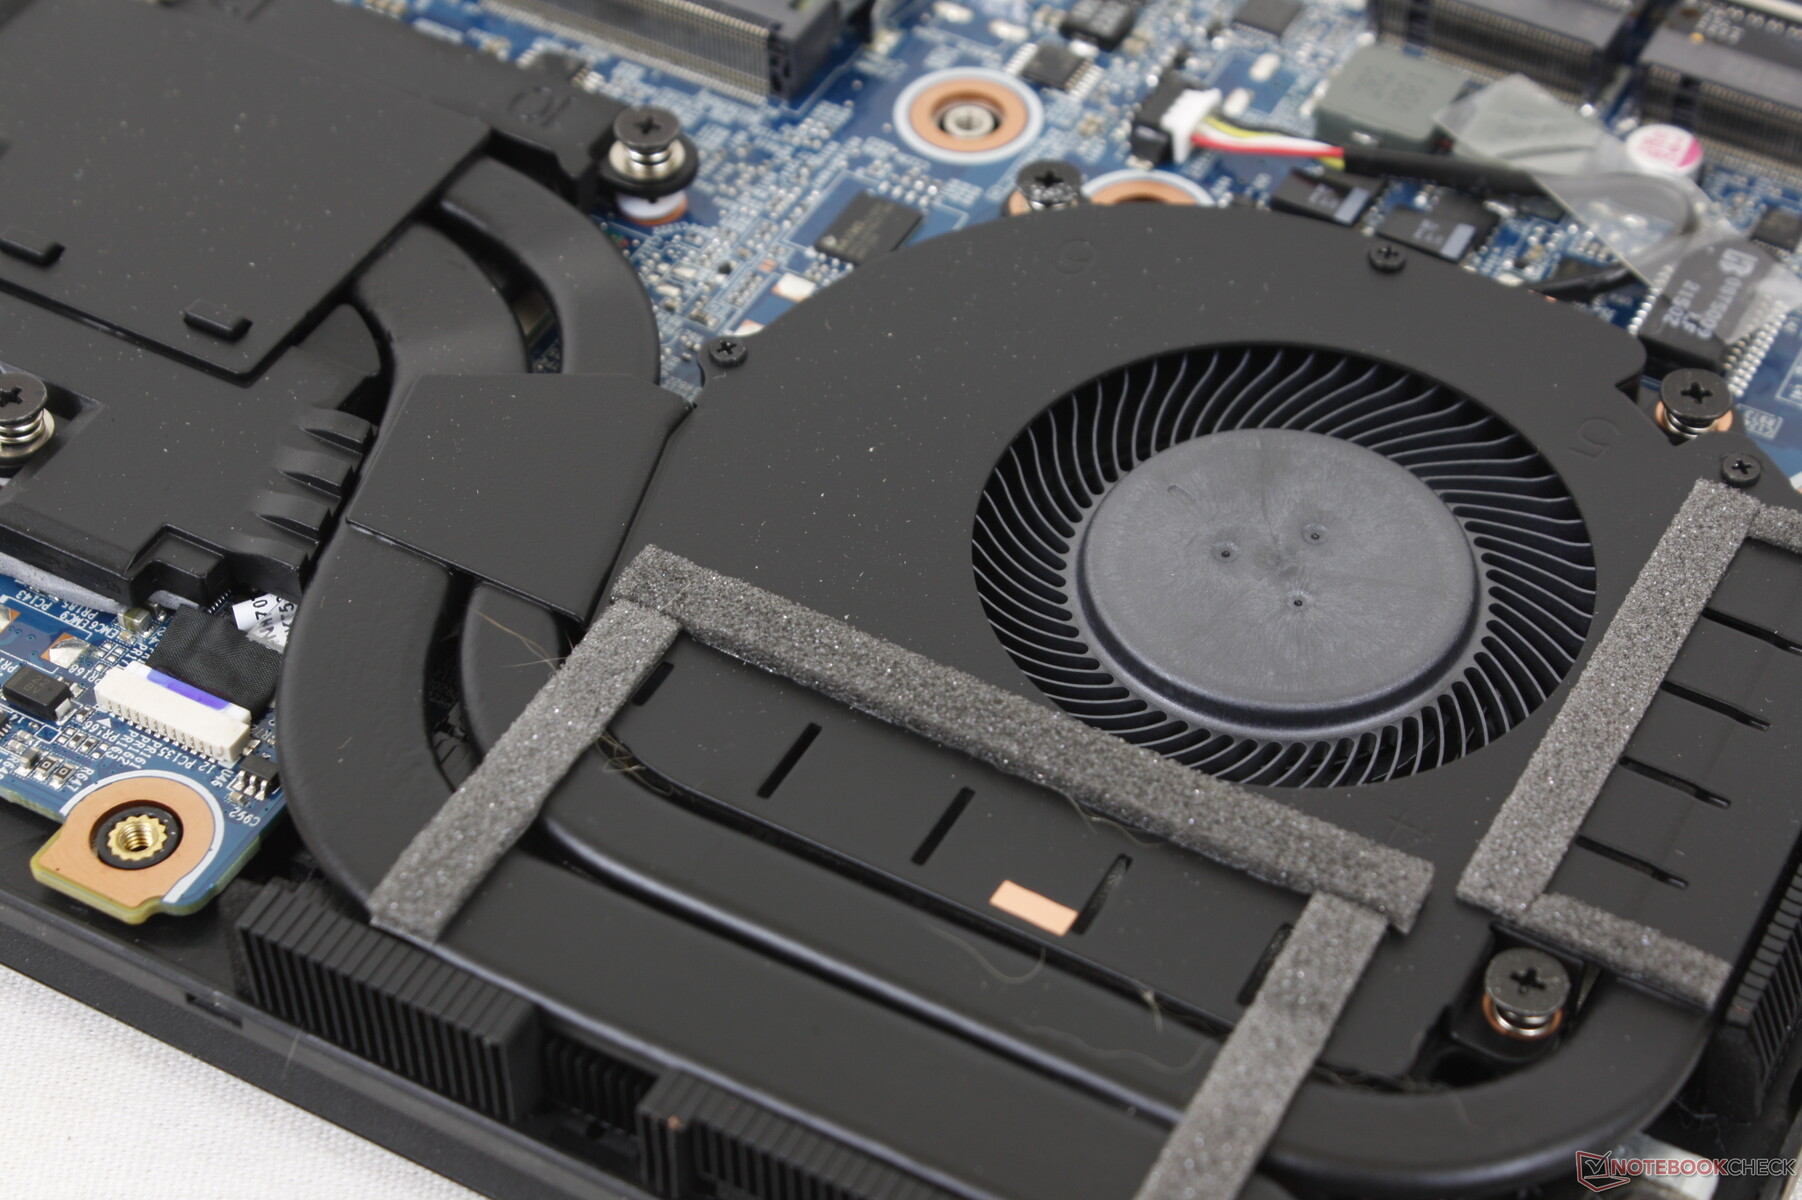
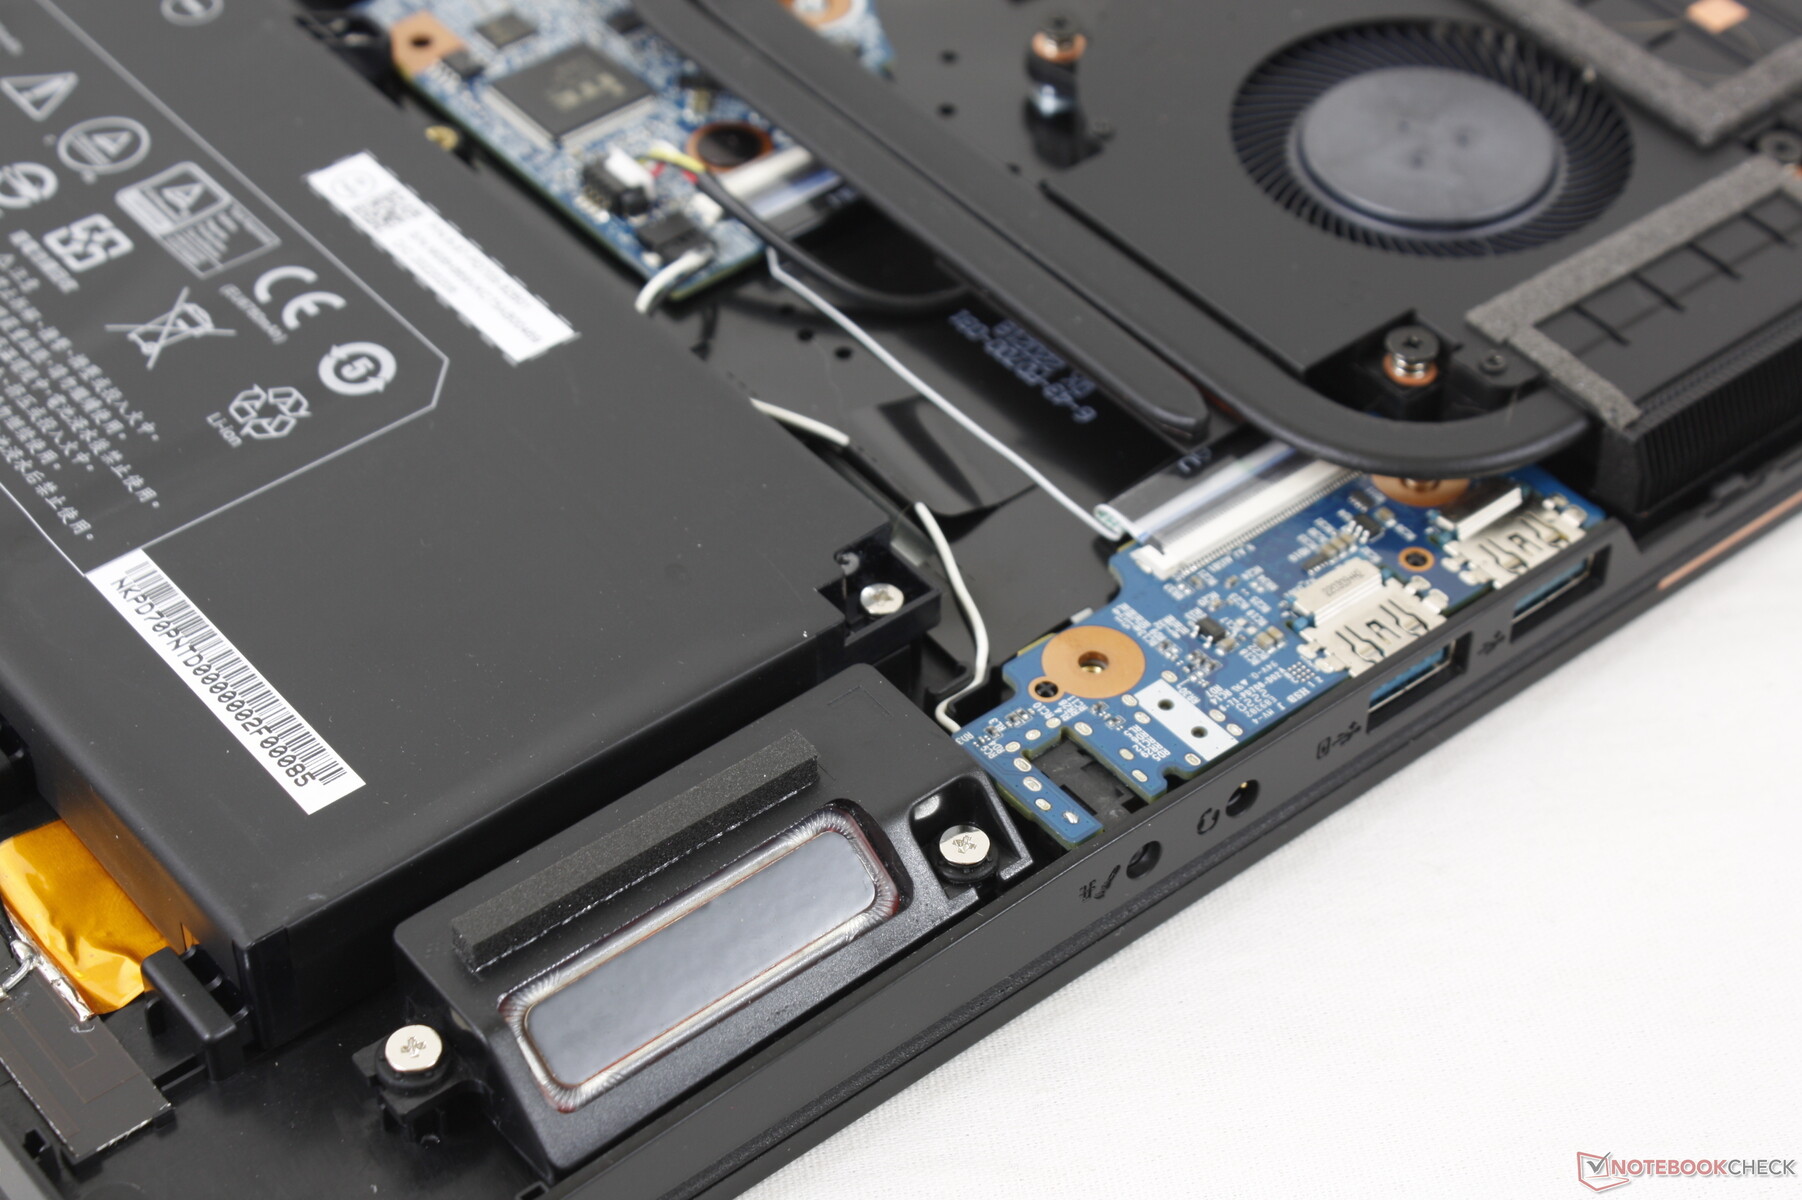
Dolny panel jest zabezpieczony 16 śrubkami Philipsa, co ułatwia serwisowanie. Większość innych laptopów do gier ma jednak znacznie mniej śrubek, więc otwarcie Eurocomu wymaga nieco więcej cierpliwości.
Akcesoria i gwarancja
Pudełko detaliczne nie zawiera żadnych dodatków poza zasilaczem i dokumentacją. W przypadku zakupu w USA obowiązuje standardowa roczna ograniczona gwarancja producenta.
Wyświetl
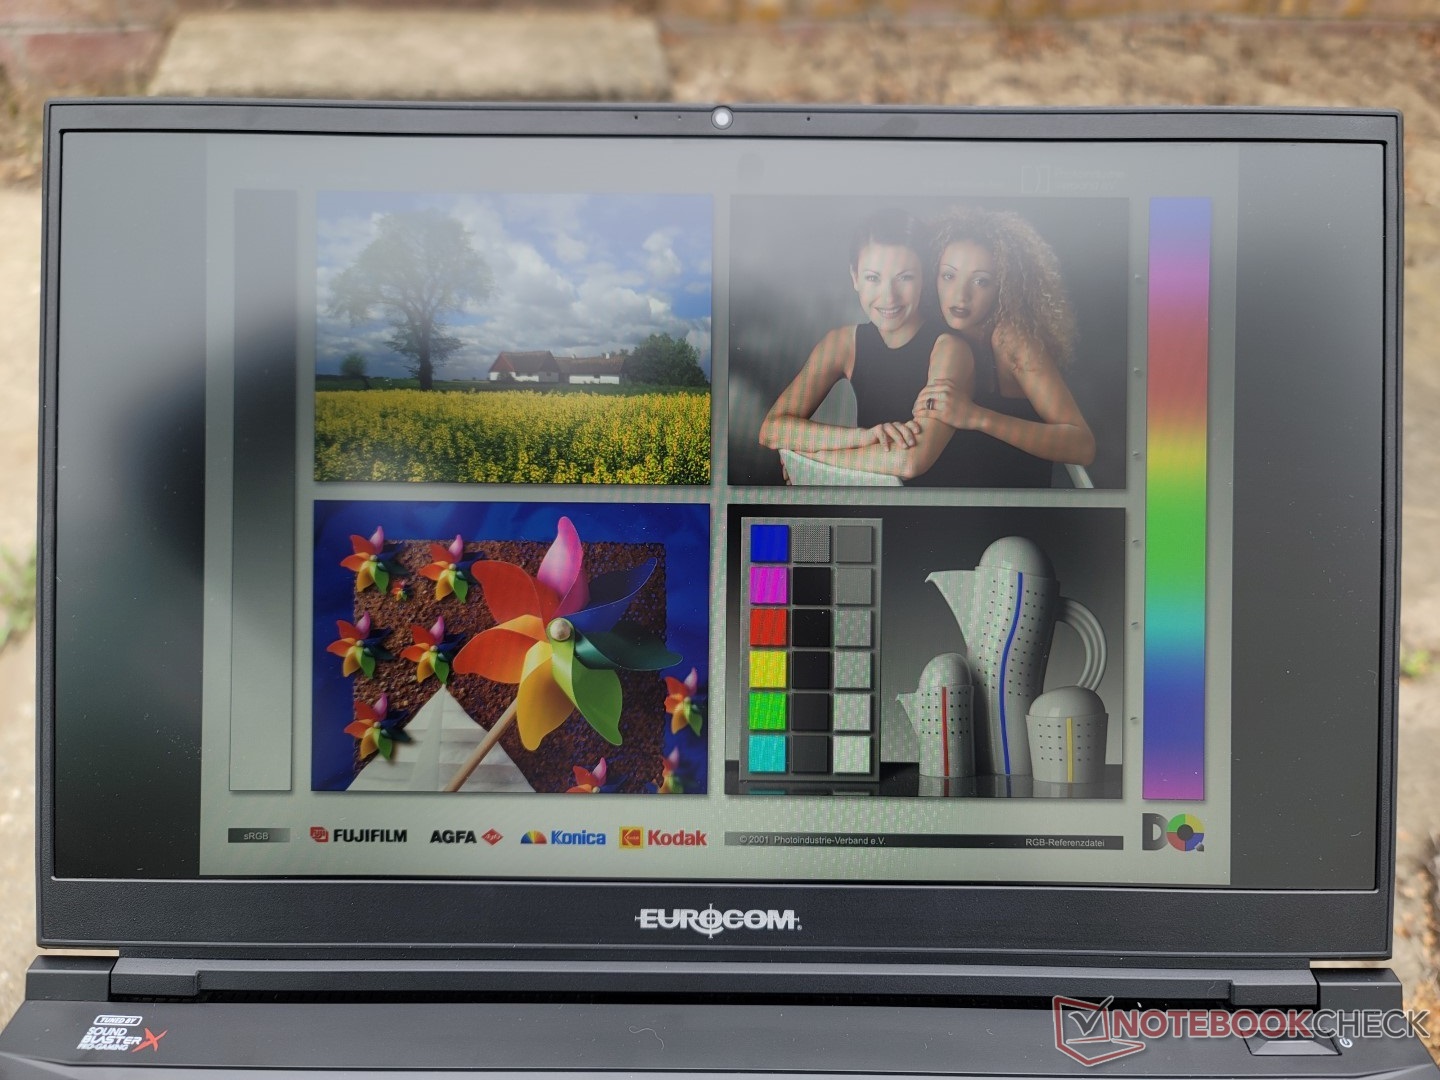
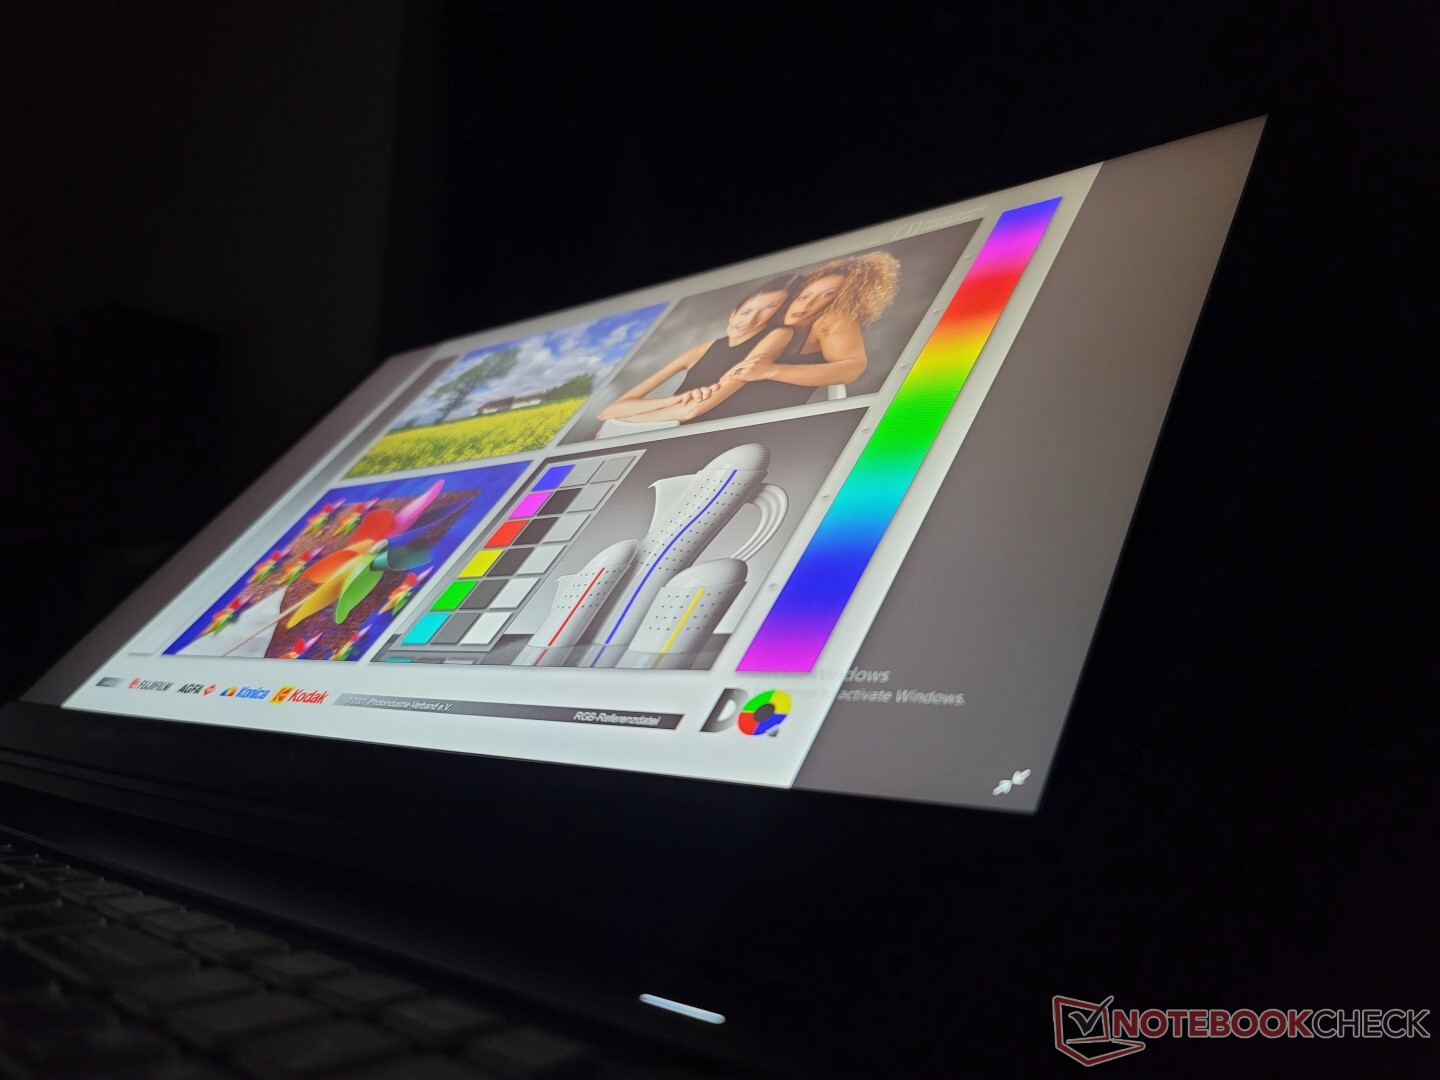
W naszym testowym egzemplarzu zastosowano ten sam panel IPS LG Philips LP173WFG-SPB3, który znalazł się w modelu Schenker XMG Focus 17. W porównaniu z panelem BOE 1440p w XMG Pro 17 E22, nasz panel LG Philips 1080p oferuje węższe kolory, wolniejszą częstotliwość odświeżania i wolniejsze czasy reakcji w czerni i bieli, dzięki czemu jest bardziej wyświetlaczem ze średniej półki niż z wyższej. Nadal jest jednak bardzo dobry, ale 1440p to zdecydowanie lepsze dopasowanie niż 1080p dla laptopa działającego na GPU GeForce RTX 3080 Ti.
Na szczęście TXi317 dostarczany jest z trzema panelami do wyboru, od 1080p do 4K. Należy pamiętać, że żaden z nich nie jest OLED, ani nie może zaoferować pełnego pokrycia AdobeRGB.
- 1080p, 144 Hz, 100% sRGB, IPS
- 1440p, 165 Hz, 100% sRGB, IPS
- 2160p, 60 Hz, 100% sRGB, IPS

| |||||||||||||||||||||||||
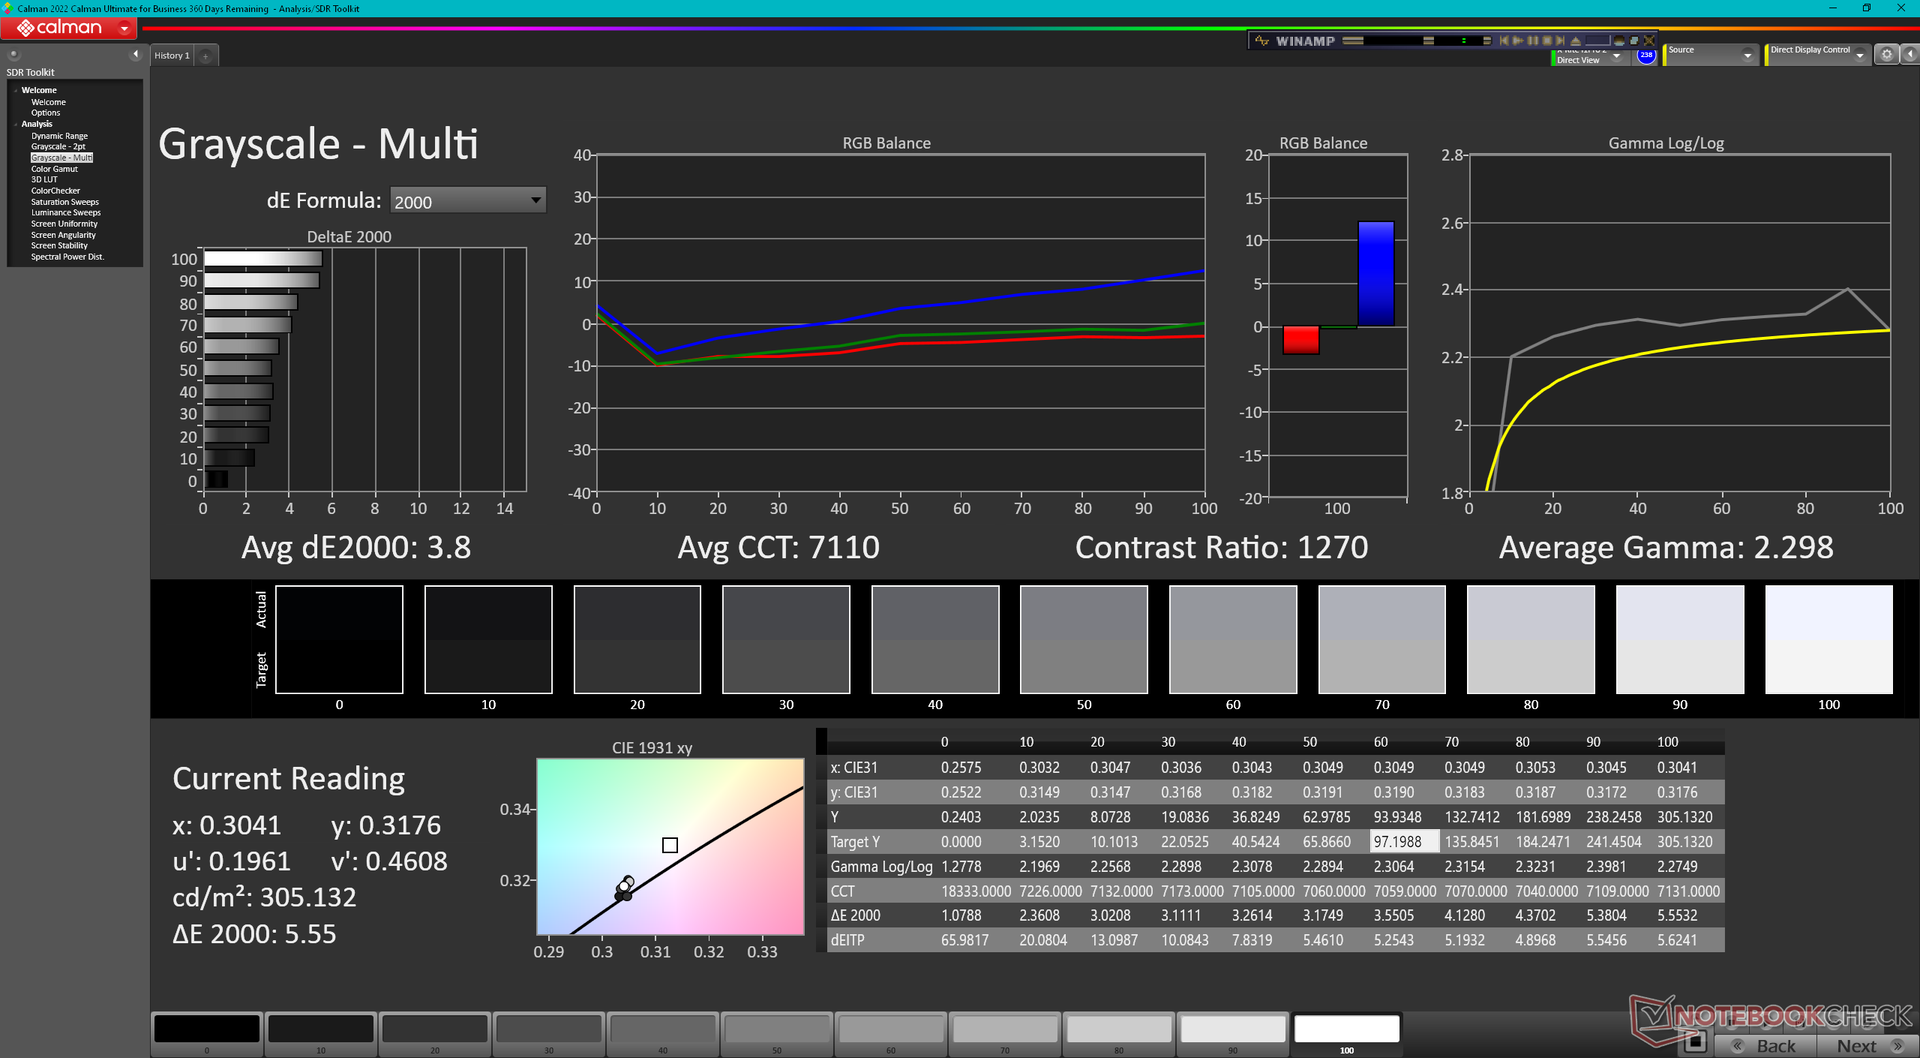
rozświetlenie: 88 %
na akumulatorze: 303.9 cd/m²
kontrast: 1013:1 (czerń: 0.3 cd/m²)
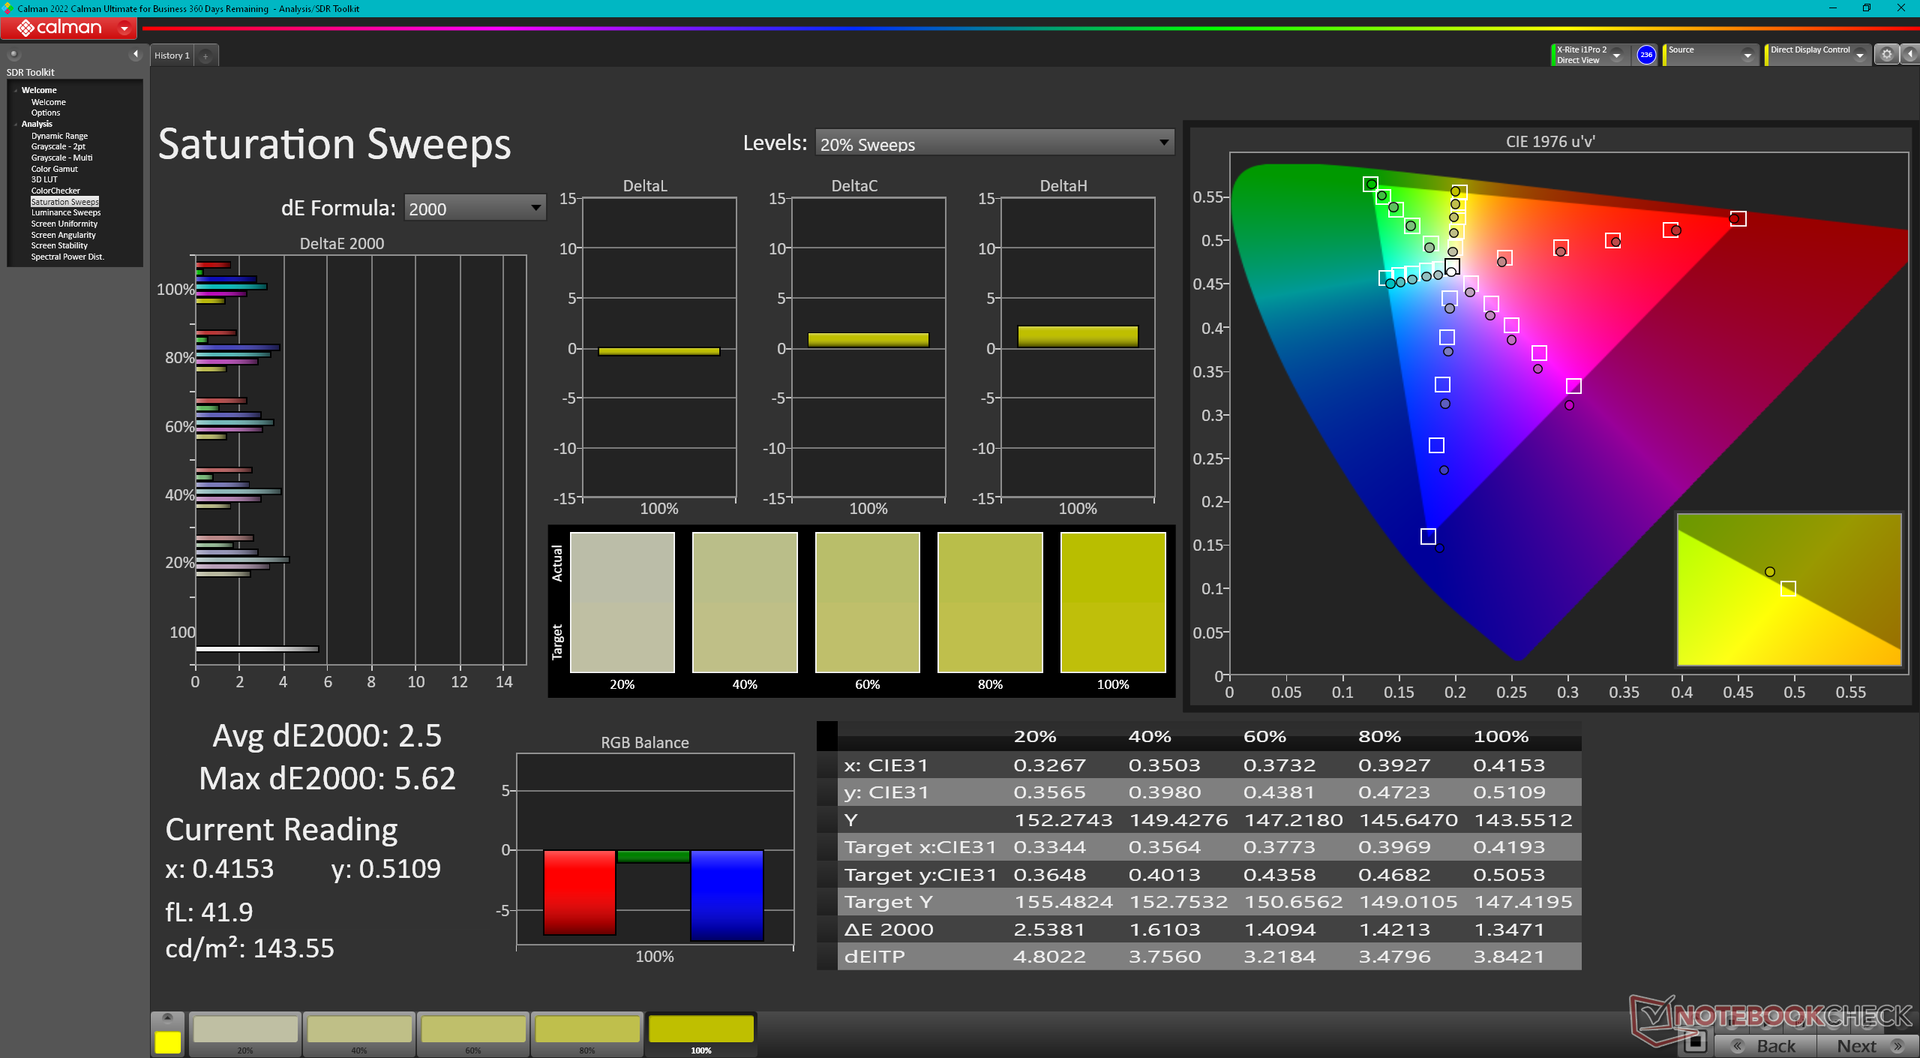
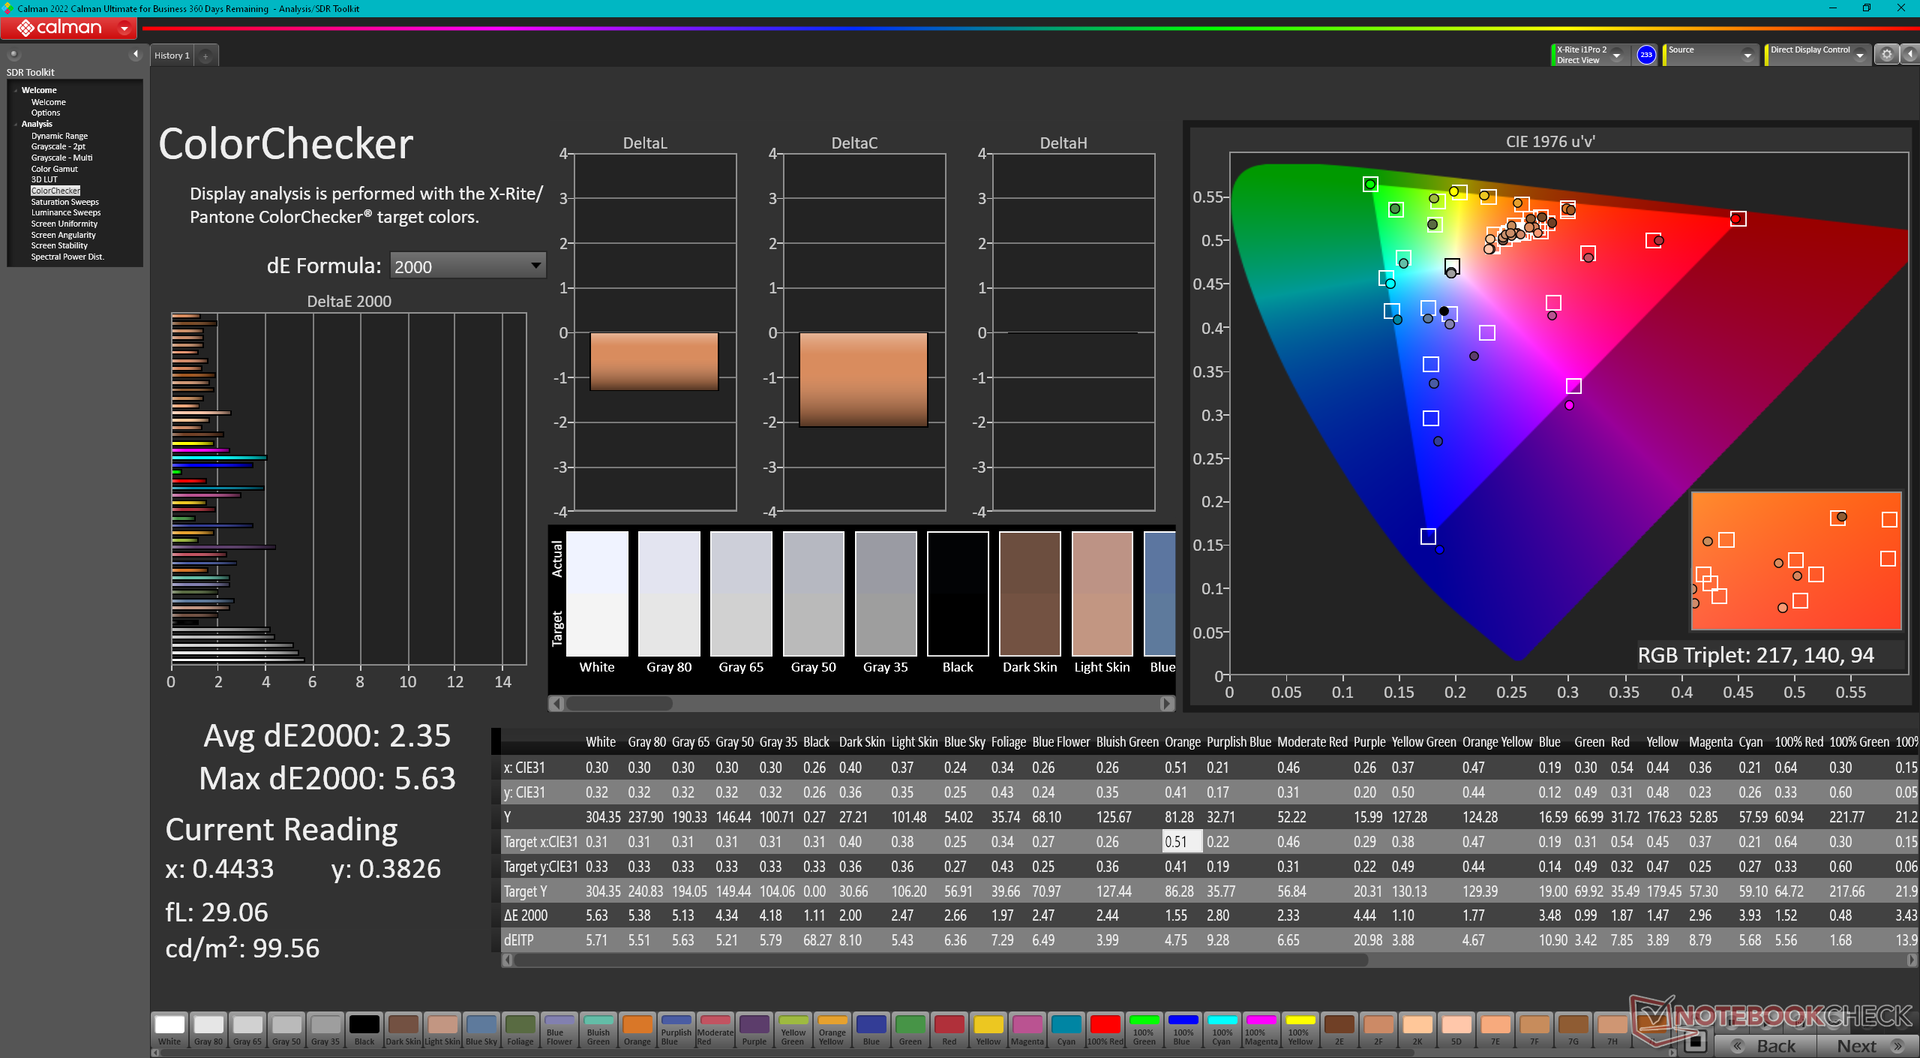
ΔE ColorChecker Calman: 2.35 | ∀{0.5-29.43 Ø4.73}
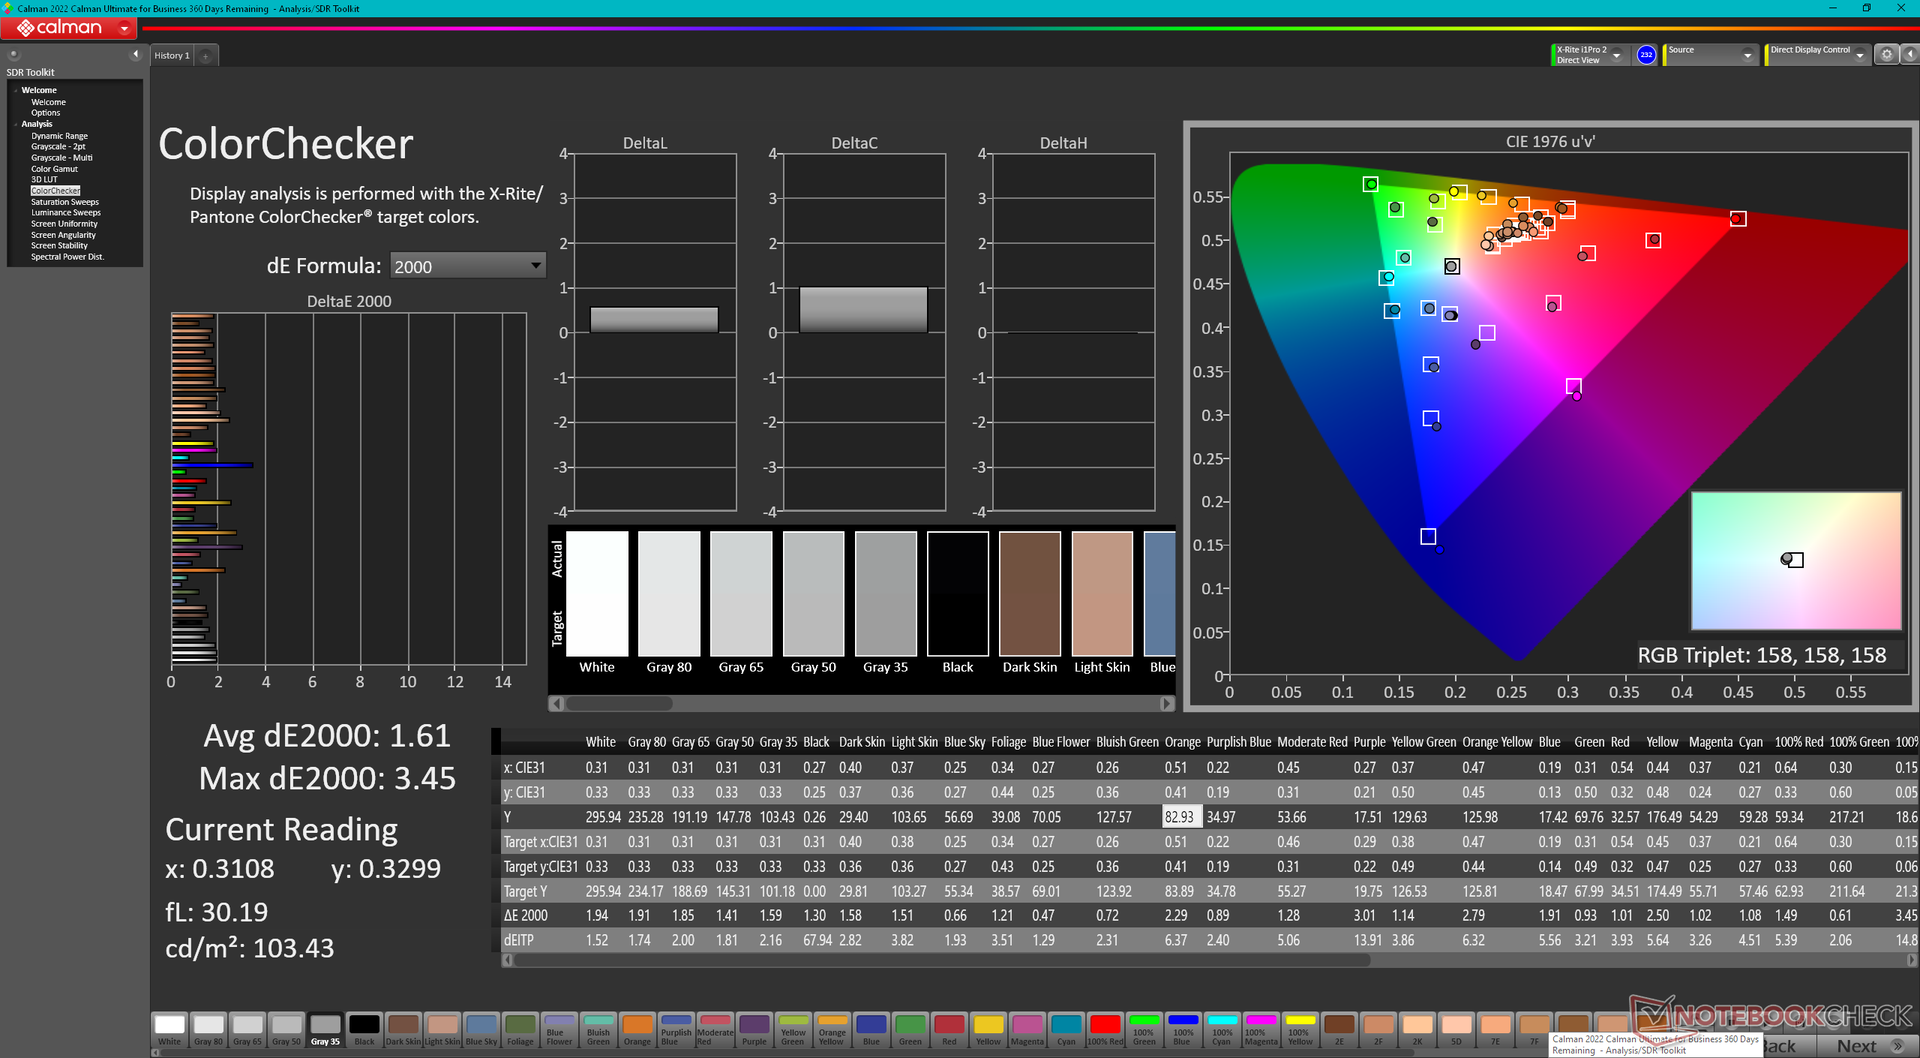
calibrated: 1.61
ΔE Greyscale Calman: 3.8 | ∀{0.09-98 Ø4.97}
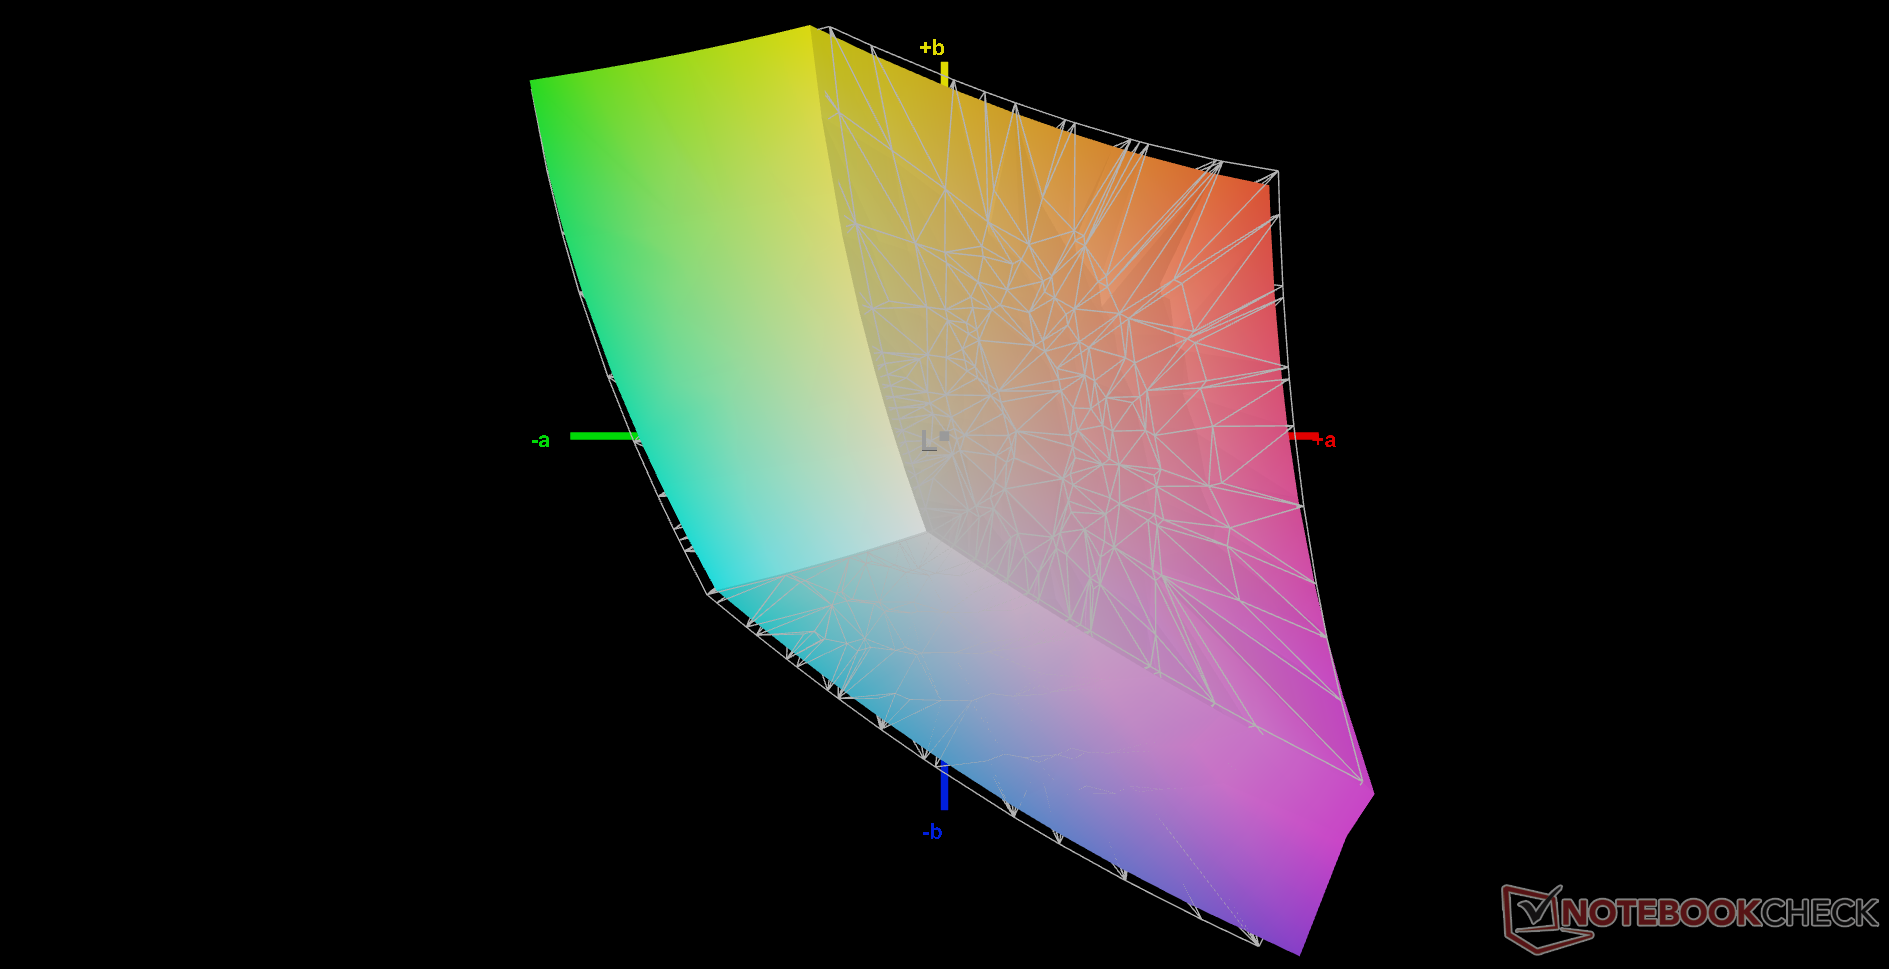
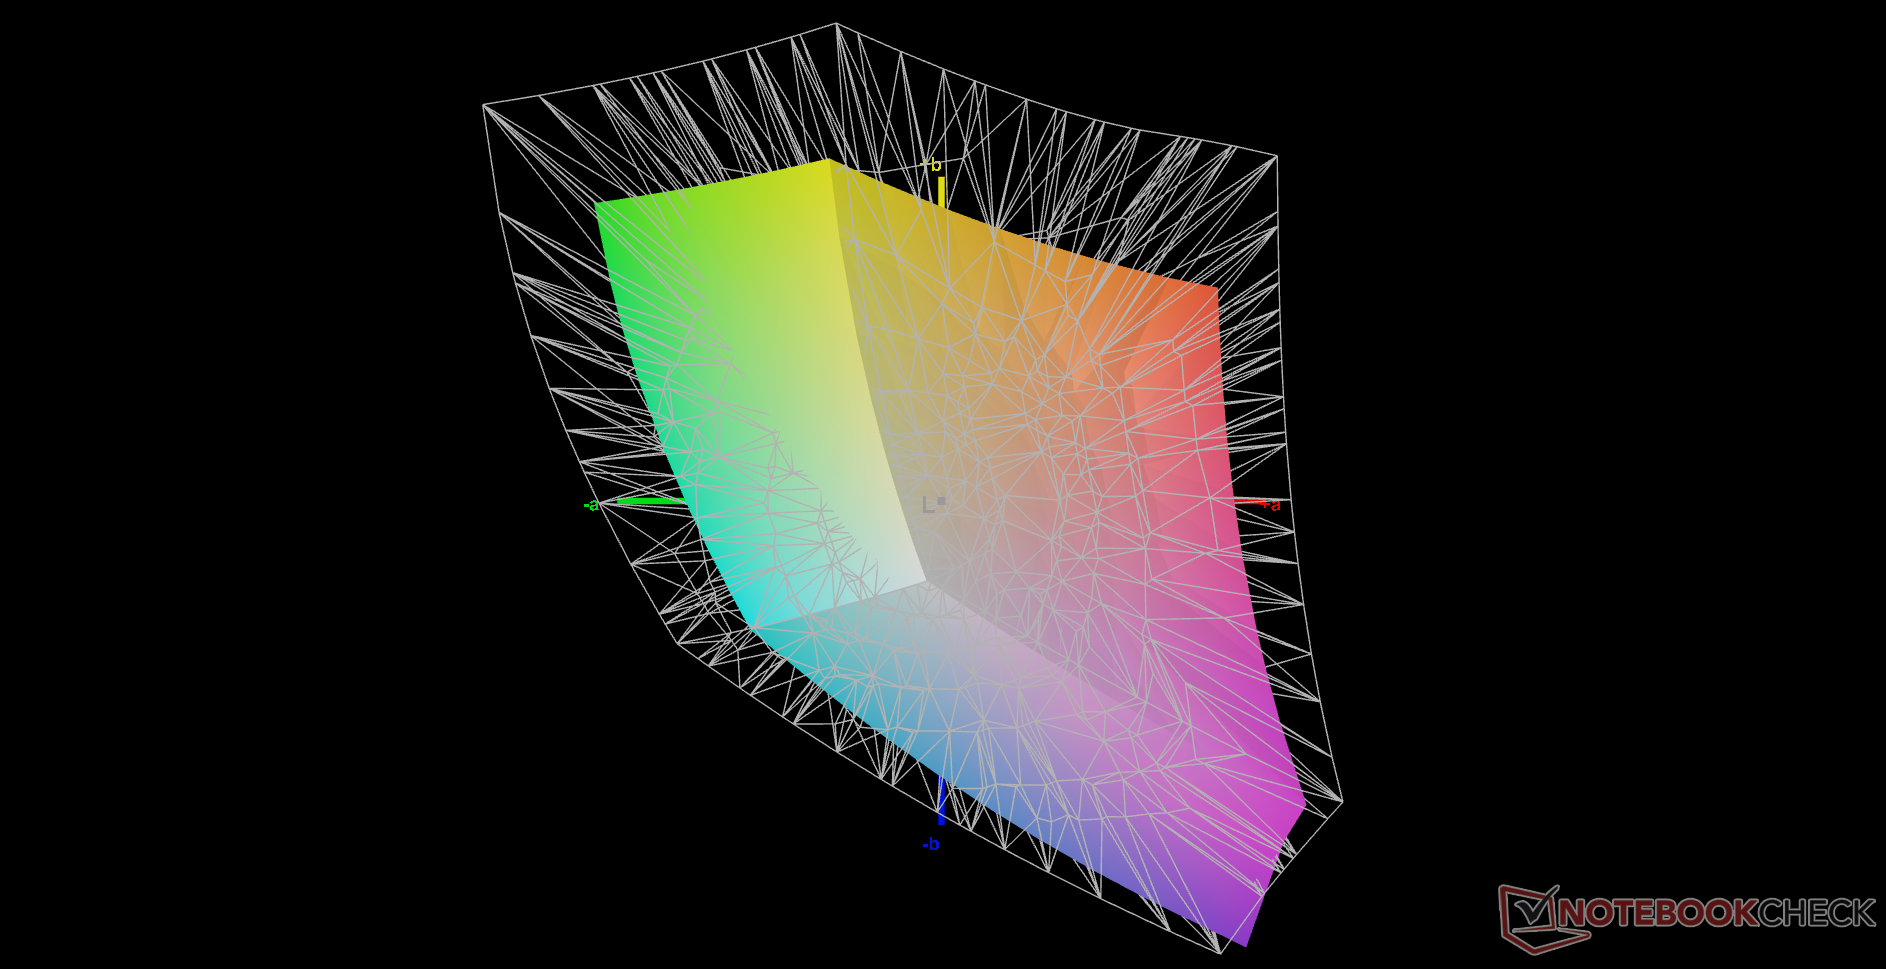
65.4% AdobeRGB 1998 (Argyll 3D)
95.2% sRGB (Argyll 3D)
64.5% Display P3 (Argyll 3D)
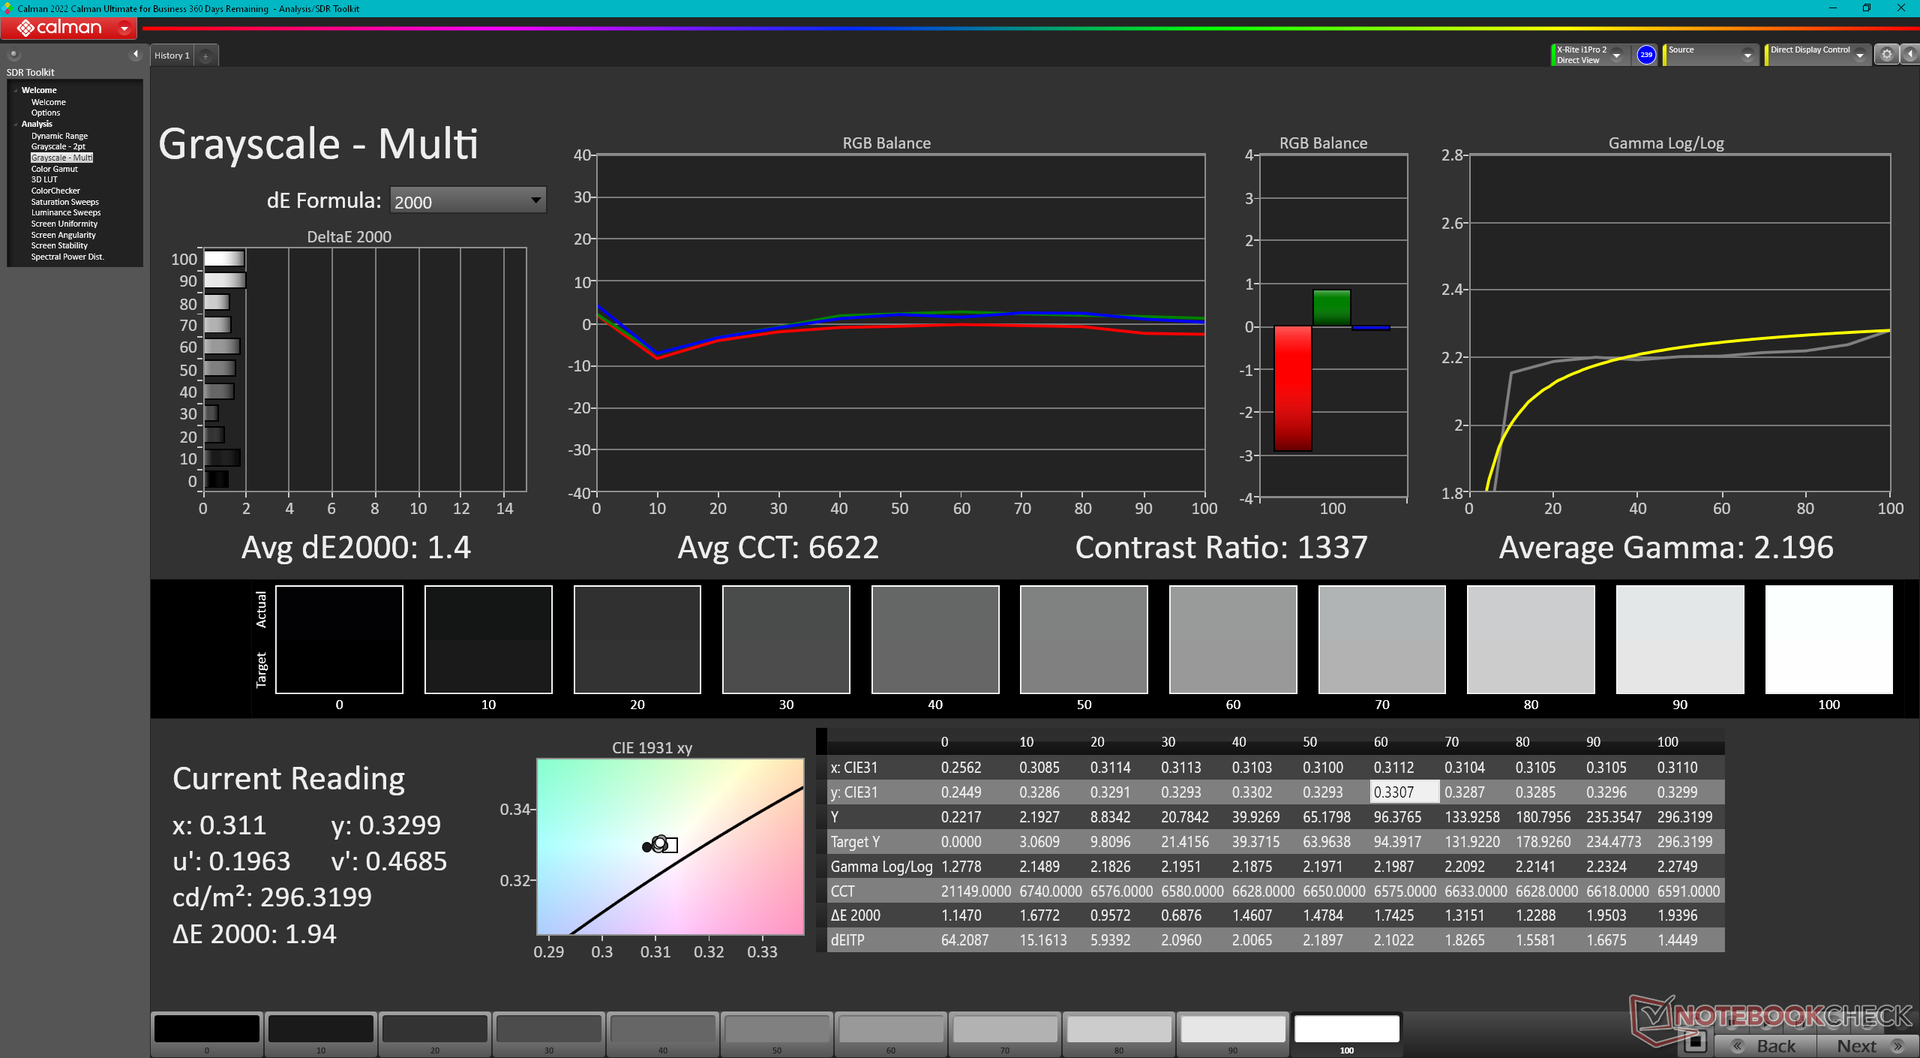
Gamma: 2.3
CCT: 7110 K
| Eurocom Nightsky TXi317 LG Philips LP173WFG-SPB3, IPS, 1920x1080, 17.3" | Schenker XMG Pro 17 E22 BOE099D, IPS, 2560x1440, 17.3" | Aorus 17X XES Sharp SHP1563, IPS, 1920x1080, 17.3" | MSI Raider GE77 HX 12UHS AU Optronics B173ZAN06.1, IPS, 3840x2160, 17.3" | Razer Blade 17 Early 2022 AU Optronics B173ZAN06.9, IPS, 3840x2160, 17.3" | Alienware x17 R2 P48E AU Optronics B173HAN, IPS, 1920x1080, 17.3" | |
|---|---|---|---|---|---|---|
| Display | 29% | 8% | 29% | 31% | 17% | |
| Display P3 Coverage (%) | 64.5 | 97.5 51% | 70.1 9% | 96.6 50% | 99.4 54% | 79.2 23% |
| sRGB Coverage (%) | 95.2 | 99.9 5% | 99.9 5% | 99.8 5% | 100 5% | 99.8 5% |
| AdobeRGB 1998 Coverage (%) | 65.4 | 85.2 30% | 71.9 10% | 85.8 31% | 87.3 33% | 79.6 22% |
| Response Times | 44% | 58% | 47% | 39% | -1% | |
| Response Time Grey 50% / Grey 80% * (ms) | 10.4 ? | 5.4 ? 48% | 3.4 ? 67% | 5.8 ? 44% | 7.5 ? 28% | 12.4 ? -19% |
| Response Time Black / White * (ms) | 11.2 ? | 6.8 ? 39% | 5.8 ? 48% | 5.6 ? 50% | 5.6 ? 50% | 9.2 ? 18% |
| PWM Frequency (Hz) | ||||||
| Screen | 5% | -24% | -19% | 33% | 2% | |
| Brightness middle (cd/m²) | 303.9 | 349 15% | 278 -9% | 381 25% | 503 66% | 365.4 20% |
| Brightness (cd/m²) | 292 | 319 9% | 273 -7% | 371 27% | 486 66% | 344 18% |
| Brightness Distribution (%) | 88 | 83 -6% | 79 -10% | 84 -5% | 84 -5% | 85 -3% |
| Black Level * (cd/m²) | 0.3 | 0.32 -7% | 0.26 13% | 0.52 -73% | 0.44 -47% | 0.29 3% |
| Contrast (:1) | 1013 | 1091 8% | 1069 6% | 733 -28% | 1143 13% | 1260 24% |
| Colorchecker dE 2000 * | 2.35 | 2.5 -6% | 3.96 -69% | 1.08 54% | 3.17 -35% | |
| Colorchecker dE 2000 max. * | 5.63 | 6.87 -22% | 10.78 -91% | 4.54 19% | 7.69 -37% | |
| Colorchecker dE 2000 calibrated * | 1.61 | 0.64 60% | 1.07 34% | 2.53 -57% | 0.6 63% | 0.51 68% |
| Greyscale dE 2000 * | 3.8 | 3.9 -3% | 6.8 -79% | 1.3 66% | 5.3 -39% | |
| Gamma | 2.3 96% | 2.09 105% | 2.224 99% | 2.151 102% | 2.18 101% | |
| CCT | 7110 91% | 7192 90% | 7651 85% | 6541 99% | 5879 111% | |
| Całkowita średnia (program / ustawienia) | 26% /
16% | 14% /
-5% | 19% /
6% | 34% /
33% | 6% /
5% |
* ... im mniej tym lepiej
Eurocom za opłatą dokona kalibracji wyświetlacza. Nasz egzemplarz testowy nie został skalibrowany, a średnie wartości deltaE w skali szarości i kolorze wyniosły odpowiednio 3,8 i 2,35, co jest w sumie niezłym wynikiem. Samodzielna kalibracja panelu poprawiłaby te średnie jeszcze bardziej, do 1,4 i 1,61. Nasz skalibrowany profil jest dostępny do pobrania za darmo powyżej.

Wyświetl czasy reakcji
| ↔ Czas reakcji od czerni do bieli | ||
|---|---|---|
| 11.2 ms ... wzrost ↗ i spadek ↘ łącznie | ↗ 6 ms wzrost | 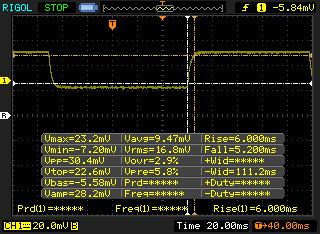 |
| ↘ 5.2 ms upadek | ||
| W naszych testach ekran wykazuje dobry współczynnik reakcji, ale może być zbyt wolny dla graczy rywalizujących ze sobą. Dla porównania, wszystkie testowane urządzenia wahają się od 0.1 (minimum) do 240 (maksimum) ms. » 30 % wszystkich urządzeń jest lepszych. Oznacza to, że zmierzony czas reakcji jest lepszy od średniej wszystkich testowanych urządzeń (19.9 ms). | ||
| ↔ Czas reakcji 50% szarości do 80% szarości | ||
| 10.4 ms ... wzrost ↗ i spadek ↘ łącznie | ↗ 6 ms wzrost | 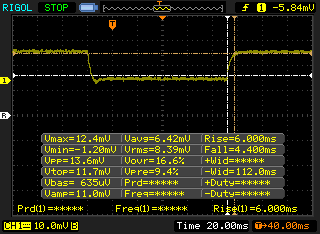 |
| ↘ 4.4 ms upadek | ||
| W naszych testach ekran wykazuje dobry współczynnik reakcji, ale może być zbyt wolny dla graczy rywalizujących ze sobą. Dla porównania, wszystkie testowane urządzenia wahają się od 0.165 (minimum) do 636 (maksimum) ms. » 24 % wszystkich urządzeń jest lepszych. Oznacza to, że zmierzony czas reakcji jest lepszy od średniej wszystkich testowanych urządzeń (31.1 ms). | ||
Migotanie ekranu / PWM (modulacja szerokości impulsu)
| Migotanie ekranu/nie wykryto PWM | 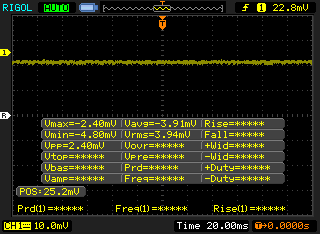 | ||
Dla porównania: 52 % wszystkich testowanych urządzeń nie używa PWM do przyciemniania wyświetlacza. Jeśli wykryto PWM, zmierzono średnio 7791 (minimum: 5 - maksimum: 343500) Hz. | |||
Przy 300 nitach maksymalnych wyświetlacz jest mniej więcej przeciętny pod względem widoczności na zewnątrz w porównaniu z innymi 17-calowymi laptopami do gier. Kilka alternatywnych rozwiązań, jak np.Razer Blade 17mają znacznie jaśniejsze wyświetlacze o wartości ponad 500 nitów, które ułatwiają czytanie na zewnątrz.
Wydajność
Warunki badania
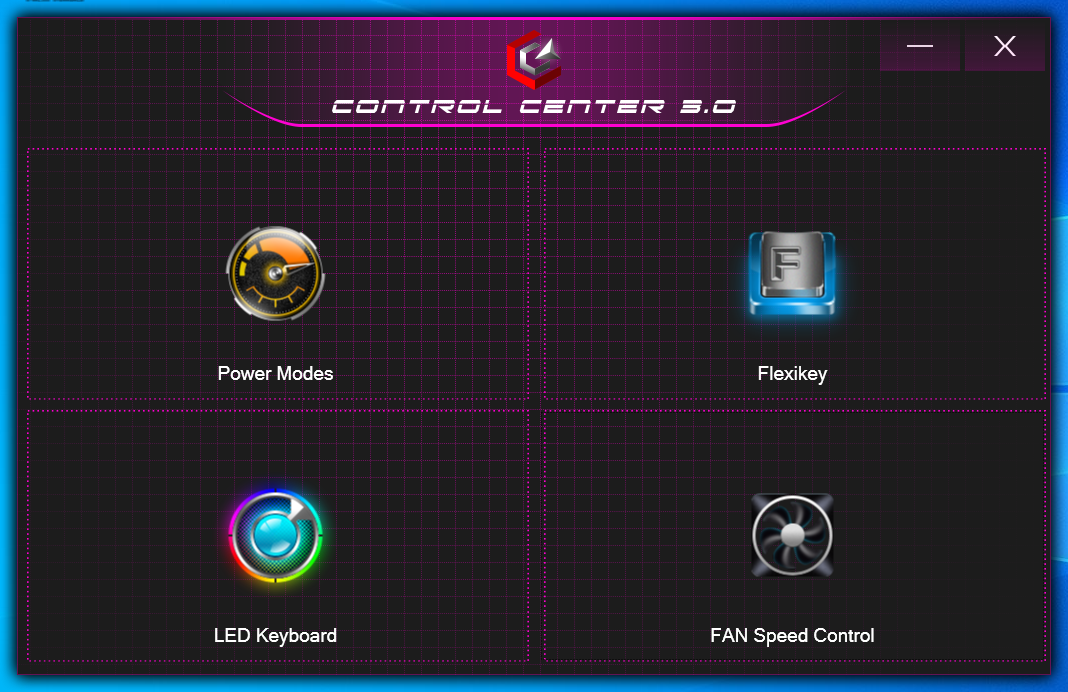
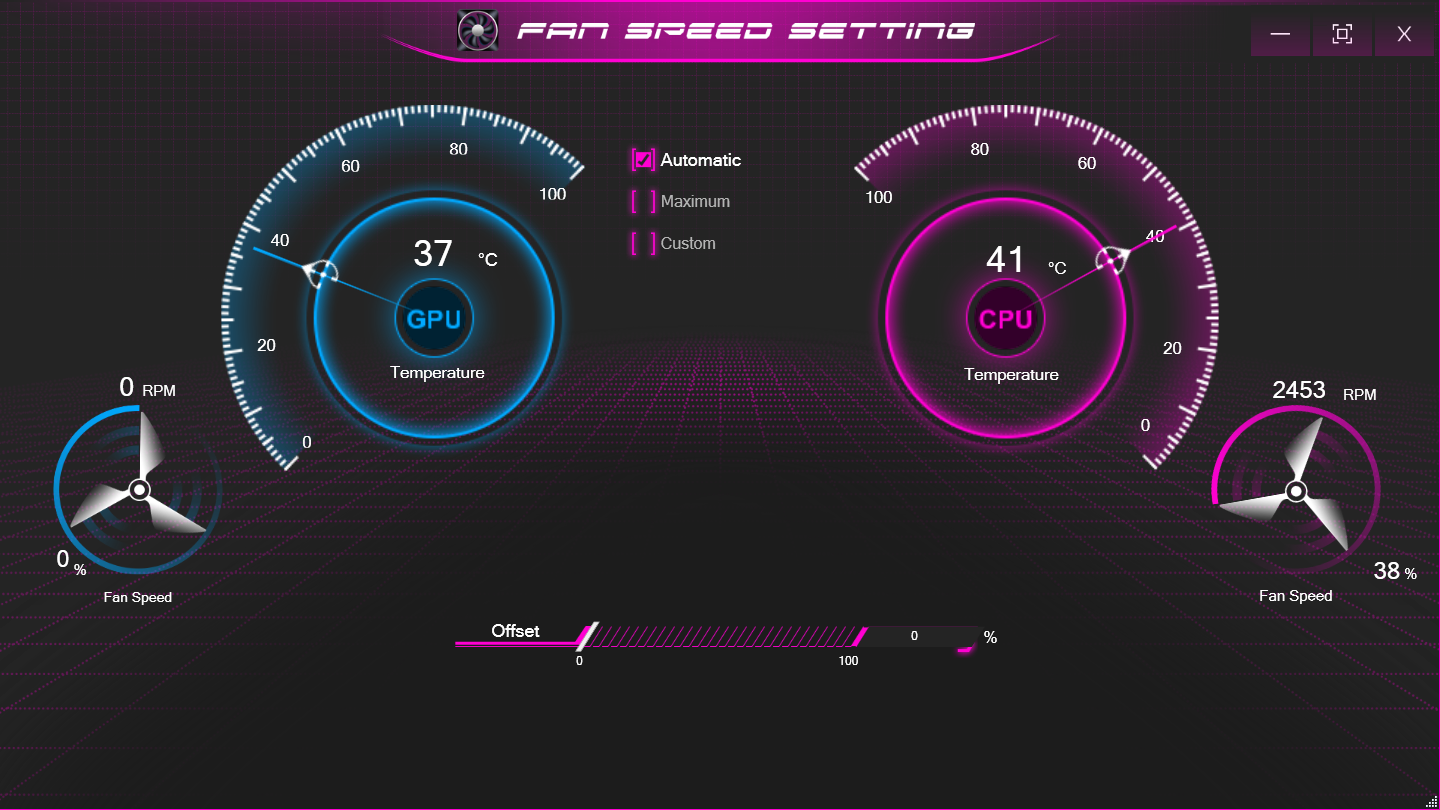
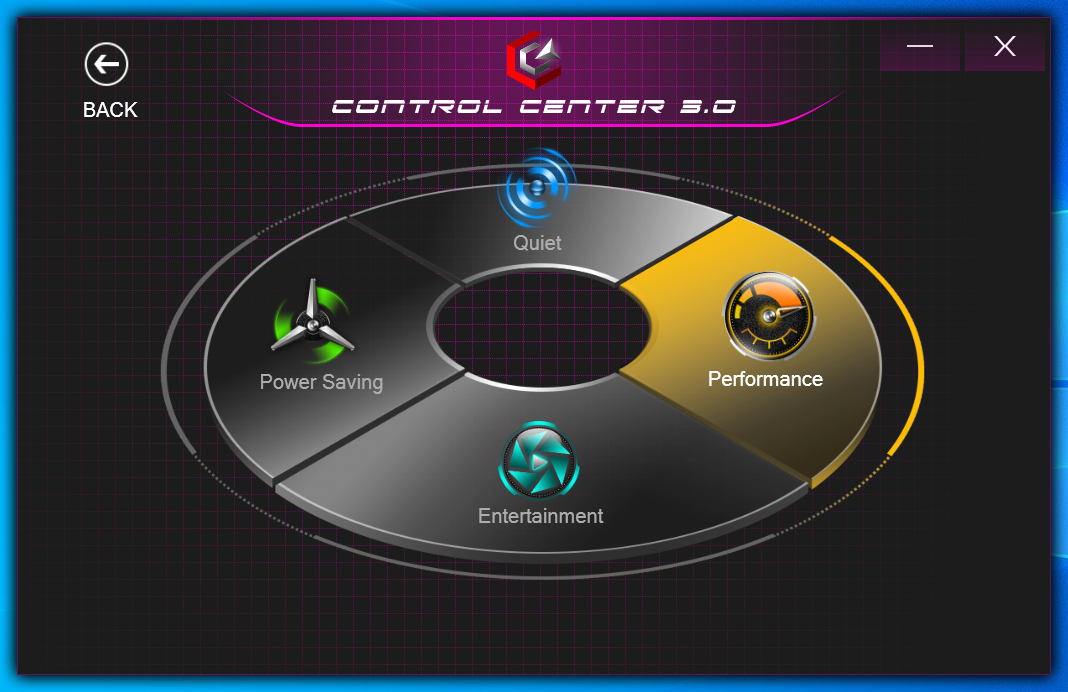
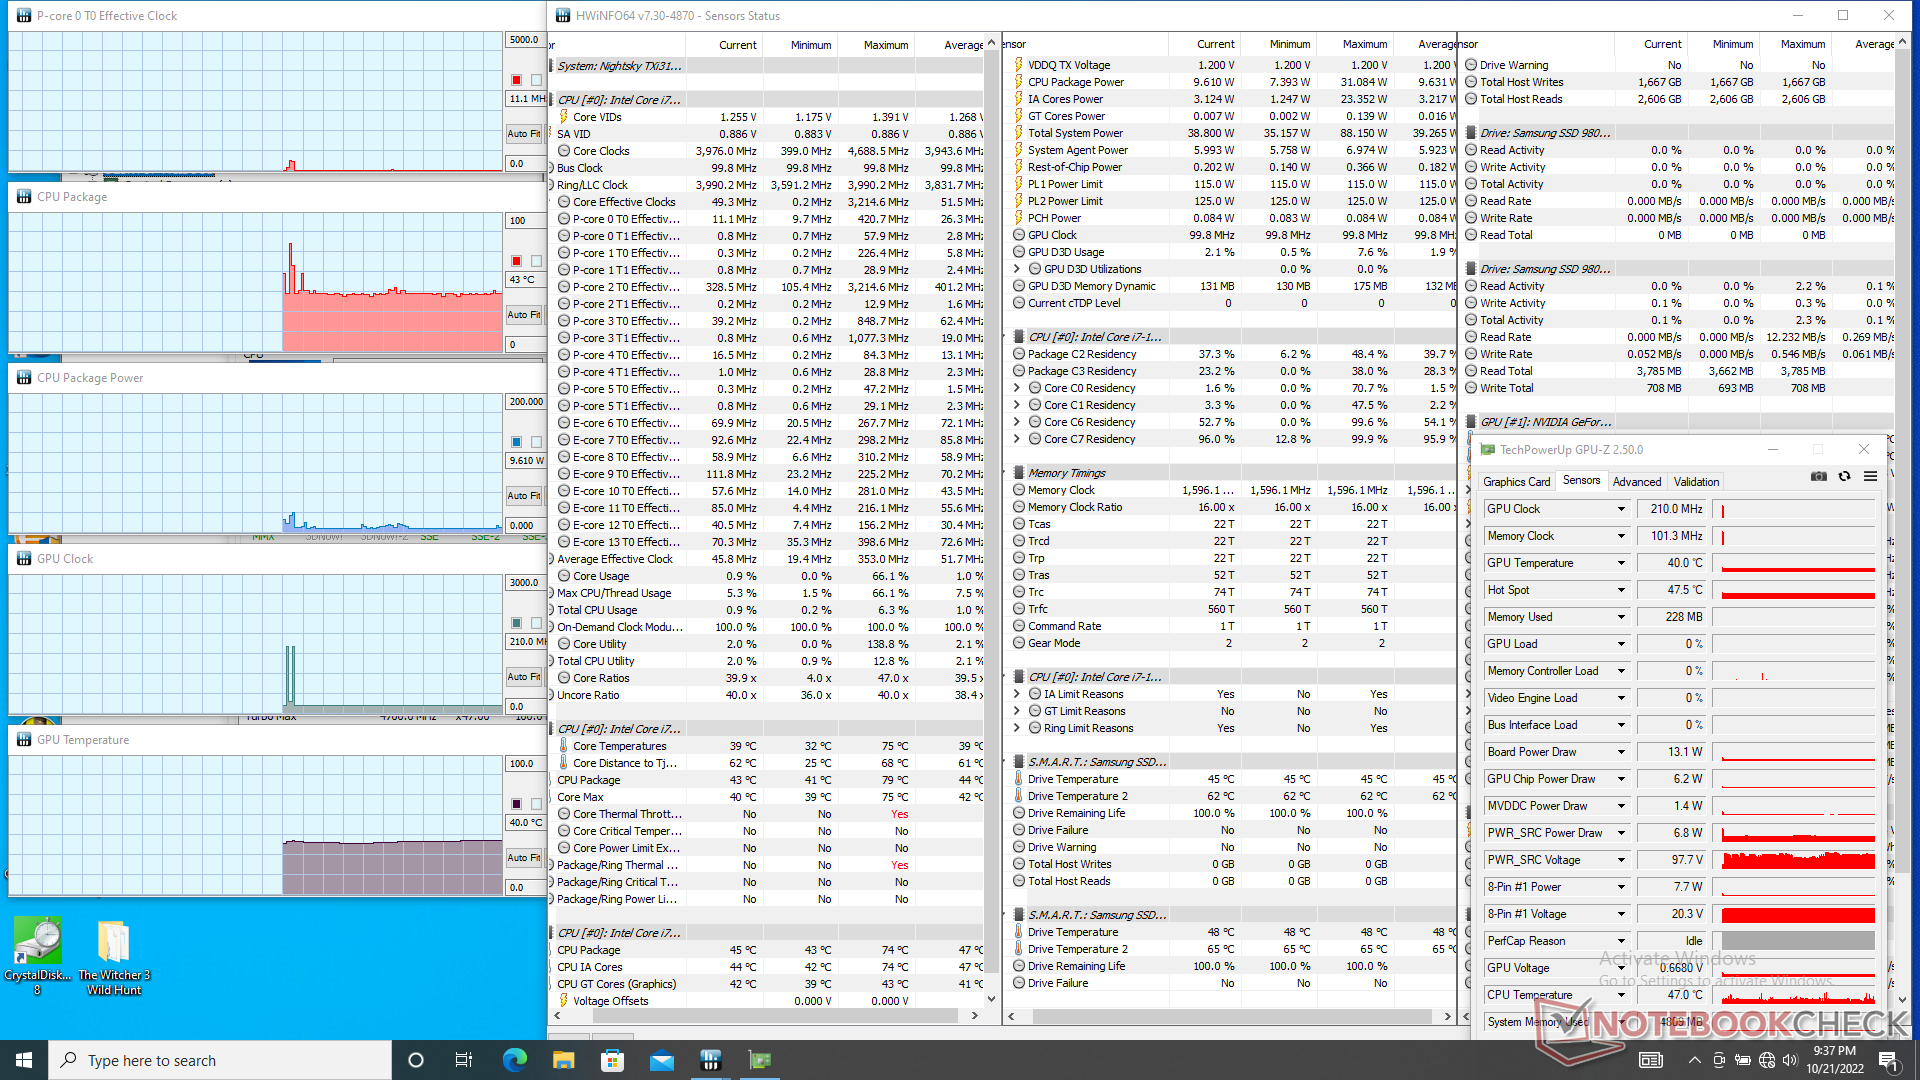
Przed uruchomieniem poniższych benchmarków nasz egzemplarz został ustawiony w trybie Performance zarówno przez system Windows, jak i preinstalowane oprogramowanie Control Center 3.0 w celu uzyskania jak najwyższych wyników. Upewniliśmy się również, że ustawiliśmy Nvidia Optimus na grafikę dyskretną; MUX nie jest tu niestety obsługiwany.
Procesor
Surowa wydajność wielowątkowa jest o około 10 procent szybsza od przeciętnego laptopa z naszej bazy danych wyposażonego w ten sam Core i7-12700H. Procesor w HP Envy 16jest dużo wolniejszy od naszego Eurocomu, nawet po uwzględnieniu ewentualnego dławienia wydajności
Aktualizacja do Core i9-12900H ma zwiększyć wydajność procesora tylko nieznacznie, o około 5 do 10 procent, na podstawie naszych doświadczeń z Alienware x15 R2 i Schenker XMG Pro 17 E22
Program CineBench R15 nie działał poprawnie na naszym urządzeniu, podobnie jak na ostatnim systemie Eurocom, który recenzowaliśmy na początku tego roku. Udało nam się skontaktować z producentem i potwierdził on nasze spostrzeżenia. Benchmark został pominięty w tej recenzji.
Cinebench R23 Multi Loop
Cinebench R23: Multi Core | Single Core
Cinebench R15: CPU Multi 64Bit | CPU Single 64Bit
Blender: v2.79 BMW27 CPU
7-Zip 18.03: 7z b 4 | 7z b 4 -mmt1
Geekbench 5.5: Multi-Core | Single-Core
HWBOT x265 Benchmark v2.2: 4k Preset
LibreOffice : 20 Documents To PDF
R Benchmark 2.5: Overall mean
| Cinebench R20 / CPU (Multi Core) | |
| MSI Raider GE77 HX 12UHS | |
| Alienware x17 R2 P48E | |
| Schenker XMG Pro 17 E22 | |
| Eurocom Nightsky TXi317 | |
| Przeciętny Intel Core i7-12700H (1576 - 7407, n=64) | |
| Schenker XMG Neo 17 M22 | |
| Alienware x17 RTX 3080 P48E | |
| Razer Blade 17 (i7-12800H, RTX 3070 Ti) | |
| Asus Strix Scar 17 G733QSA-XS99 | |
| Schenker XMG Apex 17 M21 | |
| Razer Blade 17 Early 2022 | |
| Razer Blade Pro 17 2021 (QHD Touch) | |
| Schenker XMG Core 17 (Early 2021) | |
| Cinebench R20 / CPU (Single Core) | |
| MSI Raider GE77 HX 12UHS | |
| Schenker XMG Pro 17 E22 | |
| Alienware x17 R2 P48E | |
| Razer Blade 17 (i7-12800H, RTX 3070 Ti) | |
| Razer Blade 17 Early 2022 | |
| Eurocom Nightsky TXi317 | |
| Przeciętny Intel Core i7-12700H (300 - 704, n=64) | |
| Schenker XMG Neo 17 M22 | |
| Alienware x17 RTX 3080 P48E | |
| Asus Strix Scar 17 G733QSA-XS99 | |
| Schenker XMG Apex 17 M21 | |
| Razer Blade Pro 17 2021 (QHD Touch) | |
| Schenker XMG Core 17 (Early 2021) | |
| Cinebench R23 / Multi Core | |
| MSI Raider GE77 HX 12UHS | |
| Alienware x17 R2 P48E | |
| Eurocom Nightsky TXi317 | |
| Schenker XMG Pro 17 E22 | |
| Przeciętny Intel Core i7-12700H (4032 - 19330, n=64) | |
| Razer Blade 17 (i7-12800H, RTX 3070 Ti) | |
| Schenker XMG Neo 17 M22 | |
| Alienware x17 RTX 3080 P48E | |
| Asus Strix Scar 17 G733QSA-XS99 | |
| Schenker XMG Apex 17 M21 | |
| Razer Blade 17 Early 2022 | |
| Razer Blade Pro 17 2021 (QHD Touch) | |
| Schenker XMG Core 17 (Early 2021) | |
| Cinebench R23 / Single Core | |
| Schenker XMG Pro 17 E22 | |
| Razer Blade 17 Early 2022 | |
| MSI Raider GE77 HX 12UHS | |
| Alienware x17 R2 P48E | |
| Razer Blade 17 (i7-12800H, RTX 3070 Ti) | |
| Eurocom Nightsky TXi317 | |
| Przeciętny Intel Core i7-12700H (778 - 1826, n=63) | |
| Schenker XMG Neo 17 M22 | |
| Alienware x17 RTX 3080 P48E | |
| Asus Strix Scar 17 G733QSA-XS99 | |
| Schenker XMG Apex 17 M21 | |
| Razer Blade Pro 17 2021 (QHD Touch) | |
| Schenker XMG Core 17 (Early 2021) | |
| Cinebench R15 / CPU Multi 64Bit | |
| MSI Raider GE77 HX 12UHS | |
| Alienware x17 R2 P48E | |
| Schenker XMG Pro 17 E22 | |
| Razer Blade 17 (i7-12800H, RTX 3070 Ti) | |
| Przeciętny Intel Core i7-12700H (1379 - 2916, n=70) | |
| Schenker XMG Neo 17 M22 | |
| Asus Strix Scar 17 G733QSA-XS99 | |
| Alienware x17 RTX 3080 P48E | |
| Schenker XMG Apex 17 M21 | |
| Razer Blade 17 Early 2022 | |
| Razer Blade Pro 17 2021 (QHD Touch) | |
| Schenker XMG Core 17 (Early 2021) | |
| Cinebench R15 / CPU Single 64Bit | |
| MSI Raider GE77 HX 12UHS | |
| Schenker XMG Pro 17 E22 | |
| Alienware x17 R2 P48E | |
| Razer Blade 17 (i7-12800H, RTX 3070 Ti) | |
| Razer Blade 17 Early 2022 | |
| Przeciętny Intel Core i7-12700H (113 - 263, n=65) | |
| Schenker XMG Neo 17 M22 | |
| Asus Strix Scar 17 G733QSA-XS99 | |
| Schenker XMG Apex 17 M21 | |
| Alienware x17 RTX 3080 P48E | |
| Razer Blade Pro 17 2021 (QHD Touch) | |
| Schenker XMG Core 17 (Early 2021) | |
| Blender / v2.79 BMW27 CPU | |
| Schenker XMG Core 17 (Early 2021) | |
| Razer Blade 17 Early 2022 | |
| Razer Blade Pro 17 2021 (QHD Touch) | |
| Schenker XMG Apex 17 M21 | |
| Asus Strix Scar 17 G733QSA-XS99 | |
| Przeciętny Intel Core i7-12700H (168 - 732, n=63) | |
| Razer Blade 17 (i7-12800H, RTX 3070 Ti) | |
| Alienware x17 RTX 3080 P48E | |
| Schenker XMG Neo 17 M22 | |
| Schenker XMG Pro 17 E22 | |
| Eurocom Nightsky TXi317 | |
| Alienware x17 R2 P48E | |
| MSI Raider GE77 HX 12UHS | |
| 7-Zip 18.03 / 7z b 4 | |
| MSI Raider GE77 HX 12UHS | |
| Alienware x17 R2 P48E | |
| Eurocom Nightsky TXi317 | |
| Schenker XMG Pro 17 E22 | |
| Schenker XMG Neo 17 M22 | |
| Razer Blade 17 (i7-12800H, RTX 3070 Ti) | |
| Asus Strix Scar 17 G733QSA-XS99 | |
| Przeciętny Intel Core i7-12700H (22844 - 73067, n=63) | |
| Schenker XMG Apex 17 M21 | |
| Alienware x17 RTX 3080 P48E | |
| Razer Blade 17 Early 2022 | |
| Razer Blade Pro 17 2021 (QHD Touch) | |
| Schenker XMG Core 17 (Early 2021) | |
| 7-Zip 18.03 / 7z b 4 -mmt1 | |
| MSI Raider GE77 HX 12UHS | |
| Schenker XMG Pro 17 E22 | |
| Razer Blade 17 Early 2022 | |
| Eurocom Nightsky TXi317 | |
| Schenker XMG Neo 17 M22 | |
| Alienware x17 R2 P48E | |
| Razer Blade 17 (i7-12800H, RTX 3070 Ti) | |
| Asus Strix Scar 17 G733QSA-XS99 | |
| Przeciętny Intel Core i7-12700H (2743 - 5972, n=63) | |
| Schenker XMG Apex 17 M21 | |
| Schenker XMG Core 17 (Early 2021) | |
| Alienware x17 RTX 3080 P48E | |
| Razer Blade Pro 17 2021 (QHD Touch) | |
| Geekbench 5.5 / Multi-Core | |
| MSI Raider GE77 HX 12UHS | |
| Alienware x17 R2 P48E | |
| Schenker XMG Pro 17 E22 | |
| Eurocom Nightsky TXi317 | |
| Razer Blade 17 (i7-12800H, RTX 3070 Ti) | |
| Przeciętny Intel Core i7-12700H (5144 - 13745, n=64) | |
| Schenker XMG Neo 17 M22 | |
| Razer Blade 17 Early 2022 | |
| Schenker XMG Apex 17 M21 | |
| Asus Strix Scar 17 G733QSA-XS99 | |
| Razer Blade Pro 17 2021 (QHD Touch) | |
| Schenker XMG Core 17 (Early 2021) | |
| Geekbench 5.5 / Single-Core | |
| MSI Raider GE77 HX 12UHS | |
| Alienware x17 R2 P48E | |
| Schenker XMG Pro 17 E22 | |
| Razer Blade 17 Early 2022 | |
| Eurocom Nightsky TXi317 | |
| Razer Blade 17 (i7-12800H, RTX 3070 Ti) | |
| Przeciętny Intel Core i7-12700H (803 - 1851, n=64) | |
| Schenker XMG Neo 17 M22 | |
| Asus Strix Scar 17 G733QSA-XS99 | |
| Schenker XMG Apex 17 M21 | |
| Razer Blade Pro 17 2021 (QHD Touch) | |
| Schenker XMG Core 17 (Early 2021) | |
| HWBOT x265 Benchmark v2.2 / 4k Preset | |
| MSI Raider GE77 HX 12UHS | |
| Alienware x17 R2 P48E | |
| Schenker XMG Pro 17 E22 | |
| Schenker XMG Neo 17 M22 | |
| Alienware x17 RTX 3080 P48E | |
| Asus Strix Scar 17 G733QSA-XS99 | |
| Przeciętny Intel Core i7-12700H (4.67 - 21.8, n=64) | |
| Eurocom Nightsky TXi317 | |
| Razer Blade 17 (i7-12800H, RTX 3070 Ti) | |
| Schenker XMG Apex 17 M21 | |
| Razer Blade 17 Early 2022 | |
| Razer Blade Pro 17 2021 (QHD Touch) | |
| Schenker XMG Core 17 (Early 2021) | |
| LibreOffice / 20 Documents To PDF | |
| Schenker XMG Core 17 (Early 2021) | |
| Schenker XMG Neo 17 M22 | |
| Schenker XMG Apex 17 M21 | |
| Alienware x17 RTX 3080 P48E | |
| Przeciętny Intel Core i7-12700H (34.2 - 95.3, n=63) | |
| Asus Strix Scar 17 G733QSA-XS99 | |
| Razer Blade Pro 17 2021 (QHD Touch) | |
| MSI Raider GE77 HX 12UHS | |
| Razer Blade 17 (i7-12800H, RTX 3070 Ti) | |
| Alienware x17 R2 P48E | |
| Eurocom Nightsky TXi317 | |
| Razer Blade 17 Early 2022 | |
| Schenker XMG Pro 17 E22 | |
| R Benchmark 2.5 / Overall mean | |
| Razer Blade Pro 17 2021 (QHD Touch) | |
| Schenker XMG Core 17 (Early 2021) | |
| Alienware x17 RTX 3080 P48E | |
| Schenker XMG Apex 17 M21 | |
| Asus Strix Scar 17 G733QSA-XS99 | |
| Schenker XMG Neo 17 M22 | |
| Przeciętny Intel Core i7-12700H (0.4441 - 1.052, n=63) | |
| Razer Blade 17 (i7-12800H, RTX 3070 Ti) | |
| Eurocom Nightsky TXi317 | |
| Razer Blade 17 Early 2022 | |
| Schenker XMG Pro 17 E22 | |
| Alienware x17 R2 P48E | |
| MSI Raider GE77 HX 12UHS | |
Cinebench R23: Multi Core | Single Core
Cinebench R15: CPU Multi 64Bit | CPU Single 64Bit
Blender: v2.79 BMW27 CPU
7-Zip 18.03: 7z b 4 | 7z b 4 -mmt1
Geekbench 5.5: Multi-Core | Single-Core
HWBOT x265 Benchmark v2.2: 4k Preset
LibreOffice : 20 Documents To PDF
R Benchmark 2.5: Overall mean
* ... im mniej tym lepiej
AIDA64: FP32 Ray-Trace | FPU Julia | CPU SHA3 | CPU Queen | FPU SinJulia | FPU Mandel | CPU AES | CPU ZLib | FP64 Ray-Trace | CPU PhotoWorxx
| Performance rating | |
| MSI Raider GE77 HX 12UHS | |
| Aorus 17X XES | |
| Eurocom Nightsky TXi317 | |
| Alienware x17 R2 P48E | |
| Przeciętny Intel Core i7-12700H | |
| Schenker XMG Pro 17 E22 | |
| Razer Blade 17 Early 2022 | |
| AIDA64 / FP32 Ray-Trace | |
| MSI Raider GE77 HX 12UHS | |
| Eurocom Nightsky TXi317 | |
| Aorus 17X XES | |
| Przeciętny Intel Core i7-12700H (2585 - 17957, n=64) | |
| Alienware x17 R2 P48E | |
| Schenker XMG Pro 17 E22 | |
| Razer Blade 17 Early 2022 | |
| AIDA64 / FPU Julia | |
| MSI Raider GE77 HX 12UHS | |
| Eurocom Nightsky TXi317 | |
| Aorus 17X XES | |
| Przeciętny Intel Core i7-12700H (12439 - 90760, n=64) | |
| Alienware x17 R2 P48E | |
| Schenker XMG Pro 17 E22 | |
| Razer Blade 17 Early 2022 | |
| AIDA64 / CPU SHA3 | |
| MSI Raider GE77 HX 12UHS | |
| Eurocom Nightsky TXi317 | |
| Aorus 17X XES | |
| Alienware x17 R2 P48E | |
| Przeciętny Intel Core i7-12700H (833 - 4242, n=64) | |
| Schenker XMG Pro 17 E22 | |
| Razer Blade 17 Early 2022 | |
| AIDA64 / CPU Queen | |
| Alienware x17 R2 P48E | |
| Schenker XMG Pro 17 E22 | |
| Aorus 17X XES | |
| Eurocom Nightsky TXi317 | |
| MSI Raider GE77 HX 12UHS | |
| Przeciętny Intel Core i7-12700H (57923 - 103202, n=63) | |
| Razer Blade 17 Early 2022 | |
| AIDA64 / FPU SinJulia | |
| MSI Raider GE77 HX 12UHS | |
| Aorus 17X XES | |
| Alienware x17 R2 P48E | |
| Eurocom Nightsky TXi317 | |
| Schenker XMG Pro 17 E22 | |
| Przeciętny Intel Core i7-12700H (3249 - 9939, n=64) | |
| Razer Blade 17 Early 2022 | |
| AIDA64 / FPU Mandel | |
| MSI Raider GE77 HX 12UHS | |
| Aorus 17X XES | |
| Eurocom Nightsky TXi317 | |
| Przeciętny Intel Core i7-12700H (7135 - 44760, n=64) | |
| Alienware x17 R2 P48E | |
| Schenker XMG Pro 17 E22 | |
| Razer Blade 17 Early 2022 | |
| AIDA64 / CPU AES | |
| MSI Raider GE77 HX 12UHS | |
| Eurocom Nightsky TXi317 | |
| Aorus 17X XES | |
| Alienware x17 R2 P48E | |
| Schenker XMG Pro 17 E22 | |
| Przeciętny Intel Core i7-12700H (31839 - 144360, n=64) | |
| Razer Blade 17 Early 2022 | |
| AIDA64 / CPU ZLib | |
| MSI Raider GE77 HX 12UHS | |
| Alienware x17 R2 P48E | |
| Eurocom Nightsky TXi317 | |
| Schenker XMG Pro 17 E22 | |
| Aorus 17X XES | |
| Przeciętny Intel Core i7-12700H (305 - 1171, n=64) | |
| Razer Blade 17 Early 2022 | |
| AIDA64 / FP64 Ray-Trace | |
| MSI Raider GE77 HX 12UHS | |
| Aorus 17X XES | |
| Eurocom Nightsky TXi317 | |
| Przeciętny Intel Core i7-12700H (1437 - 9692, n=64) | |
| Alienware x17 R2 P48E | |
| Schenker XMG Pro 17 E22 | |
| Razer Blade 17 Early 2022 | |
| AIDA64 / CPU PhotoWorxx | |
| MSI Raider GE77 HX 12UHS | |
| Aorus 17X XES | |
| Razer Blade 17 Early 2022 | |
| Alienware x17 R2 P48E | |
| Przeciętny Intel Core i7-12700H (12863 - 52207, n=64) | |
| Eurocom Nightsky TXi317 | |
| Schenker XMG Pro 17 E22 | |
Wydajność systemu
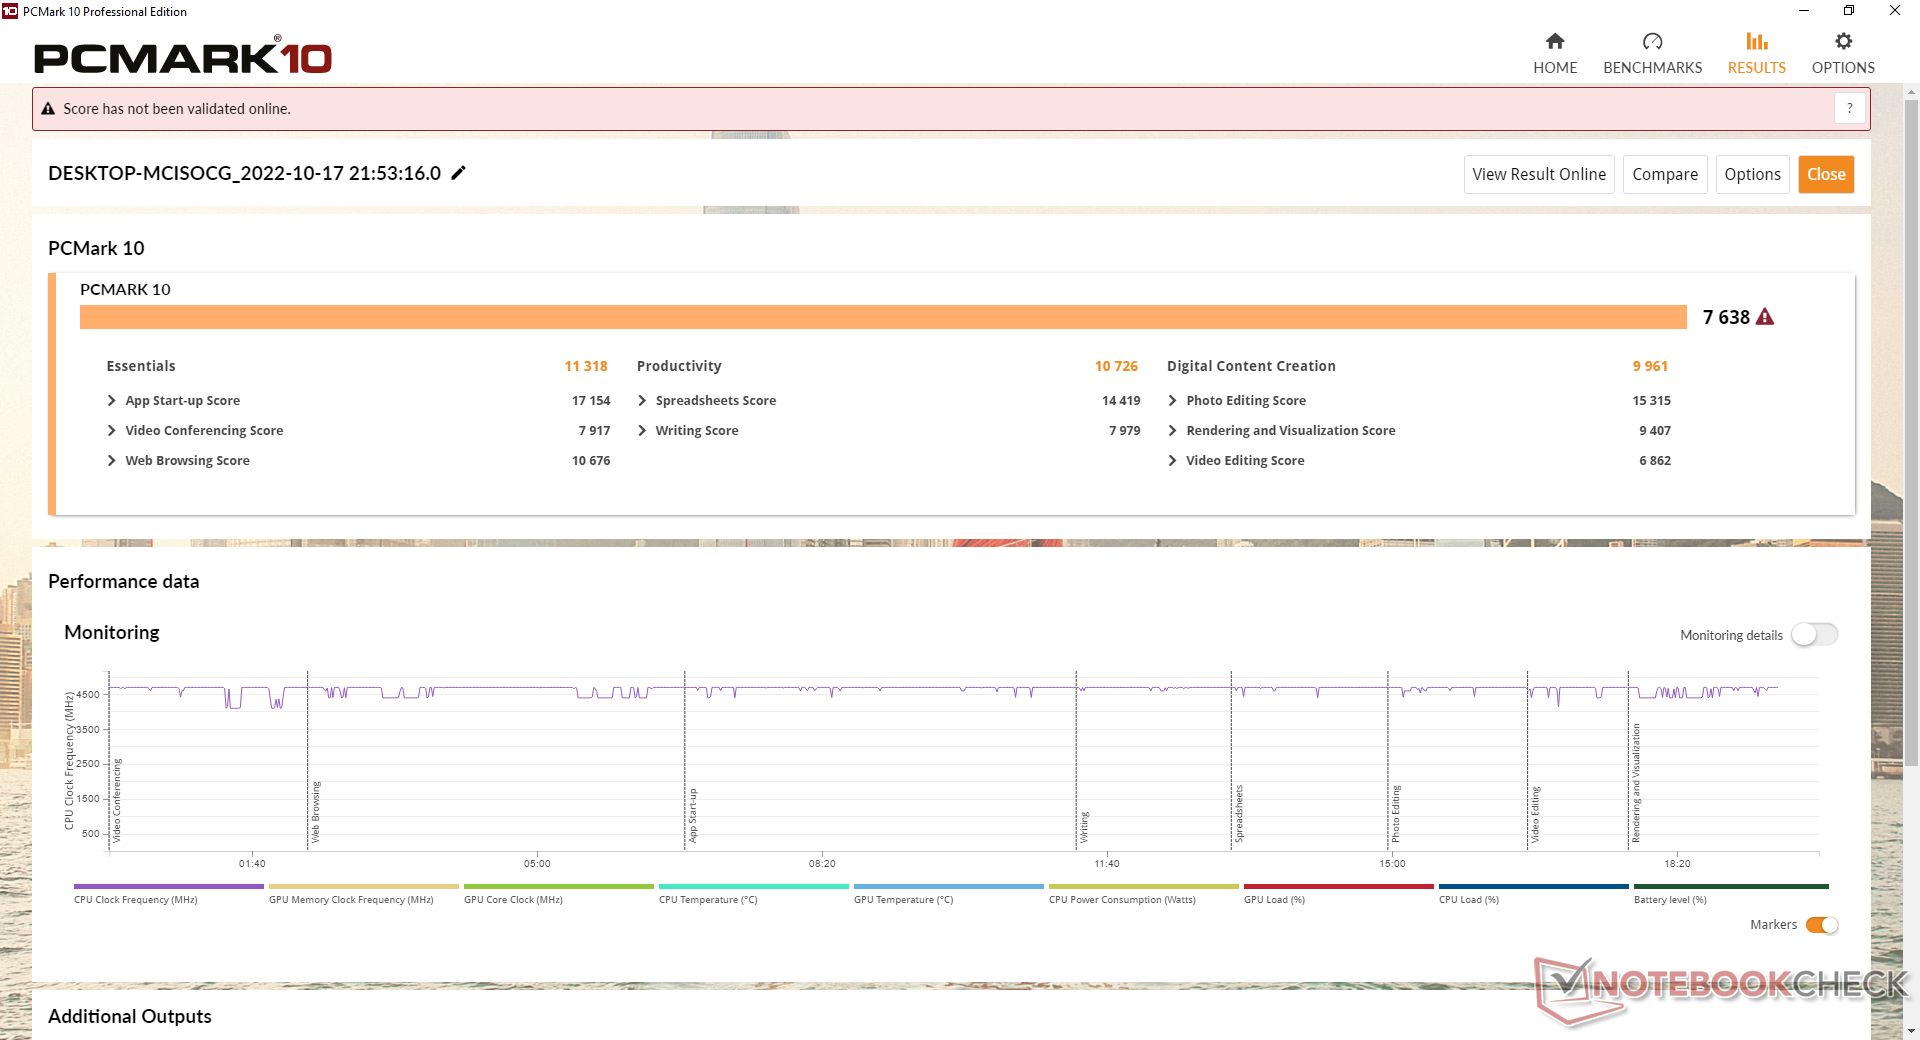
CrossMark: Overall | Productivity | Creativity | Responsiveness
| PCMark 10 / Score | |
| Alienware x17 R2 P48E | |
| Aorus 17X XES | |
| Schenker XMG Pro 17 E22 | |
| Eurocom Nightsky TXi317 | |
| Przeciętny Intel Core i7-12700H, NVIDIA GeForce RTX 3080 Ti Laptop GPU (6868 - 7638, n=7) | |
| Razer Blade 17 Early 2022 | |
| MSI Raider GE77 HX 12UHS | |
| PCMark 10 / Essentials | |
| Eurocom Nightsky TXi317 | |
| Alienware x17 R2 P48E | |
| Schenker XMG Pro 17 E22 | |
| Aorus 17X XES | |
| Przeciętny Intel Core i7-12700H, NVIDIA GeForce RTX 3080 Ti Laptop GPU (9987 - 11318, n=7) | |
| Razer Blade 17 Early 2022 | |
| MSI Raider GE77 HX 12UHS | |
| PCMark 10 / Productivity | |
| Eurocom Nightsky TXi317 | |
| Aorus 17X XES | |
| Schenker XMG Pro 17 E22 | |
| Alienware x17 R2 P48E | |
| MSI Raider GE77 HX 12UHS | |
| Przeciętny Intel Core i7-12700H, NVIDIA GeForce RTX 3080 Ti Laptop GPU (8944 - 10726, n=7) | |
| Razer Blade 17 Early 2022 | |
| PCMark 10 / Digital Content Creation | |
| Alienware x17 R2 P48E | |
| Aorus 17X XES | |
| Schenker XMG Pro 17 E22 | |
| Przeciętny Intel Core i7-12700H, NVIDIA GeForce RTX 3080 Ti Laptop GPU (8956 - 12249, n=7) | |
| Razer Blade 17 Early 2022 | |
| Eurocom Nightsky TXi317 | |
| MSI Raider GE77 HX 12UHS | |
| CrossMark / Overall | |
| MSI Raider GE77 HX 12UHS | |
| Aorus 17X XES | |
| Alienware x17 R2 P48E | |
| Eurocom Nightsky TXi317 | |
| Przeciętny Intel Core i7-12700H, NVIDIA GeForce RTX 3080 Ti Laptop GPU (1761 - 1861, n=4) | |
| Razer Blade 17 Early 2022 | |
| CrossMark / Productivity | |
| MSI Raider GE77 HX 12UHS | |
| Aorus 17X XES | |
| Alienware x17 R2 P48E | |
| Eurocom Nightsky TXi317 | |
| Razer Blade 17 Early 2022 | |
| Przeciętny Intel Core i7-12700H, NVIDIA GeForce RTX 3080 Ti Laptop GPU (1645 - 1800, n=4) | |
| CrossMark / Creativity | |
| MSI Raider GE77 HX 12UHS | |
| Aorus 17X XES | |
| Alienware x17 R2 P48E | |
| Przeciętny Intel Core i7-12700H, NVIDIA GeForce RTX 3080 Ti Laptop GPU (1936 - 2041, n=4) | |
| Eurocom Nightsky TXi317 | |
| Razer Blade 17 Early 2022 | |
| CrossMark / Responsiveness | |
| Aorus 17X XES | |
| MSI Raider GE77 HX 12UHS | |
| Eurocom Nightsky TXi317 | |
| Alienware x17 R2 P48E | |
| Przeciętny Intel Core i7-12700H, NVIDIA GeForce RTX 3080 Ti Laptop GPU (1461 - 1868, n=4) | |
| Razer Blade 17 Early 2022 | |
| PCMark 10 Score | 7638 pkt. | |
Pomoc | ||
| AIDA64 / Memory Copy | |
| MSI Raider GE77 HX 12UHS | |
| Aorus 17X XES | |
| Razer Blade 17 Early 2022 | |
| Alienware x17 R2 P48E | |
| Przeciętny Intel Core i7-12700H (25615 - 80511, n=64) | |
| Eurocom Nightsky TXi317 | |
| Schenker XMG Pro 17 E22 | |
| AIDA64 / Memory Read | |
| MSI Raider GE77 HX 12UHS | |
| Aorus 17X XES | |
| Razer Blade 17 Early 2022 | |
| Alienware x17 R2 P48E | |
| Przeciętny Intel Core i7-12700H (25586 - 79442, n=64) | |
| Eurocom Nightsky TXi317 | |
| Schenker XMG Pro 17 E22 | |
| AIDA64 / Memory Write | |
| MSI Raider GE77 HX 12UHS | |
| Aorus 17X XES | |
| Razer Blade 17 Early 2022 | |
| Przeciętny Intel Core i7-12700H (23679 - 88660, n=64) | |
| Alienware x17 R2 P48E | |
| Eurocom Nightsky TXi317 | |
| Schenker XMG Pro 17 E22 | |
| AIDA64 / Memory Latency | |
| Alienware x17 R2 P48E | |
| Schenker XMG Pro 17 E22 | |
| Eurocom Nightsky TXi317 | |
| Aorus 17X XES | |
| MSI Raider GE77 HX 12UHS | |
| Przeciętny Intel Core i7-12700H (76.2 - 133.9, n=62) | |
* ... im mniej tym lepiej
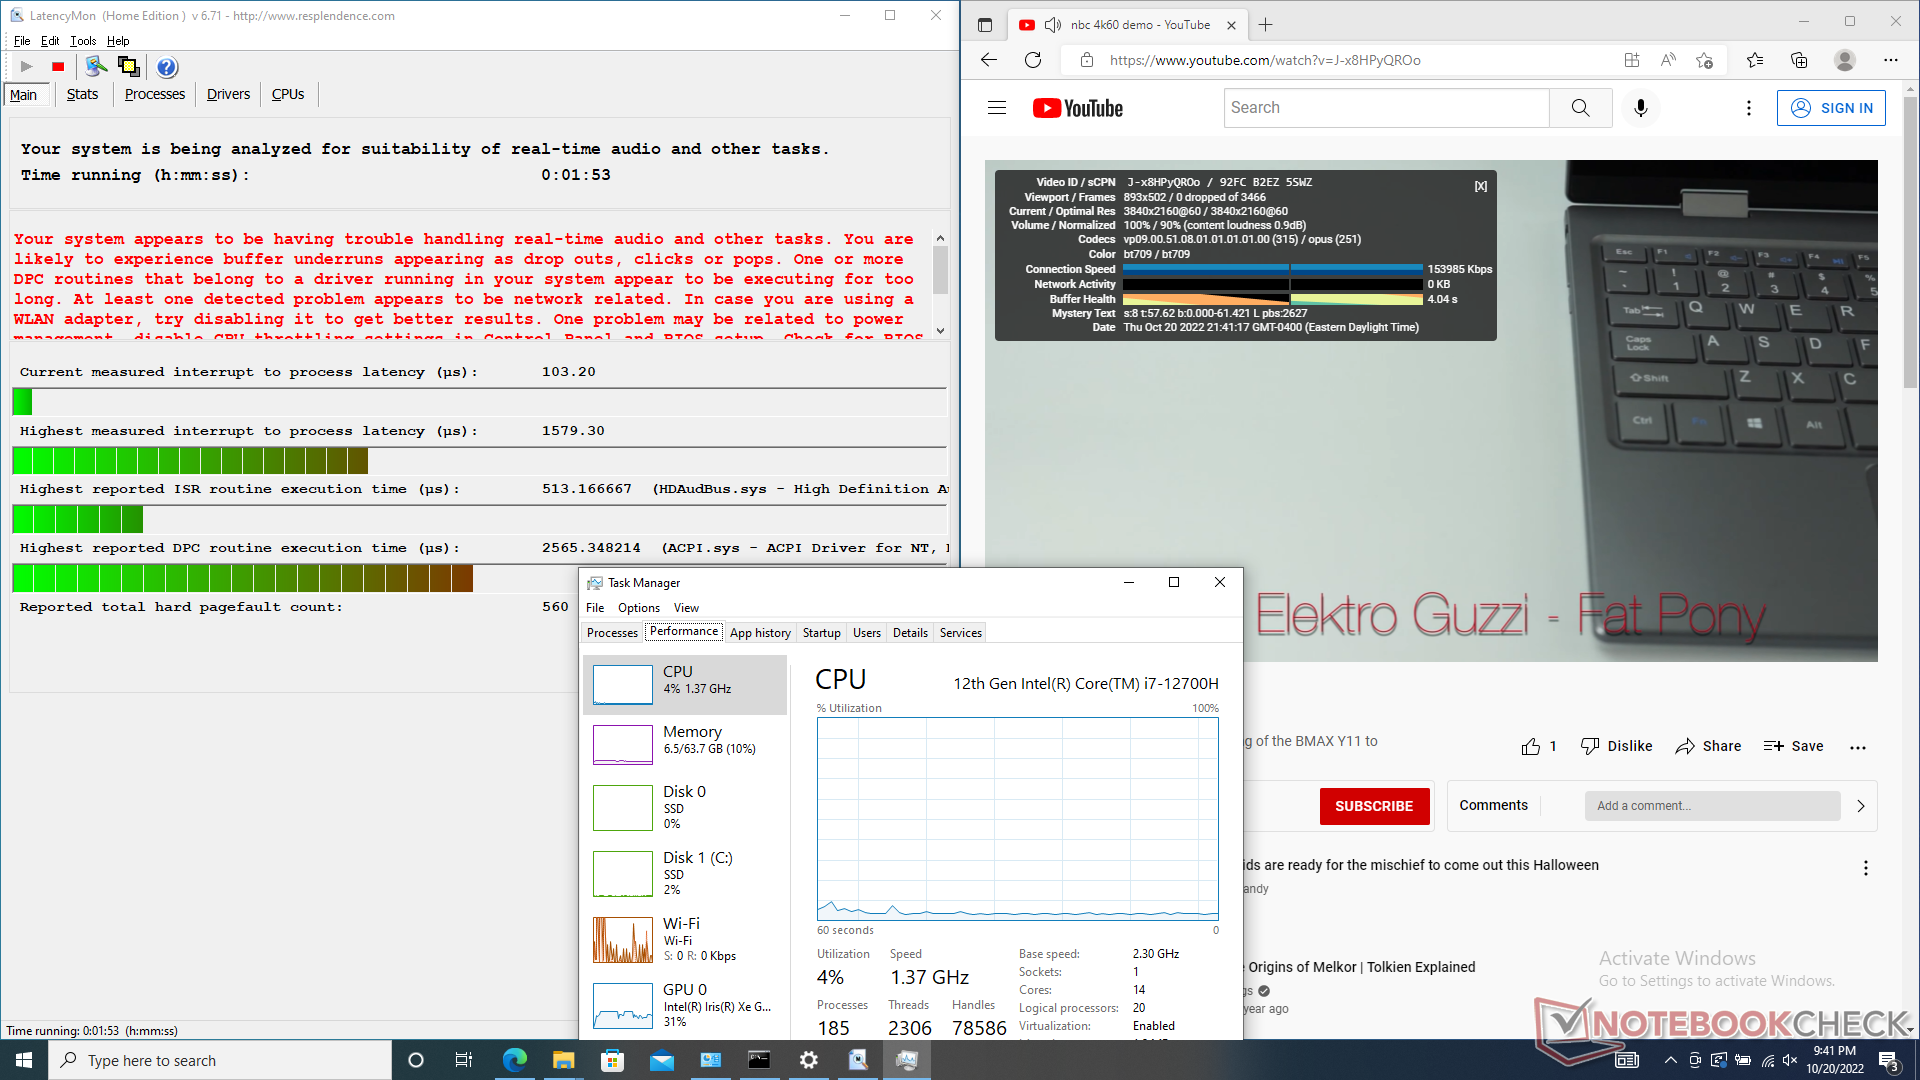
Opóźnienie DPC
LatencyMon ujawnia problemy z DPC podczas otwierania wielu kart przeglądarki na naszej stronie głównej. odtwarzanie wideo w rozdzielczości 4K przy 60 FPS jest poza tym perfekcyjne i nie ma żadnych opuszczonych klatek.
| DPC Latencies / LatencyMon - interrupt to process latency (max), Web, Youtube, Prime95 | |
| MSI Raider GE77 HX 12UHS | |
| Eurocom Nightsky TXi317 | |
| Aorus 17X XES | |
| Alienware x17 R2 P48E | |
| Schenker XMG Pro 17 E22 | |
| Razer Blade 17 Early 2022 | |
* ... im mniej tym lepiej
Urządzenia do przechowywania danych
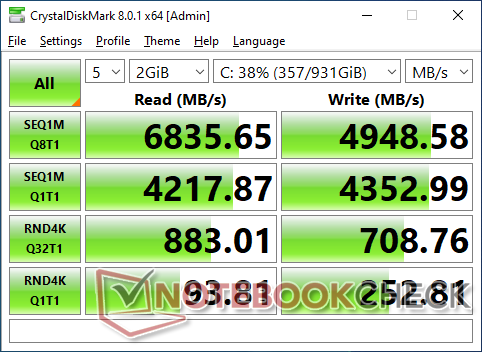
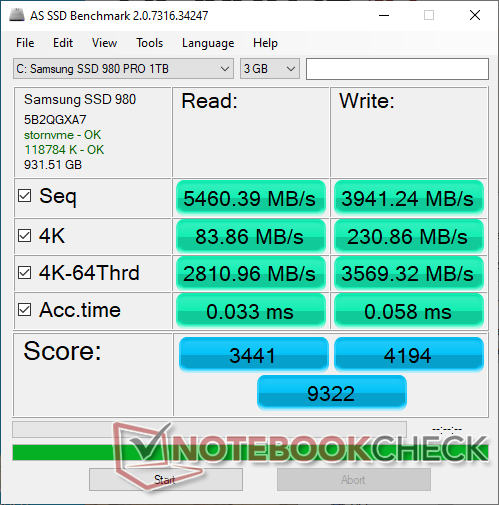
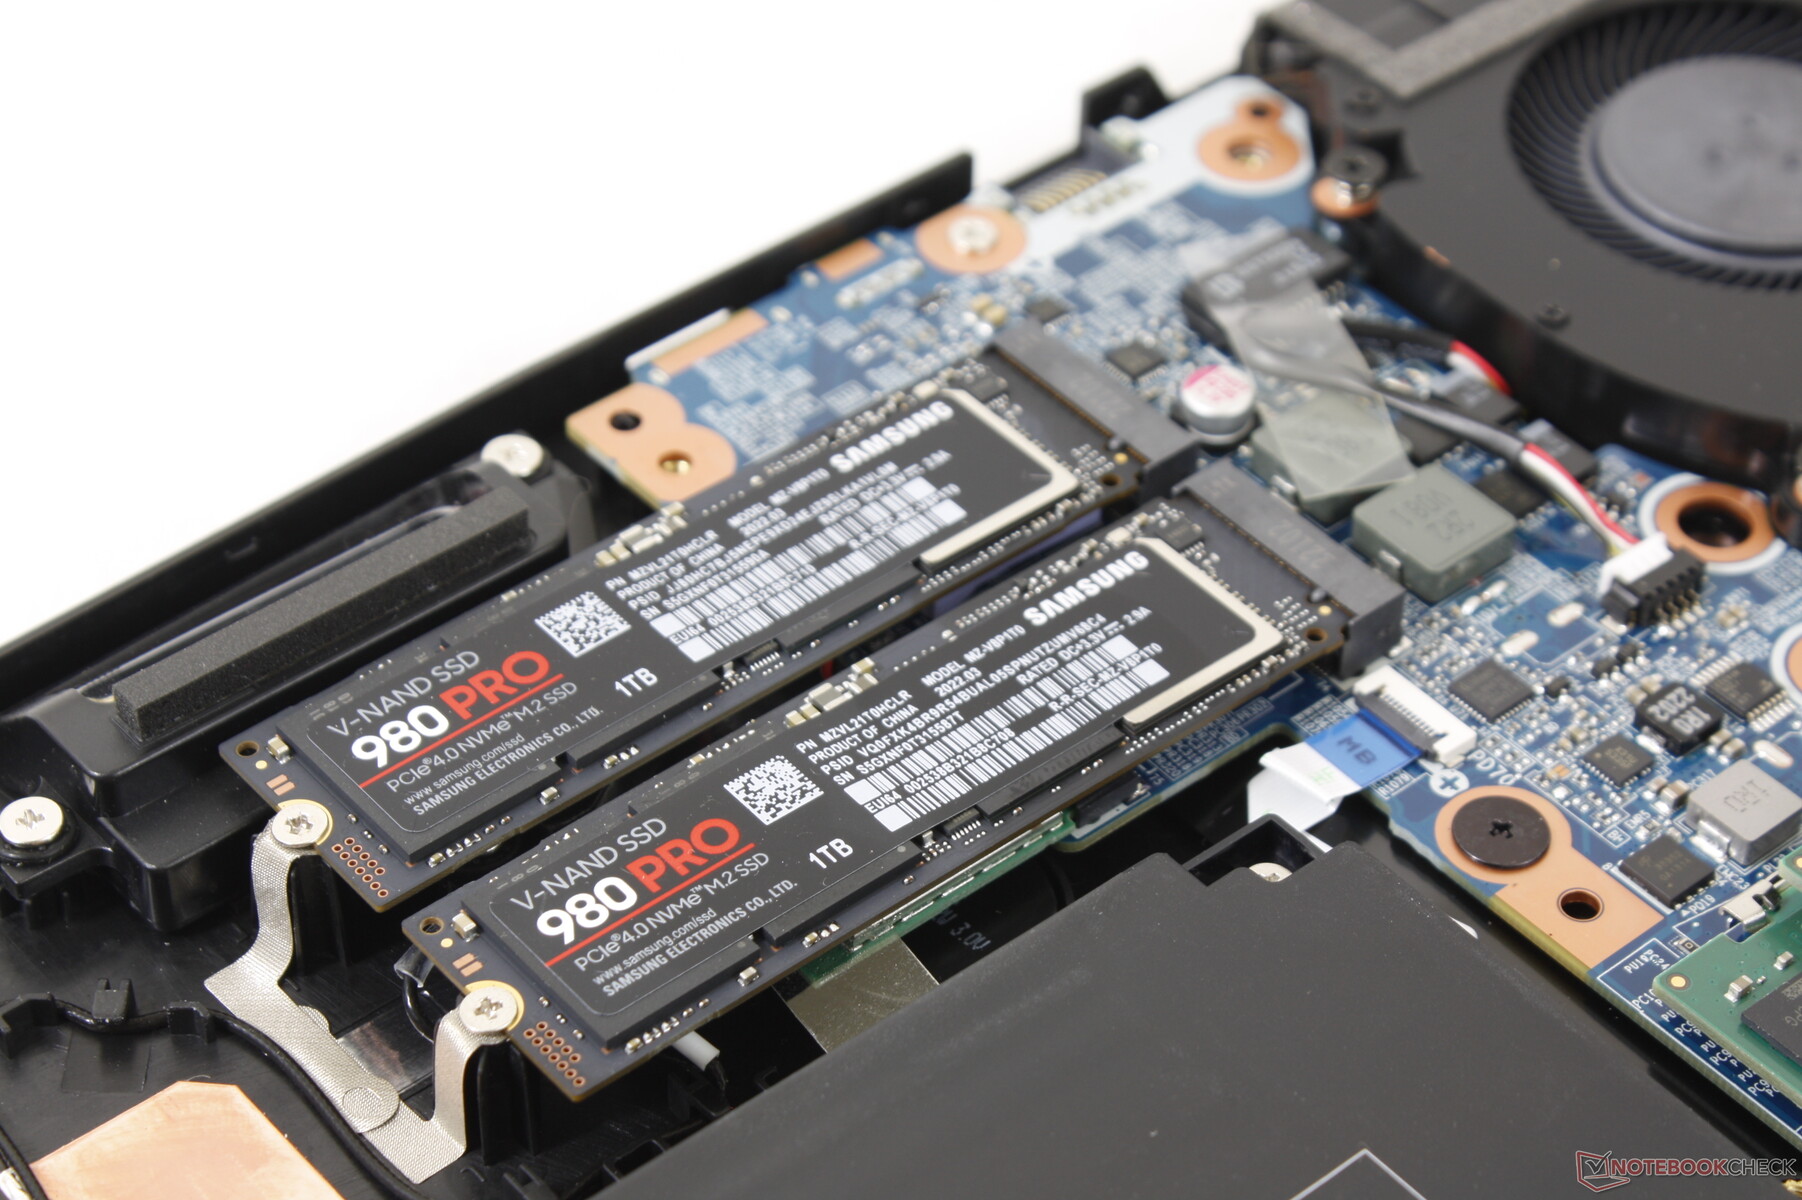
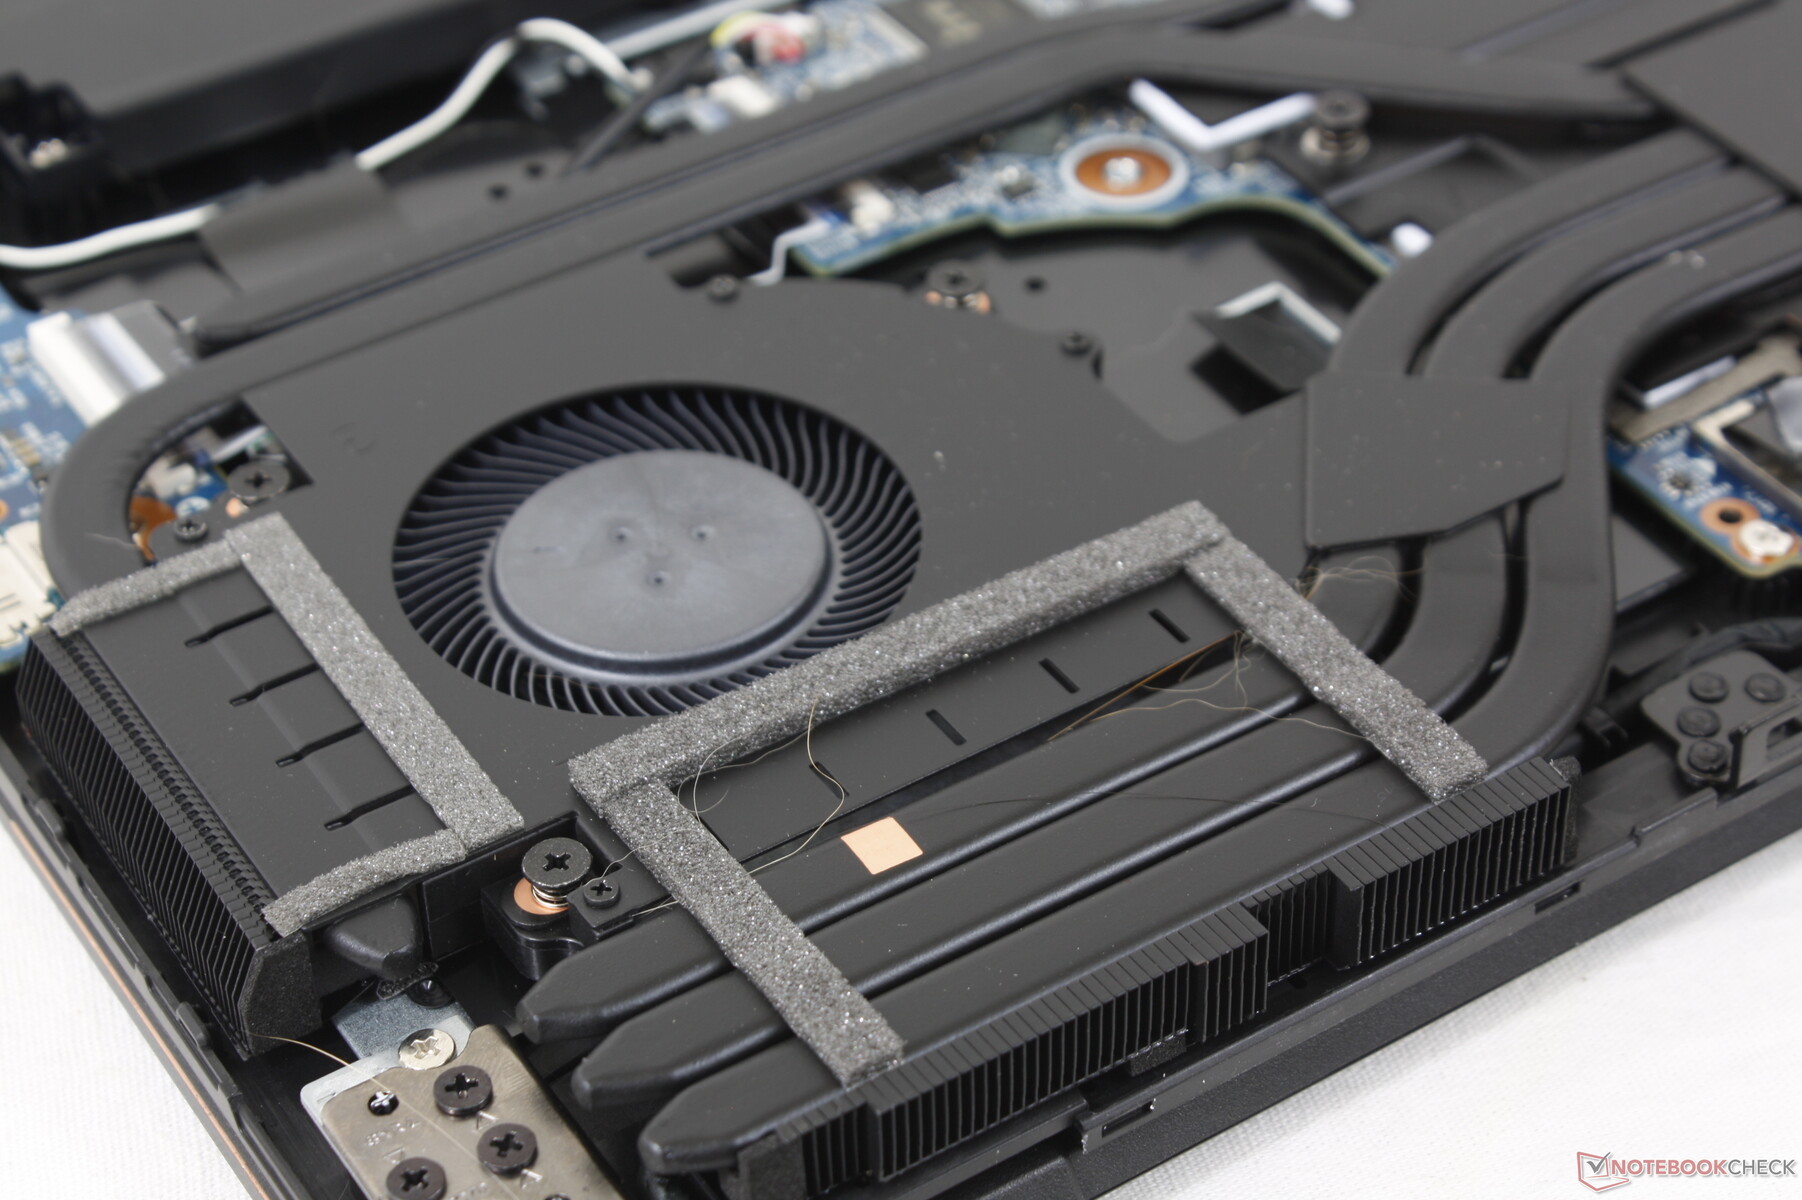
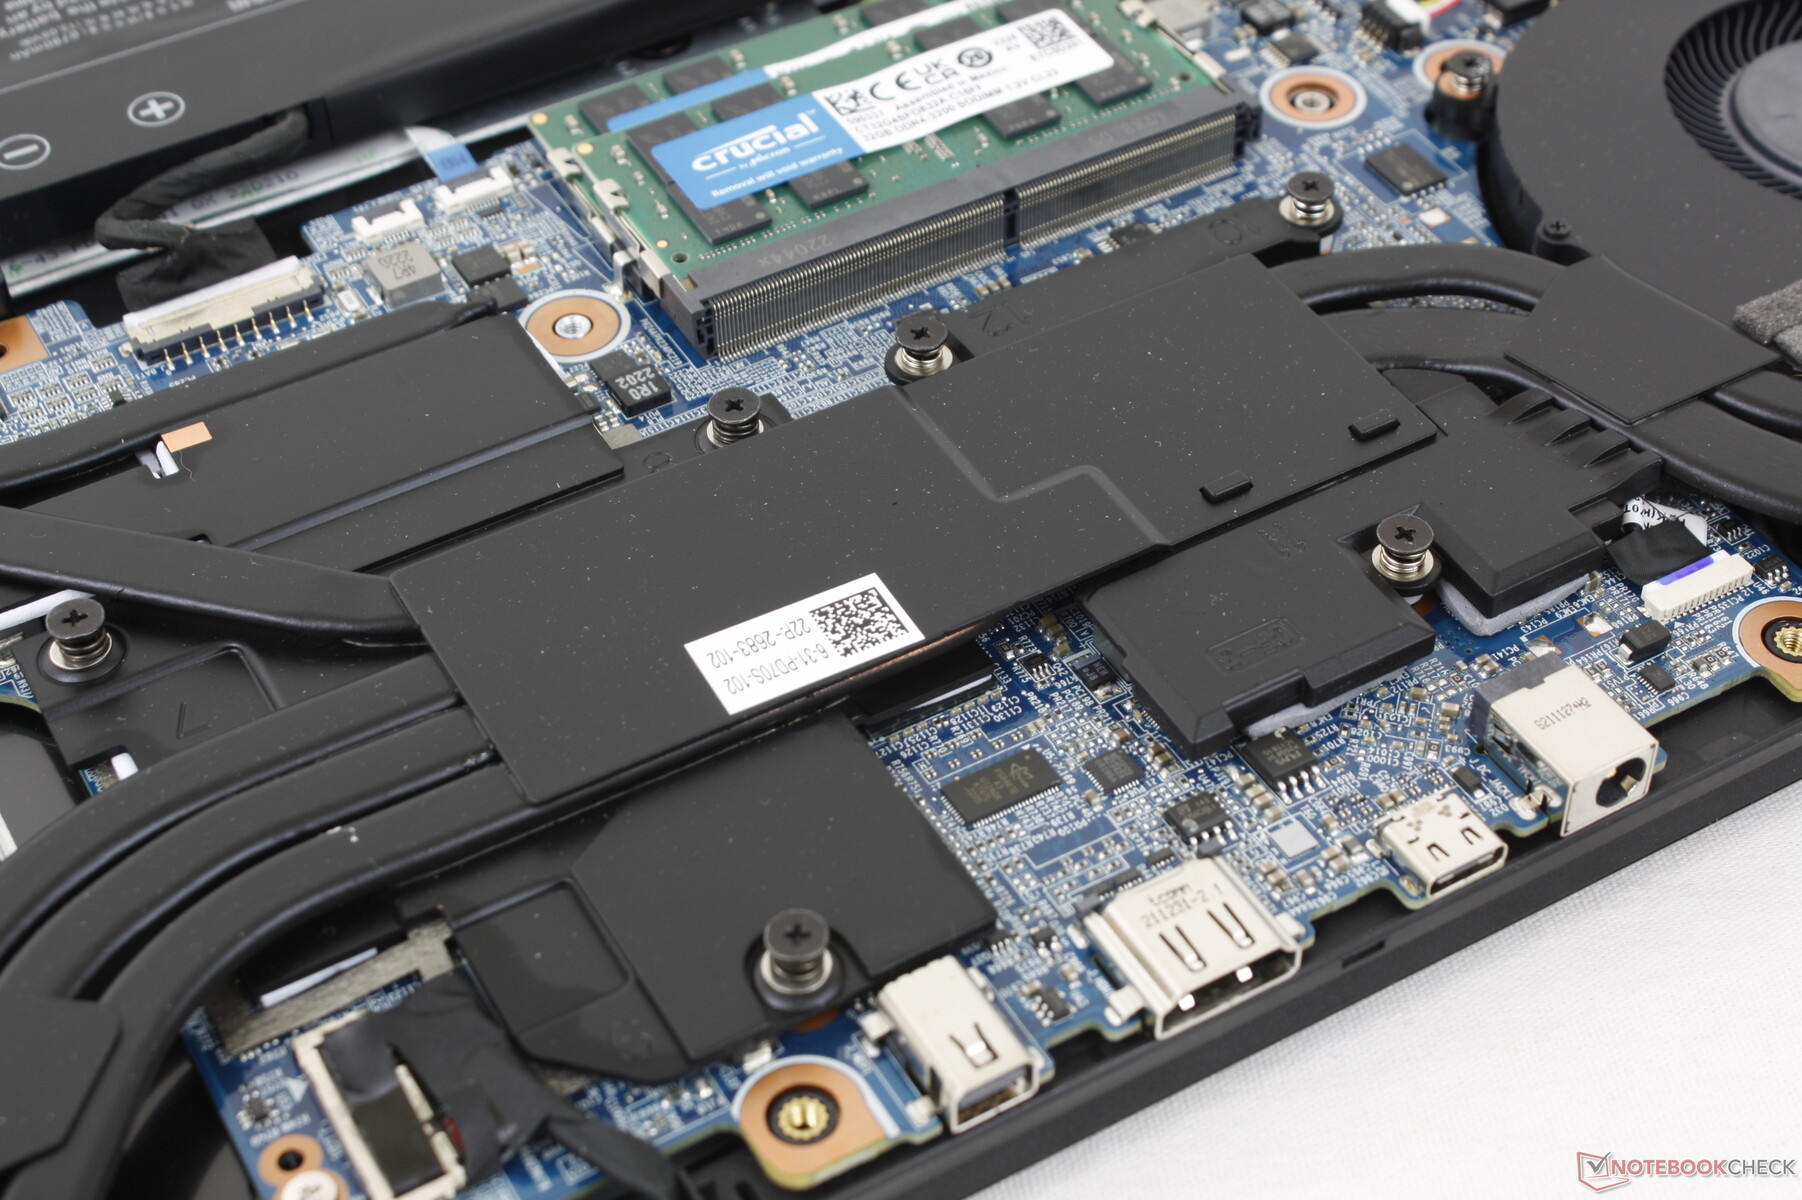
Dwa wewnętrzne gniazda M.2 2280 mogą obsługiwać dyski SSD PCIe4 x4, co zapewnia szalone prędkości, przynajmniej w teorii. W rzeczywistości jednak dyski mogą się dławić, ponieważ obudowa nie ma wbudowanego rozpraszacza ciepła dla dysków SSD. 1 TB Samsung 980 Pro PCIe4 x4 NVMe SSD w naszym teście spadłby do zaledwie 1400 MB/s z początkowego wysokiego poziomu 6800 MB/s podczas uruchamiania DiskSpd w pętli, jak pokazuje nasz wykres poniżej. Takie wyniki są ogólnie akceptowalne dla budżetowych laptopów do gier, ale są rozczarowujące, gdy widzi się je na maszynach z wyższej półki, takich jak ta.

| Drive Performance rating - Percent | |
| MSI Raider GE77 HX 12UHS | |
| Eurocom Nightsky TXi317 | |
| Aorus 17X XES | |
| Schenker XMG Pro 17 E22 | |
| Razer Blade 17 Early 2022 | |
| Alienware x17 R2 P48E | |
| DiskSpd | |
| seq read | |
| Alienware x17 R2 P48E | |
| Razer Blade 17 Early 2022 | |
| Eurocom Nightsky TXi317 | |
| Aorus 17X XES | |
| MSI Raider GE77 HX 12UHS | |
| Schenker XMG Pro 17 E22 | |
| seq write | |
| Alienware x17 R2 P48E | |
| Aorus 17X XES | |
| Razer Blade 17 Early 2022 | |
| Eurocom Nightsky TXi317 | |
| MSI Raider GE77 HX 12UHS | |
| Schenker XMG Pro 17 E22 | |
| seq q8 t1 read | |
| Alienware x17 R2 P48E | |
| Aorus 17X XES | |
| Eurocom Nightsky TXi317 | |
| Schenker XMG Pro 17 E22 | |
| MSI Raider GE77 HX 12UHS | |
| Razer Blade 17 Early 2022 | |
| seq q8 t1 write | |
| Alienware x17 R2 P48E | |
| Eurocom Nightsky TXi317 | |
| Schenker XMG Pro 17 E22 | |
| MSI Raider GE77 HX 12UHS | |
| Razer Blade 17 Early 2022 | |
| Aorus 17X XES | |
| 4k q1 t1 read | |
| Razer Blade 17 Early 2022 | |
| MSI Raider GE77 HX 12UHS | |
| Alienware x17 R2 P48E | |
| Eurocom Nightsky TXi317 | |
| Aorus 17X XES | |
| Schenker XMG Pro 17 E22 | |
| 4k q1 t1 write | |
| Aorus 17X XES | |
| MSI Raider GE77 HX 12UHS | |
| Eurocom Nightsky TXi317 | |
| Schenker XMG Pro 17 E22 | |
| Razer Blade 17 Early 2022 | |
| Alienware x17 R2 P48E | |
| 4k q32 t16 read | |
| Schenker XMG Pro 17 E22 | |
| Eurocom Nightsky TXi317 | |
| MSI Raider GE77 HX 12UHS | |
| Razer Blade 17 Early 2022 | |
| Aorus 17X XES | |
| Alienware x17 R2 P48E | |
| 4k q32 t16 write | |
| Schenker XMG Pro 17 E22 | |
| Eurocom Nightsky TXi317 | |
| Aorus 17X XES | |
| MSI Raider GE77 HX 12UHS | |
| Razer Blade 17 Early 2022 | |
| Alienware x17 R2 P48E | |
| AS SSD | |
| Score Total | |
| Eurocom Nightsky TXi317 | |
| Aorus 17X XES | |
| Schenker XMG Pro 17 E22 | |
| MSI Raider GE77 HX 12UHS | |
| Razer Blade 17 Early 2022 | |
| Alienware x17 R2 P48E | |
| Score Read | |
| Aorus 17X XES | |
| Eurocom Nightsky TXi317 | |
| MSI Raider GE77 HX 12UHS | |
| Schenker XMG Pro 17 E22 | |
| Razer Blade 17 Early 2022 | |
| Alienware x17 R2 P48E | |
| Score Write | |
| Eurocom Nightsky TXi317 | |
| Schenker XMG Pro 17 E22 | |
| MSI Raider GE77 HX 12UHS | |
| Aorus 17X XES | |
| Razer Blade 17 Early 2022 | |
| Alienware x17 R2 P48E | |
| Seq Read | |
| Alienware x17 R2 P48E | |
| Aorus 17X XES | |
| Eurocom Nightsky TXi317 | |
| MSI Raider GE77 HX 12UHS | |
| Razer Blade 17 Early 2022 | |
| Schenker XMG Pro 17 E22 | |
| Seq Write | |
| Eurocom Nightsky TXi317 | |
| Razer Blade 17 Early 2022 | |
| MSI Raider GE77 HX 12UHS | |
| Schenker XMG Pro 17 E22 | |
| Alienware x17 R2 P48E | |
| Aorus 17X XES | |
| 4K Read | |
| Aorus 17X XES | |
| Eurocom Nightsky TXi317 | |
| MSI Raider GE77 HX 12UHS | |
| Razer Blade 17 Early 2022 | |
| Alienware x17 R2 P48E | |
| Schenker XMG Pro 17 E22 | |
| 4K Write | |
| Aorus 17X XES | |
| Schenker XMG Pro 17 E22 | |
| MSI Raider GE77 HX 12UHS | |
| Eurocom Nightsky TXi317 | |
| Razer Blade 17 Early 2022 | |
| Alienware x17 R2 P48E | |
| 4K-64 Read | |
| Aorus 17X XES | |
| MSI Raider GE77 HX 12UHS | |
| Eurocom Nightsky TXi317 | |
| Schenker XMG Pro 17 E22 | |
| Razer Blade 17 Early 2022 | |
| Alienware x17 R2 P48E | |
| 4K-64 Write | |
| Eurocom Nightsky TXi317 | |
| Schenker XMG Pro 17 E22 | |
| Aorus 17X XES | |
| MSI Raider GE77 HX 12UHS | |
| Razer Blade 17 Early 2022 | |
| Alienware x17 R2 P48E | |
| Access Time Read | |
| Aorus 17X XES | |
| Schenker XMG Pro 17 E22 | |
| Razer Blade 17 Early 2022 | |
| Eurocom Nightsky TXi317 | |
| Alienware x17 R2 P48E | |
| MSI Raider GE77 HX 12UHS | |
| Access Time Write | |
| Alienware x17 R2 P48E | |
| Eurocom Nightsky TXi317 | |
| Razer Blade 17 Early 2022 | |
| Schenker XMG Pro 17 E22 | |
| MSI Raider GE77 HX 12UHS | |
| Aorus 17X XES | |
* ... im mniej tym lepiej
Disk Throttling: DiskSpd Read Loop, Queue Depth 8
Wydajność GPU
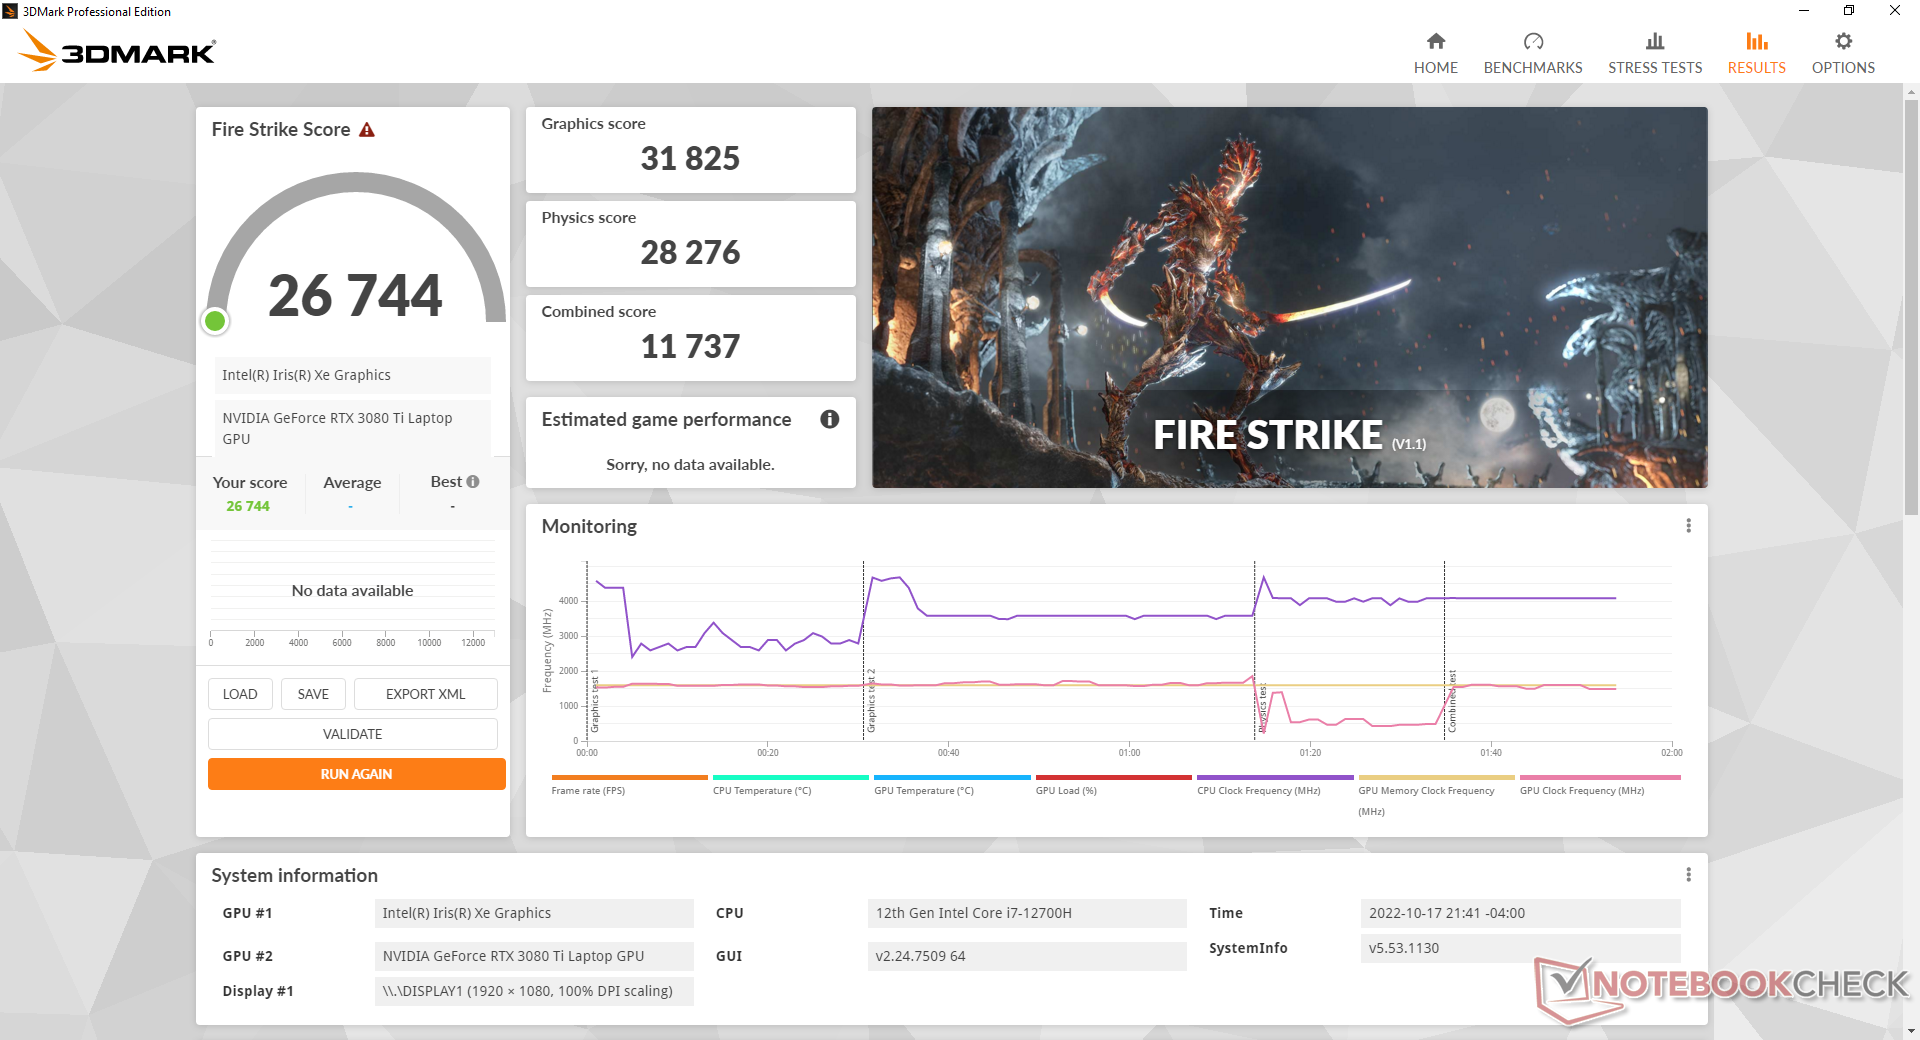
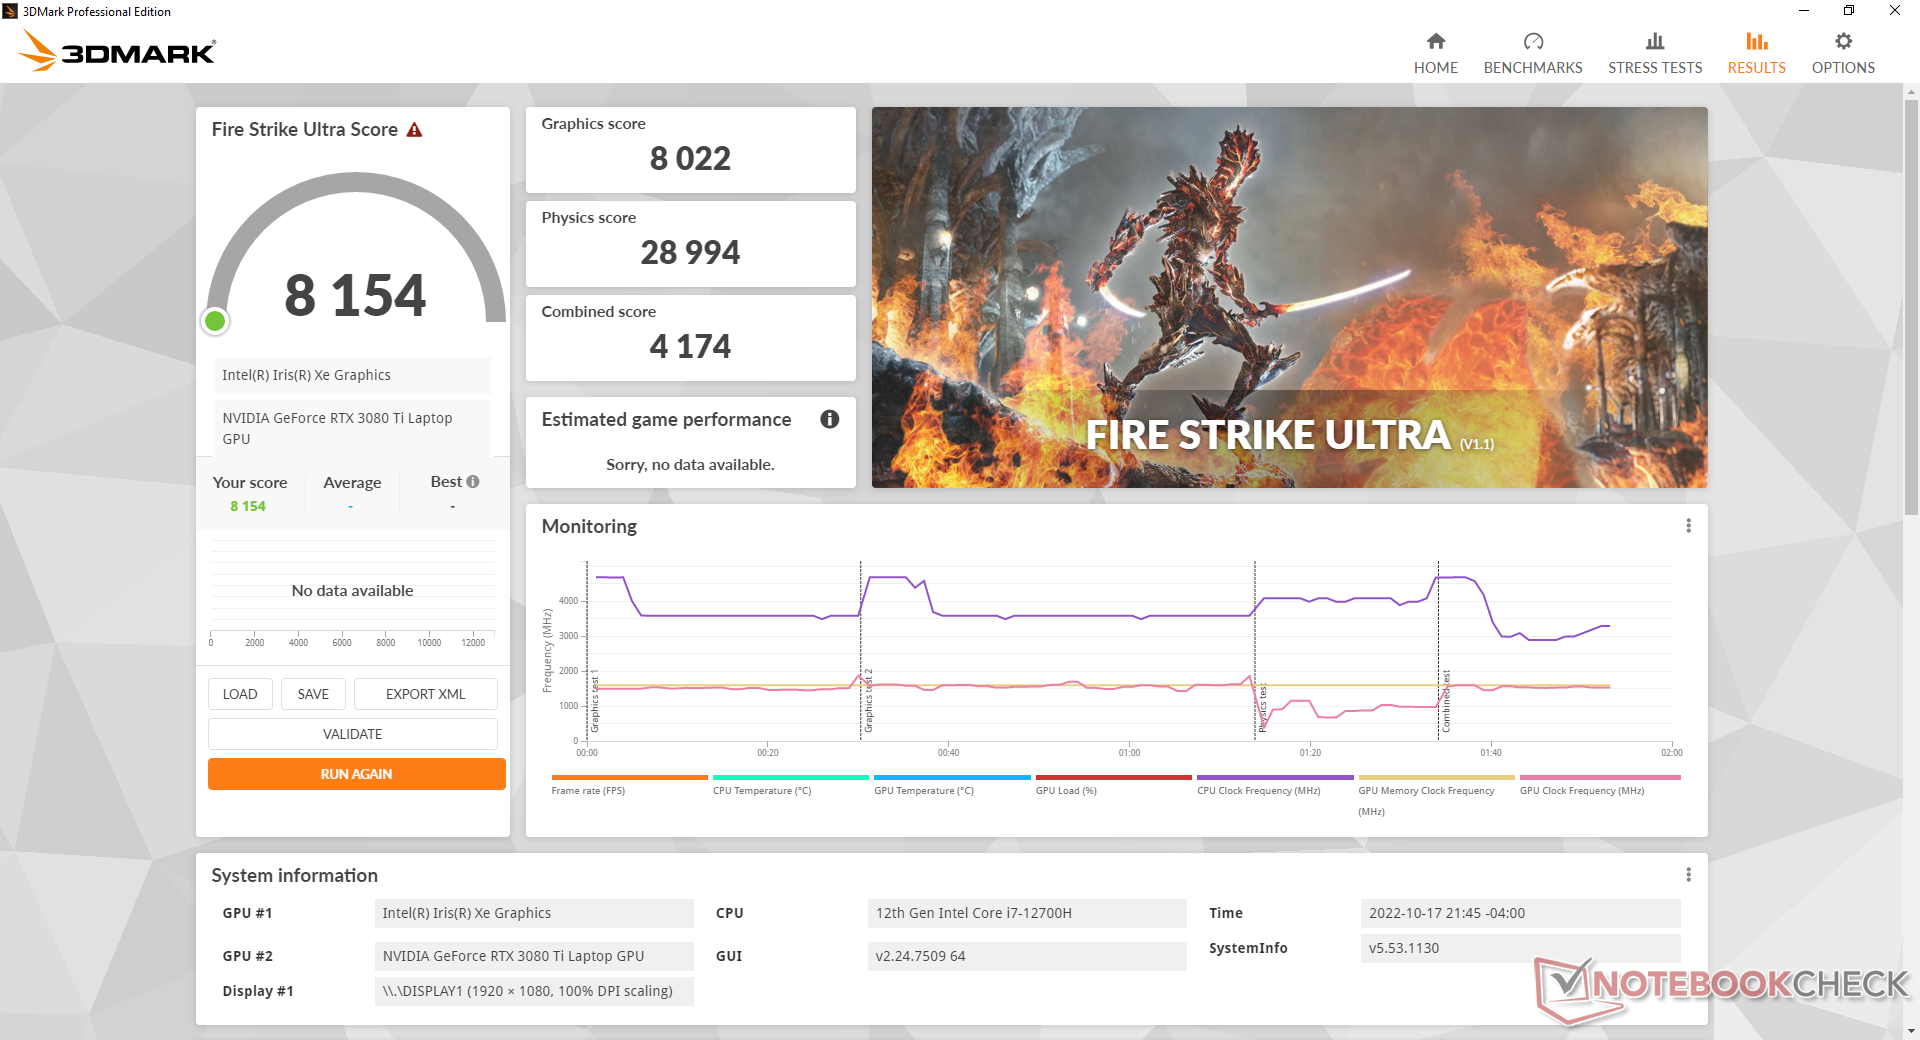
Wydajność graficzna jest doskonała, a wyniki nieznacznie wyprzedzają większość innych laptopów z tym samym GeForce RTX 3080 Ti GPU. TGP o mocy 125 W nie jest najwyższe, jak np Alienware x17 R2 a nawet Razer Blade 17 mają wyższe cele, ale jest przynajmniej wyższe, niż w wielu ultracienkich laptopach, takich jak seria MSI GS.
Co ciekawe, Nvidia Control Panel twierdzi, że TGP wynosi 155 W, podczas gdy Eurocom twierdzi, że TGP wynosi 125 W. Ta druga liczba wydaje się być bardziej dokładnym celem, co pokaże nasz poniższy rozdział Stress Test.
Zmniejszenie wydajności do GeForce RTX 3070 Ti wpłynie na wydajność grafiki tylko o około 10 procent. Ogólna wydajność jest o około 20-30% niższa niż w naszym referencyjnym desktop GeForce RTX 3080.
| 3DMark | |
| 1920x1080 Fire Strike Graphics | |
| ASUS GeForce RTX 3080 ROG STRIX OC GAMING | |
| Schenker XMG Neo 17 M22 | |
| Eurocom Nightsky TXi317 | |
| Schenker XMG Pro 17 E22 | |
| Przeciętny NVIDIA GeForce RTX 3080 Ti Laptop GPU (6928 - 34439, n=43) | |
| Alienware x17 RTX 3080 P48E | |
| Razer Blade 17 (i7-12800H, RTX 3070 Ti) | |
| Schenker XMG Apex 17 M21 | |
| Razer Blade Pro 17 2021 (QHD Touch) | |
| Schenker XMG Core 17 (Early 2021) | |
| MSI GF75 Thin 10SDR | |
| 2560x1440 Time Spy Graphics | |
| ASUS GeForce RTX 3080 ROG STRIX OC GAMING | |
| Schenker XMG Pro 17 E22 | |
| Schenker XMG Neo 17 M22 | |
| Eurocom Nightsky TXi317 | |
| Alienware x17 RTX 3080 P48E | |
| Przeciętny NVIDIA GeForce RTX 3080 Ti Laptop GPU (4921 - 13835, n=43) | |
| Razer Blade 17 (i7-12800H, RTX 3070 Ti) | |
| Razer Blade Pro 17 2021 (QHD Touch) | |
| Schenker XMG Apex 17 M21 | |
| Schenker XMG Core 17 (Early 2021) | |
| MSI GF75 Thin 10SDR | |
| 2560x1440 Time Spy Score | |
| ASUS GeForce RTX 3080 ROG STRIX OC GAMING | |
| Schenker XMG Pro 17 E22 | |
| Schenker XMG Neo 17 M22 | |
| Eurocom Nightsky TXi317 | |
| Przeciętny NVIDIA GeForce RTX 3080 Ti Laptop GPU (4973 - 13808, n=42) | |
| Alienware x17 RTX 3080 P48E | |
| Razer Blade 17 (i7-12800H, RTX 3070 Ti) | |
| Razer Blade Pro 17 2021 (QHD Touch) | |
| Schenker XMG Apex 17 M21 | |
| Schenker XMG Core 17 (Early 2021) | |
| MSI GF75 Thin 10SDR | |
| 3DMark 11 - 1280x720 Performance GPU | |
| ASUS GeForce RTX 3080 ROG STRIX OC GAMING | |
| Schenker XMG Neo 17 M22 | |
| Alienware x17 RTX 3080 P48E | |
| Eurocom Nightsky TXi317 | |
| Schenker XMG Pro 17 E22 | |
| Przeciętny NVIDIA GeForce RTX 3080 Ti Laptop GPU (13920 - 45841, n=45) | |
| Razer Blade 17 (i7-12800H, RTX 3070 Ti) | |
| Schenker XMG Apex 17 M21 | |
| Razer Blade Pro 17 2021 (QHD Touch) | |
| Schenker XMG Core 17 (Early 2021) | |
| MSI GF75 Thin 10SDR | |
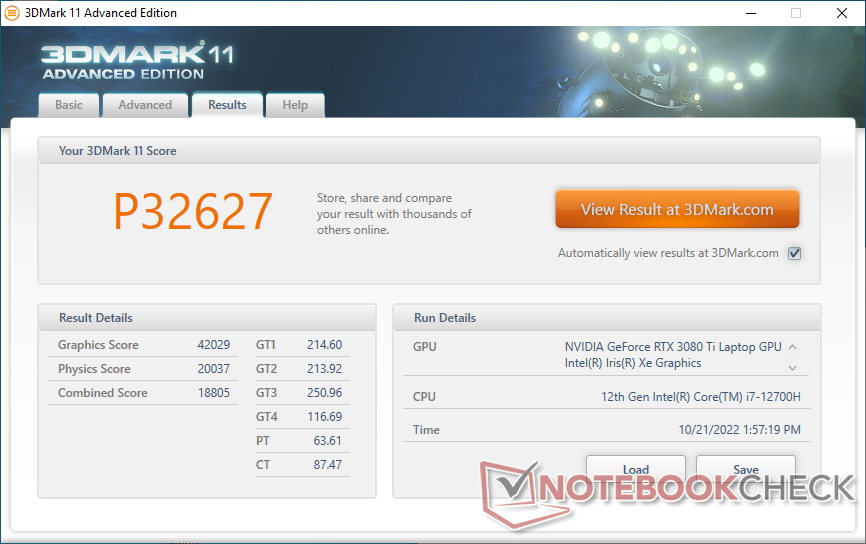
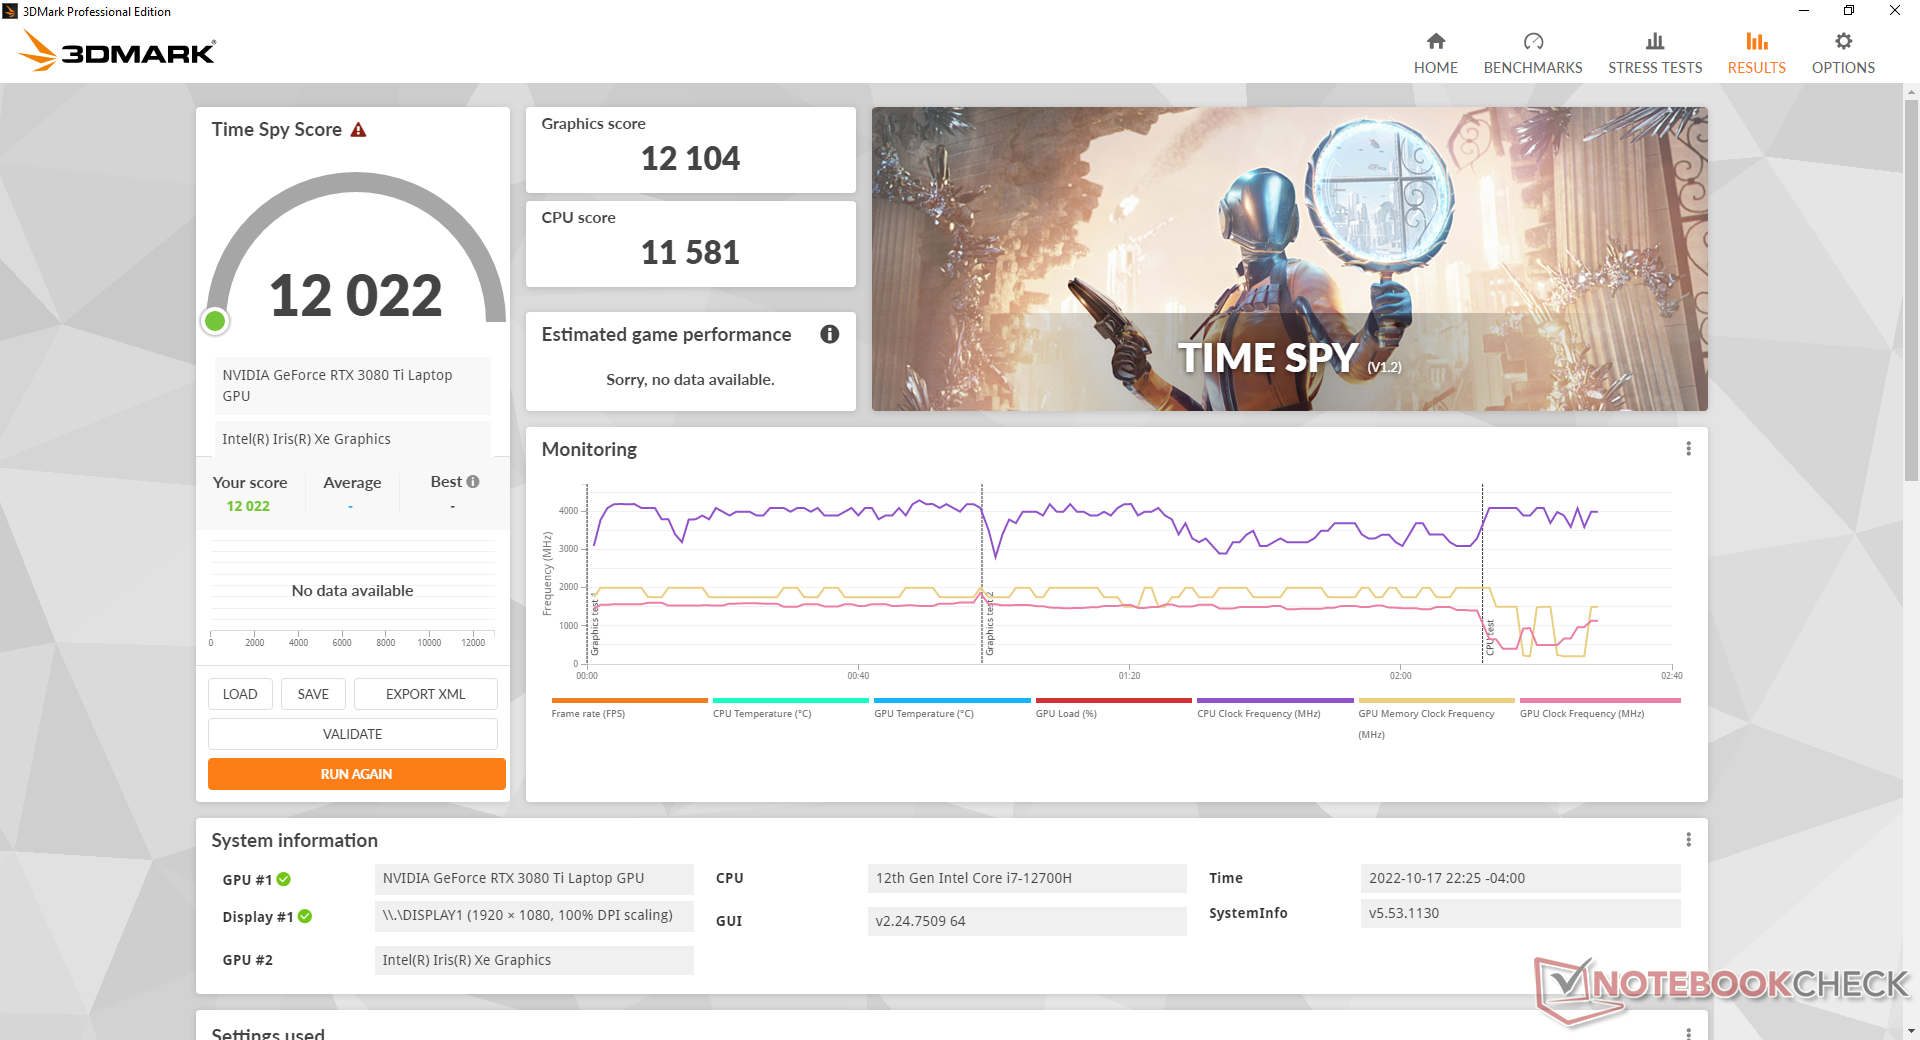
| 3DMark 11 Performance | 32627 pkt. | |
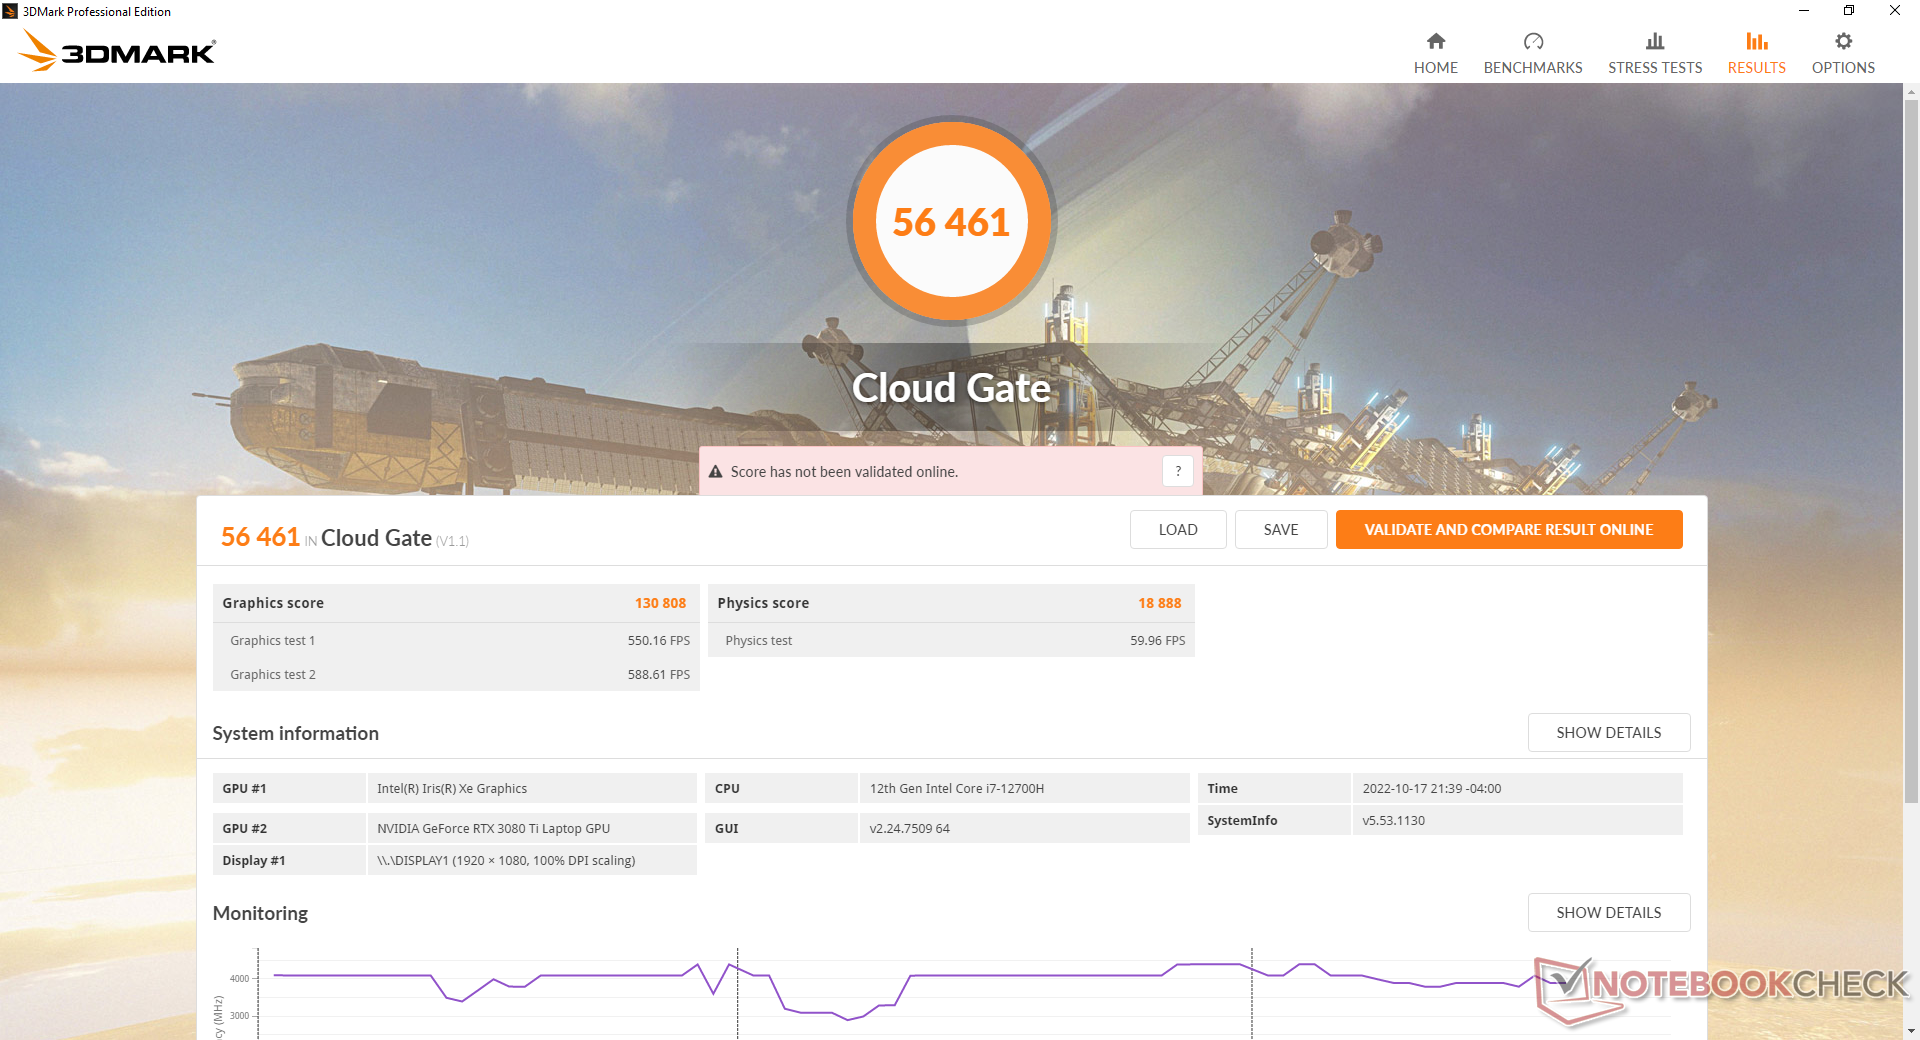
| 3DMark Cloud Gate Standard Score | 56461 pkt. | |
| 3DMark Fire Strike Score | 26744 pkt. | |
| 3DMark Time Spy Score | 12022 pkt. | |
Pomoc | ||
| Blender | |
| v3.3 Classroom OPTIX/RTX | |
| Aorus 17X XES | |
| MSI Raider GE77 HX 12UHS | |
| Przeciętny NVIDIA GeForce RTX 3080 Ti Laptop GPU (20 - 28, n=13) | |
| Eurocom Nightsky TXi317 | |
| v3.3 Classroom CUDA | |
| Aorus 17X XES | |
| MSI Raider GE77 HX 12UHS | |
| Eurocom Nightsky TXi317 | |
| Przeciętny NVIDIA GeForce RTX 3080 Ti Laptop GPU (32 - 41, n=13) | |
| v3.3 Classroom CPU | |
| Aorus 17X XES | |
| Eurocom Nightsky TXi317 | |
| Przeciętny NVIDIA GeForce RTX 3080 Ti Laptop GPU (261 - 429, n=13) | |
| MSI Raider GE77 HX 12UHS | |
* ... im mniej tym lepiej
| The Witcher 3 | |
| 1024x768 Low Graphics & Postprocessing | |
| ASUS GeForce RTX 3080 ROG STRIX OC GAMING | |
| Przeciętny NVIDIA GeForce RTX 3080 Ti Laptop GPU (316 - 543, n=24) | |
| Eurocom Nightsky TXi317 | |
| Schenker XMG Neo 17 M22 | |
| Alienware x17 RTX 3080 P48E | |
| Razer Blade Pro 17 2021 (QHD Touch) | |
| Razer Blade 17 (i7-12800H, RTX 3070 Ti) | |
| Schenker XMG Core 17 (Early 2021) | |
| 1366x768 Medium Graphics & Postprocessing | |
| ASUS GeForce RTX 3080 ROG STRIX OC GAMING | |
| Schenker XMG Neo 17 M22 | |
| Przeciętny NVIDIA GeForce RTX 3080 Ti Laptop GPU (200 - 411, n=26) | |
| Eurocom Nightsky TXi317 | |
| Razer Blade 17 (i7-12800H, RTX 3070 Ti) | |
| Alienware x17 RTX 3080 P48E | |
| Razer Blade Pro 17 2021 (QHD Touch) | |
| Schenker XMG Apex 17 M21 | |
| Schenker XMG Core 17 (Early 2021) | |
| 1920x1080 High Graphics & Postprocessing (Nvidia HairWorks Off) | |
| ASUS GeForce RTX 3080 ROG STRIX OC GAMING | |
| Schenker XMG Neo 17 M22 | |
| Przeciętny NVIDIA GeForce RTX 3080 Ti Laptop GPU (144 - 268, n=28) | |
| Eurocom Nightsky TXi317 | |
| Schenker XMG Pro 17 E22 | |
| Razer Blade Pro 17 2021 (QHD Touch) | |
| Alienware x17 RTX 3080 P48E | |
| Schenker XMG Apex 17 M21 | |
| Razer Blade 17 (i7-12800H, RTX 3070 Ti) | |
| Schenker XMG Core 17 (Early 2021) | |
| MSI GF75 Thin 10SDR | |
| 1920x1080 Ultra Graphics & Postprocessing (HBAO+) | |
| ASUS GeForce RTX 3080 ROG STRIX OC GAMING | |
| Schenker XMG Neo 17 M22 | |
| Przeciętny NVIDIA GeForce RTX 3080 Ti Laptop GPU (30 - 130.6, n=43) | |
| Schenker XMG Pro 17 E22 | |
| Razer Blade 17 (i7-12800H, RTX 3070 Ti) | |
| Eurocom Nightsky TXi317 | |
| Razer Blade Pro 17 2021 (QHD Touch) | |
| Alienware x17 RTX 3080 P48E | |
| Schenker XMG Apex 17 M21 | |
| Schenker XMG Core 17 (Early 2021) | |
| MSI GF75 Thin 10SDR | |
| GTA V | |
| 1024x768 Lowest Settings possible | |
| ASUS GeForce RTX 3080 ROG STRIX OC GAMING | |
| Eurocom Nightsky TXi317 | |
| Przeciętny NVIDIA GeForce RTX 3080 Ti Laptop GPU (178.7 - 187.3, n=24) | |
| Alienware x17 RTX 3080 P48E | |
| Razer Blade 17 (i7-12800H, RTX 3070 Ti) | |
| Schenker XMG Neo 17 M22 | |
| Razer Blade Pro 17 2021 (QHD Touch) | |
| Schenker XMG Core 17 (Early 2021) | |
| MSI GF75 Thin 10SDR | |
| 1920x1080 Lowest Settings possible | |
| ASUS GeForce RTX 3080 ROG STRIX OC GAMING | |
| Przeciętny NVIDIA GeForce RTX 3080 Ti Laptop GPU (175.6 - 187.5, n=20) | |
| Razer Blade Pro 17 2021 (QHD Touch) | |
| Eurocom Nightsky TXi317 | |
| Schenker XMG Neo 17 M22 | |
| Alienware x17 RTX 3080 P48E | |
| Razer Blade 17 (i7-12800H, RTX 3070 Ti) | |
| Schenker XMG Core 17 (Early 2021) | |
| MSI GF75 Thin 10SDR | |
| 1366x768 Normal/Off AF:4x | |
| ASUS GeForce RTX 3080 ROG STRIX OC GAMING | |
| Przeciętny NVIDIA GeForce RTX 3080 Ti Laptop GPU (170.7 - 187, n=26) | |
| Eurocom Nightsky TXi317 | |
| Razer Blade 17 (i7-12800H, RTX 3070 Ti) | |
| Schenker XMG Neo 17 M22 | |
| Alienware x17 RTX 3080 P48E | |
| Razer Blade Pro 17 2021 (QHD Touch) | |
| Schenker XMG Core 17 (Early 2021) | |
| Schenker XMG Apex 17 M21 | |
| MSI GF75 Thin 10SDR | |
| 1920x1080 Normal/Off AF:4x | |
| ASUS GeForce RTX 3080 ROG STRIX OC GAMING | |
| Przeciętny NVIDIA GeForce RTX 3080 Ti Laptop GPU (169.8 - 187.4, n=22) | |
| Eurocom Nightsky TXi317 | |
| Schenker XMG Neo 17 M22 | |
| Razer Blade 17 (i7-12800H, RTX 3070 Ti) | |
| Razer Blade Pro 17 2021 (QHD Touch) | |
| Alienware x17 RTX 3080 P48E | |
| Schenker XMG Apex 17 M21 | |
| Schenker XMG Core 17 (Early 2021) | |
| MSI GF75 Thin 10SDR | |
| 1920x1080 High/On (Advanced Graphics Off) AA:2xMSAA + FX AF:8x | |
| ASUS GeForce RTX 3080 ROG STRIX OC GAMING | |
| Schenker XMG Pro 17 E22 | |
| Przeciętny NVIDIA GeForce RTX 3080 Ti Laptop GPU (153.4 - 184.3, n=28) | |
| Eurocom Nightsky TXi317 | |
| Razer Blade 17 (i7-12800H, RTX 3070 Ti) | |
| Razer Blade Pro 17 2021 (QHD Touch) | |
| Schenker XMG Neo 17 M22 | |
| Alienware x17 RTX 3080 P48E | |
| Schenker XMG Apex 17 M21 | |
| Schenker XMG Core 17 (Early 2021) | |
| MSI GF75 Thin 10SDR | |
| 1920x1080 Highest AA:4xMSAA + FX AF:16x | |
| ASUS GeForce RTX 3080 ROG STRIX OC GAMING | |
| Schenker XMG Pro 17 E22 | |
| Przeciętny NVIDIA GeForce RTX 3080 Ti Laptop GPU (30 - 139.2, n=42) | |
| Eurocom Nightsky TXi317 | |
| Razer Blade 17 (i7-12800H, RTX 3070 Ti) | |
| Schenker XMG Neo 17 M22 | |
| Razer Blade Pro 17 2021 (QHD Touch) | |
| Alienware x17 RTX 3080 P48E | |
| Schenker XMG Apex 17 M21 | |
| Schenker XMG Core 17 (Early 2021) | |
| MSI GF75 Thin 10SDR | |
| X-Plane 11.11 | |
| 1280x720 low (fps_test=1) | |
| ASUS GeForce RTX 3080 ROG STRIX OC GAMING | |
| Przeciętny NVIDIA GeForce RTX 3080 Ti Laptop GPU (38.9 - 187.7, n=43) | |
| Razer Blade 17 (i7-12800H, RTX 3070 Ti) | |
| Razer Blade Pro 17 2021 (QHD Touch) | |
| Eurocom Nightsky TXi317 | |
| Alienware x17 RTX 3080 P48E | |
| Schenker XMG Neo 17 M22 | |
| MSI GF75 Thin 10SDR | |
| Schenker XMG Apex 17 M21 | |
| Schenker XMG Core 17 (Early 2021) | |
| 1920x1080 med (fps_test=2) | |
| ASUS GeForce RTX 3080 ROG STRIX OC GAMING | |
| Przeciętny NVIDIA GeForce RTX 3080 Ti Laptop GPU (35.2 - 164.7, n=43) | |
| Razer Blade 17 (i7-12800H, RTX 3070 Ti) | |
| Razer Blade Pro 17 2021 (QHD Touch) | |
| Eurocom Nightsky TXi317 | |
| Schenker XMG Neo 17 M22 | |
| Alienware x17 RTX 3080 P48E | |
| MSI GF75 Thin 10SDR | |
| Schenker XMG Apex 17 M21 | |
| Schenker XMG Core 17 (Early 2021) | |
| 1920x1080 high (fps_test=3) | |
| ASUS GeForce RTX 3080 ROG STRIX OC GAMING | |
| Schenker XMG Pro 17 E22 | |
| Przeciętny NVIDIA GeForce RTX 3080 Ti Laptop GPU (32.6 - 127, n=45) | |
| Eurocom Nightsky TXi317 | |
| Razer Blade 17 (i7-12800H, RTX 3070 Ti) | |
| Razer Blade Pro 17 2021 (QHD Touch) | |
| Schenker XMG Neo 17 M22 | |
| Alienware x17 RTX 3080 P48E | |
| MSI GF75 Thin 10SDR | |
| Schenker XMG Apex 17 M21 | |
| Schenker XMG Core 17 (Early 2021) | |
| Cyberpunk 2077 1.6 | |
| 1920x1080 Low Preset | |
| Przeciętny NVIDIA GeForce RTX 3080 Ti Laptop GPU (89 - 169.8, n=14) | |
| Eurocom Nightsky TXi317 | |
| Razer Blade 17 (i7-12800H, RTX 3070 Ti) | |
| 1920x1080 Medium Preset | |
| Przeciętny NVIDIA GeForce RTX 3080 Ti Laptop GPU (78 - 159.7, n=14) | |
| Eurocom Nightsky TXi317 | |
| Razer Blade 17 (i7-12800H, RTX 3070 Ti) | |
| 1920x1080 High Preset | |
| Razer Blade 17 (i7-12800H, RTX 3070 Ti) | |
| Przeciętny NVIDIA GeForce RTX 3080 Ti Laptop GPU (64 - 145.6, n=14) | |
| Eurocom Nightsky TXi317 | |
| 1920x1080 Ultra Preset | |
| Razer Blade 17 (i7-12800H, RTX 3070 Ti) | |
| Przeciętny NVIDIA GeForce RTX 3080 Ti Laptop GPU (54 - 144.1, n=16) | |
| Eurocom Nightsky TXi317 | |
| Strange Brigade | |
| 1280x720 lowest AF:1 | |
| ASUS GeForce RTX 3080 ROG STRIX OC GAMING | |
| Alienware x17 RTX 3080 P48E | |
| Przeciętny NVIDIA GeForce RTX 3080 Ti Laptop GPU (205 - 563, n=26) | |
| Razer Blade Pro 17 2021 (QHD Touch) | |
| Eurocom Nightsky TXi317 | |
| Razer Blade 17 (i7-12800H, RTX 3070 Ti) | |
| Schenker XMG Core 17 (Early 2021) | |
| Schenker XMG Neo 17 M22 | |
| 1920x1080 medium AA:medium AF:4 | |
| ASUS GeForce RTX 3080 ROG STRIX OC GAMING | |
| Razer Blade Pro 17 2021 (QHD Touch) | |
| Schenker XMG Neo 17 M22 | |
| Eurocom Nightsky TXi317 | |
| Przeciętny NVIDIA GeForce RTX 3080 Ti Laptop GPU (194 - 314, n=27) | |
| Alienware x17 RTX 3080 P48E | |
| Razer Blade 17 (i7-12800H, RTX 3070 Ti) | |
| Schenker XMG Apex 17 M21 | |
| Schenker XMG Core 17 (Early 2021) | |
| 1920x1080 high AA:high AF:8 | |
| ASUS GeForce RTX 3080 ROG STRIX OC GAMING | |
| Schenker XMG Pro 17 E22 | |
| Schenker XMG Neo 17 M22 | |
| Eurocom Nightsky TXi317 | |
| Alienware x17 RTX 3080 P48E | |
| Razer Blade Pro 17 2021 (QHD Touch) | |
| Przeciętny NVIDIA GeForce RTX 3080 Ti Laptop GPU (156 - 255, n=29) | |
| Razer Blade 17 (i7-12800H, RTX 3070 Ti) | |
| Schenker XMG Apex 17 M21 | |
| Schenker XMG Core 17 (Early 2021) | |
| 1920x1080 ultra AA:ultra AF:16 | |
| ASUS GeForce RTX 3080 ROG STRIX OC GAMING | |
| Schenker XMG Pro 17 E22 | |
| Schenker XMG Neo 17 M22 | |
| Eurocom Nightsky TXi317 | |
| Alienware x17 RTX 3080 P48E | |
| Razer Blade Pro 17 2021 (QHD Touch) | |
| Razer Blade 17 (i7-12800H, RTX 3070 Ti) | |
| Przeciętny NVIDIA GeForce RTX 3080 Ti Laptop GPU (42.3 - 224, n=41) | |
| Schenker XMG Apex 17 M21 | |
| Schenker XMG Core 17 (Early 2021) | |
| Dota 2 Reborn | |
| 1280x720 min (0/3) fastest | |
| ASUS GeForce RTX 3080 ROG STRIX OC GAMING | |
| Eurocom Nightsky TXi317 | |
| Razer Blade 17 (i7-12800H, RTX 3070 Ti) | |
| Przeciętny NVIDIA GeForce RTX 3080 Ti Laptop GPU (59.9 - 211, n=43) | |
| Alienware x17 RTX 3080 P48E | |
| Razer Blade Pro 17 2021 (QHD Touch) | |
| Schenker XMG Apex 17 M21 | |
| Schenker XMG Neo 17 M22 | |
| MSI GF75 Thin 10SDR | |
| Schenker XMG Core 17 (Early 2021) | |
| 1366x768 med (1/3) | |
| ASUS GeForce RTX 3080 ROG STRIX OC GAMING | |
| Razer Blade 17 (i7-12800H, RTX 3070 Ti) | |
| Eurocom Nightsky TXi317 | |
| Przeciętny NVIDIA GeForce RTX 3080 Ti Laptop GPU (34.6 - 191, n=43) | |
| Alienware x17 RTX 3080 P48E | |
| Razer Blade Pro 17 2021 (QHD Touch) | |
| Schenker XMG Core 17 (Early 2021) | |
| Schenker XMG Apex 17 M21 | |
| Schenker XMG Neo 17 M22 | |
| MSI GF75 Thin 10SDR | |
| 1920x1080 high (2/3) | |
| ASUS GeForce RTX 3080 ROG STRIX OC GAMING | |
| Schenker XMG Pro 17 E22 | |
| Razer Blade 17 (i7-12800H, RTX 3070 Ti) | |
| Eurocom Nightsky TXi317 | |
| Przeciętny NVIDIA GeForce RTX 3080 Ti Laptop GPU (29.9 - 180.8, n=45) | |
| Alienware x17 RTX 3080 P48E | |
| Razer Blade Pro 17 2021 (QHD Touch) | |
| Schenker XMG Neo 17 M22 | |
| Schenker XMG Apex 17 M21 | |
| MSI GF75 Thin 10SDR | |
| Schenker XMG Core 17 (Early 2021) | |
| 1920x1080 ultra (3/3) best looking | |
| ASUS GeForce RTX 3080 ROG STRIX OC GAMING | |
| Schenker XMG Pro 17 E22 | |
| Razer Blade 17 (i7-12800H, RTX 3070 Ti) | |
| Przeciętny NVIDIA GeForce RTX 3080 Ti Laptop GPU (29.9 - 170.5, n=45) | |
| Eurocom Nightsky TXi317 | |
| Alienware x17 RTX 3080 P48E | |
| Razer Blade Pro 17 2021 (QHD Touch) | |
| Schenker XMG Apex 17 M21 | |
| Schenker XMG Neo 17 M22 | |
| Schenker XMG Core 17 (Early 2021) | |
| MSI GF75 Thin 10SDR | |
| Final Fantasy XV Benchmark | |
| 1280x720 Lite Quality | |
| ASUS GeForce RTX 3080 ROG STRIX OC GAMING | |
| Eurocom Nightsky TXi317 | |
| Przeciętny NVIDIA GeForce RTX 3080 Ti Laptop GPU (148.3 - 223, n=24) | |
| Schenker XMG Neo 17 M22 | |
| Alienware x17 RTX 3080 P48E | |
| Razer Blade Pro 17 2021 (QHD Touch) | |
| Razer Blade 17 (i7-12800H, RTX 3070 Ti) | |
| Schenker XMG Core 17 (Early 2021) | |
| 1920x1080 Standard Quality | |
| ASUS GeForce RTX 3080 ROG STRIX OC GAMING | |
| Schenker XMG Neo 17 M22 | |
| Przeciętny NVIDIA GeForce RTX 3080 Ti Laptop GPU (110 - 189.3, n=27) | |
| Eurocom Nightsky TXi317 | |
| Razer Blade Pro 17 2021 (QHD Touch) | |
| Razer Blade 17 (i7-12800H, RTX 3070 Ti) | |
| Alienware x17 RTX 3080 P48E | |
| Schenker XMG Apex 17 M21 | |
| Schenker XMG Core 17 (Early 2021) | |
| 1920x1080 High Quality | |
| ASUS GeForce RTX 3080 ROG STRIX OC GAMING | |
| Schenker XMG Neo 17 M22 | |
| Schenker XMG Pro 17 E22 | |
| Eurocom Nightsky TXi317 | |
| Przeciętny NVIDIA GeForce RTX 3080 Ti Laptop GPU (30.7 - 140.6, n=42) | |
| Razer Blade Pro 17 2021 (QHD Touch) | |
| Alienware x17 RTX 3080 P48E | |
| Razer Blade 17 (i7-12800H, RTX 3070 Ti) | |
| Schenker XMG Apex 17 M21 | |
| Schenker XMG Core 17 (Early 2021) | |
Witcher 3 FPS Chart
| low | med. | high | ultra | |
|---|---|---|---|---|
| GTA V (2015) | 186.2 | 181.3 | 169.5 | 107.4 |
| The Witcher 3 (2015) | 391.9 | 313.9 | 212.5 | 109.4 |
| Dota 2 Reborn (2015) | 176.1 | 157.9 | 148.6 | 140.8 |
| Final Fantasy XV Benchmark (2018) | 200 | 147.4 | 115.1 | |
| X-Plane 11.11 (2018) | 124.3 | 106.6 | 96.4 | |
| Strange Brigade (2018) | 416 | 273 | 226 | 199.8 |
| Cyberpunk 2077 1.6 (2022) | 135.4 | 123.2 | 96.2 | 80 |
Emisje
Szum systemu
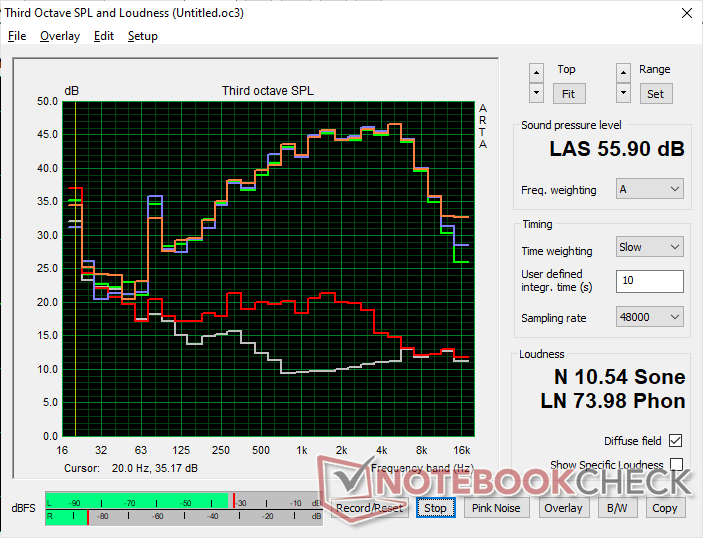
Szum wentylatorów jest prawie zawsze słyszalny. Wentylatory zwykle pracują w trybie jałowym, ale nawet najmniejsze obciążenie, takie jak przeglądanie stron internetowych, wywołuje szum wentylatorów o natężeniu 30 dB(A) na tle 23 dB(A). Przy bardziej wymagających obciążeniach, takich jak 3DMark 06 czy gry, szum wentylatora szybko osiągnąłby maksymalny poziom 56 dB(A), nawet przy ustawieniu profilu zasilania na zrównoważony. Jest to laptop do gier, który nie boi się być głośny bez względu na ustawienie profilu zasilania.
Większość innych 17-calowych laptopów do gier również osiąga poziom 50 dB(A) lub głośniejszy w podobnych warunkach, więc ten problem nie jest wyjątkowy dla Eurocom. Niemniej jednak maszyna Eurocomu ma tendencję do gwałtownego i szybkiego zwiększania głośności.
Hałas
| luz |
| 23.3 / 30.7 / 30.7 dB |
| obciążenie |
| 56.2 / 55.9 dB |
 | ||
30 dB cichy 40 dB(A) słyszalny 50 dB(A) irytujący |
||
min: | ||
| Eurocom Nightsky TXi317 GeForce RTX 3080 Ti Laptop GPU, i7-12700H, Samsung SSD 980 Pro 1TB MZ-V8P1T0BW | Schenker XMG Pro 17 E22 GeForce RTX 3080 Ti Laptop GPU, i9-12900H, Samsung SSD 980 Pro 1TB MZ-V8P1T0BW | Aorus 17X XES GeForce RTX 3070 Ti Laptop GPU, i9-12900HX, Gigabyte AG470S1TB-SI B10 | MSI Raider GE77 HX 12UHS GeForce RTX 3080 Ti Laptop GPU, i9-12900HX, Samsung PM9A1 MZVL22T0HBLB | Razer Blade 17 Early 2022 GeForce RTX 3080 Ti Laptop GPU, i9-12900H, Samsung PM9A1 MZVL21T0HCLR | Alienware x17 R2 P48E GeForce RTX 3080 Ti Laptop GPU, i9-12900HK, 2x Samsung PM9A1 1TB (RAID 0) | |
|---|---|---|---|---|---|---|
| Noise | -12% | -7% | -11% | 2% | 16% | |
| wyłączone / środowisko * (dB) | 23.3 | 26 -12% | 26 -12% | 26 -12% | 26 -12% | 22.7 3% |
| Idle Minimum * (dB) | 23.3 | 26 -12% | 28 -20% | 26 -12% | 26 -12% | 23.1 1% |
| Idle Average * (dB) | 30.7 | 34 -11% | 32 -4% | 34 -11% | 27 12% | 23.1 25% |
| Idle Maximum * (dB) | 30.7 | 42 -37% | 38 -24% | 46 -50% | 32 -4% | 23.1 25% |
| Load Average * (dB) | 56.2 | 58 -3% | 53 6% | 50 11% | 50 11% | 31.9 43% |
| Witcher 3 ultra * (dB) | 56.1 | 57 -2% | 54 4% | 55 2% | 51 9% | 52.5 6% |
| Load Maximum * (dB) | 55.9 | 58 -4% | 55 2% | 57 -2% | 51 9% | 52.5 6% |
* ... im mniej tym lepiej
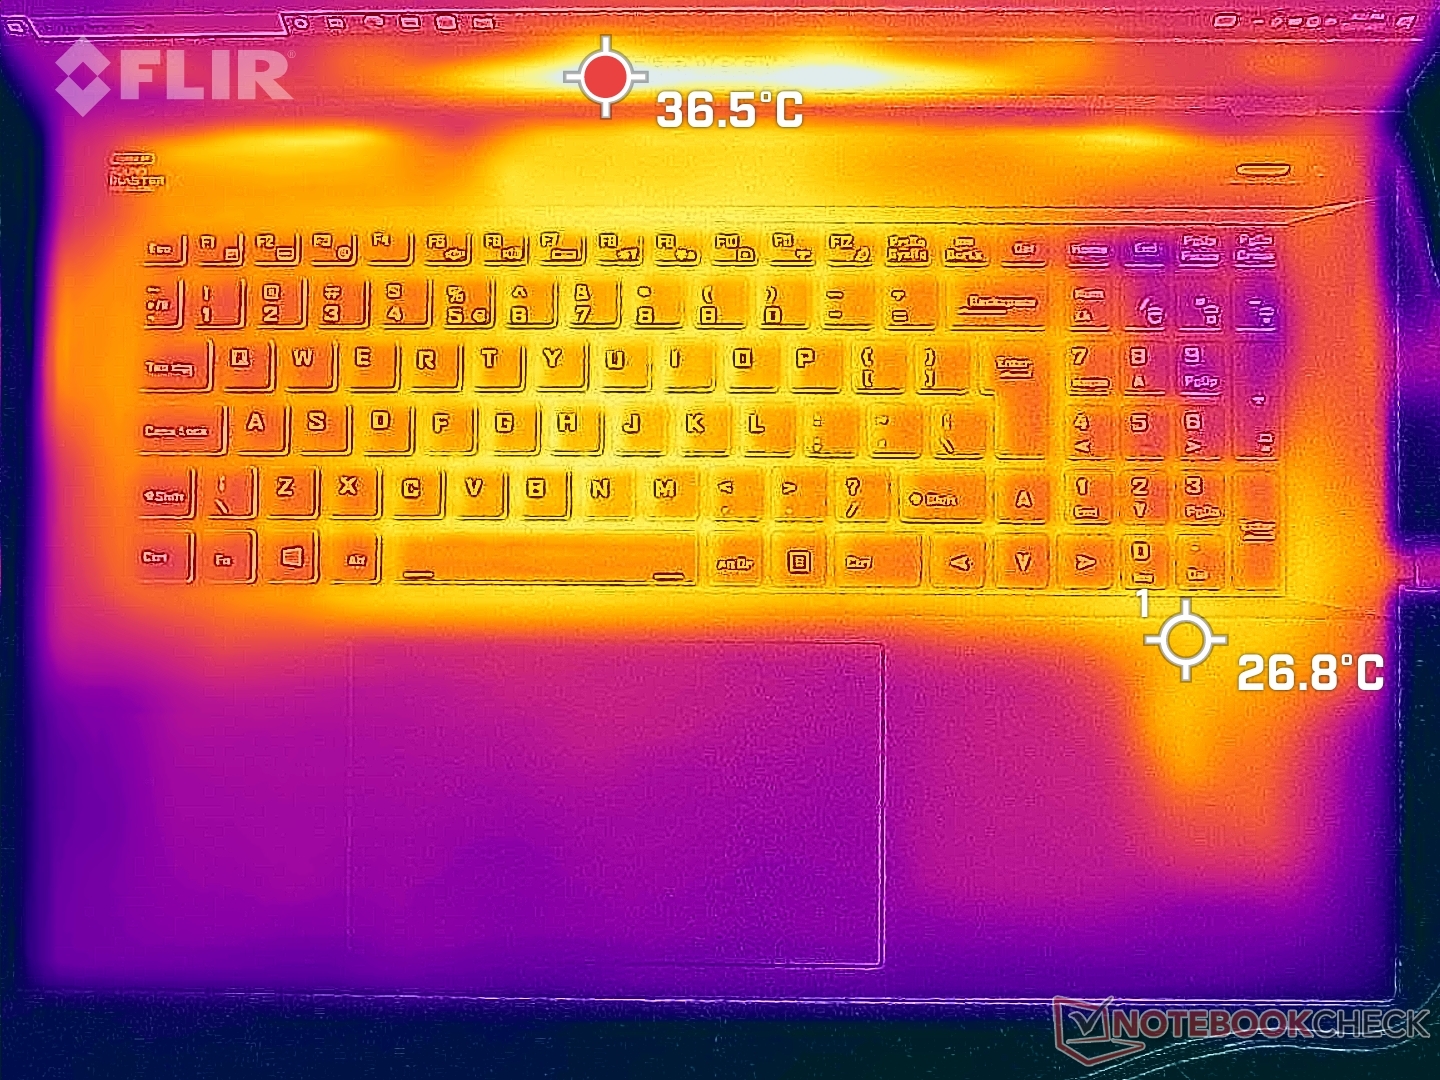
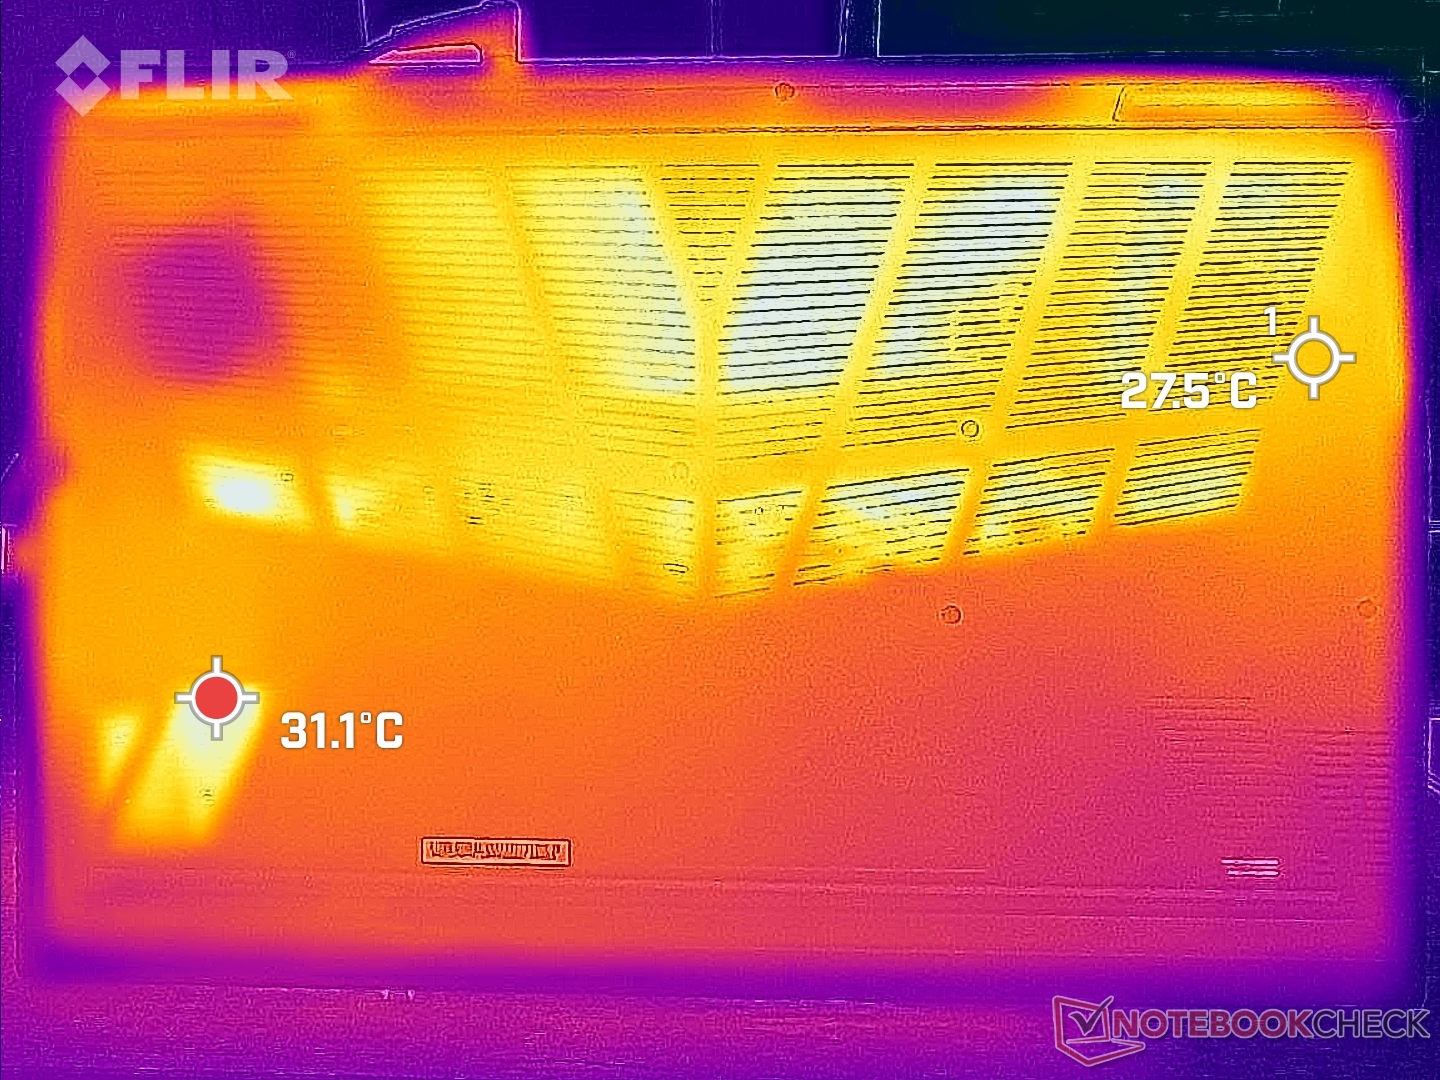
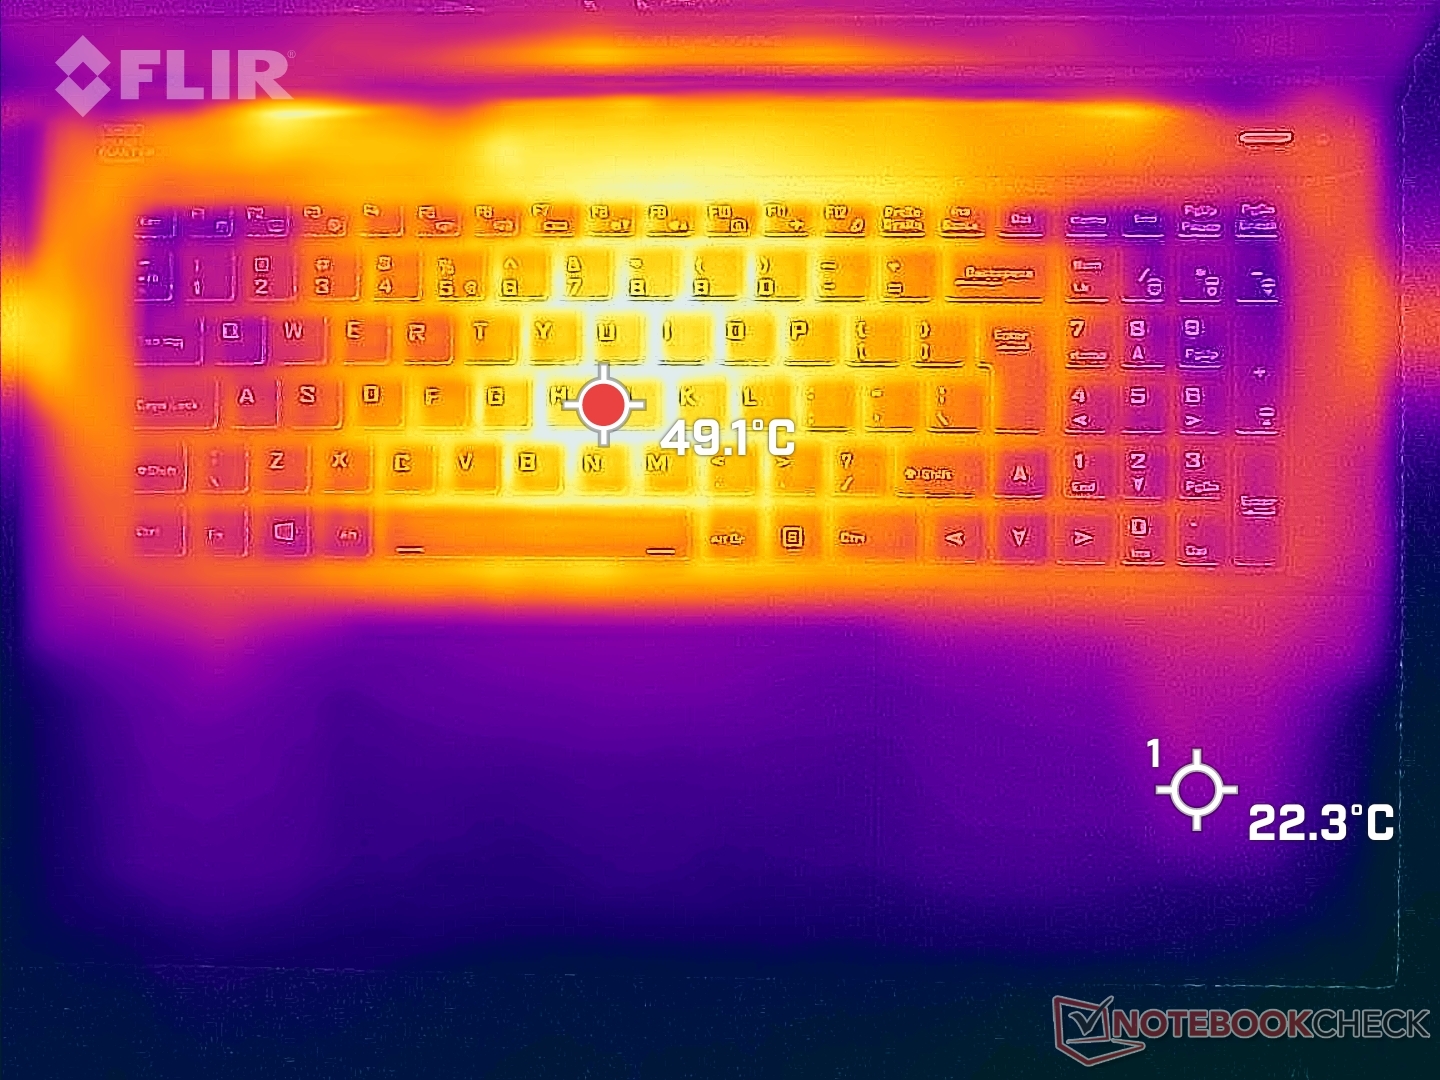
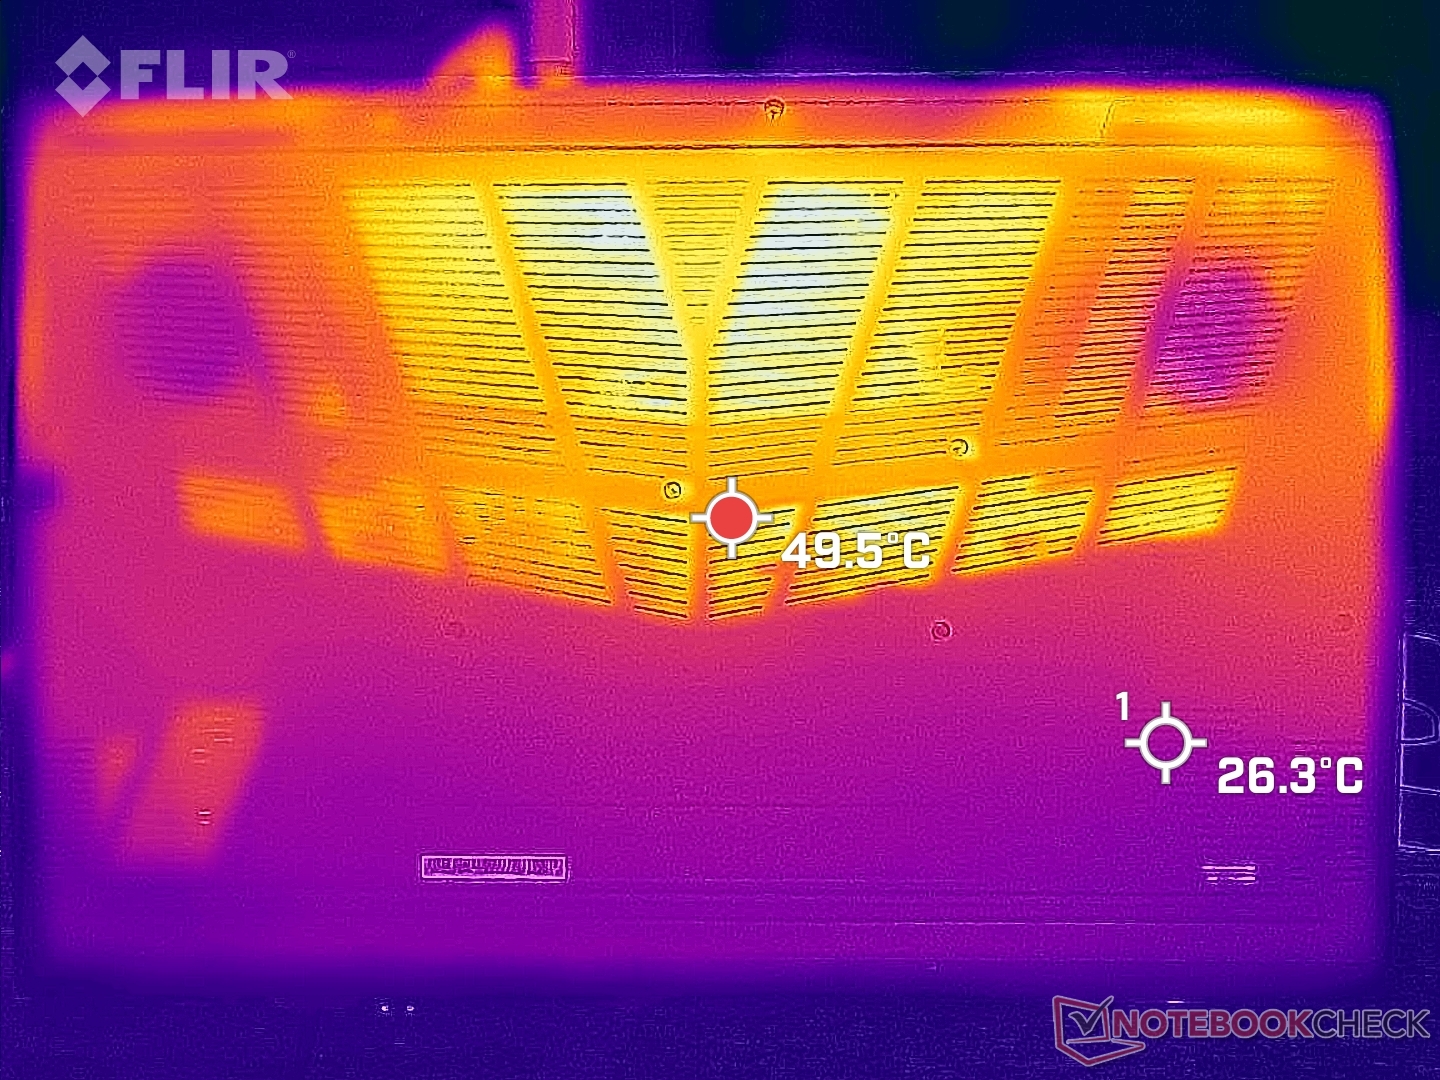
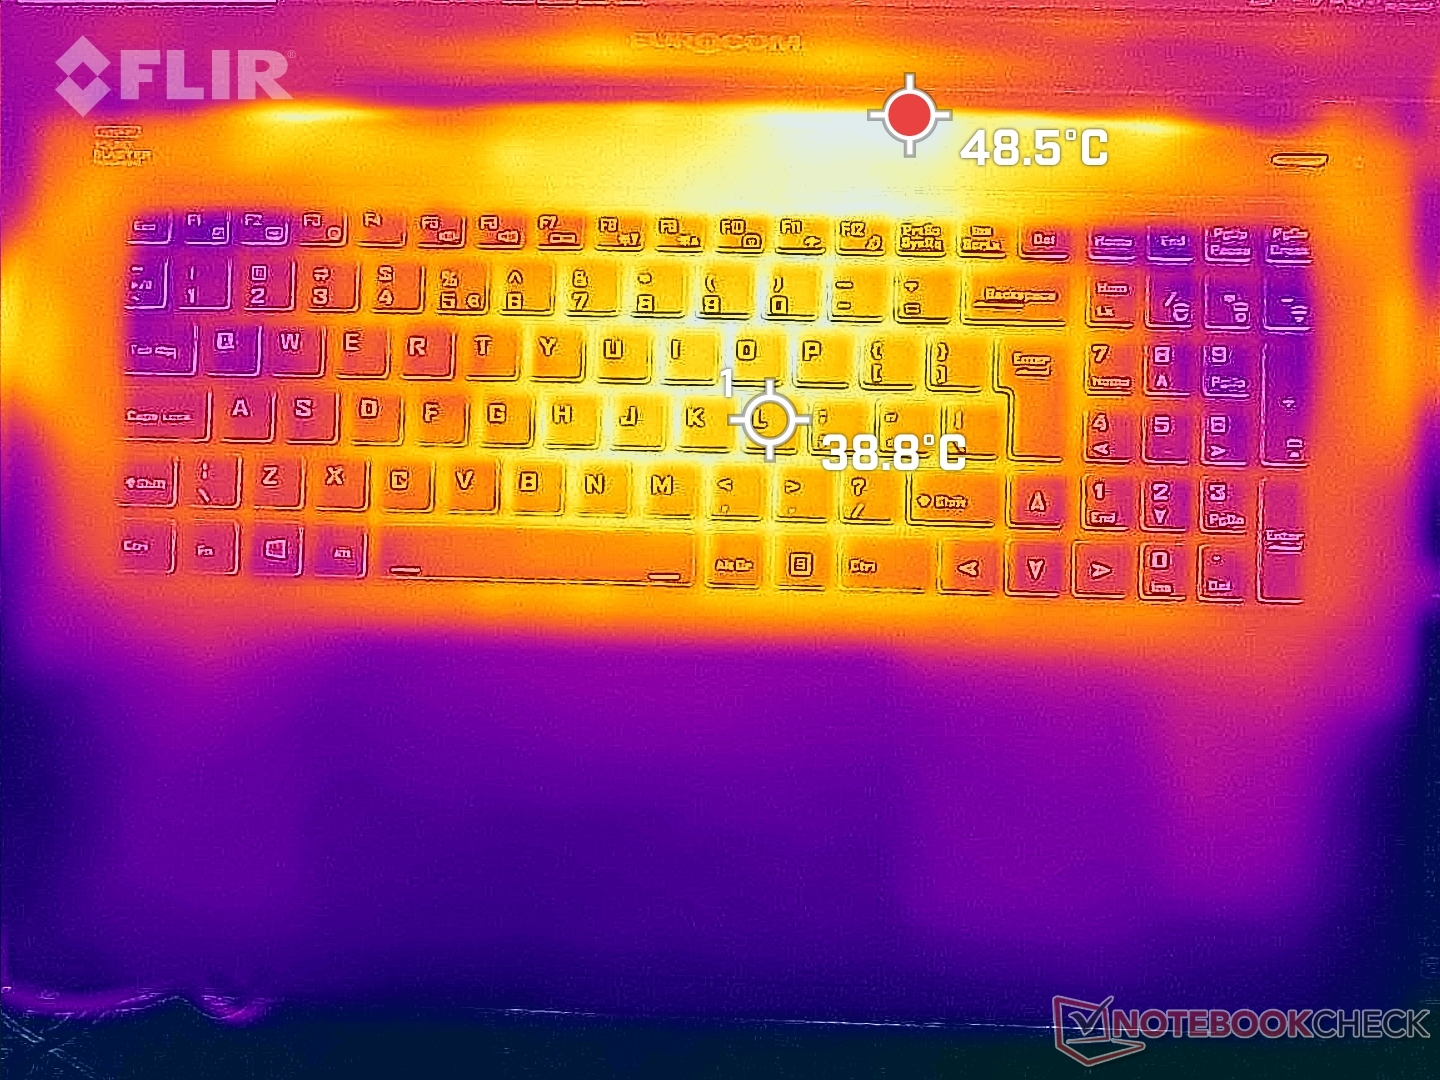
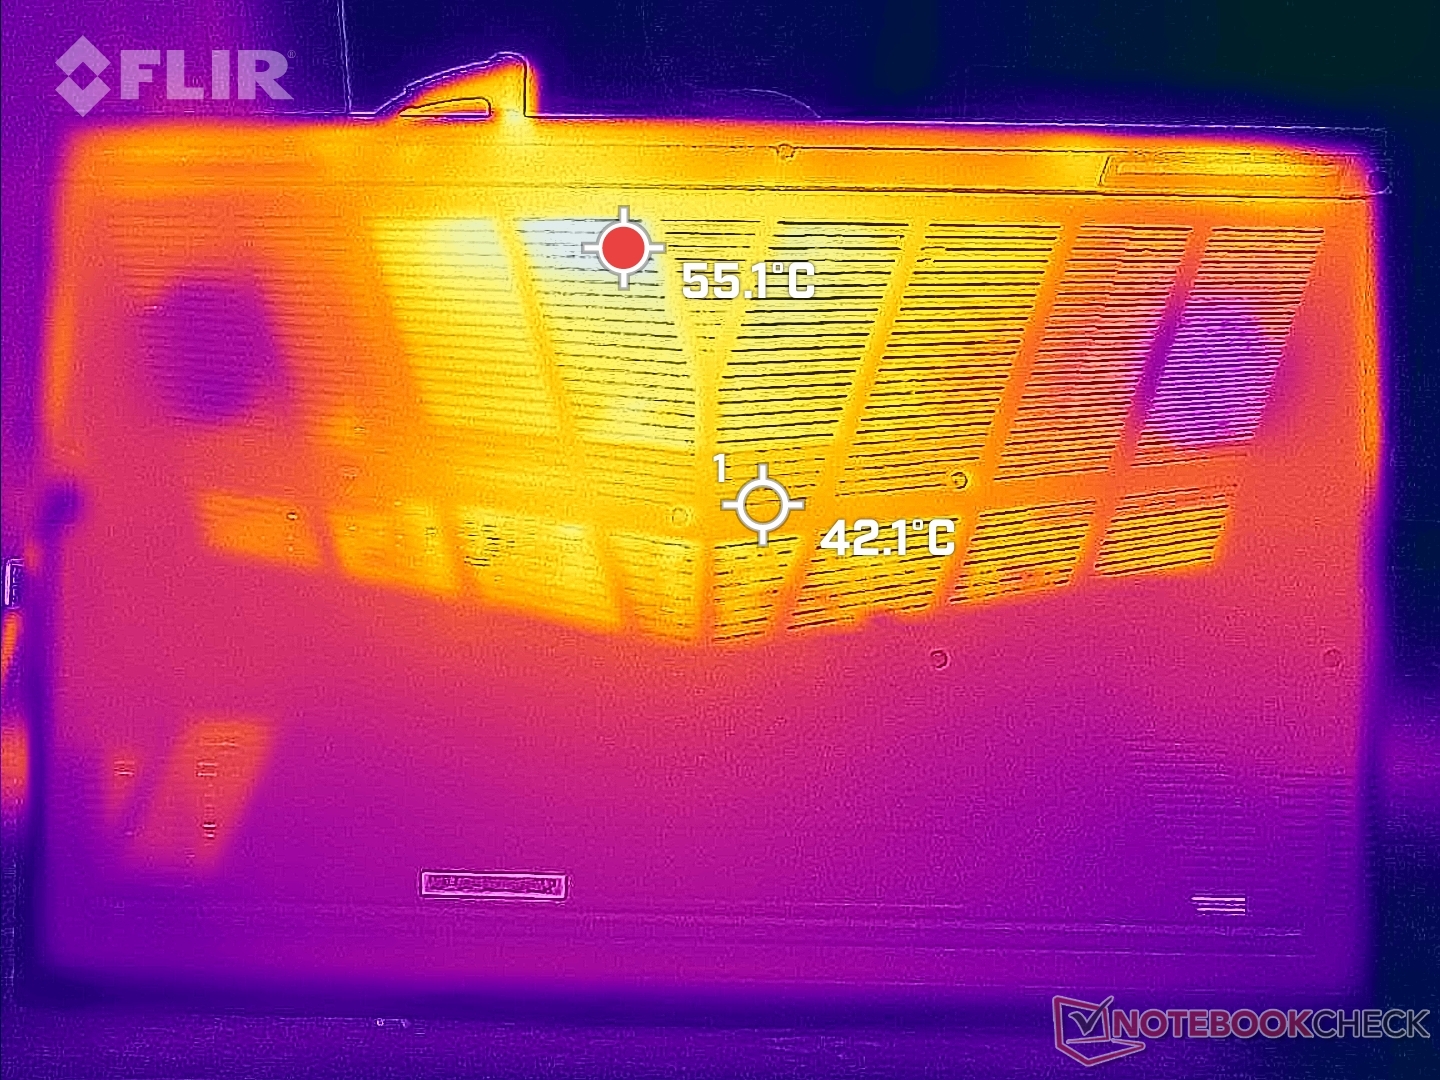
Temperatura
Temperatura powierzchni jest najcieplejsza na środku klawiatury, podczas gdy podpórki pod dłonie są znacznie chłodniejsze, co zapewnia bardziej komfortową grę. Cieńsze laptopy, jak np Razer Blade 17 mają wyraźnie cieplejsze podpórki pod nadgarstki, które są bardziej niewygodne dla dłoni
Należy pamiętać, że prawa część oparcia dłoni w Nightsky TXi317 będzie zawsze nieco cieplejsza od lewej, gdyż dyski SSD M.2 znajdują się pod prawą częścią oparcia.
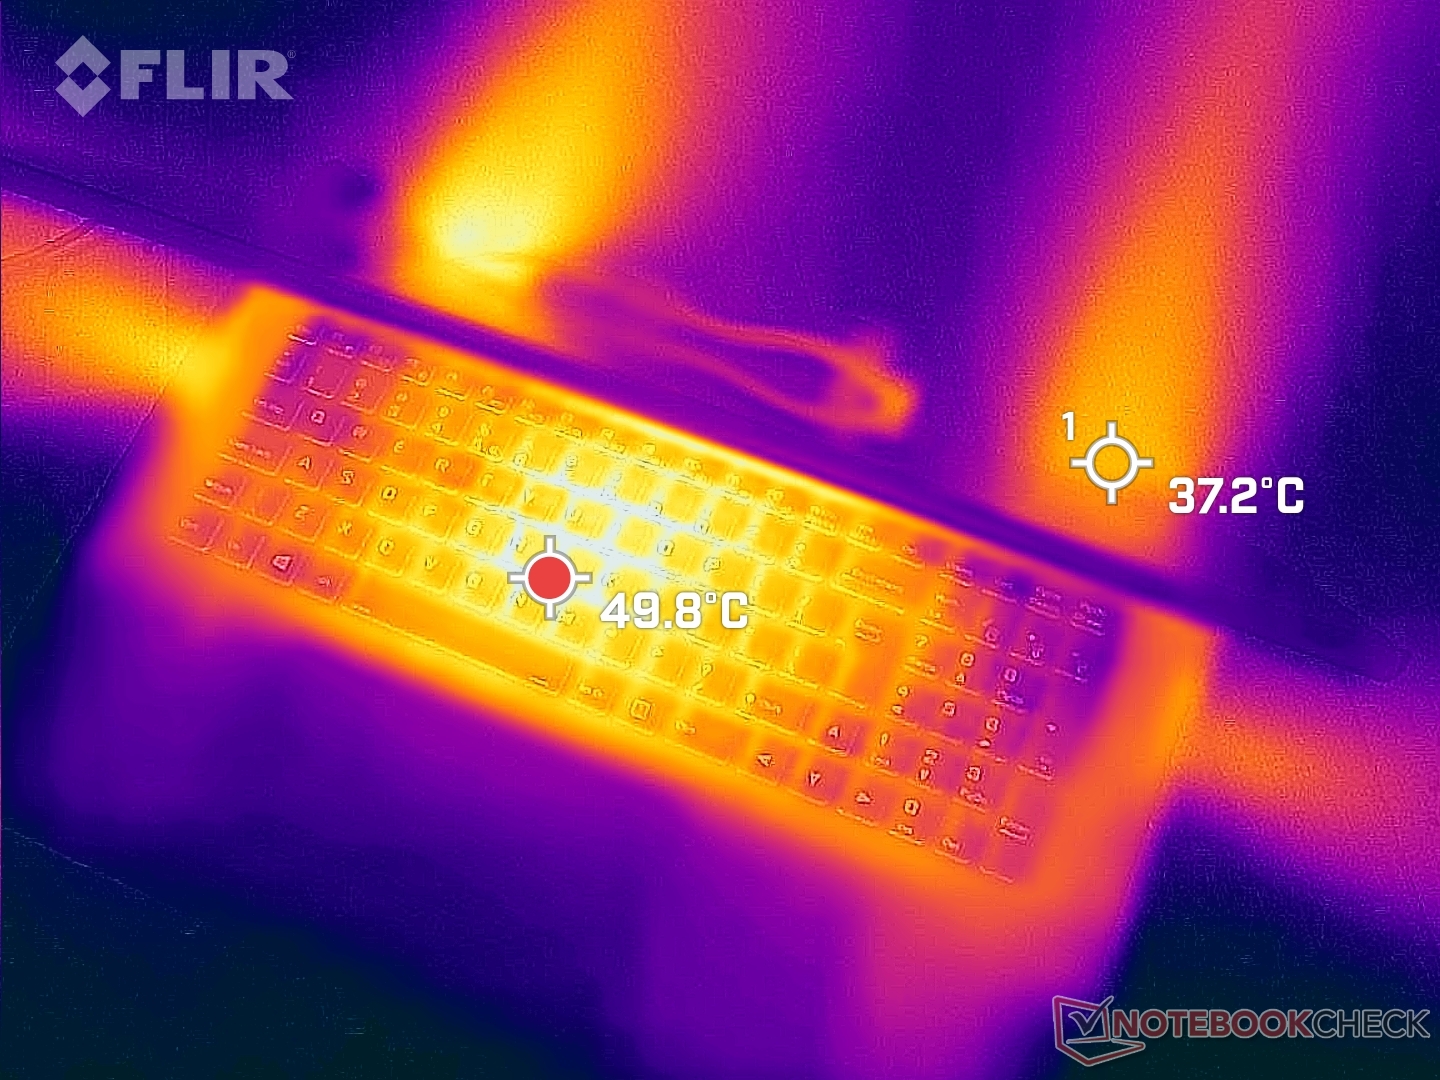
(-) Maksymalna temperatura w górnej części wynosi 50.4 °C / 123 F, w porównaniu do średniej 40.4 °C / 105 F , począwszy od 21.2 do 68.8 °C dla klasy Gaming.
(-) Dno nagrzewa się maksymalnie do 47.6 °C / 118 F, w porównaniu do średniej 43.2 °C / 110 F
(+) W stanie bezczynności średnia temperatura górnej części wynosi 29.4 °C / 85 F, w porównaniu ze średnią temperaturą urządzenia wynoszącą 33.9 °C / ### class_avg_f### F.
(-) Podczas gry w Wiedźmina 3 średnia temperatura górnej części wynosi 39.2 °C / 103 F, w porównaniu do średniej temperatury urządzenia wynoszącej 33.9 °C / ## #class_avg_f### F.
(+) Podpórki pod nadgarstki i touchpad są chłodniejsze niż temperatura skóry i maksymalnie 31.2 °C / 88.2 F i dlatego są chłodne w dotyku.
(-) Średnia temperatura obszaru podparcia dłoni w podobnych urządzeniach wynosiła 28.8 °C / 83.8 F (-2.4 °C / -4.4 F).
| Eurocom Nightsky TXi317 Intel Core i7-12700H, NVIDIA GeForce RTX 3080 Ti Laptop GPU | Schenker XMG Pro 17 E22 Intel Core i9-12900H, NVIDIA GeForce RTX 3080 Ti Laptop GPU | Aorus 17X XES Intel Core i9-12900HX, NVIDIA GeForce RTX 3070 Ti Laptop GPU | MSI Raider GE77 HX 12UHS Intel Core i9-12900HX, NVIDIA GeForce RTX 3080 Ti Laptop GPU | Razer Blade 17 Early 2022 Intel Core i9-12900H, NVIDIA GeForce RTX 3080 Ti Laptop GPU | Alienware x17 R2 P48E Intel Core i9-12900HK, NVIDIA GeForce RTX 3080 Ti Laptop GPU | |
|---|---|---|---|---|---|---|
| Heat | -12% | -15% | -19% | -10% | 7% | |
| Maximum Upper Side * (°C) | 50.4 | 56 -11% | 54 -7% | 53 -5% | 50 1% | 49.6 2% |
| Maximum Bottom * (°C) | 47.6 | 60 -26% | 58 -22% | 58 -22% | 56 -18% | 42.4 11% |
| Idle Upper Side * (°C) | 32.6 | 34 -4% | 37 -13% | 38 -17% | 36 -10% | 29.2 10% |
| Idle Bottom * (°C) | 33.2 | 36 -8% | 39 -17% | 43 -30% | 38 -14% | 32 4% |
* ... im mniej tym lepiej
Stress Test
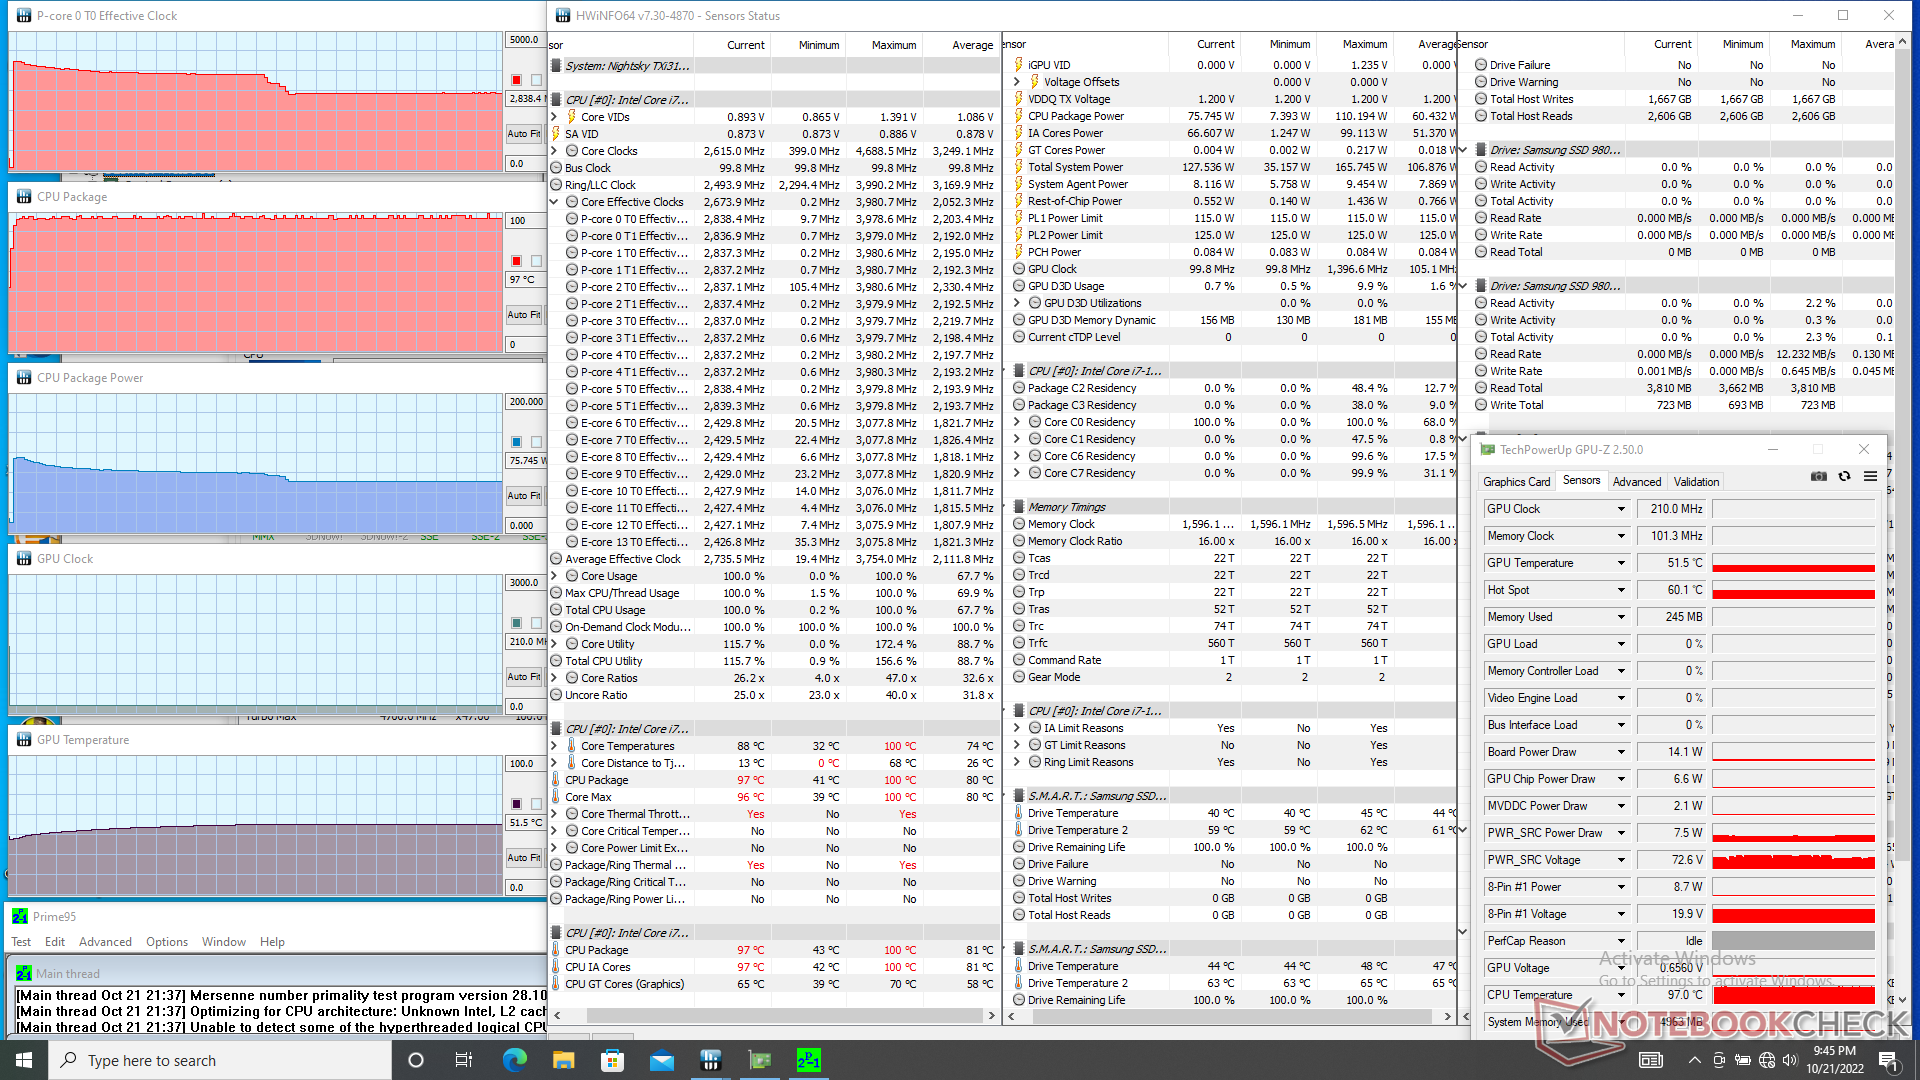
Częstotliwość taktowania procesora, temperatura i pobór mocy na płycie wzrosły do 4 GHz, 97 C i 110 W, odpowiednio, podczas inicjowania stresu Prime95. Częstotliwości taktowania i pobór mocy następnie systematycznie spadały przed ustabilizowaniem się na poziomie 2,8 GHz i 76 W, odpowiednio, bez zmian temperatury rdzenia. Powtórzenie tego samego testu naDell G16 7620 z identycznym procesorem przyniosło nieco szybsze stabilne taktowanie na poziomie około 3,3 GHz, ale podobną temperaturę rdzenia, wynoszącą prawie 100 C.
Częstotliwości taktowania GPU, temperatura i pobór mocy na płycie głównej ustabilizowały się na poziomie odpowiednio 1432 MHz, 87 C i 121 W podczas pracy Witcher 3. Powtórzenie tego testu na profilu zasilania "Rozrywka" spowodowało nieznaczne obniżenie wydajności GPU: częstotliwość taktowania i pobór mocy spadły odpowiednio do 1327 MHz i 110 W, bez zmian w temperaturze. To niefortunne, że nie możemy zbliżyć się do deklarowanych 125 do 155 W celu TGP.
Uruchomienie Witcher 3 na MSI GS77 z tą samą kartą graficzną RTX 3080 Ti, przyniosło wolniejsze taktowanie GPU, niższą temperaturę rdzenia i niższy pobór mocy na płycie, odpowiednio 1432 MHz, 75 C i 105 W, w porównaniu do naszego Eurocomu.
Wydajność jest ograniczona w przypadku zasilania z baterii. Test Fire Strike na zasilaniu akumulatorowym przyniósłby wyniki w zakresie fizyki i grafiki w wysokości odpowiednio 12300 i 5071 punktów, w porównaniu z 28276 i 31825 punktami na zasilaniu sieciowym.
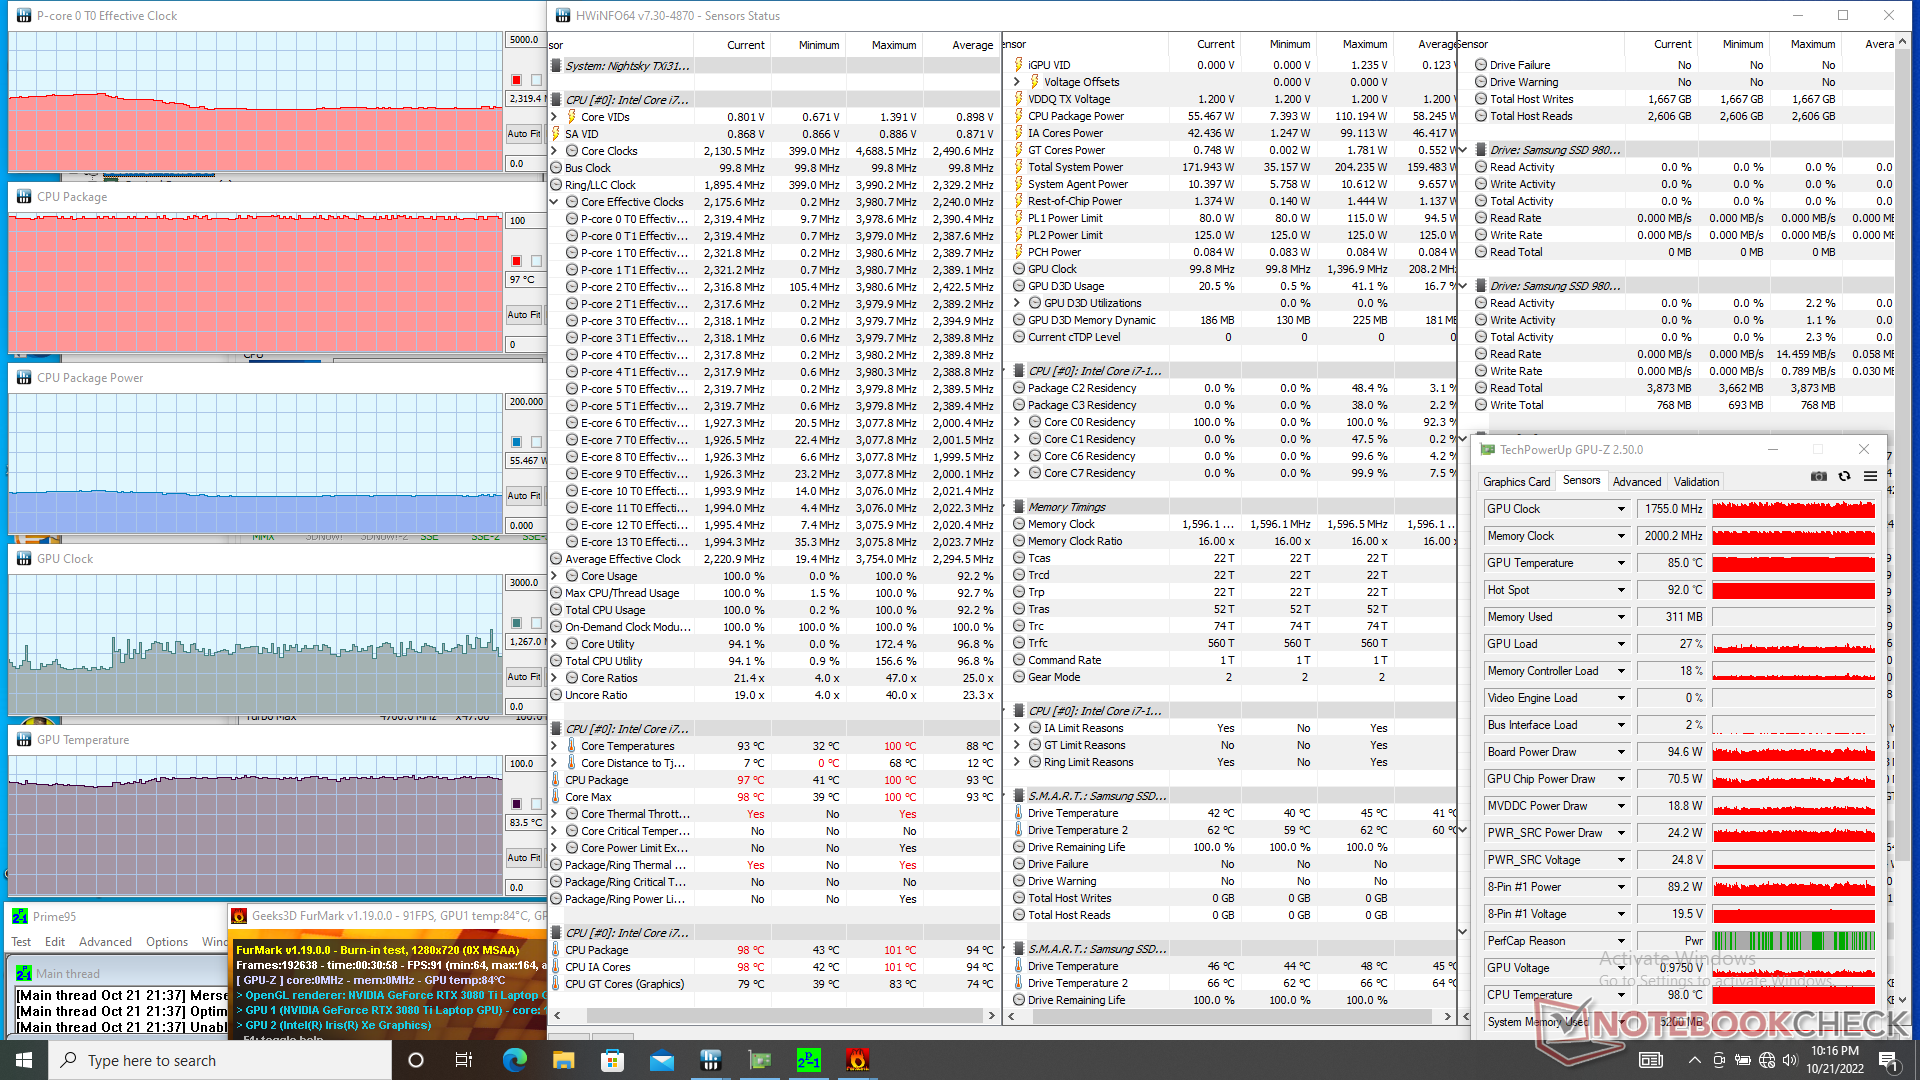
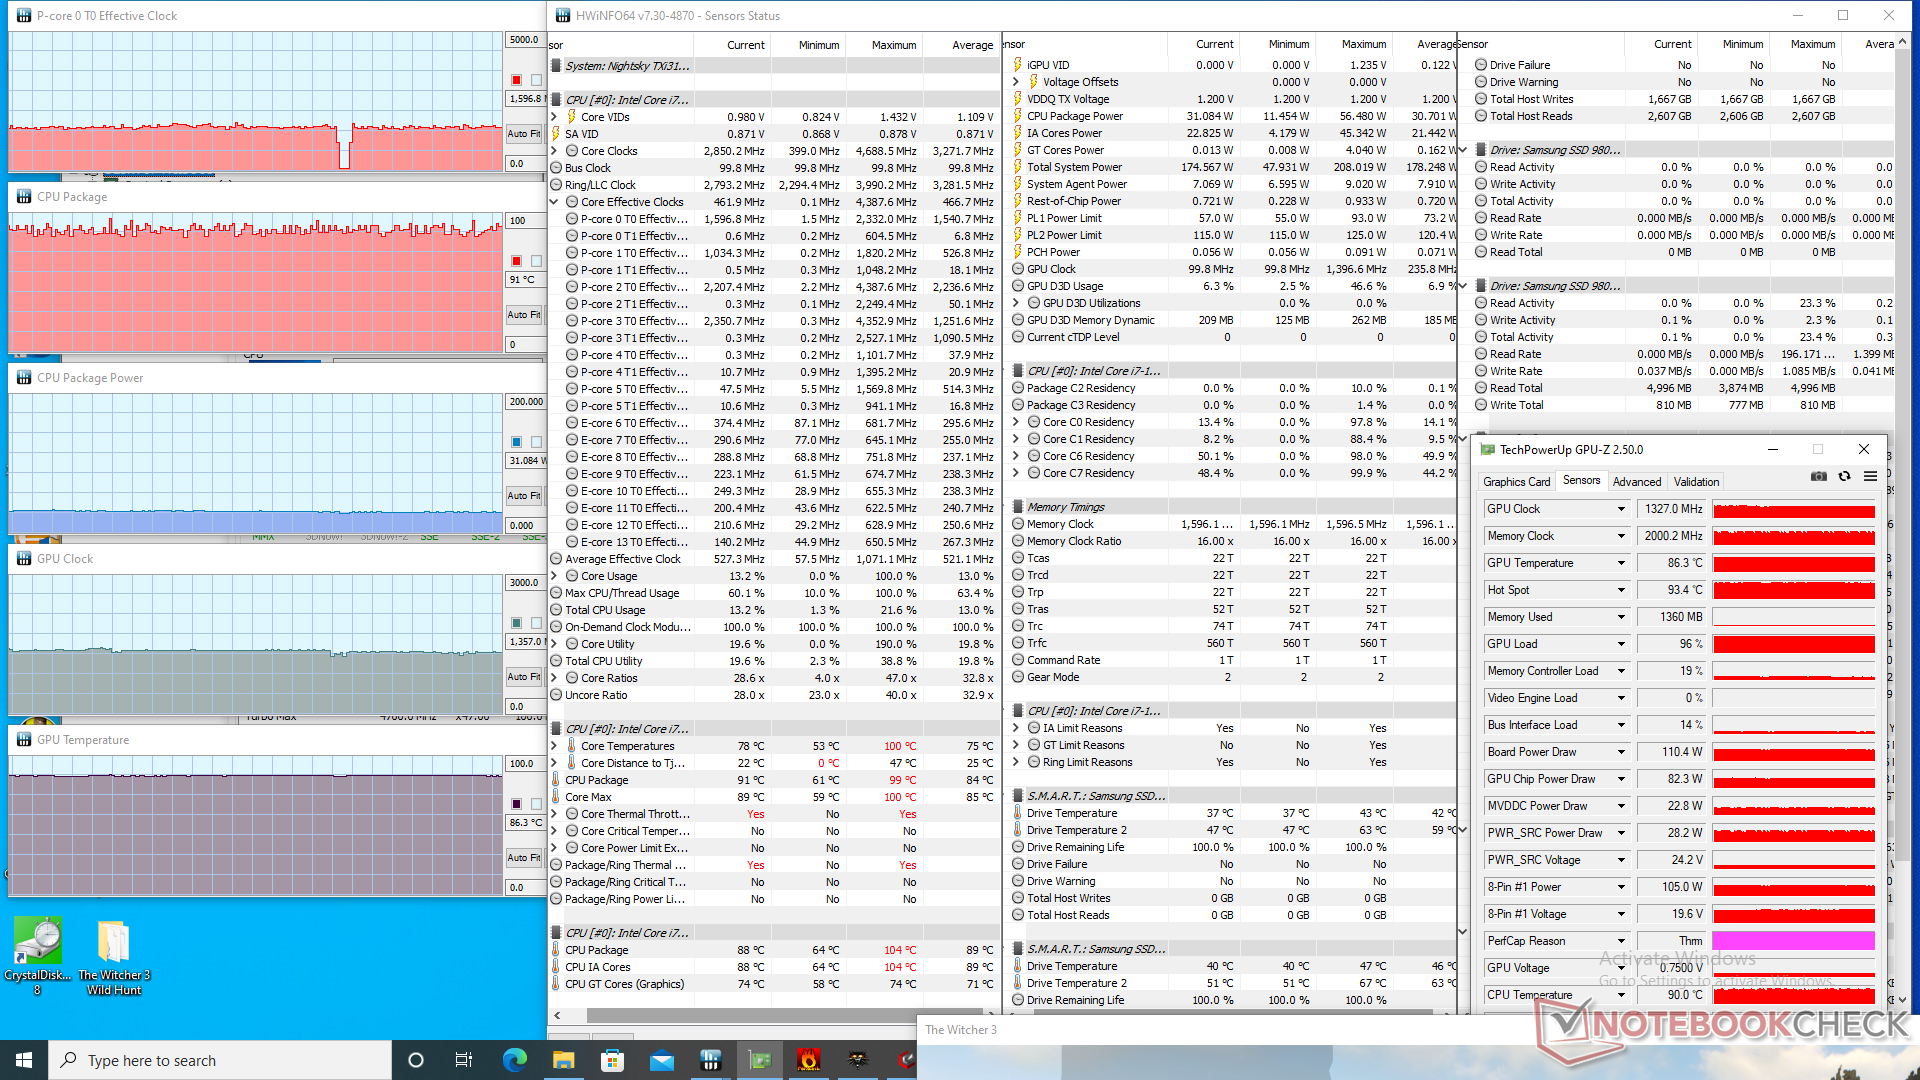
| ZegarCPU (GHz) | Zegar GPU (MHz) | Średnia temperatura CPU (°C) | Średnia temperatura GPU (°C) | |
| System w stanie bezczynności | -- | -- | 43 | 40 |
| Prime95 Stress | 2.8 | -- | 97 | 52 |
| Prime95 + FurMark Stress | 2,3 - 2,8 | 1267 - 1755 | 97 | 84 |
| Witcher 3 Stress | 1,5 | 1432 | 81 | 87 |
Mówcy
Eurocom Nightsky TXi317 analiza dźwięku
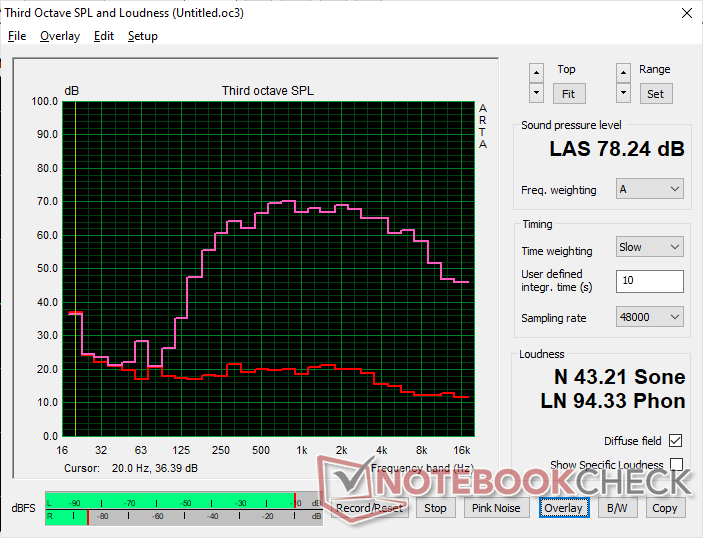
(±) | głośność głośnika jest średnia, ale dobra (78.2 dB)
Bas 100 - 315 Hz
(±) | zredukowany bas - średnio 14.6% niższy od mediany
(-) | bas nie jest liniowy (16.5% delta do poprzedniej częstotliwości)
Średnie 400 - 2000 Hz
(±) | wyższe średnie - średnio 5.1% wyższe niż mediana
(+) | średnie są liniowe (5% delta do poprzedniej częstotliwości)
Wysokie 2–16 kHz
(+) | zrównoważone maksima - tylko 4% od mediany
(+) | wzloty są liniowe (6.2% delta do poprzedniej częstotliwości)
Ogólnie 100 - 16.000 Hz
(±) | liniowość ogólnego dźwięku jest średnia (20.4% różnicy w stosunku do mediany)
W porównaniu do tej samej klasy
» 72% wszystkich testowanych urządzeń w tej klasie było lepszych, 6% podobnych, 22% gorszych
» Najlepszy miał deltę 6%, średnia wynosiła ###średnia###%, najgorsza wynosiła 132%
W porównaniu do wszystkich testowanych urządzeń
» 53% wszystkich testowanych urządzeń było lepszych, 8% podobnych, 39% gorszych
» Najlepszy miał deltę 4%, średnia wynosiła ###średnia###%, najgorsza wynosiła 134%
Apple MacBook Pro 16 2021 M1 Pro analiza dźwięku
(+) | głośniki mogą odtwarzać stosunkowo głośno (84.7 dB)
Bas 100 - 315 Hz
(+) | dobry bas - tylko 3.8% od mediany
(+) | bas jest liniowy (5.2% delta do poprzedniej częstotliwości)
Średnie 400 - 2000 Hz
(+) | zbalansowane środki średnie - tylko 1.3% od mediany
(+) | średnie są liniowe (2.1% delta do poprzedniej częstotliwości)
Wysokie 2–16 kHz
(+) | zrównoważone maksima - tylko 1.9% od mediany
(+) | wzloty są liniowe (2.7% delta do poprzedniej częstotliwości)
Ogólnie 100 - 16.000 Hz
(+) | ogólny dźwięk jest liniowy (4.6% różnicy w stosunku do mediany)
W porównaniu do tej samej klasy
» 0% wszystkich testowanych urządzeń w tej klasie było lepszych, 0% podobnych, 100% gorszych
» Najlepszy miał deltę 5%, średnia wynosiła ###średnia###%, najgorsza wynosiła 45%
W porównaniu do wszystkich testowanych urządzeń
» 0% wszystkich testowanych urządzeń było lepszych, 0% podobnych, 100% gorszych
» Najlepszy miał deltę 4%, średnia wynosiła ###średnia###%, najgorsza wynosiła 134%
Zarządzanie energią
Pobór mocy
Na biegu jałowym w pulpicie przy najniższym ustawieniu jasności i profilu zasilania potrzeba nieco poniżej 13 W, by być porównywalnym z XMG Pro 17 E22. W przypadku maksymalnego ustawienia jasności i profilu zasilania z aktywnym dyskretnym układem GPU Nvidii może to jednak skoczyć nawet do 40 W. Ze względu na znaczną oszczędność energii zaleca się korzystanie z niższych ustawień zasilania, jeśli nie jest potrzebna dodatkowa wydajność.
Pobór mocy podczas pracy Witcher 3 jest niemal identyczny z tym, który odnotowaliśmy naMSI Raider GE77 wyposażonym w ten sam procesor graficzny. System jest znacznie bardziej wymagający od starszych laptopów gamingowych działających na GeForce RTX 2080 jak np.Lenovo Legion 7 15 o ponad 80 W
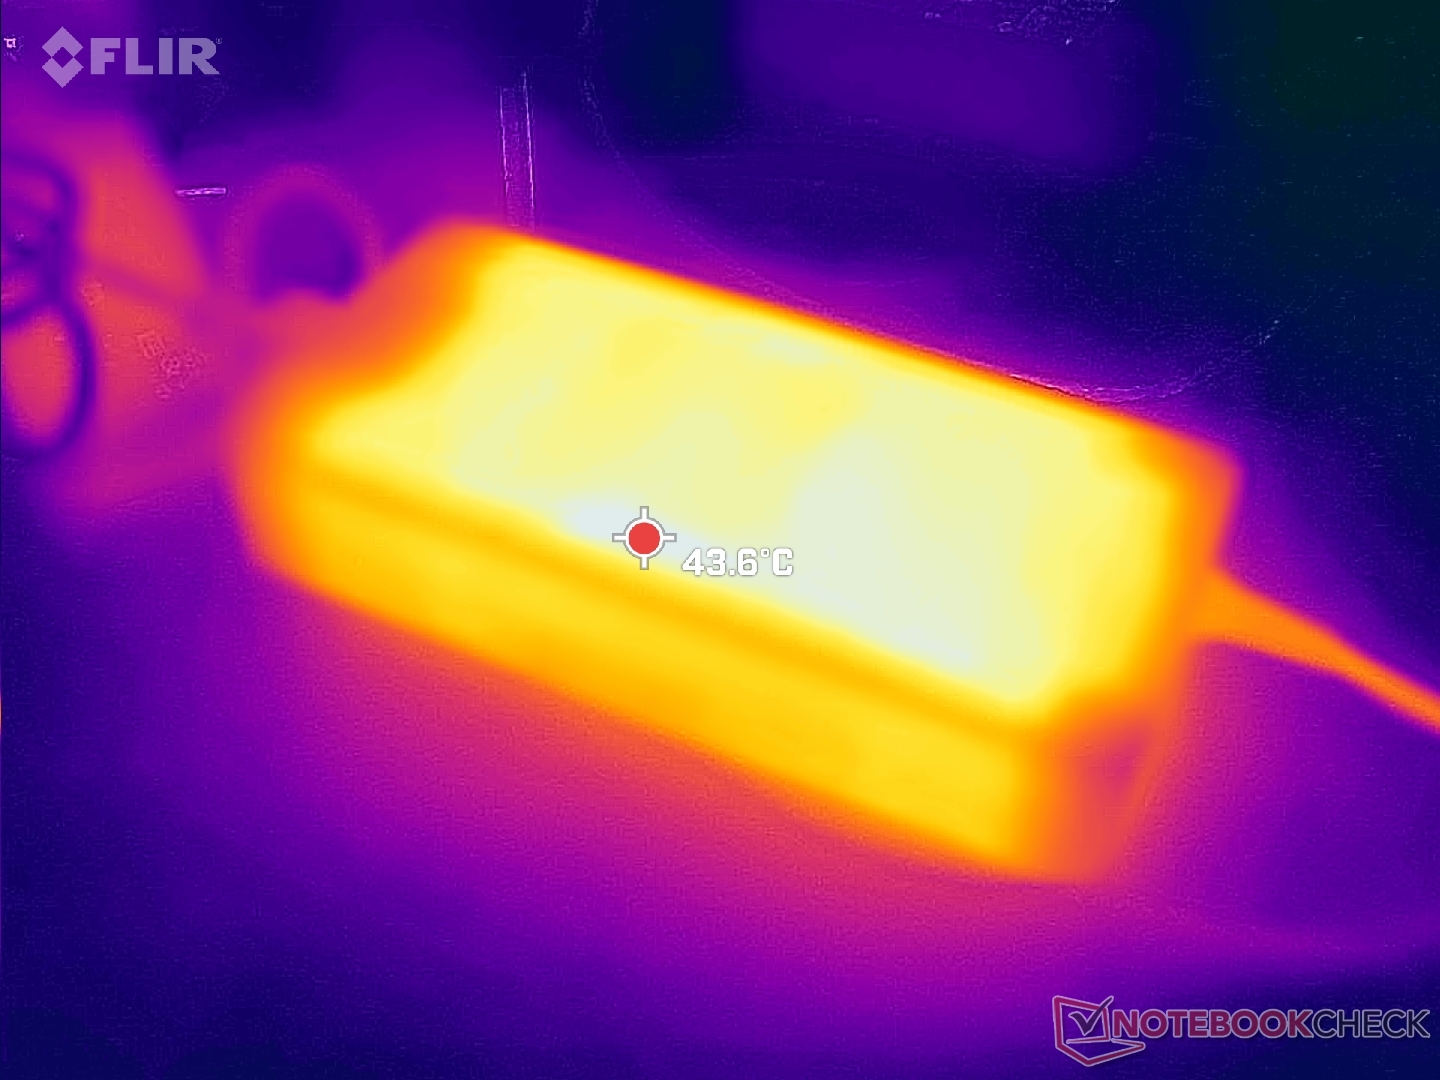
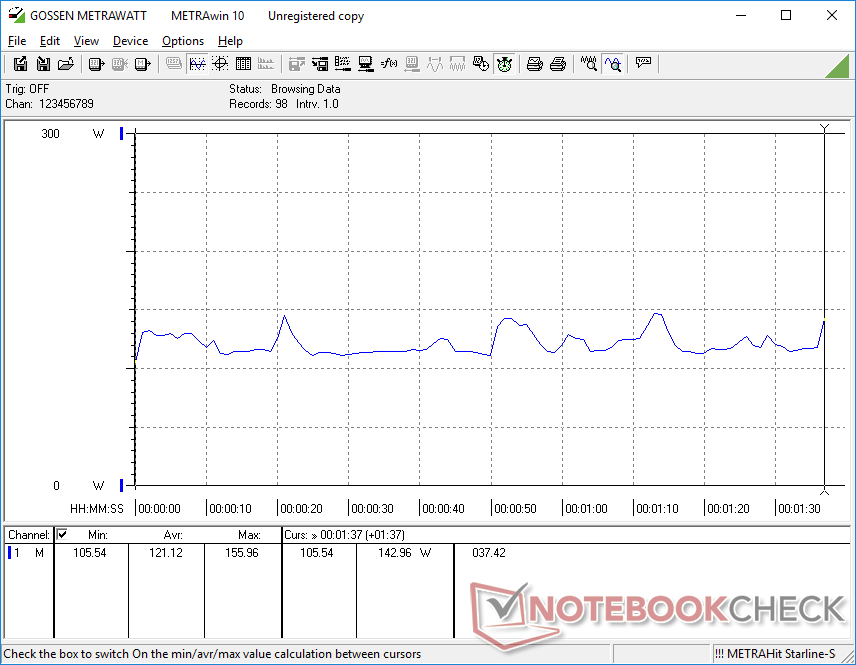
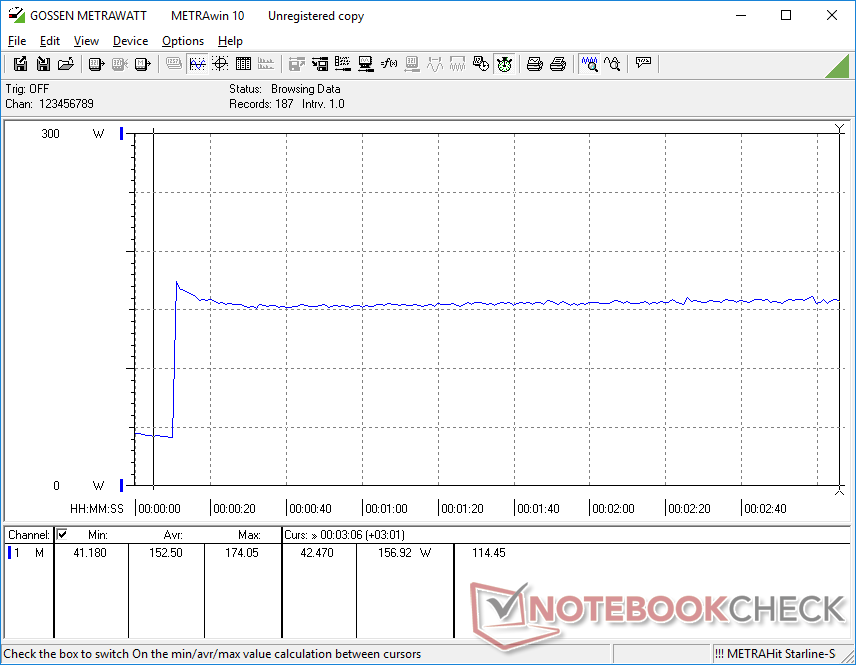
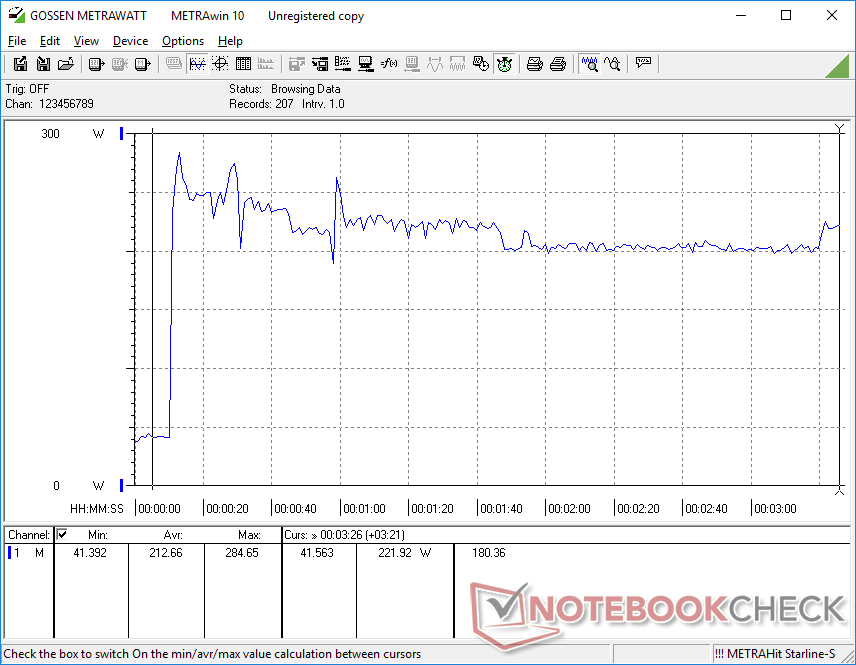
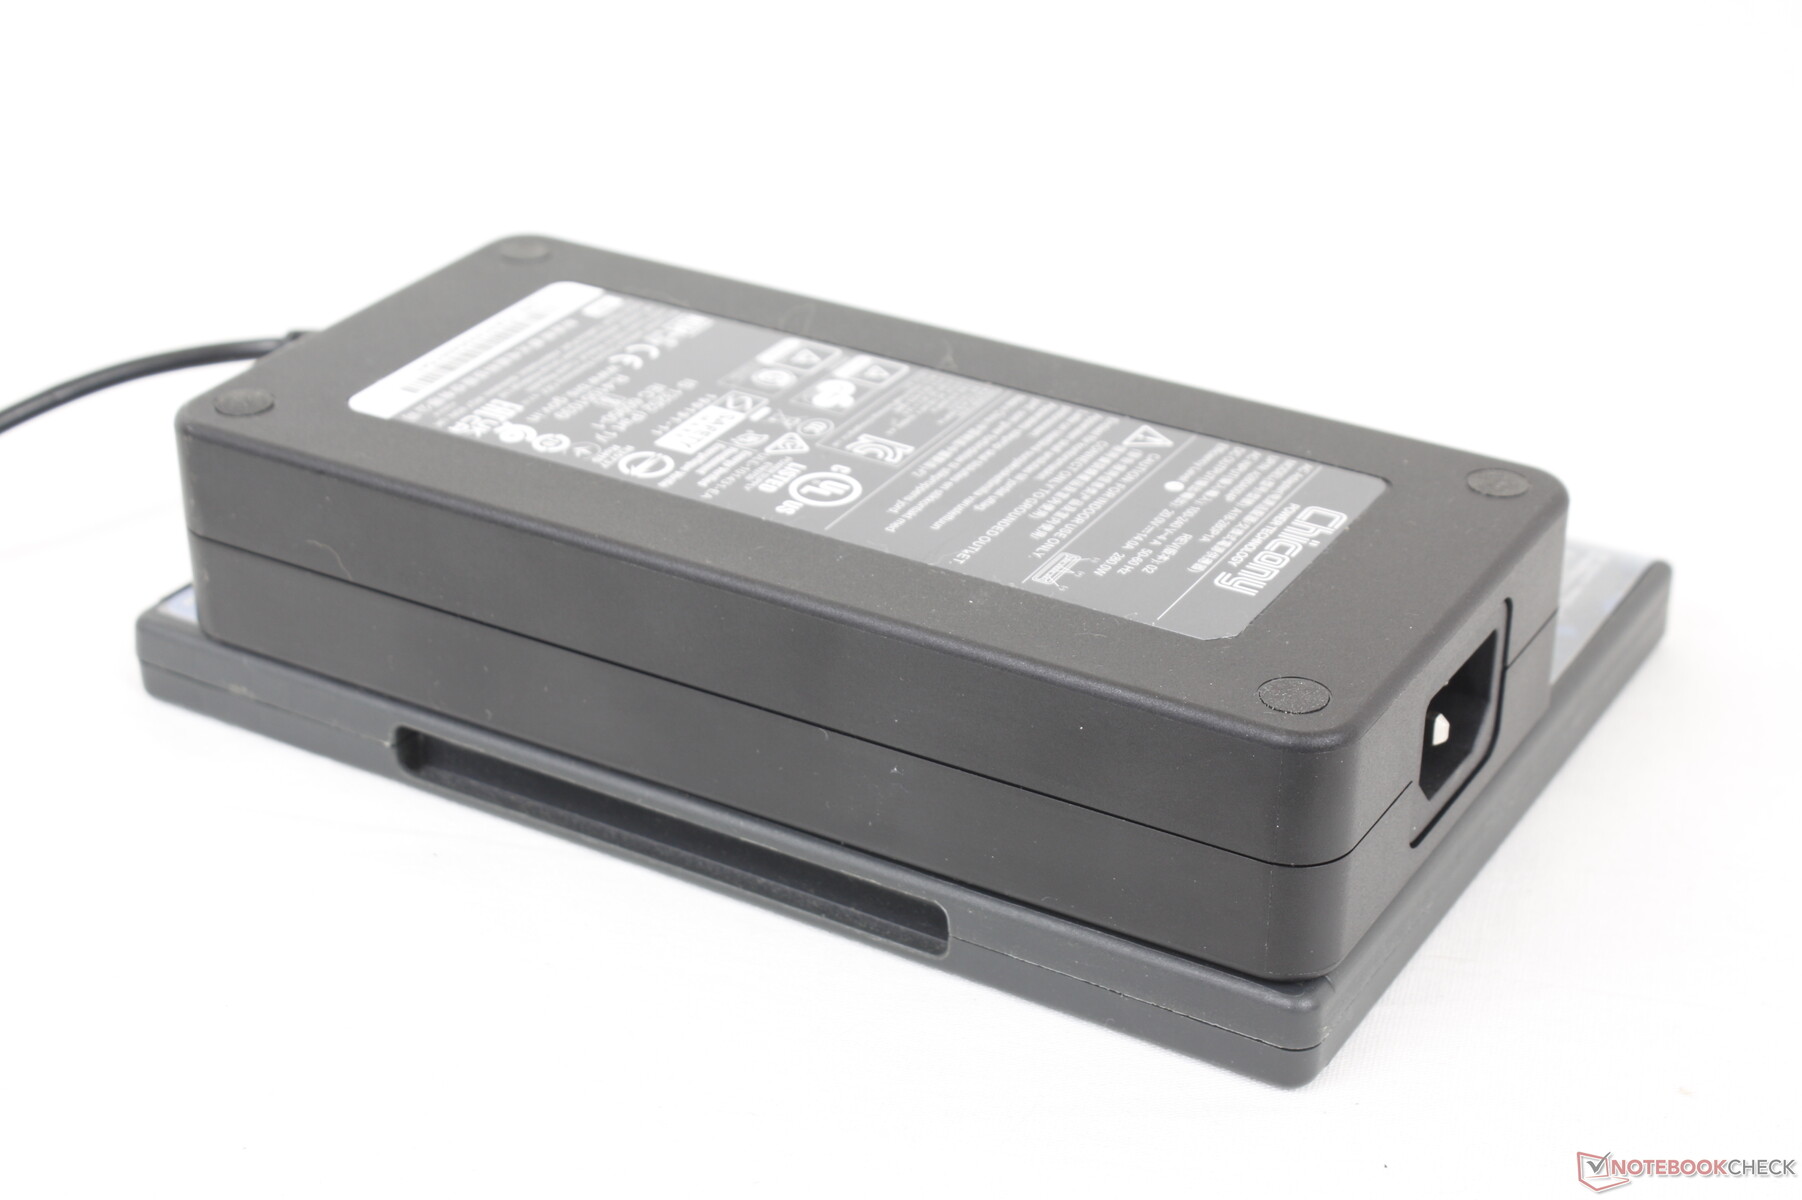
Jesteśmy w stanie zarejestrować maksymalny pobór 285 W z dużego (~18 x 8,5 x 3,5 cm) zasilacza sieciowego 280 W, gdy zarówno CPU, jak i GPU są wykorzystywane w 100 procentach. Ten wskaźnik jest tylko tymczasowy, jak pokazuje nasz wykres poniżej, ze względu na ograniczenia termiczne. System może nadal uruchamiać gry i ładować się w rozsądnym tempie jednocześnie.
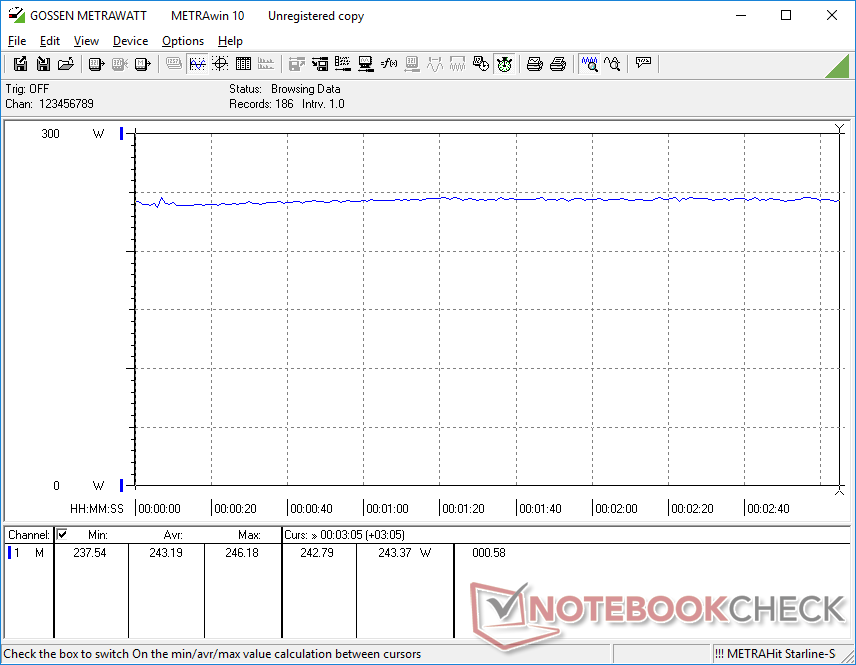
| wyłączony / stan wstrzymania | |
| luz | |
| obciążenie |
|
Legenda:
min: | |
| Eurocom Nightsky TXi317 i7-12700H, GeForce RTX 3080 Ti Laptop GPU, Samsung SSD 980 Pro 1TB MZ-V8P1T0BW, IPS, 1920x1080, 17.3" | Schenker XMG Pro 17 E22 i9-12900H, GeForce RTX 3080 Ti Laptop GPU, Samsung SSD 980 Pro 1TB MZ-V8P1T0BW, IPS, 2560x1440, 17.3" | Aorus 17X XES i9-12900HX, GeForce RTX 3070 Ti Laptop GPU, Gigabyte AG470S1TB-SI B10, IPS, 1920x1080, 17.3" | MSI Raider GE77 HX 12UHS i9-12900HX, GeForce RTX 3080 Ti Laptop GPU, Samsung PM9A1 MZVL22T0HBLB, IPS, 3840x2160, 17.3" | Razer Blade 17 Early 2022 i9-12900H, GeForce RTX 3080 Ti Laptop GPU, Samsung PM9A1 MZVL21T0HCLR, IPS, 3840x2160, 17.3" | Alienware x17 R2 P48E i9-12900HK, GeForce RTX 3080 Ti Laptop GPU, 2x Samsung PM9A1 1TB (RAID 0), IPS, 1920x1080, 17.3" | |
|---|---|---|---|---|---|---|
| Power Consumption | 17% | -6% | 4% | 6% | -25% | |
| Idle Minimum * (Watt) | 12.8 | 13 -2% | 18 -41% | 13 -2% | 17 -33% | 24.1 -88% |
| Idle Average * (Watt) | 33.9 | 17 50% | 28 17% | 19 44% | 23 32% | 28.5 16% |
| Idle Maximum * (Watt) | 39.1 | 26 34% | 36 8% | 29 26% | 34 13% | 60 -53% |
| Load Average * (Watt) | 121.1 | 120 1% | 153 -26% | 143 -18% | 120 1% | 128.7 -6% |
| Witcher 3 ultra * (Watt) | 243 | 221 9% | 221 9% | 247 -2% | 229 6% | 254 -5% |
| Load Maximum * (Watt) | 284.7 | 266 7% | 290 -2% | 352 -24% | 243 15% | 323 -13% |
* ... im mniej tym lepiej
Power Consumption Witcher 3 / Stresstest
Power Consumption external Monitor
Czas pracy na baterii
Czas pracy sieci WLAN jest krótki i wynosi nieco ponad 4 godziny przeglądania stron internetowych w świecie rzeczywistym przed koniecznością ładowania. Przed przeprowadzeniem testu czasu pracy na baterii nasz egzemplarz został ustawiony na zrównoważony profil zasilania z aktywnym iGPU. Wyniki są podobne do Razer Blade 17 lub Aorus 17X ale wciąż o ponad dwie godziny krótszy niż w przypadku Schenkera XMG Pro 17 E22.
Ładowanie od pustego do pełnego jest bardzo wolne i wynosi około 2,5 godziny. Większości laptopów do gier zajmuje to dla porównania tylko 1,5 do 2 godzin. Systemu nie można ładować przez USB-C.
| Eurocom Nightsky TXi317 i7-12700H, GeForce RTX 3080 Ti Laptop GPU, 80 Wh | Schenker XMG Pro 17 E22 i9-12900H, GeForce RTX 3080 Ti Laptop GPU, 80 Wh | Aorus 17X XES i9-12900HX, GeForce RTX 3070 Ti Laptop GPU, 99 Wh | MSI Raider GE77 HX 12UHS i9-12900HX, GeForce RTX 3080 Ti Laptop GPU, 99.99 Wh | Razer Blade 17 Early 2022 i9-12900H, GeForce RTX 3080 Ti Laptop GPU, 82 Wh | Alienware x17 R2 P48E i9-12900HK, GeForce RTX 3080 Ti Laptop GPU, 87 Wh | |
|---|---|---|---|---|---|---|
| Czasy pracy | 62% | 5% | 29% | -10% | -52% | |
| WiFi v1.3 (h) | 4.2 | 6.8 62% | 4.4 5% | 5.4 29% | 3.8 -10% | 2 -52% |
| H.264 (h) | 4.6 | 3.8 | 6.5 | 4.8 | ||
| Load (h) | 1.5 | 1.4 | 2 | 1.7 | 0.8 | |
| Reader / Idle (h) | 9.8 | 7.1 | 3.9 |
Za
Przeciw
Werdykt - Potrzebuje odświeżenia podwozia
Eurocom Nightsky TXi317 posiada wydajność CPU i GPU na poziomie dużego flagowego laptopa do gier, ale bez wielu funkcji pomocniczych, których przyszło nam oczekiwać od konstrukcji średniej wielkości. Przede wszystkim model ten nie jest w stanie uruchamiać dysków SSD przez dłuższy czas bez konieczności dławienia prędkości transferu. Docelowi odbiorcy, czyli użytkownicy wydajni, będą raczej rozczarowani, że nie mogą w pełni wykorzystać swoich nowych dysków PCIe4 x4. Alternatywy takie jak Alienware x17lub MSI GE66 mają z tego powodu rozpraszacze ciepła nad wewnętrznymi dyskami SSD.
Eurocom Nightsky TXi317 ma wydajność drogiego laptopa do gier, ale brakuje mu wielu podstawowych i zaawansowanych funkcji pomocniczych.
Do bardziej drobnych wad można zaliczyć kamerkę internetową o bardzo niskiej rozdzielczości, brak rolety prywatności, brak obsługi USB-C PD, brak Advanced Optimus, brak opcji Wi-Fi 6E oraz bardzo ciepłe temperatury rdzeni sięgające prawie 90 C podczas grania. Obudowa pozostaje nawet w tyle, jeśli chodzi o serwisowanie, gdyż zdjęcie dolnego panelu trwa dłużej niż w większości innych laptopów gamingowych w dzisiejszych czasach. Za 3000 dolarów i więcej Nightsky TXi317 po prostu nie oferuje prawie tyle, co inni konkurenci z wyższej półki.
Cena i dostępność
Nightsky TXi317 można kupić bezpośrednio w Eurocom tutaj w różnych konfiguracjach zaczynających się od 3000 USD.
Eurocom Nightsky TXi317
- 26/10/2022 v7 (old)
Allen Ngo
Price comparison

