Debiut wydajności AMD Ryzen 9 7845HX: Recenzja laptopa Alienware m16 R1

Po wprowadzeniu na rynek 15,6-calowego Alienware m15i 17-calowy Alienware m17i 18-calowy Alienware m18dell jest teraz gotowy do wysyłki 16-calowego Alienware m16 wraz z najnowszymi procesorami graficznymi Nvidia Ada Lovelace i wyborem procesorów Intel 13. generacji Raptor Lake lub AMD Zen 4. Alienware m16 różni się od niedawnego Alienware x16 który jest jeszcze cieńszym modelem z innymi specyfikacjami i funkcjami.
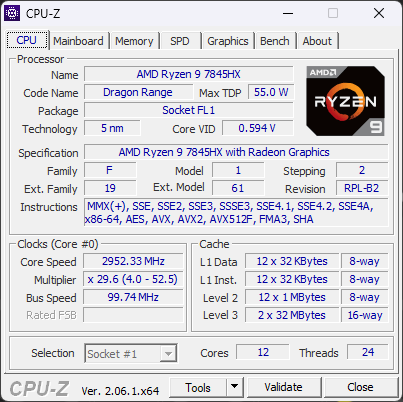
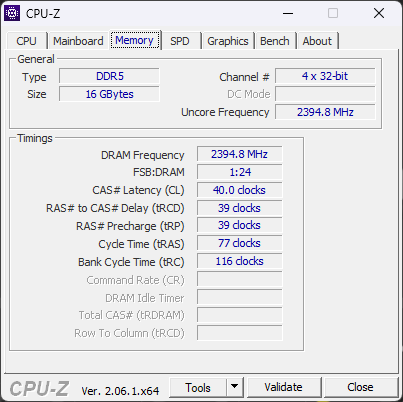
Nasza jednostka testowa to konfiguracja AMD z wyższej półki z procesorem Ryzen 9 7845HX, 175 W GeForce RTX 4080 GPU i wyświetlaczem IPS 1600p240 za około 2350 USD. Mniejsze jednostki SKU są wyposażone w procesor Ryzen 7 7745HX i kartę graficzną Radeon RX 7600M za 2150 USD, podczas gdy droższe z Ryzen 9 7945HX i RTX 4090 mogą być sprzedawane za ponad 3100 USD + w zależności od preferencji dotyczących pamięci RAM i SSD. Tymczasem wersje Intela są dostępne z tymi samymi opcjami wyświetlacza i GPU Nvidii, ale z procesorem Core i7-13700HX lub i9-13900HX.
Konkurenci obejmują inne flagowe 16-calowe laptopy do gier, takie jak HP Omen 16, Lenovo Legion Pro 7 16, Asus ROG Strix G16lub Razer Blade 16.
Więcej recenzji Dell:
Potencjalni konkurenci w porównaniu
Ocena | Data | Model | Waga | Wysokość | Rozmiar | Rezolucja | Cena |
|---|---|---|---|---|---|---|---|
| 89.2 % v7 (old) | 08/2023 | Alienware m16 R1 AMD R9 7845HX, GeForce RTX 4080 Laptop GPU | 3.1 kg | 25.4 mm | 16.00" | 2560x1600 | |
| 88.4 % v7 (old) | 06/2023 | Alienware x16 R1 i9-13900HK, GeForce RTX 4080 Laptop GPU | 2.6 kg | 18.57 mm | 16.00" | 2560x1600 | |
| 87.9 % v7 (old) | 08/2023 | HP Omen Transcend 16 i9-13900HX, GeForce RTX 4070 Laptop GPU | 2.3 kg | 19.8 mm | 16.00" | 2560x1600 | |
| 88.8 % v7 (old) | 06/2023 | Lenovo Legion Pro 7 RTX4090 i9-13900HX, GeForce RTX 4090 Laptop GPU | 2.7 kg | 26 mm | 16.00" | 2560x1600 | |
| 88.4 % v7 (old) | 03/2023 | Asus ROG Strix G16 G614JZ i9-13980HX, GeForce RTX 4080 Laptop GPU | 2.4 kg | 30.4 mm | 16.00" | 2560x1600 | |
| 91.2 % v7 (old) | 02/2023 | Razer Blade 16 Early 2023 i9-13950HX, GeForce RTX 4080 Laptop GPU | 2.4 kg | 21.99 mm | 16.00" | 2560x1600 |
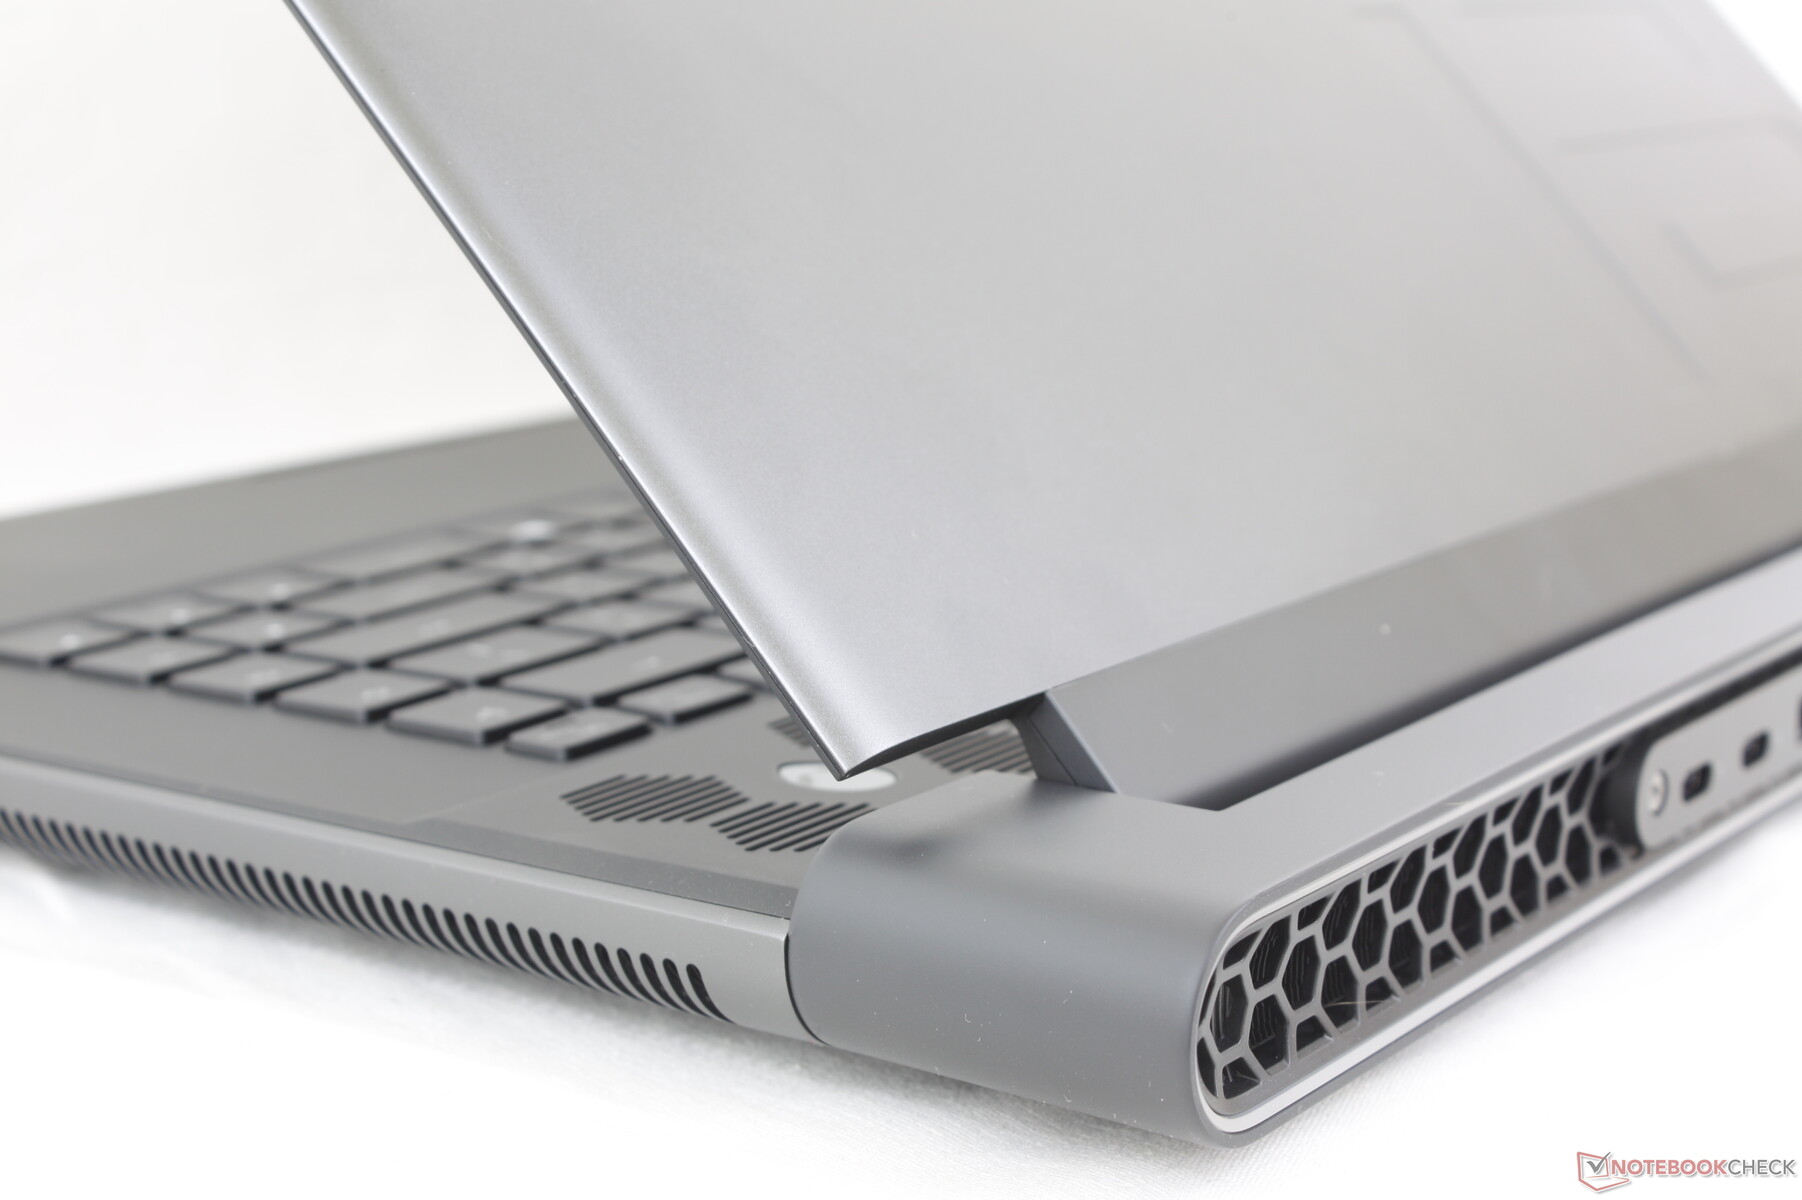
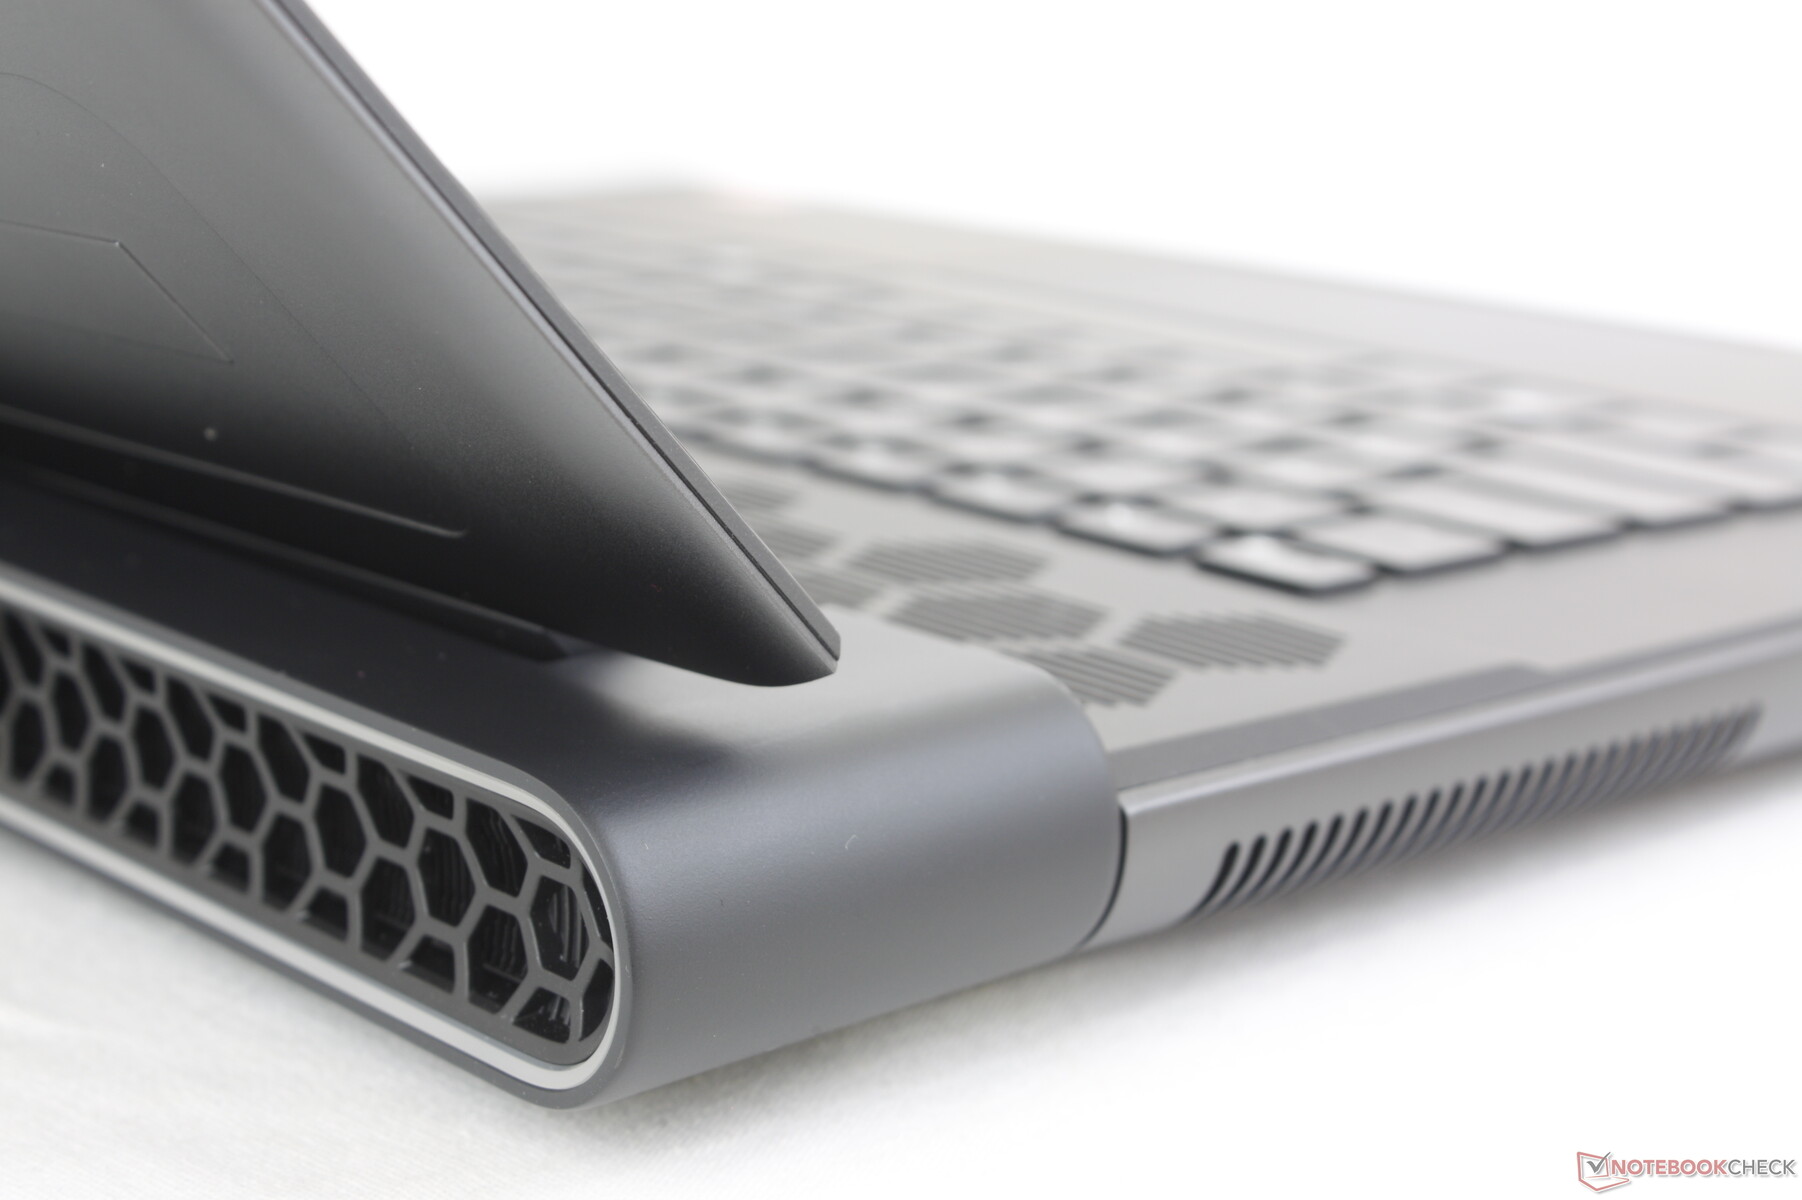
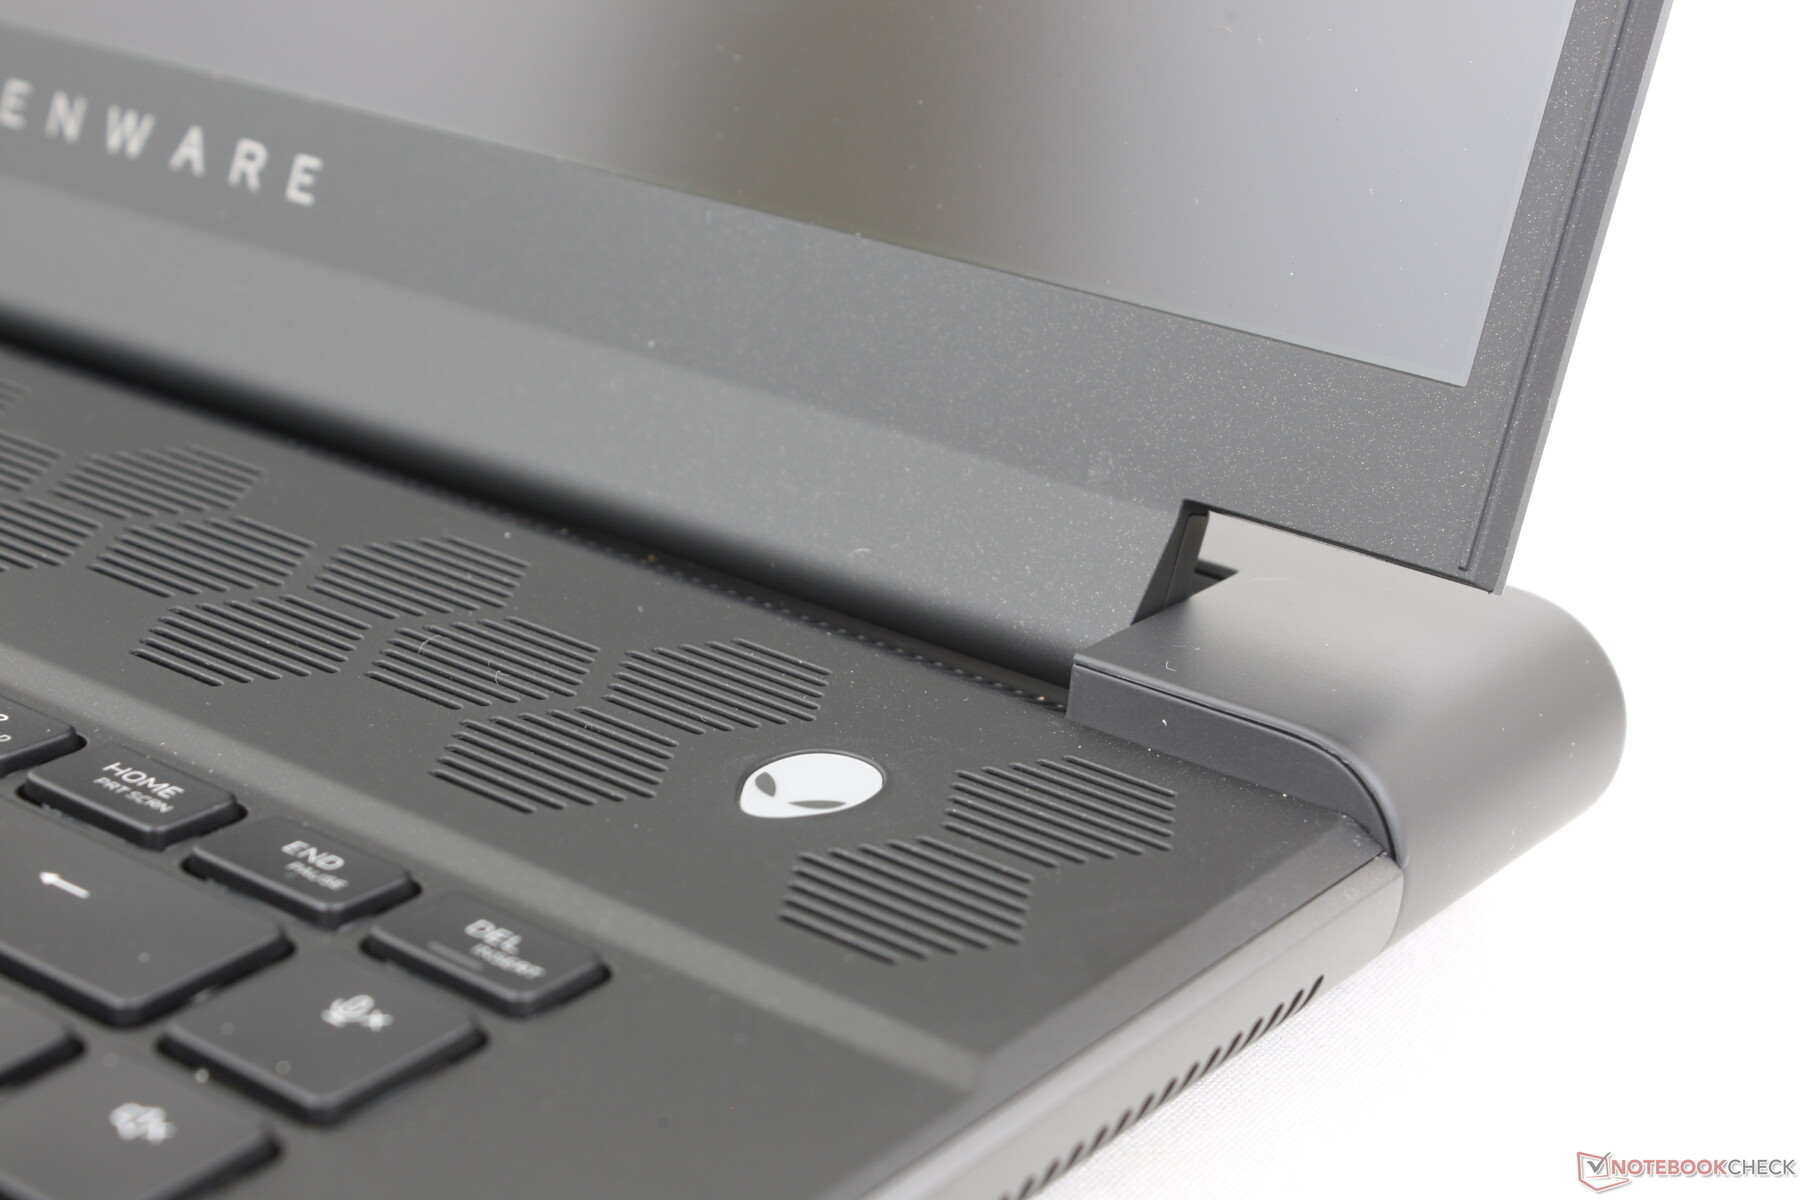
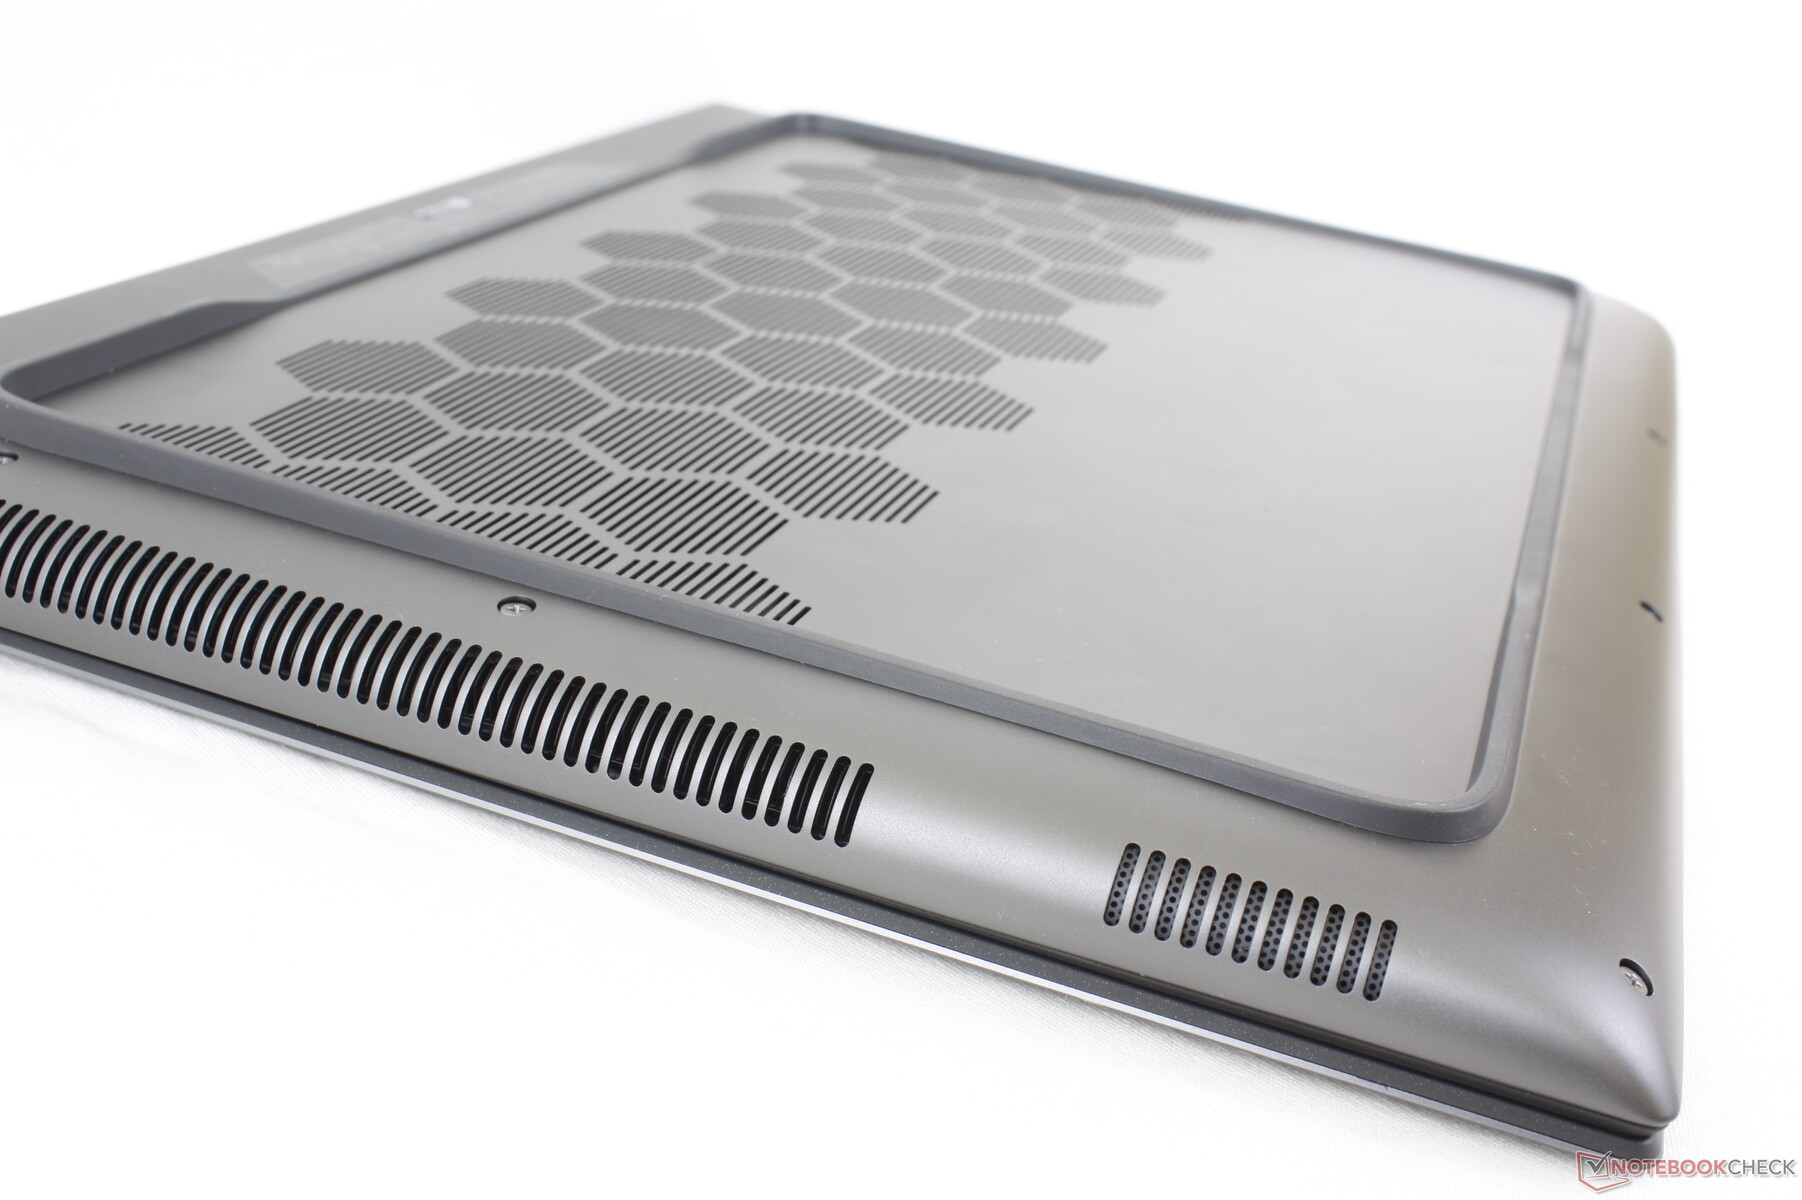
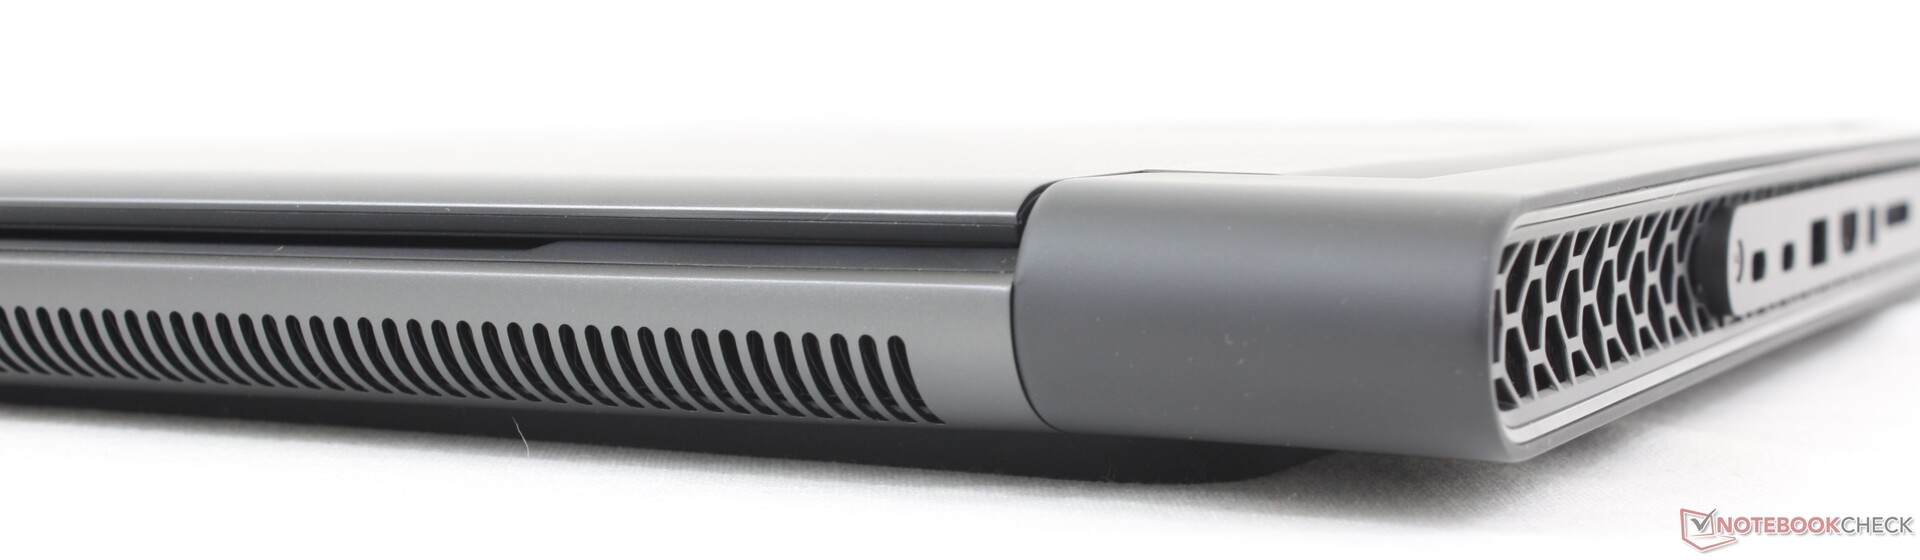
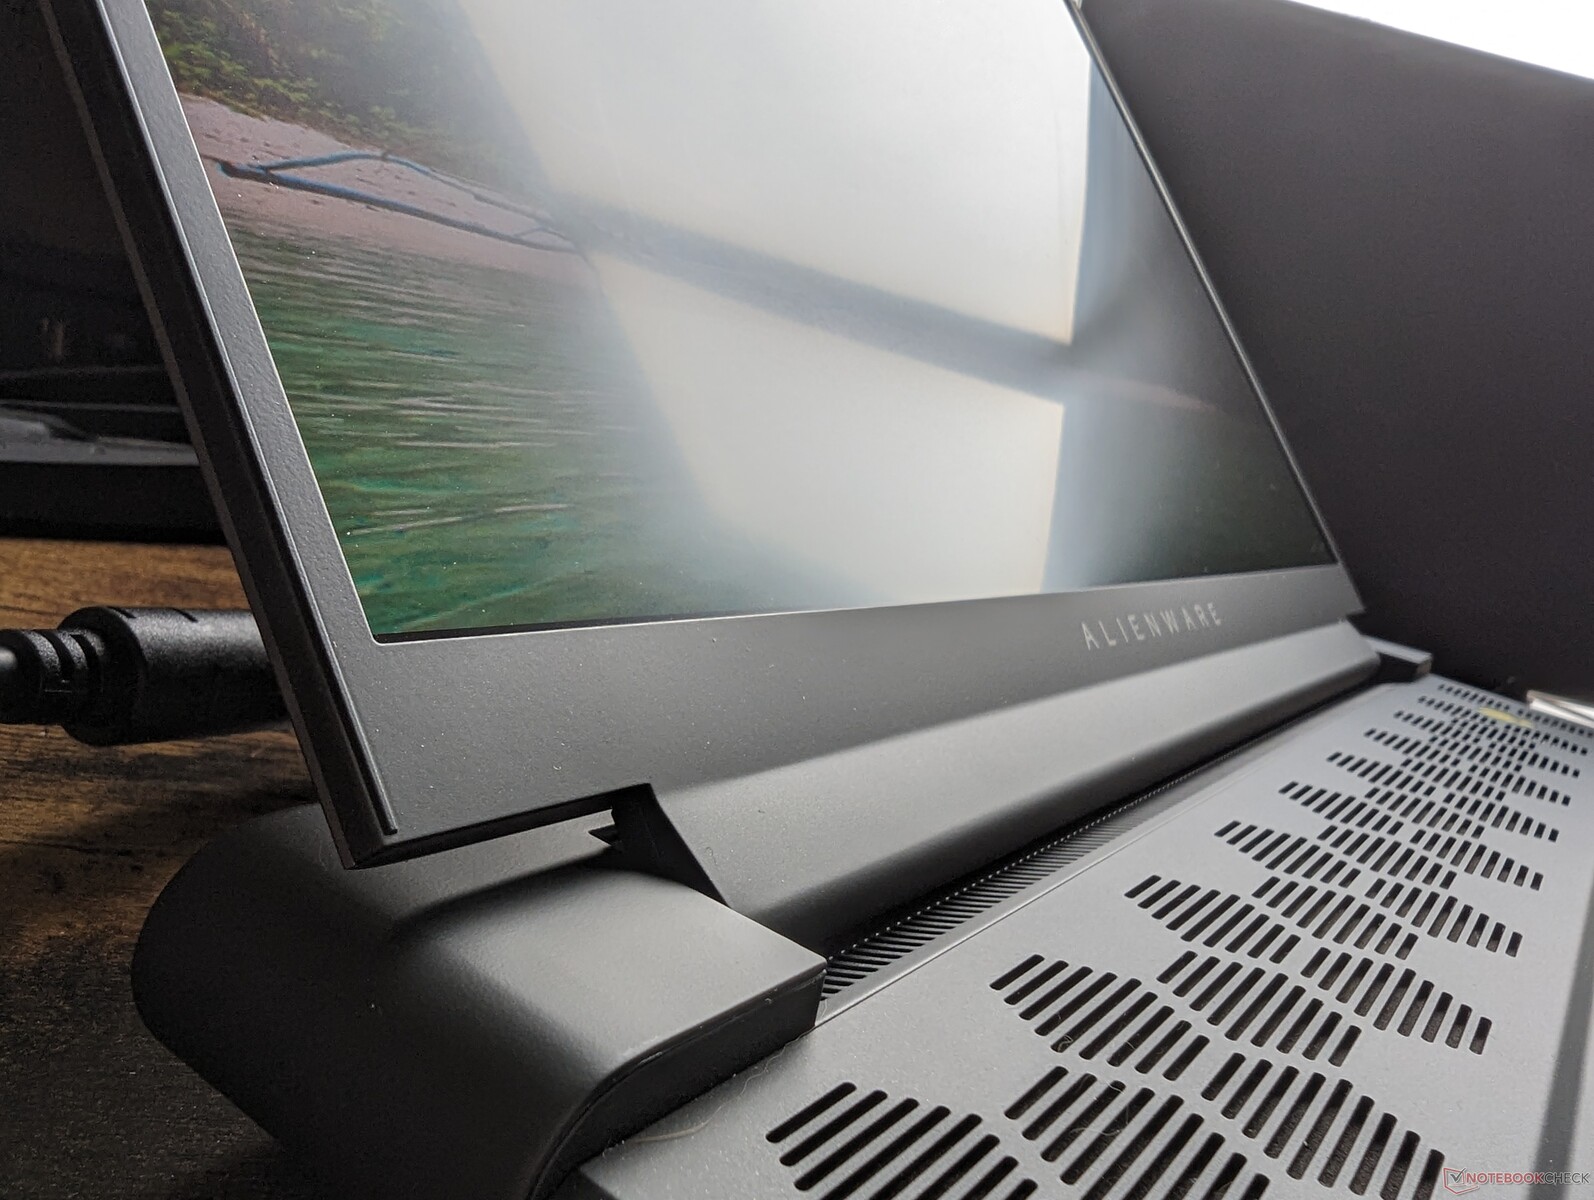
Obudowa - bez wątpienia Alienware
Obudowa jest zasadniczo grubszą wersją Alienware x16 R1, ponieważ oba modele są oparte na tym samym wzornictwie przemysłowym Legend 3.0. Gumowana stopa obwodowa, aluminiowa pokrywa zewnętrzna, sześciokątne kratki wentylacyjne, tylny pierścień LED i matowa czarna klawiatura to kombinacja niespotykana w żadnym konkurencyjnym modelu. Podstawa, pokrywa i zawiasy są solidne, bez słyszalnego skrzypienia przy próbie ich skręcenia lub zgięcia, co zapewnia lepsze pierwsze wrażenie niż w przypadku innych modeli Asus TUF Gaming A16 lub Lenovo Legion Pro 7 16.
Czarne podpórki pod nadgarstki, clickpad i klawisze klawiatury nadal są magnesami na odciski palców. Dell nie oferuje obecnie żadnych innych opcji kolorystycznych poza Dark Metallic Moon.
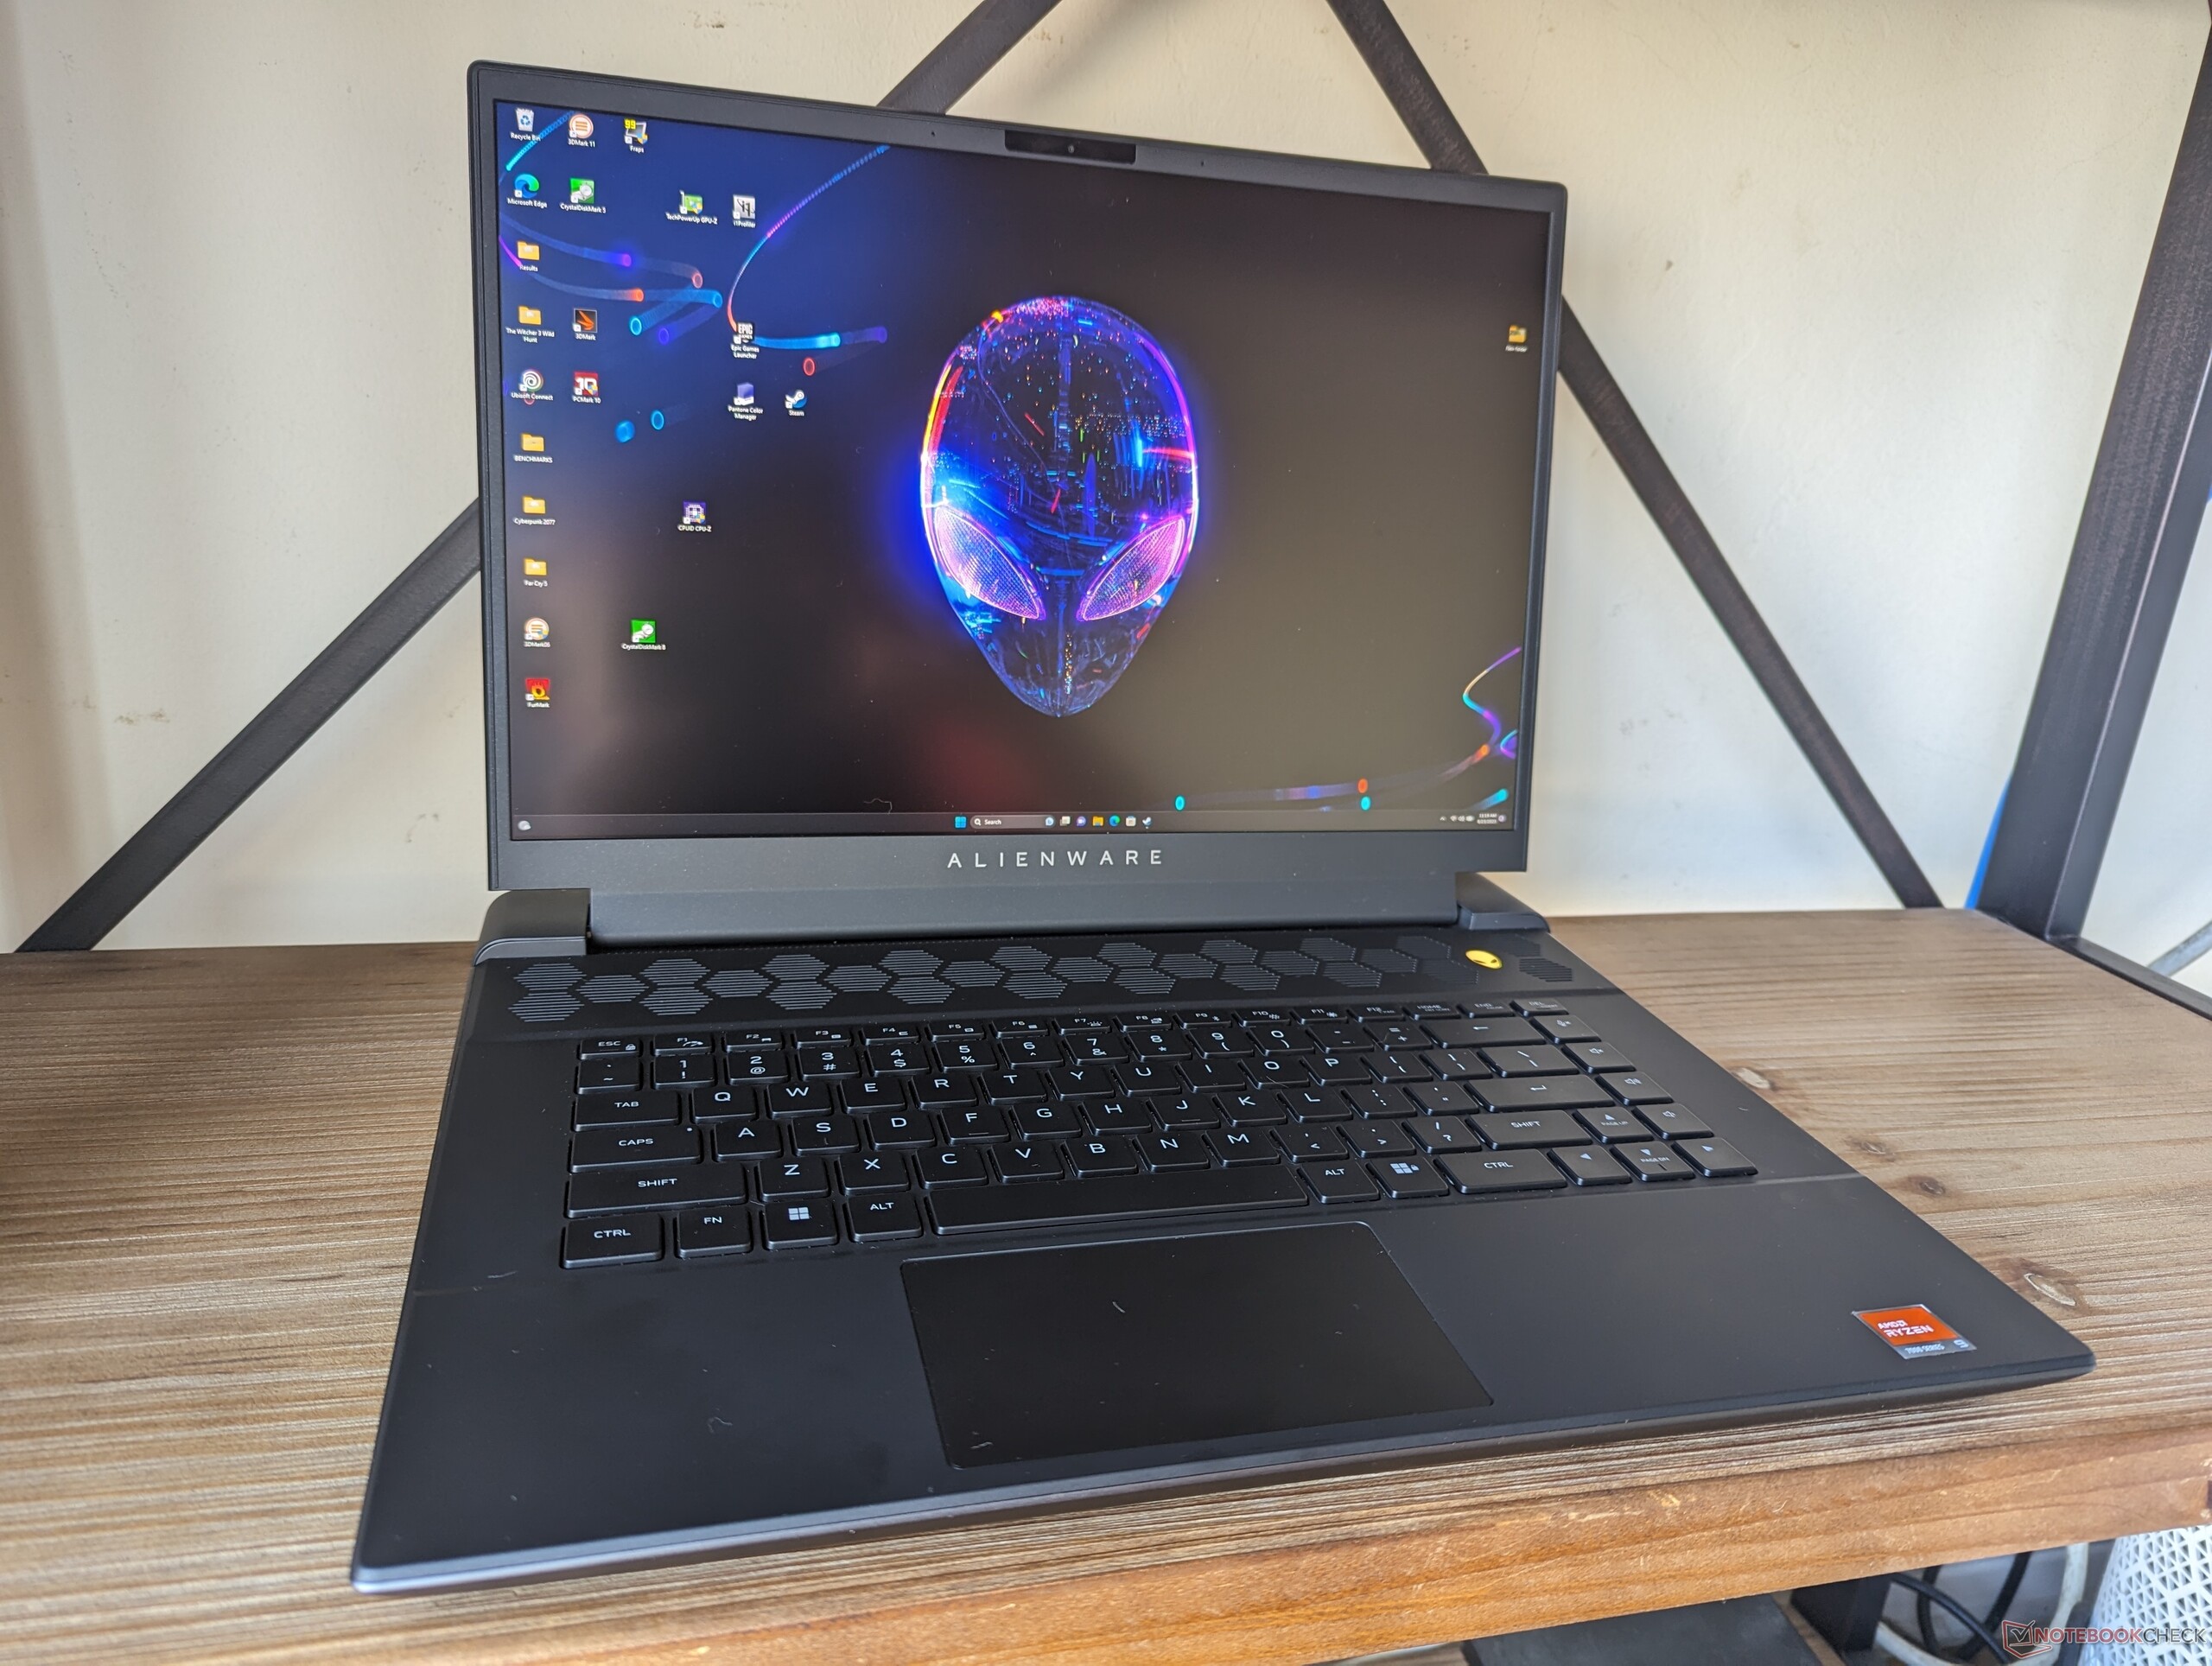
Alienware m16 R1 to jeden z najcięższych 16-calowych laptopów do gier, a także jeden z największych pod względem długości i szerokości ze względu na wydłużony tył. Jego zwarta konstrukcja zapewnia bardzo solidną konstrukcję, choć kosztem przenośności. The Legion Pro 7jest na przykład o 400 g lżejszy i ma znacznie mniejszą powierzchnię, oferując jednocześnie podobne procesory klasy HX i wysokiej klasy układy GPU.
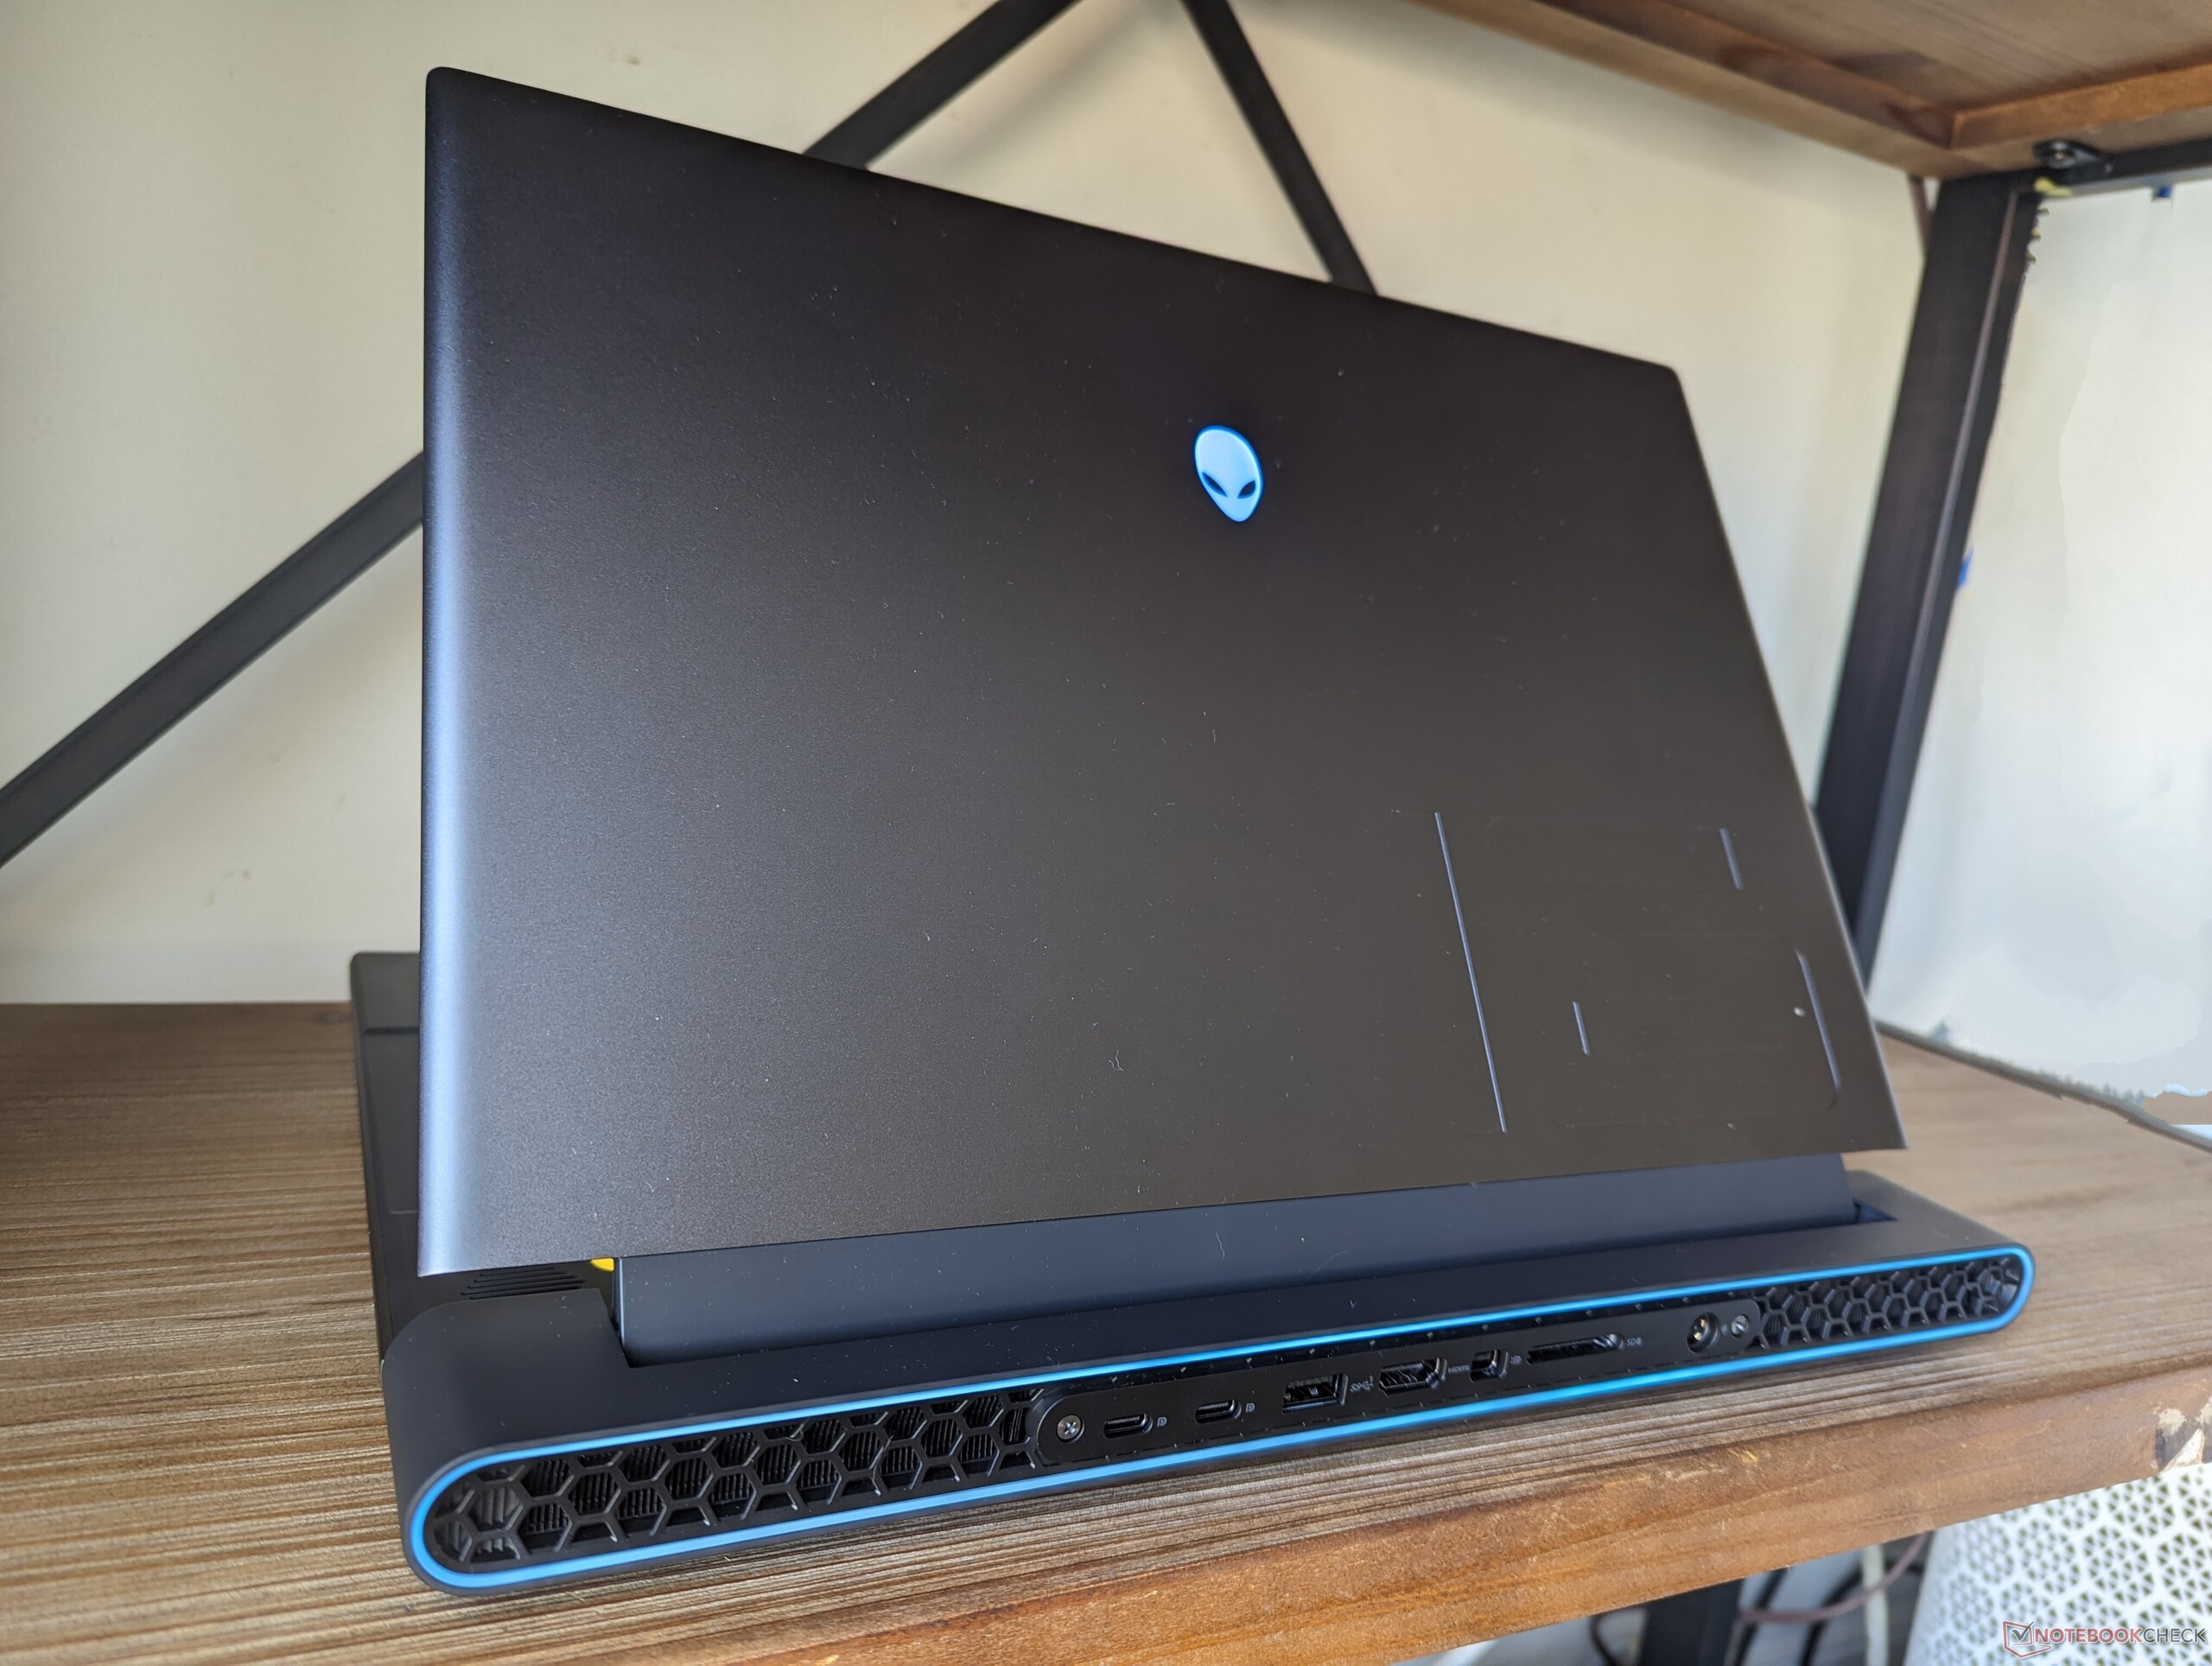
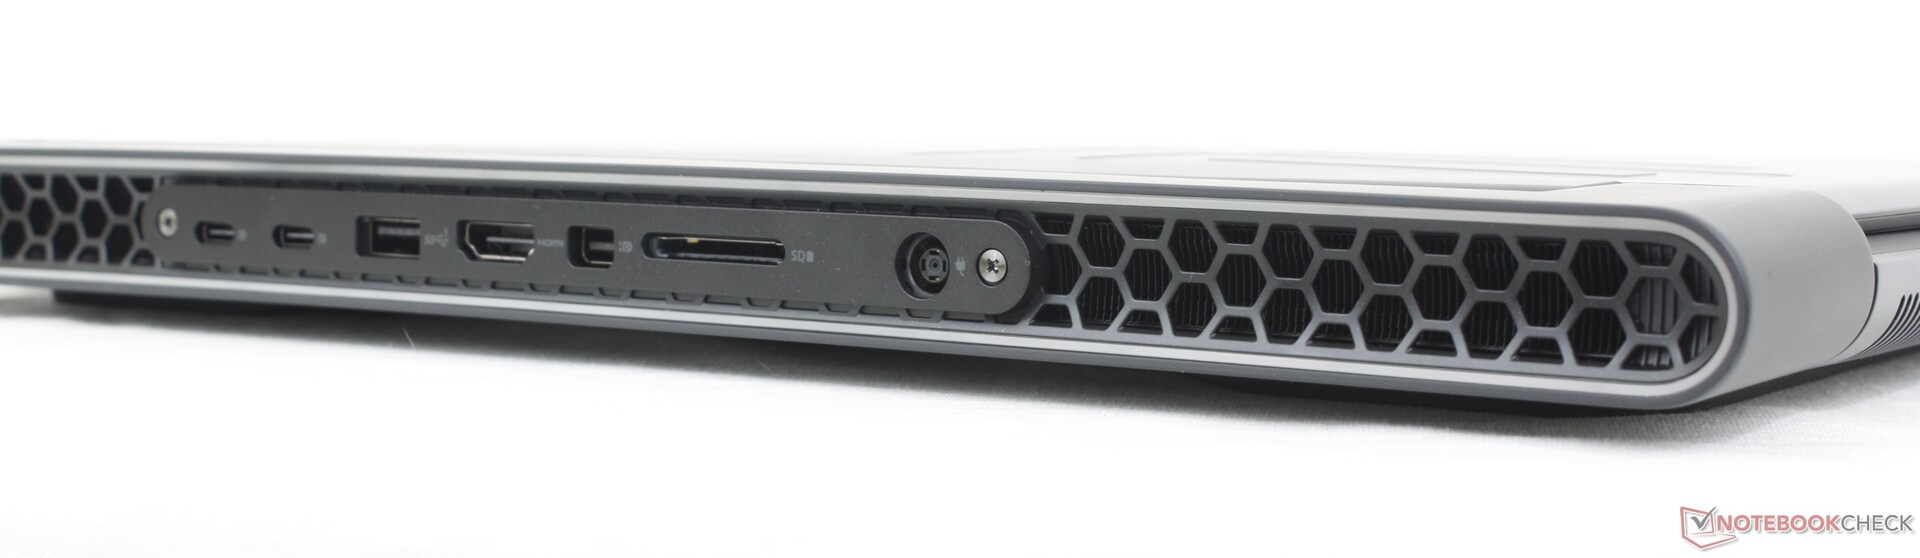
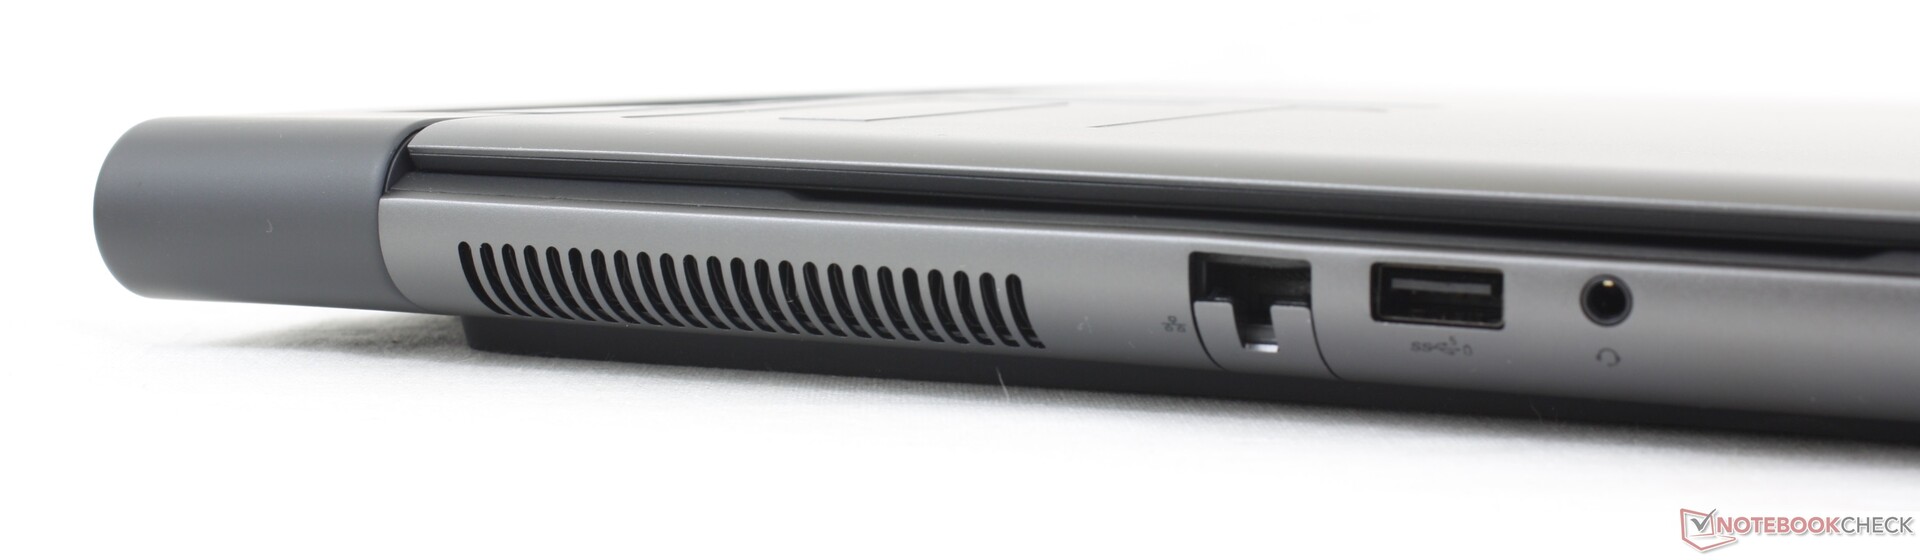
Łączność - Thunderbolt tylko dla wersji Intel
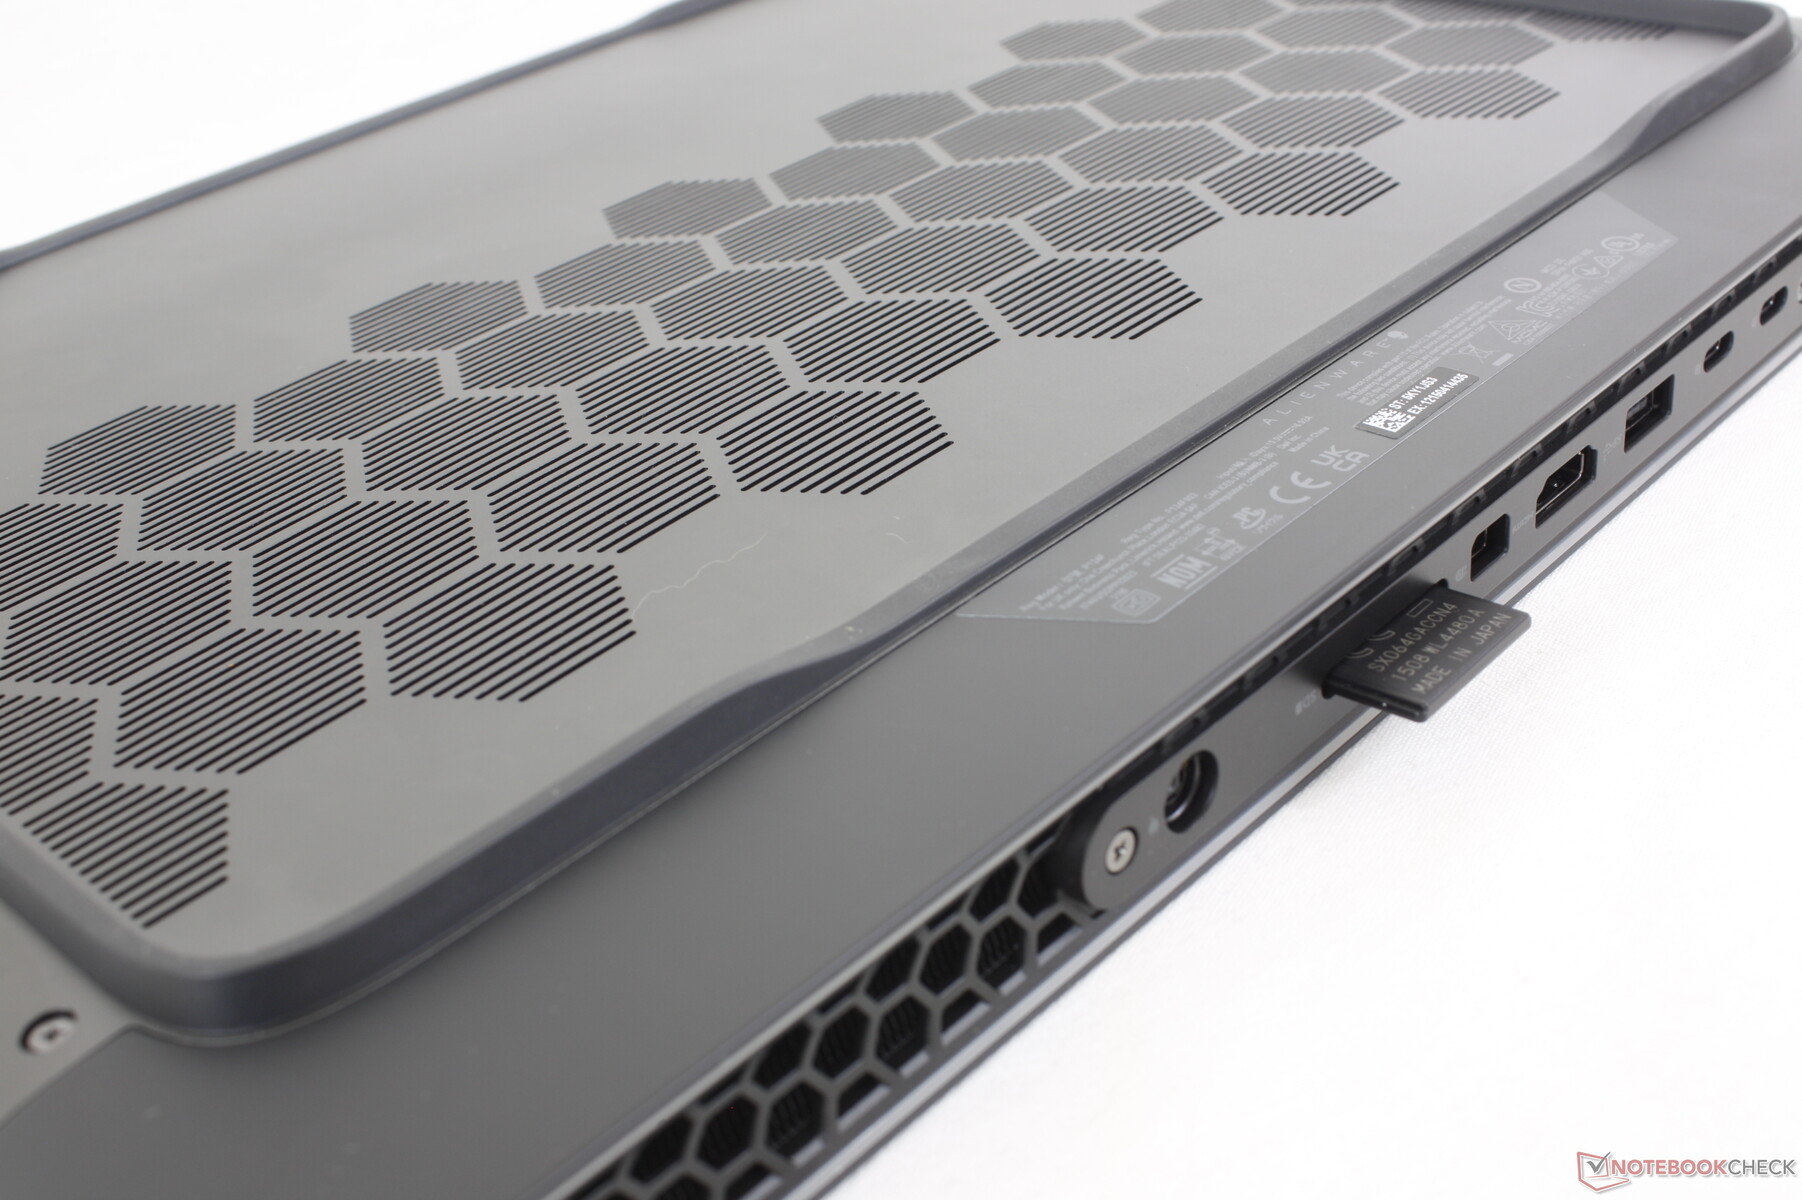
Opcje portów obejmują wszystko, co można znaleźć w Alienware x16 R1 plus RJ-45 i pełnowymiarowy czytnik SD zamiast MicroSD. Kilka portów zostało również przeniesionych na lewą krawędź, podczas gdy wszystkie są ściśnięte wzdłuż tylnej części x16. Mini-DisplayPort jest również godny uwagi, ponieważ jest rzadkością w nowszych laptopach do gier.
USB4 i Thunderbolt nie są obsługiwane w naszym modelu AMD.

Czytnik kart SD
Szybkość transferu z czytnika kart SD jest szybsza niż w większości innych laptopów do gier, co powinno zadowolić twórców treści. Przeniesienie 1 GB zdjęć z naszej karty testowej UHS-II na pulpit zajmuje nieco ponad 5 sekund.
| SD Card Reader | |
| average JPG Copy Test (av. of 3 runs) | |
| Alienware m16 R1 AMD (Toshiba Exceria Pro SDXC 64 GB UHS-II) | |
| Razer Blade 16 Early 2023 (AV PRO microSD 128 GB V60) | |
| Alienware x16 R1 (AV PRO microSD 128 GB V60) | |
| maximum AS SSD Seq Read Test (1GB) | |
| Alienware x16 R1 (AV PRO microSD 128 GB V60) | |
| Alienware m16 R1 AMD (Toshiba Exceria Pro SDXC 64 GB UHS-II) | |
| Razer Blade 16 Early 2023 (AV PRO microSD 128 GB V60) | |
Komunikacja
SKU AMD są dostarczane z Qualcomm WCN685x, podczas gdy SKU Intela są dostarczane z Killer AX1675, każdy z łącznością Wi-Fi 6E. Wydajność jest zarówno stabilna, jak i niezawodna po sparowaniu z naszą siecią 6 GHz.
| Networking | |
| iperf3 transmit AXE11000 | |
| Lenovo Legion Pro 7 RTX4090 | |
| Asus ROG Strix G16 G614JZ | |
| Alienware m16 R1 AMD | |
| HP Omen Transcend 16 | |
| Razer Blade 16 Early 2023 | |
| Alienware x16 R1 | |
| iperf3 receive AXE11000 | |
| Lenovo Legion Pro 7 RTX4090 | |
| Asus ROG Strix G16 G614JZ | |
| Alienware m16 R1 AMD | |
| HP Omen Transcend 16 | |
| Razer Blade 16 Early 2023 | |
| Alienware x16 R1 | |
| iperf3 transmit AXE11000 6GHz | |
| Alienware m16 R1 AMD | |
| HP Omen Transcend 16 | |
| Razer Blade 16 Early 2023 | |
| Alienware x16 R1 | |
| iperf3 receive AXE11000 6GHz | |
| Alienware m16 R1 AMD | |
| HP Omen Transcend 16 | |
| Razer Blade 16 Early 2023 | |
| Alienware x16 R1 | |
Kamera internetowa
Jest też kamera internetowa 2 MP z podczerwienią i bez migawki prywatności, podobnie jak w Alienware x16.


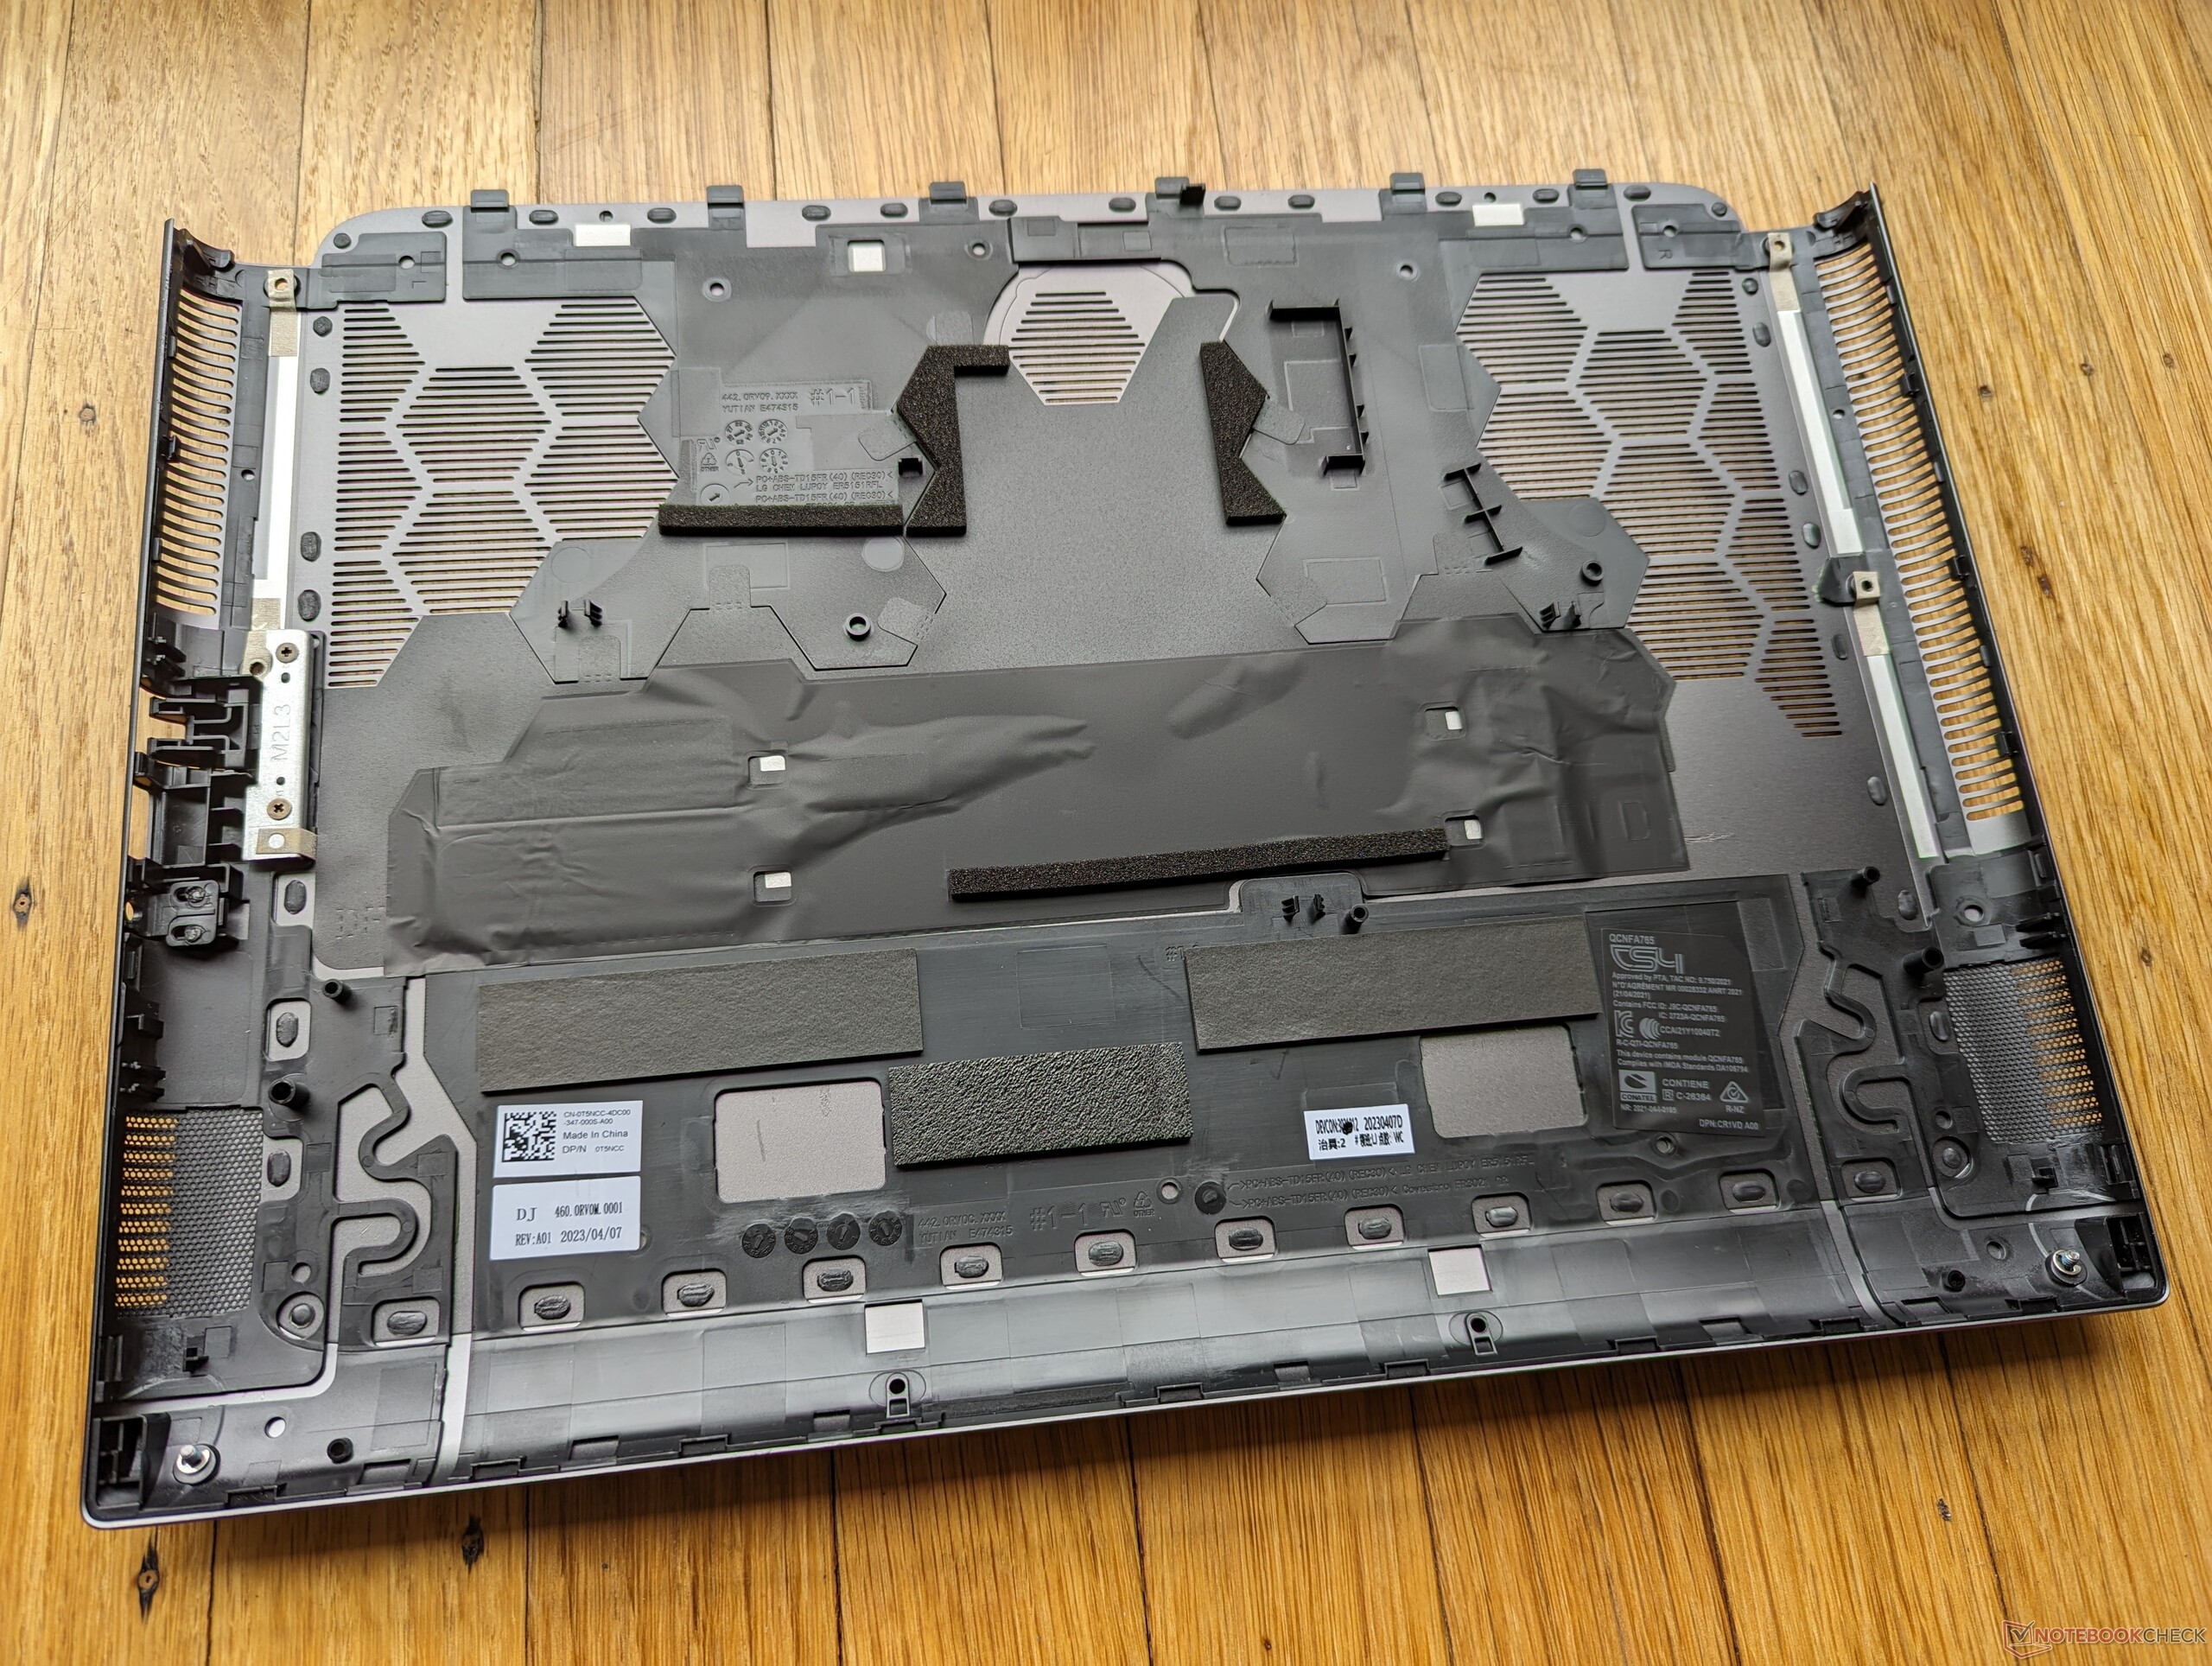
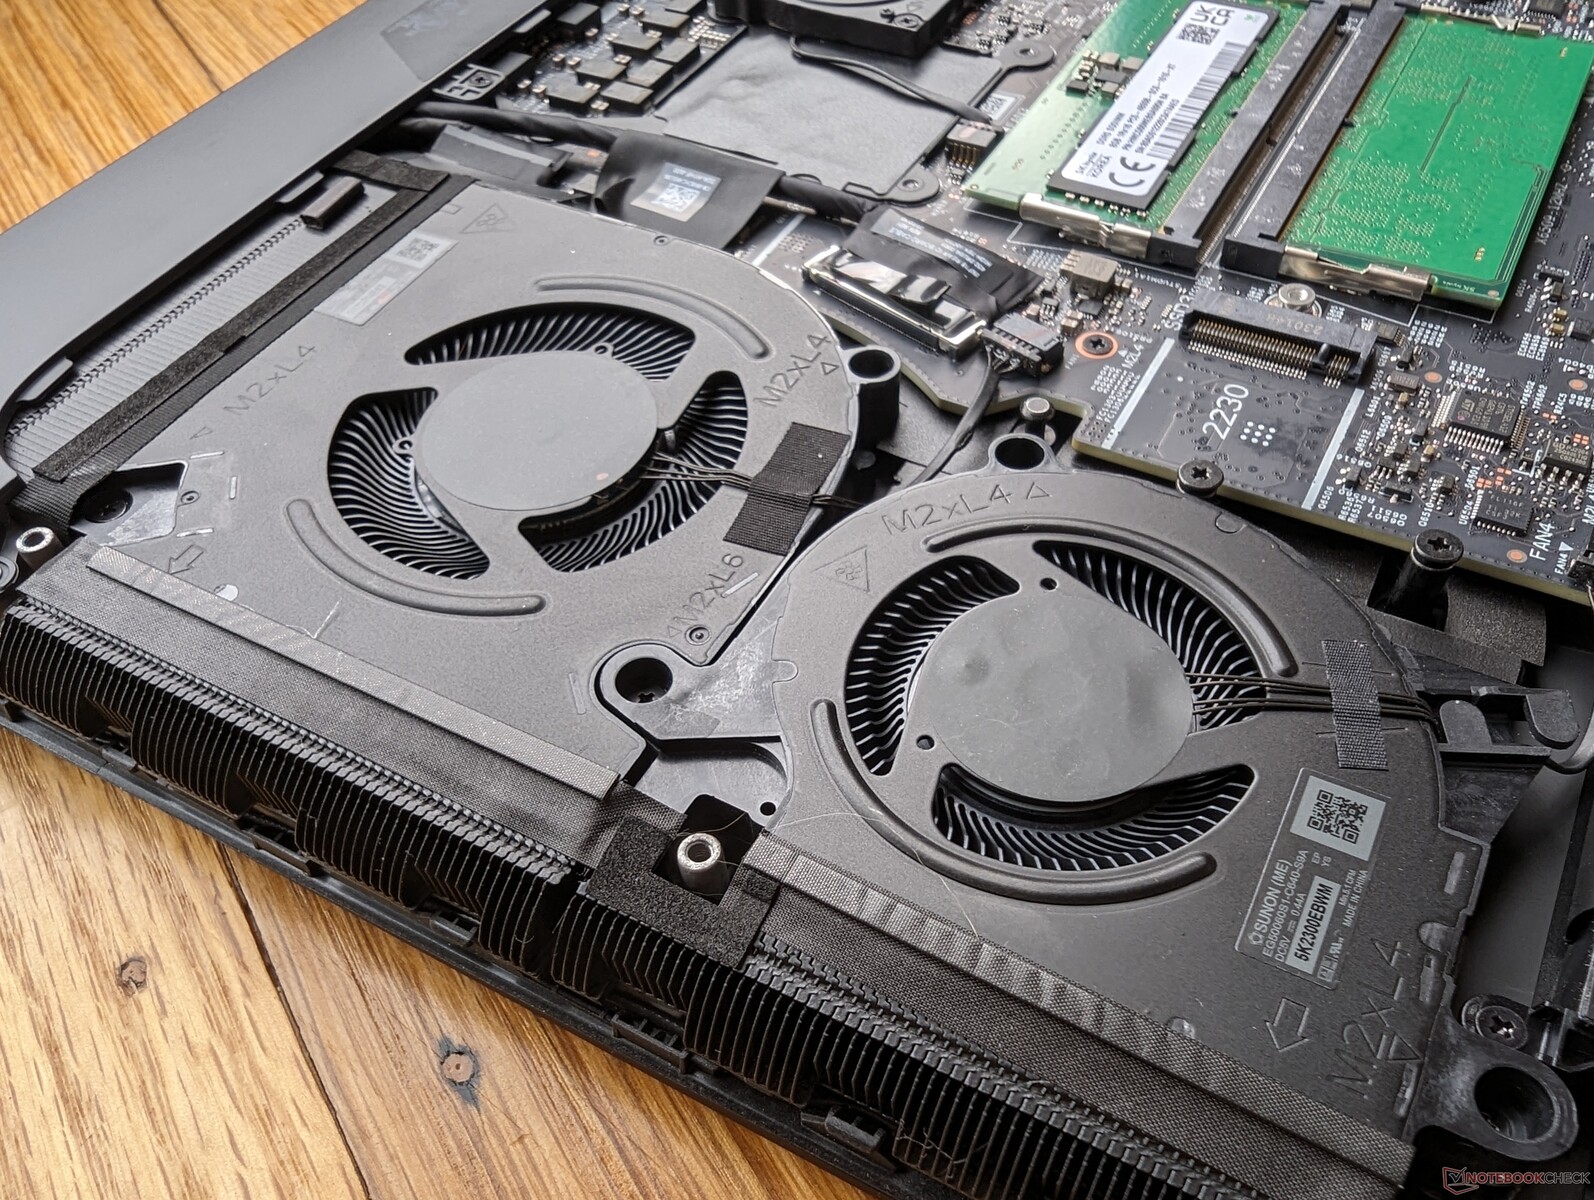
Konserwacja
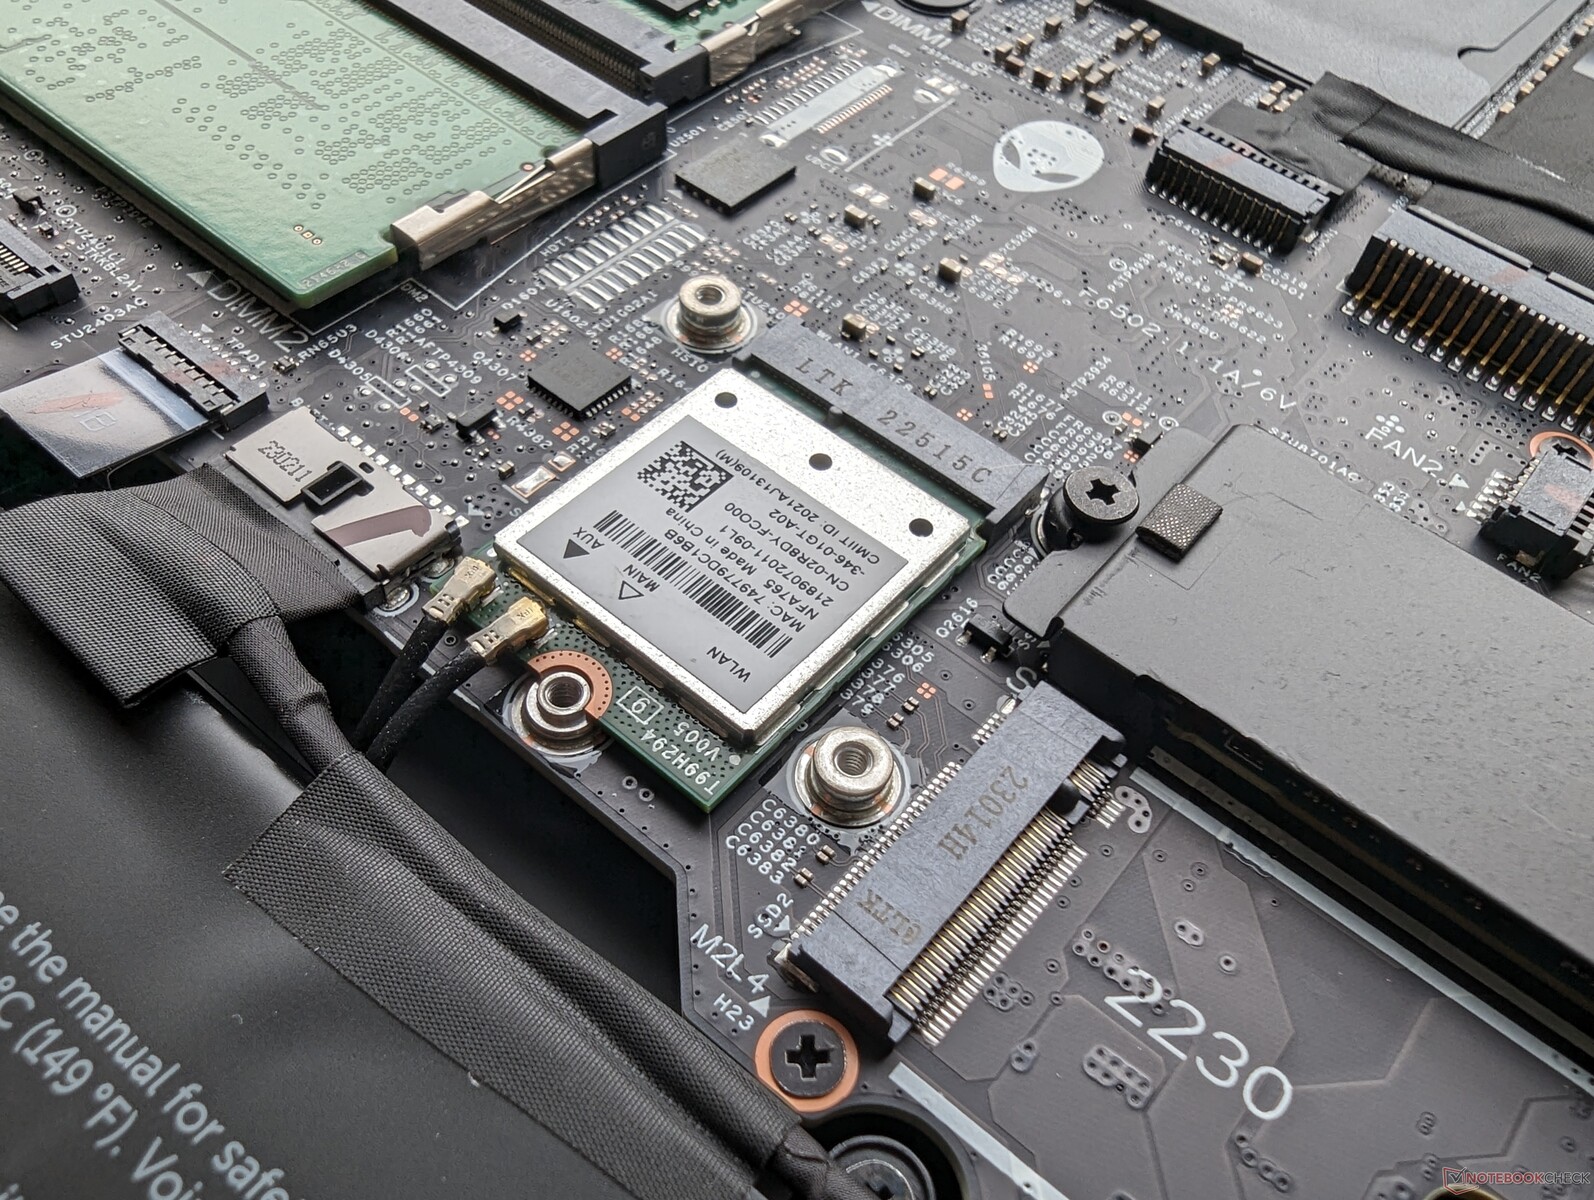
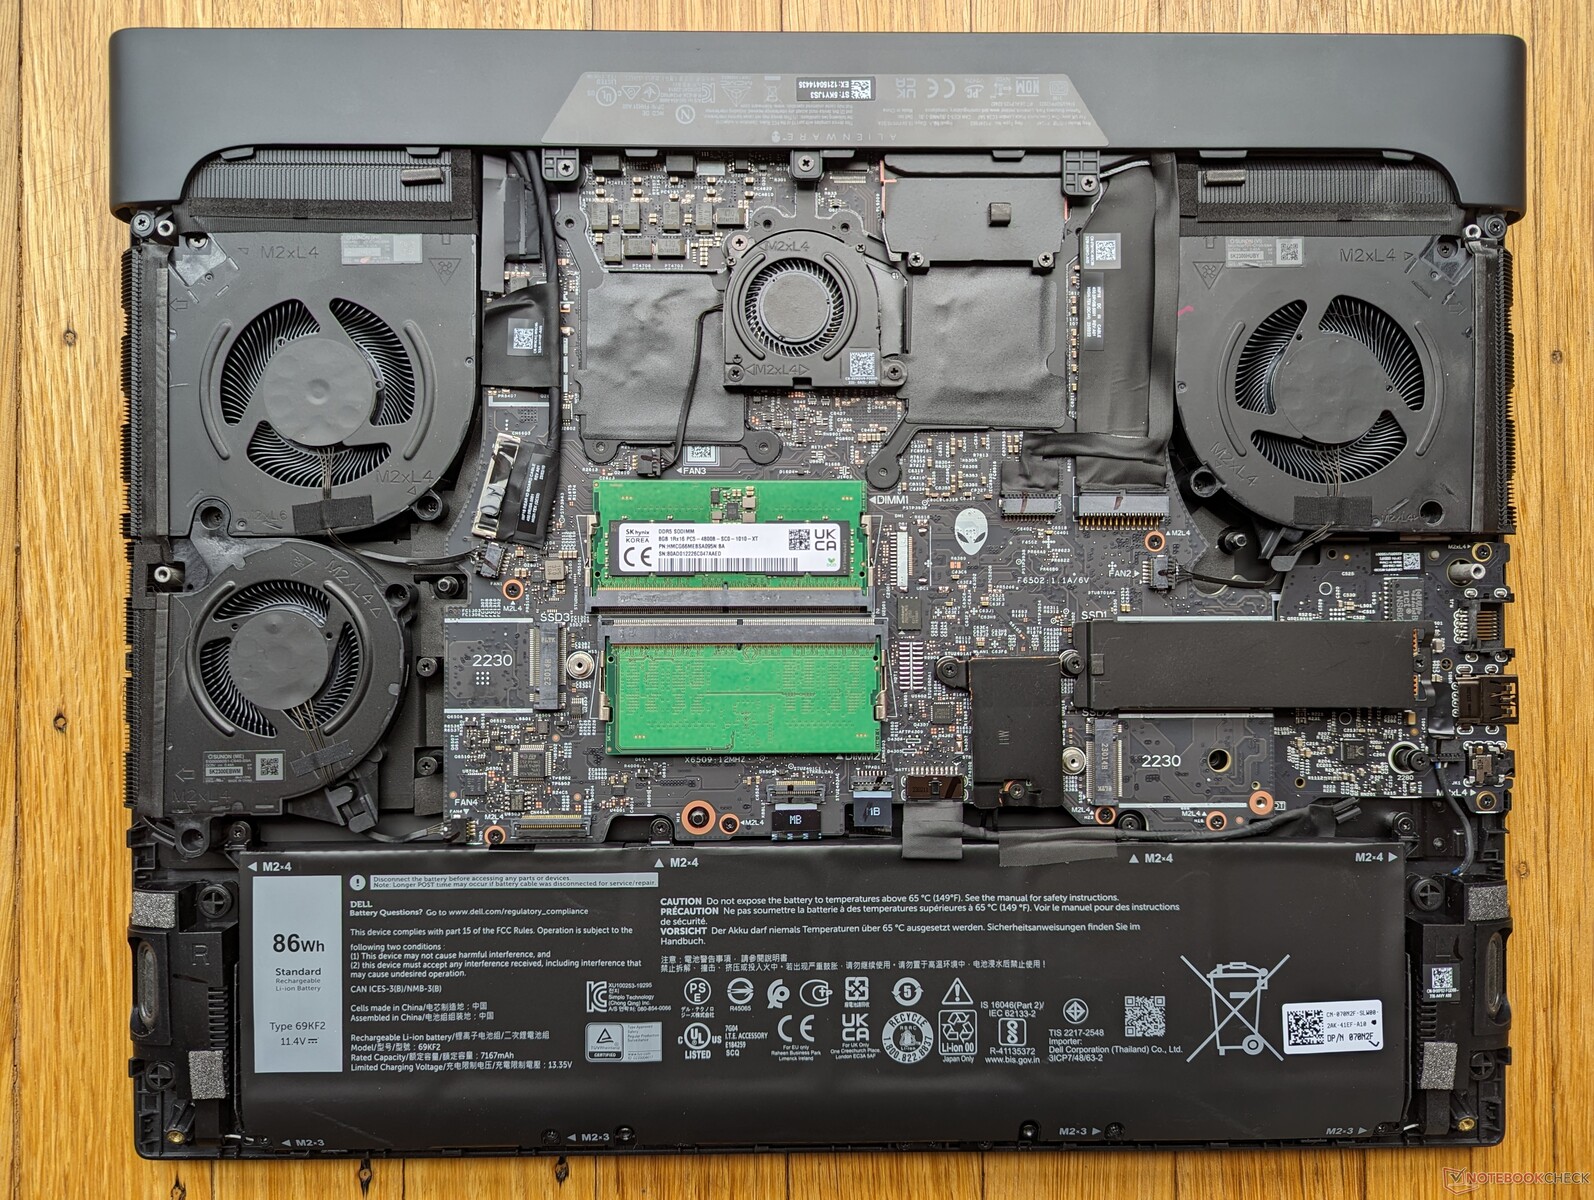
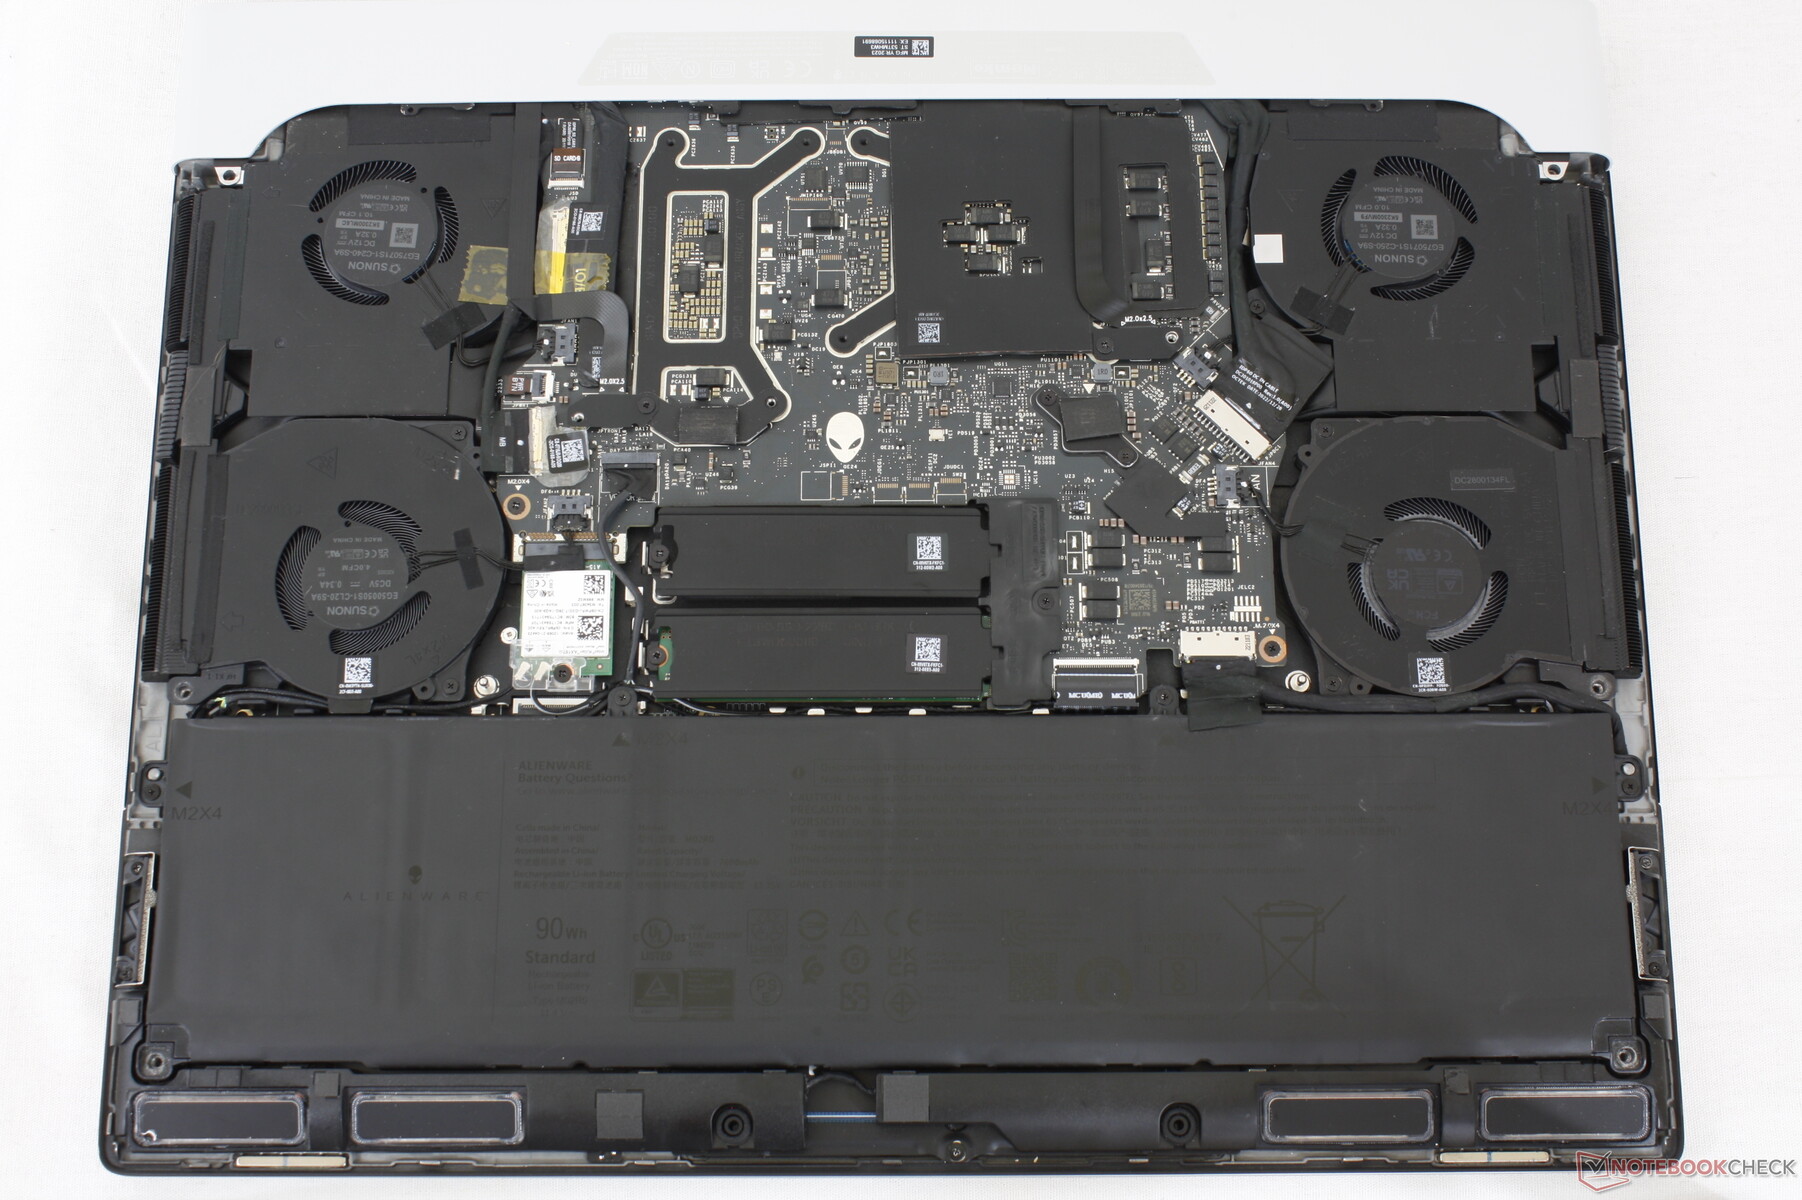
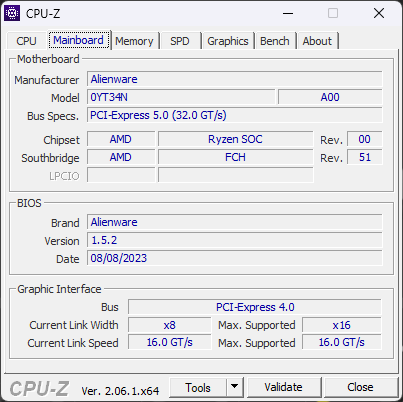
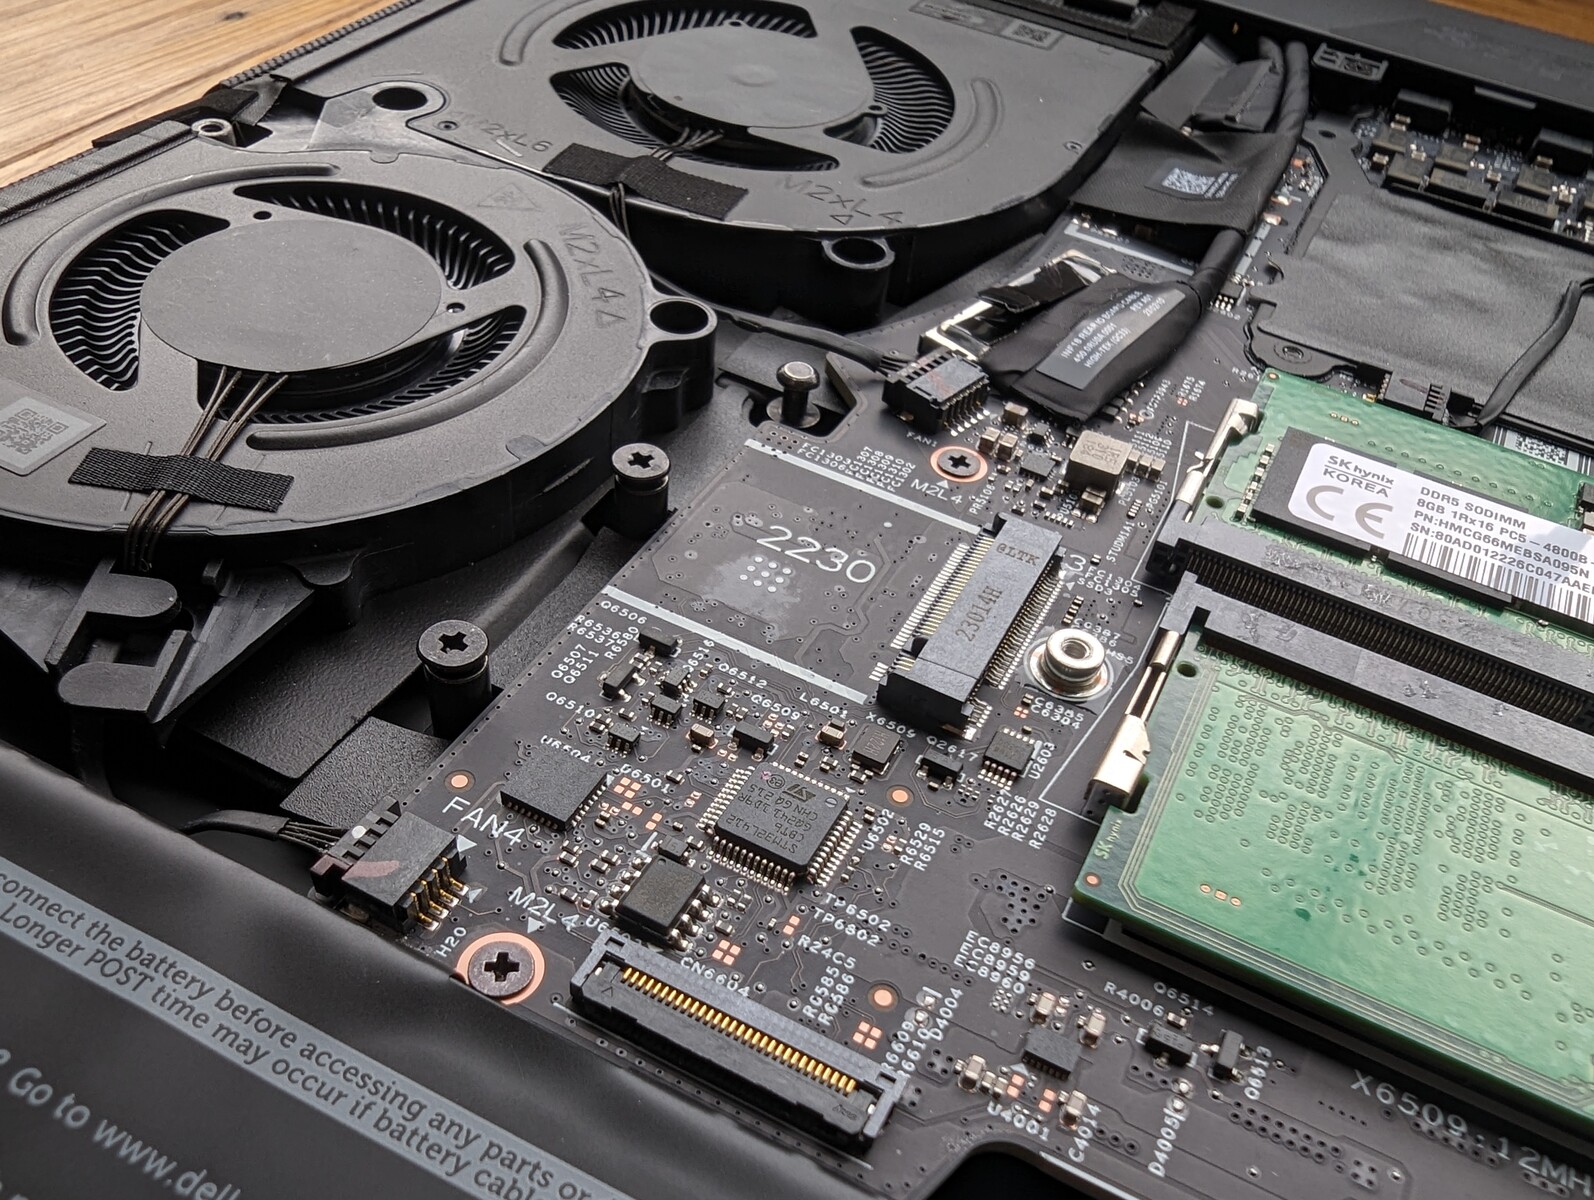
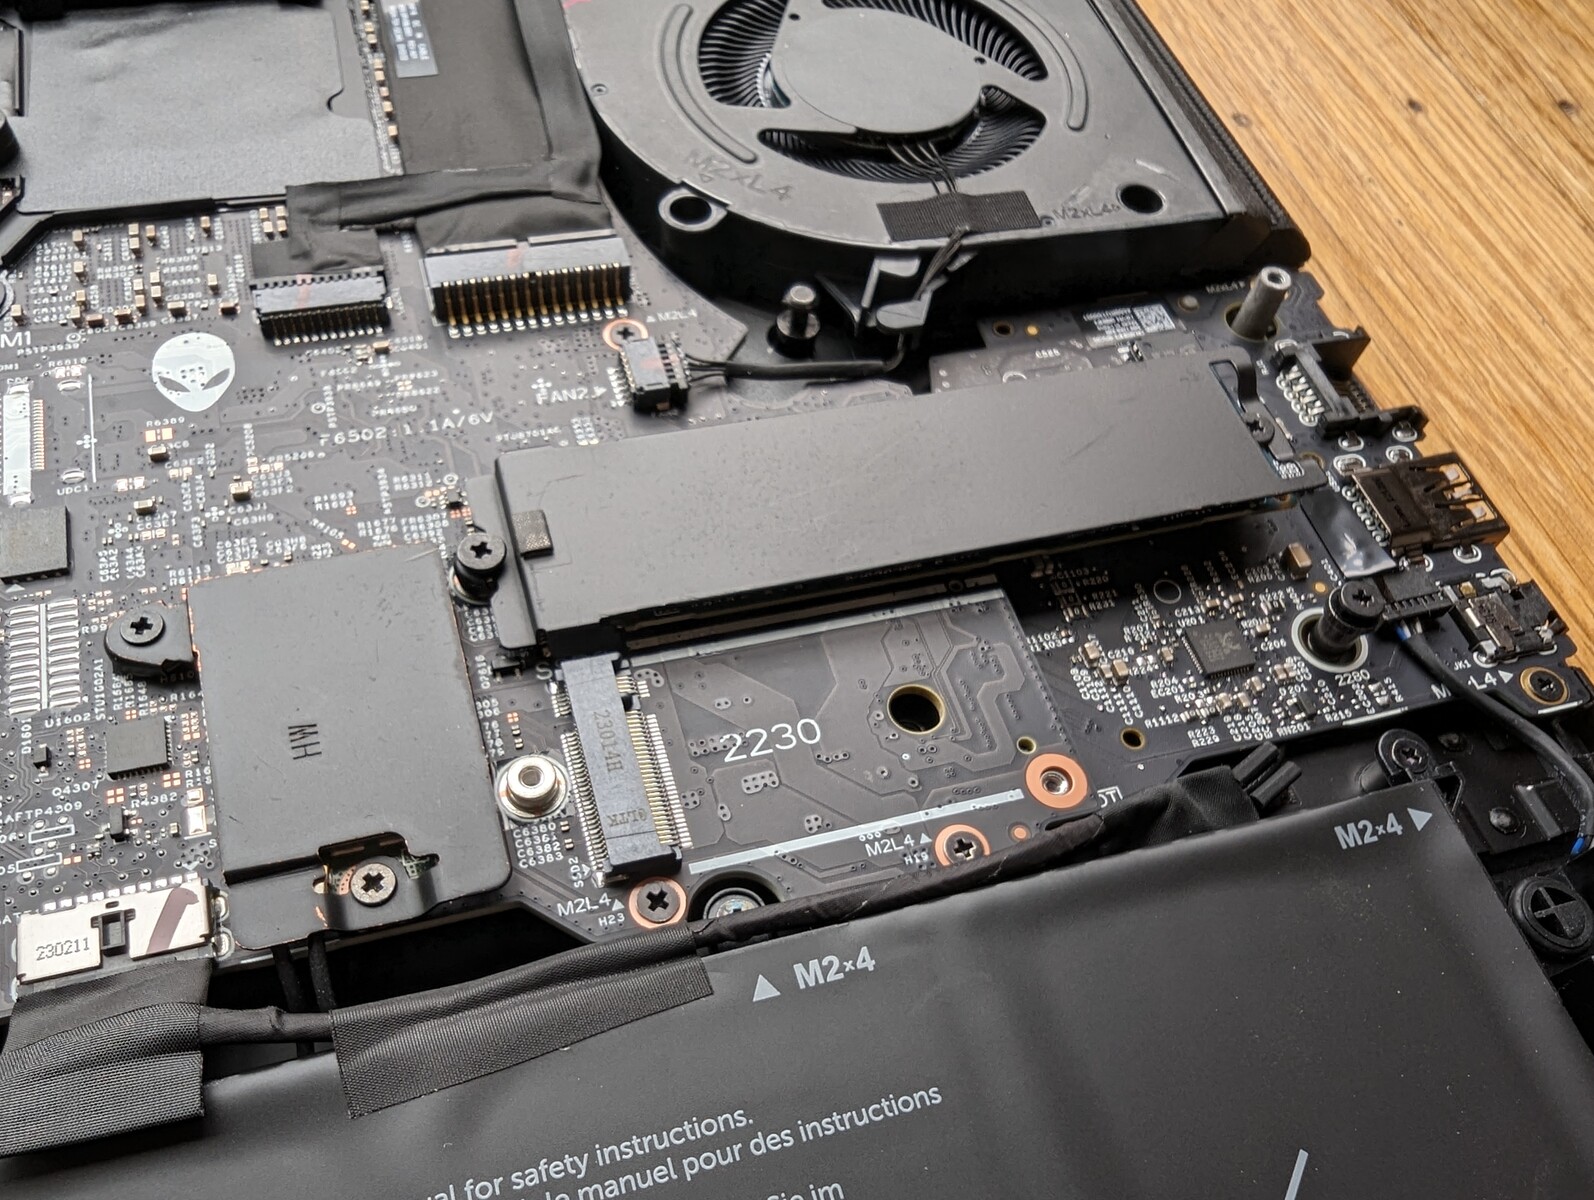
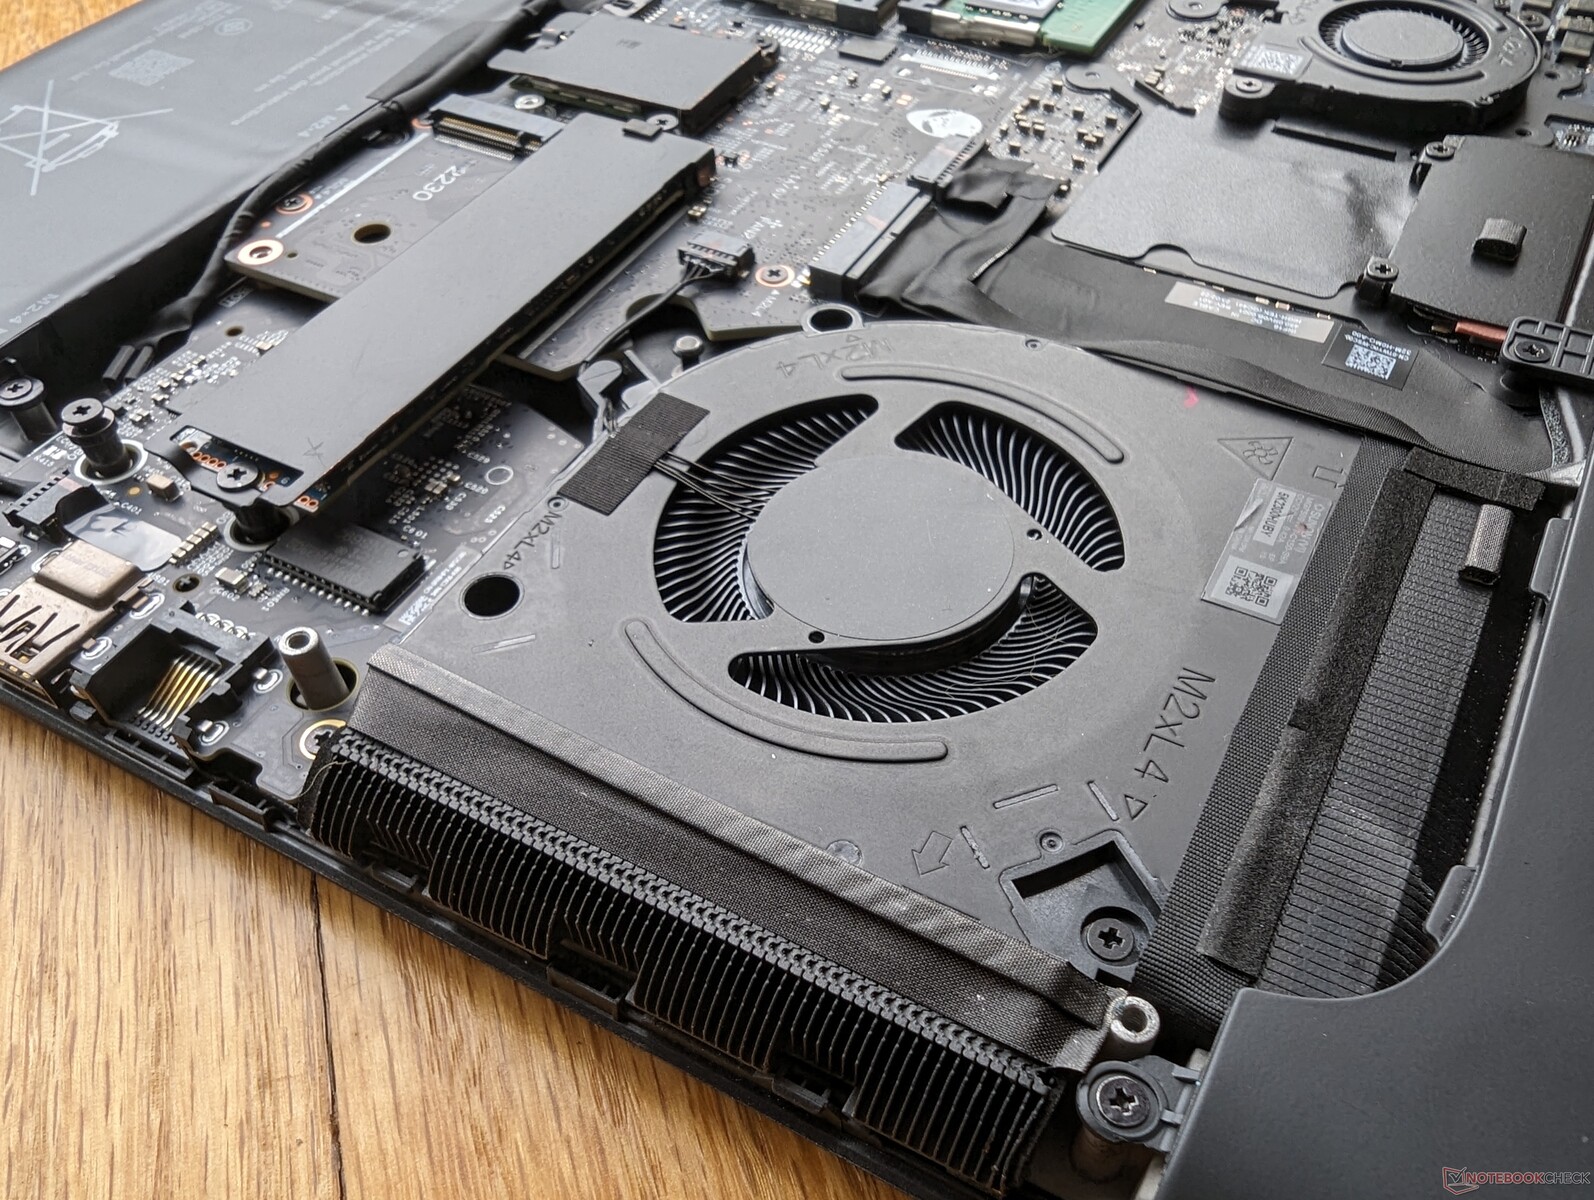
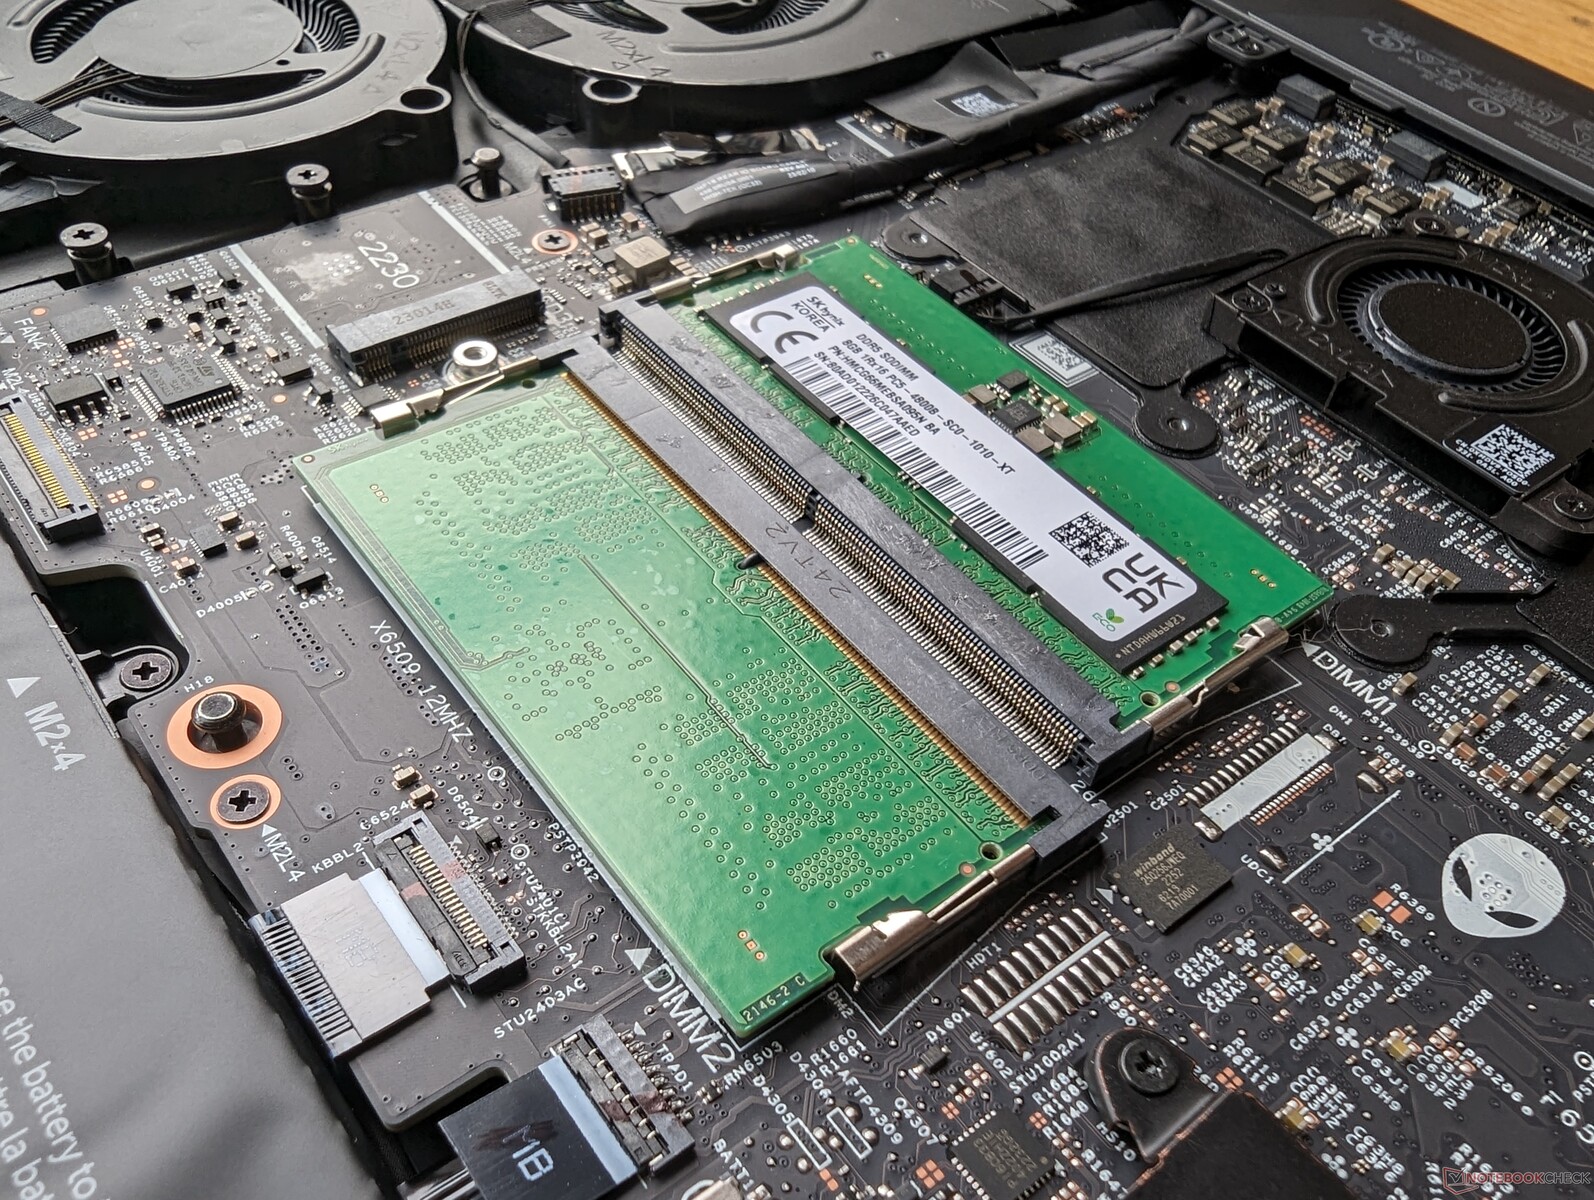
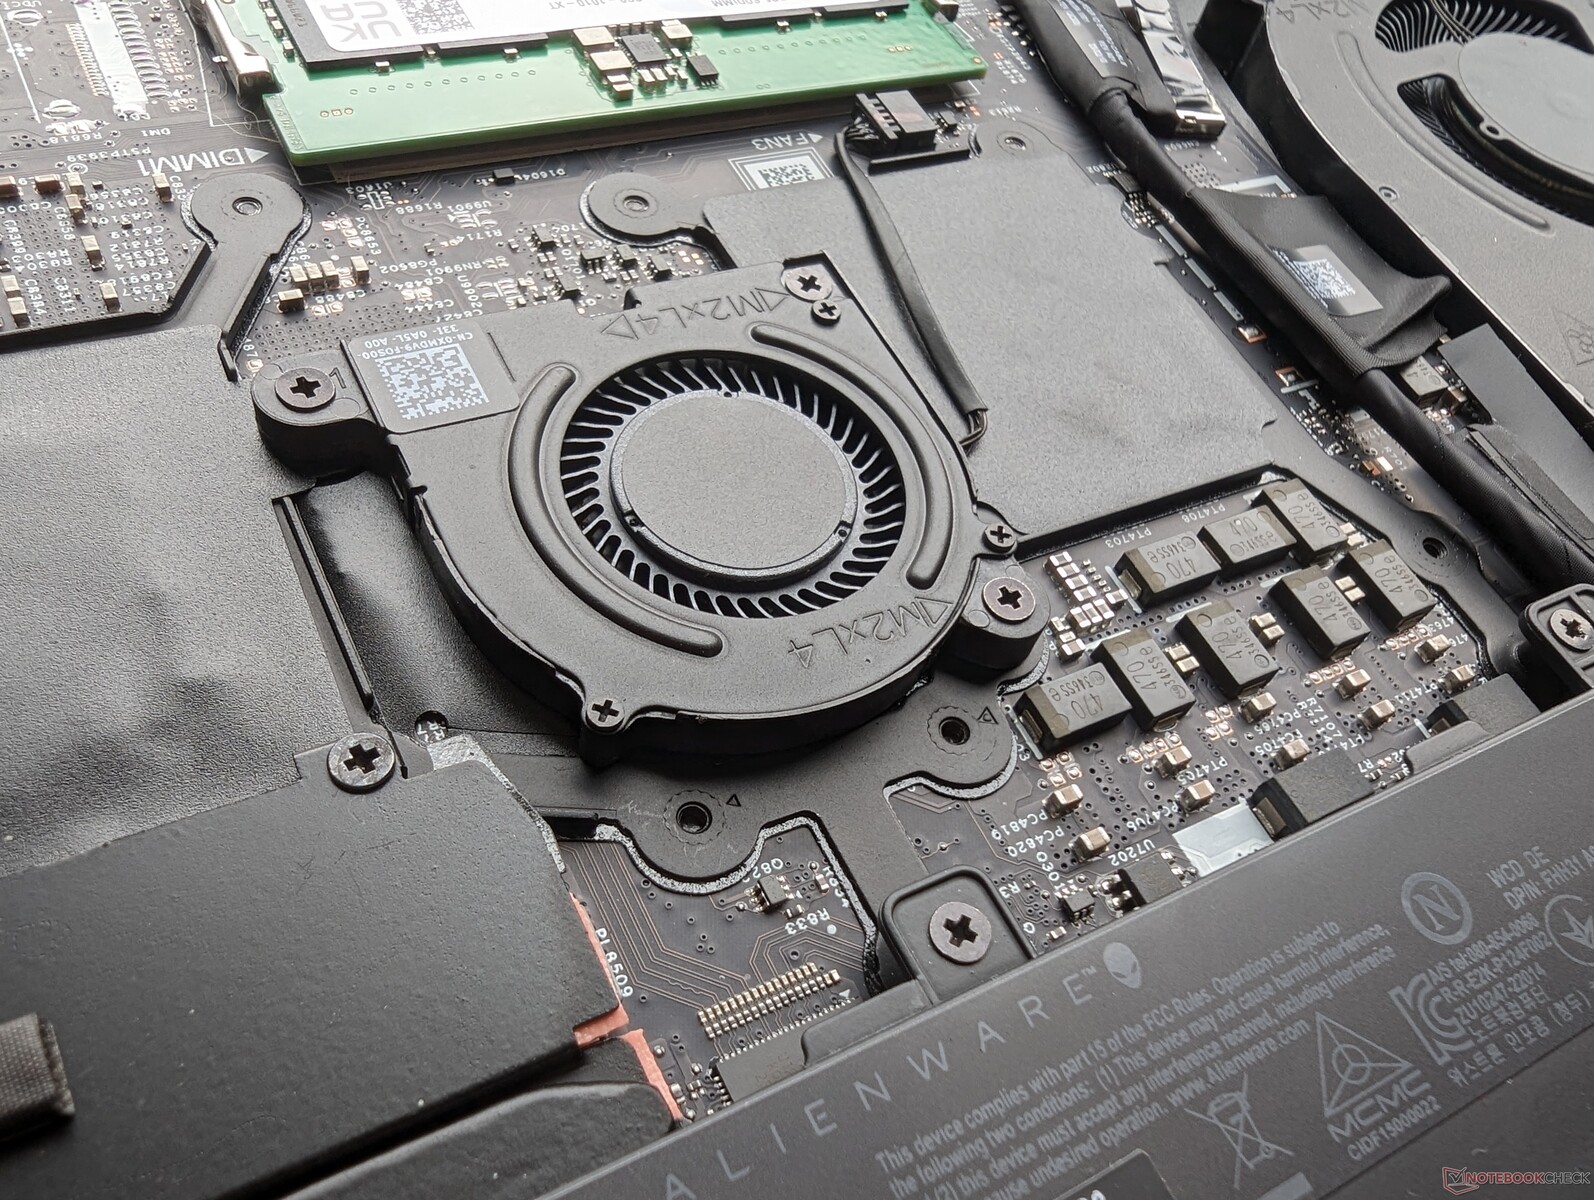
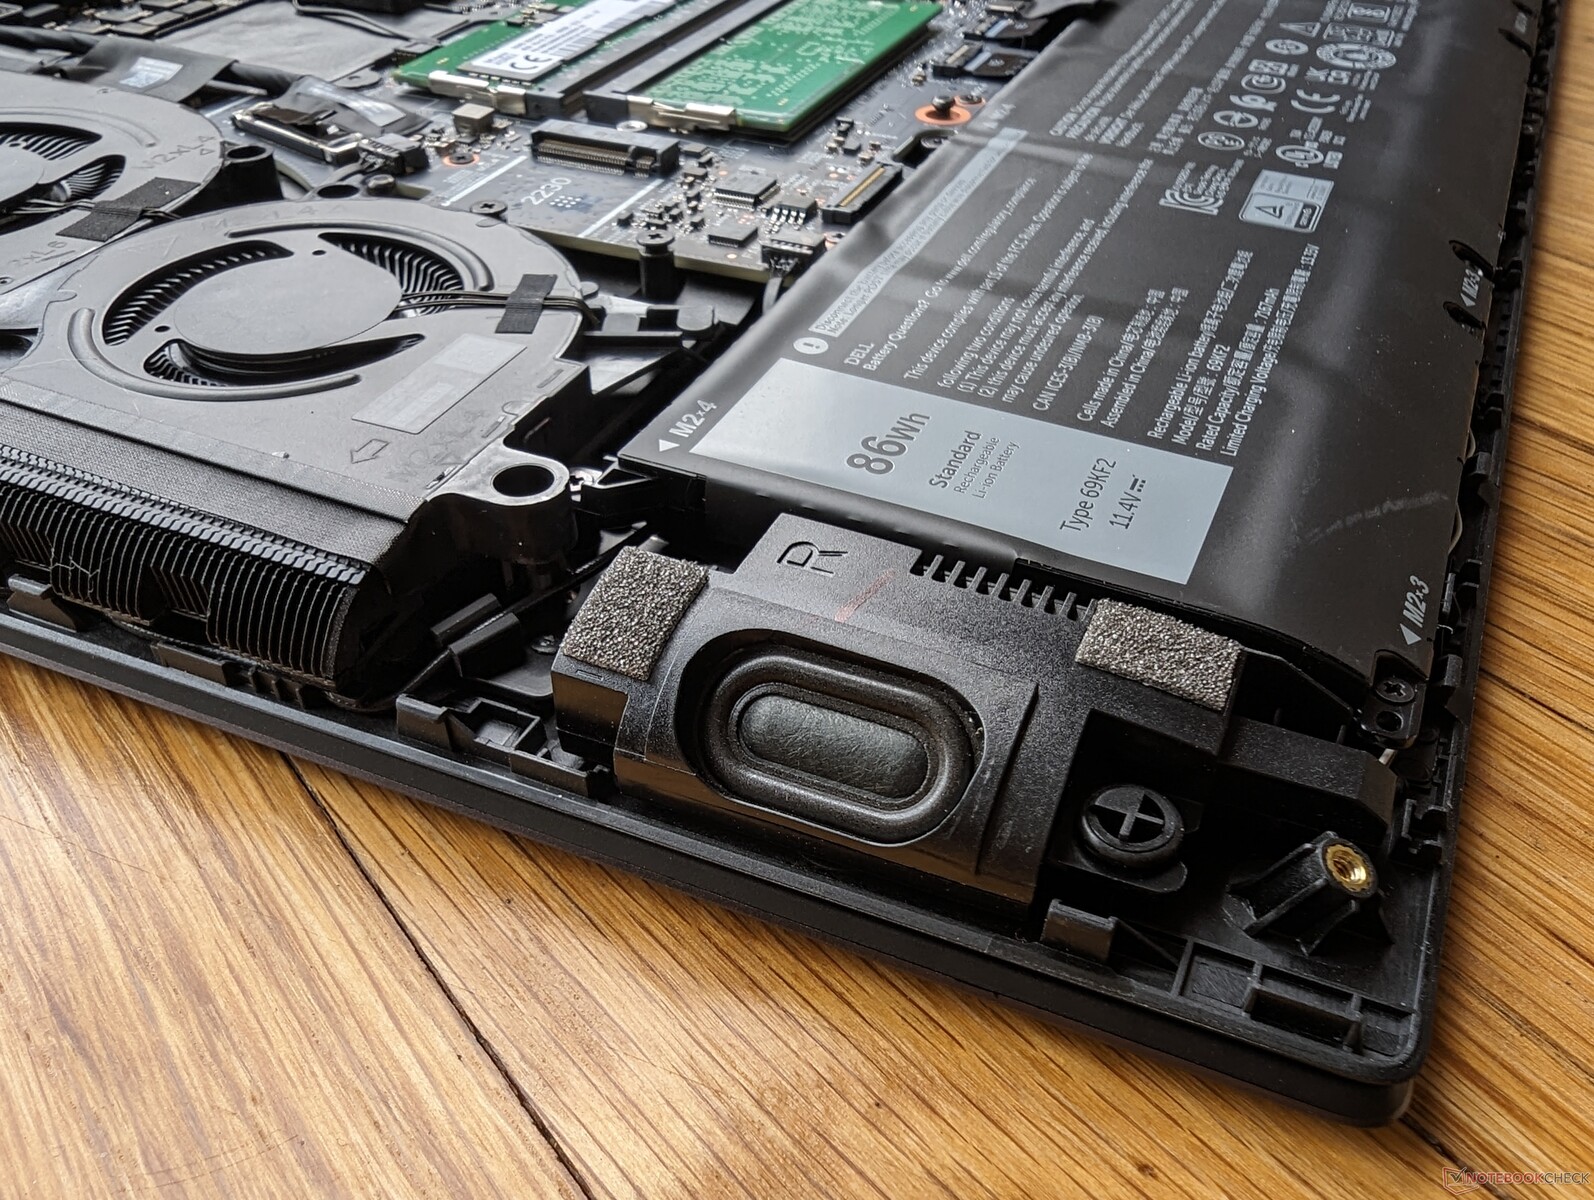
Dolny panel jest zabezpieczony 8 śrubami krzyżakowymi, co ułatwia serwisowanie. Użytkownicy mają bezpośredni dostęp do 3 zatok pamięci masowej, 2 gniazd SODIMM i wyjmowanego modułu WLAN. Należy zauważyć, że płyta główna jest odwrócona do góry nogami, co oznacza, że procesory znajdują się po przeciwnej stronie.
Konstrukcja płyty głównej jest zupełnie inna niż w Alienware x16, mimo że oba modele mają wiele wspólnych cech zewnętrznych. Zamiast tego jest najbardziej podobny do Alienware m18.
Akcesoria i gwarancja
Pudełko detaliczne zawiera dwie naklejki z logo Alienware wraz ze zwykłym zasilaczem sieciowym i dokumentacją. W przypadku zakupu w Stanach Zjednoczonych obowiązuje roczna ograniczona gwarancja producenta.
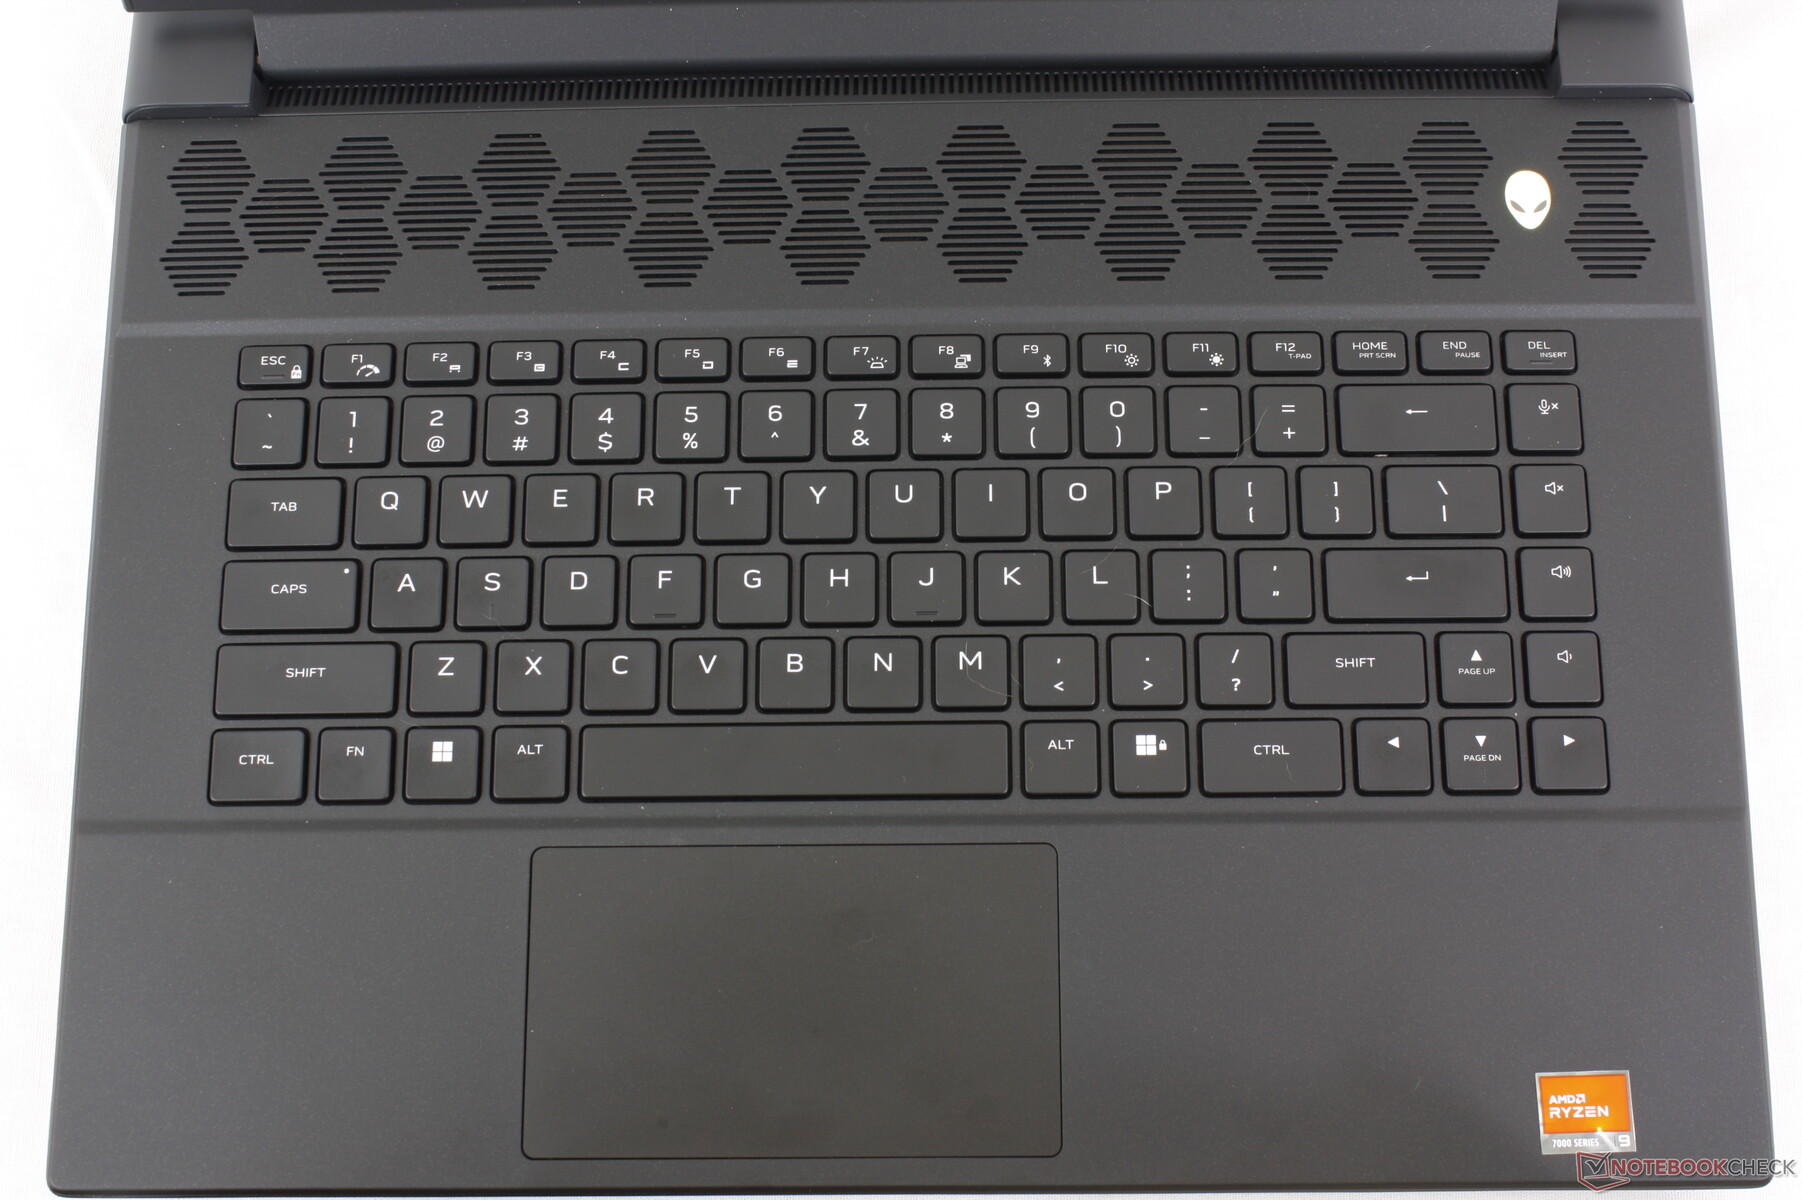
Urządzenia wejściowe - dostępne mechaniczne lub standardowe
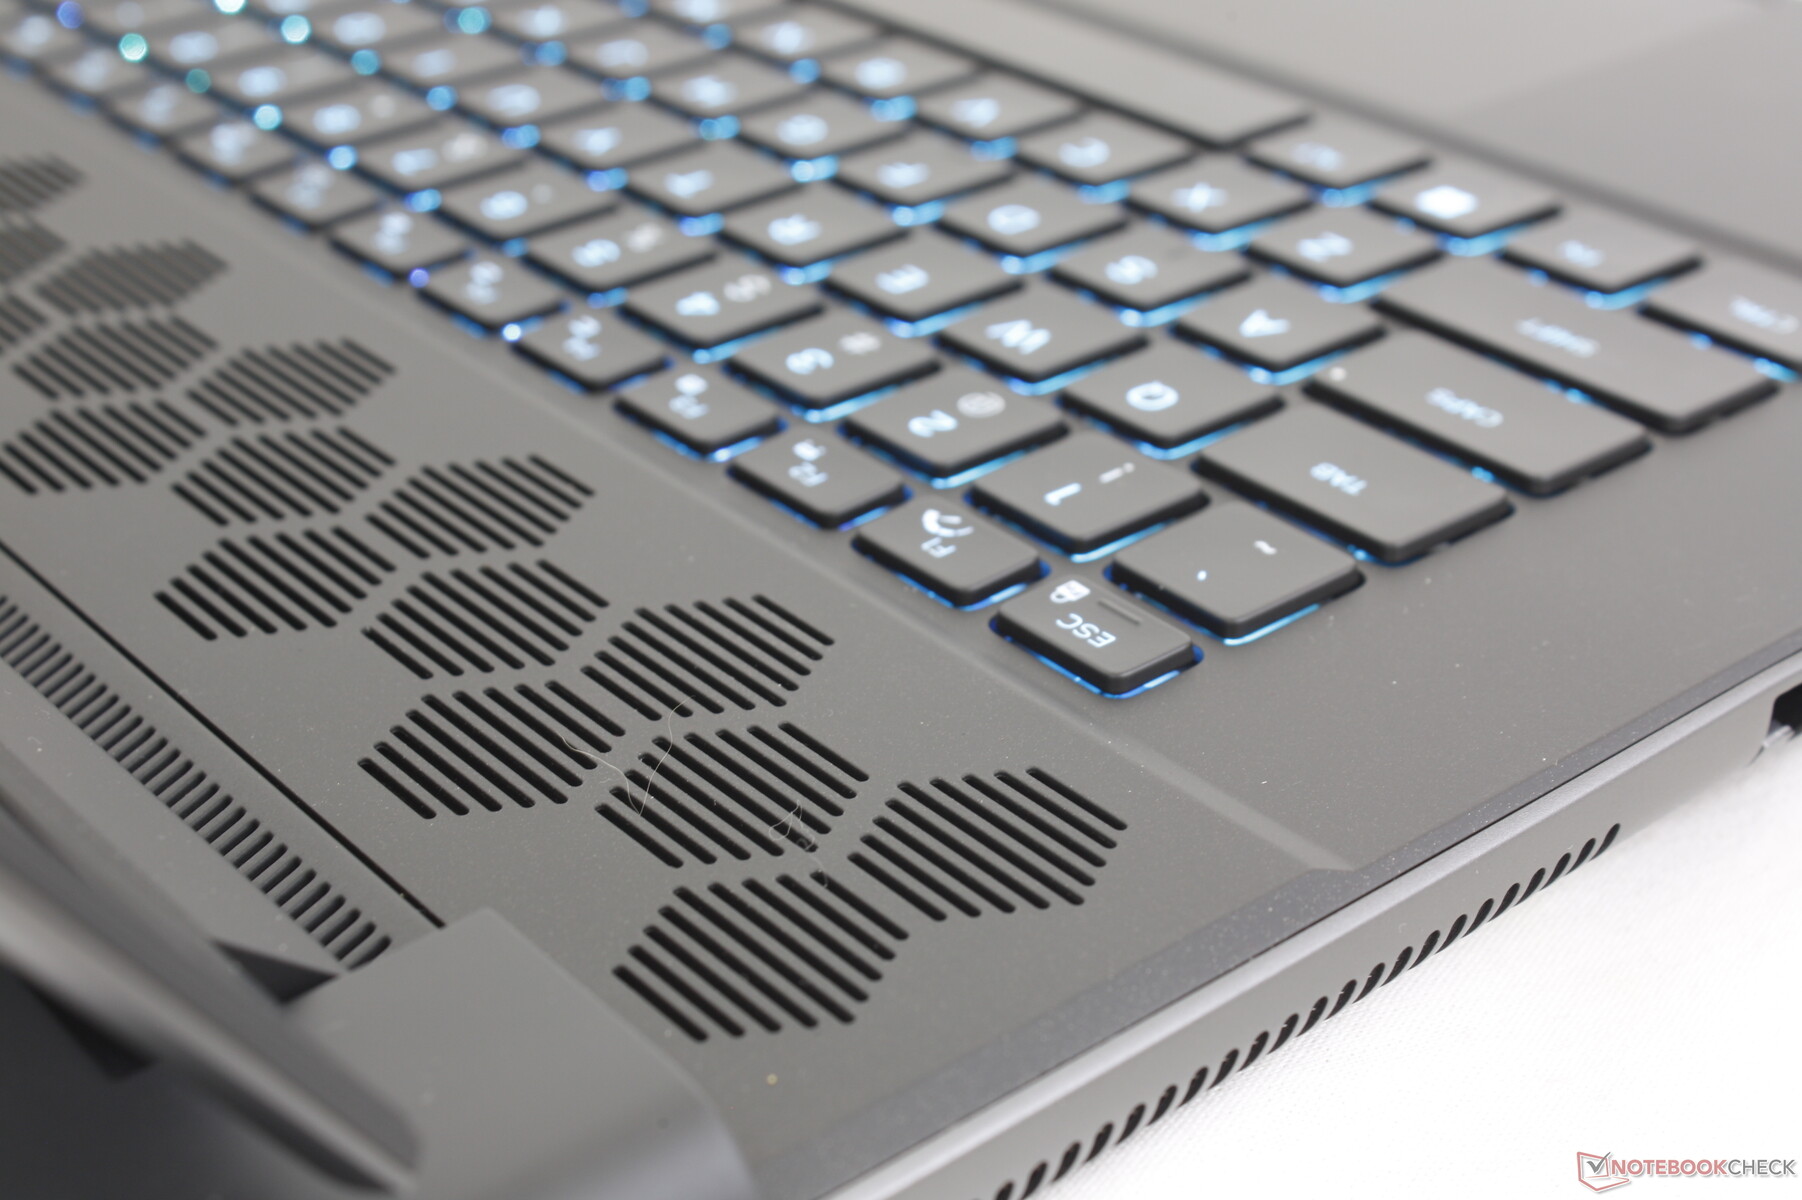
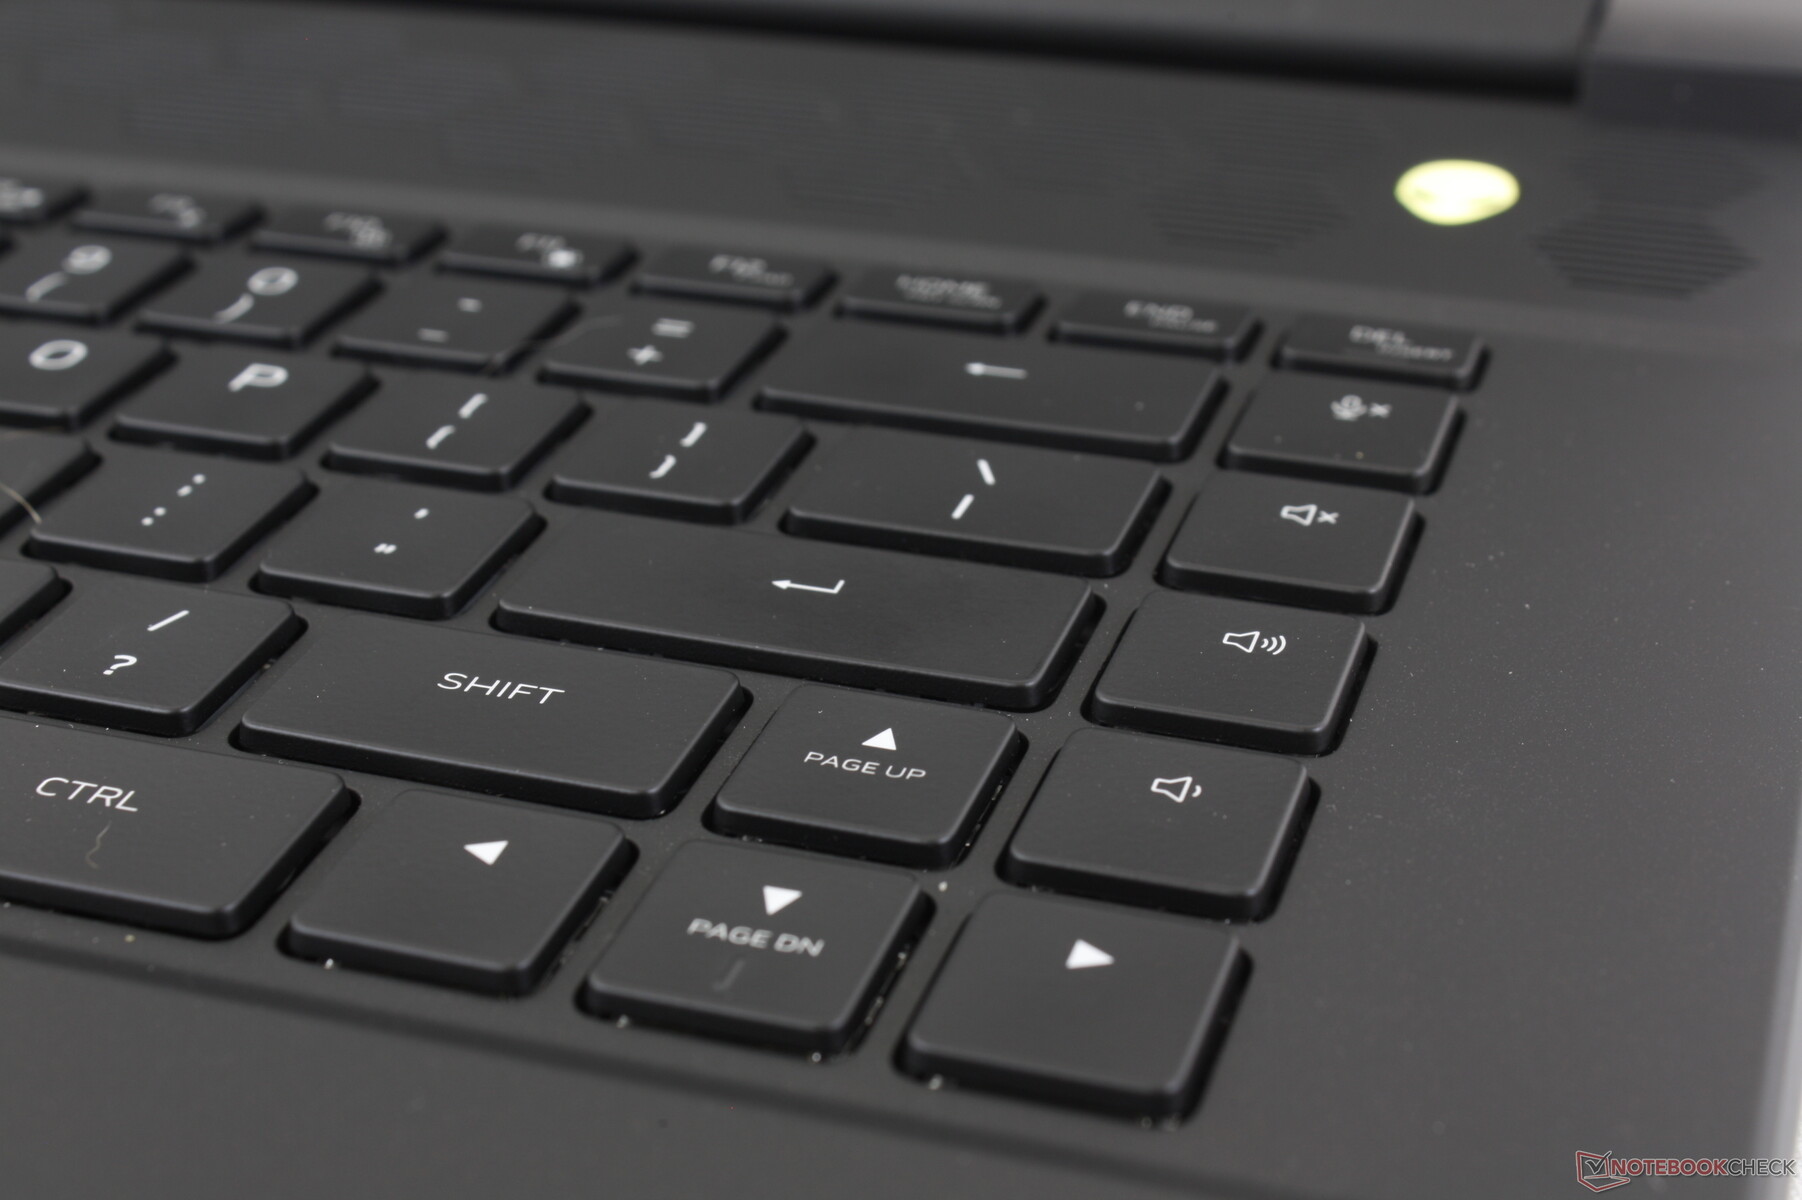
Klawiatura
Użytkownicy mogą skonfigurować standardową klawiaturę membranową lub ultra niskoprofilową klawiaturę mechaniczną CherryMX z podświetleniem RGB dla każdego klawisza. Klawiatura CherryMX została wprowadzona kilka lat temu w modelu Alienware x17 R1 i pozostaje jedną z naszych ulubionych klawiatur w każdym laptopie do gier ze względu na klikalne sprzężenie zwrotne i głęboki skok. Główną wadą jest oczywiście ostry i bardzo głośny stukot. W środowiskach wrażliwych na hałas, takich jak biblioteki, sale lekcyjne lub akademiki, warto rozważyć standardową opcję klawiatury.
Podświetlenie oświetla wszystkie klawisze i symbole, co nie było prawdą w starszych modelach w starszych modelach.
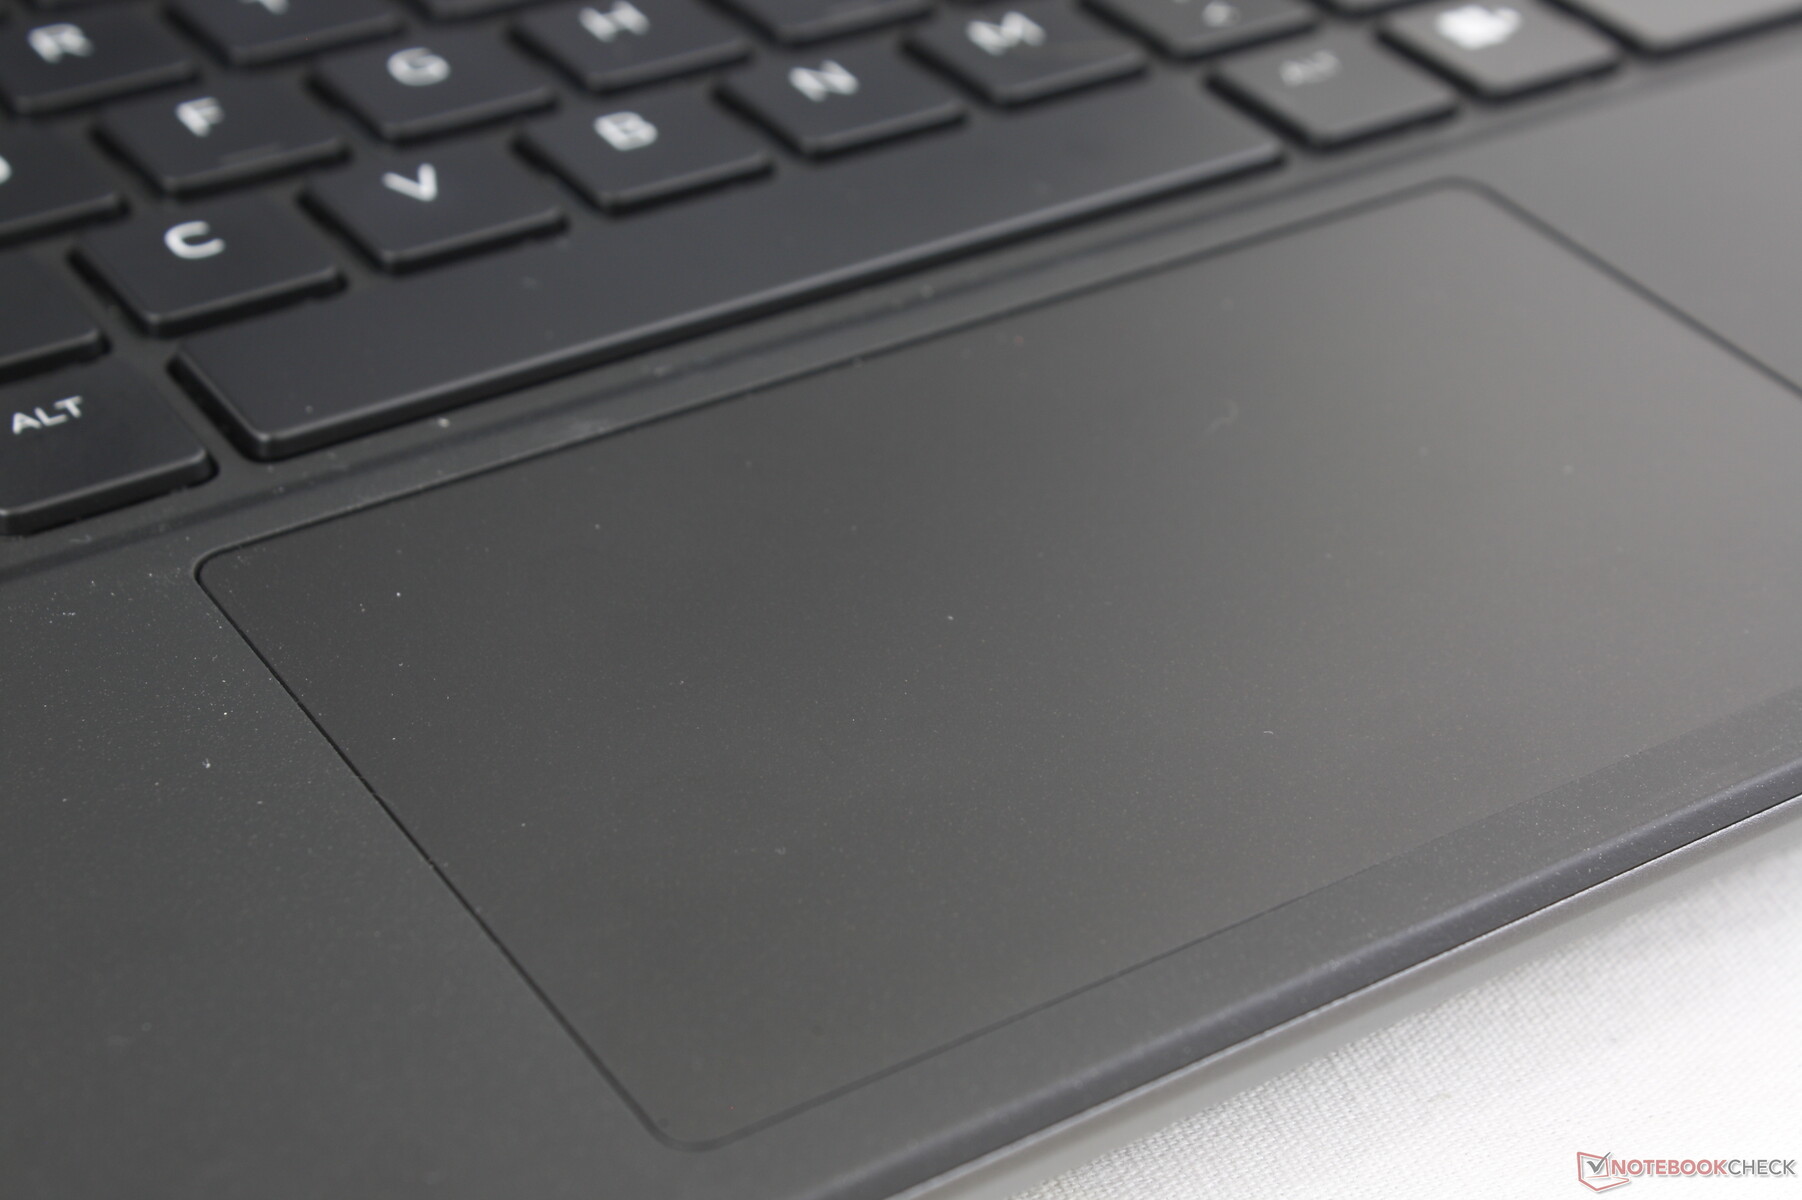
Touchpad
Klawiatura jest stosunkowo mała (11,3 x 6,6 cm), ponieważ znaczna część klawiatury jest zajęta przez duże kratki wentylacyjne. Klawiatury w HP Omen Transcend 16 i Razer Blade 16 są bardziej przestronne i mają odpowiednio 12,5 x 8 cm i 17 x 9,7 cm. Trakcja jest poza tym płynna, z mocnym i klikającym sprzężeniem zwrotnym po naciśnięciu, pomimo ciasnej powierzchni.

Wyświetlacz
Dostępne są trzy następujące opcje wyświetlania:
- 2560 x 1600, 165 Hz, 3 ms, IPS, 100% sRGB
- 2560 x 1600, 240 Hz, 3 ms, IPS, 100% DCI-P3
- 1920 x 1200, 480 Hz, 3 ms, IPS, 100% DCI-P3
Nasza jednostka została skonfigurowana z pogrubioną opcją powyżej, która naszym zdaniem jest najlepszym wyborem dla tego modelu, ponieważ oferuje pełne kolory P3, szybkie częstotliwości odświeżania i wysoką rozdzielczość w jednym. Opcja 1200p oferuje jeszcze szybsze częstotliwości odświeżania, ale korzyści stają się coraz bardziej marginalne po 240 Hz.
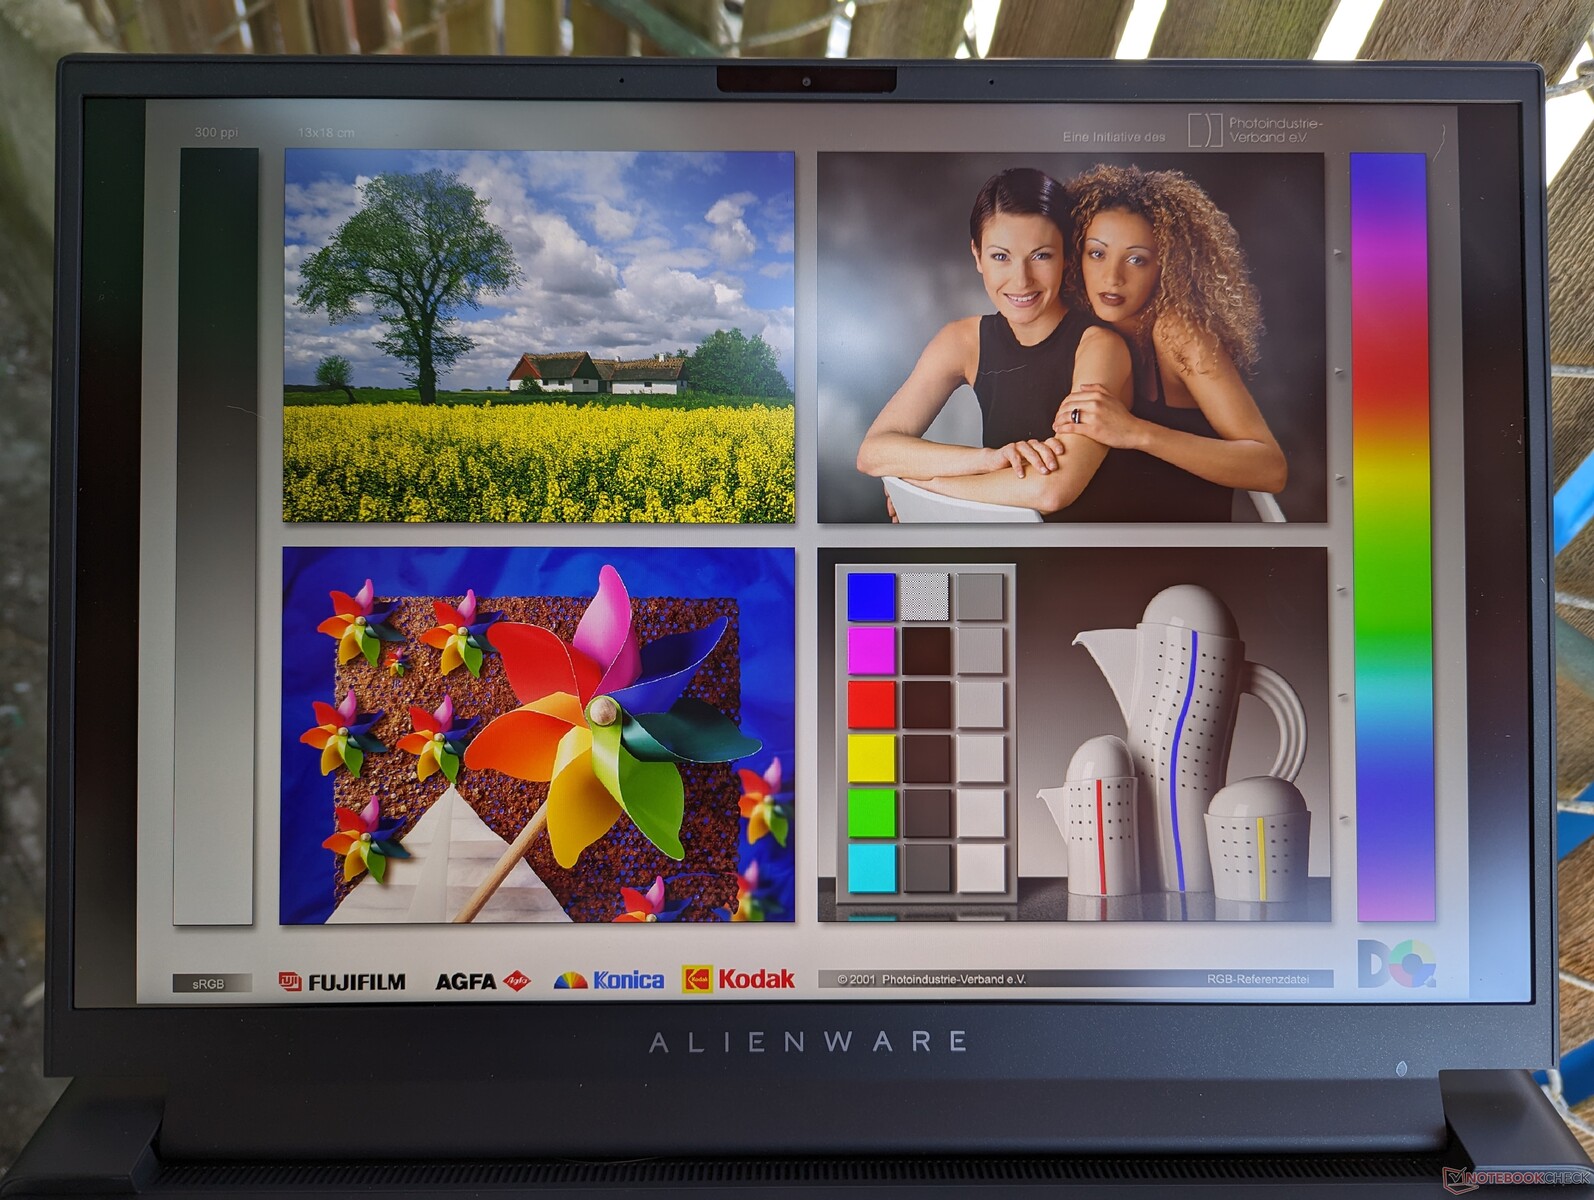
Alienware m16 R1 wykorzystuje ten sam panel BOE NE16NZ4, który można znaleźć wAlienware x16 R1 więc wrażenia z oglądania są zasadniczo identyczne między tymi dwoma modelami. Ten wysokiej klasy panel nadaje się zarówno do gier, jak i tworzenia treści z szerszymi kolorami niż panel MNG007DA2-3 w Legion Pro 7. Jednak wyświetlacze w Razer Blade 16 Early 2023 lub oparte na Mini-LED HP Omen Transcend 16 są zauważalnie jaśniejsze, co może się przydać w przypadku treści HDR.


| |||||||||||||||||||||||||
rozświetlenie: 89 %
na akumulatorze: 329 cd/m²
kontrast: 1028:1 (czerń: 0.32 cd/m²)
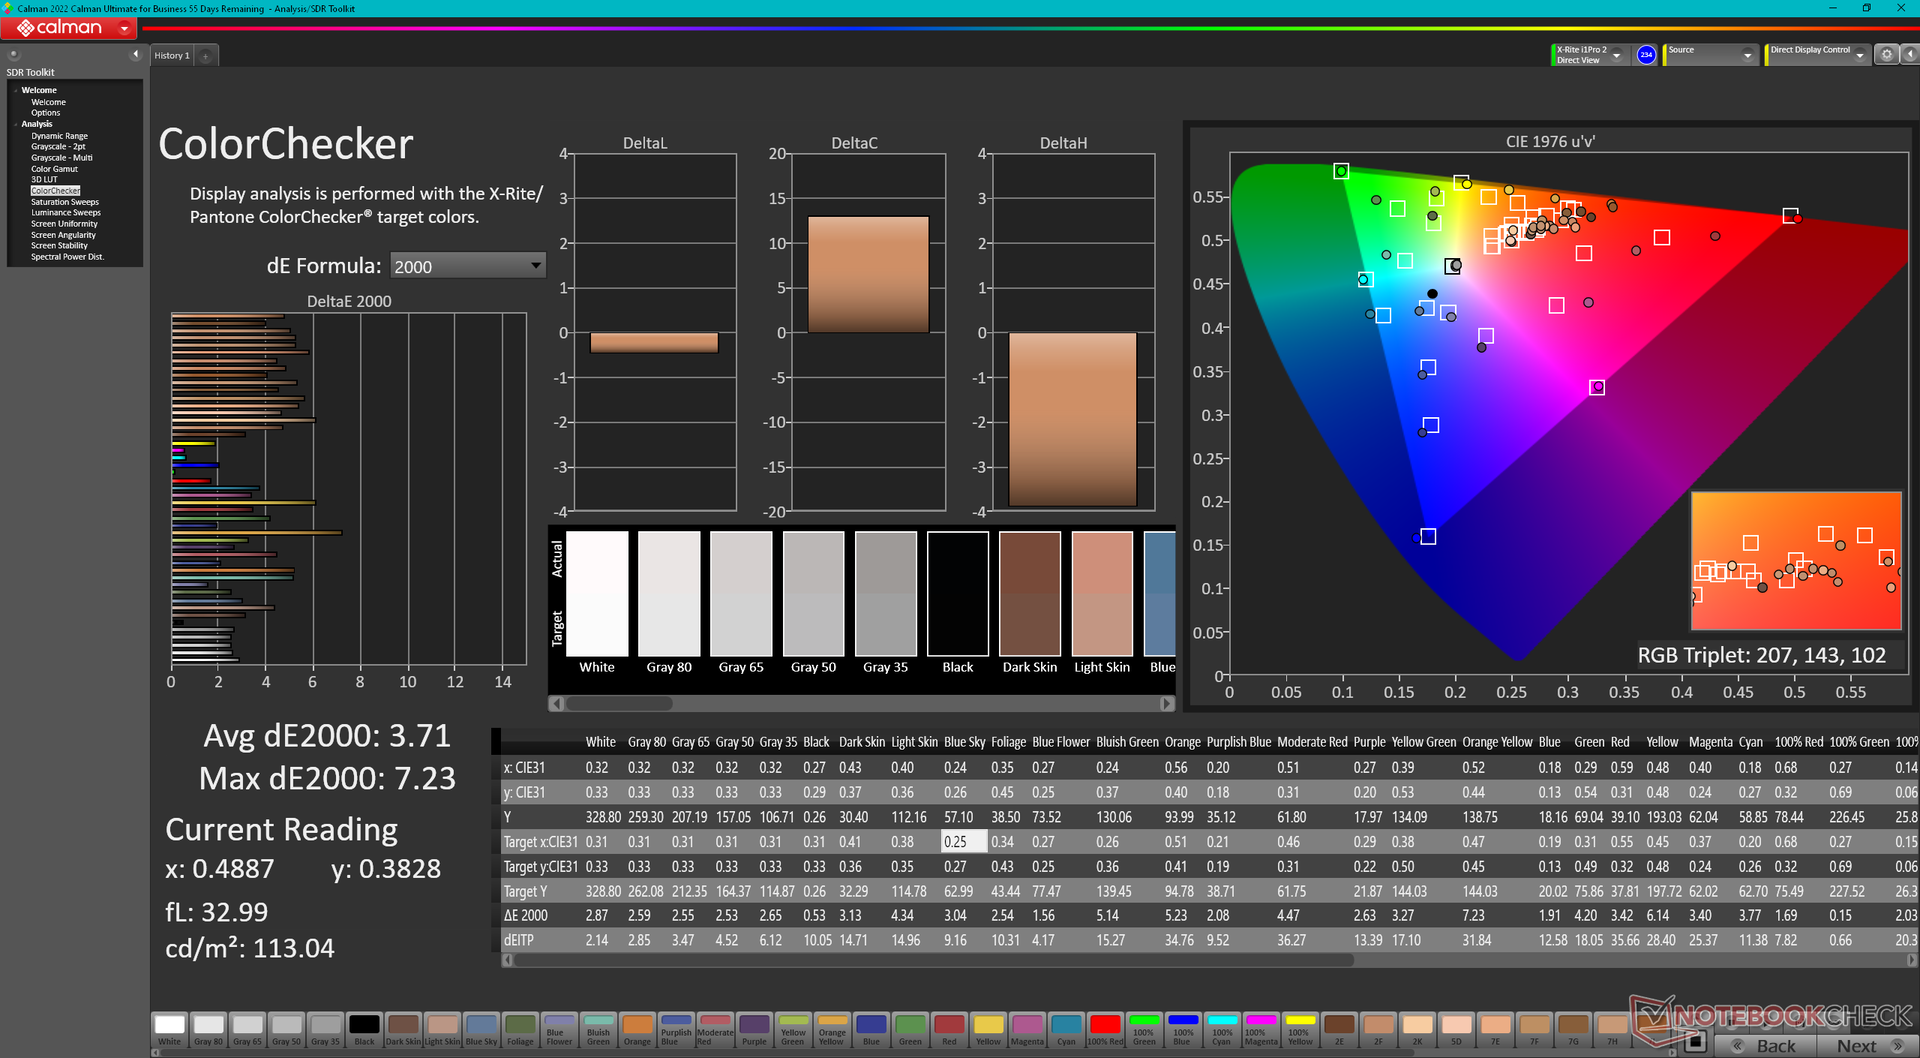
ΔE ColorChecker Calman: 3.71 | ∀{0.5-29.43 Ø4.72}
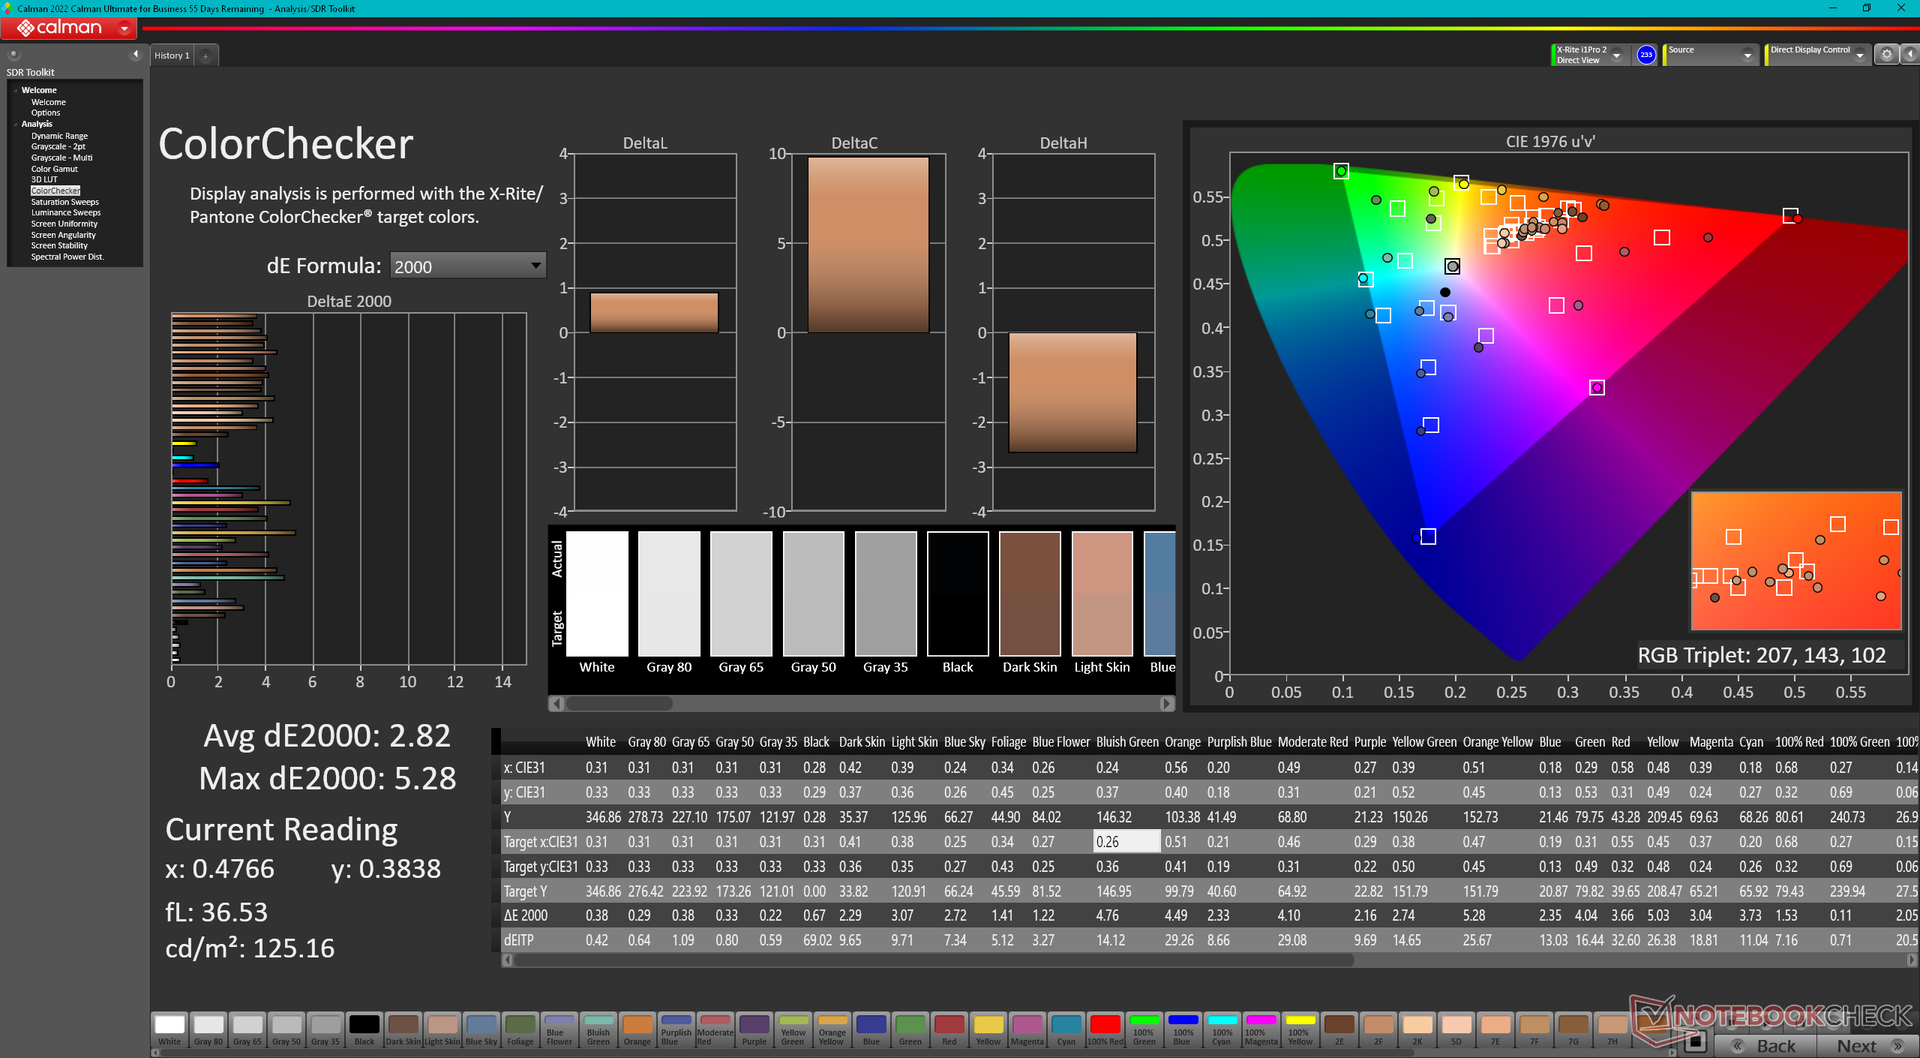
calibrated: 2.82
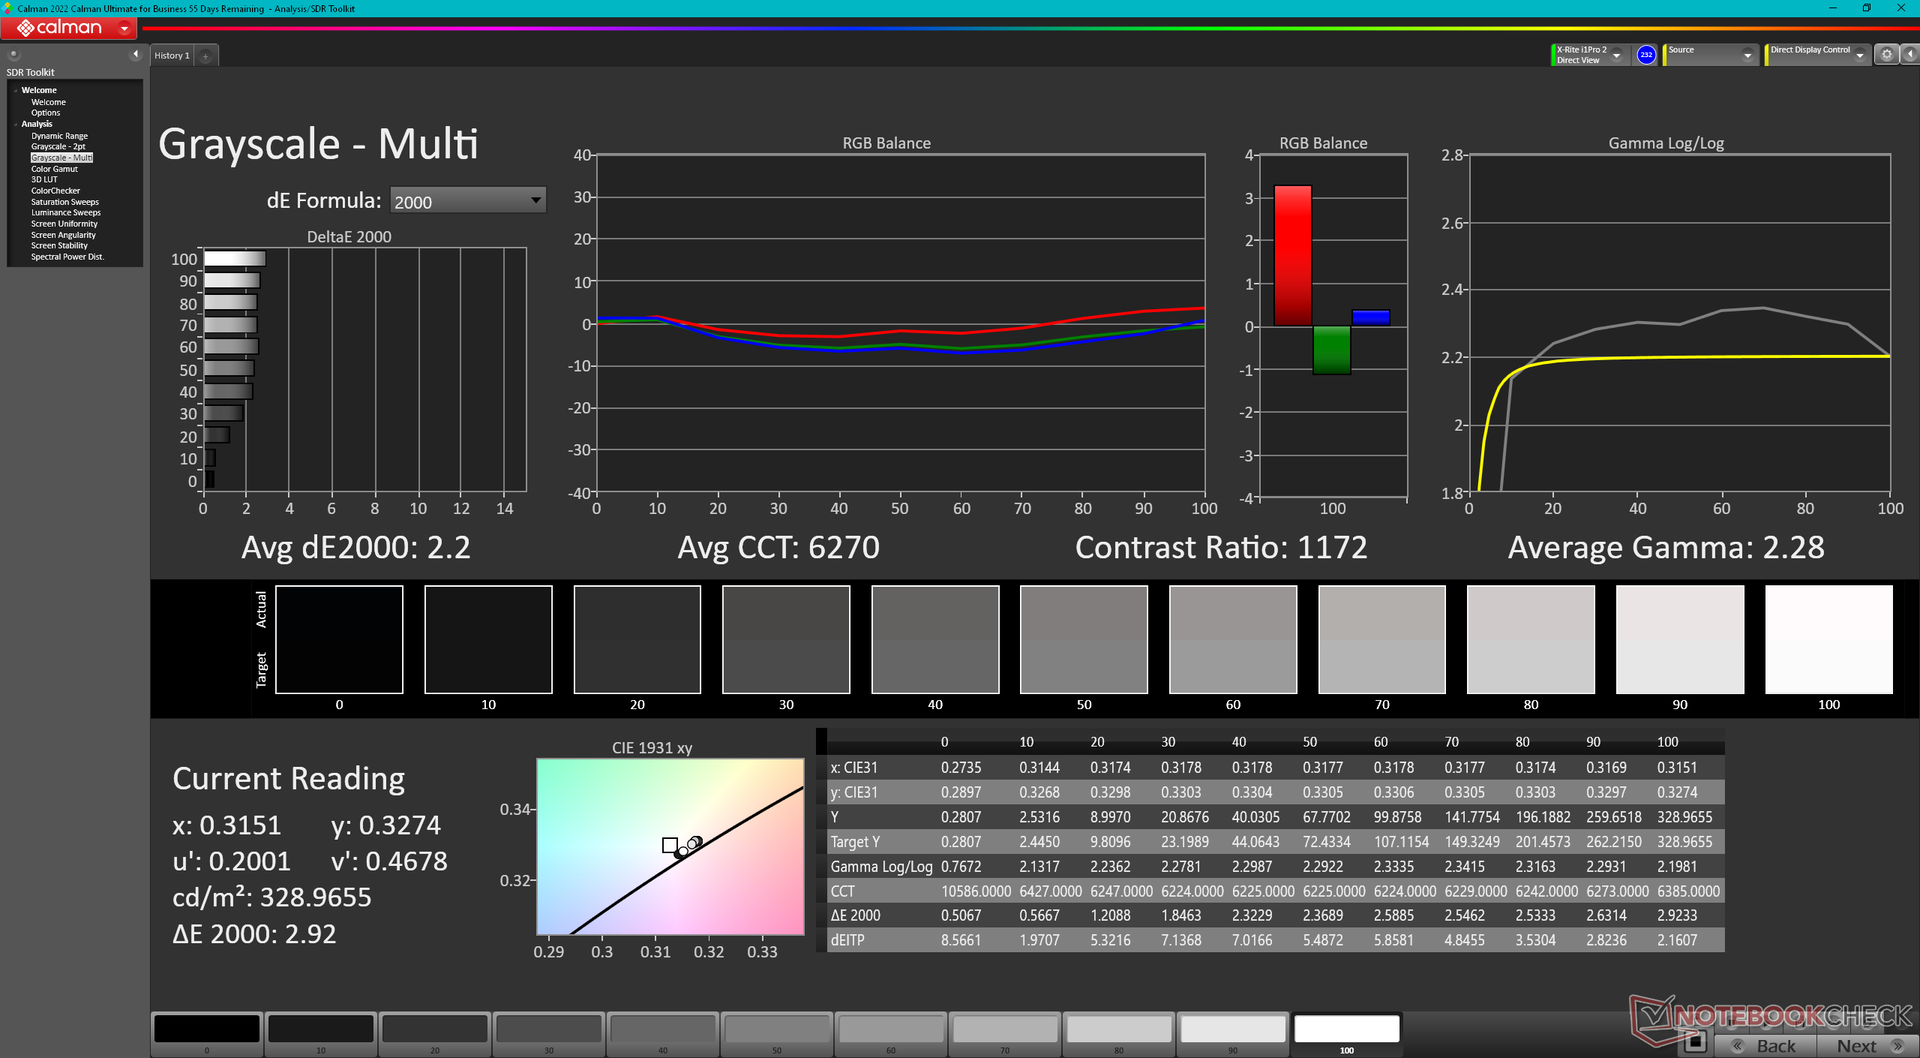
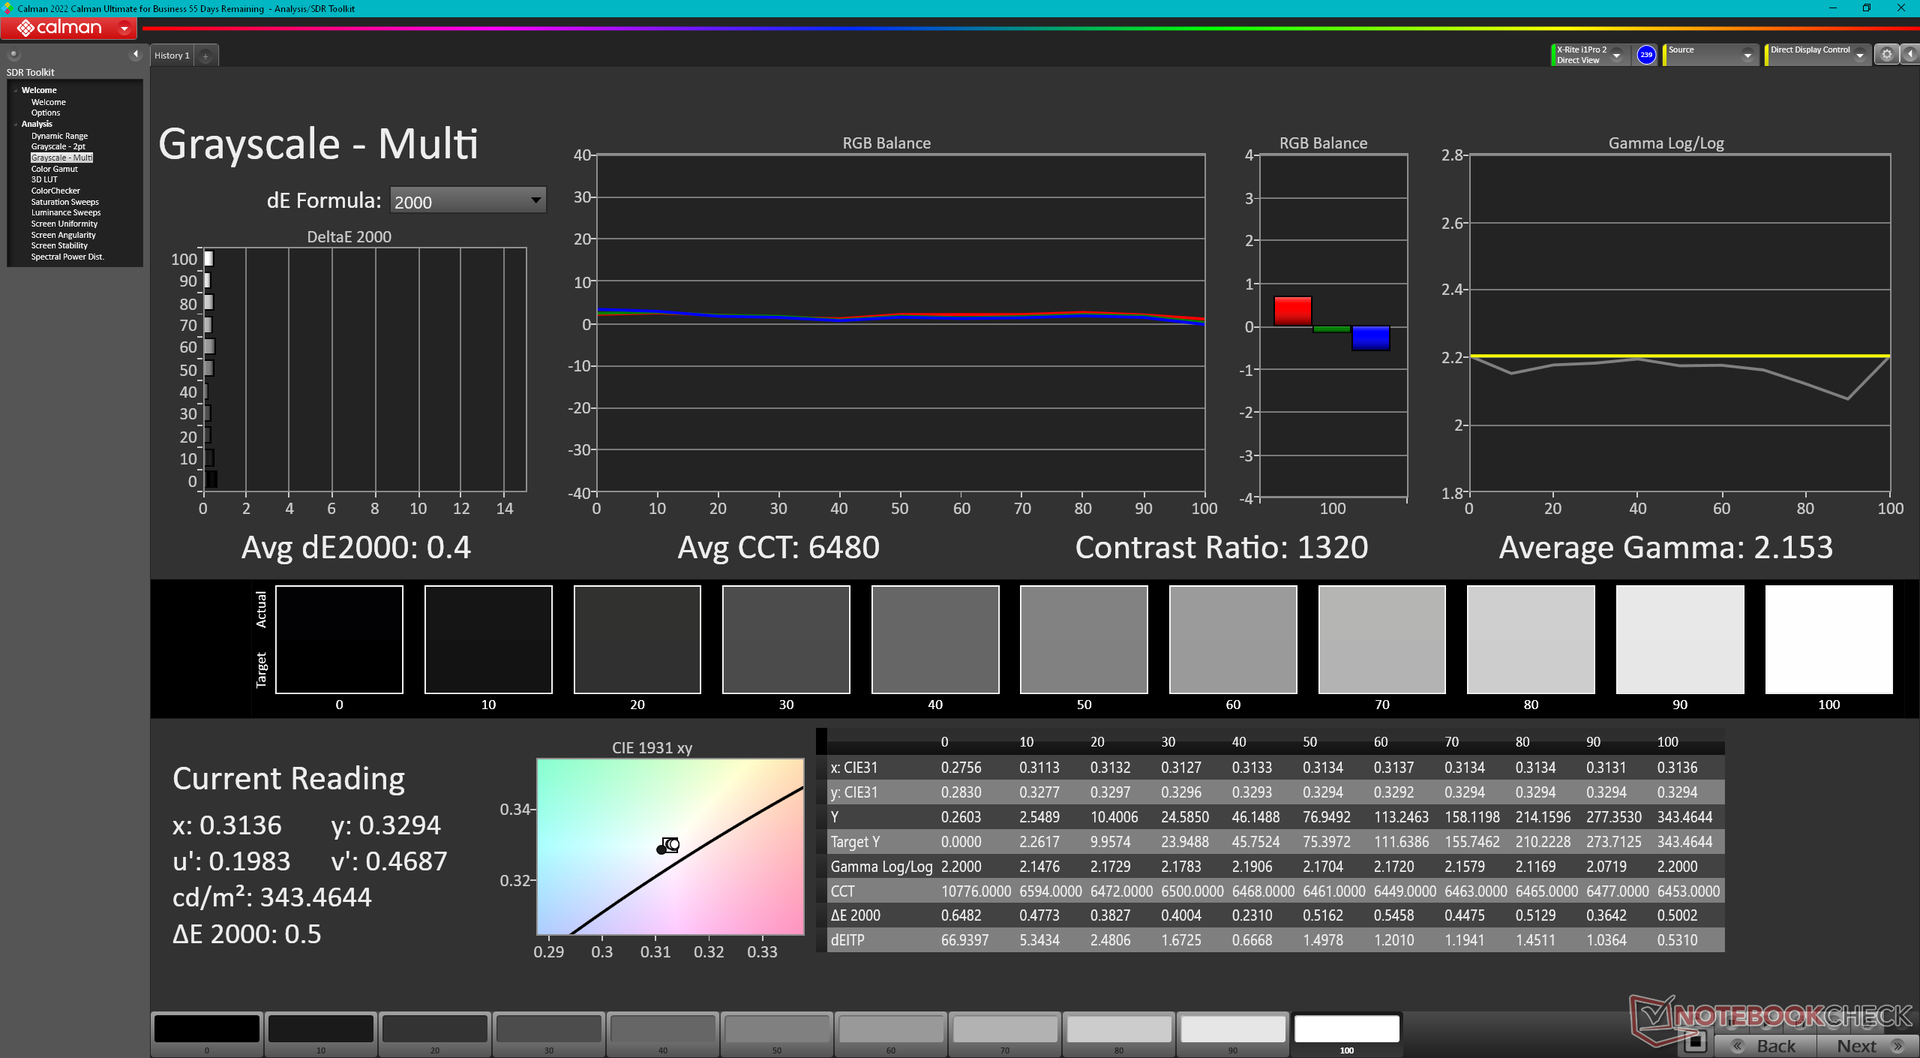
ΔE Greyscale Calman: 2.2 | ∀{0.09-98 Ø4.97}
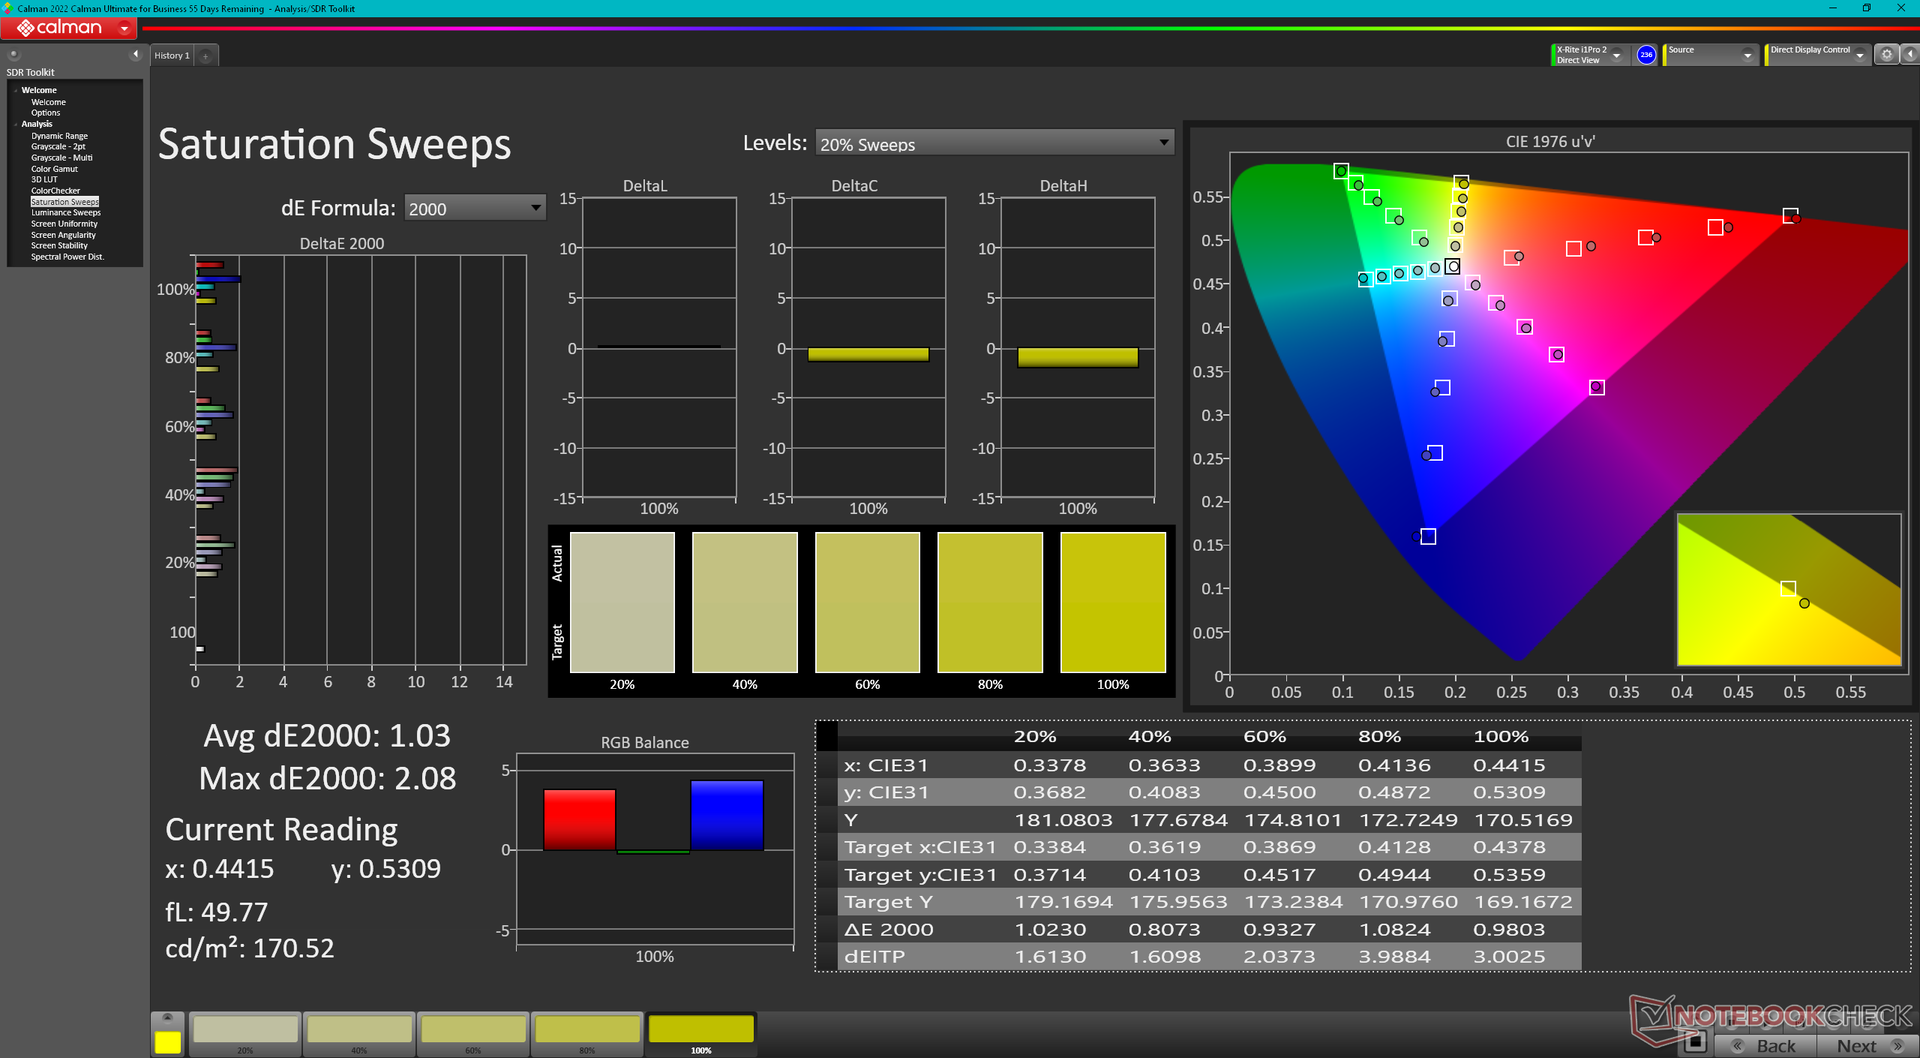
88.9% AdobeRGB 1998 (Argyll 3D)
99.9% sRGB (Argyll 3D)
98.6% Display P3 (Argyll 3D)
Gamma: 2.3
CCT: 6270 K
| Alienware m16 R1 AMD BOE NE16NZ4, IPS, 2560x1600, 16" | Alienware x16 R1 BOE NE16NZ4, IPS, 2560x1600, 16" | HP Omen Transcend 16 AUOA3A6, Mini-LED, 2560x1600, 16" | Lenovo Legion Pro 7 RTX4090 MNG007DA2-3 (CSO1628), IPS, 2560x1600, 16" | Asus ROG Strix G16 G614JZ TL160ADMP03-0, IPS, 2560x1600, 16" | Razer Blade 16 Early 2023 CSOT T3 MNG007DA4-1, IPS, 2560x1600, 16" | |
|---|---|---|---|---|---|---|
| Display | 0% | 0% | -16% | -2% | 0% | |
| Display P3 Coverage (%) | 98.6 | 99.2 1% | 99.2 1% | 69.5 -30% | 97 -2% | 98.5 0% |
| sRGB Coverage (%) | 99.9 | 100 0% | 100 0% | 99.8 0% | 99.9 0% | 100 0% |
| AdobeRGB 1998 Coverage (%) | 88.9 | 88.6 0% | 87.6 -1% | 71.6 -19% | 84.9 -4% | 89.7 1% |
| Response Times | -7% | -316% | -33% | 14% | -31% | |
| Response Time Grey 50% / Grey 80% * (ms) | 5.1 ? | 5.1 ? -0% | 26.4 ? -418% | 10.9 ? -114% | 5.1 ? -0% | 6.6 ? -29% |
| Response Time Black / White * (ms) | 9 ? | 10.3 ? -14% | 28.2 ? -213% | 4.6 ? 49% | 6.6 ? 27% | 12 ? -33% |
| PWM Frequency (Hz) | 3506 ? | |||||
| Screen | 18% | 224% | 23% | 23% | 18% | |
| Brightness middle (cd/m²) | 329 | 302.2 -8% | 791.1 140% | 491 49% | 470 43% | 456.8 39% |
| Brightness (cd/m²) | 317 | 285 -10% | 800 152% | 472 49% | 459 45% | 437 38% |
| Brightness Distribution (%) | 89 | 89 0% | 95 7% | 91 2% | 93 4% | 83 -7% |
| Black Level * (cd/m²) | 0.32 | 0.26 19% | 0.04 87% | 0.4 -25% | 0.42 -31% | 0.35 -9% |
| Contrast (:1) | 1028 | 1162 13% | 19778 1824% | 1228 19% | 1119 9% | 1305 27% |
| Colorchecker dE 2000 * | 3.71 | 1.63 56% | 4.37 -18% | 1.6 57% | 1.86 50% | 3.7 -0% |
| Colorchecker dE 2000 max. * | 7.23 | 4.13 43% | 10.39 -44% | 5.15 29% | 3.87 46% | 6.42 11% |
| Colorchecker dE 2000 calibrated * | 2.82 | 1.17 59% | 1.04 63% | 0.97 66% | 0.93 67% | 0.66 77% |
| Greyscale dE 2000 * | 2.2 | 2.5 -14% | 6.5 -195% | 3 -36% | 2.7 -23% | 2.6 -18% |
| Gamma | 2.3 96% | 2.23 99% | 2.28 96% | 2.211 100% | 2.246 98% | 2.3 96% |
| CCT | 6270 104% | 6590 99% | 6000 108% | 6979 93% | 6711 97% | 6108 106% |
| Całkowita średnia (program / ustawienia) | 4% /
10% | -31% /
99% | -9% /
7% | 12% /
17% | -4% /
7% |
* ... im mniej tym lepiej
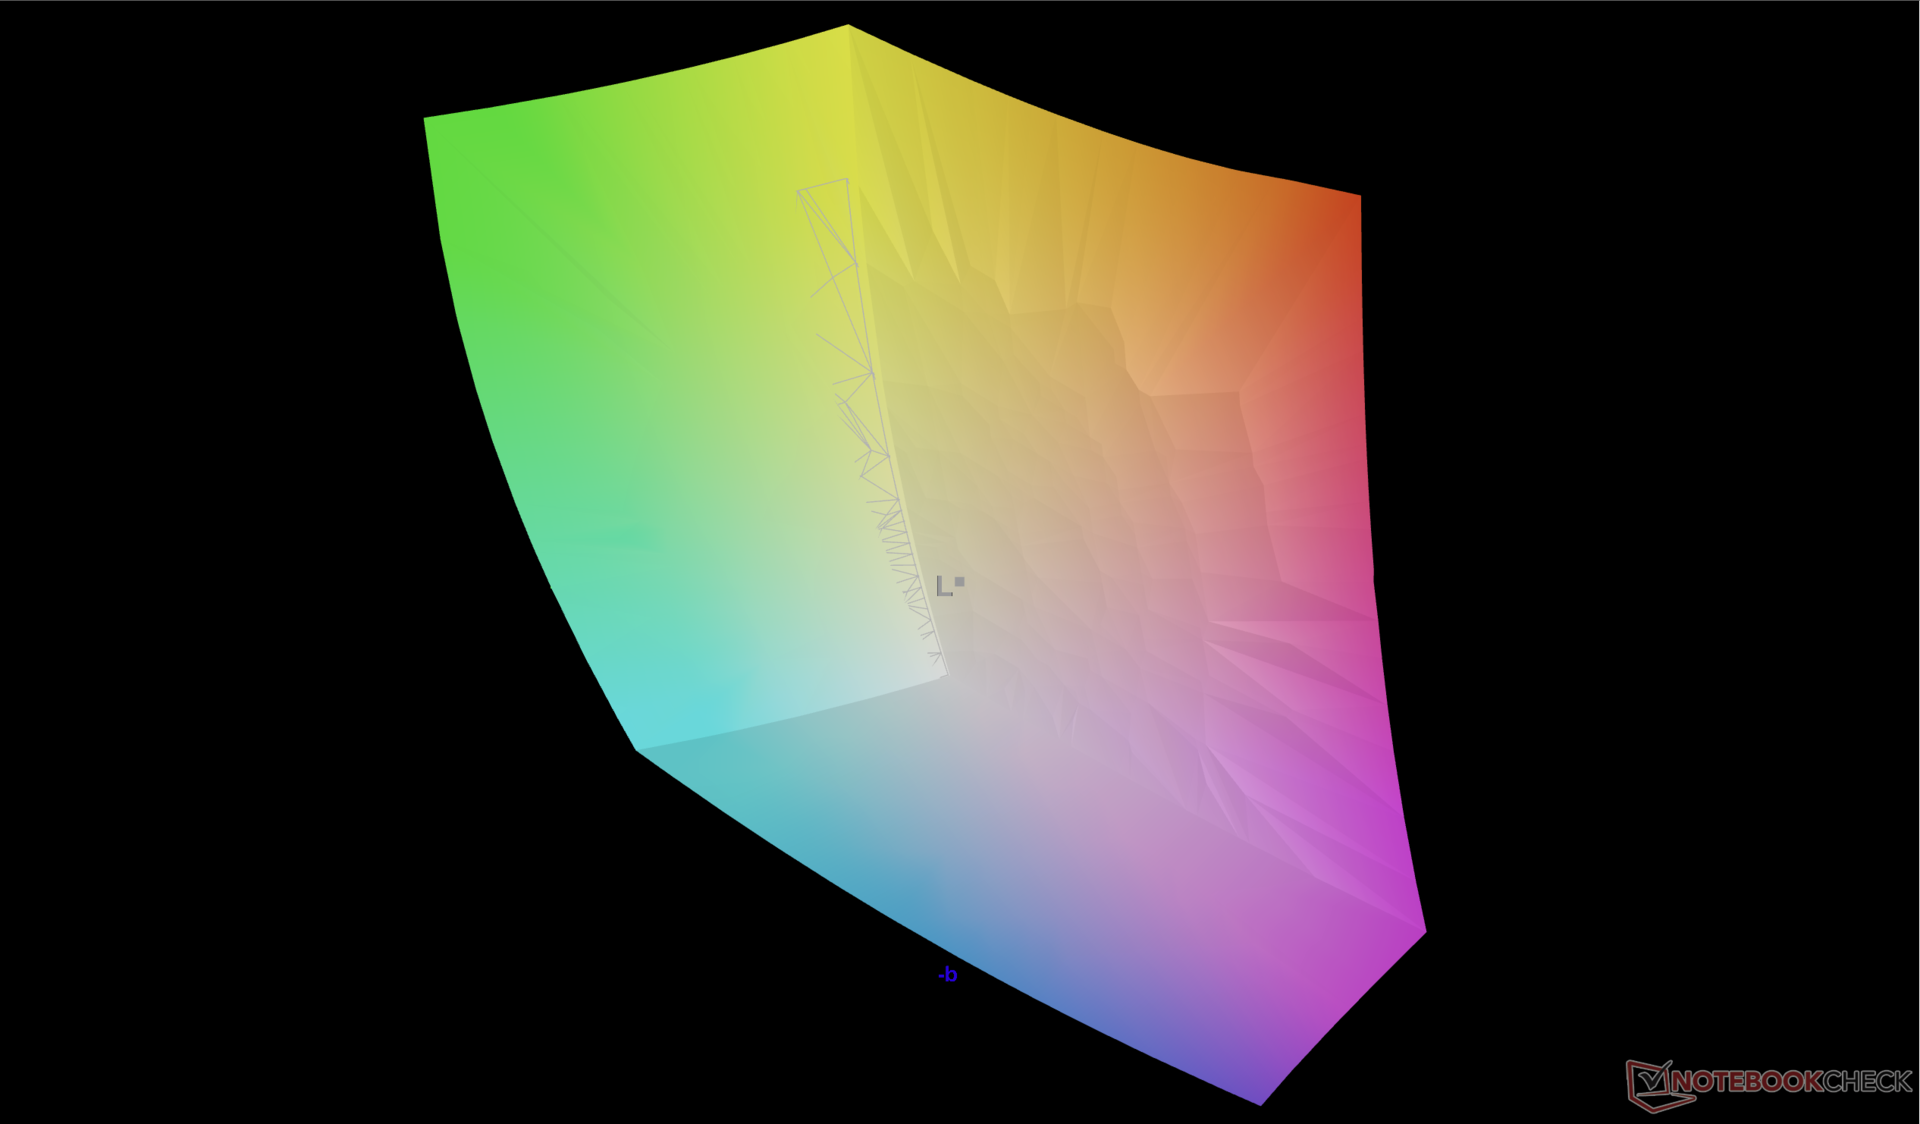
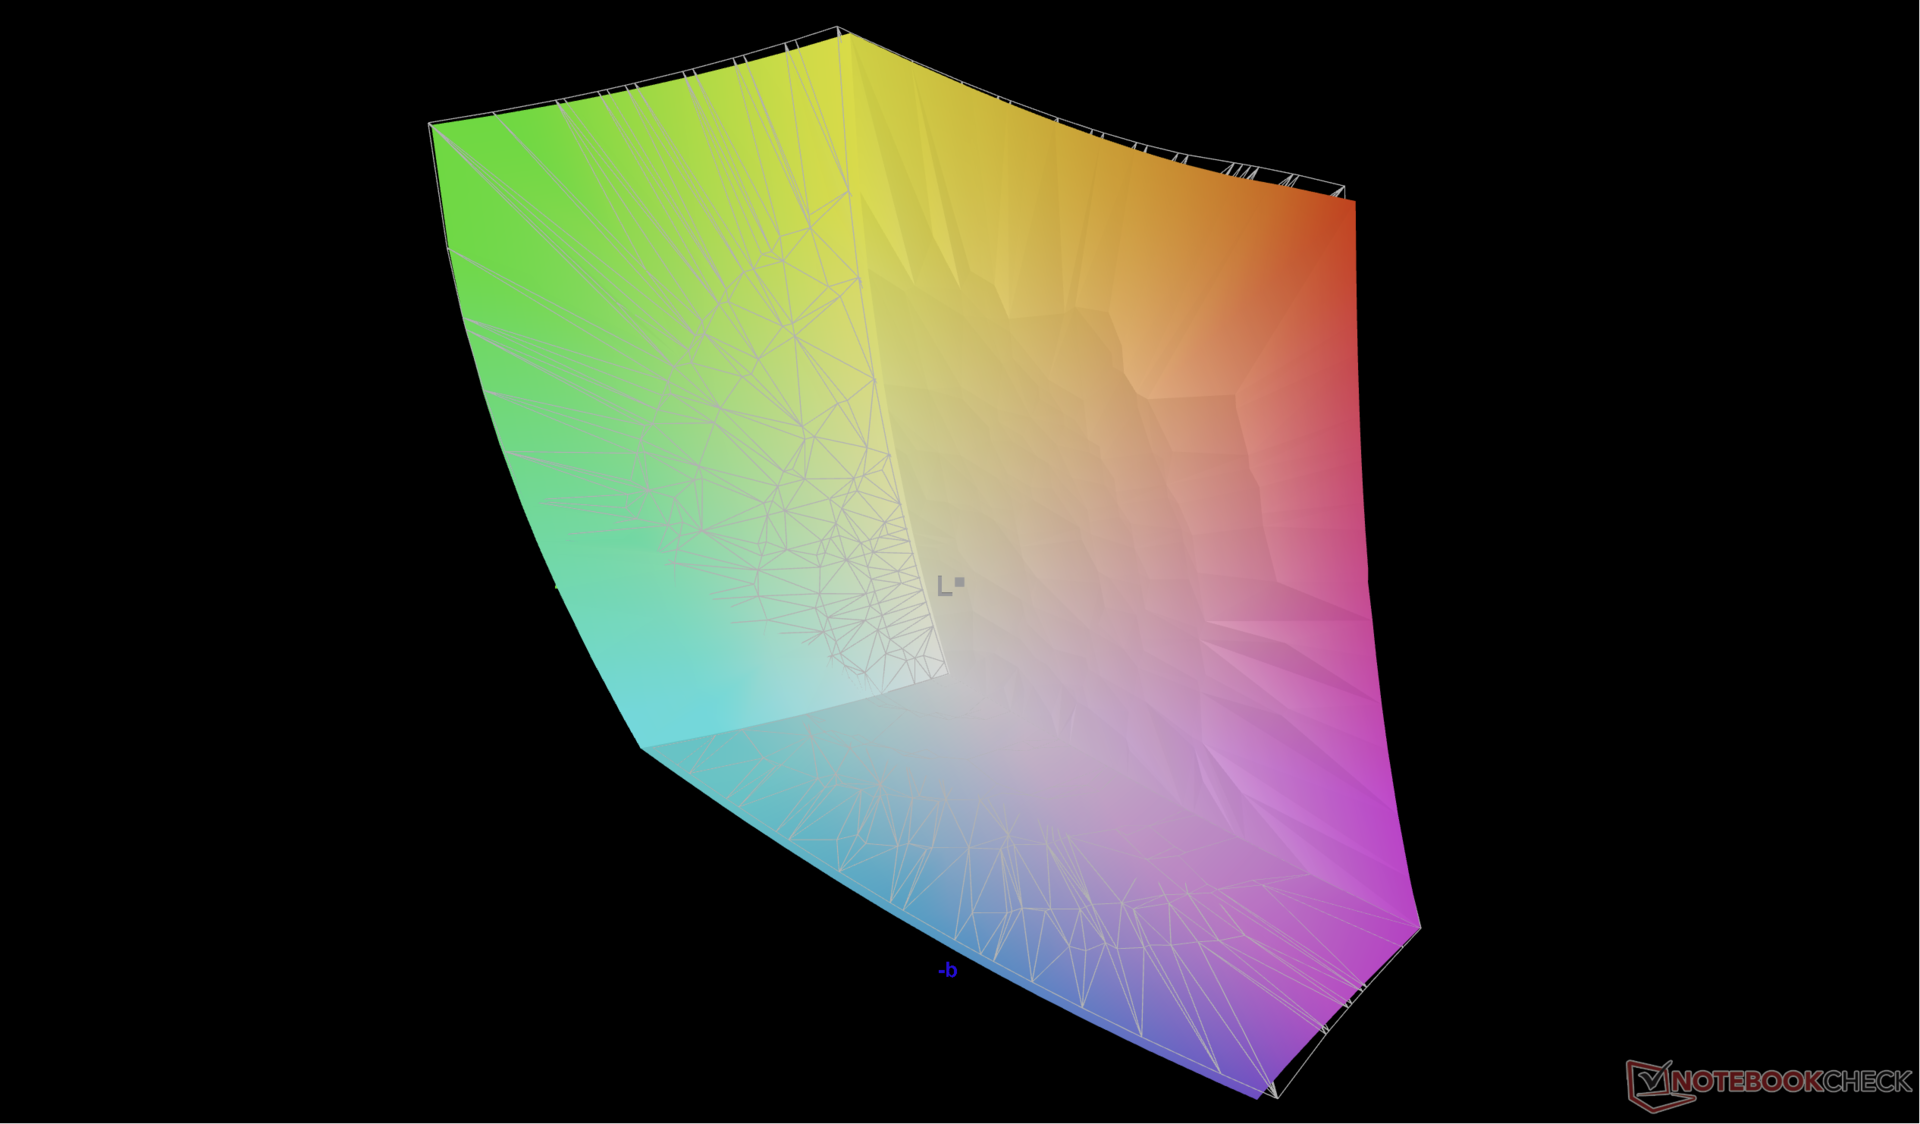
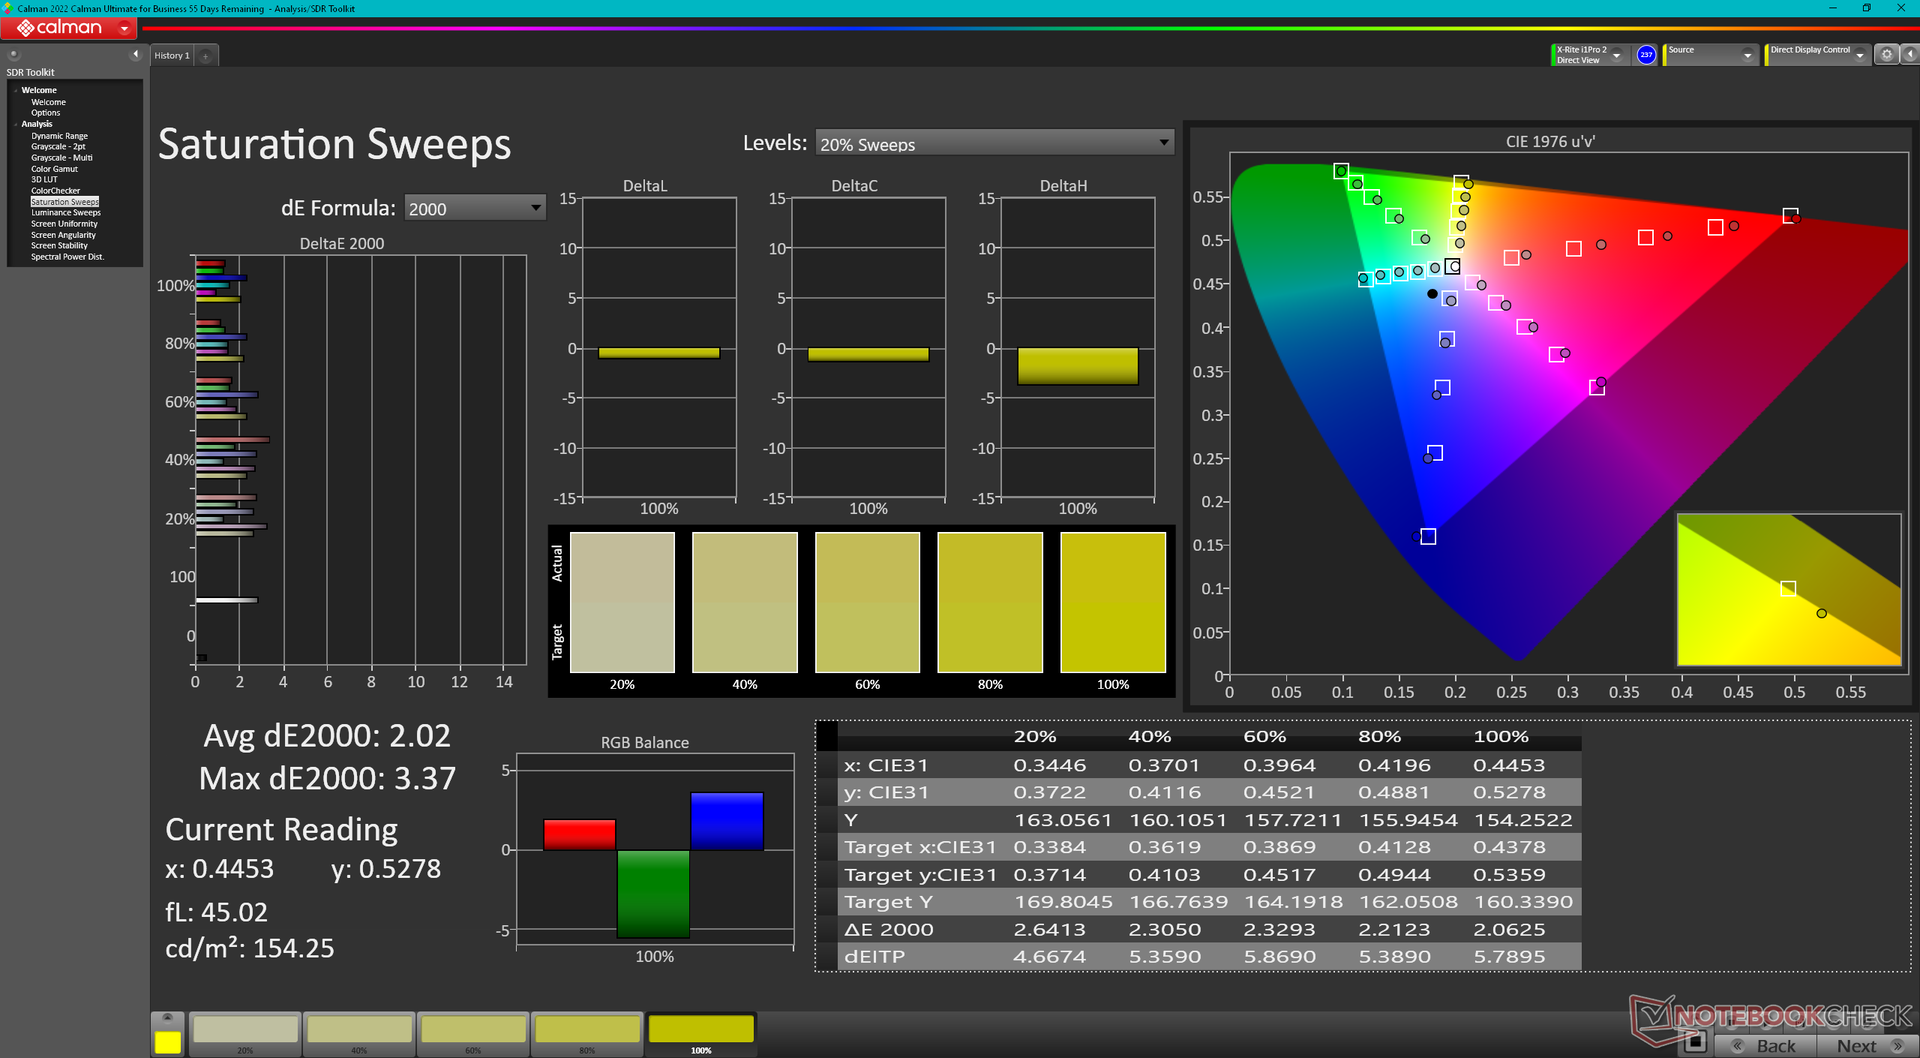
Wyświetlacz jest przyzwoicie skalibrowany po wyjęciu z pudełka względem standardu P3 ze średnimi wartościami DeltaE skali szarości i kolorów wynoszącymi odpowiednio tylko 2,2 i 3,71. Samodzielna kalibracja wyświetlacza za pomocą kolorymetru X-Rite pozwoliłaby jeszcze bardziej poprawić skalę szarości do średniej deltaE wynoszącej zaledwie 0,4, zapewniając ogólnie dokładniejsze kolory. Nasz skalibrowany profil ICM jest dostępny do pobrania powyżej za darmo.
Wyświetl czasy reakcji
| ↔ Czas reakcji od czerni do bieli | ||
|---|---|---|
| 9 ms ... wzrost ↗ i spadek ↘ łącznie | ↗ 4.8 ms wzrost | 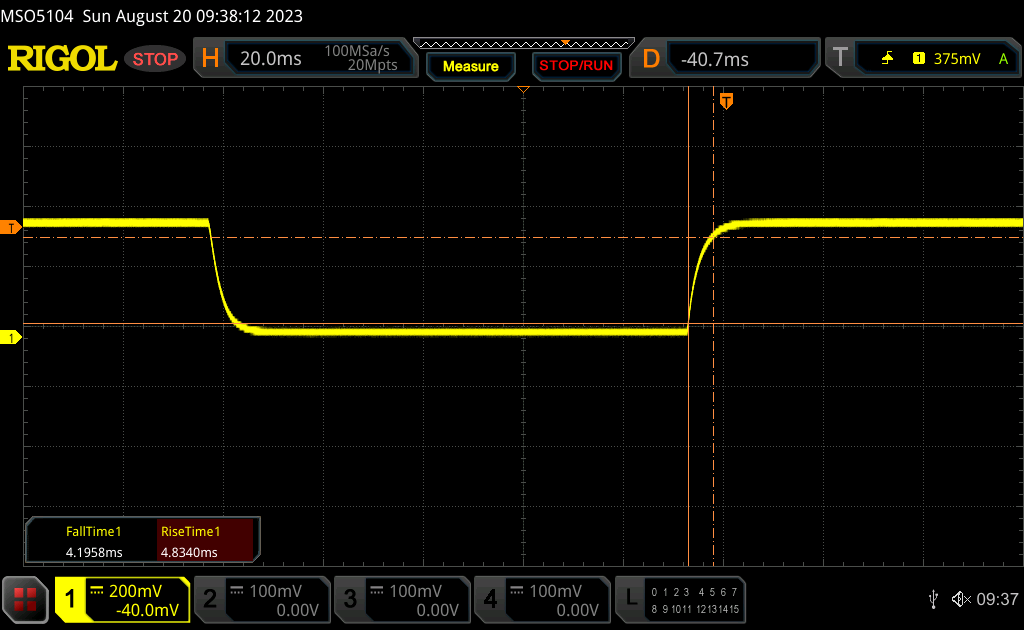 |
| ↘ 4.2 ms upadek | ||
| W naszych testach ekran wykazuje szybki czas reakcji i powinien nadawać się do gier. Dla porównania, wszystkie testowane urządzenia wahają się od 0.1 (minimum) do 240 (maksimum) ms. » 25 % wszystkich urządzeń jest lepszych. Oznacza to, że zmierzony czas reakcji jest lepszy od średniej wszystkich testowanych urządzeń (19.8 ms). | ||
| ↔ Czas reakcji 50% szarości do 80% szarości | ||
| 5.1 ms ... wzrost ↗ i spadek ↘ łącznie | ↗ 2.5 ms wzrost | 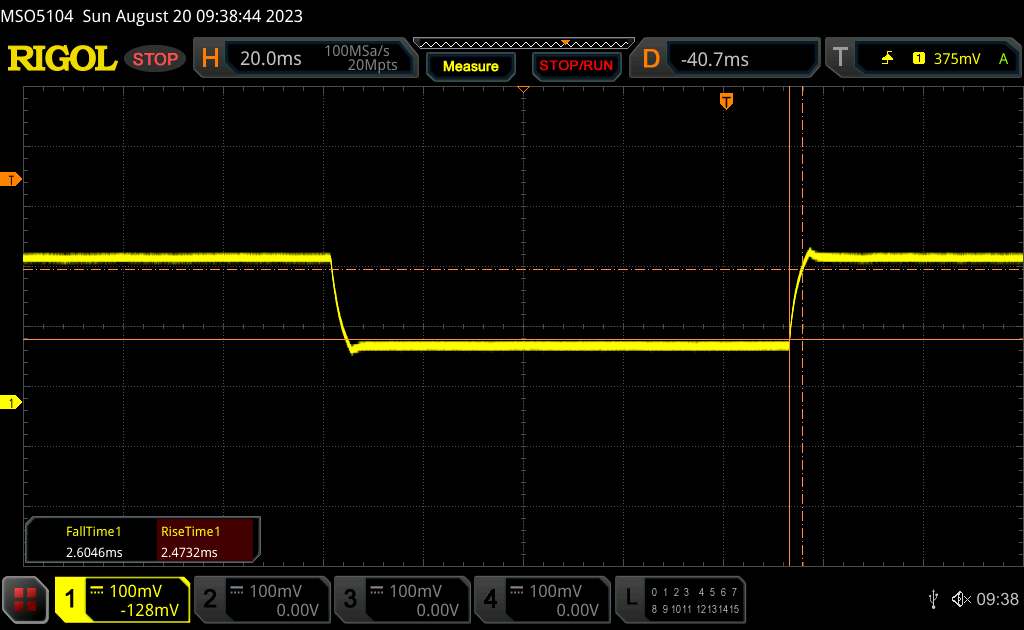 |
| ↘ 2.6 ms upadek | ||
| W naszych testach ekran wykazuje bardzo szybką reakcję i powinien bardzo dobrze nadawać się do szybkich gier. Dla porównania, wszystkie testowane urządzenia wahają się od 0.165 (minimum) do 636 (maksimum) ms. » 17 % wszystkich urządzeń jest lepszych. Oznacza to, że zmierzony czas reakcji jest lepszy od średniej wszystkich testowanych urządzeń (31 ms). | ||
Migotanie ekranu / PWM (modulacja szerokości impulsu)
| Migotanie ekranu/nie wykryto PWM | 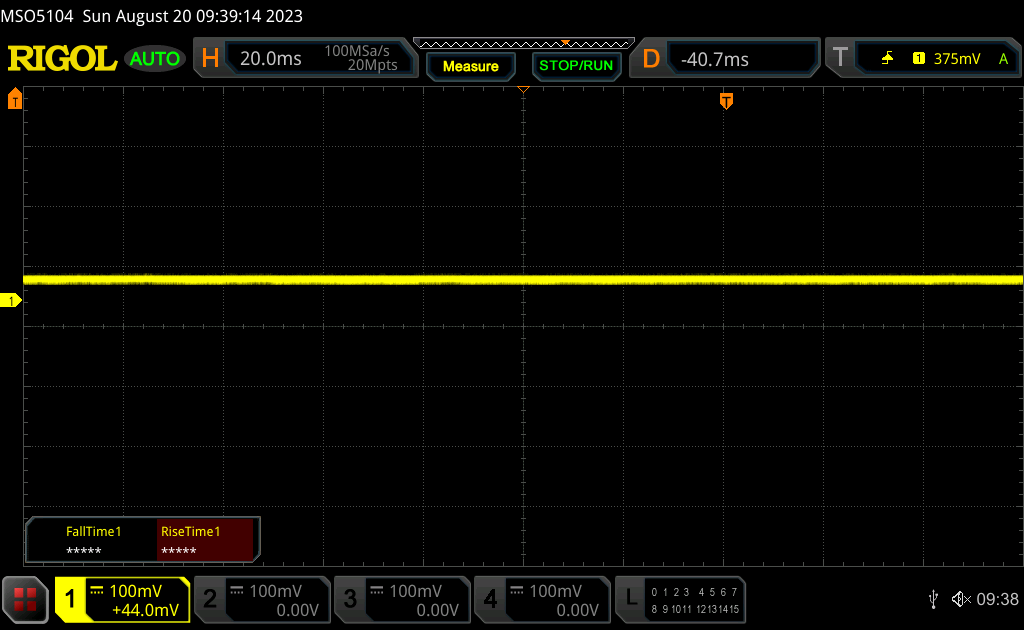 | ||
Dla porównania: 52 % wszystkich testowanych urządzeń nie używa PWM do przyciemniania wyświetlacza. Jeśli wykryto PWM, zmierzono średnio 7778 (minimum: 5 - maksimum: 343500) Hz. | |||
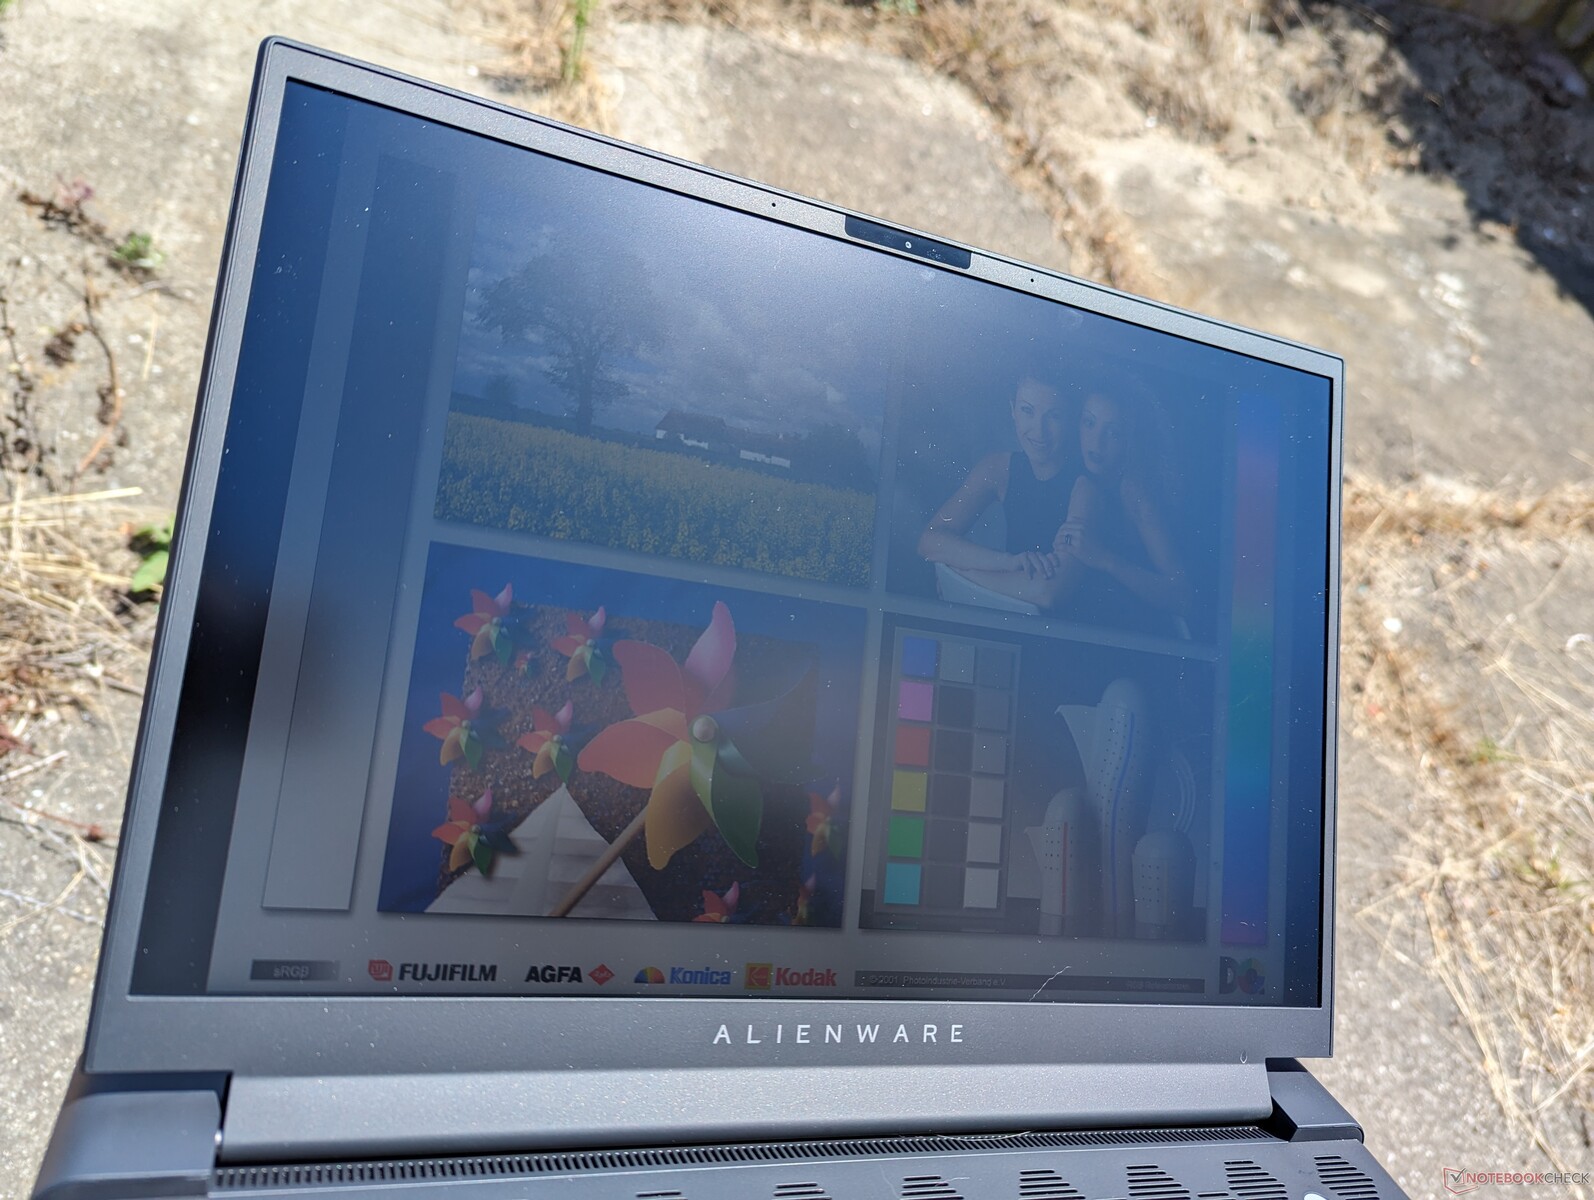
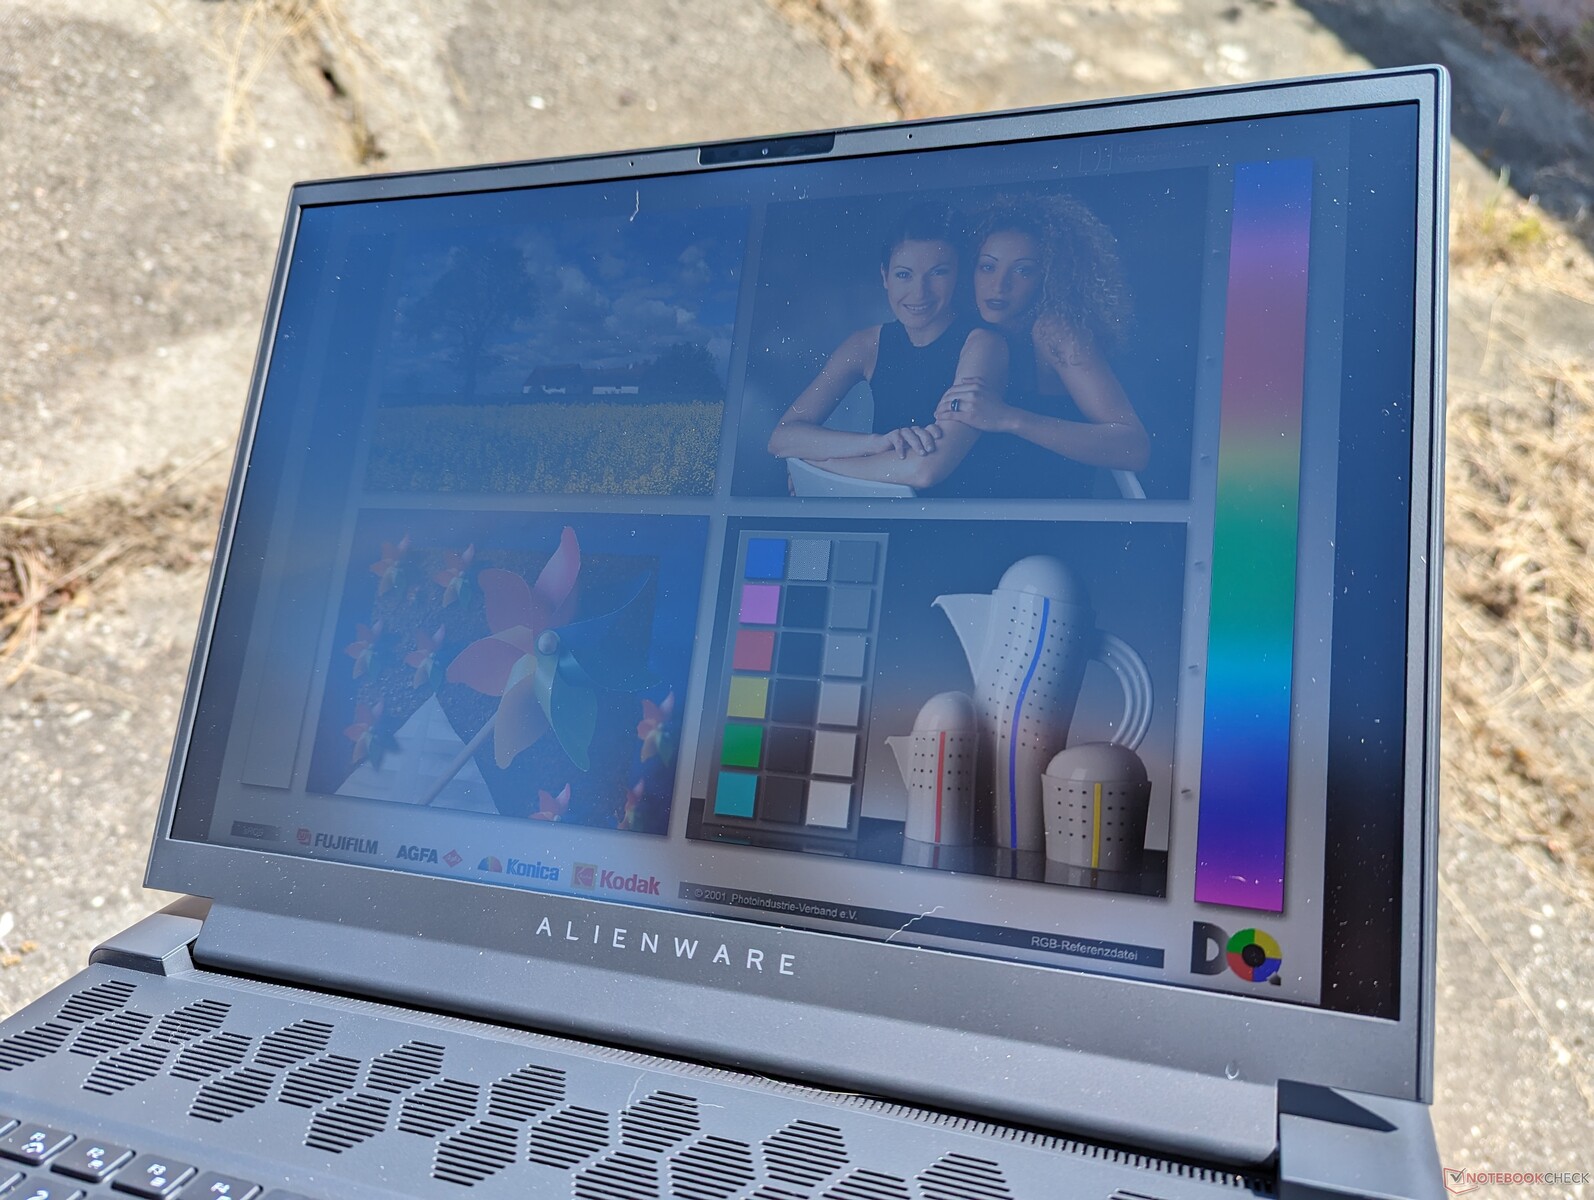
Widoczność na zewnątrz jest przyzwoita tylko w cieniu. Omen Transcend 16 i jego wyświetlacz mini-LED jest ponad 2x jaśniejszy, jeśli chodzi o widoczność na zewnątrz.

Wydajność - AMD czy Intel?
Warunki testowania
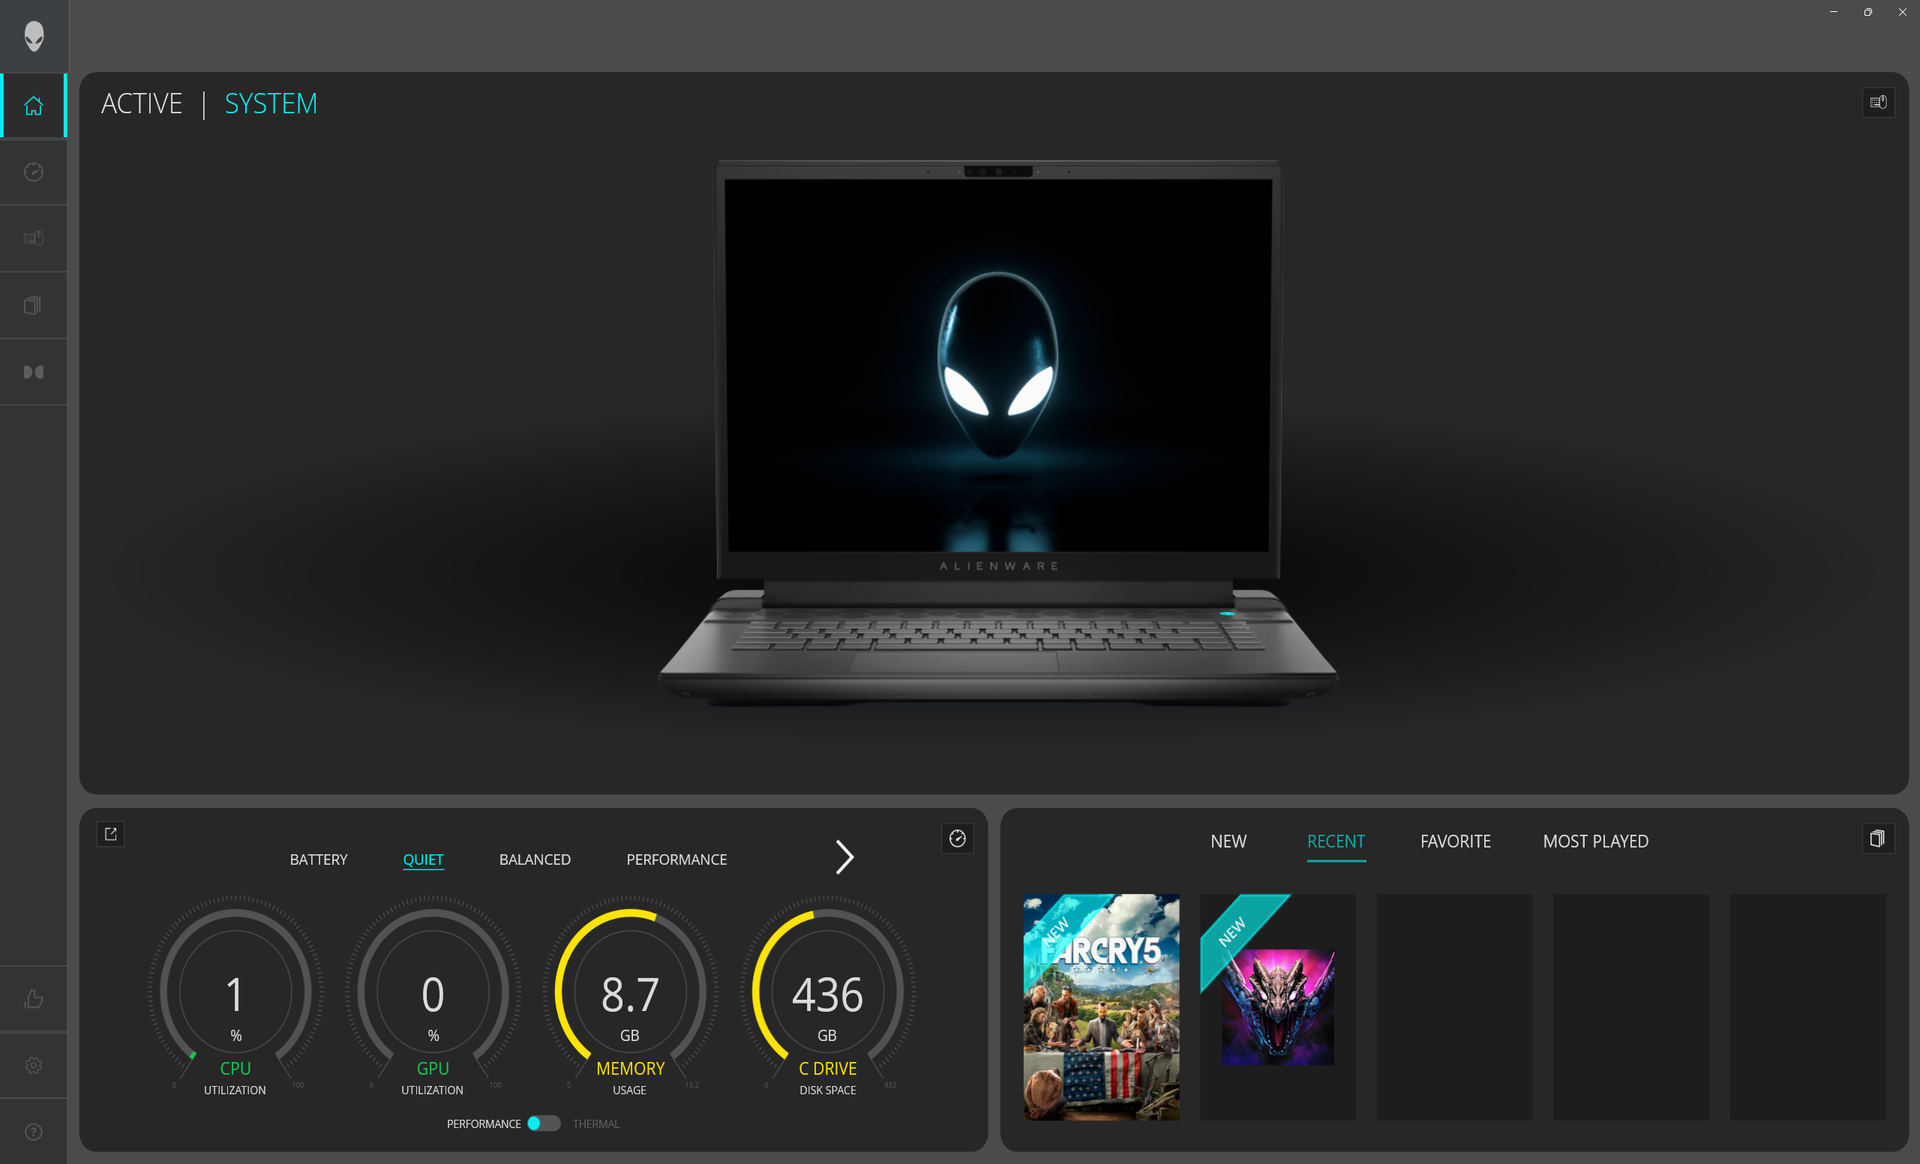
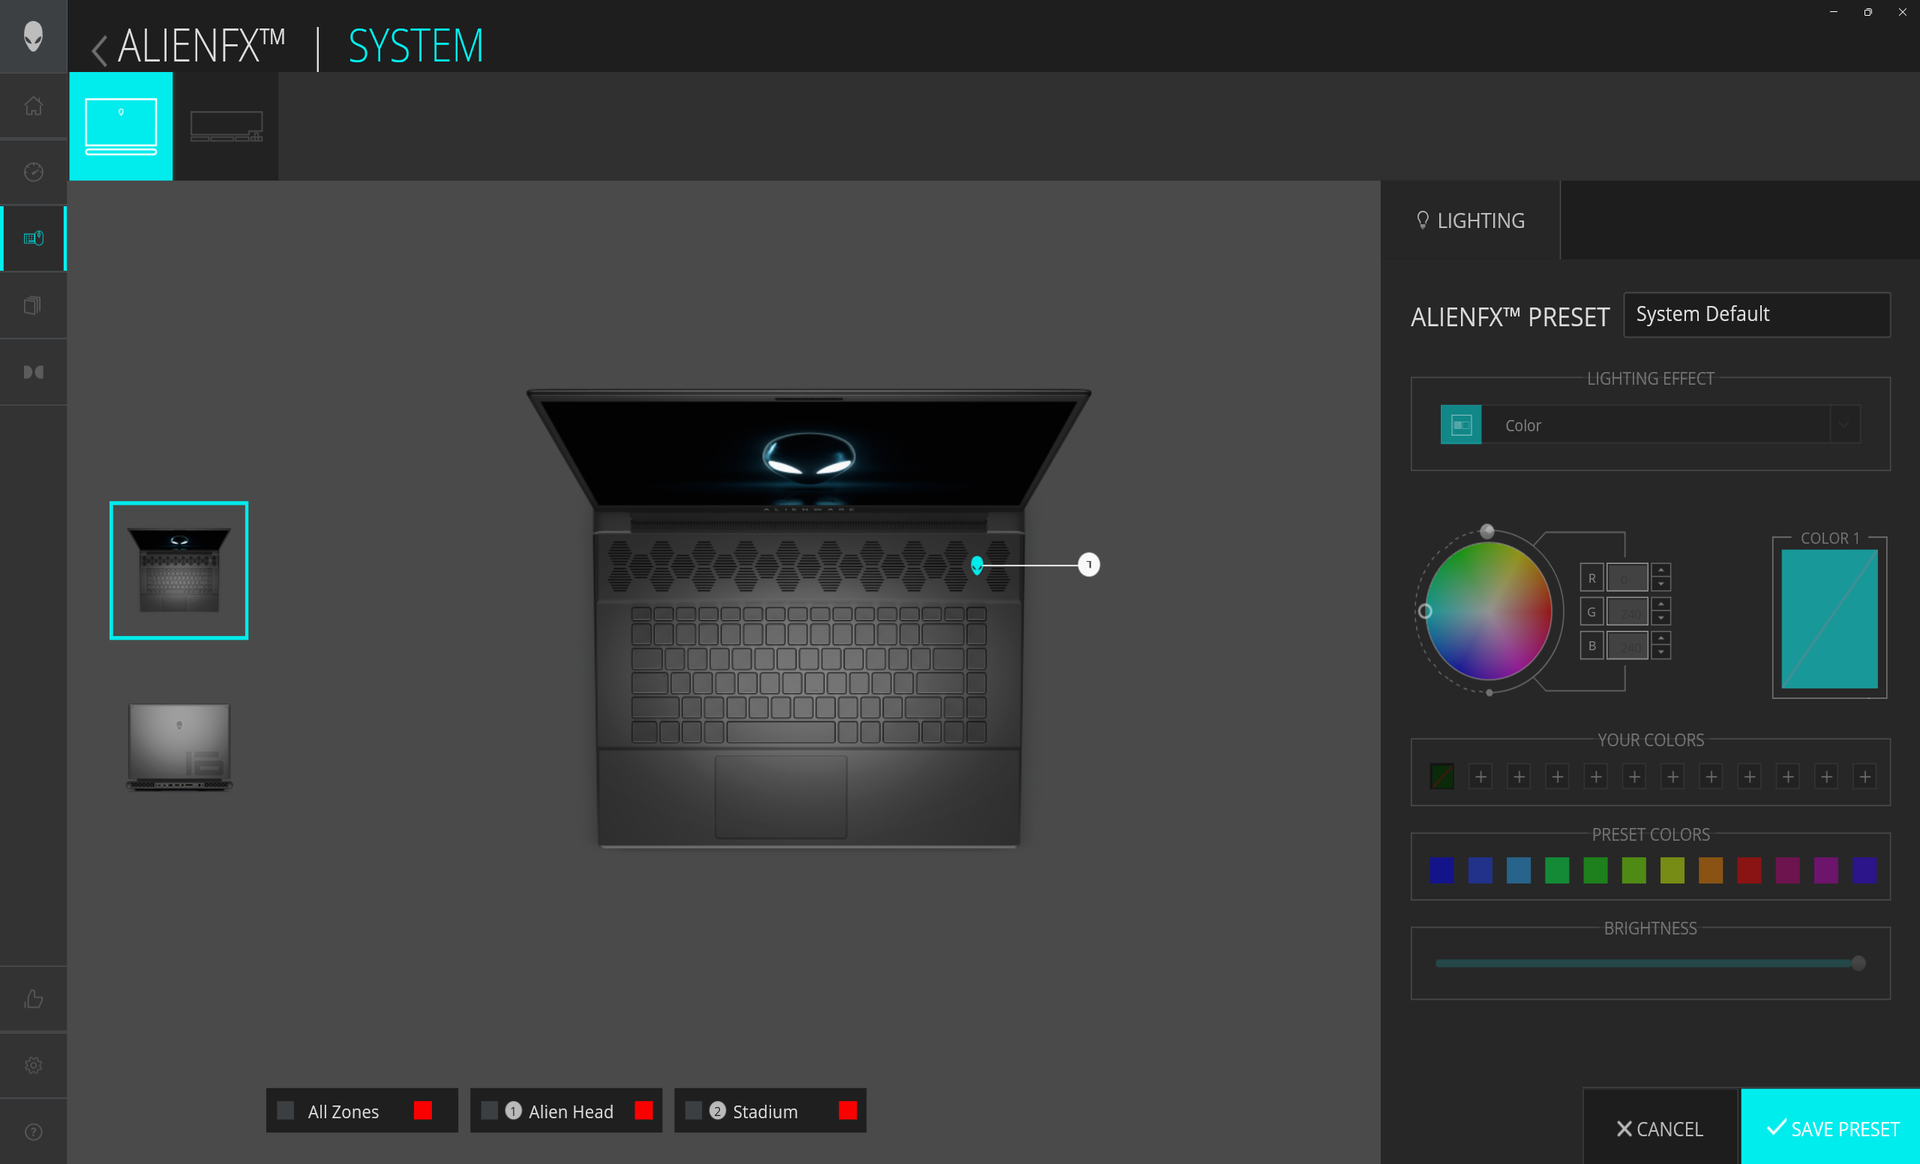
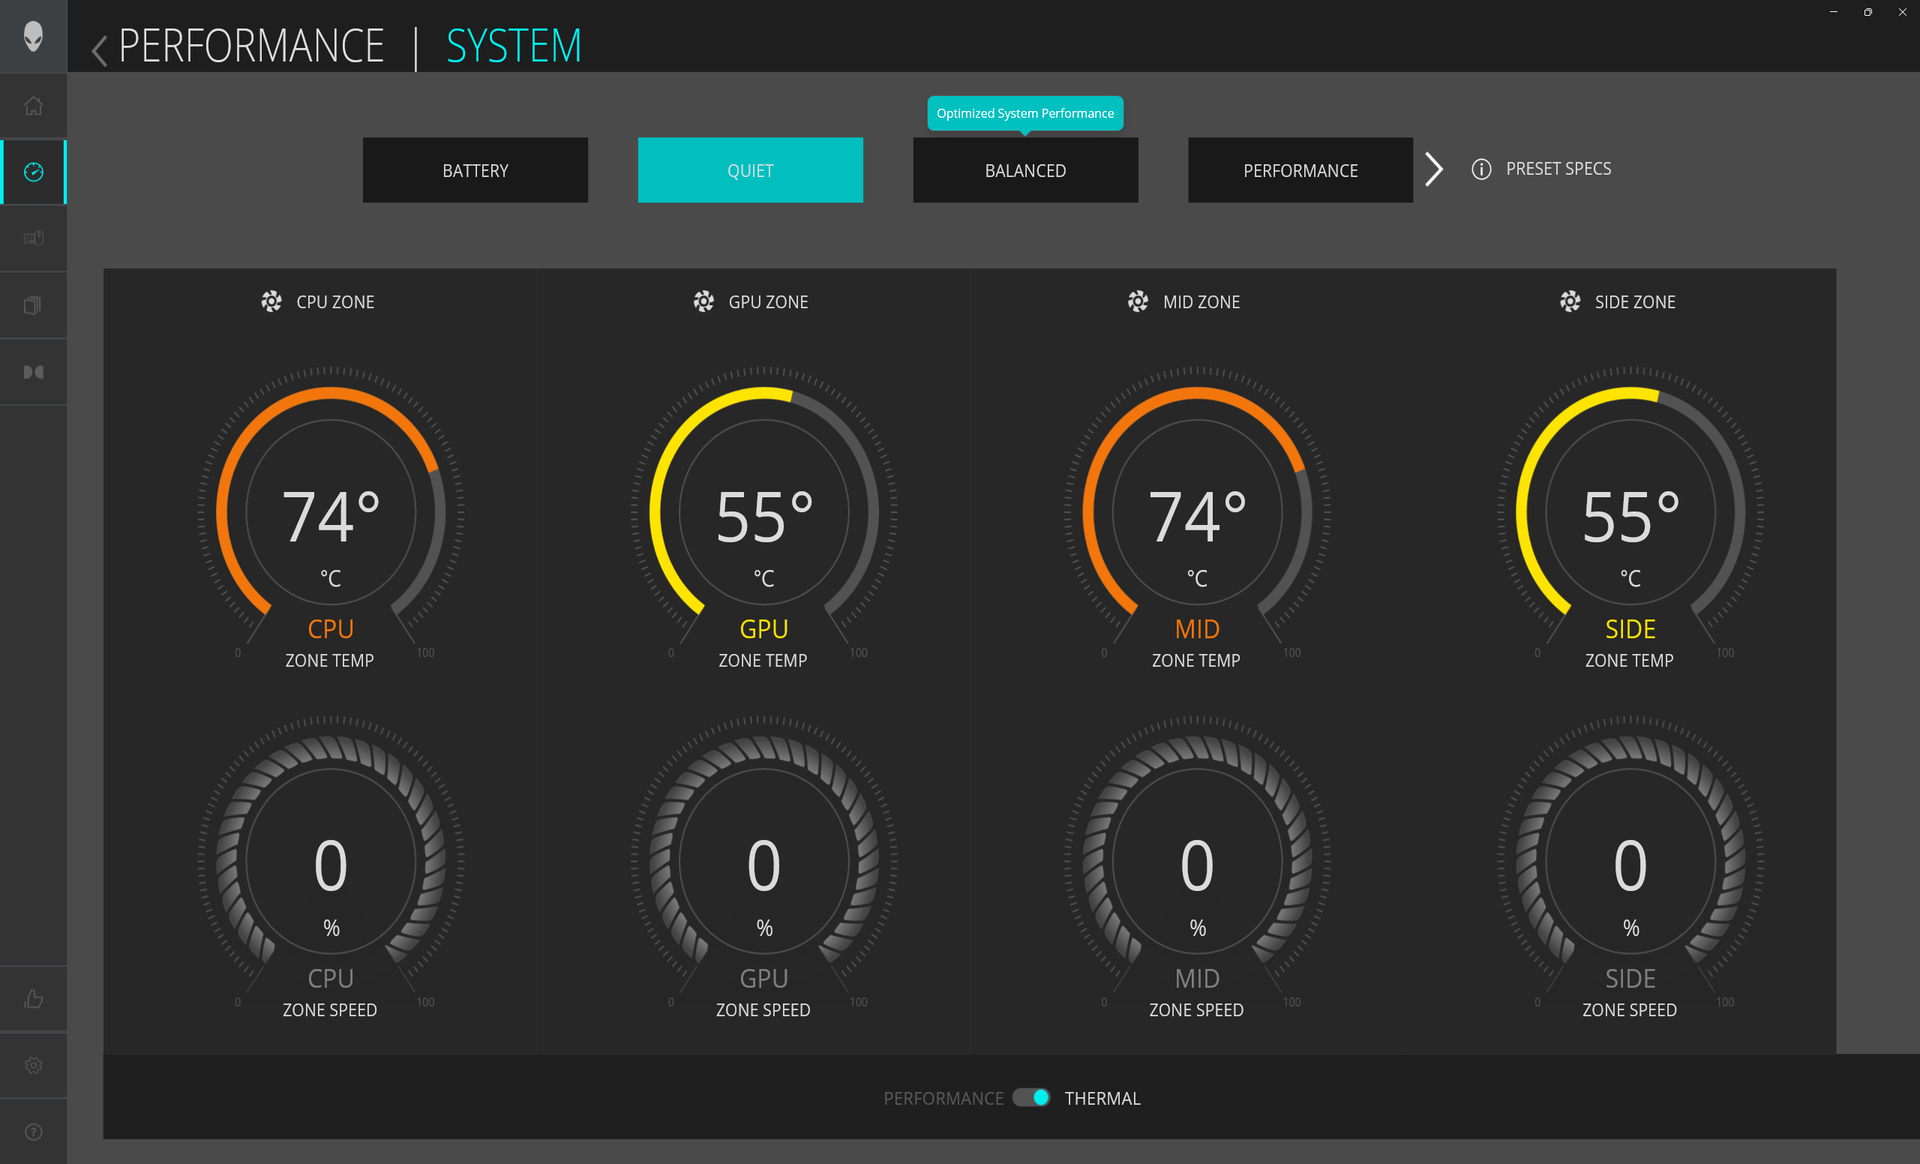
Ustawiliśmy naszą jednostkę na tryb Overdrive za pośrednictwem Alienware Command Center, a GPU na tryb dGPU przed uruchomieniem poniższych testów porównawczych. Użytkownicy powinni zapoznać się z Command Center, ponieważ jest to centrum sterowania funkcjami systemu związanymi z wydajnością, parametrami życiowymi i oświetleniem. Command Center nie należy mylić z My Alienware, które jest oprogramowaniem gwarancyjnym i pomocniczym.
Advanced Optimus lub MUX są obsługiwane. G-Sync nie jest jednak obsługiwany na wewnętrznym wyświetlaczu w wersjach AMD Alienware m16, ponieważ ta funkcja jest obecnie dostępna wyłącznie w wersjach Intel. Zamiast tego obsługiwany jest FreeSync.

Procesor
Procesor Ryzen 9 7845HX osiąga wyniki zbliżone do imponującego Ryzen 9 7945HX niż do Ryzen 7 7745HX. Wydajność wielowątkowa jest o około 20 do 25 procent wolniejsza niż w przypadku Ryzen 9 7945HX lub o około 50 procent wyższa niż w przypadku Ryzen 7 7745HX. Procesor jest więc tylko o krok od konkurencyjnego Core i9-13900HX ale znacznie wyprzedza Core i7-13700HX. Koncepcja zadowalania się niższą wydajnością procesora poprzez wybór AMD zamiast Intela nie ma zastosowania do tej generacji.
Zrównoważona wydajność jest doskonała, o czym świadczą stabilne wyniki Cinebench R15 xT poniżej.
Cinebench R15 Multi Loop
Cinebench R23: Multi Core | Single Core
Cinebench R20: CPU (Multi Core) | CPU (Single Core)
Cinebench R15: CPU Multi 64Bit | CPU Single 64Bit
Blender: v2.79 BMW27 CPU
7-Zip 18.03: 7z b 4 | 7z b 4 -mmt1
Geekbench 5.5: Multi-Core | Single-Core
HWBOT x265 Benchmark v2.2: 4k Preset
LibreOffice : 20 Documents To PDF
R Benchmark 2.5: Overall mean
| CPU Performance rating | |
| Asus ROG Strix Scar 17 G733PYV-LL053X | |
| Asus Zephyrus Duo 16 GX650PY-NM006W | |
| Lenovo Legion Pro 7 RTX4090 | |
| Asus ROG Strix G16 G614JZ | |
| Alienware m16 R1 AMD | |
| Przeciętny AMD Ryzen 9 7845HX | |
| Razer Blade 16 Early 2023 | |
| Lenovo Legion 7 16IAX7-82TD004SGE | |
| Uniwill GM6PX7X RTX 4070 | |
| Alienware x16 R1 -1! | |
| Lenovo Legion Pro 5 16ARX8 | |
| Asus ROG Zephyrus M16 GU603Z | |
| Lenovo Legion 5 Pro 16ARH7H RTX 3070 Ti | |
| Lenovo Legion 7 16ARHA7 | |
| Asus TUF Gaming A16 FA617 | |
| Dell Inspiron 16 Plus 7610-MHJ8F | |
| Lenovo Legion C7 15IMH05 82EH0030GE | |
| Cinebench R23 / Multi Core | |
| Asus Zephyrus Duo 16 GX650PY-NM006W | |
| Asus ROG Strix Scar 17 G733PYV-LL053X | |
| Lenovo Legion Pro 7 RTX4090 | |
| Asus ROG Strix G16 G614JZ | |
| Alienware m16 R1 AMD | |
| Przeciętny AMD Ryzen 9 7845HX (n=1) | |
| Razer Blade 16 Early 2023 | |
| Lenovo Legion 7 16IAX7-82TD004SGE | |
| Uniwill GM6PX7X RTX 4070 | |
| Alienware x16 R1 | |
| Lenovo Legion Pro 5 16ARX8 | |
| Asus ROG Zephyrus M16 GU603Z | |
| Lenovo Legion 5 Pro 16ARH7H RTX 3070 Ti | |
| Lenovo Legion 7 16ARHA7 | |
| Asus TUF Gaming A16 FA617 | |
| Dell Inspiron 16 Plus 7610-MHJ8F | |
| Lenovo Legion C7 15IMH05 82EH0030GE | |
| Cinebench R23 / Single Core | |
| Asus ROG Strix G16 G614JZ | |
| Lenovo Legion Pro 7 RTX4090 | |
| Razer Blade 16 Early 2023 | |
| Alienware x16 R1 | |
| Asus Zephyrus Duo 16 GX650PY-NM006W | |
| Lenovo Legion 7 16IAX7-82TD004SGE | |
| Asus ROG Strix Scar 17 G733PYV-LL053X | |
| Asus ROG Zephyrus M16 GU603Z | |
| Alienware m16 R1 AMD | |
| Przeciętny AMD Ryzen 9 7845HX (n=1) | |
| Lenovo Legion Pro 5 16ARX8 | |
| Uniwill GM6PX7X RTX 4070 | |
| Lenovo Legion 7 16ARHA7 | |
| Asus TUF Gaming A16 FA617 | |
| Lenovo Legion 5 Pro 16ARH7H RTX 3070 Ti | |
| Dell Inspiron 16 Plus 7610-MHJ8F | |
| Lenovo Legion C7 15IMH05 82EH0030GE | |
| Cinebench R20 / CPU (Multi Core) | |
| Asus Zephyrus Duo 16 GX650PY-NM006W | |
| Asus ROG Strix Scar 17 G733PYV-LL053X | |
| Lenovo Legion Pro 7 RTX4090 | |
| Asus ROG Strix G16 G614JZ | |
| Alienware m16 R1 AMD | |
| Przeciętny AMD Ryzen 9 7845HX (n=1) | |
| Razer Blade 16 Early 2023 | |
| Lenovo Legion 7 16IAX7-82TD004SGE | |
| Uniwill GM6PX7X RTX 4070 | |
| Alienware x16 R1 | |
| Lenovo Legion Pro 5 16ARX8 | |
| Asus ROG Zephyrus M16 GU603Z | |
| Lenovo Legion 5 Pro 16ARH7H RTX 3070 Ti | |
| Lenovo Legion 7 16ARHA7 | |
| Asus TUF Gaming A16 FA617 | |
| Dell Inspiron 16 Plus 7610-MHJ8F | |
| Lenovo Legion C7 15IMH05 82EH0030GE | |
| Cinebench R20 / CPU (Single Core) | |
| Asus ROG Strix G16 G614JZ | |
| Lenovo Legion Pro 7 RTX4090 | |
| Asus Zephyrus Duo 16 GX650PY-NM006W | |
| Asus ROG Strix Scar 17 G733PYV-LL053X | |
| Alienware x16 R1 | |
| Lenovo Legion 7 16IAX7-82TD004SGE | |
| Razer Blade 16 Early 2023 | |
| Alienware m16 R1 AMD | |
| Przeciętny AMD Ryzen 9 7845HX (n=1) | |
| Lenovo Legion Pro 5 16ARX8 | |
| Asus ROG Zephyrus M16 GU603Z | |
| Uniwill GM6PX7X RTX 4070 | |
| Lenovo Legion 7 16ARHA7 | |
| Asus TUF Gaming A16 FA617 | |
| Lenovo Legion 5 Pro 16ARH7H RTX 3070 Ti | |
| Dell Inspiron 16 Plus 7610-MHJ8F | |
| Lenovo Legion C7 15IMH05 82EH0030GE | |
| Cinebench R15 / CPU Multi 64Bit | |
| Asus ROG Strix Scar 17 G733PYV-LL053X | |
| Asus Zephyrus Duo 16 GX650PY-NM006W | |
| Asus ROG Strix G16 G614JZ | |
| Asus ROG Strix G16 G614JZ | |
| Lenovo Legion Pro 7 RTX4090 | |
| Razer Blade 16 Early 2023 | |
| Alienware m16 R1 AMD | |
| Przeciętny AMD Ryzen 9 7845HX (n=1) | |
| Lenovo Legion 7 16IAX7-82TD004SGE | |
| Uniwill GM6PX7X RTX 4070 | |
| Lenovo Legion Pro 5 16ARX8 | |
| Alienware x16 R1 | |
| Asus ROG Zephyrus M16 GU603Z | |
| Lenovo Legion 5 Pro 16ARH7H RTX 3070 Ti | |
| Lenovo Legion 7 16ARHA7 | |
| Asus TUF Gaming A16 FA617 | |
| Dell Inspiron 16 Plus 7610-MHJ8F | |
| Lenovo Legion C7 15IMH05 82EH0030GE | |
| Cinebench R15 / CPU Single 64Bit | |
| Asus ROG Strix Scar 17 G733PYV-LL053X | |
| Asus Zephyrus Duo 16 GX650PY-NM006W | |
| Asus ROG Strix G16 G614JZ | |
| Asus ROG Strix G16 G614JZ | |
| Alienware m16 R1 AMD | |
| Przeciętny AMD Ryzen 9 7845HX (n=1) | |
| Lenovo Legion Pro 5 16ARX8 | |
| Lenovo Legion Pro 7 RTX4090 | |
| Lenovo Legion 7 16IAX7-82TD004SGE | |
| Alienware x16 R1 | |
| Razer Blade 16 Early 2023 | |
| Asus ROG Zephyrus M16 GU603Z | |
| Uniwill GM6PX7X RTX 4070 | |
| Lenovo Legion 7 16ARHA7 | |
| Lenovo Legion 5 Pro 16ARH7H RTX 3070 Ti | |
| Asus TUF Gaming A16 FA617 | |
| Dell Inspiron 16 Plus 7610-MHJ8F | |
| Lenovo Legion C7 15IMH05 82EH0030GE | |
| Blender / v2.79 BMW27 CPU | |
| Lenovo Legion C7 15IMH05 82EH0030GE | |
| Dell Inspiron 16 Plus 7610-MHJ8F | |
| Asus TUF Gaming A16 FA617 | |
| Lenovo Legion 7 16ARHA7 | |
| Lenovo Legion 5 Pro 16ARH7H RTX 3070 Ti | |
| Asus ROG Zephyrus M16 GU603Z | |
| Lenovo Legion Pro 5 16ARX8 | |
| Uniwill GM6PX7X RTX 4070 | |
| Lenovo Legion 7 16IAX7-82TD004SGE | |
| Alienware m16 R1 AMD | |
| Przeciętny AMD Ryzen 9 7845HX (n=1) | |
| Razer Blade 16 Early 2023 | |
| Asus ROG Strix G16 G614JZ | |
| Lenovo Legion Pro 7 RTX4090 | |
| Asus ROG Strix Scar 17 G733PYV-LL053X | |
| Asus Zephyrus Duo 16 GX650PY-NM006W | |
| 7-Zip 18.03 / 7z b 4 | |
| Asus ROG Strix Scar 17 G733PYV-LL053X | |
| Asus Zephyrus Duo 16 GX650PY-NM006W | |
| Lenovo Legion Pro 7 RTX4090 | |
| Asus ROG Strix G16 G614JZ | |
| Razer Blade 16 Early 2023 | |
| Alienware m16 R1 AMD | |
| Przeciętny AMD Ryzen 9 7845HX (n=1) | |
| Uniwill GM6PX7X RTX 4070 | |
| Lenovo Legion 7 16IAX7-82TD004SGE | |
| Alienware x16 R1 | |
| Lenovo Legion Pro 5 16ARX8 | |
| Asus ROG Zephyrus M16 GU603Z | |
| Lenovo Legion 5 Pro 16ARH7H RTX 3070 Ti | |
| Lenovo Legion 7 16ARHA7 | |
| Asus TUF Gaming A16 FA617 | |
| Lenovo Legion C7 15IMH05 82EH0030GE | |
| Dell Inspiron 16 Plus 7610-MHJ8F | |
| 7-Zip 18.03 / 7z b 4 -mmt1 | |
| Asus ROG Strix Scar 17 G733PYV-LL053X | |
| Asus Zephyrus Duo 16 GX650PY-NM006W | |
| Lenovo Legion Pro 5 16ARX8 | |
| Alienware m16 R1 AMD | |
| Przeciętny AMD Ryzen 9 7845HX (n=1) | |
| Lenovo Legion Pro 7 RTX4090 | |
| Asus ROG Strix G16 G614JZ | |
| Razer Blade 16 Early 2023 | |
| Lenovo Legion 7 16IAX7-82TD004SGE | |
| Asus ROG Zephyrus M16 GU603Z | |
| Uniwill GM6PX7X RTX 4070 | |
| Alienware x16 R1 | |
| Lenovo Legion 5 Pro 16ARH7H RTX 3070 Ti | |
| Asus TUF Gaming A16 FA617 | |
| Lenovo Legion 7 16ARHA7 | |
| Lenovo Legion C7 15IMH05 82EH0030GE | |
| Dell Inspiron 16 Plus 7610-MHJ8F | |
| Geekbench 5.5 / Multi-Core | |
| Lenovo Legion Pro 7 RTX4090 | |
| Asus ROG Strix Scar 17 G733PYV-LL053X | |
| Asus Zephyrus Duo 16 GX650PY-NM006W | |
| Asus ROG Strix G16 G614JZ | |
| Razer Blade 16 Early 2023 | |
| Lenovo Legion 7 16IAX7-82TD004SGE | |
| Uniwill GM6PX7X RTX 4070 | |
| Alienware m16 R1 AMD | |
| Przeciętny AMD Ryzen 9 7845HX (n=1) | |
| Alienware x16 R1 | |
| Asus ROG Zephyrus M16 GU603Z | |
| Lenovo Legion Pro 5 16ARX8 | |
| Lenovo Legion 5 Pro 16ARH7H RTX 3070 Ti | |
| Lenovo Legion 7 16ARHA7 | |
| Asus TUF Gaming A16 FA617 | |
| Lenovo Legion C7 15IMH05 82EH0030GE | |
| Dell Inspiron 16 Plus 7610-MHJ8F | |
| Dell Inspiron 16 Plus 7610-MHJ8F | |
| Dell Inspiron 16 Plus 7610-MHJ8F | |
| Geekbench 5.5 / Single-Core | |
| Asus ROG Strix Scar 17 G733PYV-LL053X | |
| Asus Zephyrus Duo 16 GX650PY-NM006W | |
| Asus ROG Strix G16 G614JZ | |
| Lenovo Legion Pro 5 16ARX8 | |
| Lenovo Legion Pro 7 RTX4090 | |
| Alienware m16 R1 AMD | |
| Przeciętny AMD Ryzen 9 7845HX (n=1) | |
| Alienware x16 R1 | |
| Lenovo Legion 7 16IAX7-82TD004SGE | |
| Asus ROG Zephyrus M16 GU603Z | |
| Uniwill GM6PX7X RTX 4070 | |
| Razer Blade 16 Early 2023 | |
| Lenovo Legion 7 16ARHA7 | |
| Asus TUF Gaming A16 FA617 | |
| Dell Inspiron 16 Plus 7610-MHJ8F | |
| Dell Inspiron 16 Plus 7610-MHJ8F | |
| Dell Inspiron 16 Plus 7610-MHJ8F | |
| Lenovo Legion 5 Pro 16ARH7H RTX 3070 Ti | |
| Lenovo Legion C7 15IMH05 82EH0030GE | |
| HWBOT x265 Benchmark v2.2 / 4k Preset | |
| Asus ROG Strix Scar 17 G733PYV-LL053X | |
| Asus Zephyrus Duo 16 GX650PY-NM006W | |
| Lenovo Legion Pro 7 RTX4090 | |
| Asus ROG Strix G16 G614JZ | |
| Alienware m16 R1 AMD | |
| Przeciętny AMD Ryzen 9 7845HX (n=1) | |
| Razer Blade 16 Early 2023 | |
| Lenovo Legion 7 16IAX7-82TD004SGE | |
| Uniwill GM6PX7X RTX 4070 | |
| Lenovo Legion Pro 5 16ARX8 | |
| Alienware x16 R1 | |
| Asus ROG Zephyrus M16 GU603Z | |
| Lenovo Legion 5 Pro 16ARH7H RTX 3070 Ti | |
| Lenovo Legion 7 16ARHA7 | |
| Asus TUF Gaming A16 FA617 | |
| Dell Inspiron 16 Plus 7610-MHJ8F | |
| Lenovo Legion C7 15IMH05 82EH0030GE | |
| LibreOffice / 20 Documents To PDF | |
| Asus Zephyrus Duo 16 GX650PY-NM006W | |
| Asus TUF Gaming A16 FA617 | |
| Lenovo Legion C7 15IMH05 82EH0030GE | |
| Lenovo Legion 7 16ARHA7 | |
| Lenovo Legion 5 Pro 16ARH7H RTX 3070 Ti | |
| Asus ROG Strix G16 G614JZ | |
| Razer Blade 16 Early 2023 | |
| Dell Inspiron 16 Plus 7610-MHJ8F | |
| Alienware x16 R1 | |
| Asus ROG Zephyrus M16 GU603Z | |
| Lenovo Legion Pro 7 RTX4090 | |
| Alienware m16 R1 AMD | |
| Przeciętny AMD Ryzen 9 7845HX (n=1) | |
| Asus ROG Strix Scar 17 G733PYV-LL053X | |
| Uniwill GM6PX7X RTX 4070 | |
| Lenovo Legion Pro 5 16ARX8 | |
| Lenovo Legion 7 16IAX7-82TD004SGE | |
| R Benchmark 2.5 / Overall mean | |
| Lenovo Legion C7 15IMH05 82EH0030GE | |
| Dell Inspiron 16 Plus 7610-MHJ8F | |
| Asus TUF Gaming A16 FA617 | |
| Lenovo Legion 7 16ARHA7 | |
| Lenovo Legion 5 Pro 16ARH7H RTX 3070 Ti | |
| Uniwill GM6PX7X RTX 4070 | |
| Asus ROG Zephyrus M16 GU603Z | |
| Alienware x16 R1 | |
| Alienware m16 R1 AMD | |
| Przeciętny AMD Ryzen 9 7845HX (n=1) | |
| Lenovo Legion Pro 5 16ARX8 | |
| Lenovo Legion 7 16IAX7-82TD004SGE | |
| Asus ROG Strix Scar 17 G733PYV-LL053X | |
| Razer Blade 16 Early 2023 | |
| Lenovo Legion Pro 7 RTX4090 | |
| Asus Zephyrus Duo 16 GX650PY-NM006W | |
| Asus ROG Strix G16 G614JZ | |
Cinebench R23: Multi Core | Single Core
Cinebench R20: CPU (Multi Core) | CPU (Single Core)
Cinebench R15: CPU Multi 64Bit | CPU Single 64Bit
Blender: v2.79 BMW27 CPU
7-Zip 18.03: 7z b 4 | 7z b 4 -mmt1
Geekbench 5.5: Multi-Core | Single-Core
HWBOT x265 Benchmark v2.2: 4k Preset
LibreOffice : 20 Documents To PDF
R Benchmark 2.5: Overall mean
* ... im mniej tym lepiej
AIDA64: FP32 Ray-Trace | FPU Julia | CPU SHA3 | CPU Queen | FPU SinJulia | FPU Mandel | CPU AES | CPU ZLib | FP64 Ray-Trace | CPU PhotoWorxx
| Performance rating | |
| Alienware m16 R1 AMD | |
| Przeciętny AMD Ryzen 9 7845HX | |
| Lenovo Legion Pro 7 RTX4090 | |
| Asus ROG Strix G16 G614JZ | |
| HP Omen Transcend 16 | |
| Razer Blade 16 Early 2023 | |
| Alienware x16 R1 | |
| AIDA64 / FP32 Ray-Trace | |
| Alienware m16 R1 AMD | |
| Przeciętny AMD Ryzen 9 7845HX (n=1) | |
| Asus ROG Strix G16 G614JZ | |
| Lenovo Legion Pro 7 RTX4090 | |
| Razer Blade 16 Early 2023 | |
| Razer Blade 16 Early 2023 | |
| Razer Blade 16 Early 2023 | |
| HP Omen Transcend 16 | |
| Alienware x16 R1 | |
| AIDA64 / FPU Julia | |
| Alienware m16 R1 AMD | |
| Przeciętny AMD Ryzen 9 7845HX (n=1) | |
| Lenovo Legion Pro 7 RTX4090 | |
| Asus ROG Strix G16 G614JZ | |
| Razer Blade 16 Early 2023 | |
| Razer Blade 16 Early 2023 | |
| Razer Blade 16 Early 2023 | |
| HP Omen Transcend 16 | |
| Alienware x16 R1 | |
| AIDA64 / CPU SHA3 | |
| Alienware m16 R1 AMD | |
| Przeciętny AMD Ryzen 9 7845HX (n=1) | |
| Lenovo Legion Pro 7 RTX4090 | |
| Asus ROG Strix G16 G614JZ | |
| Razer Blade 16 Early 2023 | |
| Razer Blade 16 Early 2023 | |
| Razer Blade 16 Early 2023 | |
| HP Omen Transcend 16 | |
| Alienware x16 R1 | |
| AIDA64 / CPU Queen | |
| Alienware m16 R1 AMD | |
| Przeciętny AMD Ryzen 9 7845HX (n=1) | |
| Asus ROG Strix G16 G614JZ | |
| Lenovo Legion Pro 7 RTX4090 | |
| Razer Blade 16 Early 2023 | |
| Razer Blade 16 Early 2023 | |
| HP Omen Transcend 16 | |
| Alienware x16 R1 | |
| AIDA64 / FPU SinJulia | |
| Alienware m16 R1 AMD | |
| Przeciętny AMD Ryzen 9 7845HX (n=1) | |
| Asus ROG Strix G16 G614JZ | |
| Razer Blade 16 Early 2023 | |
| Razer Blade 16 Early 2023 | |
| Razer Blade 16 Early 2023 | |
| Lenovo Legion Pro 7 RTX4090 | |
| HP Omen Transcend 16 | |
| Alienware x16 R1 | |
| AIDA64 / FPU Mandel | |
| Alienware m16 R1 AMD | |
| Przeciętny AMD Ryzen 9 7845HX (n=1) | |
| Lenovo Legion Pro 7 RTX4090 | |
| Asus ROG Strix G16 G614JZ | |
| Razer Blade 16 Early 2023 | |
| Razer Blade 16 Early 2023 | |
| Razer Blade 16 Early 2023 | |
| HP Omen Transcend 16 | |
| Alienware x16 R1 | |
| AIDA64 / CPU AES | |
| Razer Blade 16 Early 2023 | |
| Razer Blade 16 Early 2023 | |
| Razer Blade 16 Early 2023 | |
| Lenovo Legion Pro 7 RTX4090 | |
| Asus ROG Strix G16 G614JZ | |
| HP Omen Transcend 16 | |
| Alienware m16 R1 AMD | |
| Przeciętny AMD Ryzen 9 7845HX (n=1) | |
| Alienware x16 R1 | |
| AIDA64 / CPU ZLib | |
| Lenovo Legion Pro 7 RTX4090 | |
| Asus ROG Strix G16 G614JZ | |
| Razer Blade 16 Early 2023 | |
| Razer Blade 16 Early 2023 | |
| Razer Blade 16 Early 2023 | |
| Alienware m16 R1 AMD | |
| Przeciętny AMD Ryzen 9 7845HX (n=1) | |
| HP Omen Transcend 16 | |
| Alienware x16 R1 | |
| AIDA64 / FP64 Ray-Trace | |
| Alienware m16 R1 AMD | |
| Przeciętny AMD Ryzen 9 7845HX (n=1) | |
| Asus ROG Strix G16 G614JZ | |
| Lenovo Legion Pro 7 RTX4090 | |
| Razer Blade 16 Early 2023 | |
| Razer Blade 16 Early 2023 | |
| Razer Blade 16 Early 2023 | |
| HP Omen Transcend 16 | |
| Alienware x16 R1 | |
| AIDA64 / CPU PhotoWorxx | |
| Razer Blade 16 Early 2023 | |
| Razer Blade 16 Early 2023 | |
| Razer Blade 16 Early 2023 | |
| Lenovo Legion Pro 7 RTX4090 | |
| HP Omen Transcend 16 | |
| Alienware x16 R1 | |
| Asus ROG Strix G16 G614JZ | |
| Alienware m16 R1 AMD | |
| Przeciętny AMD Ryzen 9 7845HX (n=1) | |
Wydajność systemu
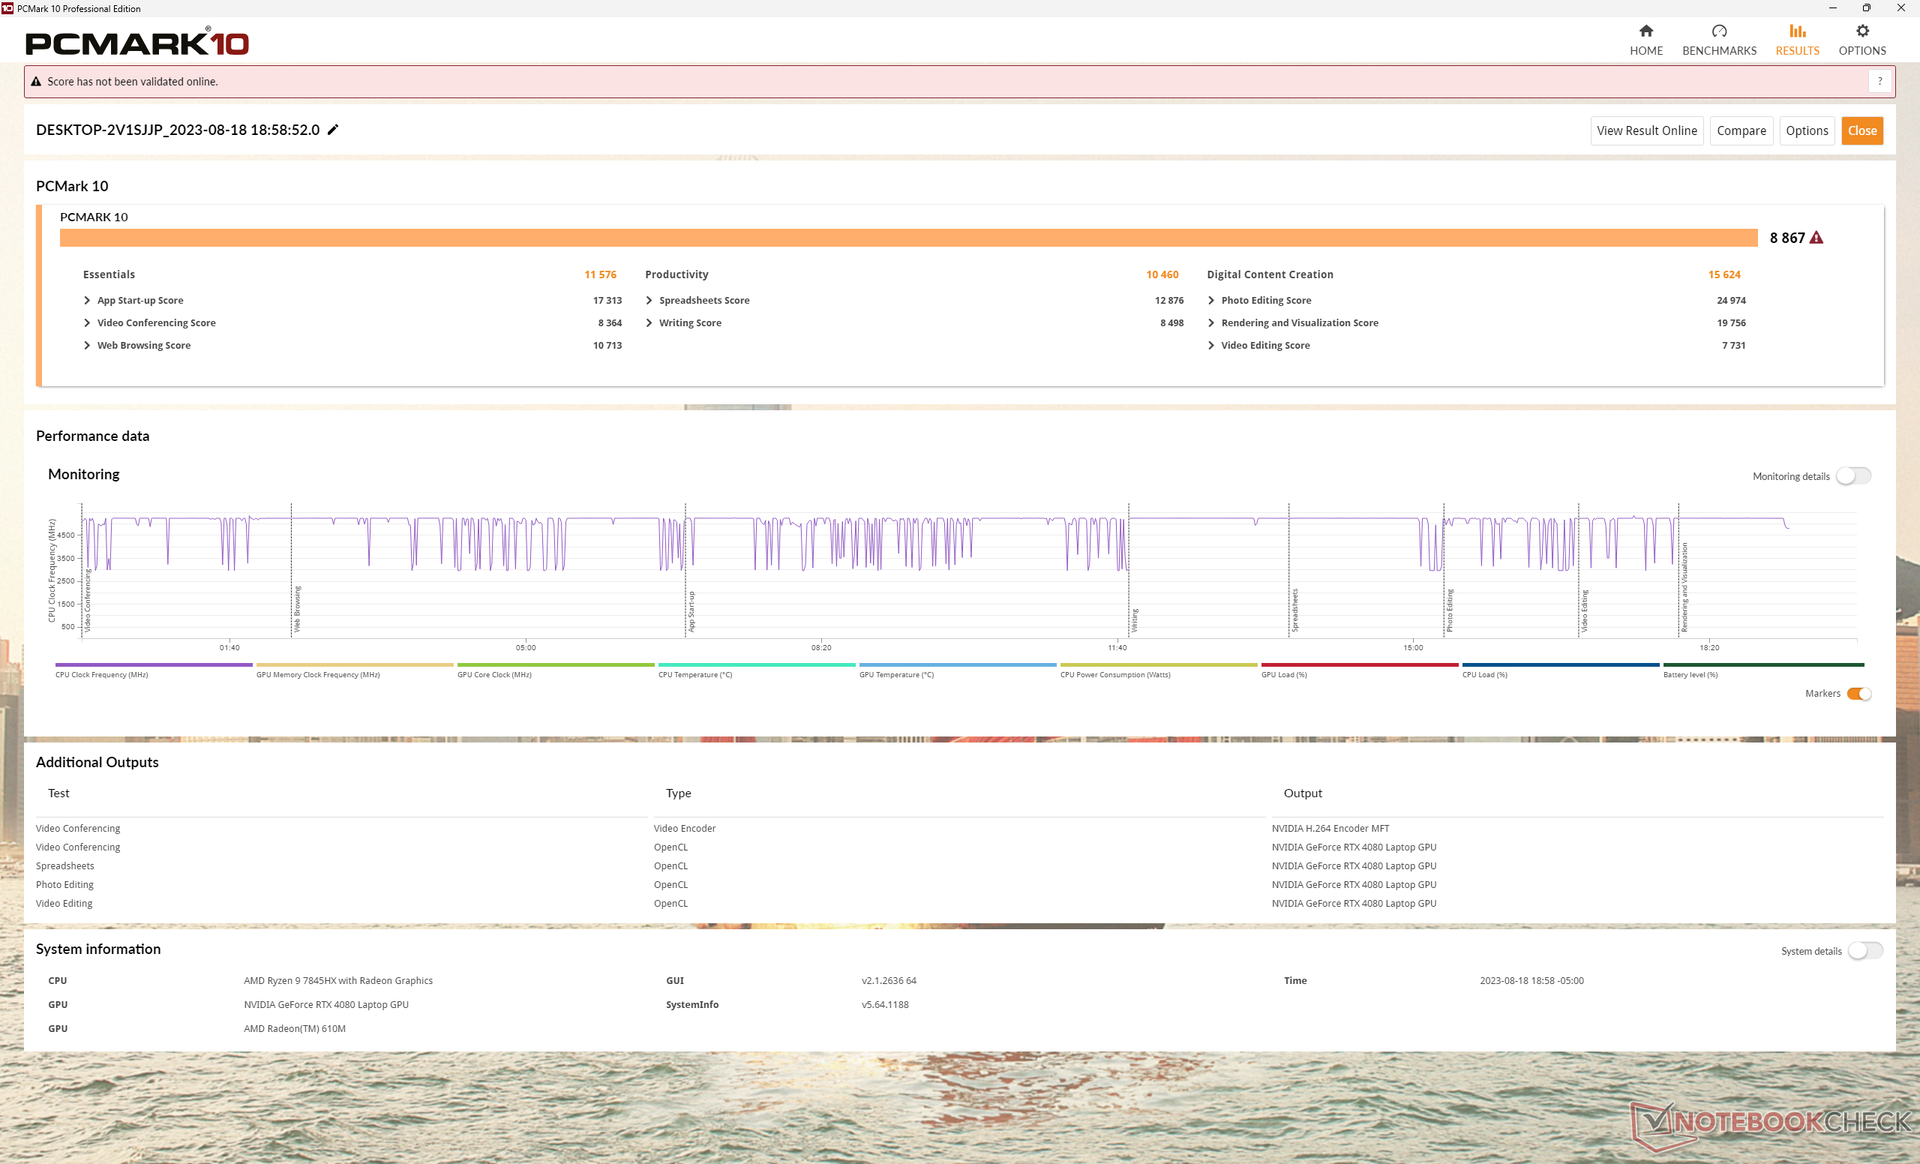
Wyniki PCMark są jednymi z najwyższych spośród wszystkich laptopów do gier. Największy margines występuje w podteście Productivity, który koncentruje się na wydajności procesora.
Niestety, doświadczyliśmy kilku problemów z wybudzaniem z uśpienia na naszej jednostce testowej. System czasami uruchamiał się ponownie bez powodu po otwarciu pokrywy lub wyświetlał niebieski ekran śmierci, nawet po aktualizacji do najnowszych sterowników od Dell i Nvidia w momencie recenzji.
CrossMark: Overall | Productivity | Creativity | Responsiveness
| PCMark 10 / Score | |
| Alienware m16 R1 AMD | |
| Przeciętny AMD Ryzen 9 7845HX, NVIDIA GeForce RTX 4080 Laptop GPU (n=1) | |
| Alienware x16 R1 | |
| Lenovo Legion Pro 7 RTX4090 | |
| HP Omen Transcend 16 | |
| Razer Blade 16 Early 2023 | |
| Asus ROG Strix G16 G614JZ | |
| PCMark 10 / Essentials | |
| Asus ROG Strix G16 G614JZ | |
| Alienware m16 R1 AMD | |
| Przeciętny AMD Ryzen 9 7845HX, NVIDIA GeForce RTX 4080 Laptop GPU (n=1) | |
| HP Omen Transcend 16 | |
| Alienware x16 R1 | |
| Lenovo Legion Pro 7 RTX4090 | |
| Razer Blade 16 Early 2023 | |
| PCMark 10 / Productivity | |
| Alienware m16 R1 AMD | |
| Przeciętny AMD Ryzen 9 7845HX, NVIDIA GeForce RTX 4080 Laptop GPU (n=1) | |
| Alienware x16 R1 | |
| HP Omen Transcend 16 | |
| Lenovo Legion Pro 7 RTX4090 | |
| Razer Blade 16 Early 2023 | |
| Asus ROG Strix G16 G614JZ | |
| PCMark 10 / Digital Content Creation | |
| Alienware m16 R1 AMD | |
| Przeciętny AMD Ryzen 9 7845HX, NVIDIA GeForce RTX 4080 Laptop GPU (n=1) | |
| Lenovo Legion Pro 7 RTX4090 | |
| Razer Blade 16 Early 2023 | |
| Alienware x16 R1 | |
| HP Omen Transcend 16 | |
| Asus ROG Strix G16 G614JZ | |
| CrossMark / Overall | |
| Asus ROG Strix G16 G614JZ | |
| Alienware m16 R1 AMD | |
| Przeciętny AMD Ryzen 9 7845HX, NVIDIA GeForce RTX 4080 Laptop GPU (n=1) | |
| HP Omen Transcend 16 | |
| Alienware x16 R1 | |
| Razer Blade 16 Early 2023 | |
| CrossMark / Productivity | |
| Asus ROG Strix G16 G614JZ | |
| Alienware m16 R1 AMD | |
| Przeciętny AMD Ryzen 9 7845HX, NVIDIA GeForce RTX 4080 Laptop GPU (n=1) | |
| Alienware x16 R1 | |
| HP Omen Transcend 16 | |
| Razer Blade 16 Early 2023 | |
| CrossMark / Creativity | |
| Asus ROG Strix G16 G614JZ | |
| HP Omen Transcend 16 | |
| Alienware m16 R1 AMD | |
| Przeciętny AMD Ryzen 9 7845HX, NVIDIA GeForce RTX 4080 Laptop GPU (n=1) | |
| Alienware x16 R1 | |
| Razer Blade 16 Early 2023 | |
| CrossMark / Responsiveness | |
| Asus ROG Strix G16 G614JZ | |
| Alienware x16 R1 | |
| Alienware m16 R1 AMD | |
| Przeciętny AMD Ryzen 9 7845HX, NVIDIA GeForce RTX 4080 Laptop GPU (n=1) | |
| HP Omen Transcend 16 | |
| Razer Blade 16 Early 2023 | |
| PCMark 10 Score | 8867 pkt. | |
Pomoc | ||
| AIDA64 / Memory Copy | |
| Razer Blade 16 Early 2023 | |
| Razer Blade 16 Early 2023 | |
| Razer Blade 16 Early 2023 | |
| Lenovo Legion Pro 7 RTX4090 | |
| HP Omen Transcend 16 | |
| Alienware x16 R1 | |
| Asus ROG Strix G16 G614JZ | |
| Alienware m16 R1 AMD | |
| Przeciętny AMD Ryzen 9 7845HX (n=1) | |
| AIDA64 / Memory Read | |
| Lenovo Legion Pro 7 RTX4090 | |
| Razer Blade 16 Early 2023 | |
| Razer Blade 16 Early 2023 | |
| Razer Blade 16 Early 2023 | |
| HP Omen Transcend 16 | |
| Asus ROG Strix G16 G614JZ | |
| Alienware x16 R1 | |
| Alienware m16 R1 AMD | |
| Przeciętny AMD Ryzen 9 7845HX (n=1) | |
| AIDA64 / Memory Write | |
| Alienware x16 R1 | |
| Razer Blade 16 Early 2023 | |
| Razer Blade 16 Early 2023 | |
| Razer Blade 16 Early 2023 | |
| Lenovo Legion Pro 7 RTX4090 | |
| HP Omen Transcend 16 | |
| Asus ROG Strix G16 G614JZ | |
| Alienware m16 R1 AMD | |
| Przeciętny AMD Ryzen 9 7845HX (n=1) | |
| AIDA64 / Memory Latency | |
| Alienware x16 R1 | |
| Razer Blade 16 Early 2023 | |
| Razer Blade 16 Early 2023 | |
| Razer Blade 16 Early 2023 | |
| Alienware m16 R1 AMD | |
| Przeciętny AMD Ryzen 9 7845HX (n=1) | |
| HP Omen Transcend 16 | |
| Asus ROG Strix G16 G614JZ | |
| Lenovo Legion Pro 7 RTX4090 | |
* ... im mniej tym lepiej
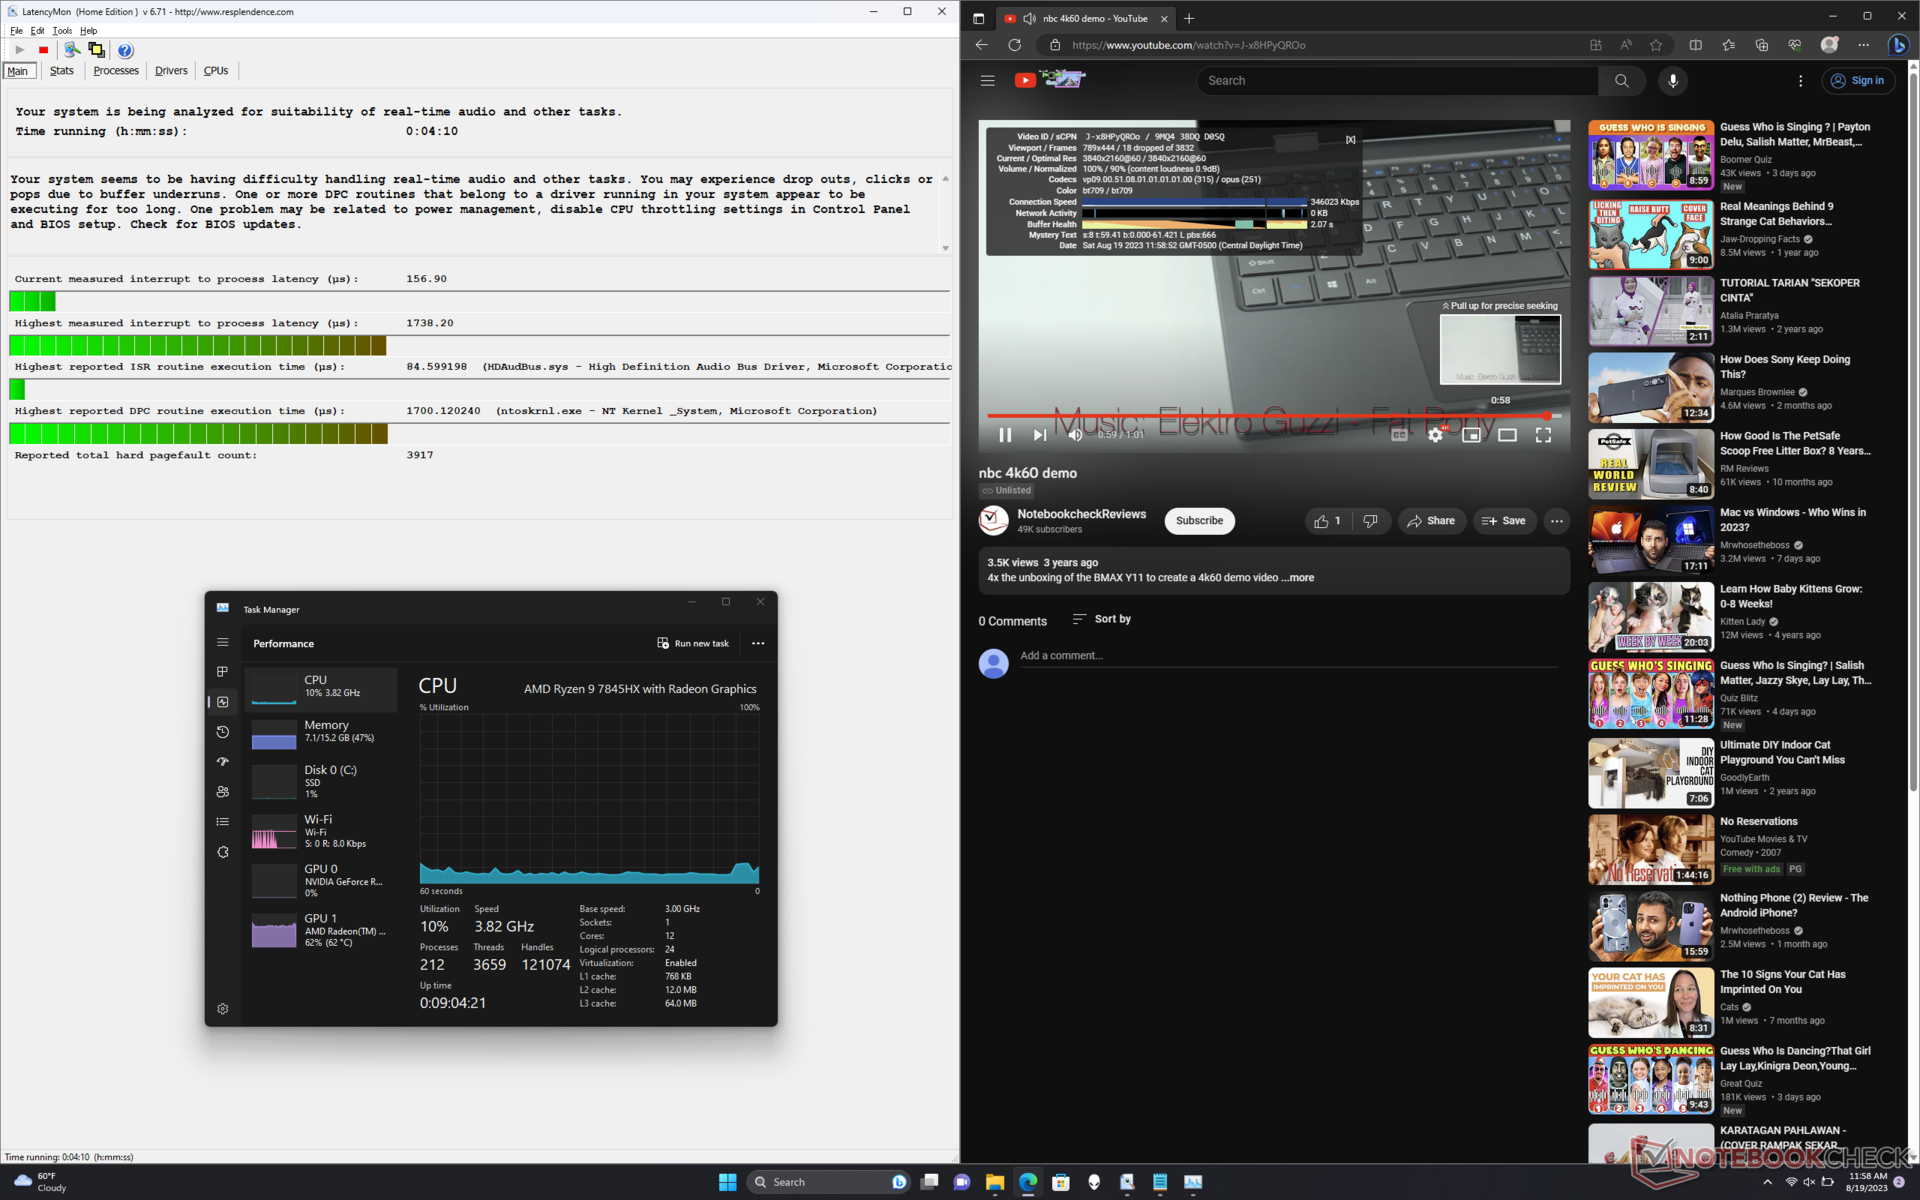
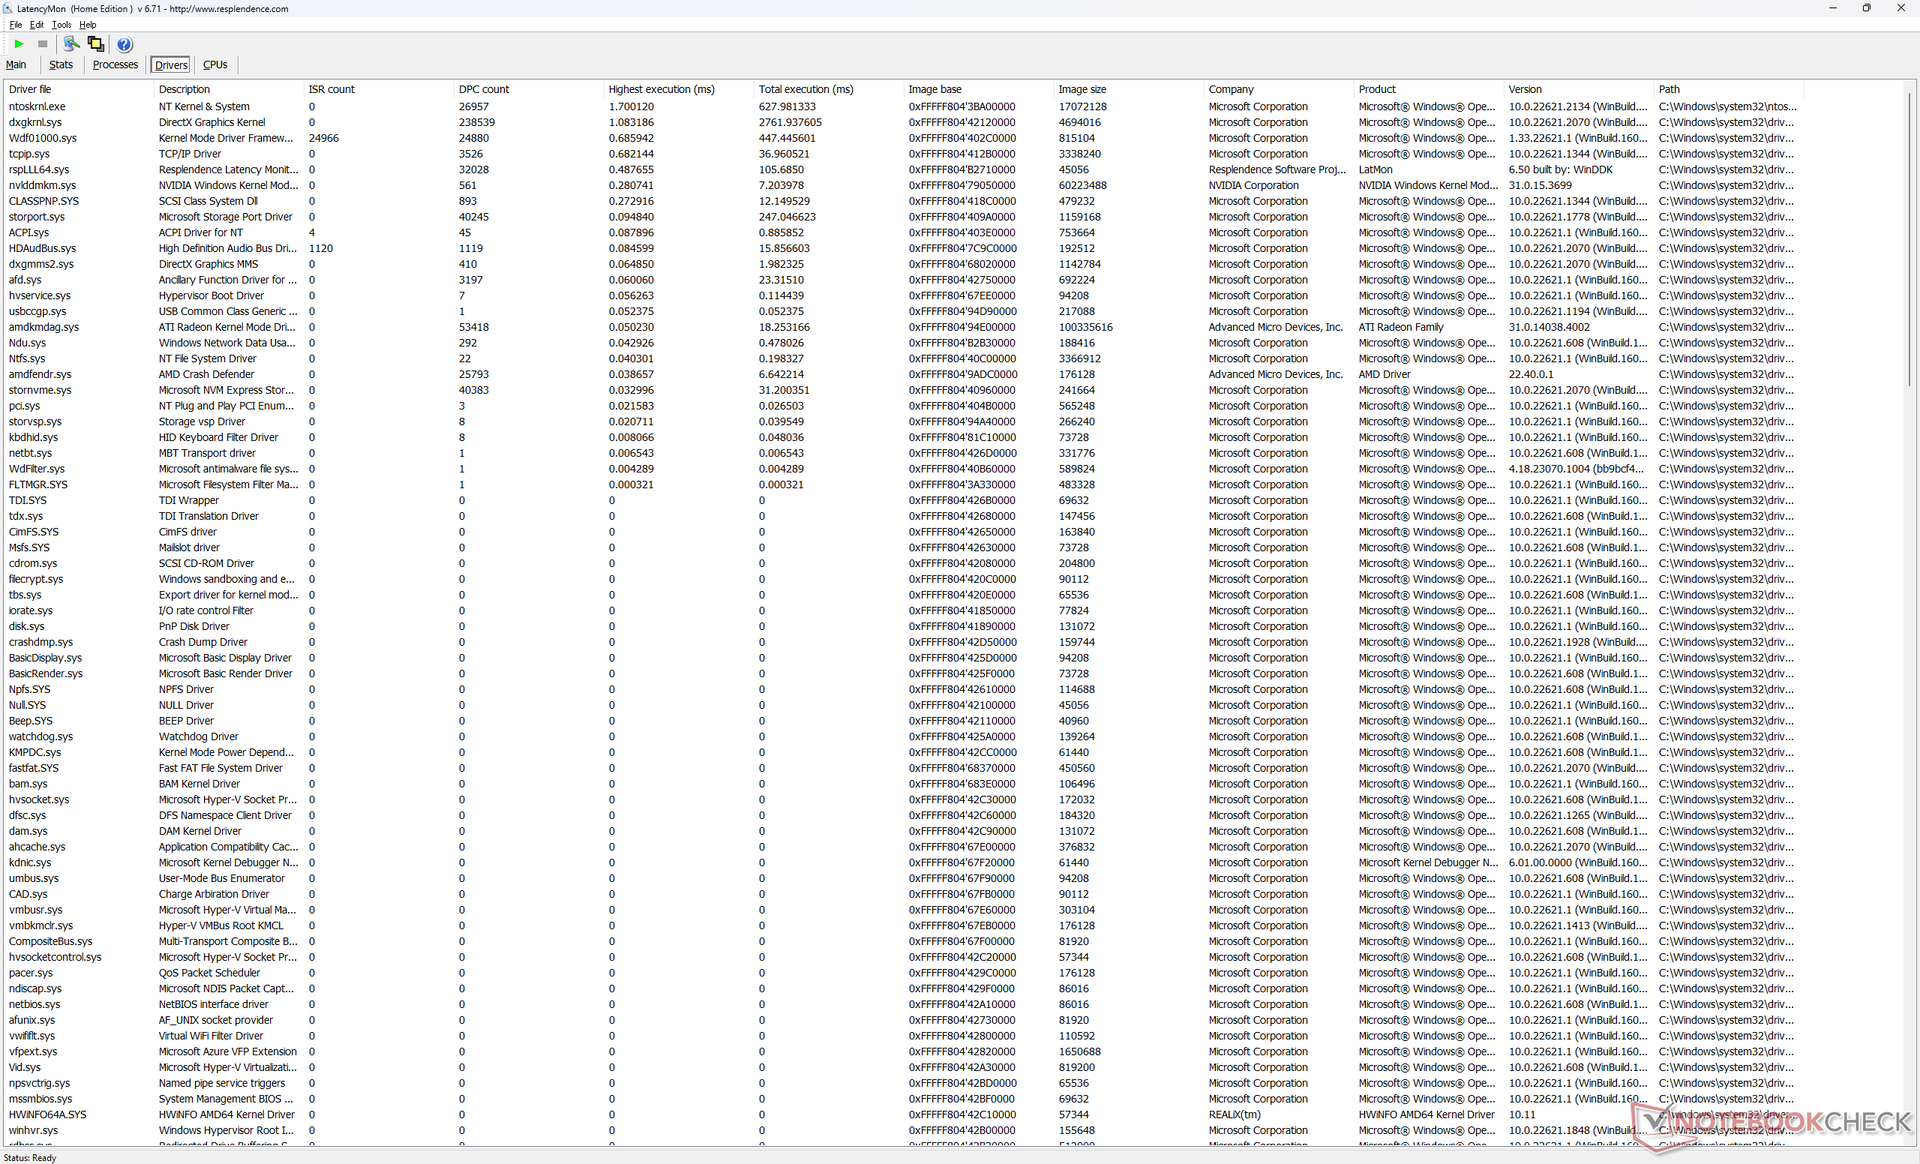
Opóźnienie DPC
LatencyMon ujawnia niewielkie problemy DPC związane z ntoskrnl.exe. Dodatkowo, odtwarzanie wideo 4K przy 60 FPS jest niedoskonałe, z 18 porzuconymi klatkami zarejestrowanymi podczas jednominutowego testu wideo, co sugeruje potencjalny błąd w akceleracji sprzętowej AMD. Wyniki nie uległy poprawie nawet po powtórzeniu testów.
| DPC Latencies / LatencyMon - interrupt to process latency (max), Web, Youtube, Prime95 | |
| Lenovo Legion Pro 7 RTX4090 | |
| Asus ROG Strix G16 G614JZ | |
| Razer Blade 16 Early 2023 | |
| Alienware m16 R1 AMD | |
| HP Omen Transcend 16 | |
| Alienware x16 R1 | |
* ... im mniej tym lepiej
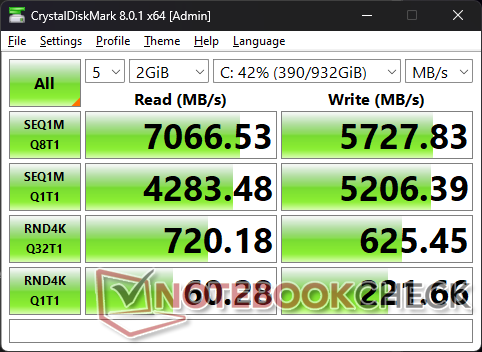
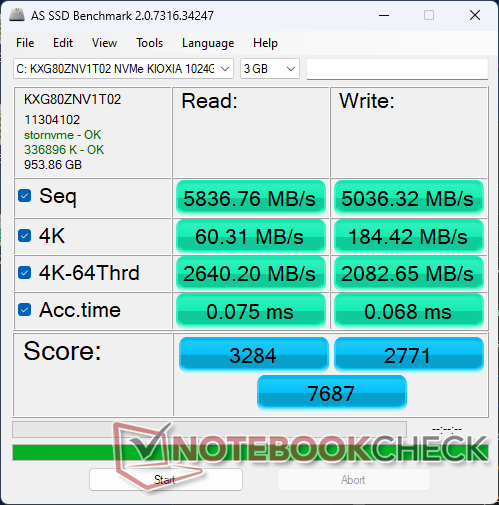
Urządzenia pamięci masowej
Nasze urządzenie jest dostarczane z wysokiej klasy dyskiem 1 TB Kioxia KXG80ZNV1T02 oferujący według producenta szybkość sekwencyjnego odczytu i zapisu danych na poziomie odpowiednio 7000 MB/s i 5600 MB/s. Dysk jest w stanie utrzymać maksymalne prędkości transferu na poziomie ponad 6500 MB/s przez dłuższy czas bez problemów z dławieniem.
Można zainstalować do trzech dysków SSD M.2, podczas gdy Alienware x16 i HP Omen 16 mogą obsługiwać tylko do dwóch dysków. Trzeci dysk musi mieć jednak długość 30 mm.

| Drive Performance rating - Percent | |
| Alienware x16 R1 | |
| Lenovo Legion Pro 7 RTX4090 | |
| Alienware m16 R1 AMD | |
| Razer Blade 16 Early 2023 | |
| HP Omen Transcend 16 | |
| Asus ROG Strix G16 G614JZ | |
* ... im mniej tym lepiej
Disk Throttling: DiskSpd Read Loop, Queue Depth 8
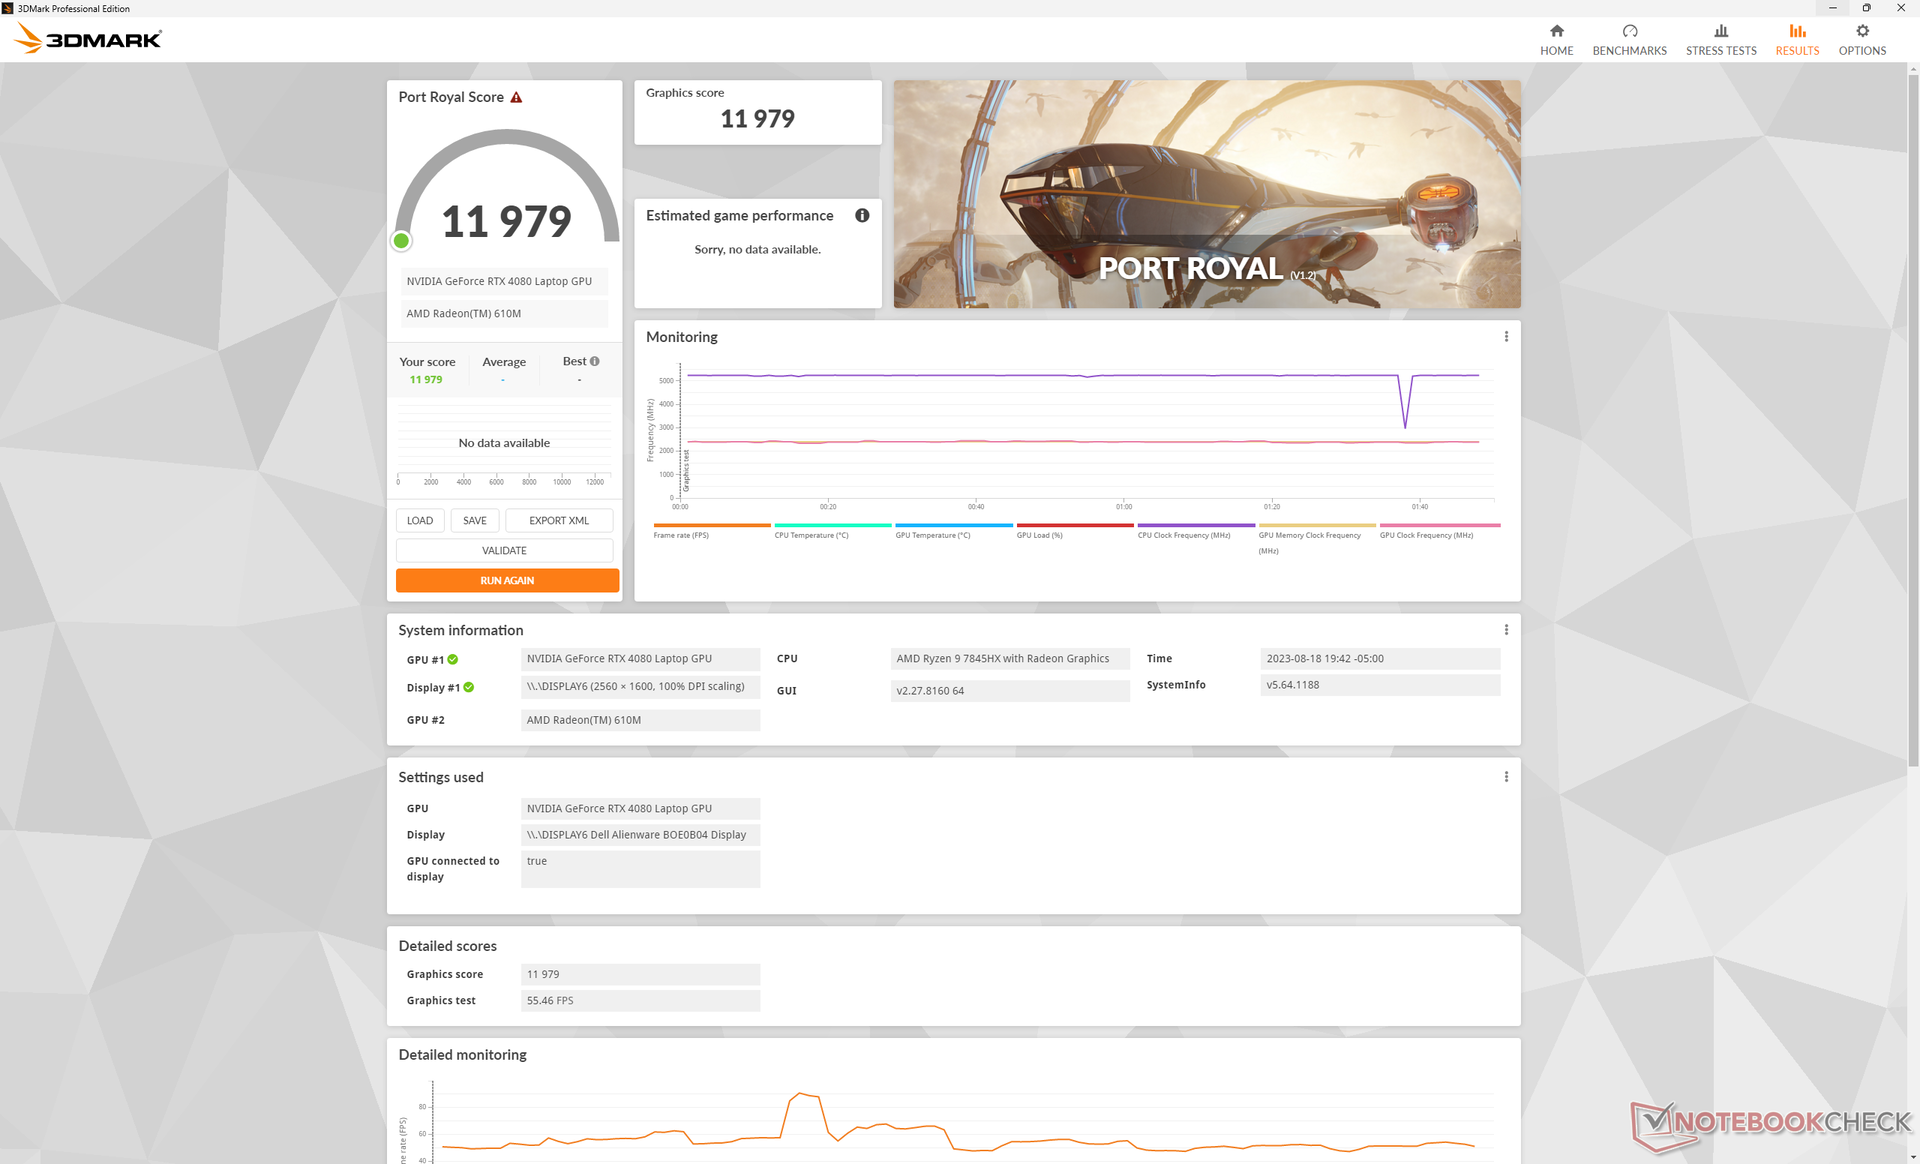
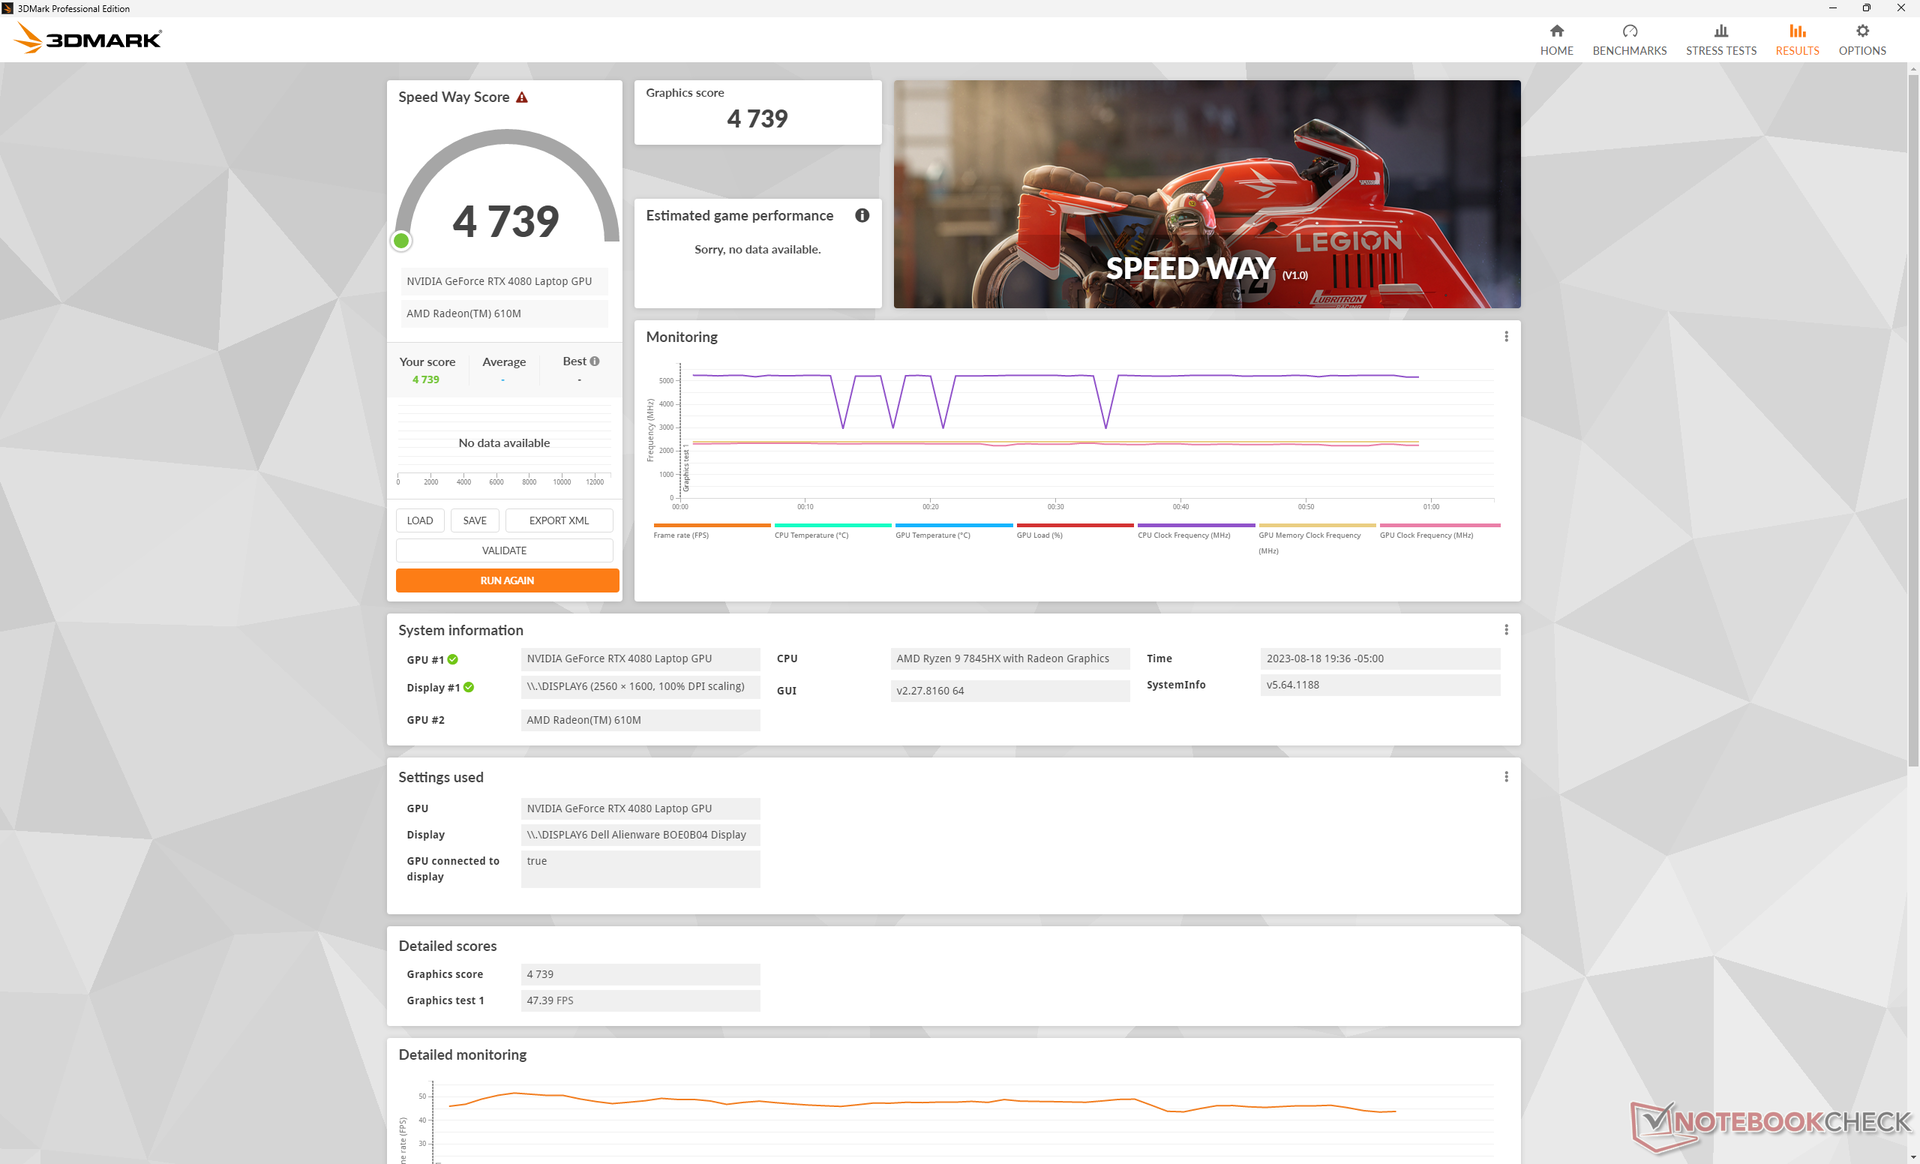
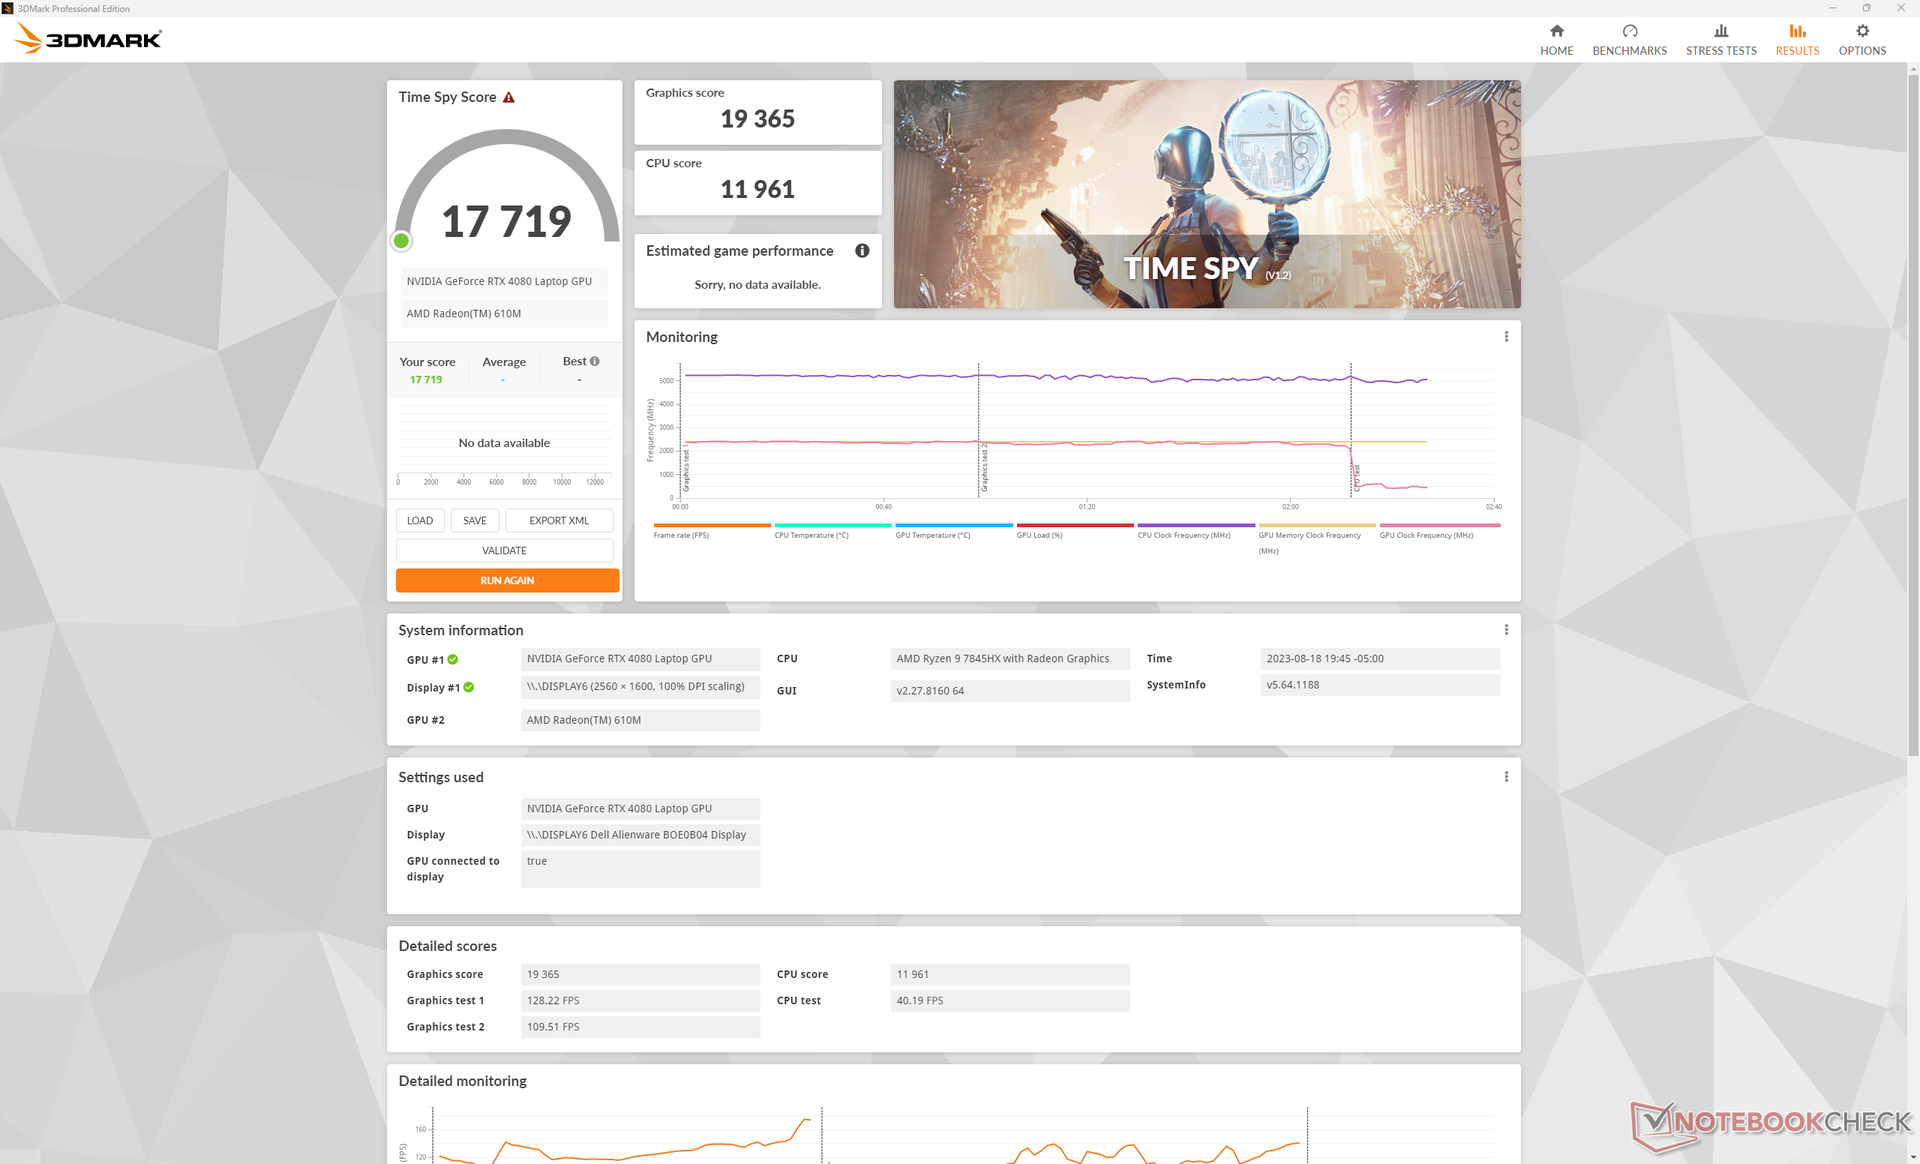
Wydajność GPU - 175 W układ graficzny TGP
Wydajność graficzna jest o około 5 do 10 procent szybsza niż w przypadku przeciętnego laptopa do gier w naszej bazie danych wyposażonego w ten sam procesor graficzny RTX 4080 ponieważ Alienware celuje w stosunkowo wysokie 175 W TGP. W rzeczywistości wydajność jest tylko o około 5 procent wolniejsza niż w przypadkuAsus Zephyrus Duo 16 działającego na RTX 4090.
Oczekuje się, że aktualizacja do SKU RTX 4090 zwiększy wydajność o zaledwie 10 procent w stosunku do naszego RTX 4080, podczas gdy obniżenie do RTX 4070 powinno zmniejszyć wydajność bardziej znacząco, nawet o 30 do 40 procent w oparciu o nasz czas z HP Omen Transcend 16. Entuzjaści powinni zatem rozważyć co najmniej jednostki SKU z RTX 4080.
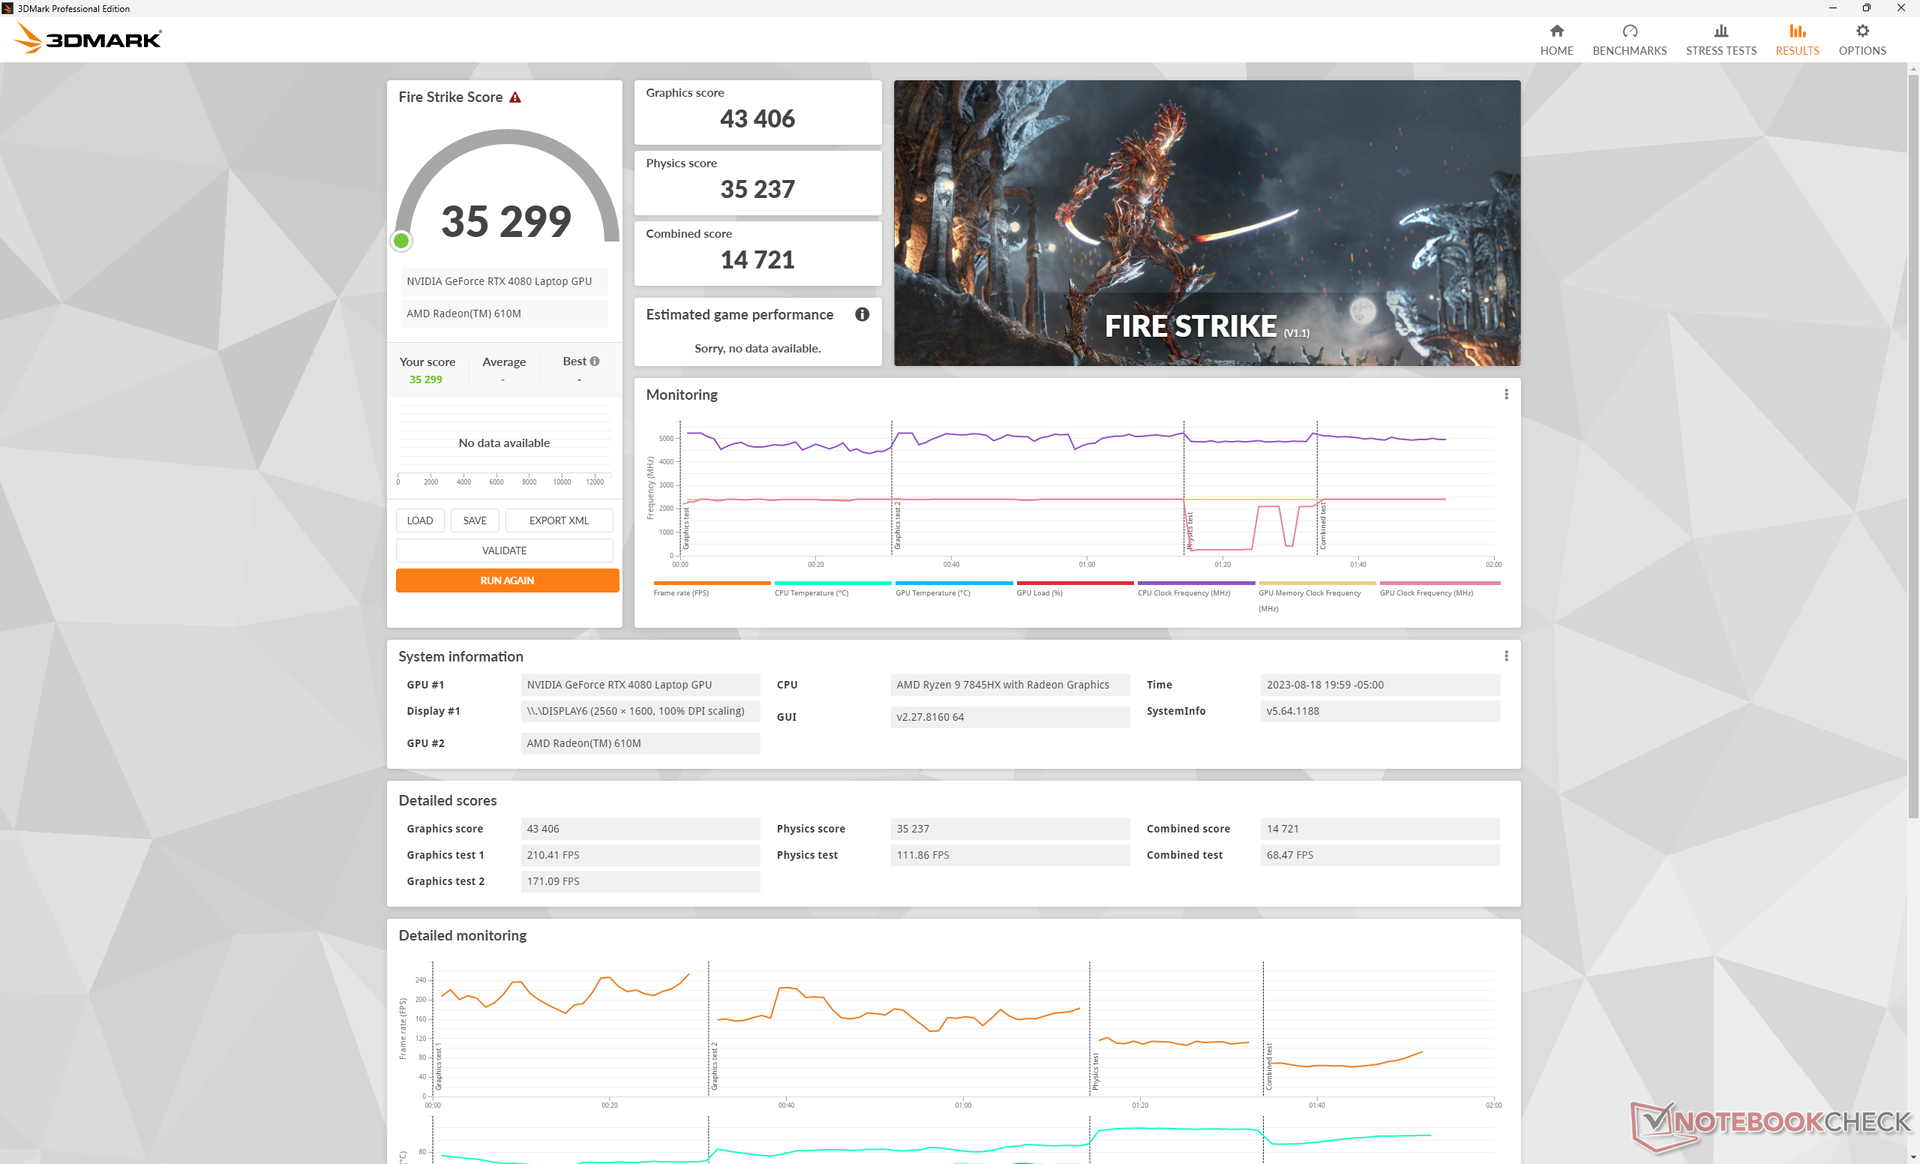
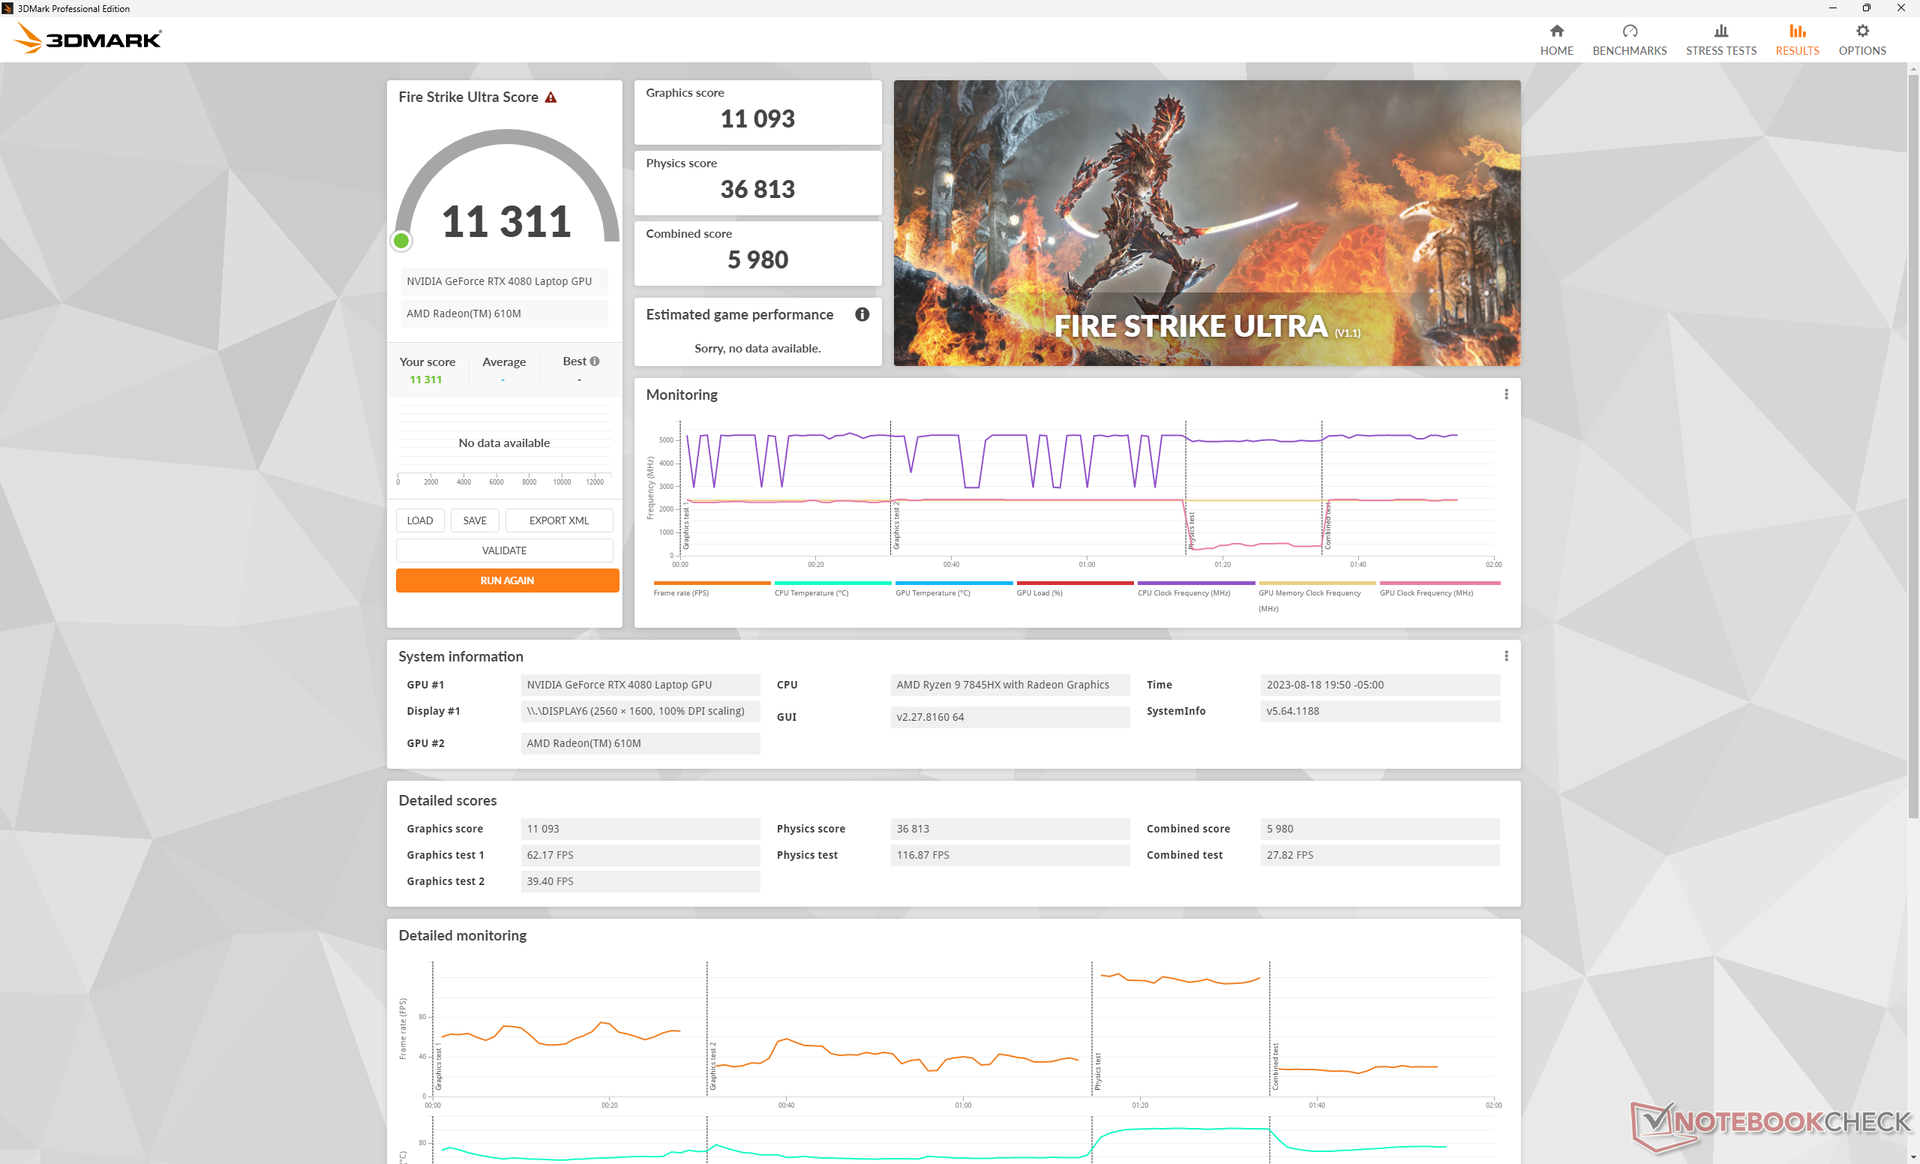
Co ciekawe, istnieją tylko niewielkie różnice w wydajności między trybami Balanced, Performance i Overdrive, o czym świadczą wyniki Fire Strike w poniższej tabeli. Jest to ważne, ponieważ tryby te różnią się znacznie pod względem hałasu wentylatora.
| Profil zasilania | Wynik grafiki | Wynik fizyki | Łączny wynik |
| Moc baterii | 22290 (-50%) | 30178 (-17%) | 9109 (-35%) |
| Tryb zrównoważony | 43406 (-3%) | 35237 (-4%) | 14721 (+5%) |
| Tryb wydajności | 44306 (-1%) | 36106 (-1%) | 13682 (-3%) |
| Tryb Overdrive | 44782 | 36557 | 14045 |

| 3DMark Performance rating - Percent | |
| NVIDIA GeForce RTX 4080 Founders Edition | |
| Asus Zephyrus Duo 16 GX650PY-NM006W -1! | |
| Alienware x16 R1 | |
| Alienware m16 R1 AMD | |
| Przeciętny NVIDIA GeForce RTX 4080 Laptop GPU | |
| Lenovo Legion 7 16IAX7-82TD004SGE -2! | |
| Lenovo Legion 7 16ARHA7 -1! | |
| Lenovo Legion 5 Pro 16ARH7H RTX 3070 Ti -1! | |
| HP Omen Transcend 16 | |
| Asus TUF Gaming A16 FA617 -2! | |
| Lenovo Legion Slim 5 16APH8 | |
| Lenovo Legion C7 15IMH05 82EH0030GE -1! | |
| 3DMark 11 Performance | 40681 pkt. | |
| 3DMark Fire Strike Score | 35751 pkt. | |
| 3DMark Time Spy Score | 17719 pkt. | |
Pomoc | ||
* ... im mniej tym lepiej
Wydajność w grach
Wydajność w grach jest doskonała, a wyniki są od 5 do 10 procent szybsze niż w przypadku innych laptopów z tym samym procesorem graficznym RTX 4080, zgodnie z przewidywaniami 3DMark. Korzyści obejmują również niższe ustawienia graficzne, co może pomóc graczom, którzy wolą maksymalizować liczbę klatek na sekundę zamiast rozdzielczości. Mobilny RTX 4080 jest wystarczająco wydajny, aby zagrać w dowolny aktualny tytuł w natywnej rozdzielczości QHD+ przy ponad 60 FPS, mimo że jest znacznie słabszy niż rTX 4080 dla komputerów stacjonarnych.
Stabilność wydajności jest niestety niedoskonała. Podczas bezczynności na Witcher 3, na przykład, liczba klatek na sekundę czasami zacinała się do 70 FPS, po czym wracała do zakresu 150+ FPS, jak pokazano na poniższym wykresie. Sugeruje to słabą optymalizację zasobów tła, które mogą zakłócać działanie aplikacji.
| Far Cry 5 | |
| 1920x1080 High Preset AA:T | |
| NVIDIA GeForce RTX 4080 Founders Edition | |
| Lenovo Legion 7 16IAX7-82TD004SGE | |
| Przeciętny NVIDIA GeForce RTX 4080 Laptop GPU (122 - 179, n=10) | |
| Alienware m16 R1 AMD | |
| Lenovo Legion C7 15IMH05 82EH0030GE | |
| Asus TUF Gaming A16 FA617 | |
| 1920x1080 Ultra Preset AA:T | |
| NVIDIA GeForce RTX 4080 Founders Edition | |
| Lenovo Legion 7 16IAX7-82TD004SGE | |
| Przeciętny NVIDIA GeForce RTX 4080 Laptop GPU (114 - 162, n=11) | |
| Alienware m16 R1 AMD | |
| Lenovo Legion C7 15IMH05 82EH0030GE | |
| Asus TUF Gaming A16 FA617 | |
| 2560x1440 Ultra Preset AA:T | |
| NVIDIA GeForce RTX 4080 Founders Edition | |
| Przeciętny NVIDIA GeForce RTX 4080 Laptop GPU (114 - 157, n=10) | |
| Alienware m16 R1 AMD | |
| Lenovo Legion 7 16IAX7-82TD004SGE | |
| 3840x2160 Ultra Preset AA:T | |
| NVIDIA GeForce RTX 4080 Founders Edition | |
| Alienware m16 R1 AMD | |
| Przeciętny NVIDIA GeForce RTX 4080 Laptop GPU (71 - 97, n=6) | |
Witcher 3 FPS Chart
| low | med. | high | ultra | QHD | 4K | |
|---|---|---|---|---|---|---|
| The Witcher 3 (2015) | 573.1 | 452.2 | 349.3 | 169.7 | 121.5 | |
| Dota 2 Reborn (2015) | 229 | 191.8 | 180.4 | 164.7 | 161 | |
| Final Fantasy XV Benchmark (2018) | 230 | 218 | 167.6 | 131.6 | 76.1 | |
| X-Plane 11.11 (2018) | 171.1 | 149 | 113.1 | 95 | ||
| Far Cry 5 (2018) | 160 | 145 | 141 | 136 | 131 | 91 |
| Strange Brigade (2018) | 572 | 461 | 400 | 357 | 248 | 123.1 |
| Cyberpunk 2077 1.6 (2022) | 154 | 151.4 | 137.5 | 128.3 | 84.5 | 39.7 |
| Tiny Tina's Wonderlands (2022) | 317.1 | 265.9 | 201.1 | 160.8 | 112.9 | 59 |
| F1 22 (2022) | 323 | 296 | 285 | 124.2 | 78.1 | 39.5 |
| Returnal (2023) | 128 | 122 | 117 | 107 | 80 | 44 |
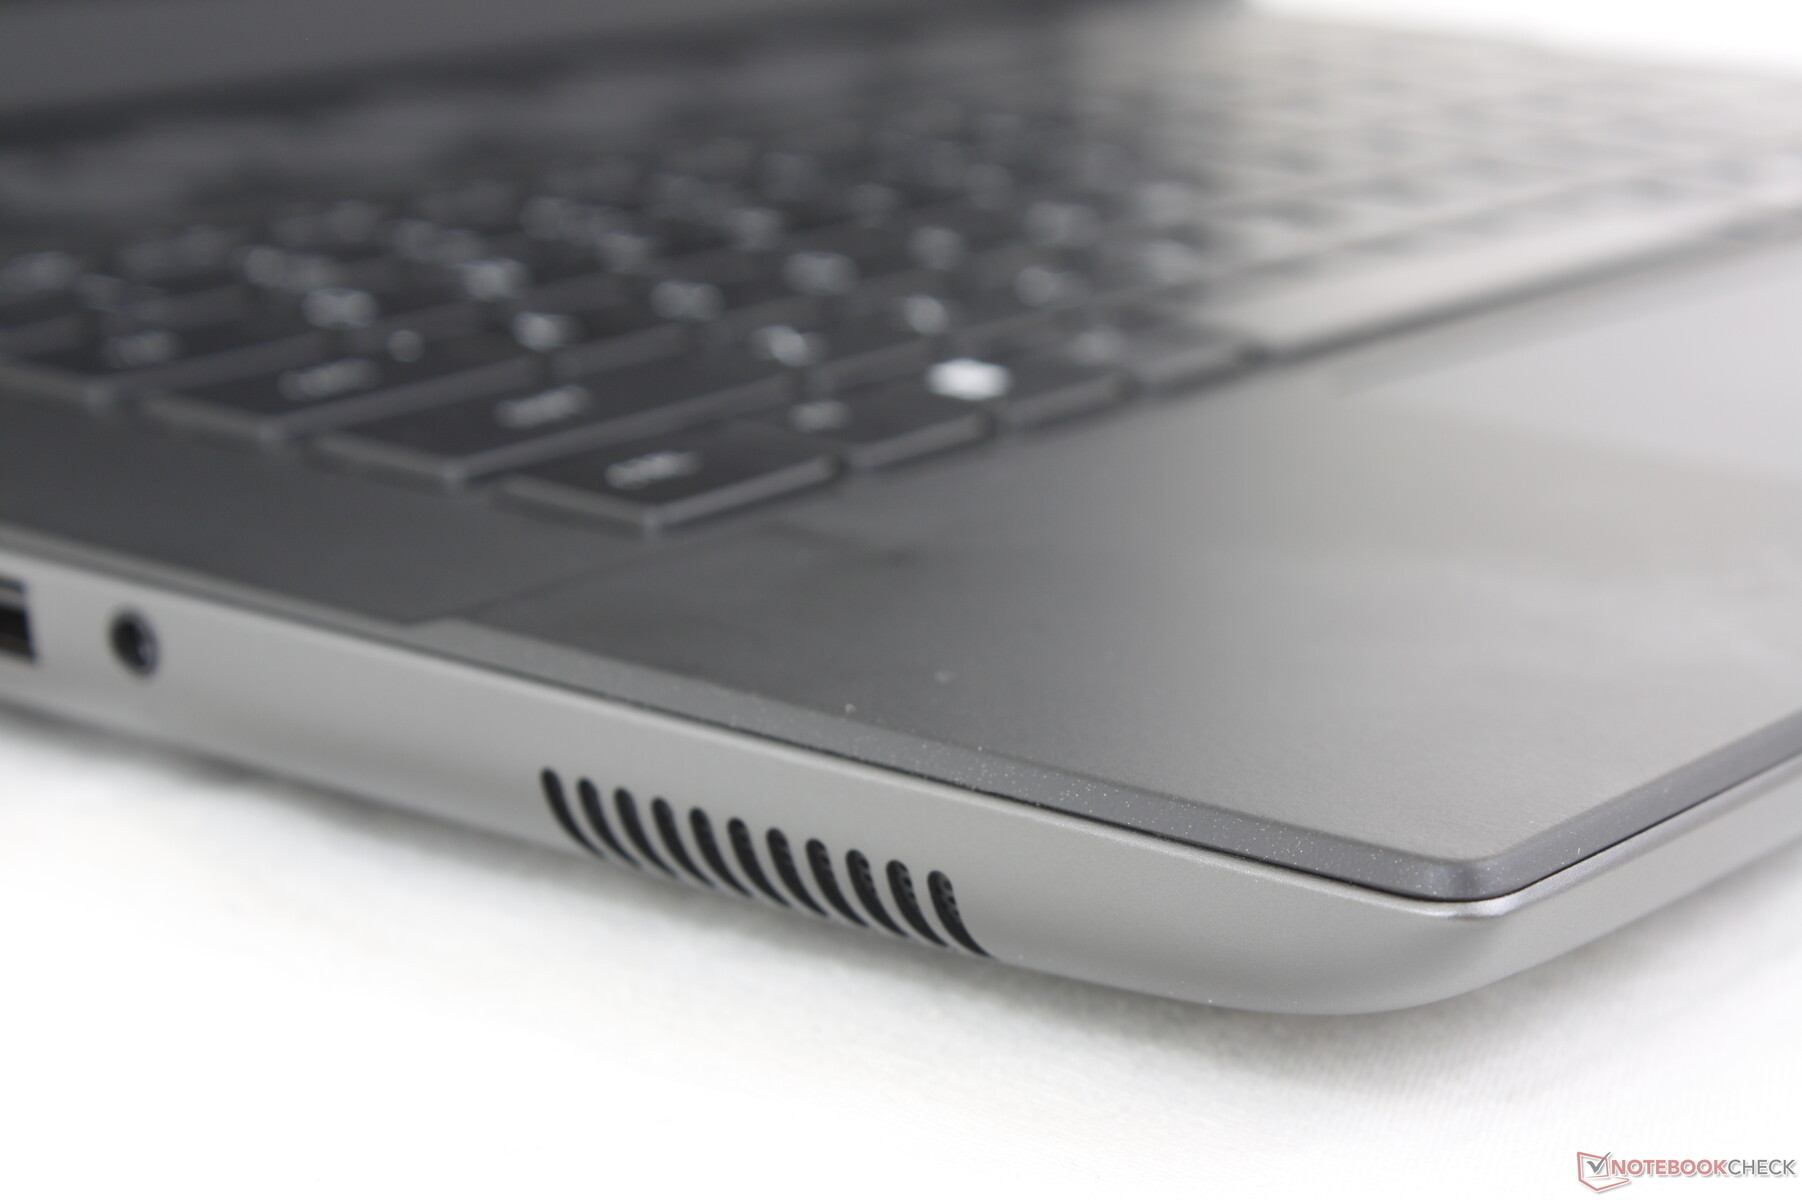
Emisje
Hałas systemowy - duże różnice między profilami zasilania
Wentylatory są prawie zawsze aktywne na poziomie nieco poniżej 30 dB(A) na cichym tle 23 dB(A). Choć słyszalny, hałas jest przynajmniej stały, ponieważ wentylatory nie pulsują głośniej podczas uruchamiania niewymagających obciążeń, takich jak przeglądarki lub wideo.
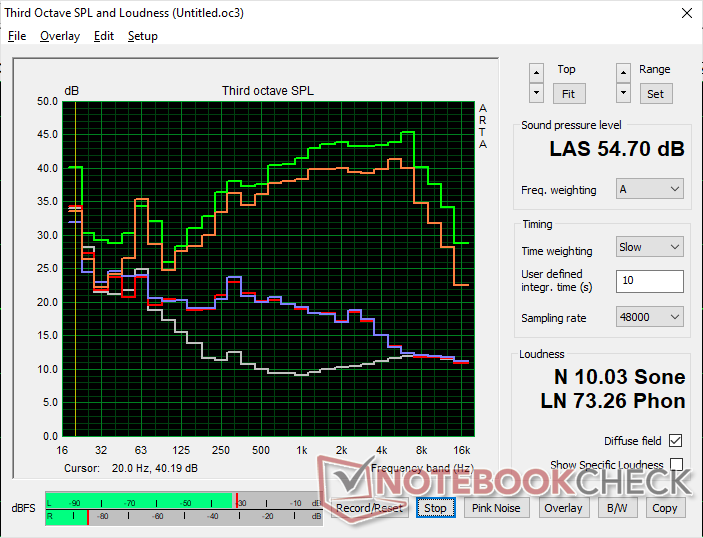
Hałas wentylatorów podczas grania w trybach Balanced, Performance lub Overdrive może wynosić odpowiednio 49,4 dB(A), 51 dB(A) i 54,7 dB(A). Ponieważ spadek wydajności w trybie zrównoważonym jest tak minimalny, jak wspomniano powyżej, użytkownicy mogą rozważyć grę w trybie zrównoważonym zamiast w trybie wydajności lub Overdrive, aby uzyskać zauważalnie cichszy hałas wentylatora. Inne 16-calowe laptopy do gier, takie jak Razer Blade 16 lub Omen Transcend 16 mają tendencję do stabilizowania się w głośniejszym zakresie od niskich do średnich 50 dB(A) podczas uruchamiania gier.
Hałas
| luz |
| 22.9 / 29.7 / 29.7 dB |
| obciążenie |
| 29.8 / 54.7 dB |
 | ||
30 dB cichy 40 dB(A) słyszalny 50 dB(A) irytujący |
||
min: | ||
| Alienware m16 R1 AMD GeForce RTX 4080 Laptop GPU, R9 7845HX, Kioxia XG8 KXG80ZNV1T02 | Alienware x16 R1 GeForce RTX 4080 Laptop GPU, i9-13900HK, SK hynix PC801 HFS001TEJ9X101N | HP Omen Transcend 16 GeForce RTX 4070 Laptop GPU, i9-13900HX, SK hynix PC801 HFS002TEJ9X101N | Lenovo Legion Pro 7 RTX4090 GeForce RTX 4090 Laptop GPU, i9-13900HX, Samsung PM9A1 MZVL21T0HCLR | Asus ROG Strix G16 G614JZ GeForce RTX 4080 Laptop GPU, i9-13980HX, WD PC SN560 SDDPNQE-1T00 | Razer Blade 16 Early 2023 GeForce RTX 4080 Laptop GPU, i9-13950HX, SSSTC CA6-8D1024 | |
|---|---|---|---|---|---|---|
| Noise | 0% | -11% | -17% | -9% | 4% | |
| wyłączone / środowisko * (dB) | 22.9 | 22.7 1% | 22.9 -0% | 25 -9% | 25 -9% | 23 -0% |
| Idle Minimum * (dB) | 22.9 | 23.1 -1% | 29.1 -27% | 28 -22% | 26 -14% | 23 -0% |
| Idle Average * (dB) | 29.7 | 25.8 13% | 29.1 2% | 30 -1% | 28 6% | 23 23% |
| Idle Maximum * (dB) | 29.7 | 25.8 13% | 29.1 2% | 38 -28% | 30 -1% | 23.6 21% |
| Load Average * (dB) | 29.8 | 39.3 -32% | 45.7 -53% | 48 -61% | 48 -61% | 39 -31% |
| Witcher 3 ultra * (dB) | 54.7 | 49.9 9% | 54.3 1% | 53 3% | 49 10% | 51.6 6% |
| Load Maximum * (dB) | 54.7 | 54.8 -0% | 54.3 1% | 55 -1% | 52 5% | 51.3 6% |
* ... im mniej tym lepiej
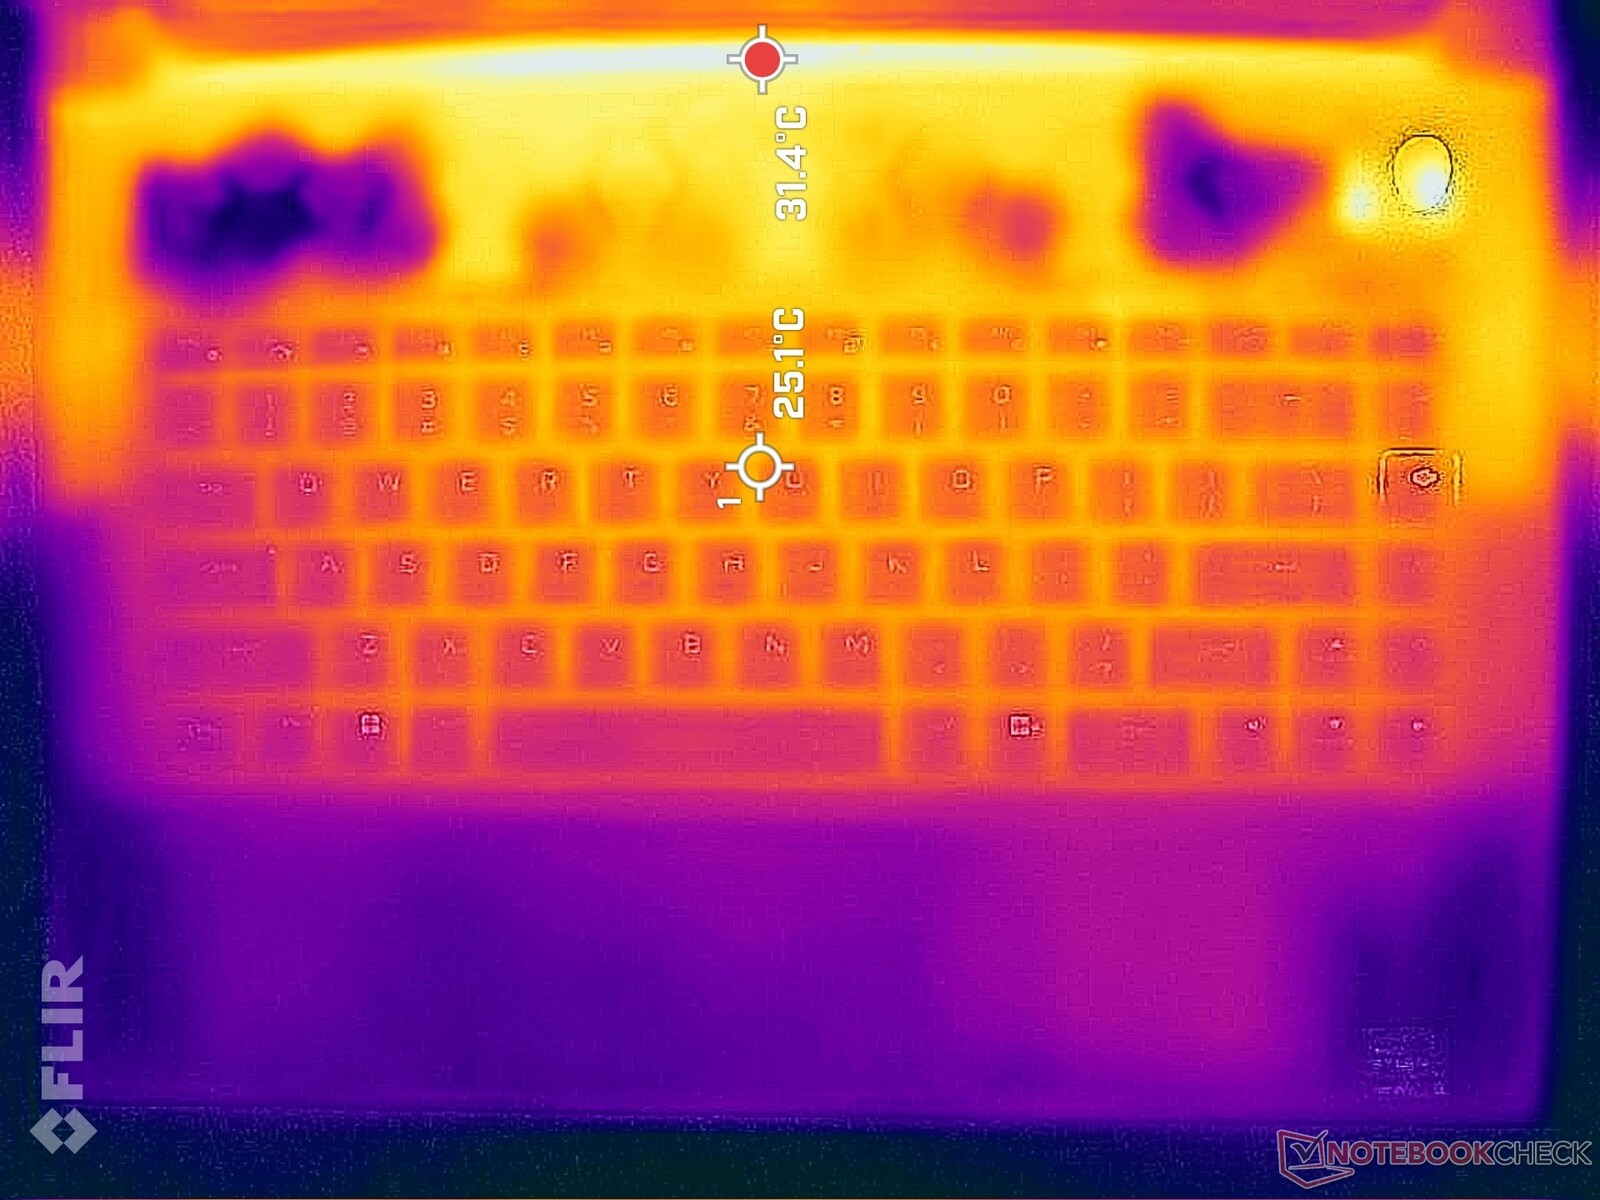
Temperatura
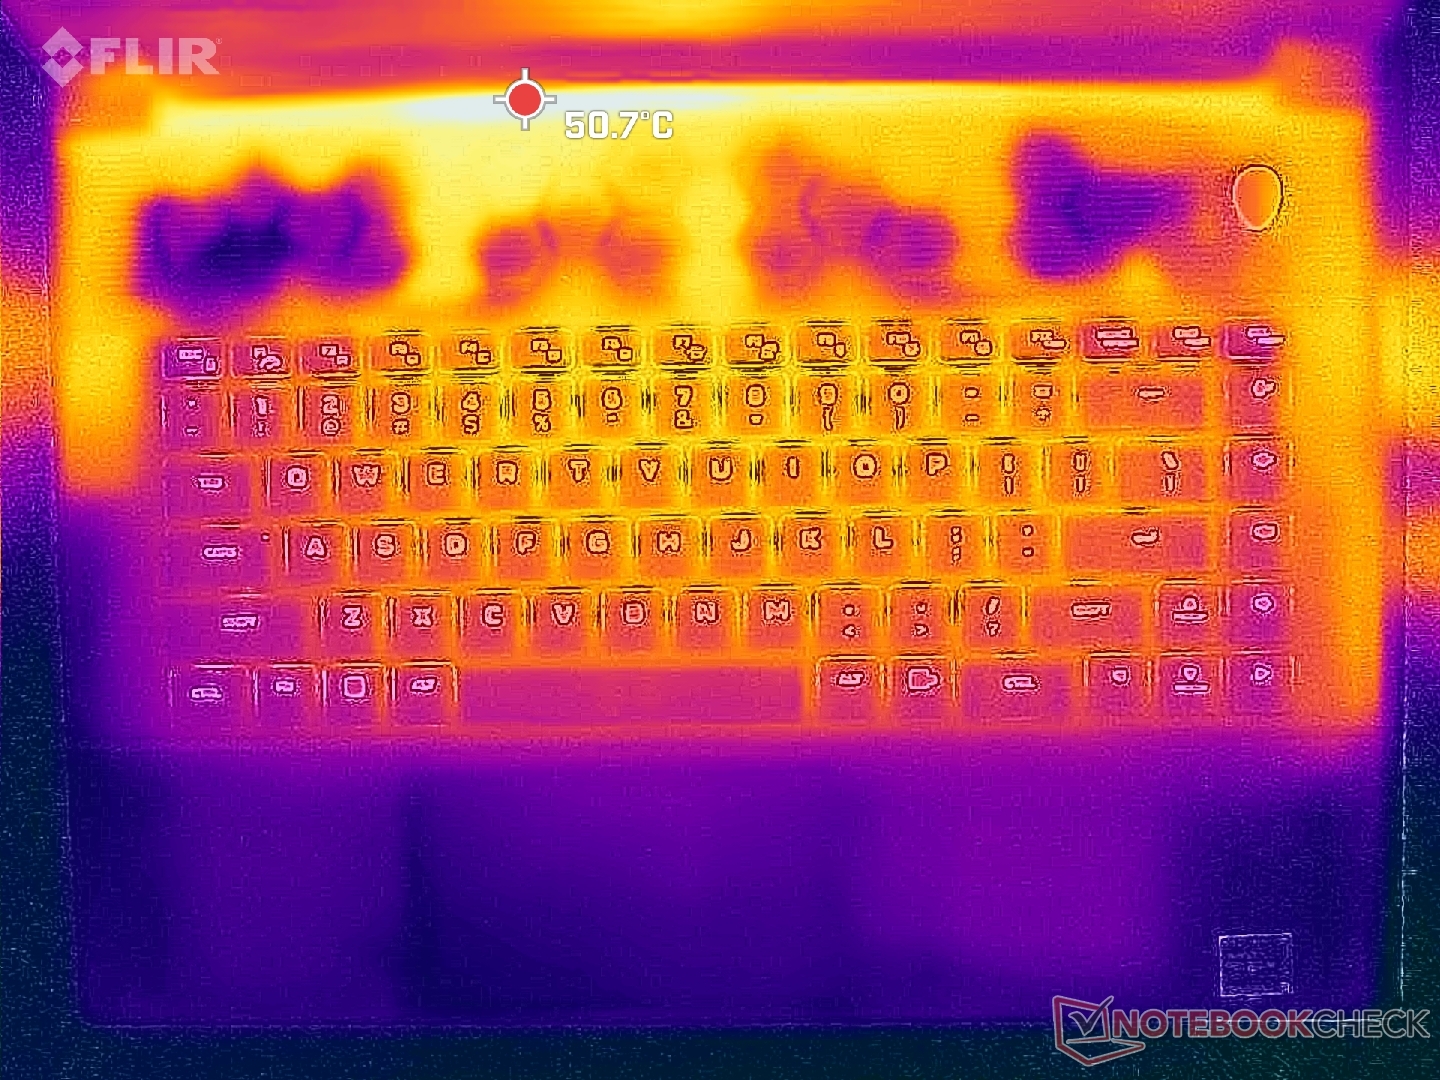
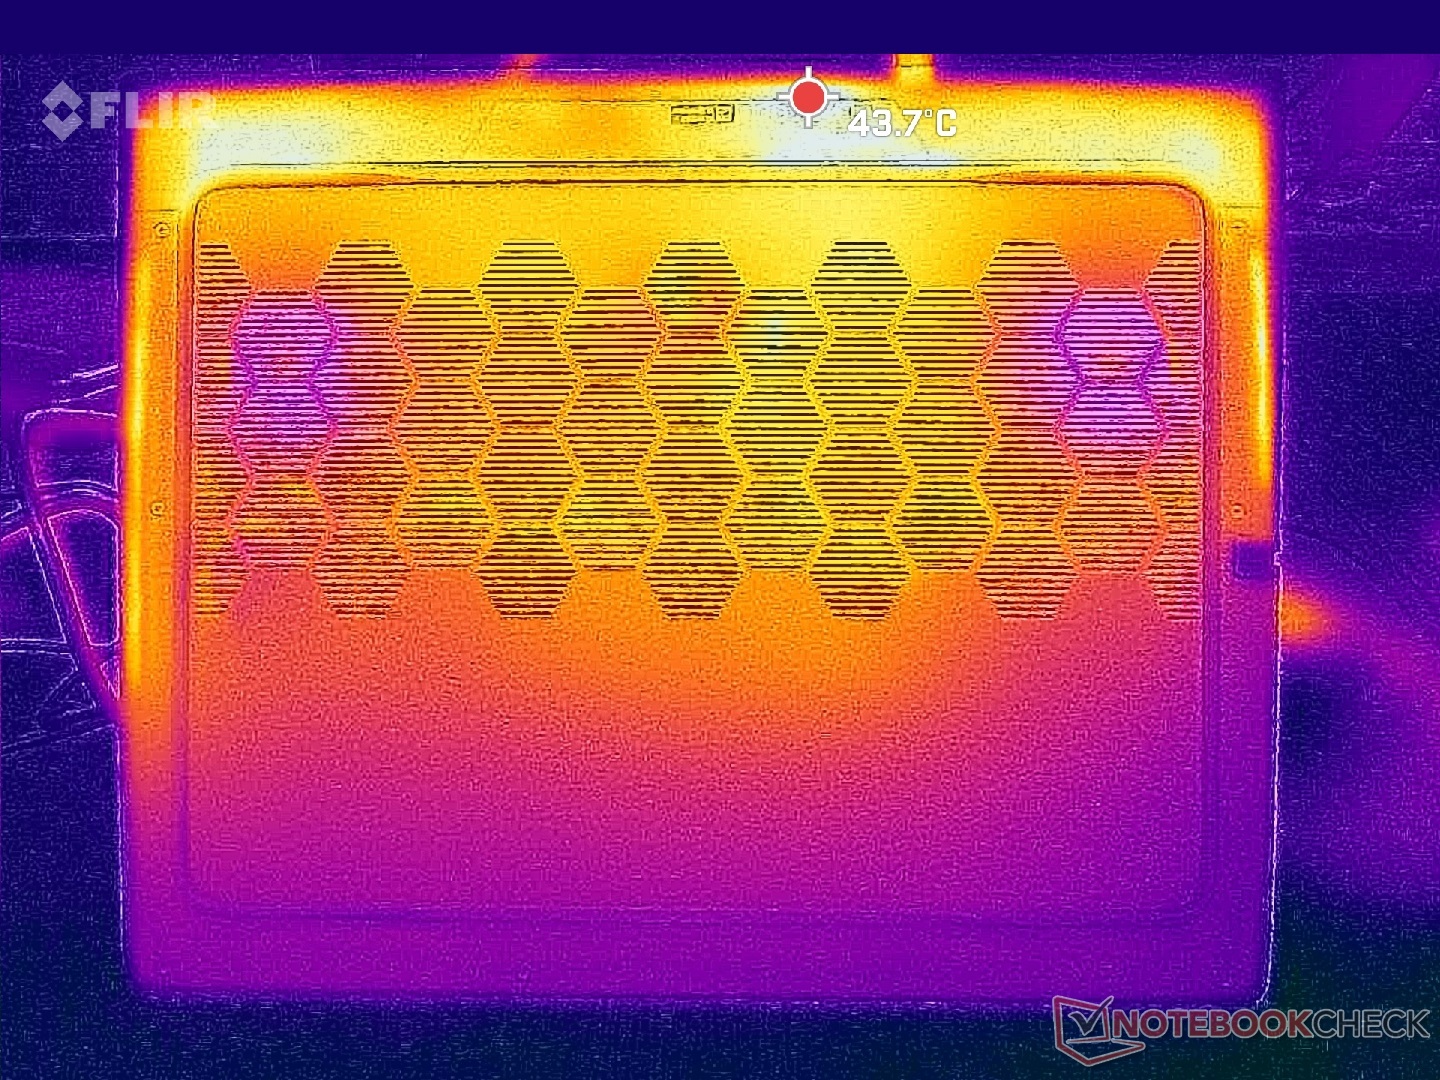
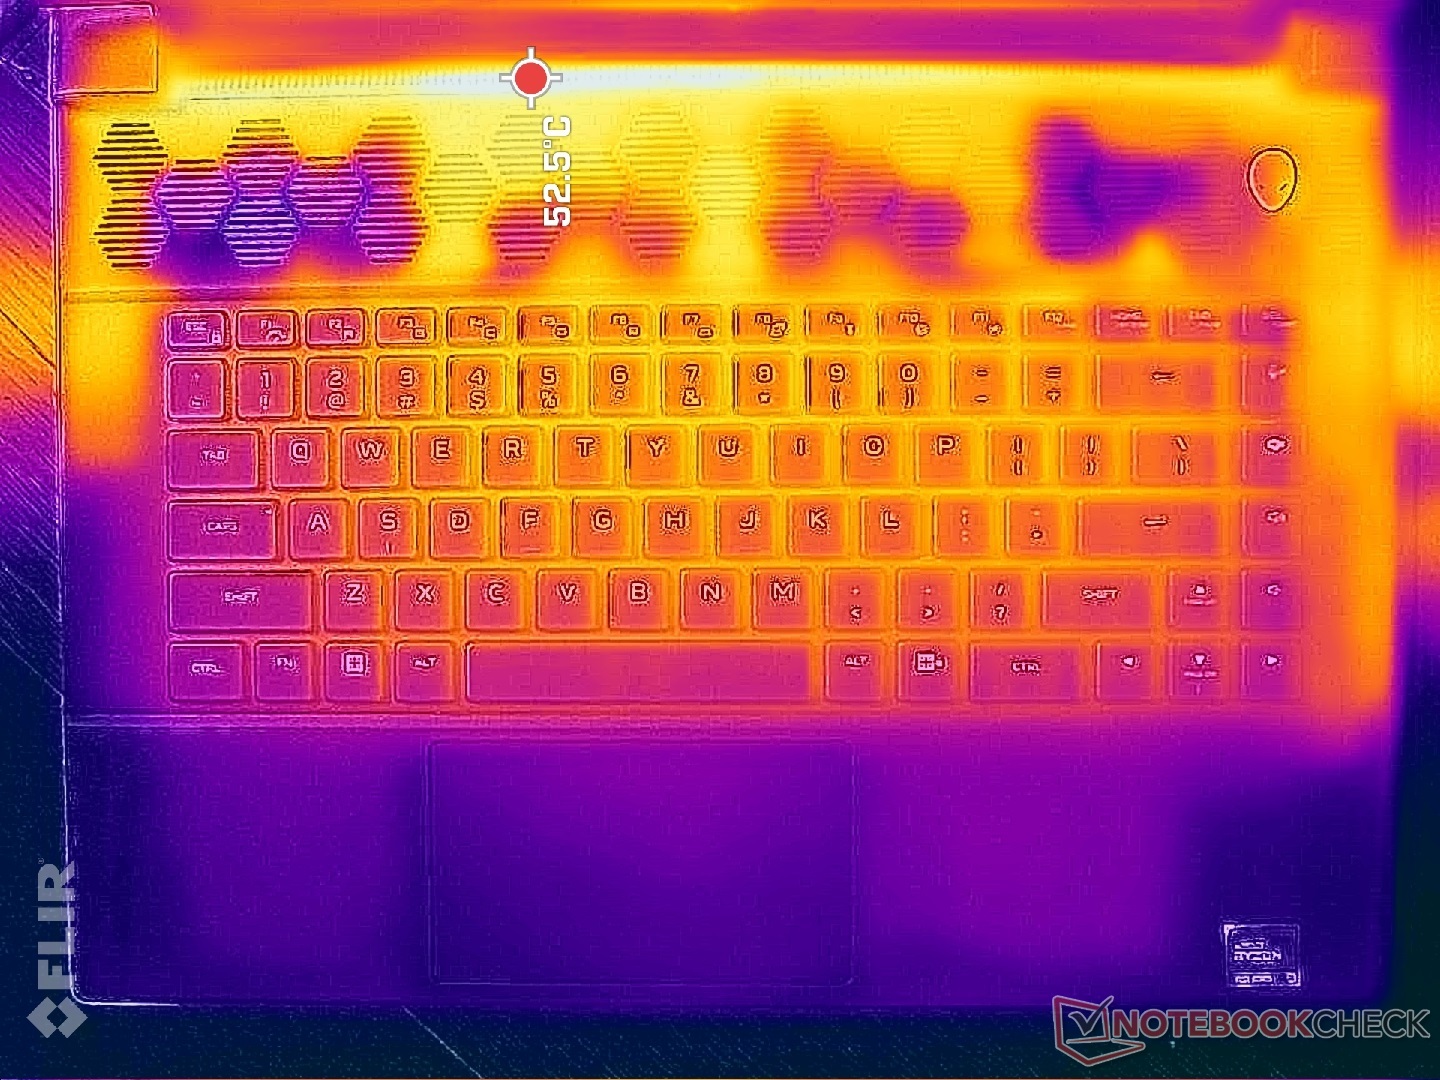
Temperatury powierzchni mogą być bardzo wysokie i dochodzić do 50 C wzdłuż tylnej części. Na szczęście podpórki pod nadgarstki i obszary klawiatury pozostają chłodniejsze w dotyku, co zapewnia większy komfort, częściowo dzięki rozległym kratkom wentylacyjnym. Na przykład środek klawiatury osiąga 42 C podczas grania w porównaniu do 46 C w Lenovo Legion Pro 7 16.
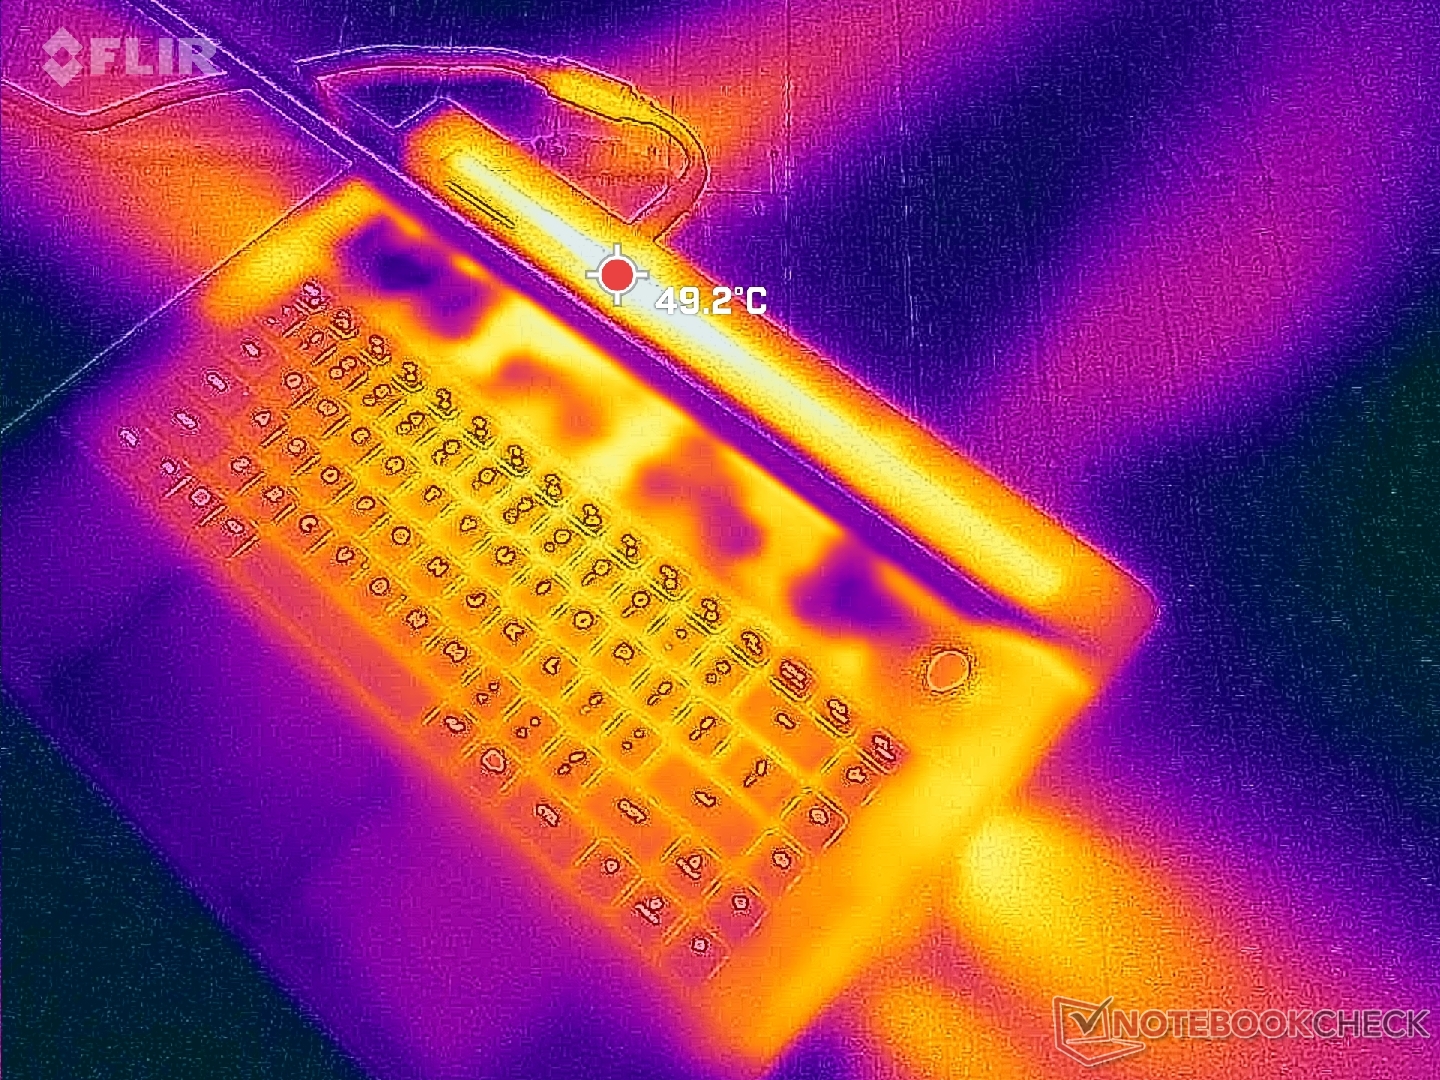
(-) Maksymalna temperatura w górnej części wynosi 48 °C / 118 F, w porównaniu do średniej 40.4 °C / 105 F , począwszy od 21.2 do 68.8 °C dla klasy Gaming.
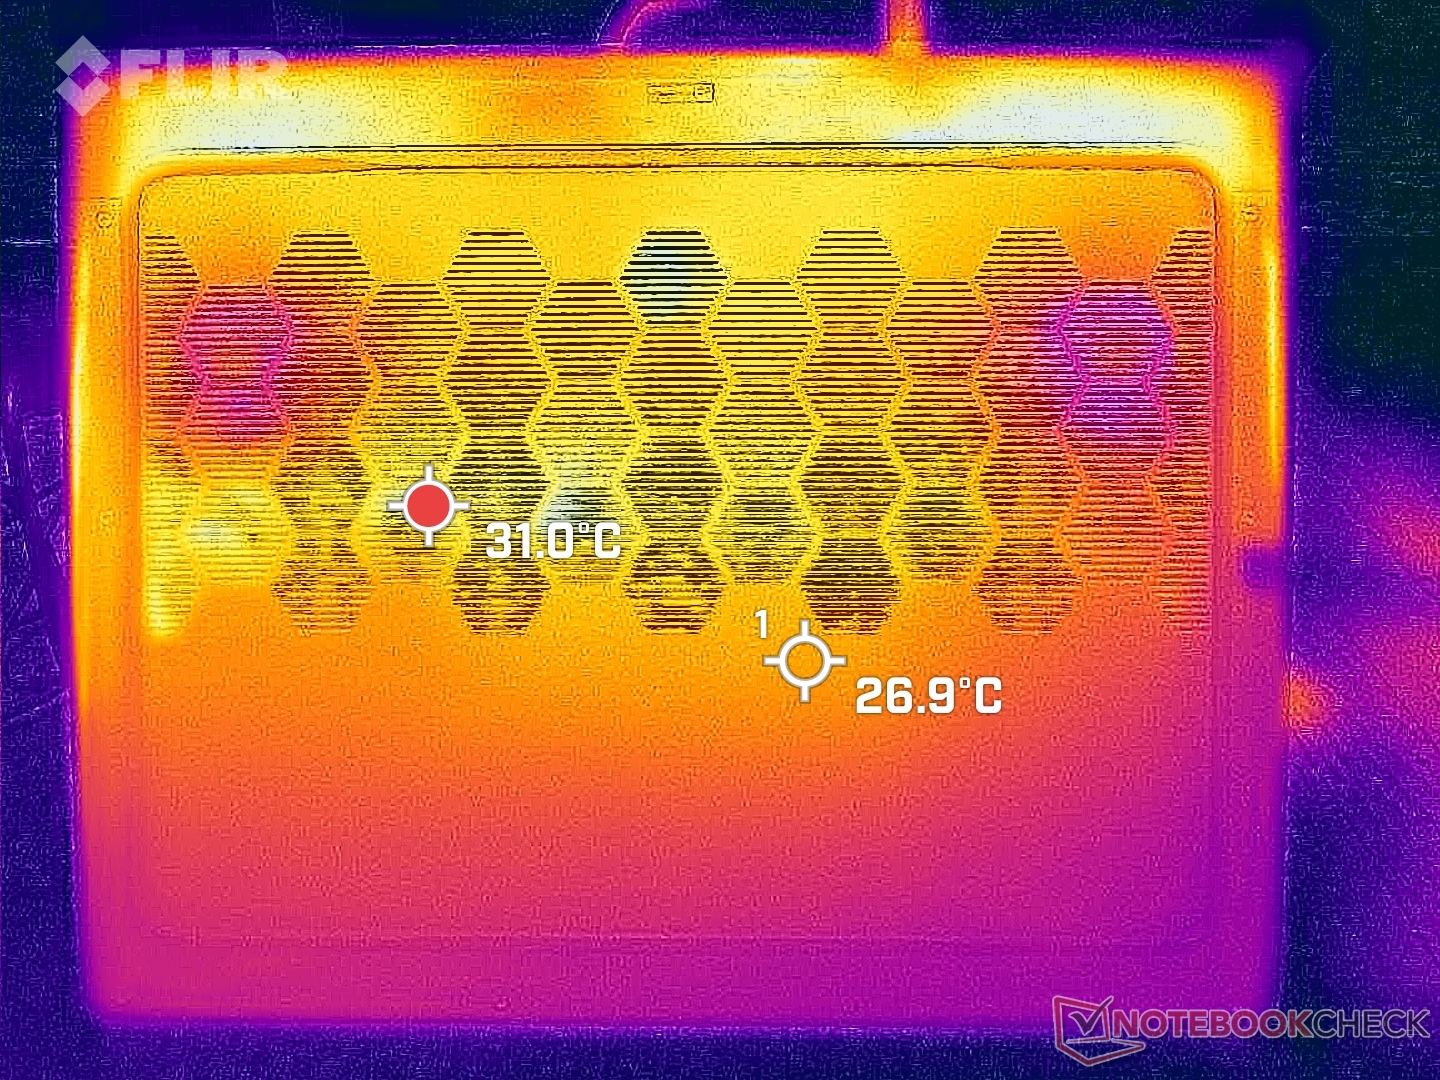
(+) Dno nagrzewa się maksymalnie do 39 °C / 102 F, w porównaniu do średniej 43.2 °C / 110 F
(±) W stanie bezczynności średnia temperatura górnej części wynosi 32.2 °C / 90 F, w porównaniu ze średnią temperaturą urządzenia wynoszącą 33.9 °C / ### class_avg_f### F.
(-) Podczas gry w Wiedźmina 3 średnia temperatura górnej części wynosi 38.1 °C / 101 F, w porównaniu do średniej temperatury urządzenia wynoszącej 33.9 °C / ## #class_avg_f### F.
(+) Podpórki pod nadgarstki i touchpad są chłodniejsze niż temperatura skóry i maksymalnie 30.4 °C / 86.7 F i dlatego są chłodne w dotyku.
(±) Średnia temperatura obszaru podparcia dłoni w podobnych urządzeniach wynosiła 28.8 °C / 83.8 F (-1.6 °C / -2.9 F).

| Alienware m16 R1 AMD AMD Ryzen 9 7845HX, NVIDIA GeForce RTX 4080 Laptop GPU | Alienware x16 R1 Intel Core i9-13900HK, NVIDIA GeForce RTX 4080 Laptop GPU | HP Omen Transcend 16 Intel Core i9-13900HX, NVIDIA GeForce RTX 4070 Laptop GPU | Lenovo Legion Pro 7 RTX4090 Intel Core i9-13900HX, NVIDIA GeForce RTX 4090 Laptop GPU | Asus ROG Strix G16 G614JZ Intel Core i9-13980HX, NVIDIA GeForce RTX 4080 Laptop GPU | Razer Blade 16 Early 2023 Intel Core i9-13950HX, NVIDIA GeForce RTX 4080 Laptop GPU | |
|---|---|---|---|---|---|---|
| Heat | -5% | 1% | -10% | -6% | 12% | |
| Maximum Upper Side * (°C) | 48 | 47.2 2% | 47.4 1% | 53 -10% | 54 -13% | 40 17% |
| Maximum Bottom * (°C) | 39 | 47.8 -23% | 54.4 -39% | 59 -51% | 55 -41% | 37.6 4% |
| Idle Upper Side * (°C) | 37 | 36.8 1% | 28.4 23% | 34 8% | 29 22% | 32.4 12% |
| Idle Bottom * (°C) | 36.2 | 35.8 1% | 29.2 19% | 32 12% | 33 9% | 31.4 13% |
* ... im mniej tym lepiej
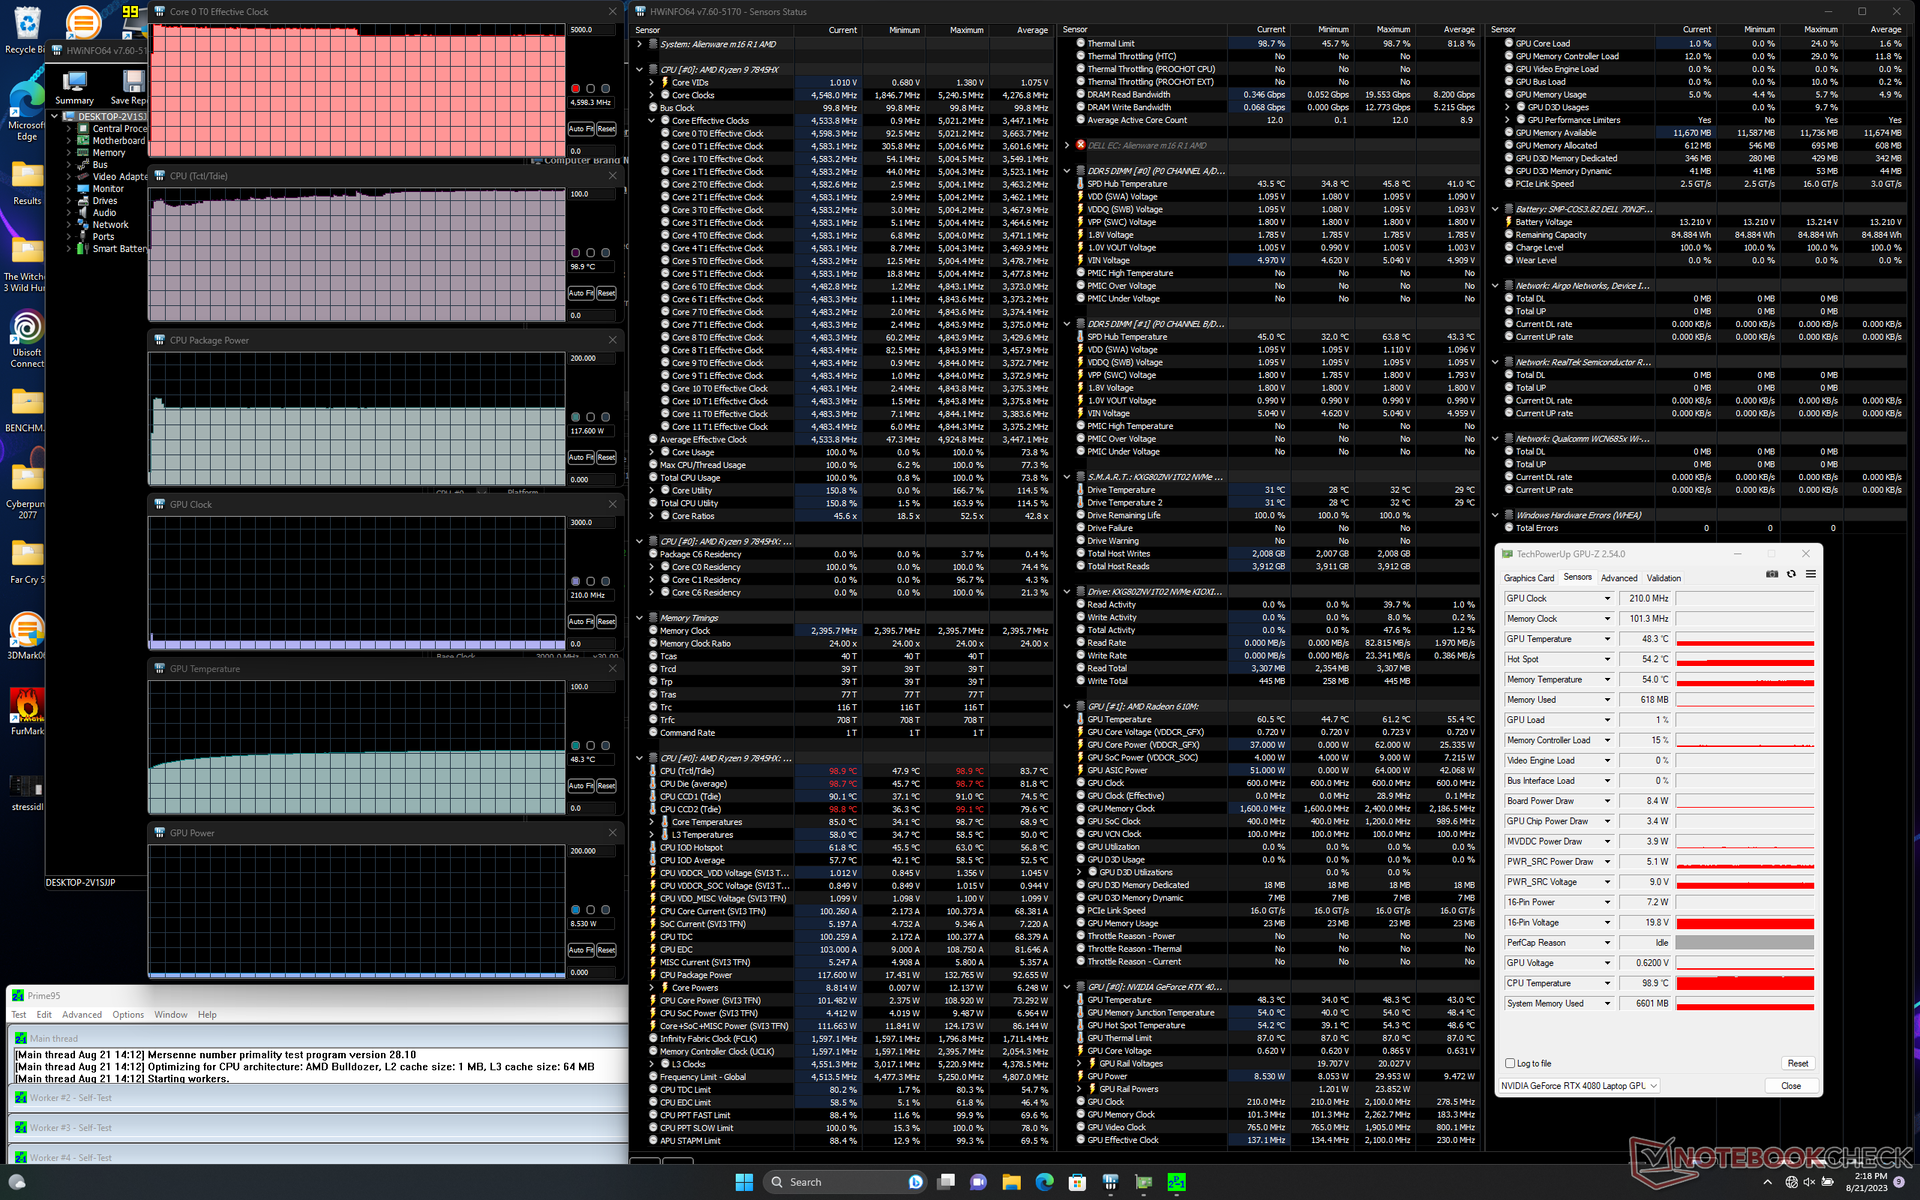
Test warunków skrajnych
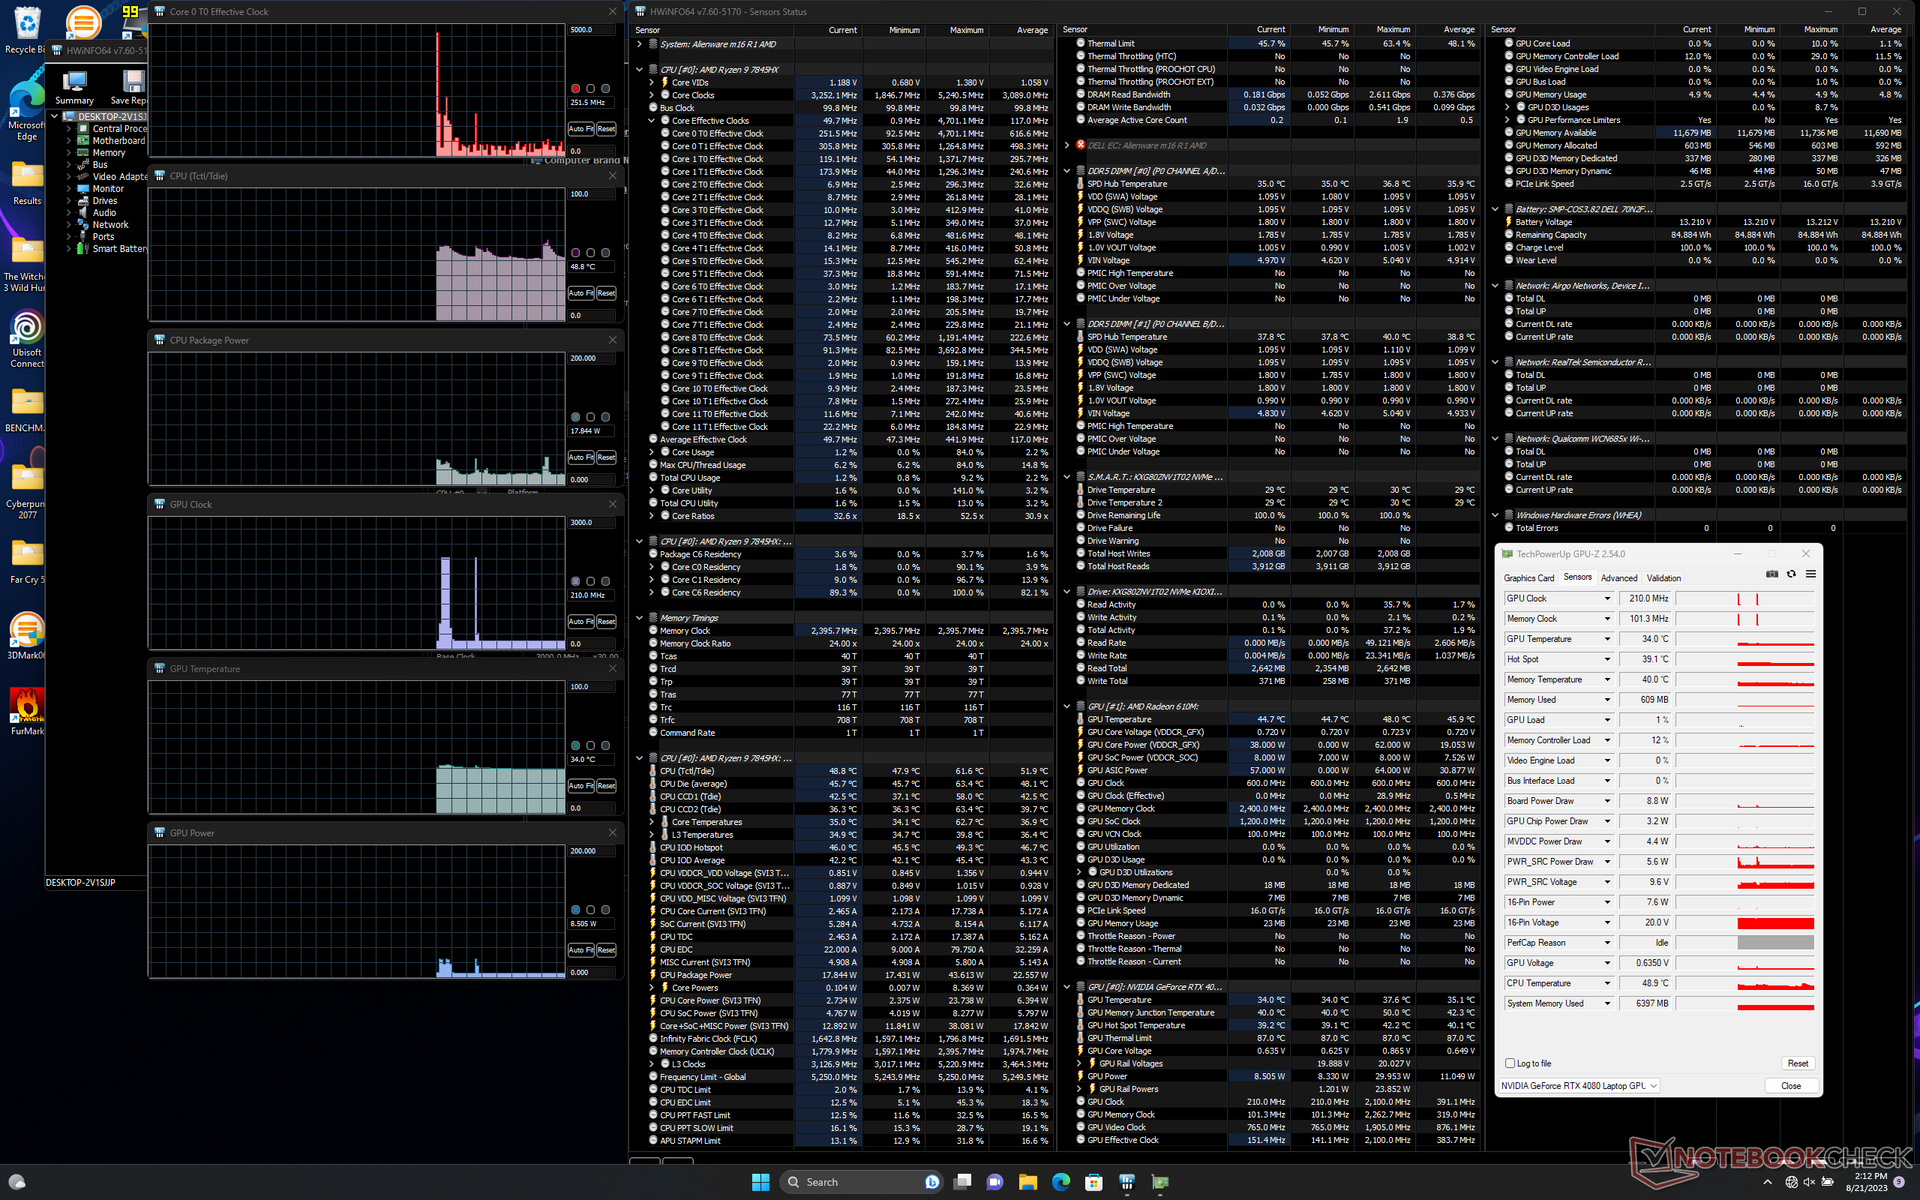
Uruchomienie Prime95 powoduje, że procesor przyspiesza do 5 GHz, 132 W i ciepłych 99 C przez kilka sekund, zanim ostatecznie ustabilizuje się na poziomie 4,6 GHz, 118 W i 85 C.
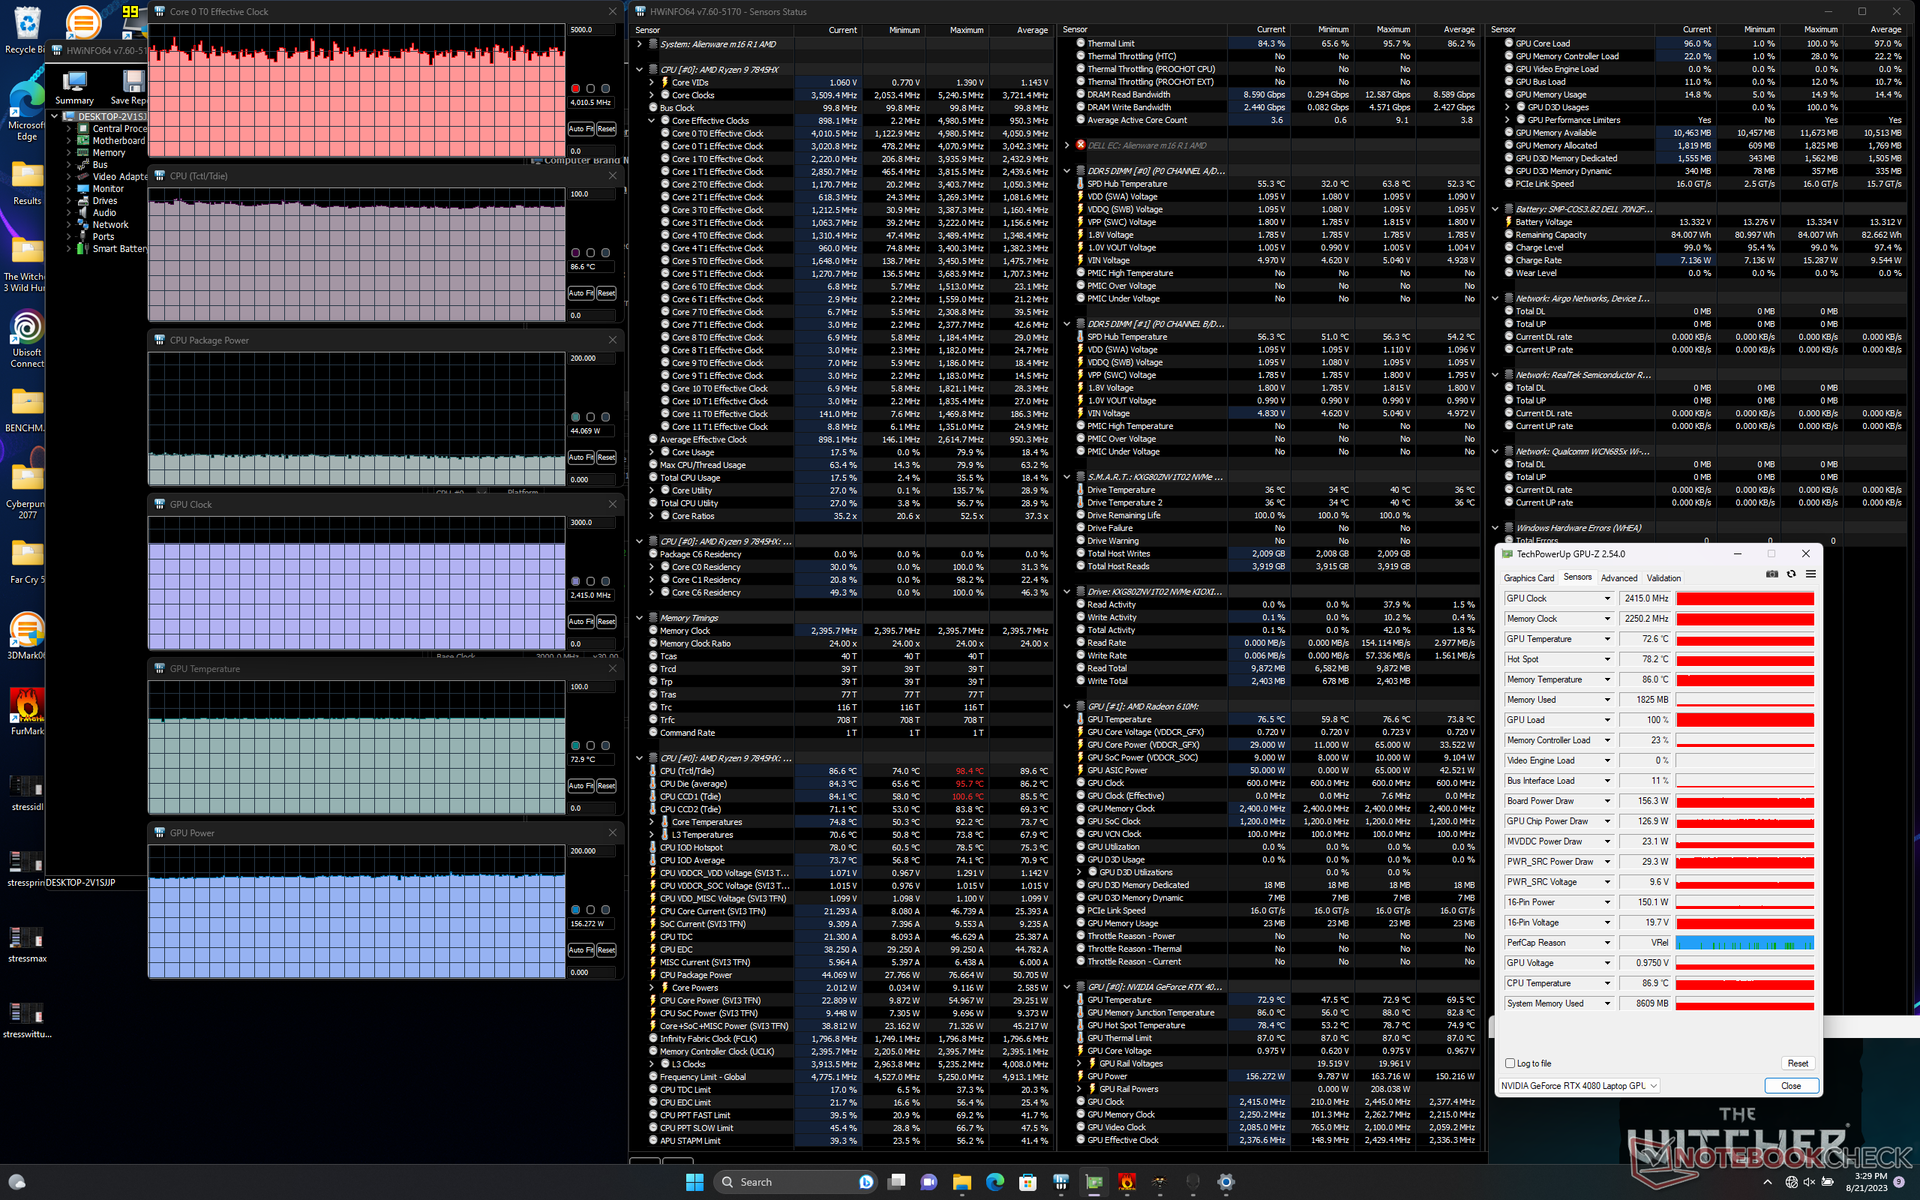
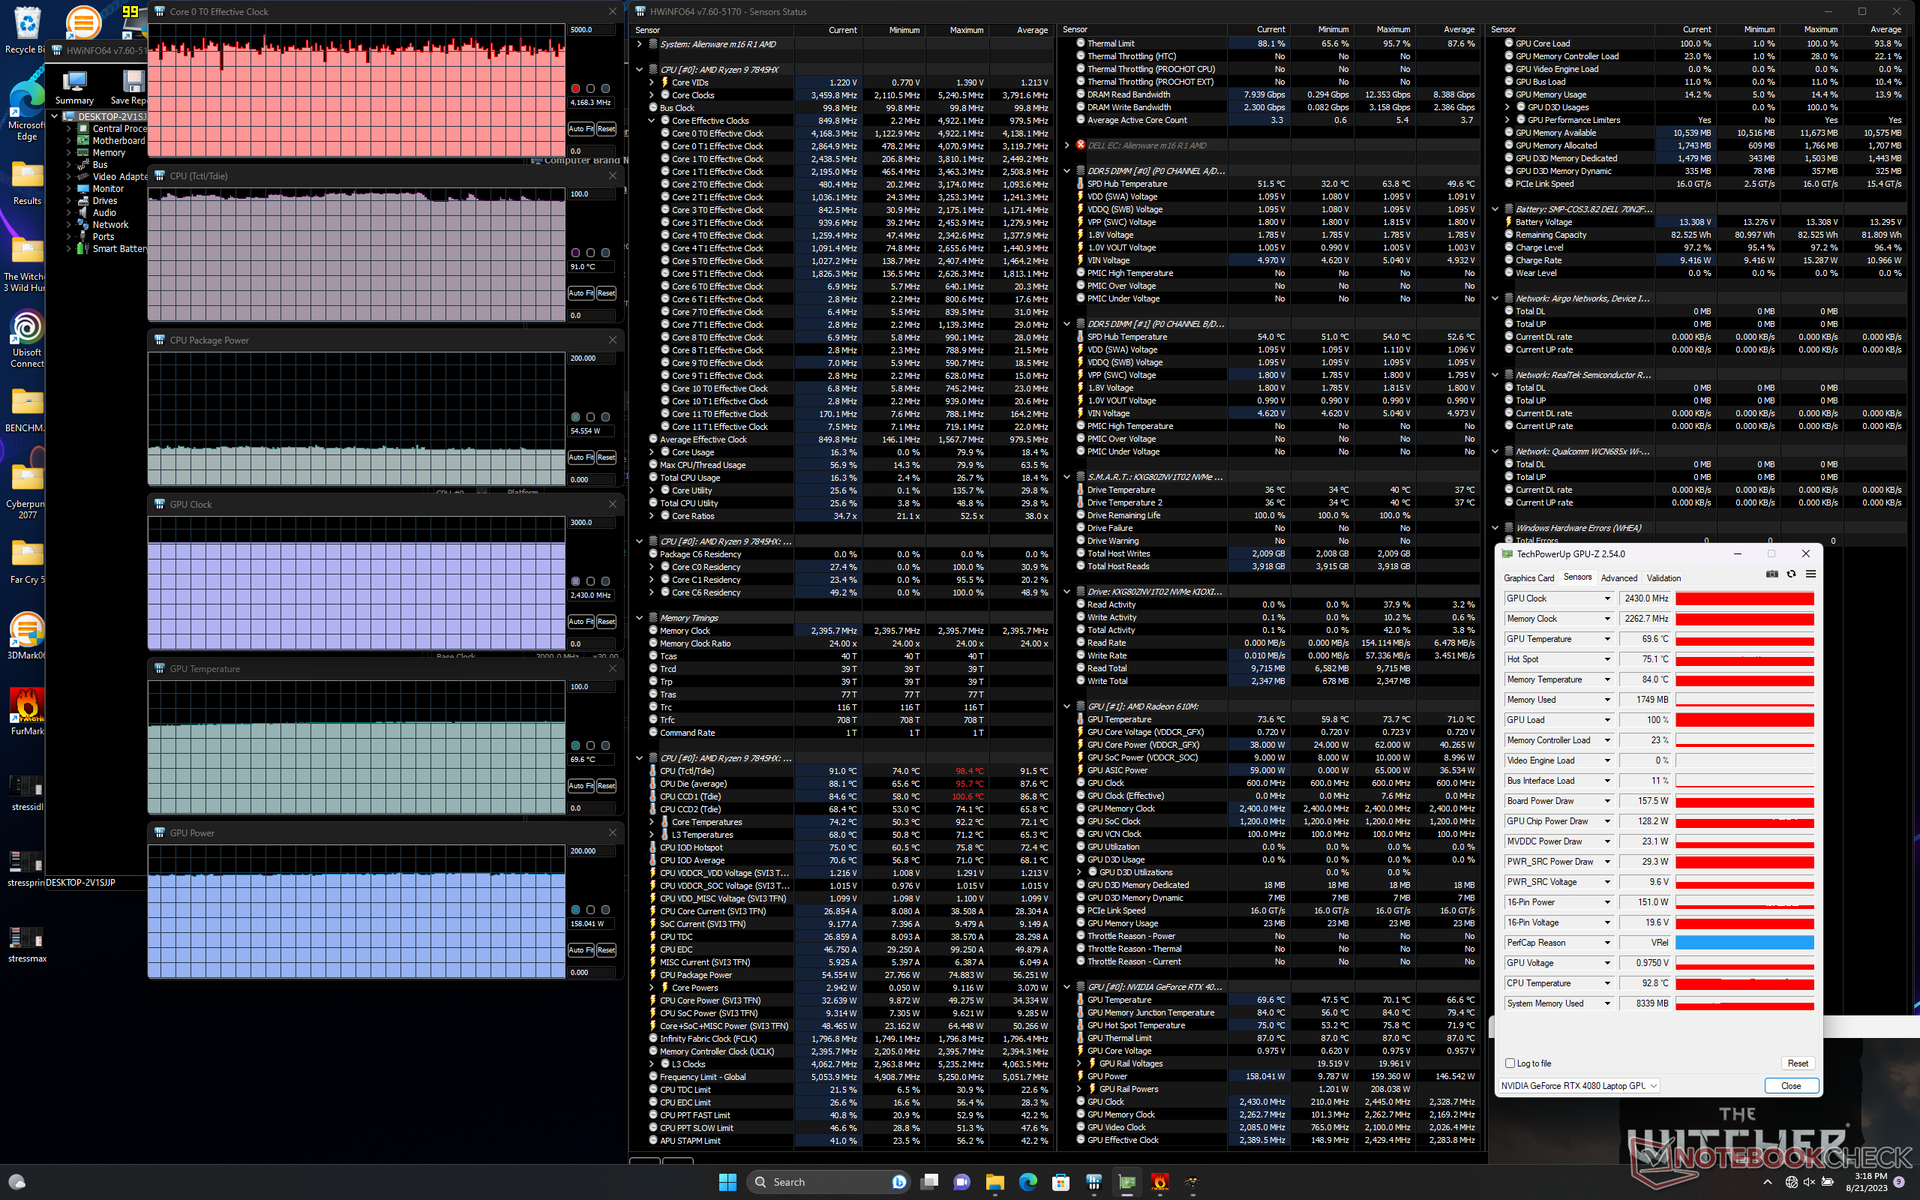
Uruchomienie Witcher 3 w trybie Overdrive procesor graficzny ustabilizowałby się przy taktowaniu 2430 MHz, pamięci VRAM 2263 MHz i poborze mocy 158 W w porównaniu do taktowania 2415 MHz, pamięci VRAM 2250 MHz i 156 W w trybie zrównoważonym według GPU-Z. Bardzo niewielkie różnice w wydajności między tymi dwoma trybami pokrywają się z naszymi obserwacjami Fire Strike wspomnianymi powyżej. Temperatury rdzenia byłyby o kilka stopni wyższe w trybie zrównoważonym w porównaniu do trybu Overdrive, ponieważ wentylatory są zauważalnie cichsze w trybie zrównoważonym.
Należy pamiętać, że chociaż GPU jest przystosowany do 175 W TGP, to w rzeczywistych warunkach gry jesteśmy w stanie osiągnąć tylko 160 W.
| Taktowanie CPU (GHz) | Taktowanie GPU (MHz) | Średnia temperatura CPU (°C) | Średnia temperatura GPU (°C) | |
| System bezczynności | -- | - | 49 | 34 |
| Prime95Stress | 4.6 | -- | 85 | 49 |
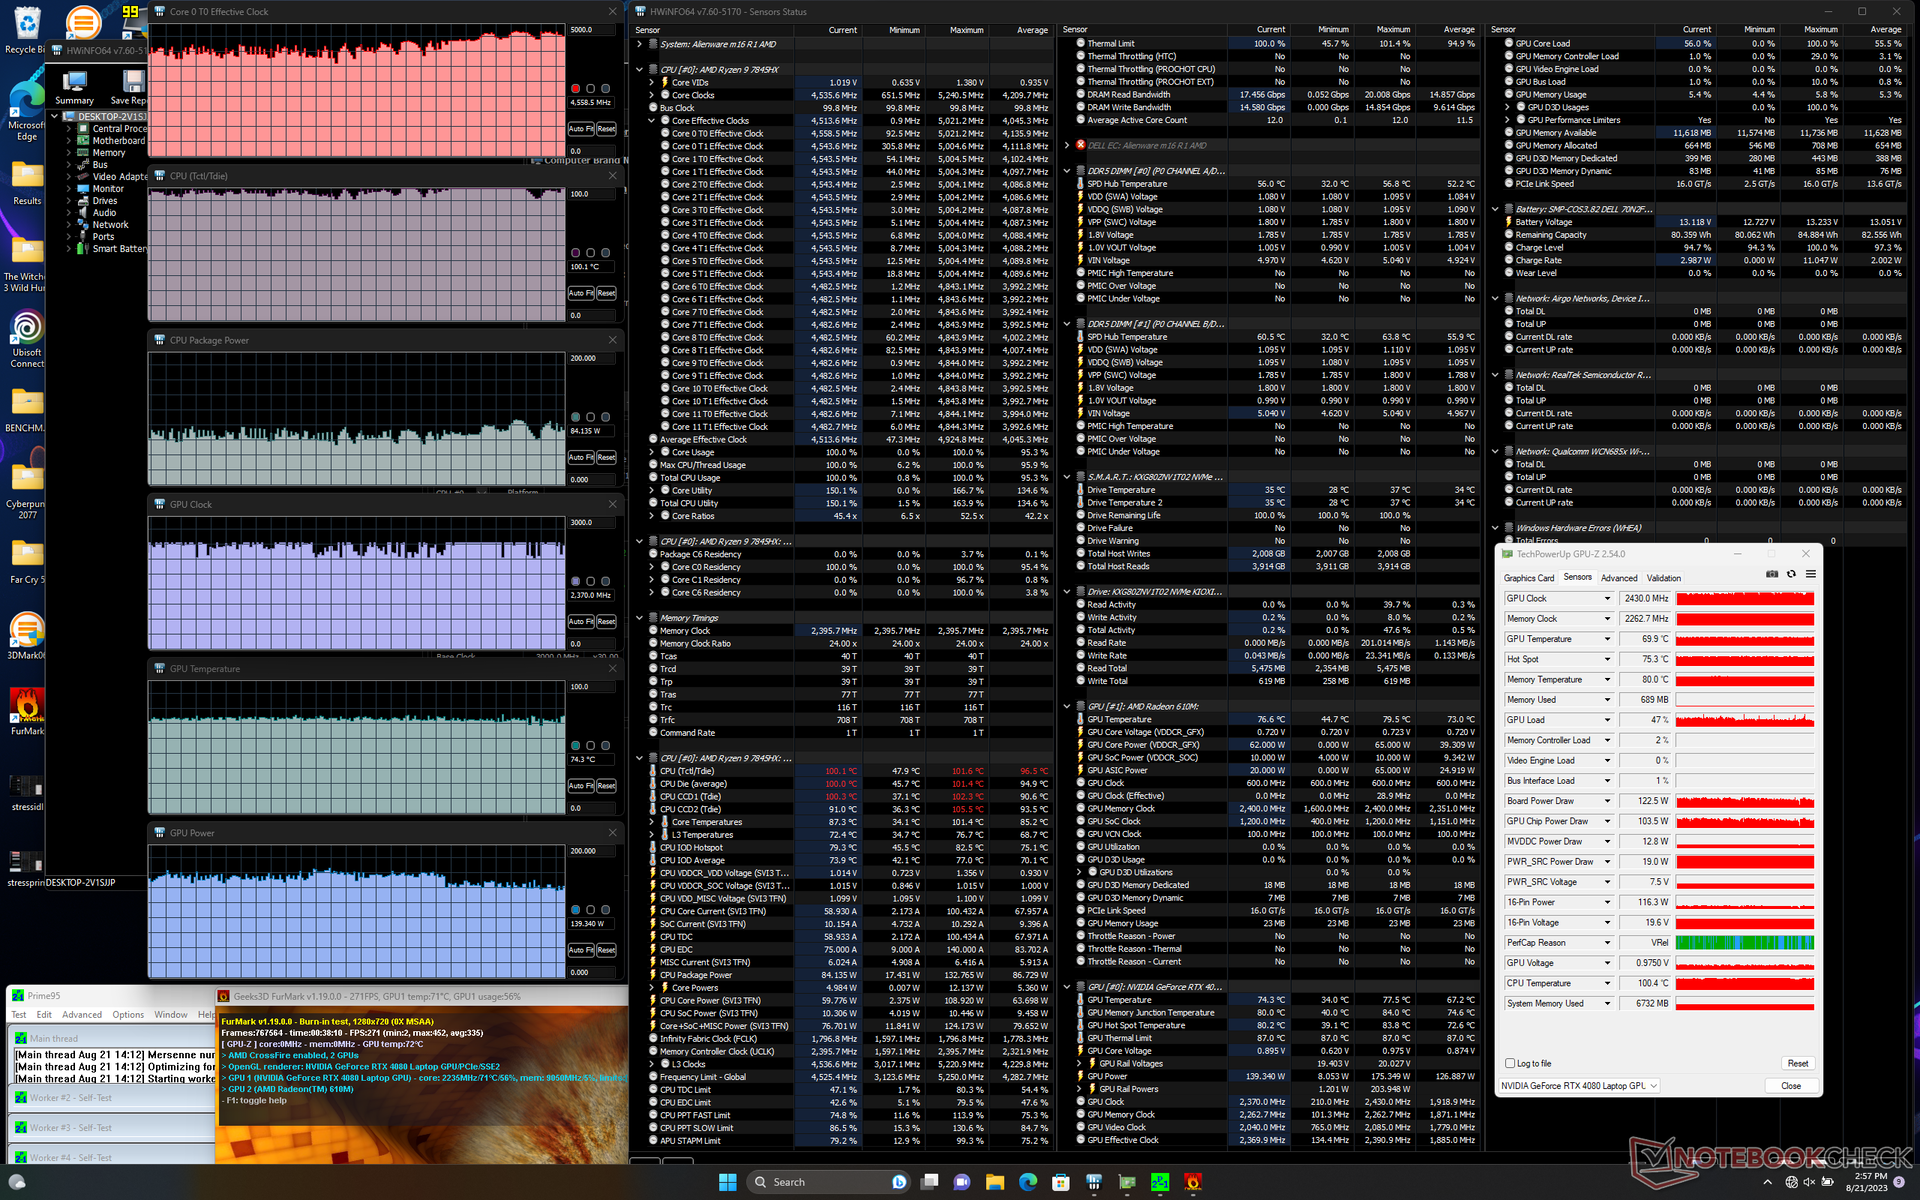
| Prime95+ FurMark Stress | ~4.0 - 4.6 | ~2430 | 87 | 74 |
| Witcher 3 Obciążenie(tryb zrównoważony) | ~4.1 | 2415 | 75 | 73 |
| Witcher 3 Stres (trybOverdrive) | ~4.1 | 2430 | 74 | 70 |
Głośniki
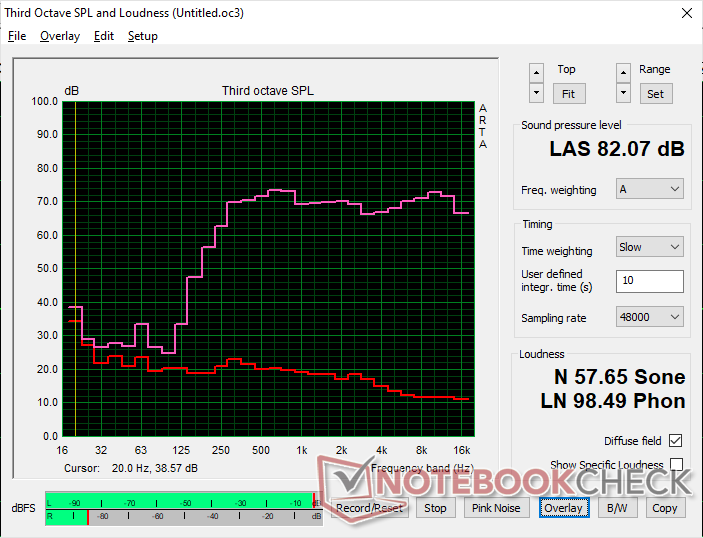
Alienware m16 R1 AMD analiza dźwięku
(+) | głośniki mogą odtwarzać stosunkowo głośno (82.1 dB)
Bas 100 - 315 Hz
(-) | prawie brak basu - średnio 20.6% niższa od mediany
(-) | bas nie jest liniowy (15.3% delta do poprzedniej częstotliwości)
Średnie 400 - 2000 Hz
(+) | zbalansowane środki średnie - tylko 1.4% od mediany
(+) | średnie są liniowe (2.1% delta do poprzedniej częstotliwości)
Wysokie 2–16 kHz
(+) | zrównoważone maksima - tylko 1.9% od mediany
(+) | wzloty są liniowe (2.9% delta do poprzedniej częstotliwości)
Ogólnie 100 - 16.000 Hz
(+) | ogólny dźwięk jest liniowy (13.9% różnicy w stosunku do mediany)
W porównaniu do tej samej klasy
» 22% wszystkich testowanych urządzeń w tej klasie było lepszych, 7% podobnych, 71% gorszych
» Najlepszy miał deltę 6%, średnia wynosiła ###średnia###%, najgorsza wynosiła 132%
W porównaniu do wszystkich testowanych urządzeń
» 16% wszystkich testowanych urządzeń było lepszych, 4% podobnych, 80% gorszych
» Najlepszy miał deltę 4%, średnia wynosiła ###średnia###%, najgorsza wynosiła 134%
Apple MacBook Pro 16 2021 M1 Pro analiza dźwięku
(+) | głośniki mogą odtwarzać stosunkowo głośno (84.7 dB)
Bas 100 - 315 Hz
(+) | dobry bas - tylko 3.8% od mediany
(+) | bas jest liniowy (5.2% delta do poprzedniej częstotliwości)
Średnie 400 - 2000 Hz
(+) | zbalansowane środki średnie - tylko 1.3% od mediany
(+) | średnie są liniowe (2.1% delta do poprzedniej częstotliwości)
Wysokie 2–16 kHz
(+) | zrównoważone maksima - tylko 1.9% od mediany
(+) | wzloty są liniowe (2.7% delta do poprzedniej częstotliwości)
Ogólnie 100 - 16.000 Hz
(+) | ogólny dźwięk jest liniowy (4.6% różnicy w stosunku do mediany)
W porównaniu do tej samej klasy
» 0% wszystkich testowanych urządzeń w tej klasie było lepszych, 0% podobnych, 100% gorszych
» Najlepszy miał deltę 5%, średnia wynosiła ###średnia###%, najgorsza wynosiła 45%
W porównaniu do wszystkich testowanych urządzeń
» 0% wszystkich testowanych urządzeń było lepszych, 0% podobnych, 100% gorszych
» Najlepszy miał deltę 4%, średnia wynosiła ###średnia###%, najgorsza wynosiła 134%
Zarządzanie energią
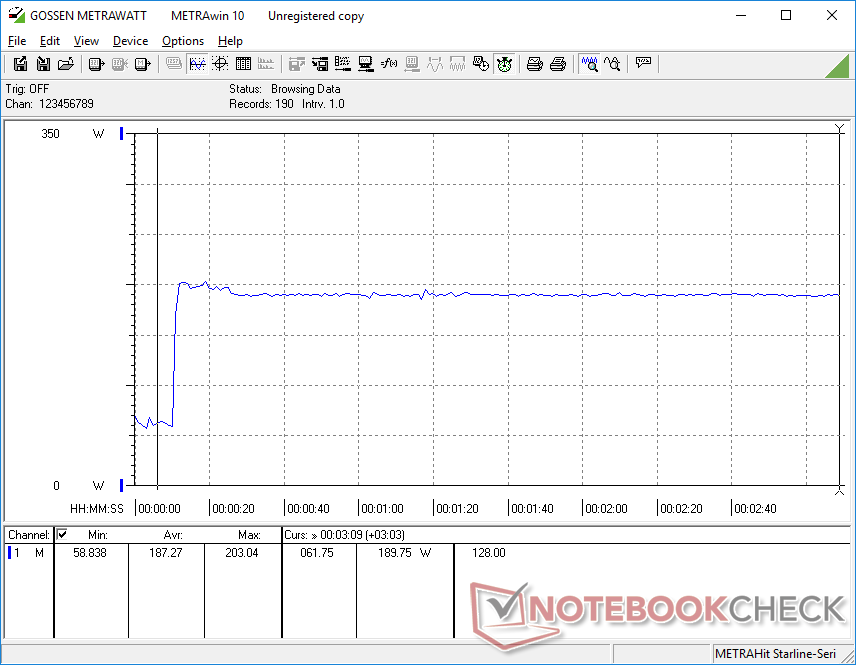
Zużycie energii
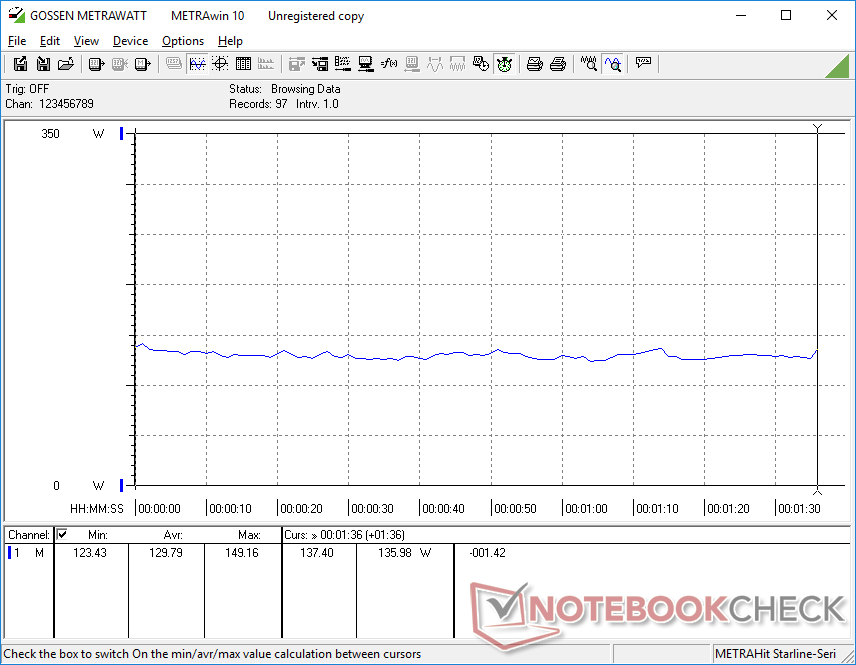
Laptopy Alienware zawsze miały jedne z najwyższych wartości zużycia energii, a nasz Alienware m16 R1 nie jest inny. Zwykły bieg jałowy na komputerze stacjonarnym pobierałby od 39 W do 69 W w porównaniu do mniej niż połowy na Lenovo Legion Pro 7 lub Asus ROG Strix G16. Te wysokie poziomy pracy na biegu jałowym są prawdopodobnie odpowiedzialne za niezadowalające wyniki żywotności baterii w następnej sekcji.
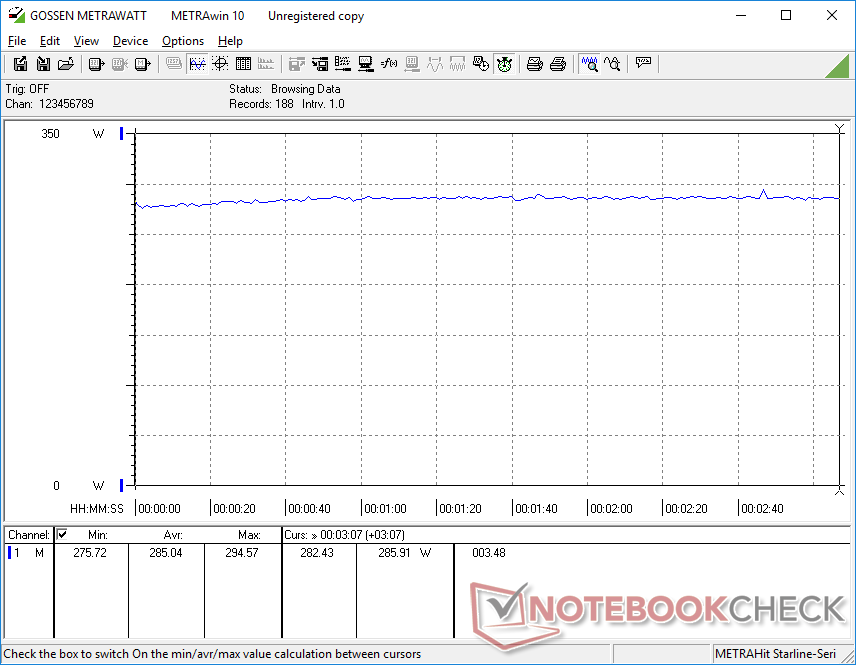
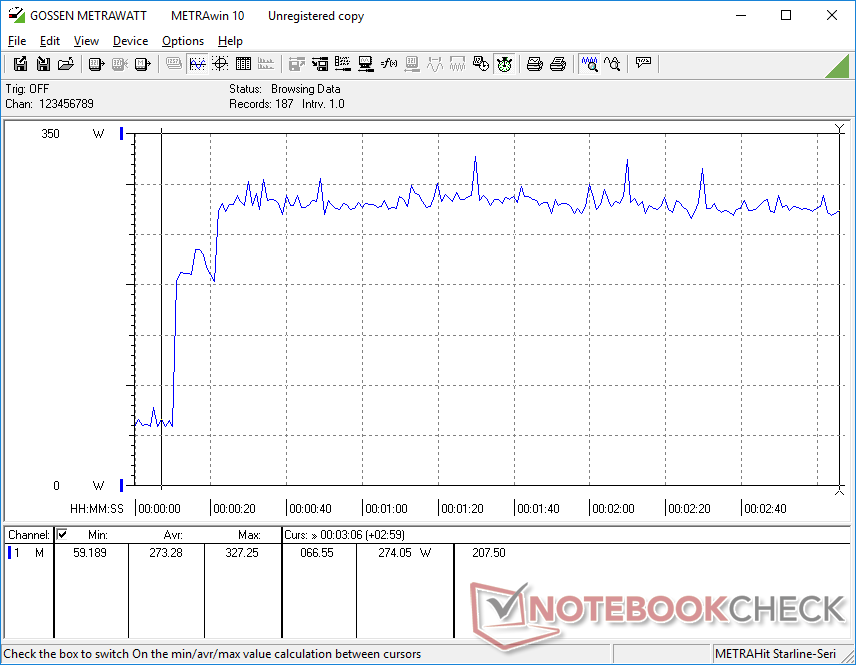
Zużycie energii podczas grania wynosi średnio 285 W, czyli ponownie więcej niż w przypadku większości innych laptopów do gier, w tym nawet Alienware x16 firmy Dell.
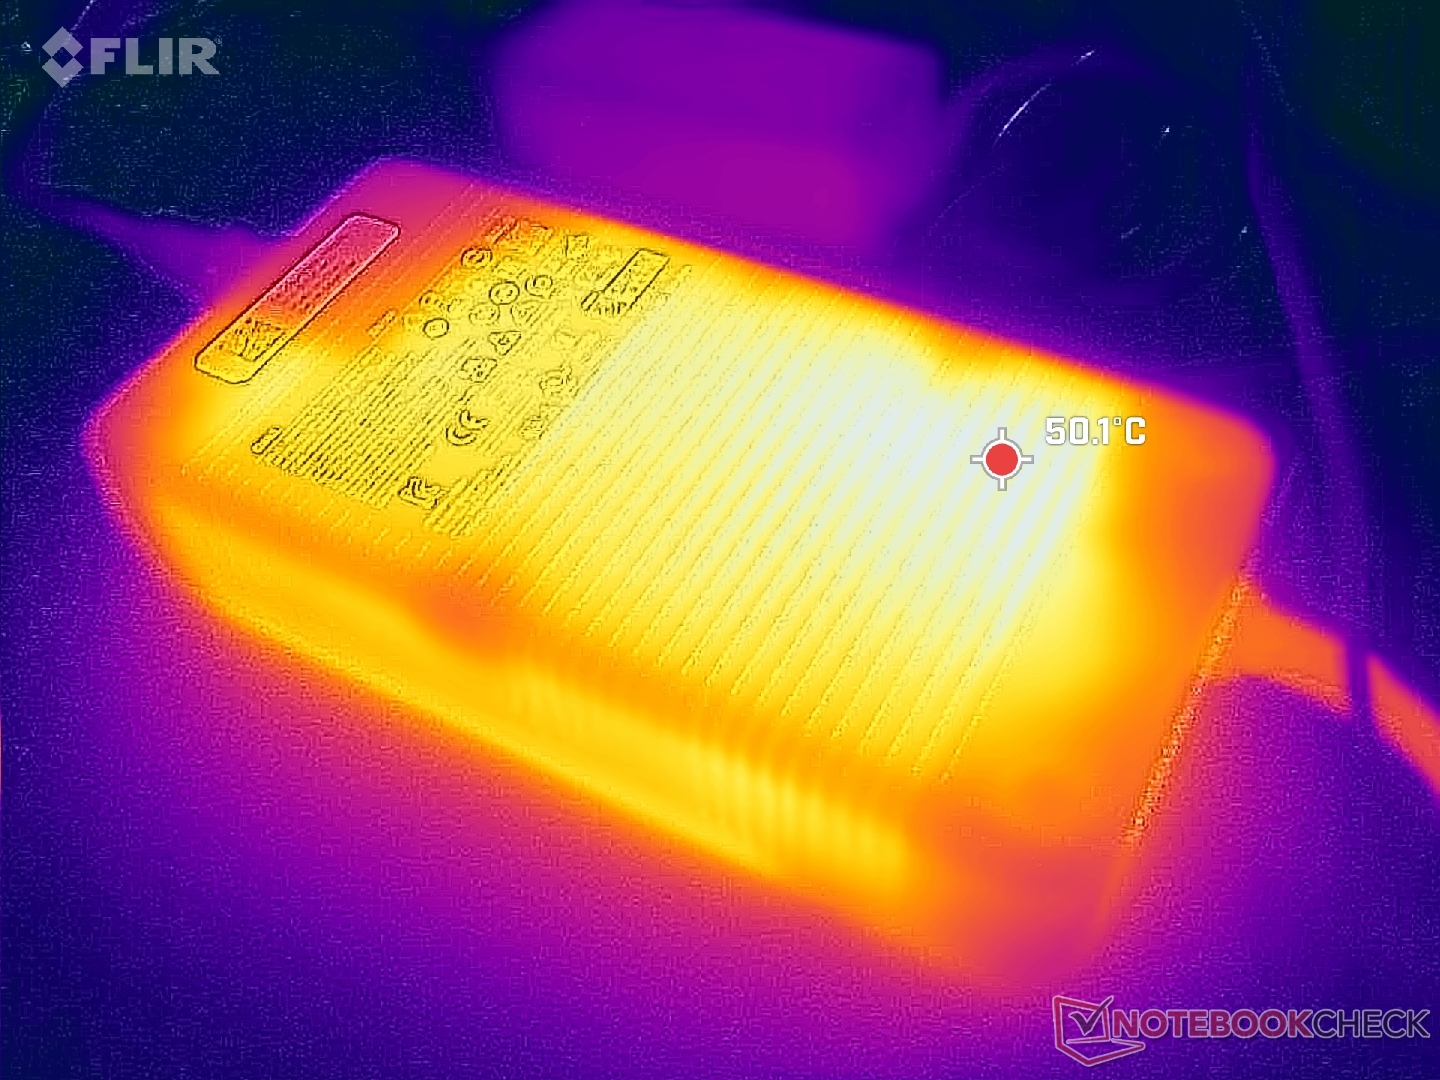
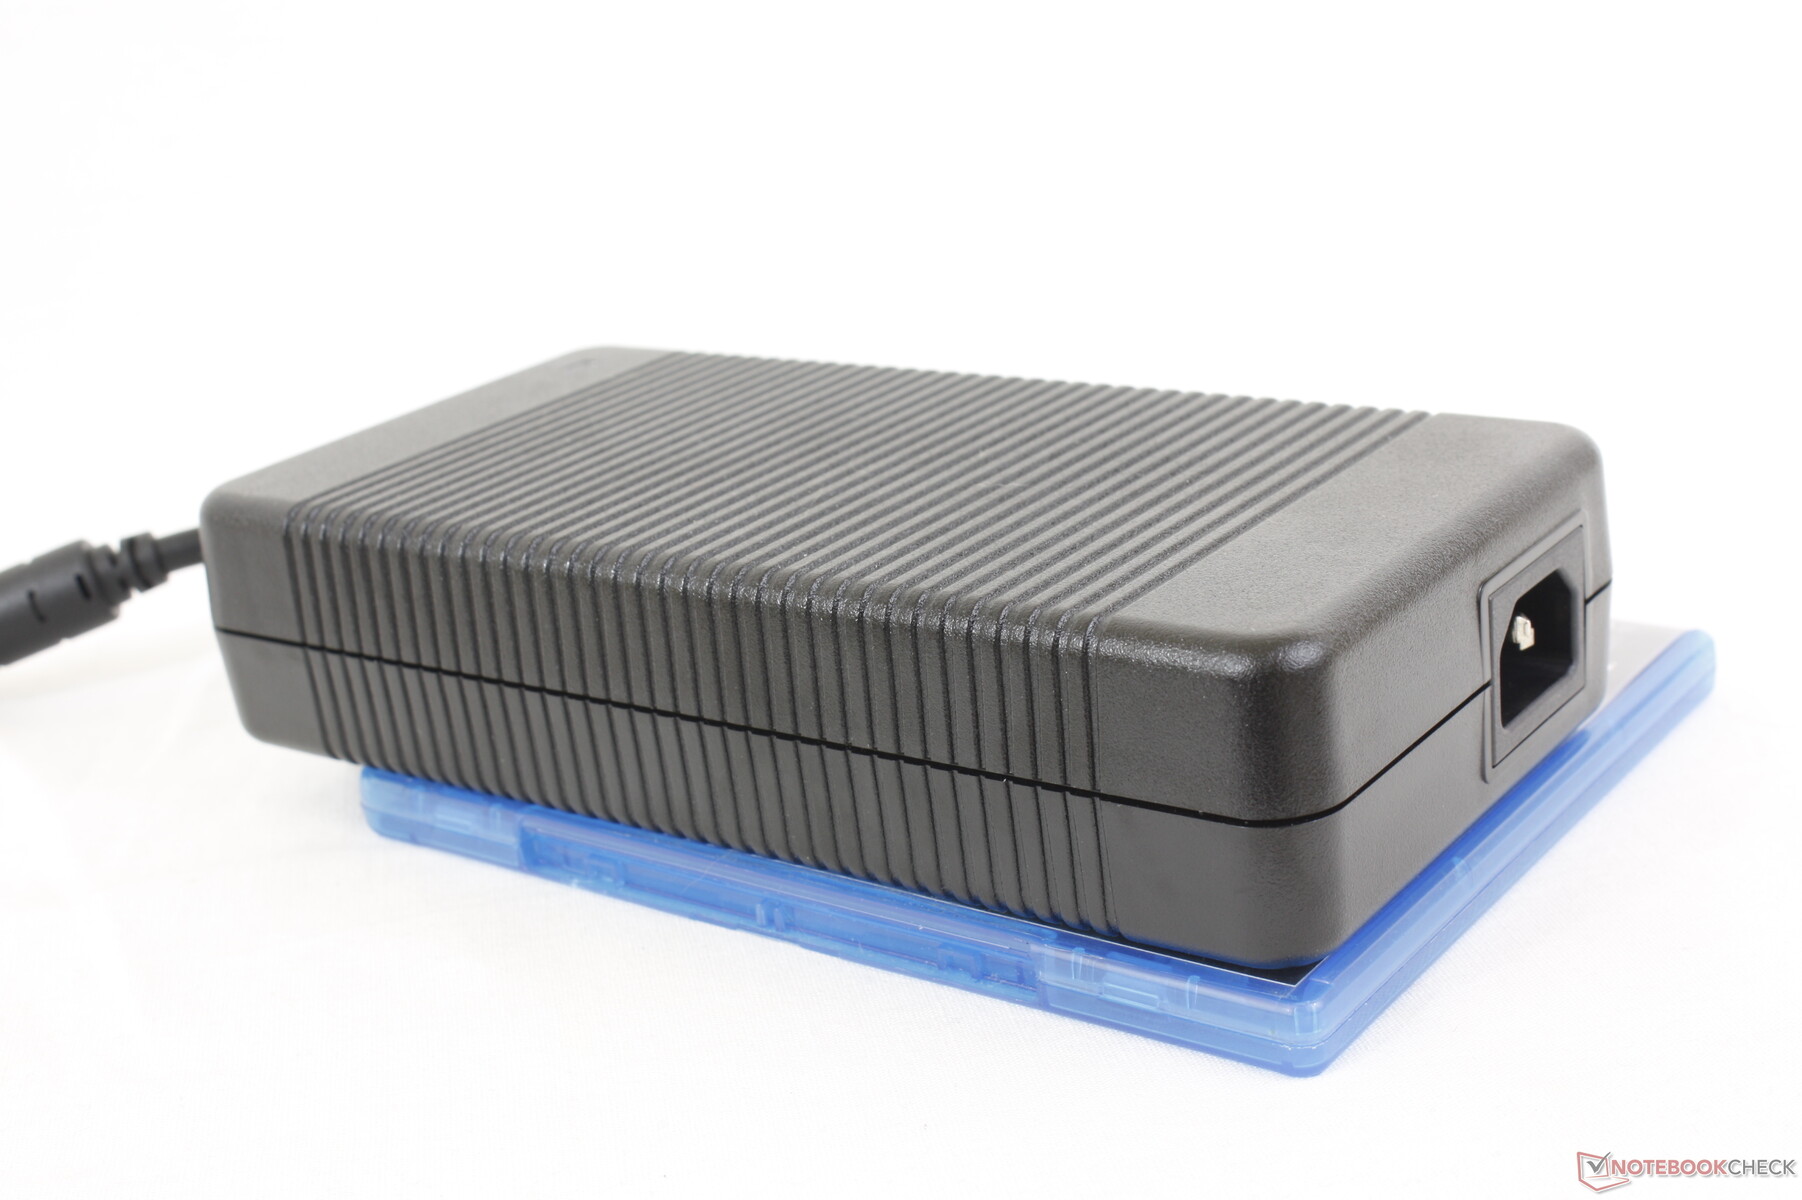
Zasilacz sieciowy o mocy 330 W jest duży (~20 x 10 x 4,5 cm) i nieporęczny. Dla porównania, zasilacz GaN 330 W dostarczany obecnie z najnowszymi laptopami Razer jest zauważalnie bardziej przenośny.
| wyłączony / stan wstrzymania | |
| luz | |
| obciążenie |
|
Legenda:
min: | |
| Alienware m16 R1 AMD R9 7845HX, GeForce RTX 4080 Laptop GPU, Kioxia XG8 KXG80ZNV1T02, IPS, 2560x1600, 16" | Alienware x16 R1 i9-13900HK, GeForce RTX 4080 Laptop GPU, SK hynix PC801 HFS001TEJ9X101N, IPS, 2560x1600, 16" | HP Omen Transcend 16 i9-13900HX, GeForce RTX 4070 Laptop GPU, SK hynix PC801 HFS002TEJ9X101N, Mini-LED, 2560x1600, 16" | Lenovo Legion Pro 7 RTX4090 i9-13900HX, GeForce RTX 4090 Laptop GPU, Samsung PM9A1 MZVL21T0HCLR, IPS, 2560x1600, 16" | Asus ROG Strix G16 G614JZ i9-13980HX, GeForce RTX 4080 Laptop GPU, WD PC SN560 SDDPNQE-1T00, IPS, 2560x1600, 16" | Razer Blade 16 Early 2023 i9-13950HX, GeForce RTX 4080 Laptop GPU, SSSTC CA6-8D1024, IPS, 2560x1600, 16" | |
|---|---|---|---|---|---|---|
| Power Consumption | 21% | 27% | 23% | 35% | 29% | |
| Idle Minimum * (Watt) | 39 | 25.2 35% | 19.2 51% | 20 49% | 10 74% | 15.2 61% |
| Idle Average * (Watt) | 44.6 | 29.9 33% | 22.7 49% | 25 44% | 16 64% | 22.8 49% |
| Idle Maximum * (Watt) | 68.1 | 49.8 27% | 55.4 19% | 35 49% | 27 60% | 49.8 27% |
| Load Average * (Watt) | 129.8 | 105.4 19% | 128.4 1% | 136 -5% | 129 1% | 121.2 7% |
| Witcher 3 ultra * (Watt) | 285 | 263 8% | 206 28% | 282 1% | 247 13% | 242 15% |
| Load Maximum * (Watt) | 327.3 | 313.8 4% | 292 11% | 320 2% | 342 -4% | 273.7 16% |
* ... im mniej tym lepiej
Power Consumption Witcher 3 / Stresstest
Power Consumption external Monitor
Żywotność baterii
Żywotność baterii pozostaje słaba, wynosząc nieco poniżej 4 godzin przeglądania sieci WLAN w świecie rzeczywistym przy zrównoważonym profilu zasilania z aktywnym iGPU. Próbowaliśmy nawet użyć specjalnego profilu zasilania "Bateria" za pośrednictwem Alienware Command Center, a nasze wyniki nadal nie uległy poprawie. Konkurencyjne modele, takie jak Lenovo Legion Pro 7 lub Asus ROG Strix G16, są w stanie wytrzymać znacznie dłużej.
Ładowanie od stanu pustego do pełnej pojemności zajmuje nieco ponad 2 godziny. System można również ładować przez USB-C, choć w wolniejszym tempie.
| Alienware m16 R1 AMD R9 7845HX, GeForce RTX 4080 Laptop GPU, 86 Wh | Alienware x16 R1 i9-13900HK, GeForce RTX 4080 Laptop GPU, 90 Wh | HP Omen Transcend 16 i9-13900HX, GeForce RTX 4070 Laptop GPU, 97 Wh | Lenovo Legion Pro 7 RTX4090 i9-13900HX, GeForce RTX 4090 Laptop GPU, 99.9 Wh | Asus ROG Strix G16 G614JZ i9-13980HX, GeForce RTX 4080 Laptop GPU, 90 Wh | Razer Blade 16 Early 2023 i9-13950HX, GeForce RTX 4080 Laptop GPU, 95.2 Wh | |
|---|---|---|---|---|---|---|
| Czasy pracy | 13% | 41% | 38% | 100% | 88% | |
| Reader / Idle (h) | 4 | 7.3 83% | 6.3 58% | 8.9 123% | ||
| WiFi v1.3 (h) | 3.7 | 2.5 -32% | 4.2 14% | 5.1 38% | 9.7 162% | 6.1 65% |
| Load (h) | 0.8 | 0.7 -13% | 1.2 50% | 1.1 38% | 1.4 75% |
Za
Przeciw
Werdykt - szybki i bogaty w funkcje, ale wymaga optymalizacji

Alienware m16 R1 ma niesamowitą moc i funkcje jak na 16-calowy laptop. Mówimy o ciekłym metalu, komorze parowej, czterech wentylatorach, 3 wnękach SSD, mechanicznej klawiaturze CherryMX, grafice 175 W, rozszerzalnej pamięci RAM, a nawet opcjach procesora i karty graficznej zarówno od Intela, jak i AMD. Konkurencyjne 16-calowe modele gamingowe, takie jak HP Omen Transcend 16, Razer Blade 16lub Asus Zephyrus M16 mają stosunkowo mniejsze zestawy funkcji i są generalnie wolniejsze, nawet jeśli są skonfigurowane z tym samym procesorem graficznym, co nasza konfiguracja testowa. Inżynierowie z Alienware zasługują na tonę uznania, biorąc pod uwagę, jak gęsto upakowany jest Alienware m16 R1.
Z drugiej strony, długa lista zintegrowanych funkcji może również działać na niekorzyść laptopa, ponieważ Alienware m16 jest zarówno cięższy, jak i większy niż wiele alternatyw z dużym marginesem. W szczególności żywotność baterii cierpi dość mocno, niezależnie od ustawienia profilu zasilania. Jeśli cenisz sobie przenośność, możesz poszukać gdzie indziej. Ponadto modelowi nadal brakuje kilku popularnych funkcji, takich jak OLED i mini-LED.
Alienware m16 R1 jest niezaprzeczalnie szybki i bogaty w funkcje z ponadprzeciętnymi wynikami. Jednak korzyści płynące z wydajności kosztują większą wagę i większy rozmiar.
Błędy, które napotkaliśmy podczas naszej recenzji, zasługują na wzmiankę. Przeskakiwanie klatek podczas odtwarzania wideo 4K, zacinanie się liczby klatek na sekundę podczas grania i problemy z wybudzaniem z uśpienia są niefortunne, biorąc pod uwagę, że Alienware ma być marką dla entuzjastów. Być może Dell odgryza nieco więcej niż może przeżuć dzięki licznym konfiguracjom Intel-Nvidia, AMD-Nvidia i AMD-AMD, które mogą sprawić, że rozwiązywanie problemów będzie dość trudne.
Cena i dostępność
Dell dostarcza obecnie swój model Alienware m16 zarówno w wersji Intel, jak i AMD. Wersja AMD zaczyna się od 1700 USD do ponad 3000-4000 USD, jeśli jest w pełni skonfigurowana.
Alienware m16 R1 AMD
- 23/08/2023 v7 (old)
Allen Ngo
Przezroczystość
Wyboru urządzeń do recenzji dokonuje nasza redakcja. Próbka testowa została udostępniona autorowi jako pożyczka od producenta lub sprzedawcy detalicznego na potrzeby tej recenzji. Pożyczkodawca nie miał wpływu na tę recenzję, producent nie otrzymał też kopii tej recenzji przed publikacją. Nie było obowiązku publikowania tej recenzji. Jako niezależna firma medialna, Notebookcheck nie podlega władzy producentów, sprzedawców detalicznych ani wydawców.
Tak testuje Notebookcheck
Każdego roku Notebookcheck niezależnie sprawdza setki laptopów i smartfonów, stosując standardowe procedury, aby zapewnić porównywalność wszystkich wyników. Od około 20 lat stale rozwijamy nasze metody badawcze, ustanawiając przy tym standardy branżowe. W naszych laboratoriach testowych doświadczeni technicy i redaktorzy korzystają z wysokiej jakości sprzętu pomiarowego. Testy te obejmują wieloetapowy proces walidacji. Nasz kompleksowy system ocen opiera się na setkach uzasadnionych pomiarów i benchmarków, co pozwala zachować obiektywizm.Price comparison

