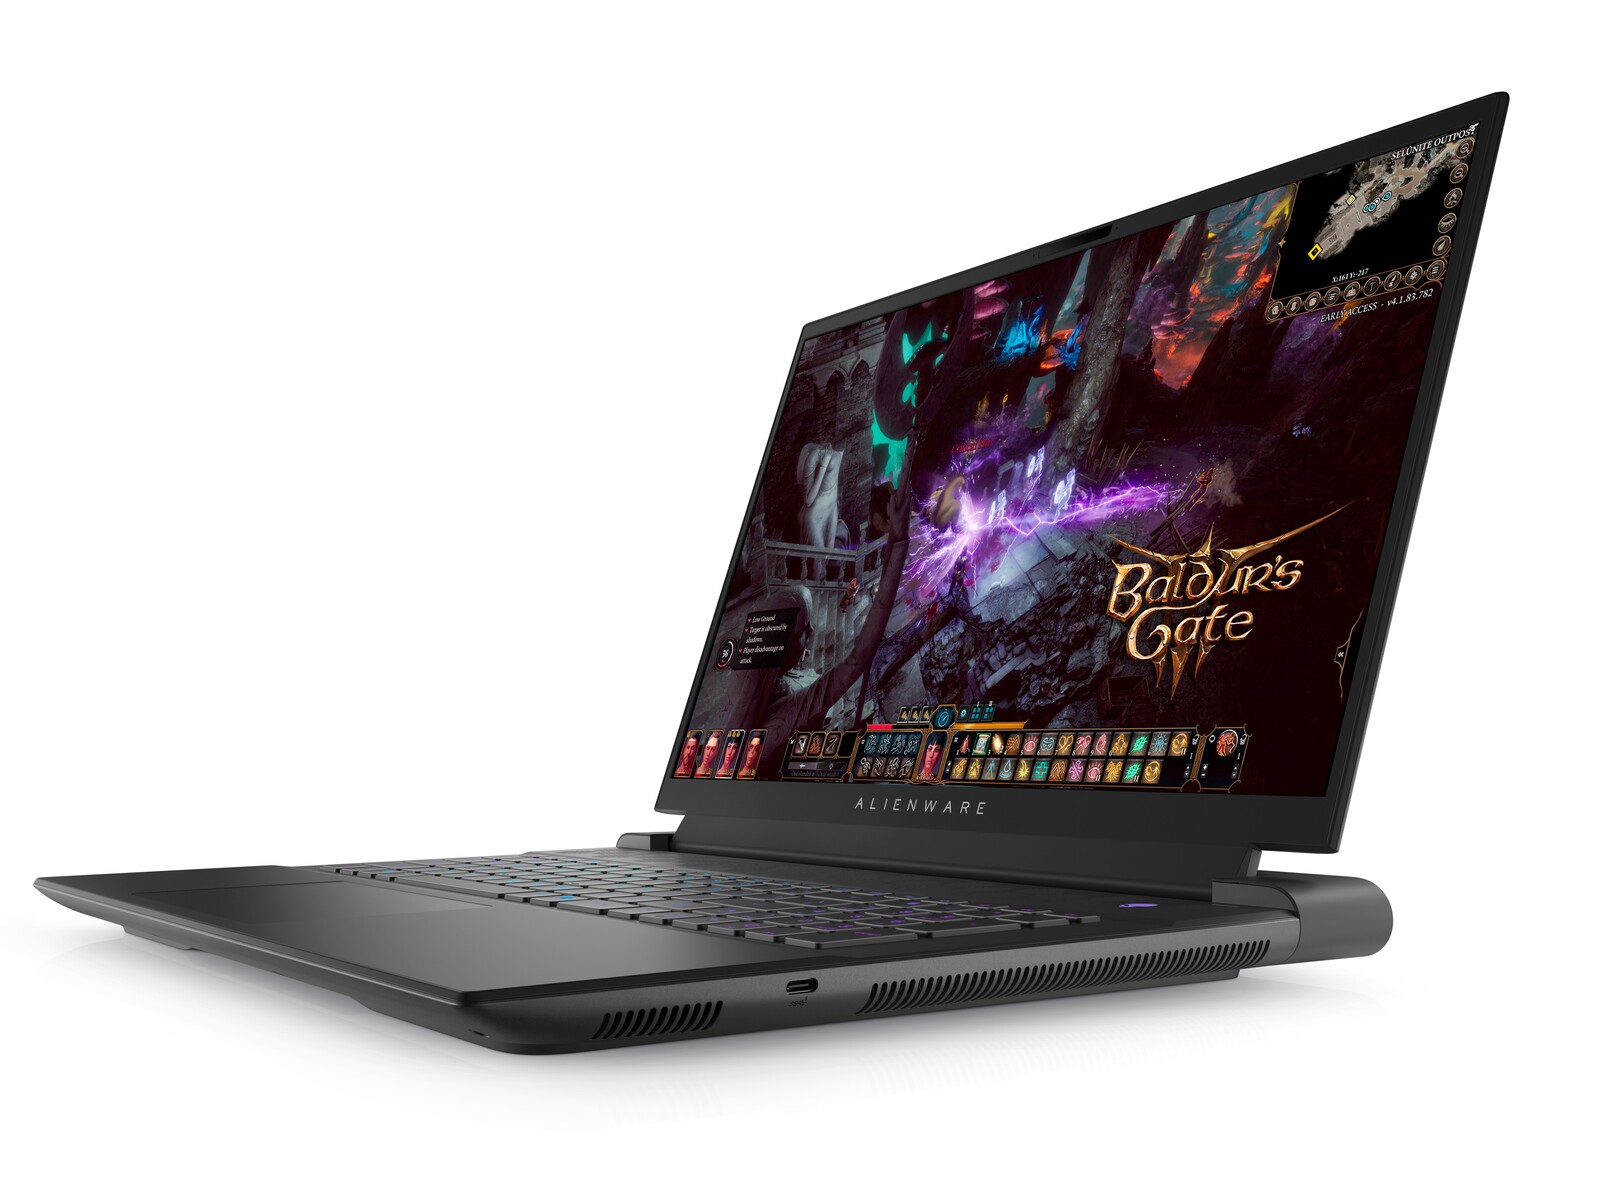
Recenzja laptopa Alienware m18 R1: Większy i cięższy od MSI Titan GT77
Odsłonięty na początku tego roku obok mobilnej serii Intel Raptor Lake-H i mobilnej serii Ada Lovelace GeForce RTX 40, flagowy Alienware m18 R1 jest pierwszym 18-calowym modelem w swojej rodzinie od 2013 roku. Od tego czasu wiele się oczywiście zmieniło, ale łowcy wydajności, którzy chcą czegoś większego niż zwykłe 17-calowe rozwiązanie, mogą znaleźć wiele do polubienia z 18-calowym czynnikiem formalnym, w którym funkcje i termiki mogą być zmaksymalizowane.
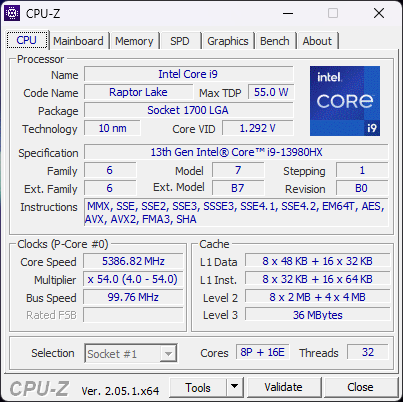
Nasza recenzowana konfiguracja to specyfikacja z wyższej półki z procesorem 13. gen Core i9-13980HX, 175 W GeForce RTX 4090, membranową klawiaturą RGB i wyświetlaczem IPS 1200p 480 Hz za około 2900 USD. Inne SKU są dostępne z RTX 4060, Core i7-13700HX, i 1600p 165 Hz wyświetlacz z CherryMX ultra niskiej klawiatury mechanicznej. Wszystkie konfiguracje inaczej obsługują G-Sync i pełne kolory DCI-P3.
Do bezpośrednich konkurentów należą inne 18-calowe laptopy do gier, jak np Razer Blade 18 lubAsus ROG Strix Scar 18. W chwili pisania tego tekstu MSI nie ogłosiło jeszcze nowego 18-calowego modelu.
Więcej recenzji Della:
Potencjalni konkurenci w porównaniu
Ocena | Data | Model | Waga | Wysokość | Rozmiar | Rezolucja | Cena |
|---|---|---|---|---|---|---|---|
| 90.7 % v7 (old) | 04/2023 | Alienware m18 R1 i9-13980HX, GeForce RTX 4090 Laptop GPU | 3.9 kg | 26.7 mm | 18.00" | 1920x1200 | |
| 91.4 % v7 (old) | 02/2023 | Razer Blade 18 RTX 4070 i9-13950HX, GeForce RTX 4070 Laptop GPU | 3 kg | 21.9 mm | 18.00" | 2560x1600 | |
| 86.6 % v7 (old) | 02/2023 | Asus ROG Strix Scar 18 2023 G834JY-N6005W i9-13980HX, GeForce RTX 4090 Laptop GPU | 3.1 kg | 30.8 mm | 18.00" | 2560x1600 | |
| 88.3 % v7 (old) | 03/2023 | MSI GE78HX 13VH-070US i9-13950HX, GeForce RTX 4080 Laptop GPU | 3 kg | 23 mm | 17.00" | 2560x1600 | |
| 89.9 % v7 (old) | 03/2023 | Eluktronics Mech-17 GP2 i9-13900HX, GeForce RTX 4090 Laptop GPU | 2.9 kg | 27 mm | 17.00" | 2560x1600 | |
| 89 % v7 (old) | 02/2023 | MSI Titan GT77 HX 13VI i9-13950HX, GeForce RTX 4090 Laptop GPU | 3.5 kg | 23 mm | 17.30" | 3840x2160 |
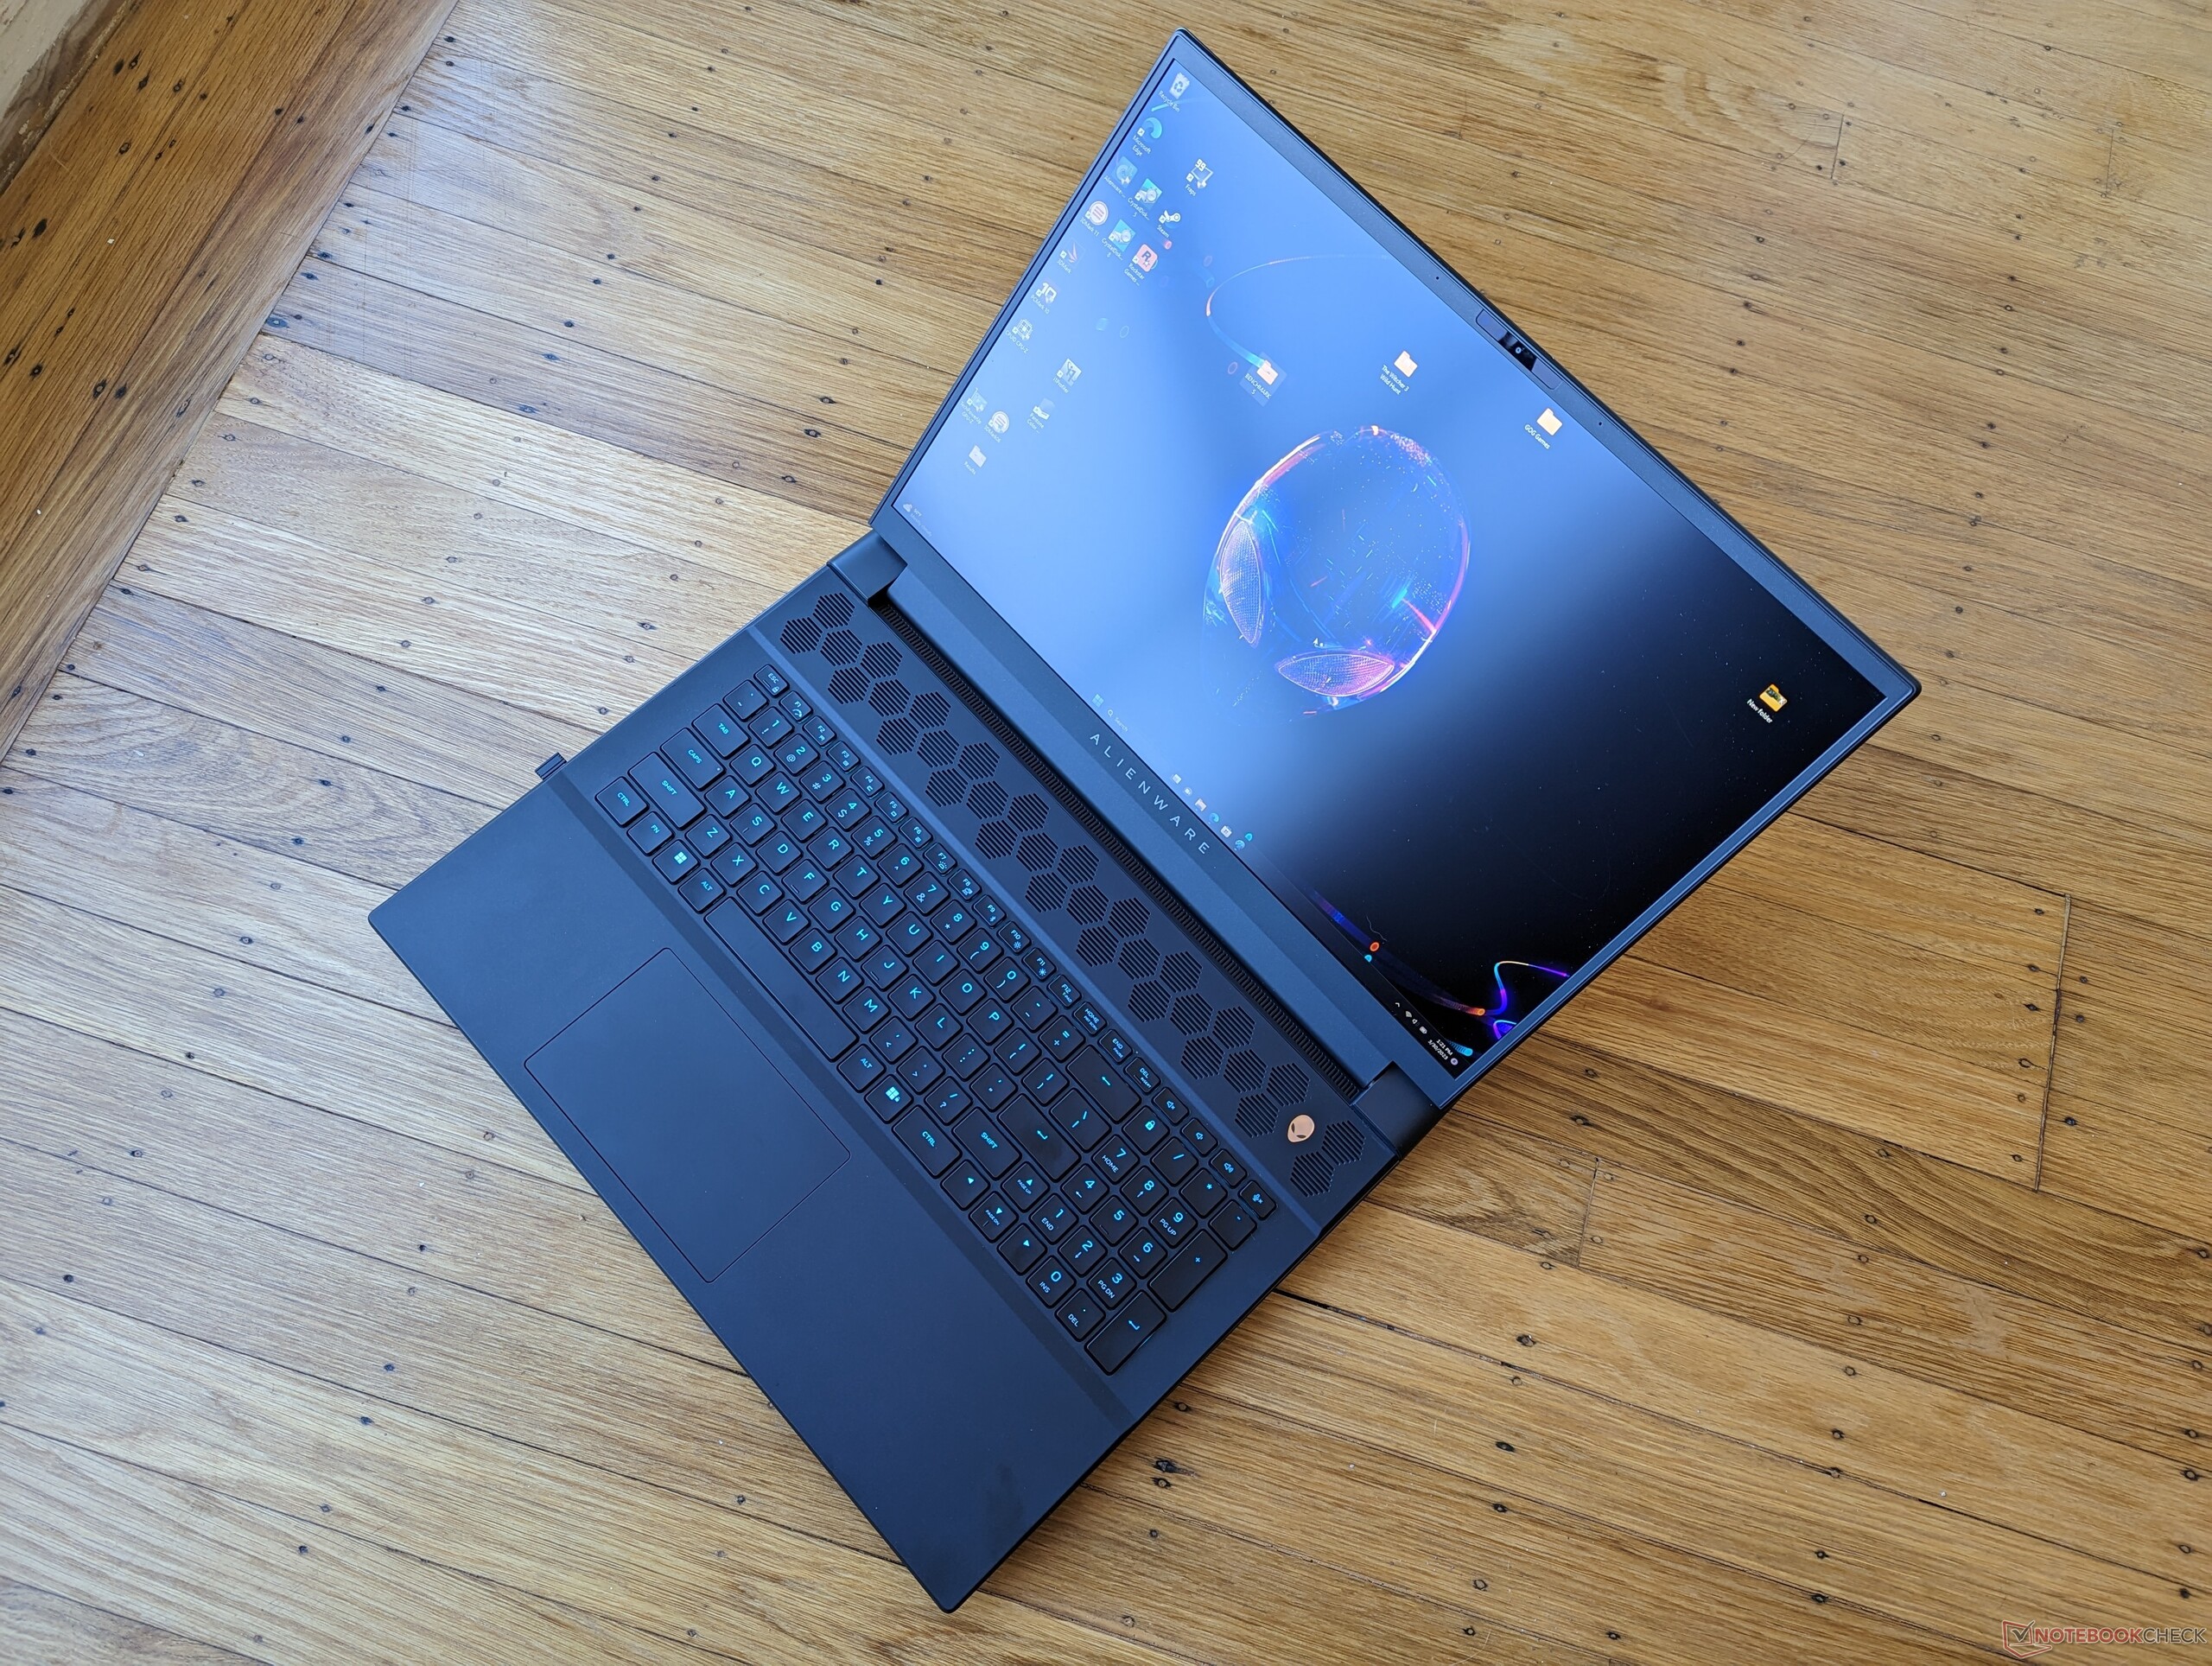
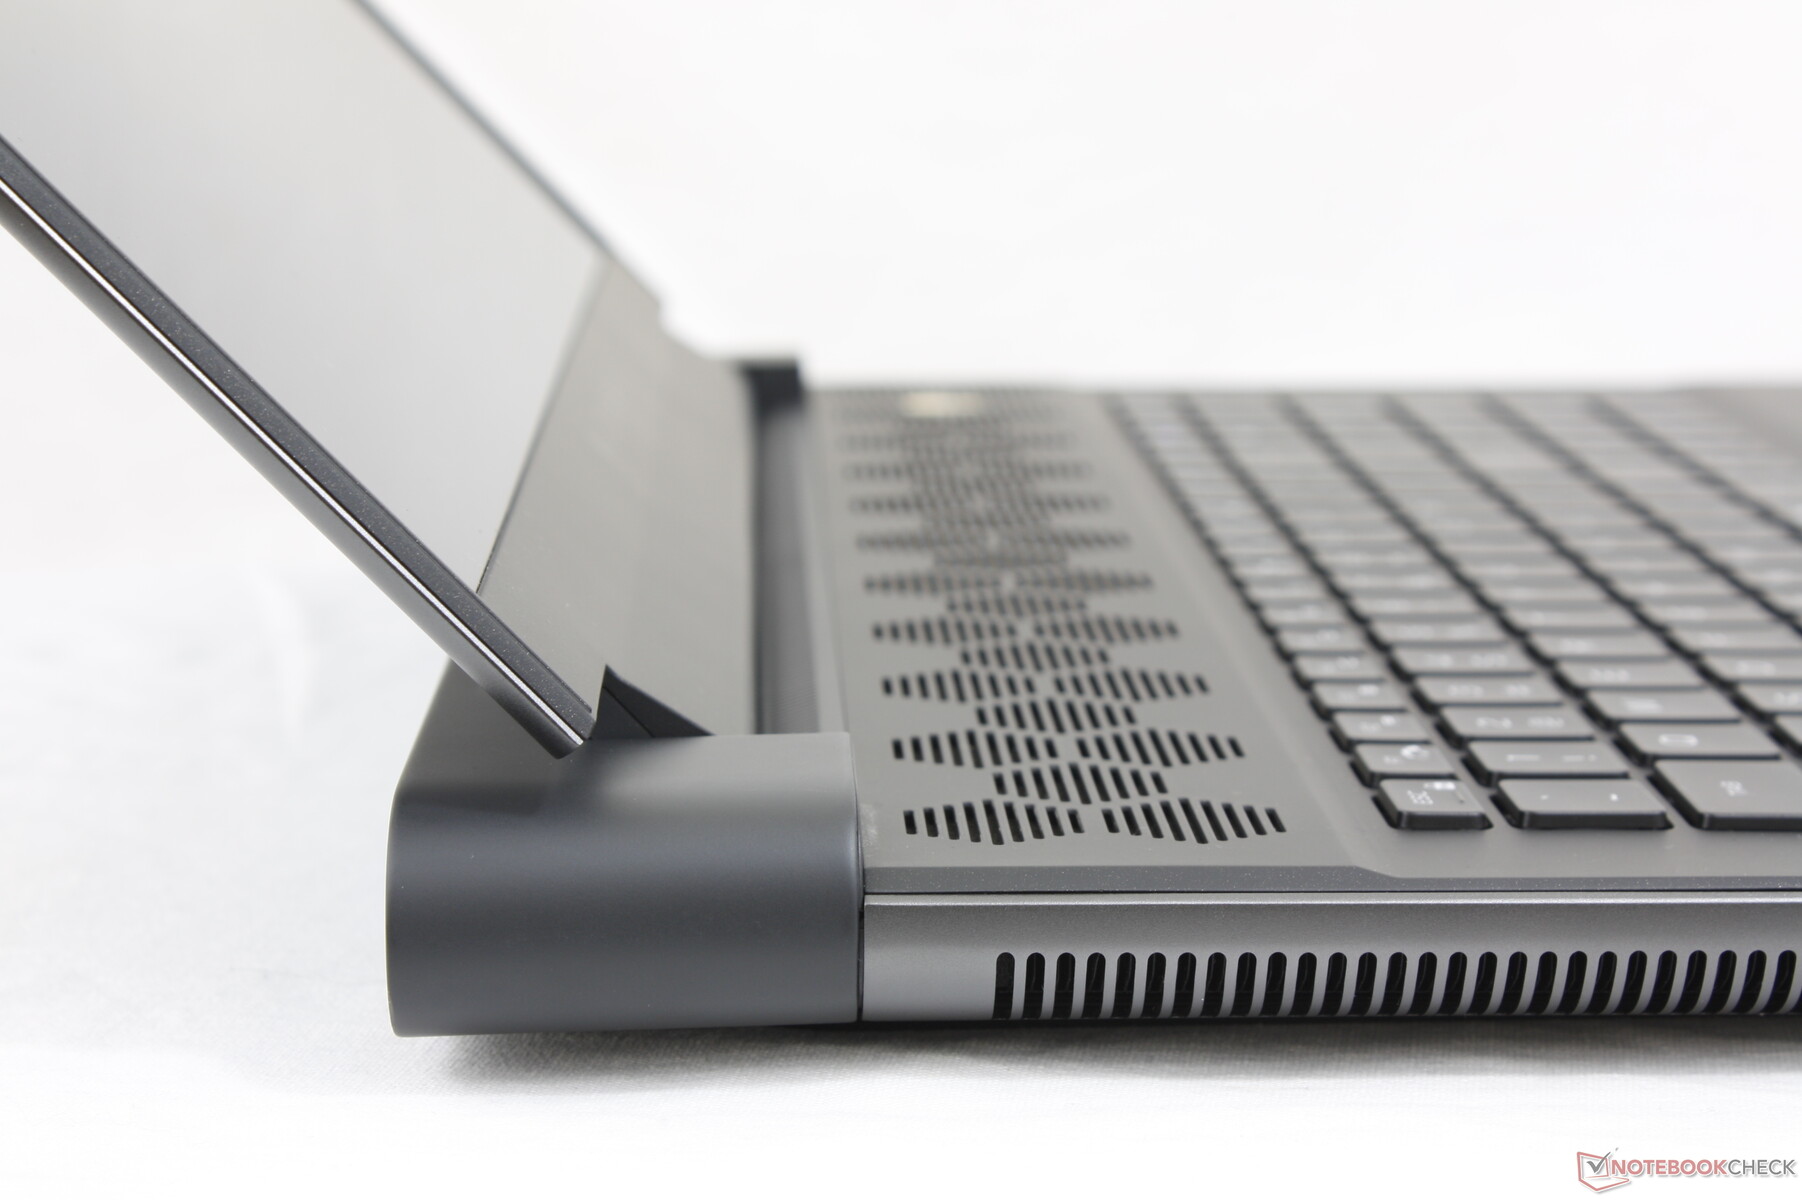
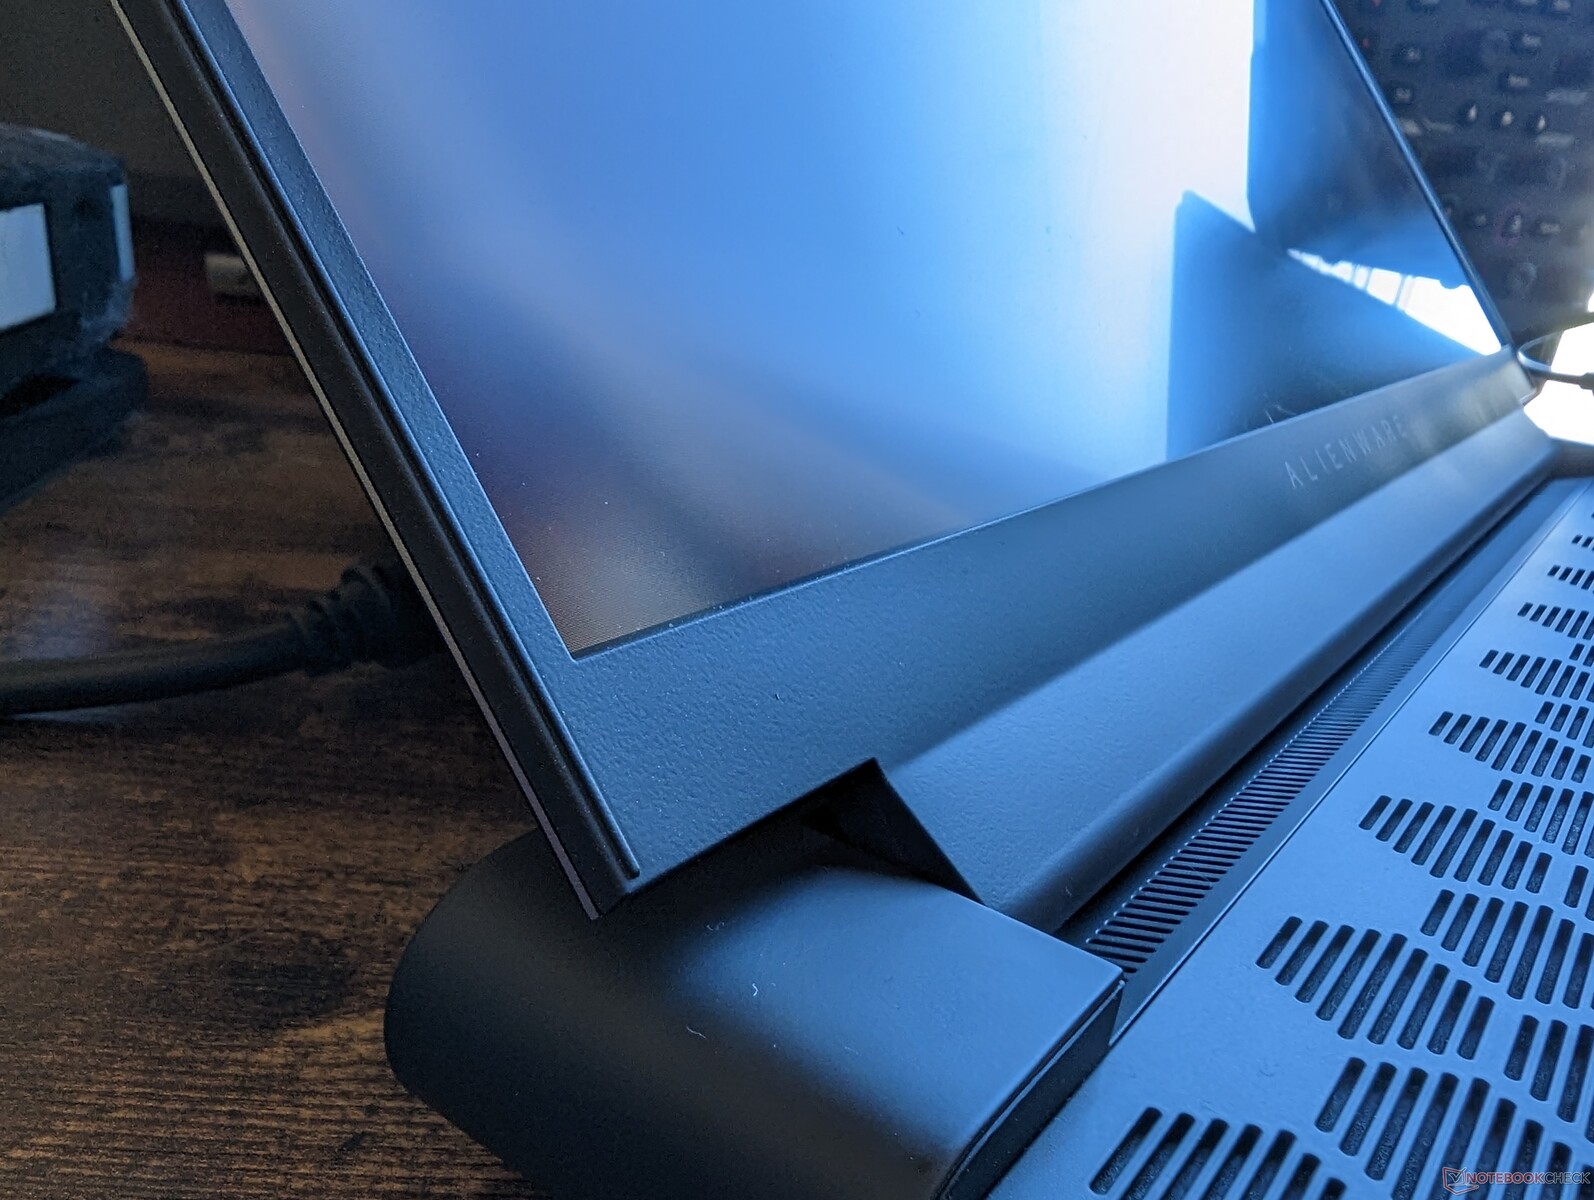
Obudowa - Legenda 3 Design
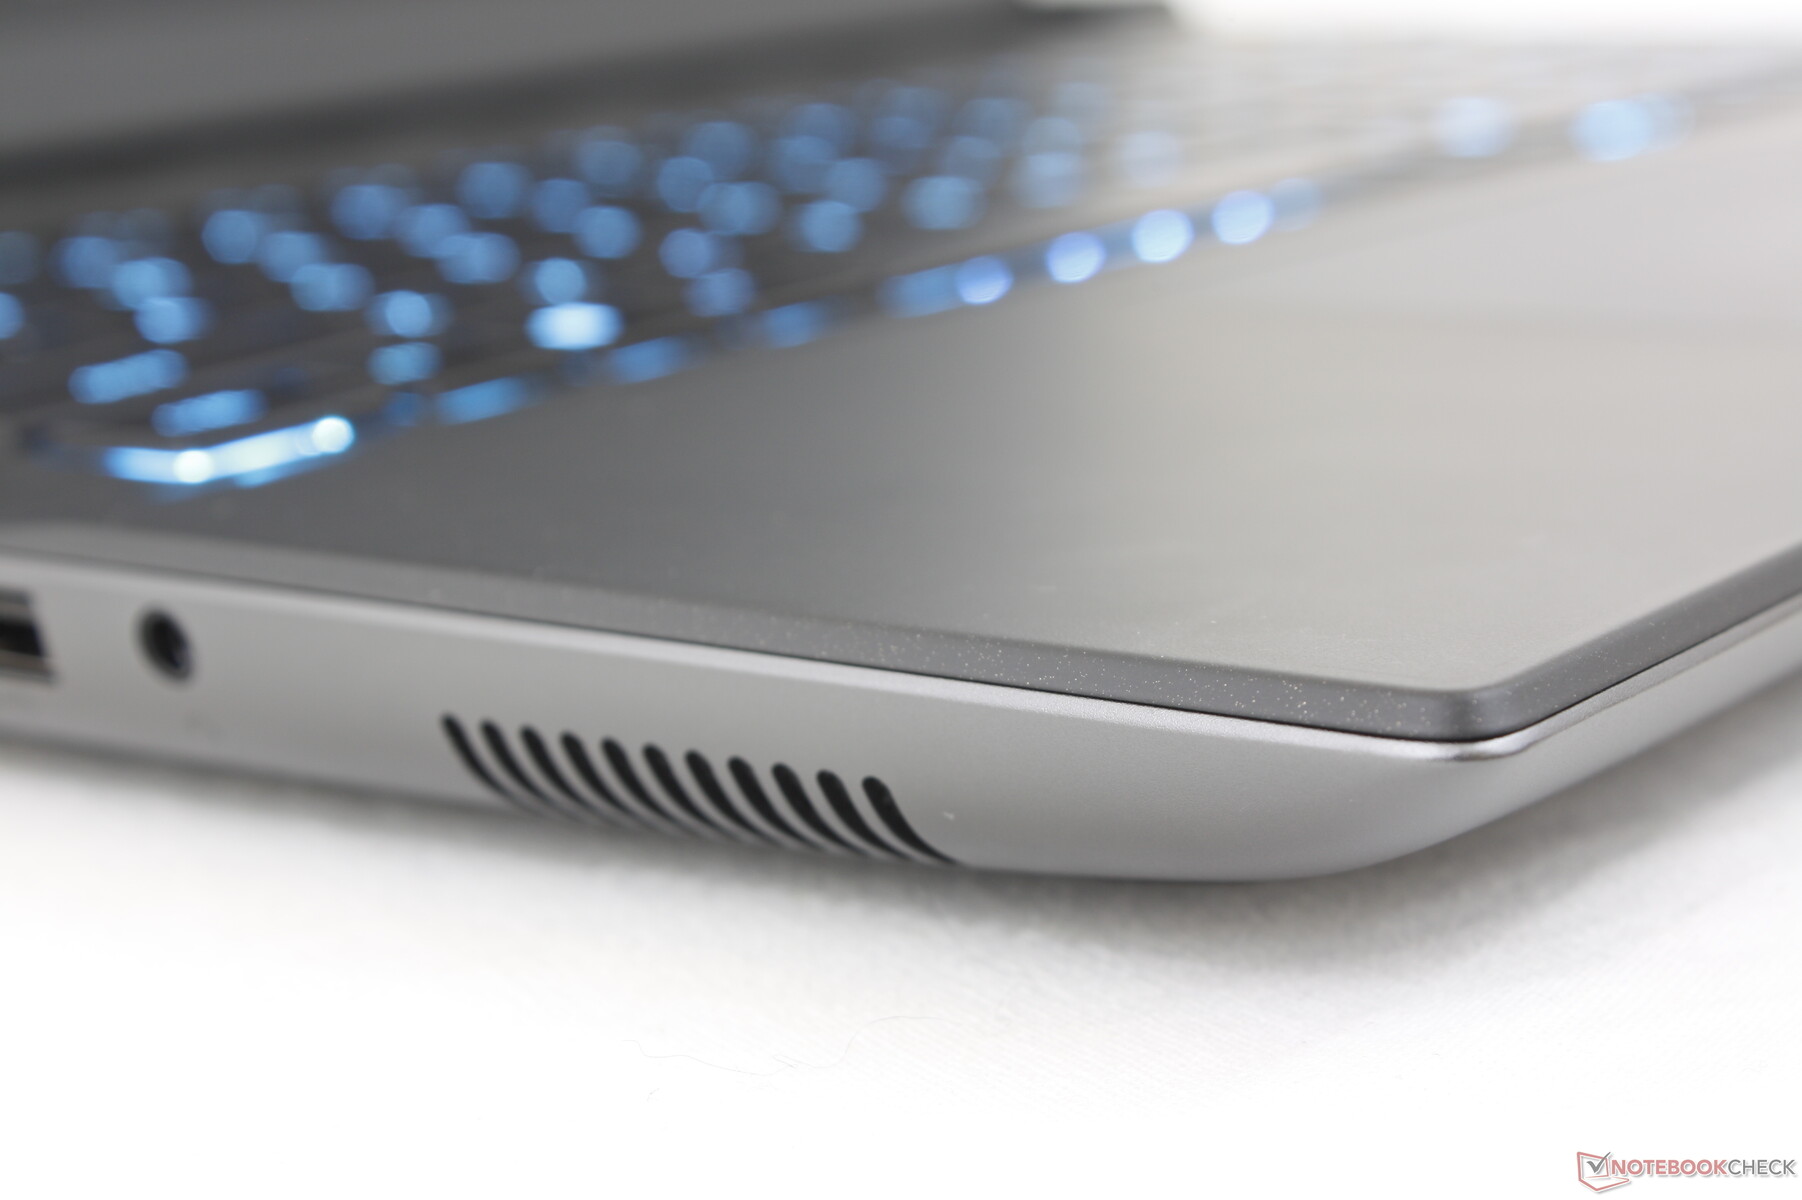
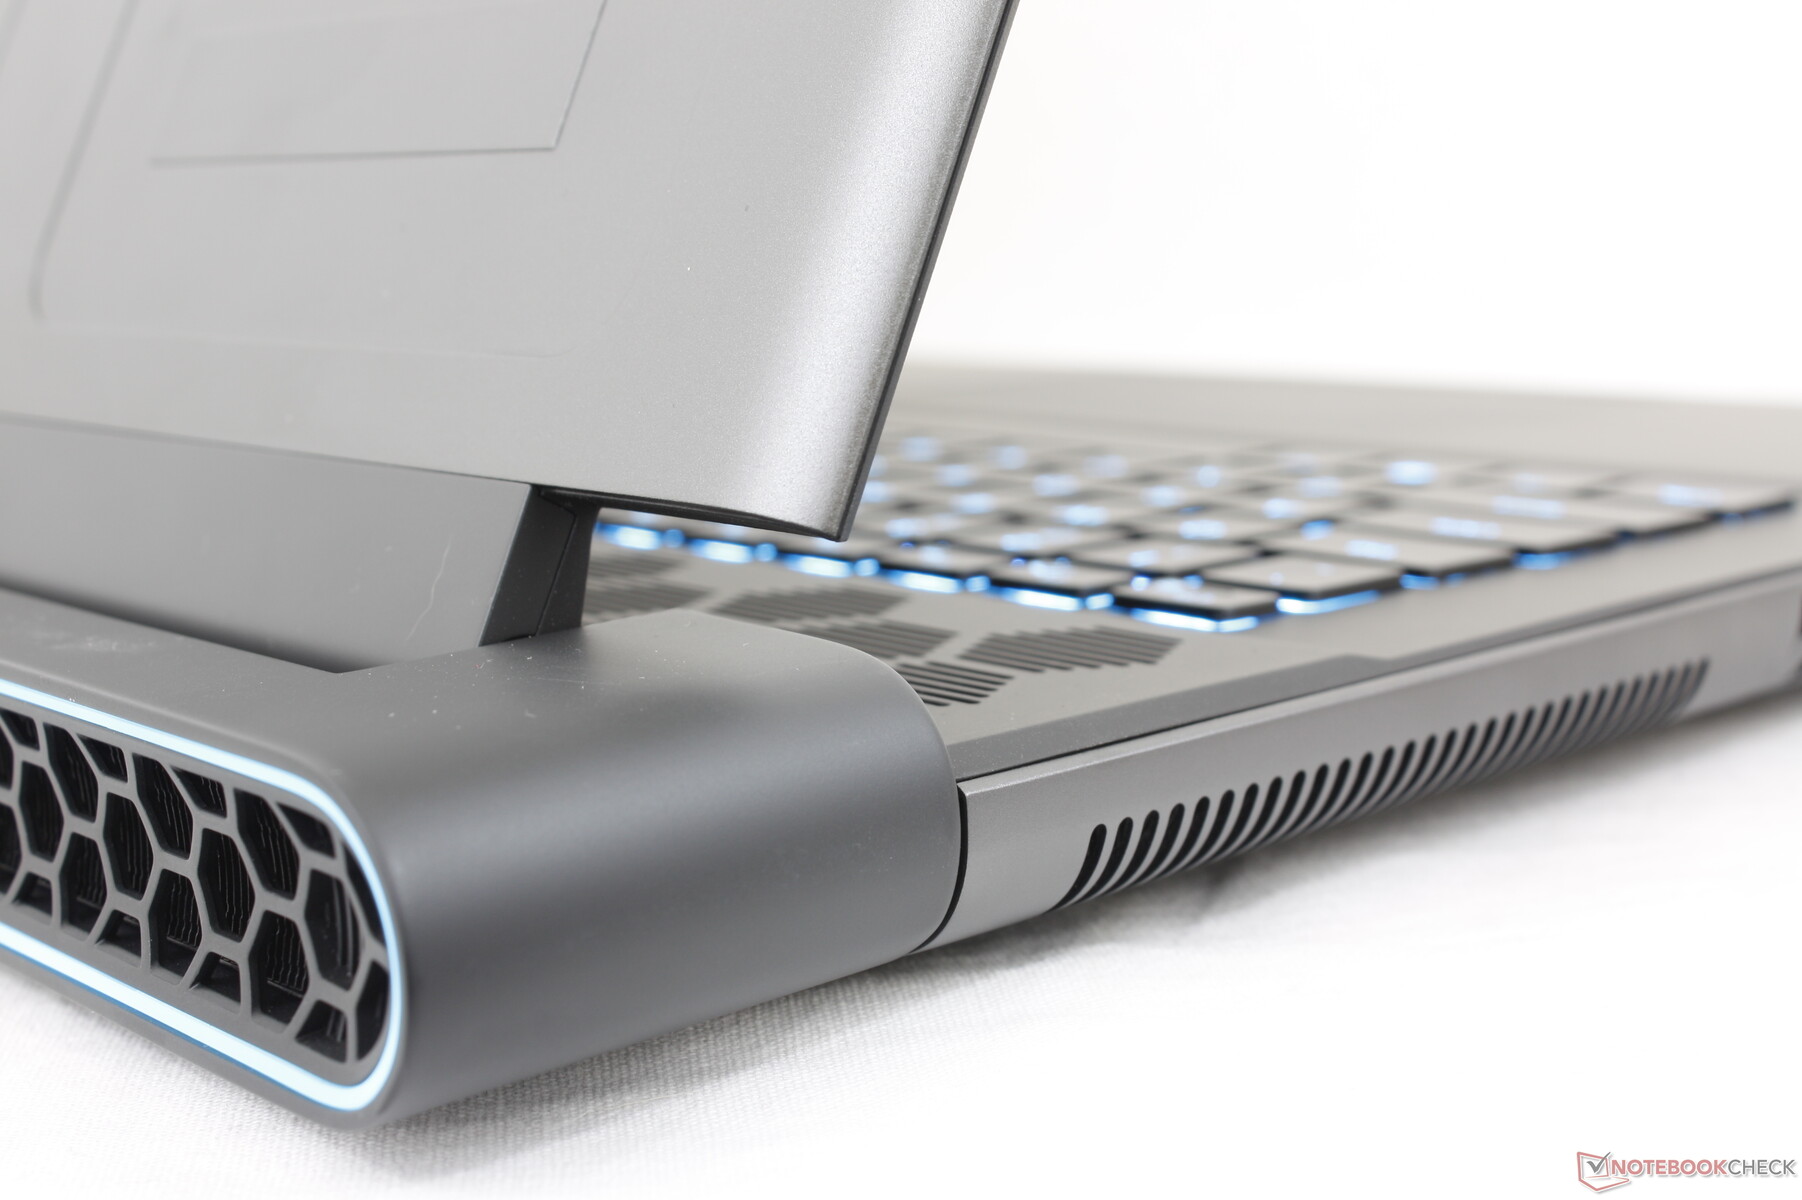
Wrażenia z obcowania z obudową są podobne jak w przypadku niedawnego Alienware x17 R2 ponieważ Alienware m18 R1 wykorzystuje podobne materiały. Gęsta konstrukcja i ścisłe wyrównanie między materiałami pokazują, że nie potrzeba konstrukcji unibody jak w Razer Blade 18, by uzyskać wrażenie wysokiej jakości. Wszystko, od środka klawiatury po zewnętrzną pokrywę, jest twardsze i bardziej odporne na wszelkie skręcenia czy zagłębienia niż w wielu innych laptopach do gier, w tym w MSI GE78.
Matowy gumowany pokład klawiatury może być mieszanym workiem, ponieważ łatwo zbiera nieestetyczny tłuszcz i odciski palców w czasie.
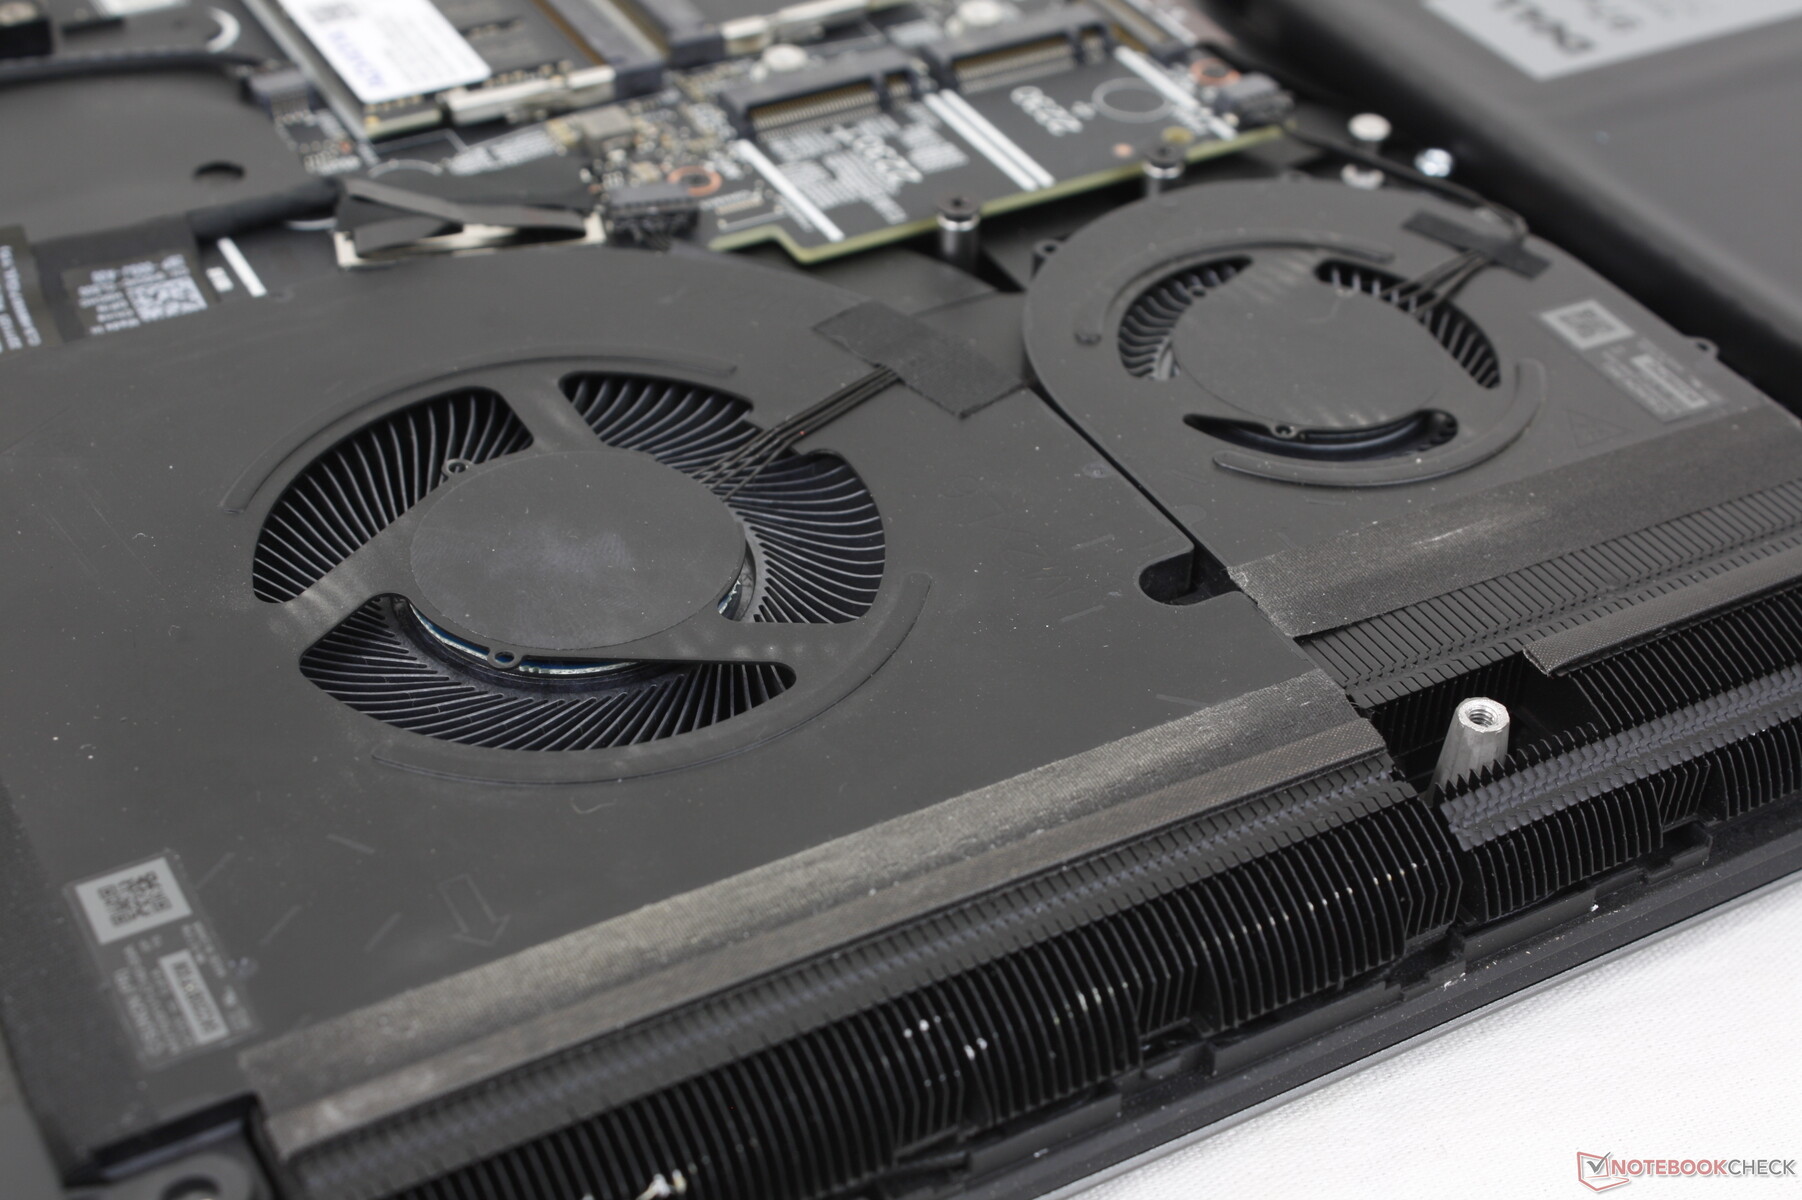
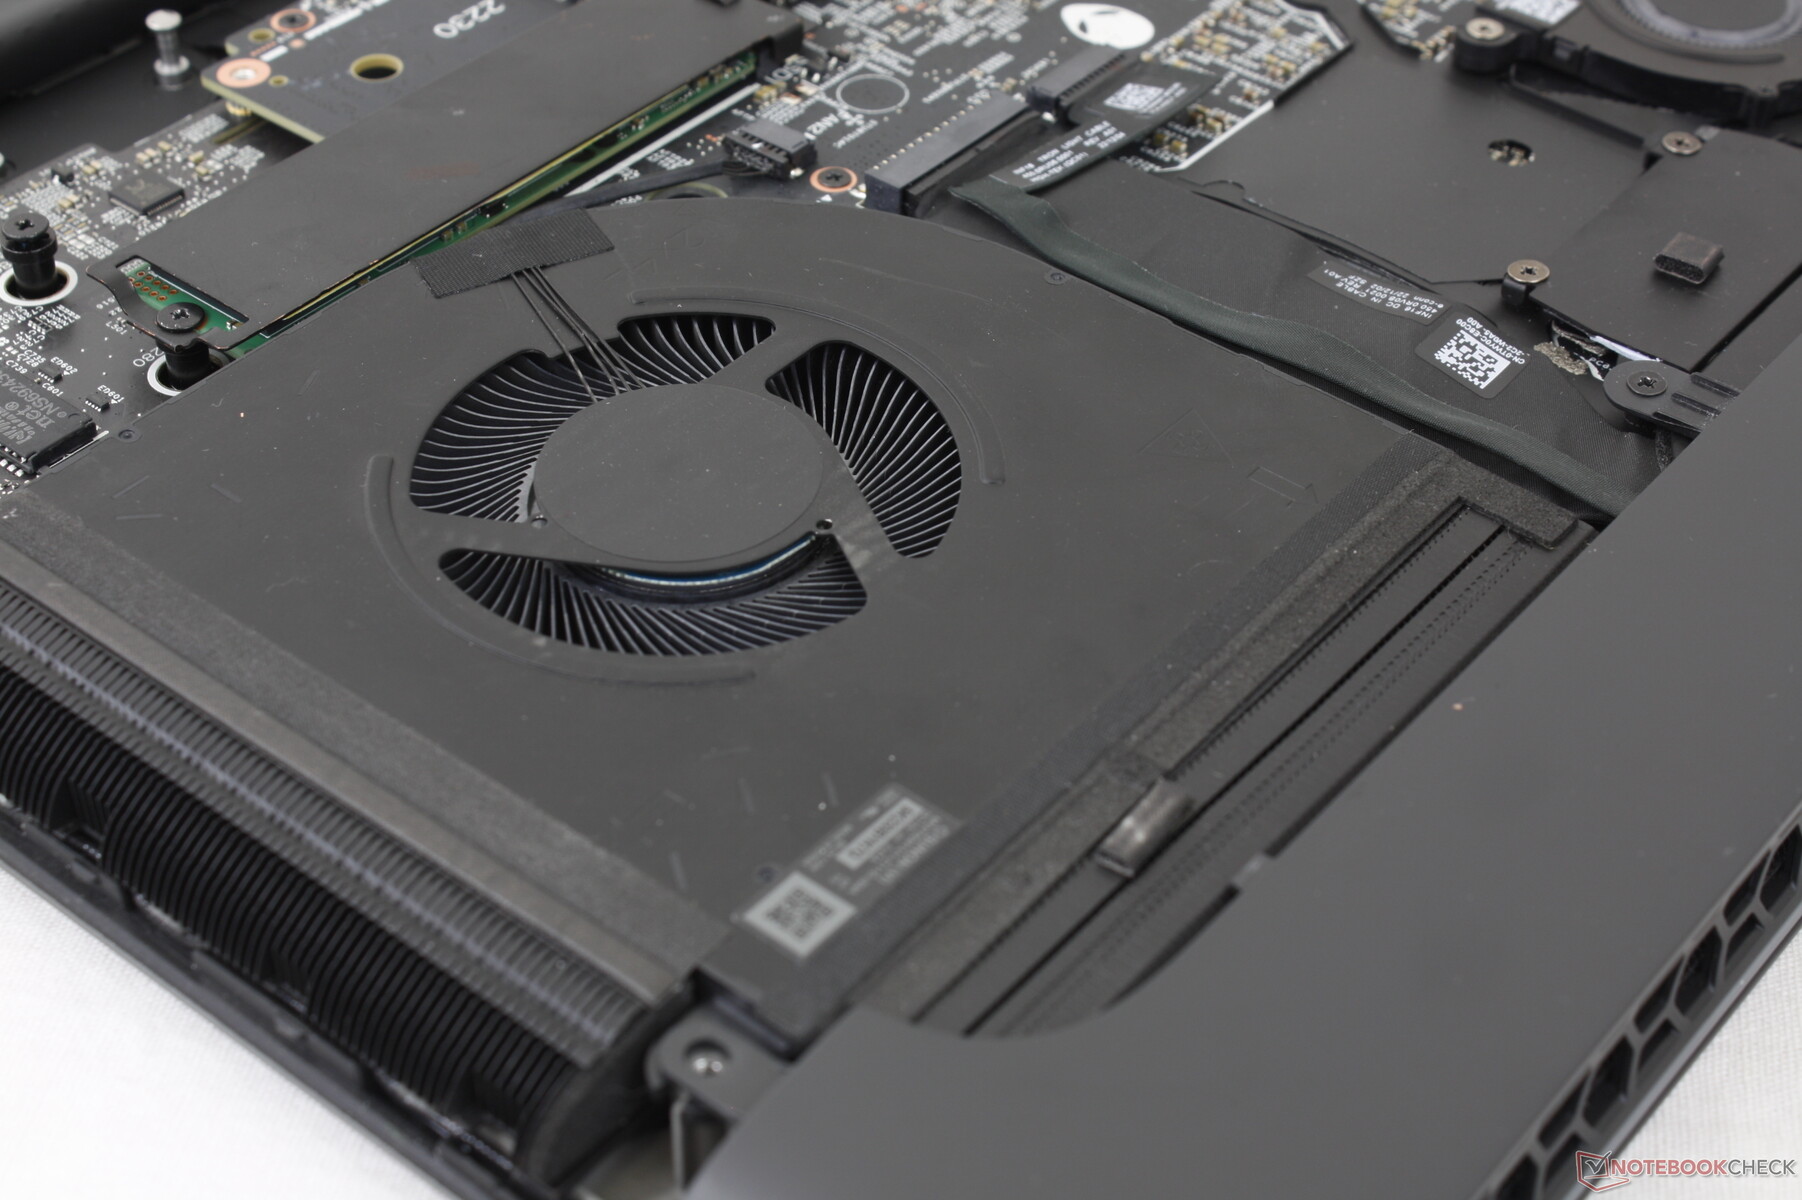
Model Alienware jest znacznie cięższy niż 18-calowy Blade 18 czy m.in.ROG Strix Scar 18 o prawie pełny kilogram każdy, by być jednym z najcięższych laptopów tego roku. W rzeczywistości nasz kurier skomentował nawet, jak ciężkie było pudło wysyłkowe w stosunku do jego niewielkich rozmiarów. Dużą część wagi można przypisać wydłużonemu tyłowi, grubszemu profilowi i chłodnicy z komorą parową, które mają poprawić chłodzenie. Jeśli zależy wam na wadze w podróży, to warto rozważyć model MSI Titan GT77 który jest lżejszy i cieńszy od naszego Alienware.
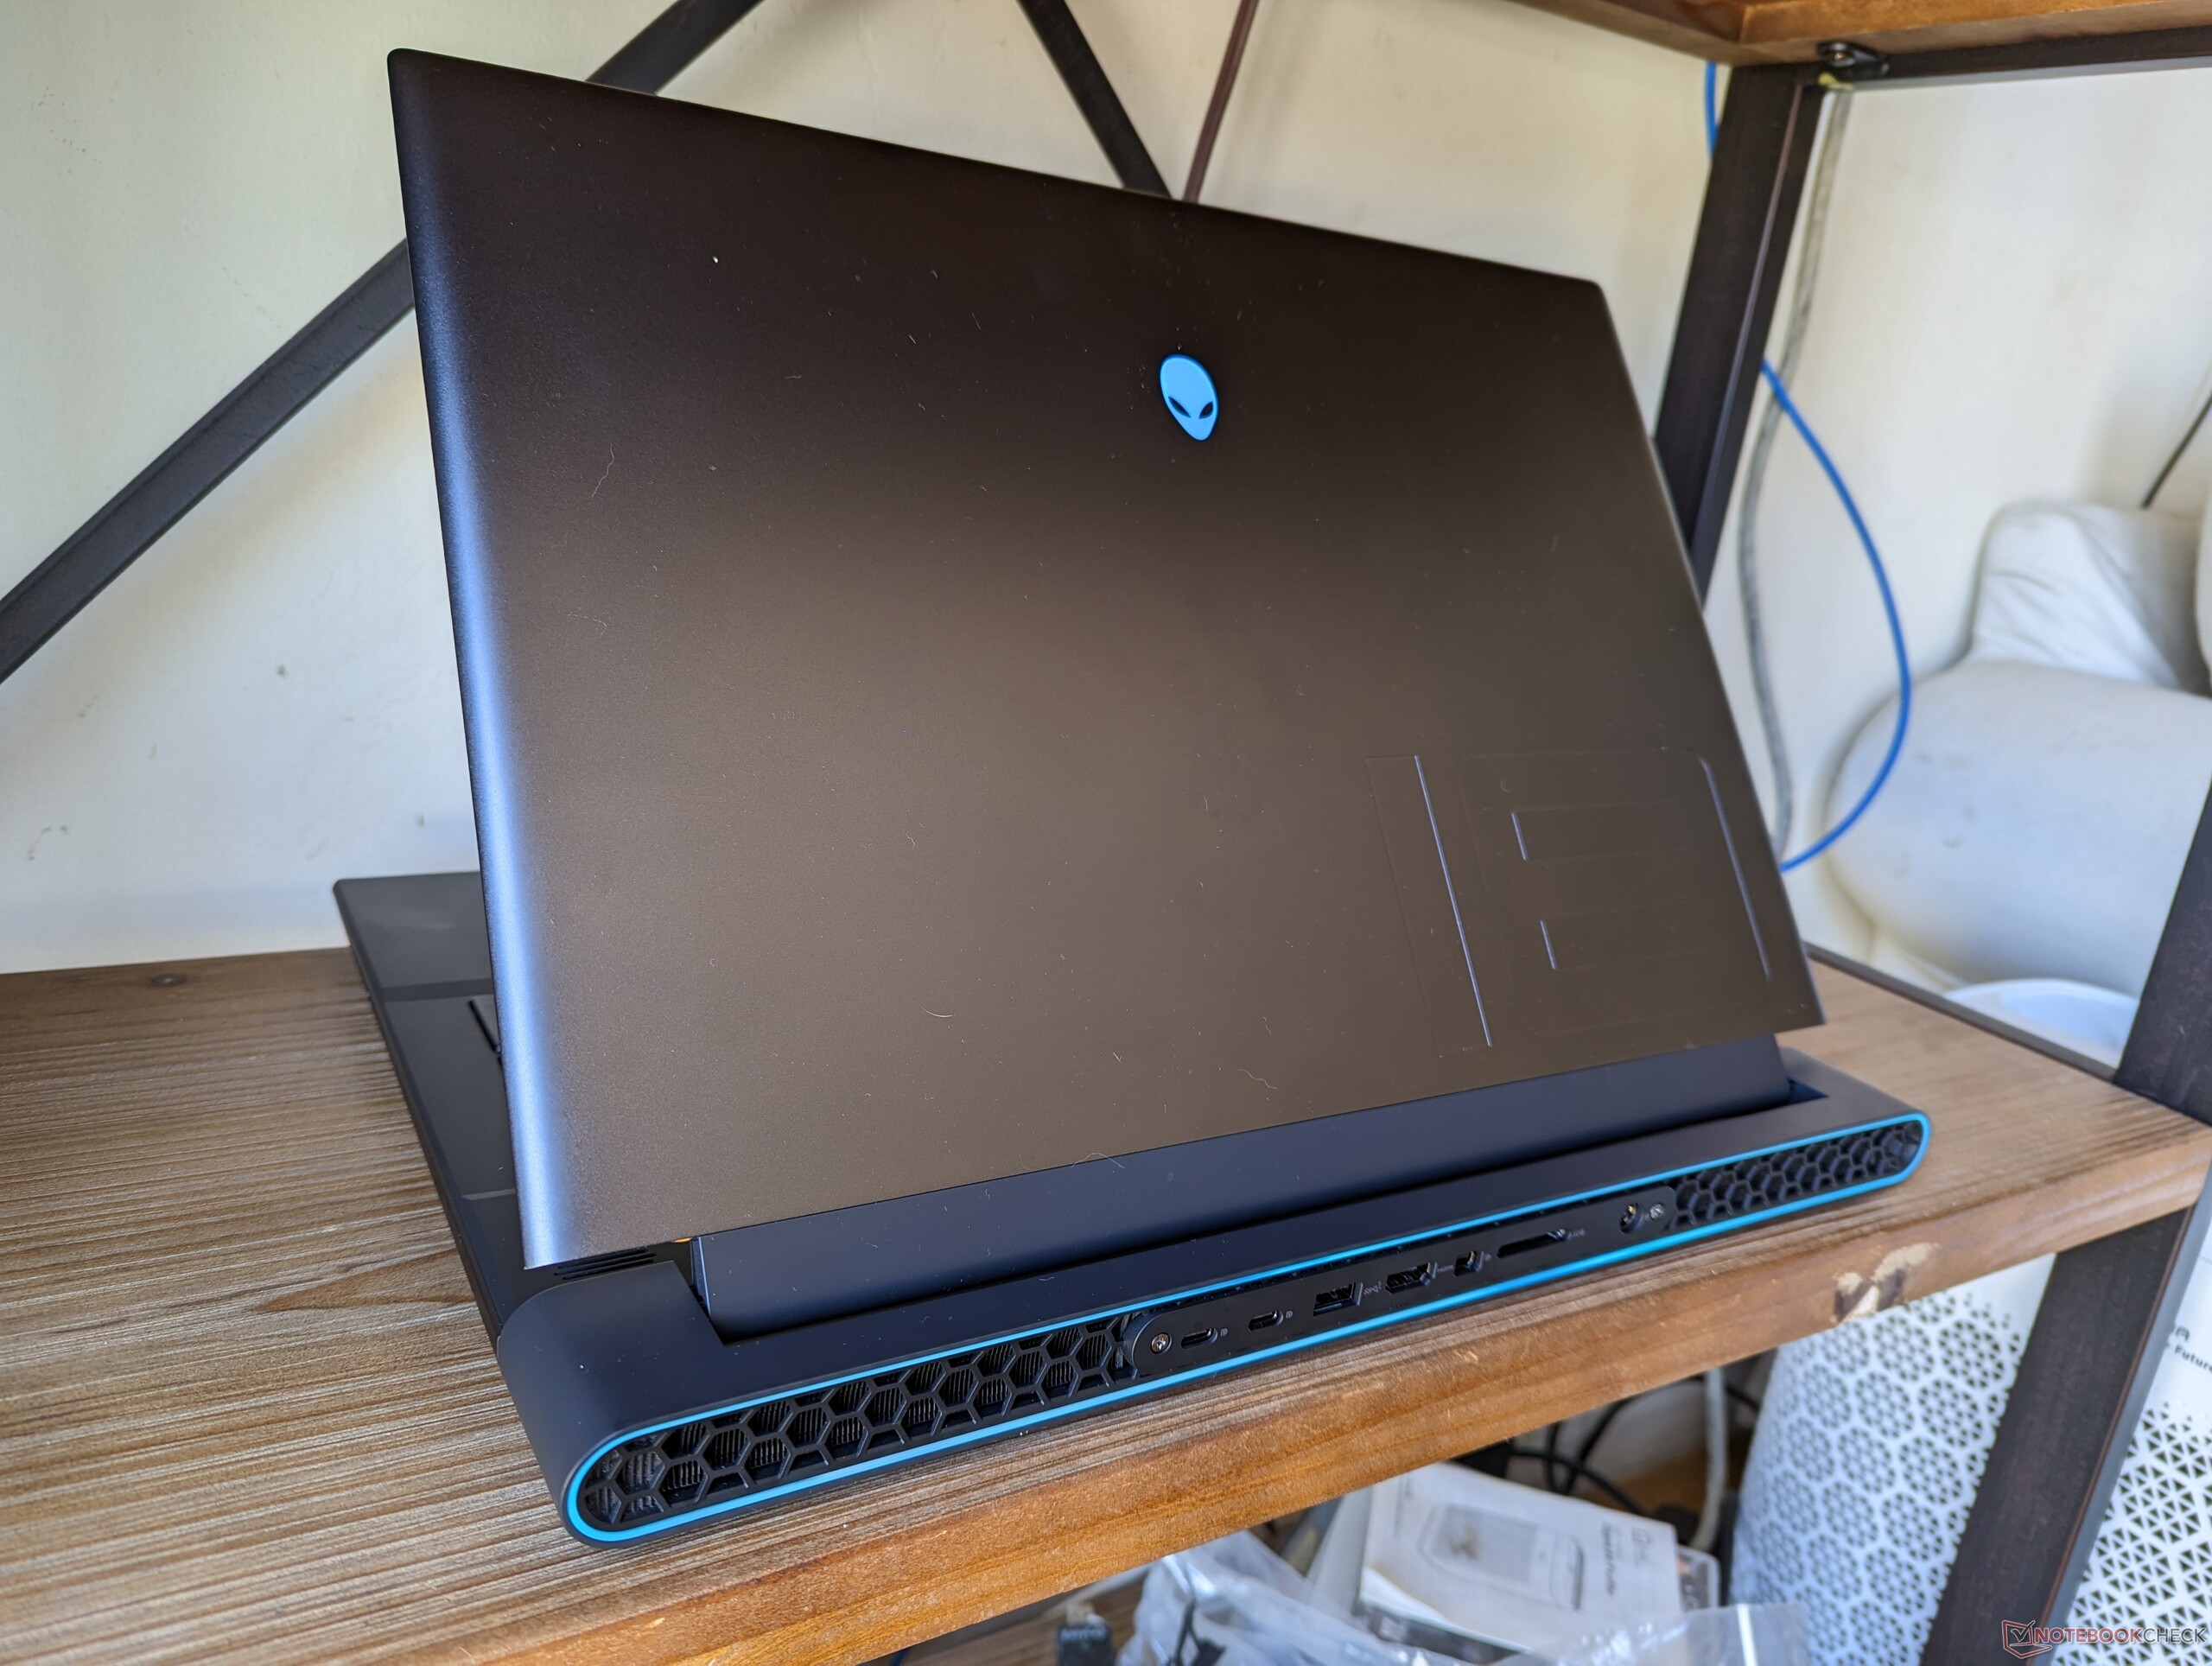
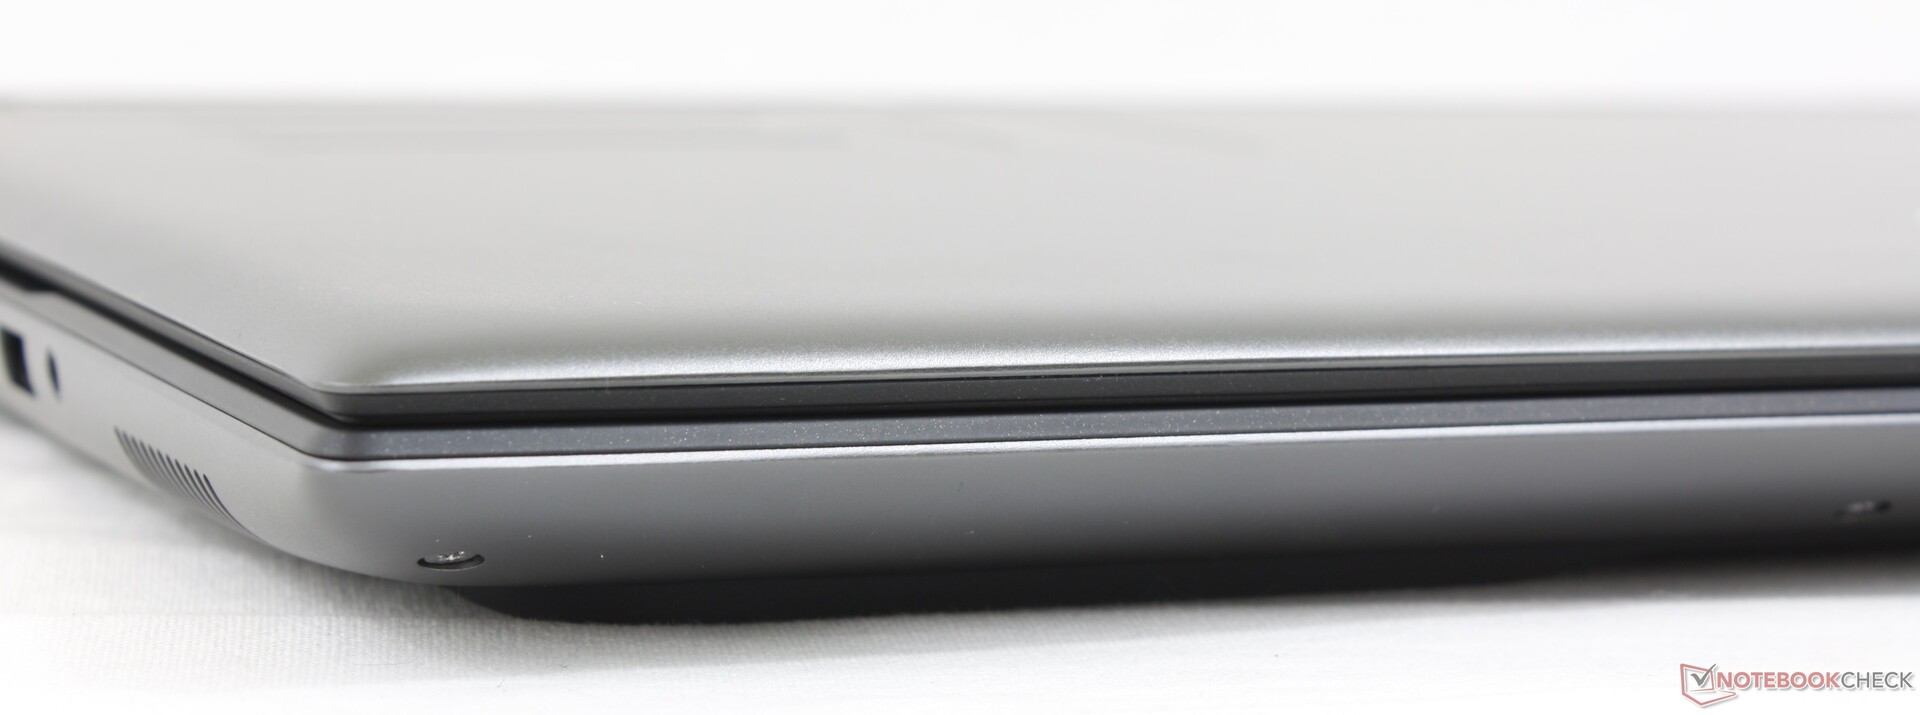
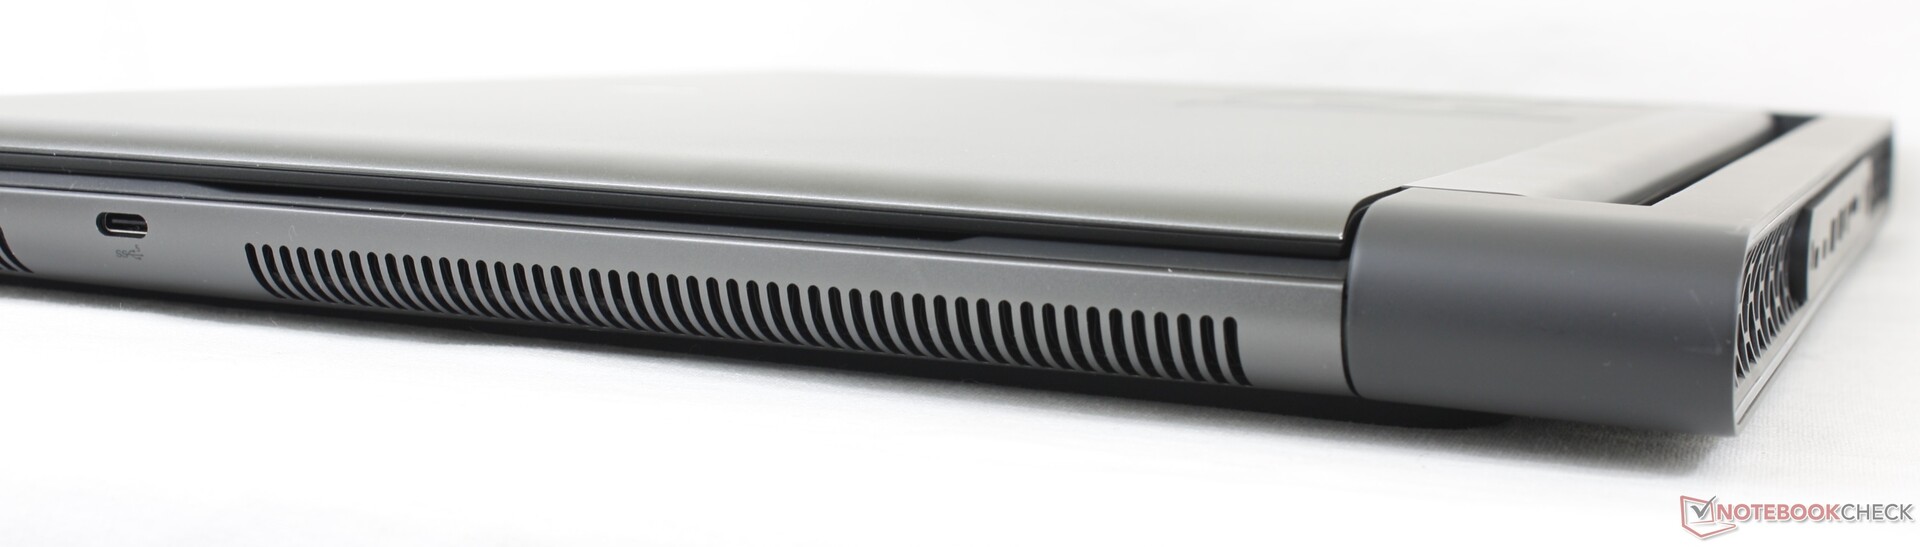
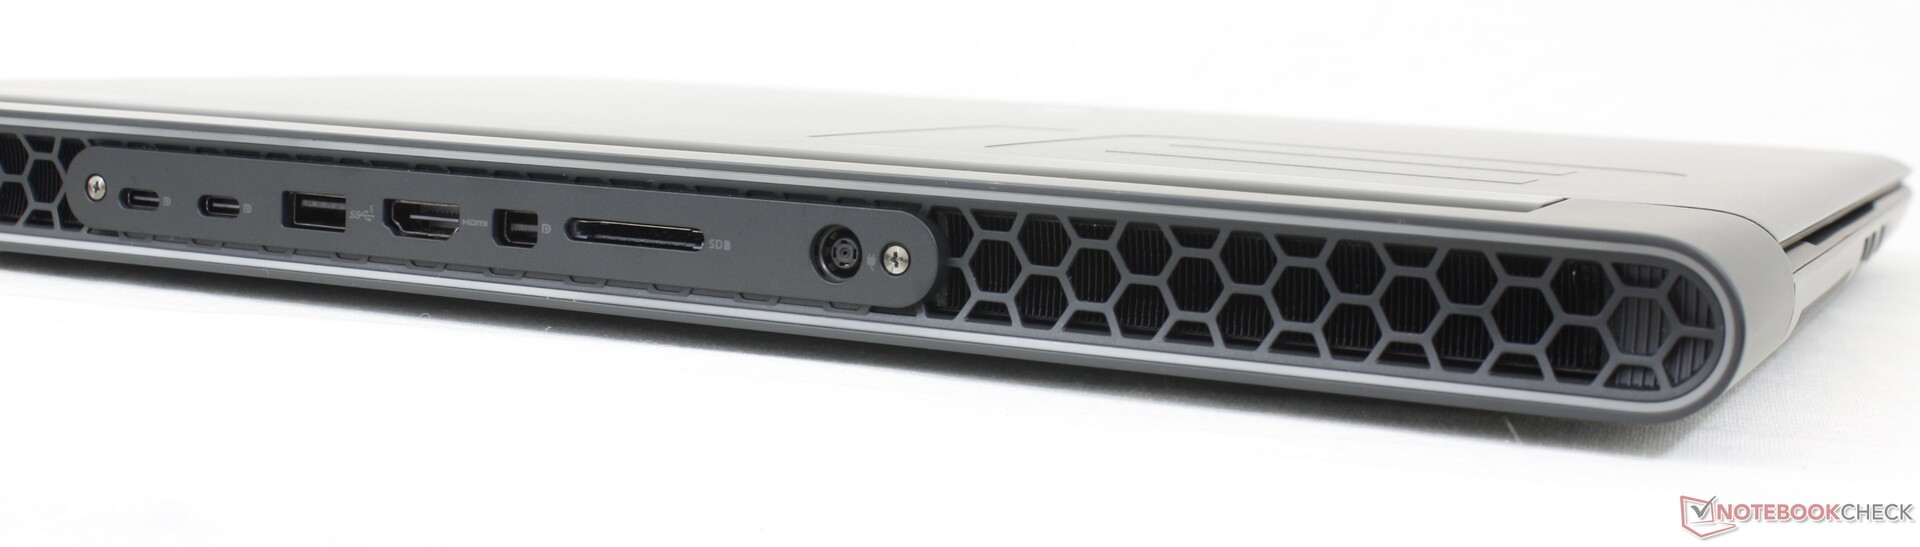
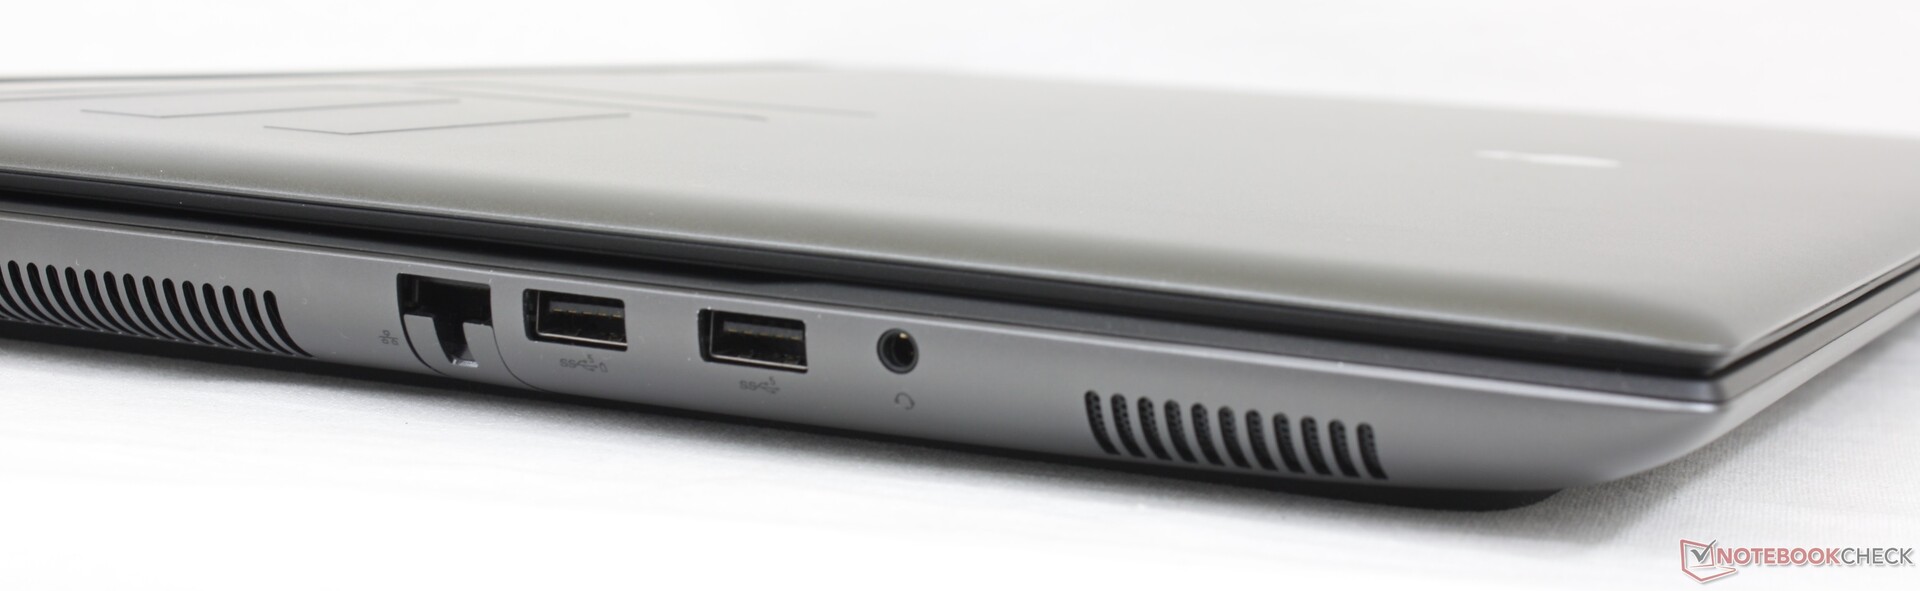
Łączność - więcej niż zwykle
W Alienware jest więcej zintegrowanych portów niż w konkurencyjnym Razer Blade 18 czy Asus ROG Strix Scar 18. Haczyk polega jednak na tym, że większość portów jest ciasno upakowana wzdłuż tylnej krawędzi, co nieco utrudnia dostęp do nich.
Monitory USB-C są obsługiwane tylko na dwóch tylnych portach USB-C, ponieważ trzeci port USB-C wzdłuż prawej krawędzi nie obsługuje wyjścia wideo.
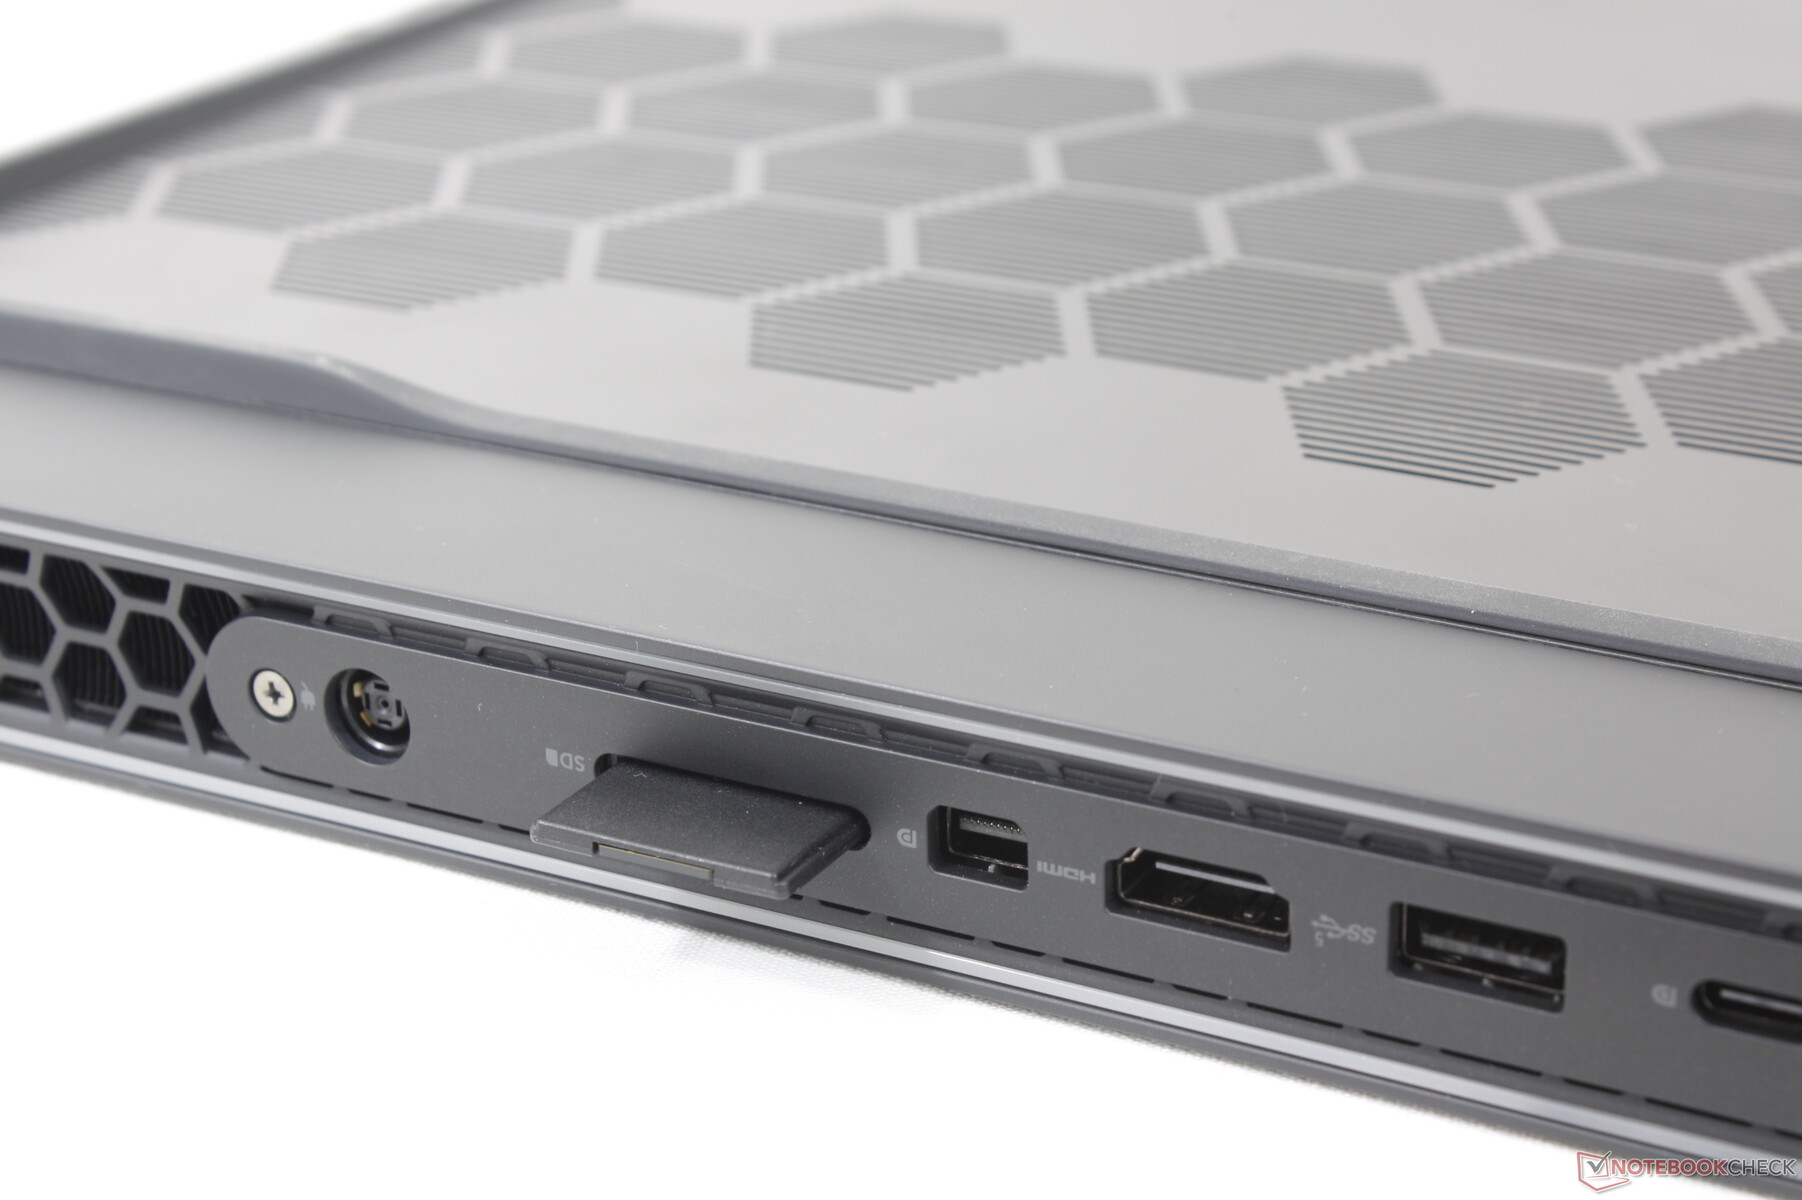
Czytnik kart SD
Zintegrowany czytnik kart SD znajduje się z tyłu urządzenia, inaczej niż w większości innych laptopów. Szybkość transferu jest jednak bardzo duża i wynosi ponad 2x więcej, niż w przypadku modelu MSI Titan GT77.
| SD Card Reader | |
| average JPG Copy Test (av. of 3 runs) | |
| Razer Blade 18 RTX 4070 (Angelibird AV Pro V60) | |
| Alienware m18 R1 (Angelibird AV Pro V60) | |
| Alienware x17 R2 P48E (AV Pro V60) | |
| MSI Titan GT77 HX 13VI (Angelibird AV Pro V60) | |
| Eluktronics Mech-17 GP2 (Angelibird AV Pro V60) | |
| maximum AS SSD Seq Read Test (1GB) | |
| Alienware x17 R2 P48E (AV Pro V60) | |
| Alienware m18 R1 (Angelibird AV Pro V60) | |
| Razer Blade 18 RTX 4070 (Angelibird AV Pro V60) | |
| Eluktronics Mech-17 GP2 (Angelibird AV Pro V60) | |
| MSI Titan GT77 HX 13VI (Angelibird AV Pro V60) | |
Komunikacja
Intel Killer 1675i standardowo zapewnia zgodność z Wi-Fi 6E i Bluetooth 5.2. Killer to submarka Intela zoptymalizowana pod kątem laptopów do gier, więc Killer 1675i to w zasadzie Intel AX211. Wydajność jest doskonała i niezawodna po sparowaniu z naszym routerem testowym Asus AXE11000.
| Networking | |
| iperf3 transmit AX12 | |
| Alienware x17 R2 P48E | |
| iperf3 receive AX12 | |
| Alienware x17 R2 P48E | |
| iperf3 transmit AXE11000 | |
| MSI Titan GT77 HX 13VI | |
| Asus ROG Strix Scar 18 2023 G834JY-N6005W | |
| Eluktronics Mech-17 GP2 | |
| Alienware m18 R1 | |
| Razer Blade 18 RTX 4070 | |
| iperf3 receive AXE11000 | |
| Asus ROG Strix Scar 18 2023 G834JY-N6005W | |
| MSI Titan GT77 HX 13VI | |
| Razer Blade 18 RTX 4070 | |
| Eluktronics Mech-17 GP2 | |
| Alienware m18 R1 | |
| iperf3 transmit AXE11000 6GHz | |
| Alienware m18 R1 | |
| Razer Blade 18 RTX 4070 | |
| iperf3 receive AXE11000 6GHz | |
| Razer Blade 18 RTX 4070 | |
| Alienware m18 R1 | |
Kamera internetowa
Kamera internetowa o rozdzielczości 2 MP jest typowa dla większości laptopów w dzisiejszych czasach, ale jesteśmy nieco rozczarowani, że nie widzimy sensora 5 MP, biorąc pod uwagę jak duża jest obudowa. Podczerwień jest standardem, a migawka kamery internetowej jest nieobecna, w przeciwieństwie do Razer Blade 18.


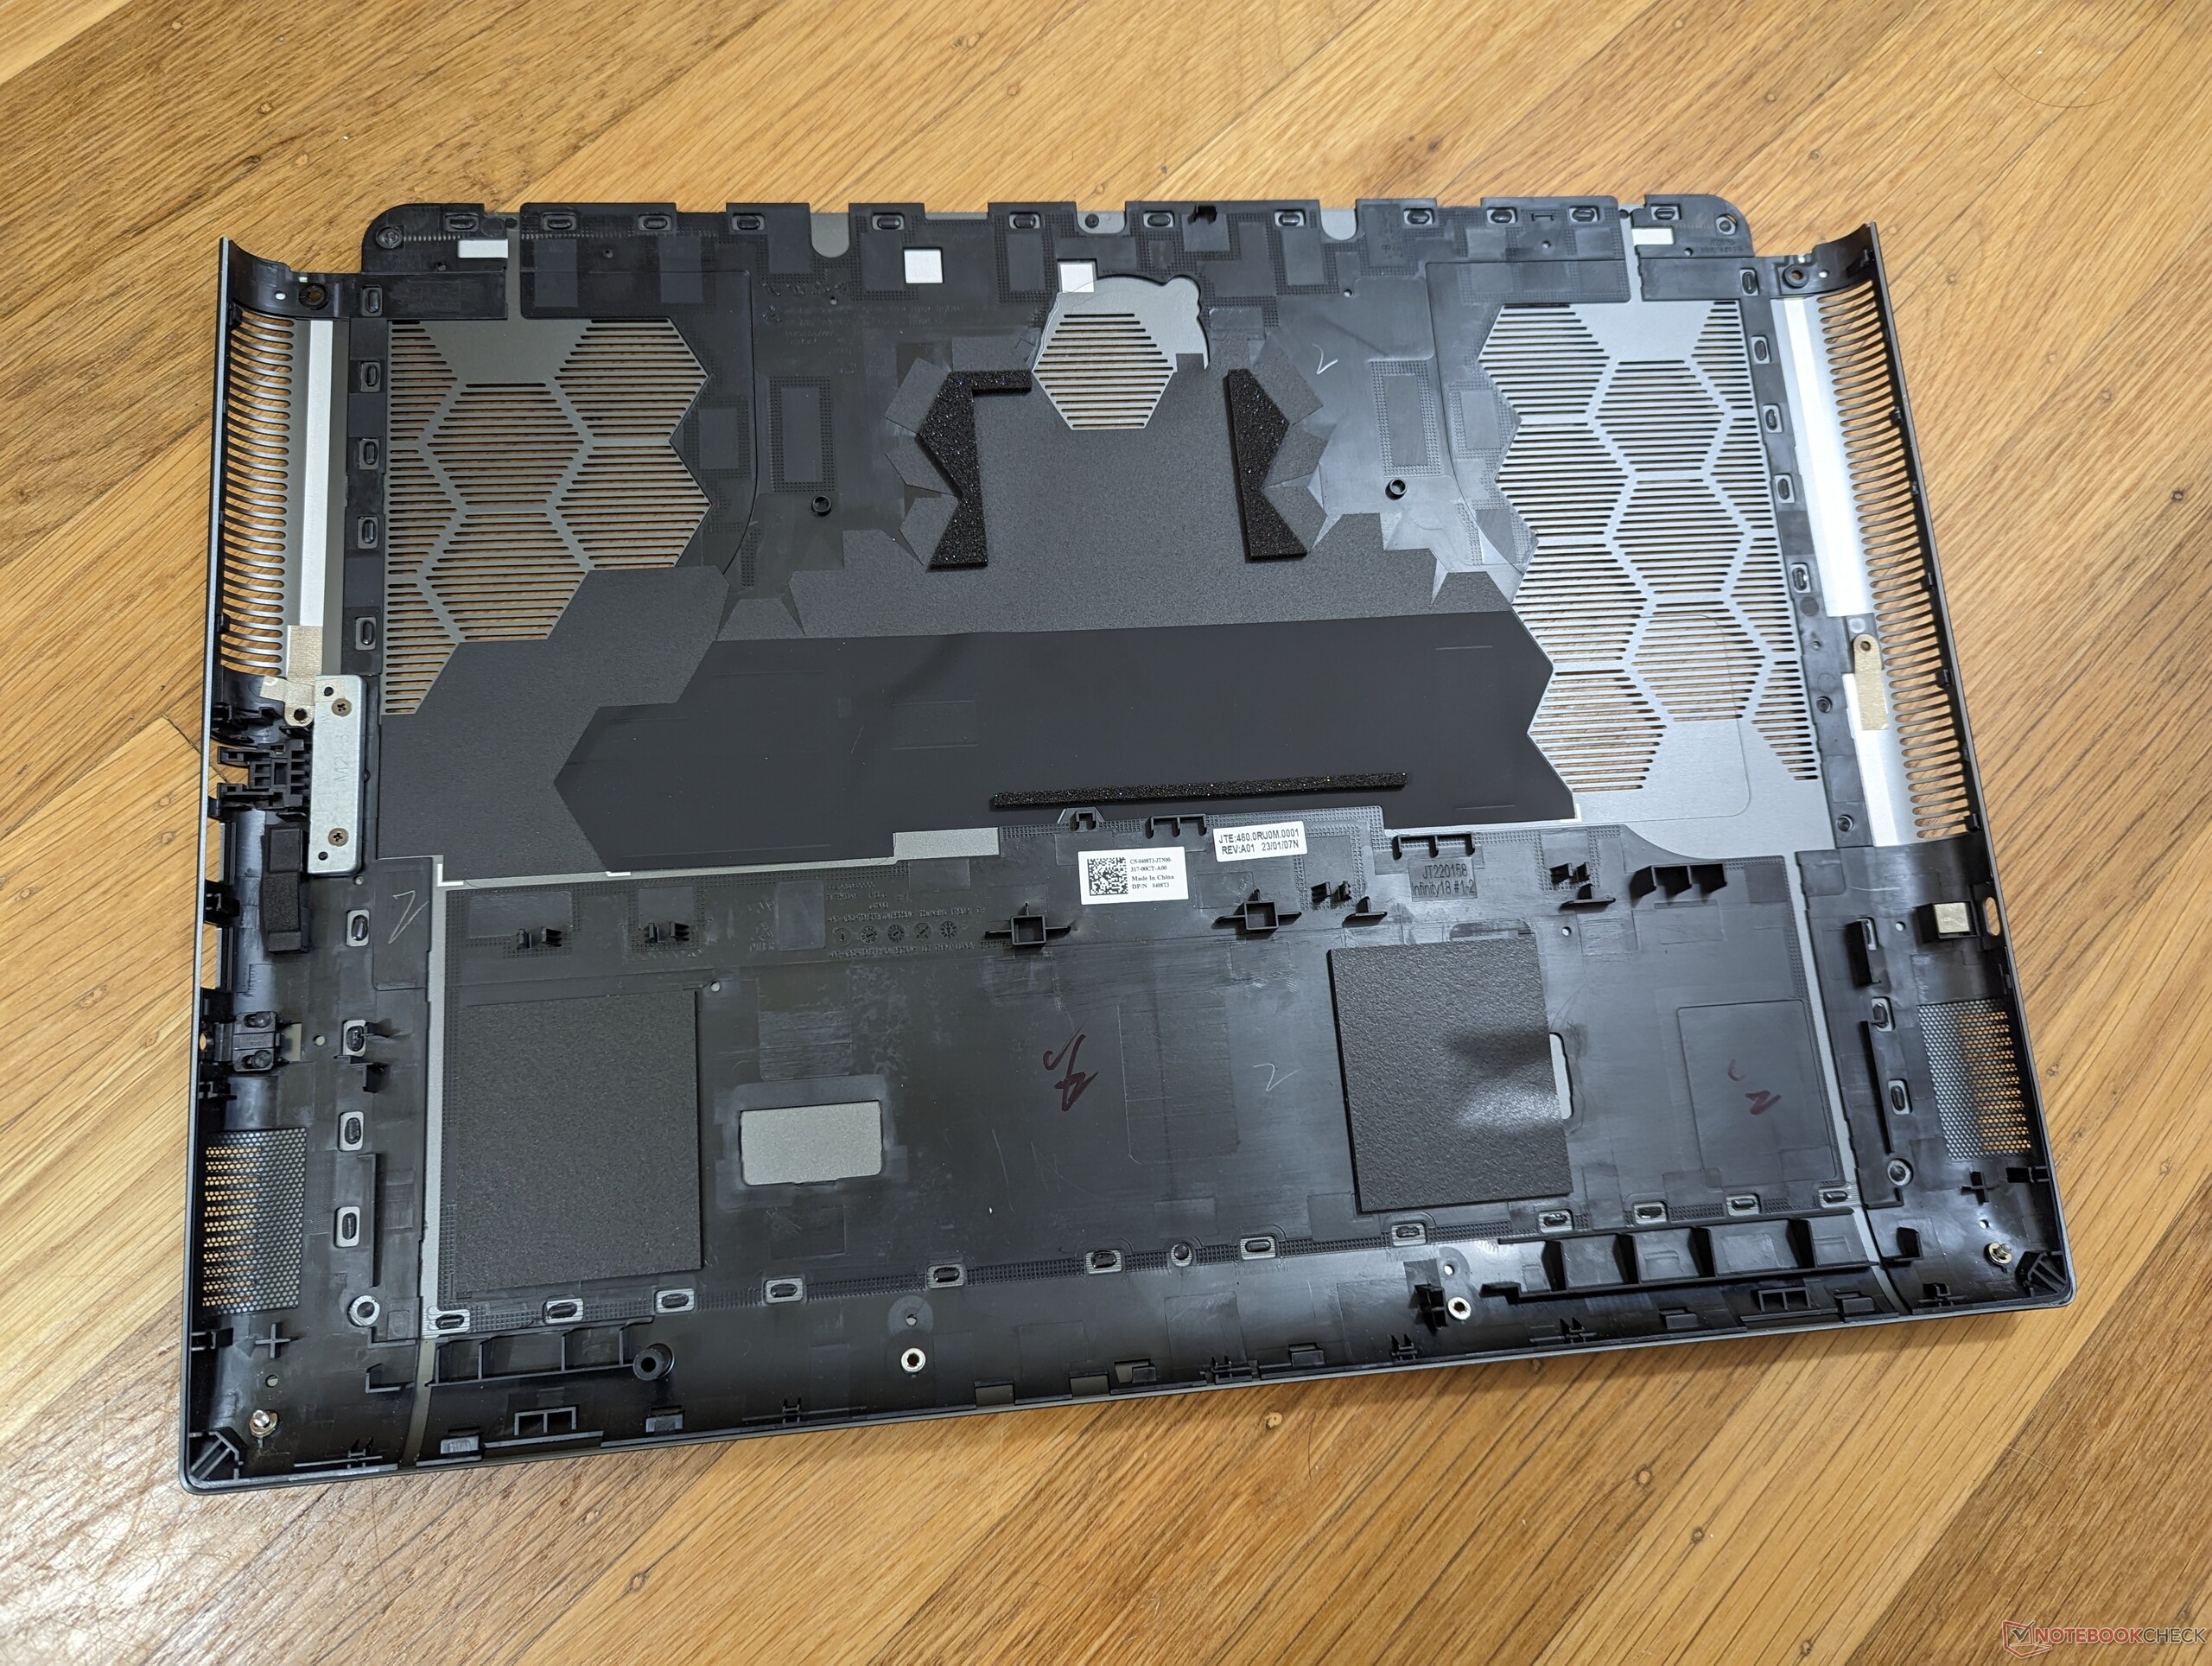
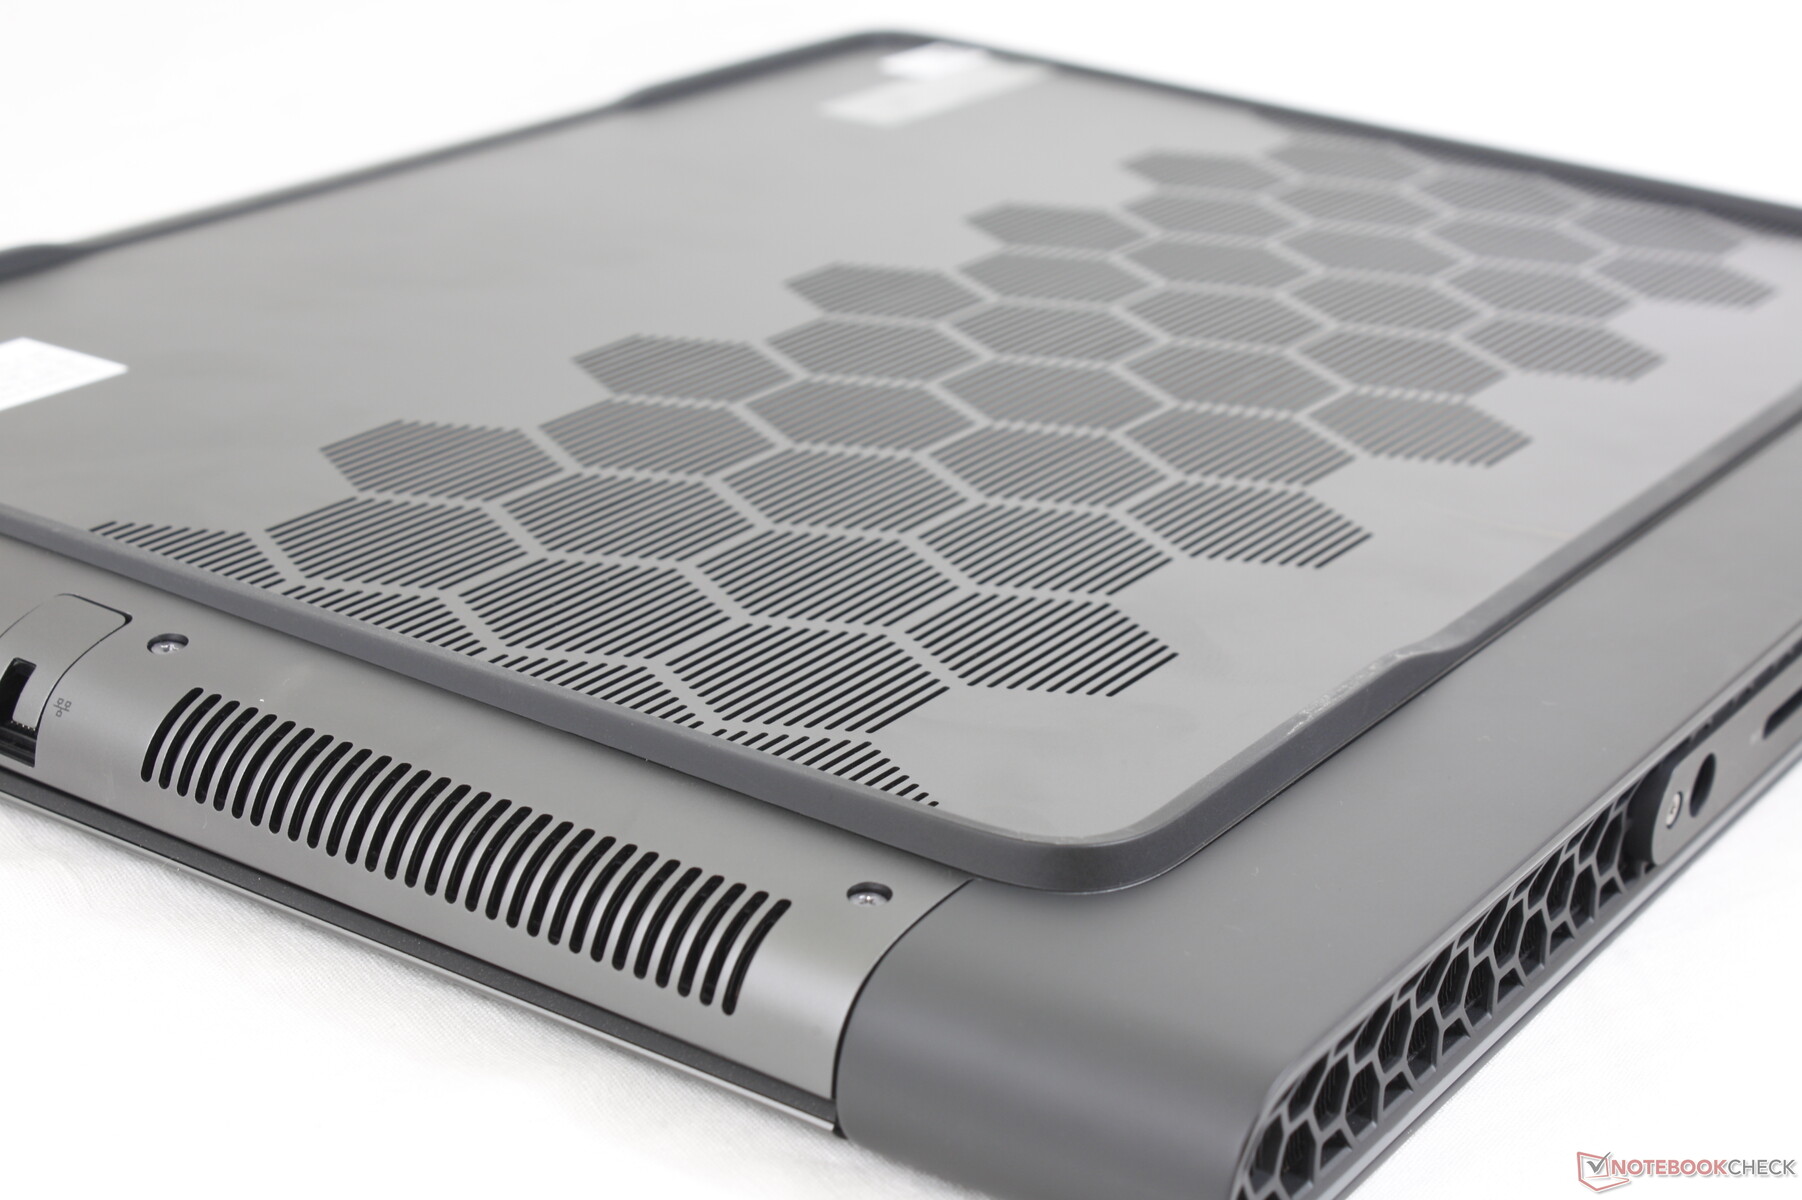
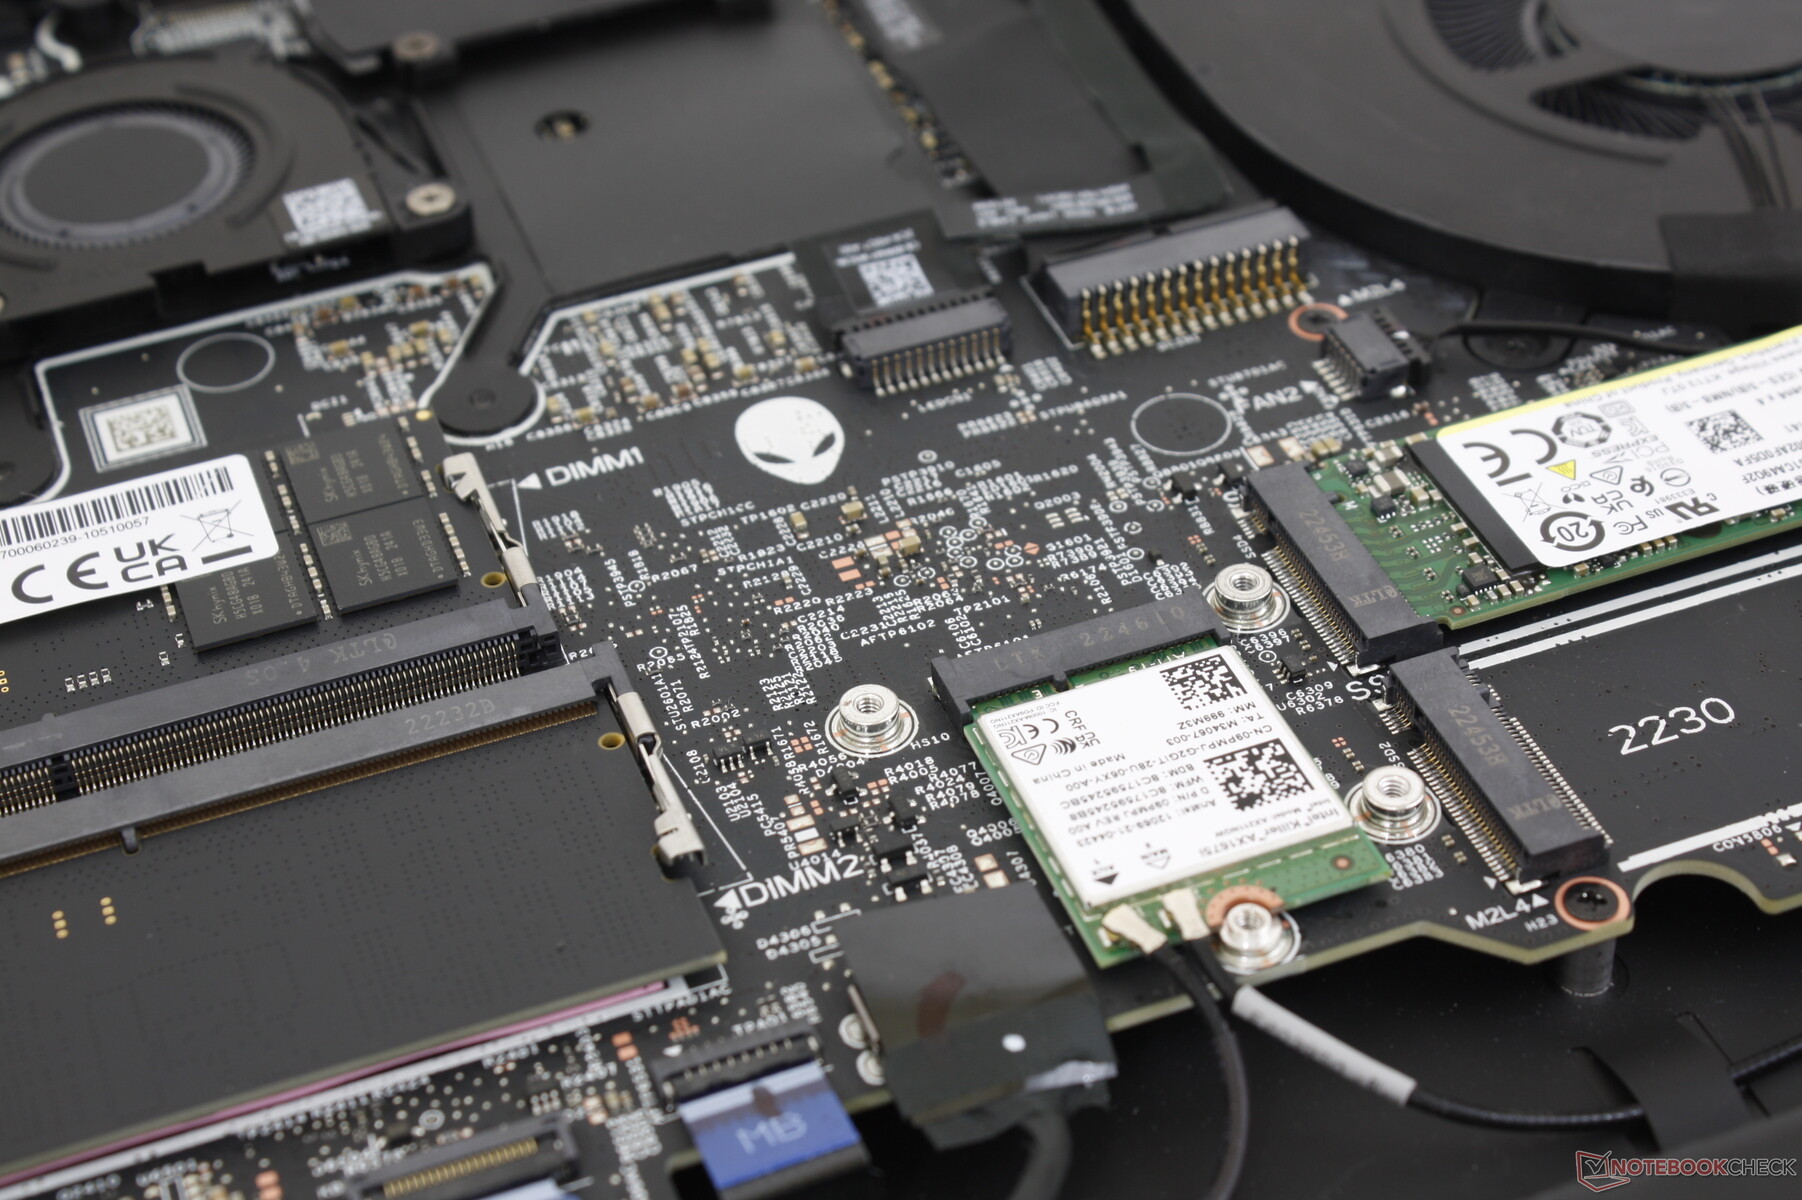
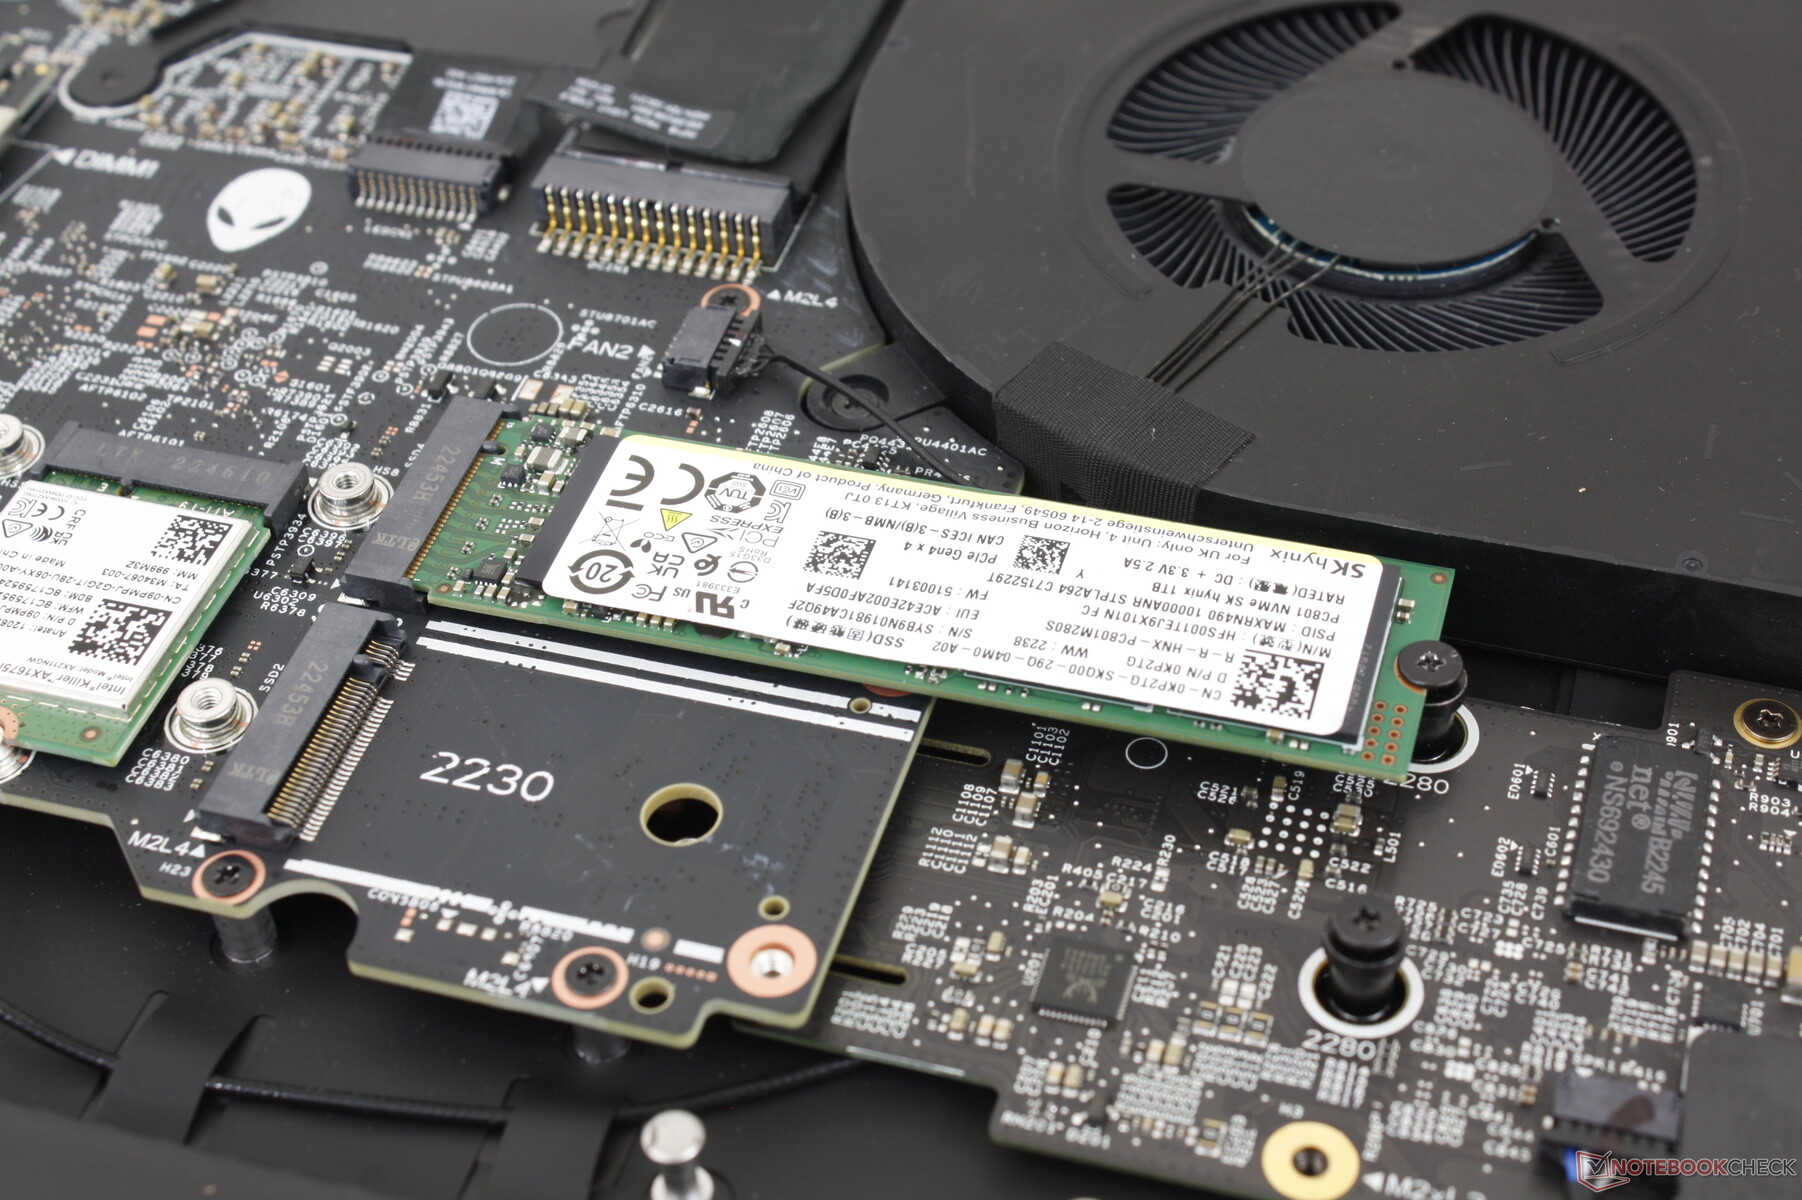
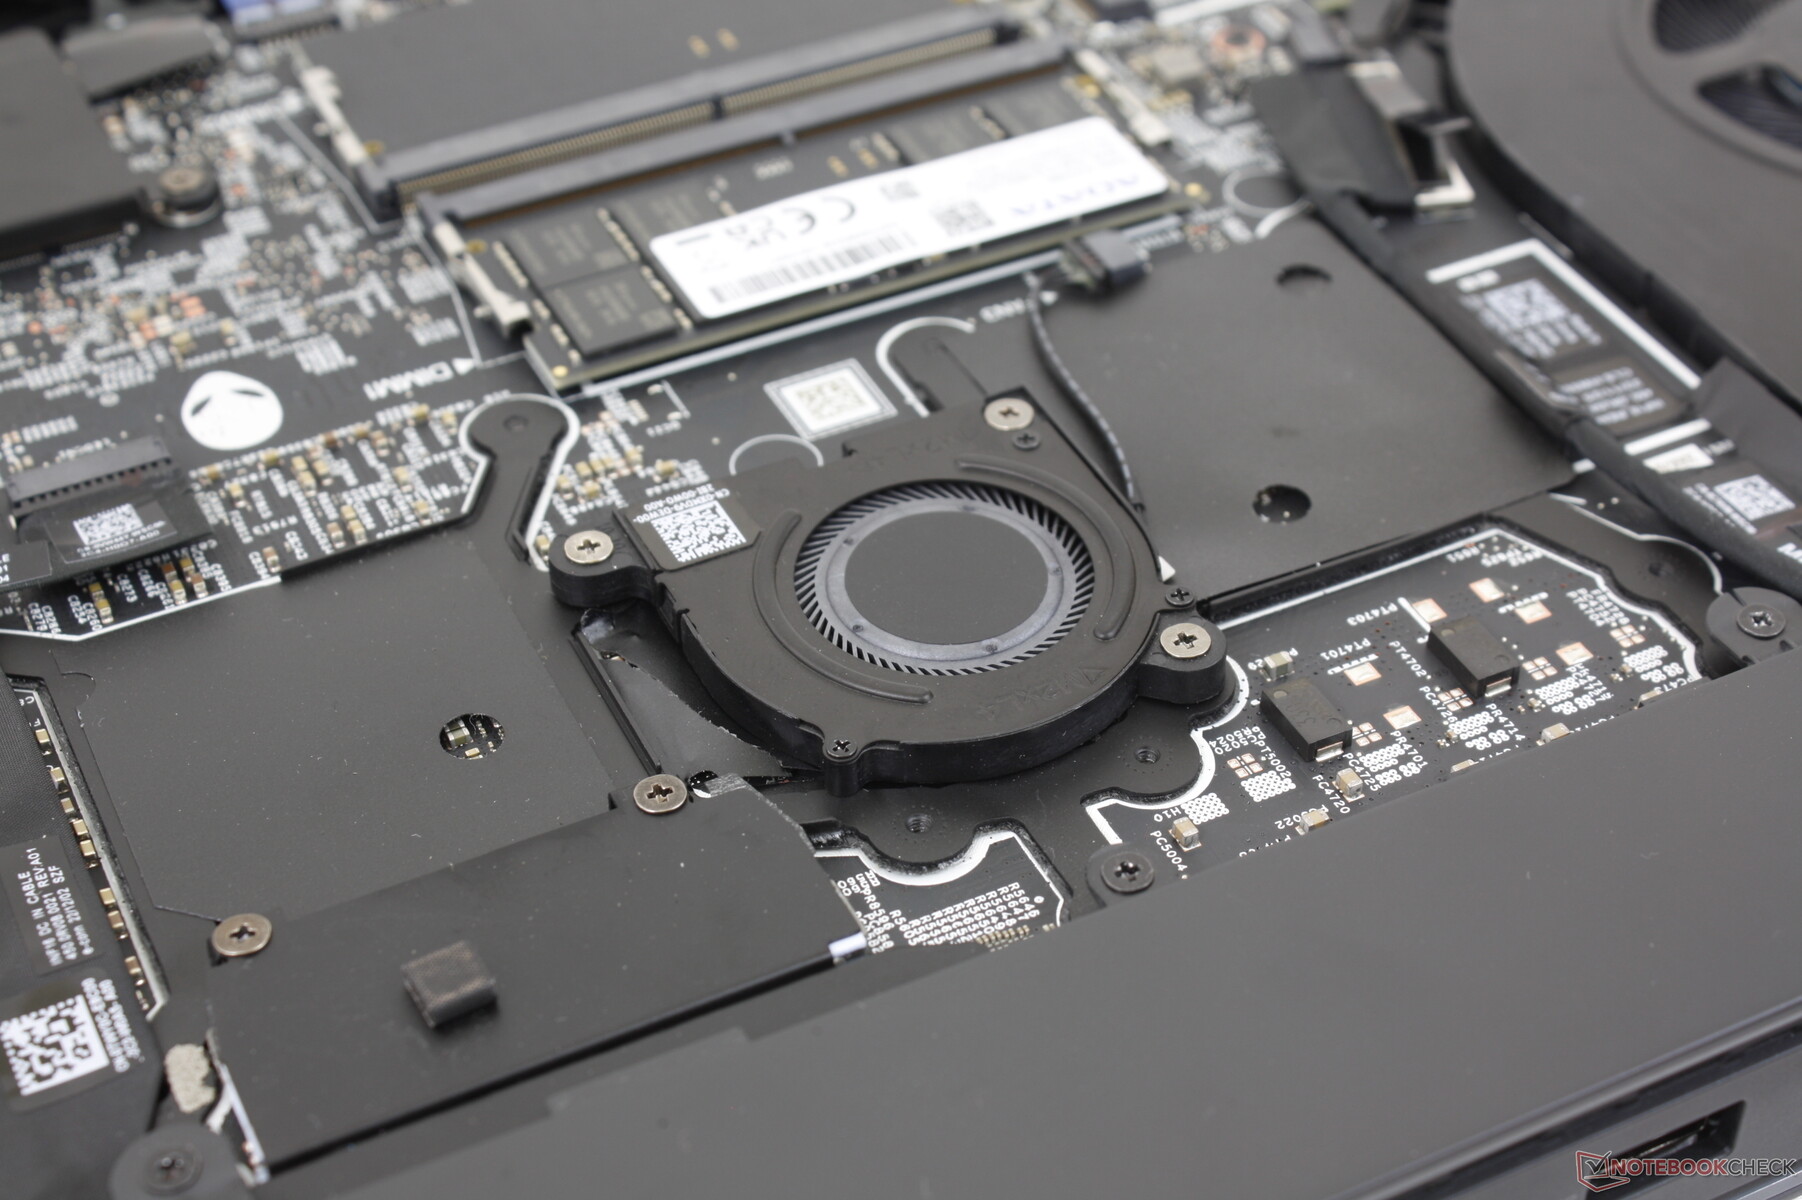
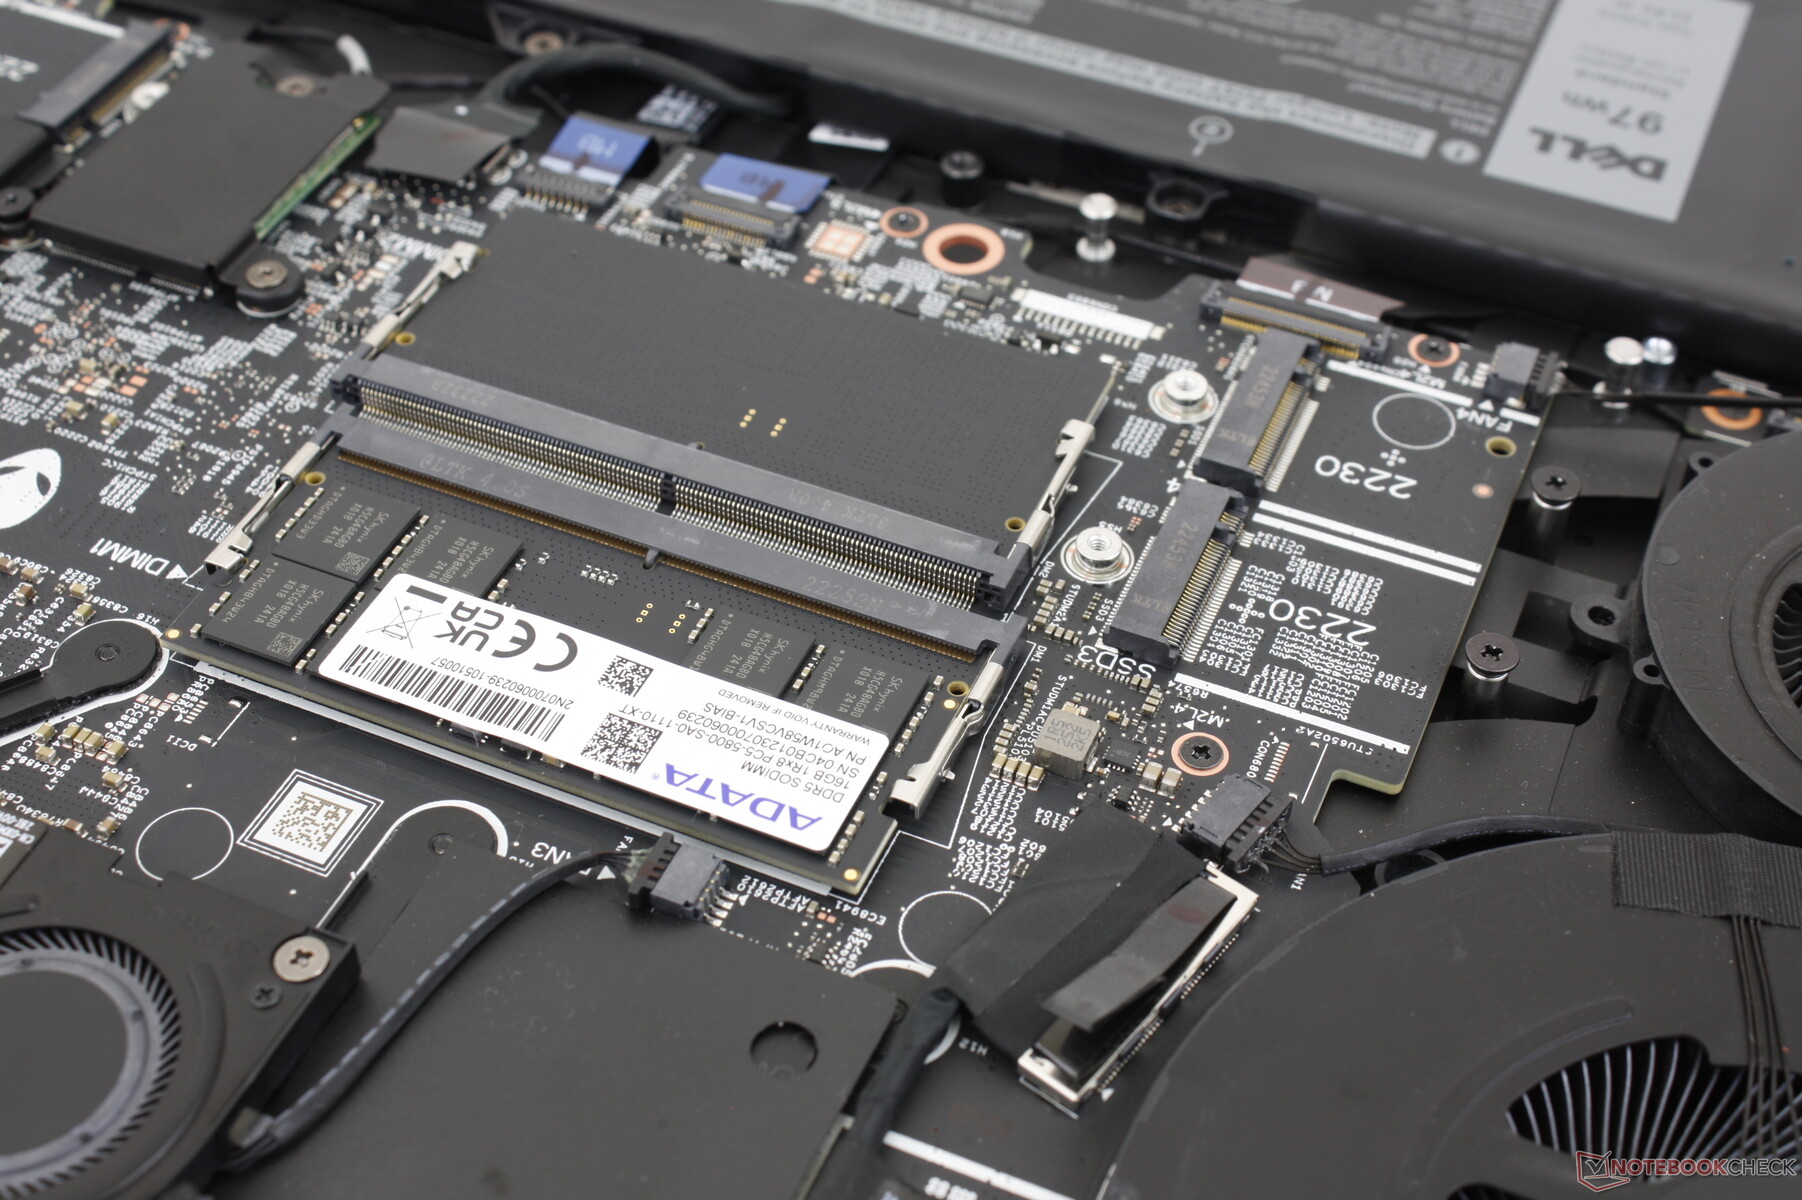
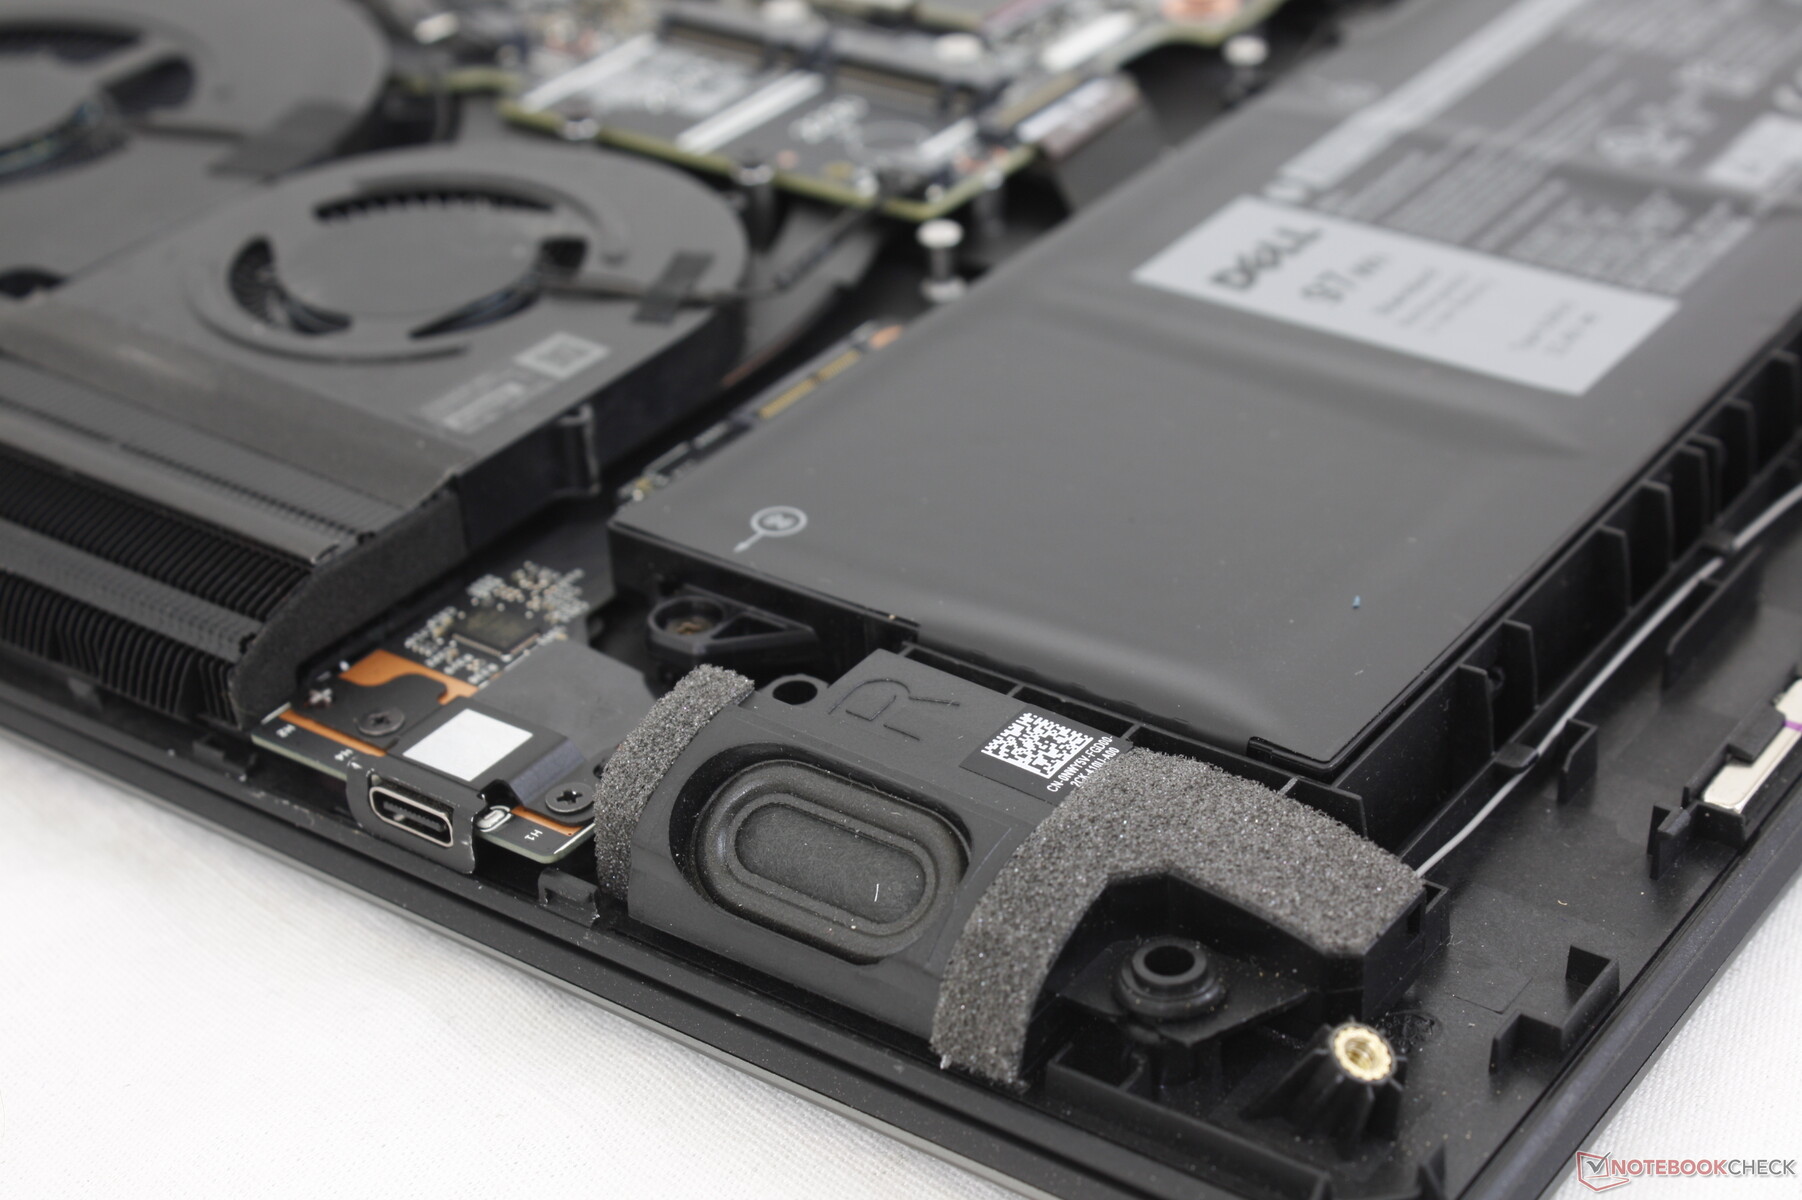
Konserwacja
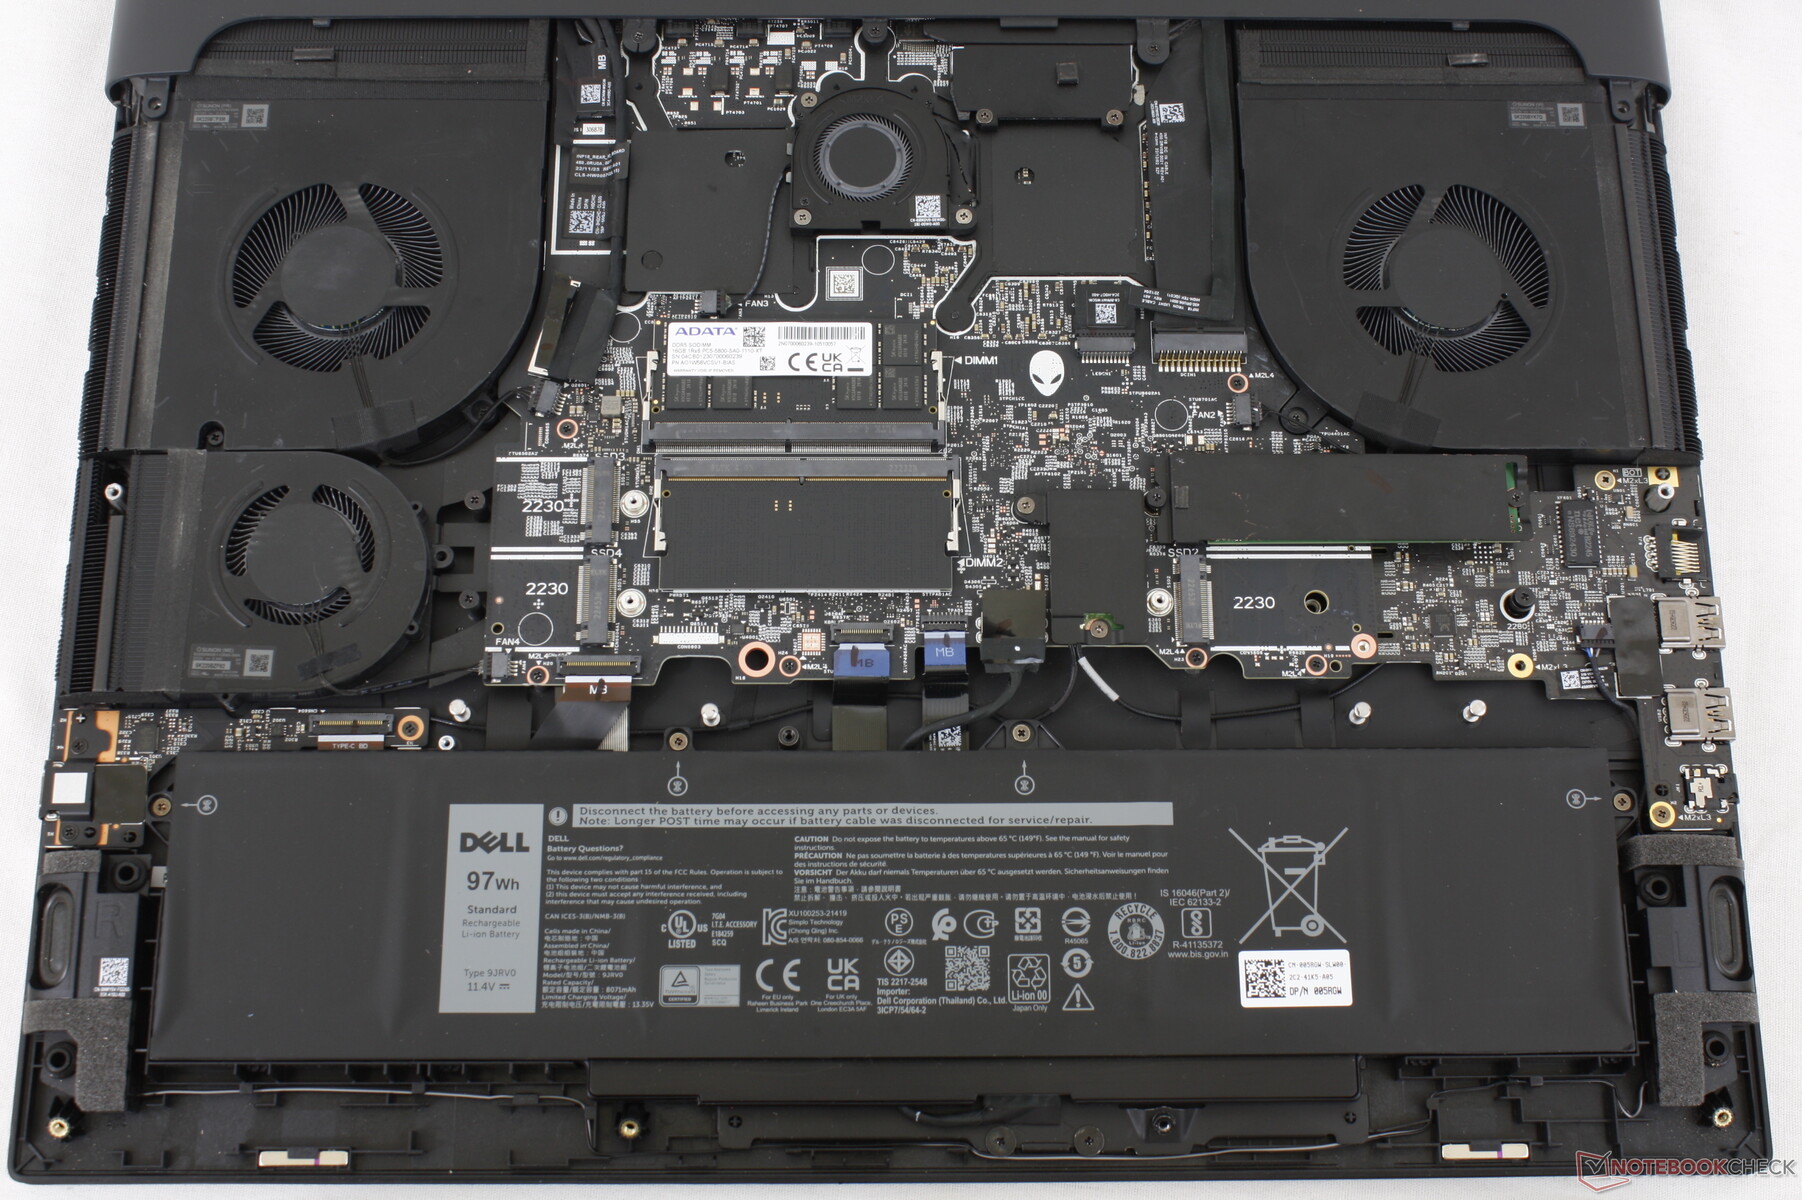
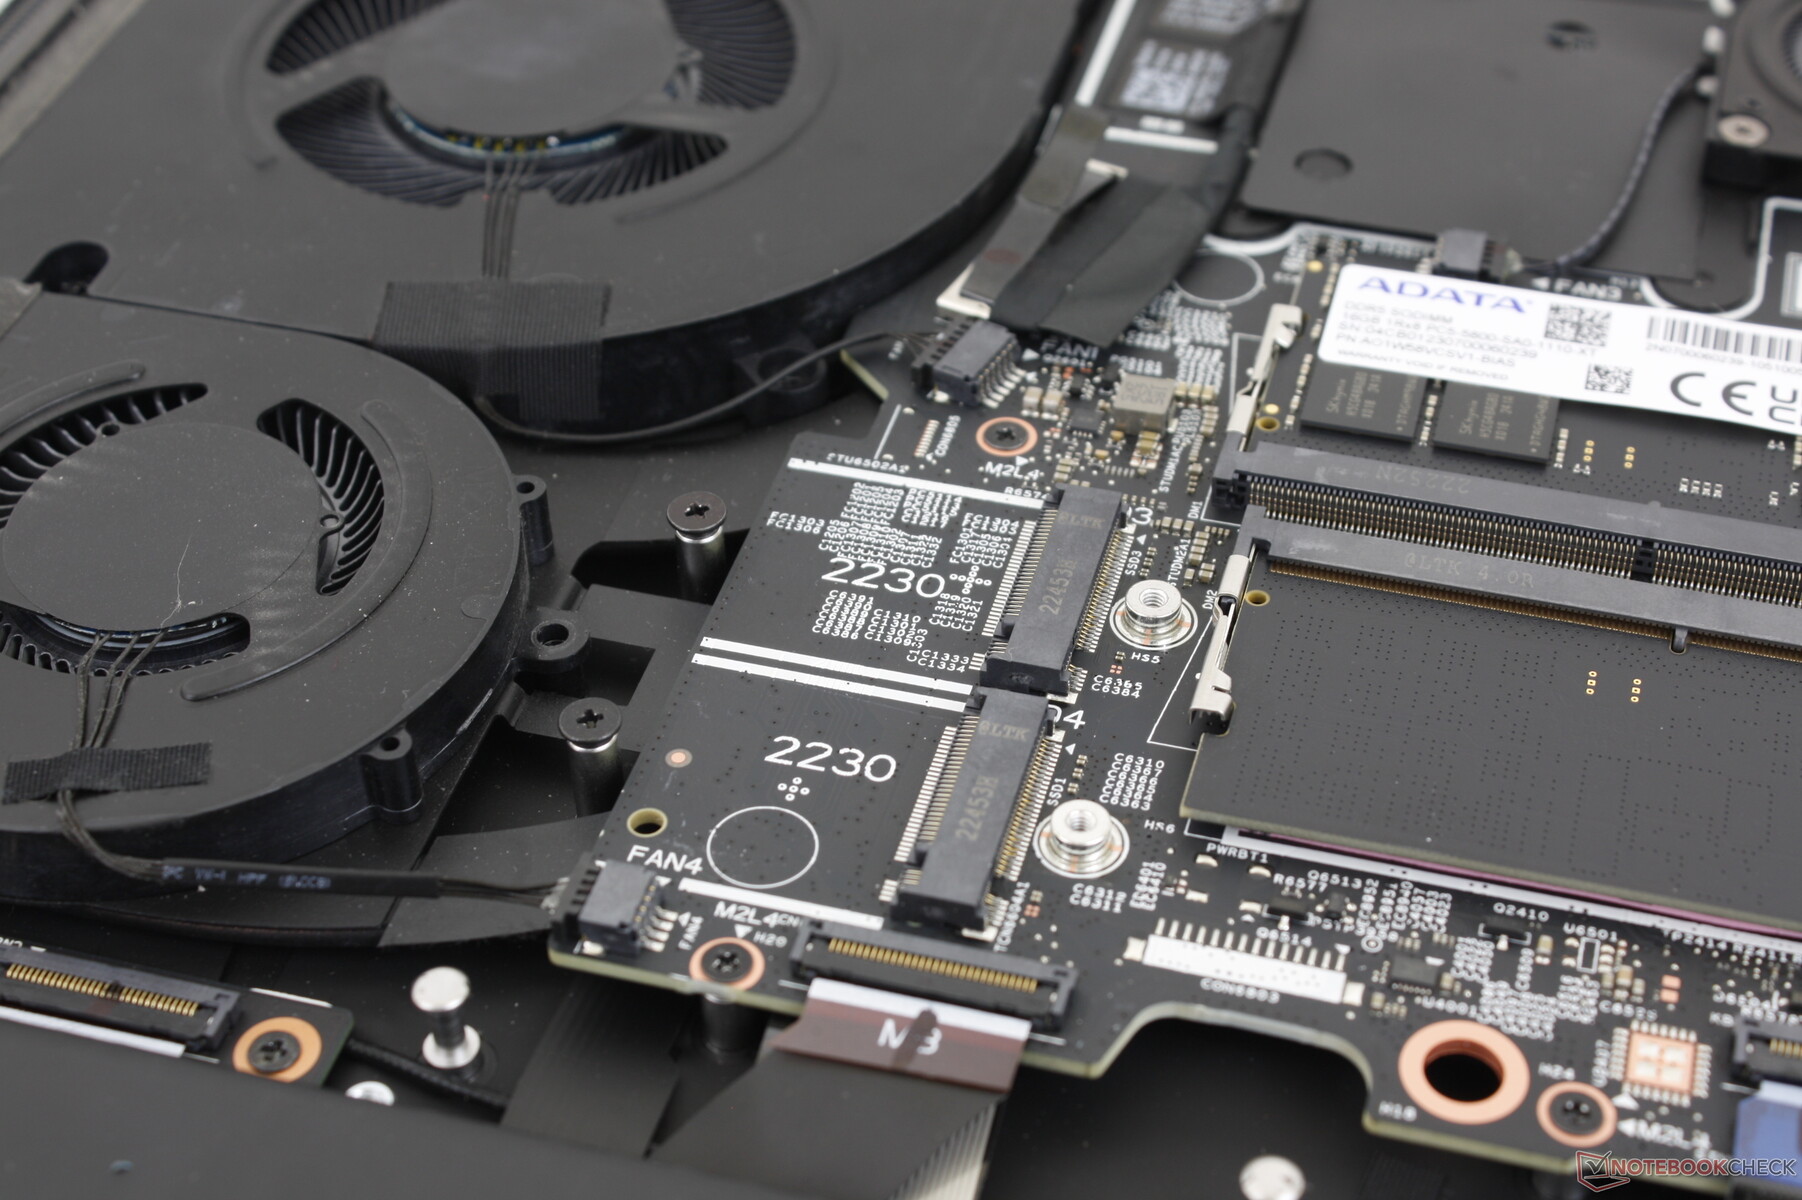
Dolny panel zdejmuje się bardzo łatwo za pomocą zwykłego śrubokręta Philips. Dla porównania, dolny panel w nowym MSI GE78 wymaga więcej zachodu i zerwania naklejki antytampingowej.
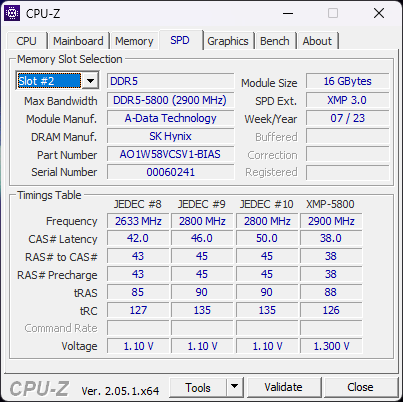
Użytkownicy mają bezpośredni dostęp do baterii, wymiennego modułu WLAN, 4x sloty M.2 SSD oraz 2x sloty DDR5 SODIMM. Jest to jeden z niewielu laptopów z obsługą czterech wewnętrznych dysków SSD NVMe (2x M.2 2230 + 2x M.2 2280). Ciekawie byłoby zobaczyć m.in CAMM zamiast SODIMM, zwłaszcza że Dell był orędownikiem szybszej technologii pamięci RAM.
Akcesoria i gwarancja
W pudełku nie ma żadnych dodatków poza zasilaczem sieciowym i papierami. Należy pamiętać, że Dell zrezygnował z autorskiego portu dokującego Alienware, więc starsza stacja dokująca Alienware eGPU nie jest już obsługiwana.
W przypadku zakupu w USA obowiązuje standardowa roczna ograniczona gwarancja.
Urządzenia wejściowe - wygodna klawiatura, gąbczasty touchpad
Klawiatura
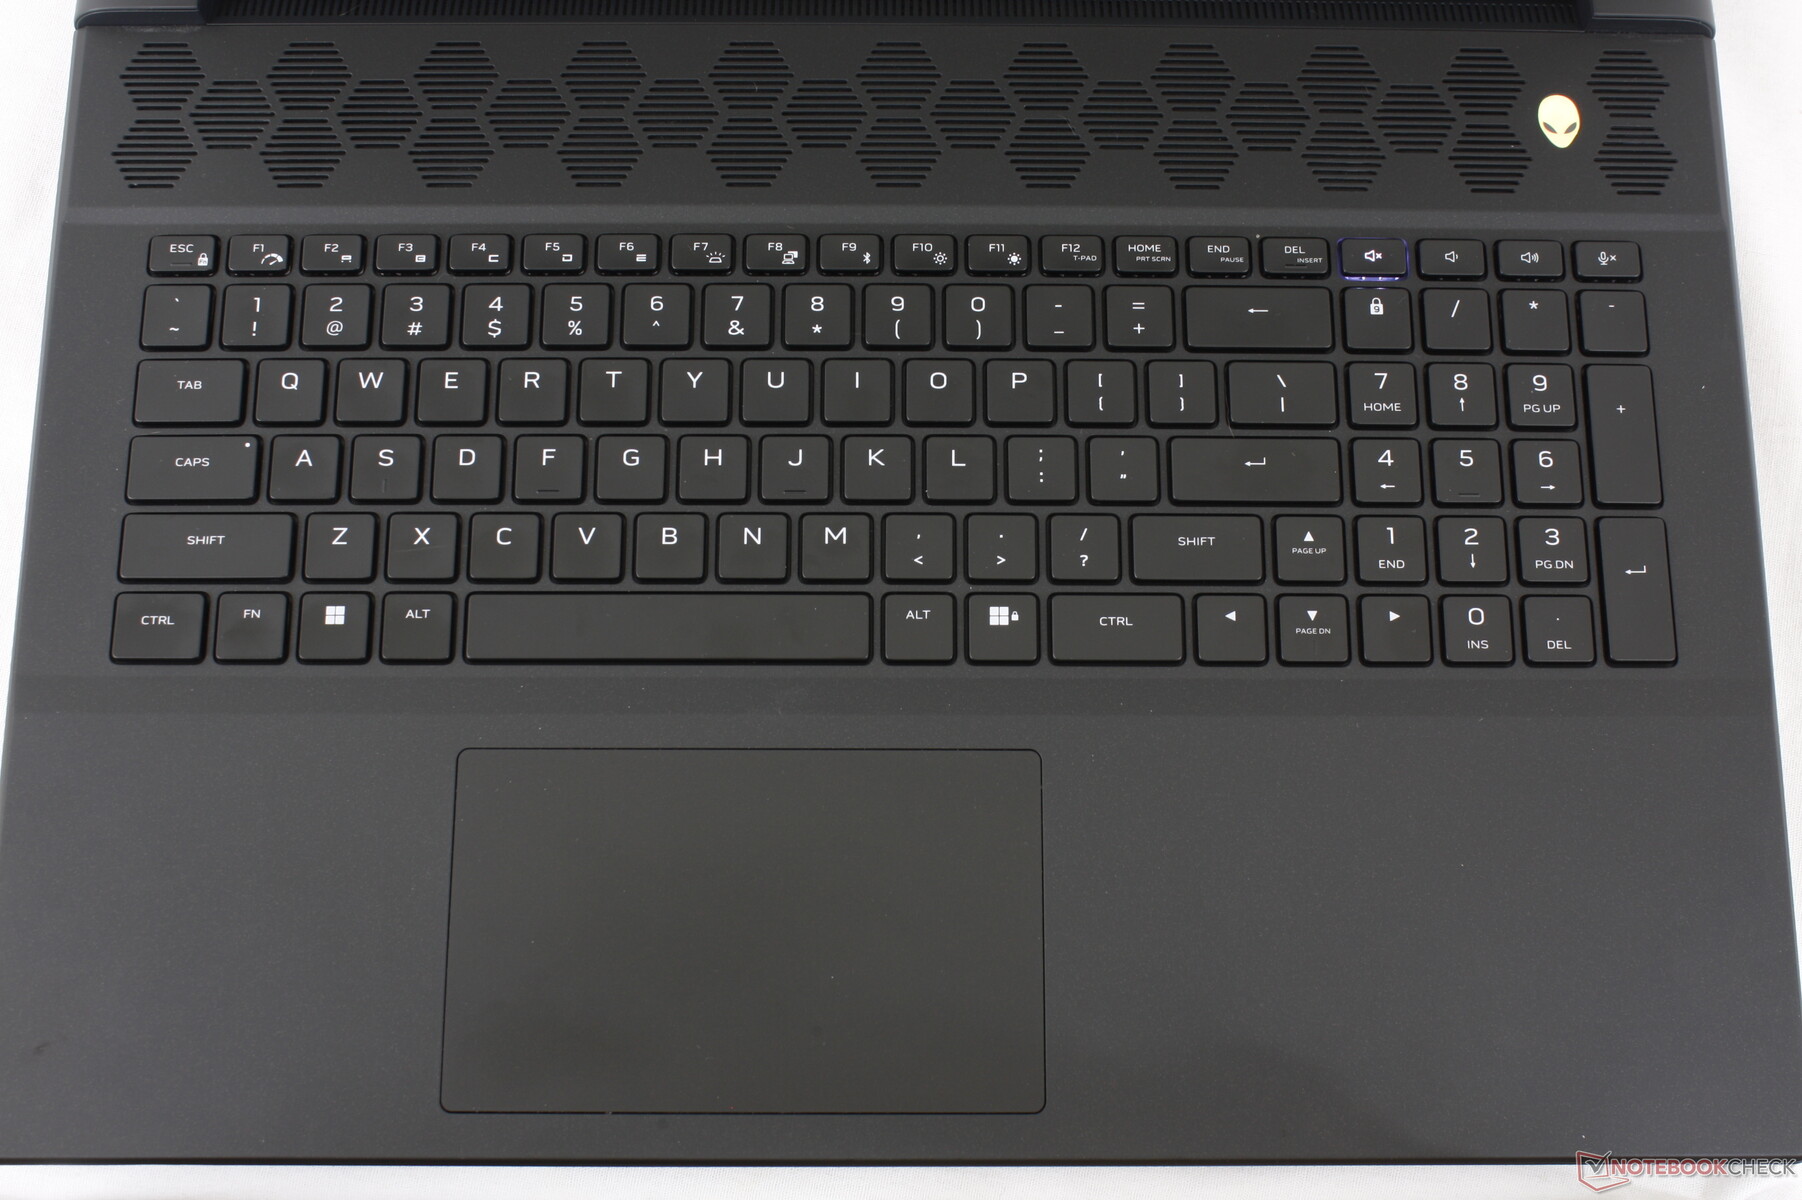
Klawisze membranowe w naszym egzemplarzu są prawdopodobnie najlepsze, z jakich korzystaliśmy w jakimkolwiek laptopie do gier. Czuć głębsze i twardsze sprzężenie zwrotne niż w przypadku klawiszy w MSI GE78 czy Razer Blade 18. W kwestii komfortu nie ma zbyt wielu powodów do narzekań.
Opcjonalne przełączniki mechaniczne CherryMX będą prawdopodobnie bardziej klarowne, ale znacznie głośniejsze. Przełączniki te to prawdopodobnie te same, które Dell oferuje do istniejących już serii Alienware M15 i M17.
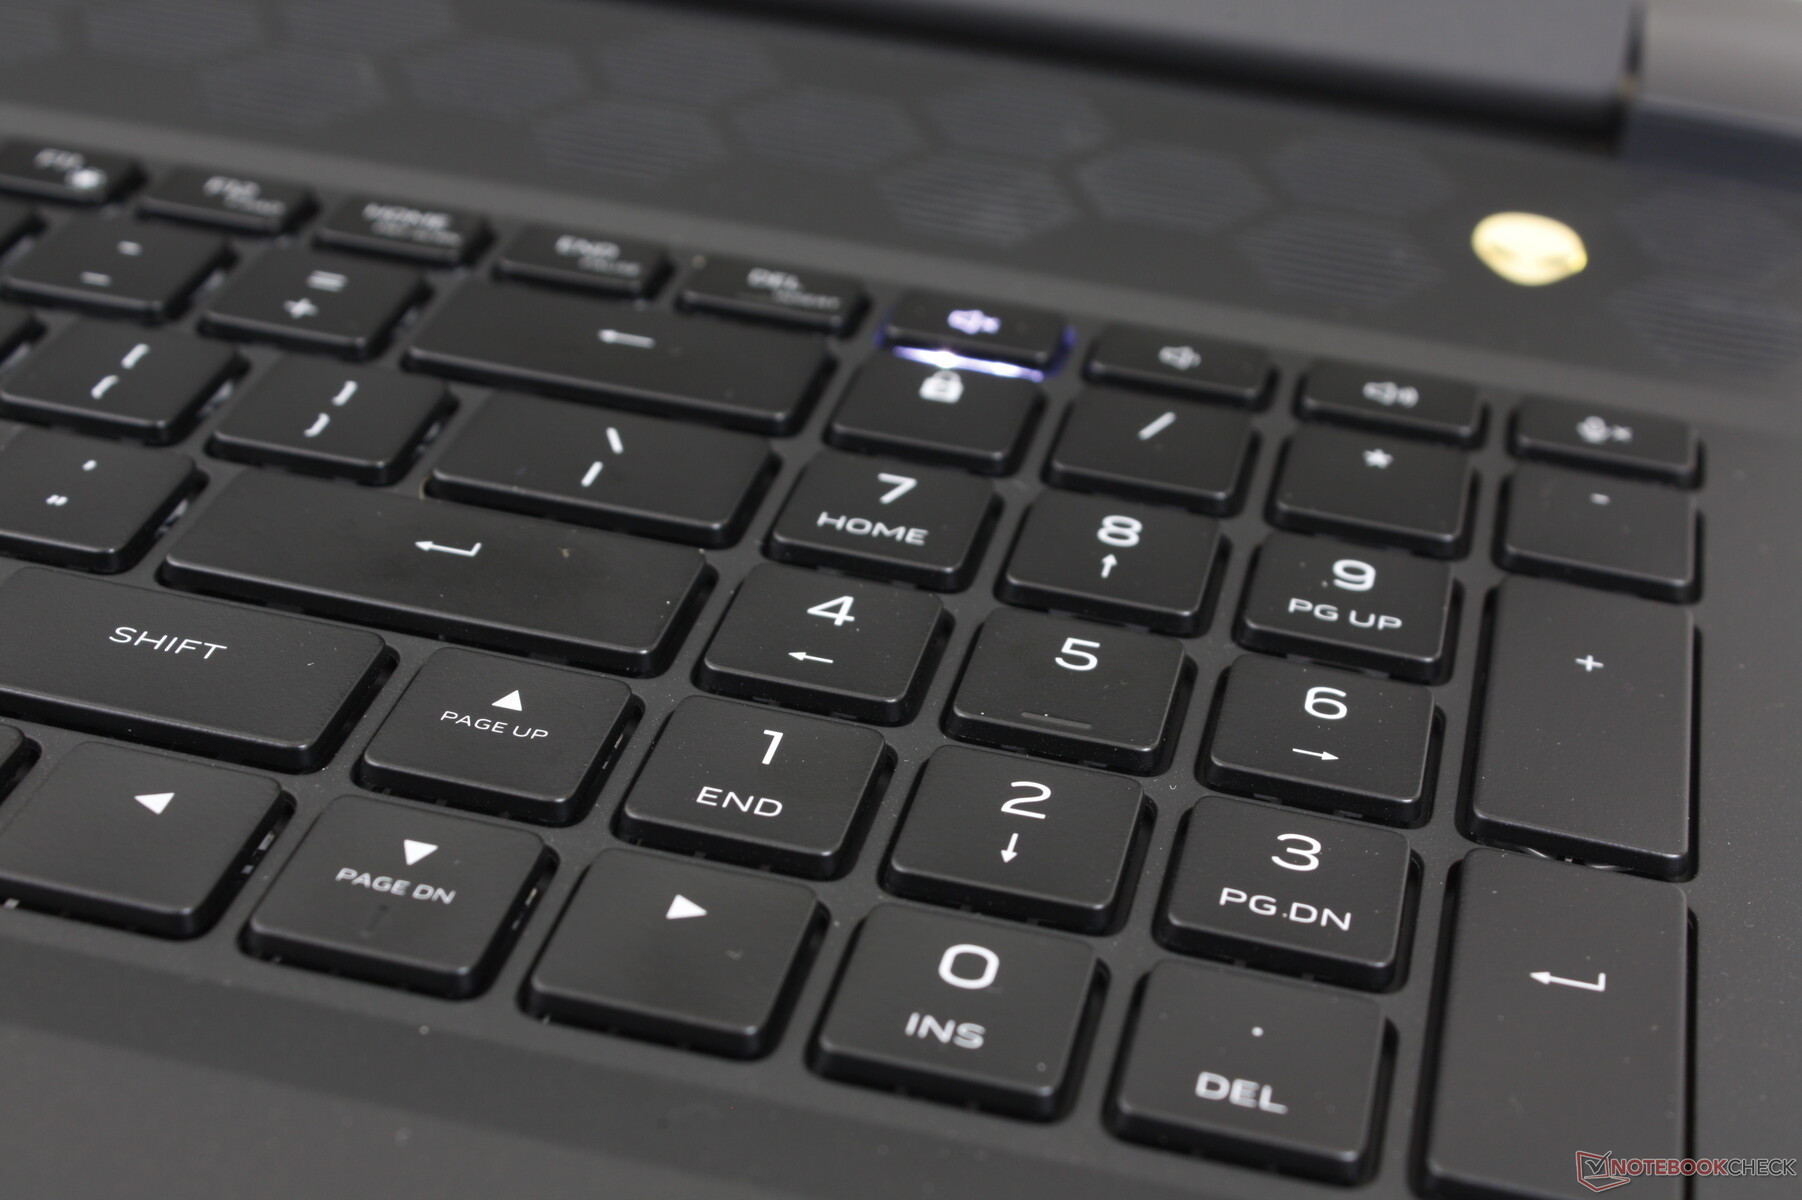
Wszystkie symbole klawiszy są podświetlane przy aktywnym podświetleniu w przeciwieństwie do starszych modeli Alienware x15/x17, gdzie drugorzędne symbole są niepodświetlane.
Touchpad
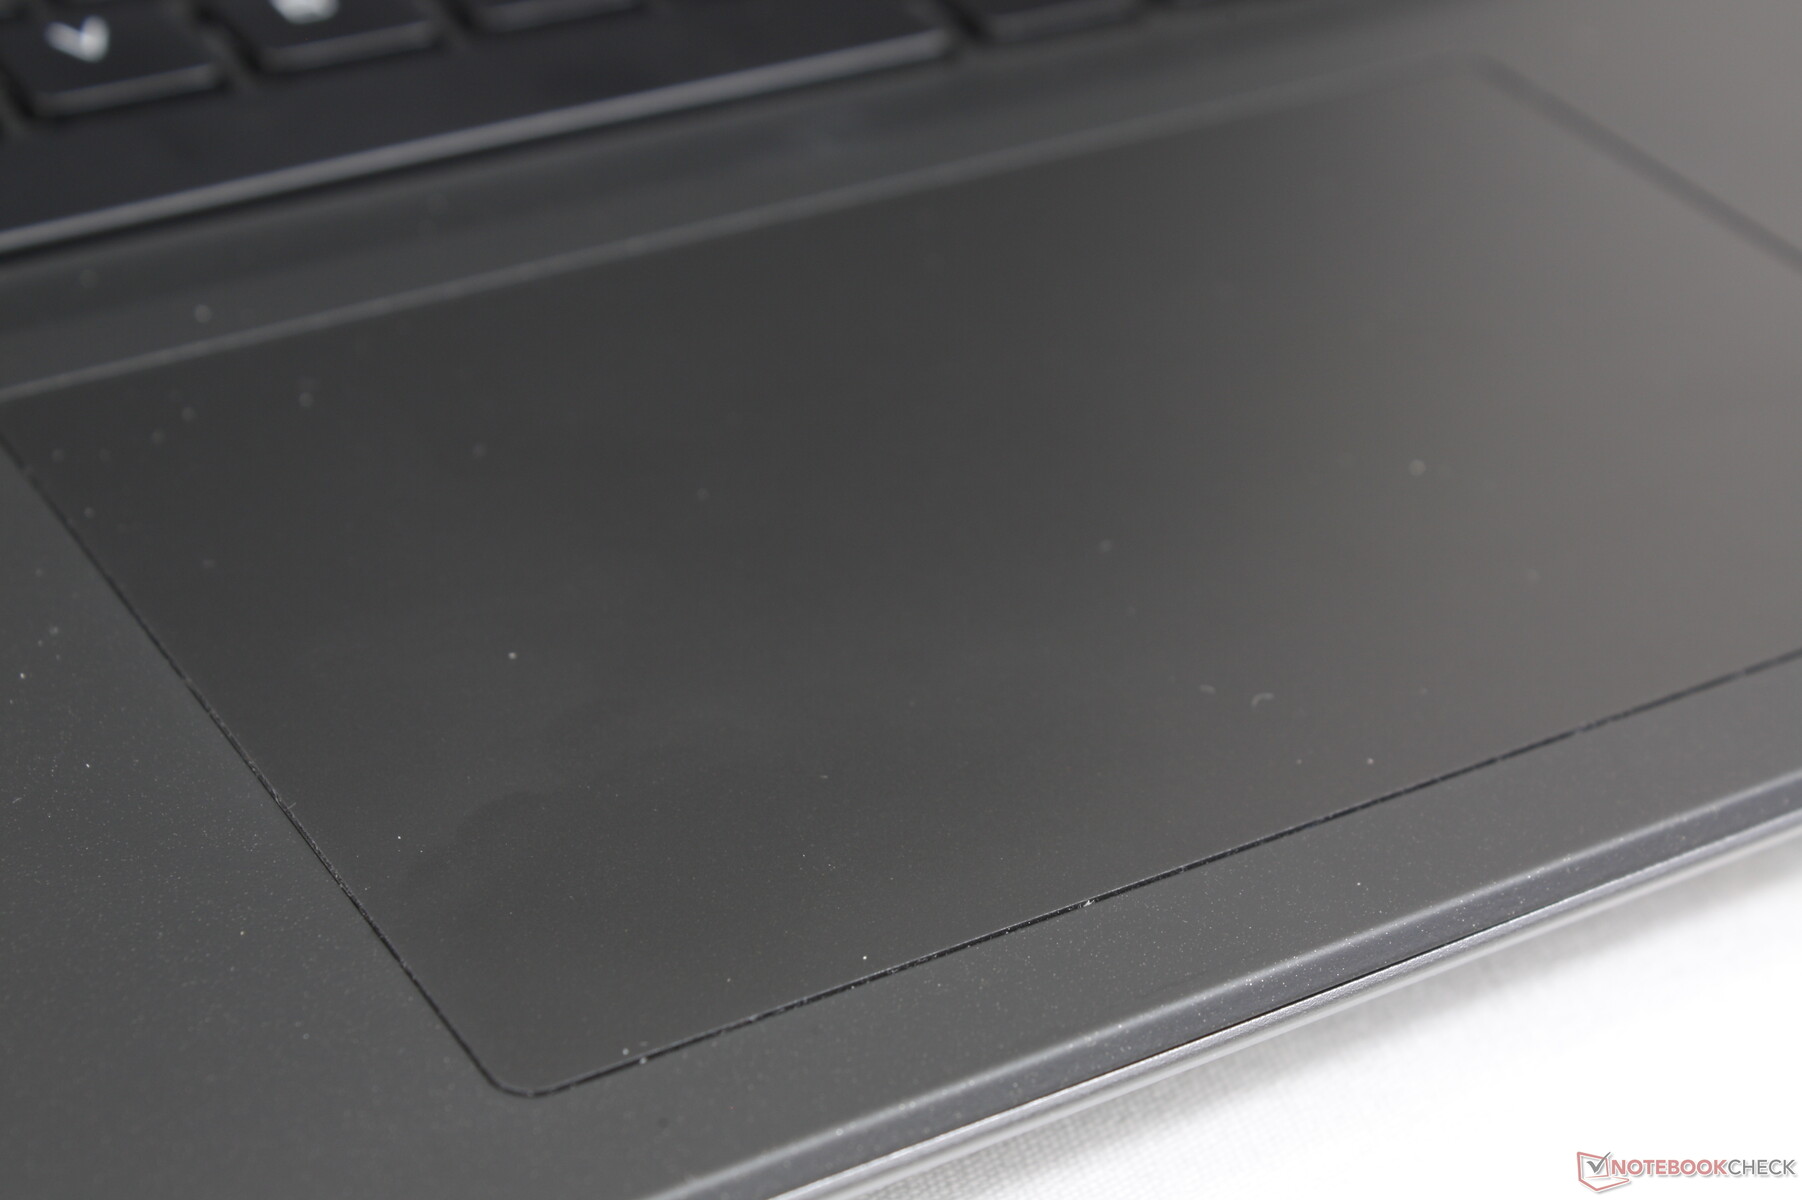
Powierzchnia jest niemal identyczna jak w przypadku klawiatury na komputerze MSI GE78 (13,2 x 8 cm vs. 13 x 8,2 cm) pomimo większej, 18-calowej obudowy Alienware. Choć trakcja jest gładka i minimalnie zacina się podczas ślizgania, sprzężenie zwrotne podczas klikania jest miękkie, co sprawia, że wrażenia są mało satysfakcjonujące. Dwukrotne kliknięcie może być męczące, gdyż każde kliknięcie wymaga użycia nieco większej siły niż w większości innych laptopów.

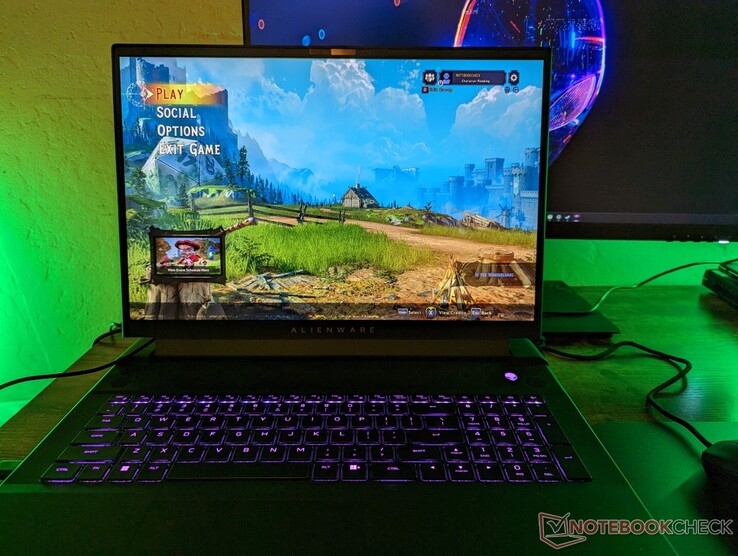
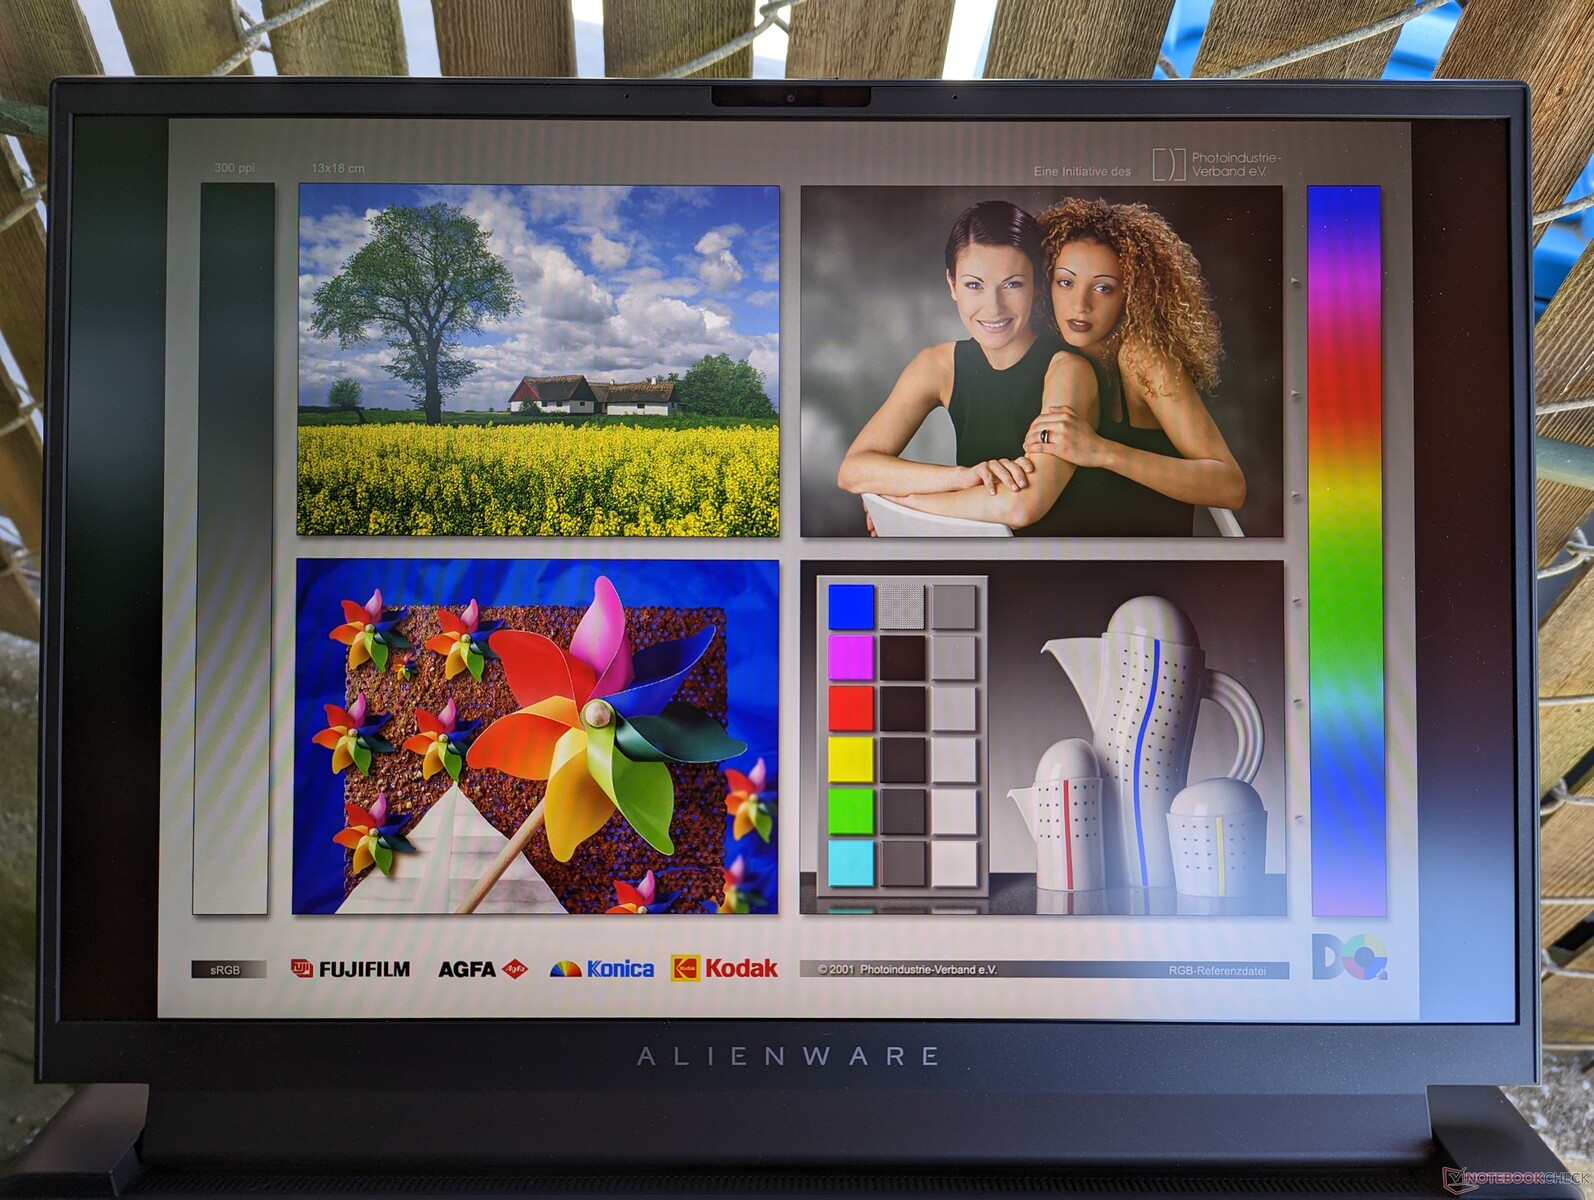
Wyświetlacz - niezwykle szybka częstotliwość odświeżania 480 Hz
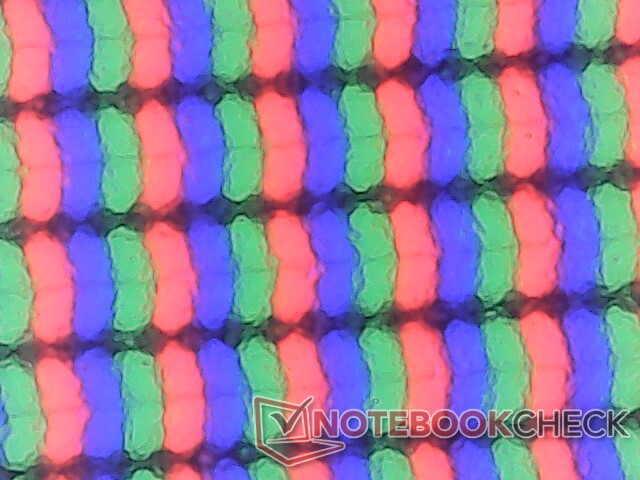
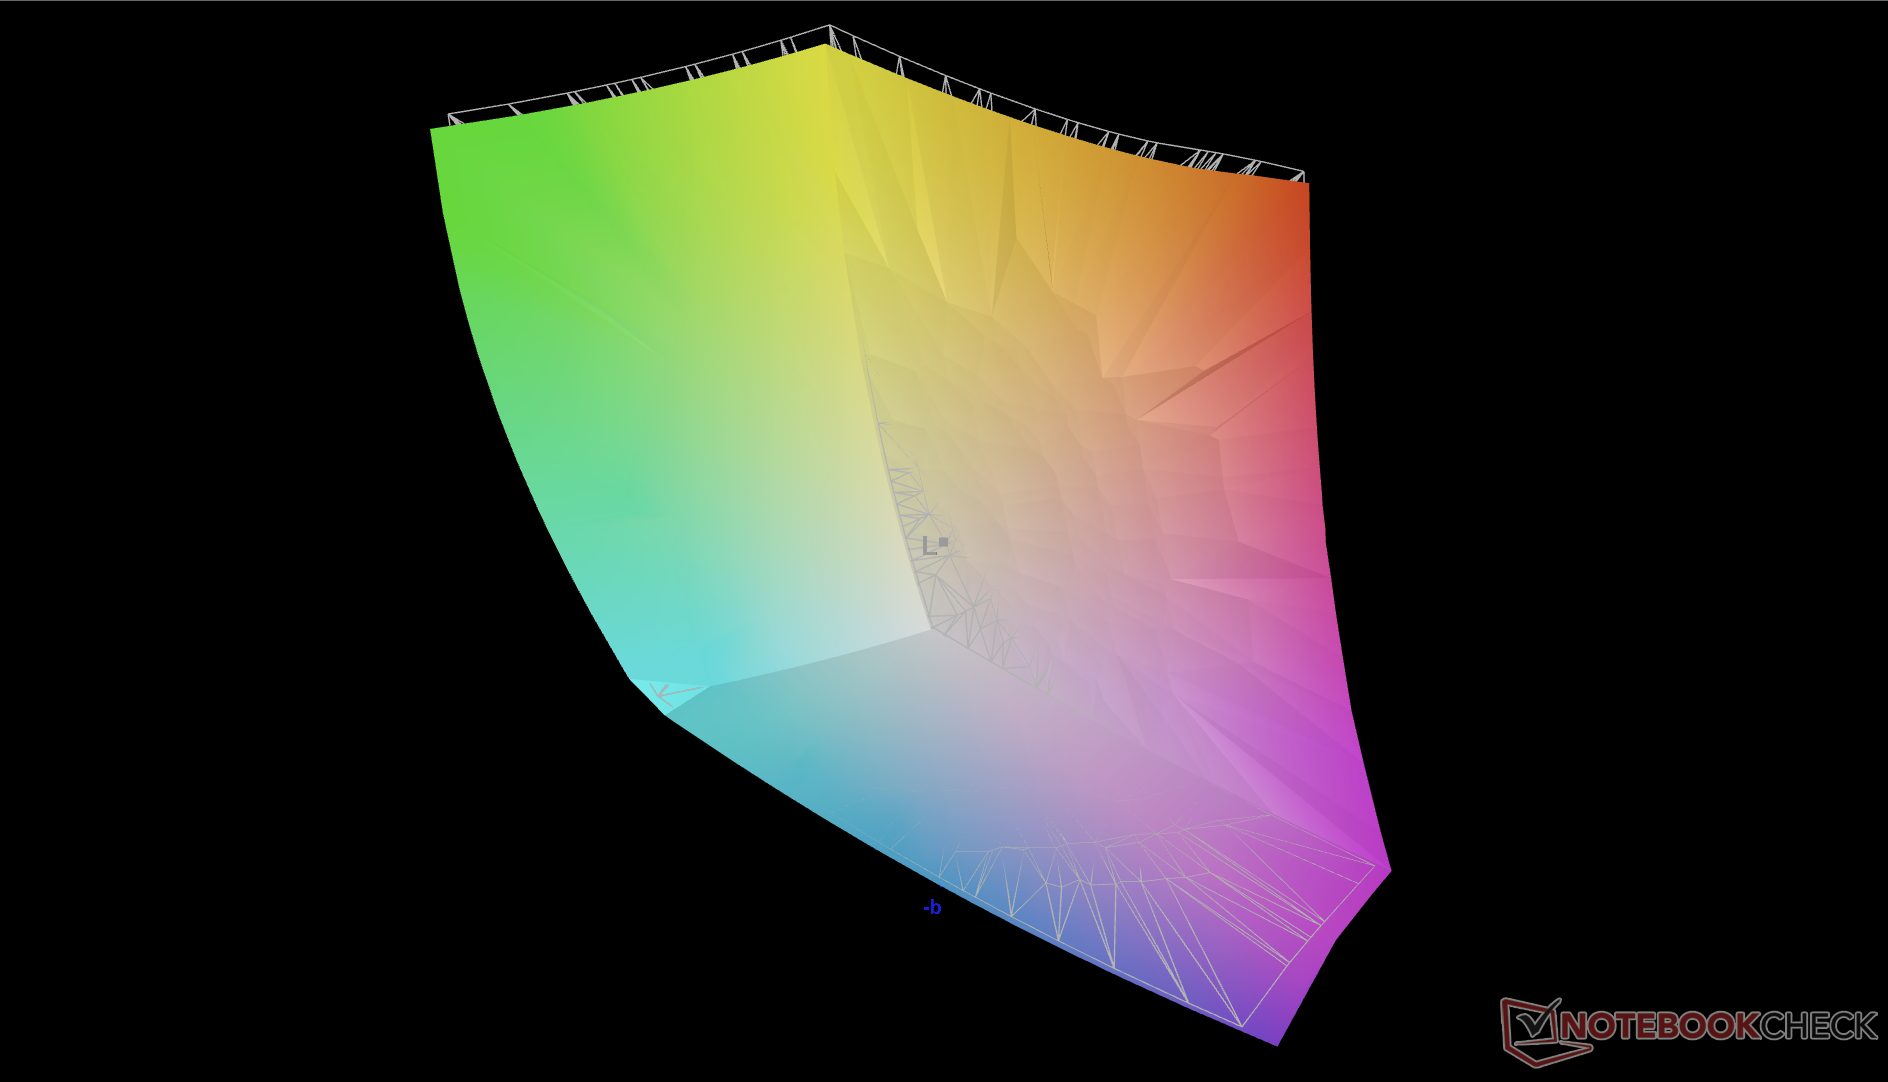
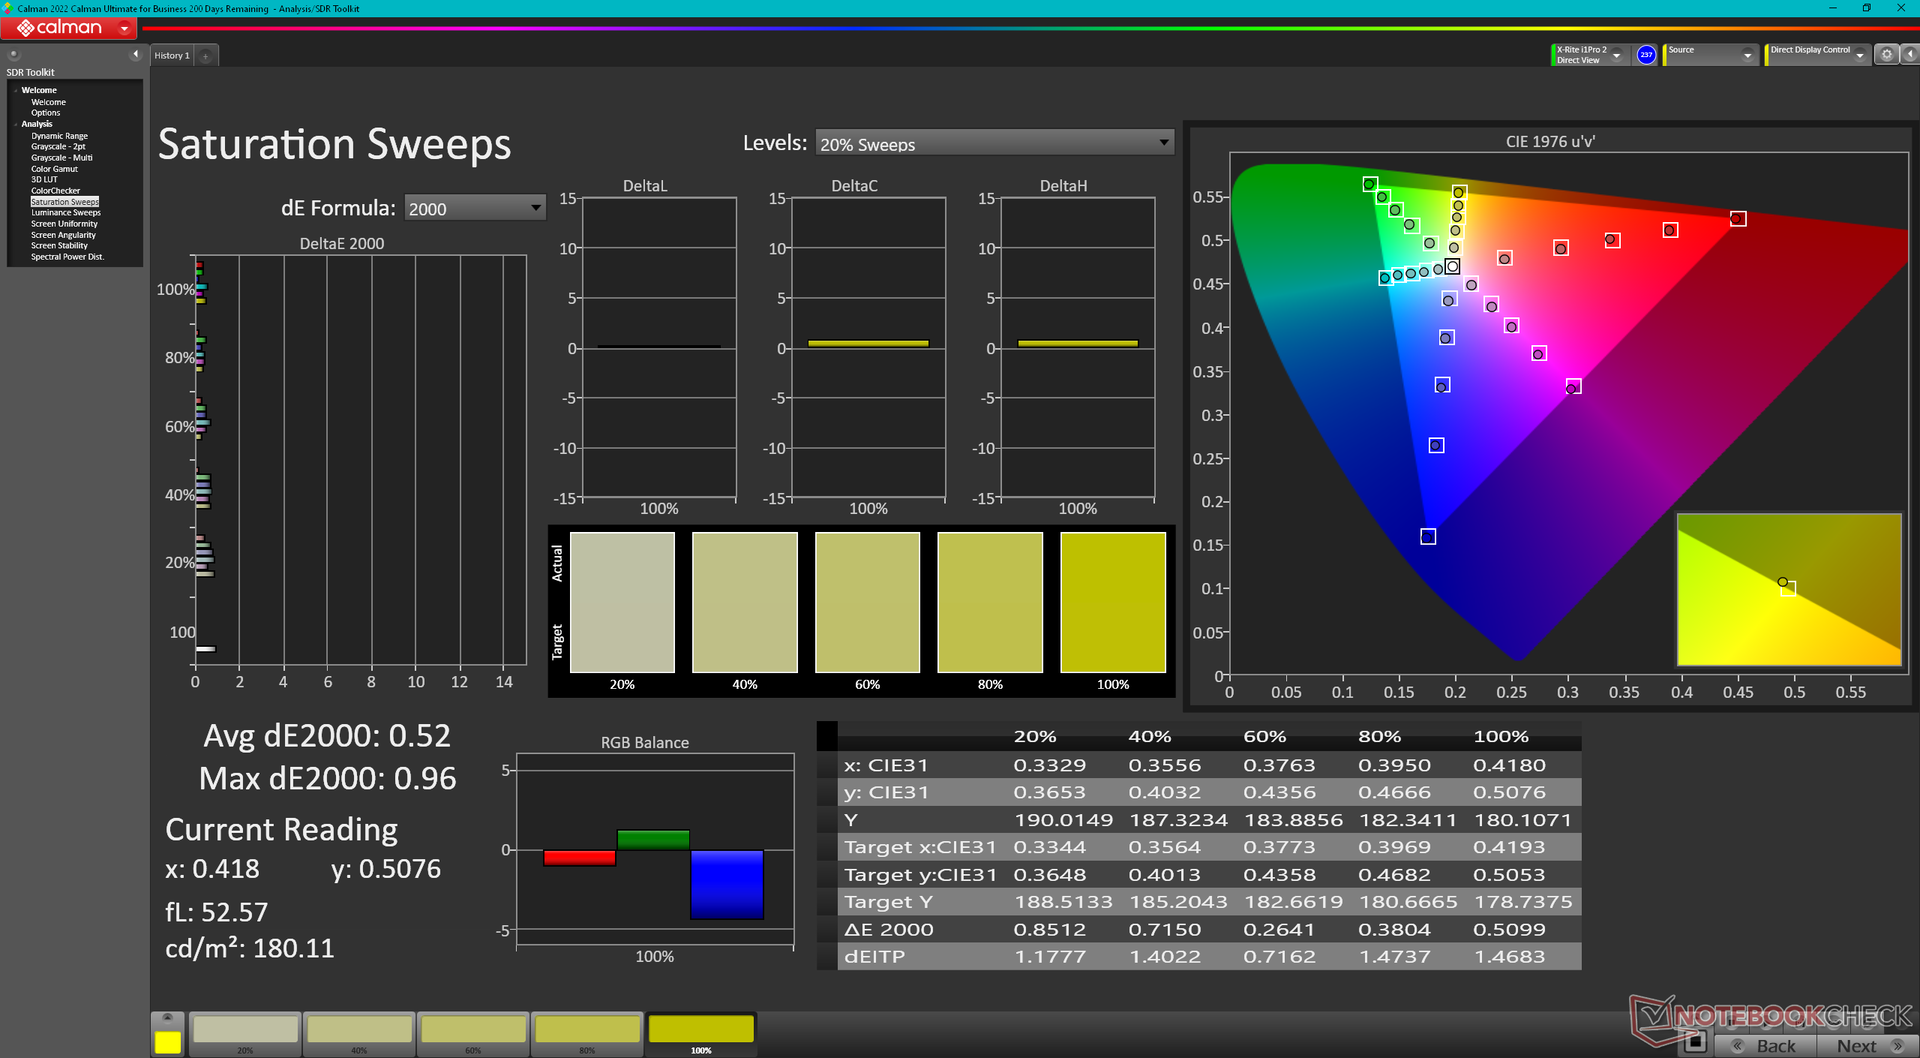
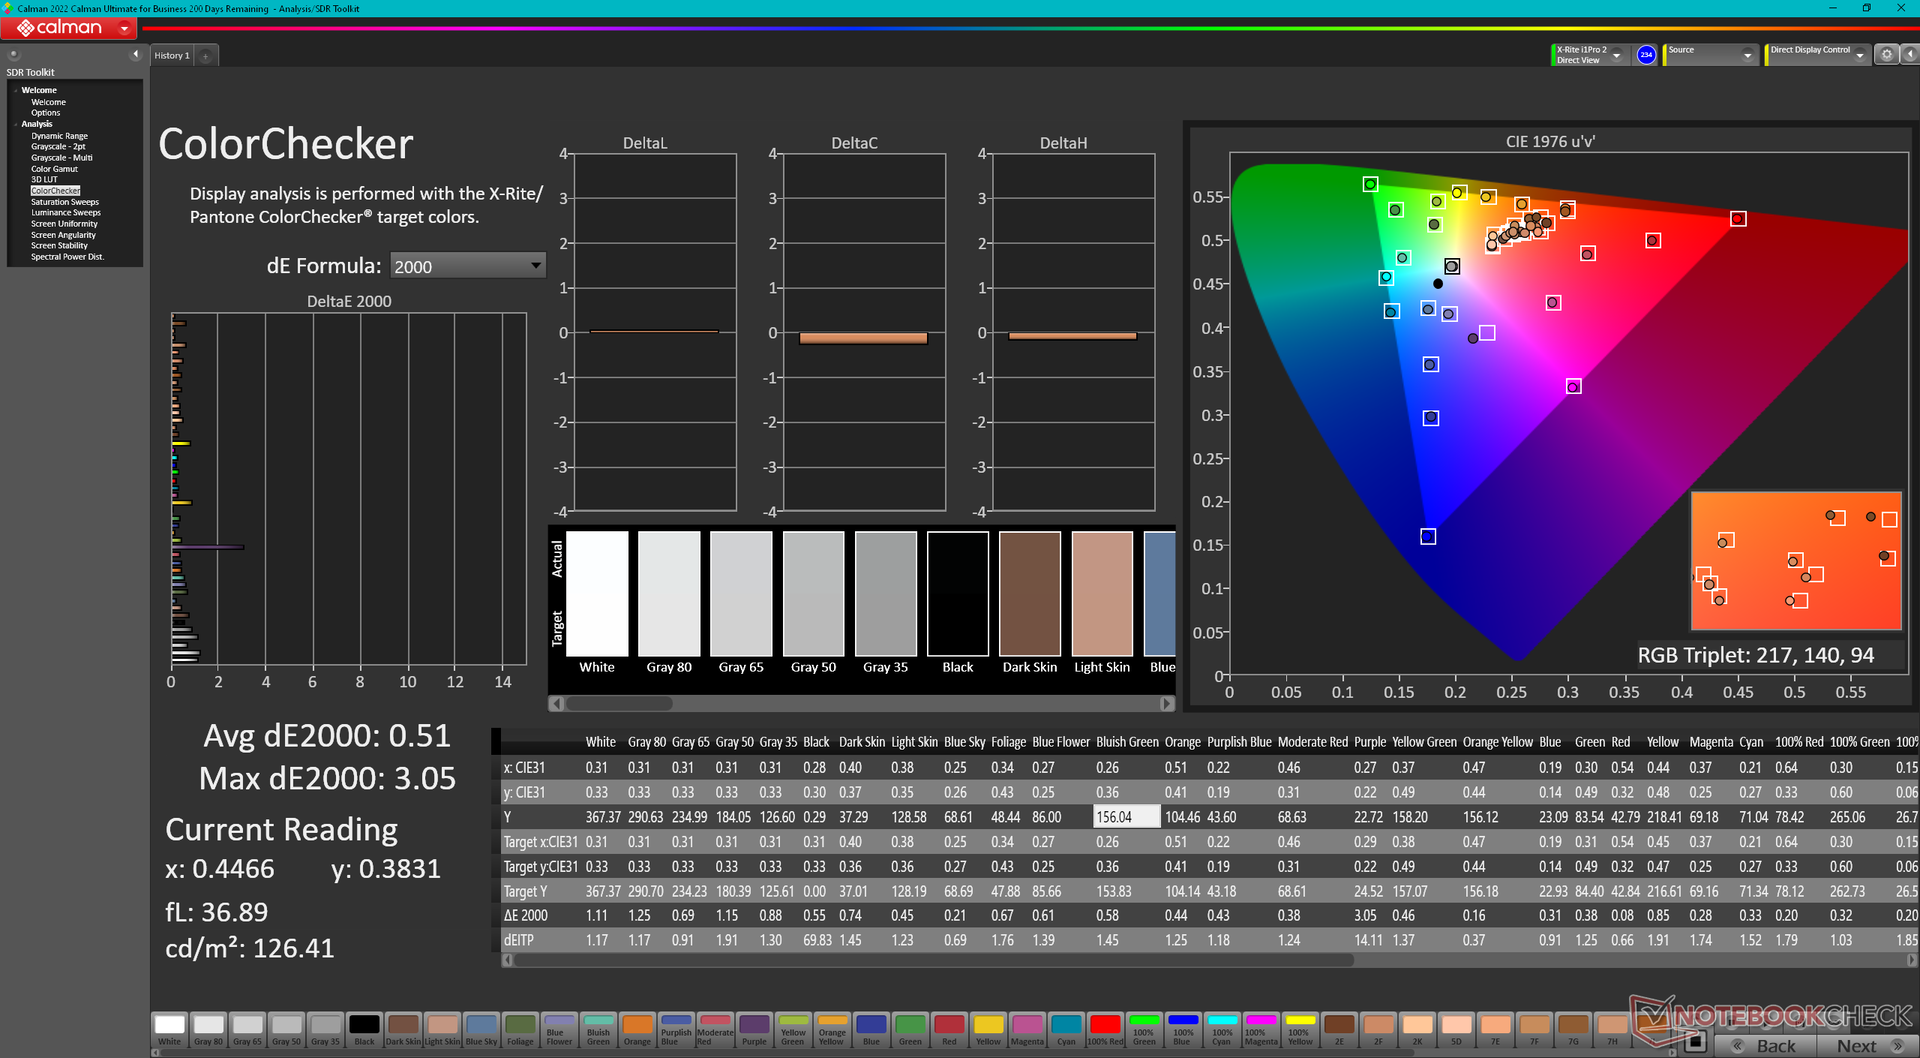
Alienware jest wyposażony w panel Chi Mei 180JME o rozdzielczości 1200p, w przeciwieństwie do paneli AU Optronics B180QAN01.0 lub BOE NE180QDM o rozdzielczości 1600p.Razer Blade 18 i Asus ROG Strix Scar 18, odpowiednio. Unikalną cechą odróżniającą ten panel Chi Mei od dwóch pozostałych jest jego 2x szybsza natywna częstotliwość odświeżania 480 Hz zamiast 240 Hz. Poza tym wszystkie trzy panele mają podobne pokrycie kolorów, czasy reakcji pikseli i współczynniki kontrastu. Pełne kolory P3 i szybka częstotliwość odświeżania sprawiają, że ten konkretny model Alienware nadaje się zarówno do gier, jak i edycji grafiki.
Druga opcja wyświetlacza jest dostępna z wyższą rozdzielczością natywną 1600p, ale niższą częstotliwością odświeżania 165 Hz.

| |||||||||||||||||||||||||
rozświetlenie: 97 %
na akumulatorze: 372.8 cd/m²
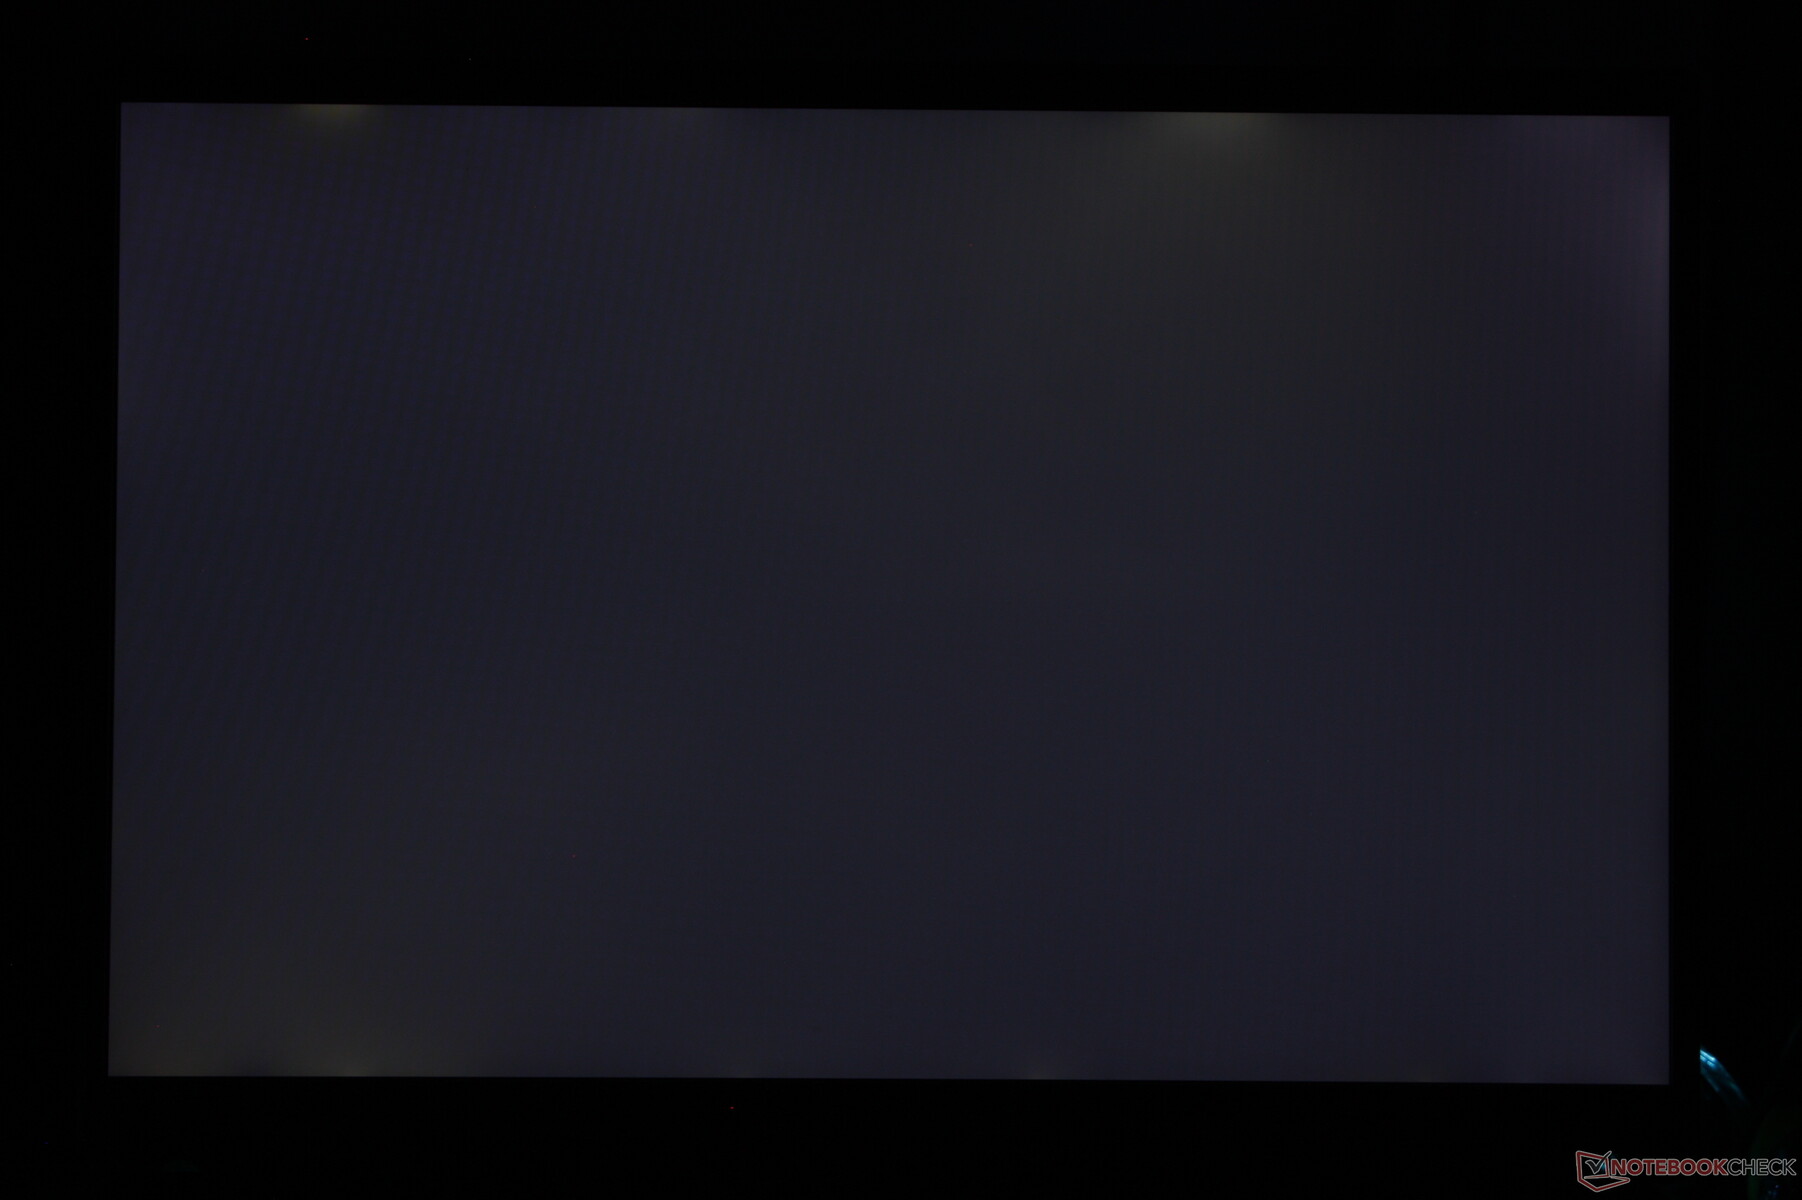
kontrast: 1165:1 (czerń: 0.32 cd/m²)
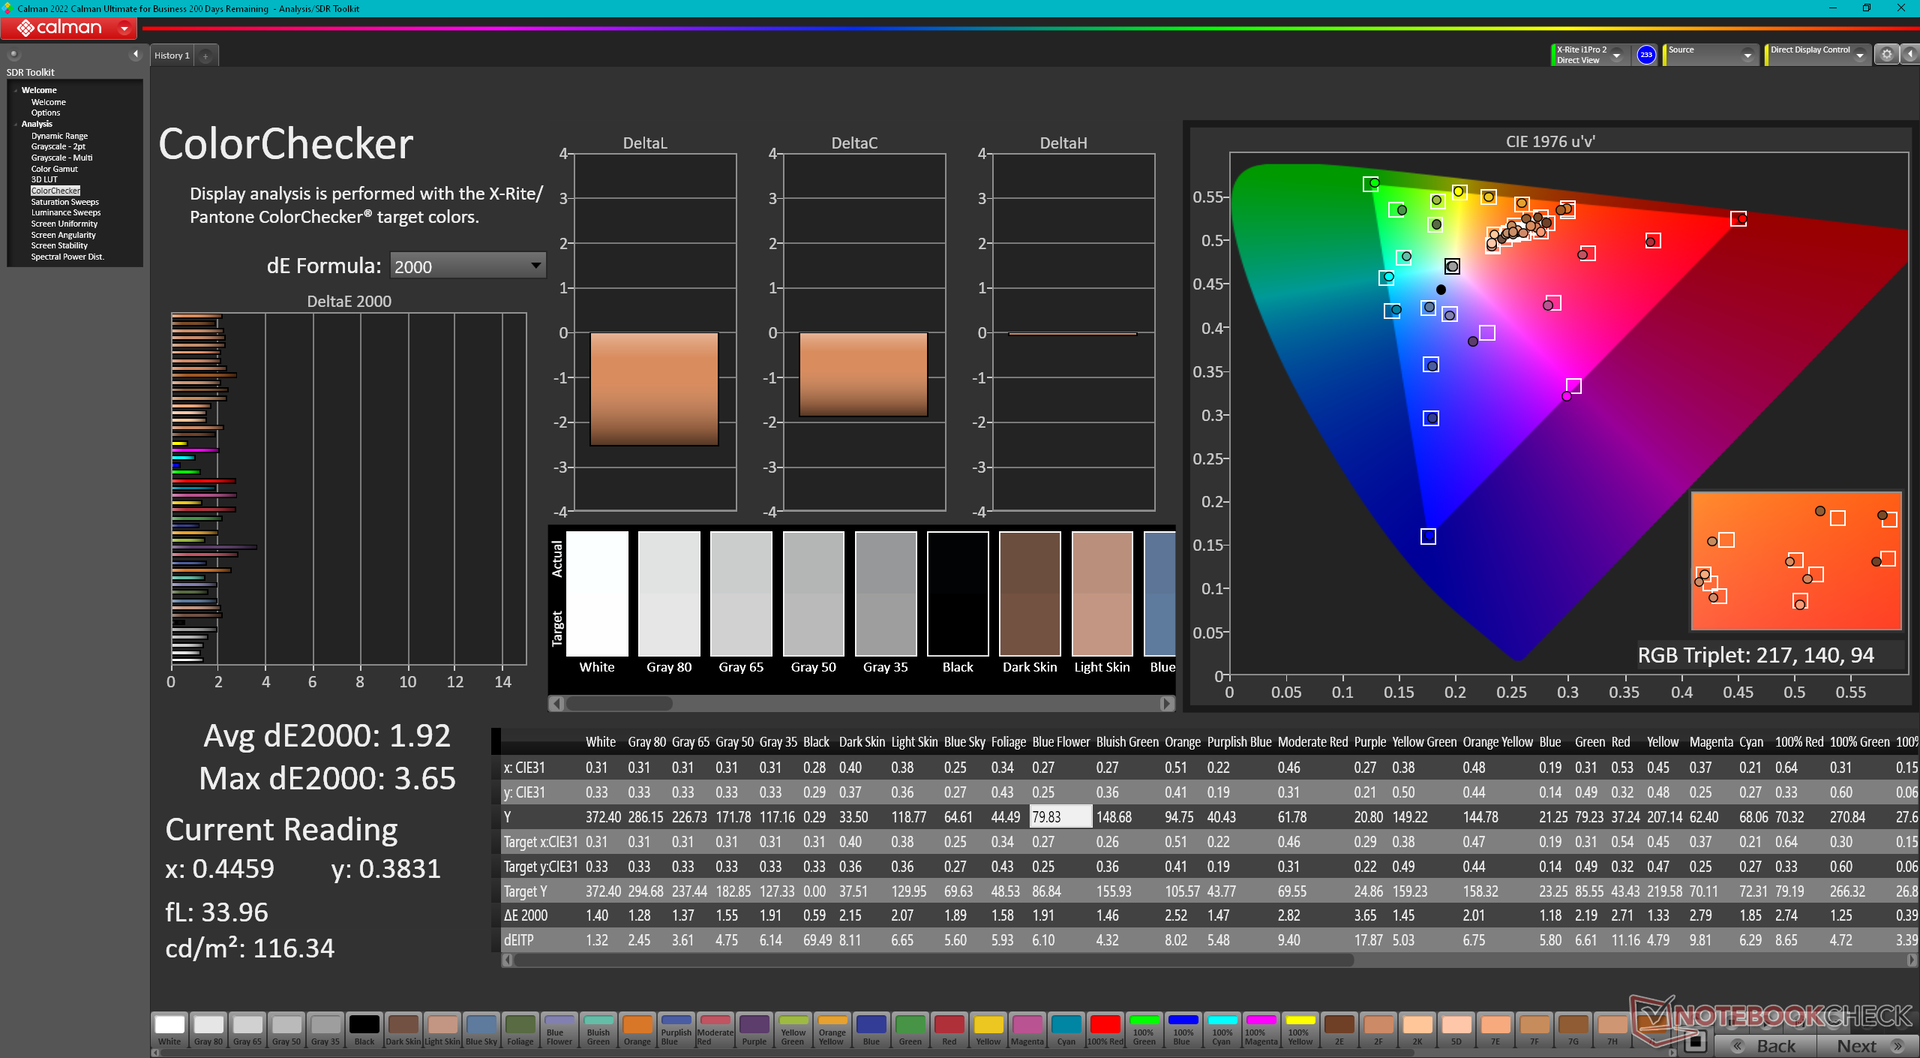
ΔE ColorChecker Calman: 1.92 | ∀{0.5-29.43 Ø4.72}
calibrated: 0.51
ΔE Greyscale Calman: 1.5 | ∀{0.09-98 Ø4.97}
89.8% AdobeRGB 1998 (Argyll 3D)
100% sRGB (Argyll 3D)
97.7% Display P3 (Argyll 3D)
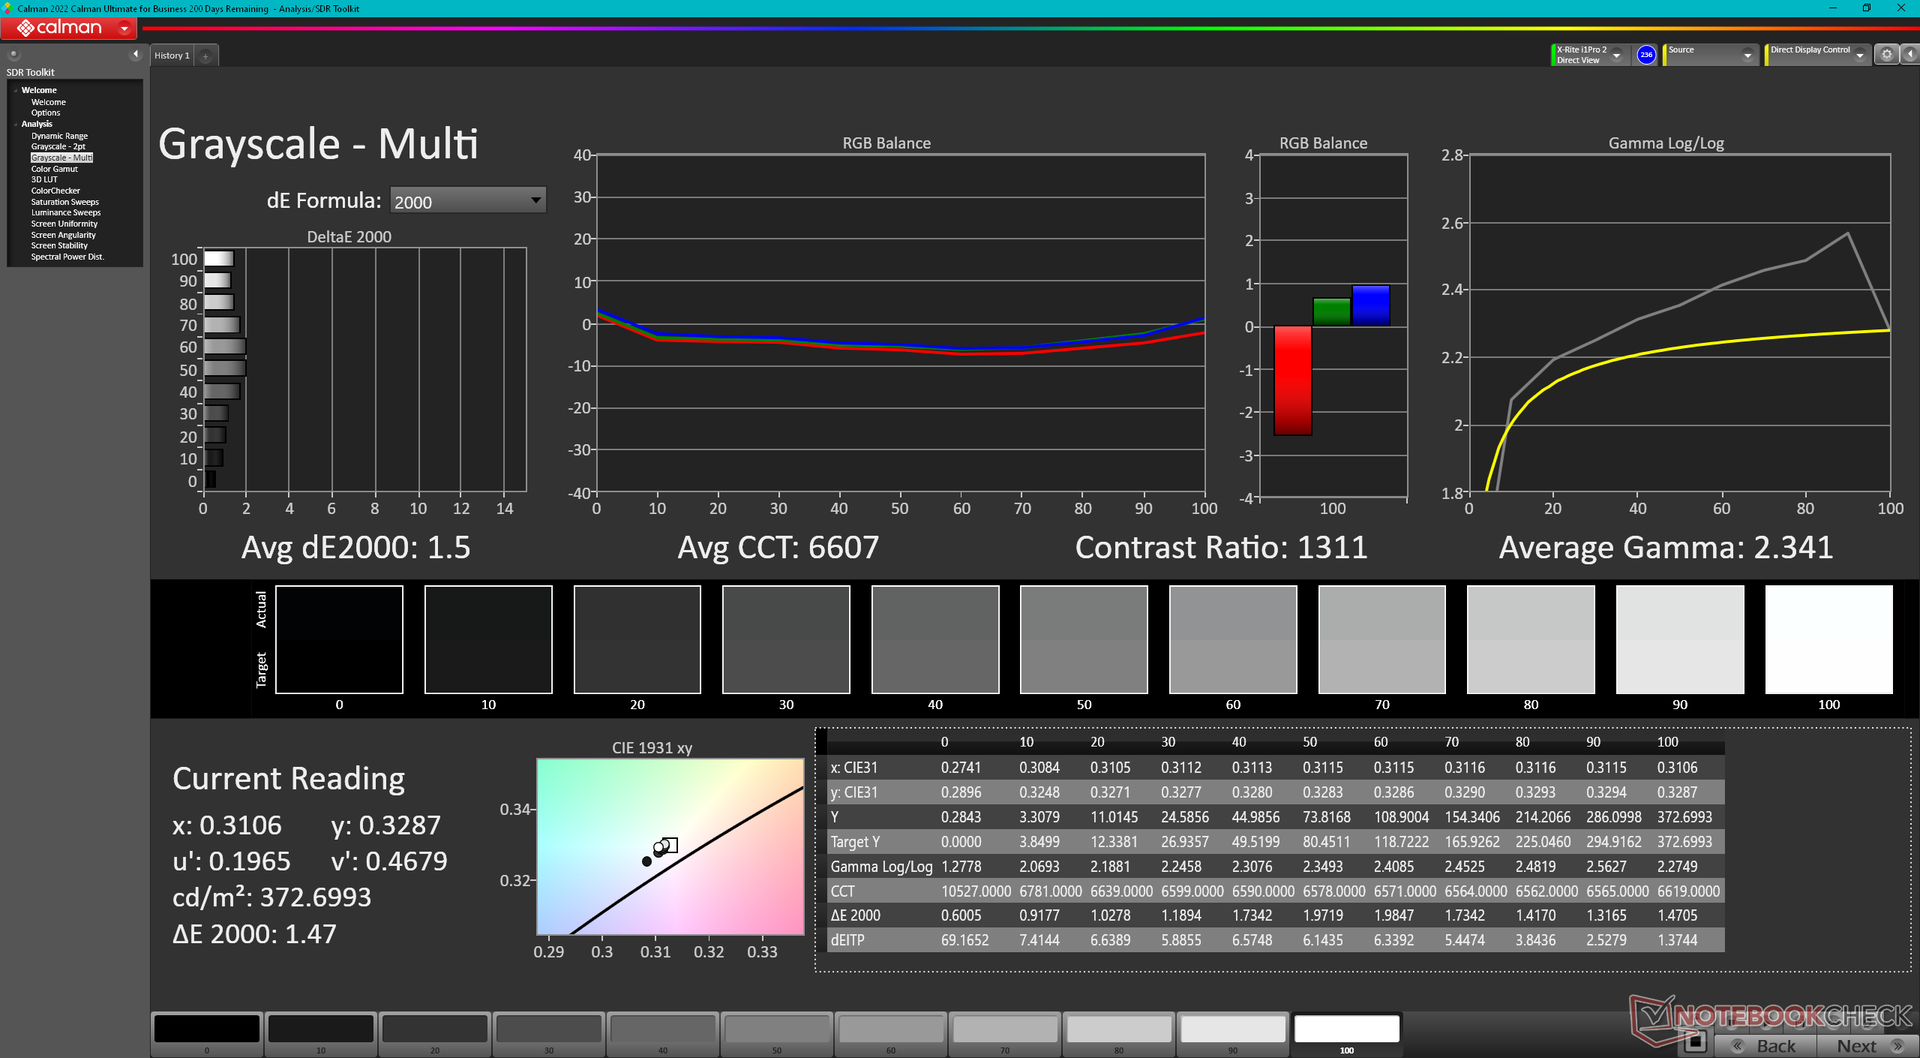
Gamma: 2.34
CCT: 6607 K
| Alienware m18 R1 Chi Mei 180JME, IPS, 1920x1200, 18" | Razer Blade 18 RTX 4070 AU Optronics B180QAN01.0, IPS, 2560x1600, 18" | Asus ROG Strix Scar 18 2023 G834JY-N6005W NE180QDM-NZ2, IPS, 2560x1600, 18" | Eluktronics Mech-17 GP2 BOE NE170QDM-NZ1, IPS, 2560x1600, 17" | MSI Titan GT77 HX 13VI B173ZAN06.C, Mini-LED, 3840x2160, 17.3" | Alienware x17 R2 P48E AU Optronics B173HAN, IPS, 1920x1080, 17.3" | |
|---|---|---|---|---|---|---|
| Display | -2% | -2% | -17% | 0% | -10% | |
| Display P3 Coverage (%) | 97.7 | 96.9 -1% | 97.2 -1% | 69.1 -29% | 94.9 -3% | 79.2 -19% |
| sRGB Coverage (%) | 100 | 99.8 0% | 99.9 0% | 99.7 0% | 99.9 0% | 99.8 0% |
| AdobeRGB 1998 Coverage (%) | 89.8 | 85.3 -5% | 84.9 -5% | 69.8 -22% | 92.4 3% | 79.6 -11% |
| Response Times | -11% | -34% | -148% | -675% | -153% | |
| Response Time Grey 50% / Grey 80% * (ms) | 3 ? | 4.2 ? -40% | 5.41 ? -80% | 12 ? -300% | 38.4 ? -1180% | 12.4 ? -313% |
| Response Time Black / White * (ms) | 9.9 ? | 8 ? 19% | 8.62 ? 13% | 9.4 ? 5% | 26.6 ? -169% | 9.2 ? 7% |
| PWM Frequency (Hz) | 2380 ? | |||||
| Screen | -68% | -141% | -17% | 57715% | -48% | |
| Brightness middle (cd/m²) | 372.8 | 549.6 47% | 490 31% | 417.3 12% | 606 63% | 365.4 -2% |
| Brightness (cd/m²) | 367 | 524 43% | 468 28% | 387 5% | 602 64% | 344 -6% |
| Brightness Distribution (%) | 97 | 89 -8% | 86 -11% | 87 -10% | 93 -4% | 85 -12% |
| Black Level * (cd/m²) | 0.32 | 0.53 -66% | 0.54 -69% | 0.42 -31% | 0.0001 100% | 0.29 9% |
| Contrast (:1) | 1165 | 1037 -11% | 907 -22% | 994 -15% | 6060000 520072% | 1260 8% |
| Colorchecker dE 2000 * | 1.92 | 3.32 -73% | 4.97 -159% | 2.14 -11% | 4.8 -150% | 3.17 -65% |
| Colorchecker dE 2000 max. * | 3.65 | 6.63 -82% | 11.02 -202% | 4.09 -12% | 8.2 -125% | 7.69 -111% |
| Colorchecker dE 2000 calibrated * | 0.51 | 2.7 -429% | 2.97 -482% | 0.42 18% | 1.8 -253% | 0.51 -0% |
| Greyscale dE 2000 * | 1.5 | 2 -33% | 7.2 -380% | 3.1 -107% | 6.5 -333% | 5.3 -253% |
| Gamma | 2.34 94% | 2.29 96% | 2.161 102% | 2.19 100% | 2.63 84% | 2.18 101% |
| CCT | 6607 98% | 6319 103% | 6515 100% | 6040 108% | 6596 99% | 5879 111% |
| Całkowita średnia (program / ustawienia) | -27% /
-46% | -59% /
-96% | -61% /
-36% | 19013% /
37006% | -70% /
-55% |
* ... im mniej tym lepiej
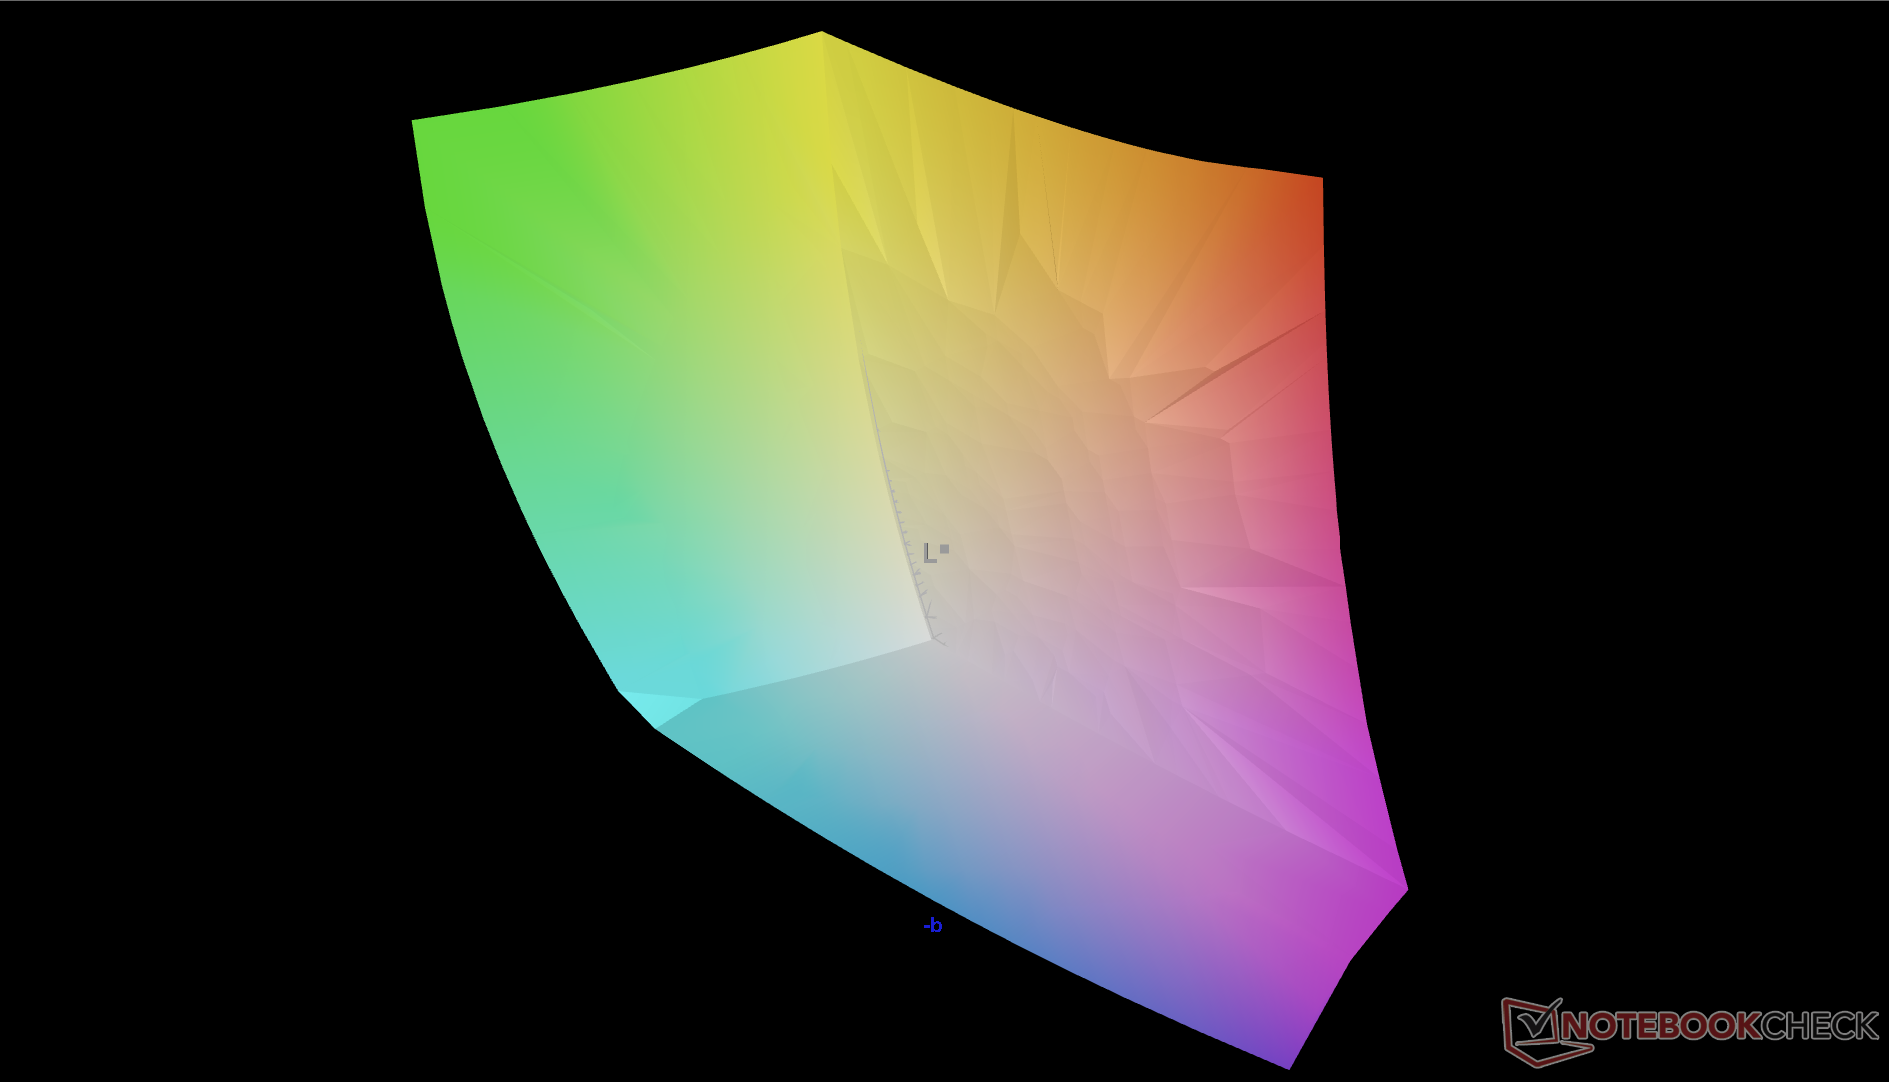
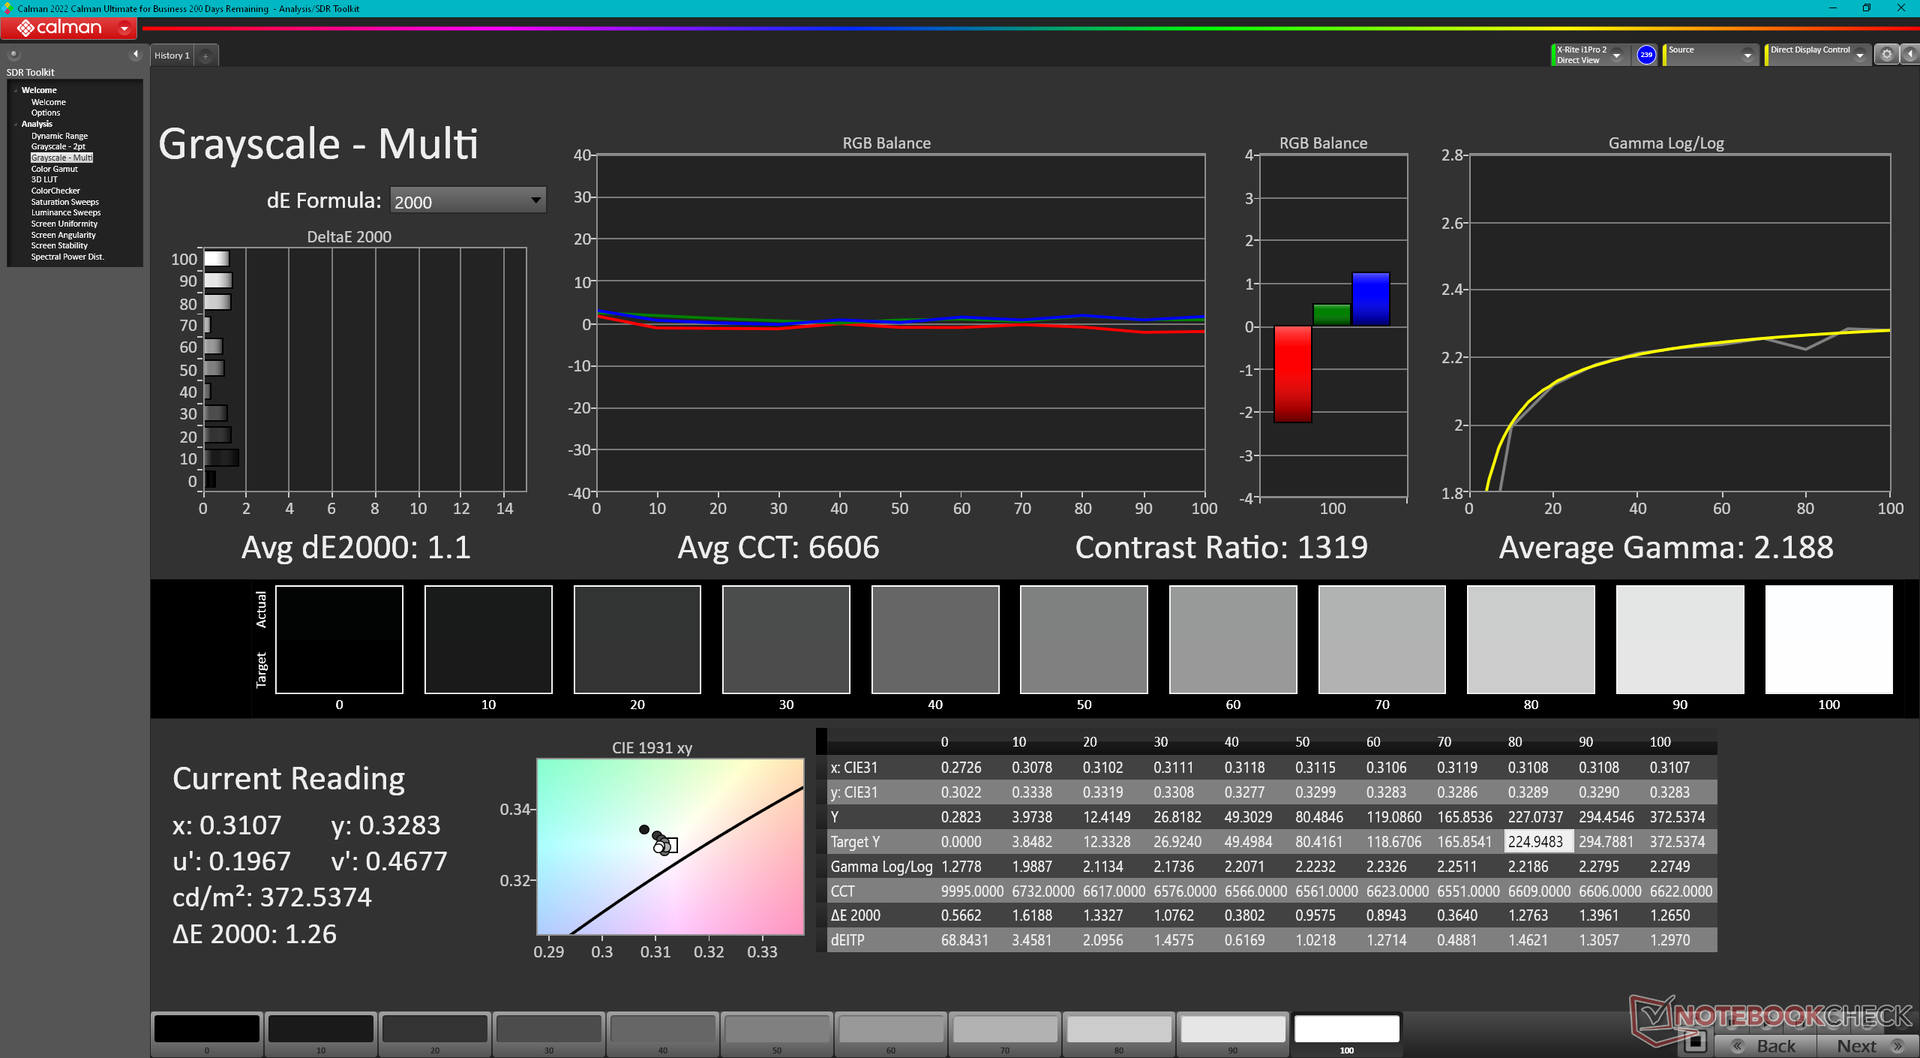
Wyświetlacz jest fabrycznie skalibrowany pod kątem wiernego odwzorowania kolorów i skali szarości. Dalsza kalibracja panelu nie poprawi znacząco średnich wartości deltaE, dlatego kalibracja przez użytkownika końcowego nie jest konieczna.

Wyświetl czasy reakcji
| ↔ Czas reakcji od czerni do bieli | ||
|---|---|---|
| 9.9 ms ... wzrost ↗ i spadek ↘ łącznie | ↗ 5.4 ms wzrost | 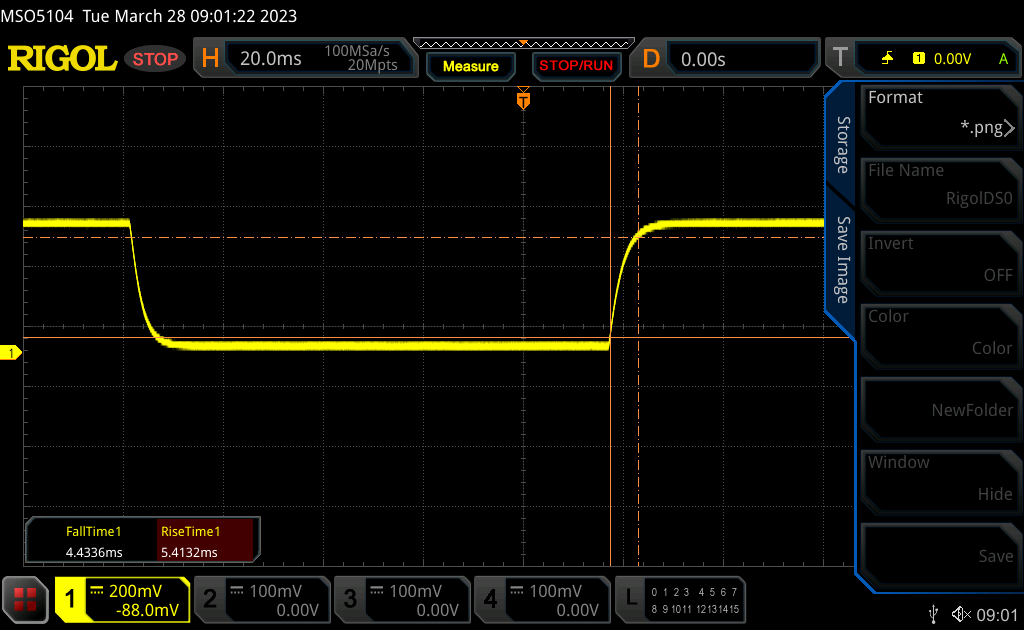 |
| ↘ 4.5 ms upadek | ||
| W naszych testach ekran wykazuje szybki czas reakcji i powinien nadawać się do gier. Dla porównania, wszystkie testowane urządzenia wahają się od 0.1 (minimum) do 240 (maksimum) ms. » 27 % wszystkich urządzeń jest lepszych. Oznacza to, że zmierzony czas reakcji jest lepszy od średniej wszystkich testowanych urządzeń (19.9 ms). | ||
| ↔ Czas reakcji 50% szarości do 80% szarości | ||
| 3 ms ... wzrost ↗ i spadek ↘ łącznie | ↗ 1.5 ms wzrost | 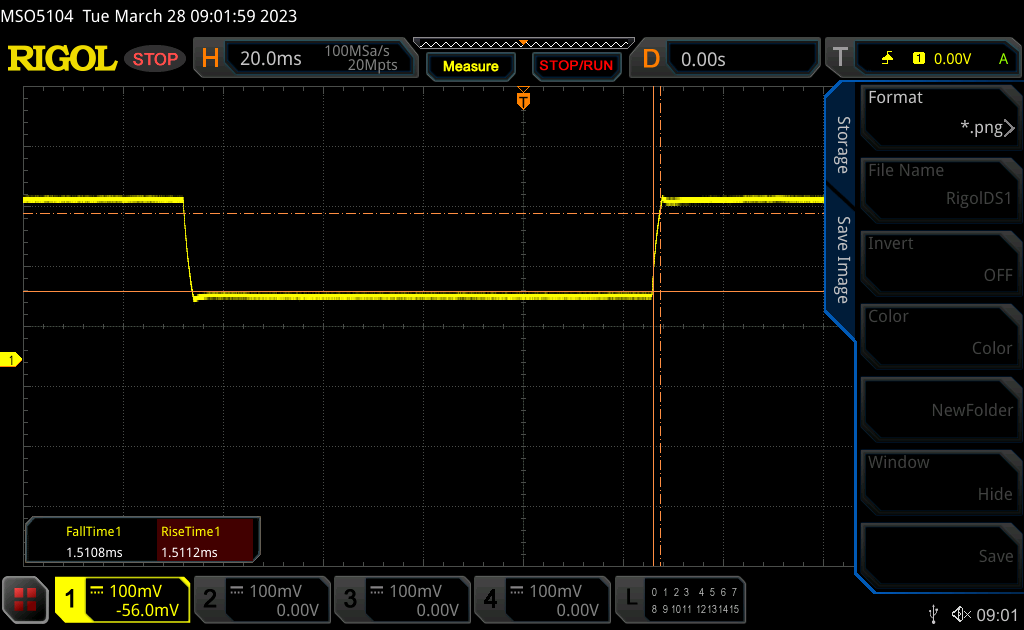 |
| ↘ 1.5 ms upadek | ||
| W naszych testach ekran wykazuje bardzo szybką reakcję i powinien bardzo dobrze nadawać się do szybkich gier. Dla porównania, wszystkie testowane urządzenia wahają się od 0.165 (minimum) do 636 (maksimum) ms. » 13 % wszystkich urządzeń jest lepszych. Oznacza to, że zmierzony czas reakcji jest lepszy od średniej wszystkich testowanych urządzeń (31.1 ms). | ||
Migotanie ekranu / PWM (modulacja szerokości impulsu)
| Migotanie ekranu/nie wykryto PWM | 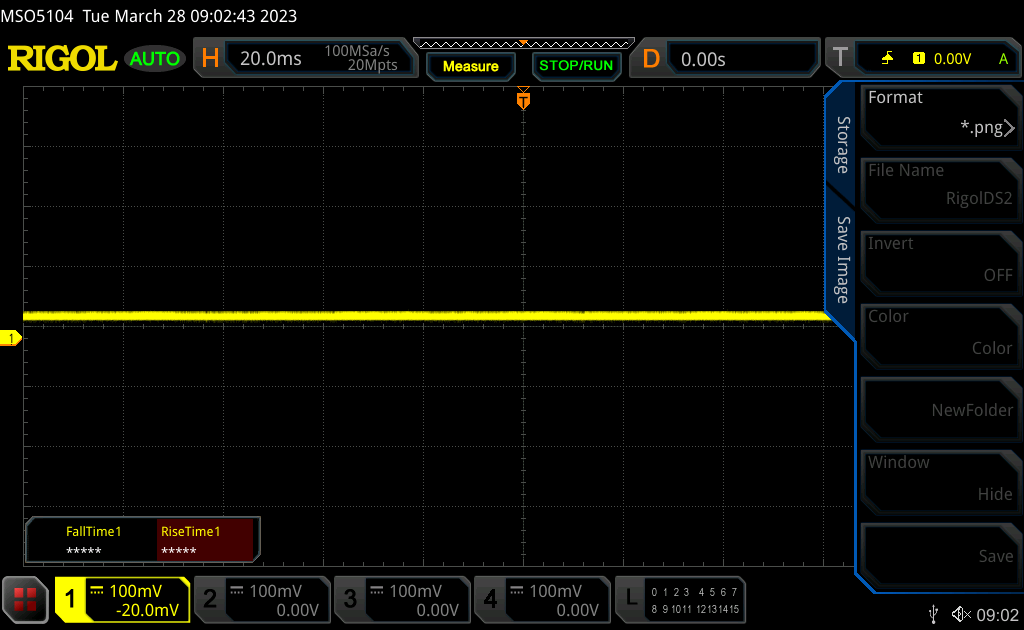 | ||
Dla porównania: 52 % wszystkich testowanych urządzeń nie używa PWM do przyciemniania wyświetlacza. Jeśli wykryto PWM, zmierzono średnio 7784 (minimum: 5 - maksimum: 343500) Hz. | |||
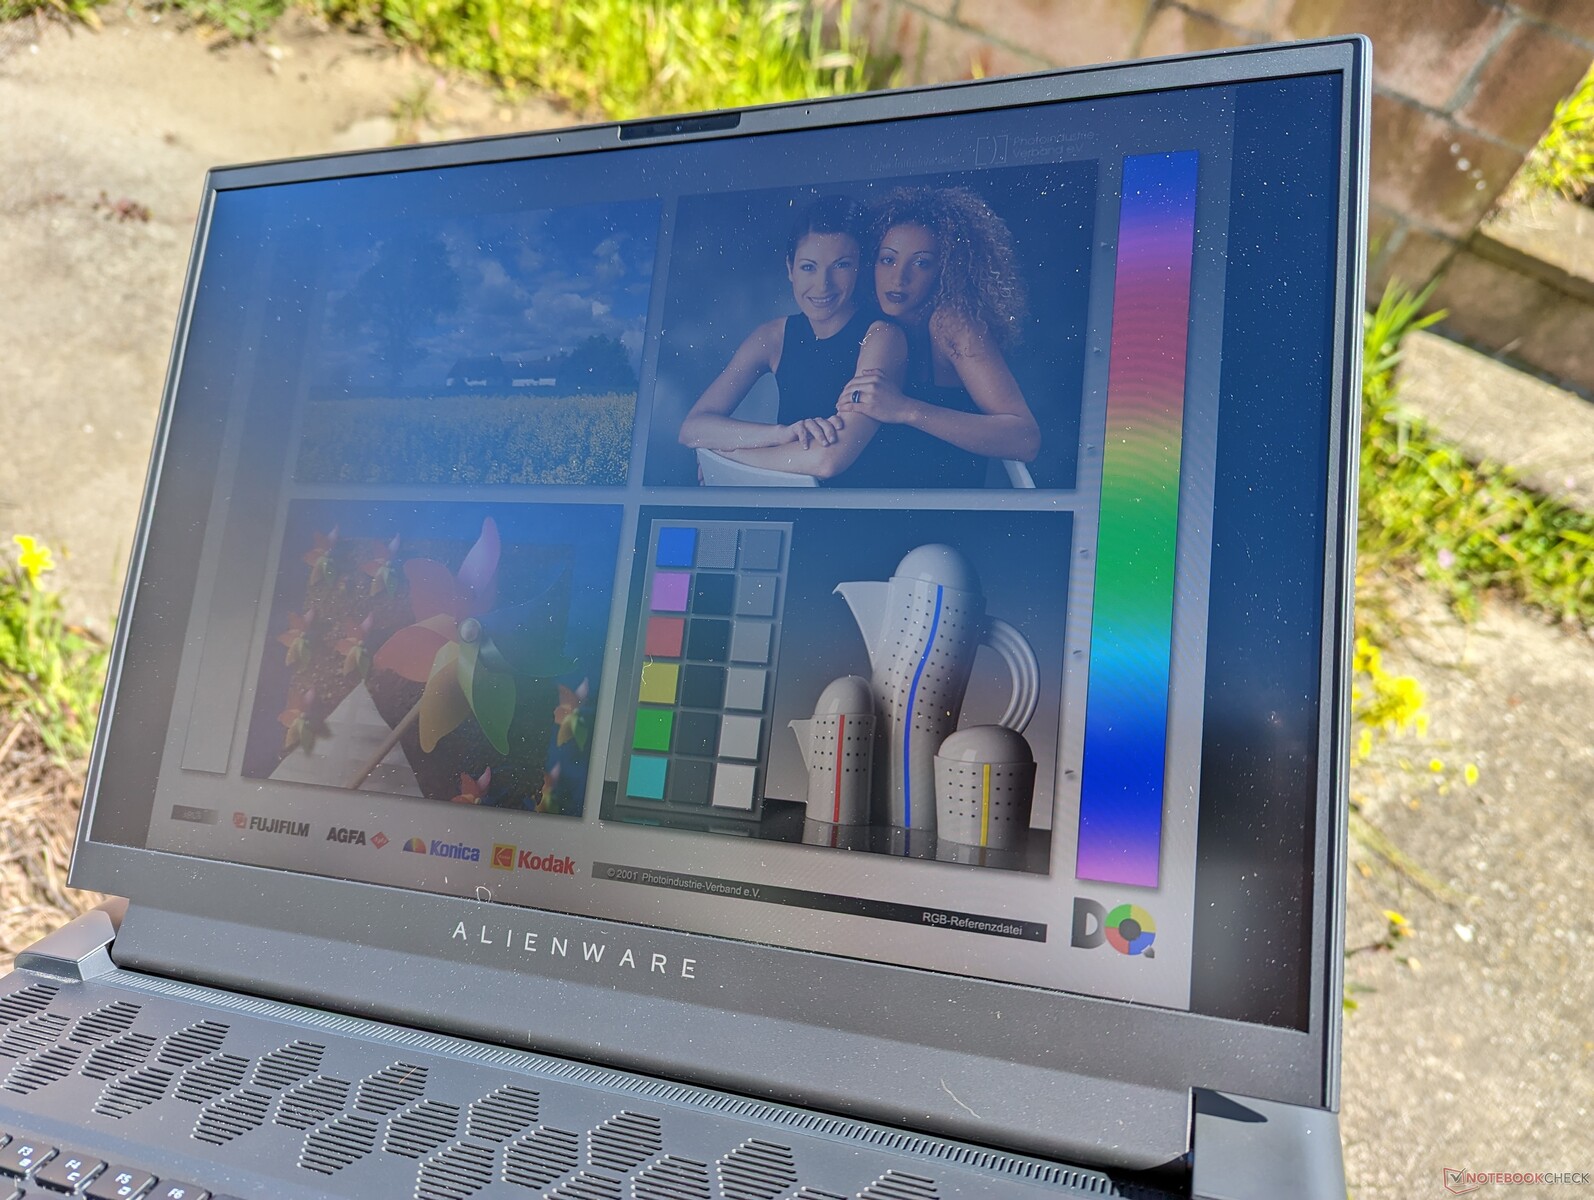
Widoczność na zewnątrz jest przeciętna w tej kategorii, ponieważ wyświetlacze w większości laptopów do gier mają zazwyczaj od 300 do 400 nitów. Mimo to ogromna waga Alienware zniechęca do używania go na zewnątrz. Blade 18 i Titan GT77 są jaśniejsze i zapewniają lepszą widoczność na zewnątrz.

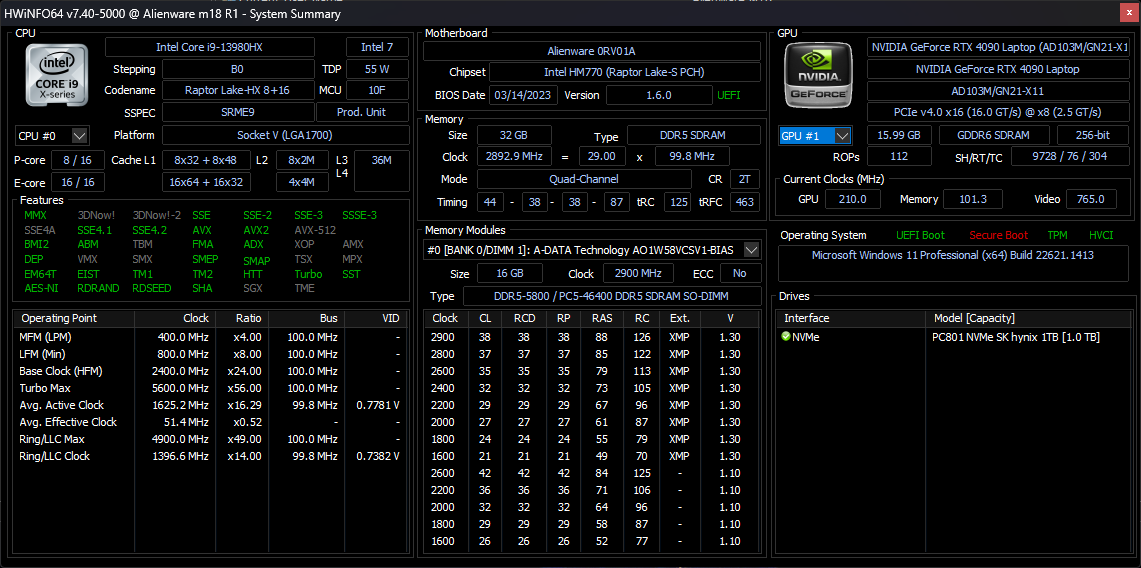
Wydajność - Intel 13th Gen + Nvidia Ada Lovelace
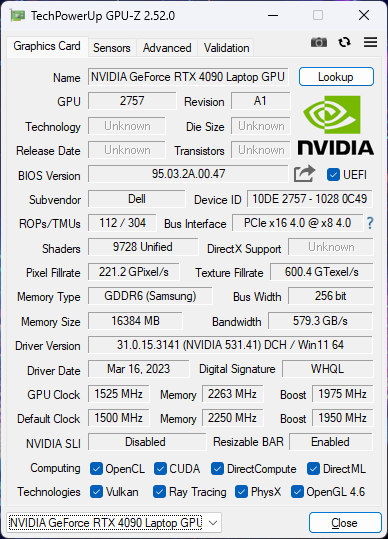
Warunki badania
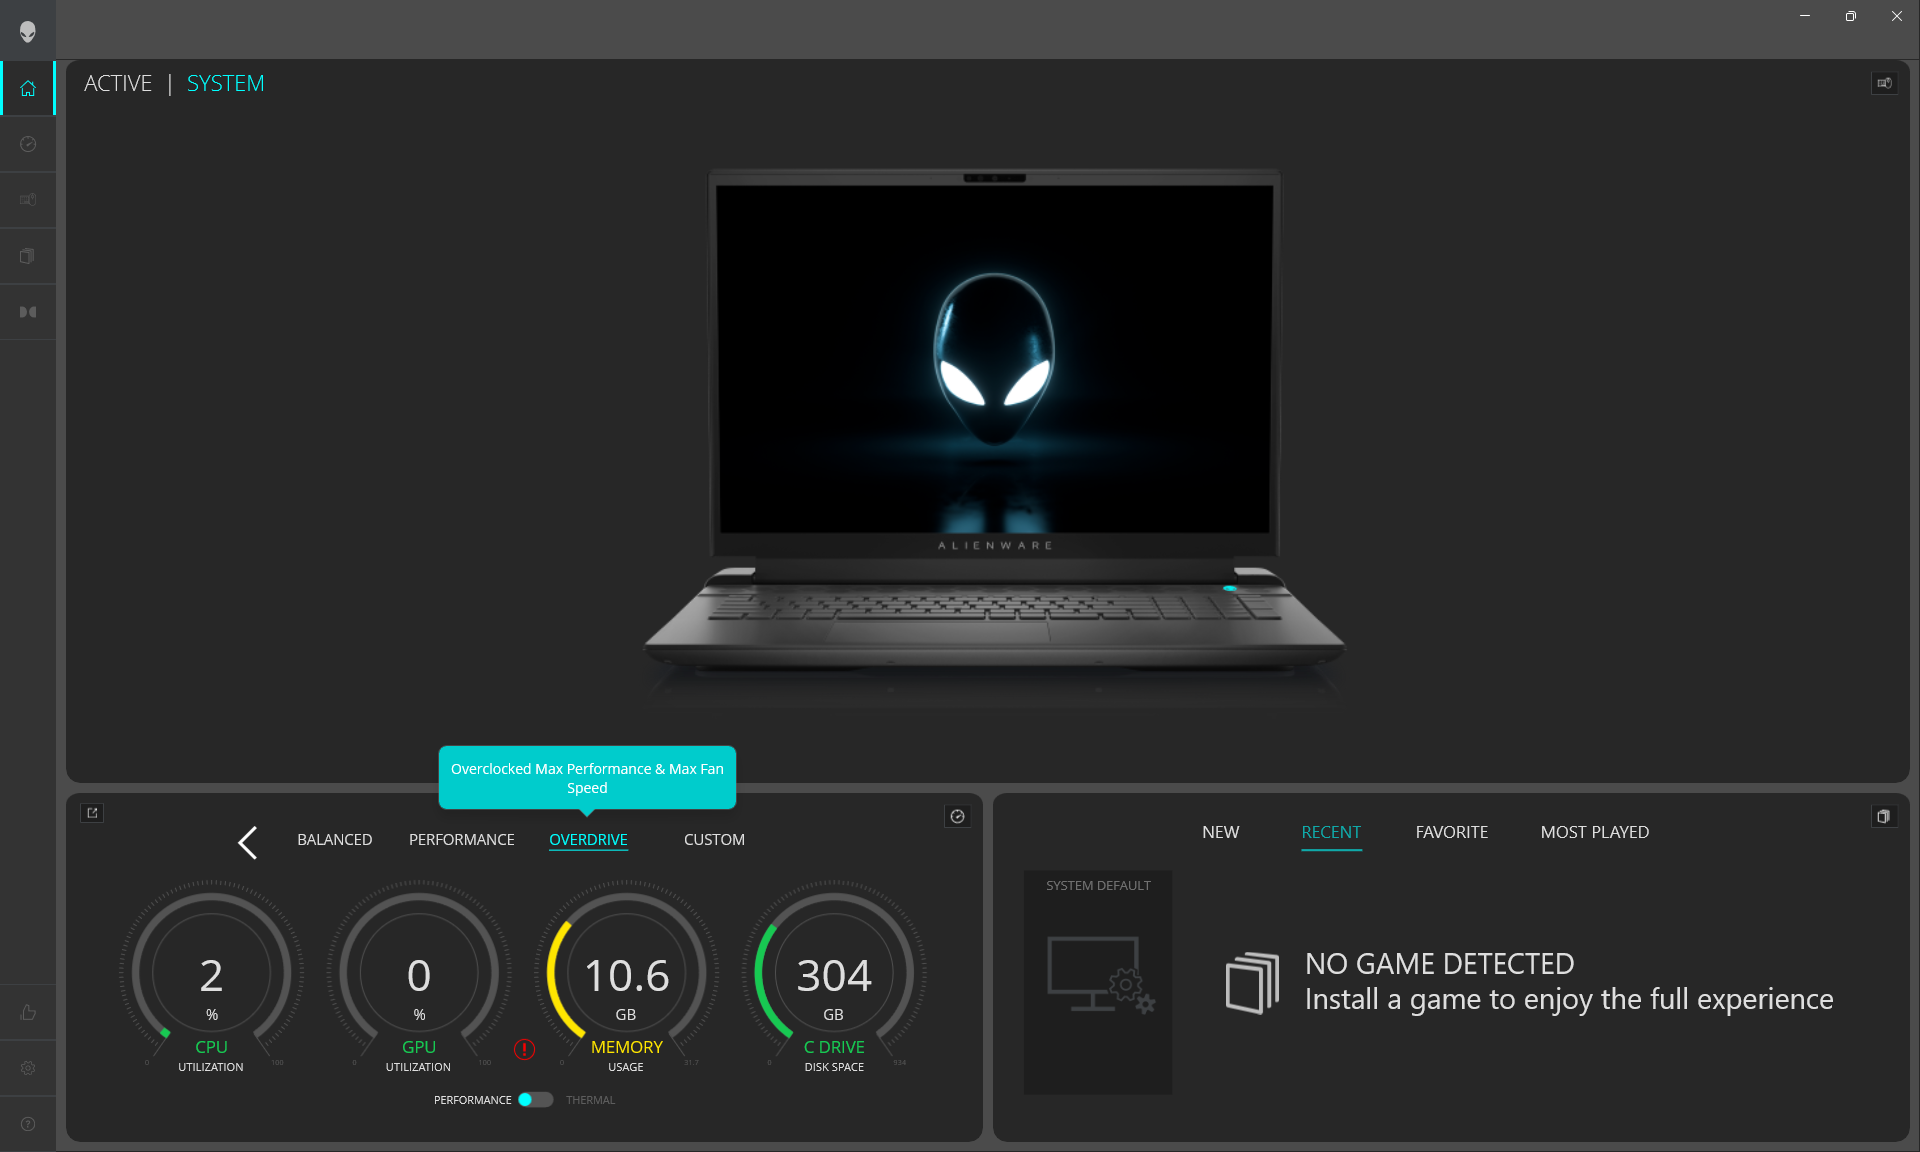
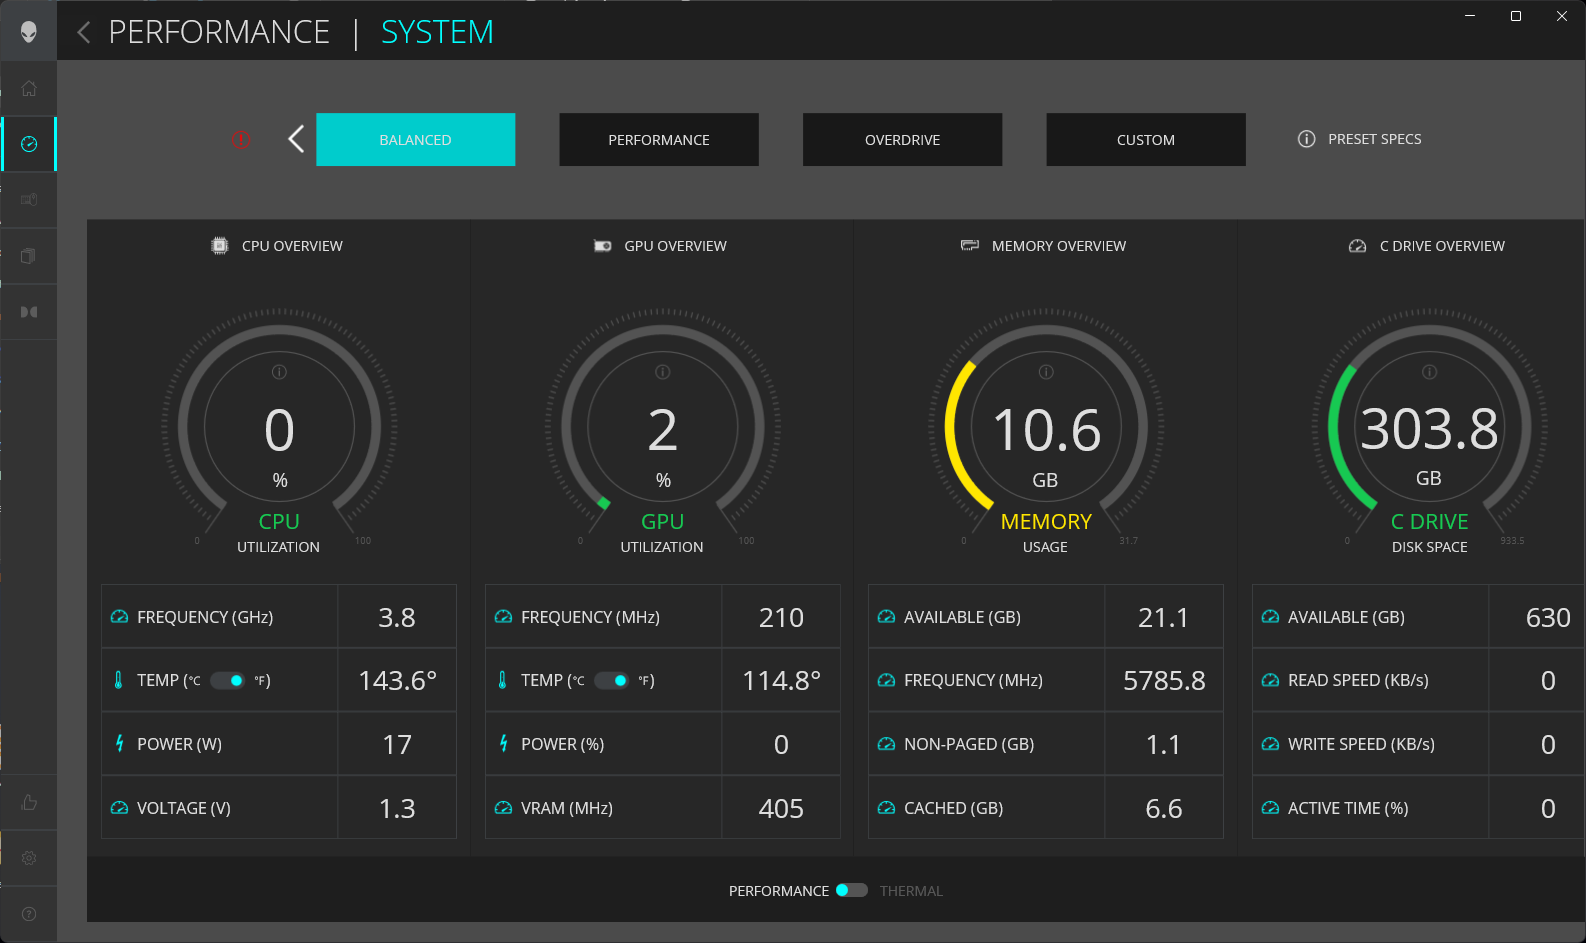
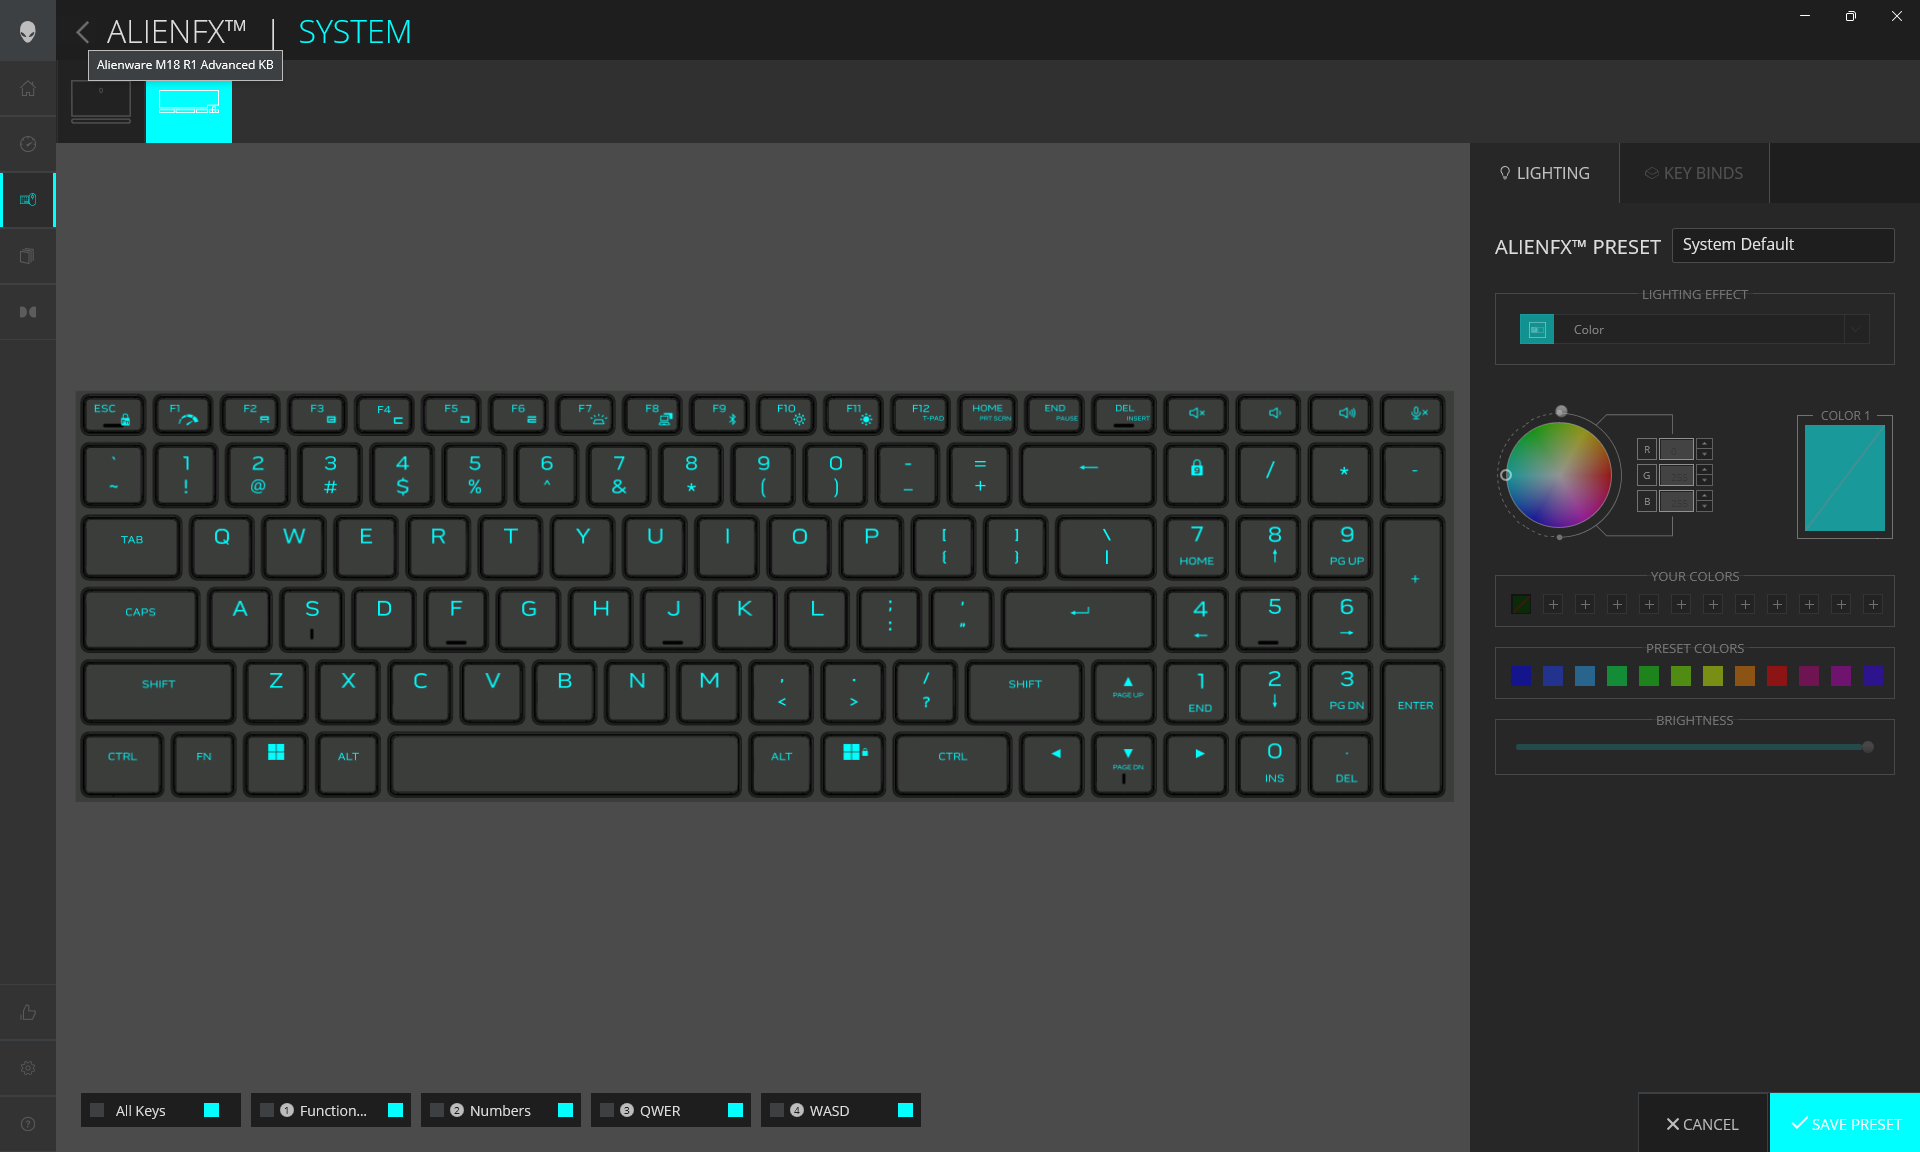
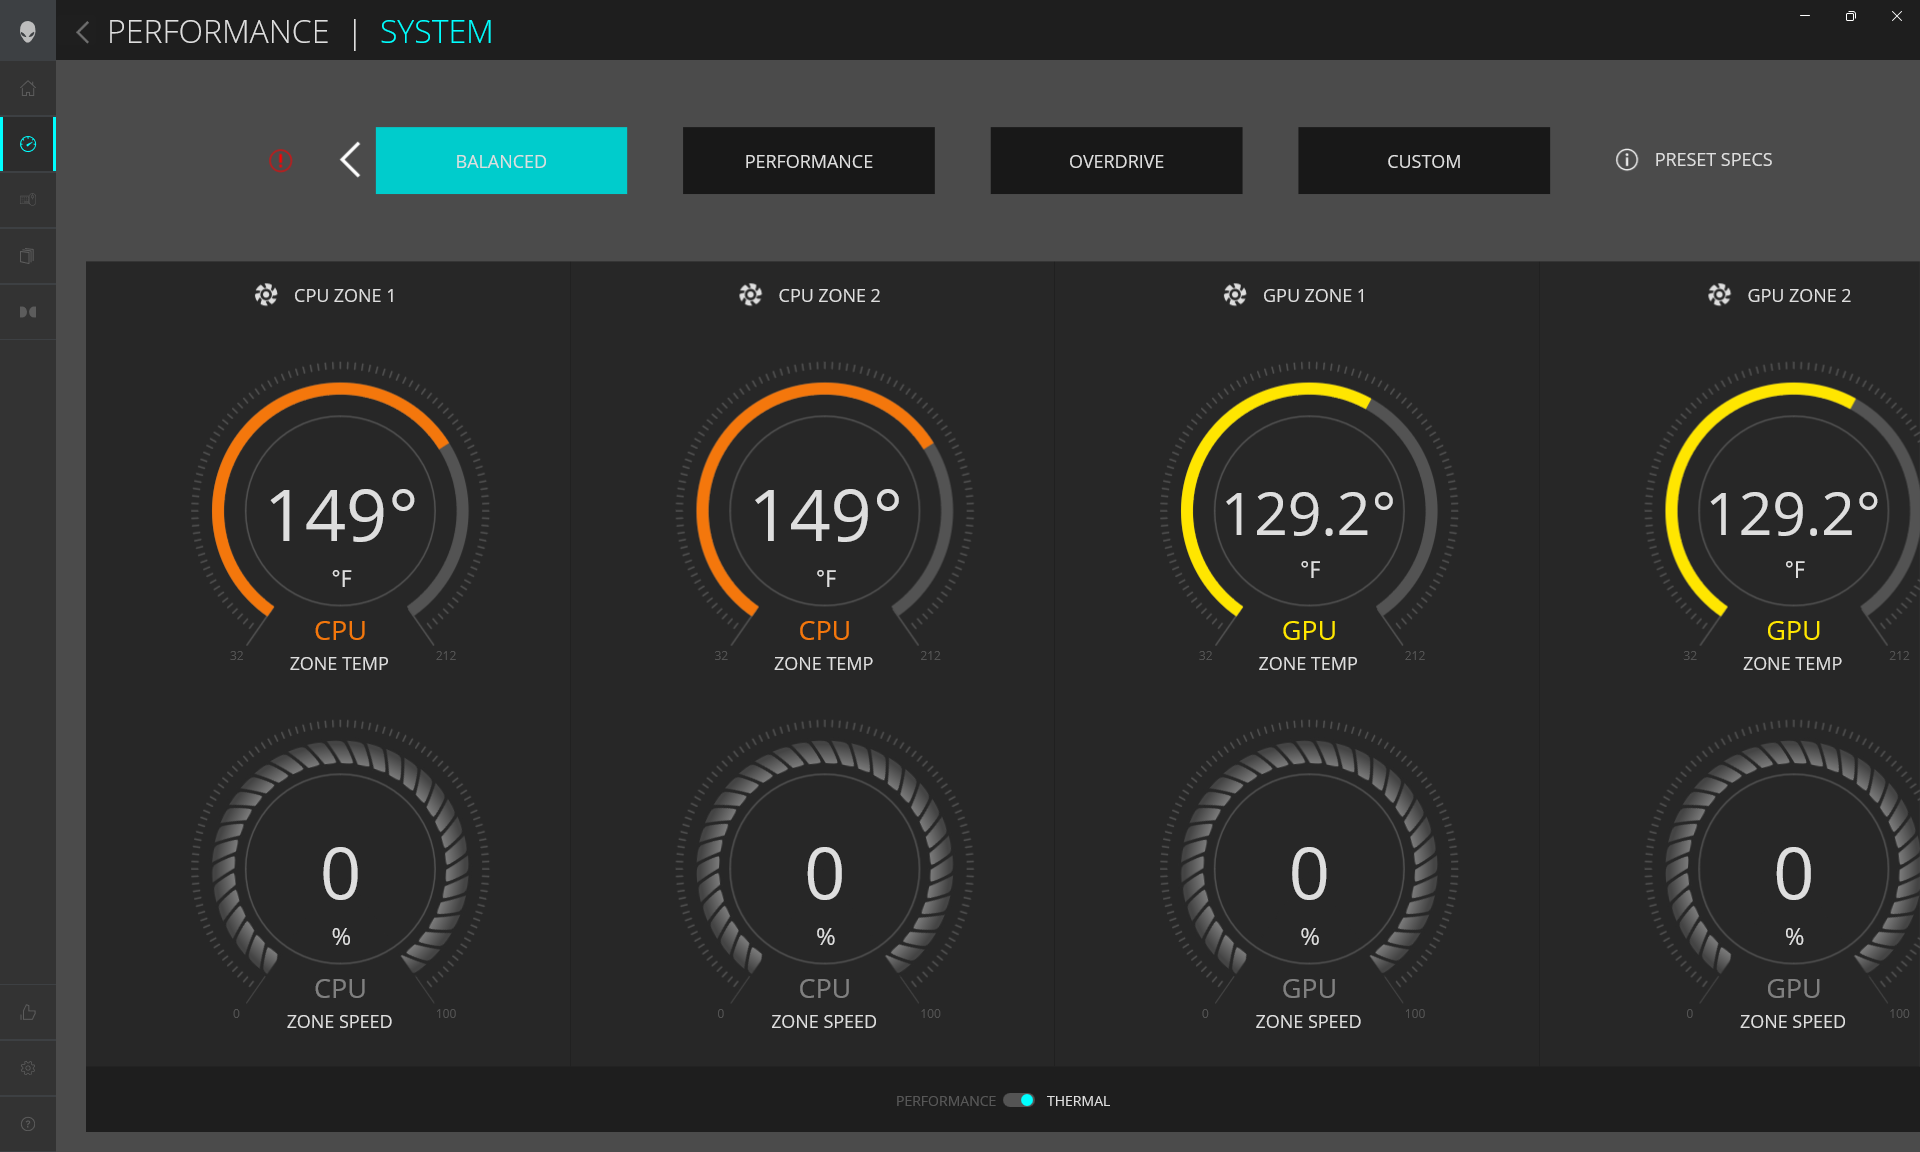
Przed uruchomieniem poniższych benchmarków ustawiliśmy nasz komputer w trybie Performance za pośrednictwem systemu Windows, tryb dyskretnego GPU za pośrednictwem panelu sterowania Nvidii oraz tryb Overdrive za pośrednictwem Alienware Command Center. Dell całkowicie odświeżył w tym roku oprogramowanie Command Center, które jest łatwiejsze w użyciu i ma większe czcionki niż wcześniej. Nadal jednak ładuje się ono bardzo wolno, zwłaszcza w porównaniu z szybszymi odpowiednikami MSI Center czy Schenker Control Center.
Doświadczyliśmy kilku błędów z Alienware Command Center, o których warto wspomnieć nawet po aktualizacji do najnowszej wersji w momencie pisania tego tekstu. Po pierwsze, oprogramowanie nie ładuje się, jeśli podłączony jest zewnętrzny monitor. Po drugie, wewnętrzne wentylatory czasami pracują bardzo głośno, nawet gdy system jest uśpiony lub hibernowany w trybie Performance lub Overdrive.
Funkcja Advanced Optimus jest obsługiwana, co oznacza, że użytkownicy mogą przełączać się między trybami dyskretnego GPU i Optimus za pośrednictwem panelu sterowania Nvidii bez konieczności ponownego uruchamiania komputera. Funkcja G-Sync jest dostępna tylko w trybie dGPU, natomiast Optimus włącza się automatycznie po podłączeniu zewnętrznego monitora.
Procesor
Wydajność procesora jest jedną z najszybszych wśród wszystkich mobilnych CPU dostępnych obecnie na rynku. Użytkownicy mogą liczyć na wzrost wydajności jednowątkowej i wielowątkowej o około 10 procent i 75 procent, odpowiednio, w stosunku do 12. generacjiCore i9-12900HK w starszym modelu Alienware x17 R2. Najlepszy konkurent AMD z serii Zen 4, czyliRyzen 9 7945HX wypada słabiej w obciążeniach jednowątkowych o około 10 do 15 procent.
Pomimo ogromnego skoku wydajności względem Alder Lake-H, różnice w wydajności pomiędzyCore i9-13900HX,Core i9-13950HXorazCore i9-13980HX są bardzo niewielkie i wynoszą poniżej 5 procent. Jeśli więc masz do wyboru te trzy procesory, możesz zaoszczędzić trochę pieniędzy, wybierając "wolniejszy" i9-13900HX.
Najniższa dostępna opcja procesora to Core i7-13700HX który jest wolniejszy od naszego i9-13980HX o około 33 procent.
Cinebench R15 Multi Loop
Cinebench R23: Multi Core | Single Core
Cinebench R20: CPU (Multi Core) | CPU (Single Core)
Cinebench R15: CPU Multi 64Bit | CPU Single 64Bit
Blender: v2.79 BMW27 CPU
7-Zip 18.03: 7z b 4 | 7z b 4 -mmt1
Geekbench 5.5: Multi-Core | Single-Core
HWBOT x265 Benchmark v2.2: 4k Preset
LibreOffice : 20 Documents To PDF
R Benchmark 2.5: Overall mean
| CPU Performance rating | |
| Eluktronics Mech-17 GP2 | |
| Alienware m18 R1 | |
| MSI Titan GT77 HX 13VI | |
| Przeciętny Intel Core i9-13980HX | |
| Asus ROG Strix G17 G713PI | |
| Razer Blade 18 RTX 4070 | |
| Uniwill GM6PX7X RTX 4070 | |
| Alienware x17 R2 P48E | |
| Razer Blade 17 (i7-12800H, RTX 3070 Ti) | |
| Alienware m17 R5 (R9 6900HX, RX 6850M XT) | |
| Corsair Voyager a1600 | |
| MSI GS76 Stealth 11UH | |
| HP Omen 16-n0033dx | |
| Alienware x17 RTX 3080 P48E -2! | |
| Razer Blade Pro 17 2021 (QHD Touch) | |
| Cinebench R23 / Multi Core | |
| MSI Titan GT77 HX 13VI | |
| Eluktronics Mech-17 GP2 | |
| Alienware m18 R1 | |
| Asus ROG Strix G17 G713PI | |
| Przeciętny Intel Core i9-13980HX (28301 - 33052, n=11) | |
| Razer Blade 18 RTX 4070 | |
| Uniwill GM6PX7X RTX 4070 | |
| Alienware x17 R2 P48E | |
| Razer Blade 17 (i7-12800H, RTX 3070 Ti) | |
| Alienware x17 RTX 3080 P48E | |
| Alienware m17 R5 (R9 6900HX, RX 6850M XT) | |
| Corsair Voyager a1600 | |
| HP Omen 16-n0033dx | |
| MSI GS76 Stealth 11UH | |
| Razer Blade Pro 17 2021 (QHD Touch) | |
| Cinebench R23 / Single Core | |
| Alienware m18 R1 | |
| MSI Titan GT77 HX 13VI | |
| Eluktronics Mech-17 GP2 | |
| Przeciętny Intel Core i9-13980HX (1825 - 2169, n=9) | |
| Razer Blade 18 RTX 4070 | |
| Alienware x17 R2 P48E | |
| Asus ROG Strix G17 G713PI | |
| Razer Blade 17 (i7-12800H, RTX 3070 Ti) | |
| Uniwill GM6PX7X RTX 4070 | |
| MSI GS76 Stealth 11UH | |
| Corsair Voyager a1600 | |
| Alienware m17 R5 (R9 6900HX, RX 6850M XT) | |
| Alienware x17 RTX 3080 P48E | |
| HP Omen 16-n0033dx | |
| Razer Blade Pro 17 2021 (QHD Touch) | |
| Cinebench R20 / CPU (Multi Core) | |
| MSI Titan GT77 HX 13VI | |
| Eluktronics Mech-17 GP2 | |
| Alienware m18 R1 | |
| Przeciętny Intel Core i9-13980HX (10353 - 12437, n=10) | |
| Razer Blade 18 RTX 4070 | |
| Asus ROG Strix G17 G713PI | |
| Uniwill GM6PX7X RTX 4070 | |
| Alienware x17 R2 P48E | |
| Alienware x17 RTX 3080 P48E | |
| Razer Blade 17 (i7-12800H, RTX 3070 Ti) | |
| Alienware m17 R5 (R9 6900HX, RX 6850M XT) | |
| Corsair Voyager a1600 | |
| HP Omen 16-n0033dx | |
| MSI GS76 Stealth 11UH | |
| Razer Blade Pro 17 2021 (QHD Touch) | |
| Cinebench R20 / CPU (Single Core) | |
| Alienware m18 R1 | |
| MSI Titan GT77 HX 13VI | |
| Eluktronics Mech-17 GP2 | |
| Razer Blade 18 RTX 4070 | |
| Przeciętny Intel Core i9-13980HX (717 - 825, n=10) | |
| Alienware x17 R2 P48E | |
| Asus ROG Strix G17 G713PI | |
| Uniwill GM6PX7X RTX 4070 | |
| Razer Blade 17 (i7-12800H, RTX 3070 Ti) | |
| Alienware m17 R5 (R9 6900HX, RX 6850M XT) | |
| MSI GS76 Stealth 11UH | |
| HP Omen 16-n0033dx | |
| Corsair Voyager a1600 | |
| Alienware x17 RTX 3080 P48E | |
| Razer Blade Pro 17 2021 (QHD Touch) | |
| Cinebench R15 / CPU Multi 64Bit | |
| MSI Titan GT77 HX 13VI | |
| Asus ROG Strix G17 G713PI | |
| Alienware m18 R1 | |
| Eluktronics Mech-17 GP2 | |
| Przeciętny Intel Core i9-13980HX (4358 - 5172, n=11) | |
| Razer Blade 18 RTX 4070 | |
| Uniwill GM6PX7X RTX 4070 | |
| Alienware x17 R2 P48E | |
| Razer Blade 17 (i7-12800H, RTX 3070 Ti) | |
| Alienware m17 R5 (R9 6900HX, RX 6850M XT) | |
| Alienware x17 RTX 3080 P48E | |
| Corsair Voyager a1600 | |
| HP Omen 16-n0033dx | |
| MSI GS76 Stealth 11UH | |
| Razer Blade Pro 17 2021 (QHD Touch) | |
| Cinebench R15 / CPU Single 64Bit | |
| Alienware m18 R1 | |
| Przeciętny Intel Core i9-13980HX (289 - 312, n=11) | |
| MSI Titan GT77 HX 13VI | |
| Eluktronics Mech-17 GP2 | |
| Razer Blade 18 RTX 4070 | |
| Asus ROG Strix G17 G713PI | |
| Alienware x17 R2 P48E | |
| Razer Blade 17 (i7-12800H, RTX 3070 Ti) | |
| Uniwill GM6PX7X RTX 4070 | |
| Alienware m17 R5 (R9 6900HX, RX 6850M XT) | |
| Corsair Voyager a1600 | |
| HP Omen 16-n0033dx | |
| MSI GS76 Stealth 11UH | |
| Alienware x17 RTX 3080 P48E | |
| Razer Blade Pro 17 2021 (QHD Touch) | |
| Blender / v2.79 BMW27 CPU | |
| Razer Blade Pro 17 2021 (QHD Touch) | |
| MSI GS76 Stealth 11UH | |
| HP Omen 16-n0033dx | |
| Corsair Voyager a1600 | |
| Alienware m17 R5 (R9 6900HX, RX 6850M XT) | |
| Razer Blade 17 (i7-12800H, RTX 3070 Ti) | |
| Alienware x17 RTX 3080 P48E | |
| Alienware x17 R2 P48E | |
| Uniwill GM6PX7X RTX 4070 | |
| Razer Blade 18 RTX 4070 | |
| Przeciętny Intel Core i9-13980HX (97 - 136, n=10) | |
| Eluktronics Mech-17 GP2 | |
| MSI Titan GT77 HX 13VI | |
| Asus ROG Strix G17 G713PI | |
| Alienware m18 R1 | |
| 7-Zip 18.03 / 7z b 4 | |
| Alienware m18 R1 | |
| MSI Titan GT77 HX 13VI | |
| Eluktronics Mech-17 GP2 | |
| Asus ROG Strix G17 G713PI | |
| Przeciętny Intel Core i9-13980HX (104616 - 129804, n=10) | |
| Razer Blade 18 RTX 4070 | |
| Uniwill GM6PX7X RTX 4070 | |
| Alienware x17 R2 P48E | |
| Razer Blade 17 (i7-12800H, RTX 3070 Ti) | |
| Corsair Voyager a1600 | |
| Alienware m17 R5 (R9 6900HX, RX 6850M XT) | |
| HP Omen 16-n0033dx | |
| Alienware x17 RTX 3080 P48E | |
| MSI GS76 Stealth 11UH | |
| Razer Blade Pro 17 2021 (QHD Touch) | |
| 7-Zip 18.03 / 7z b 4 -mmt1 | |
| Asus ROG Strix G17 G713PI | |
| Eluktronics Mech-17 GP2 | |
| Przeciętny Intel Core i9-13980HX (6230 - 7163, n=10) | |
| MSI Titan GT77 HX 13VI | |
| Alienware m18 R1 | |
| Razer Blade 18 RTX 4070 | |
| Uniwill GM6PX7X RTX 4070 | |
| Corsair Voyager a1600 | |
| Alienware x17 R2 P48E | |
| Razer Blade 17 (i7-12800H, RTX 3070 Ti) | |
| Alienware m17 R5 (R9 6900HX, RX 6850M XT) | |
| HP Omen 16-n0033dx | |
| MSI GS76 Stealth 11UH | |
| Alienware x17 RTX 3080 P48E | |
| Razer Blade Pro 17 2021 (QHD Touch) | |
| Geekbench 5.5 / Multi-Core | |
| Alienware m18 R1 | |
| Eluktronics Mech-17 GP2 | |
| MSI Titan GT77 HX 13VI | |
| Przeciętny Intel Core i9-13980HX (18475 - 22200, n=10) | |
| Razer Blade 18 RTX 4070 | |
| Asus ROG Strix G17 G713PI | |
| Uniwill GM6PX7X RTX 4070 | |
| Alienware x17 R2 P48E | |
| Razer Blade 17 (i7-12800H, RTX 3070 Ti) | |
| Corsair Voyager a1600 | |
| Alienware m17 R5 (R9 6900HX, RX 6850M XT) | |
| MSI GS76 Stealth 11UH | |
| HP Omen 16-n0033dx | |
| Razer Blade Pro 17 2021 (QHD Touch) | |
| Geekbench 5.5 / Single-Core | |
| Eluktronics Mech-17 GP2 | |
| Alienware m18 R1 | |
| Asus ROG Strix G17 G713PI | |
| Przeciętny Intel Core i9-13980HX (1796 - 2139, n=10) | |
| MSI Titan GT77 HX 13VI | |
| Razer Blade 18 RTX 4070 | |
| Alienware x17 R2 P48E | |
| Uniwill GM6PX7X RTX 4070 | |
| Razer Blade 17 (i7-12800H, RTX 3070 Ti) | |
| MSI GS76 Stealth 11UH | |
| Alienware m17 R5 (R9 6900HX, RX 6850M XT) | |
| HP Omen 16-n0033dx | |
| Corsair Voyager a1600 | |
| Razer Blade Pro 17 2021 (QHD Touch) | |
| HWBOT x265 Benchmark v2.2 / 4k Preset | |
| Eluktronics Mech-17 GP2 | |
| Asus ROG Strix G17 G713PI | |
| Alienware m18 R1 | |
| MSI Titan GT77 HX 13VI | |
| Przeciętny Intel Core i9-13980HX (27 - 33.4, n=9) | |
| Razer Blade 18 RTX 4070 | |
| Uniwill GM6PX7X RTX 4070 | |
| Alienware x17 R2 P48E | |
| Alienware x17 RTX 3080 P48E | |
| Corsair Voyager a1600 | |
| Alienware m17 R5 (R9 6900HX, RX 6850M XT) | |
| HP Omen 16-n0033dx | |
| Razer Blade 17 (i7-12800H, RTX 3070 Ti) | |
| MSI GS76 Stealth 11UH | |
| Razer Blade Pro 17 2021 (QHD Touch) | |
| LibreOffice / 20 Documents To PDF | |
| HP Omen 16-n0033dx | |
| Alienware m17 R5 (R9 6900HX, RX 6850M XT) | |
| Corsair Voyager a1600 | |
| MSI GS76 Stealth 11UH | |
| Alienware m18 R1 | |
| Alienware x17 RTX 3080 P48E | |
| MSI Titan GT77 HX 13VI | |
| Asus ROG Strix G17 G713PI | |
| Razer Blade Pro 17 2021 (QHD Touch) | |
| Razer Blade 18 RTX 4070 | |
| Przeciętny Intel Core i9-13980HX (35 - 51.4, n=10) | |
| Razer Blade 17 (i7-12800H, RTX 3070 Ti) | |
| Alienware x17 R2 P48E | |
| Uniwill GM6PX7X RTX 4070 | |
| Eluktronics Mech-17 GP2 | |
| R Benchmark 2.5 / Overall mean | |
| Razer Blade Pro 17 2021 (QHD Touch) | |
| Alienware x17 RTX 3080 P48E | |
| MSI GS76 Stealth 11UH | |
| HP Omen 16-n0033dx | |
| Corsair Voyager a1600 | |
| Alienware m17 R5 (R9 6900HX, RX 6850M XT) | |
| Uniwill GM6PX7X RTX 4070 | |
| Razer Blade 17 (i7-12800H, RTX 3070 Ti) | |
| Alienware x17 R2 P48E | |
| Asus ROG Strix G17 G713PI | |
| MSI Titan GT77 HX 13VI | |
| Przeciętny Intel Core i9-13980HX (0.3793 - 0.4462, n=10) | |
| Razer Blade 18 RTX 4070 | |
| Alienware m18 R1 | |
| Eluktronics Mech-17 GP2 | |
Cinebench R23: Multi Core | Single Core
Cinebench R20: CPU (Multi Core) | CPU (Single Core)
Cinebench R15: CPU Multi 64Bit | CPU Single 64Bit
Blender: v2.79 BMW27 CPU
7-Zip 18.03: 7z b 4 | 7z b 4 -mmt1
Geekbench 5.5: Multi-Core | Single-Core
HWBOT x265 Benchmark v2.2: 4k Preset
LibreOffice : 20 Documents To PDF
R Benchmark 2.5: Overall mean
* ... im mniej tym lepiej
AIDA64: FP32 Ray-Trace | FPU Julia | CPU SHA3 | CPU Queen | FPU SinJulia | FPU Mandel | CPU AES | CPU ZLib | FP64 Ray-Trace | CPU PhotoWorxx
| Performance rating | |
| Alienware m18 R1 | |
| Eluktronics Mech-17 GP2 | |
| MSI Titan GT77 HX 13VI | |
| Asus ROG Strix Scar 18 2023 G834JY-N6005W | |
| Przeciętny Intel Core i9-13980HX | |
| Razer Blade 18 RTX 4070 | |
| Alienware x17 R2 P48E | |
| AIDA64 / FP32 Ray-Trace | |
| Alienware m18 R1 | |
| MSI Titan GT77 HX 13VI | |
| Asus ROG Strix Scar 18 2023 G834JY-N6005W | |
| Eluktronics Mech-17 GP2 | |
| Przeciętny Intel Core i9-13980HX (21332 - 29553, n=9) | |
| Razer Blade 18 RTX 4070 | |
| Alienware x17 R2 P48E | |
| AIDA64 / FPU Julia | |
| Alienware m18 R1 | |
| MSI Titan GT77 HX 13VI | |
| Asus ROG Strix Scar 18 2023 G834JY-N6005W | |
| Przeciętny Intel Core i9-13980HX (108001 - 148168, n=9) | |
| Eluktronics Mech-17 GP2 | |
| Razer Blade 18 RTX 4070 | |
| Alienware x17 R2 P48E | |
| AIDA64 / CPU SHA3 | |
| Alienware m18 R1 | |
| MSI Titan GT77 HX 13VI | |
| Eluktronics Mech-17 GP2 | |
| Asus ROG Strix Scar 18 2023 G834JY-N6005W | |
| Przeciętny Intel Core i9-13980HX (5264 - 7142, n=9) | |
| Razer Blade 18 RTX 4070 | |
| Alienware x17 R2 P48E | |
| AIDA64 / CPU Queen | |
| Alienware m18 R1 | |
| Asus ROG Strix Scar 18 2023 G834JY-N6005W | |
| Eluktronics Mech-17 GP2 | |
| MSI Titan GT77 HX 13VI | |
| Przeciętny Intel Core i9-13980HX (126758 - 143409, n=9) | |
| Razer Blade 18 RTX 4070 | |
| Alienware x17 R2 P48E | |
| AIDA64 / FPU SinJulia | |
| Eluktronics Mech-17 GP2 | |
| Asus ROG Strix Scar 18 2023 G834JY-N6005W | |
| MSI Titan GT77 HX 13VI | |
| Alienware m18 R1 | |
| Przeciętny Intel Core i9-13980HX (13785 - 17117, n=9) | |
| Razer Blade 18 RTX 4070 | |
| Alienware x17 R2 P48E | |
| AIDA64 / FPU Mandel | |
| Alienware m18 R1 | |
| MSI Titan GT77 HX 13VI | |
| Asus ROG Strix Scar 18 2023 G834JY-N6005W | |
| Eluktronics Mech-17 GP2 | |
| Przeciętny Intel Core i9-13980HX (53398 - 73758, n=9) | |
| Razer Blade 18 RTX 4070 | |
| Alienware x17 R2 P48E | |
| AIDA64 / CPU AES | |
| Eluktronics Mech-17 GP2 | |
| MSI Titan GT77 HX 13VI | |
| Alienware m18 R1 | |
| Asus ROG Strix Scar 18 2023 G834JY-N6005W | |
| Przeciętny Intel Core i9-13980HX (105169 - 136520, n=9) | |
| Razer Blade 18 RTX 4070 | |
| Alienware x17 R2 P48E | |
| AIDA64 / CPU ZLib | |
| MSI Titan GT77 HX 13VI | |
| Asus ROG Strix Scar 18 2023 G834JY-N6005W | |
| Alienware m18 R1 | |
| Eluktronics Mech-17 GP2 | |
| Przeciętny Intel Core i9-13980HX (1513 - 2039, n=9) | |
| Razer Blade 18 RTX 4070 | |
| Alienware x17 R2 P48E | |
| AIDA64 / FP64 Ray-Trace | |
| Alienware m18 R1 | |
| MSI Titan GT77 HX 13VI | |
| Asus ROG Strix Scar 18 2023 G834JY-N6005W | |
| Eluktronics Mech-17 GP2 | |
| Przeciętny Intel Core i9-13980HX (11431 - 16325, n=9) | |
| Razer Blade 18 RTX 4070 | |
| Alienware x17 R2 P48E | |
| AIDA64 / CPU PhotoWorxx | |
| Alienware m18 R1 | |
| Razer Blade 18 RTX 4070 | |
| Przeciętny Intel Core i9-13980HX (37069 - 52949, n=9) | |
| Eluktronics Mech-17 GP2 | |
| Asus ROG Strix Scar 18 2023 G834JY-N6005W | |
| MSI Titan GT77 HX 13VI | |
| Alienware x17 R2 P48E | |
Wydajność systemu
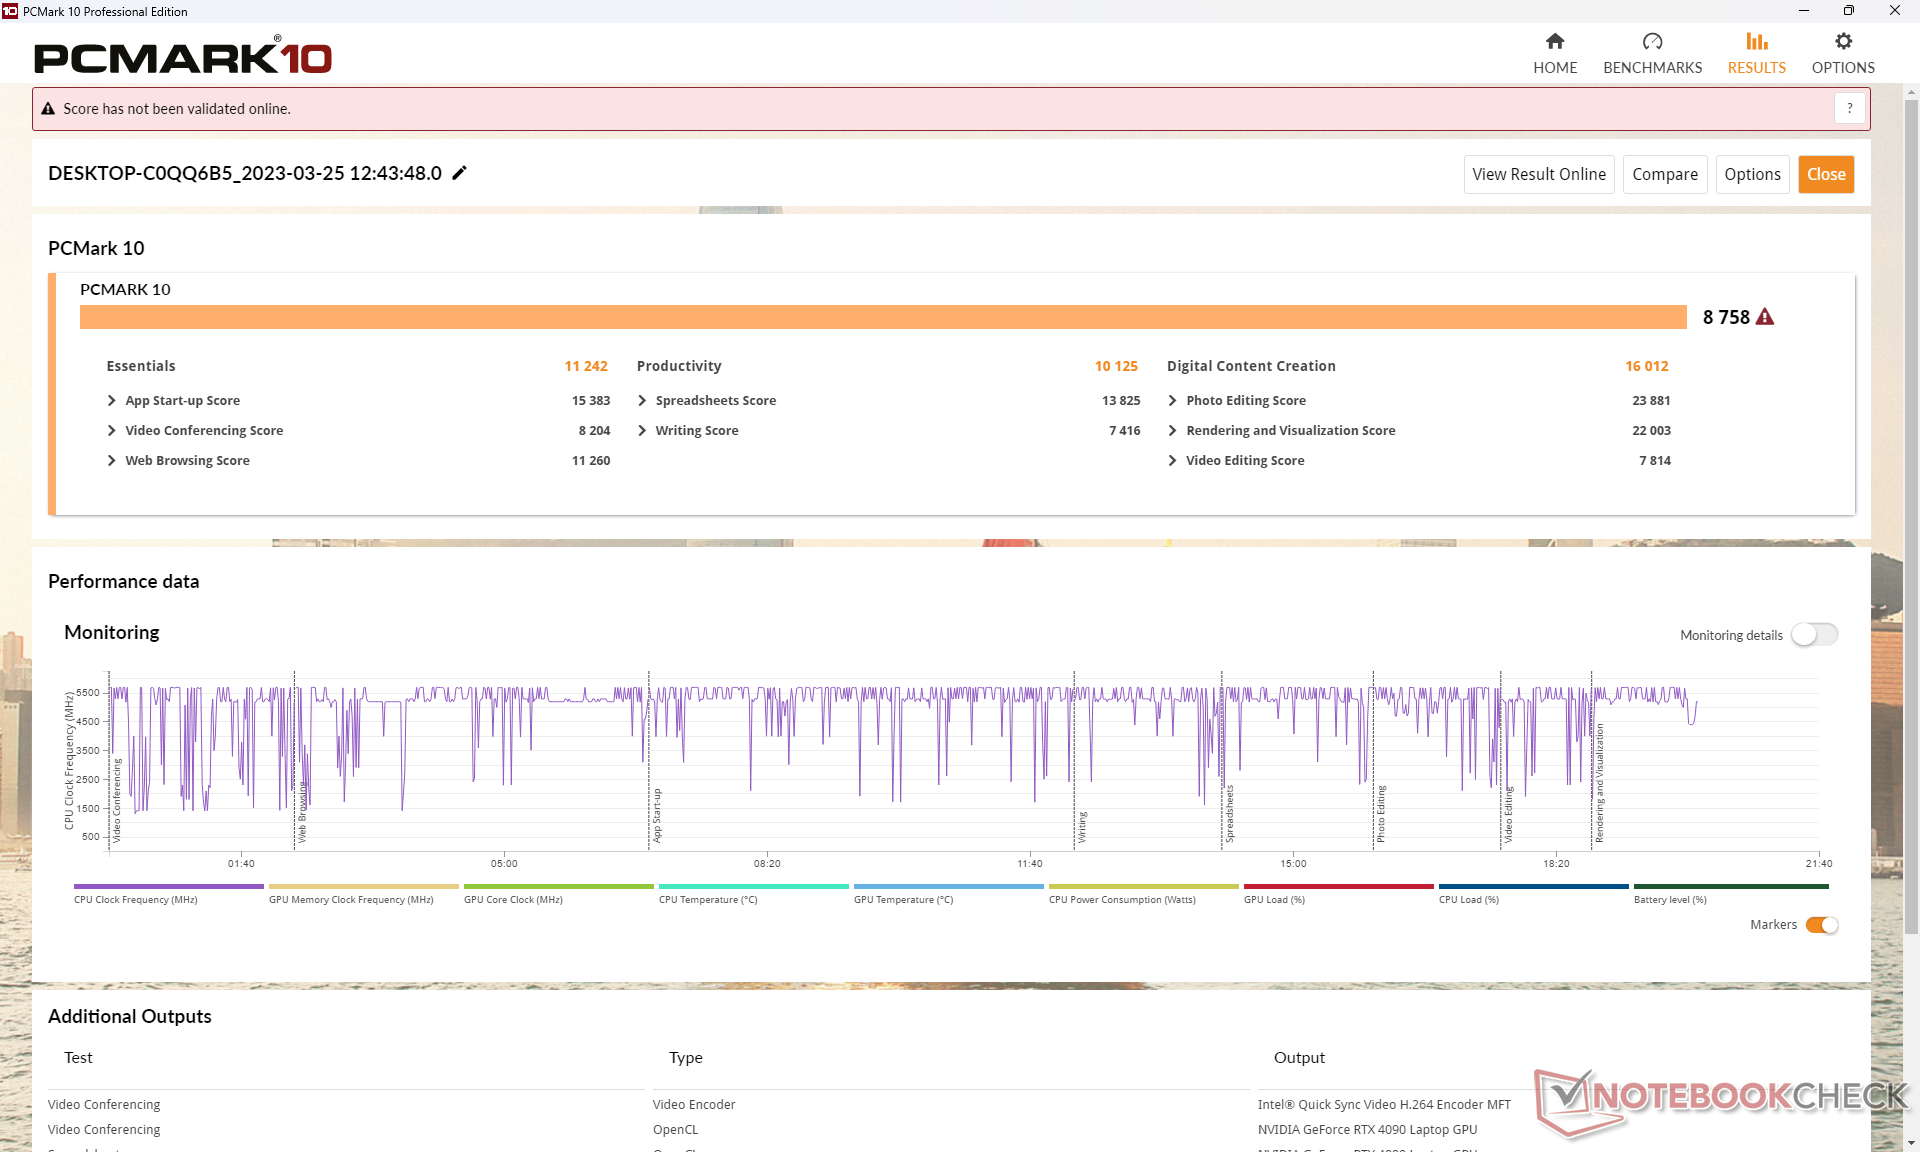
Wyniki PCMark 10 są porównywalne z innymi flagowymi laptopami do gier z podobnymi procesorami Intel 13. generacji i układami graficznymi GeForce 40, jak np.Asus ROG Strix Scar 18 czy MSI Titan GT77 HX. Naszemu Alienware udało się też wyprzedzić starszego Alienware x17 R2 działającego na dwóch dyskach SSD Samsung PM9A1 w RAID 0.
CrossMark: Overall | Productivity | Creativity | Responsiveness
| PCMark 10 / Score | |
| Eluktronics Mech-17 GP2 | |
| MSI Titan GT77 HX 13VI | |
| Przeciętny Intel Core i9-13980HX, NVIDIA GeForce RTX 4090 Laptop GPU (8650 - 9068, n=4) | |
| Asus ROG Strix Scar 18 2023 G834JY-N6005W | |
| Alienware m18 R1 | |
| Alienware x17 R2 P48E | |
| Razer Blade 18 RTX 4070 | |
| PCMark 10 / Essentials | |
| Eluktronics Mech-17 GP2 | |
| MSI Titan GT77 HX 13VI | |
| Razer Blade 18 RTX 4070 | |
| Przeciętny Intel Core i9-13980HX, NVIDIA GeForce RTX 4090 Laptop GPU (11215 - 11644, n=3) | |
| Alienware m18 R1 | |
| Alienware x17 R2 P48E | |
| PCMark 10 / Productivity | |
| Eluktronics Mech-17 GP2 | |
| Przeciętny Intel Core i9-13980HX, NVIDIA GeForce RTX 4090 Laptop GPU (10125 - 11067, n=3) | |
| Alienware x17 R2 P48E | |
| Alienware m18 R1 | |
| MSI Titan GT77 HX 13VI | |
| Razer Blade 18 RTX 4070 | |
| PCMark 10 / Digital Content Creation | |
| MSI Titan GT77 HX 13VI | |
| Alienware m18 R1 | |
| Przeciętny Intel Core i9-13980HX, NVIDIA GeForce RTX 4090 Laptop GPU (15052 - 16012, n=3) | |
| Eluktronics Mech-17 GP2 | |
| Alienware x17 R2 P48E | |
| Razer Blade 18 RTX 4070 | |
| CrossMark / Overall | |
| Eluktronics Mech-17 GP2 | |
| Alienware m18 R1 | |
| MSI Titan GT77 HX 13VI | |
| Razer Blade 18 RTX 4070 | |
| Asus ROG Strix Scar 18 2023 G834JY-N6005W | |
| Przeciętny Intel Core i9-13980HX, NVIDIA GeForce RTX 4090 Laptop GPU (1935 - 2176, n=4) | |
| Alienware x17 R2 P48E | |
| CrossMark / Productivity | |
| Eluktronics Mech-17 GP2 | |
| Alienware m18 R1 | |
| MSI Titan GT77 HX 13VI | |
| Razer Blade 18 RTX 4070 | |
| Asus ROG Strix Scar 18 2023 G834JY-N6005W | |
| Przeciętny Intel Core i9-13980HX, NVIDIA GeForce RTX 4090 Laptop GPU (1764 - 2005, n=4) | |
| Alienware x17 R2 P48E | |
| CrossMark / Creativity | |
| Eluktronics Mech-17 GP2 | |
| Alienware m18 R1 | |
| Asus ROG Strix Scar 18 2023 G834JY-N6005W | |
| MSI Titan GT77 HX 13VI | |
| Przeciętny Intel Core i9-13980HX, NVIDIA GeForce RTX 4090 Laptop GPU (2267 - 2469, n=4) | |
| Razer Blade 18 RTX 4070 | |
| Alienware x17 R2 P48E | |
| CrossMark / Responsiveness | |
| Alienware m18 R1 | |
| Razer Blade 18 RTX 4070 | |
| MSI Titan GT77 HX 13VI | |
| Eluktronics Mech-17 GP2 | |
| Przeciętny Intel Core i9-13980HX, NVIDIA GeForce RTX 4090 Laptop GPU (1556 - 1904, n=4) | |
| Alienware x17 R2 P48E | |
| Asus ROG Strix Scar 18 2023 G834JY-N6005W | |
| PCMark 10 Score | 8758 pkt. | |
Pomoc | ||
| AIDA64 / Memory Copy | |
| Alienware m18 R1 | |
| Razer Blade 18 RTX 4070 | |
| Przeciętny Intel Core i9-13980HX (62189 - 80776, n=9) | |
| Eluktronics Mech-17 GP2 | |
| Asus ROG Strix Scar 18 2023 G834JY-N6005W | |
| MSI Titan GT77 HX 13VI | |
| Alienware x17 R2 P48E | |
| AIDA64 / Memory Read | |
| Alienware m18 R1 | |
| Razer Blade 18 RTX 4070 | |
| Przeciętny Intel Core i9-13980HX (62624 - 89096, n=9) | |
| Eluktronics Mech-17 GP2 | |
| Asus ROG Strix Scar 18 2023 G834JY-N6005W | |
| MSI Titan GT77 HX 13VI | |
| Alienware x17 R2 P48E | |
| AIDA64 / Memory Write | |
| Alienware m18 R1 | |
| Razer Blade 18 RTX 4070 | |
| Przeciętny Intel Core i9-13980HX (59912 - 79917, n=9) | |
| Eluktronics Mech-17 GP2 | |
| Asus ROG Strix Scar 18 2023 G834JY-N6005W | |
| MSI Titan GT77 HX 13VI | |
| Alienware x17 R2 P48E | |
| AIDA64 / Memory Latency | |
| Alienware x17 R2 P48E | |
| MSI Titan GT77 HX 13VI | |
| Asus ROG Strix Scar 18 2023 G834JY-N6005W | |
| Eluktronics Mech-17 GP2 | |
| Przeciętny Intel Core i9-13980HX (79.4 - 93.2, n=9) | |
| Razer Blade 18 RTX 4070 | |
| Alienware m18 R1 | |
* ... im mniej tym lepiej
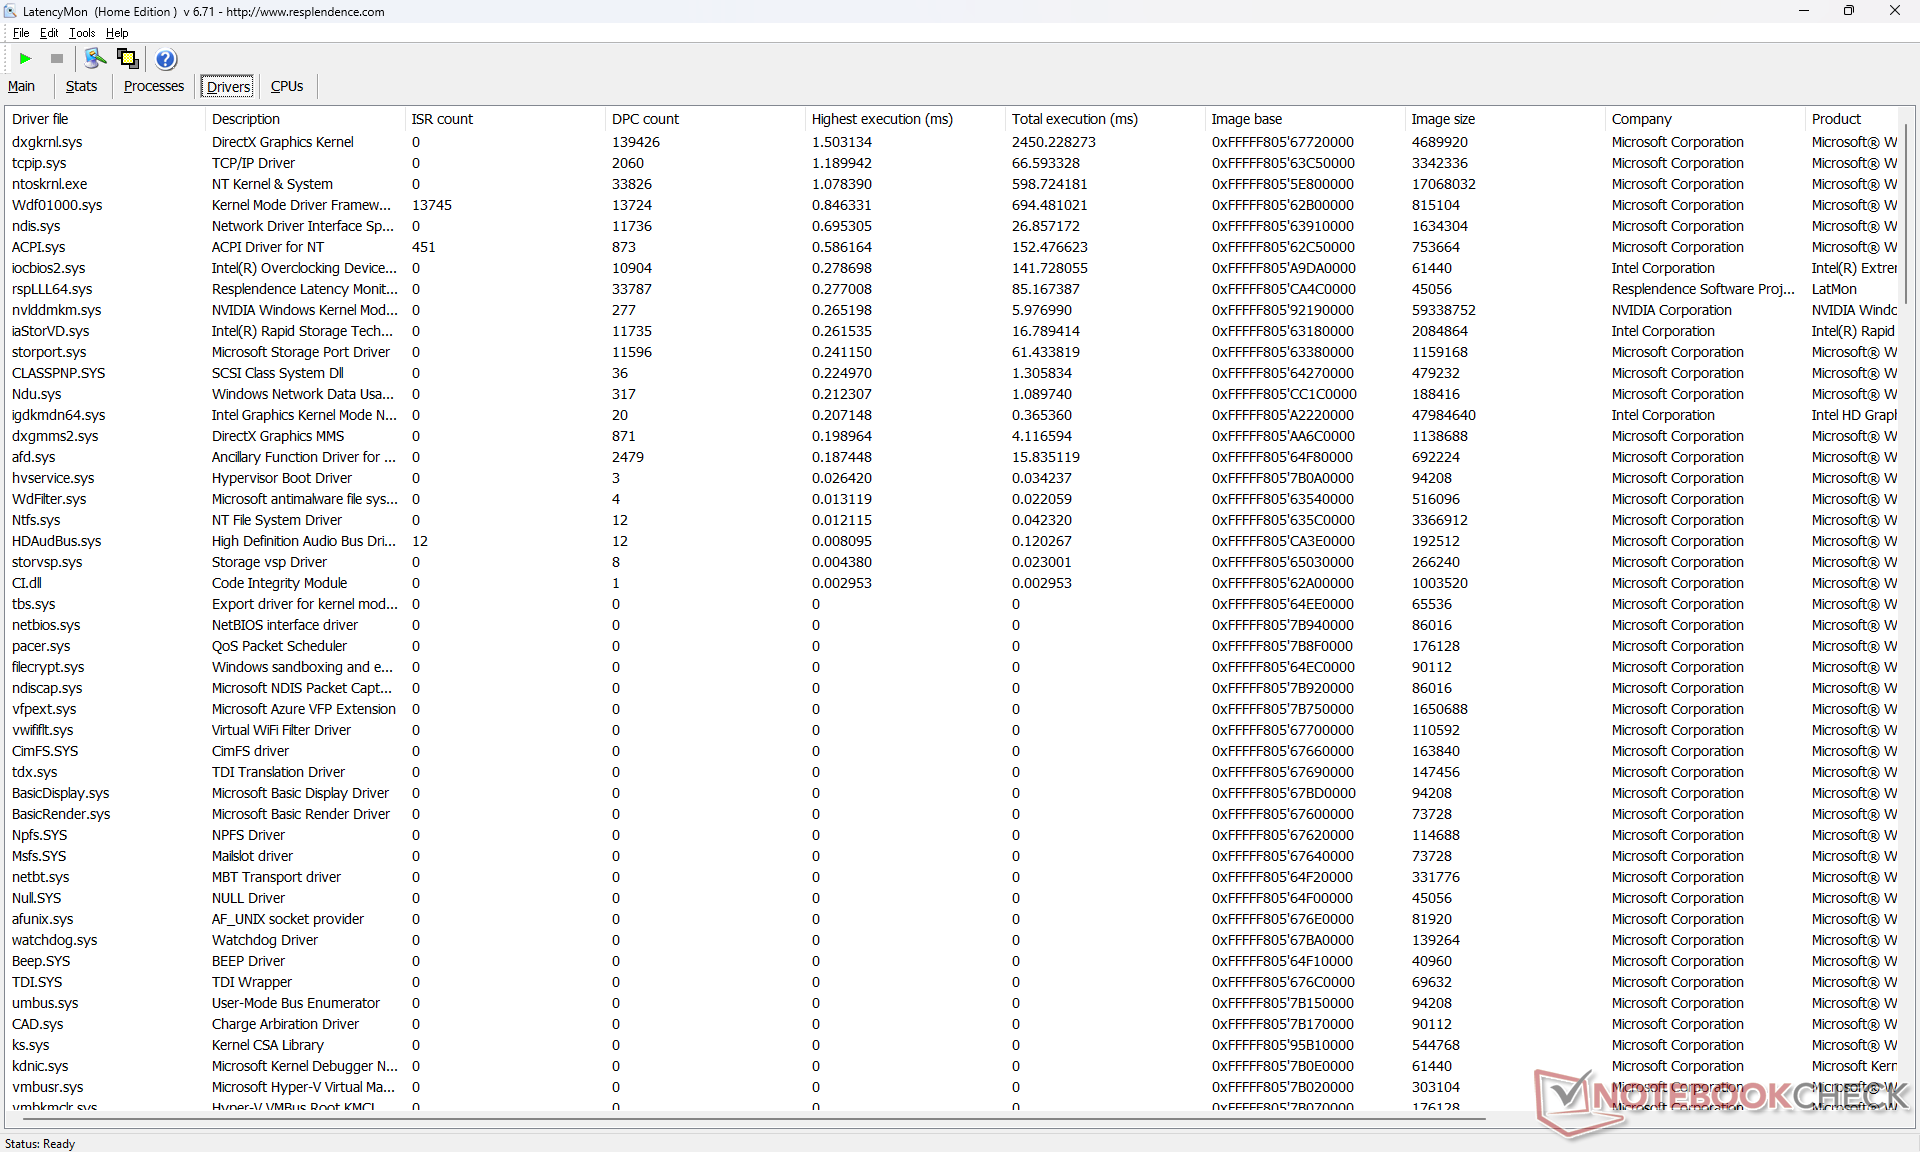
Opóźnienie DPC
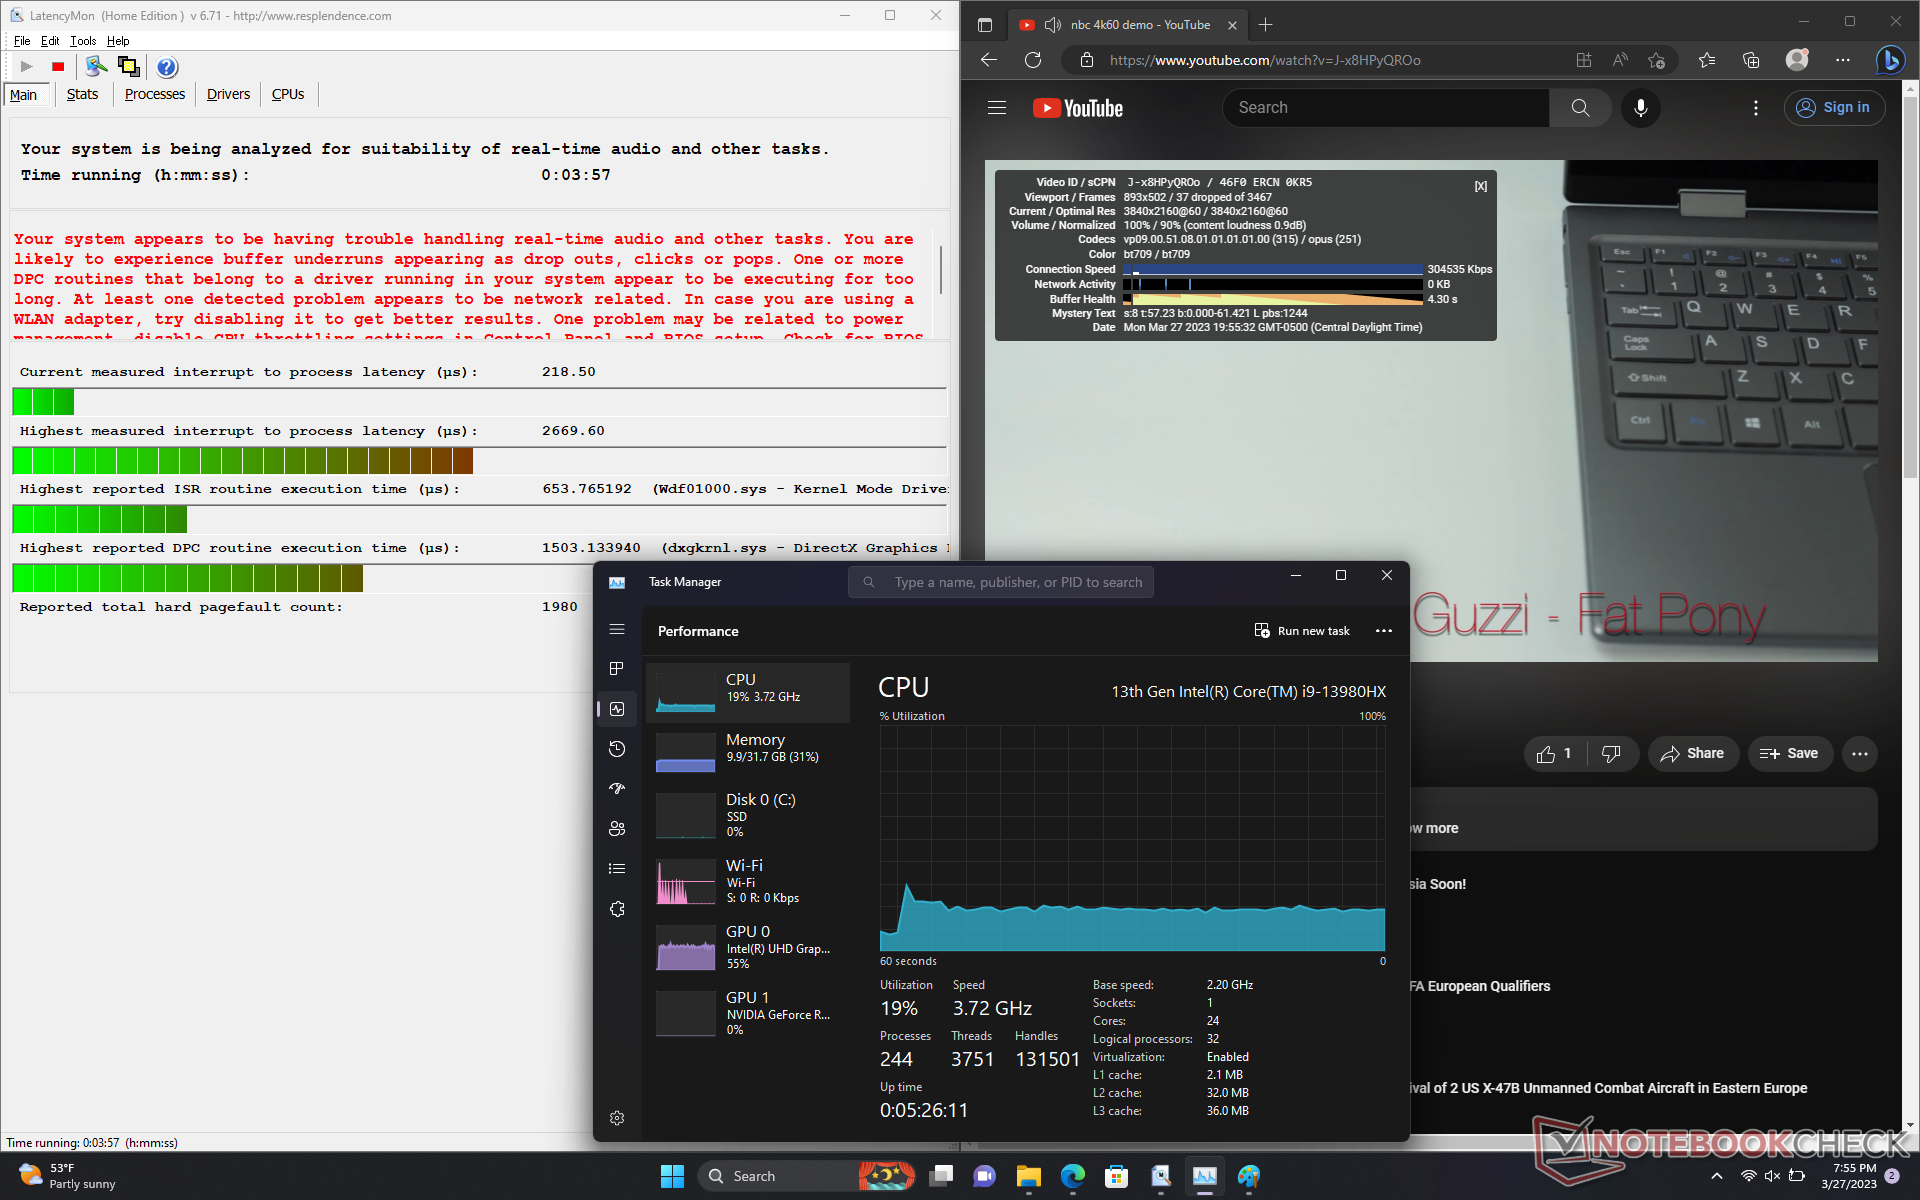
LatencyMon ujawnia problemy z DPC podczas otwierania wielu kart przeglądarki na naszej stronie głównej. Ponadto system ma problemy z odtwarzaniem materiałów wideo w rozdzielczości 4K, ponieważ podczas naszego minutowego filmu testowego odnotowaliśmy 37 opuszczonych klatek, nawet po powtórzeniu testów. Wykorzystanie CPU i iGPU jest również niezwykle wysokie i wynosi odpowiednio 19% i 55%. Te obserwacje sugerują słabą obsługę procesów w tle, które mogą wpływać na aktywność w centrum uwagi.
Co warto podkreślić, Nvidia przyznała się do błędu związanego ze wzrostem opóźnień DPC w sterowniku graficznym 531.29. Miejmy nadzieję, że poprawka pojawi się wkrótce.
| DPC Latencies / LatencyMon - interrupt to process latency (max), Web, Youtube, Prime95 | |
| MSI Titan GT77 HX 13VI | |
| Alienware m18 R1 | |
| Razer Blade 18 RTX 4070 | |
| Alienware x17 R2 P48E | |
| Asus ROG Strix Scar 18 2023 G834JY-N6005W | |
| Eluktronics Mech-17 GP2 | |
* ... im mniej tym lepiej
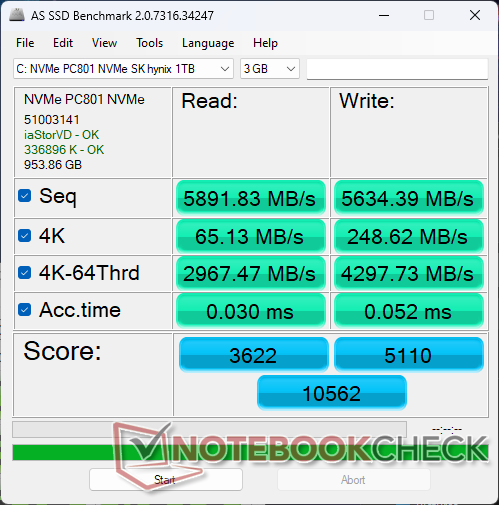
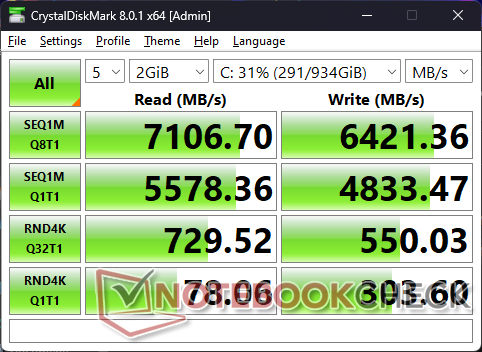
Urządzenia pamięci masowej - łącznie cztery dyski M.2
Nasze urządzenie jest skonfigurowane z SK Hynix PC801 PCIe4 x4 NVMe SSD dla sekwencyjnego odczytu i zapisu na poziomie odpowiednio 7000 MB/s i 6500 MB/s. Wydajność jest konkurencyjna w stosunku do serii Samsung PMA1, a nasz dysk nie wykazuje problemów z utrzymaniem maksymalnych prędkości bez dławienia.
Alienware nie obsługuje dysków SSD PCIe5 NVMe w przeciwieństwie do serii MSI GE78 czy GT77. Mimo to obsługuje więcej wewnętrznych dysków SSD, niż w większości innych laptopów.

| Drive Performance rating - Percent | |
| Alienware m18 R1 | |
| MSI Titan GT77 HX 13VI | |
| Razer Blade 18 RTX 4070 | |
| Alienware x17 R2 P48E | |
| Asus ROG Strix Scar 18 2023 G834JY-N6005W | |
| Eluktronics Mech-17 GP2 | |
* ... im mniej tym lepiej
Disk Throttling: DiskSpd Read Loop, Queue Depth 8
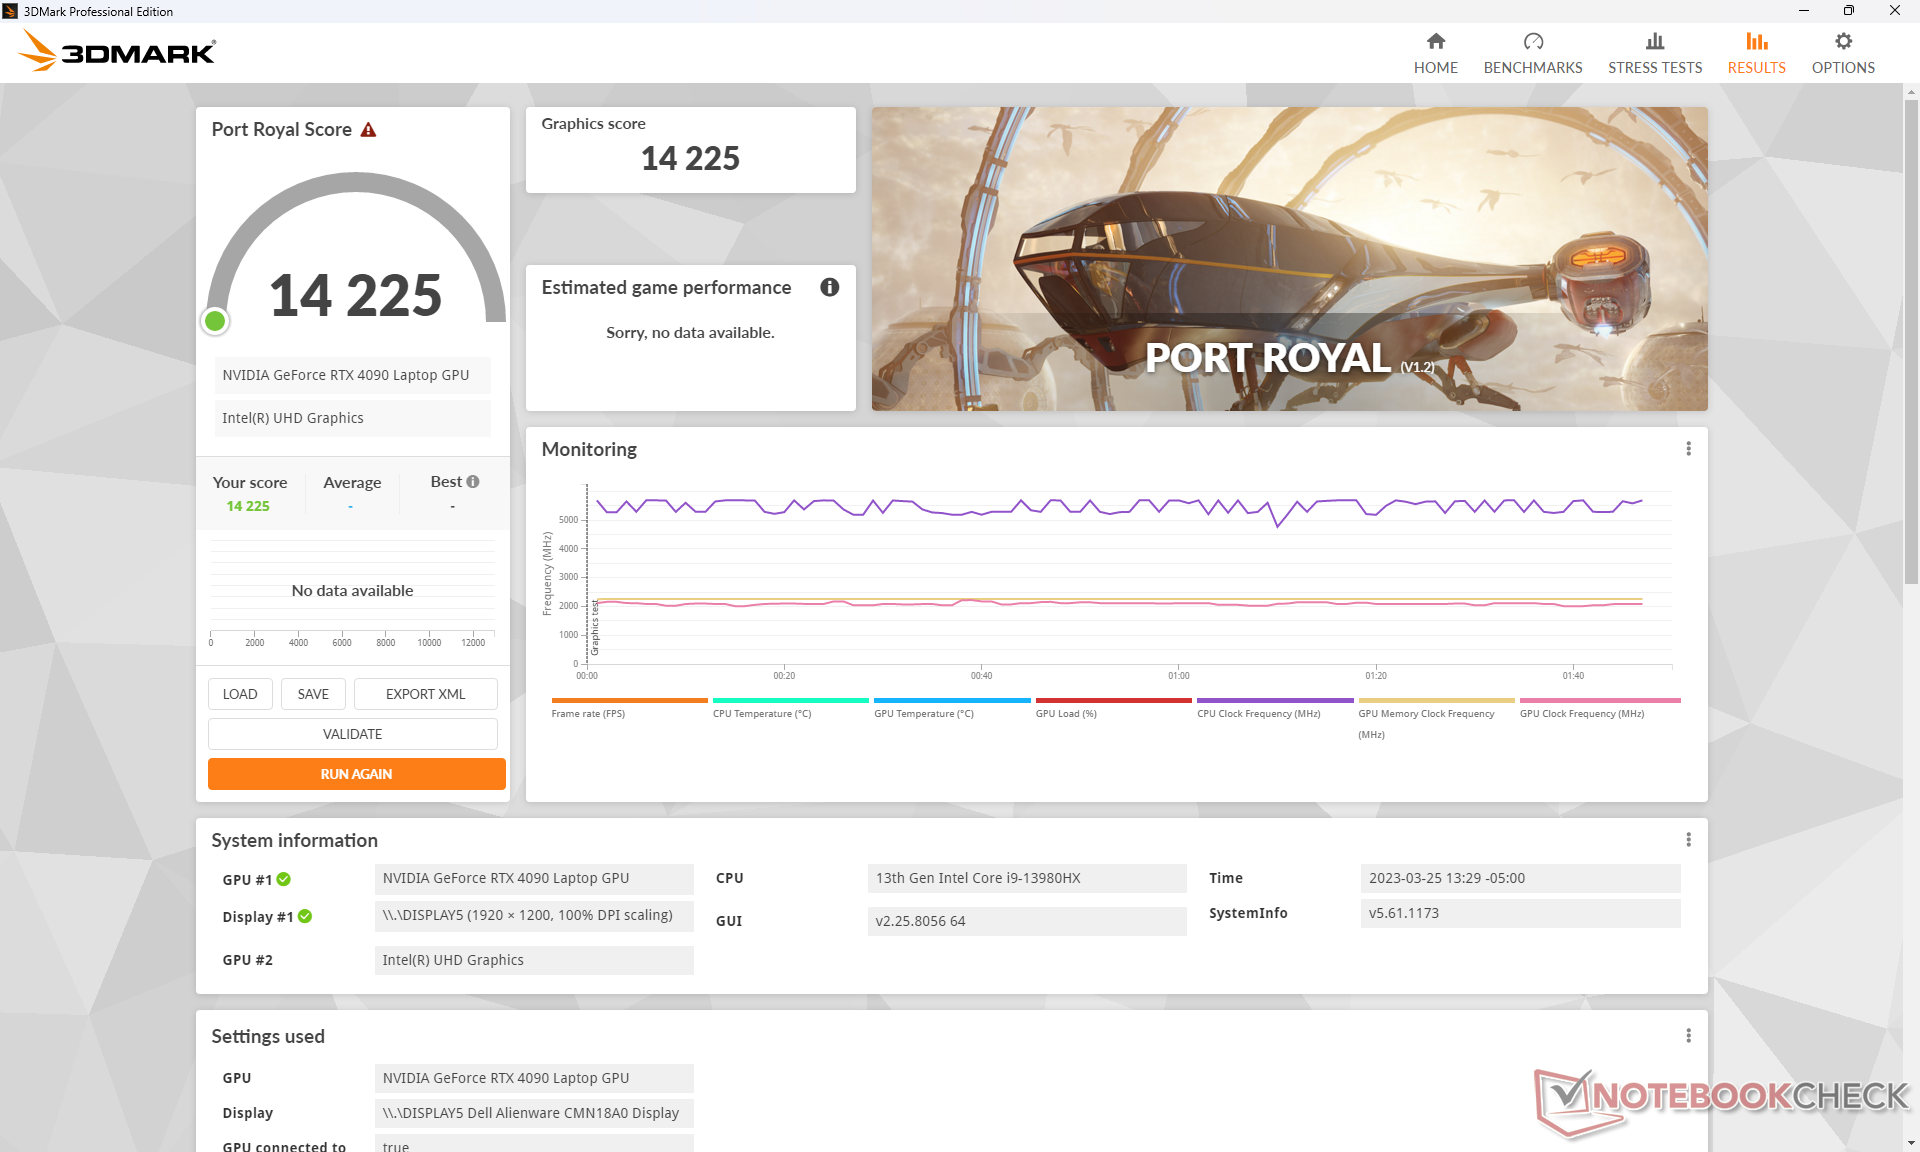
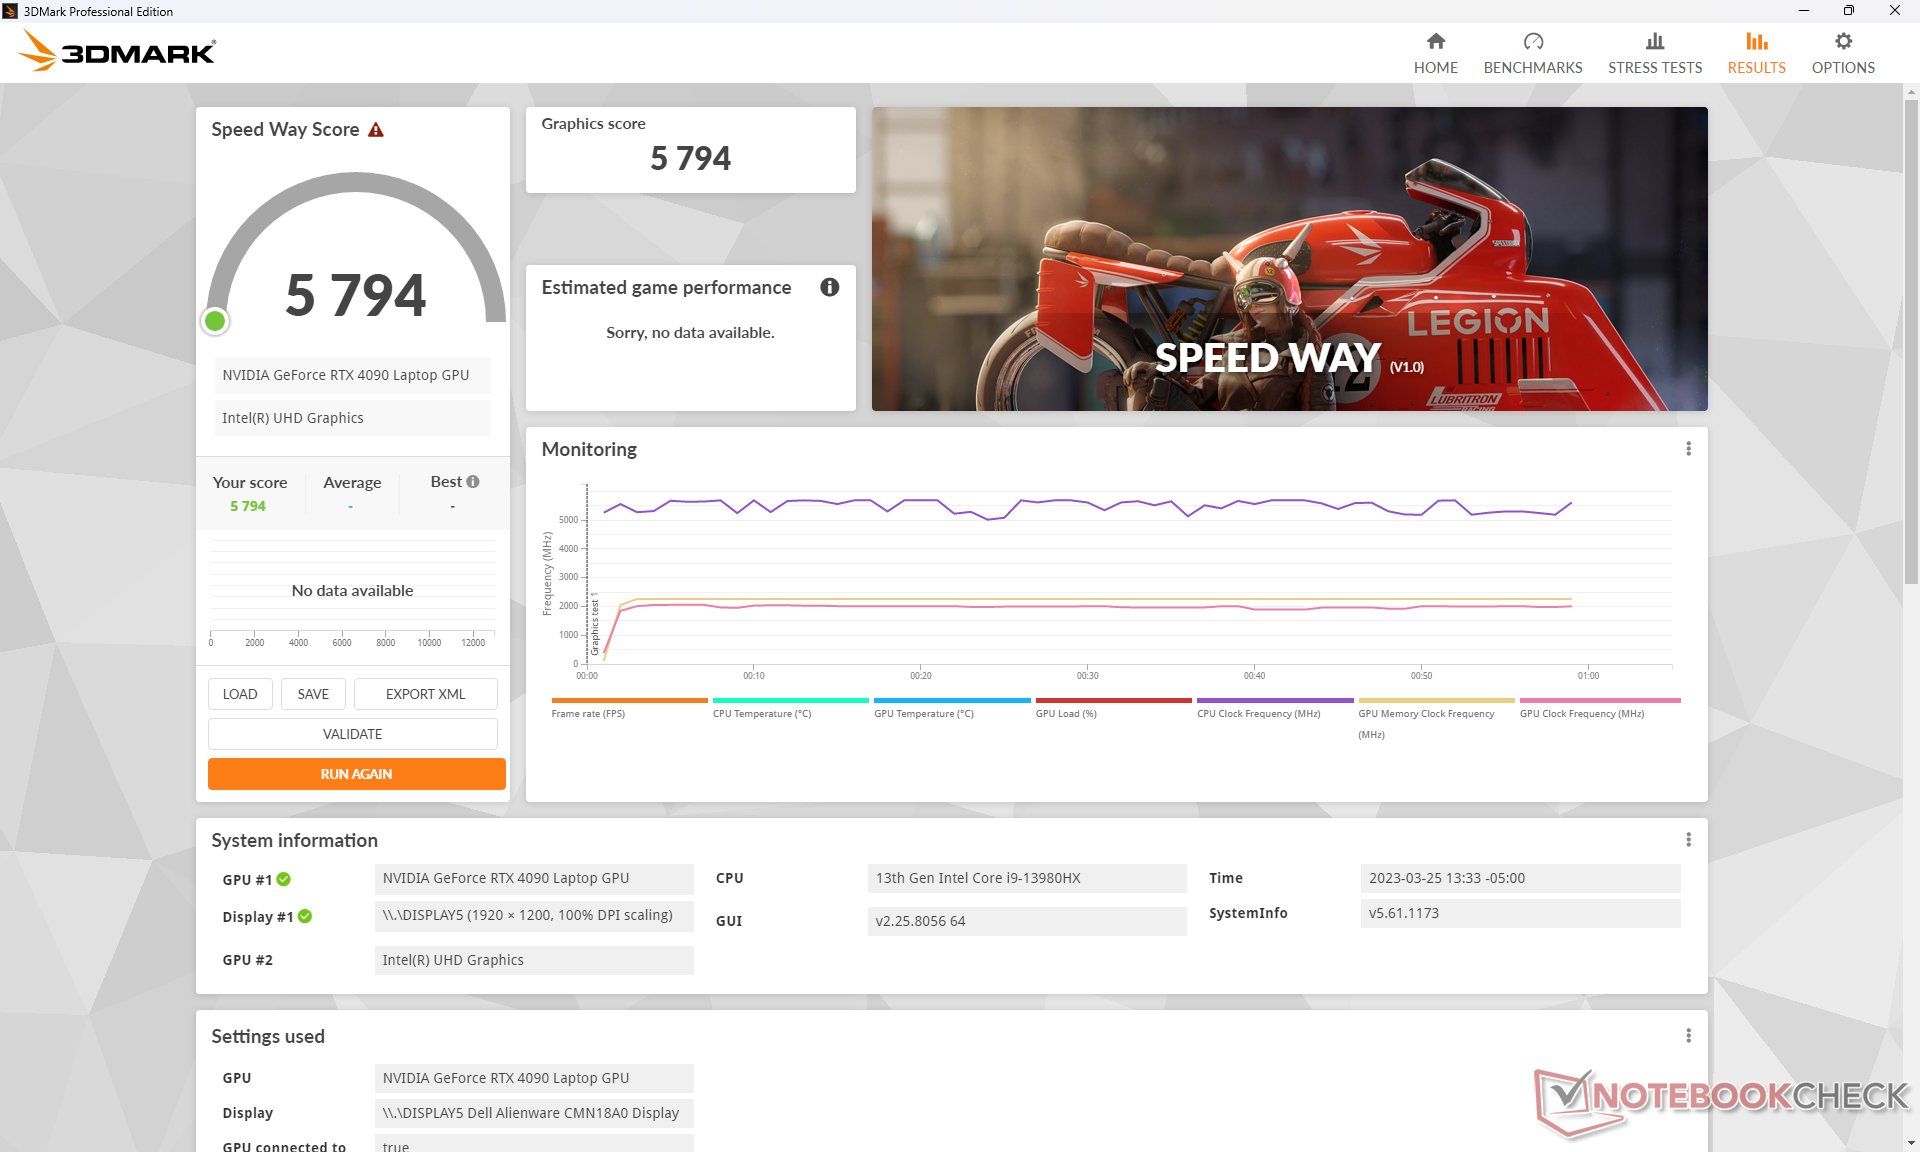
Wydajność GPU - 175 W GeForce RTX 4090
Ogólna wydajność graficzna mobilnej GeForce RTX 4090 jest najbardziej zbliżona do desktop GeForce RTX 4070. Oferuje wystarczającą wydajność, aby zagrać w każdą obecną grę na ustawieniach 4K Ultra, w tym F1 22. Jeśli jednak włączony jest ray-tracing, zaleca się włączenie DLSS lub generowania klatek tam, gdzie jest to obsługiwane, aby utrzymać liczbę klatek na sekundę.
W porównaniu z ostatnią generacją mobilnego RTX 3080 Timobilna karta RTX 4090 oferuje od 40 do 70 procent wyższą wydajność przy zachowaniu podobnej mocy 175 W.
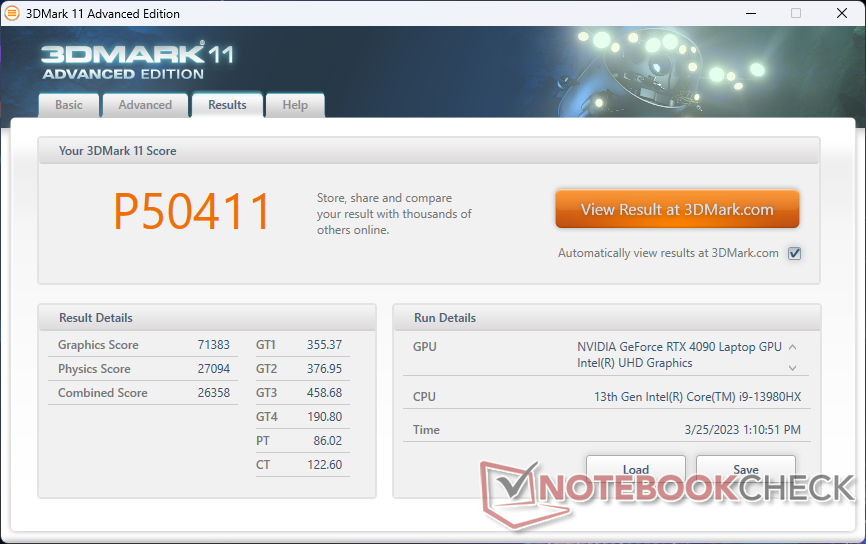
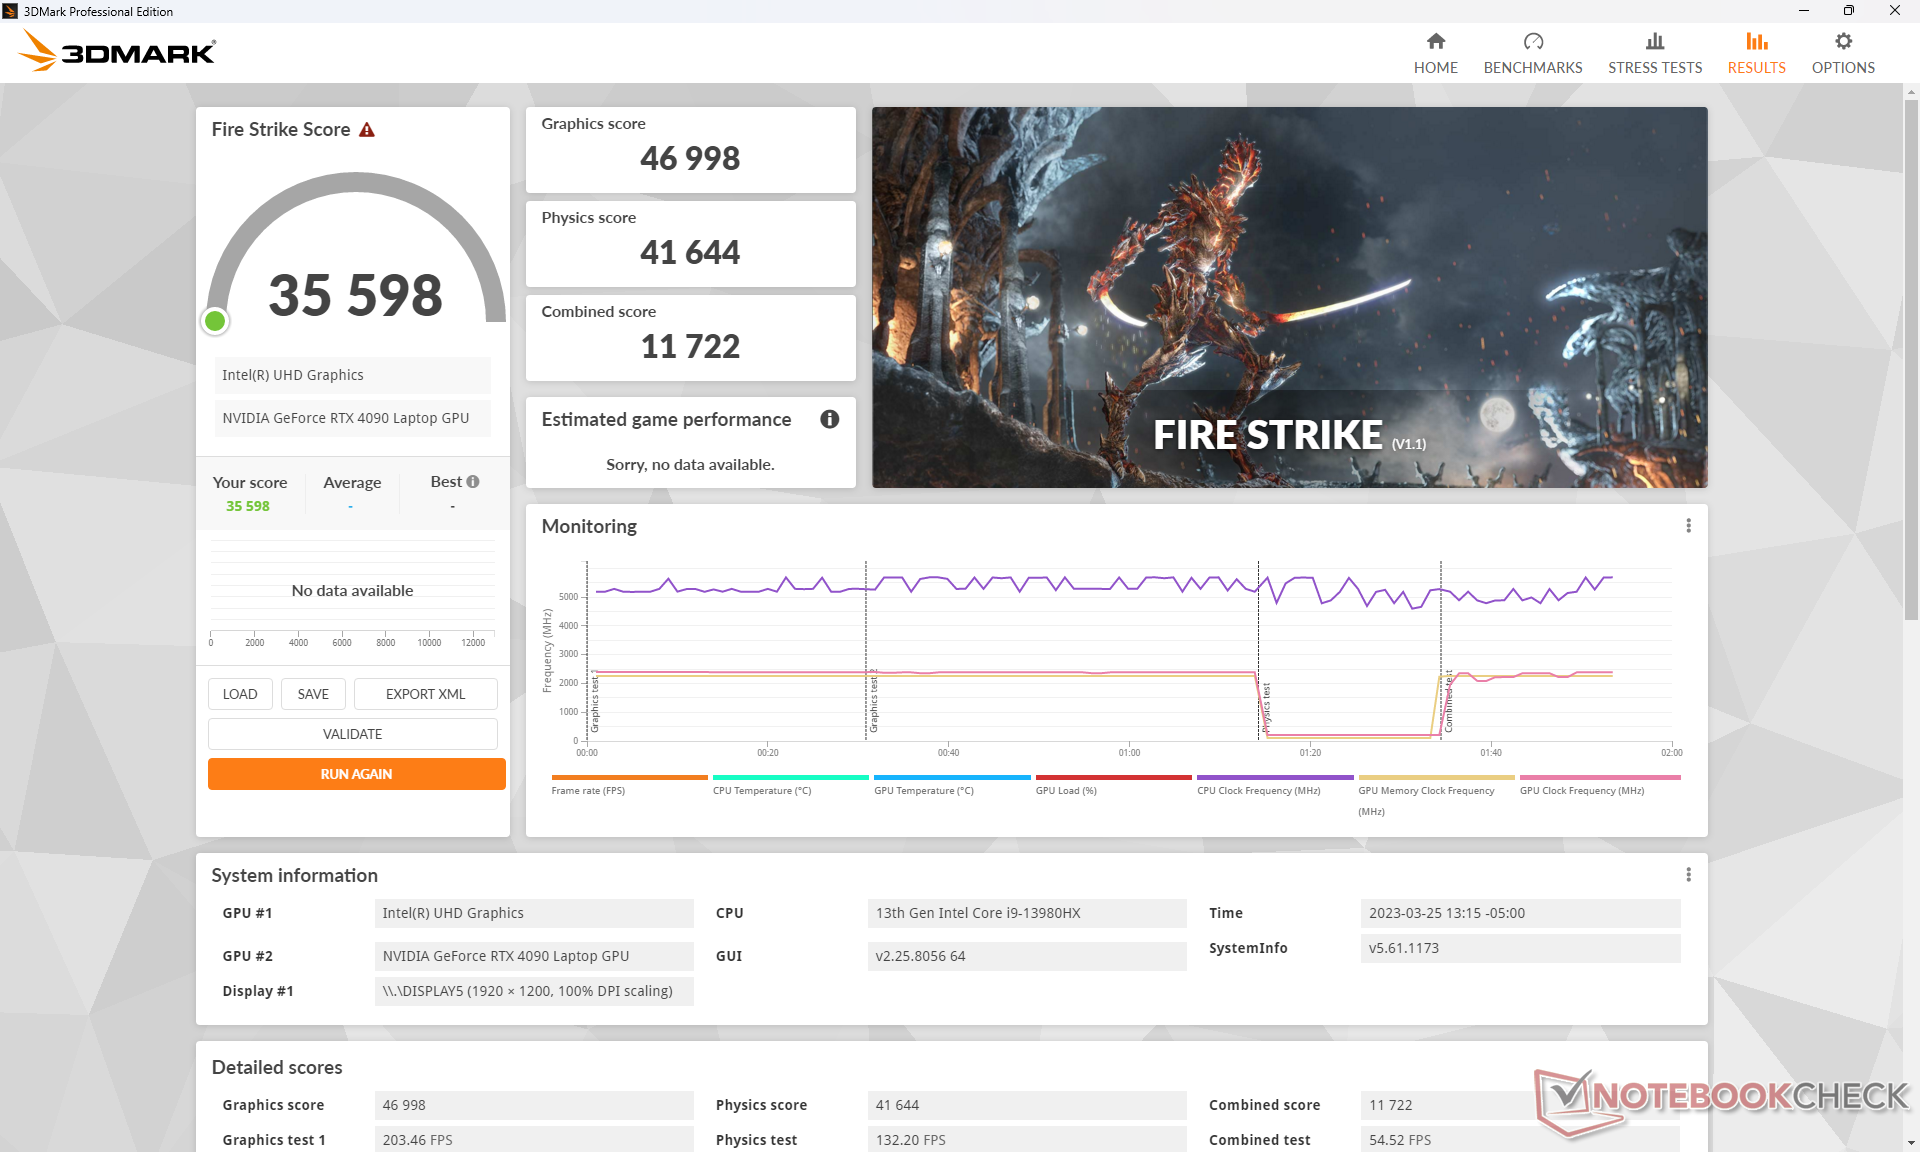
Uruchomienie strony Fire Strike w trybie Overdrive nie wykazuje większych zalet w porównaniu z cichszym trybem Performance, ponieważ ich ostateczne wyniki byłyby niemal identyczne. Powtórzenie testu w trybie Balanced spowodowałoby jednak spadek wydajności GPU i CPU odpowiednio o 5 i 9 procent.

| 3DMark Performance rating - Percent | |
| KFA2 GeForce RTX 4090 SG | |
| KFA2 GeForce RTX 4070 Ti SG | |
| Alienware m18 R1 | |
| MSI Titan GT77 HX 13VI | |
| Przeciętny NVIDIA GeForce RTX 4090 Laptop GPU | |
| Alienware x17 R2 P48E -1! | |
| Alienware m17 R5 (R9 6900HX, RX 6850M XT) -1! | |
| Alienware x17 RTX 3080 P48E -1! | |
| Razer Blade 18 RTX 4070 | |
| Razer Blade 17 (i7-12800H, RTX 3070 Ti) -1! | |
| Razer Blade Pro 17 2021 (QHD Touch) -1! | |
| Corsair Voyager a1600 | |
| MSI GS76 Stealth 11UH -1! | |
| HP Omen 16-n0033dx | |
| 3DMark 11 - 1280x720 Performance GPU | |
| KFA2 GeForce RTX 4090 SG | |
| KFA2 GeForce RTX 4070 Ti SG | |
| Alienware m18 R1 | |
| MSI Titan GT77 HX 13VI | |
| Przeciętny NVIDIA GeForce RTX 4090 Laptop GPU (54073 - 73027, n=42) | |
| Alienware x17 R2 P48E | |
| Alienware x17 RTX 3080 P48E | |
| Alienware m17 R5 (R9 6900HX, RX 6850M XT) | |
| Razer Blade 18 RTX 4070 | |
| Corsair Voyager a1600 | |
| Razer Blade 17 (i7-12800H, RTX 3070 Ti) | |
| Razer Blade Pro 17 2021 (QHD Touch) | |
| MSI GS76 Stealth 11UH | |
| HP Omen 16-n0033dx | |
| 3DMark 11 Performance | 50411 pkt. | |
| 3DMark Fire Strike Score | 35598 pkt. | |
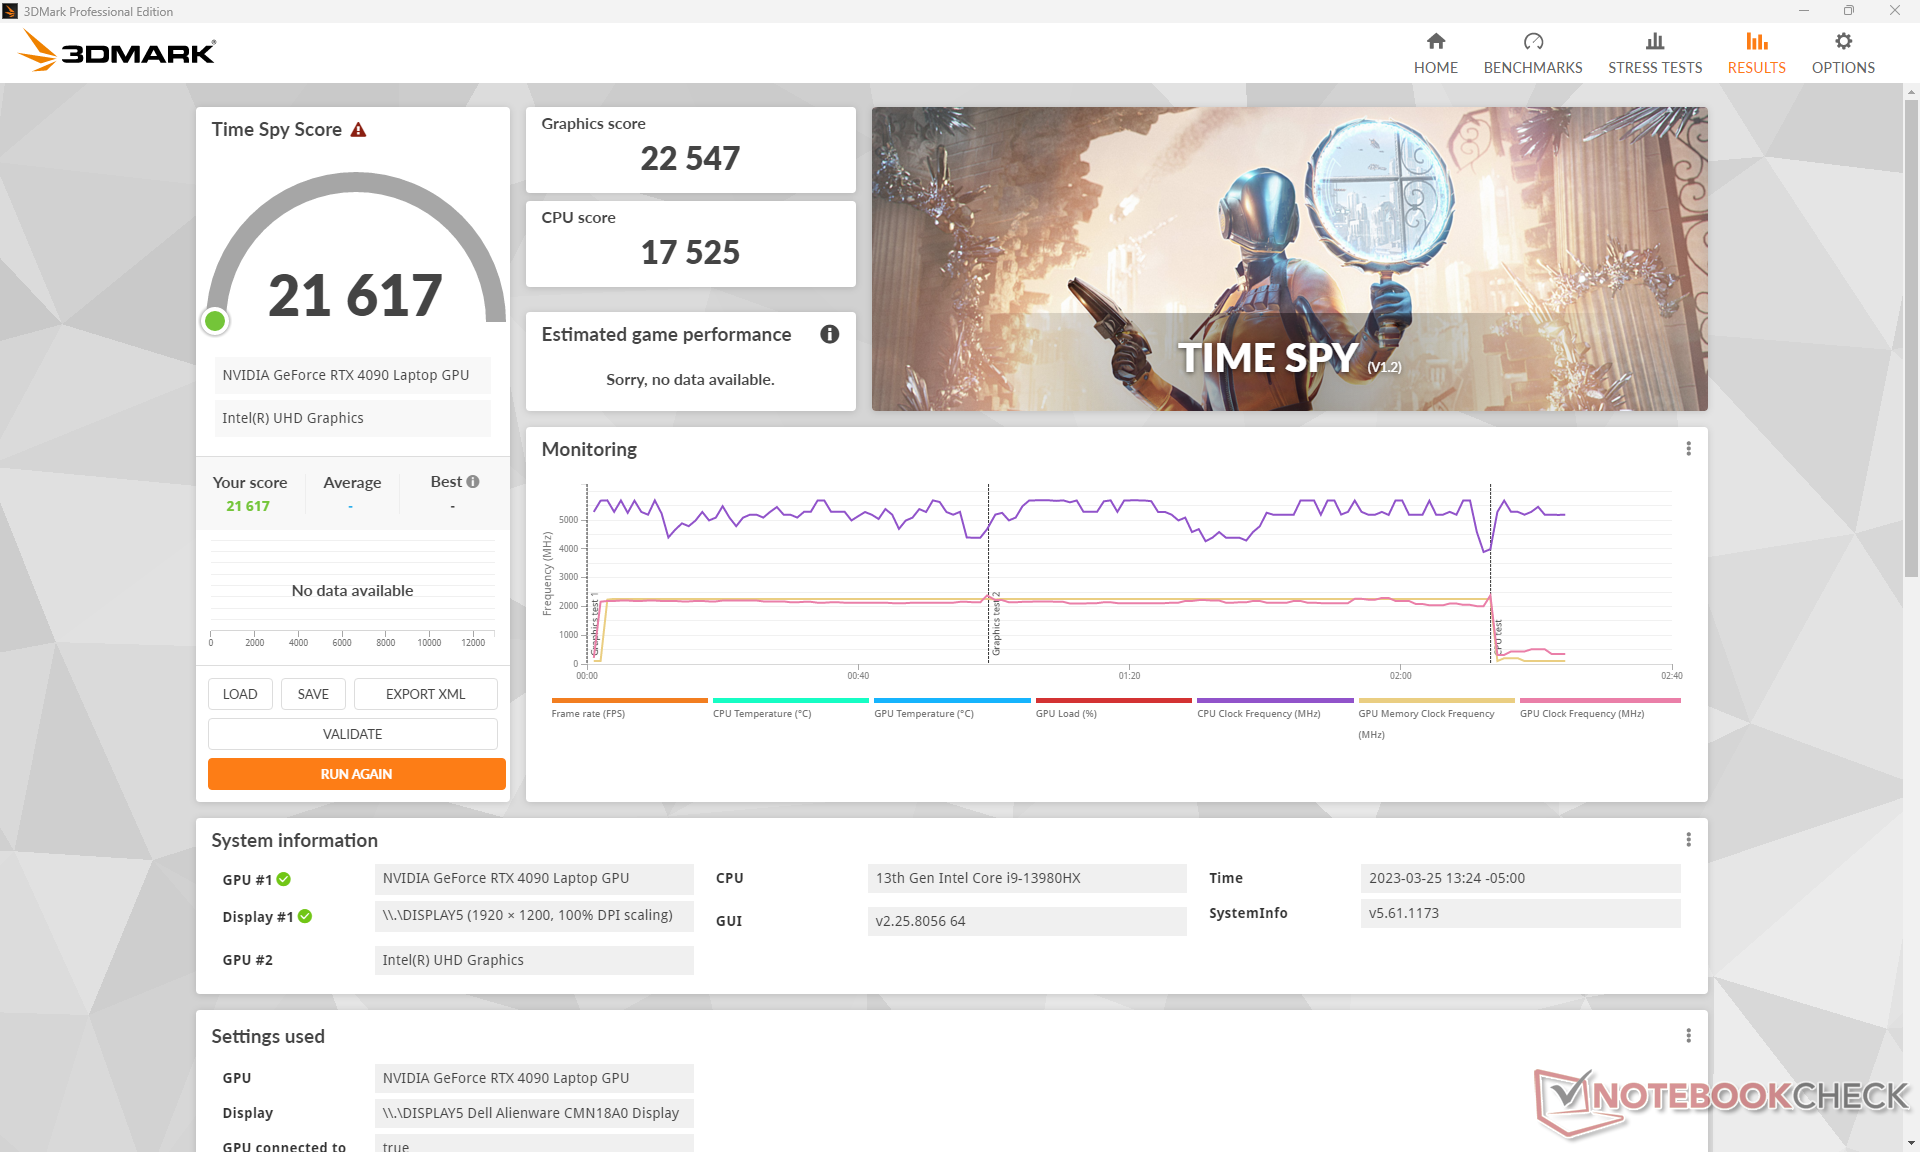
| 3DMark Time Spy Score | 21617 pkt. | |
Pomoc | ||
* ... im mniej tym lepiej
| Performance rating - Percent | |
| KFA2 GeForce RTX 4090 SG | |
| Alienware m18 R1 | |
| MSI Titan GT77 HX 13VI | |
| Razer Blade 18 RTX 4070 | |
| Alienware x17 R2 P48E | |
| Razer Blade 17 (i7-12800H, RTX 3070 Ti) | |
| Razer Blade Pro 17 2021 (QHD Touch) | |
| Alienware x17 RTX 3080 P48E | |
| MSI GS76 Stealth 11UH | |
| Alienware m17 R5 (R9 6900HX, RX 6850M XT) | |
| Corsair Voyager a1600 | |
| HP Omen 16-n0033dx -1! | |
| The Witcher 3 - 1920x1080 Ultra Graphics & Postprocessing (HBAO+) | |
| KFA2 GeForce RTX 4090 SG | |
| Alienware m18 R1 | |
| MSI Titan GT77 HX 13VI | |
| Alienware x17 R2 P48E | |
| Alienware m17 R5 (R9 6900HX, RX 6850M XT) | |
| Razer Blade 18 RTX 4070 | |
| Razer Blade 17 (i7-12800H, RTX 3070 Ti) | |
| Razer Blade Pro 17 2021 (QHD Touch) | |
| Corsair Voyager a1600 | |
| Alienware x17 RTX 3080 P48E | |
| MSI GS76 Stealth 11UH | |
| HP Omen 16-n0033dx | |
| GTA V - 1920x1080 Highest AA:4xMSAA + FX AF:16x | |
| KFA2 GeForce RTX 4090 SG | |
| Alienware m18 R1 | |
| MSI Titan GT77 HX 13VI | |
| Alienware x17 R2 P48E | |
| Razer Blade 18 RTX 4070 | |
| Razer Blade 17 (i7-12800H, RTX 3070 Ti) | |
| Razer Blade Pro 17 2021 (QHD Touch) | |
| MSI GS76 Stealth 11UH | |
| Alienware x17 RTX 3080 P48E | |
| Corsair Voyager a1600 | |
| Alienware m17 R5 (R9 6900HX, RX 6850M XT) | |
| Final Fantasy XV Benchmark - 1920x1080 High Quality | |
| KFA2 GeForce RTX 4090 SG | |
| Alienware m18 R1 | |
| MSI Titan GT77 HX 13VI | |
| Alienware x17 R2 P48E | |
| Razer Blade 18 RTX 4070 | |
| Alienware m17 R5 (R9 6900HX, RX 6850M XT) | |
| Razer Blade Pro 17 2021 (QHD Touch) | |
| Alienware x17 RTX 3080 P48E | |
| Razer Blade 17 (i7-12800H, RTX 3070 Ti) | |
| Corsair Voyager a1600 | |
| MSI GS76 Stealth 11UH | |
| HP Omen 16-n0033dx | |
| Strange Brigade - 1920x1080 ultra AA:ultra AF:16 | |
| KFA2 GeForce RTX 4090 SG | |
| MSI Titan GT77 HX 13VI | |
| Alienware m18 R1 | |
| Alienware m17 R5 (R9 6900HX, RX 6850M XT) | |
| Alienware x17 R2 P48E | |
| Razer Blade 18 RTX 4070 | |
| Corsair Voyager a1600 | |
| Alienware x17 RTX 3080 P48E | |
| Razer Blade Pro 17 2021 (QHD Touch) | |
| Razer Blade 17 (i7-12800H, RTX 3070 Ti) | |
| HP Omen 16-n0033dx | |
| MSI GS76 Stealth 11UH | |
| Dota 2 Reborn - 1920x1080 ultra (3/3) best looking | |
| KFA2 GeForce RTX 4090 SG | |
| Alienware m18 R1 | |
| MSI Titan GT77 HX 13VI | |
| Razer Blade 18 RTX 4070 | |
| Alienware x17 R2 P48E | |
| Razer Blade 17 (i7-12800H, RTX 3070 Ti) | |
| Alienware x17 RTX 3080 P48E | |
| Razer Blade Pro 17 2021 (QHD Touch) | |
| MSI GS76 Stealth 11UH | |
| Corsair Voyager a1600 | |
| HP Omen 16-n0033dx | |
| Alienware m17 R5 (R9 6900HX, RX 6850M XT) | |
| X-Plane 11.11 - 1920x1080 high (fps_test=3) | |
| KFA2 GeForce RTX 4090 SG | |
| Alienware m18 R1 | |
| Razer Blade 18 RTX 4070 | |
| MSI Titan GT77 HX 13VI | |
| MSI Titan GT77 HX 13VI | |
| Alienware x17 R2 P48E | |
| Razer Blade 17 (i7-12800H, RTX 3070 Ti) | |
| Razer Blade Pro 17 2021 (QHD Touch) | |
| MSI GS76 Stealth 11UH | |
| Alienware x17 RTX 3080 P48E | |
| HP Omen 16-n0033dx | |
| Corsair Voyager a1600 | |
| Alienware m17 R5 (R9 6900HX, RX 6850M XT) | |
Witcher 3 FPS Chart
| low | med. | high | ultra | QHD | 4K | |
|---|---|---|---|---|---|---|
| GTA V (2015) | 186.7 | 185.3 | 184.5 | 149 | 145.5 | 176.4 |
| The Witcher 3 (2015) | 649.2 | 563.8 | 441.6 | 213.9 | 165.6 | |
| Dota 2 Reborn (2015) | 251 | 220 | 210 | 194.2 | 190.2 | |
| Final Fantasy XV Benchmark (2018) | 231 | 227 | 194.8 | 159.5 | 92.6 | |
| X-Plane 11.11 (2018) | 210 | 187.1 | 143.5 | 124 | ||
| Strange Brigade (2018) | 475 | 388 | 388 | 373 | 308 | 159.8 |
| Cyberpunk 2077 1.6 (2022) | 157.2 | 151.8 | 148.2 | 127.92 | 102.16 | 49.99 |
| Tiny Tina's Wonderlands (2022) | 359.1 | 301.8 | 232.5 | 187.7 | 133.8 | 71.3 |
| F1 22 (2022) | 336 | 320 | 318 | 144.7 | 92.2 | 45.5 |
Emisja - Czterech fanów Fast & Furious
Szum systemu
Jeśli myśleliście, że laptop z czterema wentylatorami będzie głośny, to mielibyście... no cóż, całkowitą rację. Granie w trybie Performance wywoływało hałas wentylatorów na poziomie 51 dB(A), co jest wynikiem zbliżonym do np.Eluktronics Mech-17 GP2 ale głośniejszy od Razer Blade 18. W przypadku gry w trybie Overdrive hałas wentylatora byłby jeszcze głośniejszy i wynosiłby prawie 57 dB(A). Wszystko powyżej 50 dB(A) wymaga pary dobrych słuchawek, by zagłuszyć warkot wentylatorów. Należy pamiętać, że tryb Overdrive nie jest niezbędny w większości gier, co pokazuje poniższa sekcja Stress Test.
Na szczęście system lepiej radzi sobie z zachowaniem ciszy podczas mniejszych obciążeń, ponieważ wentylatory nie pulsują przy niższych ustawieniach profilu. Dzięki temu można nadal przeglądać strony internetowe lub strumieniować materiały wideo przy komfortowym poziomie hałasu wentylatorów.
Hałas
| luz |
| 23 / 23 / 23 dB |
| obciążenie |
| 35.6 / 56.7 dB |
 | ||
30 dB cichy 40 dB(A) słyszalny 50 dB(A) irytujący |
||
min: | ||
| Alienware m18 R1 GeForce RTX 4090 Laptop GPU, i9-13980HX, SK hynix PC801 HFS001TEJ9X101N | Razer Blade 18 RTX 4070 GeForce RTX 4070 Laptop GPU, i9-13950HX, SSSTC CA6-8D1024 | Asus ROG Strix Scar 18 2023 G834JY-N6005W GeForce RTX 4090 Laptop GPU, i9-13980HX, 2x Samsung PM9A1 MZVL21T0HCLR (RAID 0) | Eluktronics Mech-17 GP2 GeForce RTX 4090 Laptop GPU, i9-13900HX, Samsung PM9A1 MZVL21T0HCLR | MSI Titan GT77 HX 13VI GeForce RTX 4090 Laptop GPU, i9-13950HX, Samsung PM9A1 MZVL22T0HBLB | Alienware x17 R2 P48E GeForce RTX 3080 Ti Laptop GPU, i9-12900HK, 2x Samsung PM9A1 1TB (RAID 0) | |
|---|---|---|---|---|---|---|
| Noise | -3% | -15% | -13% | -20% | 2% | |
| wyłączone / środowisko * (dB) | 22.8 | 23.5 -3% | 23.9 -5% | 25.2 -11% | 24.6 -8% | 22.7 -0% |
| Idle Minimum * (dB) | 23 | 23.8 -3% | 23.9 -4% | 28 -22% | 29.2 -27% | 23.1 -0% |
| Idle Average * (dB) | 23 | 23.8 -3% | 32.6 -42% | 28 -22% | 29.2 -27% | 23.1 -0% |
| Idle Maximum * (dB) | 23 | 26.8 -17% | 32.6 -42% | 30.4 -32% | 29.2 -27% | 23.1 -0% |
| Load Average * (dB) | 35.6 | 37.3 -5% | 35.9 -1% | 41 -15% | 50.7 -42% | 31.9 10% |
| Witcher 3 ultra * (dB) | 51.3 | 48 6% | 50.7 1% | 53.3 -4% | 52.5 -2% | |
| Load Maximum * (dB) | 56.7 | 53.5 6% | 55.8 2% | 52.6 7% | 61 -8% | 52.5 7% |
* ... im mniej tym lepiej
Temperatura
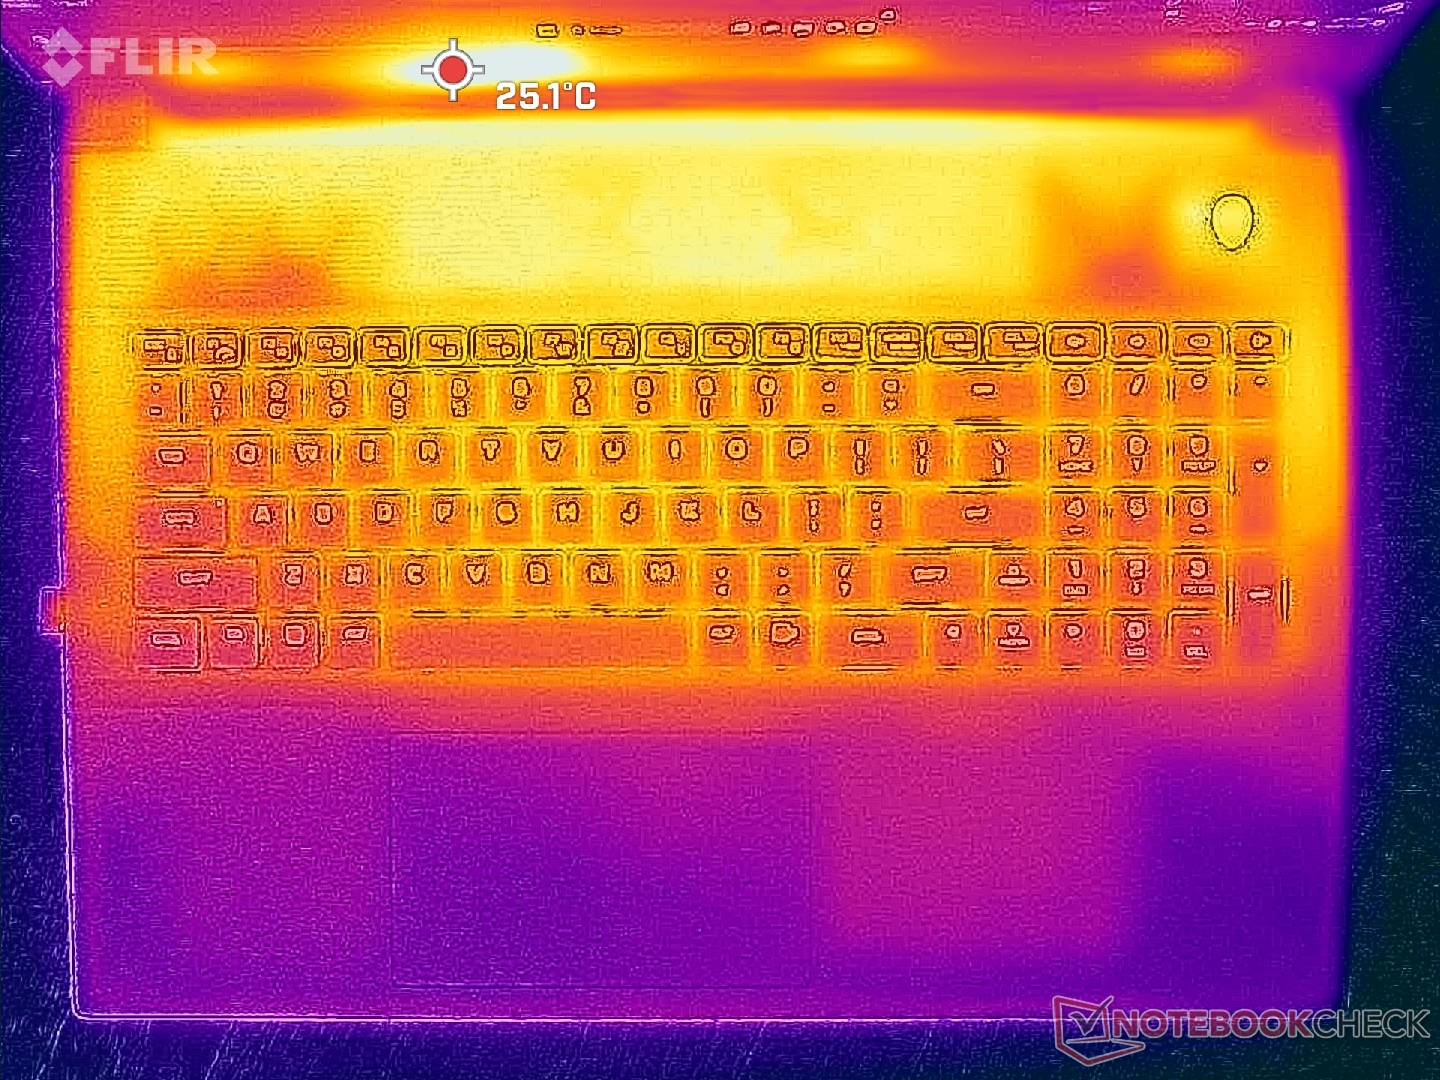
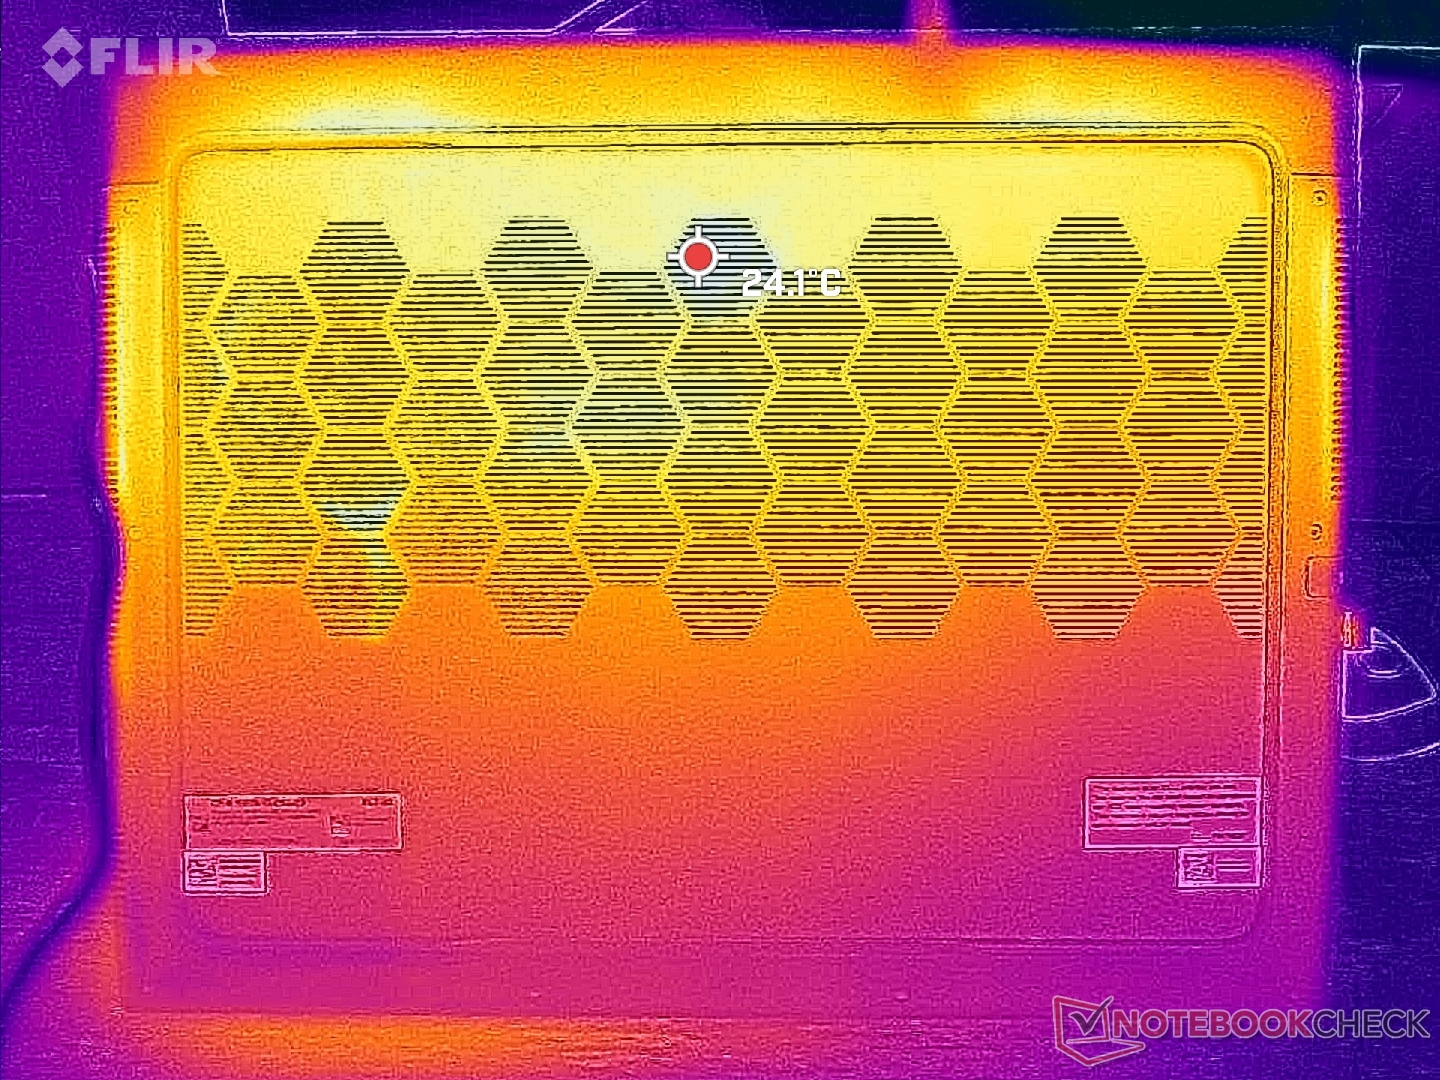
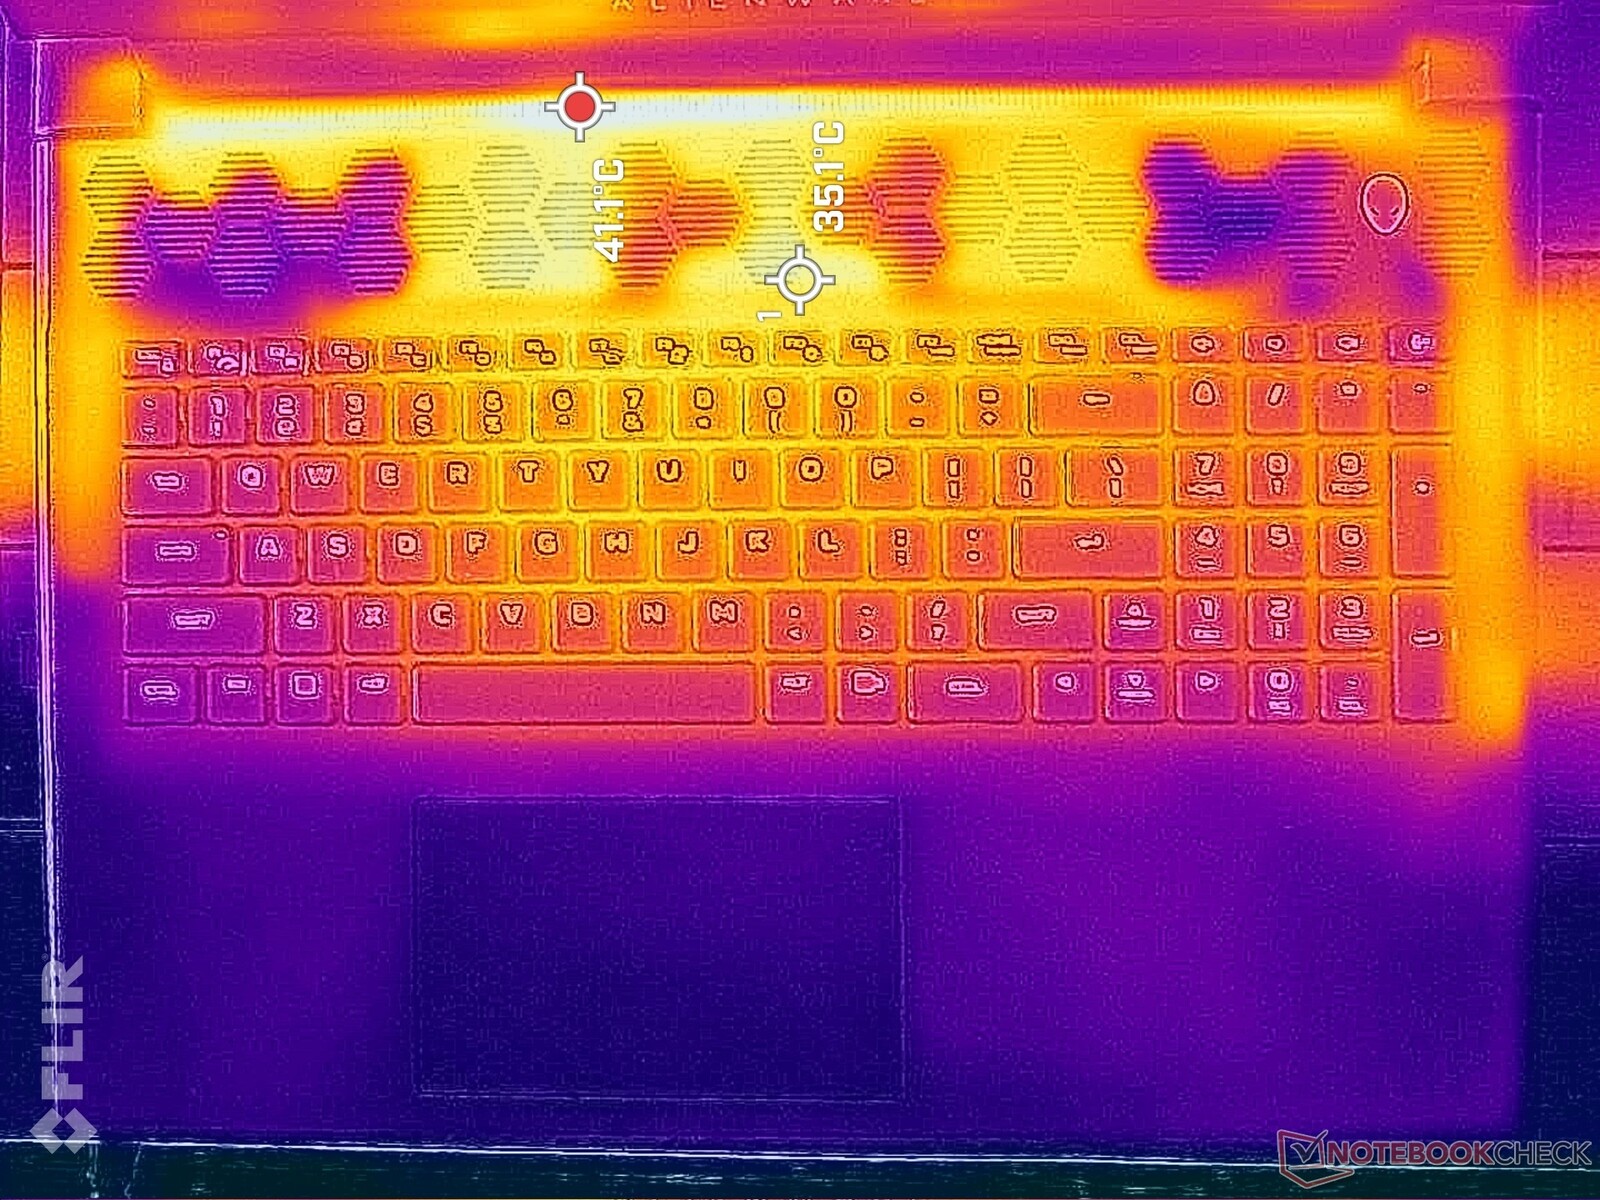
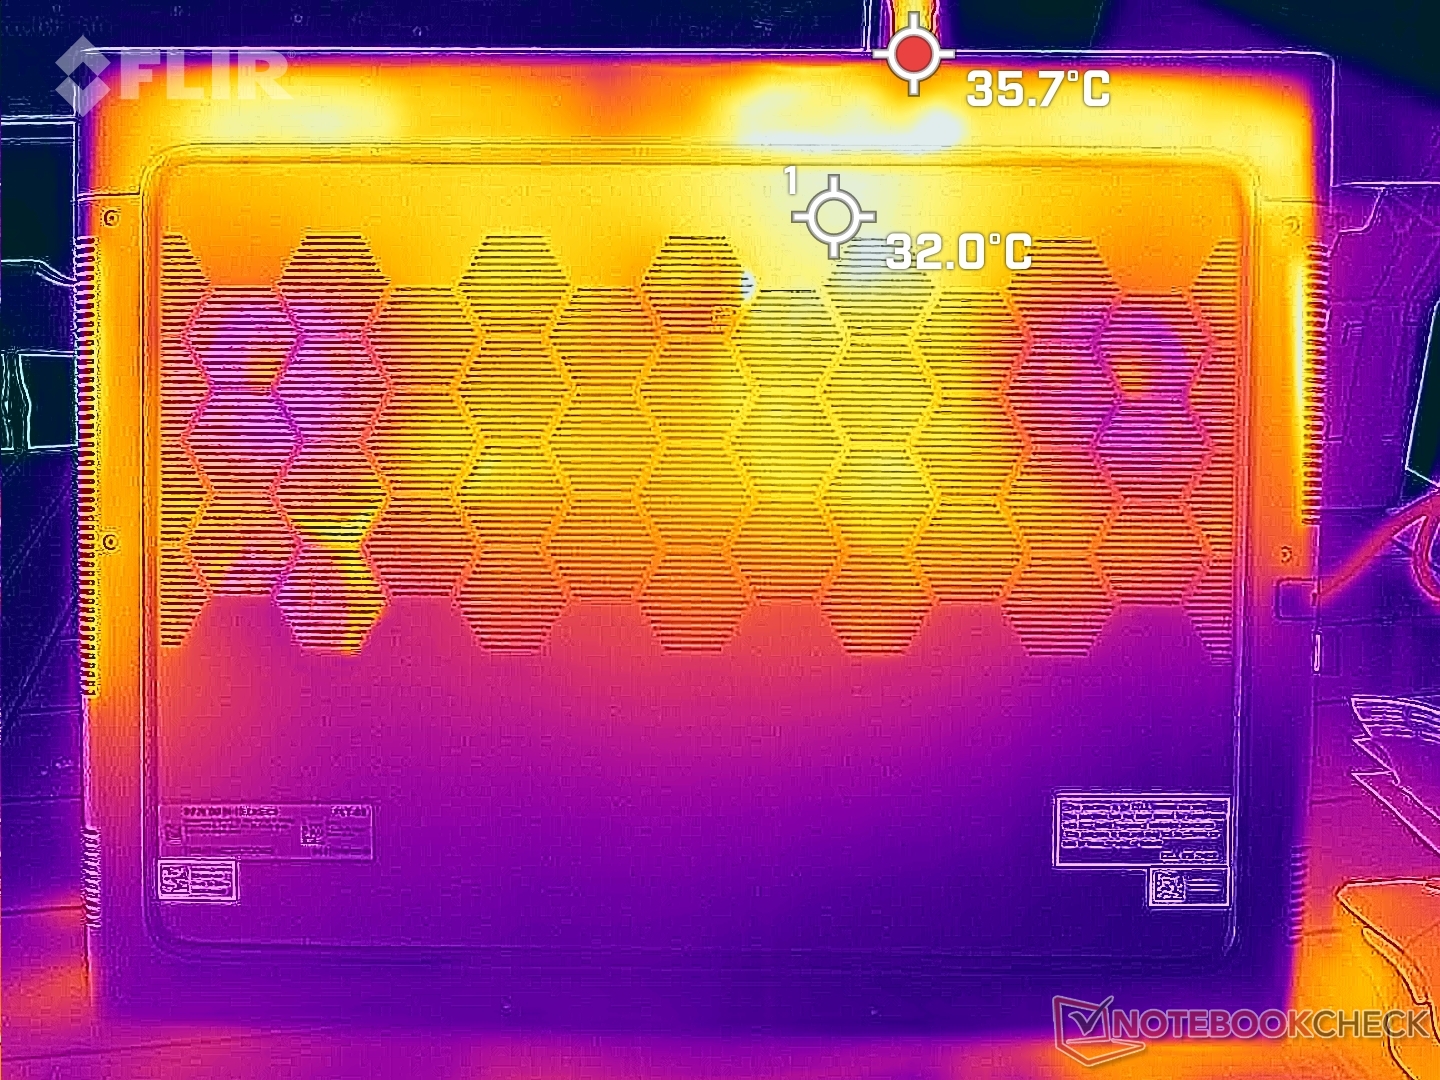
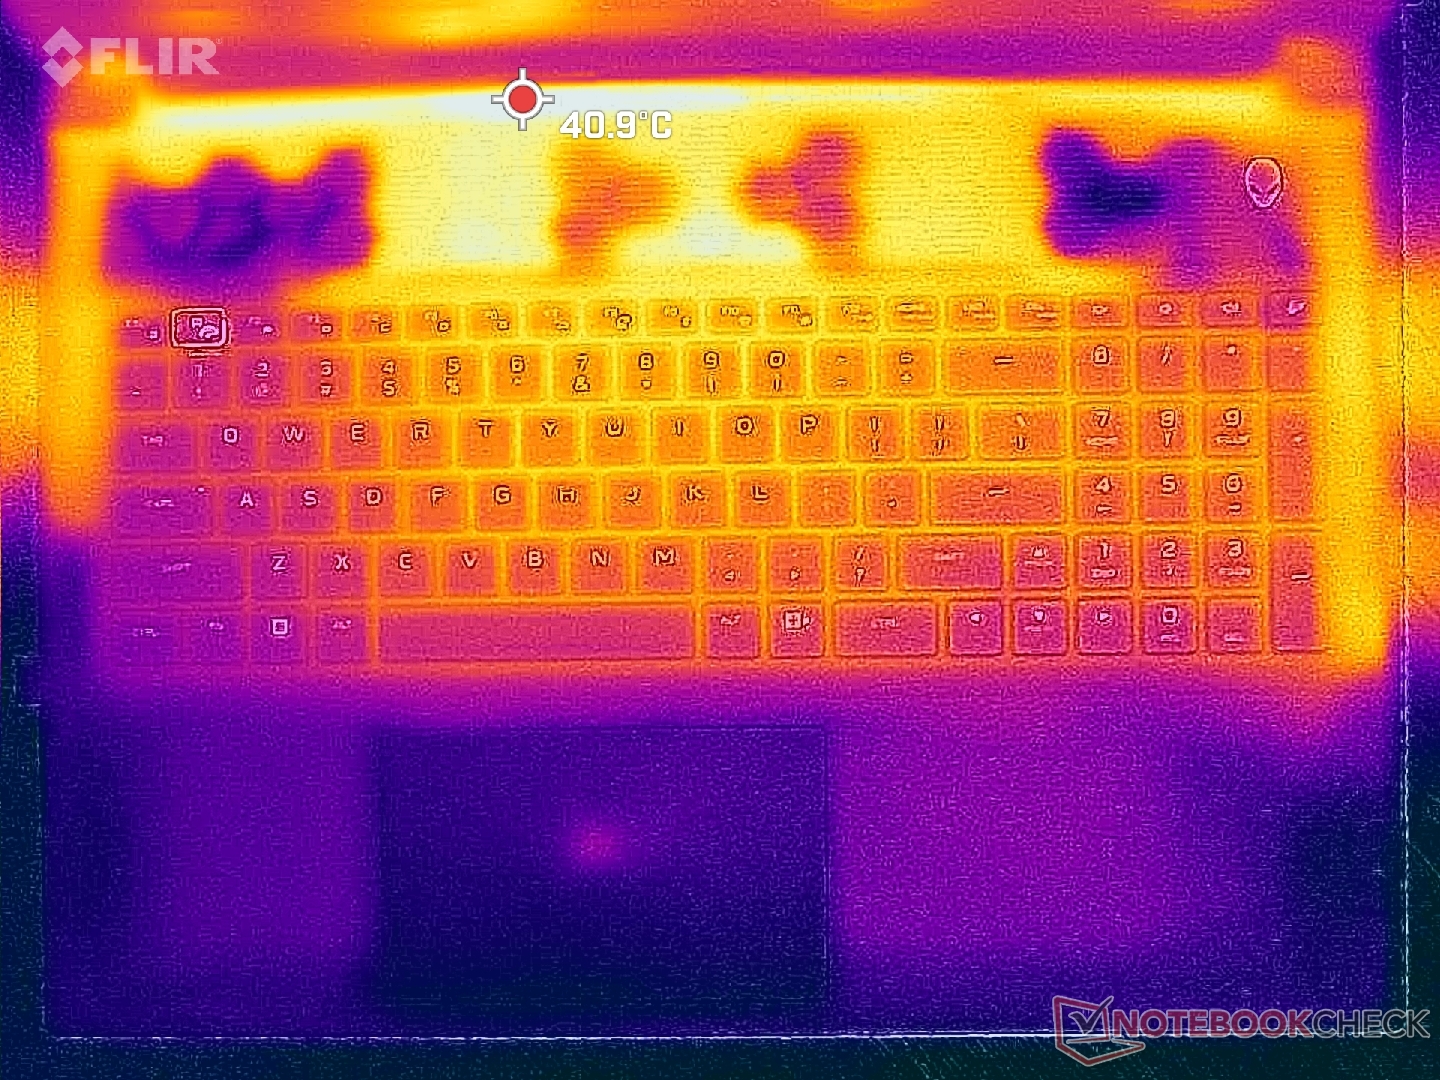
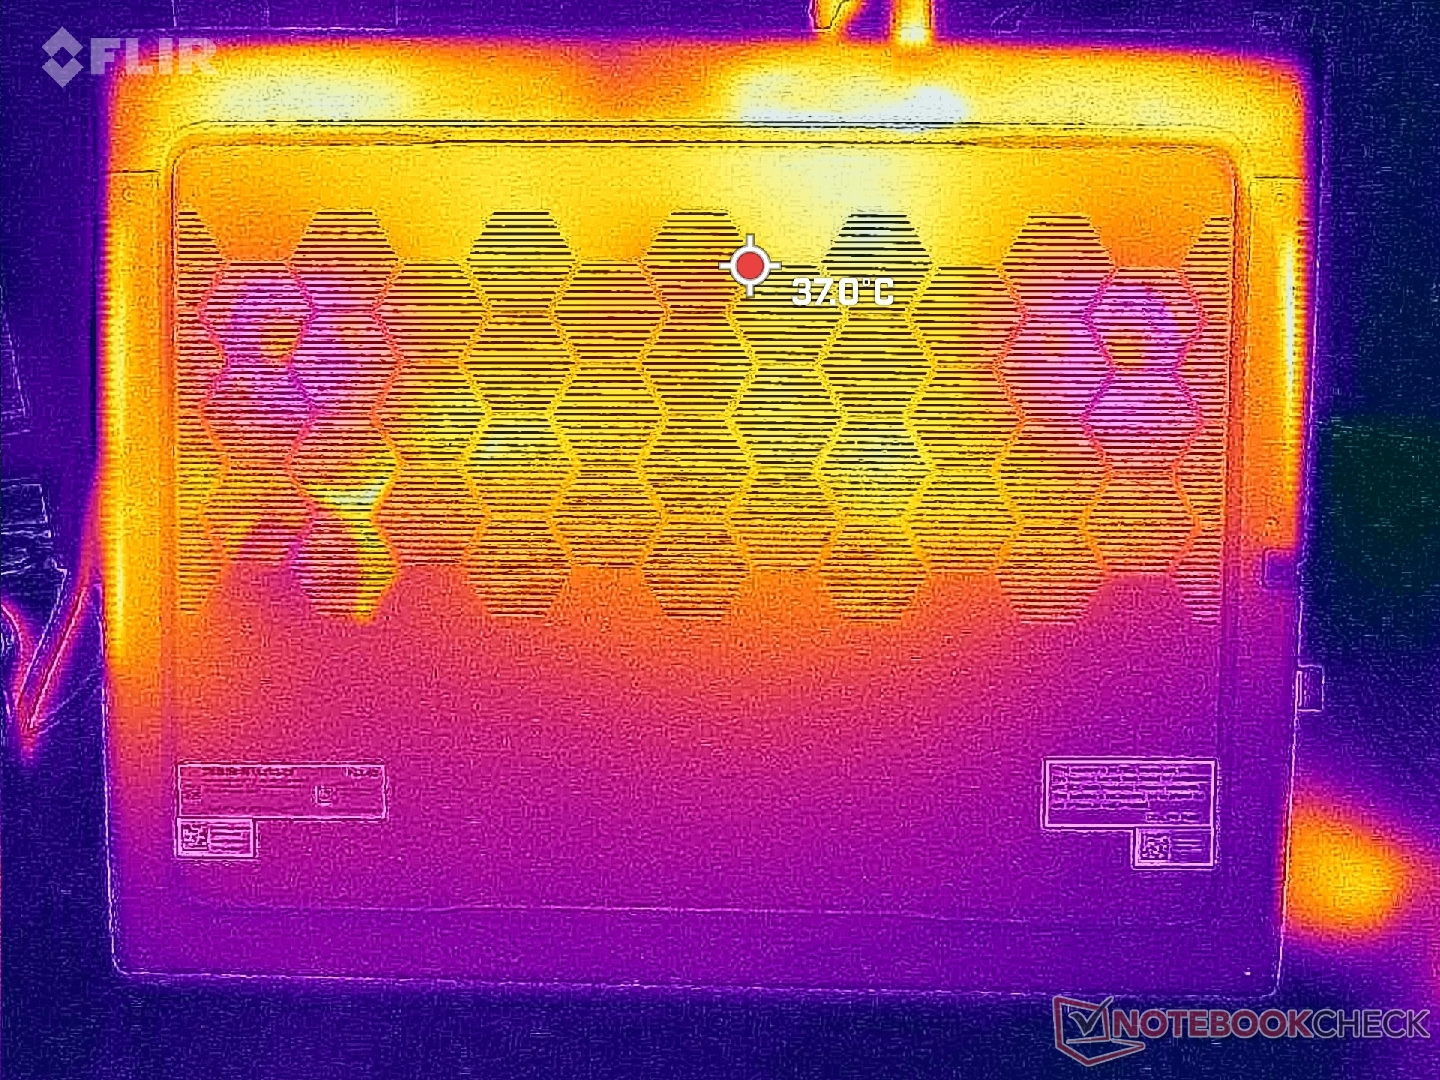
Temperatury powierzchni nie stanowią problemu, po części dzięki licznym kratkom wentylacyjnym z niemal każdej strony dużej obudowy. Najcieplejsze miejsca znajdują się z tyłu, z dala od klawiszy klawiatury i podpórek pod dłonie, dzięki czemu dłonie mają zapewniony komfort.
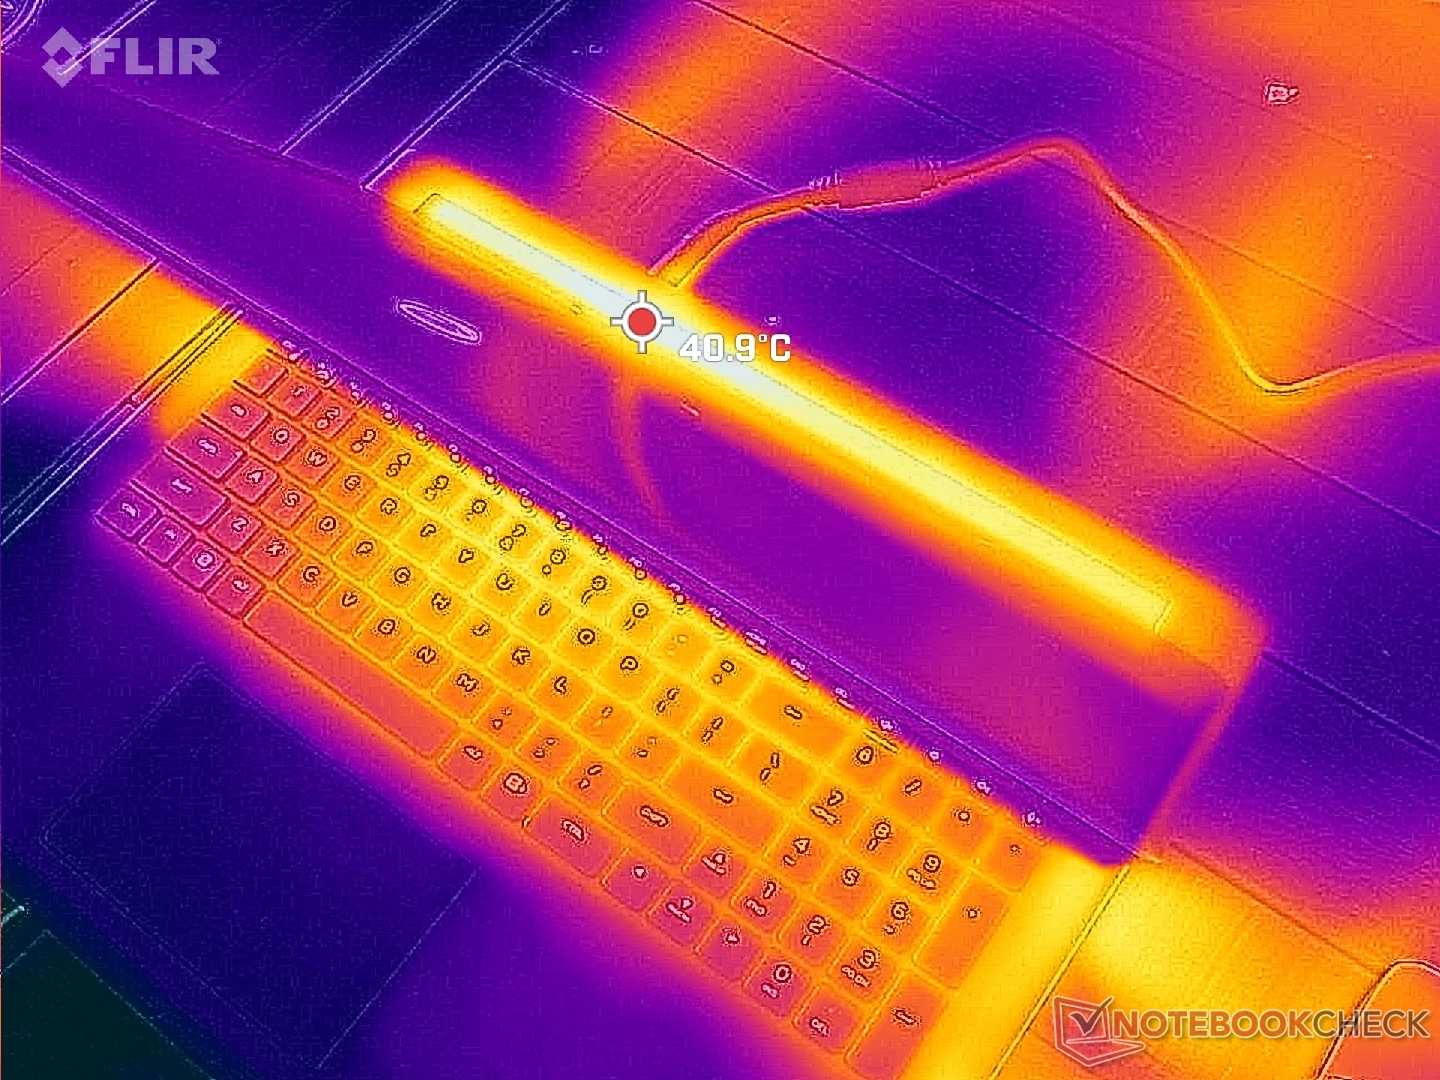
(+) Maksymalna temperatura w górnej części wynosi 39 °C / 102 F, w porównaniu do średniej 40.4 °C / 105 F , począwszy od 21.2 do 68.8 °C dla klasy Gaming.
(+) Dno nagrzewa się maksymalnie do 36.4 °C / 98 F, w porównaniu do średniej 43.2 °C / 110 F
(+) W stanie bezczynności średnia temperatura górnej części wynosi 25.2 °C / 77 F, w porównaniu ze średnią temperaturą urządzenia wynoszącą 33.9 °C / ### class_avg_f### F.
(+) Podczas gry w Wiedźmina 3 średnia temperatura górnej części wynosi 29.8 °C / 86 F, w porównaniu do średniej temperatury urządzenia wynoszącej 33.9 °C / ## #class_avg_f### F.
(+) Podpórki pod nadgarstki i touchpad są chłodniejsze niż temperatura skóry i maksymalnie 23.8 °C / 74.8 F i dlatego są chłodne w dotyku.
(+) Średnia temperatura obszaru podparcia dłoni w podobnych urządzeniach wynosiła 28.8 °C / 83.8 F (+5 °C / 9 F).
| Alienware m18 R1 Intel Core i9-13980HX, NVIDIA GeForce RTX 4090 Laptop GPU | Razer Blade 18 RTX 4070 Intel Core i9-13950HX, NVIDIA GeForce RTX 4070 Laptop GPU | Asus ROG Strix Scar 18 2023 G834JY-N6005W Intel Core i9-13980HX, NVIDIA GeForce RTX 4090 Laptop GPU | Eluktronics Mech-17 GP2 Intel Core i9-13900HX, NVIDIA GeForce RTX 4090 Laptop GPU | MSI Titan GT77 HX 13VI Intel Core i9-13950HX, NVIDIA GeForce RTX 4090 Laptop GPU | Alienware x17 R2 P48E Intel Core i9-12900HK, NVIDIA GeForce RTX 3080 Ti Laptop GPU | |
|---|---|---|---|---|---|---|
| Heat | -7% | -20% | -9% | -4% | -15% | |
| Maximum Upper Side * (°C) | 39 | 39.2 -1% | 54 -38% | 39 -0% | 40.6 -4% | 49.6 -27% |
| Maximum Bottom * (°C) | 36.4 | 35.6 2% | 46 -26% | 44 -21% | 41.1 -13% | 42.4 -16% |
| Idle Upper Side * (°C) | 29.2 | 31.8 -9% | 30 -3% | 31 -6% | 26.2 10% | 29.2 -0% |
| Idle Bottom * (°C) | 27.8 | 33.2 -19% | 31 -12% | 29.8 -7% | 30.3 -9% | 32 -15% |
* ... im mniej tym lepiej
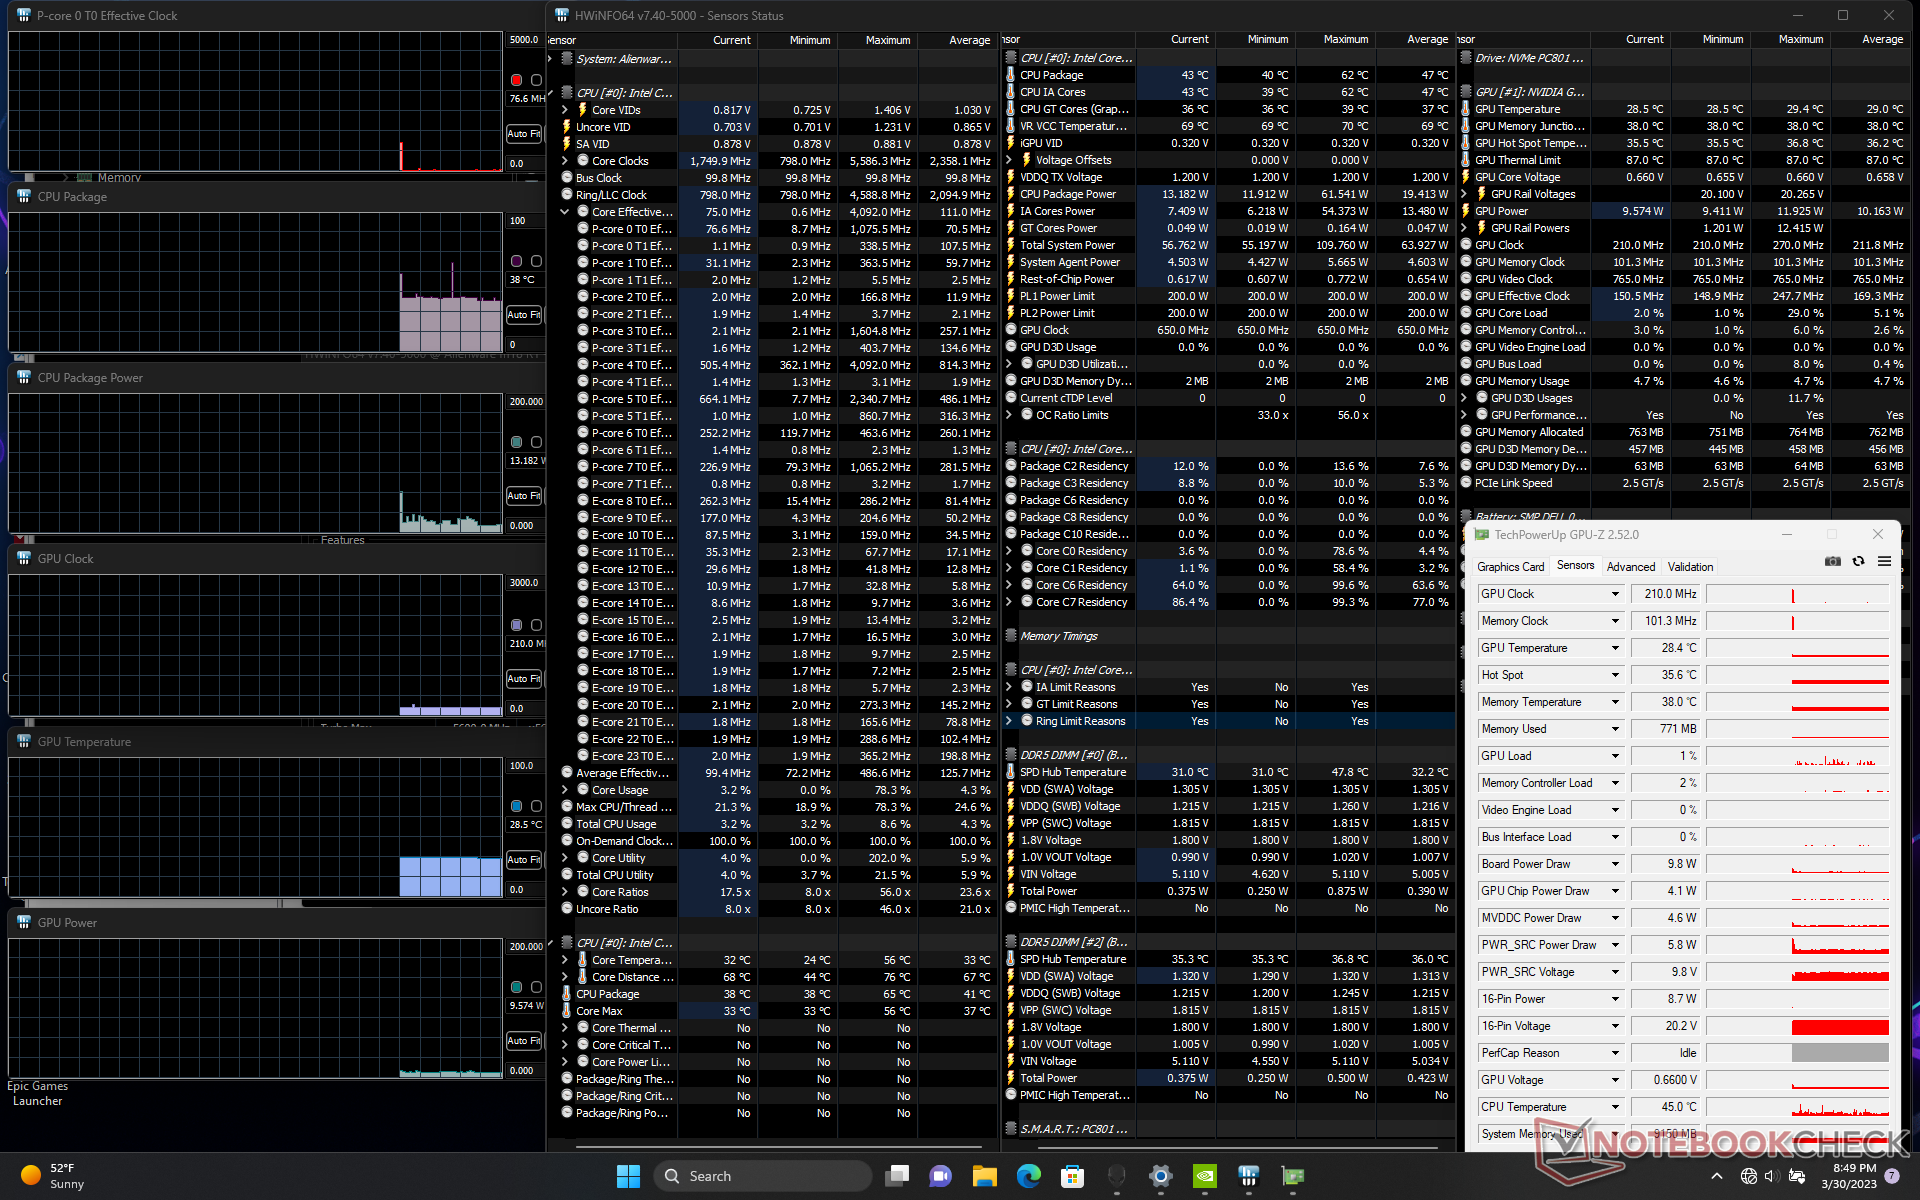
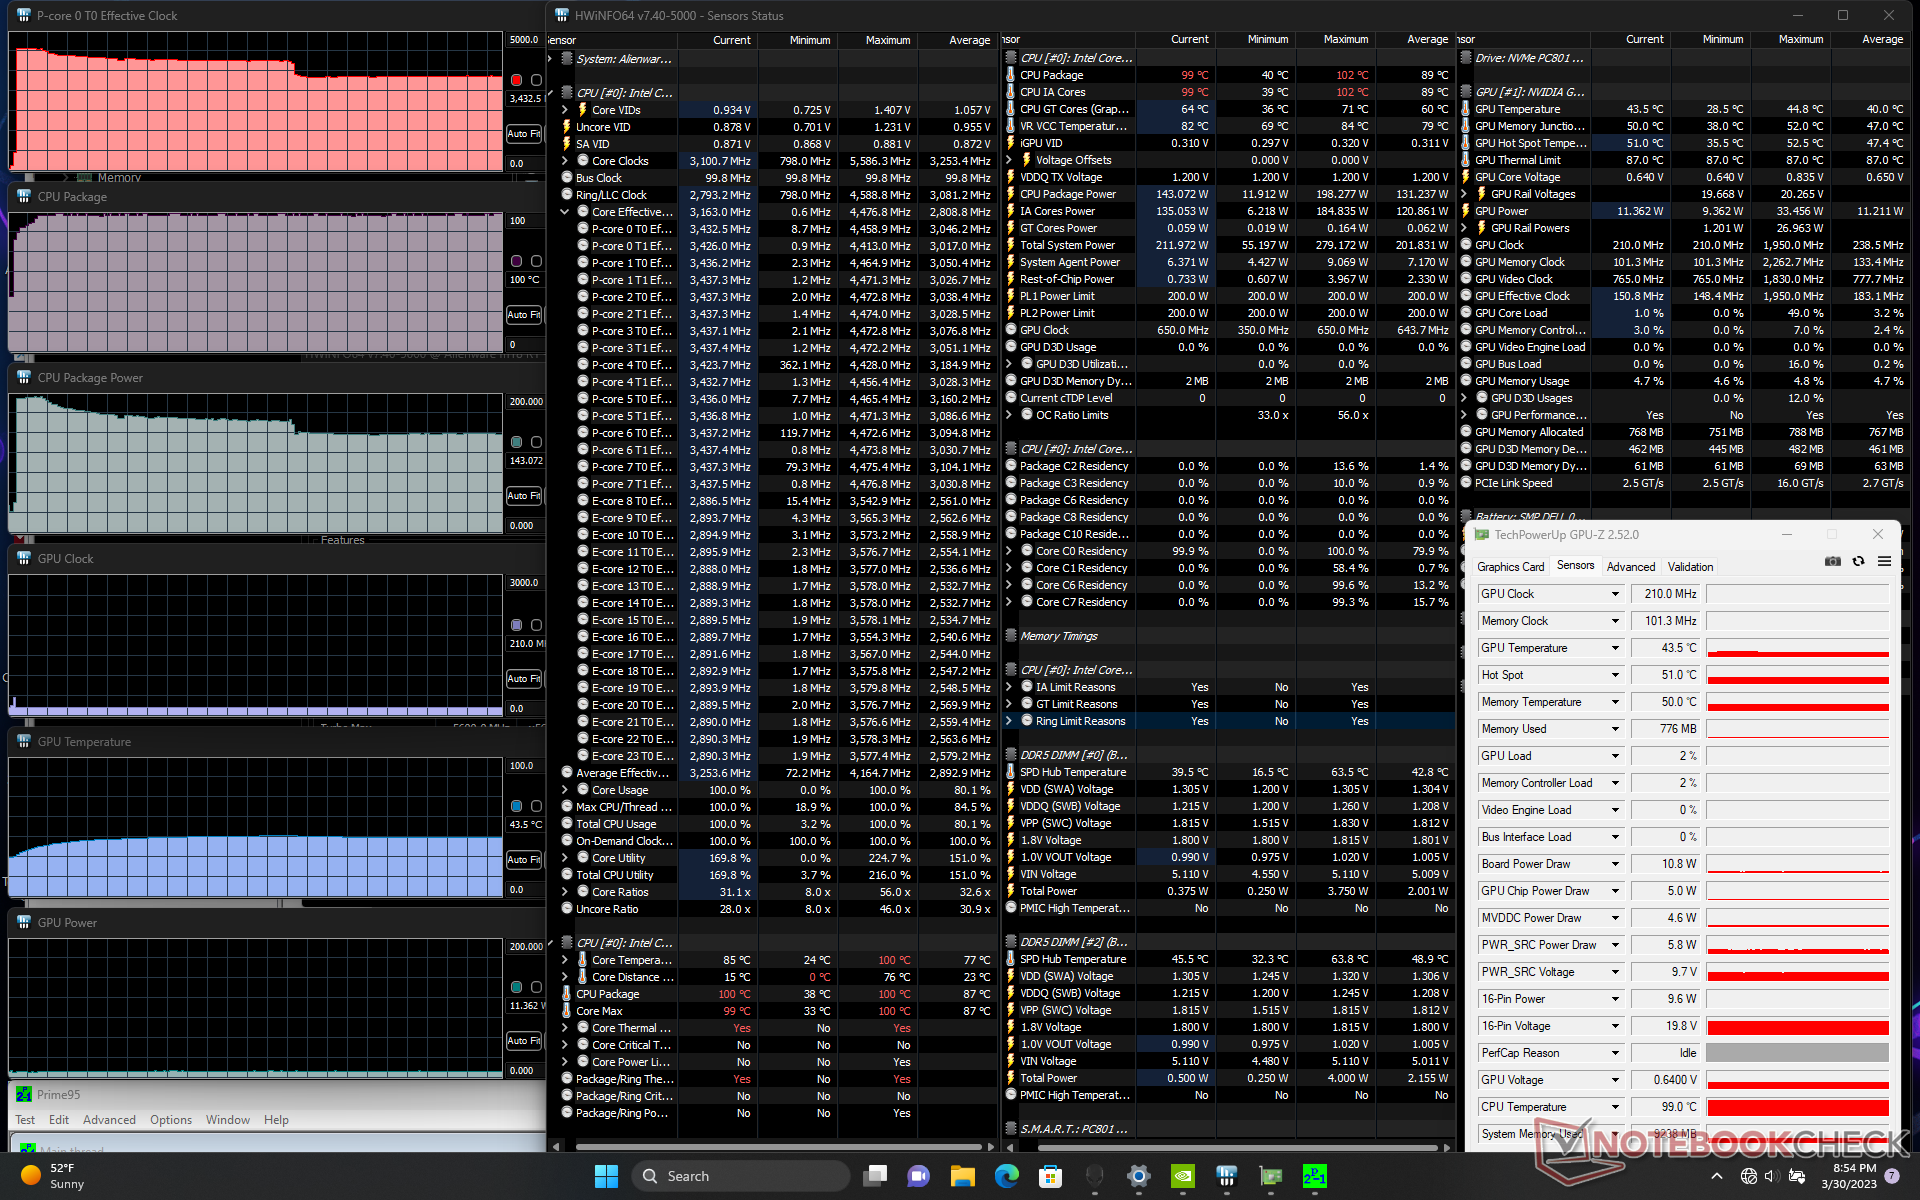
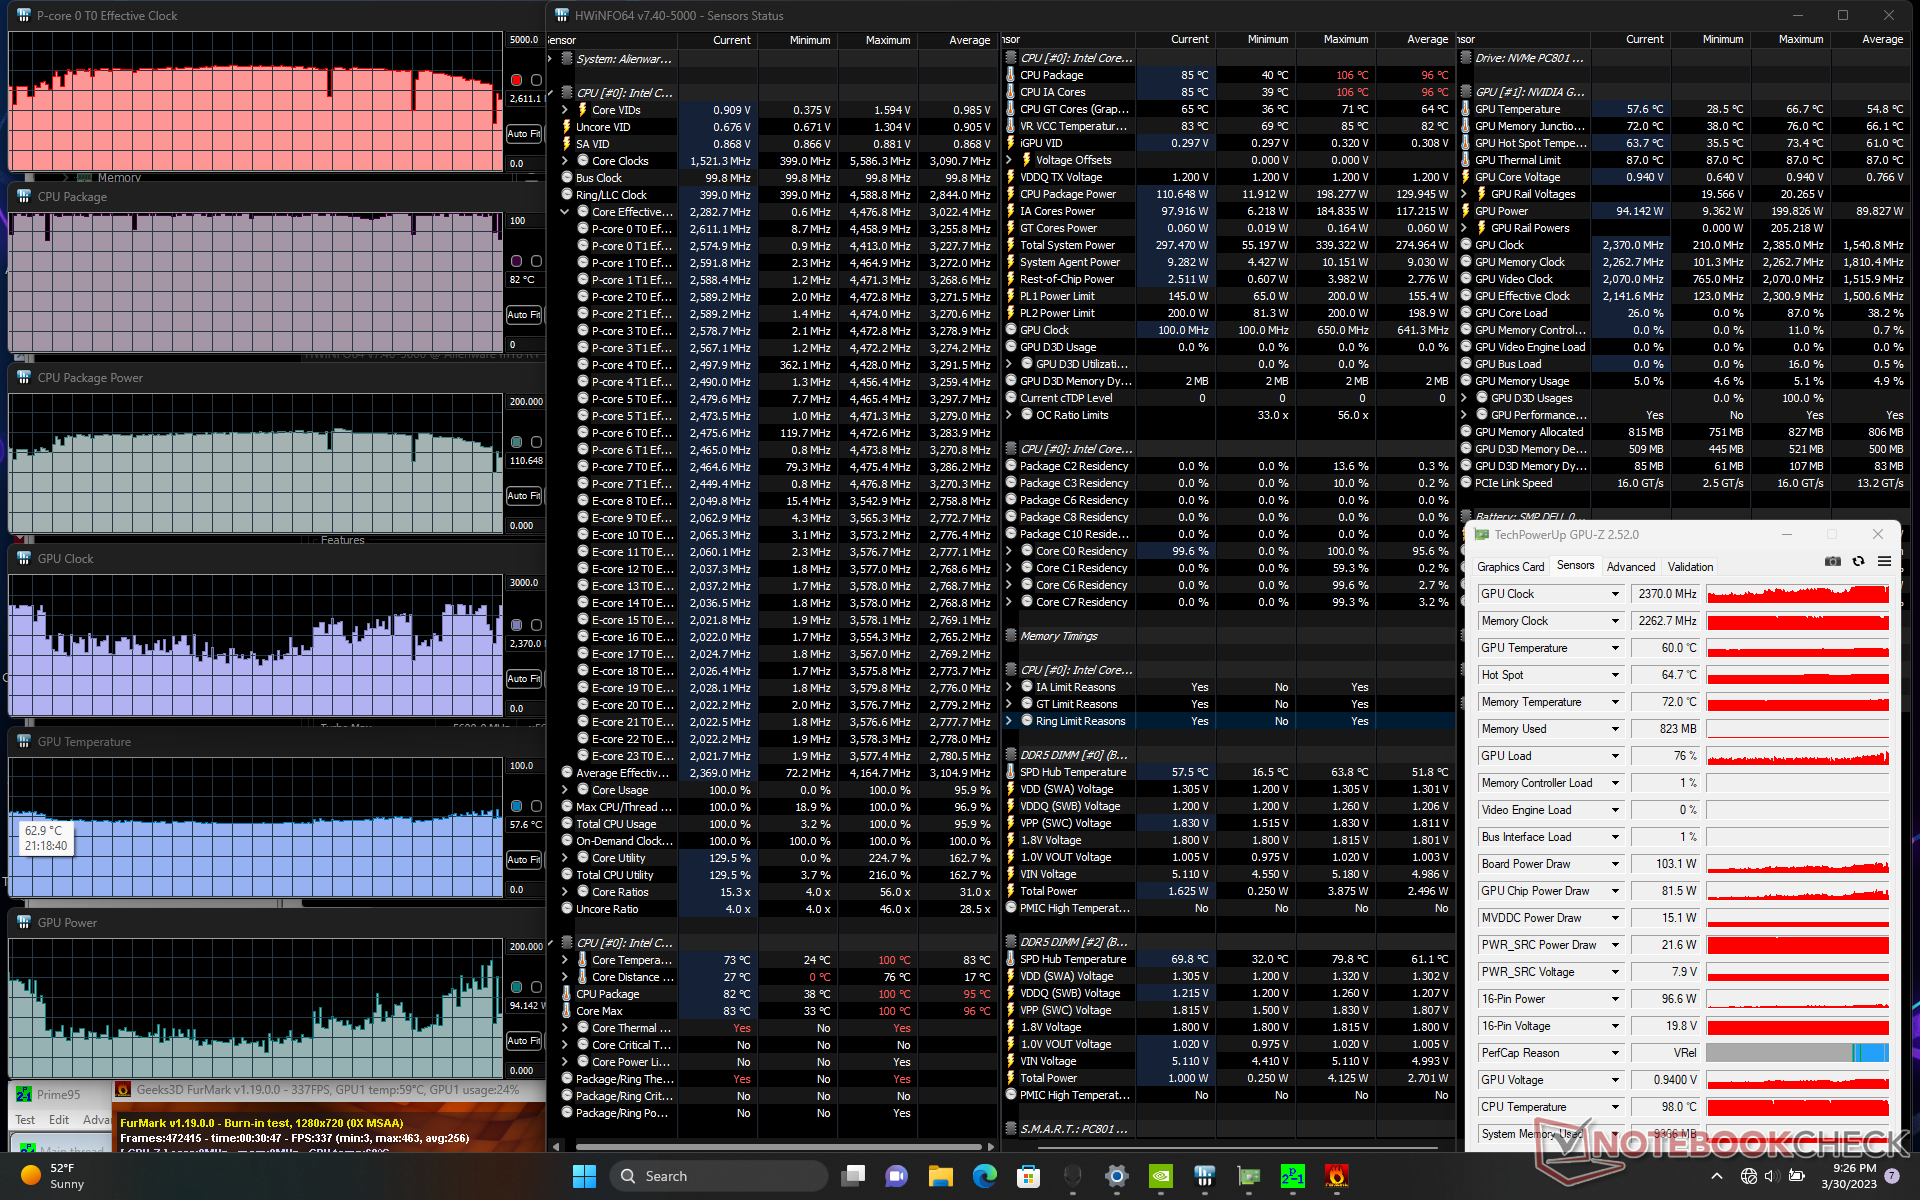
Stress Test
Po uruchomieniu Prime95 w celu obciążenia CPU częstotliwości taktowania i pobór mocy na płycie wzrosły odpowiednio do 4,5 GHz i 198 W, trwając tylko przez kilka sekund lub do momentu, kiedy temperatura rdzenia osiągnie 99 C. Następnie procesor spadł do 4,2 GHz i 175 W przez kilka następnych minut, zanim ostatecznie ustabilizował się na poziomie 3,4 GHz, 143 W i 99 C. Maksymalne Turbo Boost nie jest więc zrównoważone bez względu na tryb zasilania. Temperatury CPU są również ekstremalne, nawet jak na laptop do gier.
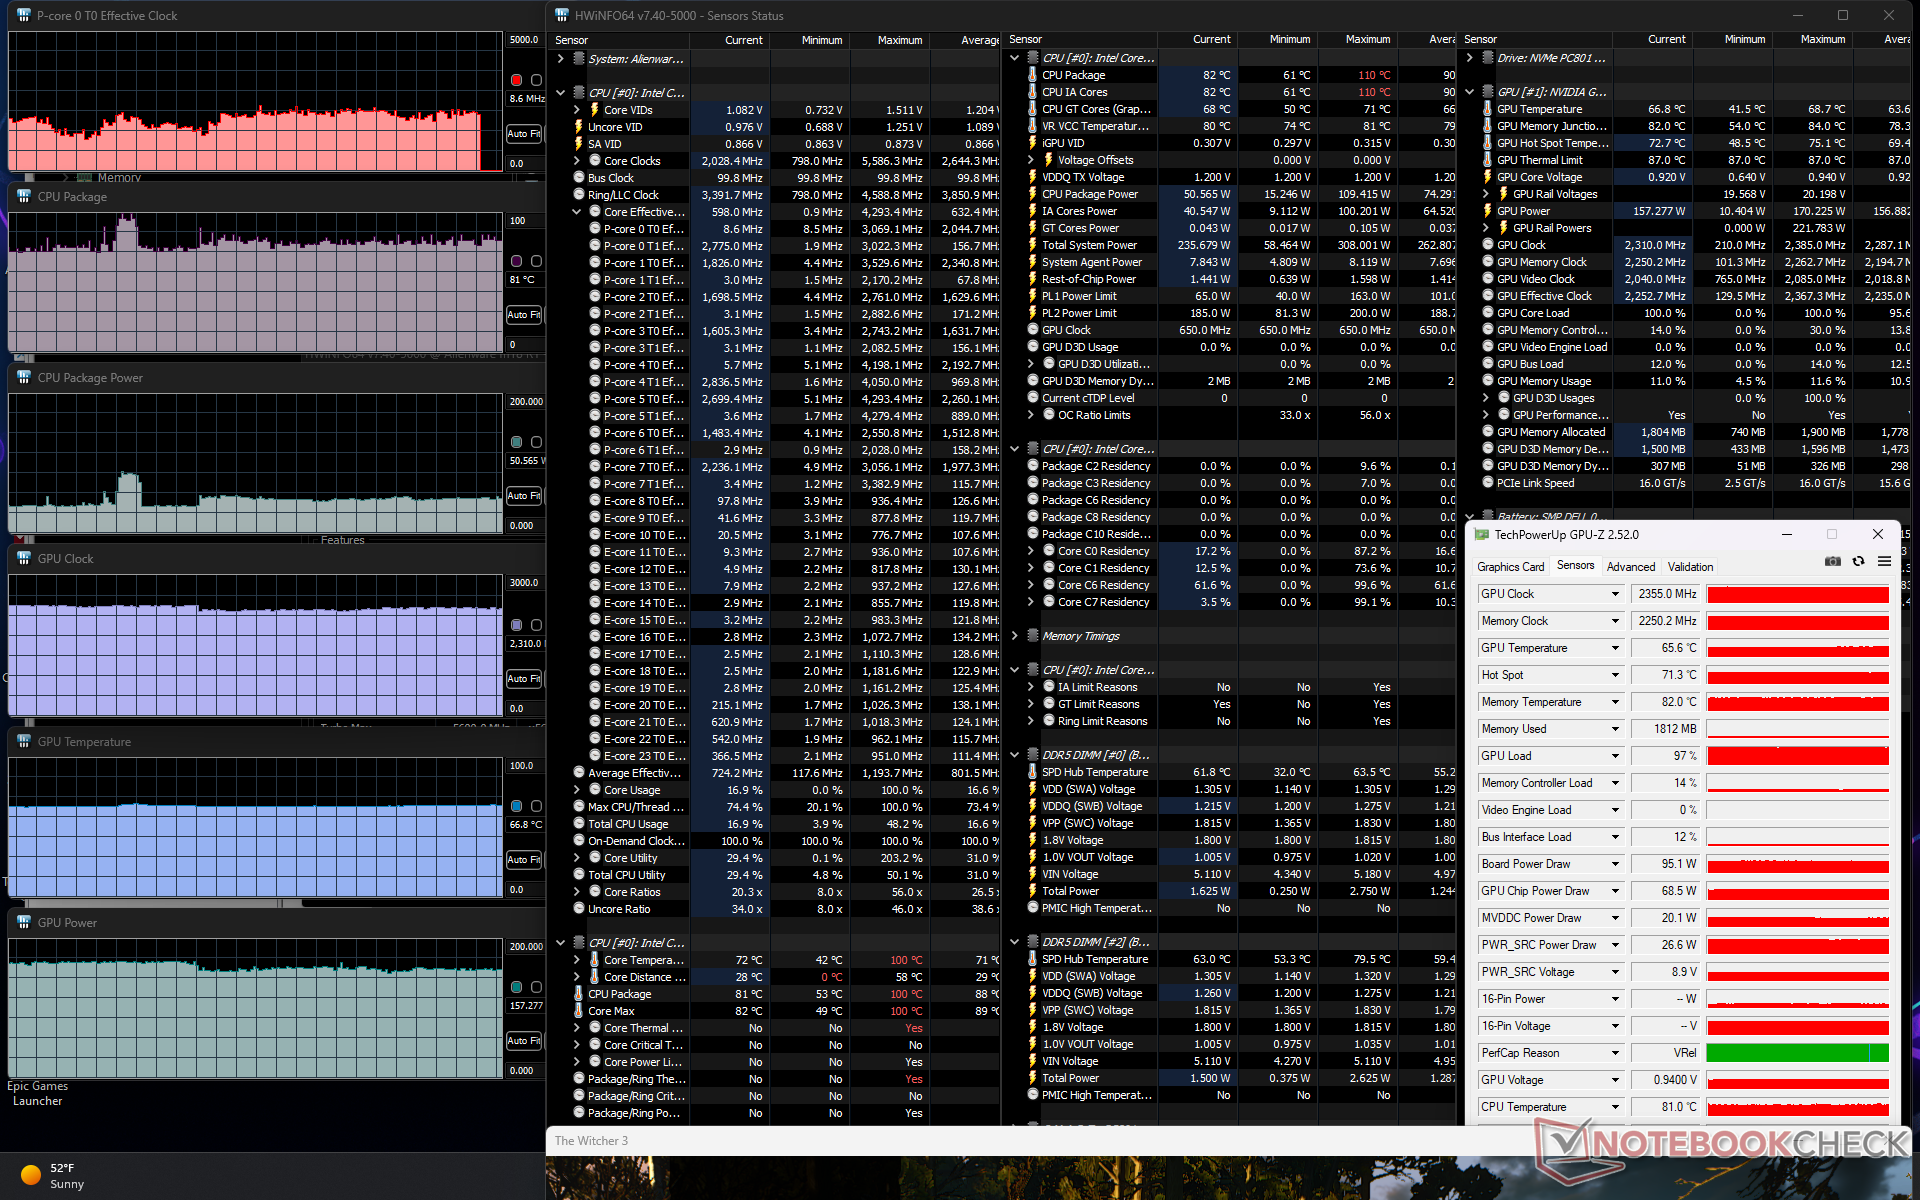
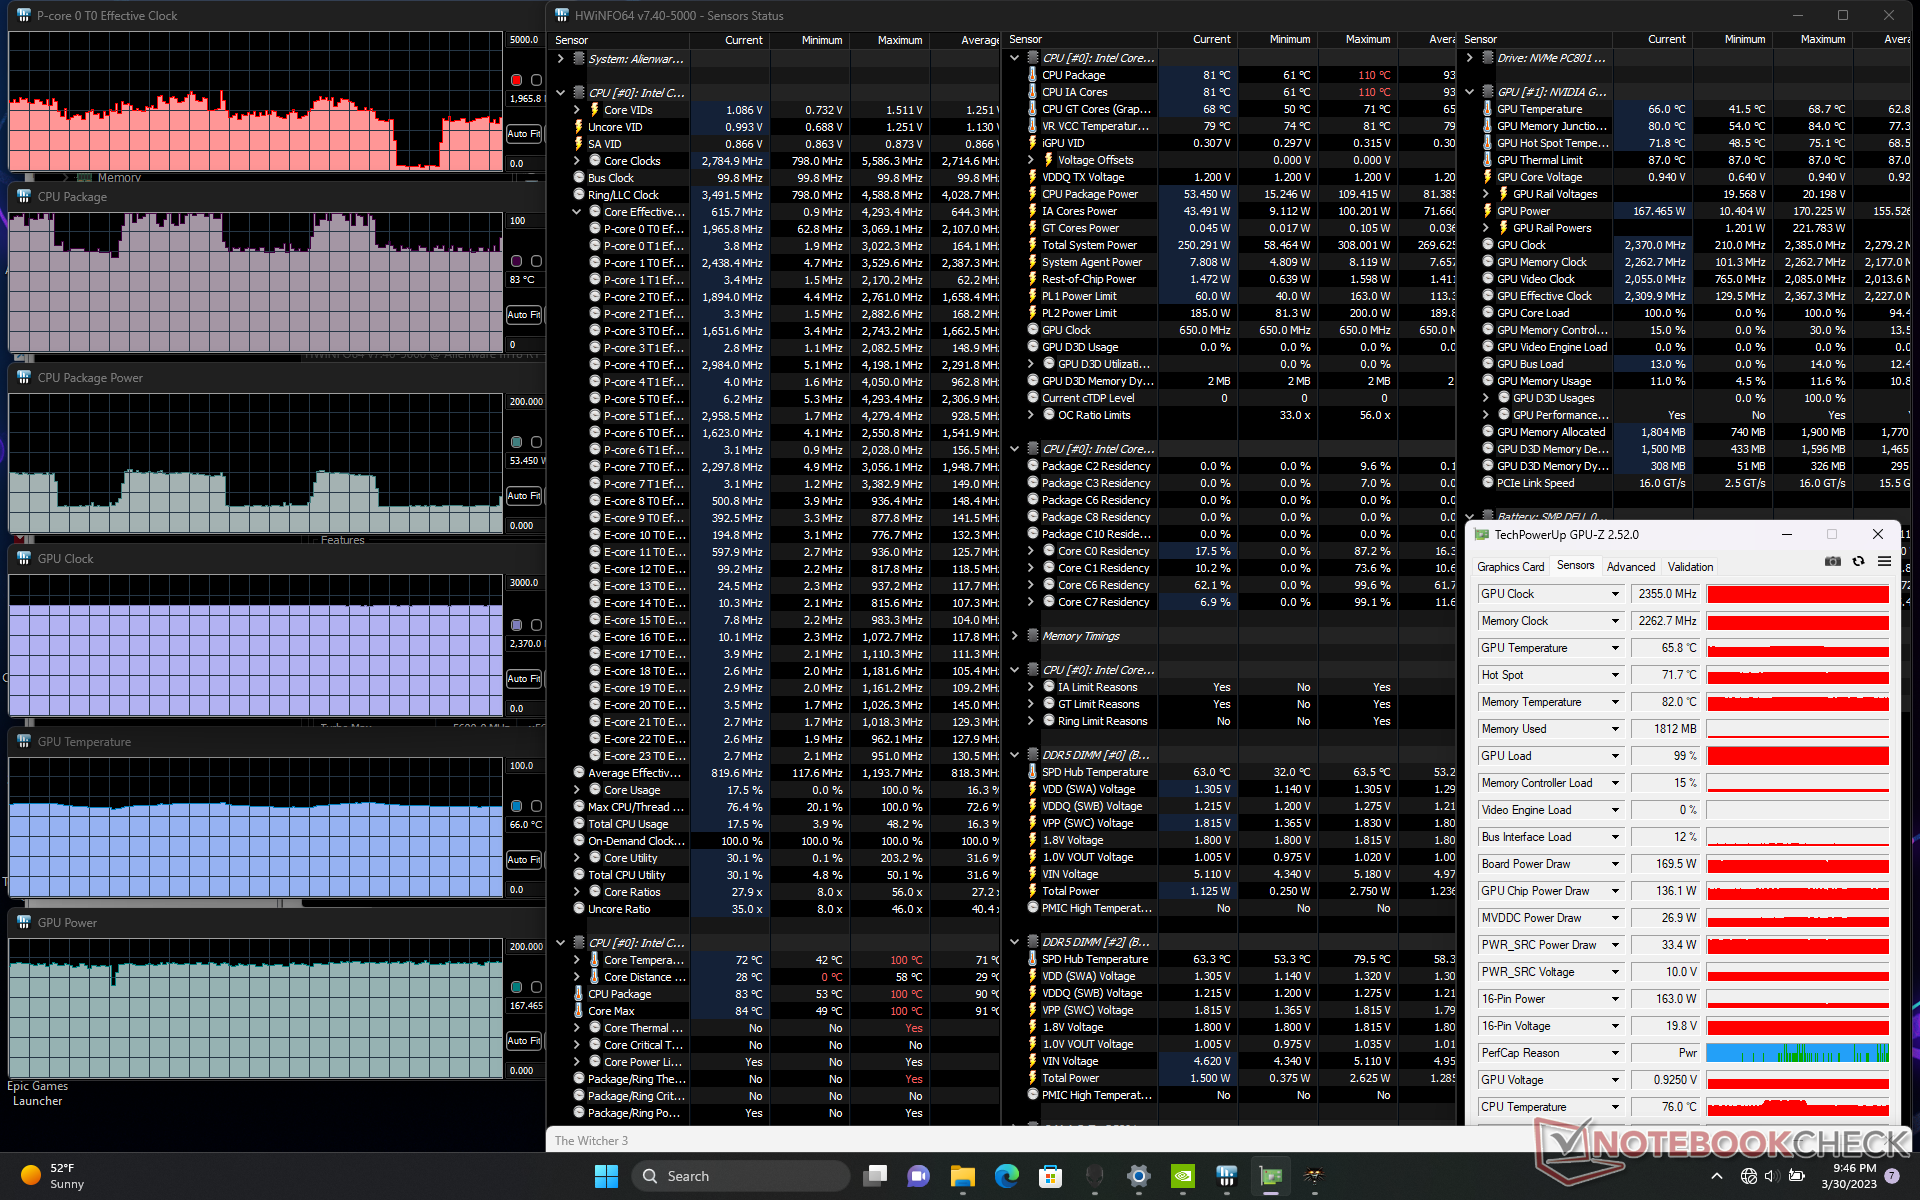
Częstotliwości taktowania GPU, temperatura i pobór mocy na płycie głównej ustabilizowały się odpowiednio na poziomie 2370 MHz, 63 C i 162 W podczas pracy w trybie Overdrive Witcher 3 w trybie Overdrive. Zauważ, że wydajność GPU nie ulega zmianie podczas pracy w cichszym trybie Performance, co zgadza się z naszymi obserwacjami z Fire Strike. Zamiast tego, to procesor centralny odnotowuje niewielki spadek wydajności. Ponieważ większość gier wykorzystuje GPU, zalecamy raczej grę w trybie Wydajność niż w głośniejszym trybie Overdrive, jeśli hałas wentylatora jest powodem do niepokoju.
Praca na zasilaniu bateryjnym ogranicza wydajność, czego można się było spodziewać. W teście Fire Strike na baterii Fizyka i Grafika uzyskałyby odpowiednio 25319 i 18778 punktów, w porównaniu do 41644 i 46998 punktów przy zasilaniu sieciowym.
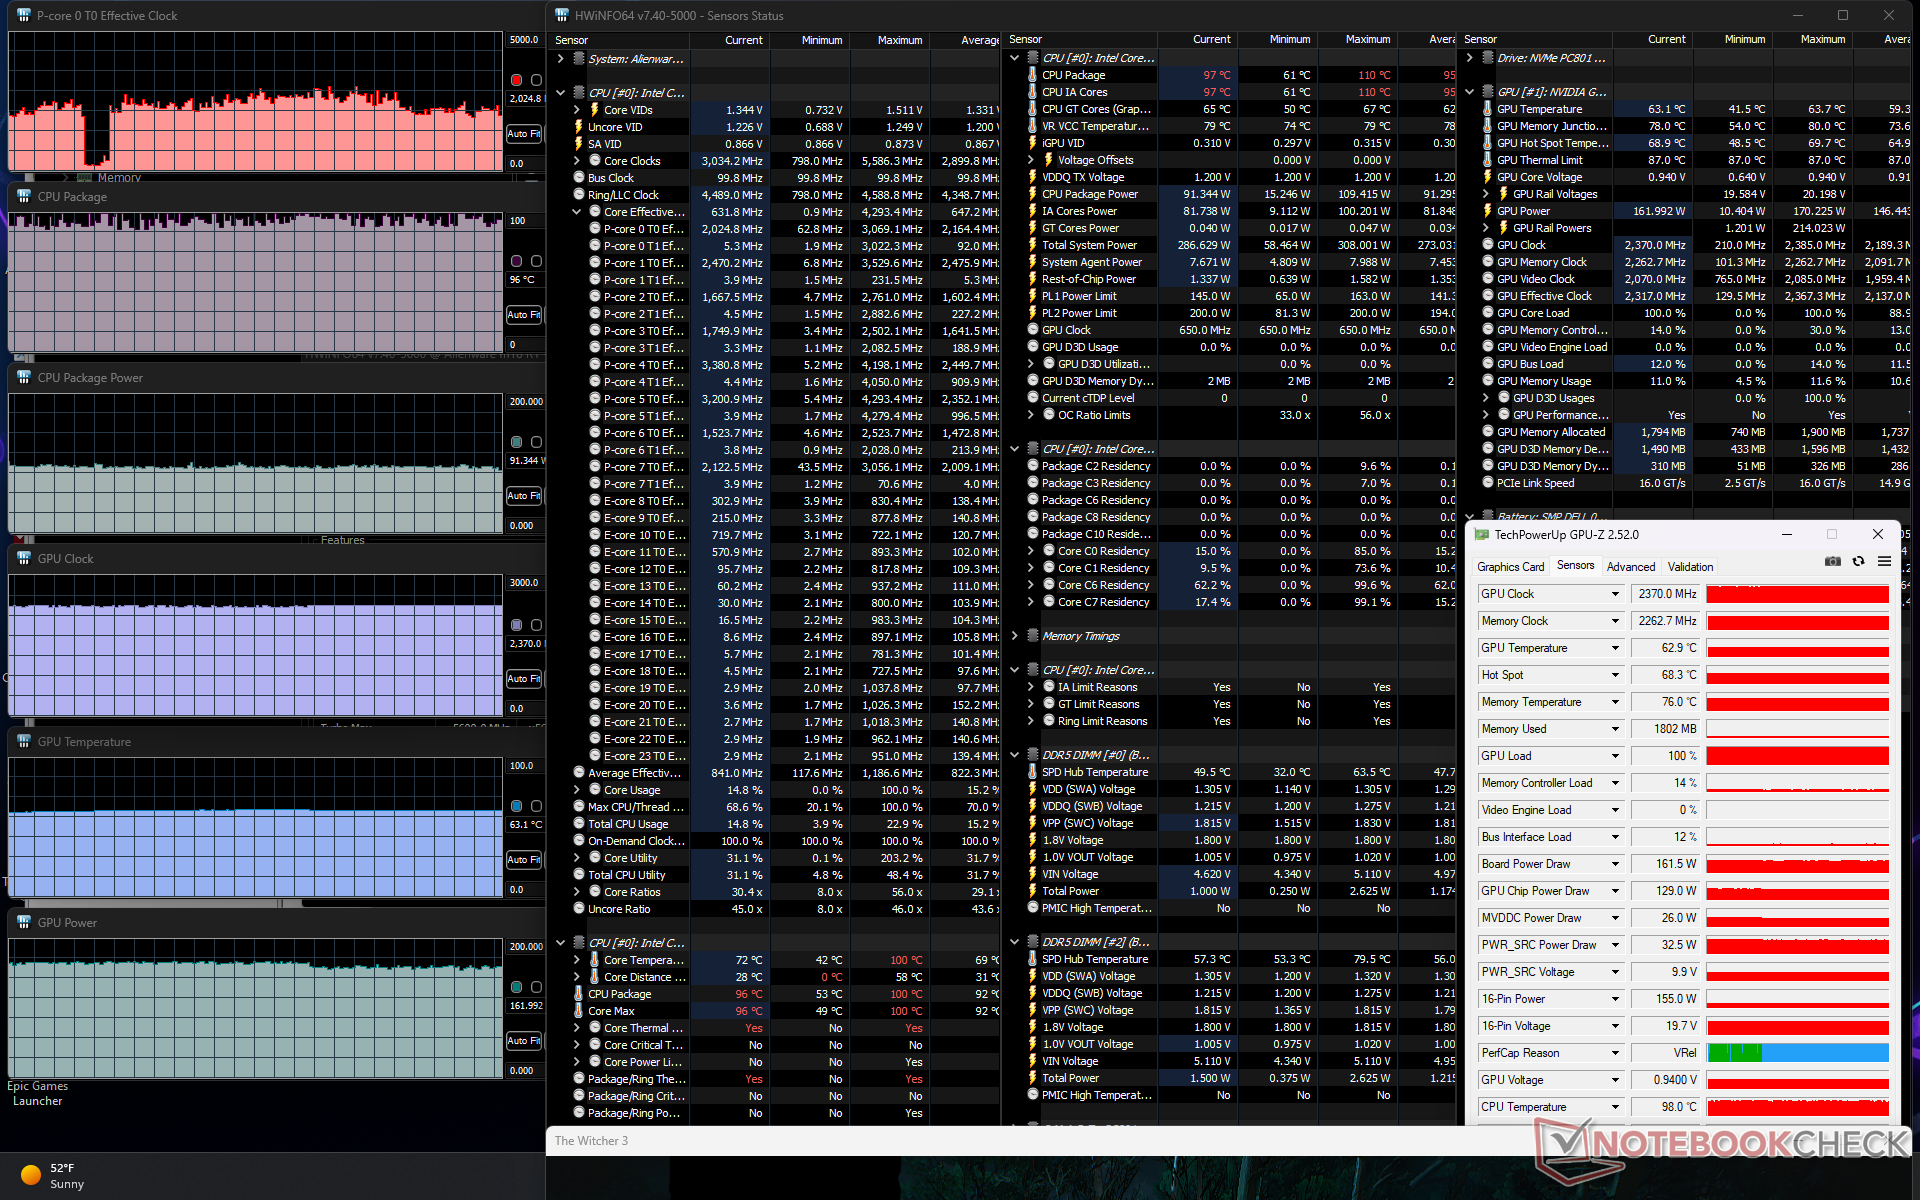
| ZegarCPU (GHz) | Zegar GPU (MHz) | Średnia temperatura CPU (°C) | Średnia temperatura GPU (°C) | |
| System w stanie bezczynności | -- | -- | 38 | 29 |
| Prime95 Stress | 3.4 | -- | 100 | 44 |
| Prime95 + FurMark Stress | 2.6+ | 1070 - 2370 | 82 - 100 | 57 |
| Witcher 3 Stress (tryb Overdrive) | ~2.0+ | 2370 | 96 | 63 |
| Witcher 3 Stres(tryb Performance) | ~1.8+ | 2370 | 81 | 66 |
| Witcher 3 Stres (trybzrównoważony) | ~1,8 | 2310 | 81 | 67 |
Mówcy
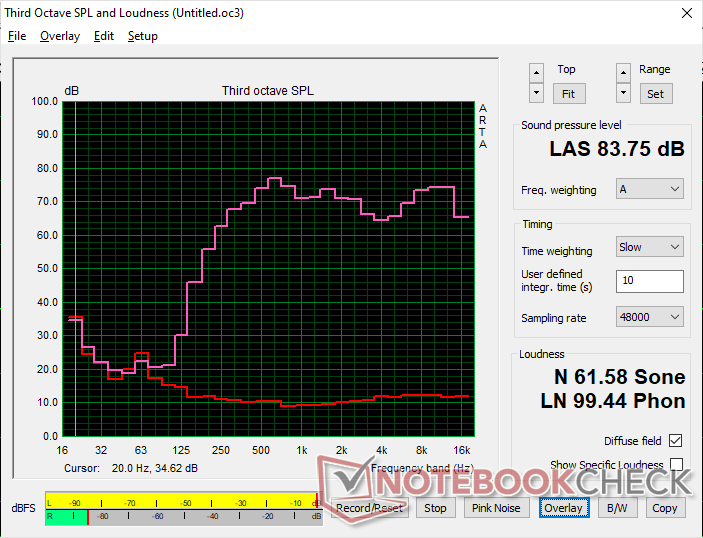
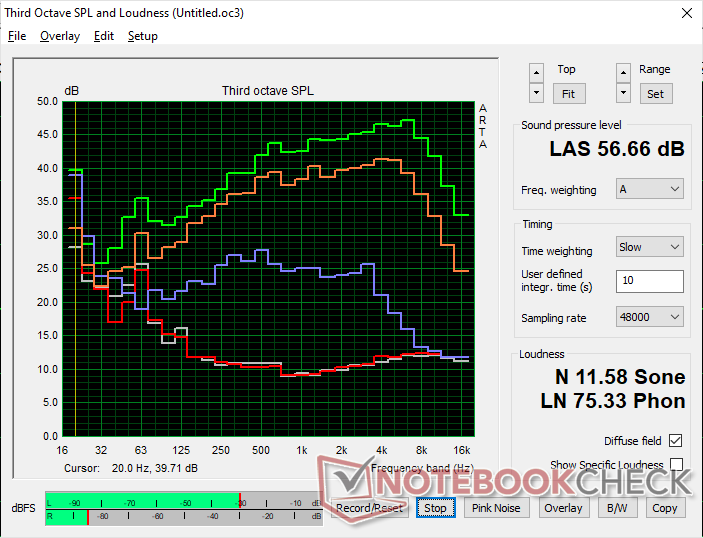
Alienware m18 R1 analiza dźwięku
(+) | głośniki mogą odtwarzać stosunkowo głośno (83.8 dB)
Bas 100 - 315 Hz
(-) | prawie brak basu - średnio 22.4% niższa od mediany
(±) | liniowość basu jest średnia (13.4% delta do poprzedniej częstotliwości)
Średnie 400 - 2000 Hz
(+) | zbalansowane środki średnie - tylko 3.2% od mediany
(+) | średnie są liniowe (4.4% delta do poprzedniej częstotliwości)
Wysokie 2–16 kHz
(+) | zrównoważone maksima - tylko 3.2% od mediany
(+) | wzloty są liniowe (4% delta do poprzedniej częstotliwości)
Ogólnie 100 - 16.000 Hz
(+) | ogólny dźwięk jest liniowy (14.6% różnicy w stosunku do mediany)
W porównaniu do tej samej klasy
» 28% wszystkich testowanych urządzeń w tej klasie było lepszych, 7% podobnych, 65% gorszych
» Najlepszy miał deltę 6%, średnia wynosiła ###średnia###%, najgorsza wynosiła 132%
W porównaniu do wszystkich testowanych urządzeń
» 19% wszystkich testowanych urządzeń było lepszych, 4% podobnych, 77% gorszych
» Najlepszy miał deltę 4%, średnia wynosiła ###średnia###%, najgorsza wynosiła 134%
Apple MacBook Pro 16 2021 M1 Pro analiza dźwięku
(+) | głośniki mogą odtwarzać stosunkowo głośno (84.7 dB)
Bas 100 - 315 Hz
(+) | dobry bas - tylko 3.8% od mediany
(+) | bas jest liniowy (5.2% delta do poprzedniej częstotliwości)
Średnie 400 - 2000 Hz
(+) | zbalansowane środki średnie - tylko 1.3% od mediany
(+) | średnie są liniowe (2.1% delta do poprzedniej częstotliwości)
Wysokie 2–16 kHz
(+) | zrównoważone maksima - tylko 1.9% od mediany
(+) | wzloty są liniowe (2.7% delta do poprzedniej częstotliwości)
Ogólnie 100 - 16.000 Hz
(+) | ogólny dźwięk jest liniowy (4.6% różnicy w stosunku do mediany)
W porównaniu do tej samej klasy
» 0% wszystkich testowanych urządzeń w tej klasie było lepszych, 0% podobnych, 100% gorszych
» Najlepszy miał deltę 5%, średnia wynosiła ###średnia###%, najgorsza wynosiła 45%
W porównaniu do wszystkich testowanych urządzeń
» 0% wszystkich testowanych urządzeń było lepszych, 0% podobnych, 100% gorszych
» Najlepszy miał deltę 4%, średnia wynosiła ###średnia###%, najgorsza wynosiła 134%
Zarządzanie energią - ponad 300 W podczas gry
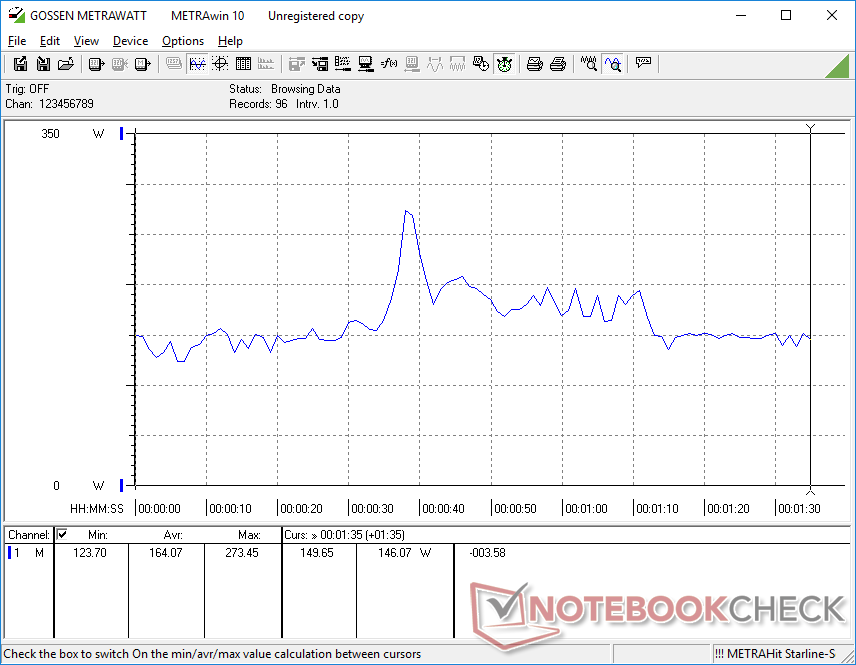
Pobór mocy
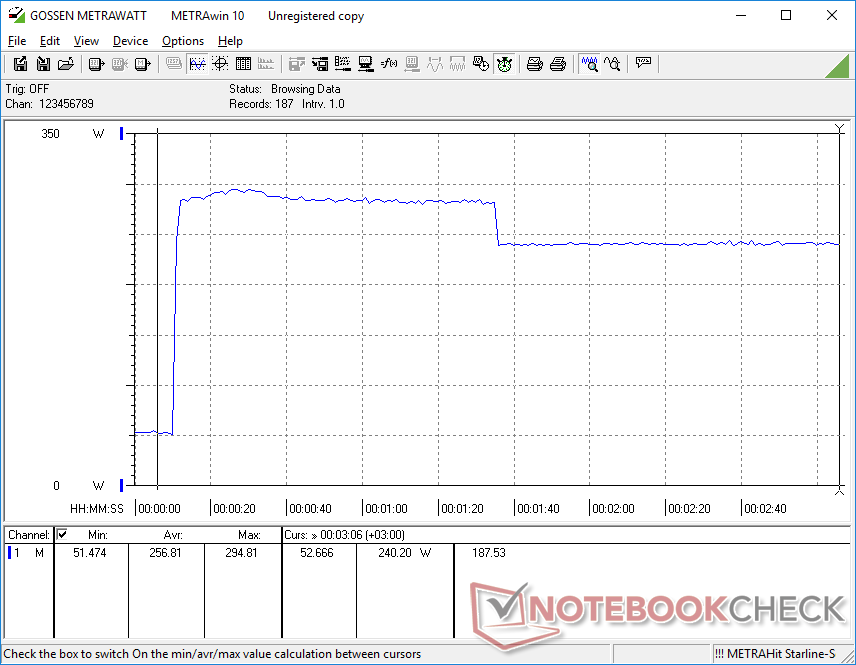
System jest bez wątpienia bardzo wymagający, nawet gdy nie są uruchomione żadne aplikacje. Udało nam się zarejestrować zaledwie 21 W podczas pracy na biegu jałowym w trybie Power Saver, Optimus i przy najniższym ustawieniu jasności. Praca na biegu jałowym w trybie Performance lub Turbo zwiększyłaby zużycie energii ponad dwukrotnie, dlatego też zaleca się unikanie ustawień o wyższym profilu, jeśli dodatkowa moc nie jest potrzebna.
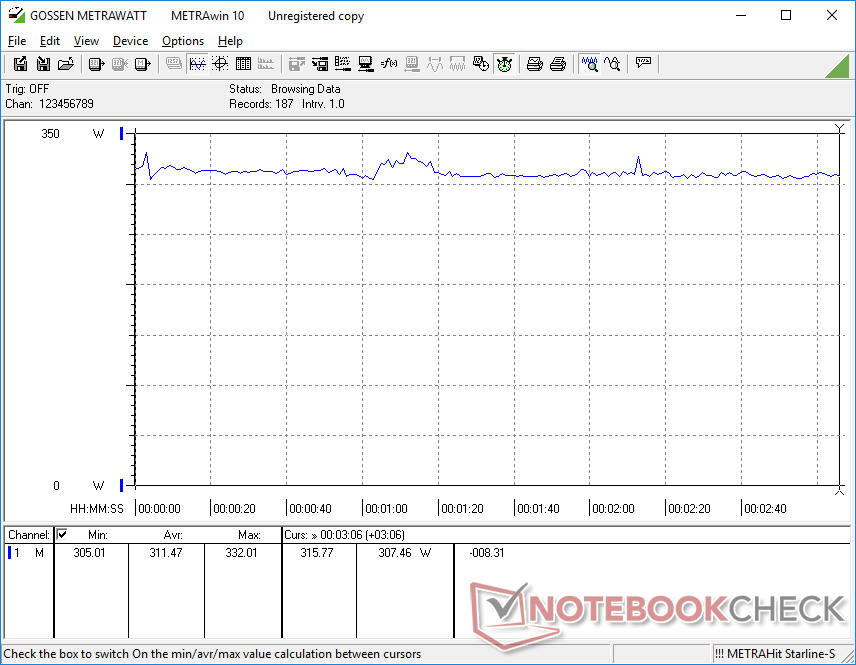
Uruchomienie strony Witcher 3 w celu odwzorowania typowego obciążenia w grach pobiera 311 W, czyli o ponad 50 W więcej niż w przypadku zeszłorocznego RTX 3080 Ti- Alienware x17 R2. Tak więc, choć wydajność jest szybsza w porównaniu do poprzedniej generacji, użytkownicy będą musieli zapłacić za to wyższe rachunki za prąd z powodu bardziej wymagającego procesora.
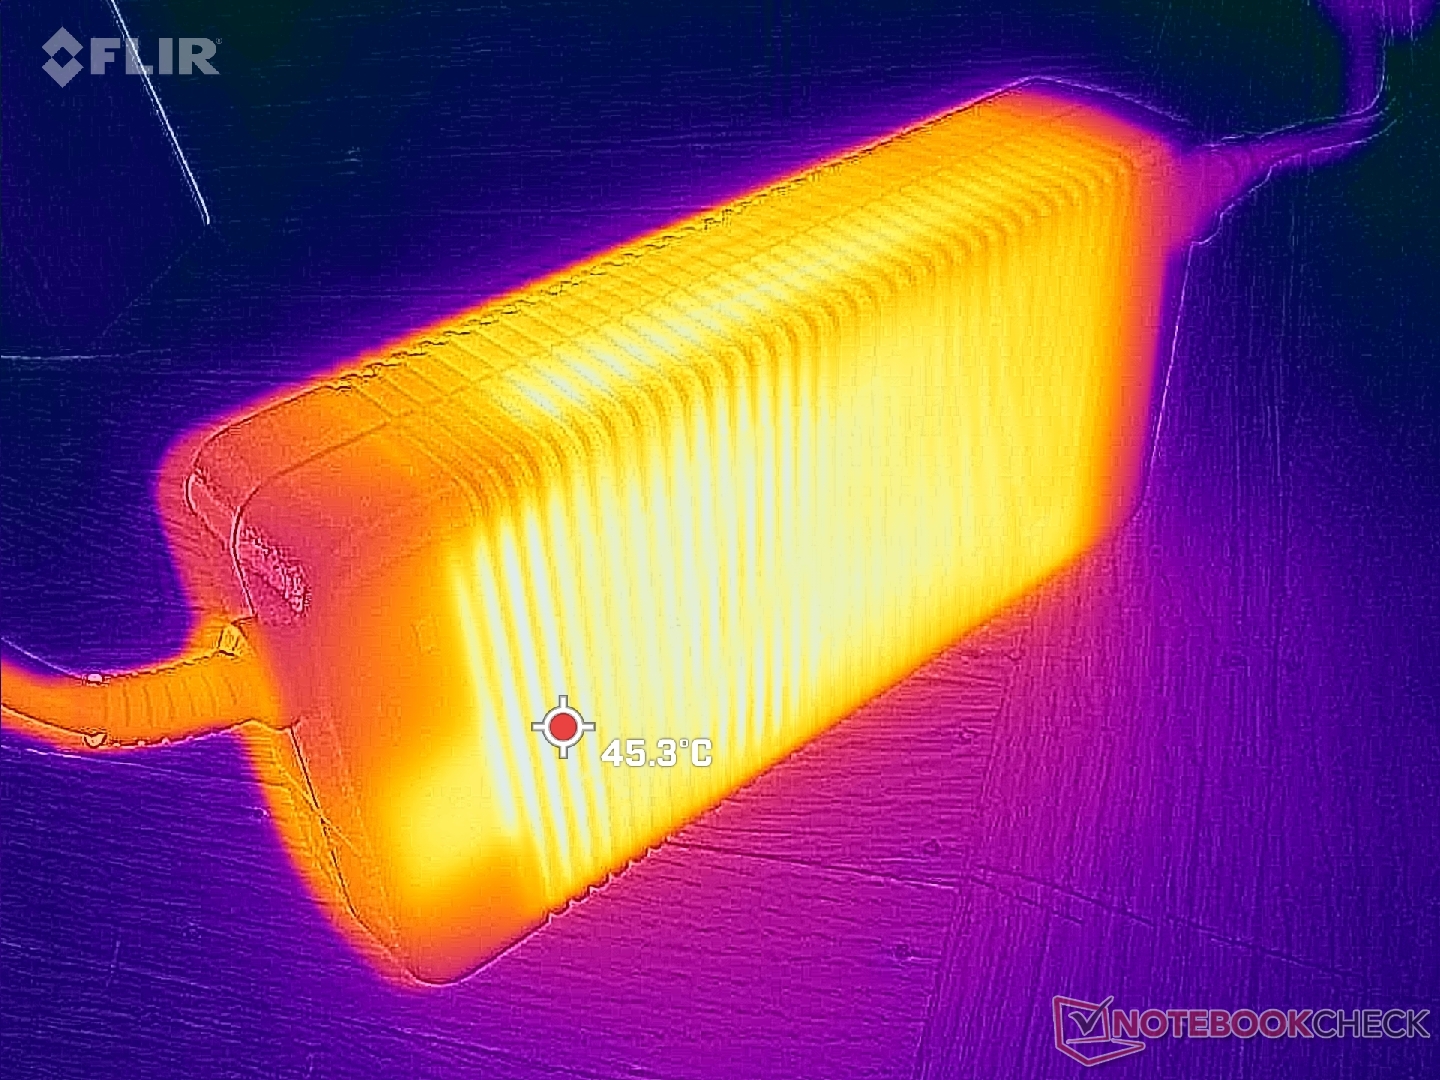
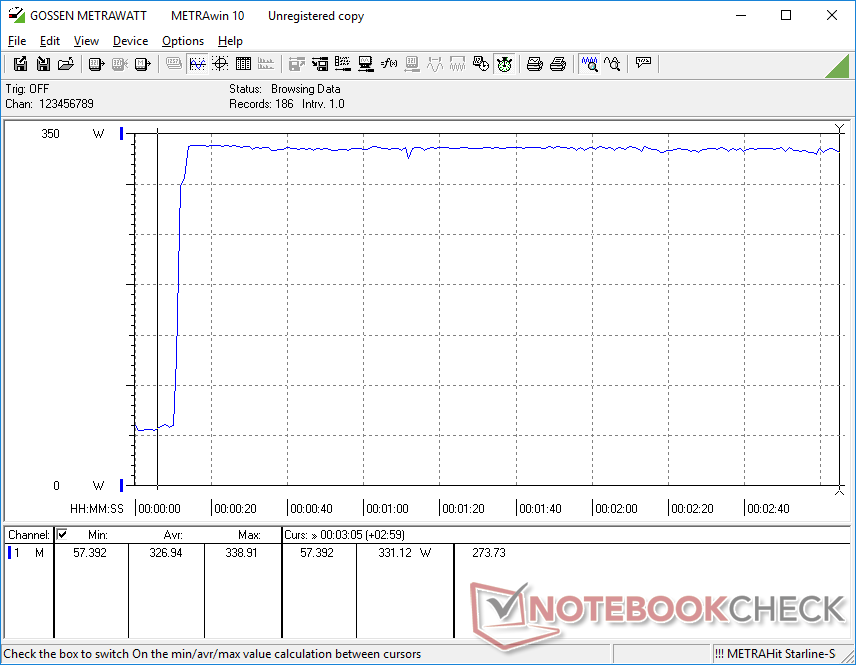
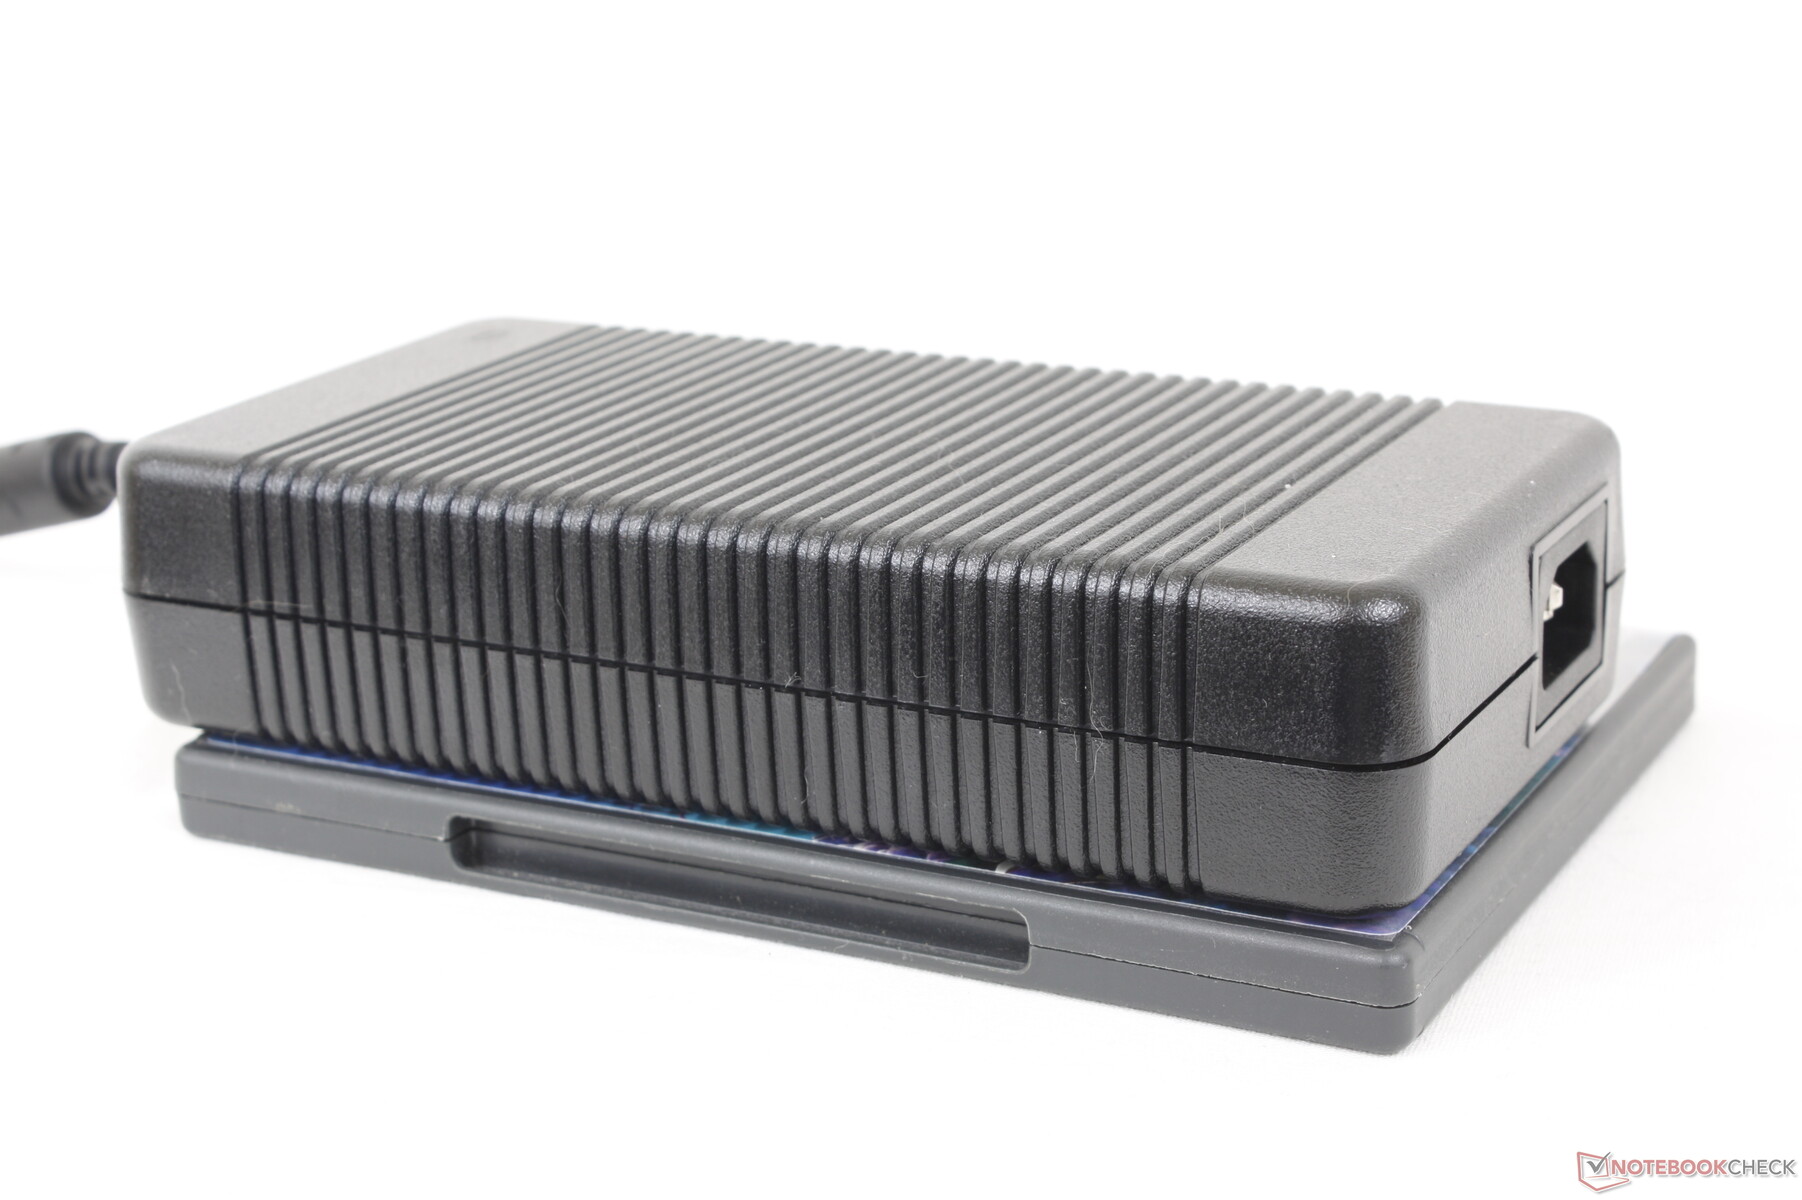
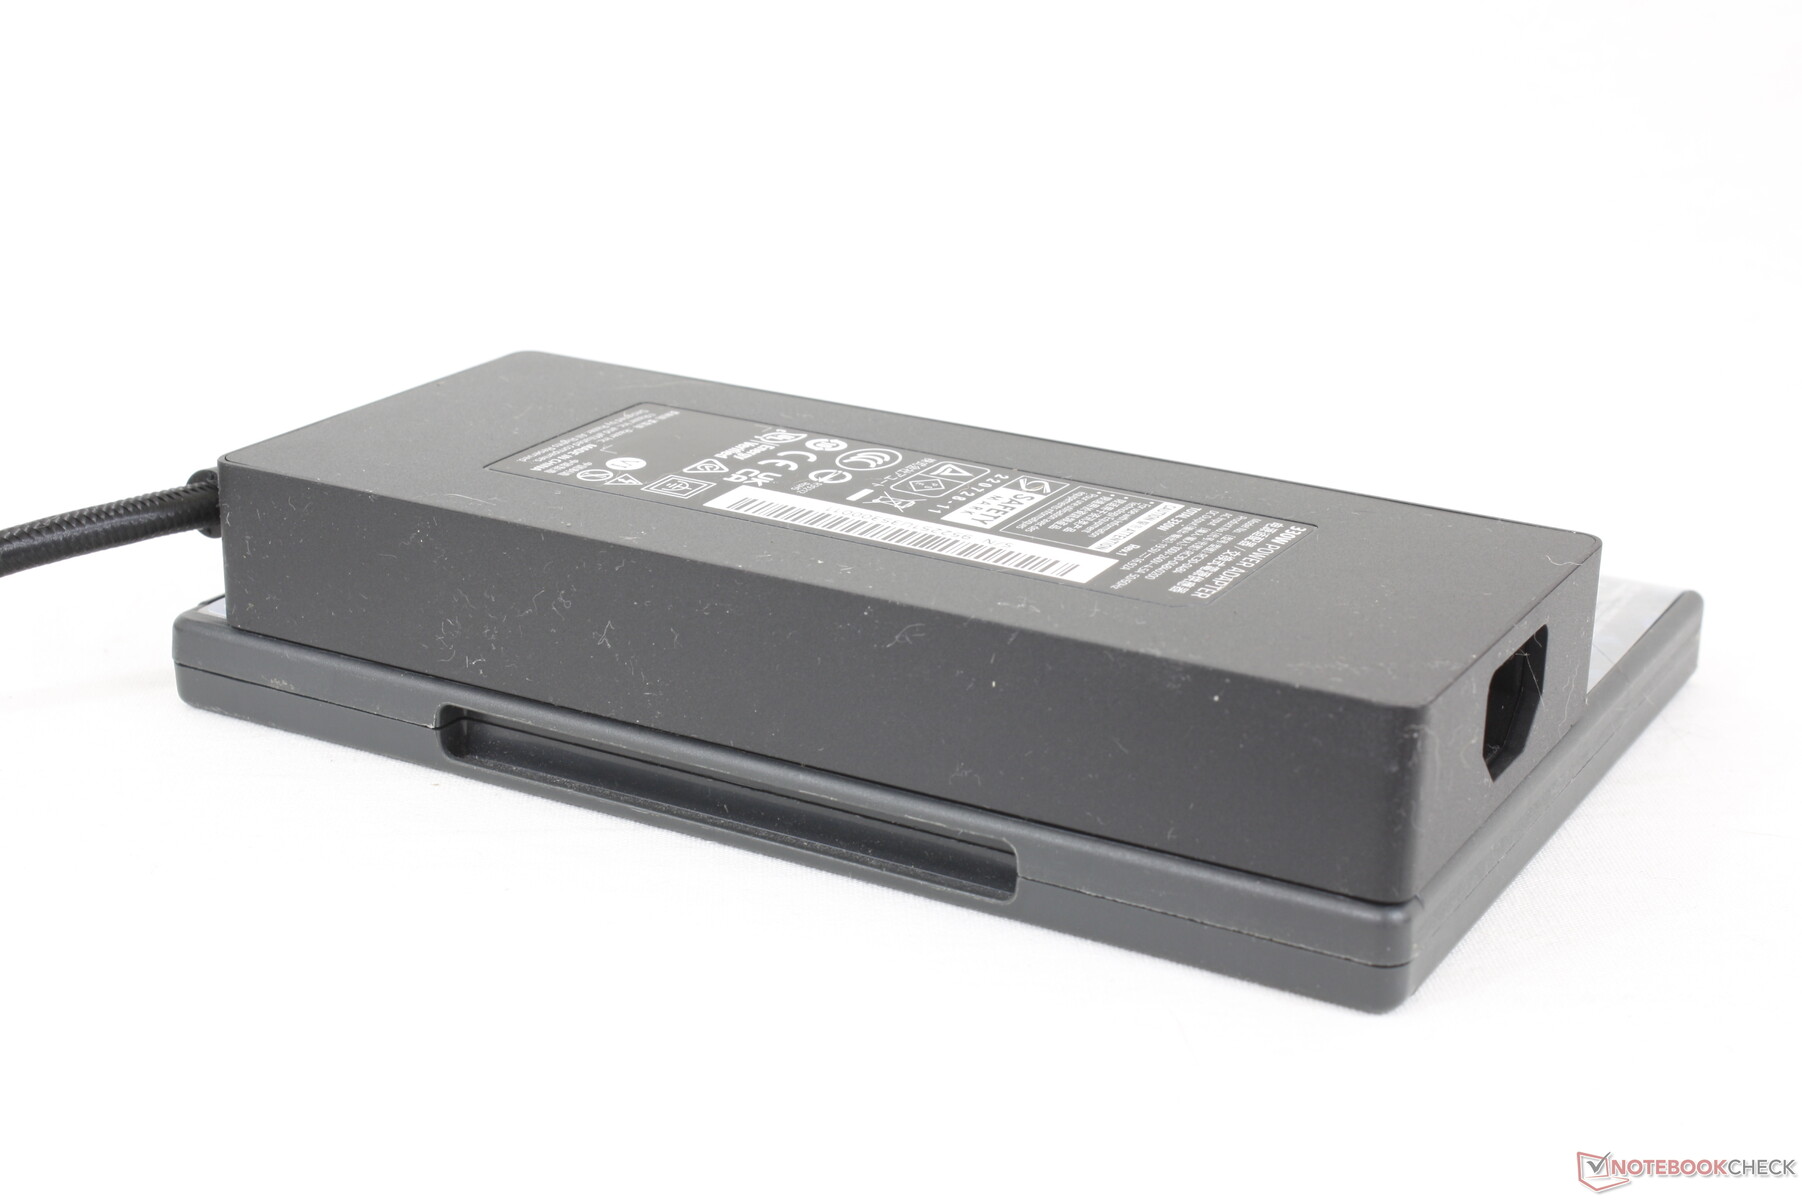
Udało nam się zarejestrować maksymalny pobór mocy na poziomie 339 W, gdy zarówno CPU, jak i GPU są wykorzystywane w 100 procentach. Nieporęczny zasilacz AC (~19,5 x 9,8 x 4 cm) ma moc 330 W, więc nasza w pełni skonfigurowana jednostka wykorzystuje dostępną moc w maksymalnym stopniu. Należy pamiętać, że tempo ładowania baterii laptopa spada podczas gry. W rzeczywistości możemy zaobserwować, że nasza bateria spada ze 100 procent do 91 procent podczas jednoczesnego uruchamiania wyjątkowo wymagających obciążeń, takich jak Prime95 i FurMark.
| wyłączony / stan wstrzymania | |
| luz | |
| obciążenie |
|
Legenda:
min: | |
| Alienware m18 R1 i9-13980HX, GeForce RTX 4090 Laptop GPU, SK hynix PC801 HFS001TEJ9X101N, IPS, 1920x1200, 18" | Razer Blade 18 RTX 4070 i9-13950HX, GeForce RTX 4070 Laptop GPU, SSSTC CA6-8D1024, IPS, 2560x1600, 18" | Asus ROG Strix Scar 18 2023 G834JY-N6005W i9-13980HX, GeForce RTX 4090 Laptop GPU, 2x Samsung PM9A1 MZVL21T0HCLR (RAID 0), IPS, 2560x1600, 18" | MSI GE78HX 13VH-070US i9-13950HX, GeForce RTX 4080 Laptop GPU, Samsung PM9A1 MZVL22T0HBLB, IPS, 2560x1600, 17" | Eluktronics Mech-17 GP2 i9-13900HX, GeForce RTX 4090 Laptop GPU, Samsung PM9A1 MZVL21T0HCLR, IPS, 2560x1600, 17" | MSI Titan GT77 HX 13VI i9-13950HX, GeForce RTX 4090 Laptop GPU, Samsung PM9A1 MZVL22T0HBLB, Mini-LED, 3840x2160, 17.3" | |
|---|---|---|---|---|---|---|
| Power Consumption | 7% | 11% | 20% | 21% | 20% | |
| Idle Minimum * (Watt) | 21.6 | 24.5 -13% | 17.3 20% | 16.1 25% | 14 35% | 14 35% |
| Idle Average * (Watt) | 25.2 | 34.1 -35% | 27 -7% | 24 5% | 19.3 23% | 21.6 14% |
| Idle Maximum * (Watt) | 56.7 | 47.7 16% | 46 19% | 34 40% | 36.8 35% | 24.8 56% |
| Load Average * (Watt) | 164.1 | 140 15% | 133 19% | 123.6 25% | 117.2 29% | 122.5 25% |
| Witcher 3 ultra * (Watt) | 311 | 202 35% | 286 8% | 304 2% | 265 15% | |
| Load Maximum * (Watt) | 338.9 | 261 23% | 329 3% | 285.7 16% | 342.5 -1% | 418 -23% |
* ... im mniej tym lepiej
Power Consumption Witcher 3 / Stresstest
Power Consumption external Monitor
Czas pracy na baterii - nienajgorszy jak na ten rozmiar
Czas pracy na baterii nigdy nie był mocną stroną serii Alienware. Na przykład zeszłoroczny Alienware x17 R2 wytrzymywał tylko kilka godzin, nawet podczas przeglądania stron internetowych. W Alienware m18 zastosowano akumulator o większej pojemności (97 Wh vs. 87 Wh) z lepszym zarządzaniem energią, dzięki czemu czas pracy przy przeglądaniu stron internetowych jest zauważalnie dłuższy i wynosi około 4 godzin. Nie jest to z pewnością czas tak długi jak w typowym Ultrabooku, ale jak na tak duży laptop do gier nie jest źle.
Ładowanie od pustego do pełnego trwa około 2 godzin przy użyciu dołączonego adaptera AC z beczką. Ładowarki USB-C nie są obsługiwane, co jest szkodą, ponieważ oznacza to, że jesteś uwiązany do ogromnego 330 W adaptera AC gdziekolwiek pójdziesz.
| Alienware m18 R1 i9-13980HX, GeForce RTX 4090 Laptop GPU, 97 Wh | Razer Blade 18 RTX 4070 i9-13950HX, GeForce RTX 4070 Laptop GPU, 91.7 Wh | Asus ROG Strix Scar 18 2023 G834JY-N6005W i9-13980HX, GeForce RTX 4090 Laptop GPU, 90 Wh | Eluktronics Mech-17 GP2 i9-13900HX, GeForce RTX 4090 Laptop GPU, 99 Wh | MSI Titan GT77 HX 13VI i9-13950HX, GeForce RTX 4090 Laptop GPU, 99.9 Wh | Alienware x17 R2 P48E i9-12900HK, GeForce RTX 3080 Ti Laptop GPU, 87 Wh | |
|---|---|---|---|---|---|---|
| Czasy pracy | 35% | 47% | 19% | 62% | -23% | |
| Reader / Idle (h) | 5.6 | 7 25% | 3.9 -30% | |||
| WiFi v1.3 (h) | 4.3 | 4 -7% | 7.1 65% | 5.1 19% | 5.3 23% | 2 -53% |
| Load (h) | 0.7 | 1.3 86% | 0.9 29% | 1.4 100% | 0.8 14% | |
| H.264 (h) | 7 | 6 | ||||
| Witcher 3 ultra (h) | 0.9 |
Za
Przeciw
Werdykt - Dziewięć funtów czystej mocy
Laptopy Alienware zawsze miały mentalność "wydajność za wszelką cenę" i Alienware m18 R1 nie jest wyjątkiem. Ta maszyna nie boi się być jednym z największych, najcięższych, a nawet najgłośniejszych laptopów na rynku, jeśli oznacza to, że może wycisnąć nieco więcej wydajności z procesora i układu graficznego lub wprowadzić więcej funkcji, które docenią zagorzali gracze. Użytkownicy, którzy zamierzają wykorzystać 4x dyski SSD M.2, szerokie opcje portów, zintegrowany numpad i szybką częstotliwość odświeżania 480 Hz, a przy tym nie przeszkadza im nieporęczna waga i ogromny zasilacz sieciowy, będą mieli wiele powodów do zadowolenia z Alienware m18 R1.
Jeśli zależy Ci na maksymalnej wydajności i funkcjach, nawet jeśli oznacza to znacznie cięższy i większy laptop, to Alienware m18 R1 jest dla Ciebie.
Jeśli powyższe cechy dodatkowe Cię nie ekscytują, to możesz uzyskać niemal taką samą wydajność rdzeniową z wyraźnie lżejszego Razer Blade 18 lub Asus ROG Strix 18. Chcielibyśmy również zobaczyć ulepszenia w nowym oprogramowaniu Alienware Command Center, ponieważ czasami ładuje się ono niezwykle wolno.
Cena i dostępność
Alienware m18 R1 jest obecnie sprzedawany bezpośrednio przez firmę Dell w cenie od 2100 USD za konfigurację z procesorem Core i7/RTX 4060 do ponad 5000 USD w przypadku pełnej konfiguracji. Nasz egzemplarz w recenzji kosztuje około 3700 USD. W chwili pisania tego tekstu model ten nie jest jeszcze szeroko dostępny u innych dużych sprzedawców.
Alienware m18 R1
- 01/04/2023 v7 (old)
Allen Ngo
Przezroczystość
Wyboru urządzeń do recenzji dokonuje nasza redakcja. Próbka testowa została udostępniona autorowi jako pożyczka od producenta lub sprzedawcy detalicznego na potrzeby tej recenzji. Pożyczkodawca nie miał wpływu na tę recenzję, producent nie otrzymał też kopii tej recenzji przed publikacją. Nie było obowiązku publikowania tej recenzji. Jako niezależna firma medialna, Notebookcheck nie podlega władzy producentów, sprzedawców detalicznych ani wydawców.
Tak testuje Notebookcheck
Każdego roku Notebookcheck niezależnie sprawdza setki laptopów i smartfonów, stosując standardowe procedury, aby zapewnić porównywalność wszystkich wyników. Od około 20 lat stale rozwijamy nasze metody badawcze, ustanawiając przy tym standardy branżowe. W naszych laboratoriach testowych doświadczeni technicy i redaktorzy korzystają z wysokiej jakości sprzętu pomiarowego. Testy te obejmują wieloetapowy proces walidacji. Nasz kompleksowy system ocen opiera się na setkach uzasadnionych pomiarów i benchmarków, co pozwala zachować obiektywizm.Price comparison

