Recenzja Dell OptiPlex Micro Plus 7010: Desktop Core i7-13700 w opakowaniu mini PC

OptiPlex Micro to mini PC zaprojektowany do celów komercyjnych i profesjonalnych, ale jego kompaktowa obudowa ma swoje zastosowania w środowiskach WFH, zwłaszcza w porównaniu ze standardowymi pełnowymiarowymi modelami OptiPlex. Ten konkretny model wyróżnia się procesorem do komputerów stacjonarnych, podczas gdy większość innych mini PC opiera się na mobilnych procesorach z serii H lub HX.
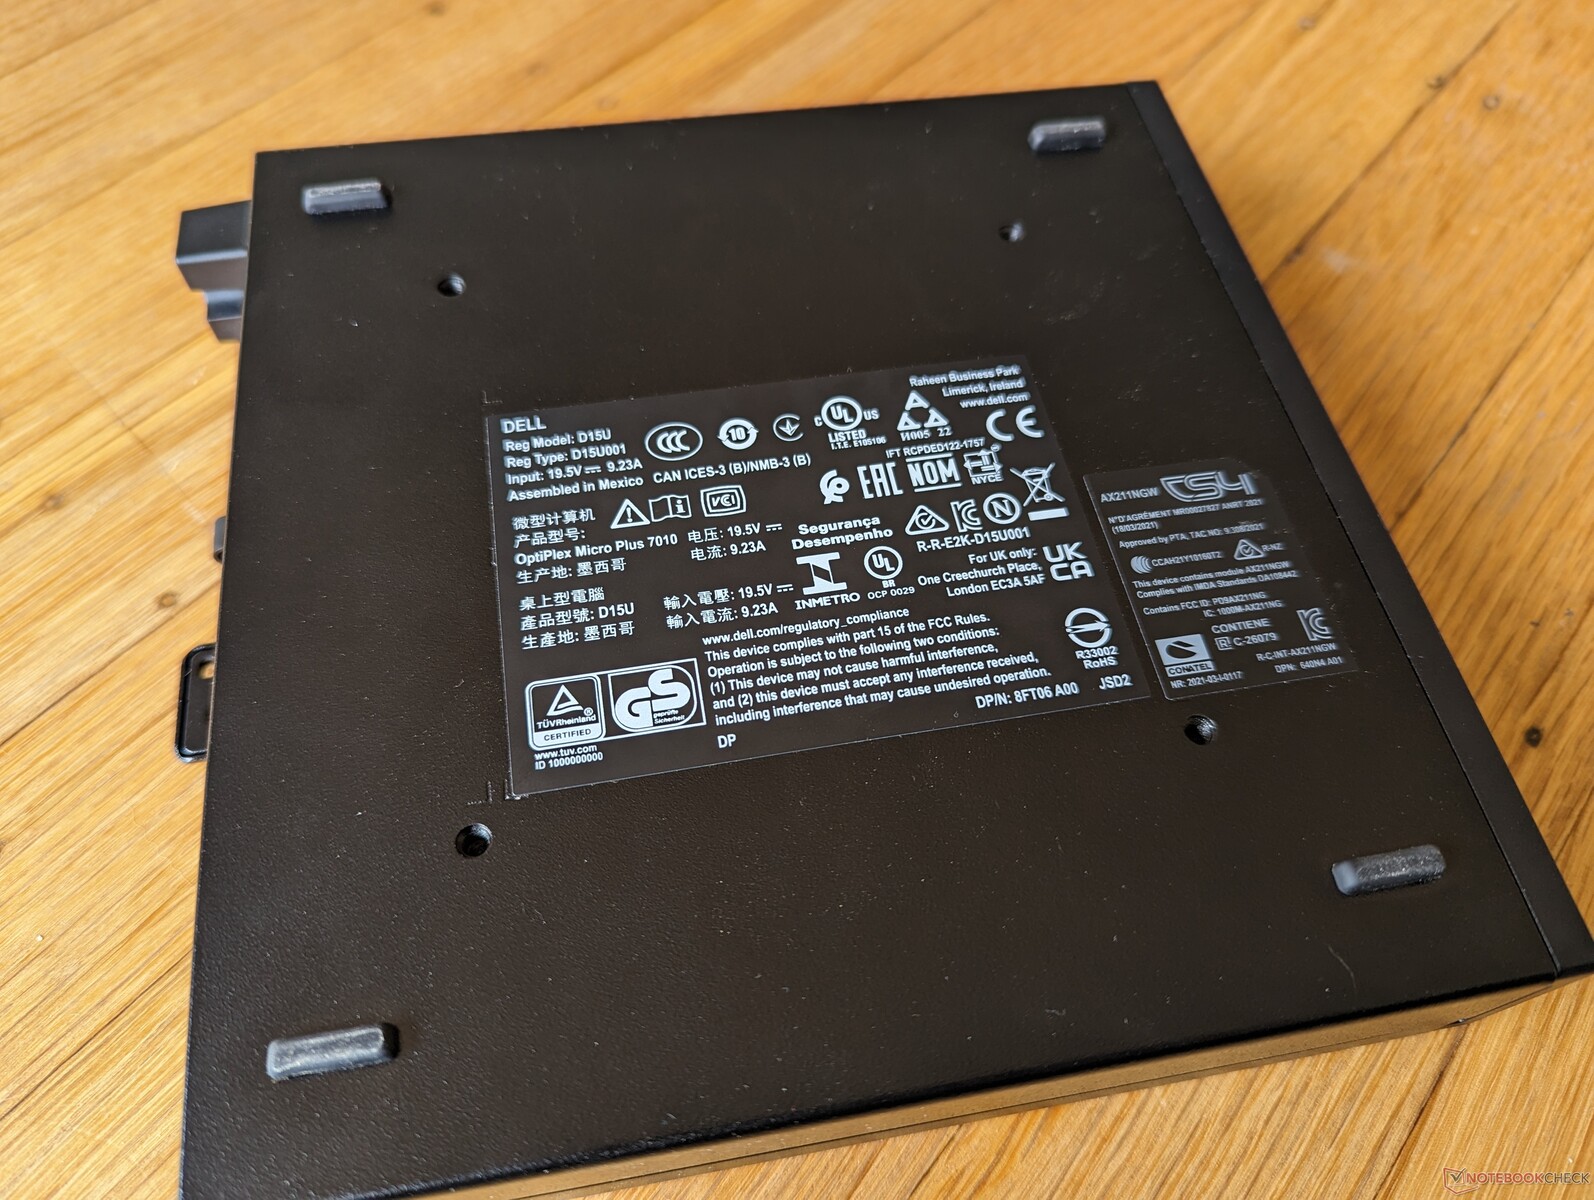
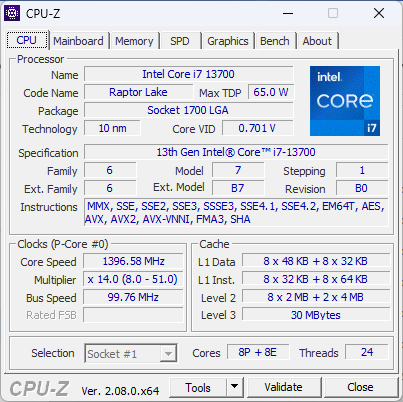
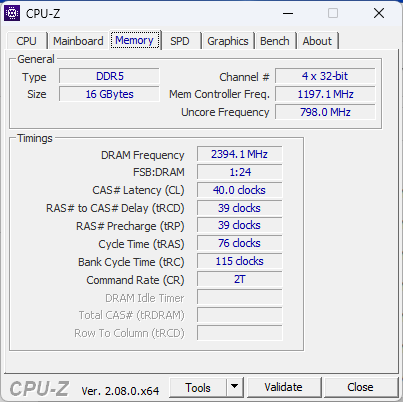
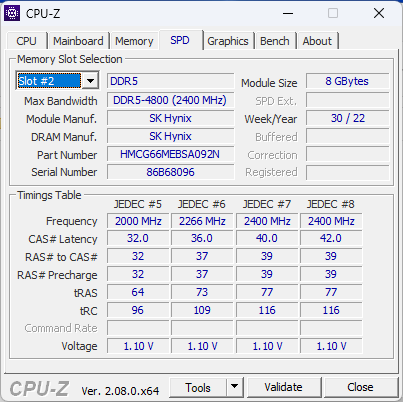
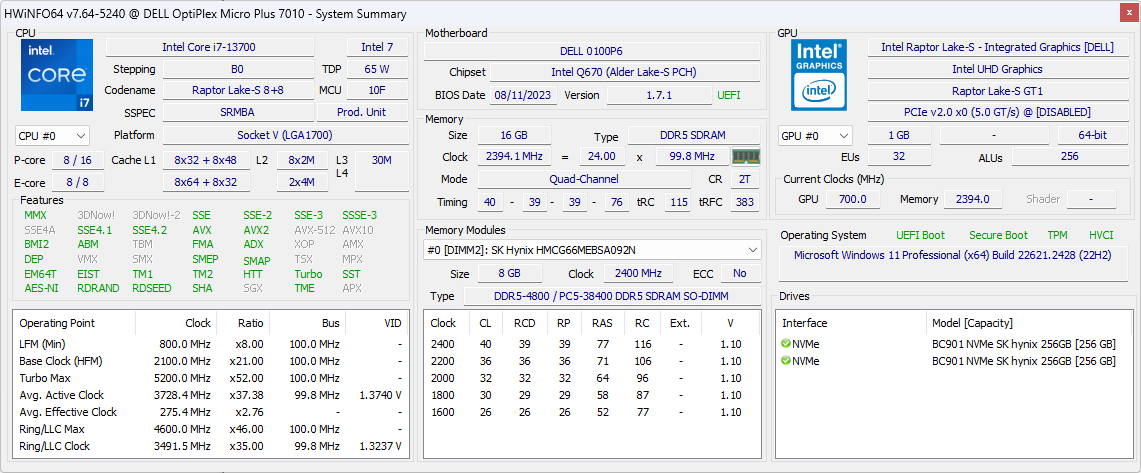
Nasza konkretna jednostka testowa została skonfigurowana z procesorem Core i7-13700 13. generacji, 16 GB pamięci RAM DDR5-4800 i 512 GB SSD w macierzy RAID 0. Niższe konfiguracje zaczynają się od Core i3-13100T za mniej niż 900 USD do Core i9-13900 vPro. Jednostki SKU inne niż Plus mogą być dostarczane z jeszcze wolniejszym Pentium Gold G7400T. Na chwilę obecną żadne konfiguracje nie oferują dyskretnej grafiki ani żadnych alternatyw AMD.
OptiPlex Micro konkuruje z innymi półprofesjonalnymi mini PC, takimi jakApple Mac Mini M2, Beelink GTR7lub Seria Intel NUC.
Więcej recenzji Dell:
Potencjalni konkurenci w porównaniu
Ocena | Data | Model | Waga | Wysokość | Rozmiar | Rezolucja | Cena |
|---|---|---|---|---|---|---|---|
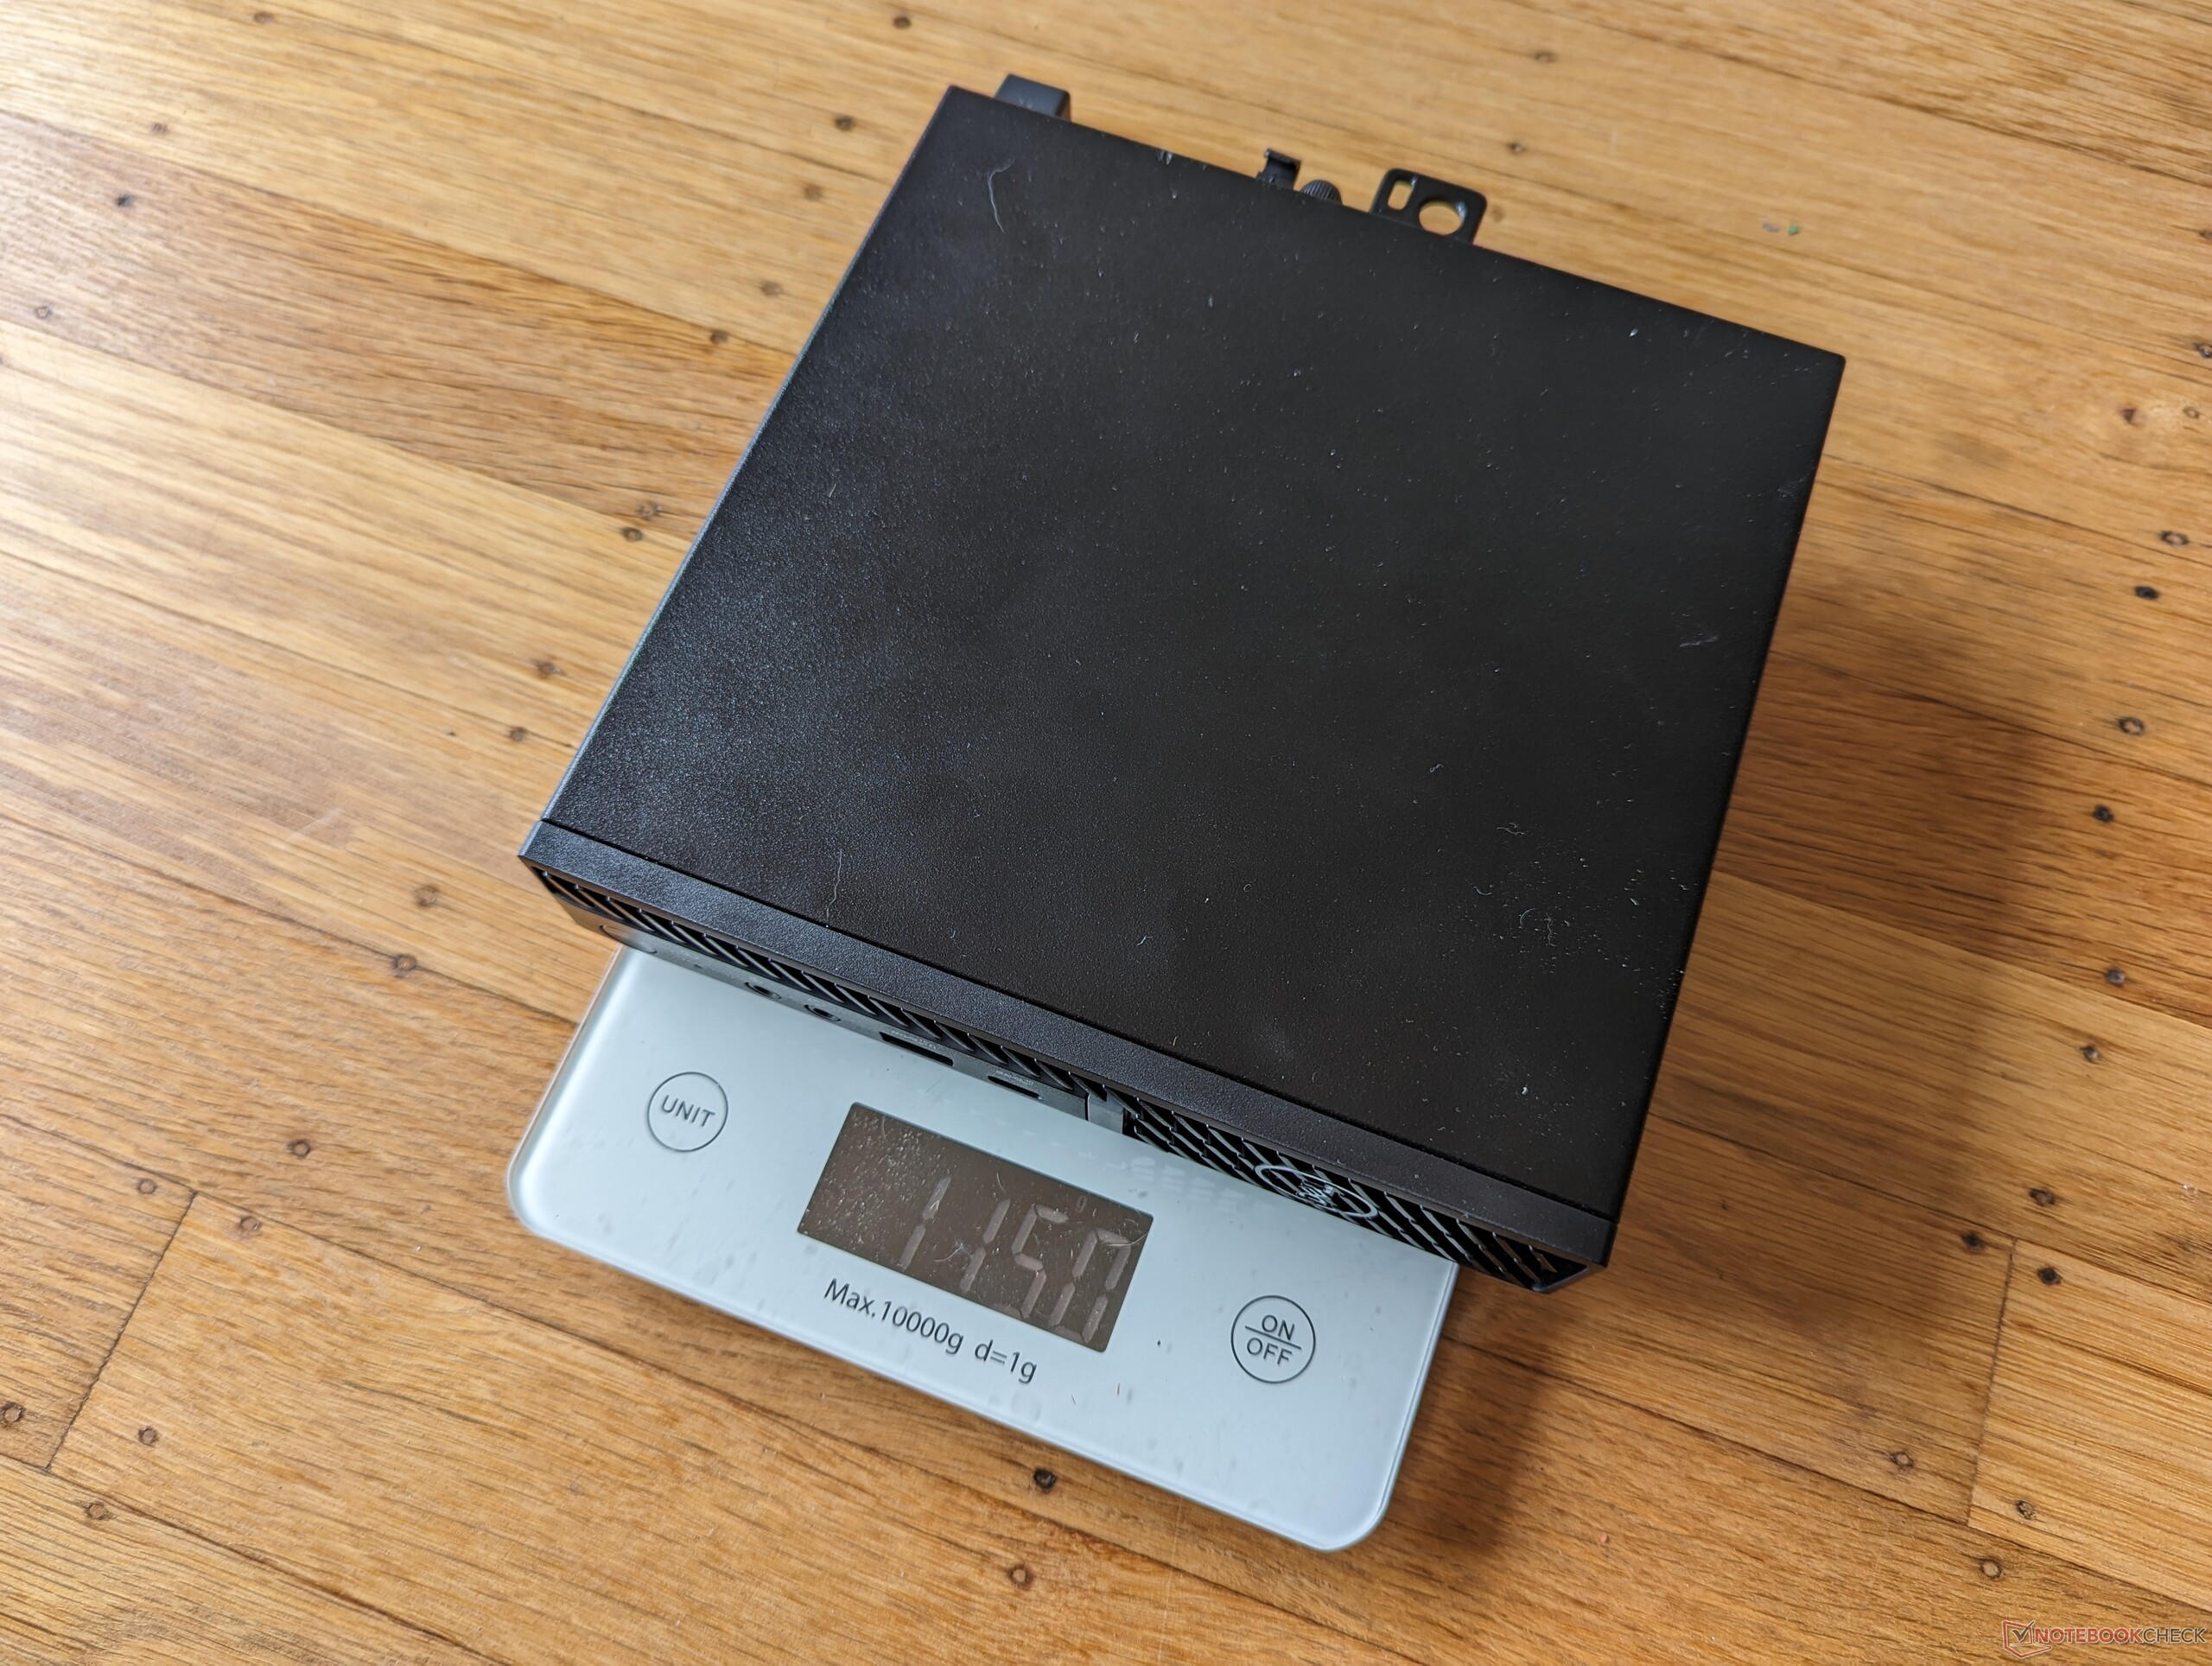
| 80.2 % v7 (old) | 10/2023 | Dell OptiPlex Micro i7-13700, UHD Graphics 770 | 1.2 kg | 36 mm | x | ||
| 87.3 % v7 (old) | 09/2023 | Apple Mac Mini M2 M2, M2 10-Core GPU | 1.2 kg | 36 mm | x | ||
| 81 % v7 (old) | 09/2023 | Lenovo IdeaCentre Mini 01IRH8 i7-13700H, Iris Xe G7 96EUs | 1.8 kg | 39 mm | x | ||
| 82.8 % v7 (old) | 10/2023 | GMK NucBox K3 Pro i7-12650H, UHD Graphics 64EUs | 396 g | 43.2 mm | x | ||
| 86.3 % v7 (old) | 07/2023 | Beelink GTR7 7840HS R7 7840HS, Radeon 780M | 890 g | 48.8 mm | x | ||
| 86.6 % v7 (old) | 09/2023 | Beelink SER7 R7 7840HS, Radeon 780M | 640 g | 49 mm | x |
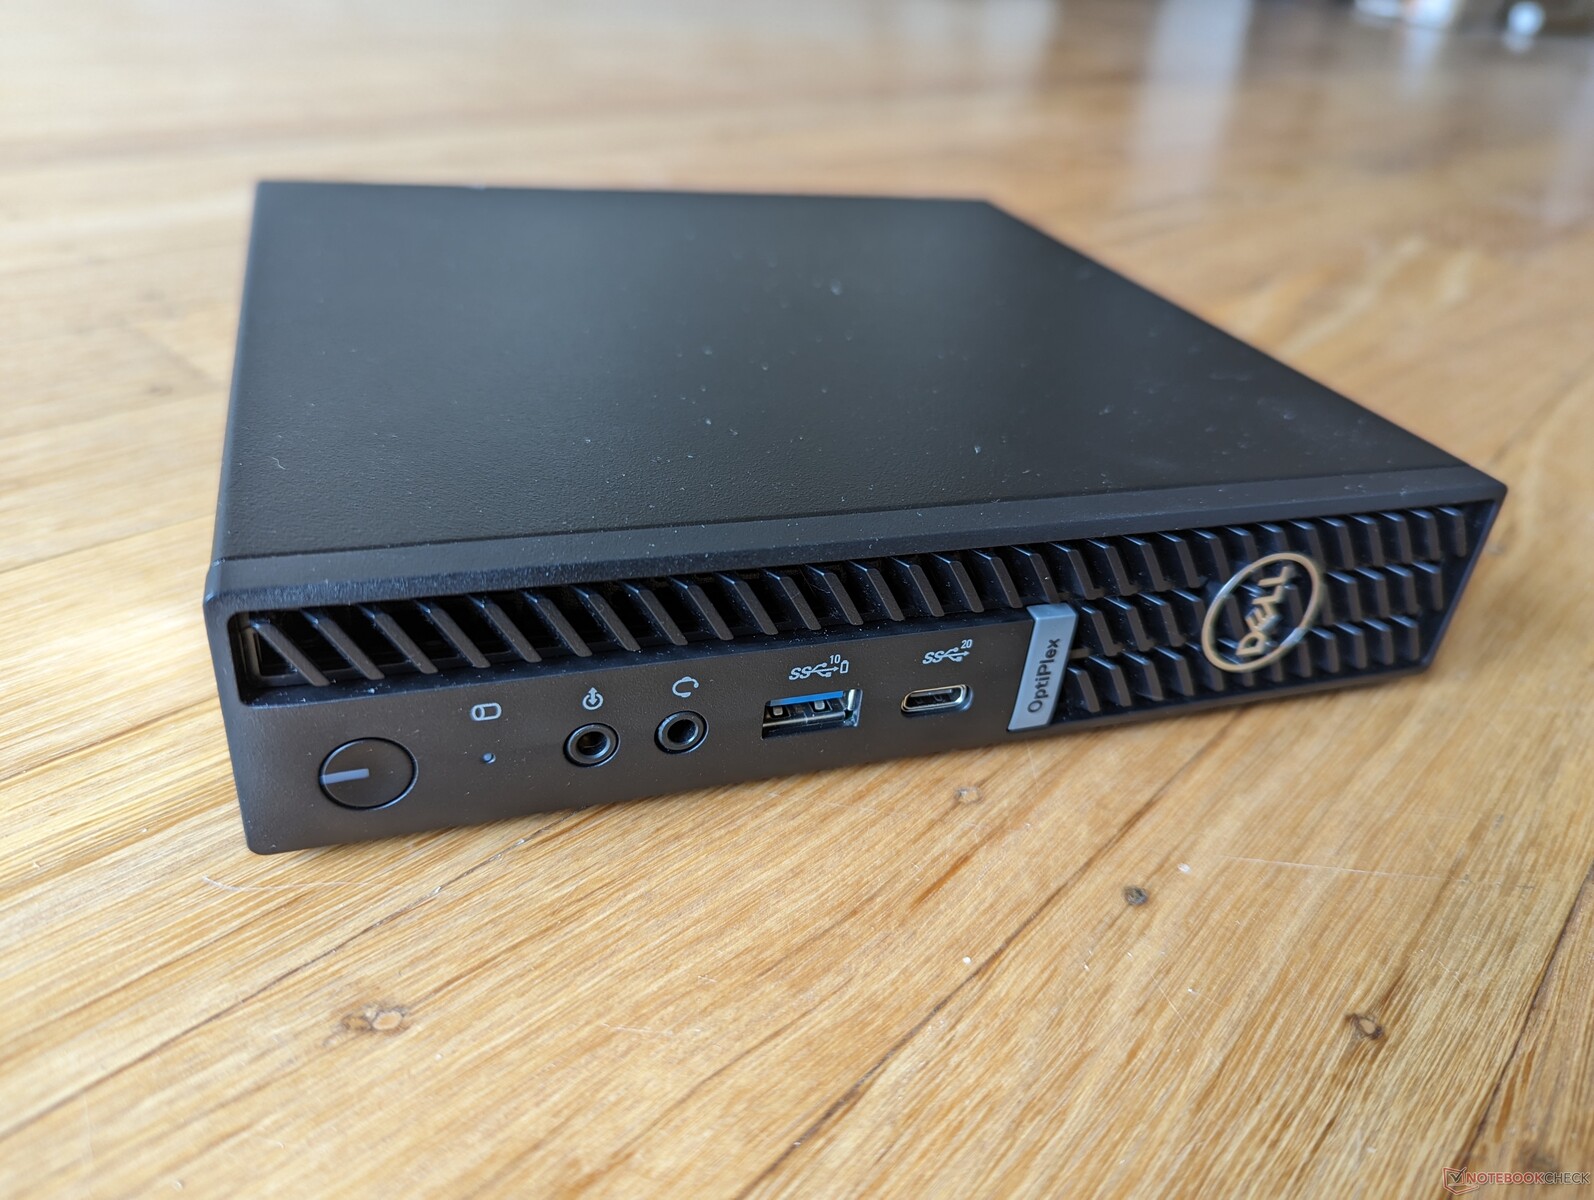
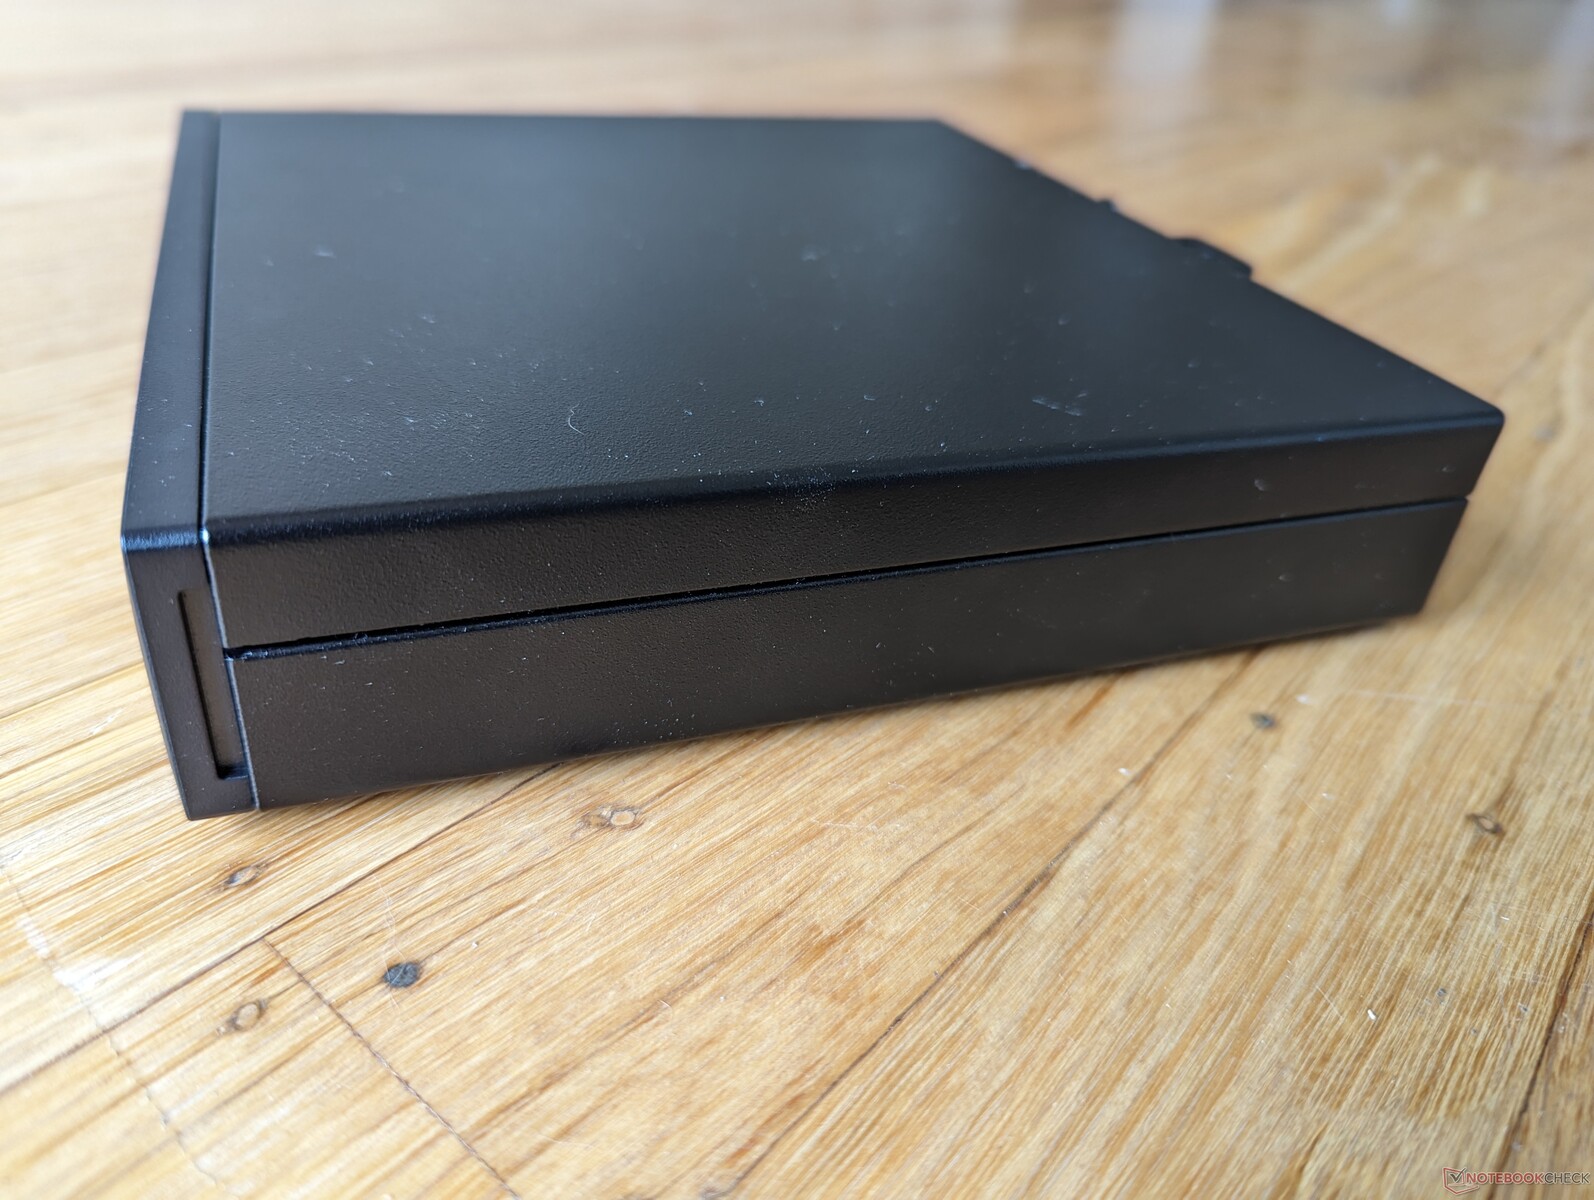
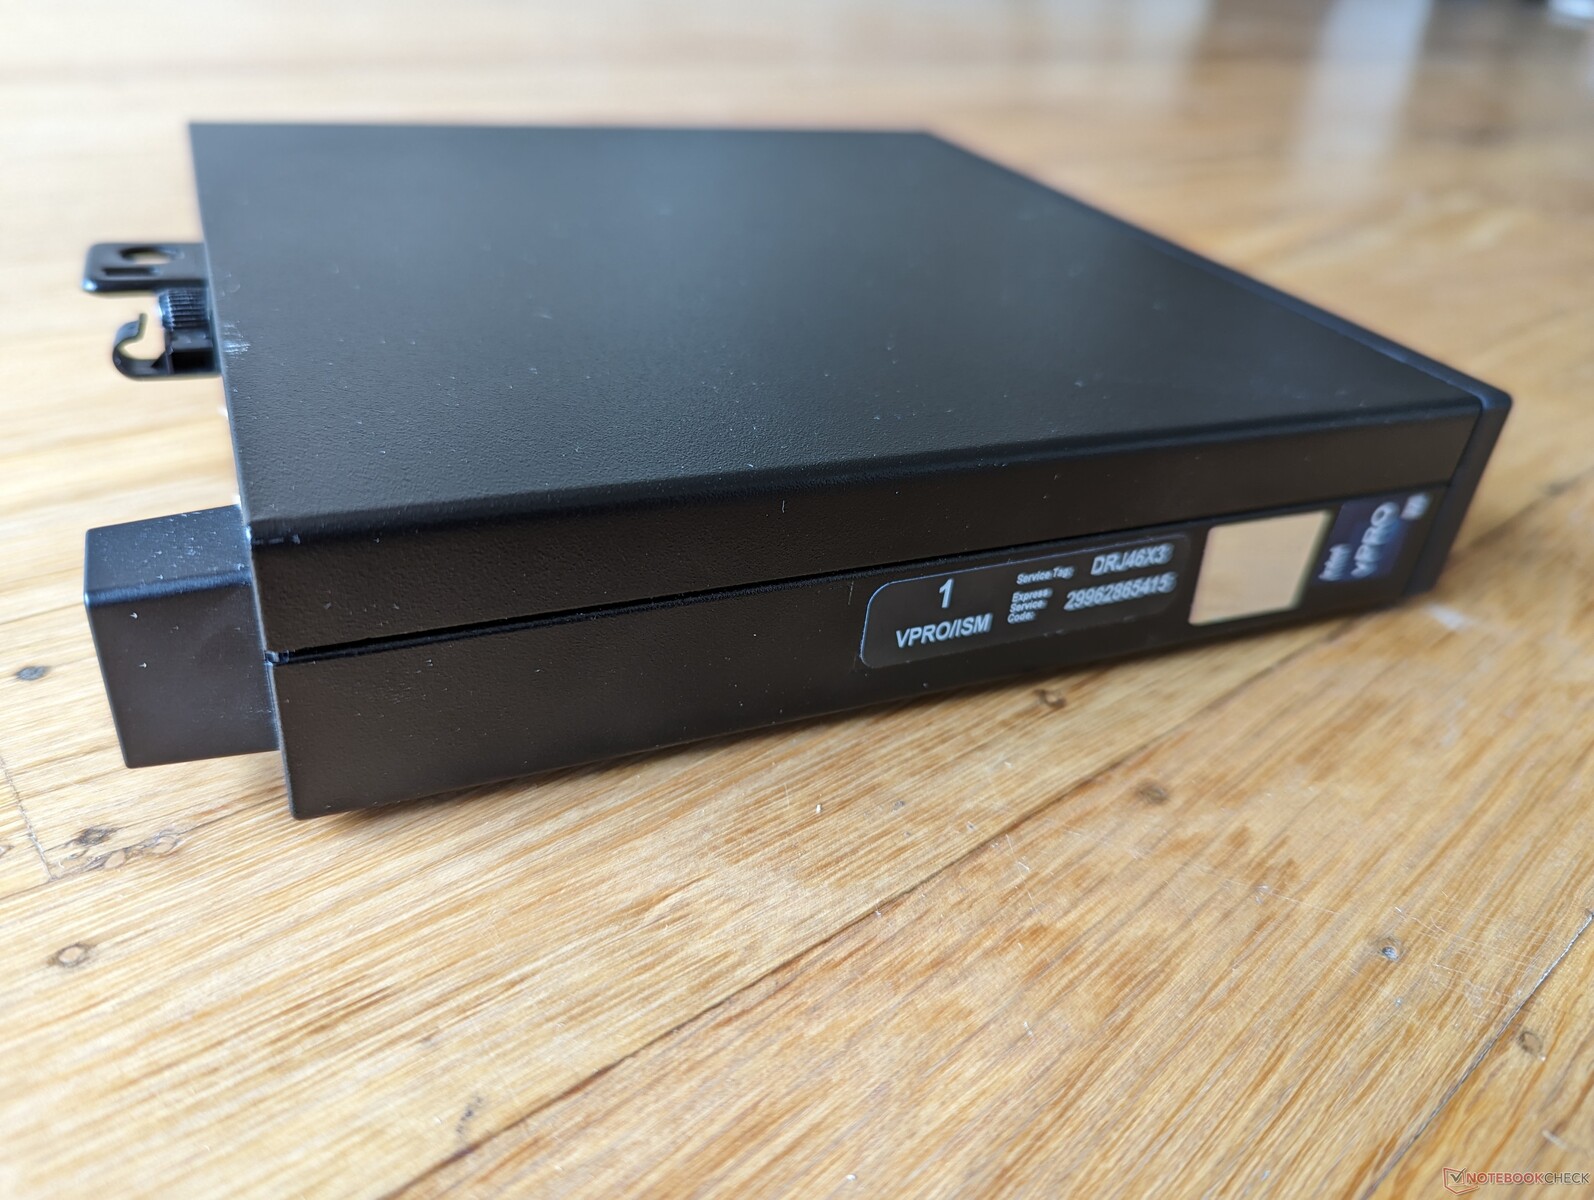
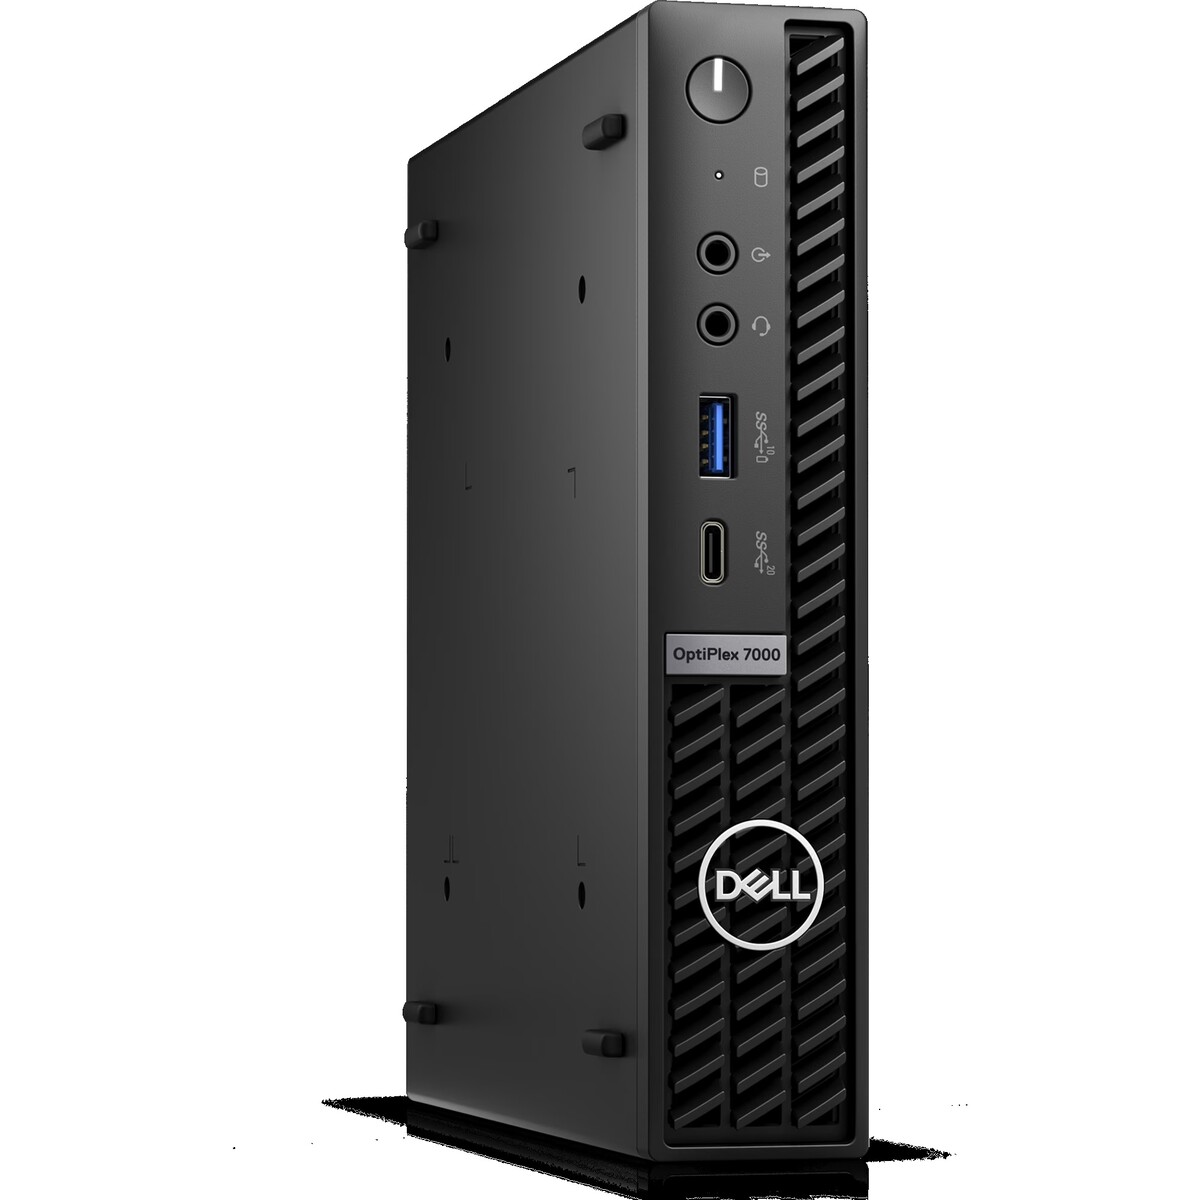
Obudowa - Mini Tower Look
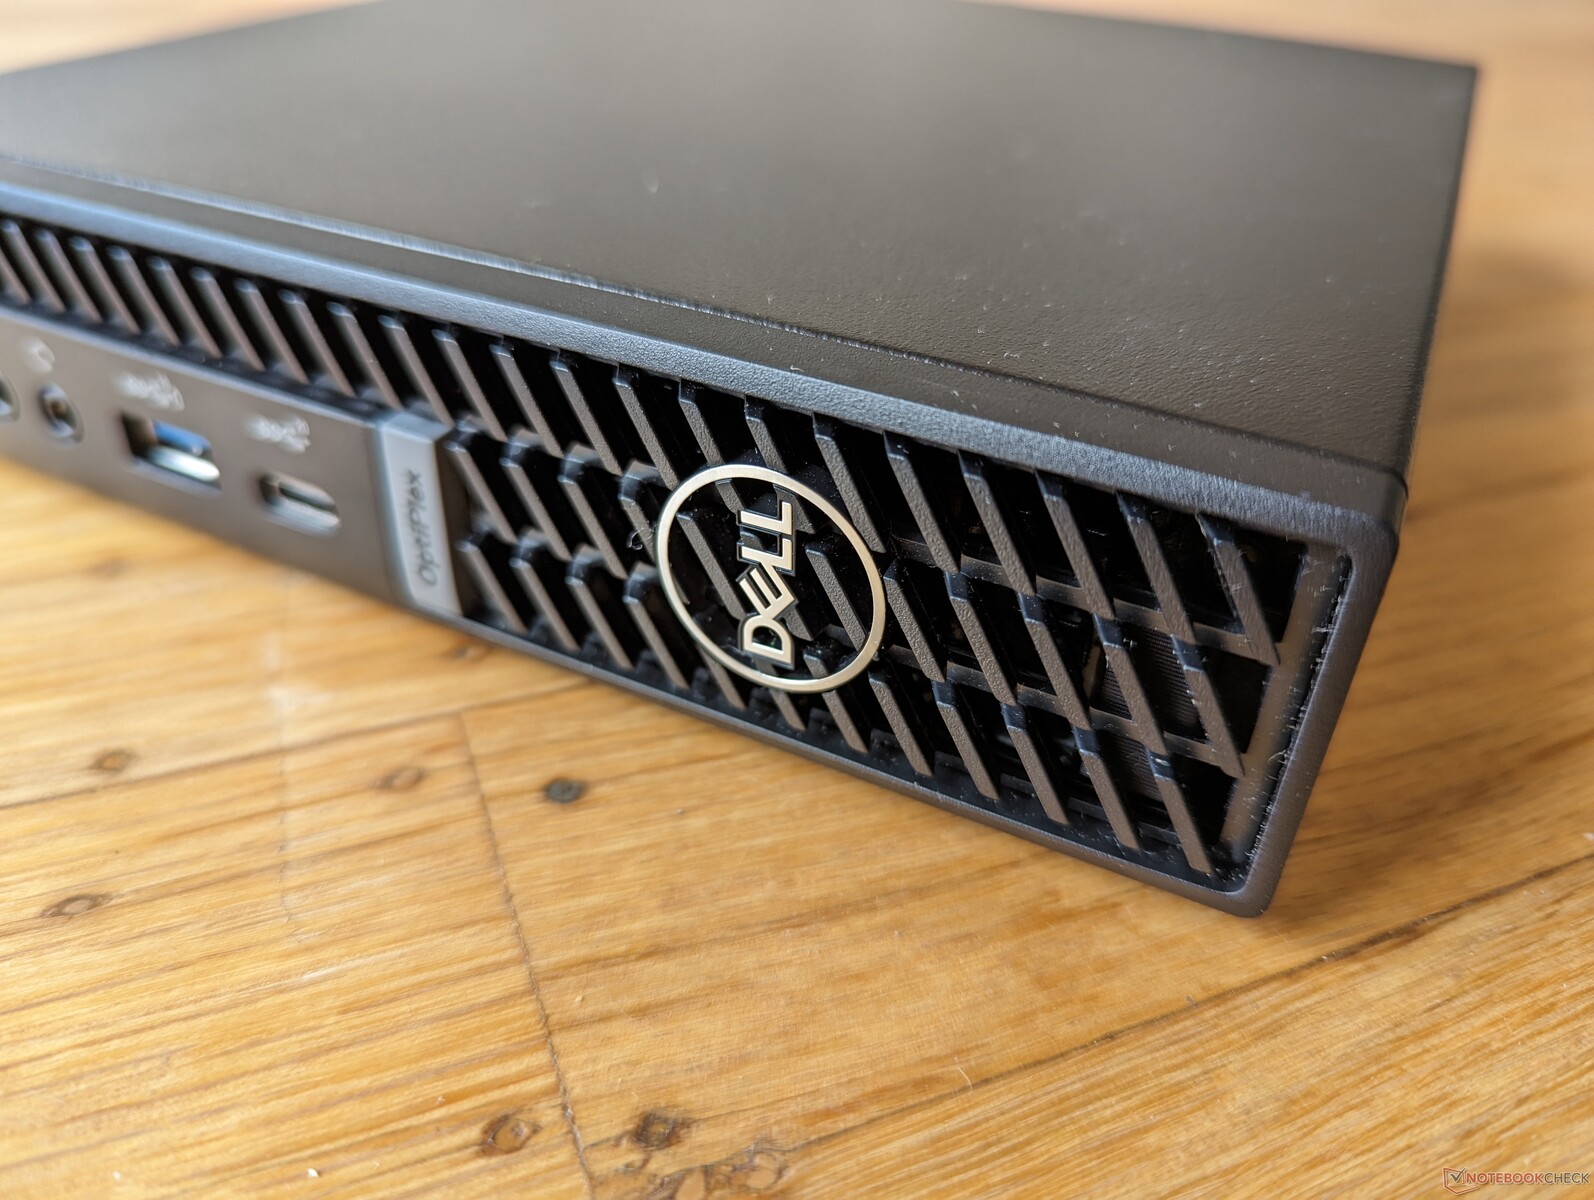
OptiPlex Micro jest dwa razy większy i cięższy od Intel NUC 13 Pro, ale wciąż mniejszy niż Mac Mini a zwłaszcza OptiPlex SFF. Całkowicie metalowa obudowa i charakterystyczna konstrukcja przedniej kratki są poza tym charakterystyczne dla OptiPlex.
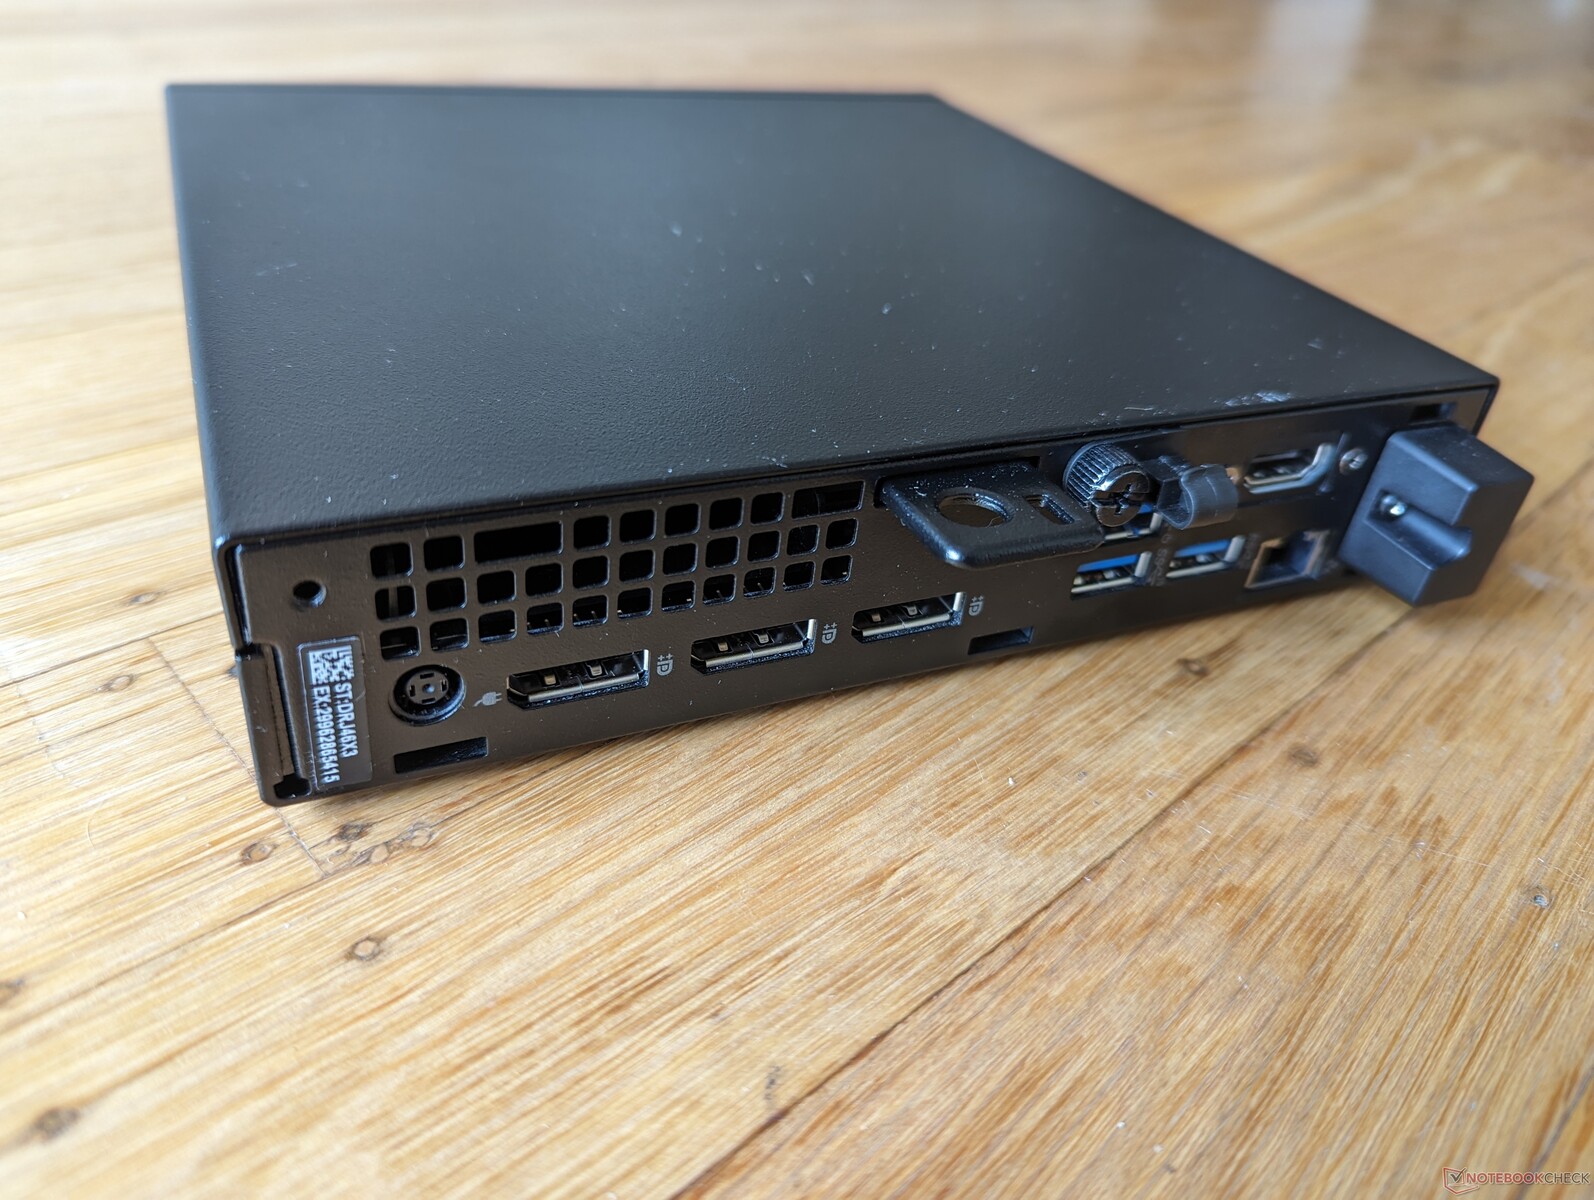
Łączność
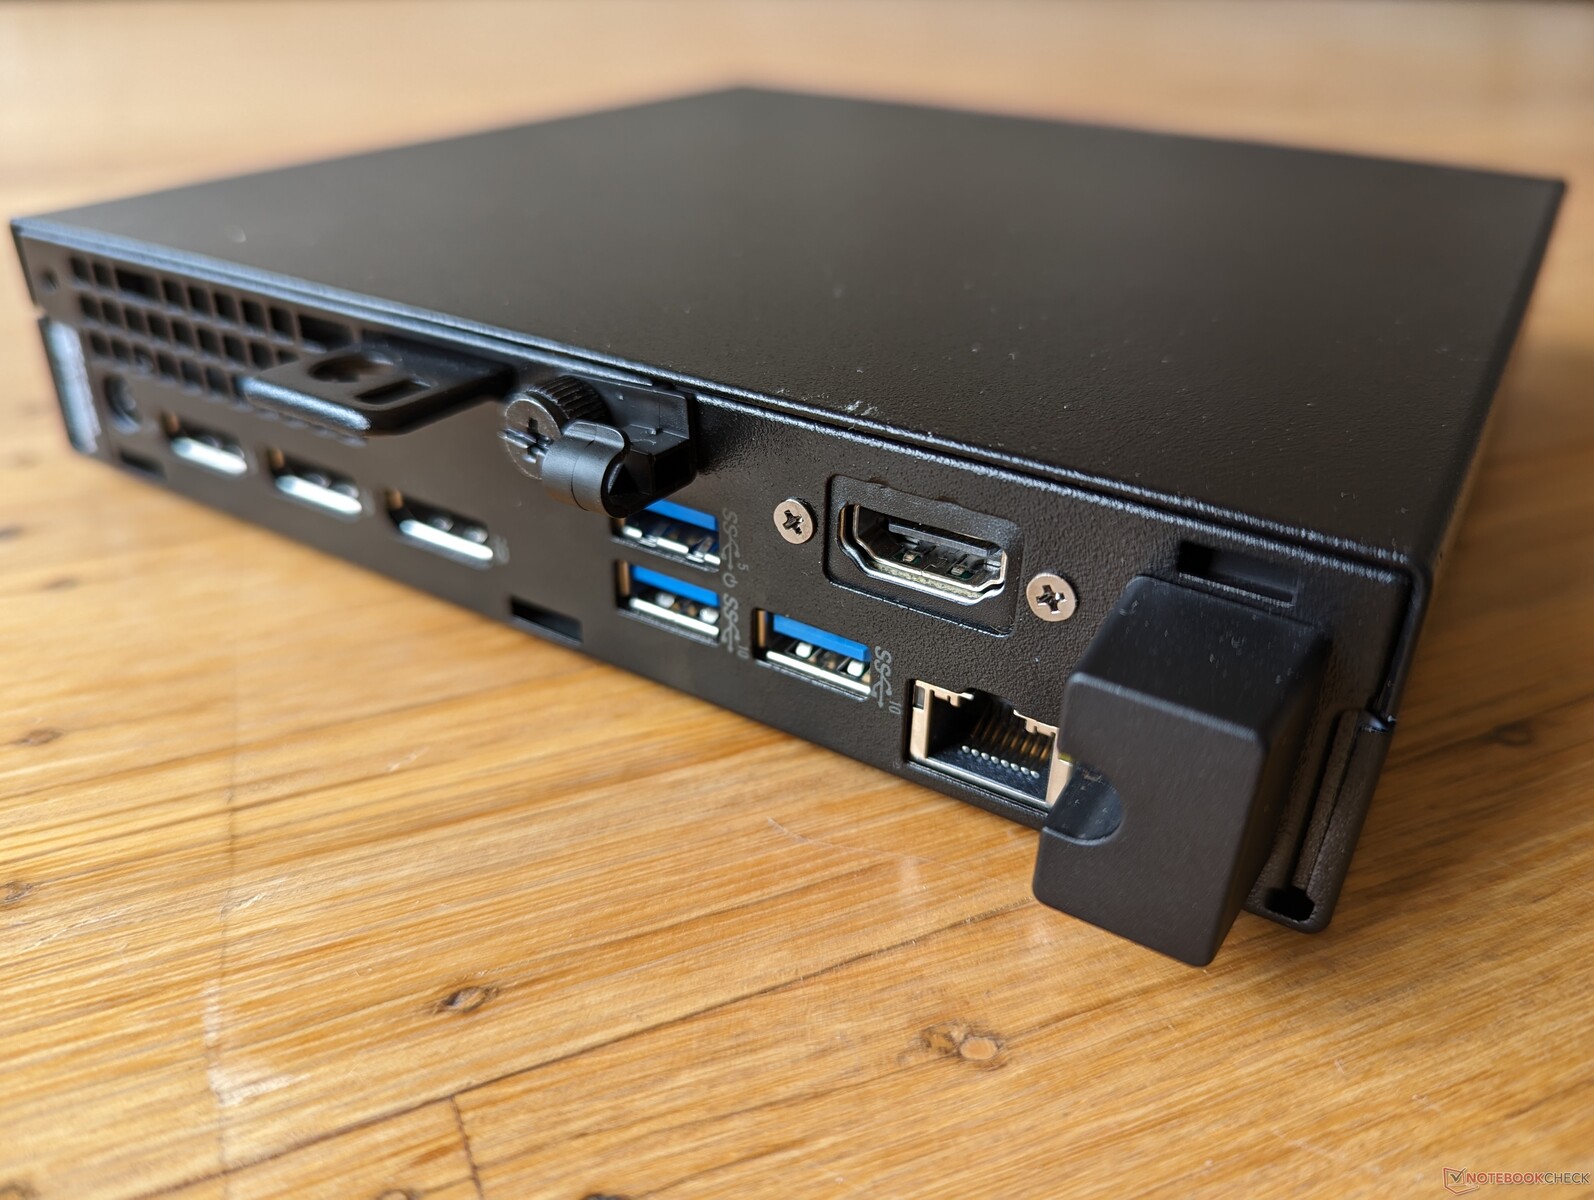
Opcje portów są zróżnicowane, a najbardziej godne uwagi są cztery indywidualne porty wyjścia wideo. Pojedynczy port USB-C nie obsługuje jednak USB4, Thunderbolt, Power Delivery, ani nawet DisplayPort, w przeciwieństwie do portów USB-C w większości komputerów Intel NUC lub mini PC Beelink.
Komunikacja
Dołączony do zestawu układ Intel AX211 oferuje łączność Wi-Fi 6E i Bluetooth 5.3. Wydajność jest niezawodna, bez większych różnic między sieciami 5 GHz i 6 GHz.
| Networking | |
| iperf3 transmit AXE11000 | |
| Apple Mac Mini M2 | |
| Beelink SER7 | |
| GMK NucBox K3 Pro | |
| Beelink GTR7 7840HS | |
| Dell OptiPlex Micro | |
| Lenovo IdeaCentre Mini 01IRH8 | |
| iperf3 receive AXE11000 | |
| Apple Mac Mini M2 | |
| GMK NucBox K3 Pro | |
| Beelink GTR7 7840HS | |
| Beelink SER7 | |
| Dell OptiPlex Micro | |
| Lenovo IdeaCentre Mini 01IRH8 | |
| iperf3 transmit AXE11000 6GHz | |
| Dell OptiPlex Micro | |
| iperf3 receive AXE11000 6GHz | |
| Dell OptiPlex Micro | |
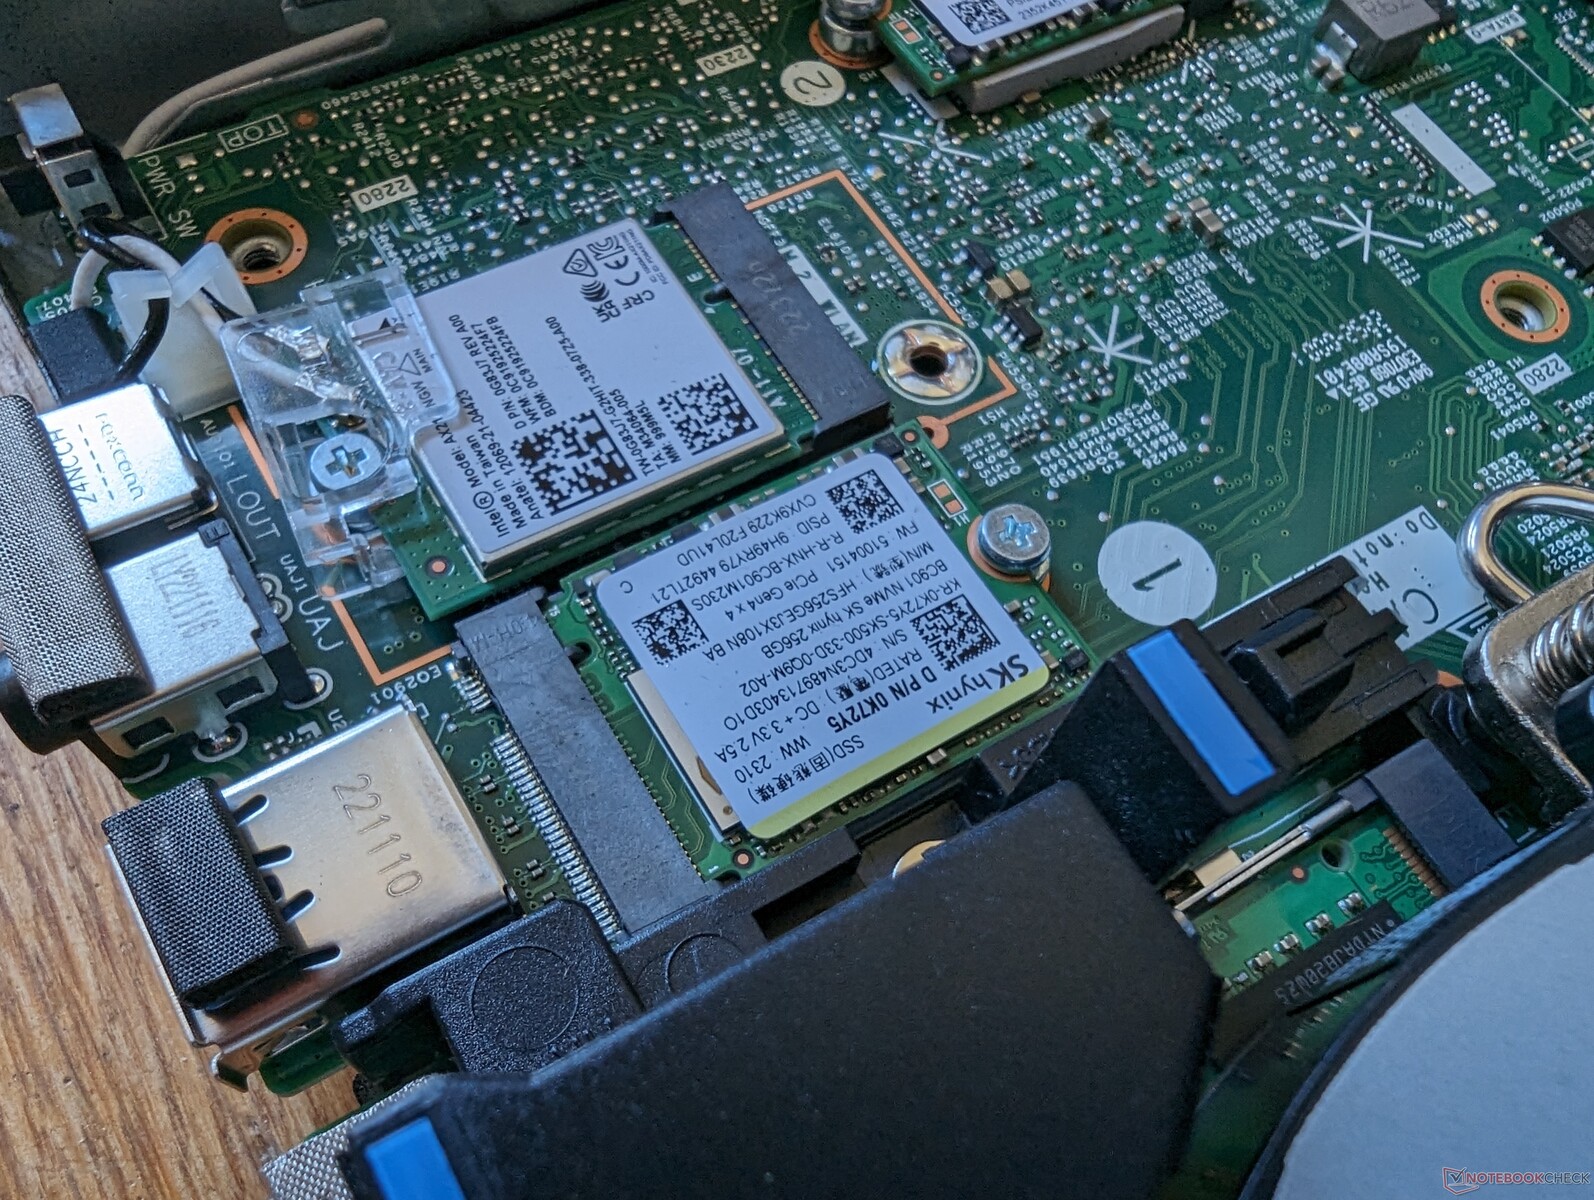
Konserwacja
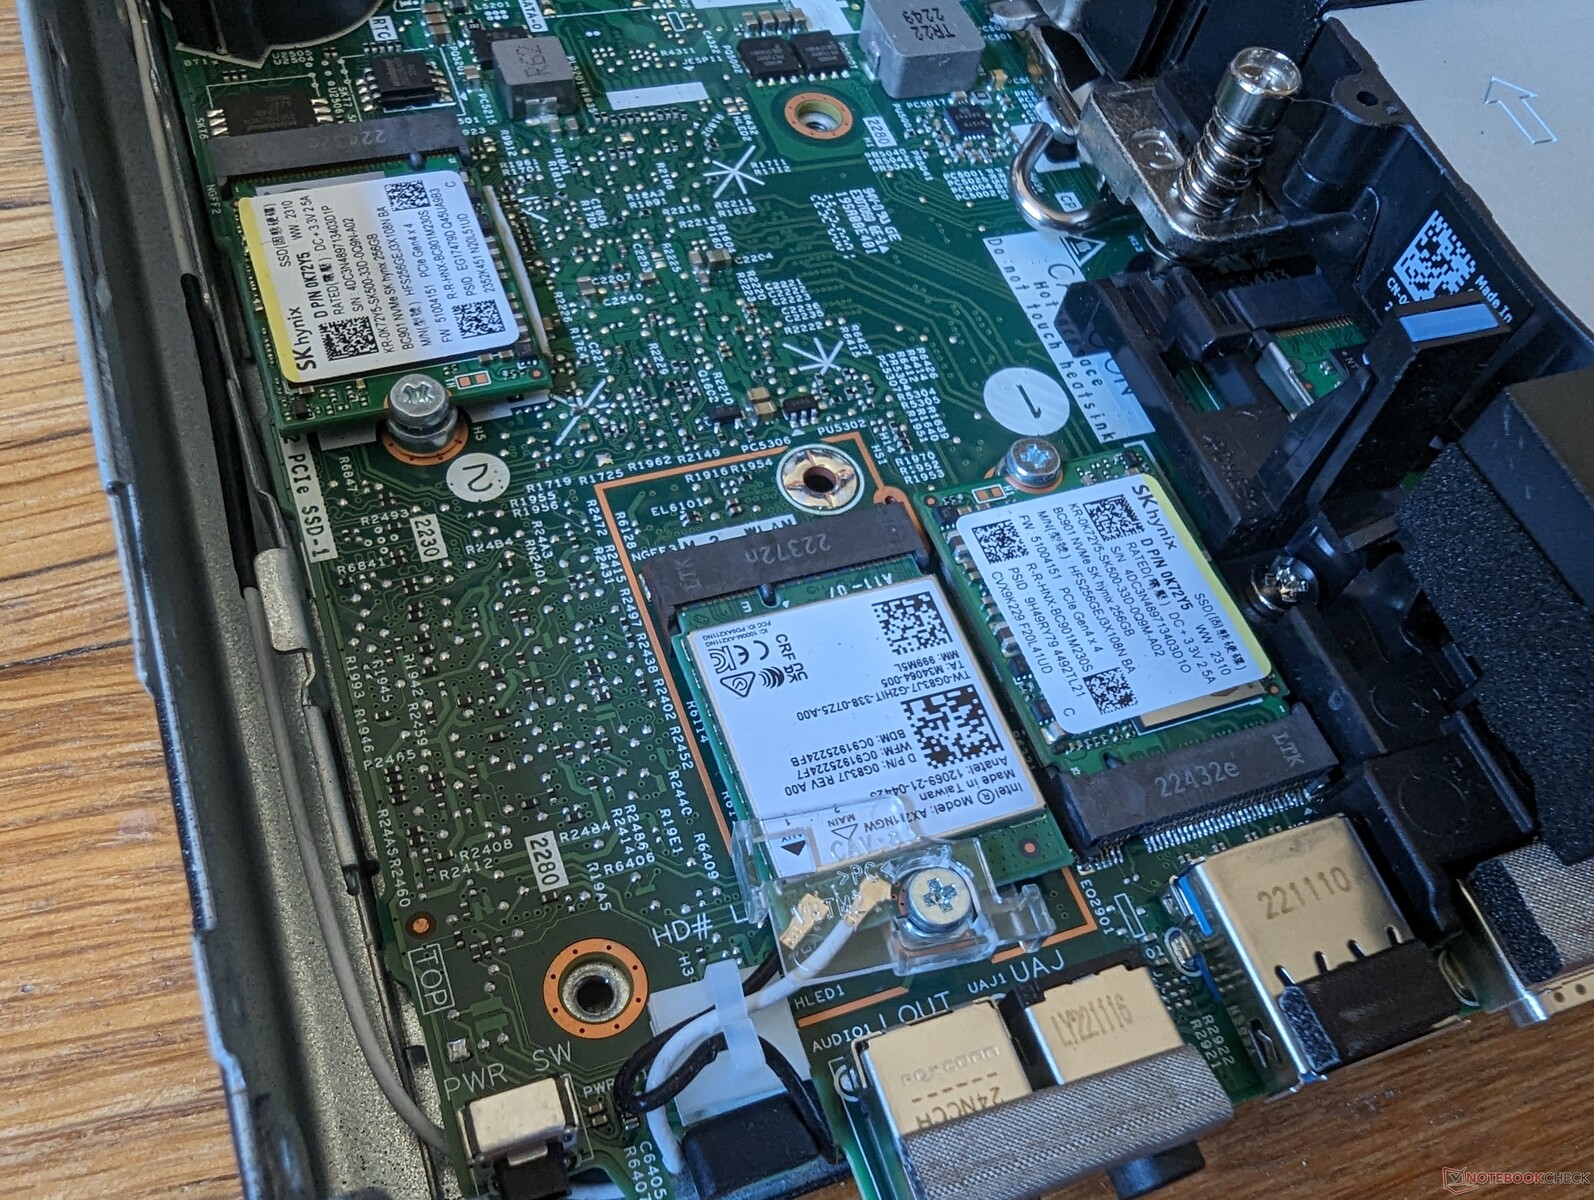
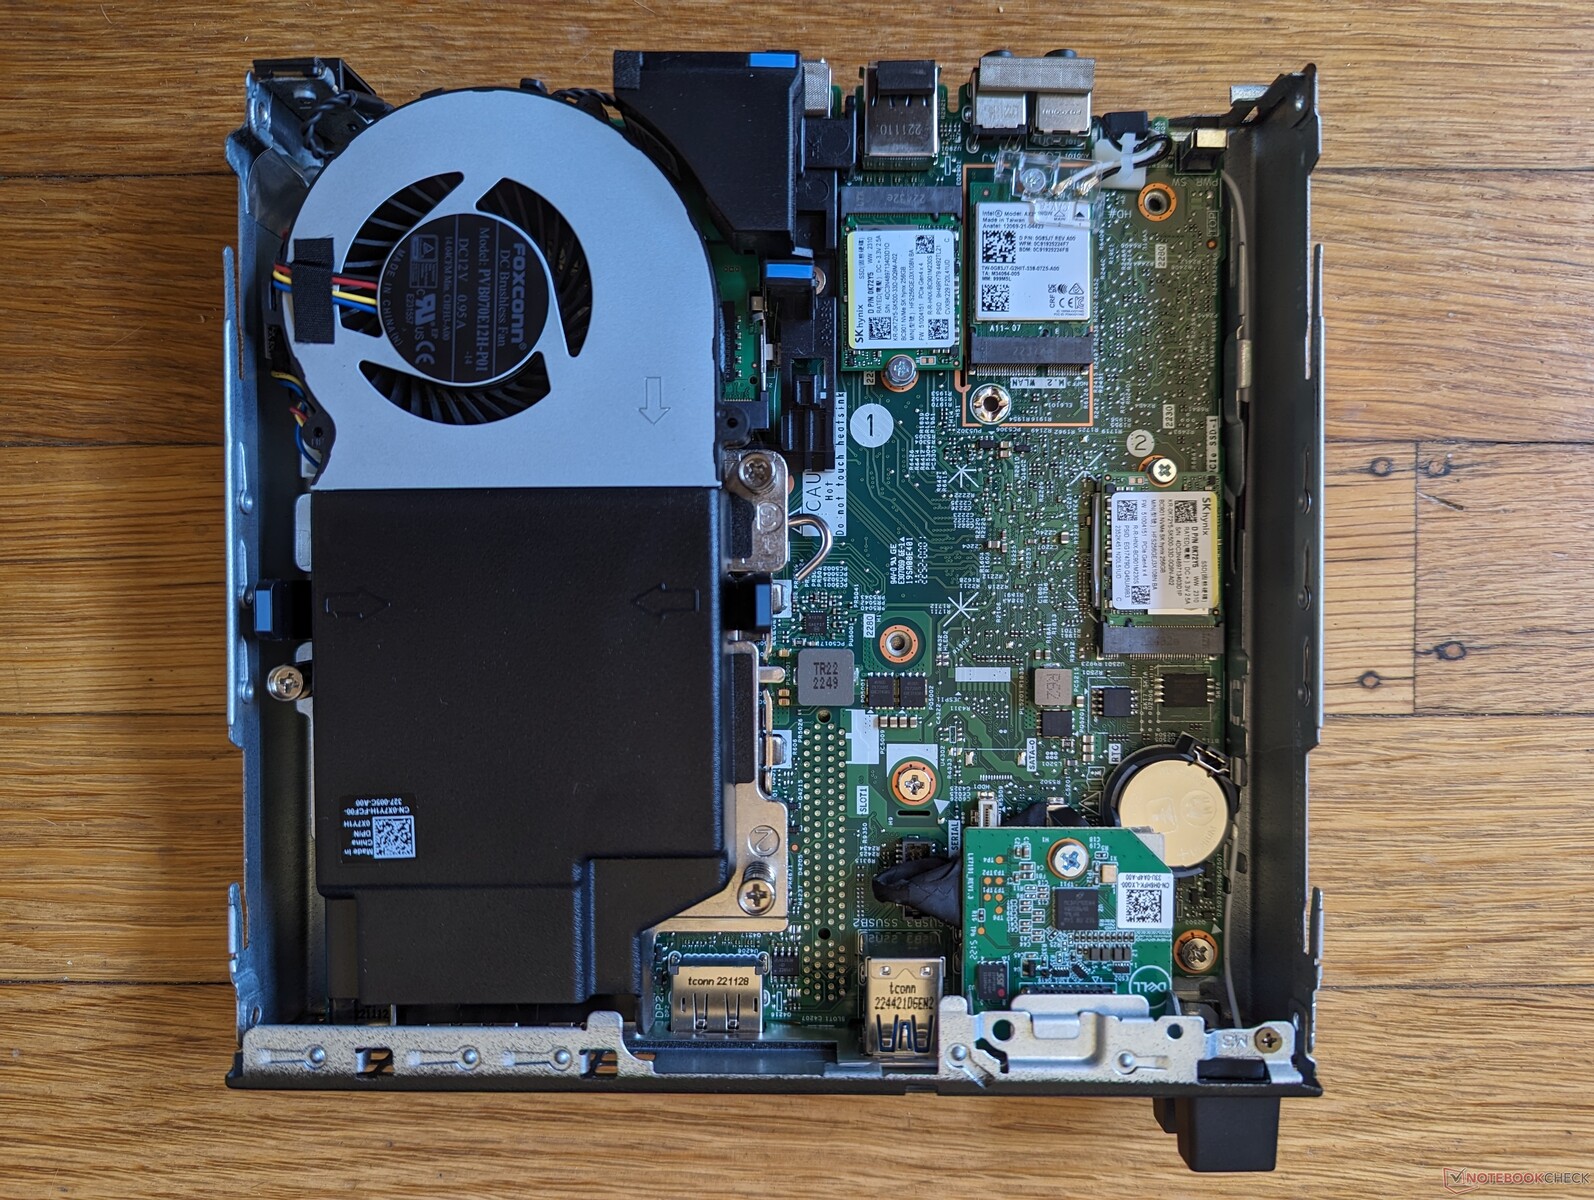
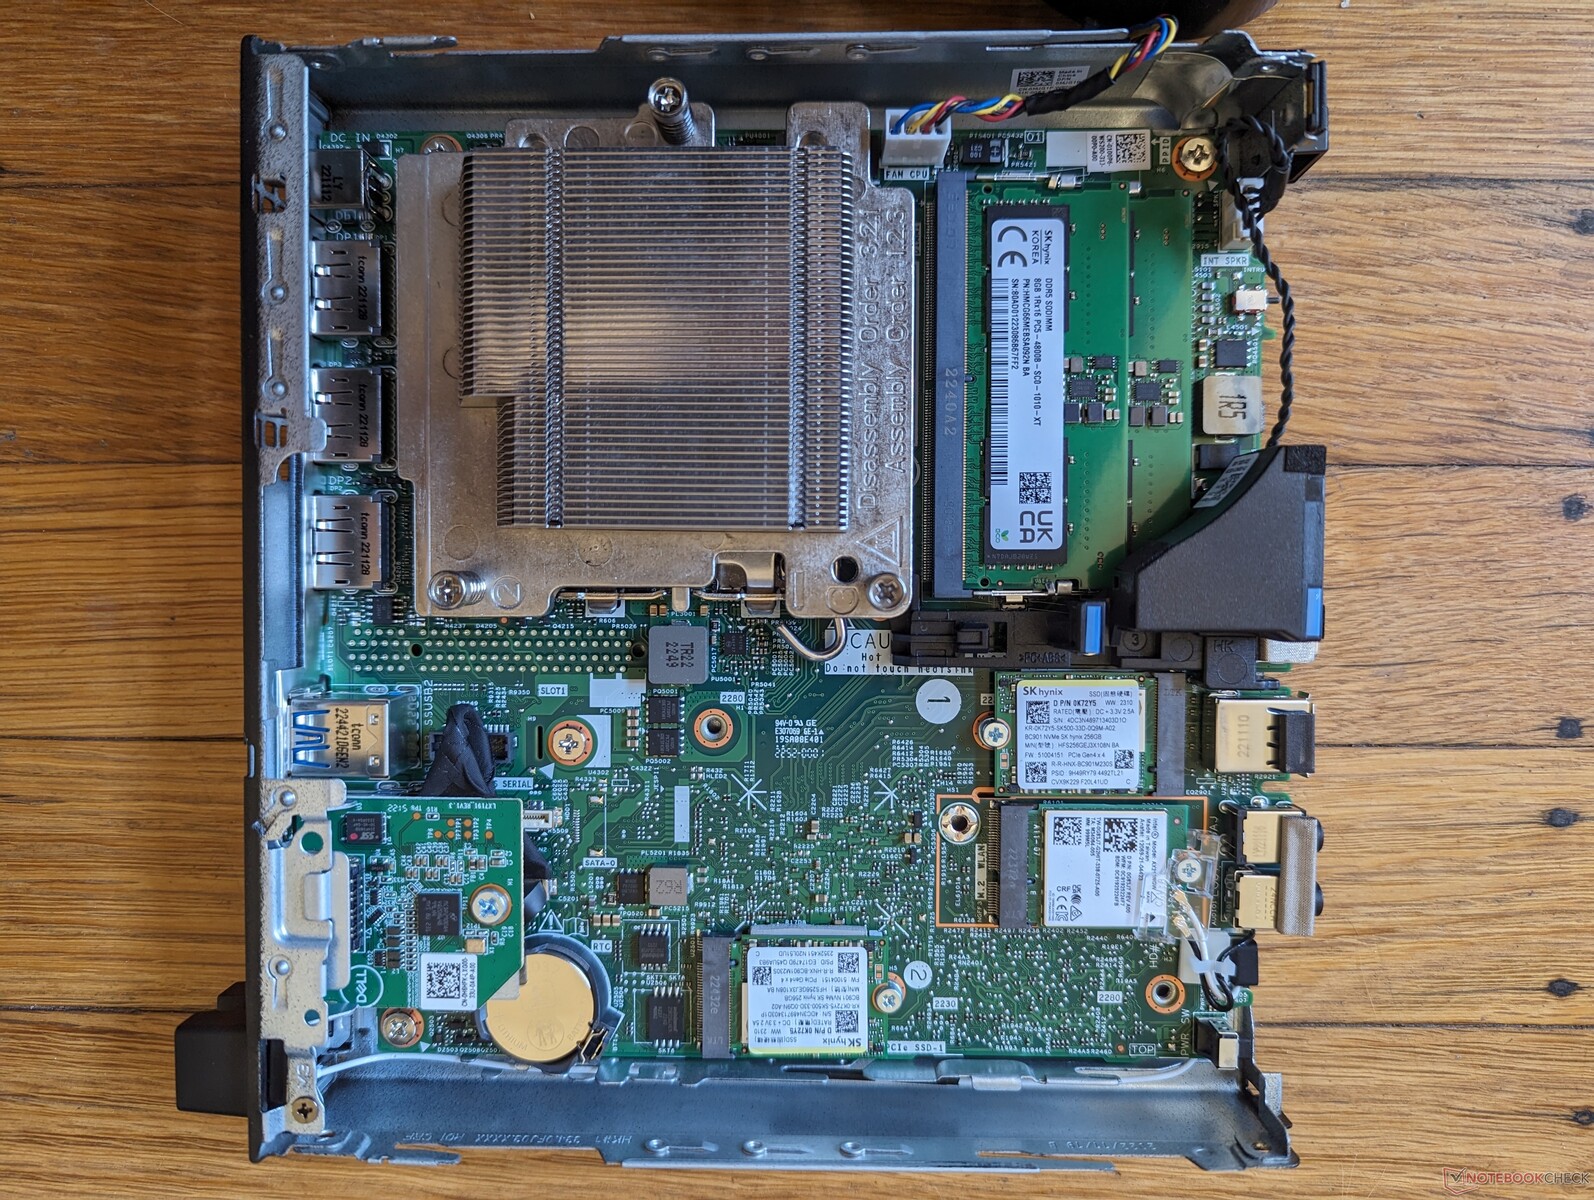
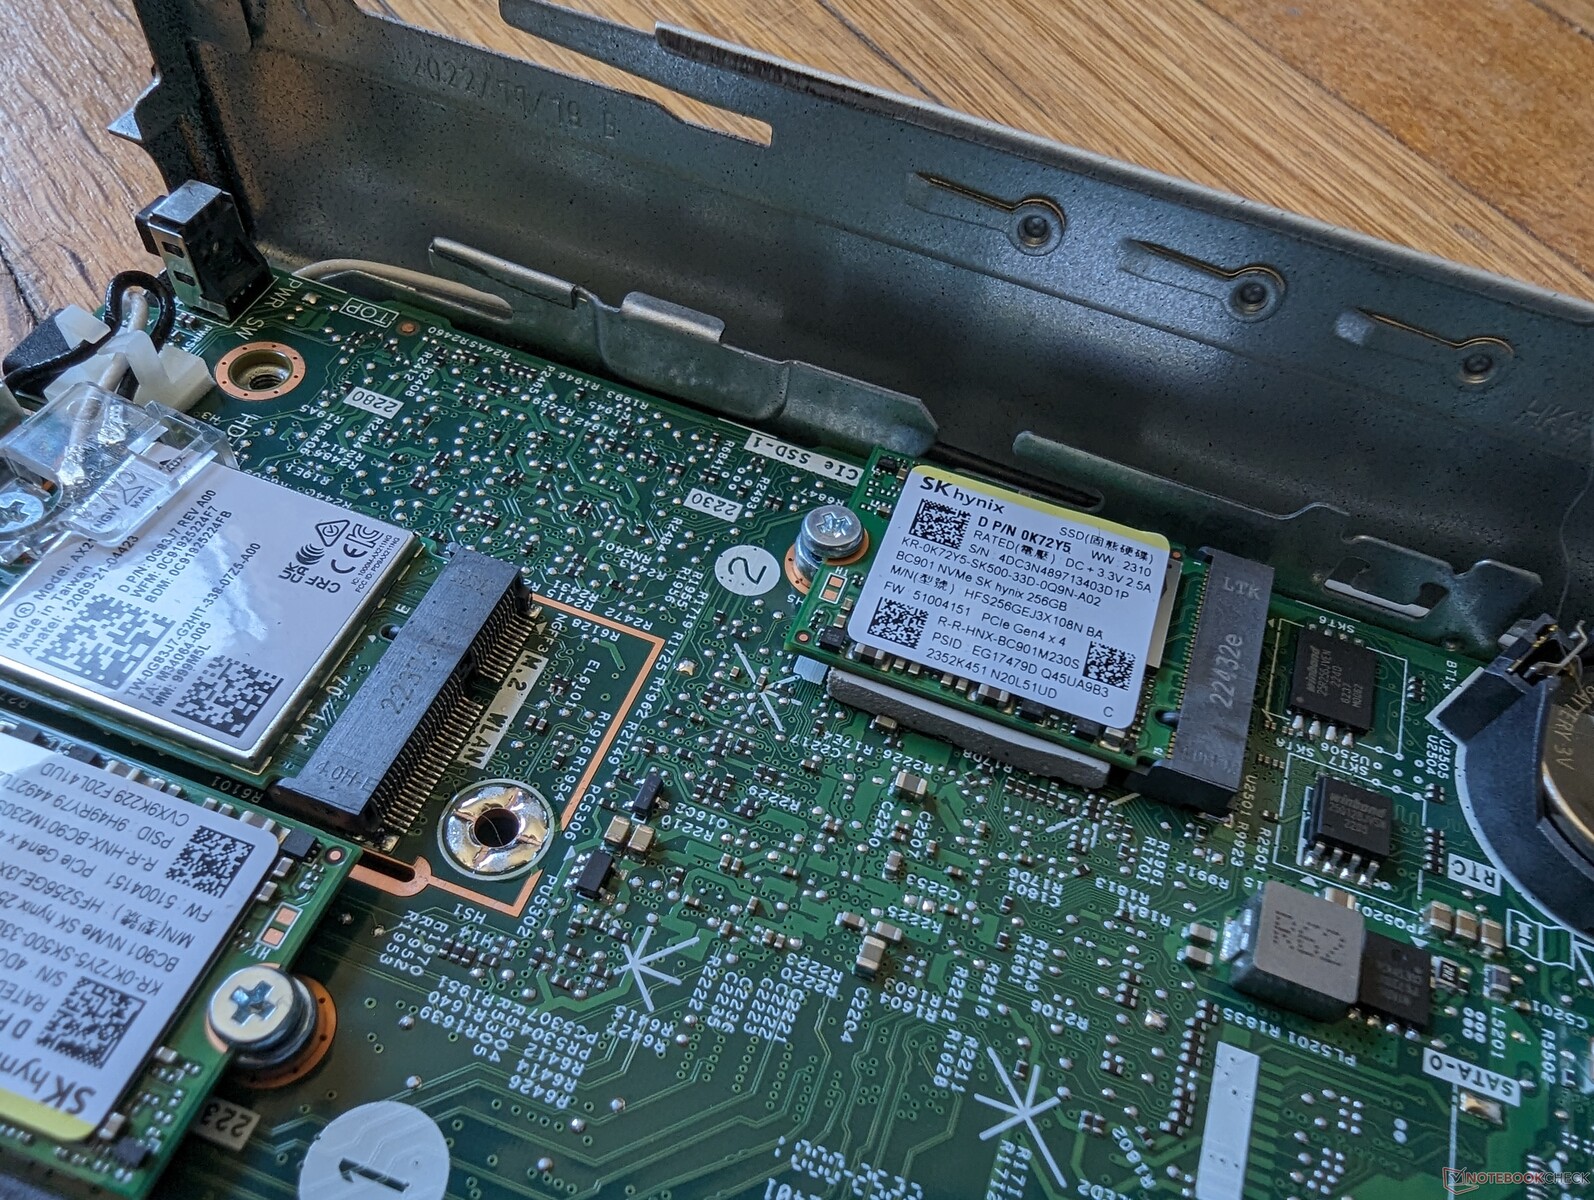
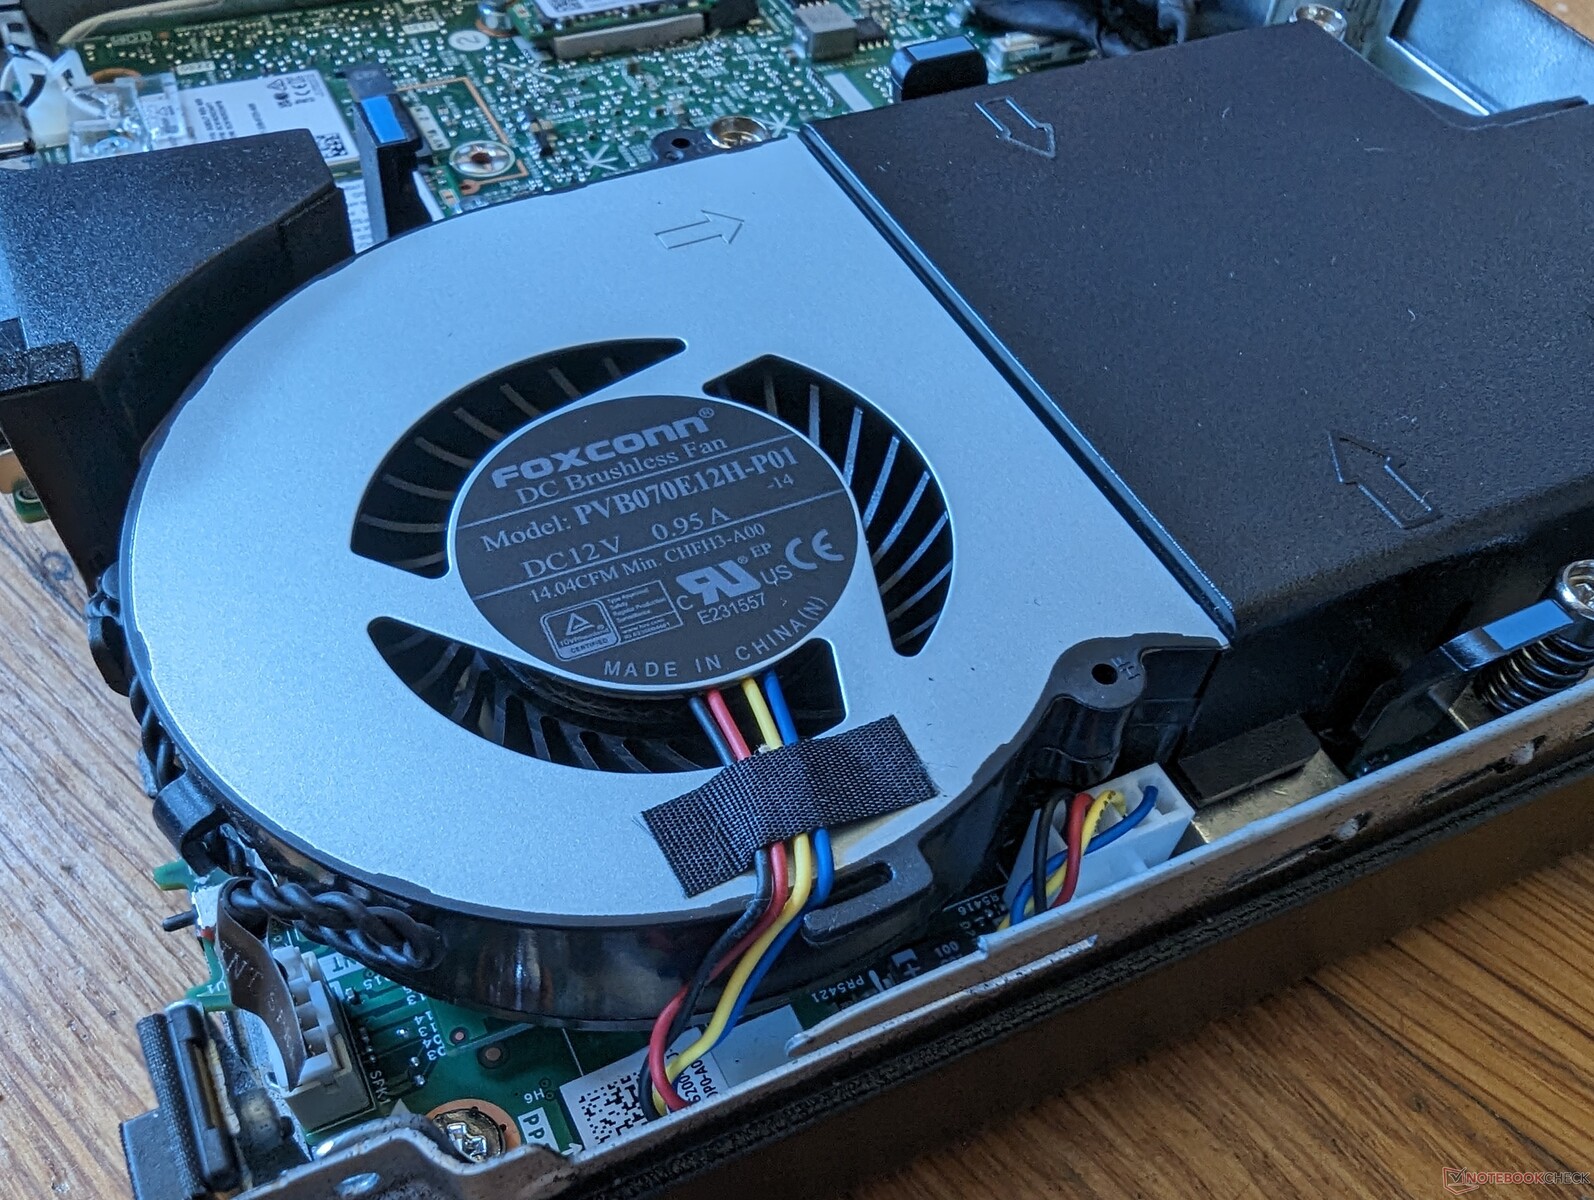
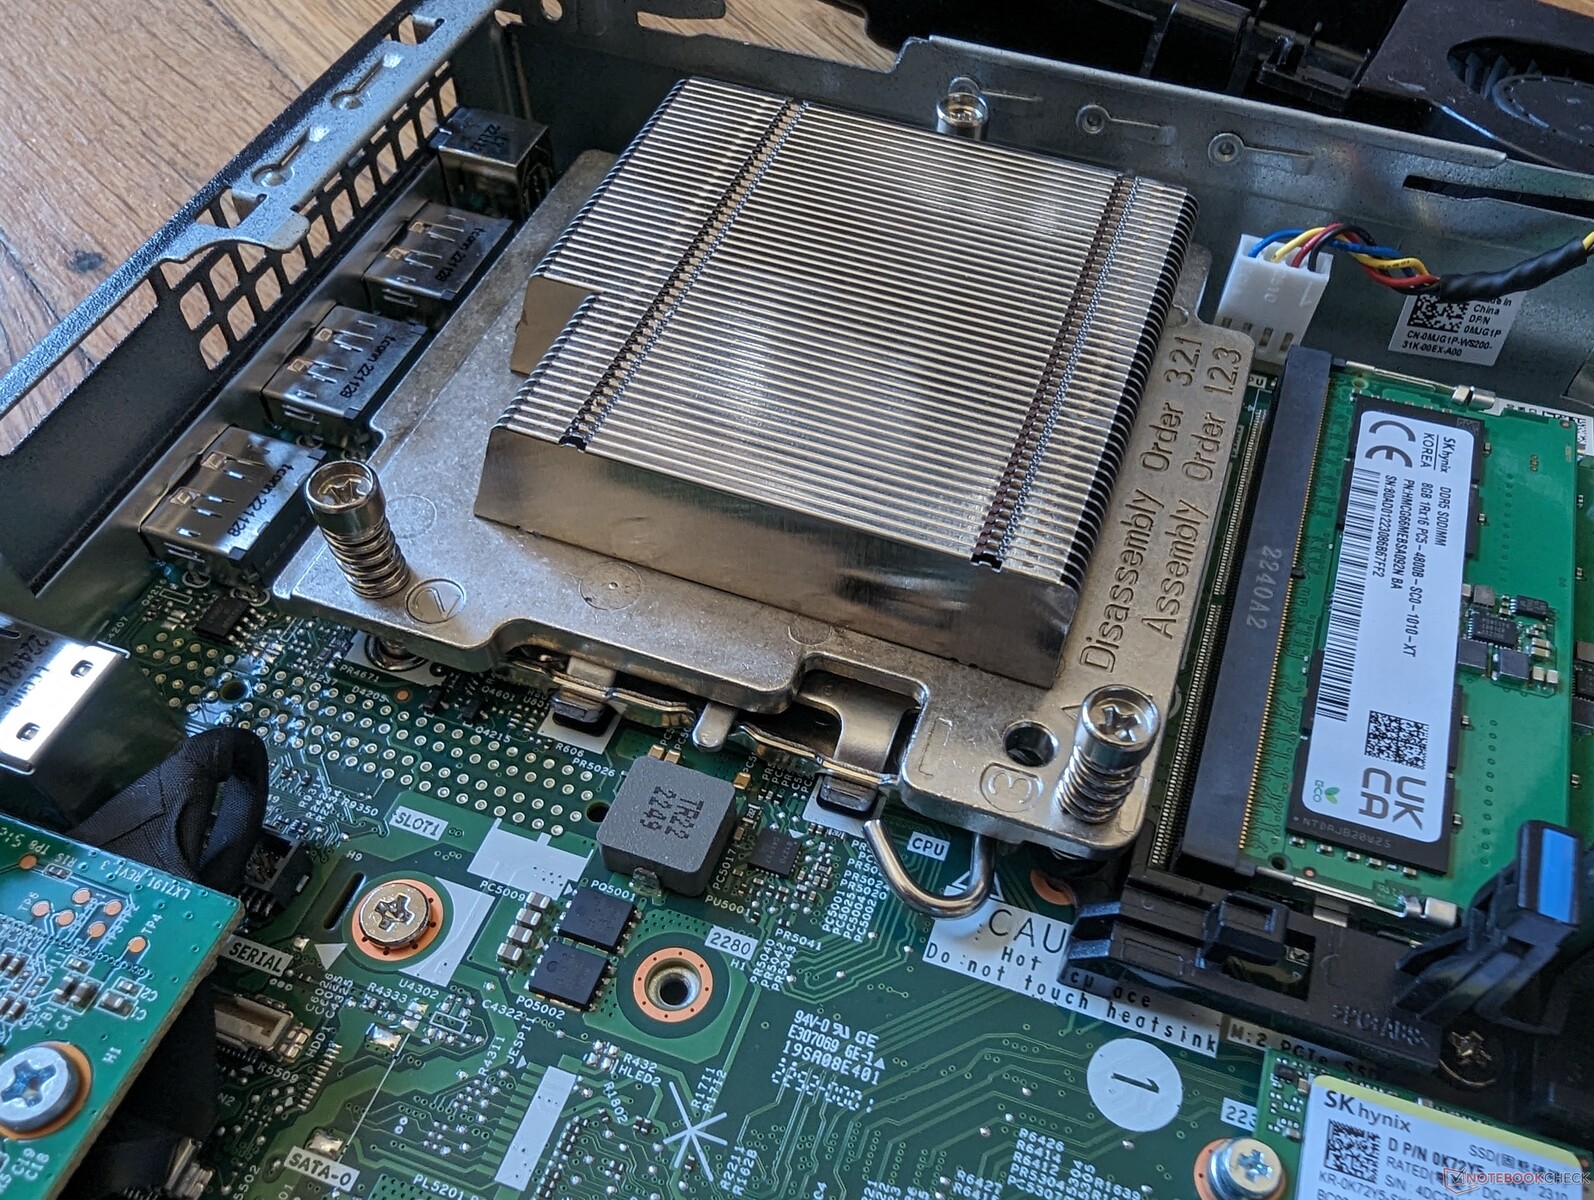
Górny panel zsuwa się z łatwością po odkręceniu tylko jednej śrubki z tyłu, aby odsłonić wyjmowany moduł WLAN i dwa gniazda SSD. Wentylator musi zostać usunięty, aby uzyskać dostęp do dwóch gniazd SODIMM, ale cały proces odbywa się bez użycia narzędzi, co ułatwia serwisowanie.
Proszę zauważyć, że procesor FCLGA1700 jest wyjmowalny i wymienny, w przeciwieństwie do większości innych mini PC.
Akcesoria i gwarancja
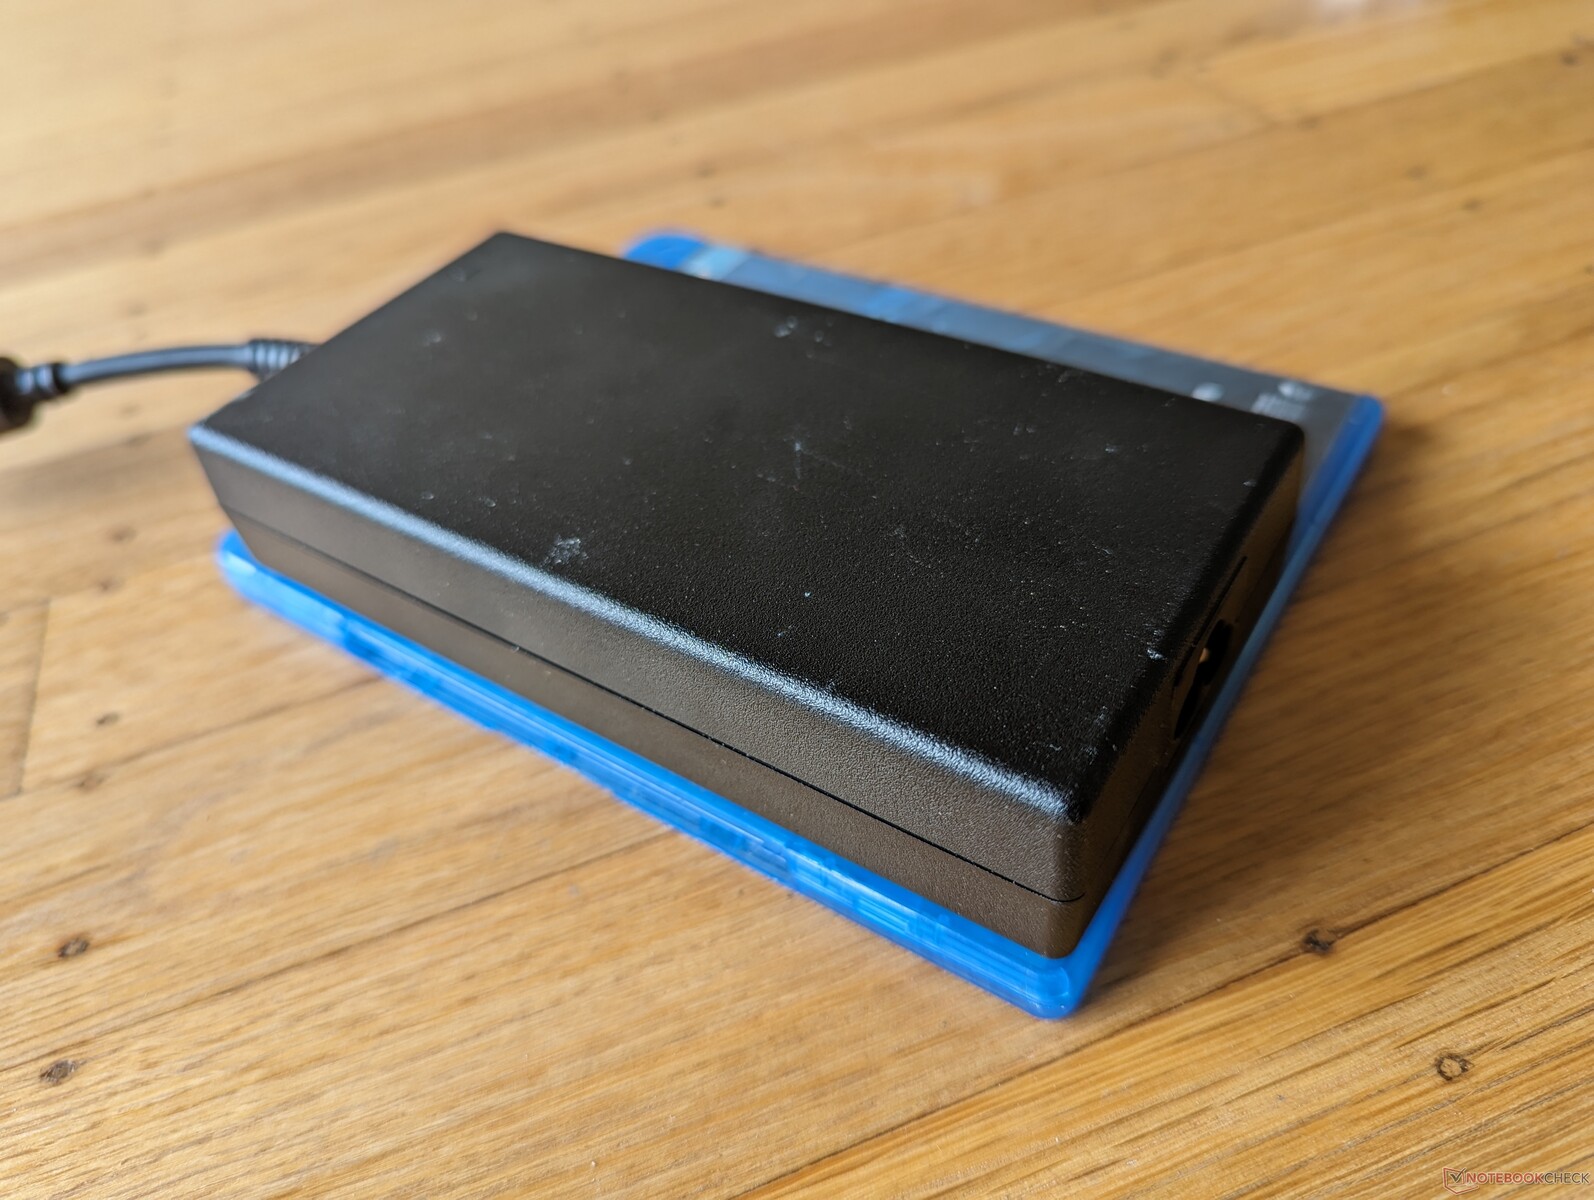
W pudełku nie ma żadnych dodatków poza zewnętrznym zasilaczem i dokumentacją. Szkoda, że pionowa podstawka jest sprzedawana oddzielnie, ponieważ system może się dość łatwo przewrócić.
Trzyletnia ograniczona gwarancja producenta ma zastosowanie podobnie jak w przypadku większości innych wysokiej klasy komputerów biznesowych firmy Dell.
Wydajność - Moc procesora komputera stacjonarnego
Warunki testowania
Przed wykonaniem poniższych testów porównawczych ustawiliśmy system Windows na tryb wydajności. Dell Optimizer jest preinstalowany, ale nie oferuje wyspecjalizowanych profili zasilania, w przeciwieństwie do większości laptopów Dell.
Procesor
Wydajność procesora jest niesamowita jak na tę obudowę. W porównaniu do serii H Core i7-13700H jaki można znaleźć w laptopach takich jak Inspiron 16 Plus 7630nasz Core i7-13700 z serii do komputerów stacjonarnych oferuje od 15 do 30 procent wyższą wydajność wielowątkową, głównie dzięki wyższemu poborowi mocy i wyższym częstotliwościom taktowania. Jego przewaga nad Apple M2 są zauważalne w przypadku dużych obciążeń procesora.
Niestety, Core i7-13700 w OptiPlex Micro jest bardziej podatny na throttling w porównaniu do większych komputerów stacjonarnych z tym samym procesorem. Nasz referencyjny Core i7-13700 działający na przykład na pełnowymiarowej wieży, zwróciłby wyniki wielowątkowych testów porównawczych o 40 do 60 procent szybciej niż nasz mini PC. Nie oznacza to, że jednostka Dell jest powolna, ale nie można zaprzeczyć, że jej małe chłodzenie jest czynnikiem ograniczającym. Podczas uruchamiania CineBench R15 xT w pętli, na przykład, wydajność spadłaby o około 20 procent po pierwszych kilku pętlach, co sugerowałoby zachowanie dławienia.
Cinebench R15 Multi Loop
Cinebench R23: Multi Core | Single Core
Cinebench R20: CPU (Multi Core) | CPU (Single Core)
Cinebench R15: CPU Multi 64Bit | CPU Single 64Bit
Blender: v2.79 BMW27 CPU
7-Zip 18.03: 7z b 4 | 7z b 4 -mmt1
Geekbench 5.5: Multi-Core | Single-Core
HWBOT x265 Benchmark v2.2: 4k Preset
LibreOffice : 20 Documents To PDF
R Benchmark 2.5: Overall mean
| CPU Performance rating | |
| Intel Core i7-13700 | |
| Przeciętny Intel Core i7-13700 | |
| Dell OptiPlex Micro | |
| Alienware m16 R1 Intel | |
| Beelink GTR7 7840HS | |
| Lenovo IdeaCentre Mini 01IRH8 | |
| Intel NUC 12, NUC12SNKi72_Serpent Canyon | |
| GMK NucBox K3 Pro | |
| Acemagic AM20 | |
| Apple Mac Mini M2 -5! | |
| Geekom A5 | |
| Acemagic AD15 | |
| Minisforum Venus Series UN1245 | |
| Cinebench R23 / Multi Core | |
| Intel Core i7-13700 | |
| Przeciętny Intel Core i7-13700 (21013 - 29725, n=2) | |
| Alienware m16 R1 Intel | |
| Dell OptiPlex Micro | |
| Beelink GTR7 7840HS | |
| Intel NUC 12, NUC12SNKi72_Serpent Canyon | |
| Lenovo IdeaCentre Mini 01IRH8 | |
| Acemagic AM20 | |
| Geekom A5 | |
| GMK NucBox K3 Pro | |
| Acemagic AD15 | |
| Minisforum Venus Series UN1245 | |
| Apple Mac Mini M2 | |
| Cinebench R23 / Single Core | |
| Intel Core i7-13700 | |
| Przeciętny Intel Core i7-13700 (1997 - 2020, n=2) | |
| Dell OptiPlex Micro | |
| Alienware m16 R1 Intel | |
| Lenovo IdeaCentre Mini 01IRH8 | |
| Beelink GTR7 7840HS | |
| Intel NUC 12, NUC12SNKi72_Serpent Canyon | |
| GMK NucBox K3 Pro | |
| Minisforum Venus Series UN1245 | |
| Apple Mac Mini M2 | |
| Acemagic AM20 | |
| Acemagic AD15 | |
| Geekom A5 | |
| Cinebench R20 / CPU (Multi Core) | |
| Intel Core i7-13700 | |
| Przeciętny Intel Core i7-13700 (7027 - 11361, n=2) | |
| Alienware m16 R1 Intel | |
| Dell OptiPlex Micro | |
| Beelink GTR7 7840HS | |
| Intel NUC 12, NUC12SNKi72_Serpent Canyon | |
| Lenovo IdeaCentre Mini 01IRH8 | |
| Acemagic AM20 | |
| Geekom A5 | |
| GMK NucBox K3 Pro | |
| Acemagic AD15 | |
| Minisforum Venus Series UN1245 | |
| Apple Mac Mini M2 | |
| Cinebench R20 / CPU (Single Core) | |
| Intel Core i7-13700 | |
| Przeciętny Intel Core i7-13700 (703 - 776, n=2) | |
| Alienware m16 R1 Intel | |
| Lenovo IdeaCentre Mini 01IRH8 | |
| Beelink GTR7 7840HS | |
| Dell OptiPlex Micro | |
| Intel NUC 12, NUC12SNKi72_Serpent Canyon | |
| GMK NucBox K3 Pro | |
| Minisforum Venus Series UN1245 | |
| Acemagic AM20 | |
| Acemagic AD15 | |
| Geekom A5 | |
| Apple Mac Mini M2 | |
| Cinebench R15 / CPU Multi 64Bit | |
| Intel Core i7-13700 | |
| Przeciętny Intel Core i7-13700 (2986 - 4398, n=2) | |
| Alienware m16 R1 Intel | |
| Dell OptiPlex Micro | |
| Beelink GTR7 7840HS | |
| Intel NUC 12, NUC12SNKi72_Serpent Canyon | |
| Lenovo IdeaCentre Mini 01IRH8 | |
| Acemagic AM20 | |
| Geekom A5 | |
| GMK NucBox K3 Pro | |
| Acemagic AD15 | |
| Minisforum Venus Series UN1245 | |
| Apple Mac Mini M2 | |
| Cinebench R15 / CPU Single 64Bit | |
| Intel Core i7-13700 | |
| Beelink GTR7 7840HS | |
| Przeciętny Intel Core i7-13700 (279 - 291, n=2) | |
| Dell OptiPlex Micro | |
| Alienware m16 R1 Intel | |
| Lenovo IdeaCentre Mini 01IRH8 | |
| Intel NUC 12, NUC12SNKi72_Serpent Canyon | |
| GMK NucBox K3 Pro | |
| Acemagic AM20 | |
| Minisforum Venus Series UN1245 | |
| Apple Mac Mini M2 | |
| Geekom A5 | |
| Acemagic AD15 | |
| Blender / v2.79 BMW27 CPU | |
| Apple Mac Mini M2 | |
| Minisforum Venus Series UN1245 | |
| GMK NucBox K3 Pro | |
| Acemagic AD15 | |
| Geekom A5 | |
| Acemagic AM20 | |
| Beelink GTR7 7840HS | |
| Lenovo IdeaCentre Mini 01IRH8 | |
| Intel NUC 12, NUC12SNKi72_Serpent Canyon | |
| Dell OptiPlex Micro | |
| Alienware m16 R1 Intel | |
| Przeciętny Intel Core i7-13700 (111 - 178, n=2) | |
| Intel Core i7-13700 | |
| 7-Zip 18.03 / 7z b 4 | |
| Intel Core i7-13700 | |
| Przeciętny Intel Core i7-13700 (74475 - 108733, n=2) | |
| Alienware m16 R1 Intel | |
| Dell OptiPlex Micro | |
| Beelink GTR7 7840HS | |
| Intel NUC 12, NUC12SNKi72_Serpent Canyon | |
| Lenovo IdeaCentre Mini 01IRH8 | |
| Geekom A5 | |
| Acemagic AM20 | |
| Acemagic AD15 | |
| GMK NucBox K3 Pro | |
| Minisforum Venus Series UN1245 | |
| 7-Zip 18.03 / 7z b 4 -mmt1 | |
| Intel Core i7-13700 | |
| Beelink GTR7 7840HS | |
| Przeciętny Intel Core i7-13700 (6466 - 6819, n=2) | |
| Dell OptiPlex Micro | |
| Alienware m16 R1 Intel | |
| Lenovo IdeaCentre Mini 01IRH8 | |
| Intel NUC 12, NUC12SNKi72_Serpent Canyon | |
| GMK NucBox K3 Pro | |
| Acemagic AD15 | |
| Acemagic AM20 | |
| Geekom A5 | |
| Minisforum Venus Series UN1245 | |
| Geekbench 5.5 / Multi-Core | |
| Intel Core i7-13700 | |
| Przeciętny Intel Core i7-13700 (15525 - 19602, n=2) | |
| Dell OptiPlex Micro | |
| Alienware m16 R1 Intel | |
| Beelink GTR7 7840HS | |
| Lenovo IdeaCentre Mini 01IRH8 | |
| Intel NUC 12, NUC12SNKi72_Serpent Canyon | |
| GMK NucBox K3 Pro | |
| Apple Mac Mini M2 | |
| Geekom A5 | |
| Acemagic AM20 | |
| Acemagic AD15 | |
| Minisforum Venus Series UN1245 | |
| Geekbench 5.5 / Single-Core | |
| Beelink GTR7 7840HS | |
| Intel Core i7-13700 | |
| Przeciętny Intel Core i7-13700 (1958 - 2009, n=2) | |
| Dell OptiPlex Micro | |
| Apple Mac Mini M2 | |
| Alienware m16 R1 Intel | |
| Lenovo IdeaCentre Mini 01IRH8 | |
| GMK NucBox K3 Pro | |
| Minisforum Venus Series UN1245 | |
| Acemagic AD15 | |
| Intel NUC 12, NUC12SNKi72_Serpent Canyon | |
| Acemagic AM20 | |
| Geekom A5 | |
| HWBOT x265 Benchmark v2.2 / 4k Preset | |
| Intel Core i7-13700 | |
| Przeciętny Intel Core i7-13700 (21.4 - 33.1, n=2) | |
| Alienware m16 R1 Intel | |
| Dell OptiPlex Micro | |
| Intel NUC 12, NUC12SNKi72_Serpent Canyon | |
| Lenovo IdeaCentre Mini 01IRH8 | |
| Acemagic AM20 | |
| Geekom A5 | |
| GMK NucBox K3 Pro | |
| Acemagic AD15 | |
| Beelink GTR7 7840HS | |
| Minisforum Venus Series UN1245 | |
| LibreOffice / 20 Documents To PDF | |
| Geekom A5 | |
| Minisforum Venus Series UN1245 | |
| Acemagic AD15 | |
| Acemagic AM20 | |
| Alienware m16 R1 Intel | |
| Intel NUC 12, NUC12SNKi72_Serpent Canyon | |
| GMK NucBox K3 Pro | |
| Beelink GTR7 7840HS | |
| Lenovo IdeaCentre Mini 01IRH8 | |
| Dell OptiPlex Micro | |
| Przeciętny Intel Core i7-13700 (34.1 - 36.4, n=2) | |
| Intel Core i7-13700 | |
| R Benchmark 2.5 / Overall mean | |
| Acemagic AD15 | |
| Acemagic AM20 | |
| Geekom A5 | |
| Minisforum Venus Series UN1245 | |
| GMK NucBox K3 Pro | |
| Intel NUC 12, NUC12SNKi72_Serpent Canyon | |
| Lenovo IdeaCentre Mini 01IRH8 | |
| Alienware m16 R1 Intel | |
| Dell OptiPlex Micro | |
| Beelink GTR7 7840HS | |
| Przeciętny Intel Core i7-13700 (0.4075 - 0.423, n=2) | |
| Intel Core i7-13700 | |
Cinebench R23: Multi Core | Single Core
Cinebench R20: CPU (Multi Core) | CPU (Single Core)
Cinebench R15: CPU Multi 64Bit | CPU Single 64Bit
Blender: v2.79 BMW27 CPU
7-Zip 18.03: 7z b 4 | 7z b 4 -mmt1
Geekbench 5.5: Multi-Core | Single-Core
HWBOT x265 Benchmark v2.2: 4k Preset
LibreOffice : 20 Documents To PDF
R Benchmark 2.5: Overall mean
* ... im mniej tym lepiej
AIDA64: FP32 Ray-Trace | FPU Julia | CPU SHA3 | CPU Queen | FPU SinJulia | FPU Mandel | CPU AES | CPU ZLib | FP64 Ray-Trace | CPU PhotoWorxx
| Performance rating | |
| Beelink GTR7 7840HS | |
| Beelink SER7 | |
| Przeciętny Intel Core i7-13700 | |
| Dell OptiPlex Micro | |
| Lenovo IdeaCentre Mini 01IRH8 | |
| GMK NucBox K3 Pro | |
| AIDA64 / FP32 Ray-Trace | |
| Beelink GTR7 7840HS | |
| Beelink SER7 | |
| Przeciętny Intel Core i7-13700 (16408 - 29348, n=2) | |
| Dell OptiPlex Micro | |
| Lenovo IdeaCentre Mini 01IRH8 | |
| GMK NucBox K3 Pro | |
| AIDA64 / FPU Julia | |
| Beelink GTR7 7840HS | |
| Przeciętny Intel Core i7-13700 (83757 - 138865, n=2) | |
| Beelink SER7 | |
| Dell OptiPlex Micro | |
| Lenovo IdeaCentre Mini 01IRH8 | |
| GMK NucBox K3 Pro | |
| AIDA64 / CPU SHA3 | |
| Beelink GTR7 7840HS | |
| Przeciętny Intel Core i7-13700 (3648 - 6169, n=2) | |
| Beelink SER7 | |
| Dell OptiPlex Micro | |
| Lenovo IdeaCentre Mini 01IRH8 | |
| GMK NucBox K3 Pro | |
| AIDA64 / CPU Queen | |
| Przeciętny Intel Core i7-13700 (113697 - 128088, n=2) | |
| Beelink GTR7 7840HS | |
| Dell OptiPlex Micro | |
| Beelink SER7 | |
| Lenovo IdeaCentre Mini 01IRH8 | |
| GMK NucBox K3 Pro | |
| AIDA64 / FPU SinJulia | |
| Beelink GTR7 7840HS | |
| Beelink SER7 | |
| Przeciętny Intel Core i7-13700 (10833 - 15314, n=2) | |
| Dell OptiPlex Micro | |
| Lenovo IdeaCentre Mini 01IRH8 | |
| GMK NucBox K3 Pro | |
| AIDA64 / FPU Mandel | |
| Beelink GTR7 7840HS | |
| Beelink SER7 | |
| Przeciętny Intel Core i7-13700 (40920 - 72217, n=2) | |
| Dell OptiPlex Micro | |
| Lenovo IdeaCentre Mini 01IRH8 | |
| GMK NucBox K3 Pro | |
| AIDA64 / CPU AES | |
| Beelink GTR7 7840HS | |
| Beelink SER7 | |
| Przeciętny Intel Core i7-13700 (76357 - 120512, n=2) | |
| GMK NucBox K3 Pro | |
| Dell OptiPlex Micro | |
| Lenovo IdeaCentre Mini 01IRH8 | |
| AIDA64 / CPU ZLib | |
| Przeciętny Intel Core i7-13700 (1045 - 1703, n=2) | |
| Beelink GTR7 7840HS | |
| Dell OptiPlex Micro | |
| Lenovo IdeaCentre Mini 01IRH8 | |
| Beelink SER7 | |
| GMK NucBox K3 Pro | |
| AIDA64 / FP64 Ray-Trace | |
| Beelink GTR7 7840HS | |
| Beelink SER7 | |
| Przeciętny Intel Core i7-13700 (8712 - 16164, n=2) | |
| Dell OptiPlex Micro | |
| Lenovo IdeaCentre Mini 01IRH8 | |
| GMK NucBox K3 Pro | |
| AIDA64 / CPU PhotoWorxx | |
| GMK NucBox K3 Pro | |
| Przeciętny Intel Core i7-13700 (37819 - 48448, n=2) | |
| Beelink SER7 | |
| Beelink GTR7 7840HS | |
| Dell OptiPlex Micro | |
| Lenovo IdeaCentre Mini 01IRH8 | |
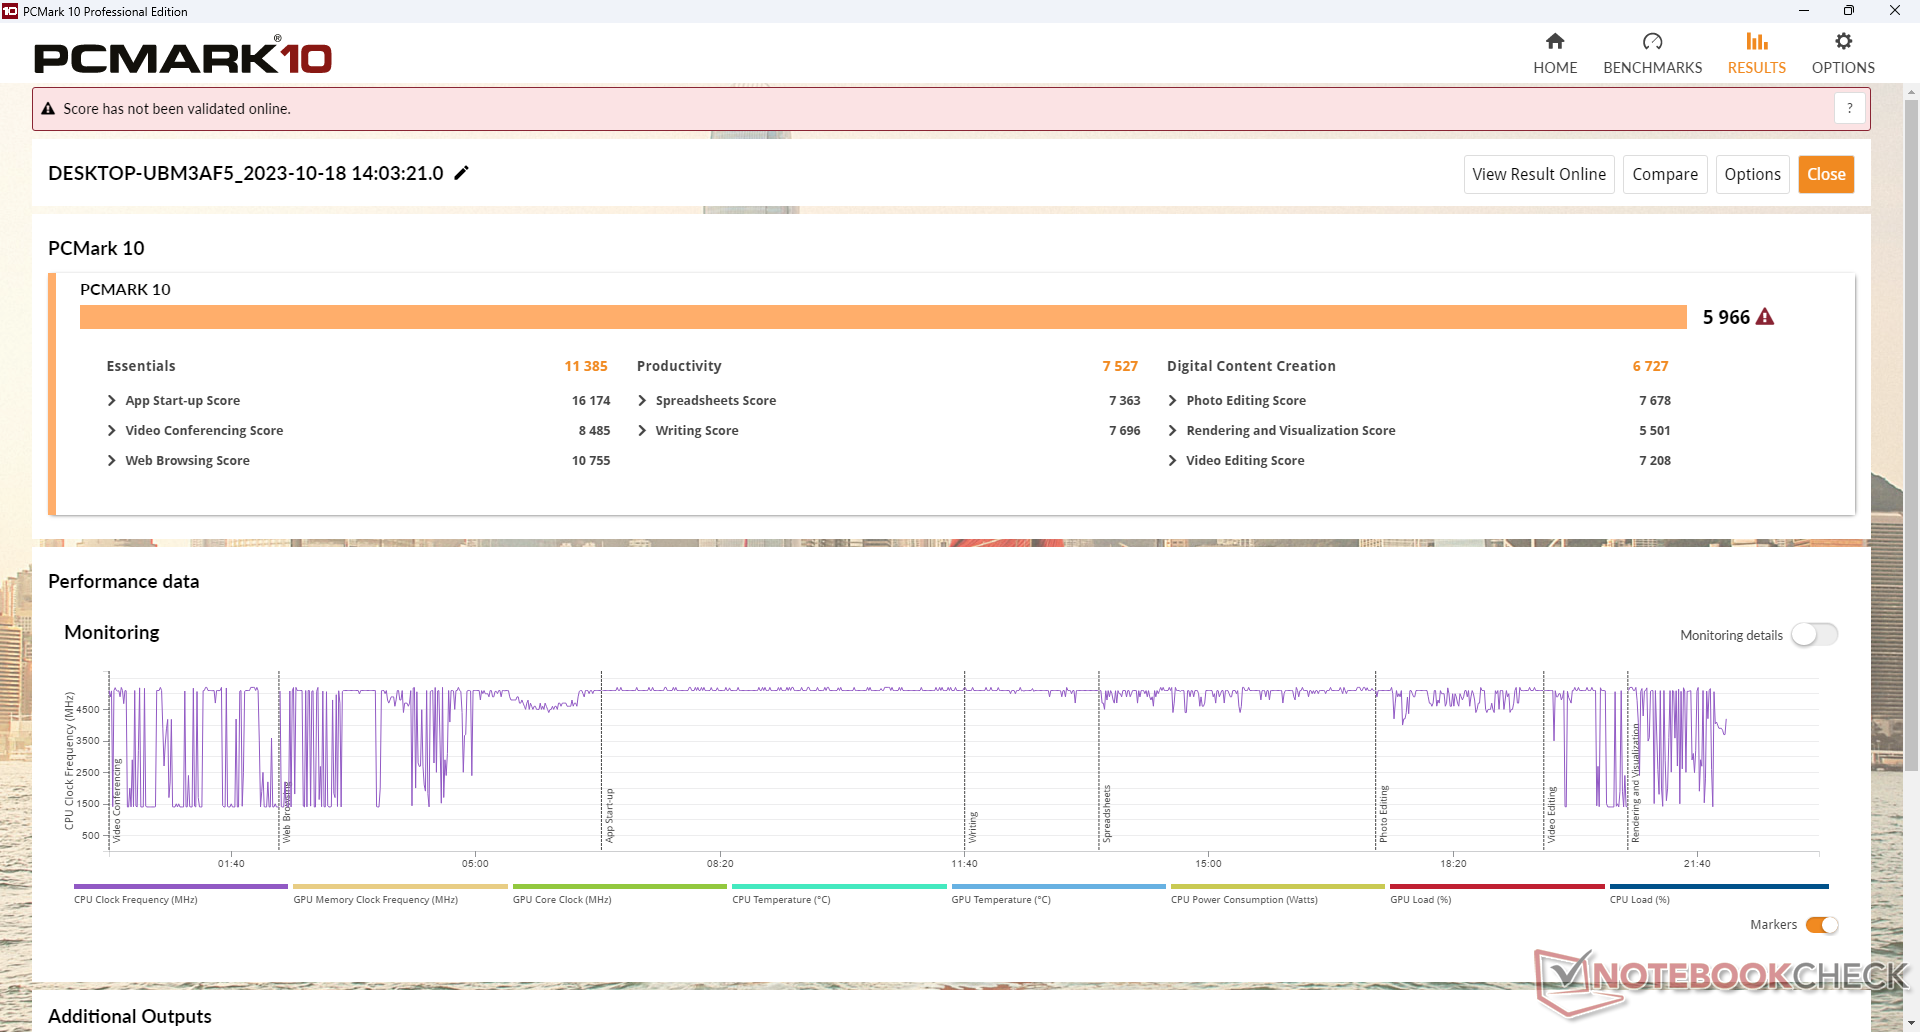
Wydajność systemu
Wyniki PCMark są porównywalne doGMK NucBox K3 Pro ale wciąż za mini PC z procesorami AMD, takimi jak Beelink SER7. Deficyt ten można w dużej mierze przypisać szybszemu zintegrowanemu procesorowi graficznemu Radeon na konkurencyjnych platformach Ryzen Zen 3+ lub Zen 4.
CrossMark: Overall | Productivity | Creativity | Responsiveness
| PCMark 10 / Score | |
| Beelink GTR7 7840HS | |
| Beelink SER7 | |
| Lenovo IdeaCentre Mini 01IRH8 | |
| Dell OptiPlex Micro | |
| Przeciętny Intel Core i7-13700, Intel UHD Graphics 770 (n=1) | |
| GMK NucBox K3 Pro | |
| PCMark 10 / Essentials | |
| Lenovo IdeaCentre Mini 01IRH8 | |
| Dell OptiPlex Micro | |
| Przeciętny Intel Core i7-13700, Intel UHD Graphics 770 (n=1) | |
| Beelink GTR7 7840HS | |
| Beelink SER7 | |
| GMK NucBox K3 Pro | |
| PCMark 10 / Productivity | |
| Beelink GTR7 7840HS | |
| Beelink SER7 | |
| GMK NucBox K3 Pro | |
| Lenovo IdeaCentre Mini 01IRH8 | |
| Dell OptiPlex Micro | |
| Przeciętny Intel Core i7-13700, Intel UHD Graphics 770 (n=1) | |
| PCMark 10 / Digital Content Creation | |
| Beelink GTR7 7840HS | |
| Beelink SER7 | |
| Lenovo IdeaCentre Mini 01IRH8 | |
| Dell OptiPlex Micro | |
| Przeciętny Intel Core i7-13700, Intel UHD Graphics 770 (n=1) | |
| GMK NucBox K3 Pro | |
| CrossMark / Overall | |
| Dell OptiPlex Micro | |
| Przeciętny Intel Core i7-13700, Intel UHD Graphics 770 (n=1) | |
| Lenovo IdeaCentre Mini 01IRH8 | |
| Beelink SER7 | |
| GMK NucBox K3 Pro | |
| Beelink GTR7 7840HS | |
| Apple Mac Mini M2 | |
| CrossMark / Productivity | |
| Dell OptiPlex Micro | |
| Przeciętny Intel Core i7-13700, Intel UHD Graphics 770 (n=1) | |
| Lenovo IdeaCentre Mini 01IRH8 | |
| Beelink SER7 | |
| Beelink GTR7 7840HS | |
| GMK NucBox K3 Pro | |
| Apple Mac Mini M2 | |
| CrossMark / Creativity | |
| Dell OptiPlex Micro | |
| Przeciętny Intel Core i7-13700, Intel UHD Graphics 770 (n=1) | |
| Beelink SER7 | |
| Lenovo IdeaCentre Mini 01IRH8 | |
| Apple Mac Mini M2 | |
| GMK NucBox K3 Pro | |
| Beelink GTR7 7840HS | |
| CrossMark / Responsiveness | |
| Beelink GTR7 7840HS | |
| Dell OptiPlex Micro | |
| Przeciętny Intel Core i7-13700, Intel UHD Graphics 770 (n=1) | |
| Lenovo IdeaCentre Mini 01IRH8 | |
| GMK NucBox K3 Pro | |
| Beelink SER7 | |
| Apple Mac Mini M2 | |
| PCMark 10 Score | 5966 pkt. | |
Pomoc | ||
| AIDA64 / Memory Copy | |
| GMK NucBox K3 Pro | |
| Beelink SER7 | |
| Beelink GTR7 7840HS | |
| Przeciętny Intel Core i7-13700 (61152 - 73900, n=2) | |
| Dell OptiPlex Micro | |
| Lenovo IdeaCentre Mini 01IRH8 | |
| AIDA64 / Memory Read | |
| Przeciętny Intel Core i7-13700 (71285 - 81167, n=2) | |
| Dell OptiPlex Micro | |
| GMK NucBox K3 Pro | |
| Beelink SER7 | |
| Beelink GTR7 7840HS | |
| Lenovo IdeaCentre Mini 01IRH8 | |
| AIDA64 / Memory Write | |
| Beelink SER7 | |
| Beelink GTR7 7840HS | |
| Przeciętny Intel Core i7-13700 (60029 - 73720, n=2) | |
| Dell OptiPlex Micro | |
| GMK NucBox K3 Pro | |
| Lenovo IdeaCentre Mini 01IRH8 | |
| AIDA64 / Memory Latency | |
| GMK NucBox K3 Pro | |
| Dell OptiPlex Micro | |
| Beelink GTR7 7840HS | |
| Beelink SER7 | |
| Lenovo IdeaCentre Mini 01IRH8 | |
| Przeciętny Intel Core i7-13700 (71.8 - 87, n=2) | |
* ... im mniej tym lepiej
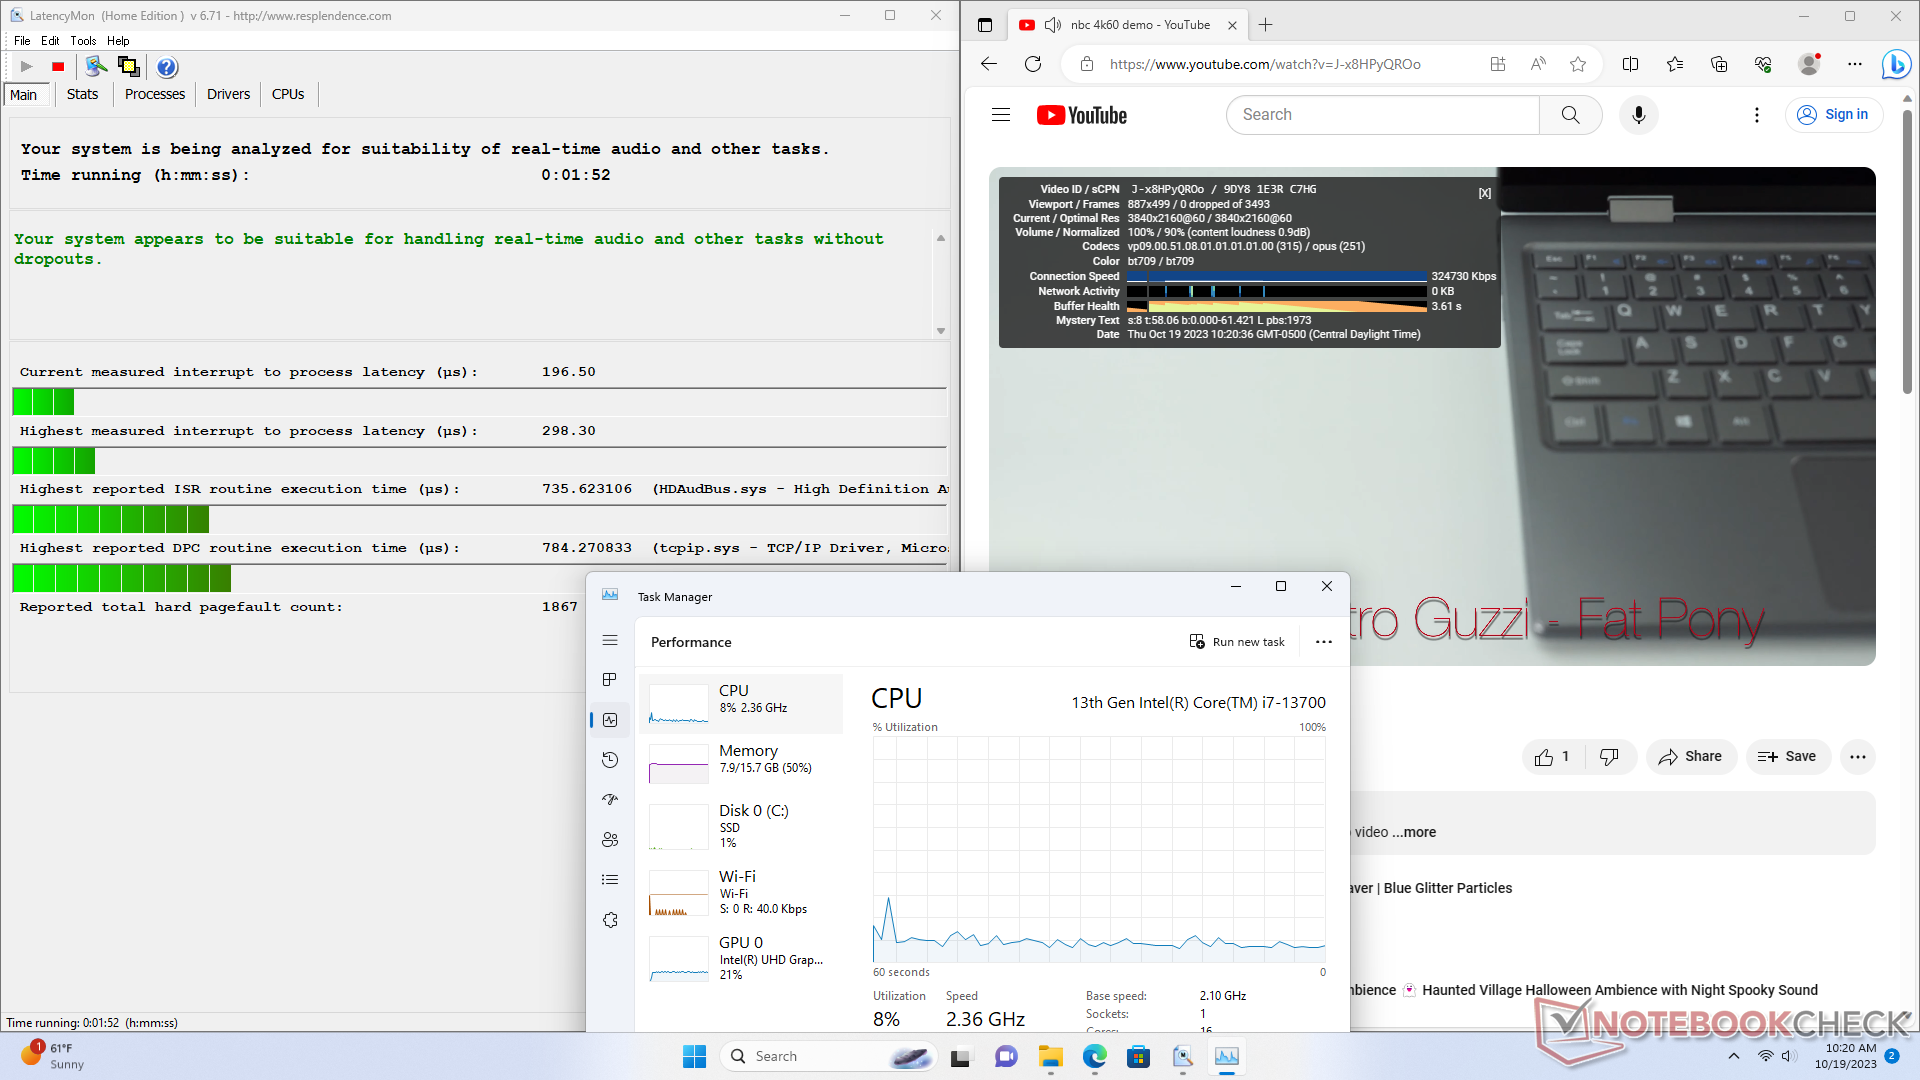
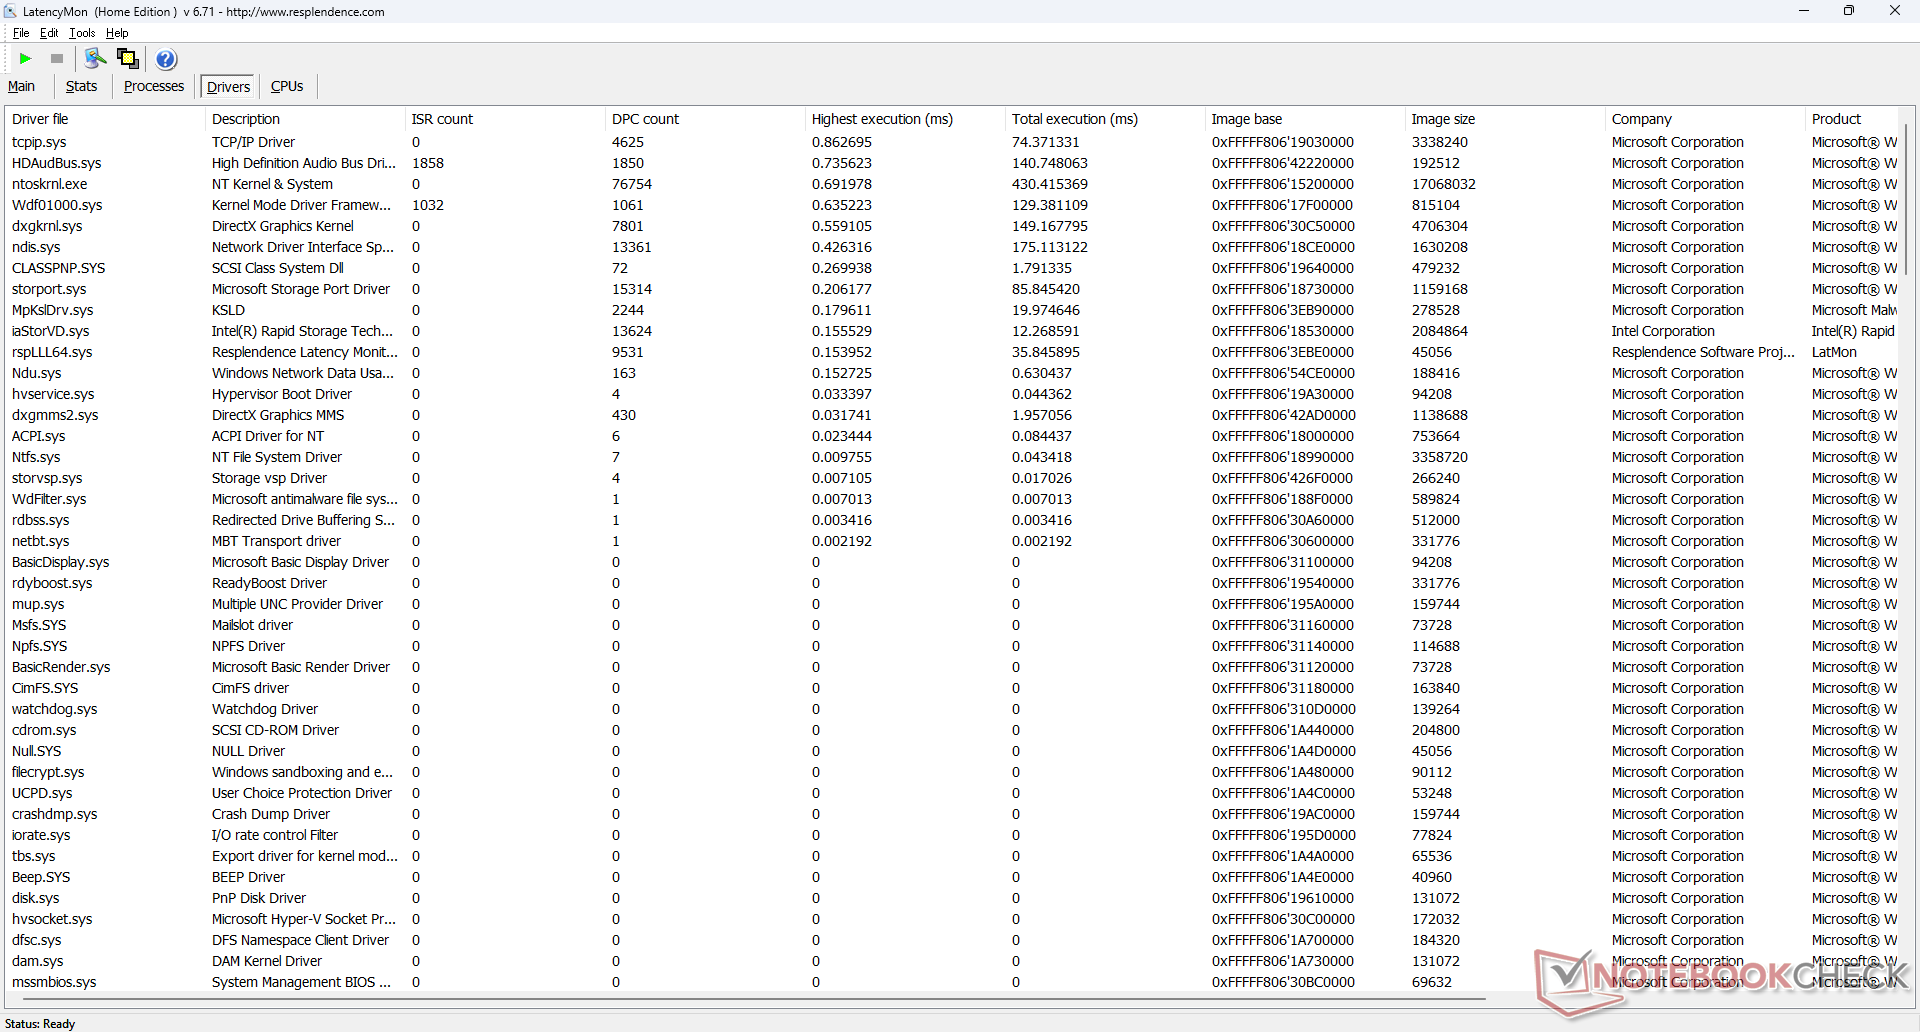
Opóźnienie DPC
LatencyMon nie wykazuje żadnych poważnych problemów z DPC podczas otwierania wielu kart przeglądarki na naszej stronie głównej i żadnych spadków klatek podczas odtwarzania w 4K przy 60 FPS.
| DPC Latencies / LatencyMon - interrupt to process latency (max), Web, Youtube, Prime95 | |
| Lenovo IdeaCentre Mini 01IRH8 | |
| GMK NucBox K3 Pro | |
| Beelink GTR7 7840HS | |
| Beelink SER7 | |
| Dell OptiPlex Micro | |
* ... im mniej tym lepiej
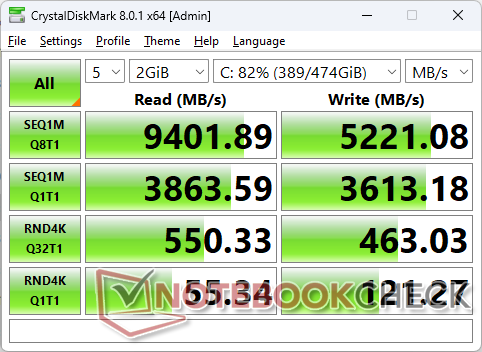
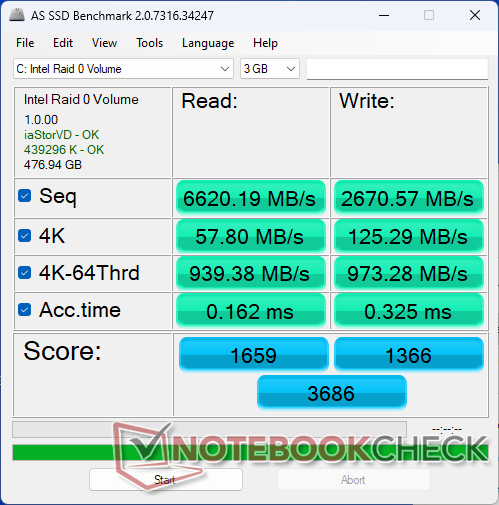
Urządzenia pamięci masowej
Nasze urządzenie wykorzystuje dwa dyski Dyski SSD SK hynix BC901 NVMe w konfiguracji RAID 0, co jest niecodziennym widokiem, ponieważ każdy dysk ma tylko 30 mm długości zamiast bardziej typowych 80 mm. Mniejsza długość i brak jakichkolwiek rozpraszaczy ciepła oznaczają, że dławienie wydajności jest bardziej prawdopodobne, gdy dyski są obciążone. Niestety, tak właśnie się dzieje, o czym świadczą poniższe wyniki testów w pętli DiskSpd, w których prędkość transferu sięgała 8600 MB/s tylko przez około pierwszą minutę, a następnie spadała do zakresu od 1500 do 2500 MB/s.
Proszę zauważyć, że system nadal może obsługiwać dwa pełnowymiarowe dyski M.2 SSD 2280, jeśli zajdzie taka potrzeba.

| Drive Performance rating - Percent | |
| Beelink GTR7 7840HS | |
| Dell OptiPlex Micro | |
| Lenovo IdeaCentre Mini 01IRH8 | |
| Beelink SER7 | |
| GMK NucBox K3 Pro | |
* ... im mniej tym lepiej
Disk Throttling: DiskSpd Read Loop, Queue Depth 8
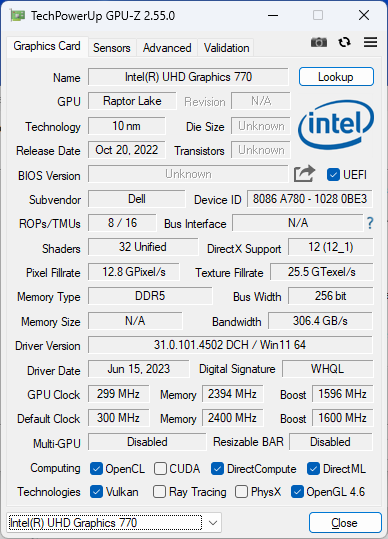
Wydajność GPU
Wydajność graficzna jest słaba, zwłaszcza w porównaniu do bardziej imponującego procesora. ModelUHD Graphics 770 stał się przestarzały i jest naprawdę przydatny tylko do celów strumieniowania lub podstawowego wyjścia wideo 4K60. Niemniej jednak nie powinno to stanowić problemu dla docelowych odbiorców, ponieważ OptiPlex Micro nie został zaprojektowany jako potęga graficzna.
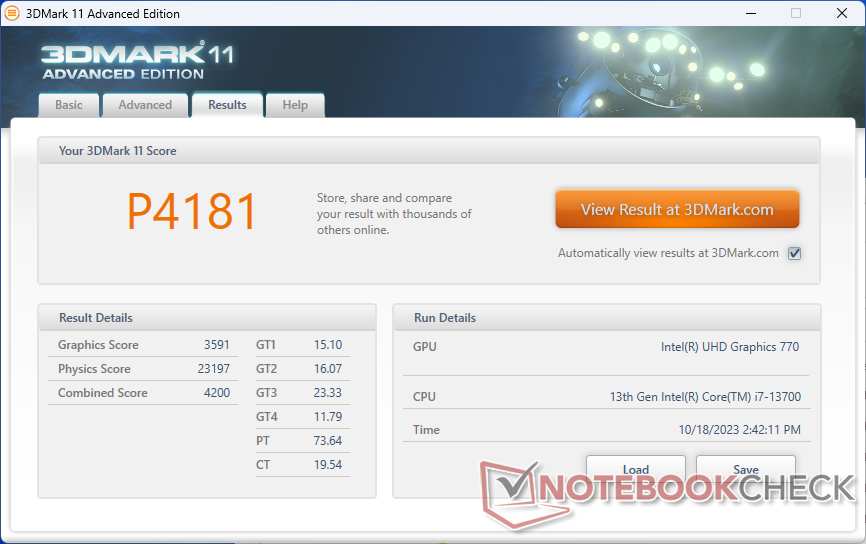
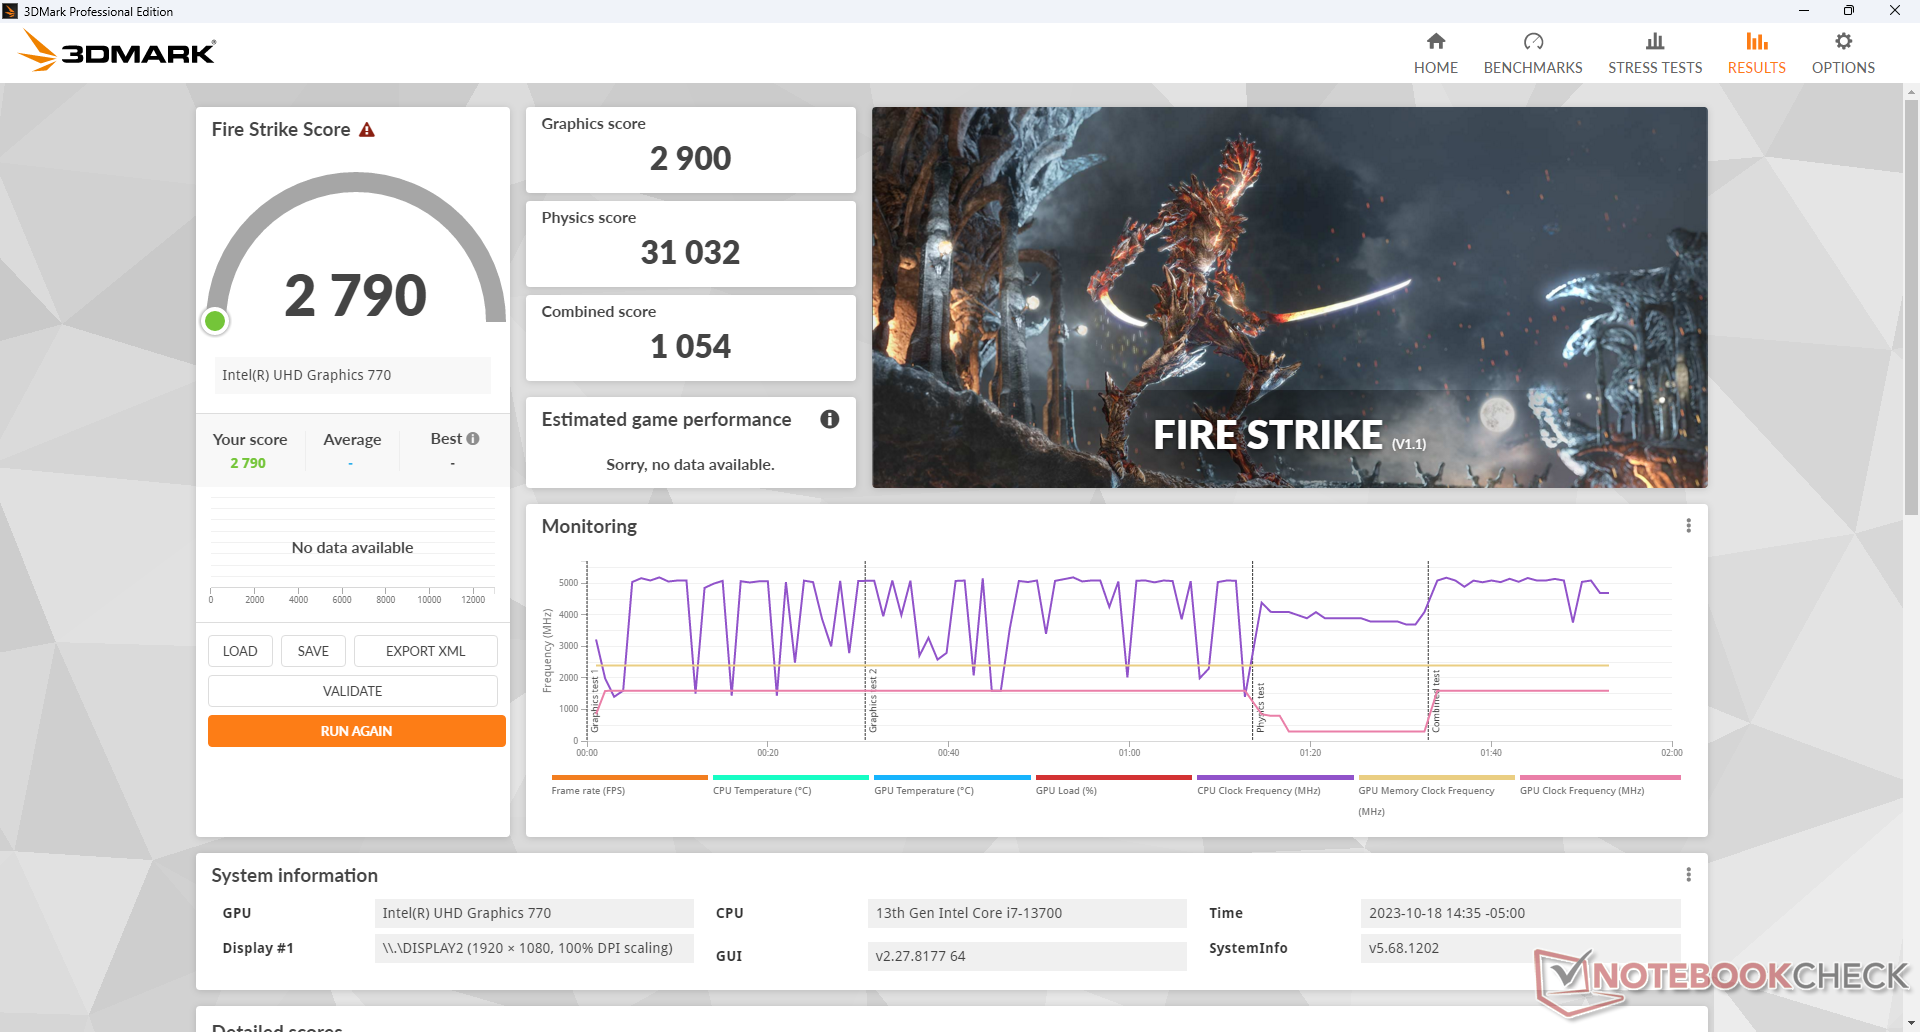
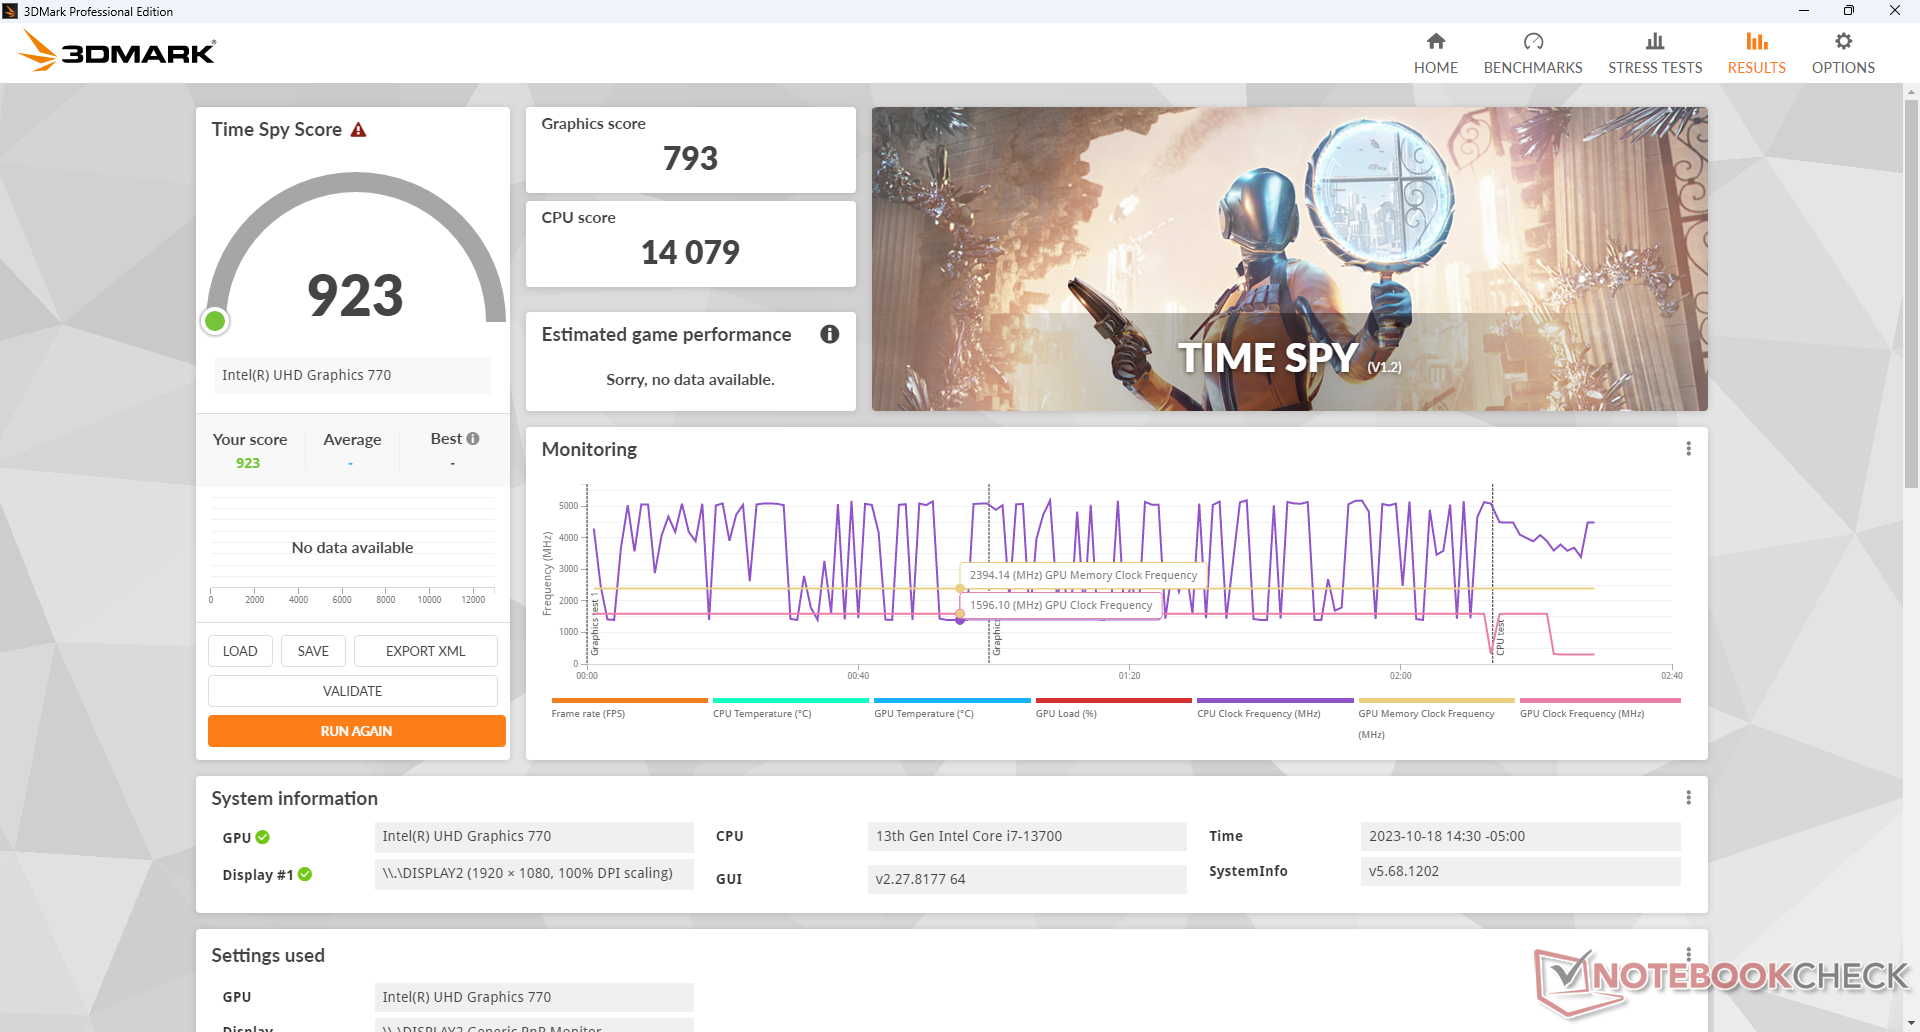
| 3DMark 11 Performance | 4181 pkt. | |
| 3DMark Fire Strike Score | 2790 pkt. | |
| 3DMark Time Spy Score | 923 pkt. | |
Pomoc | ||
| Blender | |
| v3.3 Classroom METAL | |
| Apple Mac Mini M2 | |
| v3.3 Classroom HIP/AMD | |
| Geekom A5 | |
| Acemagic AM20 | |
| v3.3 Classroom CPU | |
| Minisforum Venus Series UN1245 | |
| GMK NucBox K3 Pro | |
| Acemagic AD15 | |
| Apple Mac Mini M2 | |
| Geekom A5 | |
| Acemagic AM20 | |
| Beelink GTR7 7840HS | |
| Lenovo IdeaCentre Mini 01IRH8 | |
| Przeciętny Intel UHD Graphics 770 (320 - 533, n=5) | |
| Intel NUC 12, NUC12SNKi72_Serpent Canyon | |
| Dell OptiPlex Micro | |
* ... im mniej tym lepiej
| The Witcher 3 | |
| 1024x768 Low Graphics & Postprocessing | |
| Beelink GTR7 7840HS | |
| Acemagic AM20 | |
| Lenovo IdeaCentre Mini 01IRH8 | |
| Geekom A5 | |
| GMK NucBox K3 Pro | |
| Minisforum Venus Series UN1245 | |
| Dell OptiPlex Micro | |
| Przeciętny Intel UHD Graphics 770 (41.8 - 58, n=4) | |
| Acemagic AD15 | |
| 1366x768 Medium Graphics & Postprocessing | |
| Beelink GTR7 7840HS | |
| GMK NucBox K3 Pro | |
| Lenovo IdeaCentre Mini 01IRH8 | |
| Geekom A5 | |
| Acemagic AM20 | |
| Minisforum Venus Series UN1245 | |
| Dell OptiPlex Micro | |
| Przeciętny Intel UHD Graphics 770 (34.2 - 37.9, n=2) | |
| Cyberpunk 2077 1.6 | |
| 1280x720 Low Preset | |
| Beelink GTR7 7840HS | |
| Lenovo IdeaCentre Mini 01IRH8 | |
| Przeciętny Intel UHD Graphics 770 (18.6 - 22.2, n=2) | |
| Dell OptiPlex Micro | |
| 1920x1080 Low Preset | |
| Beelink GTR7 7840HS | |
| Lenovo IdeaCentre Mini 01IRH8 | |
| Przeciętny Intel UHD Graphics 770 (10.2 - 11.8, n=2) | |
| Dell OptiPlex Micro | |
Witcher 3 FPS Chart
| low | med. | high | ultra | |
|---|---|---|---|---|
| The Witcher 3 (2015) | 58 | 37.9 | ||
| Dota 2 Reborn (2015) | 153.1 | 96.1 | 44.2 | 40.8 |
| Final Fantasy XV Benchmark (2018) | 28.2 | 14.6 | 10.2 | |
| X-Plane 11.11 (2018) | 51.4 | 32.7 | 29.7 | |
| Cyberpunk 2077 1.6 (2022) | 10.2 | |||
| Tiny Tina's Wonderlands (2022) | 16.4 |
Emisje
Hałas systemowy
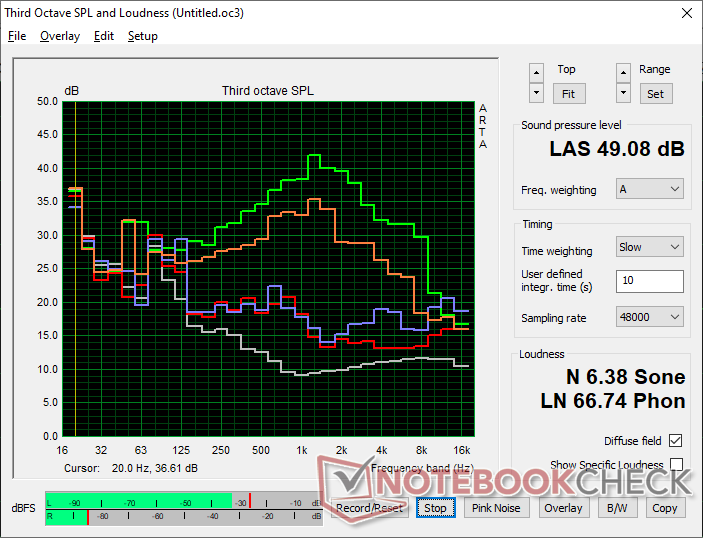
Wewnętrzny wentylator jest zawsze aktywny przy minimalnym poziomie 28,2 dB(A) na cichym tle 23,2 dB(A). Pozostaje on stosunkowo cichy na poziomie około 30 dB(A) podczas uruchamiania typowych obciążeń, takich jak przeglądarki lub arkusze kalkulacyjne, ale ekstremalne obciążenia, takie jak stres Prime95, mogą wywoływać hałas wentylatora o prawie 50 dB(A), co jest głośniejsze niż w przypadku większości innych mini PC. Innymi słowy, OptiPlex Micro staje się głośny dopiero po uruchomieniu wymagających aplikacji.
Hałas
| luz |
| 28.2 / 28.2 / 29.1 dB |
| obciążenie |
| 30.2 / 49.1 dB |
 | ||
30 dB cichy 40 dB(A) słyszalny 50 dB(A) irytujący |
||
min: | ||
| Dell OptiPlex Micro UHD Graphics 770, i7-13700 | Apple Mac Mini M2 M2 10-Core GPU, M2, Apple SSD AP0512Z | Lenovo IdeaCentre Mini 01IRH8 Iris Xe G7 96EUs, i7-13700H, Samsung PM9B1 512GB MZVL4512HBLU | GMK NucBox K3 Pro UHD Graphics 64EUs, i7-12650H, Lexar NM610 Pro NM610P001T-HNNNG | Beelink GTR7 7840HS Radeon 780M, R7 7840HS, Crucial P3 Plus CT1000P3PSSD8 | Beelink SER7 Radeon 780M, R7 7840HS, Crucial P3 Plus CT1000P3PSSD8 | |
|---|---|---|---|---|---|---|
| Noise | 15% | 2% | 4% | 1% | 5% | |
| wyłączone / środowisko * (dB) | 23.2 | 24.7 -6% | 23.4 -1% | 23.1 -0% | 25.6 -10% | 24.5 -6% |
| Idle Minimum * (dB) | 28.2 | 24.7 12% | 30.4 -8% | 25 11% | 28.1 -0% | 25.1 11% |
| Idle Average * (dB) | 28.2 | 24.7 12% | 30.4 -8% | 25.5 10% | 28.1 -0% | 25.1 11% |
| Idle Maximum * (dB) | 29.1 | 24.7 15% | 30.4 -4% | 25.5 12% | 28.1 3% | 25.1 14% |
| Load Average * (dB) | 30.2 | 24.7 18% | 30.7 -2% | 39.9 -32% | 34.9 -16% | 35.9 -19% |
| Witcher 3 ultra * (dB) | 42.6 | 33.9 20% | 39.9 6% | 36.4 15% | 35.6 16% | |
| Load Maximum * (dB) | 49.1 | 29.4 40% | 41 16% | 39.9 19% | 42.4 14% | 45.4 8% |
* ... im mniej tym lepiej
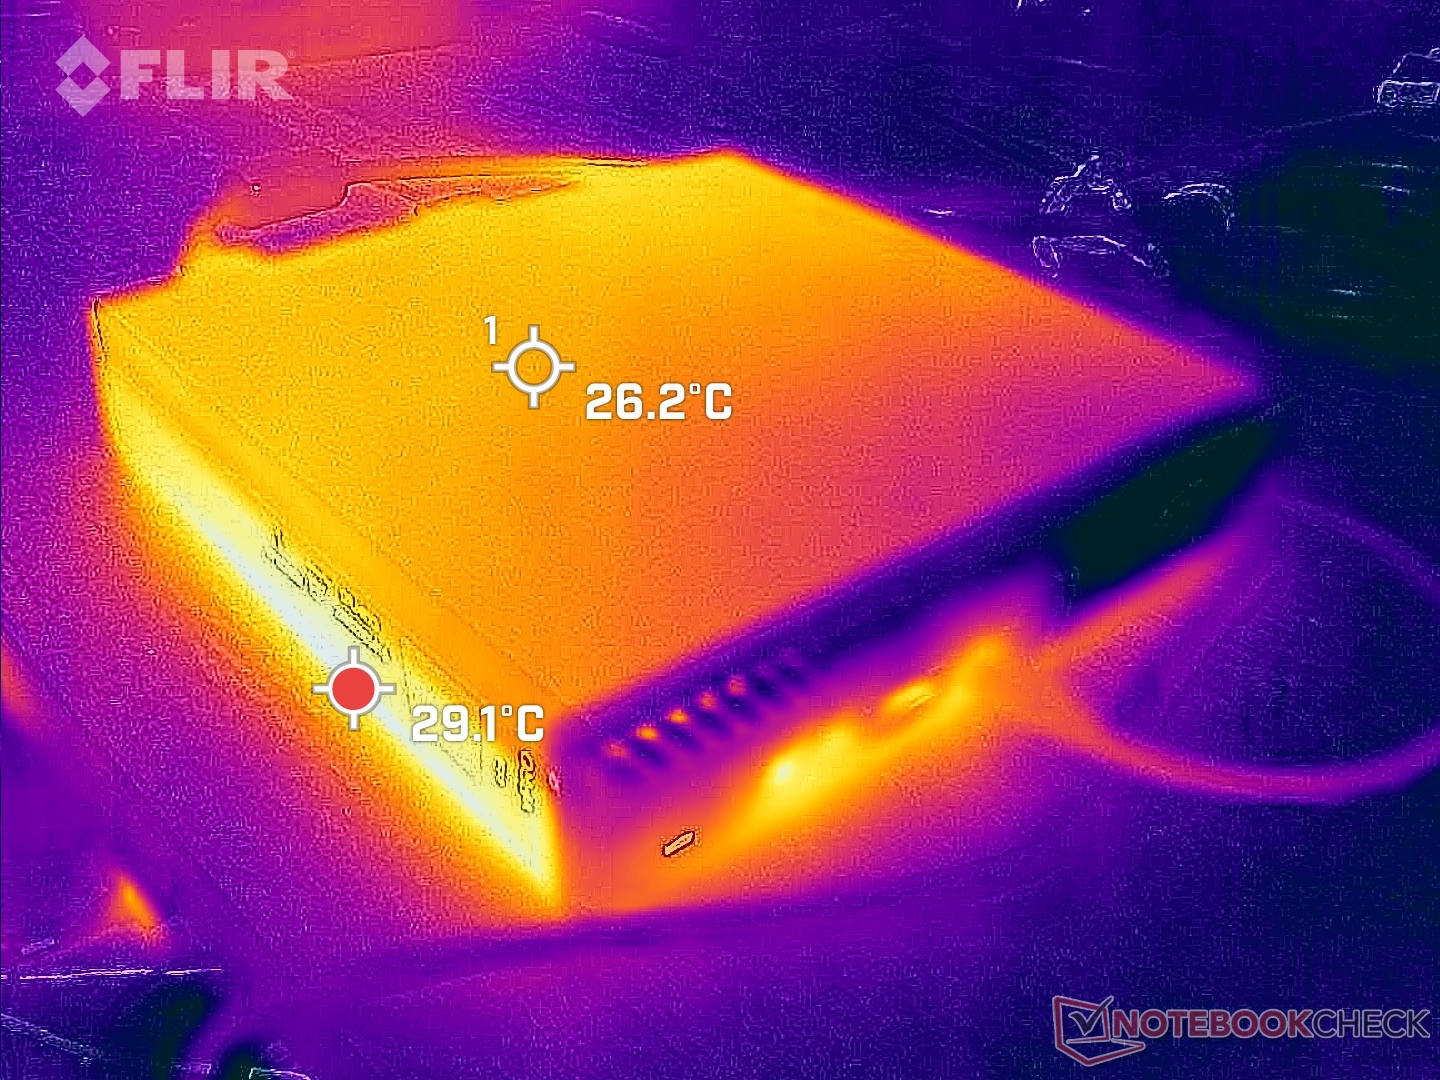
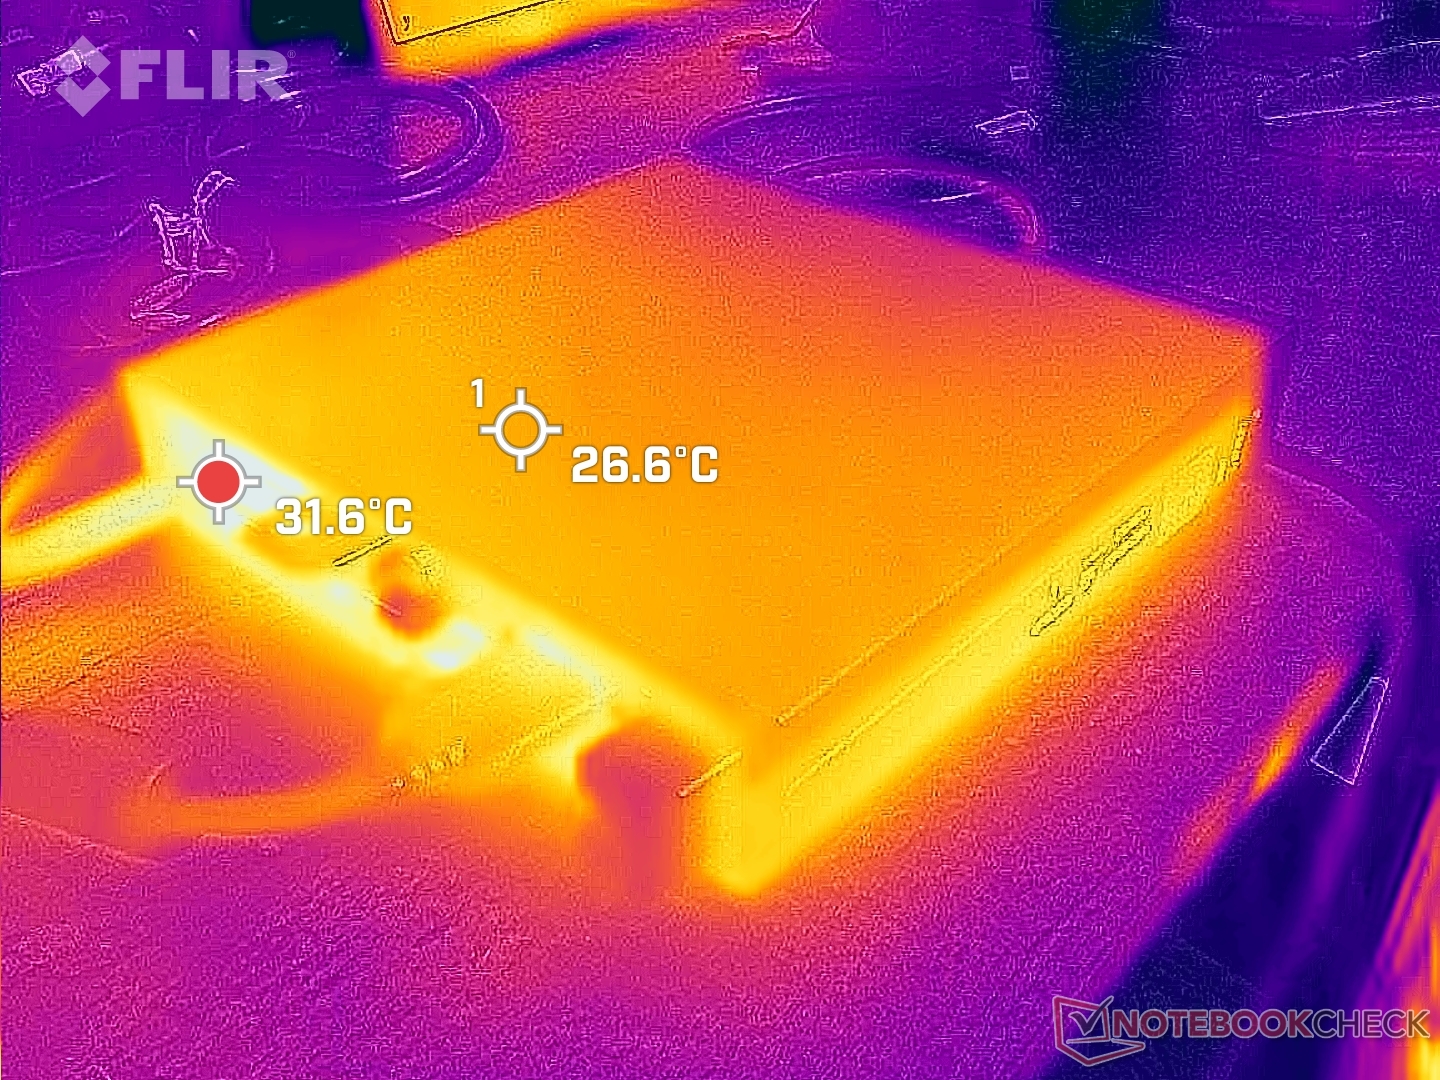
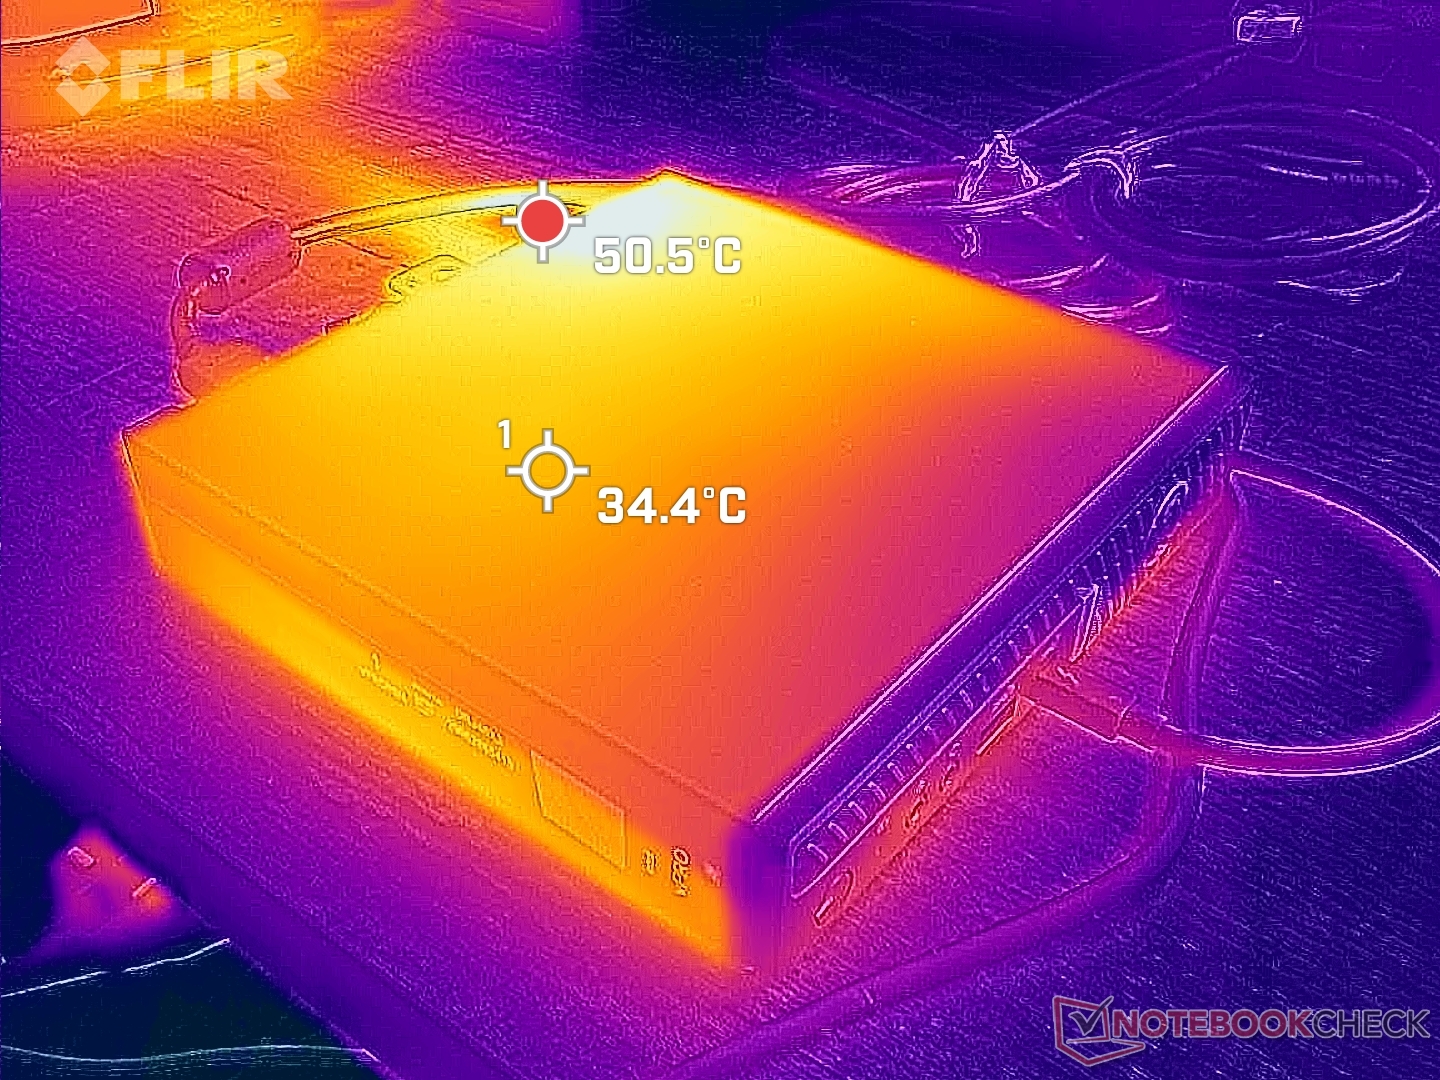
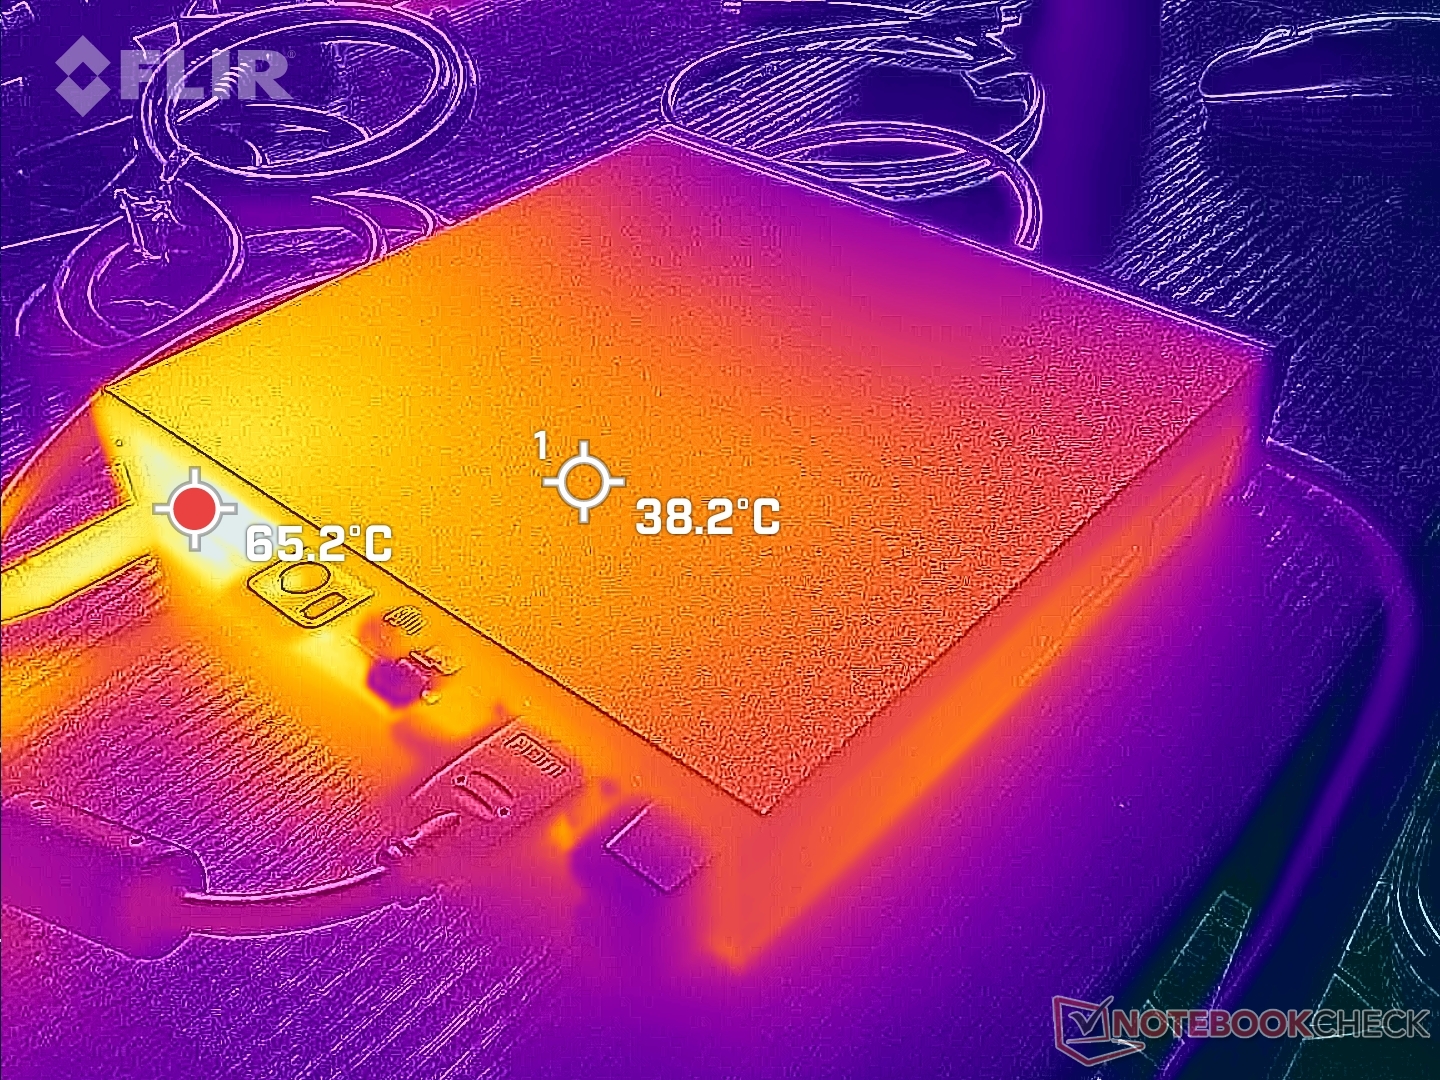
Temperatura - Hot Top
Temperatury powierzchniowe mogą być dość wysokie, ponieważ model ten zawiera procesor klasy desktop w większości metalowej obudowie. Górna powierzchnia ma temperaturę od 30 C do 35 C podczas zwykłego przeglądania stron internetowych i może osiągnąć nawet 51 C podczas uruchamiania wymagających obciążeń. Zdecydowanie warto uważać na temperaturę, jeśli umieszczają Państwo jakiekolwiek przedmioty na górze urządzenia.
Test warunków skrajnych
Temperatury rdzenia mogą być bardzo wysokie, co koreluje z wysokimi temperaturami powierzchni i wspomnianym powyżej zachowaniem dławienia. Na przykład podczas uruchamiania Prime95, procesor zwiększał taktowanie do 3,6 GHz, 155 W i prawie 100 C, trwając najwyżej minutę lub dwie. Następnie procesor ustabilizował się na poziomie 2,7 GHz i 66 W, aby utrzymać nieco niższą temperaturę rdzenia na poziomie 90 C. Powtarzając ten test naLenovo IdeaCentre Mini z wolniejszym procesorem Core i7-13700H dałoby zamiast tego niższą temperaturę rdzenia wynoszącą 81 C.
Co więcej, osiągnięcie tak wysokiej temperatury rdzenia nie zajmuje dużo czasu. Temperatura rdzenia ustabilizowałaby się na poziomie 94 C tylko podczas pracy Witcher 3 do reprezentowania wysokich obciążeń w porównaniu do zaledwie 68 C naBeelink GTR7.
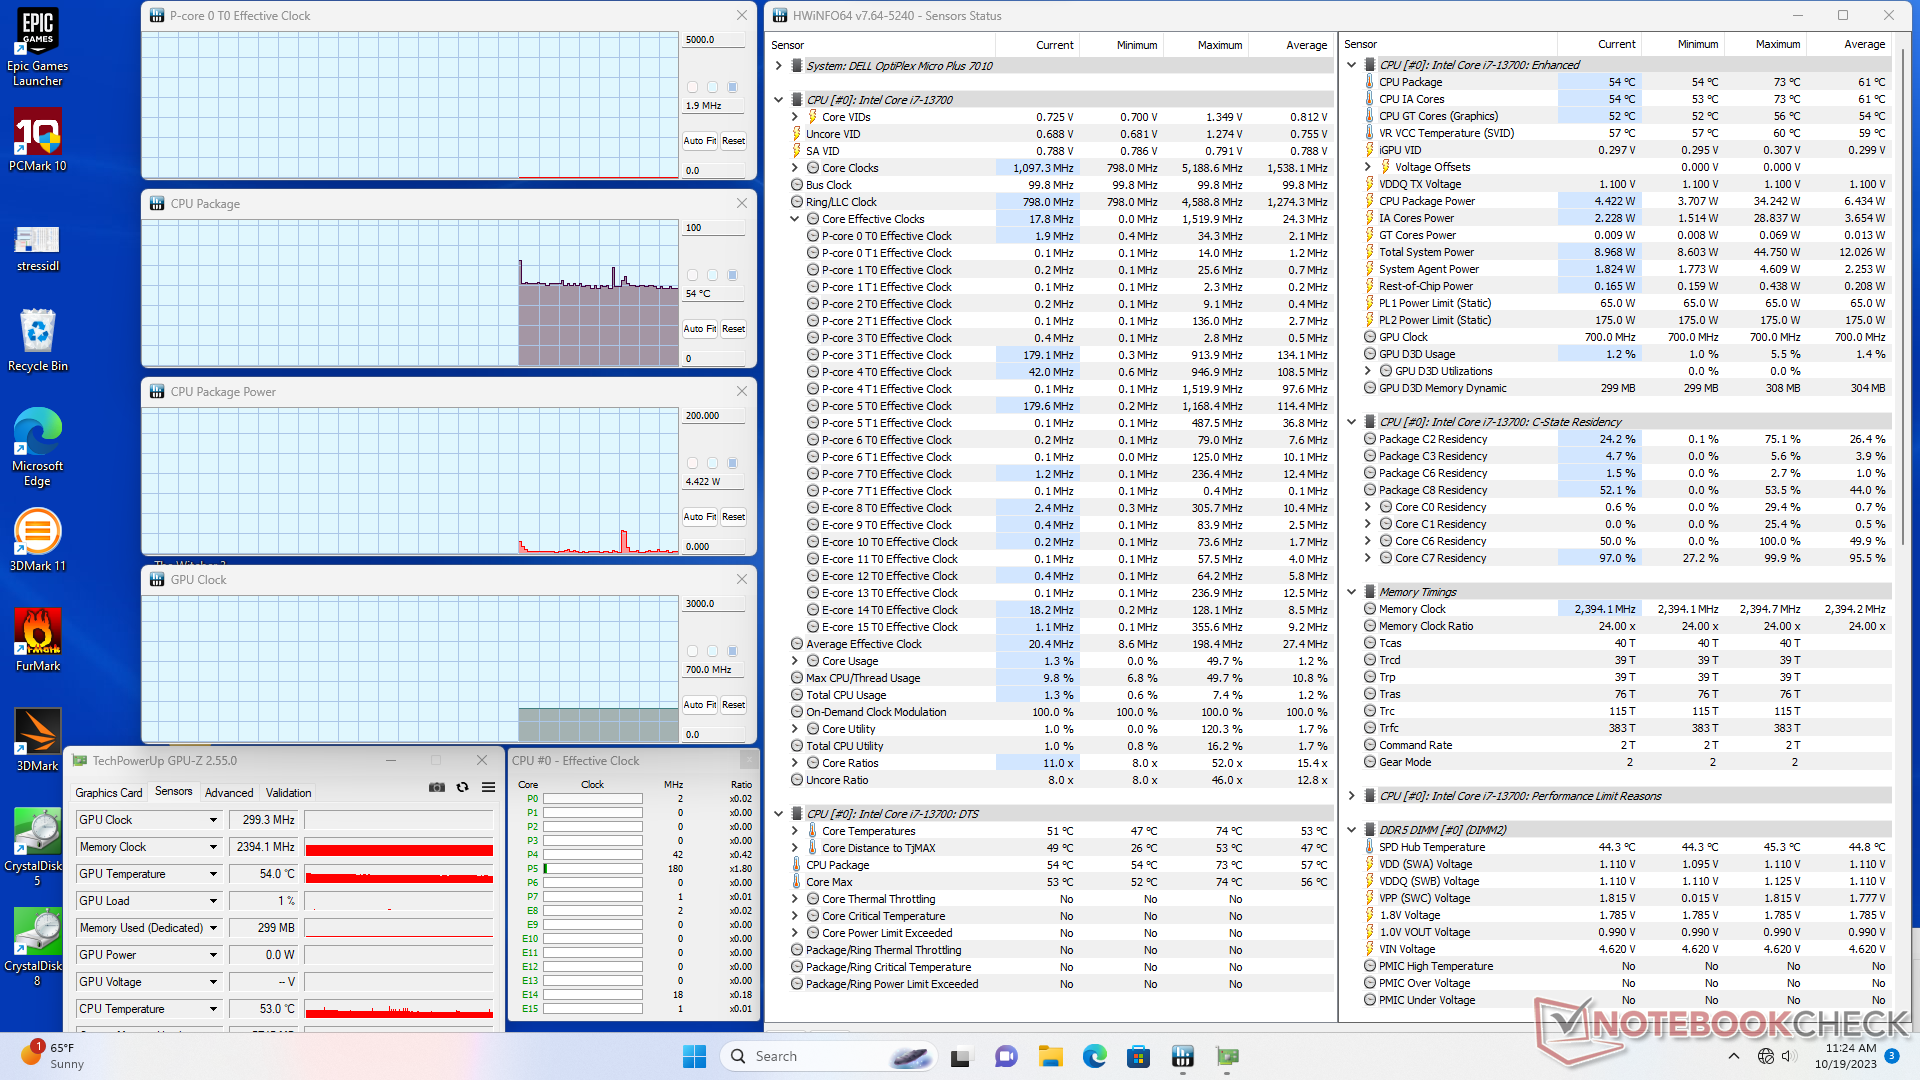
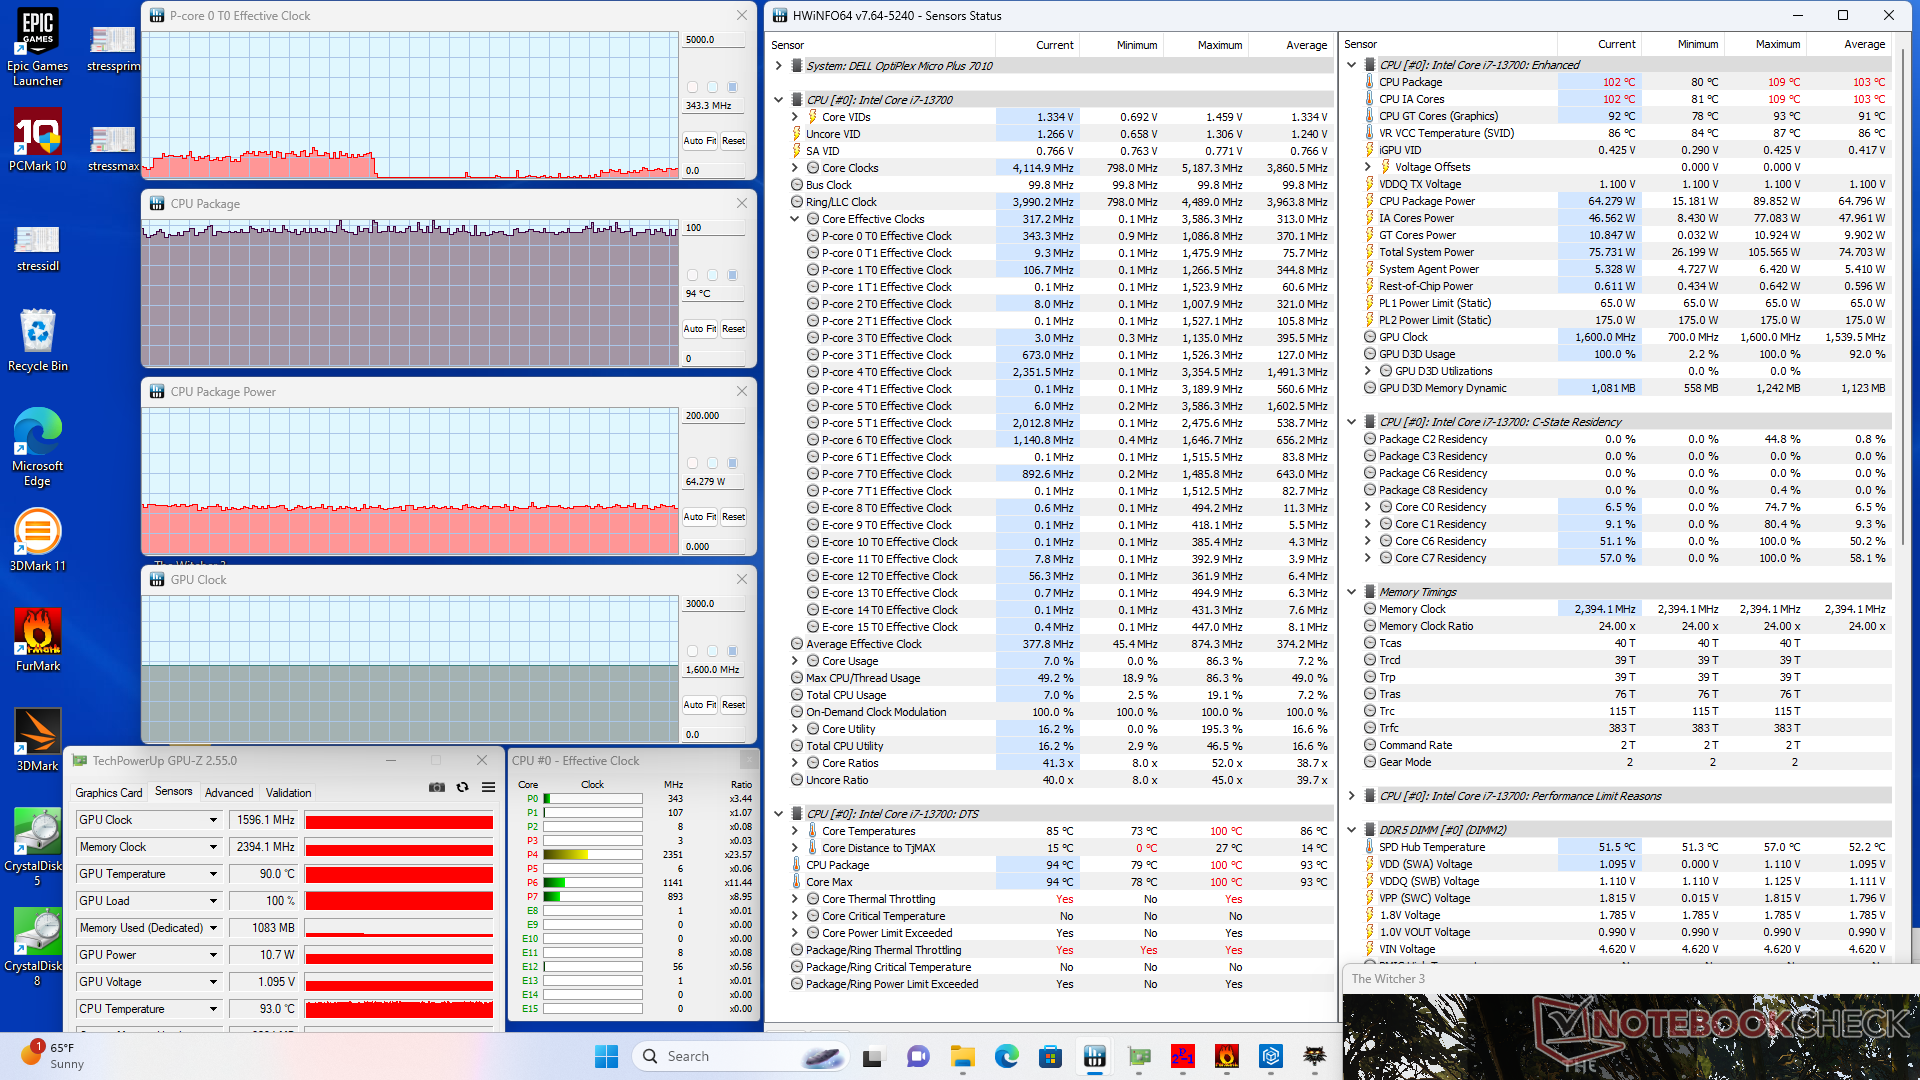
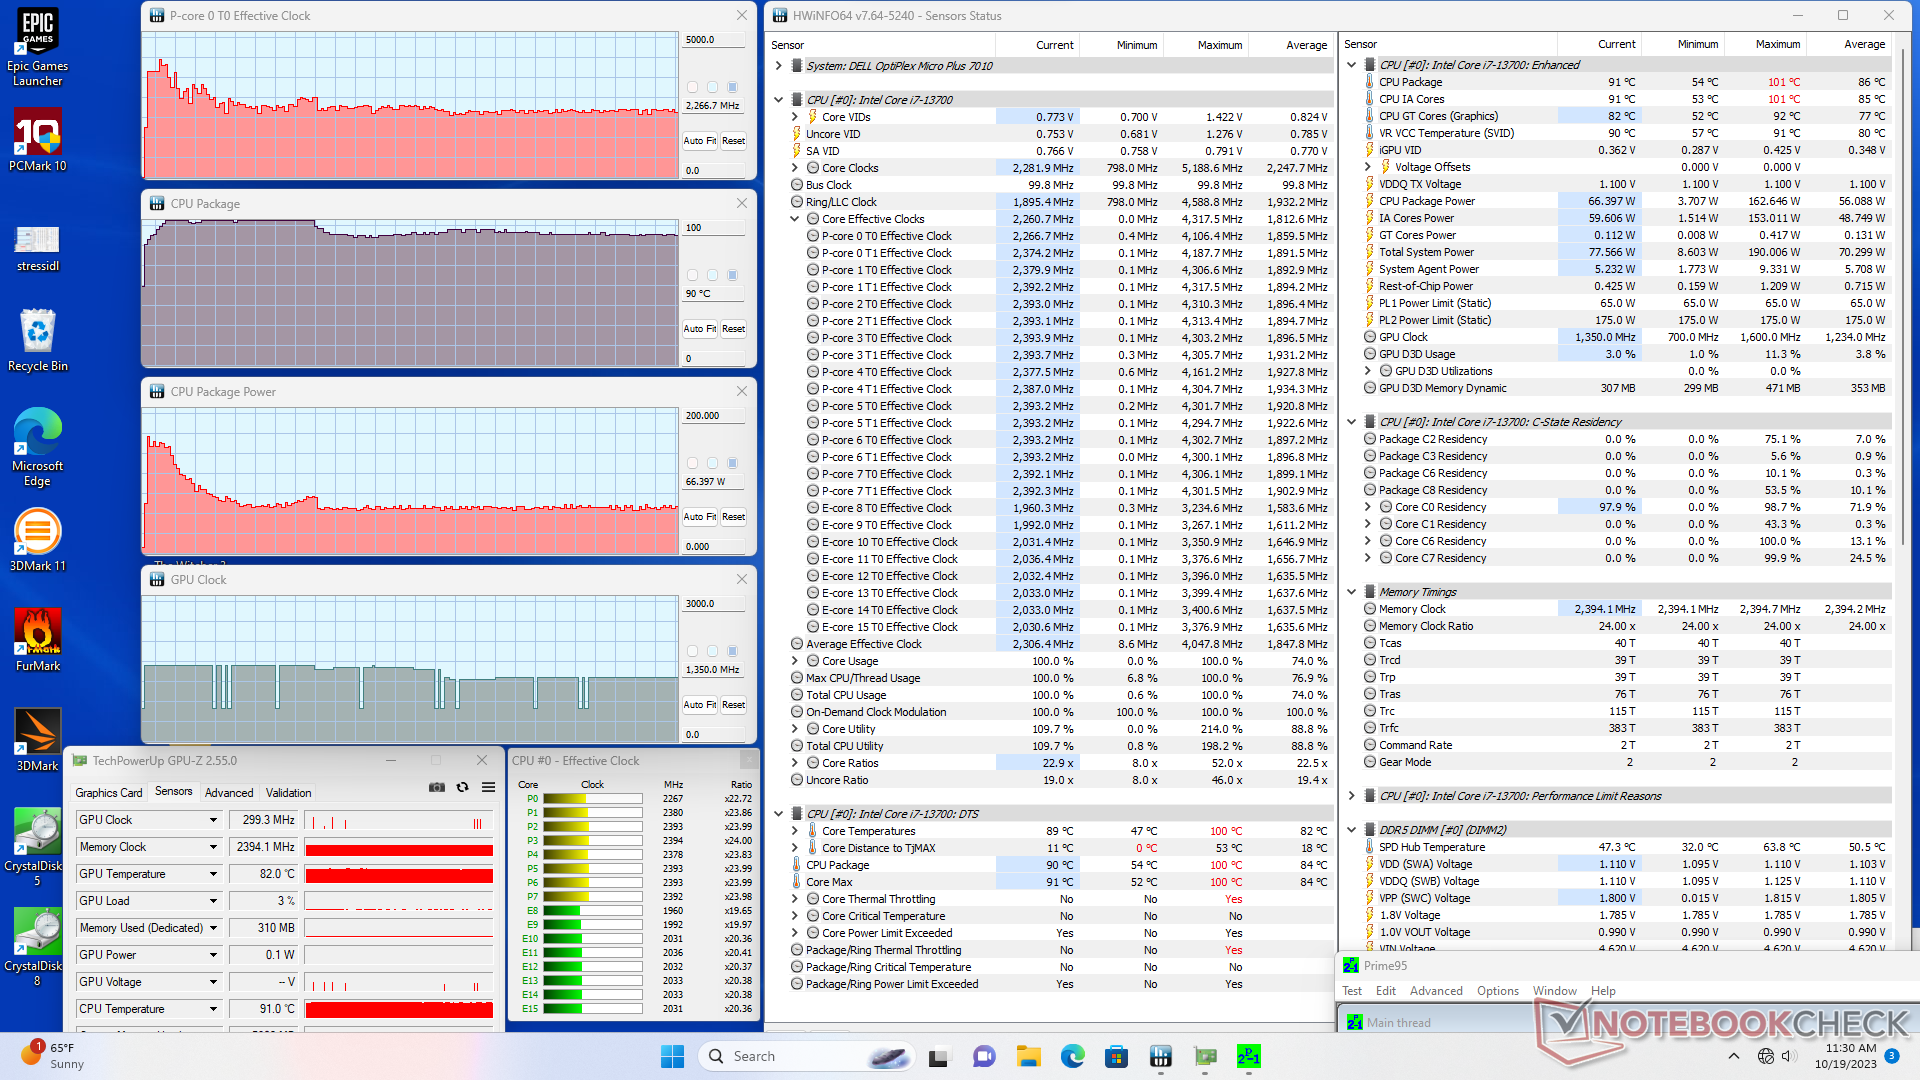
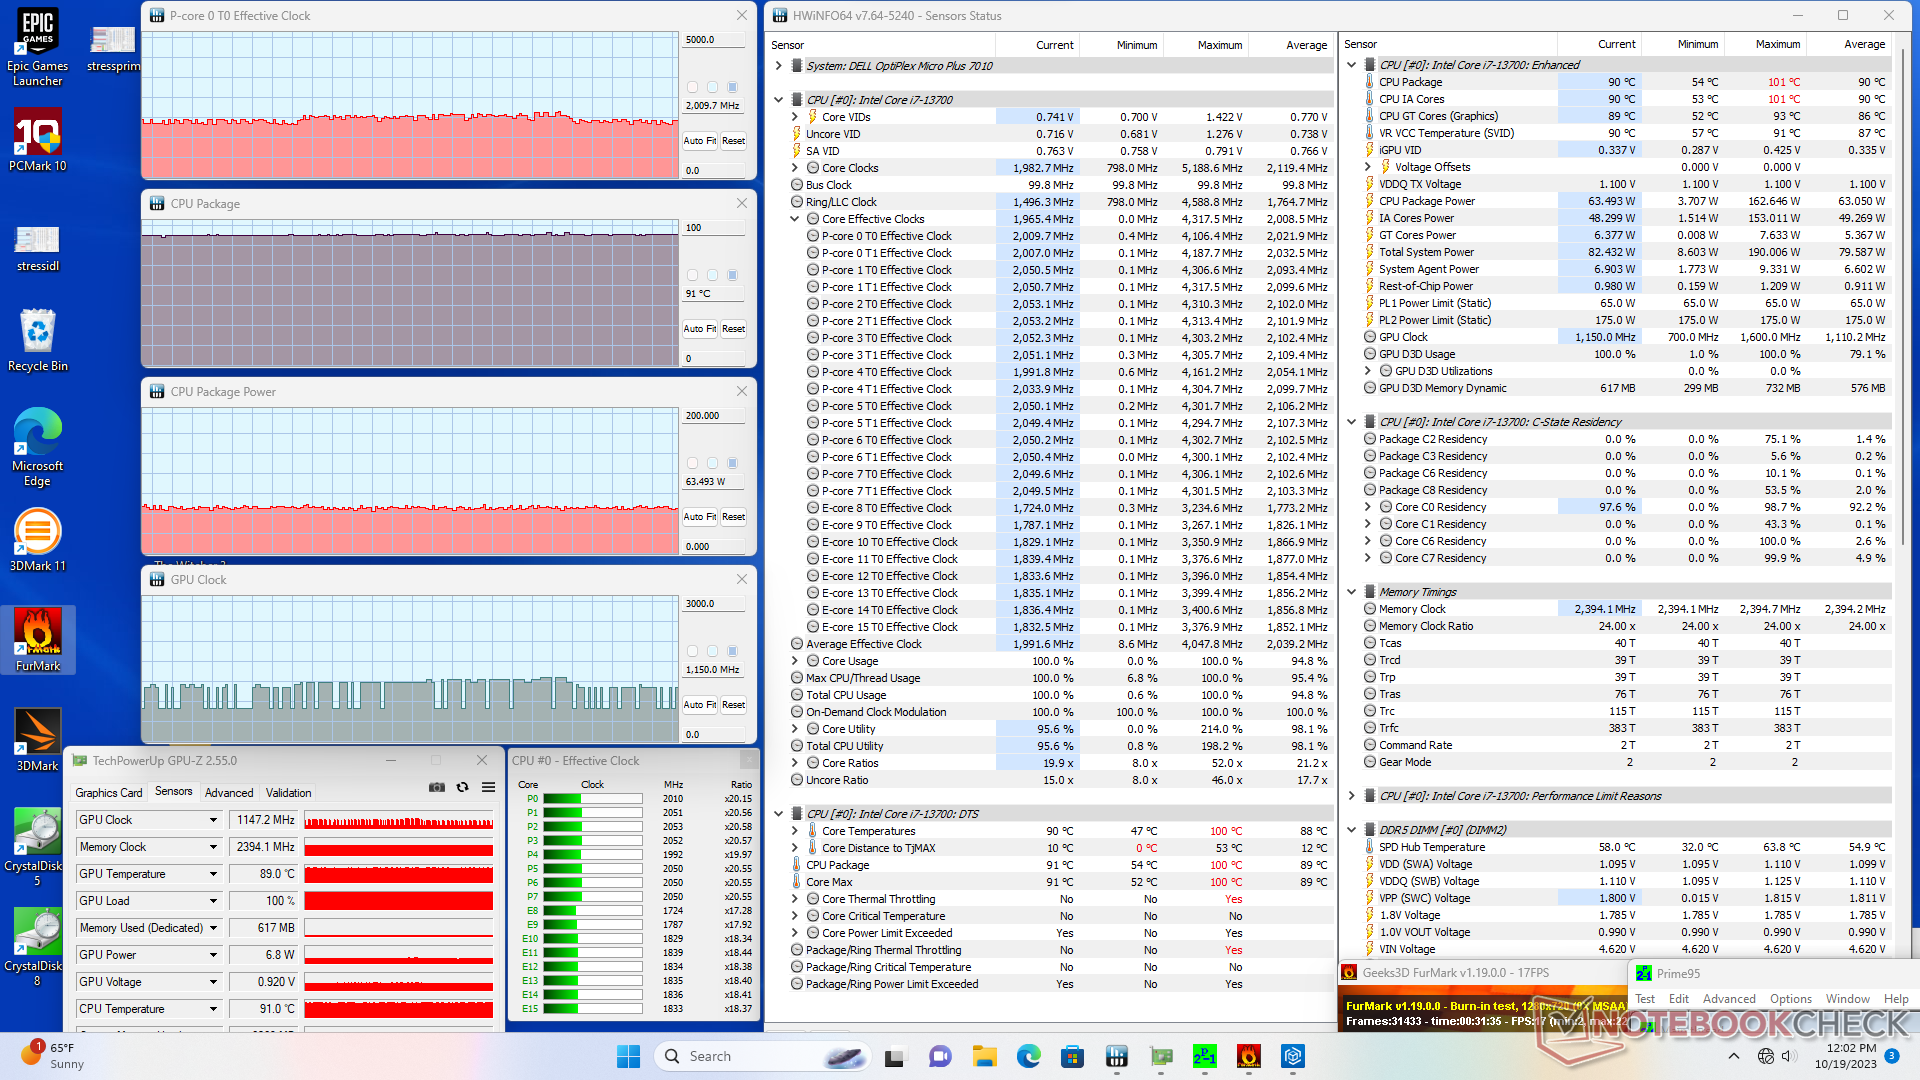
| Taktowanie CPU (GHz) | Taktowanie GPU (MHz) | Średnia temperatura CPU (°C) | |
| System bezczynności | -- | -- | 54 |
| Prime95Stress | 2.3 | -- | 90 |
| Prime95+ FurMark Stress | 2.0 | 700 - 1350 | 91 |
| Witcher 3 Obciążenie | ~0.3 | 1596 | 94 |
Głośniki
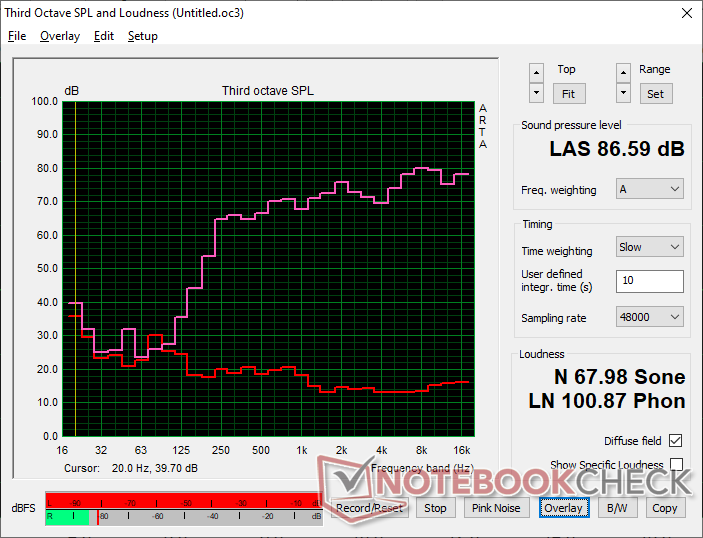
W przeciwieństwie do innych mini PC, w których zintegrowane głośniki są rzadkością, model ten integruje monofoniczny dźwięk. Głośnik jest wystarczająco głośny dla małych biur, ale zdecydowanie nie wystarczająco mocny dla sal konferencyjnych.
Dell OptiPlex Micro analiza dźwięku
(+) | głośniki mogą odtwarzać stosunkowo głośno (86.6 dB)
Bas 100 - 315 Hz
(-) | prawie brak basu - średnio 22% niższa od mediany
(±) | liniowość basu jest średnia (12.2% delta do poprzedniej częstotliwości)
Średnie 400 - 2000 Hz
(+) | zbalansowane środki średnie - tylko 2.6% od mediany
(+) | średnie są liniowe (4.1% delta do poprzedniej częstotliwości)
Wysokie 2–16 kHz
(+) | zrównoważone maksima - tylko 4.7% od mediany
(+) | wzloty są liniowe (4.4% delta do poprzedniej częstotliwości)
Ogólnie 100 - 16.000 Hz
(±) | liniowość ogólnego dźwięku jest średnia (15.9% różnicy w stosunku do mediany)
W porównaniu do tej samej klasy
» 7% wszystkich testowanych urządzeń w tej klasie było lepszych, 7% podobnych, 86% gorszych
» Najlepszy miał deltę 13%, średnia wynosiła ###średnia###%, najgorsza wynosiła 64%
W porównaniu do wszystkich testowanych urządzeń
» 25% wszystkich testowanych urządzeń było lepszych, 5% podobnych, 70% gorszych
» Najlepszy miał deltę 4%, średnia wynosiła ###średnia###%, najgorsza wynosiła 134%
Apple MacBook Pro 16 2021 M1 Pro analiza dźwięku
(+) | głośniki mogą odtwarzać stosunkowo głośno (84.7 dB)
Bas 100 - 315 Hz
(+) | dobry bas - tylko 3.8% od mediany
(+) | bas jest liniowy (5.2% delta do poprzedniej częstotliwości)
Średnie 400 - 2000 Hz
(+) | zbalansowane środki średnie - tylko 1.3% od mediany
(+) | średnie są liniowe (2.1% delta do poprzedniej częstotliwości)
Wysokie 2–16 kHz
(+) | zrównoważone maksima - tylko 1.9% od mediany
(+) | wzloty są liniowe (2.7% delta do poprzedniej częstotliwości)
Ogólnie 100 - 16.000 Hz
(+) | ogólny dźwięk jest liniowy (4.6% różnicy w stosunku do mediany)
W porównaniu do tej samej klasy
» 0% wszystkich testowanych urządzeń w tej klasie było lepszych, 0% podobnych, 100% gorszych
» Najlepszy miał deltę 5%, średnia wynosiła ###średnia###%, najgorsza wynosiła 45%
W porównaniu do wszystkich testowanych urządzeń
» 0% wszystkich testowanych urządzeń było lepszych, 0% podobnych, 100% gorszych
» Najlepszy miał deltę 4%, średnia wynosiła ###średnia###%, najgorsza wynosiła 134%
Zarządzanie energią
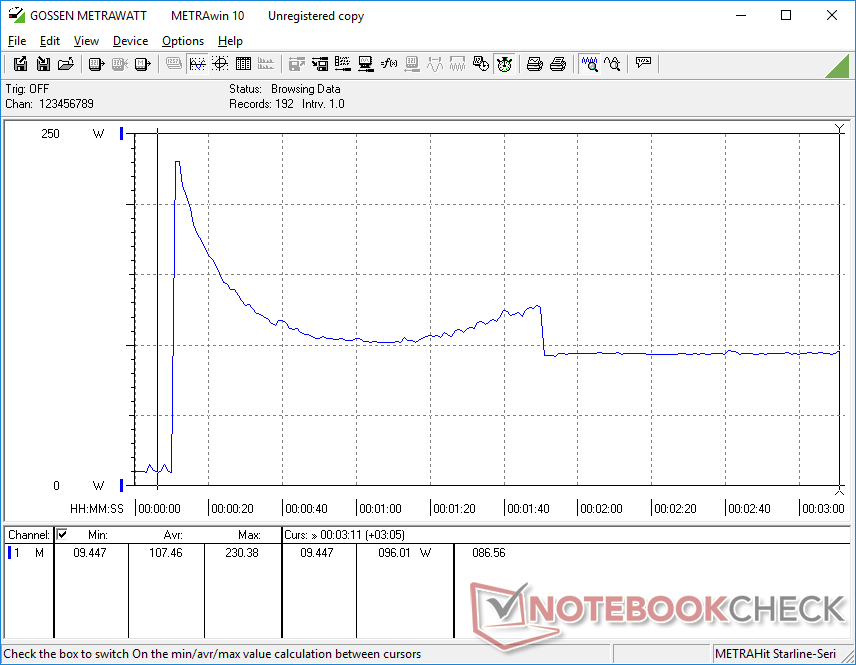
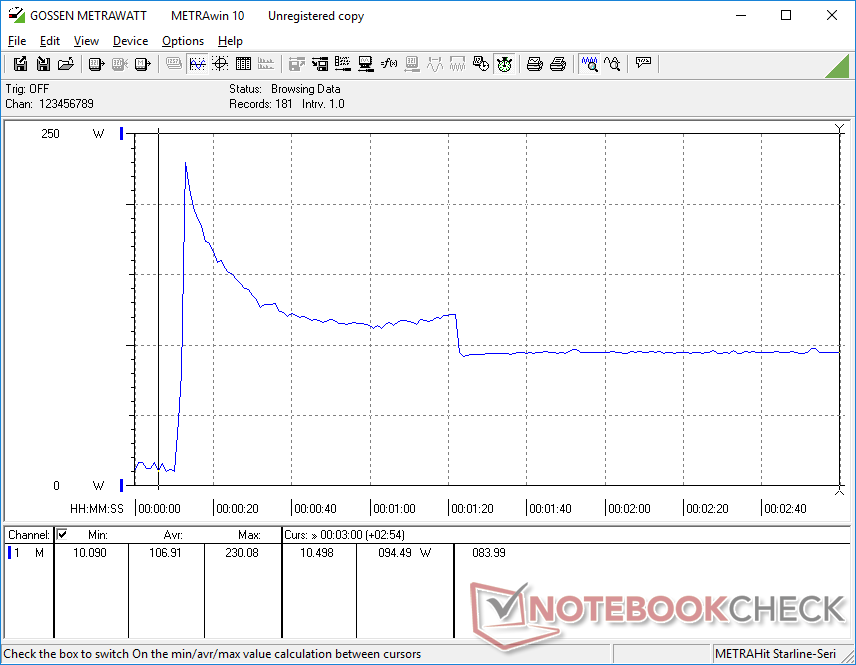
Pobór mocy - wymagająca mała maszyna
Pobór mocy może być dość wysoki, co być może nie jest nieoczekiwane, biorąc pod uwagę znajdujący się w środku procesor do komputerów stacjonarnych. Wysoki potencjał Turbo Boost Core i7-13700 może powodować, że system pobiera nawet od 190 W do 230 W podczas uruchamiania aplikacji lub wykonywania zadań intensywnie wykorzystujących procesor, co pokazują poniższe wykresy. Niemniej jednak, niska stabilność Turbo Boost mini PC oznacza, że tak ekstremalne pobory mocy są tylko tymczasowe.
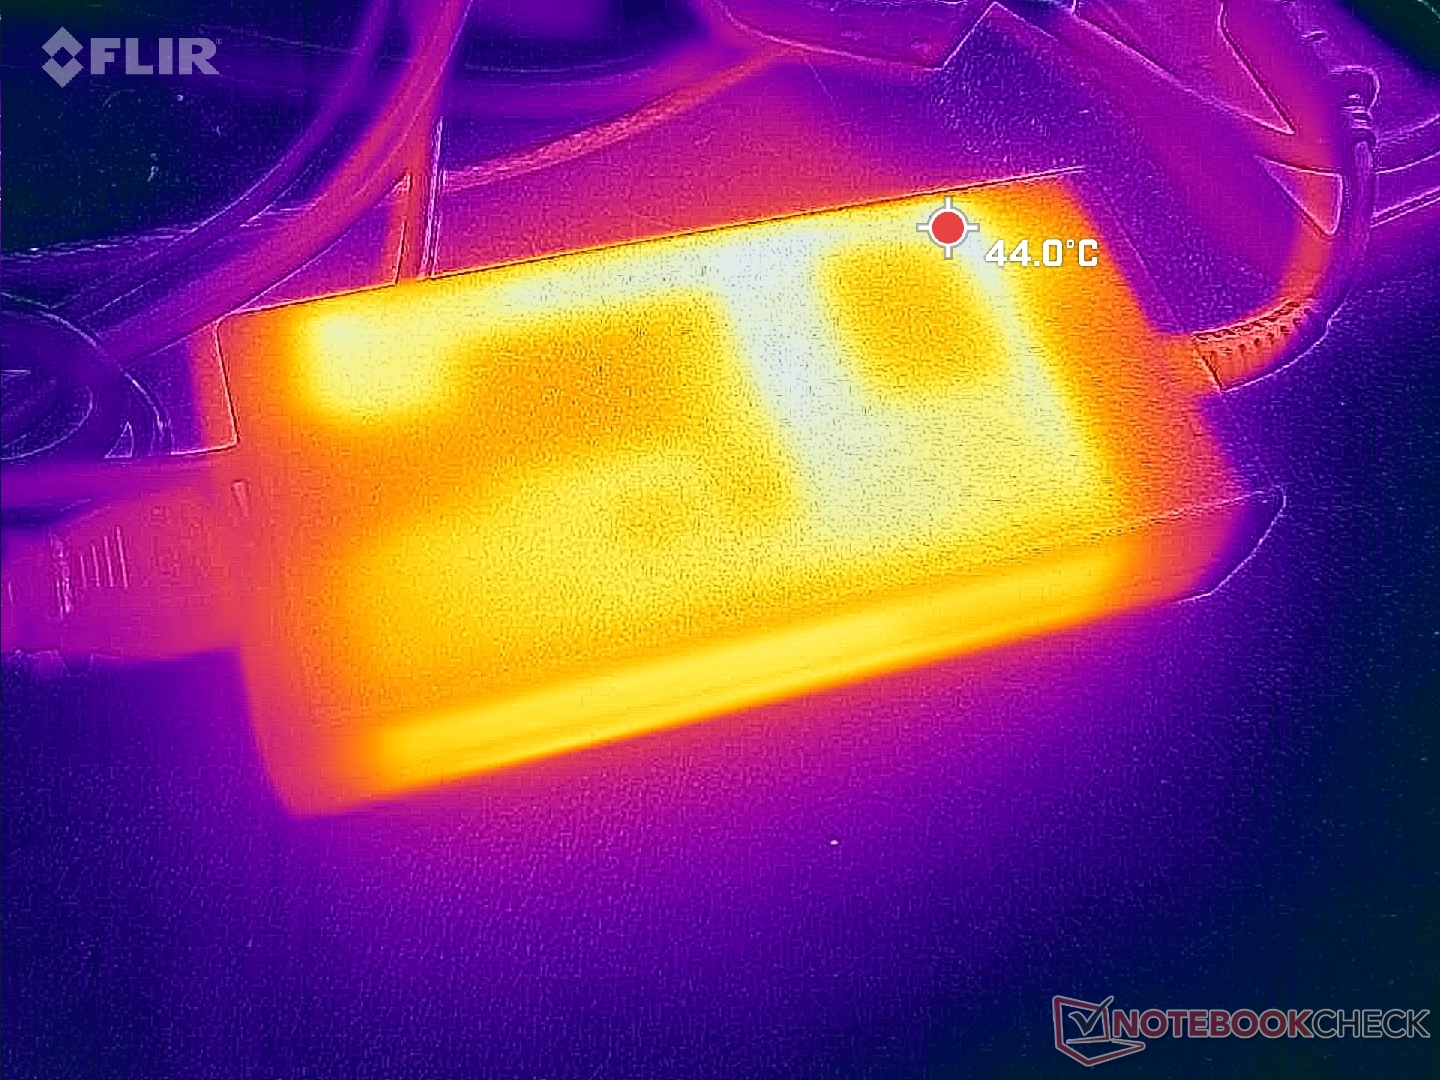
USB-C Power Delivery nie jest obsługiwane, więc dołączony zasilacz 180 W (~15,4 x 7,5 x 3,2 cm) musi być podłączony przez cały czas, aby uruchomić system. Dla porównania, niektóre mini PC, takie jak Beelink SER7 mogą działać wyłącznie na zasilaczach USB-C innych firm, podczas gdy inne, takie jak Lenovo IdeaCentre Mini, w ogóle nie mają zewnętrznego zasilacza.
| wyłączony / stan wstrzymania | |
| luz | |
| obciążenie |
|
Legenda:
min: | |
| Dell OptiPlex Micro i7-13700, UHD Graphics 770, , , x, | Apple Mac Mini M2 M2, M2 10-Core GPU, Apple SSD AP0512Z, , x, | Lenovo IdeaCentre Mini 01IRH8 i7-13700H, Iris Xe G7 96EUs, Samsung PM9B1 512GB MZVL4512HBLU, , x, | GMK NucBox K3 Pro i7-12650H, UHD Graphics 64EUs, Lexar NM610 Pro NM610P001T-HNNNG, , x, | Beelink GTR7 7840HS R7 7840HS, Radeon 780M, Crucial P3 Plus CT1000P3PSSD8, , x, | Beelink SER7 R7 7840HS, Radeon 780M, Crucial P3 Plus CT1000P3PSSD8, , x, | |
|---|---|---|---|---|---|---|
| Power Consumption | 62% | 4% | -18% | 5% | -8% | |
| Idle Minimum * (Watt) | 3.7 | 2.2 41% | 6.7 -81% | 7.1 -92% | 5.5 -49% | 6.7 -81% |
| Idle Average * (Watt) | 7.2 | 6.7 7% | 10.1 -40% | 5.8 19% | 7.3 -1% | |
| Idle Maximum * (Watt) | 8.7 | 2.6 70% | 7.1 18% | 18.6 -114% | 7.7 11% | 11.6 -33% |
| Load Average * (Watt) | 69.5 | 28.7 59% | 68.5 1% | 45.3 35% | 70.6 -2% | 64.1 8% |
| Witcher 3 ultra * (Watt) | 77.1 | 58.3 24% | 55.2 28% | 79.8 -4% | 75.8 2% | |
| Load Maximum * (Watt) | 230.6 | 51.5 78% | 104.3 55% | 52.9 77% | 111.8 52% | 94.8 59% |
* ... im mniej tym lepiej
Power Consumption Witcher 3 / Stresstest
Power Consumption external Monitor
Za
Przeciw
Werdykt - duży procesor w mikro obudowie
Najważniejsze cechy OptiPlex Micro to wymienny procesor, możliwość serwisowania bez użycia narzędzi, wysoka wydajność procesora w przeliczeniu na objętość oraz cztery indywidualne porty wideo. Użytkownicy, którzy pracują wielozadaniowo na dwóch lub więcej monitorach w celu tworzenia wykresów, arkuszy kalkulacyjnych i edytorów tekstu, uznają OptiPlex Micro za niezawodną opcję "ustaw i zapomnij".
Korzystanie z pełnoprawnego procesora Core i7 zaprojektowanego dla komputerów stacjonarnych w obudowie mini PC ma swoje wady. W szczególności potencjał Turbo Boost jest niższy, a zatem średnia wydajność jest przyzwoicie niższa niż w przypadku większego systemu OptiPlex wyposażonego w ten sam procesor. Po drugie, temperatury rdzenia są bardzo wysokie i wynoszą ponad 90 C, co choć technicznie bezpieczne, nie jest idealnym rozwiązaniem, zwłaszcza gdy większość innych mini PC działa chłodniej. I wreszcie, przestarzały zintegrowany procesor graficzny jest niewystarczający dla większości nowoczesnych rendererów 3D, a sytuację pogarsza jeszcze brak obsługi USB4 lub Thunderbolt eGPU. Zalecamy minikomputery z układami graficznymi Iris Xe lub Radeon 680M/780M, jeśli Państwa zadania wymagają edycji grafiki.
Użytkownicy mini PC, którzy cenią sobie surową wydajność procesora, uznają OptiPlex Micro za opłacalny. W przeciwnym razie, alternatywy takie jak Intel NUC 13 Pro lub Beelink GTR7 są lepiej zbalansowane pod względem wydajności CPU i GPU.
Niefortunne jest również dławienie dysków SSD. Dedykowane rozpraszacze ciepła SSD prawdopodobnie rozwiązałyby ten problem, ale zwiększyłoby to wagę i cenę.
Cena i dostępność
Dell dostarcza obecnie OptiPlex Micro Plus 7010 w cenie zaczynającej się od 929 USD, ale w chwili pisania tego tekstu dostępne są tylko konfiguracje z wolniejszymi procesorami Core serii T.
Dell OptiPlex Micro
- 24/10/2023 v7 (old)
Allen Ngo
Przezroczystość
Wyboru urządzeń do recenzji dokonuje nasza redakcja. Próbka testowa została udostępniona autorowi jako pożyczka od producenta lub sprzedawcy detalicznego na potrzeby tej recenzji. Pożyczkodawca nie miał wpływu na tę recenzję, producent nie otrzymał też kopii tej recenzji przed publikacją. Nie było obowiązku publikowania tej recenzji. Jako niezależna firma medialna, Notebookcheck nie podlega władzy producentów, sprzedawców detalicznych ani wydawców.
Tak testuje Notebookcheck
Każdego roku Notebookcheck niezależnie sprawdza setki laptopów i smartfonów, stosując standardowe procedury, aby zapewnić porównywalność wszystkich wyników. Od około 20 lat stale rozwijamy nasze metody badawcze, ustanawiając przy tym standardy branżowe. W naszych laboratoriach testowych doświadczeni technicy i redaktorzy korzystają z wysokiej jakości sprzętu pomiarowego. Testy te obejmują wieloetapowy proces walidacji. Nasz kompleksowy system ocen opiera się na setkach uzasadnionych pomiarów i benchmarków, co pozwala zachować obiektywizm.Price comparison

