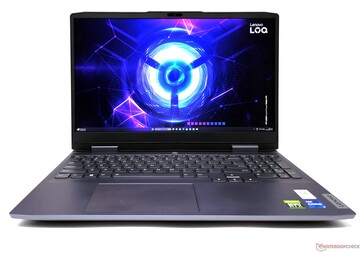
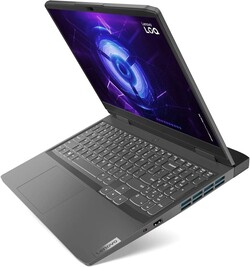
Recenzja Lenovo LOQ 15 Core i7: Przystępna cenowo alternatywa Legion, która stawia pytanie Intel vs AMD
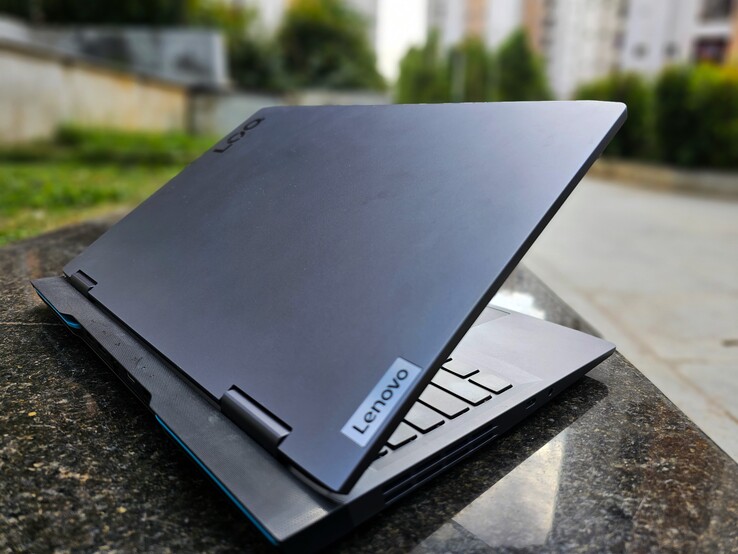
Seria Lenovo LOQ jest skierowana do niedrogich, podstawowych graczy, podobnie jak serie Dell G, HP Victus, Asus TUF, MSI Katana i Acer Nitro. Niedawno recenzowaliśmy model LOQ 15APH8 z procesoremAMD Ryzen 7 7840HSiNvidia RTX 4050 Laptop GPU. Model LOQ 16IRH8 również połączył krzem Intela i Nvidii, parując procesor Core i7-13620H z RTX 4060 grafiką.
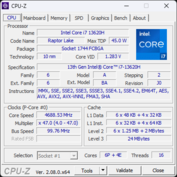
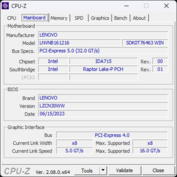
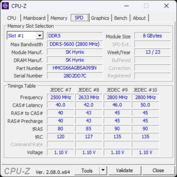
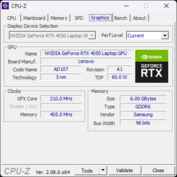
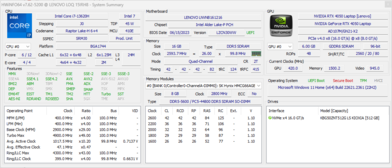
Teraz w naszych laboratoriach znajduje się 15-calowy LOQ 15IRH8, napędzany przez Core i7-13620H i RTX 4050. Nasz model testowy był również wyposażony w 16 GB pamięci DDR5-5200, dysk SSD PCIe Gen4 NVMe o pojemności 512 GB i wyświetlacz QHD G-Sync 165 Hz.
Ta konfiguracja z wyższej półki średniej kosztuje w Indiach 1 01 988 jenów (1 224 USD), podczas gdy wariant 1080p 144 Hz można nabyć za 97 790 jenów (1 050 USD).
Potencjalni konkurenci w porównaniu
Ocena | Data | Model | Waga | Wysokość | Rozmiar | Rezolucja | Cena |
|---|---|---|---|---|---|---|---|
| 85.9 % v7 (old) | 10/2023 | Lenovo LOQ 15IRH8 Core i7 i7-13620H, GeForce RTX 4050 Laptop GPU | 2.4 kg | 25.2 mm | 15.60" | 2560x1440 | |
| 87.3 % v7 (old) | 09/2023 | Lenovo LOQ 16IRH8 i7-13620H, GeForce RTX 4060 Laptop GPU | 2.7 kg | 25.9 mm | 16.00" | 2560x1600 | |
| 85.7 % v7 (old) | 07/2023 | Lenovo LOQ 15APH8 R7 7840HS, GeForce RTX 4050 Laptop GPU | 2.5 kg | 25.2 mm | 15.60" | 1920x1080 | |
| 82.1 % v7 (old) | 02/2023 | MSI Katana 17 B13VFK i7-13620H, GeForce RTX 4060 Laptop GPU | 2.8 kg | 25.2 mm | 17.30" | 1920x1080 | |
| 89 % v7 (old) | 08/2023 | Lenovo Legion Pro 5 16ARX8 (R5 7645HX, RTX 4050) R5 7645HX, GeForce RTX 4050 Laptop GPU | 2.5 kg | 27.3 mm | 16.00" | 2560x1600 | |
| 85.1 % v7 (old) | 09/2023 | HP Victus 16-r0077ng i7-13700H, GeForce RTX 4070 Laptop GPU | 2.4 kg | 24 mm | 16.10" | 1920x1080 | |
| 84.2 % v7 (old) | 06/2023 | Dell G15 5530 i7-13650HX, GeForce RTX 4060 Laptop GPU | 3 kg | 26.95 mm | 15.60" | 1920x1080 | |
| 86.9 % v7 (old) | 06/2023 | Asus TUF Gaming A16 FA617XS R9 7940HS, Radeon RX 7600S | 2.2 kg | 22.1 mm | 16.00" | 1920x1200 |
Obudowa i urządzenia wejściowe: Taka sama plastikowa konstrukcja jak w wariancie AMD
Aby uzyskać więcej informacji na temat obudowy, konserwacji i urządzeń wejściowych Lenovo LOQ 15IRH8, proszę zapoznać się z naszą Recenzja LOQ 15APH8- te aspekty są identyczne między laptopami Lenovo LOQ opartymi na procesorach Intel i AMD.
Łączność: zasilanie USB-C o mocy 140 W, ale bez Thunderbolt 4
Wybór i rozmieszczenie portów jest dokładnie takie samo jak w przypadku LOQ 16 z procesorem Intela. W przeciwieństwie do LOQ 15APH8, który wykorzystuje port USB 2.0 wśród innych portów USB 3.2, warianty Intela w pełni standaryzują łączność USB 3.2.
Według Lenovo, jedyny port USB 3.2 Gen2 Type-C jest w stanie dostarczyć 140 W mocy. Nie ma opcji USB4 lub Thunderbolt 4.
Komunikacja
Wydajność bezprzewodowa jest zgodna z oczekiwaniami dla modułu Realtek Wi-Fi 6. Zarówno testy nadawania, jak i odbioru wykazały stabilną przepustowość podczas testów z naszym referencyjnym routerem Asus ROG Rapture GT-AXE11000.
| Networking / iperf3 transmit AXE11000 | |
| Lenovo Legion Pro 5 16ARX8 (R5 7645HX, RTX 4050) | |
| Dell G15 5530 | |
| MSI Katana 17 B13VFK | |
| Średnia w klasie Gaming (469 - 1862, n=115, ostatnie 2 lata) | |
| Lenovo LOQ 15IRH8 Core i7 | |
| Lenovo LOQ 15APH8 | |
| Przeciętny Realtek RTL8852BE (536 - 943, n=66) | |
| Asus TUF Gaming A16 FA617XS | |
| Lenovo LOQ 16IRH8 | |
| HP Victus 16-r0077ng | |
| Networking / iperf3 receive AXE11000 | |
| MSI Katana 17 B13VFK | |
| Lenovo Legion Pro 5 16ARX8 (R5 7645HX, RTX 4050) | |
| Dell G15 5530 | |
| Średnia w klasie Gaming (680 - 1745, n=115, ostatnie 2 lata) | |
| Lenovo LOQ 15IRH8 Core i7 | |
| Asus TUF Gaming A16 FA617XS | |
| Przeciętny Realtek RTL8852BE (455 - 985, n=67) | |
| Lenovo LOQ 16IRH8 | |
| Lenovo LOQ 15APH8 | |
| HP Victus 16-r0077ng | |
Kamera internetowa
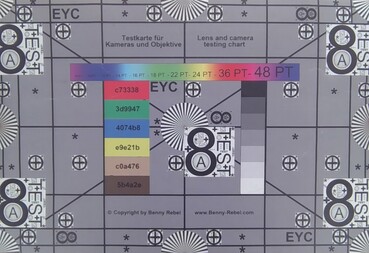
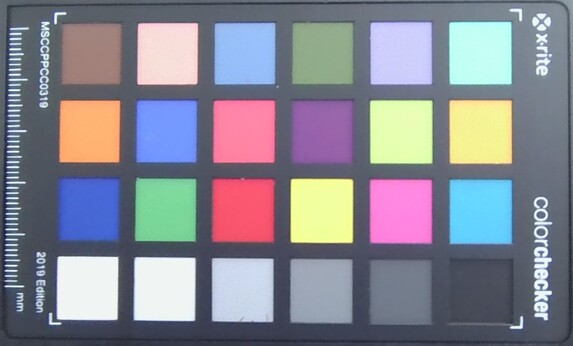
Kamera internetowa 1080p wykazuje wysokie odchylenia we wszystkich kolorach z wyjątkiem białego. Jakość obrazu jest jednak wystarczająca do prowadzenia rozmów wideo przy dobrym oświetleniu otoczenia. Elektroniczny przełącznik migawki kamery znajduje się po prawej stronie urządzenia.
Gwarancja
W Indiach Lenovo oferuje standardową roczną gwarancję na miejscu dla LOQ 15. Kupujący mogą dodatkowo zdecydować się na kilka opcji aktualizacji gwarancji i ochrony przed przypadkowymi uszkodzeniami bezpośrednio od Lenovo.
Wyświetlacz: panel QHD G-Sync 165 Hz stanowi istotną opcję modernizacji
Nasza jednostka LOQ 15 została wyposażona w panel BOE QHD z częstotliwością odświeżania 165 Hz. Panel obsługuje Nvidia G-Sync w trybie dyskretnego GPU. Lenovo ocenia jasność na 350 nitów, ale zarejestrowaliśmy do 383 nitów w najjaśniejszym punkcie wyświetlacza.
W rogach występują prześwity podświetlenia, ale ogólna jednorodność jasności jest dobra i wynosi 90%. Poziomy czerni i współczynnik kontrastu przewyższają panel QHD+ wyprodukowany przez AUO w LOQ 16IRH8.
| |||||||||||||||||||||||||
rozświetlenie: 90 %
na akumulatorze: 372 cd/m²
kontrast: 1130:1 (czerń: 0.33 cd/m²)
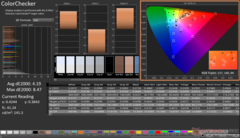
ΔE ColorChecker Calman: 4.19 | ∀{0.5-29.43 Ø4.77}
calibrated: 1.07
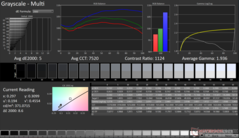
ΔE Greyscale Calman: 5 | ∀{0.09-98 Ø5}
67.7% AdobeRGB 1998 (Argyll 3D)
96.6% sRGB (Argyll 3D)
66.3% Display P3 (Argyll 3D)
Gamma: 1.93
CCT: 7520 K
| Lenovo LOQ 15IRH8 Core i7 BOE CQ NE156QHM-NY4, IPS, 2560x1440, 15.6" | Lenovo LOQ 16IRH8 AUOC1A5 (B160QAN03.L), IPS, 2560x1600, 16" | Lenovo LOQ 15APH8 BOE NJ NE156FHM-NX3, IPS, 1920x1080, 15.6" | MSI Katana 17 B13VFK B173HAN04.9, IPS LED, 1920x1080, 17.3" | Lenovo Legion Pro 5 16ARX8 (R5 7645HX, RTX 4050) CSOT T3 MNG007DA2-2, IPS, 2560x1600, 16" | HP Victus 16-r0077ng CMN162D, IPS, 1920x1080, 16.1" | Dell G15 5530 AUO B156HAN, IPS, 1920x1080, 15.6" | Asus TUF Gaming A16 FA617XS BOE NE160WUM-NX2, IPS, 1920x1200, 16" | |
|---|---|---|---|---|---|---|---|---|
| Display | 5% | -39% | -38% | 6% | 1% | 7% | 3% | |
| Display P3 Coverage (%) | 66.3 | 70.5 6% | 40.2 -39% | 40.8 -38% | 71.6 8% | 66.7 1% | 73.1 10% | 69.3 5% |
| sRGB Coverage (%) | 96.6 | 98.9 2% | 60.2 -38% | 61 -37% | 99.8 3% | 98 1% | 98.4 2% | 97.3 1% |
| AdobeRGB 1998 Coverage (%) | 67.7 | 72.6 7% | 41.5 -39% | 42.2 -38% | 72.9 8% | 69 2% | 74.4 10% | 70.7 4% |
| Response Times | -16% | -473% | -385% | -51% | -82% | 34% | -116% | |
| Response Time Grey 50% / Grey 80% * (ms) | 5 ? | 7.2 ? -44% | 42.7 ? -754% | 33 ? -560% | 12 ? -140% | 13.3 ? -166% | 3.39 ? 32% | 15.6 ? -212% |
| Response Time Black / White * (ms) | 8.41 ? | 7.4 ? 12% | 24.5 ? -191% | 26 ? -209% | 5.2 ? 38% | 8.2 ? 2% | 5.35 ? 36% | 10 ? -19% |
| PWM Frequency (Hz) | 21620 ? | |||||||
| Screen | 17% | -17% | -46% | 20% | 23% | -5% | 20% | |
| Brightness middle (cd/m²) | 373 | 407 9% | 346.2 -7% | 267 -28% | 543 46% | 308 -17% | 320 -14% | 301 -19% |
| Brightness (cd/m²) | 365 | 369 1% | 329 -10% | 256 -30% | 516 41% | 285 -22% | 316 -13% | 294 -19% |
| Brightness Distribution (%) | 90 | 85 -6% | 81 -10% | 93 3% | 87 -3% | 85 -6% | 94 4% | 94 4% |
| Black Level * (cd/m²) | 0.33 | 0.45 -36% | 0.31 6% | 0.21 36% | 0.58 -76% | 0.25 24% | 0.21 36% | 0.21 36% |
| Contrast (:1) | 1130 | 904 -20% | 1117 -1% | 1271 12% | 936 -17% | 1232 9% | 1524 35% | 1433 27% |
| Colorchecker dE 2000 * | 4.19 | 1.43 66% | 4.19 -0% | 4.7 -12% | 1.35 68% | 1.3 69% | 4.55 -9% | 1.79 57% |
| Colorchecker dE 2000 max. * | 8.47 | 3.58 58% | 19.19 -127% | 20.4 -141% | 3.22 62% | 2.76 67% | 9.83 -16% | 3.48 59% |
| Colorchecker dE 2000 calibrated * | 1.07 | 1.07 -0% | 1.66 -55% | 4.5 -321% | 1.31 -22% | 0.92 14% | 1.51 -41% | 1.2 -12% |
| Greyscale dE 2000 * | 5 | 1.13 77% | 2.6 48% | 1.5 70% | 1.03 79% | 1.7 66% | 6.2 -24% | 2.5 50% |
| Gamma | 1.93 114% | 2.5 88% | 2.19 100% | 2.12 104% | 2.38 92% | 2.167 102% | 2.07 106% | 2.265 97% |
| CCT | 7520 86% | 6526 100% | 6749 96% | 6552 99% | 6452 101% | 6767 96% | 6479 100% | 6157 106% |
| Całkowita średnia (program / ustawienia) | 2% /
9% | -176% /
-87% | -156% /
-92% | -8% /
7% | -19% /
3% | 12% /
3% | -31% /
-3% |
* ... im mniej tym lepiej
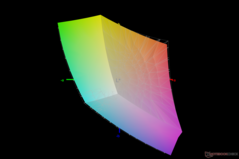
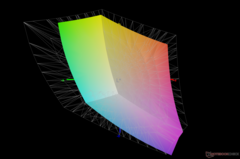
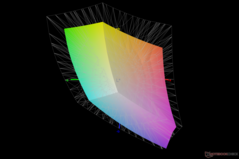
Wyświetlacz pokrywa prawie 97% gamy kolorów sRGB, co powinno wystarczyć do większości gier i treści internetowych. Jednak pokrycie Adobe RGB i Display P3 jest tylko przeciętne.
Biorąc to pod uwagę, panel QHD LOQ 15IRH8 ma znacznie lepszą charakterystykę kolorów w porównaniu do panelu 1080p 144 Hz w LOQ 15APH8 napędzanym przez AMD.
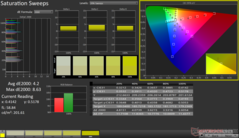
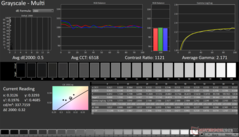
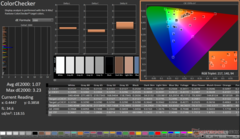
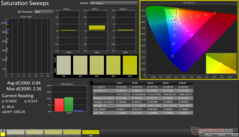
Kolory po wyjęciu z pudełka wykazują duże odchylenia, ale nasza procedura kalibracji przy użyciu spektrofotometru X-Rite i1Basic Pro 3 i oprogramowania Calman Ultimate firmy Portrait Displays wykazała znaczną poprawę wartości w skali szarości i ColorChecker Delta E.
Panel nadal ma problemy z dokładnym odwzorowaniem 100% niebieskiej części widma.
Nasz skalibrowany plik ICC można pobrać z linku powyżej.
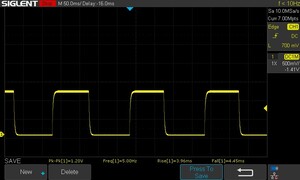
Wyświetl czasy reakcji
| ↔ Czas reakcji od czerni do bieli | ||
|---|---|---|
| 8.41 ms ... wzrost ↗ i spadek ↘ łącznie | ↗ 3.96 ms wzrost | |
| ↘ 4.45 ms upadek | ||
| W naszych testach ekran wykazuje szybki czas reakcji i powinien nadawać się do gier. Dla porównania, wszystkie testowane urządzenia wahają się od 0.1 (minimum) do 240 (maksimum) ms. » 23 % wszystkich urządzeń jest lepszych. Oznacza to, że zmierzony czas reakcji jest lepszy od średniej wszystkich testowanych urządzeń (20.1 ms). | ||
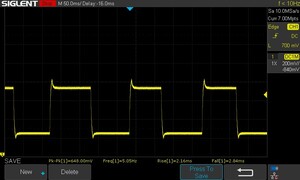
| ↔ Czas reakcji 50% szarości do 80% szarości | ||
| 5 ms ... wzrost ↗ i spadek ↘ łącznie | ↗ 2.16 ms wzrost | |
| ↘ 2.84 ms upadek | ||
| W naszych testach ekran wykazuje bardzo szybką reakcję i powinien bardzo dobrze nadawać się do szybkich gier. Dla porównania, wszystkie testowane urządzenia wahają się od 0.165 (minimum) do 636 (maksimum) ms. » 16 % wszystkich urządzeń jest lepszych. Oznacza to, że zmierzony czas reakcji jest lepszy od średniej wszystkich testowanych urządzeń (31.5 ms). | ||
Czasy reakcji są znacznie lepsze niż w przypadku panelu 1080p w LOQ 15APH8. Panel domyślnie korzysta z funkcji overdrive, która pomaga w szybkich 5 ms przejściach od 50% do 80% szarości. Wyłączenie funkcji overdrive w aplikacji Lenovo Vantage zwiększa łączny czas reakcji od 50% szarości do 80% szarości do 11 ms.
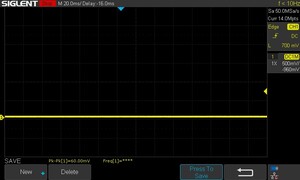
Panel nie wykazuje migotania PWM na wszystkich testowanych poziomach jasności. Aby uzyskać więcej informacji, proszę zapoznać się z naszym artykułem "Dlaczego PWM to taki ból głowy", a także w naszej Tabela rankingowa PWM dla porównania zmierzonego PWM we wszystkich recenzowanych urządzeniach.
Migotanie ekranu / PWM (modulacja szerokości impulsu)
| Migotanie ekranu/nie wykryto PWM | ≤ 100 % ustawienia jasności | ||
Dla porównania: 53 % wszystkich testowanych urządzeń nie używa PWM do przyciemniania wyświetlacza. Jeśli wykryto PWM, zmierzono średnio 8042 (minimum: 5 - maksimum: 343500) Hz. | |||
Widoczność na zewnątrz jest dobra do ogólnego użytku, chociaż szczególnie jasne słoneczne dni mogą być przytłaczające dla panelu 350 nitów. Kąty widzenia są stosunkowo stabilne, z minimalną utratą jasności i kolorów w skrajnych przypadkach.
Wydajność: Core i7-13620H z trudem radzi sobie ze stabilnym działaniem
W Indiach Lenovo oferuje wiele opcji konfiguracji LOQ 15 zarówno z procesorami Intel, jak i AMD. Modele oparte na procesorach Intel oferują wybór pomiędzy Core i5-12450H i Core i7-13620H Podczas gdy warianty AMD wyposażone są w procesory Ryzen 5 7640HS lub Ryzen 7 7840HSczęści. Jeśli chodzi o grafikę, klienci mogą wybrać wersje laptopów z kartami RTX 2050, RTX 3050, RTX 4050lub RTX 4060 GPU.
Na rynku amerykańskim Lenovo konfiguruje LOQ 15 z procesorem Core i7-13700H w połączeniu z RTX 4050 lub Core i5-13420H w połączeniu z RTX 2050.
Warunki testowania
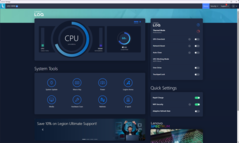
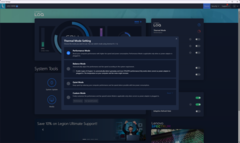
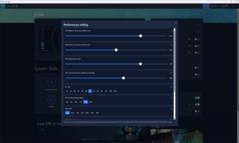
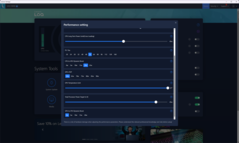
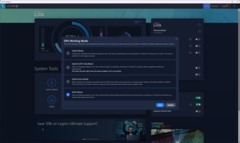
Lenovo Vantage umożliwia łatwą zmianę profili zasilania, efektów RGB i innych właściwości LOQ 15. Aplikacja pozwala również doświadczonym użytkownikom ustawić własne limity mocy procesora, czas trwania, TDP GPU, GPU do CPU Dynamic Boost i limity temperatury zgodnie z potrzebami.
Poniższa tabela pokazuje, jak domyślne profile zasilania wpływają na PL1 i PL2 procesora. Do naszych testów wykorzystaliśmy profil Wydajność i włączyliśmy tryb dGPU, aby pozwolić Core i7-13620H i RTX 4050 w pełni rozwinąć mięśnie. Testy baterii zostały przeprowadzone w profilu Quiet z GPU ustawionym na tryb Hybrid.
| Tryb wydajności | PL1 (PBP) / Tau | PL2 (MTP) / Tau | PL4 | Cinebench R15 Multi score | Cinebench R15 Multi score (30 pętli) |
|---|---|---|---|---|---|
| Cichy | 45 W / 56 s | 55 W / 2,44 ms | 210 W | 1,879 (-17,98%) | 1,412 (-26,34%) |
| Równowaga | 60 W / 56 s | 117 W / 2,44 ms | 210 W | 2,178 (-4,93%) | 1,657 (-13,56%) |
| Wydajność | 70 W / 56 s | 135 W / 2,44 ms | 210 W | 2,291 (100%) | 1,917 (100%) |
Procesor
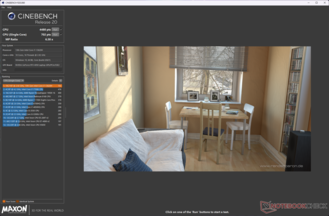
Core i7-13620H w LOQ 15IRH8 pozostaje w tyle za LOQ 15APH8 napędzanym Ryzenem 7 7840HS aż o 16% w testach wielordzeniowych Cinebench pomimo tej samej liczby wątków, prawdopodobnie z powodu wyższych zegarów w tym drugim. Widzimy jednak odwrócenie ról w wielordzeniowym Geekbench. Układ Intela prezentuje się również dobrze w większości jednordzeniowych testów porównawczych.
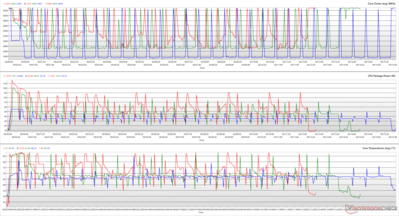
Obudowa i chłodzenie LOQ 15IRH8 wydają się mieć problemy z prawidłowym utrzymaniem wielordzeniowego testu pętli Cinebench R15. Core i7-13620H lepiej odnajduje się w LOQ 16IRH8, gdzie wydajność procesora jest bardzo stabilna.
Cinebench R15 Multi Loop
Cinebench R23: Multi Core | Single Core
Cinebench R20: CPU (Multi Core) | CPU (Single Core)
Cinebench R15: CPU Multi 64Bit | CPU Single 64Bit
Blender: v2.79 BMW27 CPU
7-Zip 18.03: 7z b 4 | 7z b 4 -mmt1
Geekbench 5.5: Multi-Core | Single-Core
HWBOT x265 Benchmark v2.2: 4k Preset
LibreOffice : 20 Documents To PDF
R Benchmark 2.5: Overall mean
| CPU Performance rating | |
| Średnia w klasie Gaming | |
| Dell G15 5530 | |
| Asus TUF Gaming A16 FA617XS | |
| Lenovo LOQ 15APH8 | |
| Lenovo LOQ 16IRH8 | |
| Lenovo Legion Pro 5 16ARX8 (R5 7645HX, RTX 4050) | |
| Lenovo LOQ 15IRH8 Core i7 | |
| MSI Katana 17 B13VFK | |
| Przeciętny Intel Core i7-13620H | |
| HP Victus 16-r0077ng | |
| Cinebench R23 / Multi Core | |
| Średnia w klasie Gaming (5668 - 40970, n=138, ostatnie 2 lata) | |
| Dell G15 5530 | |
| Lenovo LOQ 15APH8 | |
| Asus TUF Gaming A16 FA617XS | |
| MSI Katana 17 B13VFK | |
| HP Victus 16-r0077ng | |
| Lenovo LOQ 16IRH8 | |
| Lenovo LOQ 15IRH8 Core i7 | |
| Przeciętny Intel Core i7-13620H (10819 - 15496, n=6) | |
| Lenovo Legion Pro 5 16ARX8 (R5 7645HX, RTX 4050) | |
| Cinebench R23 / Single Core | |
| Średnia w klasie Gaming (1136 - 2267, n=138, ostatnie 2 lata) | |
| Lenovo LOQ 16IRH8 | |
| Lenovo LOQ 15IRH8 Core i7 | |
| Przeciętny Intel Core i7-13620H (1805 - 1871, n=6) | |
| Dell G15 5530 | |
| Lenovo Legion Pro 5 16ARX8 (R5 7645HX, RTX 4050) | |
| MSI Katana 17 B13VFK | |
| Asus TUF Gaming A16 FA617XS | |
| Lenovo LOQ 15APH8 | |
| HP Victus 16-r0077ng | |
| Cinebench R20 / CPU (Multi Core) | |
| Średnia w klasie Gaming (2179 - 16108, n=137, ostatnie 2 lata) | |
| Dell G15 5530 | |
| Lenovo LOQ 15APH8 | |
| Asus TUF Gaming A16 FA617XS | |
| MSI Katana 17 B13VFK | |
| HP Victus 16-r0077ng | |
| Lenovo LOQ 15IRH8 Core i7 | |
| Lenovo LOQ 16IRH8 | |
| Przeciętny Intel Core i7-13620H (4214 - 5905, n=6) | |
| Lenovo Legion Pro 5 16ARX8 (R5 7645HX, RTX 4050) | |
| Cinebench R20 / CPU (Single Core) | |
| Średnia w klasie Gaming (439 - 870, n=137, ostatnie 2 lata) | |
| Lenovo LOQ 15IRH8 Core i7 | |
| Dell G15 5530 | |
| Lenovo LOQ 16IRH8 | |
| Przeciętny Intel Core i7-13620H (693 - 719, n=6) | |
| Asus TUF Gaming A16 FA617XS | |
| Lenovo Legion Pro 5 16ARX8 (R5 7645HX, RTX 4050) | |
| Lenovo LOQ 15APH8 | |
| MSI Katana 17 B13VFK | |
| HP Victus 16-r0077ng | |
| Cinebench R15 / CPU Multi 64Bit | |
| Średnia w klasie Gaming (1537 - 6271, n=137, ostatnie 2 lata) | |
| Dell G15 5530 | |
| Lenovo LOQ 15APH8 | |
| Asus TUF Gaming A16 FA617XS | |
| Lenovo LOQ 16IRH8 | |
| MSI Katana 17 B13VFK | |
| HP Victus 16-r0077ng | |
| Lenovo LOQ 15IRH8 Core i7 | |
| Lenovo Legion Pro 5 16ARX8 (R5 7645HX, RTX 4050) | |
| Przeciętny Intel Core i7-13620H (1681 - 2492, n=6) | |
| Cinebench R15 / CPU Single 64Bit | |
| Średnia w klasie Gaming (188.8 - 343, n=136, ostatnie 2 lata) | |
| Lenovo Legion Pro 5 16ARX8 (R5 7645HX, RTX 4050) | |
| Asus TUF Gaming A16 FA617XS | |
| Lenovo LOQ 15APH8 | |
| Dell G15 5530 | |
| Lenovo LOQ 16IRH8 | |
| Lenovo LOQ 15IRH8 Core i7 | |
| Przeciętny Intel Core i7-13620H (258 - 269, n=6) | |
| MSI Katana 17 B13VFK | |
| HP Victus 16-r0077ng | |
| Blender / v2.79 BMW27 CPU | |
| Lenovo LOQ 15IRH8 Core i7 | |
| Przeciętny Intel Core i7-13620H (215 - 289, n=6) | |
| Lenovo Legion Pro 5 16ARX8 (R5 7645HX, RTX 4050) | |
| Lenovo LOQ 16IRH8 | |
| MSI Katana 17 B13VFK | |
| HP Victus 16-r0077ng | |
| Asus TUF Gaming A16 FA617XS | |
| Lenovo LOQ 15APH8 | |
| Dell G15 5530 | |
| Średnia w klasie Gaming (80 - 517, n=133, ostatnie 2 lata) | |
| 7-Zip 18.03 / 7z b 4 | |
| Średnia w klasie Gaming (23795 - 148086, n=135, ostatnie 2 lata) | |
| Dell G15 5530 | |
| Asus TUF Gaming A16 FA617XS | |
| HP Victus 16-r0077ng | |
| MSI Katana 17 B13VFK | |
| Lenovo Legion Pro 5 16ARX8 (R5 7645HX, RTX 4050) | |
| Lenovo LOQ 15APH8 | |
| Lenovo LOQ 16IRH8 | |
| Przeciętny Intel Core i7-13620H (45983 - 62324, n=6) | |
| Lenovo LOQ 15IRH8 Core i7 | |
| 7-Zip 18.03 / 7z b 4 -mmt1 | |
| Lenovo Legion Pro 5 16ARX8 (R5 7645HX, RTX 4050) | |
| Asus TUF Gaming A16 FA617XS | |
| Średnia w klasie Gaming (4199 - 7508, n=135, ostatnie 2 lata) | |
| Lenovo LOQ 15APH8 | |
| Przeciętny Intel Core i7-13620H (5742 - 6326, n=6) | |
| Lenovo LOQ 15IRH8 Core i7 | |
| Lenovo LOQ 16IRH8 | |
| Dell G15 5530 | |
| MSI Katana 17 B13VFK | |
| HP Victus 16-r0077ng | |
| Geekbench 5.5 / Multi-Core | |
| Średnia w klasie Gaming (4557 - 27010, n=135, ostatnie 2 lata) | |
| Dell G15 5530 | |
| Lenovo LOQ 16IRH8 | |
| Asus TUF Gaming A16 FA617XS | |
| HP Victus 16-r0077ng | |
| Lenovo LOQ 15IRH8 Core i7 | |
| MSI Katana 17 B13VFK | |
| Przeciętny Intel Core i7-13620H (8357 - 12223, n=6) | |
| Lenovo Legion Pro 5 16ARX8 (R5 7645HX, RTX 4050) | |
| Lenovo LOQ 15APH8 | |
| Geekbench 5.5 / Single-Core | |
| Asus TUF Gaming A16 FA617XS | |
| Średnia w klasie Gaming (986 - 2474, n=135, ostatnie 2 lata) | |
| Lenovo Legion Pro 5 16ARX8 (R5 7645HX, RTX 4050) | |
| Lenovo LOQ 15IRH8 Core i7 | |
| Dell G15 5530 | |
| Lenovo LOQ 15APH8 | |
| Lenovo LOQ 16IRH8 | |
| Przeciętny Intel Core i7-13620H (1785 - 1865, n=6) | |
| MSI Katana 17 B13VFK | |
| HP Victus 16-r0077ng | |
| HWBOT x265 Benchmark v2.2 / 4k Preset | |
| Średnia w klasie Gaming (7.7 - 44.3, n=135, ostatnie 2 lata) | |
| Dell G15 5530 | |
| Asus TUF Gaming A16 FA617XS | |
| Lenovo Legion Pro 5 16ARX8 (R5 7645HX, RTX 4050) | |
| Lenovo LOQ 15APH8 | |
| MSI Katana 17 B13VFK | |
| Lenovo LOQ 16IRH8 | |
| Lenovo LOQ 15IRH8 Core i7 | |
| HP Victus 16-r0077ng | |
| Przeciętny Intel Core i7-13620H (12.9 - 17.7, n=6) | |
| LibreOffice / 20 Documents To PDF | |
| HP Victus 16-r0077ng | |
| MSI Katana 17 B13VFK | |
| Lenovo Legion Pro 5 16ARX8 (R5 7645HX, RTX 4050) | |
| Przeciętny Intel Core i7-13620H (41.5 - 56.8, n=6) | |
| Średnia w klasie Gaming (19 - 88.8, n=134, ostatnie 2 lata) | |
| Dell G15 5530 | |
| Lenovo LOQ 16IRH8 | |
| Lenovo LOQ 15IRH8 Core i7 | |
| Asus TUF Gaming A16 FA617XS | |
| Lenovo LOQ 15APH8 | |
| R Benchmark 2.5 / Overall mean | |
| HP Victus 16-r0077ng | |
| Lenovo LOQ 15IRH8 Core i7 | |
| Lenovo LOQ 15APH8 | |
| Przeciętny Intel Core i7-13620H (0.4438 - 0.4545, n=6) | |
| Lenovo LOQ 16IRH8 | |
| MSI Katana 17 B13VFK | |
| Lenovo Legion Pro 5 16ARX8 (R5 7645HX, RTX 4050) | |
| Średnia w klasie Gaming (0.3439 - 0.759, n=135, ostatnie 2 lata) | |
| Dell G15 5530 | |
| Asus TUF Gaming A16 FA617XS | |
* ... im mniej tym lepiej
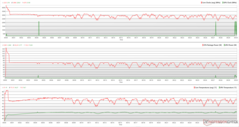
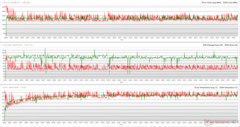
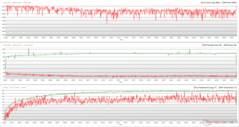
Analiza wielordzeniowego testu pętli Cinebench R15 pokazuje, jak wbudowane profile zasilania wpływają na różne parametry procesora.
Podczas gdy tryb Performance ma pozwolić procesorowi na wykorzystanie do 135 W PL2, widzimy, że osiąga on maksimum tylko przy 116,5 W. Tryb Balance również wydaje się radzić sobie z mniejszą mocą pakietu niż to możliwe (101 W vs 117 W), ale tutaj widzimy bardziej stabilny przebieg w porównaniu do Performance.
Możliwe, że układ chłodzenia LOQ 15IRH8 ma trudności, gdy limit mocy przekracza 116 W, co wyjaśnia słabą wydajność w tym teście porównawczym.
Wielordzeniowe wyniki Cinebench R20 spadają o 23% na zasilaniu bateryjnym, choć wydajność jednordzeniowa ma tylko niewielki wpływ.
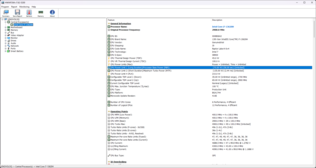
AIDA64: FP32 Ray-Trace | FPU Julia | CPU SHA3 | CPU Queen | FPU SinJulia | FPU Mandel | CPU AES | CPU ZLib | FP64 Ray-Trace | CPU PhotoWorxx
| Performance rating | |
| Średnia w klasie Gaming | |
| Asus TUF Gaming A16 FA617XS | |
| Lenovo LOQ 15APH8 | |
| Dell G15 5530 | |
| Lenovo Legion Pro 5 16ARX8 (R5 7645HX, RTX 4050) | |
| HP Victus 16-r0077ng | |
| MSI Katana 17 B13VFK | |
| Lenovo LOQ 16IRH8 | |
| Przeciętny Intel Core i7-13620H | |
| Lenovo LOQ 15IRH8 Core i7 | |
| AIDA64 / FP32 Ray-Trace | |
| Średnia w klasie Gaming (7192 - 85542, n=134, ostatnie 2 lata) | |
| Lenovo LOQ 15APH8 | |
| Asus TUF Gaming A16 FA617XS | |
| Lenovo Legion Pro 5 16ARX8 (R5 7645HX, RTX 4050) | |
| Dell G15 5530 | |
| HP Victus 16-r0077ng | |
| MSI Katana 17 B13VFK | |
| Lenovo LOQ 16IRH8 | |
| Przeciętny Intel Core i7-13620H (10779 - 13601, n=6) | |
| Lenovo LOQ 15IRH8 Core i7 | |
| AIDA64 / FPU Julia | |
| Średnia w klasie Gaming (35040 - 238426, n=134, ostatnie 2 lata) | |
| Lenovo LOQ 15APH8 | |
| Asus TUF Gaming A16 FA617XS | |
| Lenovo Legion Pro 5 16ARX8 (R5 7645HX, RTX 4050) | |
| Dell G15 5530 | |
| HP Victus 16-r0077ng | |
| MSI Katana 17 B13VFK | |
| Lenovo LOQ 16IRH8 | |
| Przeciętny Intel Core i7-13620H (54287 - 67187, n=6) | |
| Lenovo LOQ 15IRH8 Core i7 | |
| AIDA64 / CPU SHA3 | |
| Średnia w klasie Gaming (1728 - 9817, n=134, ostatnie 2 lata) | |
| Lenovo LOQ 15APH8 | |
| Asus TUF Gaming A16 FA617XS | |
| Dell G15 5530 | |
| Lenovo Legion Pro 5 16ARX8 (R5 7645HX, RTX 4050) | |
| HP Victus 16-r0077ng | |
| MSI Katana 17 B13VFK | |
| Lenovo LOQ 16IRH8 | |
| Przeciętny Intel Core i7-13620H (2357 - 2773, n=6) | |
| Lenovo LOQ 15IRH8 Core i7 | |
| AIDA64 / CPU Queen | |
| Asus TUF Gaming A16 FA617XS | |
| Lenovo LOQ 15APH8 | |
| Średnia w klasie Gaming (49785 - 173351, n=134, ostatnie 2 lata) | |
| Dell G15 5530 | |
| Lenovo Legion Pro 5 16ARX8 (R5 7645HX, RTX 4050) | |
| HP Victus 16-r0077ng | |
| Lenovo LOQ 15IRH8 Core i7 | |
| Lenovo LOQ 16IRH8 | |
| MSI Katana 17 B13VFK | |
| Przeciętny Intel Core i7-13620H (66885 - 78867, n=6) | |
| AIDA64 / FPU SinJulia | |
| Asus TUF Gaming A16 FA617XS | |
| Lenovo LOQ 15APH8 | |
| Średnia w klasie Gaming (4424 - 33636, n=134, ostatnie 2 lata) | |
| Lenovo Legion Pro 5 16ARX8 (R5 7645HX, RTX 4050) | |
| Dell G15 5530 | |
| HP Victus 16-r0077ng | |
| MSI Katana 17 B13VFK | |
| Lenovo LOQ 16IRH8 | |
| Przeciętny Intel Core i7-13620H (6737 - 8421, n=6) | |
| Lenovo LOQ 15IRH8 Core i7 | |
| AIDA64 / FPU Mandel | |
| Średnia w klasie Gaming (17585 - 128721, n=134, ostatnie 2 lata) | |
| Lenovo LOQ 15APH8 | |
| Asus TUF Gaming A16 FA617XS | |
| Lenovo Legion Pro 5 16ARX8 (R5 7645HX, RTX 4050) | |
| Dell G15 5530 | |
| HP Victus 16-r0077ng | |
| MSI Katana 17 B13VFK | |
| Lenovo LOQ 16IRH8 | |
| Lenovo LOQ 15IRH8 Core i7 | |
| Przeciętny Intel Core i7-13620H (27242 - 32787, n=6) | |
| AIDA64 / CPU AES | |
| Średnia w klasie Gaming (19065 - 247074, n=134, ostatnie 2 lata) | |
| Asus TUF Gaming A16 FA617XS | |
| Dell G15 5530 | |
| Lenovo LOQ 15APH8 | |
| HP Victus 16-r0077ng | |
| Przeciętny Intel Core i7-13620H (52697 - 85895, n=6) | |
| MSI Katana 17 B13VFK | |
| Lenovo LOQ 16IRH8 | |
| Lenovo Legion Pro 5 16ARX8 (R5 7645HX, RTX 4050) | |
| Lenovo LOQ 15IRH8 Core i7 | |
| AIDA64 / CPU ZLib | |
| Średnia w klasie Gaming (373 - 2531, n=134, ostatnie 2 lata) | |
| Dell G15 5530 | |
| Lenovo LOQ 15APH8 | |
| Asus TUF Gaming A16 FA617XS | |
| HP Victus 16-r0077ng | |
| Lenovo Legion Pro 5 16ARX8 (R5 7645HX, RTX 4050) | |
| Lenovo LOQ 16IRH8 | |
| MSI Katana 17 B13VFK | |
| Przeciętny Intel Core i7-13620H (697 - 835, n=6) | |
| Lenovo LOQ 15IRH8 Core i7 | |
| AIDA64 / FP64 Ray-Trace | |
| Średnia w klasie Gaming (3856 - 45446, n=134, ostatnie 2 lata) | |
| Lenovo LOQ 15APH8 | |
| Asus TUF Gaming A16 FA617XS | |
| Lenovo Legion Pro 5 16ARX8 (R5 7645HX, RTX 4050) | |
| Dell G15 5530 | |
| HP Victus 16-r0077ng | |
| MSI Katana 17 B13VFK | |
| Lenovo LOQ 16IRH8 | |
| Przeciętny Intel Core i7-13620H (6077 - 7364, n=6) | |
| Lenovo LOQ 15IRH8 Core i7 | |
| AIDA64 / CPU PhotoWorxx | |
| Średnia w klasie Gaming (10805 - 62916, n=134, ostatnie 2 lata) | |
| HP Victus 16-r0077ng | |
| Dell G15 5530 | |
| MSI Katana 17 B13VFK | |
| Lenovo LOQ 15IRH8 Core i7 | |
| Lenovo LOQ 16IRH8 | |
| Asus TUF Gaming A16 FA617XS | |
| Przeciętny Intel Core i7-13620H (19421 - 34544, n=6) | |
| Lenovo Legion Pro 5 16ARX8 (R5 7645HX, RTX 4050) | |
| Lenovo LOQ 15APH8 | |
Proszę sprawdzić nasz dedykowany Intel Core i7-13620H aby uzyskać więcej informacji i porównać wydajność.
Wydajność systemu
LOQ 15IRH8 wyprzedza swojego kuzyna LOQ 15APH8 opartego na AMD o 19% w ogólnym CrossMark, ale oba te urządzenia są praktycznie remisowe w PCMark. Nie zaobserwowaliśmy czkawki w codziennej wydajności systemu podczas zadań związanych z produktywnością lub grami.
CrossMark: Overall | Productivity | Creativity | Responsiveness
AIDA64: Memory Copy | Memory Read | Memory Write | Memory Latency
| PCMark 10 / Score | |
| Lenovo Legion Pro 5 16ARX8 (R5 7645HX, RTX 4050) | |
| Średnia w klasie Gaming (5776 - 10060, n=113, ostatnie 2 lata) | |
| Asus TUF Gaming A16 FA617XS | |
| Lenovo LOQ 15APH8 | |
| Lenovo LOQ 15IRH8 Core i7 | |
| Przeciętny Intel Core i7-13620H, NVIDIA GeForce RTX 4050 Laptop GPU (n=1) | |
| MSI Katana 17 B13VFK | |
| HP Victus 16-r0077ng | |
| Dell G15 5530 | |
| Lenovo LOQ 16IRH8 | |
| PCMark 10 / Essentials | |
| Lenovo Legion Pro 5 16ARX8 (R5 7645HX, RTX 4050) | |
| Dell G15 5530 | |
| Lenovo LOQ 15IRH8 Core i7 | |
| Przeciętny Intel Core i7-13620H, NVIDIA GeForce RTX 4050 Laptop GPU (n=1) | |
| Asus TUF Gaming A16 FA617XS | |
| MSI Katana 17 B13VFK | |
| Średnia w klasie Gaming (8810 - 12600, n=117, ostatnie 2 lata) | |
| HP Victus 16-r0077ng | |
| Lenovo LOQ 15APH8 | |
| Lenovo LOQ 16IRH8 | |
| PCMark 10 / Productivity | |
| Lenovo Legion Pro 5 16ARX8 (R5 7645HX, RTX 4050) | |
| Asus TUF Gaming A16 FA617XS | |
| Średnia w klasie Gaming (6662 - 16716, n=115, ostatnie 2 lata) | |
| Dell G15 5530 | |
| Lenovo LOQ 15APH8 | |
| Lenovo LOQ 15IRH8 Core i7 | |
| Przeciętny Intel Core i7-13620H, NVIDIA GeForce RTX 4050 Laptop GPU (n=1) | |
| MSI Katana 17 B13VFK | |
| HP Victus 16-r0077ng | |
| Lenovo LOQ 16IRH8 | |
| PCMark 10 / Digital Content Creation | |
| Średnia w klasie Gaming (7440 - 19351, n=115, ostatnie 2 lata) | |
| Asus TUF Gaming A16 FA617XS | |
| Lenovo LOQ 15APH8 | |
| Lenovo LOQ 15IRH8 Core i7 | |
| Przeciętny Intel Core i7-13620H, NVIDIA GeForce RTX 4050 Laptop GPU (n=1) | |
| Lenovo Legion Pro 5 16ARX8 (R5 7645HX, RTX 4050) | |
| HP Victus 16-r0077ng | |
| MSI Katana 17 B13VFK | |
| Lenovo LOQ 16IRH8 | |
| Dell G15 5530 | |
| CrossMark / Overall | |
| Średnia w klasie Gaming (1247 - 2344, n=113, ostatnie 2 lata) | |
| Lenovo LOQ 16IRH8 | |
| Lenovo Legion Pro 5 16ARX8 (R5 7645HX, RTX 4050) | |
| Lenovo LOQ 15IRH8 Core i7 | |
| Przeciętny Intel Core i7-13620H, NVIDIA GeForce RTX 4050 Laptop GPU (n=1) | |
| MSI Katana 17 B13VFK | |
| Dell G15 5530 | |
| Asus TUF Gaming A16 FA617XS | |
| Lenovo LOQ 15APH8 | |
| CrossMark / Productivity | |
| Lenovo Legion Pro 5 16ARX8 (R5 7645HX, RTX 4050) | |
| Lenovo LOQ 16IRH8 | |
| Średnia w klasie Gaming (1299 - 2211, n=113, ostatnie 2 lata) | |
| Lenovo LOQ 15IRH8 Core i7 | |
| Przeciętny Intel Core i7-13620H, NVIDIA GeForce RTX 4050 Laptop GPU (n=1) | |
| MSI Katana 17 B13VFK | |
| Dell G15 5530 | |
| Asus TUF Gaming A16 FA617XS | |
| Lenovo LOQ 15APH8 | |
| CrossMark / Creativity | |
| Średnia w klasie Gaming (1275 - 2729, n=113, ostatnie 2 lata) | |
| Dell G15 5530 | |
| Lenovo LOQ 16IRH8 | |
| Lenovo Legion Pro 5 16ARX8 (R5 7645HX, RTX 4050) | |
| MSI Katana 17 B13VFK | |
| Lenovo LOQ 15IRH8 Core i7 | |
| Przeciętny Intel Core i7-13620H, NVIDIA GeForce RTX 4050 Laptop GPU (n=1) | |
| Asus TUF Gaming A16 FA617XS | |
| Lenovo LOQ 15APH8 | |
| CrossMark / Responsiveness | |
| Lenovo LOQ 16IRH8 | |
| Lenovo Legion Pro 5 16ARX8 (R5 7645HX, RTX 4050) | |
| Lenovo LOQ 15IRH8 Core i7 | |
| Przeciętny Intel Core i7-13620H, NVIDIA GeForce RTX 4050 Laptop GPU (n=1) | |
| MSI Katana 17 B13VFK | |
| Średnia w klasie Gaming (1030 - 2330, n=113, ostatnie 2 lata) | |
| Dell G15 5530 | |
| Asus TUF Gaming A16 FA617XS | |
| Lenovo LOQ 15APH8 | |
| AIDA64 / Memory Copy | |
| Średnia w klasie Gaming (21750 - 108104, n=134, ostatnie 2 lata) | |
| HP Victus 16-r0077ng | |
| Asus TUF Gaming A16 FA617XS | |
| Dell G15 5530 | |
| Lenovo LOQ 15IRH8 Core i7 | |
| Przeciętny Intel Core i7-13620H, NVIDIA GeForce RTX 4050 Laptop GPU (n=1) | |
| Lenovo LOQ 16IRH8 | |
| MSI Katana 17 B13VFK | |
| Lenovo Legion Pro 5 16ARX8 (R5 7645HX, RTX 4050) | |
| Lenovo LOQ 15APH8 | |
| AIDA64 / Memory Read | |
| Średnia w klasie Gaming (22956 - 104349, n=134, ostatnie 2 lata) | |
| HP Victus 16-r0077ng | |
| Dell G15 5530 | |
| Lenovo LOQ 16IRH8 | |
| Lenovo LOQ 15IRH8 Core i7 | |
| Przeciętny Intel Core i7-13620H, NVIDIA GeForce RTX 4050 Laptop GPU (n=1) | |
| MSI Katana 17 B13VFK | |
| Asus TUF Gaming A16 FA617XS | |
| Lenovo Legion Pro 5 16ARX8 (R5 7645HX, RTX 4050) | |
| Lenovo LOQ 15APH8 | |
| AIDA64 / Memory Write | |
| Średnia w klasie Gaming (22297 - 133486, n=134, ostatnie 2 lata) | |
| Asus TUF Gaming A16 FA617XS | |
| HP Victus 16-r0077ng | |
| Dell G15 5530 | |
| Lenovo LOQ 15IRH8 Core i7 | |
| Przeciętny Intel Core i7-13620H, NVIDIA GeForce RTX 4050 Laptop GPU (n=1) | |
| Lenovo LOQ 16IRH8 | |
| Lenovo Legion Pro 5 16ARX8 (R5 7645HX, RTX 4050) | |
| MSI Katana 17 B13VFK | |
| Lenovo LOQ 15APH8 | |
| AIDA64 / Memory Latency | |
| Lenovo LOQ 15IRH8 Core i7 | |
| Przeciętny Intel Core i7-13620H, NVIDIA GeForce RTX 4050 Laptop GPU (n=1) | |
| Lenovo LOQ 16IRH8 | |
| Średnia w klasie Gaming (59.5 - 259, n=134, ostatnie 2 lata) | |
| MSI Katana 17 B13VFK | |
| Lenovo LOQ 15APH8 | |
| HP Victus 16-r0077ng | |
| Dell G15 5530 | |
| Asus TUF Gaming A16 FA617XS | |
| Lenovo Legion Pro 5 16ARX8 (R5 7645HX, RTX 4050) | |
* ... im mniej tym lepiej
| PCMark 8 Home Score Accelerated v2 | 5795 pkt. | |
| PCMark 8 Work Score Accelerated v2 | 6177 pkt. | |
| PCMark 10 Score | 7656 pkt. | |
Pomoc | ||
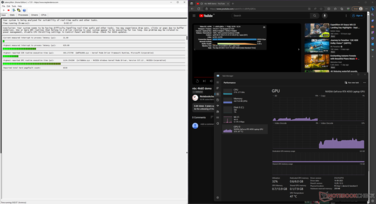
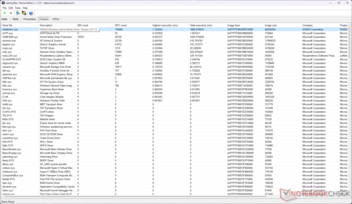
Opóźnienie DPC
| DPC Latencies / LatencyMon - interrupt to process latency (max), Web, Youtube, Prime95 | |
| Dell G15 5530 | |
| MSI Katana 17 B13VFK | |
| HP Victus 16-r0077ng | |
| Lenovo LOQ 15APH8 | |
| Lenovo LOQ 16IRH8 | |
| Asus TUF Gaming A16 FA617XS | |
| Lenovo Legion Pro 5 16ARX8 (R5 7645HX, RTX 4050) | |
| Lenovo LOQ 15IRH8 Core i7 | |
* ... im mniej tym lepiej
Nasz Ranking opóźnień DPC znajdą Państwo przegląd zmierzonych opóźnień w recenzowanych urządzeniach.
Urządzenia pamięci masowej
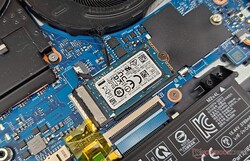
Nasza jednostka LOQ 15IRH8 została wyposażona w dysk SSD Kioxia 512 GB M.2 2230 PCIe Gen4 NVMe. W razie potrzeby można go wymienić na dysk M.2280 o większej pojemności. Dostępne jest również wolne gniazdo M.2 2280 do rozbudowy pamięci masowej.
Ogólna wydajność dysku pozostaje w tyle za dyskiem Kioxia 1 TB, który można znaleźć w HP Victus 16. Dysk SSD ma również trudności z utrzymaniem stałej prędkości odczytu, ponieważ widzimy spadki wydajności po 25 uruchomieniu w naszym teście pętli odczytu DiskSpd przy głębokości kolejki 8.
* ... im mniej tym lepiej
Disk Throttling: DiskSpd Read Loop, Queue Depth 8
Więcej informacji i porównań wydajności można znaleźć w naszych Testy porównawcze dysków HDD i SSD strona.
Wydajność GPU
Procesor graficzny RTX 4050 w laptopie LOQ 15IRH8 jest oceniany na 95 W TGP, ale ma zapas mocy, aby wykorzystać więcej energii podczas stresu. Widzimy, że ten sam procesor graficzny w LOQ 15APH8 jest o około 6% szybszy w skumulowanych testach 3DMark.
Co ciekawe, ten 95-watowy RTX 4050 jest tylko o krok za 140-watowym wariantem w Lenovo Legion Pro 5. Ten ostatni nadrabia jednak ten deficyt w benchmarku Blender CUDA.
| 3DMark 11 Performance | 27474 pkt. | |
| 3DMark Ice Storm Standard Score | 229274 pkt. | |
| 3DMark Cloud Gate Standard Score | 49040 pkt. | |
| 3DMark Fire Strike Score | 19230 pkt. | |
| 3DMark Fire Strike Extreme Score | 9873 pkt. | |
| 3DMark Time Spy Score | 8701 pkt. | |
Pomoc | ||
| Blender / v3.3 Classroom OPTIX/RTX | |
| Przeciętny NVIDIA GeForce RTX 4050 Laptop GPU (25 - 37, n=39) | |
| Lenovo Legion Pro 5 16ARX8 (R5 7645HX, RTX 4050) | |
| Lenovo LOQ 15IRH8 Core i7 | |
| MSI Katana 17 B13VFK | |
| Lenovo LOQ 15APH8 | |
| HP Victus 16-r0077ng | |
| Lenovo LOQ 16IRH8 | |
| Dell G15 5530 | |
| Średnia w klasie Gaming (9 - 95, n=131, ostatnie 2 lata) | |
| Blender / v3.3 Classroom CUDA | |
| Przeciętny NVIDIA GeForce RTX 4050 Laptop GPU (47 - 68, n=39) | |
| Lenovo LOQ 15IRH8 Core i7 | |
| Lenovo LOQ 15APH8 | |
| Lenovo Legion Pro 5 16ARX8 (R5 7645HX, RTX 4050) | |
| MSI Katana 17 B13VFK | |
| Lenovo LOQ 16IRH8 | |
| Dell G15 5530 | |
| HP Victus 16-r0077ng | |
| Średnia w klasie Gaming (15 - 228, n=136, ostatnie 2 lata) | |
| Blender / v3.3 Classroom CPU | |
| Lenovo LOQ 15IRH8 Core i7 | |
| Przeciętny NVIDIA GeForce RTX 4050 Laptop GPU (243 - 907, n=40) | |
| Lenovo LOQ 16IRH8 | |
| HP Victus 16-r0077ng | |
| Lenovo Legion Pro 5 16ARX8 (R5 7645HX, RTX 4050) | |
| MSI Katana 17 B13VFK | |
| Asus TUF Gaming A16 FA617XS | |
| Lenovo LOQ 15APH8 | |
| Dell G15 5530 | |
| Średnia w klasie Gaming (122 - 962, n=132, ostatnie 2 lata) | |
* ... im mniej tym lepiej
Wydajność w grach
Podobne trendy można zaobserwować również w benchmarkach gamingowych. 95 W RTX 4050 w LOQ 15 i 140 W RTX 4050 w Legion Pro 5 dały niemal identyczny pokaz w skumulowanych testach gier 1080p Ultra, ale wyższa moc tego drugiego pozwala na zauważalną przewagę w QHD Ultra.
LOQ 15IRH8 jest zasadniczo maszyną do gier 1080p Ultra. Grywalną liczbę klatek na sekundę można osiągnąć w rozdzielczości QHD Ultra w nieco starszych tytułach. Gracze, którzy chcą uzyskać więcej klatek w QHD lub 4K, będą musieli nieuchronnie skorzystać z technologii skalowania w górę, takich jak AMD FSR, Nvidia DLSS lub Intel XeSS, w zależności od tytułu.
| The Witcher 3 - 1920x1080 Ultra Graphics & Postprocessing (HBAO+) | |
| Średnia w klasie Gaming (29.6 - 240, n=39, ostatnie 2 lata) | |
| HP Victus 16-r0077ng | |
| MSI Katana 17 B13VFK | |
| Dell G15 5530 | |
| Lenovo LOQ 16IRH8 | |
| Asus TUF Gaming A16 FA617XS | |
| Lenovo Legion Pro 5 16ARX8 (R5 7645HX, RTX 4050) | |
| Lenovo LOQ 15IRH8 Core i7 | |
| Lenovo LOQ 15APH8 | |
| The Witcher 3 - 2560x1440 Ultra Graphics & Postprocessing (HBAO+) | |
| Średnia w klasie Gaming (61 - 199.1, n=19, ostatnie 2 lata) | |
| Lenovo LOQ 16IRH8 | |
| Lenovo LOQ 15IRH8 Core i7 | |
| Przeciętny NVIDIA GeForce RTX 4050 Laptop GPU (39 - 61.3, n=8) | |
| Cyberpunk 2077 1.6 | |
| 1920x1080 Ultra Preset | |
| Dell G15 5530 | |
| MSI Katana 17 B13VFK | |
| Lenovo LOQ 15APH8 | |
| Lenovo LOQ 15IRH8 Core i7 | |
| Przeciętny NVIDIA GeForce RTX 4050 Laptop GPU (44.4 - 79.4, n=14) | |
| 2560x1440 Ultra Preset | |
| MSI Katana 17 B13VFK | |
| Lenovo LOQ 15IRH8 Core i7 | |
| Przeciętny NVIDIA GeForce RTX 4050 Laptop GPU (27.2 - 43.1, n=10) | |
| 1920x1080 Ray Tracing Ultra Preset (DLSS off) | |
| Dell G15 5530 | |
| Przeciętny NVIDIA GeForce RTX 4050 Laptop GPU (15.8 - 65.6, n=5) | |
| MSI Katana 17 B13VFK | |
| Lenovo LOQ 15IRH8 Core i7 | |
| F1 22 | |
| 1920x1080 Ultra High Preset AA:T AF:16x | |
| Średnia w klasie Gaming (40.1 - 135.1, n=15, ostatnie 2 lata) | |
| Dell G15 5530 | |
| MSI Katana 17 B13VFK | |
| Lenovo LOQ 15IRH8 Core i7 | |
| Asus TUF Gaming A16 FA617XS | |
| Przeciętny NVIDIA GeForce RTX 4050 Laptop GPU (10.9 - 56.4, n=24) | |
| 2560x1440 Ultra High Preset AA:T AF:16x | |
| Średnia w klasie Gaming (31 - 91.4, n=12, ostatnie 2 lata) | |
| MSI Katana 17 B13VFK | |
| Lenovo LOQ 15IRH8 Core i7 | |
| Przeciętny NVIDIA GeForce RTX 4050 Laptop GPU (6.58 - 34, n=14) | |
| F1 23 | |
| 1920x1080 Ultra High Preset AA:T AF:16x | |
| Średnia w klasie Gaming (27 - 149.2, n=11, ostatnie 2 lata) | |
| Lenovo Legion Pro 5 16ARX8 (R5 7645HX, RTX 4050) | |
| Lenovo LOQ 15IRH8 Core i7 | |
| Przeciętny NVIDIA GeForce RTX 4050 Laptop GPU (25.7 - 60.8, n=14) | |
| 2560x1440 Ultra High Preset AA:T AF:16x | |
| Średnia w klasie Gaming (17 - 144.6, n=10, ostatnie 2 lata) | |
| Lenovo Legion Pro 5 16ARX8 (R5 7645HX, RTX 4050) | |
| Lenovo LOQ 15IRH8 Core i7 | |
| Przeciętny NVIDIA GeForce RTX 4050 Laptop GPU (16.7 - 40.8, n=11) | |
Wykres Witcher 3 FPS
Podczas gdy długotrwała wydajność procesora LOQ 15 (lub jej brak) budzi wątpliwości, chłodzenie laptopa wydaje się być odpowiednie dla karty graficznej RTX 4050 Laptop, o czym świadczy stosunkowo stabilna liczba klatek na sekundę w The Witcher 3 w rozdzielczości 1080p Ultra.
| low | med. | high | ultra | QHD | |
|---|---|---|---|---|---|
| GTA V (2015) | 185.9 | 179.7 | 168.9 | 93.2 | 66 |
| The Witcher 3 (2015) | 390 | 286 | 167.6 | 85.6 | 61.3 |
| Dota 2 Reborn (2015) | 196.3 | 178.3 | 171.1 | 162.2 | |
| Final Fantasy XV Benchmark (2018) | 192.9 | 121.2 | 84 | 60.9 | |
| X-Plane 11.11 (2018) | 159.9 | 139.8 | 110.2 | ||
| Far Cry 5 (2018) | 156 | 135 | 128 | 121 | 83 |
| Strange Brigade (2018) | 475 | 211 | 171.8 | 149.2 | 95.5 |
| Cyberpunk 2077 1.6 (2022) | 103.3 | 85.5 | 72.9 | 67.8 | 41 |
| F1 22 (2022) | 233 | 224 | 172.3 | 55 | 33.9 |
| F1 23 (2023) | 228 | 222 | 158.4 | 44.1 | 34.1 |
Emisje: Wysoka temperatura powierzchni pod obciążeniem
Hałas systemowy
Hałas wentylatora LOQ 15IRH8 podczas bezczynności jest w dużej mierze podobny do tego, co widzieliśmy w przypadku wariantu LOQ 15 AMD, ale wentylatory tego ostatniego są o około 7% głośniejsze pod pełnym obciążeniem. Lenovo ograniczyło poziomy hałasu wentylatora poniżej pewnych progów w zależności od wybranego profilu mocy, co można zobaczyć w poniższej tabeli.
W trybie Performance pod obciążeniem poziom hałasu nie przekracza 50 dB(A). Podczas gdy tryb cichy skutkuje znacznym spadkiem wydajności procesora, gry powinny być nadal stosunkowo wygodne w porównaniu z profilem wydajności.
Hałas
| luz |
| 29.03 / 29.03 / 29.03 dB |
| obciążenie |
| 48.7 / 48.7 dB |
 | ||
30 dB cichy 40 dB(A) słyszalny 50 dB(A) irytujący |
||
min: | ||
| Tryb wydajności | Bezczynność dB(A) | Średnie obciążenie dB(A) | Maksymalne obciążenie dB(A) | Witcher 3 1080p Ultra dB(A) |
|---|---|---|---|---|
| Cichy | 25.28 | 33.09 | 36.07 | 36.69 / 78 fps |
| Równowaga | 25.28 | 40.40 | 45.15 | 45.42 / 83 fps |
| Wydajność | 29.03 | 48.72 | 48.71 | 48.52 / 85 fps |
| Lenovo LOQ 15IRH8 Core i7 i7-13620H, GeForce RTX 4050 Laptop GPU | Lenovo LOQ 16IRH8 i7-13620H, GeForce RTX 4060 Laptop GPU | Lenovo LOQ 15APH8 R7 7840HS, GeForce RTX 4050 Laptop GPU | MSI Katana 17 B13VFK i7-13620H, GeForce RTX 4060 Laptop GPU | Lenovo Legion Pro 5 16ARX8 (R5 7645HX, RTX 4050) R5 7645HX, GeForce RTX 4050 Laptop GPU | HP Victus 16-r0077ng i7-13700H, GeForce RTX 4070 Laptop GPU | Dell G15 5530 i7-13650HX, GeForce RTX 4060 Laptop GPU | Asus TUF Gaming A16 FA617XS R9 7940HS, Radeon RX 7600S | |
|---|---|---|---|---|---|---|---|---|
| Noise | 3% | 9% | -6% | 14% | 2% | 12% | 3% | |
| wyłączone / środowisko * (dB) | 23.69 | 23 3% | 23.1 2% | 24.5 -3% | 23 3% | 25 -6% | 20.41 14% | 25 -6% |
| Idle Minimum * (dB) | 29.03 | 23 21% | 23.1 20% | 24.5 16% | 23 21% | 28 4% | 26.85 8% | 25 14% |
| Idle Average * (dB) | 29.03 | 23 21% | 23.1 20% | 24.5 16% | 23 21% | 29 -0% | 26.85 8% | 26 10% |
| Idle Maximum * (dB) | 29.03 | 27.66 5% | 25.2 13% | 40 -38% | 24.42 16% | 30 -3% | 26.85 8% | 28 4% |
| Load Average * (dB) | 48.7 | 53.62 -10% | 44.3 9% | 48.3 1% | 34.94 28% | 43 12% | 27.65 43% | 43 12% |
| Witcher 3 ultra * (dB) | 48.5 | 53.5 -10% | 45.8 6% | 56 -15% | 43.79 10% | 46 5% | 47.9 1% | 51 -5% |
| Load Maximum * (dB) | 48.7 | 53.5 -10% | 52 -7% | 59.1 -21% | 50 -3% | 48 1% | 47.86 2% | 53 -9% |
* ... im mniej tym lepiej
Temperatura
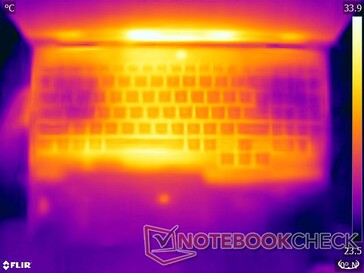
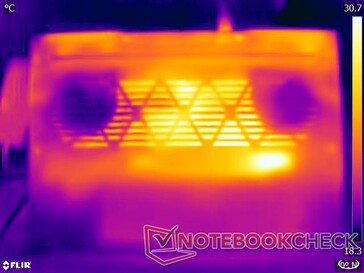
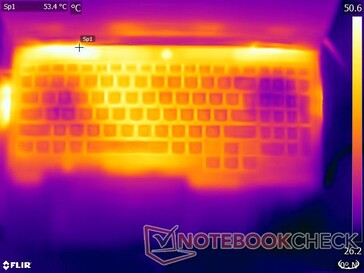
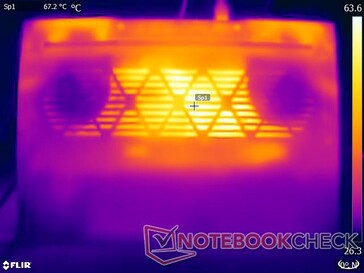
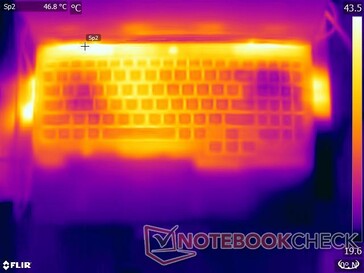
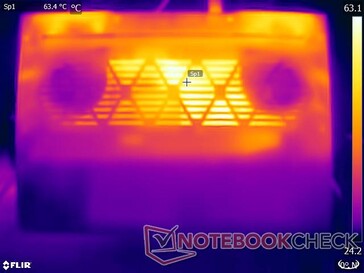
Temperatury powierzchni podczas obciążania w profilu Performance mogą być dość wysokie, szczególnie w dolnej części obudowy. Chociaż nasze testy obciążeniowe reprezentują ekstremalne scenariusze, nie zalecamy używania tego urządzenia na kolanach do niczego innego niż lekkie użytkowanie.
(-) Maksymalna temperatura w górnej części wynosi 46.4 °C / 116 F, w porównaniu do średniej 40.4 °C / 105 F , począwszy od 21.2 do 68.8 °C dla klasy Gaming.
(-) Dno nagrzewa się maksymalnie do 59.2 °C / 139 F, w porównaniu do średniej 43.3 °C / 110 F
(±) W stanie bezczynności średnia temperatura górnej części wynosi 32.7 °C / 91 F, w porównaniu ze średnią temperaturą urządzenia wynoszącą 33.9 °C / ### class_avg_f### F.
(-) Podczas gry w Wiedźmina 3 średnia temperatura górnej części wynosi 39.4 °C / 103 F, w porównaniu do średniej temperatury urządzenia wynoszącej 33.9 °C / ## #class_avg_f### F.
(+) Podparcia dłoni i touchpad osiągają maksymalną temperaturę skóry (34 °C / 93.2 F) i dlatego nie są gorące.
(-) Średnia temperatura obszaru podparcia dłoni w podobnych urządzeniach wynosiła 28.8 °C / 83.8 F (-5.2 °C / -9.4 F).
| Lenovo LOQ 15IRH8 Core i7 Intel Core i7-13620H, NVIDIA GeForce RTX 4050 Laptop GPU | Lenovo LOQ 16IRH8 Intel Core i7-13620H, NVIDIA GeForce RTX 4060 Laptop GPU | Lenovo LOQ 15APH8 AMD Ryzen 7 7840HS, NVIDIA GeForce RTX 4050 Laptop GPU | MSI Katana 17 B13VFK Intel Core i7-13620H, NVIDIA GeForce RTX 4060 Laptop GPU | Lenovo Legion Pro 5 16ARX8 (R5 7645HX, RTX 4050) AMD Ryzen 5 7645HX, NVIDIA GeForce RTX 4050 Laptop GPU | HP Victus 16-r0077ng Intel Core i7-13700H, NVIDIA GeForce RTX 4070 Laptop GPU | Dell G15 5530 Intel Core i7-13650HX, NVIDIA GeForce RTX 4060 Laptop GPU | Asus TUF Gaming A16 FA617XS AMD Ryzen 9 7940HS, AMD Radeon RX 7600S | |
|---|---|---|---|---|---|---|---|---|
| Heat | 10% | 13% | 11% | 1% | 3% | -3% | 9% | |
| Maximum Upper Side * (°C) | 46.4 | 48 -3% | 44.4 4% | 41.6 10% | 45 3% | 51 -10% | 54 -16% | 53 -14% |
| Maximum Bottom * (°C) | 59.2 | 59 -0% | 52 12% | 43.1 27% | 54 9% | 54 9% | 62.2 -5% | 48 19% |
| Idle Upper Side * (°C) | 34.4 | 28 19% | 28 19% | 32 7% | 36 -5% | 37 -8% | 33.4 3% | 30 13% |
| Idle Bottom * (°C) | 36.2 | 28 23% | 29.6 18% | 35.8 1% | 38 -5% | 29 20% | 33.4 8% | 30 17% |
* ... im mniej tym lepiej
Test warunków skrajnych
W przeciwieństwie do tego, co widzieliśmy wcześniej w teście wielordzeniowej pętli Cinebench R15, obciążając LOQ 15 za pomocą Prime95 in-place large FFTs widzimy, że Core i7-13620H w końcu jest w stanie osiągnąć 133 W przy maksymalnym taktowaniu 4,27 GHz. Jest to jednak krótkotrwałe, ponieważ procesor ostatecznie osiąga średnią moc pakietu 65 W.
Połączone obciążenie Prime95 i FurMark wskazuje, że RTX 4050 może wykorzystać do 117 W przy maksymalnym taktowaniu 2,565 MHz. Core i7-13620H musi zmagać się ze szczytowym taktowaniem 3,6 GHz, ponieważ musi dzielić przestrzeń termiczną i energetyczną z RTX 4050.
| Test obciążeniowy | Taktowanie CPU (GHz) | Taktowanie GPU (MHz) | Średnia temperatura CPU (°C) | Średnia temperatura GPU (°C) |
| System w stanie spoczynku | 4.3 | 210 | 37 | 38.4 |
| Prime95 | 4.8 | 210 | 75 | 54.2 |
| Prime95+ FurMark | 3.2 | 2,220 | 77 | 79.7 |
| The Witcher 3 1080p Ultra | 4.8 | 2,535 | 76 | 80.5 |
W teście obciążeniowym The Witcher 3 1080p Ultra, RTX 4050 jest w stanie osiągnąć ten sam zegar 2565 MHz, ale przy znacznie niższym maksymalnym TGP wynoszącym 103 W. Daje to trochę miejsca na oddech dla Core i7-13620H, który może wykorzystać do 42 W przy maksymalnym przyspieszeniu 4,26 GHz.
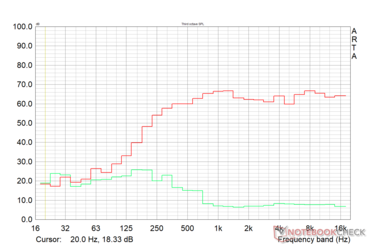
Głośniki
Lenovo LOQ 15IRH8 Core i7 analiza dźwięku
(±) | głośność głośnika jest średnia, ale dobra (75.9 dB)
Bas 100 - 315 Hz
(-) | prawie brak basu - średnio 18.6% niższa od mediany
(±) | liniowość basu jest średnia (10.2% delta do poprzedniej częstotliwości)
Średnie 400 - 2000 Hz
(+) | zbalansowane środki średnie - tylko 2.2% od mediany
(+) | średnie są liniowe (3.1% delta do poprzedniej częstotliwości)
Wysokie 2–16 kHz
(+) | zrównoważone maksima - tylko 2.3% od mediany
(+) | wzloty są liniowe (4.4% delta do poprzedniej częstotliwości)
Ogólnie 100 - 16.000 Hz
(+) | ogólny dźwięk jest liniowy (13.7% różnicy w stosunku do mediany)
W porównaniu do tej samej klasy
» 21% wszystkich testowanych urządzeń w tej klasie było lepszych, 7% podobnych, 73% gorszych
» Najlepszy miał deltę 6%, średnia wynosiła ###średnia###%, najgorsza wynosiła 132%
W porównaniu do wszystkich testowanych urządzeń
» 14% wszystkich testowanych urządzeń było lepszych, 4% podobnych, 82% gorszych
» Najlepszy miał deltę 4%, średnia wynosiła ###średnia###%, najgorsza wynosiła 134%
Apple MacBook Pro 16 2021 M1 Pro analiza dźwięku
(+) | głośniki mogą odtwarzać stosunkowo głośno (84.7 dB)
Bas 100 - 315 Hz
(+) | dobry bas - tylko 3.8% od mediany
(+) | bas jest liniowy (5.2% delta do poprzedniej częstotliwości)
Średnie 400 - 2000 Hz
(+) | zbalansowane środki średnie - tylko 1.3% od mediany
(+) | średnie są liniowe (2.1% delta do poprzedniej częstotliwości)
Wysokie 2–16 kHz
(+) | zrównoważone maksima - tylko 1.9% od mediany
(+) | wzloty są liniowe (2.7% delta do poprzedniej częstotliwości)
Ogólnie 100 - 16.000 Hz
(+) | ogólny dźwięk jest liniowy (4.6% różnicy w stosunku do mediany)
W porównaniu do tej samej klasy
» 0% wszystkich testowanych urządzeń w tej klasie było lepszych, 0% podobnych, 100% gorszych
» Najlepszy miał deltę 5%, średnia wynosiła ###średnia###%, najgorsza wynosiła 45%
W porównaniu do wszystkich testowanych urządzeń
» 0% wszystkich testowanych urządzeń było lepszych, 0% podobnych, 100% gorszych
» Najlepszy miał deltę 4%, średnia wynosiła ###średnia###%, najgorsza wynosiła 134%
Zarządzanie energią: Wariant AMD wydaje się być bardziej ekonomiczny
Zużycie energii
Zużycie energii pod obciążeniem jest generalnie niższe w porównaniu do konkurencji. Niezależnie od różnic w wyświetlaniu, LOQ 15APH8 z procesorem Ryzen 7 7840HS jest o około 18% bardziej ekonomiczny pod względem ogólnego zużycia energii niż nasza jednostka LOQ 15IRH8 z procesorem Intela.
Asus TUF Gaming A16 Asus TUF Gaming A16 jest ogólnie najbardziej oszczędny, ale zużycie energii pod obciążeniem mieści się w porównywalnym zakresie z LOQ 15IRH8. Pobór mocy przy maksymalnym obciążeniu przekracza 170 W dostarczonej ładowarki.
| wyłączony / stan wstrzymania | |
| luz | |
| obciążenie |
|
Legenda:
min: | |
| Lenovo LOQ 15IRH8 Core i7 i7-13620H, GeForce RTX 4050 Laptop GPU, IPS, 2560x1440, 15.6" | Lenovo LOQ 16IRH8 i7-13620H, GeForce RTX 4060 Laptop GPU, IPS, 2560x1600, 16" | Lenovo LOQ 15APH8 R7 7840HS, GeForce RTX 4050 Laptop GPU, IPS, 1920x1080, 15.6" | MSI Katana 17 B13VFK i7-13620H, GeForce RTX 4060 Laptop GPU, IPS LED, 1920x1080, 17.3" | Lenovo Legion Pro 5 16ARX8 (R5 7645HX, RTX 4050) R5 7645HX, GeForce RTX 4050 Laptop GPU, IPS, 2560x1600, 16" | HP Victus 16-r0077ng i7-13700H, GeForce RTX 4070 Laptop GPU, IPS, 1920x1080, 16.1" | Dell G15 5530 i7-13650HX, GeForce RTX 4060 Laptop GPU, IPS, 1920x1080, 15.6" | Asus TUF Gaming A16 FA617XS R9 7940HS, Radeon RX 7600S, IPS, 1920x1200, 16" | Przeciętny NVIDIA GeForce RTX 4050 Laptop GPU | Średnia w klasie Gaming | |
|---|---|---|---|---|---|---|---|---|---|---|
| Power Consumption | 6% | 18% | 19% | 15% | 20% | 12% | 31% | 25% | 0% | |
| Idle Minimum * (Watt) | 18.52 | 17.2 7% | 15 19% | 12.2 34% | 13 30% | 8 57% | 8.4 55% | 7 62% | 9.95 ? 46% | 13.7 ? 26% |
| Idle Average * (Watt) | 22.54 | 19.3 14% | 17.7 21% | 14.9 34% | 17.4 23% | 13 42% | 14.98 34% | 10 56% | 15.8 ? 30% | 19.5 ? 13% |
| Idle Maximum * (Watt) | 29.79 | 21.2 29% | 21.5 28% | 15.8 47% | 21.8 27% | 22 26% | 15.56 48% | 15 50% | 20.1 ? 33% | 25.7 ? 14% |
| Load Average * (Watt) | 94.5 | 90 5% | 73.5 22% | 85.22 10% | 96.4 -2% | 86 9% | 96.8 -2% | 86 9% | 88 ? 7% | 110.2 ? -17% |
| Witcher 3 ultra * (Watt) | 154.4 | 168 -9% | 138.6 10% | 151.1 2% | 125 19% | 141.8 8% | 186 -20% | 160.6 -4% | ||
| Load Maximum * (Watt) | 190.4 | 211 -11% | 176.5 7% | 212.8 -12% | 204 -7% | 233 -22% | 271.42 -43% | 172 10% | 176.3 ? 7% | 257 ? -35% |
* ... im mniej tym lepiej
Power Consumption: The Witcher 3 / Stress test
Power Consumption: External Monitor
Żywotność baterii
Czas pracy na baterii jest podobny do tego, co zaobserwowaliśmy w przypadku LOQ 16IRH8. Wzrost zużycia energii LOQ 15APH8 przekłada się na 25% dłuższy czas pracy na baterii w porównaniu do LOQ 15IRH8.
Dostarczony zasilacz 170 W obsługuje szybkie ładowanie Rapid Charge, które można włączyć w aplikacji Lenovo Vantage. Pozwala to na naładowanie urządzenia od zera do 100% w około 45 minut.
| Lenovo LOQ 15IRH8 Core i7 i7-13620H, GeForce RTX 4050 Laptop GPU, 60 Wh | Lenovo LOQ 16IRH8 i7-13620H, GeForce RTX 4060 Laptop GPU, 80 Wh | Lenovo LOQ 15APH8 R7 7840HS, GeForce RTX 4050 Laptop GPU, 60 Wh | MSI Katana 17 B13VFK i7-13620H, GeForce RTX 4060 Laptop GPU, 53.5 Wh | Lenovo Legion Pro 5 16ARX8 (R5 7645HX, RTX 4050) R5 7645HX, GeForce RTX 4050 Laptop GPU, 80 Wh | HP Victus 16-r0077ng i7-13700H, GeForce RTX 4070 Laptop GPU, 83 Wh | Dell G15 5530 i7-13650HX, GeForce RTX 4060 Laptop GPU, 86 Wh | Asus TUF Gaming A16 FA617XS R9 7940HS, Radeon RX 7600S, 90 Wh | Średnia w klasie Gaming | |
|---|---|---|---|---|---|---|---|---|---|
| Czasy pracy | 6% | 25% | -51% | -8% | 20% | 11% | 107% | 23% | |
| H.264 (h) | 6.1 | 6.4 5% | 5.4 -11% | 6.8 11% | 12.4 103% | 8.05 ? 32% | |||
| WiFi v1.3 (h) | 5.9 | 6.3 7% | 7.4 25% | 2.9 -51% | 5.6 -5% | 7.1 20% | 6.5 10% | 12.4 110% | 6.73 ? 14% |
| Load (h) | 1.5 | 1.1 | 1 | 0.8 | 0.9 | 1.464 ? | |||
| Reader / Idle (h) | 9.8 | 20.3 | 9.23 ? | ||||||
| Witcher 3 ultra (h) | 0.8 | 0.8 | 0.958 ? |
Za
Przeciw
Werdykt: Granie w rozdzielczości 1080p Ultra bez rozbijania banku
LOQ 15 Core i7 posiada wyświetlacz QHD G-Sync 165 Hz i kamerę internetową 1080p pomimo swojej niskiej ceny. Panel QHD szczególnie imponuje znacznie lepszymi kolorami i czasem reakcji w porównaniu z opcją FHD 144 Hz.
Jakość wykonania, co zrozumiałe, cierpi z powodu dużej ilości plastiku. Bardziej niepokojącym aspektem jest to, że Core i7-13620H w LOQ 15IRH8 ma trudności z utrzymaniem wydajności, w przeciwieństwie do tego, co widzieliśmy w przypadku AMD Ryzen 7 7840HS LOQ 15APH8 lub nawet LOQ 16IRH8.
Wydajność jest jednak wystarczająca do płynnego grania w 1080p, dzięki procesorowi Intel i7-13620H i grafice RTX 4050, która może wykorzystać więcej niż jej znamionowe TGP.
Lenovo LOQ 15 Core i7 spełnia większość wymagań i zasługuje na dużą uwagę, jeśli szukają Państwo wydajnego laptopa do gier 1080p w okolicach 1200 USD lub 1 00 00 GBP. Oczekiwania należy jednak złagodzić w odniesieniu do jakości wykonania i emisji ciepła"
Kolejnym obszarem, w którym LOQ 15 z procesorem Intela rozczarowuje, jest emisja ciepła. Z drugiej strony, poziomy hałasu wentylatorów są do opanowania i możliwe jest odpowiednie granie w 1080p nawet przy niższych profilach mocy.
Wybór pomiędzy LOQ 15 z procesorami Intela i AMD sprowadza się do priorytetów. Wersja Intel zapewnia lepszą wydajność w grach w rozdzielczości 1080p i niższy hałas wentylatora pod obciążeniem. Jednak wariant AMD ma przewagę pod względem ogólnej wydajności procesora, działa chłodniej, jest bardziej energooszczędny i ma lepszą żywotność baterii.
Biorąc to pod uwagę, oba warianty LOQ 15 prezentują wysoką wartość w porównaniu do Legion Pro 5 16. Laptopy takie jak HP Victus 16 i MSI Katana 17 wypadają zauważalnie lepiej na wykresach, ale ich ceny nie wydają się dobrze skalować z oferowanym sprzętem w stosunku do LOQ 15.
Cena i dostępność
Cena LOQ 15 Core i7 zaczyna się od 97 790 jenów za wariant FHD 144 Hz i można go kupić bezpośrednio na stronie Lenovo India. Witryna nie zawiera obecnie listy dostępności testowanego wariantu QHD.
Amazon India nie ma obecnie w magazynie większości wariantów LOQ 15, z wyjątkiem LOQ 16IRH8 z Core i7-13700H i RTX 4060, który jest wymieniony na ₹2,25,766.
Lenovo US ma również wiele laptopów LOQ 15 z procesorami Intela 13. generacji z kilkoma opcjami GPU Nvidii. Best Buy oferuje LOQ 15 z procesorem Core i5-13420H i grafiką RTX 3050 za 650 USD. Amazon US ma wariant z RTX 4050 za 1227 USD. Opcja Ryzen 7 7840HS z RTX 4050 jest również dostępna w Best Buy za 1240 USD.
Lenovo LOQ 15IRH8 Core i7
- 13/10/2023 v7 (old)
Vaidyanathan Subramaniam
Przezroczystość
Wyboru urządzeń do recenzji dokonuje nasza redakcja. Próbka testowa została udostępniona autorowi jako pożyczka od producenta lub sprzedawcy detalicznego na potrzeby tej recenzji. Pożyczkodawca nie miał wpływu na tę recenzję, producent nie otrzymał też kopii tej recenzji przed publikacją. Nie było obowiązku publikowania tej recenzji. Jako niezależna firma medialna, Notebookcheck nie podlega władzy producentów, sprzedawców detalicznych ani wydawców.
Tak testuje Notebookcheck
Każdego roku Notebookcheck niezależnie sprawdza setki laptopów i smartfonów, stosując standardowe procedury, aby zapewnić porównywalność wszystkich wyników. Od około 20 lat stale rozwijamy nasze metody badawcze, ustanawiając przy tym standardy branżowe. W naszych laboratoriach testowych doświadczeni technicy i redaktorzy korzystają z wysokiej jakości sprzętu pomiarowego. Testy te obejmują wieloetapowy proces walidacji. Nasz kompleksowy system ocen opiera się na setkach uzasadnionych pomiarów i benchmarków, co pozwala zachować obiektywizm.

