Niewiele lepiej niż w poprzednim roku: 2023 Recenzja Dell XPS 13 Plus 9320 Core i7-1360P

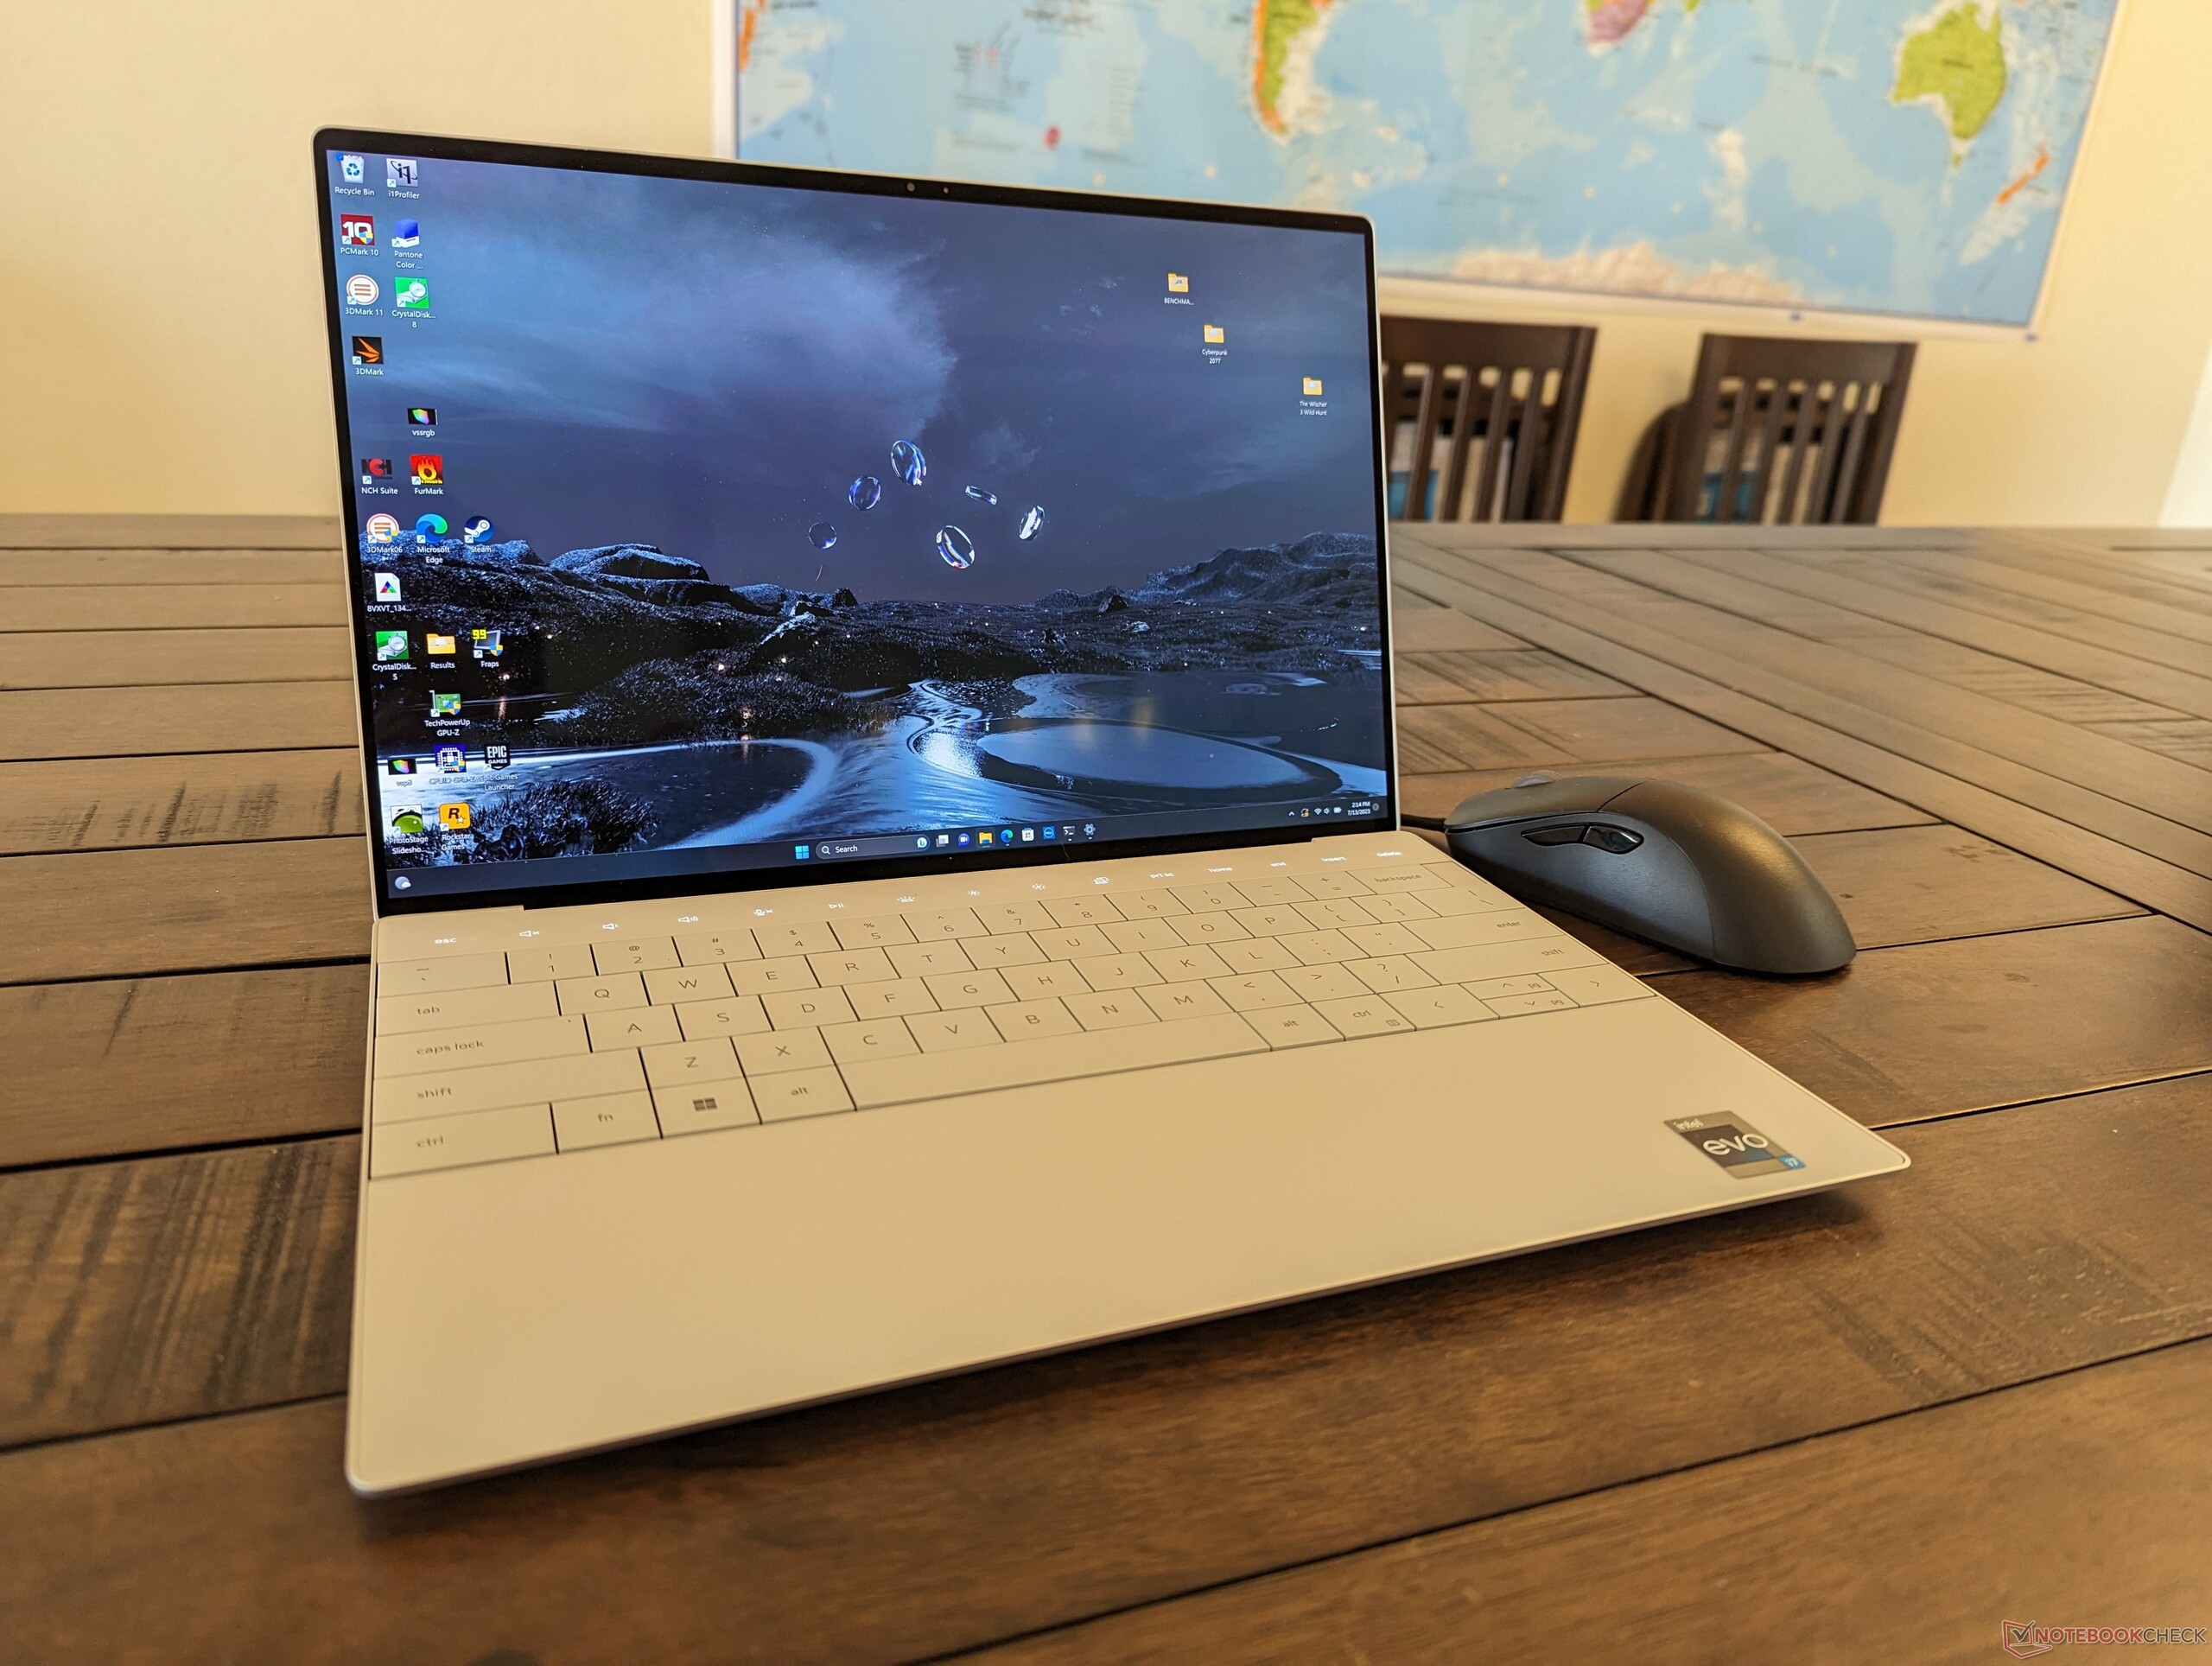
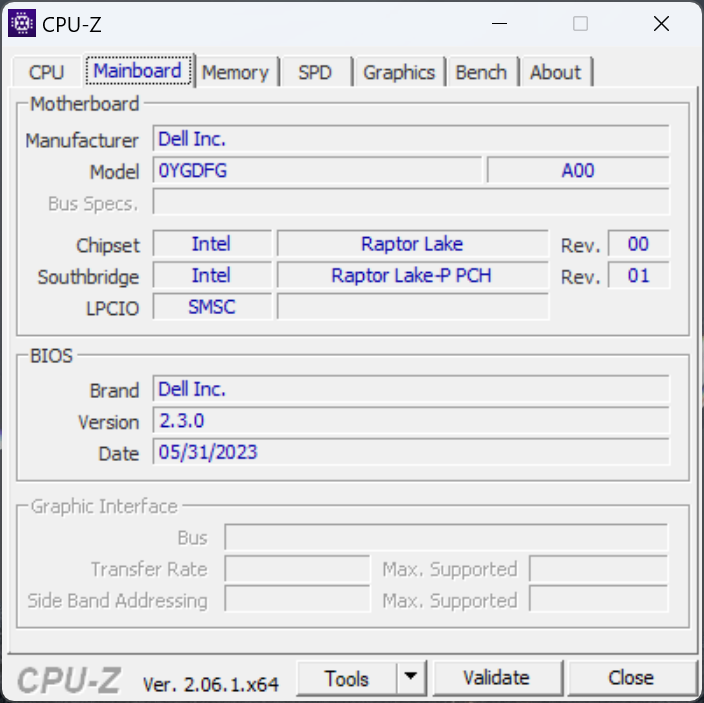
XPS 13 Plus 9320 z 2023 roku jest tegorocznym odświeżeniem oryginalnego modelu z 2022 roku. Wykorzystuje tę samą konstrukcję obudowy, ale z nowszymi opcjami procesorów Raptor Lake 13. generacji, aby zastąpić starsze opcje Alder Lake 12. generacji. Poza tym nie ma żadnych zmian zewnętrznych, dlatego zalecamy sprawdzenie naszą recenzję modelu 2022 aby dowiedzieć się więcej o fizycznych cechach XPS 13 Plus.
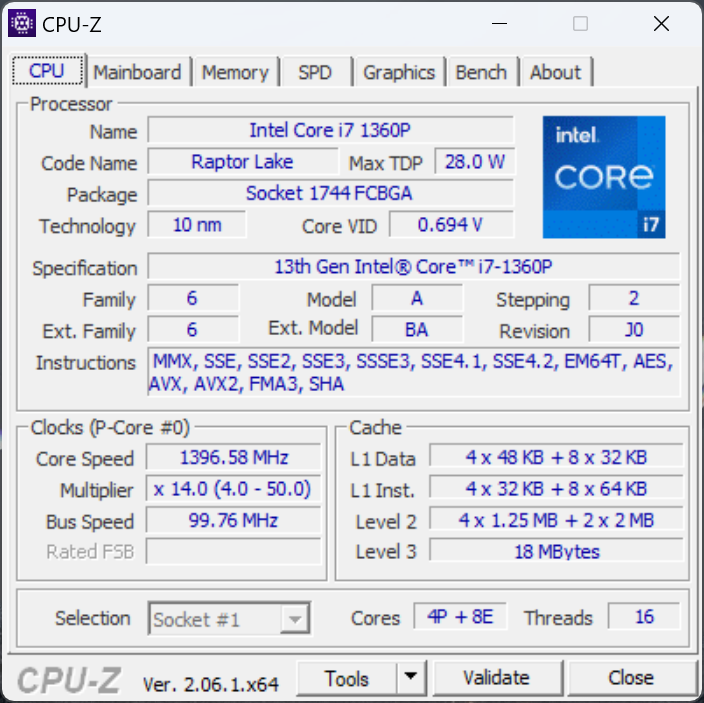
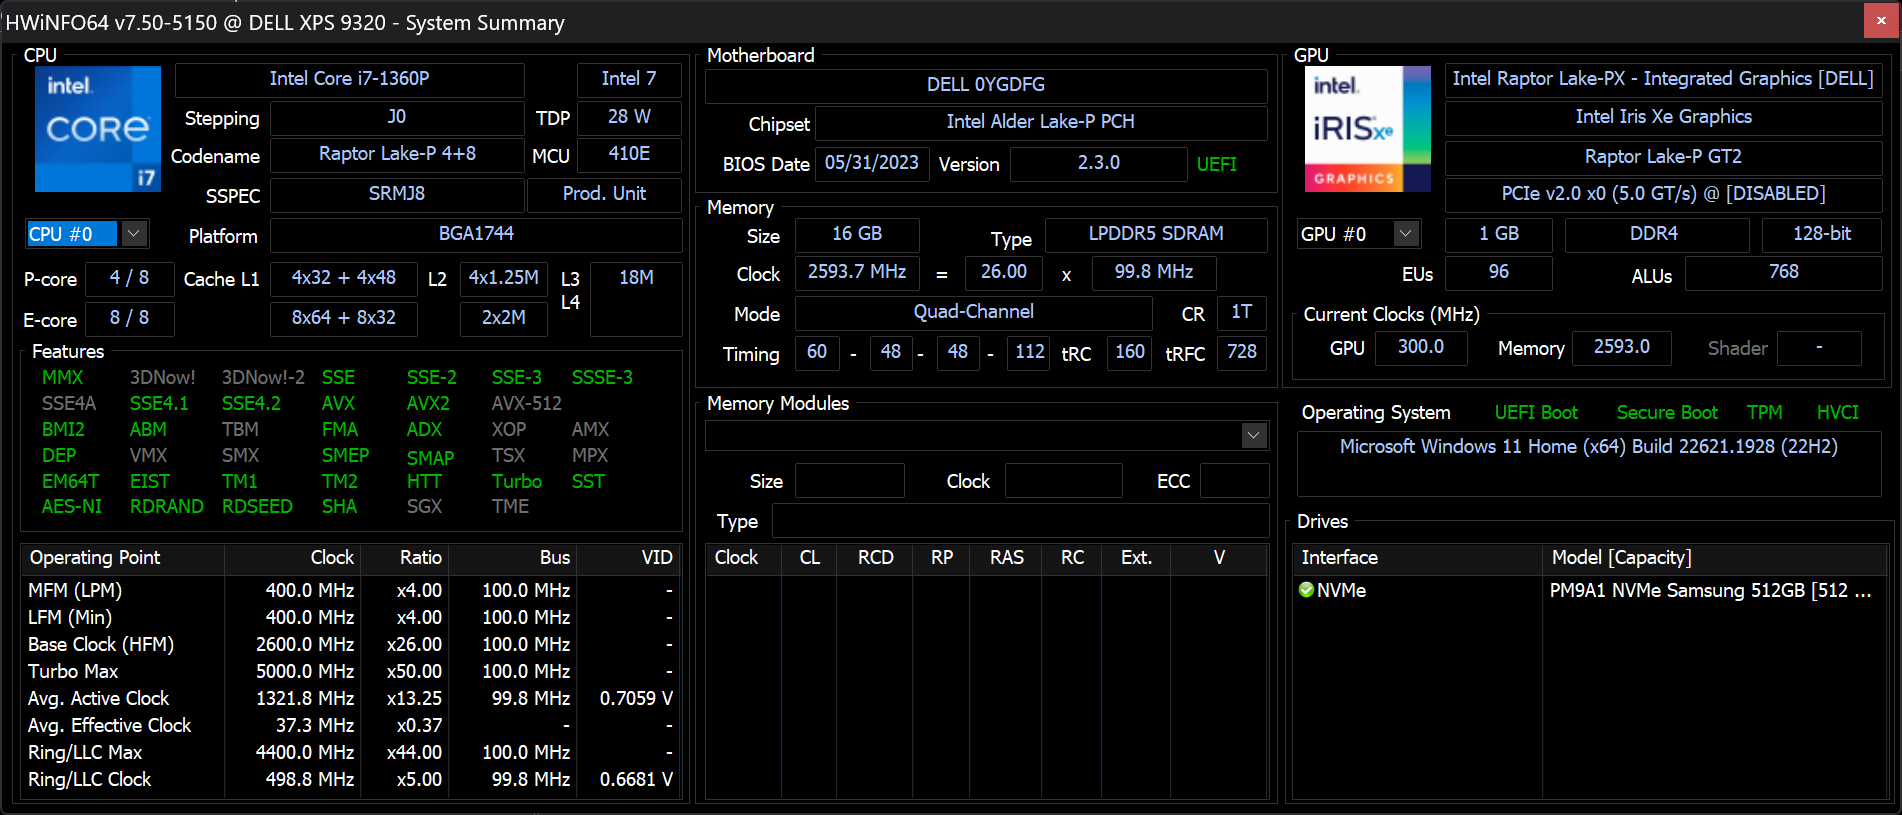
Nasza konfiguracja to SKU średniej klasy z 13,4-calowym ekranem dotykowym OLED o rozdzielczości 3,5K (3456 x 2160) i 16 GB szybkiej pamięci RAM LPDDR5 6000 MHz za około 1300 USD. Inne jednostki SKU mogą być wyposażone w panele 1200p lub 2400p, ale wszystkie są obecnie dostarczane z tym samym procesorem Core i7-1360P.
Alternatywy dla XPS 13 Plus obejmują inne flagowe 13-calowe subnotebooki, takie jakFramework Laptop 13.5,HP Spectre x360 13.5lub Lenovo ThinkPad X13 G3.
Więcej recenzji Dell:
Potencjalni konkurenci w porównaniu
Ocena | Data | Model | Waga | Wysokość | Rozmiar | Rezolucja | Cena |
|---|---|---|---|---|---|---|---|
| 87.4 % v7 (old) | 07/2023 | Dell XPS 13 Plus 9320 Core i7-1360P i7-1360P, Iris Xe G7 96EUs | 1.3 kg | 15.3 mm | 13.40" | 3456x2160 | |
| 87.3 % v7 (old) | 09/2022 | Dell XPS 13 Plus 9320 i7-1280P OLED i7-1280P, Iris Xe G7 96EUs | 1.3 kg | 15.28 mm | 13.40" | 3456x2160 | |
| 85.9 % v7 (old) | Dell XPS 13 7390 Core i7-10710U i7-10710U, UHD Graphics 620 | 1.2 kg | 11.6 mm | 13.30" | 3840x2160 | ||
| 86.2 % v7 (old) | 05/2023 | Framework Laptop 13.5 13th Gen Intel i7-1370P, Iris Xe G7 96EUs | 1.3 kg | 15.85 mm | 13.50" | 2256x1504 | |
| 89.1 % v7 (old) | 06/2023 | Lenovo ThinkPad X13 Yoga G3 21AW003UGE i7-1265U, Iris Xe G7 96EUs | 1.2 kg | 15.9 mm | 13.30" | 2560x1600 | |
| 90.3 % v7 (old) | HP Spectre x360 13.5 14t-ef000 i7-1255U, Iris Xe G7 96EUs | 1.4 kg | 17 mm | 13.50" | 3000x2000 |
Przypadek
Komunikacja
| Networking | |
| iperf3 transmit AX12 | |
| Dell XPS 13 7390 Core i7-10710U | |
| iperf3 receive AX12 | |
| Dell XPS 13 7390 Core i7-10710U | |
| iperf3 transmit AXE11000 | |
| Dell XPS 13 Plus 9320 Core i7-1360P | |
| Framework Laptop 13.5 13th Gen Intel | |
| Lenovo ThinkPad X13 Yoga G3 21AW003UGE | |
| iperf3 receive AXE11000 | |
| Lenovo ThinkPad X13 Yoga G3 21AW003UGE | |
| Dell XPS 13 Plus 9320 Core i7-1360P | |
| Framework Laptop 13.5 13th Gen Intel | |
| iperf3 transmit AXE11000 6GHz | |
| HP Spectre x360 13.5 14t-ef000 | |
| Framework Laptop 13.5 13th Gen Intel | |
| Dell XPS 13 Plus 9320 Core i7-1360P | |
| iperf3 receive AXE11000 6GHz | |
| Framework Laptop 13.5 13th Gen Intel | |
| Dell XPS 13 Plus 9320 Core i7-1360P | |
| HP Spectre x360 13.5 14t-ef000 | |
Kamera internetowa
Nie ma żadnych zmian w kamerze internetowej 1 MP, podczas gdy niektóre konkurencyjne modele, takie jak HP Spectre przeszły już na wyższej jakości sensory 5 MP.


Konserwacja
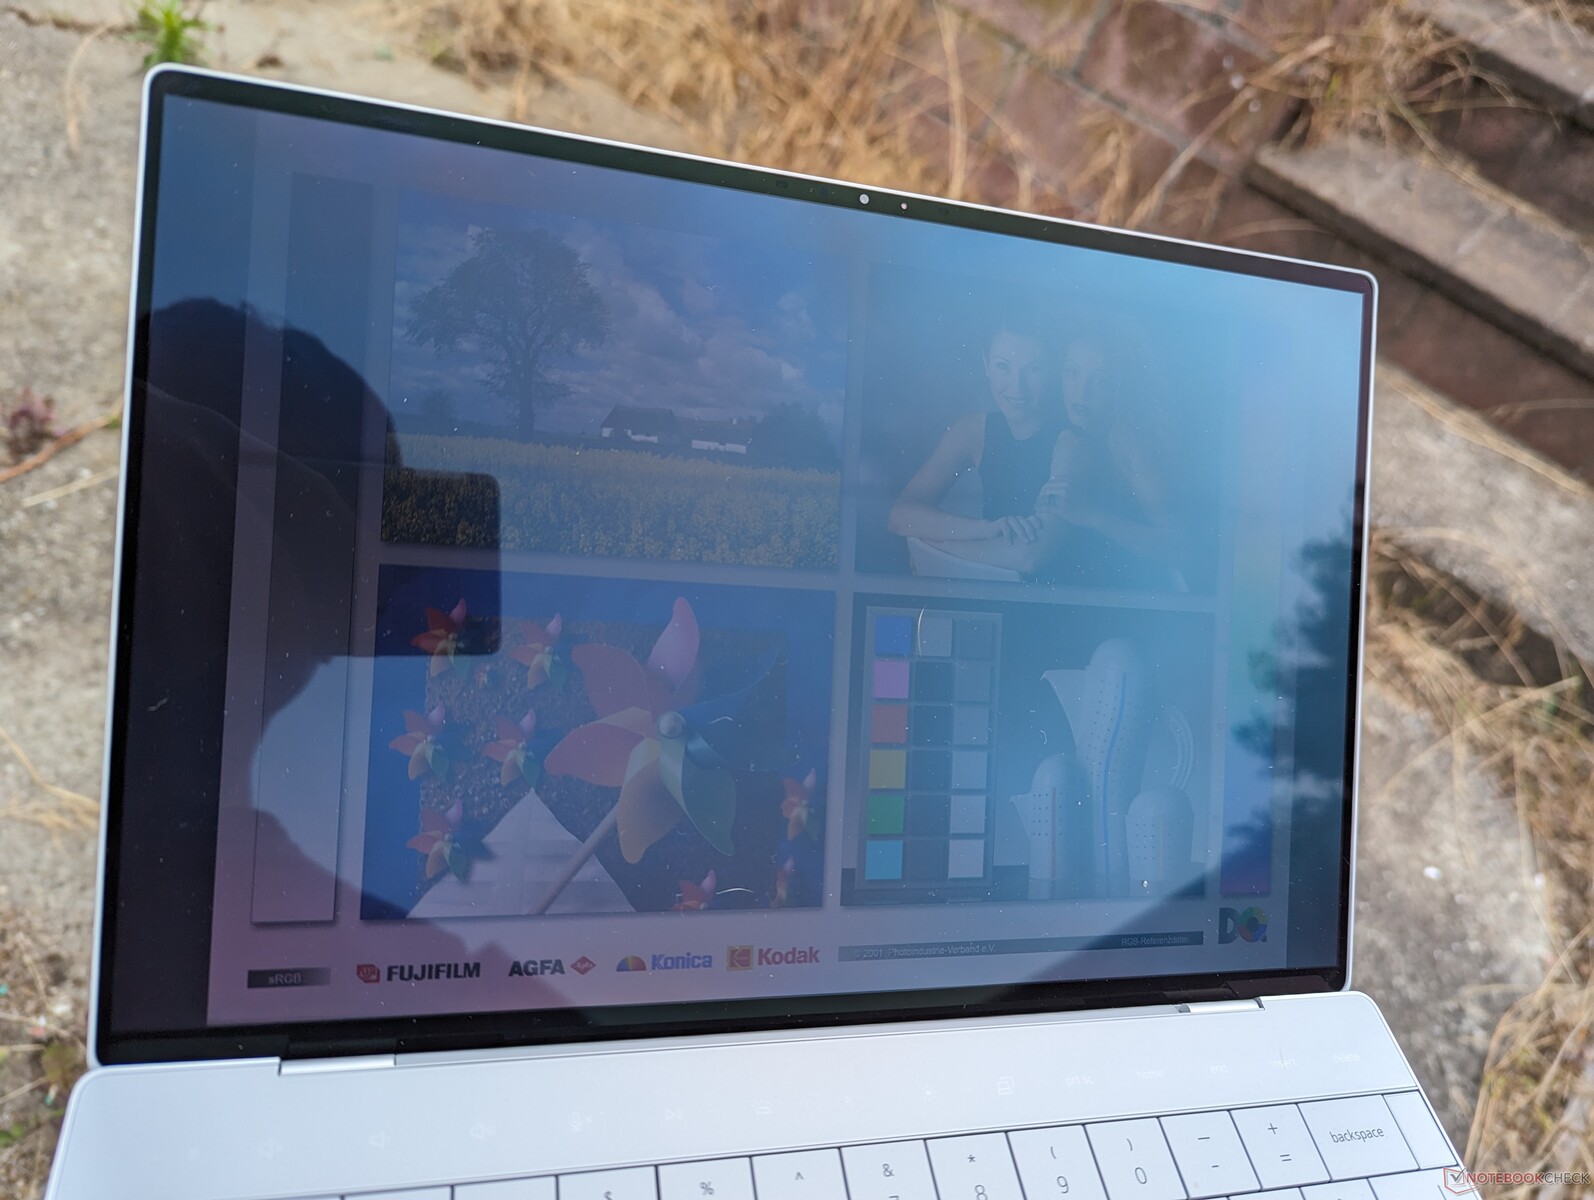
Wyświetlacz
Dostępne są cztery następujące opcje wyświetlacza:
- 1920 x 1200, 60 Hz, IPS, bezdotykowy, matowy, 500 nitów
- 1920 x 1200, 60 Hz, IPS, dotykowy, matowy, 500 nitów
- 3456 x 2160, 60 Hz, OLED, dotykowy, błyszczący, 400 nitów
- 3840 x 2400, 60 Hz, IPS, dotykowy, błyszczący, 500 nitów
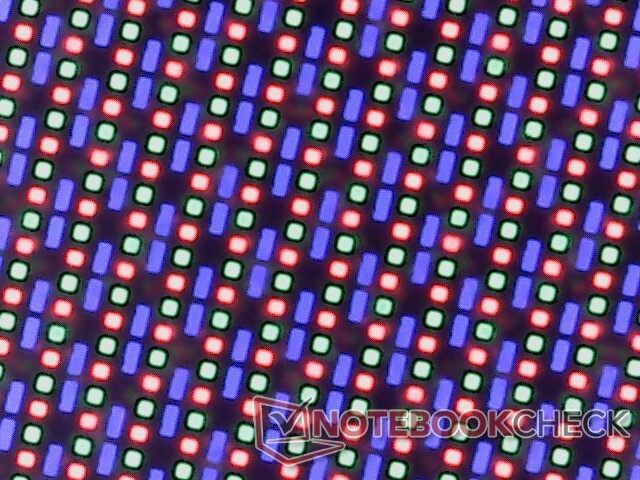
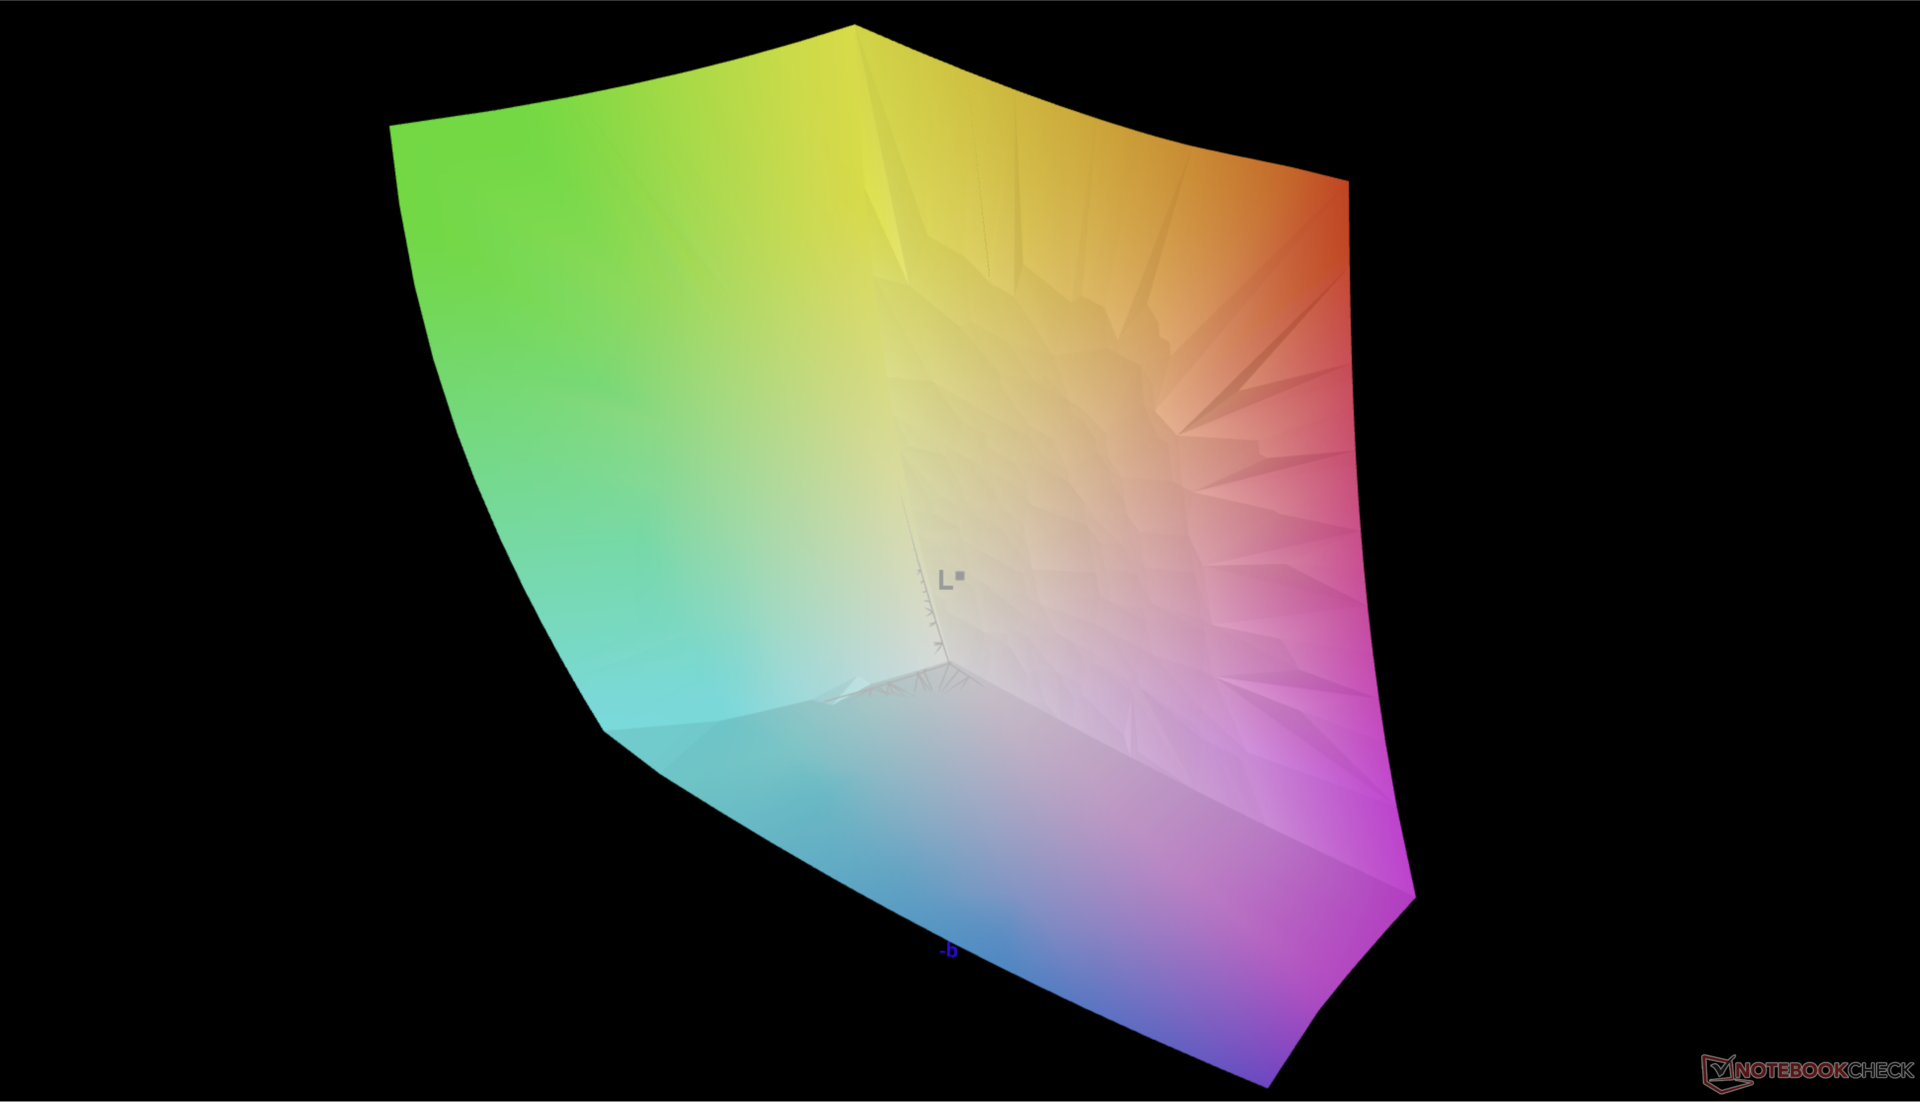
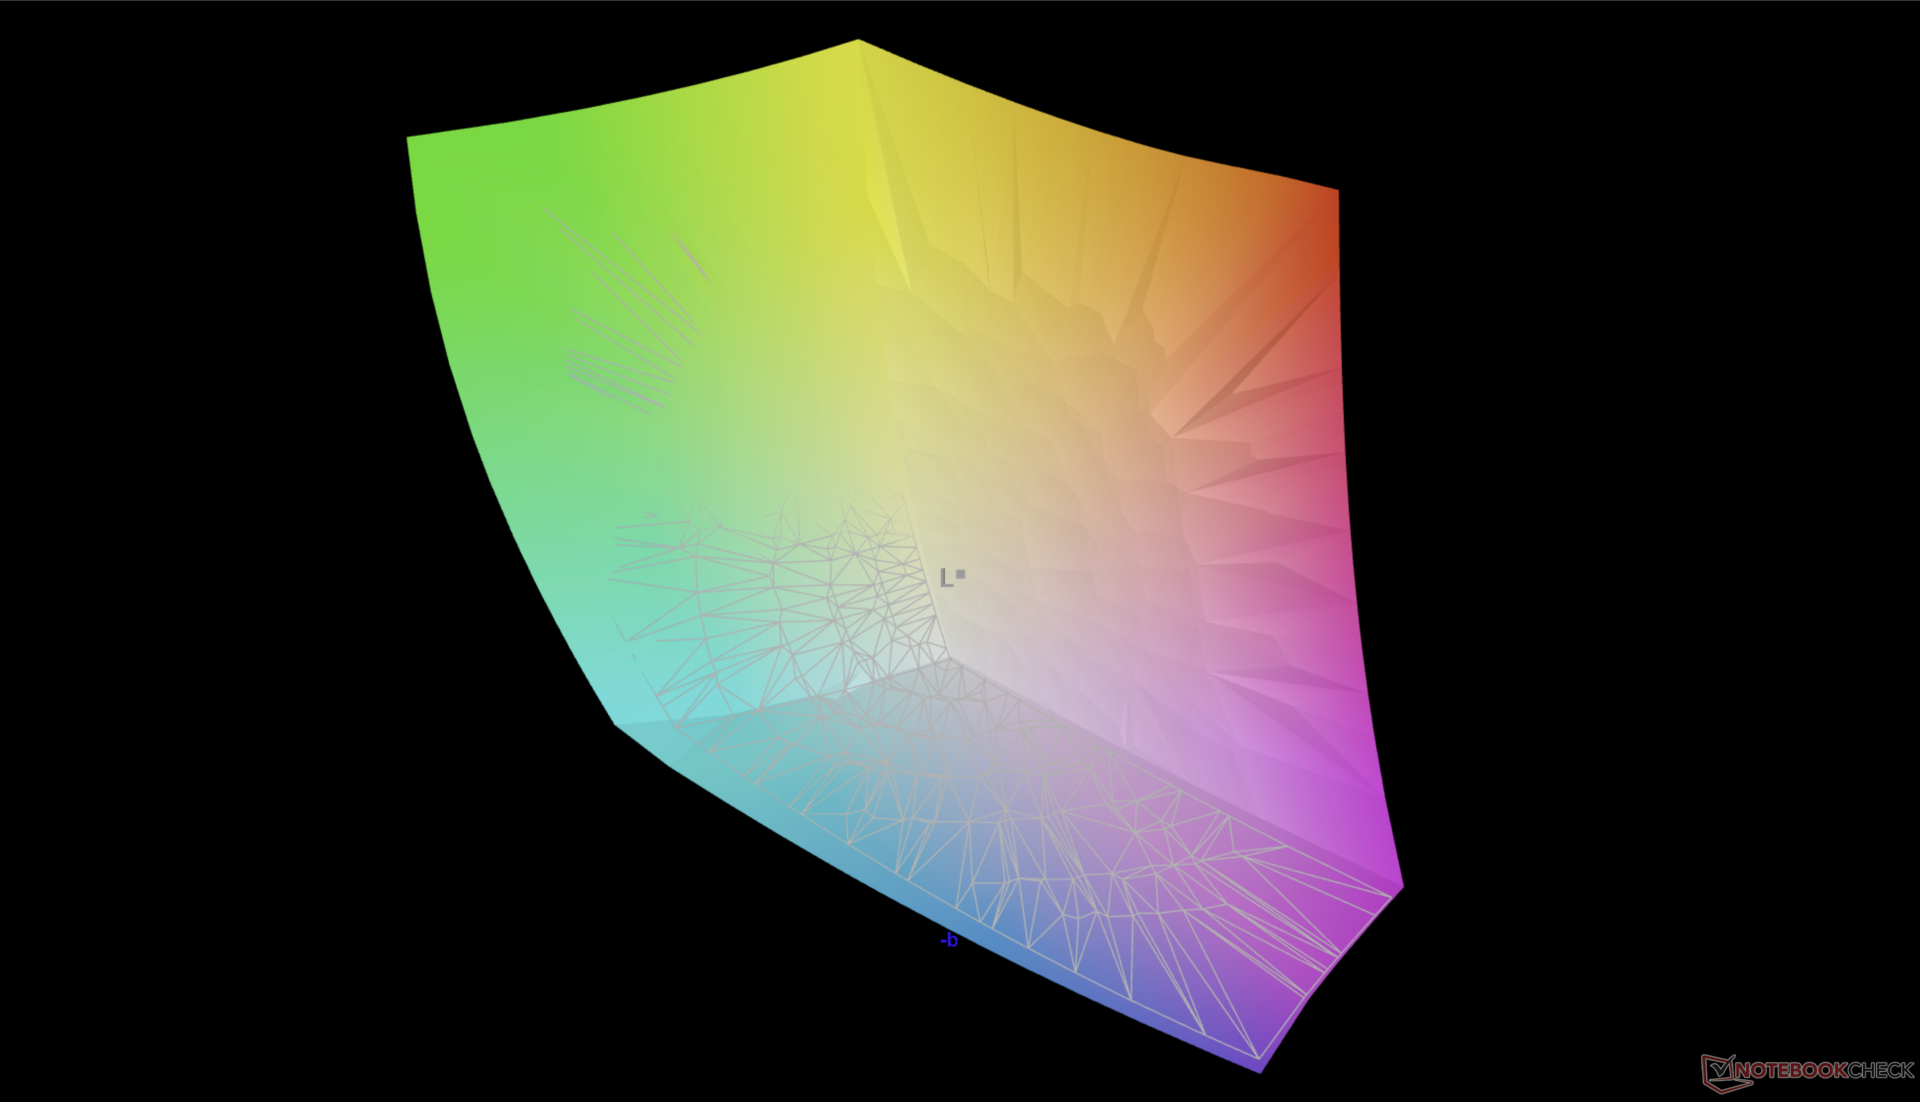
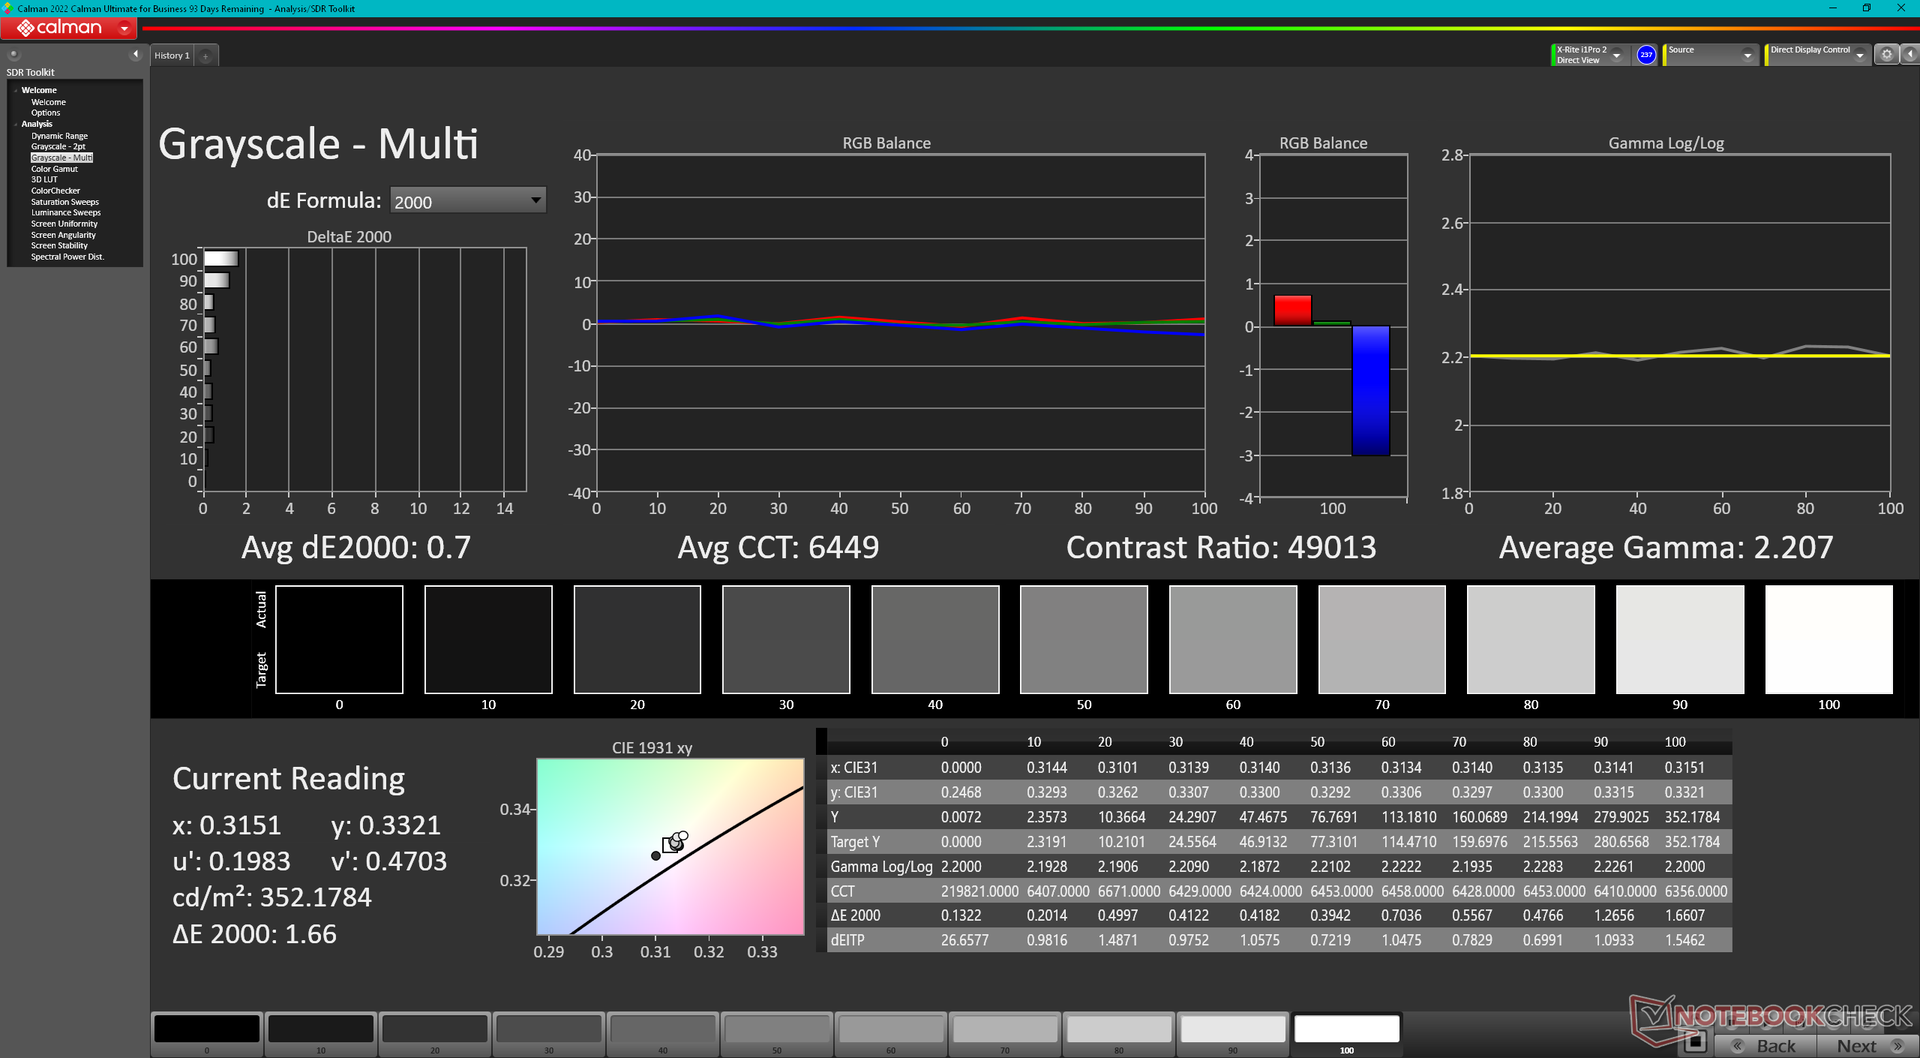
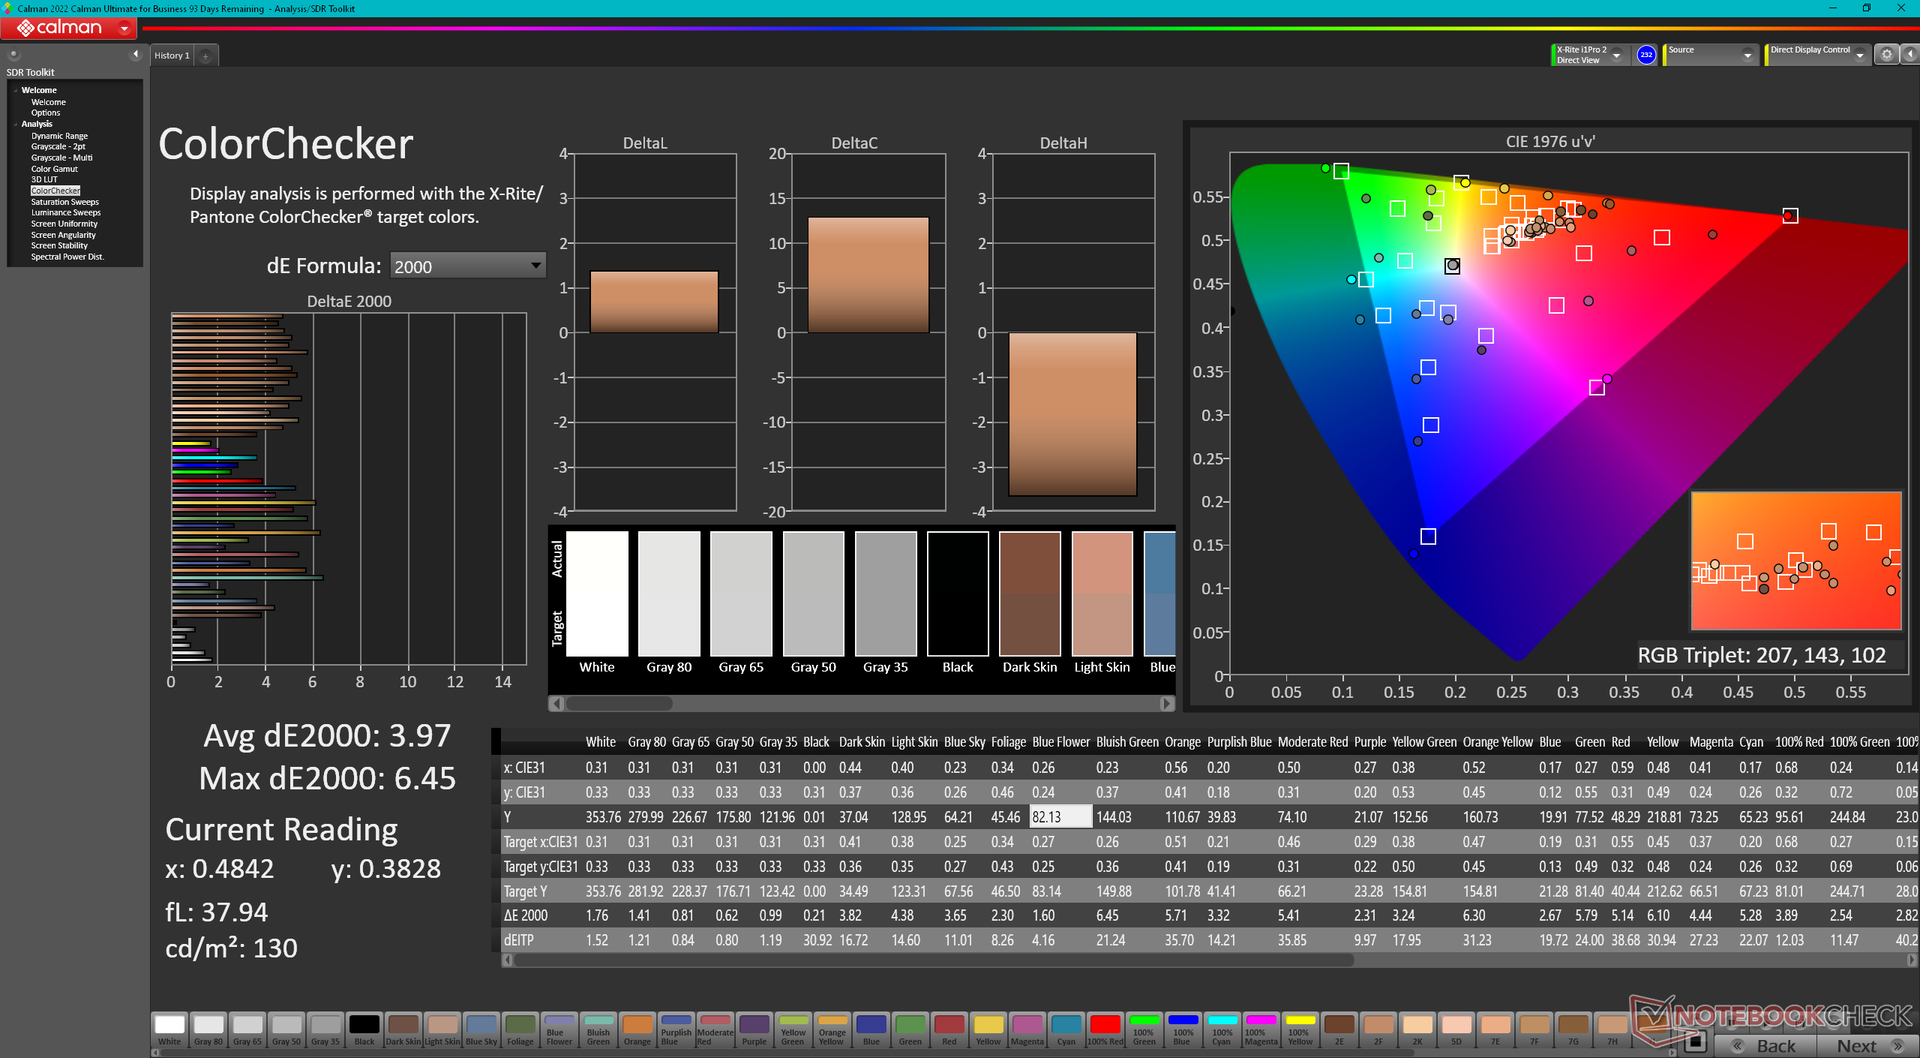
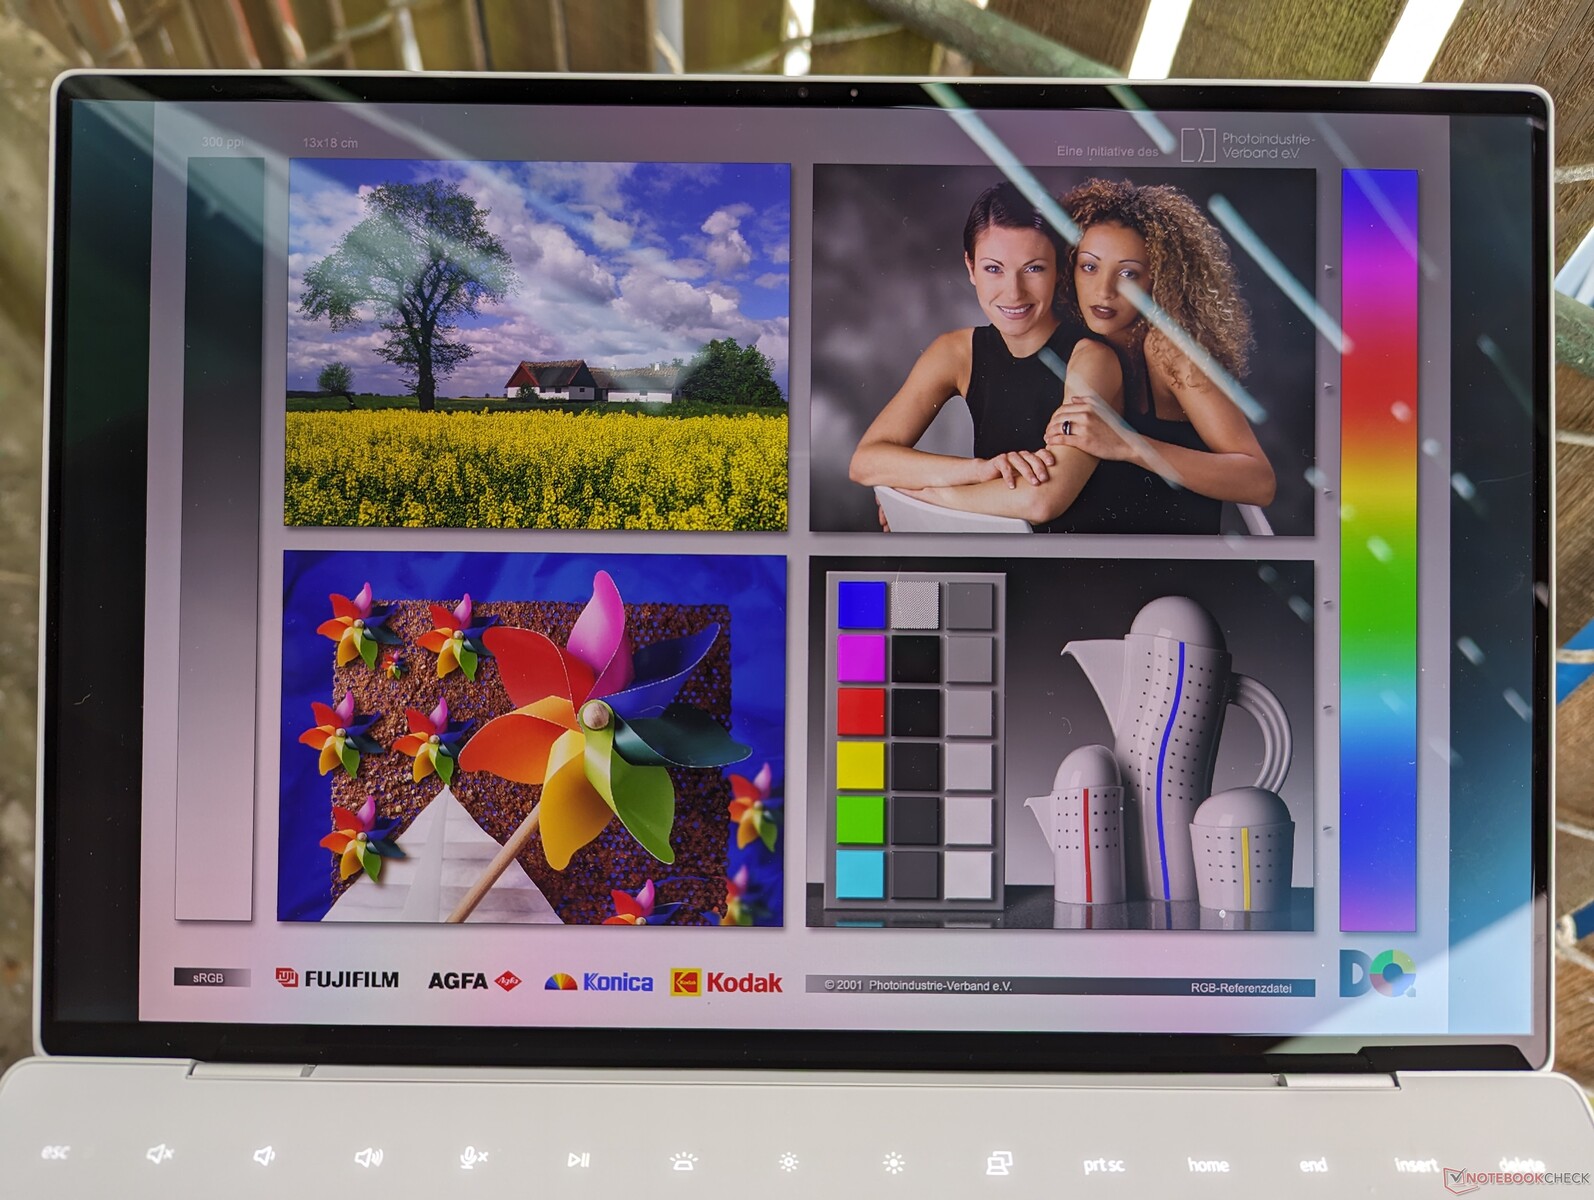
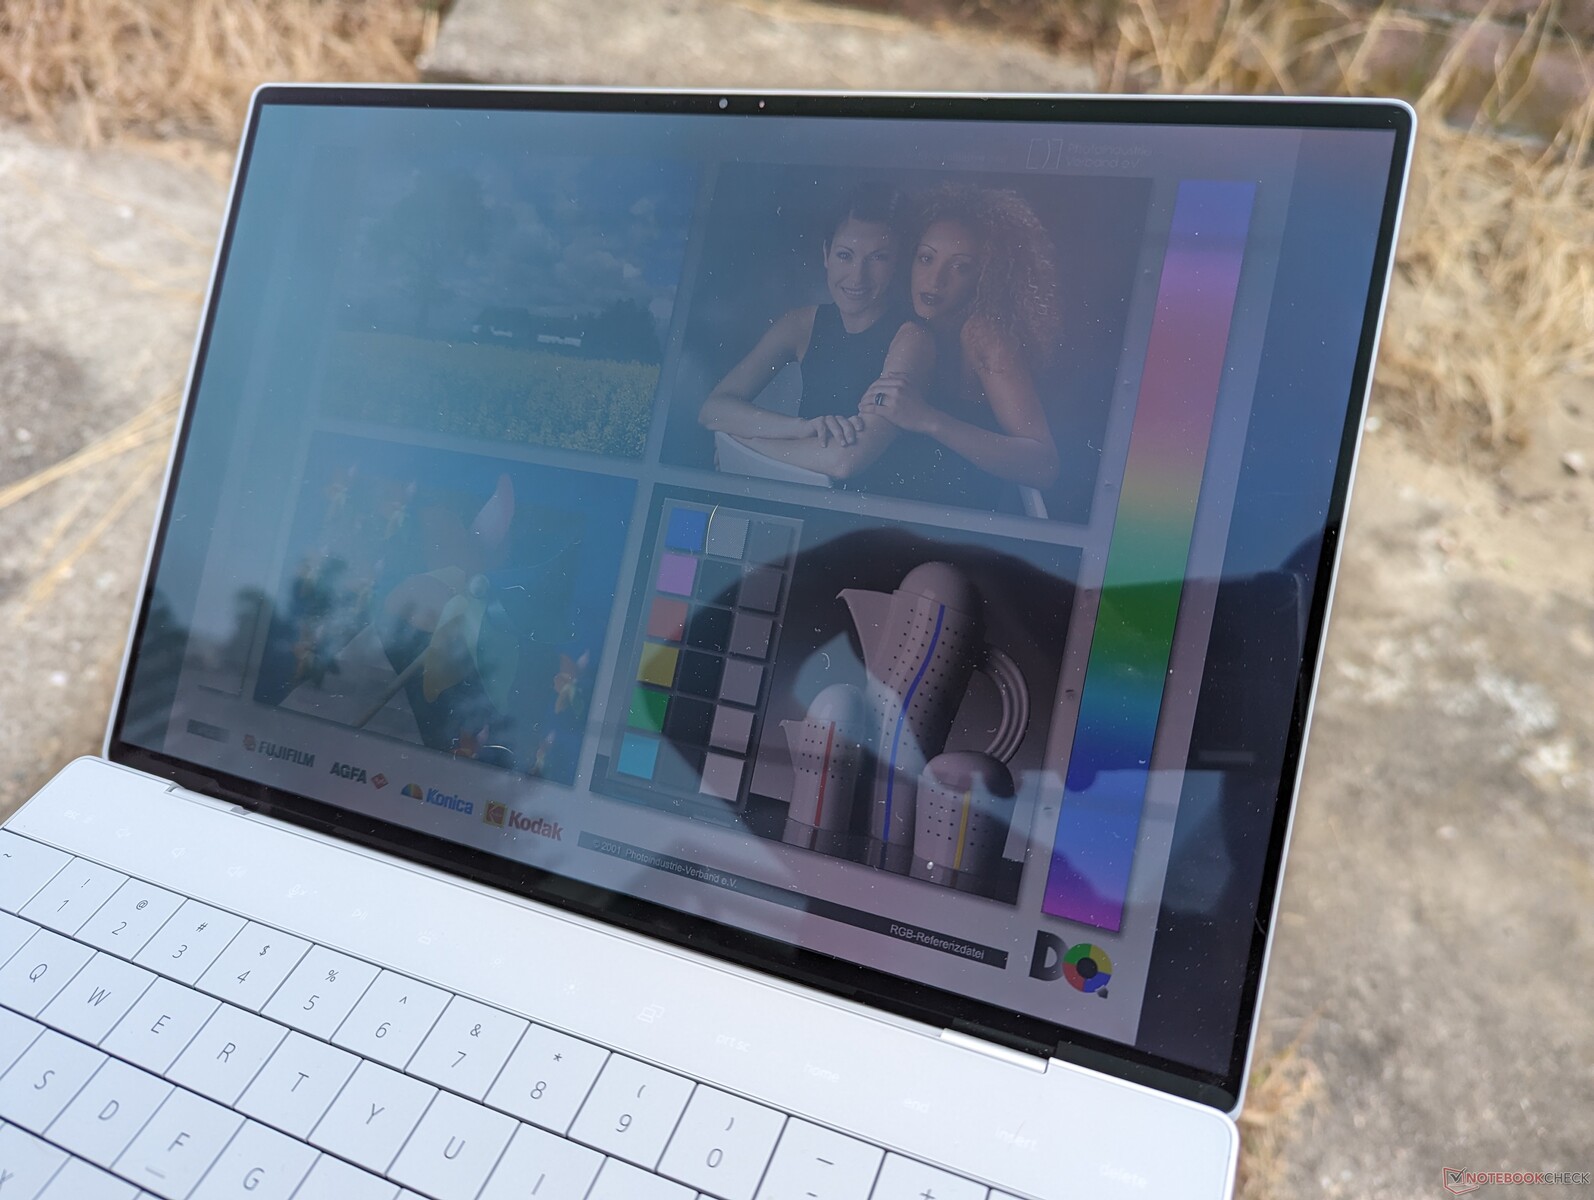
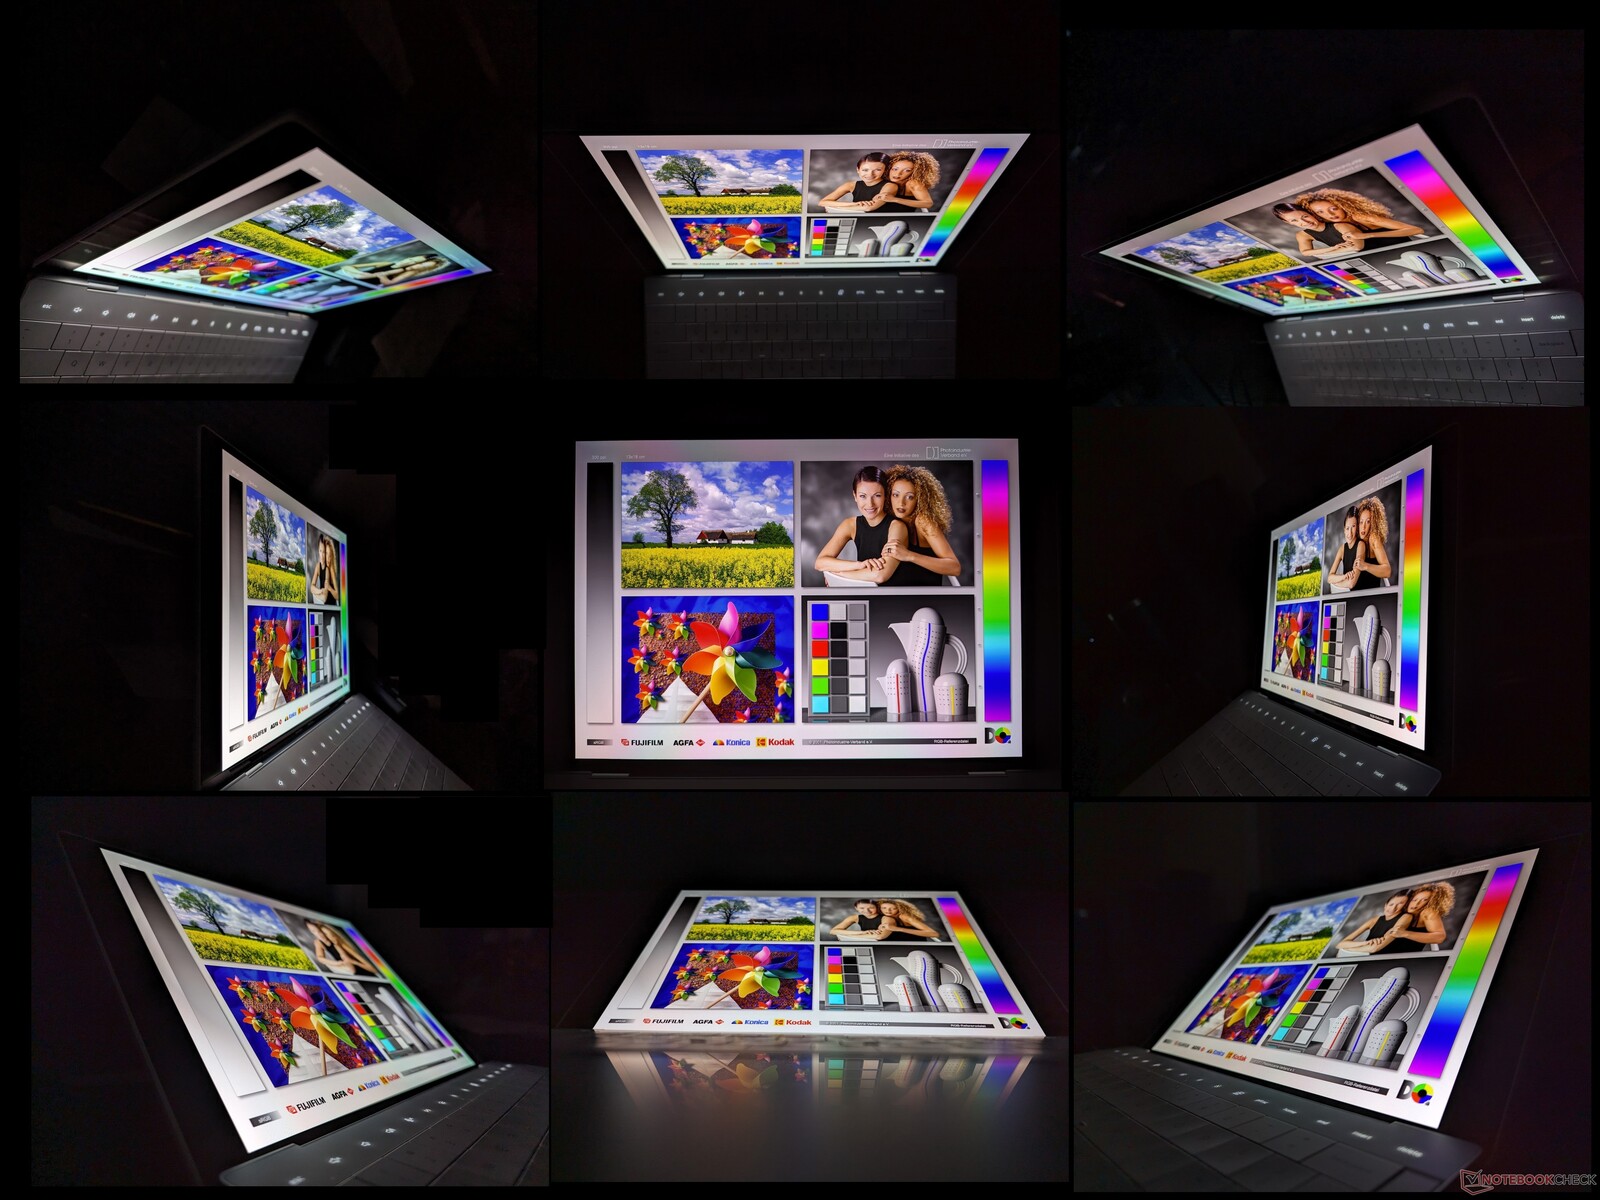
Nasza konfiguracja OLED wykorzystuje ten sam panel Samsung 134XK04, który można było znaleźć w zeszłorocznej jednostce SKU OLED więc wrażenia z oglądania pozostają identyczne. Właściciele uzyskują co najmniej 99-procentowe pokrycie sRGB bez względu na wybraną opcję, w oparciu o nasze doświadczenia z wszystkie trzy rozdzielczość opcje.

| |||||||||||||||||||||||||
rozświetlenie: 96 %
na akumulatorze: 361.7 cd/m²
kontrast: ∞:1 (czerń: 0 cd/m²)
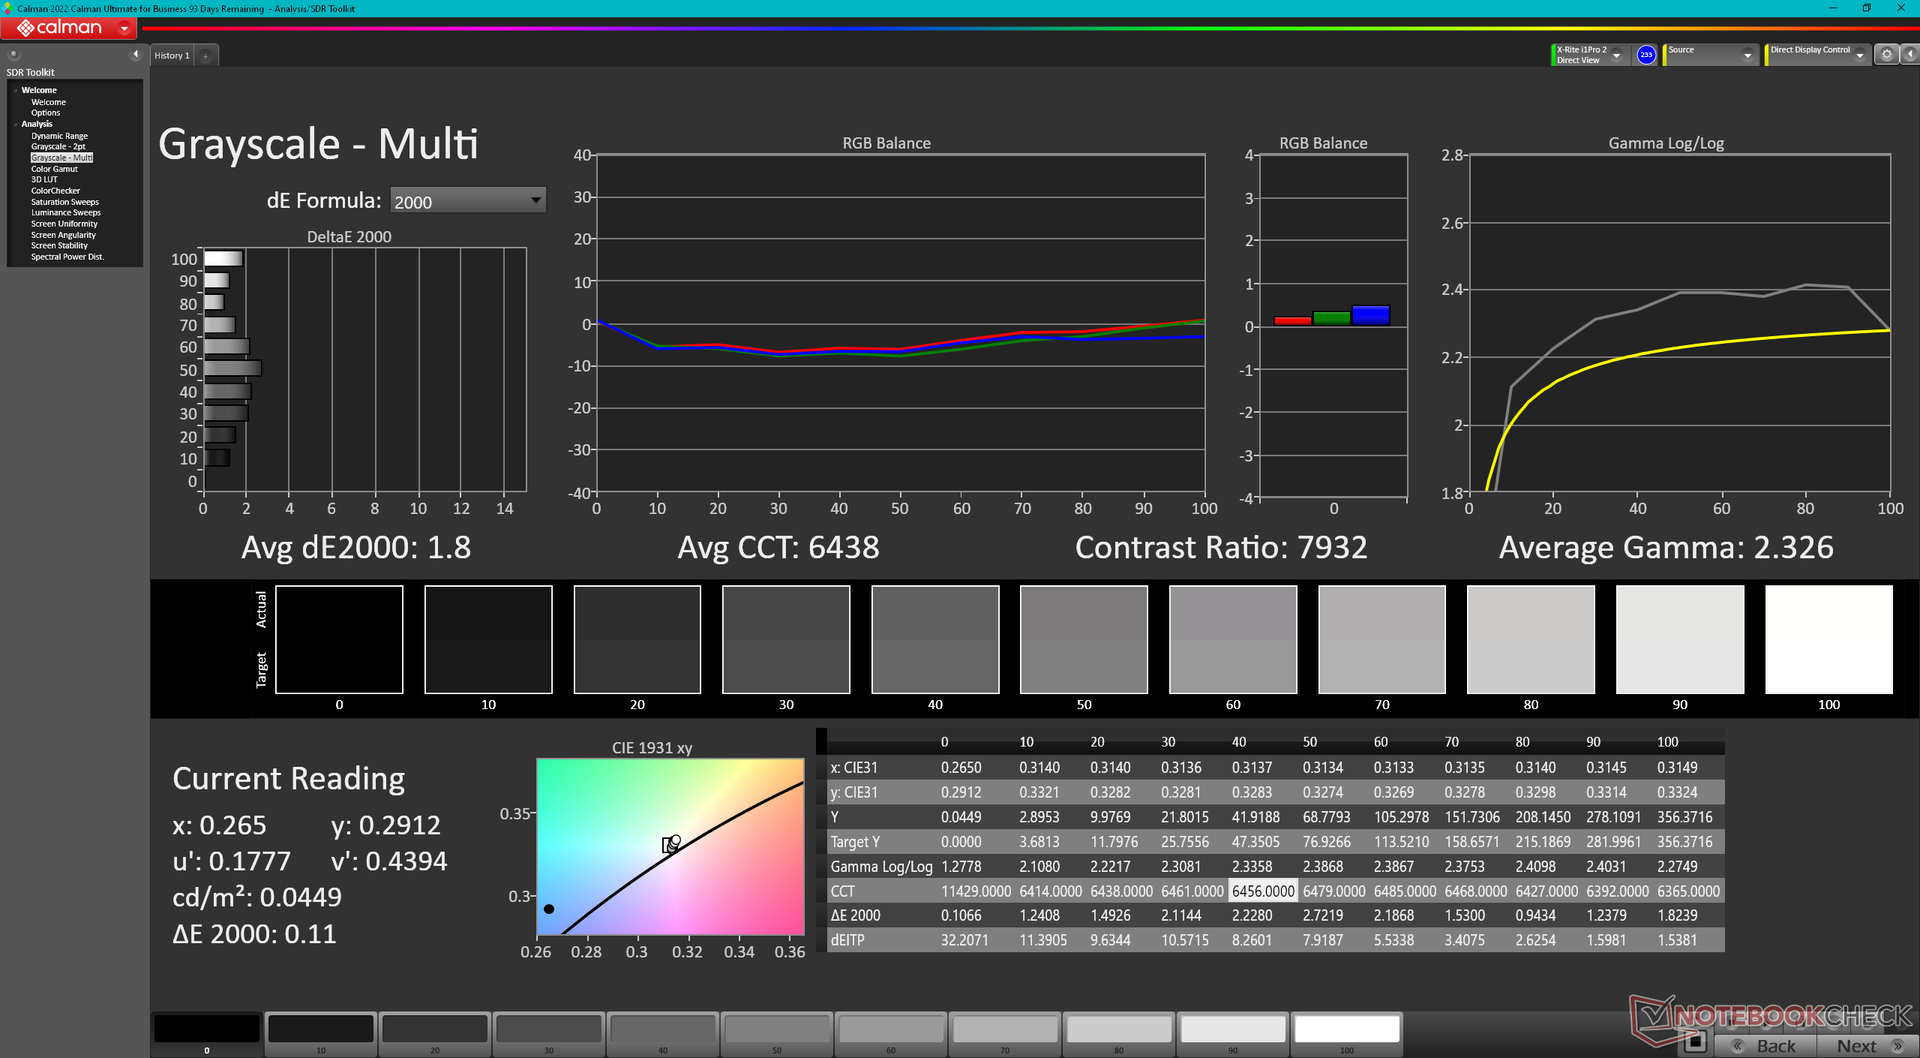
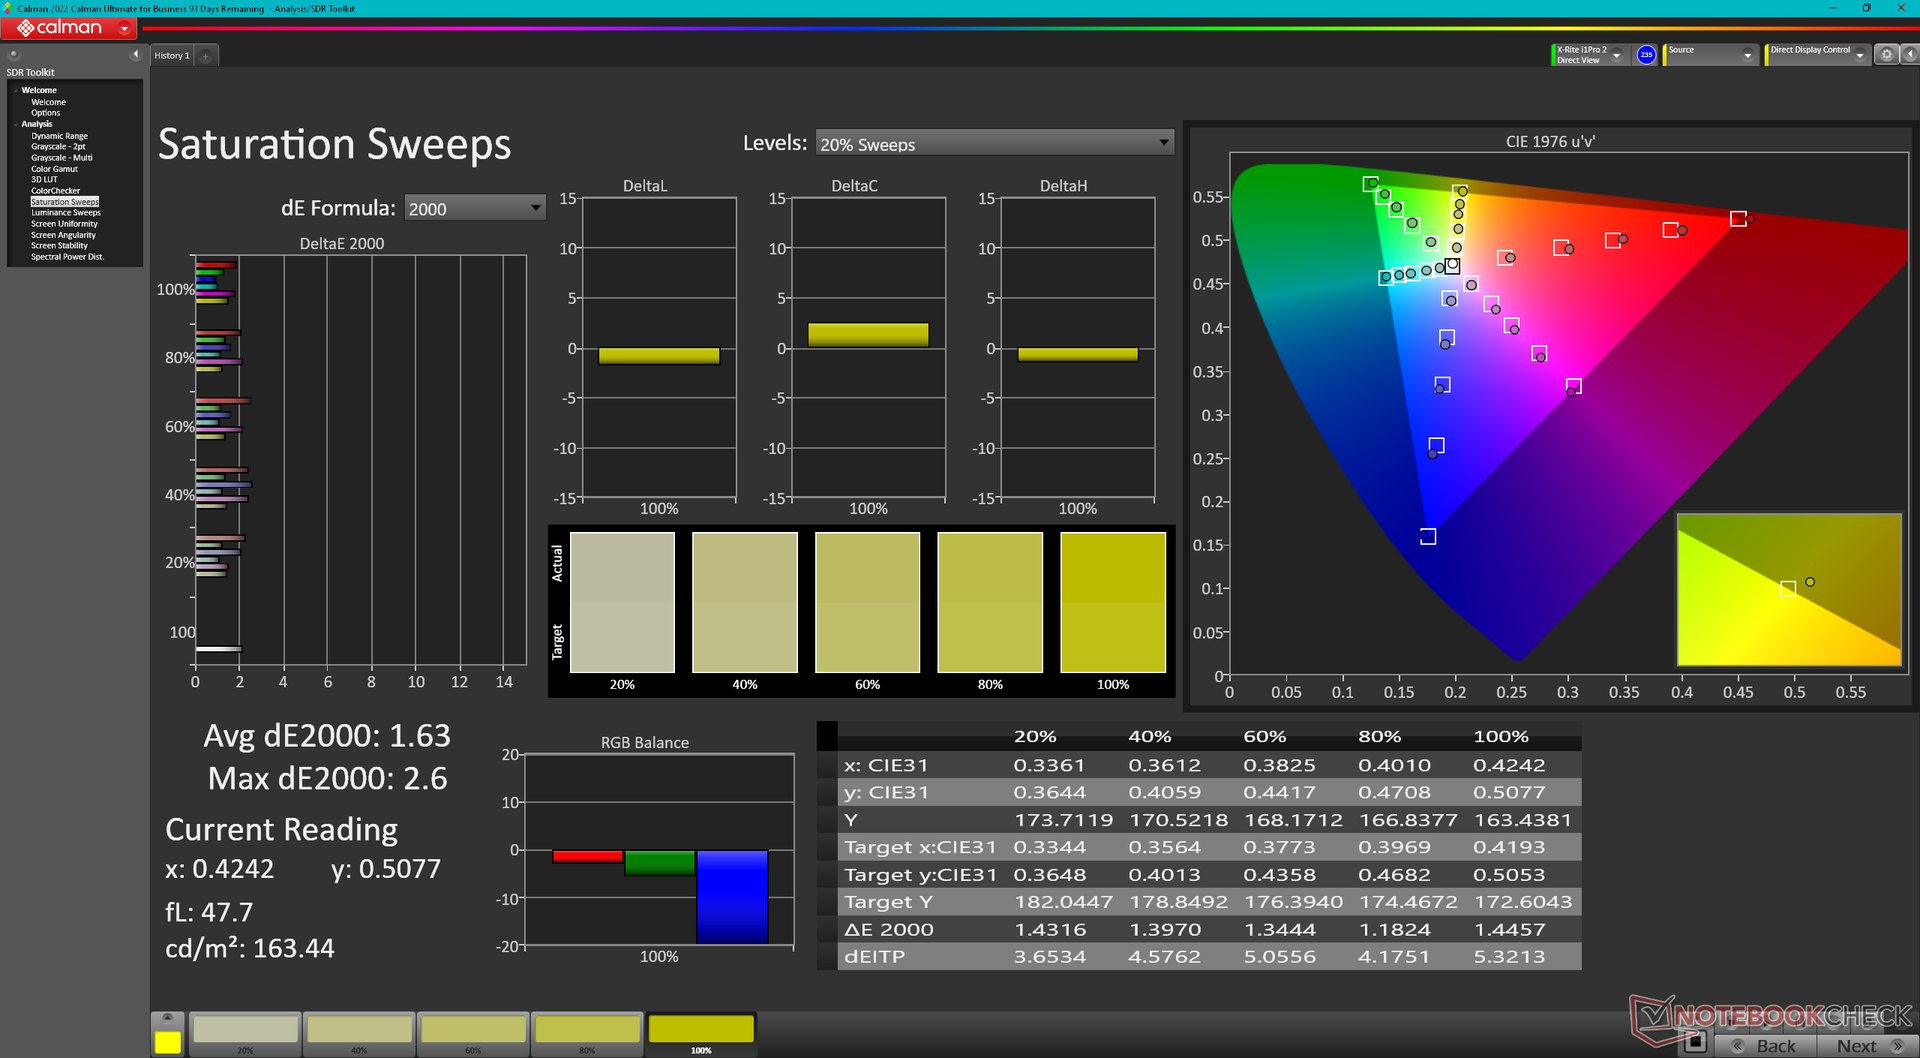
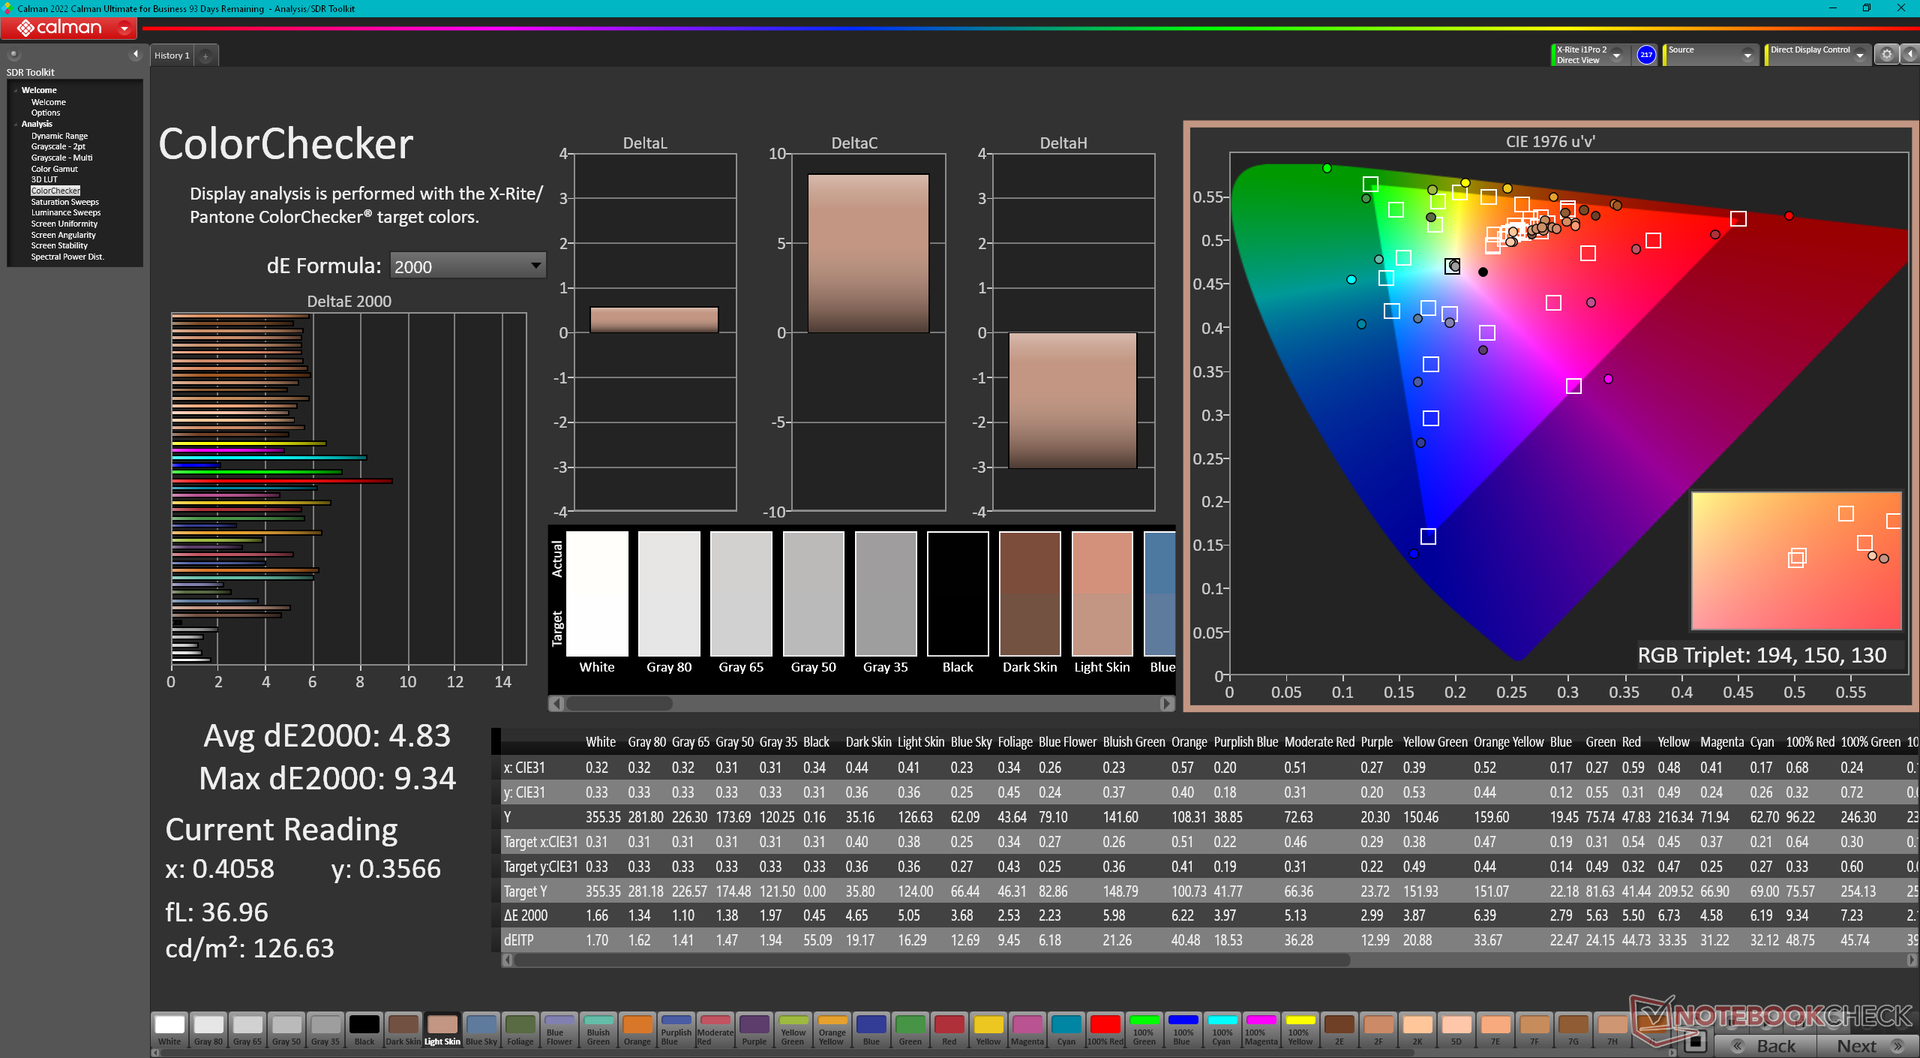
ΔE ColorChecker Calman: 4.83 | ∀{0.5-29.43 Ø4.73}
calibrated: 3.97
ΔE Greyscale Calman: 1.8 | ∀{0.09-98 Ø4.97}
96.8% AdobeRGB 1998 (Argyll 3D)
100% sRGB (Argyll 3D)
99.7% Display P3 (Argyll 3D)
Gamma: 2.33
CCT: 6438 K
| Dell XPS 13 Plus 9320 Core i7-1360P Samsung 134XK04, OLED, 3456x2160, 13.4" | Dell XPS 13 Plus 9320 i7-1280P OLED Samsung 134XK04, OLED, 3456x2160, 13.4" | Dell XPS 13 7390 Core i7-10710U AU Optronics B133ZAN, Dell P/N: 90NTH, IPS, 3840x2160, 13.3" | Framework Laptop 13.5 13th Gen Intel BOE CQ NE135FBM-N41, IPS, 2256x1504, 13.5" | Lenovo ThinkPad X13 Yoga G3 21AW003UGE LP133WQ1-SPF2, IPS LED, 2560x1600, 13.3" | HP Spectre x360 13.5 14t-ef000 SDC4160, OLED, 3000x2000, 13.5" | |
|---|---|---|---|---|---|---|
| Display | 1% | -25% | -20% | -20% | -2% | |
| Display P3 Coverage (%) | 99.7 | 99.5 0% | 63.4 -36% | 68.9 -31% | 68 -32% | 99.9 0% |
| sRGB Coverage (%) | 100 | 100 0% | 93.7 -6% | 97.5 -2% | 98.6 -1% | 100 0% |
| AdobeRGB 1998 Coverage (%) | 96.8 | 98.4 2% | 64.3 -34% | 71.1 -27% | 69.5 -28% | 90.8 -6% |
| Response Times | -10% | -1891% | -1965% | -1617% | 5% | |
| Response Time Grey 50% / Grey 80% * (ms) | 2.18 ? | 2.6 ? -19% | 51.6 ? -2267% | 54.9 ? -2418% | 45.9 ? -2006% | 1.9 ? 13% |
| Response Time Black / White * (ms) | 2.08 ? | 2.1 ? -1% | 33.6 ? -1515% | 33.5 ? -1511% | 27.6 ? -1227% | 2.16 ? -4% |
| PWM Frequency (Hz) | 238.6 ? | 59.5 | 60.2 ? | |||
| Screen | 14% | -39% | 2% | 23% | 9% | |
| Brightness middle (cd/m²) | 361.7 | 371.8 3% | 408.2 13% | 503 39% | 438 21% | 351.7 -3% |
| Brightness (cd/m²) | 367 | 374 2% | 399 9% | 472 29% | 399 9% | 351 -4% |
| Brightness Distribution (%) | 96 | 98 2% | 89 -7% | 87 -9% | 84 -12% | 87 -9% |
| Black Level * (cd/m²) | 0.39 | 0.36 | 0.29 | |||
| Colorchecker dE 2000 * | 4.83 | 2.37 51% | 4.6 5% | 3.38 30% | 1.8 63% | 1.78 63% |
| Colorchecker dE 2000 max. * | 9.34 | 6.1 35% | 11.84 -27% | 7.08 24% | 4 57% | 6.14 34% |
| Colorchecker dE 2000 calibrated * | 3.97 | 2.03 49% | 1.21 70% | 0.8 80% | ||
| Greyscale dE 2000 * | 1.8 | 2 -11% | 7.5 -317% | 4.8 -167% | 2.8 -56% | 2.3 -28% |
| Gamma | 2.33 94% | 2.29 96% | 2.12 104% | 2.13 103% | 2.24 98% | 2.11 104% |
| CCT | 6438 101% | 6261 104% | 7966 82% | 6235 104% | 6785 96% | 6683 97% |
| Contrast (:1) | 1047 | 1397 | 1510 | |||
| Color Space (Percent of AdobeRGB 1998) (%) | 59.5 | |||||
| Color Space (Percent of sRGB) (%) | 93.5 | |||||
| Całkowita średnia (program / ustawienia) | 2% /
6% | -652% /
-344% | -661% /
-331% | -538% /
-261% | 4% /
5% |
* ... im mniej tym lepiej
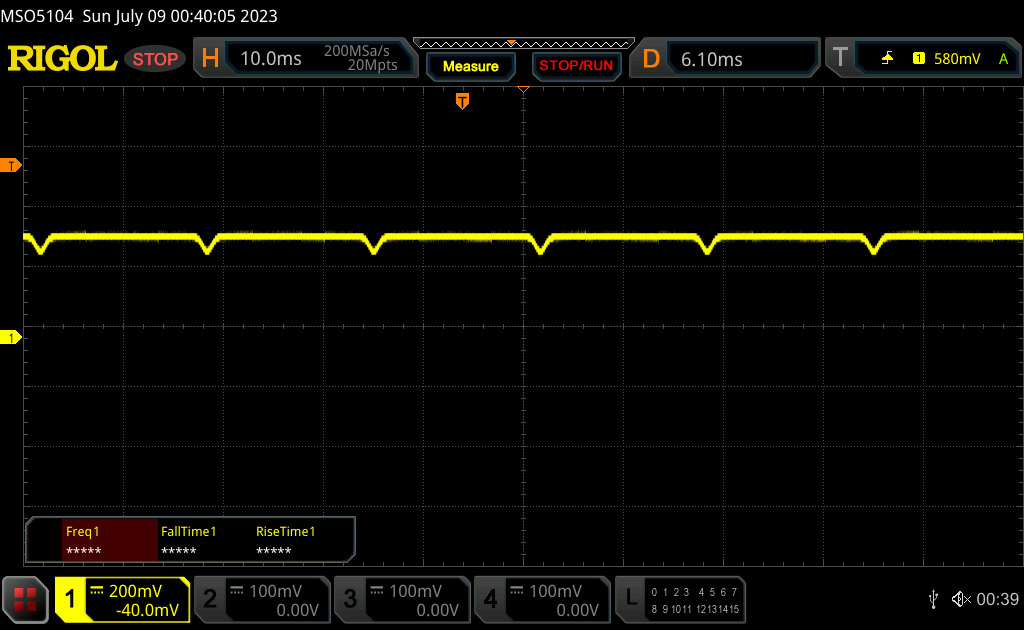
Wyświetl czasy reakcji
| ↔ Czas reakcji od czerni do bieli | ||
|---|---|---|
| 2.08 ms ... wzrost ↗ i spadek ↘ łącznie | ↗ 0.98 ms wzrost | 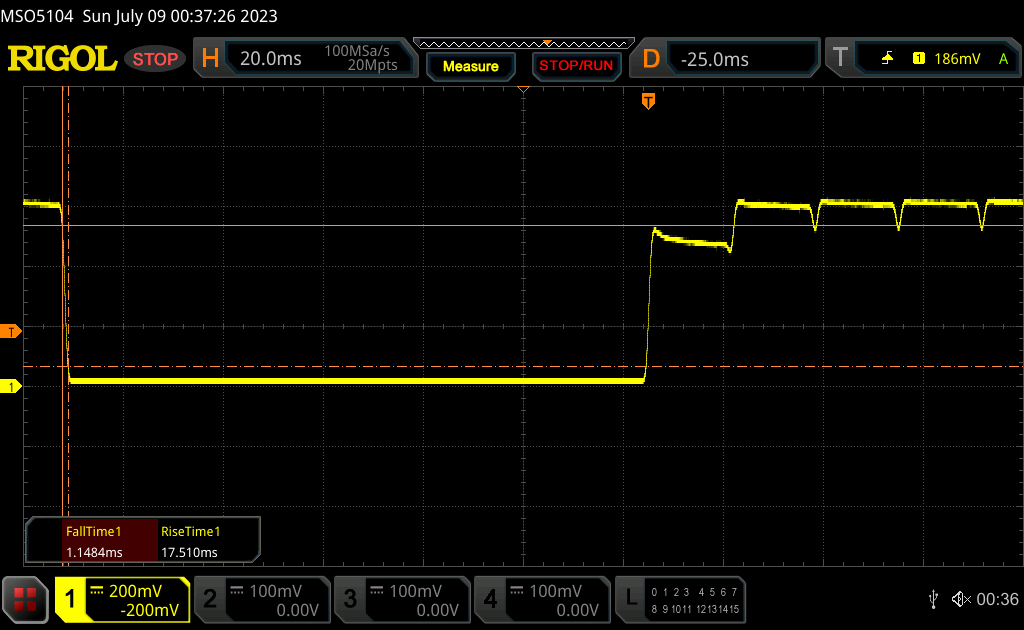 |
| ↘ 1.1 ms upadek | ||
| W naszych testach ekran wykazuje bardzo szybką reakcję i powinien bardzo dobrze nadawać się do szybkich gier. Dla porównania, wszystkie testowane urządzenia wahają się od 0.1 (minimum) do 240 (maksimum) ms. » 12 % wszystkich urządzeń jest lepszych. Oznacza to, że zmierzony czas reakcji jest lepszy od średniej wszystkich testowanych urządzeń (19.9 ms). | ||
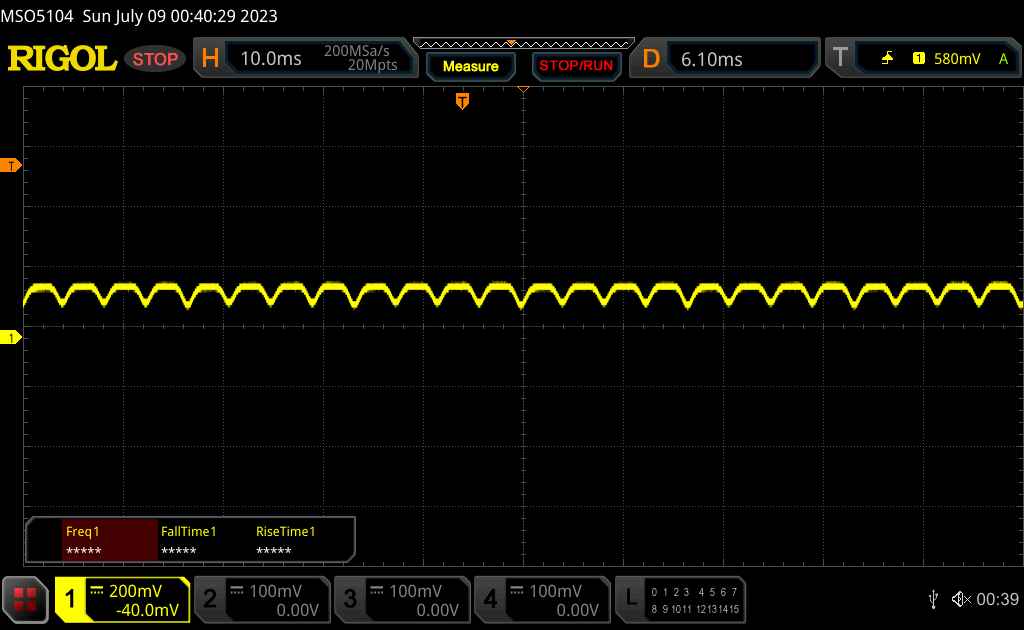
| ↔ Czas reakcji 50% szarości do 80% szarości | ||
| 2.18 ms ... wzrost ↗ i spadek ↘ łącznie | ↗ 1.2 ms wzrost | 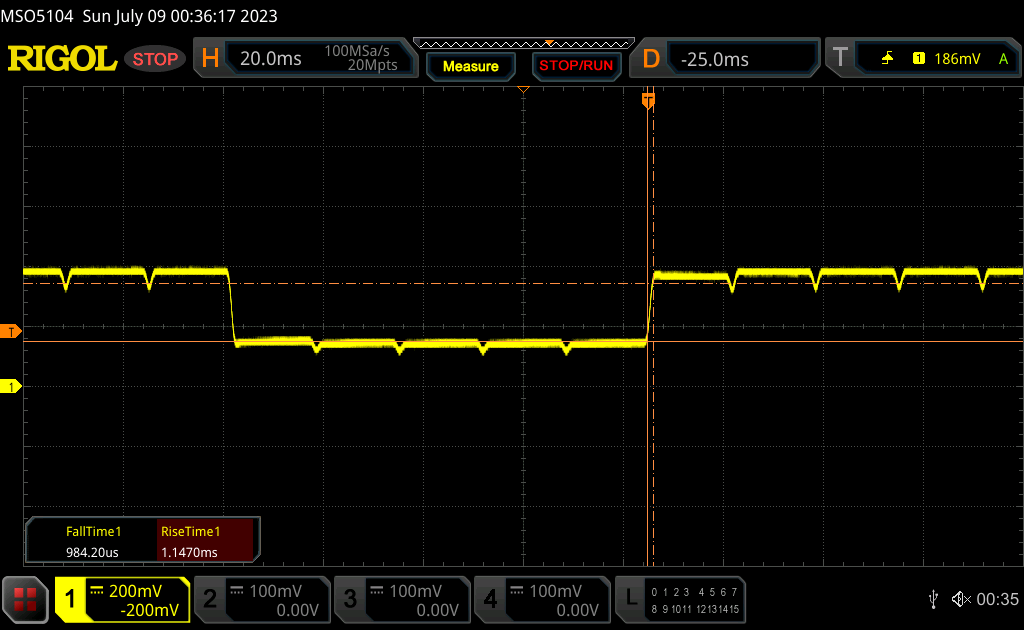 |
| ↘ 0.98 ms upadek | ||
| W naszych testach ekran wykazuje bardzo szybką reakcję i powinien bardzo dobrze nadawać się do szybkich gier. Dla porównania, wszystkie testowane urządzenia wahają się od 0.165 (minimum) do 636 (maksimum) ms. » 11 % wszystkich urządzeń jest lepszych. Oznacza to, że zmierzony czas reakcji jest lepszy od średniej wszystkich testowanych urządzeń (31.1 ms). | ||
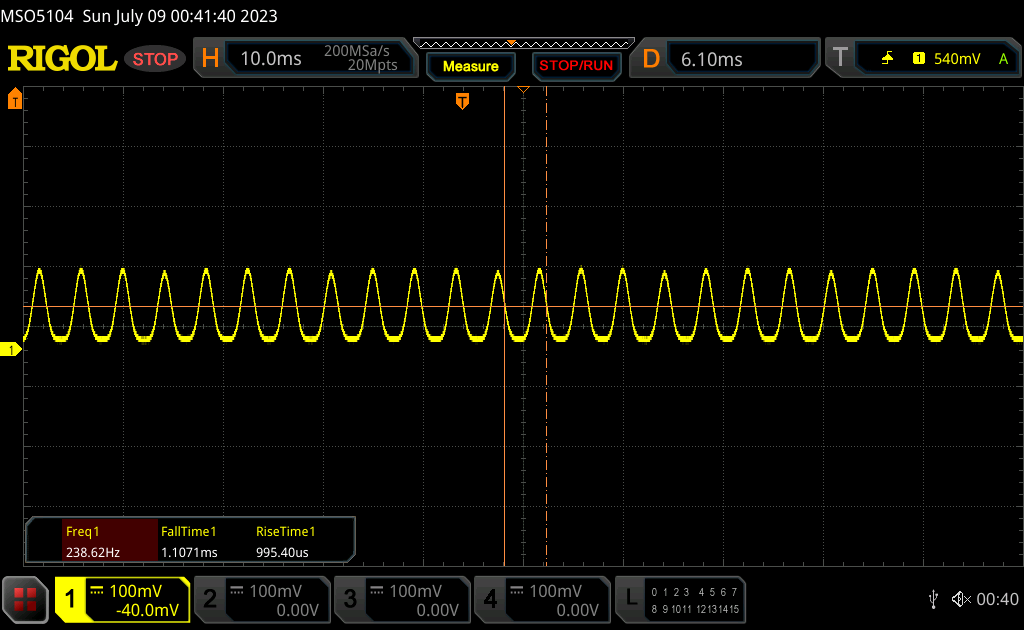
Migotanie ekranu / PWM (modulacja szerokości impulsu)
| Wykryto migotanie ekranu/wykryto PWM | 238.6 Hz | ≤ 100 % ustawienia jasności | 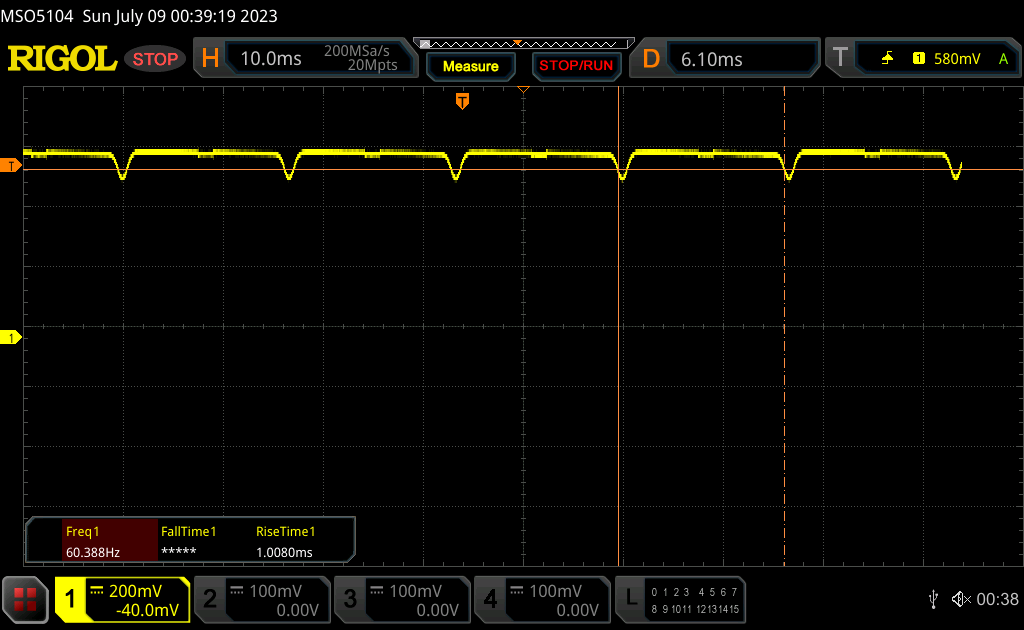 |
Podświetlenie wyświetlacza miga z częstotliwością 238.6 Hz (najgorszy przypadek, np. przy użyciu PWM) Wykryto migotanie przy ustawieniu jasności 100 % i poniżej. Powyżej tego ustawienia jasności nie powinno być żadnego migotania ani PWM. Częstotliwość 238.6 Hz jest stosunkowo niska, więc wrażliwi użytkownicy prawdopodobnie zauważą migotanie i odczują zmęczenie oczu przy podanym ustawieniu jasności i poniżej. Dla porównania: 52 % wszystkich testowanych urządzeń nie używa PWM do przyciemniania wyświetlacza. Jeśli wykryto PWM, zmierzono średnio 7798 (minimum: 5 - maksimum: 343500) Hz. | |||
Modulacja szerokości impulsu lub migotanie jest nadal obecne na większości poziomów jasności. Jesteśmy w stanie wykryć częstotliwość 238,6 Hz od 0 procent do 52 procent jasności i 60 Hz od 53 procent jasności do maksimum. Oczekuje się, że alternatywne opcje IPS nie będą miały migotania ani PWM.

Wydajność
Warunki testowania
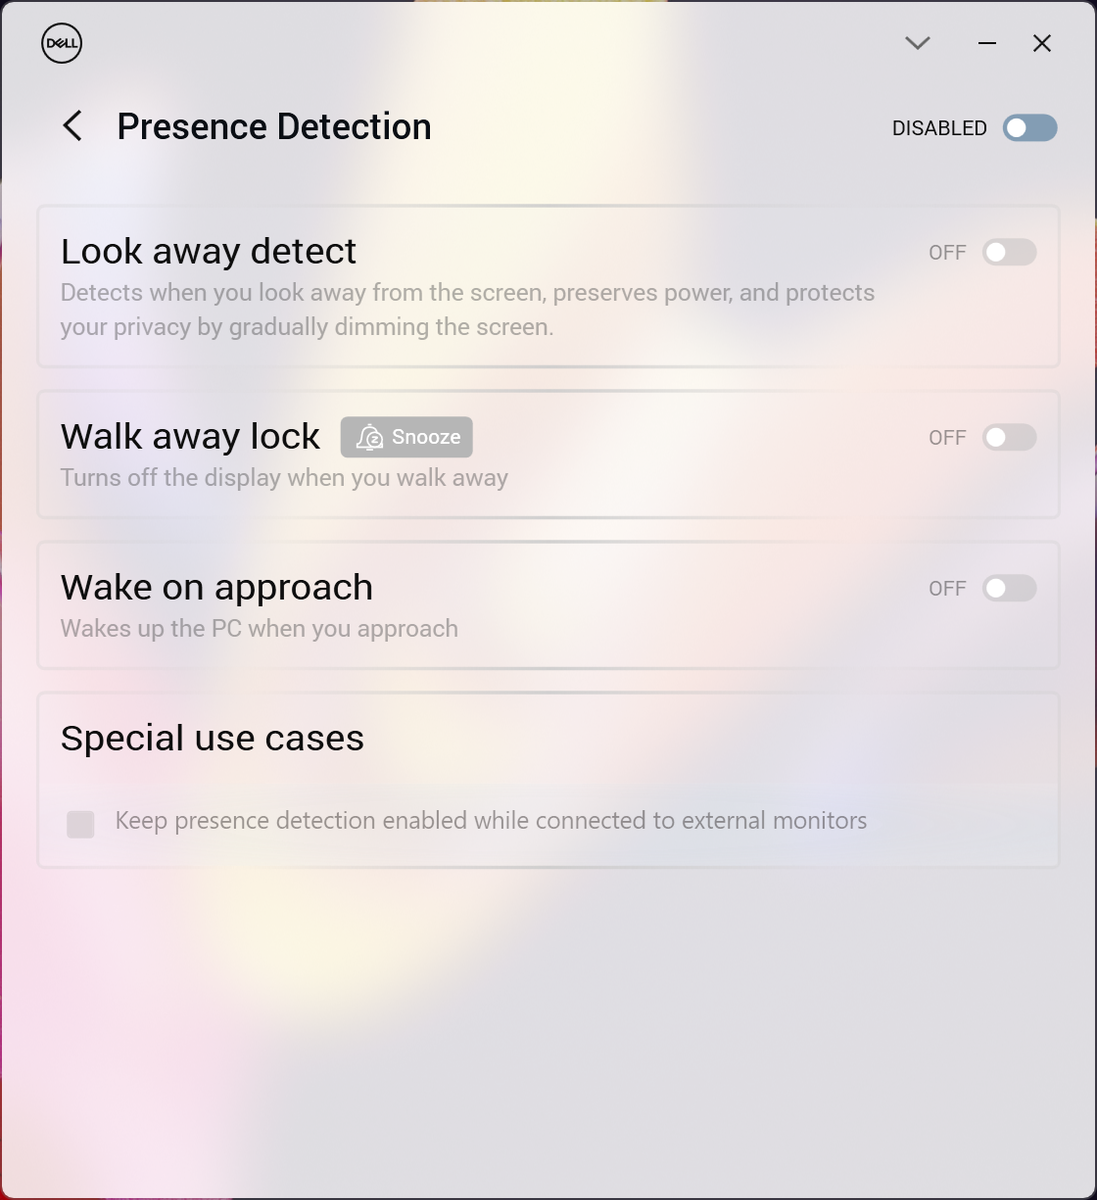
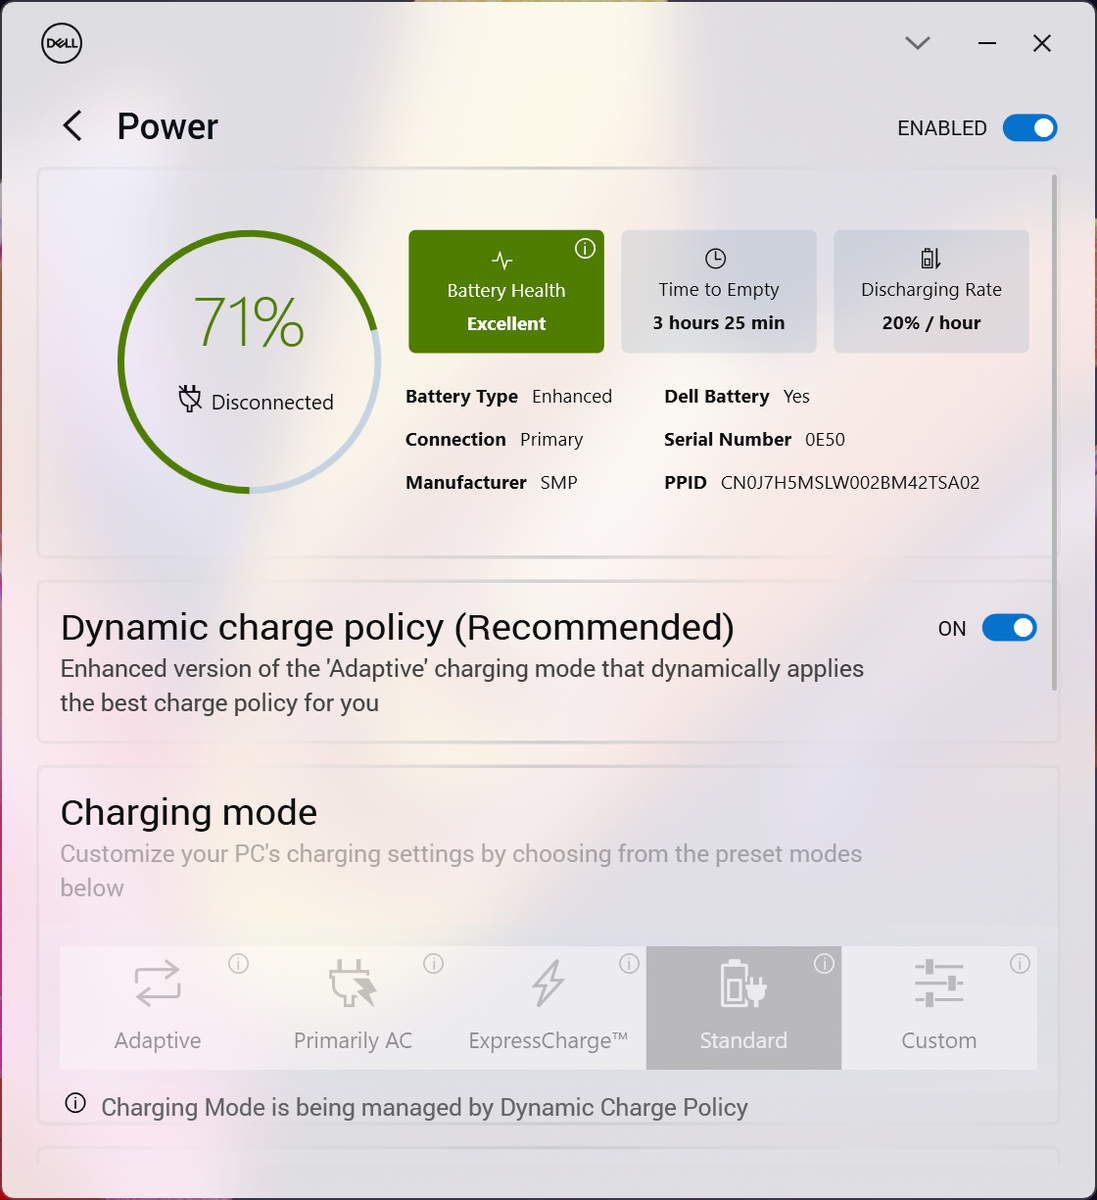
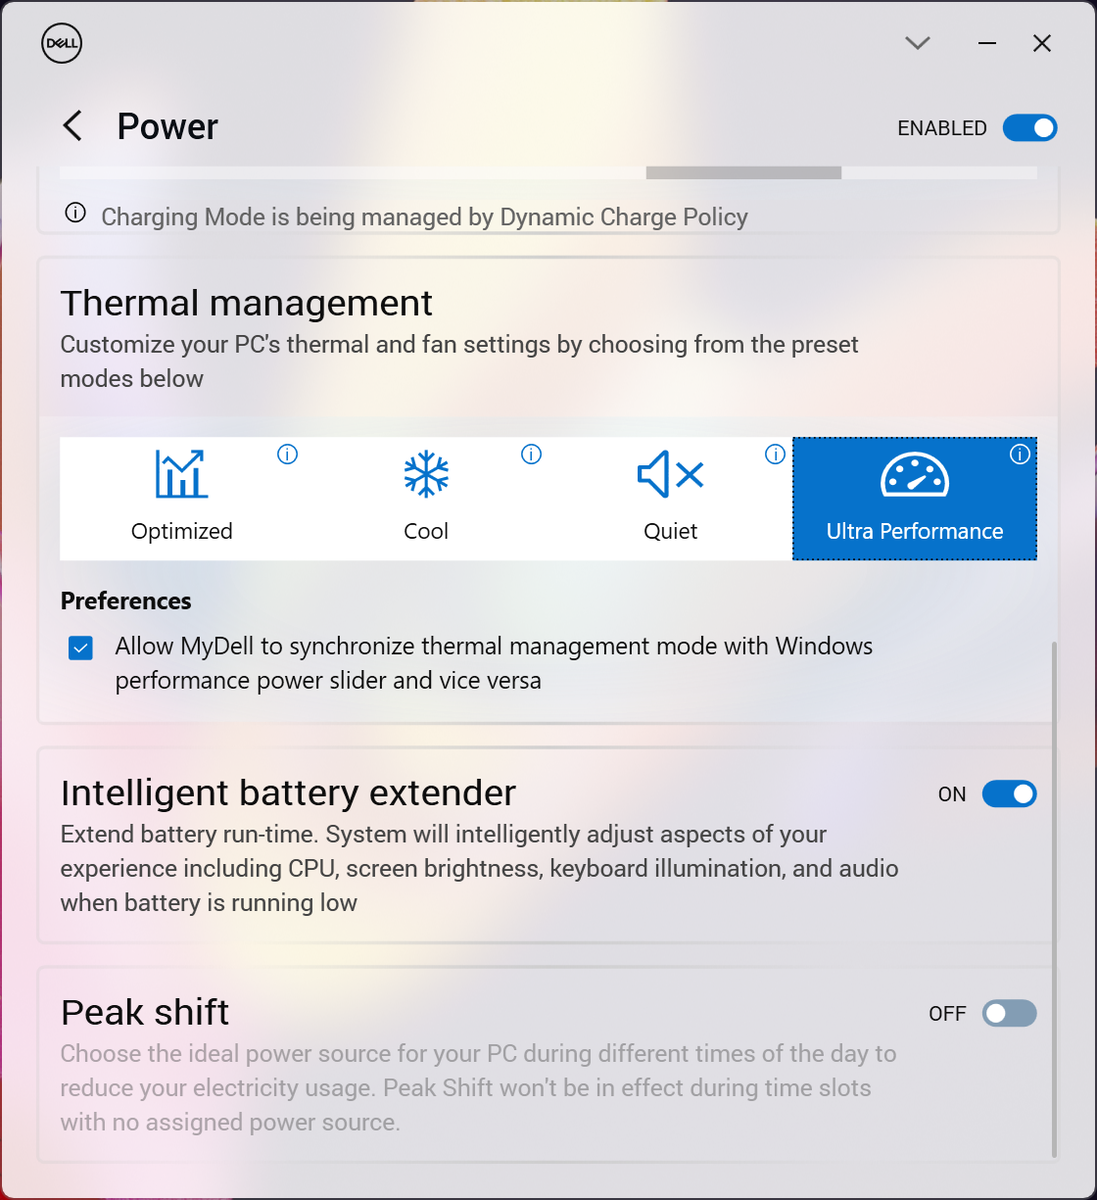
Przed przeprowadzeniem poniższych testów porównawczych ustawiliśmy nasze urządzenie w tryb Ultra Performance za pomocą przeprojektowanego oprogramowania MyDell. MyDell jest odpowiednikiem oprogramowania XPS Optimizer, które jest dostarczane z wieloma modelami Latitude, a więc integruje podobne funkcje, takie jak profile wydajności, nawyki ładowania i wykrywanie obecności. Profile zasilania Dell można wygodnie zsynchronizować ze standardowymi profilami Windows, w przeciwieństwie do większości innych laptopów.
Procesor
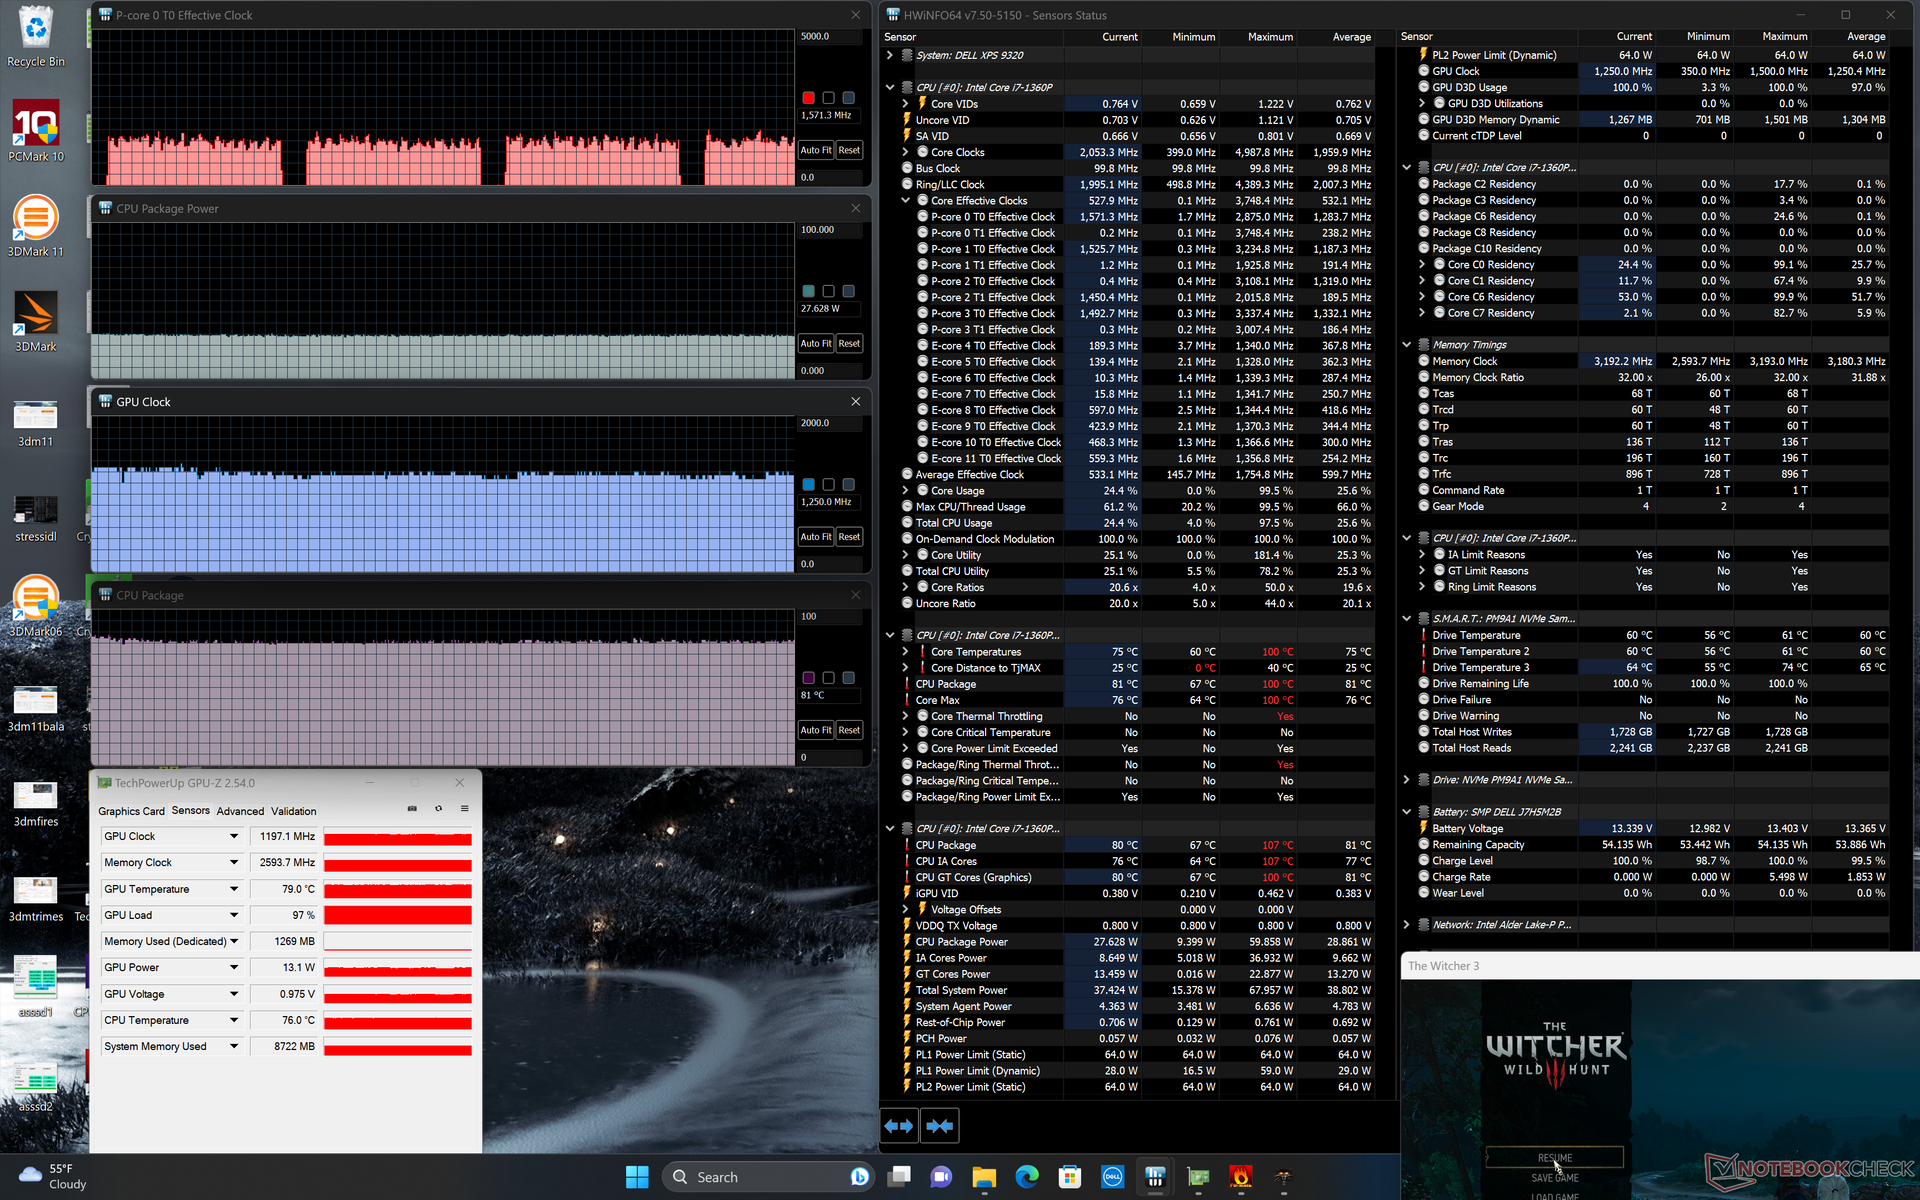
Wydajność wielowątkowa naszych procesorów 13. generacji Core i7-1360P jest niemal identyczna jak w przypadku 12. generacji Core i7-1280P w XPS 13 Plus z 2022 roku. Nawet ich zachowanie w trybie Turbo Boost jest takie samo, czego przykładem są poniższe wyniki testu pętli CineBench R15 xT. TestyLenovo Yoga 9 14IRP G8wyposażony w ten sam procesor Core i7-1360P, jest w stanie utrzymać nieco wyższe częstotliwości taktowania Turbo Boost przez dłuższy czas w tym samym teście.
Podczas gdy wydajność wielowątkowa tak naprawdę nie zmieniła się z roku na rok, wydajność jednowątkowa wzrosła o około 10 do 15 procent w porównaniu do Core i7-1280P. Oczekuje się jednak, że nie będzie to miało większego wpływu na codzienne obciążenia, ponieważ większość nowoczesnych aplikacji jest wielowątkowa.
Cinebench R15 Multi Loop
Cinebench R20: CPU (Multi Core) | CPU (Single Core)
Cinebench R23: Multi Core | Single Core
Cinebench R15: CPU Multi 64Bit | CPU Single 64Bit
Blender: v2.79 BMW27 CPU
7-Zip 18.03: 7z b 4 | 7z b 4 -mmt1
Geekbench 5.5: Multi-Core | Single-Core
HWBOT x265 Benchmark v2.2: 4k Preset
LibreOffice : 20 Documents To PDF
R Benchmark 2.5: Overall mean
| CPU Performance rating | |
| Framework Laptop 13.5 13th Gen Intel | |
| Dell XPS 13 Plus 9320 Core i7-1360P | |
| Dell XPS 13 Plus 9320 i7-1280P OLED | |
| Przeciętny Intel Core i7-1360P | |
| Asus Zenbook S 13 OLED | |
| Lenovo Yoga Book 9i 2-in-1 Dual Screen | |
| HP Spectre x360 13.5 14t-ef000 | |
| HP Pavilion Aero 13 be0097nr -2! | |
| Lenovo ThinkPad X13 Yoga G3 21AW003UGE | |
| Lenovo Yoga 6 13ALC6 -2! | |
| Dell XPS 13 7390 Core i7-10710U -6! | |
| Microsoft Surface Laptop 4 13 i7 | |
| Dell Inspiron 13 7306-6TYH5 | |
| HP Envy 13-ba0001ng -2! | |
| Cinebench R20 / CPU (Multi Core) | |
| Framework Laptop 13.5 13th Gen Intel | |
| Dell XPS 13 Plus 9320 i7-1280P OLED | |
| Dell XPS 13 Plus 9320 Core i7-1360P | |
| Asus Zenbook S 13 OLED | |
| Przeciętny Intel Core i7-1360P (2474 - 4887, n=16) | |
| Lenovo Yoga Book 9i 2-in-1 Dual Screen | |
| Lenovo ThinkPad X13 Yoga G3 21AW003UGE | |
| HP Spectre x360 13.5 14t-ef000 | |
| HP Pavilion Aero 13 be0097nr | |
| Lenovo Yoga 6 13ALC6 | |
| Dell XPS 13 7390 Core i7-10710U | |
| Microsoft Surface Laptop 4 13 i7 | |
| Dell Inspiron 13 7306-6TYH5 | |
| HP Envy 13-ba0001ng | |
| Cinebench R20 / CPU (Single Core) | |
| Framework Laptop 13.5 13th Gen Intel | |
| Dell XPS 13 Plus 9320 Core i7-1360P | |
| Lenovo Yoga Book 9i 2-in-1 Dual Screen | |
| Przeciętny Intel Core i7-1360P (611 - 736, n=16) | |
| HP Spectre x360 13.5 14t-ef000 | |
| Dell XPS 13 Plus 9320 i7-1280P OLED | |
| Microsoft Surface Laptop 4 13 i7 | |
| Lenovo ThinkPad X13 Yoga G3 21AW003UGE | |
| Dell Inspiron 13 7306-6TYH5 | |
| Asus Zenbook S 13 OLED | |
| HP Pavilion Aero 13 be0097nr | |
| Lenovo Yoga 6 13ALC6 | |
| Dell XPS 13 7390 Core i7-10710U | |
| HP Envy 13-ba0001ng | |
| Cinebench R23 / Multi Core | |
| Framework Laptop 13.5 13th Gen Intel | |
| Dell XPS 13 Plus 9320 i7-1280P OLED | |
| Dell XPS 13 Plus 9320 Core i7-1360P | |
| Przeciętny Intel Core i7-1360P (6390 - 12637, n=16) | |
| Asus Zenbook S 13 OLED | |
| Lenovo Yoga Book 9i 2-in-1 Dual Screen | |
| Lenovo ThinkPad X13 Yoga G3 21AW003UGE | |
| HP Spectre x360 13.5 14t-ef000 | |
| HP Pavilion Aero 13 be0097nr | |
| Lenovo Yoga 6 13ALC6 | |
| Microsoft Surface Laptop 4 13 i7 | |
| Dell Inspiron 13 7306-6TYH5 | |
| Cinebench R23 / Single Core | |
| Framework Laptop 13.5 13th Gen Intel | |
| Dell XPS 13 Plus 9320 Core i7-1360P | |
| Lenovo Yoga Book 9i 2-in-1 Dual Screen | |
| Przeciętny Intel Core i7-1360P (1596 - 1909, n=16) | |
| HP Spectre x360 13.5 14t-ef000 | |
| Dell XPS 13 Plus 9320 i7-1280P OLED | |
| Microsoft Surface Laptop 4 13 i7 | |
| Lenovo ThinkPad X13 Yoga G3 21AW003UGE | |
| Asus Zenbook S 13 OLED | |
| Dell Inspiron 13 7306-6TYH5 | |
| HP Pavilion Aero 13 be0097nr | |
| Lenovo Yoga 6 13ALC6 | |
| Cinebench R15 / CPU Multi 64Bit | |
| Framework Laptop 13.5 13th Gen Intel | |
| Dell XPS 13 Plus 9320 Core i7-1360P | |
| Dell XPS 13 Plus 9320 i7-1280P OLED | |
| Przeciętny Intel Core i7-1360P (1079 - 2214, n=16) | |
| Asus Zenbook S 13 OLED | |
| HP Spectre x360 13.5 14t-ef000 | |
| HP Pavilion Aero 13 be0097nr | |
| Lenovo Yoga Book 9i 2-in-1 Dual Screen | |
| Lenovo Yoga 6 13ALC6 | |
| Lenovo ThinkPad X13 Yoga G3 21AW003UGE | |
| Dell XPS 13 7390 Core i7-10710U | |
| Microsoft Surface Laptop 4 13 i7 | |
| Dell Inspiron 13 7306-6TYH5 | |
| Dell Inspiron 13 7306-6TYH5 | |
| HP Envy 13-ba0001ng | |
| Cinebench R15 / CPU Single 64Bit | |
| Framework Laptop 13.5 13th Gen Intel | |
| Lenovo Yoga Book 9i 2-in-1 Dual Screen | |
| Dell XPS 13 Plus 9320 Core i7-1360P | |
| HP Spectre x360 13.5 14t-ef000 | |
| Przeciętny Intel Core i7-1360P (180 - 271, n=16) | |
| Asus Zenbook S 13 OLED | |
| HP Pavilion Aero 13 be0097nr | |
| Dell XPS 13 Plus 9320 i7-1280P OLED | |
| Microsoft Surface Laptop 4 13 i7 | |
| Dell Inspiron 13 7306-6TYH5 | |
| Dell Inspiron 13 7306-6TYH5 | |
| Lenovo Yoga 6 13ALC6 | |
| Dell XPS 13 7390 Core i7-10710U | |
| HP Envy 13-ba0001ng | |
| Lenovo ThinkPad X13 Yoga G3 21AW003UGE | |
| Blender / v2.79 BMW27 CPU | |
| HP Envy 13-ba0001ng | |
| Dell Inspiron 13 7306-6TYH5 | |
| Microsoft Surface Laptop 4 13 i7 | |
| Dell XPS 13 7390 Core i7-10710U | |
| Lenovo ThinkPad X13 Yoga G3 21AW003UGE | |
| Lenovo ThinkPad X13 Yoga G3 21AW003UGE | |
| HP Spectre x360 13.5 14t-ef000 | |
| Lenovo Yoga Book 9i 2-in-1 Dual Screen | |
| Lenovo Yoga 6 13ALC6 | |
| HP Pavilion Aero 13 be0097nr | |
| Przeciętny Intel Core i7-1360P (268 - 496, n=17) | |
| Asus Zenbook S 13 OLED | |
| Dell XPS 13 Plus 9320 Core i7-1360P | |
| Dell XPS 13 Plus 9320 i7-1280P OLED | |
| Framework Laptop 13.5 13th Gen Intel | |
| 7-Zip 18.03 / 7z b 4 | |
| Framework Laptop 13.5 13th Gen Intel | |
| Dell XPS 13 Plus 9320 i7-1280P OLED | |
| Dell XPS 13 Plus 9320 Core i7-1360P | |
| Asus Zenbook S 13 OLED | |
| HP Pavilion Aero 13 be0097nr | |
| Przeciętny Intel Core i7-1360P (26534 - 52959, n=16) | |
| Lenovo Yoga 6 13ALC6 | |
| Lenovo ThinkPad X13 Yoga G3 21AW003UGE | |
| Lenovo Yoga Book 9i 2-in-1 Dual Screen | |
| HP Spectre x360 13.5 14t-ef000 | |
| Dell XPS 13 7390 Core i7-10710U | |
| Microsoft Surface Laptop 4 13 i7 | |
| Dell Inspiron 13 7306-6TYH5 | |
| HP Envy 13-ba0001ng | |
| 7-Zip 18.03 / 7z b 4 -mmt1 | |
| Framework Laptop 13.5 13th Gen Intel | |
| Przeciętny Intel Core i7-1360P (4647 - 5973, n=16) | |
| Dell XPS 13 Plus 9320 Core i7-1360P | |
| HP Spectre x360 13.5 14t-ef000 | |
| Lenovo Yoga Book 9i 2-in-1 Dual Screen | |
| Asus Zenbook S 13 OLED | |
| HP Pavilion Aero 13 be0097nr | |
| Microsoft Surface Laptop 4 13 i7 | |
| Dell Inspiron 13 7306-6TYH5 | |
| Dell XPS 13 Plus 9320 i7-1280P OLED | |
| HP Envy 13-ba0001ng | |
| Lenovo ThinkPad X13 Yoga G3 21AW003UGE | |
| Lenovo Yoga 6 13ALC6 | |
| Dell XPS 13 7390 Core i7-10710U | |
| Geekbench 5.5 / Multi-Core | |
| Framework Laptop 13.5 13th Gen Intel | |
| Dell XPS 13 Plus 9320 i7-1280P OLED | |
| Dell XPS 13 Plus 9320 Core i7-1360P | |
| Przeciętny Intel Core i7-1360P (7549 - 10817, n=17) | |
| HP Spectre x360 13.5 14t-ef000 | |
| Lenovo Yoga Book 9i 2-in-1 Dual Screen | |
| Lenovo ThinkPad X13 Yoga G3 21AW003UGE | |
| Asus Zenbook S 13 OLED | |
| Dell Inspiron 13 7306-6TYH5 | |
| Microsoft Surface Laptop 4 13 i7 | |
| HP Envy 13-ba0001ng | |
| Geekbench 5.5 / Single-Core | |
| Framework Laptop 13.5 13th Gen Intel | |
| Dell XPS 13 Plus 9320 Core i7-1360P | |
| Lenovo Yoga Book 9i 2-in-1 Dual Screen | |
| Dell XPS 13 Plus 9320 i7-1280P OLED | |
| Przeciętny Intel Core i7-1360P (1435 - 1871, n=17) | |
| HP Spectre x360 13.5 14t-ef000 | |
| Dell Inspiron 13 7306-6TYH5 | |
| Microsoft Surface Laptop 4 13 i7 | |
| Asus Zenbook S 13 OLED | |
| Lenovo ThinkPad X13 Yoga G3 21AW003UGE | |
| HP Envy 13-ba0001ng | |
| HWBOT x265 Benchmark v2.2 / 4k Preset | |
| Framework Laptop 13.5 13th Gen Intel | |
| Dell XPS 13 Plus 9320 i7-1280P OLED | |
| Dell XPS 13 Plus 9320 Core i7-1360P | |
| Asus Zenbook S 13 OLED | |
| Przeciętny Intel Core i7-1360P (6.9 - 14.2, n=16) | |
| HP Pavilion Aero 13 be0097nr | |
| Lenovo Yoga Book 9i 2-in-1 Dual Screen | |
| HP Spectre x360 13.5 14t-ef000 | |
| Lenovo Yoga 6 13ALC6 | |
| Lenovo ThinkPad X13 Yoga G3 21AW003UGE | |
| Dell XPS 13 7390 Core i7-10710U | |
| Microsoft Surface Laptop 4 13 i7 | |
| Dell Inspiron 13 7306-6TYH5 | |
| HP Envy 13-ba0001ng | |
| LibreOffice / 20 Documents To PDF | |
| Lenovo Yoga 6 13ALC6 | |
| HP Envy 13-ba0001ng | |
| Asus Zenbook S 13 OLED | |
| HP Pavilion Aero 13 be0097nr | |
| Lenovo ThinkPad X13 Yoga G3 21AW003UGE | |
| Microsoft Surface Laptop 4 13 i7 | |
| Dell XPS 13 Plus 9320 i7-1280P OLED | |
| Lenovo Yoga Book 9i 2-in-1 Dual Screen | |
| Dell XPS 13 Plus 9320 Core i7-1360P | |
| Dell Inspiron 13 7306-6TYH5 | |
| Przeciętny Intel Core i7-1360P (40.3 - 57.2, n=16) | |
| HP Spectre x360 13.5 14t-ef000 | |
| Framework Laptop 13.5 13th Gen Intel | |
| R Benchmark 2.5 / Overall mean | |
| HP Envy 13-ba0001ng | |
| Lenovo Yoga 6 13ALC6 | |
| Microsoft Surface Laptop 4 13 i7 | |
| Lenovo ThinkPad X13 Yoga G3 21AW003UGE | |
| Dell Inspiron 13 7306-6TYH5 | |
| HP Pavilion Aero 13 be0097nr | |
| Asus Zenbook S 13 OLED | |
| Dell XPS 13 Plus 9320 i7-1280P OLED | |
| HP Spectre x360 13.5 14t-ef000 | |
| Przeciętny Intel Core i7-1360P (0.445 - 0.583, n=16) | |
| Lenovo Yoga Book 9i 2-in-1 Dual Screen | |
| Dell XPS 13 Plus 9320 Core i7-1360P | |
| Framework Laptop 13.5 13th Gen Intel | |
Cinebench R20: CPU (Multi Core) | CPU (Single Core)
Cinebench R23: Multi Core | Single Core
Cinebench R15: CPU Multi 64Bit | CPU Single 64Bit
Blender: v2.79 BMW27 CPU
7-Zip 18.03: 7z b 4 | 7z b 4 -mmt1
Geekbench 5.5: Multi-Core | Single-Core
HWBOT x265 Benchmark v2.2: 4k Preset
LibreOffice : 20 Documents To PDF
R Benchmark 2.5: Overall mean
* ... im mniej tym lepiej
AIDA64: FP32 Ray-Trace | FPU Julia | CPU SHA3 | CPU Queen | FPU SinJulia | FPU Mandel | CPU AES | CPU ZLib | FP64 Ray-Trace | CPU PhotoWorxx
| Performance rating | |
| Framework Laptop 13.5 13th Gen Intel | |
| Dell XPS 13 Plus 9320 i7-1280P OLED | |
| Dell XPS 13 Plus 9320 Core i7-1360P | |
| HP Spectre x360 13.5 14t-ef000 | |
| Lenovo ThinkPad X13 Yoga G3 21AW003UGE | |
| AIDA64 / FP32 Ray-Trace | |
| Framework Laptop 13.5 13th Gen Intel | |
| Dell XPS 13 Plus 9320 i7-1280P OLED | |
| Dell XPS 13 Plus 9320 Core i7-1360P | |
| Lenovo ThinkPad X13 Yoga G3 21AW003UGE | |
| HP Spectre x360 13.5 14t-ef000 | |
| AIDA64 / FPU Julia | |
| Framework Laptop 13.5 13th Gen Intel | |
| Dell XPS 13 Plus 9320 i7-1280P OLED | |
| Dell XPS 13 Plus 9320 Core i7-1360P | |
| Lenovo ThinkPad X13 Yoga G3 21AW003UGE | |
| HP Spectre x360 13.5 14t-ef000 | |
| AIDA64 / CPU SHA3 | |
| Framework Laptop 13.5 13th Gen Intel | |
| Dell XPS 13 Plus 9320 i7-1280P OLED | |
| Dell XPS 13 Plus 9320 Core i7-1360P | |
| Lenovo ThinkPad X13 Yoga G3 21AW003UGE | |
| HP Spectre x360 13.5 14t-ef000 | |
| AIDA64 / CPU Queen | |
| Framework Laptop 13.5 13th Gen Intel | |
| Dell XPS 13 Plus 9320 i7-1280P OLED | |
| Dell XPS 13 Plus 9320 Core i7-1360P | |
| Lenovo ThinkPad X13 Yoga G3 21AW003UGE | |
| HP Spectre x360 13.5 14t-ef000 | |
| AIDA64 / FPU SinJulia | |
| Framework Laptop 13.5 13th Gen Intel | |
| Dell XPS 13 Plus 9320 i7-1280P OLED | |
| Dell XPS 13 Plus 9320 Core i7-1360P | |
| Lenovo ThinkPad X13 Yoga G3 21AW003UGE | |
| HP Spectre x360 13.5 14t-ef000 | |
| AIDA64 / FPU Mandel | |
| Framework Laptop 13.5 13th Gen Intel | |
| Dell XPS 13 Plus 9320 i7-1280P OLED | |
| Dell XPS 13 Plus 9320 Core i7-1360P | |
| Lenovo ThinkPad X13 Yoga G3 21AW003UGE | |
| HP Spectre x360 13.5 14t-ef000 | |
| AIDA64 / CPU AES | |
| Framework Laptop 13.5 13th Gen Intel | |
| HP Spectre x360 13.5 14t-ef000 | |
| Dell XPS 13 Plus 9320 i7-1280P OLED | |
| Dell XPS 13 Plus 9320 Core i7-1360P | |
| Lenovo ThinkPad X13 Yoga G3 21AW003UGE | |
| AIDA64 / CPU ZLib | |
| Framework Laptop 13.5 13th Gen Intel | |
| Dell XPS 13 Plus 9320 Core i7-1360P | |
| Dell XPS 13 Plus 9320 i7-1280P OLED | |
| Lenovo ThinkPad X13 Yoga G3 21AW003UGE | |
| HP Spectre x360 13.5 14t-ef000 | |
| AIDA64 / FP64 Ray-Trace | |
| Framework Laptop 13.5 13th Gen Intel | |
| Dell XPS 13 Plus 9320 i7-1280P OLED | |
| Dell XPS 13 Plus 9320 Core i7-1360P | |
| HP Spectre x360 13.5 14t-ef000 | |
| Lenovo ThinkPad X13 Yoga G3 21AW003UGE | |
| AIDA64 / CPU PhotoWorxx | |
| Dell XPS 13 Plus 9320 Core i7-1360P | |
| Dell XPS 13 Plus 9320 i7-1280P OLED | |
| HP Spectre x360 13.5 14t-ef000 | |
| Lenovo ThinkPad X13 Yoga G3 21AW003UGE | |
| Framework Laptop 13.5 13th Gen Intel | |
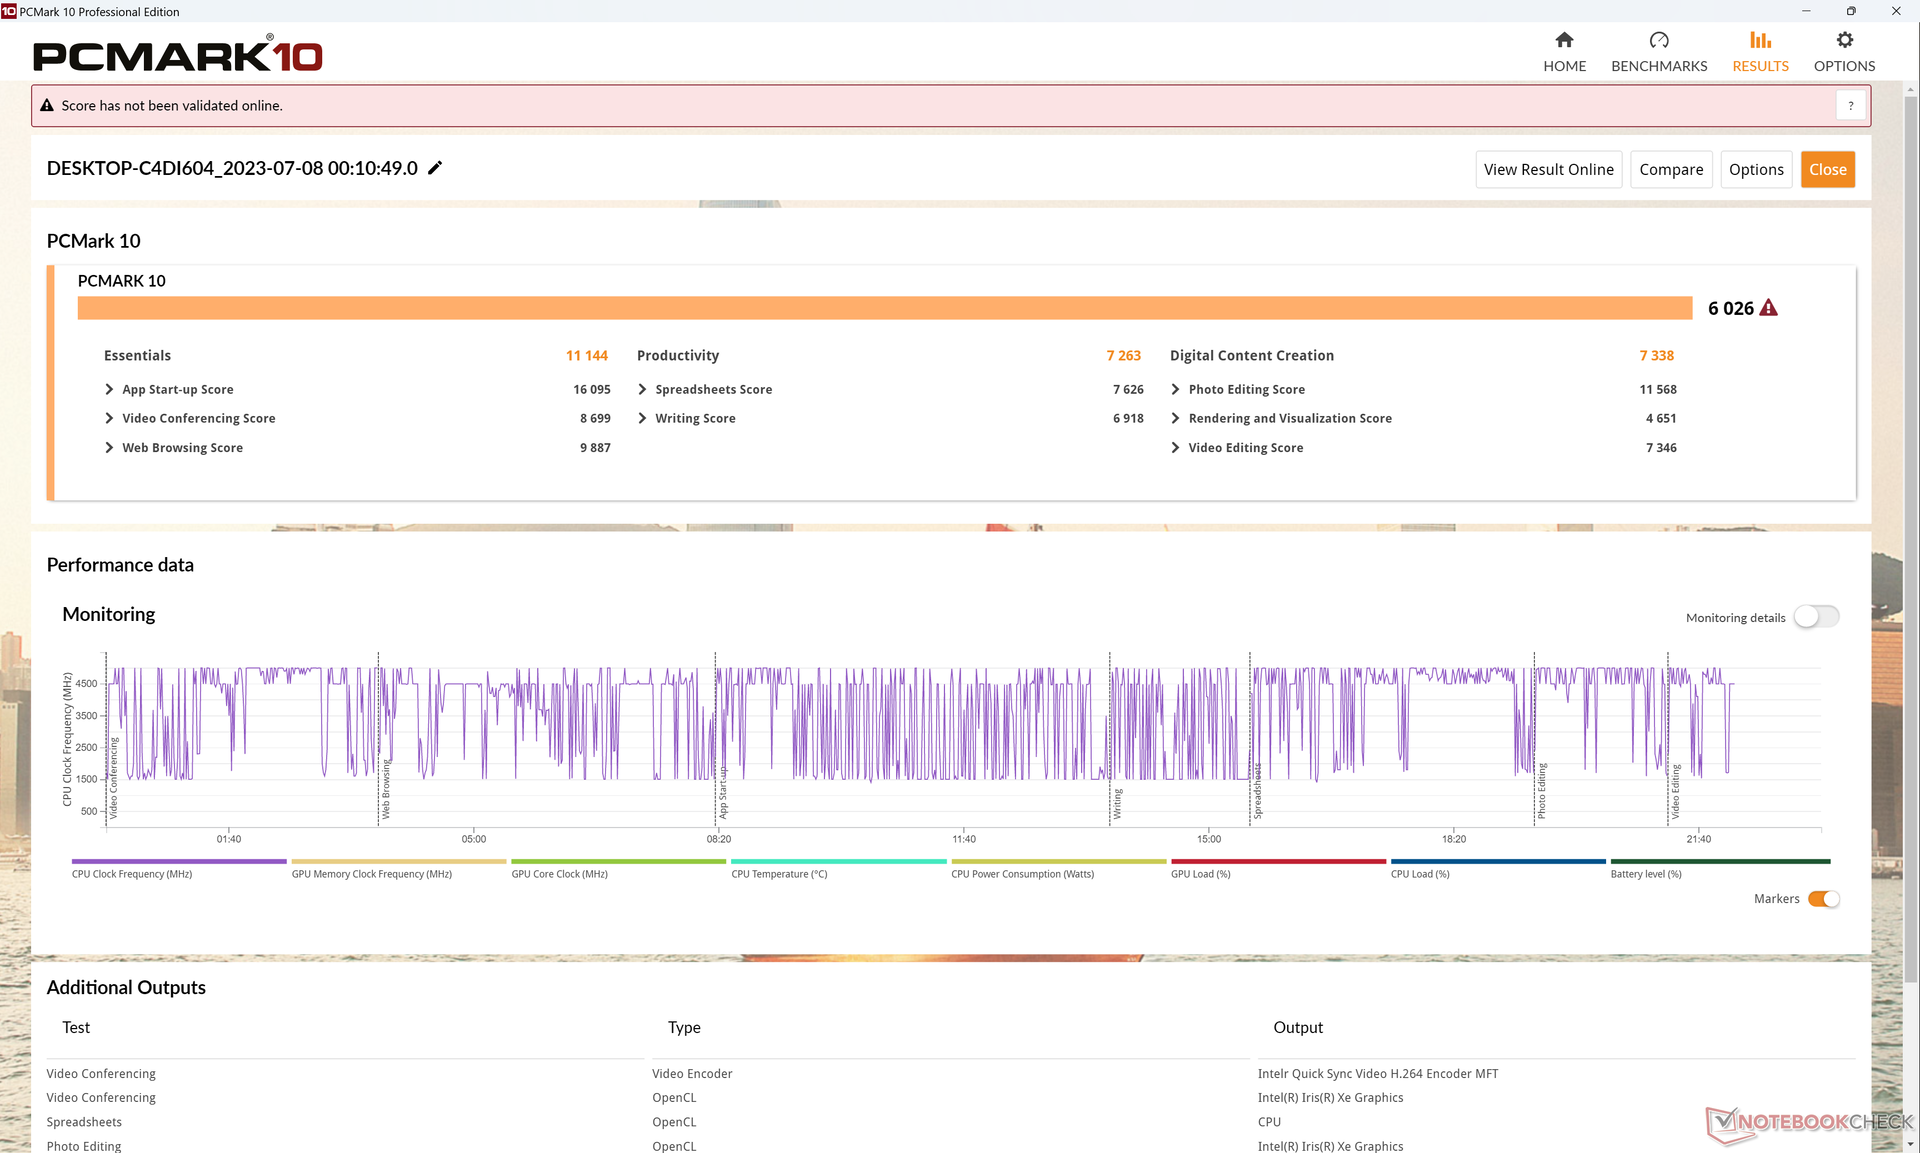
Wydajność systemu
Wyniki PCMark tylko nieznacznie, ale konsekwentnie wyprzedzają zeszłoroczny XPS 13 Plus o jednocyfrowe punkty procentowe, prawdopodobnie ze względu na szybszą pamięć RAM i nieco wyższą wydajność jednowątkową.
CrossMark: Overall | Productivity | Creativity | Responsiveness
| PCMark 10 / Score | |
| Framework Laptop 13.5 13th Gen Intel | |
| Dell XPS 13 Plus 9320 Core i7-1360P | |
| Przeciętny Intel Core i7-1360P (5360 - 6998, n=16) | |
| Dell XPS 13 Plus 9320 i7-1280P OLED | |
| HP Spectre x360 13.5 14t-ef000 | |
| Lenovo ThinkPad X13 Yoga G3 21AW003UGE | |
| Dell XPS 13 7390 Core i7-10710U | |
| PCMark 10 / Essentials | |
| Framework Laptop 13.5 13th Gen Intel | |
| HP Spectre x360 13.5 14t-ef000 | |
| Dell XPS 13 Plus 9320 Core i7-1360P | |
| Przeciętny Intel Core i7-1360P (9883 - 12059, n=16) | |
| Lenovo ThinkPad X13 Yoga G3 21AW003UGE | |
| Dell XPS 13 Plus 9320 i7-1280P OLED | |
| Dell XPS 13 7390 Core i7-10710U | |
| PCMark 10 / Productivity | |
| Framework Laptop 13.5 13th Gen Intel | |
| Przeciętny Intel Core i7-1360P (6572 - 9371, n=16) | |
| HP Spectre x360 13.5 14t-ef000 | |
| Dell XPS 13 Plus 9320 Core i7-1360P | |
| Dell XPS 13 Plus 9320 i7-1280P OLED | |
| Lenovo ThinkPad X13 Yoga G3 21AW003UGE | |
| Dell XPS 13 7390 Core i7-10710U | |
| PCMark 10 / Digital Content Creation | |
| Framework Laptop 13.5 13th Gen Intel | |
| Dell XPS 13 Plus 9320 Core i7-1360P | |
| Przeciętny Intel Core i7-1360P (5723 - 9597, n=16) | |
| Dell XPS 13 Plus 9320 i7-1280P OLED | |
| HP Spectre x360 13.5 14t-ef000 | |
| Lenovo ThinkPad X13 Yoga G3 21AW003UGE | |
| Dell XPS 13 7390 Core i7-10710U | |
| CrossMark / Overall | |
| Dell XPS 13 Plus 9320 Core i7-1360P | |
| Dell XPS 13 Plus 9320 i7-1280P OLED | |
| Framework Laptop 13.5 13th Gen Intel | |
| Przeciętny Intel Core i7-1360P (1527 - 1891, n=15) | |
| HP Spectre x360 13.5 14t-ef000 | |
| Lenovo ThinkPad X13 Yoga G3 21AW003UGE | |
| CrossMark / Productivity | |
| Framework Laptop 13.5 13th Gen Intel | |
| Dell XPS 13 Plus 9320 Core i7-1360P | |
| Dell XPS 13 Plus 9320 i7-1280P OLED | |
| Przeciętny Intel Core i7-1360P (1503 - 1842, n=15) | |
| HP Spectre x360 13.5 14t-ef000 | |
| Lenovo ThinkPad X13 Yoga G3 21AW003UGE | |
| CrossMark / Creativity | |
| Dell XPS 13 Plus 9320 Core i7-1360P | |
| Dell XPS 13 Plus 9320 i7-1280P OLED | |
| Framework Laptop 13.5 13th Gen Intel | |
| Przeciętny Intel Core i7-1360P (1558 - 2003, n=15) | |
| HP Spectre x360 13.5 14t-ef000 | |
| Lenovo ThinkPad X13 Yoga G3 21AW003UGE | |
| CrossMark / Responsiveness | |
| Przeciętny Intel Core i7-1360P (1311 - 1899, n=15) | |
| Dell XPS 13 Plus 9320 i7-1280P OLED | |
| Dell XPS 13 Plus 9320 Core i7-1360P | |
| Framework Laptop 13.5 13th Gen Intel | |
| HP Spectre x360 13.5 14t-ef000 | |
| Lenovo ThinkPad X13 Yoga G3 21AW003UGE | |
| PCMark 10 Score | 6026 pkt. | |
Pomoc | ||
| AIDA64 / Memory Copy | |
| Dell XPS 13 Plus 9320 Core i7-1360P | |
| Dell XPS 13 Plus 9320 i7-1280P OLED | |
| Przeciętny Intel Core i7-1360P (44299 - 72748, n=16) | |
| HP Spectre x360 13.5 14t-ef000 | |
| Lenovo ThinkPad X13 Yoga G3 21AW003UGE | |
| Framework Laptop 13.5 13th Gen Intel | |
| AIDA64 / Memory Read | |
| Dell XPS 13 Plus 9320 i7-1280P OLED | |
| Dell XPS 13 Plus 9320 Core i7-1360P | |
| HP Spectre x360 13.5 14t-ef000 | |
| Przeciętny Intel Core i7-1360P (44751 - 68945, n=16) | |
| Lenovo ThinkPad X13 Yoga G3 21AW003UGE | |
| Framework Laptop 13.5 13th Gen Intel | |
| AIDA64 / Memory Write | |
| Dell XPS 13 Plus 9320 Core i7-1360P | |
| Przeciętny Intel Core i7-1360P (45887 - 93331, n=16) | |
| HP Spectre x360 13.5 14t-ef000 | |
| Dell XPS 13 Plus 9320 i7-1280P OLED | |
| Framework Laptop 13.5 13th Gen Intel | |
| Lenovo ThinkPad X13 Yoga G3 21AW003UGE | |
| AIDA64 / Memory Latency | |
| Dell XPS 13 Plus 9320 i7-1280P OLED | |
| Lenovo ThinkPad X13 Yoga G3 21AW003UGE | |
| Dell XPS 13 Plus 9320 Core i7-1360P | |
| Przeciętny Intel Core i7-1360P (85 - 110.5, n=16) | |
| HP Spectre x360 13.5 14t-ef000 | |
| Framework Laptop 13.5 13th Gen Intel | |
* ... im mniej tym lepiej
Opóźnienie DPC
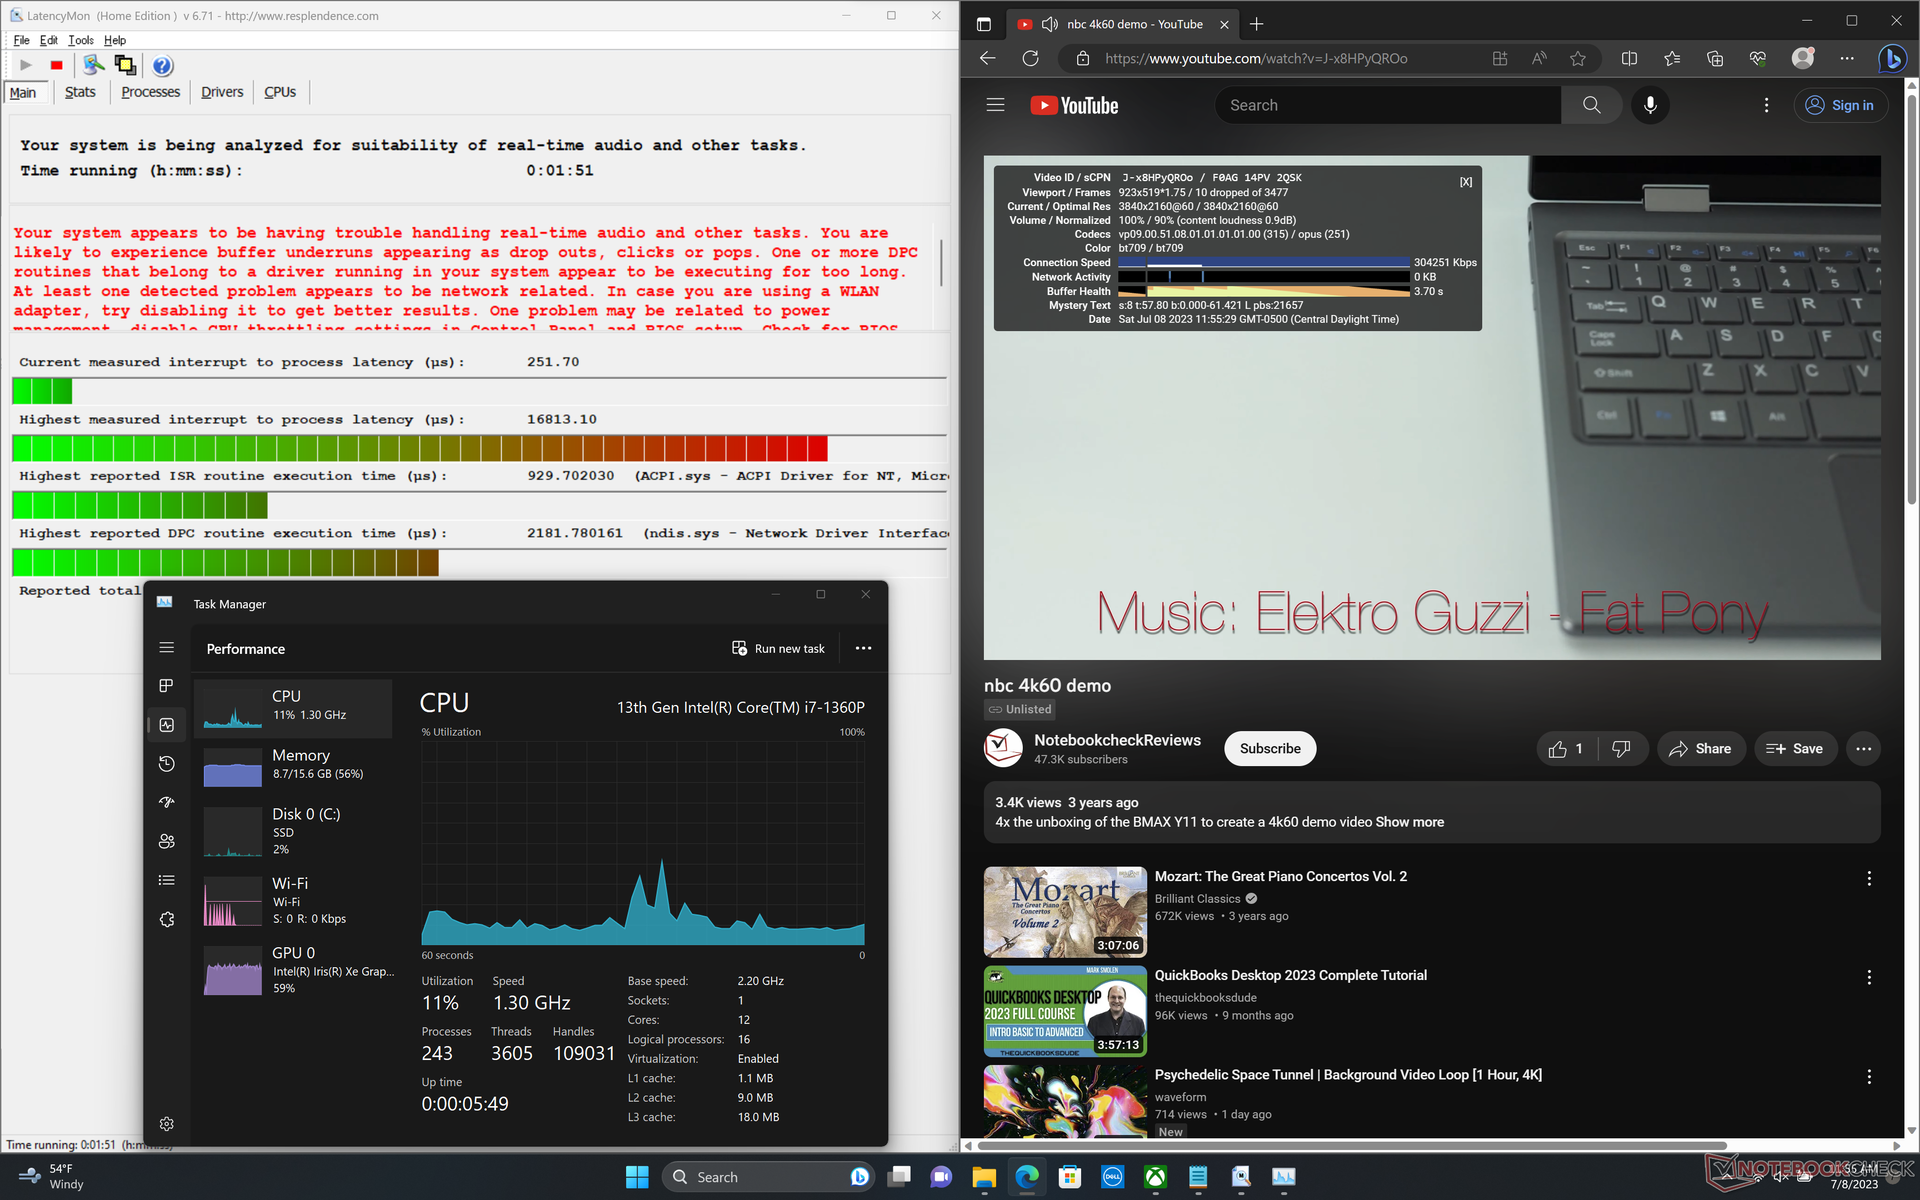
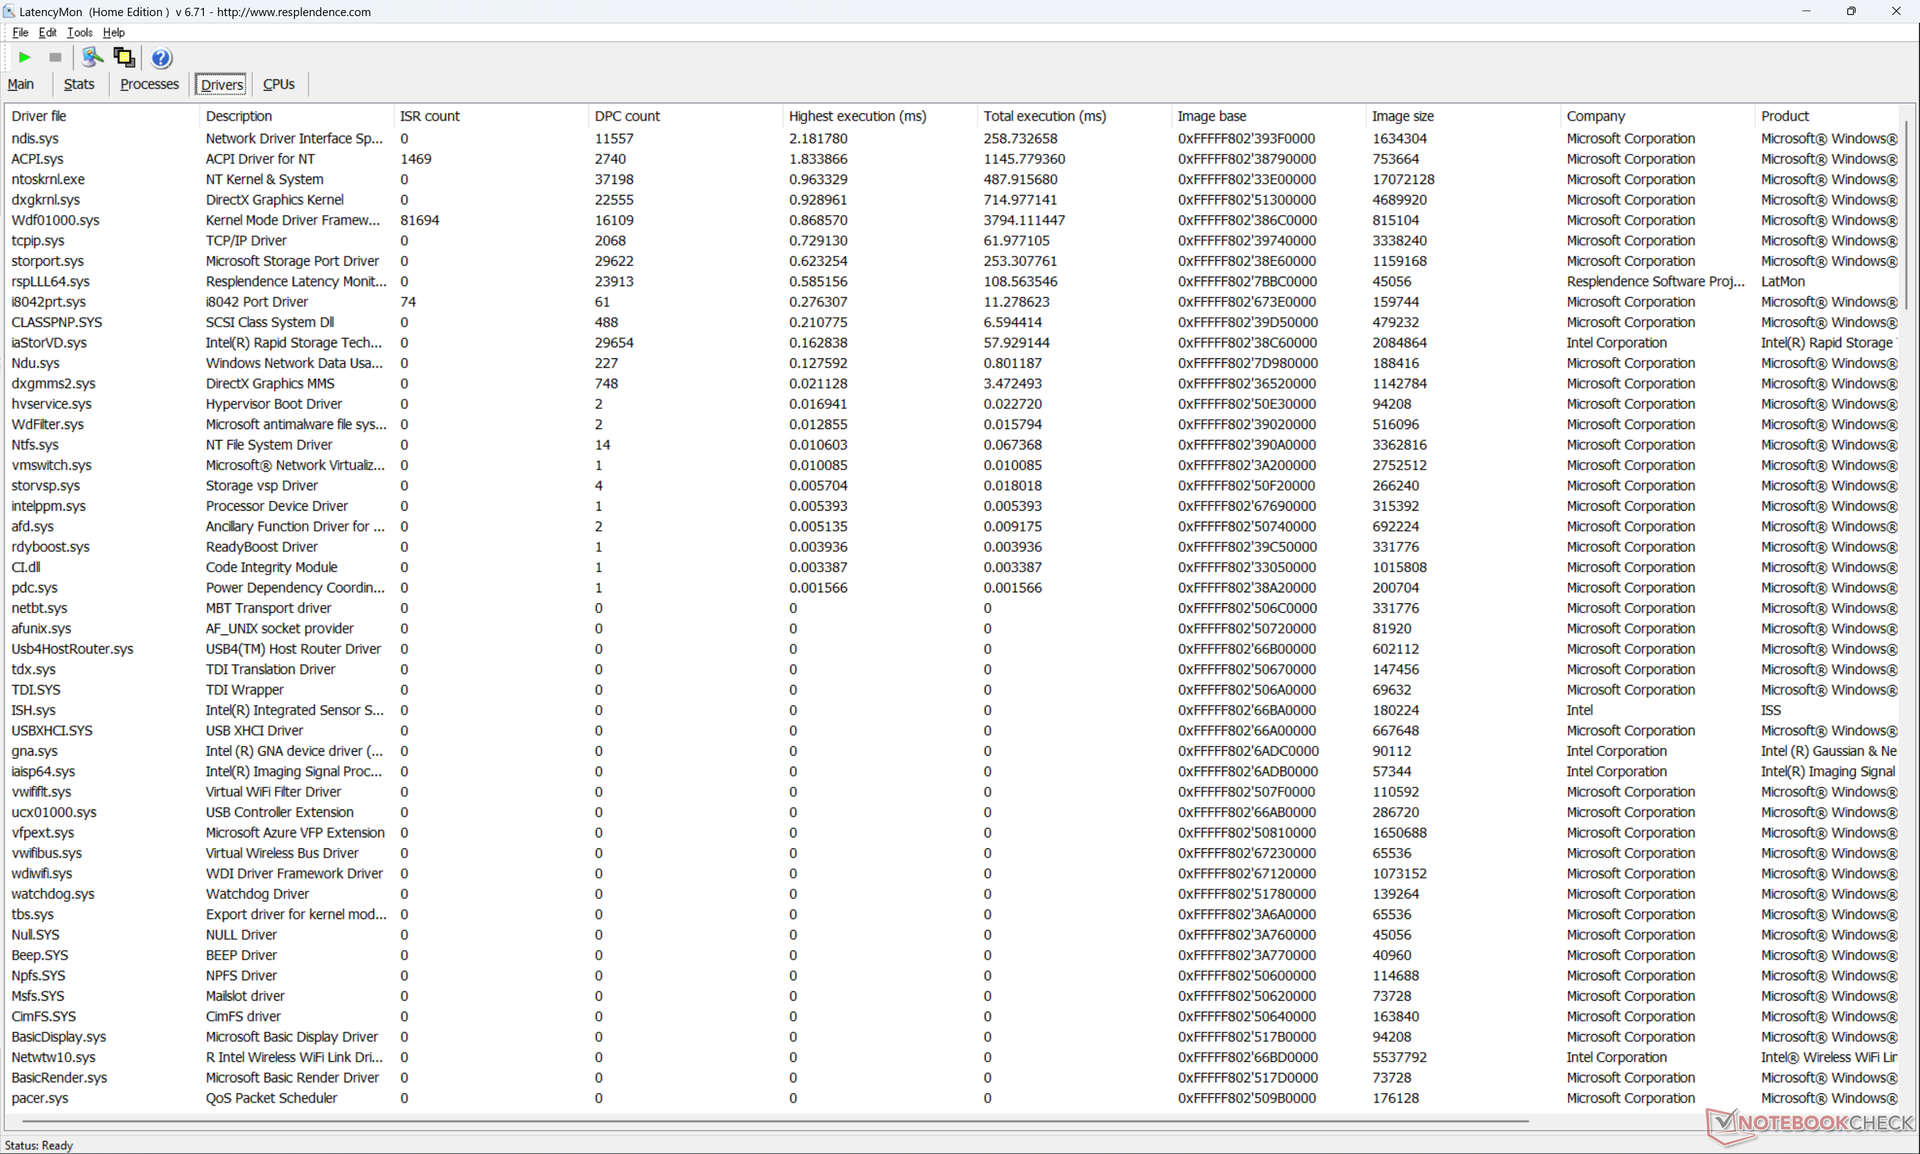
Nasze urządzenie wykazywało problemy z opóźnieniami podczas otwierania wielu kart przeglądarki lub strony głównej, nawet po wielu próbach. odtwarzanie wideo 4K przy 60 klatkach na sekundę było również niedoskonałe z 10 utraconymi klatkami podczas naszego minutowego filmu testowego. Może to być potencjalnie błąd w nowym modelu 2023, ponieważ żadna z naszych trzech jednostek testowych 2022 nie wykazywała takich problemów.
| DPC Latencies / LatencyMon - interrupt to process latency (max), Web, Youtube, Prime95 | |
| Dell XPS 13 Plus 9320 Core i7-1360P | |
| Lenovo ThinkPad X13 Yoga G3 21AW003UGE | |
| Dell XPS 13 Plus 9320 i5-1240p | |
| Dell XPS 13 Plus 9320 4K | |
| HP Spectre x360 13.5 14t-ef000 | |
| Dell XPS 13 Plus 9320 i7-1280P OLED | |
| Framework Laptop 13.5 13th Gen Intel | |
* ... im mniej tym lepiej
Urządzenia pamięci masowej
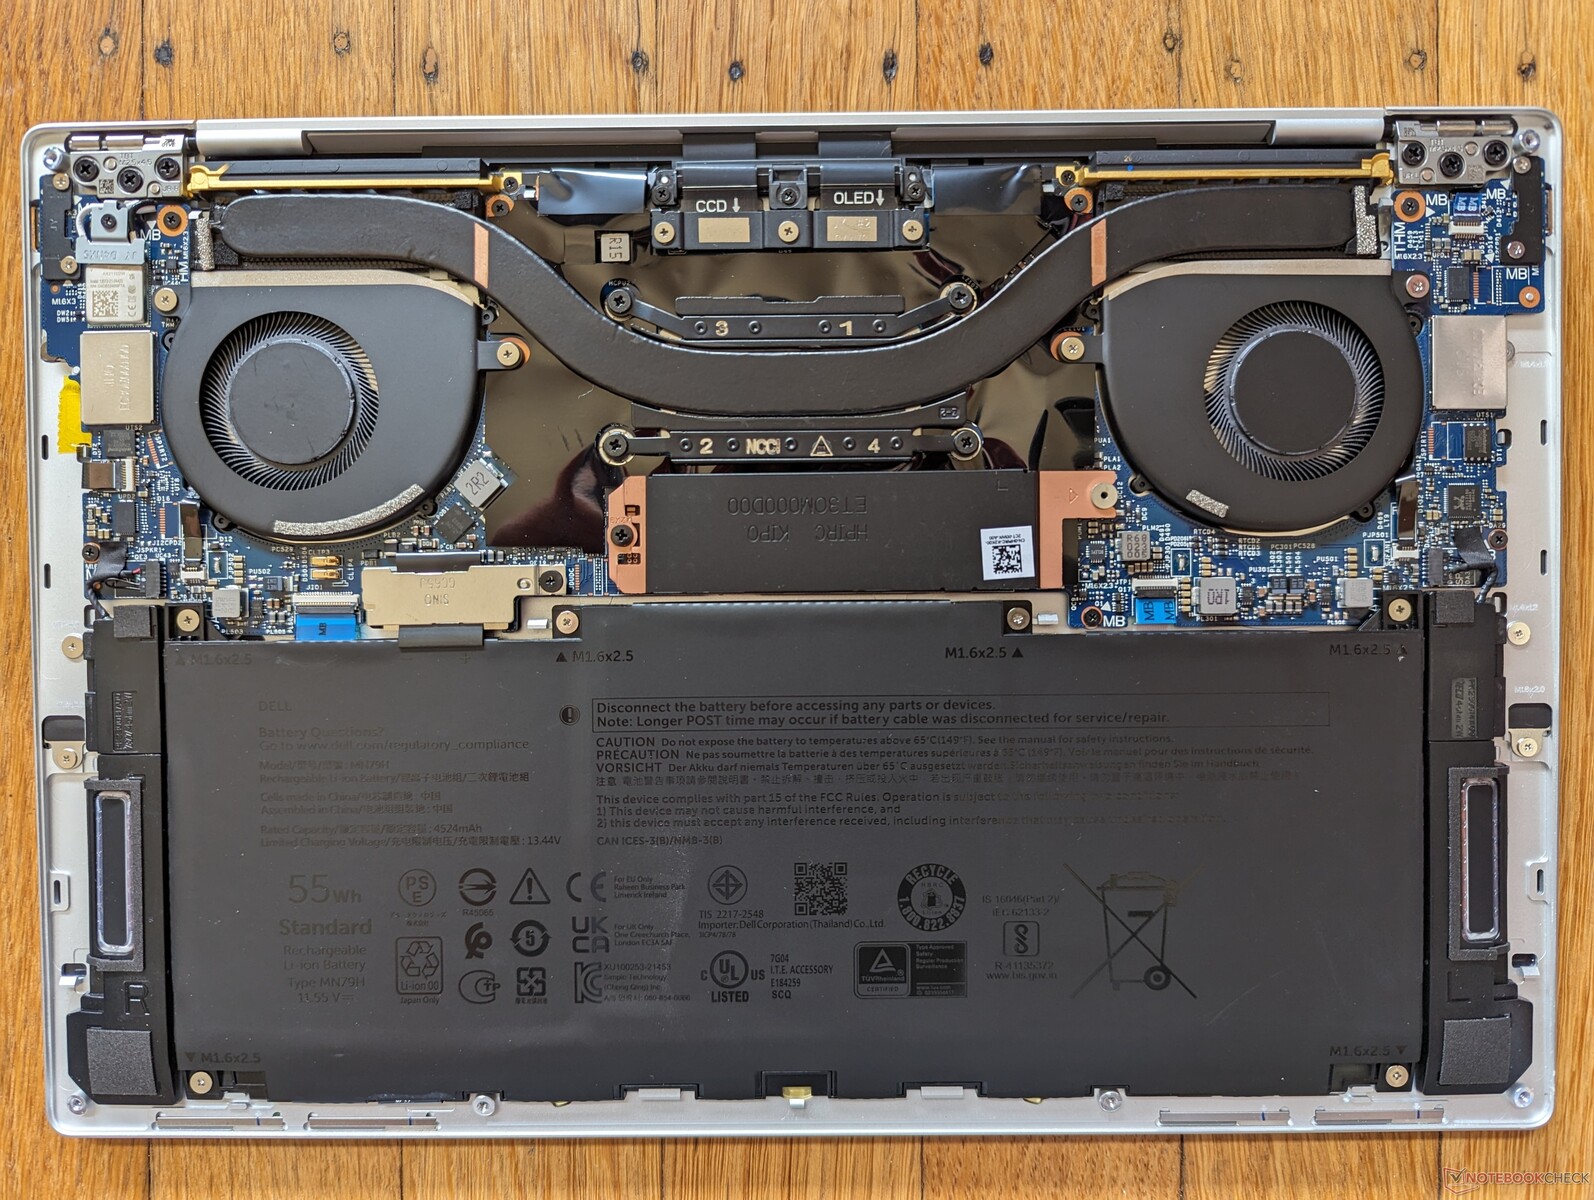
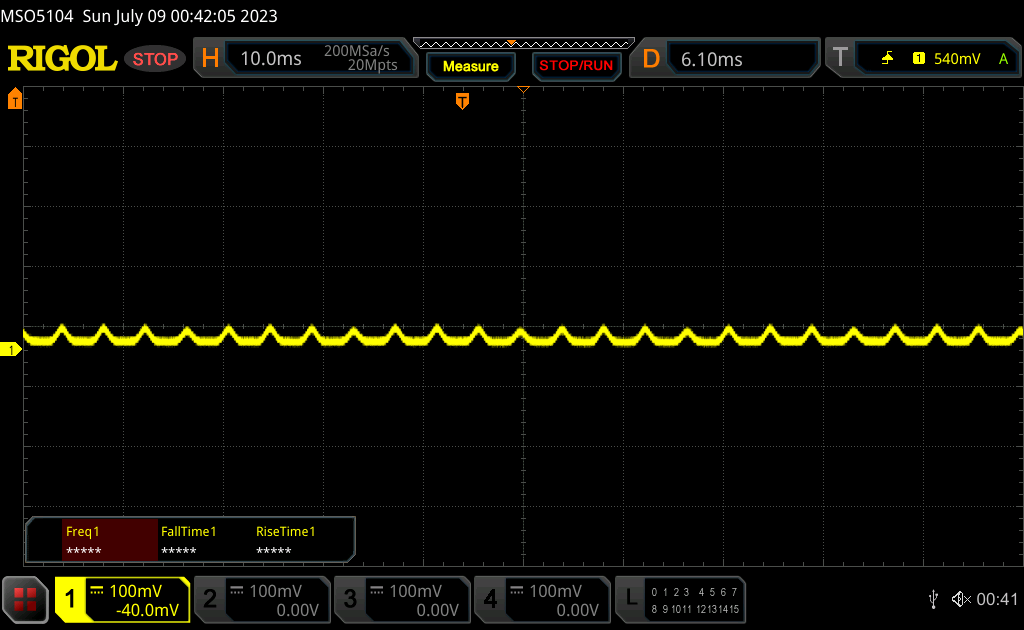
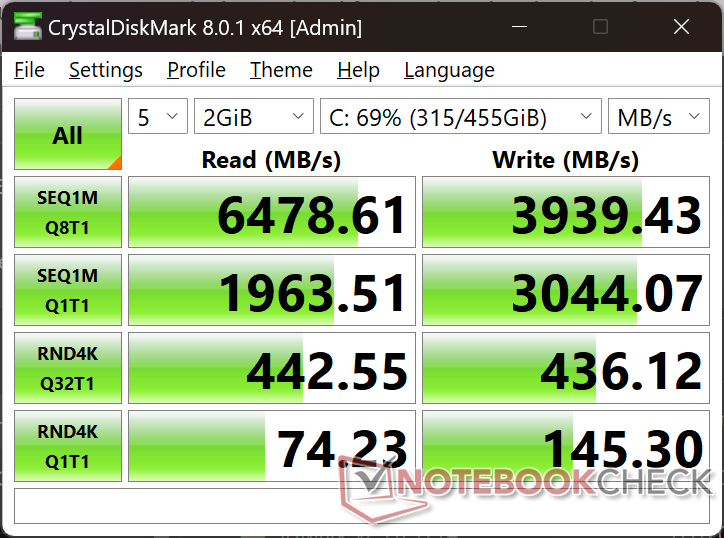
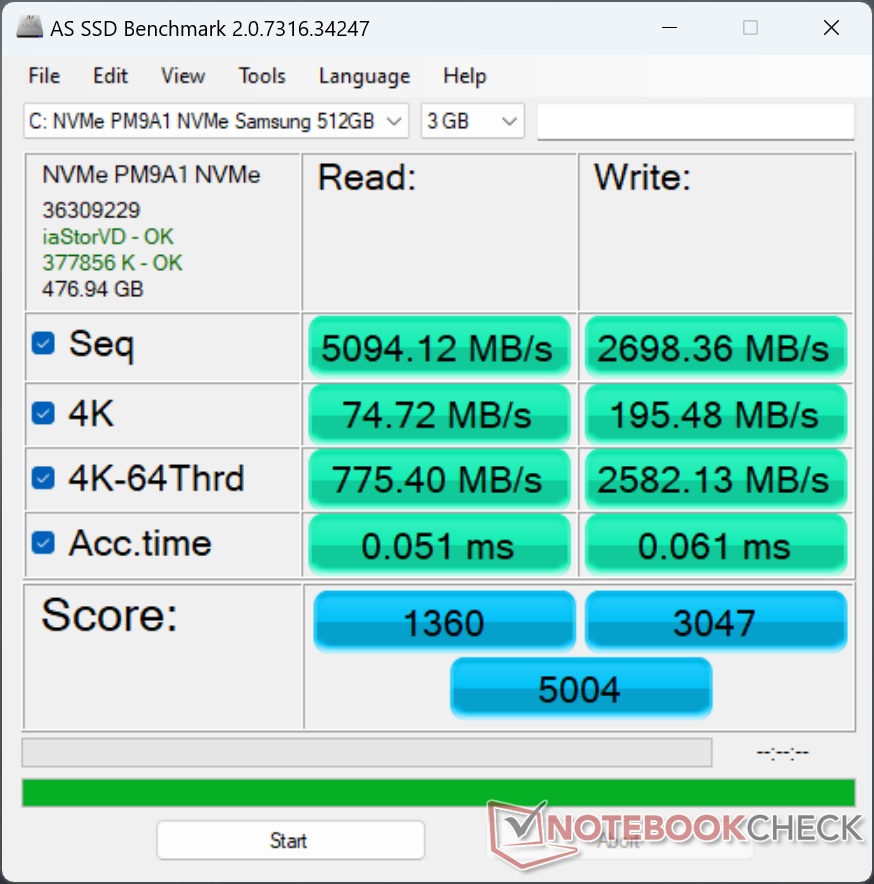
Dyski SSD w serii XPS 13 Plus mogą pochodzić od Samsunga, Microna lub Western Digital. W przypadku tej konkretnej jednostki, nasz dysk SSD to Samsung PM9A1 PCIe4 x4 oferujący sekwencyjny odczyt i zapis na poziomie odpowiednio prawie 7000 MB/s i 4000 MB/s. Niestety, wydajność naszego dysku spadła do 2000 MB/s, gdy był on obciążony, jak pokazują poniższe wyniki testu pętli DiskSpd. Powtórzenie testu nie przyniosłoby żadnej poprawy. W przeciwieństwie do tego, ten sam dysk w naszym XPS 13 Plus z 2022 roku nie wykazywał żadnego dławienia wydajności. Nie jesteśmy pewni żadnych konkretnych przyczyn, ponieważ nie wprowadzono żadnych zmian w rozpraszaczu ciepła SSD, o ile nam wiadomo.

| Drive Performance rating - Percent | |
| Framework Laptop 13.5 13th Gen Intel | |
| Dell XPS 13 Plus 9320 i7-1280P OLED | |
| Dell XPS 13 Plus 9320 Core i7-1360P | |
| HP Spectre x360 13.5 14t-ef000 | |
| Lenovo ThinkPad X13 Yoga G3 21AW003UGE | |
| Dell XPS 13 7390 Core i7-10710U -8! | |
* ... im mniej tym lepiej
Disk Throttling: DiskSpd Read Loop, Queue Depth 8
Wydajność GPU
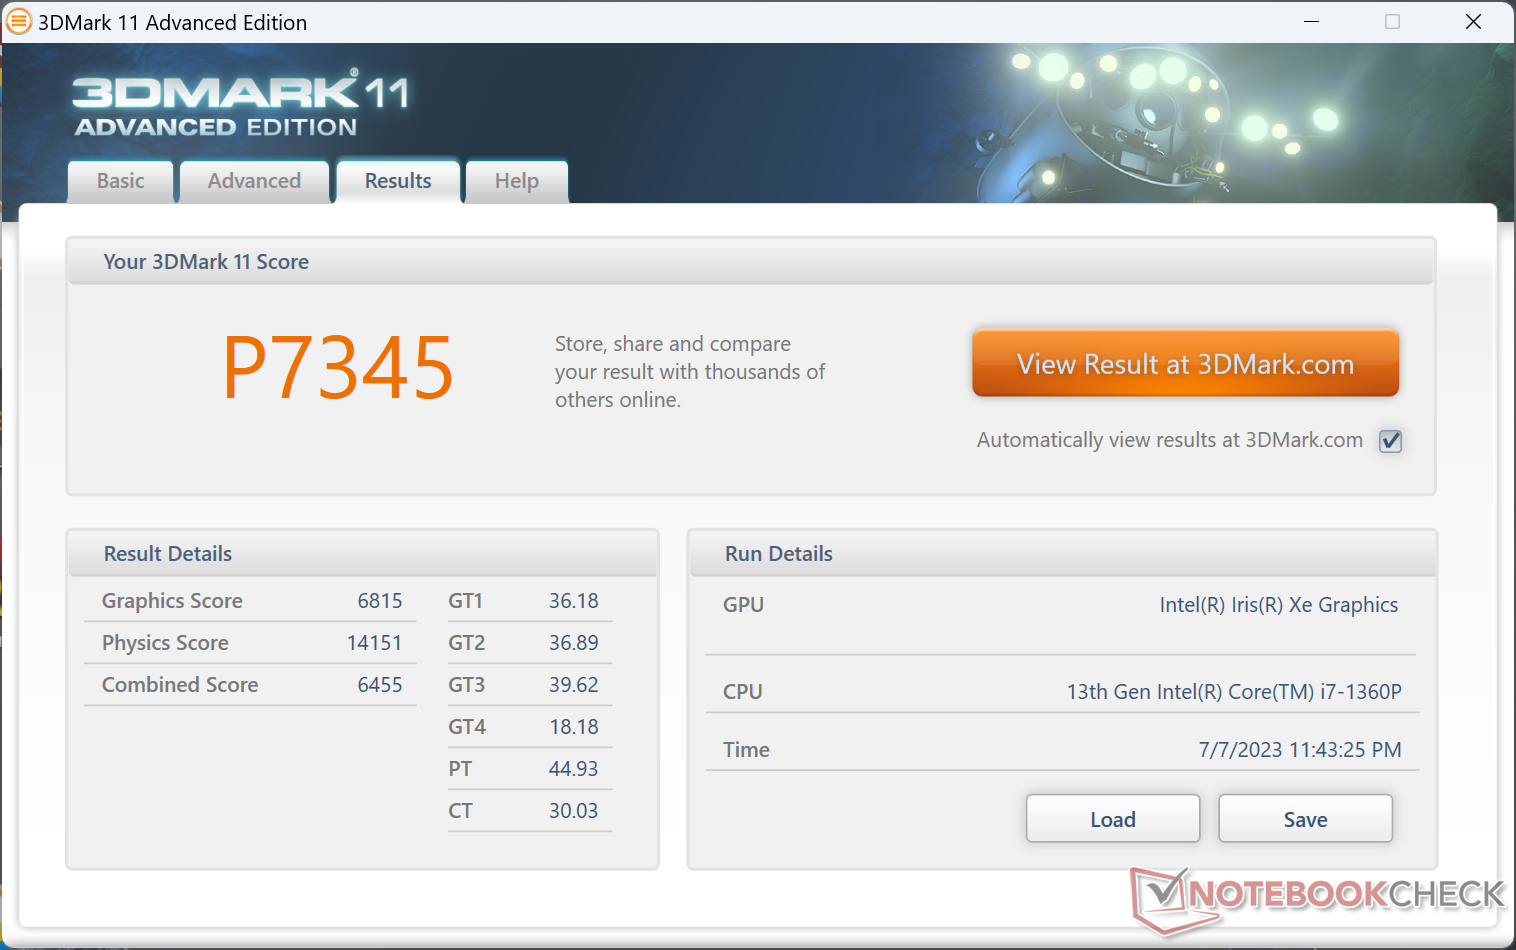
Iris Xe 96 EU Iris Xe 96 EUs pozostaje najszybszym zintegrowanym rozwiązaniem graficznym od Intela, mimo że ma już kilka lat. Tegoroczna wersja jest nieco szybsza od zeszłorocznej o kilka punktów procentowych ze względu na niewielki wzrost częstotliwości taktowania pamięci, ale nadal blednie w porównaniu z konkurencyjnym Radeon 680M lub 780M.
| 3DMark Performance rating - Percent | |
| Asus Zenbook S 13 OLED | |
| Dell XPS 13 Plus 9320 Core i7-1360P | |
| Framework Laptop 13.5 13th Gen Intel | |
| Dell XPS 13 Plus 9320 i7-1280P OLED | |
| Microsoft Surface Laptop 4 13 i7 | |
| Lenovo Yoga Book 9i 2-in-1 Dual Screen | |
| HP Spectre x360 13.5 14t-ef000 | |
| Dell Inspiron 13 7306-6TYH5 | |
| Przeciętny Intel Iris Xe Graphics G7 96EUs | |
| Lenovo ThinkPad X13 Yoga G3 21AW003UGE | |
| HP Envy 13-ba0001ng | |
| Lenovo Yoga 6 13ALC6 | |
| HP Pavilion Aero 13 be0097nr | |
| Dell XPS 13 7390 Core i7-10710U | |
| 3DMark 11 - 1280x720 Performance GPU | |
| Asus Zenbook S 13 OLED | |
| Framework Laptop 13.5 13th Gen Intel | |
| Dell XPS 13 Plus 9320 i7-1280P OLED | |
| Microsoft Surface Laptop 4 13 i7 | |
| Dell XPS 13 Plus 9320 Core i7-1360P | |
| Lenovo Yoga Book 9i 2-in-1 Dual Screen | |
| Przeciętny Intel Iris Xe Graphics G7 96EUs (2867 - 7676, n=209) | |
| HP Spectre x360 13.5 14t-ef000 | |
| Dell Inspiron 13 7306-6TYH5 | |
| HP Pavilion Aero 13 be0097nr | |
| Lenovo Yoga 6 13ALC6 | |
| Lenovo ThinkPad X13 Yoga G3 21AW003UGE | |
| HP Envy 13-ba0001ng | |
| Dell XPS 13 7390 Core i7-10710U | |
| 3DMark | |
| 1920x1080 Fire Strike Graphics | |
| Asus Zenbook S 13 OLED | |
| Dell XPS 13 Plus 9320 Core i7-1360P | |
| Framework Laptop 13.5 13th Gen Intel | |
| Microsoft Surface Laptop 4 13 i7 | |
| Dell XPS 13 Plus 9320 i7-1280P OLED | |
| Lenovo Yoga Book 9i 2-in-1 Dual Screen | |
| Dell Inspiron 13 7306-6TYH5 | |
| HP Spectre x360 13.5 14t-ef000 | |
| Przeciętny Intel Iris Xe Graphics G7 96EUs (2286 - 6624, n=222) | |
| Lenovo ThinkPad X13 Yoga G3 21AW003UGE | |
| HP Envy 13-ba0001ng | |
| Lenovo Yoga 6 13ALC6 | |
| HP Pavilion Aero 13 be0097nr | |
| Dell XPS 13 7390 Core i7-10710U | |
| 2560x1440 Time Spy Graphics | |
| Asus Zenbook S 13 OLED | |
| Dell XPS 13 Plus 9320 Core i7-1360P | |
| Dell XPS 13 Plus 9320 i7-1280P OLED | |
| Framework Laptop 13.5 13th Gen Intel | |
| Lenovo Yoga Book 9i 2-in-1 Dual Screen | |
| Dell Inspiron 13 7306-6TYH5 | |
| HP Spectre x360 13.5 14t-ef000 | |
| Microsoft Surface Laptop 4 13 i7 | |
| Przeciętny Intel Iris Xe Graphics G7 96EUs (707 - 1890, n=218) | |
| Lenovo ThinkPad X13 Yoga G3 21AW003UGE | |
| HP Envy 13-ba0001ng | |
| HP Pavilion Aero 13 be0097nr | |
| Lenovo Yoga 6 13ALC6 | |
| Dell XPS 13 7390 Core i7-10710U | |
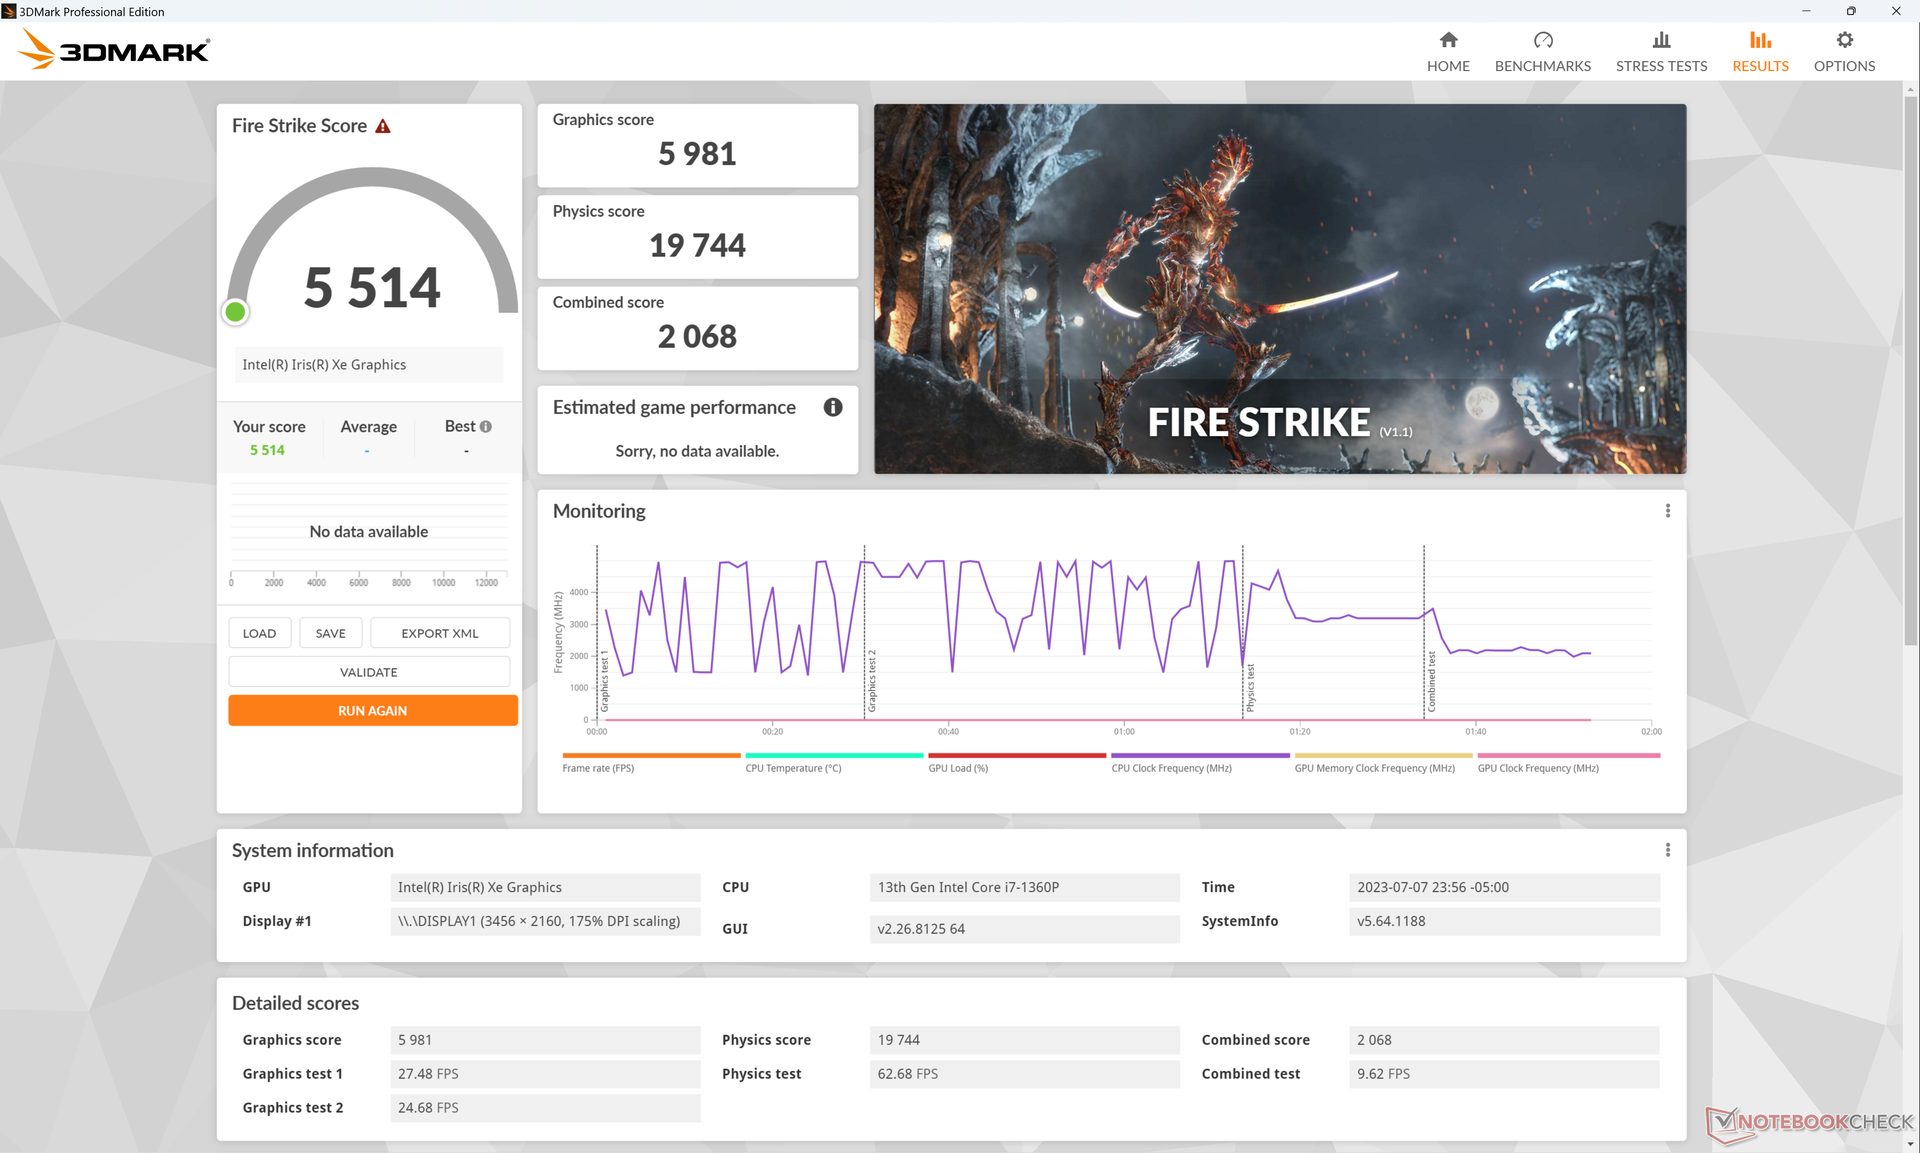
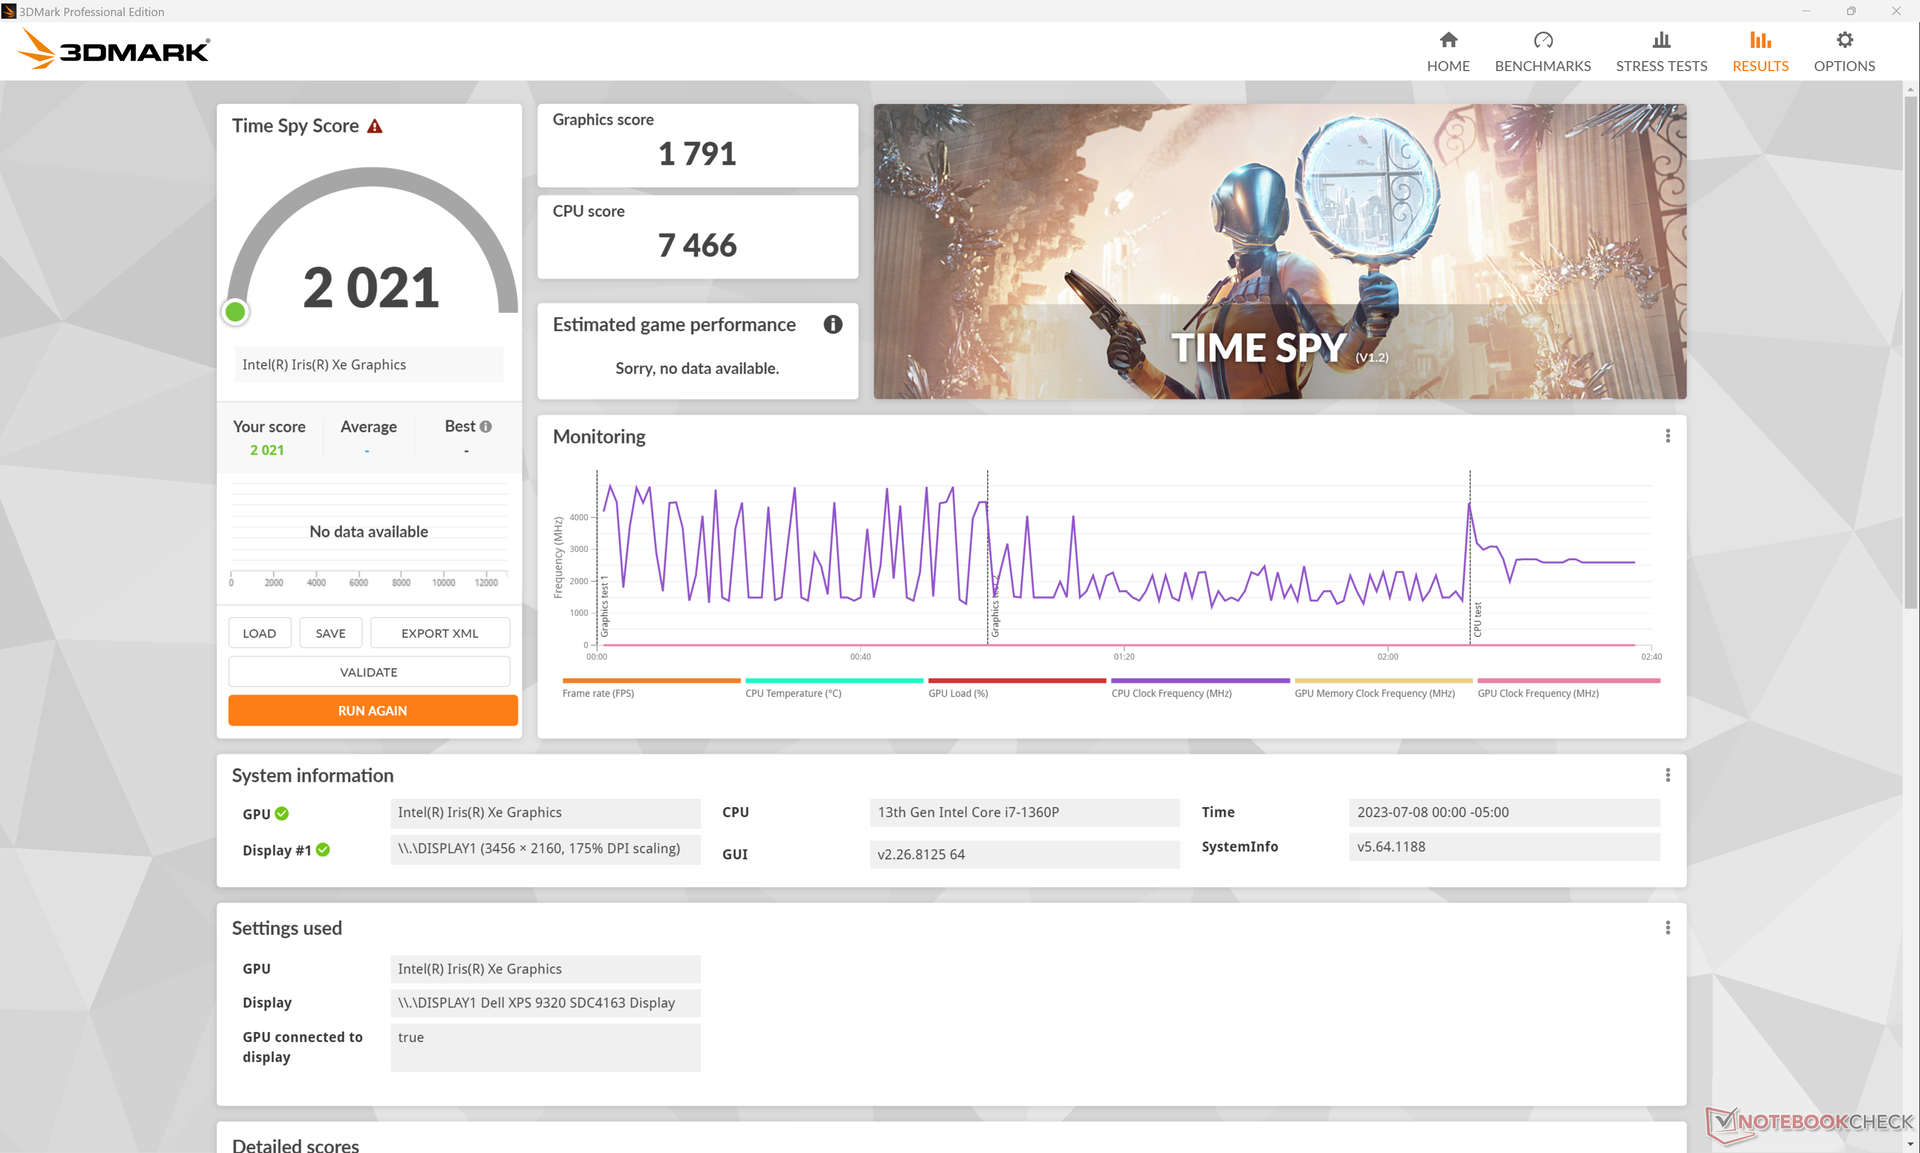
| 3DMark 11 Performance | 7345 pkt. | |
| 3DMark Fire Strike Score | 5514 pkt. | |
| 3DMark Time Spy Score | 2021 pkt. | |
Pomoc | ||
| Blender - v3.3 Classroom CPU | |
| Lenovo ThinkPad X13 Yoga G3 21AW003UGE | |
| Lenovo Yoga Book 9i 2-in-1 Dual Screen | |
| HP Spectre x360 13.5 14t-ef000 | |
| Przeciętny Intel Iris Xe Graphics G7 96EUs (336 - 1259, n=109) | |
| Dell XPS 13 Plus 9320 i7-1280P OLED | |
| Dell XPS 13 Plus 9320 Core i7-1360P | |
| Framework Laptop 13.5 13th Gen Intel | |
* ... im mniej tym lepiej
| Cyberpunk 2077 1.6 | |
| 1280x720 Low Preset | |
| Asus Zenbook S 13 OLED | |
| Dell XPS 13 Plus 9320 Core i7-1360P | |
| Przeciętny Intel Iris Xe Graphics G7 96EUs (20.6 - 44.7, n=17) | |
| 1920x1080 Low Preset | |
| Asus Zenbook S 13 OLED | |
| HP Spectre x360 13.5 14t-ef000 | |
| Dell XPS 13 Plus 9320 i7-1280P OLED | |
| Dell XPS 13 Plus 9320 Core i7-1360P | |
| Przeciętny Intel Iris Xe Graphics G7 96EUs (13 - 25.9, n=42) | |
| 1920x1080 Medium Preset | |
| Asus Zenbook S 13 OLED | |
| HP Spectre x360 13.5 14t-ef000 | |
| Dell XPS 13 Plus 9320 i7-1280P OLED | |
| Dell XPS 13 Plus 9320 Core i7-1360P | |
| Przeciętny Intel Iris Xe Graphics G7 96EUs (10.8 - 21.7, n=37) | |
| 1920x1080 High Preset | |
| Asus Zenbook S 13 OLED | |
| HP Spectre x360 13.5 14t-ef000 | |
| Dell XPS 13 Plus 9320 i7-1280P OLED | |
| Dell XPS 13 Plus 9320 Core i7-1360P | |
| Przeciętny Intel Iris Xe Graphics G7 96EUs (9.8 - 16.9, n=34) | |
| 1920x1080 Ultra Preset | |
| Asus Zenbook S 13 OLED | |
| HP Spectre x360 13.5 14t-ef000 | |
| Dell XPS 13 Plus 9320 i7-1280P OLED | |
| Dell XPS 13 Plus 9320 Core i7-1360P | |
| Przeciętny Intel Iris Xe Graphics G7 96EUs (7.4 - 16.8, n=32) | |
| Tiny Tina's Wonderlands | |
| 1920x1080 Low Preset (DX12) | |
| Framework Laptop 13.5 13th Gen Intel | |
| Przeciętny Intel Iris Xe Graphics G7 96EUs (22.3 - 53, n=32) | |
| Dell XPS 13 Plus 9320 Core i7-1360P | |
| 1920x1080 Medium Preset (DX12) | |
| Framework Laptop 13.5 13th Gen Intel | |
| Dell XPS 13 Plus 9320 Core i7-1360P | |
| Przeciętny Intel Iris Xe Graphics G7 96EUs (17 - 40.1, n=30) | |
| 1920x1080 High Preset (DX12) | |
| Framework Laptop 13.5 13th Gen Intel | |
| Dell XPS 13 Plus 9320 Core i7-1360P | |
| Przeciętny Intel Iris Xe Graphics G7 96EUs (10.6 - 24.1, n=29) | |
| 1920x1080 Badass Preset (DX12) | |
| Framework Laptop 13.5 13th Gen Intel | |
| Dell XPS 13 Plus 9320 Core i7-1360P | |
| Przeciętny Intel Iris Xe Graphics G7 96EUs (8.4 - 18.4, n=26) | |
| 1280x720 Lowest Preset (DX12) | |
| Dell XPS 13 Plus 9320 Core i7-1360P | |
| Przeciętny Intel Iris Xe Graphics G7 96EUs (25.9 - 67.3, n=32) | |
Witcher 3 FPS Chart
| low | med. | high | ultra | QHD | |
|---|---|---|---|---|---|
| GTA V (2015) | 130.6 | 105.3 | 26.6 | 11.6 | 7.35 |
| The Witcher 3 (2015) | 86.7 | 56.1 | 33.9 | 15.4 | |
| Dota 2 Reborn (2015) | 125.6 | 97.7 | 68.7 | 61.6 | |
| Final Fantasy XV Benchmark (2018) | 44.5 | 25.2 | 17.5 | ||
| X-Plane 11.11 (2018) | 42.7 | 36.2 | 33.2 | ||
| Strange Brigade (2018) | 93.9 | 43.8 | 35.4 | 27.5 | |
| Cyberpunk 2077 1.6 (2022) | 20.8 | 17.3 | 13.6 | 11 | |
| Tiny Tina's Wonderlands (2022) | 29.6 | 23.7 | 15.2 | 12.2 | |
| F1 22 (2022) | 47.5 | 42.8 | 31.9 | 24.1 |
Emisje
Hałas systemowy
Chociaż nie ma żadnych zmian w rozwiązaniu chłodzącym lub poziomie hałasu wentylatora, jesteśmy w stanie zauważyć lekki wycie cewki z naszej jednostki testowej, gdy umieszczamy ucho w pobliżu klawiszy klawiatury. Poza tym wentylatory pracują na biegu jałowym lub są ledwo słyszalne przy większości lekkich obciążeń, takich jak przeglądanie stron internetowych lub przetwarzanie tekstu.
Hałas
| luz |
| 24 / 24 / 24.4 dB |
| obciążenie |
| 37 / 42 dB |
 | ||
30 dB cichy 40 dB(A) słyszalny 50 dB(A) irytujący |
||
min: | ||
| Dell XPS 13 Plus 9320 Core i7-1360P Iris Xe G7 96EUs, i7-1360P, Samsung PM9A1 MZVL2512HCJQ | Dell XPS 13 Plus 9320 i7-1280P OLED Iris Xe G7 96EUs, i7-1280P, WDC PC SN810 512GB | Dell XPS 13 7390 Core i7-10710U UHD Graphics 620, i7-10710U, SK Hynix PC601 NVMe 512 GB | Framework Laptop 13.5 13th Gen Intel Iris Xe G7 96EUs, i7-1370P, WD PC SN740 SDDPNQD-1T00 | Lenovo ThinkPad X13 Yoga G3 21AW003UGE Iris Xe G7 96EUs, i7-1265U, Samsung PM9A1 MZVL2512HCJQ | HP Spectre x360 13.5 14t-ef000 Iris Xe G7 96EUs, i7-1255U, Micron 3400 1TB MTFDKBA1T0TFH | |
|---|---|---|---|---|---|---|
| Noise | 3% | -12% | -6% | -2% | 7% | |
| wyłączone / środowisko * (dB) | 23.7 | 23.4 1% | 28 -18% | 23.2 2% | 23.22 2% | 23.5 1% |
| Idle Minimum * (dB) | 24 | 23.4 2% | 28 -17% | 23.2 3% | 23.2 3% | 23.5 2% |
| Idle Average * (dB) | 24 | 23.4 2% | 28 -17% | 23.2 3% | 23.2 3% | 23.5 2% |
| Idle Maximum * (dB) | 24.4 | 23.4 4% | 28 -15% | 23.2 5% | 28.6 -17% | 23.5 4% |
| Load Average * (dB) | 37 | 35 5% | 33.7 9% | 45.3 -22% | 39.8 -8% | 27 27% |
| Witcher 3 ultra * (dB) | 42.1 | 41.6 1% | 47.9 -14% | 41.8 1% | 36.2 14% | |
| Load Maximum * (dB) | 42 | 39.9 5% | 46.5 -11% | 49.2 -17% | 40.6 3% | 42.4 -1% |
* ... im mniej tym lepiej
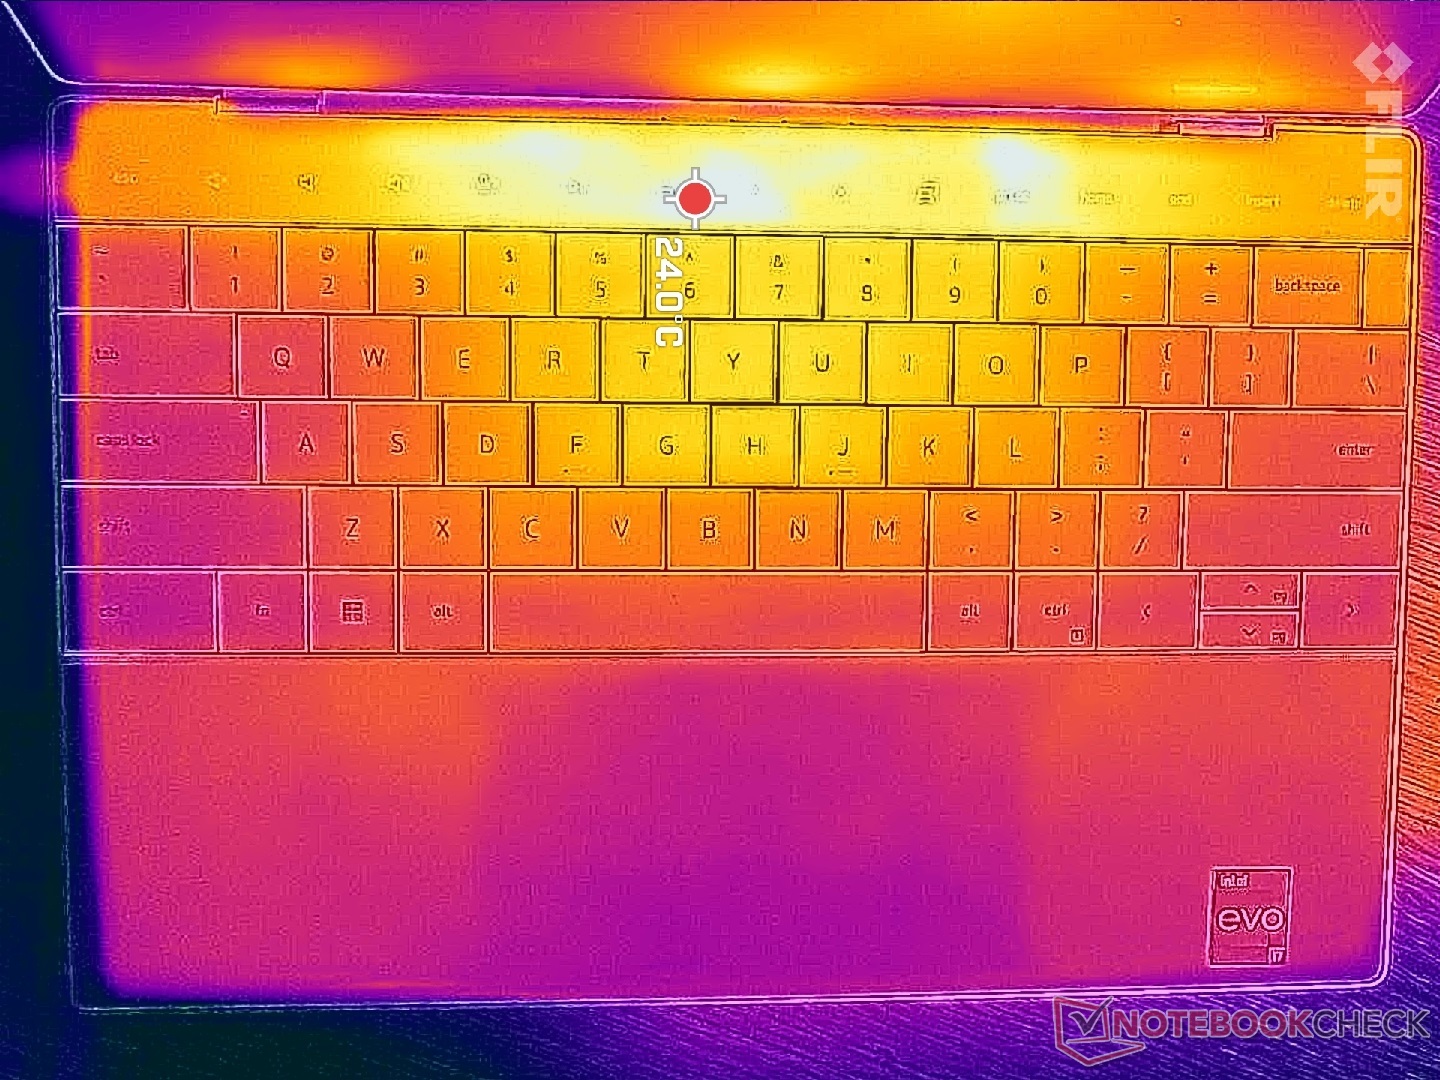
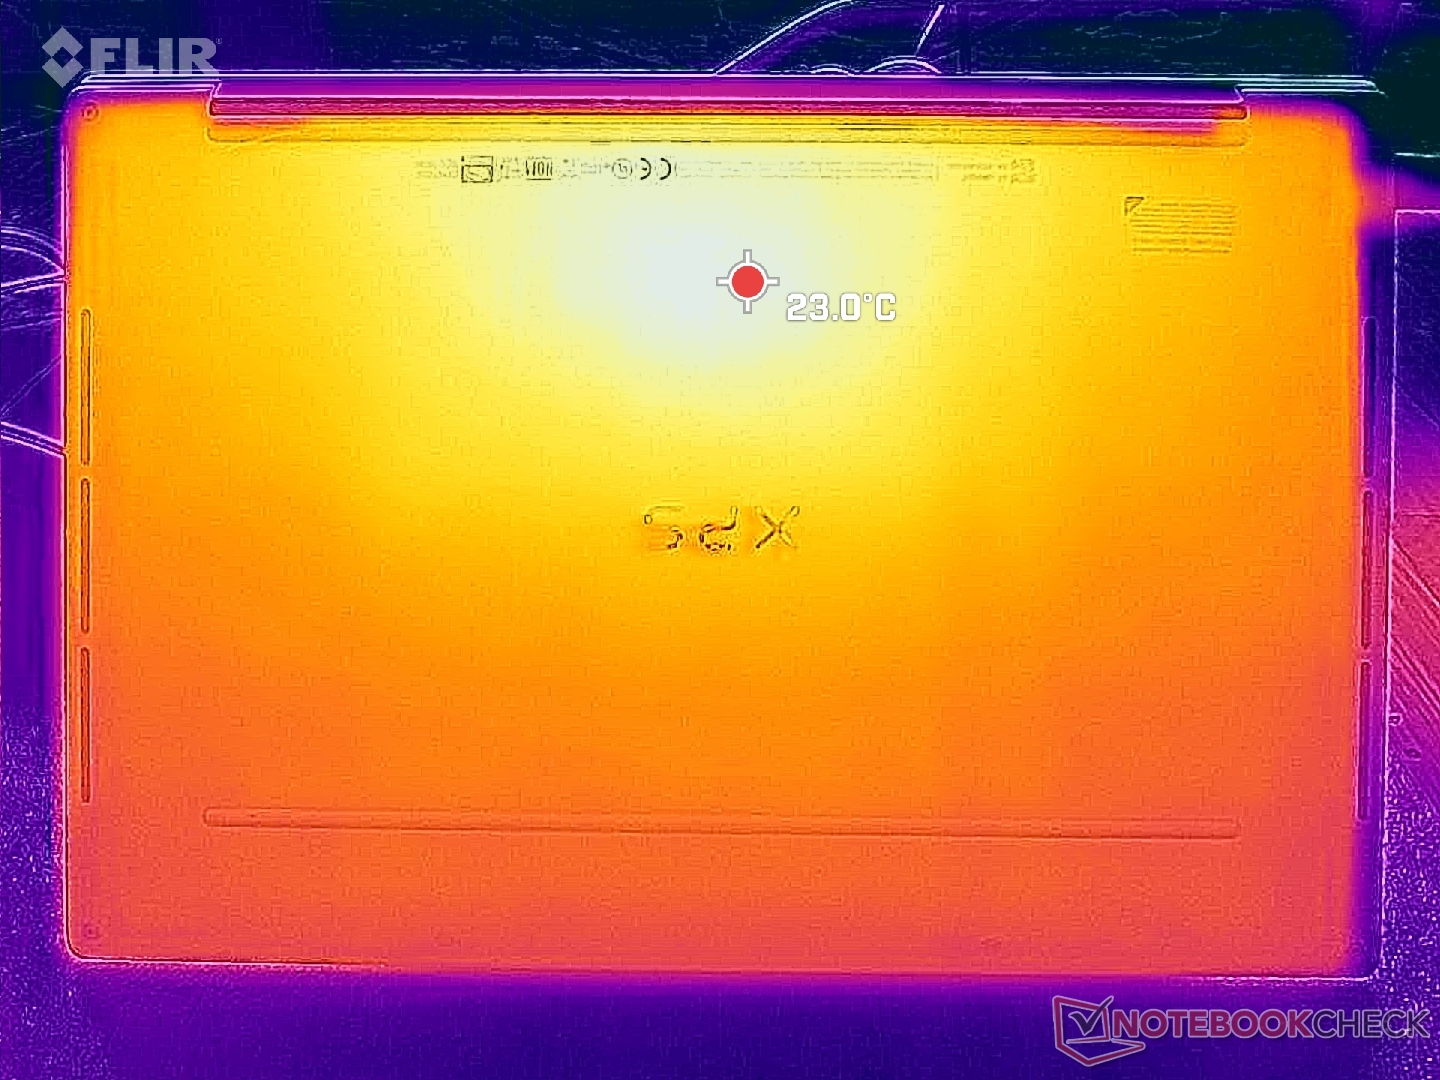
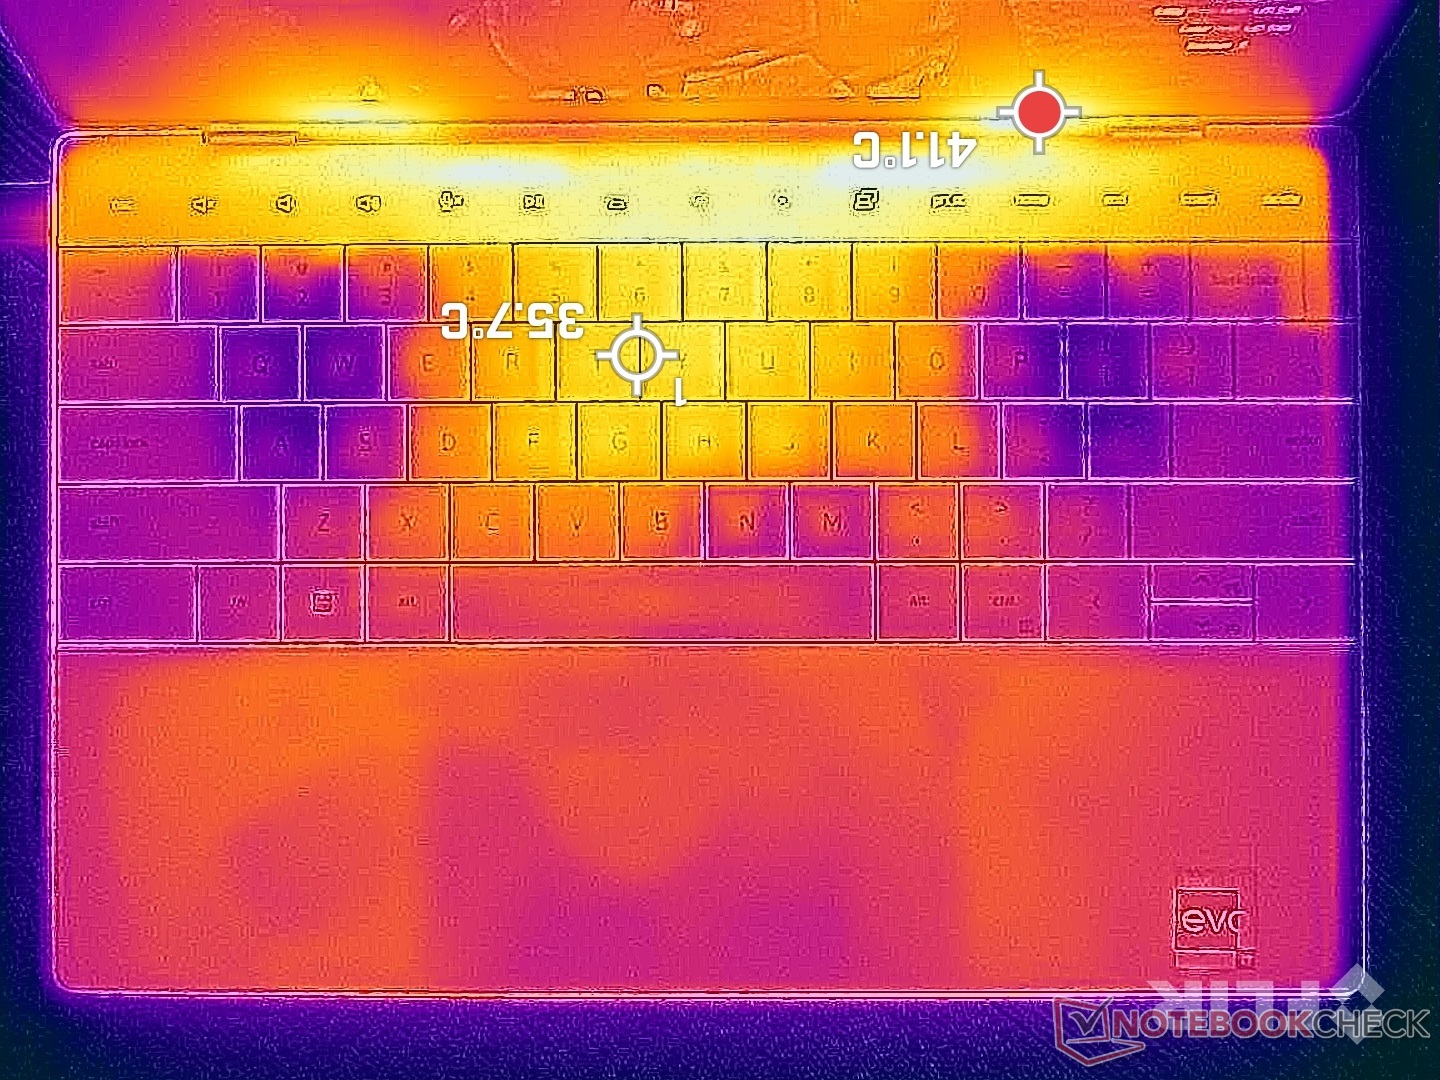
Temperatura
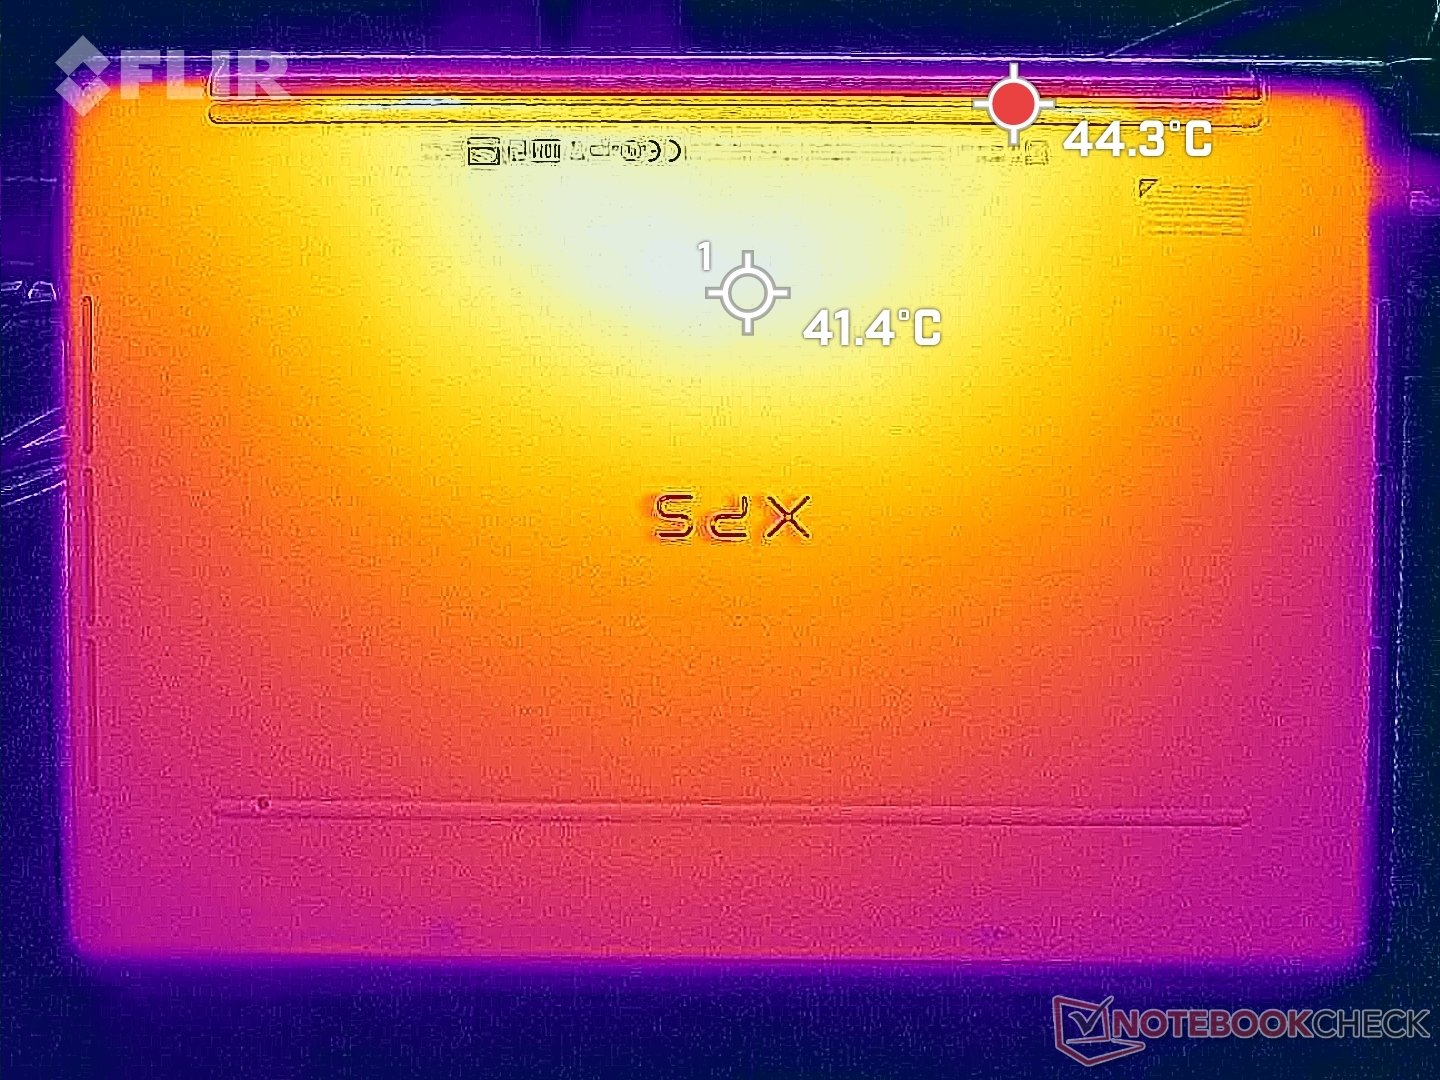
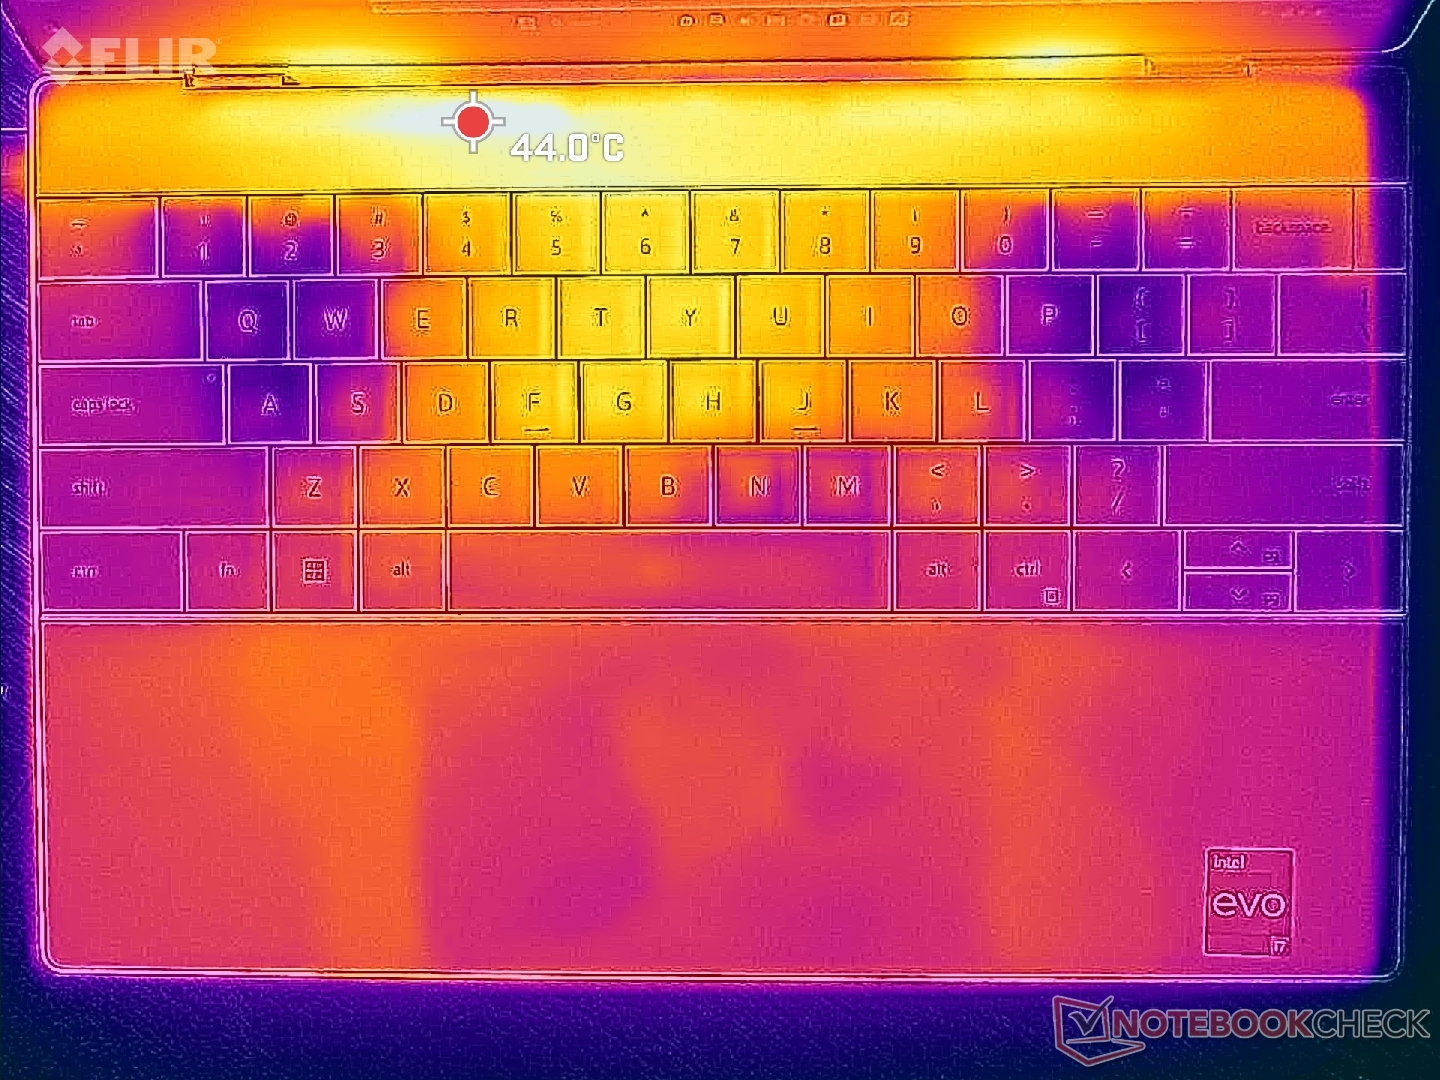
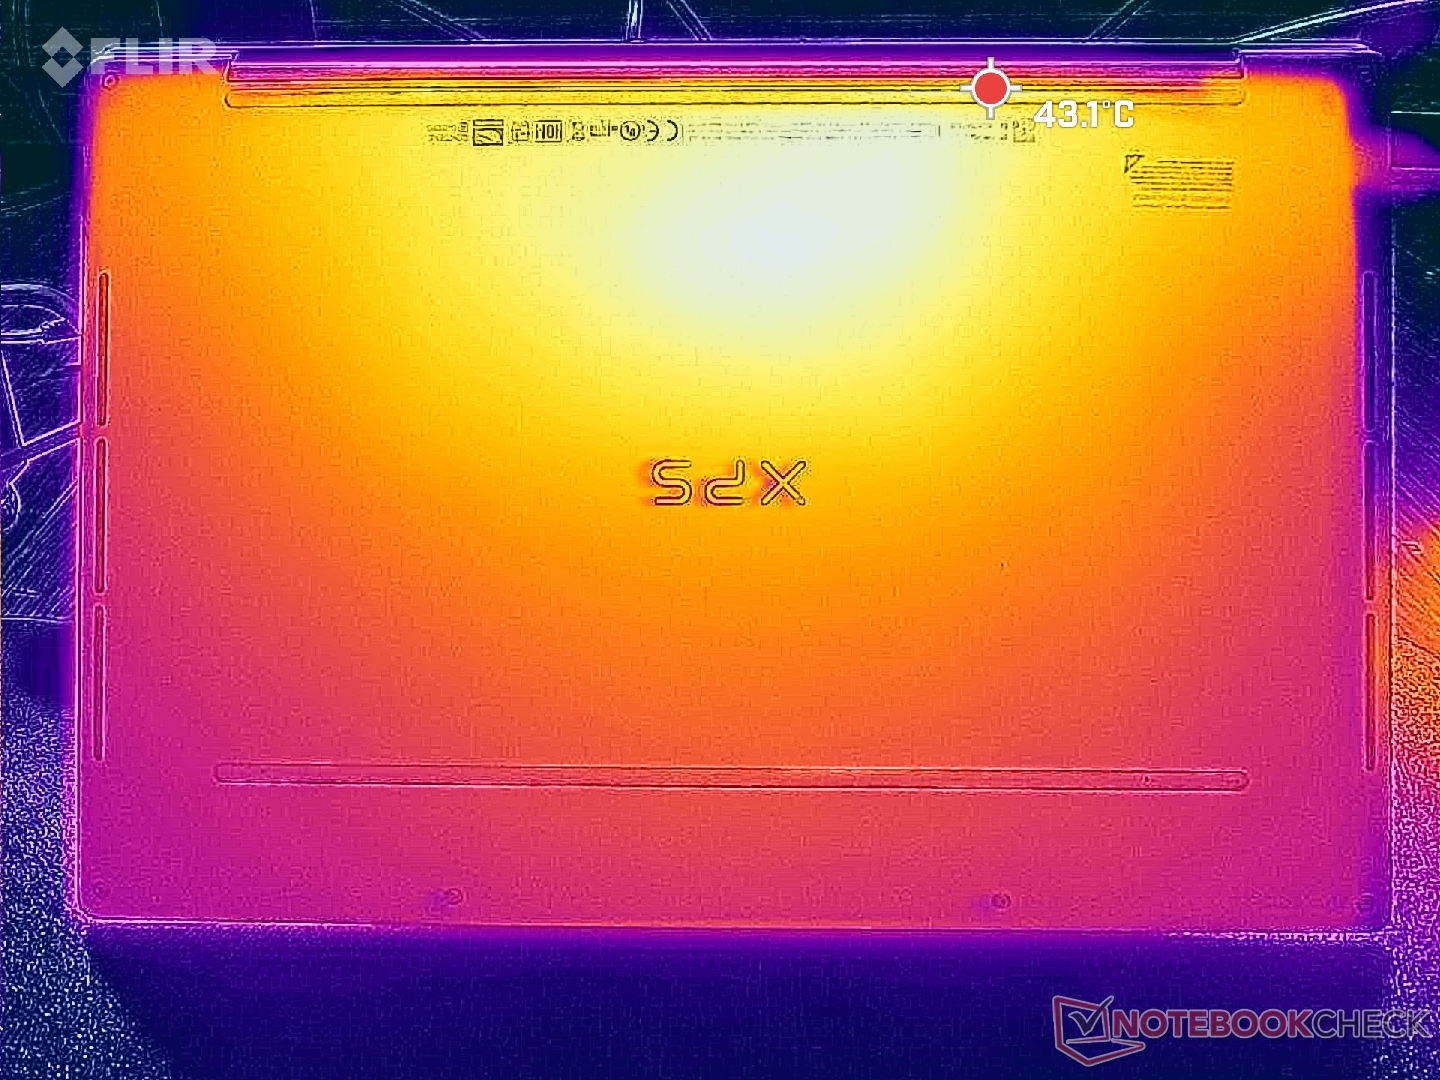
Temperatury powierzchniowe mogą być bardzo wysokie ze względu na cienki profil, procesor Core-P i brak jakichkolwiek kratek wentylacyjnych na dolnym panelu. Gorące punkty mogą osiągnąć nawet 45 C w porównaniu do zaledwie 35 C na wolniejszym HP Dragonfly Folio 13.5 G3.
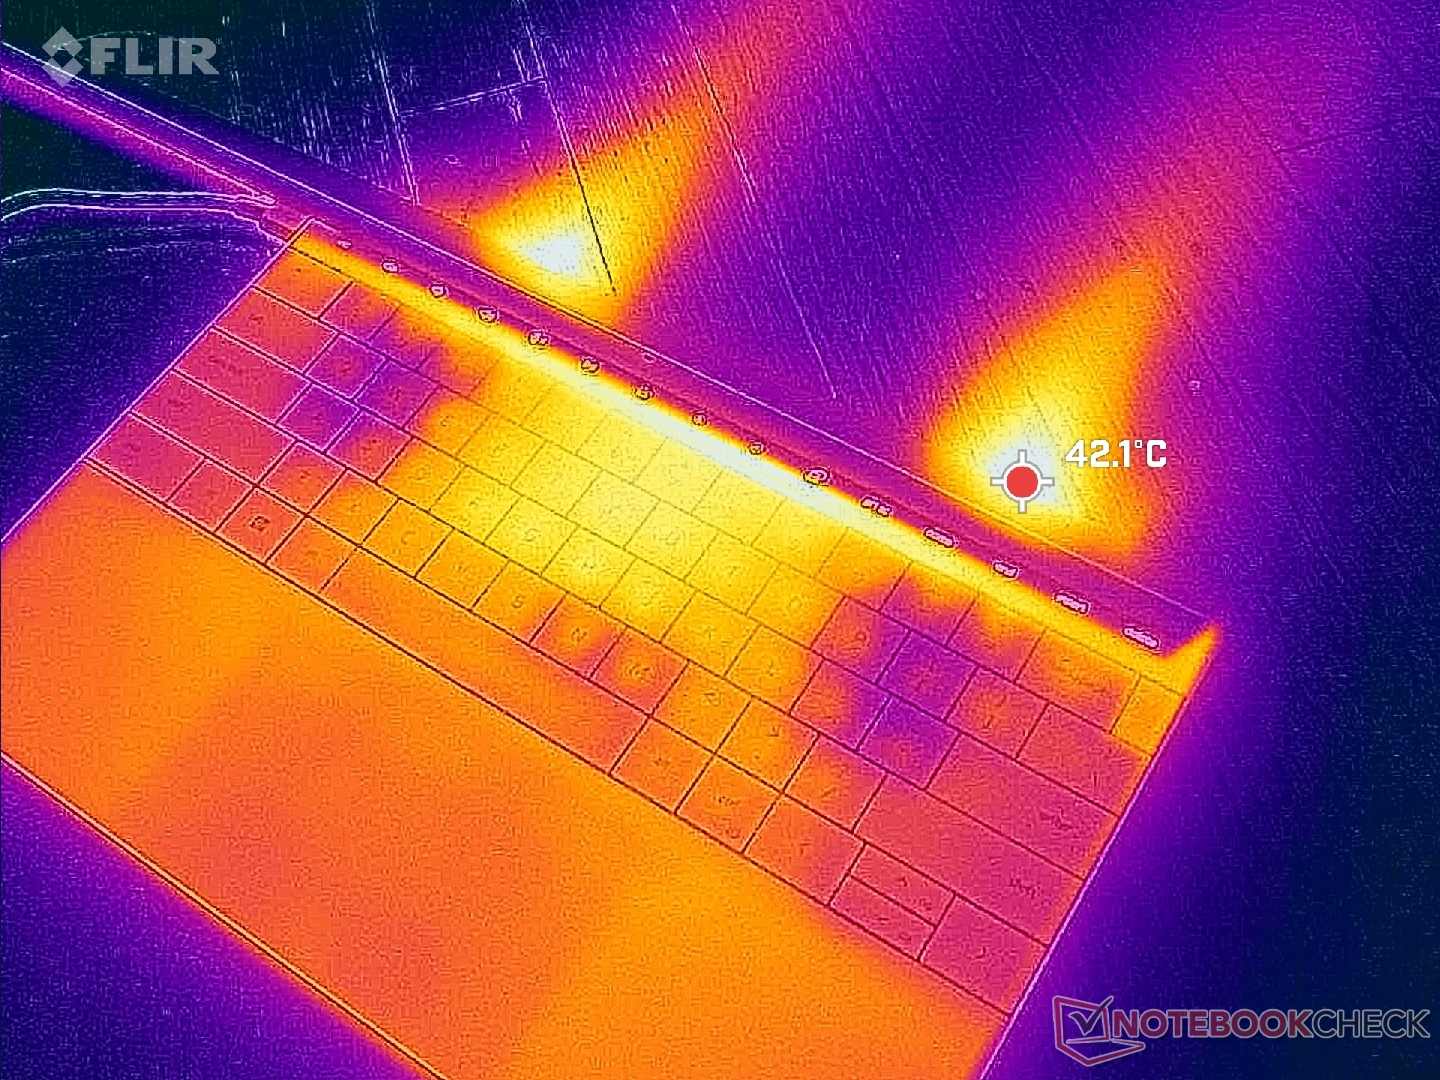
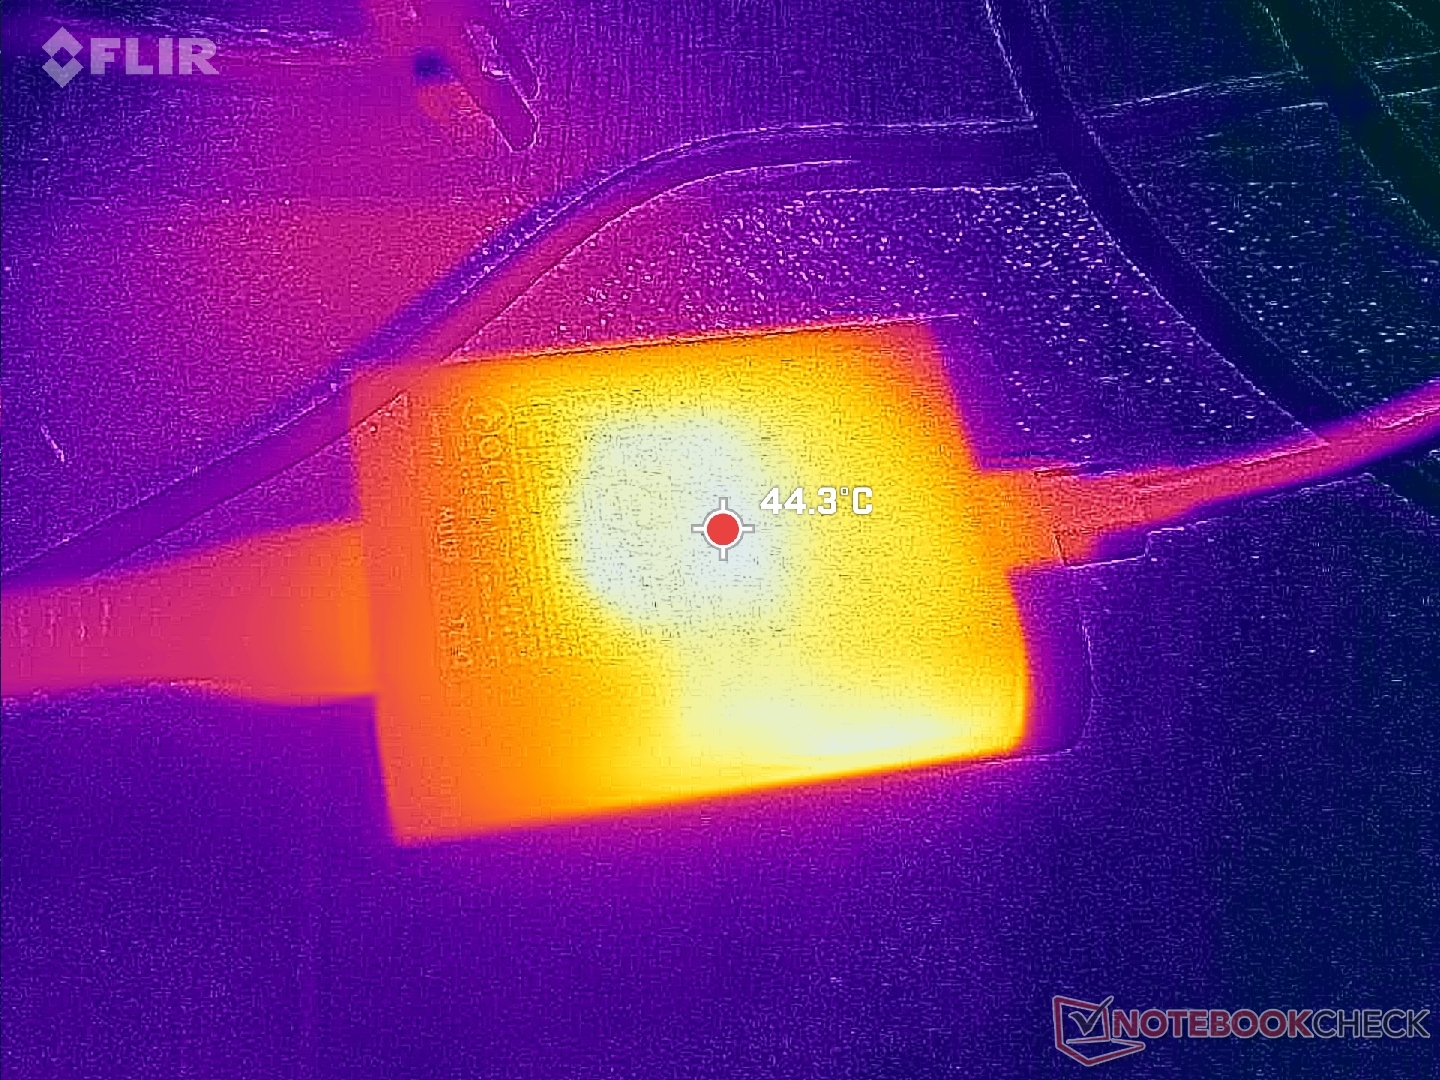
(±) Maksymalna temperatura w górnej części wynosi 43.8 °C / 111 F, w porównaniu do średniej 35.9 °C / 97 F , począwszy od 21.4 do 59 °C dla klasy Subnotebook.
(±) Dno nagrzewa się maksymalnie do 44.4 °C / 112 F, w porównaniu do średniej 39.2 °C / 103 F
(+) W stanie bezczynności średnia temperatura górnej części wynosi 22.4 °C / 72 F, w porównaniu ze średnią temperaturą urządzenia wynoszącą 30.8 °C / ### class_avg_f### F.
(±) Podczas gry w Wiedźmina 3 średnia temperatura górnej części wynosi 32.9 °C / 91 F, w porównaniu do średniej temperatury urządzenia wynoszącej 30.8 °C / ## #class_avg_f### F.
(+) Podparcia dłoni i touchpad osiągają maksymalną temperaturę skóry (32.6 °C / 90.7 F) i dlatego nie są gorące.
(-) Średnia temperatura obszaru podparcia dłoni w podobnych urządzeniach wynosiła 28.2 °C / 82.8 F (-4.4 °C / -7.9 F).
| Dell XPS 13 Plus 9320 Core i7-1360P Intel Core i7-1360P, Intel Iris Xe Graphics G7 96EUs | Dell XPS 13 Plus 9320 i5-1240p Intel Core i5-1240P, Intel Iris Xe Graphics G7 80EUs | Dell XPS 13 7390 Core i7-10710U Intel Core i7-10710U, Intel UHD Graphics 620 | Framework Laptop 13.5 13th Gen Intel Intel Core i7-1370P, Intel Iris Xe Graphics G7 96EUs | Lenovo ThinkPad X13 Yoga G3 21AW003UGE Intel Core i7-1265U, Intel Iris Xe Graphics G7 96EUs | HP Spectre x360 13.5 14t-ef000 Intel Core i7-1255U, Intel Iris Xe Graphics G7 96EUs | |
|---|---|---|---|---|---|---|
| Heat | -41% | -13% | 1% | -25% | 14% | |
| Maximum Upper Side * (°C) | 43.8 | 47.6 -9% | 44.6 -2% | 38.2 13% | 52.2 -19% | 36.4 17% |
| Maximum Bottom * (°C) | 44.4 | 57 -28% | 49.2 -11% | 41.4 7% | 50.2 -13% | 37 17% |
| Idle Upper Side * (°C) | 24 | 38.8 -62% | 28.2 -18% | 25.8 -8% | 32 -33% | 20.8 13% |
| Idle Bottom * (°C) | 25.2 | 41 -63% | 30.2 -20% | 27.6 -10% | 33.6 -33% | 22.6 10% |
* ... im mniej tym lepiej
Test warunków skrajnych
Po obciążeniu w Prime95, limity PL2 i PL1 Core i7-1360P są dokładnie takie same, jak te, które zaobserwowaliśmy w zeszłorocznym XPS 13 Plus z Core i7-1280P, odpowiednio 64 W i 34 W. Częstotliwości taktowania wzrosłyby do 3,6 GHz przez około pierwszą sekundę, po czym spadłyby i ostatecznie ustabilizowały się na poziomie 2,3 GHz i 90 C. Bardzo wysoka temperatura procesora jest częściowo odpowiedzialna za wysokie temperatury powierzchni wspomniane powyżej.
Praca na baterii nie wpływa na wydajność. Test 3DMark 11 na zasilaniu bateryjnym dałby zasadniczo takie same wyniki jak na zasilaniu sieciowym.
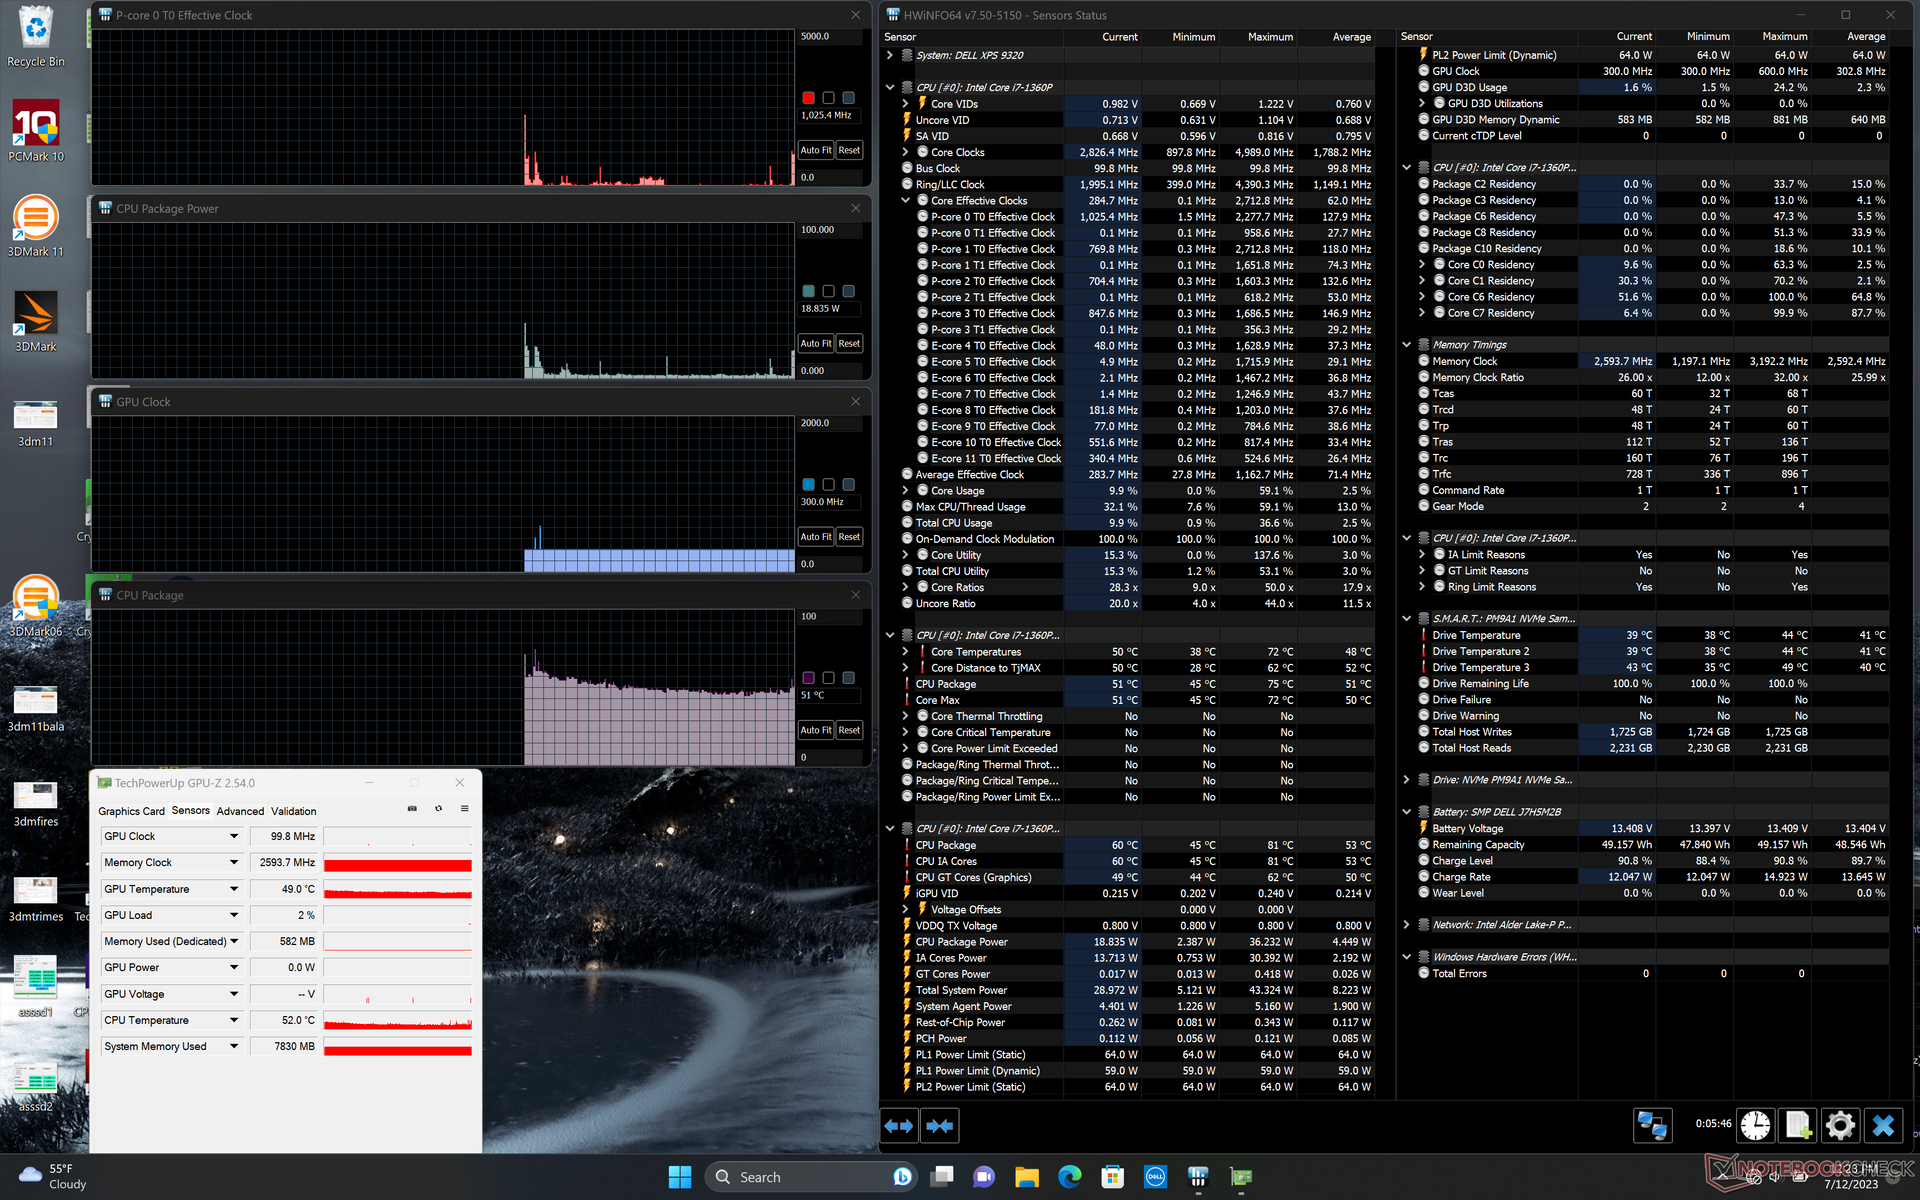
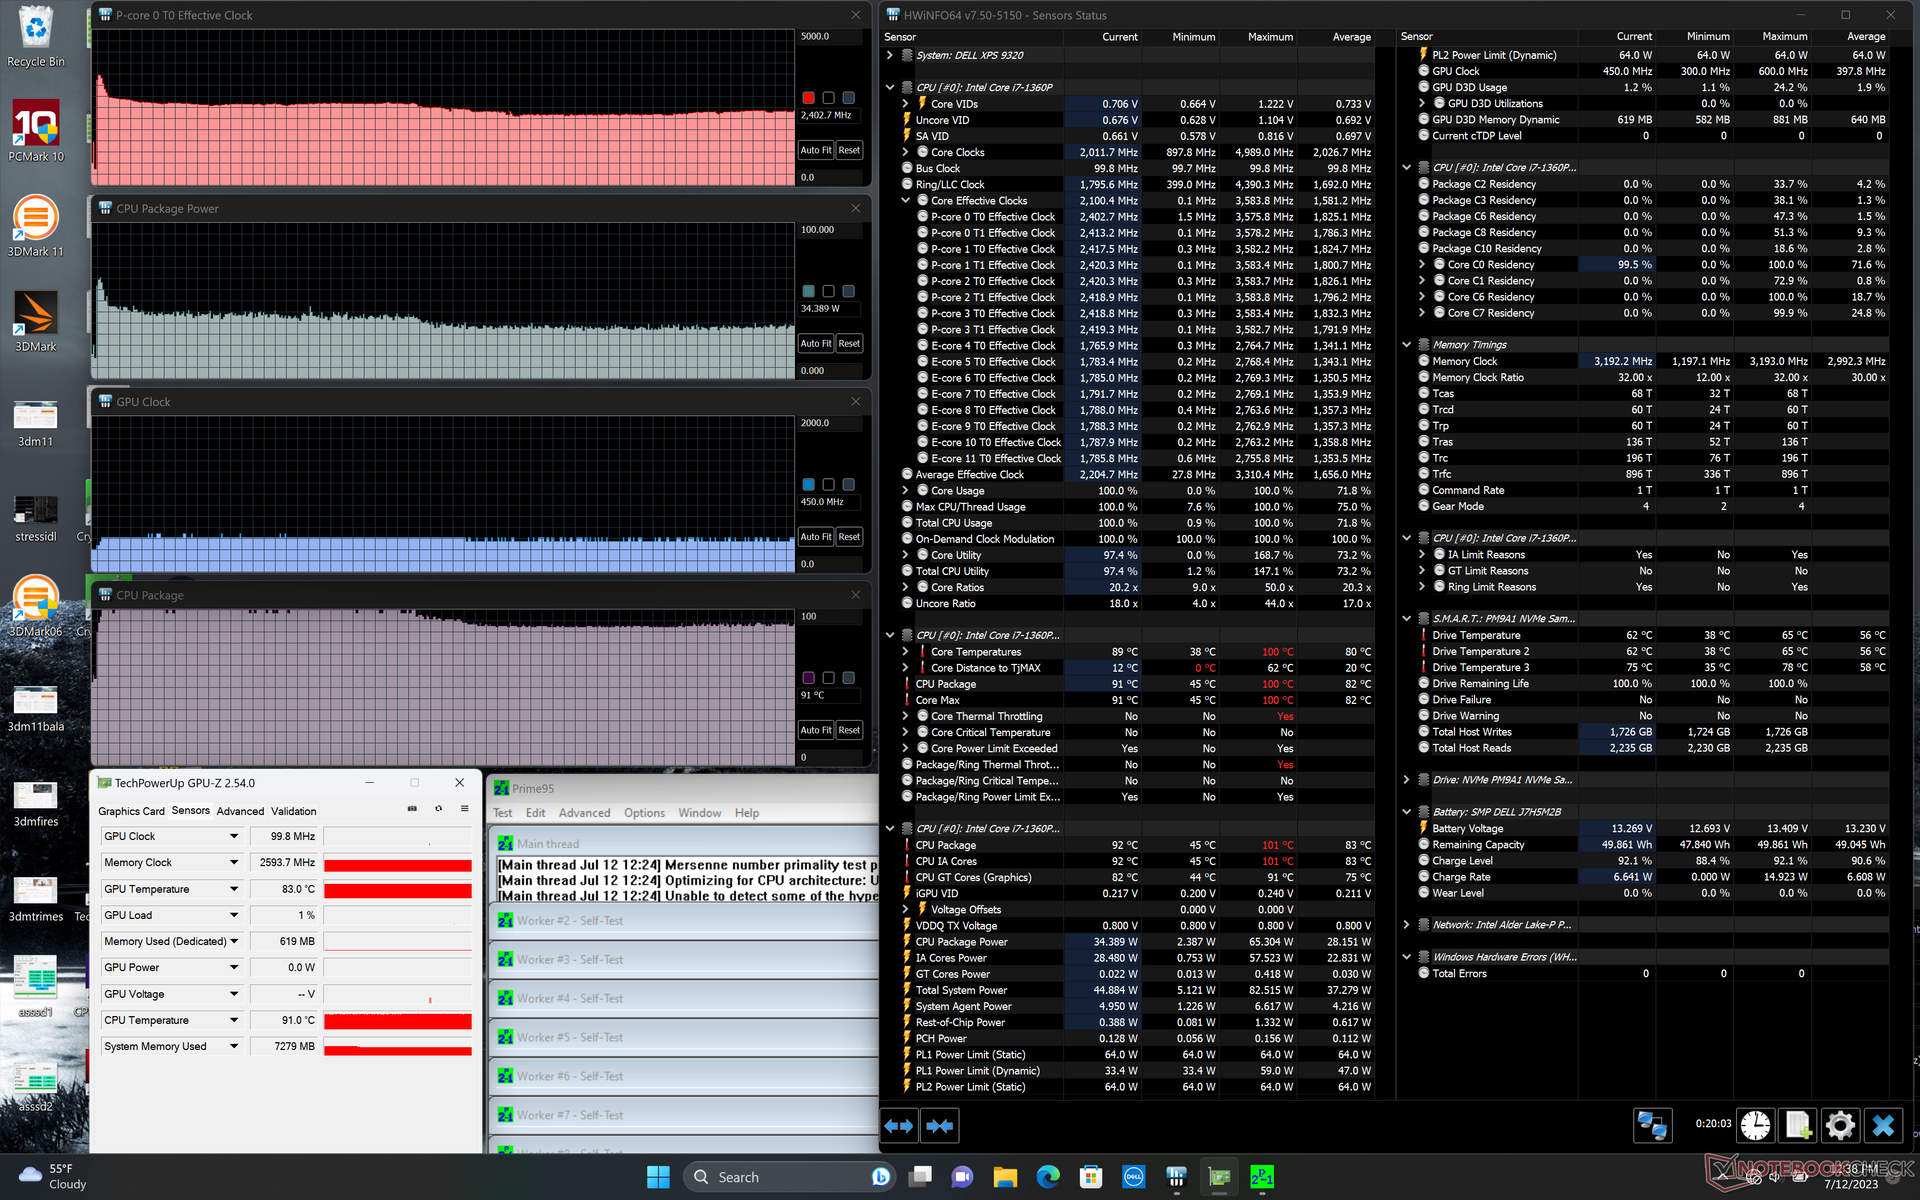
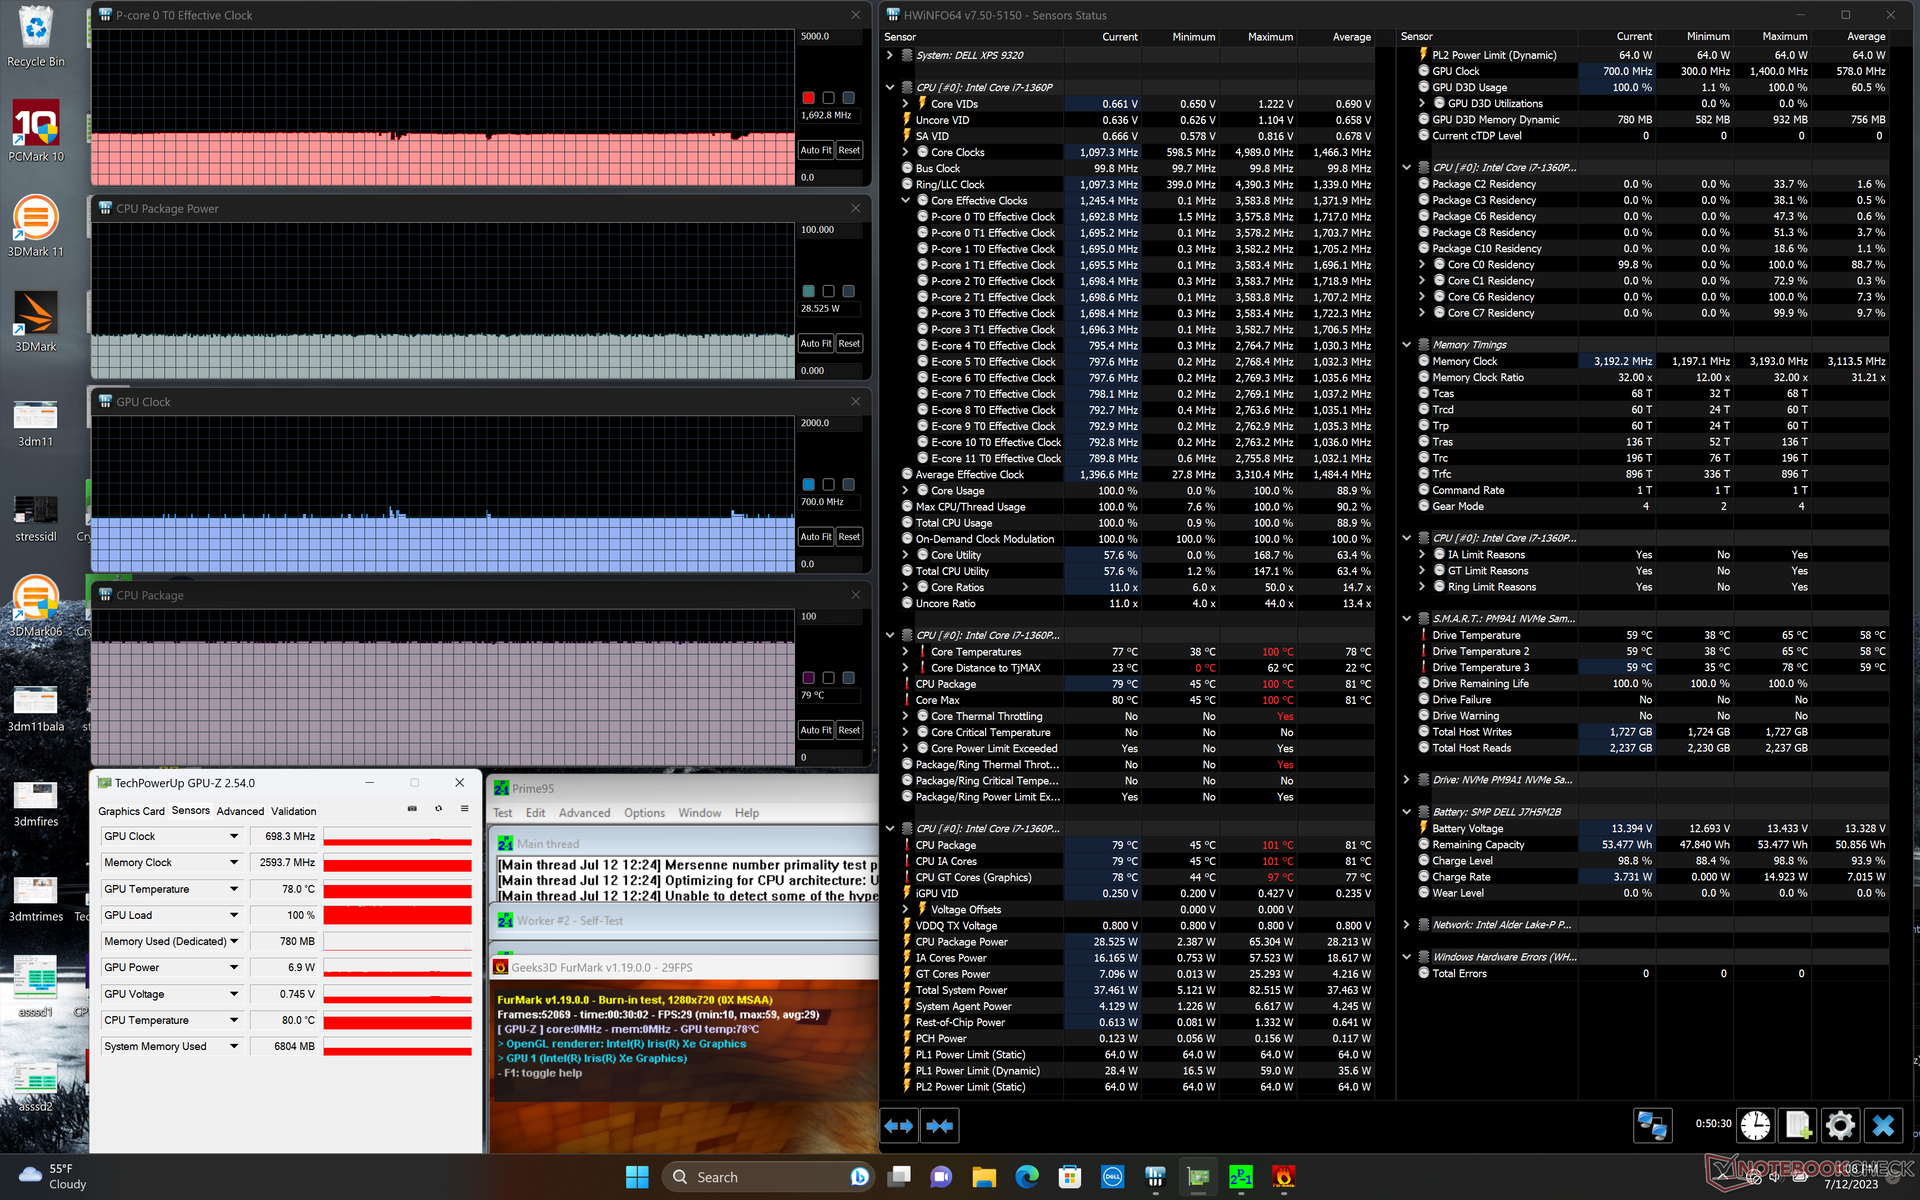
| Taktowanie CPU (GHz) | Taktowanie GPU (MHz) | Średnia temperatura CPU (°C) | |
| System bezczynności | -- | -- | 51 |
| Prime95Stress | 2.4 | -- | 91 |
| Prime95+ FurMark Stress | 1.7 | 700 | 79 |
| Witcher 3 Obciążenie | ~1,6 | 1250 | 81 |
Głośniki
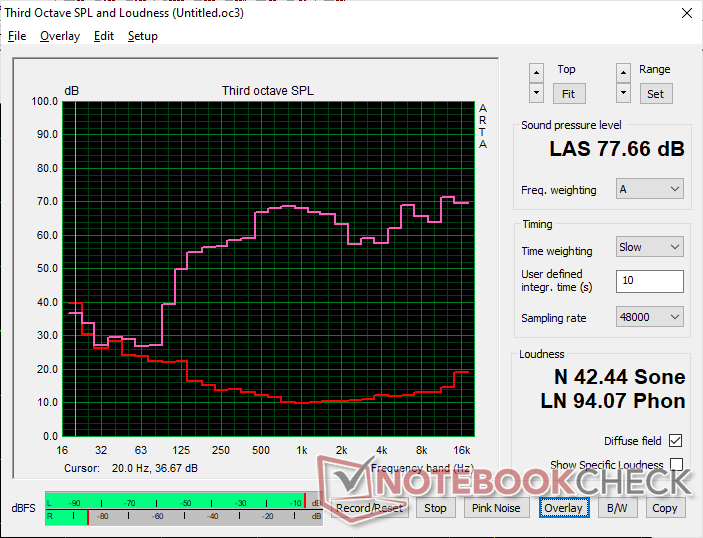
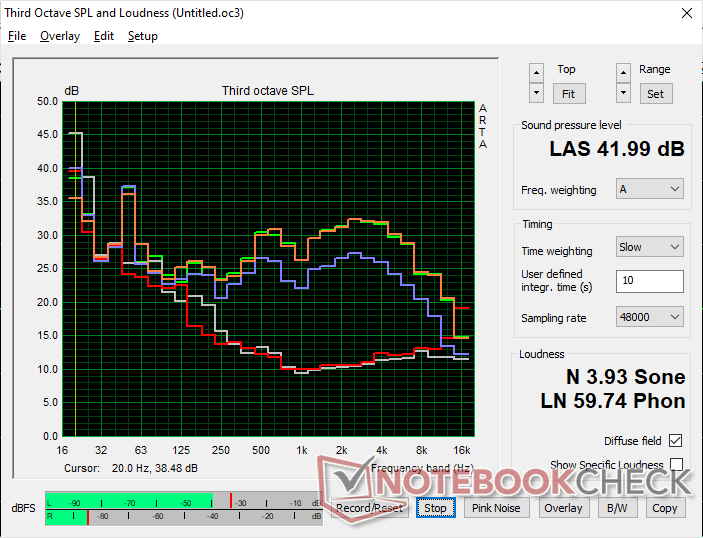
Dell XPS 13 Plus 9320 Core i7-1360P analiza dźwięku
(±) | głośność głośnika jest średnia, ale dobra (77.7 dB)
Bas 100 - 315 Hz
(±) | zredukowany bas - średnio 10.8% niższy od mediany
(±) | liniowość basu jest średnia (10.2% delta do poprzedniej częstotliwości)
Średnie 400 - 2000 Hz
(+) | zbalansowane środki średnie - tylko 3.6% od mediany
(+) | średnie są liniowe (3.8% delta do poprzedniej częstotliwości)
Wysokie 2–16 kHz
(+) | zrównoważone maksima - tylko 3.6% od mediany
(±) | liniowość wysokich wartości jest średnia (7.4% delta do poprzedniej częstotliwości)
Ogólnie 100 - 16.000 Hz
(+) | ogólny dźwięk jest liniowy (13.2% różnicy w stosunku do mediany)
W porównaniu do tej samej klasy
» 21% wszystkich testowanych urządzeń w tej klasie było lepszych, 5% podobnych, 74% gorszych
» Najlepszy miał deltę 5%, średnia wynosiła ###średnia###%, najgorsza wynosiła 53%
W porównaniu do wszystkich testowanych urządzeń
» 13% wszystkich testowanych urządzeń było lepszych, 3% podobnych, 84% gorszych
» Najlepszy miał deltę 4%, średnia wynosiła ###średnia###%, najgorsza wynosiła 134%
Apple MacBook Pro 16 2021 M1 Pro analiza dźwięku
(+) | głośniki mogą odtwarzać stosunkowo głośno (84.7 dB)
Bas 100 - 315 Hz
(+) | dobry bas - tylko 3.8% od mediany
(+) | bas jest liniowy (5.2% delta do poprzedniej częstotliwości)
Średnie 400 - 2000 Hz
(+) | zbalansowane środki średnie - tylko 1.3% od mediany
(+) | średnie są liniowe (2.1% delta do poprzedniej częstotliwości)
Wysokie 2–16 kHz
(+) | zrównoważone maksima - tylko 1.9% od mediany
(+) | wzloty są liniowe (2.7% delta do poprzedniej częstotliwości)
Ogólnie 100 - 16.000 Hz
(+) | ogólny dźwięk jest liniowy (4.6% różnicy w stosunku do mediany)
W porównaniu do tej samej klasy
» 0% wszystkich testowanych urządzeń w tej klasie było lepszych, 0% podobnych, 100% gorszych
» Najlepszy miał deltę 5%, średnia wynosiła ###średnia###%, najgorsza wynosiła 45%
W porównaniu do wszystkich testowanych urządzeń
» 0% wszystkich testowanych urządzeń było lepszych, 0% podobnych, 100% gorszych
» Najlepszy miał deltę 4%, średnia wynosiła ###średnia###%, najgorsza wynosiła 134%
Zarządzanie energią
Zużycie energii
Praca na biegu jałowym na komputerze stacjonarnym może pobierać od 6 W do 14 W, co jest szerszym zakresem niż w przypadku większości innych subnotebooków ze względu na bardziej wymagający wyświetlacz OLED. Jak szczegółowo opisaliśmy w naszym artykule tutajniektóre kolory będą wymagały więcej energii na panelu OLED, podczas gdy zużycie energii jest niezależne od koloru na IPS.
Ogólny pobór mocy jest poza tym podobny do zeszłorocznego modelu, pomimo procesora nowszej generacji. Na przykład uruchomienie Prime95 wymagałoby około 63 W z każdego systemu, co oznacza, że korzyści z wydajności na wat w przypadku Core i7-1360P 13. generacji nie są lepsze niż w przypadku Core i7-1280P 12. generacji.
| wyłączony / stan wstrzymania | |
| luz | |
| obciążenie |
|
Legenda:
min: | |
| Dell XPS 13 Plus 9320 Core i7-1360P i7-1360P, Iris Xe G7 96EUs, Samsung PM9A1 MZVL2512HCJQ, OLED, 3456x2160, 13.4" | Dell XPS 13 Plus 9320 i7-1280P OLED i7-1280P, Iris Xe G7 96EUs, WDC PC SN810 512GB, OLED, 3456x2160, 13.4" | Dell XPS 13 7390 Core i7-10710U i7-10710U, UHD Graphics 620, SK Hynix PC601 NVMe 512 GB, IPS, 3840x2160, 13.3" | Framework Laptop 13.5 13th Gen Intel i7-1370P, Iris Xe G7 96EUs, WD PC SN740 SDDPNQD-1T00, IPS, 2256x1504, 13.5" | Lenovo ThinkPad X13 Yoga G3 21AW003UGE i7-1265U, Iris Xe G7 96EUs, Samsung PM9A1 MZVL2512HCJQ, IPS LED, 2560x1600, 13.3" | HP Spectre x360 13.5 14t-ef000 i7-1255U, Iris Xe G7 96EUs, Micron 3400 1TB MTFDKBA1T0TFH, OLED, 3000x2000, 13.5" | |
|---|---|---|---|---|---|---|
| Power Consumption | -5% | 16% | 10% | 7% | 16% | |
| Idle Minimum * (Watt) | 6.9 | 6.5 6% | 4.7 32% | 2.9 58% | 4.6 33% | 4 42% |
| Idle Average * (Watt) | 7.4 | 7.8 -5% | 8.3 -12% | 6.3 15% | 7.9 -7% | 4.9 34% |
| Idle Maximum * (Watt) | 13.6 | 13 4% | 9 34% | 9.9 27% | 8.9 35% | 12.5 8% |
| Load Average * (Watt) | 43.5 | 56.6 -30% | 42 3% | 56.2 -29% | 56.1 -29% | 48.1 -11% |
| Witcher 3 ultra * (Watt) | 48 | 49.2 -3% | 56.6 -18% | 40.4 16% | 35.8 25% | |
| Load Maximum * (Watt) | 63.3 | 63 -0% | 49 23% | 60.8 4% | 66.1 -4% | 65.2 -3% |
* ... im mniej tym lepiej
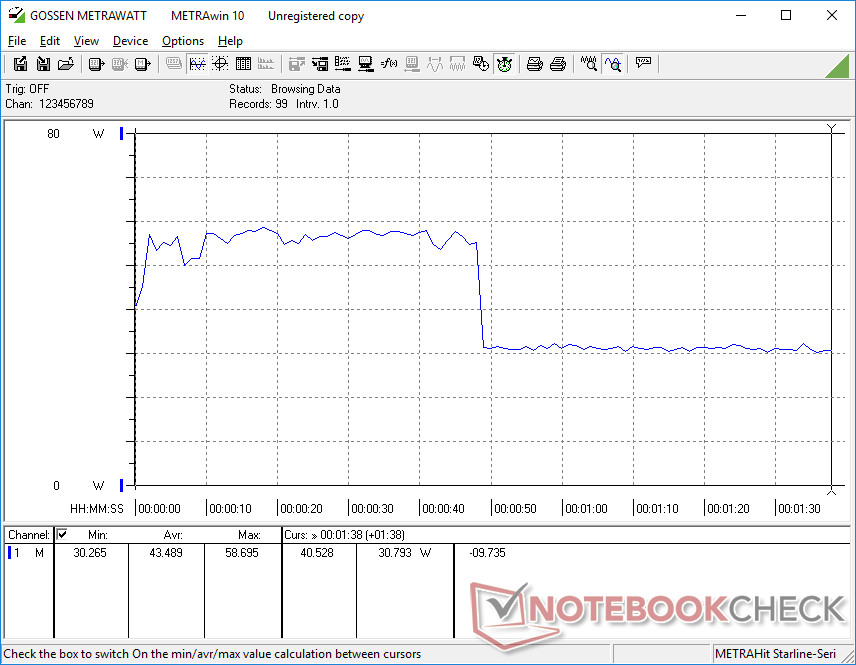
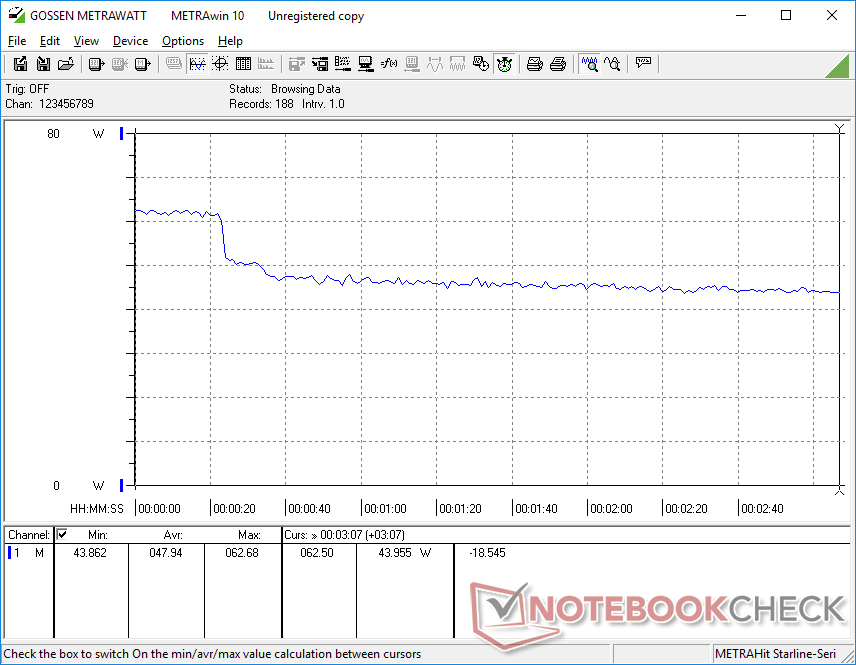
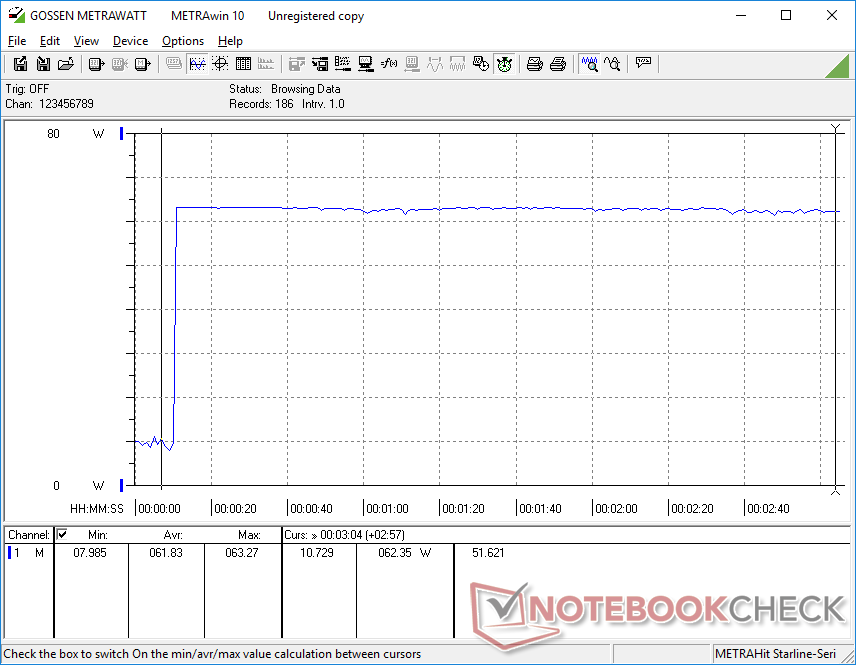
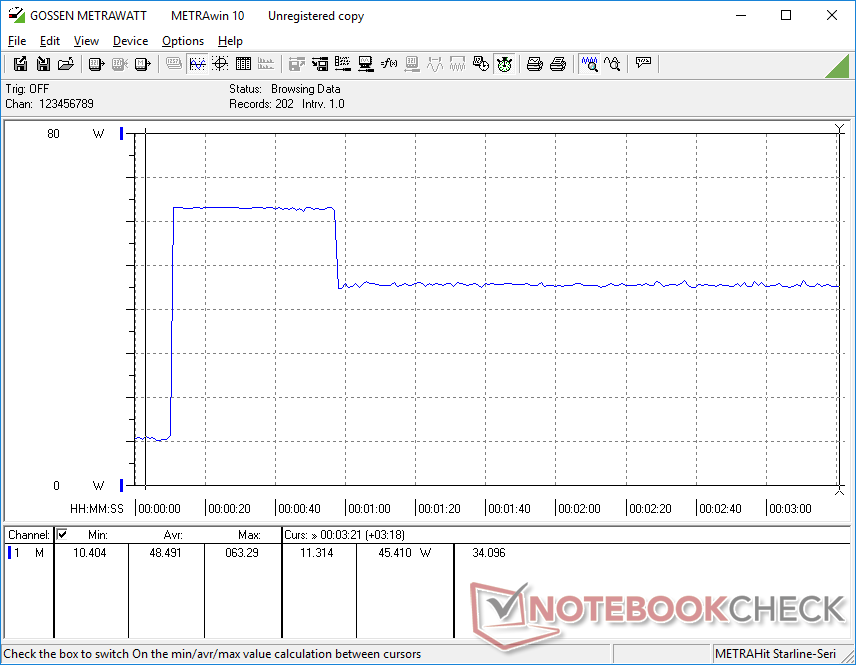
Power Consumption Witcher 3 / Stresstest
Power Consumption external Monitor
Żywotność baterii
Czasy pracy są niemal identyczne z zeszłoroczną konfiguracją Core i7-1260P i wynoszą około 7,5 godziny rzeczywistego przeglądania Internetu.
Ładowanie od stanu pustego do pełnej pojemności za pomocą dołączonego adaptera zajmuje nieco ponad 2 godziny.
| Dell XPS 13 Plus 9320 Core i7-1360P i7-1360P, Iris Xe G7 96EUs, 55 Wh | Dell XPS 13 Plus 9320 i7-1280P OLED i7-1280P, Iris Xe G7 96EUs, 55 Wh | Dell XPS 13 7390 Core i7-10710U i7-10710U, UHD Graphics 620, 52 Wh | Framework Laptop 13.5 13th Gen Intel i7-1370P, Iris Xe G7 96EUs, 61 Wh | Lenovo ThinkPad X13 Yoga G3 21AW003UGE i7-1265U, Iris Xe G7 96EUs, 52.8 Wh | HP Spectre x360 13.5 14t-ef000 i7-1255U, Iris Xe G7 96EUs, 66 Wh | |
|---|---|---|---|---|---|---|
| Czasy pracy | -21% | 15% | 21% | 11% | 10% | |
| WiFi v1.3 (h) | 7.3 | 5.8 -21% | 8.4 15% | 8.8 21% | 8.1 11% | 8 10% |
| Load (h) | 1.9 | 2.2 | ||||
| Reader / Idle (h) | 20.4 |
Za
Przeciw
Werdykt - pomiń wersję 2023 i kup wersję 2022
Konstrukcja XPS 13 Plus został wprowadzony zaledwie w zeszłym roku, więc tegoroczne odświeżenie jest prawdopodobnie niewielkie. Nierealistyczne byłoby zakładanie jakichkolwiek dramatycznych aktualizacji obudowy lub elementów wewnętrznych w tym momencie, ale odświeżenie z 2023 roku jest niestety niezapomniane, biorąc pod uwagę, że ledwo oferuje jakiekolwiek korzyści pod względem wydajności procesora lub wydajności na wat w porównaniu z poprzednim rokiem. Co więcej, inne aspekty wydają się niespójne, takie jak przeskakiwanie klatek podczas odtwarzania wideo i dławienie dysku SSD. Wszystkie główne zalety i wady oryginalnego XPS 13 Plus 9320 nadal dotyczą wersji 2023.
Trzynasty Core i7-1360P sprawia wrażenie rebrandingu Core i7-1280P 12. generacji. W rezultacie zainteresowani nabywcy mogą chcieć rozważyć oryginalny XPS 13 Plus 9320 z 2022 roku zamiast nowszej wersji z 2023 roku.
Jeśli jesteś na rynku XPS 13 Plus 9320, to polecamy oryginalny model z 2022 roku, ponieważ jest tańszy i ma zasadniczo taką samą wydajność jak iteracja z 2023 roku. Kupujący mogą zamiast tego zainwestować zaoszczędzone pieniądze w bardziej namacalne funkcje, takie jak więcej pamięci RAM, więcej pamięci masowej lub wyświetlacz o wyższej rozdzielczości.
Cena i dostępność
Dell dostarcza obecnie XPS 13 Plus 9320 w cenie od 1150 USD za podstawową konfigurację FHD do 1750 USD za konfigurację 4K UHD.
Dell XPS 13 Plus 9320 Core i7-1360P
- 16/07/2023 v7 (old)
Allen Ngo
Przezroczystość
Wyboru urządzeń do recenzji dokonuje nasza redakcja. Próbka testowa została udostępniona autorowi jako pożyczka od producenta lub sprzedawcy detalicznego na potrzeby tej recenzji. Pożyczkodawca nie miał wpływu na tę recenzję, producent nie otrzymał też kopii tej recenzji przed publikacją. Nie było obowiązku publikowania tej recenzji. Jako niezależna firma medialna, Notebookcheck nie podlega władzy producentów, sprzedawców detalicznych ani wydawców.
Tak testuje Notebookcheck
Każdego roku Notebookcheck niezależnie sprawdza setki laptopów i smartfonów, stosując standardowe procedury, aby zapewnić porównywalność wszystkich wyników. Od około 20 lat stale rozwijamy nasze metody badawcze, ustanawiając przy tym standardy branżowe. W naszych laboratoriach testowych doświadczeni technicy i redaktorzy korzystają z wysokiej jakości sprzętu pomiarowego. Testy te obejmują wieloetapowy proces walidacji. Nasz kompleksowy system ocen opiera się na setkach uzasadnionych pomiarów i benchmarków, co pozwala zachować obiektywizm.Price comparison

