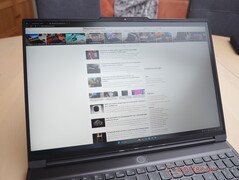
Recenzja gamingowego laptopa Lenovo Legion Slim 7 16: Przekonujący nawet z AMD Ryzen
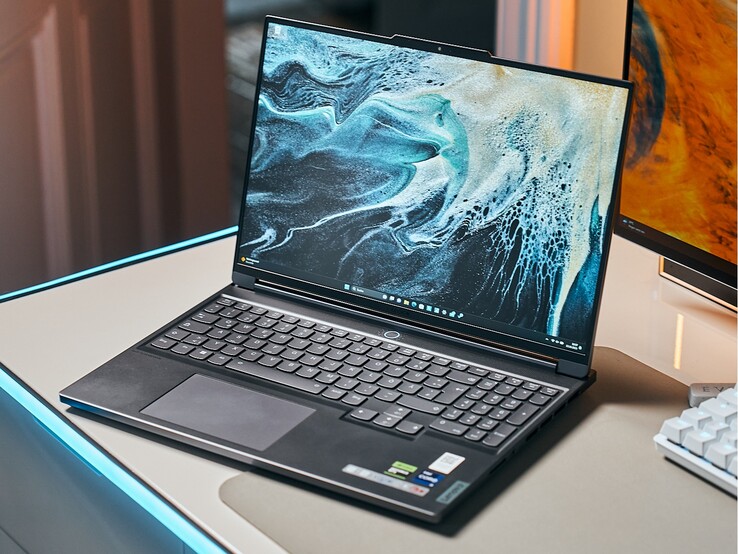
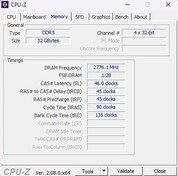
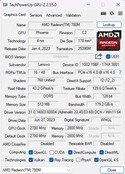
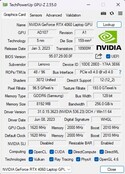
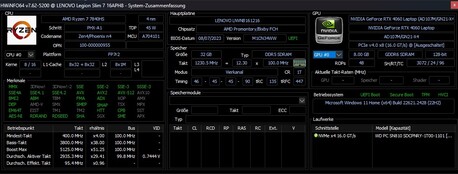
Oprócz procesorów Intel, Lenovo oferuje procesory AMD dla serii Legion Slim 7. Model, który testowaliśmy, 16APH8, posiada procesor Ryzen 7 7840HS w połączeniu z kartą graficzną GeForce RTX 4060 GPU, 32 GB pamięci DDR5-5600-RAM i pojemnym dyskiem SSD M.2 o pojemności 1 TB. Laptop może pochwalić się żywym wyświetlaczem WQXGA o rozdzielczości 2560 x 1600 pikseli, wysoką częstotliwością odświeżania 240 Hz, fabryczną kalibracją i obsługą HDR, a całość uzupełnia system Windows 11 Home. Pomimo imponującej specyfikacji, 16APH8 jest wyceniony na około 1750 USD, co czyni go stosunkowo drogim jak na laptopa wyposażonego w kartę graficzną RTX 4060.
Slim 7 musi stawić czoła konkurencji ze strony innych 16-calowych notebooków do gier wyposażonych w RTX 4060, w tym modeli takich jak Asus ROG Flow X16 GV601V, Alienware m16 R1, Acer Predator Helios 16 PH16-71-731Qjak również Lenovo Legion Pro 5 16IRX8 i Lenovo LOQ 16IRH8 notebooki.
Potencjalni konkurenci w porównaniu
Ocena | Data | Model | Waga | Wysokość | Rozmiar | Rezolucja | Cena |
|---|---|---|---|---|---|---|---|
| 90.4 % v7 (old) | 11/2023 | Lenovo Legion Slim 7 16APH8 R7 7840HS, GeForce RTX 4060 Laptop GPU | 2.1 kg | 20 mm | 16.00" | 2560x1600 | |
| 89.7 % v7 (old) | 06/2023 | Asus ROG Flow X16 GV601V i9-13900H, GeForce RTX 4060 Laptop GPU | 2.1 kg | 19.4 mm | 16.00" | 2560x1600 | |
| 88.3 % v7 (old) | 09/2023 | Alienware m16 R1 Intel i7-13700HX, GeForce RTX 4060 Laptop GPU | 3 kg | 25.4 mm | 16.00" | 2560x1600 | |
| 89.5 % v7 (old) | 07/2023 | Acer Predator Helios 16 PH16-71-731Q i7-13700HX, GeForce RTX 4060 Laptop GPU | 2.6 kg | 26.9 mm | 16.00" | 2560x1600 | |
| 87.9 % v7 (old) | 05/2023 | Lenovo Legion Pro 5 16IRX8 i7-13700HX, GeForce RTX 4060 Laptop GPU | 2.5 kg | 26.8 mm | 16.00" | 2560x1600 | |
| 87.3 % v7 (old) | 09/2023 | Lenovo LOQ 16IRH8 i7-13620H, GeForce RTX 4060 Laptop GPU | 2.7 kg | 25.9 mm | 16.00" | 2560x1600 |
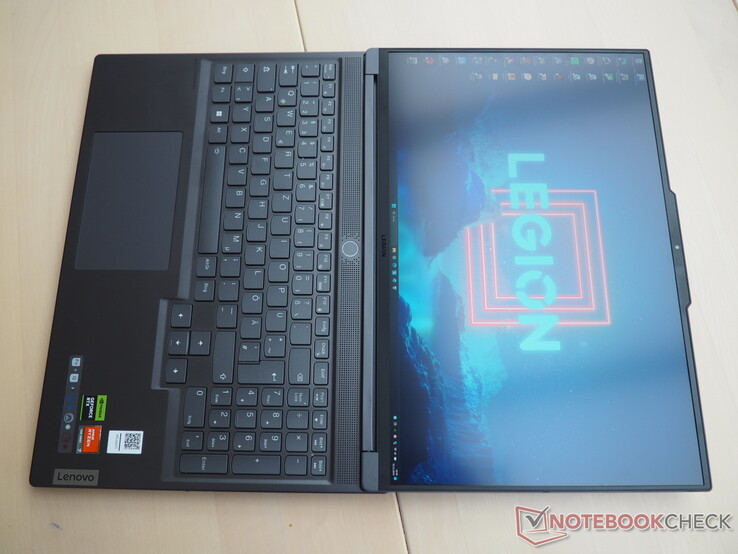
Z wyjątkiem kilku drobnych różnic, obudowa jest taka sama jak w wersji Wersja Intel z procesorem Core i9-13900H i GeForce RTX 4070 którą już zbadaliśmy. Dlatego w tym artykule omówimy tylko pokrótce obudowę, funkcje i urządzenia wejściowe.
Sprawa
Jedną z wyróżniających się cech jest stylowa obudowa. 16-calowe urządzenie charakteryzuje się eleganckim wyglądem, wysokiej jakości materiałami i doskonałą stabilnością. Ważąc zaledwie 4,6 funta, plasuje się na lżejszym końcu skali w porównaniu do swoich konkurentów.
Łączność
Pomimo braku portu RJ45, Slim 7 oferuje szeroką gamę połączeń. Po prawej stronie znajdą Państwo czytnik kart pamięci o średniej szybkości i przesłonę prywatności dla przyzwoitej kamery internetowej. Po lewej stronie znajduje się gniazdo audio i dwa porty USB (1x USB 4, 1x USB 3.2 Gen2), z których oba obsługują DisplayPort 1.4 i 140-watowe zasilanie. Dodatkowo znajduje się tam port HDMI 2.1, umożliwiający podłączenie do trzech zewnętrznych monitorów. Z tyłu znajdują się trzy porty USB 3.2 Gen2 oraz złącze dla dołączonego 230-watowego zasilacza.
Jeśli chodzi o łączność bezprzewodową, laptop wykorzystuje układ Wi-Fi 6E (MediaTek RZ616), który działa nieco poniżej średniej podczas transmisji, ale powyżej średniej podczas odbioru.
Czytnik kart SD
| SD Card Reader | |
| average JPG Copy Test (av. of 3 runs) | |
| Alienware m16 R1 Intel (AV PRO microSD 128 GB V60) | |
| Średnia w klasie Gaming (20 - 210, n=70, ostatnie 2 lata) | |
| Asus ROG Flow X16 GV601V | |
| Lenovo Legion Slim 7 16APH8 (AV PRO microSD 128 GB V60) | |
| Acer Predator Helios 16 PH16-71-731Q | |
| maximum AS SSD Seq Read Test (1GB) | |
| Asus ROG Flow X16 GV601V | |
| Alienware m16 R1 Intel (AV PRO microSD 128 GB V60) | |
| Średnia w klasie Gaming (25.5 - 261, n=66, ostatnie 2 lata) | |
| Acer Predator Helios 16 PH16-71-731Q | |
| Lenovo Legion Slim 7 16APH8 (AV PRO microSD 128 GB V60) | |
Komunikacja
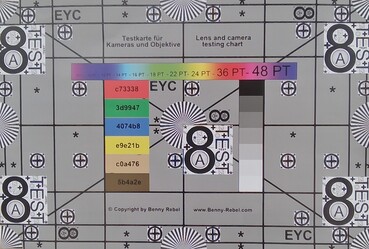
Kamera internetowa
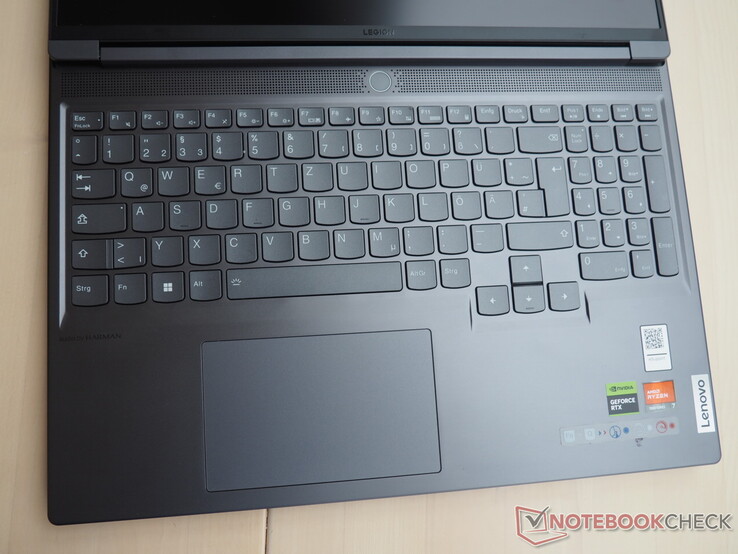
Urządzenia wejściowe
Wyświetlacz
Chociaż wyświetlacz w modelu Intela i naszym urządzeniu testowym ma podobne podstawowe cechy, nie są one takie same. Nasz model wyposażony był w panel BOE o oznaczeniu NE160QDM-NZ3.
| |||||||||||||||||||||||||
rozświetlenie: 82 %
na akumulatorze: 545 cd/m²
kontrast: 1135:1 (czerń: 0.48 cd/m²)
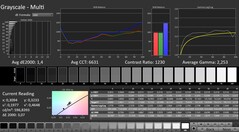
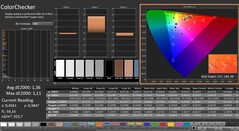
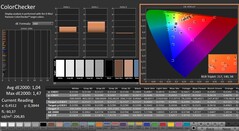
ΔE ColorChecker Calman: 1.36 | ∀{0.5-29.43 Ø4.77}
calibrated: 1.04
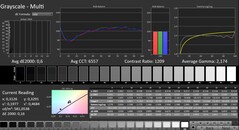
ΔE Greyscale Calman: 1.4 | ∀{0.09-98 Ø5}
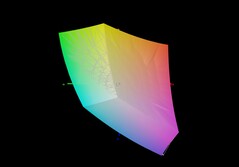
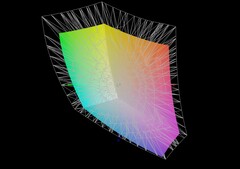
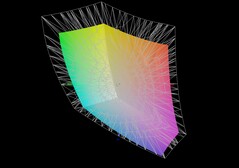
72.4% AdobeRGB 1998 (Argyll 3D)
99.6% sRGB (Argyll 3D)
70.3% Display P3 (Argyll 3D)
Gamma: 2.253
CCT: 6631 K
| Lenovo Legion Slim 7 16APH8 BOE NE160QDM-NZ3, IPS, 2560x1600, 16" | Asus ROG Flow X16 GV601V TMX1603 (TL160ADMP03-0), IPS, 2560x1600, 16" | Alienware m16 R1 Intel BOE NE16NYB, IPS, 2560x1600, 16" | Acer Predator Helios 16 PH16-71-731Q BOE NE160QDM-NZ2, IPS-LED, 2560x1600, 16" | Lenovo Legion Pro 5 16IRX8 AU Optronics B160QAN03.1, IPS, 2560x1600, 16" | Lenovo LOQ 16IRH8 AUOC1A5 (B160QAN03.L), IPS, 2560x1600, 16" | |
|---|---|---|---|---|---|---|
| Display | 18% | -3% | 18% | 0% | -0% | |
| Display P3 Coverage (%) | 70.3 | 96.61 37% | 67.7 -4% | 97.1 38% | 71.2 1% | 70.5 0% |
| sRGB Coverage (%) | 99.6 | 99.92 0% | 97.2 -2% | 100 0% | 98.8 -1% | 98.9 -1% |
| AdobeRGB 1998 Coverage (%) | 72.4 | 84.63 17% | 70 -3% | 84.7 17% | 73.3 1% | 72.6 0% |
| Response Times | 21% | 22% | -8% | -46% | 9% | |
| Response Time Grey 50% / Grey 80% * (ms) | 12.6 ? | 3.8 ? 70% | 4 ? 68% | 13.6 ? -8% | 14.5 ? -15% | 7.2 ? 43% |
| Response Time Black / White * (ms) | 5.9 ? | 7.6 ? -29% | 7.3 ? -24% | 6.4 ? -8% | 10.4 ? -76% | 7.4 ? -25% |
| PWM Frequency (Hz) | ||||||
| Screen | -25% | -32% | -17% | -3% | -7% | |
| Brightness middle (cd/m²) | 545 | 486 -11% | 306 -44% | 511 -6% | 405.7 -26% | 407 -25% |
| Brightness (cd/m²) | 502 | 469 -7% | 302 -40% | 498 -1% | 368 -27% | 369 -26% |
| Brightness Distribution (%) | 82 | 91 11% | 89 9% | 94 15% | 87 6% | 85 4% |
| Black Level * (cd/m²) | 0.48 | 0.39 19% | 0.3 37% | 0.36 25% | 0.38 21% | 0.45 6% |
| Contrast (:1) | 1135 | 1246 10% | 1020 -10% | 1419 25% | 1068 -6% | 904 -20% |
| Colorchecker dE 2000 * | 1.36 | 2.27 -67% | 2.57 -89% | 1.76 -29% | 1.65 -21% | 1.43 -5% |
| Colorchecker dE 2000 max. * | 3.11 | 5.73 -84% | 4.26 -37% | 3.7 -19% | 4.2 -35% | 3.58 -15% |
| Colorchecker dE 2000 calibrated * | 1.04 | 0.6 42% | 0.85 18% | 1.56 -50% | 0.53 49% | 1.07 -3% |
| Greyscale dE 2000 * | 1.4 | 3.36 -140% | 3.3 -136% | 3 -114% | 1.2 14% | 1.13 19% |
| Gamma | 2.253 98% | 2.46 89% | 1.997 110% | 2.33 94% | 2.3 96% | 2.5 88% |
| CCT | 6631 98% | 6625 98% | 6895 94% | 6341 103% | 6453 101% | 6526 100% |
| Całkowita średnia (program / ustawienia) | 5% /
-9% | -4% /
-18% | -2% /
-8% | -16% /
-8% | 1% /
-3% |
* ... im mniej tym lepiej
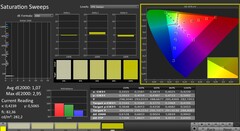
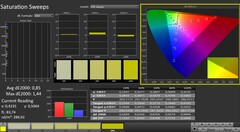
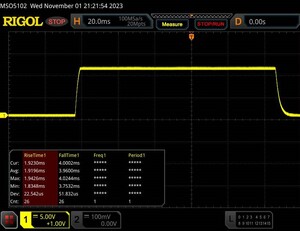
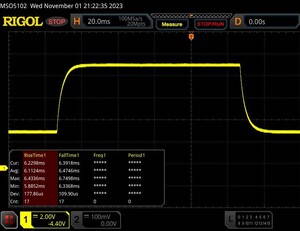
Pomijając przestrzeń kolorów, która mogłaby być nieco większa, biorąc pod uwagę 70% pokrycie DCI-P3 i 72% AdobeRGB (w porównaniu do Alienware m16 i Acer Predator Helios 16), ekran WQXGA działa wyjątkowo dobrze w niemal każdym aspekcie. Dzięki fabrycznej kalibracji, dokładność odwzorowania kolorów jest wyjątkowa od samego początku. Dodatkowo, czasy reakcji panelu 240 Hz są przyzwoite, mierząc nieco poniżej 6 ms dla przejść z czerni do bieli i 12 ms dla przejść z szarości do szarości.
Na szczególną uwagę zasługuje jasność: średnia wartość 502 cd/m2 jest dość wysoka jak na ekran IPS, a nawet przekracza standardy firmy dotyczące jasności w pomieszczeniach SDR (400 cd/m2). Gracze docenią wsparcie FreeSync i GSync. Pomimo maksymalnej jasności w polu testowym, kontrast nie wyróżnia się na tle konkurencji. Wynika to z niezadowalającej wartości czerni na poziomie 0,48 cd/m².
Wyświetl czasy reakcji
| ↔ Czas reakcji od czerni do bieli | ||
|---|---|---|
| 5.9 ms ... wzrost ↗ i spadek ↘ łącznie | ↗ 1.9 ms wzrost | |
| ↘ 4 ms upadek | ||
| W naszych testach ekran wykazuje bardzo szybką reakcję i powinien bardzo dobrze nadawać się do szybkich gier. Dla porównania, wszystkie testowane urządzenia wahają się od 0.1 (minimum) do 240 (maksimum) ms. » 17 % wszystkich urządzeń jest lepszych. Oznacza to, że zmierzony czas reakcji jest lepszy od średniej wszystkich testowanych urządzeń (20.2 ms). | ||
| ↔ Czas reakcji 50% szarości do 80% szarości | ||
| 12.6 ms ... wzrost ↗ i spadek ↘ łącznie | ↗ 6.1 ms wzrost | |
| ↘ 6.5 ms upadek | ||
| W naszych testach ekran wykazuje dobry współczynnik reakcji, ale może być zbyt wolny dla graczy rywalizujących ze sobą. Dla porównania, wszystkie testowane urządzenia wahają się od 0.165 (minimum) do 636 (maksimum) ms. » 25 % wszystkich urządzeń jest lepszych. Oznacza to, że zmierzony czas reakcji jest lepszy od średniej wszystkich testowanych urządzeń (31.6 ms). | ||
Migotanie ekranu / PWM (modulacja szerokości impulsu)
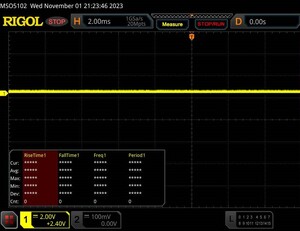
| Migotanie ekranu/nie wykryto PWM | |||
Dla porównania: 53 % wszystkich testowanych urządzeń nie używa PWM do przyciemniania wyświetlacza. Jeśli wykryto PWM, zmierzono średnio 8088 (minimum: 5 - maksimum: 343500) Hz. | |||
Wydajność
Karta graficzna GeForce RTX 4060 plasuje Legion w średniej kategorii notebooków do gier. Dzięki 32 GB pamięci RAM i dyskowi SSD o pojemności 1 TB powinien on na razie wystarczyć większości nabywców. Osoby poszukujące wyższej wydajności mogą zdecydować się na wersję RTX 4070. Lenovo nie oferuje jednak obecnie wersji RTX 4080 lub RTX 4090 dla Slim 7.
Warunki testowania
Preinstalowane oprogramowanie Lenovo Vantage wyróżnia się szerokimi możliwościami personalizacji. Oprócz trybu termicznego, użytkownicy mogą również wybrać tryb pracy GPU. Jako że wzrost FPS w profilu Performance nie jest proporcjonalny do wyższej głośności (jak pokazano w tabeli), wszystkie pomiary przeprowadziliśmy w profilu Balanced. Domyślne przełączanie grafiki (tryb hybrydowy) było zawsze włączone.
| Cichy | Zrównoważony | Wydajność | |
|---|---|---|---|
| Hałas (Witcher 3, FHD/Ultra) | 36 dB(A) | 47 dB(A) | 52 dB(A) |
| Wydajność (Witcher 3, FHD/Ultra) | ~86 fps | ~98 fps | ~100 fps |
| Limit mocy 1 (HWInfo) | 50 w | 54 w | 100 w |
| Limit mocy 2 (HWInfo) | 60 w | 65 w | 125 w |
Procesor
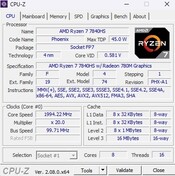
Ryzen 7 7840HS to ośmiordzeniowy procesor wyposażony w 16 MB pamięci podręcznej L3 i możliwość obsługi do 16 wątków jednocześnie dzięki technologii SMT. Dodatkowo, wykonany w technologii 4 nm układ posiada stosunkowo szybki zintegrowany procesor graficzny Radeon 780Mradeon 780M, odpowiedzialny za obliczenia graficzne i wyświetlanie obrazu, do mniej wymagających zadań, takich jak praca biurowa, strumieniowanie wideo i przeglądanie stron internetowych. W testach porównawczych wydajność procesora plasuje się pomiędzy Core i7-13620H a Core i7-13700HX. Jedną z godnych uwagi zalet procesora AMD jest stała poprawa wydajności, co nie jest w pełni lub tylko częściowo prawdziwe w przypadku wielu odpowiedników Intela, co jest widoczne w testach porównawczych, takich jak pętla Cinebench.
Cinebench R15 Multi Loop
* ... im mniej tym lepiej
AIDA64: FP32 Ray-Trace | FPU Julia | CPU SHA3 | CPU Queen | FPU SinJulia | FPU Mandel | CPU AES | CPU ZLib | FP64 Ray-Trace | CPU PhotoWorxx
| Performance rating | |
| Średnia w klasie Gaming | |
| Przeciętny AMD Ryzen 7 7840HS | |
| Lenovo Legion Slim 7 16APH8 | |
| Alienware m16 R1 Intel | |
| Acer Predator Helios 16 PH16-71-731Q | |
| Lenovo Legion Pro 5 16IRX8 | |
| Asus ROG Flow X16 GV601V | |
| Lenovo LOQ 16IRH8 | |
| AIDA64 / FP32 Ray-Trace | |
| Średnia w klasie Gaming (7192 - 85542, n=144, ostatnie 2 lata) | |
| Przeciętny AMD Ryzen 7 7840HS (22845 - 28921, n=21) | |
| Lenovo Legion Slim 7 16APH8 | |
| Lenovo Legion Pro 5 16IRX8 | |
| Alienware m16 R1 Intel | |
| Acer Predator Helios 16 PH16-71-731Q | |
| Asus ROG Flow X16 GV601V | |
| Lenovo LOQ 16IRH8 | |
| AIDA64 / FPU Julia | |
| Średnia w klasie Gaming (35040 - 238426, n=144, ostatnie 2 lata) | |
| Lenovo Legion Slim 7 16APH8 | |
| Przeciętny AMD Ryzen 7 7840HS (97164 - 123167, n=21) | |
| Lenovo Legion Pro 5 16IRX8 | |
| Alienware m16 R1 Intel | |
| Acer Predator Helios 16 PH16-71-731Q | |
| Asus ROG Flow X16 GV601V | |
| Lenovo LOQ 16IRH8 | |
| AIDA64 / CPU SHA3 | |
| Średnia w klasie Gaming (1728 - 9817, n=144, ostatnie 2 lata) | |
| Alienware m16 R1 Intel | |
| Przeciętny AMD Ryzen 7 7840HS (4293 - 5155, n=21) | |
| Lenovo Legion Slim 7 16APH8 | |
| Lenovo Legion Pro 5 16IRX8 | |
| Acer Predator Helios 16 PH16-71-731Q | |
| Asus ROG Flow X16 GV601V | |
| Lenovo LOQ 16IRH8 | |
| AIDA64 / CPU Queen | |
| Średnia w klasie Gaming (49785 - 173351, n=144, ostatnie 2 lata) | |
| Lenovo Legion Slim 7 16APH8 | |
| Przeciętny AMD Ryzen 7 7840HS (102271 - 125820, n=21) | |
| Alienware m16 R1 Intel | |
| Acer Predator Helios 16 PH16-71-731Q | |
| Lenovo Legion Pro 5 16IRX8 | |
| Asus ROG Flow X16 GV601V | |
| Lenovo LOQ 16IRH8 | |
| AIDA64 / FPU SinJulia | |
| Lenovo Legion Slim 7 16APH8 | |
| Przeciętny AMD Ryzen 7 7840HS (13767 - 15525, n=21) | |
| Średnia w klasie Gaming (4424 - 33636, n=144, ostatnie 2 lata) | |
| Alienware m16 R1 Intel | |
| Lenovo Legion Pro 5 16IRX8 | |
| Acer Predator Helios 16 PH16-71-731Q | |
| Asus ROG Flow X16 GV601V | |
| Lenovo LOQ 16IRH8 | |
| AIDA64 / FPU Mandel | |
| Średnia w klasie Gaming (17585 - 128721, n=144, ostatnie 2 lata) | |
| Lenovo Legion Slim 7 16APH8 | |
| Przeciętny AMD Ryzen 7 7840HS (52084 - 65812, n=21) | |
| Lenovo Legion Pro 5 16IRX8 | |
| Alienware m16 R1 Intel | |
| Acer Predator Helios 16 PH16-71-731Q | |
| Asus ROG Flow X16 GV601V | |
| Lenovo LOQ 16IRH8 | |
| AIDA64 / CPU AES | |
| Alienware m16 R1 Intel | |
| Acer Predator Helios 16 PH16-71-731Q | |
| Przeciętny AMD Ryzen 7 7840HS (67389 - 177158, n=21) | |
| Średnia w klasie Gaming (19065 - 247074, n=144, ostatnie 2 lata) | |
| Lenovo Legion Pro 5 16IRX8 | |
| Asus ROG Flow X16 GV601V | |
| Lenovo Legion Slim 7 16APH8 | |
| Lenovo LOQ 16IRH8 | |
| AIDA64 / CPU ZLib | |
| Średnia w klasie Gaming (373 - 2531, n=144, ostatnie 2 lata) | |
| Acer Predator Helios 16 PH16-71-731Q | |
| Alienware m16 R1 Intel | |
| Lenovo Legion Pro 5 16IRX8 | |
| Asus ROG Flow X16 GV601V | |
| Lenovo Legion Slim 7 16APH8 | |
| Przeciętny AMD Ryzen 7 7840HS (944 - 1123, n=21) | |
| Lenovo LOQ 16IRH8 | |
| AIDA64 / FP64 Ray-Trace | |
| Średnia w klasie Gaming (3856 - 45446, n=144, ostatnie 2 lata) | |
| Przeciętny AMD Ryzen 7 7840HS (12248 - 15599, n=21) | |
| Lenovo Legion Slim 7 16APH8 | |
| Lenovo Legion Pro 5 16IRX8 | |
| Alienware m16 R1 Intel | |
| Acer Predator Helios 16 PH16-71-731Q | |
| Asus ROG Flow X16 GV601V | |
| Lenovo LOQ 16IRH8 | |
| AIDA64 / CPU PhotoWorxx | |
| Średnia w klasie Gaming (10805 - 62916, n=144, ostatnie 2 lata) | |
| Lenovo Legion Slim 7 16APH8 | |
| Asus ROG Flow X16 GV601V | |
| Przeciętny AMD Ryzen 7 7840HS (17615 - 41516, n=21) | |
| Lenovo Legion Pro 5 16IRX8 | |
| Alienware m16 R1 Intel | |
| Acer Predator Helios 16 PH16-71-731Q | |
| Lenovo LOQ 16IRH8 | |
Wydajność systemu
Jeśli chodzi o wydajność systemu, Slim 7 z łatwością konkuruje z rywalami, zdobywając 7 502 punkty w PCMark 10. Pamięć DDR5, znana z wyjątkowej szybkości, przewyższa średnią. Co więcej, komputer wykazuje przyjemną i szybką reakcję w praktycznych scenariuszach użytkowania.
CrossMark: Overall | Productivity | Creativity | Responsiveness
| PCMark 10 / Score | |
| Średnia w klasie Gaming (5776 - 9667, n=122, ostatnie 2 lata) | |
| Asus ROG Flow X16 GV601V | |
| Przeciętny AMD Ryzen 7 7840HS, NVIDIA GeForce RTX 4060 Laptop GPU (7502 - 7946, n=4) | |
| Acer Predator Helios 16 PH16-71-731Q | |
| Lenovo Legion Pro 5 16IRX8 | |
| Lenovo Legion Slim 7 16APH8 | |
| Alienware m16 R1 Intel | |
| Lenovo LOQ 16IRH8 | |
| PCMark 10 / Essentials | |
| Asus ROG Flow X16 GV601V | |
| Acer Predator Helios 16 PH16-71-731Q | |
| Lenovo Legion Pro 5 16IRX8 | |
| Przeciętny AMD Ryzen 7 7840HS, NVIDIA GeForce RTX 4060 Laptop GPU (10441 - 11169, n=4) | |
| Alienware m16 R1 Intel | |
| Średnia w klasie Gaming (8810 - 12600, n=127, ostatnie 2 lata) | |
| Lenovo Legion Slim 7 16APH8 | |
| Lenovo LOQ 16IRH8 | |
| PCMark 10 / Productivity | |
| Acer Predator Helios 16 PH16-71-731Q | |
| Asus ROG Flow X16 GV601V | |
| Przeciętny AMD Ryzen 7 7840HS, NVIDIA GeForce RTX 4060 Laptop GPU (9575 - 10273, n=4) | |
| Średnia w klasie Gaming (6662 - 16716, n=122, ostatnie 2 lata) | |
| Lenovo Legion Slim 7 16APH8 | |
| Alienware m16 R1 Intel | |
| Lenovo Legion Pro 5 16IRX8 | |
| Lenovo LOQ 16IRH8 | |
| PCMark 10 / Digital Content Creation | |
| Średnia w klasie Gaming (7440 - 19351, n=122, ostatnie 2 lata) | |
| Lenovo Legion Pro 5 16IRX8 | |
| Przeciętny AMD Ryzen 7 7840HS, NVIDIA GeForce RTX 4060 Laptop GPU (11464 - 12418, n=4) | |
| Lenovo Legion Slim 7 16APH8 | |
| Asus ROG Flow X16 GV601V | |
| Acer Predator Helios 16 PH16-71-731Q | |
| Alienware m16 R1 Intel | |
| Lenovo LOQ 16IRH8 | |
| CrossMark / Overall | |
| Acer Predator Helios 16 PH16-71-731Q | |
| Alienware m16 R1 Intel | |
| Średnia w klasie Gaming (1247 - 2344, n=118, ostatnie 2 lata) | |
| Asus ROG Flow X16 GV601V | |
| Lenovo LOQ 16IRH8 | |
| Przeciętny AMD Ryzen 7 7840HS, NVIDIA GeForce RTX 4060 Laptop GPU (1800 - 1866, n=3) | |
| Lenovo Legion Pro 5 16IRX8 | |
| CrossMark / Productivity | |
| Acer Predator Helios 16 PH16-71-731Q | |
| Alienware m16 R1 Intel | |
| Lenovo LOQ 16IRH8 | |
| Średnia w klasie Gaming (1299 - 2211, n=118, ostatnie 2 lata) | |
| Asus ROG Flow X16 GV601V | |
| Przeciętny AMD Ryzen 7 7840HS, NVIDIA GeForce RTX 4060 Laptop GPU (1743 - 1821, n=3) | |
| Lenovo Legion Pro 5 16IRX8 | |
| CrossMark / Creativity | |
| Acer Predator Helios 16 PH16-71-731Q | |
| Alienware m16 R1 Intel | |
| Średnia w klasie Gaming (1275 - 2729, n=118, ostatnie 2 lata) | |
| Asus ROG Flow X16 GV601V | |
| Lenovo LOQ 16IRH8 | |
| Przeciętny AMD Ryzen 7 7840HS, NVIDIA GeForce RTX 4060 Laptop GPU (1908 - 1966, n=3) | |
| Lenovo Legion Pro 5 16IRX8 | |
| CrossMark / Responsiveness | |
| Acer Predator Helios 16 PH16-71-731Q | |
| Alienware m16 R1 Intel | |
| Lenovo LOQ 16IRH8 | |
| Średnia w klasie Gaming (1030 - 2330, n=118, ostatnie 2 lata) | |
| Asus ROG Flow X16 GV601V | |
| Lenovo Legion Pro 5 16IRX8 | |
| Przeciętny AMD Ryzen 7 7840HS, NVIDIA GeForce RTX 4060 Laptop GPU (1522 - 1776, n=3) | |
| PCMark 10 Score | 7502 pkt. | |
Pomoc | ||
| AIDA64 / Memory Copy | |
| Lenovo Legion Slim 7 16APH8 | |
| Średnia w klasie Gaming (21750 - 108104, n=144, ostatnie 2 lata) | |
| Przeciętny AMD Ryzen 7 7840HS (30937 - 72158, n=21) | |
| Asus ROG Flow X16 GV601V | |
| Lenovo Legion Pro 5 16IRX8 | |
| Alienware m16 R1 Intel | |
| Acer Predator Helios 16 PH16-71-731Q | |
| Lenovo LOQ 16IRH8 | |
| AIDA64 / Memory Read | |
| Średnia w klasie Gaming (22956 - 104349, n=144, ostatnie 2 lata) | |
| Asus ROG Flow X16 GV601V | |
| Lenovo Legion Pro 5 16IRX8 | |
| Alienware m16 R1 Intel | |
| Acer Predator Helios 16 PH16-71-731Q | |
| Lenovo LOQ 16IRH8 | |
| Lenovo Legion Slim 7 16APH8 | |
| Przeciętny AMD Ryzen 7 7840HS (30497 - 62147, n=21) | |
| AIDA64 / Memory Write | |
| Lenovo Legion Slim 7 16APH8 | |
| Acer Predator Helios 16 PH16-71-731Q | |
| Przeciętny AMD Ryzen 7 7840HS (34590 - 93323, n=21) | |
| Średnia w klasie Gaming (22297 - 133486, n=144, ostatnie 2 lata) | |
| Lenovo Legion Pro 5 16IRX8 | |
| Asus ROG Flow X16 GV601V | |
| Alienware m16 R1 Intel | |
| Lenovo LOQ 16IRH8 | |
| AIDA64 / Memory Latency | |
| Lenovo LOQ 16IRH8 | |
| Średnia w klasie Gaming (59.5 - 259, n=144, ostatnie 2 lata) | |
| Przeciętny AMD Ryzen 7 7840HS (85.1 - 112, n=21) | |
| Asus ROG Flow X16 GV601V | |
| Lenovo Legion Slim 7 16APH8 | |
| Alienware m16 R1 Intel | |
| Acer Predator Helios 16 PH16-71-731Q | |
| Lenovo Legion Pro 5 16IRX8 | |
* ... im mniej tym lepiej
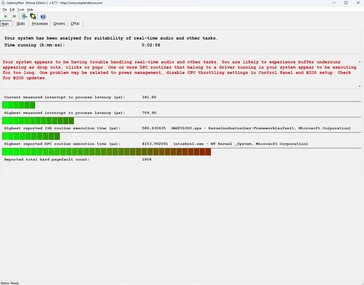
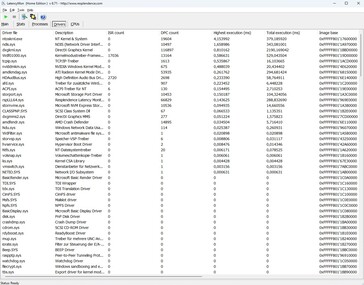
Opóźnienie DPC
| DPC Latencies / LatencyMon - interrupt to process latency (max), Web, Youtube, Prime95 | |
| Alienware m16 R1 Intel | |
| Acer Predator Helios 16 PH16-71-731Q | |
| Lenovo LOQ 16IRH8 | |
| Asus ROG Flow X16 GV601V | |
| Lenovo Legion Pro 5 16IRX8 | |
| Lenovo Legion Slim 7 16APH8 | |
* ... im mniej tym lepiej
Urządzenia pamięci masowej
Zintegrowany dysk SSD o pojemności 1 TB od WDC (model SN810) generalnie oferuje doskonałą prędkość, ale czasami napotyka problemy z dławieniem przy dłuższym obciążeniu. Problemy te nie są jednak tak poważne, jak te zaobserwowane w Acer Predator Helios 16.
* ... im mniej tym lepiej
Continuous power read: DiskSpd Read Loop, Queue Depth 8
Karta graficzna
Karta graficzna GeForce RTX 4060 to obecnie jeden z najpopularniejszych i najbardziej udanych układów GPU do laptopów. Chociaż ten model ze średniej półki nie nadaje się do ekranów UHD i może mieć ograniczoną odporność na przyszłość ze względu na niską architekturę 8 GB GDDR6 VRAM, jego wydajność w rozdzielczościach Full HD (FHD) lub Quad HD (QHD) jest jednak niezwykła.
W syntetycznych benchmarkach graficznych wydajność 3D w trybie zrównoważonym jest porównywalna z dotychczasową średnią wydajnością RTX 4060, choć spada nieco poniżej wydajności urządzeń porównawczych. Warto zauważyć, że Slim 7 nawet nie zbliża się do osiągnięcia maksymalnego TGP wynoszącego 140 watów, w tym Dynamic Boost.
| 3DMark 11 Performance | 30859 pkt. | |
| 3DMark Ice Storm Standard Score | 123335 pkt. | |
| 3DMark Cloud Gate Standard Score | 60481 pkt. | |
| 3DMark Fire Strike Score | 23735 pkt. | |
| 3DMark Time Spy Score | 10032 pkt. | |
Pomoc | ||
* ... im mniej tym lepiej
Wydajność w grach
Testy porównawcze w grach pokazują podobny wzorzec. Poza kilkoma bardzo wymagającymi grami, takimi jak Lords of the Fallen lub Alan Wake 2większość z nich można bez problemu uruchomić w natywnej rozdzielczości przy wysokich lub maksymalnych ustawieniach, choć osiągnięcie 60 FPS nie zawsze jest gwarantowane.
| The Witcher 3 - 1920x1080 Ultra Graphics & Postprocessing (HBAO+) | |
| Średnia w klasie Gaming (18.4 - 240, n=54, ostatnie 2 lata) | |
| Lenovo Legion Pro 5 16IRX8 | |
| Asus ROG Flow X16 GV601V | |
| Alienware m16 R1 Intel | |
| Lenovo LOQ 16IRH8 | |
| Acer Predator Helios 16 PH16-71-731Q | |
| Przeciętny NVIDIA GeForce RTX 4060 Laptop GPU (77 - 159.7, n=42) | |
| Lenovo Legion Slim 7 16APH8 | |
| Alan Wake 2 | |
| 1920x1080 High Preset | |
| Średnia w klasie Gaming (20.3 - 133.2, n=41, ostatnie 2 lata) | |
| Przeciętny NVIDIA GeForce RTX 4060 Laptop GPU (53.8 - 64.3, n=3) | |
| XMG Pro 15 E23 | |
| Lenovo Legion Slim 7 16APH8 | |
| 2560x1440 High Preset | |
| Średnia w klasie Gaming (22.5 - 93.1, n=40, ostatnie 2 lata) | |
| XMG Pro 15 E23 | |
| Przeciętny NVIDIA GeForce RTX 4060 Laptop GPU (33 - 36.7, n=3) | |
| Lenovo Legion Slim 7 16APH8 | |
| Lords of the Fallen | |
| 1920x1080 High Preset | |
| XMG Pro 15 E23 | |
| Przeciętny NVIDIA GeForce RTX 4060 Laptop GPU (46.7 - 53.9, n=3) | |
| Średnia w klasie Gaming (30.2 - 87.3, n=6, ostatnie 2 lata) | |
| Lenovo Legion Slim 7 16APH8 | |
| 1920x1080 Ultra Preset | |
| XMG Pro 15 E23 | |
| Średnia w klasie Gaming (20.2 - 64.2, n=6, ostatnie 2 lata) | |
| Przeciętny NVIDIA GeForce RTX 4060 Laptop GPU (32.8 - 38.1, n=3) | |
| Lenovo Legion Slim 7 16APH8 | |
| 2560x1440 Ultra Preset | |
| Średnia w klasie Gaming (21.9 - 43, n=3, ostatnie 2 lata) | |
| XMG Pro 15 E23 | |
| Przeciętny NVIDIA GeForce RTX 4060 Laptop GPU (24.2 - 25.7, n=2) | |
| Lenovo Legion Slim 7 16APH8 | |
| Total War Pharaoh | |
| 1920x1080 High Preset | |
| XMG Pro 15 E23 | |
| Przeciętny NVIDIA GeForce RTX 4060 Laptop GPU (128 - 149, n=2) | |
| Lenovo Legion Slim 7 16APH8 | |
| Średnia w klasie Gaming (18.9 - 200, n=9, ostatnie 2 lata) | |
| 1920x1080 Ultra Preset | |
| XMG Pro 15 E23 | |
| Przeciętny NVIDIA GeForce RTX 4060 Laptop GPU (104 - 116, n=2) | |
| Lenovo Legion Slim 7 16APH8 | |
| Średnia w klasie Gaming (16.6 - 161.4, n=9, ostatnie 2 lata) | |
| 2560x1440 Ultra Preset | |
| XMG Pro 15 E23 | |
| Przeciętny NVIDIA GeForce RTX 4060 Laptop GPU (76 - 81.6, n=2) | |
| Lenovo Legion Slim 7 16APH8 | |
| Średnia w klasie Gaming (24.1 - 127.4, n=3, ostatnie 2 lata) | |
| Assassin's Creed Mirage | |
| 1920x1080 High Preset (Adaptive Quality Off) | |
| Średnia w klasie Gaming (44 - 205, n=8, ostatnie 2 lata) | |
| XMG Pro 15 E23 | |
| Przeciętny NVIDIA GeForce RTX 4060 Laptop GPU (76 - 118, n=4) | |
| Lenovo Legion Slim 7 16APH8 | |
| 1920x1080 Ultra High Preset (Adaptive Quality Off) | |
| Średnia w klasie Gaming (31 - 160, n=11, ostatnie 2 lata) | |
| XMG Pro 15 E23 | |
| Przeciętny NVIDIA GeForce RTX 4060 Laptop GPU (65 - 93, n=6) | |
| Lenovo Legion Slim 7 16APH8 | |
| 2560x1440 Ultra High Preset (Adaptive Quality Off) | |
| Średnia w klasie Gaming (44 - 136, n=8, ostatnie 2 lata) | |
| XMG Pro 15 E23 | |
| Przeciętny NVIDIA GeForce RTX 4060 Laptop GPU (64 - 72, n=5) | |
| Lenovo Legion Slim 7 16APH8 | |
| EA Sports FC 24 | |
| 1920x1080 High Preset | |
| Lenovo Legion Slim 7 16APH8 | |
| XMG Pro 15 E23 | |
| Przeciętny NVIDIA GeForce RTX 4060 Laptop GPU (142.9 - 155.2, n=3) | |
| 1920x1080 Ultra Preset | |
| XMG Pro 15 E23 | |
| Przeciętny NVIDIA GeForce RTX 4060 Laptop GPU (136.9 - 138, n=3) | |
| Lenovo Legion Slim 7 16APH8 | |
| Średnia w klasie Gaming (47.9 - 93.9, n=3, ostatnie 2 lata) | |
| 2560x1440 Ultra Preset | |
| XMG Pro 15 E23 | |
| Przeciętny NVIDIA GeForce RTX 4060 Laptop GPU (117.5 - 121, n=2) | |
| Lenovo Legion Slim 7 16APH8 | |
Podczas 60-minutowego testu z The Witcher 3nie zaobserwowano żadnych anomalii. Liczba klatek na sekundę pozostawała względnie stabilna przez cały czas trwania testu.
Witcher 3 FPS chart
| low | med. | high | ultra | QHD | |
|---|---|---|---|---|---|
| GTA V (2015) | 172.9 | 166 | 103.2 | ||
| The Witcher 3 (2015) | 98 | ||||
| Dota 2 Reborn (2015) | 161.6 | 159.2 | 140.6 | 134.7 | |
| X-Plane 11.11 (2018) | 116 | 103.5 | 81.6 | ||
| Strange Brigade (2018) | 258 | 208 | 180.8 | ||
| Atomic Heart (2023) | 122.1 | 82.7 | 64.9 | 50.7 | |
| Company of Heroes 3 (2023) | 156 | 122 | 120 | 92 | |
| Sons of the Forest (2023) | 83.8 | 80.2 | 78.8 | 64.2 | |
| Resident Evil 4 Remake (2023) | 98.4 | 92.1 | 64.4 | 55.1 | |
| Armored Core 6 (2023) | 104.5 | 103.1 | 95.6 | 73.2 | |
| Baldur's Gate 3 (2023) | 98.7 | 84.8 | 82.6 | 55.8 | |
| EA Sports FC 24 (2023) | 187.9 | 155.2 | 136.9 | 117.5 | |
| Assassin's Creed Mirage (2023) | 80 | 76 | 65 | 64 | |
| Total War Pharaoh (2023) | 193 | 128 | 104 | 76 | |
| Lords of the Fallen (2023) | 66.4 | 48.2 | 33.2 | 24.2 | |
| Alan Wake 2 (2023) | 58.5 | 53.8 | 33.8 |
Emisje
Hałas systemowy
Charakteryzuje się najniższym poziomem hałasu w polu testowym, z poziomem hałasu w zakresie od 33 do 49 dB(A) w trybie 3D. W przypadku graczy wrażliwych na hałas zalecamy wybranie trybu cichego, który powoduje minimalną utratę wydajności przy jednoczesnym radykalnym obniżeniu hałasu podczas pracy (proszę zapoznać się z tabelą dotyczącą konkretnych warunków testowych). Wentylatory okazjonalnie są całkowicie ciche podczas bezczynności, a nawet gdy są aktywne, generowany hałas jest ograniczony do minimum. Warto wspomnieć, że nasza jednostka testowa nie wykazywała żadnych oznak marudzenia cewek.
Hałas
| luz |
| 25 / 28 / 31 dB |
| obciążenie |
| 33 / 49 dB |
 | ||
30 dB cichy 40 dB(A) słyszalny 50 dB(A) irytujący |
||
min: | ||
| Lenovo Legion Slim 7 16APH8 R7 7840HS, GeForce RTX 4060 Laptop GPU | Asus ROG Flow X16 GV601V i9-13900H, GeForce RTX 4060 Laptop GPU | Alienware m16 R1 Intel i7-13700HX, GeForce RTX 4060 Laptop GPU | Acer Predator Helios 16 PH16-71-731Q i7-13700HX, GeForce RTX 4060 Laptop GPU | Lenovo Legion Pro 5 16IRX8 i7-13700HX, GeForce RTX 4060 Laptop GPU | Lenovo LOQ 16IRH8 i7-13620H, GeForce RTX 4060 Laptop GPU | |
|---|---|---|---|---|---|---|
| Noise | 3% | -8% | -0% | 4% | -6% | |
| wyłączone / środowisko * (dB) | 24 | 24 -0% | 25 -4% | 24 -0% | 23 4% | 23 4% |
| Idle Minimum * (dB) | 25 | 24 4% | 25 -0% | 24 4% | 23.1 8% | 23 8% |
| Idle Average * (dB) | 28 | 24 14% | 26 7% | 24 14% | 23.1 17% | 23 18% |
| Idle Maximum * (dB) | 31 | 24 23% | 27 13% | 32.32 -4% | 26.6 14% | 27.66 11% |
| Load Average * (dB) | 33 | 36.71 -11% | 52 -58% | 36.66 -11% | 34.7 -5% | 53.62 -62% |
| Witcher 3 ultra * (dB) | 47 | 50.92 -8% | 51 -9% | 49.06 -4% | 47.6 -1% | 53.5 -14% |
| Load Maximum * (dB) | 49 | 50.92 -4% | 53 -8% | 49.49 -1% | 54.8 -12% | 53.5 -9% |
* ... im mniej tym lepiej
Temperatura
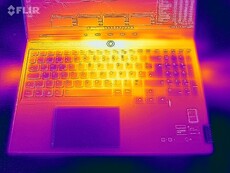
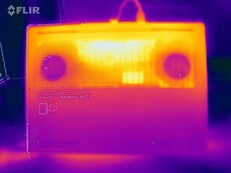
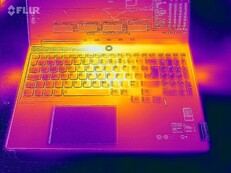
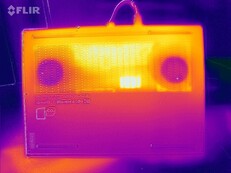
Temperatura wewnątrz obudowy mieści się w średnim zakresie i nie osiąga wyjątkowo niskich lub wysokich poziomów. Podczas testów obciążeniowych za pomocą narzędzi Furmark i Prime95 karta graficzna dławiła się, powodując najwyższe temperatury obserwowane w trybie gry. Po 60 minutach działania The Witcher 3, obudowa osiągnęła maksymalnie 49°C na górze i 52°C na spodzie, co jest typowymi wartościami dla notebooka do gier. W trybie bezczynności temperatury powierzchni oscylują wokół średnio 30°C, co wskazuje na umiarkowany poziom ciepła.
(-) Maksymalna temperatura w górnej części wynosi 46 °C / 115 F, w porównaniu do średniej 40.4 °C / 105 F , począwszy od 21.2 do 68.8 °C dla klasy Gaming.
(-) Dno nagrzewa się maksymalnie do 46 °C / 115 F, w porównaniu do średniej 43.3 °C / 110 F
(+) W stanie bezczynności średnia temperatura górnej części wynosi 30.3 °C / 87 F, w porównaniu ze średnią temperaturą urządzenia wynoszącą 33.9 °C / ### class_avg_f### F.
(-) Podczas gry w Wiedźmina 3 średnia temperatura górnej części wynosi 41.6 °C / 107 F, w porównaniu do średniej temperatury urządzenia wynoszącej 33.9 °C / ## #class_avg_f### F.
(+) Podparcia dłoni i touchpad osiągają maksymalną temperaturę skóry (35 °C / 95 F) i dlatego nie są gorące.
(-) Średnia temperatura obszaru podparcia dłoni w podobnych urządzeniach wynosiła 28.8 °C / 83.8 F (-6.2 °C / -11.2 F).
| Lenovo Legion Slim 7 16APH8 R7 7840HS, GeForce RTX 4060 Laptop GPU | Asus ROG Flow X16 GV601V i9-13900H, GeForce RTX 4060 Laptop GPU | Alienware m16 R1 Intel i7-13700HX, GeForce RTX 4060 Laptop GPU | Acer Predator Helios 16 PH16-71-731Q i7-13700HX, GeForce RTX 4060 Laptop GPU | Lenovo Legion Pro 5 16IRX8 i7-13700HX, GeForce RTX 4060 Laptop GPU | Lenovo LOQ 16IRH8 i7-13620H, GeForce RTX 4060 Laptop GPU | |
|---|---|---|---|---|---|---|
| Heat | 1% | -12% | -13% | 2% | 0% | |
| Maximum Upper Side * (°C) | 46 | 46 -0% | 49 -7% | 41 11% | 42.8 7% | 48 -4% |
| Maximum Bottom * (°C) | 46 | 41 11% | 48 -4% | 66 -43% | 50 -9% | 59 -28% |
| Idle Upper Side * (°C) | 33 | 36 -9% | 40 -21% | 36 -9% | 29.6 10% | 28 15% |
| Idle Bottom * (°C) | 34 | 33 3% | 39 -15% | 37 -9% | 34 -0% | 28 18% |
* ... im mniej tym lepiej
Test warunków skrajnych
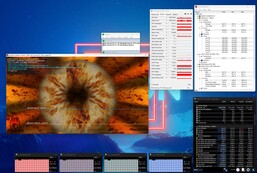
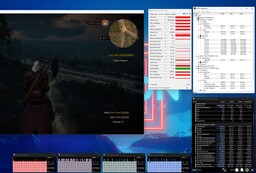
Podczas naszego 60-minutowego testu obciążeniowego procesor stał się dość gorący. Chociaż Ryzen 7 7840HS osiągnął 95°C, utrzymywał stałe taktowanie 4,1 GHz. W trybie gry sytuacja jest znacznie spokojniejsza. Podczas grania w The Witcher 3, temperatura procesora wahała się na poziomie 66°C, podczas gdy temperatura karty graficznej utrzymywała się w zielonym zakresie na poziomie nieco poniżej 72°C.
Głośniki
Jakość dźwięku przewyższa większość konkurentów. System 2.0 (Harman) generuje solidny dźwięk, który w razie potrzeby może być przyjemnie głośny. Jednak, podobnie jak w przypadku większości notebooków, nieco brakuje basów.
Lenovo Legion Slim 7 16APH8 analiza dźwięku
(+) | głośniki mogą odtwarzać stosunkowo głośno (87 dB)
Bas 100 - 315 Hz
(±) | zredukowany bas - średnio 13.8% niższy od mediany
(±) | liniowość basu jest średnia (8.5% delta do poprzedniej częstotliwości)
Średnie 400 - 2000 Hz
(+) | zbalansowane środki średnie - tylko 1.1% od mediany
(+) | średnie są liniowe (2.5% delta do poprzedniej częstotliwości)
Wysokie 2–16 kHz
(+) | zrównoważone maksima - tylko 4.1% od mediany
(+) | wzloty są liniowe (4.8% delta do poprzedniej częstotliwości)
Ogólnie 100 - 16.000 Hz
(+) | ogólny dźwięk jest liniowy (9.9% różnicy w stosunku do mediany)
W porównaniu do tej samej klasy
» 5% wszystkich testowanych urządzeń w tej klasie było lepszych, 2% podobnych, 94% gorszych
» Najlepszy miał deltę 6%, średnia wynosiła ###średnia###%, najgorsza wynosiła 132%
W porównaniu do wszystkich testowanych urządzeń
» 4% wszystkich testowanych urządzeń było lepszych, 1% podobnych, 95% gorszych
» Najlepszy miał deltę 4%, średnia wynosiła ###średnia###%, najgorsza wynosiła 134%
Asus ROG Flow X16 GV601V analiza dźwięku
(±) | głośność głośnika jest średnia, ale dobra (77.38 dB)
Bas 100 - 315 Hz
(±) | zredukowany bas - średnio 9.6% niższy od mediany
(±) | liniowość basu jest średnia (9.2% delta do poprzedniej częstotliwości)
Średnie 400 - 2000 Hz
(+) | zbalansowane środki średnie - tylko 4.7% od mediany
(±) | liniowość środka jest średnia (7.5% delta do poprzedniej częstotliwości)
Wysokie 2–16 kHz
(+) | zrównoważone maksima - tylko 2.2% od mediany
(+) | wzloty są liniowe (6.1% delta do poprzedniej częstotliwości)
Ogólnie 100 - 16.000 Hz
(+) | ogólny dźwięk jest liniowy (12% różnicy w stosunku do mediany)
W porównaniu do tej samej klasy
» 12% wszystkich testowanych urządzeń w tej klasie było lepszych, 4% podobnych, 84% gorszych
» Najlepszy miał deltę 6%, średnia wynosiła ###średnia###%, najgorsza wynosiła 132%
W porównaniu do wszystkich testowanych urządzeń
» 9% wszystkich testowanych urządzeń było lepszych, 2% podobnych, 89% gorszych
» Najlepszy miał deltę 4%, średnia wynosiła ###średnia###%, najgorsza wynosiła 134%
Zarządzanie energią
Zużycie energii
Pobór mocy czasami wydaje się być niespójny. Pomimo aktywnego przełączania grafiki, pobór mocy w stanie spoczynku wynoszący od 33 do 45 watów jest wyższy niż średnia. Jednak w 3DMark 06 zużycie energii na poziomie około 59 watów jest bardzo niskie. Co więcej, wyniki uzyskane podczas testu The Witcher 3 (131 W) i testu warunków skrajnych (maksymalnie 177 W) są niższe od konkurencji, co pokazuje energooszczędność procesora Zen 4, przynajmniej pod obciążeniem.
| wyłączony / stan wstrzymania | |
| luz | |
| obciążenie |
|
Legenda:
min: | |
| Lenovo Legion Slim 7 16APH8 R7 7840HS, GeForce RTX 4060 Laptop GPU | Asus ROG Flow X16 GV601V i9-13900H, GeForce RTX 4060 Laptop GPU | Alienware m16 R1 Intel i7-13700HX, GeForce RTX 4060 Laptop GPU | Acer Predator Helios 16 PH16-71-731Q i7-13700HX, GeForce RTX 4060 Laptop GPU | Lenovo Legion Pro 5 16IRX8 i7-13700HX, GeForce RTX 4060 Laptop GPU | Lenovo LOQ 16IRH8 i7-13620H, GeForce RTX 4060 Laptop GPU | Średnia w klasie Gaming | |
|---|---|---|---|---|---|---|---|
| Power Consumption | 14% | -7% | -4% | -13% | 8% | 2% | |
| Idle Minimum * (Watt) | 33 | 9.6 71% | 10 70% | 15.9 52% | 24.5 26% | 17.2 48% | 13.5 ? 59% |
| Idle Average * (Watt) | 35 | 16 54% | 14 60% | 20.5 41% | 29.2 17% | 19.3 45% | 19.3 ? 45% |
| Idle Maximum * (Watt) | 45 | 16.9 62% | 21 53% | 20.9 54% | 34.3 24% | 21.2 53% | 25.8 ? 43% |
| Load Average * (Watt) | 59 | 104 -76% | 119 -102% | 106 -80% | 98.7 -67% | 90 -53% | 110.9 ? -88% |
| Witcher 3 ultra * (Watt) | 131 | 142 -8% | 186.7 -43% | 175 -34% | 178.6 -36% | 168 -28% | |
| Load Maximum * (Watt) | 177 | 214 -21% | 323 -82% | 276 -56% | 249.6 -41% | 211 -19% | 260 ? -47% |
* ... im mniej tym lepiej
Power consumption Witcher 3 / stress test
Power consumption with external monitor
Żywotność baterii
Biorąc pod uwagę dużą baterię o pojemności 99,9 Wh, czas pracy nie bije żadnych rekordów. Około 7 godzin przeglądania Internetu przy obniżonej jasności na poziomie 150 cd/m2 to dobry wynik, ale biorąc pod uwagę rozmiar baterii, może być znacznie lepiej. Niemniej jednak zapewnia sobie drugie miejsce w teście, tuż za Asusem ROG Flow X16.
| Lenovo Legion Slim 7 16APH8 R7 7840HS, GeForce RTX 4060 Laptop GPU, 99.9 Wh | Asus ROG Flow X16 GV601V i9-13900H, GeForce RTX 4060 Laptop GPU, 90 Wh | Alienware m16 R1 Intel i7-13700HX, GeForce RTX 4060 Laptop GPU, 86 Wh | Acer Predator Helios 16 PH16-71-731Q i7-13700HX, GeForce RTX 4060 Laptop GPU, 90 Wh | Lenovo Legion Pro 5 16IRX8 i7-13700HX, GeForce RTX 4060 Laptop GPU, 80 Wh | Lenovo LOQ 16IRH8 i7-13620H, GeForce RTX 4060 Laptop GPU, 80 Wh | Średnia w klasie Gaming | |
|---|---|---|---|---|---|---|---|
| Czasy pracy | 11% | -32% | -21% | -52% | -11% | -5% | |
| WiFi v1.3 (h) | 7.1 | 7.9 11% | 4.8 -32% | 5.6 -21% | 3.4 -52% | 6.3 -11% | 6.78 ? -5% |
| H.264 (h) | 8.9 | 5.6 | 4.8 | 6.4 | 8.1 ? | ||
| Load (h) | 1.5 | 1 | 1.5 | 0.7 | 1.5 | 1.43 ? | |
| Reader / Idle (h) | 6.4 | 6.7 | 9.62 ? | ||||
| Witcher 3 ultra (h) | 1.5 | 0.958 ? |
Za
Przeciw
Werdykt
Wersja AMD laptopa, podobnie jak jego odpowiednik Intela, jest wysoce zalecana.
Synergia pomiędzy układem Ryzen 7 7840HS a GeForce RTX 4060 pozwala na płynne działanie, umożliwiając wysokie i maksymalne ustawienia w rozdzielczości 2560 x 1600 pikseli.
Wyświetlacz 240 Hz jest godny uwagi nie tylko ze względu na wysoką jasność, ale także widoczność w środowisku zewnętrznym. Obudowa laptopa wyróżnia się pod różnymi względami, w tym połączeniami, stabilnością, wzornictwem i jakością materiałów. Pomimo 16-calowego rozmiaru, jest raczej lekki (4,6 funta). Ma również dobrze przemyślane urządzenia wejściowe i doskonałą jakość dźwięku.
Chociaż istnieją drobne wady, takie jak nieco większy pobór mocy w trybie bezczynności i sporadyczne dławienie dysku SSD w czasie, niedociągnięcia te nie odwracają znacząco uwagi od ogólnego doskonałego doświadczenia. W rezultacie laptop otrzymuje bardzo dobrą ocenę ogólną.
Warto wspomnieć, że konkurencja, jak np Asus ROG Flow X16zapewnia również doskonałą wydajność, ale w wyższej cenie, co czyni naszą propozycję jeszcze bardziej kuszącą.
Cena i dostępność
Testowany Lenovo Legion Slim 7 16APH8 jest dostępny w cenie około 1750 USD na Amazon.
Lenovo Legion Slim 7 16APH8
- 03/11/2023 v7 (old)
Florian Glaser
Przezroczystość
Wyboru urządzeń do recenzji dokonuje nasza redakcja. Próbka testowa została udostępniona autorowi jako pożyczka od producenta lub sprzedawcy detalicznego na potrzeby tej recenzji. Pożyczkodawca nie miał wpływu na tę recenzję, producent nie otrzymał też kopii tej recenzji przed publikacją. Nie było obowiązku publikowania tej recenzji. Jako niezależna firma medialna, Notebookcheck nie podlega władzy producentów, sprzedawców detalicznych ani wydawców.
Tak testuje Notebookcheck
Każdego roku Notebookcheck niezależnie sprawdza setki laptopów i smartfonów, stosując standardowe procedury, aby zapewnić porównywalność wszystkich wyników. Od około 20 lat stale rozwijamy nasze metody badawcze, ustanawiając przy tym standardy branżowe. W naszych laboratoriach testowych doświadczeni technicy i redaktorzy korzystają z wysokiej jakości sprzętu pomiarowego. Testy te obejmują wieloetapowy proces walidacji. Nasz kompleksowy system ocen opiera się na setkach uzasadnionych pomiarów i benchmarków, co pozwala zachować obiektywizm.


