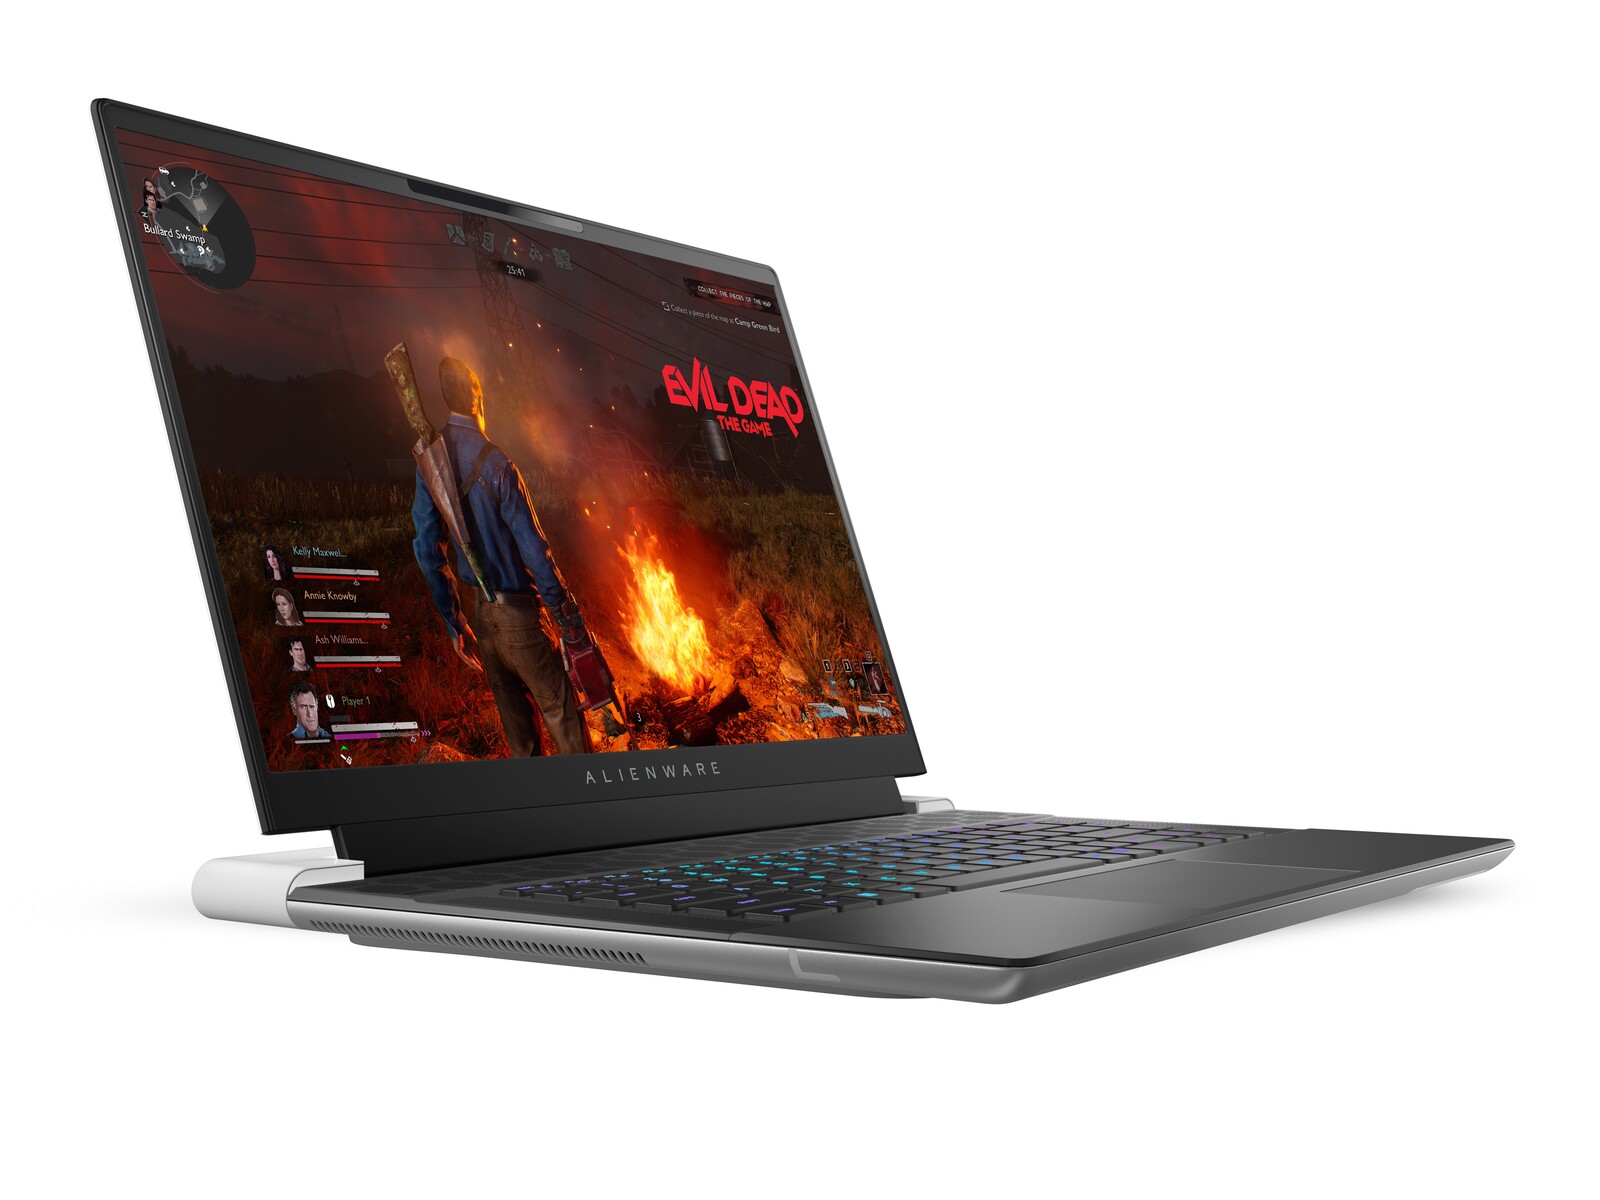
Debiut wydajności Intel Core i9-13900HK: Recenzja laptopa Alienware x16 R1

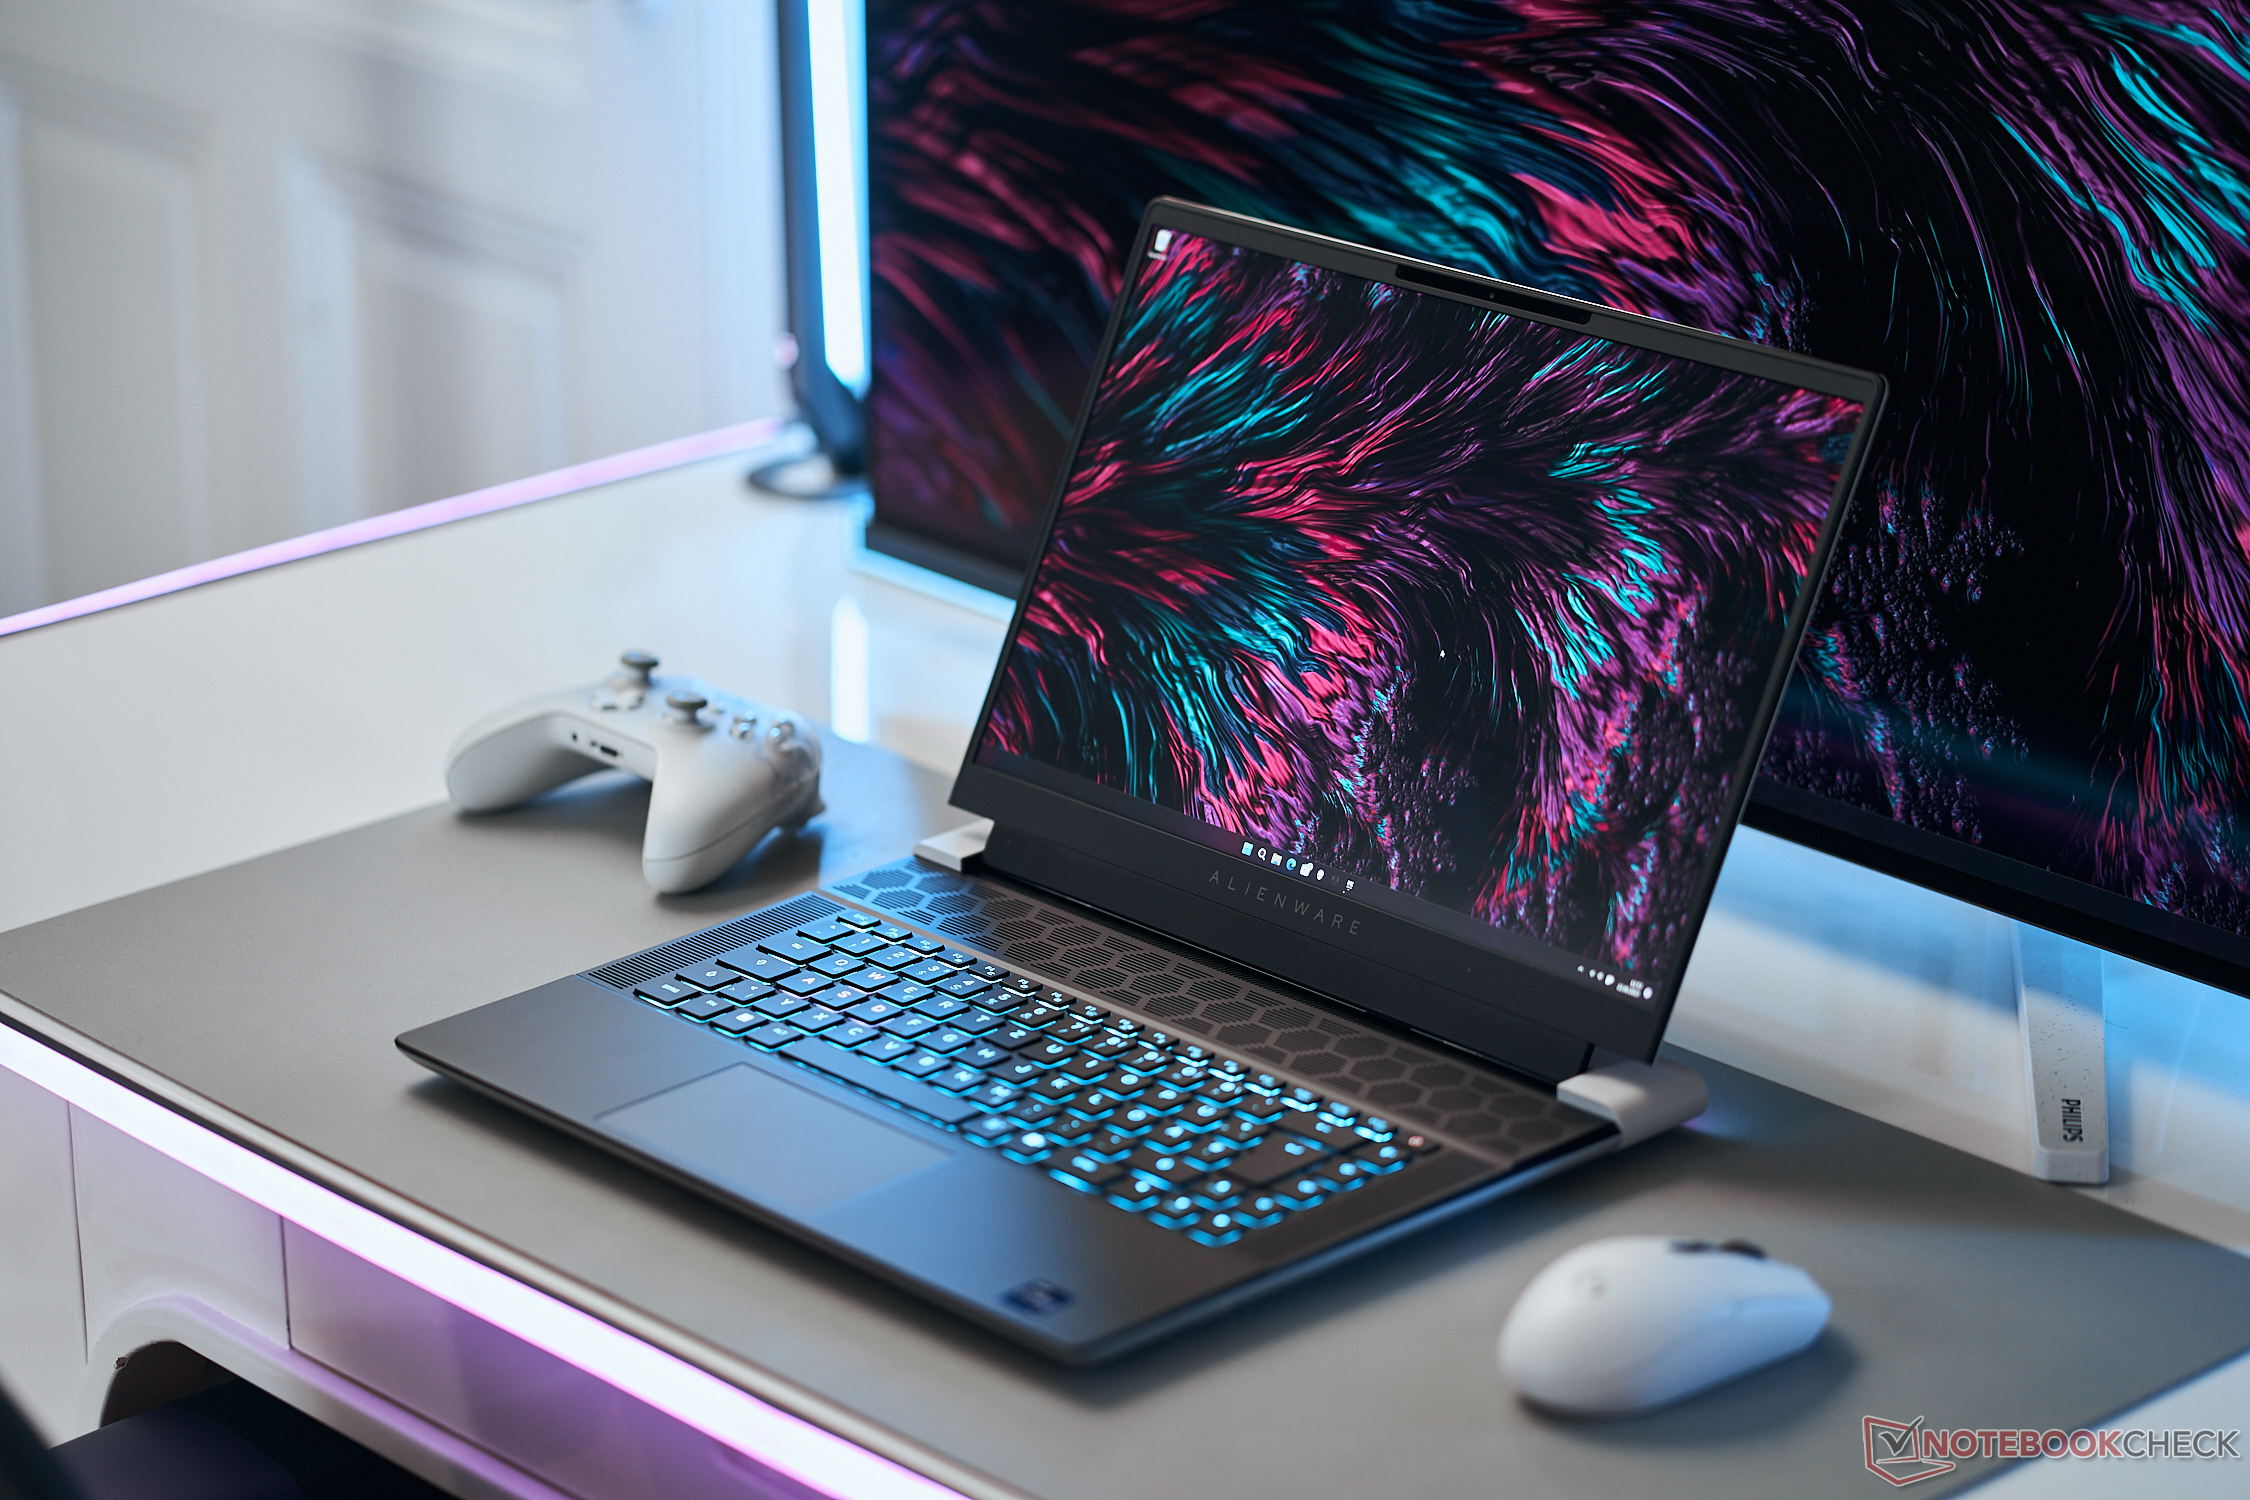
Zaprezentowany na targach CES 2023alienware x16 R1 to drugi 16-calowy model w rodzinie po grubszym i mocniejszym Alienware m16, którego jeszcze nie recenzowaliśmy. Te dwa modele uzupełniają istniejące 14-calowy, 15-calowy, 17-calowe i 18-calowe Alienware są już dostępne na rynku.
Nasza jednostka testowa to konfiguracja wyższej klasy z procesorem Core i9-13900HK 13. generacji Raptor Lake, procesorem graficznym GeForce RTX 4080 i 16,0-calowym wyświetlaczem IPS 2560 x 1600 240 Hz za około 3350 USD. Tańsze lub droższe konfiguracje są dostępne w zakresie od Core i7-13620H, wyświetlacza 1200p i GPU RTX 4050 do RTX 4090 za 2200 USD do ponad 4000 USD.
Alternatywy dla Alienware x16 R1 obejmują inne 16-calowe laptopy do gier, takie jak Lenovo Legion Pro 7, Asus ROG Zephyrus M16, Razer Blade 16 lub HP Omen 16. Ta konkretna kategoria rozmiarów zyskuje na popularności w ciągu ostatnich kilku lat.
Więcej recenzji Dell:
Potencjalni konkurenci w porównaniu
Ocena | Data | Model | Waga | Wysokość | Rozmiar | Rezolucja | Cena |
|---|---|---|---|---|---|---|---|
| 88.4 % v7 (old) | 06/2023 | Alienware x16 R1 i9-13900HK, GeForce RTX 4080 Laptop GPU | 2.6 kg | 18.57 mm | 16.00" | 2560x1600 | |
| 88.8 % v7 (old) | 06/2023 | Lenovo Legion Pro 7 RTX4090 i9-13900HX, GeForce RTX 4090 Laptop GPU | 2.7 kg | 26 mm | 16.00" | 2560x1600 | |
| 89.4 % v7 (old) | 03/2023 | Asus ROG Zephyrus M16 GU604VY-NM042X i9-13900H, GeForce RTX 4090 Laptop GPU | 2.3 kg | 22.9 mm | 16.00" | 2560x1600 | |
| 91.2 % v7 (old) | 02/2023 | Razer Blade 16 Early 2023 i9-13950HX, GeForce RTX 4080 Laptop GPU | 2.4 kg | 21.99 mm | 16.00" | 2560x1600 | |
| 86.1 % v7 (old) | 10/2022 | Dell G16 7620 i7-12700H, GeForce RTX 3060 Laptop GPU | 2.6 kg | 26.9 mm | 16.00" | 2560x1600 | |
| 86.1 % v7 (old) | 01/2023 | Alienware m17 R5 (R9 6900HX, RX 6850M XT) R9 6900HX, Radeon RX 6850M XT | 3.4 kg | 26.7 mm | 17.00" | 3840x2160 |
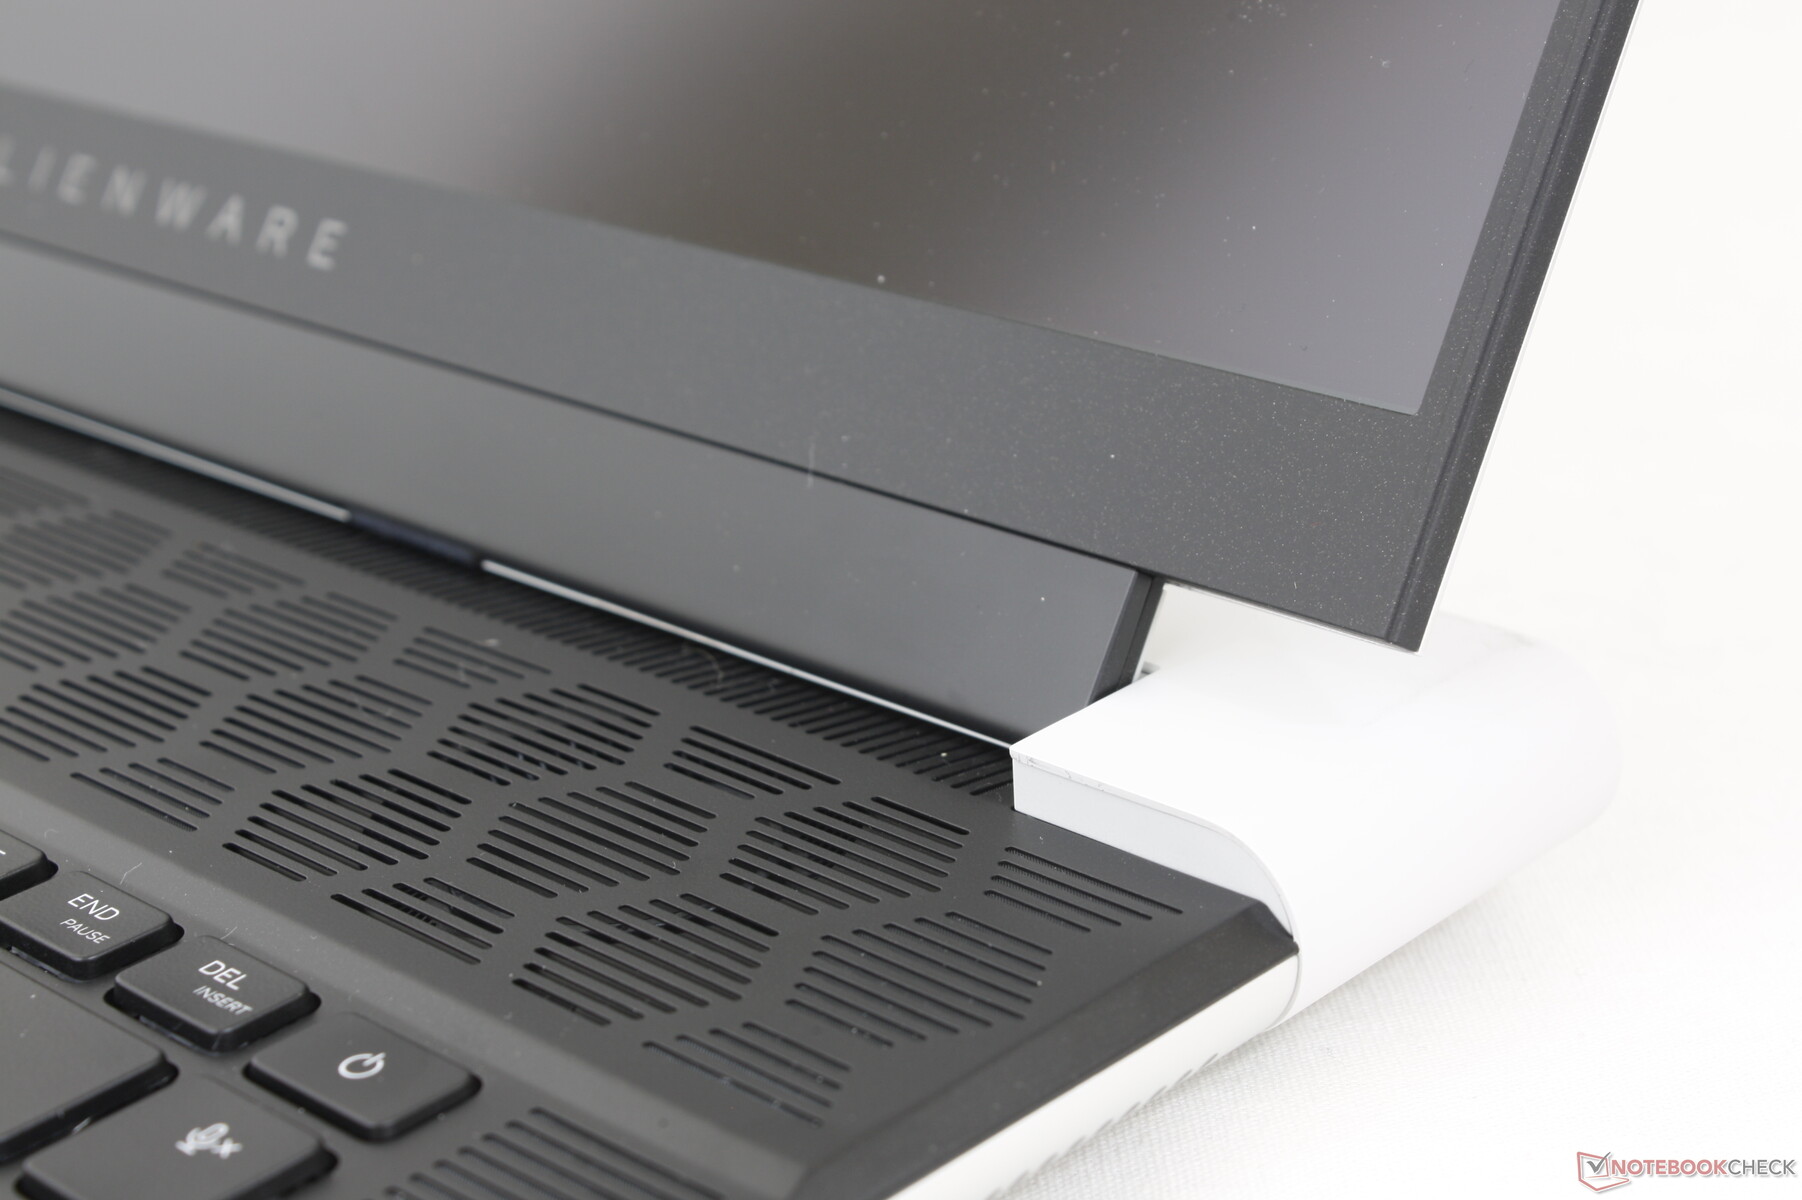
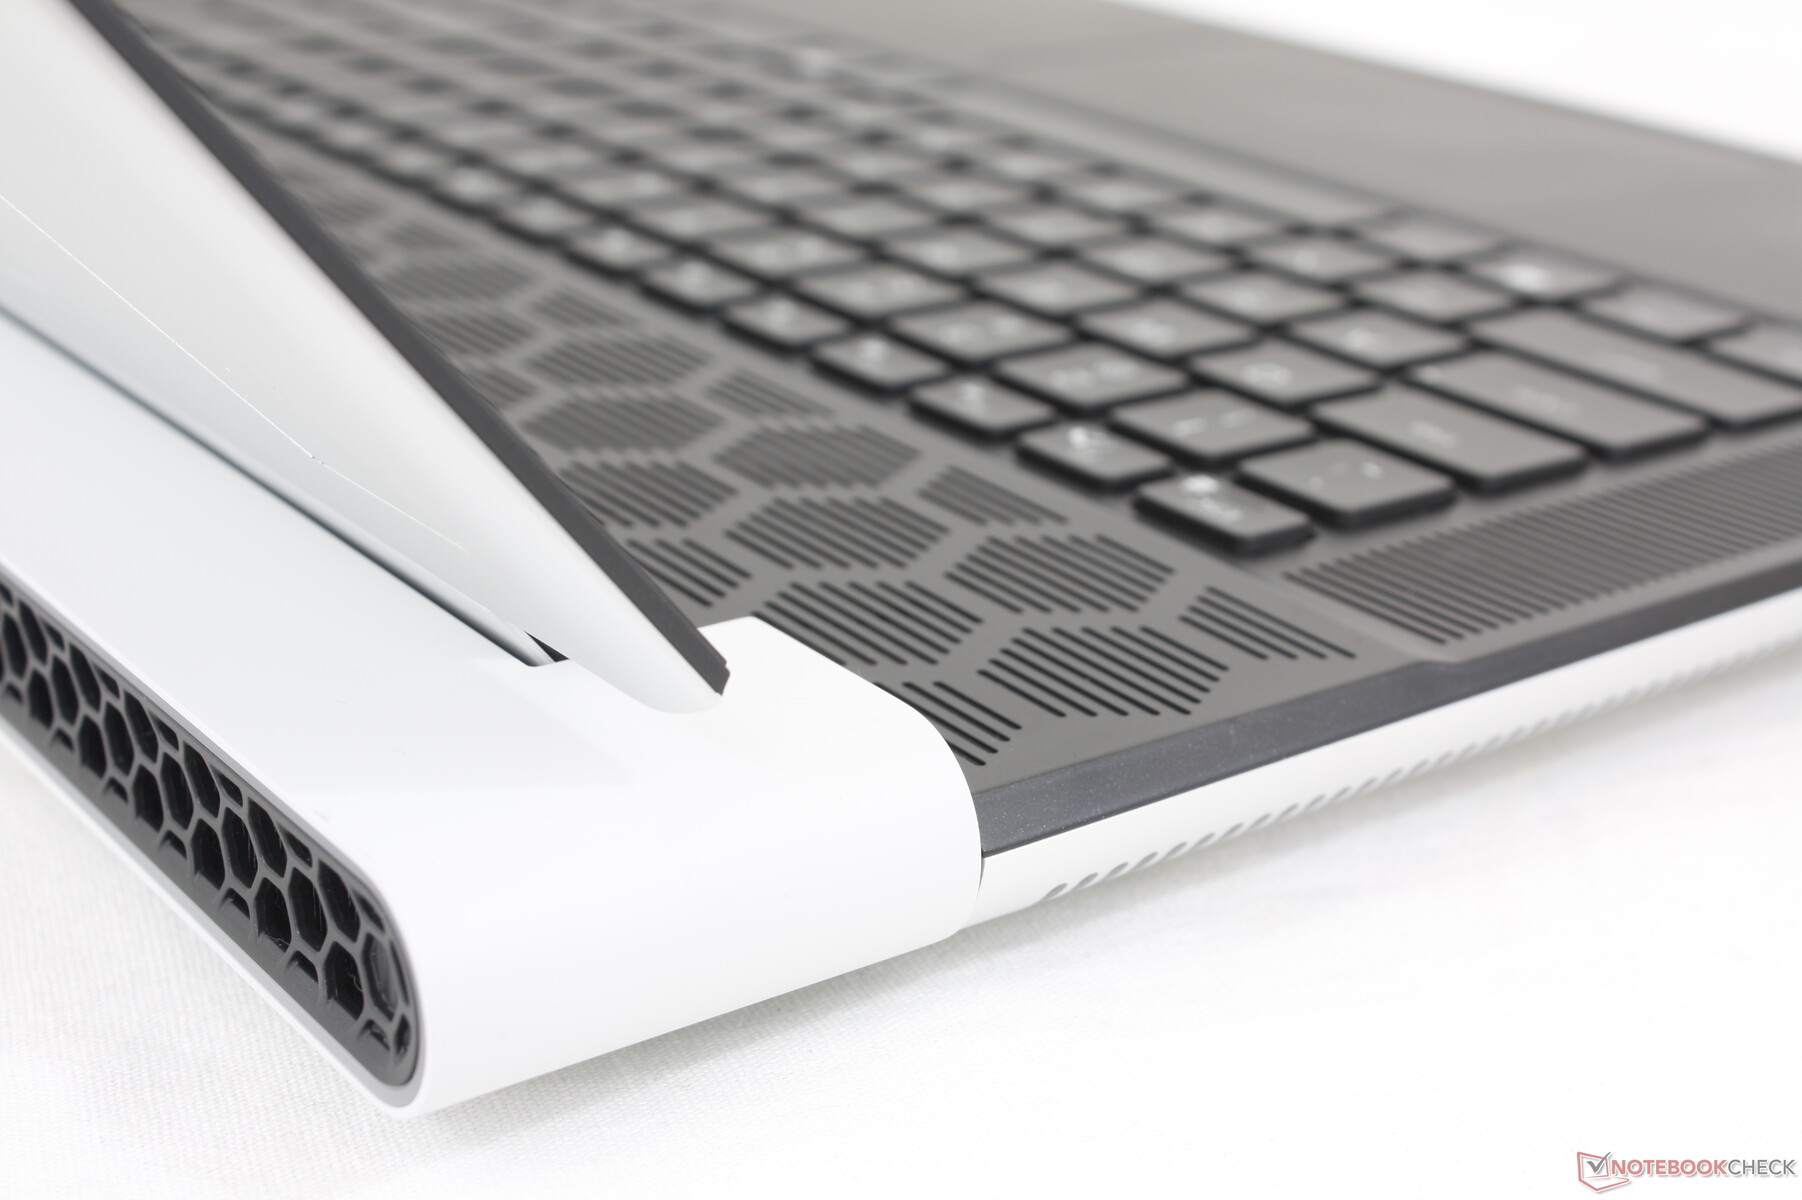
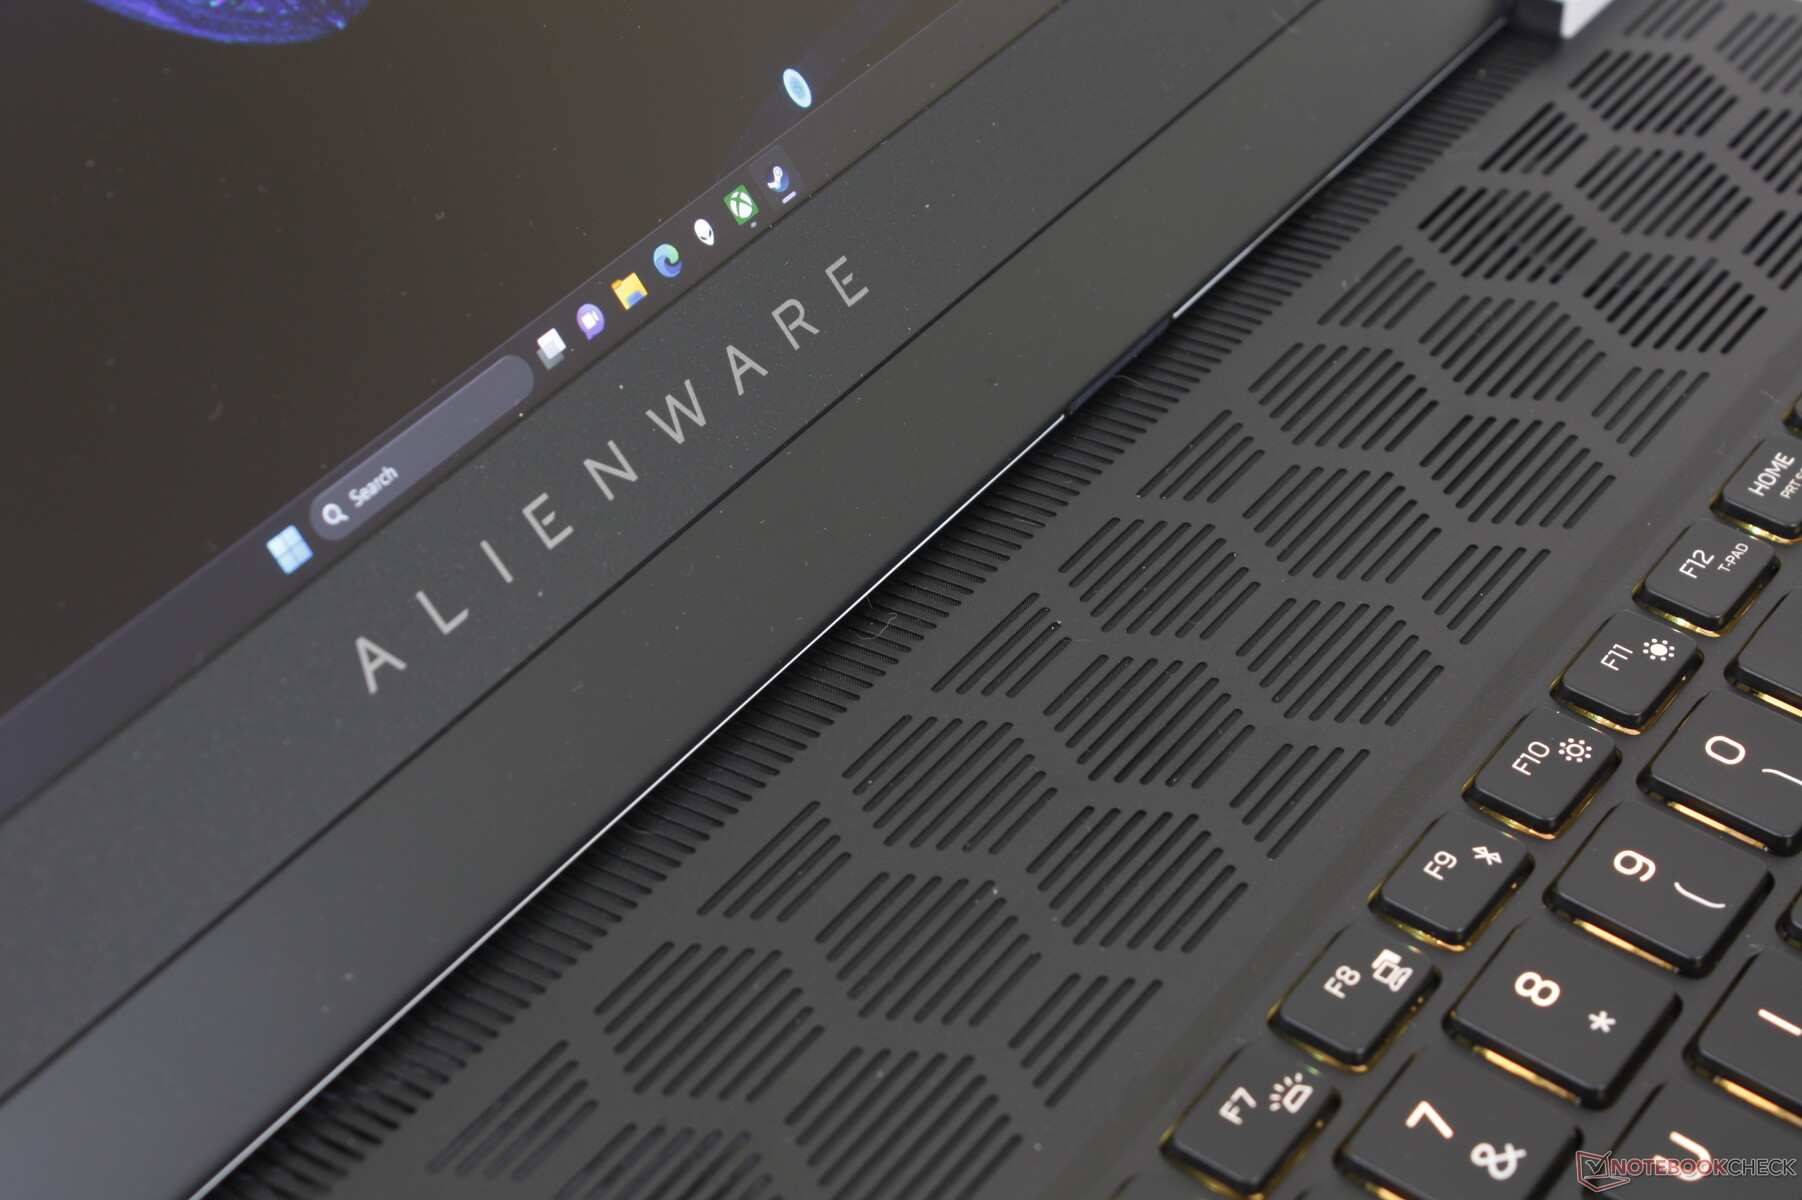
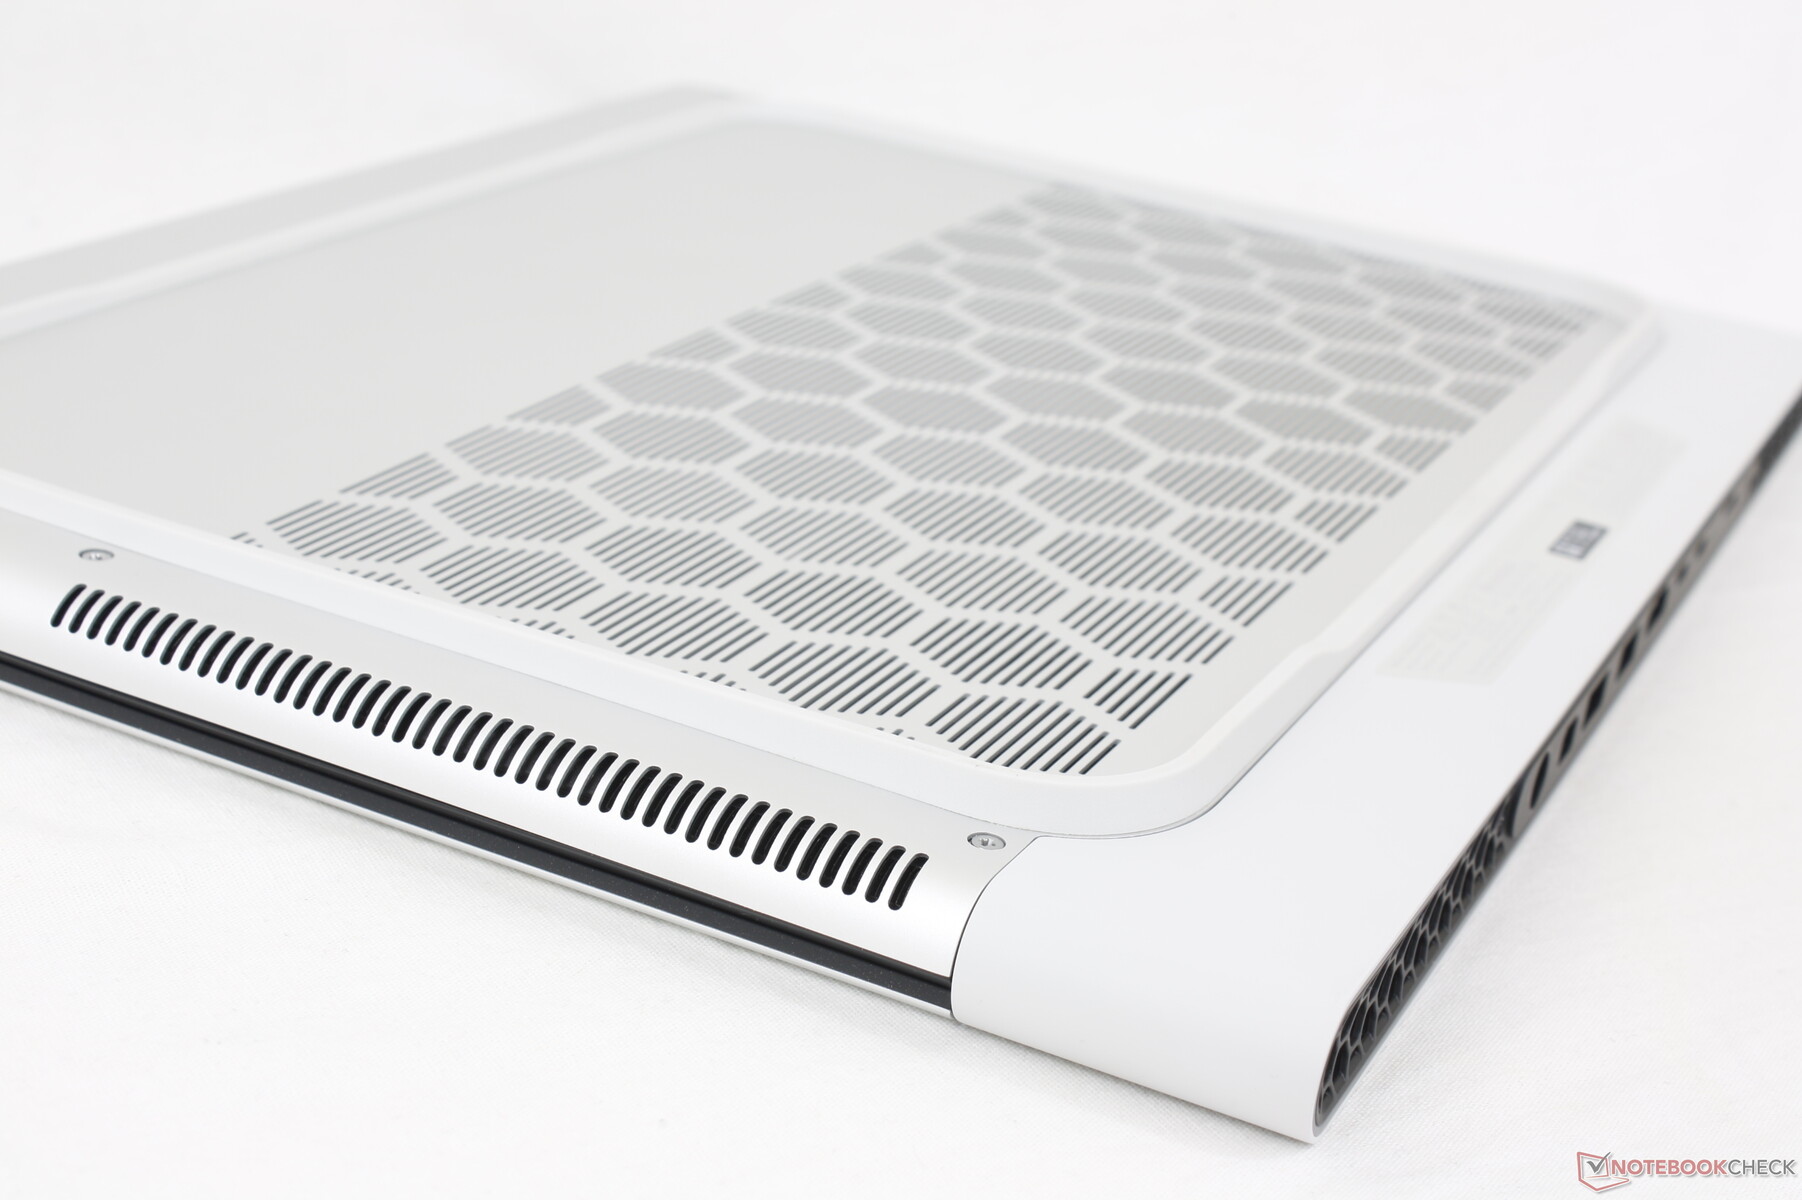
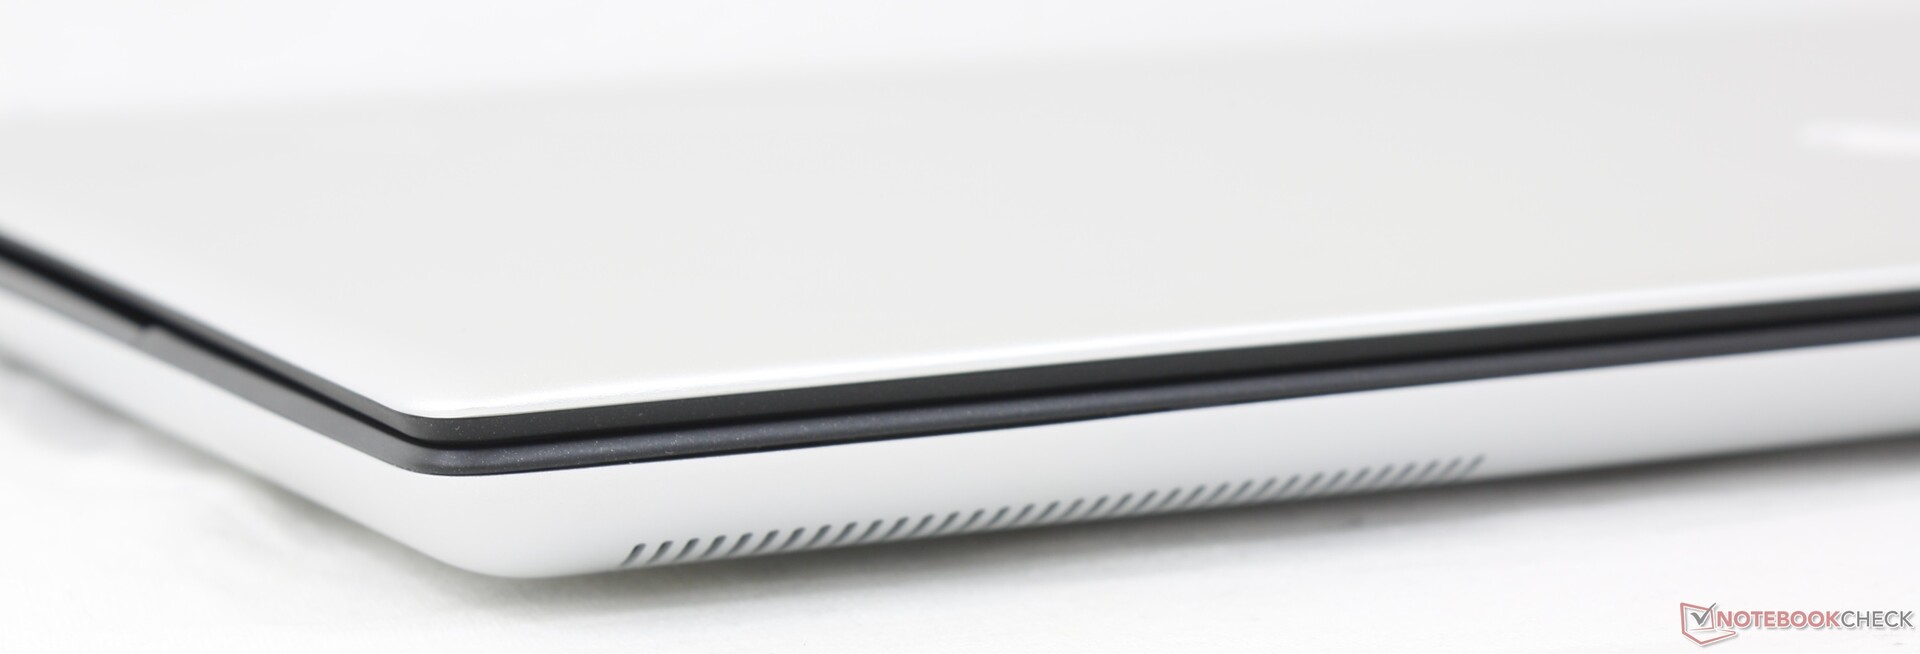
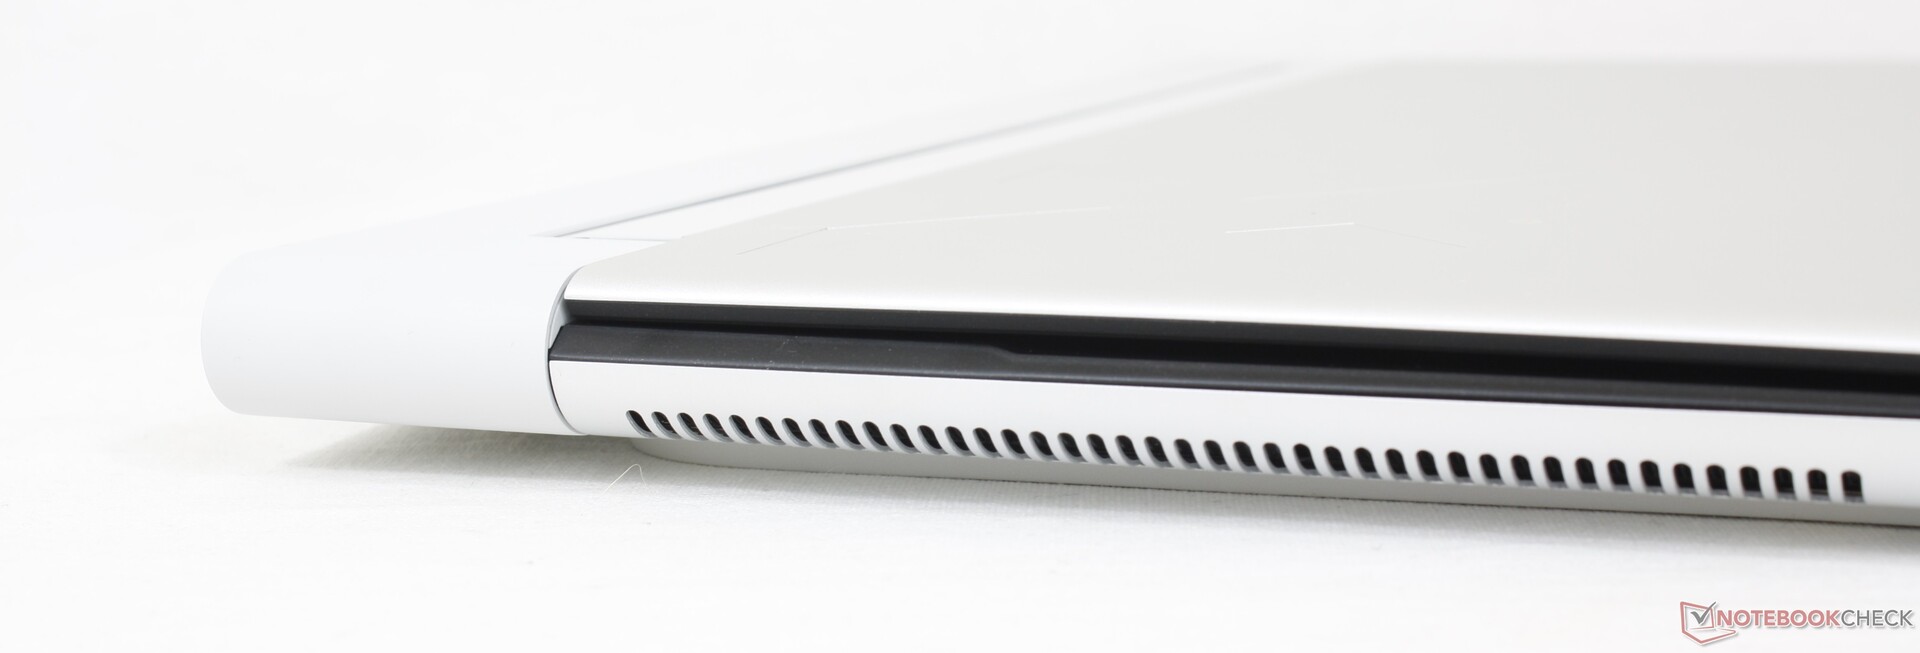
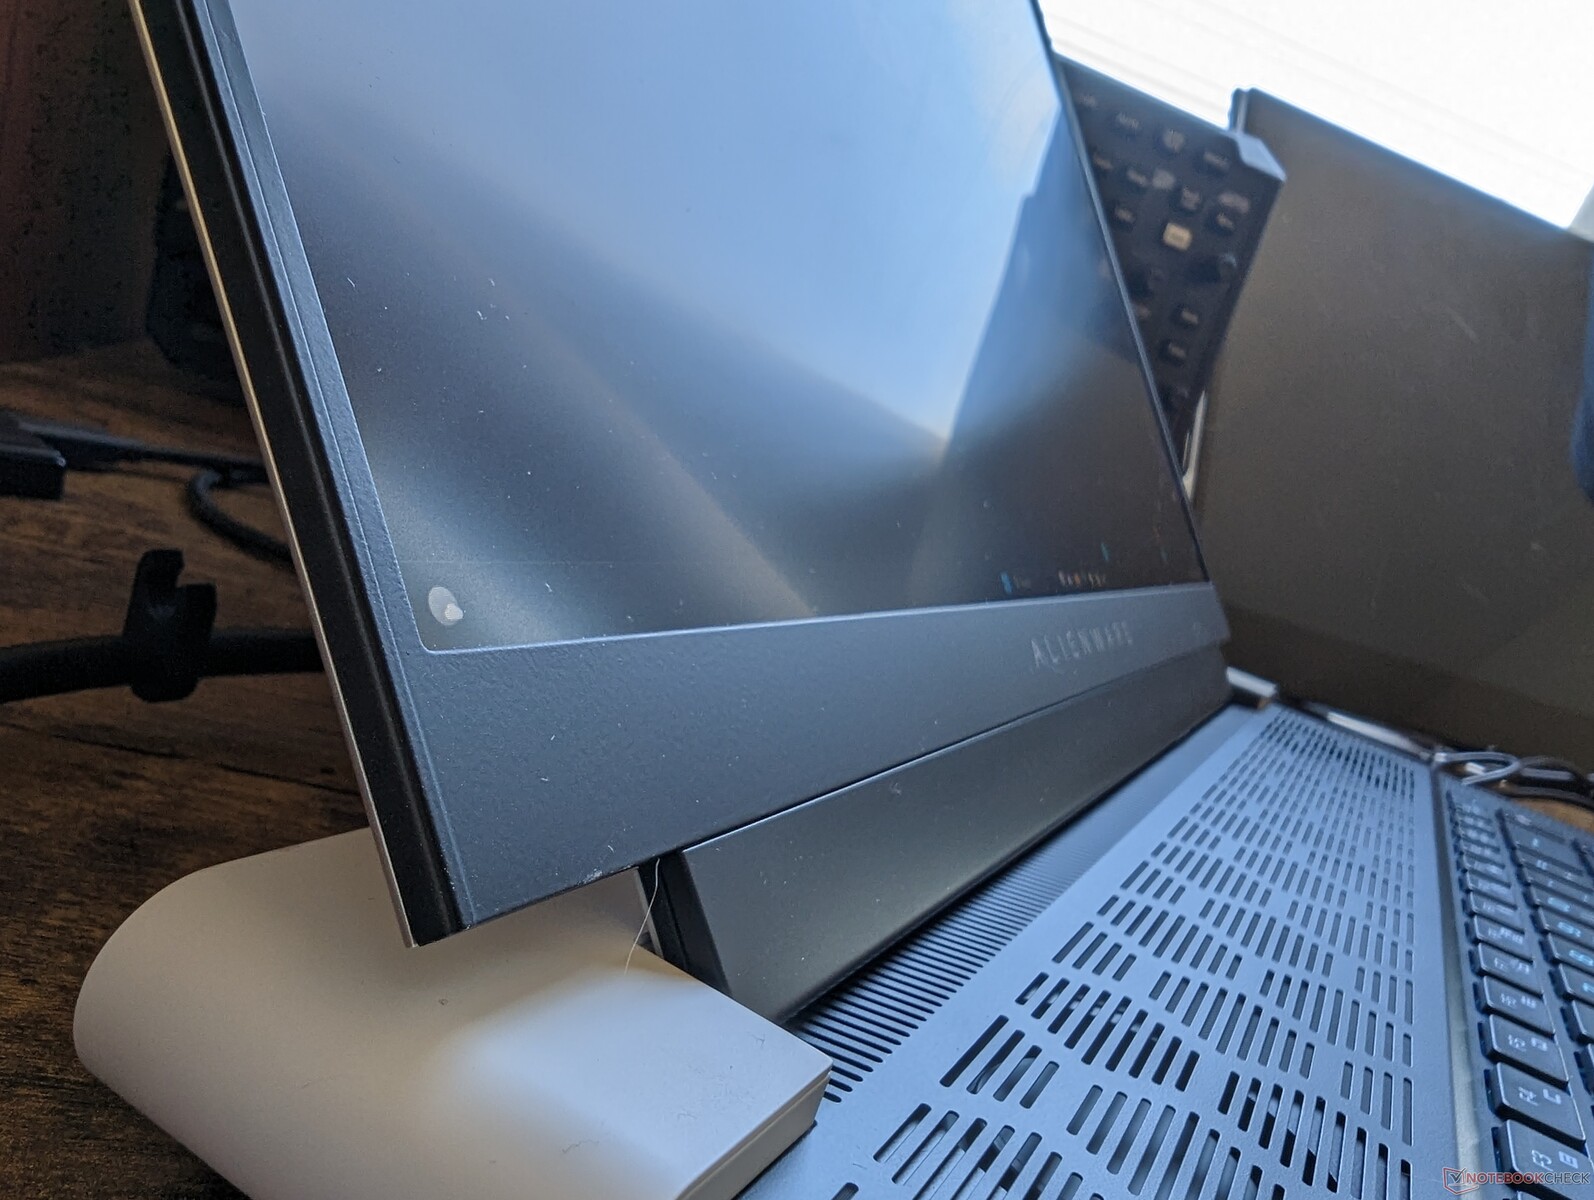
Obudowa - wyraźnie Alienware
Obudowa ma wiele wspólnego z Alienware x15 R2 i X17 R2, ponieważ wszystkie mają wspólny język projektowania Legend 3. Dwukolorowa czerń i biel, anodyzowane aluminium i stop magnezu oraz pierścień RGB z tyłu pomagają wizualnie odróżnić serię Alienware od oceanu innych laptopów do gier. To, czy jest bardziej atrakcyjny lub pożądany niż konkurencyjne modele, zależy od preferencji użytkownika.
Sztywność obudowy jest doskonała, zwłaszcza wokół podstawy, gdzie skręcanie i wypaczanie są na minimalnym poziomie. Pokrywa i zawiasy nie są jednak tak sztywne, jak byśmy chcieli, w porównaniu do sztywniejszych wyświetlaczy w serii Asus Strix Scar lub Blade 16.
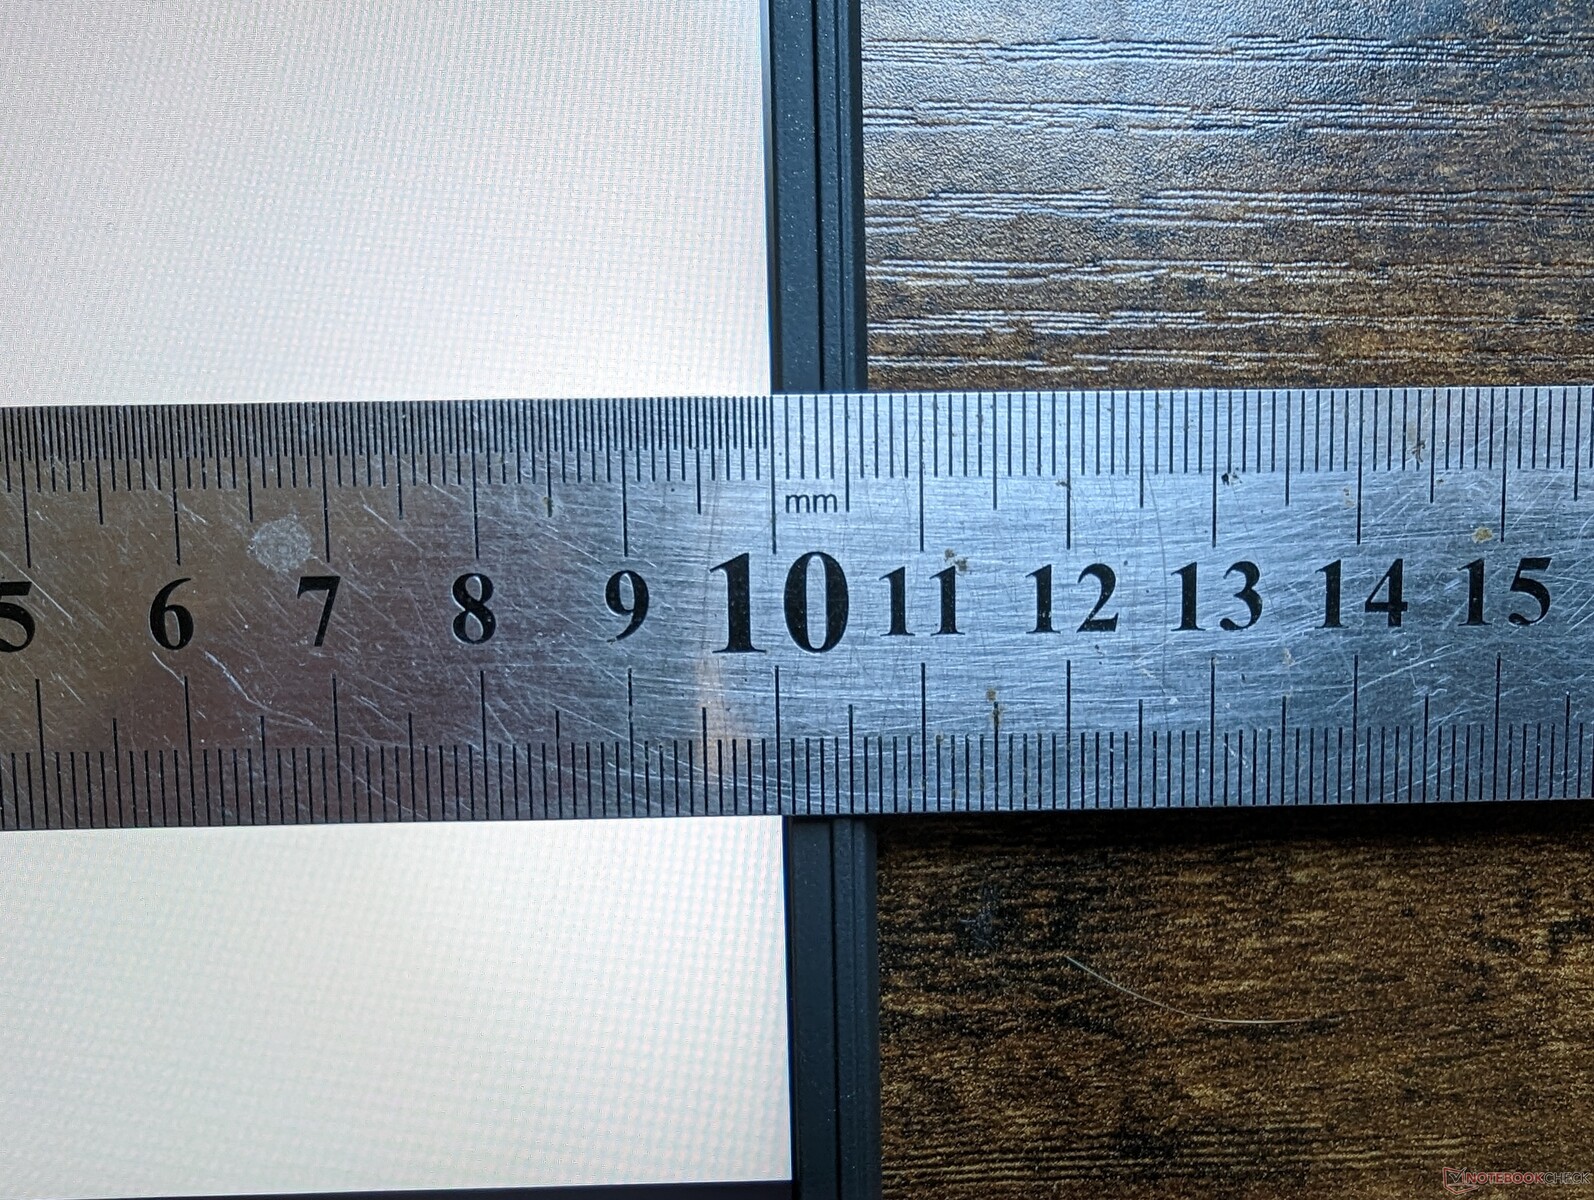
Mając mniej niż 19 mm, Alienware x16 jest jednym z najcieńszych 16-calowych laptopów do gier na rynku, cieńszym nawet od Razer Blade 16. Niestety, system jest szerszy i dłuższy, przez co jego ogólna objętość nie jest mniejsza niż u wielu konkurentów. Na przykład Alienware jest o prawie 4 mm cieńszy niż Blade 16, ale jest dłuższy o ponad 40 mm i cięższy o około 200 gramów.
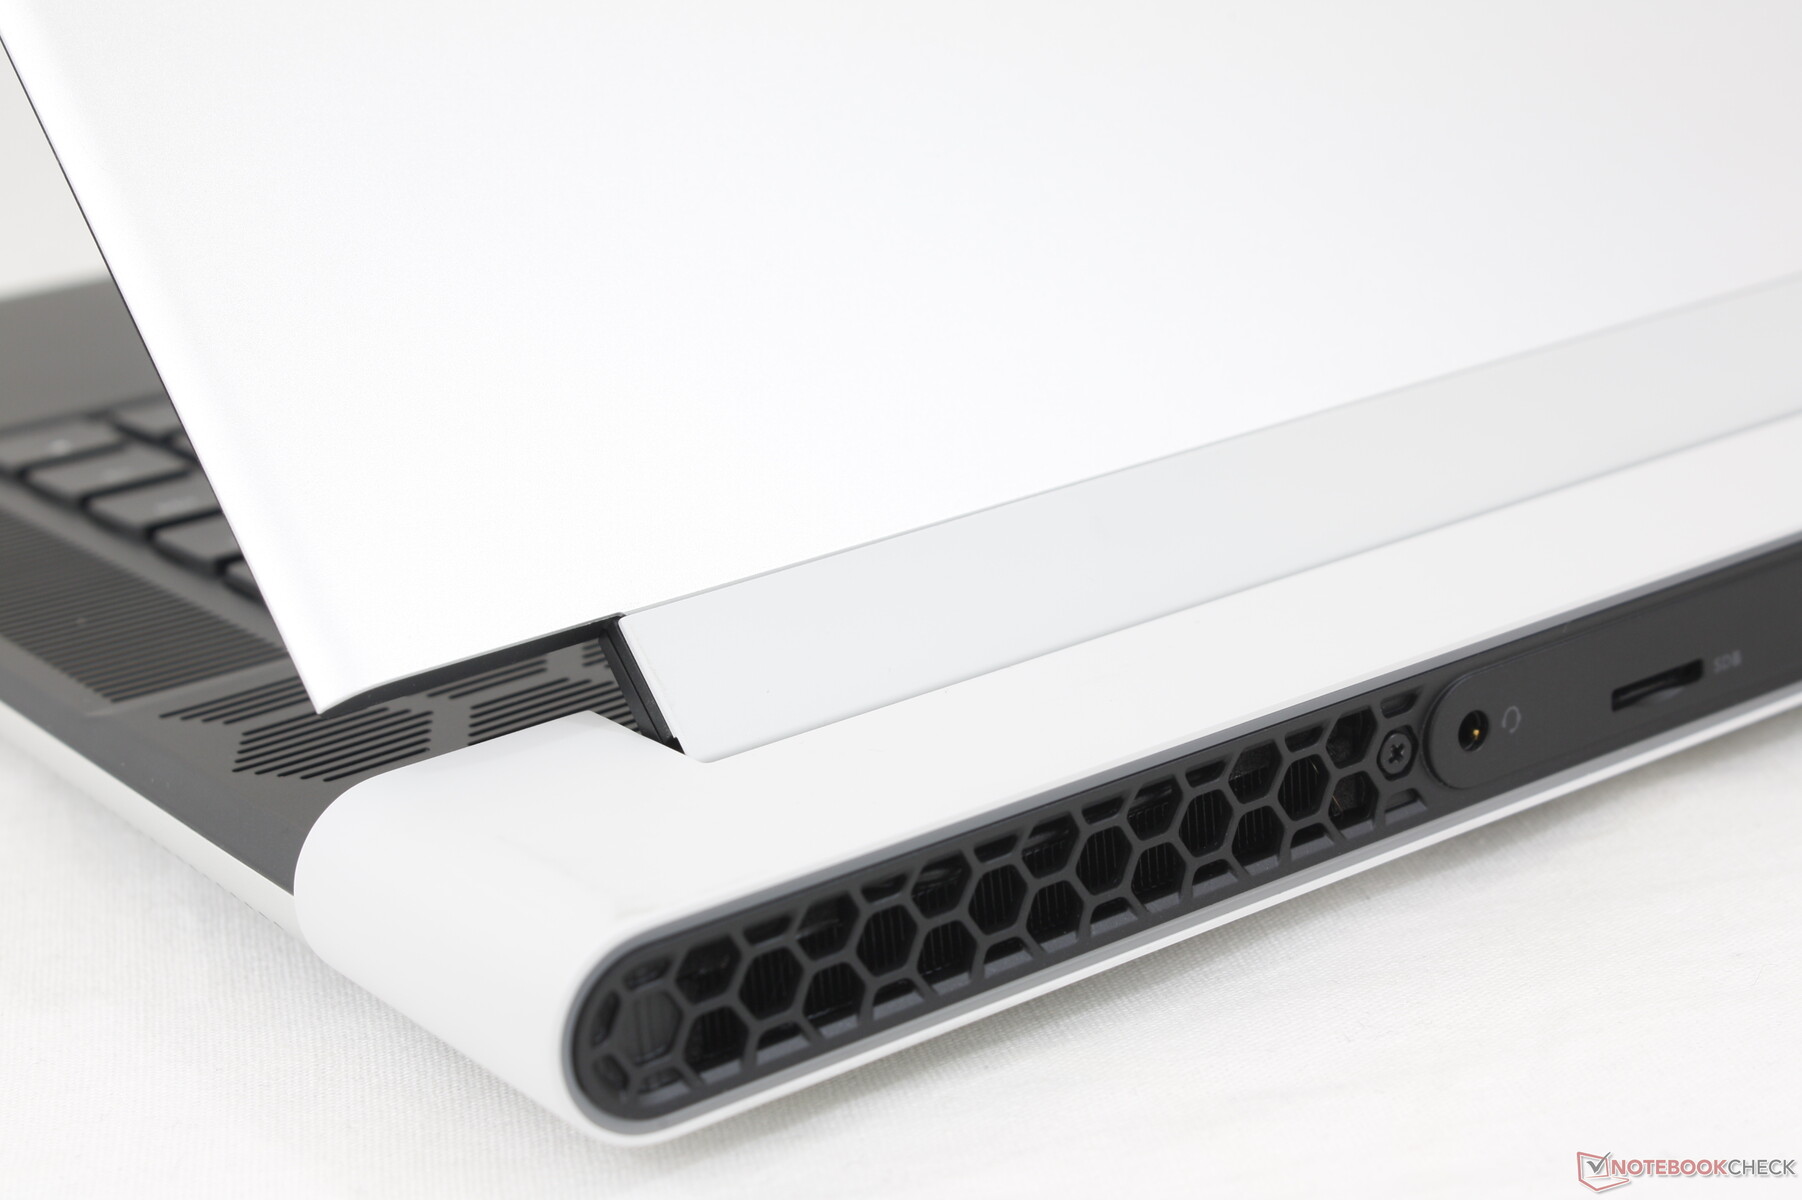
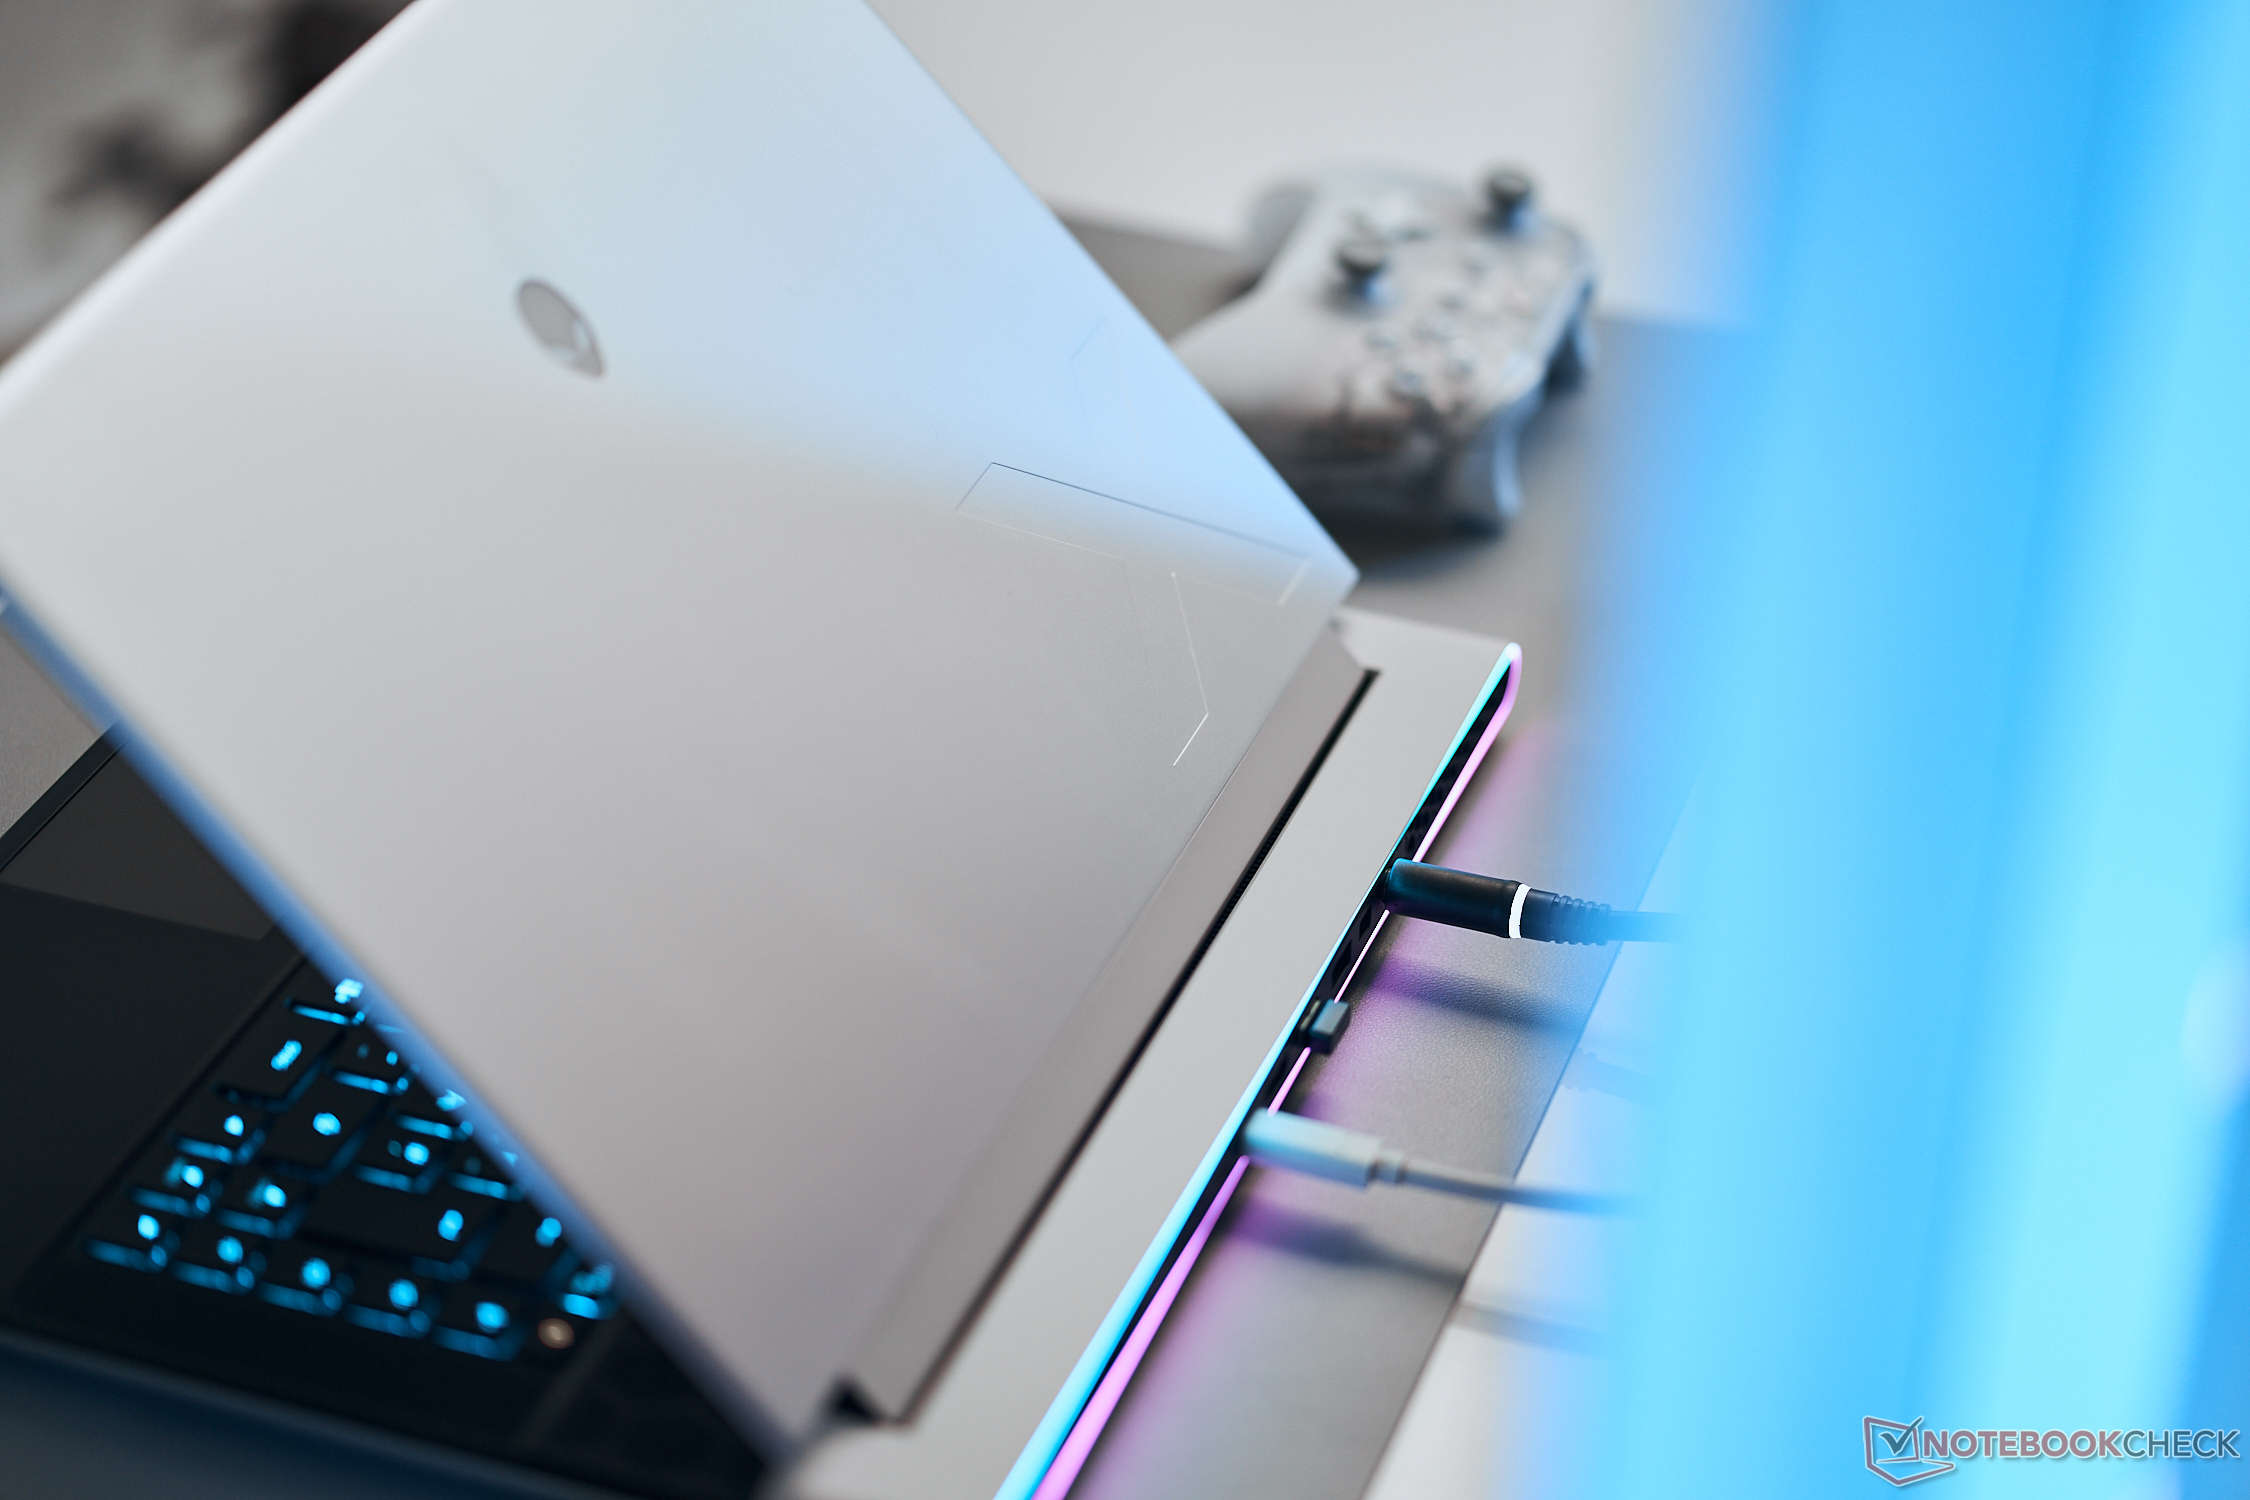
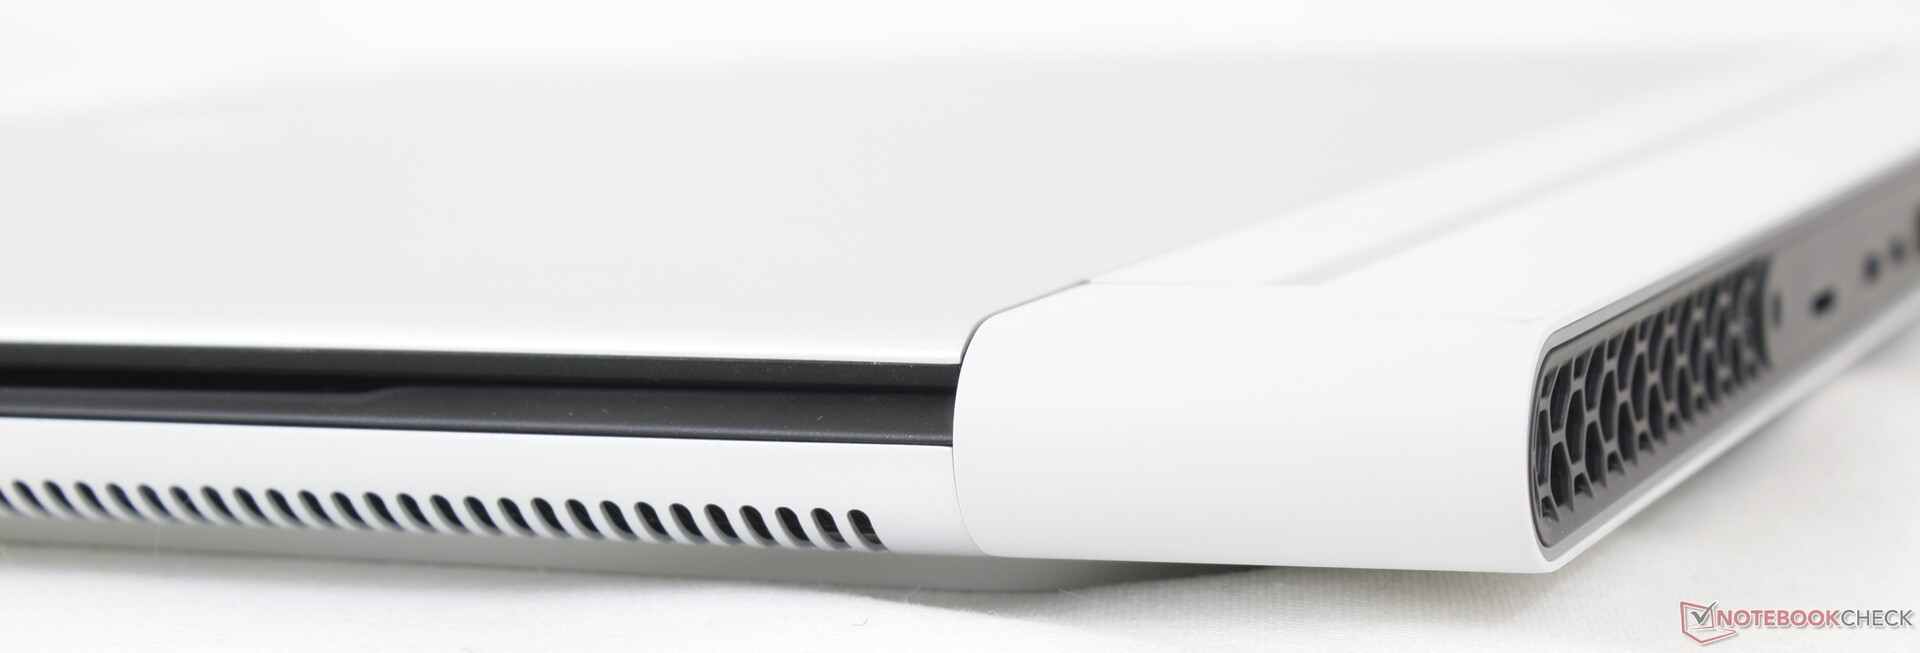
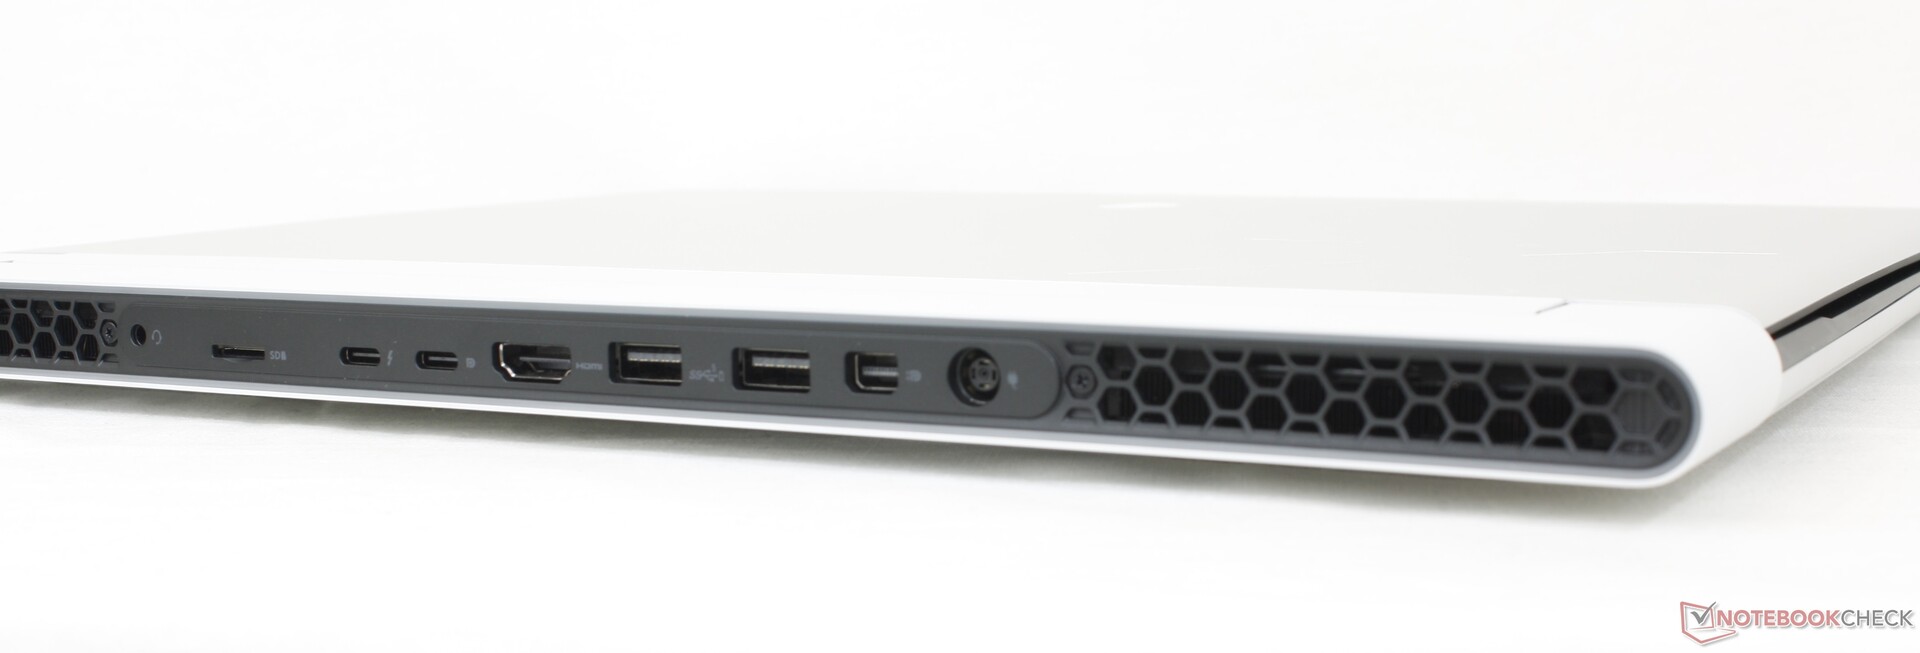
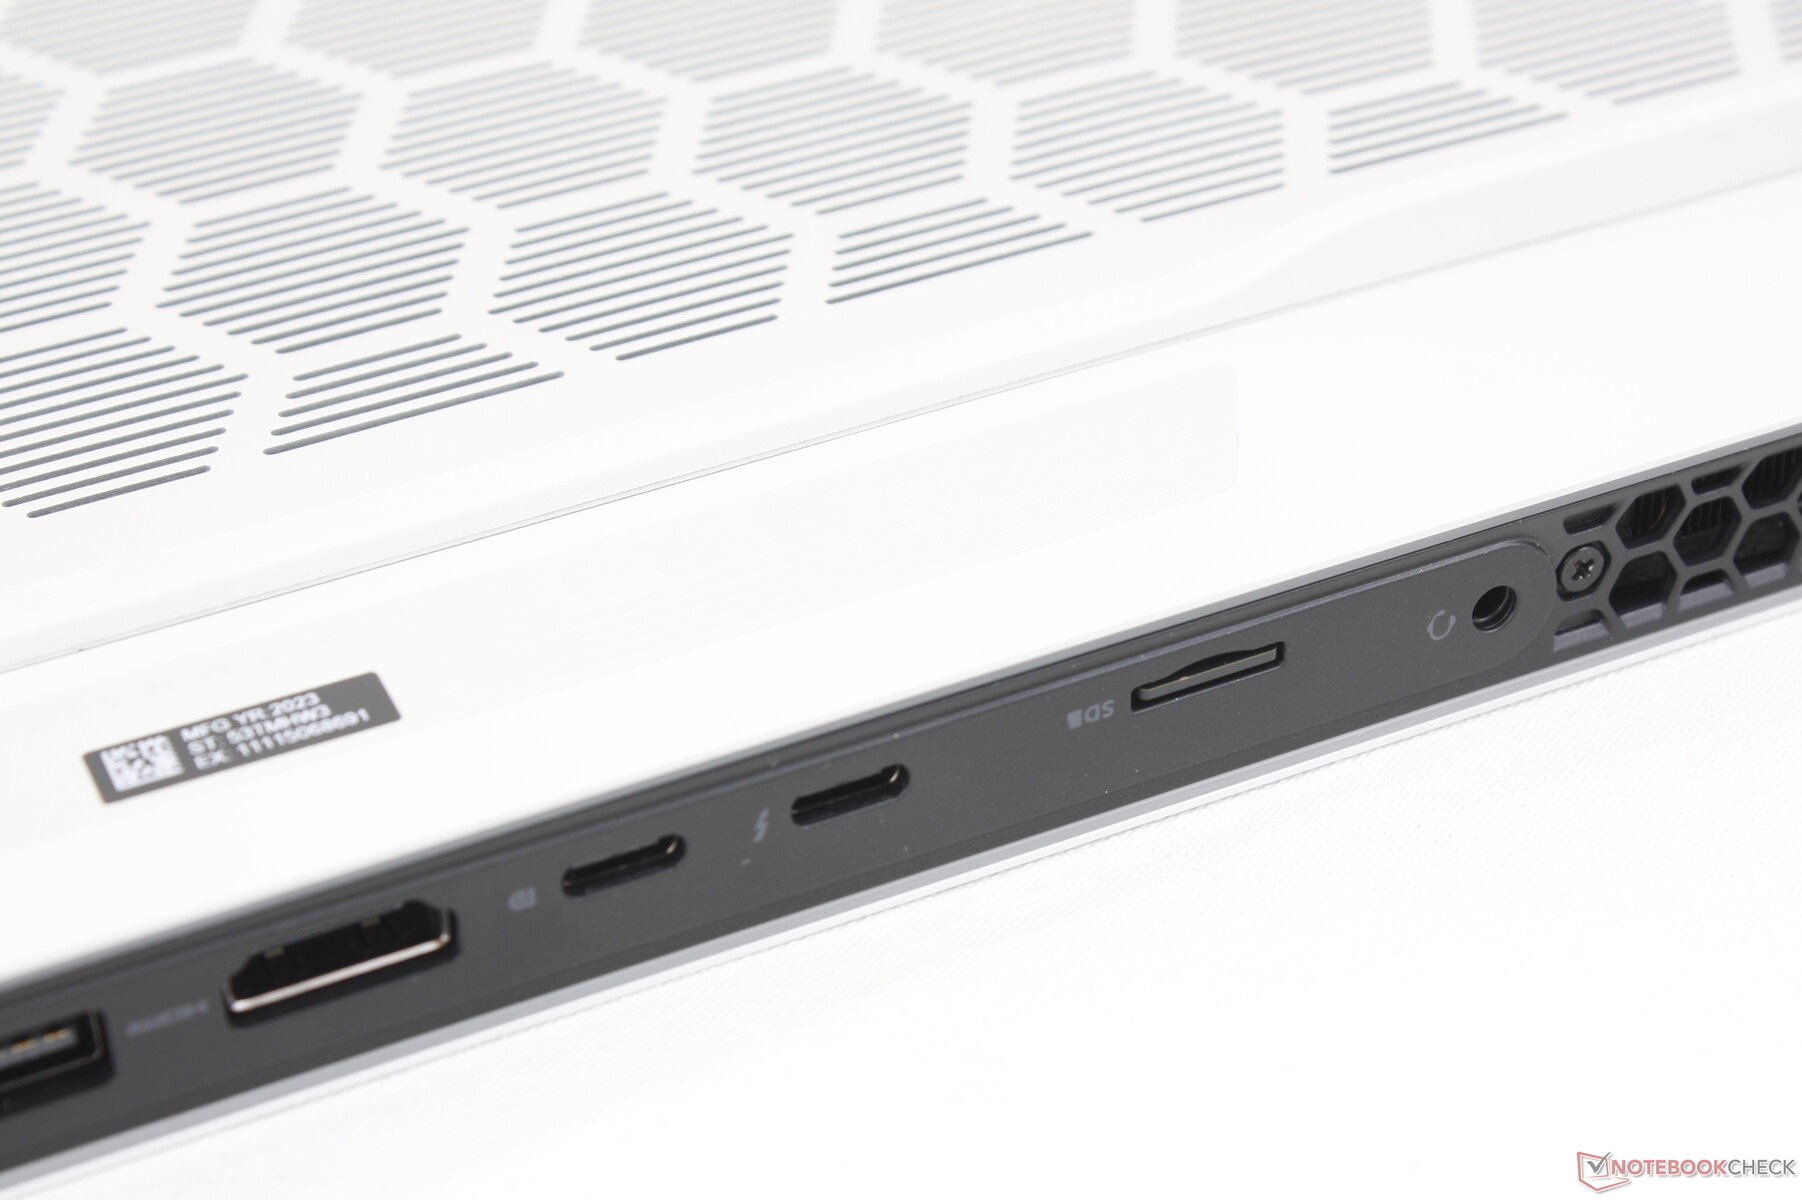
Łączność - nic po bokach
Wszystkie porty znajdują się z tyłu, co może być zarówno błogosławieństwem, jak i kłopotem. Z jednej strony, brak jakichkolwiek portów bocznych oznacza brak nieestetycznych lub rozpraszających kabli. Z drugiej strony, rozmieszczenie portów nie jest idealne, szczególnie w przypadku powszechnie używanych portów USB.
Należy pamiętać, że Thunderbolt 4 jest obsługiwany tylko przez jeden z dwóch portów USB-C.
Czytnik kart SD
AS SSD raportuje sekwencyjną szybkość odczytu na poziomie 256,1 MB/s, podczas gdy rzeczywisty test przesyłania 1 GB zdjęć byłby znacznie wolniejszy i wyniósłby zaledwie 57 MB/s z naszą testową kartą MicroSD UHS-II, nawet po wielu próbach.
W przeciwieństwie do większości innych laptopów, czytnik MicroSD znajduje się z tyłu obudowy, a nie po bokach.
| SD Card Reader | |
| average JPG Copy Test (av. of 3 runs) | |
| Asus ROG Zephyrus M16 GU604VY-NM042X | |
| Razer Blade 16 Early 2023 (AV PRO microSD 128 GB V60) | |
| Alienware x16 R1 (AV PRO microSD 128 GB V60) | |
| maximum AS SSD Seq Read Test (1GB) | |
| Alienware x16 R1 (AV PRO microSD 128 GB V60) | |
| Razer Blade 16 Early 2023 (AV PRO microSD 128 GB V60) | |
| Asus ROG Zephyrus M16 GU604VY-NM042X | |
Komunikacja
| Networking | |
| iperf3 transmit AXE11000 | |
| Lenovo Legion Pro 7 16IRX8H | |
| Razer Blade 16 Early 2023 | |
| Alienware x16 R1 | |
| Alienware m17 R5 (R9 6900HX, RX 6850M XT) | |
| Dell G16 7620 | |
| iperf3 receive AXE11000 | |
| Lenovo Legion Pro 7 16IRX8H | |
| Razer Blade 16 Early 2023 | |
| Alienware x16 R1 | |
| Dell G16 7620 | |
| Alienware m17 R5 (R9 6900HX, RX 6850M XT) | |
| iperf3 transmit AXE11000 6GHz | |
| Asus ROG Zephyrus M16 GU604VY-NM042X | |
| Razer Blade 16 Early 2023 | |
| Alienware x16 R1 | |
| iperf3 receive AXE11000 6GHz | |
| Asus ROG Zephyrus M16 GU604VY-NM042X | |
| Razer Blade 16 Early 2023 | |
| Alienware x16 R1 | |
Kamera internetowa
Kamera internetowa 2 MP jest standardem wraz z obsługą IR dla Hello. Nie ma jednak żadnej migawki prywatności.


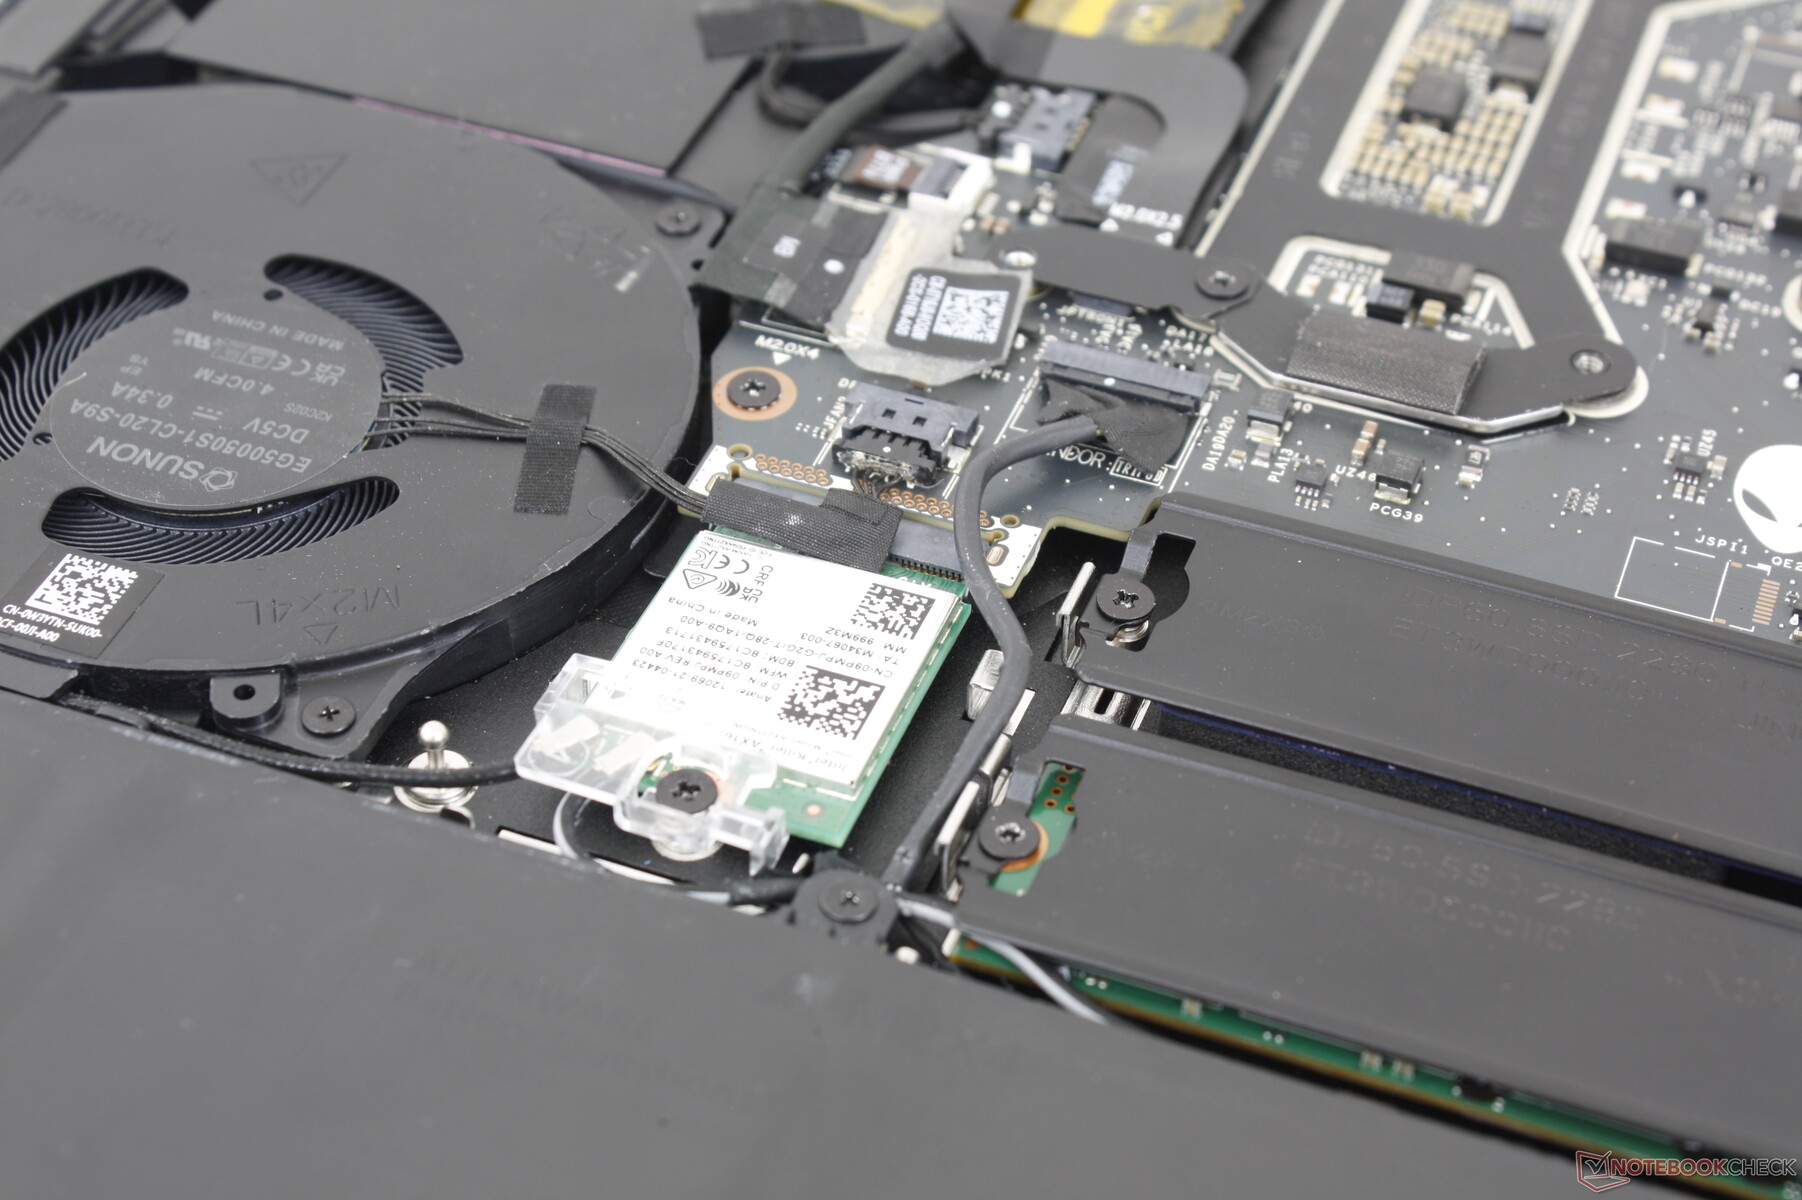
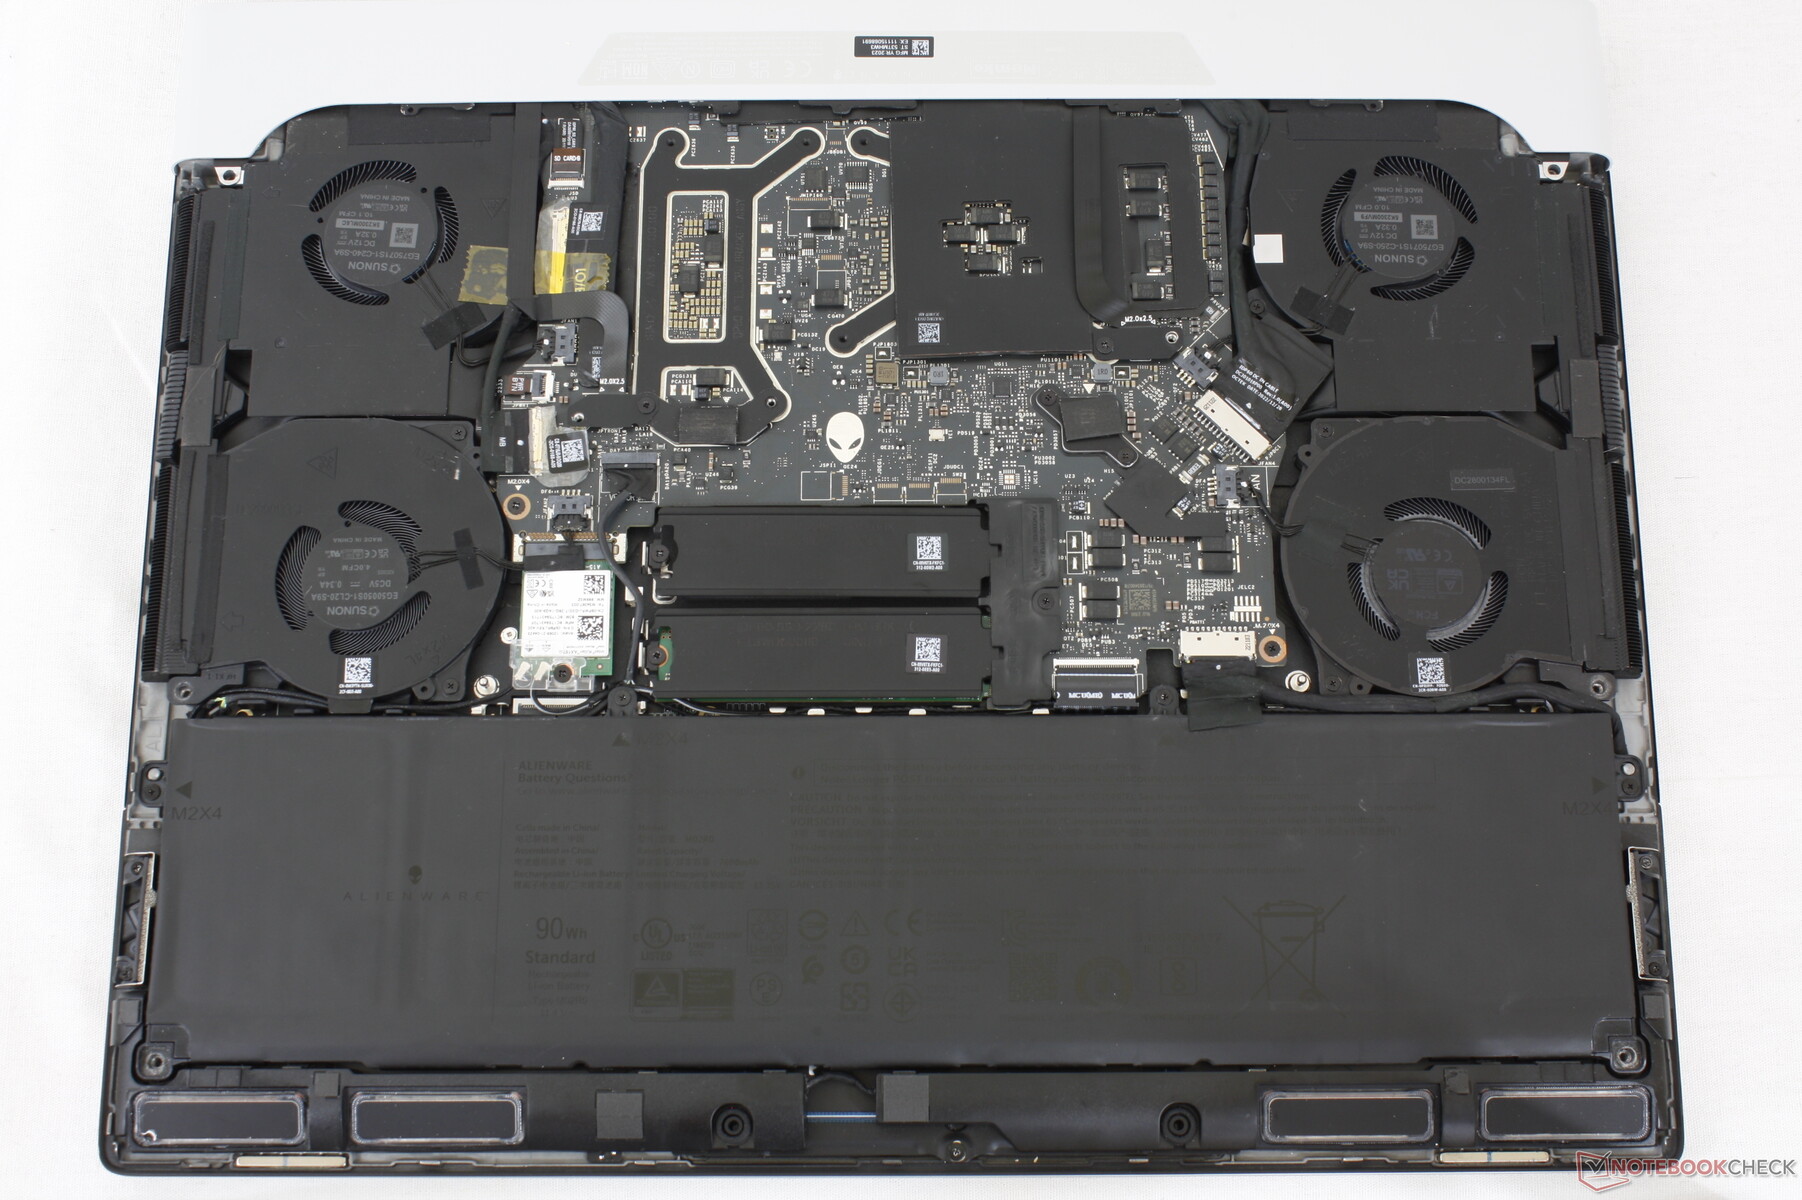
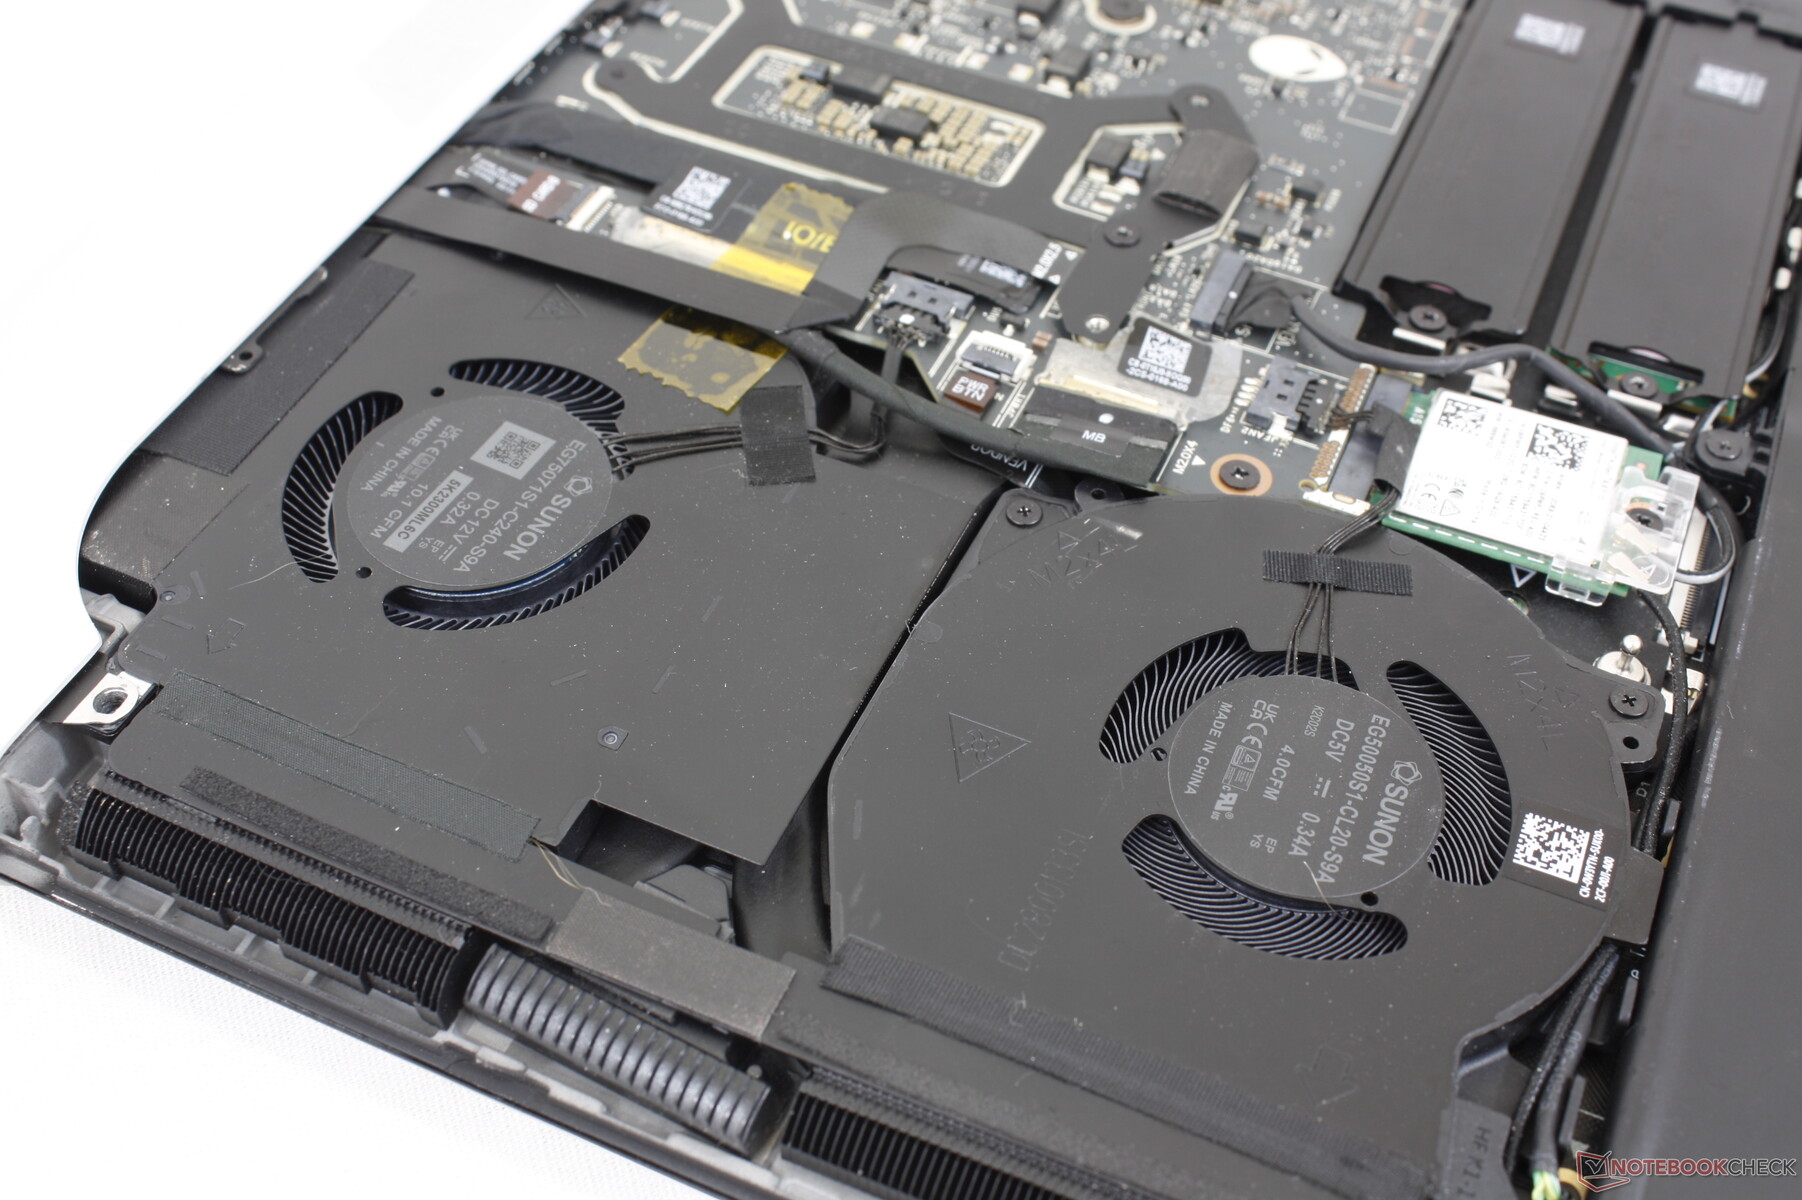
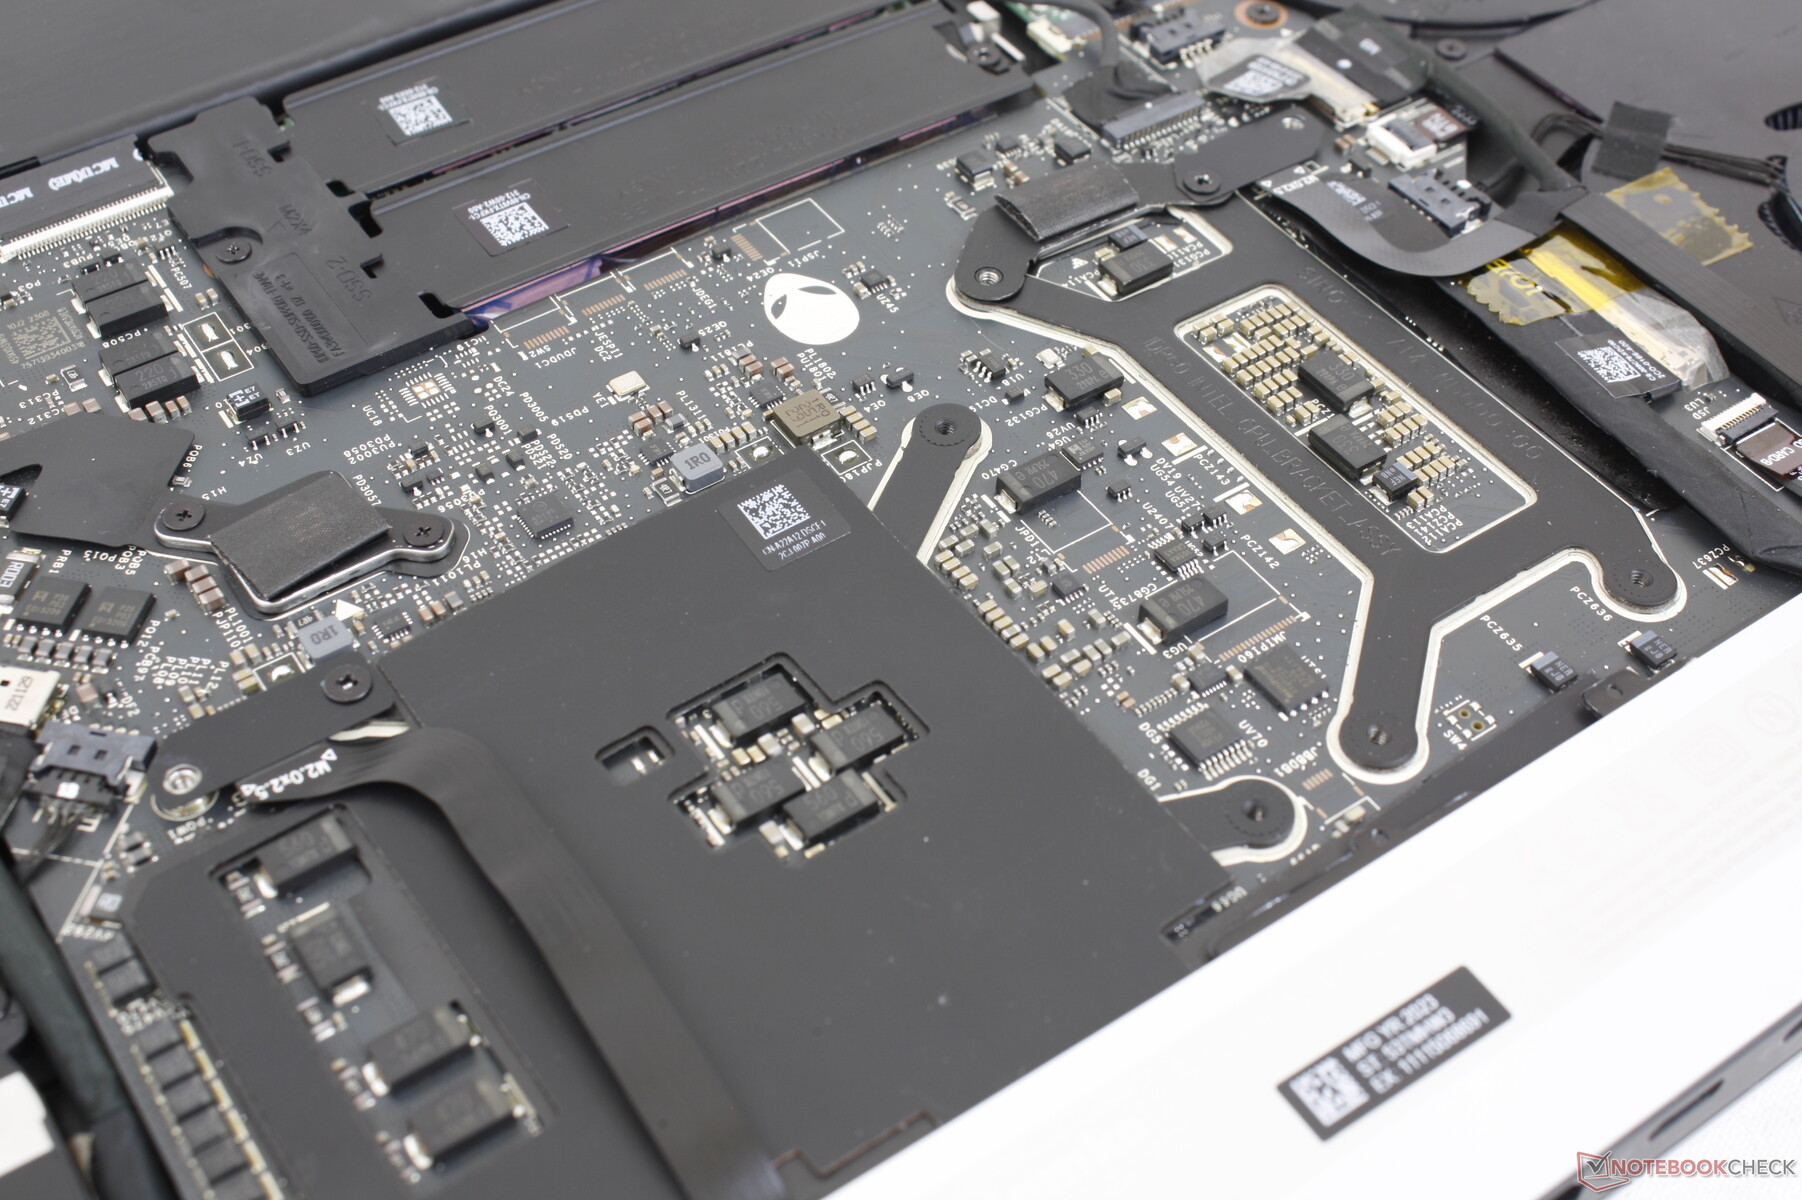
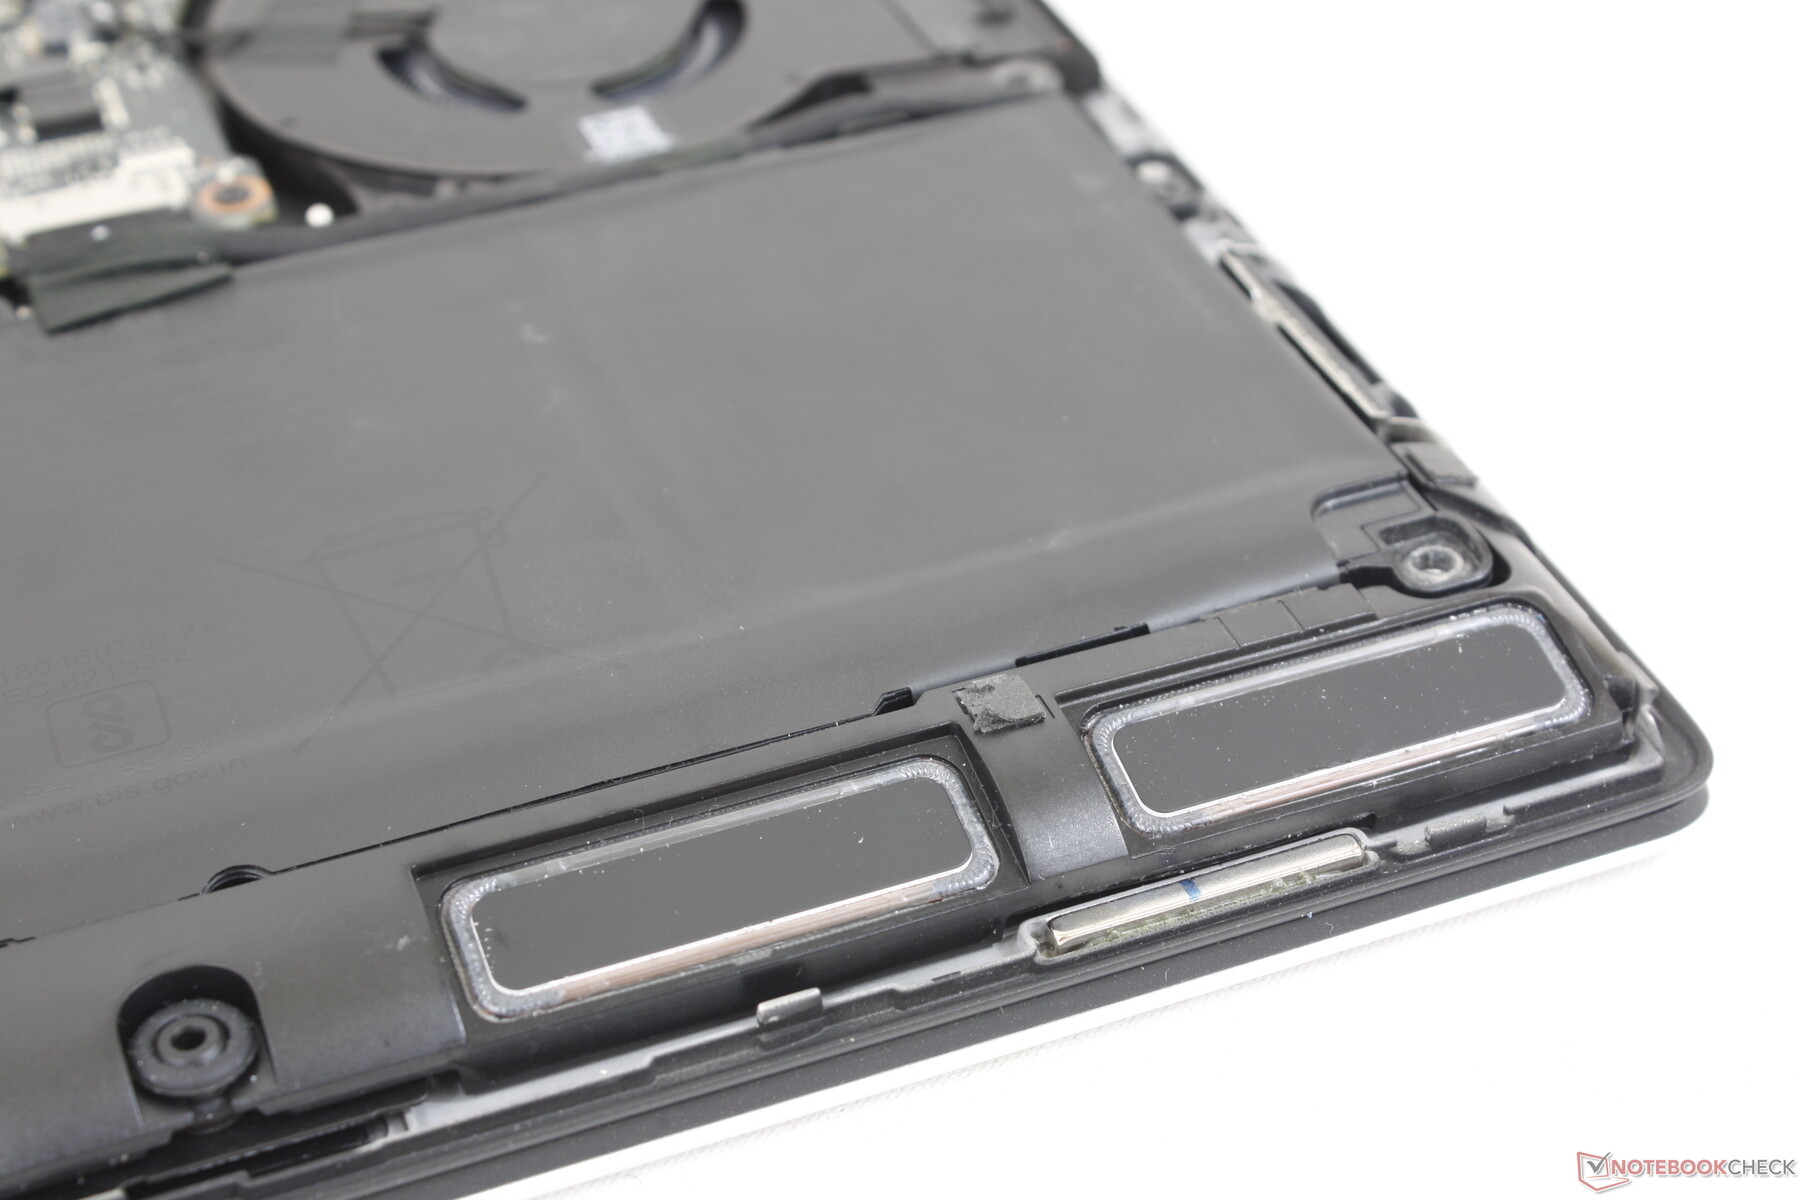
Konserwacja
Dolny panel jest zabezpieczony tylko sześcioma śrubami krzyżakowymi, co ułatwia jego demontaż. Właściciele mają bezpośredni dostęp do dwóch gniazd M.2 2280 SSD, baterii i wyjmowanego modułu WLAN.
Akcesoria i gwarancja
W pudełku nie ma żadnych dodatków poza zasilaczem sieciowym i dokumentacją. Zwykła roczna ograniczona gwarancja producenta ma zastosowanie w przypadku zakupu w USA.
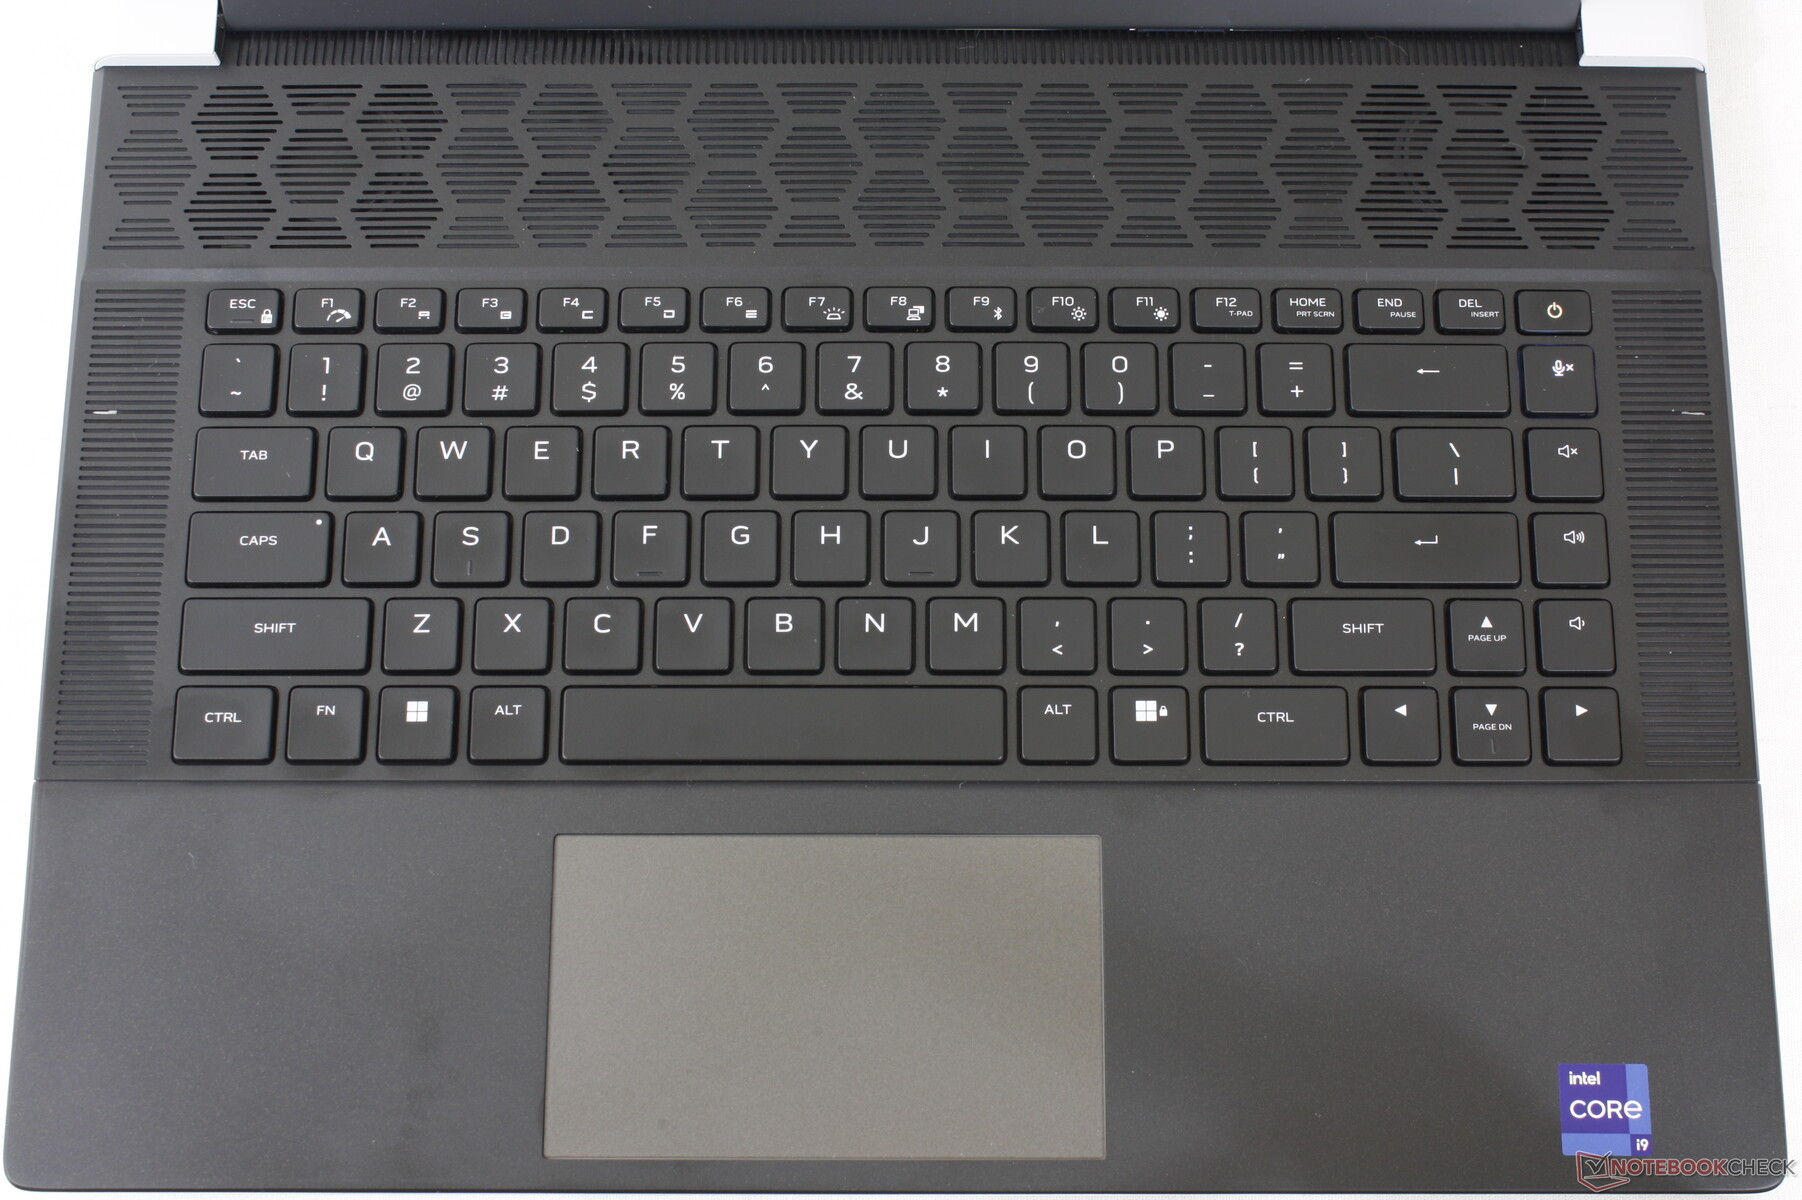
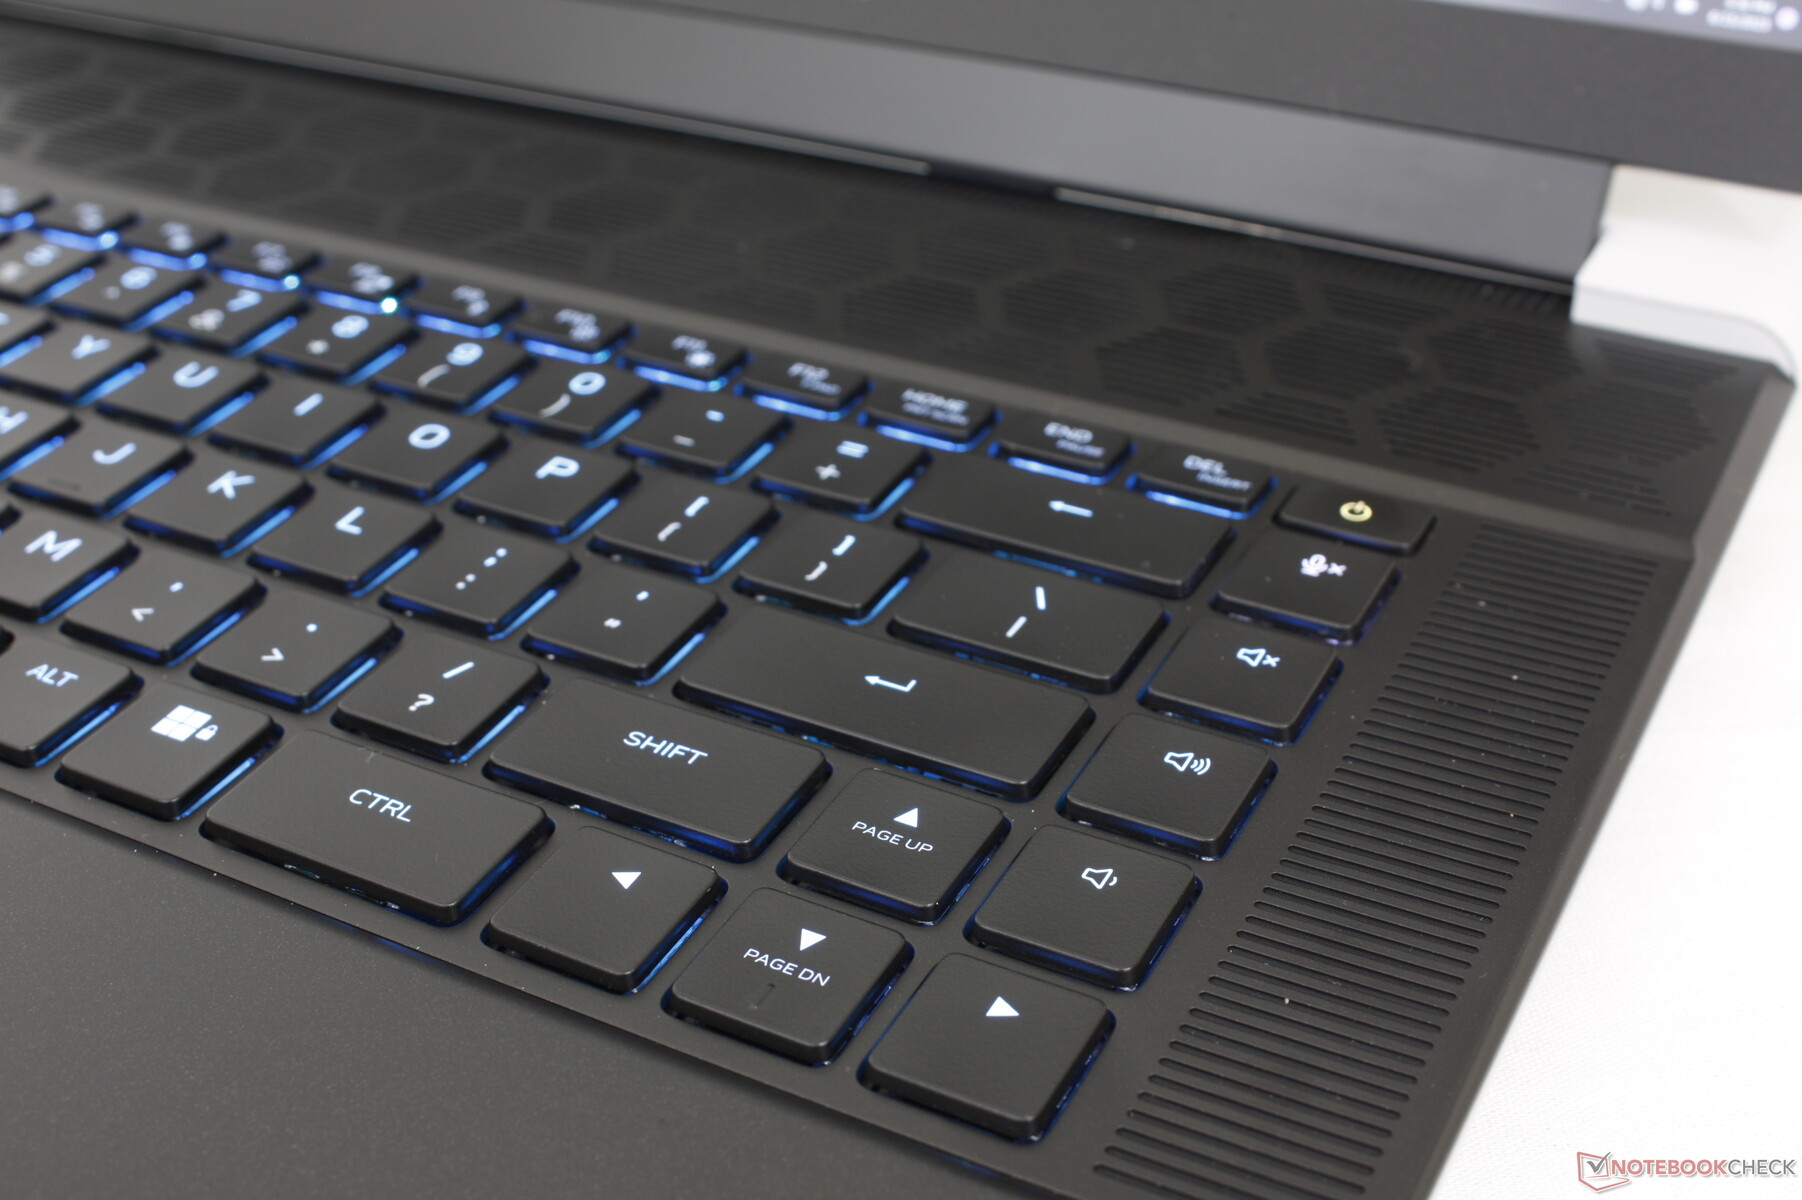
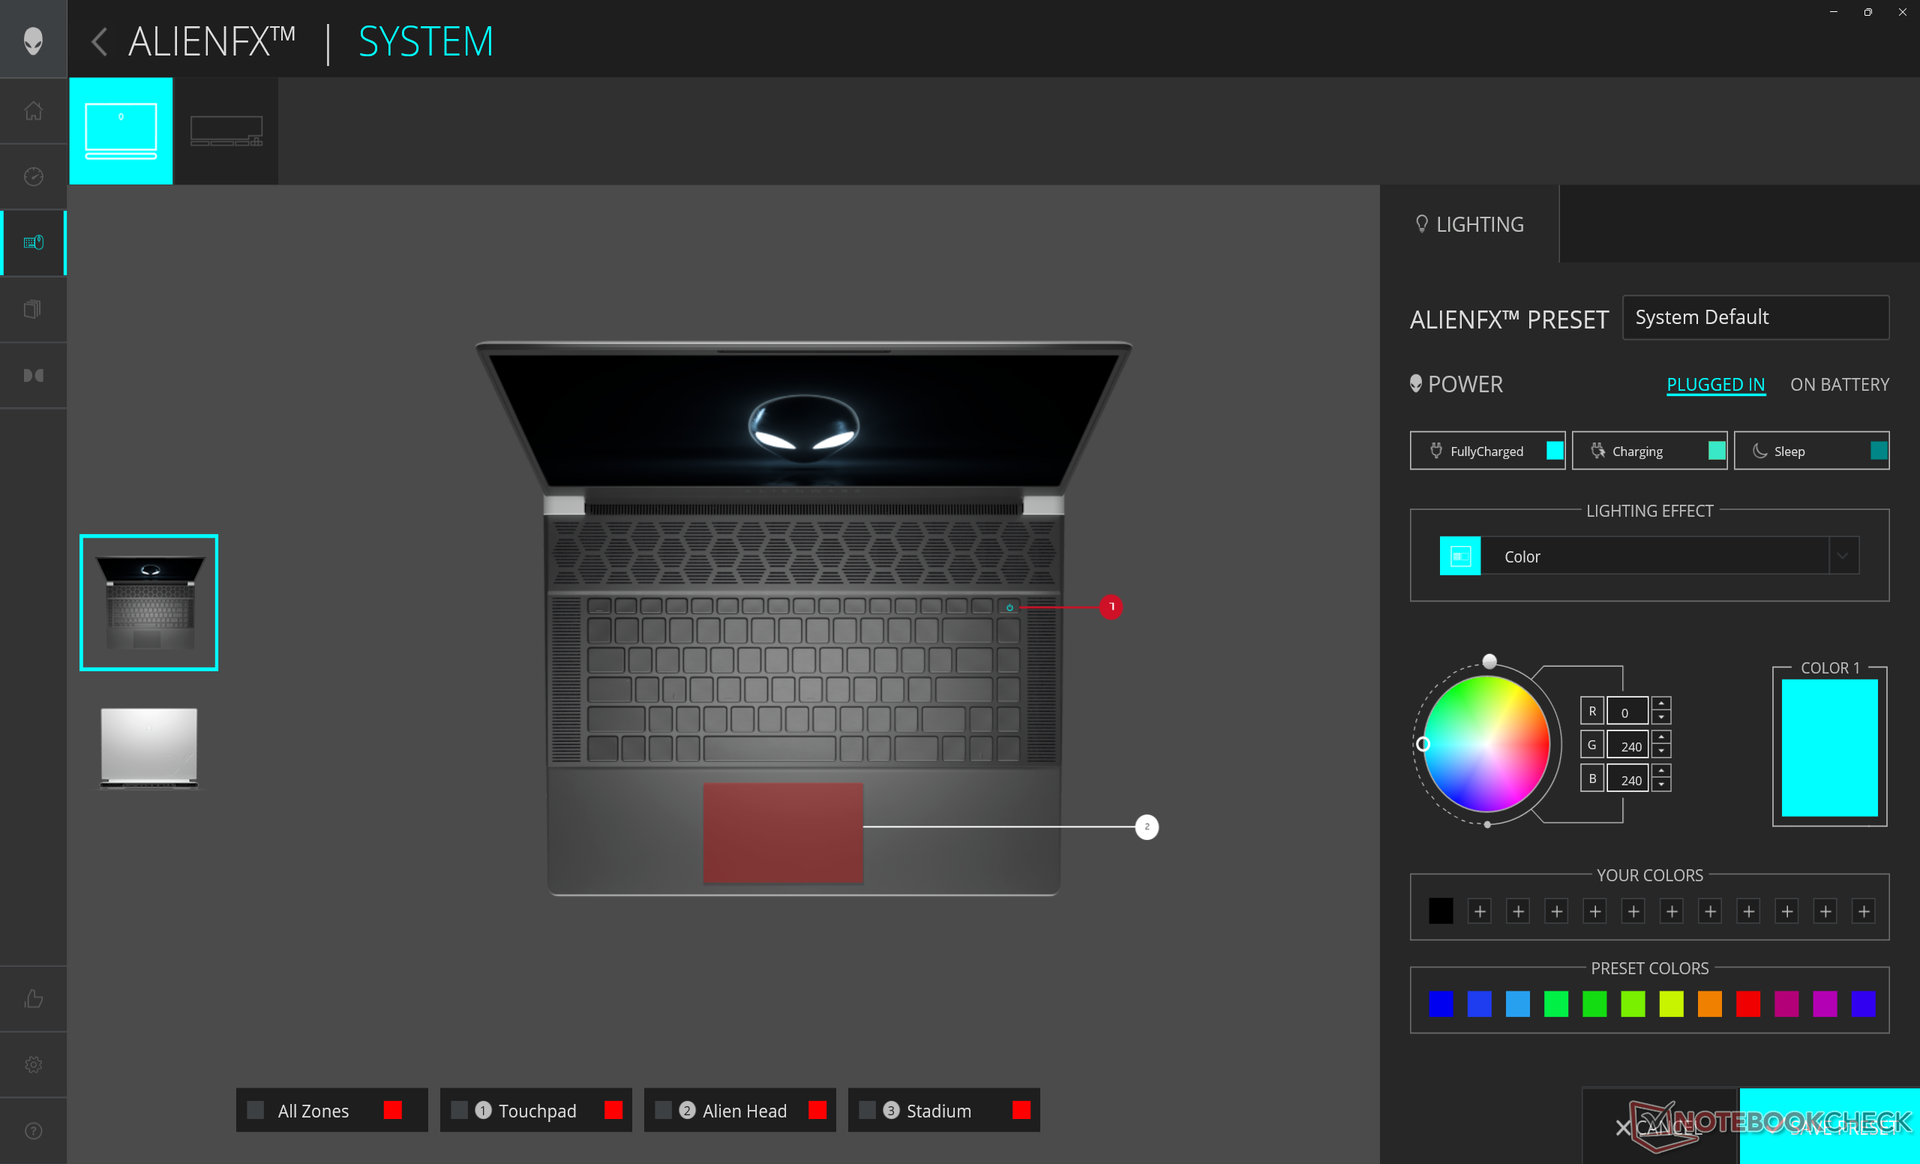
Urządzenia wejściowe - klawisze mechaniczne są głośne i dumne
Klawiatura
Dell oferuje dwie opcje klawiatury: standardowe klawisze membranowe i ultra niskoprofilowe klawisze CherryMX z podświetleniem RGB dla każdego klawisza. Nasza jednostka testowa jest wyposażona w te drugie, a wrażenia z pisania są dzień i noc w porównaniu do klawiszy membranowych w większości innych laptopów do gier. Skok klawiszy wynoszący 1,8 mm jest głębszy niż bardziej typowe 1,5 mm, a sprzężenie zwrotne jest znacznie twardsze i wyraźniejsze, co zapewnia bardziej satysfakcjonujące wrażenia. Trudno jest wrócić do pisania na czymś takim jak Razer Blade 16 po przyzwyczajeniu się do klawiszy CherryMX w Alienware x16.
Główną wadą jest oczywiście znacznie głośniejszy stukot klawiszy mechanicznych. Dlatego warto rozważyć standardową opcję niemechaniczną, jeśli zamierzasz używać laptopa w środowiskach wrażliwych na hałas, takich jak sale lekcyjne lub ciasne pokoje w akademikach.
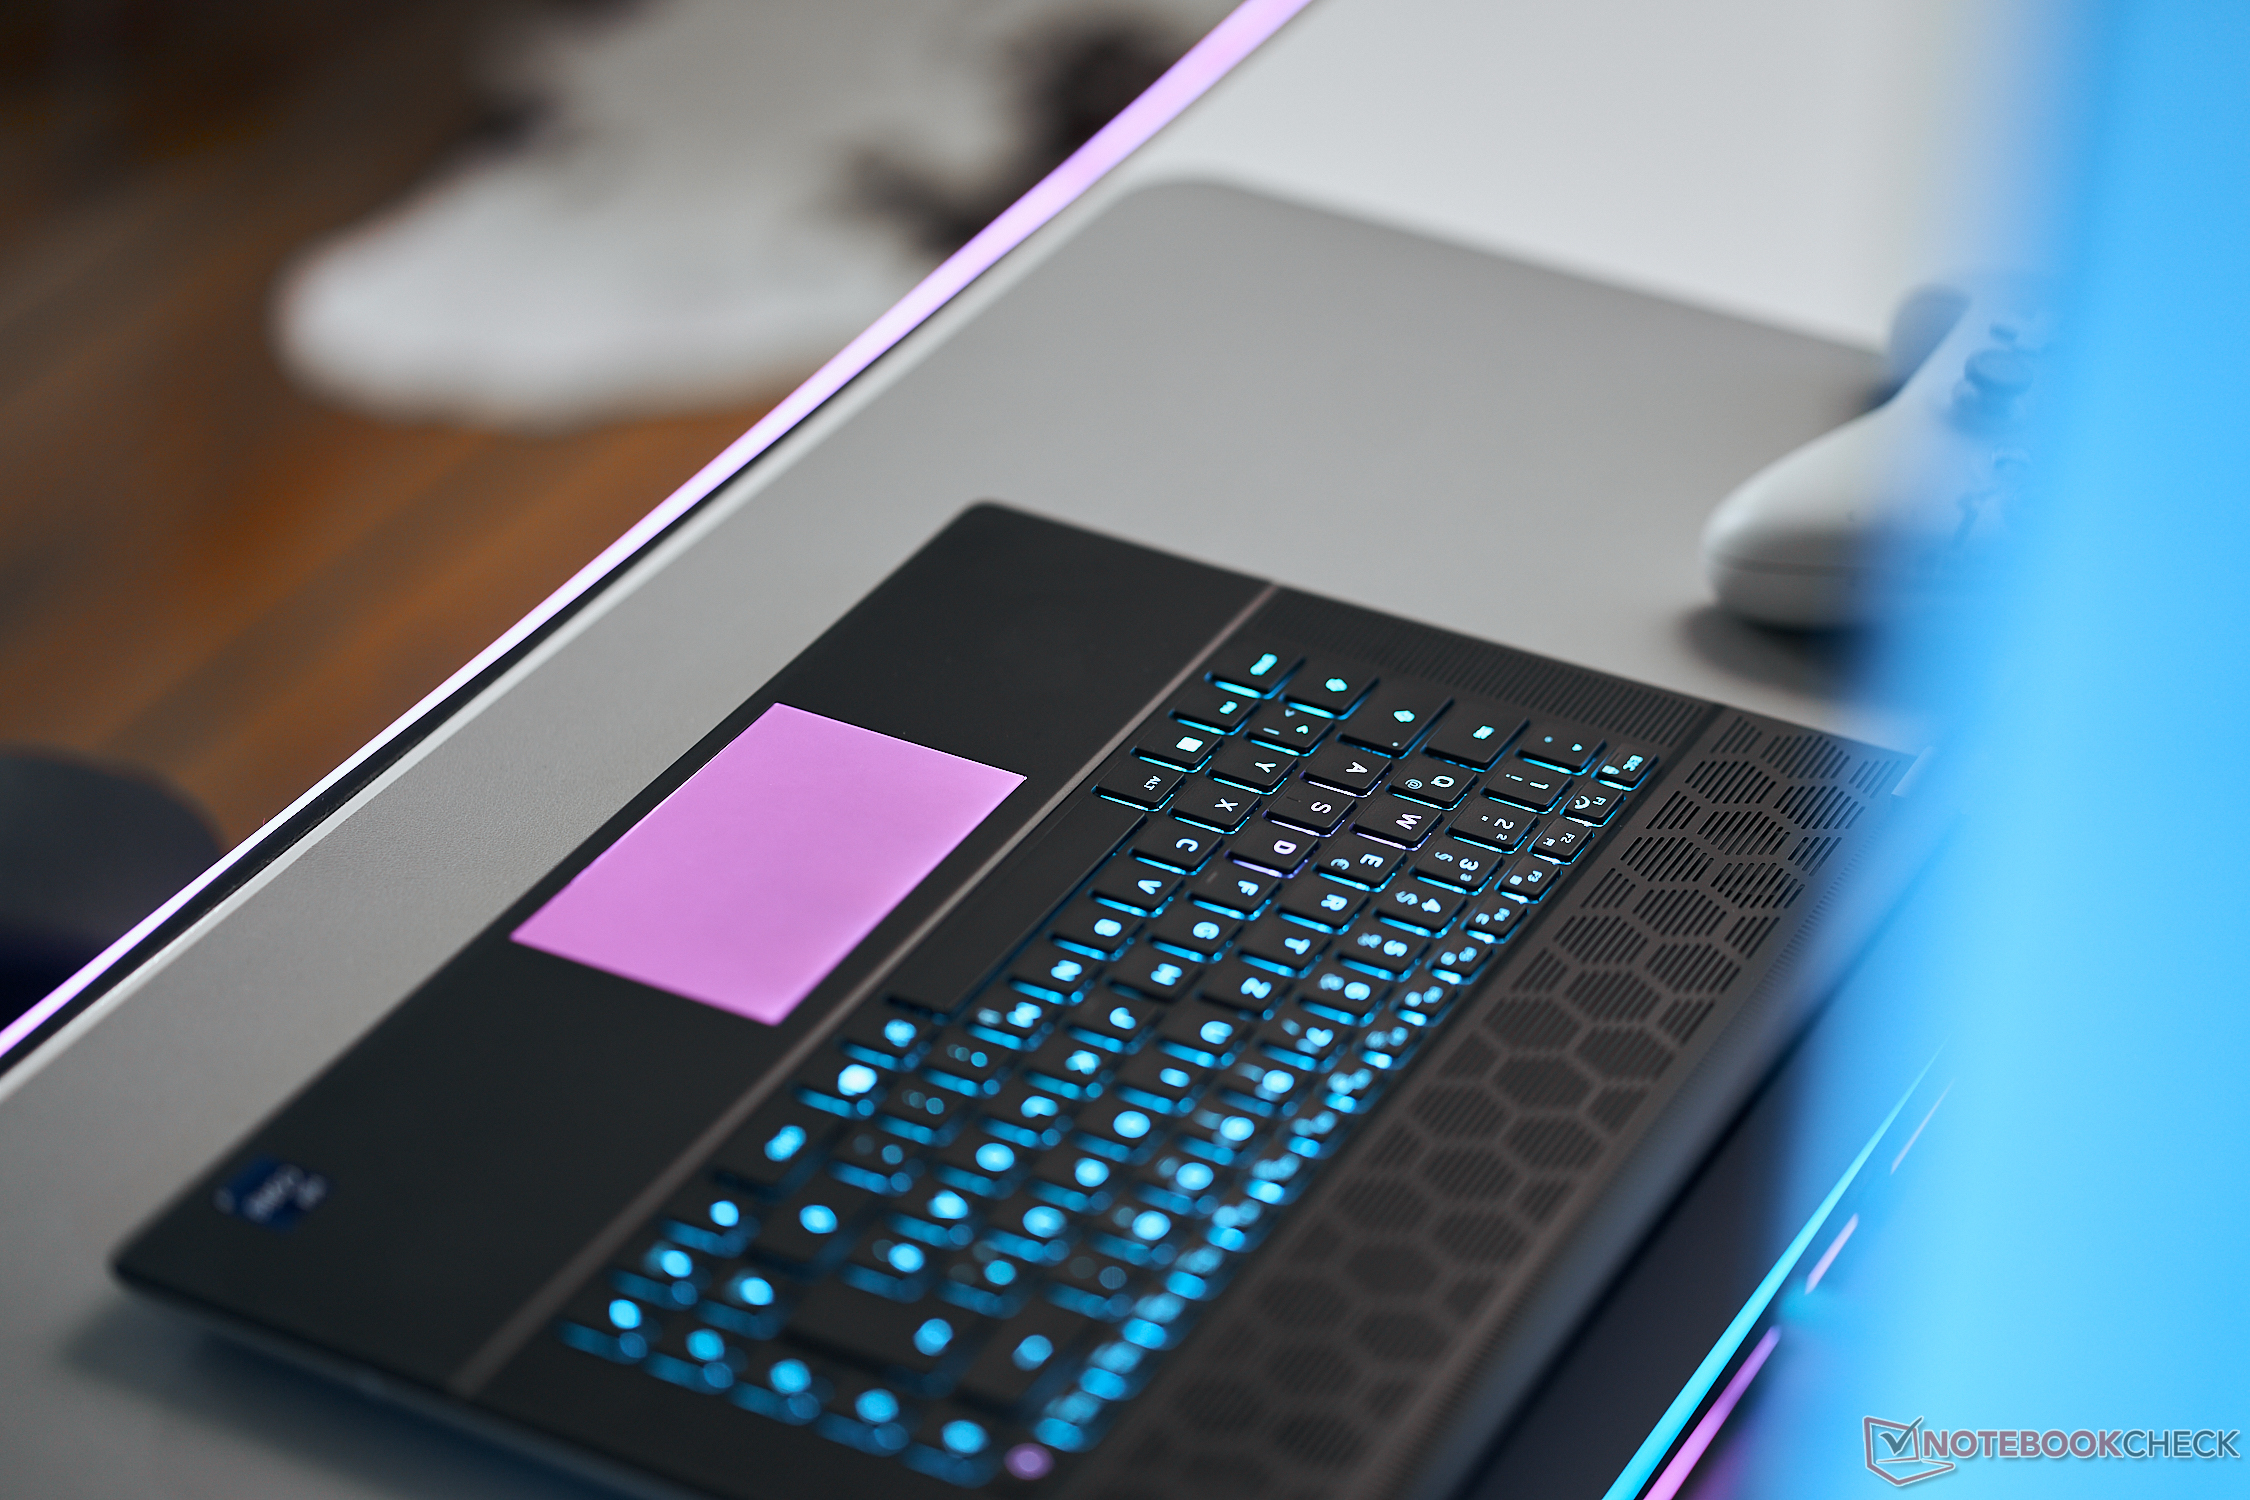
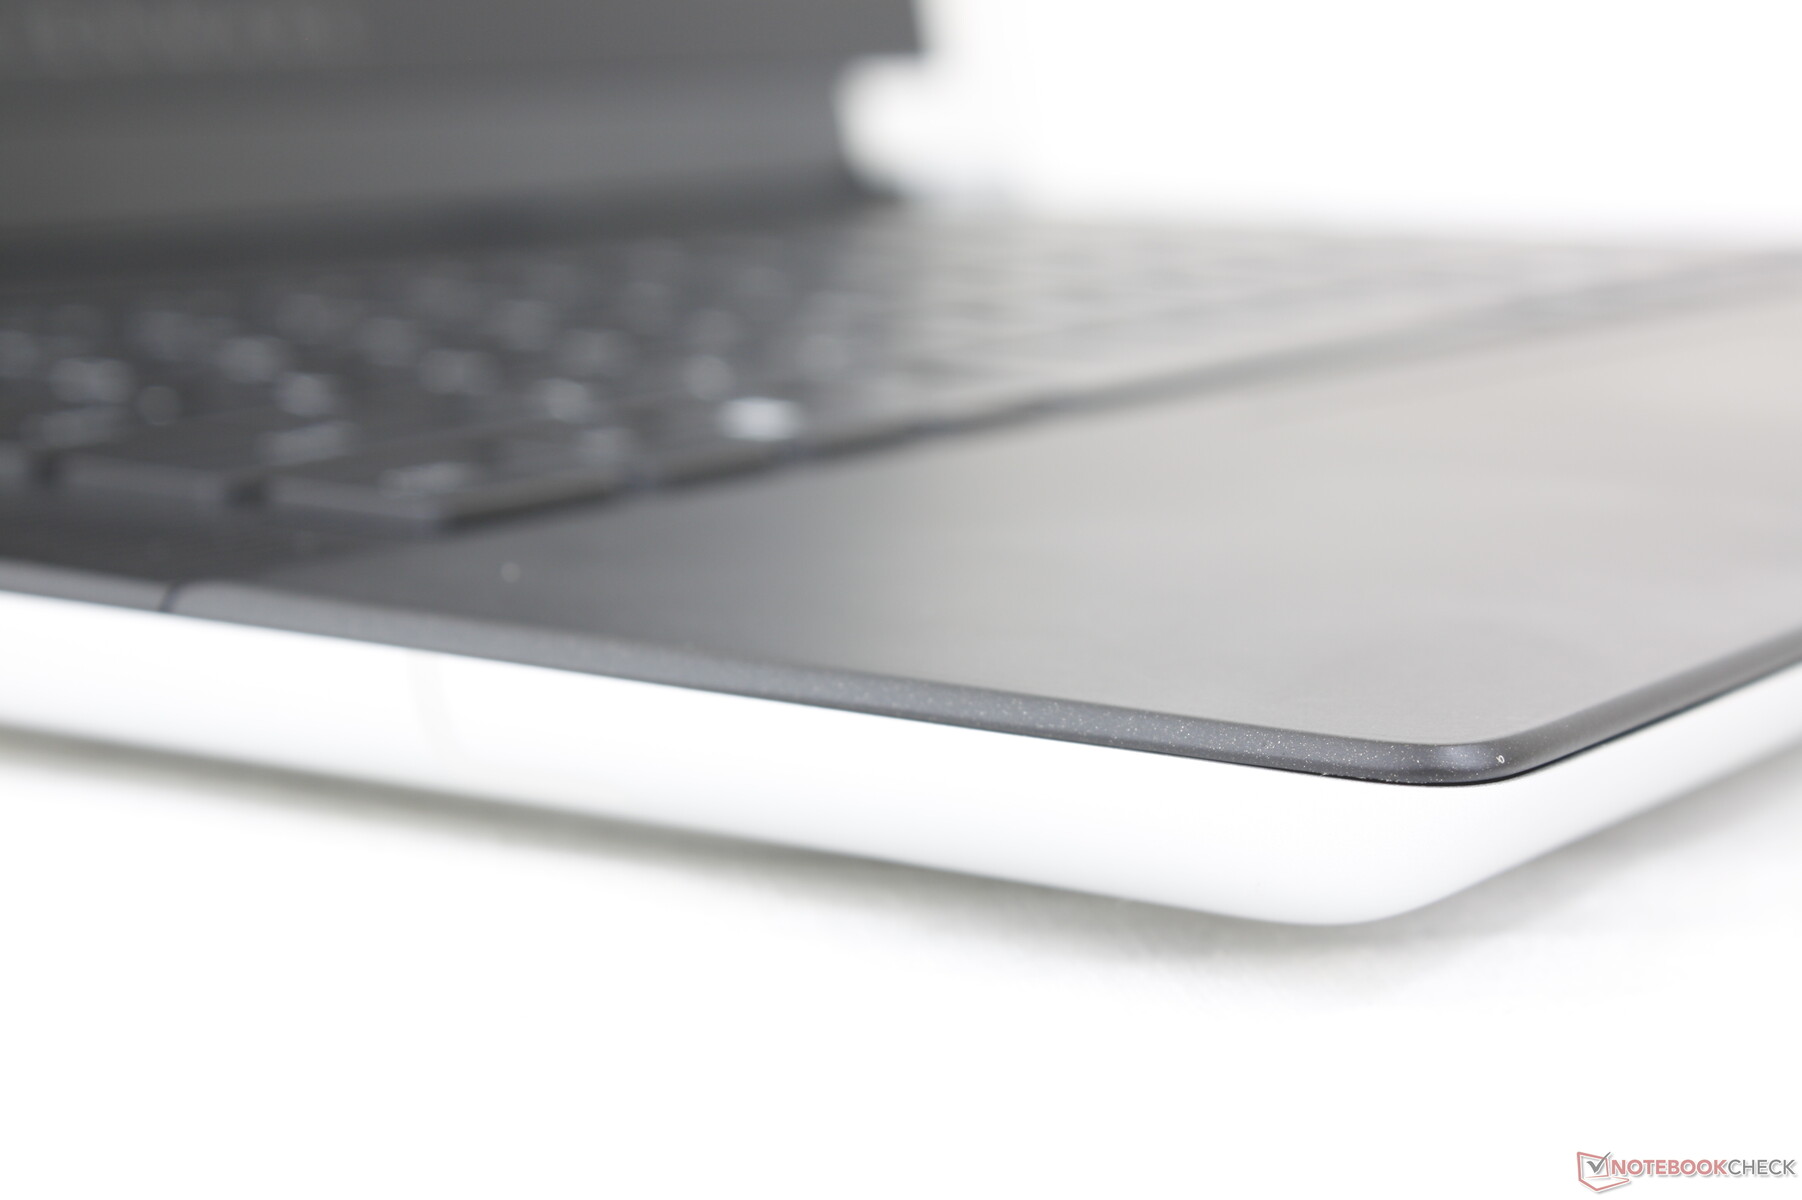
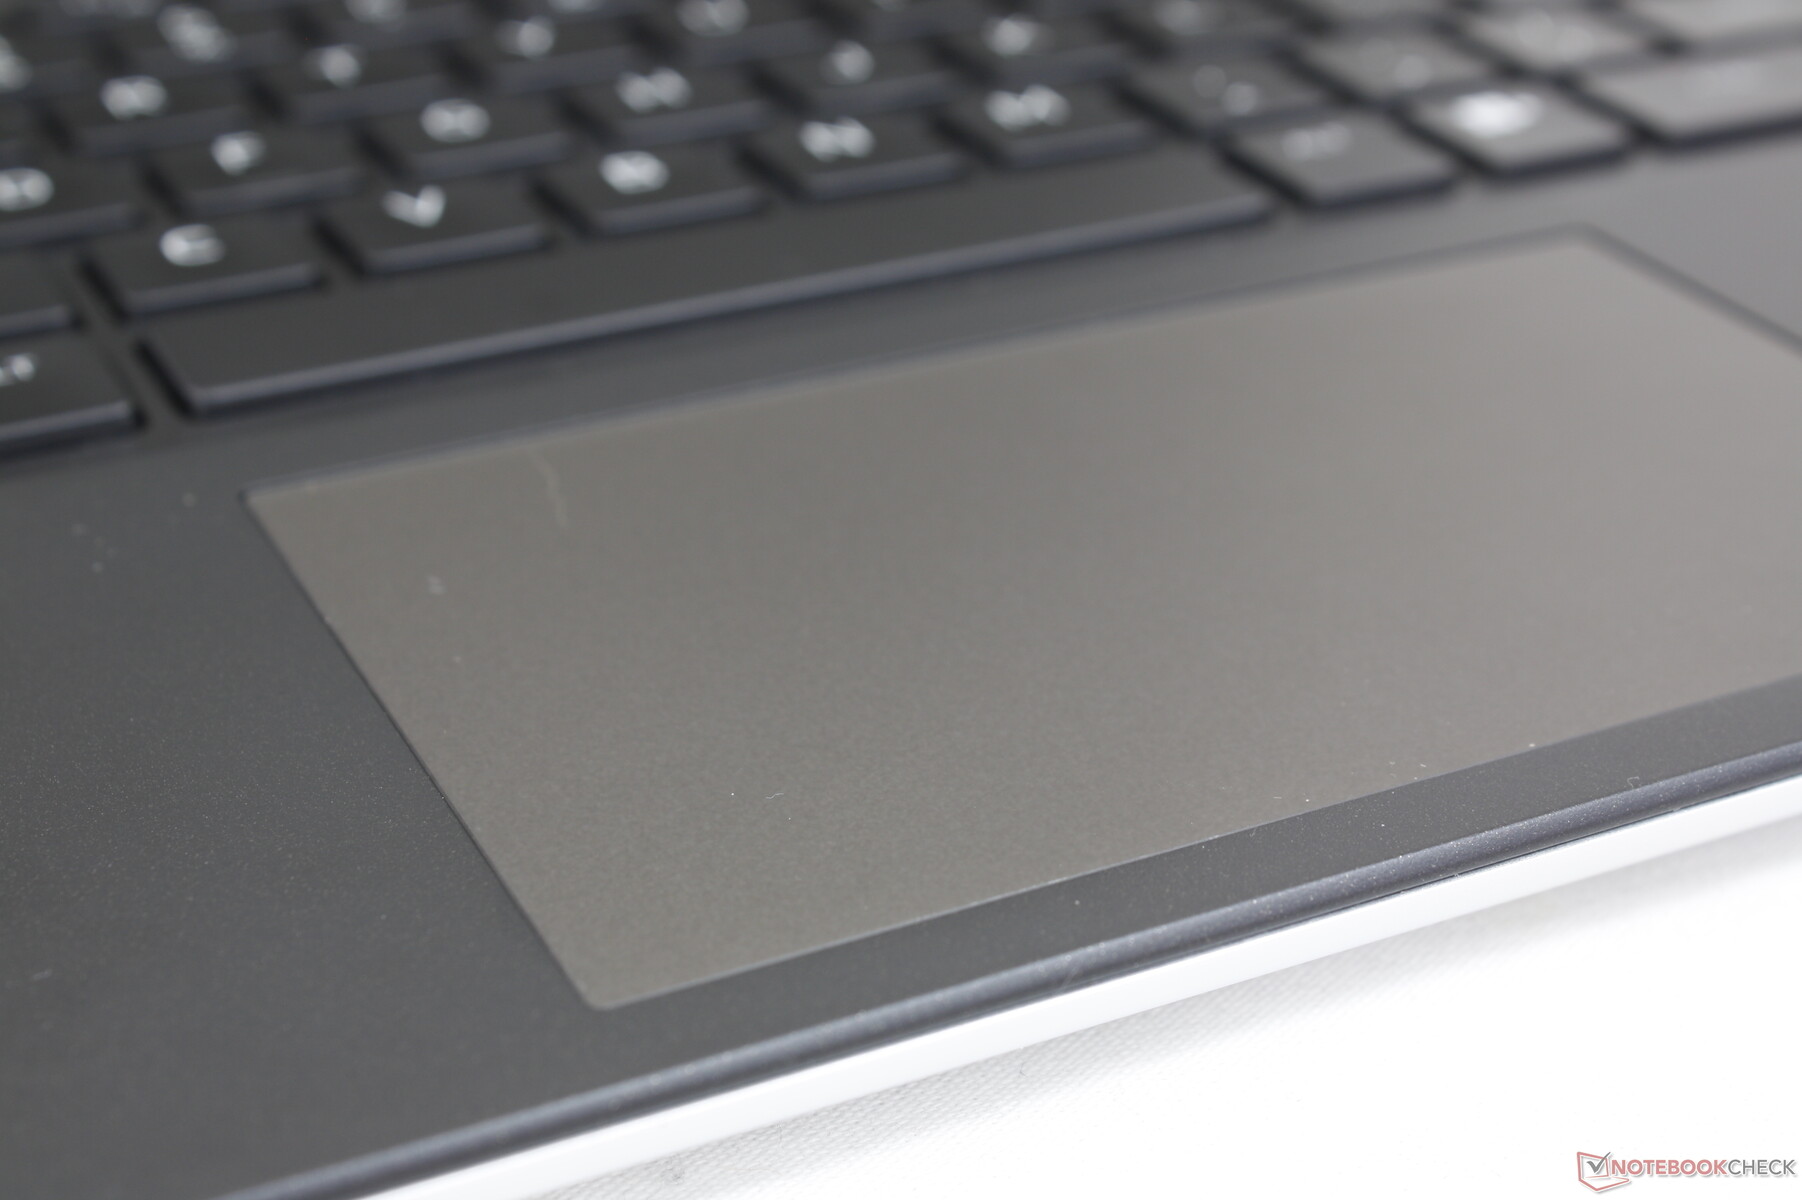
Touchpad
Clickpad jest jednym z najmniejszych dla 16-calowego laptopa do gier i ma zaledwie 11,2 x 6,5 cm w porównaniu do 17 x 9,7 cm i 12 x 7,5 cm w Blade 16 i Legion Pro 5 16odpowiednio. Mniejszy rozmiar wynika z dużego rozwiązania chłodzącego i kratek wentylacyjnych zajmujących więcej miejsca wzdłuż tylnej połowy systemu. Poślizg jest płynny, z niewielkim zacinaniem się podczas poruszania się z mniejszą prędkością, co zapewnia dokładniejsze kliknięcia.
Sprzężenie zwrotne podczas klikania jest lekkie i bardzo płytkie, co daje niezadowalające odczucia. W oparciu o to i niewielką powierzchnię, jasne jest, że Dell oczekuje, że większość użytkowników będzie miała gotową do pracy mysz USB.

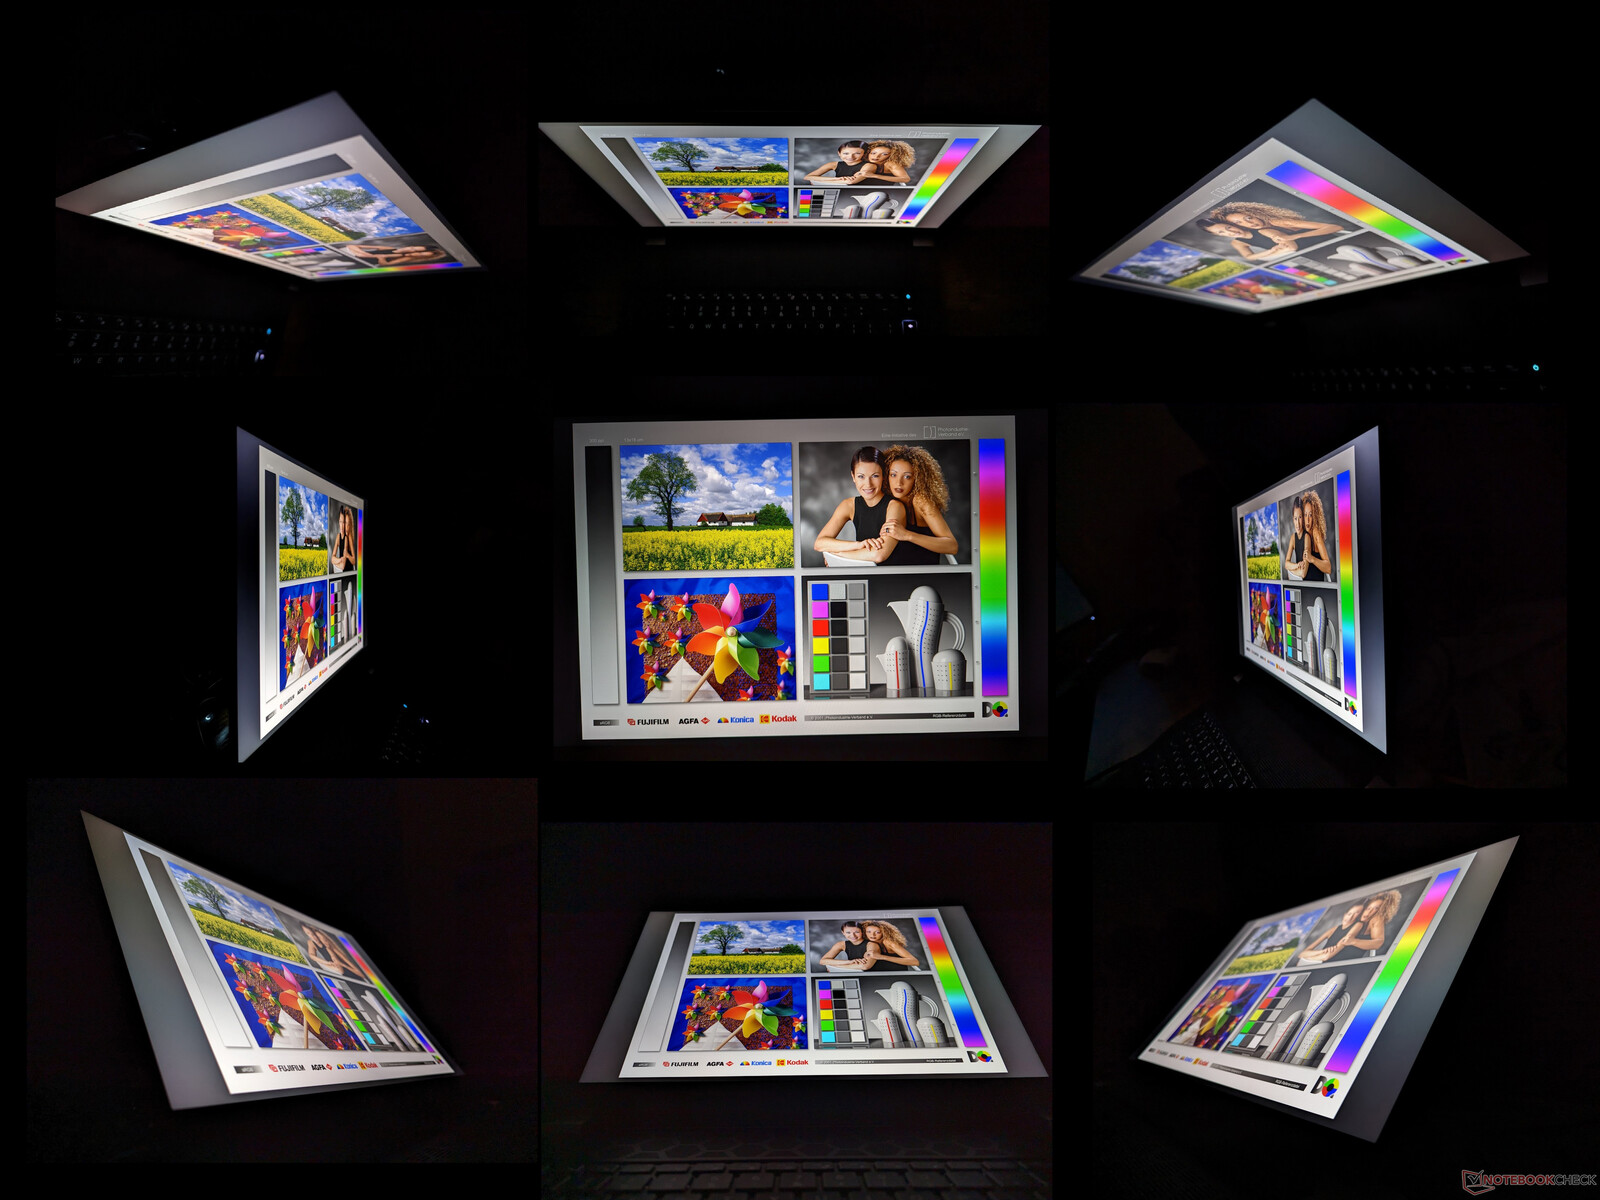
Wyświetlacz - nie ma złych opcji
Dostępne są trzy opcje wyświetlania, a nasze pomiary odzwierciedlają tylko opcję pogrubioną:
- 2560 x 1600, 165 Hz, 3 ms, 100% sRGB, G-Sync
- 1920 x 1200, 480 Hz, 3 ms, 100% DCI-P3, G-Sync
- 2560 x 1600, 240 Hz, 3 ms, 100% DCI-P3, G-Sync
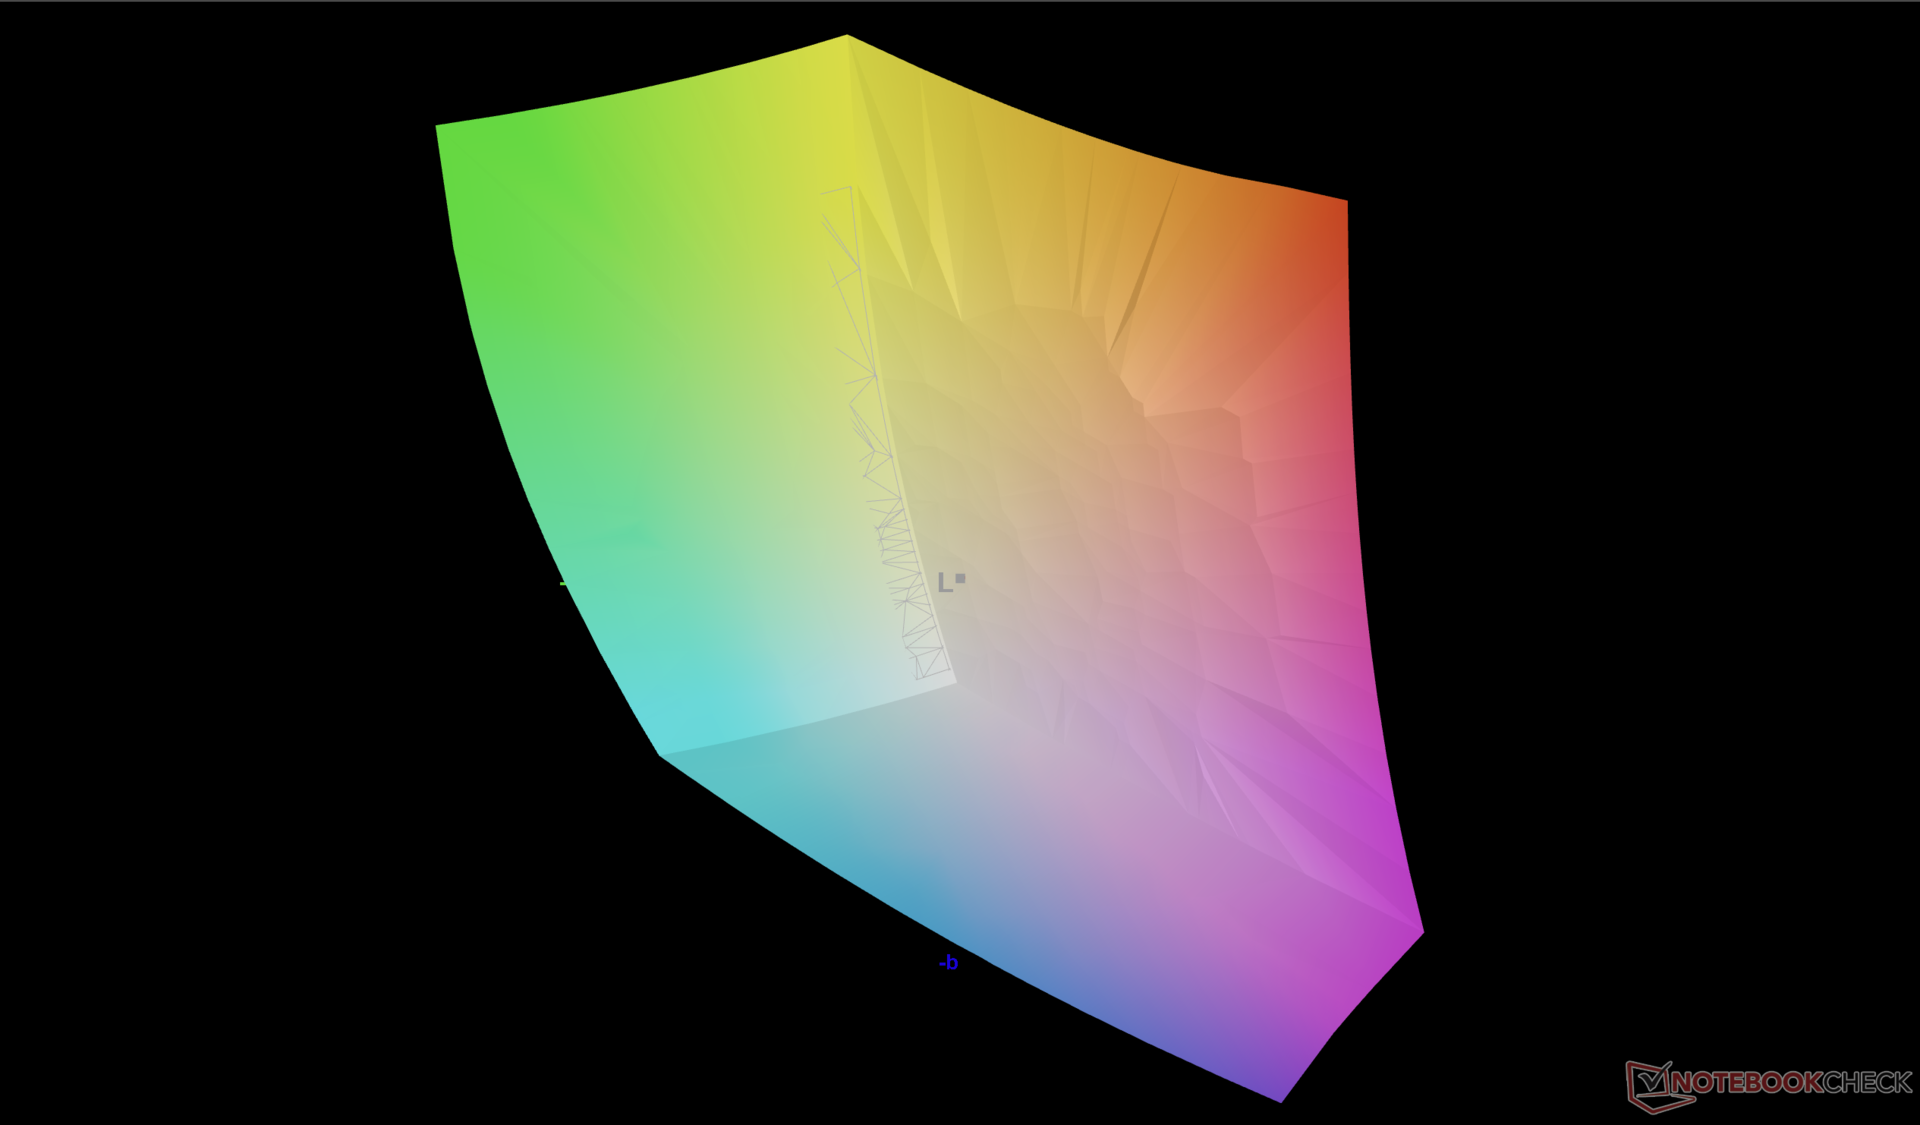
Z pewnością nie ma złego lub "niewłaściwego" panelu, ponieważ wszystkie panele nadają się do gier dzięki szybkim częstotliwościom odświeżania i krótkim czasom reakcji. Mając to na uwadze, nasz skonfigurowany panel 1600p240 jest najlepszym rozwiązaniem dla większości użytkowników, ponieważ opcja 1200p480 poświęca rozdzielczość, a opcja 1600p165 ma płytsze kolory. Wrażenia z oglądania są porównywalne z Blade 16, a jednocześnie lepsze niż Dell G16 i Lenovo Legion Pro 7 16 pod względem zakresu kolorów.
| |||||||||||||||||||||||||
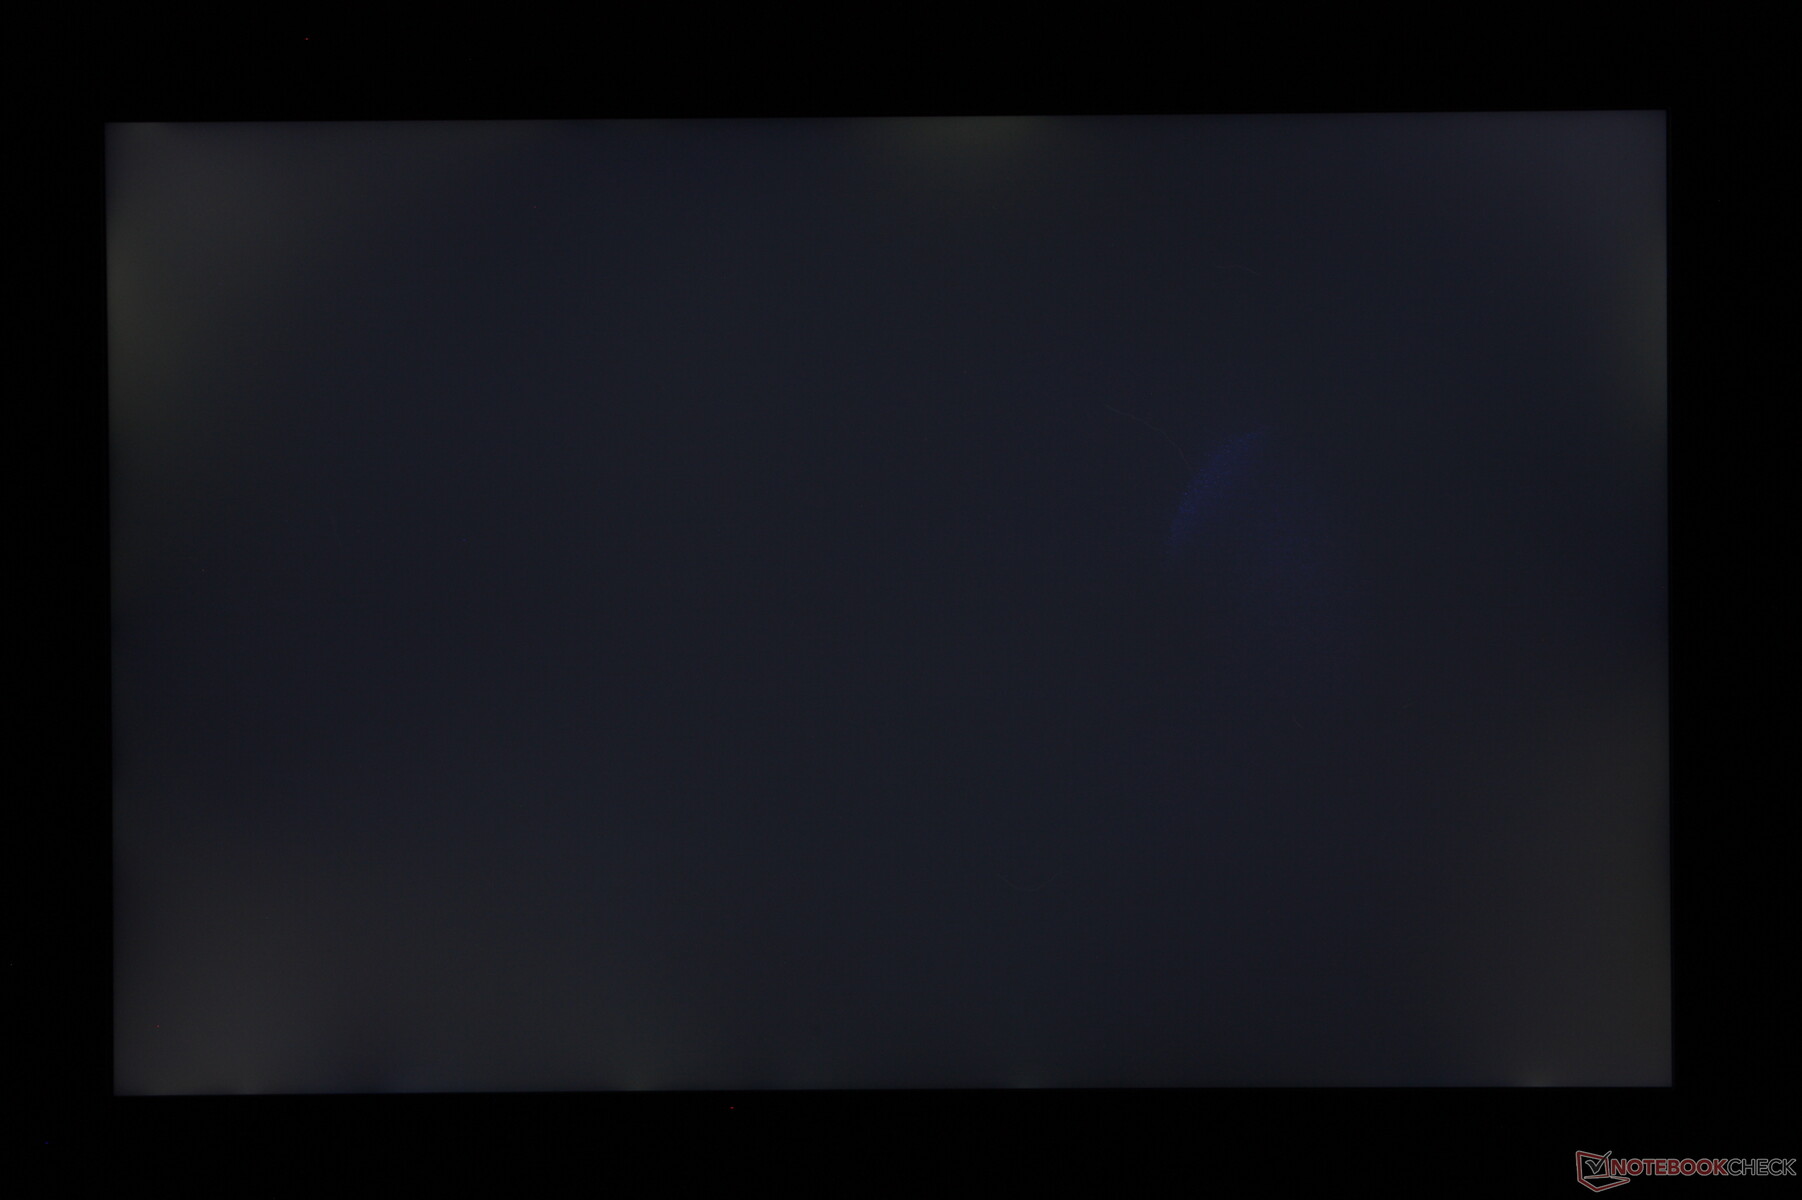
rozświetlenie: 89 %
na akumulatorze: 302.2 cd/m²
kontrast: 1162:1 (czerń: 0.26 cd/m²)
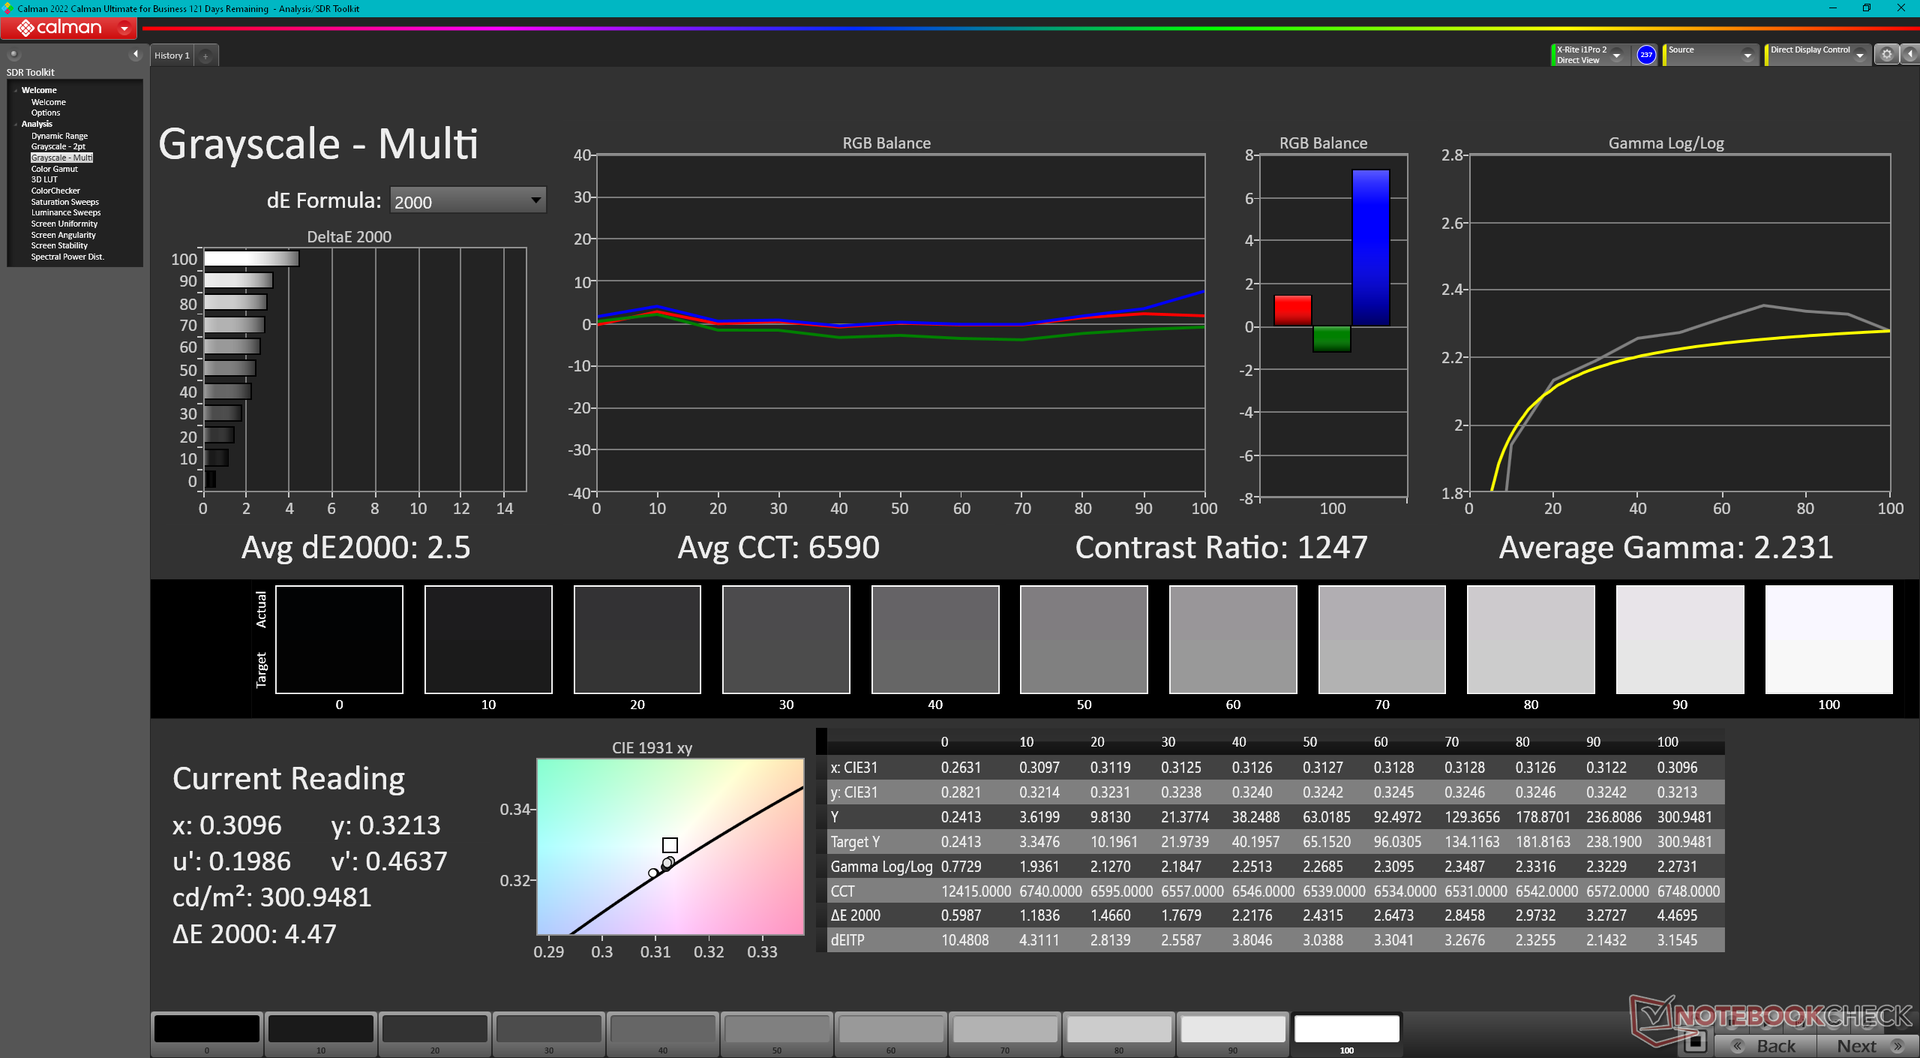
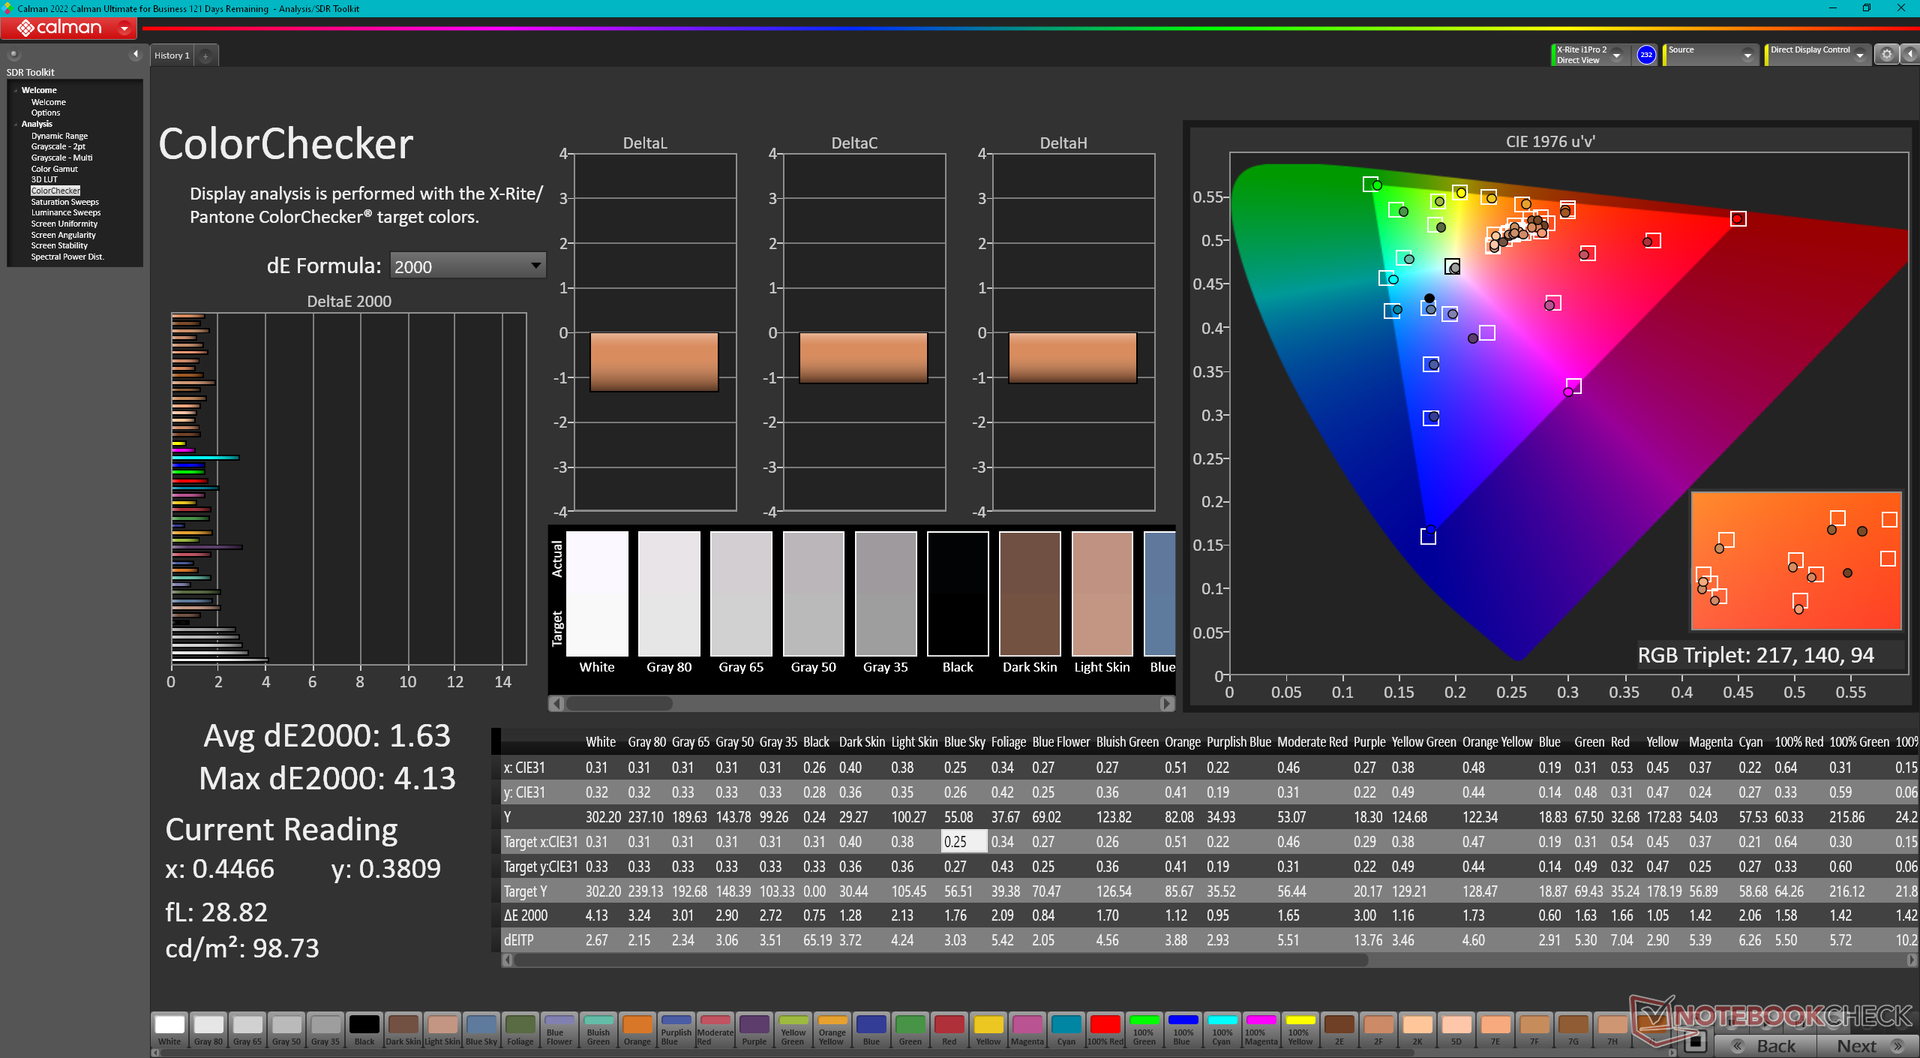
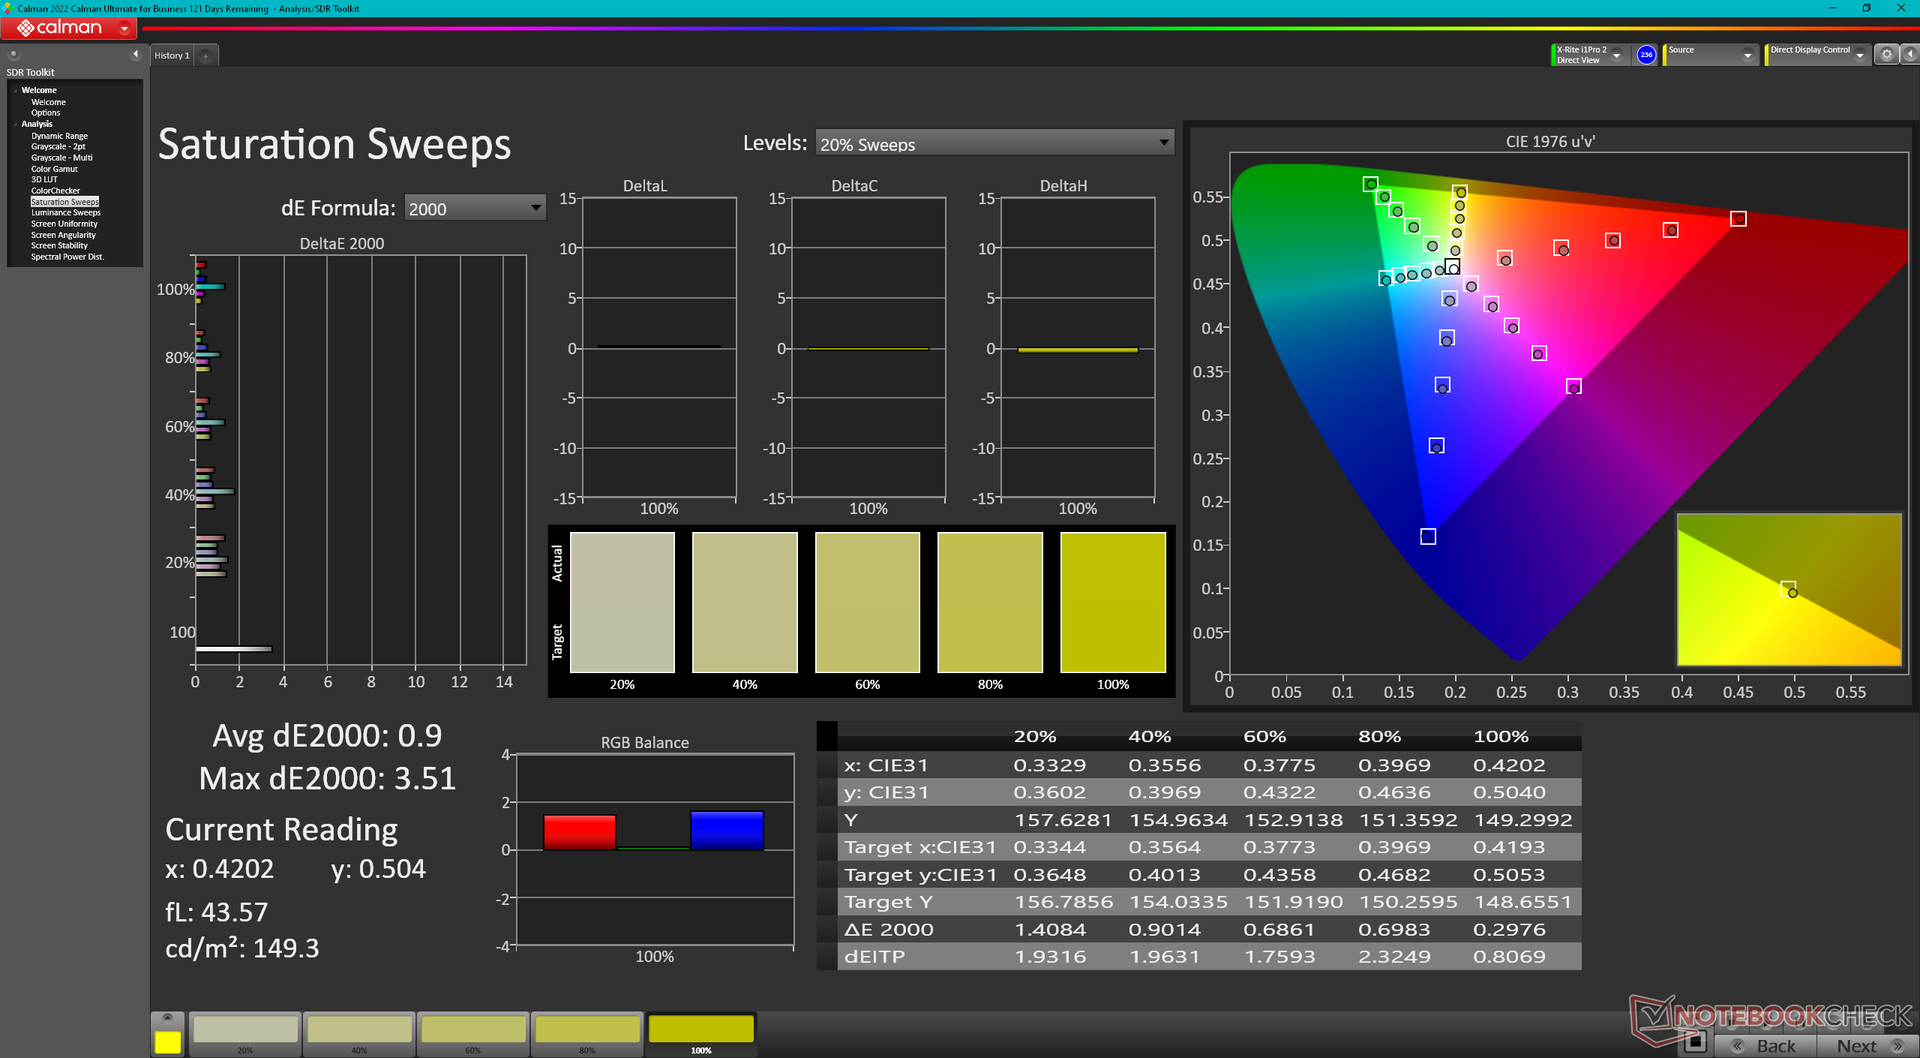
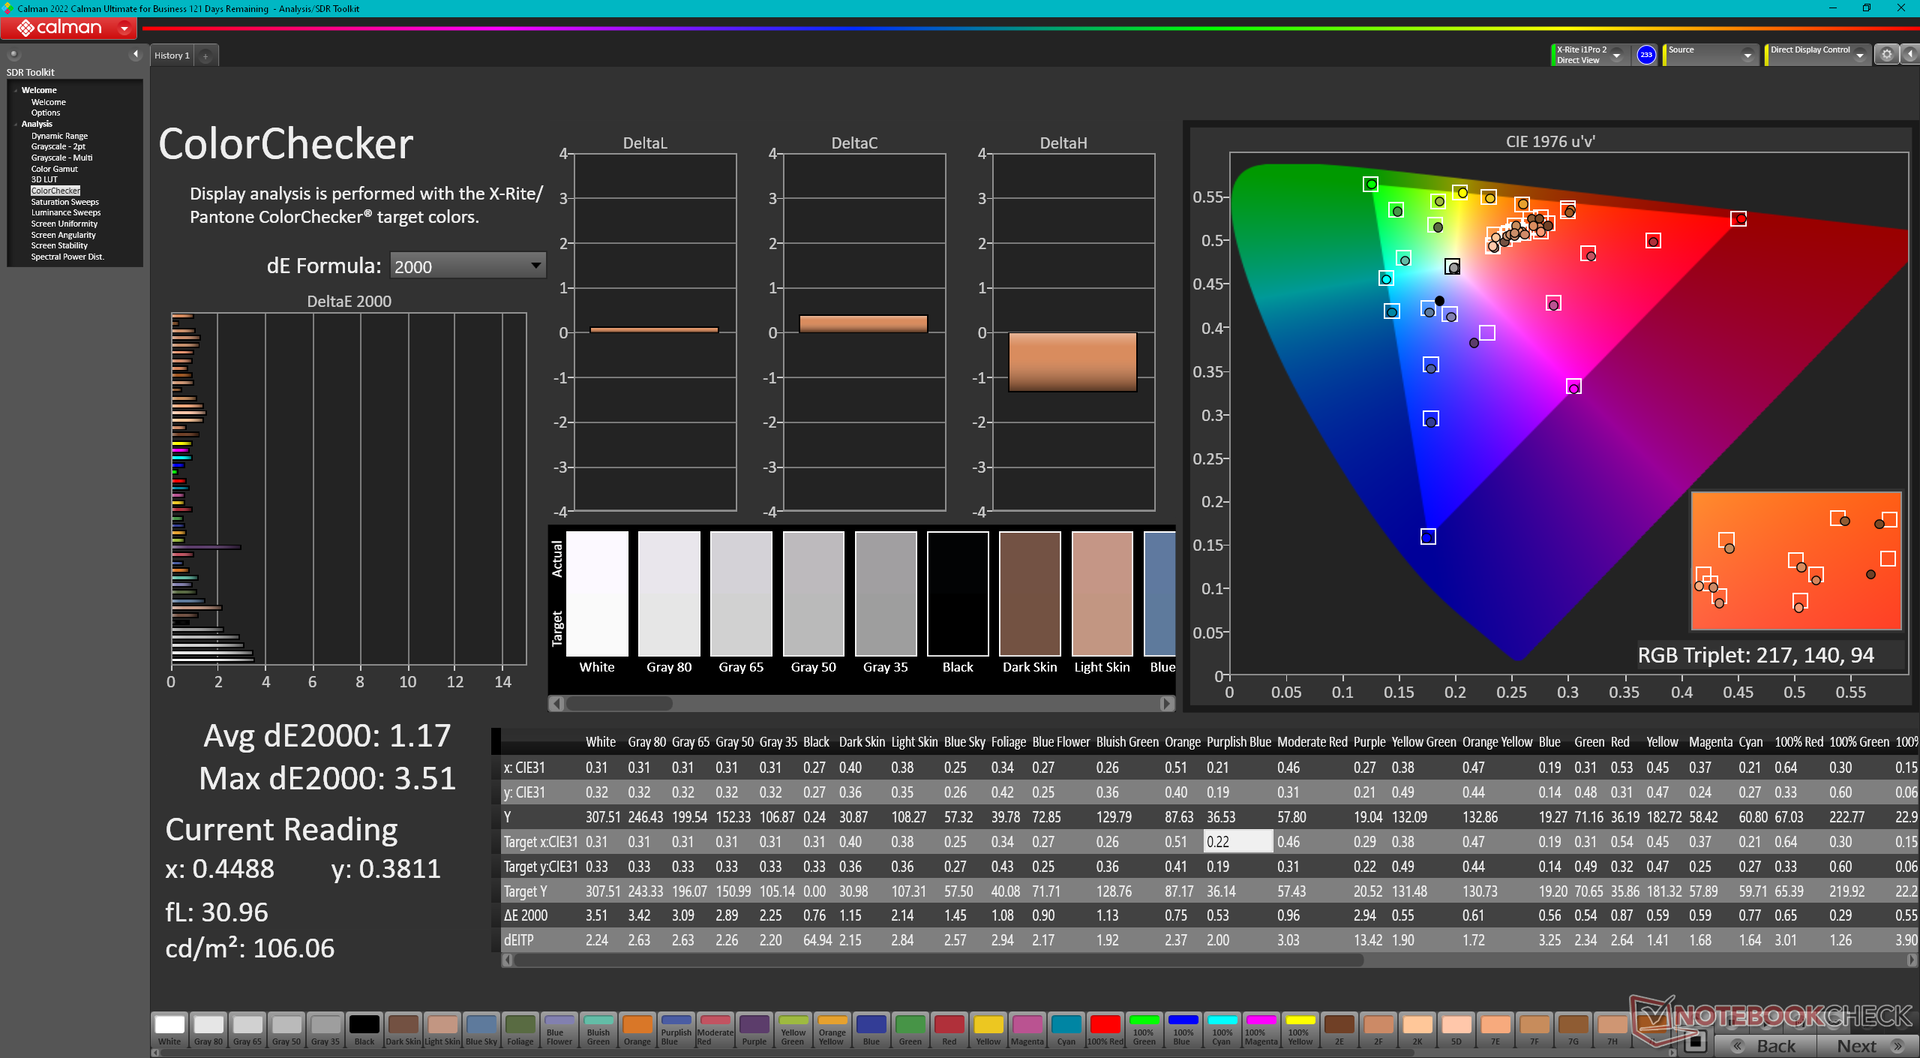
ΔE ColorChecker Calman: 1.63 | ∀{0.5-29.43 Ø4.73}
calibrated: 1.17
ΔE Greyscale Calman: 2.5 | ∀{0.09-98 Ø4.97}
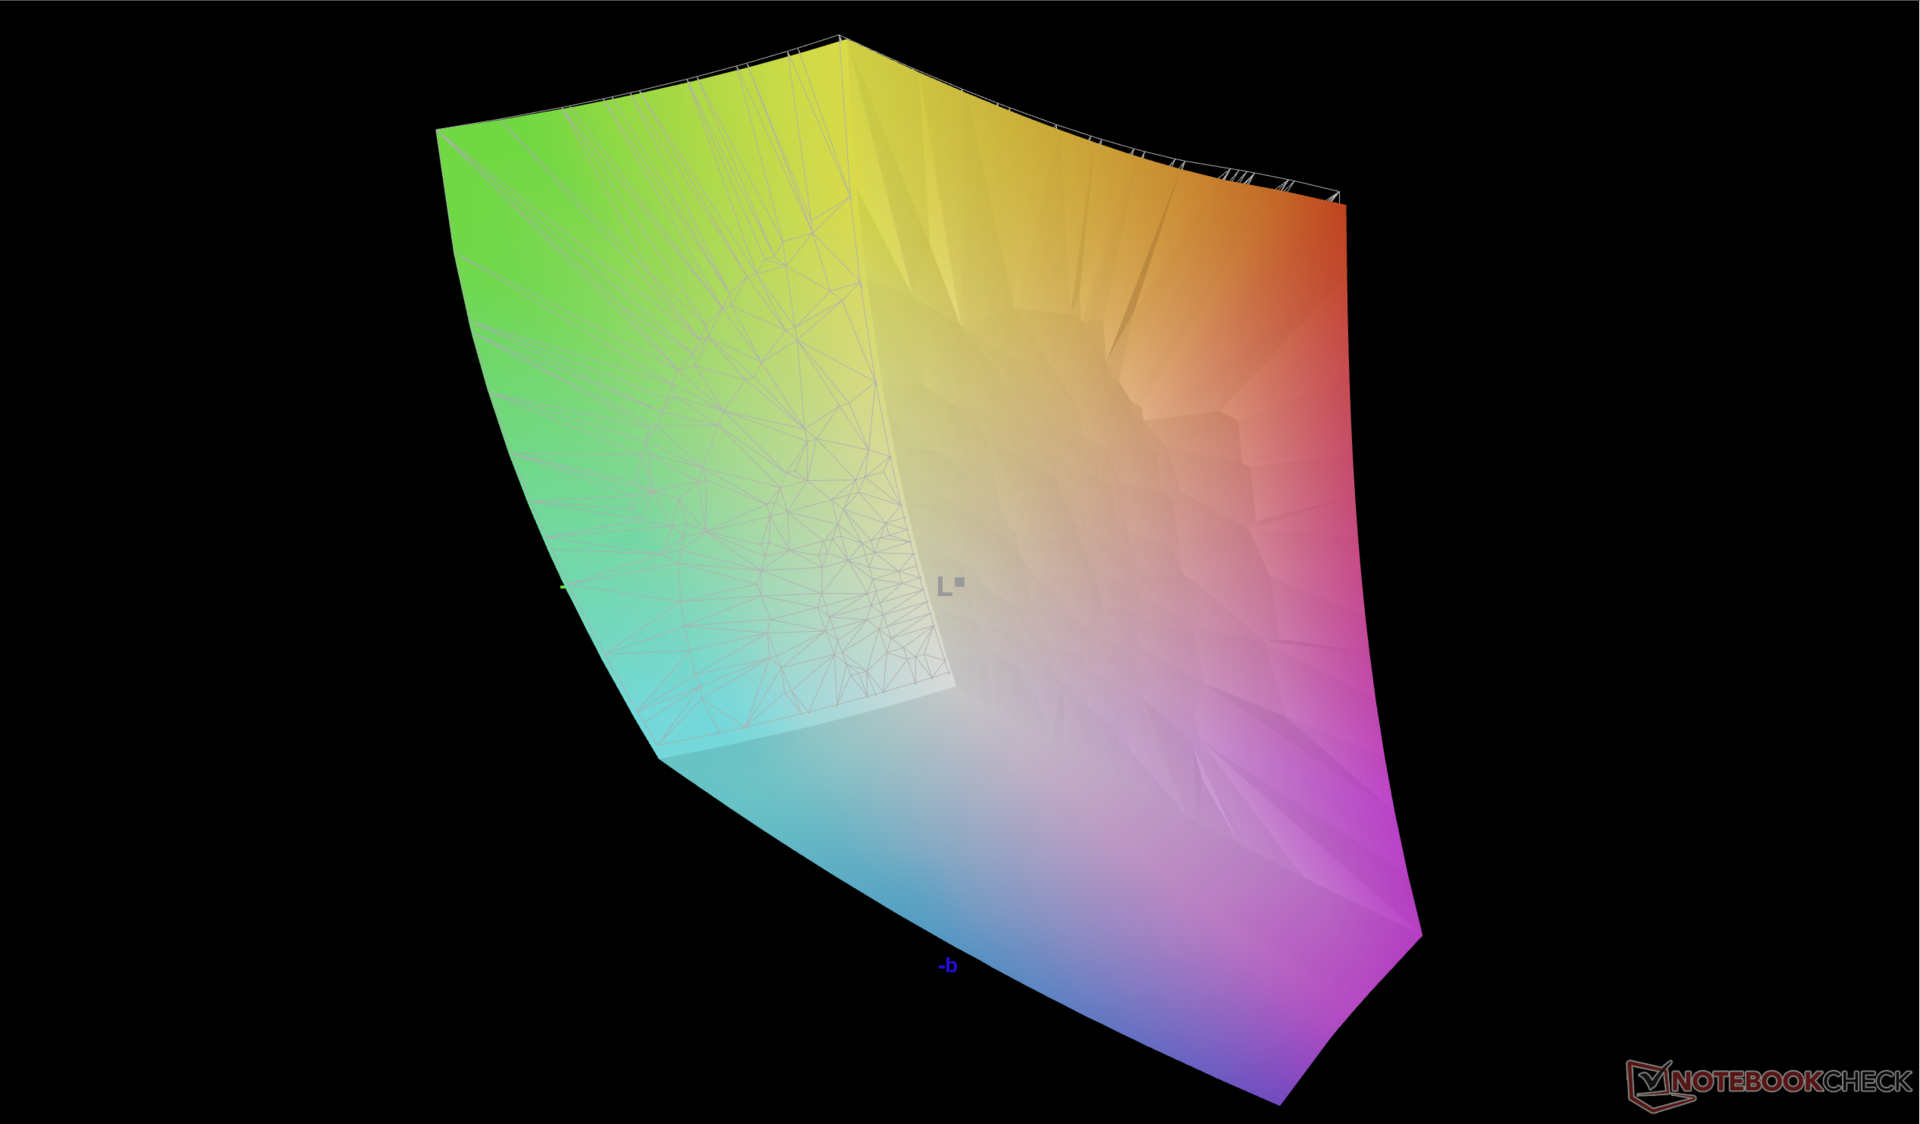
88.6% AdobeRGB 1998 (Argyll 3D)
100% sRGB (Argyll 3D)
99.2% Display P3 (Argyll 3D)
Gamma: 2.23
CCT: 6590 K
| Alienware x16 R1 BOE NE16NZ4, IPS, 2560x1600, 16" | Asus ROG Zephyrus M16 GU604VY-NM042X BOE0B74 (NE160QDM-NM4, IPS, 2560x1600, 16" | Razer Blade 16 Early 2023 CSOT T3 MNG007DA4-1, IPS, 2560x1600, 16" | Dell G16 7620 BOE NE16QDM, IPS, 2560x1600, 16" | Alienware m17 R5 (R9 6900HX, RX 6850M XT) AU Optronics AUODBA3, IPS, 3840x2160, 17" | Lenovo Legion Pro 7 16IRX8H MNG007DA2-3 (CSO1628), IPS, 2560x1600, 16" | |
|---|---|---|---|---|---|---|
| Display | 1% | 0% | -18% | -1% | -17% | |
| Display P3 Coverage (%) | 99.2 | 99.33 0% | 98.5 -1% | 68.3 -31% | 97.2 -2% | 69.1 -30% |
| sRGB Coverage (%) | 100 | 99.9 0% | 100 0% | 98 -2% | 99.6 0% | 99.7 0% |
| AdobeRGB 1998 Coverage (%) | 88.6 | 90.01 2% | 89.7 1% | 70.5 -20% | 88.4 0% | 71.2 -20% |
| Response Times | -542% | -23% | -35% | -118% | -49% | |
| Response Time Grey 50% / Grey 80% * (ms) | 5.1 ? | 50.8 ? -896% | 6.6 ? -29% | 8.6 ? -69% | 16.4 ? -222% | 12.3 ? -141% |
| Response Time Black / White * (ms) | 10.3 ? | 29.6 ? -187% | 12 ? -17% | 10.4 ? -1% | 11.6 ? -13% | 5.9 ? 43% |
| PWM Frequency (Hz) | 12000 | |||||
| Screen | 247% | -8% | -4% | -80% | 31% | |
| Brightness middle (cd/m²) | 302.2 | 634 110% | 456.8 51% | 369.4 22% | 484 60% | 511 69% |
| Brightness (cd/m²) | 285 | 627 120% | 437 53% | 348 22% | 449 58% | 469 65% |
| Brightness Distribution (%) | 89 | 92 3% | 83 -7% | 83 -7% | 87 -2% | 86 -3% |
| Black Level * (cd/m²) | 0.26 | 0.03 88% | 0.35 -35% | 0.32 -23% | 0.55 -112% | 0.4 -54% |
| Contrast (:1) | 1162 | 21133 1719% | 1305 12% | 1154 -1% | 880 -24% | 1278 10% |
| Colorchecker dE 2000 * | 1.63 | 0.89 45% | 3.7 -127% | 1.78 -9% | 4.8 -194% | 0.95 42% |
| Colorchecker dE 2000 max. * | 4.13 | 1.79 57% | 6.42 -55% | 4.41 -7% | 7.48 -81% | 2.07 50% |
| Colorchecker dE 2000 calibrated * | 1.17 | 0.91 22% | 0.66 44% | 1.22 -4% | 4.74 -305% | 0.91 22% |
| Greyscale dE 2000 * | 2.5 | 1.13 55% | 2.6 -4% | 3.2 -28% | 5.5 -120% | 0.6 76% |
| Gamma | 2.23 99% | 2.47 89% | 2.3 96% | 2.2 100% | 2.42 91% | 2.176 101% |
| CCT | 6590 99% | 6497 100% | 6108 106% | 6750 96% | 6148 106% | 6545 99% |
| Całkowita średnia (program / ustawienia) | -98% /
81% | -10% /
-8% | -19% /
-11% | -66% /
-68% | -12% /
9% |
* ... im mniej tym lepiej
Wyświetlacz jest dobrze skalibrowany po wyjęciu z pudełka ze średnimi wartościami deltaE skali szarości i kolorów wynoszącymi odpowiednio zaledwie 2,5 i 1,63. Próba dalszej kalibracji wyświetlacza za pomocą naszego kolorymetru X-Rite przyniosłaby bardzo niewielkie korzyści, więc kalibracja przez użytkownika końcowego nie jest konieczna.

Wyświetl czasy reakcji
| ↔ Czas reakcji od czerni do bieli | ||
|---|---|---|
| 10.3 ms ... wzrost ↗ i spadek ↘ łącznie | ↗ 5.4 ms wzrost | 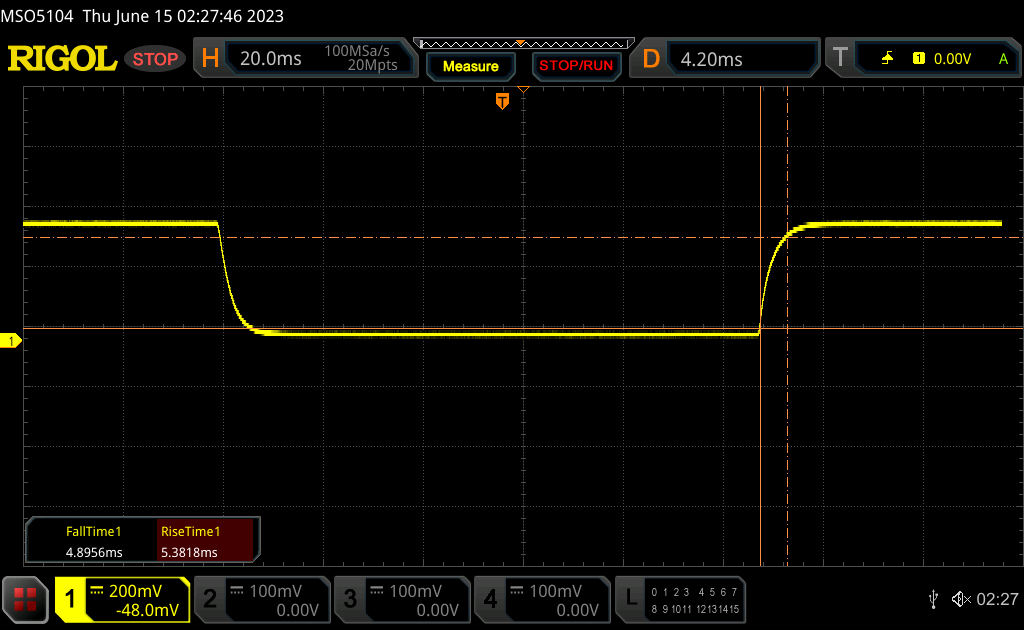 |
| ↘ 4.9 ms upadek | ||
| W naszych testach ekran wykazuje dobry współczynnik reakcji, ale może być zbyt wolny dla graczy rywalizujących ze sobą. Dla porównania, wszystkie testowane urządzenia wahają się od 0.1 (minimum) do 240 (maksimum) ms. » 28 % wszystkich urządzeń jest lepszych. Oznacza to, że zmierzony czas reakcji jest lepszy od średniej wszystkich testowanych urządzeń (19.9 ms). | ||
| ↔ Czas reakcji 50% szarości do 80% szarości | ||
| 5.1 ms ... wzrost ↗ i spadek ↘ łącznie | ↗ 2.4 ms wzrost | 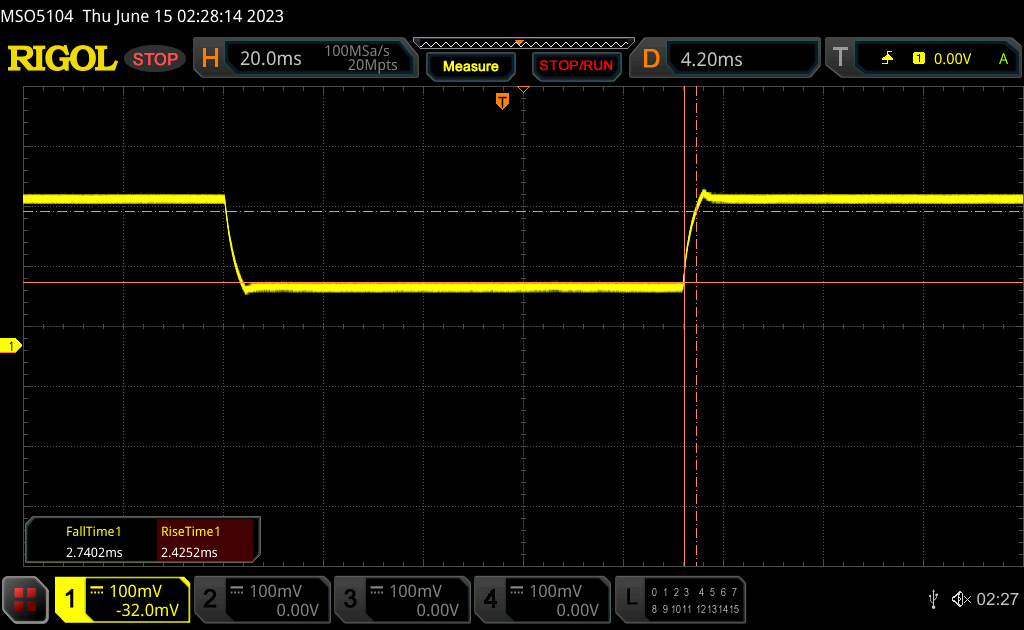 |
| ↘ 2.7 ms upadek | ||
| W naszych testach ekran wykazuje bardzo szybką reakcję i powinien bardzo dobrze nadawać się do szybkich gier. Dla porównania, wszystkie testowane urządzenia wahają się od 0.165 (minimum) do 636 (maksimum) ms. » 17 % wszystkich urządzeń jest lepszych. Oznacza to, że zmierzony czas reakcji jest lepszy od średniej wszystkich testowanych urządzeń (31.1 ms). | ||
Migotanie ekranu / PWM (modulacja szerokości impulsu)
| Migotanie ekranu/nie wykryto PWM | 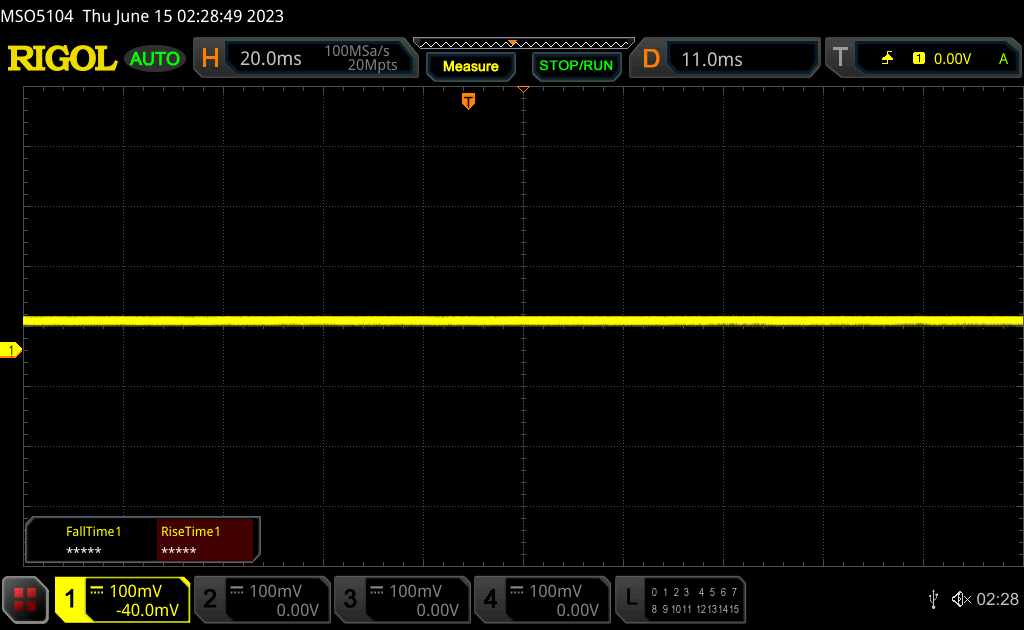 | ||
Dla porównania: 52 % wszystkich testowanych urządzeń nie używa PWM do przyciemniania wyświetlacza. Jeśli wykryto PWM, zmierzono średnio 7798 (minimum: 5 - maksimum: 343500) Hz. | |||
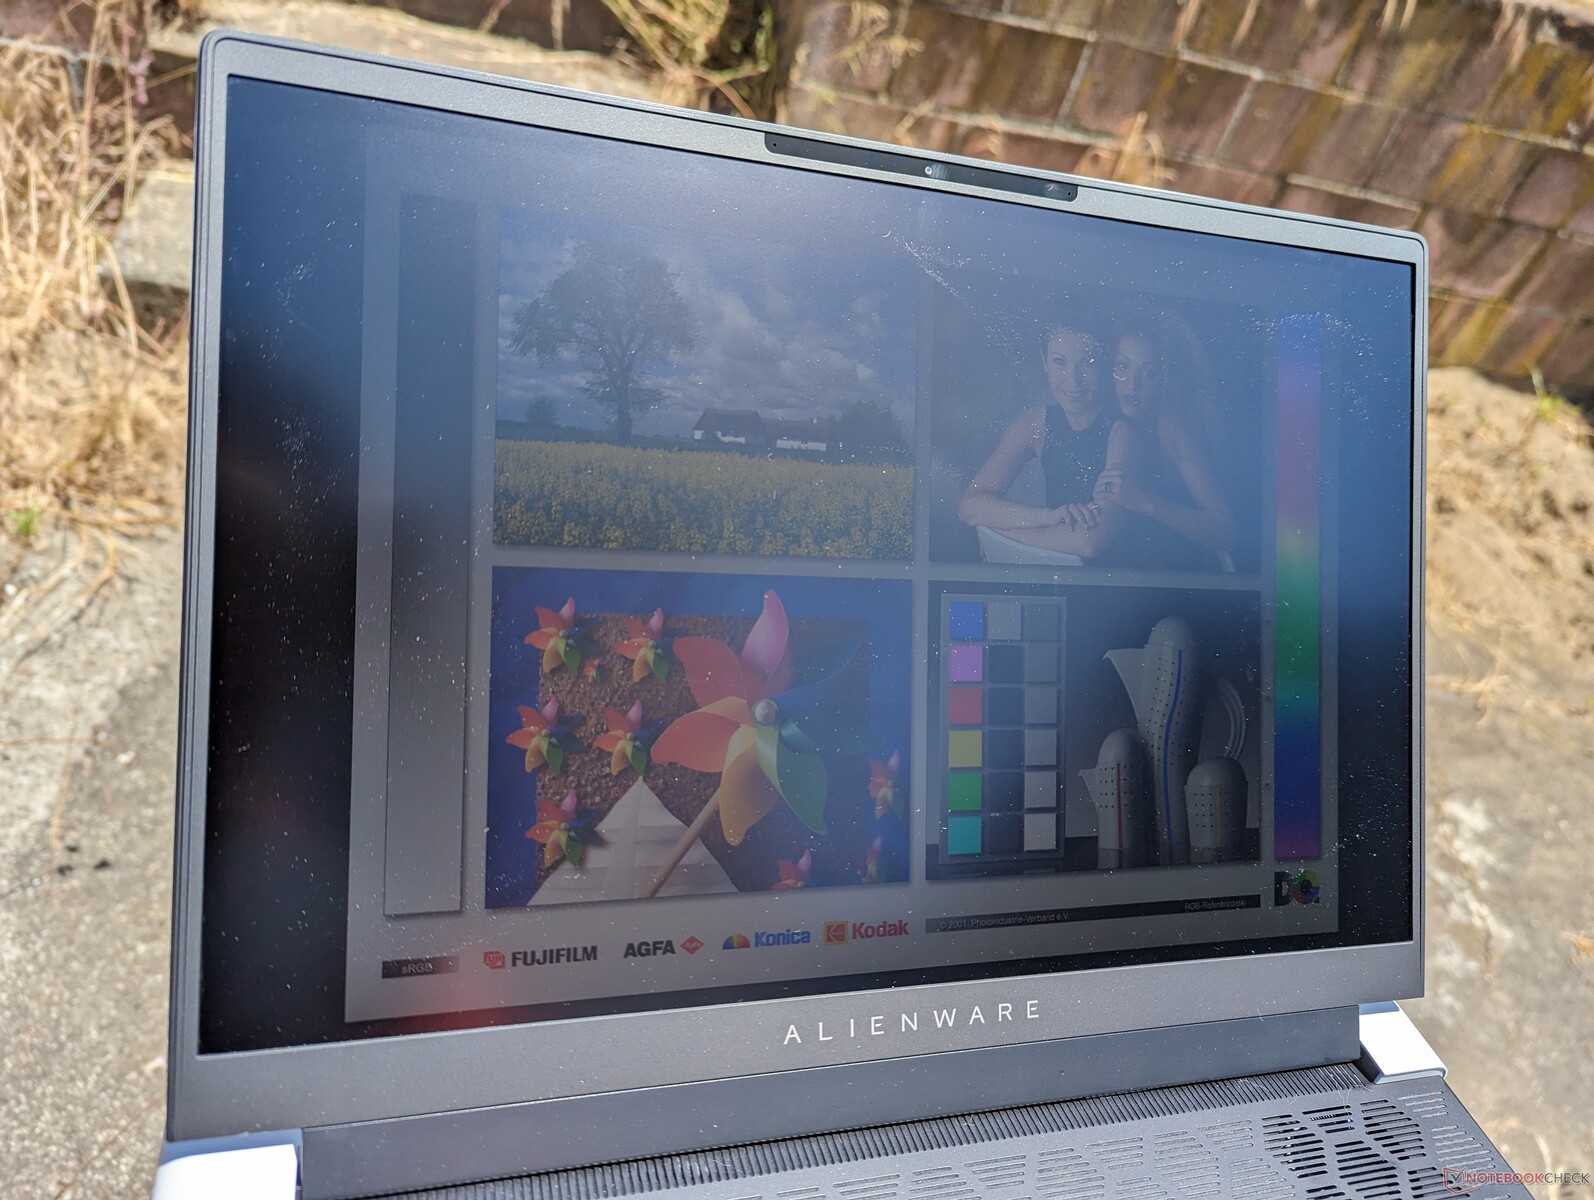
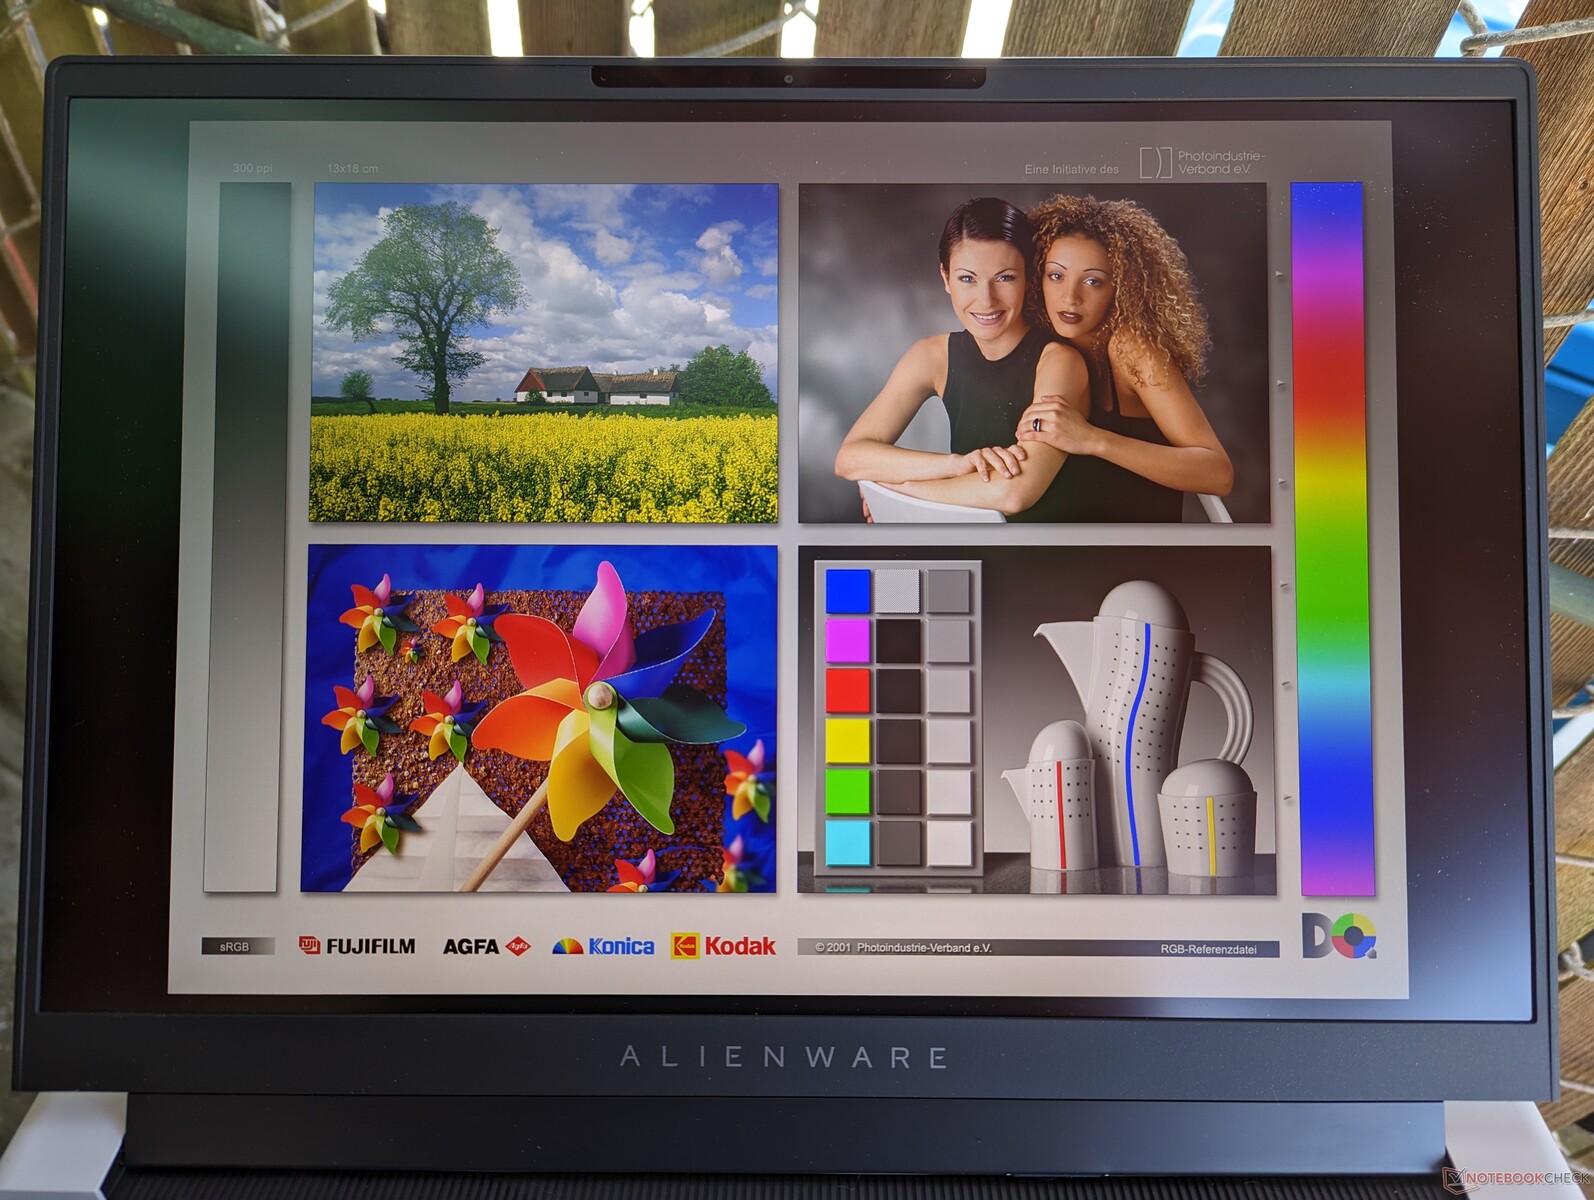
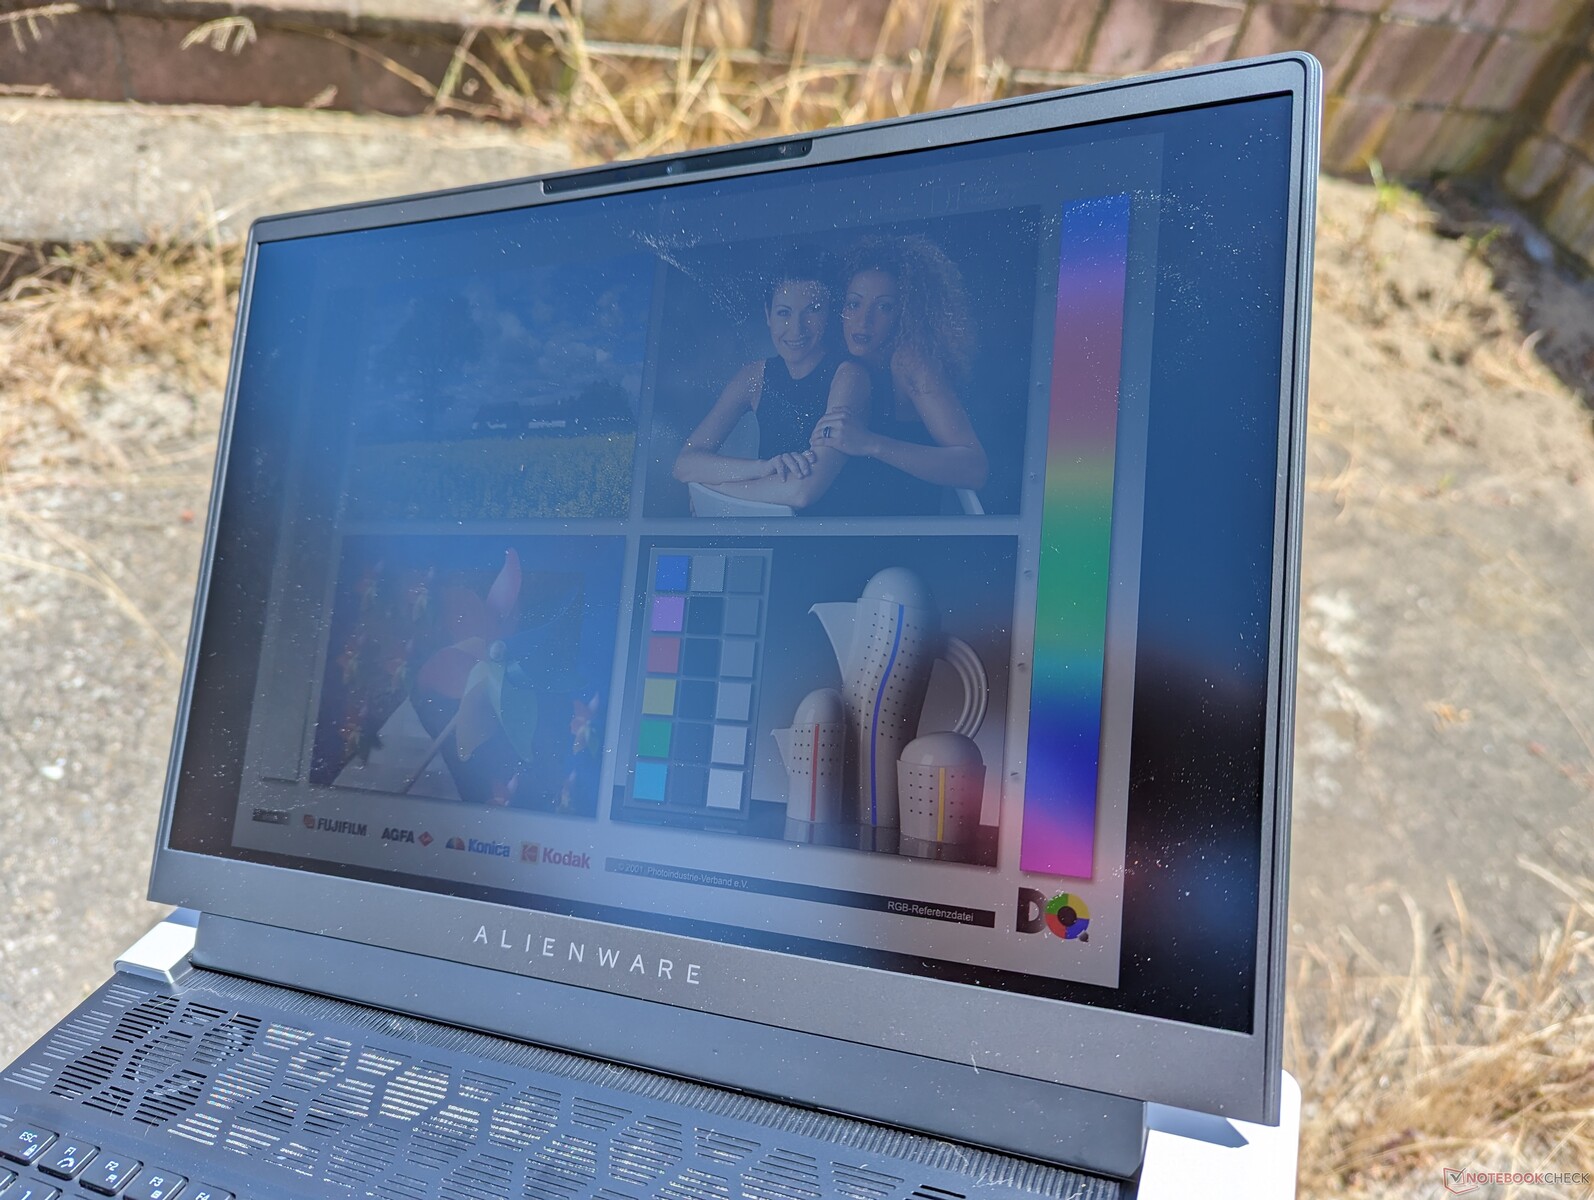
Widoczność na zewnątrz nie jest tak dobra, jak w przypadku innych 16-calowych laptopów do gier, takich jakZephyrus M16, Blade 16 lub Legion Pro 7 16, ponieważ wyświetlacz w Alienware jest zauważalnie ciemniejszy. W połączeniu ze stosunkowo dużą powierzchnią podstawy, Alienware x16 R1 zdecydowanie nie jest laptopem przyjaznym dla środowiska zewnętrznego, pomimo cienkiej konstrukcji obudowy.
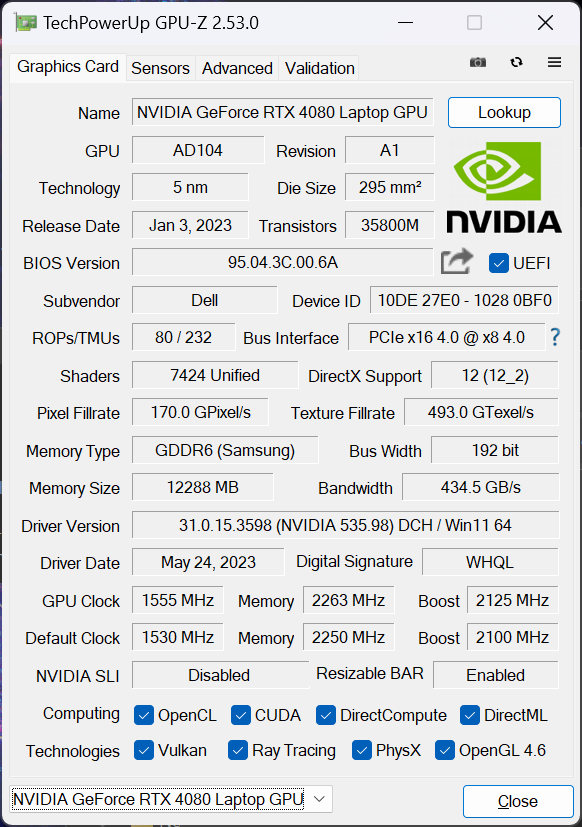
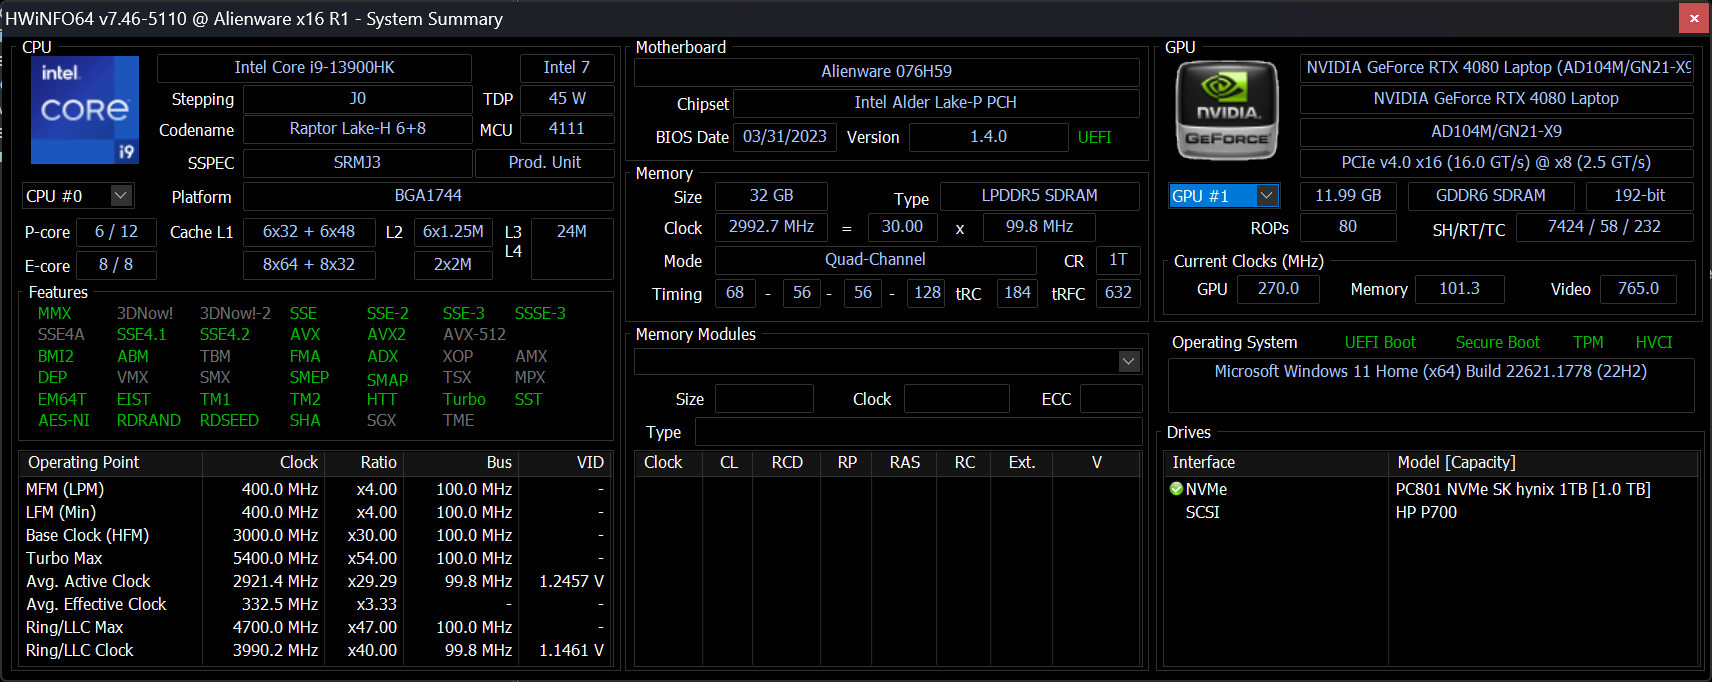
Wydajność - Meh CPU, imponujący GPU
Warunki testowania
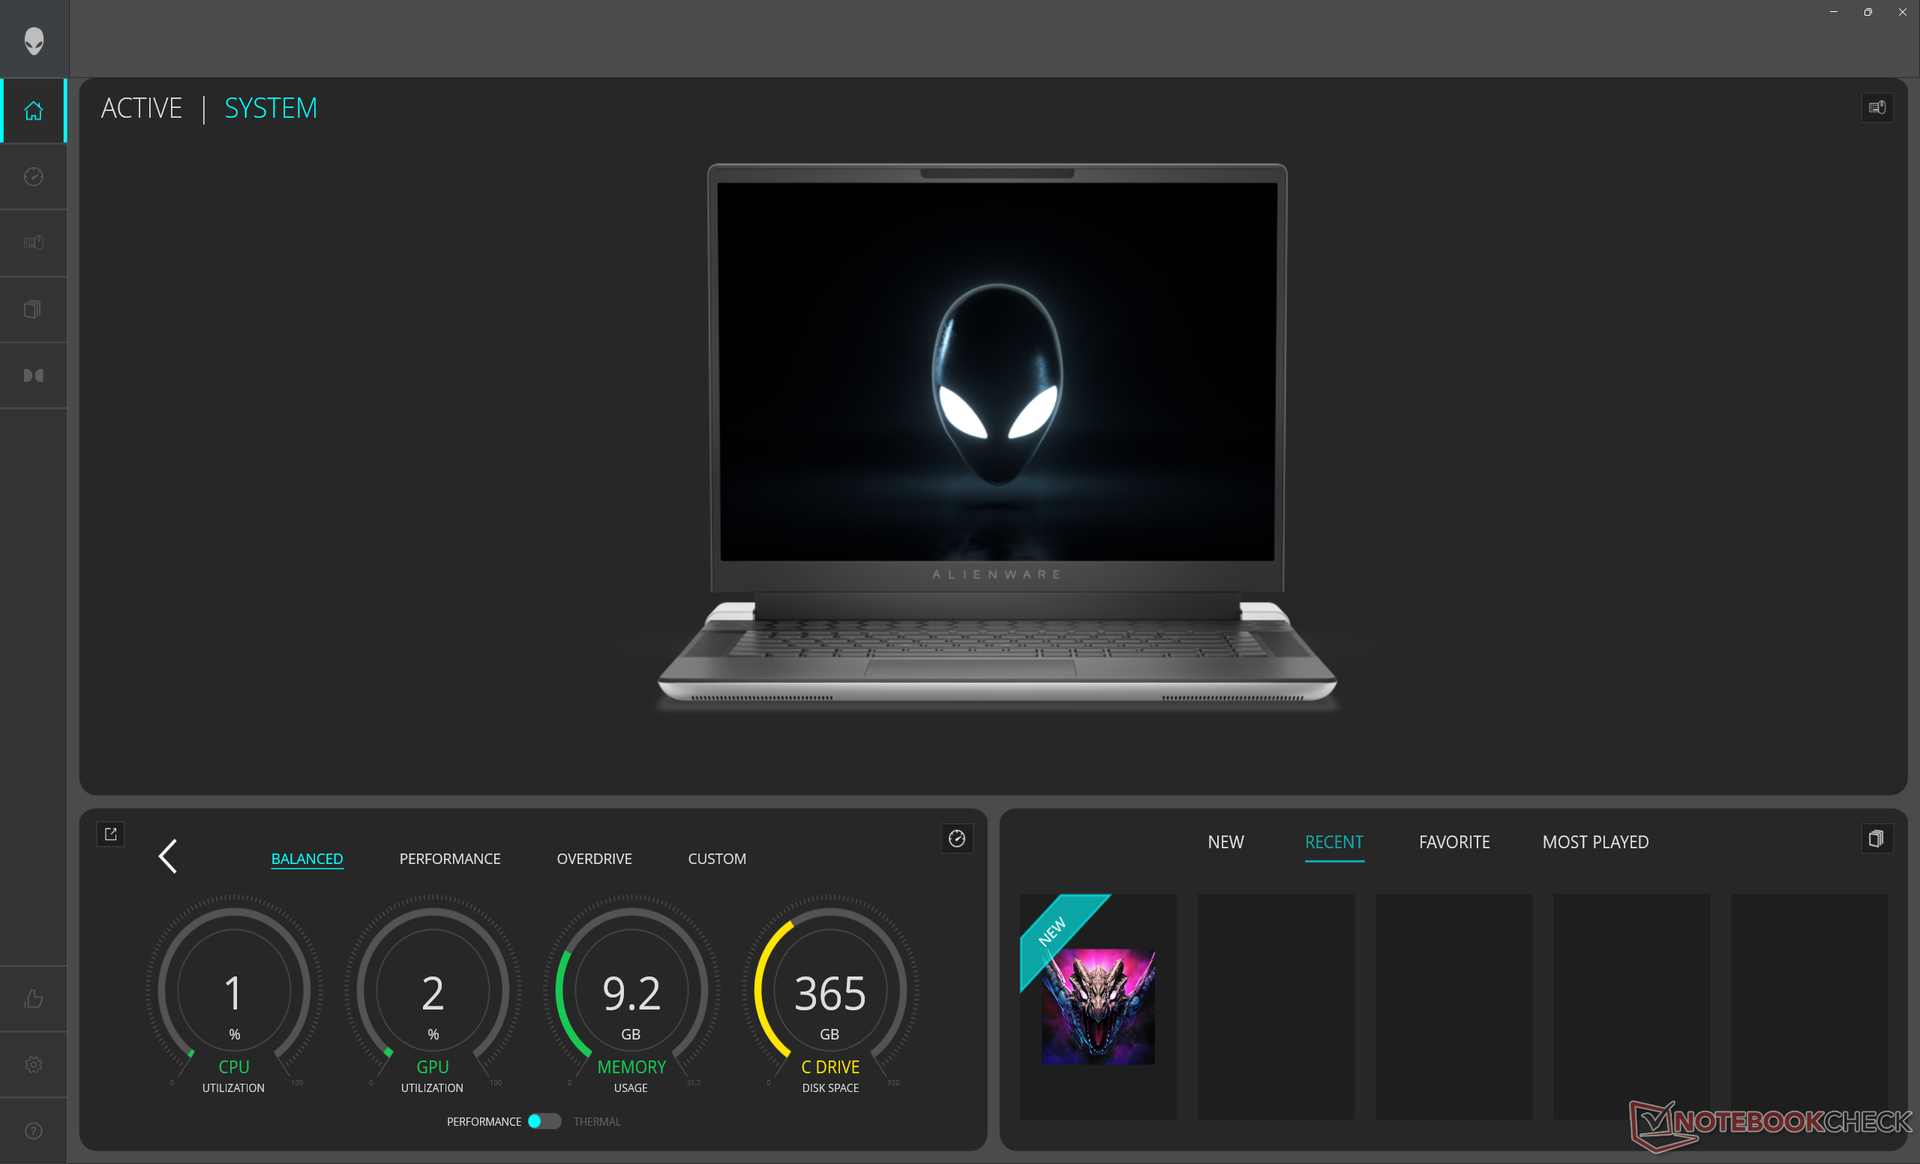
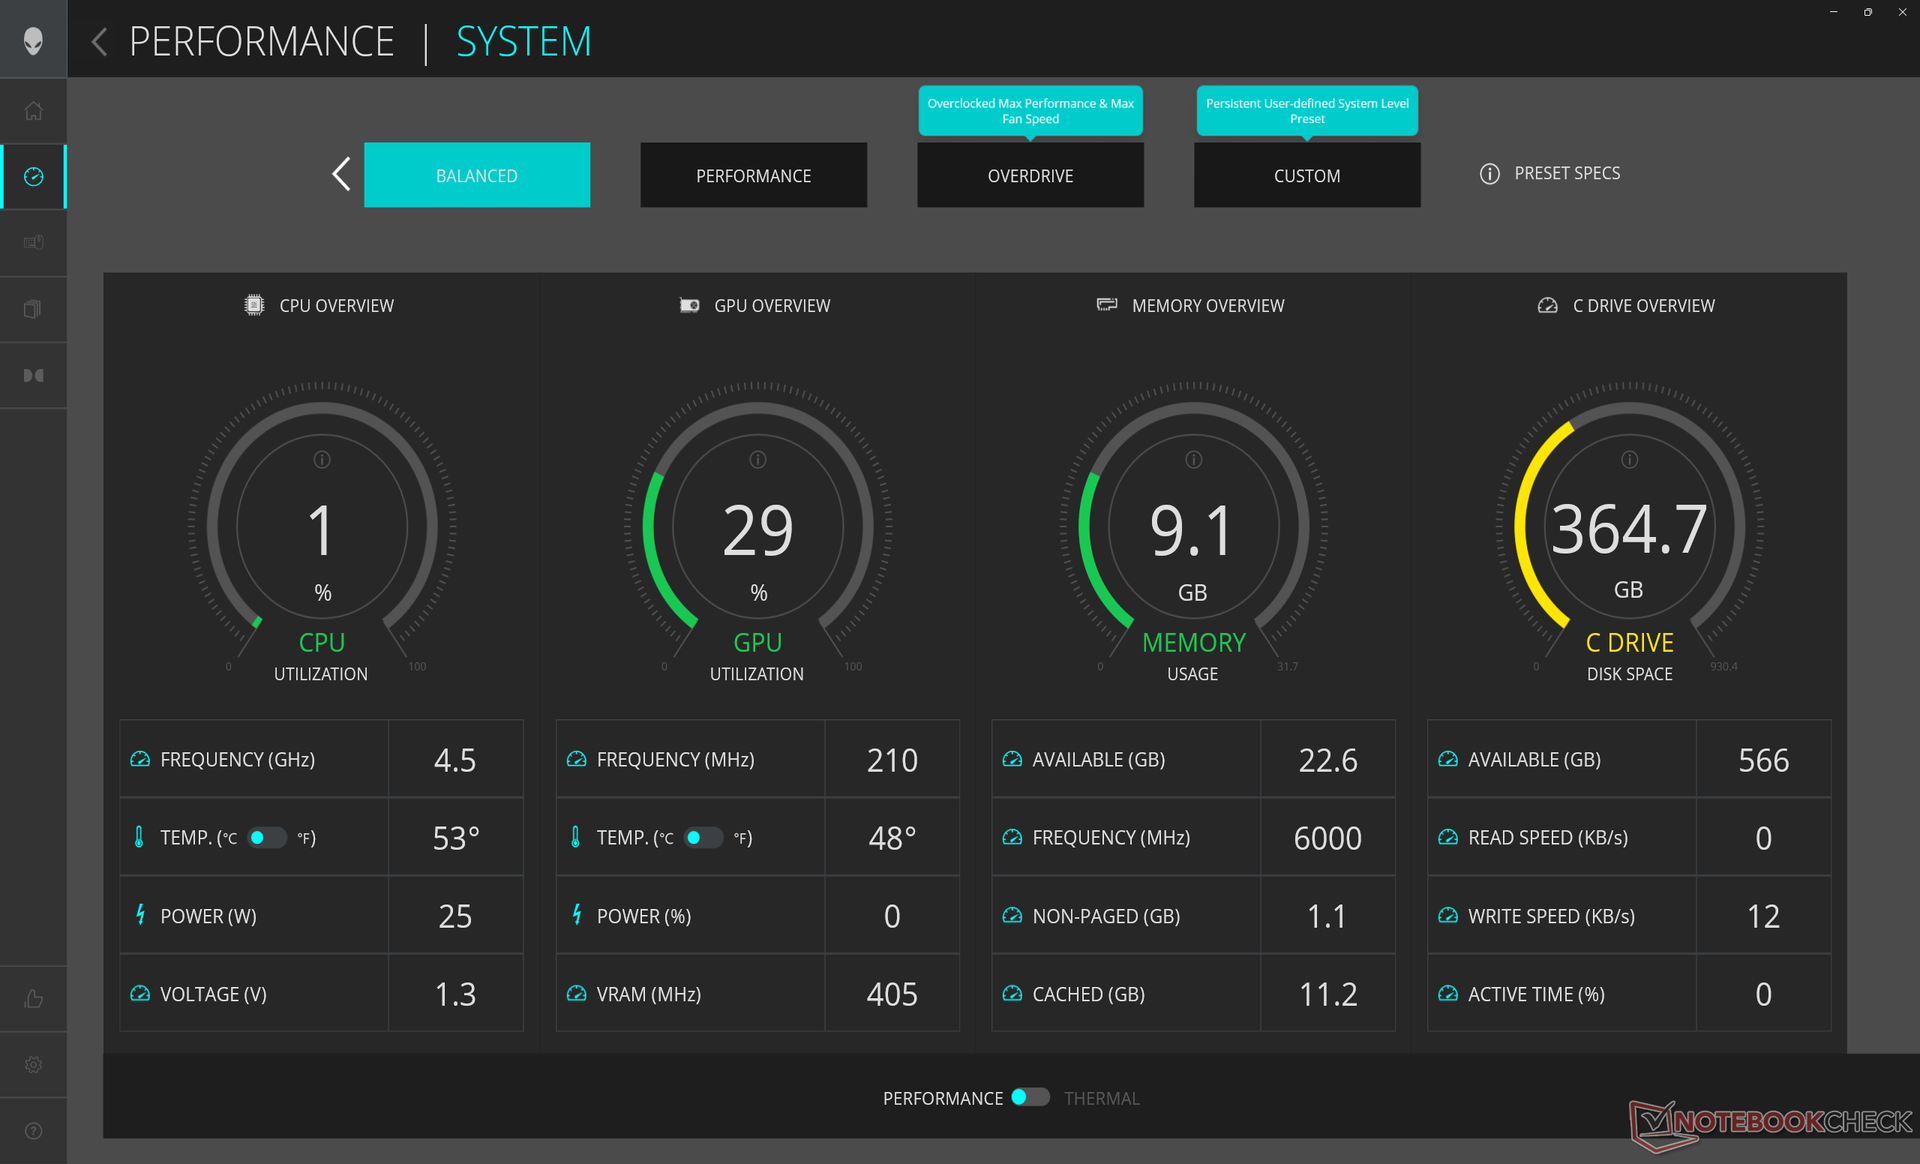
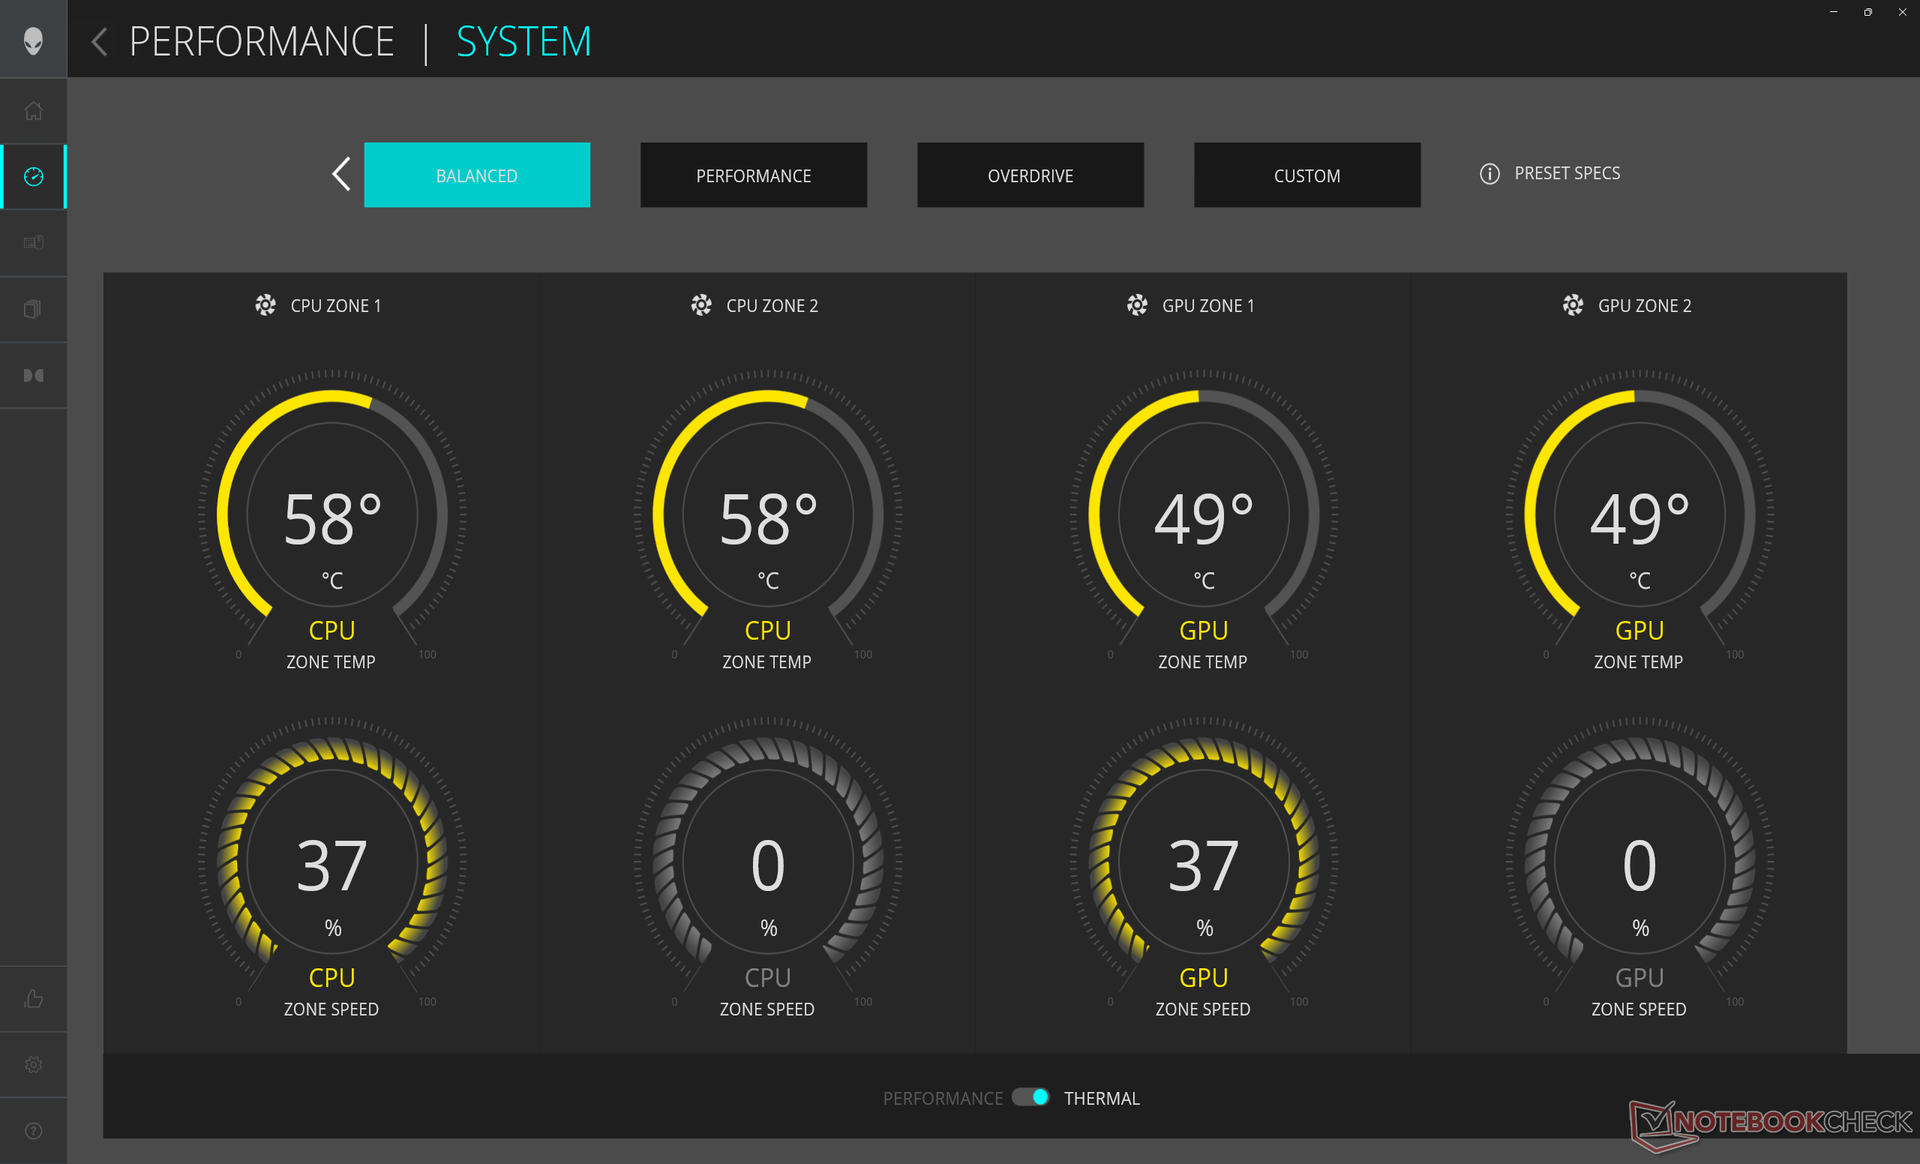
Przed uruchomieniem poniższych testów porównawczych ustawiliśmy naszą jednostkę na tryb Overdrive za pośrednictwem Alienware Command Center (ACC) i tryb High Performance za pośrednictwem systemu Windows. Upewniliśmy się również, aby ustawić grafikę tylko na tryb dGPU, a nie Optimus za pośrednictwem Panelu sterowania Nvidia. Irytujące jest to, że profile zasilania ACC nie są zsynchronizowane z systemem Windows, więc możliwe jest, że aktywne są sprzeczne profile (tj. jeden ustawiony na oszczędzanie energii, a drugi na wydajność).
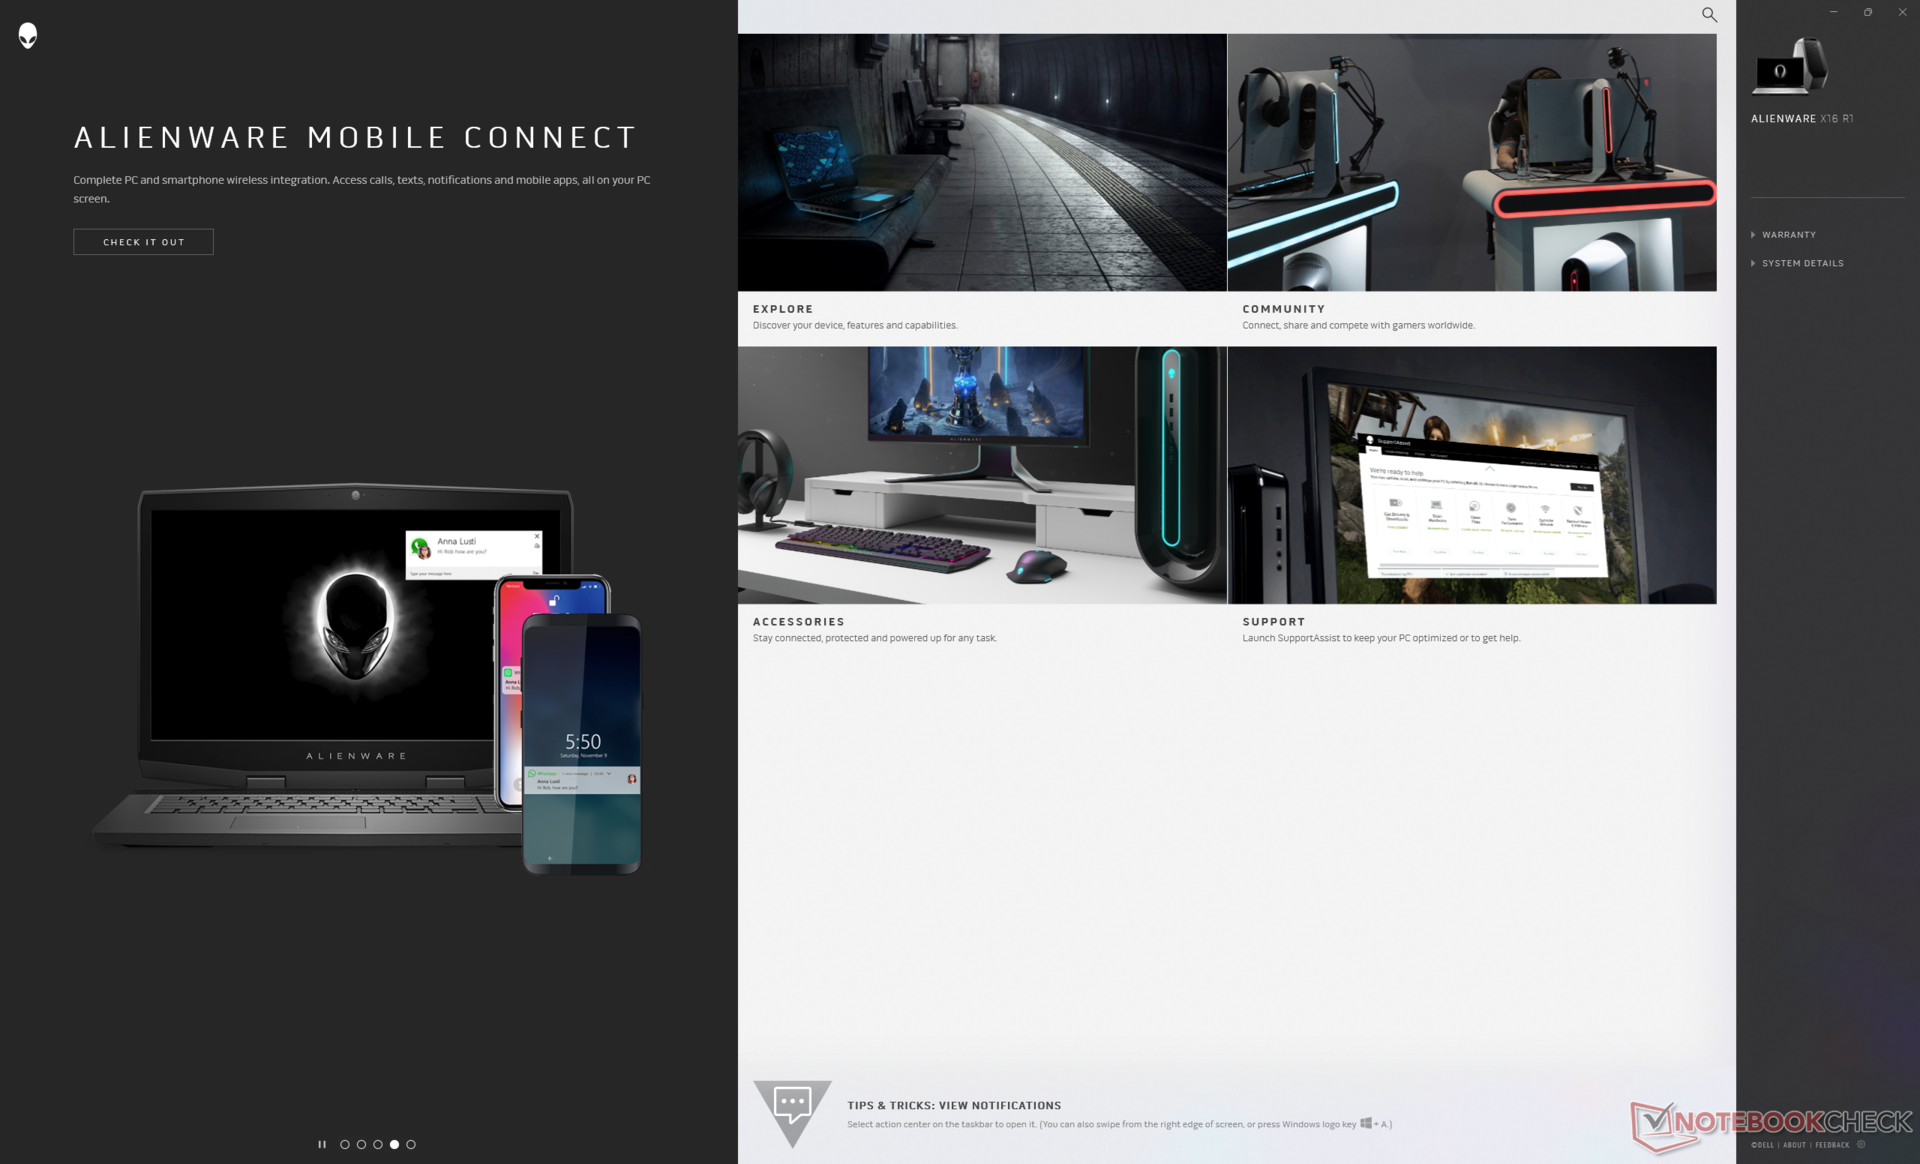
ACC nie należy mylić z My Alienware. Pierwsza z nich jest centrum sterowania dla parametrów systemu, ustawień RGB, profili zasilania i ustawień gier, podczas gdy druga jest nexusem dla wsparcia Dell, łączności mobilnej i opcjonalnych akcesoriów.
Zaawansowany Optimus lub MUX jest obsługiwany we wszystkich jednostkach SKU. Należy pamiętać, że G-Sync jest aktywny dla monitora wewnętrznego, jeśli jest ustawiony tylko na tryb dGPU.
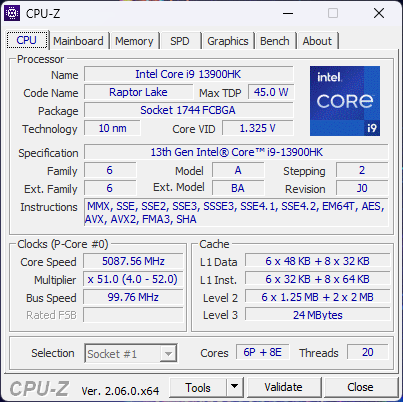
Procesor
Ważne jest, aby pamiętać, że model ten osiąga maksimum przy Core i9-13900HK a nie Core i9-13900HX który może zaoferować od 50 do 60 procent wyższą wydajność wielowątkową. Ogólna wydajność naszego Core i7-13900HK jest zatem niemal identyczna z tańszym modelem Core i9-13900H i porównywalna do konkurencyjnego Ryzen 7 7745HX. Aby uzyskać wyższą wydajność, gracze mogą zamiast tego rozważyć grubszy Alienware m16 lub Lenovo Legion Pro 7, ponieważ można je skonfigurować z Core i7-13900HX.
Przejście na tańszy model i7-13620H lub i7-13700H oczekuje się, że wpłynie na wydajność procesora o około 15 do 20 procent, w oparciu o nasz czas spędzony zMSI Katana 17 i Dell XPS 17 9730.
Cinebench R15 Multi Loop
Cinebench R20: CPU (Multi Core) | CPU (Single Core)
Cinebench R23: Multi Core | Single Core
Cinebench R15: CPU Multi 64Bit | CPU Single 64Bit
Blender: v2.79 BMW27 CPU
7-Zip 18.03: 7z b 4 | 7z b 4 -mmt1
Geekbench 5.5: Multi-Core | Single-Core
HWBOT x265 Benchmark v2.2: 4k Preset
LibreOffice : 20 Documents To PDF
R Benchmark 2.5: Overall mean
| CPU Performance rating | |
| Asus Zephyrus Duo 16 GX650PY-NM006W | |
| Lenovo Legion Pro 7 RTX4090 | |
| Razer Blade 16 Early 2023 | |
| Alienware x16 R1 -1! | |
| Asus ROG Zephyrus M16 GU604VY-NM042X | |
| Lenovo Legion Pro 5 16ARX8 | |
| MSI GE67 HX 12UGS | |
| Dell G16 7620 | |
| Przeciętny Intel Core i9-13900HK | |
| Lenovo Legion 5 Pro 16ARH7H RTX 3070 Ti | |
| Alienware m17 R5 (R9 6900HX, RX 6850M XT) | |
| HP Omen 16-c0077ng -1! | |
| Cinebench R20 / CPU (Multi Core) | |
| Asus Zephyrus Duo 16 GX650PY-NM006W | |
| Lenovo Legion Pro 7 RTX4090 | |
| Razer Blade 16 Early 2023 | |
| MSI GE67 HX 12UGS | |
| Alienware x16 R1 | |
| Asus ROG Zephyrus M16 GU604VY-NM042X | |
| Lenovo Legion Pro 5 16ARX8 | |
| Dell G16 7620 | |
| Przeciętny Intel Core i9-13900HK (4968 - 7542, n=4) | |
| Lenovo Legion 5 Pro 16ARH7H RTX 3070 Ti | |
| Alienware m17 R5 (R9 6900HX, RX 6850M XT) | |
| HP Omen 16-c0077ng | |
| Cinebench R20 / CPU (Single Core) | |
| Lenovo Legion Pro 7 RTX4090 | |
| Asus Zephyrus Duo 16 GX650PY-NM006W | |
| Asus ROG Zephyrus M16 GU604VY-NM042X | |
| Alienware x16 R1 | |
| Razer Blade 16 Early 2023 | |
| Lenovo Legion Pro 5 16ARX8 | |
| Przeciętny Intel Core i9-13900HK (549 - 798, n=4) | |
| MSI GE67 HX 12UGS | |
| Dell G16 7620 | |
| Alienware m17 R5 (R9 6900HX, RX 6850M XT) | |
| Lenovo Legion 5 Pro 16ARH7H RTX 3070 Ti | |
| HP Omen 16-c0077ng | |
| Cinebench R23 / Multi Core | |
| Asus Zephyrus Duo 16 GX650PY-NM006W | |
| Lenovo Legion Pro 7 RTX4090 | |
| Razer Blade 16 Early 2023 | |
| MSI GE67 HX 12UGS | |
| Alienware x16 R1 | |
| Asus ROG Zephyrus M16 GU604VY-NM042X | |
| Lenovo Legion Pro 5 16ARX8 | |
| Dell G16 7620 | |
| Przeciętny Intel Core i9-13900HK (12799 - 19704, n=4) | |
| Lenovo Legion 5 Pro 16ARH7H RTX 3070 Ti | |
| Alienware m17 R5 (R9 6900HX, RX 6850M XT) | |
| HP Omen 16-c0077ng | |
| Cinebench R23 / Single Core | |
| Lenovo Legion Pro 7 RTX4090 | |
| Razer Blade 16 Early 2023 | |
| Asus ROG Zephyrus M16 GU604VY-NM042X | |
| Alienware x16 R1 | |
| Asus Zephyrus Duo 16 GX650PY-NM006W | |
| Lenovo Legion Pro 5 16ARX8 | |
| MSI GE67 HX 12UGS | |
| Przeciętny Intel Core i9-13900HK (1426 - 2089, n=4) | |
| Dell G16 7620 | |
| Alienware m17 R5 (R9 6900HX, RX 6850M XT) | |
| Lenovo Legion 5 Pro 16ARH7H RTX 3070 Ti | |
| HP Omen 16-c0077ng | |
| Cinebench R15 / CPU Multi 64Bit | |
| Asus Zephyrus Duo 16 GX650PY-NM006W | |
| Lenovo Legion Pro 7 RTX4090 | |
| Razer Blade 16 Early 2023 | |
| MSI GE67 HX 12UGS | |
| Asus ROG Zephyrus M16 GU604VY-NM042X | |
| Lenovo Legion Pro 5 16ARX8 | |
| Alienware x16 R1 | |
| Dell G16 7620 | |
| Przeciętny Intel Core i9-13900HK (2004 - 2950, n=4) | |
| Lenovo Legion 5 Pro 16ARH7H RTX 3070 Ti | |
| Alienware m17 R5 (R9 6900HX, RX 6850M XT) | |
| HP Omen 16-c0077ng | |
| Cinebench R15 / CPU Single 64Bit | |
| Asus Zephyrus Duo 16 GX650PY-NM006W | |
| Lenovo Legion Pro 5 16ARX8 | |
| Asus ROG Zephyrus M16 GU604VY-NM042X | |
| Lenovo Legion Pro 7 RTX4090 | |
| Alienware x16 R1 | |
| Razer Blade 16 Early 2023 | |
| MSI GE67 HX 12UGS | |
| Przeciętny Intel Core i9-13900HK (204 - 296, n=4) | |
| Alienware m17 R5 (R9 6900HX, RX 6850M XT) | |
| Lenovo Legion 5 Pro 16ARH7H RTX 3070 Ti | |
| Dell G16 7620 | |
| HP Omen 16-c0077ng | |
| Blender / v2.79 BMW27 CPU | |
| HP Omen 16-c0077ng | |
| Alienware m17 R5 (R9 6900HX, RX 6850M XT) | |
| Przeciętny Intel Core i9-13900HK (197 - 253, n=3) | |
| Lenovo Legion 5 Pro 16ARH7H RTX 3070 Ti | |
| Dell G16 7620 | |
| Lenovo Legion Pro 5 16ARX8 | |
| Asus ROG Zephyrus M16 GU604VY-NM042X | |
| MSI GE67 HX 12UGS | |
| Razer Blade 16 Early 2023 | |
| Lenovo Legion Pro 7 RTX4090 | |
| Asus Zephyrus Duo 16 GX650PY-NM006W | |
| 7-Zip 18.03 / 7z b 4 | |
| Asus Zephyrus Duo 16 GX650PY-NM006W | |
| Lenovo Legion Pro 7 RTX4090 | |
| Razer Blade 16 Early 2023 | |
| Asus ROG Zephyrus M16 GU604VY-NM042X | |
| Alienware x16 R1 | |
| MSI GE67 HX 12UGS | |
| Lenovo Legion Pro 5 16ARX8 | |
| Dell G16 7620 | |
| Lenovo Legion 5 Pro 16ARH7H RTX 3070 Ti | |
| Przeciętny Intel Core i9-13900HK (50278 - 77190, n=4) | |
| Alienware m17 R5 (R9 6900HX, RX 6850M XT) | |
| 7-Zip 18.03 / 7z b 4 -mmt1 | |
| Asus Zephyrus Duo 16 GX650PY-NM006W | |
| Lenovo Legion Pro 5 16ARX8 | |
| Lenovo Legion Pro 7 RTX4090 | |
| Razer Blade 16 Early 2023 | |
| Asus ROG Zephyrus M16 GU604VY-NM042X | |
| Alienware x16 R1 | |
| Lenovo Legion 5 Pro 16ARH7H RTX 3070 Ti | |
| Alienware m17 R5 (R9 6900HX, RX 6850M XT) | |
| Przeciętny Intel Core i9-13900HK (4461 - 6516, n=4) | |
| MSI GE67 HX 12UGS | |
| HP Omen 16-c0077ng | |
| Dell G16 7620 | |
| Geekbench 5.5 / Multi-Core | |
| Lenovo Legion Pro 7 RTX4090 | |
| Asus Zephyrus Duo 16 GX650PY-NM006W | |
| Razer Blade 16 Early 2023 | |
| Asus ROG Zephyrus M16 GU604VY-NM042X | |
| Alienware x16 R1 | |
| MSI GE67 HX 12UGS | |
| Lenovo Legion Pro 5 16ARX8 | |
| Dell G16 7620 | |
| Przeciętny Intel Core i9-13900HK (7927 - 14985, n=5) | |
| Lenovo Legion 5 Pro 16ARH7H RTX 3070 Ti | |
| Alienware m17 R5 (R9 6900HX, RX 6850M XT) | |
| HP Omen 16-c0077ng | |
| Geekbench 5.5 / Single-Core | |
| Asus Zephyrus Duo 16 GX650PY-NM006W | |
| Lenovo Legion Pro 5 16ARX8 | |
| Lenovo Legion Pro 7 RTX4090 | |
| Asus ROG Zephyrus M16 GU604VY-NM042X | |
| Alienware x16 R1 | |
| Razer Blade 16 Early 2023 | |
| MSI GE67 HX 12UGS | |
| Przeciętny Intel Core i9-13900HK (1315 - 1996, n=5) | |
| Dell G16 7620 | |
| Alienware m17 R5 (R9 6900HX, RX 6850M XT) | |
| Lenovo Legion 5 Pro 16ARH7H RTX 3070 Ti | |
| HP Omen 16-c0077ng | |
| HWBOT x265 Benchmark v2.2 / 4k Preset | |
| Asus Zephyrus Duo 16 GX650PY-NM006W | |
| Lenovo Legion Pro 7 RTX4090 | |
| Razer Blade 16 Early 2023 | |
| MSI GE67 HX 12UGS | |
| Lenovo Legion Pro 5 16ARX8 | |
| Alienware x16 R1 | |
| Asus ROG Zephyrus M16 GU604VY-NM042X | |
| Dell G16 7620 | |
| Lenovo Legion 5 Pro 16ARH7H RTX 3070 Ti | |
| Przeciętny Intel Core i9-13900HK (14.2 - 21.9, n=4) | |
| Alienware m17 R5 (R9 6900HX, RX 6850M XT) | |
| HP Omen 16-c0077ng | |
| LibreOffice / 20 Documents To PDF | |
| HP Omen 16-c0077ng | |
| Asus Zephyrus Duo 16 GX650PY-NM006W | |
| Alienware m17 R5 (R9 6900HX, RX 6850M XT) | |
| Dell G16 7620 | |
| Lenovo Legion 5 Pro 16ARH7H RTX 3070 Ti | |
| Asus ROG Zephyrus M16 GU604VY-NM042X | |
| Przeciętny Intel Core i9-13900HK (37.3 - 56, n=4) | |
| Razer Blade 16 Early 2023 | |
| Alienware x16 R1 | |
| MSI GE67 HX 12UGS | |
| Lenovo Legion Pro 7 RTX4090 | |
| Lenovo Legion Pro 5 16ARX8 | |
| R Benchmark 2.5 / Overall mean | |
| HP Omen 16-c0077ng | |
| Dell G16 7620 | |
| Przeciętny Intel Core i9-13900HK (0.4119 - 0.653, n=4) | |
| Lenovo Legion 5 Pro 16ARH7H RTX 3070 Ti | |
| Alienware m17 R5 (R9 6900HX, RX 6850M XT) | |
| MSI GE67 HX 12UGS | |
| Alienware x16 R1 | |
| Lenovo Legion Pro 5 16ARX8 | |
| Razer Blade 16 Early 2023 | |
| Asus ROG Zephyrus M16 GU604VY-NM042X | |
| Lenovo Legion Pro 7 RTX4090 | |
| Asus Zephyrus Duo 16 GX650PY-NM006W | |
* ... im mniej tym lepiej
AIDA64: FP32 Ray-Trace | FPU Julia | CPU SHA3 | CPU Queen | FPU SinJulia | FPU Mandel | CPU AES | CPU ZLib | FP64 Ray-Trace | CPU PhotoWorxx
| Performance rating | |
| Lenovo Legion Pro 7 RTX4090 | |
| Razer Blade 16 Early 2023 | |
| Asus ROG Zephyrus M16 GU604VY-NM042X | |
| Alienware x16 R1 | |
| Alienware m17 R5 (R9 6900HX, RX 6850M XT) | |
| Dell G16 7620 | |
| Przeciętny Intel Core i9-13900HK | |
| AIDA64 / FP32 Ray-Trace | |
| Lenovo Legion Pro 7 RTX4090 | |
| Razer Blade 16 Early 2023 | |
| Razer Blade 16 Early 2023 | |
| Razer Blade 16 Early 2023 | |
| Asus ROG Zephyrus M16 GU604VY-NM042X | |
| Alienware x16 R1 | |
| Alienware m17 R5 (R9 6900HX, RX 6850M XT) | |
| Przeciętny Intel Core i9-13900HK (12351 - 18326, n=4) | |
| Dell G16 7620 | |
| AIDA64 / CPU Queen | |
| Lenovo Legion Pro 7 RTX4090 | |
| Razer Blade 16 Early 2023 | |
| Razer Blade 16 Early 2023 | |
| Asus ROG Zephyrus M16 GU604VY-NM042X | |
| Alienware x16 R1 | |
| Alienware m17 R5 (R9 6900HX, RX 6850M XT) | |
| Dell G16 7620 | |
| Przeciętny Intel Core i9-13900HK (75615 - 118166, n=4) | |
| AIDA64 / FPU SinJulia | |
| Razer Blade 16 Early 2023 | |
| Razer Blade 16 Early 2023 | |
| Razer Blade 16 Early 2023 | |
| Lenovo Legion Pro 7 RTX4090 | |
| Alienware m17 R5 (R9 6900HX, RX 6850M XT) | |
| Asus ROG Zephyrus M16 GU604VY-NM042X | |
| Alienware x16 R1 | |
| Dell G16 7620 | |
| Przeciętny Intel Core i9-13900HK (7427 - 11249, n=4) | |
| AIDA64 / FP64 Ray-Trace | |
| Lenovo Legion Pro 7 RTX4090 | |
| Razer Blade 16 Early 2023 | |
| Razer Blade 16 Early 2023 | |
| Razer Blade 16 Early 2023 | |
| Asus ROG Zephyrus M16 GU604VY-NM042X | |
| Alienware x16 R1 | |
| Alienware m17 R5 (R9 6900HX, RX 6850M XT) | |
| Przeciętny Intel Core i9-13900HK (6839 - 10018, n=4) | |
| Dell G16 7620 | |
| AIDA64 / CPU PhotoWorxx | |
| Razer Blade 16 Early 2023 | |
| Razer Blade 16 Early 2023 | |
| Razer Blade 16 Early 2023 | |
| Lenovo Legion Pro 7 RTX4090 | |
| Alienware x16 R1 | |
| Asus ROG Zephyrus M16 GU604VY-NM042X | |
| Dell G16 7620 | |
| Przeciętny Intel Core i9-13900HK (15421 - 49539, n=4) | |
| Alienware m17 R5 (R9 6900HX, RX 6850M XT) | |
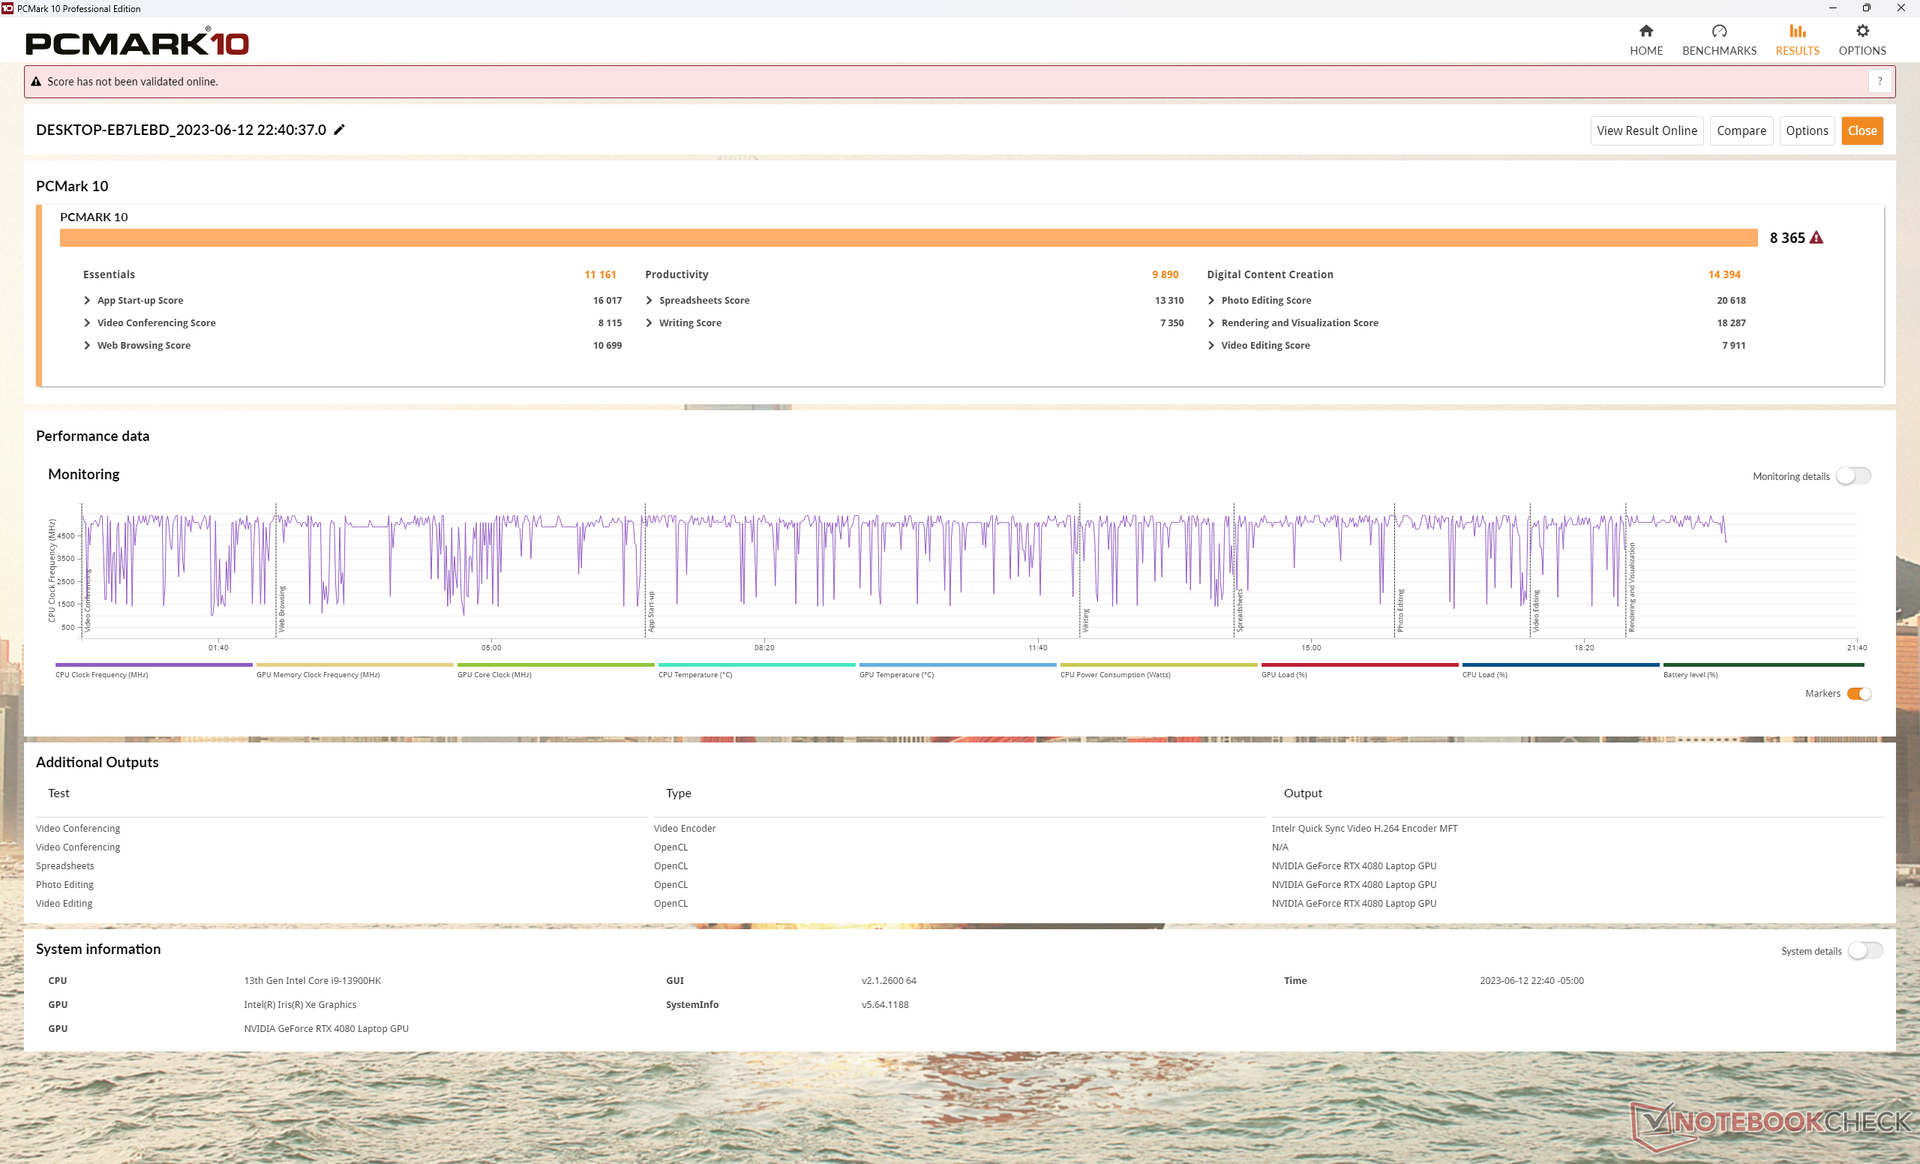
Wydajność systemu
CrossMark: Overall | Productivity | Creativity | Responsiveness
| PCMark 10 / Score | |
| Alienware x16 R1 | |
| Przeciętny Intel Core i9-13900HK, NVIDIA GeForce RTX 4080 Laptop GPU (n=1) | |
| Asus ROG Zephyrus M16 GU604VY-NM042X | |
| Lenovo Legion Pro 7 RTX4090 | |
| Razer Blade 16 Early 2023 | |
| Alienware m17 R5 (R9 6900HX, RX 6850M XT) | |
| Dell G16 7620 | |
| PCMark 10 / Essentials | |
| Asus ROG Zephyrus M16 GU604VY-NM042X | |
| Alienware x16 R1 | |
| Przeciętny Intel Core i9-13900HK, NVIDIA GeForce RTX 4080 Laptop GPU (n=1) | |
| Lenovo Legion Pro 7 RTX4090 | |
| Razer Blade 16 Early 2023 | |
| Dell G16 7620 | |
| Alienware m17 R5 (R9 6900HX, RX 6850M XT) | |
| PCMark 10 / Productivity | |
| Asus ROG Zephyrus M16 GU604VY-NM042X | |
| Alienware x16 R1 | |
| Przeciętny Intel Core i9-13900HK, NVIDIA GeForce RTX 4080 Laptop GPU (n=1) | |
| Alienware m17 R5 (R9 6900HX, RX 6850M XT) | |
| Lenovo Legion Pro 7 RTX4090 | |
| Dell G16 7620 | |
| Razer Blade 16 Early 2023 | |
| PCMark 10 / Digital Content Creation | |
| Lenovo Legion Pro 7 RTX4090 | |
| Razer Blade 16 Early 2023 | |
| Alienware x16 R1 | |
| Przeciętny Intel Core i9-13900HK, NVIDIA GeForce RTX 4080 Laptop GPU (n=1) | |
| Asus ROG Zephyrus M16 GU604VY-NM042X | |
| Alienware m17 R5 (R9 6900HX, RX 6850M XT) | |
| Dell G16 7620 | |
| CrossMark / Overall | |
| Asus ROG Zephyrus M16 GU604VY-NM042X | |
| Alienware x16 R1 | |
| Przeciętny Intel Core i9-13900HK, NVIDIA GeForce RTX 4080 Laptop GPU (n=1) | |
| Dell G16 7620 | |
| Alienware m17 R5 (R9 6900HX, RX 6850M XT) | |
| Razer Blade 16 Early 2023 | |
| CrossMark / Productivity | |
| Asus ROG Zephyrus M16 GU604VY-NM042X | |
| Alienware x16 R1 | |
| Przeciętny Intel Core i9-13900HK, NVIDIA GeForce RTX 4080 Laptop GPU (n=1) | |
| Dell G16 7620 | |
| Alienware m17 R5 (R9 6900HX, RX 6850M XT) | |
| Razer Blade 16 Early 2023 | |
| CrossMark / Creativity | |
| Asus ROG Zephyrus M16 GU604VY-NM042X | |
| Alienware x16 R1 | |
| Przeciętny Intel Core i9-13900HK, NVIDIA GeForce RTX 4080 Laptop GPU (n=1) | |
| Dell G16 7620 | |
| Razer Blade 16 Early 2023 | |
| Alienware m17 R5 (R9 6900HX, RX 6850M XT) | |
| CrossMark / Responsiveness | |
| Alienware x16 R1 | |
| Przeciętny Intel Core i9-13900HK, NVIDIA GeForce RTX 4080 Laptop GPU (n=1) | |
| Asus ROG Zephyrus M16 GU604VY-NM042X | |
| Dell G16 7620 | |
| Razer Blade 16 Early 2023 | |
| Alienware m17 R5 (R9 6900HX, RX 6850M XT) | |
| PCMark 10 Score | 8365 pkt. | |
Pomoc | ||
| AIDA64 / Memory Write | |
| Alienware x16 R1 | |
| Razer Blade 16 Early 2023 | |
| Razer Blade 16 Early 2023 | |
| Razer Blade 16 Early 2023 | |
| Lenovo Legion Pro 7 RTX4090 | |
| Asus ROG Zephyrus M16 GU604VY-NM042X | |
| Przeciętny Intel Core i9-13900HK (47347 - 85917, n=4) | |
| Dell G16 7620 | |
| Alienware m17 R5 (R9 6900HX, RX 6850M XT) | |
| AIDA64 / Memory Latency | |
| Alienware x16 R1 | |
| Dell G16 7620 | |
| Razer Blade 16 Early 2023 | |
| Razer Blade 16 Early 2023 | |
| Razer Blade 16 Early 2023 | |
| Przeciętny Intel Core i9-13900HK (83 - 115.3, n=4) | |
| Alienware m17 R5 (R9 6900HX, RX 6850M XT) | |
| Asus ROG Zephyrus M16 GU604VY-NM042X | |
| Lenovo Legion Pro 7 RTX4090 | |
* ... im mniej tym lepiej
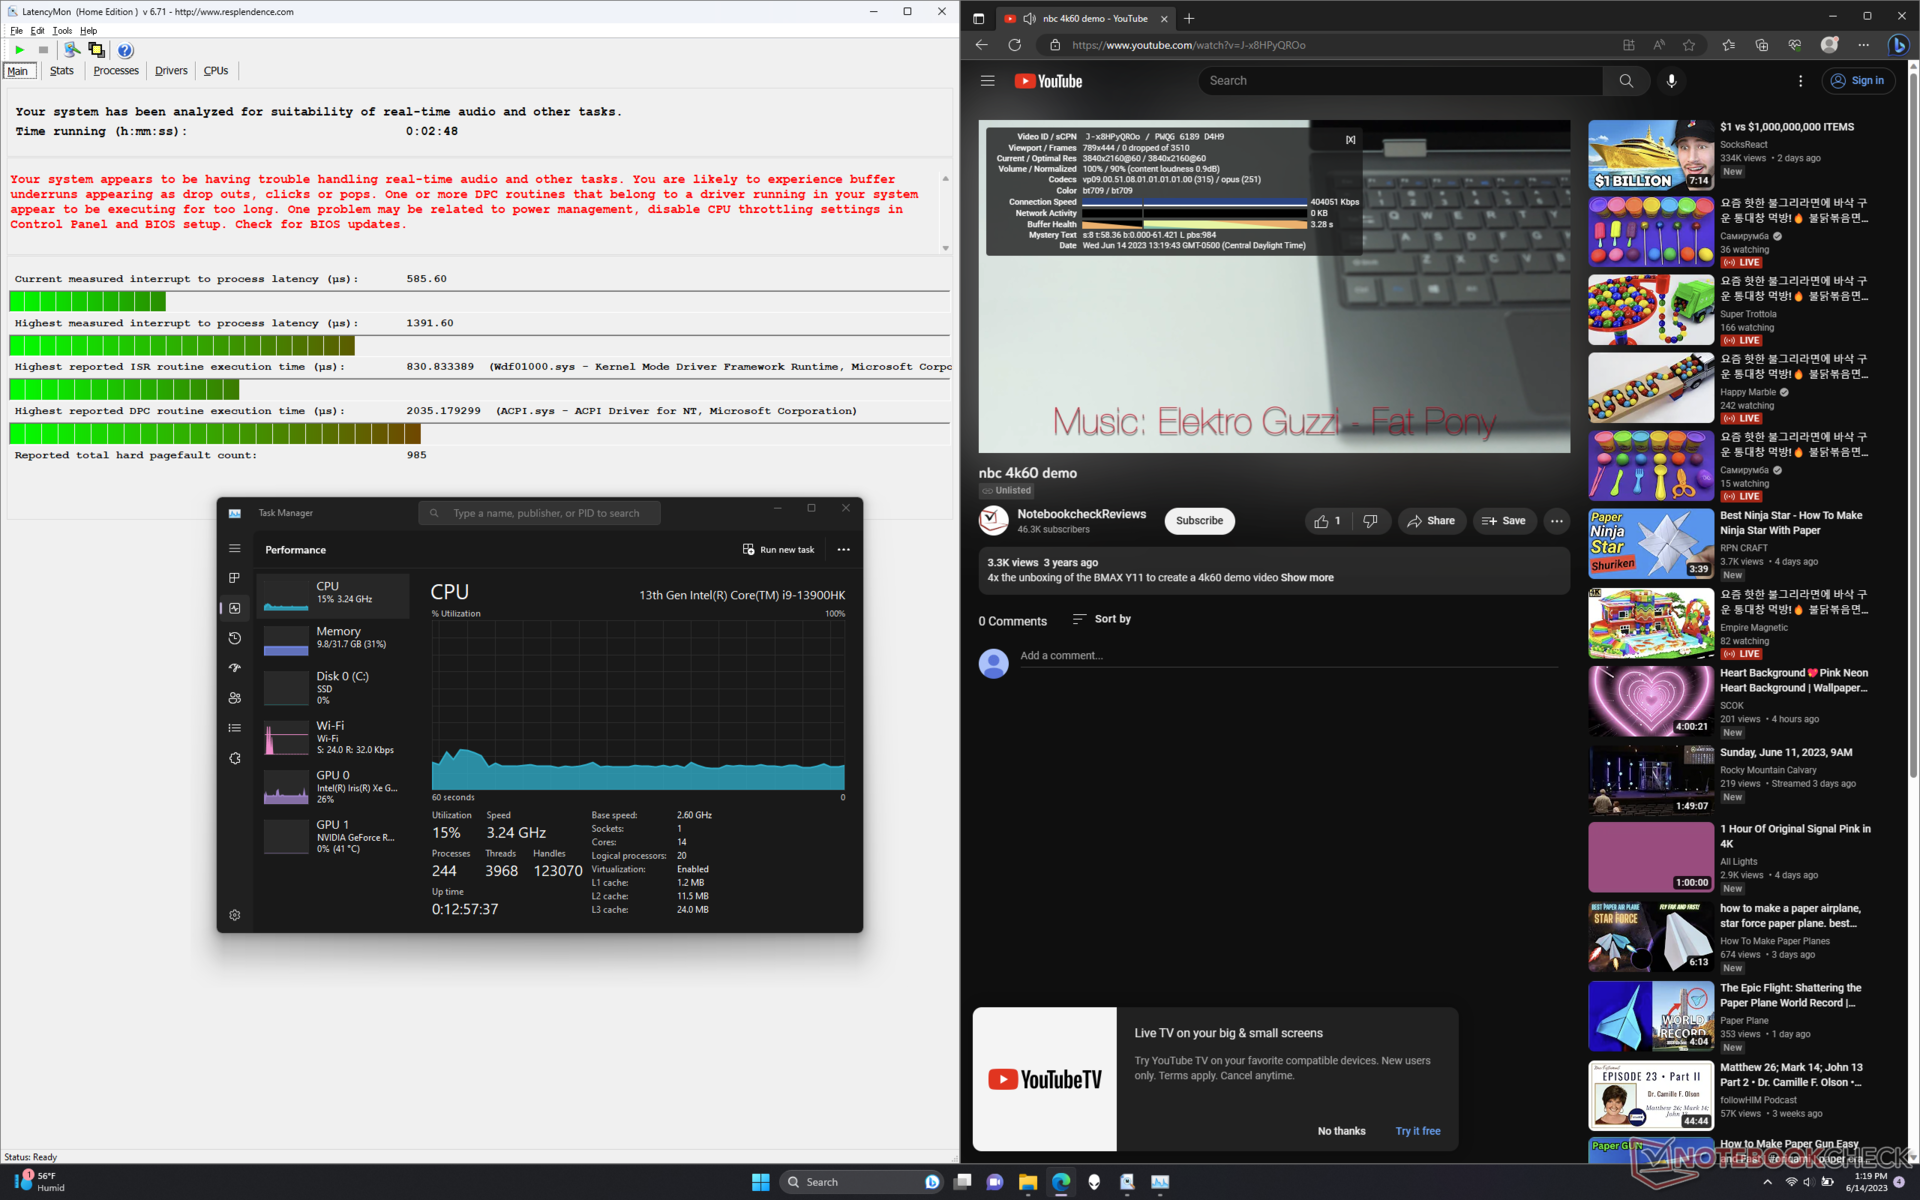
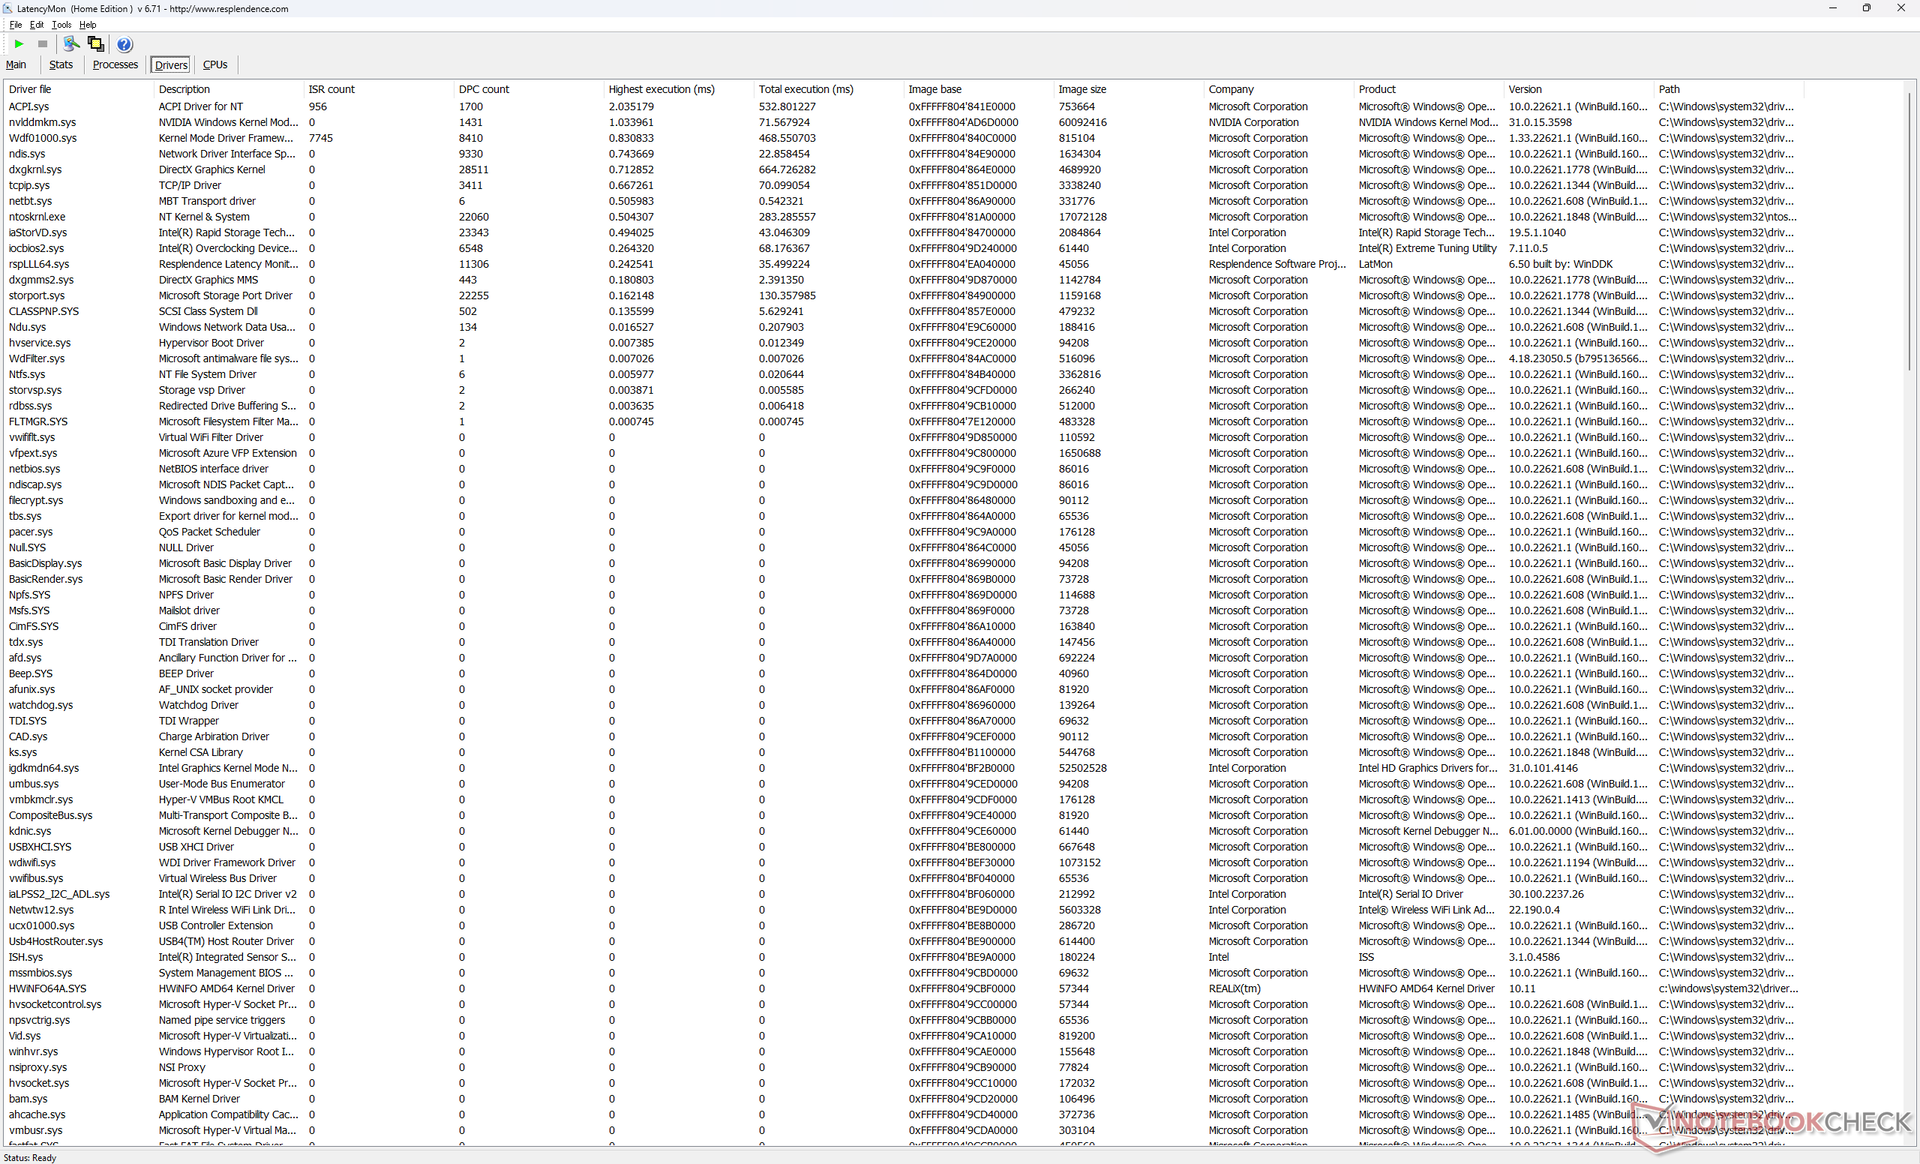
Opóźnienie DPC
LatencyMon ujawnia problemy z DPC podczas otwierania wielu kart przeglądarki na naszej stronie głównej. odtwarzanie wideo 4K przy 60 FPS jest poza tym idealne, bez żadnych spadków klatek.
| DPC Latencies / LatencyMon - interrupt to process latency (max), Web, Youtube, Prime95 | |
| Lenovo Legion Pro 7 RTX4090 | |
| Asus ROG Zephyrus M16 GU604VY-NM042X | |
| Razer Blade 16 Early 2023 | |
| Alienware x16 R1 | |
| Alienware m17 R5 (R9 6900HX, RX 6850M XT) | |
| Dell G16 7620 | |
* ... im mniej tym lepiej
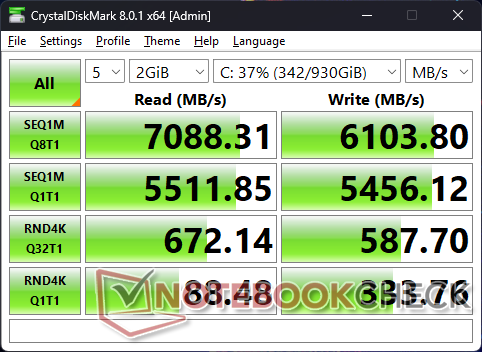
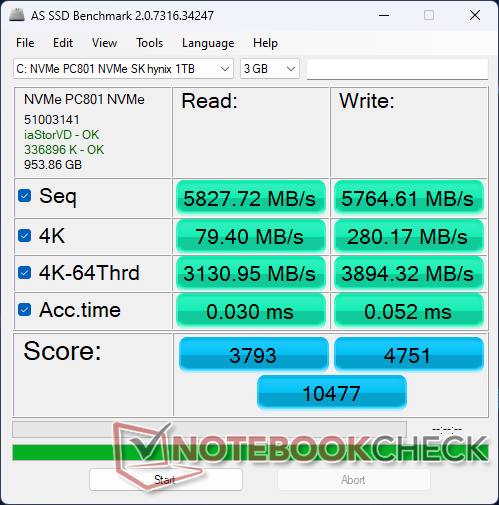
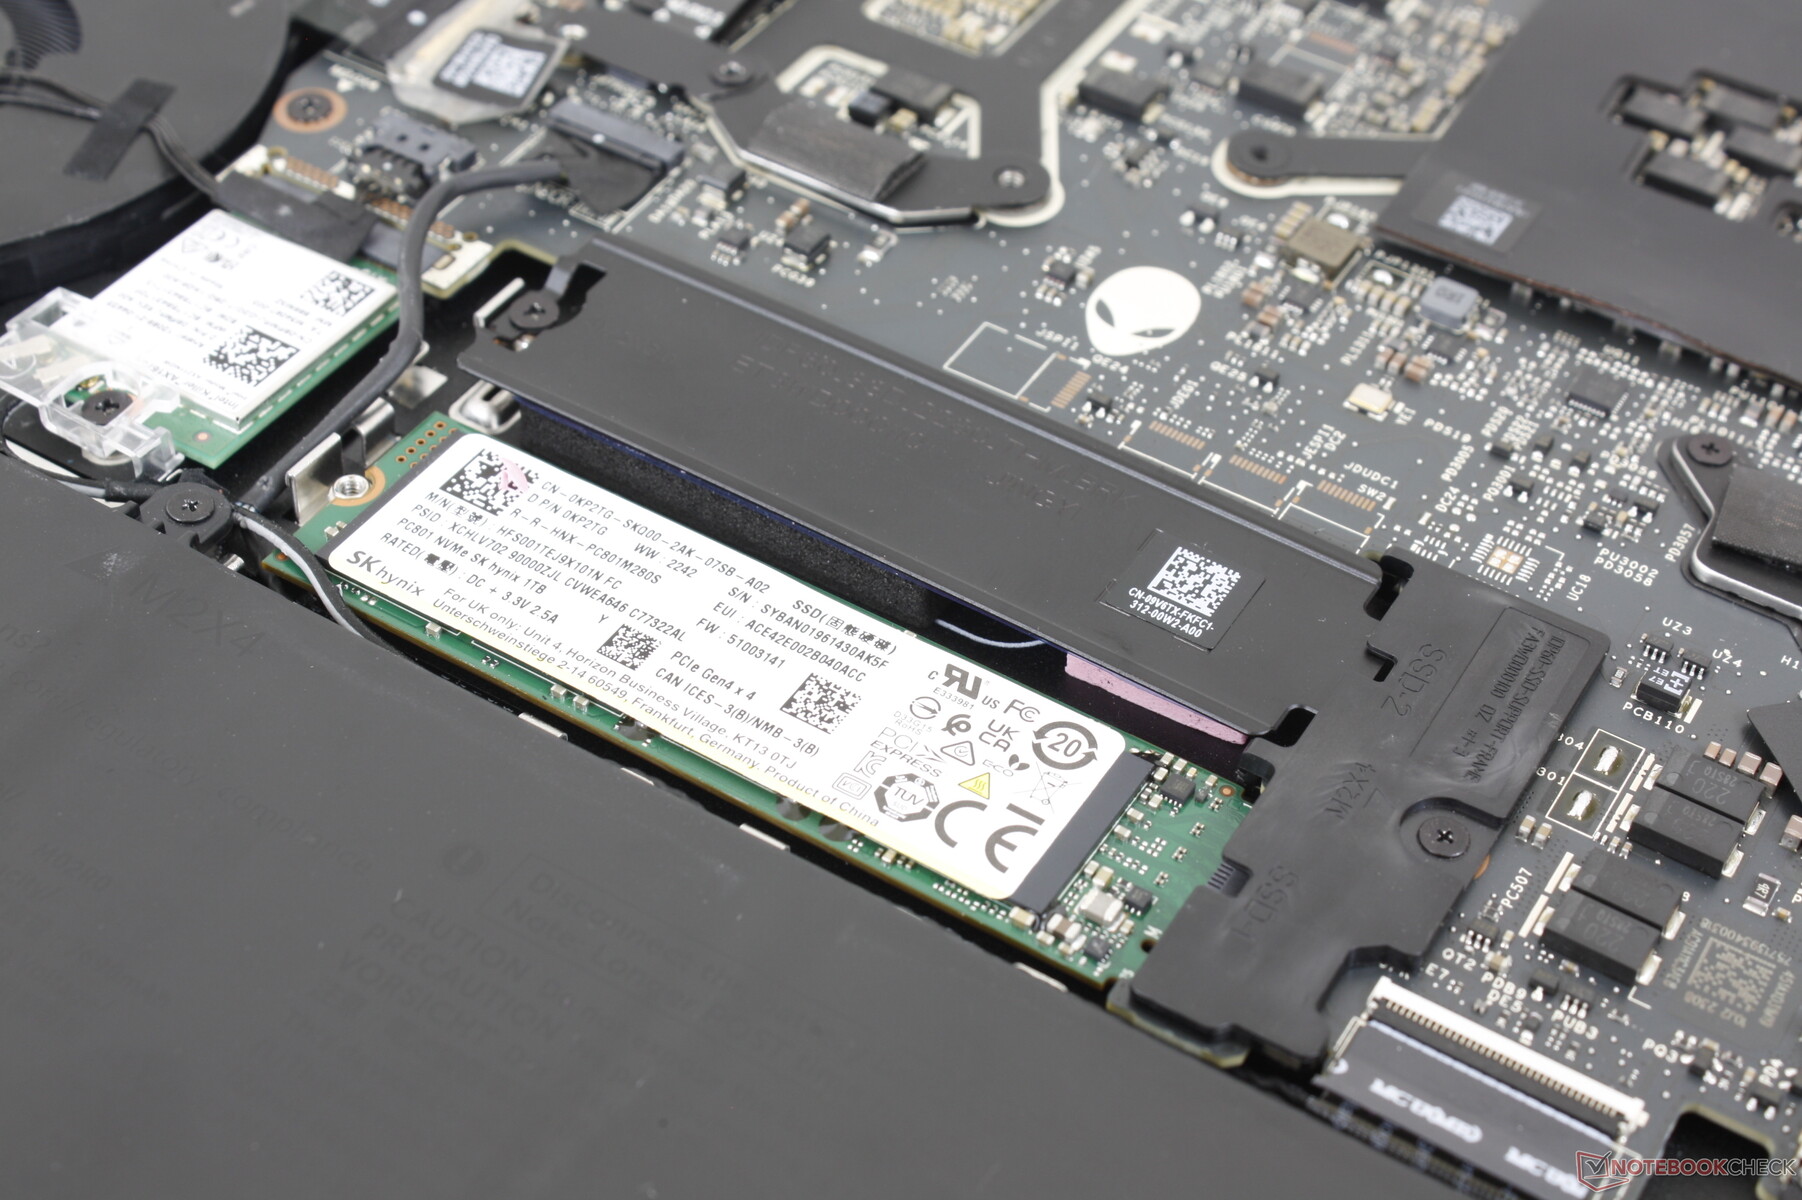
Urządzenia pamięci masowej
PCIe4 x4 SK Hynix PC801 w naszym urządzeniu może osiągnąć prędkość odczytu do 7100 MB/s, co jest porównywalne z popularnym dyskiem Samsung PM9A1. Niestety, dysk ma problemy z utrzymaniem maksymalnej prędkości transferu przez dłuższy czas, prawdopodobnie z powodu niewystarczającego chłodzenia. Przykładowo, po uruchomieniu programu DiskSpd w pętli, prędkość odczytu spadła do 3400 MB/s po zaledwie kilku minutach testu obciążeniowego, jak pokazano na poniższym wykresie. Wyniki nie uległy poprawie po powtórzeniu testu.

| Drive Performance rating - Percent | |
| Alienware x16 R1 | |
| Lenovo Legion Pro 7 RTX4090 | |
| Dell G16 7620 | |
| Asus ROG Zephyrus M16 GU604VY-NM042X | |
| Razer Blade 16 Early 2023 | |
| Alienware m17 R5 (R9 6900HX, RX 6850M XT) | |
* ... im mniej tym lepiej
Disk Throttling: DiskSpd Read Loop, Queue Depth 8
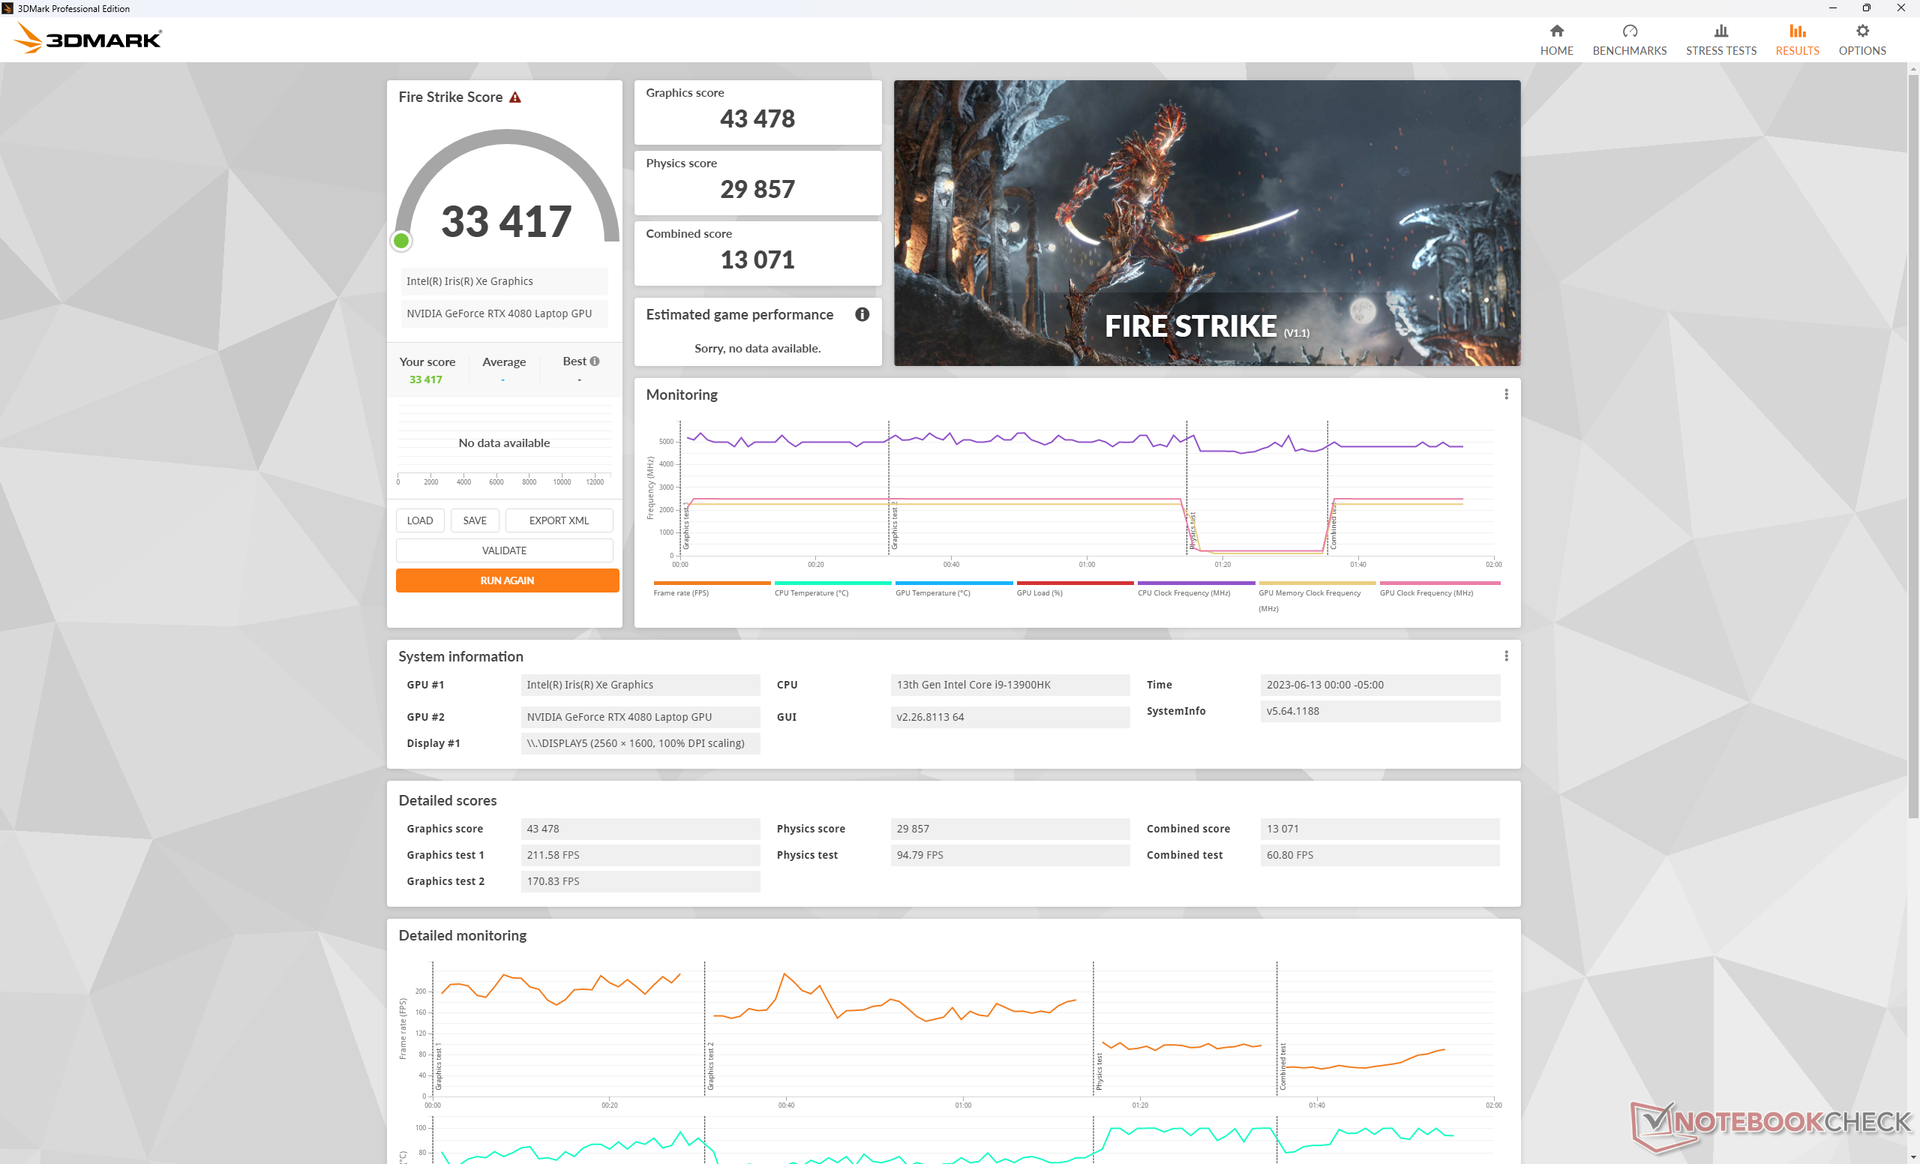
Wydajność GPU - 175 W GeForce RTX 4080
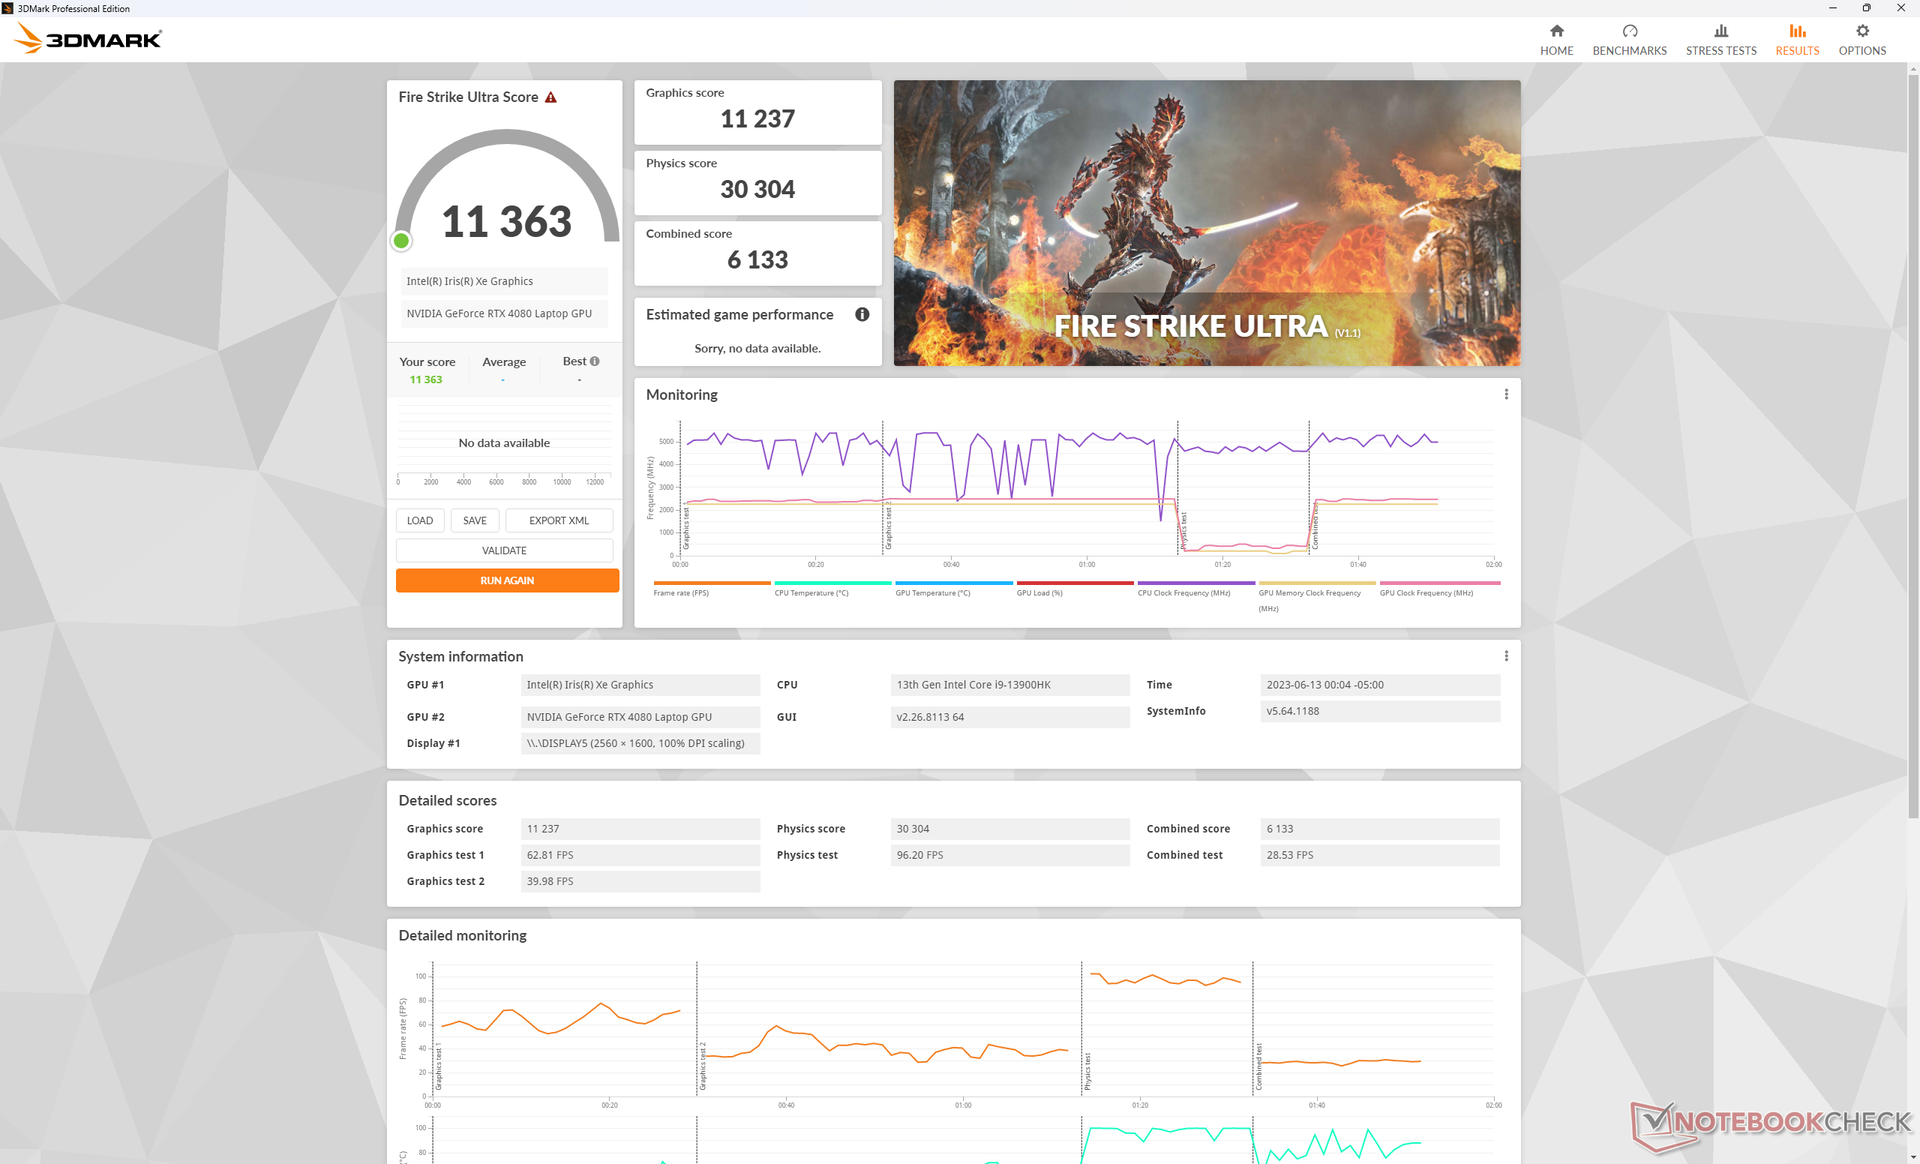
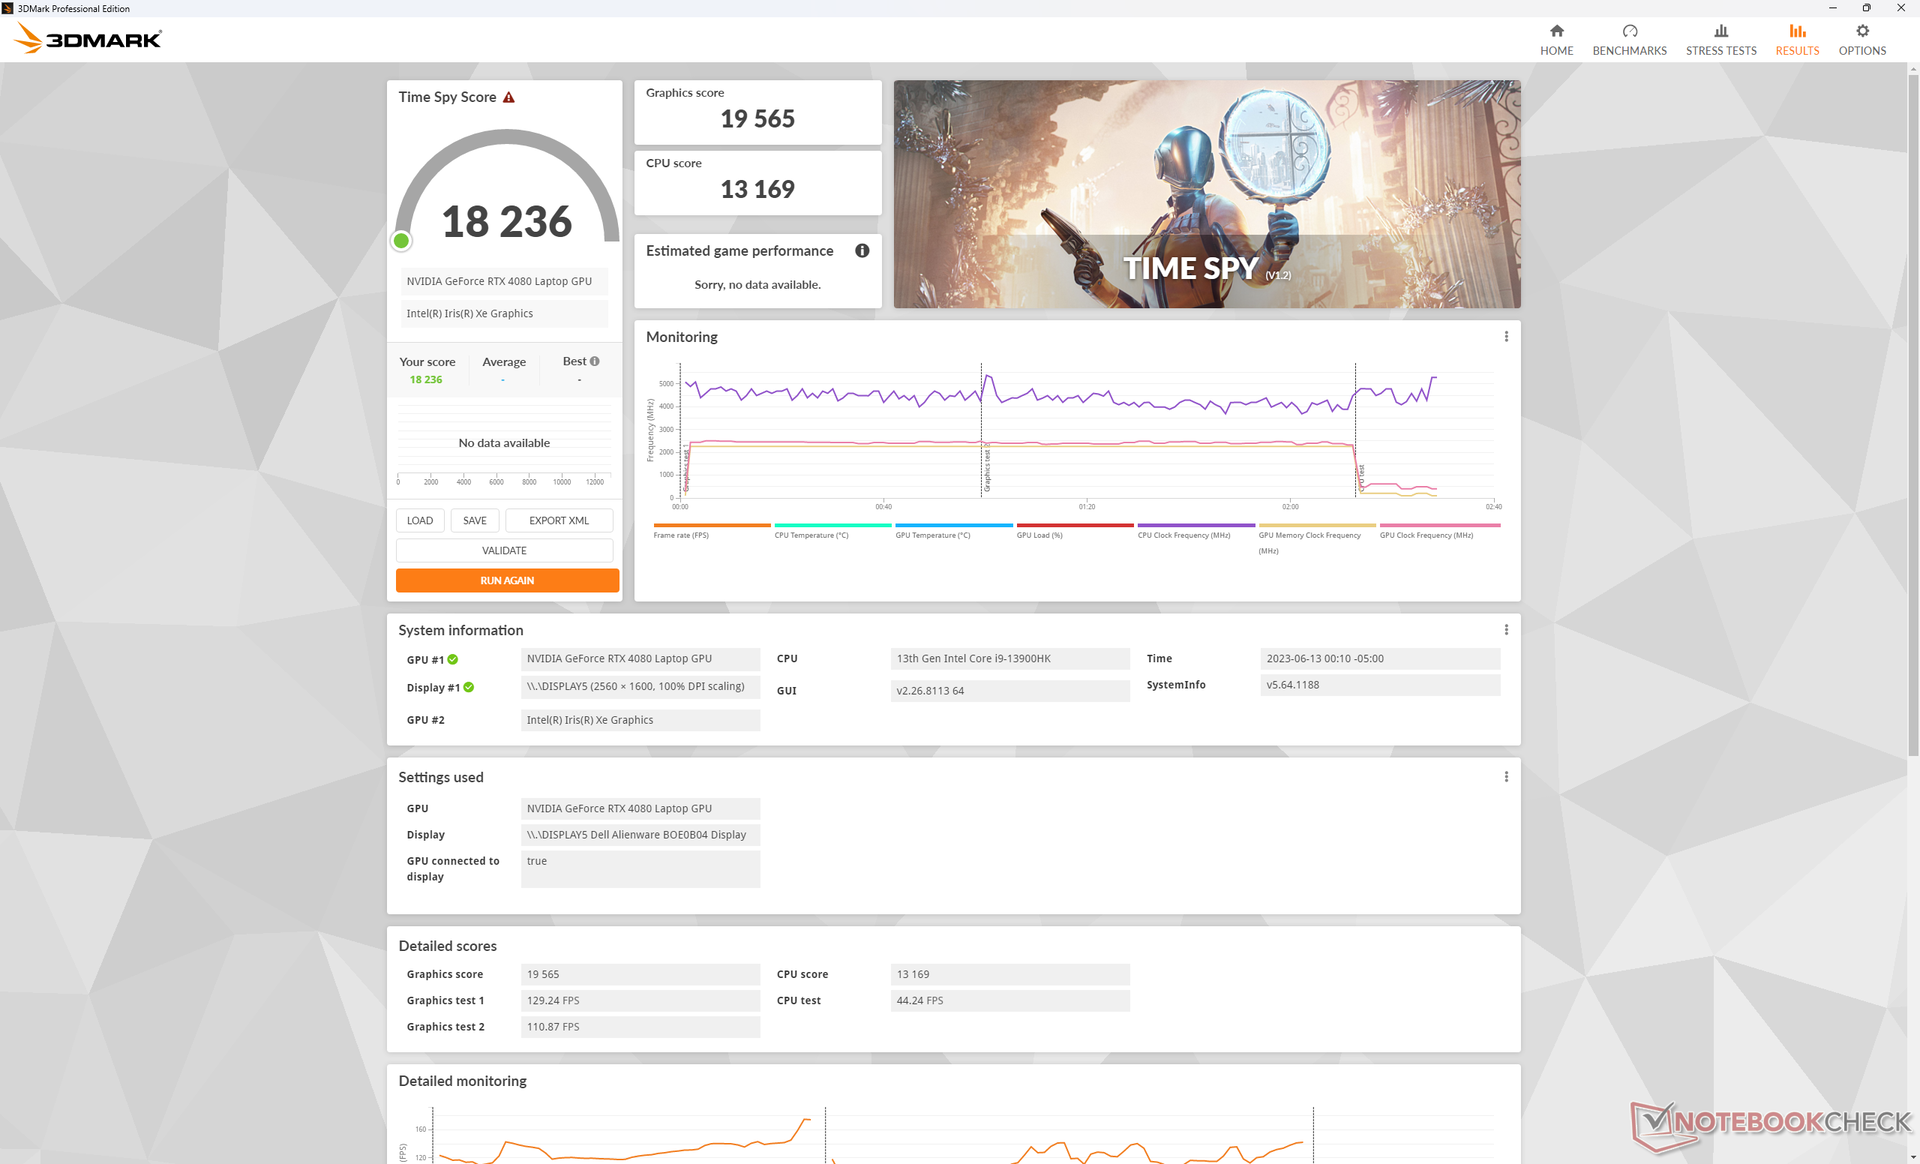
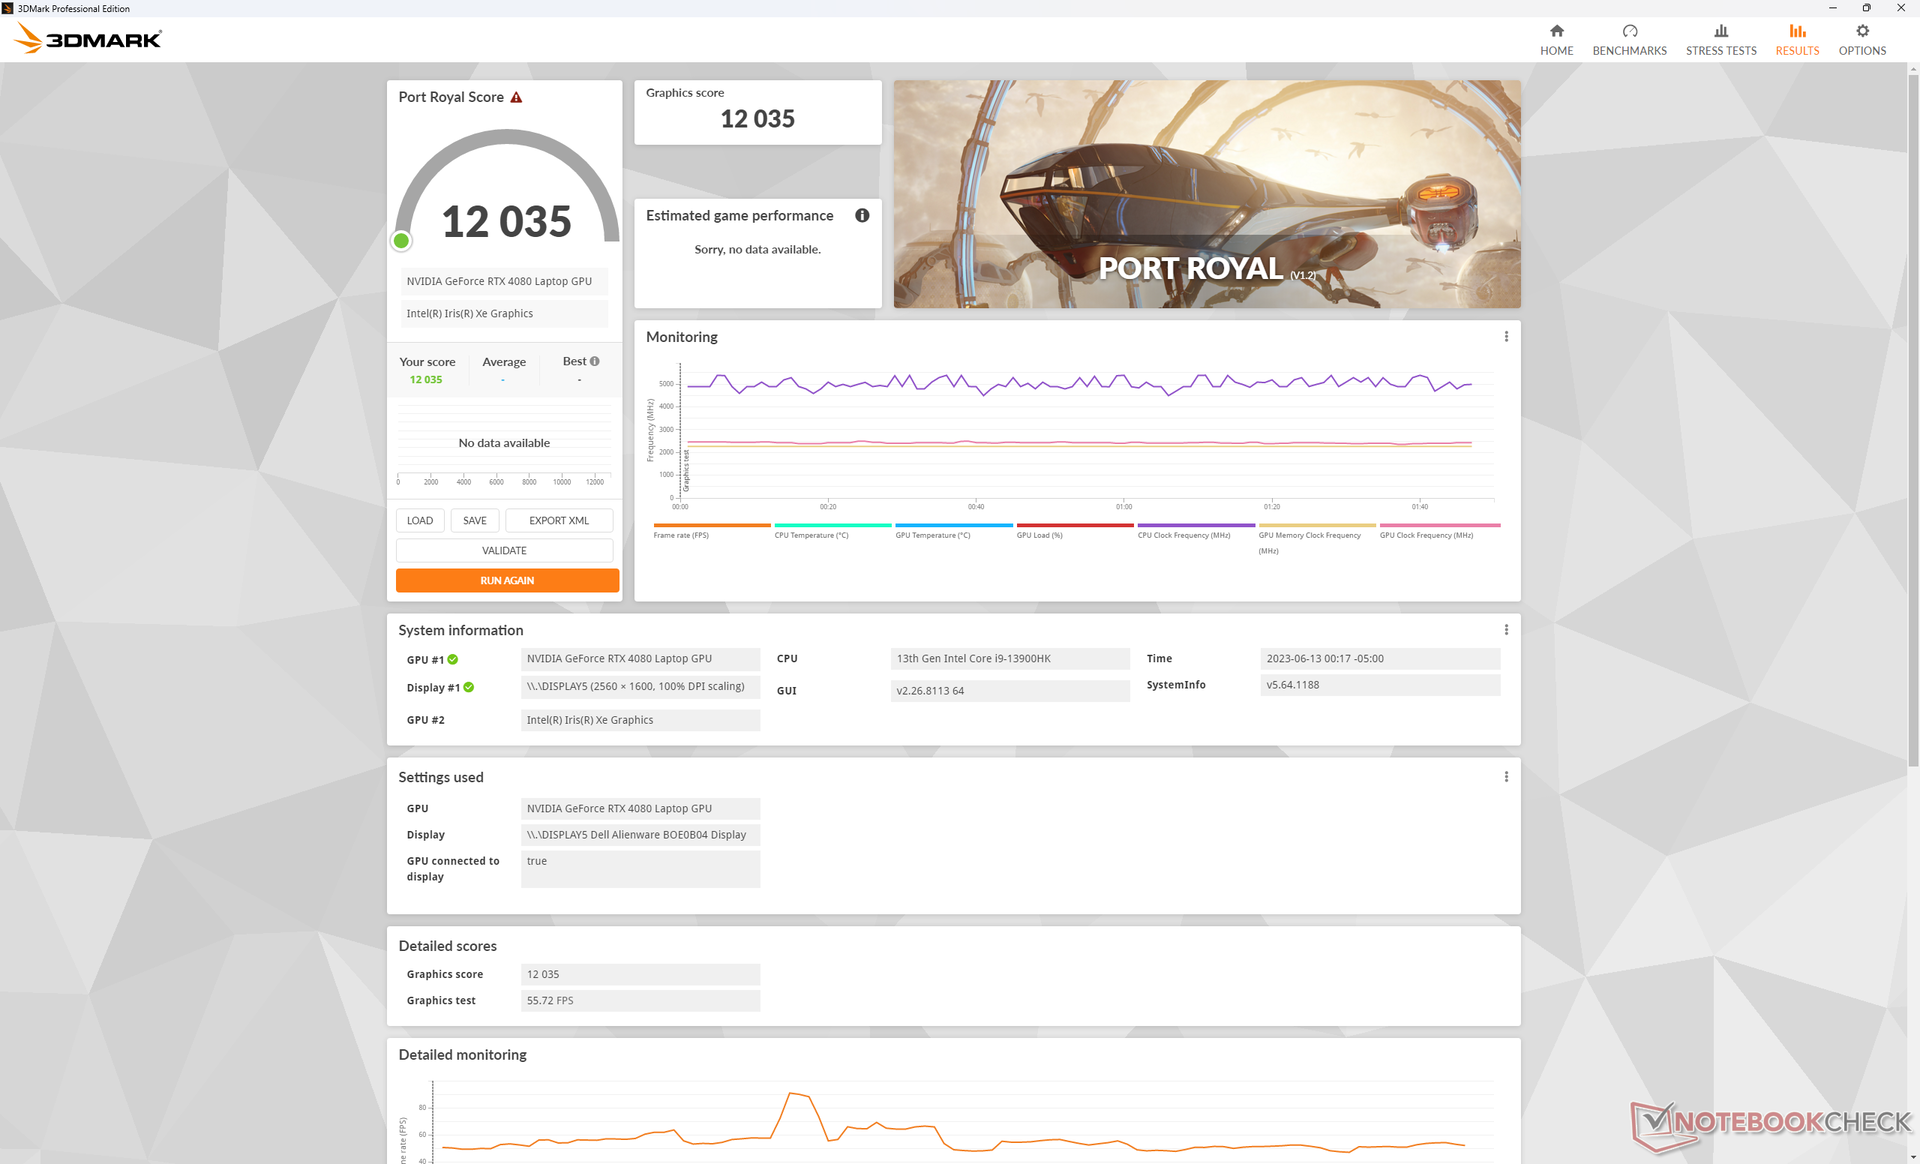
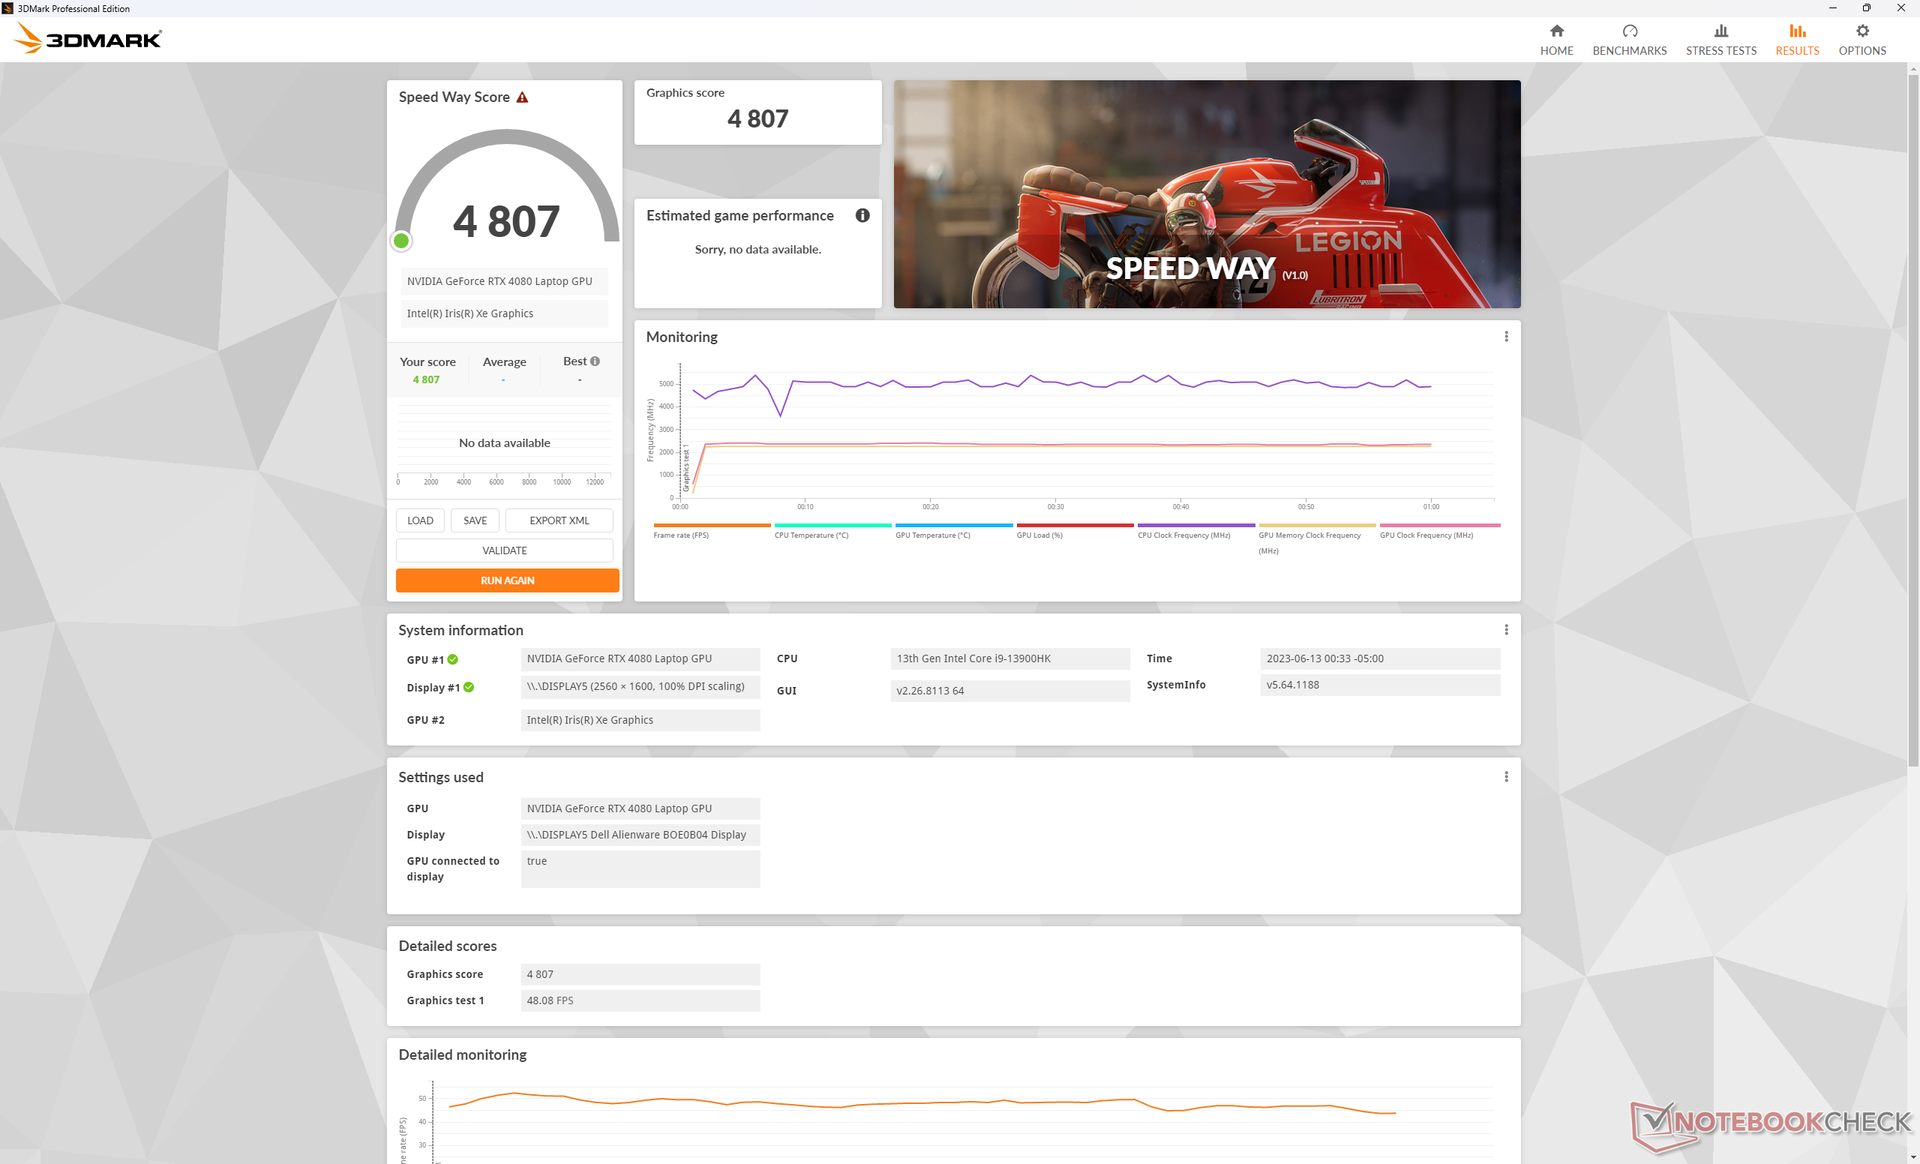
Karta graficzna GeForce RTX 4080 w naszym Alienware x16 jest o około 5 do 10 procent szybszy niż przeciętny laptop w naszej bazie danych wyposażony w ten sam procesor graficzny RTX 4080. Przewaga może nie wydawać się duża, ale wystarczy, aby system stał się jednym z najszybszych laptopów do gier z RTX 4080, jakie można kupić. wyniki 3DMark mieszczą się zaledwie w 10 procentach wyników RTX 4090 w laptopieasus Zephyrus Duo 16na przykład.
Co ciekawe, wyniki 3DMark spadły tylko o kilka punktów procentowych podczas pracy w cichszych trybach Performance i Balanced zamiast w najwyższym trybie Overdrive, jak pokazuje poniższa tabela. Należy o tym pamiętać w poniższych sekcjach dotyczących testów obciążeniowych i hałasu systemowego.
Obniżenie wydajności do RTX 4070 może wpłynąć na wydajność nawet o 30 do 35 procent, podczas gdy aktualizacja do RTX 4090 powinna zwiększyć wydajność o około 10 procent.
| Ustawienie profilu zasilania | Fire Strike Wynik fizyki | Fire Strike Wynik GPU | Fire Strike Łączny wynik |
| Overdrive | 29857 | 43478 | 13071 |
| Wydajność | 27890 (-7%) | 43605 (-0%) | 12961 (-1%) |
| Zrównoważony | 28704 (-4%) | 41909 (-4%) | 12476 (-5%) |
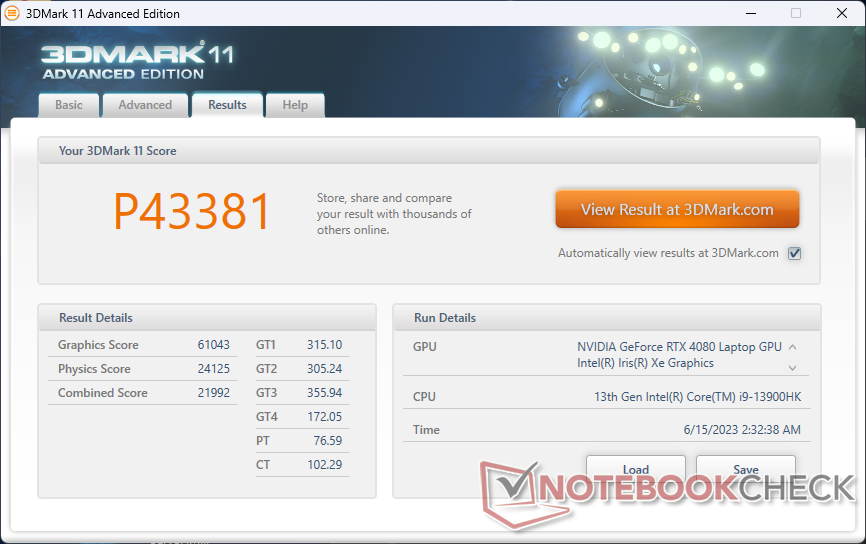
| 3DMark 11 Performance | 43381 pkt. | |
| 3DMark Fire Strike Score | 33417 pkt. | |
| 3DMark Time Spy Score | 18236 pkt. | |
Pomoc | ||
* ... im mniej tym lepiej
Wydajność w grach
Wszystkie gry działają w natywnej rozdzielczości QHD+ ze stabilną liczbą klatek na sekundę na poziomie 60 FPS lub wyższym. Nawet rozgrywka w rozdzielczości 4K jest możliwa na zewnętrznym monitorze z większością ustawień na wysokim lub maksymalnym poziomie, w tym Returnal i F122. Aby jednak uzyskać trzycyfrową liczbę klatek na sekundę, warto włączyć DLSS 2 lub DLSS 3, jeśli są dostępne, aby lepiej wykorzystać wysoką częstotliwość odświeżania monitora.
Witcher 3 FPS Chart
| low | med. | high | ultra | QHD | 4K | |
|---|---|---|---|---|---|---|
| GTA V (2015) | 185.8 | 180.4 | 176.4 | 120.3 | 115.4 | 142.9 |
| The Witcher 3 (2015) | 425.6 | 352.7 | 306.5 | 160.2 | 115 | |
| Dota 2 Reborn (2015) | 178.8 | 164 | 159.7 | 146.8 | 129.4 | |
| Final Fantasy XV Benchmark (2018) | 211 | 195.5 | 164.2 | 132.4 | 76.2 | |
| X-Plane 11.11 (2018) | 145.3 | 134.5 | 104.2 | 90.5 | ||
| Strange Brigade (2018) | 469 | 373 | 350 | 325 | 237 | 120.5 |
| Shadow of the Tomb Raider (2018) | 165 | 143 | 84 | |||
| Far Cry 6 (2021) | 121 | 112 | 73 | |||
| Cyberpunk 2077 1.6 (2022) | 158 | 150.9 | 141.2 | 133.6 | 84.4 | 38.5 |
| Tiny Tina's Wonderlands (2022) | 256.6 | 217.3 | 183.3 | 156.4 | 111.1 | 58.6 |
| F1 22 (2022) | 265 | 259 | 244 | 110 | 79 | 39 |
| Call of Duty Modern Warfare 2 2022 (2022) | 139 | 110 | 67 | |||
| Returnal (2023) | 116 | 117 | 114 | 109 | 79 | 43 |
Emisje
Hałas systemowy - wiele opcji profili zasilania
Hałas wentylatorów jest bezpośrednio powiązany z ustawieniami profilu zasilania ACC. Jeśli nie grasz, zaleca się ustawienie ACC na tryb zrównoważony lub cichy, ponieważ wentylatory mają tendencję do pulsowania znacznie częściej, gdy są w trybie Performance lub Overdrive.
Praca Witcher 3 w trybie Performance i Overdrive skutkowałoby hałasem wentylatora na poziomie odpowiednio 50 dB(A) i 55 dB(A). Ponieważ utrata liczby klatek na sekundę jest minimalna między trybami Wydajność i Overdrive, jak wspomniano w naszej sekcji Wydajność GPU powyżej, możesz mieć zauważalnie cichsze wrażenia z gry po ustawieniu trybu Wydajność. Hałas wentylatora byłby jeszcze cichszy w trybie zrównoważonym bez znaczącego wpływu na liczbę klatek na sekundę. 50+ dB(A) jest oczywiście nadal bardzo głośne, ale jest to powszechny zakres w konkurencyjnych modelach, takich jak Lenovo Legion Pro 7 lub Razer Blade 16.
Hałas
| luz |
| 23.1 / 25.8 / 25.8 dB |
| obciążenie |
| 39.3 / 54.8 dB |
 | ||
30 dB cichy 40 dB(A) słyszalny 50 dB(A) irytujący |
||
min: | ||
| Alienware x16 R1 GeForce RTX 4080 Laptop GPU, i9-13900HK, SK hynix PC801 HFS001TEJ9X101N | Lenovo Legion Pro 7 RTX4090 GeForce RTX 4090 Laptop GPU, i9-13900HX, Samsung PM9A1 MZVL21T0HCLR | Asus ROG Zephyrus M16 GU604VY-NM042X GeForce RTX 4090 Laptop GPU, i9-13900H, Samsung PM9A1 MZVL22T0HBLB | Razer Blade 16 Early 2023 GeForce RTX 4080 Laptop GPU, i9-13950HX, SSSTC CA6-8D1024 | Dell G16 7620 GeForce RTX 3060 Laptop GPU, i7-12700H, WDC PC SN810 512GB | Alienware m17 R5 (R9 6900HX, RX 6850M XT) Radeon RX 6850M XT, R9 6900HX, SSSTC CA6-8D1024 | |
|---|---|---|---|---|---|---|
| Noise | -17% | -10% | 3% | -2% | 2% | |
| wyłączone / środowisko * (dB) | 22.7 | 25 -10% | 24 -6% | 23 -1% | 23.2 -2% | 23 -1% |
| Idle Minimum * (dB) | 23.1 | 28 -21% | 24 -4% | 23 -0% | 28.3 -23% | 23 -0% |
| Idle Average * (dB) | 25.8 | 30 -16% | 29.96 -16% | 23 11% | 28.8 -12% | 28.11 -9% |
| Idle Maximum * (dB) | 25.8 | 38 -47% | 34.27 -33% | 23.6 9% | 28.9 -12% | 28.11 -9% |
| Load Average * (dB) | 39.3 | 48 -22% | 35.89 9% | 39 1% | 32.4 18% | 30.62 22% |
| Witcher 3 ultra * (dB) | 49.9 | 53 -6% | 57.5 -15% | 51.6 -3% | 48.3 3% | 49.75 -0% |
| Load Maximum * (dB) | 54.8 | 55 -0% | 57.54 -5% | 51.3 6% | 48.1 12% | 50.17 8% |
* ... im mniej tym lepiej
Temperatura
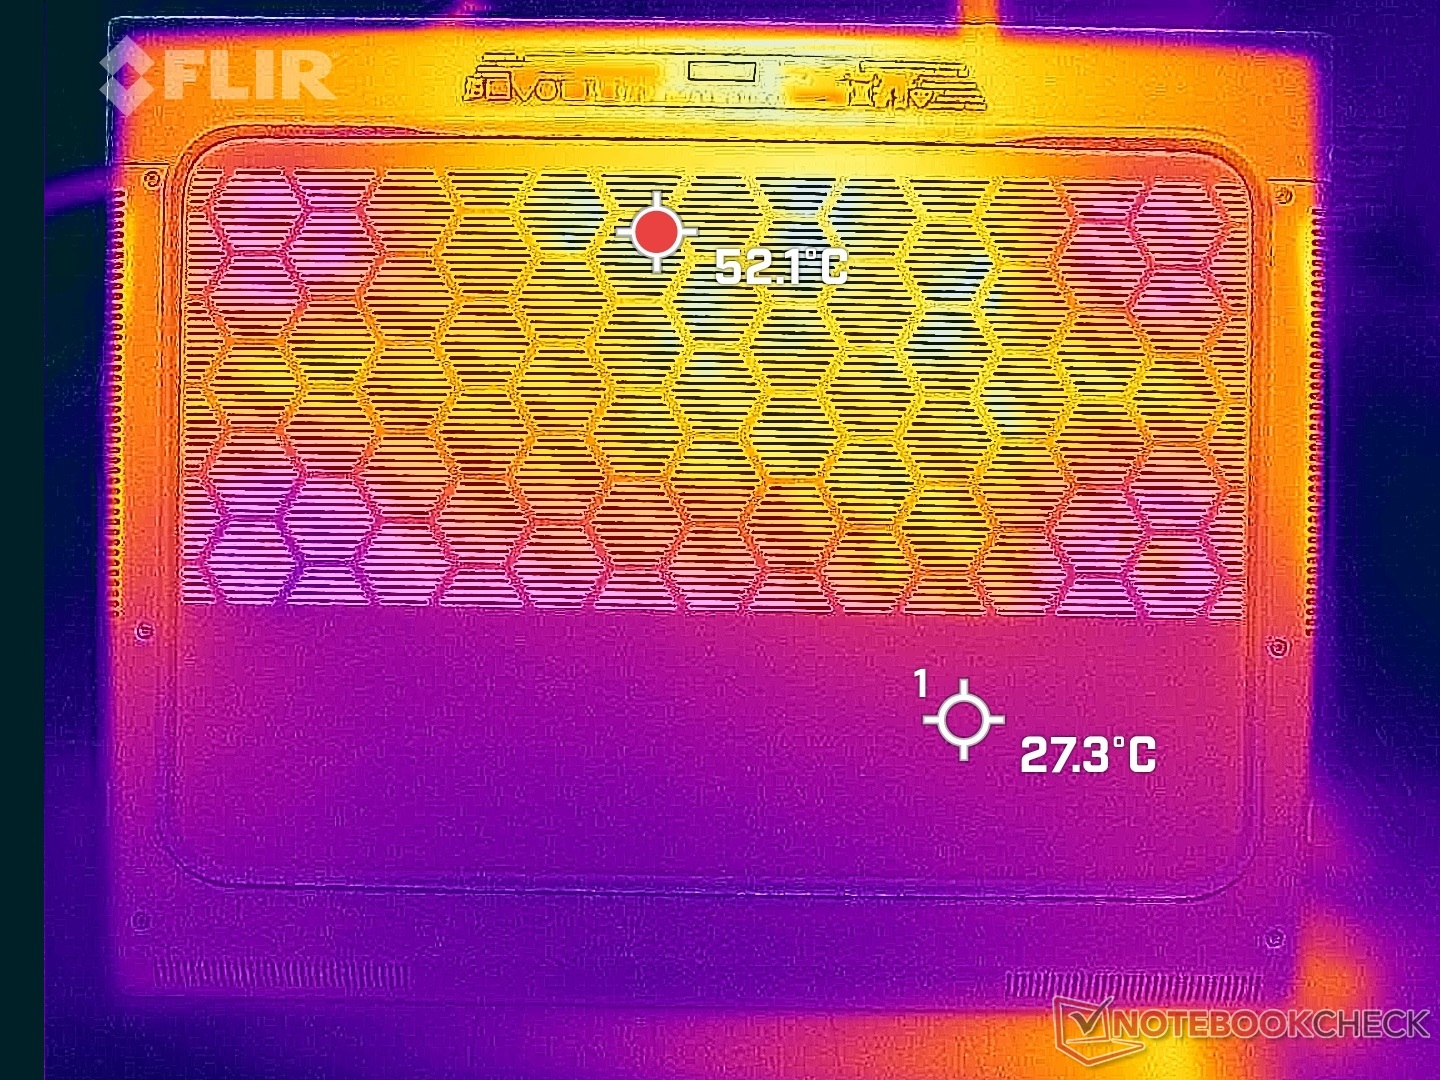
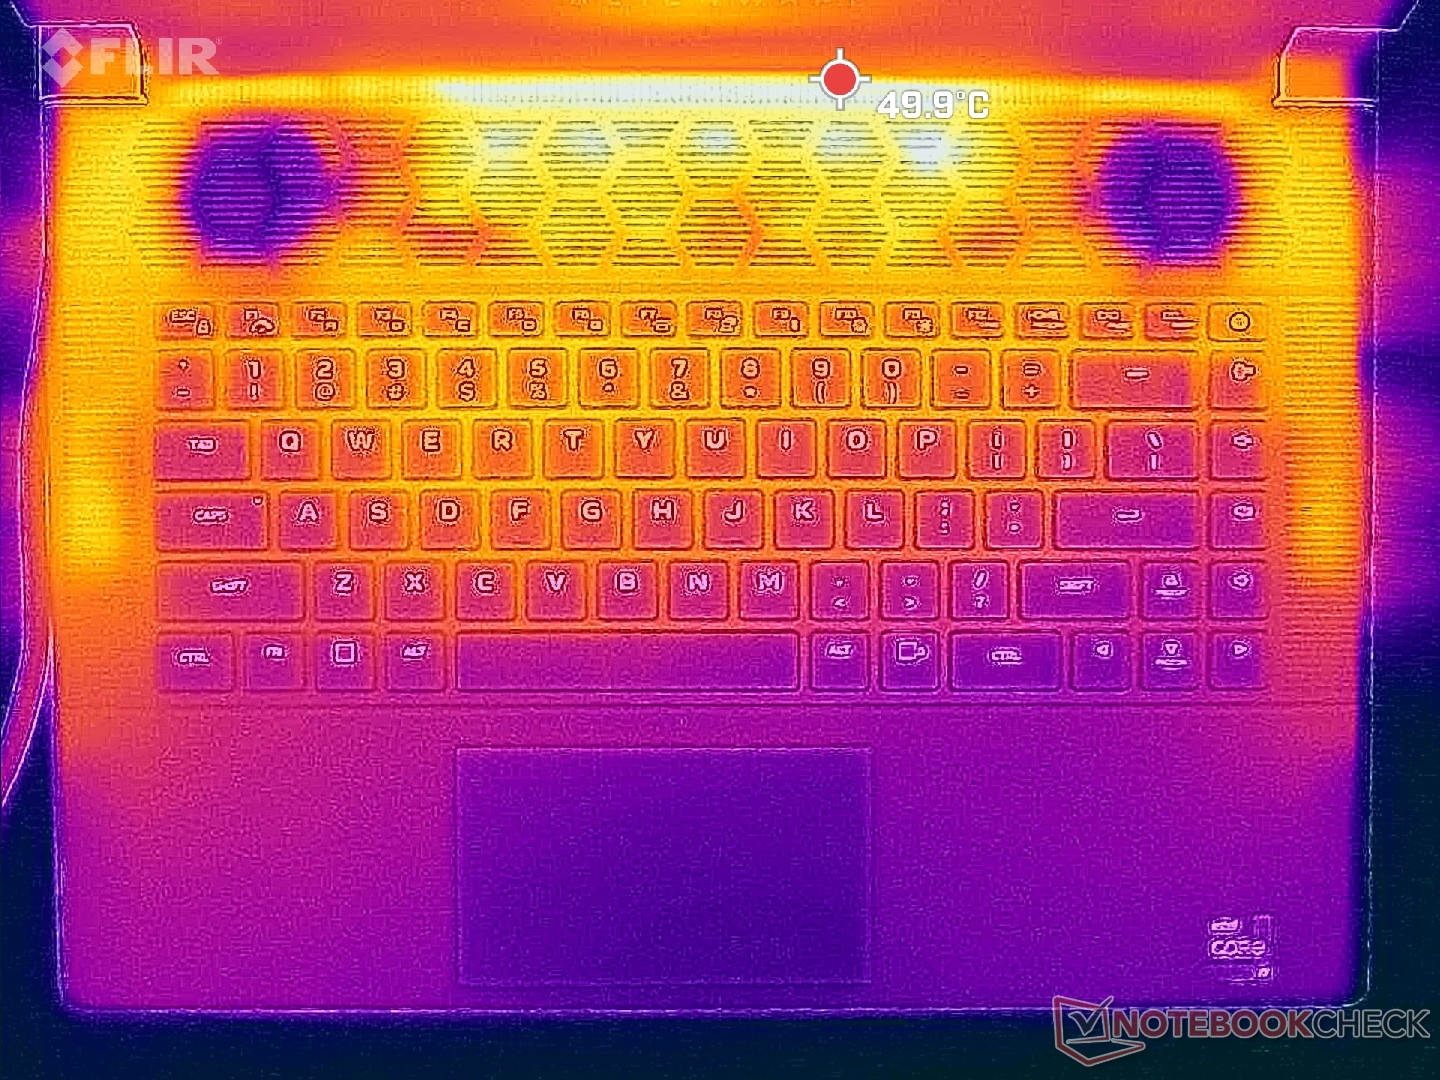
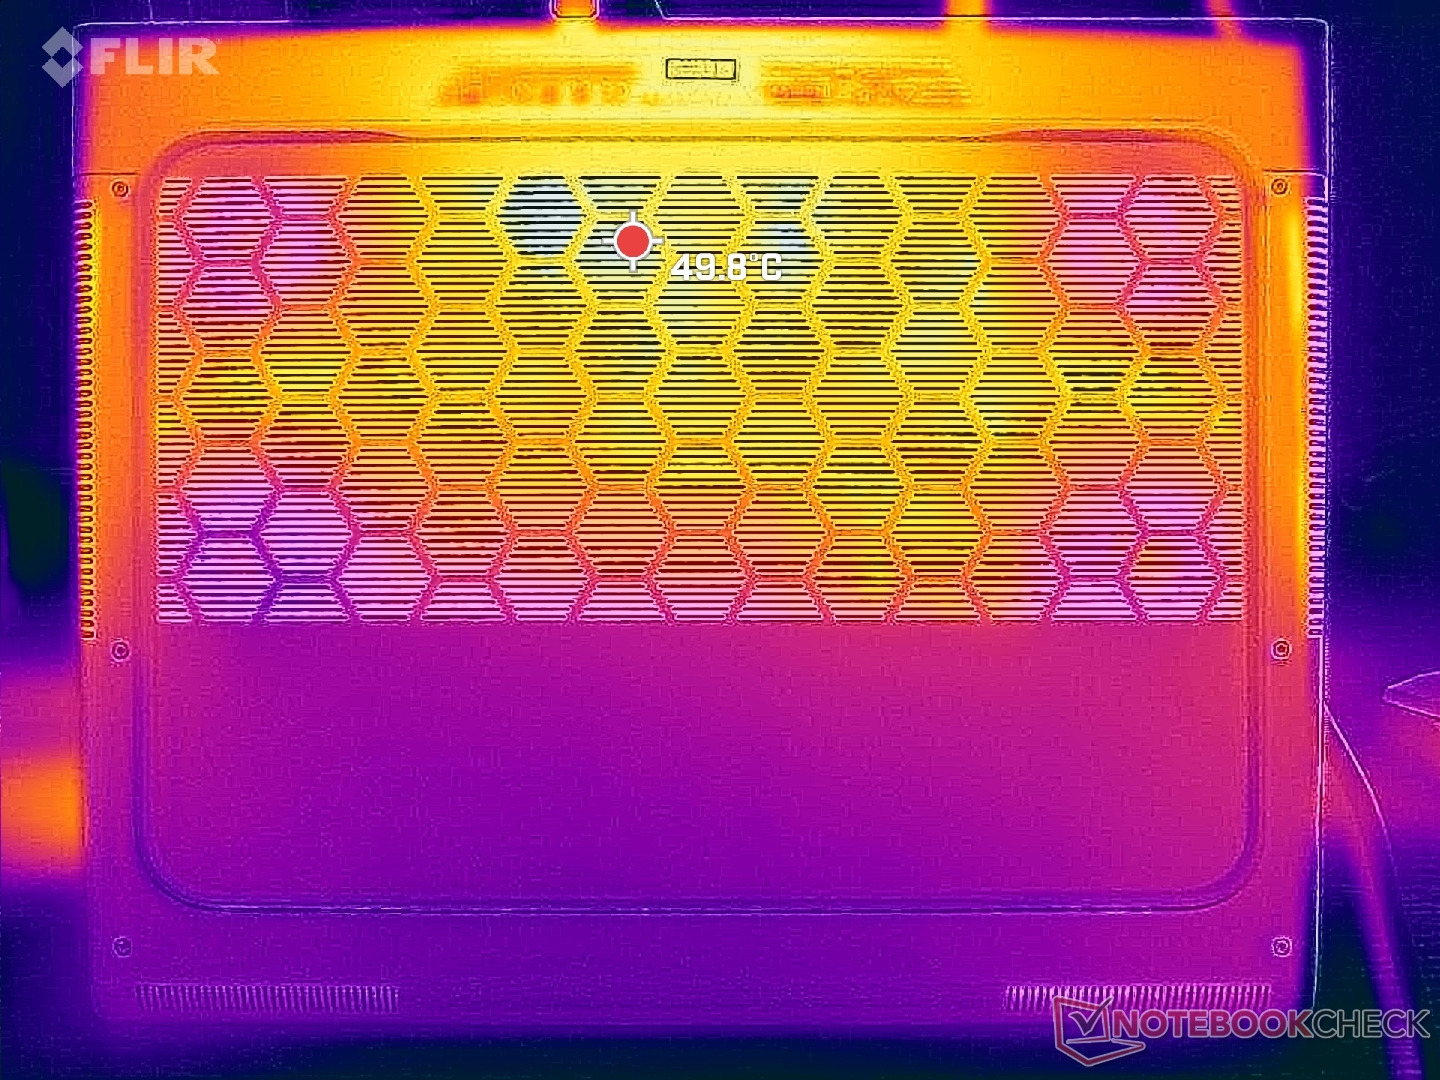
Temperatura powierzchni może być bardzo wysoka ze względu na cienki profil. Gorące punkty mogą osiągnąć około 50 C na górze i na dole w porównaniu do zaledwie 40 C na Blade 16. Na szczęście te gorące punkty znajdują się z tyłu i z dala od podpórek pod dłonie.
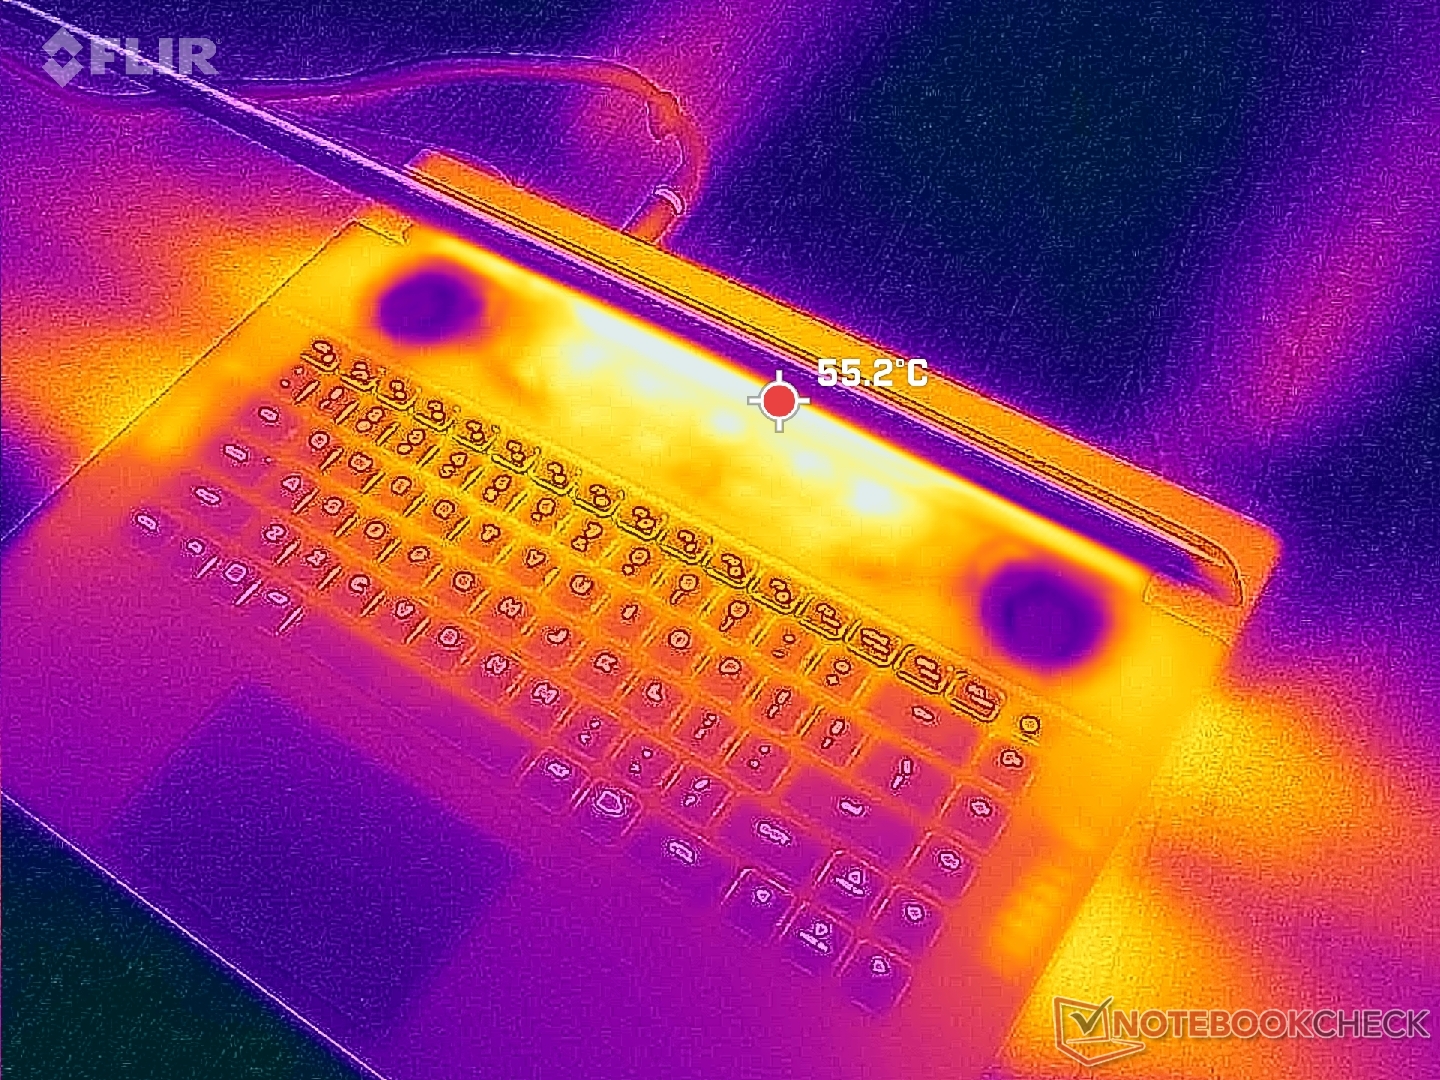
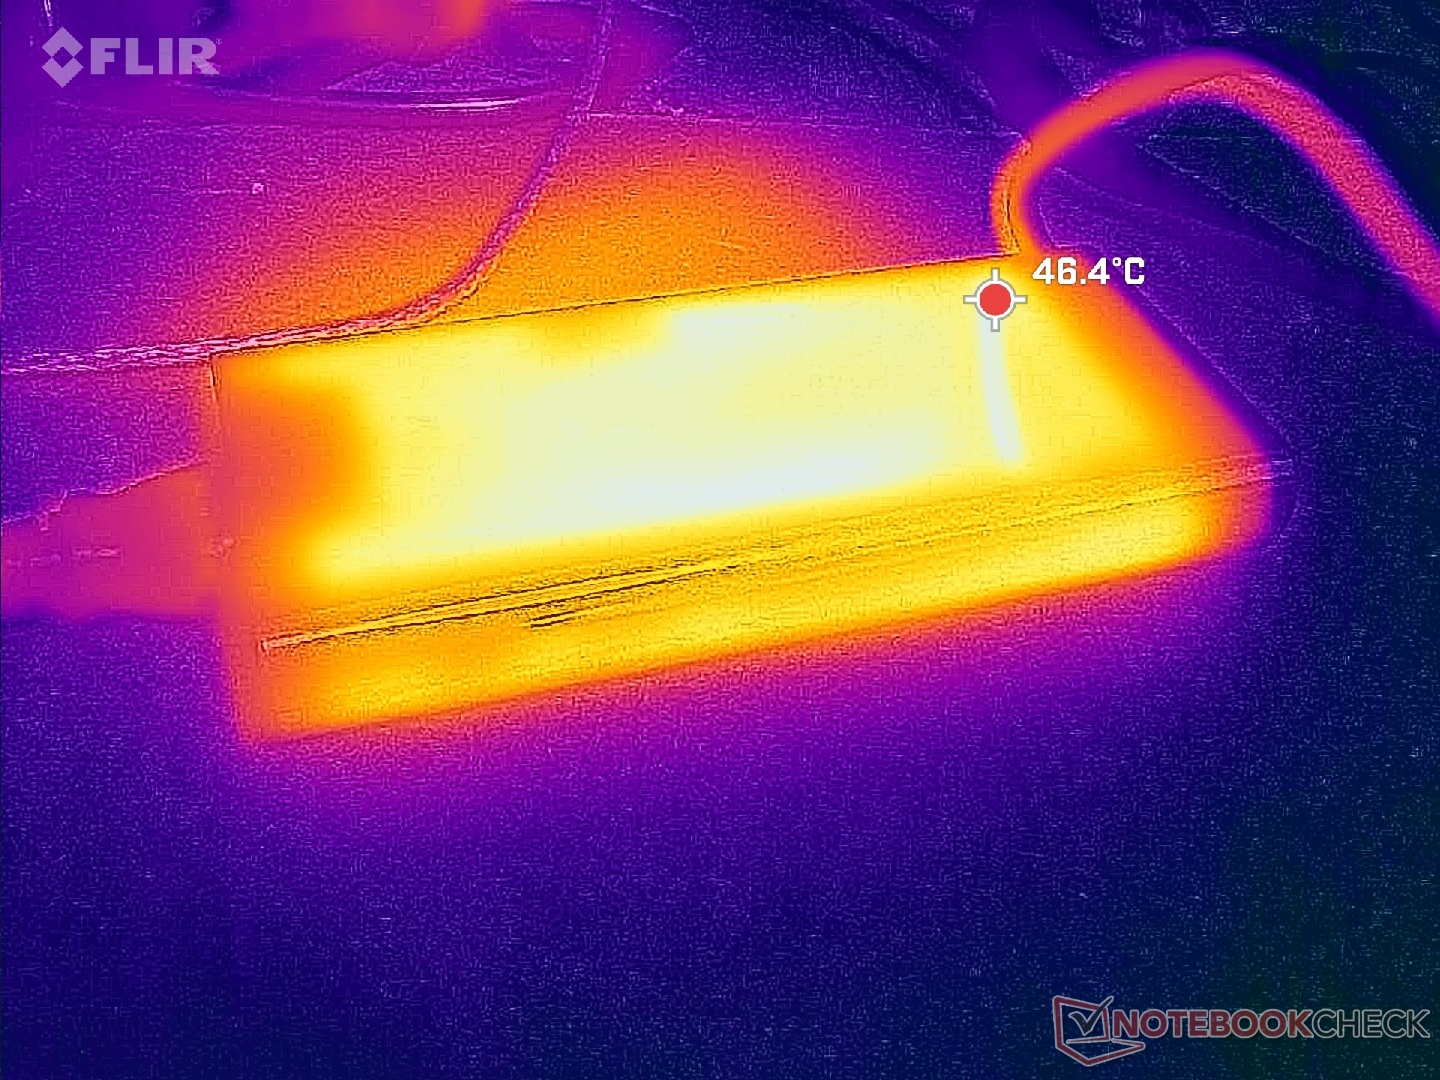
(-) Maksymalna temperatura w górnej części wynosi 47.2 °C / 117 F, w porównaniu do średniej 40.4 °C / 105 F , począwszy od 21.2 do 68.8 °C dla klasy Gaming.
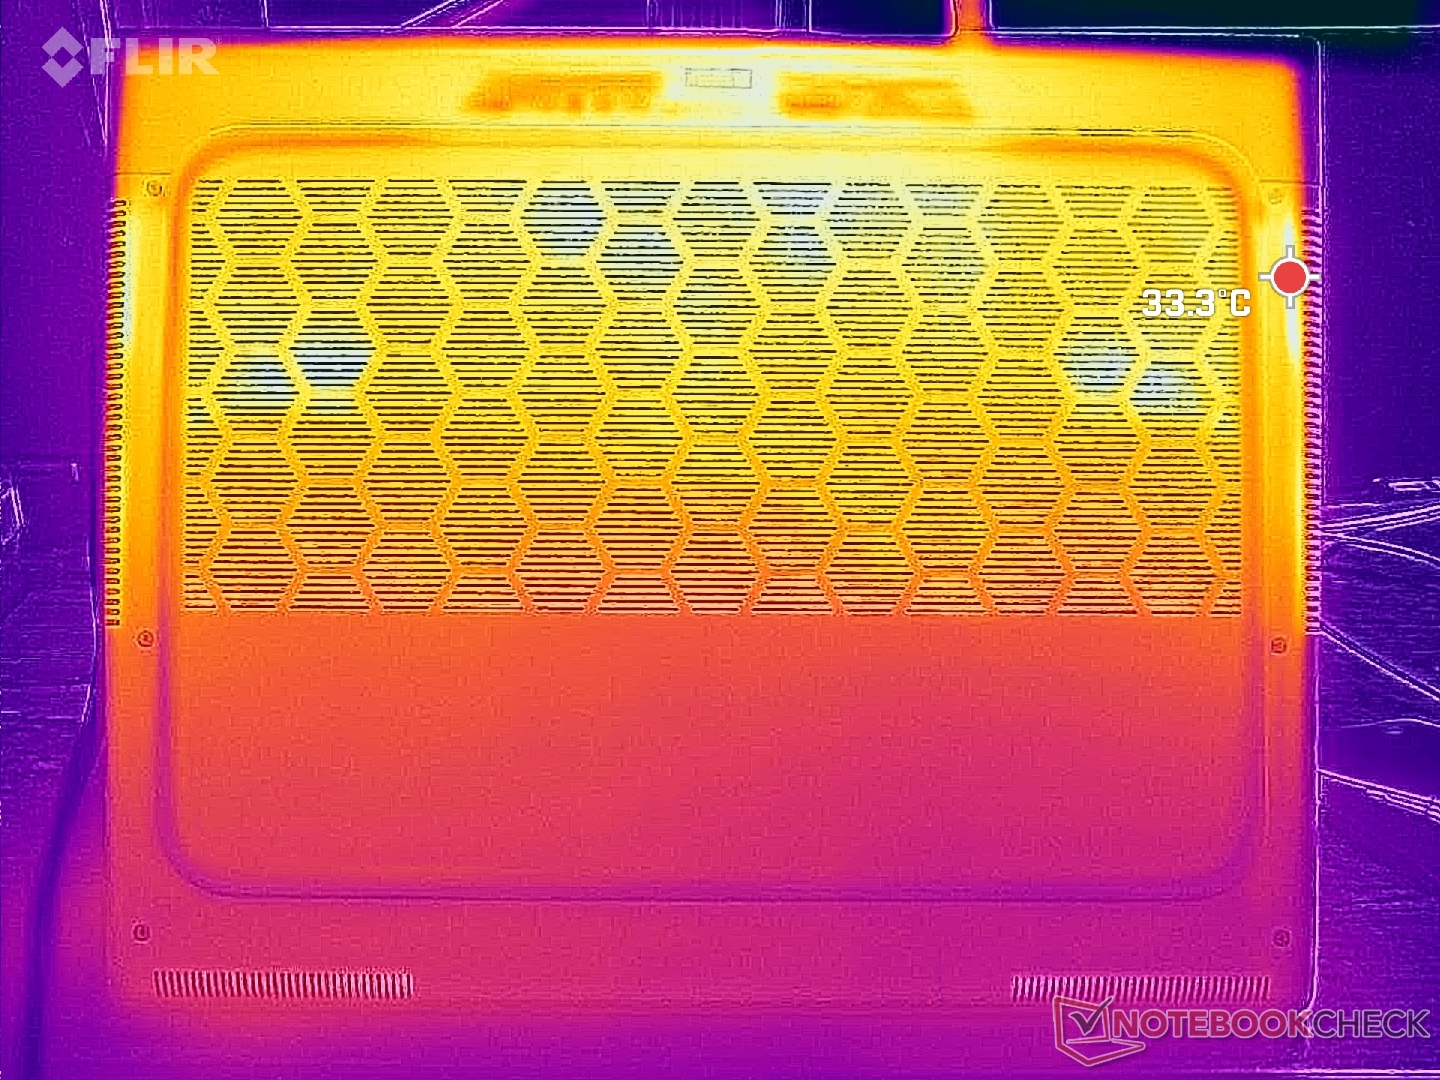
(-) Dno nagrzewa się maksymalnie do 47.8 °C / 118 F, w porównaniu do średniej 43.2 °C / 110 F
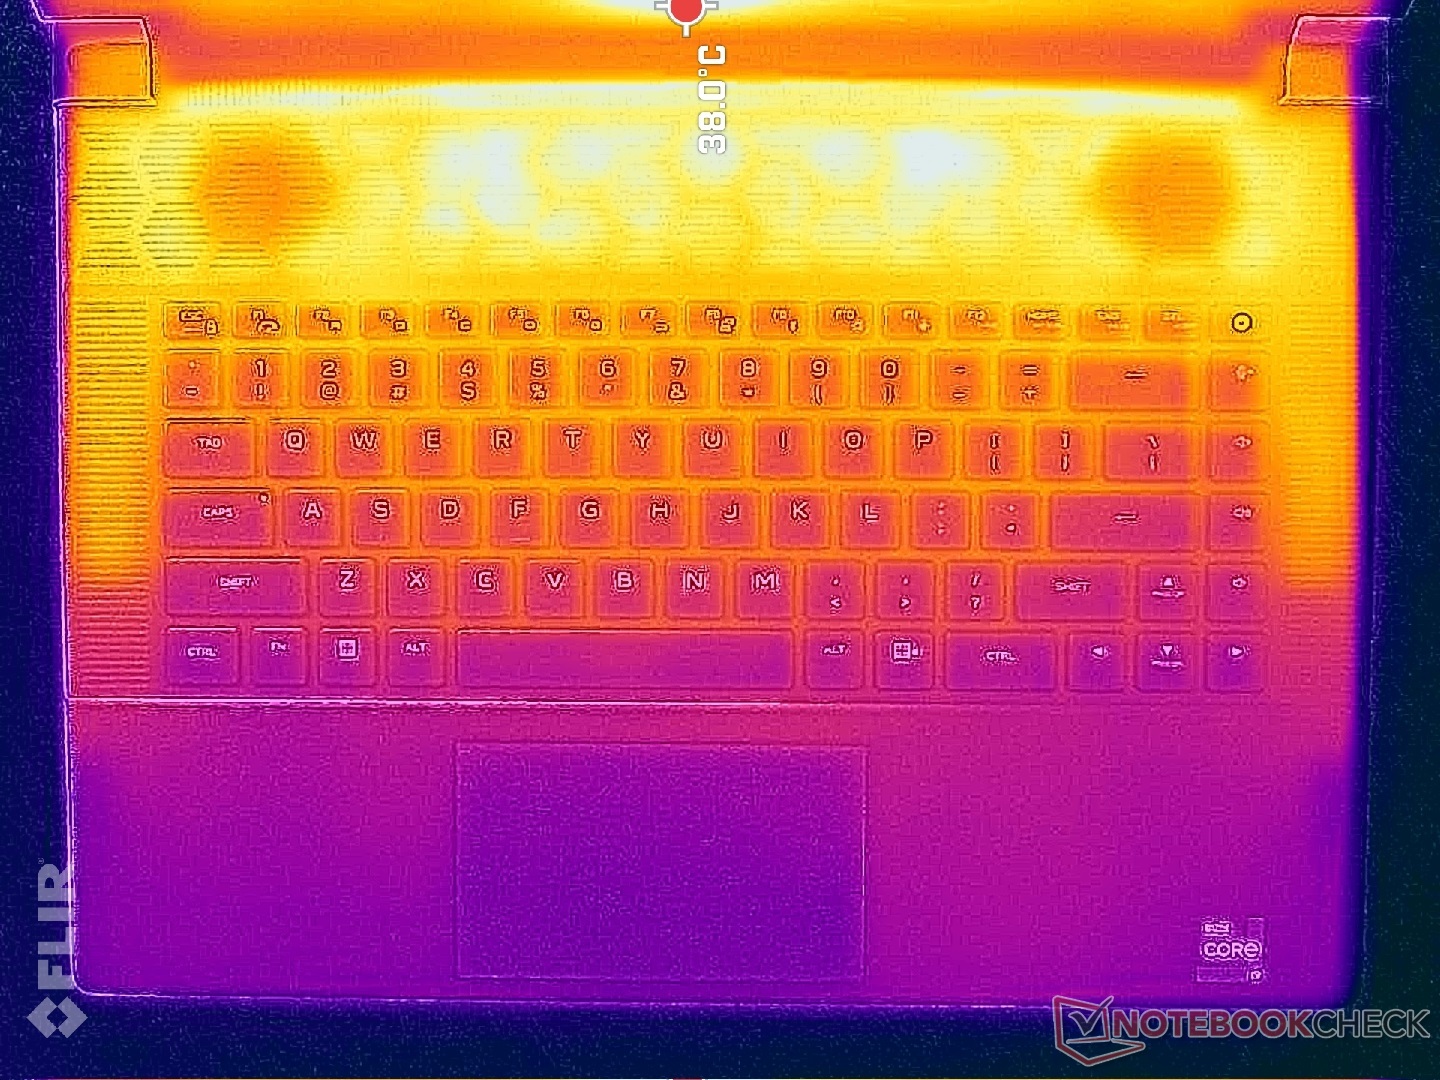
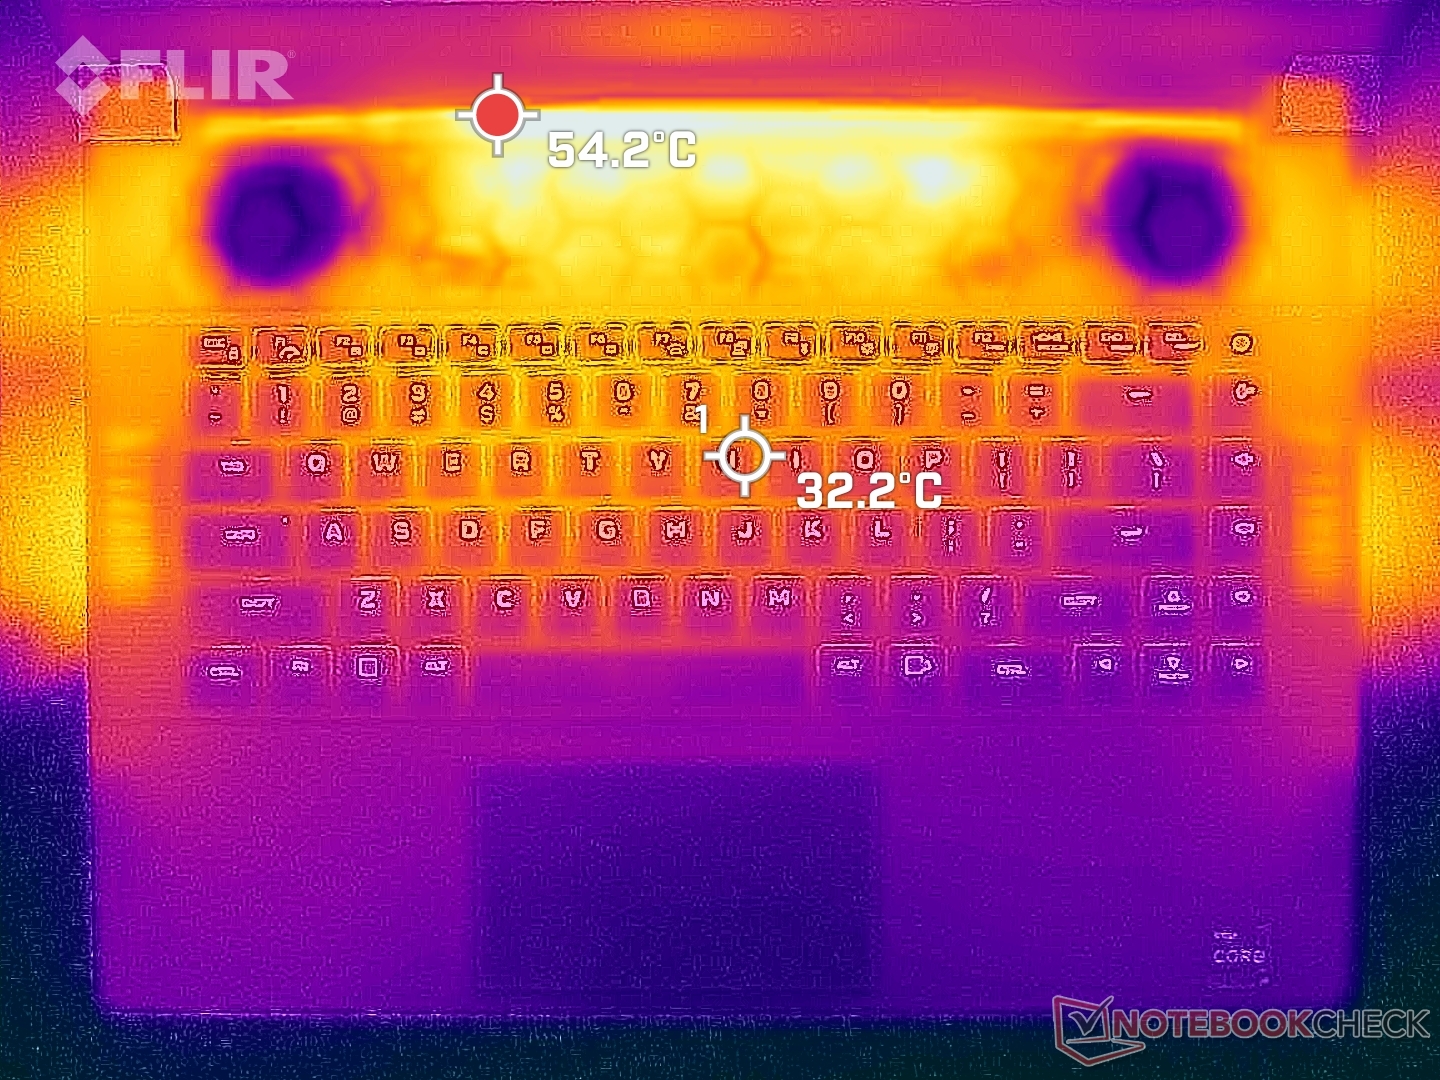
(+) W stanie bezczynności średnia temperatura górnej części wynosi 30.8 °C / 87 F, w porównaniu ze średnią temperaturą urządzenia wynoszącą 33.9 °C / ### class_avg_f### F.
(±) Podczas gry w Wiedźmina 3 średnia temperatura górnej części wynosi 38 °C / 100 F, w porównaniu do średniej temperatury urządzenia wynoszącej 33.9 °C / ## #class_avg_f### F.
(+) Podpórki pod nadgarstki i touchpad są chłodniejsze niż temperatura skóry i maksymalnie 30.6 °C / 87.1 F i dlatego są chłodne w dotyku.
(±) Średnia temperatura obszaru podparcia dłoni w podobnych urządzeniach wynosiła 28.8 °C / 83.8 F (-1.8 °C / -3.3 F).
| Alienware x16 R1 Intel Core i9-13900HK, NVIDIA GeForce RTX 4080 Laptop GPU | Lenovo Legion Pro 7 RTX4090 Intel Core i9-13900HX, NVIDIA GeForce RTX 4090 Laptop GPU | Asus ROG Zephyrus M16 GU604VY-NM042X Intel Core i9-13900H, NVIDIA GeForce RTX 4090 Laptop GPU | Razer Blade 16 Early 2023 Intel Core i9-13950HX, NVIDIA GeForce RTX 4080 Laptop GPU | Dell G16 7620 Intel Core i7-12700H, NVIDIA GeForce RTX 3060 Laptop GPU | Alienware m17 R5 (R9 6900HX, RX 6850M XT) AMD Ryzen 9 6900HX, AMD Radeon RX 6850M XT | |
|---|---|---|---|---|---|---|
| Heat | -4% | 6% | 15% | 14% | 2% | |
| Maximum Upper Side * (°C) | 47.2 | 53 -12% | 50 -6% | 40 15% | 47.6 -1% | 53 -12% |
| Maximum Bottom * (°C) | 47.8 | 59 -23% | 58 -21% | 37.6 21% | 54 -13% | 56 -17% |
| Idle Upper Side * (°C) | 36.8 | 34 8% | 26 29% | 32.4 12% | 23 37% | 30 18% |
| Idle Bottom * (°C) | 35.8 | 32 11% | 28 22% | 31.4 12% | 24.6 31% | 29 19% |
* ... im mniej tym lepiej
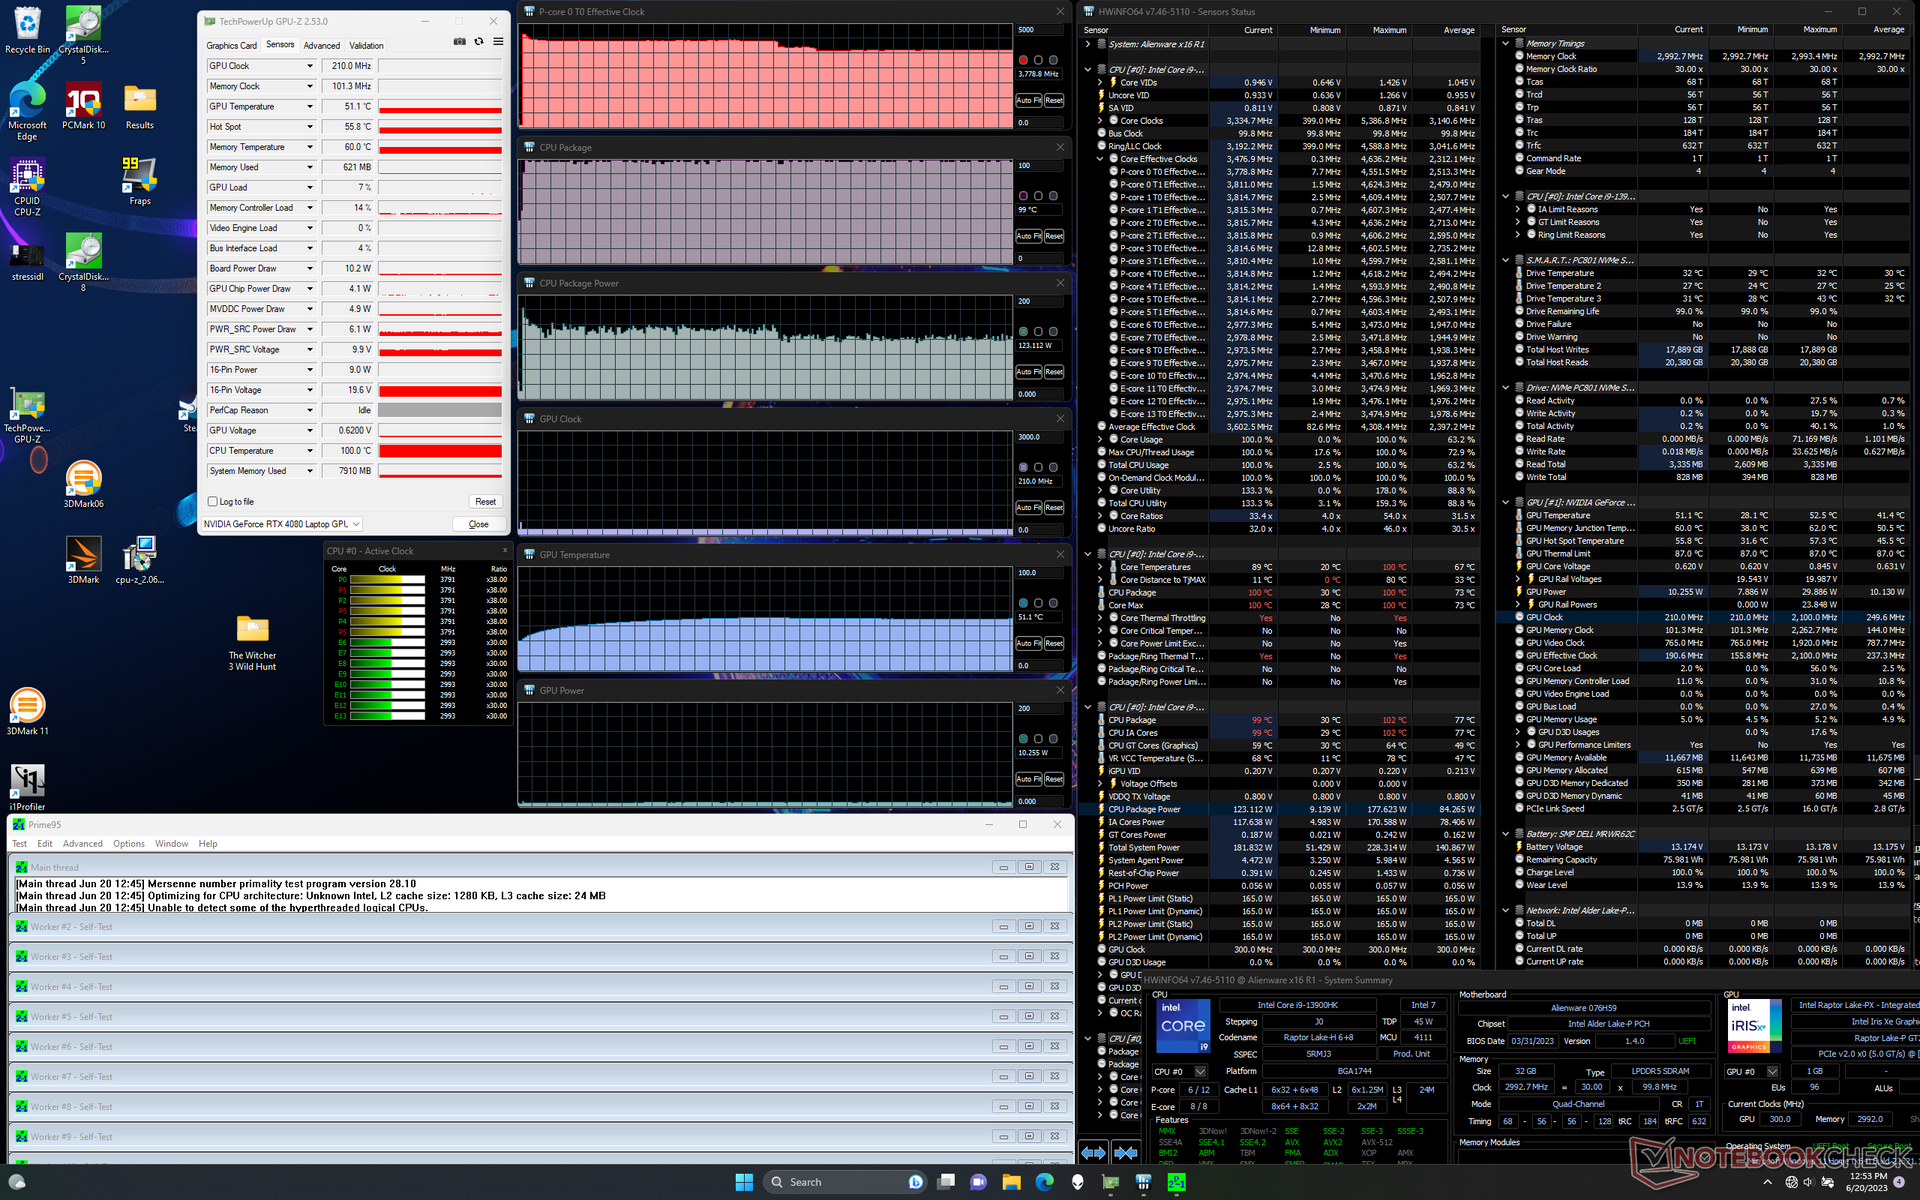
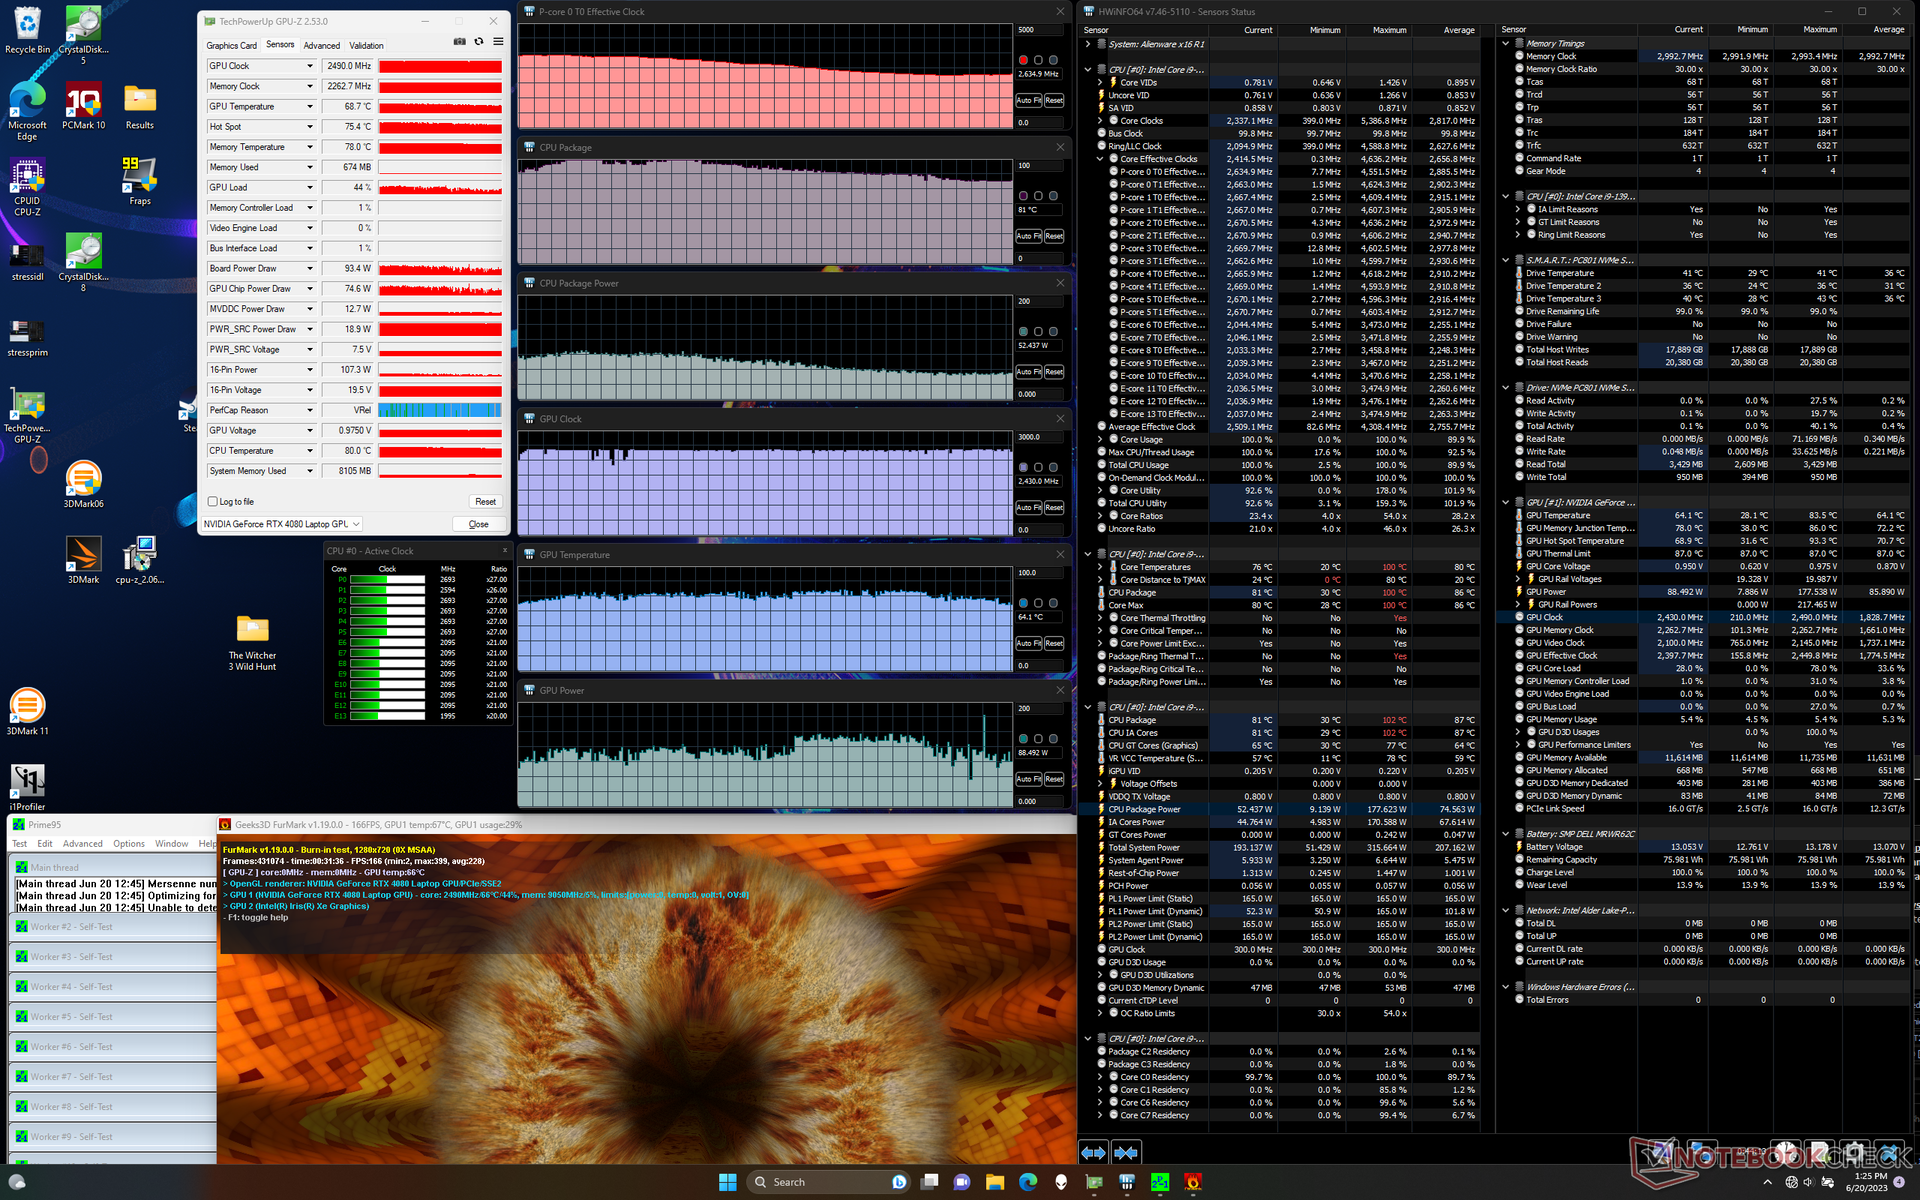
Test warunków skrajnych
Częstotliwość taktowania procesora, pobór mocy przez płytę główną i temperatura rdzenia wzrosły odpowiednio do 4,5 GHz, 178 W i 99 C podczas inicjowania stresu Prime95. Procesor ostatecznie ustabilizował się na poziomie 3,8 GHz, 123 W i 99 C po zaledwie kilku minutach. Przy tak wysokich temperaturach rdzenia jasne jest, że procesor przesuwa rozwiązanie chłodzące do granic możliwości, aby utrzymać najwyższe możliwe częstotliwości taktowania Turbo Boost. Powtórzenie tego samego testu na Blade 16 zaowocowałoby na przykład niższą stabilną temperaturą rdzenia wynoszącą 82 C.
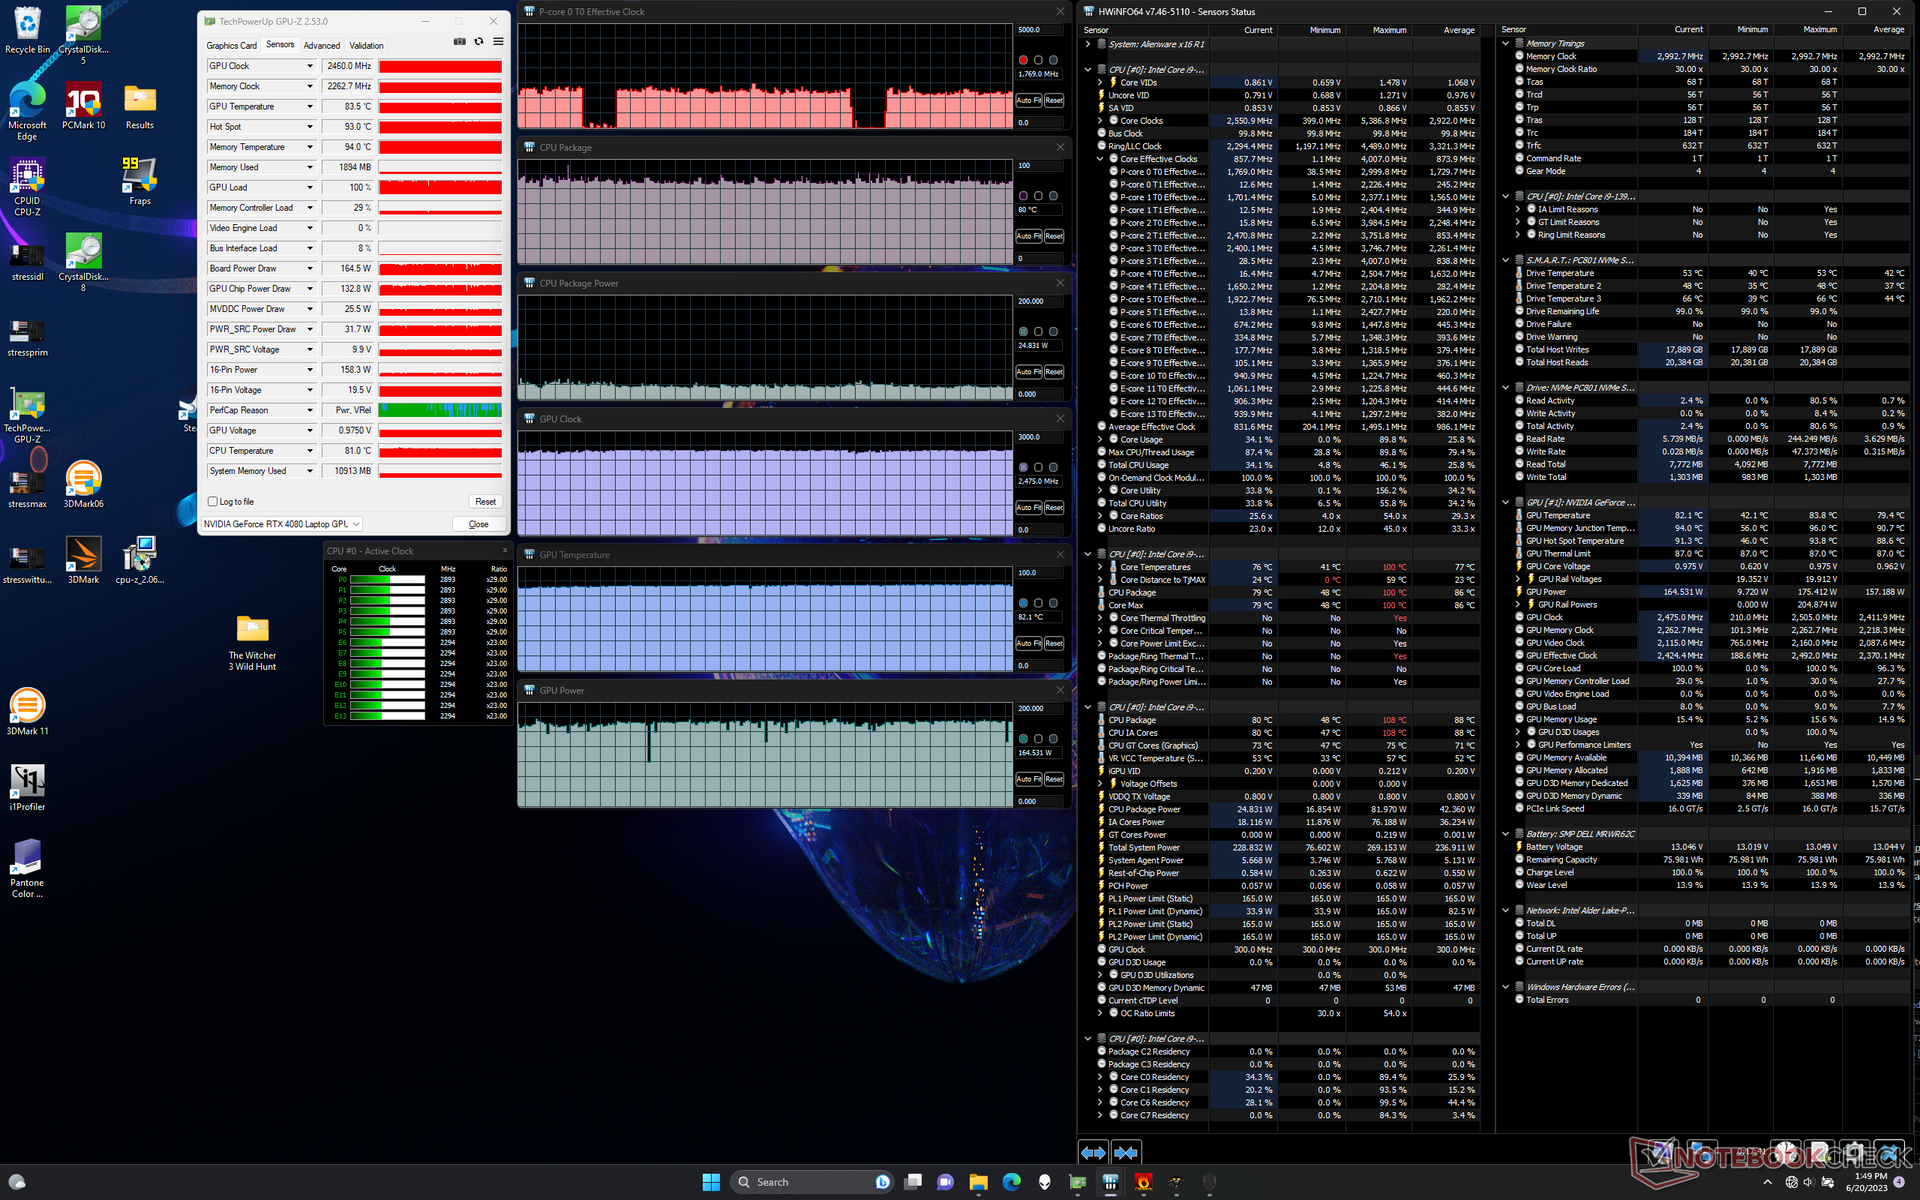
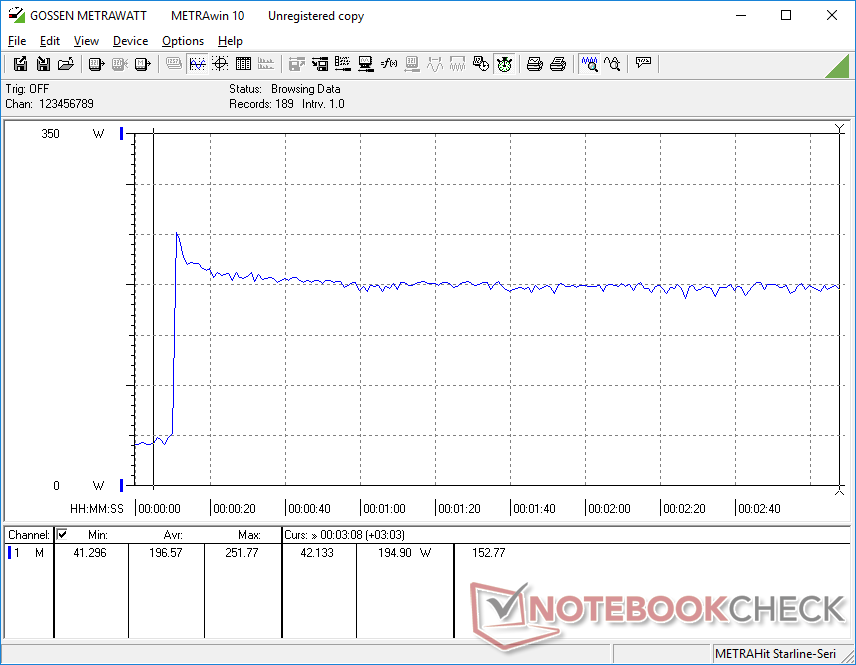
Po uruchomieniu strony Witcher 3 w trybie Overdrive, który reprezentuje typowe obciążenia w grach, GPU ustabilizowałoby się na poziomie około 166 W w porównaniu do docelowych 175 W. Co ciekawe, pobór mocy płyty ledwo spadłby do zaledwie 161 W w trybie Balanced, jak pokazują poniższe zrzuty ekranu, co reprezentuje bardzo marginalny spadek wydajności w stosunku do znacznie cichszego hałasu wentylatora w porównaniu do trybu Overdrive. Właściciele mogą zatem rozważyć granie w trybie Balanced zamiast głośniejszych trybów Performance lub Overdrive.
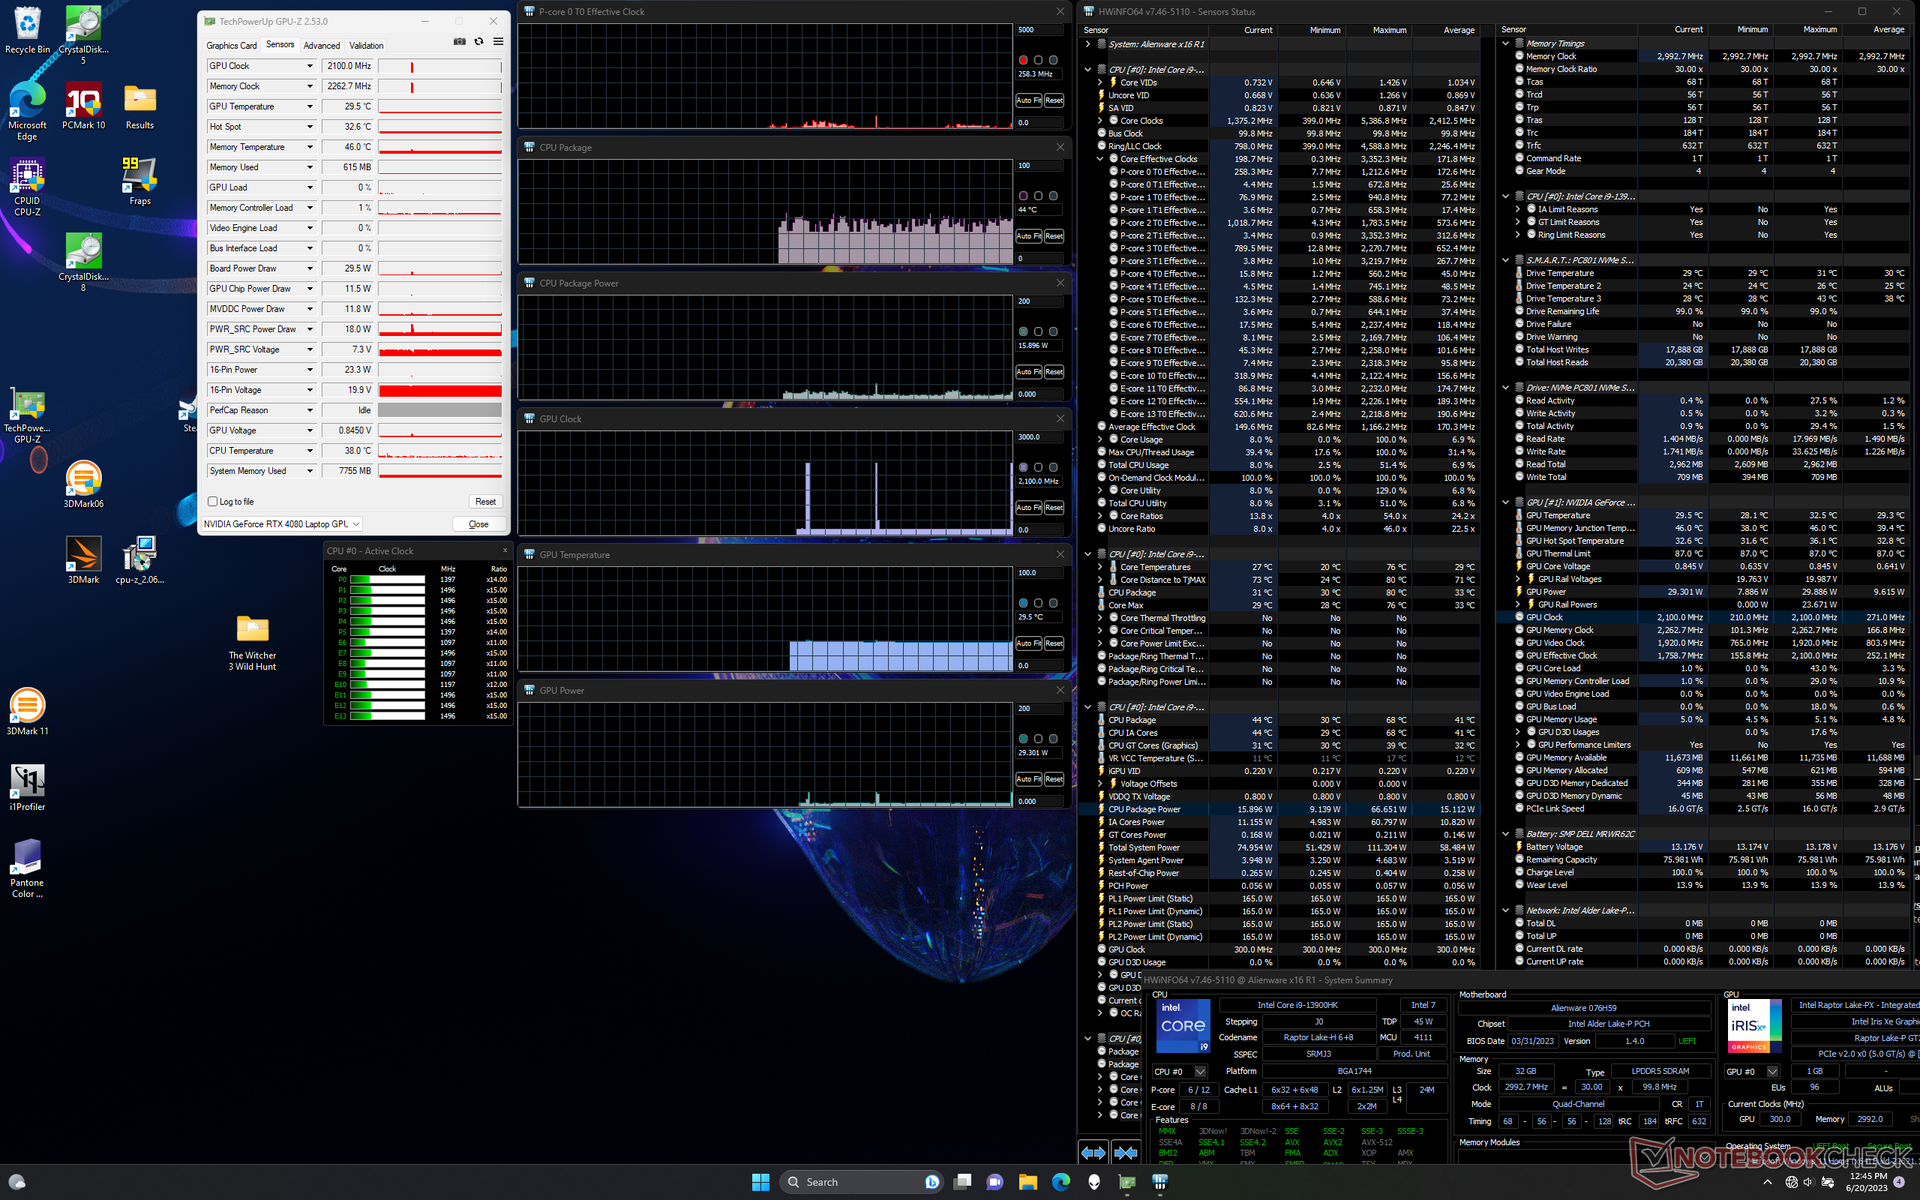

| Taktowanie CPU (GHz) | Taktowanie GPU (MHz) | Średnia temperatura CPU (°C) | Średnia temperatura GPU (°C) | |
| System w stanie spoczynku | -- | -- | 44 | 30 |
| Prime95Stress | 3.8 | -- | 99 | 51 |
| Prime95+ FurMark Stress | 2.5 - 3.6 | 2475 | 82 - 100 | 72 - 77 |
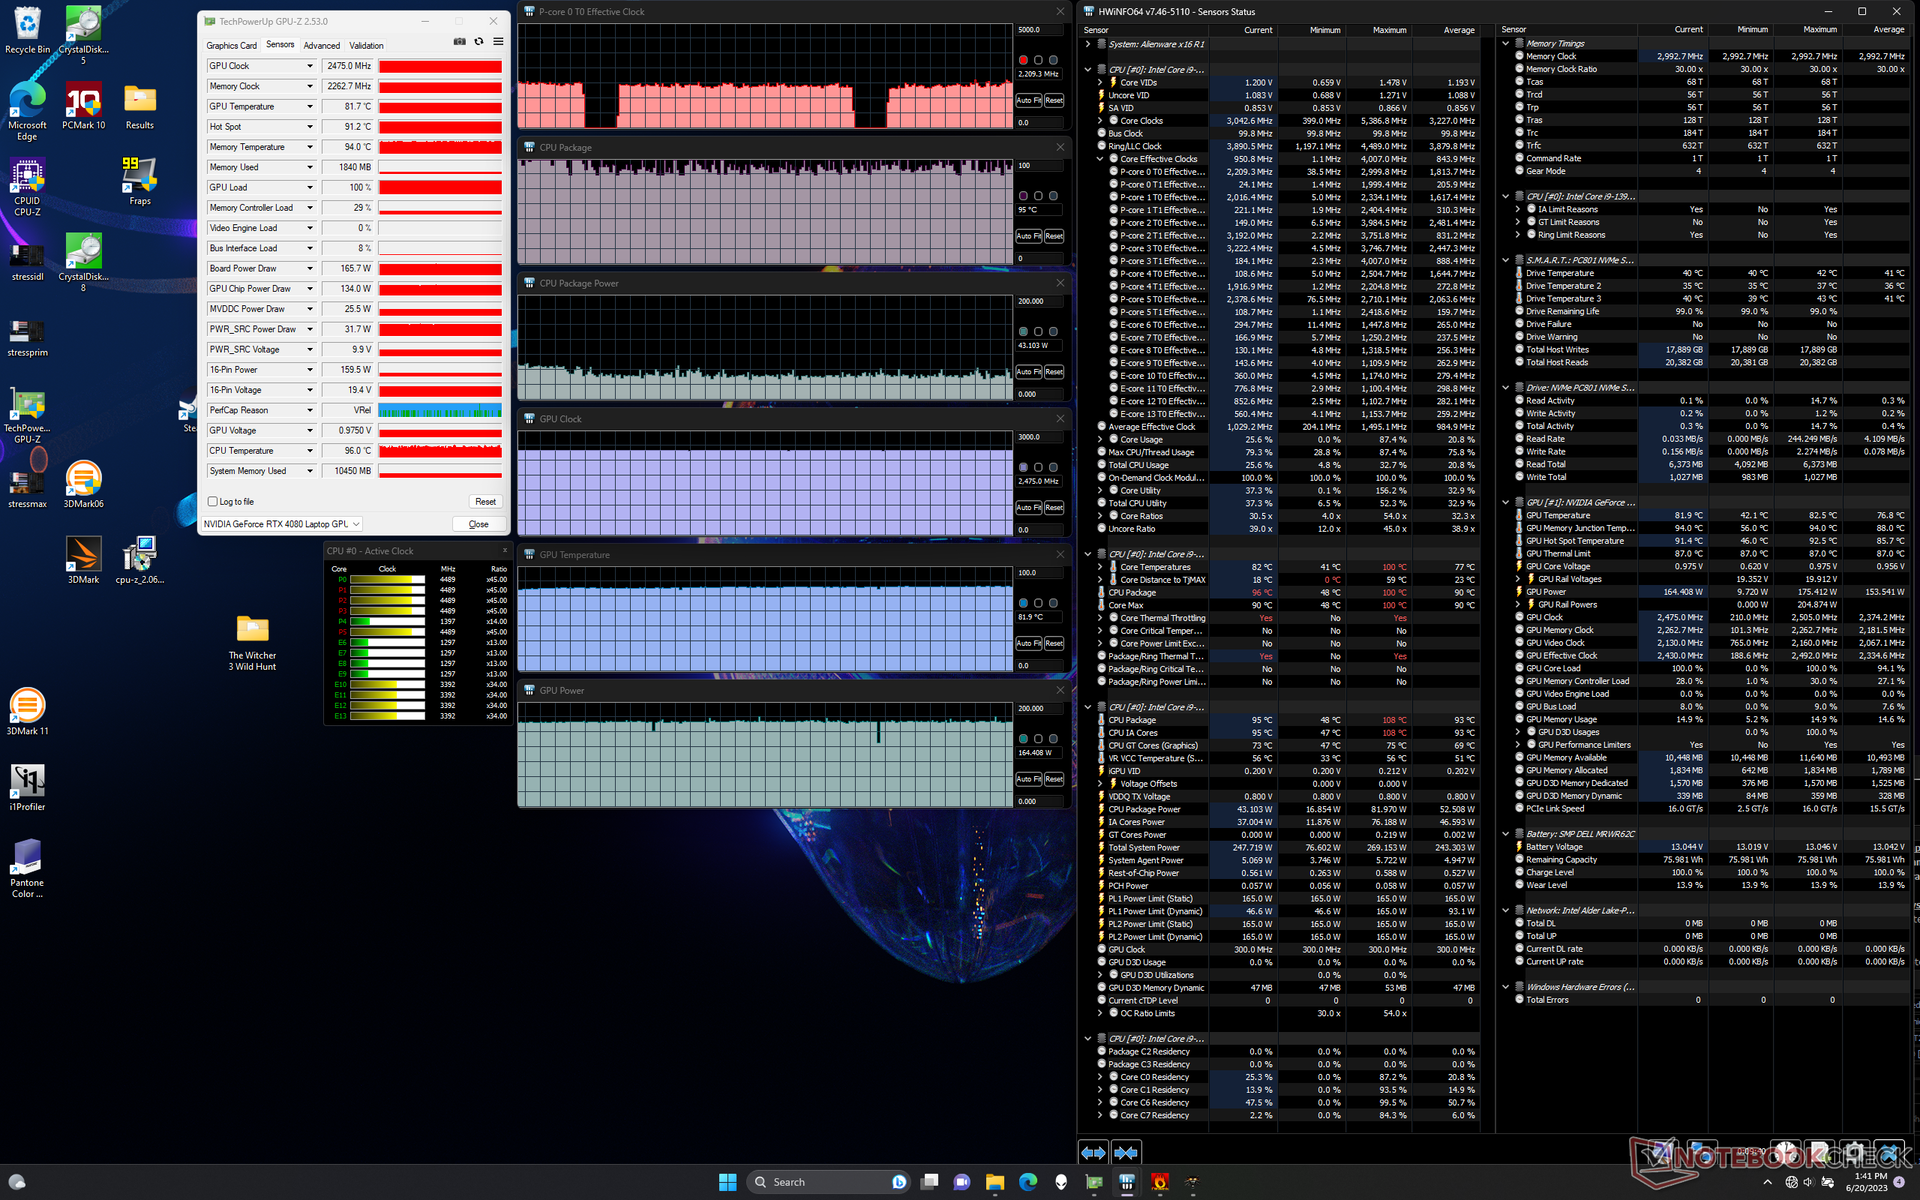
| Witcher 3 Obciążenie (trybzrównoważony) | ~1,8 | 2460 | 81 | 85 |
| Witcher 3 Obciążenie (tryb wydajności) | ~1,8 | 2460 | 80 | 82 |
| Witcher 3 Stres (trybOverdrive) | ~2.2 | 2475 | 95 | 82 |
Głośniki
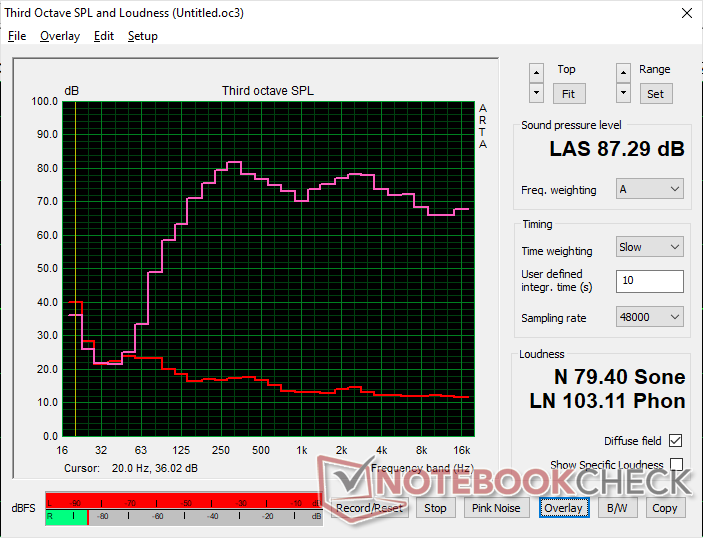
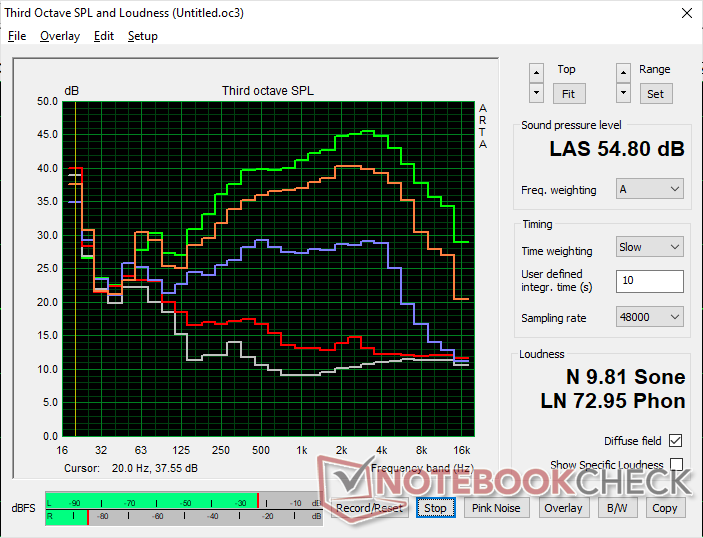
Alienware x16 R1 analiza dźwięku
(+) | głośniki mogą odtwarzać stosunkowo głośno (87.3 dB)
Bas 100 - 315 Hz
(±) | zredukowany bas - średnio 7.3% niższy od mediany
(±) | liniowość basu jest średnia (9.1% delta do poprzedniej częstotliwości)
Średnie 400 - 2000 Hz
(+) | zbalansowane środki średnie - tylko 2.2% od mediany
(+) | średnie są liniowe (3.8% delta do poprzedniej częstotliwości)
Wysokie 2–16 kHz
(+) | zrównoważone maksima - tylko 3.6% od mediany
(+) | wzloty są liniowe (3.3% delta do poprzedniej częstotliwości)
Ogólnie 100 - 16.000 Hz
(+) | ogólny dźwięk jest liniowy (7.9% różnicy w stosunku do mediany)
W porównaniu do tej samej klasy
» 1% wszystkich testowanych urządzeń w tej klasie było lepszych, 1% podobnych, 98% gorszych
» Najlepszy miał deltę 6%, średnia wynosiła ###średnia###%, najgorsza wynosiła 132%
W porównaniu do wszystkich testowanych urządzeń
» 2% wszystkich testowanych urządzeń było lepszych, 1% podobnych, 98% gorszych
» Najlepszy miał deltę 4%, średnia wynosiła ###średnia###%, najgorsza wynosiła 134%
Apple MacBook Pro 16 2021 M1 Pro analiza dźwięku
(+) | głośniki mogą odtwarzać stosunkowo głośno (84.7 dB)
Bas 100 - 315 Hz
(+) | dobry bas - tylko 3.8% od mediany
(+) | bas jest liniowy (5.2% delta do poprzedniej częstotliwości)
Średnie 400 - 2000 Hz
(+) | zbalansowane środki średnie - tylko 1.3% od mediany
(+) | średnie są liniowe (2.1% delta do poprzedniej częstotliwości)
Wysokie 2–16 kHz
(+) | zrównoważone maksima - tylko 1.9% od mediany
(+) | wzloty są liniowe (2.7% delta do poprzedniej częstotliwości)
Ogólnie 100 - 16.000 Hz
(+) | ogólny dźwięk jest liniowy (4.6% różnicy w stosunku do mediany)
W porównaniu do tej samej klasy
» 0% wszystkich testowanych urządzeń w tej klasie było lepszych, 0% podobnych, 100% gorszych
» Najlepszy miał deltę 5%, średnia wynosiła ###średnia###%, najgorsza wynosiła 45%
W porównaniu do wszystkich testowanych urządzeń
» 0% wszystkich testowanych urządzeń było lepszych, 0% podobnych, 100% gorszych
» Najlepszy miał deltę 4%, średnia wynosiła ###średnia###%, najgorsza wynosiła 134%
Zarządzanie energią
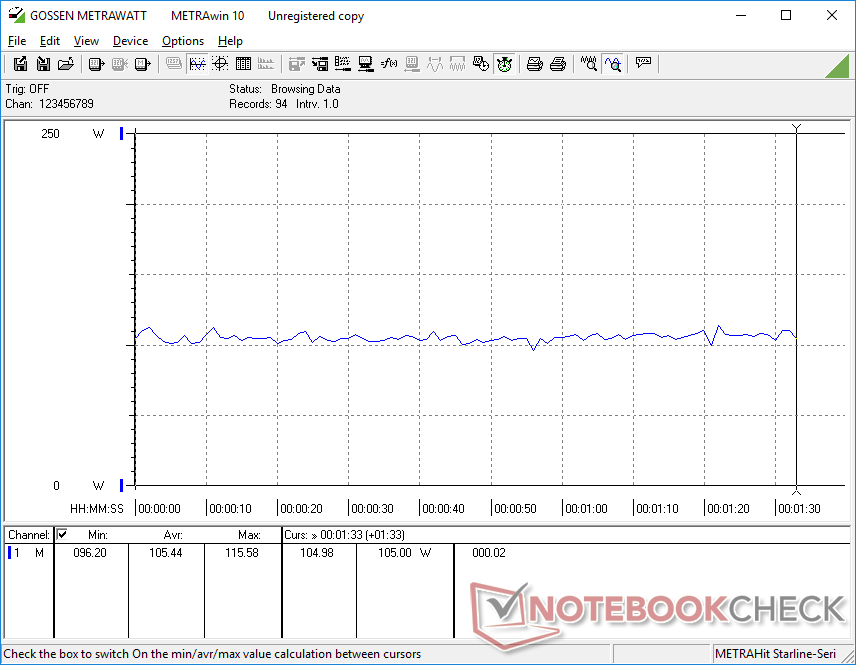
Zużycie energii - wysokie zgodnie z oczekiwaniami
Zużycie energii waha się od 25 W do 50 W na biegu jałowym w zależności od profilu zasilania, GPU i ustawień jasności. Zakres ten jest wysoki nawet w tej kategorii, ponieważ inne 16-calowe modele, takie jak Razer Blade 16 lub Alienware m17 mogą osiągnąć zaledwie 15 W przy podobnych minimalnych ustawieniach zasilania.
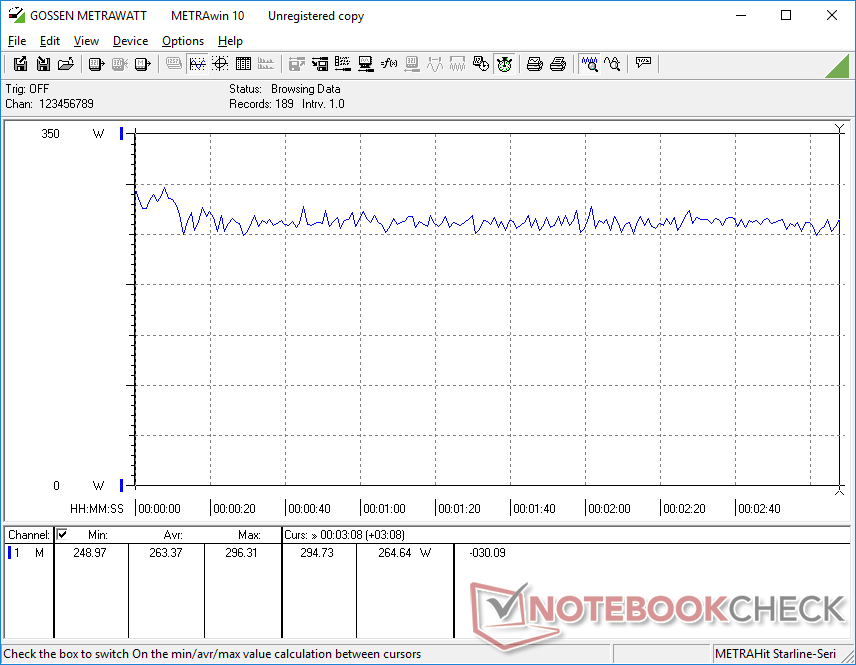
Gaming wymaga około 263 W, co plasuje się pomiędzy Asus ROG Strix G16 i MSI GE78 HX każda z tym samym procesorem graficznym RTX 4080. Być może bardziej znaczące jest to, że napędzany RTX 4090 Asus ROG Zephyrus M16 zużywa o 20 procent mniej energii, zapewniając jednocześnie mniej więcej taką samą wydajność graficzną jak nasz Alienware z RTX 4080.
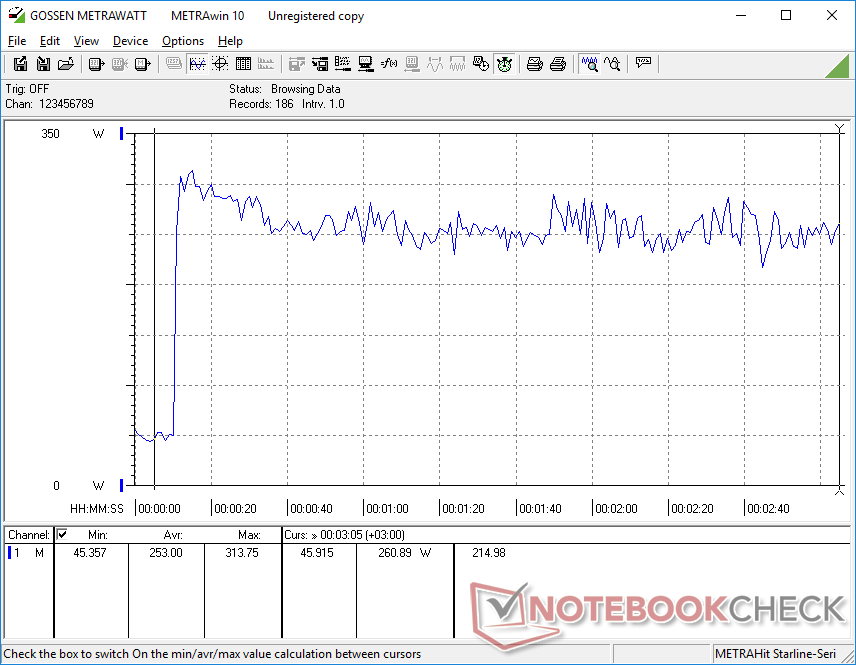
Jesteśmy w stanie zmierzyć maksymalny tymczasowy pobór mocy na poziomie 313 W ze średniej wielkości (~18,3 x 8,6 x 2,6 cm) zasilacza sieciowego o mocy 330 W, gdy zarówno CPU, jak i GPU są wykorzystywane w 100 procentach. Szybkość ładowania spada przy tak wymagających obciążeniach.
| wyłączony / stan wstrzymania | |
| luz | |
| obciążenie |
|
Legenda:
min: | |
| Alienware x16 R1 i9-13900HK, GeForce RTX 4080 Laptop GPU, SK hynix PC801 HFS001TEJ9X101N, IPS, 2560x1600, 16" | Lenovo Legion Pro 7 RTX4090 i9-13900HX, GeForce RTX 4090 Laptop GPU, Samsung PM9A1 MZVL21T0HCLR, IPS, 2560x1600, 16" | Asus ROG Zephyrus M16 GU604VY-NM042X i9-13900H, GeForce RTX 4090 Laptop GPU, Samsung PM9A1 MZVL22T0HBLB, IPS, 2560x1600, 16" | Razer Blade 16 Early 2023 i9-13950HX, GeForce RTX 4080 Laptop GPU, SSSTC CA6-8D1024, IPS, 2560x1600, 16" | Dell G16 7620 i7-12700H, GeForce RTX 3060 Laptop GPU, WDC PC SN810 512GB, IPS, 2560x1600, 16" | Alienware m17 R5 (R9 6900HX, RX 6850M XT) R9 6900HX, Radeon RX 6850M XT, SSSTC CA6-8D1024, IPS, 3840x2160, 17" | |
|---|---|---|---|---|---|---|
| Power Consumption | 5% | 21% | 12% | 30% | 33% | |
| Idle Minimum * (Watt) | 25.2 | 20 21% | 20 21% | 15.2 40% | 14.4 43% | 13 48% |
| Idle Average * (Watt) | 29.9 | 25 16% | 24 20% | 22.8 24% | 17.8 40% | 16.5 45% |
| Idle Maximum * (Watt) | 49.8 | 35 30% | 25 50% | 49.8 -0% | 31.5 37% | 17 66% |
| Load Average * (Watt) | 105.4 | 136 -29% | 107 -2% | 121.2 -15% | 101.2 4% | 93 12% |
| Witcher 3 ultra * (Watt) | 263 | 282 -7% | 208 21% | 242 8% | 176.9 33% | 239 9% |
| Load Maximum * (Watt) | 313.8 | 320 -2% | 267 15% | 273.7 13% | 242.9 23% | 251 20% |
* ... im mniej tym lepiej
Power Consumption Witcher 3 / Stresstest
Power Consumption external Monitor
Żywotność baterii
Podczas naszego testu przeglądania sieci WLAN udało nam się uzyskać tylko 2,5 godziny czasu pracy, nawet przy ACC ustawionym na tryb baterii i systemie w trybie iGPU Optimus. Powtórzenie testów dałoby podobne wyniki. Nie oczekujemy długiego czasu pracy od laptopów do gier, ale nadal jest on znacznie krótszy w porównaniu do konkurencyjnych platform. Dell twierdzi, że czas przeglądania wynosi ponad 7 godzin, co możemy uzyskać tylko na biegu jałowym na pulpicie przy najniższym ustawieniu jasności. Wyniki są niezwykłe, ponieważ naszAlienware x17 wytrzymałby dwa razy dłużej niż nasz Alienware x16 podczas tego samego testu WLAN.
Ładowanie od pustego do pełnego trwa około dwóch godzin przy użyciu dołączonego zasilacza sieciowego. System można ładować również za pomocą adapterów USB-C, w tym adapterów 130 W dostarczanych z modelami XPS.
| Alienware x16 R1 i9-13900HK, GeForce RTX 4080 Laptop GPU, 90 Wh | Asus ROG Zephyrus M16 GU604VY-NM042X i9-13900H, GeForce RTX 4090 Laptop GPU, 90 Wh | Razer Blade 16 Early 2023 i9-13950HX, GeForce RTX 4080 Laptop GPU, 95.2 Wh | Dell G16 7620 i7-12700H, GeForce RTX 3060 Laptop GPU, 84 Wh | Alienware m17 R5 (R9 6900HX, RX 6850M XT) R9 6900HX, Radeon RX 6850M XT, 97 Wh | Lenovo Legion Pro 7 16IRX8H i9-13900HX, GeForce RTX 4080 Laptop GPU, 99.9 Wh | |
|---|---|---|---|---|---|---|
| Czasy pracy | 193% | 89% | 32% | 125% | 97% | |
| Reader / Idle (h) | 7.3 | 8.9 22% | 7.1 -3% | 6.4 -12% | ||
| WiFi v1.3 (h) | 2.5 | 4.3 72% | 6.1 144% | 5 100% | 4.8 92% | 5.1 104% |
| Load (h) | 0.7 | 2.9 314% | 1.4 100% | 0.7 0% | 1.8 157% | 2.1 200% |
| H.264 (h) | 4.8 | 4.9 |
Za
Przeciw
Werdykt - udana pogoń za smukłością i grafiką
Powszechnie uważa się, że wydajność laptopa jest odwrotnie proporcjonalna do jego grubości. Alienware x16 rzuca temu wyzwanie, będąc jednym z najcieńszych w swojej kategorii rozmiarów, a jednocześnie przewyższając głównych konkurentów, takich jak Razer Blade 16, Asus ROG Strix G16lub HP Omen 17 pod względem wydajności graficznej. Imponujące jest to, że model ten jest w stanie wcisnąć 175 W GeForce RTX GPU, biorąc pod uwagę ultracienki profil.
Jeśli chcesz zmaksymalizować wydajność GPU przy jednoczesnym zminimalizowaniu smukłości, Alienware x16 powinien znaleźć się na szczycie listy.
Niemniej jednak istnieje kilka wad, z których niektóre są unikalne dla Alienware x16. Po pierwsze, tylko dlatego, że jest super cienki, nie oznacza, że jest super mały lub lekki, ponieważ system jest bardzo duży pod względem długości i szerokości, aby nadrobić cieńszą wysokość Z. Po drugie, brak jakichkolwiek portów po bokach może sprawić, że podłączanie monitorów lub akcesoriów będzie za każdym razem nieco kłopotliwe. I wreszcie, procesor Core i9-13900HK oferuje jedynie marginalne ulepszenia w stosunku do poprzedniej generacjiCore i9-12900H ponieważ nie jest tak wydajny jakCore i9-13900HX który jest dostępny w grubszym Alienware m16, a nie Alienware x16. Aby zmaksymalizować moc GPU, prawdopodobnie konieczne były ustępstwa w zakresie zajmowanej powierzchni, rozmieszczenia portów i wydajności procesora.
Cena i dostępność
Dell wysyła teraz Alienware x16 do konsumentów w cenie od 2200 USD za konfigurację podstawową do 3350 USD za naszą recenzowaną konfigurację.
Alienware x16 R1
- 22/06/2023 v7 (old)
Allen Ngo
Przezroczystość
Wyboru urządzeń do recenzji dokonuje nasza redakcja. Próbka testowa została udostępniona autorowi jako pożyczka od producenta lub sprzedawcy detalicznego na potrzeby tej recenzji. Pożyczkodawca nie miał wpływu na tę recenzję, producent nie otrzymał też kopii tej recenzji przed publikacją. Nie było obowiązku publikowania tej recenzji. Jako niezależna firma medialna, Notebookcheck nie podlega władzy producentów, sprzedawców detalicznych ani wydawców.
Tak testuje Notebookcheck
Każdego roku Notebookcheck niezależnie sprawdza setki laptopów i smartfonów, stosując standardowe procedury, aby zapewnić porównywalność wszystkich wyników. Od około 20 lat stale rozwijamy nasze metody badawcze, ustanawiając przy tym standardy branżowe. W naszych laboratoriach testowych doświadczeni technicy i redaktorzy korzystają z wysokiej jakości sprzętu pomiarowego. Testy te obejmują wieloetapowy proces walidacji. Nasz kompleksowy system ocen opiera się na setkach uzasadnionych pomiarów i benchmarków, co pozwala zachować obiektywizm.Price comparison

