Recenzja laptopa Lenovo ThinkPad X13 G3 AMD: Już bardzo dobry ThinkPad jeszcze lepszy dzięki Ryzen 6000
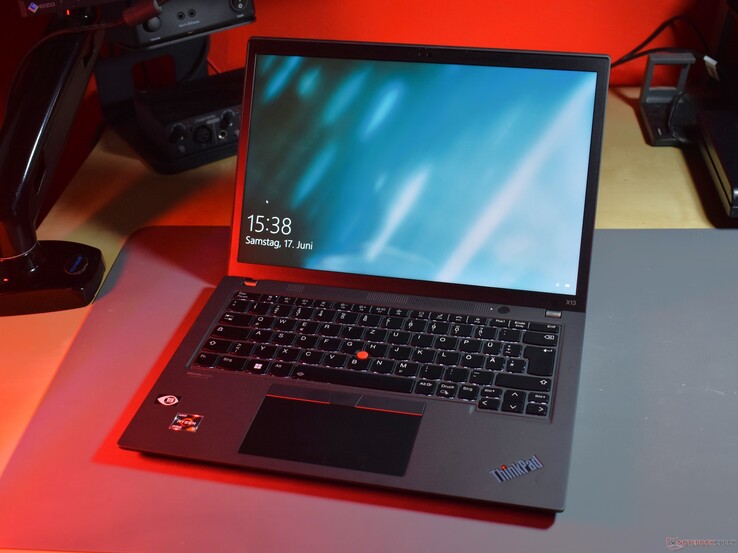
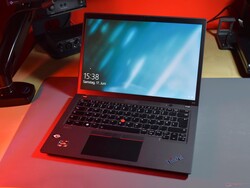
Recenzja ThinkPada z 2022 roku w 2023 roku - brzmi jak sprzeczność, ale może mieć sens. Dzisiejsze urządzenie do recenzji, Lenovo ThinkPad X13 Gen 3 AMD, może być "wczorajszą technologią", ale to nie znaczy, że jest złe. Następca tego kompaktowego laptopa biznesowego, model Lenovo ThinkPad X13 Gen 4nie jest jeszcze dostępny w wersji AMD. To wystarczający powód, by po raz ostatni przyjrzeć się starszemu wariantowi - być może warto będzie go kupić w nadchodzącej obniżce cen.
Ponieważ jest to aktualizacja istniejącej konstrukcji, nie będziemy tracić czasu na kolejny opis konstrukcji, urządzeń wejściowych i łączności. Szczegółowe informacje na te tematy można znaleźć w recenzji modelu ThinkPad X13 Gen 2.
Potencjalni konkurenci w porównaniu
Ocena | Data | Model | Waga | Wysokość | Rozmiar | Rezolucja | Cena |
|---|---|---|---|---|---|---|---|
| 90.6 % v7 (old) | 06/2023 | Lenovo ThinkPad X13 G3 21CM002UGE R5 PRO 6650U, Radeon 660M | 1.3 kg | 18.1 mm | 13.30" | 1920x1200 | |
| 90.6 % v7 (old) | Lenovo ThinkPad X13 G2 AMD 20XH001KGE R5 PRO 5650U, Vega 7 | 1.4 kg | 18.19 mm | 13.30" | 1920x1200 | ||
| 89.2 % v7 (old) | 01/2023 | HP EliteBook 835 G9 R7 PRO 6850U, Radeon 680M | 1.3 kg | 19.2 mm | 13.30" | 1920x1200 | |
| 89 % v7 (old) | Dell Latitude 13 7330 i7-1265U, Iris Xe G7 96EUs | 1 kg | 16.96 mm | 13.30" | 1920x1080 | ||
| 89.4 % v7 (old) | 11/2022 | Lenovo ThinkPad X13 G3 21BN0046GE i5-1235U, Iris Xe G7 80EUs | 1.3 kg | 18.9 mm | 13.30" | 1920x1200 |
Porównanie rozmiaru i wagi
Łączność
W porównaniu zLenovo ThinkPad X13 Gen 2 AMDwybór portów jest w zasadzie niezmieniony. Nowością jest dodanie USB4, co oznacza kompatybilność z Thunderbolt.
Komunikacja
Szczególnie słabe są szybkości transferu wysyłania Lenovo ThinkPad X13 G3 AMD, a raczej jego rozwiązania Qualcomm WiFi. Z drugiej strony szybkość pobierania jest bardzo dobra.
| Networking | |
| Lenovo ThinkPad X13 G3 21CM002UGE | |
| iperf3 transmit AXE11000 | |
| iperf3 receive AXE11000 | |
| iperf3 transmit AXE11000 6GHz | |
| iperf3 receive AXE11000 6GHz | |
| HP EliteBook 835 G9 | |
| iperf3 transmit AXE11000 | |
| iperf3 receive AXE11000 | |
| Dell Latitude 13 7330 | |
| iperf3 transmit AXE11000 6GHz | |
| iperf3 receive AXE11000 6GHz | |
| Lenovo ThinkPad X13 G3 21BN0046GE | |
| iperf3 transmit AXE11000 | |
| iperf3 receive AXE11000 | |
| Przeciętny Qualcomm WCN685x | |
| iperf3 transmit AXE11000 | |
| iperf3 receive AXE11000 | |
| iperf3 transmit AXE11000 6GHz | |
| iperf3 receive AXE11000 6GHz | |
Kamera internetowa
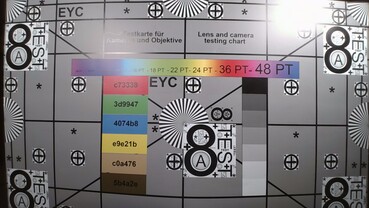
W porównaniu do Lenovo ThinkPad X13 Gen 2nie ma żadnych zmian w jakości kamery internetowej 1080p.

Wyświetlacz: jasność ekranu laptopa Lenovo mogłaby być lepsza
Wybór 13,3-calowych ekranów pozostaje niezmieniony w porównaniu do modelu 2022. Wszystkie dostępne ekrany mają matową powierzchnię, proporcje 16:10 i częstotliwość odświeżania 60 Hz:
- 1 920 x 1 200 (WUXGA), 300 cd/m², 72% NTSC
- 1 920 x 1 200 (WUXGA), 300 cd/m², 72 % NTSC, On-Cell Touch
- 1,920 x 1,200 (WUXGA), 500 cd/m², 72% NTSC, PrivacyGuard
- 2 560 x 1 600 (WQXGA), 400 cd/m², 100% sRGB, Low Power, Dolby Vision
Zmierzona średnia jasność 321 cd/m² jest nieco powyżej reklamowanego progu 300 cd/m². Godne uwagi: Konkurencja w postaci Della i HP oferuje znacznie jaśniejsze ekrany. Średnio 830 cd/m², jak w przypadku HP EliteBook 835 G9 nie jest tak naprawdę potrzebna na podstawowym panelu, ale byłoby miło, gdyby Lenovo przyznało X13 jaśniejsze ekrany - bez zmuszania użytkownika do aktualizacji do paneli WQXGA lub PrivacyGuard. 400 cd/m² plus X jakDell Latitude 7330byłoby rozsądne.
| |||||||||||||||||||||||||
rozświetlenie: 85 %
na akumulatorze: 348 cd/m²
kontrast: 1024:1 (czerń: 0.34 cd/m²)
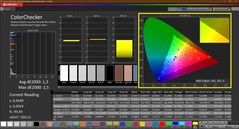
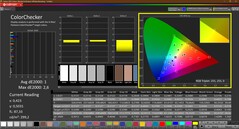
ΔE ColorChecker Calman: 1.3 | ∀{0.5-29.43 Ø4.77}
calibrated: 1
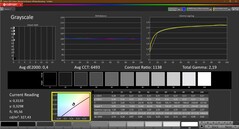
ΔE Greyscale Calman: 0.9 | ∀{0.09-98 Ø5}
70.3% AdobeRGB 1998 (Argyll 3D)
98.4% sRGB (Argyll 3D)
69% Display P3 (Argyll 3D)
Gamma: 2.16
CCT: 6431 K
| Lenovo ThinkPad X13 G3 21CM002UGE M133NW4J R3, IPS LED, 1920x1200, 13.3" | Lenovo ThinkPad X13 G2 AMD 20XH001KGE NV133WUM-N61, IPS LED, 1920x1200, 13.3" | HP EliteBook 835 G9 InfoVision X133NV4M R0, IPS, 1920x1200, 13.3" | Dell Latitude 13 7330 LG Philips 133WF9, IPS, 1920x1080, 13.3" | Lenovo ThinkPad X13 G3 21BN0046GE NV133WUM-N61, IPS Grade, 1920x1200, 13.3" | |
|---|---|---|---|---|---|
| Display | 1% | 2% | -4% | 1% | |
| Display P3 Coverage (%) | 69 | 70.1 2% | 70.7 2% | 66.1 -4% | 70.4 2% |
| sRGB Coverage (%) | 98.4 | 99.4 1% | 100 2% | 93.5 -5% | 99.8 1% |
| AdobeRGB 1998 Coverage (%) | 70.3 | 71.3 1% | 72.1 3% | 68.2 -3% | 71 1% |
| Response Times | 23% | 17% | -8% | 48% | |
| Response Time Grey 50% / Grey 80% * (ms) | 44.2 ? | 34 ? 23% | 37.7 ? 15% | 48.4 ? -10% | 22.9 ? 48% |
| Response Time Black / White * (ms) | 28.1 ? | 22 ? 22% | 22.7 ? 19% | 29.6 ? -5% | 14.8 ? 47% |
| PWM Frequency (Hz) | |||||
| Screen | -14% | 21% | -16% | -25% | |
| Brightness middle (cd/m²) | 348 | 309 -11% | 928 167% | 460.1 32% | 290 -17% |
| Brightness (cd/m²) | 321 | 297 -7% | 828 158% | 445 39% | 288 -10% |
| Brightness Distribution (%) | 85 | 81 -5% | 65 -24% | 89 5% | 88 4% |
| Black Level * (cd/m²) | 0.34 | 0.26 24% | 0.35 -3% | 0.31 9% | 0.21 38% |
| Contrast (:1) | 1024 | 1188 16% | 2651 159% | 1484 45% | 1381 35% |
| Colorchecker dE 2000 * | 1.3 | 1.6 -23% | 1.76 -35% | 2.42 -86% | 1.9 -46% |
| Colorchecker dE 2000 max. * | 2.5 | 3 -20% | 3.94 -58% | 3.97 -59% | 4 -60% |
| Colorchecker dE 2000 calibrated * | 1 | 0.8 20% | 1.09 -9% | 0.77 23% | 0.8 20% |
| Greyscale dE 2000 * | 0.9 | 2 -122% | 2.4 -167% | 2.3 -156% | 2.6 -189% |
| Gamma | 2.16 102% | 2.24 98% | 2.324 95% | 2.23 99% | 2.23 99% |
| CCT | 6431 101% | 6315 103% | 6689 97% | 6262 104% | 6195 105% |
| Całkowita średnia (program / ustawienia) | 3% /
-6% | 13% /
16% | -9% /
-13% | 8% /
-9% |
* ... im mniej tym lepiej
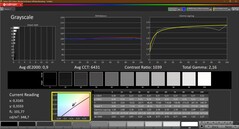
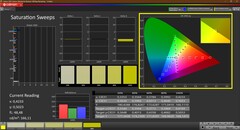
Panel jest już fabrycznie całkiem dobrze wyregulowany pod względem kolorów. Świadczy o tym niski średni deltaE wynoszący zaledwie 1,3, zmierzony za pomocą CalMan i kolorymetru X-Rite i1Pro 2. Po kalibracji za pomocą X-Rite i1Profiler, ekran staje się nieco bardziej dokładny pod względem kolorów (1,0 zamiast 1,3). Profil kolorów, który stworzyliśmy w tym celu, jest jak zawsze dostępny do pobrania za darmo.
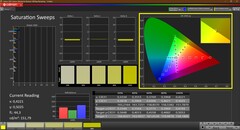
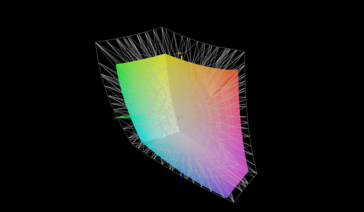
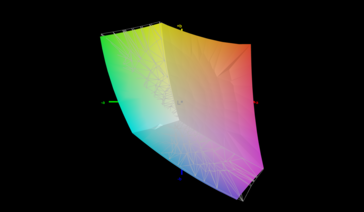
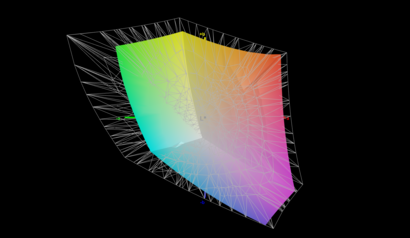
Jeśli chodzi o pokrycie gamy kolorów, panel Lenovo ThinkPad X13 G3 AMD prawie całkowicie pokrywa gamę kolorów sRGB. Nadaje się do podstawowych zadań związanych z edycją zdjęć.
Wyświetl czasy reakcji
| ↔ Czas reakcji od czerni do bieli | ||
|---|---|---|
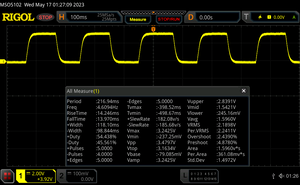
| 28.1 ms ... wzrost ↗ i spadek ↘ łącznie | ↗ 14.2 ms wzrost | |
| ↘ 13.9 ms upadek | ||
| W naszych testach ekran wykazuje stosunkowo powolne tempo reakcji i może być zbyt wolny dla graczy. Dla porównania, wszystkie testowane urządzenia wahają się od 0.1 (minimum) do 240 (maksimum) ms. » 74 % wszystkich urządzeń jest lepszych. Oznacza to, że zmierzony czas reakcji jest gorszy od średniej wszystkich testowanych urządzeń (20.1 ms). | ||
| ↔ Czas reakcji 50% szarości do 80% szarości | ||
| 44.2 ms ... wzrost ↗ i spadek ↘ łącznie | ↗ 20.7 ms wzrost | |
| ↘ 23.5 ms upadek | ||
| W naszych testach ekran wykazuje powolne tempo reakcji, co będzie niezadowalające dla graczy. Dla porównania, wszystkie testowane urządzenia wahają się od 0.165 (minimum) do 636 (maksimum) ms. » 75 % wszystkich urządzeń jest lepszych. Oznacza to, że zmierzony czas reakcji jest gorszy od średniej wszystkich testowanych urządzeń (31.5 ms). | ||
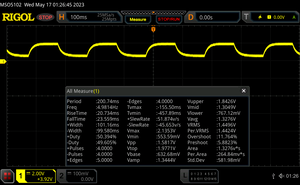
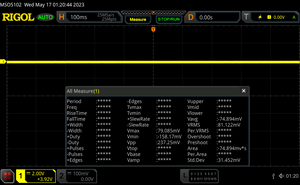
Migotanie ekranu / PWM (modulacja szerokości impulsu)
| Migotanie ekranu/nie wykryto PWM | |||
Dla porównania: 53 % wszystkich testowanych urządzeń nie używa PWM do przyciemniania wyświetlacza. Jeśli wykryto PWM, zmierzono średnio 8042 (minimum: 5 - maksimum: 343500) Hz. | |||
Wydajność: AMD Ryzen 5 zapewnia dobrą wydajność
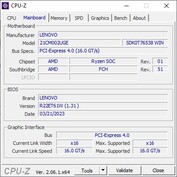
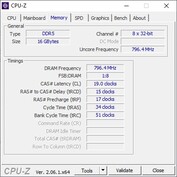
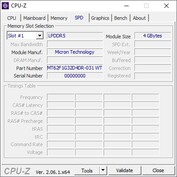
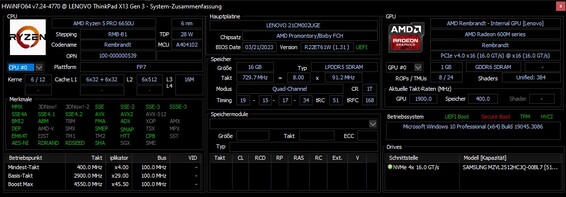
Lenovo sprzedaje ThinkPada X13 Gen 3 AMD z dwoma różnymi procesorami AMD, a dostępne opcje to AMD Ryzen 5 Pro 6650Ui Ryzen 7 Pro 6850U. W zależności od wybranego procesora, albo Radeon 660Mlub Radeon 680Msłużą jako rozwiązanie GPU. Pamięć RAM jest zawsze wlutowana, dostępne są warianty z 8, 16 lub 32 GB pamięci LPDDR5-6400. Nie przylutowany jest dysk SSD M.2 2280, Lenovo oferuje maksymalnie 2 TB pamięci SSD.
Warunki testowe
Jak zwykle w przypadku ThinkPadów Lenovo, nie ma zastrzeżonego oprogramowania OEM do zarządzania profilami zasilania. Zamiast tego, profile energetyczne systemu Windows są wykorzystywane do zarządzania limitami mocy (PL1 = wydajność przy stałym obciążeniu, PL2 = krótkotrwałe zwiększenie wydajności).
- Większa wydajność baterii: PL1 12 W / PL2 12 W
- Lepsza wydajność: PL1 17 W / PL2 25 W
- Najlepsza wydajność: PL1 22,5 W / PL2 30 W
Procesor
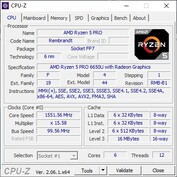
ProcesorAMD Ryzen 5 Pro 6650U to procesor U generacji Rembrandt, przeznaczony do kompaktowych laptopów biznesowych. Jako procesor "Pro", układ ten bezpośrednio konkuruje z procesorami vPro firmy Intel. Typowe TDP wynosi 15 W, procesor ma sześć rdzeni i dwanaście wątków. Kompleksowe porównania z innymi procesorami są możliwe dzięki naszemu Narzędzie do porównywania procesorów.
Wydajność ThinkPada X13 Gen 3 AMD jest nieco lepsza niż poprzednika. Modele oparte na procesorach Intel ThinkPad X13 G3 Intel iDell Latitude 7330oferują lepszą wydajność pojedynczego rdzenia i częściowo lepszą wydajność w trybie boost, ale bledną, jeśli chodzi o długotrwałe testy wielordzeniowe. Tymczasem HP EliteBook 835 G9 oferuje ogromny skok mocy, ale ten model jest wyposażony w ośmiordzeniowy układ AMD Ryzen 7 Pro 6850U, który jest również dostępny dla X13 Gen 3 AMD.
Wydajność procesora nie jest dławiona w trybie bateryjnym.
Cinebench R15 Multi sustained load
Cinebench R23: Multi Core | Single Core
Cinebench R20: CPU (Multi Core) | CPU (Single Core)
Cinebench R15: CPU Multi 64Bit | CPU Single 64Bit
Blender: v2.79 BMW27 CPU
7-Zip 18.03: 7z b 4 | 7z b 4 -mmt1
Geekbench 5.5: Multi-Core | Single-Core
HWBOT x265 Benchmark v2.2: 4k Preset
LibreOffice : 20 Documents To PDF
R Benchmark 2.5: Overall mean
| CPU Performance rating | |
| Średnia w klasie Subnotebook | |
| HP EliteBook 835 G9 | |
| Dell Latitude 13 7330 | |
| Przeciętny AMD Ryzen 5 PRO 6650U | |
| Lenovo ThinkPad X13 G3 21BN0046GE | |
| Lenovo ThinkPad X13 G3 21CM002UGE | |
| Lenovo ThinkPad X13 G2 AMD 20XH001KGE | |
| Cinebench R23 / Multi Core | |
| Średnia w klasie Subnotebook (1555 - 21812, n=71, ostatnie 2 lata) | |
| HP EliteBook 835 G9 | |
| Przeciętny AMD Ryzen 5 PRO 6650U (7805 - 9534, n=4) | |
| Dell Latitude 13 7330 | |
| Lenovo ThinkPad X13 G3 21CM002UGE | |
| Lenovo ThinkPad X13 G2 AMD 20XH001KGE | |
| Lenovo ThinkPad X13 G3 21BN0046GE | |
| Cinebench R23 / Single Core | |
| Dell Latitude 13 7330 | |
| Średnia w klasie Subnotebook (358 - 2165, n=72, ostatnie 2 lata) | |
| Lenovo ThinkPad X13 G3 21BN0046GE | |
| HP EliteBook 835 G9 | |
| Przeciętny AMD Ryzen 5 PRO 6650U (1439 - 1476, n=4) | |
| Lenovo ThinkPad X13 G3 21CM002UGE | |
| Lenovo ThinkPad X13 G2 AMD 20XH001KGE | |
| Cinebench R20 / CPU (Multi Core) | |
| Średnia w klasie Subnotebook (579 - 8541, n=66, ostatnie 2 lata) | |
| HP EliteBook 835 G9 | |
| Lenovo ThinkPad X13 G3 21BN0046GE | |
| Przeciętny AMD Ryzen 5 PRO 6650U (3057 - 3684, n=4) | |
| Dell Latitude 13 7330 | |
| Lenovo ThinkPad X13 G3 21CM002UGE | |
| Lenovo ThinkPad X13 G2 AMD 20XH001KGE | |
| Cinebench R20 / CPU (Single Core) | |
| Dell Latitude 13 7330 | |
| Lenovo ThinkPad X13 G3 21BN0046GE | |
| Średnia w klasie Subnotebook (128 - 826, n=66, ostatnie 2 lata) | |
| HP EliteBook 835 G9 | |
| Przeciętny AMD Ryzen 5 PRO 6650U (548 - 578, n=4) | |
| Lenovo ThinkPad X13 G3 21CM002UGE | |
| Lenovo ThinkPad X13 G2 AMD 20XH001KGE | |
| Cinebench R15 / CPU Multi 64Bit | |
| Średnia w klasie Subnotebook (327 - 3345, n=66, ostatnie 2 lata) | |
| HP EliteBook 835 G9 | |
| Przeciętny AMD Ryzen 5 PRO 6650U (1299 - 1555, n=4) | |
| Dell Latitude 13 7330 | |
| Lenovo ThinkPad X13 G3 21CM002UGE | |
| Lenovo ThinkPad X13 G2 AMD 20XH001KGE | |
| Lenovo ThinkPad X13 G3 21BN0046GE | |
| Cinebench R15 / CPU Single 64Bit | |
| Średnia w klasie Subnotebook (72.4 - 322, n=66, ostatnie 2 lata) | |
| Dell Latitude 13 7330 | |
| Przeciętny AMD Ryzen 5 PRO 6650U (230 - 234, n=4) | |
| Lenovo ThinkPad X13 G3 21CM002UGE | |
| HP EliteBook 835 G9 | |
| Lenovo ThinkPad X13 G2 AMD 20XH001KGE | |
| Lenovo ThinkPad X13 G3 21BN0046GE | |
| Blender / v2.79 BMW27 CPU | |
| Lenovo ThinkPad X13 G3 21CM002UGE | |
| Lenovo ThinkPad X13 G3 21CM002UGE | |
| Lenovo ThinkPad X13 G3 21BN0046GE | |
| Lenovo ThinkPad X13 G2 AMD 20XH001KGE | |
| Przeciętny AMD Ryzen 5 PRO 6650U (328 - 548, n=5) | |
| Dell Latitude 13 7330 | |
| Średnia w klasie Subnotebook (159 - 2271, n=69, ostatnie 2 lata) | |
| HP EliteBook 835 G9 | |
| 7-Zip 18.03 / 7z b 4 | |
| HP EliteBook 835 G9 | |
| Średnia w klasie Subnotebook (11668 - 77867, n=66, ostatnie 2 lata) | |
| Lenovo ThinkPad X13 G3 21BN0046GE | |
| Lenovo ThinkPad X13 G3 21CM002UGE | |
| Przeciętny AMD Ryzen 5 PRO 6650U (32613 - 41530, n=4) | |
| Lenovo ThinkPad X13 G2 AMD 20XH001KGE | |
| Dell Latitude 13 7330 | |
| 7-Zip 18.03 / 7z b 4 -mmt1 | |
| Dell Latitude 13 7330 | |
| HP EliteBook 835 G9 | |
| Średnia w klasie Subnotebook (2643 - 6442, n=68, ostatnie 2 lata) | |
| Przeciętny AMD Ryzen 5 PRO 6650U (5175 - 5427, n=4) | |
| Lenovo ThinkPad X13 G3 21BN0046GE | |
| Lenovo ThinkPad X13 G3 21CM002UGE | |
| Lenovo ThinkPad X13 G2 AMD 20XH001KGE | |
| Geekbench 5.5 / Multi-Core | |
| Średnia w klasie Subnotebook (2557 - 17218, n=61, ostatnie 2 lata) | |
| Lenovo ThinkPad X13 G3 21BN0046GE | |
| HP EliteBook 835 G9 | |
| Dell Latitude 13 7330 | |
| Przeciętny AMD Ryzen 5 PRO 6650U (6171 - 7227, n=4) | |
| Lenovo ThinkPad X13 G3 21CM002UGE | |
| Lenovo ThinkPad X13 G2 AMD 20XH001KGE | |
| Geekbench 5.5 / Single-Core | |
| Średnia w klasie Subnotebook (726 - 2350, n=61, ostatnie 2 lata) | |
| Dell Latitude 13 7330 | |
| HP EliteBook 835 G9 | |
| Lenovo ThinkPad X13 G3 21BN0046GE | |
| Przeciętny AMD Ryzen 5 PRO 6650U (1433 - 1487, n=4) | |
| Lenovo ThinkPad X13 G3 21CM002UGE | |
| Lenovo ThinkPad X13 G2 AMD 20XH001KGE | |
| HWBOT x265 Benchmark v2.2 / 4k Preset | |
| Średnia w klasie Subnotebook (0.97 - 25.1, n=66, ostatnie 2 lata) | |
| HP EliteBook 835 G9 | |
| Przeciętny AMD Ryzen 5 PRO 6650U (8.71 - 11.8, n=4) | |
| Lenovo ThinkPad X13 G3 21CM002UGE | |
| Dell Latitude 13 7330 | |
| Lenovo ThinkPad X13 G2 AMD 20XH001KGE | |
| Lenovo ThinkPad X13 G3 21BN0046GE | |
| LibreOffice / 20 Documents To PDF | |
| Lenovo ThinkPad X13 G3 21CM002UGE | |
| Przeciętny AMD Ryzen 5 PRO 6650U (50.3 - 63.2, n=4) | |
| HP EliteBook 835 G9 | |
| Średnia w klasie Subnotebook (38.5 - 220, n=65, ostatnie 2 lata) | |
| Lenovo ThinkPad X13 G2 AMD 20XH001KGE | |
| Dell Latitude 13 7330 | |
| Lenovo ThinkPad X13 G3 21BN0046GE | |
| R Benchmark 2.5 / Overall mean | |
| Lenovo ThinkPad X13 G3 21CM002UGE | |
| Lenovo ThinkPad X13 G2 AMD 20XH001KGE | |
| Przeciętny AMD Ryzen 5 PRO 6650U (0.521 - 0.59, n=4) | |
| Średnia w klasie Subnotebook (0.403 - 1.456, n=67, ostatnie 2 lata) | |
| Lenovo ThinkPad X13 G3 21BN0046GE | |
| HP EliteBook 835 G9 | |
| Dell Latitude 13 7330 | |
* ... im mniej tym lepiej
AIDA64: FP32 Ray-Trace | FPU Julia | CPU SHA3 | CPU Queen | FPU SinJulia | FPU Mandel | CPU AES | CPU ZLib | FP64 Ray-Trace | CPU PhotoWorxx
| Performance rating | |
| Średnia w klasie Subnotebook | |
| HP EliteBook 835 G9 | |
| Przeciętny AMD Ryzen 5 PRO 6650U | |
| Lenovo ThinkPad X13 G2 AMD 20XH001KGE | |
| Lenovo ThinkPad X13 G3 21CM002UGE | |
| Lenovo ThinkPad X13 G3 21BN0046GE | |
| Dell Latitude 13 7330 | |
| AIDA64 / FP32 Ray-Trace | |
| Średnia w klasie Subnotebook (1135 - 32888, n=65, ostatnie 2 lata) | |
| HP EliteBook 835 G9 | |
| Przeciętny AMD Ryzen 5 PRO 6650U (8854 - 10630, n=4) | |
| Lenovo ThinkPad X13 G3 21CM002UGE | |
| Lenovo ThinkPad X13 G2 AMD 20XH001KGE | |
| Lenovo ThinkPad X13 G3 21BN0046GE | |
| Dell Latitude 13 7330 | |
| AIDA64 / FPU Julia | |
| HP EliteBook 835 G9 | |
| Średnia w klasie Subnotebook (5218 - 123315, n=65, ostatnie 2 lata) | |
| Przeciętny AMD Ryzen 5 PRO 6650U (56214 - 68106, n=4) | |
| Lenovo ThinkPad X13 G3 21CM002UGE | |
| Lenovo ThinkPad X13 G2 AMD 20XH001KGE | |
| Lenovo ThinkPad X13 G3 21BN0046GE | |
| Dell Latitude 13 7330 | |
| AIDA64 / CPU SHA3 | |
| Średnia w klasie Subnotebook (444 - 5287, n=65, ostatnie 2 lata) | |
| HP EliteBook 835 G9 | |
| Przeciętny AMD Ryzen 5 PRO 6650U (1881 - 2326, n=4) | |
| Lenovo ThinkPad X13 G3 21BN0046GE | |
| Dell Latitude 13 7330 | |
| Lenovo ThinkPad X13 G3 21CM002UGE | |
| Lenovo ThinkPad X13 G2 AMD 20XH001KGE | |
| AIDA64 / CPU Queen | |
| HP EliteBook 835 G9 | |
| Przeciętny AMD Ryzen 5 PRO 6650U (69023 - 78797, n=4) | |
| Lenovo ThinkPad X13 G3 21CM002UGE | |
| Lenovo ThinkPad X13 G2 AMD 20XH001KGE | |
| Średnia w klasie Subnotebook (10579 - 115682, n=65, ostatnie 2 lata) | |
| Dell Latitude 13 7330 | |
| Lenovo ThinkPad X13 G3 21BN0046GE | |
| AIDA64 / FPU SinJulia | |
| HP EliteBook 835 G9 | |
| Przeciętny AMD Ryzen 5 PRO 6650U (8320 - 9488, n=4) | |
| Lenovo ThinkPad X13 G3 21CM002UGE | |
| Lenovo ThinkPad X13 G2 AMD 20XH001KGE | |
| Średnia w klasie Subnotebook (744 - 18418, n=65, ostatnie 2 lata) | |
| Lenovo ThinkPad X13 G3 21BN0046GE | |
| Dell Latitude 13 7330 | |
| AIDA64 / FPU Mandel | |
| HP EliteBook 835 G9 | |
| Przeciętny AMD Ryzen 5 PRO 6650U (30969 - 37461, n=4) | |
| Średnia w klasie Subnotebook (3341 - 65433, n=65, ostatnie 2 lata) | |
| Lenovo ThinkPad X13 G3 21CM002UGE | |
| Lenovo ThinkPad X13 G2 AMD 20XH001KGE | |
| Lenovo ThinkPad X13 G3 21BN0046GE | |
| Dell Latitude 13 7330 | |
| AIDA64 / CPU AES | |
| Lenovo ThinkPad X13 G2 AMD 20XH001KGE | |
| Średnia w klasie Subnotebook (638 - 124284, n=65, ostatnie 2 lata) | |
| Przeciętny AMD Ryzen 5 PRO 6650U (37259 - 93914, n=4) | |
| HP EliteBook 835 G9 | |
| Lenovo ThinkPad X13 G3 21BN0046GE | |
| Dell Latitude 13 7330 | |
| Lenovo ThinkPad X13 G3 21CM002UGE | |
| AIDA64 / CPU ZLib | |
| Średnia w klasie Subnotebook (164.9 - 1379, n=65, ostatnie 2 lata) | |
| HP EliteBook 835 G9 | |
| Lenovo ThinkPad X13 G3 21BN0046GE | |
| Dell Latitude 13 7330 | |
| Przeciętny AMD Ryzen 5 PRO 6650U (504 - 602, n=4) | |
| Lenovo ThinkPad X13 G3 21CM002UGE | |
| Lenovo ThinkPad X13 G2 AMD 20XH001KGE | |
| AIDA64 / FP64 Ray-Trace | |
| Średnia w klasie Subnotebook (610 - 17495, n=65, ostatnie 2 lata) | |
| HP EliteBook 835 G9 | |
| Przeciętny AMD Ryzen 5 PRO 6650U (4620 - 5468, n=4) | |
| Lenovo ThinkPad X13 G3 21CM002UGE | |
| Lenovo ThinkPad X13 G2 AMD 20XH001KGE | |
| Lenovo ThinkPad X13 G3 21BN0046GE | |
| Dell Latitude 13 7330 | |
| AIDA64 / CPU PhotoWorxx | |
| Średnia w klasie Subnotebook (6569 - 64588, n=65, ostatnie 2 lata) | |
| Lenovo ThinkPad X13 G3 21BN0046GE | |
| HP EliteBook 835 G9 | |
| Lenovo ThinkPad X13 G3 21CM002UGE | |
| Przeciętny AMD Ryzen 5 PRO 6650U (19643 - 26137, n=4) | |
| Dell Latitude 13 7330 | |
| Lenovo ThinkPad X13 G2 AMD 20XH001KGE | |
Wydajność systemu
Jeśli chodzi o wydajność systemu, model AMD jest lepszy niż jego wariant Intel. W codziennym użytkowaniu wydajność jest bardzo dobra.
CrossMark: Overall | Productivity | Creativity | Responsiveness
| PCMark 10 / Score | |
| Średnia w klasie Subnotebook (4920 - 8424, n=53, ostatnie 2 lata) | |
| HP EliteBook 835 G9 | |
| Lenovo ThinkPad X13 G2 AMD 20XH001KGE | |
| Przeciętny AMD Ryzen 5 PRO 6650U, AMD Radeon 660M (5513 - 5958, n=4) | |
| Lenovo ThinkPad X13 G3 21CM002UGE | |
| Dell Latitude 13 7330 | |
| Lenovo ThinkPad X13 G3 21BN0046GE | |
| PCMark 10 / Essentials | |
| Dell Latitude 13 7330 | |
| Średnia w klasie Subnotebook (8552 - 11406, n=53, ostatnie 2 lata) | |
| Lenovo ThinkPad X13 G2 AMD 20XH001KGE | |
| HP EliteBook 835 G9 | |
| Lenovo ThinkPad X13 G3 21CM002UGE | |
| Przeciętny AMD Ryzen 5 PRO 6650U, AMD Radeon 660M (9578 - 9982, n=4) | |
| Lenovo ThinkPad X13 G3 21BN0046GE | |
| PCMark 10 / Productivity | |
| Średnia w klasie Subnotebook (5435 - 16132, n=53, ostatnie 2 lata) | |
| Lenovo ThinkPad X13 G2 AMD 20XH001KGE | |
| HP EliteBook 835 G9 | |
| Przeciętny AMD Ryzen 5 PRO 6650U, AMD Radeon 660M (7848 - 9094, n=4) | |
| Lenovo ThinkPad X13 G3 21CM002UGE | |
| Dell Latitude 13 7330 | |
| Lenovo ThinkPad X13 G3 21BN0046GE | |
| PCMark 10 / Digital Content Creation | |
| Średnia w klasie Subnotebook (5722 - 12442, n=53, ostatnie 2 lata) | |
| HP EliteBook 835 G9 | |
| Przeciętny AMD Ryzen 5 PRO 6650U, AMD Radeon 660M (5837 - 6447, n=4) | |
| Lenovo ThinkPad X13 G3 21CM002UGE | |
| Lenovo ThinkPad X13 G2 AMD 20XH001KGE | |
| Dell Latitude 13 7330 | |
| Lenovo ThinkPad X13 G3 21BN0046GE | |
| CrossMark / Overall | |
| Średnia w klasie Subnotebook (365 - 2038, n=66, ostatnie 2 lata) | |
| Dell Latitude 13 7330 | |
| HP EliteBook 835 G9 | |
| Przeciętny AMD Ryzen 5 PRO 6650U, AMD Radeon 660M (1338 - 1432, n=3) | |
| Lenovo ThinkPad X13 G3 21BN0046GE | |
| Lenovo ThinkPad X13 G3 21CM002UGE | |
| CrossMark / Productivity | |
| Średnia w klasie Subnotebook (364 - 1918, n=66, ostatnie 2 lata) | |
| Dell Latitude 13 7330 | |
| HP EliteBook 835 G9 | |
| Przeciętny AMD Ryzen 5 PRO 6650U, AMD Radeon 660M (1366 - 1440, n=3) | |
| Lenovo ThinkPad X13 G3 21CM002UGE | |
| Lenovo ThinkPad X13 G3 21BN0046GE | |
| CrossMark / Creativity | |
| Średnia w klasie Subnotebook (372 - 2396, n=66, ostatnie 2 lata) | |
| Dell Latitude 13 7330 | |
| Lenovo ThinkPad X13 G3 21BN0046GE | |
| Przeciętny AMD Ryzen 5 PRO 6650U, AMD Radeon 660M (1397 - 1517, n=3) | |
| HP EliteBook 835 G9 | |
| Lenovo ThinkPad X13 G3 21CM002UGE | |
| CrossMark / Responsiveness | |
| Średnia w klasie Subnotebook (312 - 1889, n=66, ostatnie 2 lata) | |
| Lenovo ThinkPad X13 G3 21BN0046GE | |
| Dell Latitude 13 7330 | |
| HP EliteBook 835 G9 | |
| Przeciętny AMD Ryzen 5 PRO 6650U, AMD Radeon 660M (1106 - 1229, n=3) | |
| Lenovo ThinkPad X13 G3 21CM002UGE | |
| PCMark 10 Score | 5685 pkt. | |
Pomoc | ||
| AIDA64 / Memory Copy | |
| Średnia w klasie Subnotebook (14554 - 109035, n=65, ostatnie 2 lata) | |
| Lenovo ThinkPad X13 G3 21BN0046GE | |
| Lenovo ThinkPad X13 G3 21CM002UGE | |
| HP EliteBook 835 G9 | |
| Przeciętny AMD Ryzen 5 PRO 6650U (31014 - 48558, n=4) | |
| Dell Latitude 13 7330 | |
| Lenovo ThinkPad X13 G2 AMD 20XH001KGE | |
| AIDA64 / Memory Read | |
| Średnia w klasie Subnotebook (15948 - 127174, n=65, ostatnie 2 lata) | |
| Lenovo ThinkPad X13 G3 21BN0046GE | |
| HP EliteBook 835 G9 | |
| Dell Latitude 13 7330 | |
| Lenovo ThinkPad X13 G3 21CM002UGE | |
| Przeciętny AMD Ryzen 5 PRO 6650U (34690 - 39833, n=4) | |
| Lenovo ThinkPad X13 G2 AMD 20XH001KGE | |
| AIDA64 / Memory Write | |
| Średnia w klasie Subnotebook (15709 - 117898, n=65, ostatnie 2 lata) | |
| Lenovo ThinkPad X13 G3 21BN0046GE | |
| Lenovo ThinkPad X13 G3 21CM002UGE | |
| HP EliteBook 835 G9 | |
| Przeciętny AMD Ryzen 5 PRO 6650U (34563 - 51117, n=4) | |
| Dell Latitude 13 7330 | |
| Lenovo ThinkPad X13 G2 AMD 20XH001KGE | |
| AIDA64 / Memory Latency | |
| Lenovo ThinkPad X13 G3 21CM002UGE | |
| Przeciętny AMD Ryzen 5 PRO 6650U (91.6 - 126.5, n=4) | |
| Lenovo ThinkPad X13 G2 AMD 20XH001KGE | |
| Średnia w klasie Subnotebook (6.8 - 187.8, n=64, ostatnie 2 lata) | |
| HP EliteBook 835 G9 | |
| Lenovo ThinkPad X13 G3 21BN0046GE | |
| Dell Latitude 13 7330 | |
* ... im mniej tym lepiej
Opóźnienie DPC
| DPC Latencies / LatencyMon - interrupt to process latency (max), Web, Youtube, Prime95 | |
| Lenovo ThinkPad X13 G2 AMD 20XH001KGE | |
| Lenovo ThinkPad X13 G3 21BN0046GE | |
| HP EliteBook 835 G9 | |
| Dell Latitude 13 7330 | |
| Lenovo ThinkPad X13 G3 21CM002UGE | |
* ... im mniej tym lepiej
Przechowywanie
Dysk SSD M.2 2280 w Lenovo ThinkPad X13 G3 AMD pochodzi od firmy Samsung. PM9A1 ma pojemność 512 GB i jest podłączony za pośrednictwem standardu NVMe PCIe 4.0. Ten dysk SSD mógłby być jeszcze szybszy, ale i tak działa szybciej w X13 G3 w porównaniu z dyskami SSD w porównywanych urządzeniach.
| Drive Performance rating - Percent | |
| Przeciętny Samsung PM9A1 MZVL2512HCJQ | |
| Lenovo ThinkPad X13 G3 21BN0046GE | |
| Średnia w klasie Subnotebook | |
| Lenovo ThinkPad X13 G3 21CM002UGE | |
| HP EliteBook 835 G9 | |
| Lenovo ThinkPad X13 G2 AMD 20XH001KGE | |
| Dell Latitude 13 7330 | |
* ... im mniej tym lepiej
Sustained load read: DiskSpd Read Loop, Queue Depth 8
Karta graficzna
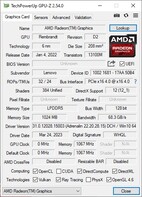
Karta graficznaAMD Radeon 660M to standardowe rozwiązanie graficzne klasy Ryzen 5. Jako zintegrowany GPU, Radeon 660M nie ma własnej pamięci, musi polegać na głównej pamięci systemowej. Logiczny wniosek: wydajność GPU zależy od szybkości pamięci RAM i tego, czy działa ona w trybie jedno- czy dwukanałowym.
W ThinkPadzie X13 G3 AMD, iGPU może polegać na szybkiej pamięci LPDDR5-6400, która działa w trybie dwukanałowym. Są to prawie idealne warunki, a ThinkPad X13 Gen 3 znacznie wyprzedza modele Intela z i5 i własnym poprzednikiem. Ponownie HP EliteBook 835 G9z mocniejszym Radeonem 680M wyprzedza ThinkPada.
Ten biznesowy laptop nie jest stworzony do grania, aczkolwiek ostatnie gry są nadal grywalne - na niskich ustawieniach.
Podobnie jak CPU, GPU zapewnia 100 procent swojej wydajności w trybie bateryjnym.
| 3DMark Performance rating - Percent | |
| Średnia w klasie Subnotebook | |
| HP EliteBook 835 G9 | |
| Lenovo ThinkPad X13 G3 21CM002UGE | |
| Przeciętny AMD Radeon 660M | |
| Dell Latitude 13 7330 | |
| Lenovo ThinkPad X13 G3 21BN0046GE | |
| Lenovo ThinkPad X13 G2 AMD 20XH001KGE -1! | |
| 3DMark 11 - 1280x720 Performance GPU | |
| Średnia w klasie Subnotebook (995 - 16296, n=63, ostatnie 2 lata) | |
| HP EliteBook 835 G9 | |
| Lenovo ThinkPad X13 G3 21CM002UGE | |
| Przeciętny AMD Radeon 660M (4636 - 7184, n=12) | |
| Dell Latitude 13 7330 | |
| Lenovo ThinkPad X13 G2 AMD 20XH001KGE | |
| Lenovo ThinkPad X13 G3 21BN0046GE | |
| 3DMark | |
| 1280x720 Cloud Gate Standard Graphics | |
| Średnia w klasie Subnotebook (5577 - 61591, n=28, ostatnie 2 lata) | |
| HP EliteBook 835 G9 | |
| Lenovo ThinkPad X13 G3 21CM002UGE | |
| Przeciętny AMD Radeon 660M (21857 - 33949, n=11) | |
| Dell Latitude 13 7330 | |
| Lenovo ThinkPad X13 G3 21BN0046GE | |
| 1920x1080 Fire Strike Graphics | |
| Średnia w klasie Subnotebook (832 - 10333, n=65, ostatnie 2 lata) | |
| HP EliteBook 835 G9 | |
| Lenovo ThinkPad X13 G3 21CM002UGE | |
| Przeciętny AMD Radeon 660M (3447 - 4993, n=12) | |
| Lenovo ThinkPad X13 G3 21BN0046GE | |
| Dell Latitude 13 7330 | |
| Lenovo ThinkPad X13 G2 AMD 20XH001KGE | |
| 2560x1440 Time Spy Graphics | |
| Średnia w klasie Subnotebook (804 - 4288, n=64, ostatnie 2 lata) | |
| HP EliteBook 835 G9 | |
| Lenovo ThinkPad X13 G3 21CM002UGE | |
| Przeciętny AMD Radeon 660M (1016 - 1588, n=12) | |
| Dell Latitude 13 7330 | |
| Lenovo ThinkPad X13 G3 21BN0046GE | |
| Lenovo ThinkPad X13 G2 AMD 20XH001KGE | |
| 3DMark 11 Performance | 7067 pkt. | |
| 3DMark Cloud Gate Standard Score | 21798 pkt. | |
| 3DMark Fire Strike Score | 4472 pkt. | |
| 3DMark Time Spy Score | 1729 pkt. | |
Pomoc | ||
| Blender | |
| v3.3 Classroom HIP/AMD | |
| Przeciętny AMD Radeon 660M (438 - 755, n=8) | |
| Lenovo ThinkPad X13 G3 21CM002UGE | |
| HP EliteBook 835 G9 | |
| v3.3 Classroom CPU | |
| Lenovo ThinkPad X13 G3 21CM002UGE | |
| Dell Latitude 13 7330 | |
| Lenovo ThinkPad X13 G3 21BN0046GE | |
| Przeciętny AMD Radeon 660M (323 - 968, n=12) | |
| Średnia w klasie Subnotebook (241 - 861, n=68, ostatnie 2 lata) | |
| HP EliteBook 835 G9 | |
* ... im mniej tym lepiej
| Performance rating - Percent | |
| Średnia w klasie Subnotebook | |
| HP EliteBook 835 G9 | |
| Lenovo ThinkPad X13 G2 AMD 20XH001KGE -2! | |
| Lenovo ThinkPad X13 G3 21CM002UGE | |
| Lenovo ThinkPad X13 G3 21BN0046GE | |
| Dell Latitude 13 7330 | |
| The Witcher 3 - 1920x1080 Ultra Graphics & Postprocessing (HBAO+) | |
| Średnia w klasie Subnotebook (13.9 - 34.6, n=27, ostatnie 2 lata) | |
| HP EliteBook 835 G9 | |
| Lenovo ThinkPad X13 G3 21CM002UGE | |
| Dell Latitude 13 7330 | |
| Lenovo ThinkPad X13 G3 21BN0046GE | |
| GTA V - 1920x1080 Highest AA:4xMSAA + FX AF:16x | |
| Średnia w klasie Subnotebook (9.97 - 32.7, n=63, ostatnie 2 lata) | |
| HP EliteBook 835 G9 | |
| Lenovo ThinkPad X13 G3 21CM002UGE | |
| Lenovo ThinkPad X13 G2 AMD 20XH001KGE | |
| Lenovo ThinkPad X13 G3 21BN0046GE | |
| Dell Latitude 13 7330 | |
| Final Fantasy XV Benchmark - 1920x1080 High Quality | |
| Średnia w klasie Subnotebook (11.6 - 37.2, n=66, ostatnie 2 lata) | |
| HP EliteBook 835 G9 | |
| Lenovo ThinkPad X13 G3 21BN0046GE | |
| Lenovo ThinkPad X13 G3 21CM002UGE | |
| Dell Latitude 13 7330 | |
| Strange Brigade - 1920x1080 ultra AA:ultra AF:16 | |
| Średnia w klasie Subnotebook (19 - 60.6, n=61, ostatnie 2 lata) | |
| HP EliteBook 835 G9 | |
| Lenovo ThinkPad X13 G3 21CM002UGE | |
| Lenovo ThinkPad X13 G2 AMD 20XH001KGE | |
| Dell Latitude 13 7330 | |
| Lenovo ThinkPad X13 G3 21BN0046GE | |
| Dota 2 Reborn - 1920x1080 ultra (3/3) best looking | |
| Średnia w klasie Subnotebook (13 - 94.9, n=70, ostatnie 2 lata) | |
| HP EliteBook 835 G9 | |
| Lenovo ThinkPad X13 G2 AMD 20XH001KGE | |
| Dell Latitude 13 7330 | |
| Lenovo ThinkPad X13 G3 21BN0046GE | |
| Lenovo ThinkPad X13 G3 21CM002UGE | |
| X-Plane 11.11 - 1920x1080 high (fps_test=3) | |
| HP EliteBook 835 G9 | |
| Średnia w klasie Subnotebook (20.7 - 49.5, n=59, ostatnie 2 lata) | |
| Dell Latitude 13 7330 | |
| Lenovo ThinkPad X13 G3 21BN0046GE | |
| Lenovo ThinkPad X13 G2 AMD 20XH001KGE | |
| Lenovo ThinkPad X13 G3 21CM002UGE | |
Witcher 3 FPS graph
| low | med. | high | ultra | |
|---|---|---|---|---|
| GTA V (2015) | 118.8 | 103.2 | 36.4 | 14.2 |
| The Witcher 3 (2015) | 86.7 | 27.6 | 17.9 | |
| Dota 2 Reborn (2015) | 93.7 | 72.2 | 37.4 | 32.8 |
| Final Fantasy XV Benchmark (2018) | 45.5 | 21.9 | 16 | |
| X-Plane 11.11 (2018) | 36 | 24.2 | 22.1 | |
| Strange Brigade (2018) | 99.5 | 40 | 31.5 | 26.7 |
| F1 22 (2022) | 42.4 | 37 | 26.2 | 5.13 |
Emisje: ThinkPad X13 jest chłodny i cichy
Hałas
Lenovo ThinkPad X13 G3 AMD to raczej cichy laptop. W prawie każdym przypadku jest mniej hałaśliwy niż konkurencja. Należy jednak zauważyć, że bezpośredni poprzednik X13 Gen 2 AMDbył jeszcze mniej hałaśliwy.
Podczas korzystania z ThinkPada wykryliśmy słaby syczący hałas, ale był on zauważalny tylko wtedy, gdy trzymaliśmy ucho bezpośrednio nad klawiaturą. Wrażliwe uszy mogą jednak nadal przeszkadzać.
Hałas
| luz |
| 23.1 / 23.1 / 23.1 dB |
| obciążenie |
| 27 / 35.5 dB |
 | ||
30 dB cichy 40 dB(A) słyszalny 50 dB(A) irytujący |
||
min: | ||
| Lenovo ThinkPad X13 G3 21CM002UGE Radeon 660M, R5 PRO 6650U, Samsung PM9A1 MZVL2512HCJQ | Lenovo ThinkPad X13 G2 AMD 20XH001KGE Vega 7, R5 PRO 5650U, Samsung SSD PM981a MZVLB512HBJQ | HP EliteBook 835 G9 Radeon 680M, R7 PRO 6850U, Kioxia BG5 KBG50ZNV512G | Dell Latitude 13 7330 Iris Xe G7 96EUs, i7-1265U, Toshiba KBG40ZNS512G NVMe | Lenovo ThinkPad X13 G3 21BN0046GE Iris Xe G7 80EUs, i5-1235U, SK Hynix HFS512 GDE9X081N | |
|---|---|---|---|---|---|
| Noise | -3% | -13% | -9% | -4% | |
| wyłączone / środowisko * (dB) | 23.1 | 24.17 -5% | 26 -13% | 23.4 -1% | 24.6 -6% |
| Idle Minimum * (dB) | 23.1 | 24.17 -5% | 26 -13% | 23.4 -1% | 24.6 -6% |
| Idle Average * (dB) | 23.1 | 24.17 -5% | 27 -17% | 23.4 -1% | 24.6 -6% |
| Idle Maximum * (dB) | 23.1 | 24.17 -5% | 28 -21% | 23.4 -1% | 25.9 -12% |
| Load Average * (dB) | 27 | 29.92 -11% | 35 -30% | 37.8 -40% | 30.7 -14% |
| Witcher 3 ultra * (dB) | 38.7 | 37 4% | 39.2 -1% | 34.6 11% | |
| Load Maximum * (dB) | 35.5 | 31.52 11% | 37 -4% | 43 -21% | 34.6 3% |
* ... im mniej tym lepiej
Ciepło
Lenovo ThinkPad X13 Gen 3 nie nagrzewa się zbytnio. Nawet przy pełnym obciążeniu temperatura obudowy ledwo przekracza 40 stopni Celsjusza / 100 stopni Fahrenheita.
Podczas testu obciążeniowego procesor może utrzymać zużycie energii na poziomie 20 W. Nie wykryliśmy dławienia.
(+) Maksymalna temperatura w górnej części wynosi 38.1 °C / 101 F, w porównaniu do średniej 35.9 °C / 97 F , począwszy od 21.4 do 59 °C dla klasy Subnotebook.
(±) Dno nagrzewa się maksymalnie do 40.1 °C / 104 F, w porównaniu do średniej 39.3 °C / 103 F
(+) W stanie bezczynności średnia temperatura górnej części wynosi 30.9 °C / 88 F, w porównaniu ze średnią temperaturą urządzenia wynoszącą 30.8 °C / ### class_avg_f### F.
(±) Podczas gry w Wiedźmina 3 średnia temperatura górnej części wynosi 34.3 °C / 94 F, w porównaniu do średniej temperatury urządzenia wynoszącej 30.8 °C / ## #class_avg_f### F.
(+) Podpórki pod nadgarstki i touchpad są chłodniejsze niż temperatura skóry i maksymalnie 31.6 °C / 88.9 F i dlatego są chłodne w dotyku.
(-) Średnia temperatura obszaru podparcia dłoni w podobnych urządzeniach wynosiła 28.2 °C / 82.8 F (-3.4 °C / -6.1 F).
| Lenovo ThinkPad X13 G3 21CM002UGE AMD Ryzen 5 PRO 6650U, AMD Radeon 660M | Lenovo ThinkPad X13 G2 AMD 20XH001KGE AMD Ryzen 5 PRO 5650U, AMD Radeon RX Vega 7 | HP EliteBook 835 G9 AMD Ryzen 7 PRO 6850U, AMD Radeon 680M | Dell Latitude 13 7330 Intel Core i7-1265U, Intel Iris Xe Graphics G7 96EUs | Lenovo ThinkPad X13 G3 21BN0046GE Intel Core i5-1235U, Intel Iris Xe Graphics G7 80EUs | |
|---|---|---|---|---|---|
| Heat | 9% | 4% | 12% | -4% | |
| Maximum Upper Side * (°C) | 38.1 | 43.7 -15% | 46 -21% | 38.6 -1% | 45.3 -19% |
| Maximum Bottom * (°C) | 40.1 | 38 5% | 49 -22% | 42 -5% | 41.8 -4% |
| Idle Upper Side * (°C) | 33.6 | 25.8 23% | 24 29% | 23.8 29% | 31.6 6% |
| Idle Bottom * (°C) | 33.4 | 26.2 22% | 24 28% | 24.6 26% | 32.6 2% |
* ... im mniej tym lepiej
Głośniki
Głośniki skierowane w stronę użytkownika emitują dźwięk średniej jakości, bez podstawy - tylko w wyższej części spektrum fal dźwiękowych dźwięk jest zrównoważony. GłośnikiHP EliteBook 835 G9są niewiele lepsze, ale przynajmniej nieco głośniejsze.
Lenovo ThinkPad X13 G3 21CM002UGE analiza dźwięku
(±) | głośność głośnika jest średnia, ale dobra (76.1 dB)
Bas 100 - 315 Hz
(-) | prawie brak basu - średnio 24% niższa od mediany
(±) | liniowość basu jest średnia (14.2% delta do poprzedniej częstotliwości)
Średnie 400 - 2000 Hz
(+) | zbalansowane środki średnie - tylko 2.9% od mediany
(+) | średnie są liniowe (2.8% delta do poprzedniej częstotliwości)
Wysokie 2–16 kHz
(+) | zrównoważone maksima - tylko 2.7% od mediany
(+) | wzloty są liniowe (3.9% delta do poprzedniej częstotliwości)
Ogólnie 100 - 16.000 Hz
(±) | liniowość ogólnego dźwięku jest średnia (19.3% różnicy w stosunku do mediany)
W porównaniu do tej samej klasy
» 59% wszystkich testowanych urządzeń w tej klasie było lepszych, 7% podobnych, 35% gorszych
» Najlepszy miał deltę 5%, średnia wynosiła ###średnia###%, najgorsza wynosiła 53%
W porównaniu do wszystkich testowanych urządzeń
» 46% wszystkich testowanych urządzeń było lepszych, 8% podobnych, 46% gorszych
» Najlepszy miał deltę 4%, średnia wynosiła ###średnia###%, najgorsza wynosiła 134%
HP EliteBook 835 G9 analiza dźwięku
(±) | głośność głośnika jest średnia, ale dobra (79 dB)
Bas 100 - 315 Hz
(-) | prawie brak basu - średnio 17.8% niższa od mediany
(±) | liniowość basu jest średnia (11.2% delta do poprzedniej częstotliwości)
Średnie 400 - 2000 Hz
(+) | zbalansowane środki średnie - tylko 1.7% od mediany
(+) | średnie są liniowe (3.2% delta do poprzedniej częstotliwości)
Wysokie 2–16 kHz
(+) | zrównoważone maksima - tylko 3.2% od mediany
(±) | liniowość wysokich wartości jest średnia (8% delta do poprzedniej częstotliwości)
Ogólnie 100 - 16.000 Hz
(+) | ogólny dźwięk jest liniowy (14.7% różnicy w stosunku do mediany)
W porównaniu do tej samej klasy
» 30% wszystkich testowanych urządzeń w tej klasie było lepszych, 5% podobnych, 65% gorszych
» Najlepszy miał deltę 5%, średnia wynosiła ###średnia###%, najgorsza wynosiła 53%
W porównaniu do wszystkich testowanych urządzeń
» 19% wszystkich testowanych urządzeń było lepszych, 4% podobnych, 77% gorszych
» Najlepszy miał deltę 4%, średnia wynosiła ###średnia###%, najgorsza wynosiła 134%
Zarządzanie energią: wydajny Lenovo ThinkPad
Zużycie energii
Laptop Lenovo może pochwalić się dość niskim zużyciem energii, wszystkie recenzowane urządzenia działają średnio mniej wydajnie. Szczególnie na biegu jałowym różnica jest istotna. W tym obszarzeHP EliteBook 835 G9wypada wyraźnie gorzej.
Maksymalny pobór mocy na poziomie 49,1 W mieści się w granicach możliwości ładowarki 65 W.
| wyłączony / stan wstrzymania | |
| luz | |
| obciążenie |
|
Legenda:
min: | |
| Lenovo ThinkPad X13 G3 21CM002UGE R5 PRO 6650U, Radeon 660M, Samsung PM9A1 MZVL2512HCJQ, IPS LED, 1920x1200, 13.3" | Lenovo ThinkPad X13 G2 AMD 20XH001KGE R5 PRO 5650U, Vega 7, Samsung SSD PM981a MZVLB512HBJQ, IPS LED, 1920x1200, 13.3" | HP EliteBook 835 G9 R7 PRO 6850U, Radeon 680M, Kioxia BG5 KBG50ZNV512G, IPS, 1920x1200, 13.3" | Dell Latitude 13 7330 i7-1265U, Iris Xe G7 96EUs, Toshiba KBG40ZNS512G NVMe, IPS, 1920x1080, 13.3" | Lenovo ThinkPad X13 G3 21BN0046GE i5-1235U, Iris Xe G7 80EUs, SK Hynix HFS512 GDE9X081N, IPS Grade, 1920x1200, 13.3" | Przeciętny AMD Radeon 660M | Średnia w klasie Subnotebook | |
|---|---|---|---|---|---|---|---|
| Power Consumption | -7% | -33% | -10% | -7% | -38% | -32% | |
| Idle Minimum * (Watt) | 3.2 | 3.82 -19% | 5 -56% | 2.8 13% | 2.7 16% | 4.75 ? -48% | 3.94 ? -23% |
| Idle Average * (Watt) | 5.2 | 5.74 -10% | 6 -15% | 4.8 8% | 5.2 -0% | 6.99 ? -34% | 6.83 ? -31% |
| Idle Maximum * (Watt) | 6.1 | 7.65 -25% | 11 -80% | 7.3 -20% | 6.2 -2% | 9.15 ? -50% | 8.41 ? -38% |
| Load Average * (Watt) | 33.6 | 35.79 -7% | 45 -34% | 48.1 -43% | 38.4 -14% | 44.2 ? -32% | 43.8 ? -30% |
| Witcher 3 ultra * (Watt) | 39.3 | 35.6 9% | 45.2 -15% | 35.4 10% | 41.9 -7% | ||
| Load Maximum * (Watt) | 49.1 | 45.04 8% | 48 2% | 63.6 -30% | 66.7 -36% | 62.4 ? -27% | 66.7 ? -36% |
* ... im mniej tym lepiej
Power consumption Witcher 3 / stress test
Energieaufnahme mit externem Monitor
Żywotność baterii
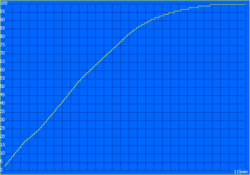
Wewnętrzna bateria nadal ma pojemność 54,7 Wh, choć dostępny jest również wariant z 41 Wh. Testowany przez nas model osiągnął świetne czasy pracy na baterii: 12 godzin i 30 minut w teście WiFi (jasność ekranu 150 cd/m²) są już godne podziwu, ale 10 godzin i 40 minut w tym samym teście z maksymalną jasnością ekranu są jeszcze lepsze w wartościach względnych. ThinkPad X13 G3 AMD to urządzenie zdolne wytrzymać cały dzień pracy.
| Lenovo ThinkPad X13 G3 21CM002UGE R5 PRO 6650U, Radeon 660M, 54.7 Wh | Lenovo ThinkPad X13 G2 AMD 20XH001KGE R5 PRO 5650U, Vega 7, 54.7 Wh | HP EliteBook 835 G9 R7 PRO 6850U, Radeon 680M, 51 Wh | Dell Latitude 13 7330 i7-1265U, Iris Xe G7 96EUs, 41 Wh | Lenovo ThinkPad X13 G3 21BN0046GE i5-1235U, Iris Xe G7 80EUs, 54.7 Wh | Średnia w klasie Subnotebook | |
|---|---|---|---|---|---|---|
| Czasy pracy | -17% | -27% | -21% | 8% | 19% | |
| WiFi v1.3 (h) | 12.5 | 9.3 -26% | 9.1 -27% | 8.3 -34% | 10.2 -18% | 13.5 ? 8% |
| Load (h) | 1.5 | 1.4 -7% | 1.1 -27% | 1.4 -7% | 2 33% | 1.948 ? 30% |
Za
Przeciw
Werdykt: ThinkPad X13 AMD to wciąż bardzo dobry subnotebook
Wraz z Lenovo ThinkPad X13 Gen 3 AMD, producent opiera się na już bardzo dobrym laptopie, Lenovo ThinkPad X13 Gen 2 AMD.Lenovo ThinkPad X13 Gen 2. Nowy model ma wszystkie aspekty, które sprawiły, że stary był dobry, ale dodaje USB4 i Rembrandt. Logicznie rzecz biorąc, nic dziwnego, że nowy model również osiąga bardzo dobrą ocenę.
Oprócz istniejących mocnych stron, takich jak solidna i lekka obudowa, przyjemne urządzenia wejściowe i dobre opcje łączności, nowy model ma lepszą żywotność baterii. ThinkPad X13 Gen 3 osiąga dobrą wydajność i nadal działa chłodno i cicho, co nie jest oczywiste w porównaniu z konkurencją Intela.
Oczywiście wciąż jest miejsce na ulepszenia. Jasność ekranu mogłaby być lepsza, zwłaszcza biorąc pod uwagę konkurencję. Chcielibyśmy również zobaczyć kamerę internetową o wyższej rozdzielczości, a także możliwość rozbudowy pamięci RAM. Ponadto szybkość przesyłania danych przez WiFi była raczej niska.
Kompaktowy, wydajny, długi czas pracy na baterii, chłodny i cichy - Lenovo ThinkPad X13 Gen 3 AMD łączy w sobie wiele pozytywnych cech.
To głównie krytyka na wysokim poziomie. Jeśli szukasz szybkiego, ultramobilnego urządzenia do pracy, które wytrzyma cały dzień, ThinkPad X13 G3 AMD zdecydowanie powinien być konkurentem. To samo można powiedzieć o HP EliteBook 835 G9 - nabywcyDell Latitude 7330muszą zmagać się z procesorami Intela, które zapewniają lepszą wydajność pojedynczego rdzenia, ale poza tym działają mniej wydajnie. Lenovo ThinkPad X13 Gen.Lenovo ThinkPad X13 Gen 4z AMD Phoenix jest już na horyzoncie, ale nie jest jeszcze dostępny - zakup poprzednika zdecydowanie nie jest złym wyborem.
Ceny i dostępność
Amazon oferuje Lenovo ThinkPad X13 G3 AMD za 1200 USD.
Lenovo ThinkPad X13 G3 21CM002UGE
- 27/06/2023 v7 (old)
Benjamin Herzig
Przezroczystość
Wyboru urządzeń do recenzji dokonuje nasza redakcja. Próbka testowa została udostępniona autorowi jako pożyczka od producenta lub sprzedawcy detalicznego na potrzeby tej recenzji. Pożyczkodawca nie miał wpływu na tę recenzję, producent nie otrzymał też kopii tej recenzji przed publikacją. Nie było obowiązku publikowania tej recenzji. Jako niezależna firma medialna, Notebookcheck nie podlega władzy producentów, sprzedawców detalicznych ani wydawców.
Tak testuje Notebookcheck
Każdego roku Notebookcheck niezależnie sprawdza setki laptopów i smartfonów, stosując standardowe procedury, aby zapewnić porównywalność wszystkich wyników. Od około 20 lat stale rozwijamy nasze metody badawcze, ustanawiając przy tym standardy branżowe. W naszych laboratoriach testowych doświadczeni technicy i redaktorzy korzystają z wysokiej jakości sprzętu pomiarowego. Testy te obejmują wieloetapowy proces walidacji. Nasz kompleksowy system ocen opiera się na setkach uzasadnionych pomiarów i benchmarków, co pozwala zachować obiektywizm.

