Recenzja laptopa Lenovo Legion Slim 7-16IAH7: smukły notebook Legion jest równie doskonały dzięki Nvidii i Intelowi
W ciągu ostatnich kilku lat Lenovo zdołało przekształcić swoją "Legion" gamingową markę w dość popularną nazwę na rynku laptopów. Seria Legion 7 obejmuje high-endowe modele dostępne zarówno w wersji zwykłej, jak i "Slim". Dziś zrecenzujemy jeden z takich modeli typu slim: Lenovo Legion Slim 7 16IAH7 (znany również jako Legion S7i).
Skrót "IAH" mówi już coś o specyfikacji laptopa: "I" oznacza Intel, a "AH" - Alder Lake-H. Jest to o tyle istotne, że istnieje również m.in Wariant oparty na AMDz Legion Slim 7, który już zrecenzowaliśmy. Który z tych dwóch modeli wypada więc lepiej? To z pewnością jedno z najciekawszych pytań, na które odpowiedź znajdziemy w tej recenzji.
Potencjalni konkurenci w porównaniu
Ocena | Data | Model | Waga | Wysokość | Rozmiar | Rezolucja | Cena |
|---|---|---|---|---|---|---|---|
| 87.9 % v7 (old) | 11/2022 | Lenovo Legion Slim 7-16IAH 82TF004YGE i7-12700H, GeForce RTX 3060 Laptop GPU | 2.2 kg | 16.9 mm | 16.00" | 2560x1600 | |
| 89.3 % v7 (old) | Lenovo Legion S7 16ARHA7 R9 6900HX, Radeon RX 6800S | 2.2 kg | 16.9 mm | 16.00" | 2560x1600 | ||
| 87.2 % v7 (old) | Acer Predator Triton 500 SE PT516-52s-70KX i7-12700H, GeForce RTX 3080 Ti Laptop GPU | 2.3 kg | 19.9 mm | 16.00" | 2560x1600 | ||
| 85.5 % v7 (old) | HP Omen 16-b1090ng i7-12700H, GeForce RTX 3070 Ti Laptop GPU | 2.3 kg | 23 mm | 16.10" | 2560x1440 | ||
| 85.6 % v7 (old) | Asus ROG Zephyrus M16 GU603H i9-11900H, GeForce RTX 3070 Laptop GPU | 2 kg | 20 mm | 16.00" | 2560x1600 |
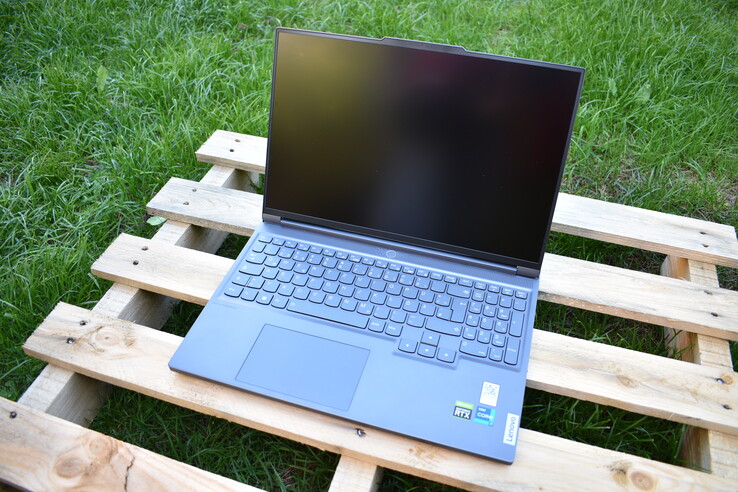
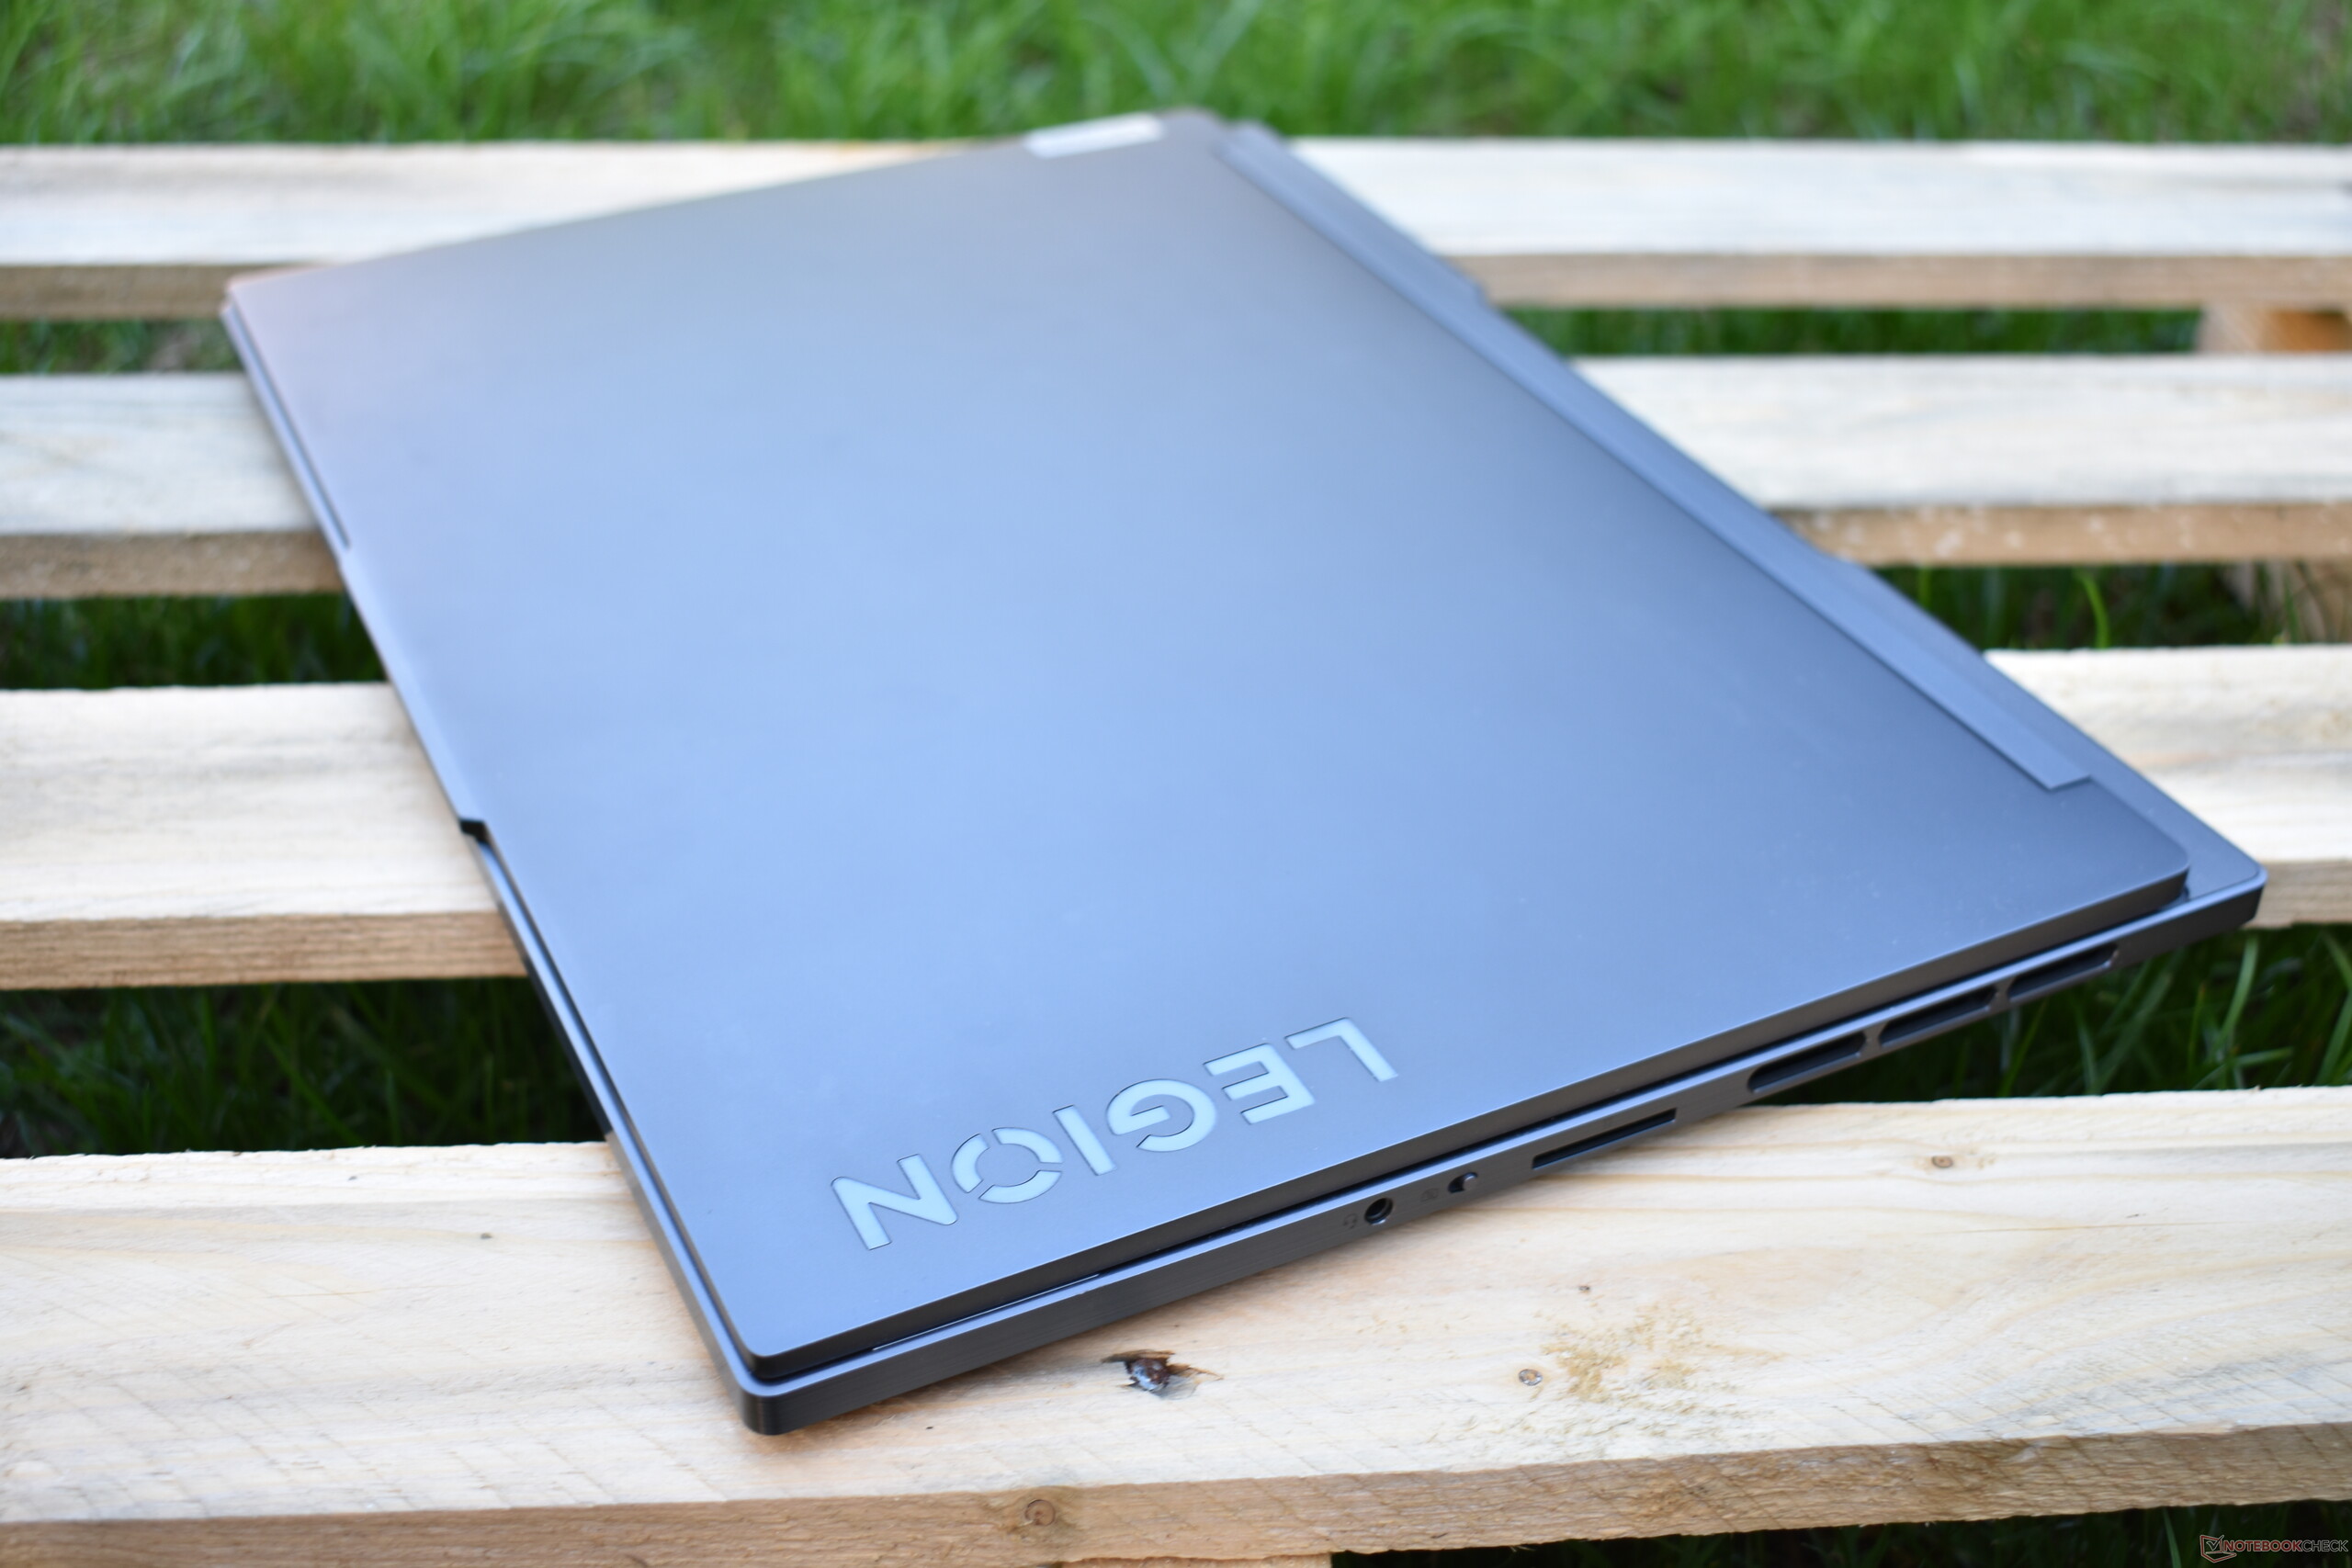
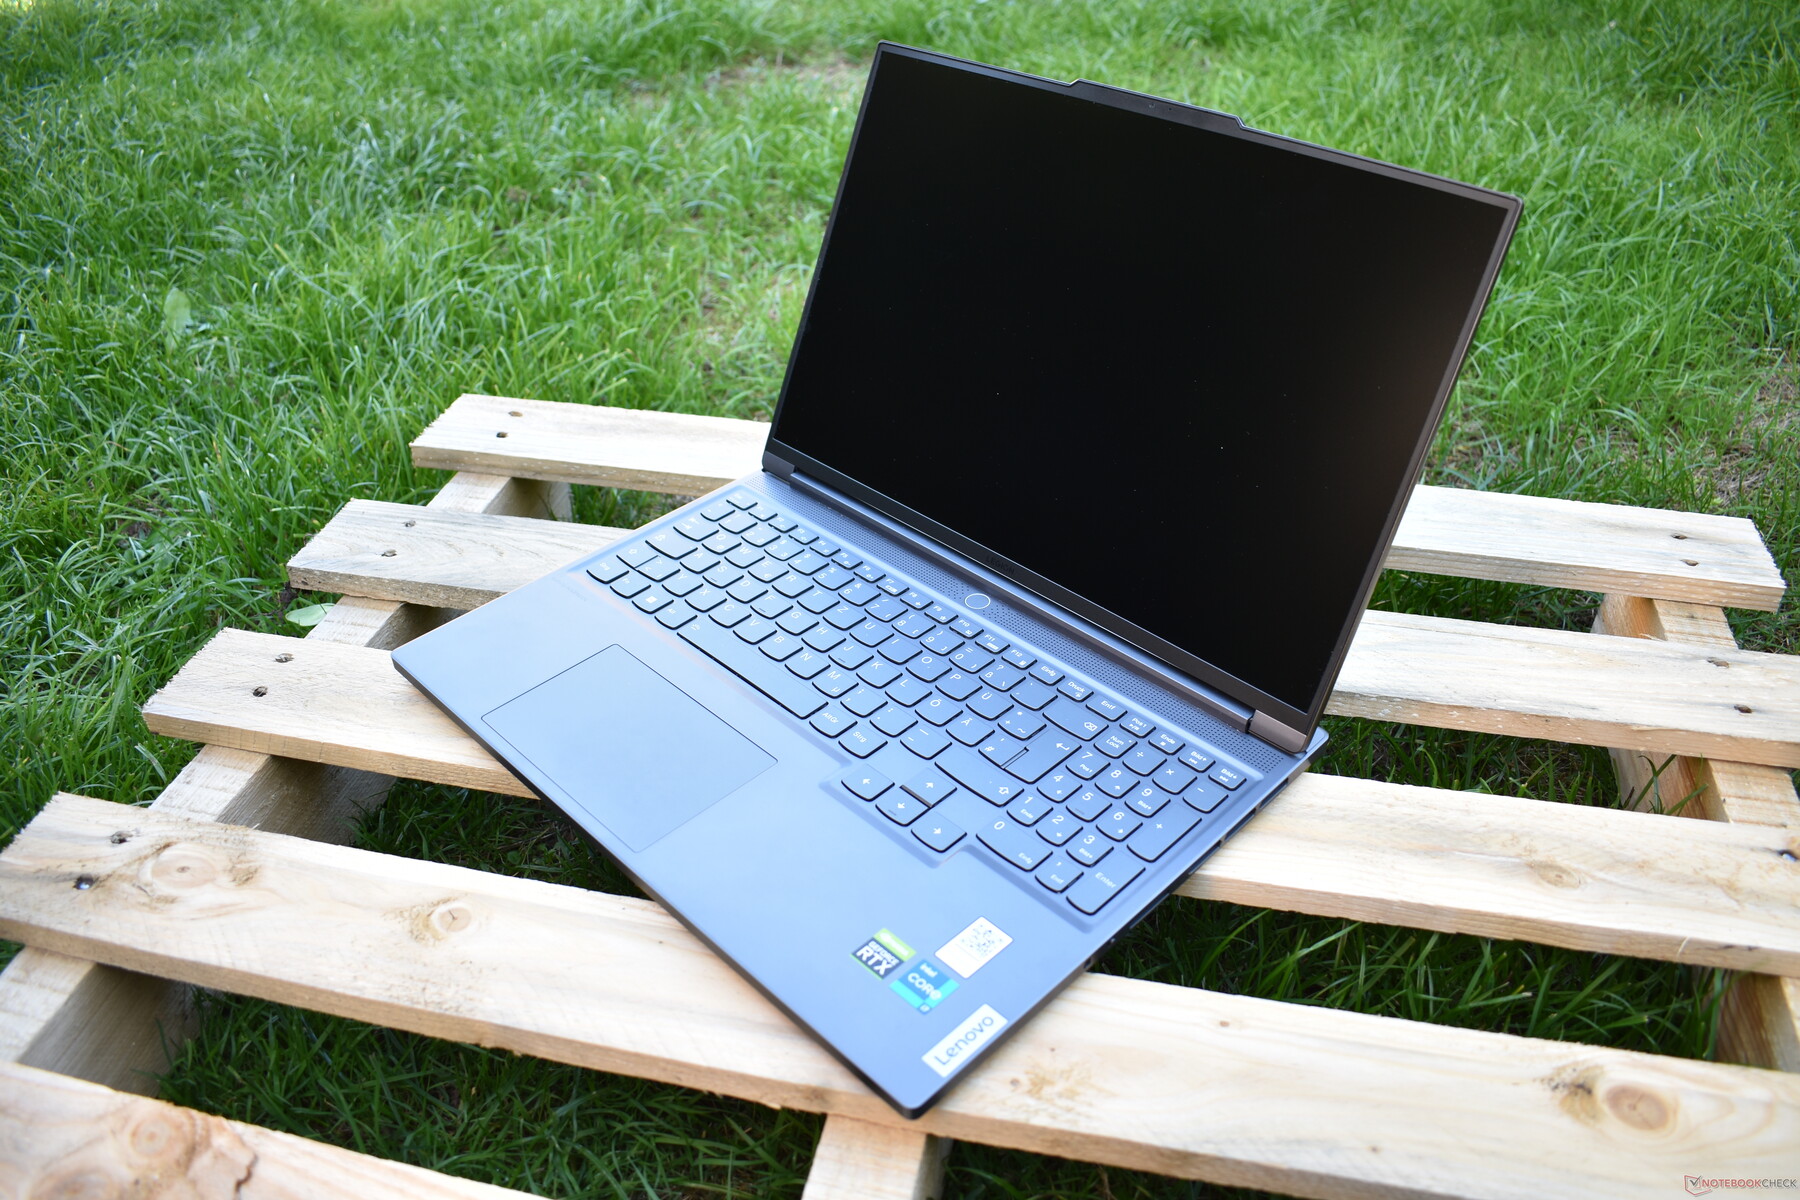
Obudowa: Lenovo Legion z aluminiową konstrukcją w kolorze szarym
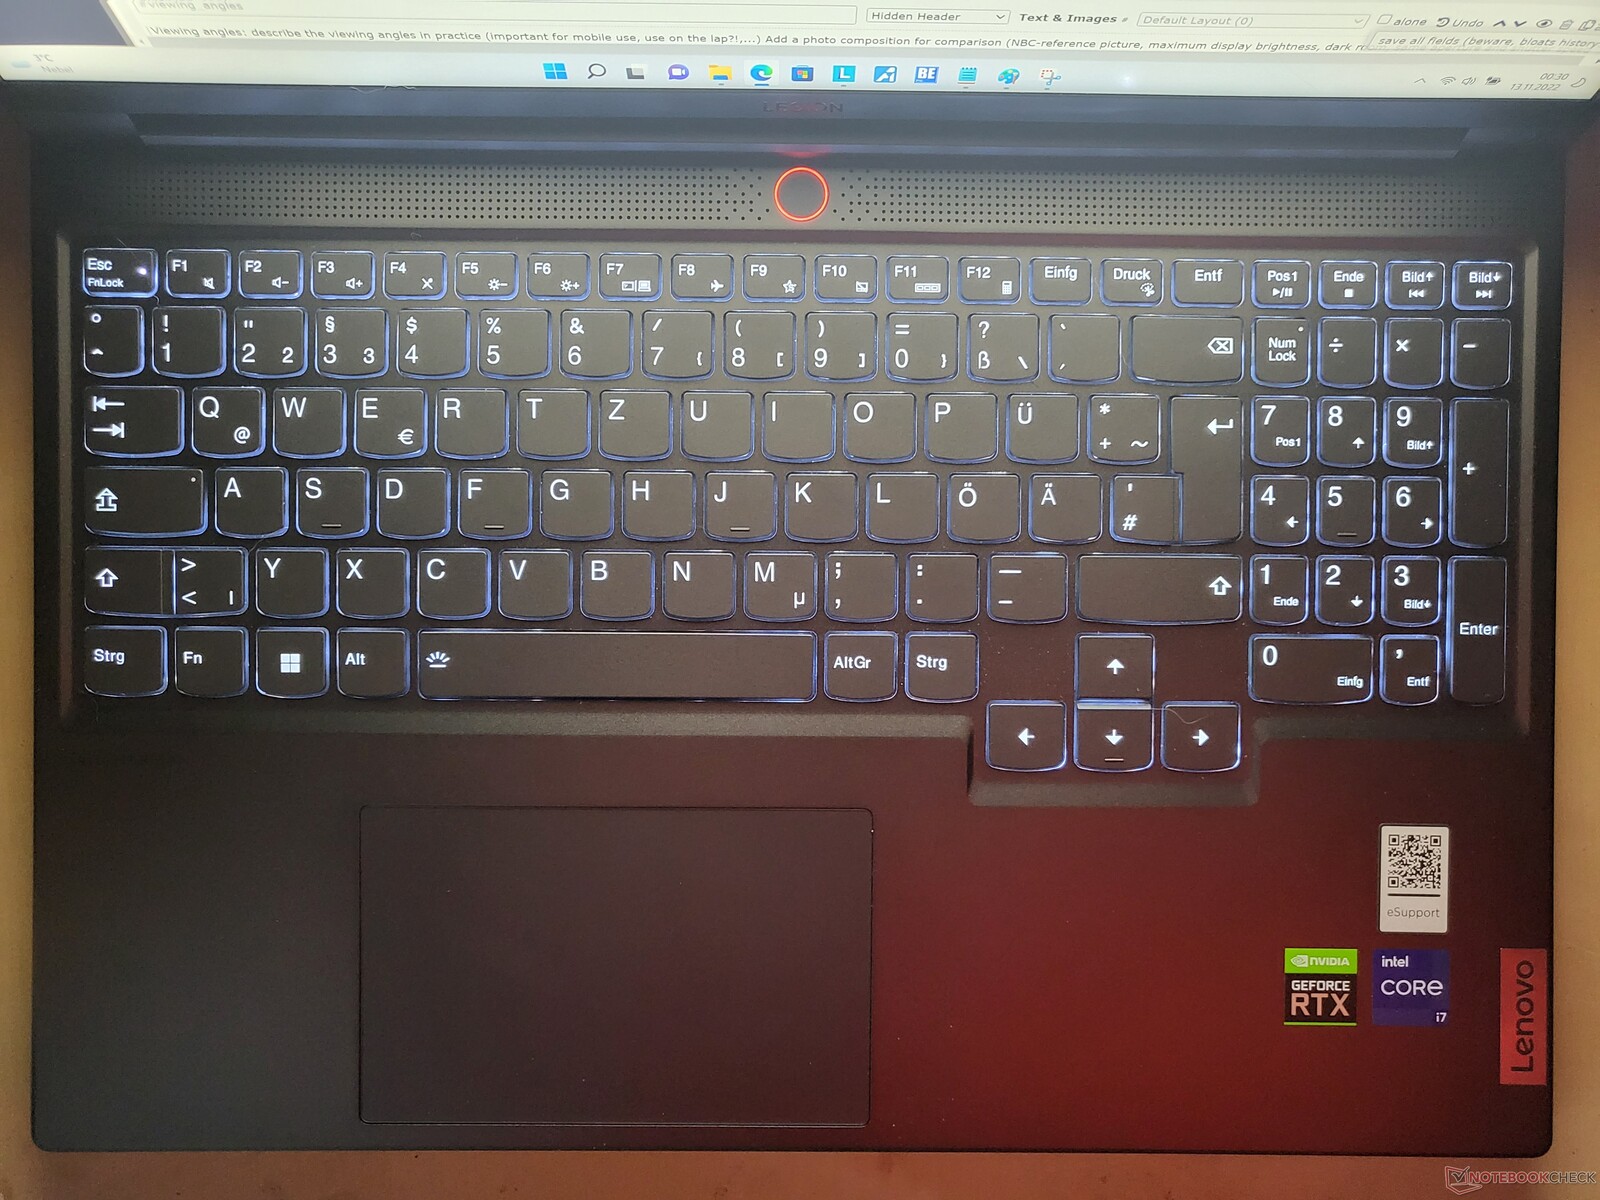
Podczas gdy tańsze laptopy Lenovo Legion 5 są częściowo wykonane z plastiku, Legion Slim 7 ma w większości aluminiową konstrukcję. Maskownica wyświetlacza jest jedynym plastikowym elementem na obudowie. Pod względem wzornictwa Legion Slim 7 jest znacznie bardziej powściągliwy niż grubsze Lenovo Legion 7. Lenovo zrezygnowało z krzykliwego podświetlenia RGB w Slim 7 i zamiast tego postawiło na ciemnoszarą kolorystykę, która nie wyglądałaby zbyt nie na miejscu w laptopie biznesowym. Białe podświetlenie klawiatury również przywodzi na myśl biznesową serię ThinkPad firmy Lenovo. Dioda LED na przycisku zasilania jest jedną z niewielu kolorowych plam na urządzeniu. W zależności od wybranego profilu wydajności może ona świecić na niebiesko (tryb oszczędzania baterii), biało (tryb zrównoważony) lub czerwono (tryb wydajności).
Pomimo posiadania prostszej konstrukcji, S7 jest nadal łatwo rozpoznawalny jako laptop Legion. Lenovo wykonało dobrą robotę, jeśli chodzi o jakość: Spasowanie i wykończenie jest perfekcyjne, a aluminiowa obudowa jest również bardzo regidalna. Nawet pokrywa wyświetlacza jest stosunkowo solidna mimo swojej cienkości i wąskiej ramki.
Zawiasy są przymocowane do części bazowej i umożliwiają otwarcie laptopa do 180 stopni. Nie zalecamy jednak odchylania ekranu w naszym egzemplarzu testowym o więcej niż około 135 stopni - w przeciwnym razie obrazy na wyświetlaczu będą zniekształcone. Przynajmniej zawiasy trzymają ekran mocno w miejscu, a ponadto są tak dobrze wyregulowane, że laptop można otworzyć jedną ręką.

Lenovo Legion S7i Gen 7 ma najsmuklejszą obudowę wśród wszystkich gamingowych laptopów w zestawieniu. Przy zaledwie 16,9 mm grubości urządzenie znajduje się niemal na terytorium ultrabooka. Inaczej jest jednak z jego wagą. Chociaż Lenovo Legion Slim 7 nie jest strasznie ciężki, nie jest też lekki - waży 2,2 kg (4,85 lb). Model Asus ROG Zephyrus M16 jest minimalnie lżejszy od Slim 7.
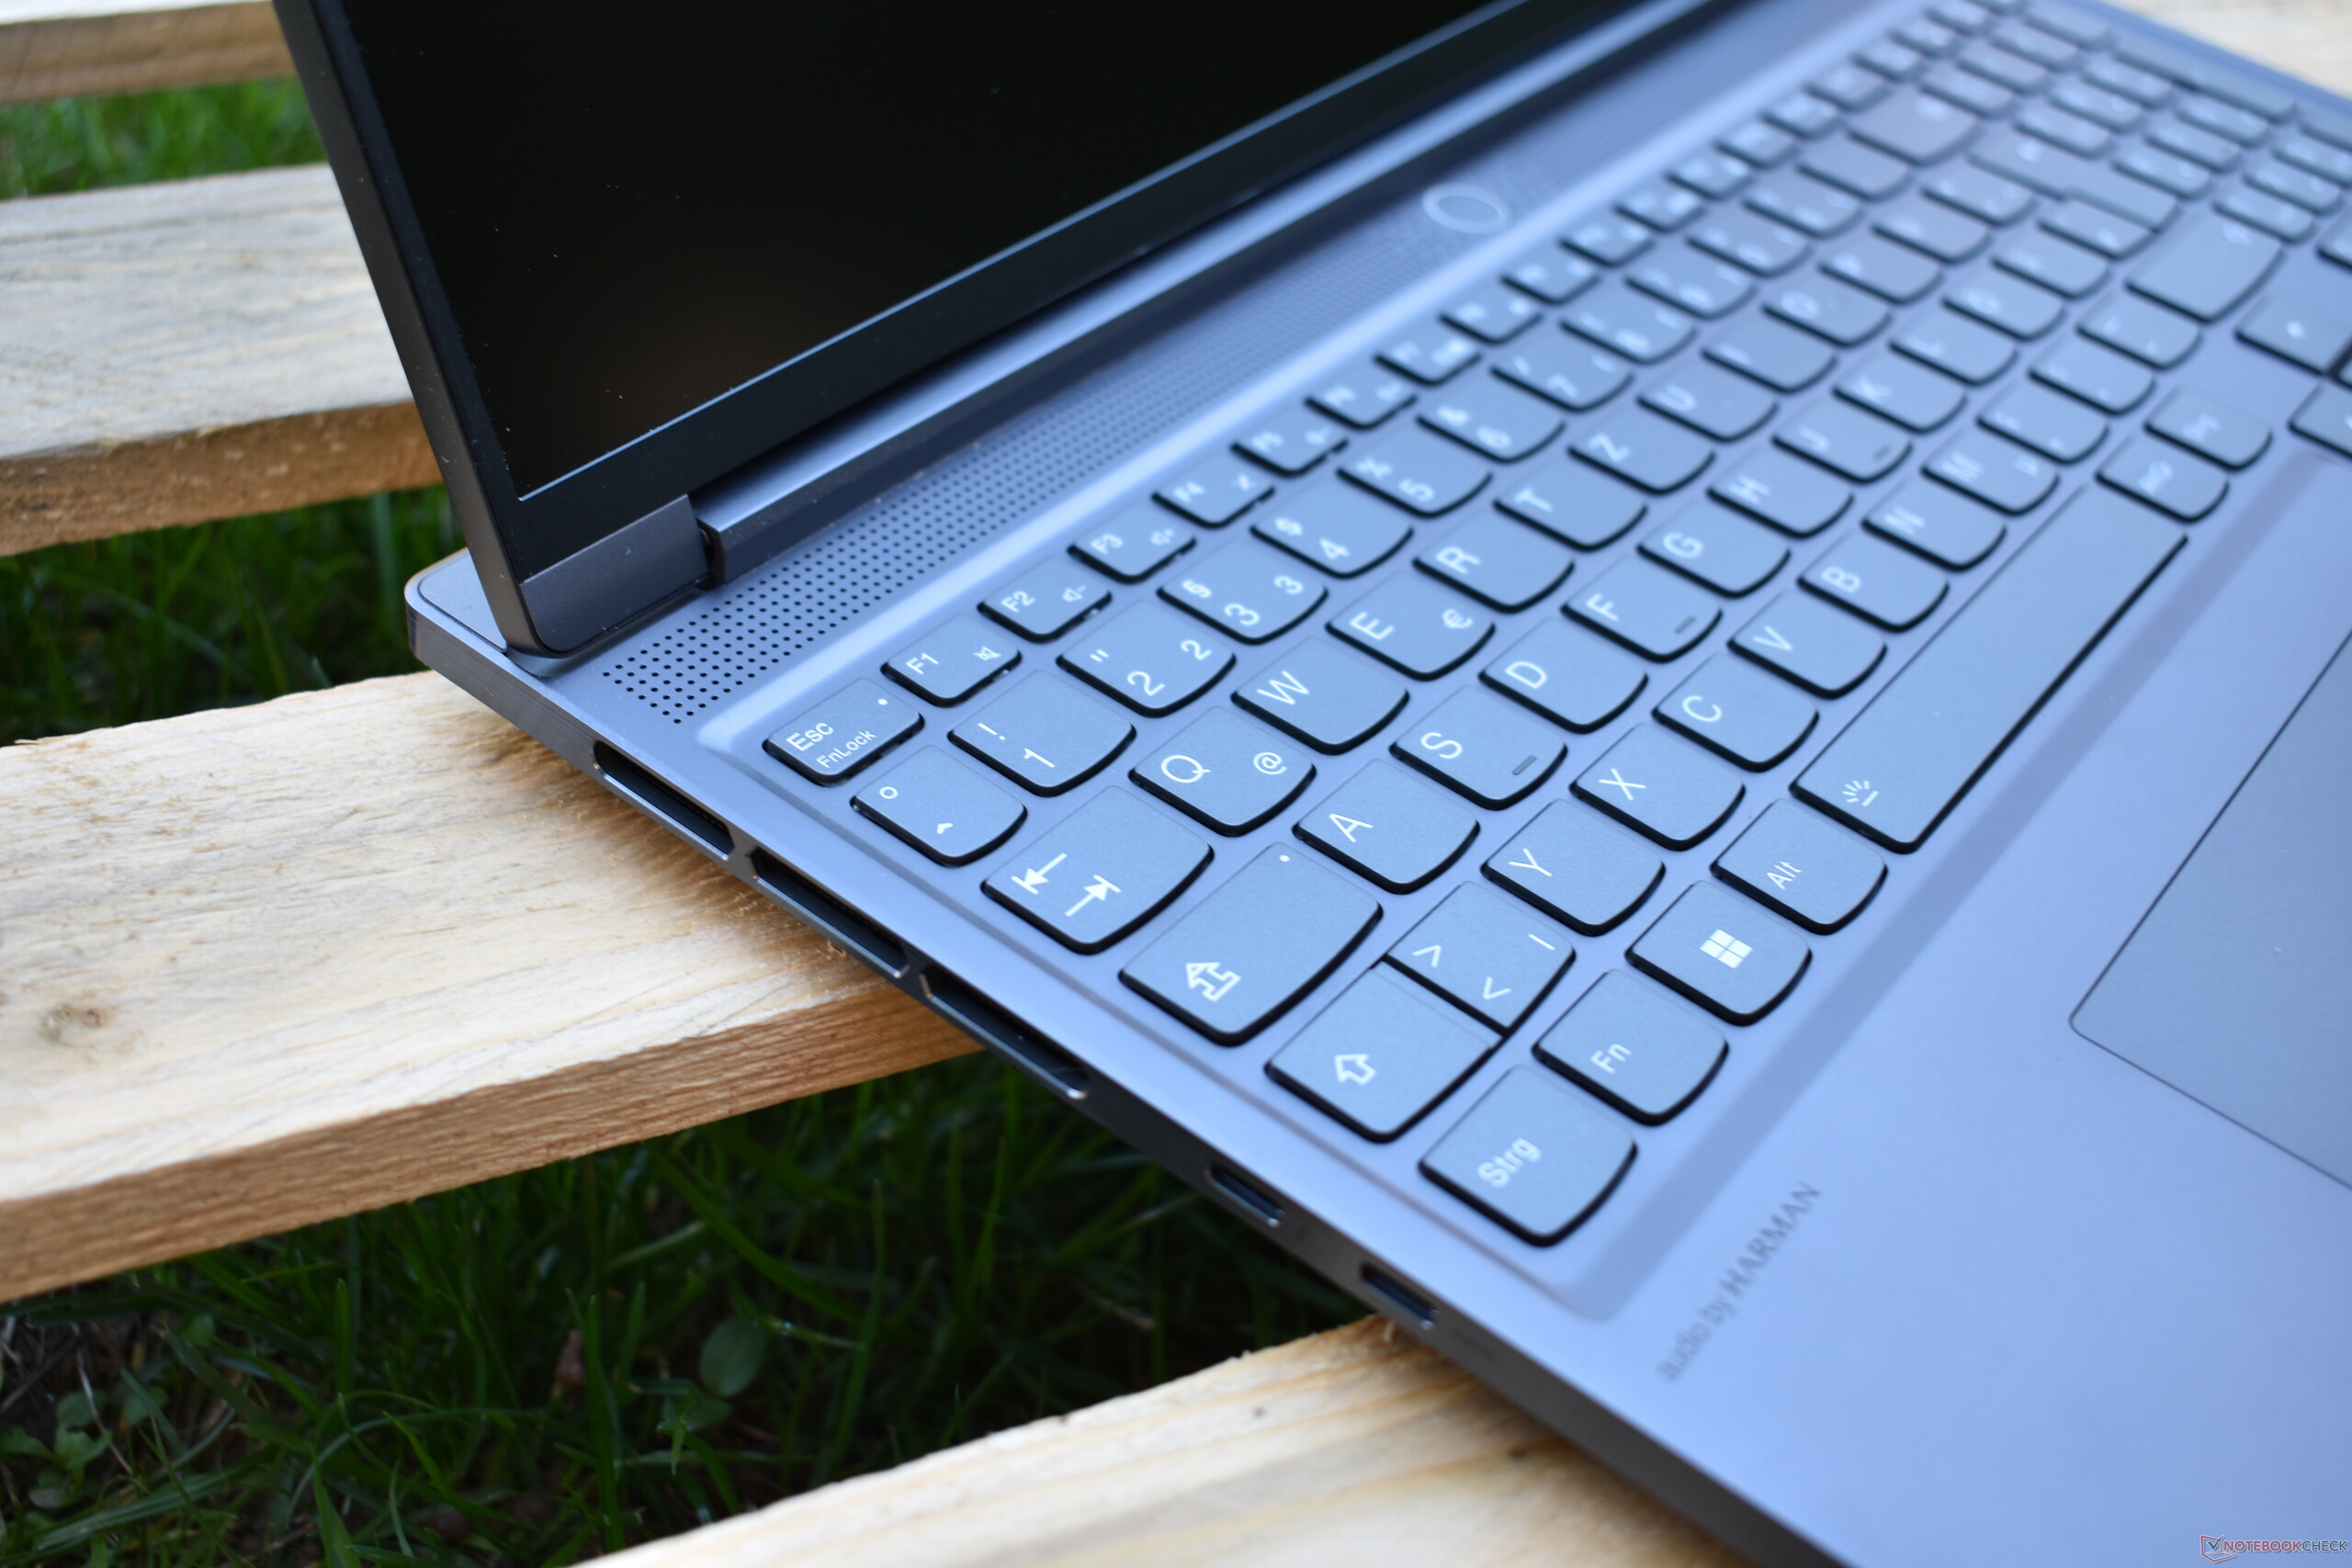
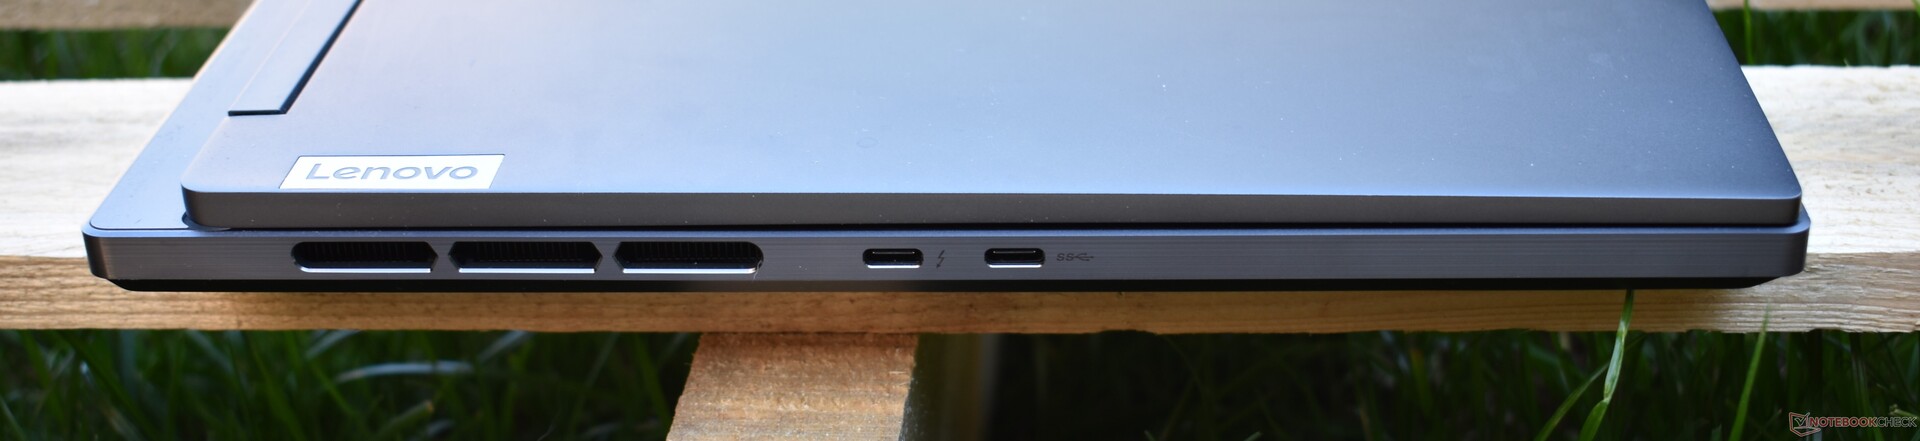
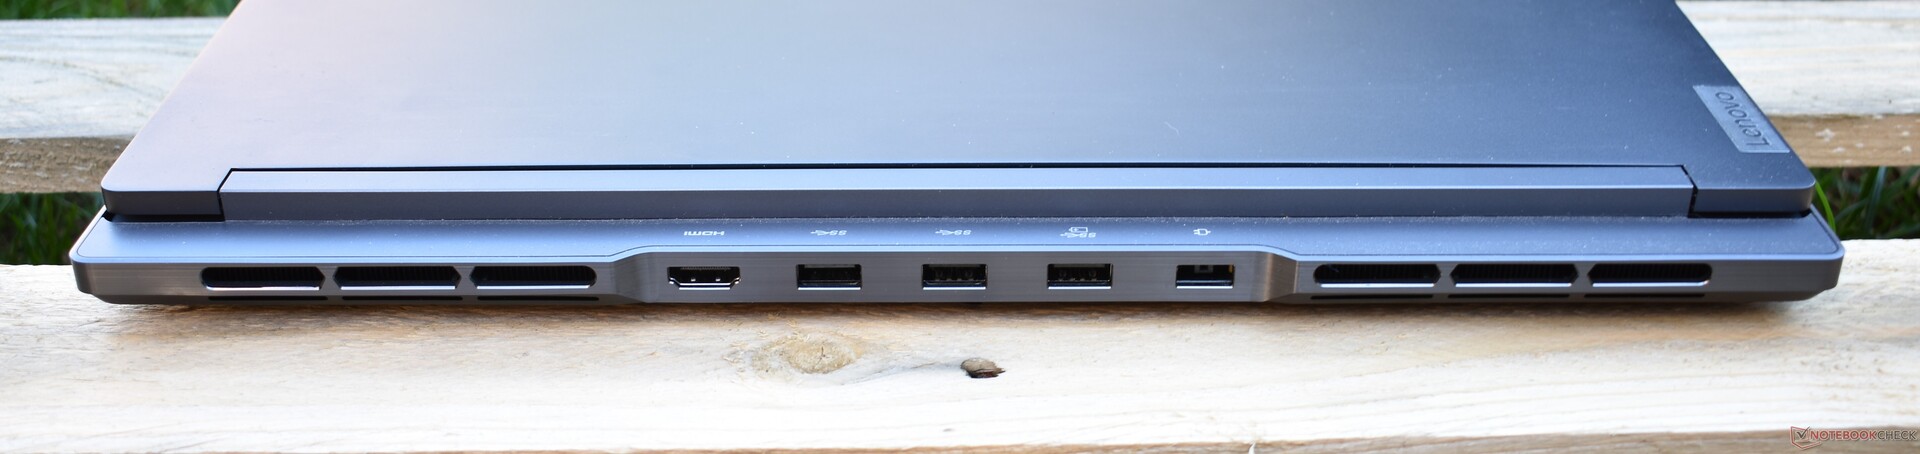
Specyfikacja: Legion S7i z Thunderbolt 4
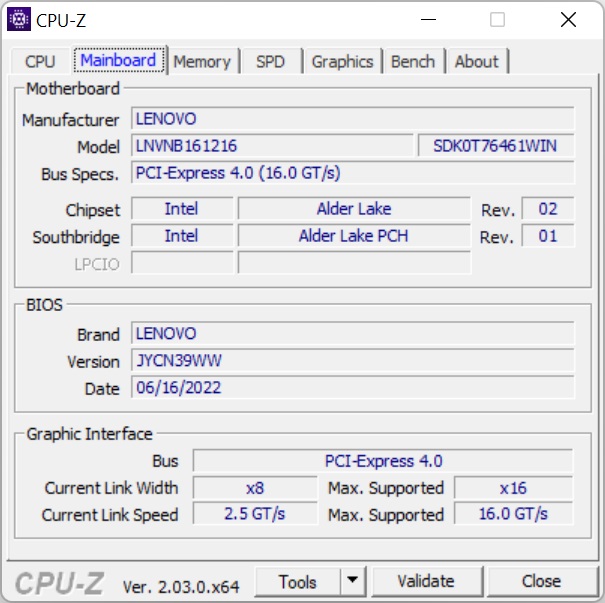
W przeciwieństwie do wariantu AMD, Lenovo Legion S7-16IAH posiada port Thunderbolt 4. Posiada też duży wybór portów (rozmieszczonych po bokach i z tyłu), ale brakuje w nim gniazda RJ45. Ci, którzy chcą mieć port Ethernet, mogą spojrzeć na zwykły, "nie-slim" Lenovo Legion 7.
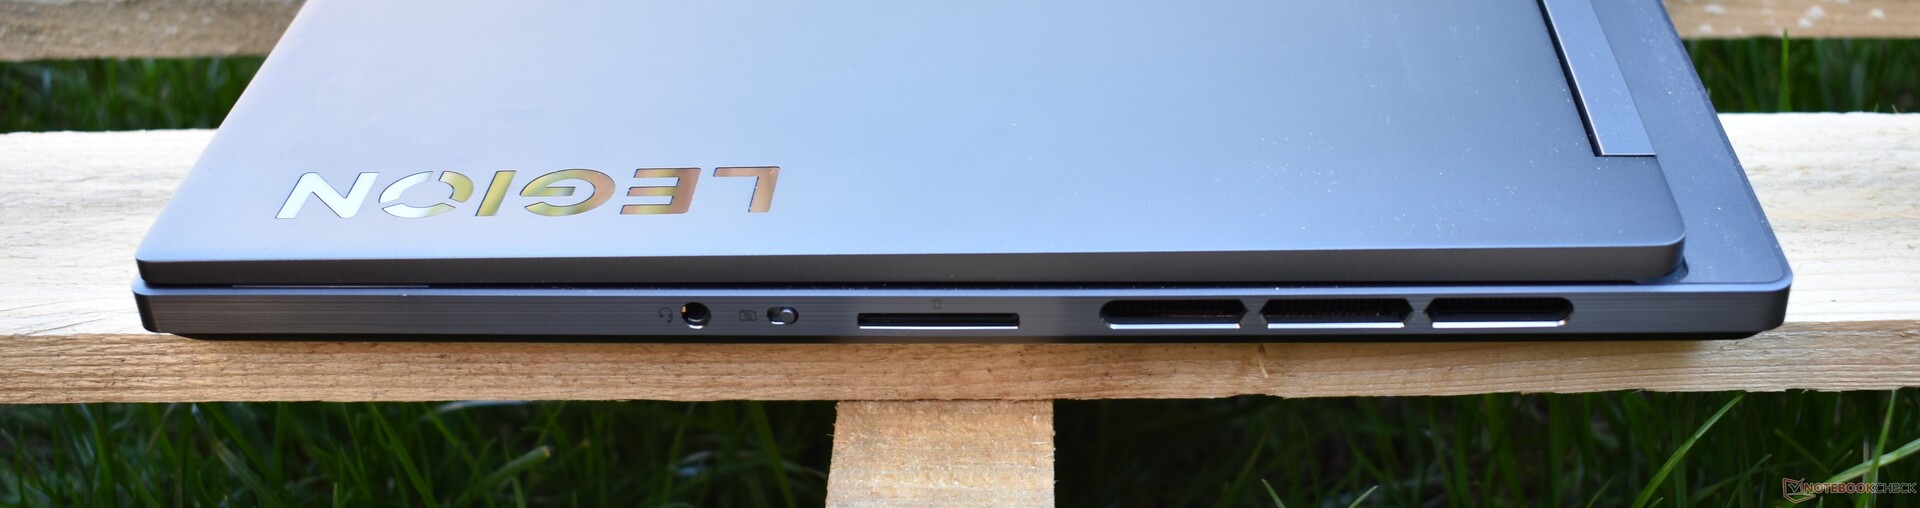
Czytnik kart SD
Czytnik kart SD nie pozwala na włożenie karty do końca, co oznacza, że nie nadaje się on do długoterminowego rozszerzania pamięci masowej. W naszych benchmarkach, przeprowadzonych z użyciem karty referencyjnej AV Pro MicroSD V60, laptop uzyskał przeciętny wynik.
| SD Card Reader | |
| average JPG Copy Test (av. of 3 runs) | |
| Średnia w klasie Gaming (20.9 - 210, n=54, ostatnie 2 lata) | |
| Asus ROG Zephyrus M16 GU603H (AV PRO microSD 128 GB V60) | |
| Lenovo Legion S7 16ARHA7 (AV PRO microSD 128 GB V60) | |
| Lenovo Legion Slim 7-16IAH 82TF004YGE | |
| Acer Predator Triton 500 SE PT516-52s-70KX (AV PRO microSD 128 GB V60) | |
| HP Omen 16-b1090ng (AV PRO microSD 128 GB V60) | |
| maximum AS SSD Seq Read Test (1GB) | |
| Asus ROG Zephyrus M16 GU603H (AV PRO microSD 128 GB V60) | |
| Średnia w klasie Gaming (25.5 - 261, n=51, ostatnie 2 lata) | |
| Lenovo Legion S7 16ARHA7 (AV PRO microSD 128 GB V60) | |
| Lenovo Legion Slim 7-16IAH 82TF004YGE | |
| Acer Predator Triton 500 SE PT516-52s-70KX (AV PRO microSD 128 GB V60) | |
Łączność
Lenovo Legion Slim 7-16IAH posiada moduł Killer Wi-Fi 6E AX1675i, który obsługuje nowy standard Wi-Fi 6E. W naszych testach ten moduł 2x2 zapewnił wysoki transfer z kilkoma drobnymi wahaniami podczas testu nadawania. Technicznie rzecz biorąc, powinno to dotyczyć także trybu Wi-Fi 6E, ale laptop nie był w stanie znaleźć sieci 6 GHz - prawdopodobnie z powodu problemu ze sterownikami.
| Networking | |
| iperf3 receive AXE11000 | |
| Lenovo Legion Slim 7-16IAH 82TF004YGE | |
| Acer Predator Triton 500 SE PT516-52s-70KX | |
| Przeciętny Killer Wi-Fi 6E AX1675i 160MHz Wireless Network Adapter (872 - 1714, n=29) | |
| Średnia w klasie Gaming (680 - 1745, n=93, ostatnie 2 lata) | |
| HP Omen 16-b1090ng | |
| iperf3 transmit AXE11000 | |
| Lenovo Legion Slim 7-16IAH 82TF004YGE | |
| Acer Predator Triton 500 SE PT516-52s-70KX | |
| Przeciętny Killer Wi-Fi 6E AX1675i 160MHz Wireless Network Adapter (797 - 1622, n=27) | |
| Średnia w klasie Gaming (560 - 1862, n=93, ostatnie 2 lata) | |
| HP Omen 16-b1090ng | |
Kamera internetowa
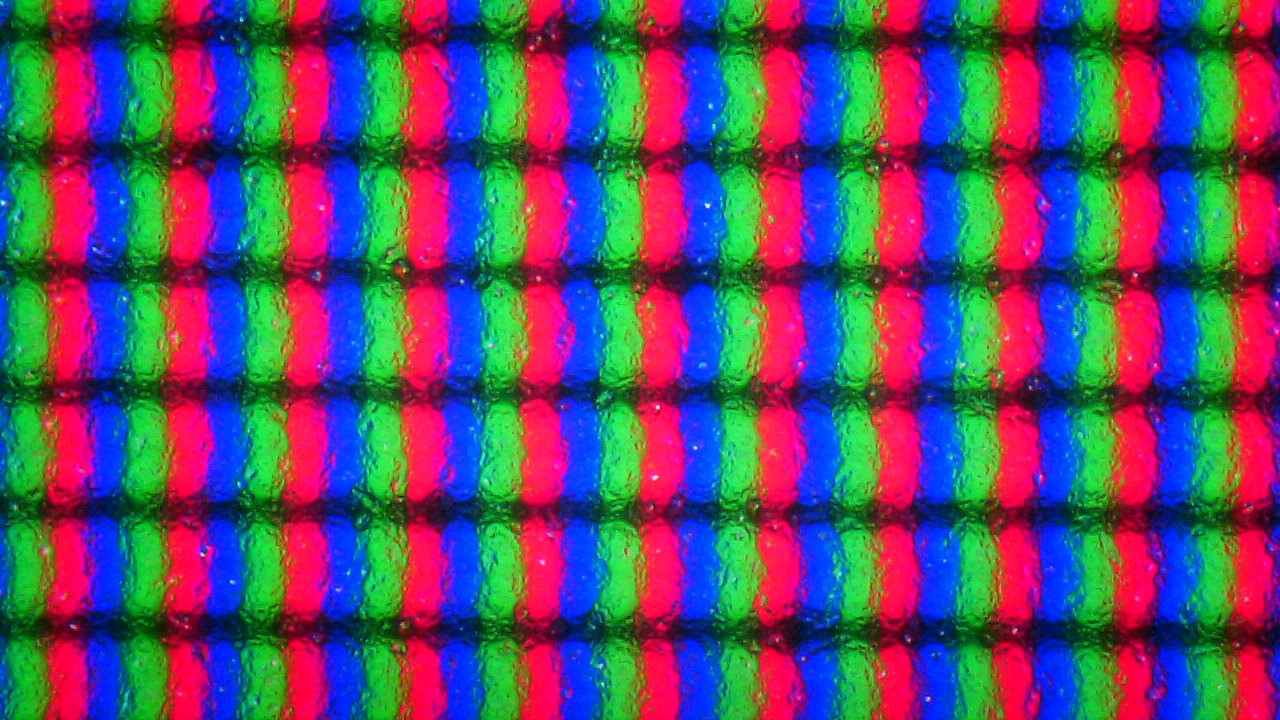
Legion Slim 7 może być skonfigurowany z kamerą internetową 1080p lub 720p. Nasz egzemplarz recenzencki jest wyposażony w opcję o wyższej rozdzielczości. Mimo to kamera internetowa działa słabo i daje stosunkowo pikselowate i zaszumione obrazy.


Akcesoria
Lenovo nie dołączyło do Legion Slim 7 żadnych akcesoriów poza 230-watową ładowarką z wtyczką Slim.
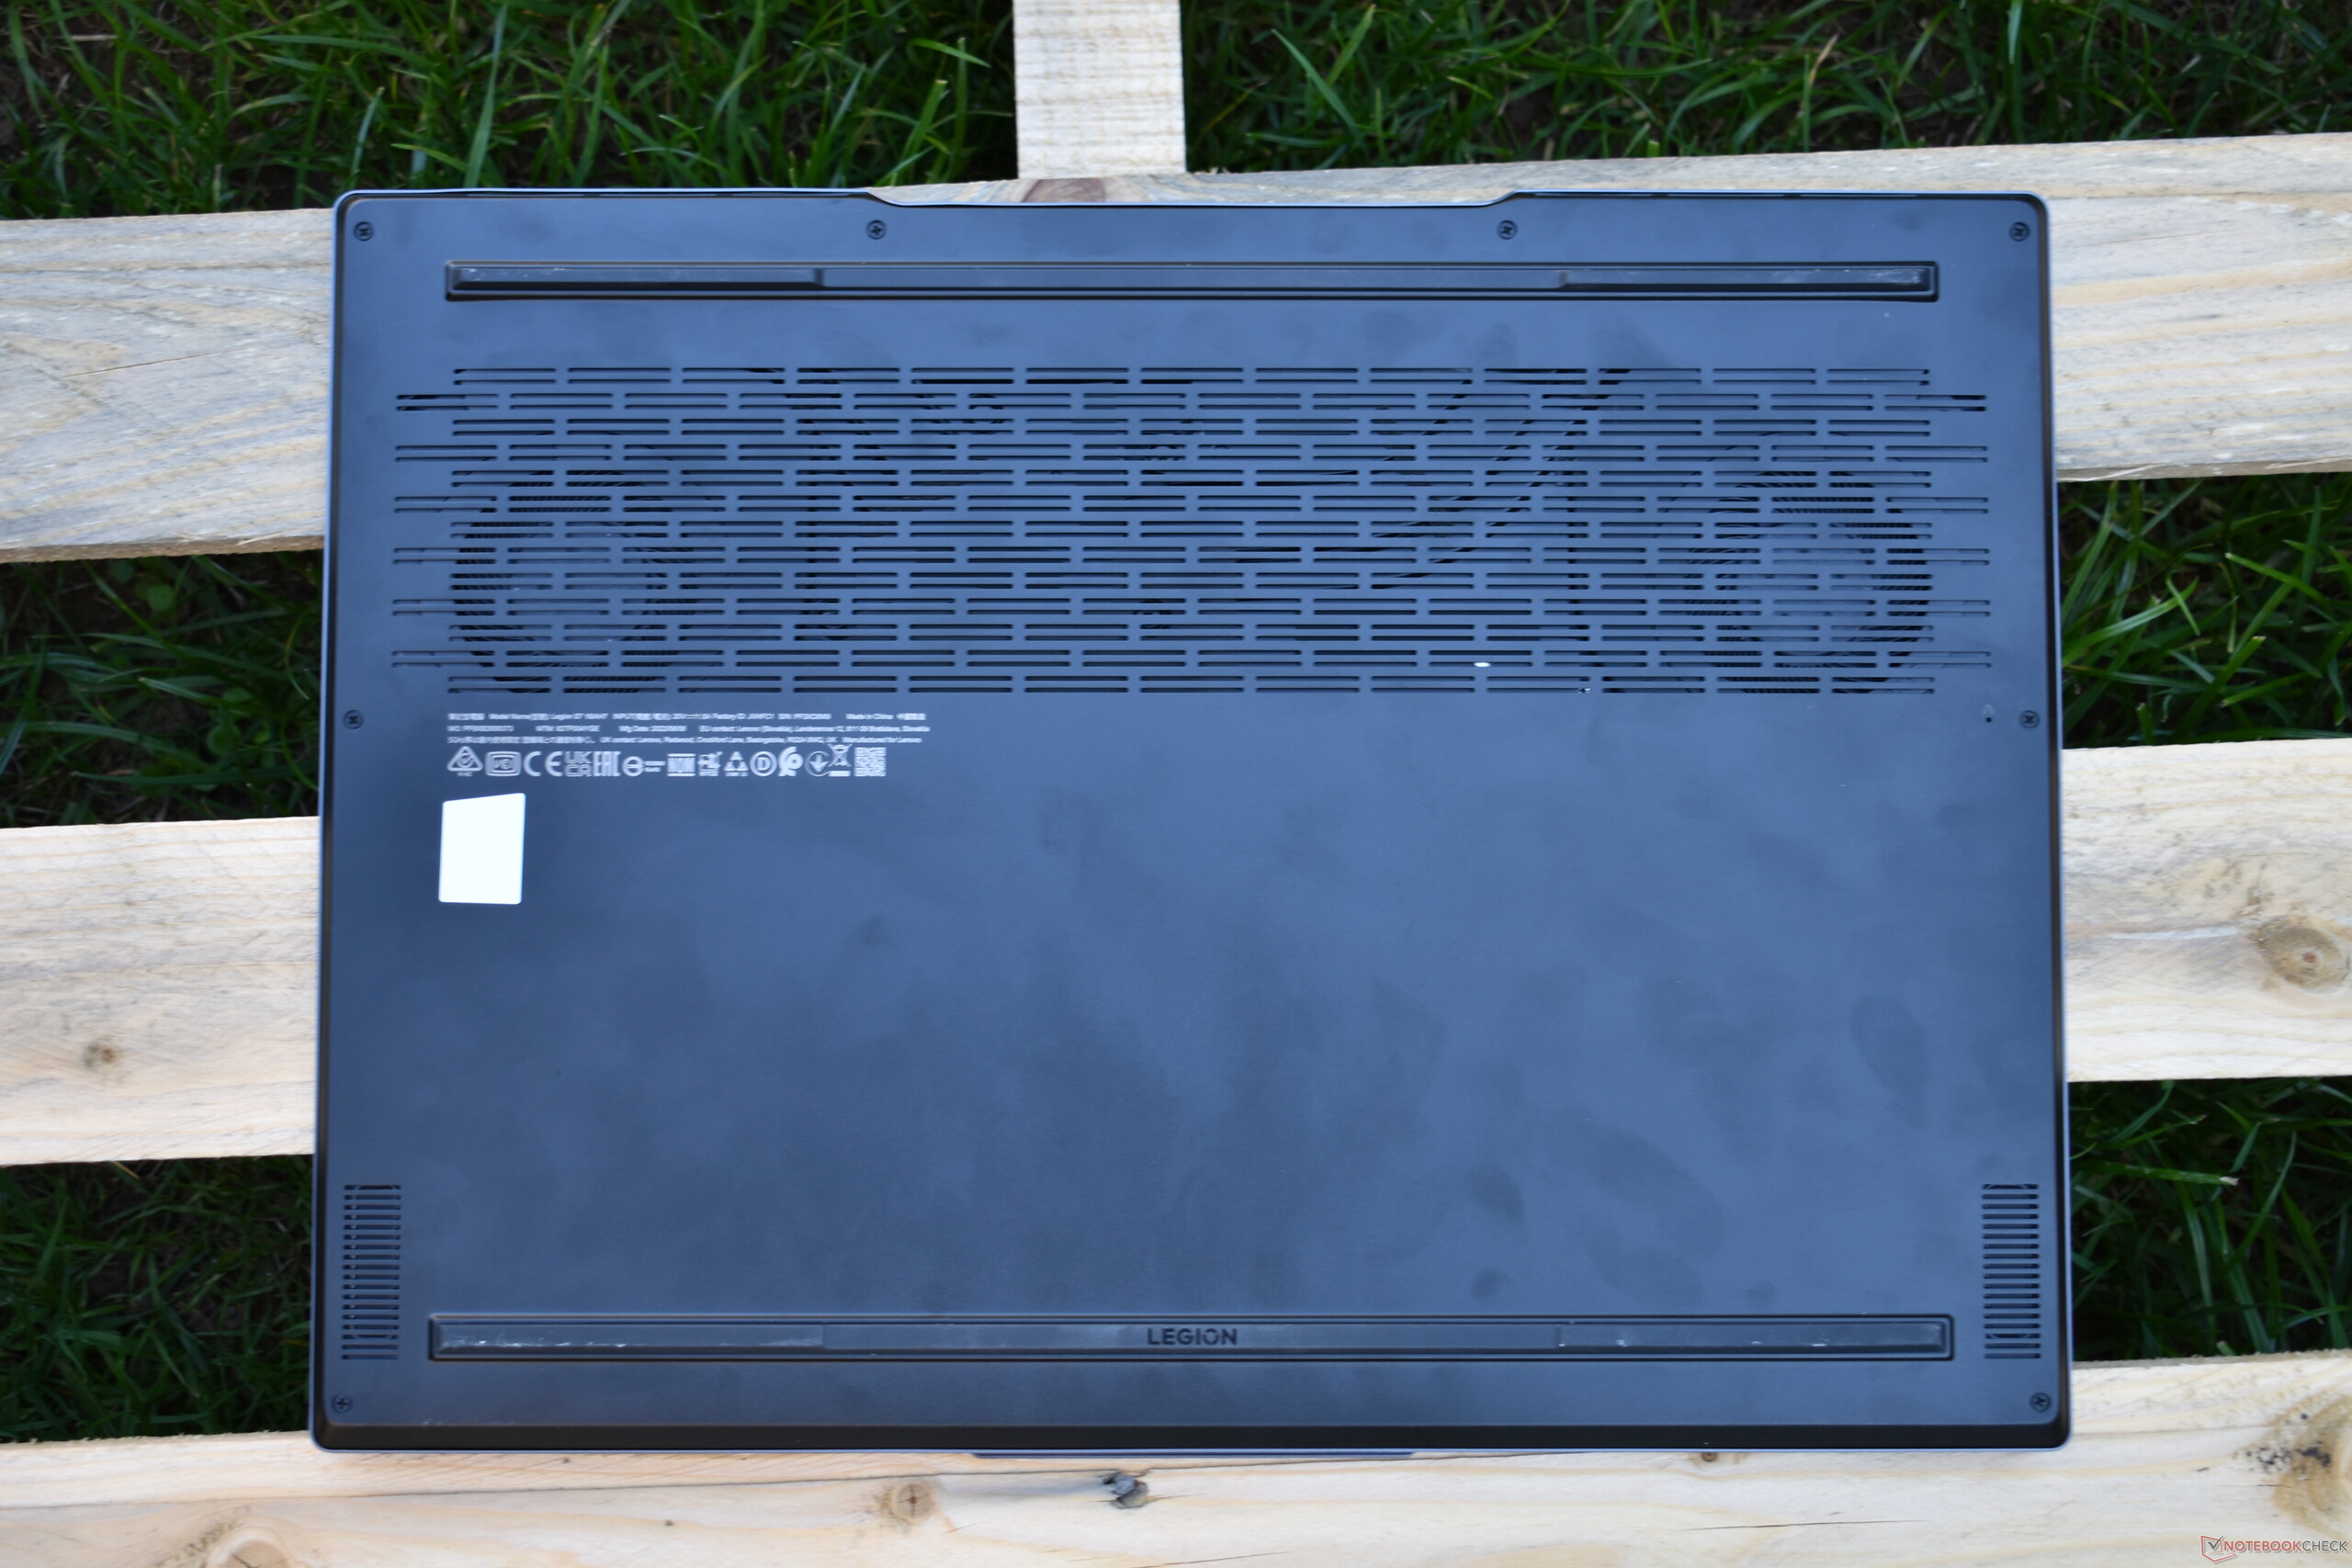
Konserwacja
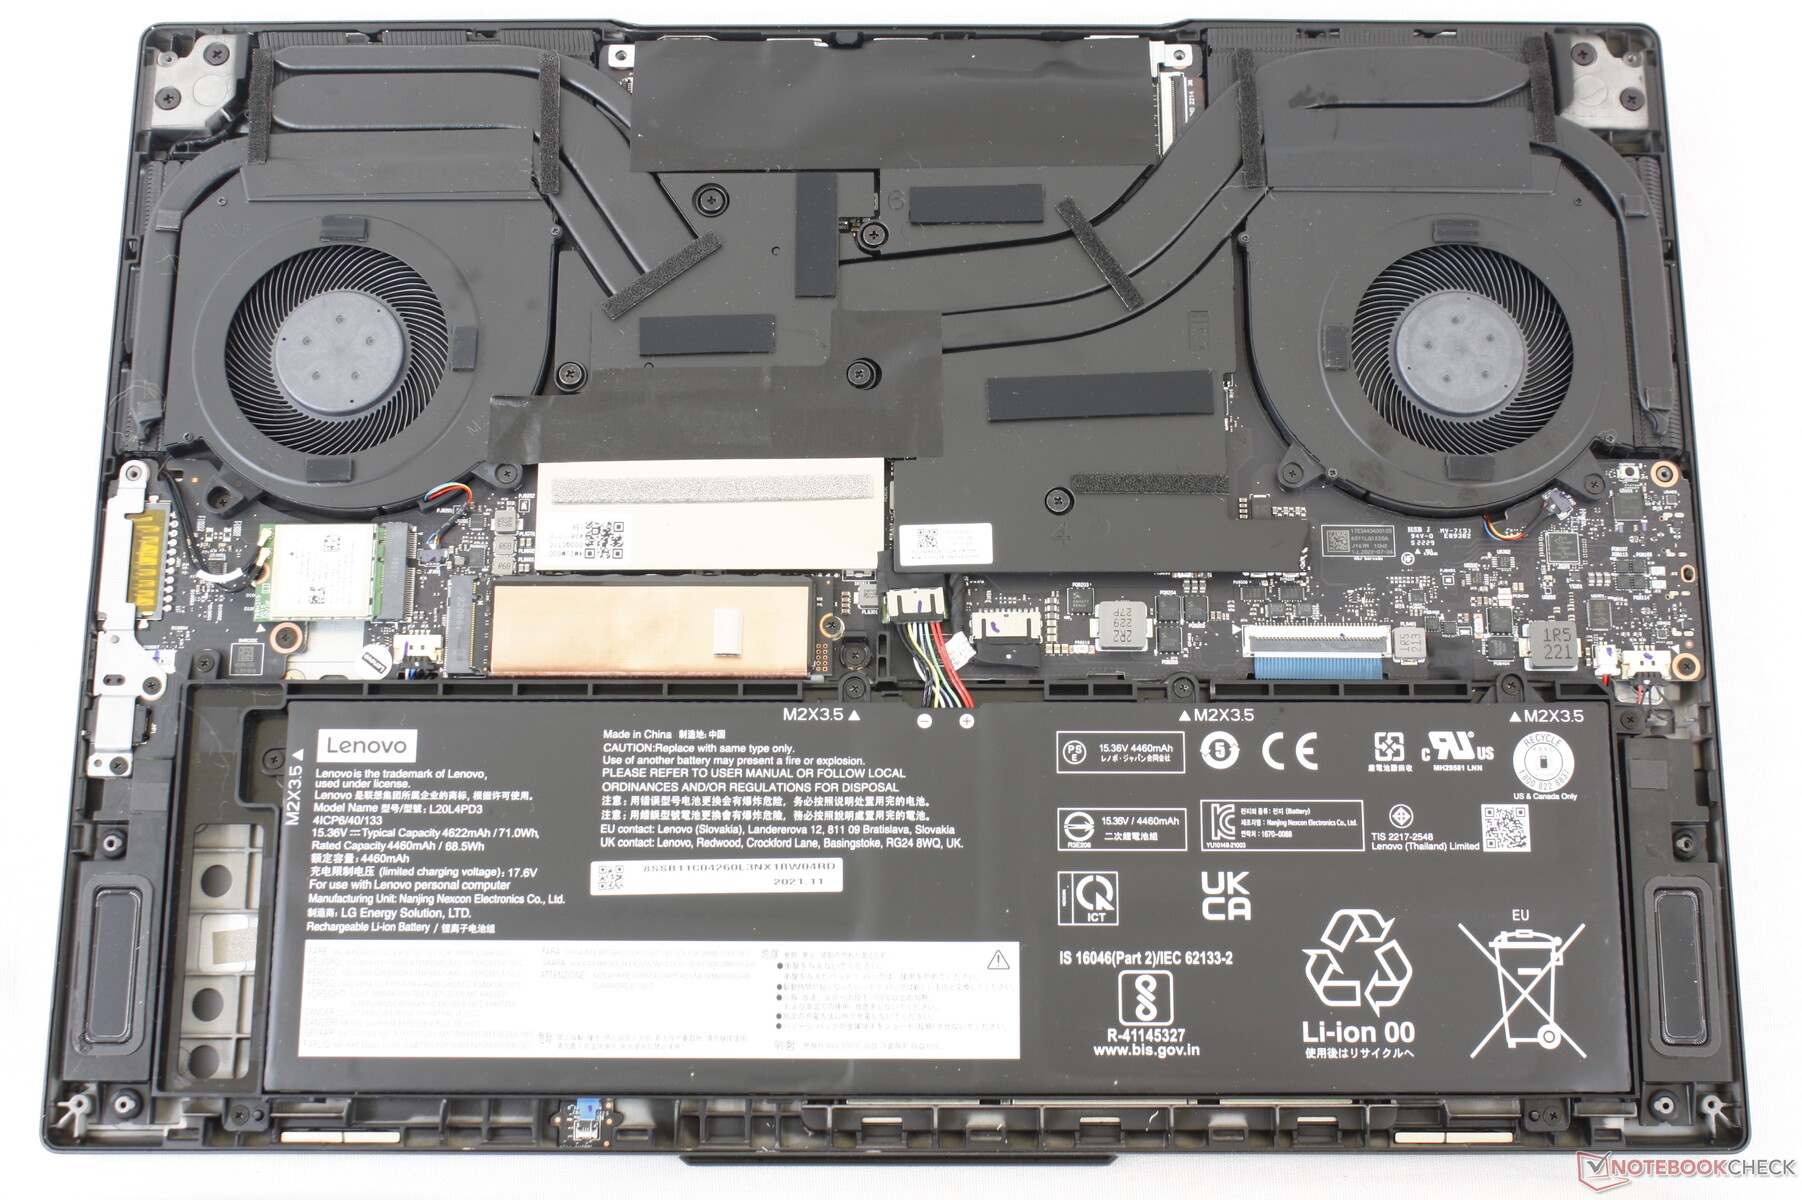
Teoretycznie Lenovo Legion Slim 7i można otworzyć i zmodernizować. Aby to zrobić, trzeba zdjąć panel bazowy, który jest zabezpieczony ośmioma śrubkami i licznymi klipsami. Powiedzieliśmy "teoretycznie", bo nie udało nam się otworzyć urządzenia nawet po kilku próbach. Nie dało się odkręcić klipsów bez ryzyka uszkodzenia obudowy. Niemniej jednak, układ elementów wewnętrznych powinien być podobny do tego w wersji AMD, dlatego też zapożyczyliśmy odpowiednie zdjęcie z tamtej recenzji.
Poza dyskiem SSD M.2 2280 zarówno pamięć RAM SODIMM, jak i moduł Wi-Fi podlegają modernizacji. Podobnie można wymienić akumulator.
Gwarancja
Lenovo oferuje 24-miesięczną gwarancję z usługą bring-in na urządzenie Lenovo Legion S7 zakupione w Niemczech. Okresy gwarancji mogą się różnić w zależności od kraju. Na przykład klienci w USA otrzymają domyślnie tylko roczną gwarancję.
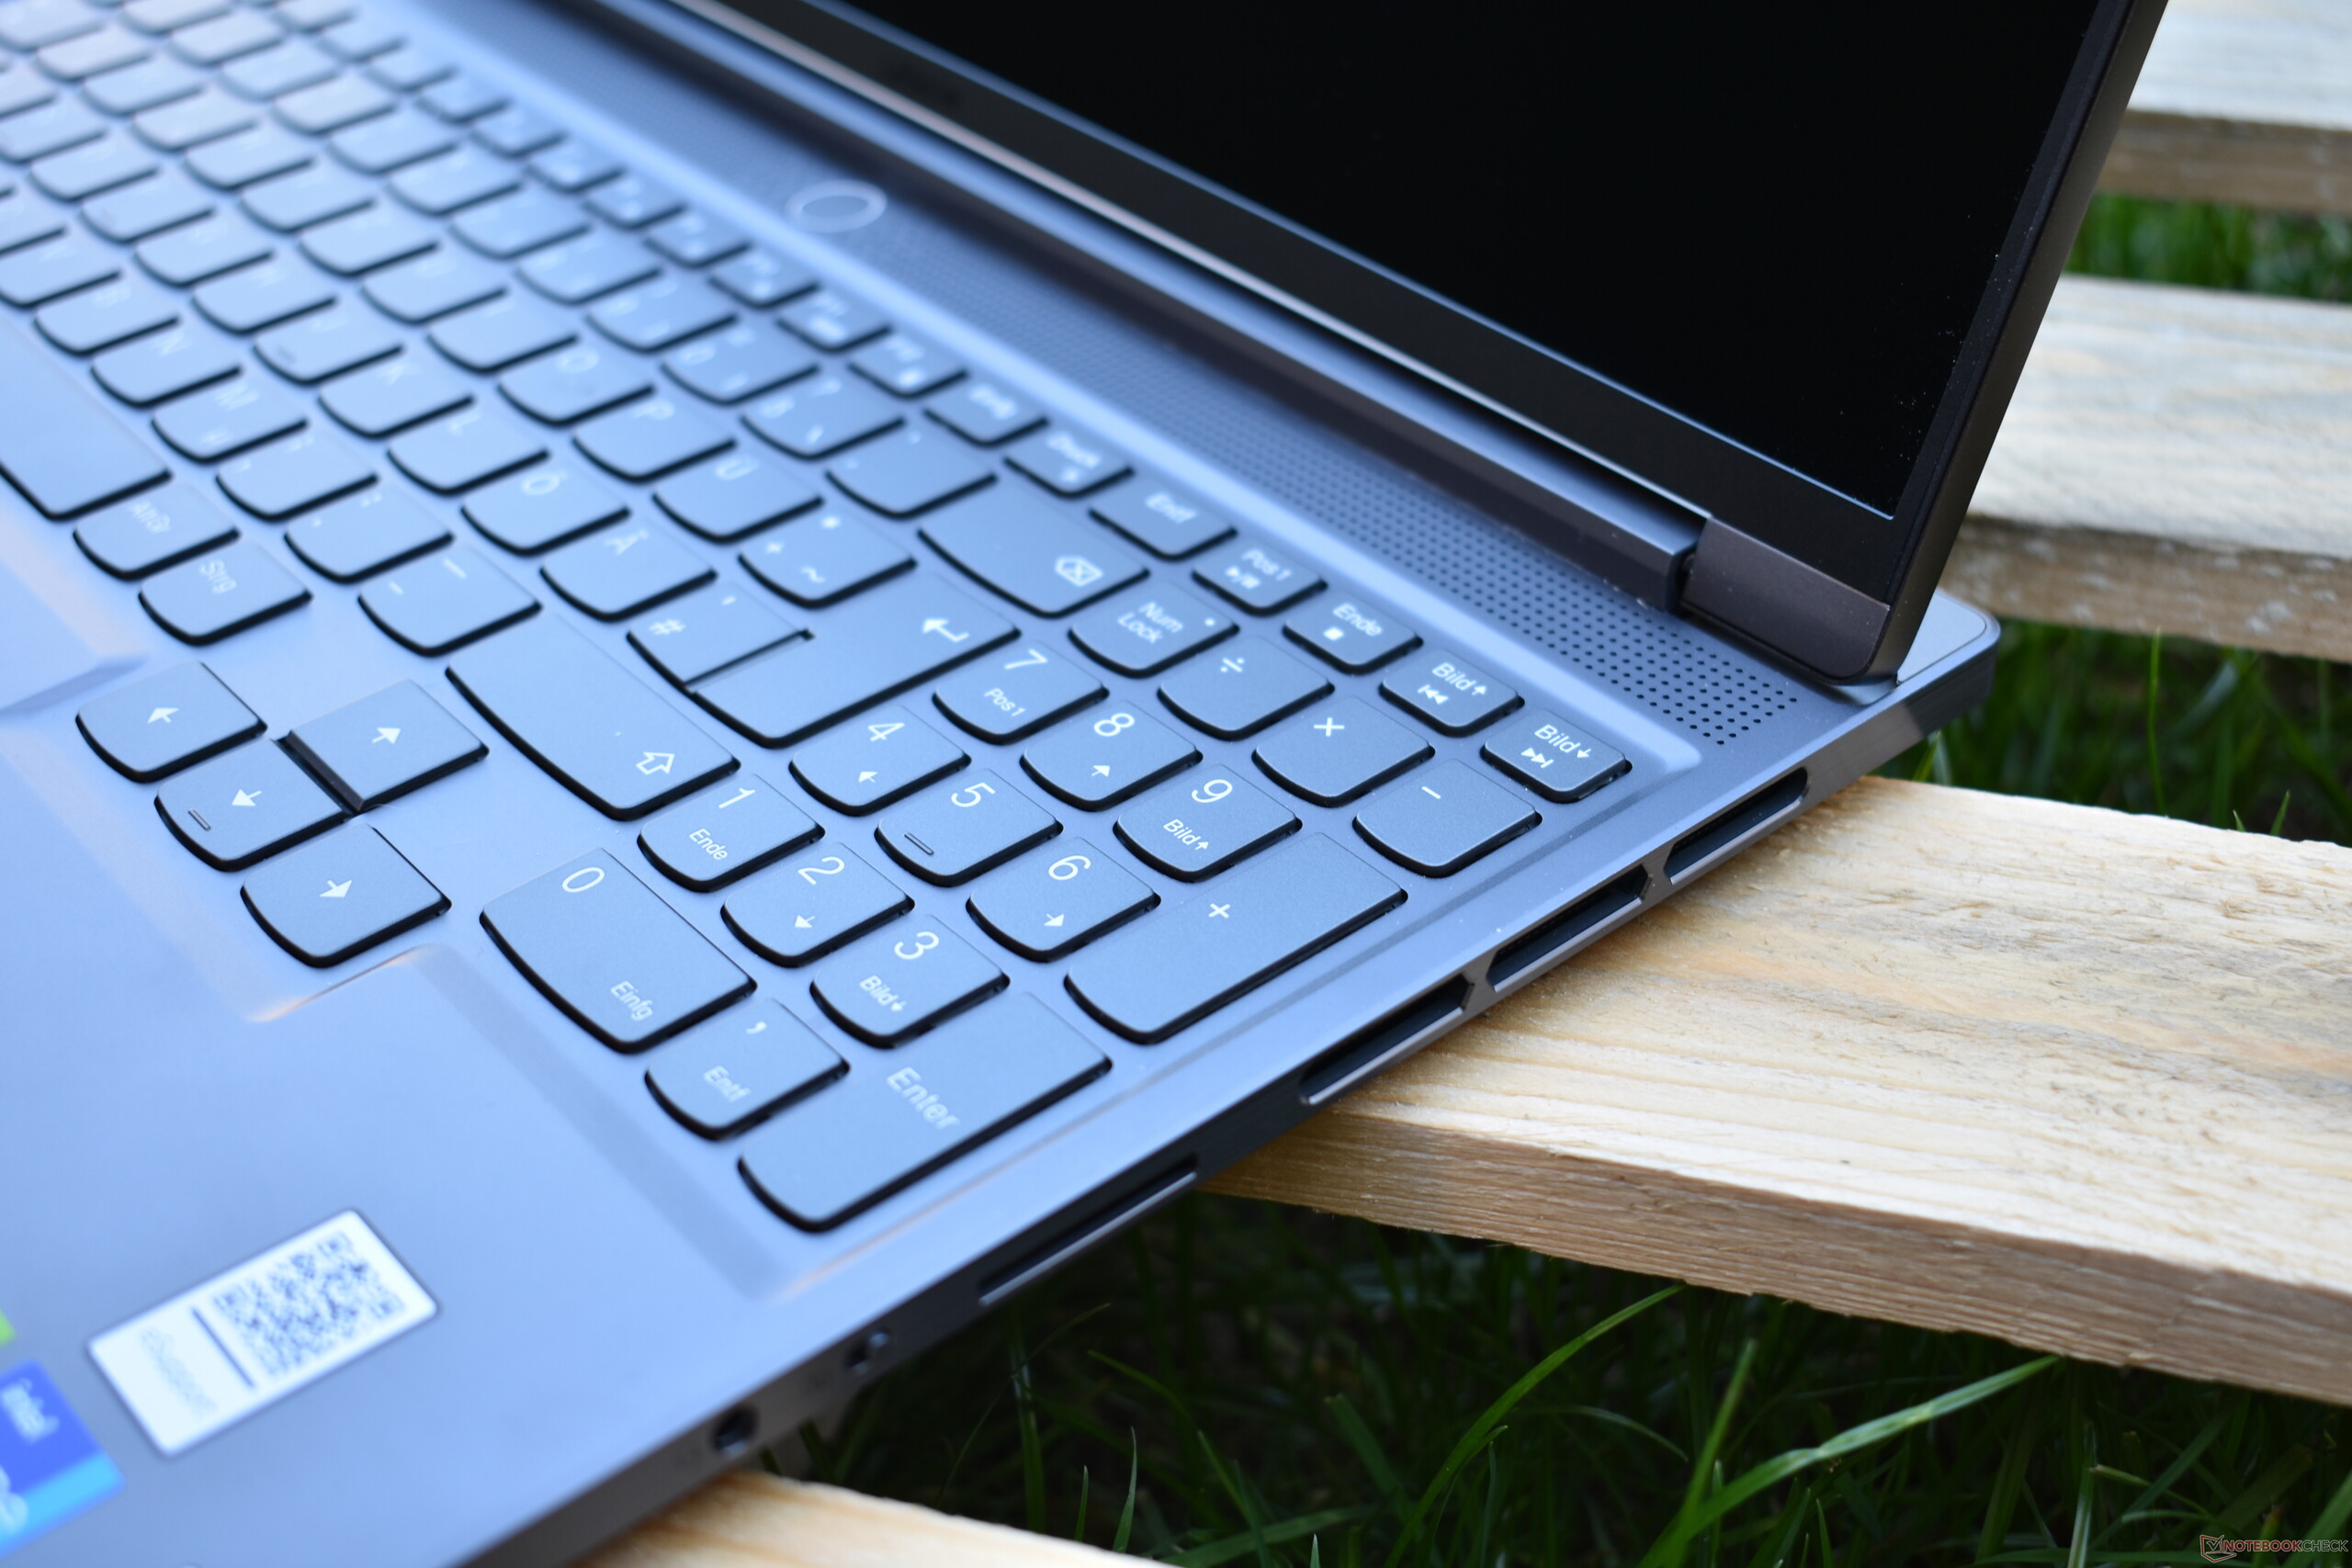
Urządzenia wejściowe: Laptop gamingowy bez klawiatury RGB
Klawiatura
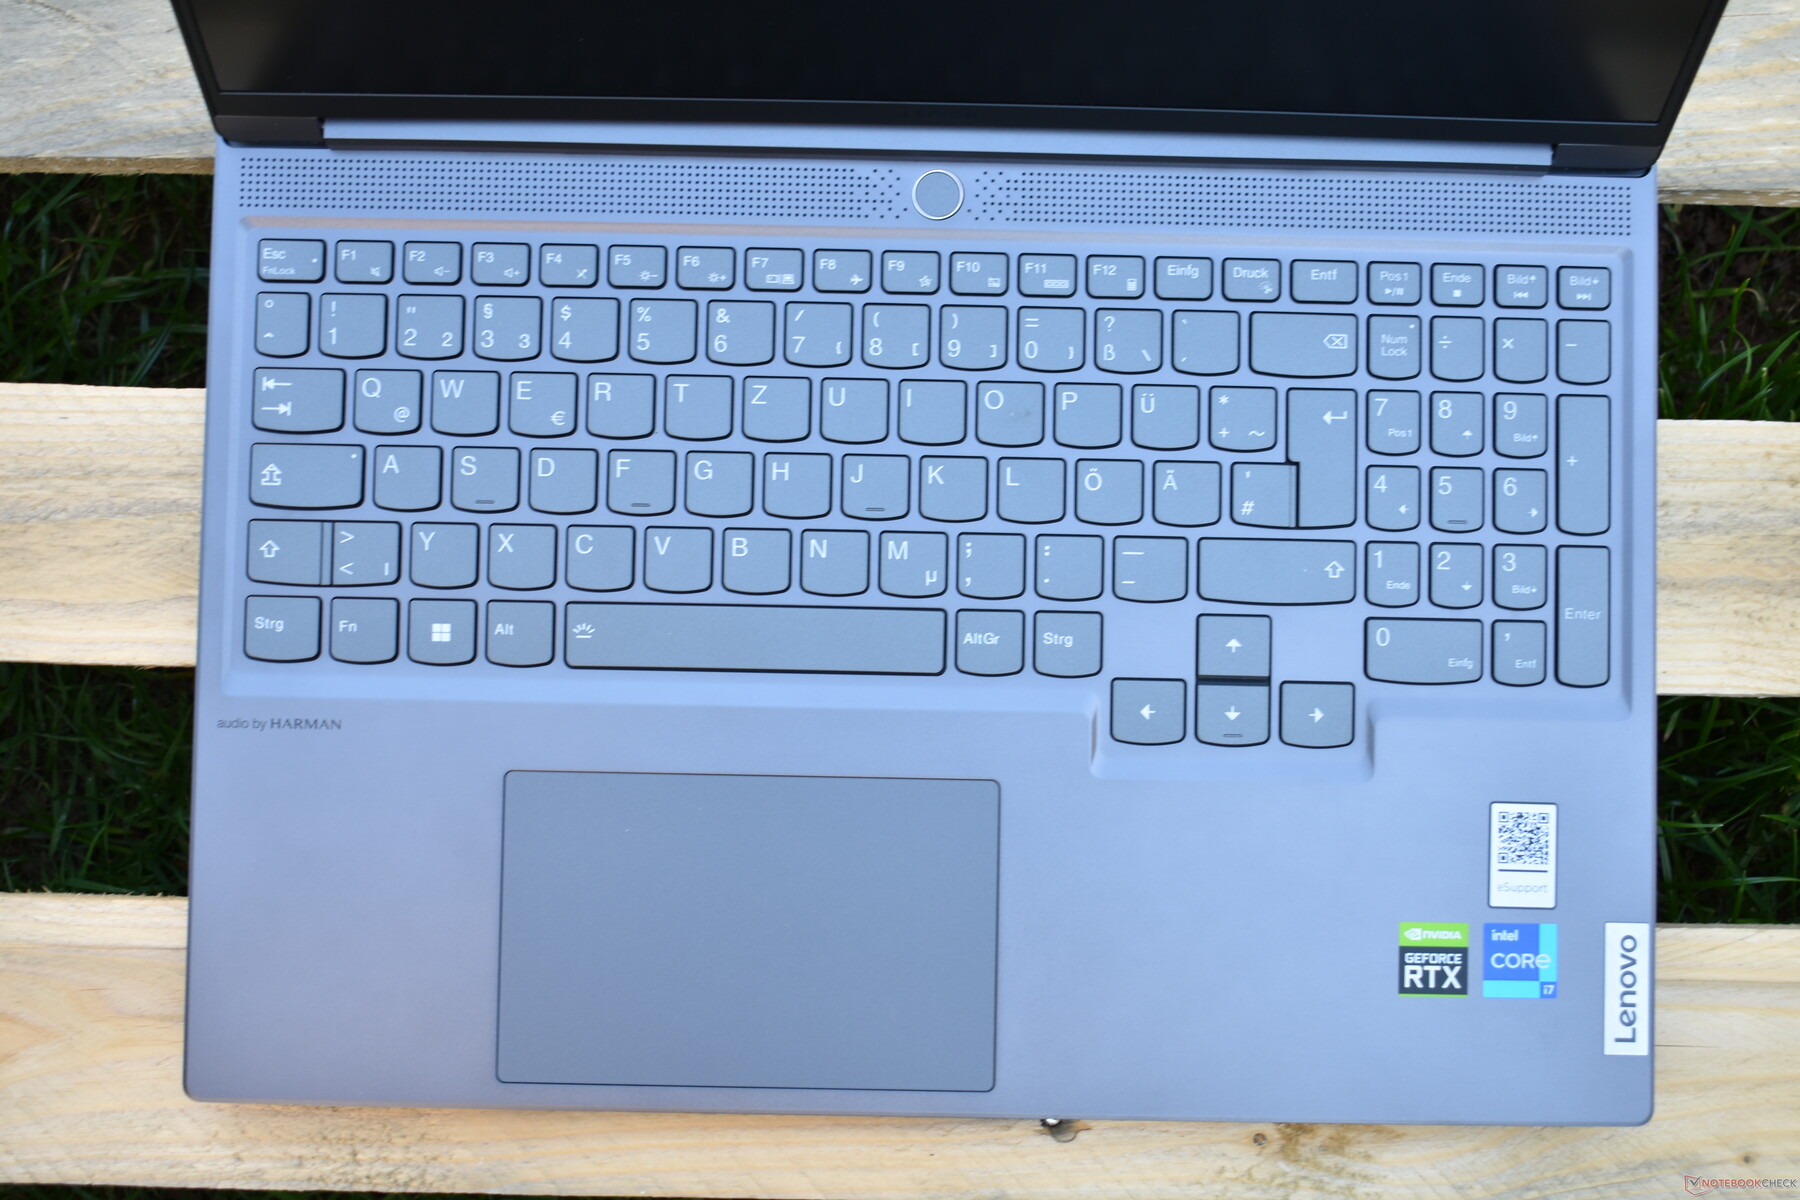
Klawisze chiclet na klawiaturze są ciemnoszare, by pasowały do koloru obudowy. Jak już wspomniano w części niniejszej recenzji poświęconej obudowie, Lenovo zrezygnowało z typowych sztuczek RGB stosowanych w laptopach do gier, nadając klawiaturze niebiesko-białe podświetlenie. Klawiatura z podświetleniem RGB jest dostępna za dodatkową opłatą.
Klawiatura zajmuje prawie całą szerokość obudowy i posiada blok numeryczny. Warto zwrócić uwagę na bardzo duże klawisze strzałek, które nie są często spotykane w laptopach. Choć jest to miłe, to wąski klawisz Enter nie przypadł nam do gustu tak bardzo. Ogólnie rzecz biorąc, na Lenovo Slim 7i pisze się całkiem przyjemnie. Klawisze mają około 1,5 mm (0,06 cala) skoku i wyraźny punkt aktywacji, dzięki czemu nie sprawiają wrażenia miękkich. Ponadto metalowa obudowa jest solidna i zapobiega uginaniu się klawiatury podczas pisania.
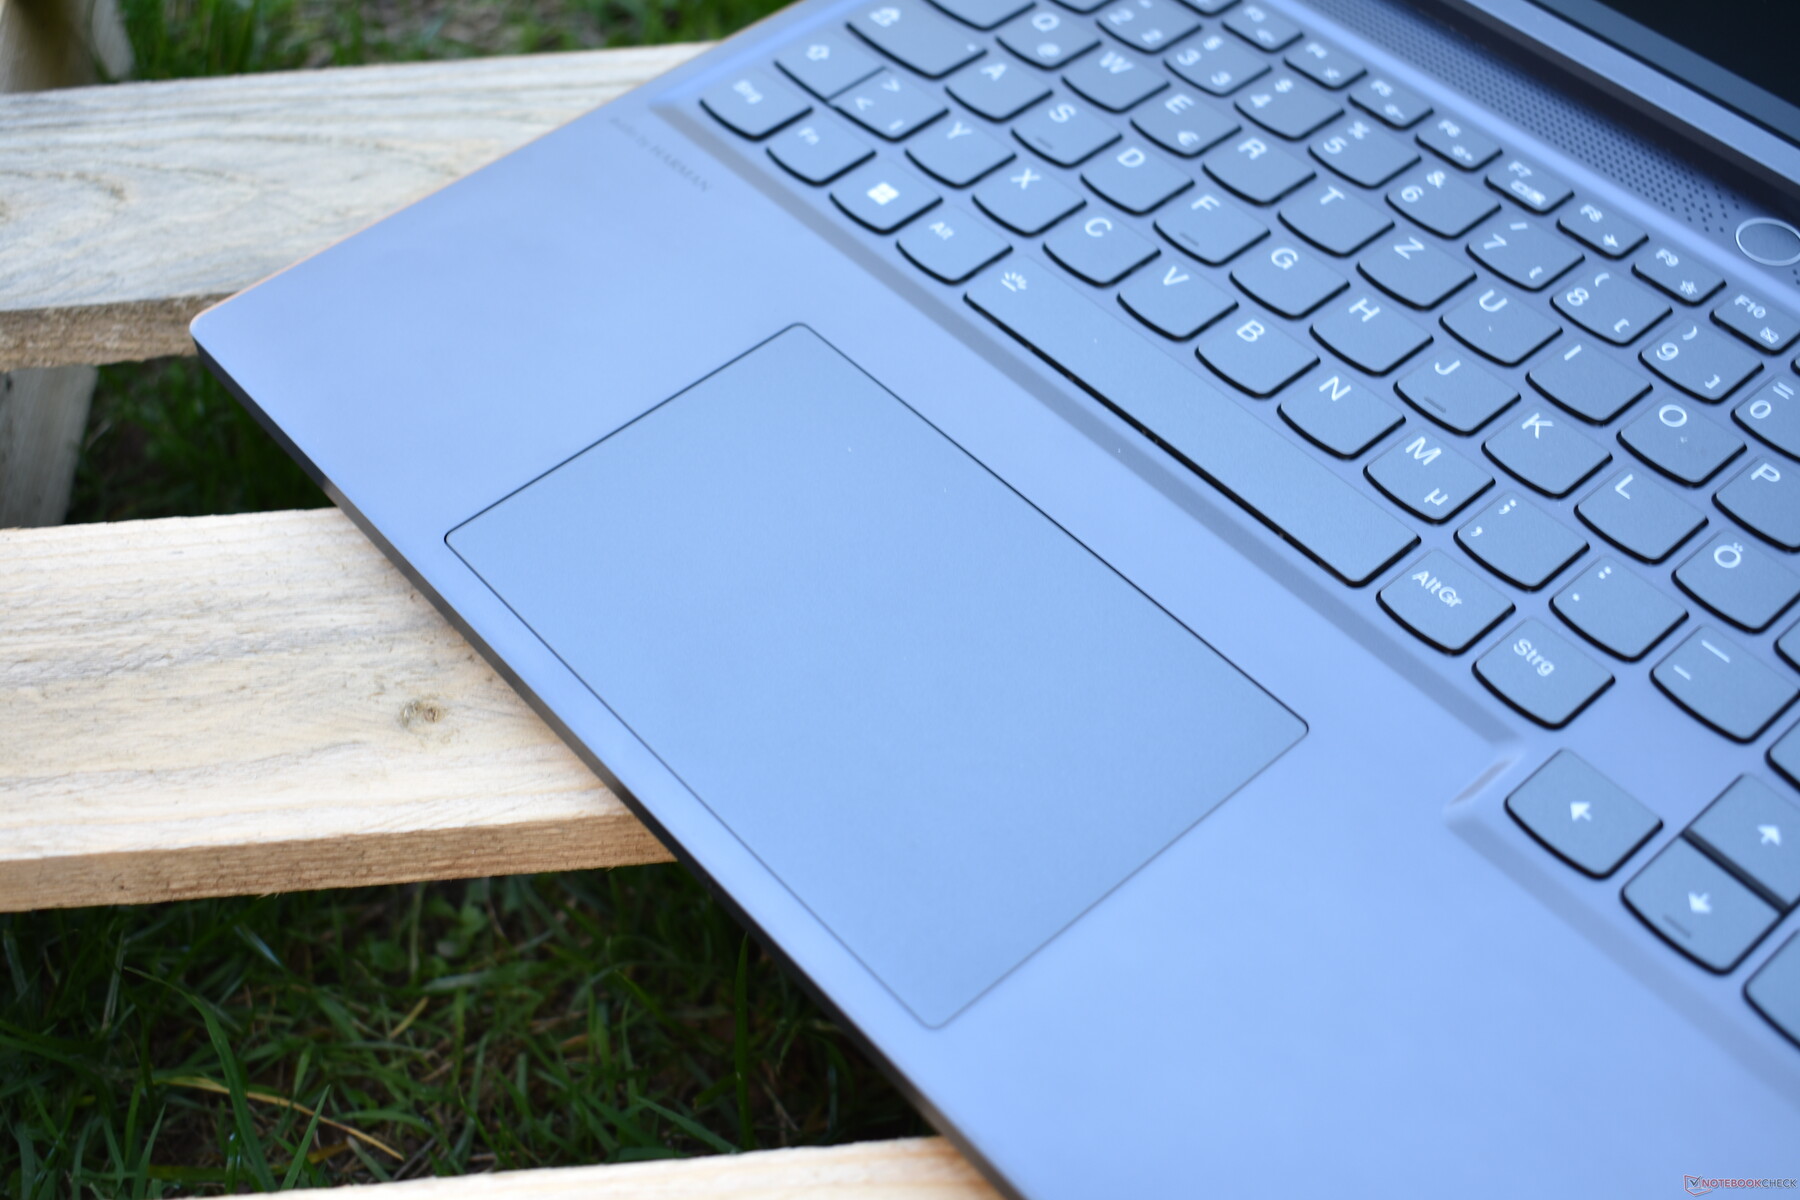
Touchpad
Mierzący 12 x 7,5 cm (4,72 x 2,95") touchpad jest odpowiedni, ale naszym zdaniem mógłby być nieco większy. Szklany gładzik ma gładką, matową powierzchnię, która sprawia wrażenie wysokiej jakości i pozwala palcom przesuwać się po nim bez wysiłku. Mniejsze wrażenie robi na nas tradycyjny mechanizm klikania (uruchamiany przez naciśnięcie dolnej strefy). Powodem jest to, że touchpad wydaje dość głośne dźwięki klikania, które mogą być denerwujące. To jednak nasz jedyny zarzut wobec touchpada; programowa implementacja takich funkcji jak gesty multitouch jest bez zarzutu, a wskaźnik myszy można kontrolować z bardzo dużą precyzją.
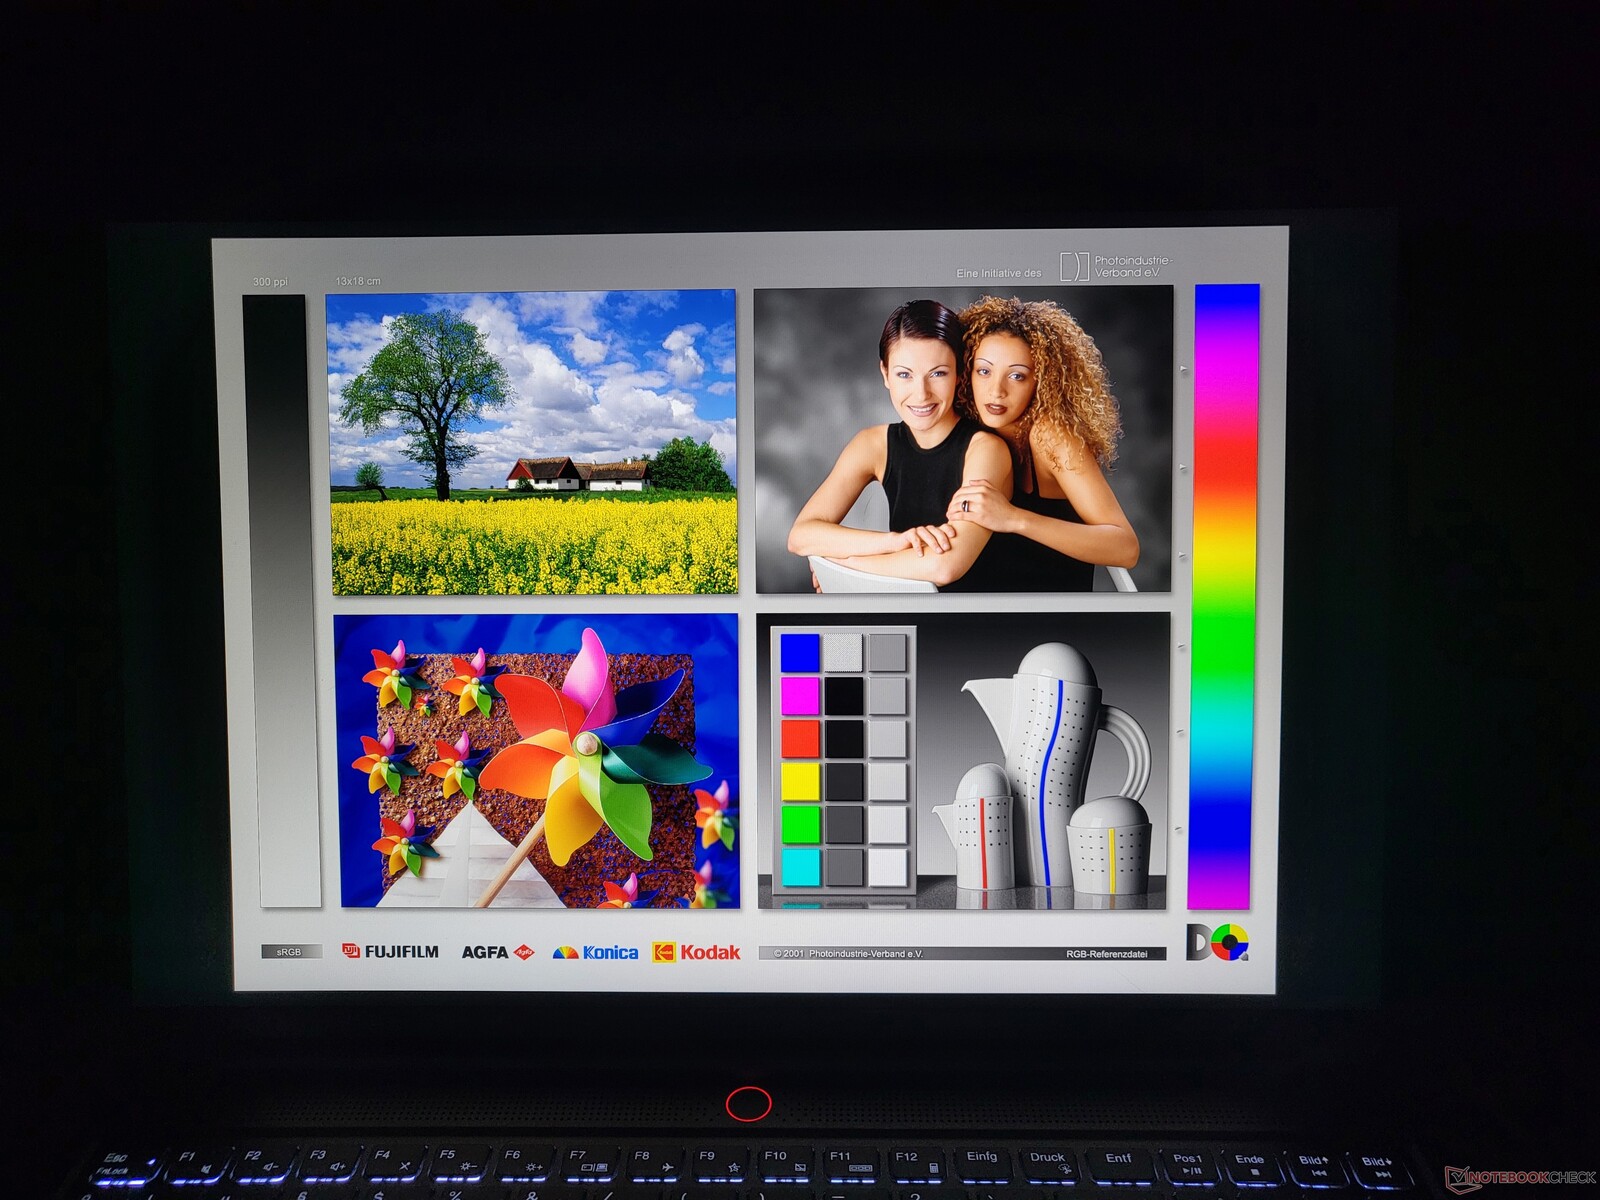
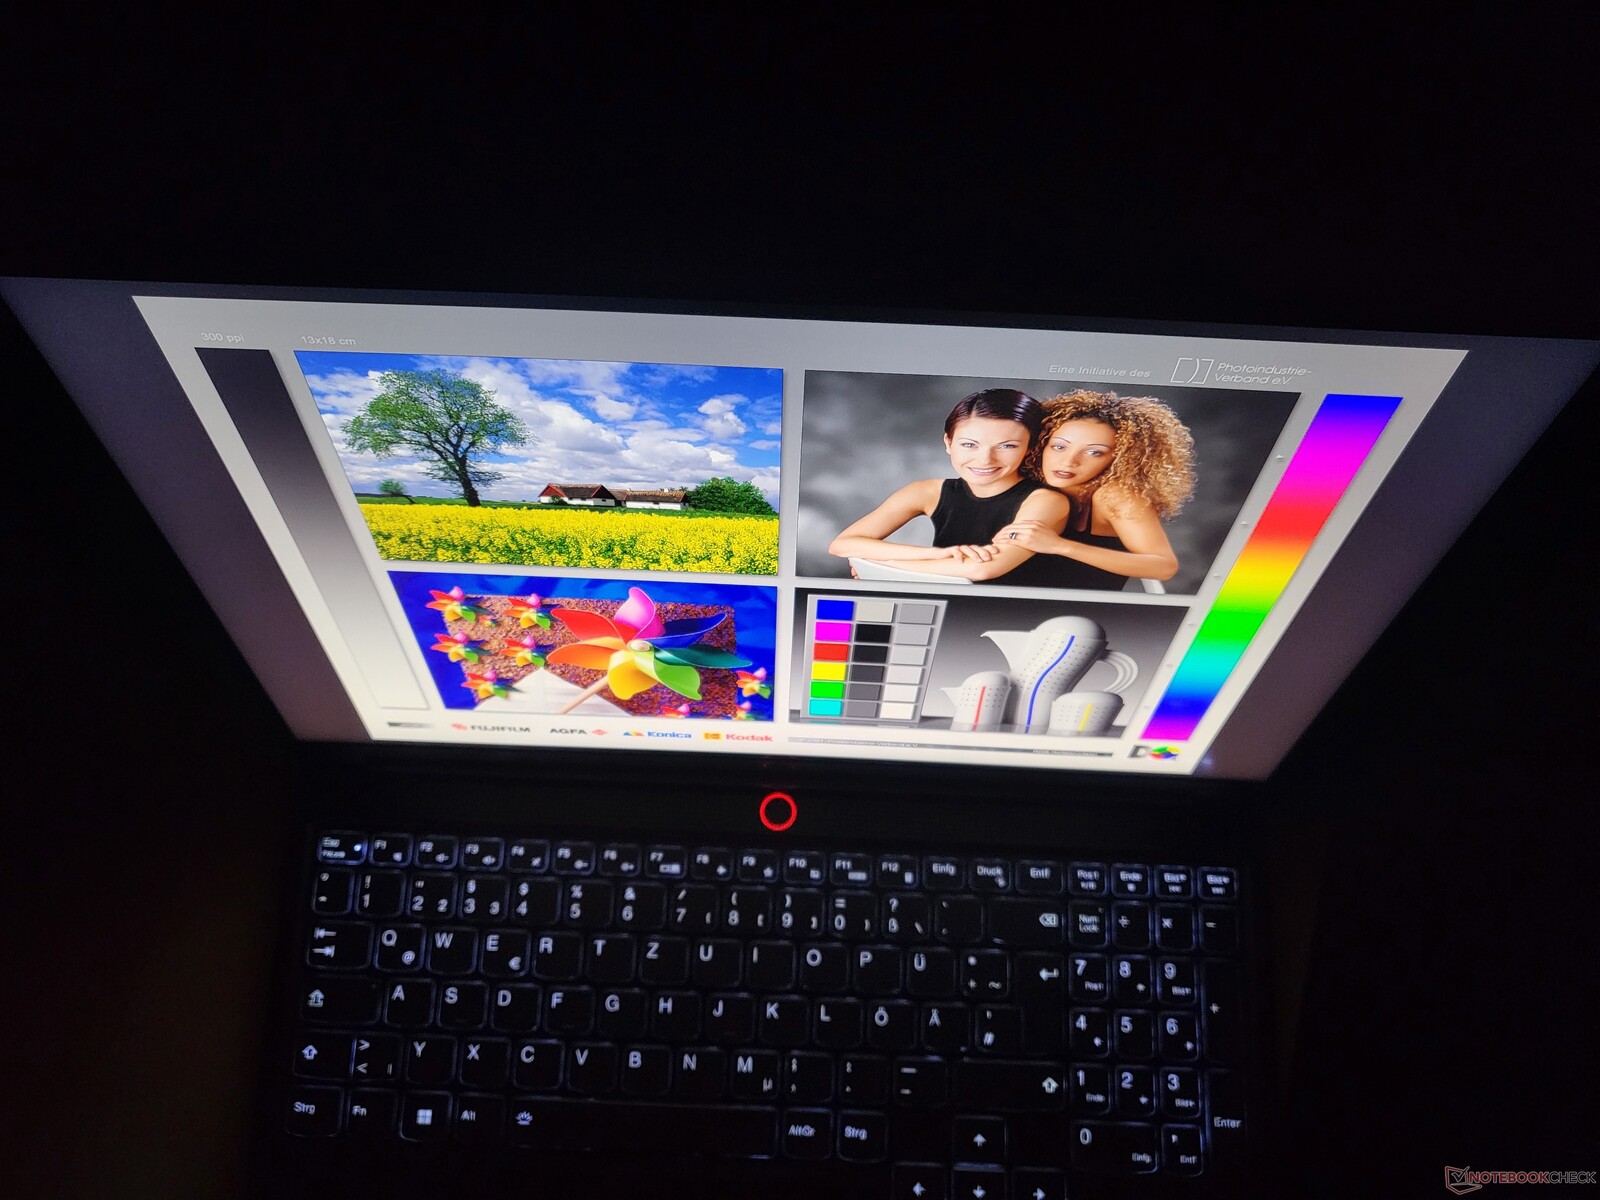
Doskonały wyświetlacz WQXGA o częstotliwości odświeżania 165 Hz
Wszystkie opcje wyświetlaczy dostępne w modelu Legion S7i to matowe panele IPS o proporcjach 16:10 i przekątnej 16 cali. Różnią się one rozdzielczością i zestawem funkcji:
- WUXGA (1.920 x 1.200), 300 cd/m², 100% sRGB, 165 Hz
- WQXGA (2.560 x 1.600), 500 cd/m², 100% sRGB, 165 Hz
- WQXGA (2,560 x 1,600), 500 cd/m², 100% sRGB, 240 Hz
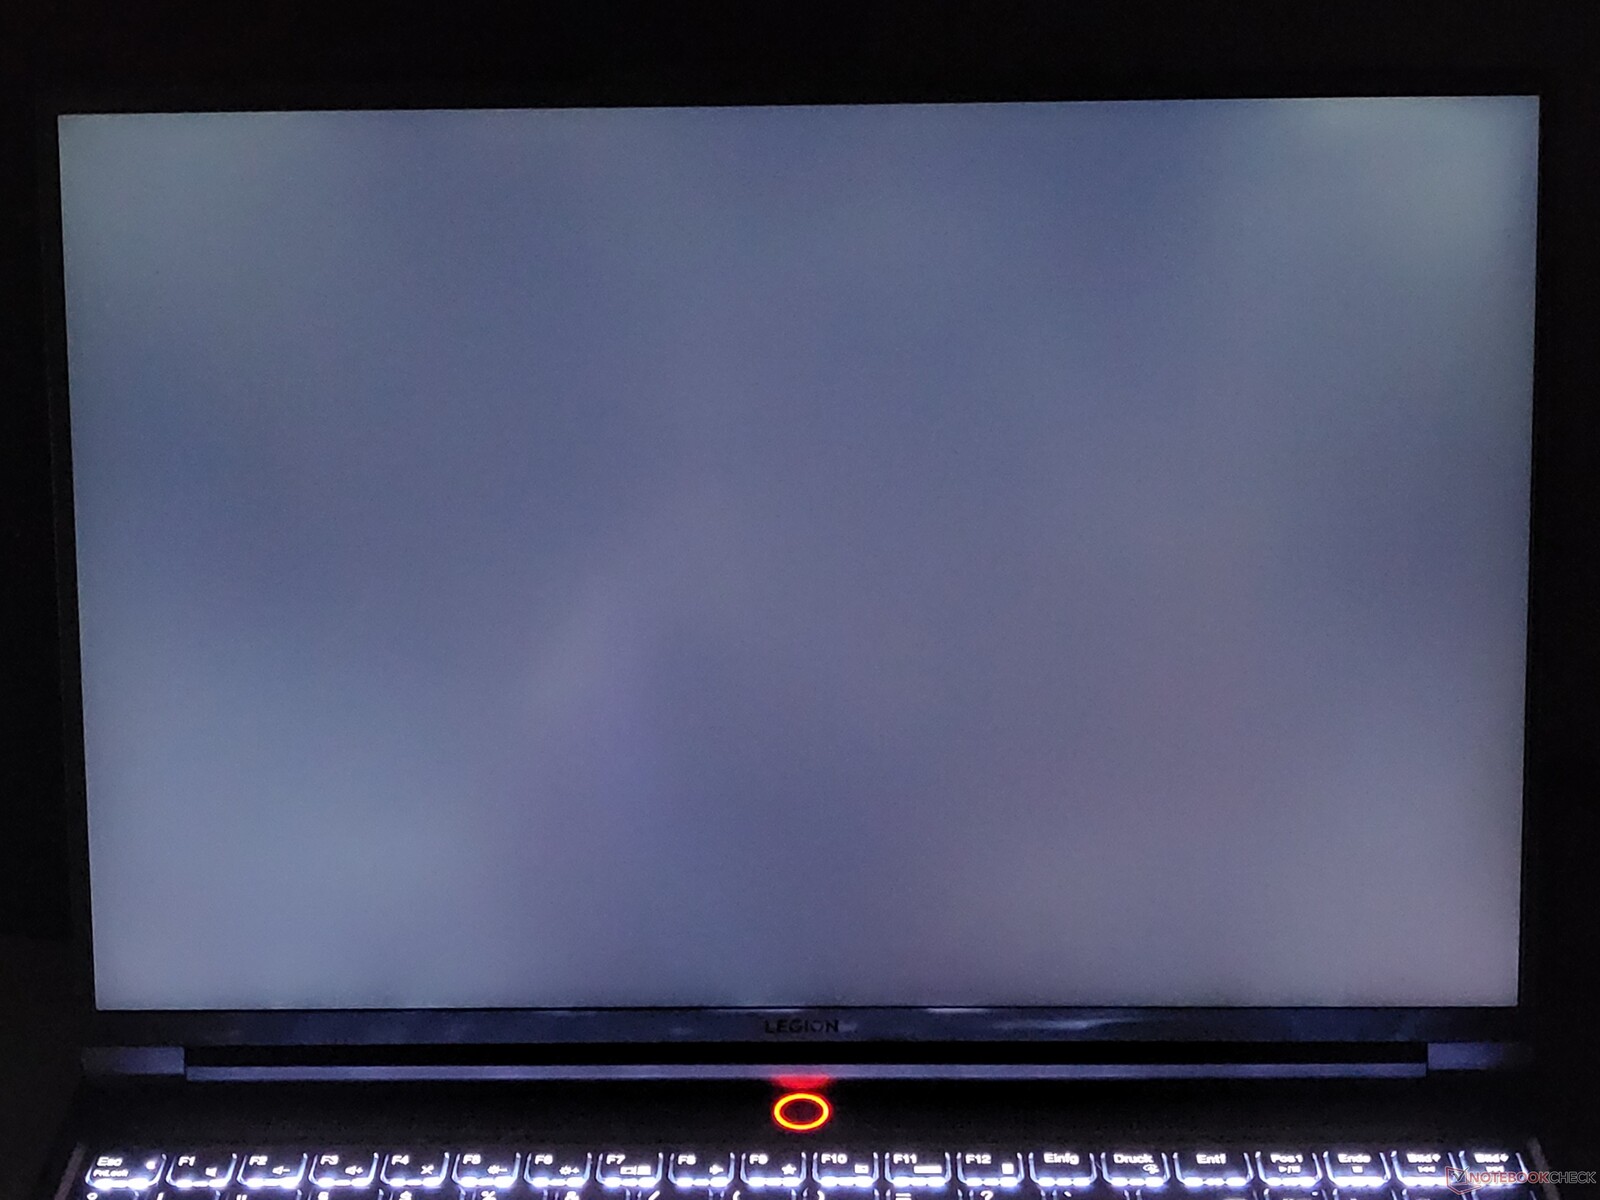
Nasz egzemplarz testowy przekroczył deklarowaną jasność szczytową 500 cd/m², a ekran osiągnął jasność 523 cd/m². Średnia szczytowa jasność ekranu wynosi 494 cd/m², co oznacza, że Lenovo Legion S7-16IAH7 ma najjaśniejszy ekran w zestawieniu.
Dzięki częstotliwości odświeżania 165 Hz treści na ekranie wyglądają bardzo płynnie w ruchu, co idealnie sprawdza się w grach. Co więcej, wyświetlacz charakteryzuje się również niskim czasem reakcji jak na panel IPS.
| |||||||||||||||||||||||||
rozświetlenie: 90 %
na akumulatorze: 523 cd/m²
kontrast: 1308:1 (czerń: 0.4 cd/m²)
ΔE ColorChecker Calman: 2.6 | ∀{0.5-29.43 Ø4.72}
calibrated: 1
ΔE Greyscale Calman: 3.3 | ∀{0.09-98 Ø4.97}
72.8% AdobeRGB 1998 (Argyll 3D)
99.1% sRGB (Argyll 3D)
70.5% Display P3 (Argyll 3D)
Gamma: 2.17
CCT: 6013 K
| Lenovo Legion Slim 7-16IAH 82TF004YGE MNG007DA1-G , IPS LED, 2560x1600, 16" | Lenovo Legion S7 16ARHA7 BOE CQ NE160QDM-NY1, IPS, 2560x1600, 16" | Acer Predator Triton 500 SE PT516-52s-70KX NE160QDM-NZ2, IPS LED, 2560x1600, 16" | HP Omen 16-b1090ng BOE09E5, IPS, 2560x1440, 16.1" | Asus ROG Zephyrus M16 GU603H AU Optronics AUOC199, IPS, 2560x1600, 16" | |
|---|---|---|---|---|---|
| Display | -1% | 19% | 0% | ||
| Display P3 Coverage (%) | 70.5 | 69.8 -1% | 97.3 38% | 71 1% | |
| sRGB Coverage (%) | 99.1 | 98.1 -1% | 100 1% | 97.9 -1% | |
| AdobeRGB 1998 Coverage (%) | 72.8 | 71.9 -1% | 84.9 17% | 73.3 1% | |
| Response Times | -33% | -3% | -28% | 37% | |
| Response Time Grey 50% / Grey 80% * (ms) | 12 ? | 10 ? 17% | 13.8 ? -15% | 14.5 ? -21% | 4.8 ? 60% |
| Response Time Black / White * (ms) | 7 ? | 12.8 ? -83% | 6.4 ? 9% | 9.4 ? -34% | 6 ? 14% |
| PWM Frequency (Hz) | |||||
| Screen | 9% | 10% | -39% | -34% | |
| Brightness middle (cd/m²) | 523 | 492.4 -6% | 498 -5% | 335 -36% | 448 -14% |
| Brightness (cd/m²) | 494 | 471 -5% | 468 -5% | 319 -35% | 446 -10% |
| Brightness Distribution (%) | 90 | 90 0% | 80 -11% | 90 0% | 86 -4% |
| Black Level * (cd/m²) | 0.4 | 0.4 -0% | 0.36 10% | 0.28 30% | 0.48 -20% |
| Contrast (:1) | 1308 | 1231 -6% | 1383 6% | 1196 -9% | 933 -29% |
| Colorchecker dE 2000 * | 2.6 | 1.9 27% | 1.77 32% | 4.38 -68% | 2.76 -6% |
| Colorchecker dE 2000 max. * | 5 | 3.81 24% | 5.24 -5% | 9.48 -90% | 7.09 -42% |
| Colorchecker dE 2000 calibrated * | 1 | 0.99 1% | 0.63 37% | 1.33 -33% | 2.86 -186% |
| Greyscale dE 2000 * | 3.3 | 1.7 48% | 2.4 27% | 7 -112% | 3.1 6% |
| Gamma | 2.17 101% | 2.36 93% | 2.14 103% | 2.103 105% | 2.153 102% |
| CCT | 6013 108% | 6497 100% | 7046 92% | 6244 104% | 6826 95% |
| Color Space (Percent of AdobeRGB 1998) (%) | 87 | ||||
| Color Space (Percent of sRGB) (%) | 100 | ||||
| Całkowita średnia (program / ustawienia) | -8% /
1% | 9% /
10% | -22% /
-29% | 2% /
-21% |
* ... im mniej tym lepiej
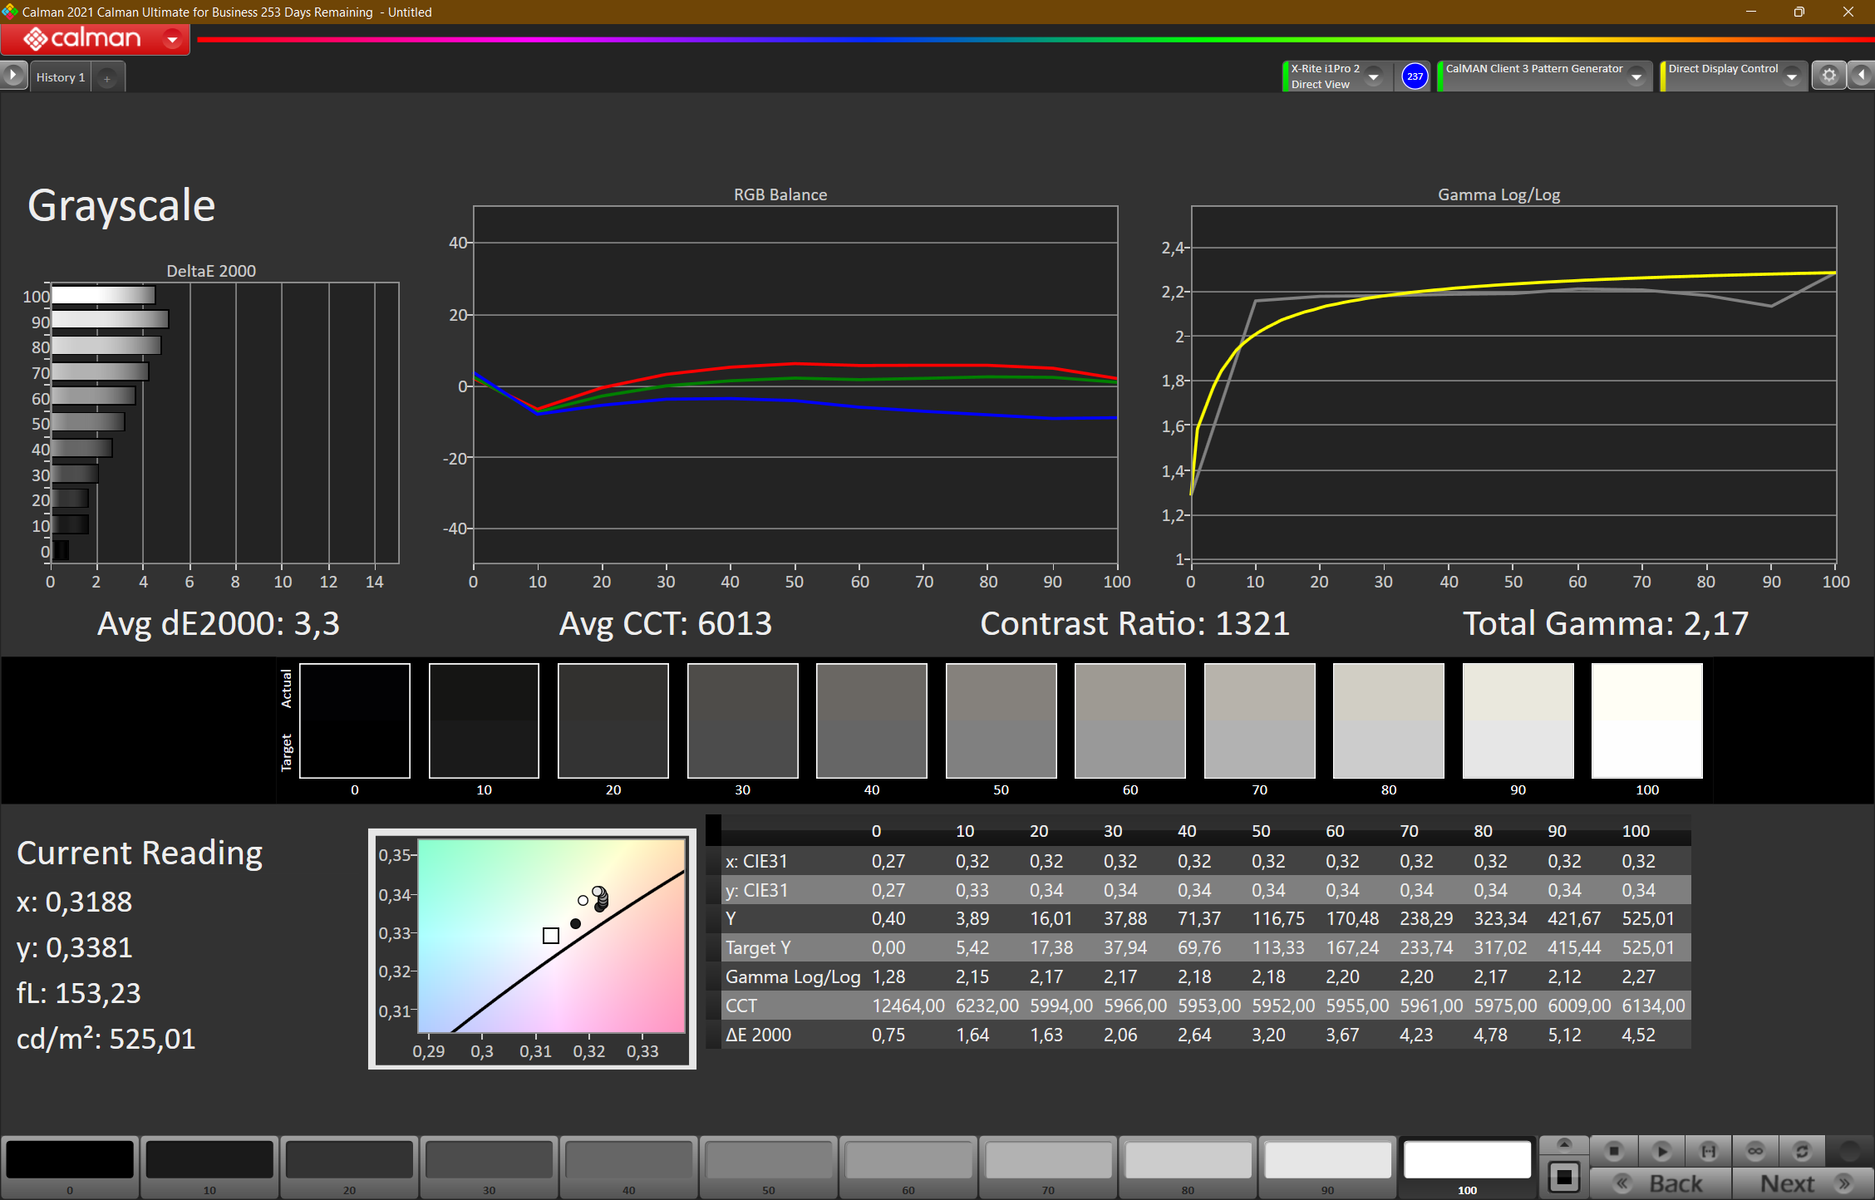
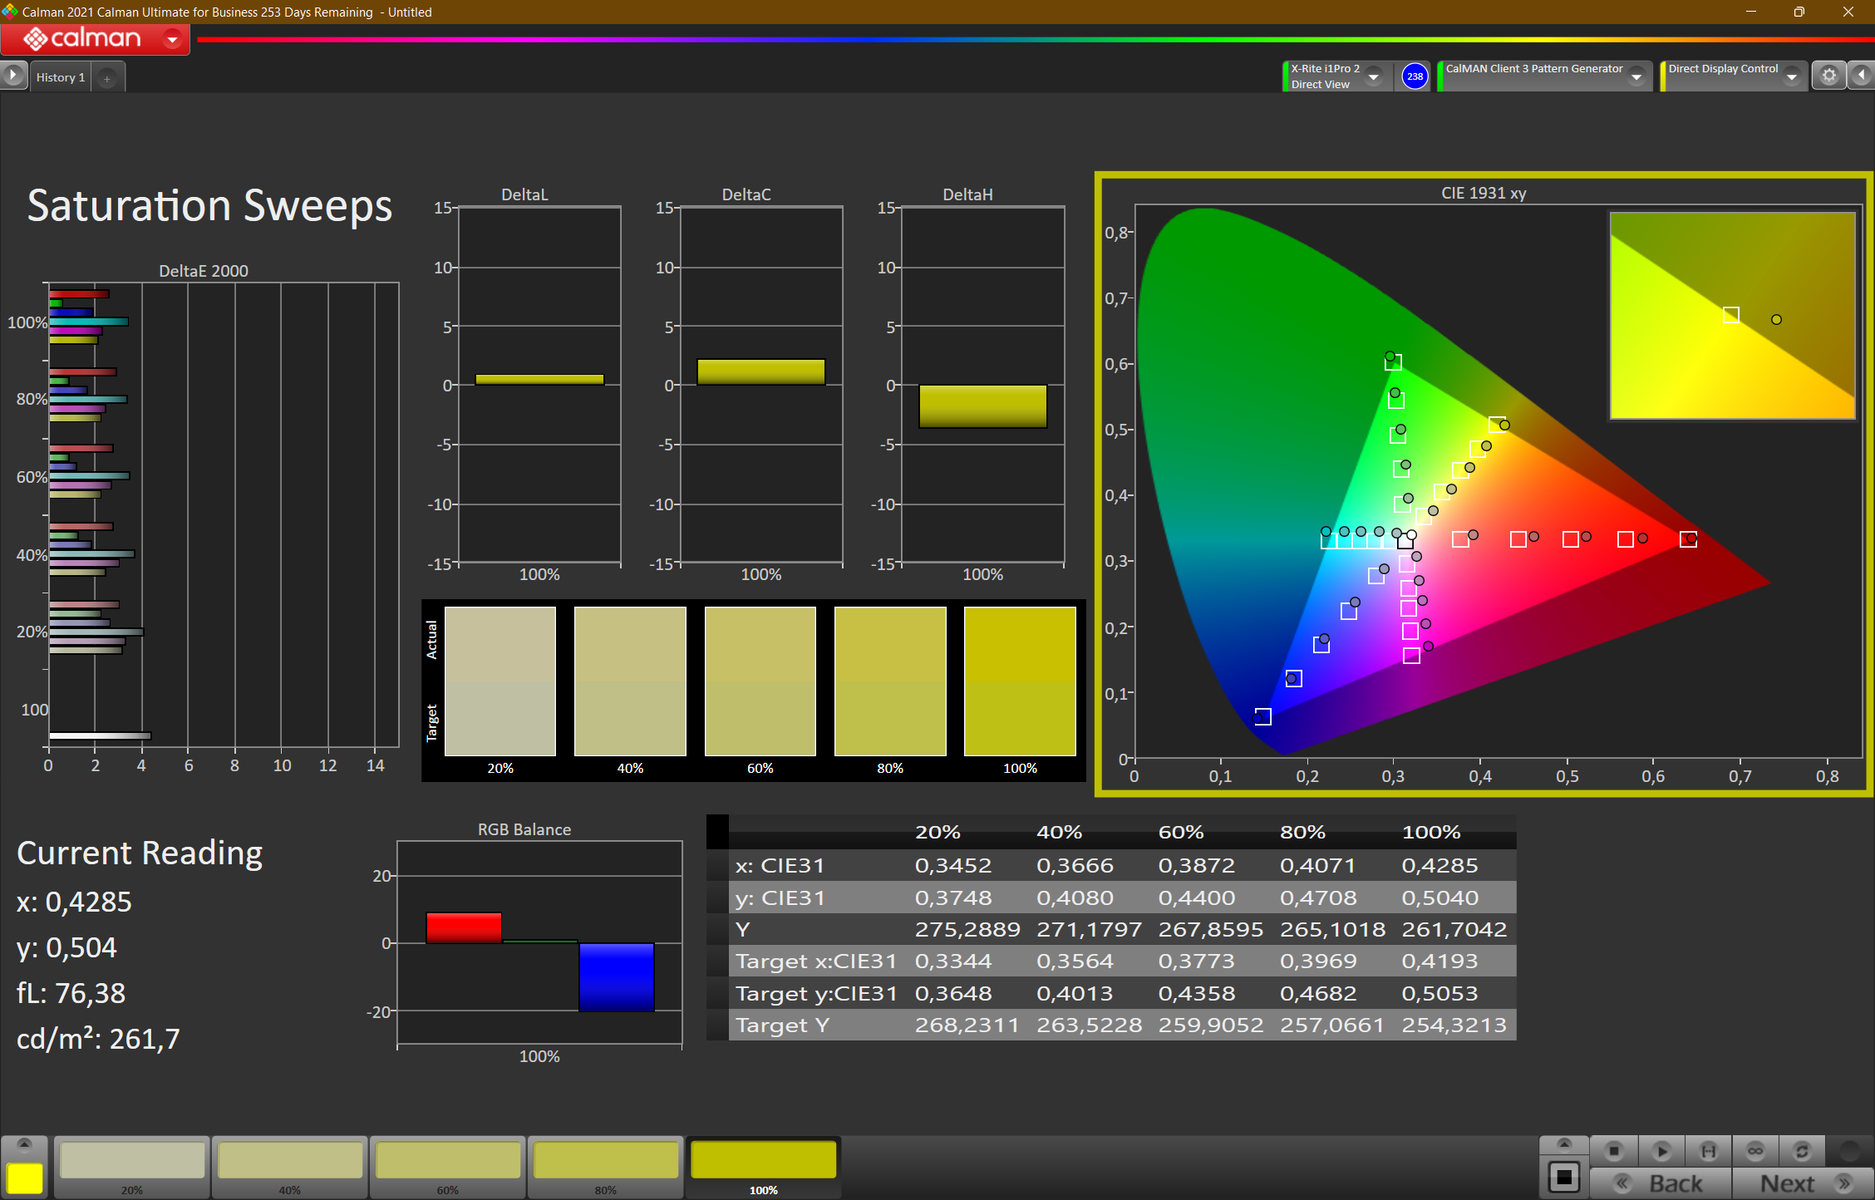
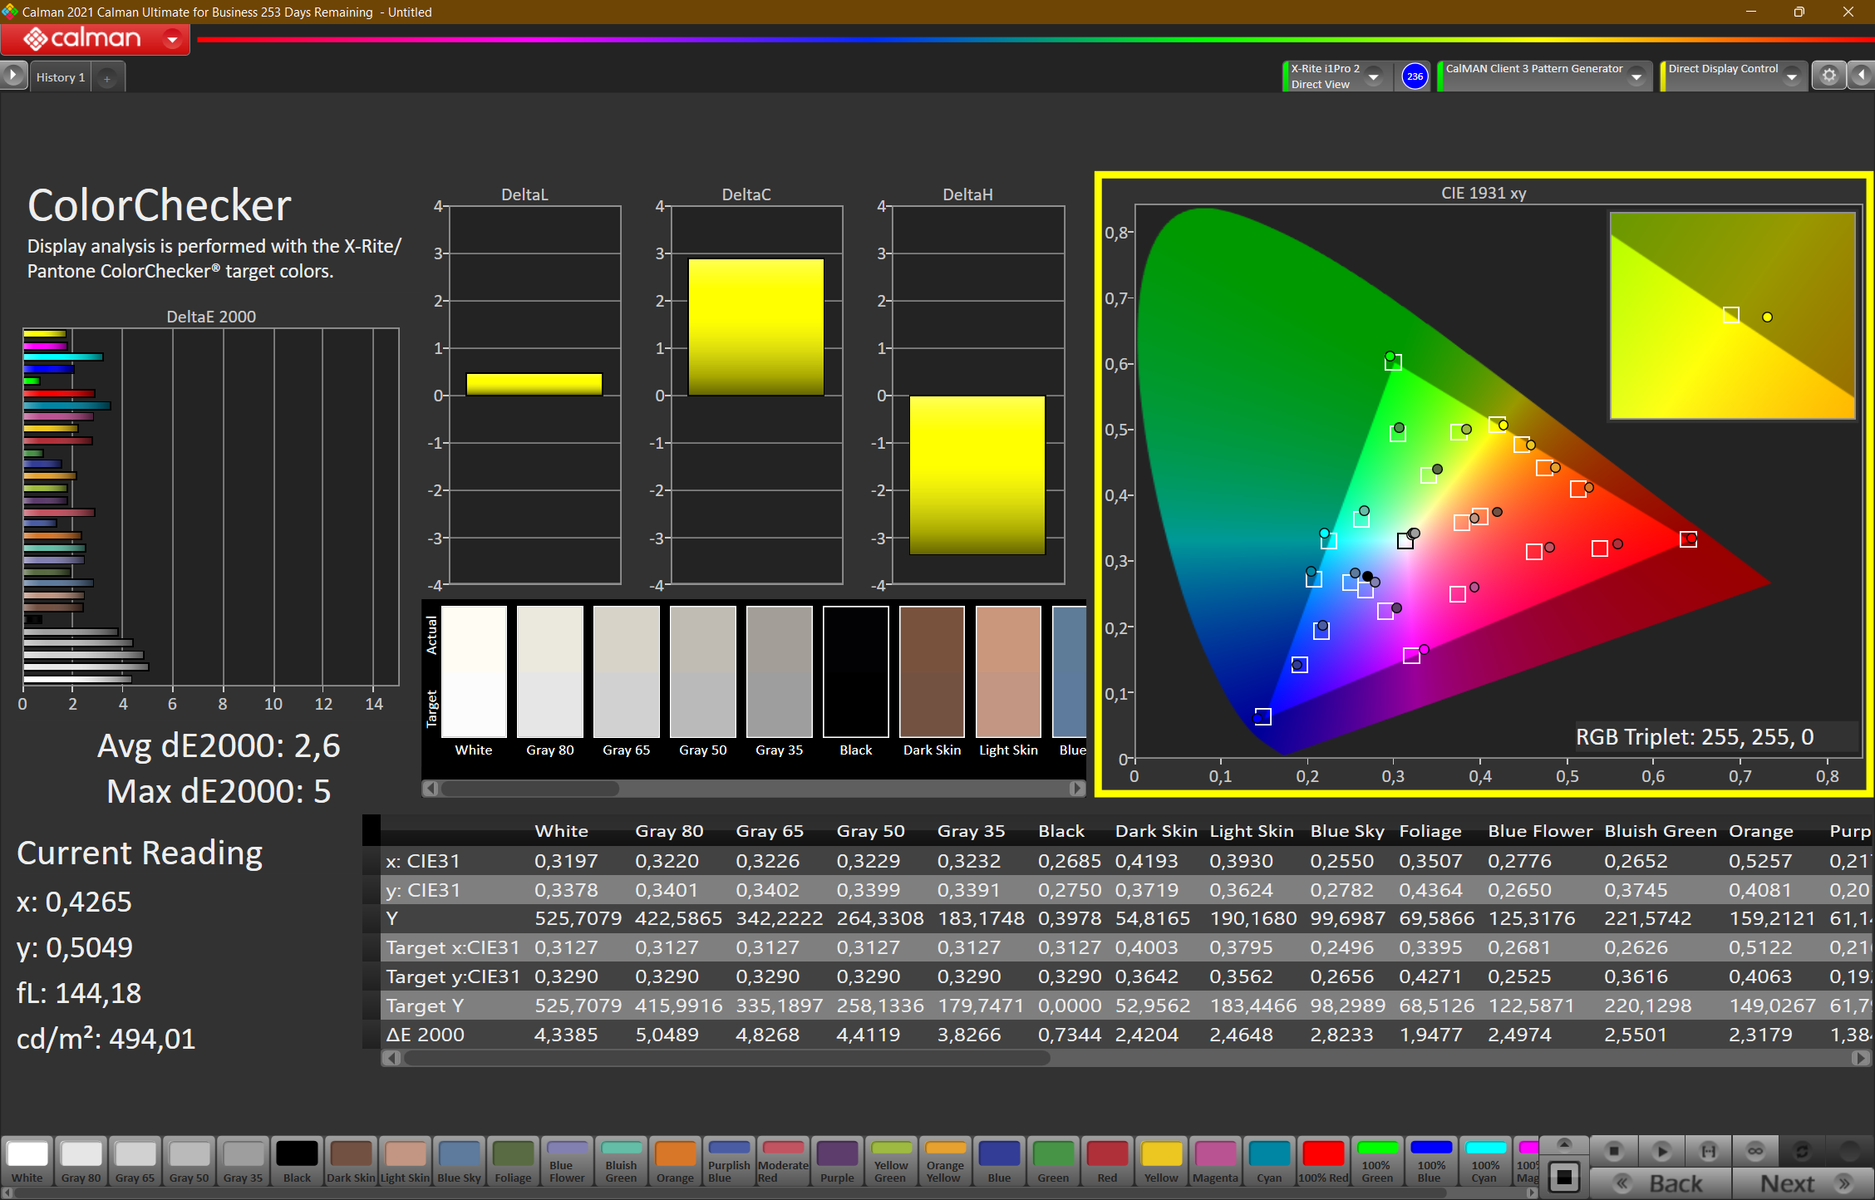
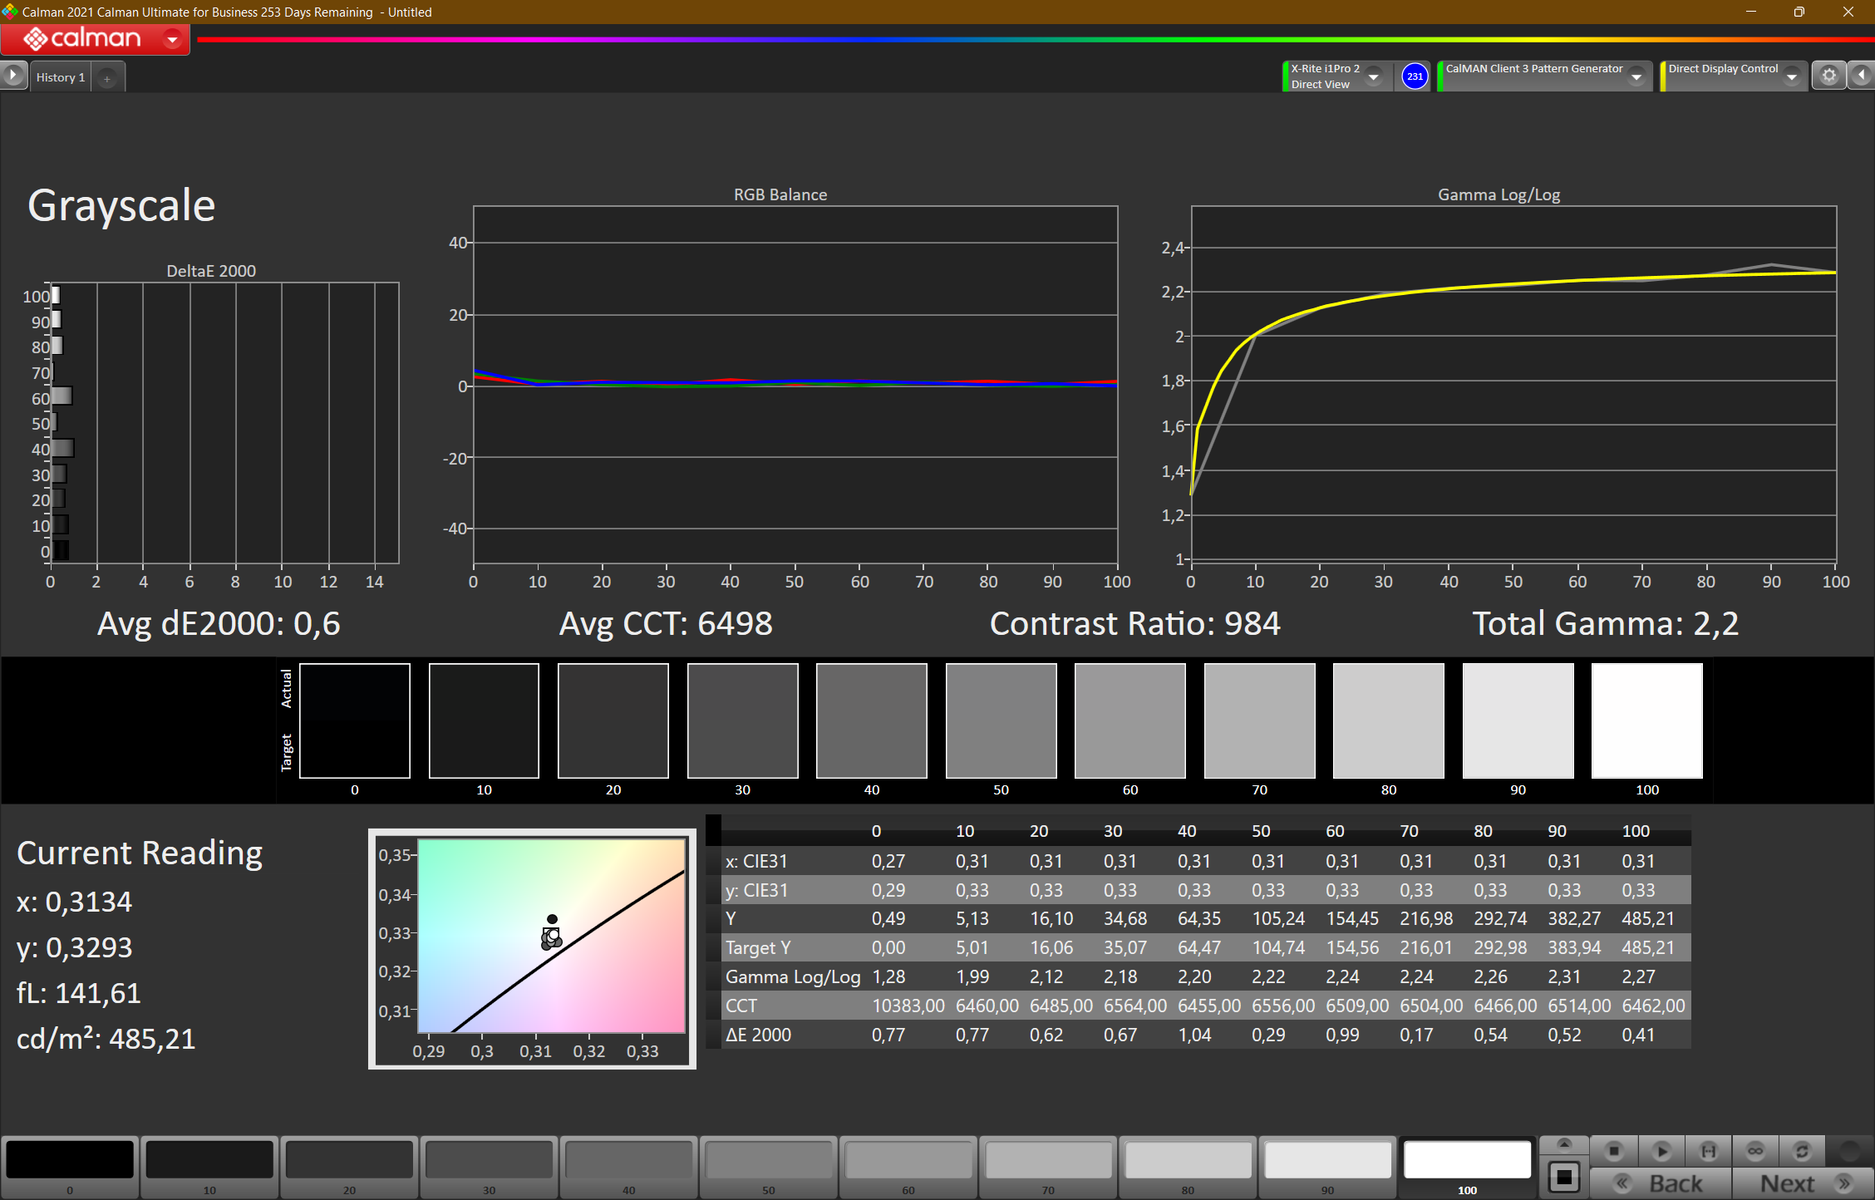
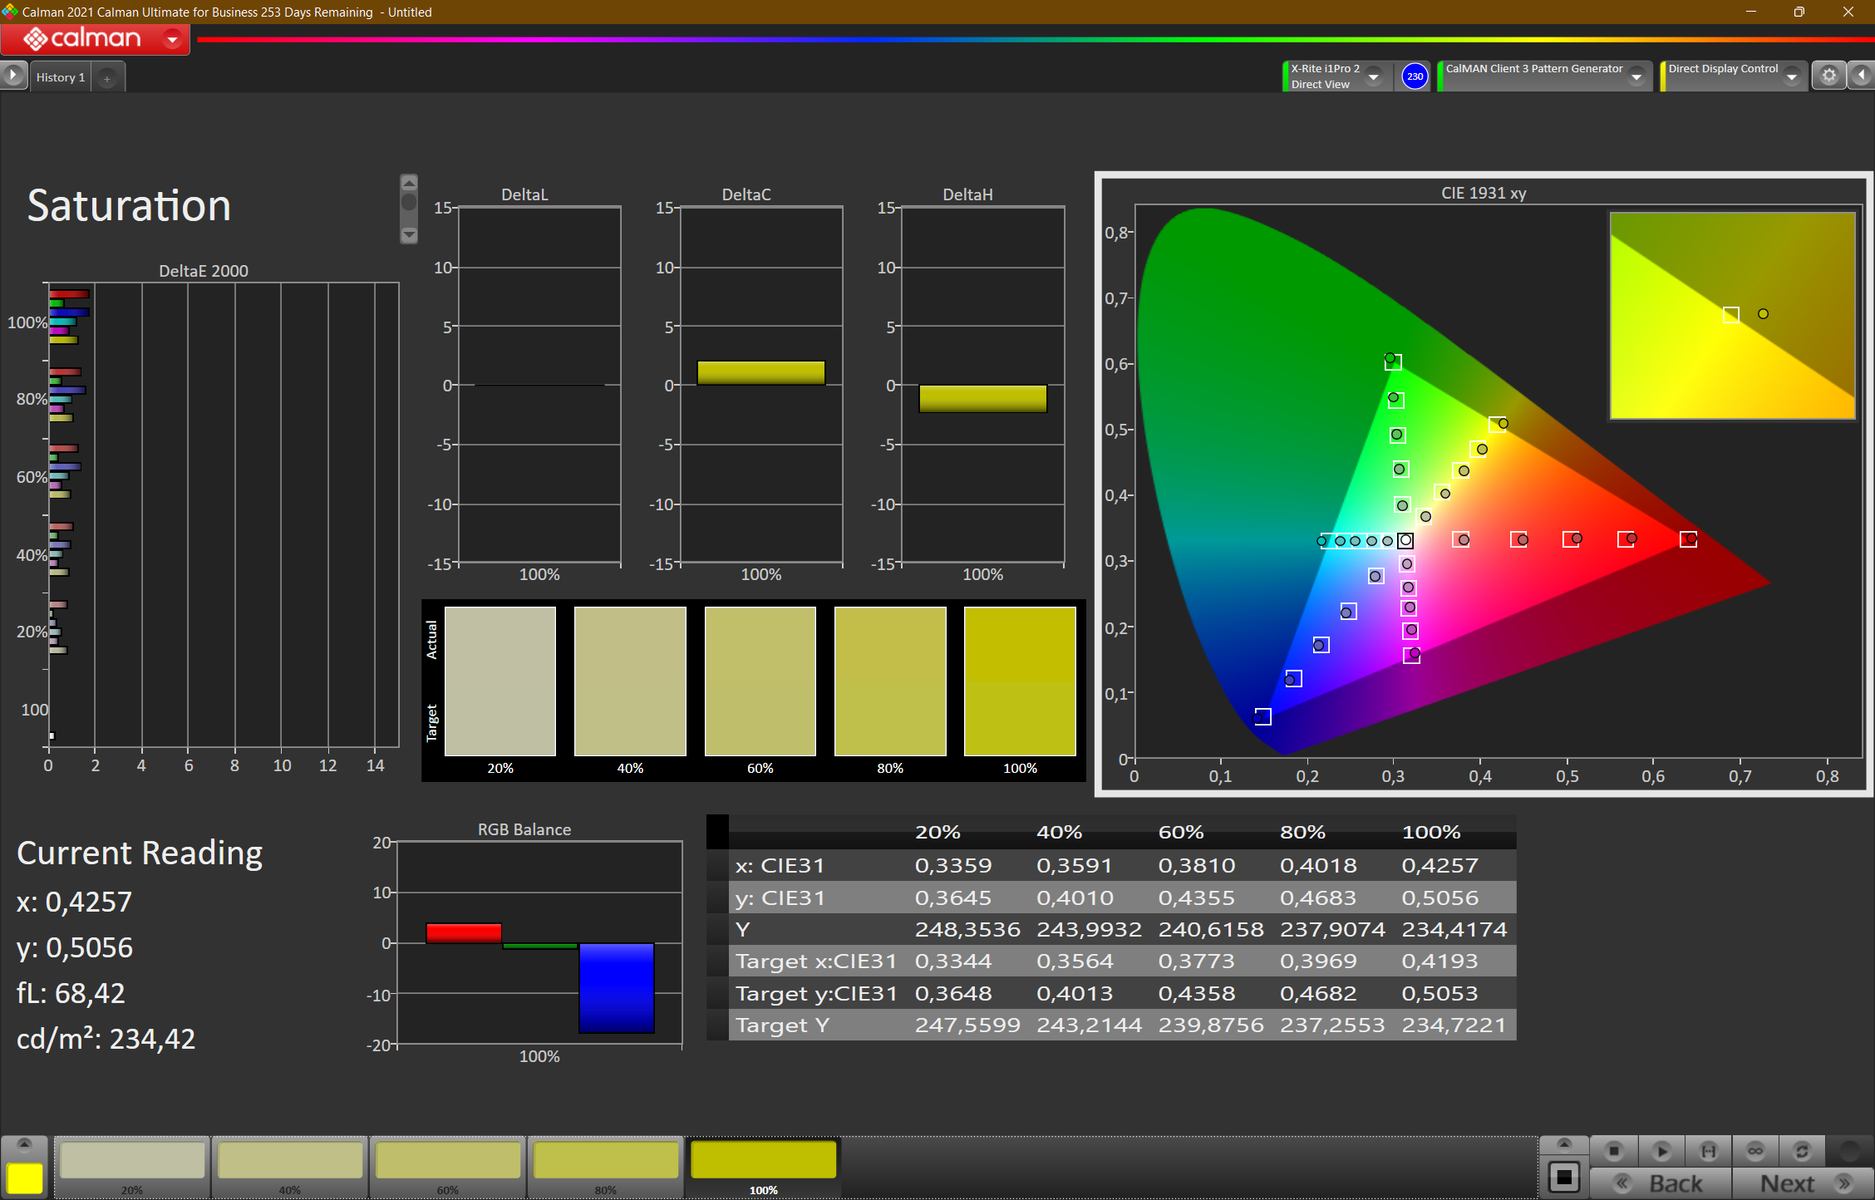
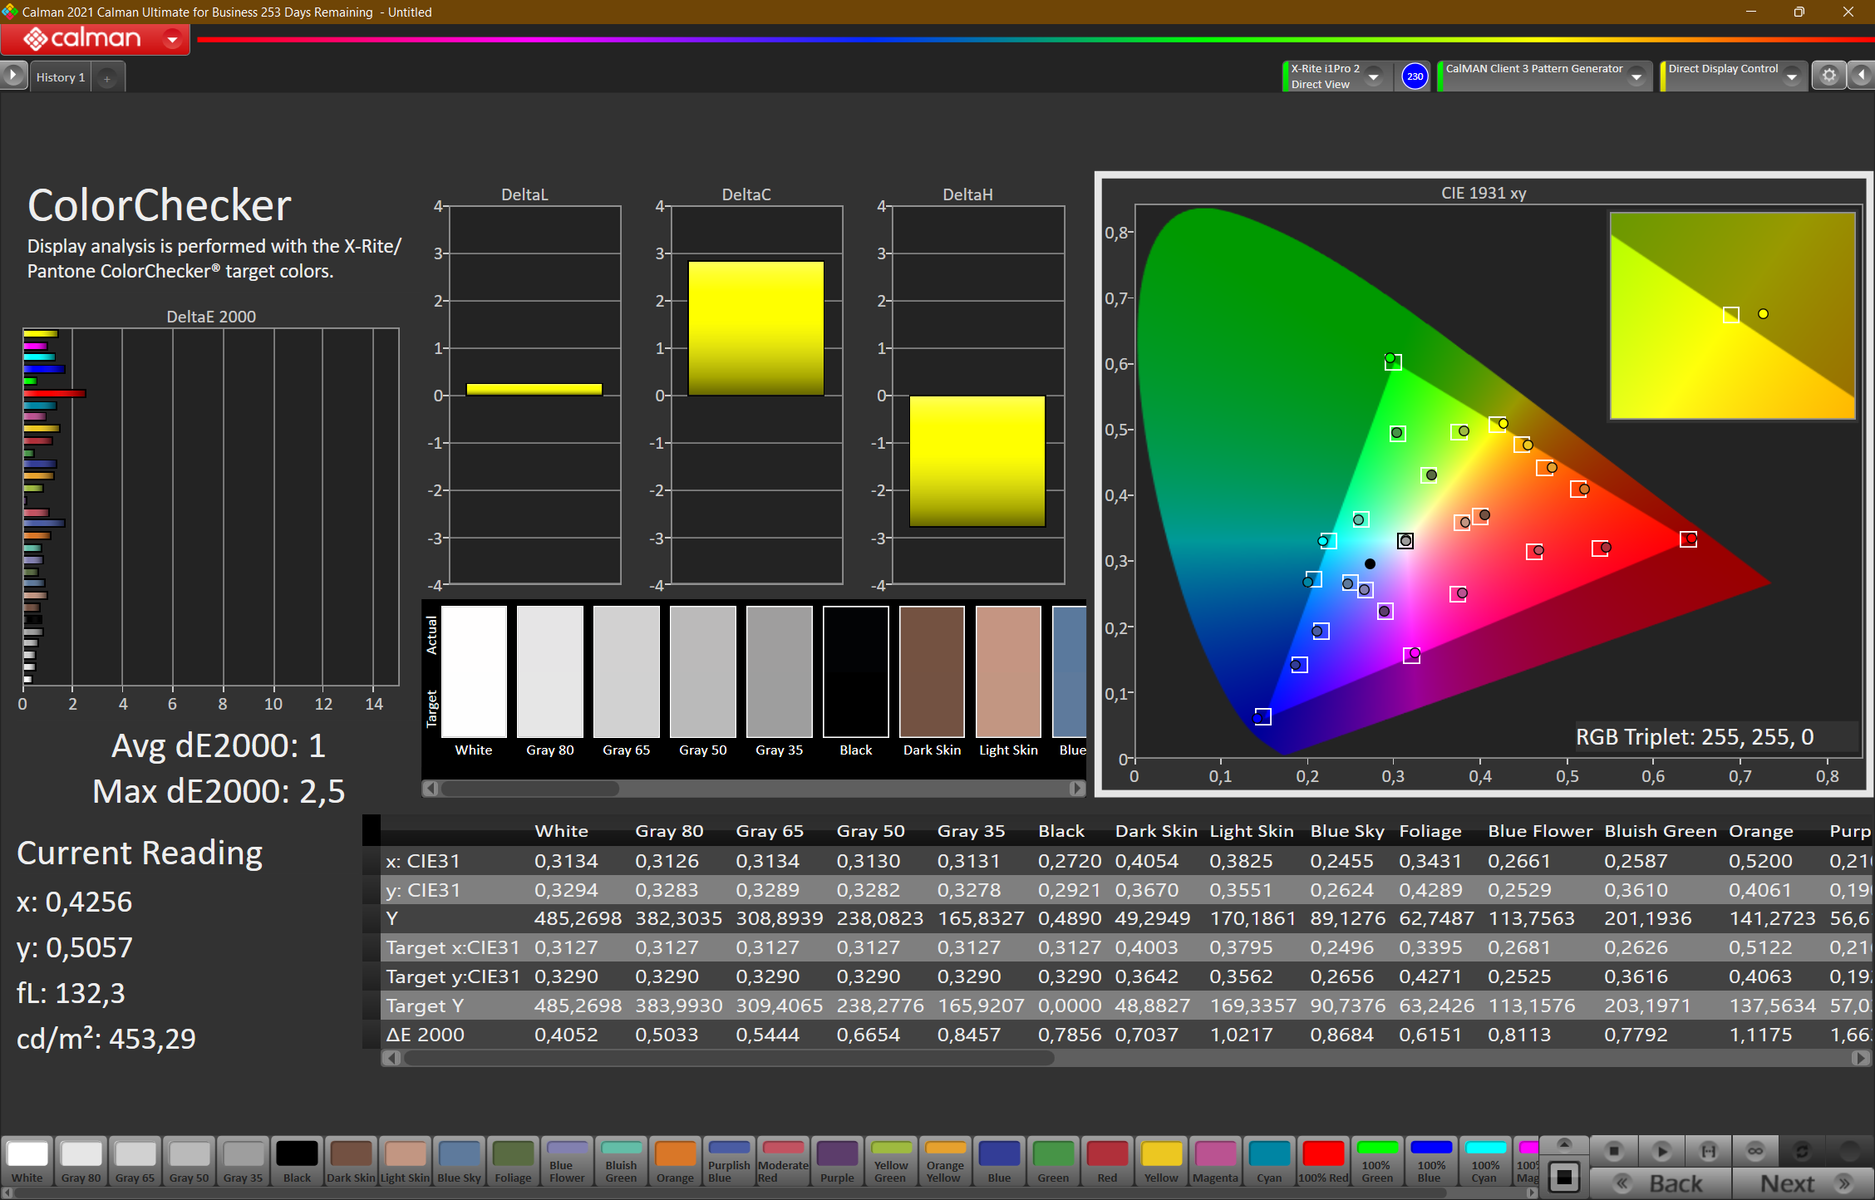
Do analizy ekranu wykorzystaliśmy CalMan oraz kolorymetr X-Rite i1Pro 2. Do kalibracji ekranu użyto również X-Rite i1 Profiler w połączeniu z i1Pro 2. Ekran skorzystał z kalibracji i uzyskał znacznie niższe wartości Delta E. Oznacza to, że odwzorowanie kolorów stało się bardziej dokładne. Jak zawsze, w szarym polu powyżej znajduje się link do pobrania stworzonego przez nas profilu kolorów.
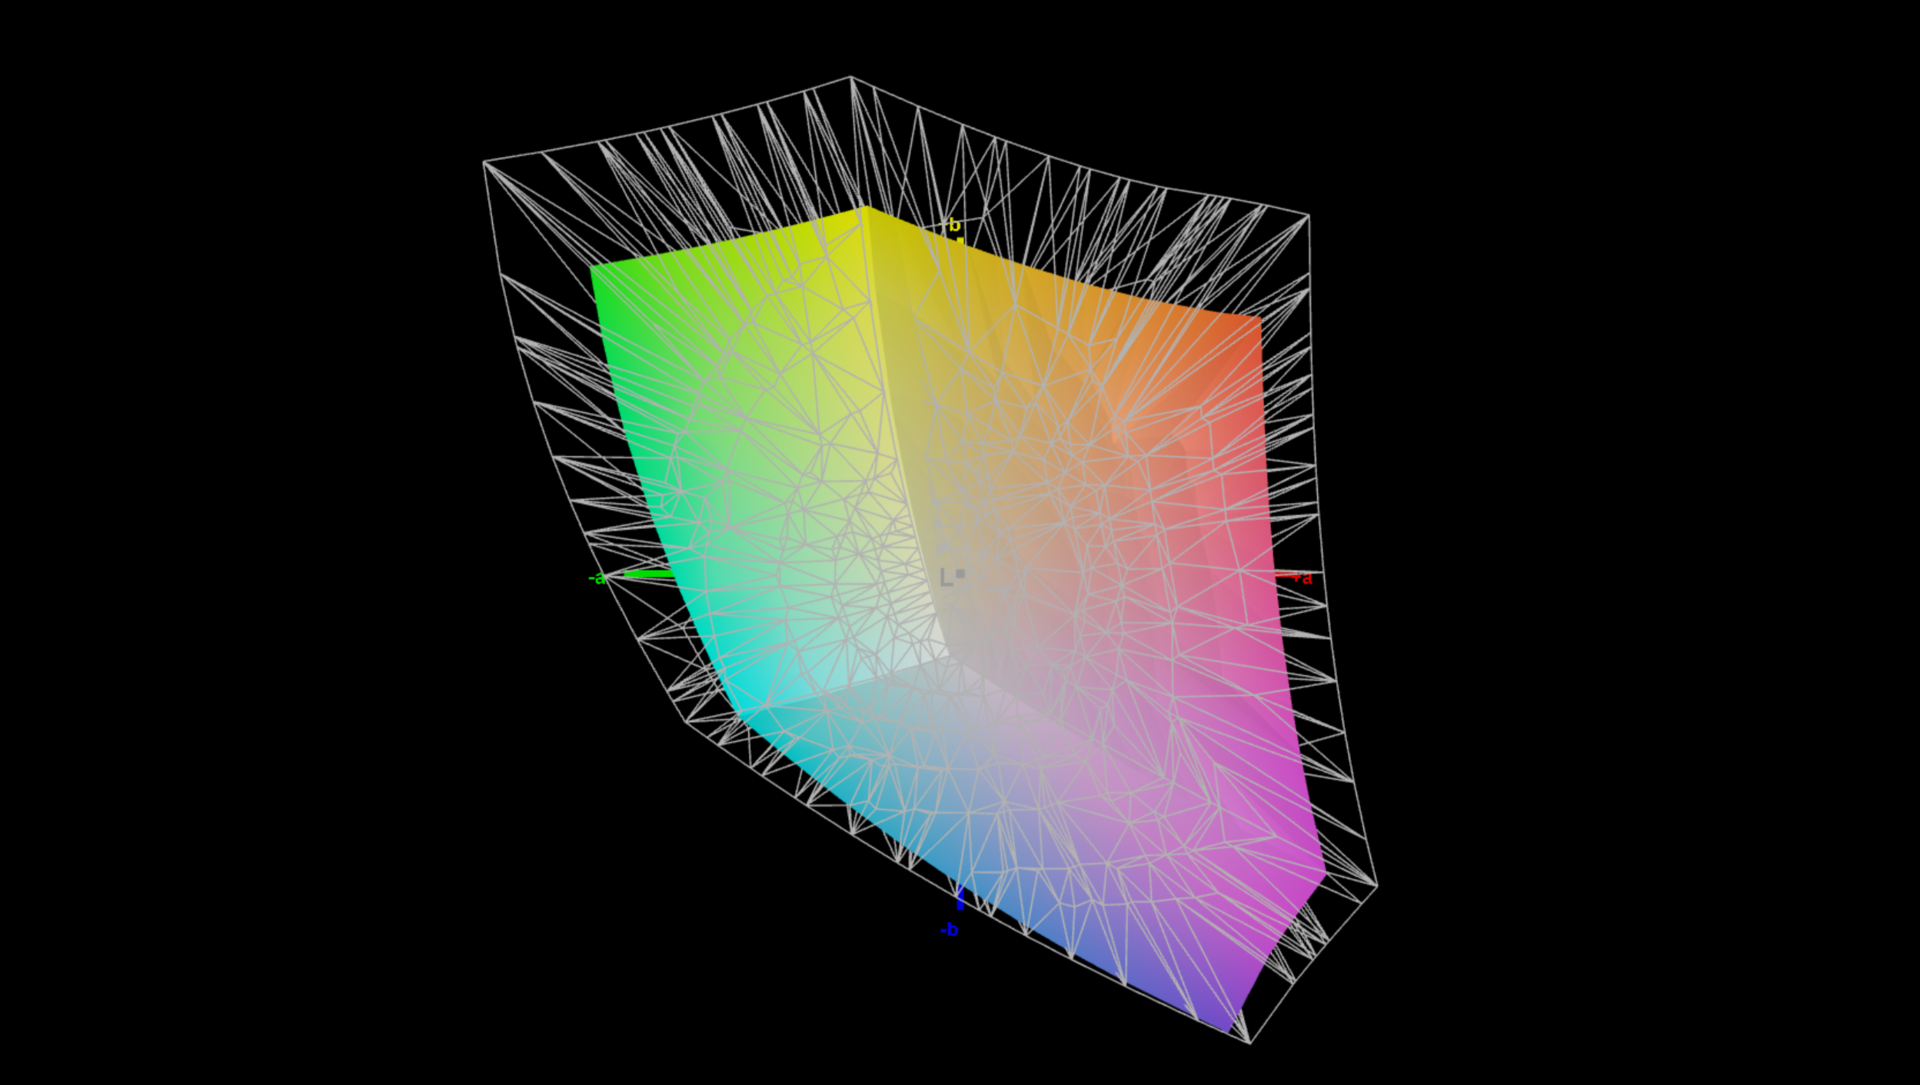
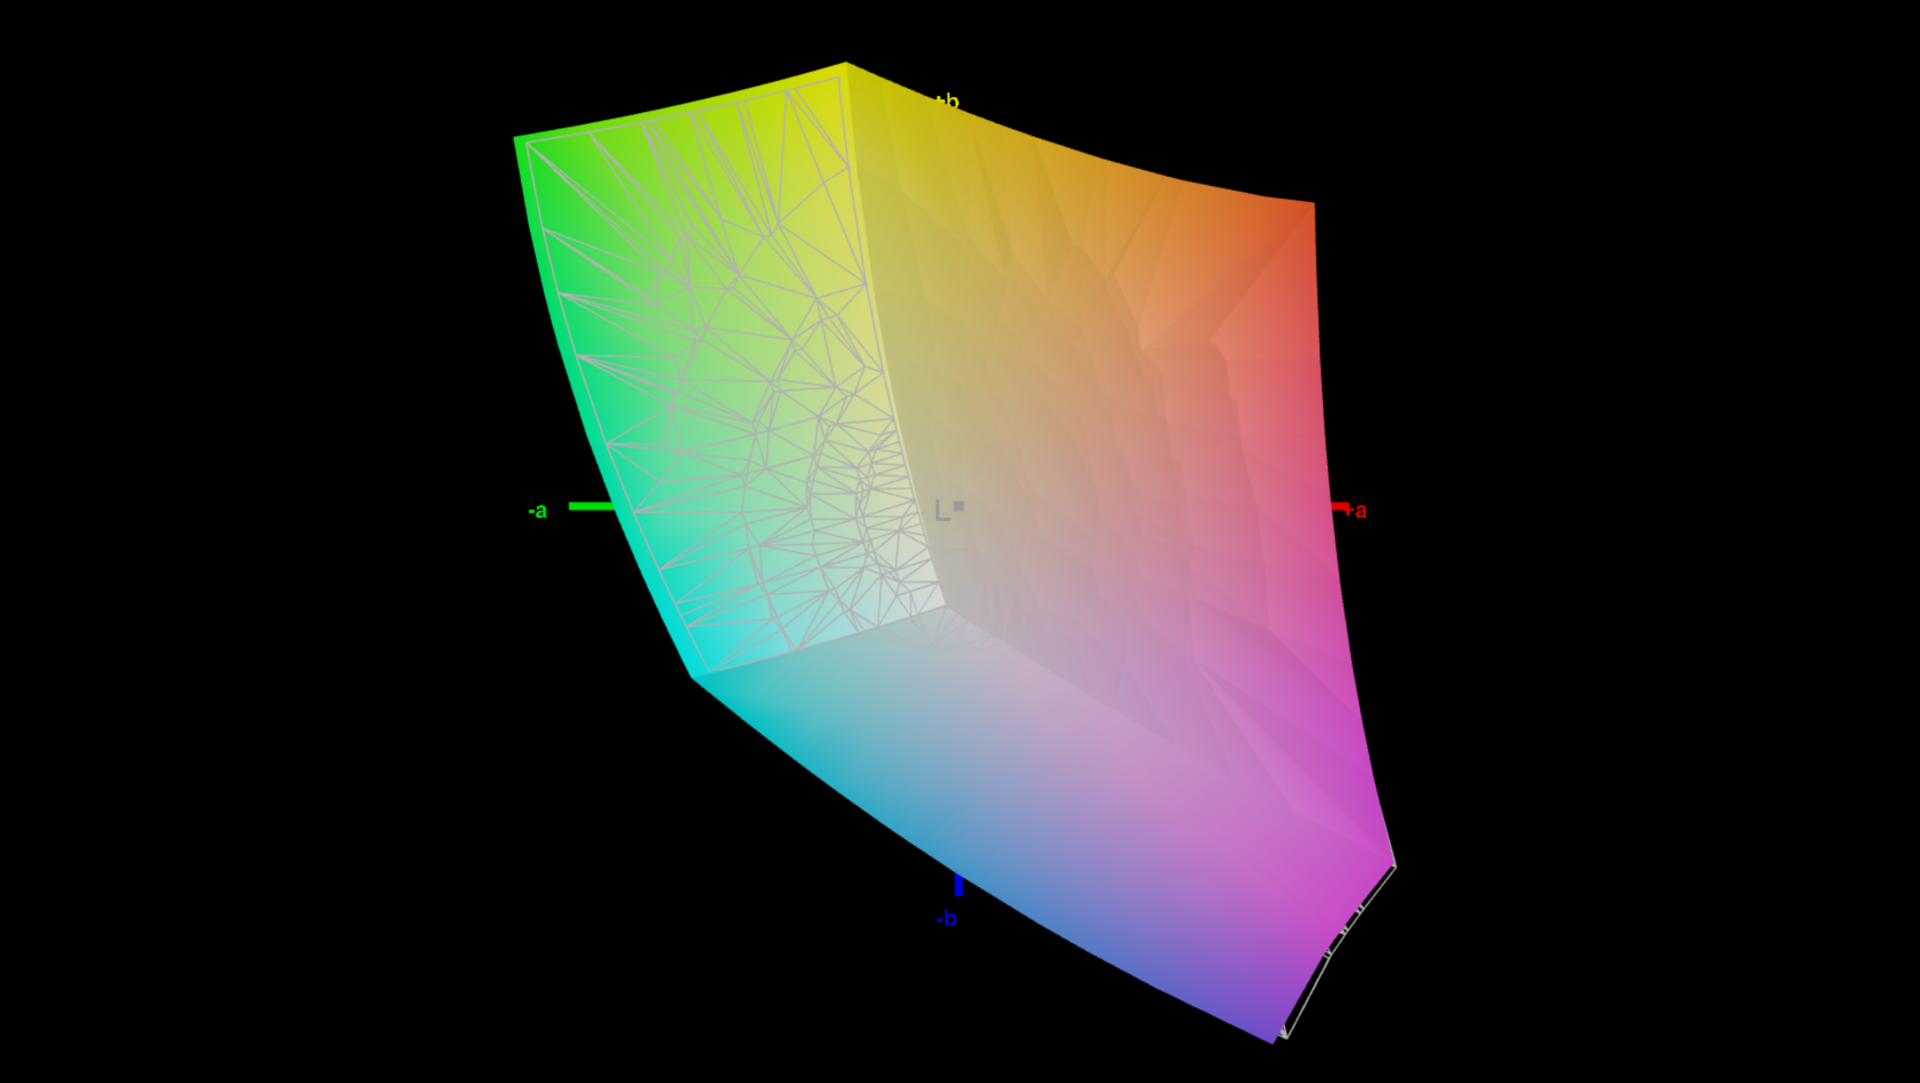
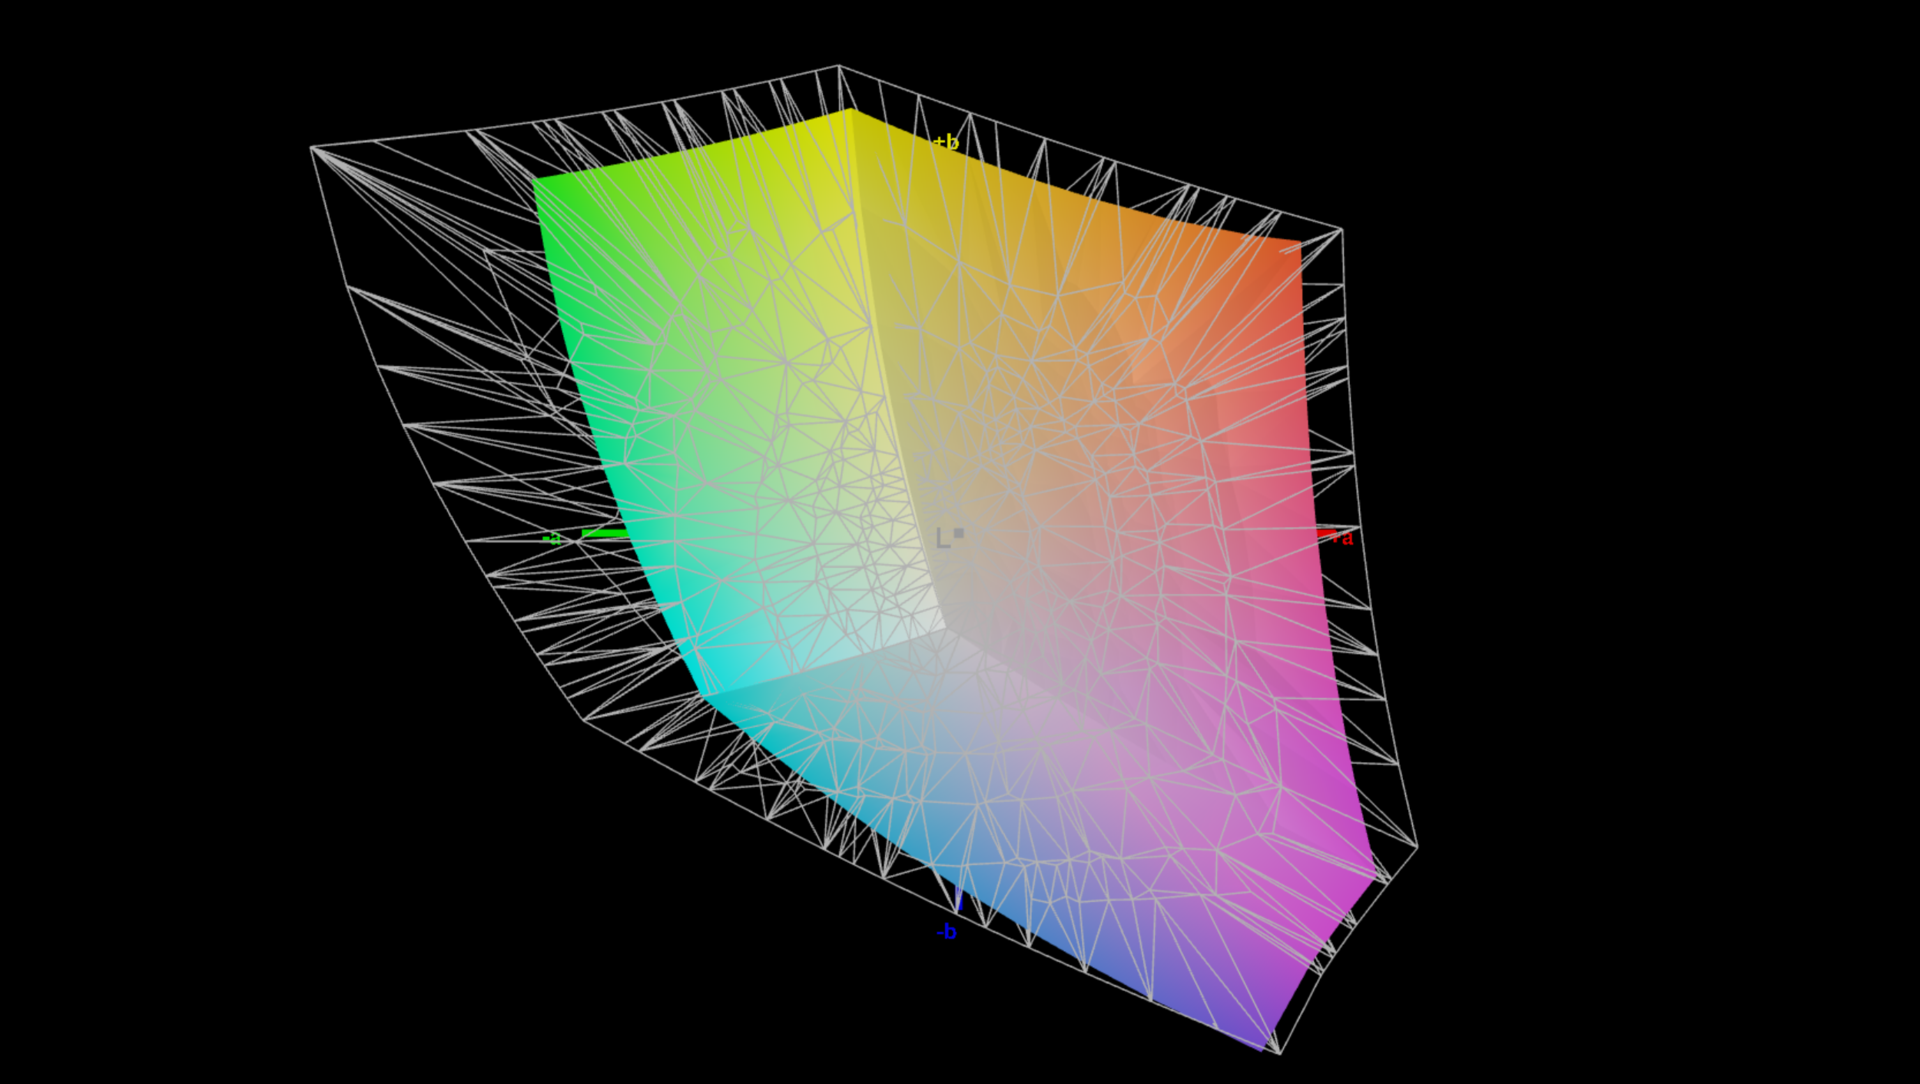
Pokrycie kolorów przez wyświetlacz nie należy do najlepszych. Wprawdzie mniejsza gama sRGB jest niemal w pełni pokryta, ale w przypadku szerszych przestrzeni barwnych P3 i AdobeRGB sprawa wygląda inaczej. Droższy Acer Predator Triton 500 SEma lepsze pokrycie kolorów, co jest szczególnie przydatne podczas edycji zdjęć.
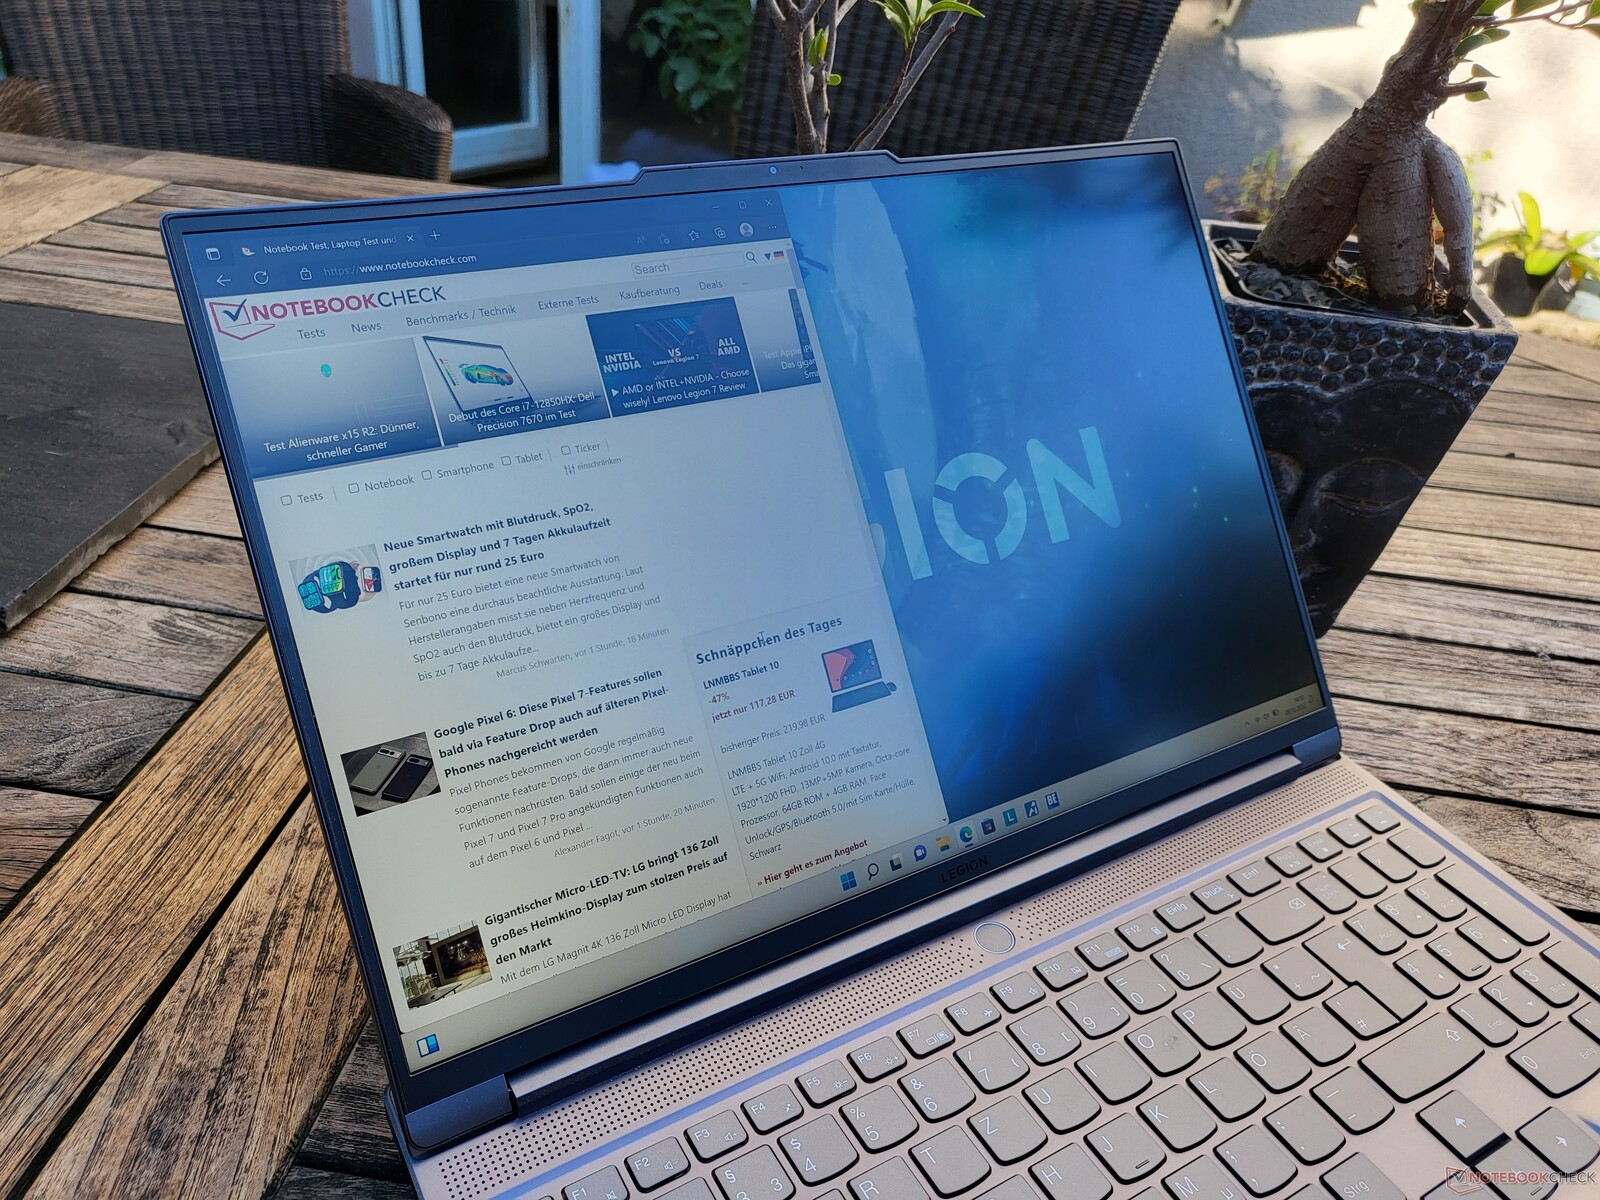
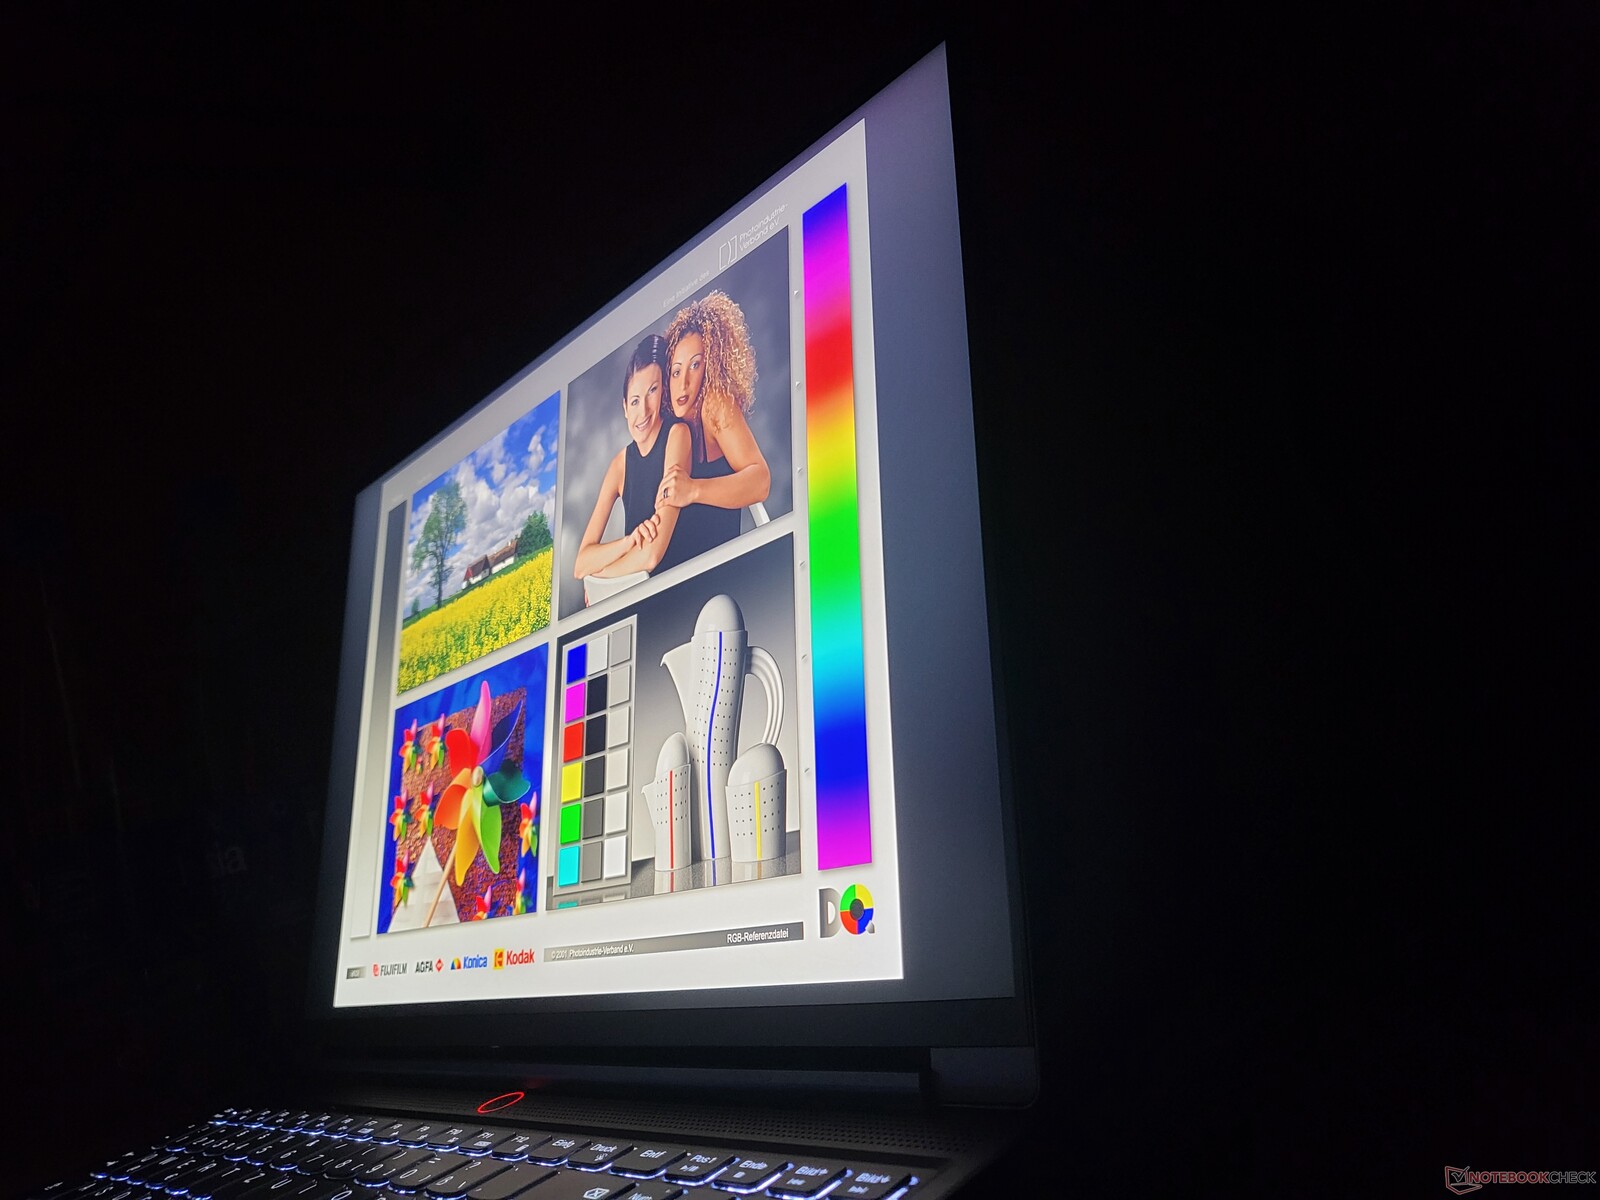
Lenovo Legion S7i jest bardzo użyteczny na zewnątrz dzięki matowemu wyświetlaczowi i wysokiej jasności ekranu. To świetny laptop do zabrania na imprezę LAN na świeżym powietrzu.
Wyświetl czasy reakcji
| ↔ Czas reakcji od czerni do bieli | ||
|---|---|---|
| 7 ms ... wzrost ↗ i spadek ↘ łącznie | ↗ 4 ms wzrost | 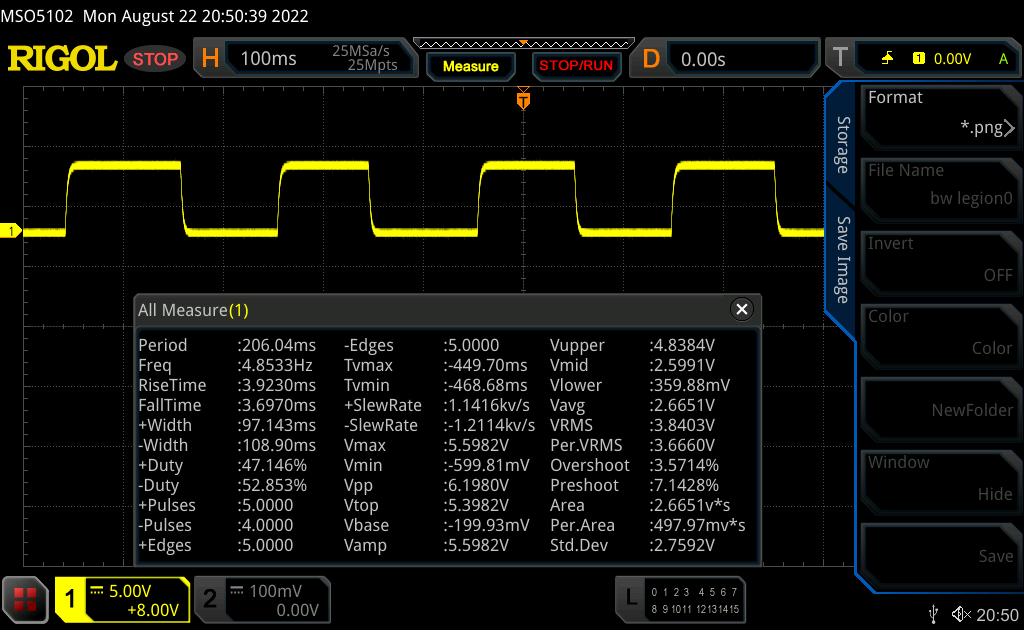 |
| ↘ 3 ms upadek | ||
| W naszych testach ekran wykazuje bardzo szybką reakcję i powinien bardzo dobrze nadawać się do szybkich gier. Dla porównania, wszystkie testowane urządzenia wahają się od 0.1 (minimum) do 240 (maksimum) ms. » 21 % wszystkich urządzeń jest lepszych. Oznacza to, że zmierzony czas reakcji jest lepszy od średniej wszystkich testowanych urządzeń (19.8 ms). | ||
| ↔ Czas reakcji 50% szarości do 80% szarości | ||
| 12 ms ... wzrost ↗ i spadek ↘ łącznie | ↗ 6 ms wzrost | 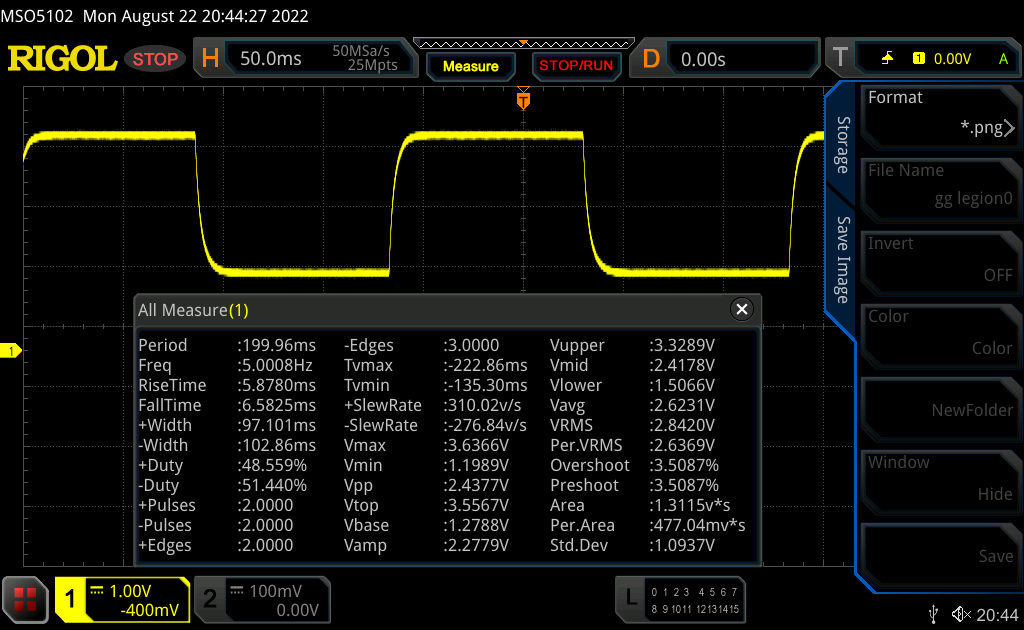 |
| ↘ 6 ms upadek | ||
| W naszych testach ekran wykazuje dobry współczynnik reakcji, ale może być zbyt wolny dla graczy rywalizujących ze sobą. Dla porównania, wszystkie testowane urządzenia wahają się od 0.165 (minimum) do 636 (maksimum) ms. » 25 % wszystkich urządzeń jest lepszych. Oznacza to, że zmierzony czas reakcji jest lepszy od średniej wszystkich testowanych urządzeń (31 ms). | ||
Migotanie ekranu / PWM (modulacja szerokości impulsu)
| Migotanie ekranu/nie wykryto PWM | 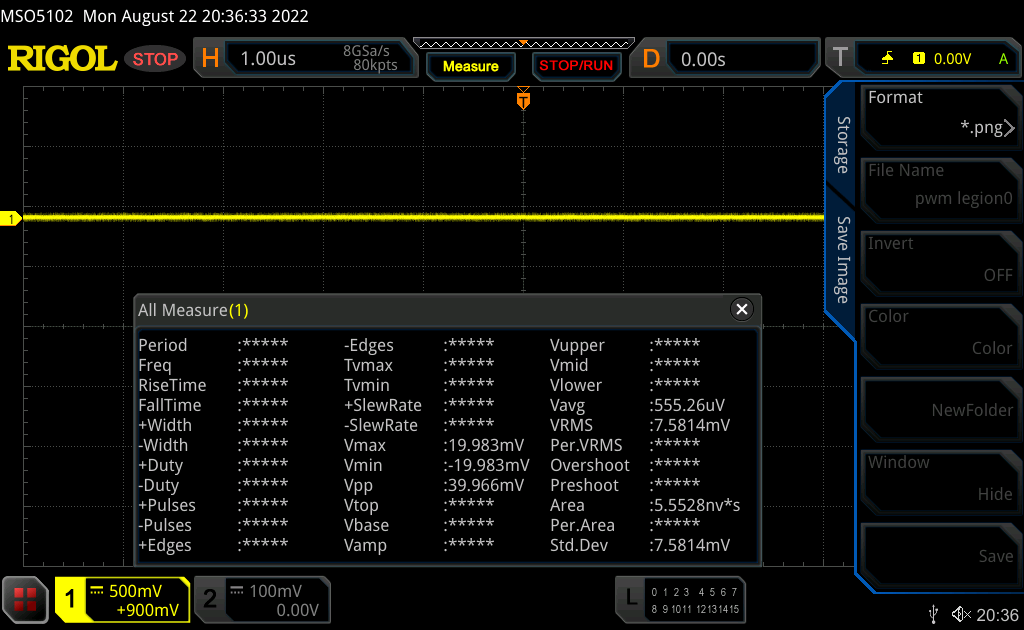 | ||
Dla porównania: 52 % wszystkich testowanych urządzeń nie używa PWM do przyciemniania wyświetlacza. Jeśli wykryto PWM, zmierzono średnio 7772 (minimum: 5 - maksimum: 343500) Hz. | |||
Świetna wydajność dzięki Nvidia RTX i Intel Alder Lake
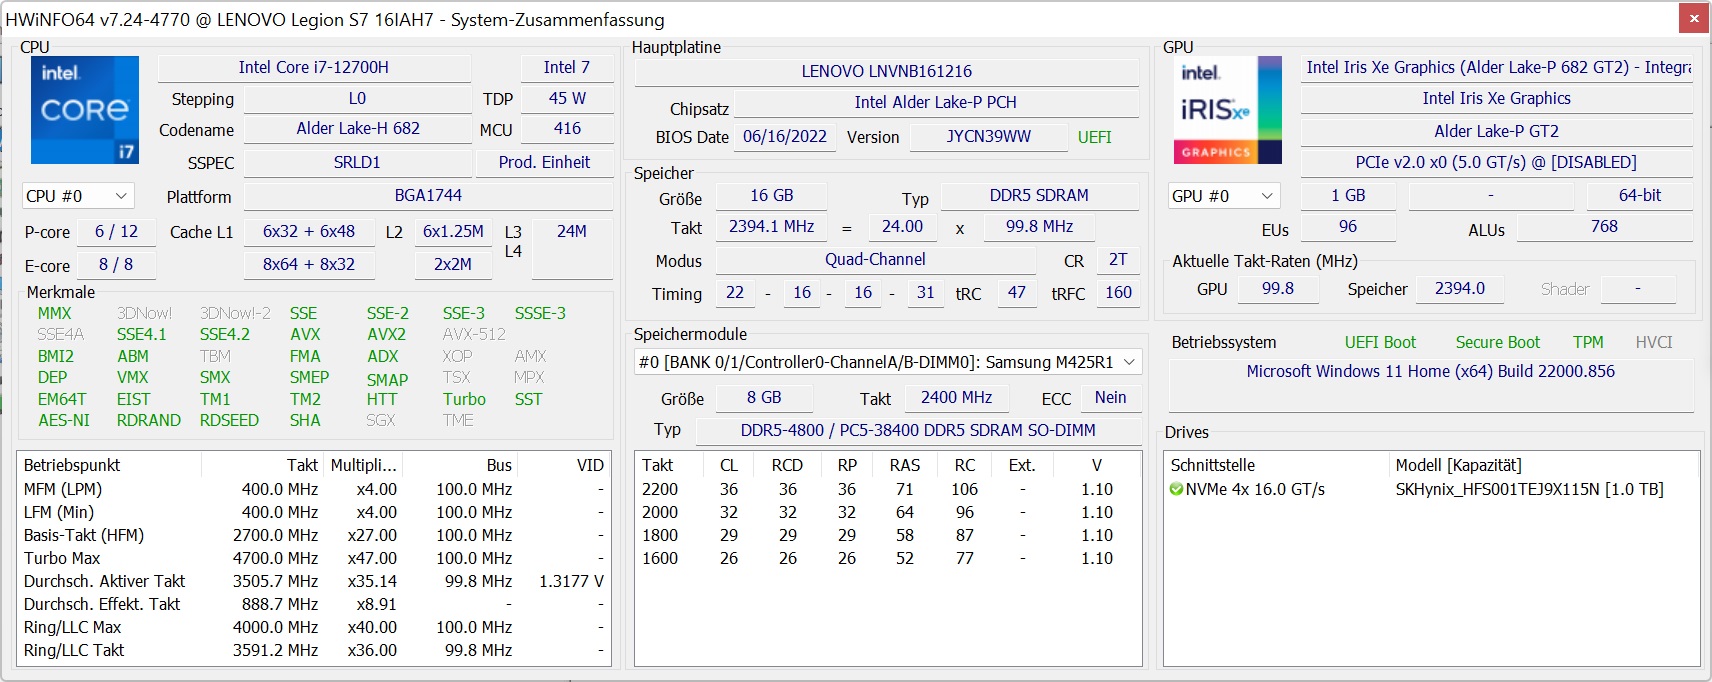
Lenovo oferuje trzy opcje procesora dla modelu Legion S7-16IAH: Intel Core i5-12500H, Core i7-12700Horaz Core i9-12900H. Laptop posiada również taką samą liczbę opcji GPU (tym razem od Nvidii) GeForce RTX 3050 Ti, GeForce RTX 3060 oraz GeForce RTX 3070.
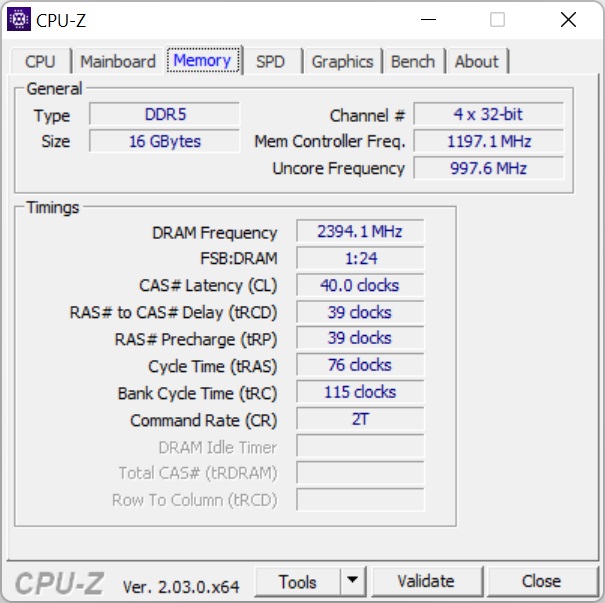
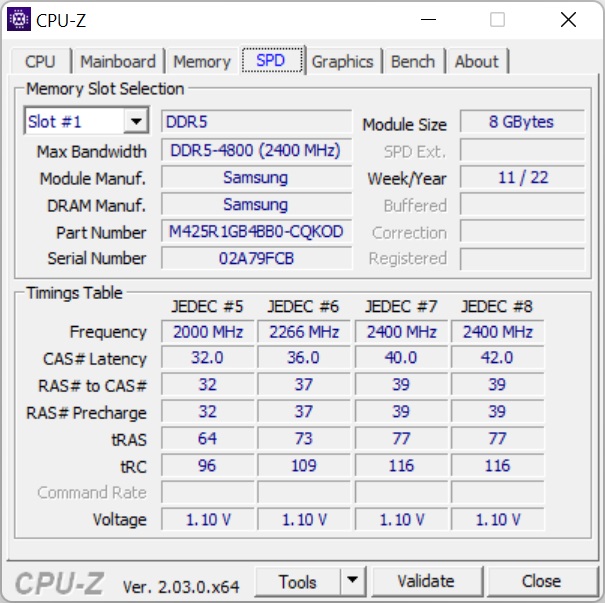
Lenovo Legion S7 jest wyposażony w 8 GB wlutowanej pamięci RAM DDR5-4800, a także w gniazdo SODIMM (nasz egzemplarz recenzencki ma moduł 8 GB). Lenovo sprzedaje laptop z maksymalnie 24 GB pamięci RAM, ale powinno być możliwe zwiększenie jej ilości do 40 GB. Do przechowywania danych służy gniazdo M.2 2280.
Warunki badania
Procesor w Lenovo Legion S7-16IAH może w krótkich zrywach pobierać nawet 100 W mocy. Przy absolutnym obciążeniu szczytowym może to być nawet nieco więcej. Przy stałym obciążeniu zużycie energii jest ograniczone do 70 W w trybie cichym, 80 W w trybie automatycznym i 90 W w trybie wydajności. Możesz przełączać się między profilami zasilania, naciskając Fn + Q.
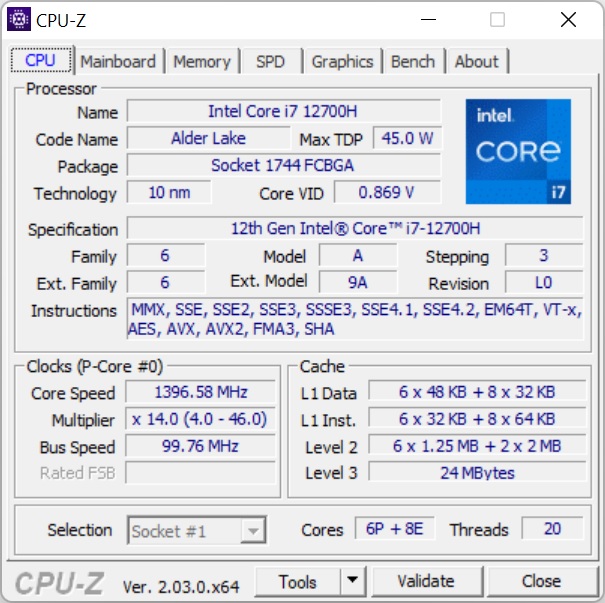
Procesor
Na stronie Intel Core i7-12700H jest częścią linii Alder Lake. Wykorzystuje nową hybrydową architekturę z dwoma rodzajami rdzeni: sześcioma dużymi rdzeniami wydajnościowymi i ośmioma małymi rdzeniami wydajnościowymi. Procesor ma łącznie 14 rdzeni i 20 wątków, ponieważ sześć dużych rdzeni obsługuje hyperthreading. Jego TDP wynosi zazwyczaj około 45 W, a częstotliwość taktowania wynosi od 2,4 do 4,7 GHz dla rdzeni P i od 1,8 do 3,5 GHz dla rdzeni E. Szczegółowe porównania w benchmarkach można znaleźć w naszym zestawieniu porównawczym procesorów https://www.notebookcheck.net/Mobile-Processors-Benchmark-List.2436.0.html.
Procesor Alder Lake zapewnia doskonałą wydajność w Lenovo Legion S7i. Ten laptop Lenovo jest najszybszy spośród wszystkich urządzeń z procesorem "H" w naszym porównaniu i pokonuje nawet wariant AMD w Legion Slim 7. Na stronie HP Omen 16 objął początkowo maleńkie prowadzenie, ale pod trwałym obciążeniem został w tyle. Asus ROG Zephyrus M16który posiada starszy układ Tiger Lake, jest znacznie wolniejszy. Jeśli jednak zależy Ci na maksymalnej wydajności procesora, istnieje jeszcze szybsza opcja z procesorem Intel "HX". Większy Lenovo Legion 7dzięki mocniejszemu systemowi chłodzenia zapewnia średnio o 22% więcej mocy.
Tryb wydajności nie jest dostępny, kiedy laptop działa na akumulatorze. W takim przypadku zużycie energii przez procesor jest ograniczone do około 80 W w trybie automatycznym. W programie Cinebench R20 model Legion S7i uzyskał po odłączeniu od zasilania wynik 4886 - co odpowiada spadkowi wydajności o 28%.
Cinebench R15 Multi Sustained Load
Cinebench R23: Multi Core | Single Core
Cinebench R20: CPU (Multi Core) | CPU (Single Core)
Cinebench R15: CPU Multi 64Bit | CPU Single 64Bit
Blender: v2.79 BMW27 CPU
7-Zip 18.03: 7z b 4 | 7z b 4 -mmt1
Geekbench 5.5: Multi-Core | Single-Core
HWBOT x265 Benchmark v2.2: 4k Preset
LibreOffice : 20 Documents To PDF
R Benchmark 2.5: Overall mean
| CPU Performance rating | |
| Średnia w klasie Gaming | |
| Lenovo Legion 7 16IAX7-82TD004SGE | |
| HP Omen 16-b1090ng | |
| Lenovo Legion Slim 7-16IAH 82TF004YGE | |
| Acer Predator Triton 500 SE PT516-52s-70KX | |
| Przeciętny Intel Core i7-12700H | |
| Lenovo Legion S7 16ARHA7 | |
| Asus ROG Zephyrus M16 GU603H -2! | |
| Cinebench R23 / Multi Core | |
| Średnia w klasie Gaming (10488 - 40970, n=111, ostatnie 2 lata) | |
| Lenovo Legion 7 16IAX7-82TD004SGE | |
| Lenovo Legion Slim 7-16IAH 82TF004YGE | |
| Acer Predator Triton 500 SE PT516-52s-70KX | |
| HP Omen 16-b1090ng | |
| Przeciętny Intel Core i7-12700H (4032 - 19330, n=64) | |
| Lenovo Legion S7 16ARHA7 | |
| Cinebench R23 / Single Core | |
| Średnia w klasie Gaming (1166 - 2356, n=111, ostatnie 2 lata) | |
| Lenovo Legion 7 16IAX7-82TD004SGE | |
| HP Omen 16-b1090ng | |
| Przeciętny Intel Core i7-12700H (778 - 1826, n=63) | |
| Lenovo Legion Slim 7-16IAH 82TF004YGE | |
| Acer Predator Triton 500 SE PT516-52s-70KX | |
| Lenovo Legion S7 16ARHA7 | |
| Cinebench R20 / CPU (Multi Core) | |
| Średnia w klasie Gaming (4029 - 16108, n=110, ostatnie 2 lata) | |
| Lenovo Legion 7 16IAX7-82TD004SGE | |
| Lenovo Legion Slim 7-16IAH 82TF004YGE | |
| Acer Predator Triton 500 SE PT516-52s-70KX | |
| Przeciętny Intel Core i7-12700H (1576 - 7407, n=64) | |
| HP Omen 16-b1090ng | |
| Lenovo Legion S7 16ARHA7 | |
| Asus ROG Zephyrus M16 GU603H | |
| Cinebench R20 / CPU (Single Core) | |
| Średnia w klasie Gaming (442 - 895, n=110, ostatnie 2 lata) | |
| Lenovo Legion 7 16IAX7-82TD004SGE | |
| HP Omen 16-b1090ng | |
| Przeciętny Intel Core i7-12700H (300 - 704, n=64) | |
| Lenovo Legion Slim 7-16IAH 82TF004YGE | |
| Acer Predator Triton 500 SE PT516-52s-70KX | |
| Lenovo Legion S7 16ARHA7 | |
| Asus ROG Zephyrus M16 GU603H | |
| Cinebench R15 / CPU Multi 64Bit | |
| Średnia w klasie Gaming (1578 - 6271, n=109, ostatnie 2 lata) | |
| Lenovo Legion 7 16IAX7-82TD004SGE | |
| HP Omen 16-b1090ng | |
| Lenovo Legion Slim 7-16IAH 82TF004YGE | |
| Acer Predator Triton 500 SE PT516-52s-70KX | |
| Przeciętny Intel Core i7-12700H (1379 - 2916, n=70) | |
| Lenovo Legion S7 16ARHA7 | |
| Asus ROG Zephyrus M16 GU603H | |
| Cinebench R15 / CPU Single 64Bit | |
| Średnia w klasie Gaming (188.8 - 343, n=110, ostatnie 2 lata) | |
| Lenovo Legion 7 16IAX7-82TD004SGE | |
| HP Omen 16-b1090ng | |
| Lenovo Legion S7 16ARHA7 | |
| Lenovo Legion Slim 7-16IAH 82TF004YGE | |
| Przeciętny Intel Core i7-12700H (113 - 263, n=65) | |
| Asus ROG Zephyrus M16 GU603H | |
| Acer Predator Triton 500 SE PT516-52s-70KX | |
| Blender / v2.79 BMW27 CPU | |
| Asus ROG Zephyrus M16 GU603H | |
| Przeciętny Intel Core i7-12700H (168 - 732, n=63) | |
| Lenovo Legion S7 16ARHA7 | |
| Acer Predator Triton 500 SE PT516-52s-70KX | |
| HP Omen 16-b1090ng | |
| Lenovo Legion Slim 7-16IAH 82TF004YGE | |
| Średnia w klasie Gaming (80 - 330, n=108, ostatnie 2 lata) | |
| Lenovo Legion 7 16IAX7-82TD004SGE | |
| 7-Zip 18.03 / 7z b 4 | |
| Średnia w klasie Gaming (33491 - 148086, n=109, ostatnie 2 lata) | |
| Lenovo Legion 7 16IAX7-82TD004SGE | |
| HP Omen 16-b1090ng | |
| Lenovo Legion Slim 7-16IAH 82TF004YGE | |
| Acer Predator Triton 500 SE PT516-52s-70KX | |
| Lenovo Legion S7 16ARHA7 | |
| Przeciętny Intel Core i7-12700H (22844 - 73067, n=63) | |
| Asus ROG Zephyrus M16 GU603H | |
| 7-Zip 18.03 / 7z b 4 -mmt1 | |
| Średnia w klasie Gaming (4199 - 7436, n=109, ostatnie 2 lata) | |
| Lenovo Legion 7 16IAX7-82TD004SGE | |
| Lenovo Legion S7 16ARHA7 | |
| HP Omen 16-b1090ng | |
| Przeciętny Intel Core i7-12700H (2743 - 5972, n=63) | |
| Asus ROG Zephyrus M16 GU603H | |
| Lenovo Legion Slim 7-16IAH 82TF004YGE | |
| Acer Predator Triton 500 SE PT516-52s-70KX | |
| Geekbench 5.5 / Multi-Core | |
| Średnia w klasie Gaming (6460 - 27010, n=109, ostatnie 2 lata) | |
| Lenovo Legion 7 16IAX7-82TD004SGE | |
| HP Omen 16-b1090ng | |
| Lenovo Legion Slim 7-16IAH 82TF004YGE | |
| Acer Predator Triton 500 SE PT516-52s-70KX | |
| Przeciętny Intel Core i7-12700H (5144 - 13745, n=64) | |
| Lenovo Legion S7 16ARHA7 | |
| Asus ROG Zephyrus M16 GU603H | |
| Geekbench 5.5 / Single-Core | |
| Średnia w klasie Gaming (986 - 2474, n=109, ostatnie 2 lata) | |
| Lenovo Legion 7 16IAX7-82TD004SGE | |
| HP Omen 16-b1090ng | |
| Acer Predator Triton 500 SE PT516-52s-70KX | |
| Przeciętny Intel Core i7-12700H (803 - 1851, n=64) | |
| Lenovo Legion Slim 7-16IAH 82TF004YGE | |
| Lenovo Legion S7 16ARHA7 | |
| Asus ROG Zephyrus M16 GU603H | |
| HWBOT x265 Benchmark v2.2 / 4k Preset | |
| Średnia w klasie Gaming (11.5 - 44.3, n=109, ostatnie 2 lata) | |
| Lenovo Legion 7 16IAX7-82TD004SGE | |
| HP Omen 16-b1090ng | |
| Lenovo Legion Slim 7-16IAH 82TF004YGE | |
| Acer Predator Triton 500 SE PT516-52s-70KX | |
| Lenovo Legion S7 16ARHA7 | |
| Przeciętny Intel Core i7-12700H (4.67 - 21.8, n=64) | |
| Asus ROG Zephyrus M16 GU603H | |
| LibreOffice / 20 Documents To PDF | |
| Średnia w klasie Gaming (19 - 88.8, n=109, ostatnie 2 lata) | |
| Lenovo Legion S7 16ARHA7 | |
| Przeciętny Intel Core i7-12700H (34.2 - 95.3, n=63) | |
| Acer Predator Triton 500 SE PT516-52s-70KX | |
| HP Omen 16-b1090ng | |
| Asus ROG Zephyrus M16 GU603H | |
| Lenovo Legion Slim 7-16IAH 82TF004YGE | |
| Lenovo Legion 7 16IAX7-82TD004SGE | |
| R Benchmark 2.5 / Overall mean | |
| Asus ROG Zephyrus M16 GU603H | |
| Przeciętny Intel Core i7-12700H (0.4441 - 1.052, n=63) | |
| Lenovo Legion Slim 7-16IAH 82TF004YGE | |
| Acer Predator Triton 500 SE PT516-52s-70KX | |
| Lenovo Legion S7 16ARHA7 | |
| HP Omen 16-b1090ng | |
| Średnia w klasie Gaming (0.3439 - 0.759, n=110, ostatnie 2 lata) | |
| Lenovo Legion 7 16IAX7-82TD004SGE | |
* ... im mniej tym lepiej
AIDA64: FP32 Ray-Trace | FPU Julia | CPU SHA3 | CPU Queen | FPU SinJulia | FPU Mandel | CPU AES | CPU ZLib | FP64 Ray-Trace | CPU PhotoWorxx
| Performance rating | |
| Średnia w klasie Gaming | |
| Lenovo Legion S7 16ARHA7 | |
| Lenovo Legion Slim 7-16IAH 82TF004YGE | |
| Lenovo Legion 7 16IAX7-82TD004SGE | |
| Acer Predator Triton 500 SE PT516-52s-70KX | |
| Przeciętny Intel Core i7-12700H | |
| HP Omen 16-b1090ng | |
| Asus ROG Zephyrus M16 GU603H -9! | |
| AIDA64 / FP32 Ray-Trace | |
| Średnia w klasie Gaming (10227 - 85542, n=108, ostatnie 2 lata) | |
| Lenovo Legion Slim 7-16IAH 82TF004YGE | |
| Lenovo Legion S7 16ARHA7 | |
| Lenovo Legion 7 16IAX7-82TD004SGE | |
| Przeciętny Intel Core i7-12700H (2585 - 17957, n=64) | |
| Acer Predator Triton 500 SE PT516-52s-70KX | |
| HP Omen 16-b1090ng | |
| AIDA64 / FPU Julia | |
| Średnia w klasie Gaming (51376 - 238426, n=108, ostatnie 2 lata) | |
| Lenovo Legion S7 16ARHA7 | |
| Lenovo Legion Slim 7-16IAH 82TF004YGE | |
| Przeciętny Intel Core i7-12700H (12439 - 90760, n=64) | |
| Lenovo Legion 7 16IAX7-82TD004SGE | |
| Acer Predator Triton 500 SE PT516-52s-70KX | |
| HP Omen 16-b1090ng | |
| AIDA64 / CPU SHA3 | |
| Średnia w klasie Gaming (2180 - 9817, n=108, ostatnie 2 lata) | |
| Lenovo Legion 7 16IAX7-82TD004SGE | |
| Lenovo Legion Slim 7-16IAH 82TF004YGE | |
| Lenovo Legion S7 16ARHA7 | |
| Acer Predator Triton 500 SE PT516-52s-70KX | |
| Przeciętny Intel Core i7-12700H (833 - 4242, n=64) | |
| HP Omen 16-b1090ng | |
| AIDA64 / CPU Queen | |
| Średnia w klasie Gaming (49785 - 173351, n=96, ostatnie 2 lata) | |
| Lenovo Legion S7 16ARHA7 | |
| Lenovo Legion Slim 7-16IAH 82TF004YGE | |
| Lenovo Legion 7 16IAX7-82TD004SGE | |
| HP Omen 16-b1090ng | |
| Acer Predator Triton 500 SE PT516-52s-70KX | |
| Przeciętny Intel Core i7-12700H (57923 - 103202, n=63) | |
| AIDA64 / FPU SinJulia | |
| Średnia w klasie Gaming (4424 - 33636, n=108, ostatnie 2 lata) | |
| Lenovo Legion 7 16IAX7-82TD004SGE | |
| Lenovo Legion S7 16ARHA7 | |
| Acer Predator Triton 500 SE PT516-52s-70KX | |
| Lenovo Legion Slim 7-16IAH 82TF004YGE | |
| HP Omen 16-b1090ng | |
| Przeciętny Intel Core i7-12700H (3249 - 9939, n=64) | |
| AIDA64 / FPU Mandel | |
| Średnia w klasie Gaming (25115 - 128721, n=108, ostatnie 2 lata) | |
| Lenovo Legion S7 16ARHA7 | |
| Lenovo Legion Slim 7-16IAH 82TF004YGE | |
| Lenovo Legion 7 16IAX7-82TD004SGE | |
| Przeciętny Intel Core i7-12700H (7135 - 44760, n=64) | |
| Acer Predator Triton 500 SE PT516-52s-70KX | |
| HP Omen 16-b1090ng | |
| AIDA64 / CPU AES | |
| Lenovo Legion Slim 7-16IAH 82TF004YGE | |
| Lenovo Legion S7 16ARHA7 | |
| Lenovo Legion 7 16IAX7-82TD004SGE | |
| Średnia w klasie Gaming (39258 - 247074, n=108, ostatnie 2 lata) | |
| Acer Predator Triton 500 SE PT516-52s-70KX | |
| Przeciętny Intel Core i7-12700H (31839 - 144360, n=64) | |
| HP Omen 16-b1090ng | |
| AIDA64 / CPU ZLib | |
| Średnia w klasie Gaming (574 - 2531, n=108, ostatnie 2 lata) | |
| Lenovo Legion 7 16IAX7-82TD004SGE | |
| Acer Predator Triton 500 SE PT516-52s-70KX | |
| Lenovo Legion Slim 7-16IAH 82TF004YGE | |
| Przeciętny Intel Core i7-12700H (305 - 1171, n=64) | |
| HP Omen 16-b1090ng | |
| Lenovo Legion S7 16ARHA7 | |
| Asus ROG Zephyrus M16 GU603H | |
| AIDA64 / FP64 Ray-Trace | |
| Średnia w klasie Gaming (5509 - 45446, n=108, ostatnie 2 lata) | |
| Lenovo Legion S7 16ARHA7 | |
| Lenovo Legion Slim 7-16IAH 82TF004YGE | |
| Lenovo Legion 7 16IAX7-82TD004SGE | |
| Przeciętny Intel Core i7-12700H (1437 - 9692, n=64) | |
| Acer Predator Triton 500 SE PT516-52s-70KX | |
| HP Omen 16-b1090ng | |
| AIDA64 / CPU PhotoWorxx | |
| Średnia w klasie Gaming (12271 - 89891, n=108, ostatnie 2 lata) | |
| HP Omen 16-b1090ng | |
| Lenovo Legion 7 16IAX7-82TD004SGE | |
| Acer Predator Triton 500 SE PT516-52s-70KX | |
| Lenovo Legion Slim 7-16IAH 82TF004YGE | |
| Przeciętny Intel Core i7-12700H (12863 - 52207, n=64) | |
| Lenovo Legion S7 16ARHA7 | |
Wydajność systemu
Biorąc pod uwagę wszystkie wydajne podzespoły w Lenovo Legion Slim 7i, nie dziwi fakt, że urządzenie nie tylko oferuje doskonałą wydajność w codziennym użytkowaniu, ale także dobrze radzi sobie w benchmarkach wydajności systemu.
CrossMark: Overall | Productivity | Creativity | Responsiveness
| PCMark 10 / Score | |
| Lenovo Legion 7 16IAX7-82TD004SGE | |
| Średnia w klasie Gaming (5828 - 11574, n=96, ostatnie 2 lata) | |
| Lenovo Legion S7 16ARHA7 | |
| Acer Predator Triton 500 SE PT516-52s-70KX | |
| Lenovo Legion Slim 7-16IAH 82TF004YGE | |
| HP Omen 16-b1090ng | |
| Przeciętny Intel Core i7-12700H, NVIDIA GeForce RTX 3060 Laptop GPU (5986 - 8156, n=12) | |
| Asus ROG Zephyrus M16 GU603H | |
| PCMark 10 / Essentials | |
| Lenovo Legion 7 16IAX7-82TD004SGE | |
| Lenovo Legion Slim 7-16IAH 82TF004YGE | |
| Acer Predator Triton 500 SE PT516-52s-70KX | |
| Lenovo Legion S7 16ARHA7 | |
| Średnia w klasie Gaming (8810 - 12600, n=100, ostatnie 2 lata) | |
| Przeciętny Intel Core i7-12700H, NVIDIA GeForce RTX 3060 Laptop GPU (9289 - 12144, n=12) | |
| Asus ROG Zephyrus M16 GU603H | |
| HP Omen 16-b1090ng | |
| PCMark 10 / Productivity | |
| Lenovo Legion 7 16IAX7-82TD004SGE | |
| Średnia w klasie Gaming (6845 - 21327, n=98, ostatnie 2 lata) | |
| Lenovo Legion S7 16ARHA7 | |
| Acer Predator Triton 500 SE PT516-52s-70KX | |
| HP Omen 16-b1090ng | |
| Lenovo Legion Slim 7-16IAH 82TF004YGE | |
| Przeciętny Intel Core i7-12700H, NVIDIA GeForce RTX 3060 Laptop GPU (6161 - 10362, n=12) | |
| Asus ROG Zephyrus M16 GU603H | |
| PCMark 10 / Digital Content Creation | |
| Lenovo Legion 7 16IAX7-82TD004SGE | |
| Średnia w klasie Gaming (7602 - 19657, n=98, ostatnie 2 lata) | |
| Lenovo Legion S7 16ARHA7 | |
| Acer Predator Triton 500 SE PT516-52s-70KX | |
| HP Omen 16-b1090ng | |
| Lenovo Legion Slim 7-16IAH 82TF004YGE | |
| Przeciętny Intel Core i7-12700H, NVIDIA GeForce RTX 3060 Laptop GPU (8950 - 12554, n=12) | |
| Asus ROG Zephyrus M16 GU603H | |
| CrossMark / Overall | |
| Lenovo Legion 7 16IAX7-82TD004SGE | |
| Średnia w klasie Gaming (1366 - 2409, n=96, ostatnie 2 lata) | |
| Lenovo Legion Slim 7-16IAH 82TF004YGE | |
| Acer Predator Triton 500 SE PT516-52s-70KX | |
| Przeciętny Intel Core i7-12700H, NVIDIA GeForce RTX 3060 Laptop GPU (1649 - 2017, n=11) | |
| Lenovo Legion S7 16ARHA7 | |
| CrossMark / Productivity | |
| Lenovo Legion 7 16IAX7-82TD004SGE | |
| Średnia w klasie Gaming (1386 - 2254, n=96, ostatnie 2 lata) | |
| Lenovo Legion Slim 7-16IAH 82TF004YGE | |
| Acer Predator Triton 500 SE PT516-52s-70KX | |
| Przeciętny Intel Core i7-12700H, NVIDIA GeForce RTX 3060 Laptop GPU (1536 - 1958, n=11) | |
| Lenovo Legion S7 16ARHA7 | |
| CrossMark / Creativity | |
| Lenovo Legion 7 16IAX7-82TD004SGE | |
| Średnia w klasie Gaming (1343 - 2729, n=96, ostatnie 2 lata) | |
| Lenovo Legion Slim 7-16IAH 82TF004YGE | |
| Przeciętny Intel Core i7-12700H, NVIDIA GeForce RTX 3060 Laptop GPU (1816 - 2084, n=11) | |
| Acer Predator Triton 500 SE PT516-52s-70KX | |
| Lenovo Legion S7 16ARHA7 | |
| CrossMark / Responsiveness | |
| Lenovo Legion 7 16IAX7-82TD004SGE | |
| Acer Predator Triton 500 SE PT516-52s-70KX | |
| Lenovo Legion Slim 7-16IAH 82TF004YGE | |
| Średnia w klasie Gaming (1226 - 2334, n=96, ostatnie 2 lata) | |
| Przeciętny Intel Core i7-12700H, NVIDIA GeForce RTX 3060 Laptop GPU (1210 - 2207, n=11) | |
| Lenovo Legion S7 16ARHA7 | |
| PCMark 10 Score | 7380 pkt. | |
Pomoc | ||
| AIDA64 / Memory Copy | |
| Średnia w klasie Gaming (21750 - 129946, n=108, ostatnie 2 lata) | |
| HP Omen 16-b1090ng | |
| Acer Predator Triton 500 SE PT516-52s-70KX | |
| Przeciętny Intel Core i7-12700H (25615 - 80511, n=64) | |
| Lenovo Legion Slim 7-16IAH 82TF004YGE | |
| Lenovo Legion S7 16ARHA7 | |
| AIDA64 / Memory Read | |
| Średnia w klasie Gaming (22956 - 118858, n=108, ostatnie 2 lata) | |
| Acer Predator Triton 500 SE PT516-52s-70KX | |
| HP Omen 16-b1090ng | |
| Lenovo Legion Slim 7-16IAH 82TF004YGE | |
| Przeciętny Intel Core i7-12700H (25586 - 79442, n=64) | |
| Lenovo Legion S7 16ARHA7 | |
| AIDA64 / Memory Write | |
| Średnia w klasie Gaming (22297 - 135096, n=108, ostatnie 2 lata) | |
| HP Omen 16-b1090ng | |
| Lenovo Legion Slim 7-16IAH 82TF004YGE | |
| Lenovo Legion S7 16ARHA7 | |
| Przeciętny Intel Core i7-12700H (23679 - 88660, n=64) | |
| Acer Predator Triton 500 SE PT516-52s-70KX | |
| AIDA64 / Memory Latency | |
| Acer Predator Triton 500 SE PT516-52s-70KX | |
| Średnia w klasie Gaming (75.3 - 259, n=108, ostatnie 2 lata) | |
| Lenovo Legion Slim 7-16IAH 82TF004YGE | |
| HP Omen 16-b1090ng | |
| Lenovo Legion S7 16ARHA7 | |
| Przeciętny Intel Core i7-12700H (76.2 - 133.9, n=62) | |
| Asus ROG Zephyrus M16 GU603H | |
* ... im mniej tym lepiej
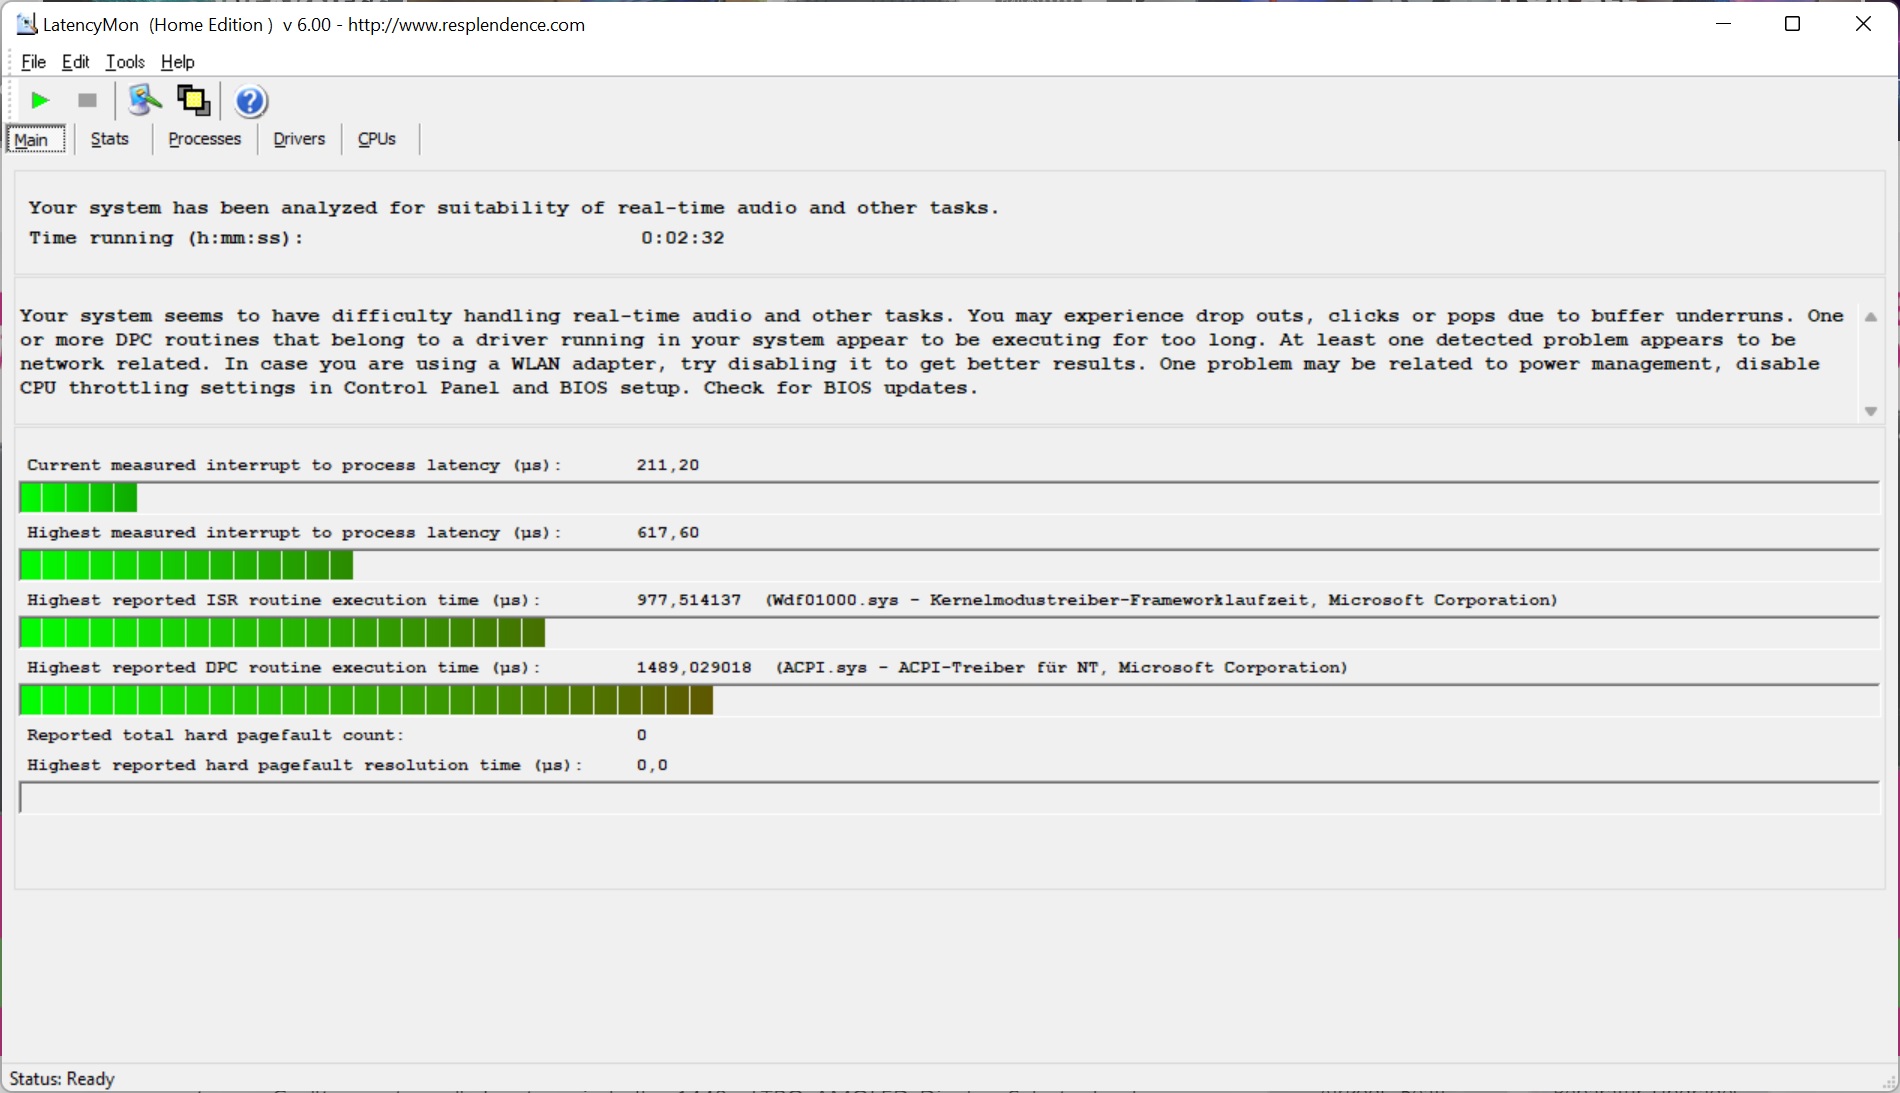
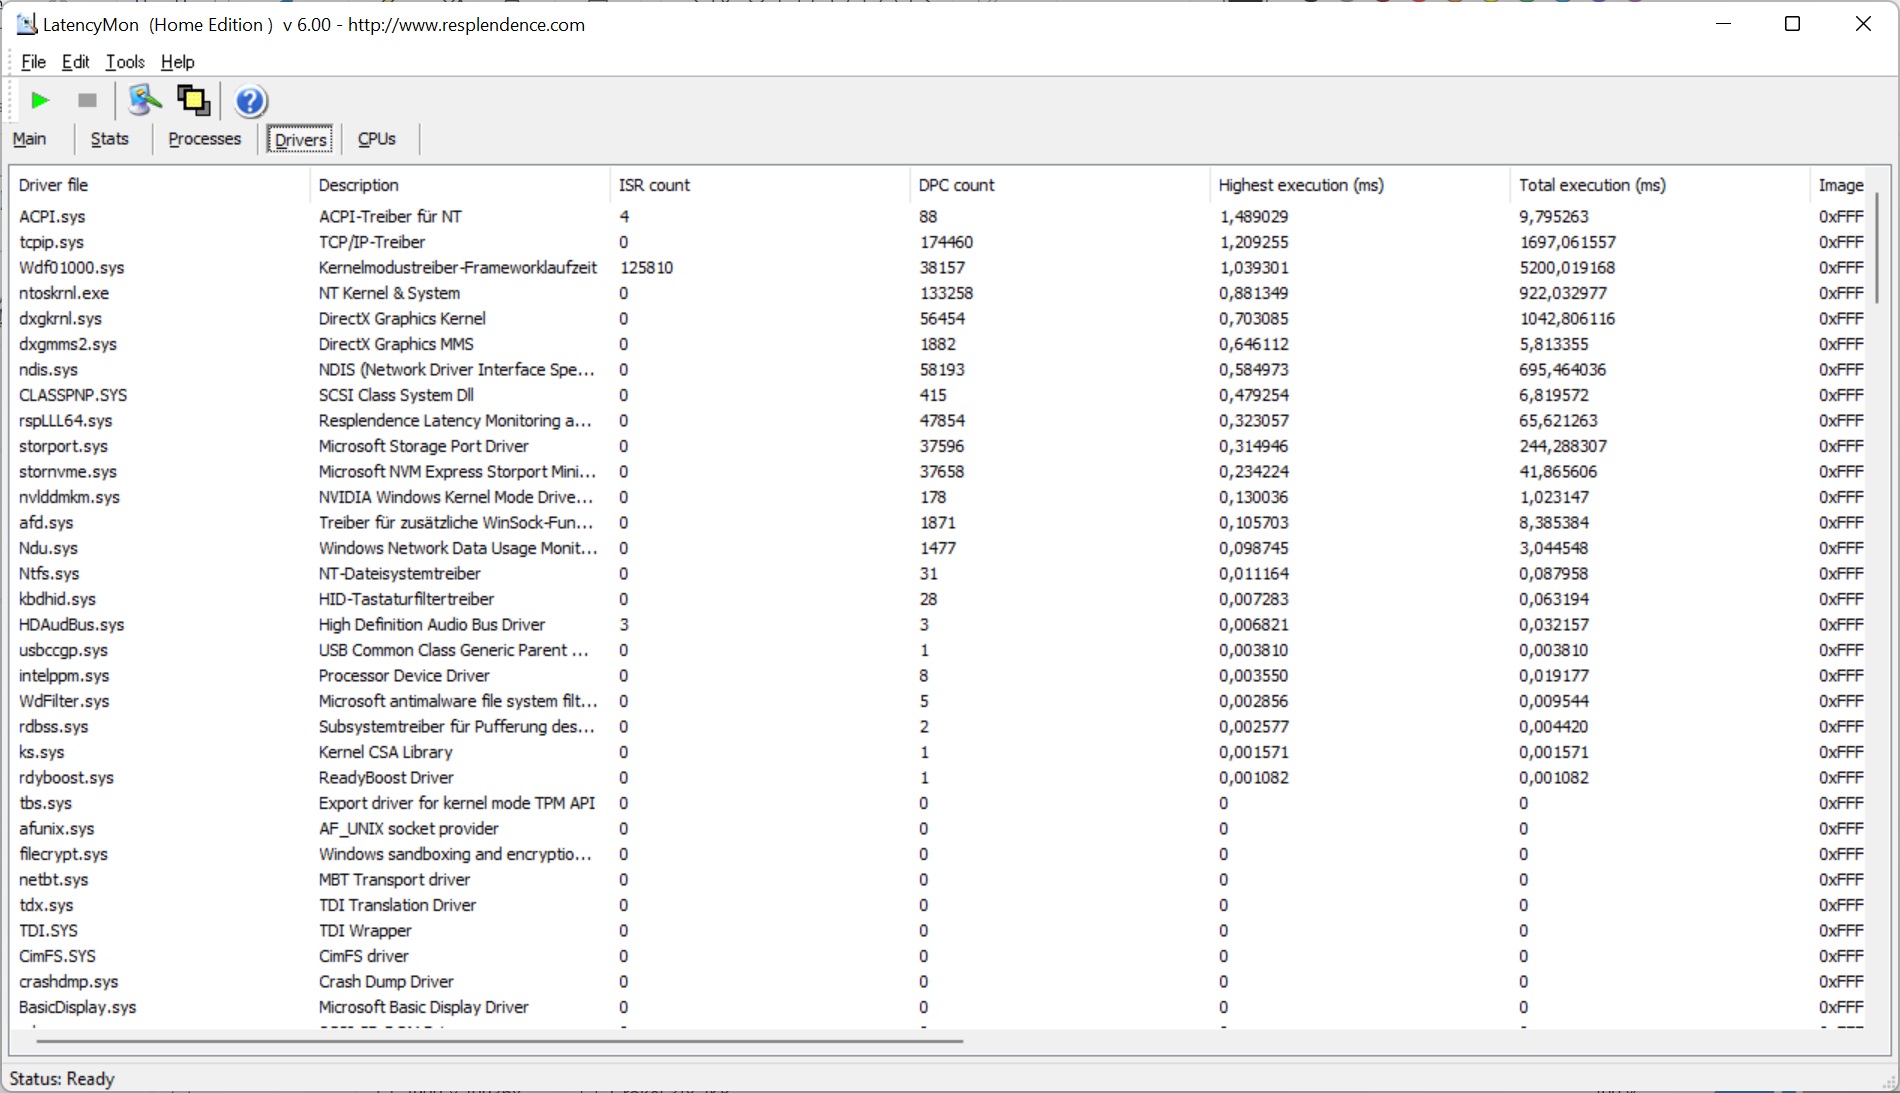
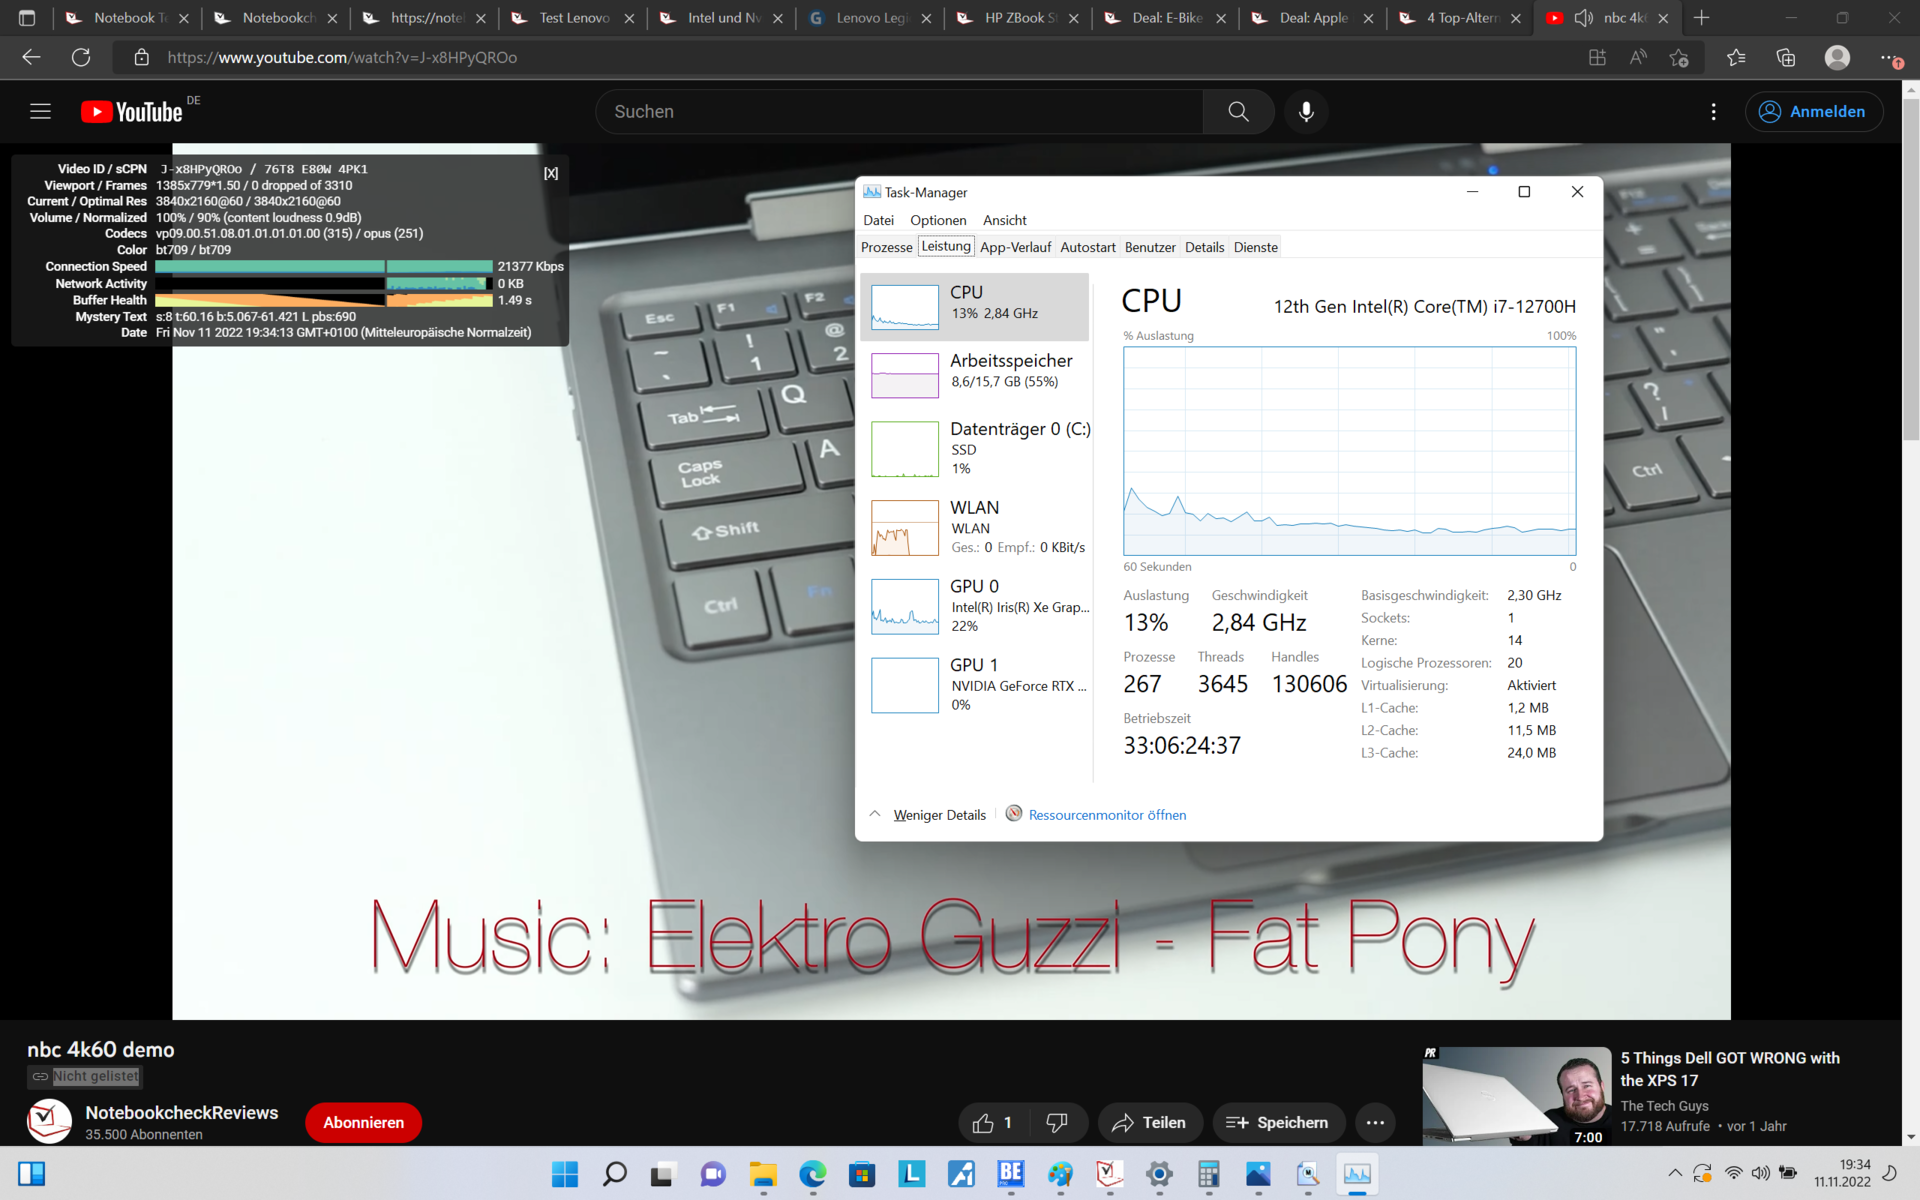
Opóźnienie DPC
Choć latencja jest stosunkowo niska, nasz egzemplarz recenzencki miał kilka problemów z obsługą dźwięku w czasie rzeczywistym. Z drugiej strony, podczas naszego testu na YouTube nie było żadnych zrzuconych klatek.
| DPC Latencies / LatencyMon - interrupt to process latency (max), Web, Youtube, Prime95 | |
| Acer Predator Triton 500 SE PT516-52s-70KX | |
| Asus ROG Zephyrus M16 GU603H | |
| Lenovo Legion S7 16ARHA7 | |
| HP Omen 16-b1090ng | |
| Lenovo Legion Slim 7-16IAH 82TF004YGE | |
* ... im mniej tym lepiej
Pamięć masowa
Model Legion Slim 7-16IAH jest wyposażony w dysk SSD M.2 2280 produkcji SK Hynix. Dysk NVMe PCIe 4.0 o pojemności 1 TB działał szybko w naszych benchmarkach i nie odnotował żadnych zauważalnych spadków wydajności pod trwałym obciążeniem.

| Drive Performance rating - Percent | |
| Asus ROG Zephyrus M16 GU603H | |
| Acer Predator Triton 500 SE PT516-52s-70KX -1! | |
| Przeciętny SK Hynix HFS001TEJ9X115N | |
| Lenovo Legion Slim 7-16IAH 82TF004YGE | |
| Średnia w klasie Gaming | |
| HP Omen 16-b1090ng | |
| Lenovo Legion S7 16ARHA7 | |
* ... im mniej tym lepiej
Sustained Read: DiskSpd Read Loop, Queue Depth 8
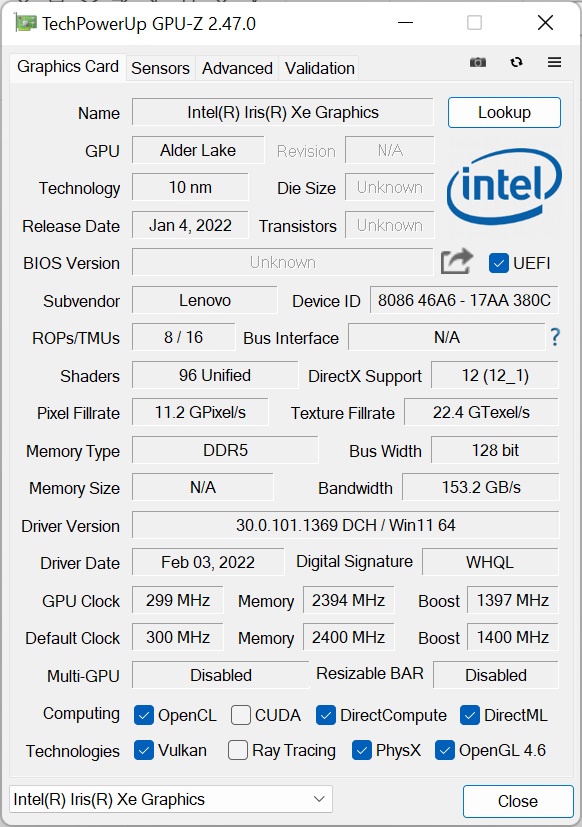
Karta graficzna
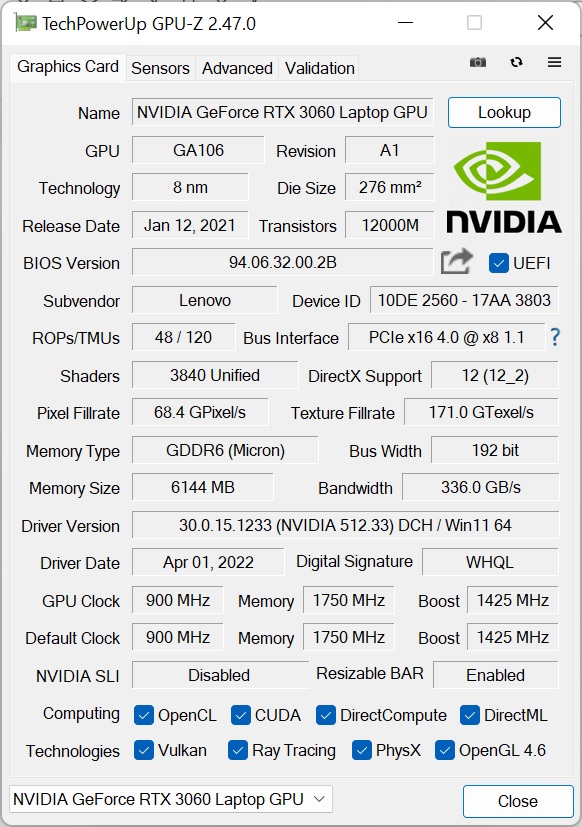
Na stronie GeForce RTX 3060 to karta ze średniej półki w mobilnej linii GPU Nvidii. Układ GA106 posiada 3840 jednostek cieniujących i 6 GB dedykowanej pamięci RAM GDDR6. Więcej danych na temat tej i wielu innych kart graficznych znajdziecie w naszym zestawieniu GPU.
Pozostałe laptopy w tym porównaniu są wyposażone w znacznie wydajniejsze procesory graficzne. Dlatego Lenovo Legion S7i wypadł w testach 3DMark gorzej od większości z nich. Jedyny wyjątek to Asus ROG Zephyrus M16który działał wolniej pomimo posiadania GeForce RTX 3070.
Wydajność GPU jest zauważalnie ograniczona, kiedy laptop jest odłączony od zasilania. Na zasilaniu akumulatorowym Lenovo Legion S7i zdołało osiągnąć w teście grafiki 3DMark 11 tylko wynik 9412 - o 65% niższy, niż po podłączeniu do prądu.
| 3DMark Performance rating - Percent | |
| Średnia w klasie Gaming | |
| Acer Predator Triton 500 SE PT516-52s-70KX | |
| Lenovo Legion S7 16ARHA7 | |
| HP Omen 16-b1090ng | |
| Przeciętny NVIDIA GeForce RTX 3060 Laptop GPU | |
| Lenovo Legion Slim 7-16IAH 82TF004YGE | |
| Asus ROG Zephyrus M16 GU603H | |
| 3DMark 11 - 1280x720 Performance GPU | |
| Średnia w klasie Gaming (21841 - 80022, n=107, ostatnie 2 lata) | |
| Acer Predator Triton 500 SE PT516-52s-70KX | |
| Lenovo Legion S7 16ARHA7 | |
| HP Omen 16-b1090ng | |
| Przeciętny NVIDIA GeForce RTX 3060 Laptop GPU (13799 - 30772, n=43) | |
| Lenovo Legion Slim 7-16IAH 82TF004YGE | |
| Asus ROG Zephyrus M16 GU603H | |
| 3DMark | |
| 1280x720 Cloud Gate Standard Graphics | |
| Lenovo Legion S7 16ARHA7 | |
| Średnia w klasie Gaming (86886 - 223650, n=63, ostatnie 2 lata) | |
| HP Omen 16-b1090ng | |
| Acer Predator Triton 500 SE PT516-52s-70KX | |
| Lenovo Legion Slim 7-16IAH 82TF004YGE | |
| Przeciętny NVIDIA GeForce RTX 3060 Laptop GPU (33126 - 136826, n=38) | |
| Asus ROG Zephyrus M16 GU603H | |
| 1920x1080 Fire Strike Graphics | |
| Średnia w klasie Gaming (12242 - 62849, n=119, ostatnie 2 lata) | |
| Acer Predator Triton 500 SE PT516-52s-70KX | |
| HP Omen 16-b1090ng | |
| Lenovo Legion S7 16ARHA7 | |
| Przeciętny NVIDIA GeForce RTX 3060 Laptop GPU (16354 - 23109, n=49) | |
| Lenovo Legion Slim 7-16IAH 82TF004YGE | |
| Asus ROG Zephyrus M16 GU603H | |
| 2560x1440 Time Spy Graphics | |
| Średnia w klasie Gaming (5012 - 26212, n=118, ostatnie 2 lata) | |
| Acer Predator Triton 500 SE PT516-52s-70KX | |
| HP Omen 16-b1090ng | |
| Lenovo Legion S7 16ARHA7 | |
| Przeciętny NVIDIA GeForce RTX 3060 Laptop GPU (6285 - 9235, n=49) | |
| Lenovo Legion Slim 7-16IAH 82TF004YGE | |
| Asus ROG Zephyrus M16 GU603H | |
| 3DMark 11 Performance | 25620 pkt. | |
| 3DMark Fire Strike Score | 18596 pkt. | |
| 3DMark Time Spy Score | 8319 pkt. | |
Pomoc | ||
Co ciekawe, oparty na Intelu Legion S7 przewyższył w benchmarkach Blendera swój odpowiednik z AMD. Różnica w wydajności była niewielka, gdy scena była renderowana przy użyciu CPU. Jednak model Intela (wykorzystujący CUDA lub OptiX) był znacząco szybszy od Legion Slim 7 AMD(wykorzystujący HIP) w benchmarku renderowania na GPU.
| Blender | |
| v3.3 Classroom CPU | |
| Lenovo Legion S7 16ARHA7 | |
| Lenovo Legion Slim 7-16IAH 82TF004YGE | |
| Lenovo Legion 7 16IAX7-82TD004SGE | |
| v3.3 Classroom CUDA | |
| Lenovo Legion Slim 7-16IAH 82TF004YGE | |
| Lenovo Legion 7 16IAX7-82TD004SGE | |
| v3.3 Classroom OPTIX/RTX | |
| Lenovo Legion Slim 7-16IAH 82TF004YGE | |
| Lenovo Legion 7 16IAX7-82TD004SGE | |
| v3.3 Classroom HIP/AMD | |
| Lenovo Legion S7 16ARHA7 | |
* ... im mniej tym lepiej
Wydajność w grach
Nie jest wielkim zaskoczeniem, że Lenovo Legion Slim 7i był wolniejszy od pozostałych urządzeń z grupy porównawczej podczas benchmarków dla gier, biorąc pod uwagę, że wszystkie mają szybsze GPU. Niemniej jednak, Legion S7i był tylko minimalnie wolniejszy w porównaniu z przeciętnym RTX 3060. Ma również wystarczającą wydajność GPU, aby bez wysiłku uruchamiać nowoczesne gry w rozdzielczości 2K (2 560 x 1 440) i wysokich ustawieniach.
| Performance rating - Percent | |
| Średnia w klasie Gaming | |
| Acer Predator Triton 500 SE PT516-52s-70KX | |
| HP Omen 16-b1090ng | |
| Lenovo Legion Slim 7-16IAH 82TF004YGE | |
| Lenovo Legion S7 16ARHA7 | |
| Przeciętny NVIDIA GeForce RTX 3060 Laptop GPU | |
| Asus ROG Zephyrus M16 GU603H | |
| The Witcher 3 - 1920x1080 Ultra Graphics & Postprocessing (HBAO+) | |
| Średnia w klasie Gaming (95 - 240, n=8, ostatnie 2 lata) | |
| Acer Predator Triton 500 SE PT516-52s-70KX | |
| HP Omen 16-b1090ng | |
| Lenovo Legion S7 16ARHA7 | |
| Asus ROG Zephyrus M16 GU603H | |
| Przeciętny NVIDIA GeForce RTX 3060 Laptop GPU (58.2 - 91.5, n=48) | |
| Lenovo Legion Slim 7-16IAH 82TF004YGE | |
| Strange Brigade - 1920x1080 ultra AA:ultra AF:16 | |
| Średnia w klasie Gaming (76.3 - 456, n=90, ostatnie 2 lata) | |
| Acer Predator Triton 500 SE PT516-52s-70KX | |
| Lenovo Legion S7 16ARHA7 | |
| HP Omen 16-b1090ng | |
| Przeciętny NVIDIA GeForce RTX 3060 Laptop GPU (102.2 - 166.3, n=43) | |
| Lenovo Legion Slim 7-16IAH 82TF004YGE | |
| Asus ROG Zephyrus M16 GU603H | |
| GTA V - 1920x1080 Highest AA:4xMSAA + FX AF:16x | |
| Średnia w klasie Gaming (48.3 - 186.9, n=99, ostatnie 2 lata) | |
| Acer Predator Triton 500 SE PT516-52s-70KX | |
| HP Omen 16-b1090ng | |
| Lenovo Legion Slim 7-16IAH 82TF004YGE | |
| Przeciętny NVIDIA GeForce RTX 3060 Laptop GPU (69.2 - 109.8, n=46) | |
| Lenovo Legion S7 16ARHA7 | |
| Asus ROG Zephyrus M16 GU603H | |
| Dota 2 Reborn - 1920x1080 ultra (3/3) best looking | |
| Średnia w klasie Gaming (84.8 - 248, n=111, ostatnie 2 lata) | |
| Lenovo Legion Slim 7-16IAH 82TF004YGE | |
| HP Omen 16-b1090ng | |
| Acer Predator Triton 500 SE PT516-52s-70KX | |
| Asus ROG Zephyrus M16 GU603H | |
| Przeciętny NVIDIA GeForce RTX 3060 Laptop GPU (90.7 - 154.8, n=49) | |
| Lenovo Legion S7 16ARHA7 | |
Witcher 3 FPS chart
| low | med. | high | ultra | QHD | |
|---|---|---|---|---|---|
| GTA V (2015) | 183.5 | 179.8 | 169.3 | 98 | 70.9 |
| The Witcher 3 (2015) | 362 | 246 | 139.3 | 73.7 | |
| Dota 2 Reborn (2015) | 177.3 | 163.2 | 153.4 | 146.2 | |
| Final Fantasy XV Benchmark (2018) | 175.5 | 100 | 75 | 55.2 | |
| X-Plane 11.11 (2018) | 146.6 | 132.8 | 105 | ||
| Strange Brigade (2018) | 390 | 186.4 | 151.9 | 131.8 | 100.2 |
Emisje: Legion Slim 7i płaci cenę za swoje wysokie osiągi
Emisja hałasu
Mimo świetnej wydajności Lenovo Legion Slim 7i ma dobrze dostrojone sterowanie wentylatorem, które pozwala mu na cichą pracę w stanie spoczynku. Pod obciążeniem laptop wytwarzał do 52 dB(a) hałasu, ale pozostał cichszy od konkurencji. Jako jedyny wyjątek Legion Slim 7 z procesorem AMD działał pod obciążeniem jeszcze ciszej.
Trzymając ucho blisko klawiatury, mogliśmy usłyszeć delikatny syczący dźwięk dochodzący z laptopa. Szum ten nie był jednak słyszalny, gdy znajdowaliśmy się w normalnej odległości od urządzenia.
Hałas
| luz |
| 23 / 23 / 23 dB |
| obciążenie |
| 43.7 / 52 dB |
 | ||
30 dB cichy 40 dB(A) słyszalny 50 dB(A) irytujący |
||
min: | ||
| Lenovo Legion Slim 7-16IAH 82TF004YGE GeForce RTX 3060 Laptop GPU, i7-12700H, SK Hynix HFS001TEJ9X115N | Lenovo Legion S7 16ARHA7 Radeon RX 6800S, R9 6900HX, SK Hynix HFS001TEJ9X115N | Acer Predator Triton 500 SE PT516-52s-70KX GeForce RTX 3080 Ti Laptop GPU, i7-12700H, Micron 3400 1TB MTFDKBA1T0TFH | HP Omen 16-b1090ng GeForce RTX 3070 Ti Laptop GPU, i7-12700H, WDC PC SN810 1TB | Asus ROG Zephyrus M16 GU603H GeForce RTX 3070 Laptop GPU, i9-11900H, Samsung PM9A1 MZVL22T0HBLB | |
|---|---|---|---|---|---|
| Noise | 4% | -18% | -21% | -22% | |
| wyłączone / środowisko * (dB) | 23 | 23.1 -0% | 26 -13% | 26 -13% | 25 -9% |
| Idle Minimum * (dB) | 23 | 23.1 -0% | 26 -13% | 30 -30% | 25 -9% |
| Idle Average * (dB) | 23 | 23.1 -0% | 29 -26% | 31 -35% | 31 -35% |
| Idle Maximum * (dB) | 23 | 23.1 -0% | 34 -48% | 33 -43% | 42 -83% |
| Load Average * (dB) | 43.7 | 31.4 28% | 50 -14% | 49 -12% | 48 -10% |
| Witcher 3 ultra * (dB) | 51.7 | 51.4 1% | 53 -3% | 53 -3% | 52 -1% |
| Load Maximum * (dB) | 52 | 51.2 2% | 56 -8% | 57 -10% | 56 -8% |
* ... im mniej tym lepiej
Temperatura
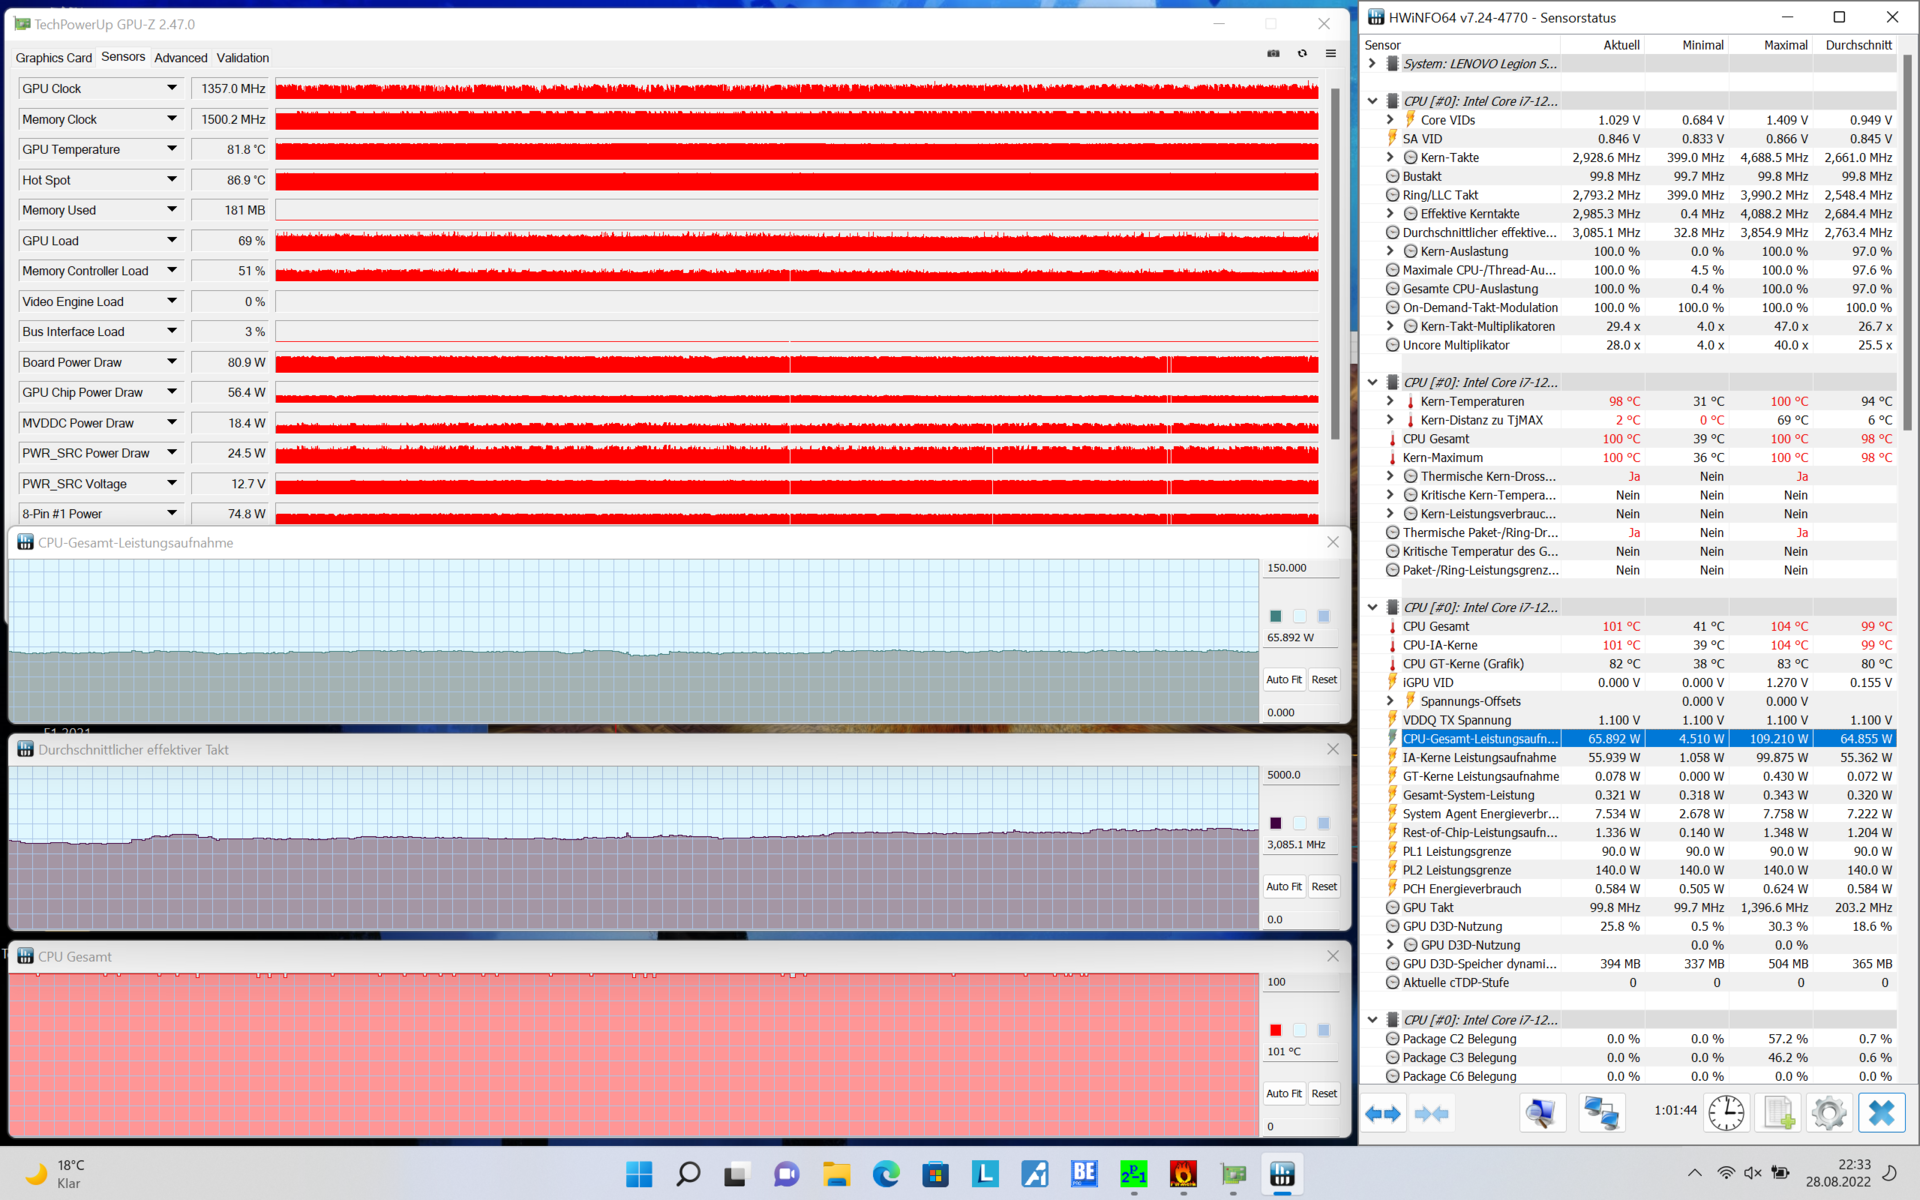
Cienka obudowa w połączeniu z potężnymi podzespołami to przepis na wysokie temperatury. W stanie spoczynku laptop Lenovo był stosunkowo chłodny. Mimo to generował zauważalną ilość ciepła, a temperatura obudowy sięgała 37,6°C (99,7°F). Podczas testu obciążeniowego zmierzyliśmy maksymalną temperaturę 55°C (131°F) w hotspocie na spodzie urządzenia, co jest już poza dopuszczalnym zakresem. W teście Witcher 3 (ważnym dla laptopa do gier) temperatury obudowy na spodzie nie przekroczyły 50°C (122°F), ale pokład klawiatury stał się nieco cieplejszy niż podczas testu obciążeniowego. Oznacza to, że podczas grania na tym urządzeniu mogą się pocić ręce.
Podczas połączonego testu obciążeniowego CPU/GPU pobór mocy procesora został ograniczony do 65 W, natomiast zużycie energii przez GPU było nieco wyższe i wyniosło 80 W. Lenovo Legion Slim 7-16IAH nie ma problemu z obniżeniem taktowania CPU lub GPU poniżej ich zegarów bazowych z powodu throttlingu.
(-) Maksymalna temperatura w górnej części wynosi 48.3 °C / 119 F, w porównaniu do średniej 40.4 °C / 105 F , począwszy od 21.2 do 68.8 °C dla klasy Gaming.
(-) Dno nagrzewa się maksymalnie do 55.3 °C / 132 F, w porównaniu do średniej 43.2 °C / 110 F
(+) W stanie bezczynności średnia temperatura górnej części wynosi 31.3 °C / 88 F, w porównaniu ze średnią temperaturą urządzenia wynoszącą 33.9 °C / ### class_avg_f### F.
(-) Podczas gry w Wiedźmina 3 średnia temperatura górnej części wynosi 39.2 °C / 103 F, w porównaniu do średniej temperatury urządzenia wynoszącej 33.9 °C / ## #class_avg_f### F.
(±) Podpórki pod nadgarstki i touchpad mogą się bardzo nagrzać w dotyku, maksymalnie do 39.5 °C / 103.1 F.
(-) Średnia temperatura obszaru podparcia dłoni w podobnych urządzeniach wynosiła 28.8 °C / 83.8 F (-10.7 °C / -19.3 F).
| Lenovo Legion Slim 7-16IAH 82TF004YGE Intel Core i7-12700H, NVIDIA GeForce RTX 3060 Laptop GPU | Lenovo Legion S7 16ARHA7 AMD Ryzen 9 6900HX, AMD Radeon RX 6800S | Acer Predator Triton 500 SE PT516-52s-70KX Intel Core i7-12700H, NVIDIA GeForce RTX 3080 Ti Laptop GPU | HP Omen 16-b1090ng Intel Core i7-12700H, NVIDIA GeForce RTX 3070 Ti Laptop GPU | Asus ROG Zephyrus M16 GU603H Intel Core i9-11900H, NVIDIA GeForce RTX 3070 Laptop GPU | |
|---|---|---|---|---|---|
| Heat | 17% | 11% | 16% | -5% | |
| Maximum Upper Side * (°C) | 48.3 | 46.6 4% | 47 3% | 41 15% | 52 -8% |
| Maximum Bottom * (°C) | 55.3 | 50.8 8% | 49 11% | 62 -12% | 53 4% |
| Idle Upper Side * (°C) | 35.7 | 26.4 26% | 31 13% | 25 30% | 38 -6% |
| Idle Bottom * (°C) | 37.6 | 27.2 28% | 32 15% | 26 31% | 41 -9% |
* ... im mniej tym lepiej
Mówcy
Głośniki w Legion S7i znajdują się nad klawiaturą. Brzmią całkiem nieźle jak na parę głośników laptopowych, gdyż mają trochę basu i potrafią być dość głośne.
Lenovo Legion Slim 7-16IAH 82TF004YGE analiza dźwięku
(±) | głośność głośnika jest średnia, ale dobra (73.4 dB)
Bas 100 - 315 Hz
(±) | zredukowany bas - średnio 10% niższy od mediany
(±) | liniowość basu jest średnia (13.4% delta do poprzedniej częstotliwości)
Średnie 400 - 2000 Hz
(+) | zbalansowane środki średnie - tylko 1.2% od mediany
(+) | średnie są liniowe (3.3% delta do poprzedniej częstotliwości)
Wysokie 2–16 kHz
(±) | wyższe maksima - średnio 5.5% wyższe od mediany
(±) | liniowość wysokich wartości jest średnia (10.6% delta do poprzedniej częstotliwości)
Ogólnie 100 - 16.000 Hz
(+) | ogólny dźwięk jest liniowy (13% różnicy w stosunku do mediany)
W porównaniu do tej samej klasy
» 18% wszystkich testowanych urządzeń w tej klasie było lepszych, 3% podobnych, 79% gorszych
» Najlepszy miał deltę 6%, średnia wynosiła ###średnia###%, najgorsza wynosiła 132%
W porównaniu do wszystkich testowanych urządzeń
» 13% wszystkich testowanych urządzeń było lepszych, 2% podobnych, 85% gorszych
» Najlepszy miał deltę 4%, średnia wynosiła ###średnia###%, najgorsza wynosiła 134%
Asus ROG Zephyrus M16 GU603H analiza dźwięku
(±) | głośność głośnika jest średnia, ale dobra (80 dB)
Bas 100 - 315 Hz
(±) | zredukowany bas - średnio 7.4% niższy od mediany
(±) | liniowość basu jest średnia (9.2% delta do poprzedniej częstotliwości)
Średnie 400 - 2000 Hz
(±) | wyższe średnie - średnio 5.6% wyższe niż mediana
(+) | średnie są liniowe (4% delta do poprzedniej częstotliwości)
Wysokie 2–16 kHz
(+) | zrównoważone maksima - tylko 2.6% od mediany
(+) | wzloty są liniowe (6.7% delta do poprzedniej częstotliwości)
Ogólnie 100 - 16.000 Hz
(+) | ogólny dźwięk jest liniowy (12.1% różnicy w stosunku do mediany)
W porównaniu do tej samej klasy
» 12% wszystkich testowanych urządzeń w tej klasie było lepszych, 4% podobnych, 84% gorszych
» Najlepszy miał deltę 6%, średnia wynosiła ###średnia###%, najgorsza wynosiła 132%
W porównaniu do wszystkich testowanych urządzeń
» 9% wszystkich testowanych urządzeń było lepszych, 2% podobnych, 88% gorszych
» Najlepszy miał deltę 4%, średnia wynosiła ###średnia###%, najgorsza wynosiła 134%
Zarządzanie energią: Lenovo Legion S7i nie jest zbyt wydajne
Pobór mocy
Jedną z głównych słabości Lenovo Slim 7i jest wysoki pobór mocy. W stanie bezczynności jego zużycie energii jest już bardzo wysokie i wynosi 13,3 W. Model z procesorem AMD jest pod tym względem lepszy.
Podczas naszych testów zmierzyliśmy szczytowy pobór mocy na poziomie 232 watów - nieco powyżej 230 watów, które może oddać ładowarka. Mimo to nie trzeba się martwić o rozładowanie akumulatora, kiedy laptop jest podłączony do prądu, gdyż jest to absolutna wartość szczytowa, a pobór mocy laptopa szybko spadł poniżej krytycznej granicy.
| wyłączony / stan wstrzymania | |
| luz | |
| obciążenie |
|
Legenda:
min: | |
| Lenovo Legion Slim 7-16IAH 82TF004YGE i7-12700H, GeForce RTX 3060 Laptop GPU, SK Hynix HFS001TEJ9X115N, IPS LED, 2560x1600, 16" | Lenovo Legion S7 16ARHA7 R9 6900HX, Radeon RX 6800S, SK Hynix HFS001TEJ9X115N, IPS, 2560x1600, 16" | Acer Predator Triton 500 SE PT516-52s-70KX i7-12700H, GeForce RTX 3080 Ti Laptop GPU, Micron 3400 1TB MTFDKBA1T0TFH, IPS LED, 2560x1600, 16" | HP Omen 16-b1090ng i7-12700H, GeForce RTX 3070 Ti Laptop GPU, WDC PC SN810 1TB, IPS, 2560x1440, 16.1" | Asus ROG Zephyrus M16 GU603H i9-11900H, GeForce RTX 3070 Laptop GPU, Samsung PM9A1 MZVL22T0HBLB, IPS, 2560x1600, 16" | Przeciętny NVIDIA GeForce RTX 3060 Laptop GPU | Średnia w klasie Gaming | |
|---|---|---|---|---|---|---|---|
| Power Consumption | 11% | -1% | 17% | -6% | 9% | -7% | |
| Idle Minimum * (Watt) | 13.3 | 8.8 34% | 7 47% | 4 70% | 11 17% | 10.4 ? 22% | 13.1 ? 2% |
| Idle Average * (Watt) | 17.5 | 14.7 16% | 19 -9% | 10 43% | 20 -14% | 14.5 ? 17% | 18.8 ? -7% |
| Idle Maximum * (Watt) | 18.4 | 19.8 -8% | 28 -52% | 19 -3% | 30 -63% | 21.4 ? -16% | 24.4 ? -33% |
| Load Average * (Watt) | 122.8 | 85.3 31% | 114 7% | 114 7% | 111 10% | 109.3 ? 11% | 108.5 ? 12% |
| Witcher 3 ultra * (Watt) | 154.7 | 167.5 -8% | 159 -3% | 183.2 -18% | 156 -1% | ||
| Load Maximum * (Watt) | 232.6 | 230.7 1% | 227 2% | 221 5% | 197 15% | 206 ? 11% | 254 ? -9% |
* ... im mniej tym lepiej
Power consumption Witcher 3 / Stress test
Power consumption with external monitor
Żywotność baterii
Lenovo nie szczędziło wysiłków, jeśli chodzi o pojemność akumulatora, umieszczając w nim największą baterię (99,99 Wh) dopuszczalną w laptopie według przepisów dotyczących podróży. Z powodu dużego poboru mocy urządzenia czasy pracy na akumulatorze są jednak raczej przeciętne. Podczas testu Wi-Fi (jasność ekranu na poziomie 150 cd/m²) laptop zdołał działać tylko przez pięć godzin. Dla porównania wydajniejszy model AMD wytrzymał mniej więcej o godzinę dłużej.
| Lenovo Legion Slim 7-16IAH 82TF004YGE i7-12700H, GeForce RTX 3060 Laptop GPU, 99.99 Wh | Lenovo Legion S7 16ARHA7 R9 6900HX, Radeon RX 6800S, 71 Wh | Acer Predator Triton 500 SE PT516-52s-70KX i7-12700H, GeForce RTX 3080 Ti Laptop GPU, 99.98 Wh | HP Omen 16-b1090ng i7-12700H, GeForce RTX 3070 Ti Laptop GPU, 83 Wh | Asus ROG Zephyrus M16 GU603H i9-11900H, GeForce RTX 3070 Laptop GPU, 90 Wh | Średnia w klasie Gaming | |
|---|---|---|---|---|---|---|
| Czasy pracy | 19% | 22% | 27% | 36% | 11% | |
| H.264 (h) | 9.5 | 8.2 -14% | 8.26 ? -13% | |||
| WiFi v1.3 (h) | 5.2 | 6.2 19% | 5.7 10% | 5.6 8% | 7.7 48% | 6.98 ? 34% |
| Witcher 3 ultra (h) | 1.5 | |||||
| Load (h) | 1.3 | 2.2 69% | 1.9 46% | 1.6 23% | 1.47 ? 13% |
Za
Przeciw
Werdykt: Legion Slim 7i jest nieco uszkodzony przez słabą żywotność baterii
Pełna para AMD lub Intel z Nvidią - Lenovo pozwala konsumentom dokonać samodzielnego wyboru przy zakupie Legion Slim 7. Oba warianty oferują własne zalety, jednocześnie mając wiele wspólnych atutów.
Pomimo posiadania znacząco różnych procesorów i układów graficznych, oba warianty łączy ta sama smukła, aluminiowa obudowa, świetne urządzenia wejściowe, przyzwoity wybór portów, szybki, wysokiej jakości wyświetlacz WQXGA i świetna wydajność. Obsługa Thunderbolt 4 to jedna z zalet przetestowanego w niniejszej recenzji modelu Intel/Nvidia. Ponadto ten wariant ma nieco wyższą wydajność CPU, a także lepszą wydajność GPU w niektórych zastosowaniach (np. aplikacje oparte na CUDA)
Lenovo Legion S7i jest cienki, premium i wydajny - ale mniej wydajny od swojego odpowiednika z procesorem AMD
.
Mimo to wariant oparty na procesorze AMD okazuje się lepszym rozwiązaniem. Lenovo Legion S7i 16IAH7 nie tylko jest bardziej gorący i głośniejszy, ale także ma krótszy czas pracy na baterii niżLenovo Legion S7 16ARHA7. Uważamy, że zwłaszcza czas pracy na baterii jest kluczowym czynnikiem, który osłabia próbę Lenovo pozycjonowania Slim 7i 16IAH7 jako cienkiego i przenośnego laptopa do gier. Legion S7i wpada trochę między dwa stołki: model z AMD jest lepszy do zastosowań przenośnych, natomiast grubszy Lenovo Legion 7 16IAX7posiada procesor HX i jest prawdopodobnie lepszym wyborem dla tych, którzy naprawdę chcą tej ostatniej odrobiny wydajności.
Wśród konkurentów należy wymienić m.in Acer Predator Triton 500 SE jest szczególnie interesującą alternatywą ze względu na szybszy procesor graficzny i lepszy wyświetlacz. Jest jednak droższy i ma tylko wlutowaną pamięć RAM. Warto również wspomnieć o Asus ROG Zephyrus M16, ale jest on wciąż wyposażony w starszy procesor.
Cena i dostępność
Lenovo Legion Slim 7 16IAH7 jest obecnie dostępny na stronie Lenovo US po obniżonej cenie 1 360 USD (cena pierwotna 1 700 USD). Konfiguracja recenzencka https://lenovo.vzew.net/c/2597802/218864/3808?subId1=news&u=https://www.lenovo.com/us/en/configurator/cto/index.html?bundleId=82TFCTO1WWUS1 po uwzględnieniu rabatów kosztuje 1700 USD.
Uwaga: Ceny są dokładne na dzień 17.11.22 i mogą ulec zmianie
Lenovo Legion Slim 7-16IAH 82TF004YGE
- 13/11/2022 v7 (old)
Benjamin Herzig
Price comparison

