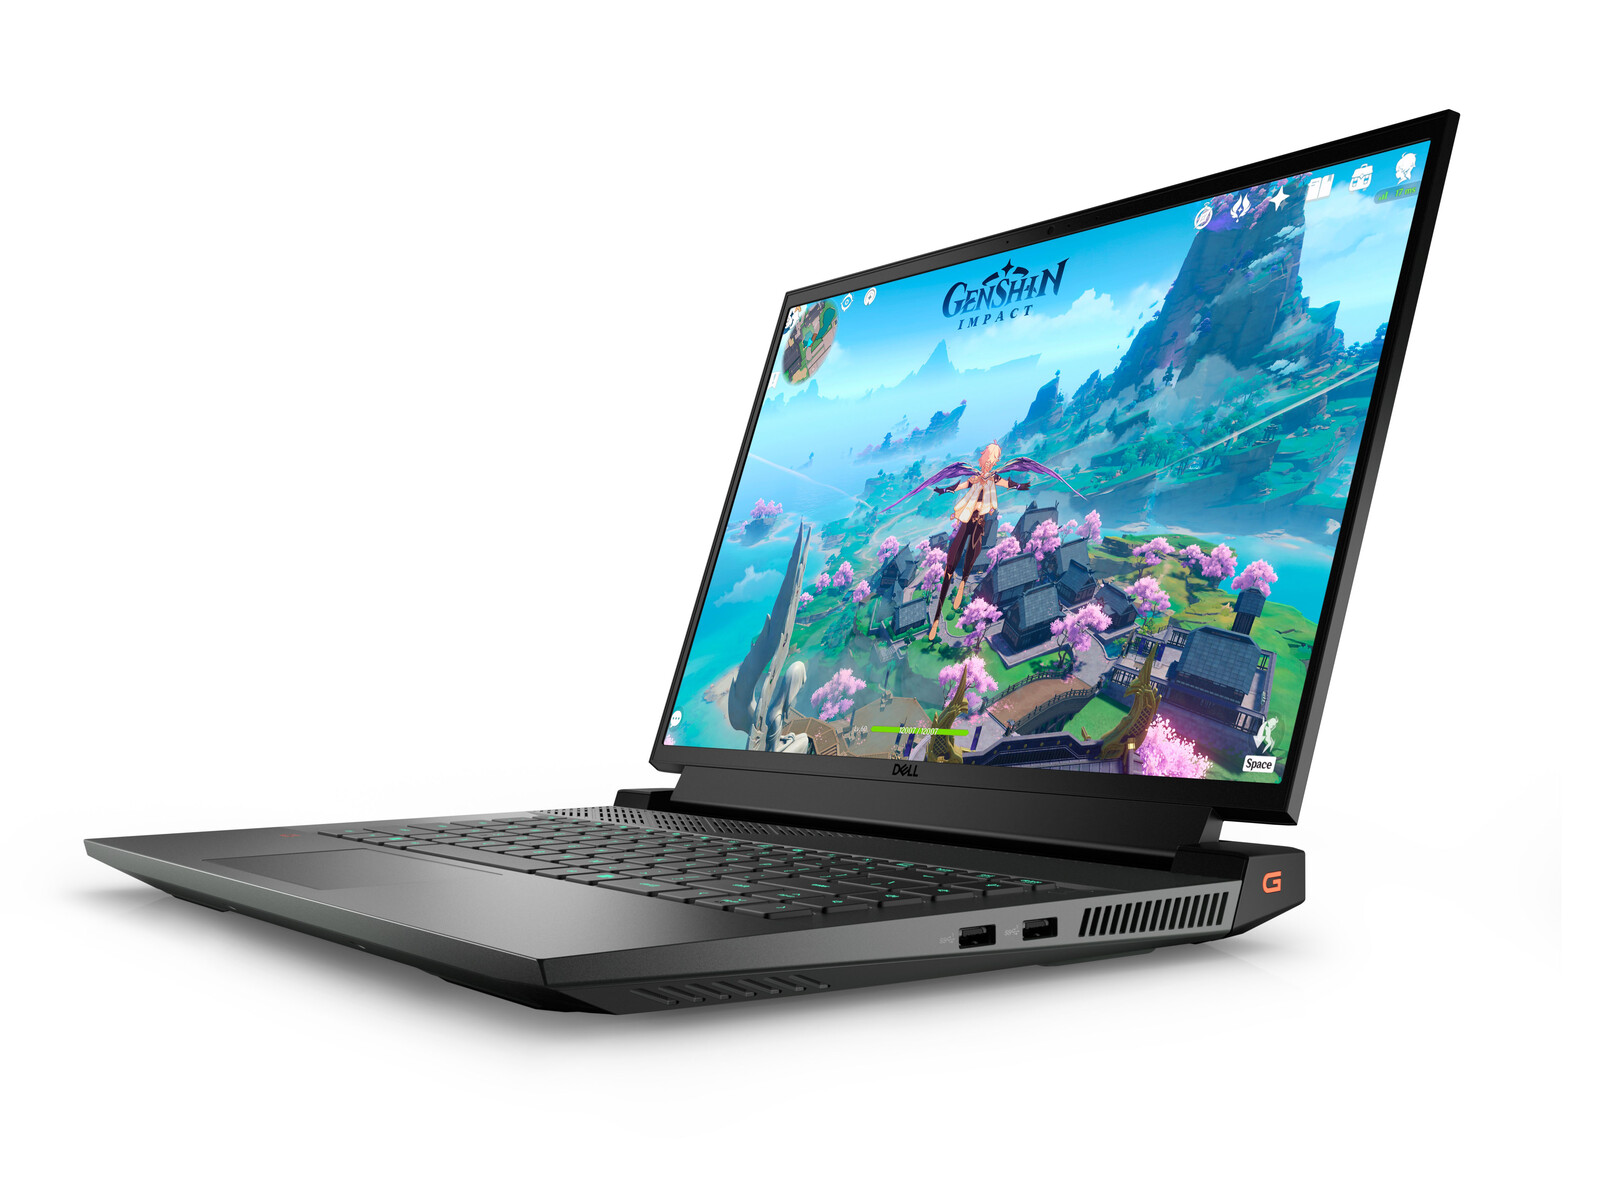
Recenzja laptopa Dell G16 7620: Gruba konstrukcja dla szybkiej wydajności
Seria Dell G obejmuje budżetowe i średnie laptopy do gier w przeciwieństwie do wyższej serii Alienware. Seria ma zaledwie kilka lat, a początkowe modele G15 i G17 obejmują odpowiednio 15,6 i 17,3-calowe formaty. W 2022 roku Dell wprowadził 16-calowy model o nazwie G16, który został wyposażony w najnowsze procesory Intel Core-H 12. generacji i karty graficzne Nvidia RTX Ampere
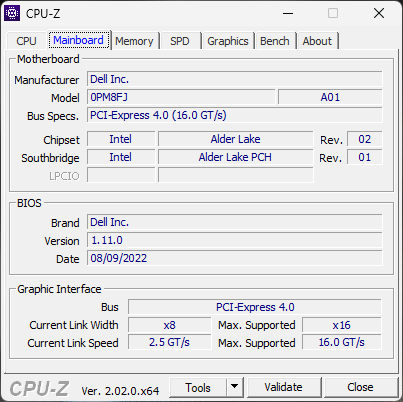
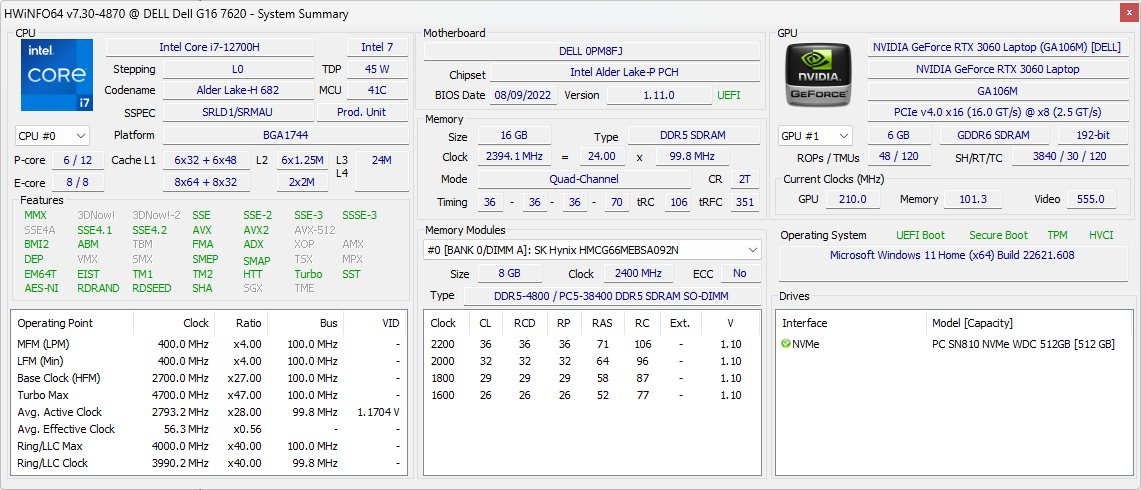
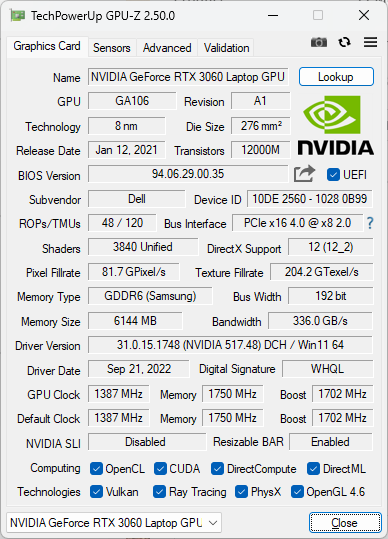
Nasz egzemplarz w recenzji to konfiguracja ze średniej półki z procesorem Core i7-12700H i GPU 130 W GeForce RTX 3060 w cenie detalicznej około 1500 USD. Inne jednostki SKU są dostępne z wolniejszym RTX 3050 Ti, szybszym RTX 3070 Ti lub Core i9-12900H. Wszystkie obecne konfiguracje są wyposażone w ten sam 16-calowy wyświetlacz 1600p 165 Hz
Do konkurentów w tej przestrzeni należą inne 16-calowe laptopy do gier, np Lenovo Legion 7 16, HP Victus 16, Asus ROG Zephyrus M16, lub Acer Swift X SFX16
Więcej recenzji Della
Potencjalni konkurenci w porównaniu
Ocena | Data | Model | Waga | Wysokość | Rozmiar | Rezolucja | Cena |
|---|---|---|---|---|---|---|---|
| 86.1 % v7 (old) | 10/2022 | Dell G16 7620 i7-12700H, GeForce RTX 3060 Laptop GPU | 2.6 kg | 26.9 mm | 16.00" | 2560x1600 | |
| 90.8 % v7 (old) | 10/2022 | Lenovo Legion 7 16ARHA7 R9 6900HX, Radeon RX 6850M XT | 2.6 kg | 19.4 mm | 16.00" | 2560x1600 | |
| 82.3 % v7 (old) | 03/2025 | HP Victus 16-e0145ng R5 5600H, GeForce RTX 3050 Ti Laptop GPU | 2.4 kg | 23.5 mm | 16.10" | 1920x1080 | |
| 85.6 % v7 (old) | Asus ROG Zephyrus M16 GU603H i9-11900H, GeForce RTX 3070 Laptop GPU | 2 kg | 20 mm | 16.00" | 2560x1600 | ||
| 86.6 % v7 (old) | 08/2025 | Lenovo Legion 5 Pro 16IAH7H i7-12700H, GeForce RTX 3060 Laptop GPU | 2.6 kg | 27 mm | 16.00" | 2560x1600 | |
| 86.2 % v7 (old) | Acer Swift X SFX16-51G-5388 i5-11320H, GeForce RTX 3050 4GB Laptop GPU | 1.8 kg | 18.9 mm | 16.10" | 1920x1080 |
Sprawa - większy G15
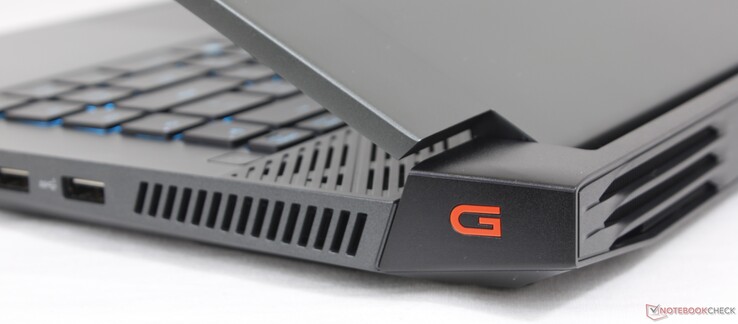
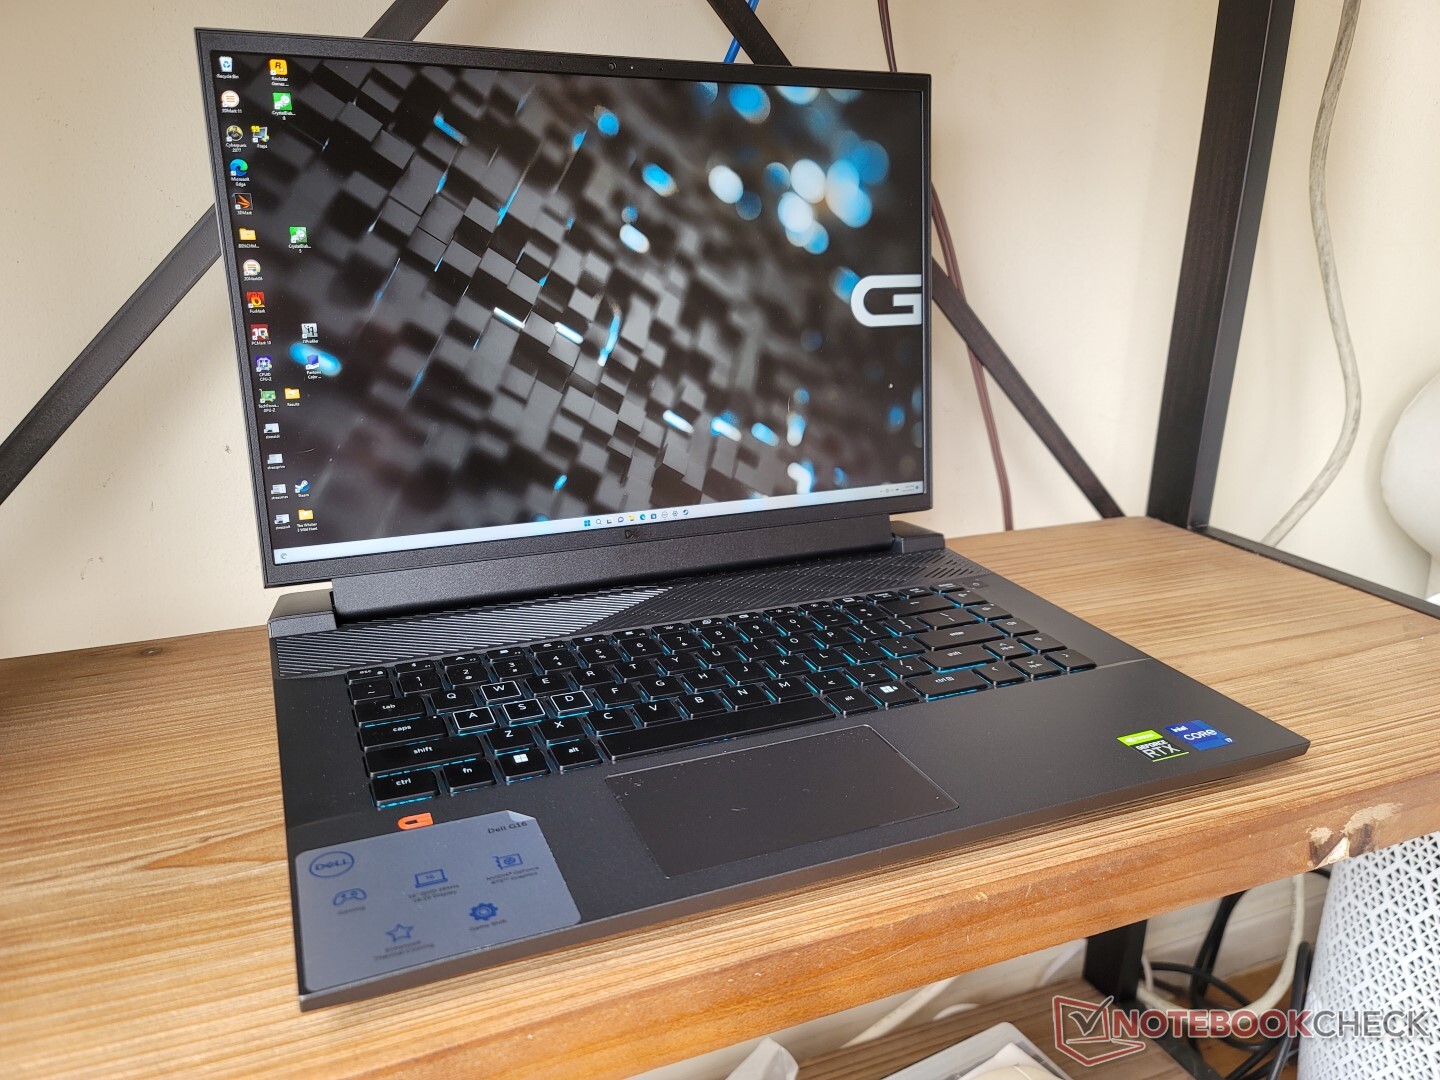
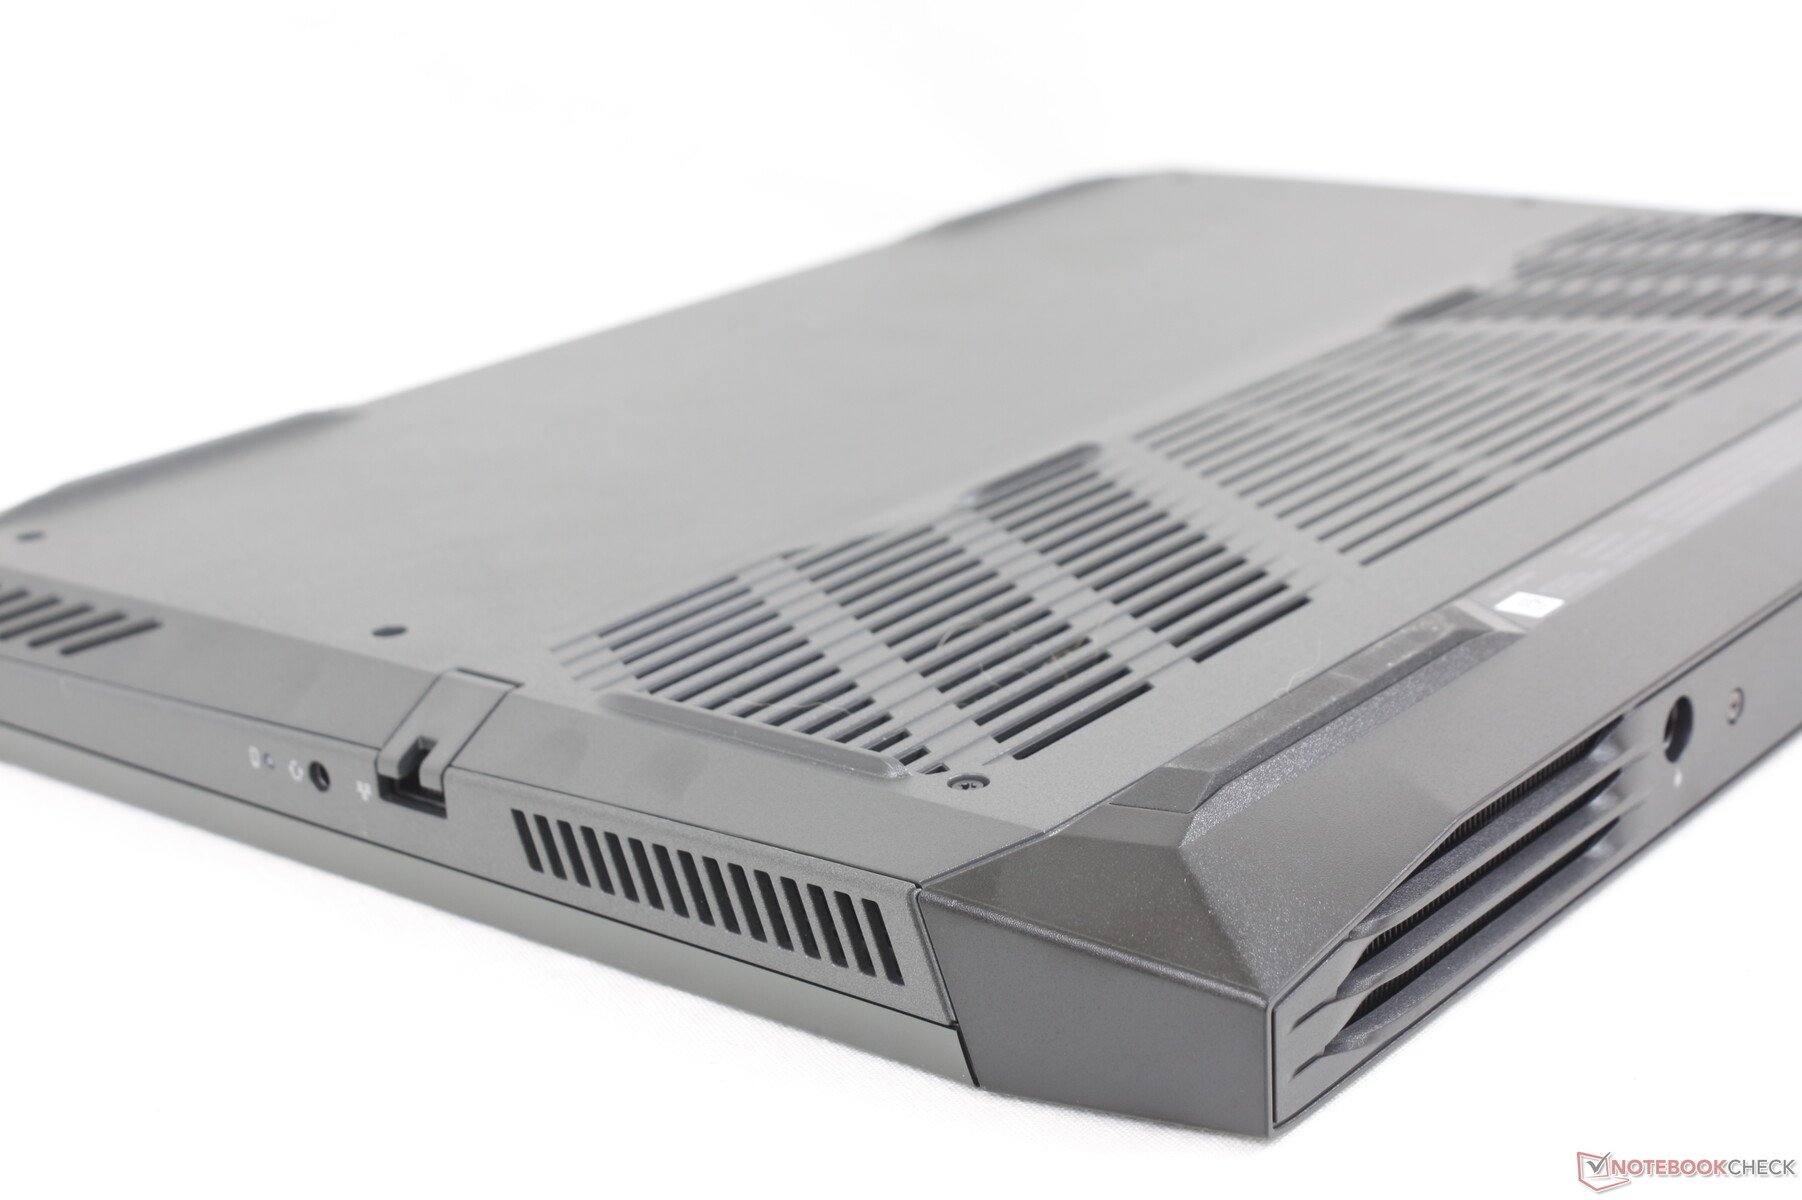
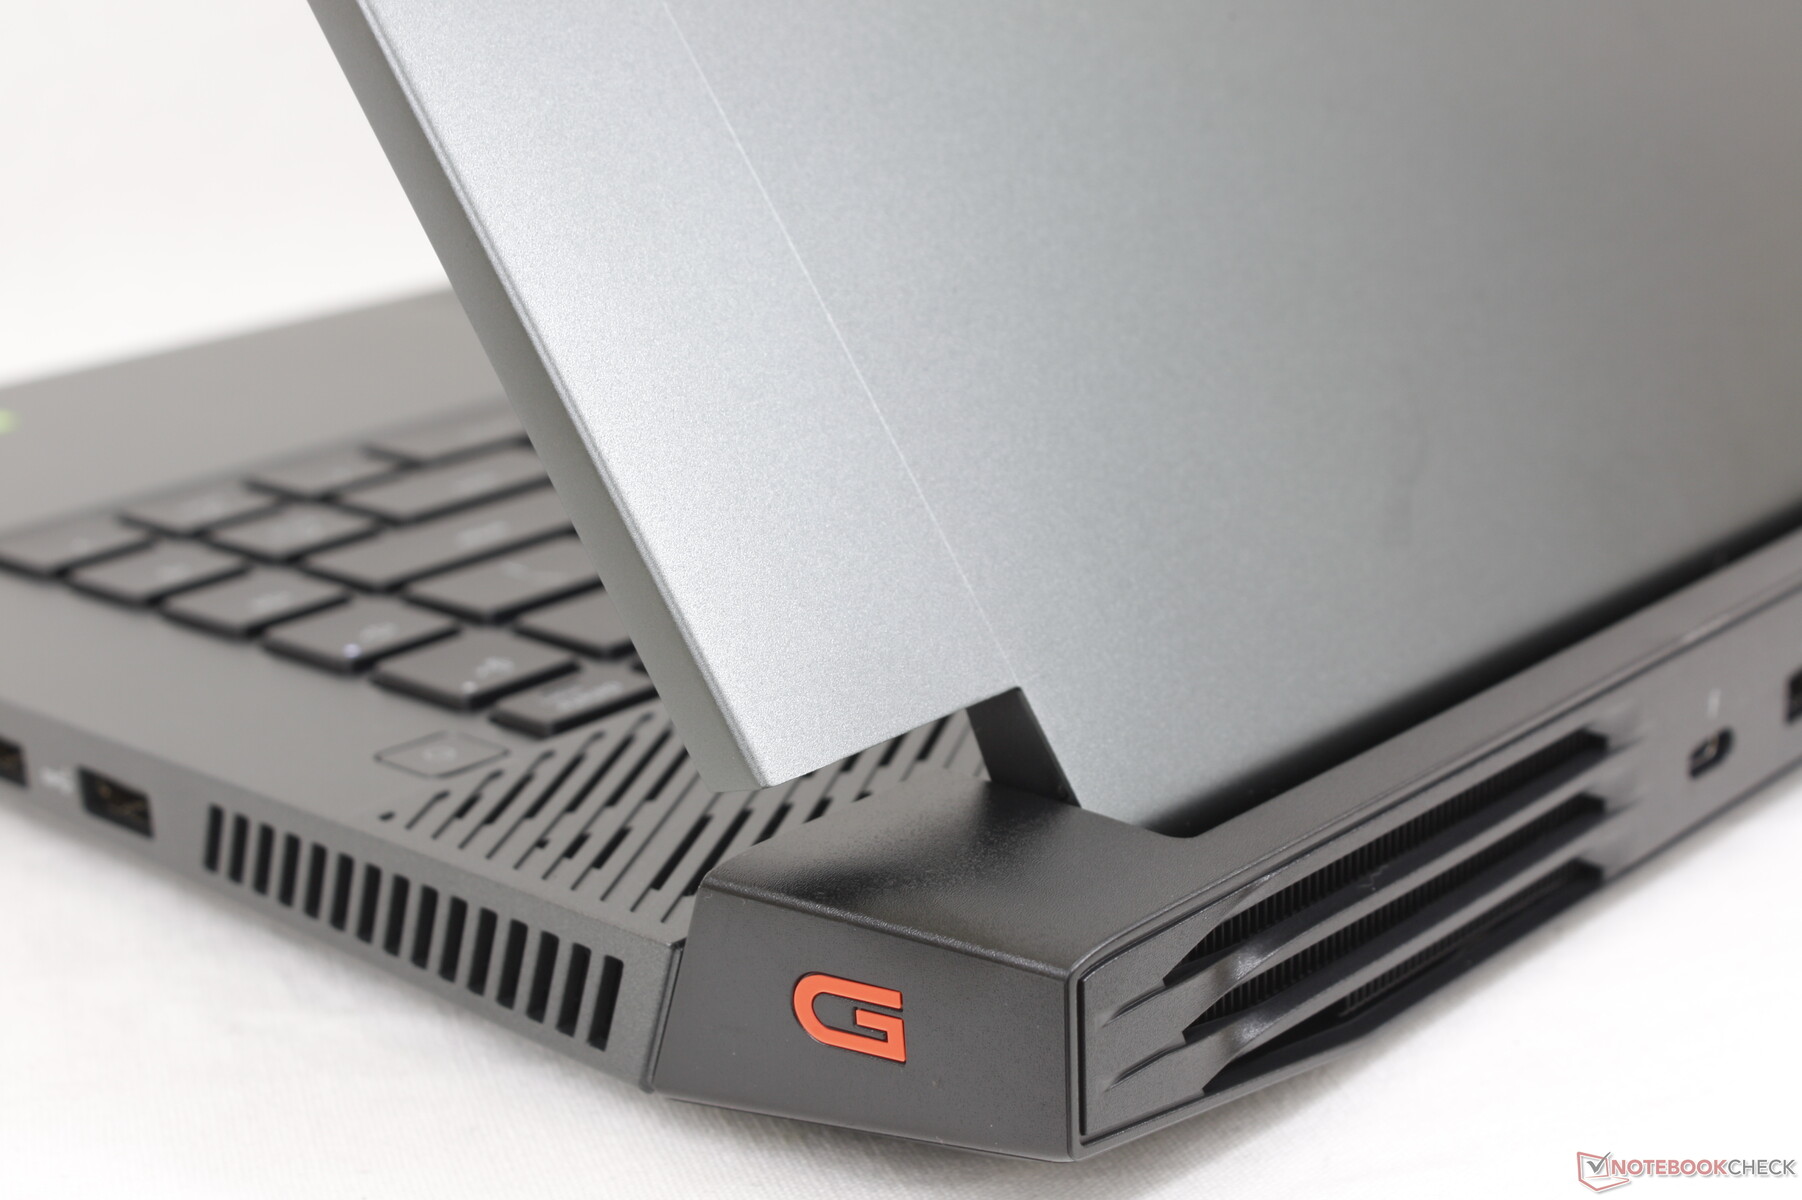
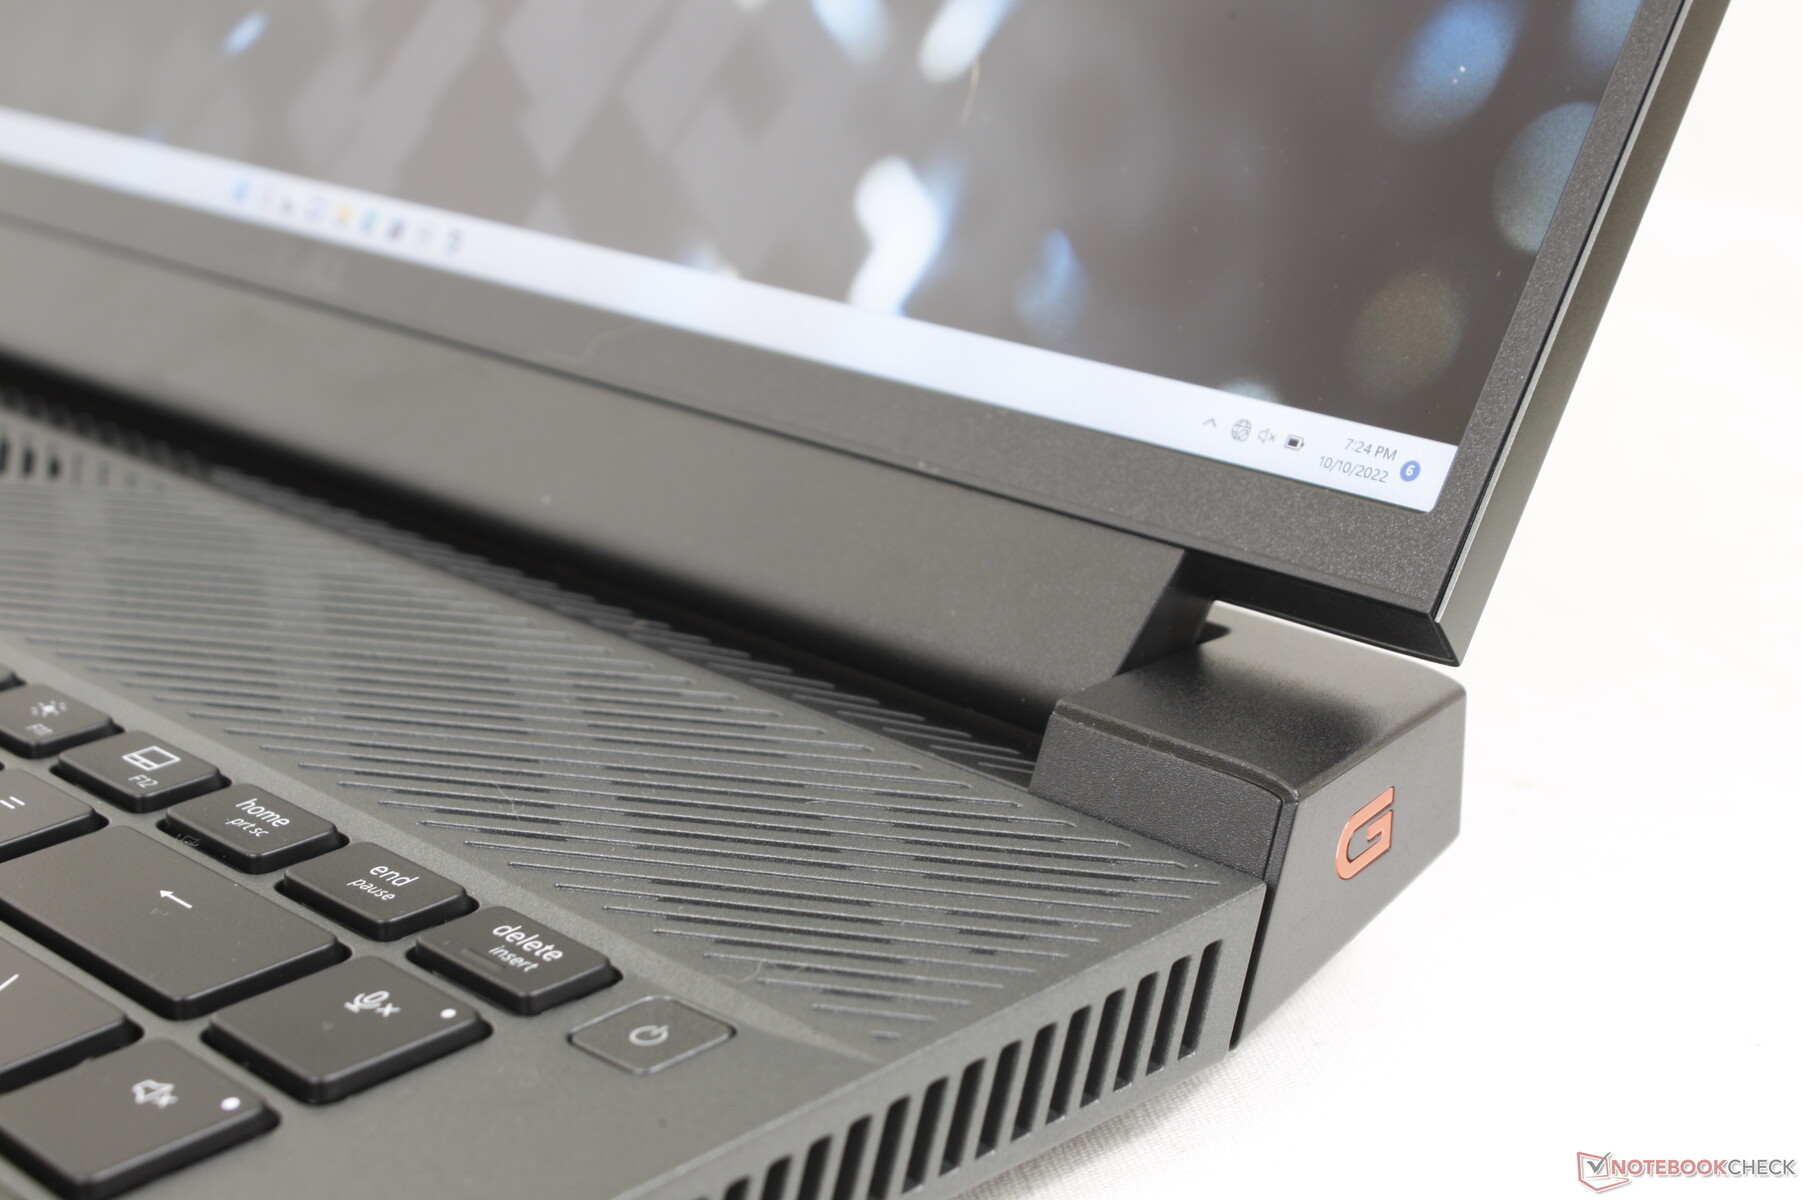
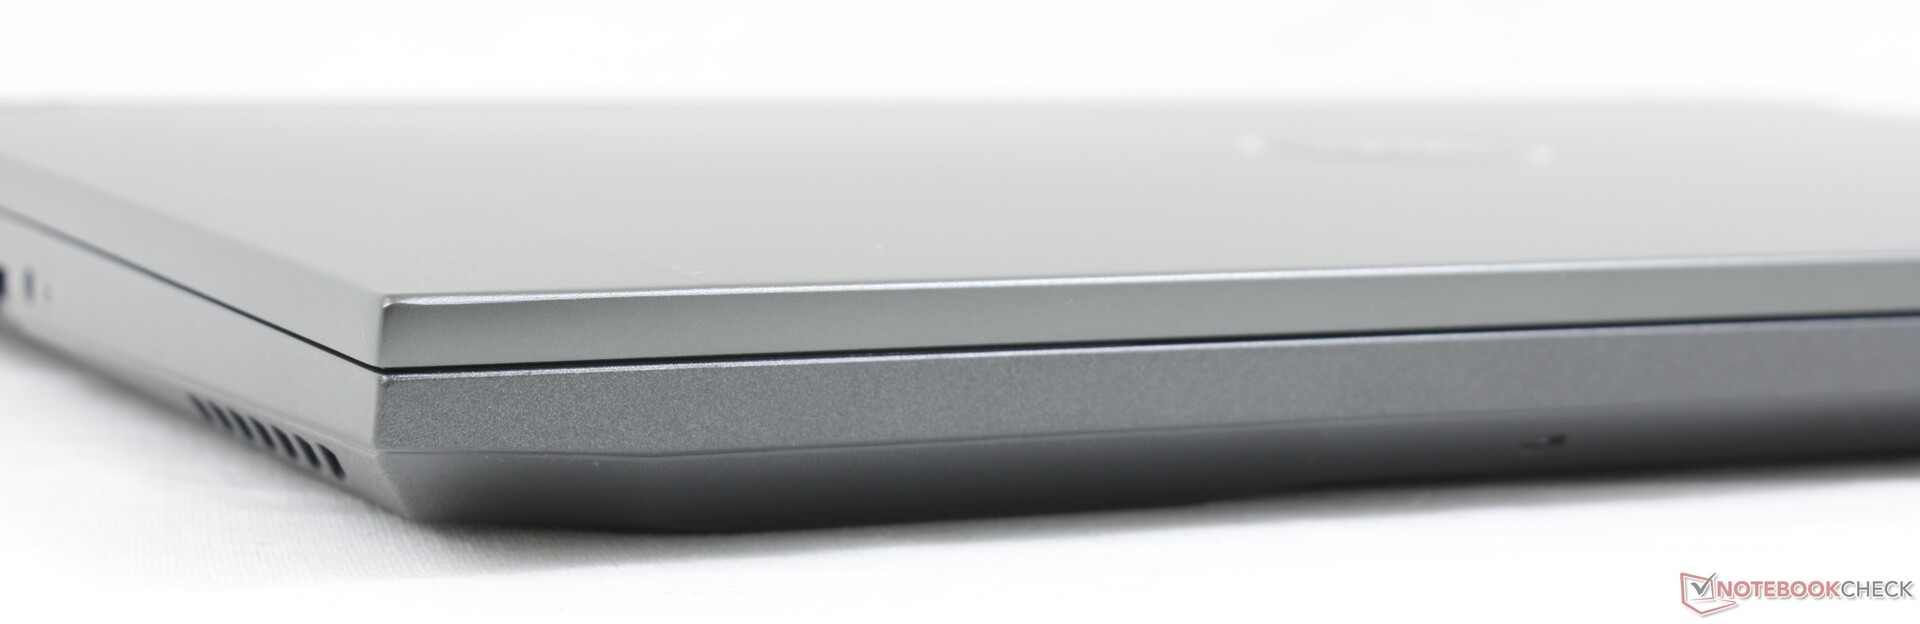
Ogólna konstrukcja ma wiele podobieństw do istniejącego 15,6-calowego modelu 16:9 Dell G15 ale odświeżony dla nowego formatu 16:10. Podstawa z obsydianowego tworzywa sztucznego i anodowana aluminiowa pokrywa pozostały takie same, dzięki czemu uzyskano znajomą, gładką fakturę i wrażenie. "W serii G nie ma takich elementów estetycznych dla graczy, jak błyszcząca wewnętrzna ramka wyświetlacza czy pierścień RGB w laptopach Alienware.
Obudowa jest sztywna w okolicach podstawy i centrum klawiatury, gdzie ugięcia i skręcenia są minimalne. Pokrywa wykazuje relatywnie większe ugięcia, ale nie są one na tyle znaczące, by budziły niepokój.
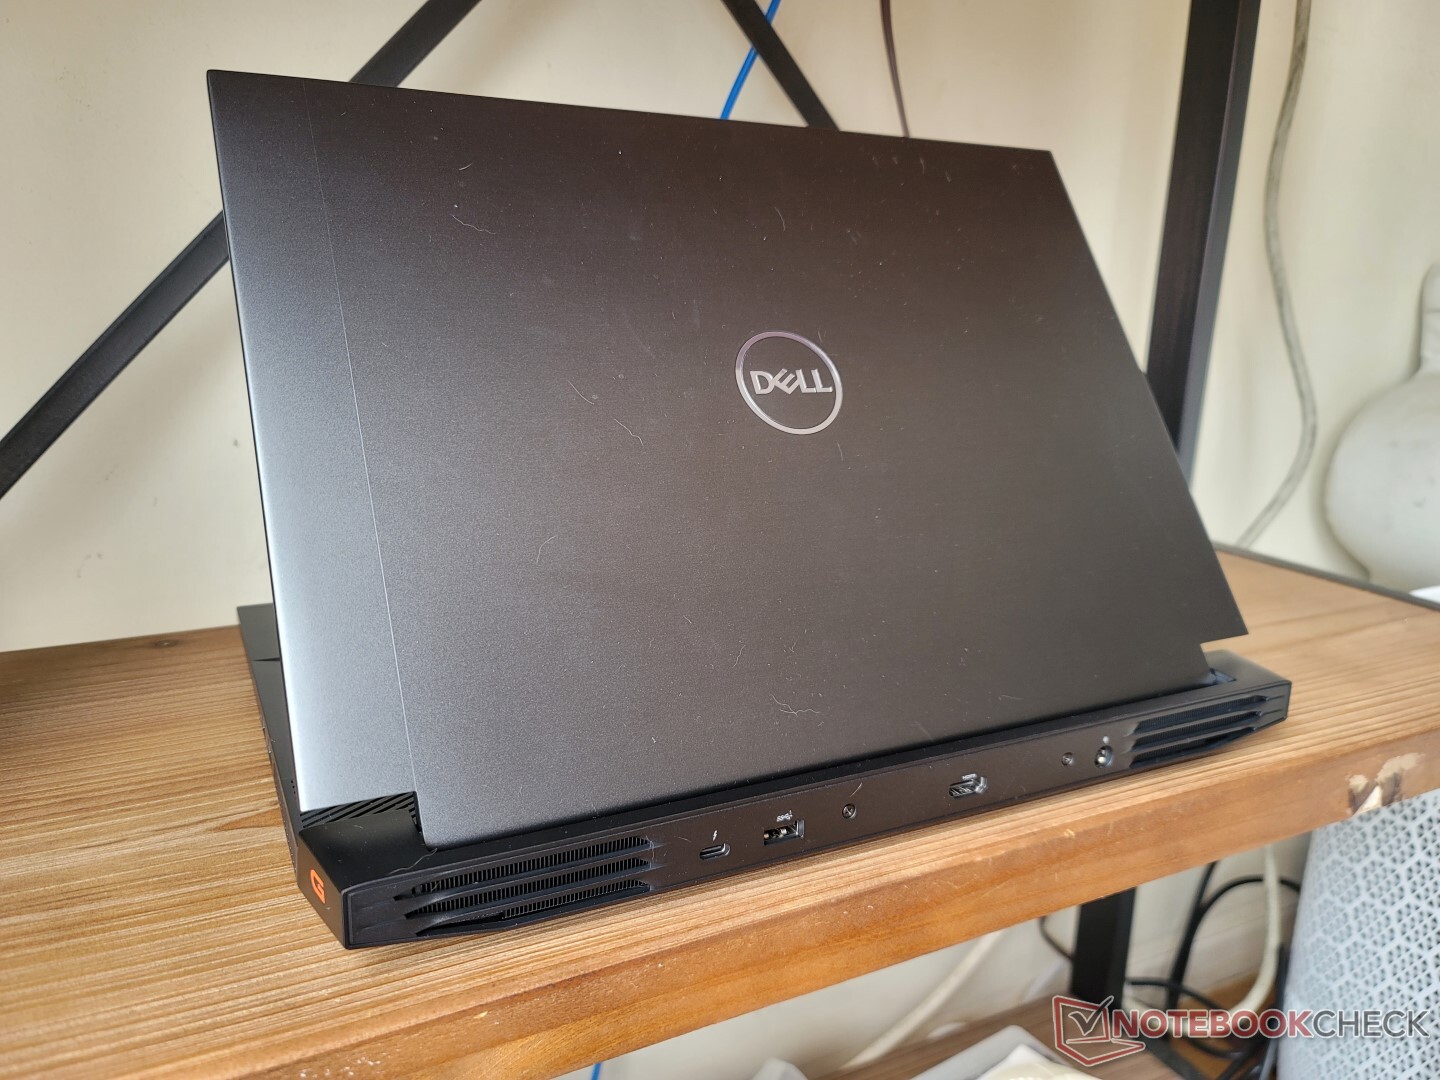
Gamingowe laptopy Dell są zazwyczaj cięższe od konkurencji i G16 nie jest tu wyjątkiem. Przy masie 2,6 kg model ten jest cięższy od m.in HP Victus 16, Acer Swift X i Asus Zephyrus M16 o kilkaset gramów każdy. G16 jest w konsekwencji grubszy także od większości innych laptopów do gier w swojej kategorii wielkości.
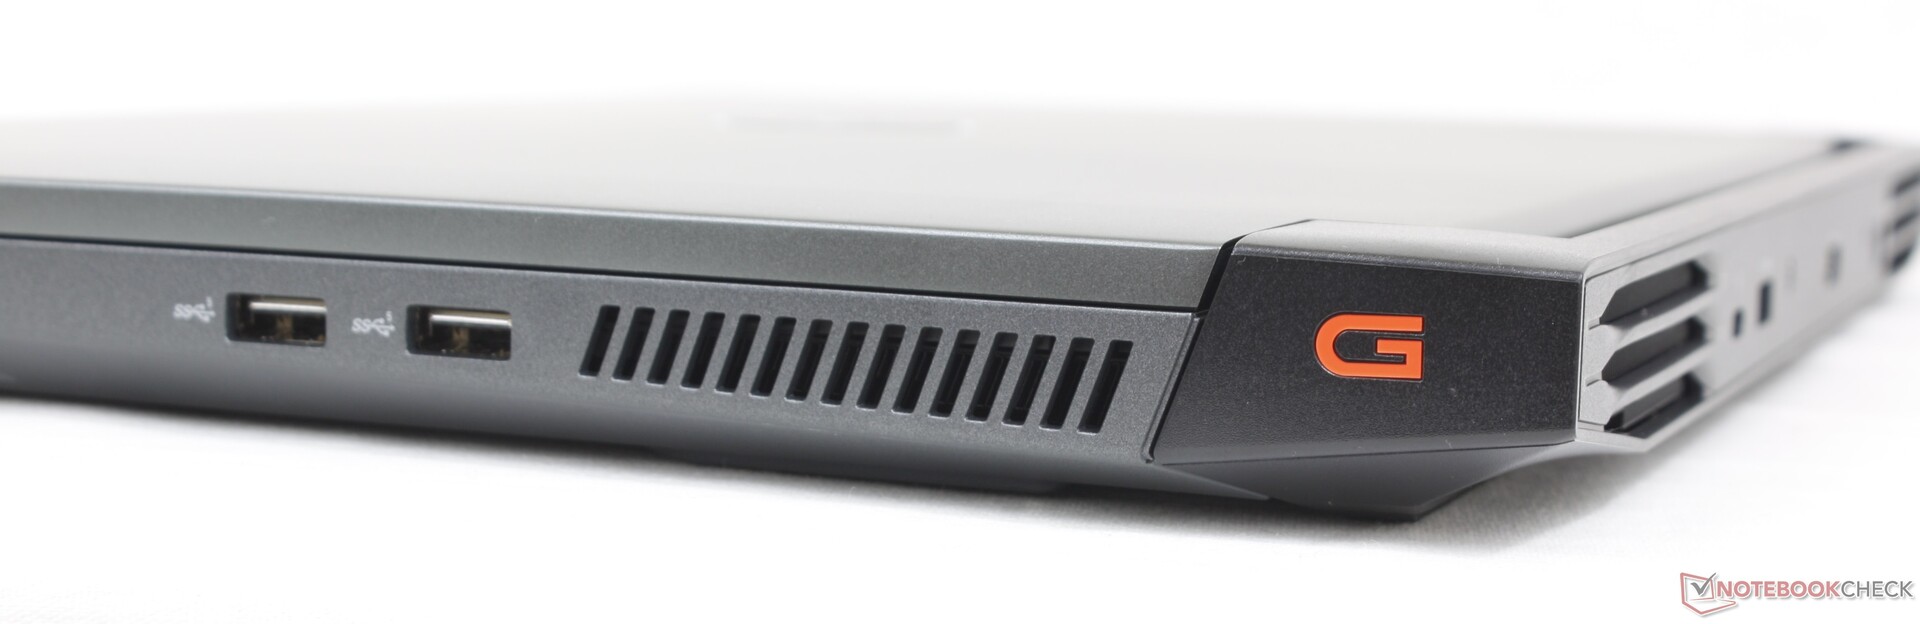
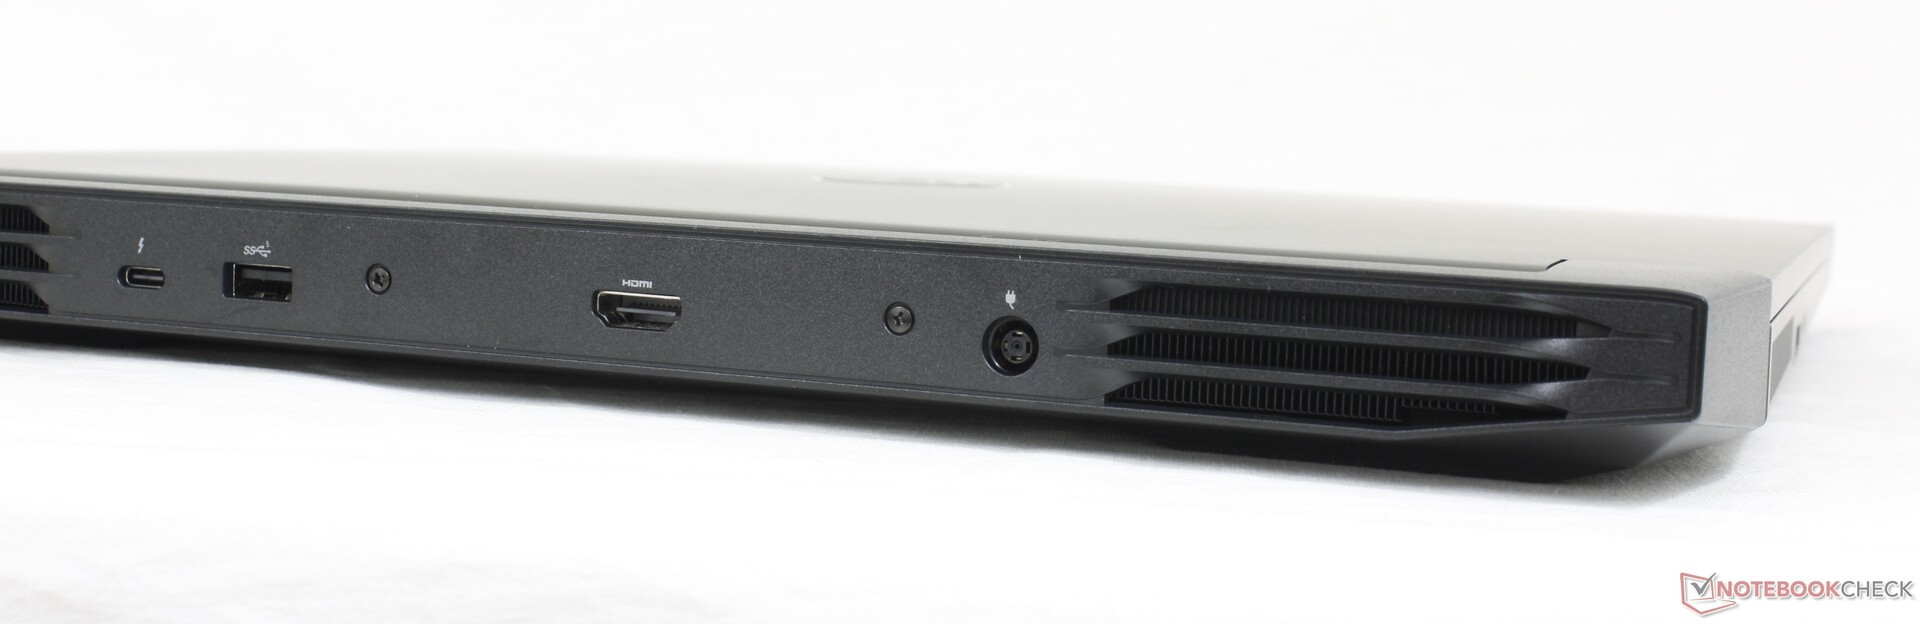
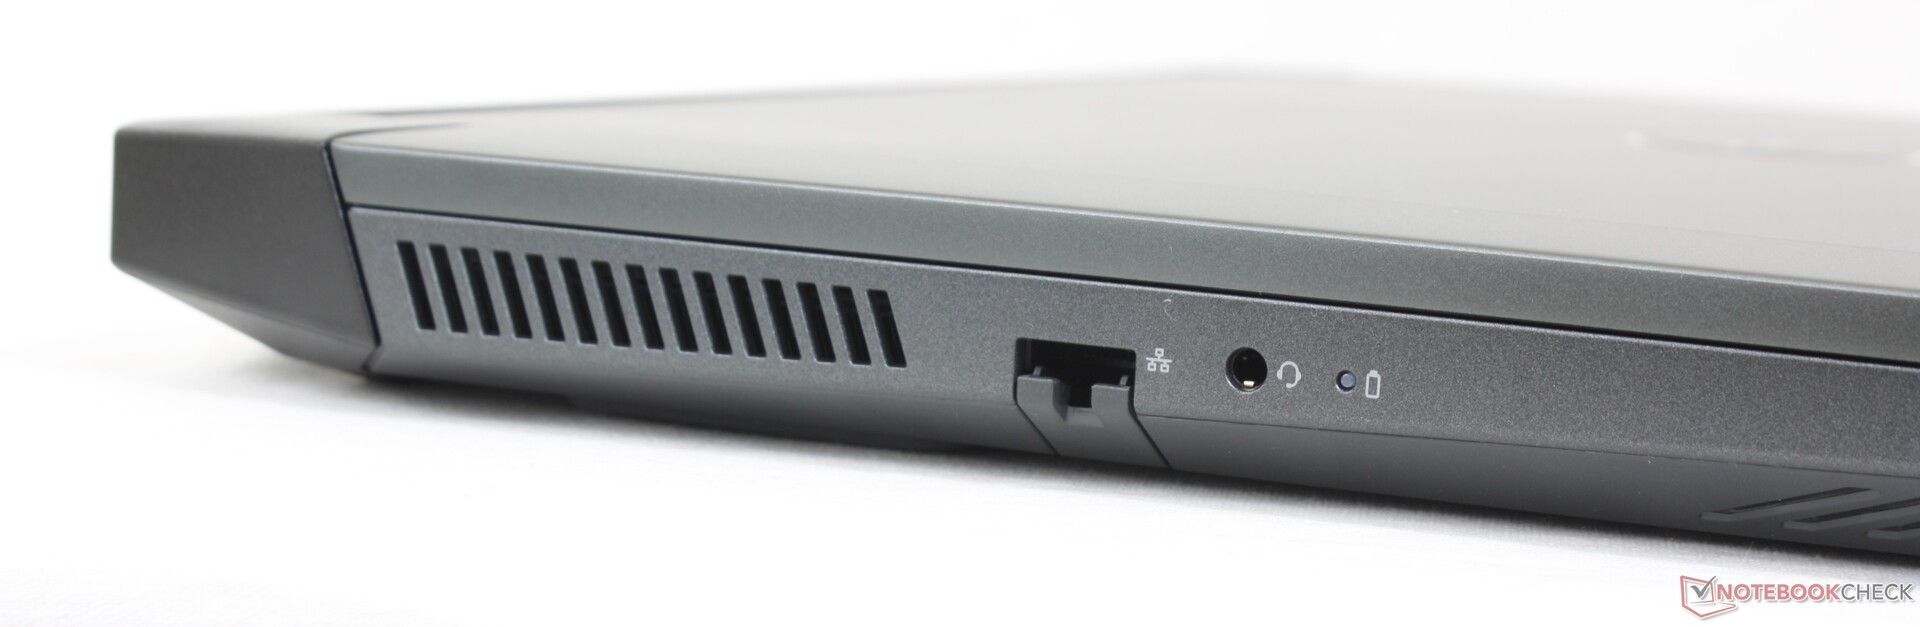
Łączność - Obsługa Thunderbolt 4
Opcje portów są najbardziej podobne do tych z HP Victus 16, aczkolwiek są inaczej rozmieszczone. W rzeczywistości połowa portów w G16 znajduje się wzdłuż tyłu ze względu na duże kratki wentylacyjne na lewej i prawej krawędzi. Chcielibyśmy zobaczyć więcej portów USB-C w przyszłości, ponieważ jest tylko jeden w porównaniu do trzech w konkurencyjnych modelach.Lenovo Legion 5 Pro.
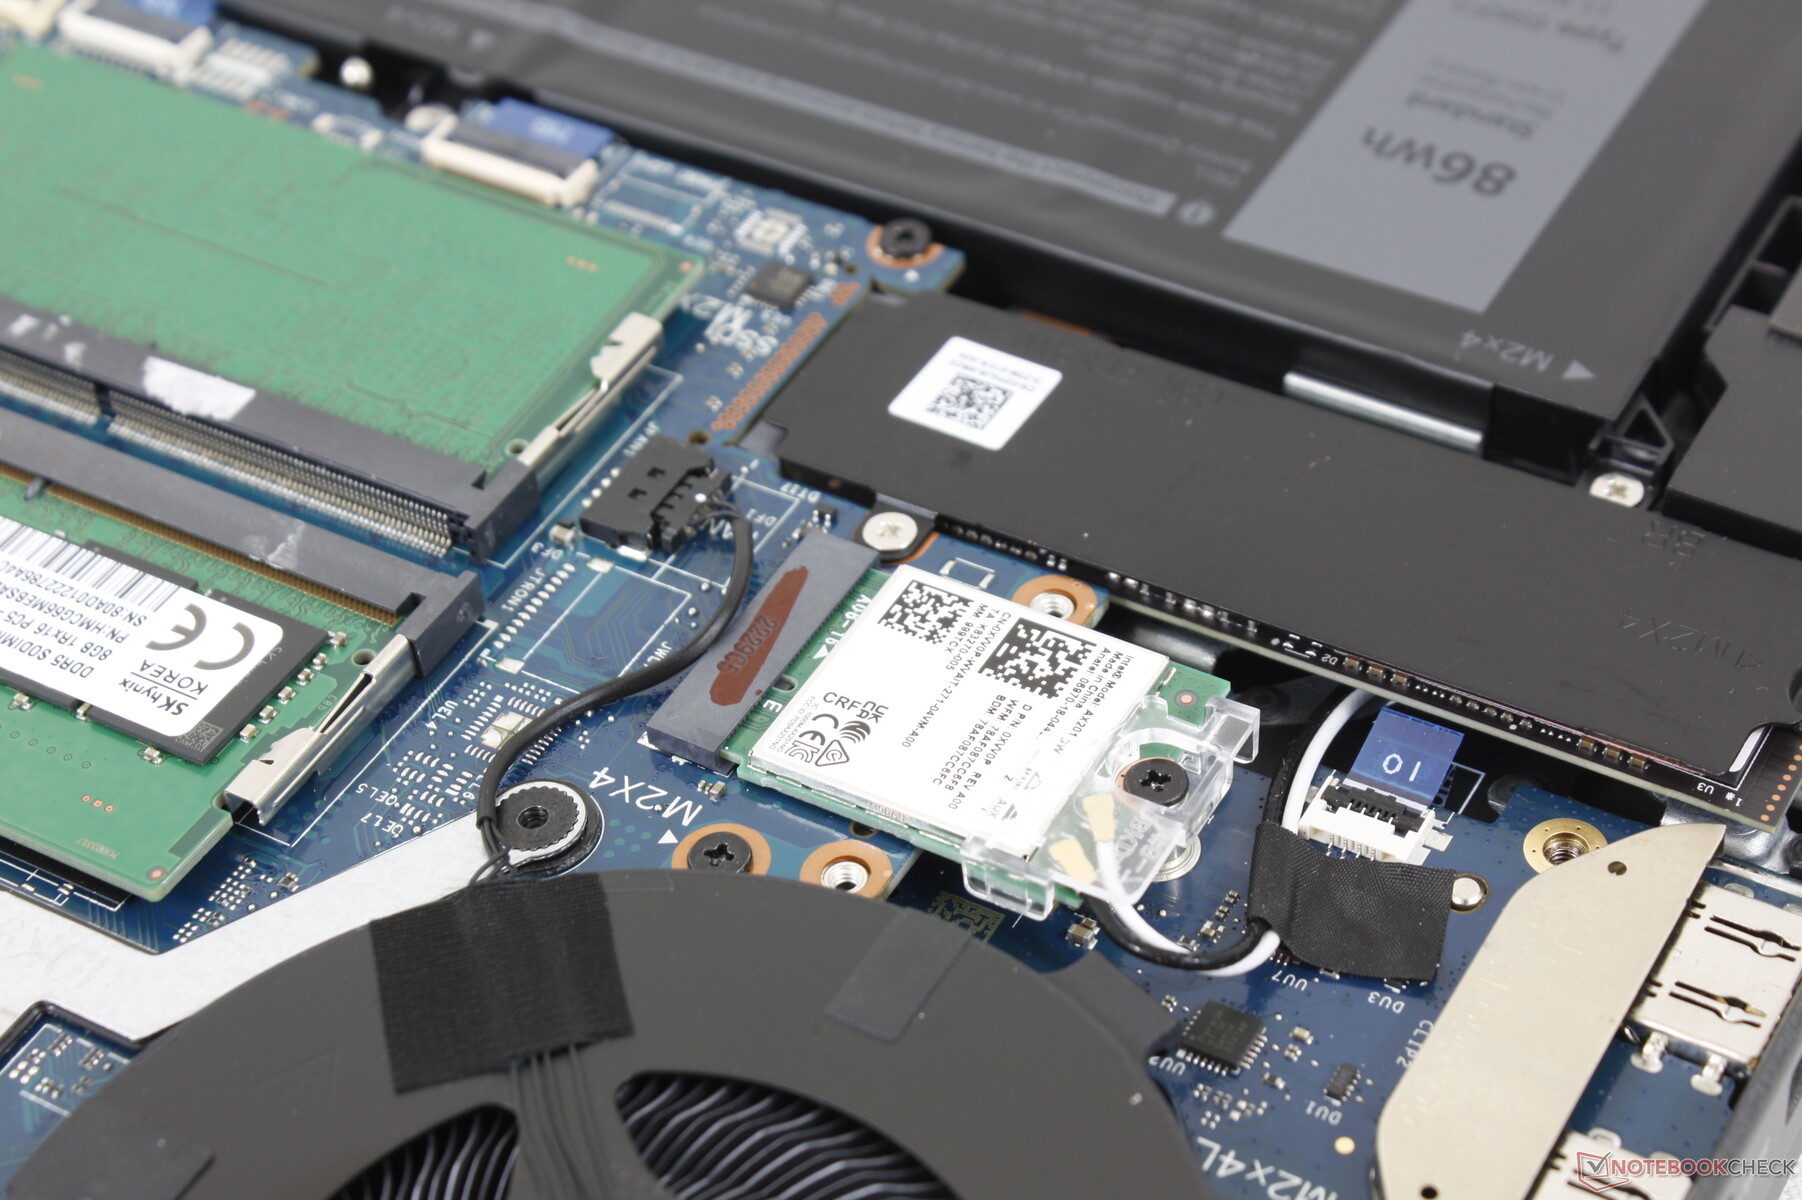
Komunikacja - 6 GHz Nie dołączono
Intel AX201 w standardzie zapewnia łączność Wi-Fi 6 i Bluetooth 5.2. Nie ma opcji Wi-Fi 6E, które mogłyby zaoszczędzić na kosztach. Po sparowaniu z routerem AXE11000 szybkość transferu jest stabilna, a nawet nie zachwyca.
| Networking | |
| iperf3 transmit AX12 | |
| Acer Swift X SFX16-51G-5388 | |
| Asus ROG Zephyrus M16 GU603H | |
| iperf3 receive AX12 | |
| Acer Swift X SFX16-51G-5388 | |
| Asus ROG Zephyrus M16 GU603H | |
| iperf3 receive AXE11000 6GHz | |
| Lenovo Legion 5 Pro 16IAH7H | |
| Lenovo Legion 7 16ARHA7 | |
| iperf3 receive AXE11000 | |
| Dell G16 7620 | |
| HP Victus 16-e0145ng | |
| iperf3 transmit AXE11000 6GHz | |
| Lenovo Legion 7 16ARHA7 | |
| Lenovo Legion 5 Pro 16IAH7H | |
| iperf3 transmit AXE11000 | |
| Dell G16 7620 | |
| HP Victus 16-e0145ng | |
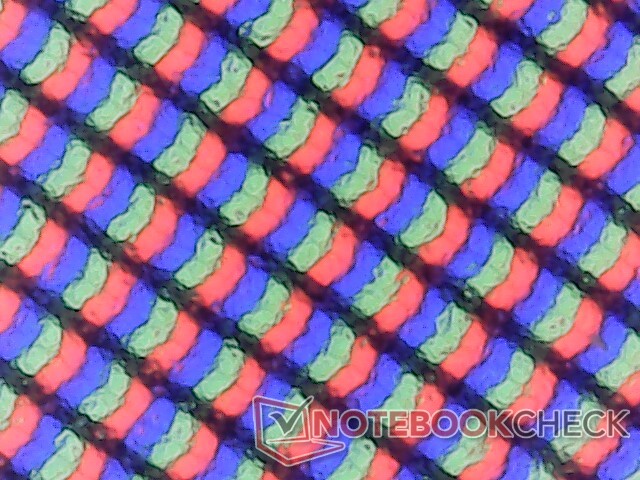
Kamera internetowa
Kamera internetowa ma rozczarowujące 1 MP i daje bardzo mętny obraz. Nie ma też czujnika podczerwieni ani migawki prywatności.


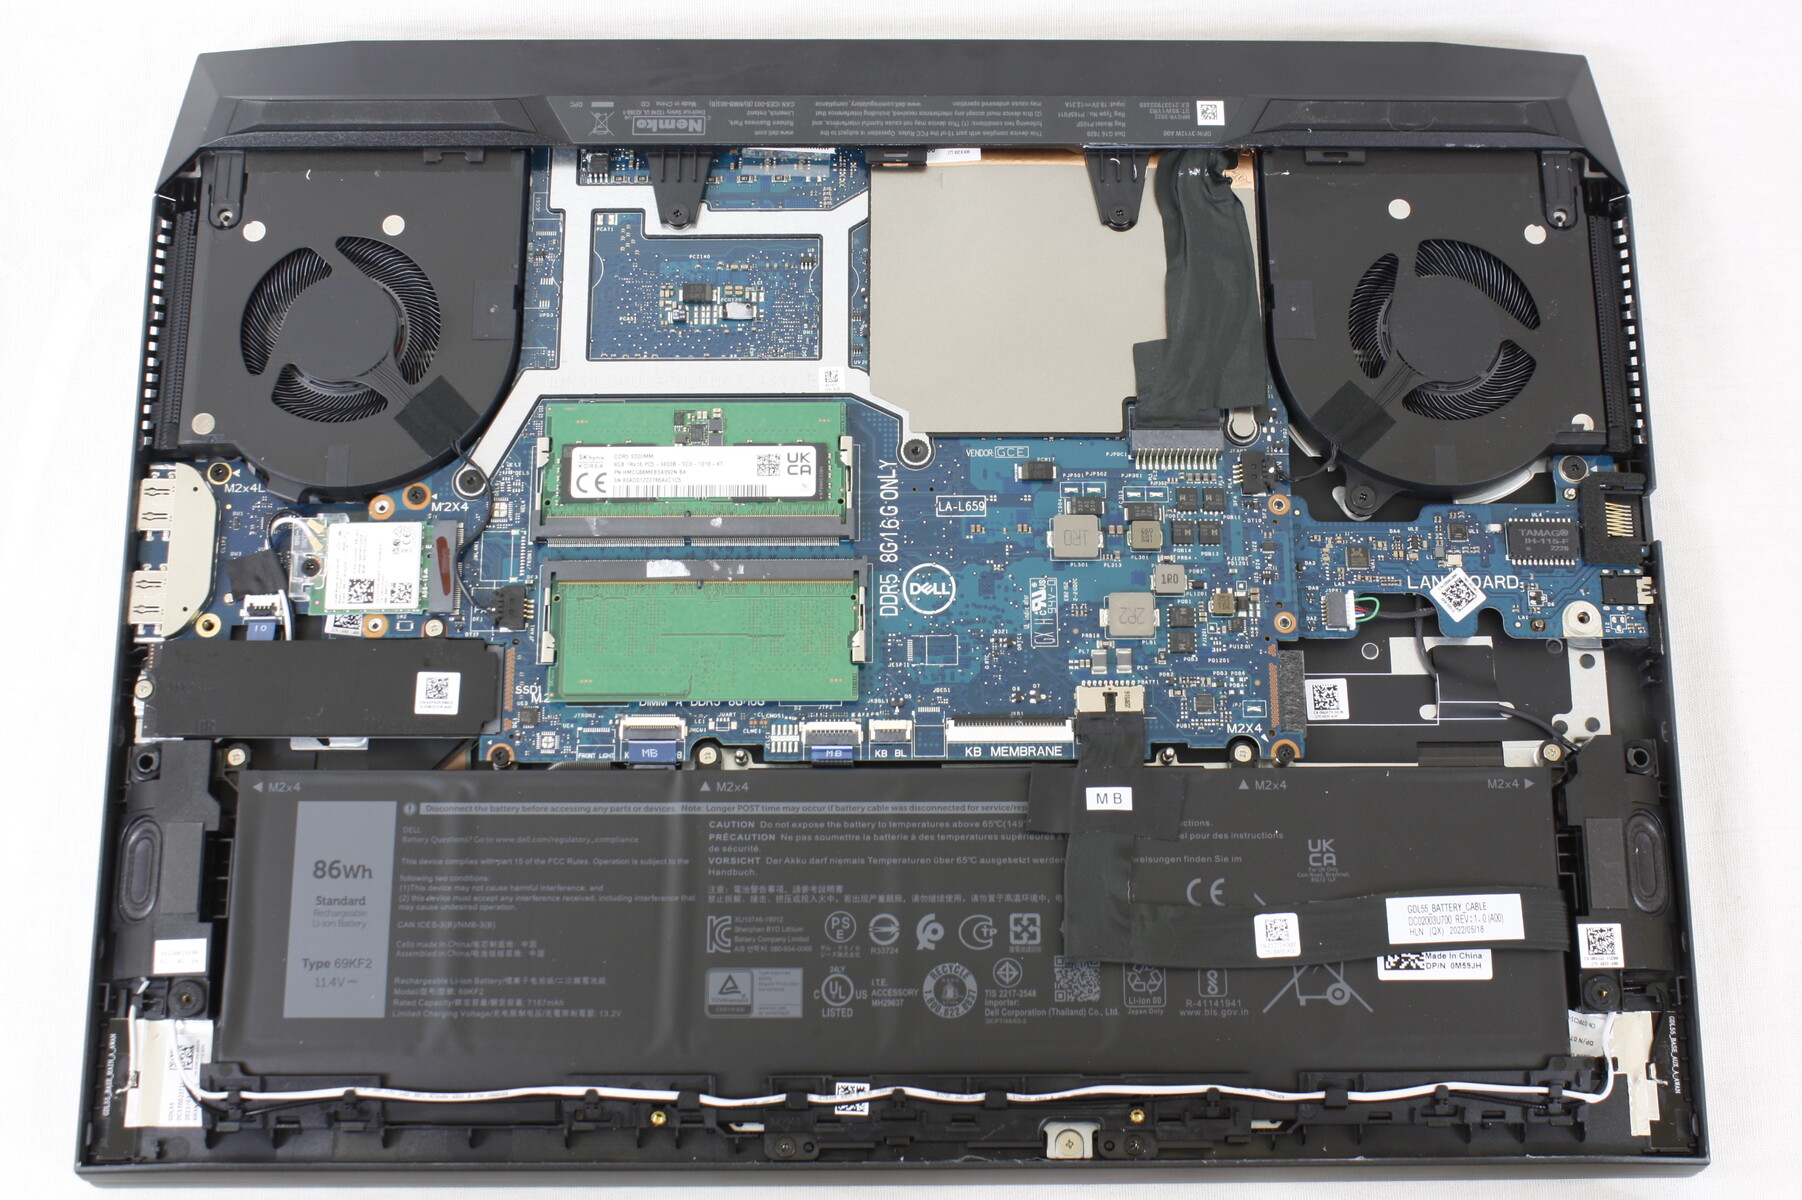
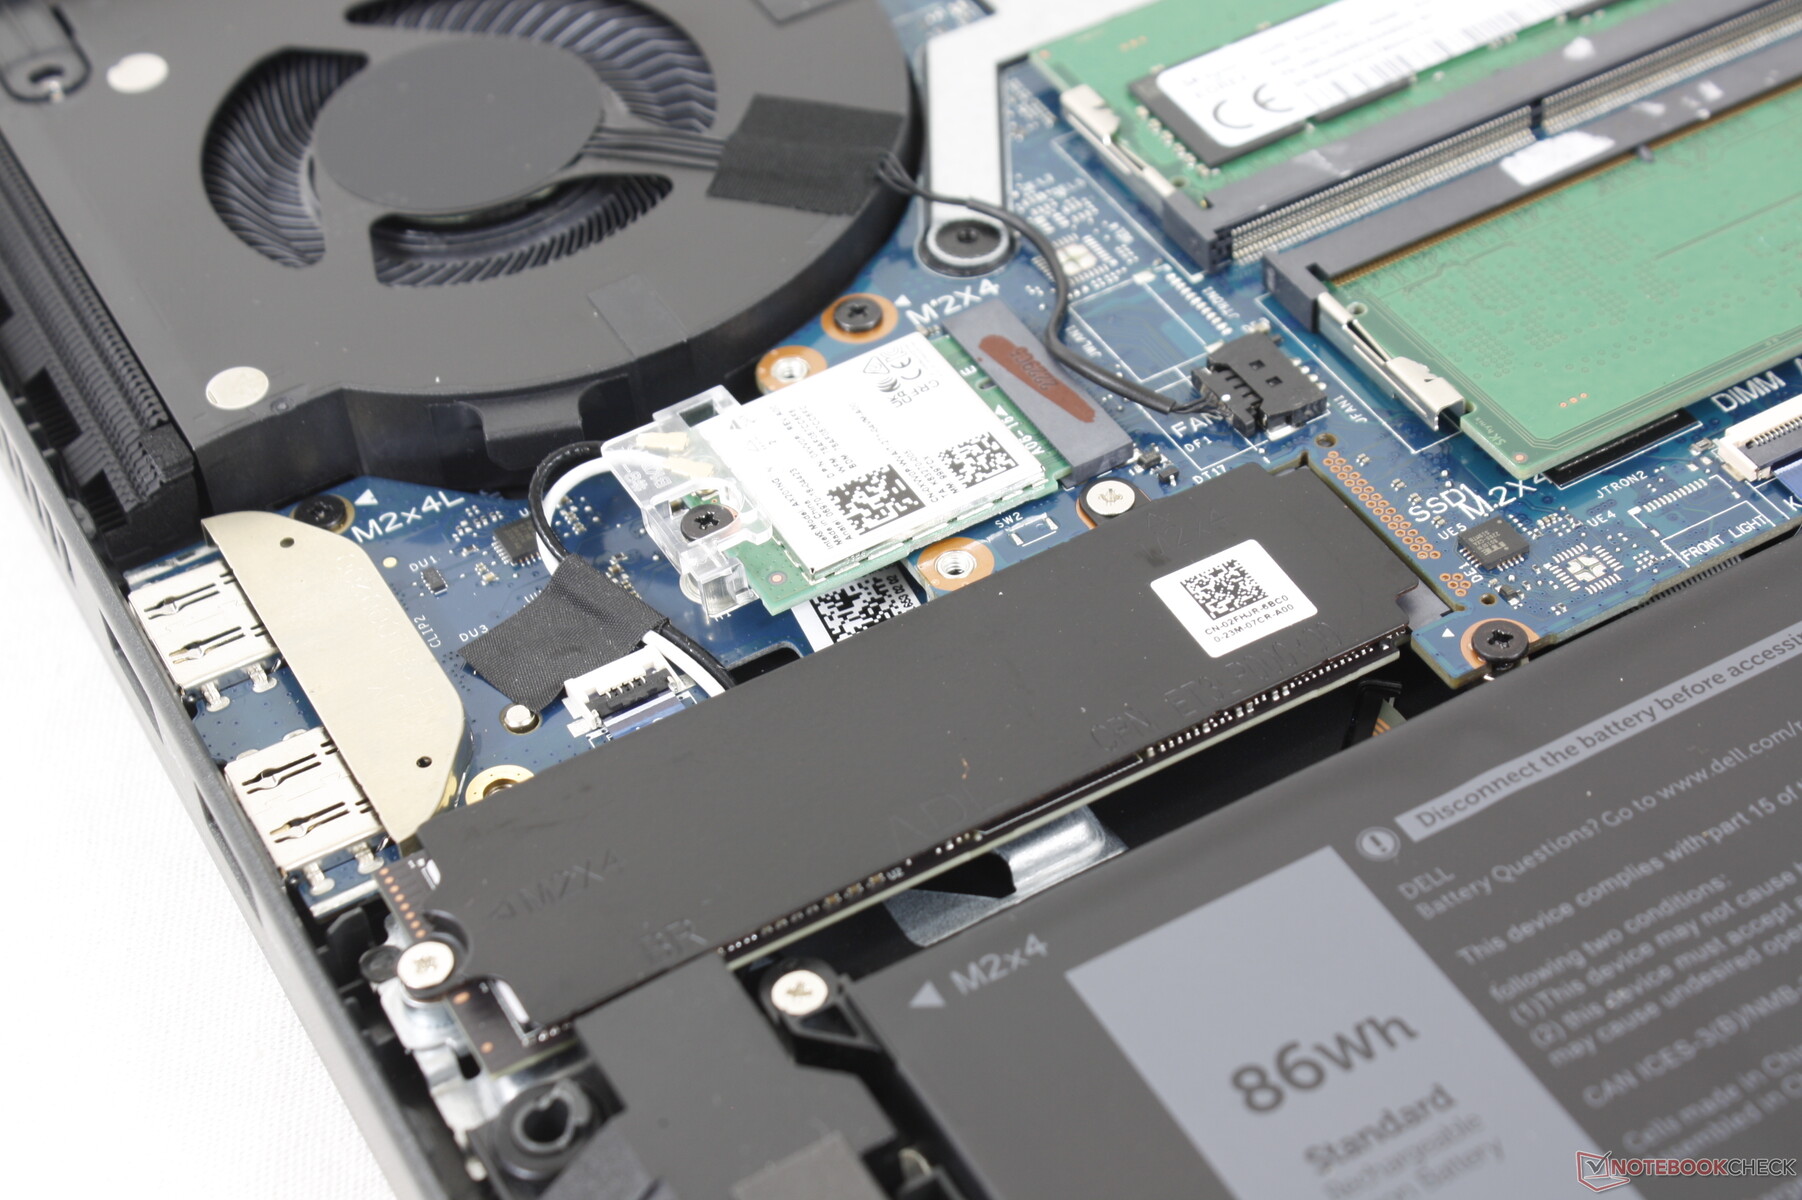
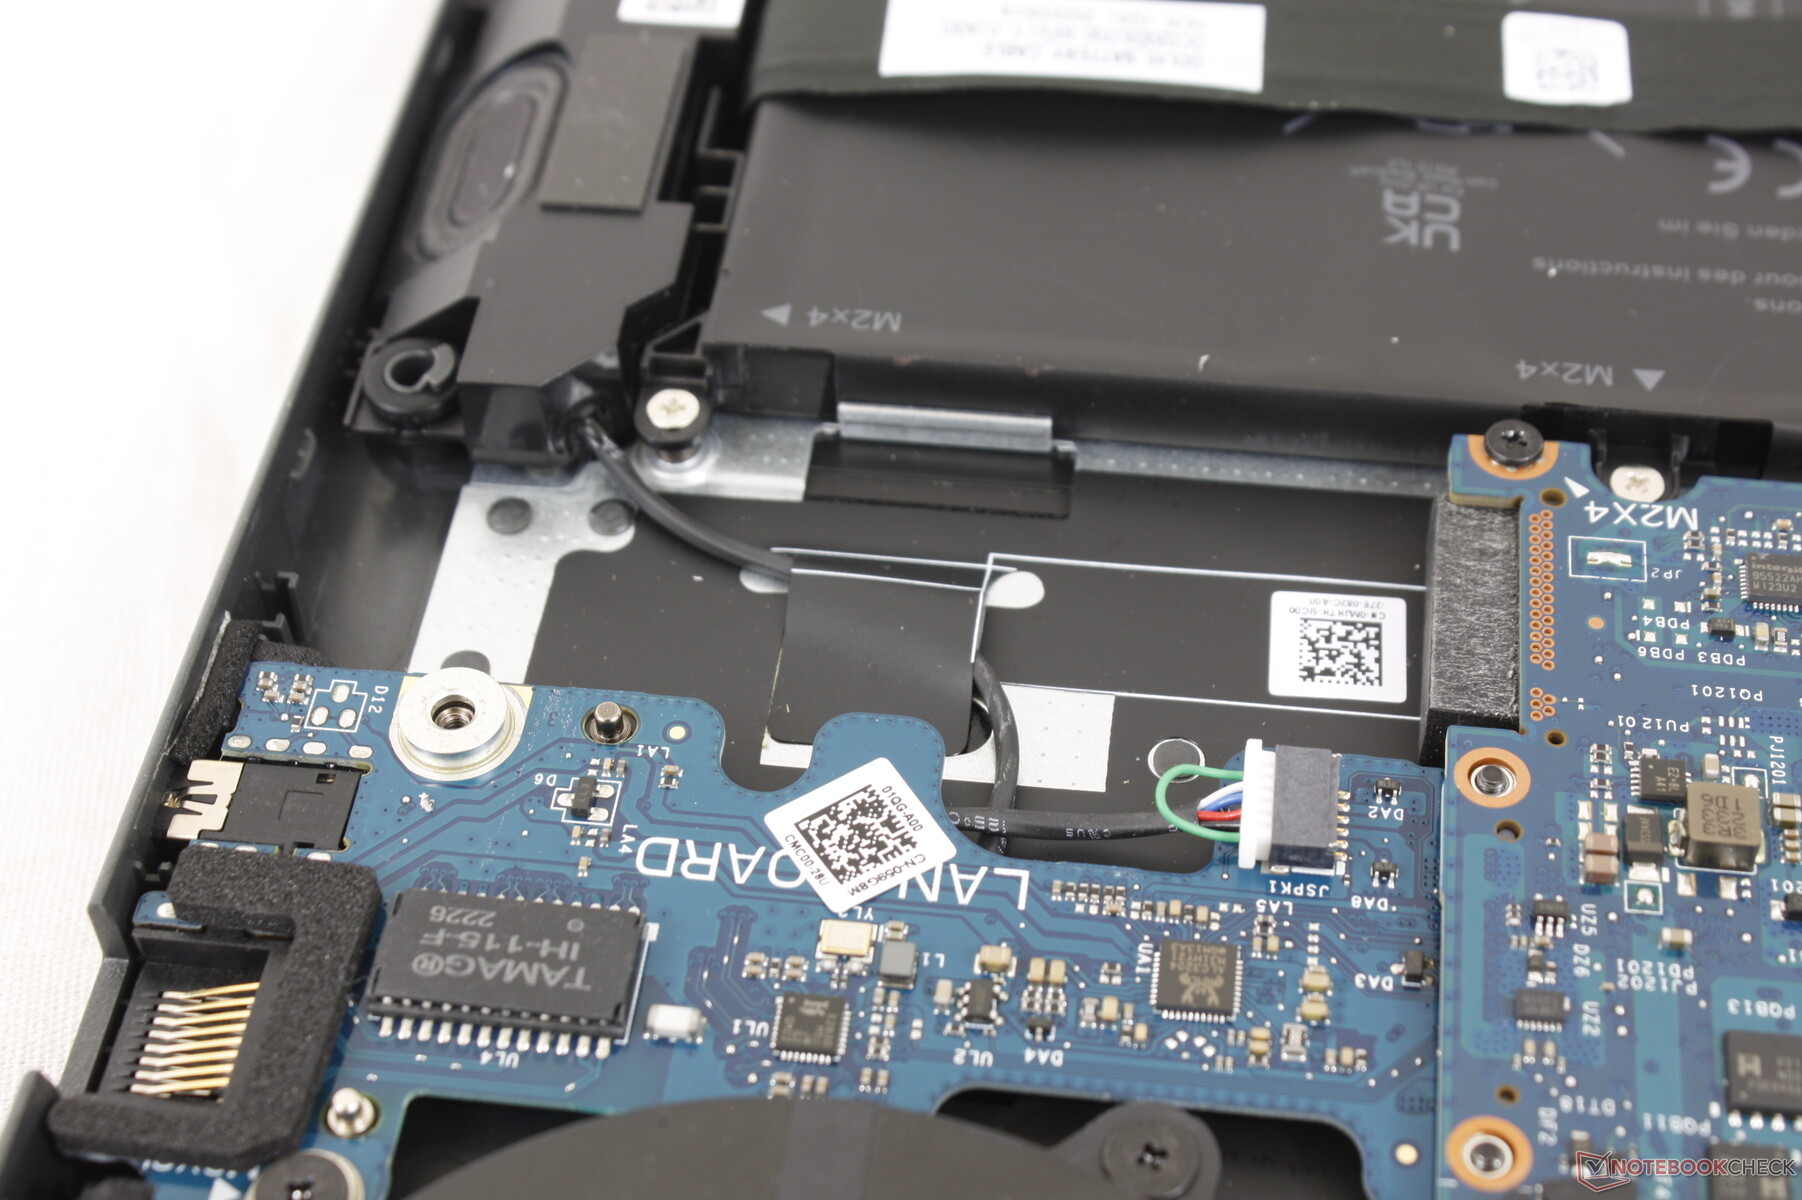
Konserwacja
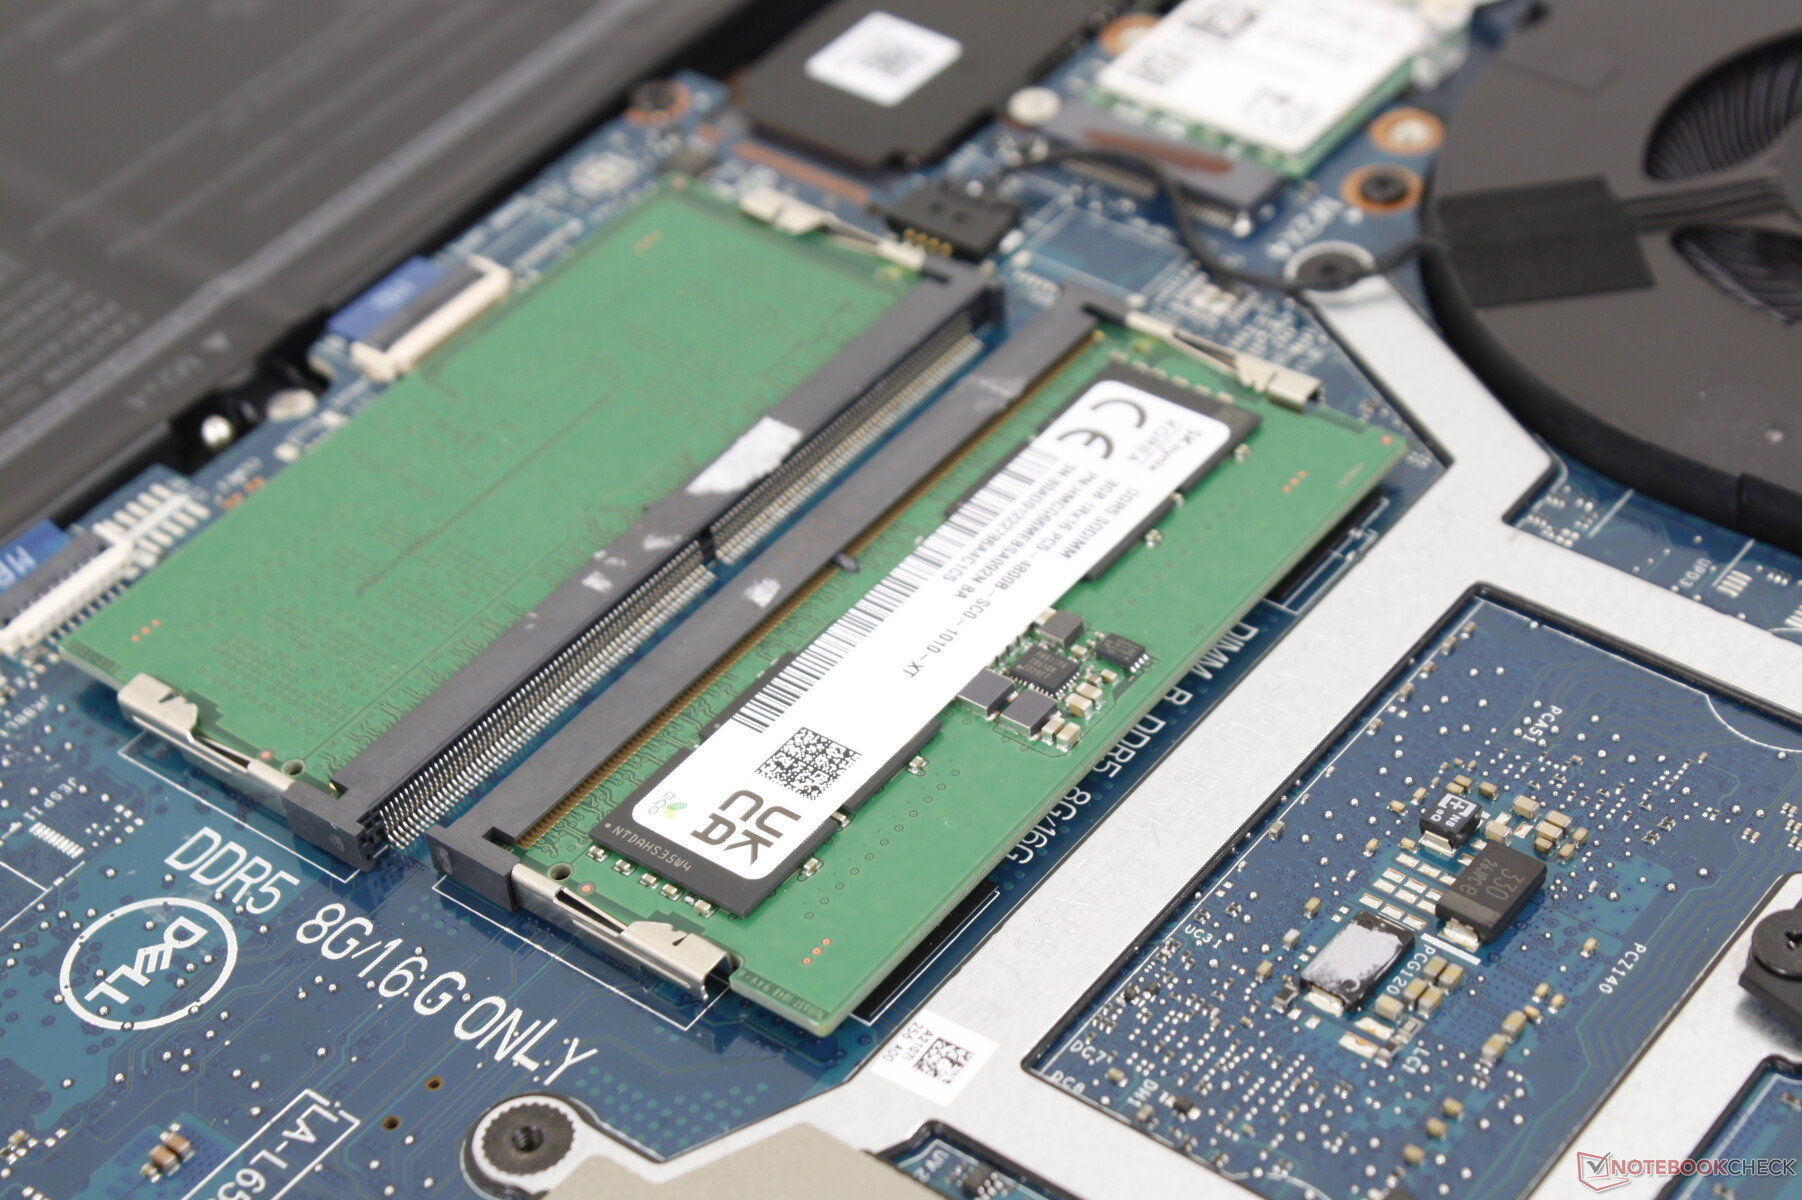
Dolny panel jest zabezpieczony przez 8 śrubek Philipsa, co ułatwia serwisowanie. Użytkownicy mają bezpośredni dostęp do 2x gniazd DDR5 SODIMM, 1x gniazda M.2 2280 SSD, baterii oraz wymiennego modułu M.2 WLAN. Rurki cieplne i procesory znajdują się po przeciwnej stronie i wymagają dalszego demontażu, aby uzyskać do nich dostęp.
Akcesoria i gwarancja
W pudełku nie ma żadnych dodatków poza zasilaczem sieciowym i dokumentacją. W przypadku zakupu w USA obowiązuje roczna ograniczona gwarancja producenta.
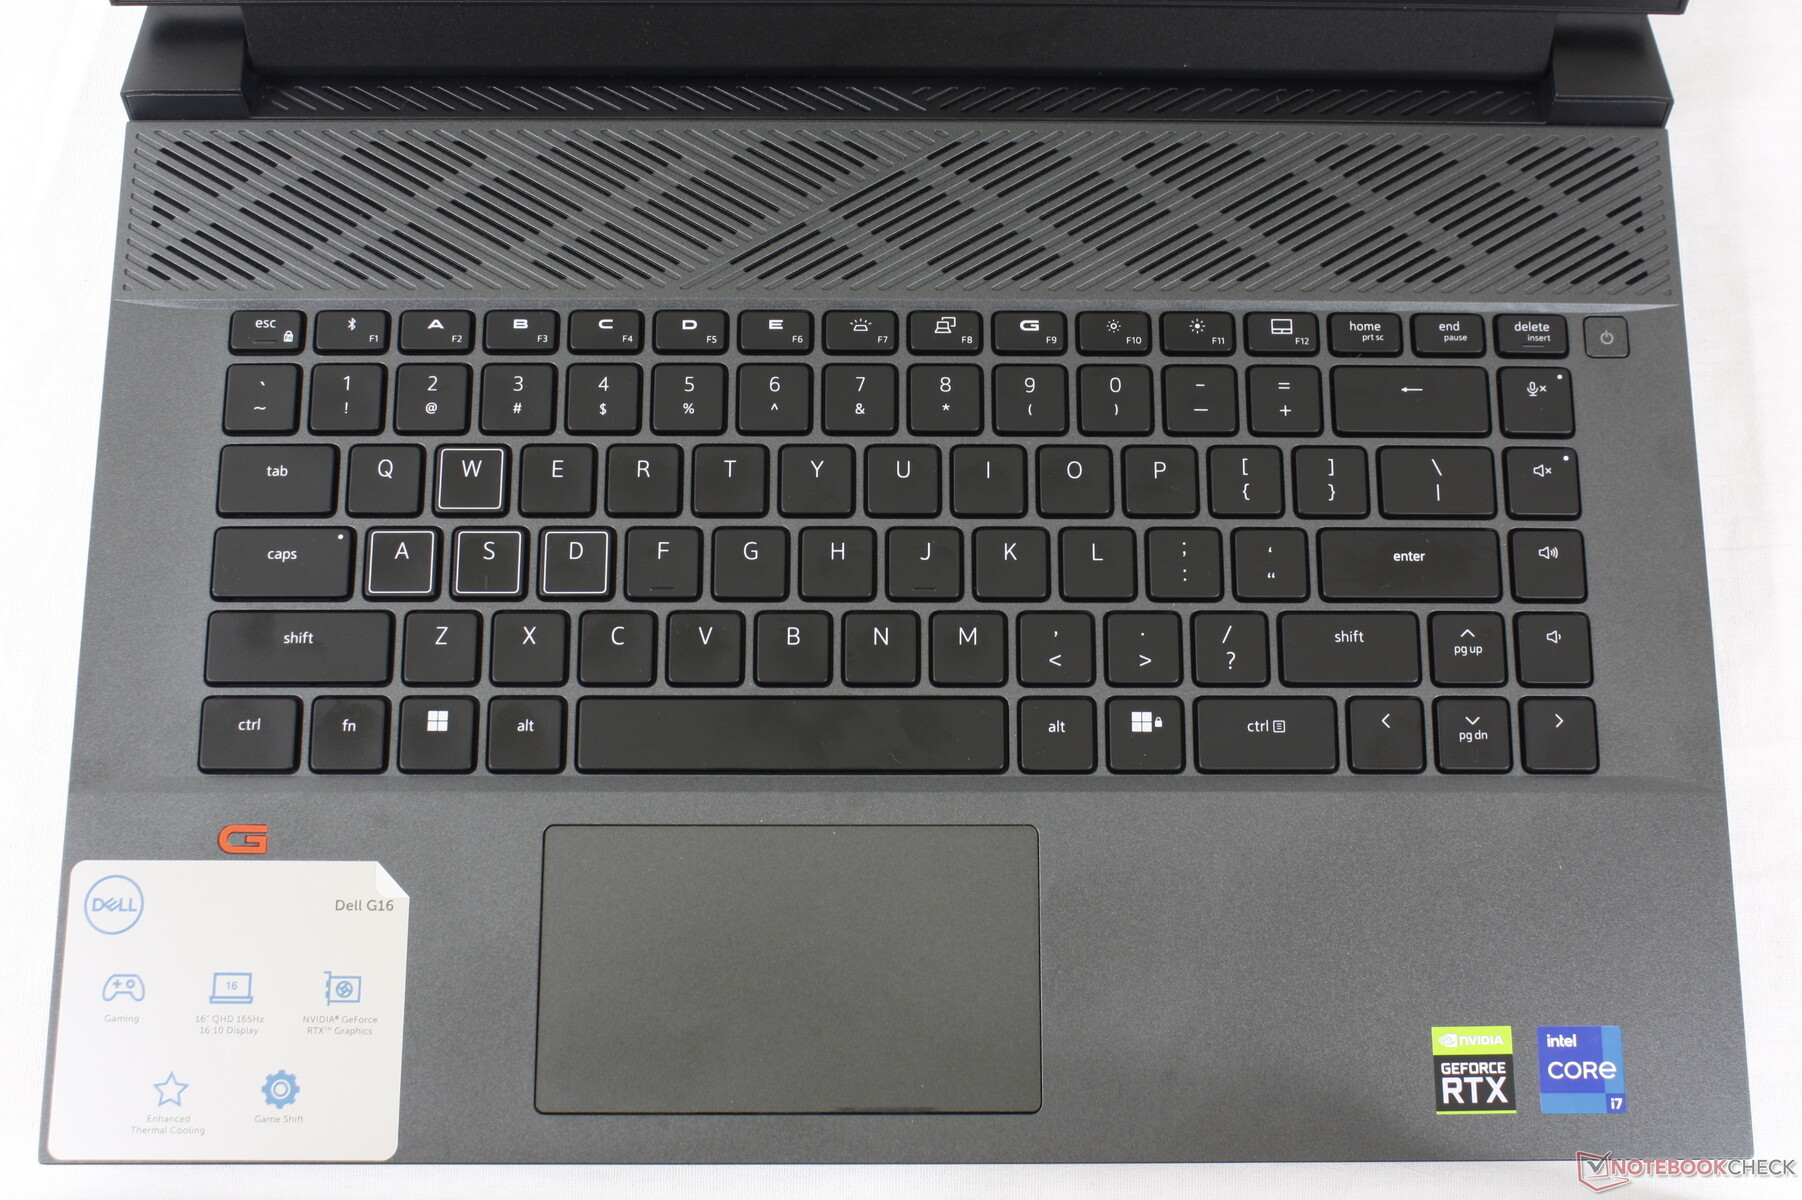
Urządzenia wejściowe - koniec z Numpadem
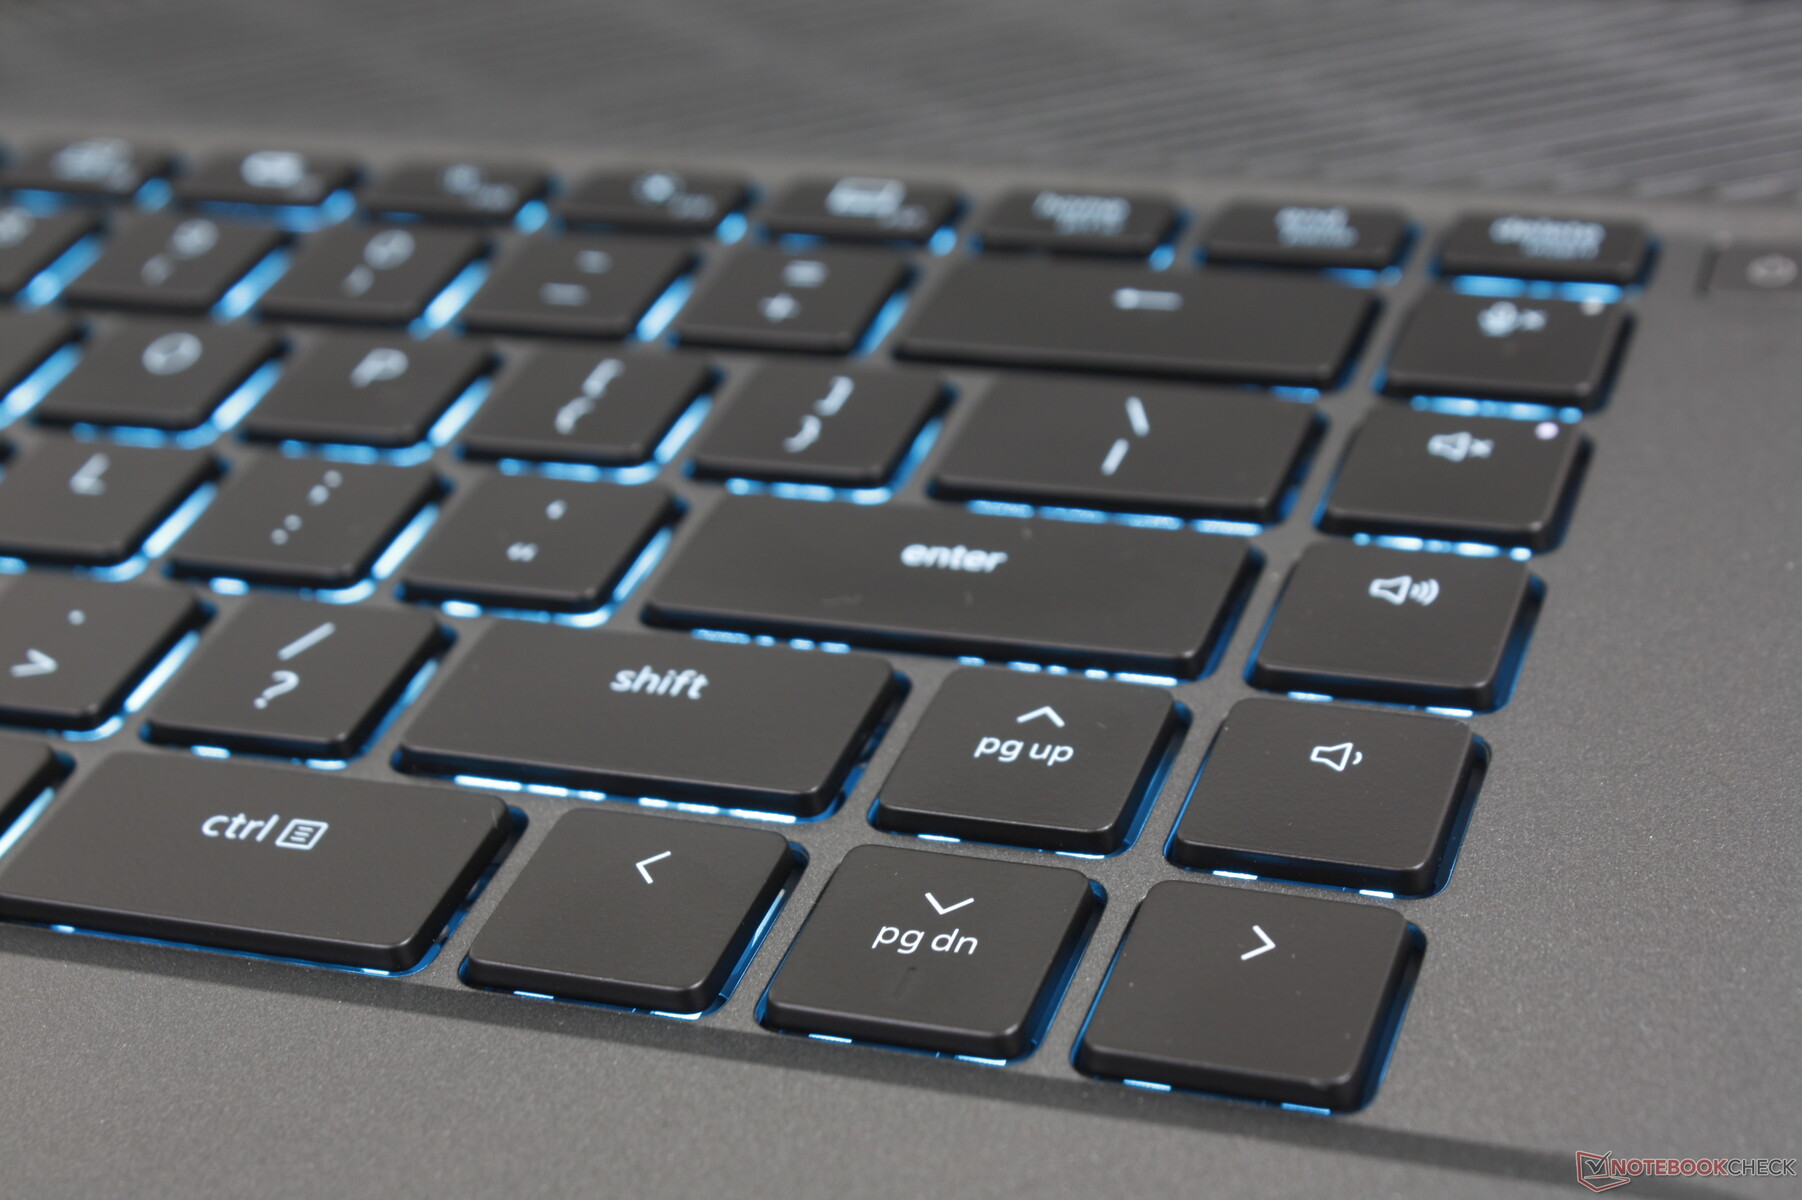
Klawiatura
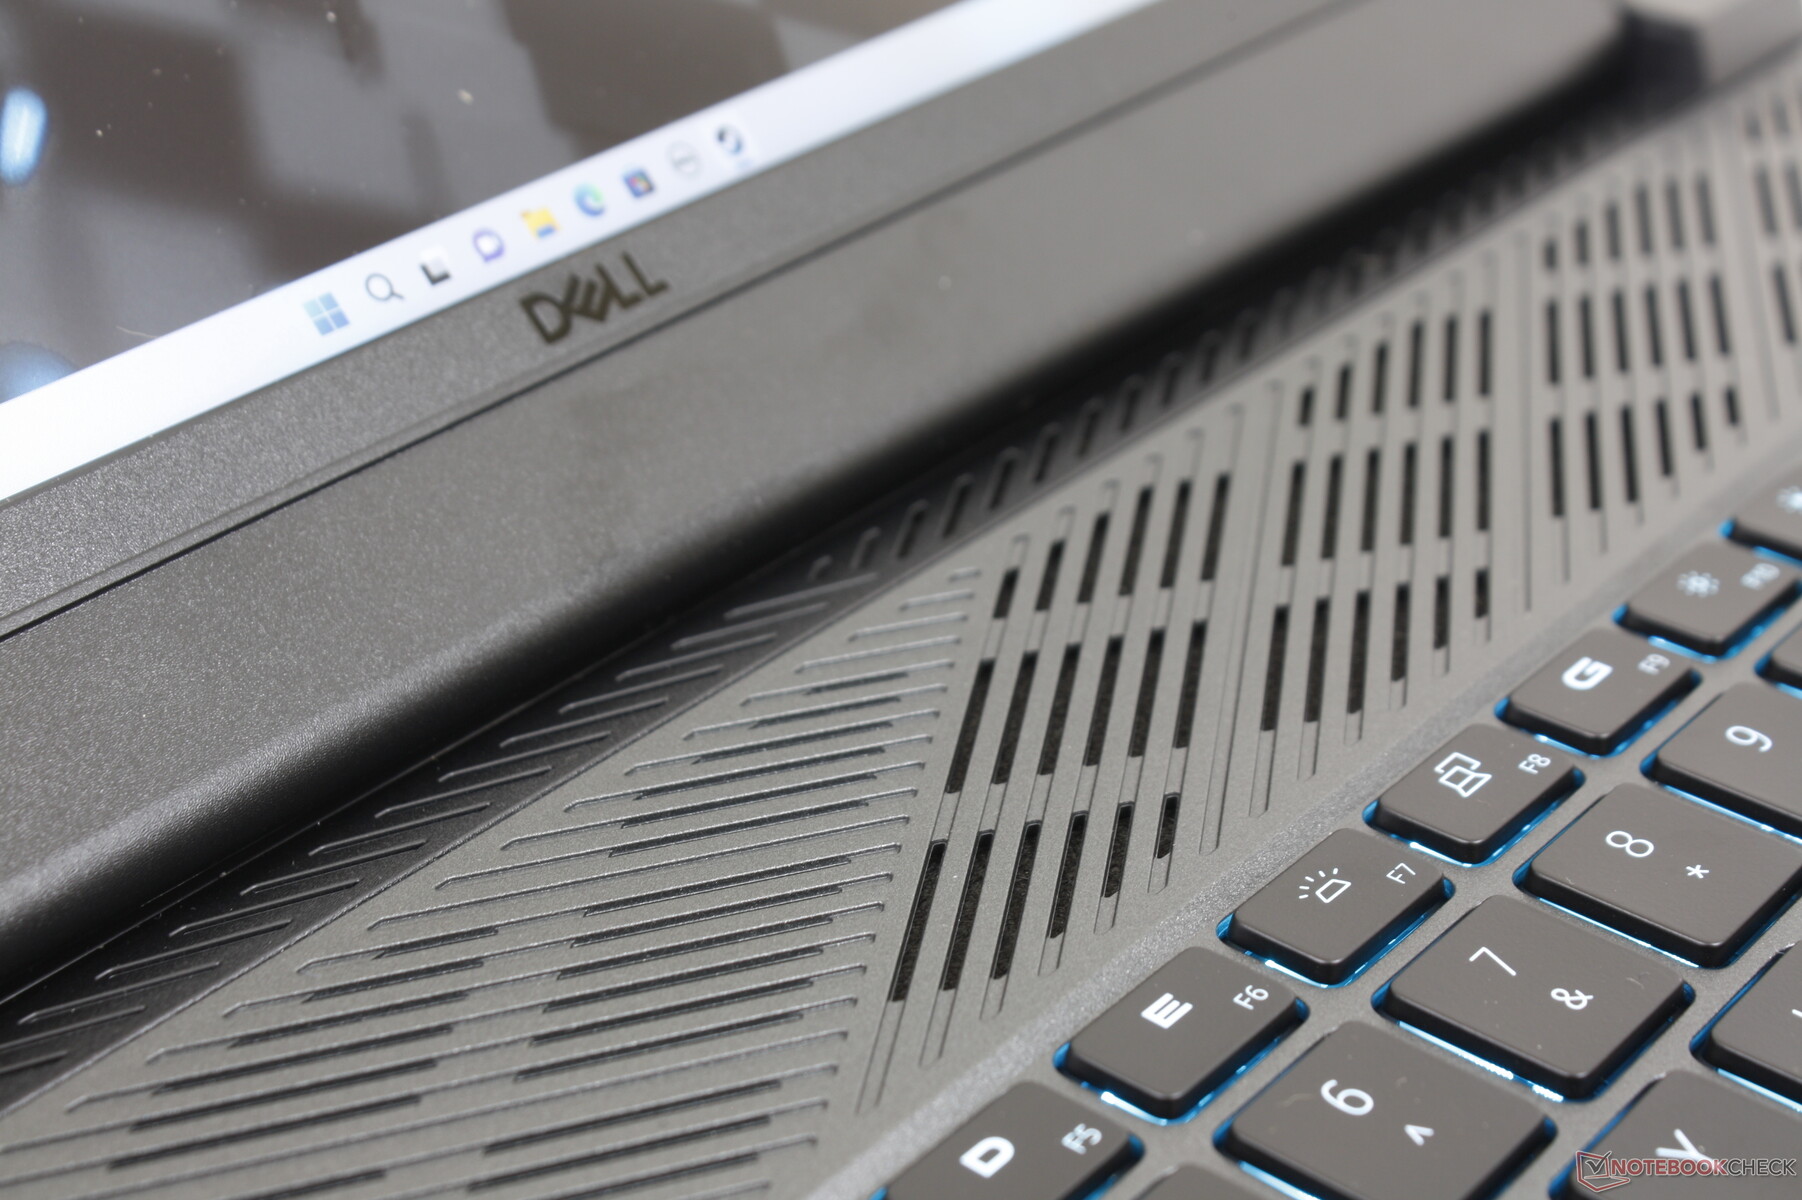
Podczas gdy Dell mógł z łatwością użyć dokładnie tej samej klawiatury G15 w swoim nowym modelu G16, zamiast tego zdecydował się na zupełnie inną. W klawiaturze G16 zrezygnowano z numpada na rzecz pełnowymiarowych klawiszy strzałek, co w zależności od aplikacji lub gry jest mieszanką. Z drugiej strony, sprzężenie zwrotne między klawiszami jest wyraźniejsze i twardsze niż w modelu G15, co zapewnia bardziej satysfakcjonujące wrażenia z pisania.
Irytujące jest to, że użytkownicy będą musieli zapłacić więcej za funkcję podświetlenia RGB dla każdego klawisza w G16. W przeciwnym razie model ten jest wyposażony w jednostrefowe niebieskie podświetlenie LED, co widać na naszych zdjęciach poniżej.
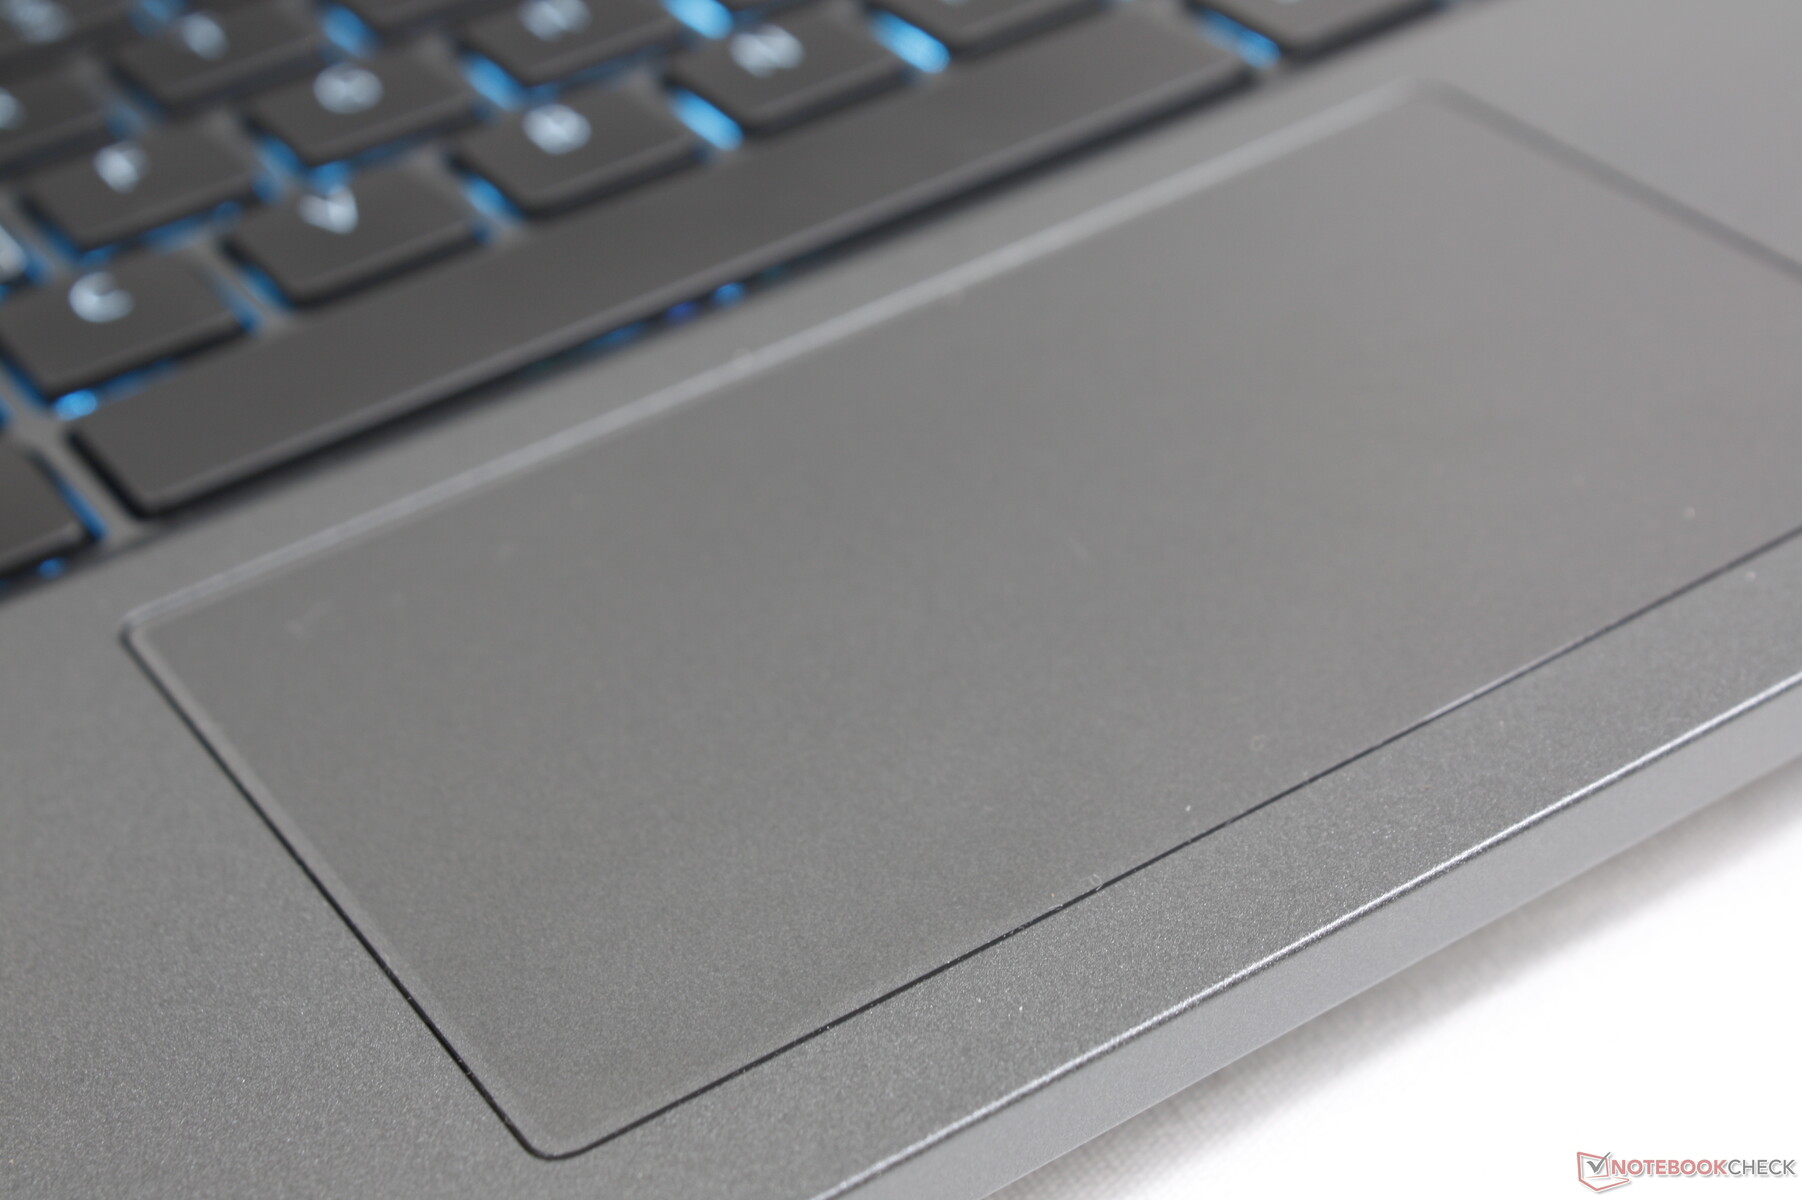
Touchpad
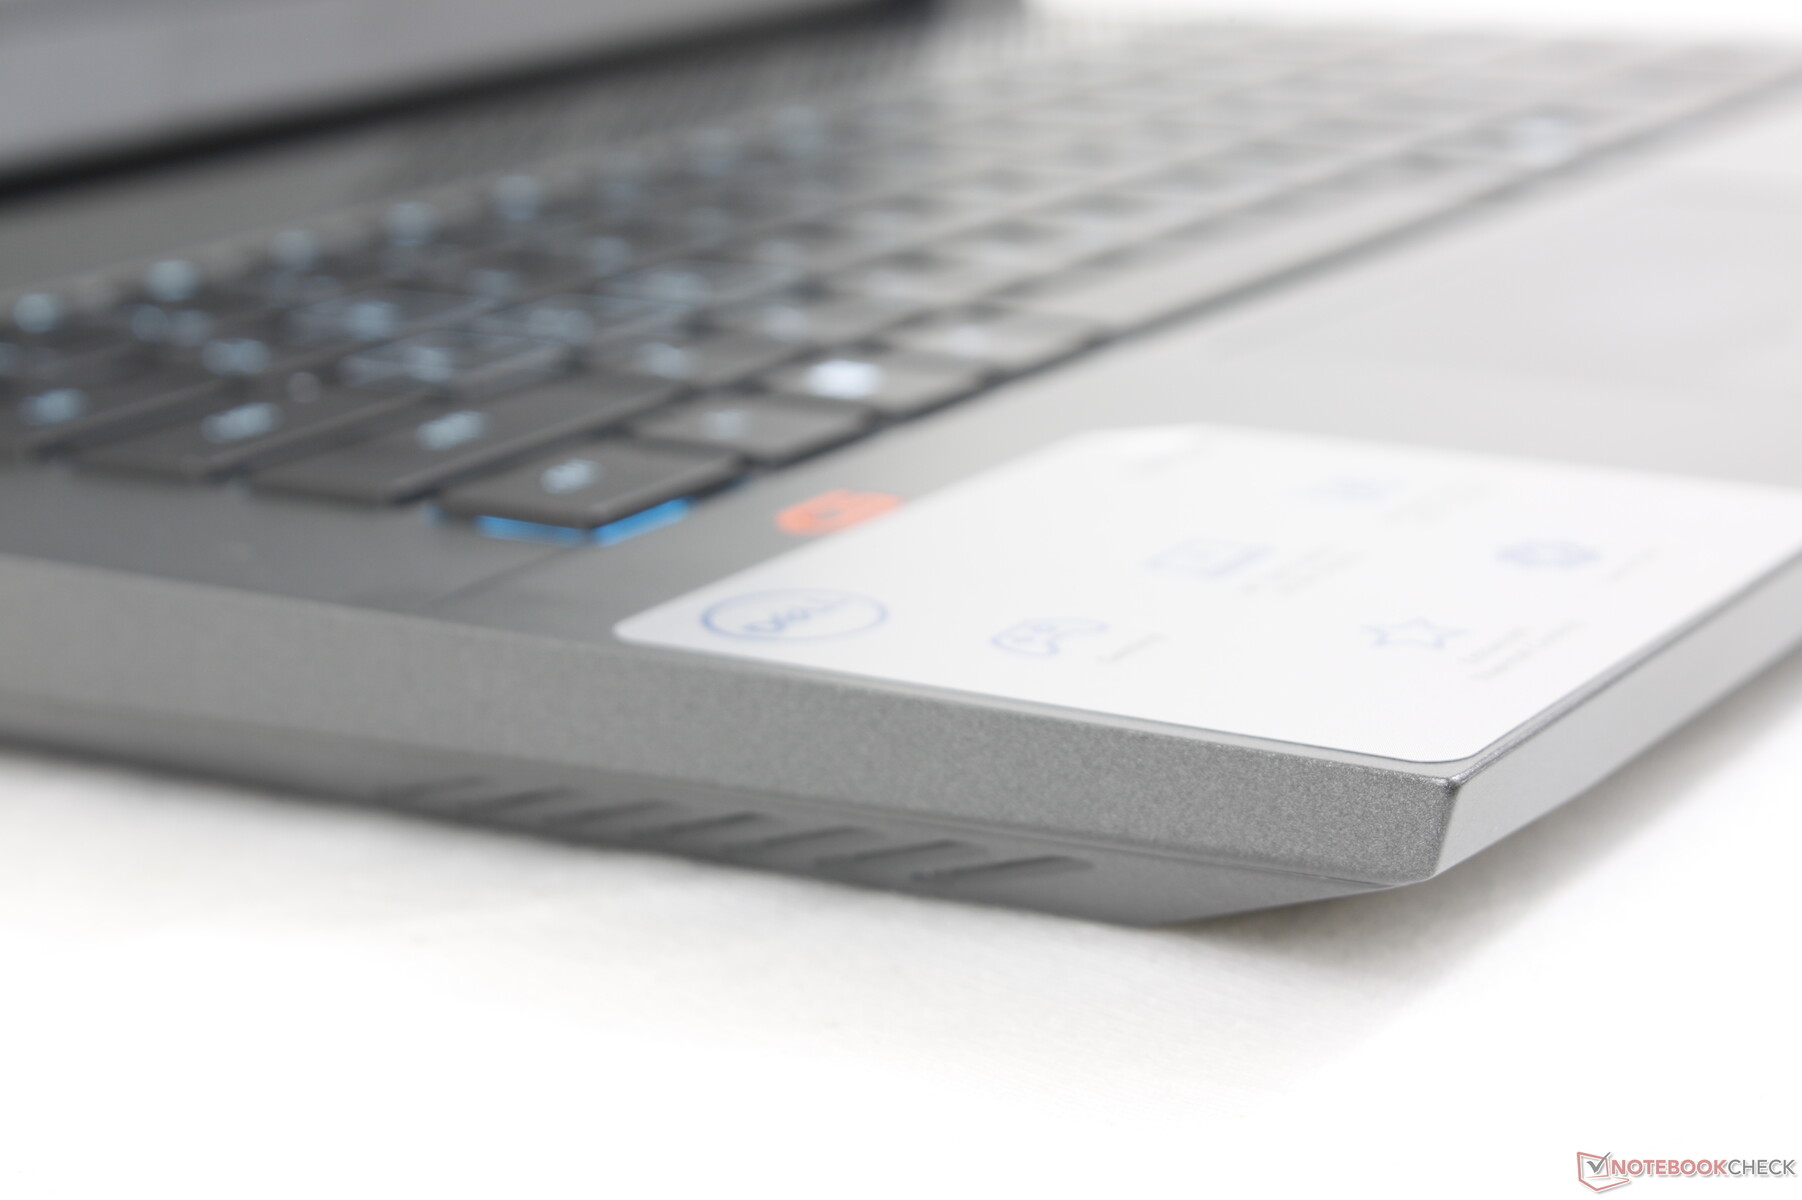
Mając zaledwie 10,5 x 6 cm, gładzik G16 jest jednym z najmniejszych gładzików, jakie widzieliśmy w jakimkolwiek laptopie w tym przedziale cenowym. Tabliczka dotykowa w modelu Inspiron 16 Plus 7620 ma dla porównania 11,5 x 8 cm. Niewielki rozmiar nie jest jednak wadą, gdyż docelowi odbiorcy gier i tak będą mieli mysz w pogotowiu przez cały czas.

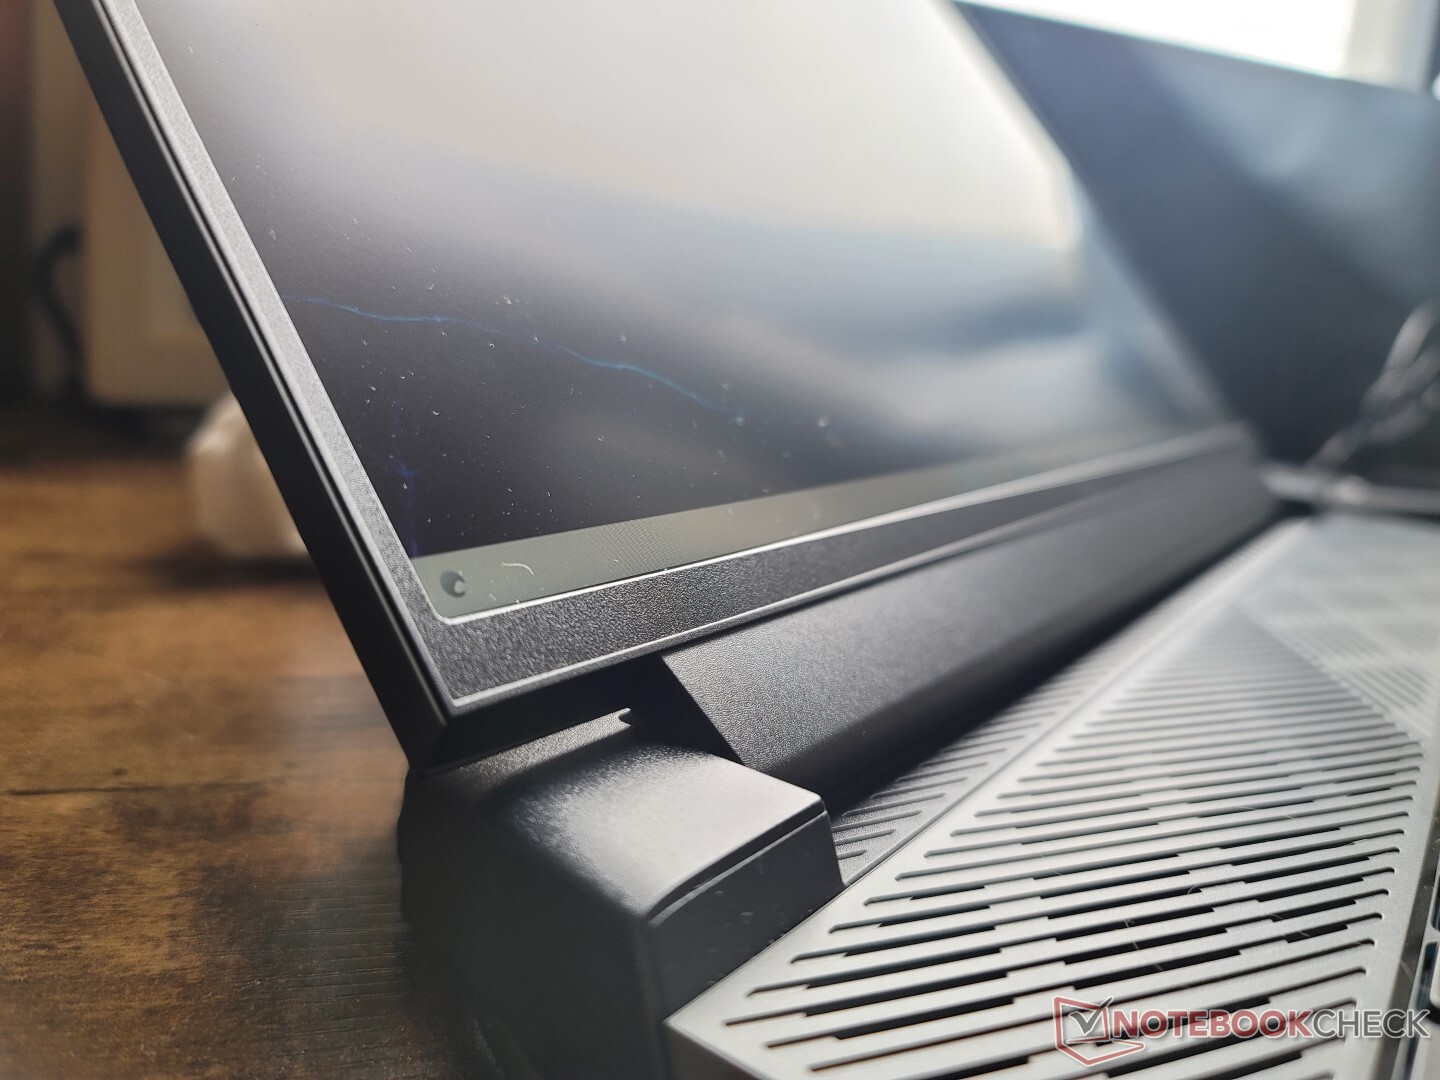
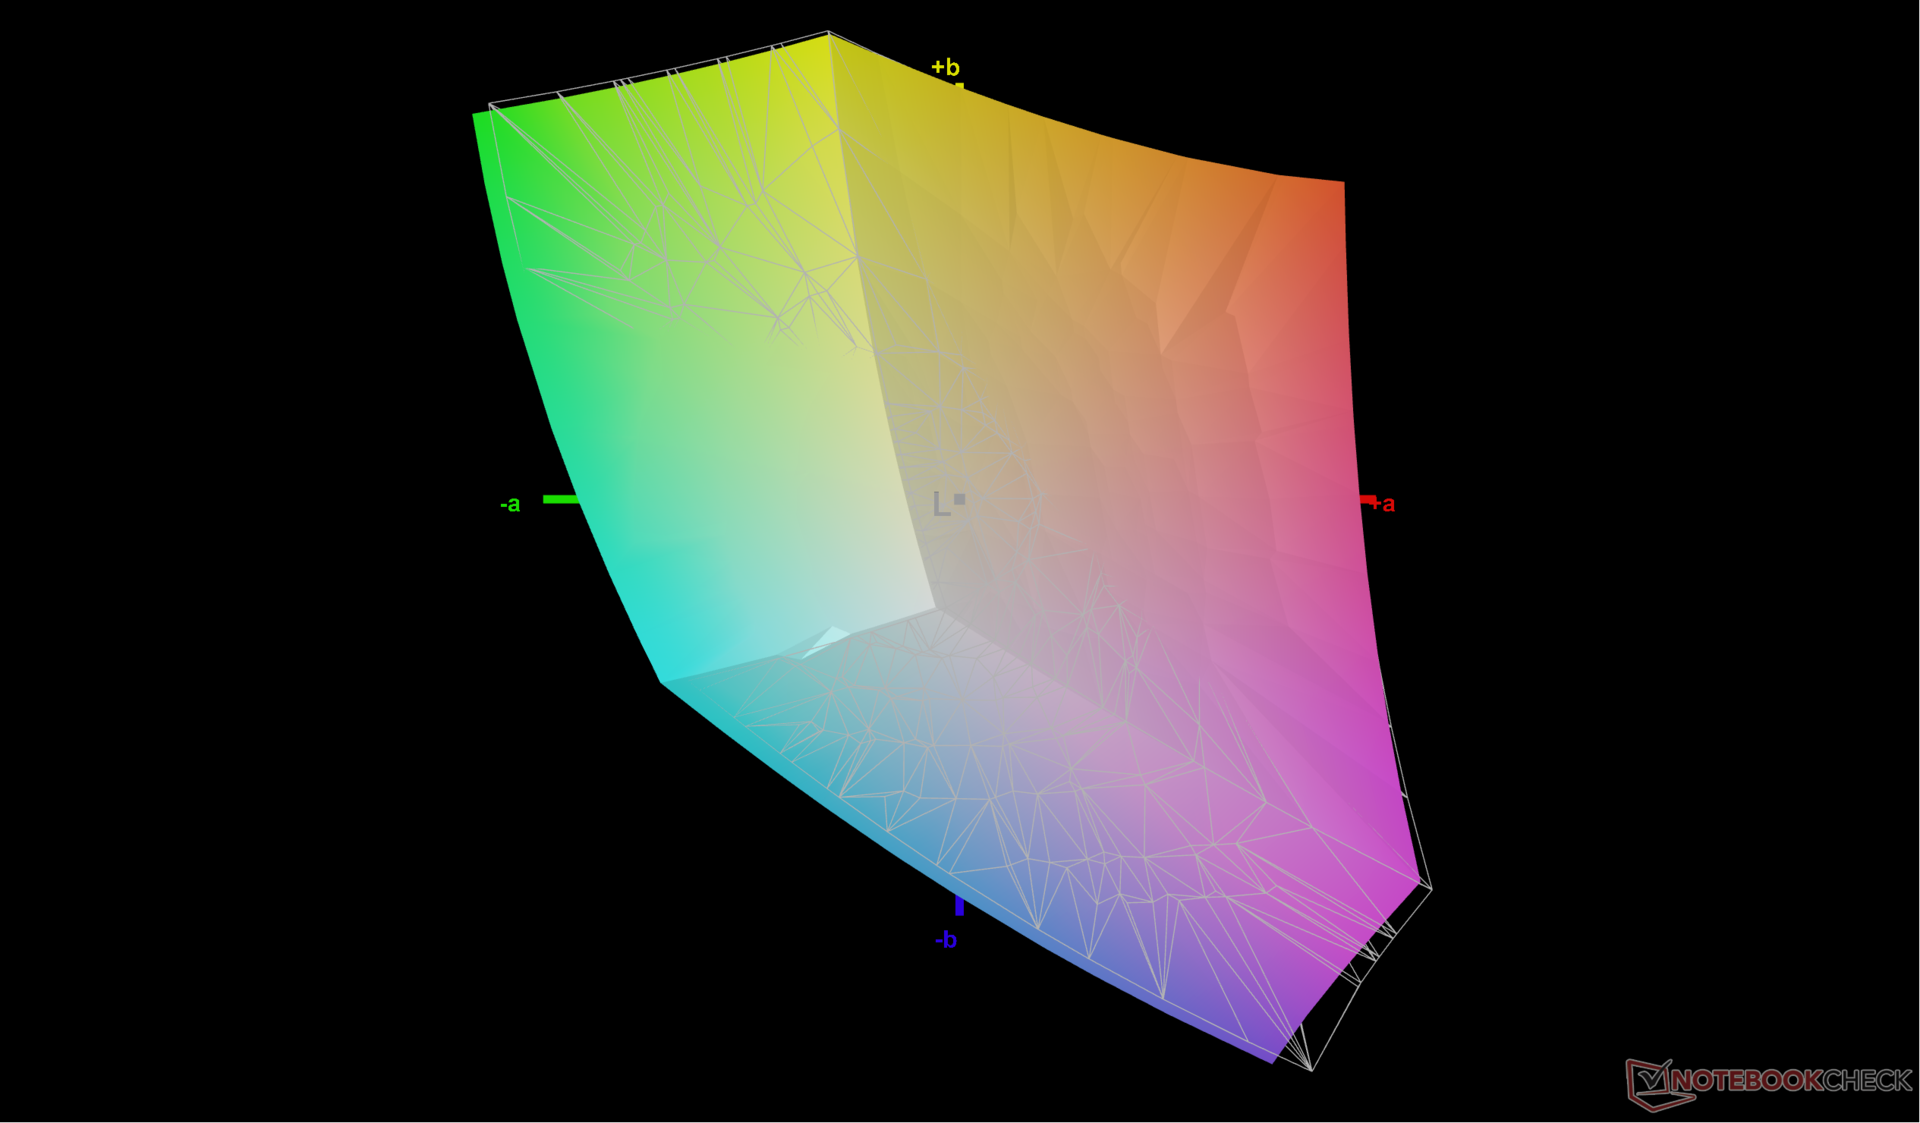
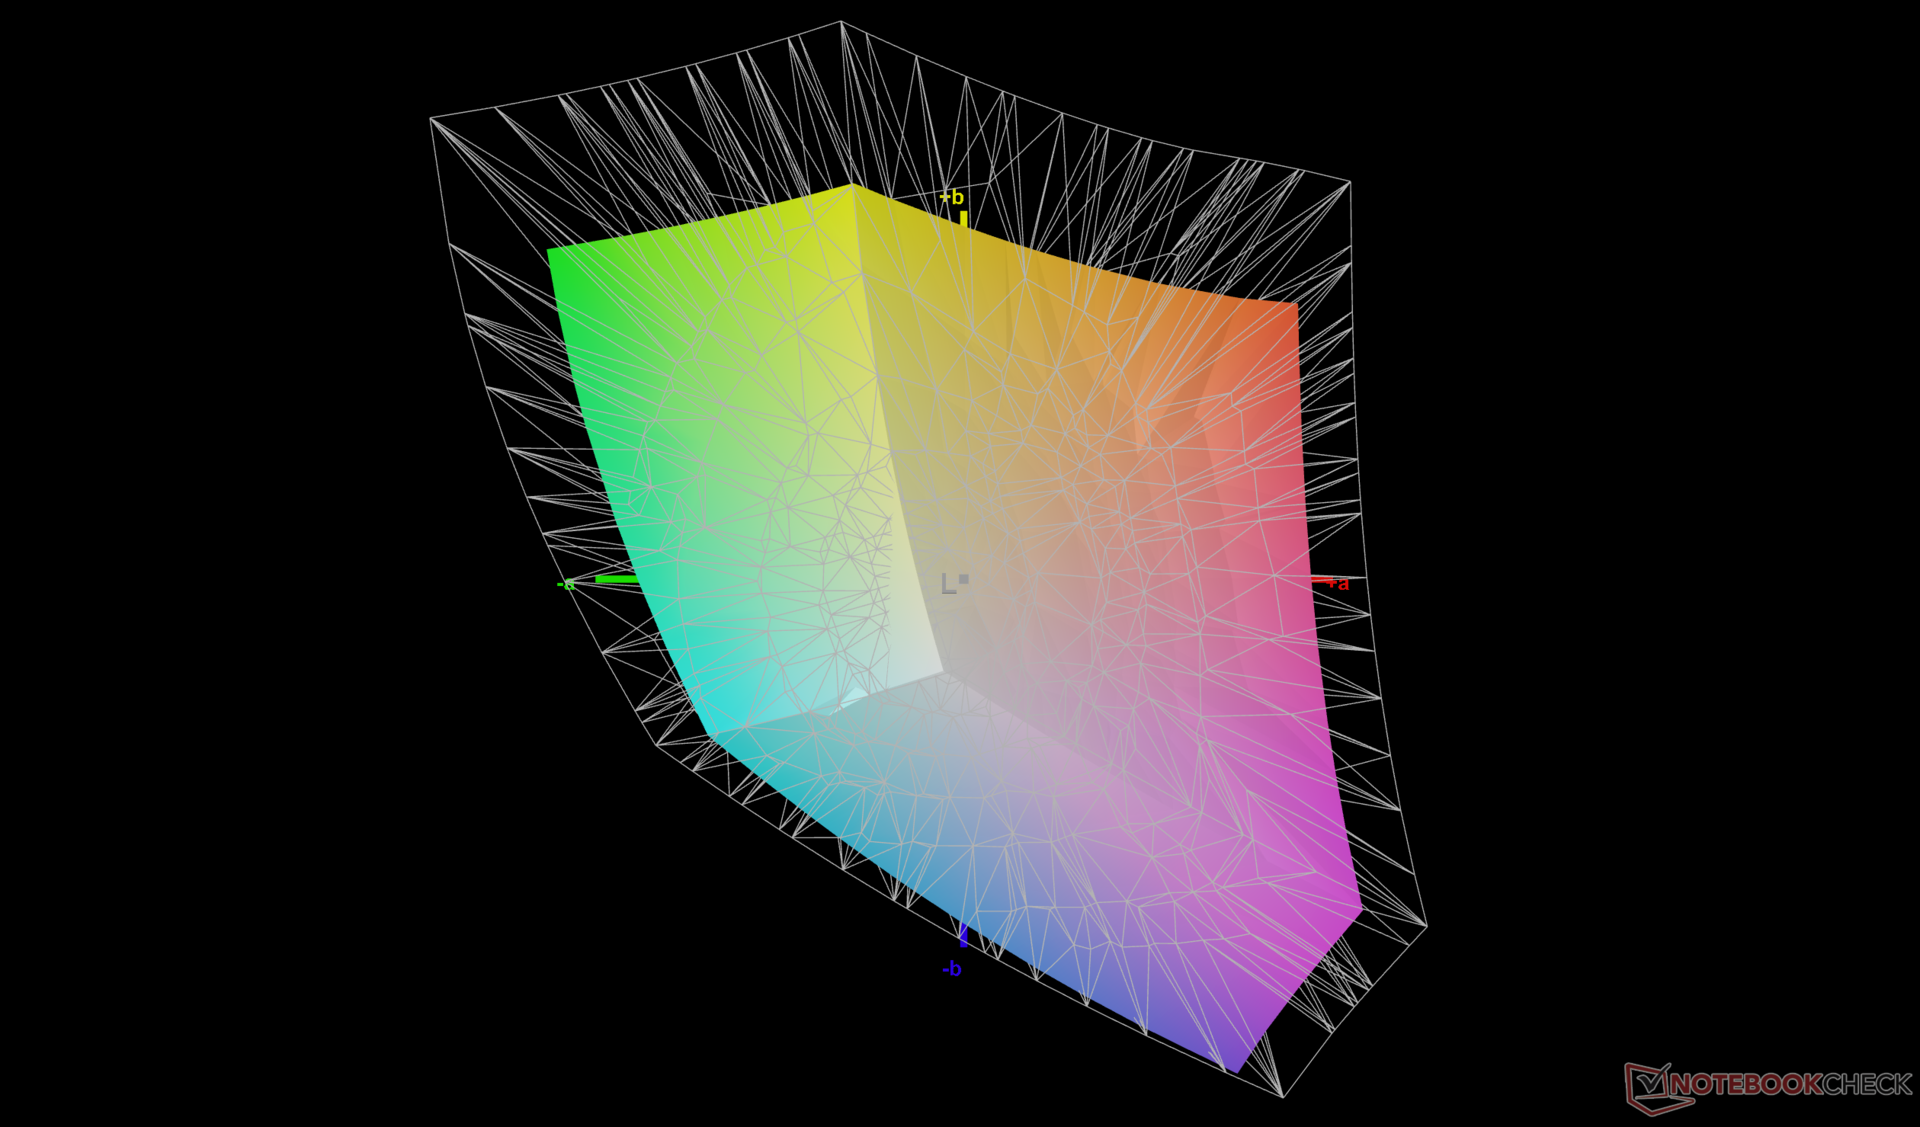
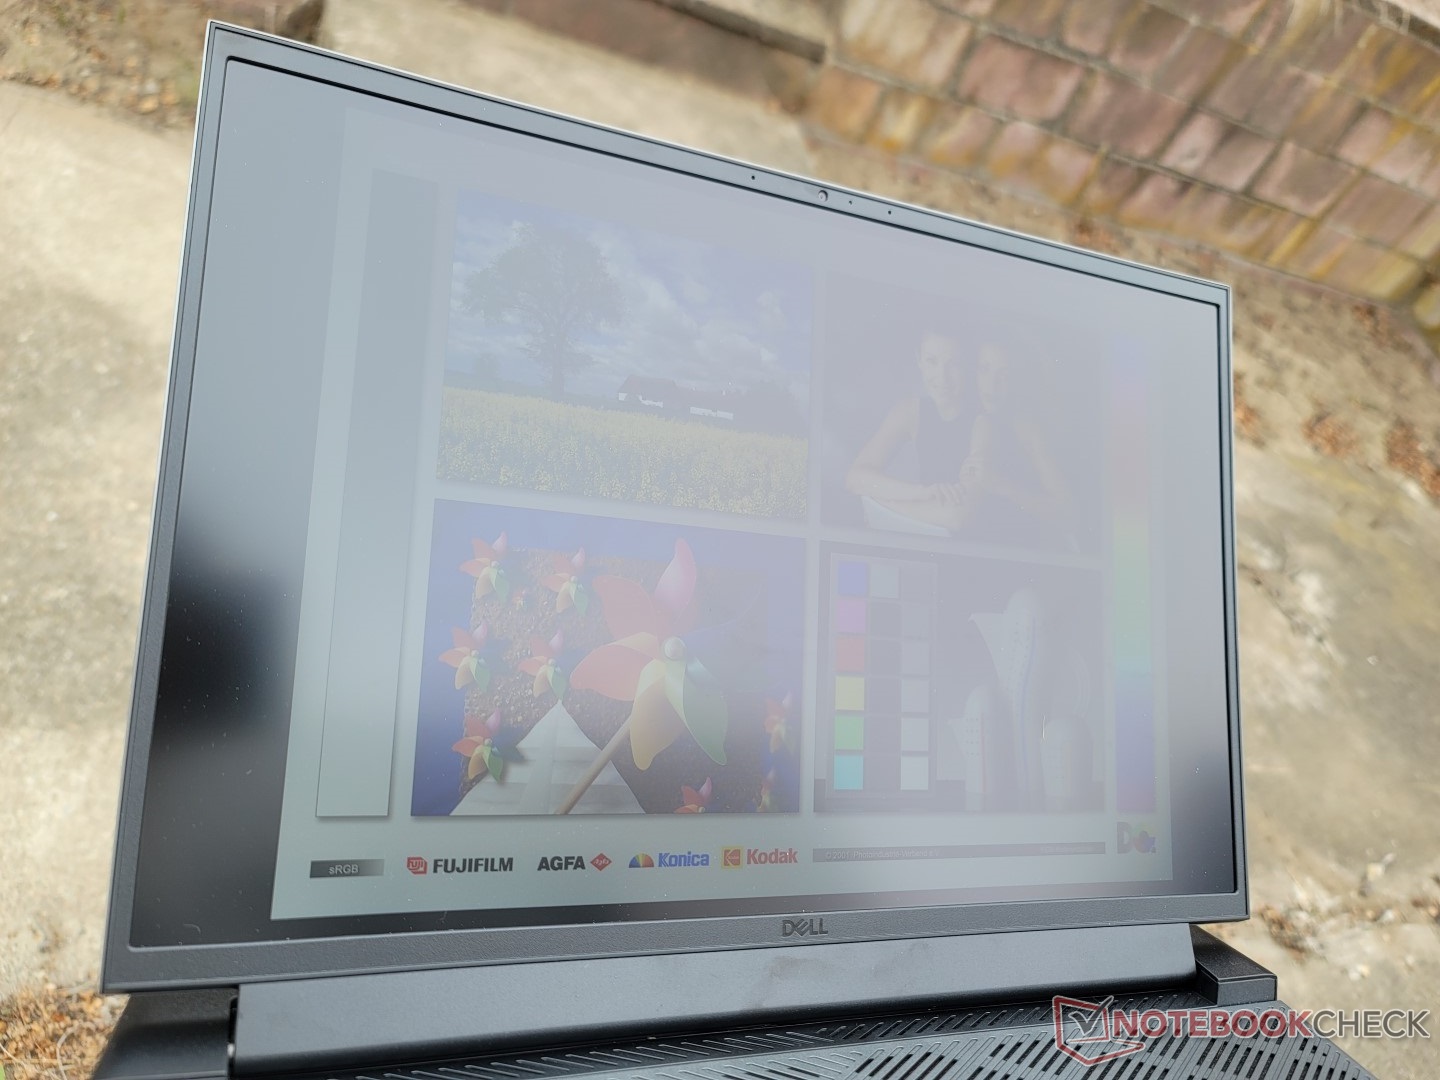
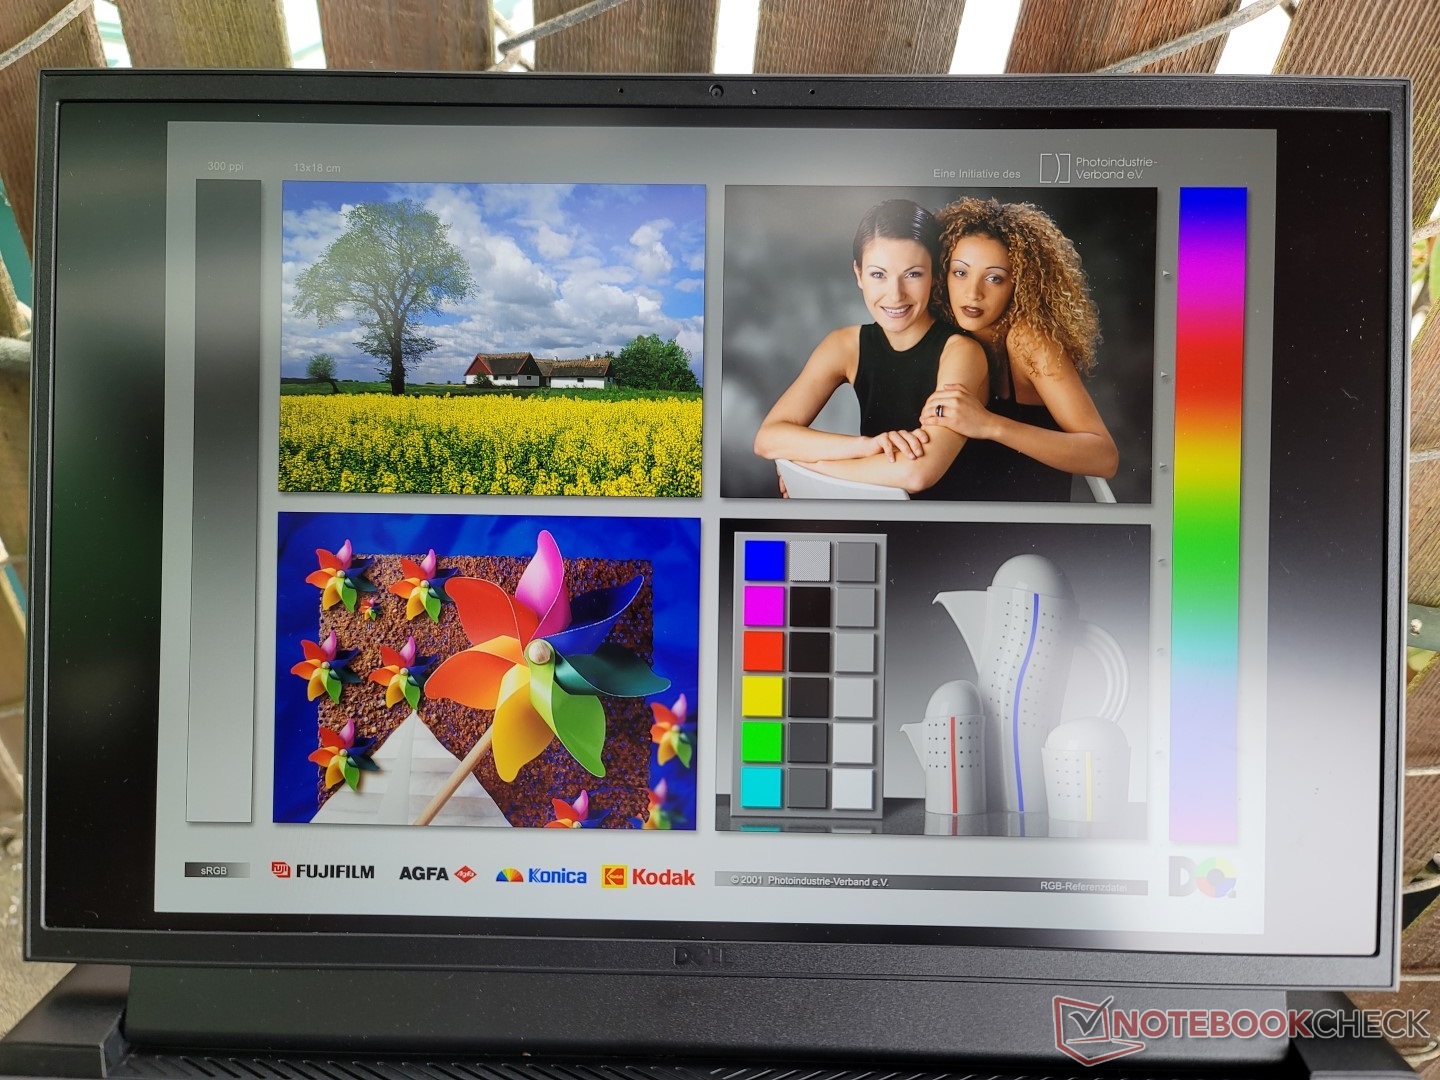
Wyświetlacz - IPS, pełna sRGB, 165 Hz i szybki czas reakcji
Panel jest tu podobny do tego, który jest obecnie dostarczany z Lenovo Legion 7 16ARHA7, ponieważ mają tego samego producenta, tę samą wysoką częstotliwość odświeżania, tę samą rozdzielczość, ten sam 100% cel sRGB, a nawet niemal identyczne współczynniki kontrastu i czasy reakcji czerni i bieli. Jakość obrazu jest znacznie lepsza od panelu Chi Mei, jaki znajdziemy w HP Victus 16. Choć to trochę szkoda, że nie ma innych opcji do wyboru, oznacza to przynajmniej, że wszyscy posiadacze G16 powinni uzyskać te same doskonałe wrażenia z oglądania, bez nieoczekiwanych konfiguracji z niskim ekranem.


| |||||||||||||||||||||||||
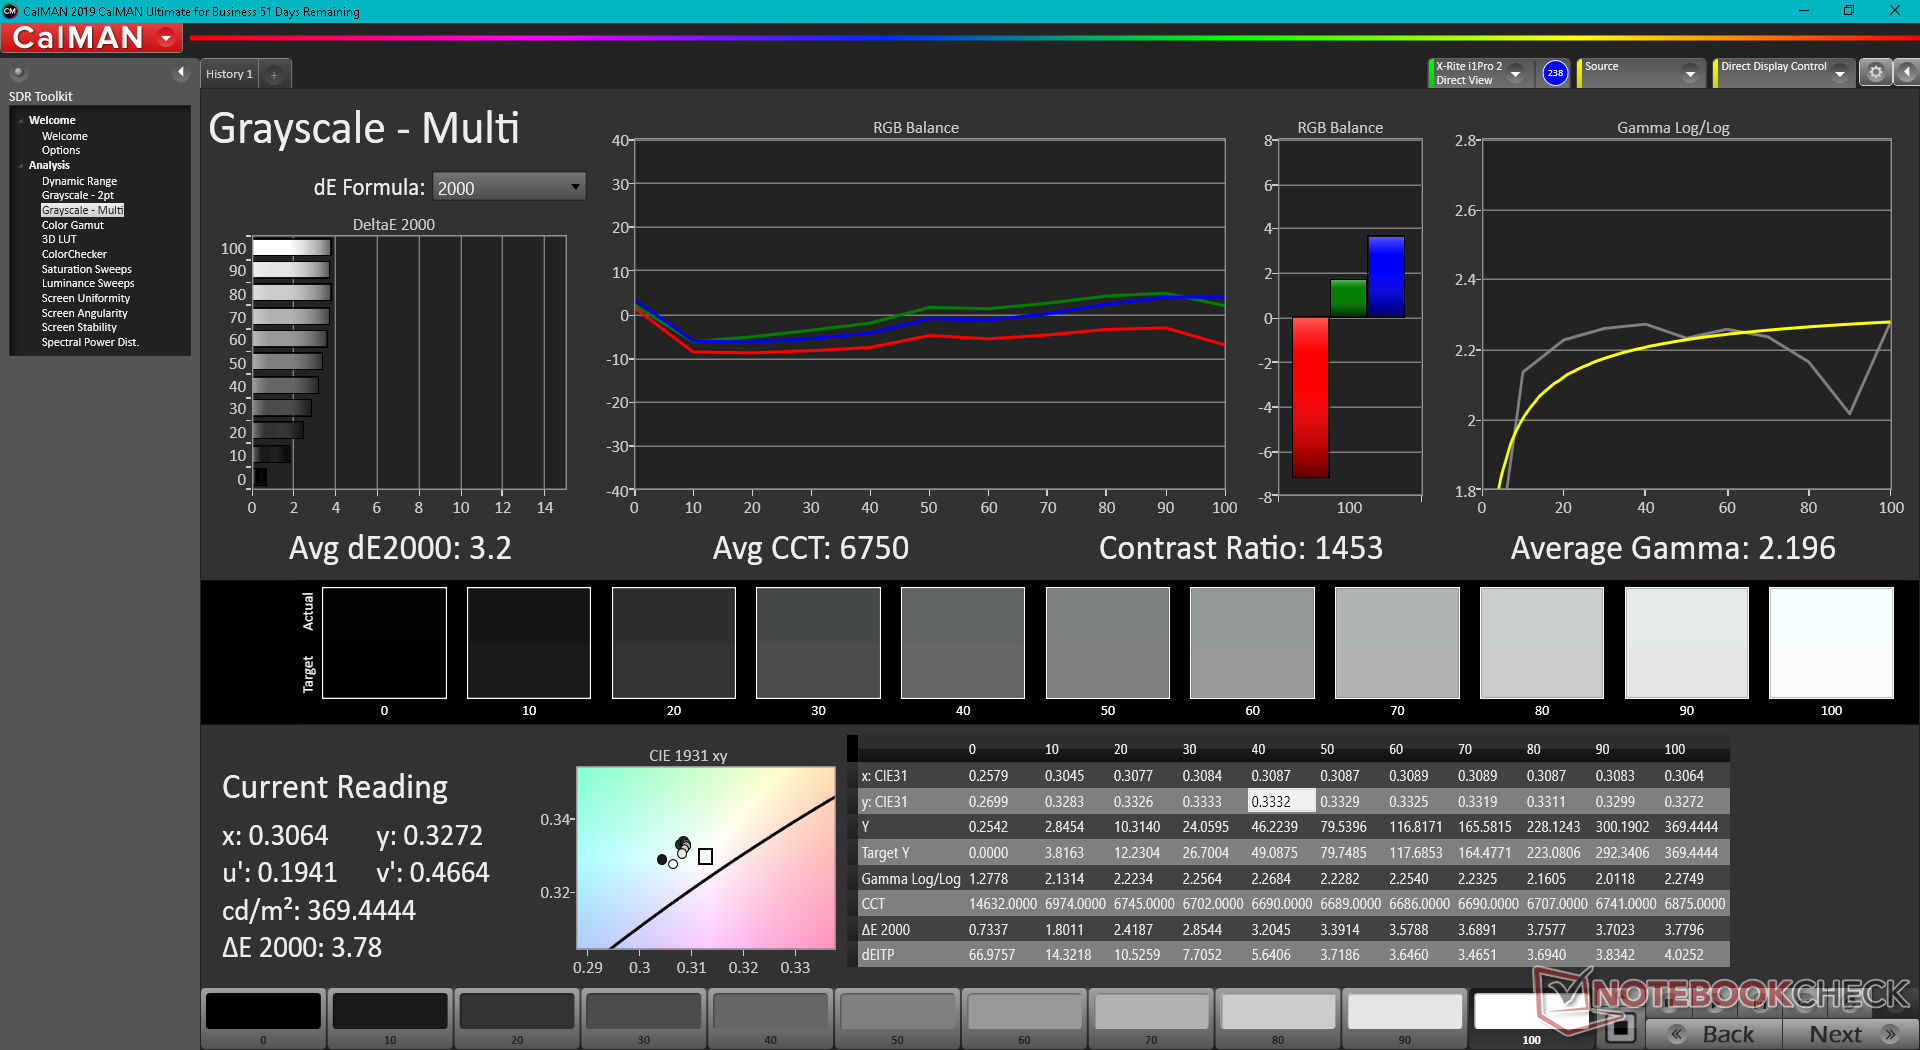
rozświetlenie: 83 %
na akumulatorze: 369.4 cd/m²
kontrast: 1154:1 (czerń: 0.32 cd/m²)
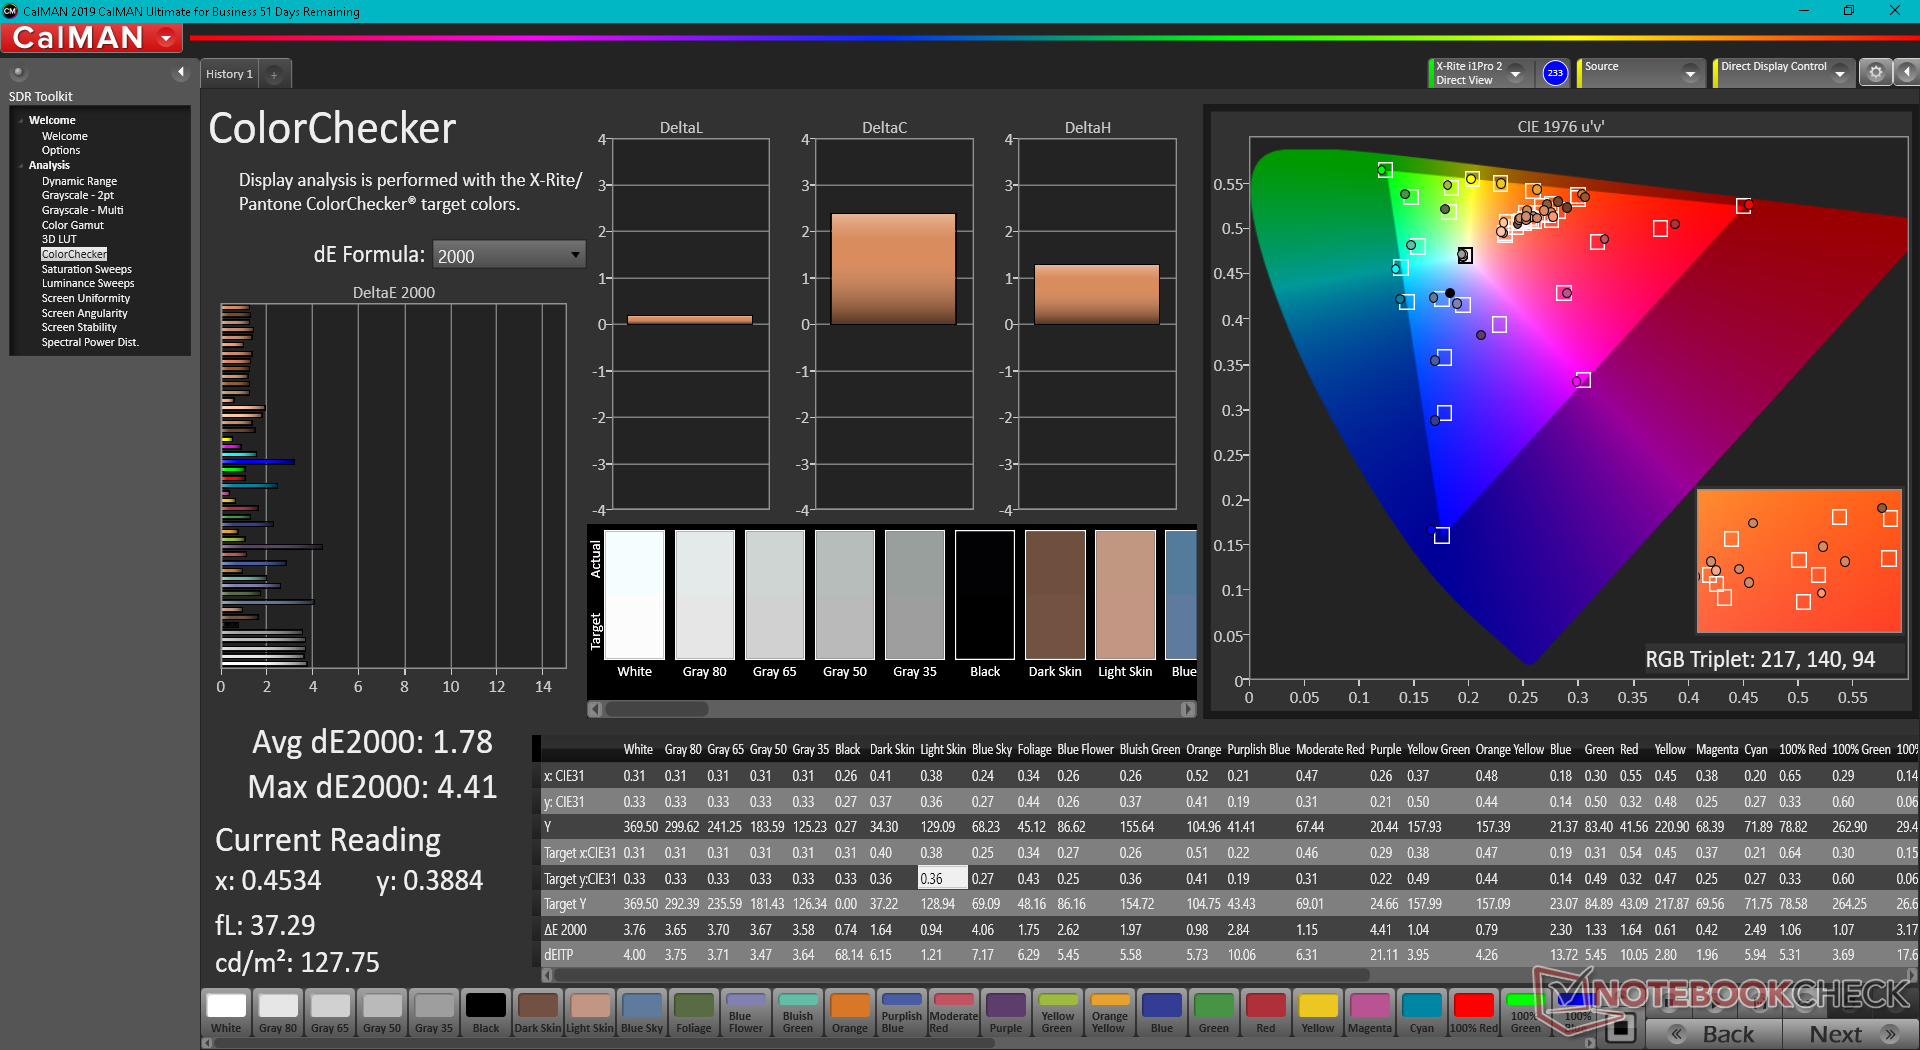
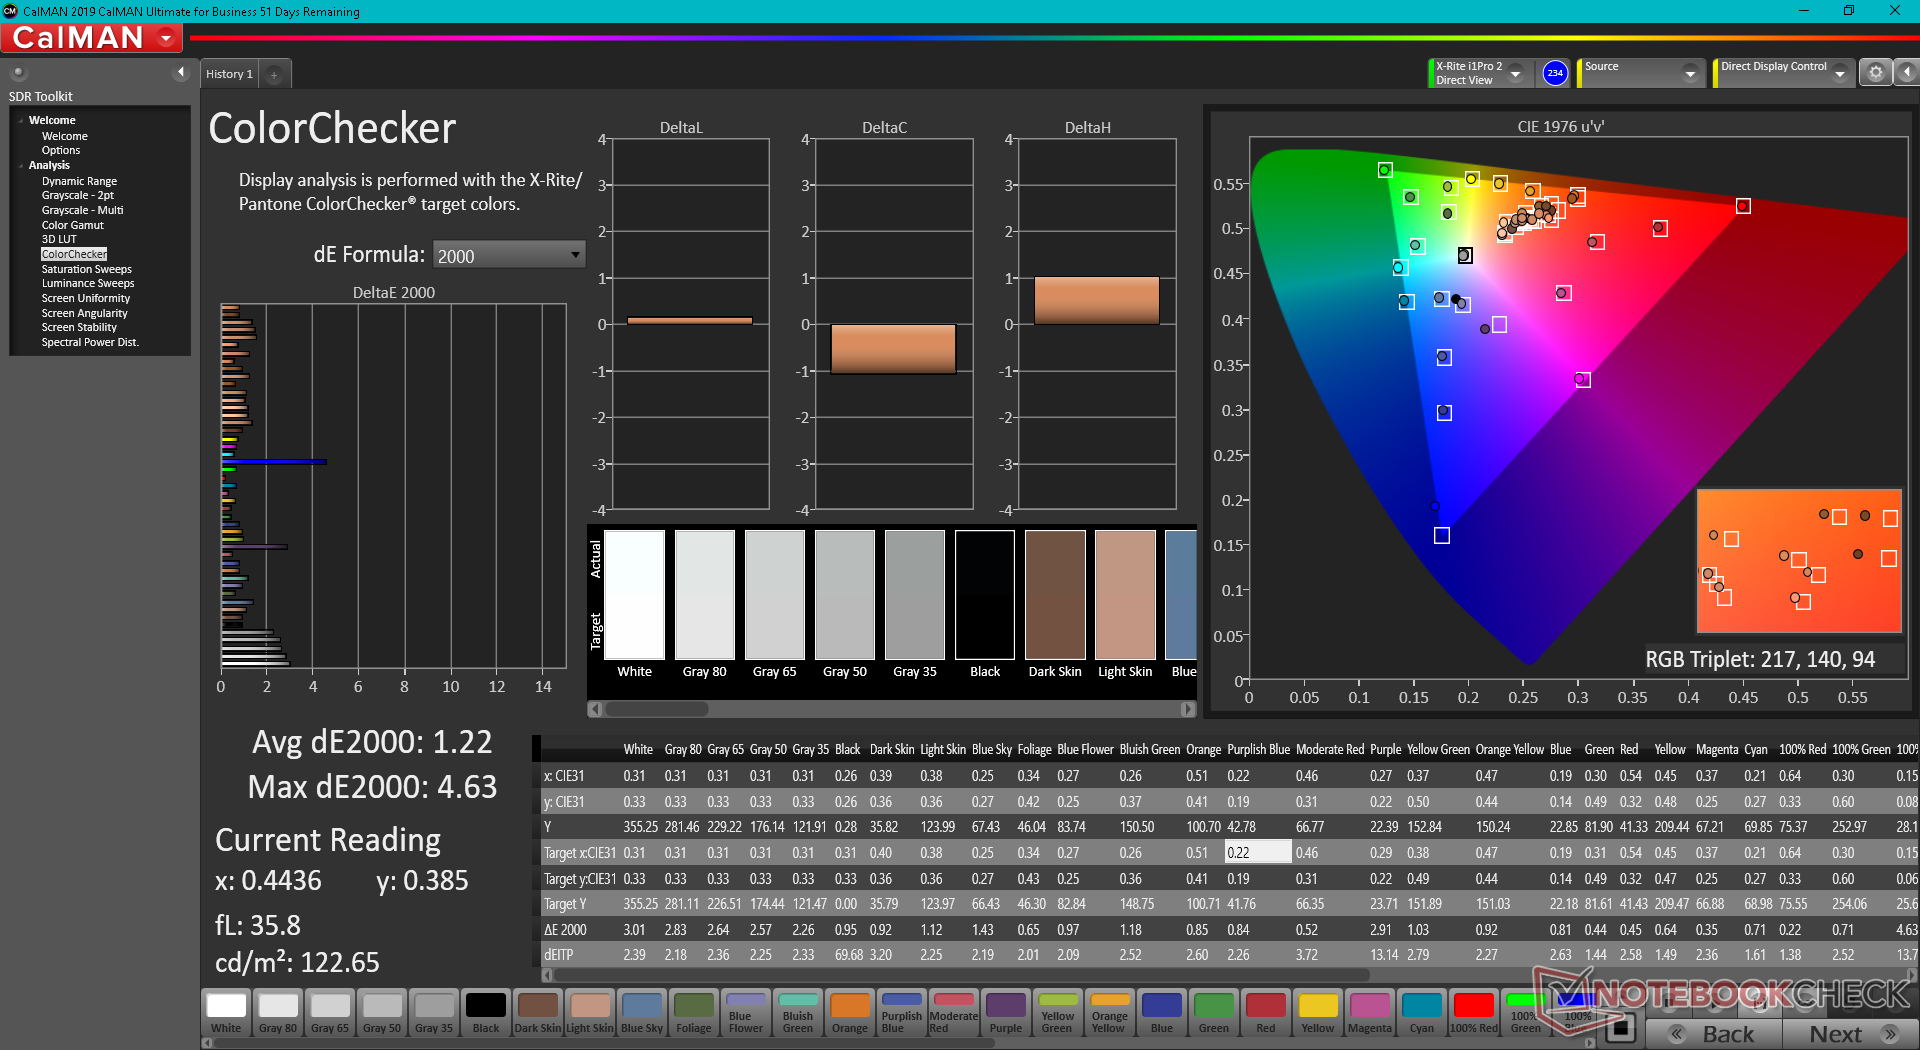
ΔE ColorChecker Calman: 1.78 | ∀{0.5-29.43 Ø4.72}
calibrated: 1.22
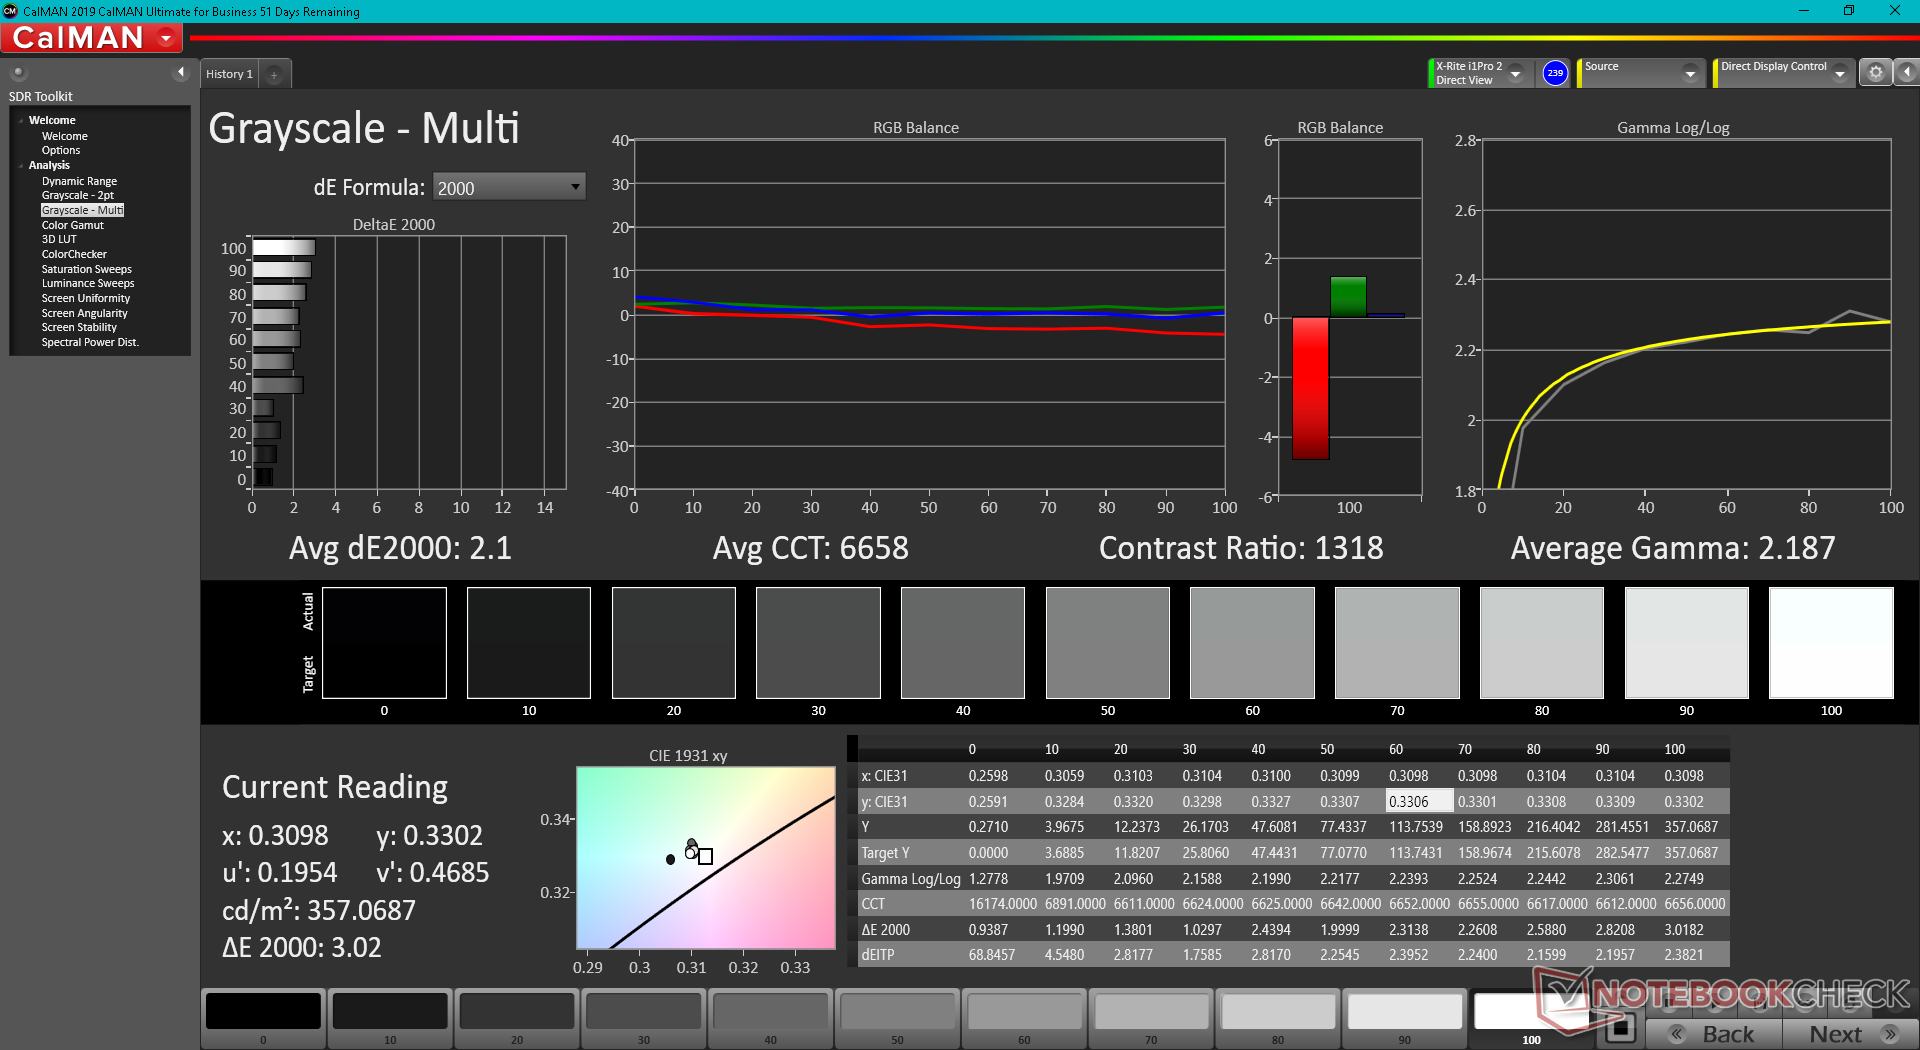
ΔE Greyscale Calman: 3.2 | ∀{0.09-98 Ø4.97}
70.5% AdobeRGB 1998 (Argyll 3D)
98% sRGB (Argyll 3D)
68.3% Display P3 (Argyll 3D)
Gamma: 2.2
CCT: 6750 K
| Dell G16 7620 BOE NE16QDM, IPS, 2560x1600, 16" | Lenovo Legion 7 16ARHA7 BOE CQ NE160QDM-NY1, IPS, 2560x1600, 16" | HP Victus 16-e0145ng CMN1609, IPS, 1920x1080, 16.1" | Asus ROG Zephyrus M16 GU603H AU Optronics AUOC199, IPS, 2560x1600, 16" | Lenovo Legion 5 Pro 16IAH7H BOE CCQ_NE160QDM_NY1, IPS, 2560x1600, 16" | Acer Swift X SFX16-51G-5388 Chi Mei N161HCA-EA3, , 1920x1080, 16.1" | |
|---|---|---|---|---|---|---|
| Display | -6% | -38% | 0% | -4% | ||
| Display P3 Coverage (%) | 68.3 | 63.7 -7% | 41.6 -39% | 68.53 0% | 65.1 -5% | |
| sRGB Coverage (%) | 98 | 95.3 -3% | 61.9 -37% | 98.38 0% | 95.65 -2% | |
| AdobeRGB 1998 Coverage (%) | 70.5 | 65.7 -7% | 43 -39% | 70.45 0% | 66.75 -5% | |
| Response Times | 1% | -166% | 43% | -11% | -171% | |
| Response Time Grey 50% / Grey 80% * (ms) | 8.6 ? | 9.2 ? -7% | 29.6 ? -244% | 4.8 ? 44% | 14 ? -63% | 30 ? -249% |
| Response Time Black / White * (ms) | 10.4 ? | 9.6 ? 8% | 19.4 ? -87% | 6 ? 42% | 6 ? 42% | 20 ? -92% |
| PWM Frequency (Hz) | ||||||
| Screen | -2% | -119% | -29% | 3% | 14% | |
| Brightness middle (cd/m²) | 369.4 | 478.8 30% | 257 -30% | 448 21% | 515 39% | 276 -25% |
| Brightness (cd/m²) | 348 | 477 37% | 239 -31% | 446 28% | 475 36% | 264 -24% |
| Brightness Distribution (%) | 83 | 90 8% | 88 6% | 86 4% | 85 2% | 85 2% |
| Black Level * (cd/m²) | 0.32 | 0.43 -34% | 0.25 22% | 0.48 -50% | 0.45 -41% | 0.16 50% |
| Contrast (:1) | 1154 | 1113 -4% | 1028 -11% | 933 -19% | 1144 -1% | 1725 49% |
| Colorchecker dE 2000 * | 1.78 | 2.24 -26% | 6.91 -288% | 2.76 -55% | 2.38 -34% | 1.8 -1% |
| Colorchecker dE 2000 max. * | 4.41 | 4.49 -2% | 22.27 -405% | 7.09 -61% | 4.37 1% | 3.77 15% |
| Colorchecker dE 2000 calibrated * | 1.22 | 1.89 -55% | 3.61 -196% | 2.86 -134% | 1.1 10% | 0.63 48% |
| Greyscale dE 2000 * | 3.2 | 2.3 28% | 7.5 -134% | 3.1 3% | 2.71 15% | 2.76 14% |
| Gamma | 2.2 100% | 2.25 98% | 2.125 104% | 2.153 102% | 2.49 88% | 2.37 93% |
| CCT | 6750 96% | 6955 93% | 6025 108% | 6826 95% | 6117 106% | 6564 99% |
| Color Space (Percent of AdobeRGB 1998) (%) | 87 | |||||
| Color Space (Percent of sRGB) (%) | 100 | |||||
| Całkowita średnia (program / ustawienia) | -2% /
-2% | -108% /
-108% | 7% /
-16% | -3% /
0% | -54% /
-16% |
* ... im mniej tym lepiej
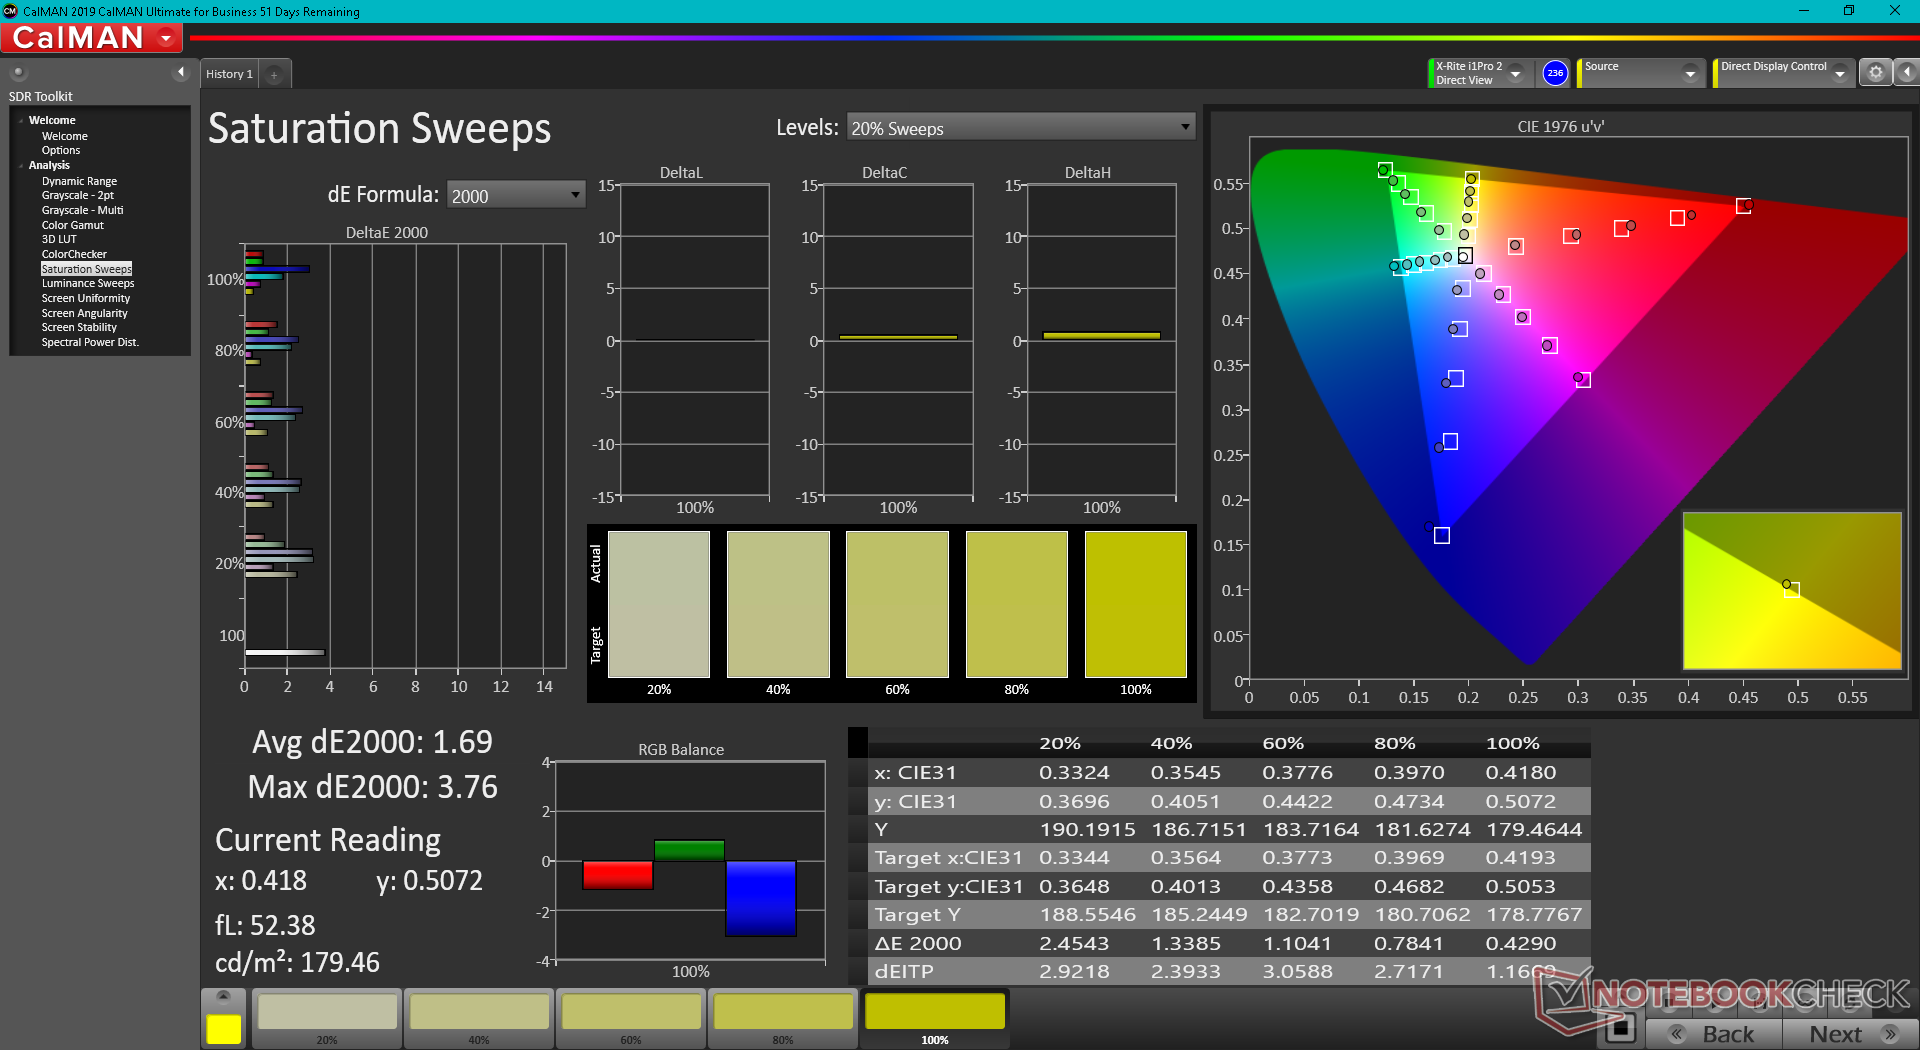
Kolory są przyzwoicie skalibrowane po wyjęciu z pudełka, mimo że Dell nie stosuje żadnych procedur prekalibracji dla G16. Samodzielna kalibracja panelu kolorymetrem X-Rite poprawiłaby średnie wartości DeltaE w skali szarości i kolorze tylko nieznacznie, z 3,2 i 1,78 do odpowiednio 2,1 i 1,22. Kalibracja dla użytkownika końcowego nie jest więc konieczna dla większości właścicieli.
Użytkownicy mogą zastosować nasz skalibrowany profil powyżej, aby uzyskać dokładniejsze wyświetlanie obrazu.
Wyświetl czasy reakcji
| ↔ Czas reakcji od czerni do bieli | ||
|---|---|---|
| 10.4 ms ... wzrost ↗ i spadek ↘ łącznie | ↗ 5.2 ms wzrost | 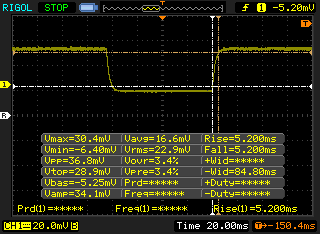 |
| ↘ 5.2 ms upadek | ||
| W naszych testach ekran wykazuje dobry współczynnik reakcji, ale może być zbyt wolny dla graczy rywalizujących ze sobą. Dla porównania, wszystkie testowane urządzenia wahają się od 0.1 (minimum) do 240 (maksimum) ms. » 28 % wszystkich urządzeń jest lepszych. Oznacza to, że zmierzony czas reakcji jest lepszy od średniej wszystkich testowanych urządzeń (19.8 ms). | ||
| ↔ Czas reakcji 50% szarości do 80% szarości | ||
| 8.6 ms ... wzrost ↗ i spadek ↘ łącznie | ↗ 3.4 ms wzrost | 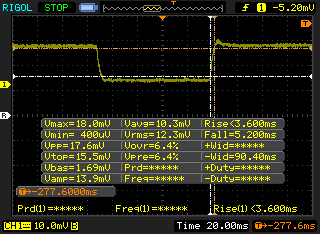 |
| ↘ 5.2 ms upadek | ||
| W naszych testach ekran wykazuje szybki czas reakcji i powinien nadawać się do gier. Dla porównania, wszystkie testowane urządzenia wahają się od 0.165 (minimum) do 636 (maksimum) ms. » 22 % wszystkich urządzeń jest lepszych. Oznacza to, że zmierzony czas reakcji jest lepszy od średniej wszystkich testowanych urządzeń (31 ms). | ||
Migotanie ekranu / PWM (modulacja szerokości impulsu)
| Migotanie ekranu/nie wykryto PWM | 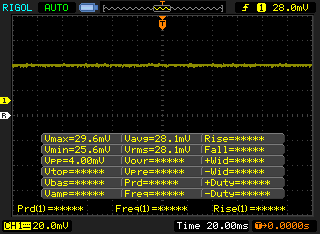 | ||
Dla porównania: 52 % wszystkich testowanych urządzeń nie używa PWM do przyciemniania wyświetlacza. Jeśli wykryto PWM, zmierzono średnio 7763 (minimum: 5 - maksimum: 343500) Hz. | |||
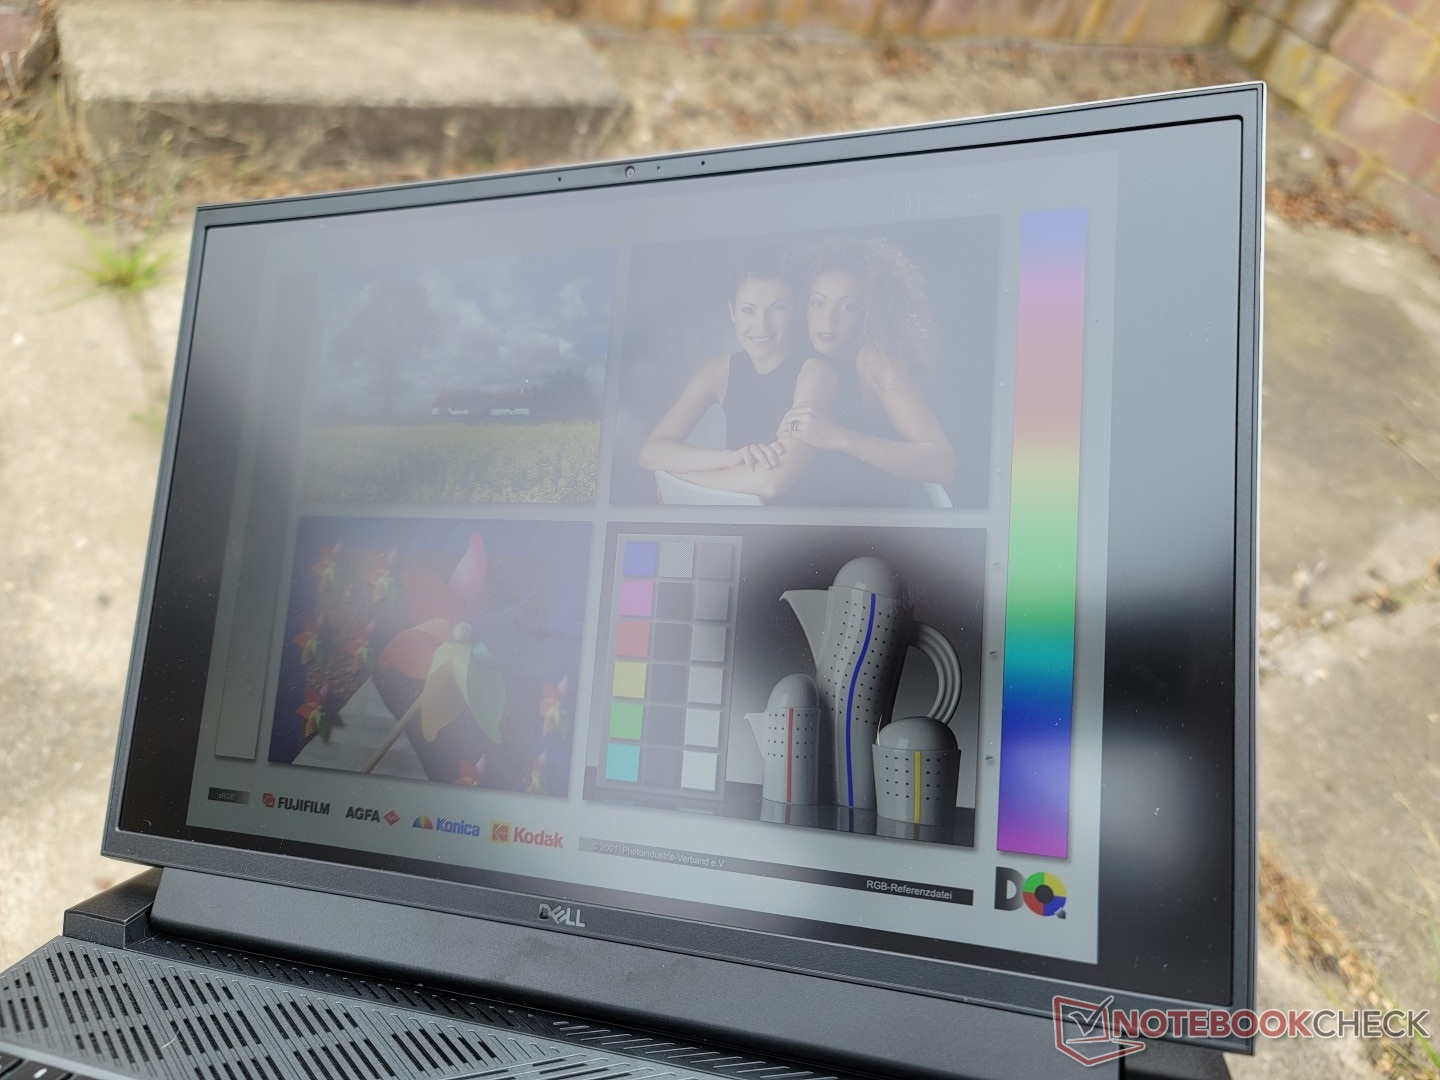
Widoczność na zewnątrz jest przyzwoita, jeśli znajduje się w cieniu, ale odblaski stają się zbyt silne, jeśli mamy do czynienia z jaśniejszym oświetleniem otoczenia. Alternatywy, takie jak Lenovo Legion 5 Pro 16 lub Legion 7 16 mają znacznie jaśniejsze wyświetlacze o jasności około 500 nitów każdy, jeśli widoczność na zewnątrz jest problemem.
Wydajność - szybsza niż przeciętna
Warunki badania
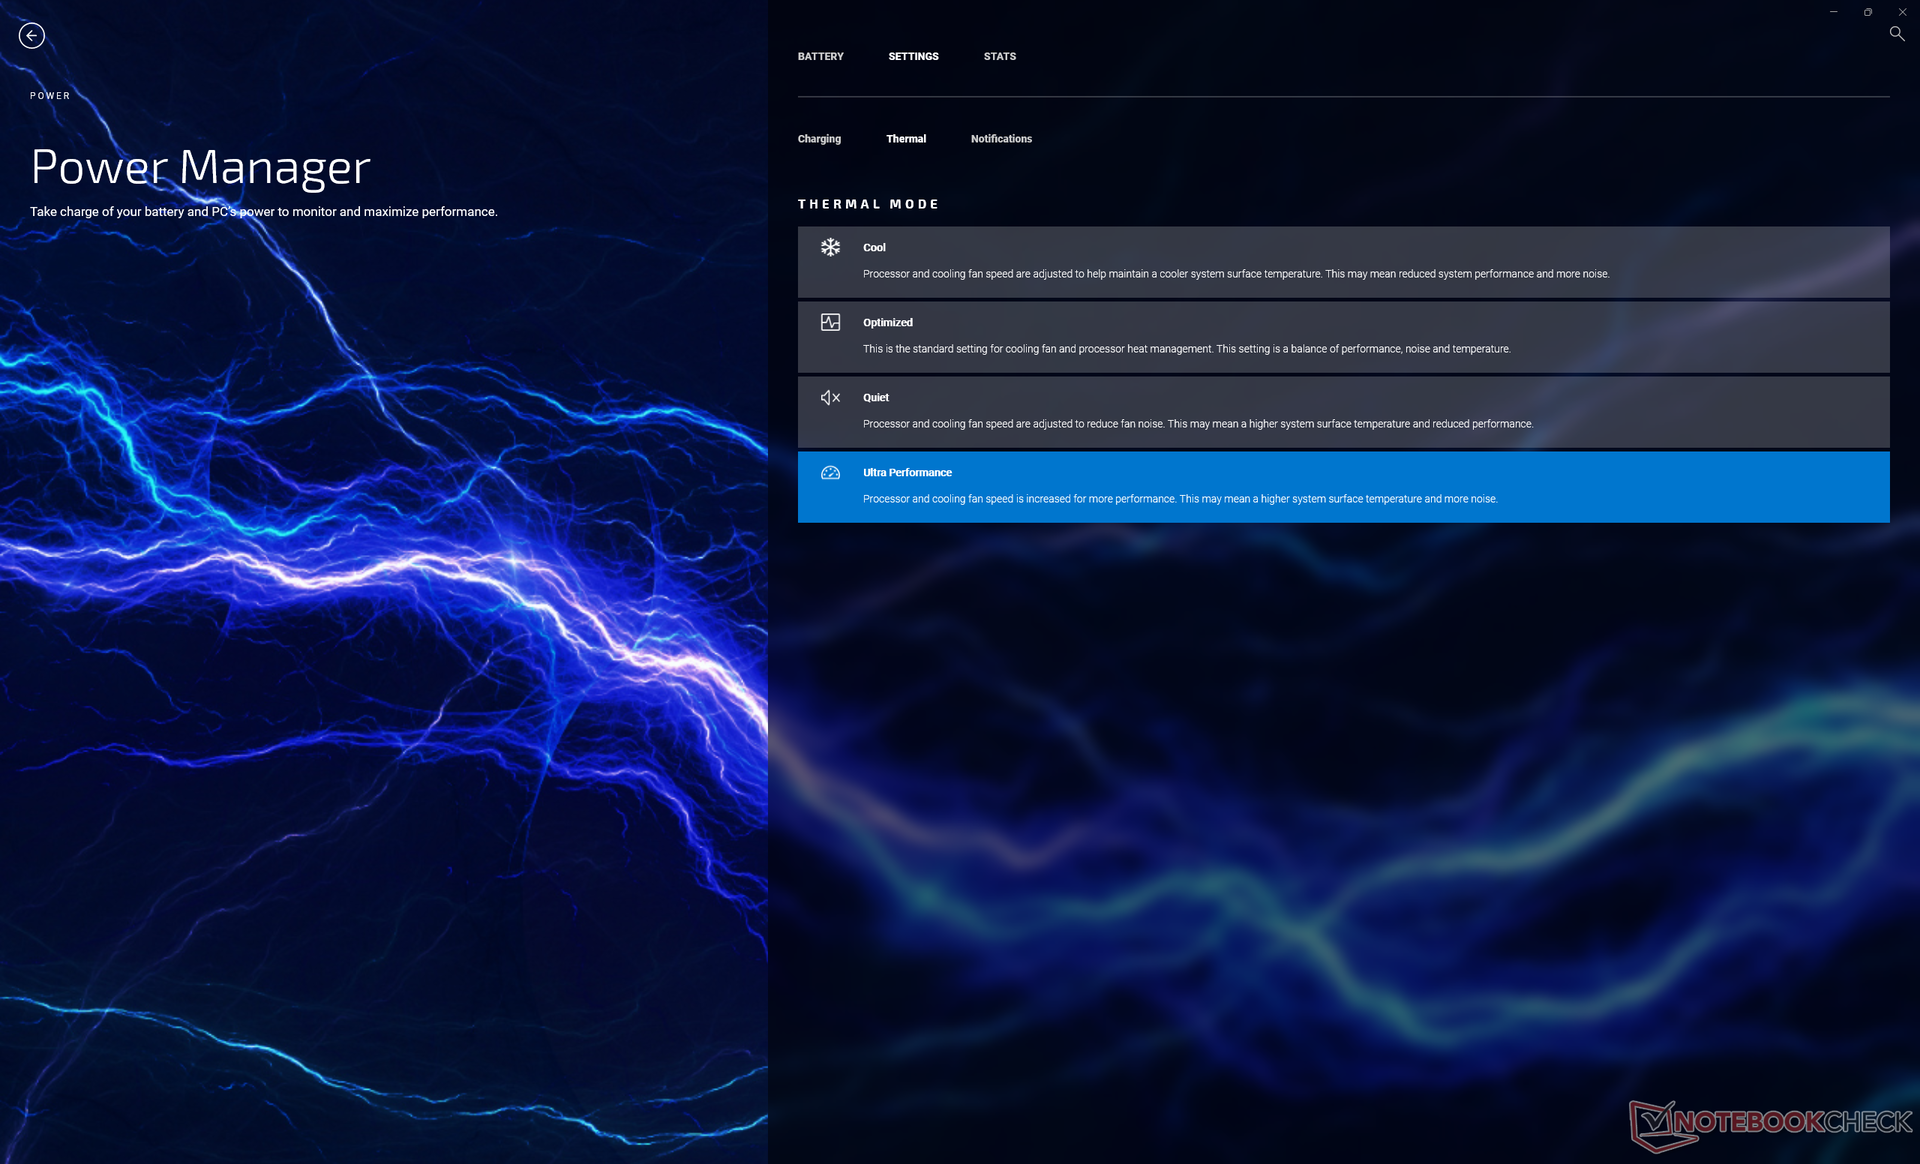
Przed przeprowadzeniem poniższych benchmarków ustawiliśmy nasz egzemplarz w trybie Performance za pośrednictwem systemu Windows oraz w trybie Ultra Performance za pośrednictwem oprogramowania My Dell. Upewniliśmy się także, że wyłączyliśmy Optimusa i ustawiliśmy system w tryb dyskretnego GPU za pośrednictwem panelu sterowania Nvidii. Zaleca się, by właściciele zapoznali się z oprogramowaniem My Dell i Dell Update, ponieważ te dwie preinstalowane aplikacje są niezbędne do dostosowania zachowania systemu.
Procesor
Wydajność wielowątkowa jest doskonała, a wyniki są o 5 do 10 procent szybsze niż w przypadku przeciętnego laptopa w naszej bazie danych z tym samym Core i7-12700H CPU. Procesor jest o około 20-30% szybszy od nawet ostatniej generacji Core i9-11900H w obciążeniach wielowątkowych, ale wydajność jednowątkowa może być wolniejsza nawet o 10 procent
Aktualizacja do Core i9-12900H powinna zwiększyć wydajność tylko o około 5 procent w oparciu o nasze doświadczenia z modelemAlienware x15 R2. W związku z tym Core i7-12700H jest znacznie lepszą opcją pod względem wydajności za dolara
Trwałość wydajności jest doskonała i lepsza, niż w przypadkuDell Inspiron 16 Plus 7620 wyposażonym w ten sam procesor, co pokazuje nasz poniższy wykres porównania testów pętli CineBench R15 xT.
Cinebench R15 Multi Loop
Cinebench R23: Multi Core | Single Core
Cinebench R15: CPU Multi 64Bit | CPU Single 64Bit
Blender: v2.79 BMW27 CPU
7-Zip 18.03: 7z b 4 | 7z b 4 -mmt1
Geekbench 5.5: Multi-Core | Single-Core
HWBOT x265 Benchmark v2.2: 4k Preset
LibreOffice : 20 Documents To PDF
R Benchmark 2.5: Overall mean
| Cinebench R20 / CPU (Multi Core) | |
| Lenovo Legion 7 16IAX7-82TD004SGE | |
| Lenovo Legion 5 Pro 16IAH7H | |
| Alienware x17 R2 P48E | |
| Alienware x15 R2 P111F | |
| Dell G16 7620 | |
| Przeciętny Intel Core i7-12700H (1576 - 7407, n=64) | |
| Lenovo Legion 7 16ARHA7 | |
| Asus ROG Zephyrus M16 GU603H | |
| HP Victus 16-e0145ng | |
| Razer Blade 15 Advanced Model Early 2021 | |
| Acer Swift X SFX16-51G-5388 | |
| Cinebench R20 / CPU (Single Core) | |
| Lenovo Legion 7 16IAX7-82TD004SGE | |
| Alienware x15 R2 P111F | |
| Alienware x17 R2 P48E | |
| Przeciętny Intel Core i7-12700H (300 - 704, n=64) | |
| Lenovo Legion 5 Pro 16IAH7H | |
| Dell G16 7620 | |
| Lenovo Legion 7 16ARHA7 | |
| Asus ROG Zephyrus M16 GU603H | |
| Acer Swift X SFX16-51G-5388 | |
| HP Victus 16-e0145ng | |
| Razer Blade 15 Advanced Model Early 2021 | |
| Cinebench R23 / Multi Core | |
| Lenovo Legion 7 16IAX7-82TD004SGE | |
| Lenovo Legion 5 Pro 16IAH7H | |
| Alienware x17 R2 P48E | |
| Dell G16 7620 | |
| Alienware x15 R2 P111F | |
| Przeciętny Intel Core i7-12700H (4032 - 19330, n=64) | |
| Lenovo Legion 7 16ARHA7 | |
| HP Victus 16-e0145ng | |
| Razer Blade 15 Advanced Model Early 2021 | |
| Acer Swift X SFX16-51G-5388 | |
| Cinebench R23 / Single Core | |
| Lenovo Legion 7 16IAX7-82TD004SGE | |
| Alienware x17 R2 P48E | |
| Alienware x15 R2 P111F | |
| Przeciętny Intel Core i7-12700H (778 - 1826, n=63) | |
| Lenovo Legion 5 Pro 16IAH7H | |
| Dell G16 7620 | |
| Lenovo Legion 7 16ARHA7 | |
| HP Victus 16-e0145ng | |
| Acer Swift X SFX16-51G-5388 | |
| Razer Blade 15 Advanced Model Early 2021 | |
| Cinebench R15 / CPU Multi 64Bit | |
| Lenovo Legion 7 16IAX7-82TD004SGE | |
| Alienware x17 R2 P48E | |
| Lenovo Legion 5 Pro 16IAH7H | |
| Alienware x15 R2 P111F | |
| Dell G16 7620 | |
| Przeciętny Intel Core i7-12700H (1379 - 2916, n=70) | |
| Lenovo Legion 7 16ARHA7 | |
| Asus ROG Zephyrus M16 GU603H | |
| HP Victus 16-e0145ng | |
| Razer Blade 15 Advanced Model Early 2021 | |
| Acer Swift X SFX16-51G-5388 | |
| Cinebench R15 / CPU Single 64Bit | |
| Lenovo Legion 7 16IAX7-82TD004SGE | |
| Alienware x15 R2 P111F | |
| Alienware x17 R2 P48E | |
| Przeciętny Intel Core i7-12700H (113 - 263, n=65) | |
| Lenovo Legion 7 16ARHA7 | |
| Lenovo Legion 5 Pro 16IAH7H | |
| Dell G16 7620 | |
| Asus ROG Zephyrus M16 GU603H | |
| HP Victus 16-e0145ng | |
| Acer Swift X SFX16-51G-5388 | |
| Razer Blade 15 Advanced Model Early 2021 | |
| Blender / v2.79 BMW27 CPU | |
| Acer Swift X SFX16-51G-5388 | |
| Razer Blade 15 Advanced Model Early 2021 | |
| HP Victus 16-e0145ng | |
| Asus ROG Zephyrus M16 GU603H | |
| Przeciętny Intel Core i7-12700H (168 - 732, n=63) | |
| Lenovo Legion 7 16ARHA7 | |
| Alienware x15 R2 P111F | |
| Dell G16 7620 | |
| Alienware x17 R2 P48E | |
| Lenovo Legion 5 Pro 16IAH7H | |
| Lenovo Legion 7 16IAX7-82TD004SGE | |
| 7-Zip 18.03 / 7z b 4 | |
| Lenovo Legion 7 16IAX7-82TD004SGE | |
| Alienware x15 R2 P111F | |
| Lenovo Legion 5 Pro 16IAH7H | |
| Alienware x17 R2 P48E | |
| Dell G16 7620 | |
| Lenovo Legion 7 16ARHA7 | |
| Przeciętny Intel Core i7-12700H (22844 - 73067, n=63) | |
| Asus ROG Zephyrus M16 GU603H | |
| HP Victus 16-e0145ng | |
| Razer Blade 15 Advanced Model Early 2021 | |
| Acer Swift X SFX16-51G-5388 | |
| 7-Zip 18.03 / 7z b 4 -mmt1 | |
| Lenovo Legion 7 16IAX7-82TD004SGE | |
| Alienware x15 R2 P111F | |
| Alienware x17 R2 P48E | |
| Lenovo Legion 7 16ARHA7 | |
| Przeciętny Intel Core i7-12700H (2743 - 5972, n=63) | |
| Asus ROG Zephyrus M16 GU603H | |
| Lenovo Legion 5 Pro 16IAH7H | |
| HP Victus 16-e0145ng | |
| Dell G16 7620 | |
| Razer Blade 15 Advanced Model Early 2021 | |
| Acer Swift X SFX16-51G-5388 | |
| Geekbench 5.5 / Multi-Core | |
| Lenovo Legion 7 16IAX7-82TD004SGE | |
| Alienware x15 R2 P111F | |
| Alienware x17 R2 P48E | |
| Lenovo Legion 5 Pro 16IAH7H | |
| Dell G16 7620 | |
| Przeciętny Intel Core i7-12700H (5144 - 13745, n=64) | |
| Lenovo Legion 7 16ARHA7 | |
| Asus ROG Zephyrus M16 GU603H | |
| HP Victus 16-e0145ng | |
| Razer Blade 15 Advanced Model Early 2021 | |
| Acer Swift X SFX16-51G-5388 | |
| Geekbench 5.5 / Single-Core | |
| Alienware x17 R2 P48E | |
| Lenovo Legion 7 16IAX7-82TD004SGE | |
| Alienware x15 R2 P111F | |
| Przeciętny Intel Core i7-12700H (803 - 1851, n=64) | |
| Lenovo Legion 5 Pro 16IAH7H | |
| Dell G16 7620 | |
| Asus ROG Zephyrus M16 GU603H | |
| Lenovo Legion 7 16ARHA7 | |
| Acer Swift X SFX16-51G-5388 | |
| HP Victus 16-e0145ng | |
| Razer Blade 15 Advanced Model Early 2021 | |
| HWBOT x265 Benchmark v2.2 / 4k Preset | |
| Lenovo Legion 7 16IAX7-82TD004SGE | |
| Alienware x17 R2 P48E | |
| Lenovo Legion 5 Pro 16IAH7H | |
| Alienware x15 R2 P111F | |
| Dell G16 7620 | |
| Lenovo Legion 7 16ARHA7 | |
| Przeciętny Intel Core i7-12700H (4.67 - 21.8, n=64) | |
| Asus ROG Zephyrus M16 GU603H | |
| HP Victus 16-e0145ng | |
| Razer Blade 15 Advanced Model Early 2021 | |
| Acer Swift X SFX16-51G-5388 | |
| LibreOffice / 20 Documents To PDF | |
| HP Victus 16-e0145ng | |
| Razer Blade 15 Advanced Model Early 2021 | |
| Lenovo Legion 7 16ARHA7 | |
| Dell G16 7620 | |
| Acer Swift X SFX16-51G-5388 | |
| Alienware x15 R2 P111F | |
| Przeciętny Intel Core i7-12700H (34.2 - 95.3, n=63) | |
| Alienware x17 R2 P48E | |
| Asus ROG Zephyrus M16 GU603H | |
| Lenovo Legion 5 Pro 16IAH7H | |
| Lenovo Legion 7 16IAX7-82TD004SGE | |
| R Benchmark 2.5 / Overall mean | |
| Acer Swift X SFX16-51G-5388 | |
| Razer Blade 15 Advanced Model Early 2021 | |
| Asus ROG Zephyrus M16 GU603H | |
| HP Victus 16-e0145ng | |
| Dell G16 7620 | |
| Lenovo Legion 7 16ARHA7 | |
| Lenovo Legion 5 Pro 16IAH7H | |
| Przeciętny Intel Core i7-12700H (0.4441 - 1.052, n=63) | |
| Alienware x15 R2 P111F | |
| Alienware x17 R2 P48E | |
| Lenovo Legion 7 16IAX7-82TD004SGE | |
* ... im mniej tym lepiej
AIDA64: FP32 Ray-Trace | FPU Julia | CPU SHA3 | CPU Queen | FPU SinJulia | FPU Mandel | CPU AES | CPU ZLib | FP64 Ray-Trace | CPU PhotoWorxx
| Performance rating | |
| Lenovo Legion 7 16ARHA7 | |
| Dell G16 7620 | |
| Lenovo Legion 5 Pro 16IAH7H | |
| Przeciętny Intel Core i7-12700H | |
| HP Victus 16-e0145ng | |
| Acer Swift X SFX16-51G-5388 | |
| Asus ROG Zephyrus M16 GU603H -9! | |
| AIDA64 / FP32 Ray-Trace | |
| Lenovo Legion 7 16ARHA7 | |
| Dell G16 7620 | |
| Lenovo Legion 5 Pro 16IAH7H | |
| Lenovo Legion 5 Pro 16IAH7H | |
| HP Victus 16-e0145ng | |
| Przeciętny Intel Core i7-12700H (2585 - 17957, n=64) | |
| Acer Swift X SFX16-51G-5388 | |
| AIDA64 / FPU Julia | |
| Lenovo Legion 7 16ARHA7 | |
| Dell G16 7620 | |
| Lenovo Legion 5 Pro 16IAH7H | |
| Lenovo Legion 5 Pro 16IAH7H | |
| HP Victus 16-e0145ng | |
| Przeciętny Intel Core i7-12700H (12439 - 90760, n=64) | |
| Acer Swift X SFX16-51G-5388 | |
| AIDA64 / CPU SHA3 | |
| Dell G16 7620 | |
| Lenovo Legion 7 16ARHA7 | |
| Lenovo Legion 5 Pro 16IAH7H | |
| Lenovo Legion 5 Pro 16IAH7H | |
| Przeciętny Intel Core i7-12700H (833 - 4242, n=64) | |
| HP Victus 16-e0145ng | |
| Acer Swift X SFX16-51G-5388 | |
| AIDA64 / CPU Queen | |
| Lenovo Legion 7 16ARHA7 | |
| Dell G16 7620 | |
| Lenovo Legion 5 Pro 16IAH7H | |
| Przeciętny Intel Core i7-12700H (57923 - 103202, n=63) | |
| HP Victus 16-e0145ng | |
| Acer Swift X SFX16-51G-5388 | |
| AIDA64 / FPU SinJulia | |
| Lenovo Legion 7 16ARHA7 | |
| Lenovo Legion 5 Pro 16IAH7H | |
| Lenovo Legion 5 Pro 16IAH7H | |
| Dell G16 7620 | |
| Przeciętny Intel Core i7-12700H (3249 - 9939, n=64) | |
| HP Victus 16-e0145ng | |
| Acer Swift X SFX16-51G-5388 | |
| AIDA64 / FPU Mandel | |
| Lenovo Legion 7 16ARHA7 | |
| HP Victus 16-e0145ng | |
| Lenovo Legion 5 Pro 16IAH7H | |
| Lenovo Legion 5 Pro 16IAH7H | |
| Dell G16 7620 | |
| Przeciętny Intel Core i7-12700H (7135 - 44760, n=64) | |
| Acer Swift X SFX16-51G-5388 | |
| AIDA64 / CPU AES | |
| Lenovo Legion 7 16ARHA7 | |
| Lenovo Legion 5 Pro 16IAH7H | |
| Lenovo Legion 5 Pro 16IAH7H | |
| Przeciętny Intel Core i7-12700H (31839 - 144360, n=64) | |
| Dell G16 7620 | |
| Acer Swift X SFX16-51G-5388 | |
| HP Victus 16-e0145ng | |
| AIDA64 / CPU ZLib | |
| Lenovo Legion 5 Pro 16IAH7H | |
| Lenovo Legion 5 Pro 16IAH7H | |
| Dell G16 7620 | |
| Przeciętny Intel Core i7-12700H (305 - 1171, n=64) | |
| Lenovo Legion 7 16ARHA7 | |
| HP Victus 16-e0145ng | |
| Acer Swift X SFX16-51G-5388 | |
| Asus ROG Zephyrus M16 GU603H | |
| AIDA64 / FP64 Ray-Trace | |
| Lenovo Legion 7 16ARHA7 | |
| Dell G16 7620 | |
| Lenovo Legion 5 Pro 16IAH7H | |
| Lenovo Legion 5 Pro 16IAH7H | |
| HP Victus 16-e0145ng | |
| Przeciętny Intel Core i7-12700H (1437 - 9692, n=64) | |
| Acer Swift X SFX16-51G-5388 | |
| AIDA64 / CPU PhotoWorxx | |
| Acer Swift X SFX16-51G-5388 | |
| Dell G16 7620 | |
| Lenovo Legion 5 Pro 16IAH7H | |
| Lenovo Legion 5 Pro 16IAH7H | |
| Przeciętny Intel Core i7-12700H (12863 - 52207, n=64) | |
| Lenovo Legion 7 16ARHA7 | |
| HP Victus 16-e0145ng | |
Wydajność systemu
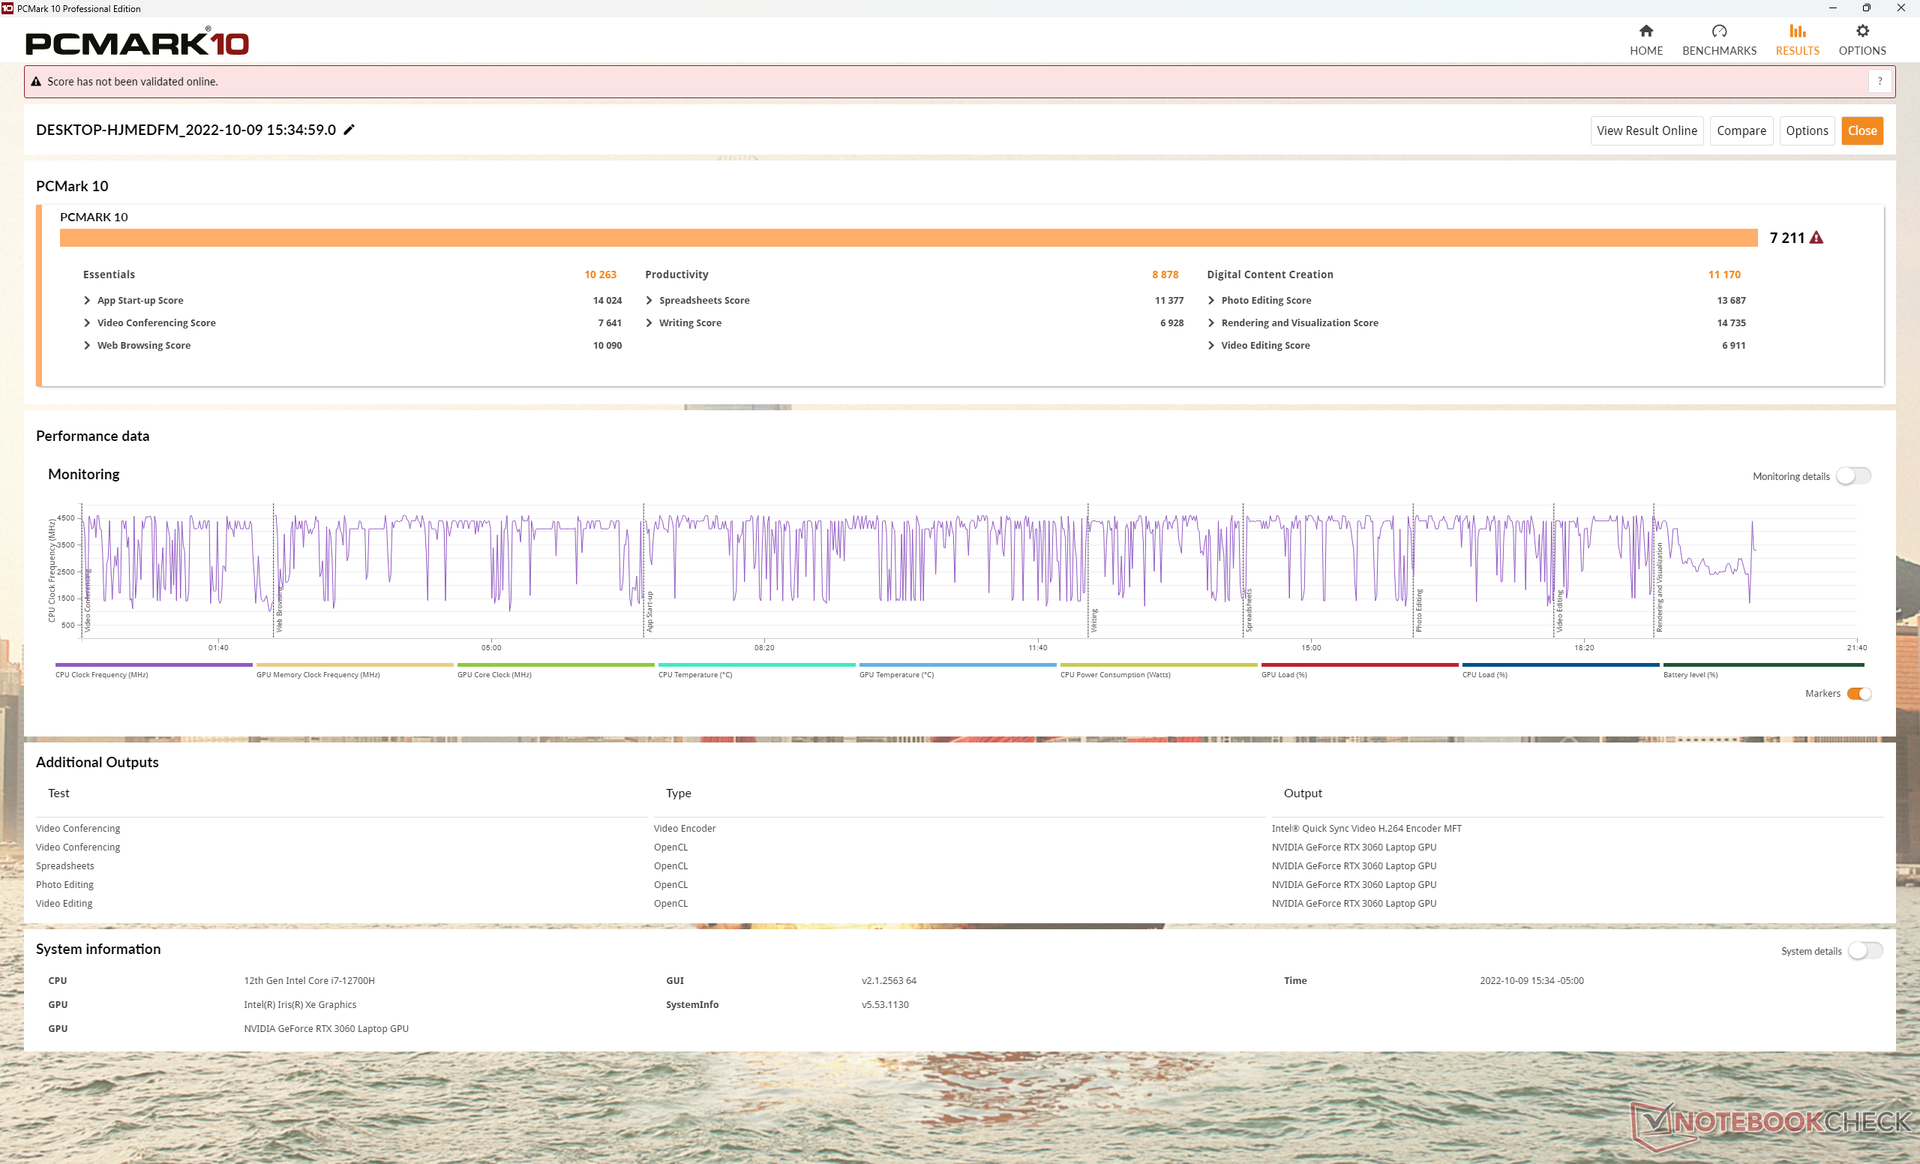
Wyniki PCMark mieszczą się w granicach kilku punktów procentowych od innych laptopów z tym samym procesorem Core i7-12700H i kartą grafiki RTX 3060. Wyniki są też średnio wyższe, niż w przypadku zeszłorocznego Alienware m15 R5 z tym samym GPU, ale wolniejszym AMD Ryzen 7 5800H.
CrossMark: Overall | Productivity | Creativity | Responsiveness
| PCMark 10 / Score | |
| Lenovo Legion 5 Pro 16IAH7H | |
| Lenovo Legion 7 16ARHA7 | |
| Przeciętny Intel Core i7-12700H, NVIDIA GeForce RTX 3060 Laptop GPU (5986 - 8156, n=12) | |
| Dell G16 7620 | |
| Asus ROG Zephyrus M16 GU603H | |
| HP Victus 16-e0145ng | |
| Acer Swift X SFX16-51G-5388 | |
| PCMark 10 / Essentials | |
| Lenovo Legion 5 Pro 16IAH7H | |
| Przeciętny Intel Core i7-12700H, NVIDIA GeForce RTX 3060 Laptop GPU (9289 - 12144, n=12) | |
| Asus ROG Zephyrus M16 GU603H | |
| Lenovo Legion 7 16ARHA7 | |
| Dell G16 7620 | |
| HP Victus 16-e0145ng | |
| Acer Swift X SFX16-51G-5388 | |
| PCMark 10 / Productivity | |
| Lenovo Legion 5 Pro 16IAH7H | |
| Przeciętny Intel Core i7-12700H, NVIDIA GeForce RTX 3060 Laptop GPU (6161 - 10362, n=12) | |
| Asus ROG Zephyrus M16 GU603H | |
| Lenovo Legion 7 16ARHA7 | |
| Dell G16 7620 | |
| Acer Swift X SFX16-51G-5388 | |
| HP Victus 16-e0145ng | |
| PCMark 10 / Digital Content Creation | |
| Lenovo Legion 7 16ARHA7 | |
| Lenovo Legion 5 Pro 16IAH7H | |
| Dell G16 7620 | |
| Przeciętny Intel Core i7-12700H, NVIDIA GeForce RTX 3060 Laptop GPU (8950 - 12554, n=12) | |
| Asus ROG Zephyrus M16 GU603H | |
| HP Victus 16-e0145ng | |
| Acer Swift X SFX16-51G-5388 | |
| CrossMark / Overall | |
| Przeciętny Intel Core i7-12700H, NVIDIA GeForce RTX 3060 Laptop GPU (1649 - 2017, n=11) | |
| Dell G16 7620 | |
| Lenovo Legion 5 Pro 16IAH7H | |
| Lenovo Legion 7 16ARHA7 | |
| Acer Swift X SFX16-51G-5388 | |
| CrossMark / Productivity | |
| Przeciętny Intel Core i7-12700H, NVIDIA GeForce RTX 3060 Laptop GPU (1536 - 1958, n=11) | |
| Lenovo Legion 5 Pro 16IAH7H | |
| Dell G16 7620 | |
| Lenovo Legion 7 16ARHA7 | |
| Acer Swift X SFX16-51G-5388 | |
| CrossMark / Creativity | |
| Przeciętny Intel Core i7-12700H, NVIDIA GeForce RTX 3060 Laptop GPU (1816 - 2084, n=11) | |
| Dell G16 7620 | |
| Lenovo Legion 5 Pro 16IAH7H | |
| Lenovo Legion 7 16ARHA7 | |
| Acer Swift X SFX16-51G-5388 | |
| CrossMark / Responsiveness | |
| Lenovo Legion 5 Pro 16IAH7H | |
| Przeciętny Intel Core i7-12700H, NVIDIA GeForce RTX 3060 Laptop GPU (1210 - 2207, n=11) | |
| Dell G16 7620 | |
| Lenovo Legion 7 16ARHA7 | |
| Acer Swift X SFX16-51G-5388 | |
| PCMark 10 Score | 7211 pkt. | |
Pomoc | ||
| AIDA64 / Memory Copy | |
| Acer Swift X SFX16-51G-5388 | |
| Lenovo Legion 5 Pro 16IAH7H | |
| Lenovo Legion 5 Pro 16IAH7H | |
| Dell G16 7620 | |
| Przeciętny Intel Core i7-12700H (25615 - 80511, n=64) | |
| Lenovo Legion 7 16ARHA7 | |
| HP Victus 16-e0145ng | |
| AIDA64 / Memory Read | |
| Dell G16 7620 | |
| Lenovo Legion 5 Pro 16IAH7H | |
| Lenovo Legion 5 Pro 16IAH7H | |
| Przeciętny Intel Core i7-12700H (25586 - 79442, n=64) | |
| Acer Swift X SFX16-51G-5388 | |
| Lenovo Legion 7 16ARHA7 | |
| HP Victus 16-e0145ng | |
| AIDA64 / Memory Write | |
| Acer Swift X SFX16-51G-5388 | |
| Lenovo Legion 5 Pro 16IAH7H | |
| Lenovo Legion 5 Pro 16IAH7H | |
| Dell G16 7620 | |
| Lenovo Legion 7 16ARHA7 | |
| Przeciętny Intel Core i7-12700H (23679 - 88660, n=64) | |
| HP Victus 16-e0145ng | |
| AIDA64 / Memory Latency | |
| Lenovo Legion 5 Pro 16IAH7H | |
| Lenovo Legion 5 Pro 16IAH7H | |
| Acer Swift X SFX16-51G-5388 | |
| Dell G16 7620 | |
| Lenovo Legion 7 16ARHA7 | |
| Przeciętny Intel Core i7-12700H (76.2 - 133.9, n=62) | |
| HP Victus 16-e0145ng | |
| Asus ROG Zephyrus M16 GU603H | |
* ... im mniej tym lepiej
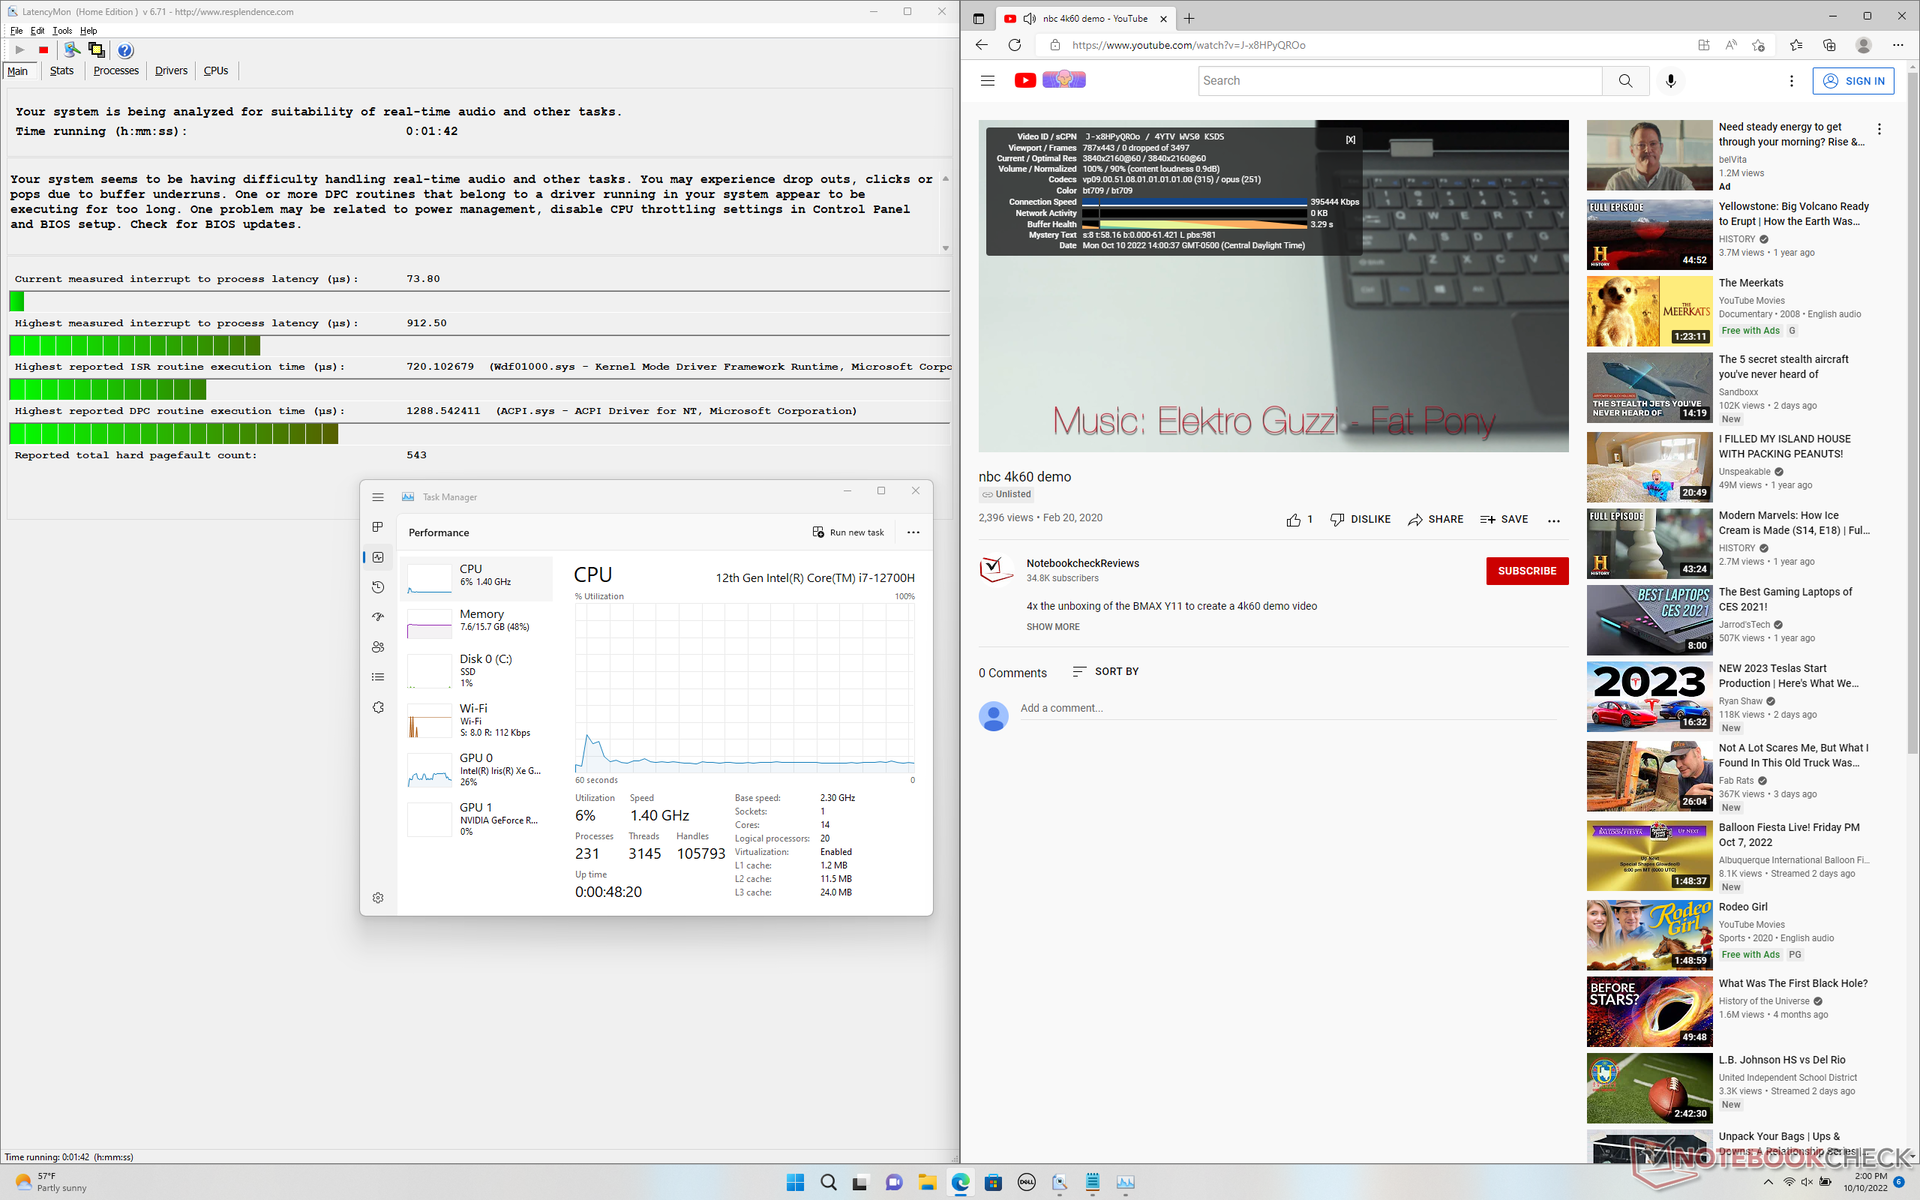
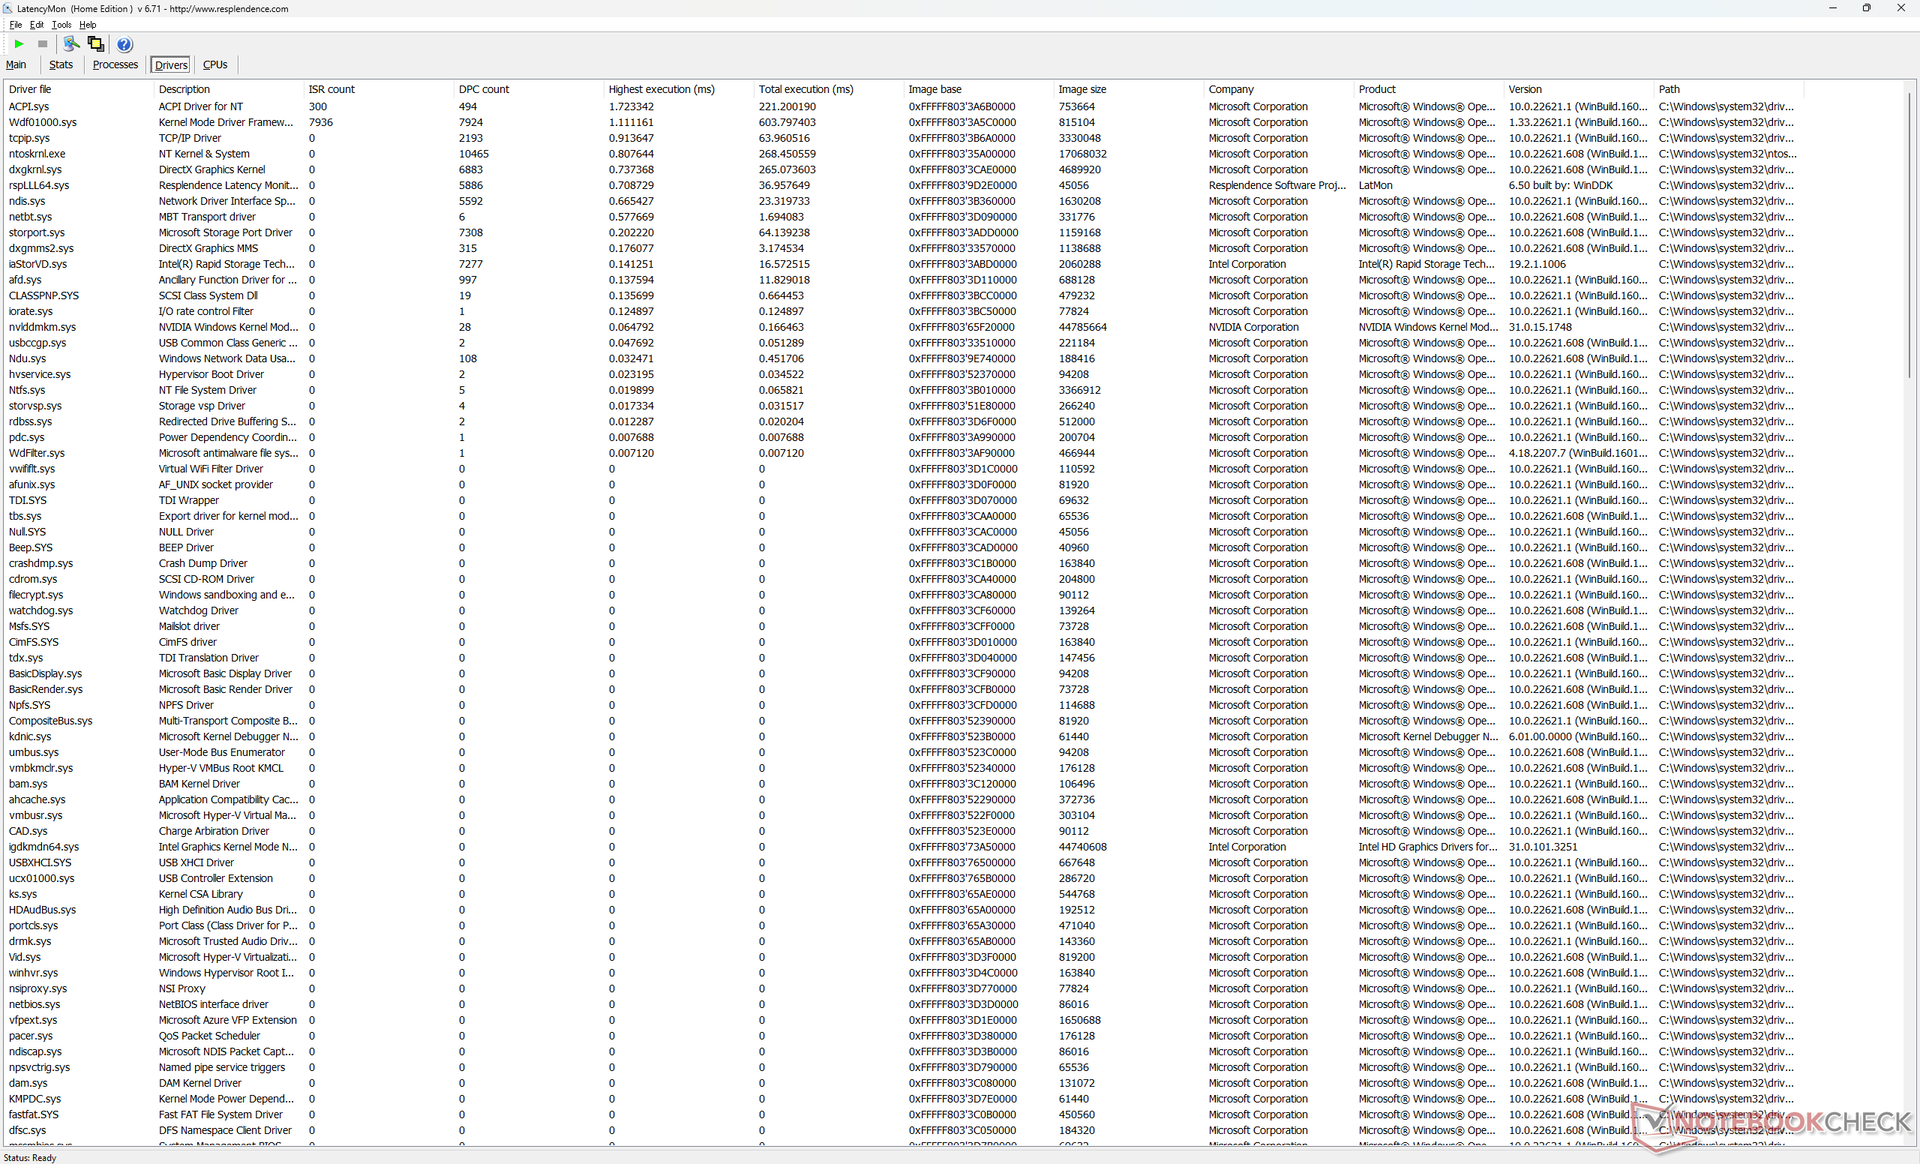
Opóźnienie DPC
LatencyMon ujawnia niewielkie problemy z DPC podczas otwierania wielu kart przeglądarki na naszej stronie głównej. odtwarzanie wideo w rozdzielczości 4K przy 60 FPS jest poza tym perfekcyjne i nie ma żadnych opuszczonych klatek.
| DPC Latencies / LatencyMon - interrupt to process latency (max), Web, Youtube, Prime95 | |
| Acer Swift X SFX16-51G-5388 | |
| Lenovo Legion 7 16ARHA7 | |
| Asus ROG Zephyrus M16 GU603H | |
| Dell G16 7620 | |
| HP Victus 16-e0145ng | |
| Lenovo Legion 5 Pro 16IAH7H | |
* ... im mniej tym lepiej
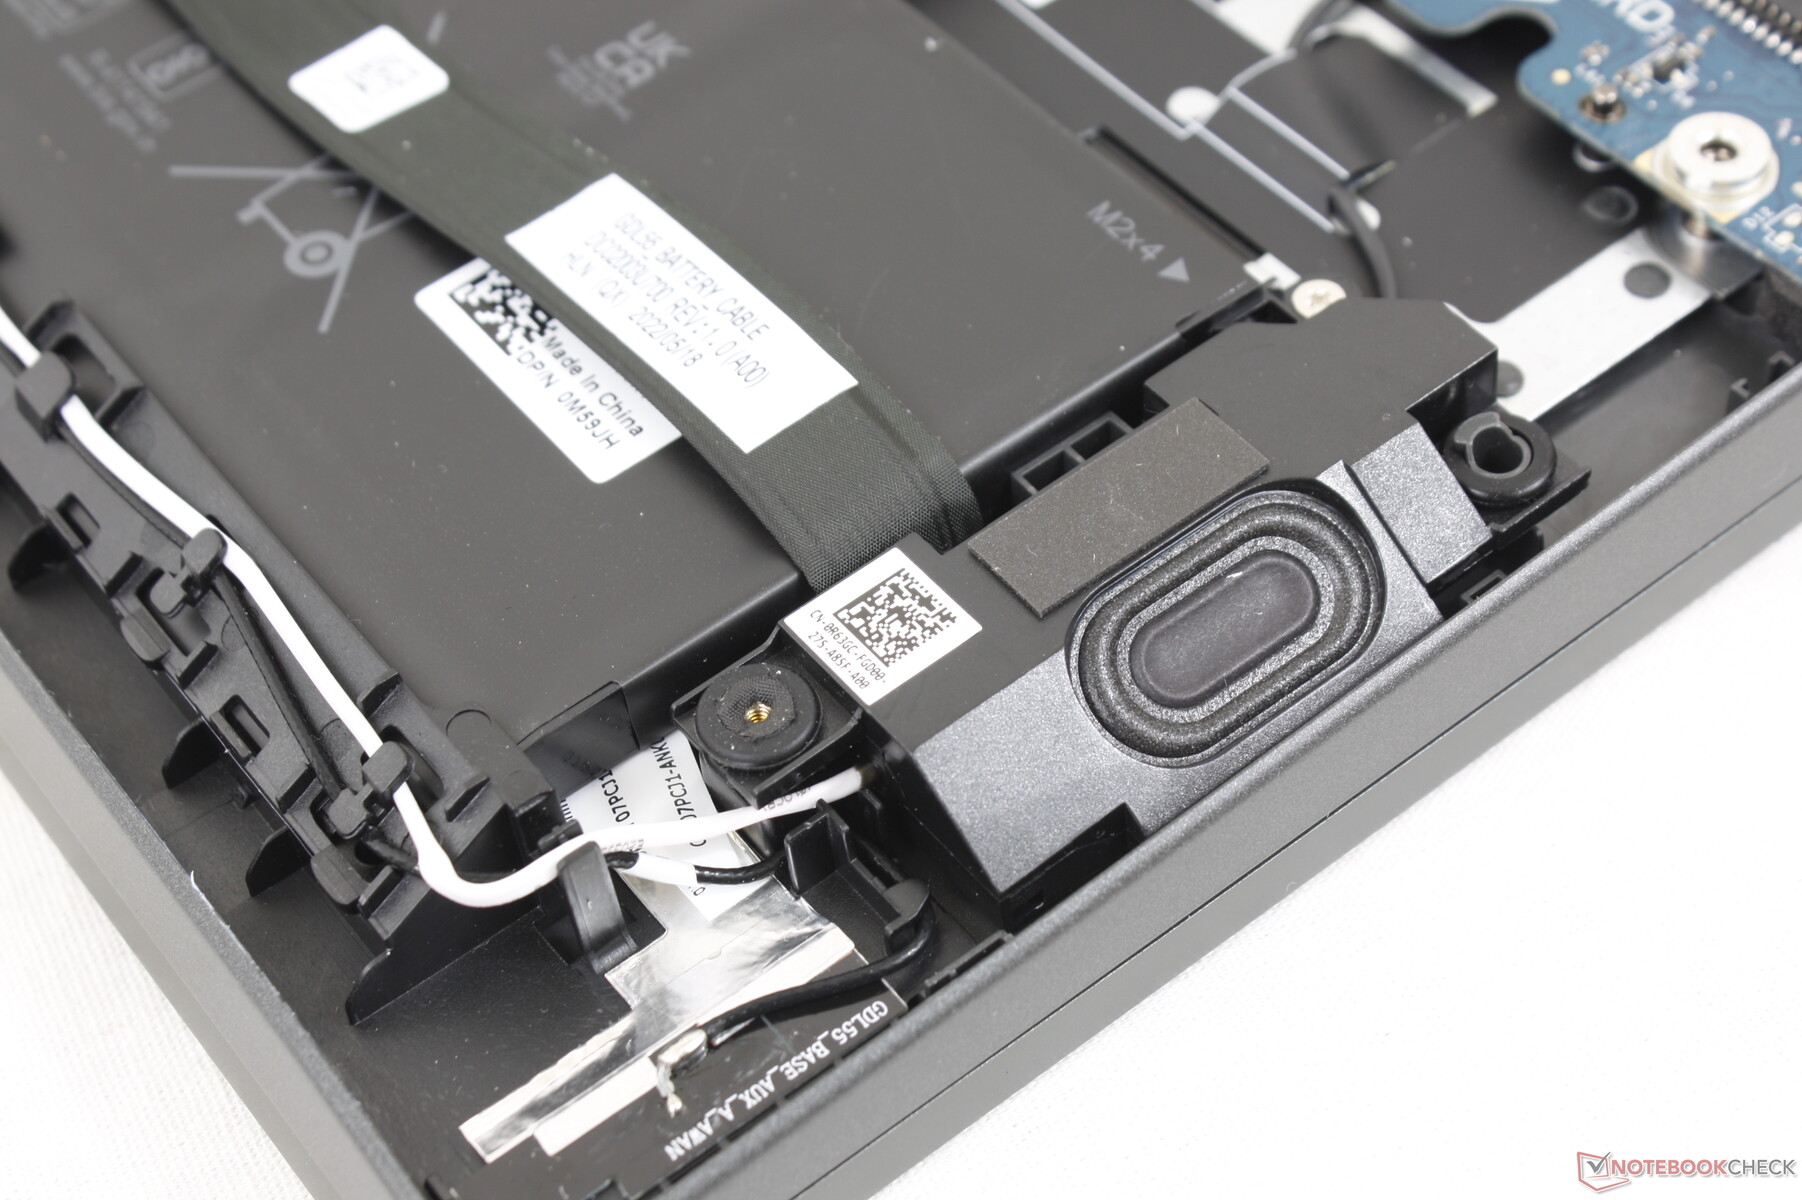
Urządzenia do przechowywania danych
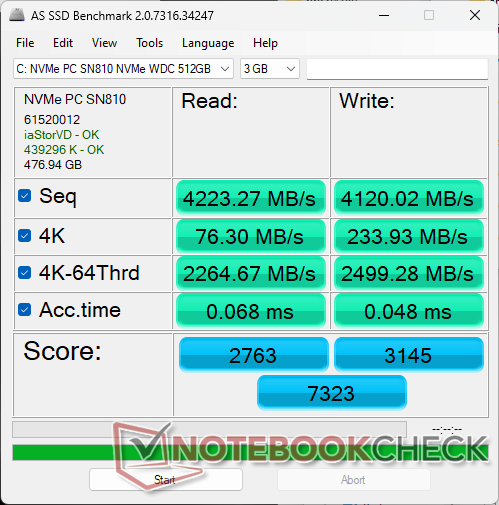
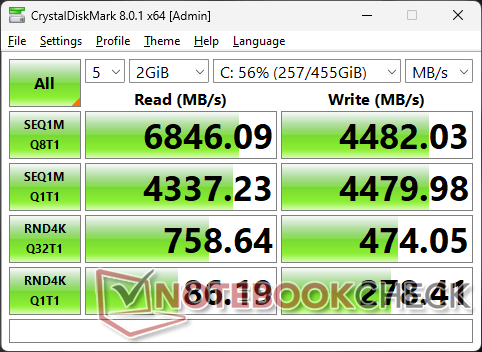
Płyta główna ma miejsce na maksymalnie dwa dyski SSD M.2 2280, co pokazują nasze zdjęcia poniżej. Jednak wszystkie konfiguracje są obecnie dostarczane z usuniętym drugim złączem, co oznacza, że G16 może obsługiwać tylko jeden wewnętrzny dysk SSD M.2 2280
Nasz egzemplarz testowy jest dostarczany z modelem z wyższej półki cenowej WDC PC SN810 PCIe4 x4 NVMe SSD zapewniający teoretyczną szybkość sekwencyjnego odczytu i zapisu na poziomie odpowiednio do 6000 MB/s i 4000 MB/s, według producenta. Dysk w naszym egzemplarzu jest w stanie osiągnąć 6700 MB/s, ale nie jest w stanie utrzymać tak szybkich prędkości przez dłuższy czas. Na przykład podczas pracy w pętli DiskSpd, prędkość odczytu spadła do 3500 MB/s.

| Drive Performance rating - Percent | |
| Lenovo Legion 5 Pro 16IAH7H | |
| Asus ROG Zephyrus M16 GU603H | |
| Dell G16 7620 | |
| Lenovo Legion 7 16ARHA7 | |
| HP Victus 16-e0145ng | |
| Acer Swift X SFX16-51G-5388 | |
* ... im mniej tym lepiej
Disk Throttling: DiskSpd Read Loop, Queue Depth 8
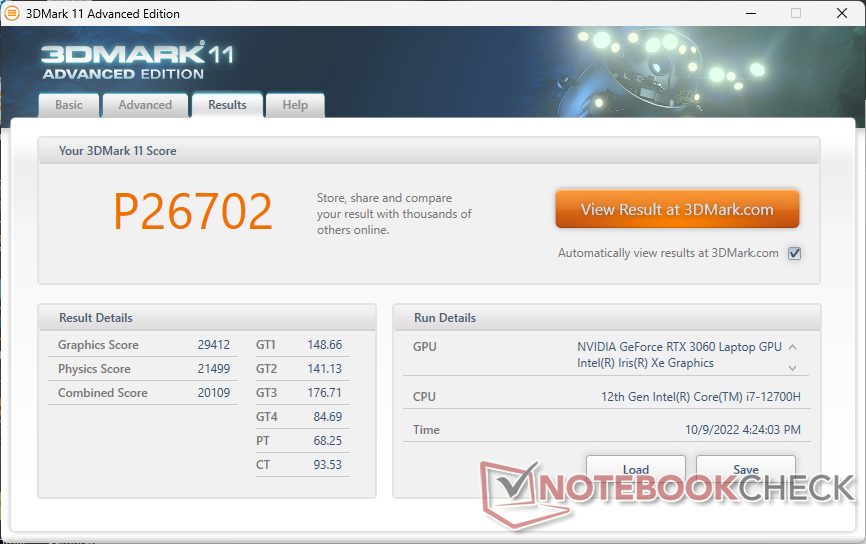
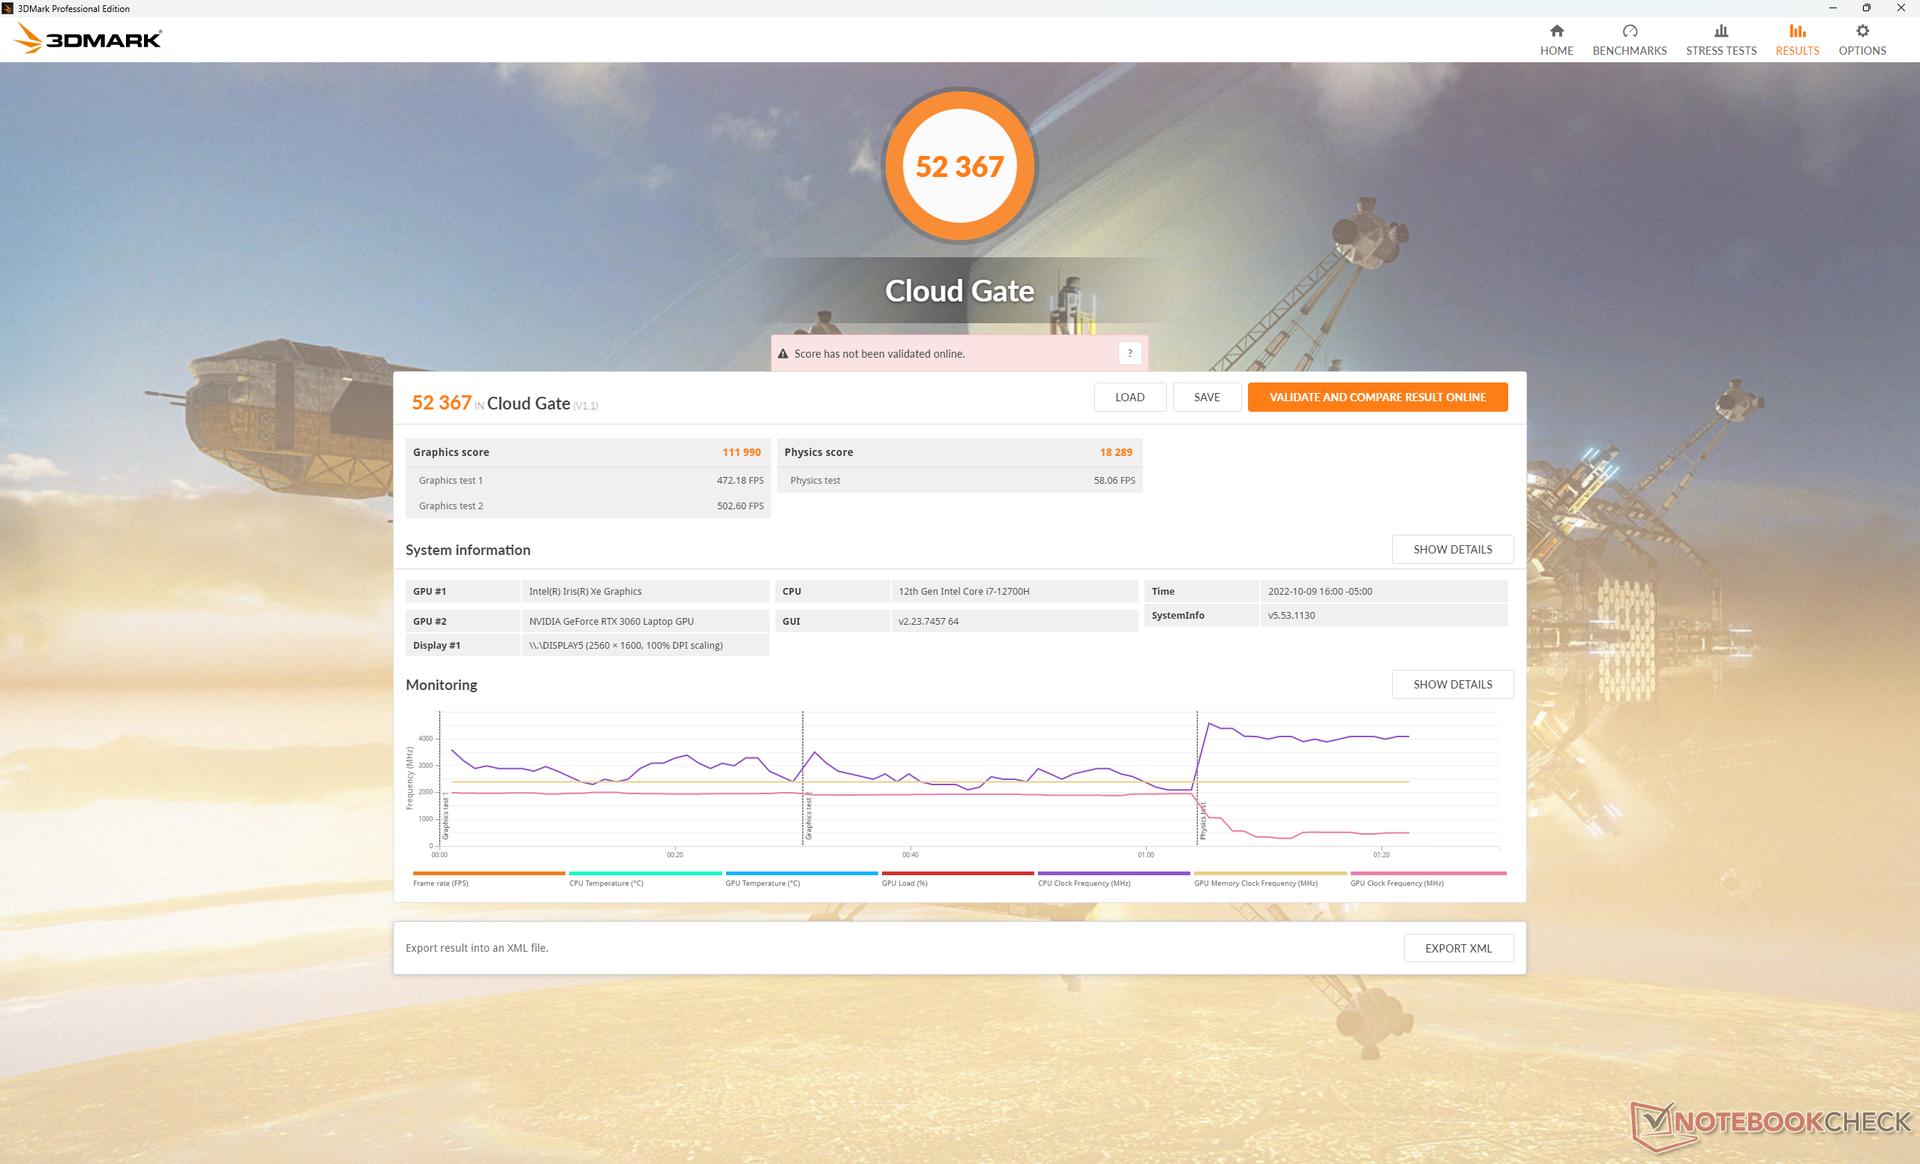
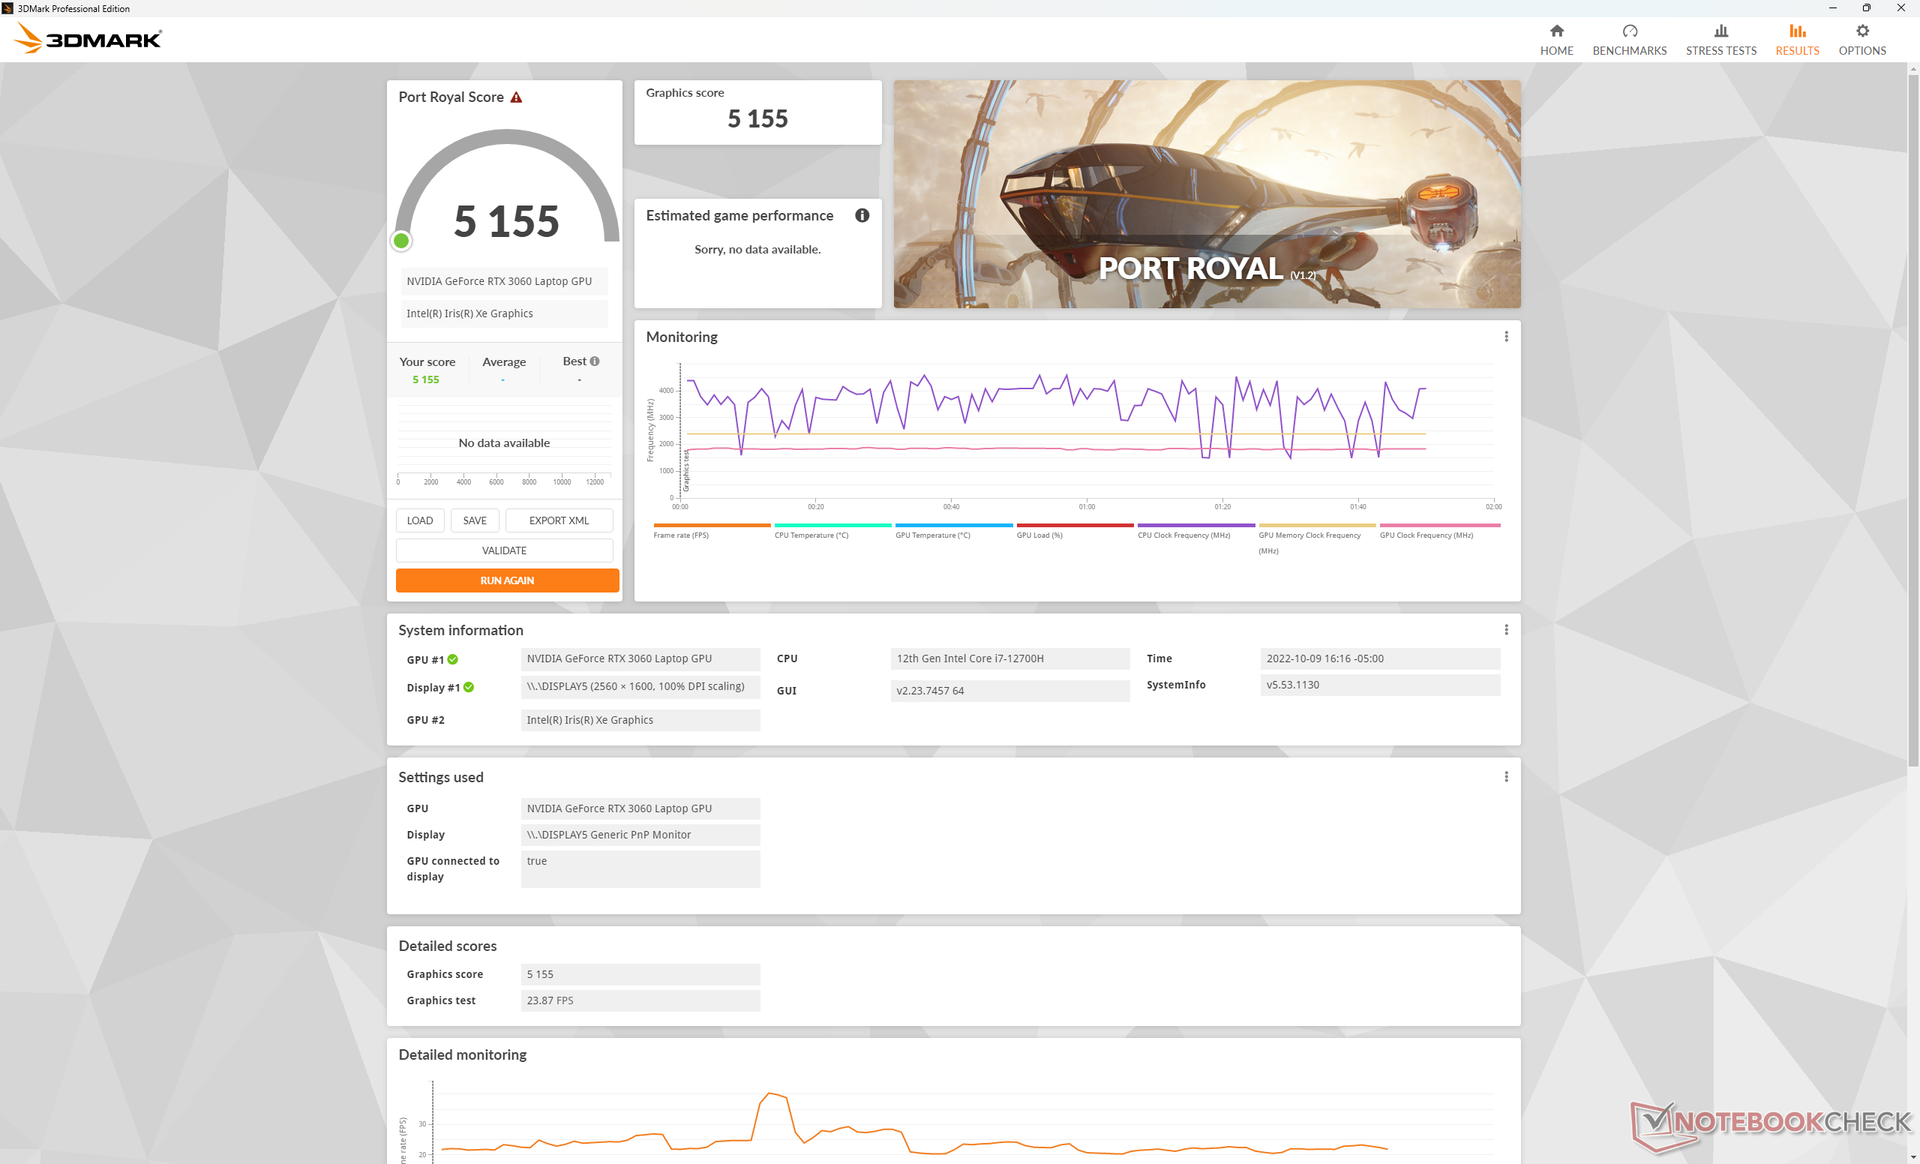
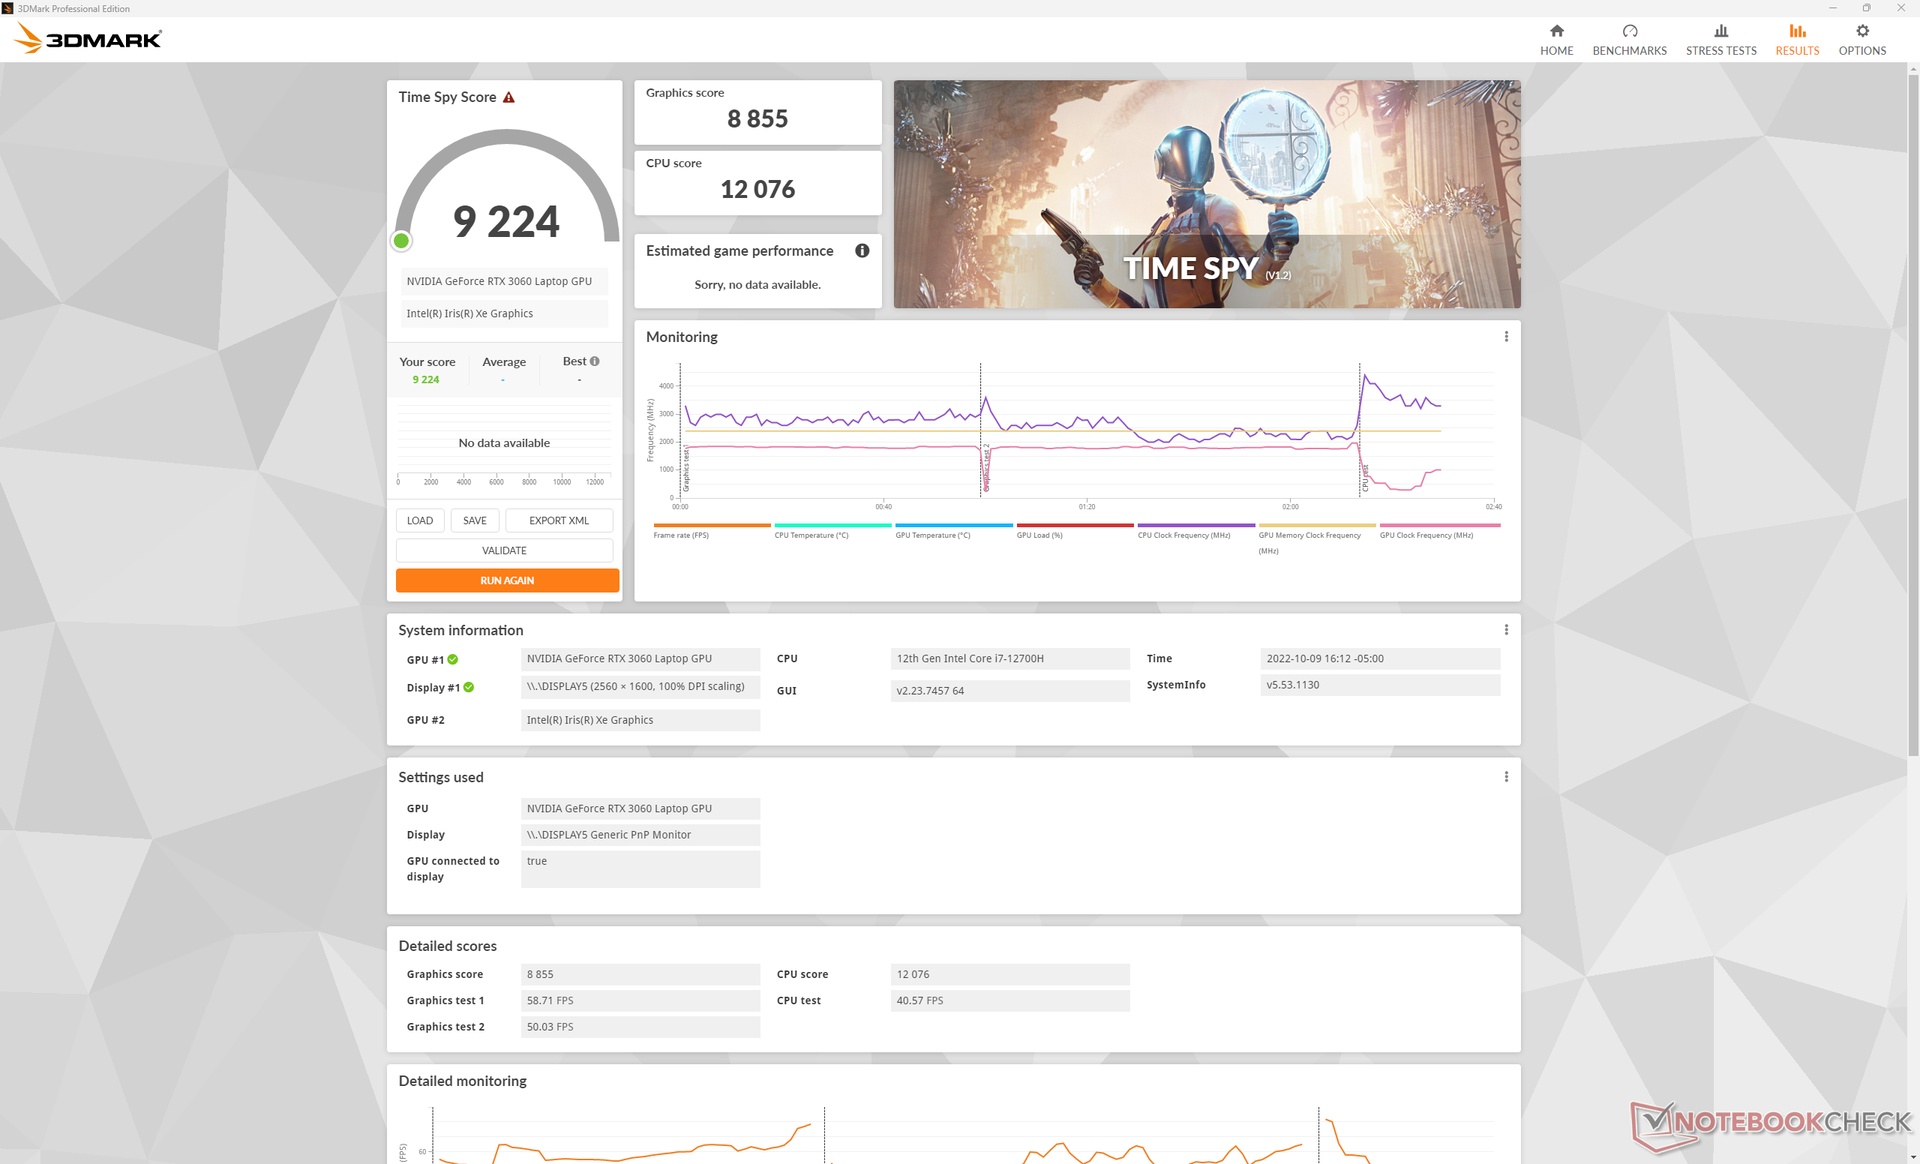
Wydajność GPU - 130 W TGP Graphics
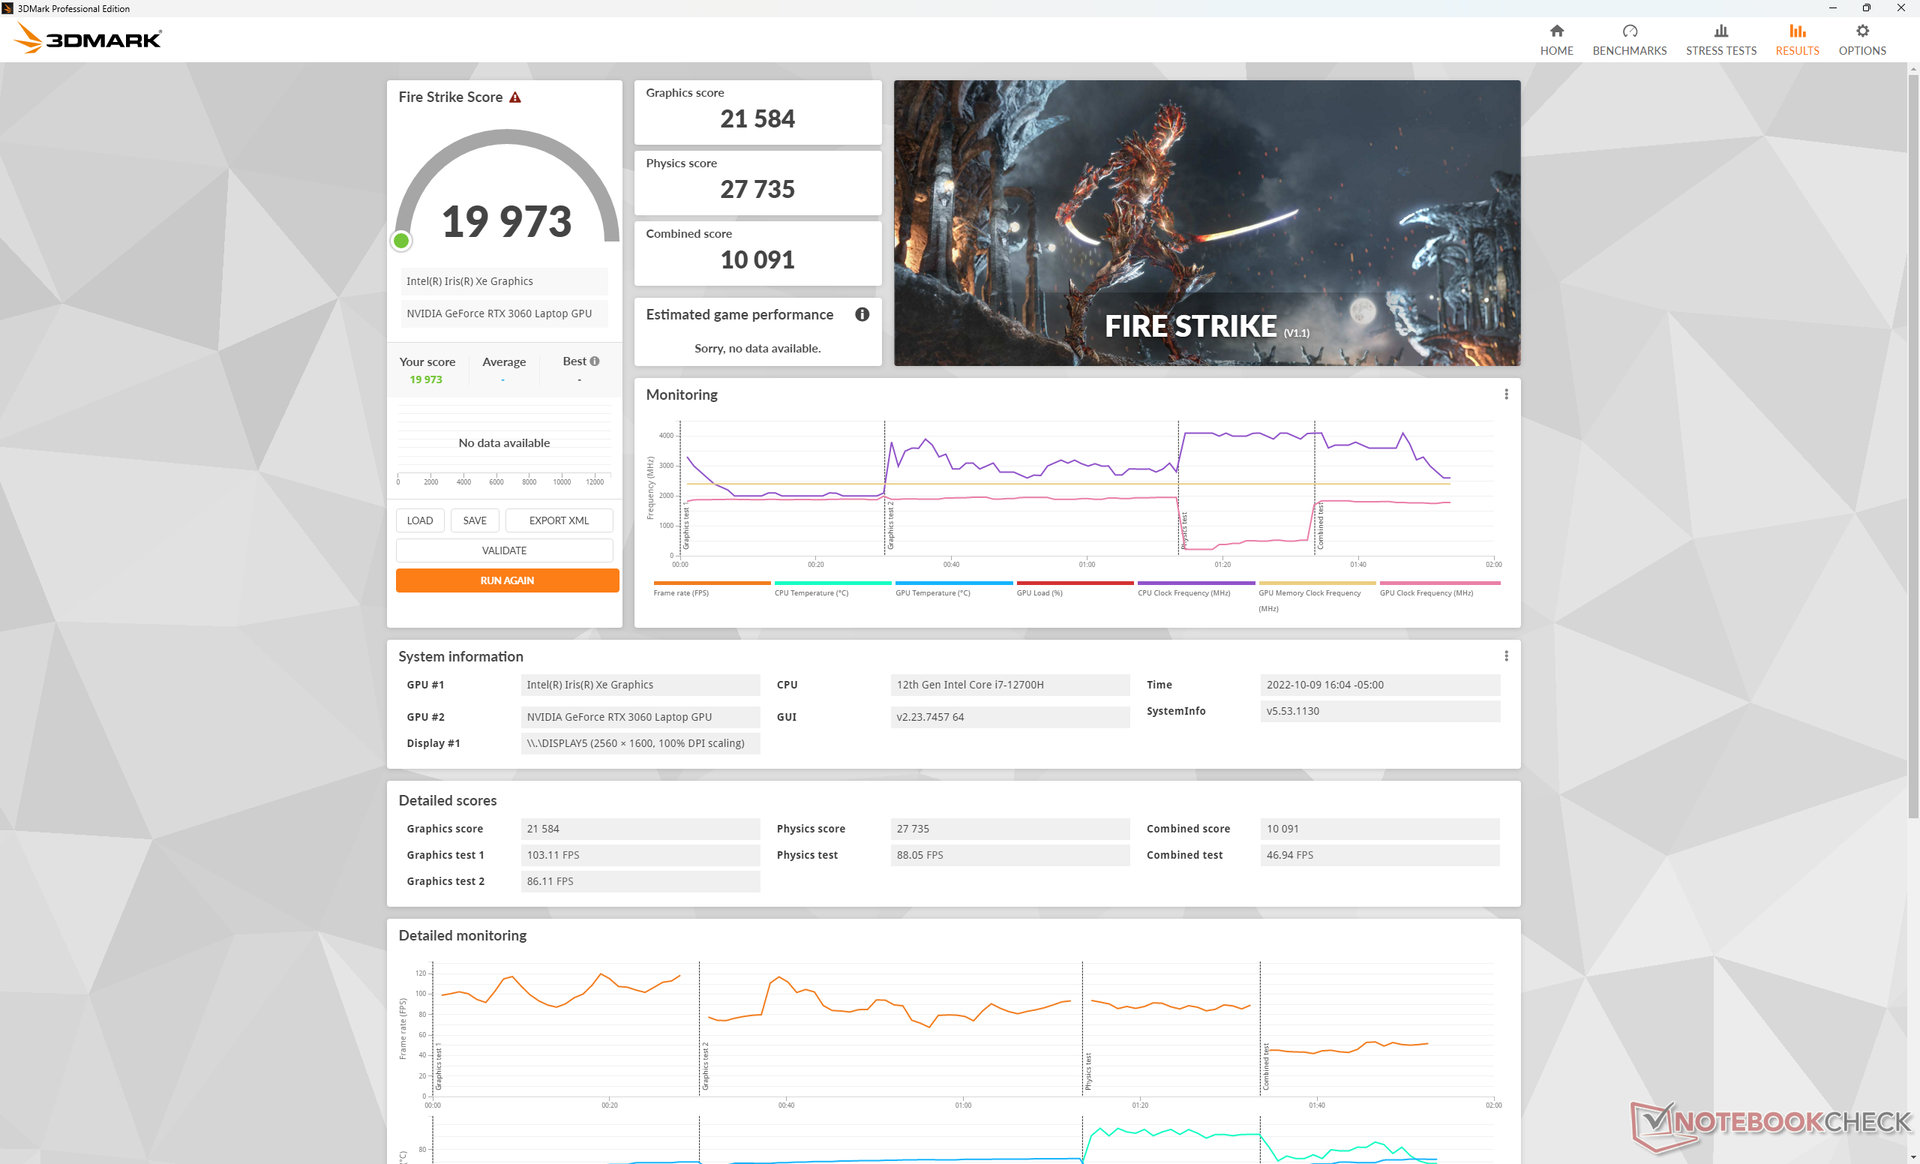
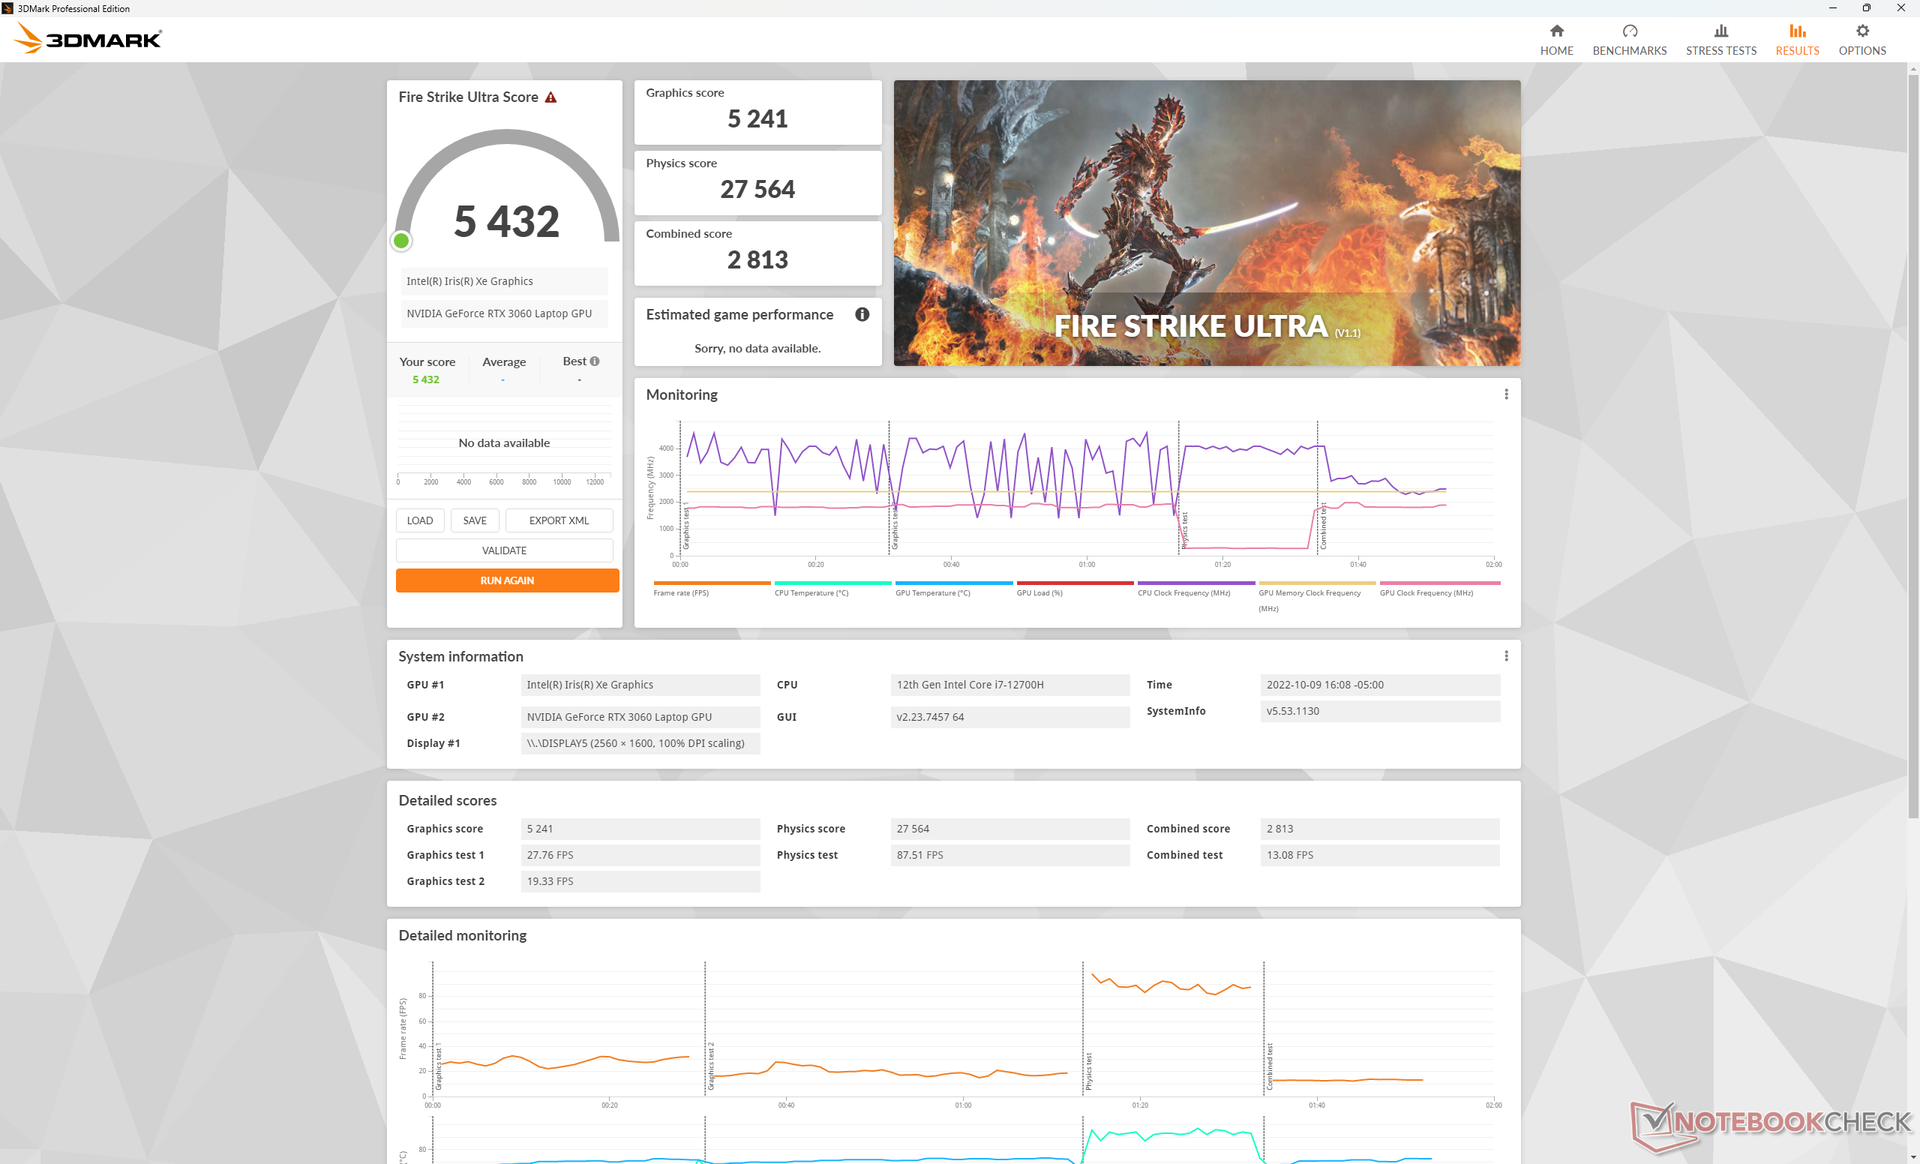
Wydajność graficzna jest doskonała z wynikami, które są o 5 do 10 procent szybsze niż w przypadku przeciętnego laptopa w naszej bazie danych wyposażonego w ten sam GeForce RTX 3060 GPU. Ogólna wydajność mieści się teraz w granicach 10 procent właściwego desktopowego RTX 3060. Wynika to częściowo z docelowej mocy 130 W TGP w Dellu G16, który znajduje się na wyższym końcu spektrum, jeśli chodzi o laptopy do gier.
Aktualizacja do RTX 3070 Ti ma zwiększyć wydajność grafiki o około 20-30%, podczas gdy obniżenie konfiguracji do RTX 3050 Ti obniży wydajność o około 30 do 35 procent.
Uruchomienie trybu Optimized zamiast trybu Ultra Performance ma bardzo niewielki wpływ na wydajność. Test Fire Strike w trybie Optimized przyniósłby wyniki w zakresie fizyki i grafiki na poziomie odpowiednio 26289 i 21492 punktów, w porównaniu do 27735 i 21584 punktów w trybie Ultra Performance.
| 3DMark 11 - 1280x720 Performance GPU | |
| Lenovo Legion 7 16IAX7-82TD004SGE | |
| Lenovo Legion 7 16ARHA7 | |
| Schenker XMG Neo 15 (Ryzen 9 6900HX, RTX 3070 Ti) | |
| Razer Blade 15 Advanced Model Early 2021 | |
| Lenovo Legion 5 Pro 16IAH7H | |
| Dell G16 7620 | |
| Inno3D GeForce RTX 3060 Twin X2 | |
| Przeciętny NVIDIA GeForce RTX 3060 Laptop GPU (13799 - 30772, n=43) | |
| Asus ROG Zephyrus M16 GU603H | |
| HP Victus 16-e0145ng | |
| Acer Swift X SFX16-51G-5388 | |
| 3DMark 11 Performance | 26702 pkt. | |
| 3DMark Cloud Gate Standard Score | 52367 pkt. | |
| 3DMark Fire Strike Score | 19973 pkt. | |
| 3DMark Time Spy Score | 9224 pkt. | |
Pomoc | ||
| Blender | |
| v3.3 Classroom HIP/AMD | |
| Lenovo Legion 7 16ARHA7 | |
| v3.3 Classroom OPTIX/RTX | |
| Lenovo Legion 5 Pro 16IAH7H | |
| Lenovo Legion 5 Pro 16IAH7H | |
| Dell G16 7620 | |
| Lenovo Legion 7 16IAX7-82TD004SGE | |
| v3.3 Classroom CUDA | |
| Acer Swift X SFX16-51G-5388 | |
| Lenovo Legion 5 Pro 16IAH7H | |
| Lenovo Legion 5 Pro 16IAH7H | |
| Dell G16 7620 | |
| Lenovo Legion 7 16IAX7-82TD004SGE | |
| v3.3 Classroom CPU | |
| Acer Swift X SFX16-51G-5388 | |
| Lenovo Legion 5 Pro 16IAH7H | |
| Lenovo Legion 5 Pro 16IAH7H | |
| Lenovo Legion 7 16ARHA7 | |
| Dell G16 7620 | |
| Lenovo Legion 7 16IAX7-82TD004SGE | |
* ... im mniej tym lepiej
| Cyberpunk 2077 1.6 | |
| 1920x1080 Low Preset | |
| Lenovo Legion 7 16ARHA7 | |
| Dell G16 7620 | |
| Przeciętny NVIDIA GeForce RTX 3060 Laptop GPU (80 - 135.7, n=14) | |
| Lenovo Legion 7 16IAX7-82TD004SGE | |
| Inno3D GeForce RTX 3060 Twin X2 | |
| 1920x1080 Medium Preset | |
| Lenovo Legion 7 16ARHA7 | |
| Dell G16 7620 | |
| Przeciętny NVIDIA GeForce RTX 3060 Laptop GPU (68 - 118, n=14) | |
| Inno3D GeForce RTX 3060 Twin X2 | |
| Lenovo Legion 7 16IAX7-82TD004SGE | |
| 1920x1080 High Preset | |
| Lenovo Legion 7 16ARHA7 | |
| Dell G16 7620 | |
| Inno3D GeForce RTX 3060 Twin X2 | |
| Przeciętny NVIDIA GeForce RTX 3060 Laptop GPU (42.2 - 87.7, n=14) | |
| Lenovo Legion 7 16IAX7-82TD004SGE | |
| 1920x1080 Ultra Preset | |
| Lenovo Legion 7 16ARHA7 | |
| Dell G16 7620 | |
| Inno3D GeForce RTX 3060 Twin X2 | |
| Lenovo Legion 5 Pro 16IAH7H | |
| Przeciętny NVIDIA GeForce RTX 3060 Laptop GPU (40 - 78.8, n=16) | |
| Lenovo Legion 7 16IAX7-82TD004SGE | |
| 2560x1440 Ultra Preset | |
| Lenovo Legion 7 16ARHA7 | |
| Dell G16 7620 | |
| Inno3D GeForce RTX 3060 Twin X2 | |
| Lenovo Legion 5 Pro 16IAH7H | |
| Przeciętny NVIDIA GeForce RTX 3060 Laptop GPU (23 - 45.8, n=9) | |
| Lenovo Legion 7 16IAX7-82TD004SGE | |
Podczas korzystania z witryny Witcher 3 można zaobserwować tymczasowy spadek wydajności do poziomu 43 FPS, co pokazuje nasz poniższy wykres. Nagła zmiana jest zwykle spowodowana złym zarządzaniem zasobami przez niektóre aplikacje działające w tle, takie jak wszelkie preinstalowane programy producenta, które przerywają działanie aktualnie skupionej aplikacji.
Witcher 3 FPS Chart
| low | med. | high | ultra | QHD | |
|---|---|---|---|---|---|
| GTA V (2015) | 185.6 | 179.9 | 176.2 | 108.7 | 82.1 |
| The Witcher 3 (2015) | 415.2 | 260.5 | 167.2 | 86.6 | |
| Dota 2 Reborn (2015) | 171.8 | 159.3 | 159 | 147.2 | |
| Final Fantasy XV Benchmark (2018) | 176.7 | 123.3 | 89.4 | 67.1 | |
| X-Plane 11.11 (2018) | 147.8 | 130.5 | 102.6 | ||
| Strange Brigade (2018) | 395 | 228 | 180.2 | 155.5 | 113 |
| Cyberpunk 2077 1.6 (2022) | 125.1 | 105.4 | 80.4 | 66.8 | 41.6 |
Emisje
Szum systemu - prawie nigdy nie jest cichy
Wewnętrzne wentylatory w G16 prawie nigdy nie są bezczynne nawet przy ustawieniu najniższego profilu mocy. W trybie "Quiet" udało nam się na przykład zarejestrować szum wentylatorów o wartości 28 dB(A) na tle cichego tła o wartości 23 dB(A). Jest to wystarczająco głośne, by być zauważalnym podczas streamingu wideo, a także głośniejsze niż wiele innych laptopów do gier w podobnych warunkach, takich jak Lenovo Legion 7 16 czy HP Victus 16.
Dobra wiadomość jest taka, że wysoki poziom hałasu oznacza, iż wentylatory będą wolniej się rozpędzać przy większym obciążeniu. W pierwszej scenie benchmarku 3DMark 06 szum wentylatorów osiągnął 32 dB(A), podczas gdy w Acerze Swift X SFX16 HP Victus 16 wynosił 40 dB(A) lub więcej.
Szum wentylatora ustabilizował się na poziomie 45,7 dB(A) i 48,3 dB(A) podczas pracy w trybach zrównoważonym i wydajnościowym Witcher 3 w trybie zrównoważonym i w trybie wydajności.

Hałas
| luz |
| 28.3 / 28.8 / 28.9 dB |
| obciążenie |
| 32.4 / 48.1 dB |
 | ||
30 dB cichy 40 dB(A) słyszalny 50 dB(A) irytujący |
||
min: | ||
| Dell G16 7620 GeForce RTX 3060 Laptop GPU, i7-12700H, WDC PC SN810 512GB | Lenovo Legion 7 16ARHA7 Radeon RX 6850M XT, R9 6900HX, Samsung PM9A1 MZVL22T0HBLB | HP Victus 16-e0145ng GeForce RTX 3050 Ti Laptop GPU, R5 5600H, Samsung SSD PM981a MZVLB512HBJQ | Asus ROG Zephyrus M16 GU603H GeForce RTX 3070 Laptop GPU, i9-11900H, Samsung PM9A1 MZVL22T0HBLB | Lenovo Legion 5 Pro 16IAH7H GeForce RTX 3060 Laptop GPU, i7-12700H, 2x Samsung PM9A1 MZVL21T0HCLR (RAID 0) | Acer Swift X SFX16-51G-5388 GeForce RTX 3050 4GB Laptop GPU, i5-11320H, Samsung PM991 MZVLQ512HBLU | |
|---|---|---|---|---|---|---|
| Noise | 8% | -9% | -17% | -14% | -1% | |
| wyłączone / środowisko * (dB) | 23.2 | 22.8 2% | 26 -12% | 25 -8% | 24.6 -6% | 25.4 -9% |
| Idle Minimum * (dB) | 28.3 | 23 19% | 26 8% | 25 12% | 28.7 -1% | 25.4 10% |
| Idle Average * (dB) | 28.8 | 23 20% | 28 3% | 31 -8% | 32 -11% | 25.4 12% |
| Idle Maximum * (dB) | 28.9 | 23 20% | 34 -18% | 42 -45% | 32 -11% | 27.8 4% |
| Load Average * (dB) | 32.4 | 26.8 17% | 44 -36% | 48 -48% | 45.2 -40% | 41 -27% |
| Witcher 3 ultra * (dB) | 48.3 | 54.3 -12% | 48 1% | 52 -8% | ||
| Load Maximum * (dB) | 48.1 | 54.2 -13% | 53 -10% | 56 -16% | 54.4 -13% | 47 2% |
* ... im mniej tym lepiej
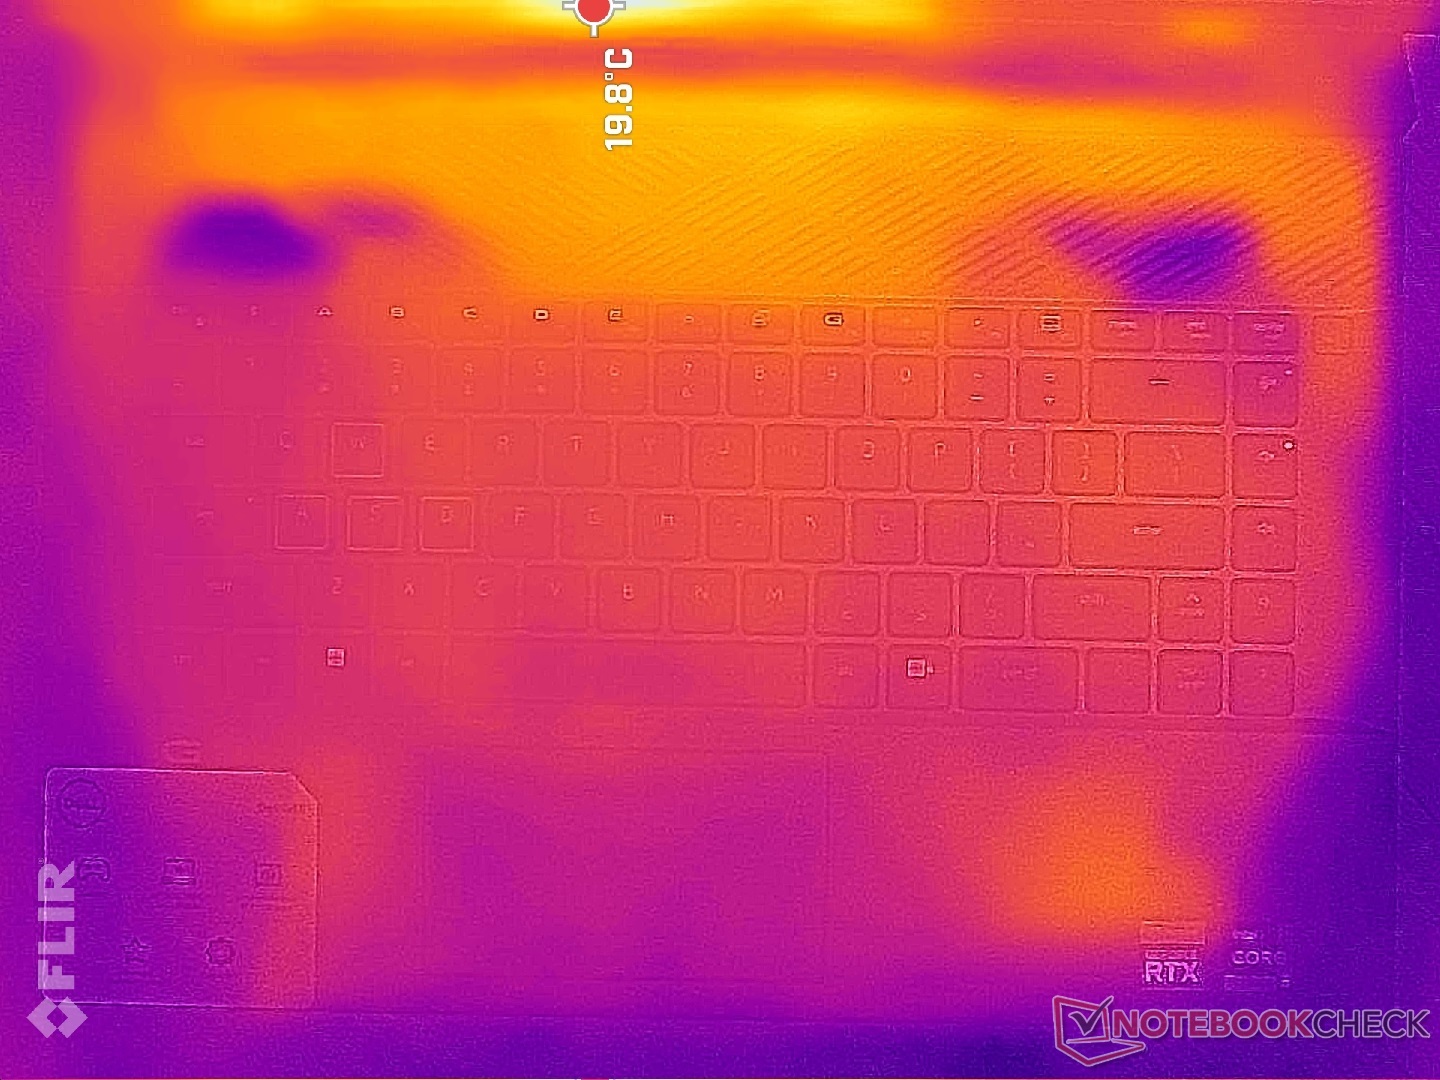
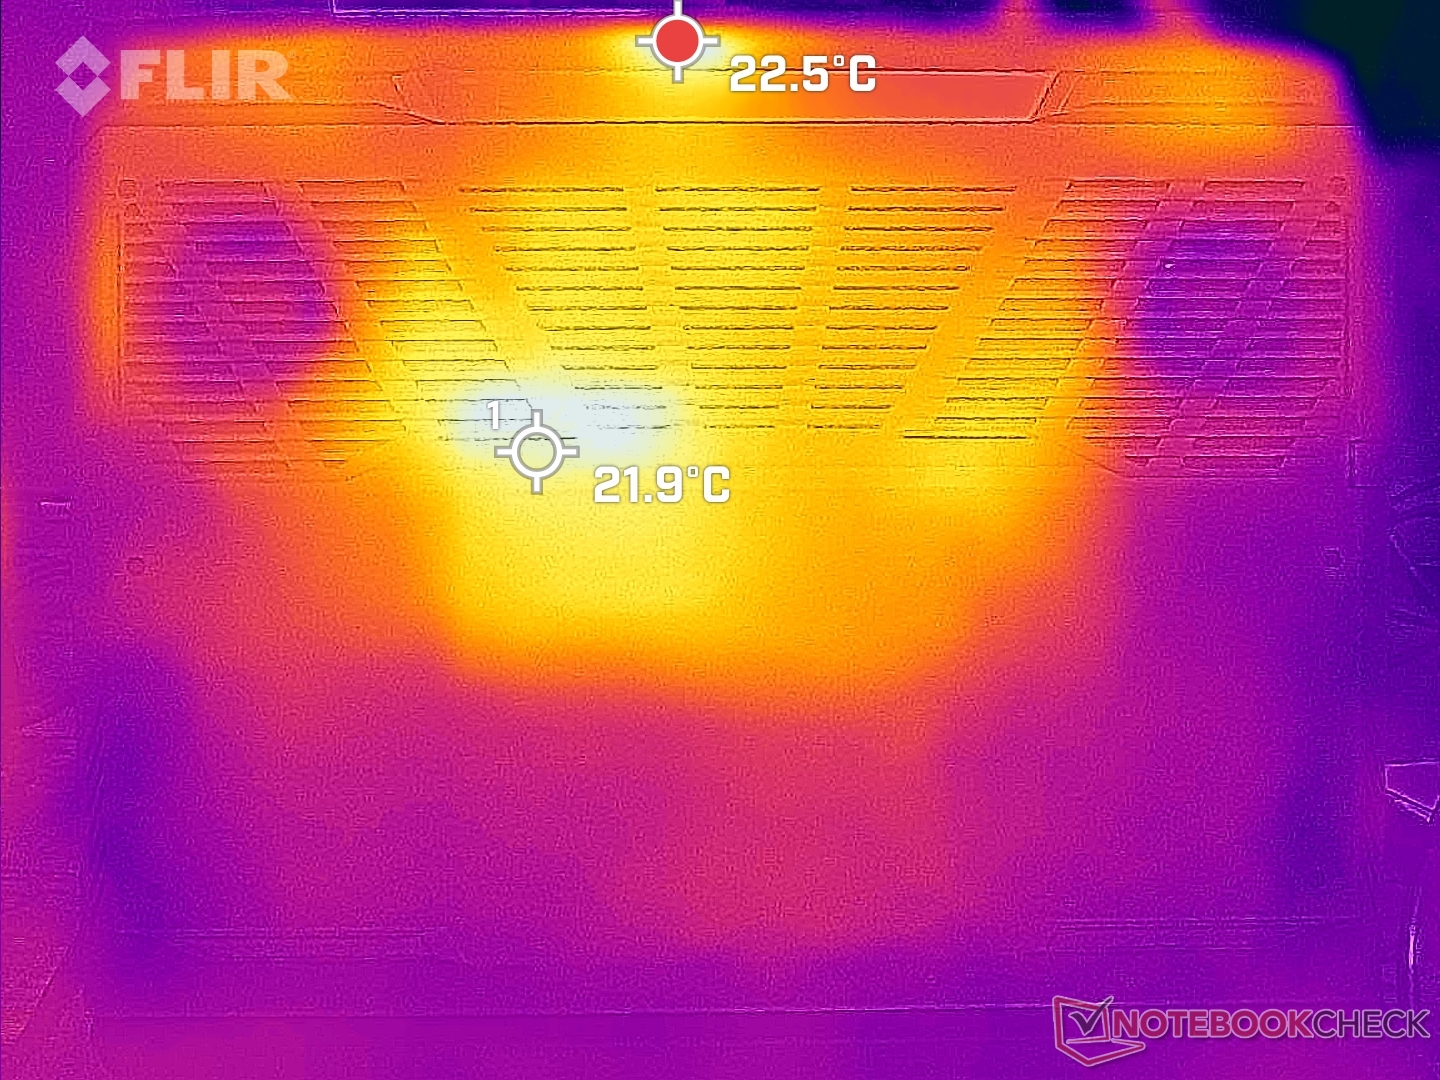
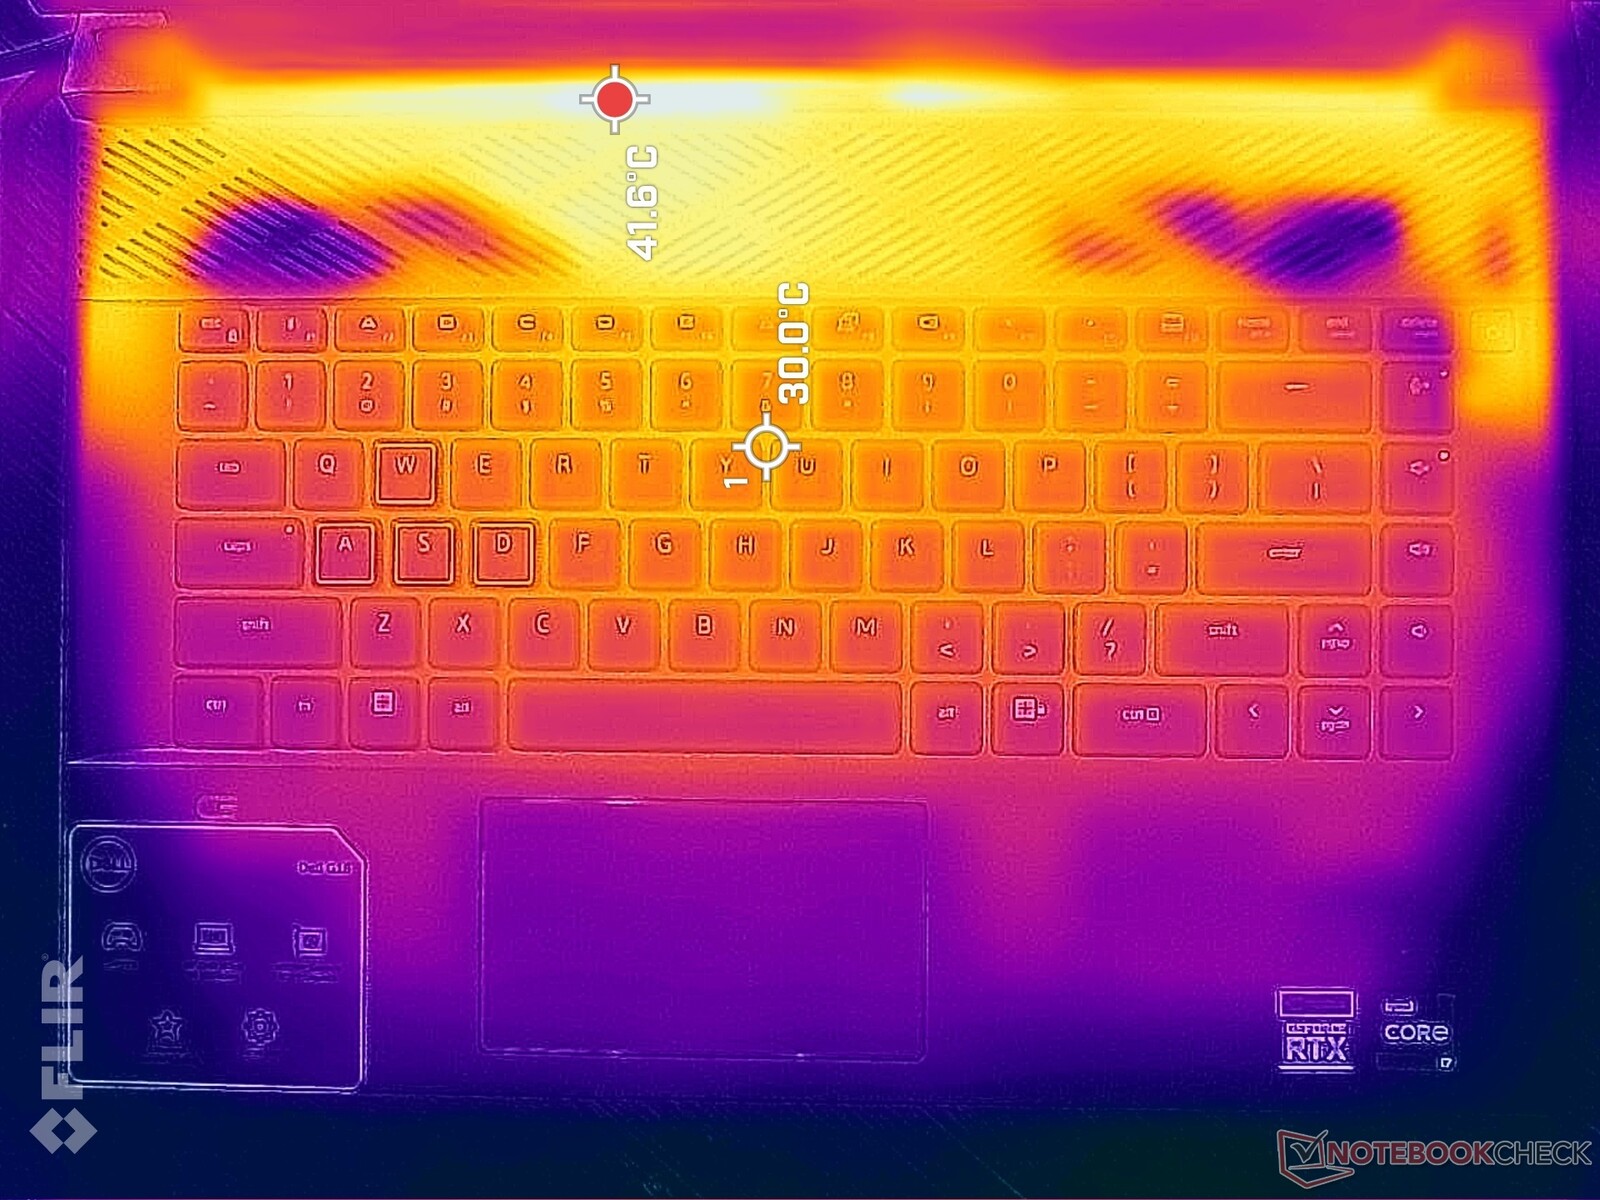
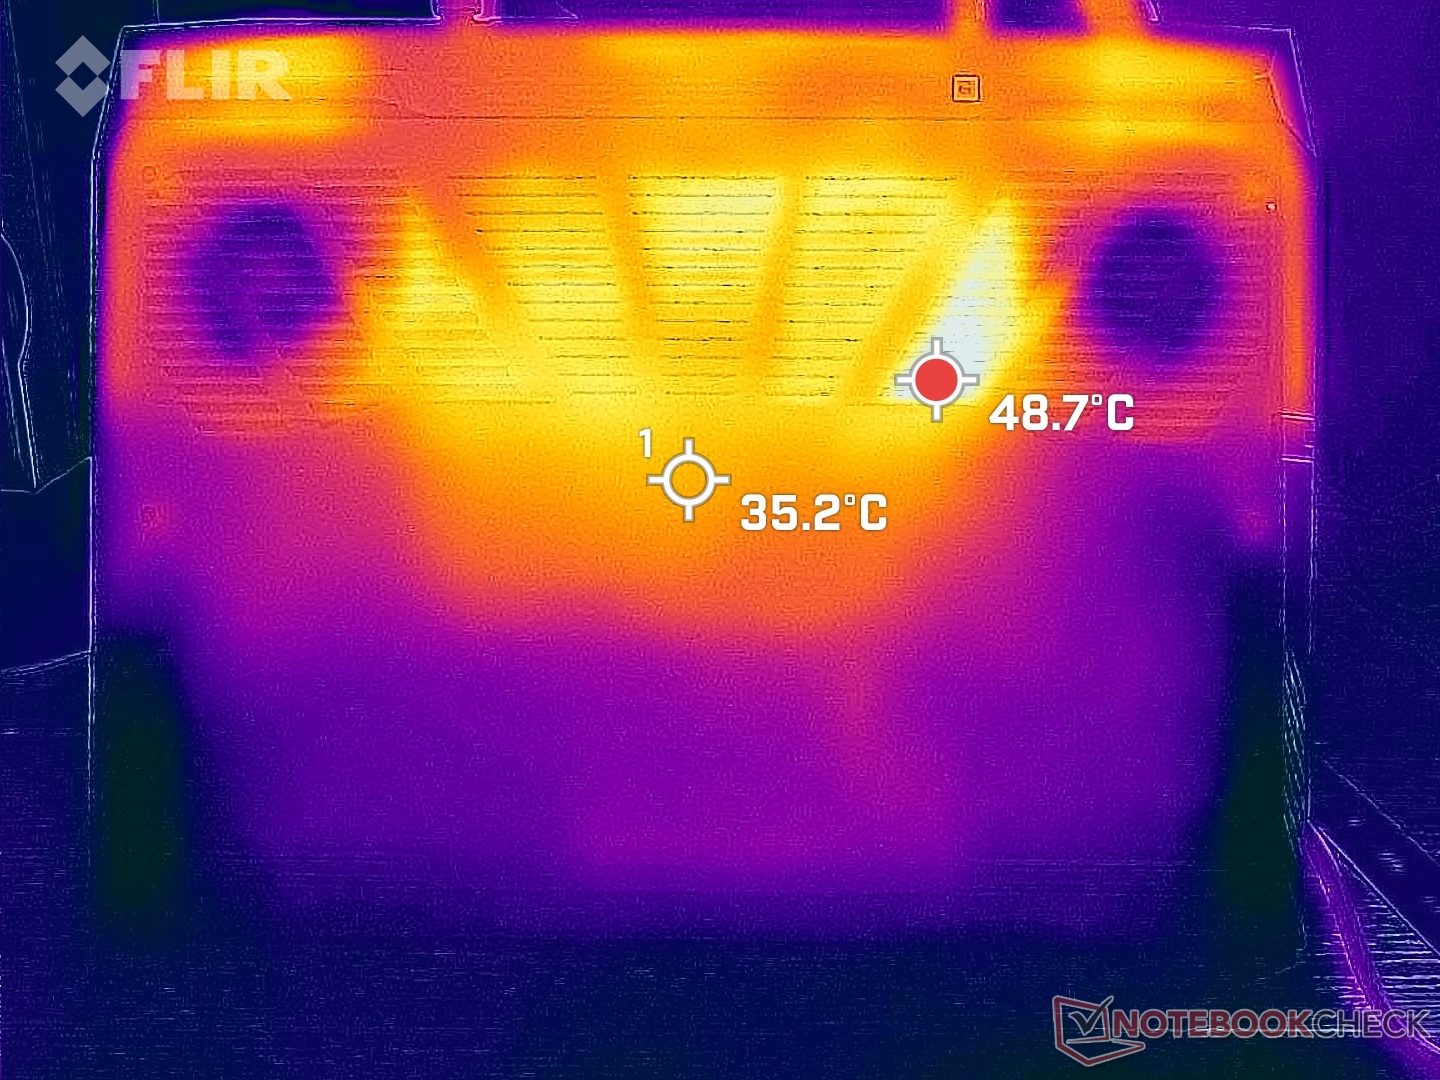
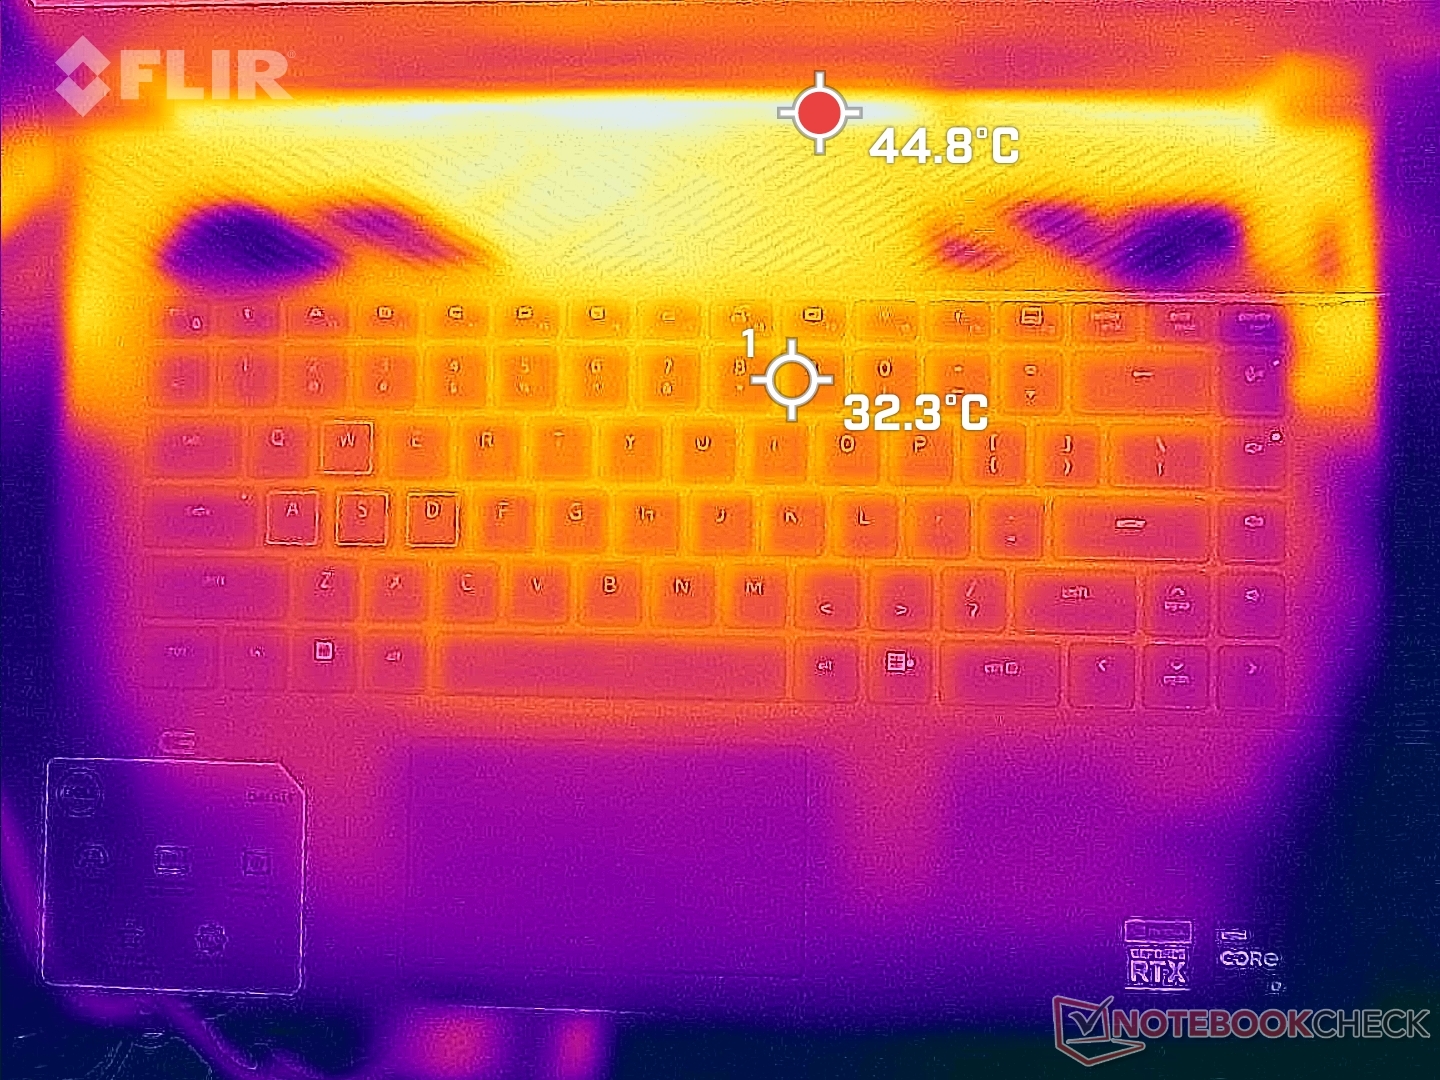
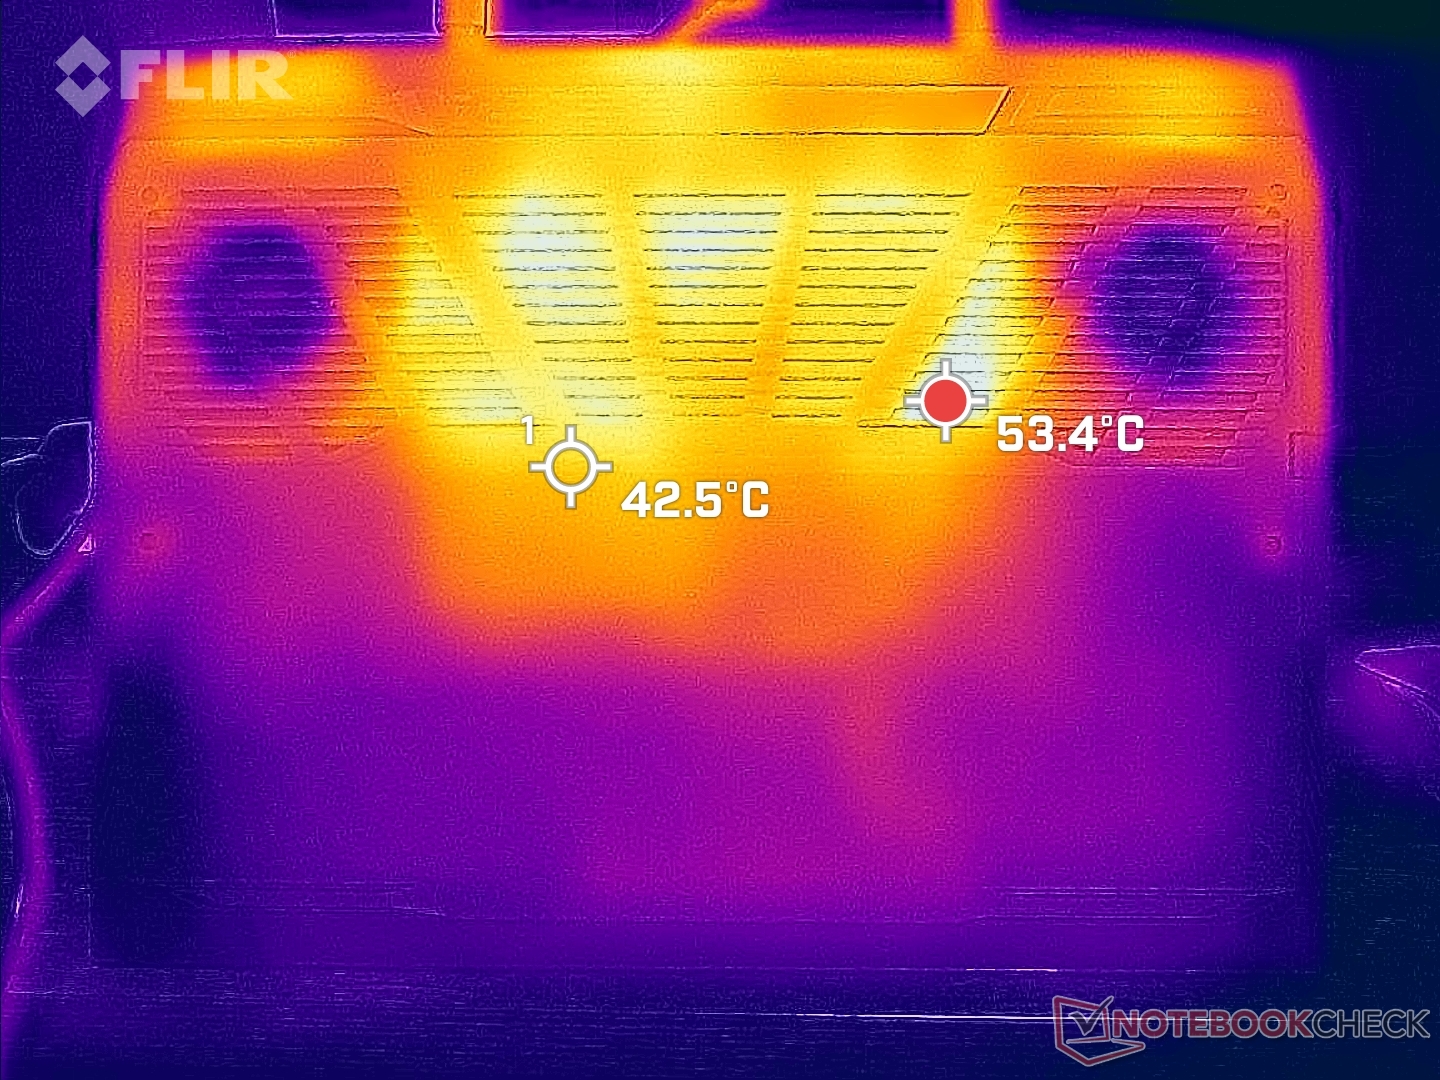
Temperatura - bardzo ciepła w kierunku pleców
Temperatury powierzchni podczas grania mogą osiągnąć do 48 C i 51 C odpowiednio na górze i na dole, w porównaniu do 54 C i 46 C na HP Victus 16 w podobnych warunkach. Gorące punkty znajdują się na szczęście z tyłu i z dala od klawiszy klawiatury lub obszarów przednich. Dzięki temu miejsca oparcia dłoni i klawisze nigdy nie stają się nieprzyjemnie ciepłe podczas gry.
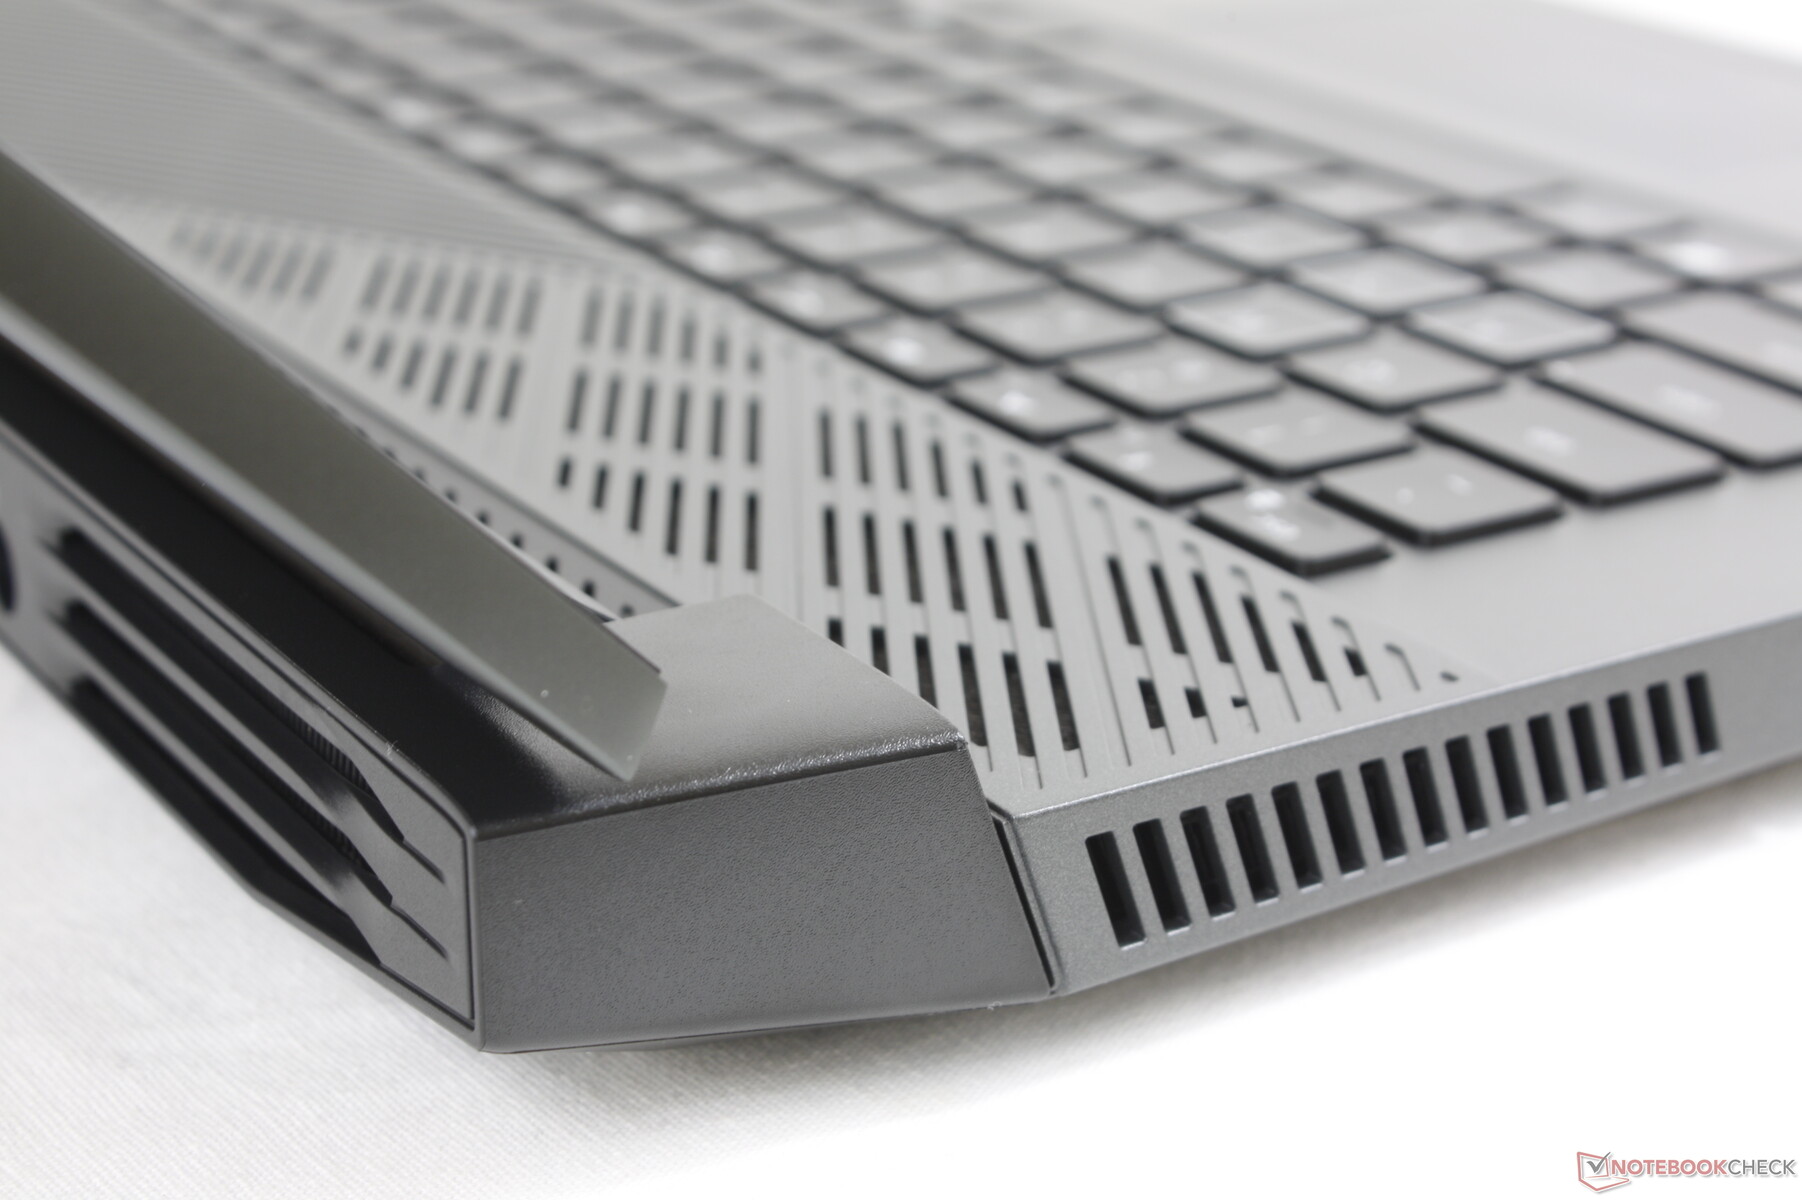
Duża część tyłu jest przeznaczona na wentylację, co widać po wielu kratkach na wszystkich stronach podstawy.
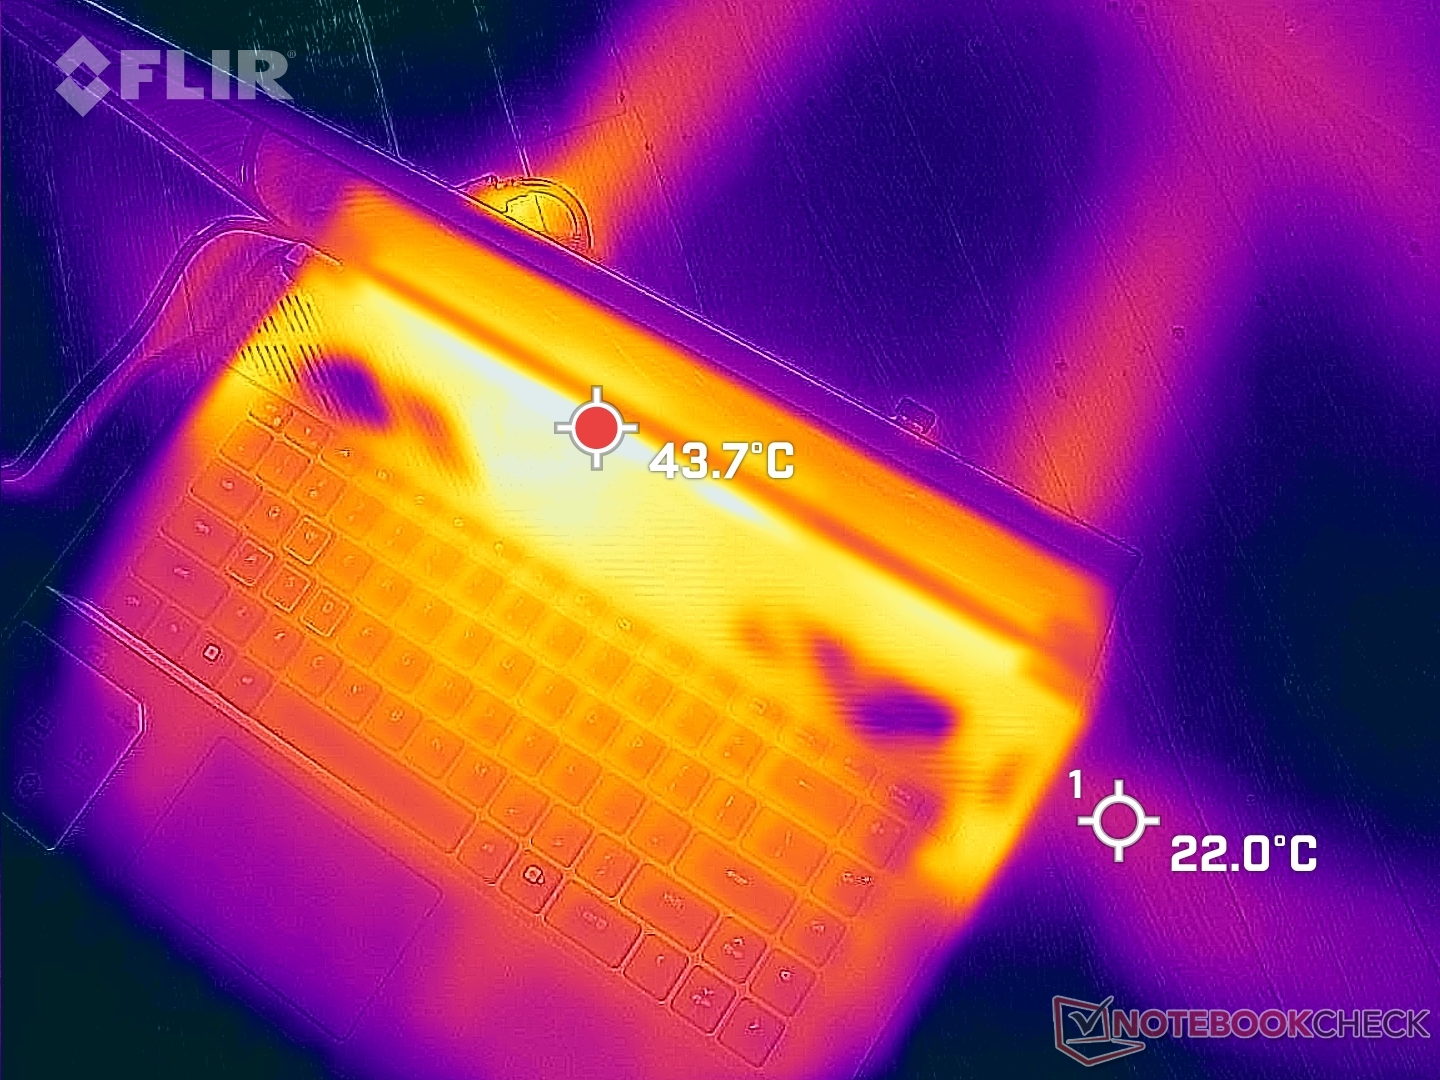
(-) Maksymalna temperatura w górnej części wynosi 47.6 °C / 118 F, w porównaniu do średniej 40.4 °C / 105 F , począwszy od 21.2 do 68.8 °C dla klasy Gaming.
(-) Dno nagrzewa się maksymalnie do 54 °C / 129 F, w porównaniu do średniej 43.2 °C / 110 F
(+) W stanie bezczynności średnia temperatura górnej części wynosi 21.8 °C / 71 F, w porównaniu ze średnią temperaturą urządzenia wynoszącą 33.9 °C / ### class_avg_f### F.
(±) Podczas gry w Wiedźmina 3 średnia temperatura górnej części wynosi 33.7 °C / 93 F, w porównaniu do średniej temperatury urządzenia wynoszącej 33.9 °C / ## #class_avg_f### F.
(+) Podpórki pod nadgarstki i touchpad są chłodniejsze niż temperatura skóry i maksymalnie 30.2 °C / 86.4 F i dlatego są chłodne w dotyku.
(±) Średnia temperatura obszaru podparcia dłoni w podobnych urządzeniach wynosiła 28.8 °C / 83.8 F (-1.4 °C / -2.6 F).
| Dell G16 7620 Intel Core i7-12700H, NVIDIA GeForce RTX 3060 Laptop GPU | Lenovo Legion 7 16ARHA7 AMD Ryzen 9 6900HX, AMD Radeon RX 6850M XT | HP Victus 16-e0145ng AMD Ryzen 5 5600H, NVIDIA GeForce RTX 3050 Ti Laptop GPU | Asus ROG Zephyrus M16 GU603H Intel Core i9-11900H, NVIDIA GeForce RTX 3070 Laptop GPU | Lenovo Legion 5 Pro 16IAH7H Intel Core i7-12700H, NVIDIA GeForce RTX 3060 Laptop GPU | Acer Swift X SFX16-51G-5388 Intel Core i5-11320H, NVIDIA GeForce RTX 3050 4GB Laptop GPU | |
|---|---|---|---|---|---|---|
| Heat | -10% | -26% | -35% | -19% | -15% | |
| Maximum Upper Side * (°C) | 47.6 | 37.2 22% | 54 -13% | 52 -9% | 45.8 4% | 52.4 -10% |
| Maximum Bottom * (°C) | 54 | 43 20% | 47 13% | 53 2% | 66.3 -23% | 50 7% |
| Idle Upper Side * (°C) | 23 | 34 -48% | 41 -78% | 38 -65% | 30.4 -32% | 30.3 -32% |
| Idle Bottom * (°C) | 24.6 | 32.8 -33% | 31 -26% | 41 -67% | 30.4 -24% | 30.4 -24% |
* ... im mniej tym lepiej
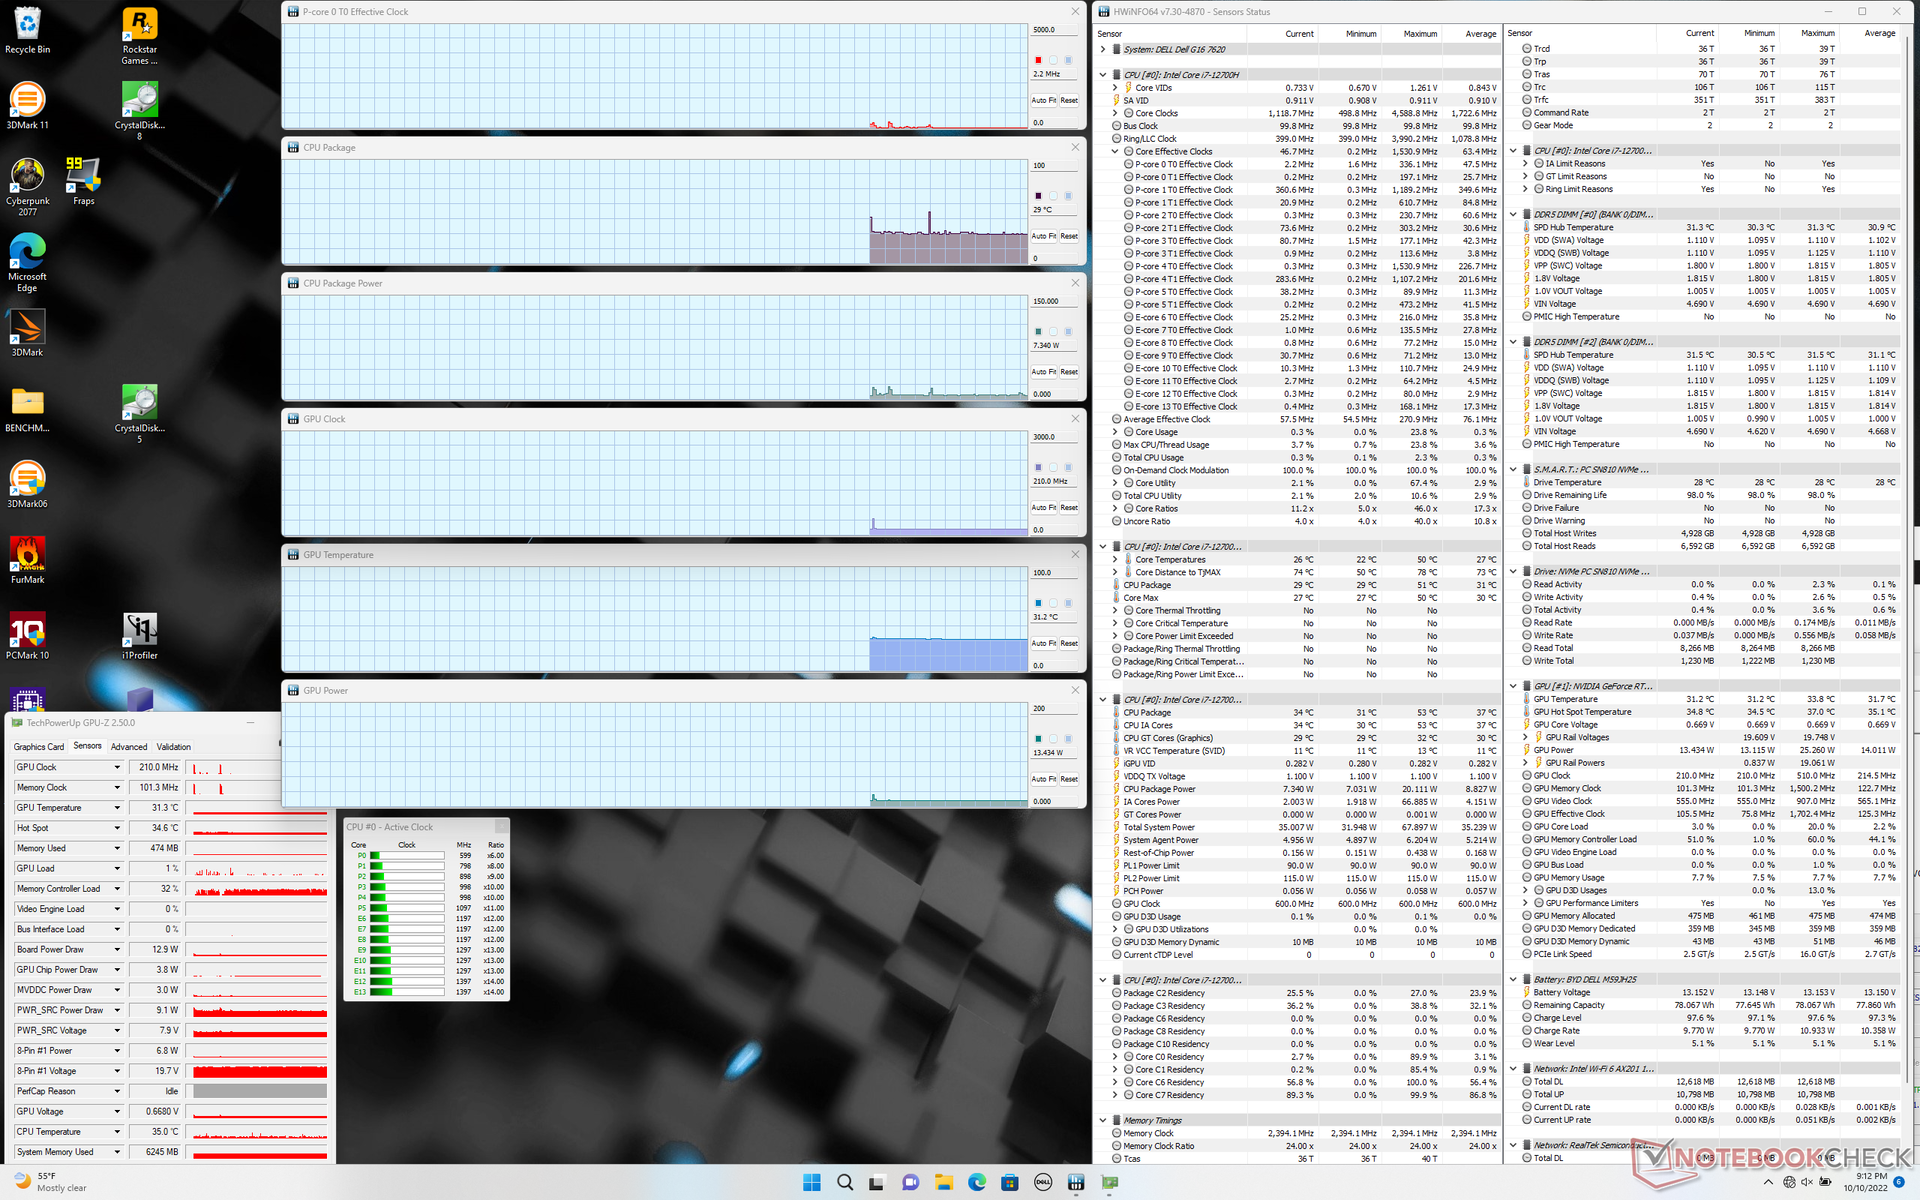
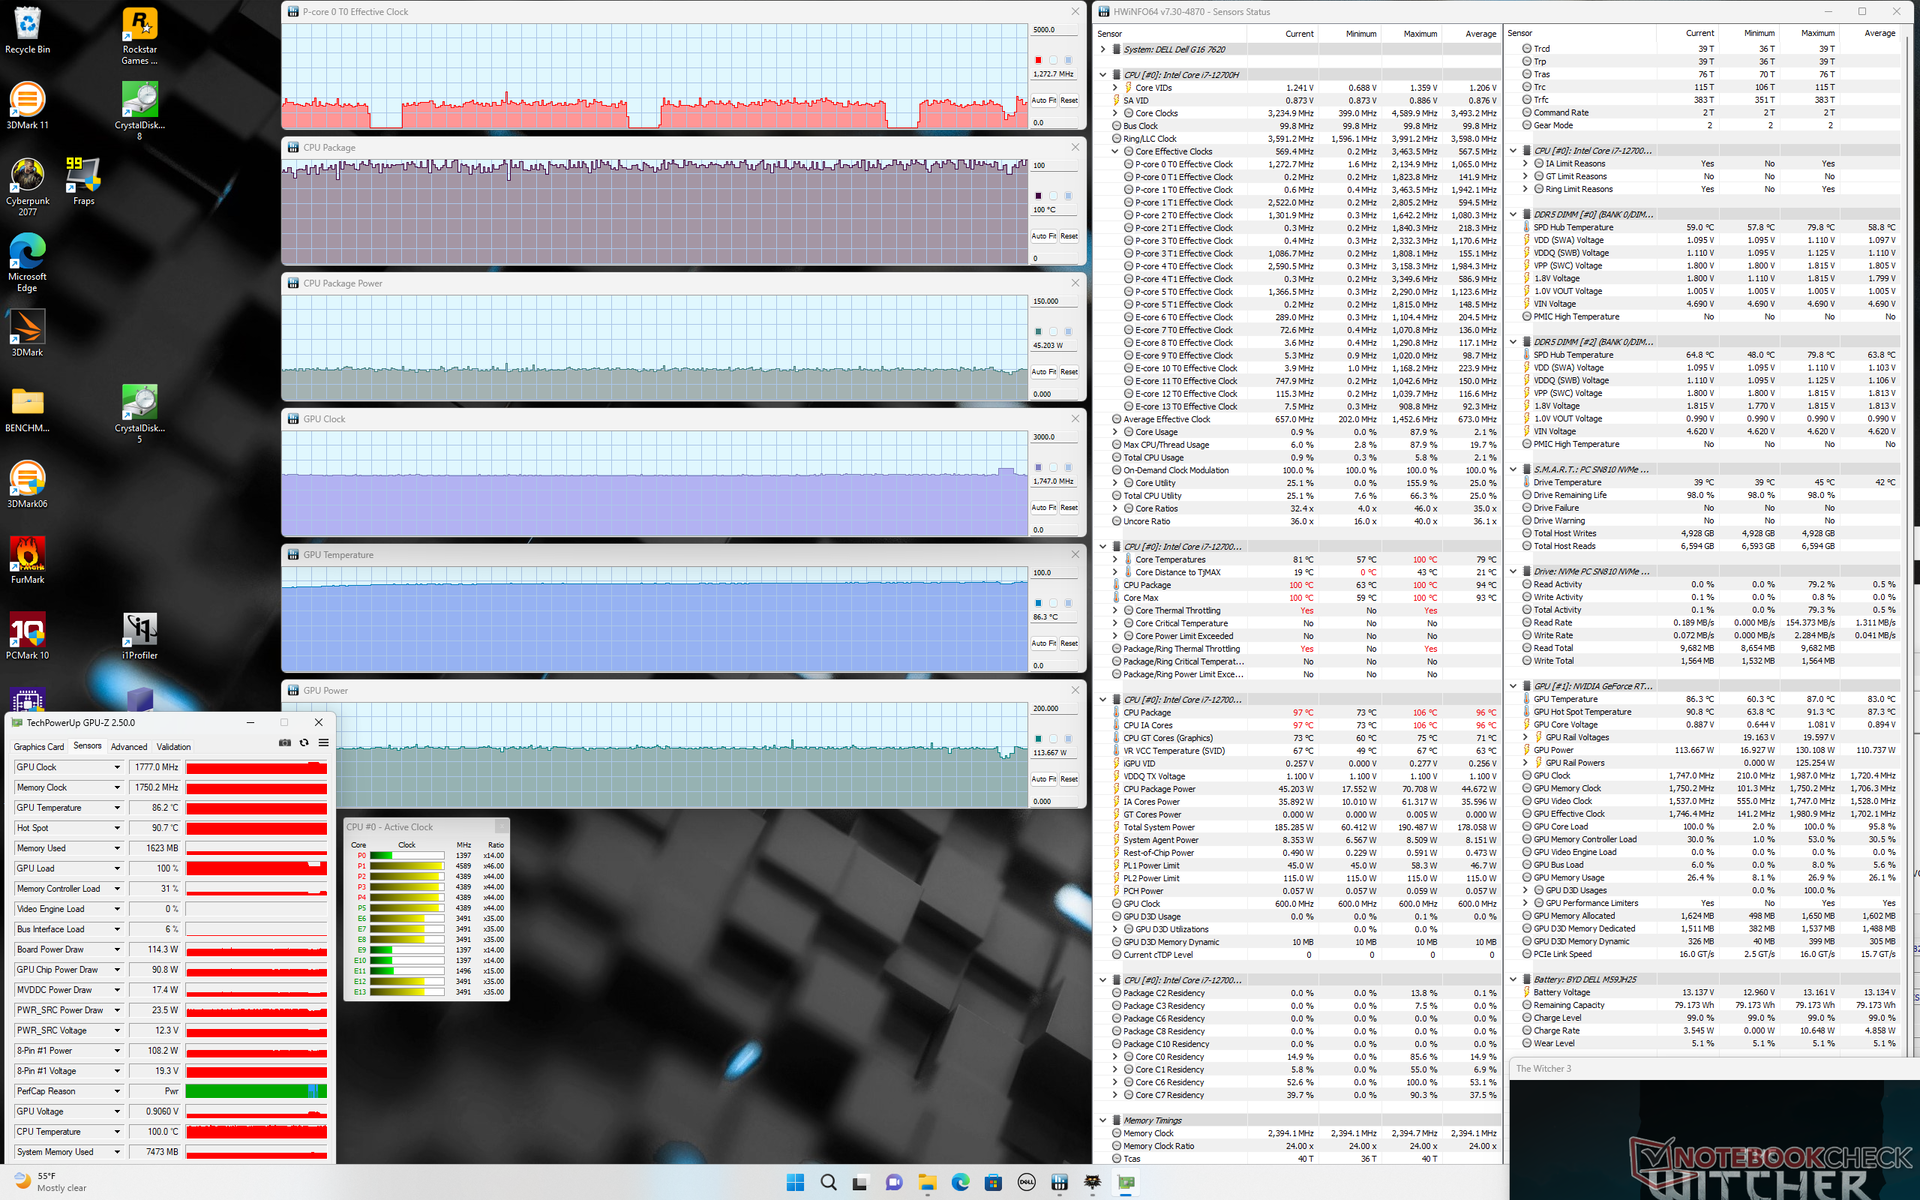
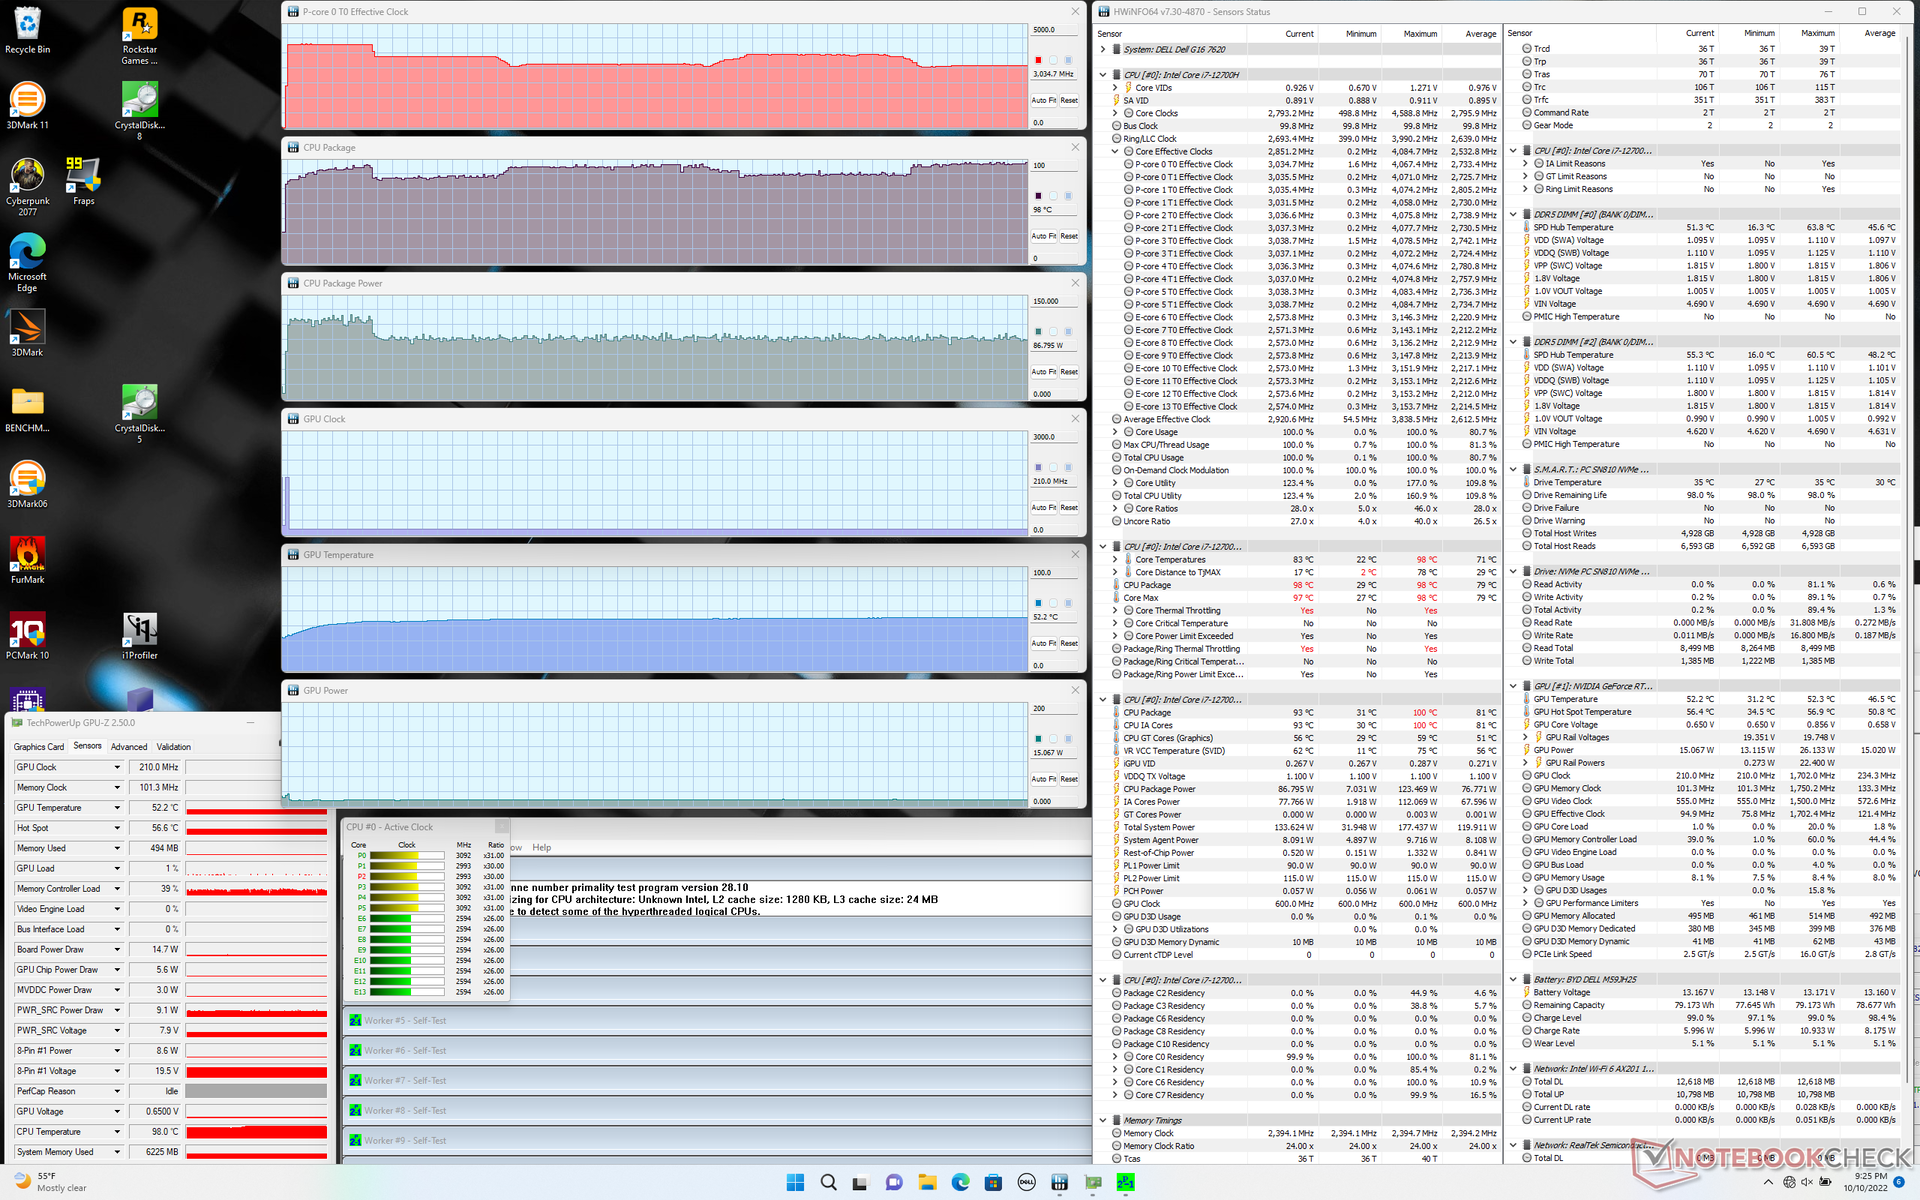
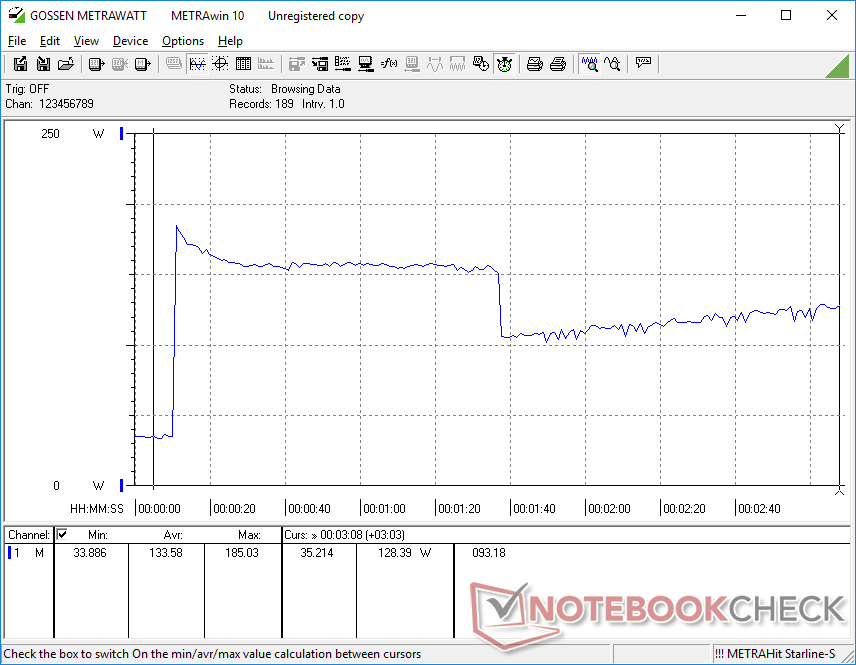
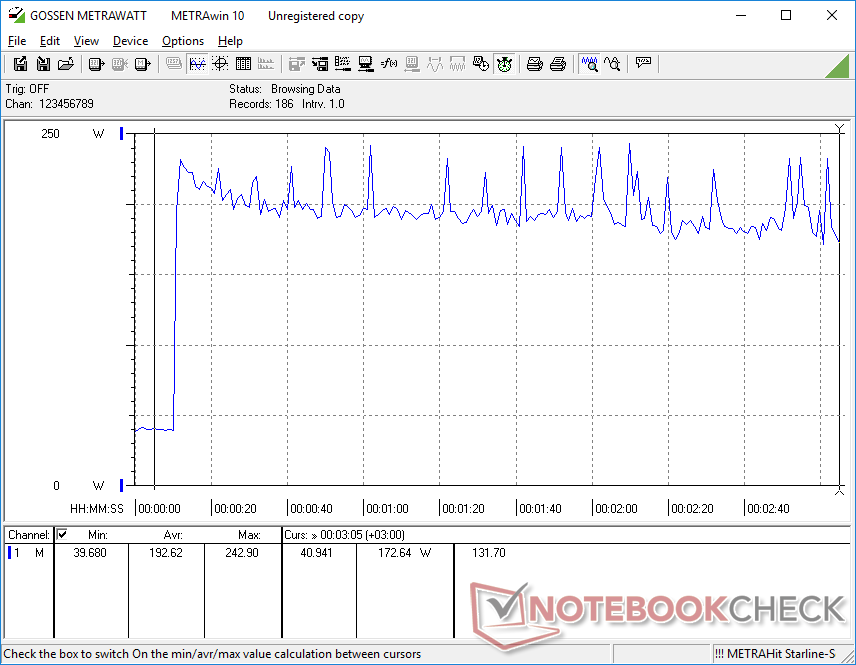
Stress Test
Temperatura procesora staje się bardzo wysoka, gdy system jest obciążony. Na przykład w teście Prime95 częstotliwość taktowania zegara i pobór mocy na płycie wzrosły odpowiednio do 4,1 GHz i 117 W, utrzymując się przez około minutę w temperaturze do 99 C. Następnie procesor spadł do zakresu 3,1-3,5 GHz i przy niższym poborze mocy na płycie 88 W, by zapobiec osiągnięciu przez temperaturę rdzenia 100 C. Dla porównania, w tym samym teście na HP Envy 16 można było uzyskać więcej punktów HP Envy 16 z tym samym procesorem Core i7-12700H i kartą graficzną GeForce temperatura rdzenia wyniosłaby zaledwie 66 C. Już wysoka temperatura rdzenia G16 sugeruje, że droższa jednostka SKU Core i9-12900H przyniesie co najwyżej niewielki wzrost wydajności.
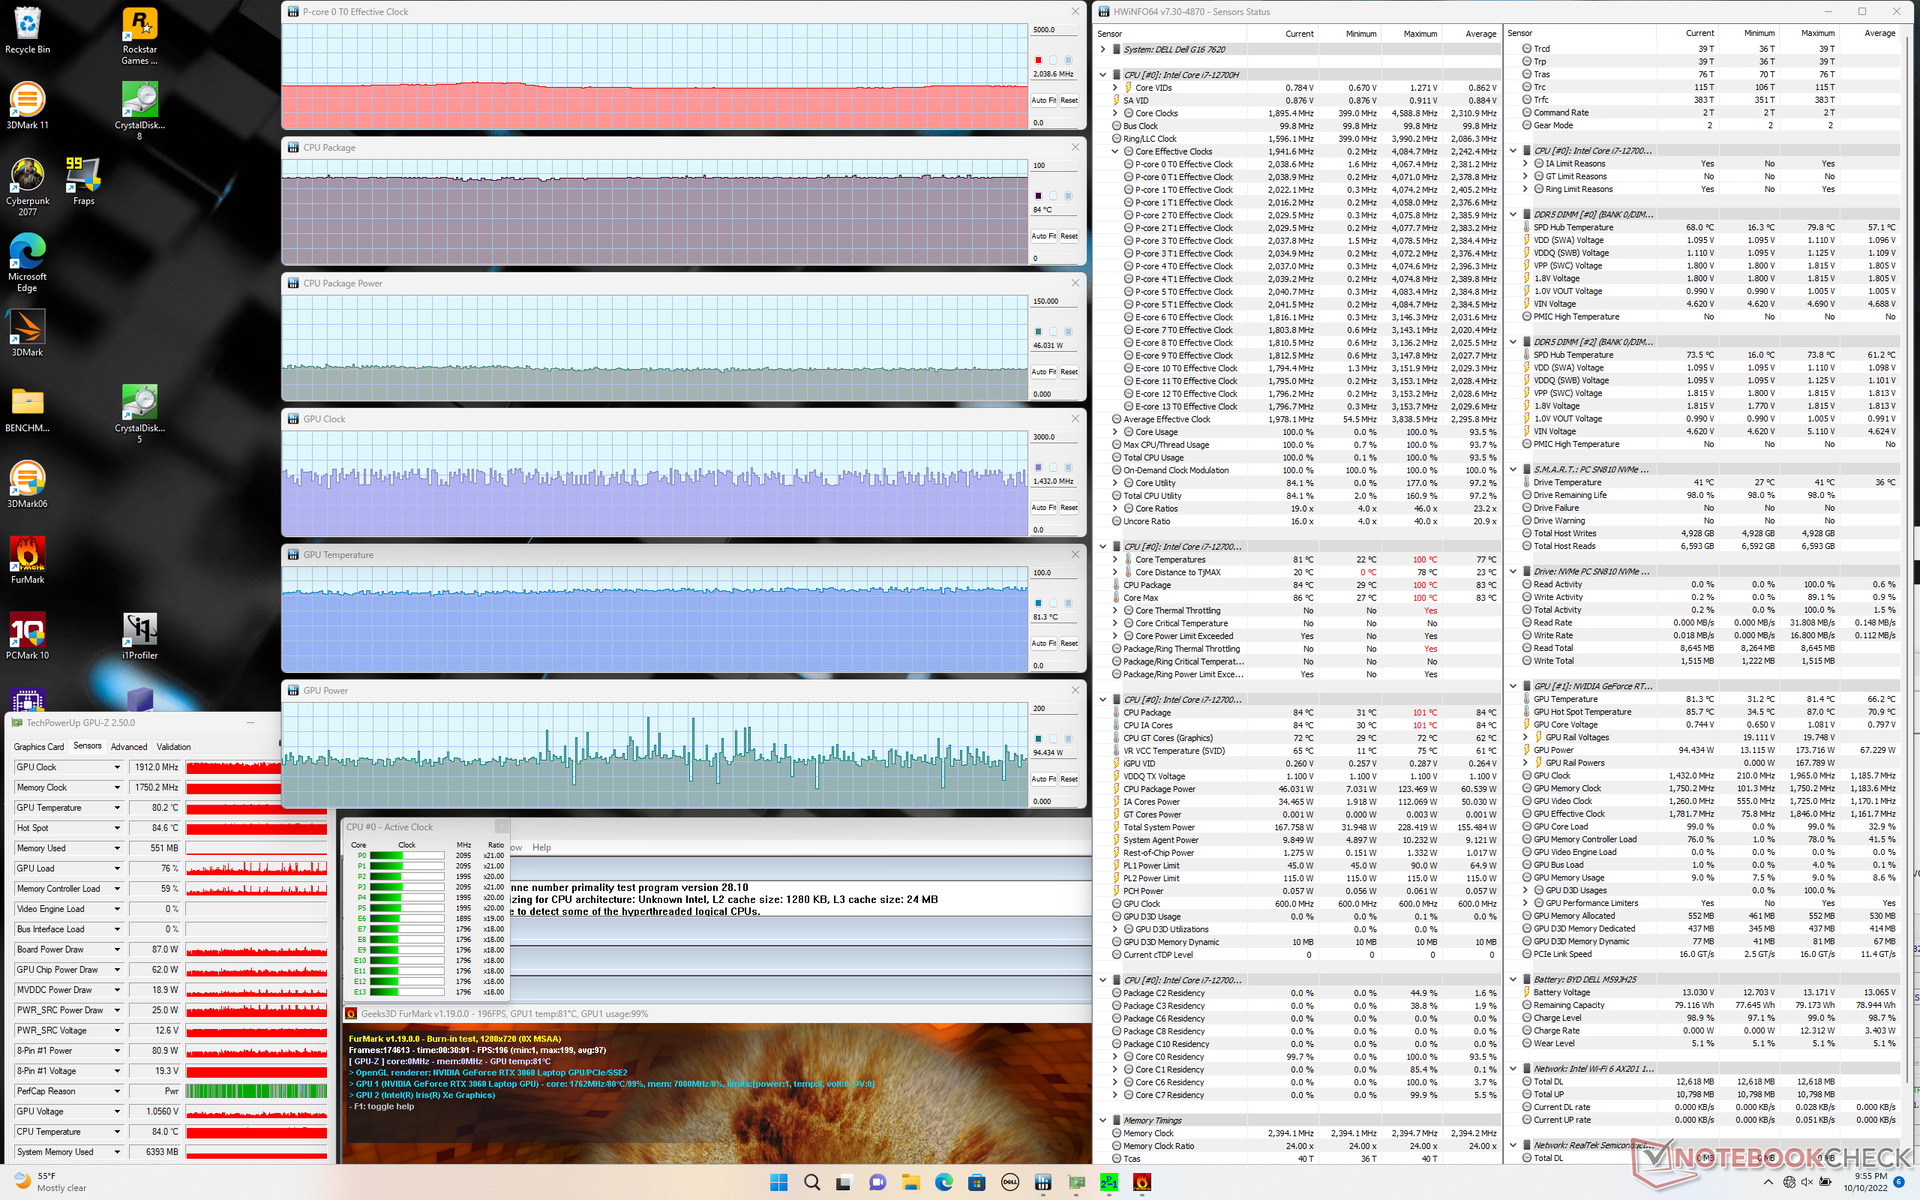
Uruchomienie strony Witcher 3 zaowocowało stabilnym taktowaniem rdzenia GPU, temperaturą i poborem mocy na poziomie odpowiednio 1777 MHz, 86 C i 114 W, w porównaniu do docelowego poziomu 130 W TGP. Powtórzenie tego samego testu na wspomnianym Envy 16 zaowocowało nieco niższym taktowaniem rdzenia oraz niższą temperaturą i zapotrzebowaniem na energię. Bardziej niepokojące jest jednak to, że temperatura procesora w G16 ponownie przekroczyła 90 C i jest znacznie cieplejsza, niż w konkurencyjnych laptopach do gier.
Praca na zasilaniu akumulatorowym poważnie ogranicza wydajność. Test Fire Strike na akumulatorze zwróciłby wyniki z fizyki i grafiki w wysokości odpowiednio 19465 i 4162 pkt. wobec 27735 i 21584 pkt. na zasilaniu sieciowym.
| ZegarCPU (GHz) | Zegar GPU (MHz) | Średnia temperatura CPU (°C) | Średnia temperatura GPU (°C) | |
| System w stanie bezczynności | -- | -- | 29 | 31 |
| Prime95 Stress | 3.1 - 3.6 | -- | 86 - 98 | 52 |
| Prime95 + FurMark Stress | 2.0 | ~1432 - ~1912 | 84 | 81 |
| Witcher 3 Stress | ~1.3 | 1777 | ~99 | 86 |
Mówcy
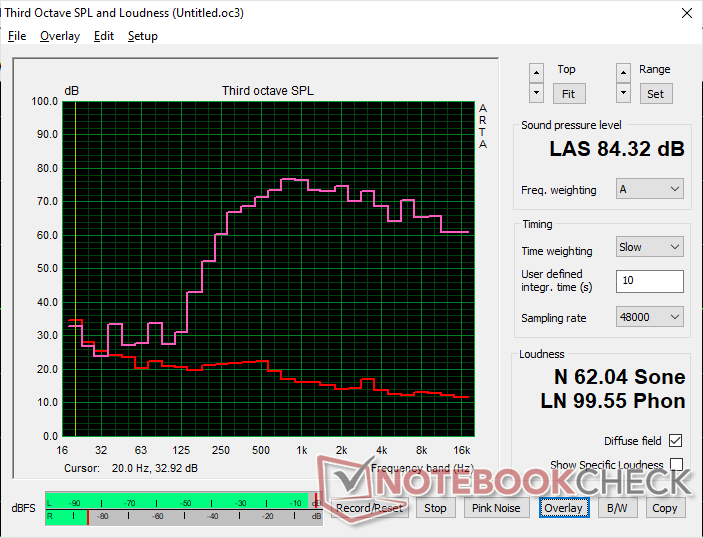
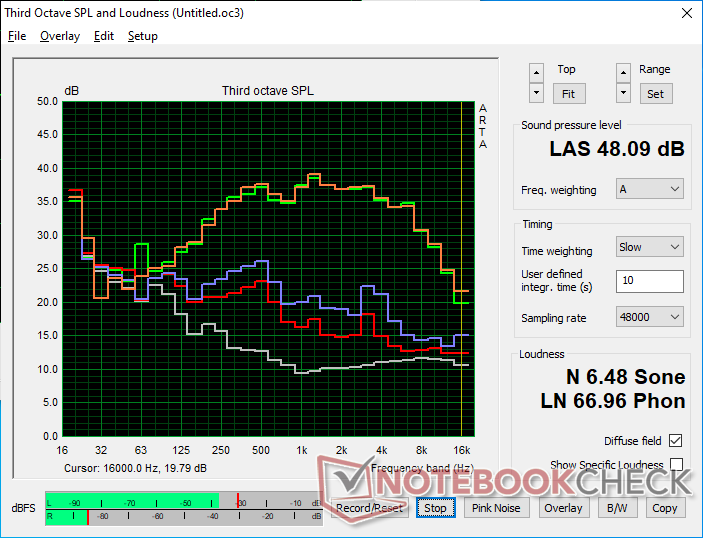
Dell G16 7620 analiza dźwięku
(+) | głośniki mogą odtwarzać stosunkowo głośno (84.3 dB)
Bas 100 - 315 Hz
(-) | prawie brak basu - średnio 21.8% niższa od mediany
(±) | liniowość basu jest średnia (14.5% delta do poprzedniej częstotliwości)
Średnie 400 - 2000 Hz
(+) | zbalansowane środki średnie - tylko 4.9% od mediany
(+) | średnie są liniowe (3.5% delta do poprzedniej częstotliwości)
Wysokie 2–16 kHz
(+) | zrównoważone maksima - tylko 2.6% od mediany
(±) | liniowość wysokich wartości jest średnia (7.7% delta do poprzedniej częstotliwości)
Ogólnie 100 - 16.000 Hz
(±) | liniowość ogólnego dźwięku jest średnia (17.2% różnicy w stosunku do mediany)
W porównaniu do tej samej klasy
» 46% wszystkich testowanych urządzeń w tej klasie było lepszych, 11% podobnych, 42% gorszych
» Najlepszy miał deltę 6%, średnia wynosiła ###średnia###%, najgorsza wynosiła 132%
W porównaniu do wszystkich testowanych urządzeń
» 32% wszystkich testowanych urządzeń było lepszych, 8% podobnych, 60% gorszych
» Najlepszy miał deltę 4%, średnia wynosiła ###średnia###%, najgorsza wynosiła 134%
Apple MacBook Pro 16 2021 M1 Pro analiza dźwięku
(+) | głośniki mogą odtwarzać stosunkowo głośno (84.7 dB)
Bas 100 - 315 Hz
(+) | dobry bas - tylko 3.8% od mediany
(+) | bas jest liniowy (5.2% delta do poprzedniej częstotliwości)
Średnie 400 - 2000 Hz
(+) | zbalansowane środki średnie - tylko 1.3% od mediany
(+) | średnie są liniowe (2.1% delta do poprzedniej częstotliwości)
Wysokie 2–16 kHz
(+) | zrównoważone maksima - tylko 1.9% od mediany
(+) | wzloty są liniowe (2.7% delta do poprzedniej częstotliwości)
Ogólnie 100 - 16.000 Hz
(+) | ogólny dźwięk jest liniowy (4.6% różnicy w stosunku do mediany)
W porównaniu do tej samej klasy
» 0% wszystkich testowanych urządzeń w tej klasie było lepszych, 0% podobnych, 100% gorszych
» Najlepszy miał deltę 5%, średnia wynosiła ###średnia###%, najgorsza wynosiła 45%
W porównaniu do wszystkich testowanych urządzeń
» 0% wszystkich testowanych urządzeń było lepszych, 0% podobnych, 100% gorszych
» Najlepszy miał deltę 4%, średnia wynosiła ###średnia###%, najgorsza wynosiła 134%
Zarządzanie energią - wymagające w większości scenariuszy
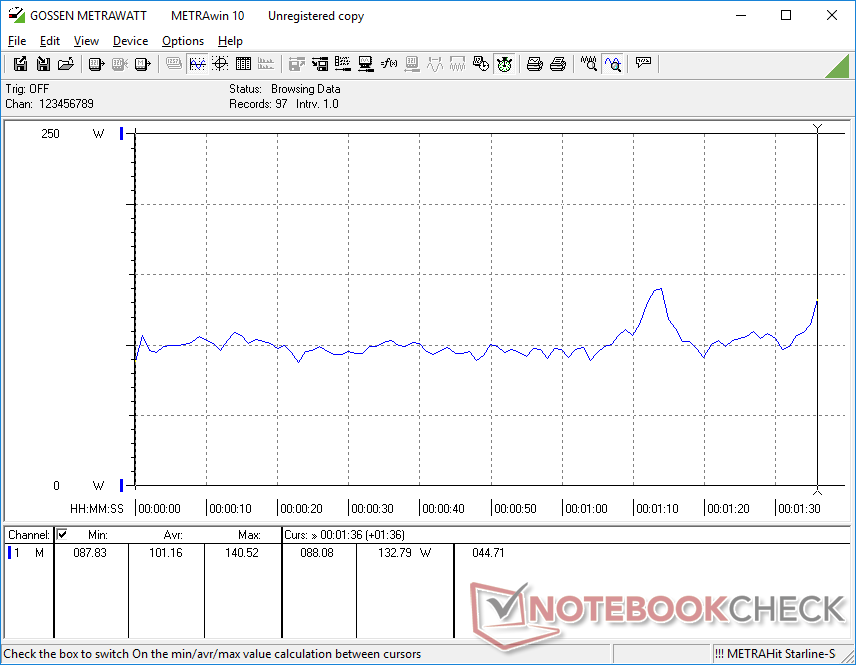
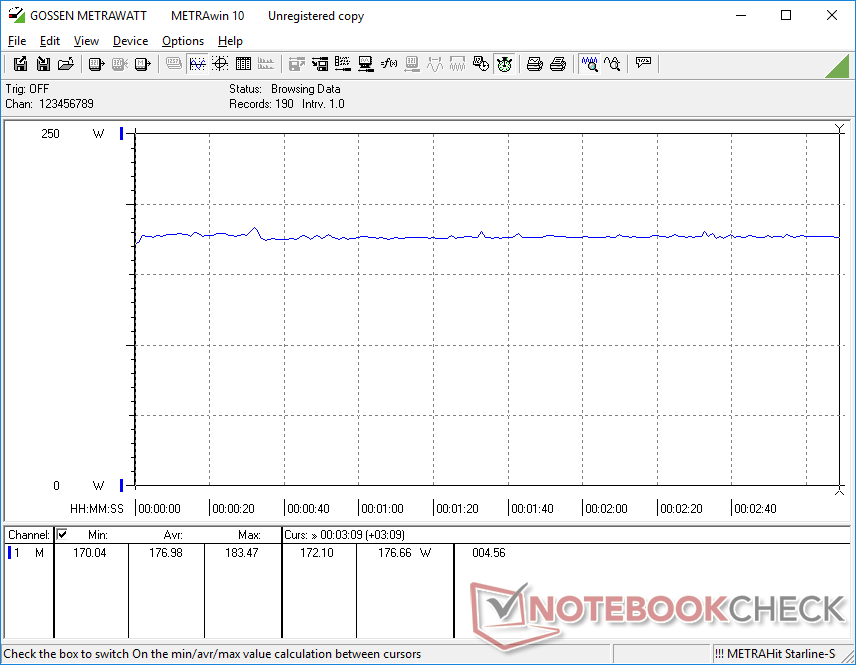
Pobór mocy
Pobór mocy na biegu jałowym w pulpicie jest stosunkowo wysoki i wynosi od 14 do 32 W. Niemniej jednak zakres ten jest tylko nieco wyższy, niż w przypadku HP Envy 16 z tym samym CPU i GPU. W grach można spodziewać się zużycia na poziomie 177 W, czyli o około 20 W mniej, niż w modelu Lenovo 5 Pro Lenovo Legion 5 Pro lub Asus ROG Strix Scar 15
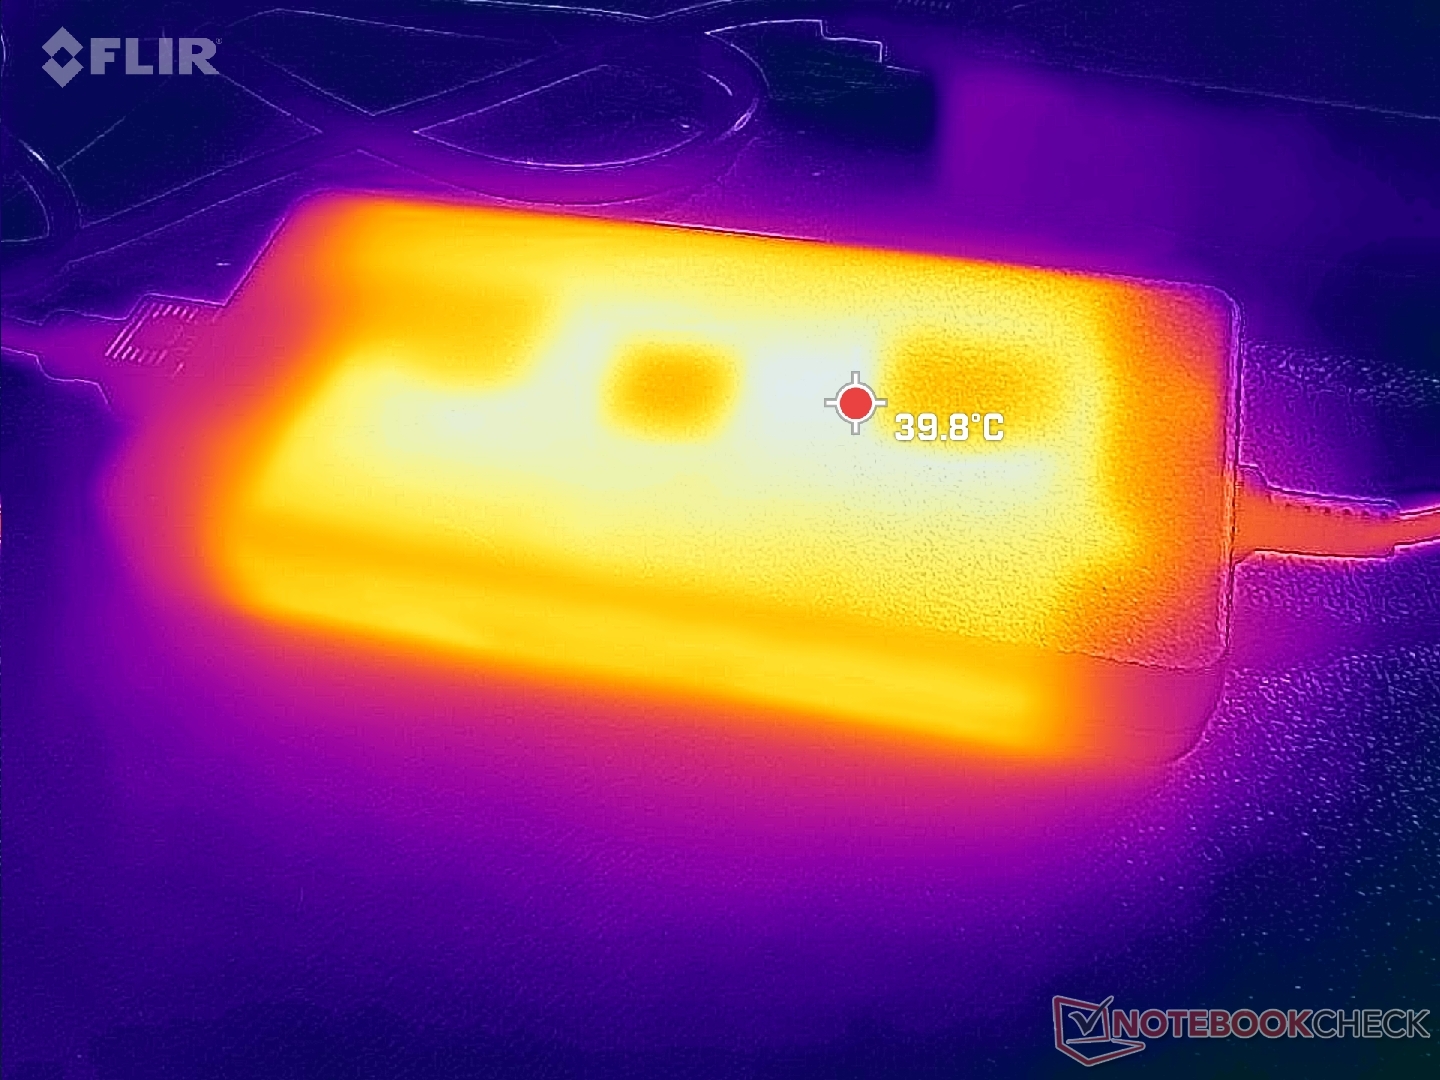
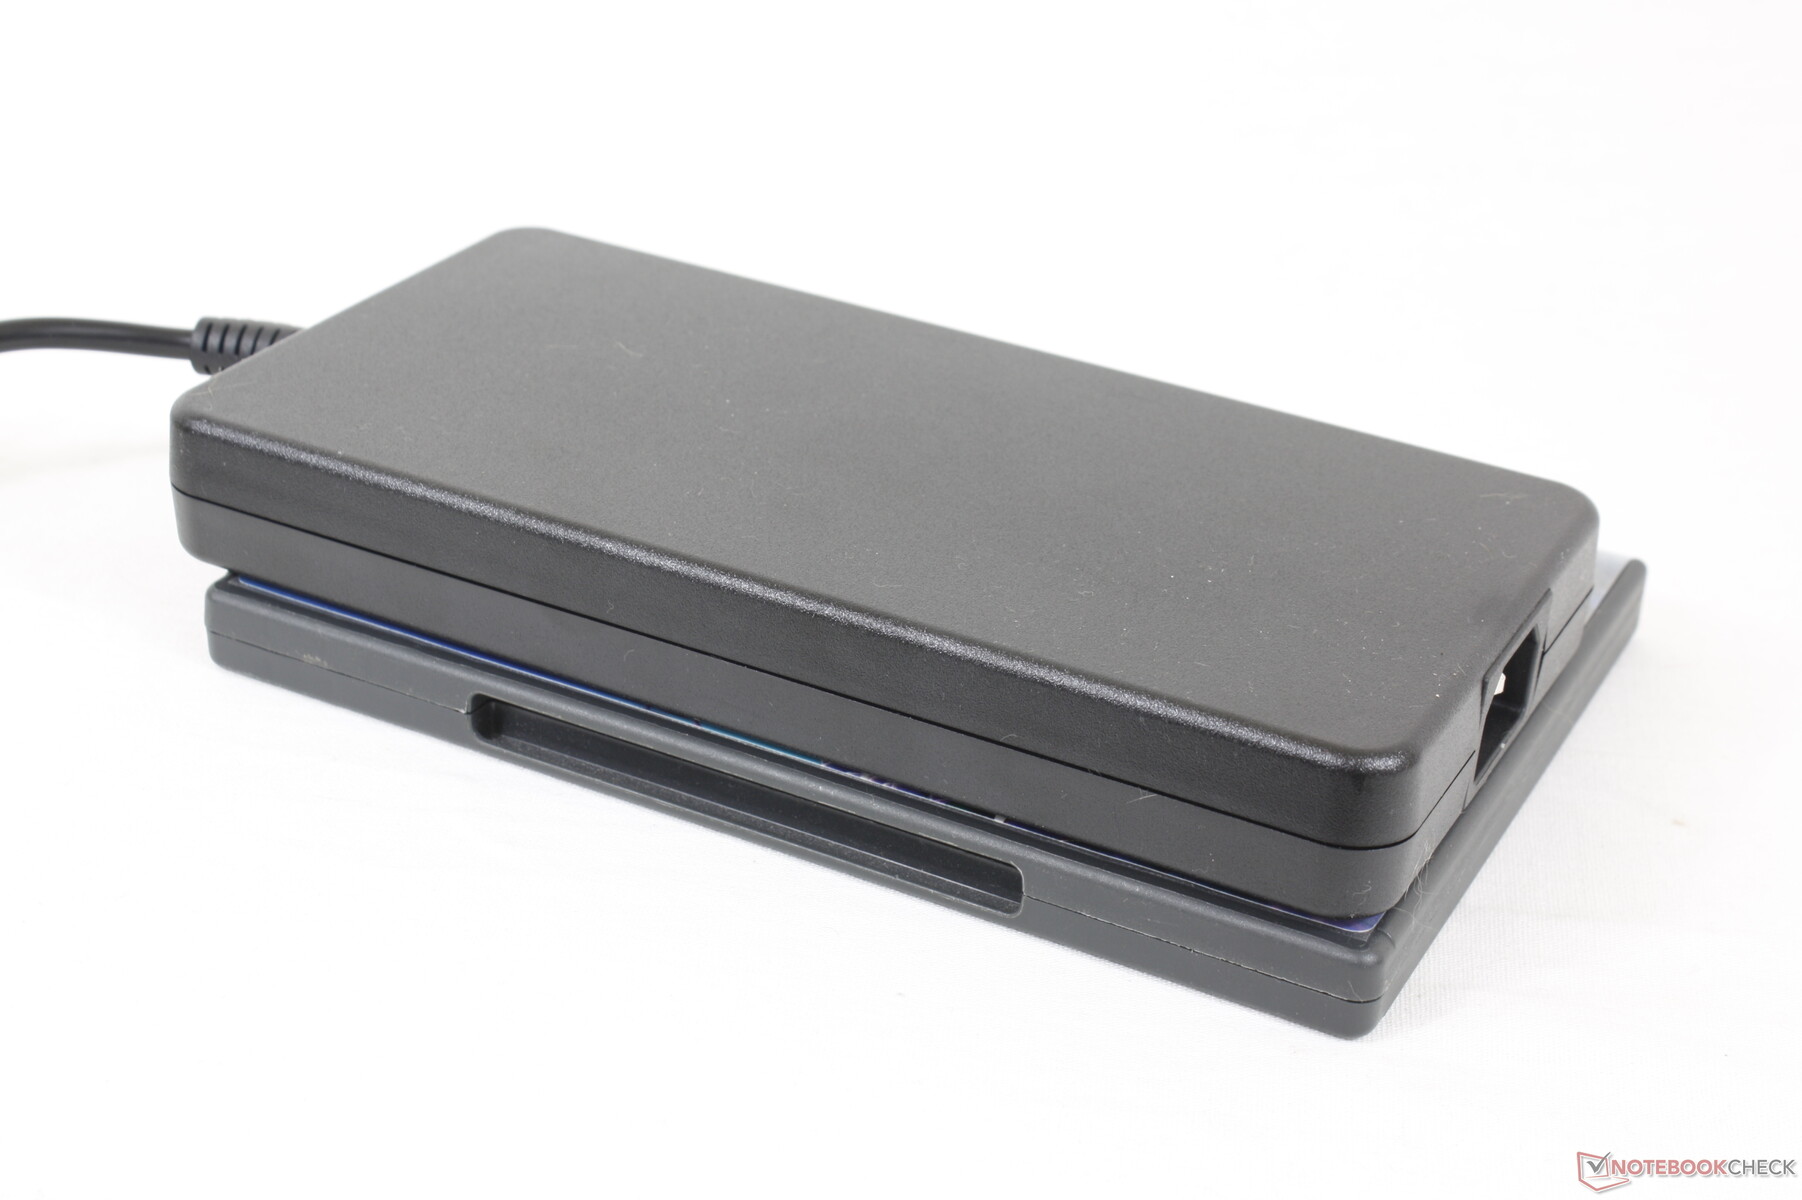
Udało nam się zarejestrować maksymalny pobór 243 W z dużego (~19,9 x 10 x 2,5 cm) zasilacza 240 W, gdy CPU i GPU są wykorzystywane w 100 procentach. W takich warunkach zużycie wahało się pomiędzy 180 W a 240 W, prawdopodobnie z powodu ograniczeń termicznych.
| wyłączony / stan wstrzymania | |
| luz | |
| obciążenie |
|
Legenda:
min: | |
| Dell G16 7620 i7-12700H, GeForce RTX 3060 Laptop GPU, WDC PC SN810 512GB, IPS, 2560x1600, 16" | Lenovo Legion 7 16ARHA7 R9 6900HX, Radeon RX 6850M XT, Samsung PM9A1 MZVL22T0HBLB, IPS, 2560x1600, 16" | HP Victus 16-e0145ng R5 5600H, GeForce RTX 3050 Ti Laptop GPU, Samsung SSD PM981a MZVLB512HBJQ, IPS, 1920x1080, 16.1" | Asus ROG Zephyrus M16 GU603H i9-11900H, GeForce RTX 3070 Laptop GPU, Samsung PM9A1 MZVL22T0HBLB, IPS, 2560x1600, 16" | Lenovo Legion 5 Pro 16IAH7H i7-12700H, GeForce RTX 3060 Laptop GPU, 2x Samsung PM9A1 MZVL21T0HCLR (RAID 0), IPS, 2560x1600, 16" | Acer Swift X SFX16-51G-5388 i5-11320H, GeForce RTX 3050 4GB Laptop GPU, Samsung PM991 MZVLQ512HBLU, , 1920x1080, 16.1" | |
|---|---|---|---|---|---|---|
| Power Consumption | -2% | 35% | 6% | -39% | 51% | |
| Idle Minimum * (Watt) | 14.4 | 9.9 31% | 7 51% | 11 24% | 22.8 -58% | 7 51% |
| Idle Average * (Watt) | 17.8 | 22 -24% | 9 49% | 20 -12% | 26.5 -49% | 10.1 43% |
| Idle Maximum * (Watt) | 31.5 | 23.1 27% | 15 52% | 30 5% | 41 -30% | 15 52% |
| Load Average * (Watt) | 101.2 | 94.4 7% | 93 8% | 111 -10% | 191 -89% | 63.3 37% |
| Witcher 3 ultra * (Watt) | 176.9 | 249 -41% | 134.5 24% | 156 12% | 194.7 -10% | 63.3 64% |
| Load Maximum * (Watt) | 242.9 | 276 -14% | 185 24% | 197 19% | 238 2% | 94 61% |
* ... im mniej tym lepiej
Power Consumption Witcher 3 / Stresstest
Power Consumption external Monitor
Czas pracy na baterii - nienajlepszy
Czasy pracy są tylko przeciętne nawet jak na duży laptop do gier. Czas pracy na baterii w sieci WLAN wynosi niecałe 5 godzin w porównaniu do 7 godzin naLenovo Legion 7 16ARHA7 lub HP Victus 16.
Ładowanie od pustego do pełnego trwa około 2 godzin. Model ten nie obsługuje USB-PD, więc nie można go ładować przez USB-C.
| Dell G16 7620 i7-12700H, GeForce RTX 3060 Laptop GPU, 84 Wh | Lenovo Legion 7 16ARHA7 R9 6900HX, Radeon RX 6850M XT, 99 Wh | HP Victus 16-e0145ng R5 5600H, GeForce RTX 3050 Ti Laptop GPU, 70 Wh | Asus ROG Zephyrus M16 GU603H i9-11900H, GeForce RTX 3070 Laptop GPU, 90 Wh | Lenovo Legion 5 Pro 16IAH7H i7-12700H, GeForce RTX 3060 Laptop GPU, 80 Wh | Acer Swift X SFX16-51G-5388 i5-11320H, GeForce RTX 3050 4GB Laptop GPU, 58.7 Wh | |
|---|---|---|---|---|---|---|
| Czasy pracy | 57% | 42% | 90% | -21% | 88% | |
| Reader / Idle (h) | 7.1 | 4.9 -31% | 13.3 87% | |||
| WiFi v1.3 (h) | 5 | 7.3 46% | 7.1 42% | 7.7 54% | 3.6 -28% | 8.1 62% |
| Load (h) | 0.7 | 1.8 157% | 1.6 129% | 0.6 -14% | 1.5 114% | |
| H.264 (h) | 4.1 | 8.4 | ||||
| Witcher 3 ultra (h) | 2.1 | |||||
| Gaming (h) | 1.1 |
Za
Przeciw
Werdykt - Duży i szybki
G16 ma wiele podobieństw do niektórych najnowszych Laptopów Alienware na lepsze lub gorsze. Dokładniej mówiąc, system jest większy i cięższy niż wielu konkurentów, a nawet działa znacznie cieplej z temperaturami rdzenia oscylującymi wokół 90 C podczas gry. G16 nie jest zatem najlepszym rozwiązaniem dla użytkowników, którzy chcą cienki i lekki laptop do gier doświadczenie. Alternatywy, takie jak np.Lenovo Legion 7 16 lub Asus ROG Zephyrus M16 są cieńsze, lżejsze, a nawet oba, oferując jednocześnie podobne opcje wyświetlacza i procesora.
Dell G16 wyróżnia się pod względem wydajności kosztem większej powierzchni podstawy, większej wagi i cieplejszych temperatur rdzenia.
Tam, gdzie system Dell walczy, nadrabia to wydajnością. System jest szybszy od większości innych laptopów z dokładnie tym samym CPU i GPU, co jest bezpośrednim wynikiem grubszego profilu i cieplejszych temperatur. Mimo to przeciętny czas pracy na akumulatorze, brak obsługi dodatkowego dysku SSD, słaba kamera internetowa i niewygodnie duża kostka zasilająca oznaczają, że wciąż jest sporo miejsca na poprawę.
Cena i dostępność
Dell G16 7620 jest już sprzedawany przez Best Buy w naszej obecnej konfiguracji za 1600 USD. W tej chwili nie ma go jeszcze na Amazon. Więcej jednostek SKU można zamówić bezpośrednio w firmie Dell w cenie od 1140 do 1935 USD.
Dell G16 7620
- 18/10/2022 v7 (old)
Allen Ngo
Price comparison

