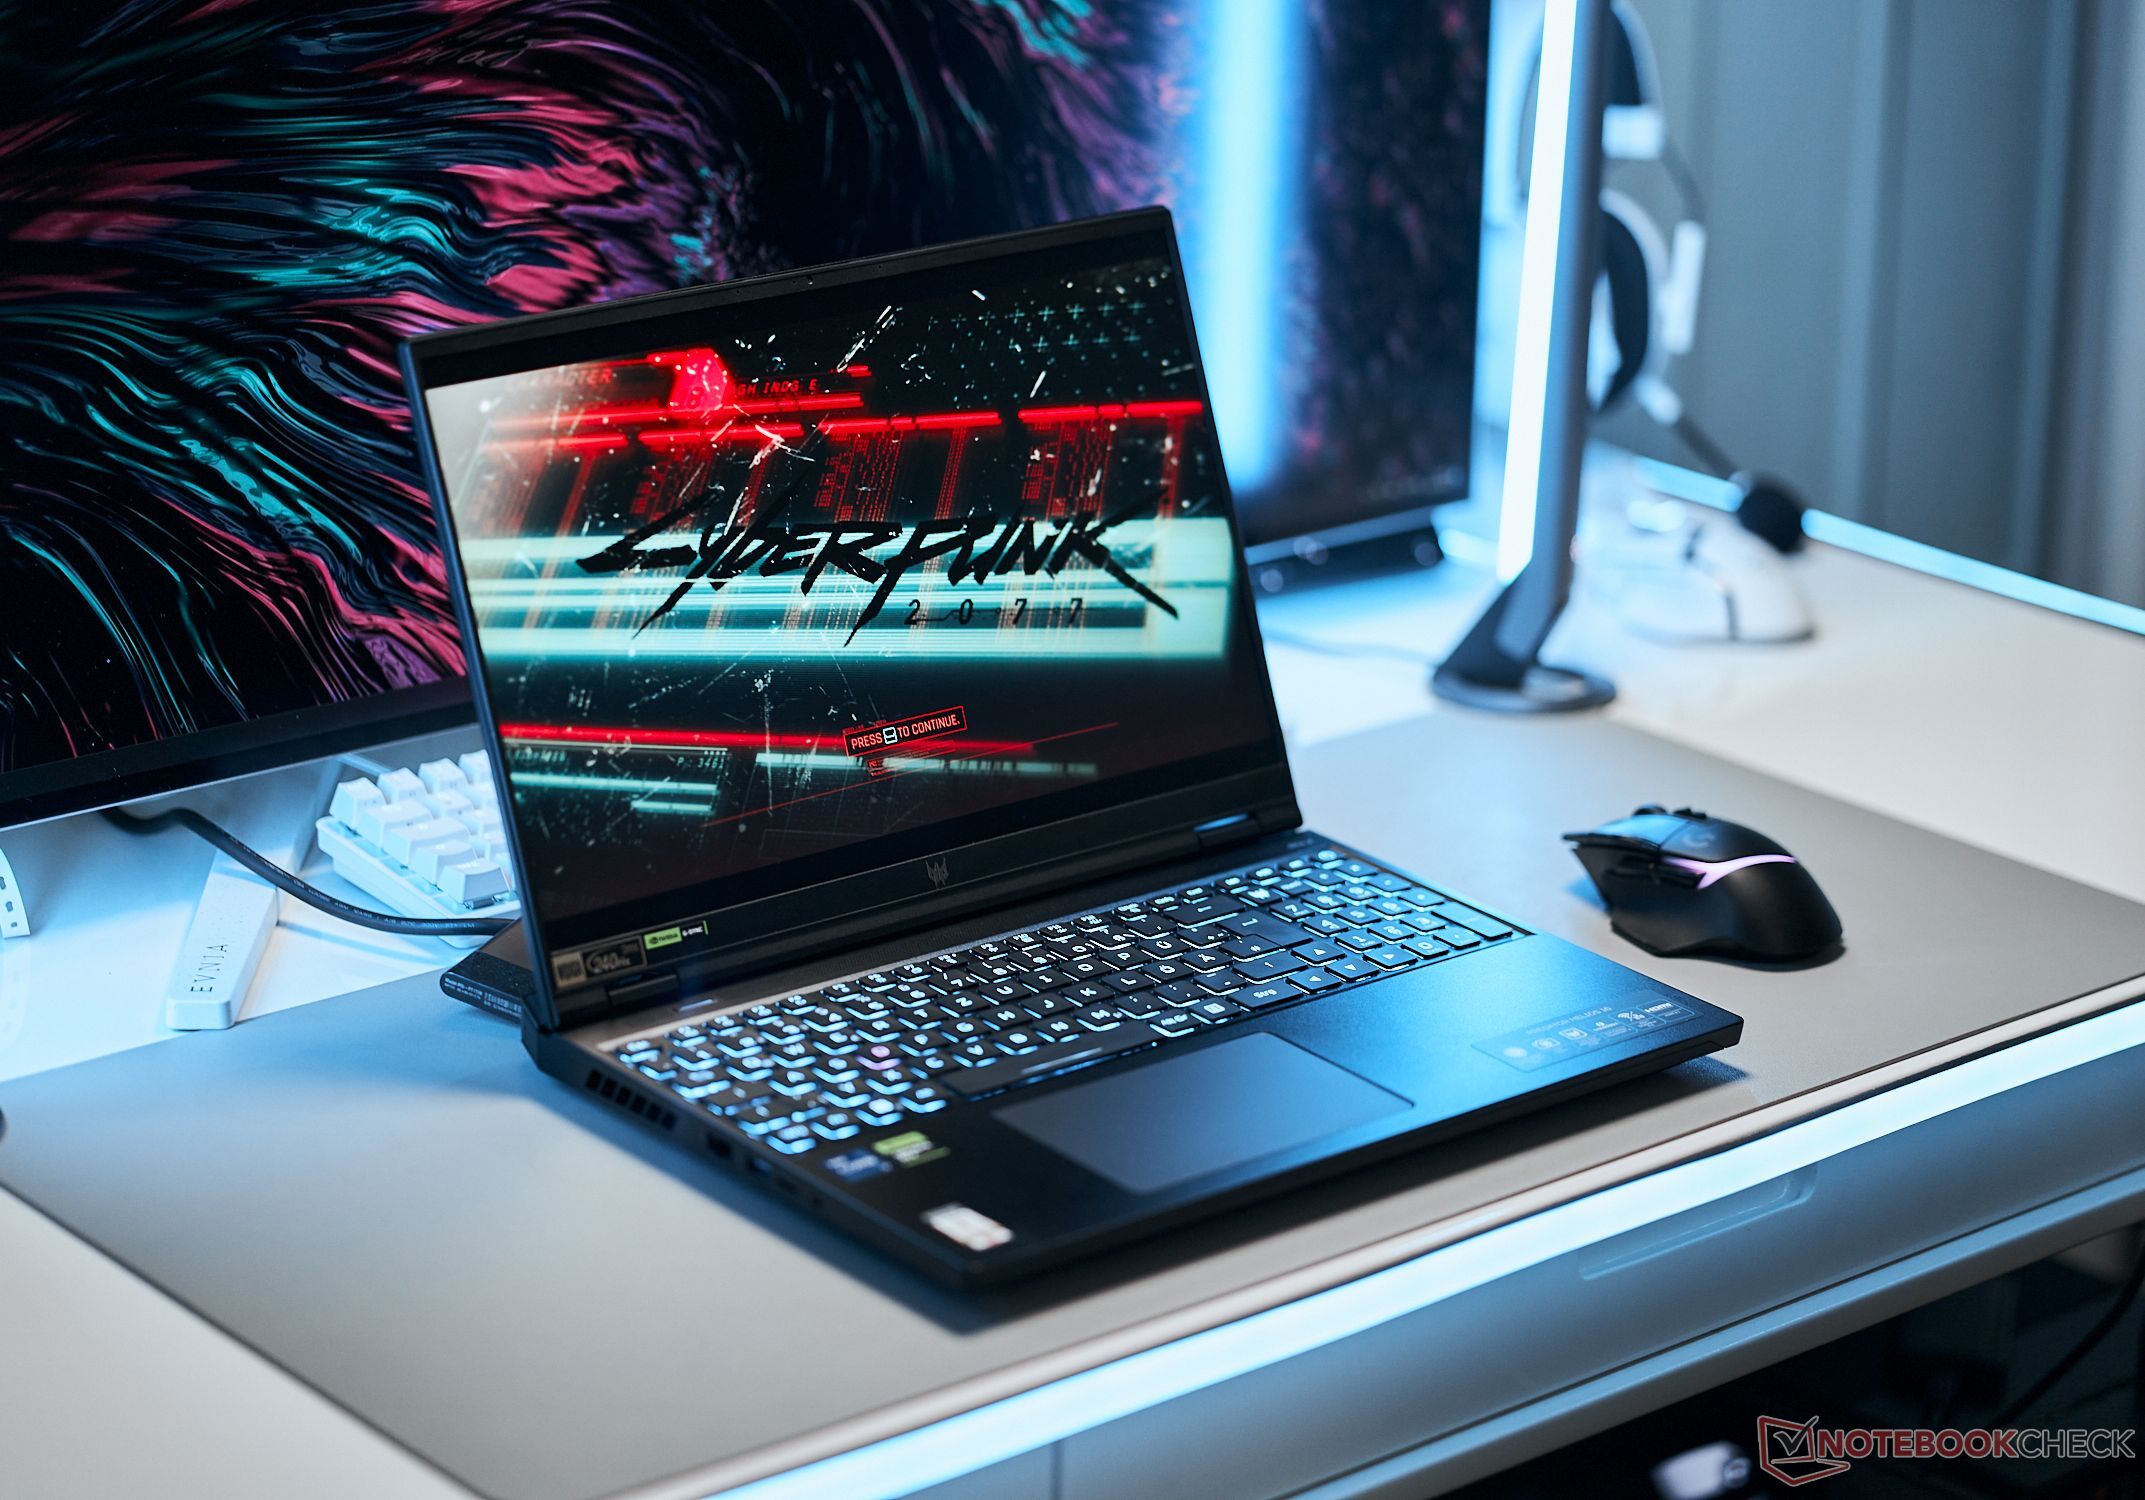
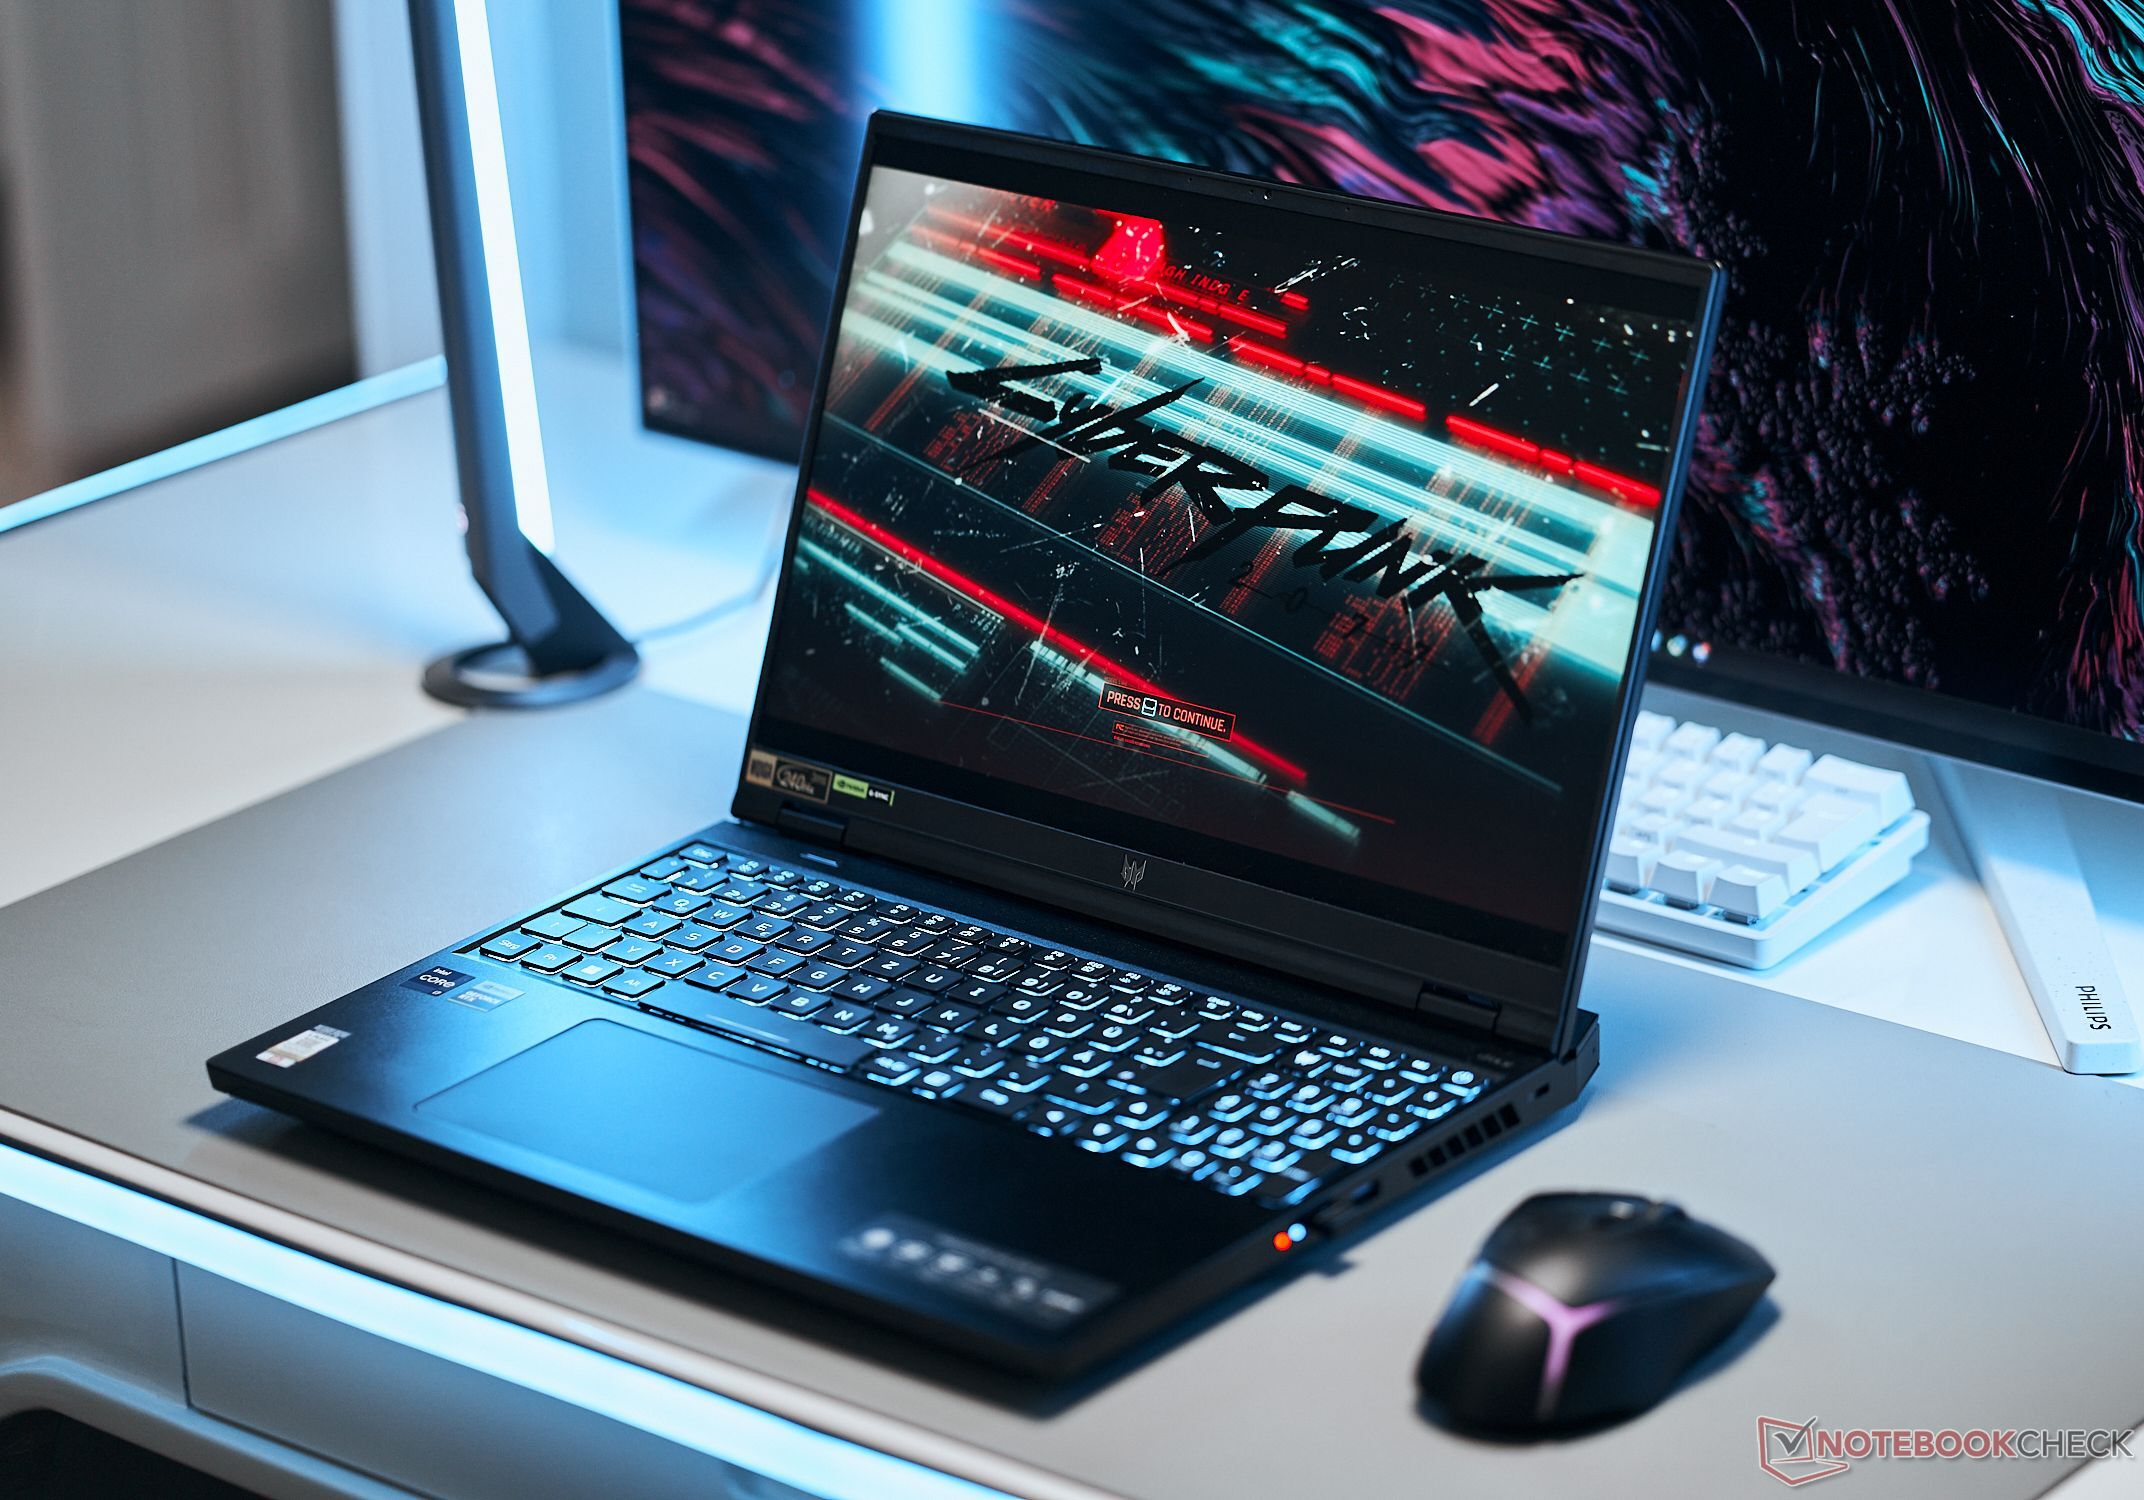
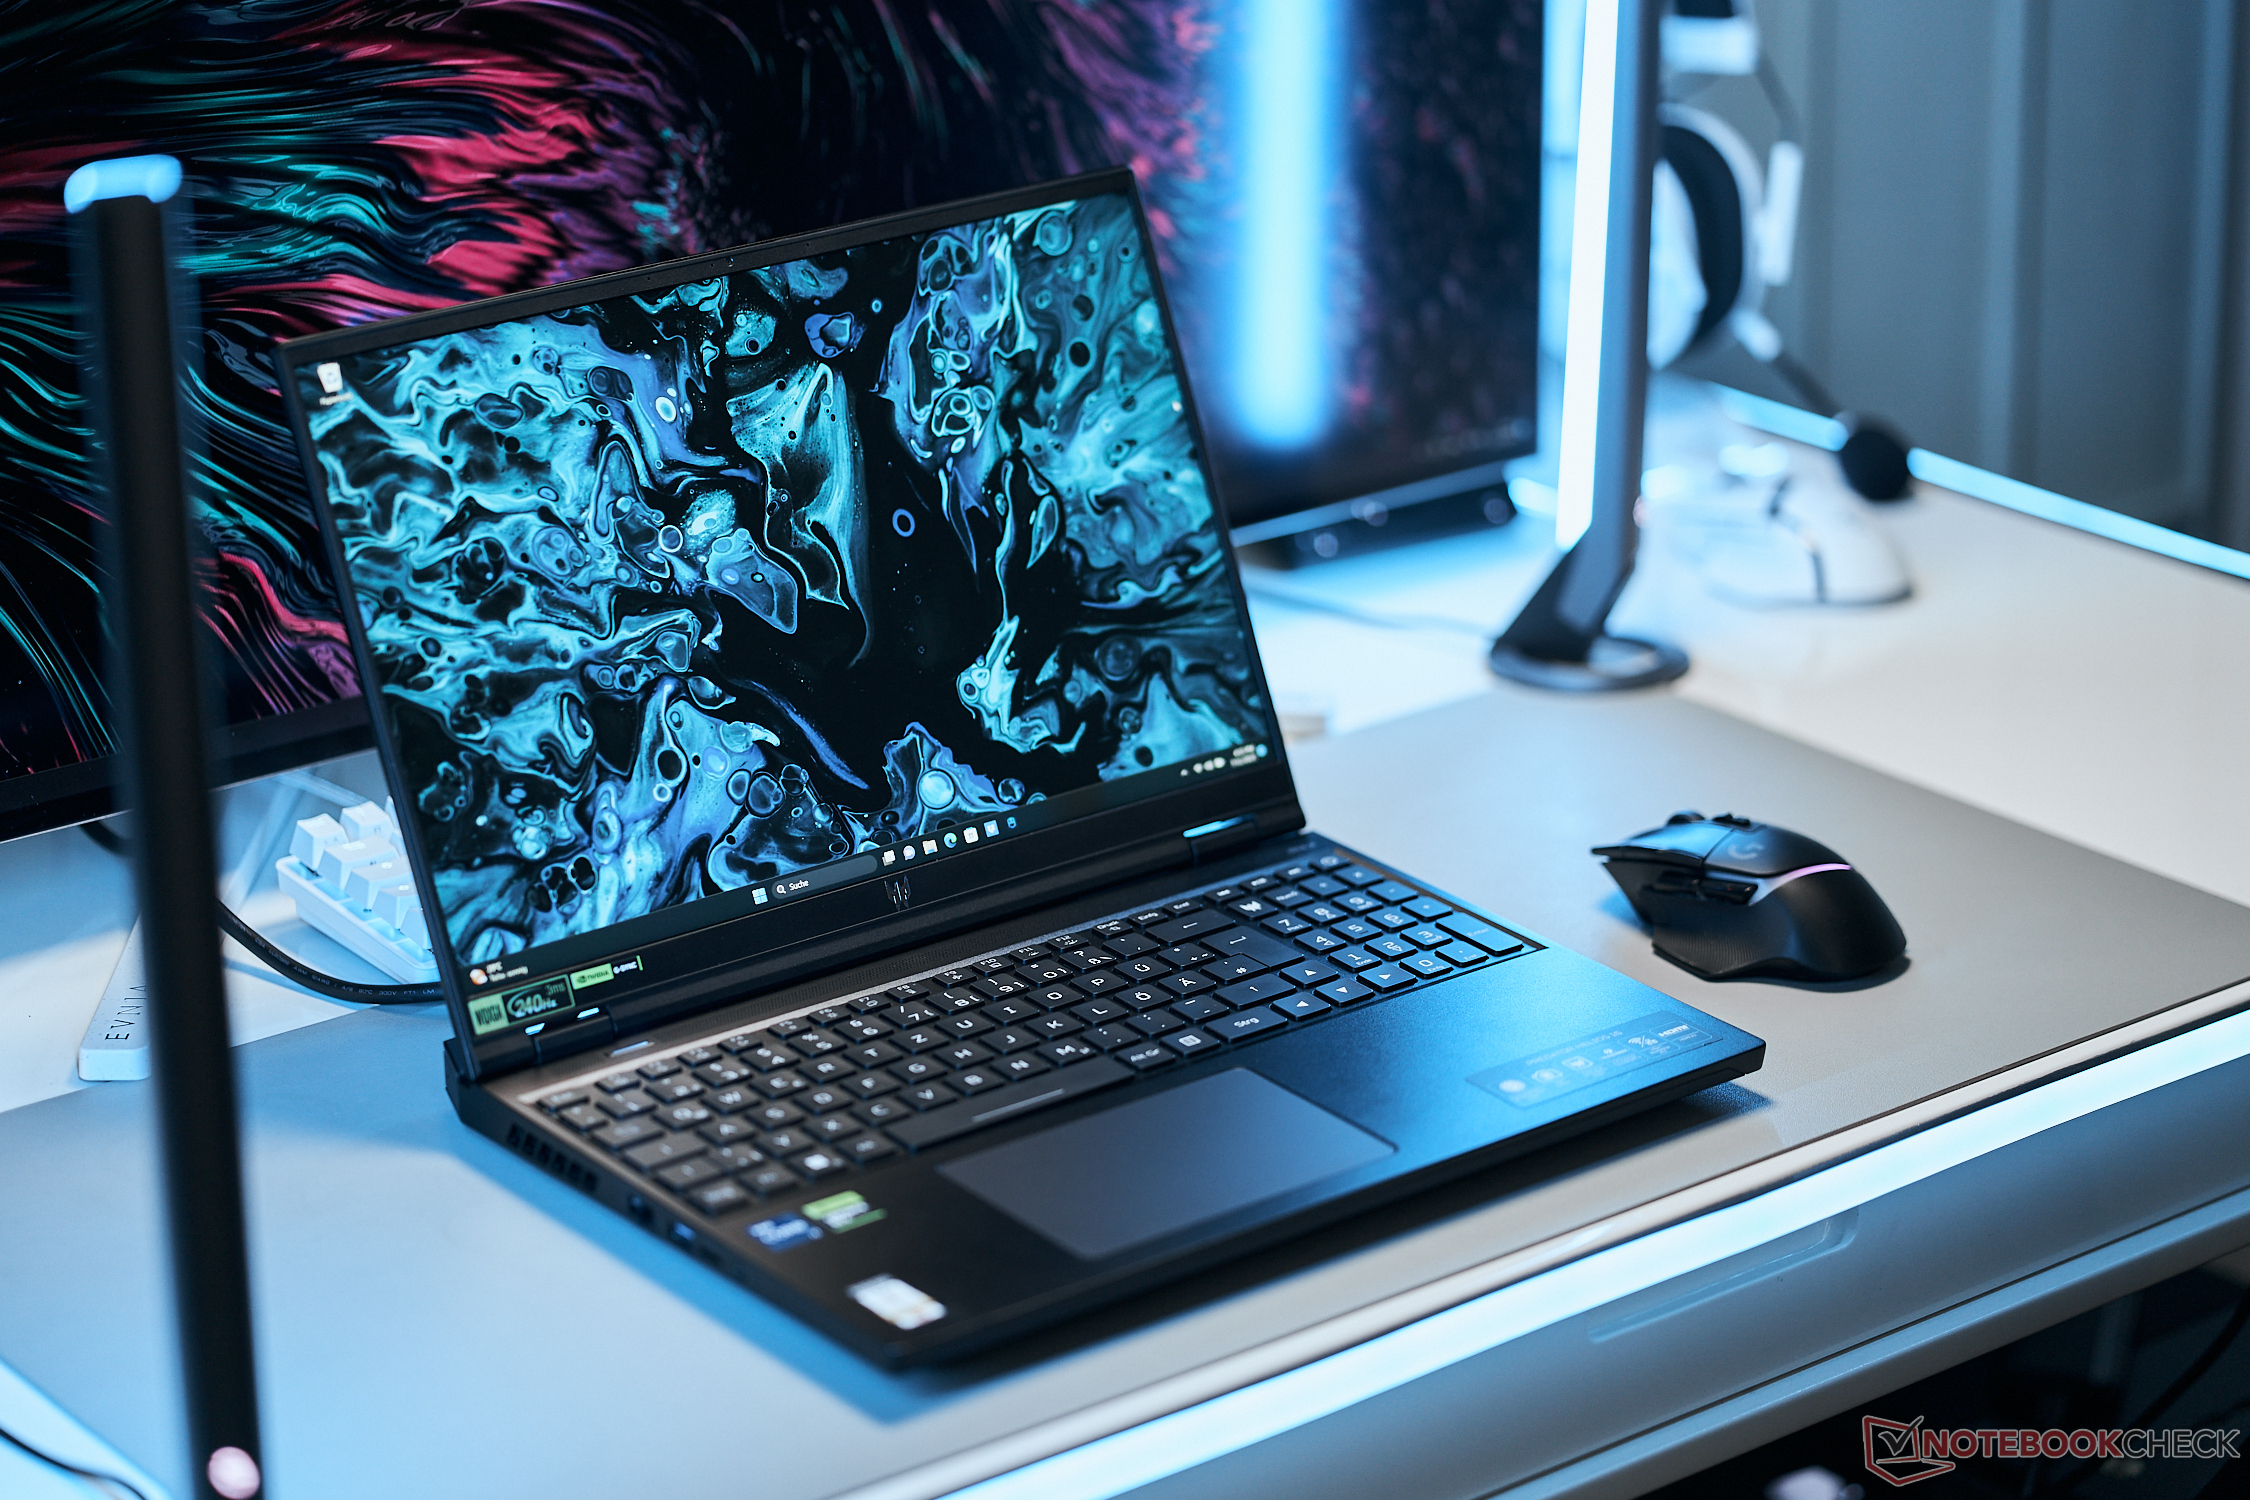
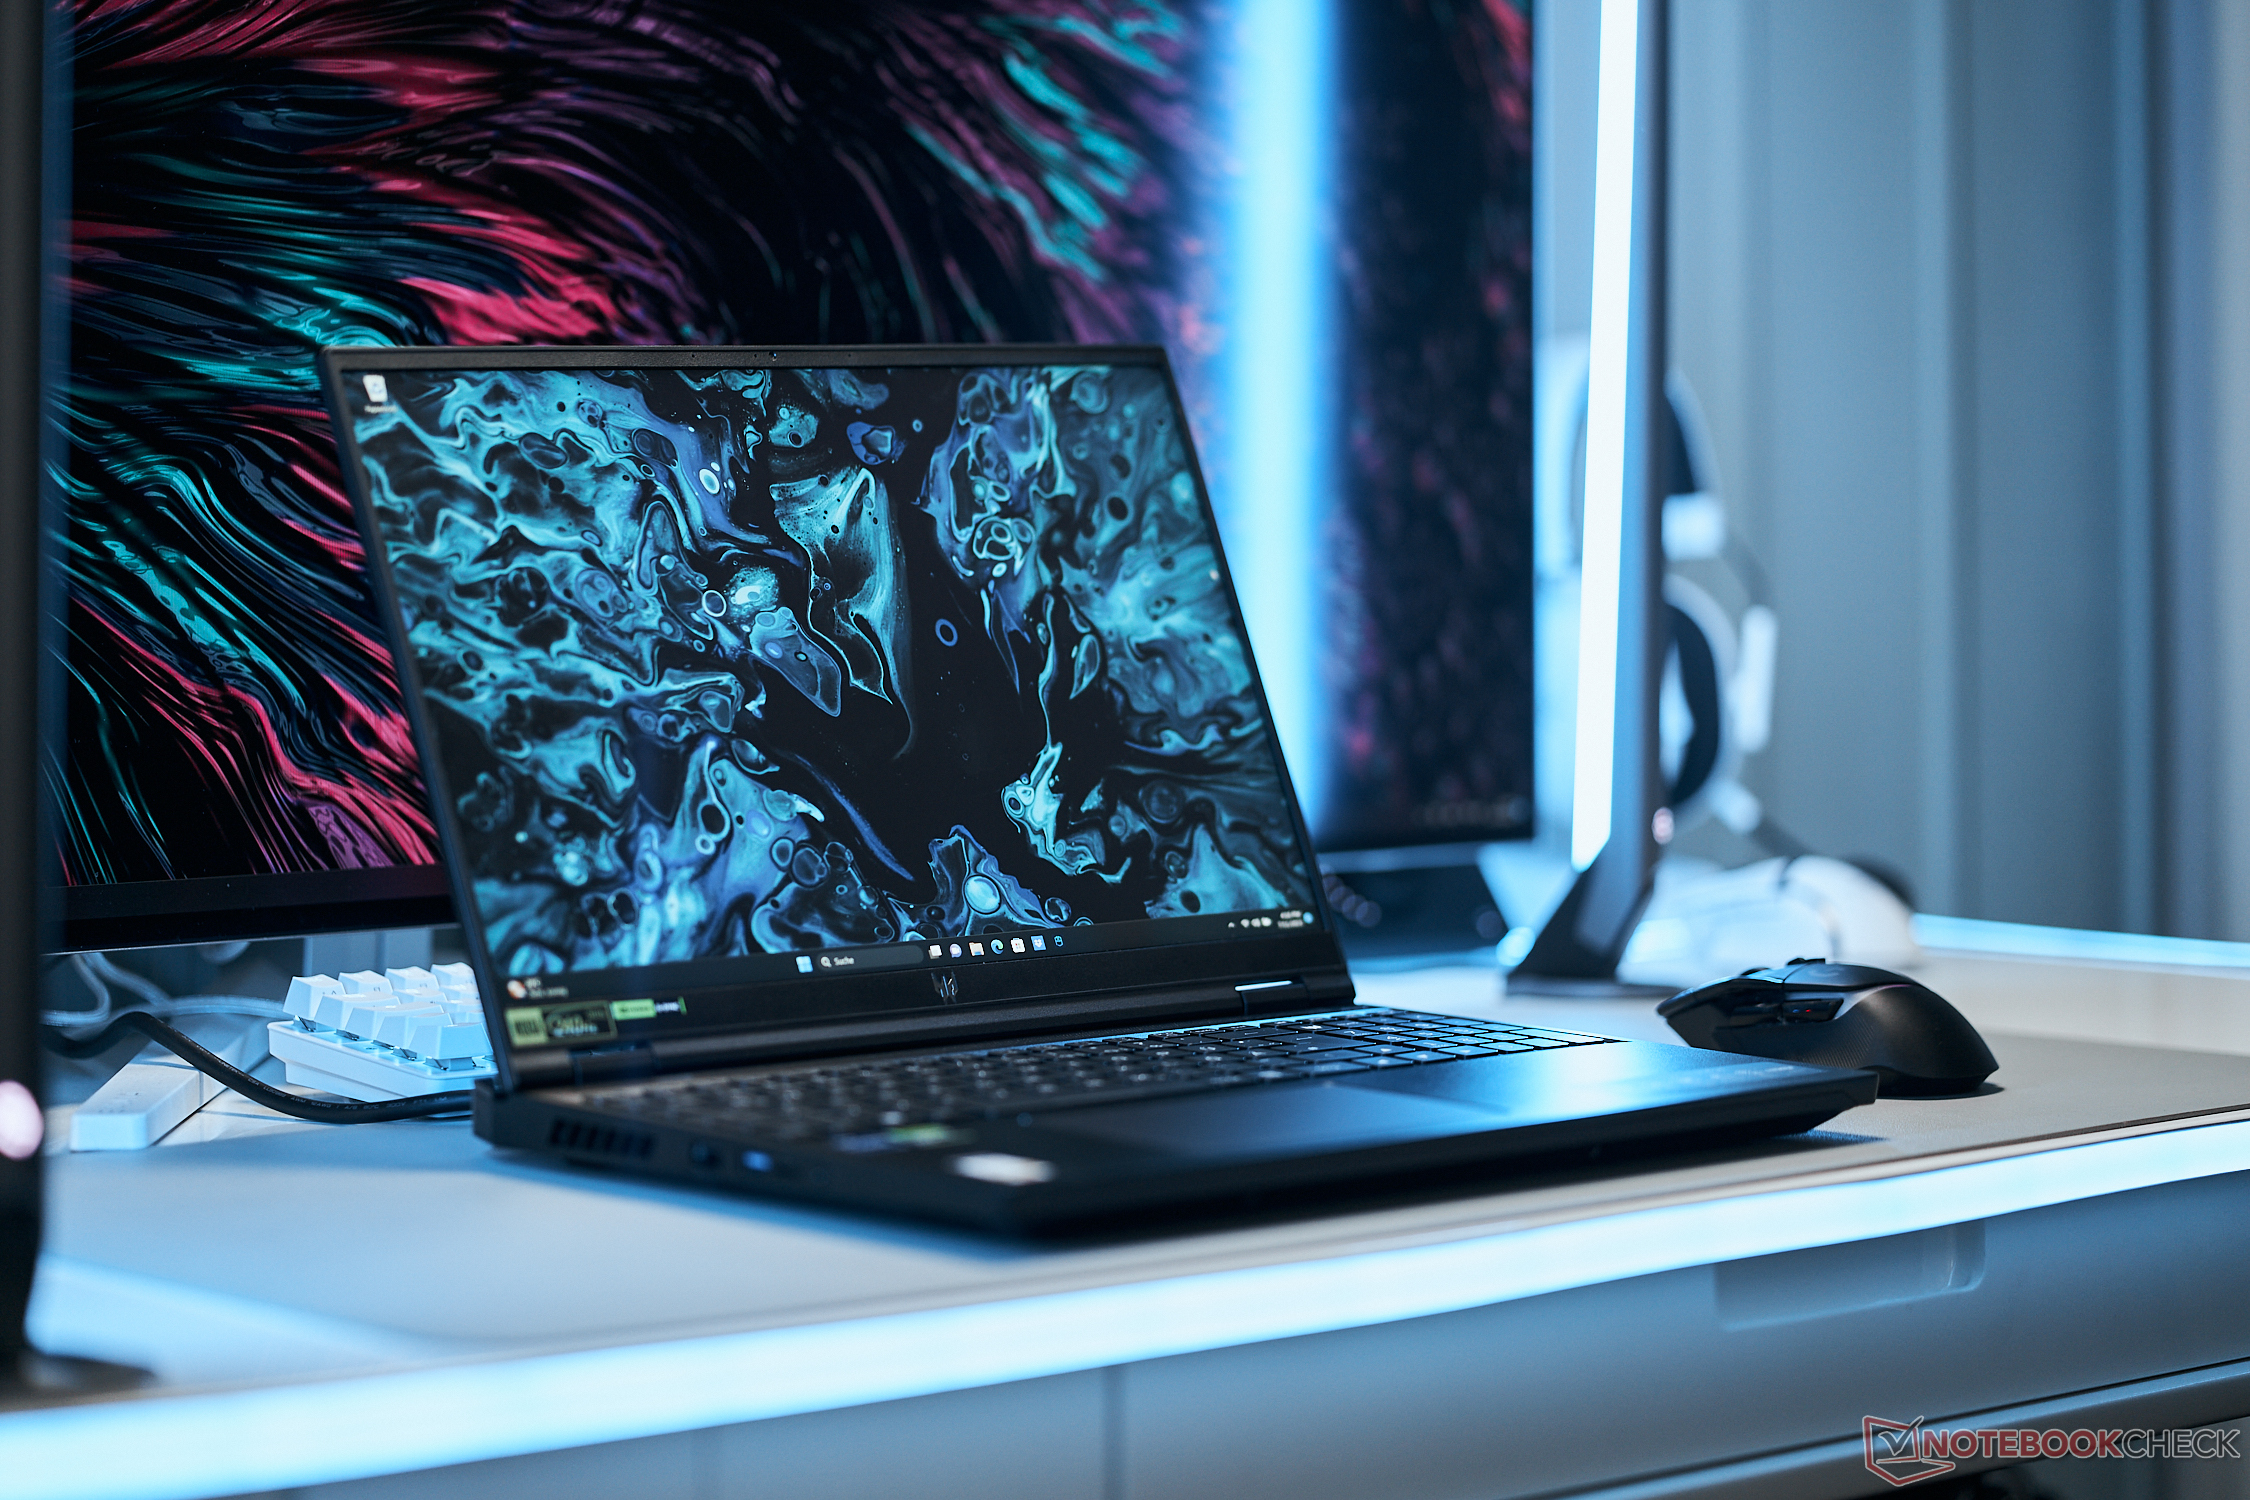
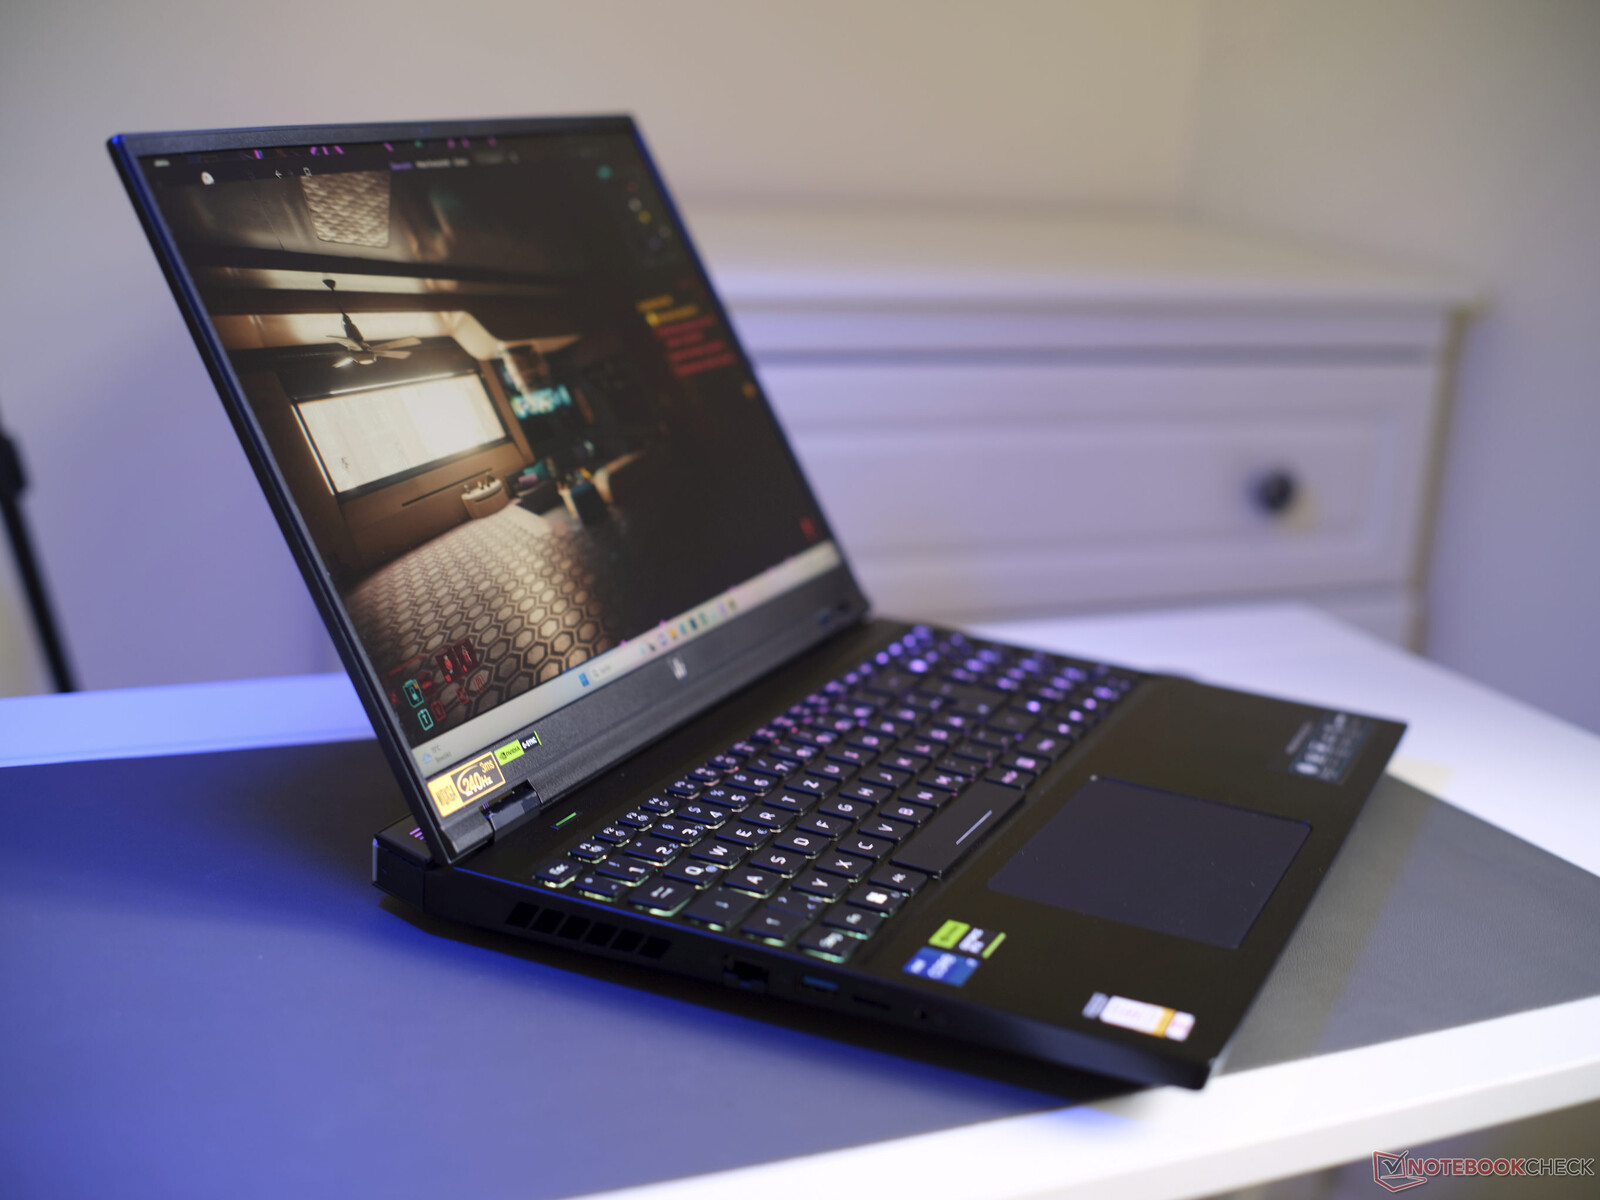
Recenzja laptopa Acer Predator Helios 16: Cichy laptop do gier z wieloma mocnymi stronami
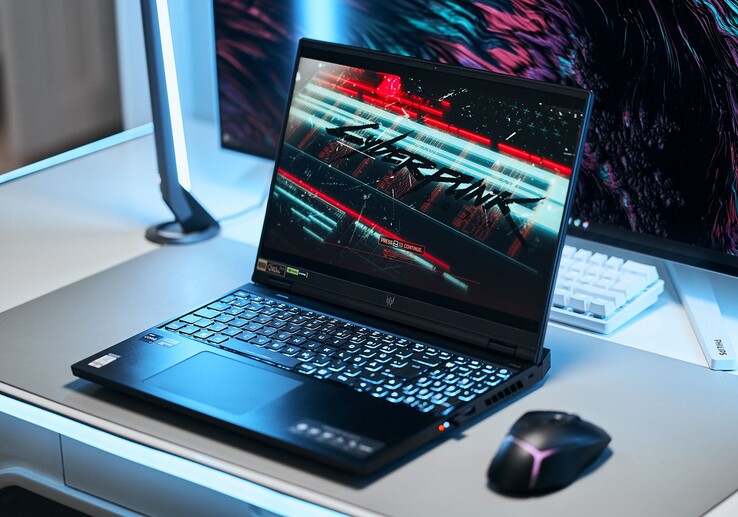
Jako następca Predator Helios 300predator Helios 16 to najnowszy high-endowy laptop do gier firmy Acer z elementami średniej klasy. Nasz model testowy wybrał kartę graficznąRTX 4060średniej klasy GPU i kosztuje około 1700 USD, z jednostkami SKU doRTX 4080również dostępne. Czysta średnia półka Acer jest reprezentowana przezHelios Neo 16iSeria Nitroprzy czym ta ostatnia służy do pokrycia segmentu podstawowego. Dla kontrastuTriton 16to ultracienki laptop do gier firmy Acer.
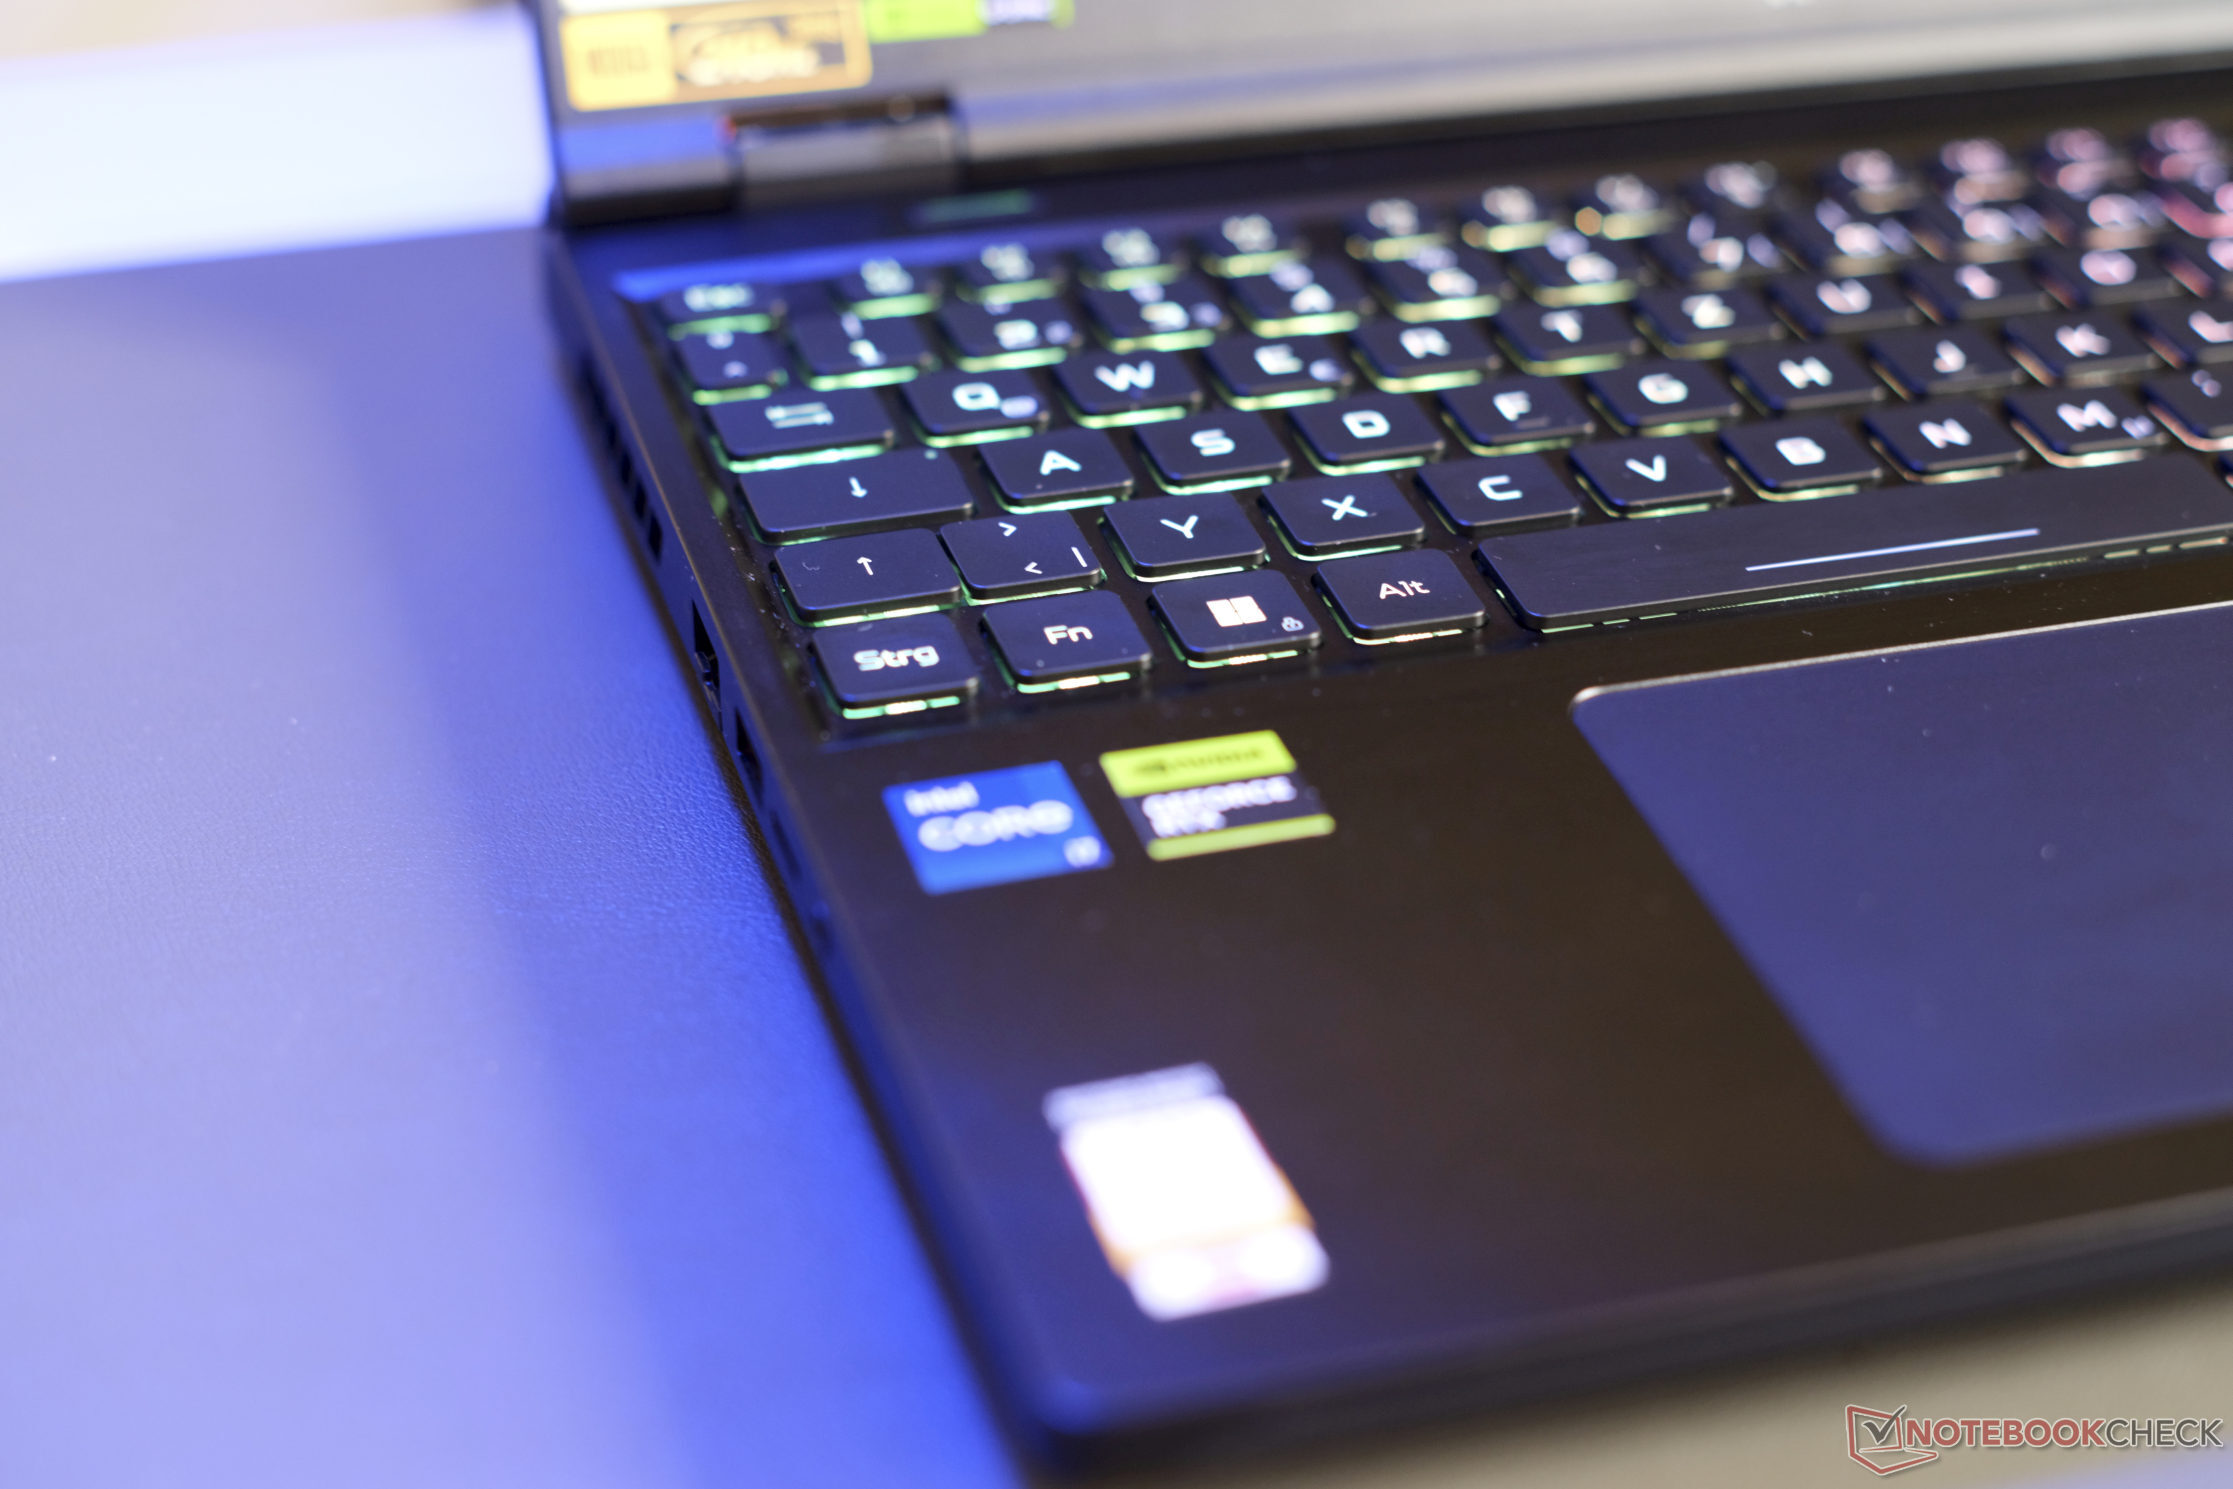
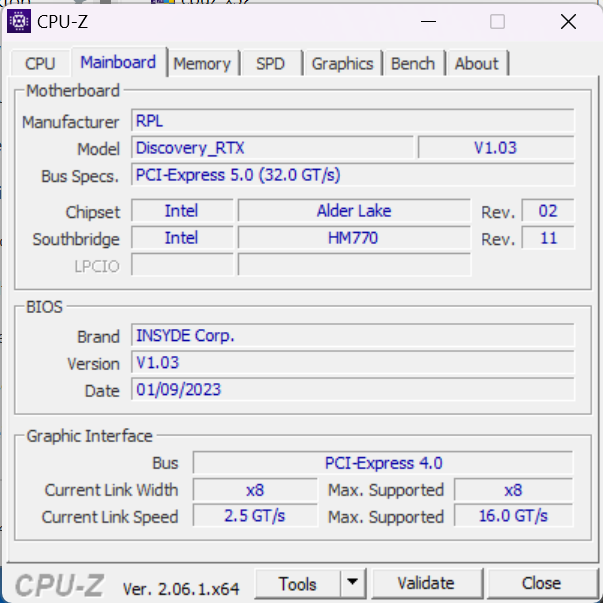
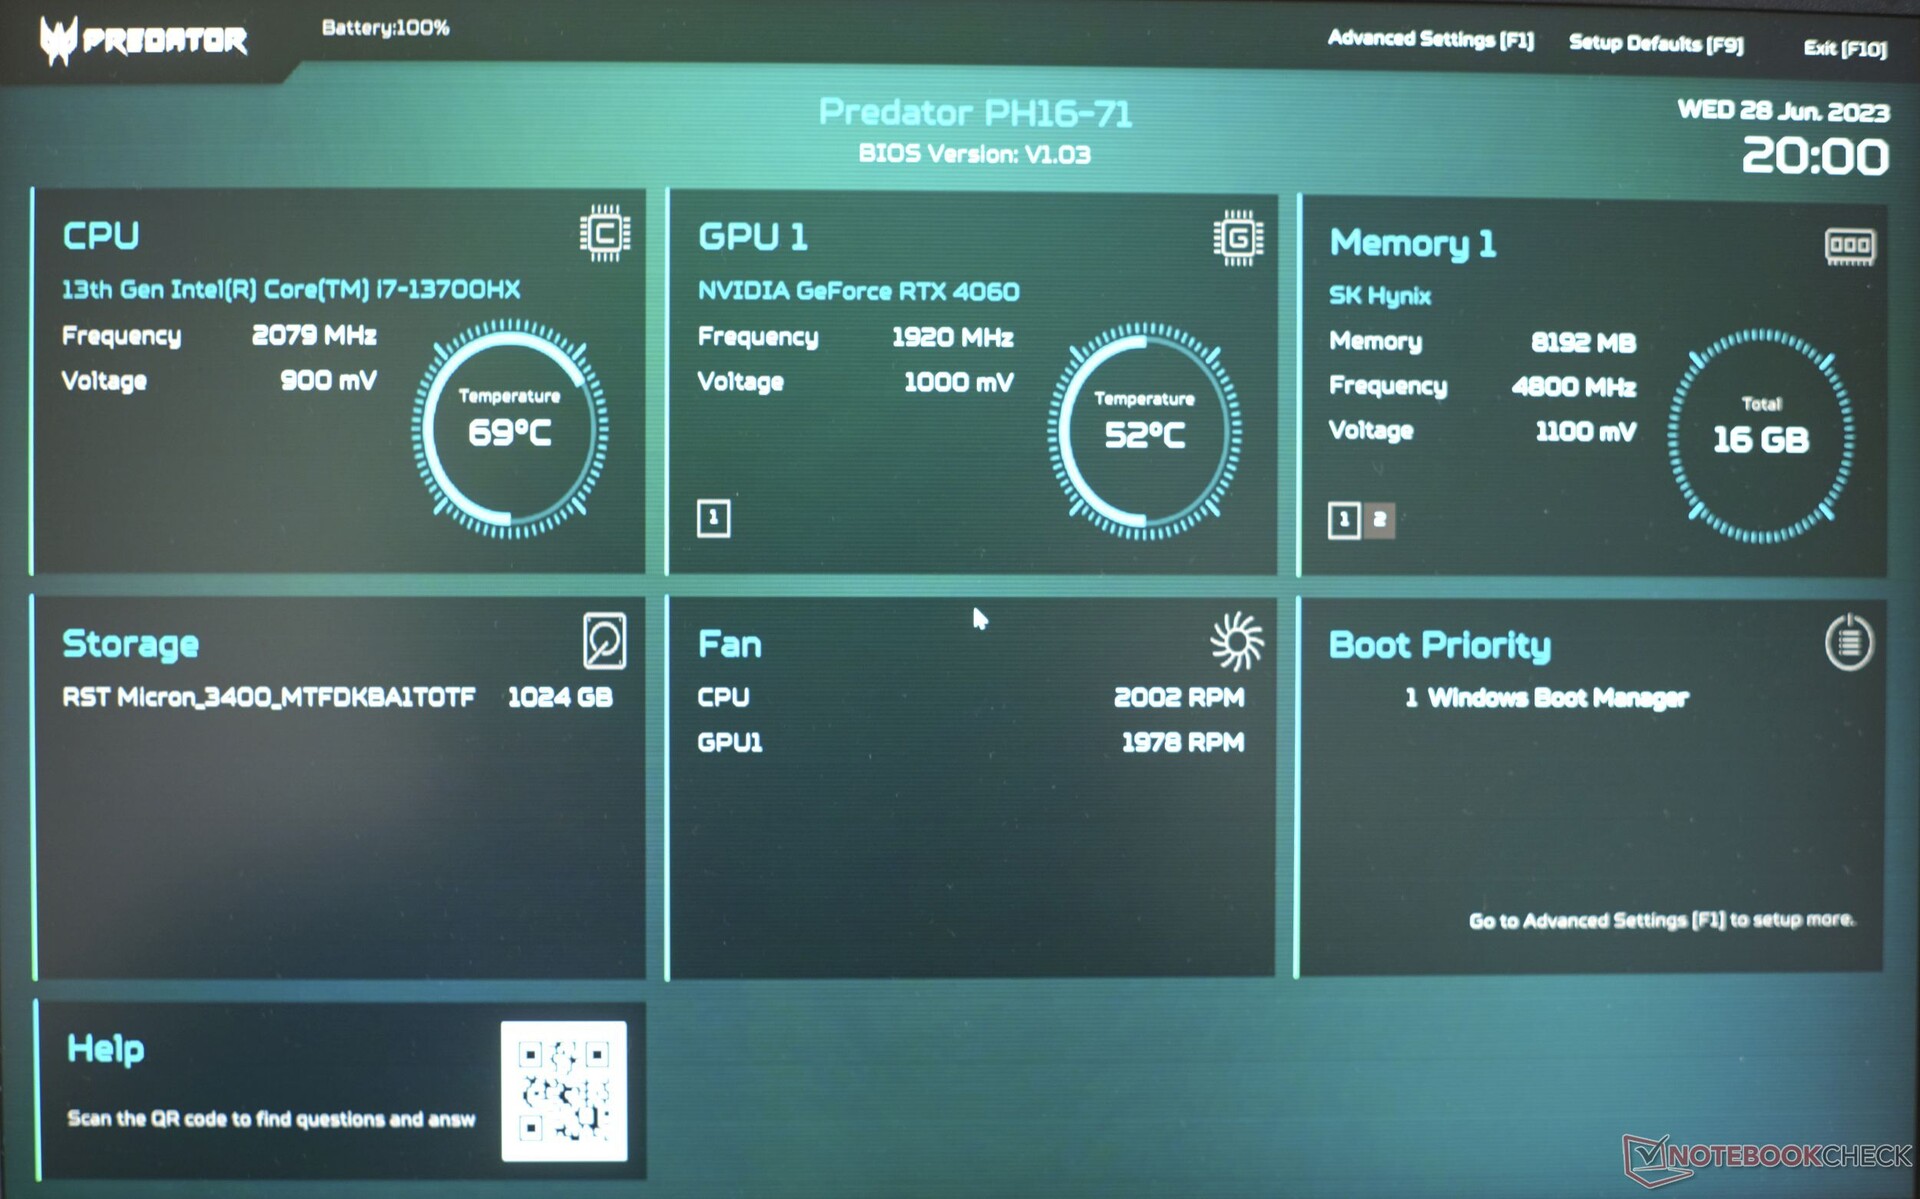
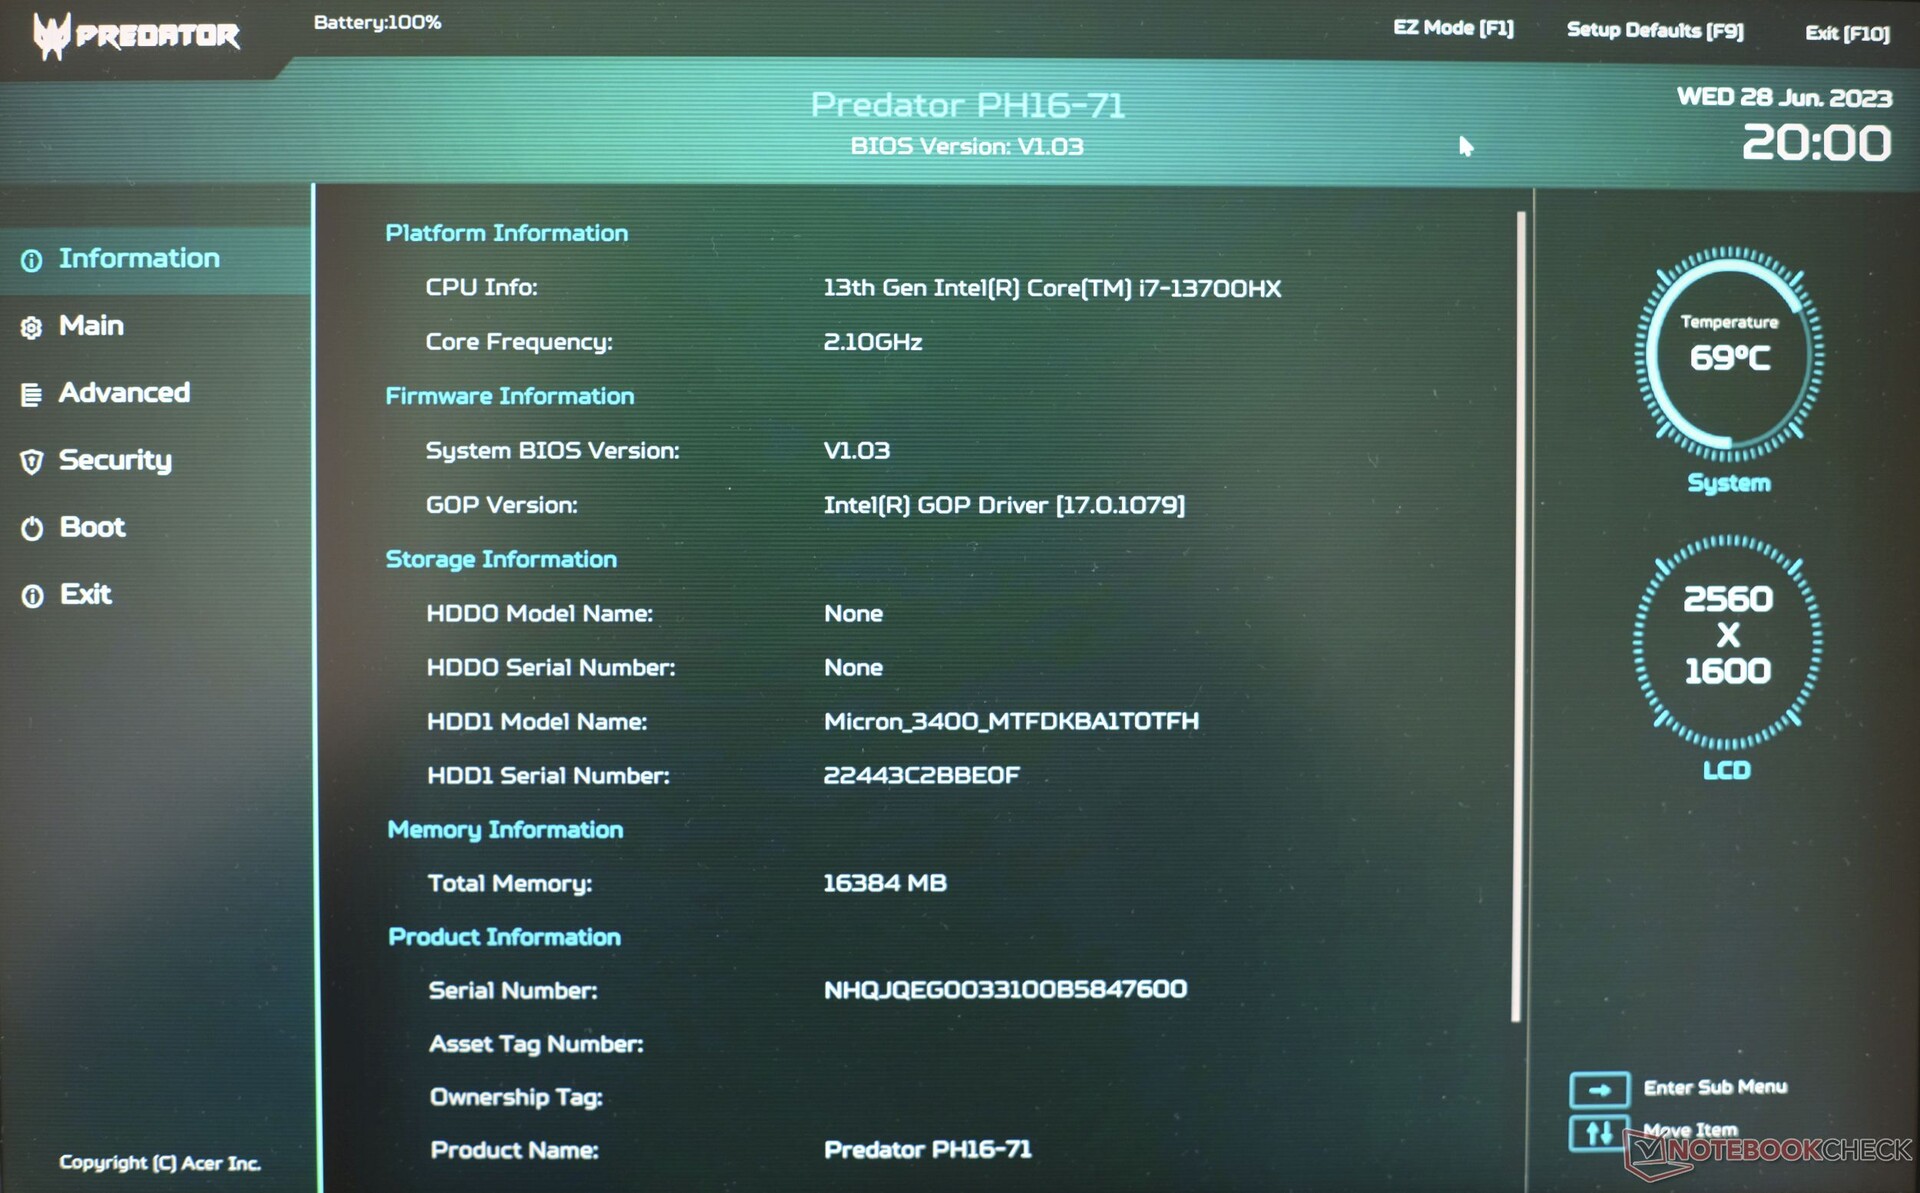
Ponadto, procesor Intel Core i7-13700HX (TDP 55 W), 16 GB pamięci RAM DDR5 (dwa banki RAM) i dysk SSD o pojemności 1 TB (PCIe 4.0). Chociaż dostępny jest również wyświetlacz mini-LED, nasz model jest wyposażony w zwykły panel IPS z podświetleniem LED, który nieoczekiwanie został wyposażony w wysokiej klasy zestaw funkcji, jak pokazuje nasza recenzja.
Konkurencja pojawia się głównie w postaci Lenovo Legion Pro 5 ale Asus TUF Gaming A16, Gigabyte's Aorus 15Xi Dell G15 również walczą o tytuł najlepszego laptopa do gier średniej klasy.
Potencjalni konkurenci w porównaniu
Ocena | Data | Model | Waga | Wysokość | Rozmiar | Rezolucja | Cena |
|---|---|---|---|---|---|---|---|
| 89.5 % v7 (old) | 07/2023 | Acer Predator Helios 16 PH16-71-731Q i7-13700HX, GeForce RTX 4060 Laptop GPU | 2.6 kg | 26.9 mm | 16.00" | 2560x1600 | |
| 88.1 % v7 (old) | 06/2023 | Acer Nitro 16 AN16-41 R7 7735HS, GeForce RTX 4070 Laptop GPU | 2.7 kg | 27.9 mm | 16.00" | 2560x1600 | |
| 87.9 % v7 (old) | 05/2023 | Lenovo Legion Pro 5 16IRX8 i7-13700HX, GeForce RTX 4060 Laptop GPU | 2.5 kg | 26.8 mm | 16.00" | 2560x1600 | |
| 86.2 % v7 (old) | 04/2023 | Aorus 15X ASF i7-13700HX, GeForce RTX 4070 Laptop GPU | 2.3 kg | 19.7 mm | 15.60" | 2560x1440 | |
| 86.2 % v7 (old) | 02/2023 | Asus TUF Gaming A16 FA617 R7 7735HS, Radeon RX 7600S | 2.2 kg | 27 mm | 16.00" | 1920x1200 | |
| 84.2 % v7 (old) | 06/2023 | Dell G15 5530 i7-13650HX, GeForce RTX 4060 Laptop GPU | 3 kg | 26.95 mm | 15.60" | 1920x1080 |
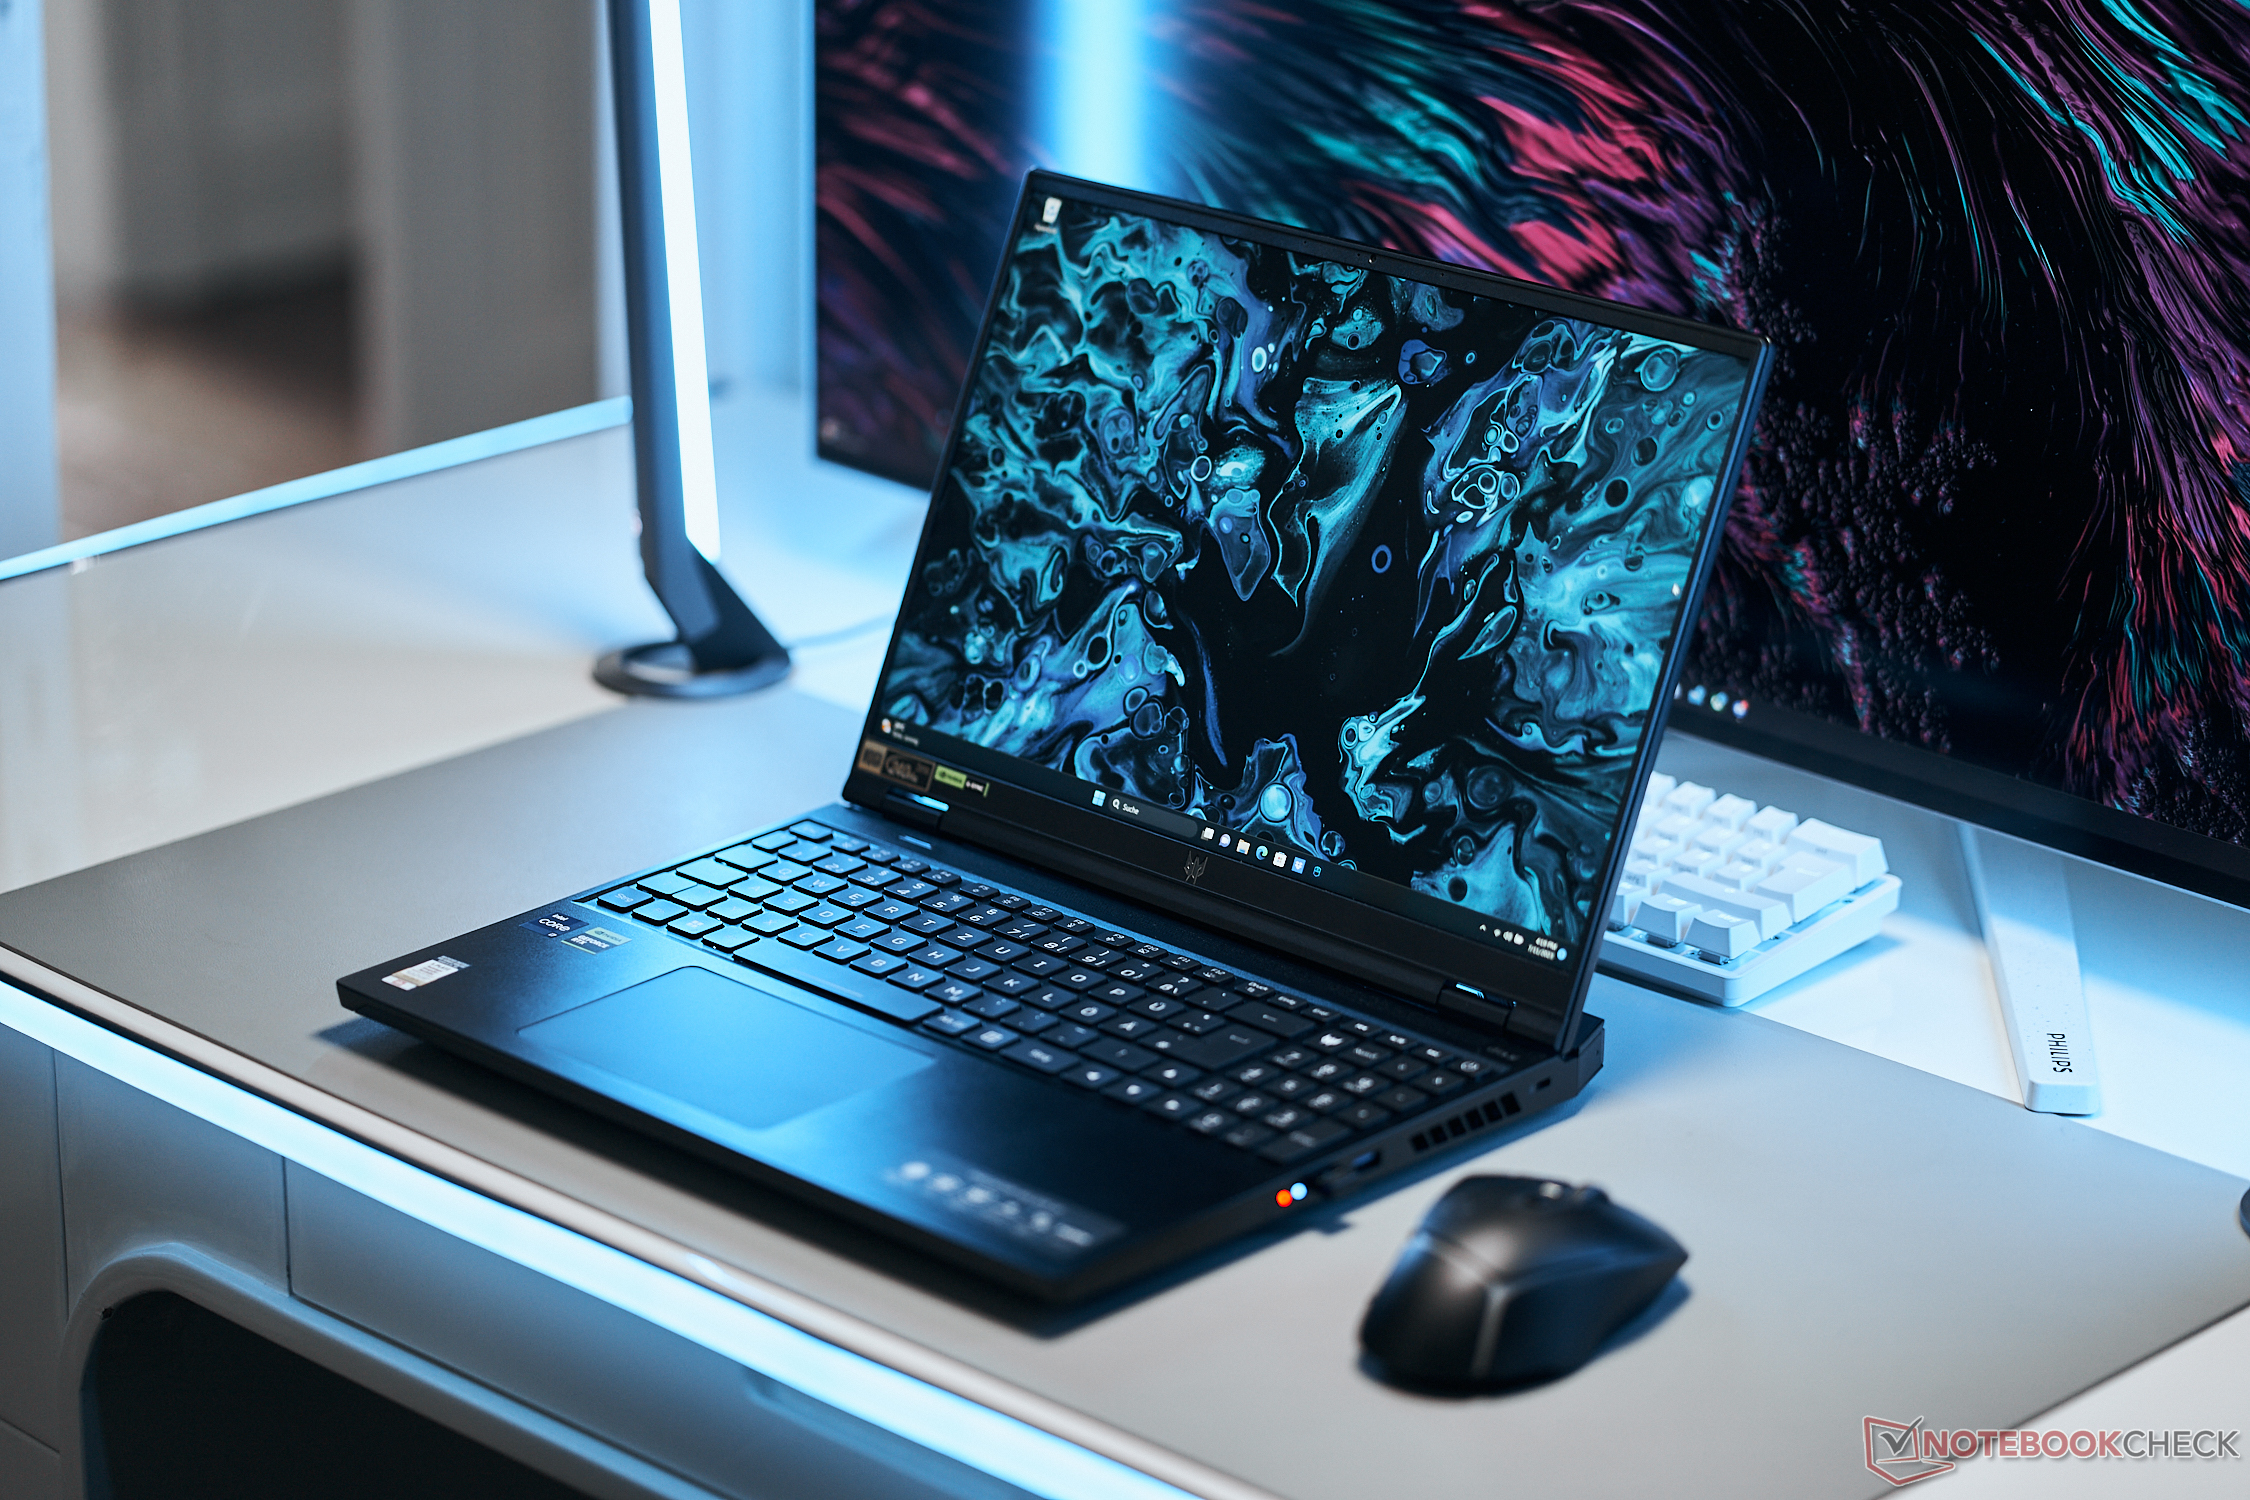
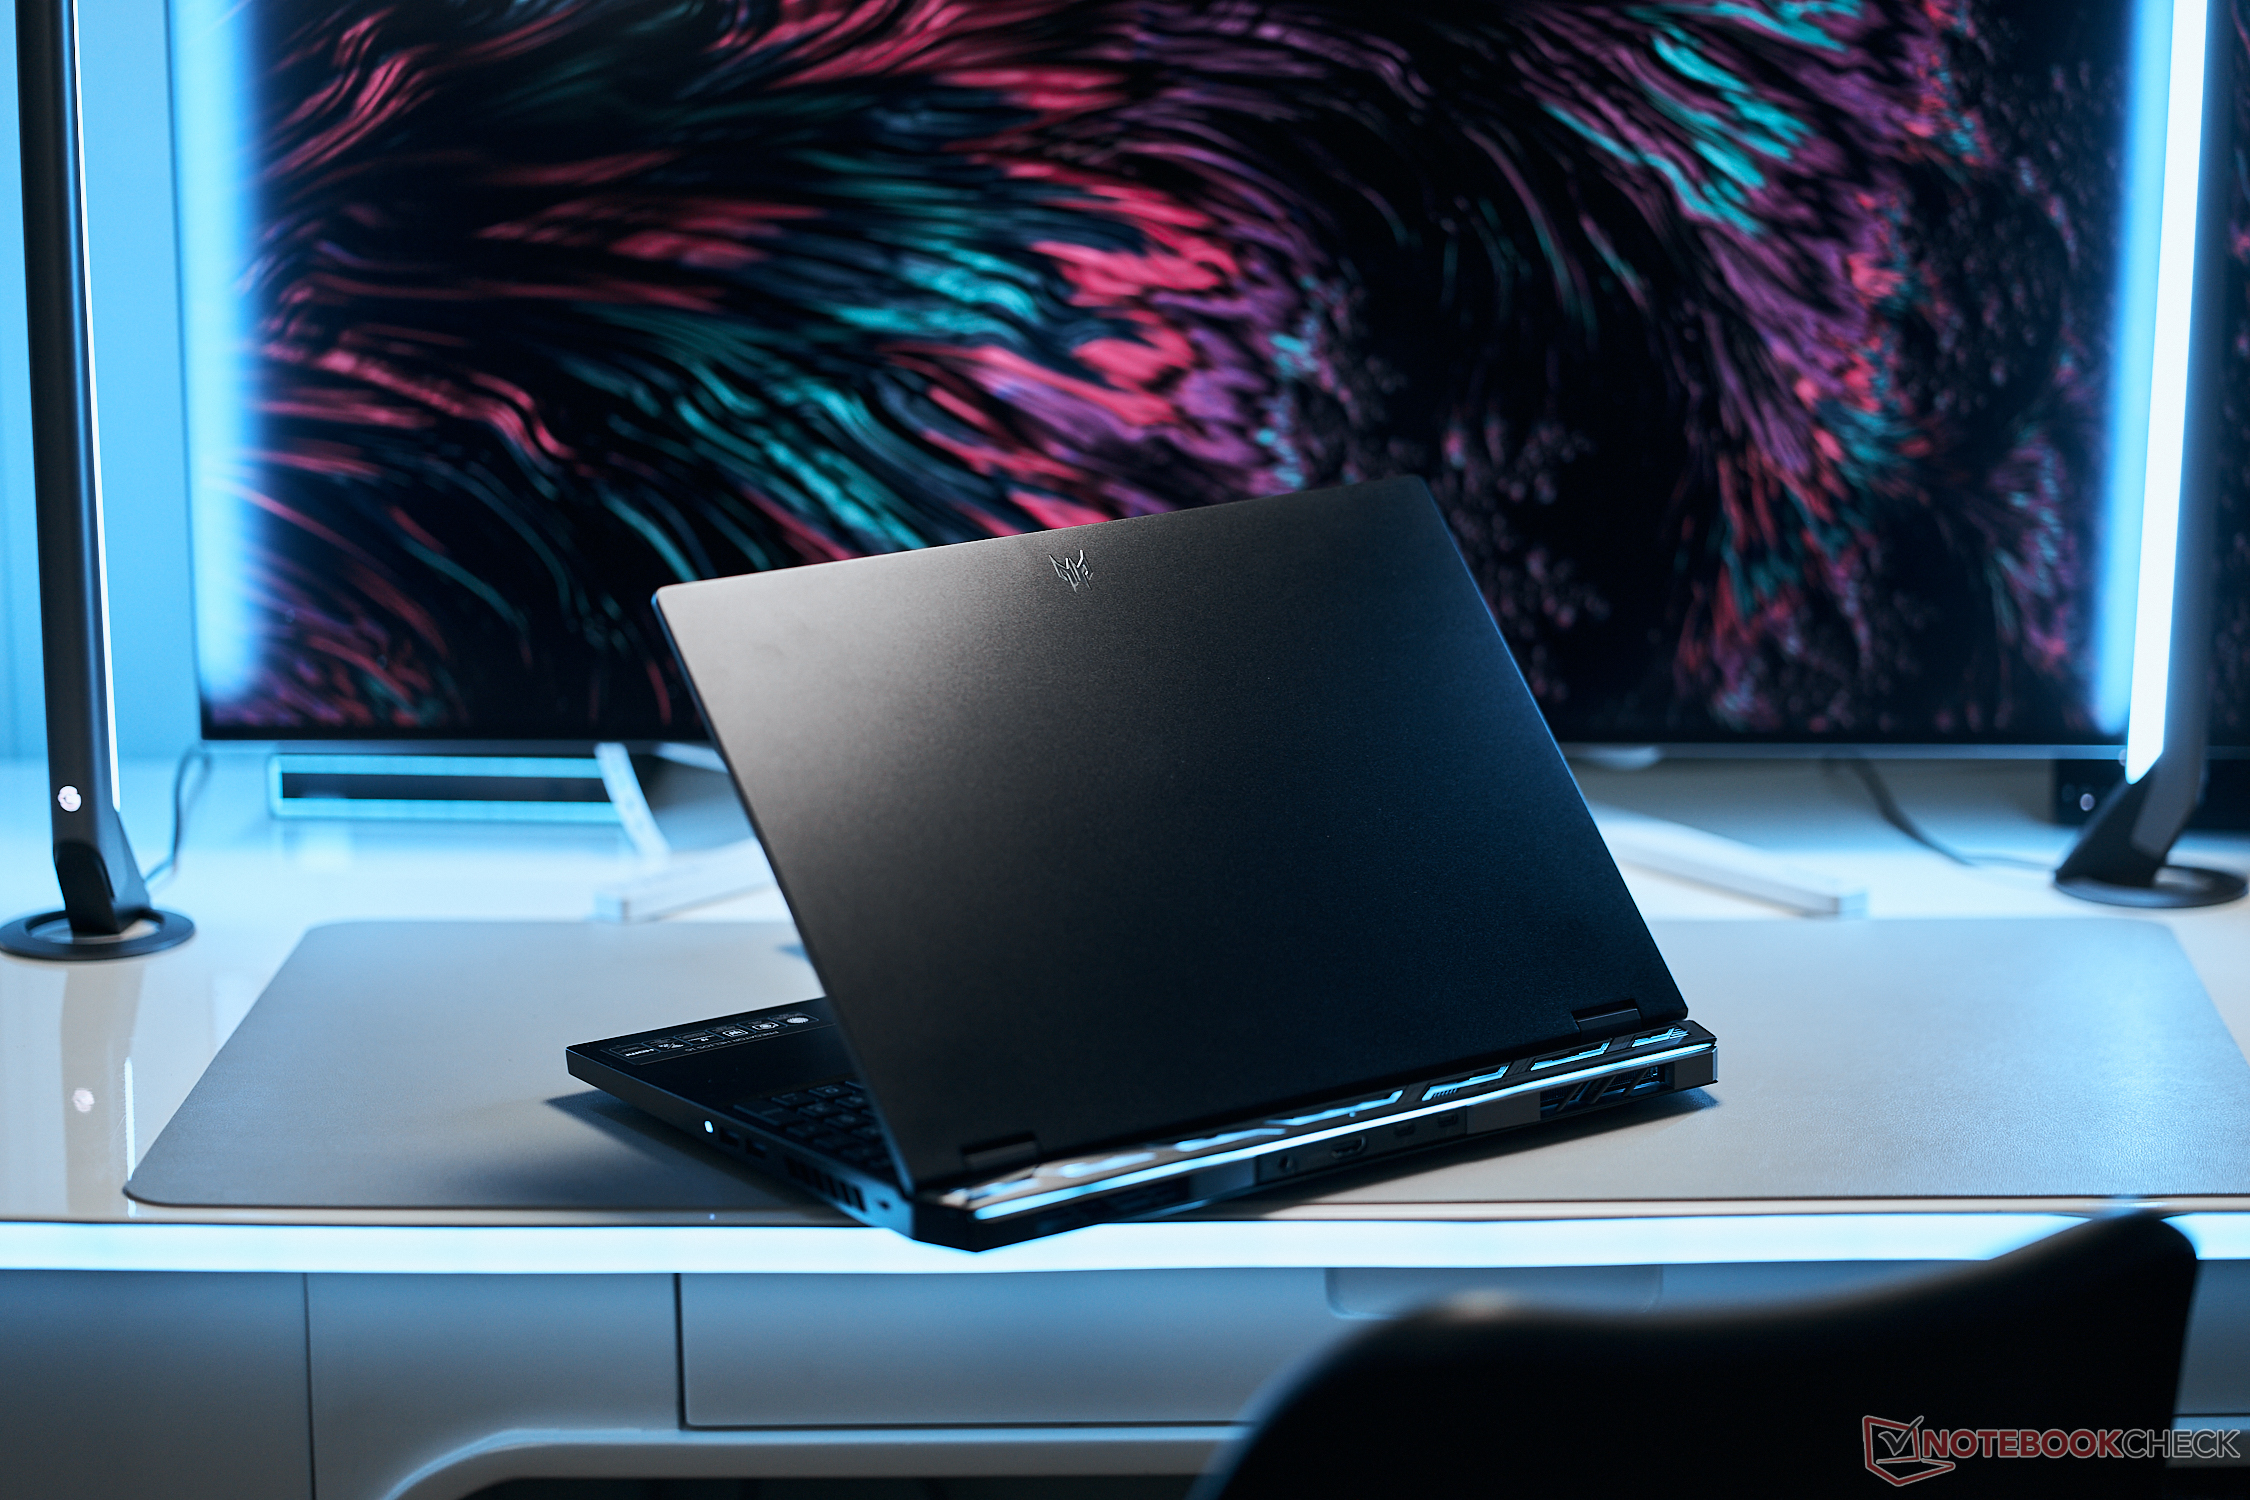
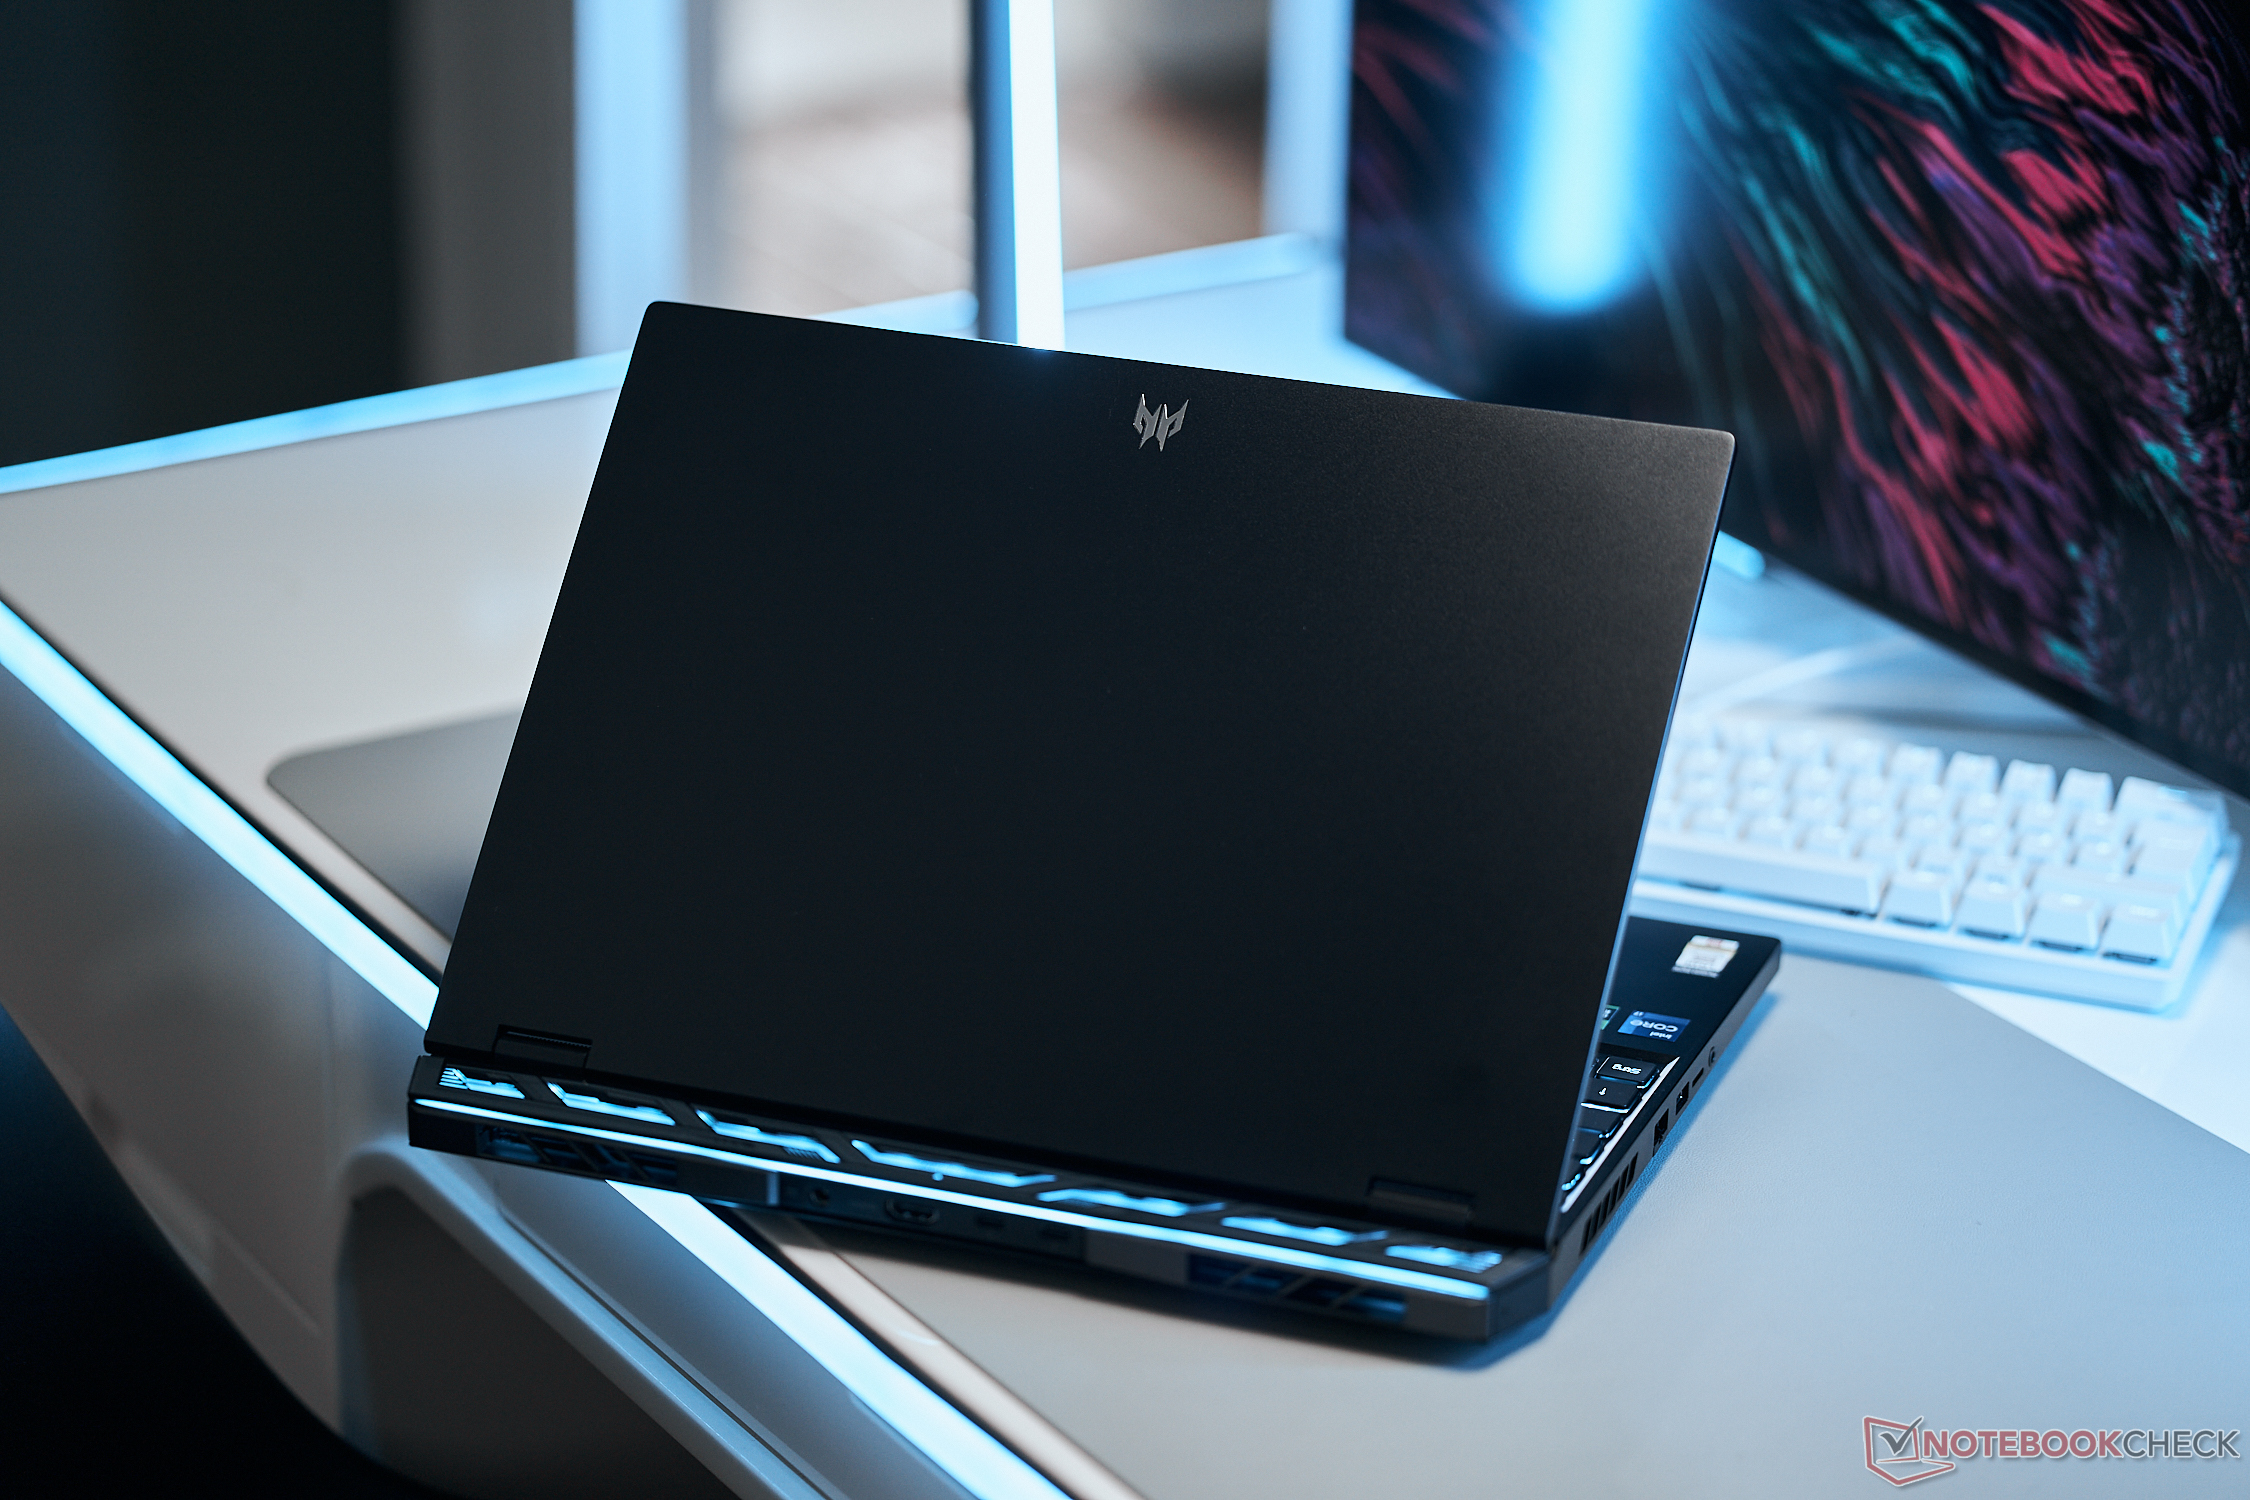
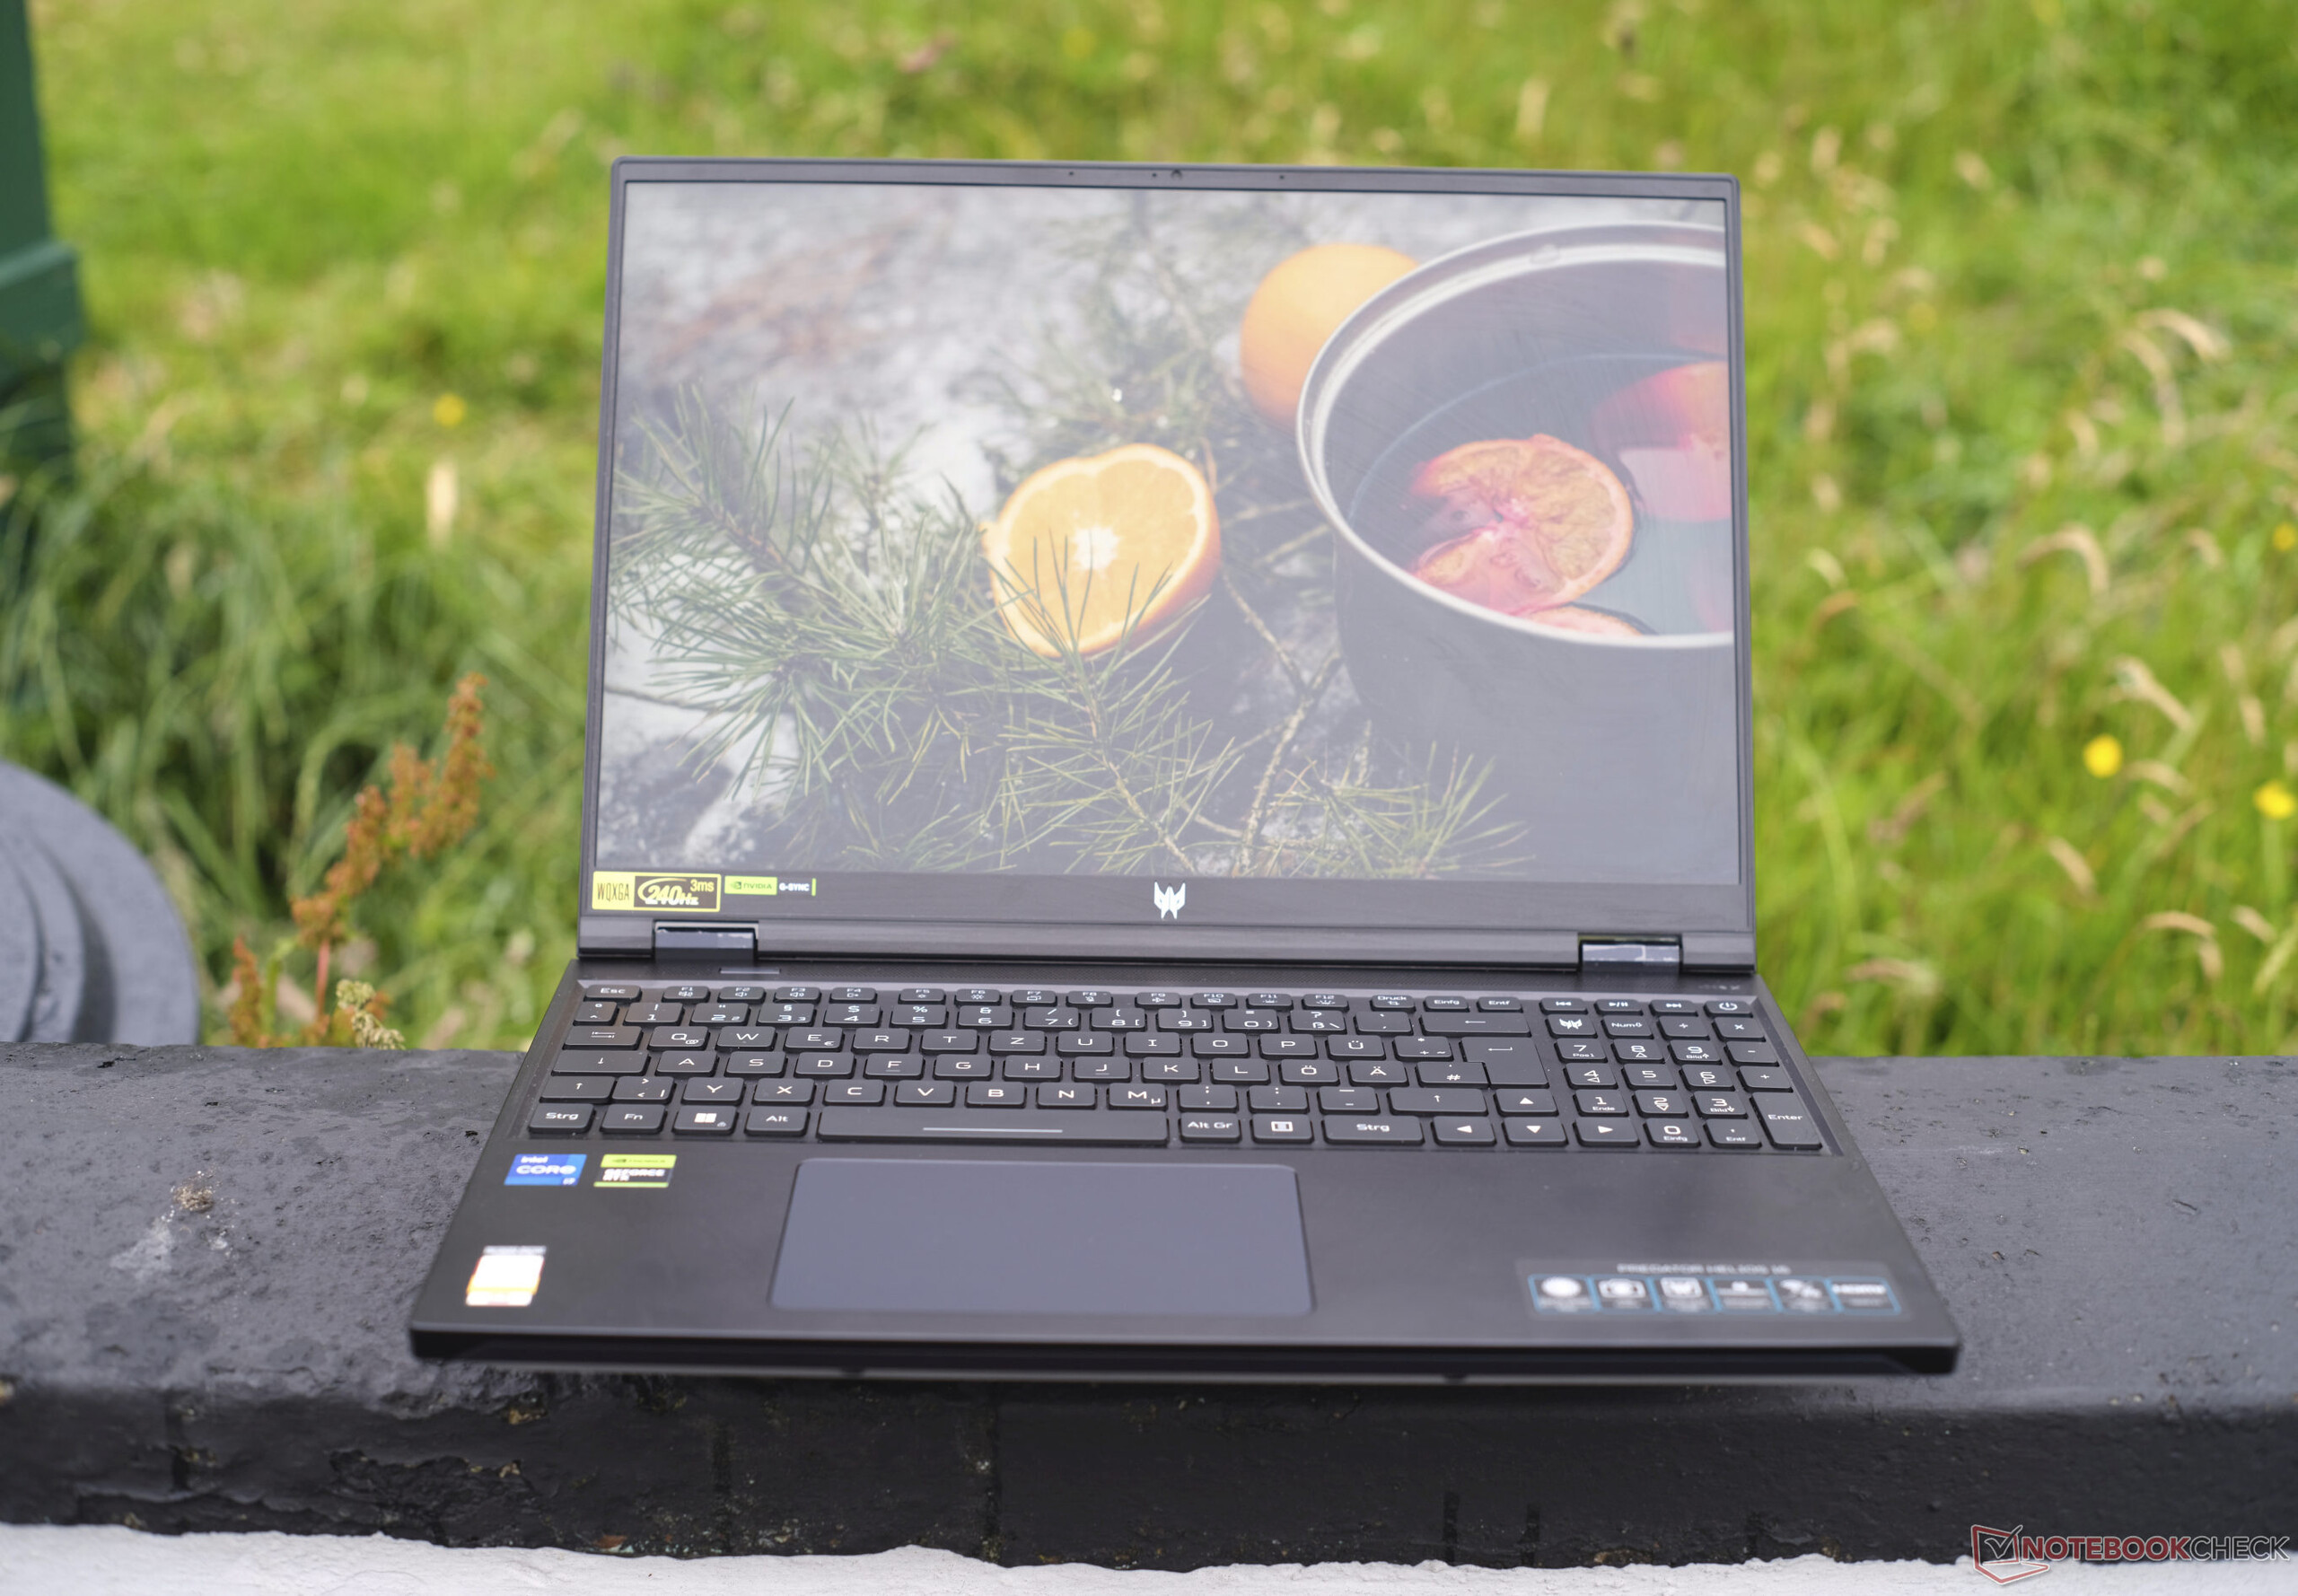
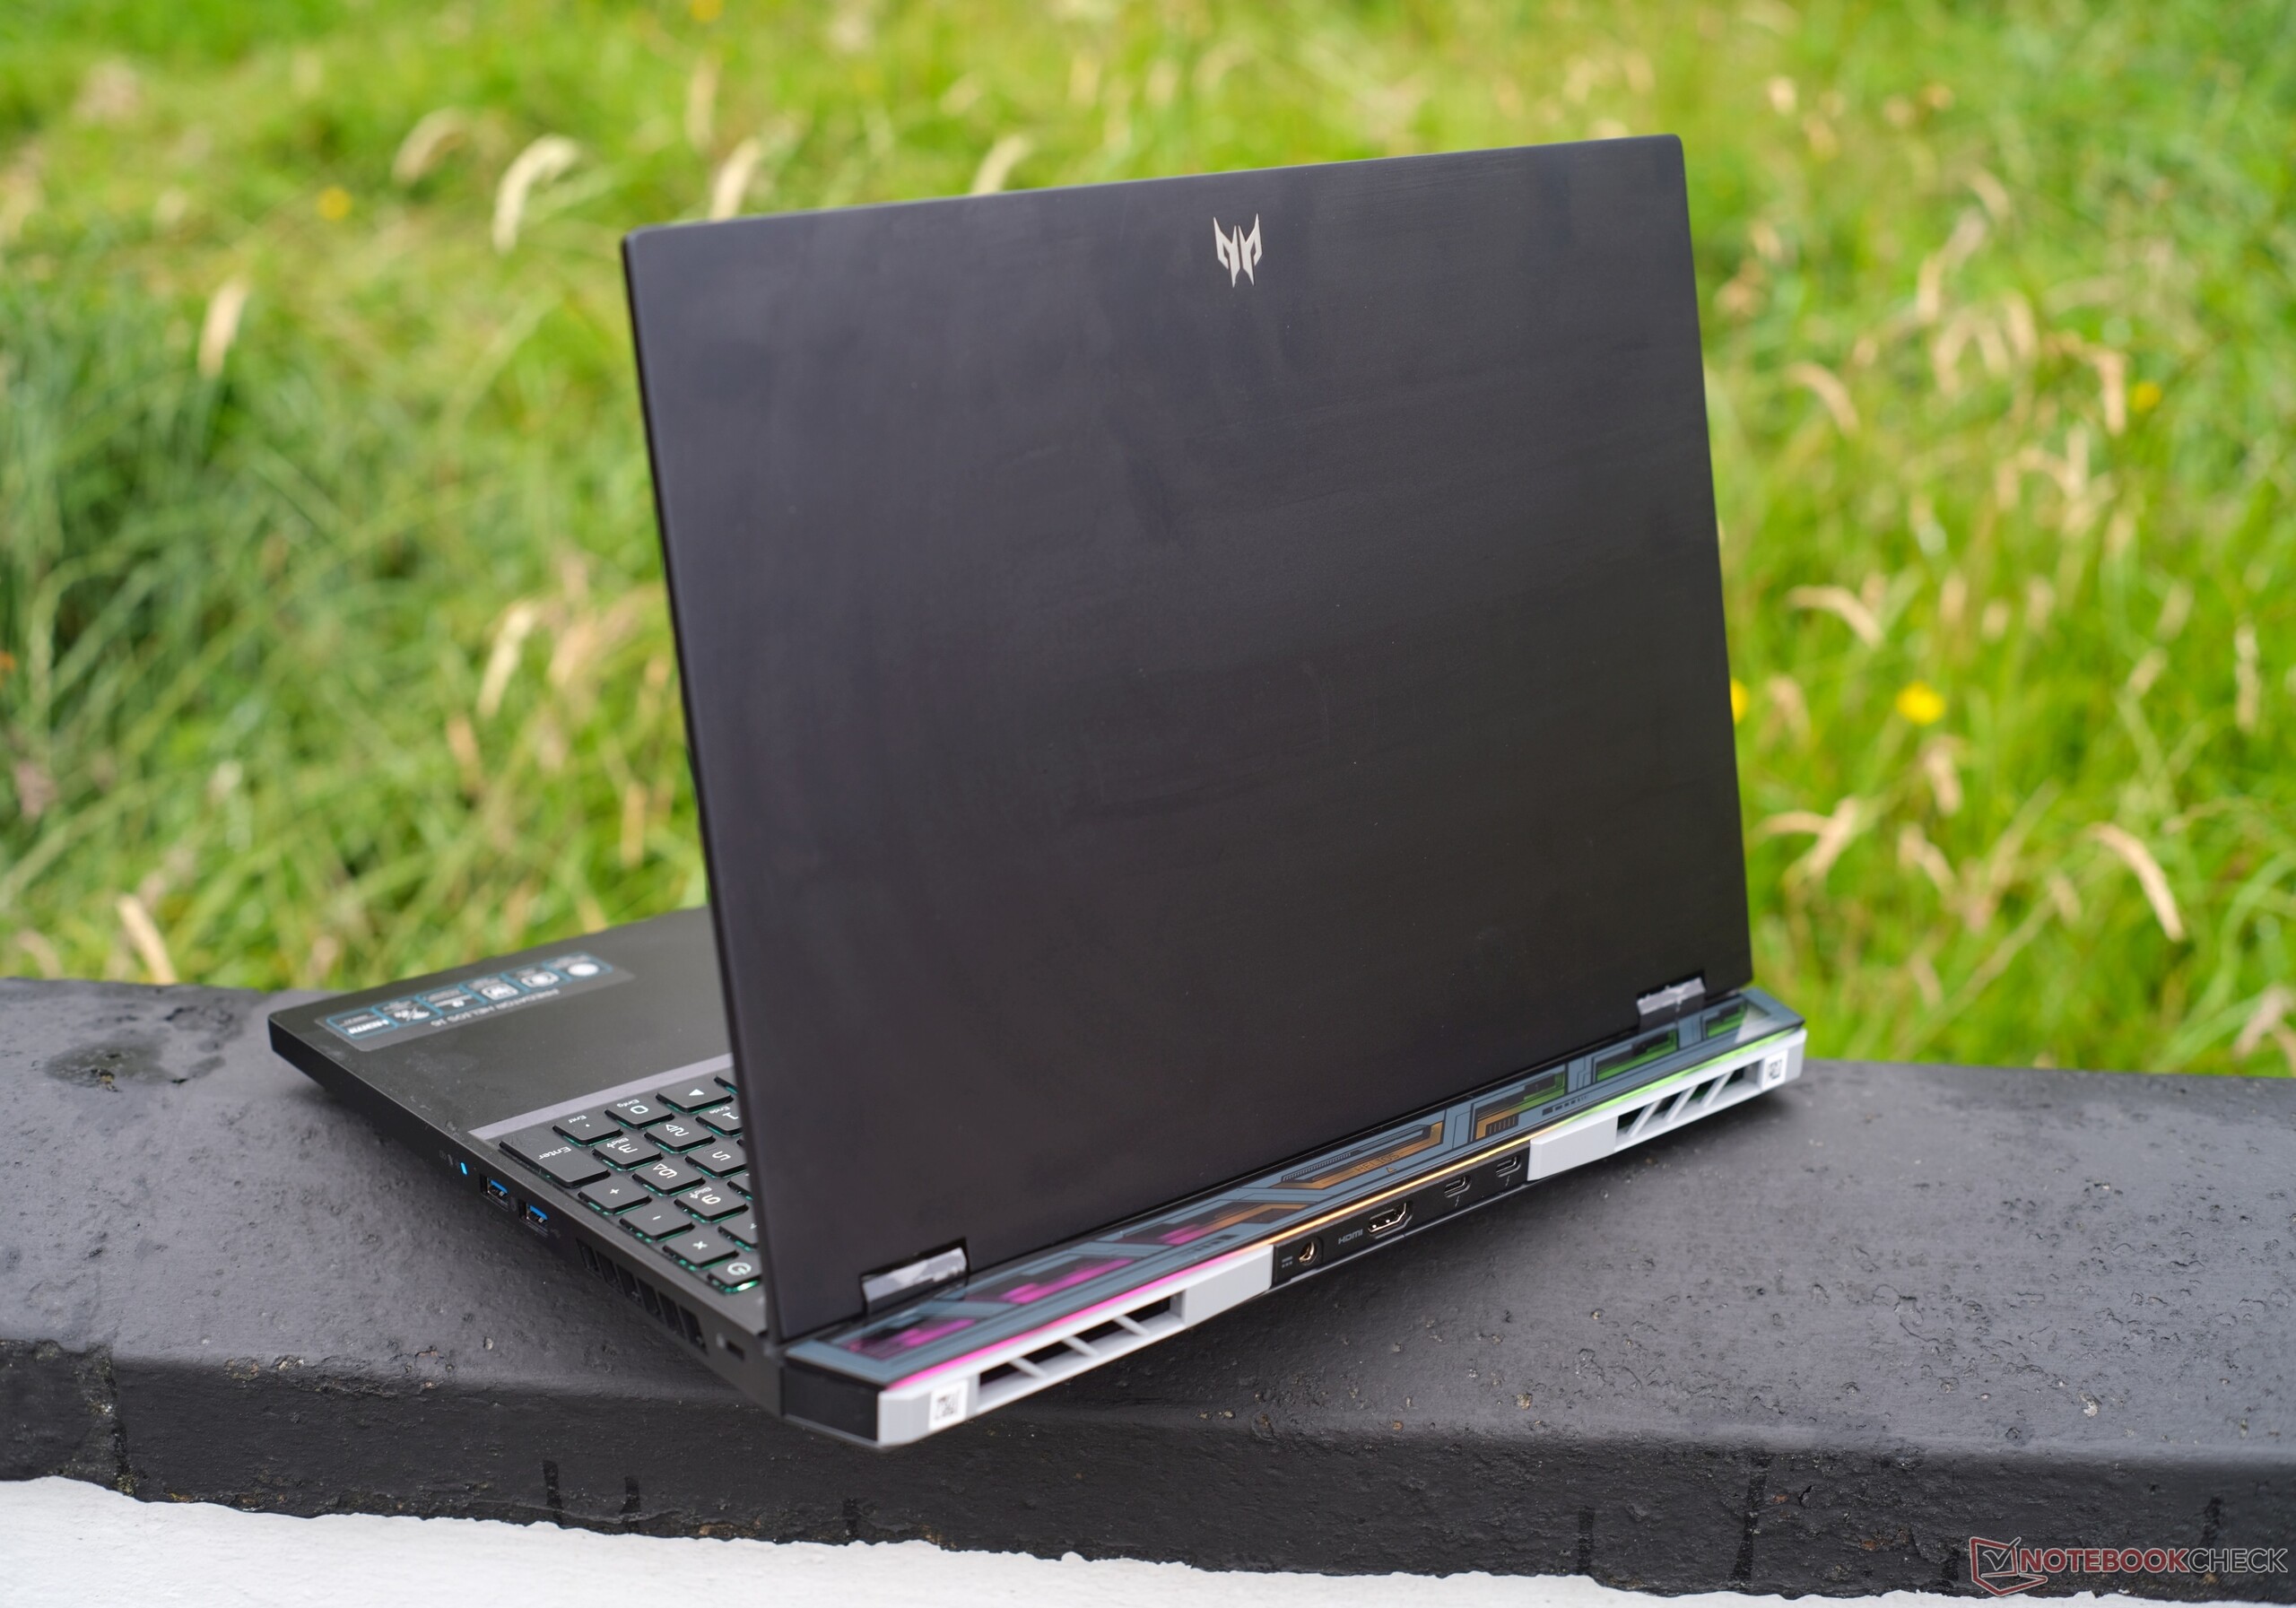
Obudowa: Solidny, niemal niedoceniany laptop do gier Acer
Podobnie jak jego poprzednikhelios 16 jest dostępny w matowej czerni i jest w większości wykonany ze szczotkowanego stopu aluminium, a tylko podstawa i krawędź wyświetlacza są wykonane z tworzywa sztucznego, aby uniknąć wad związanych z materiałami przewodzącymi ciepło.
Akcenty, w skądinąd skromnie wyglądającej obudowie, mają postać eleganckiego logo Predator na pokrywie wyświetlacza i dolnej ramce, a także podświetlanego diodami LED, skierowanego do tyłu systemu chłodzenia. Gładkie powierzchnie dobrze radzą sobie z przyciąganiem odcisków palców, a dopasowanie i wykończenie są bezbłędne - nie ma tu żadnych skrzypień.
Jednostka bazowa jest bardzo stabilna, podczas gdy pokrywę można lekko przekręcić, ale nie byliśmy w stanie wywołać zniekształceń obrazu, nawet po zastosowaniu ukierunkowanego nacisku. Zawiasy są bardzo mocno zamocowane, pokrywa prawie się nie chwieje i można ją otworzyć jedną ręką pod kątem do ~ 145°. Ogólnie rzecz biorąc, Predator Helios robi bardzo solidne wrażenie.

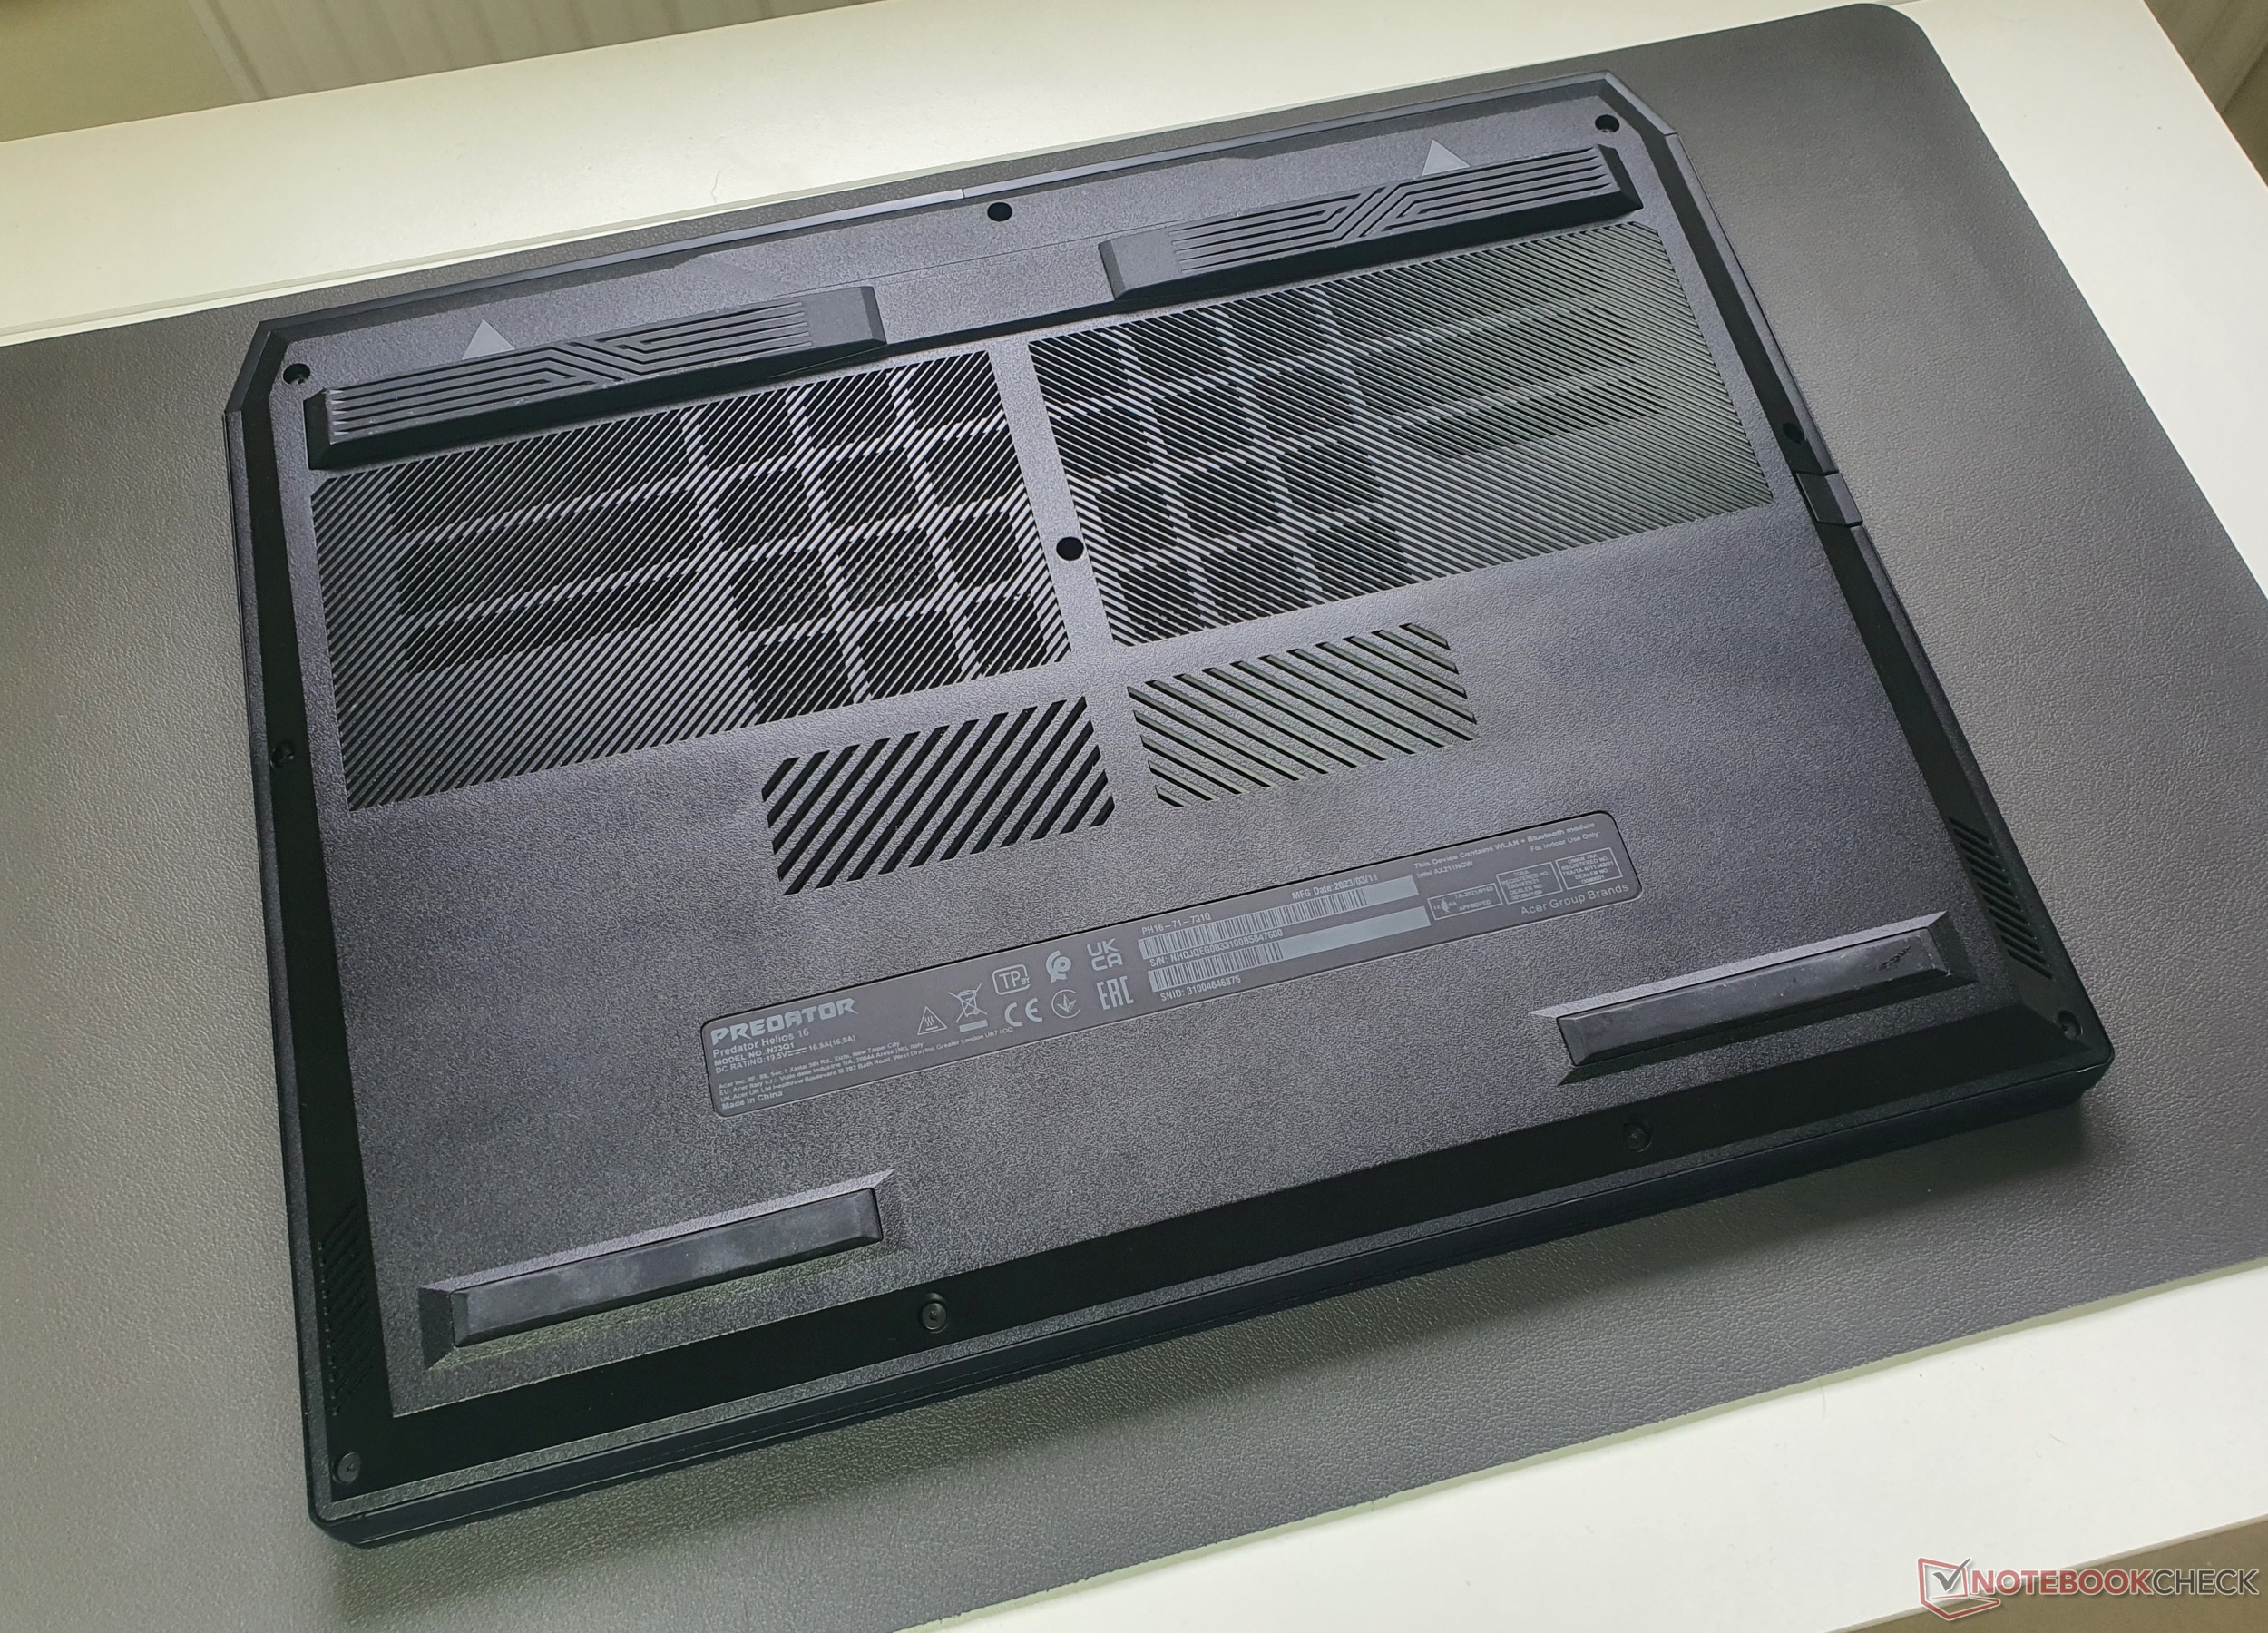
Acer Predator Helios ma około 27 mm grubości i waży niecałe 2,6 kg. Te istotne statystyki można uznać za przeciętne dla maszyny do gier z tak potężnym systemem chłodzenia. Jednakże, pomimo tej samej wysokości, przy wadze 2,2 kg, modelAsus TUF Gaming A16jest znacznie lżejszy, podczas gdy 19,7 mm grubościGigabyte Aorus 15Xjest znacznie cieńszy, pomimo tego samego TGP.
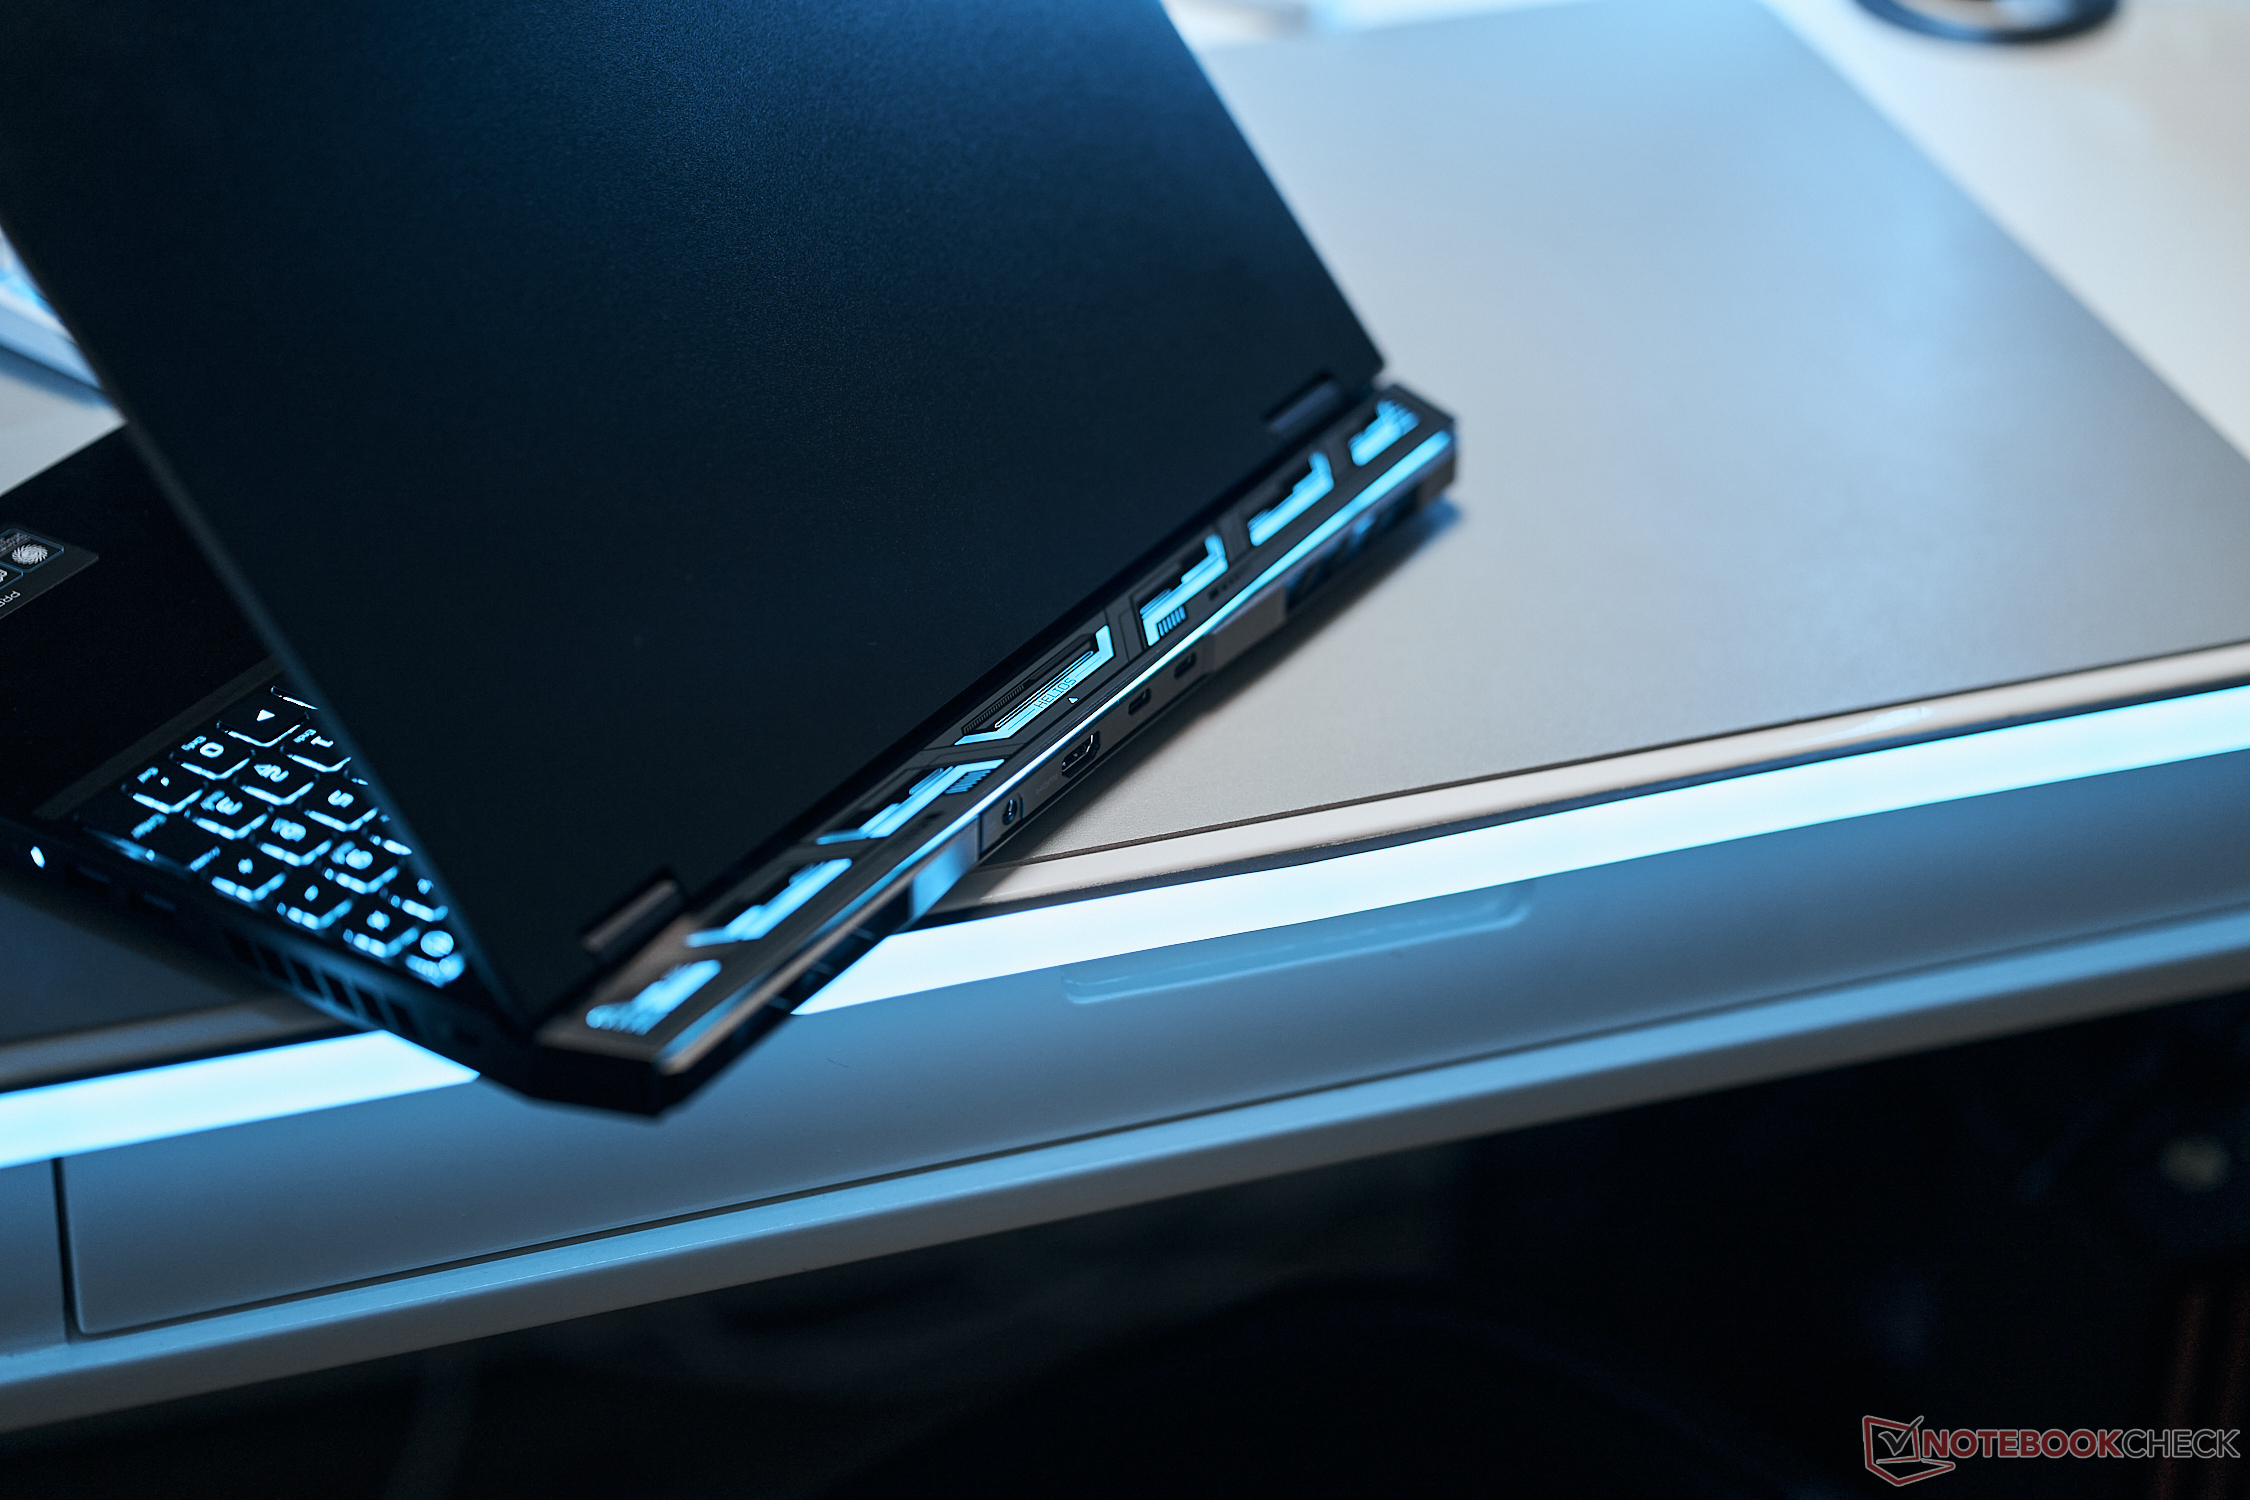
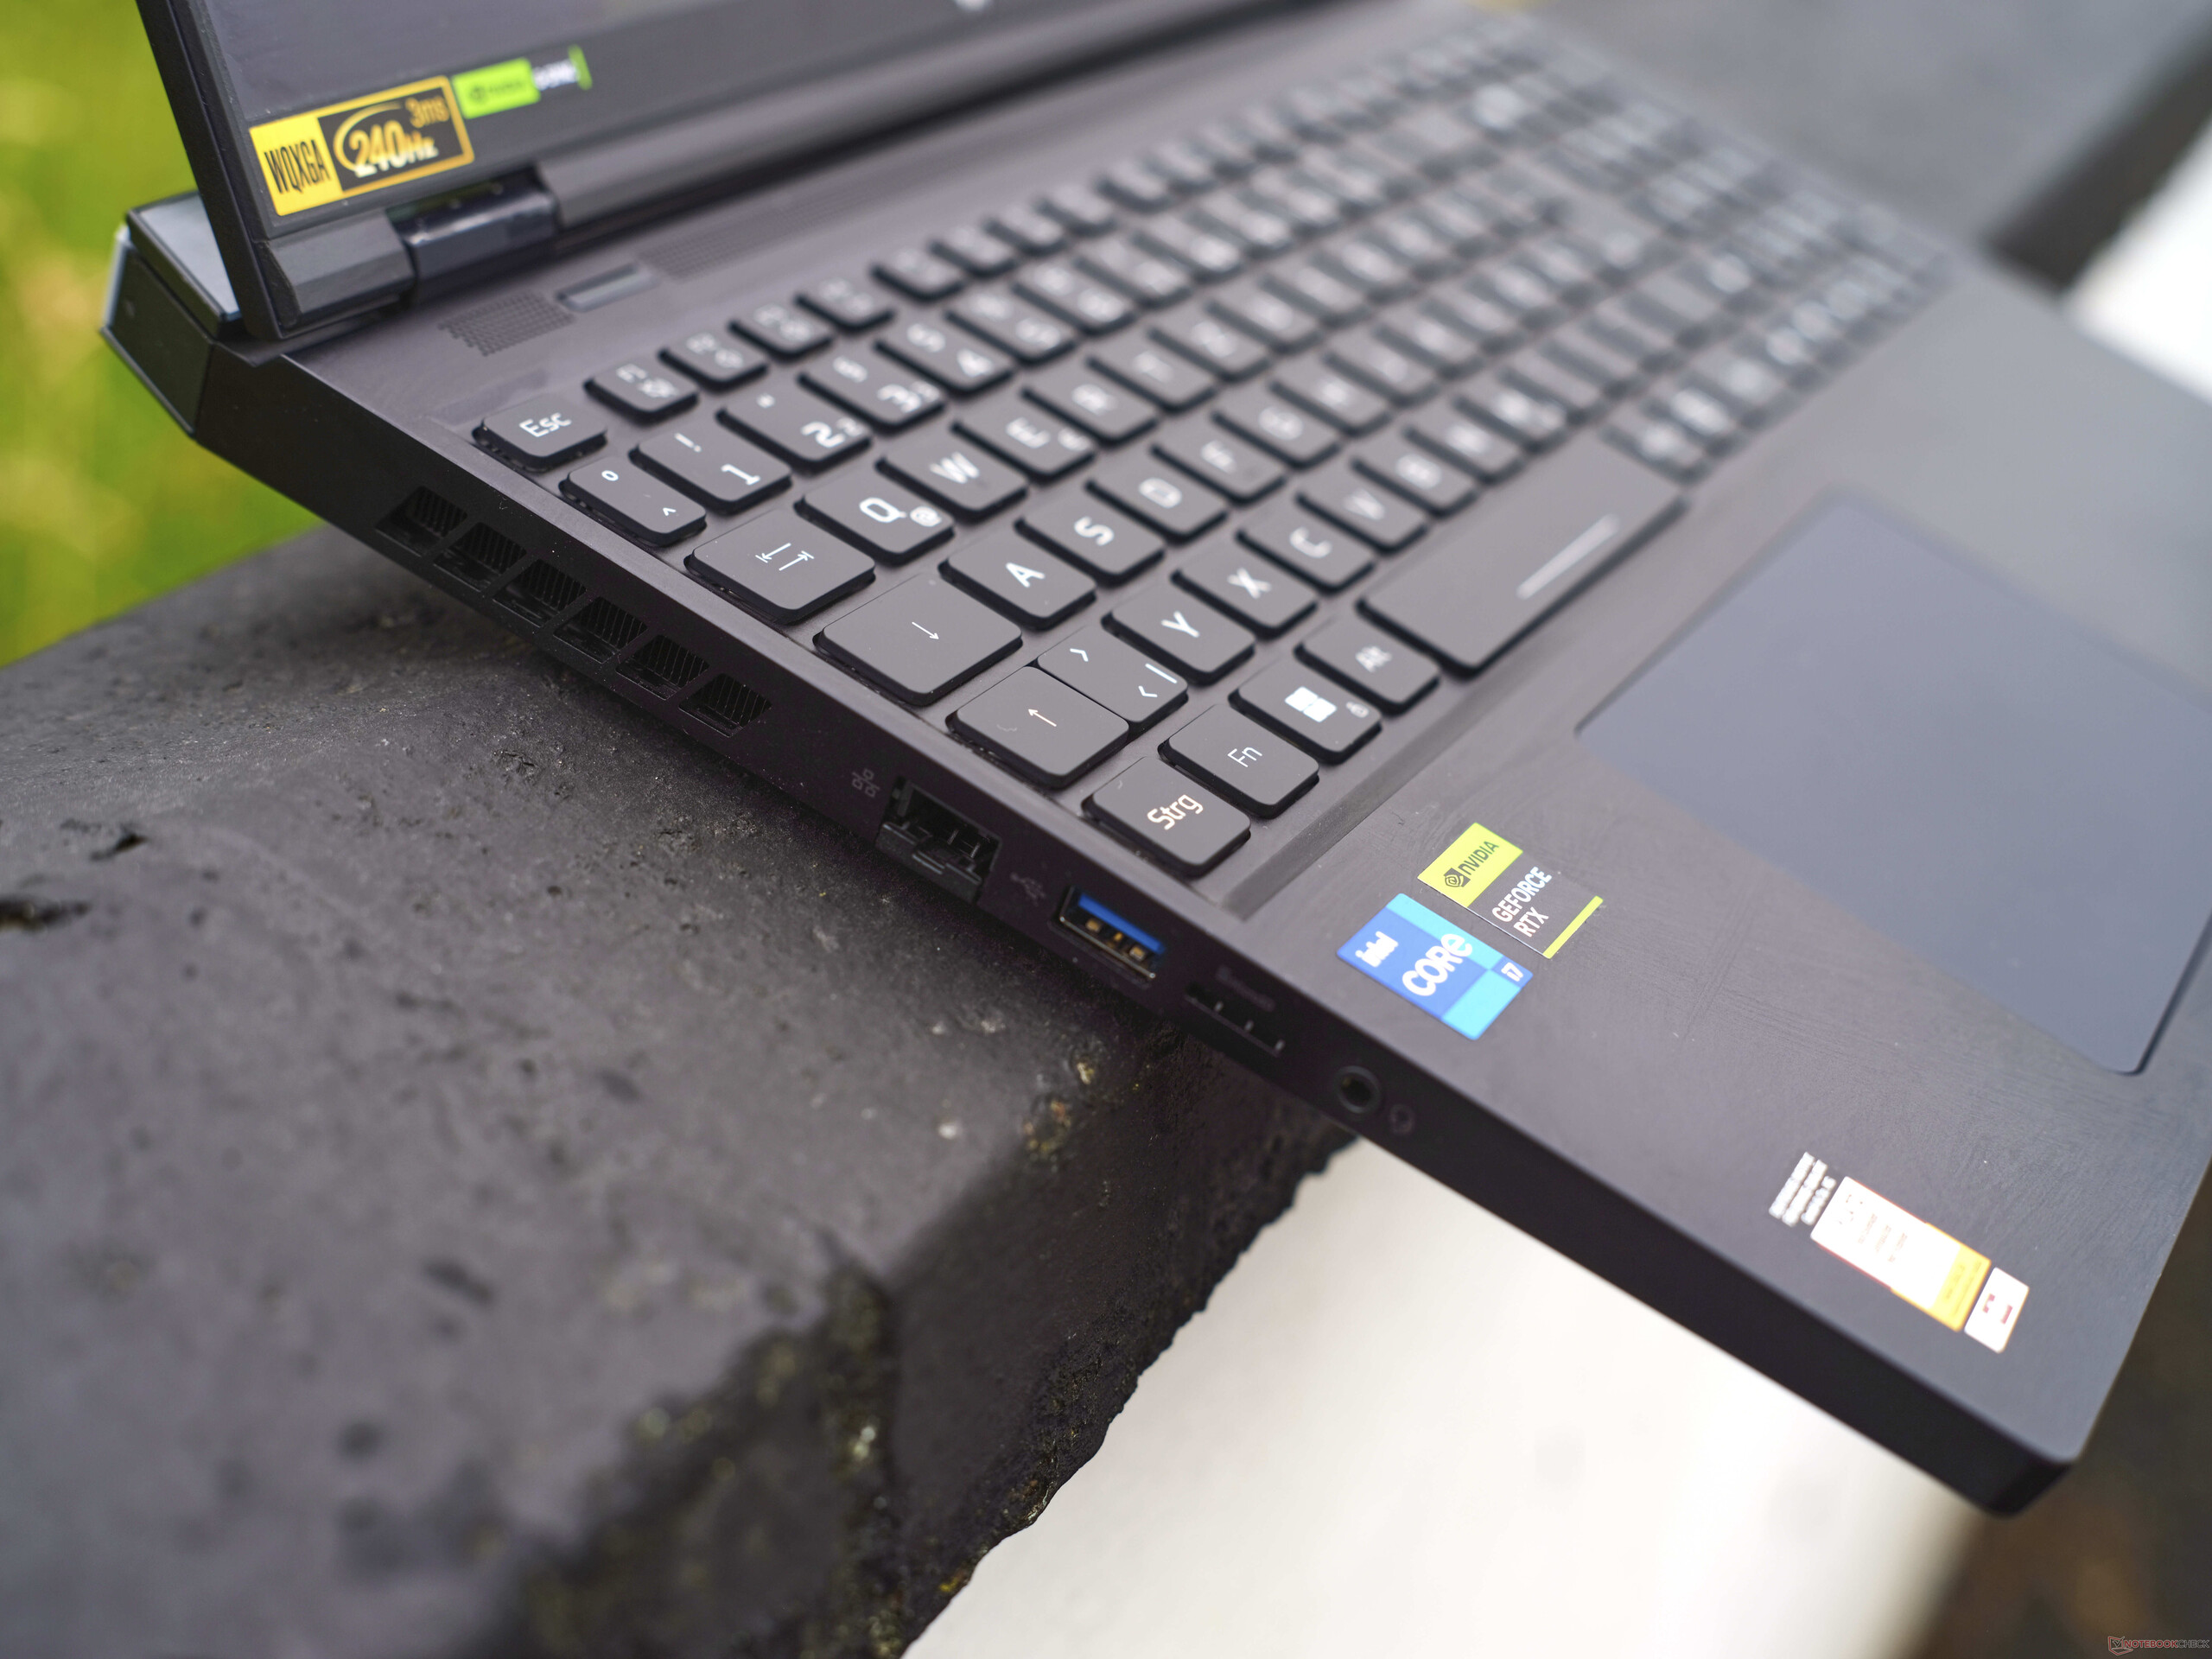
Cechy: Helios 16 oferuje bogaty wybór portów i szybkie Wi-Fi Killer
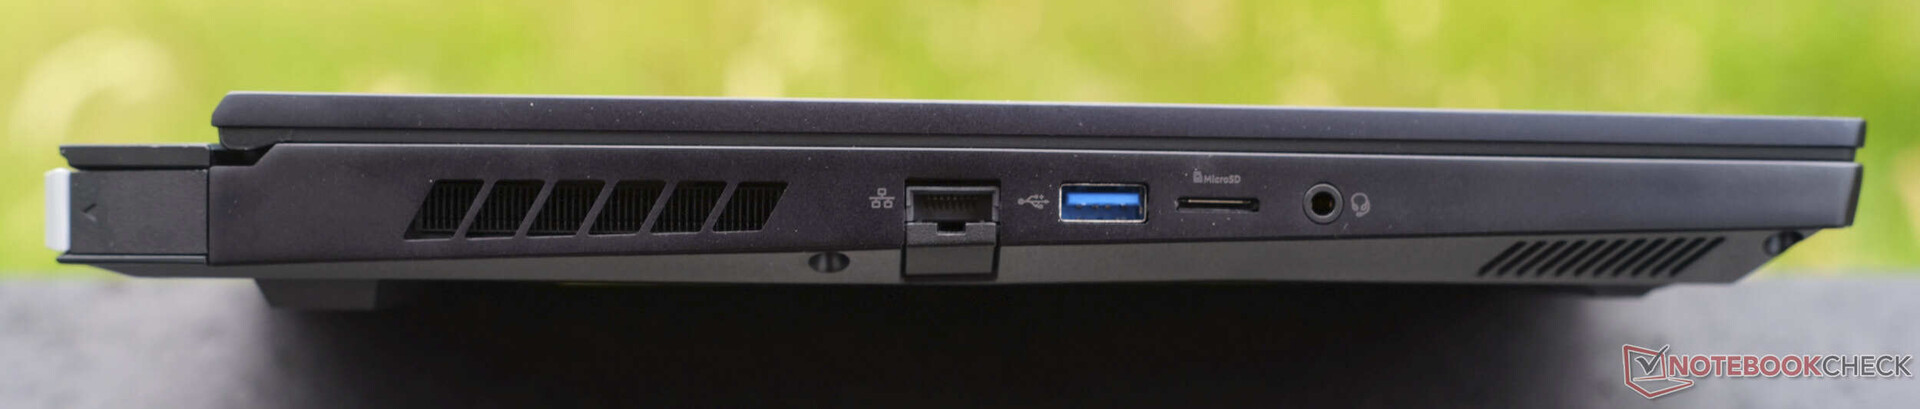
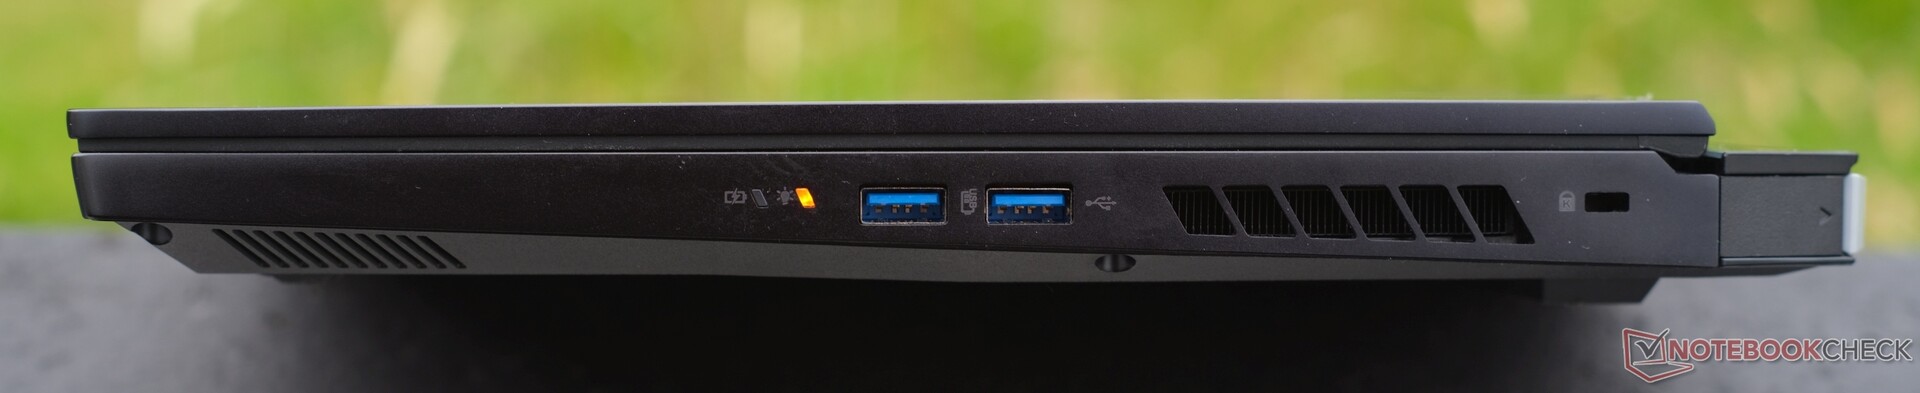
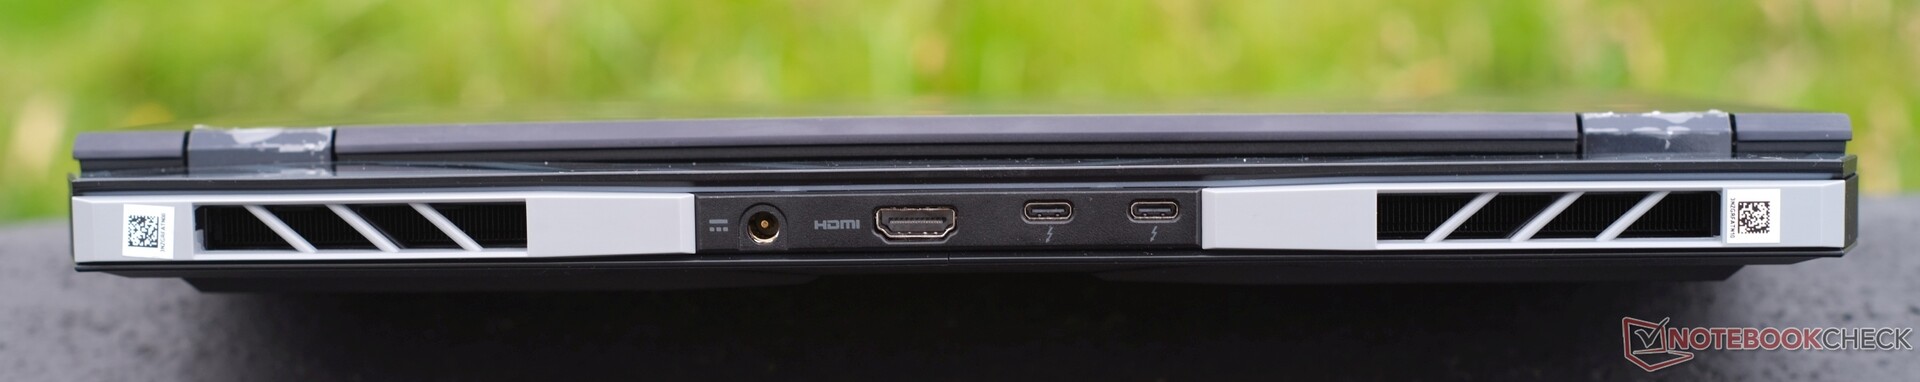
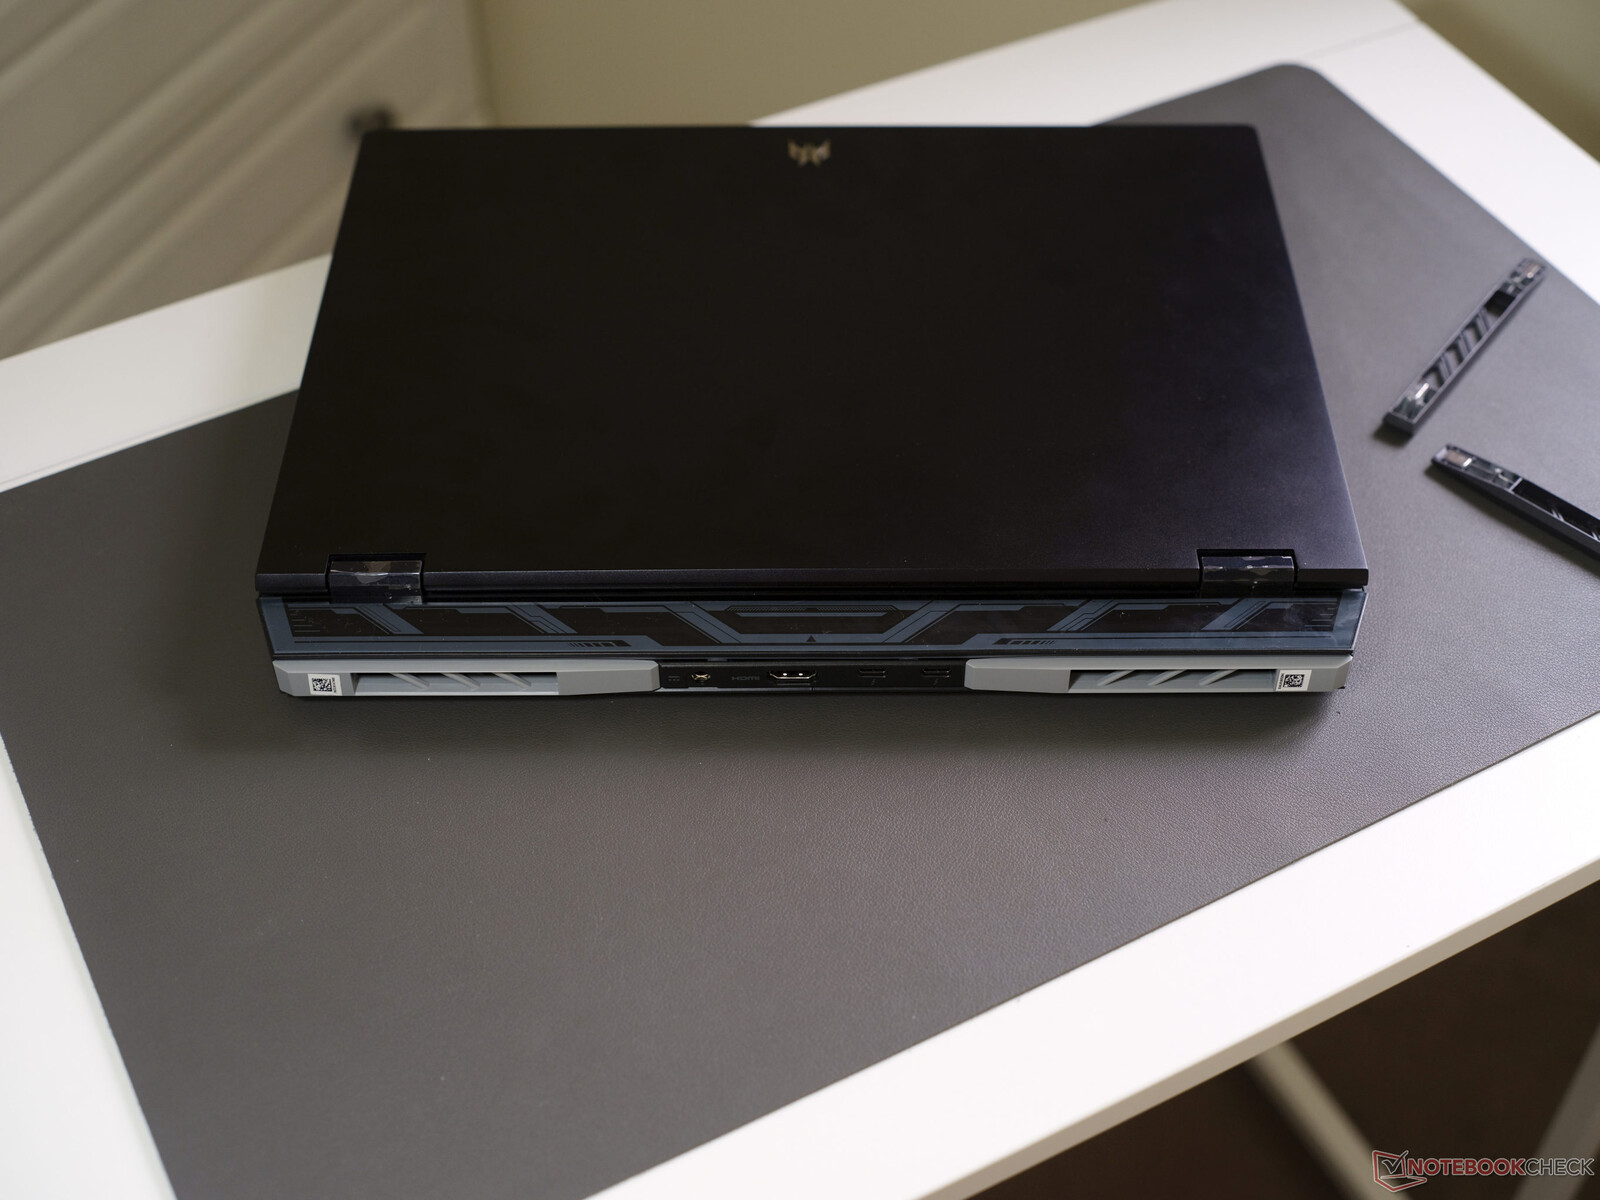
Laptop do gier Acer ma liczne porty, w tym 5x USB. Po lewej stronie znajduje się 1x USB-A 3.1 (5 GBit/s), po prawej 2x USB-A 3.2 (10 GBit/s), a także 2x Thunderbolt 4 z tyłu, który obejmuje DisplayPort 1.4 i Power Delivery (100 watów). Laptop jest również domem dla gigabitowego Ethernetu, czytnika kart microSD, gniazda audio 3,5 mm, blokady Kensington, HDMI 2.1 i złącza ładowania.
Czytnik kart SD
W połączeniu z naszą referencyjną kartą AV PRO microSD 128 GB V60, czytnik kart microSD niekoniecznie jest powolny, ale też niezbyt szybki, a szkoda, biorąc pod uwagę cenę Heliosa 16. Jednak urządzenia w naszej konkurencji (przynajmniej te wyposażone w czytnik kart) odczytują i kopiują dane podobnie szybko.
| SD Card Reader | |
| average JPG Copy Test (av. of 3 runs) | |
| Średnia w klasie Gaming (20.9 - 210, n=54, ostatnie 2 lata) | |
| Lenovo Legion S7 16ARHA7 (AV PRO microSD 128 GB V60) | |
| Medion Erazer Defender P40 (AV PRO microSD 128 GB V60) | |
| Acer Nitro 16 AN16-41 (AV Pro SD microSD 128 GB V60) | |
| HP Omen 17-ck2097ng (AV PRO microSD 128 GB V60) | |
| Acer Predator Helios 16 PH16-71-731Q | |
| maximum AS SSD Seq Read Test (1GB) | |
| Średnia w klasie Gaming (25.5 - 261, n=51, ostatnie 2 lata) | |
| Medion Erazer Defender P40 (AV PRO microSD 128 GB V60) | |
| Lenovo Legion S7 16ARHA7 (AV PRO microSD 128 GB V60) | |
| Acer Predator Helios 16 PH16-71-731Q | |
| Acer Nitro 16 AN16-41 (AV Pro SD microSD 128 GB V60) | |
| HP Omen 17-ck2097ng (AV PRO microSD 128 GB V60) | |
Komunikacja
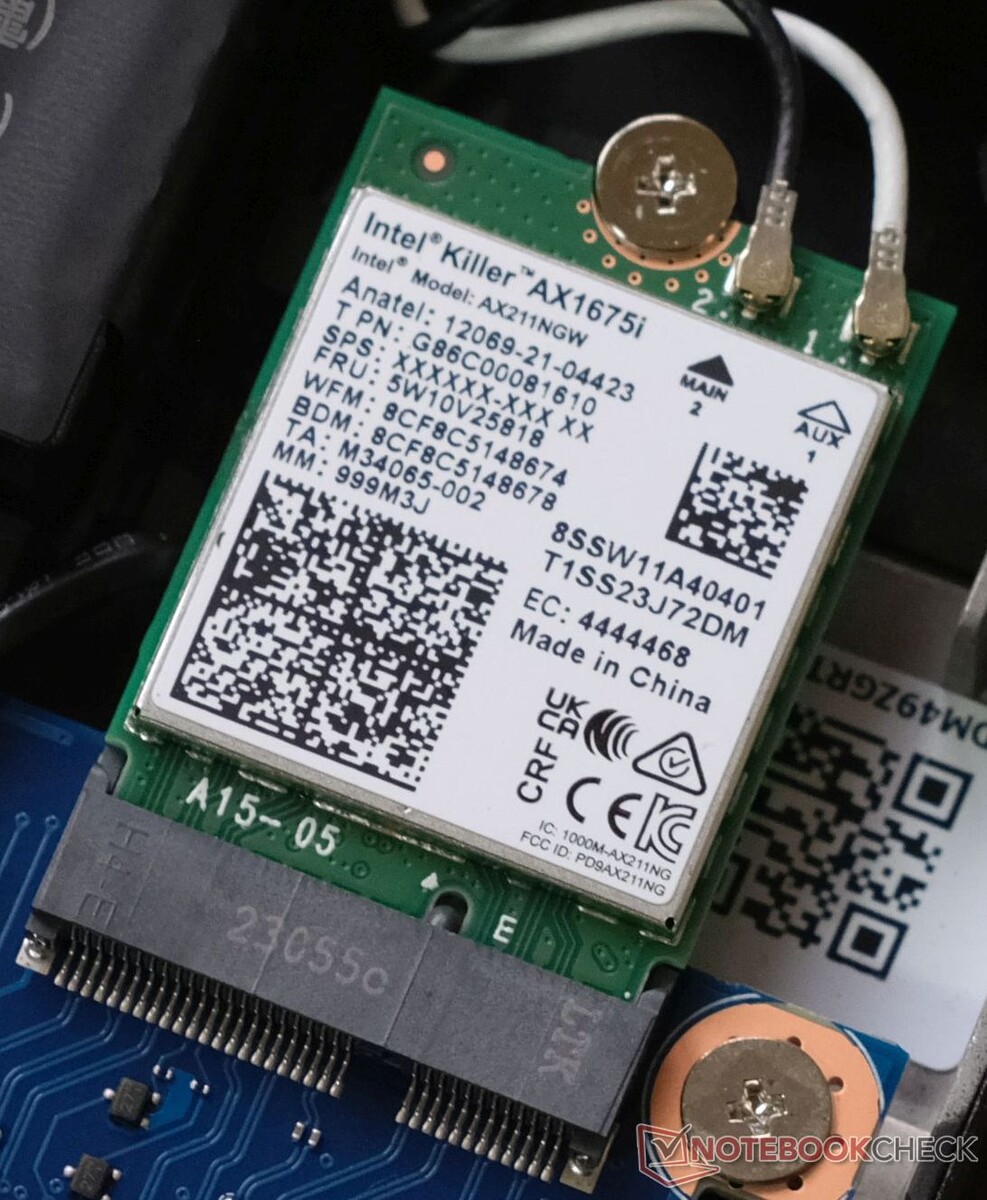
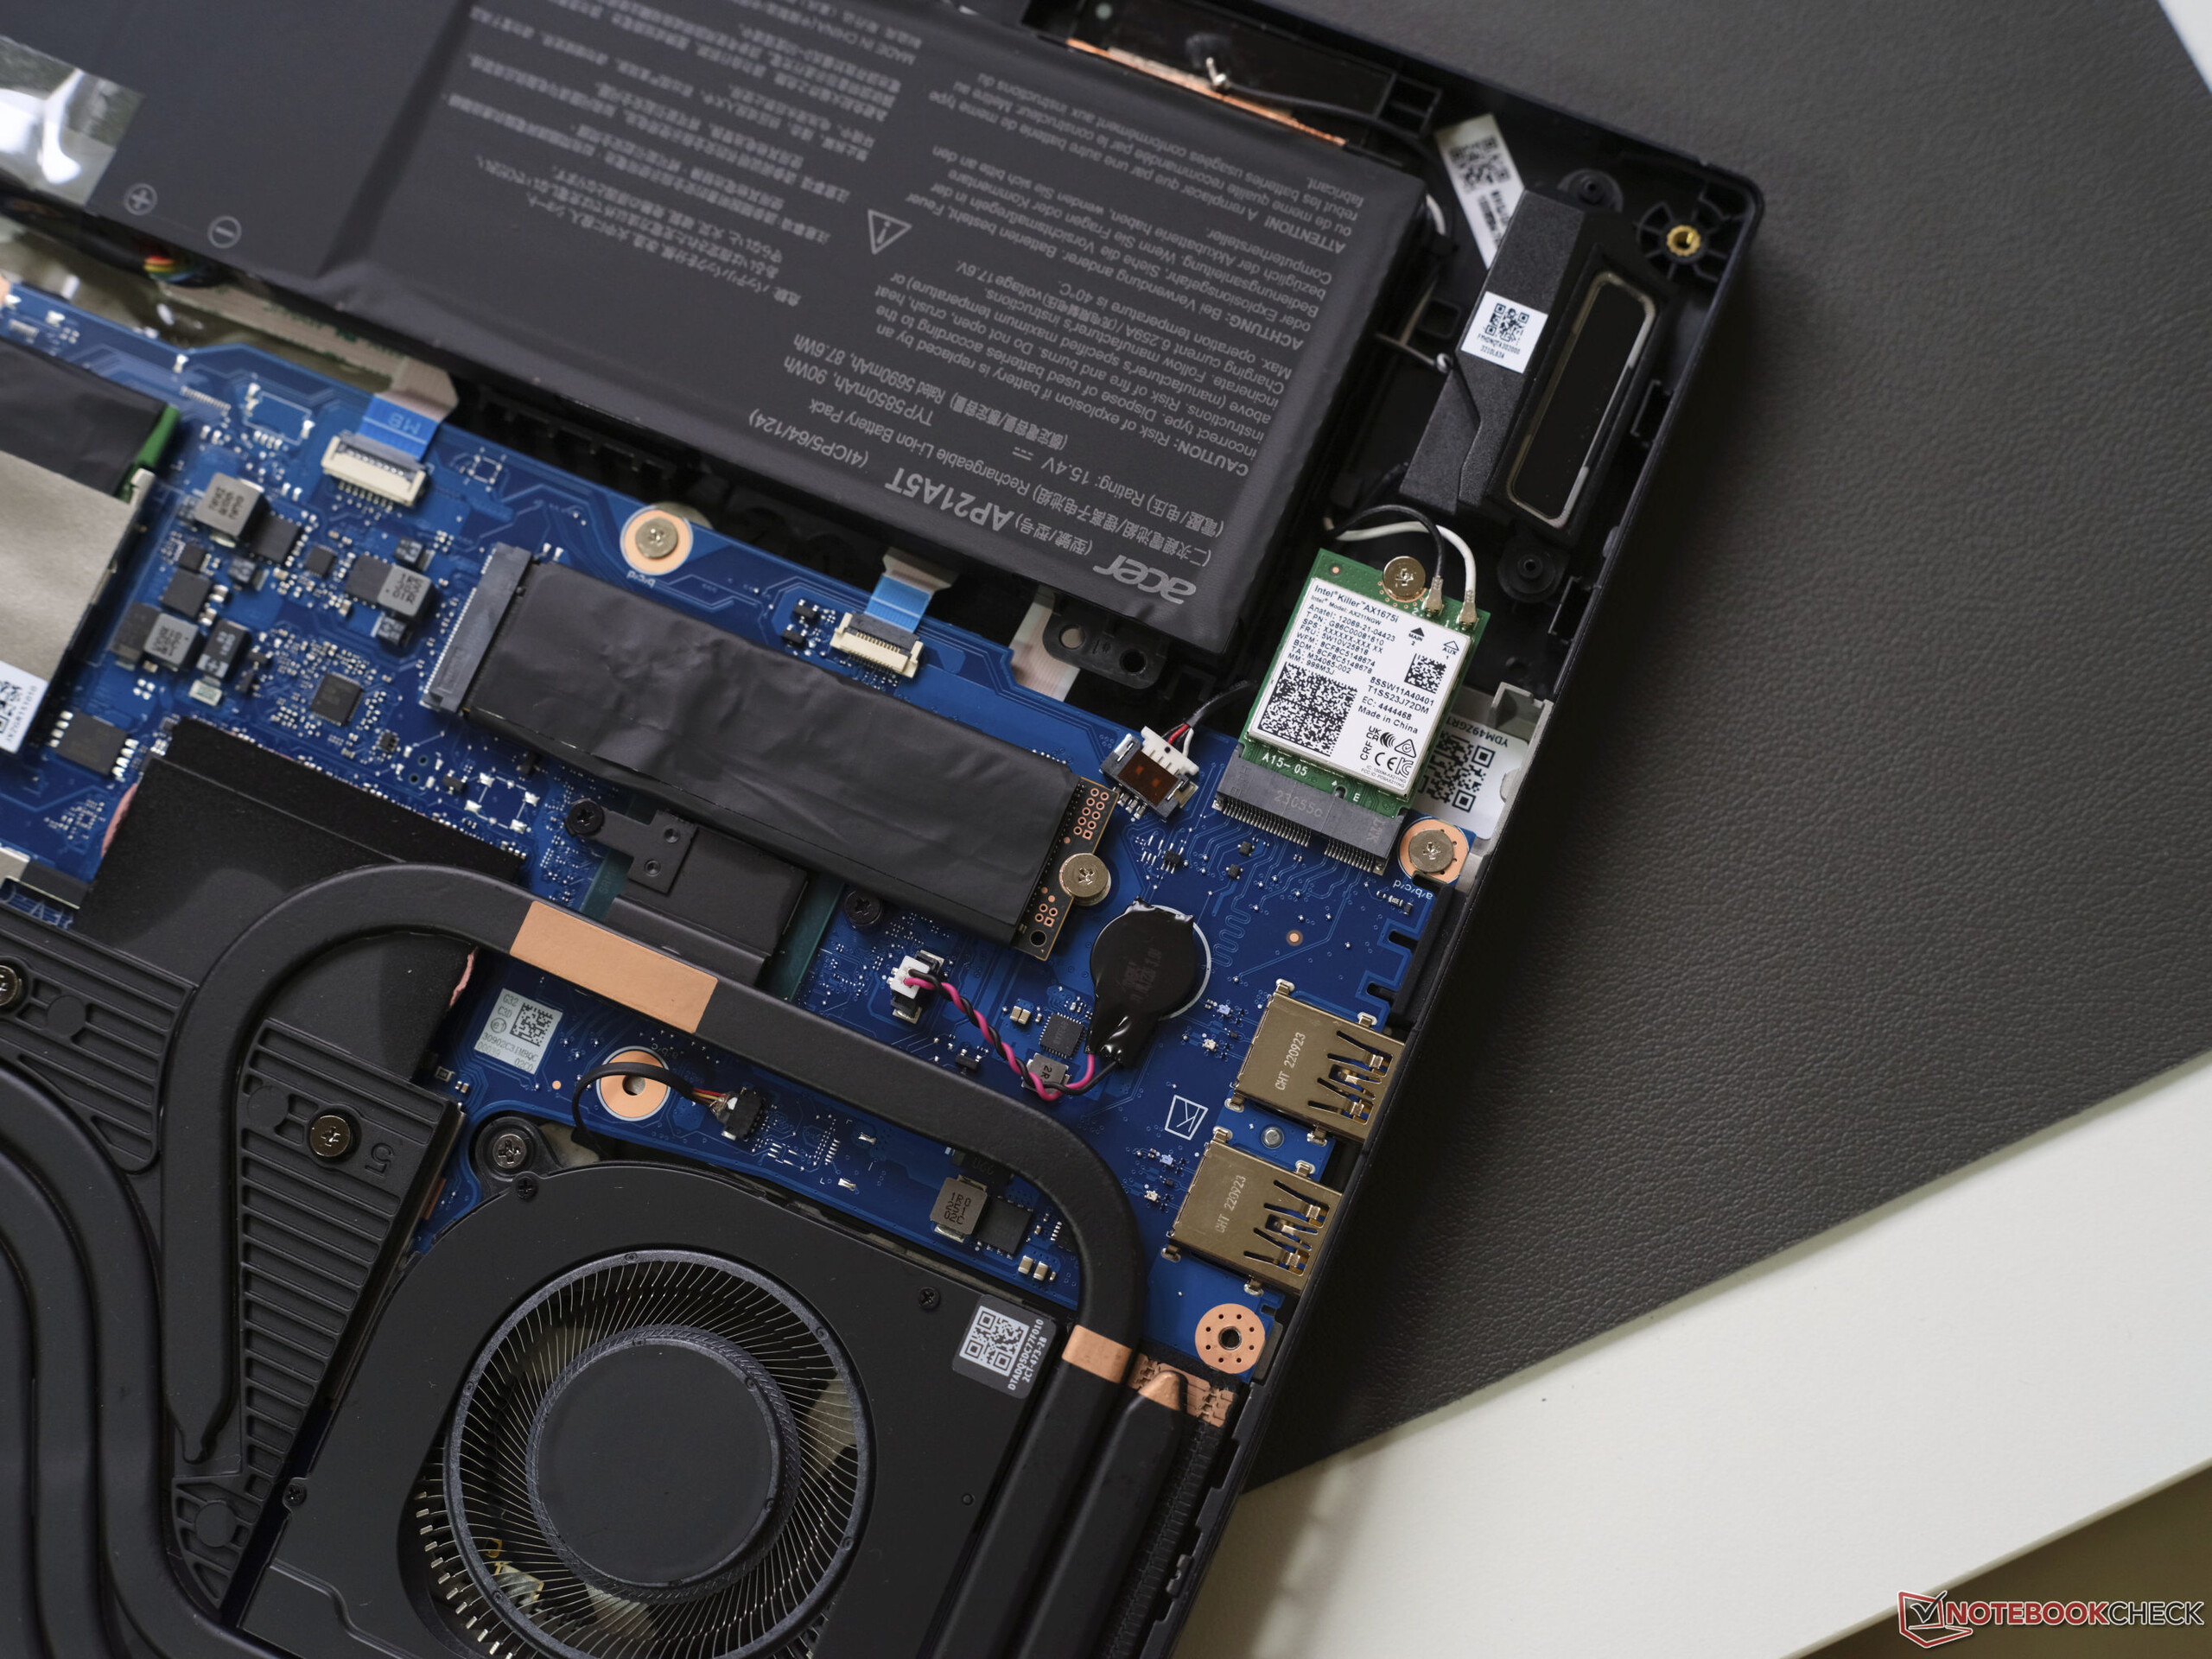
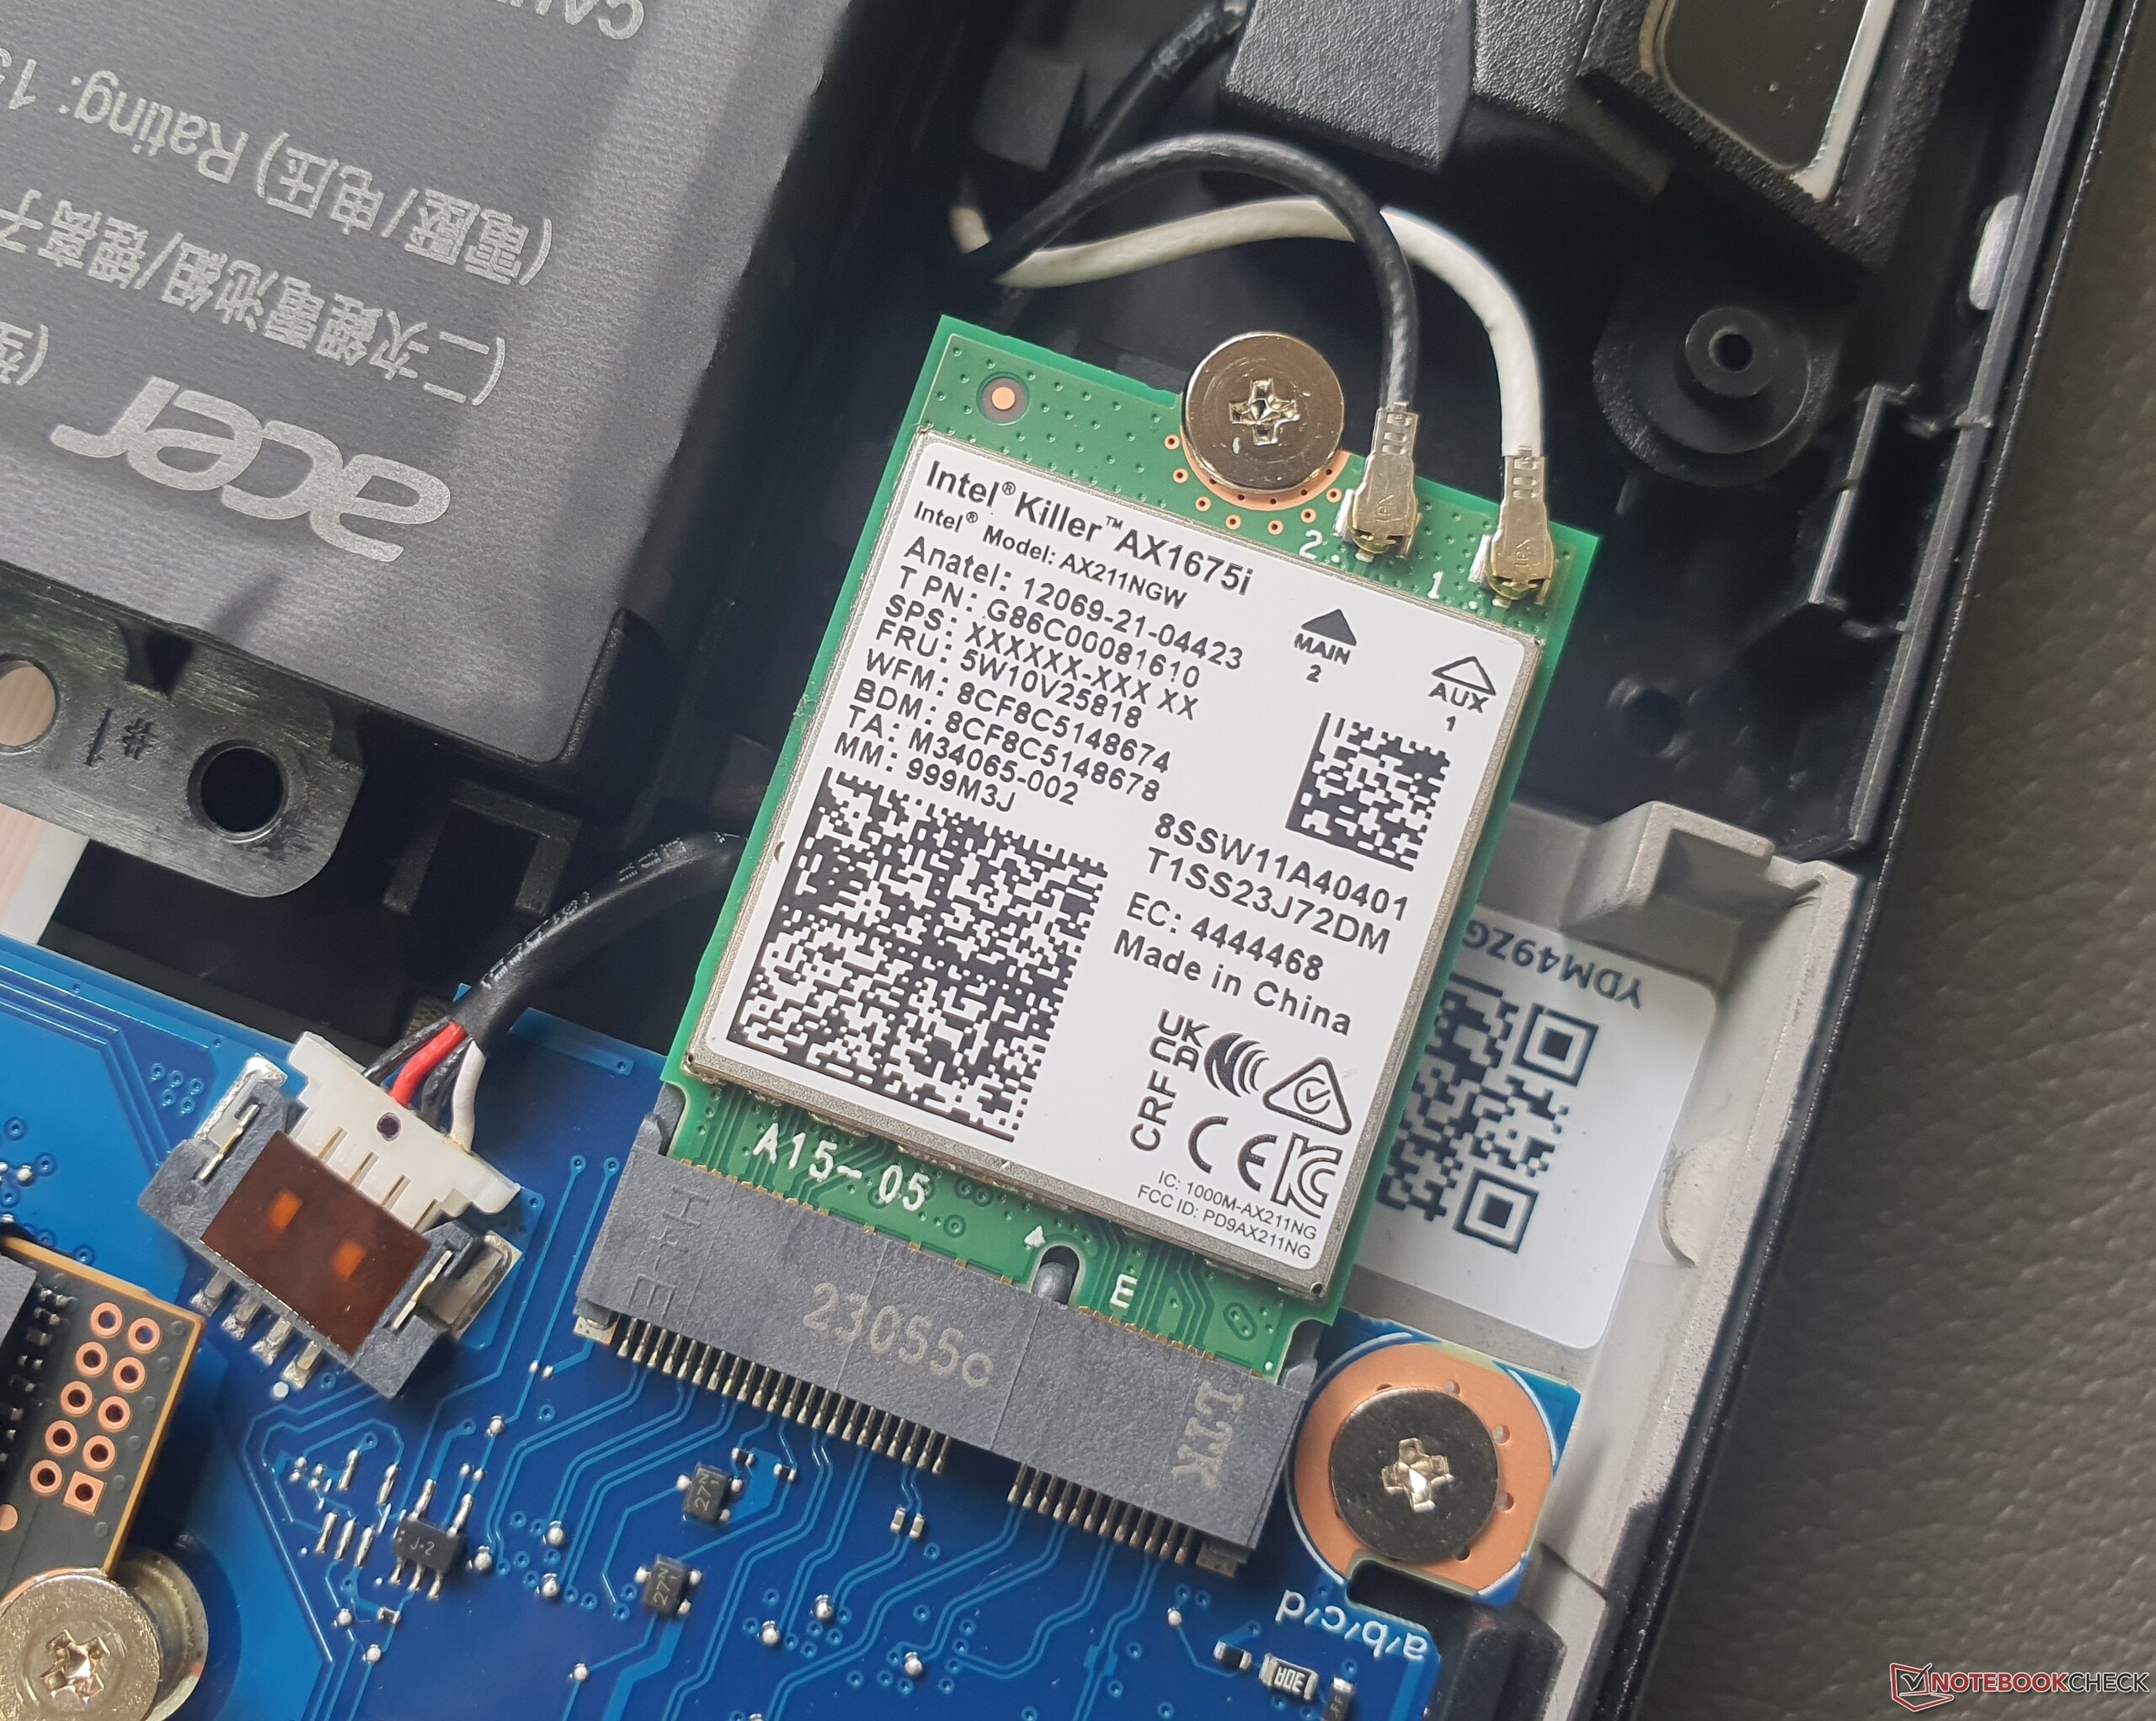
Układ Intel Killer AX1675i Wi-Fi 6E odpowiada za bezprzewodową transmisję sieciową, działając z najwyższej klasy prędkością do 1,6 GBit/s i jest szybszy niż pozwala na to zainstalowany gigabitowy port RJ45 (Killer 2600), ponieważ nie obsługuje 2,5 GBit/s W szczególnościLegion Pro 5 16iTUF Gaming A16pozostają w tyle za Heliosem 16. Bluetooth 5.2 jest na pokładzie.
Kamera internetowa
W dobrych warunkach oświetleniowych kamera internetowa 1080p zapewnia bardzo dobry obraz. W konfrontacji z podświetleniem (w tym przypadku pochodzącym z bocznego okna bez dodatkowych źródeł światła) następuje drastyczny spadek jakości. Windows Hello jest obsługiwane, ale fizyczna migawka kamery jest nieobecna.


Akcesoria

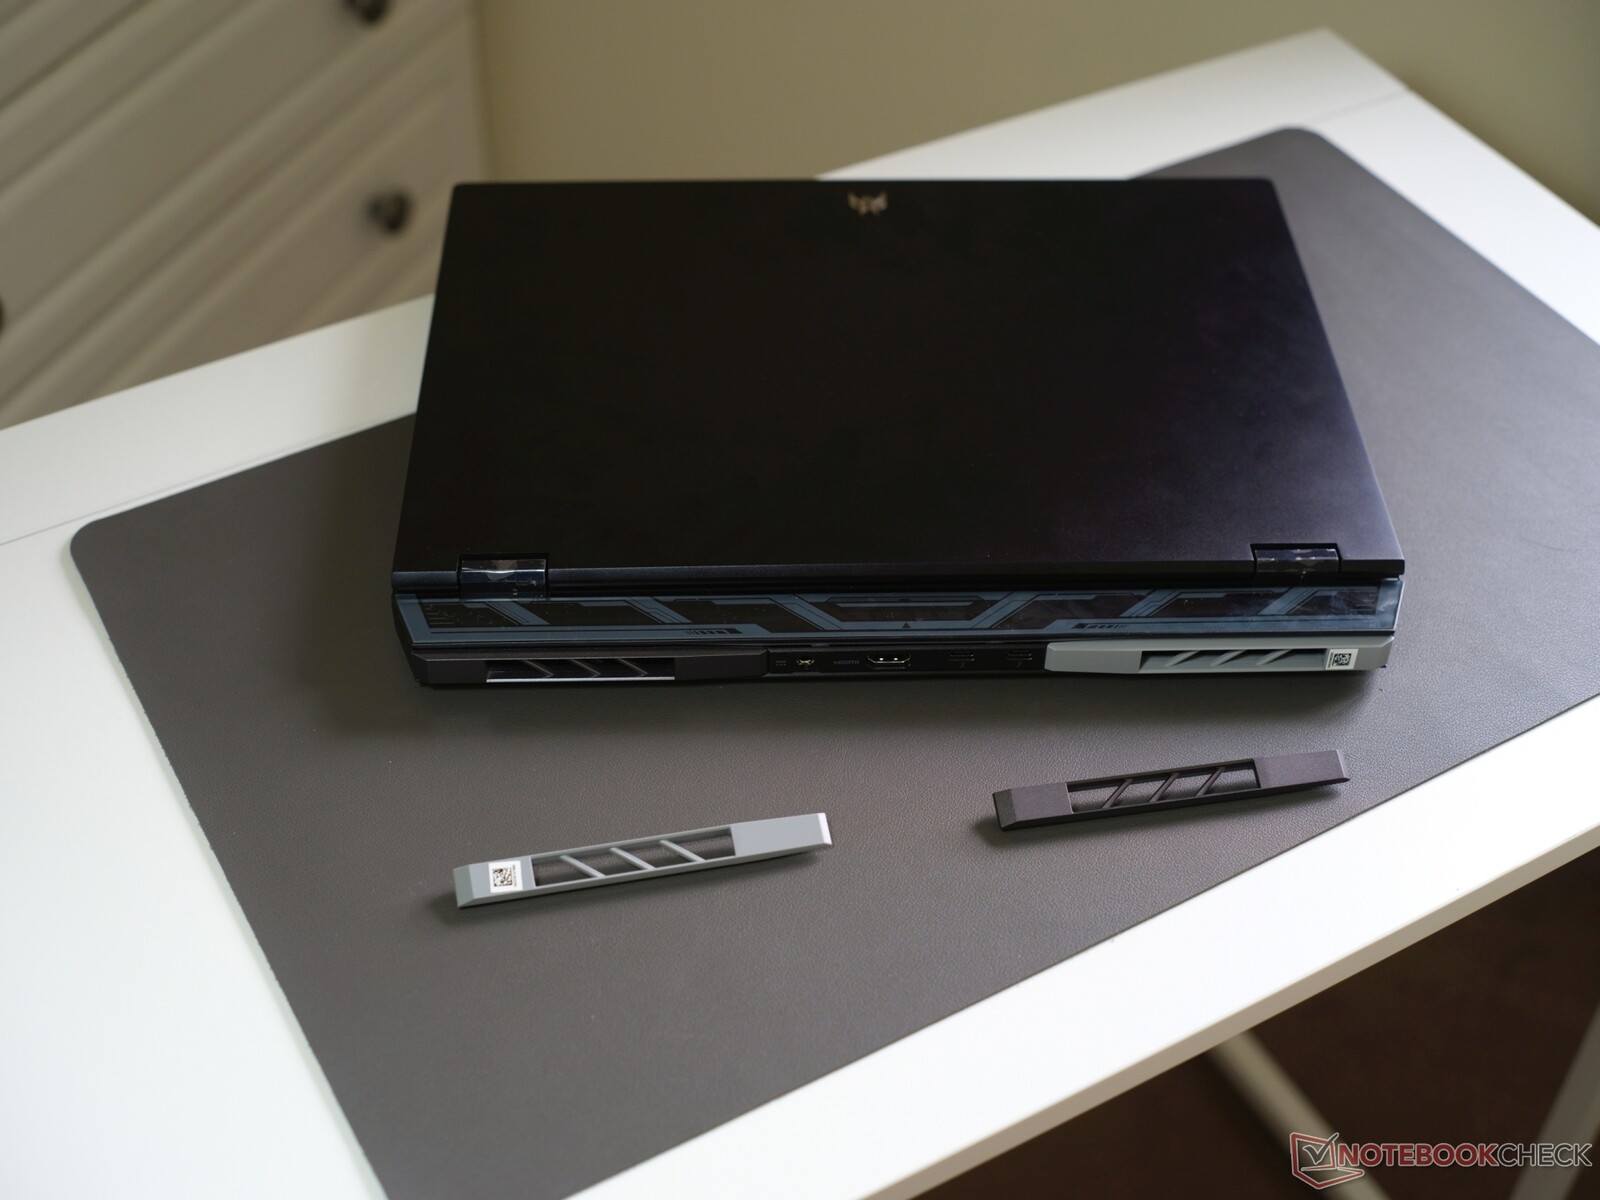
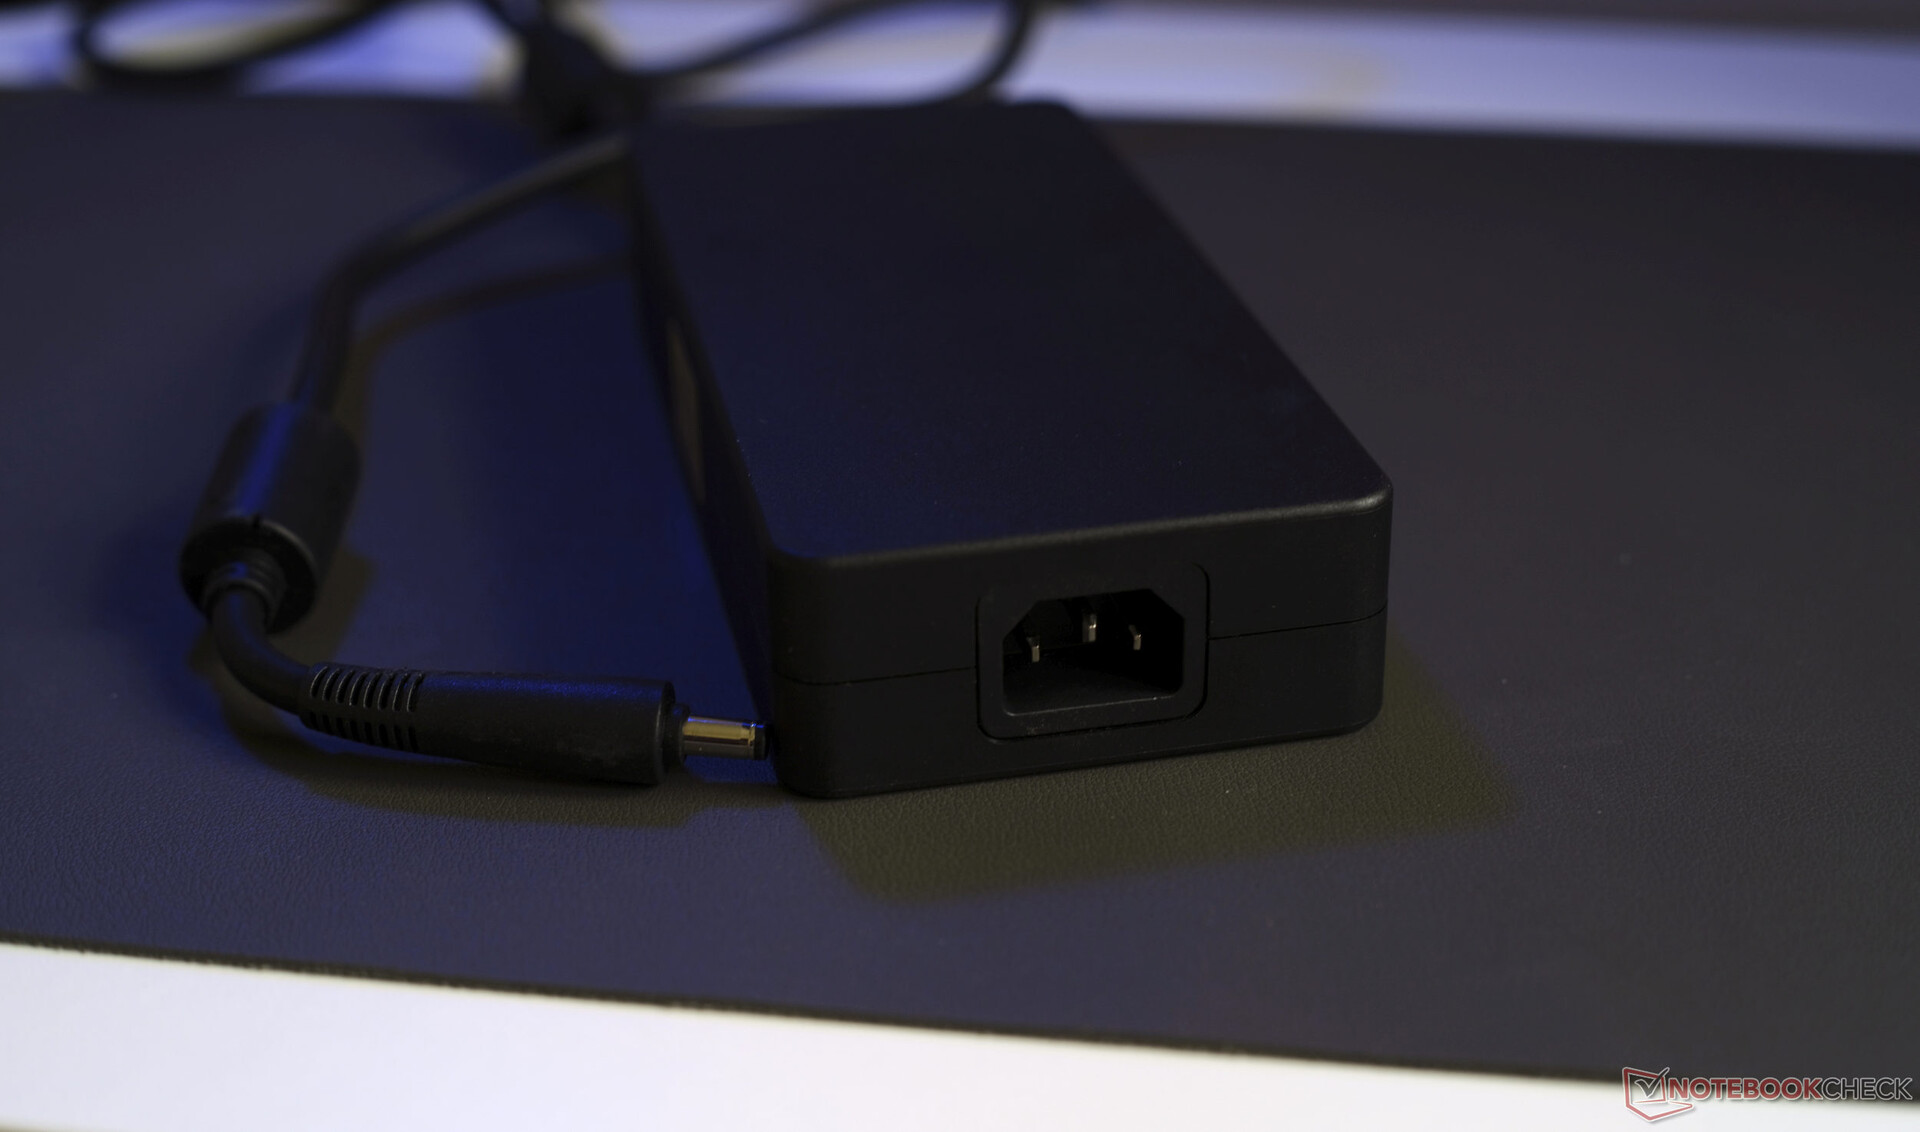
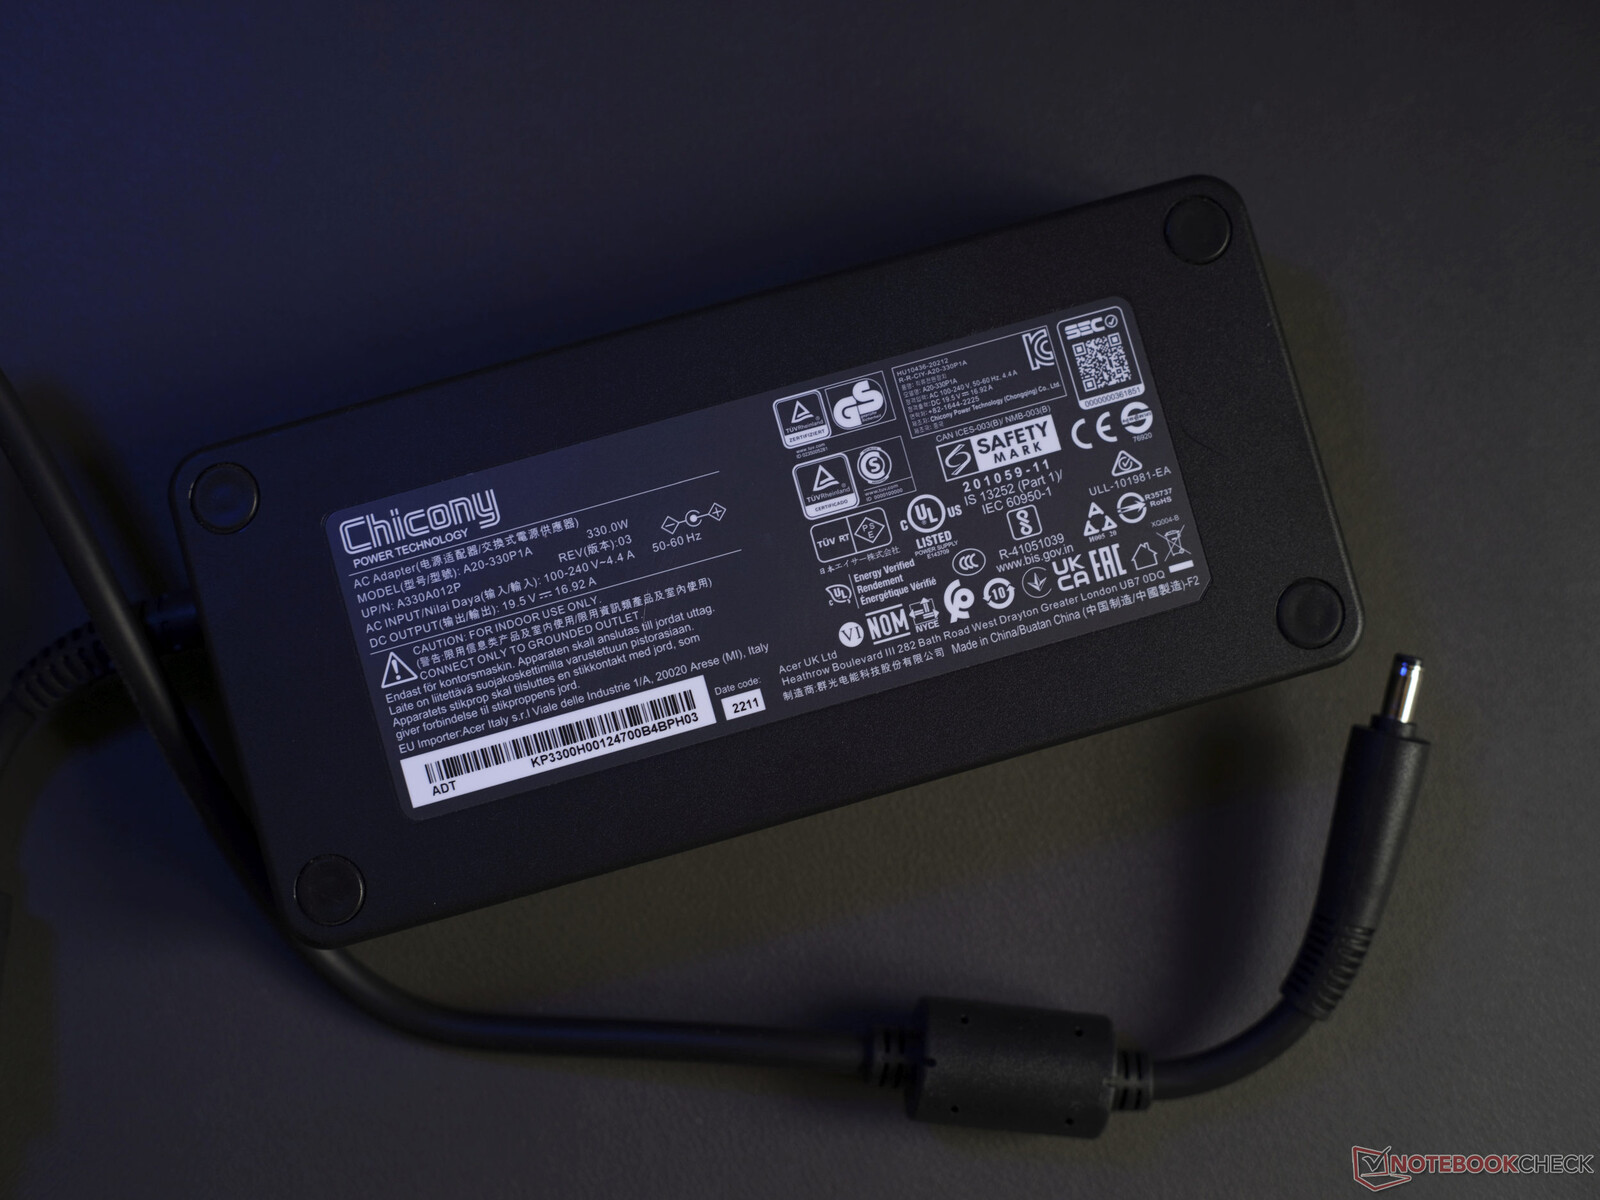
Acer dołączył dwa dodatkowe jasnoszare magnetyczne grille wentylatorów, aby zastąpić fabrycznie zainstalowane ciemnoszare. Przydałoby się więcej odważnych akcentów kolorystycznych. Poza tym jest tylko 330-watowy zasilacz. Producent nie zdecydował się na ekologiczne opakowanie.
Zdjęcia po prawej stronie dotyczą gamingowego pakietu Predator dostępnego obecnie w niemieckim sklepie Acer.
Konserwacja
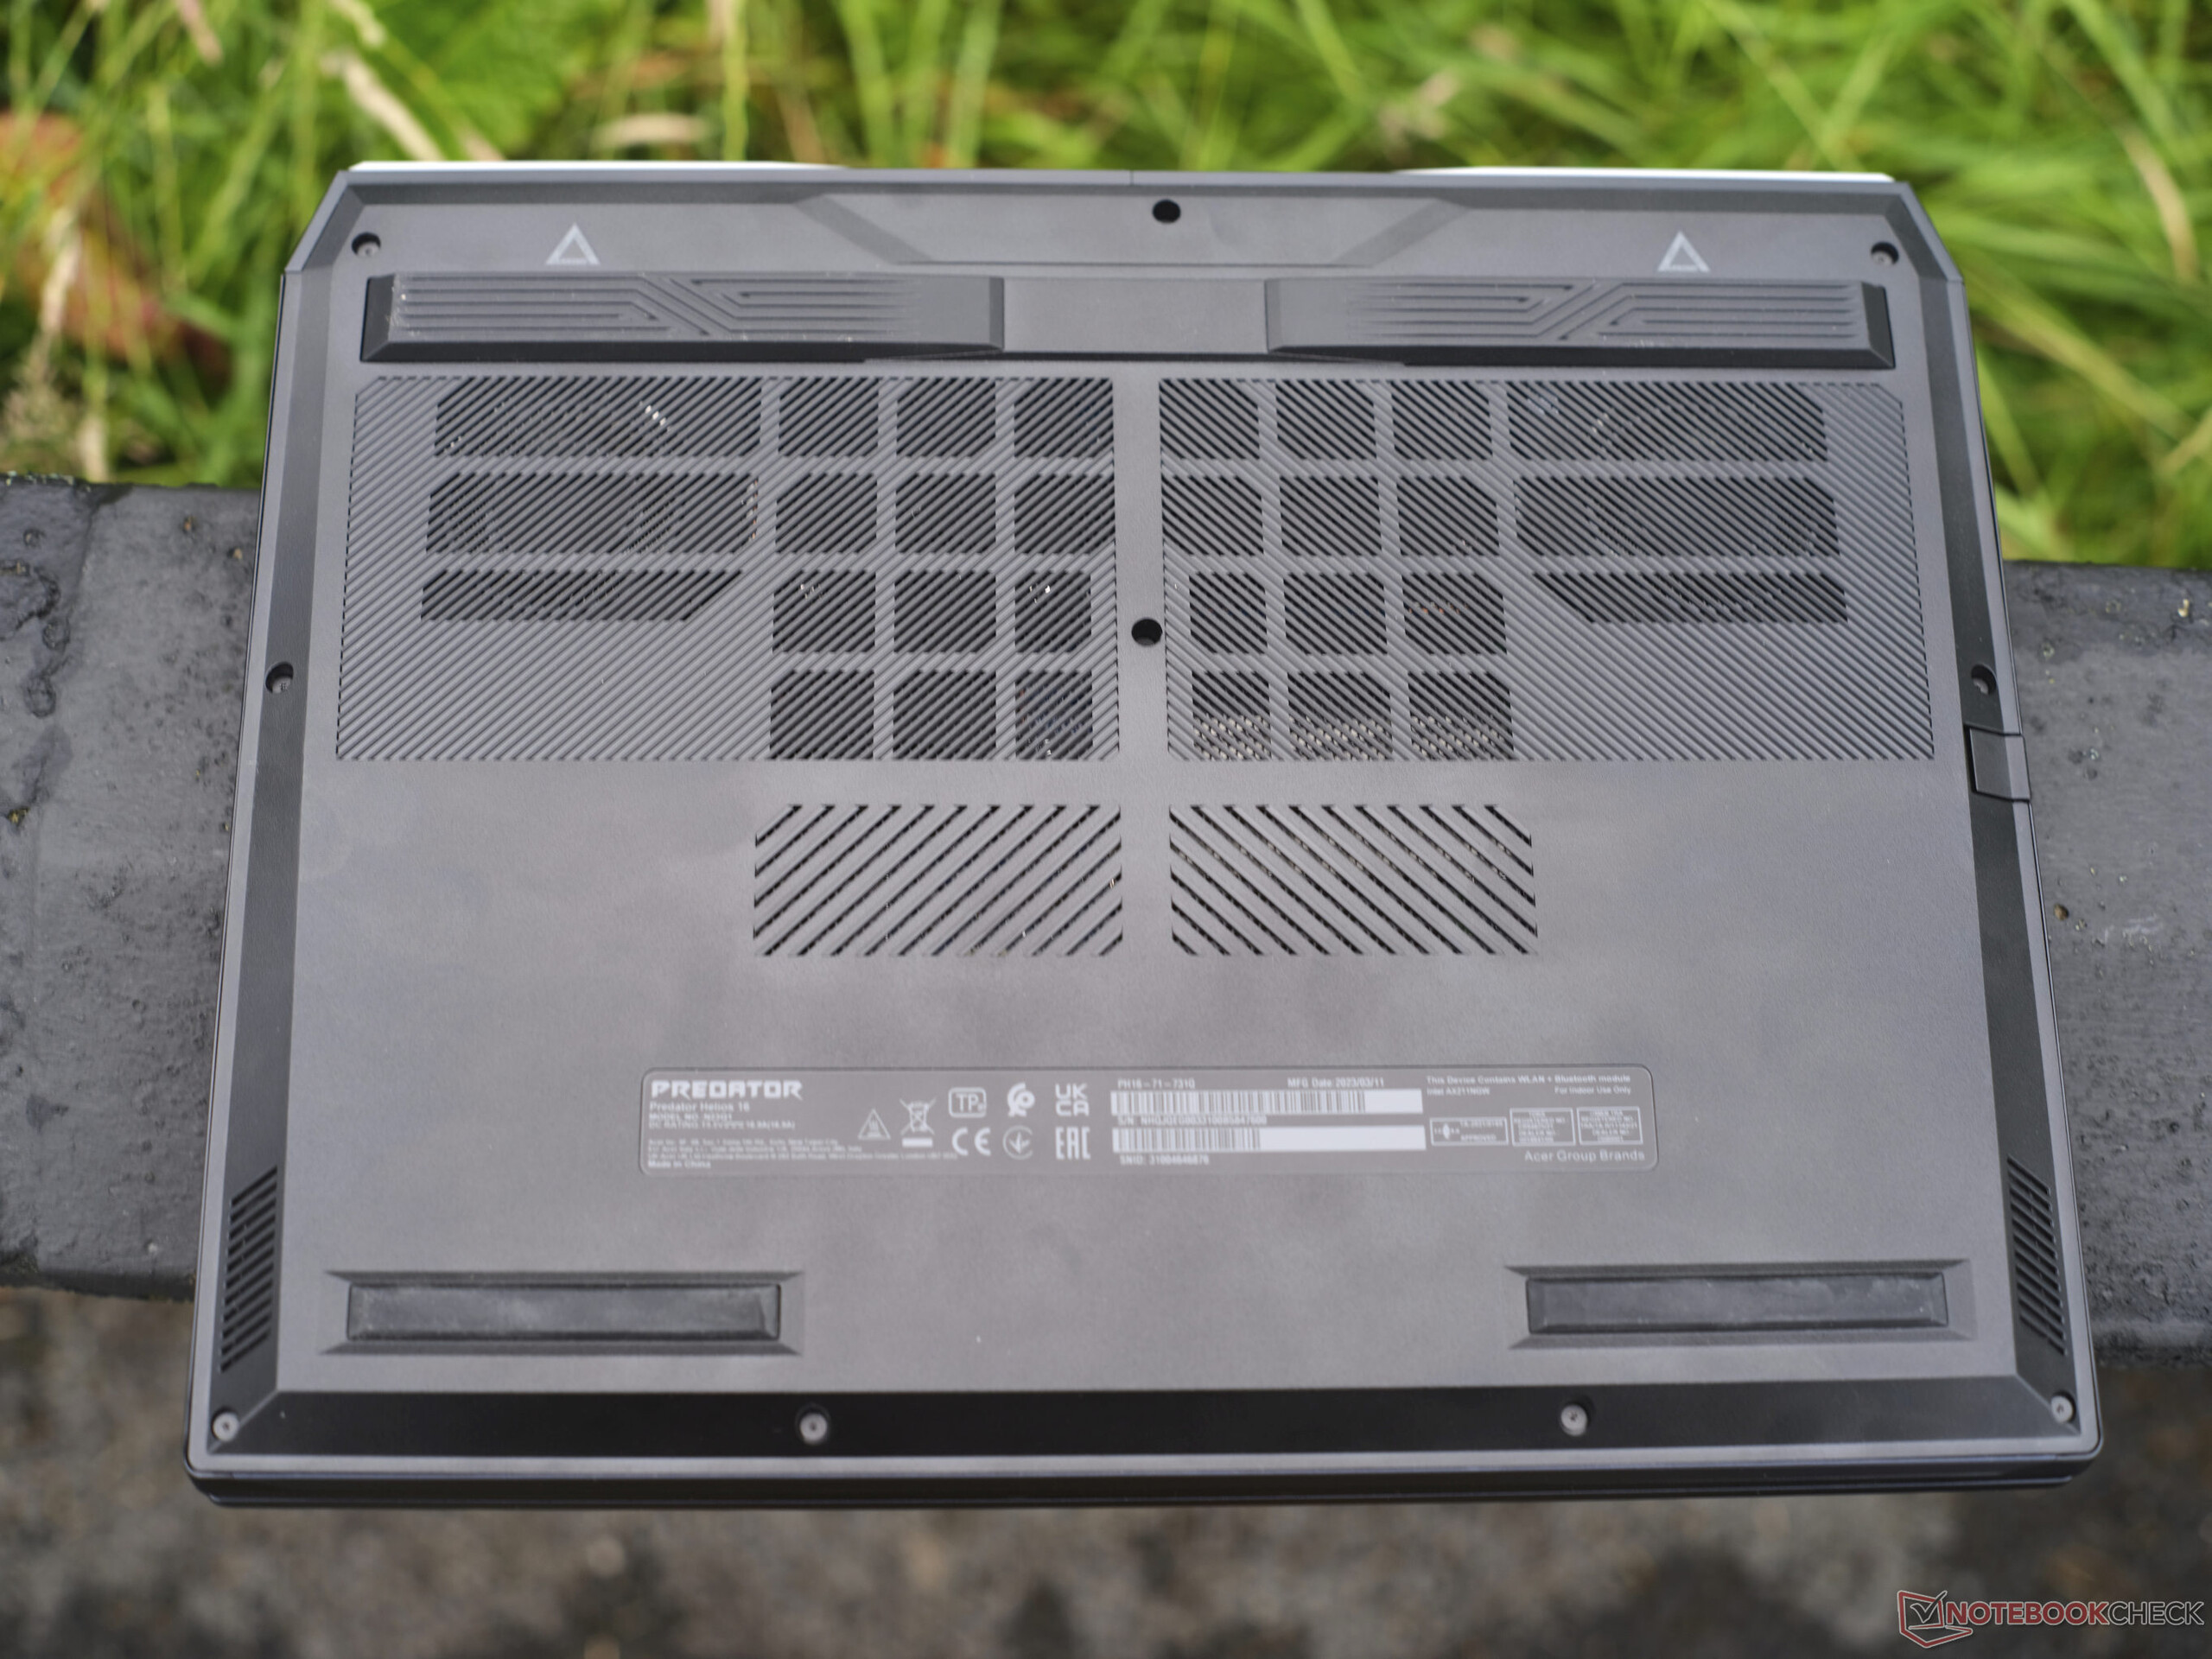
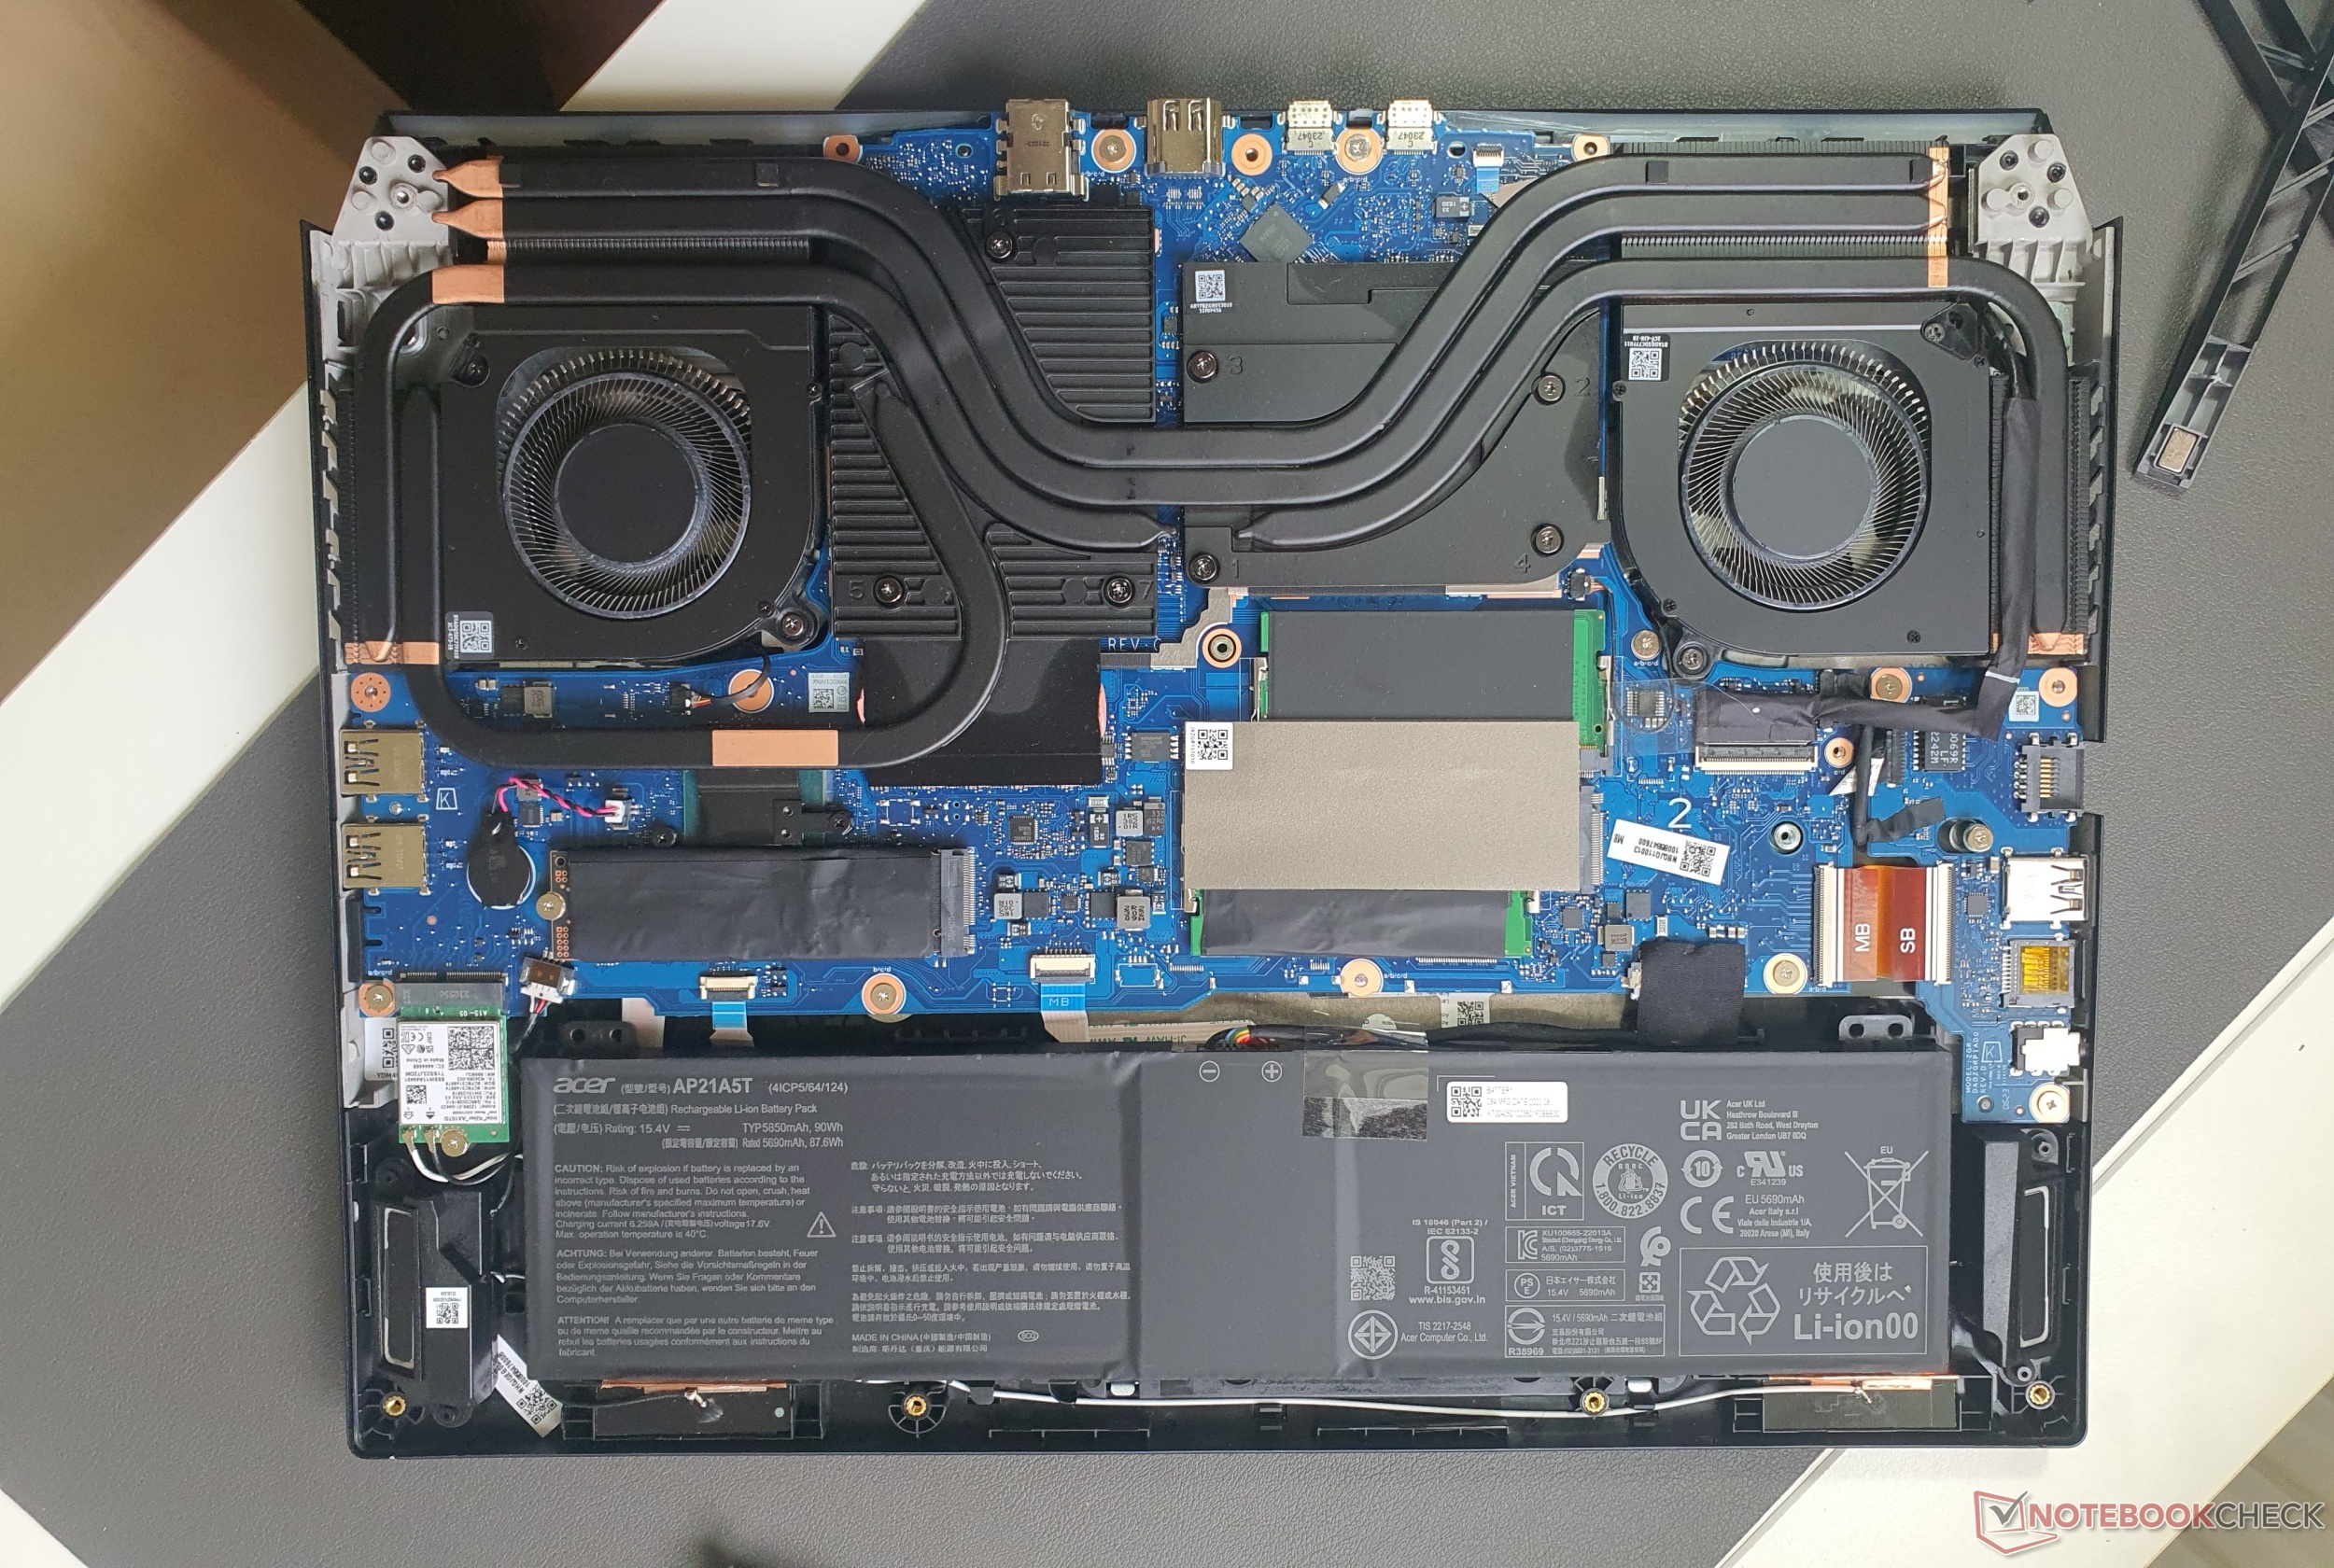
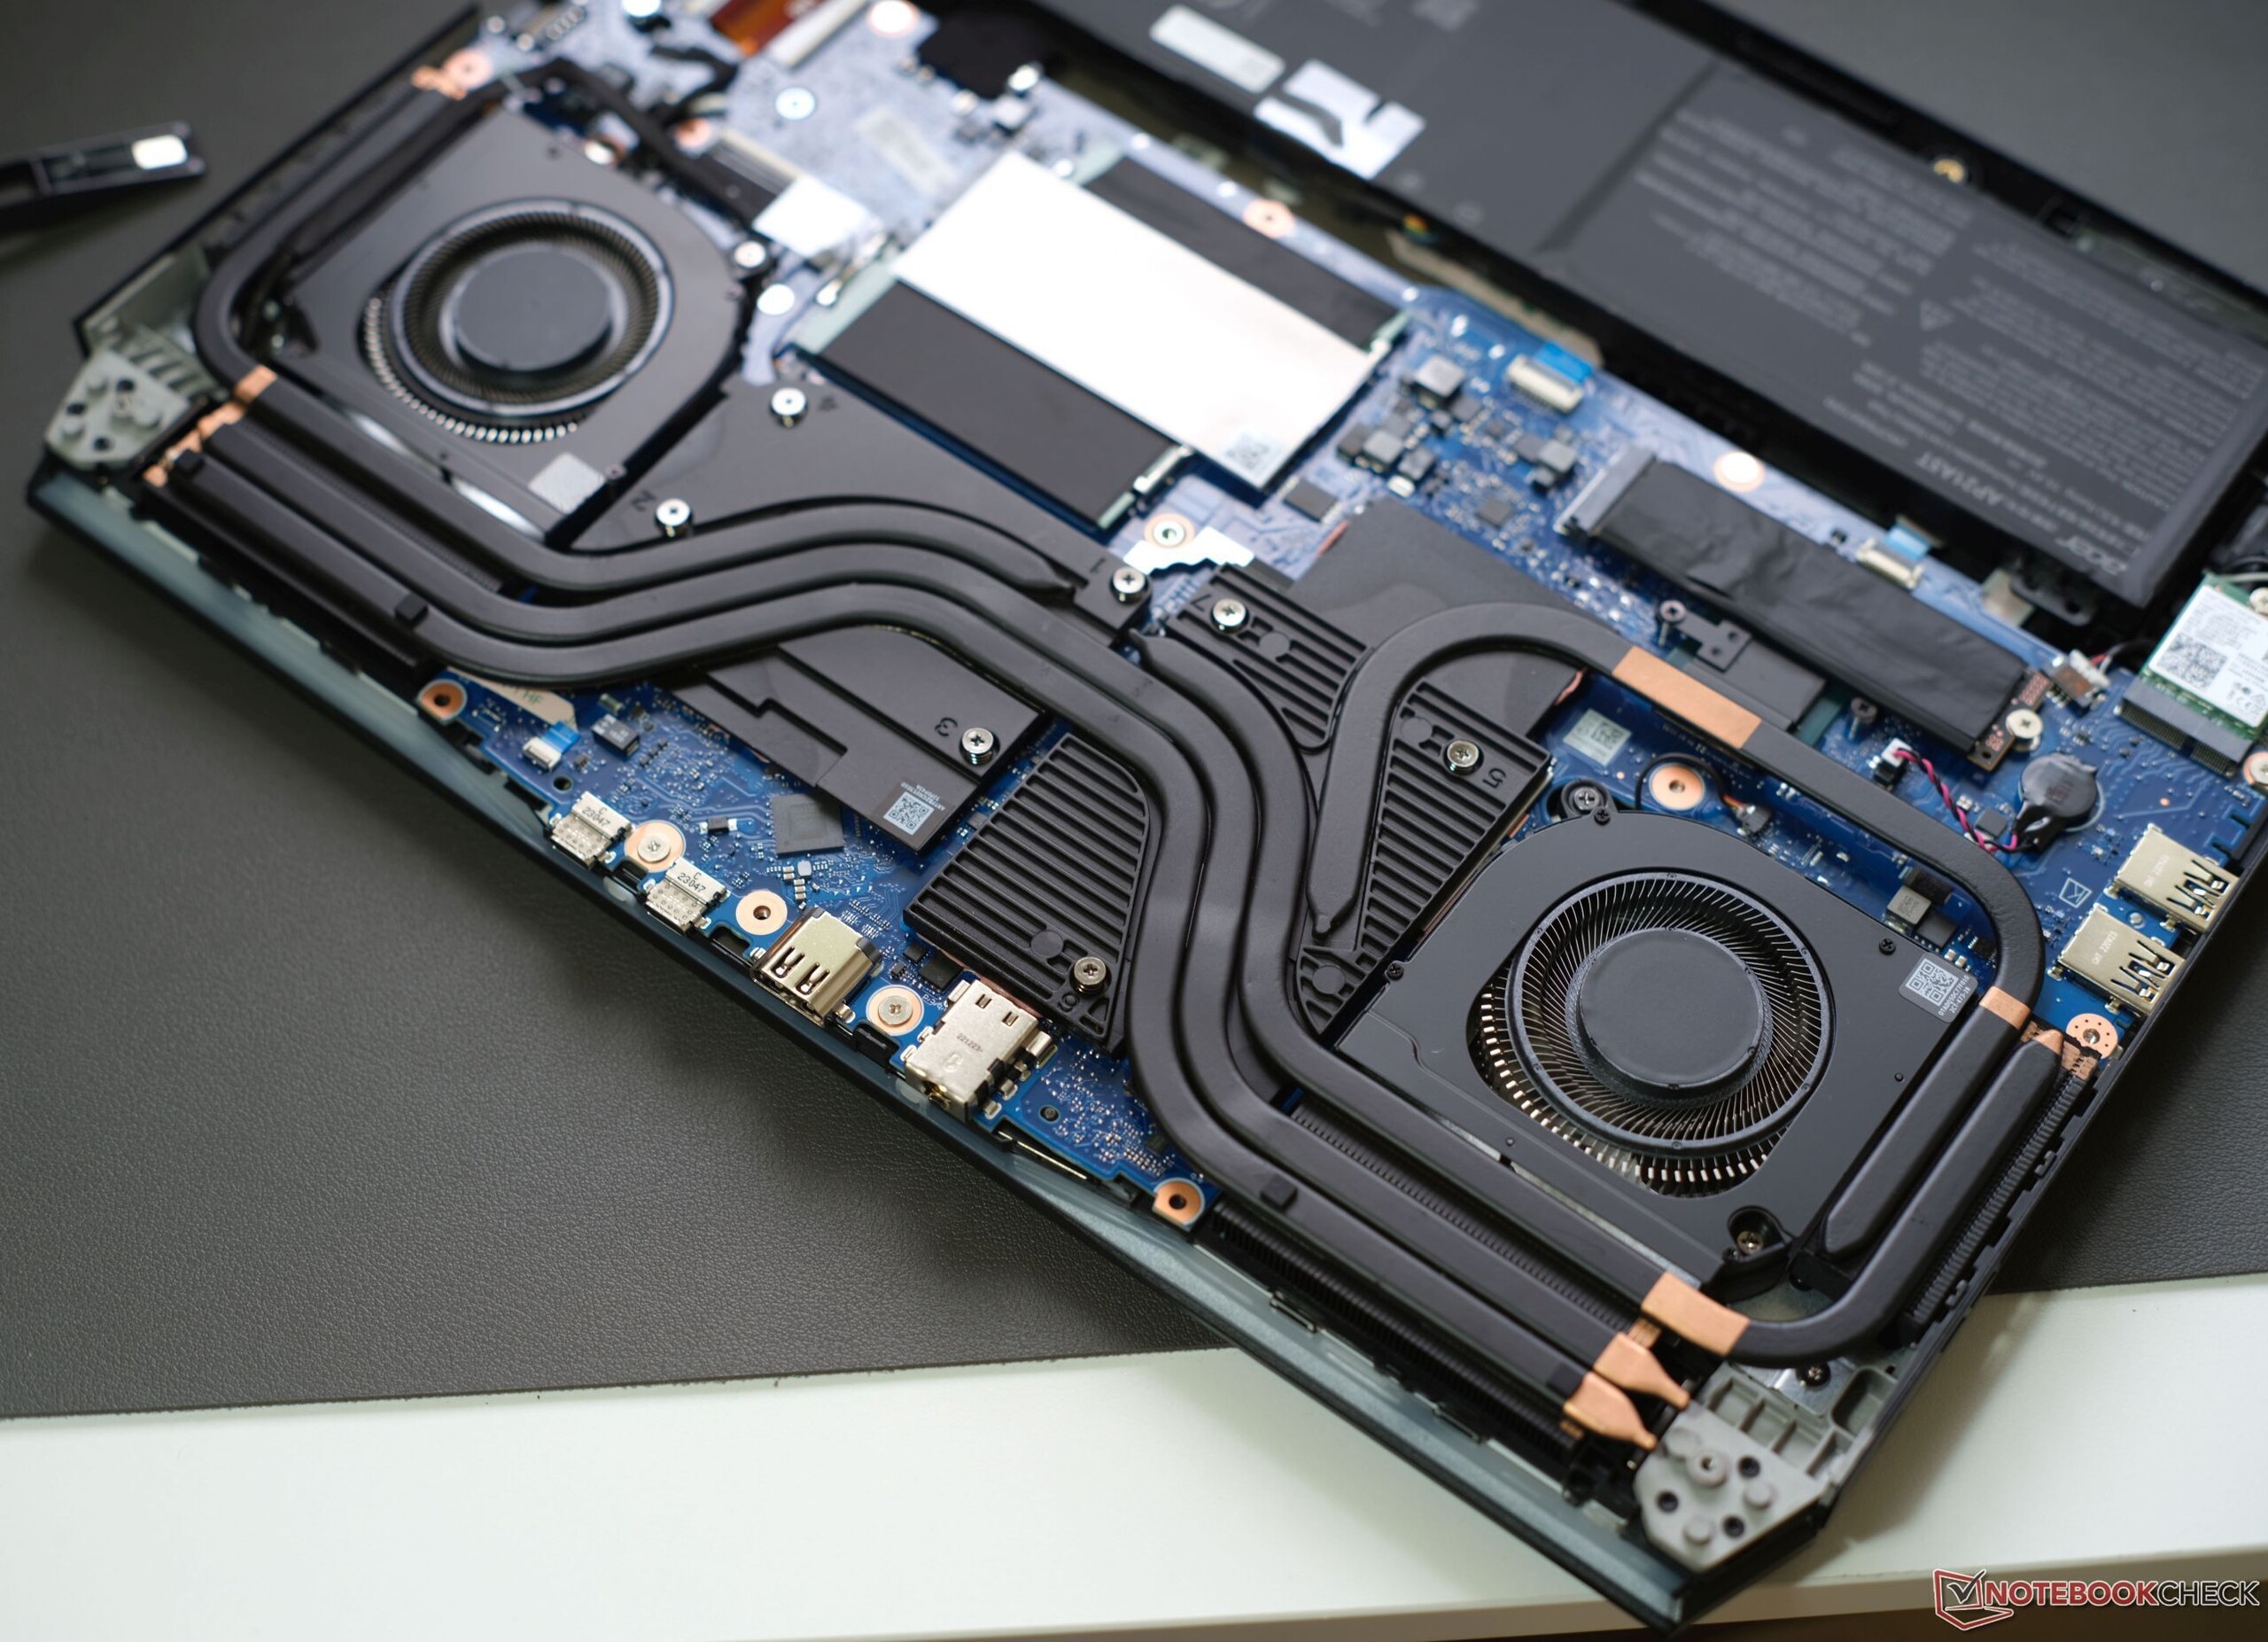
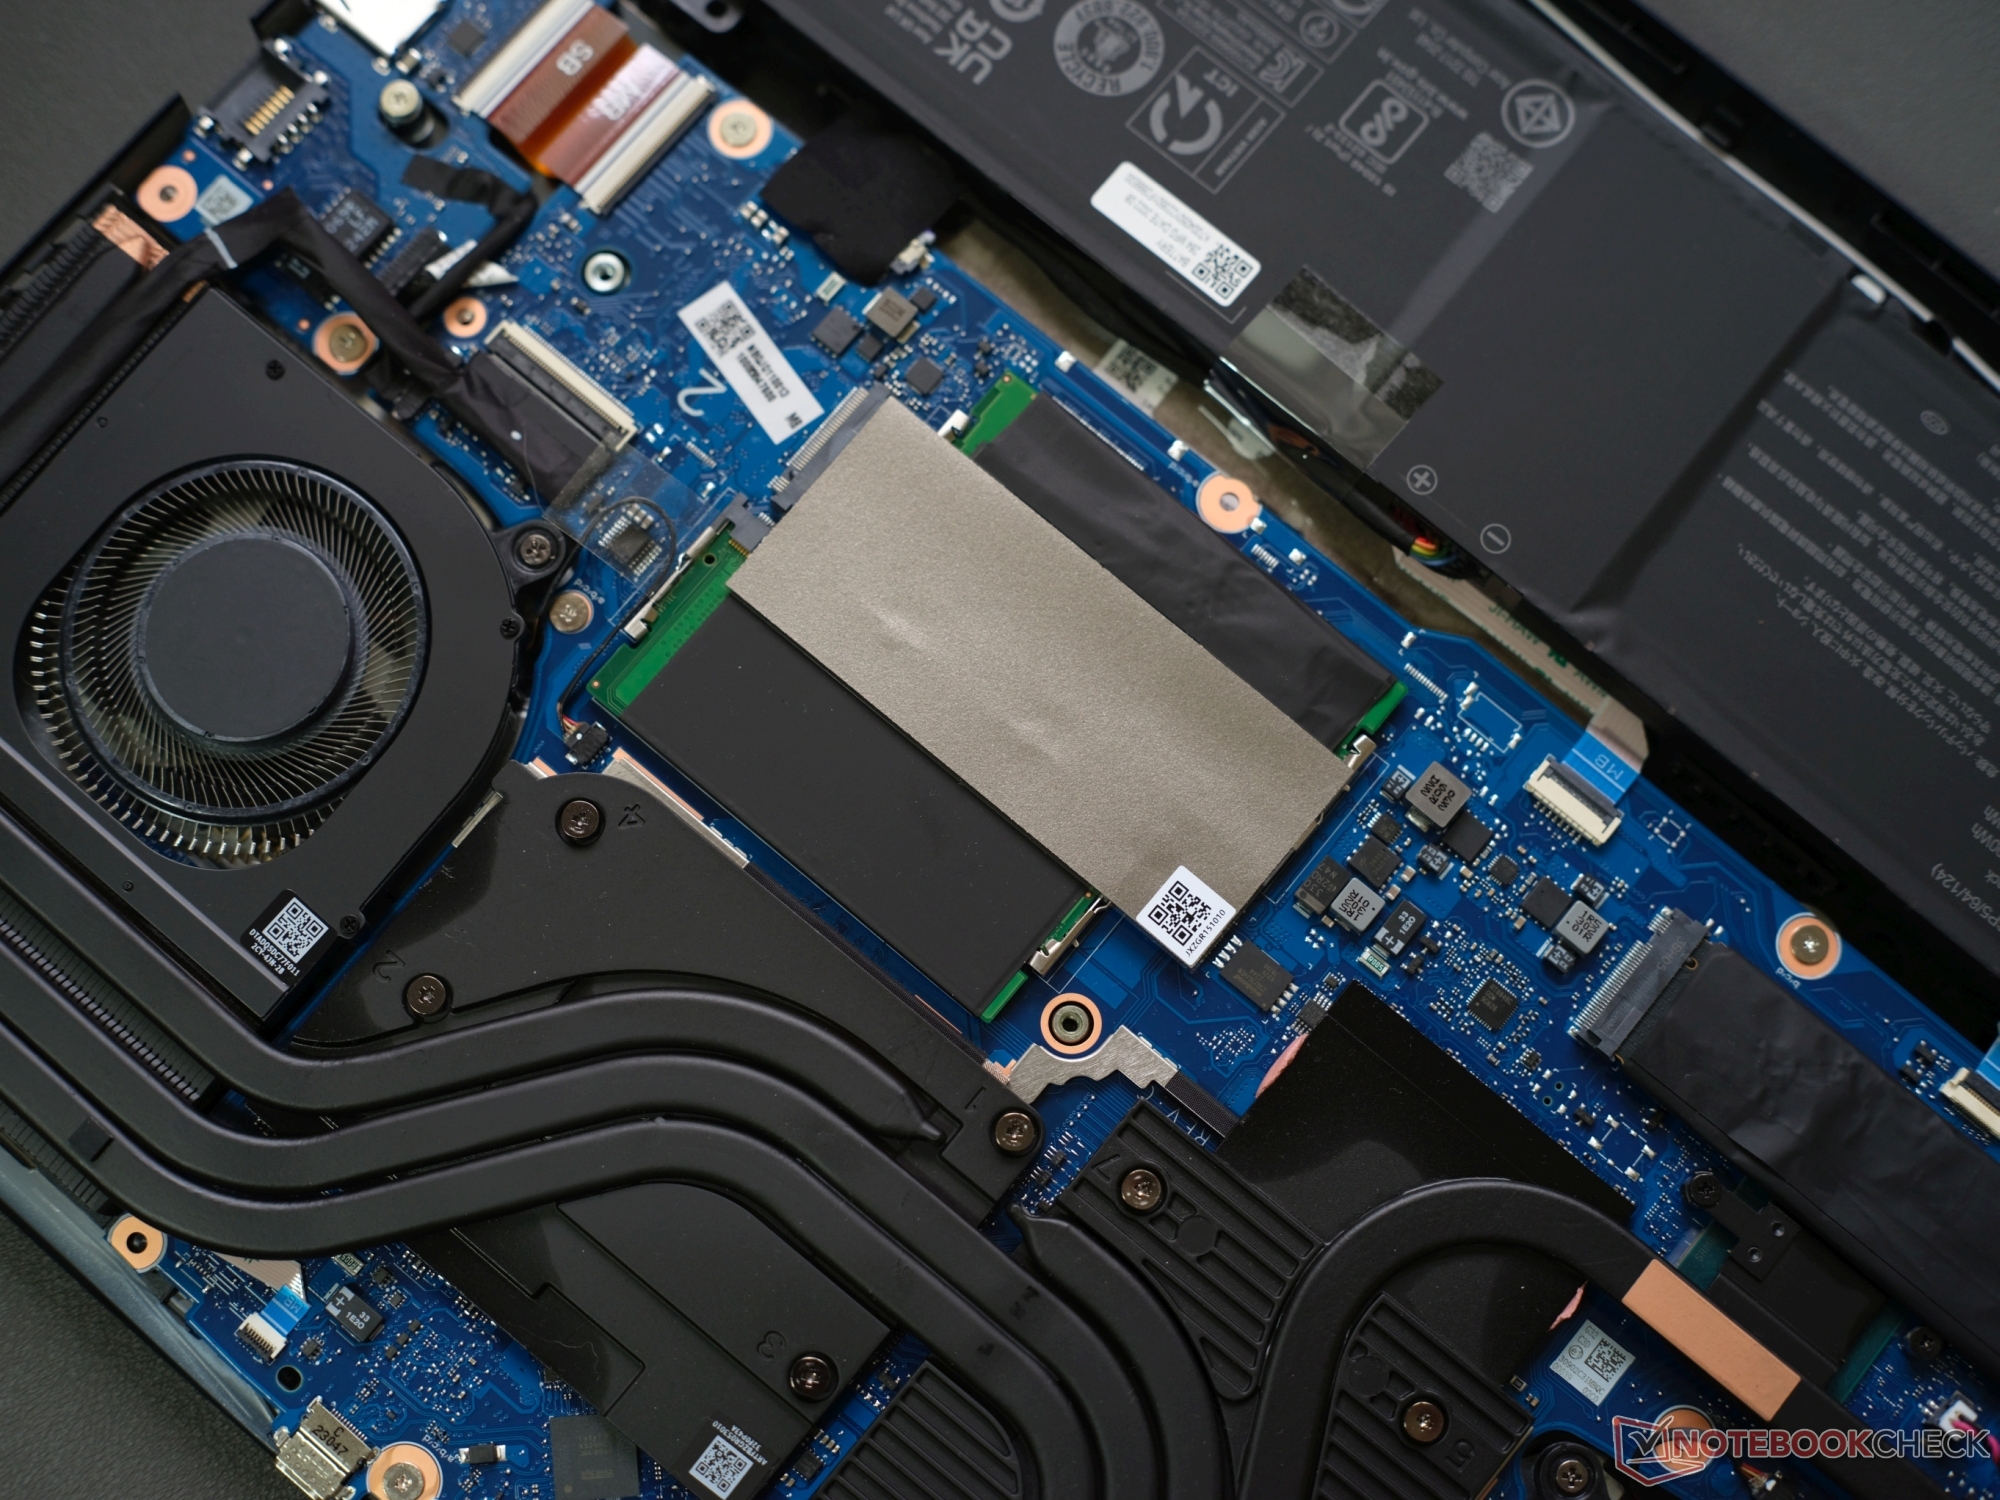
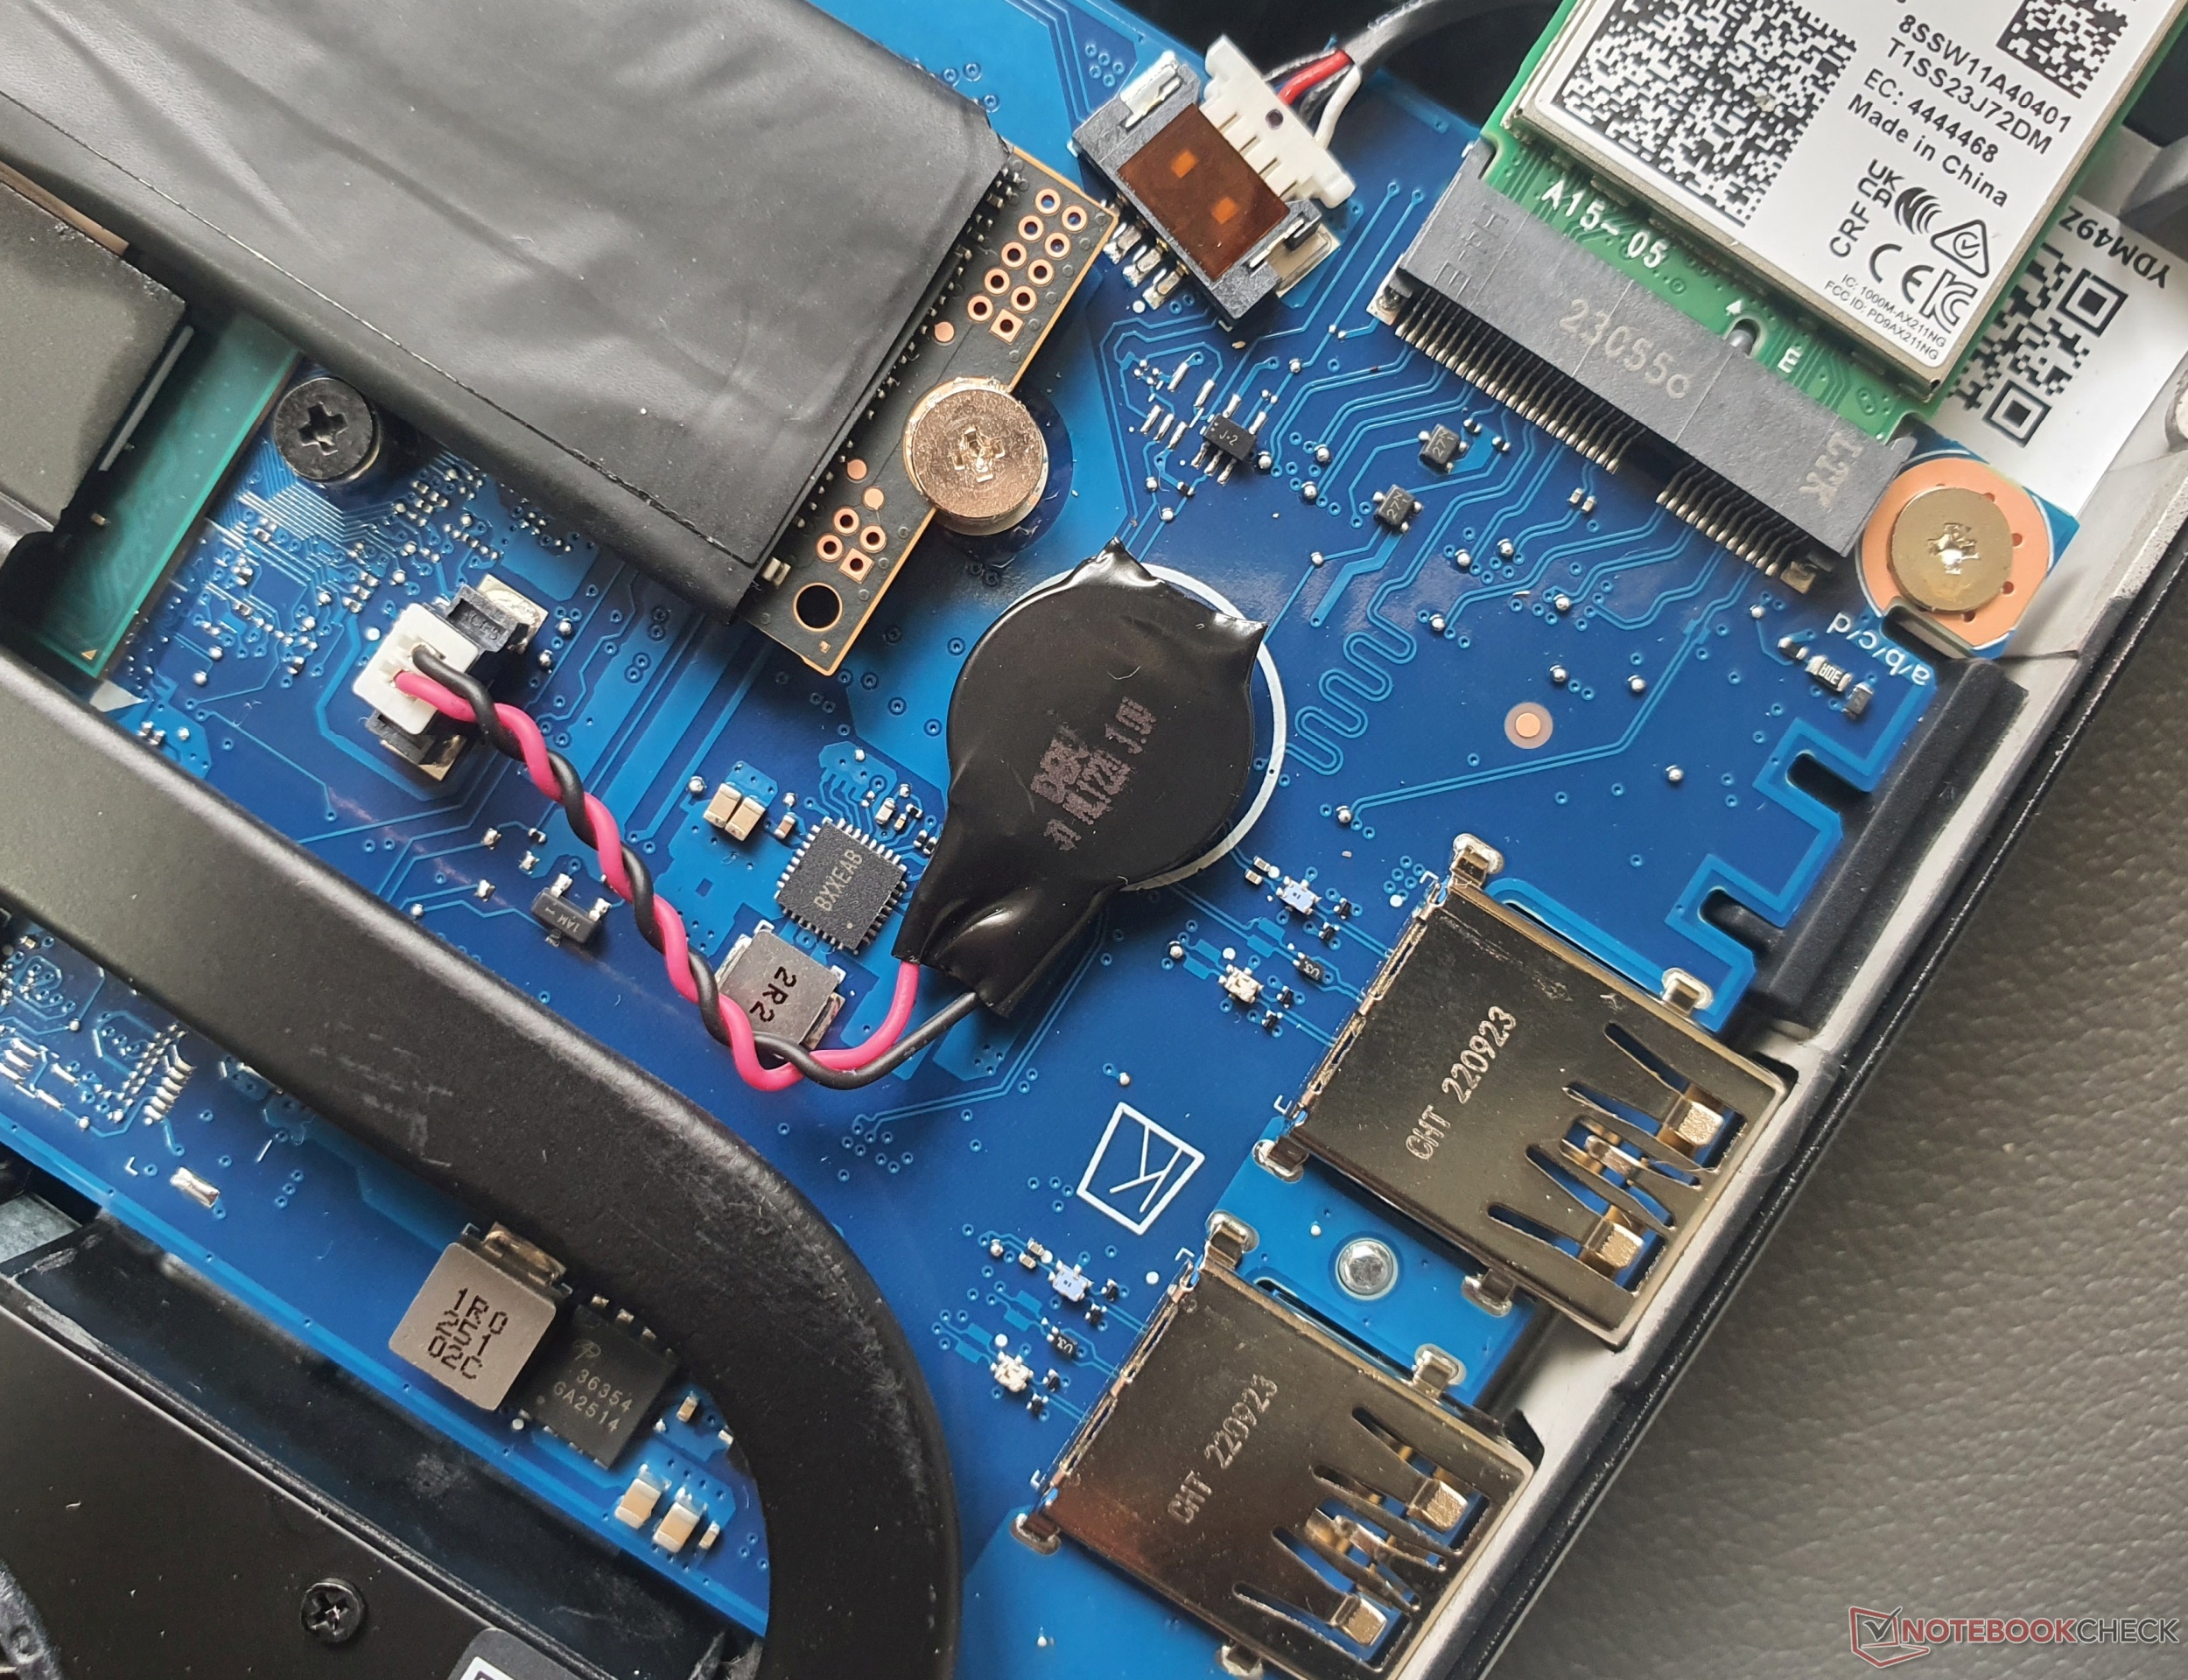
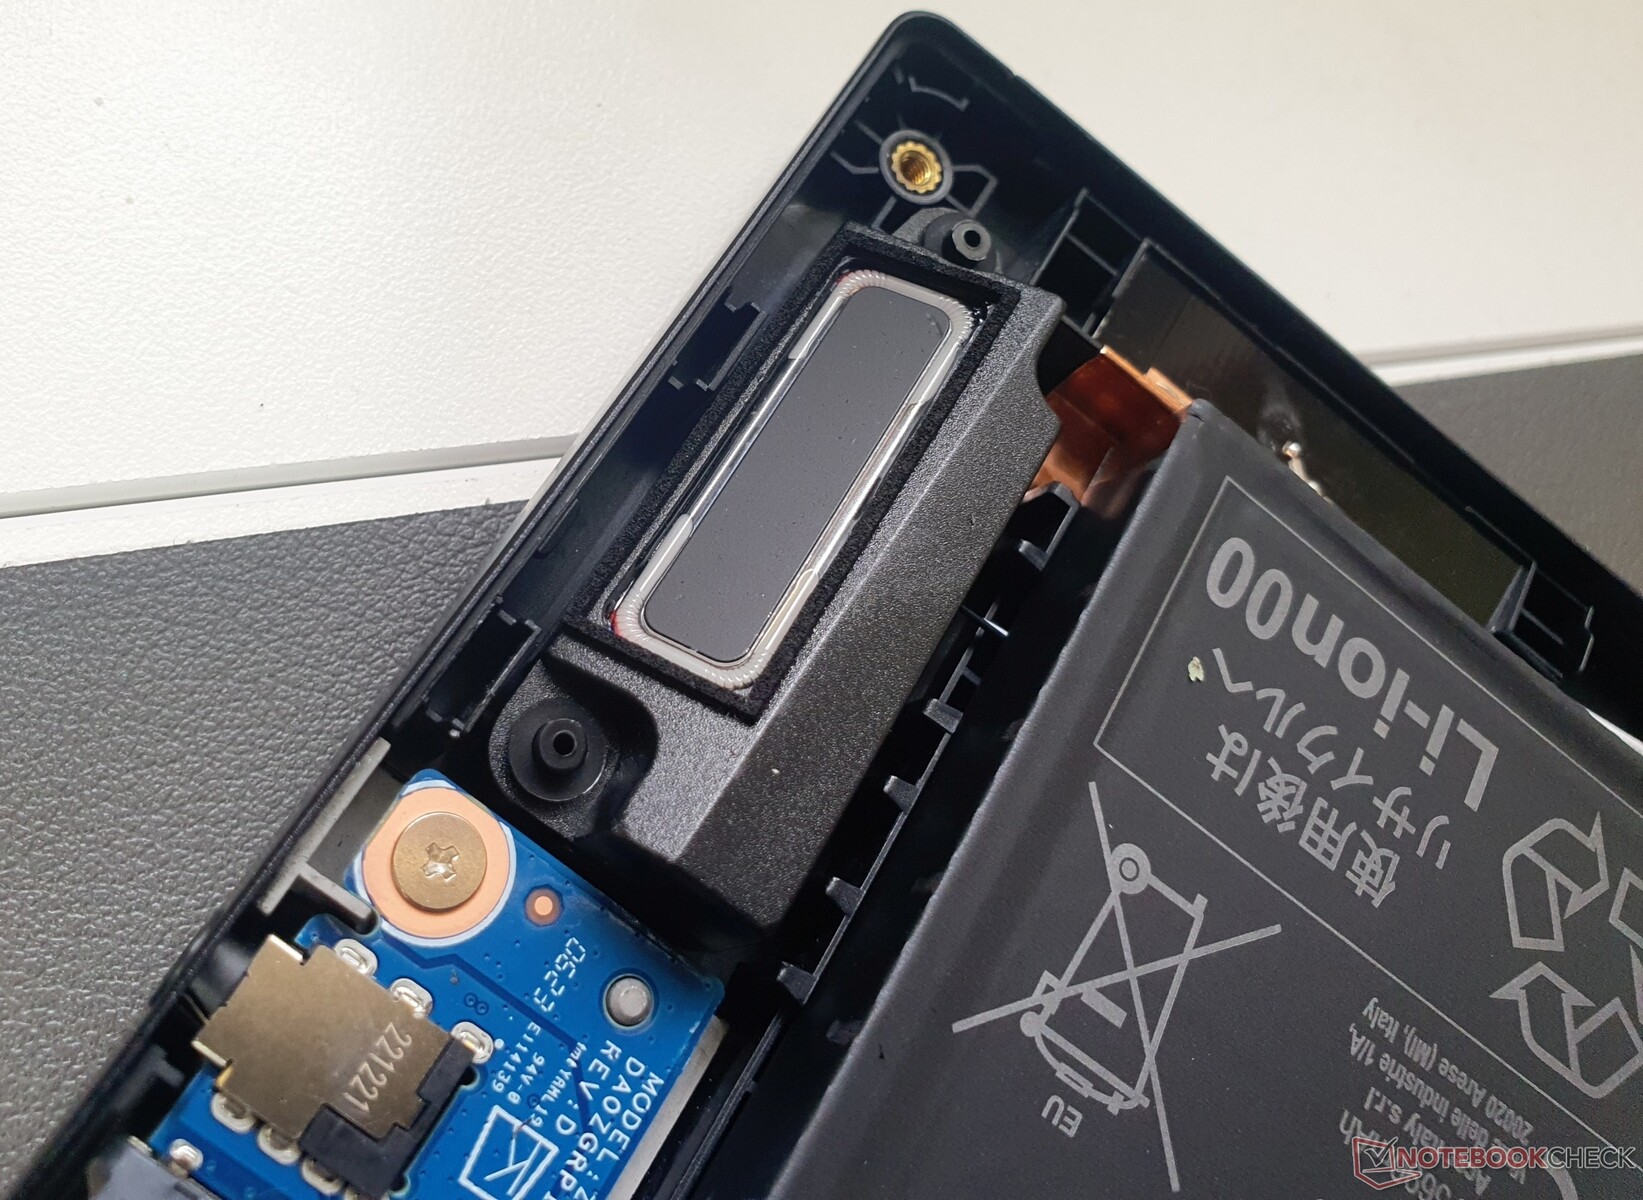
Dostęp do wnętrza obudowy jest dość łatwy po odkręceniu dziesięciu śrub Torx T5. Wymienialne części obejmują pamięć RAM (dwa banki), dysk SSD M.2 2280 i układ Wi-Fi. Można również łatwo wymienić przykręcaną baterię i baterię BIOS-u.
Gwarancja
W Niemczech firma Acer udziela 24-miesięcznej gwarancji. Dzięki usłudze Acer Care Plus można ją przedłużyć nawet o pięć lat.
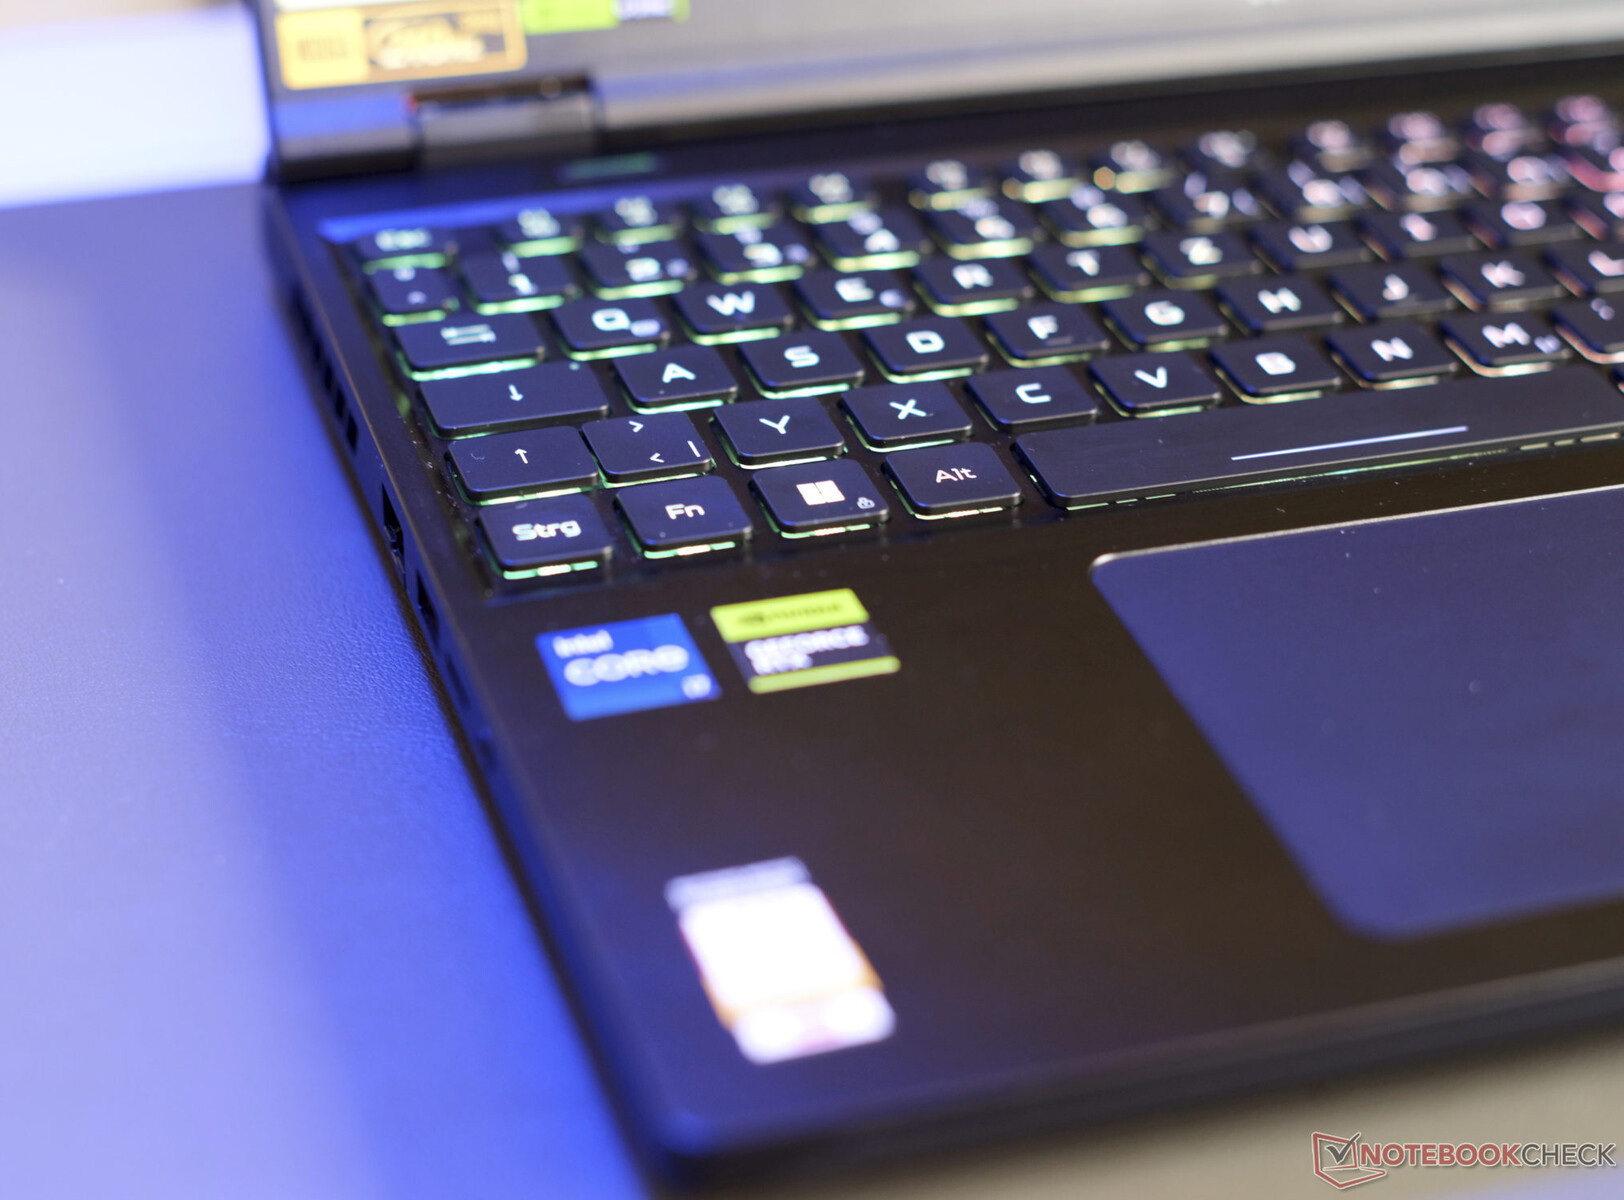
Urządzenia wejściowe: Predator Helios posiada oświetlenie mini-LED
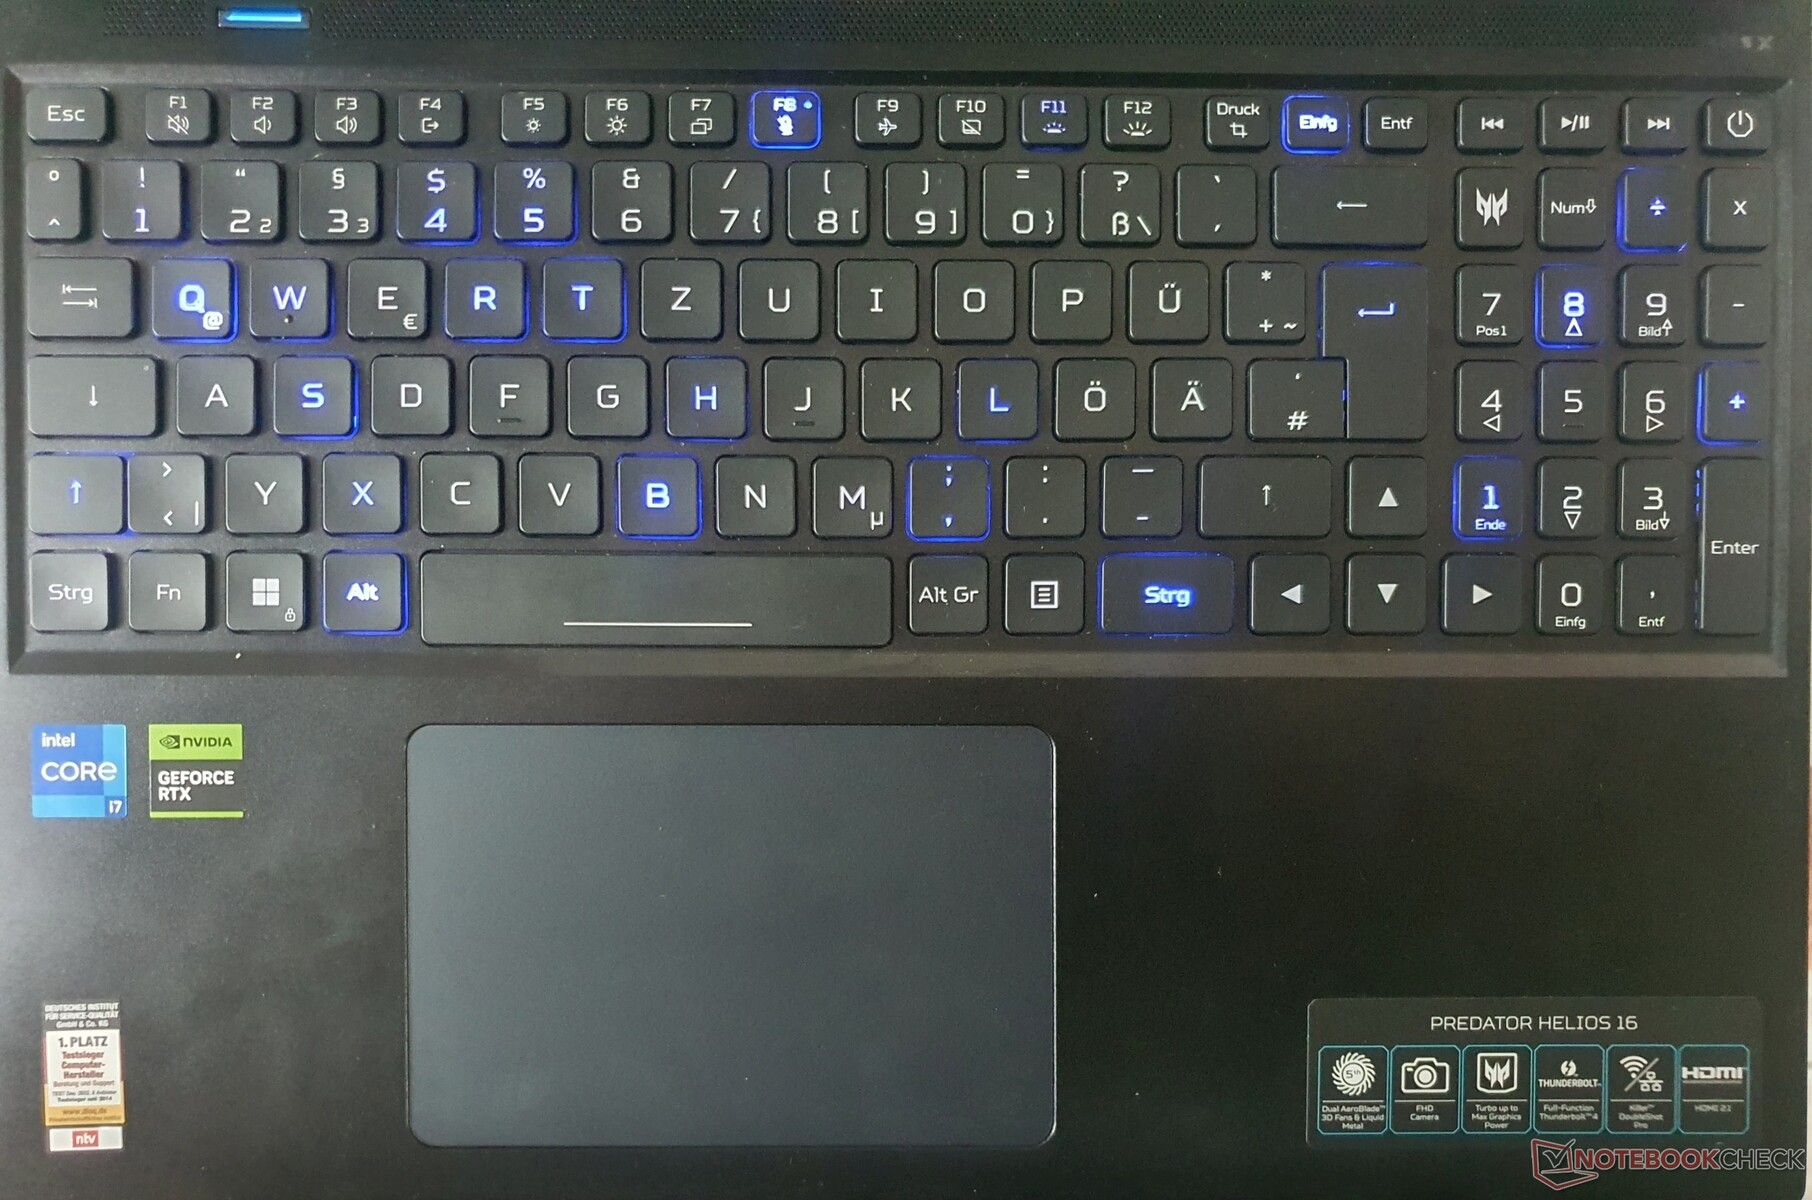
Klawiatura
Acer używa tej samej 6-rzędowej klawiatury typu chiclet z klawiszami 15 x 15 mm od modelumodelu 2020. Pomimo dużego skoku klawiszy, sprzężenie zwrotne nie do końca osiąga swój potencjał: Punkt nacisku jest namacalny i mógłby być nieco bardziej zdefiniowany, ale hałas podczas pisania jest niepozorny. Na środku i po prawej stronie klawiatura znacznie się ugina, ale nie jest to denerwujące podczas pisania, o ile nie uderzasz w klawisze.
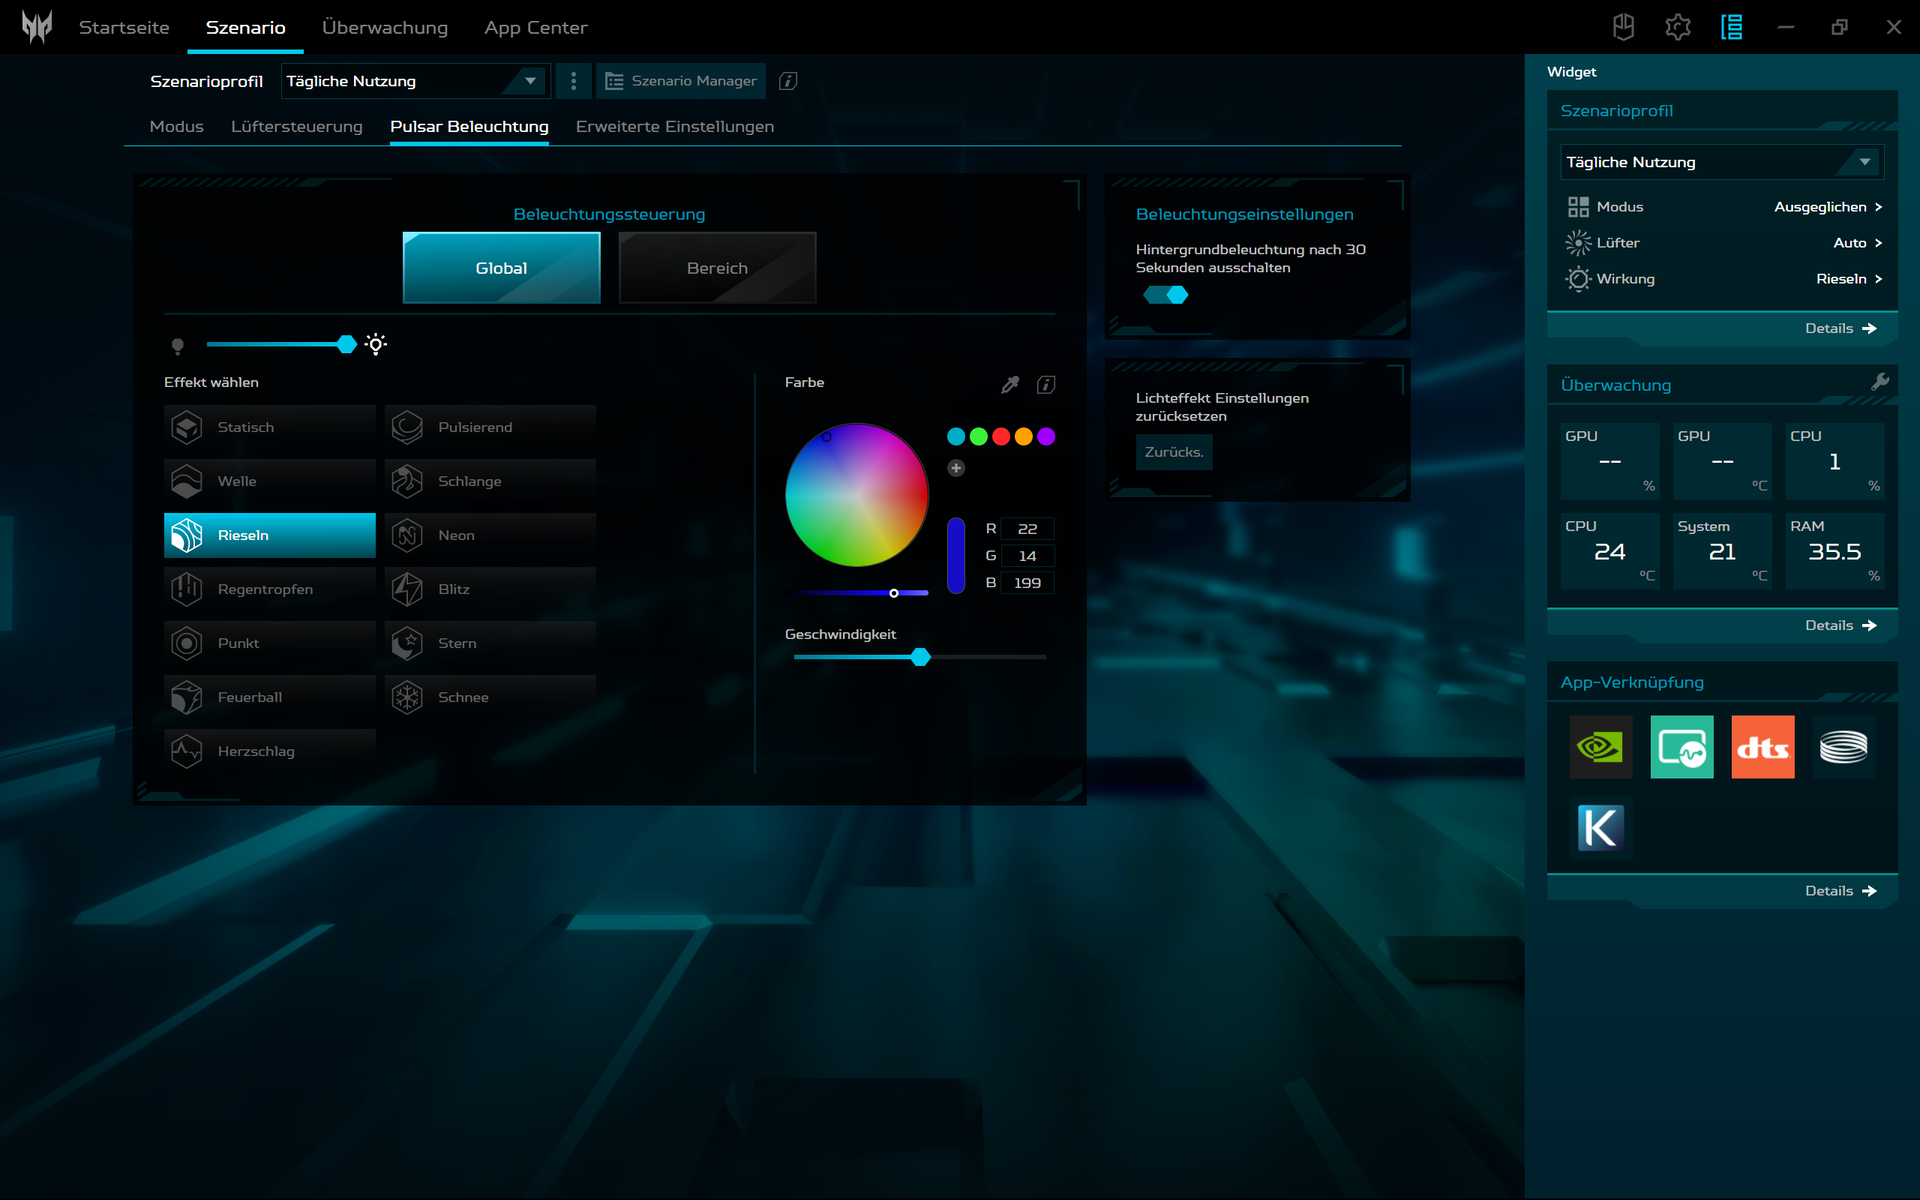
Podświetlenie mini-LED jest nowe i oferuje główne różne ustawienia. RGB dla poszczególnych klawiszy ma cztery dostępne ustawienia i może być bardzo jasne. Przejścia są szczególnie płynne i czyste, a diody mini-LED są również bardziej energooszczędne.
Podoba nam się układ, a w szczególności normalnej wielkości klawisze strzałek kosztem mniejszego Shift. Podczas gdy przycisk z logo uruchamia aplikację Predator Sense, możliwe jest przełączanie między trybami wydajności za pomocą przycisku po lewej stronie nad klawiaturą.
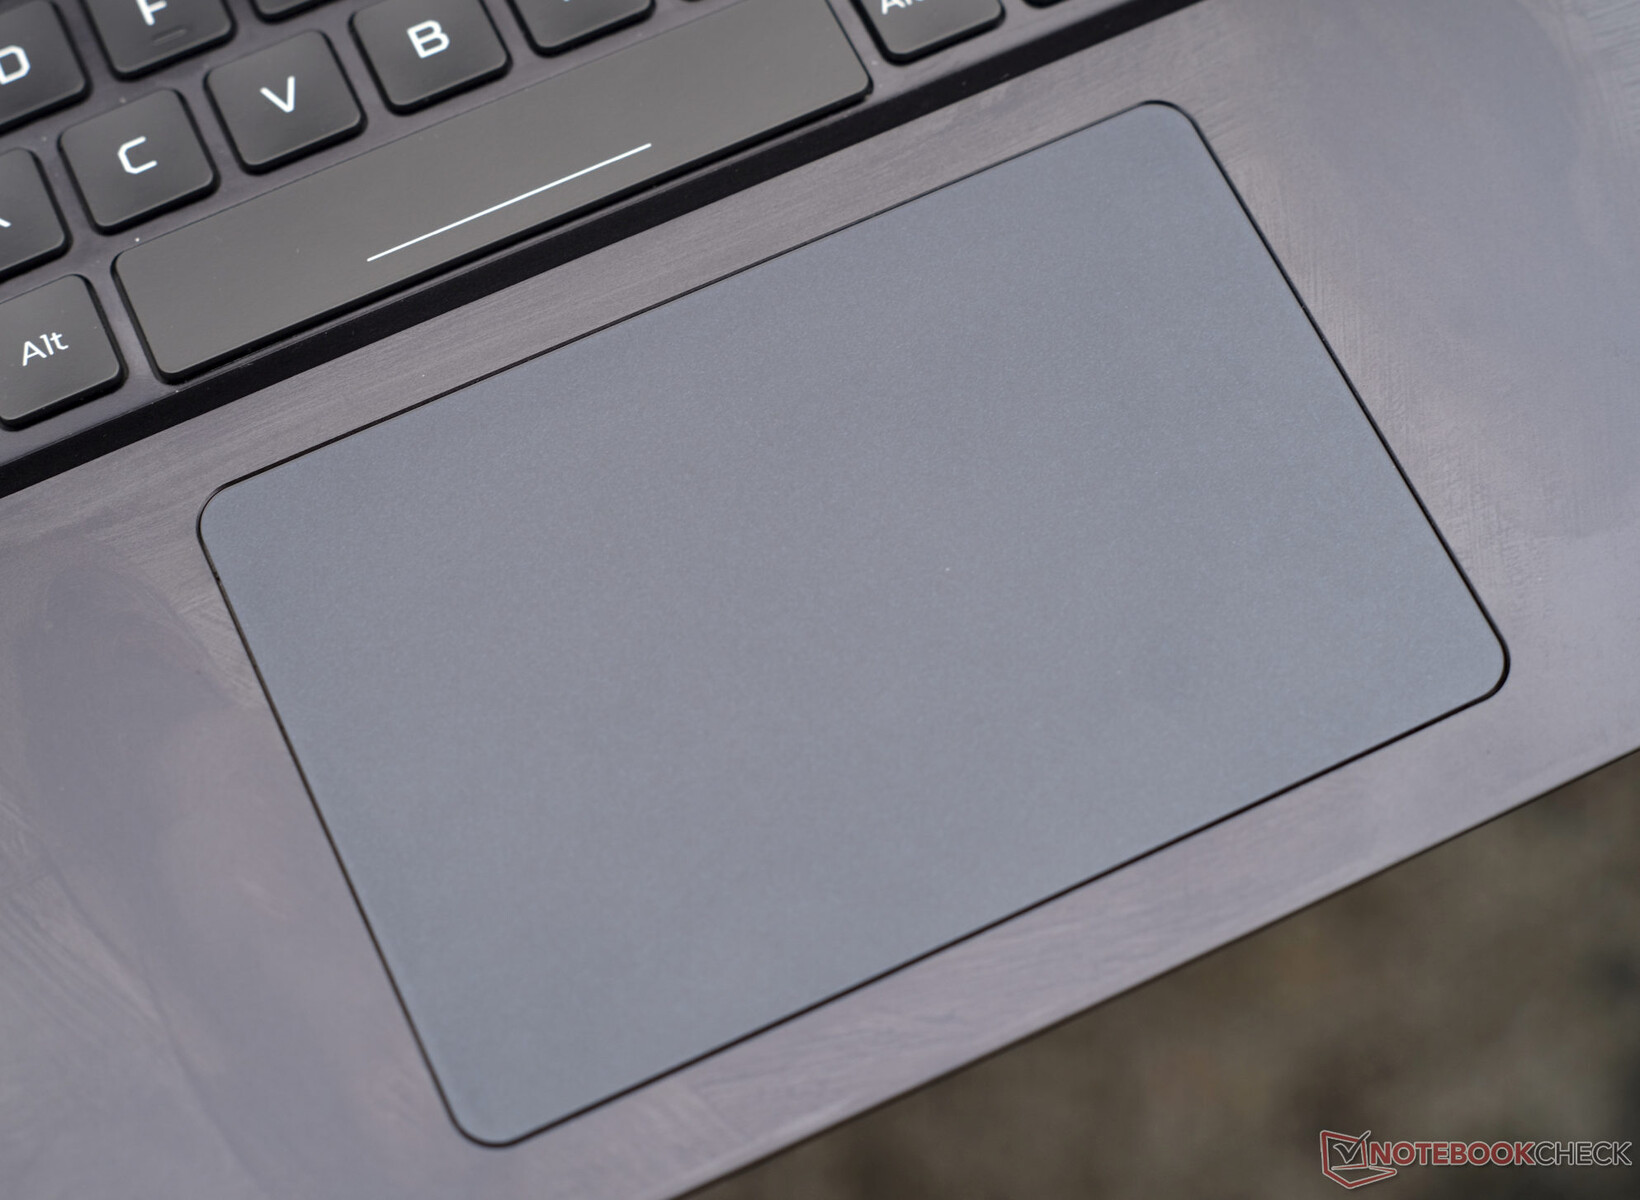
Touchpad
Dzięki powłoce Gorilla Glass palce przesuwają się po touchpadzie o wymiarach 12,6 x 8,3 mm z dużą precyzją. W związku z tym gesty wielodotykowe i przewijanie są wykonywane bez wysiłku. Zintegrowane przyciski mają średni skok i zadowalającą reakcję.
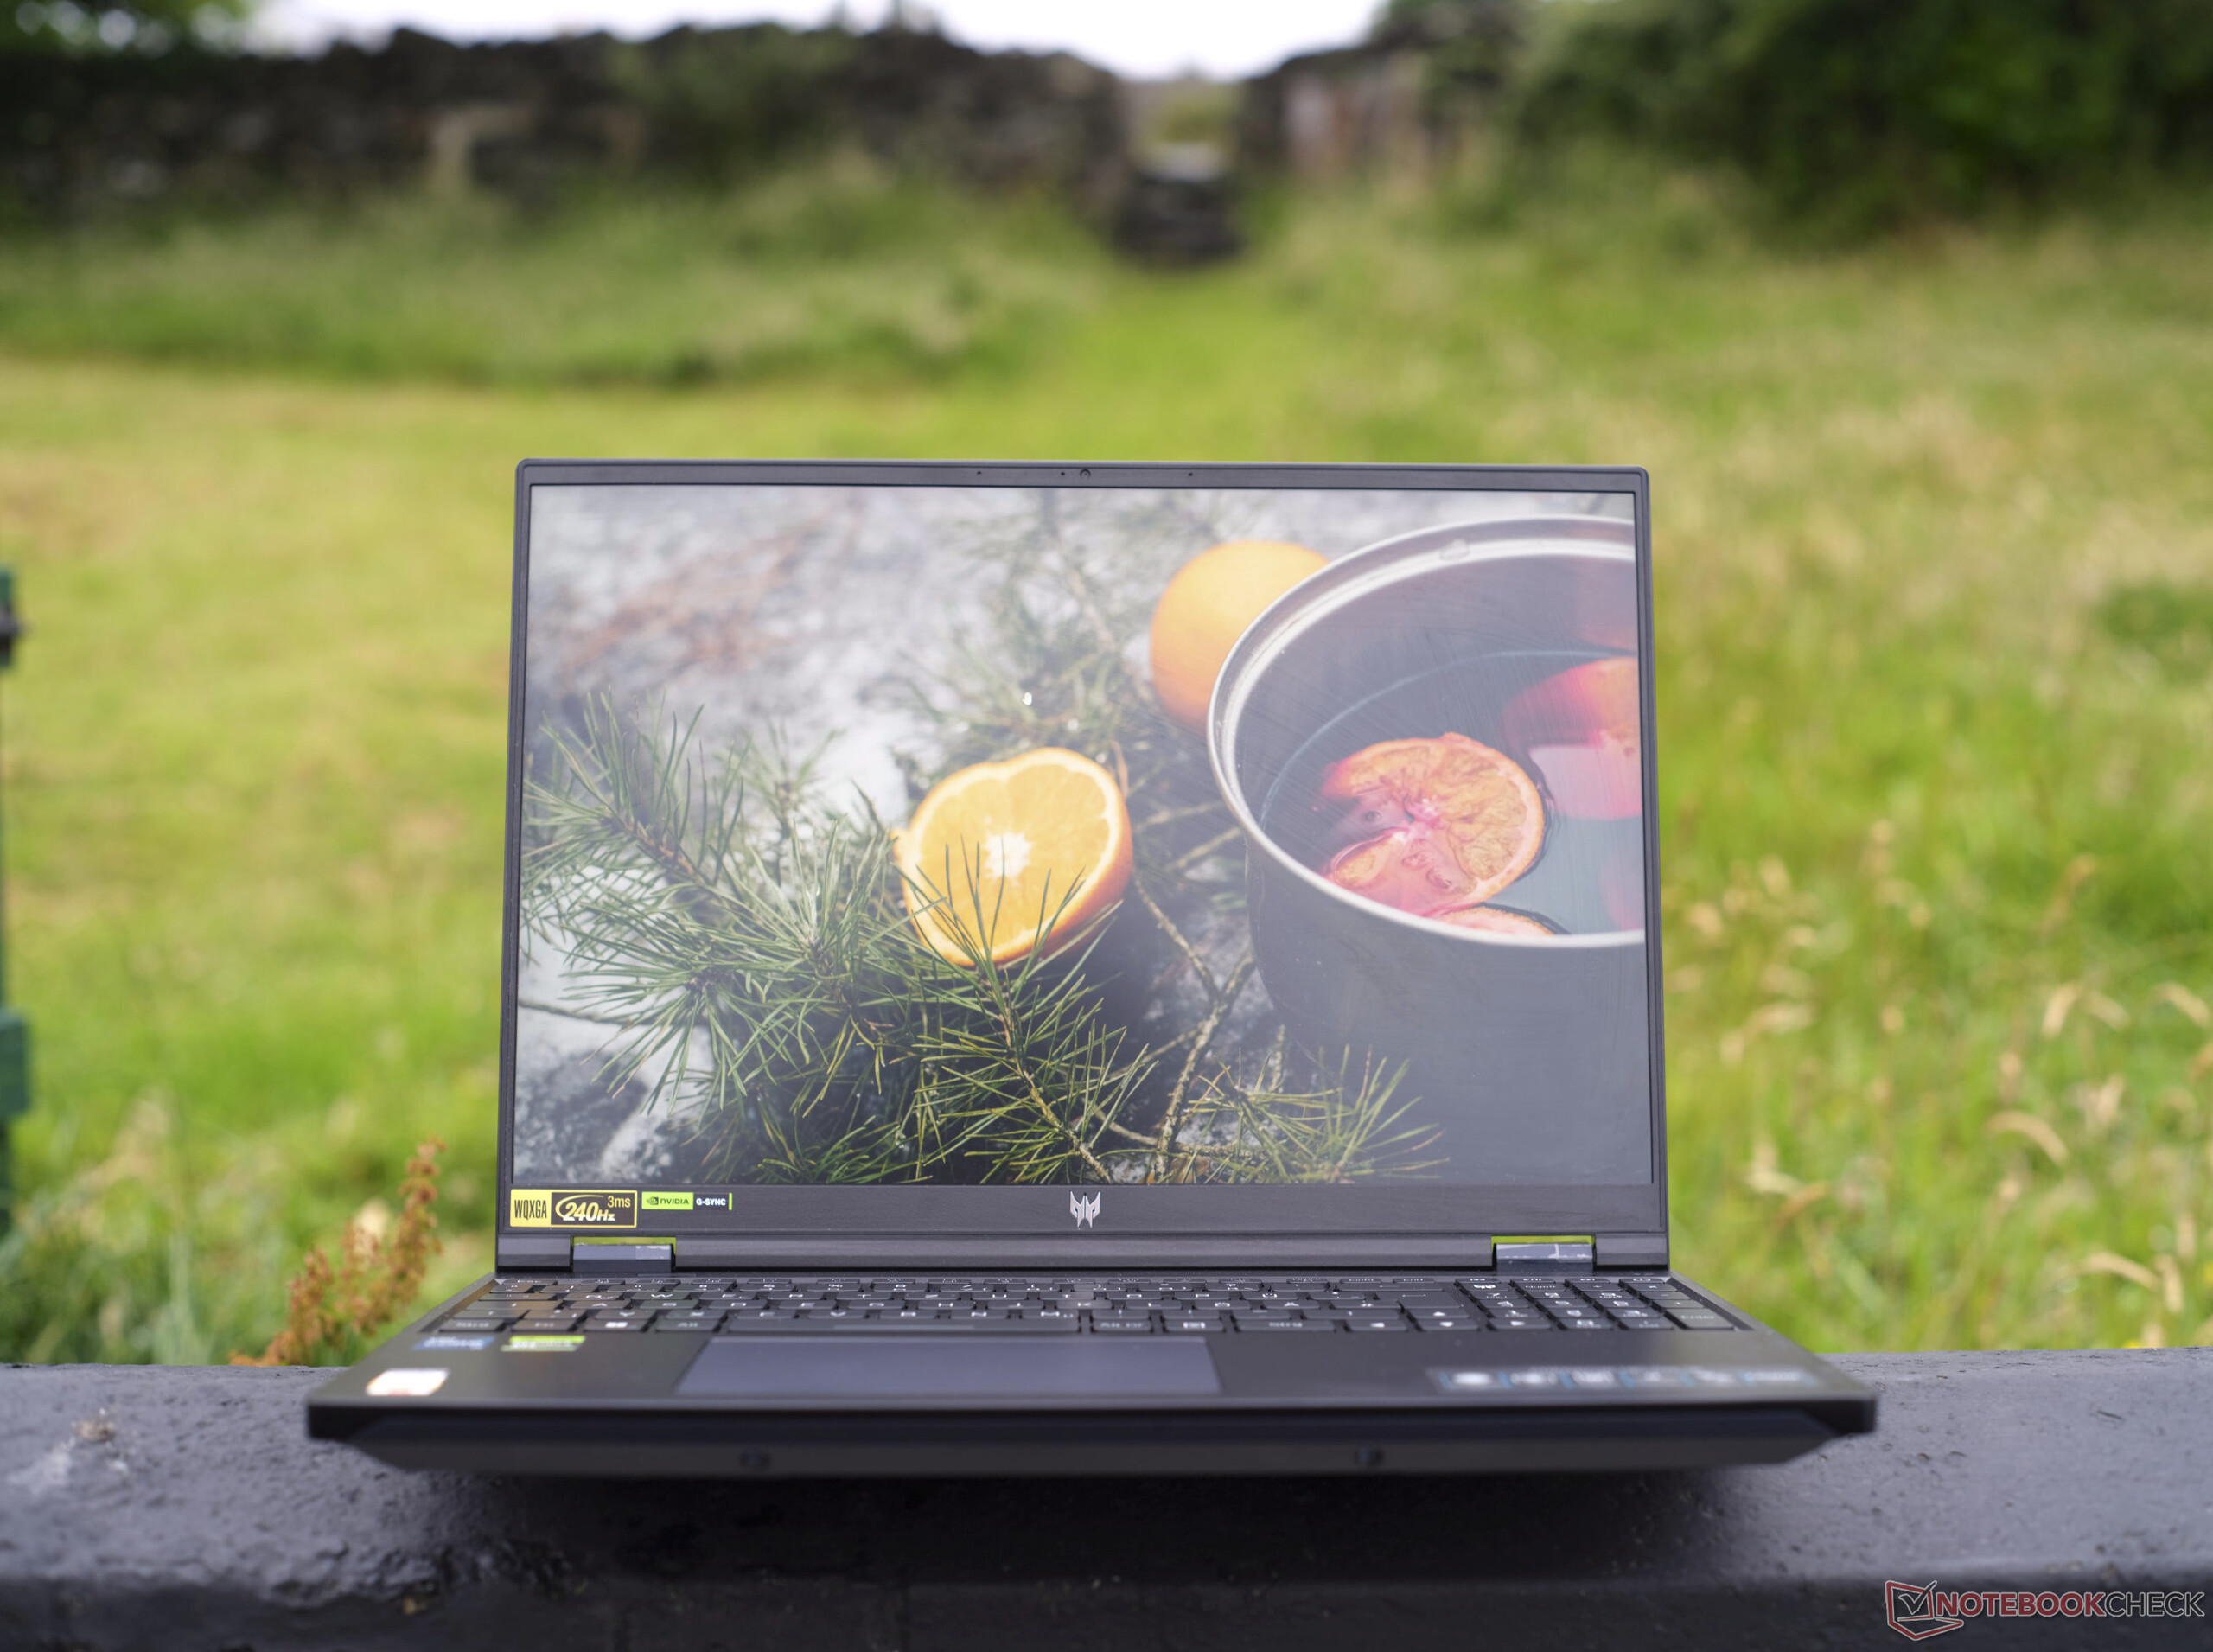
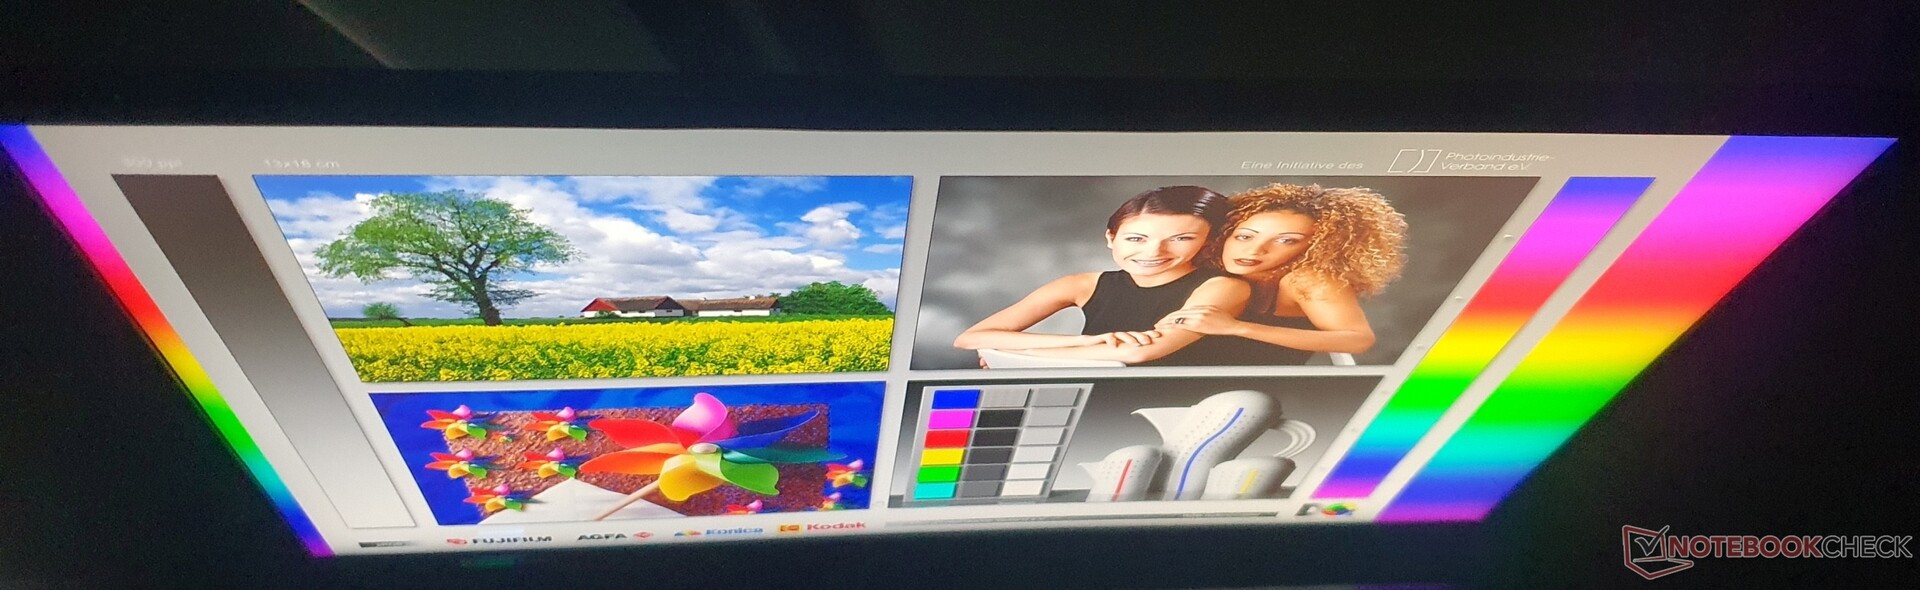
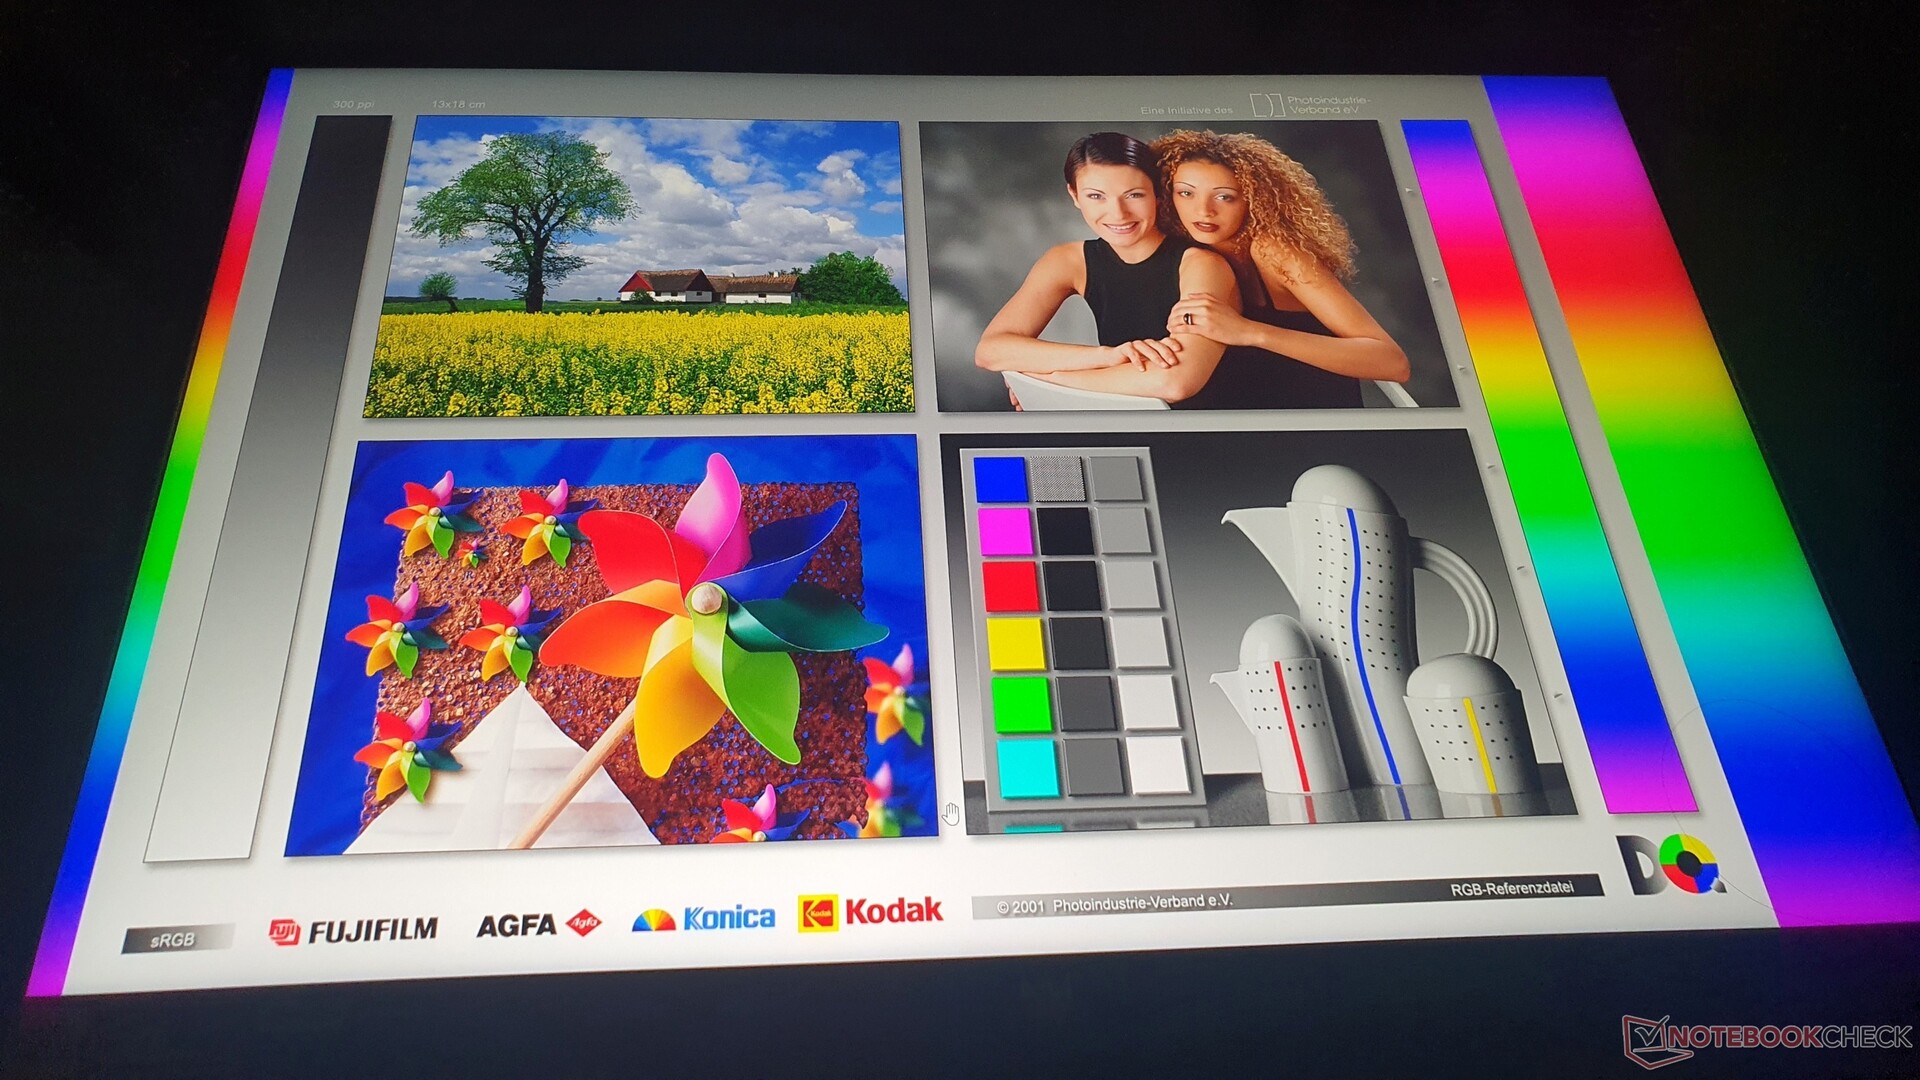
Wyświetlacz: Maszyna do gier z 97% DCI P3, 500 cd/m² i 240 Hz
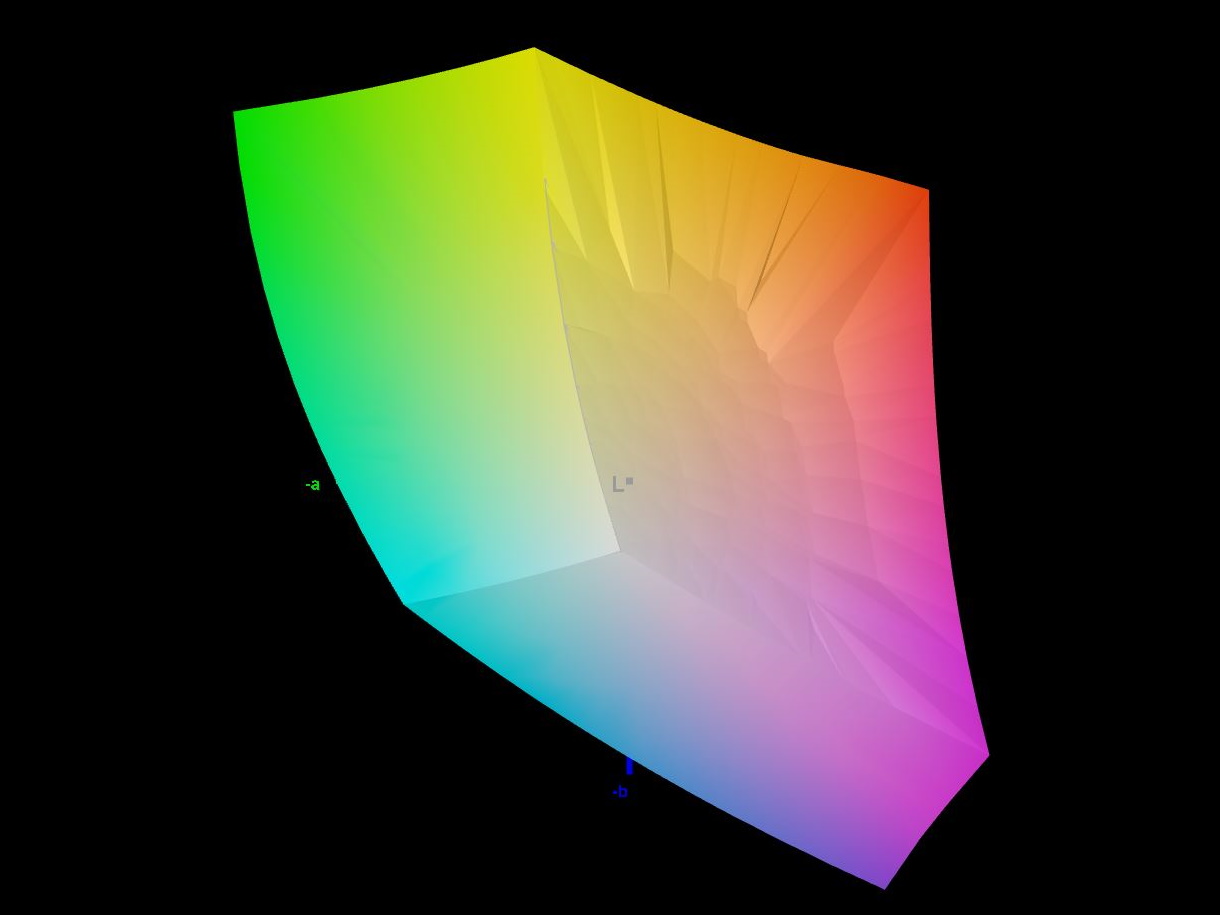
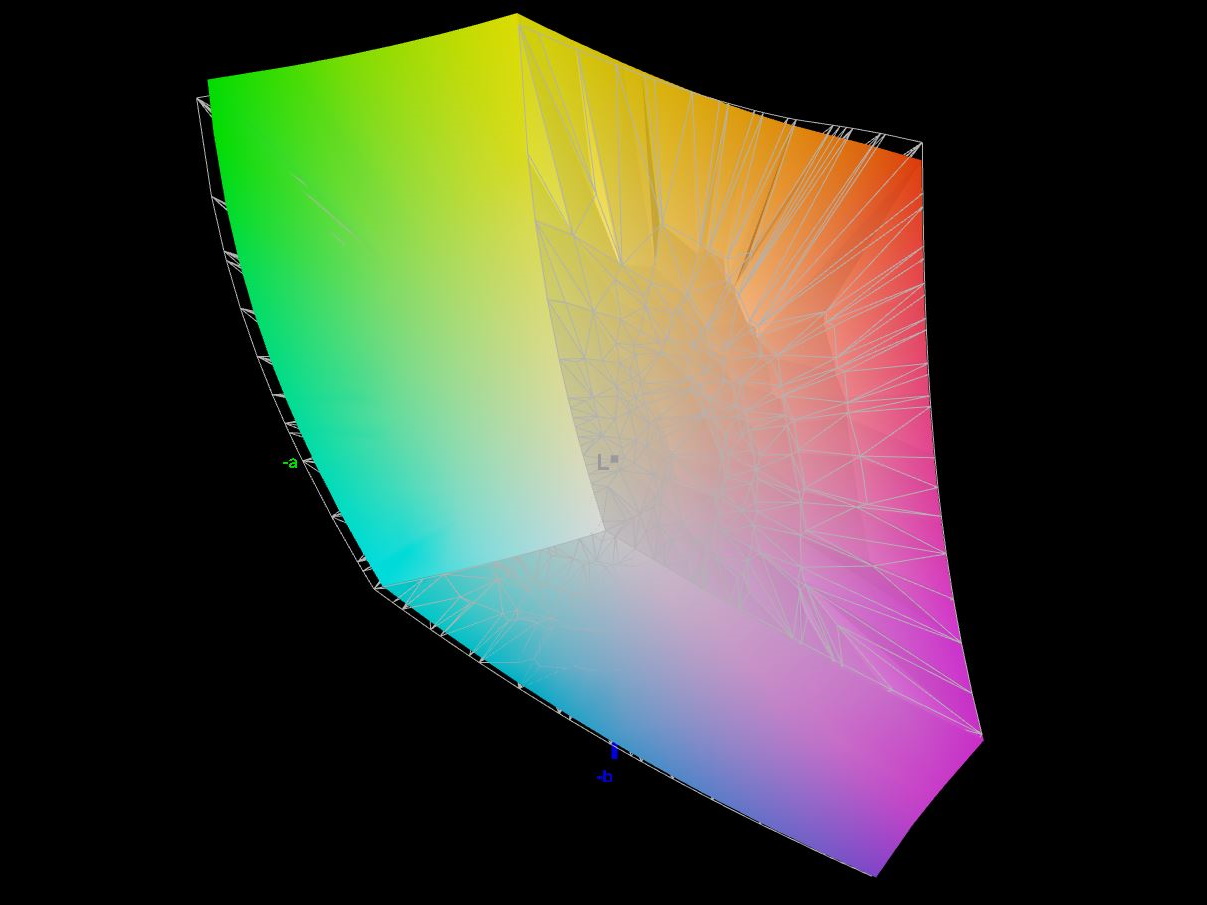
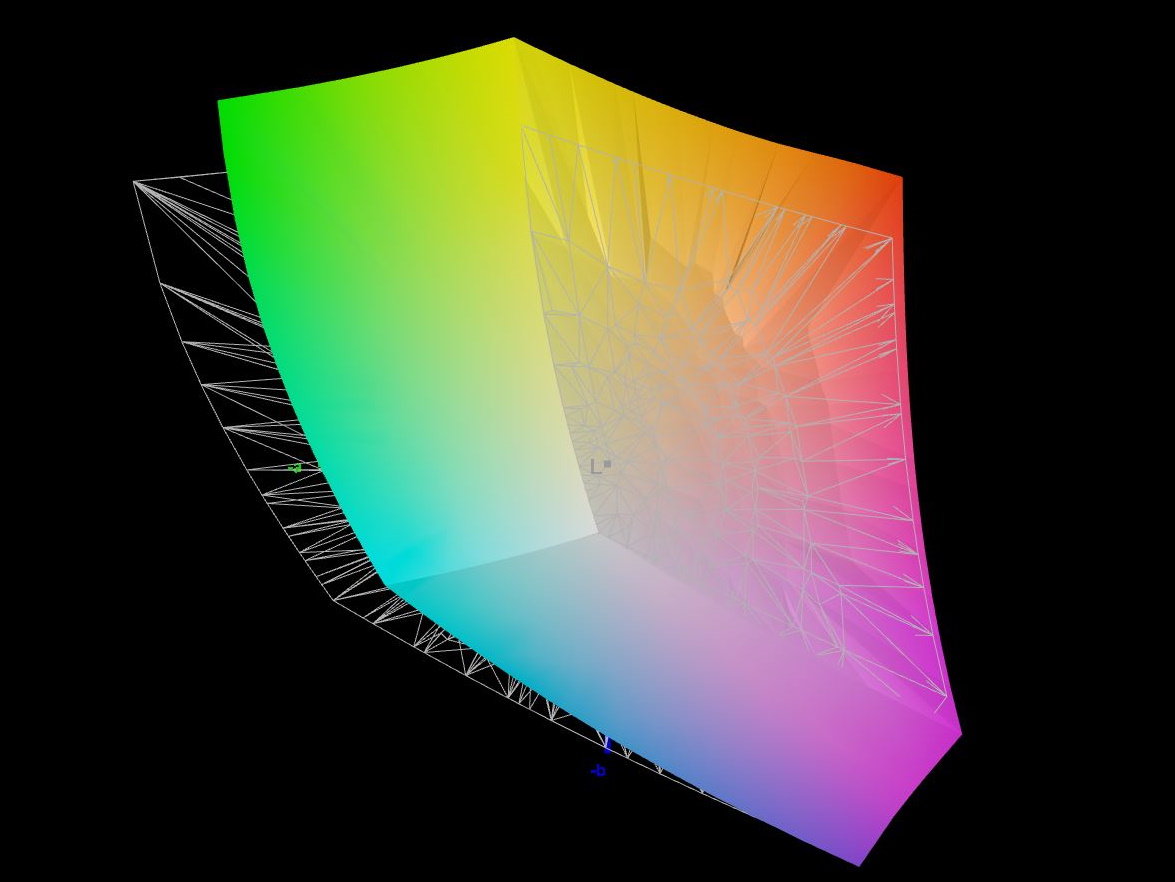
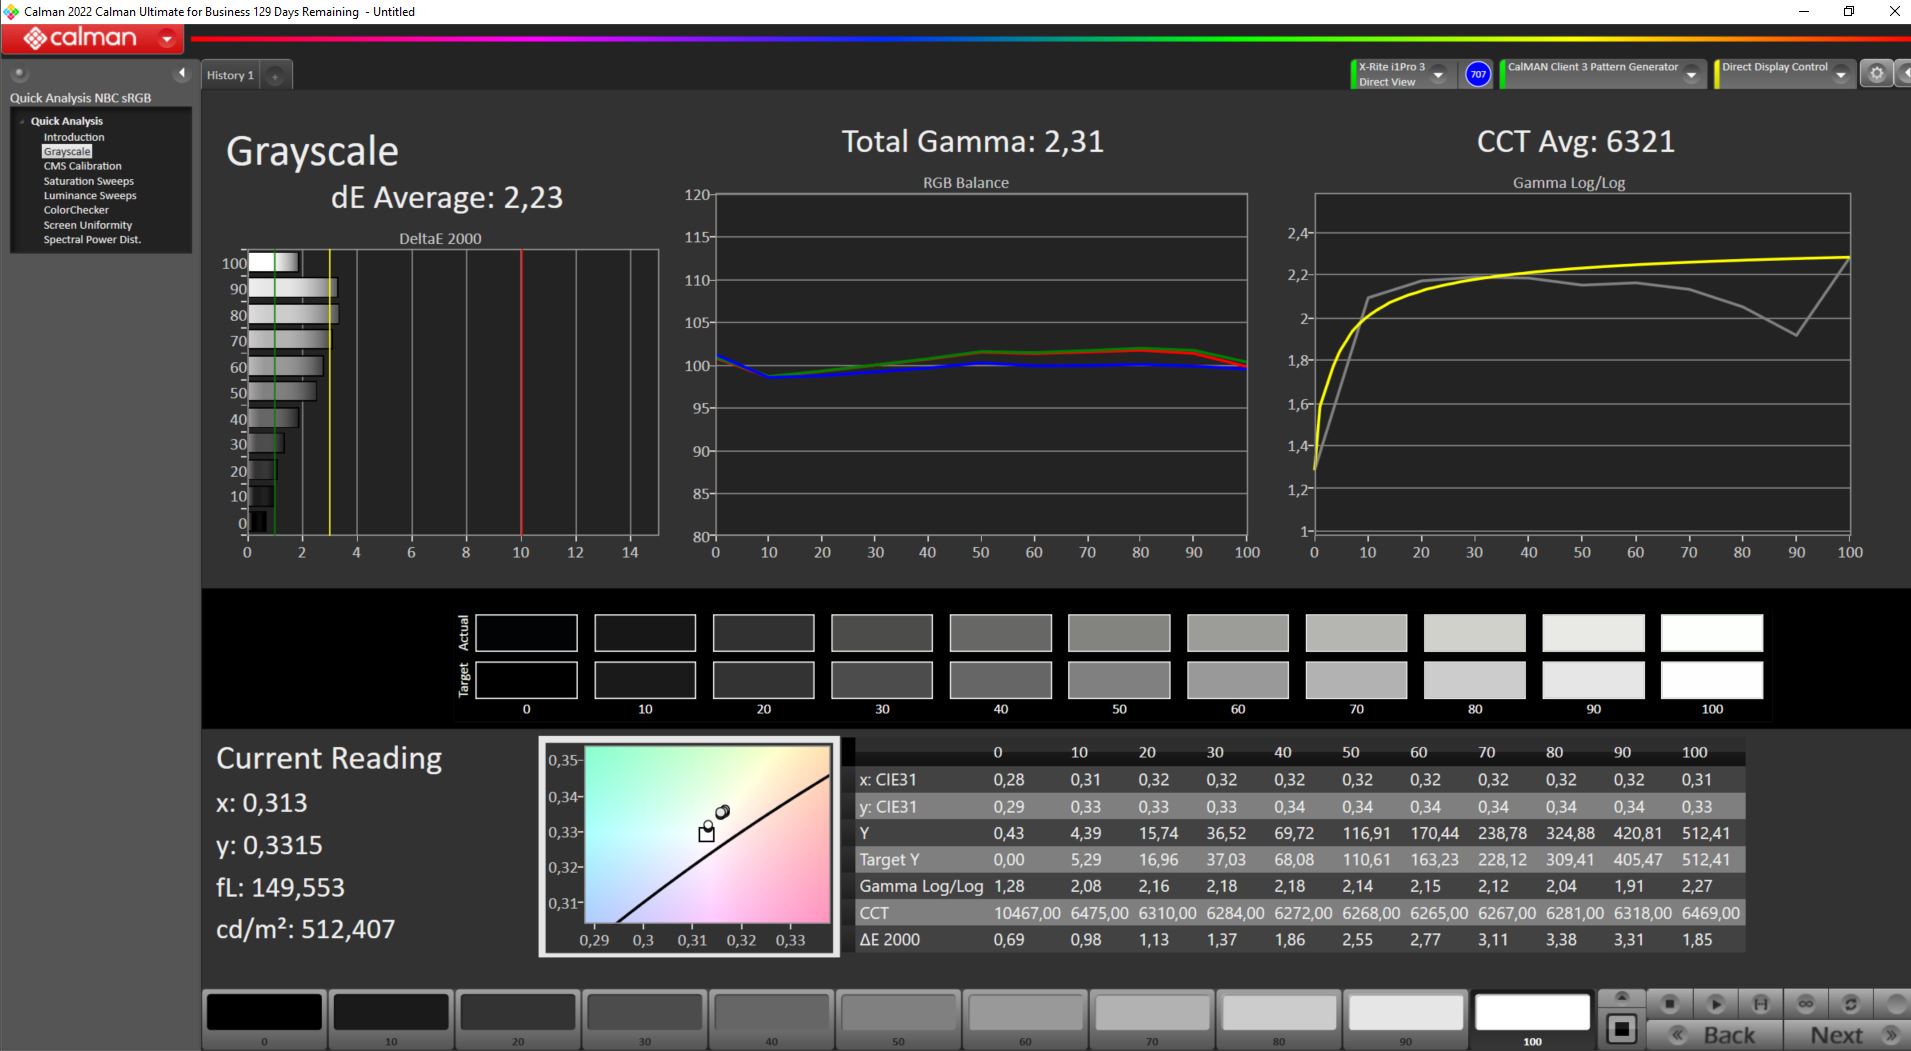
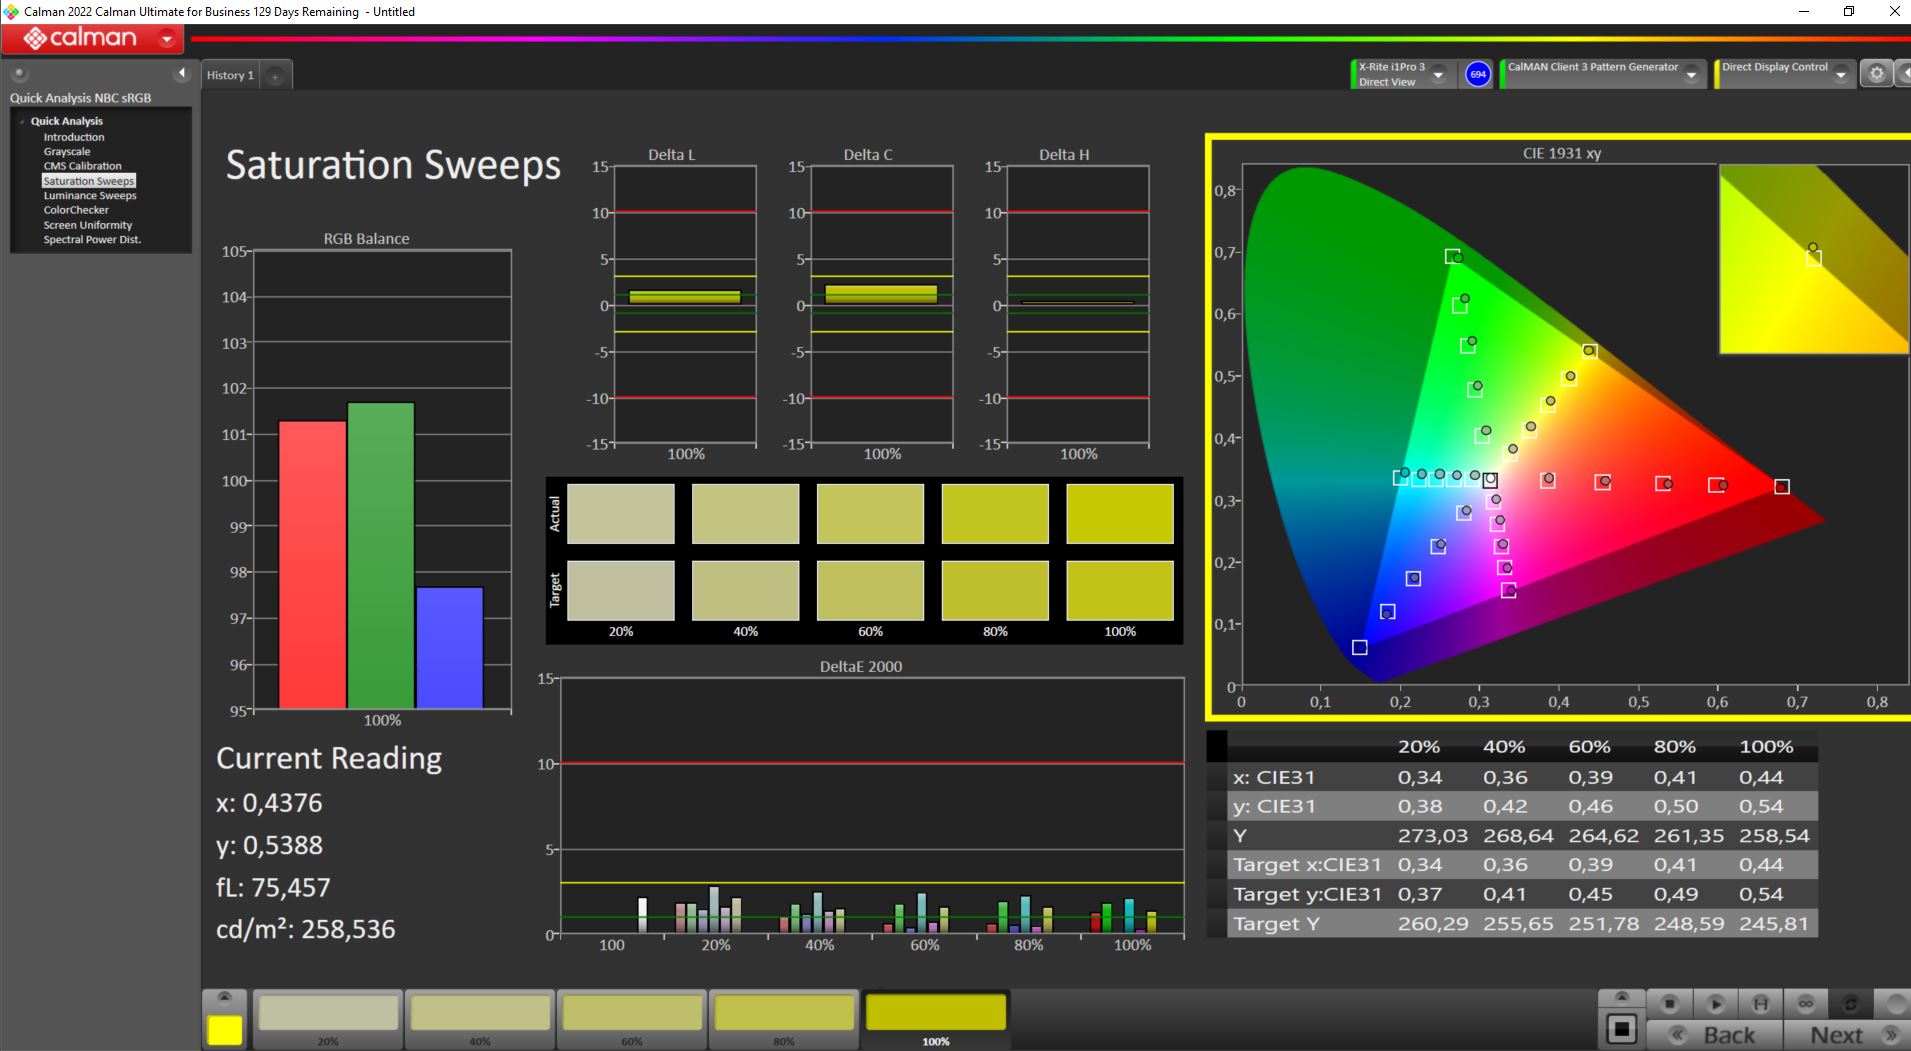
Recenzowane urządzenie o numerze modelu PH16-71-731Q nie posiada opcjonalnie dostępnego wyświetlacza mini-LED i jego 1024 stref przyciemniania. Niemniej jednak byliśmy zaskoczeni, że szybki, 240 Hz, matowy panel IPS o rozdzielczości 2560 x 1600 pikseli (16:10) z dumą pokrywa 97% przestrzeni kolorów DCI P3. Oznacza to, że obrazy, między innymi w grach, wydają się jeszcze bardziej żywe.
Wszystkie inne kluczowe dane również wyglądają dobrze: Jasność nieco poniżej 500 cd/m², wysoki kontrast 1:419:1 i równomierne podświetlenie na poziomie 94%. Ponadto nie zastosowano PWM, który może prowadzić do zmęczenia oczu lub bólu głowy, Acer Nitro 16 jest jedynym konkurentem w naszym zestawieniu konkurencyjnych urządzeń, który zarządza jasnością znacznie powyżej ~300 cd/m²
.Dobre czasy reakcji od szarości do szarości wynoszące 13,6 ms i od czerni do bieli wynoszące 6,4 ms są podobne do jego rówieśników, przy czym Dell G15 5530 ma nos z przodu z czasem od szarości do szarości wynoszącym tylko 3,4 ms. Ponadto obsługiwane są również Nvidia G-Sync i Dolby Vision.
| |||||||||||||||||||||||||
rozświetlenie: 94 %
na akumulatorze: 511 cd/m²
kontrast: 1419:1 (czerń: 0.36 cd/m²)
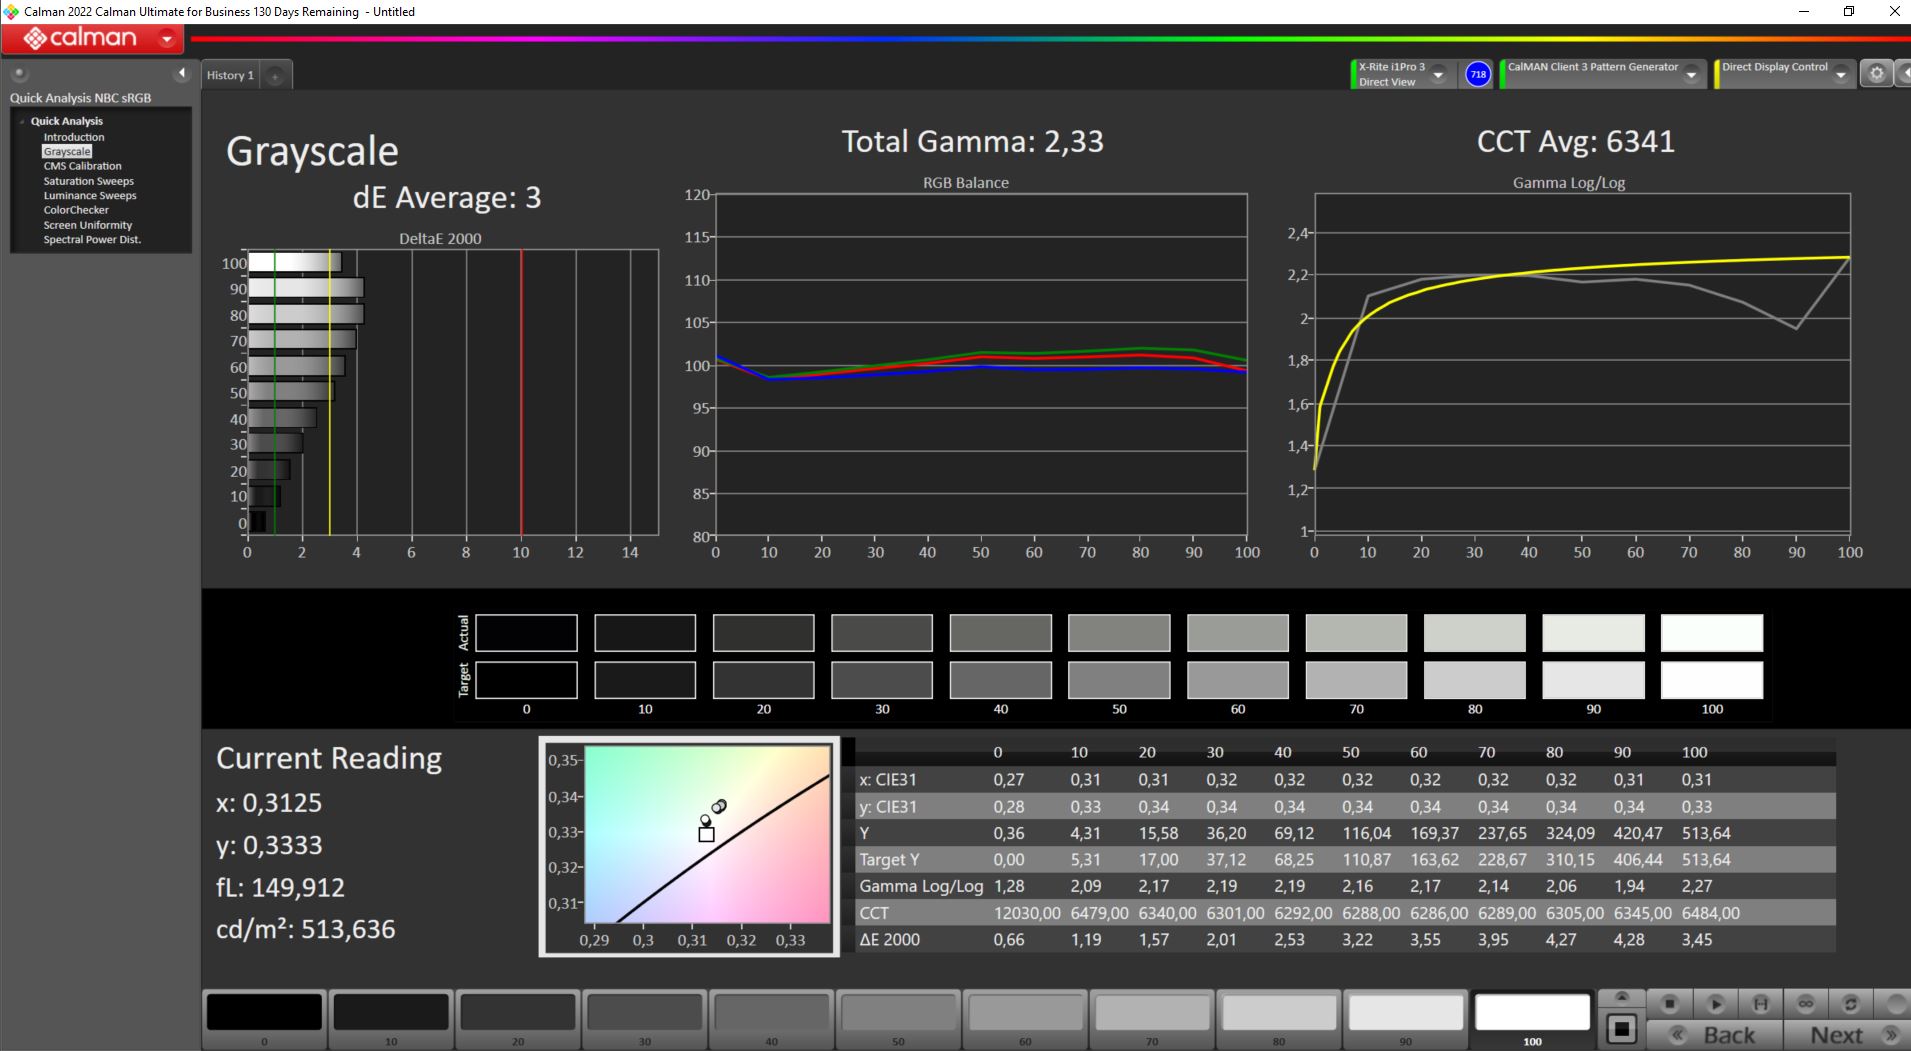
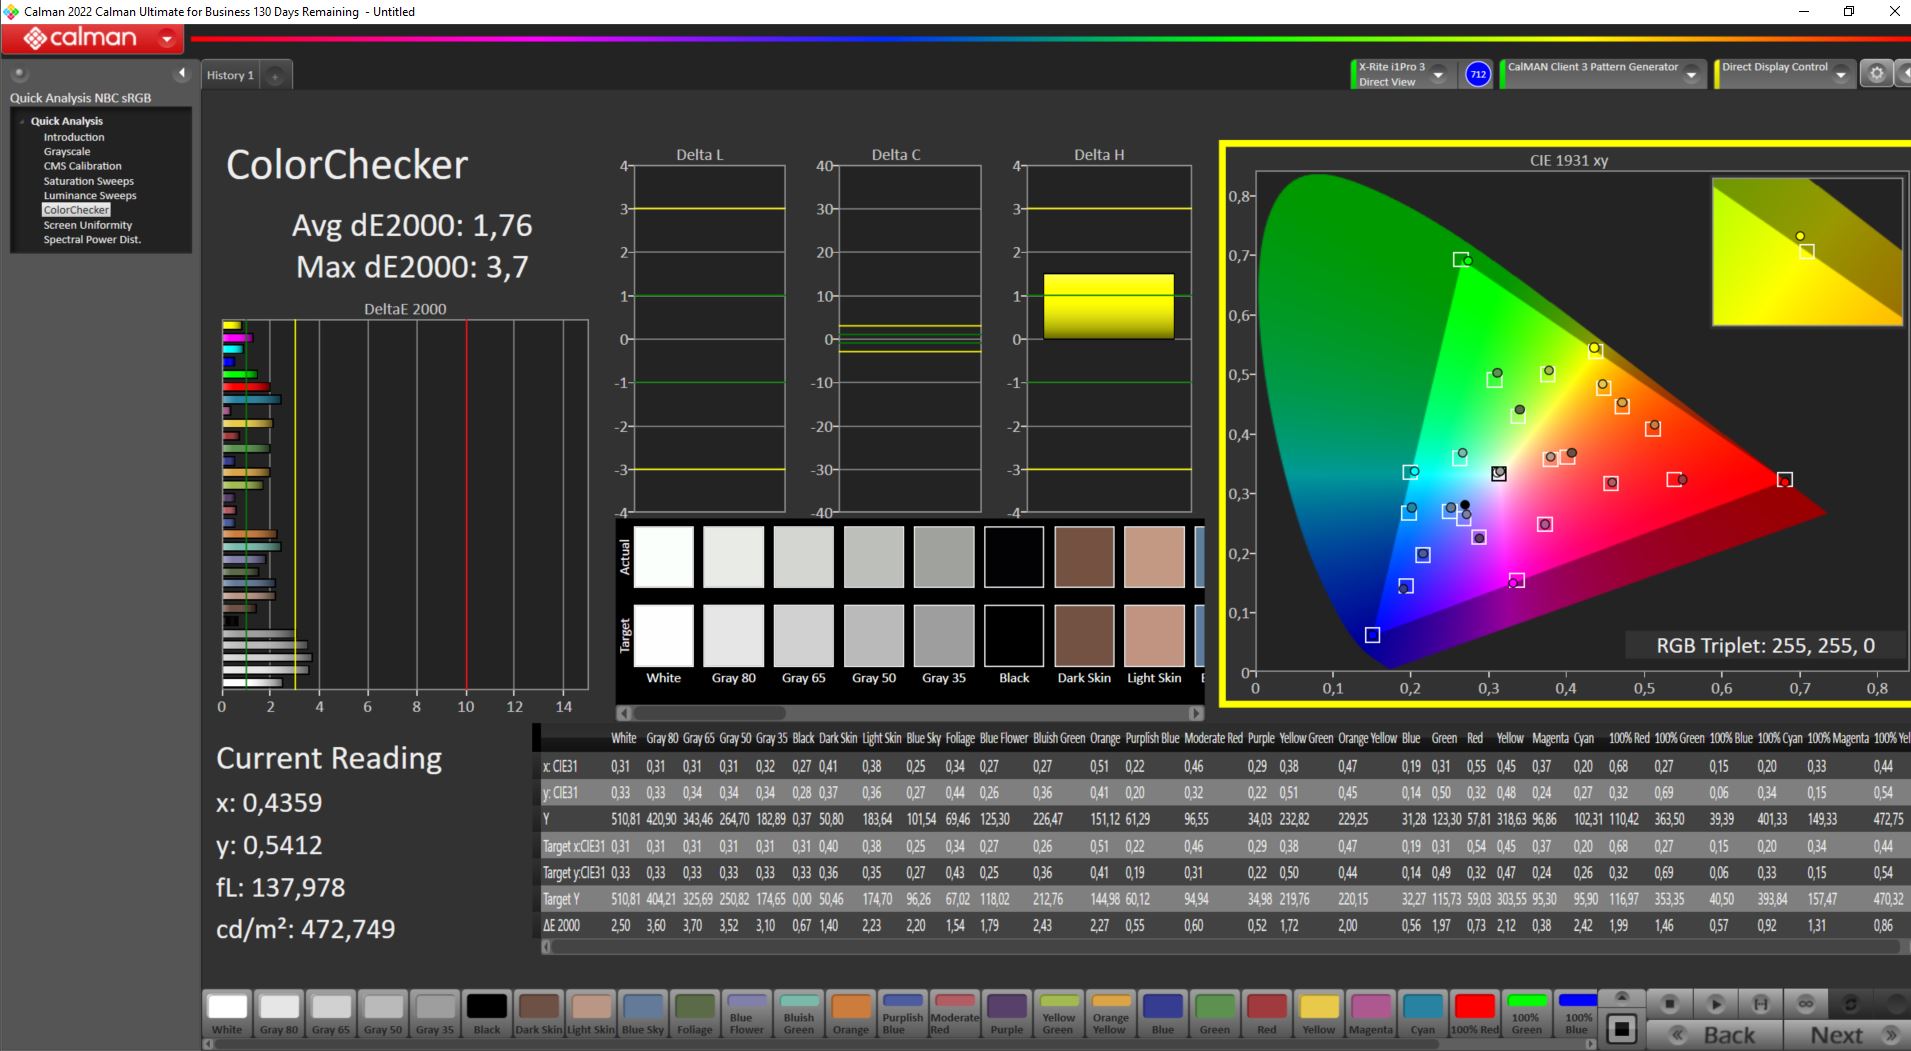
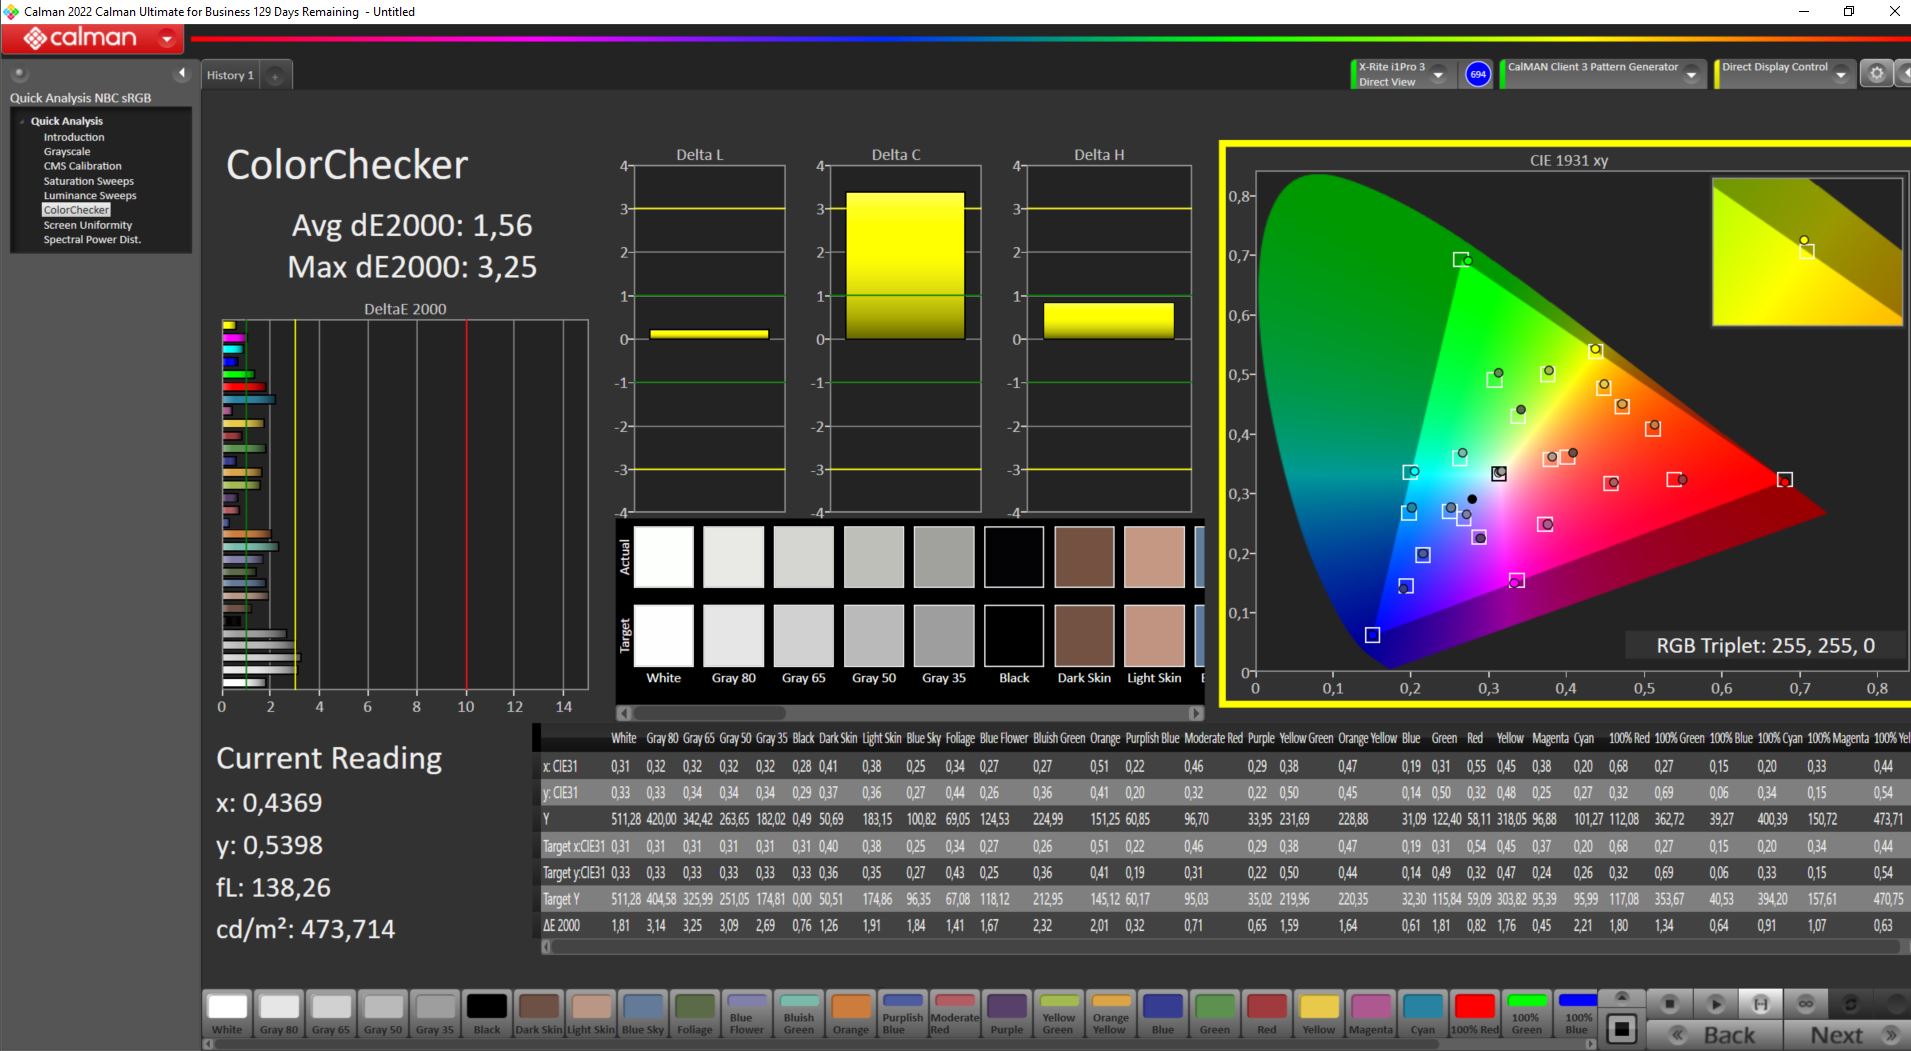
ΔE ColorChecker Calman: 1.76 | ∀{0.5-29.43 Ø4.73}
calibrated: 1.56
ΔE Greyscale Calman: 3 | ∀{0.09-98 Ø4.97}
84.7% AdobeRGB 1998 (Argyll 3D)
100% sRGB (Argyll 3D)
97.1% Display P3 (Argyll 3D)
Gamma: 2.33
CCT: 6341 K
| Acer Predator Helios 16 PH16-71-731Q BOE NE160QDM-NZ2, IPS-LED, 2560x1600, 16" | Acer Nitro 16 AN16-41 BOE CQ NE16QDM-NY1, IPS, 2560x1600, 16" | Lenovo Legion Pro 5 16IRX8 AU Optronics B160QAN03.1, IPS, 2560x1600, 16" | Aorus 15X ASF BOE CQ NE156QHM-NZ1, IPS, 2560x1440, 15.6" | Asus TUF Gaming A16 FA617 NE160WUM-NX2 (BOE0B33), IPS-Level, 1920x1200, 16" | Dell G15 5530 AUO B156HAN, IPS, 1920x1080, 15.6" | |
|---|---|---|---|---|---|---|
| Display | -16% | -14% | -16% | -16% | -13% | |
| Display P3 Coverage (%) | 97.1 | 67.9 -30% | 71.2 -27% | 69.3 -29% | 69.4 -29% | 73.1 -25% |
| sRGB Coverage (%) | 100 | 99.1 -1% | 98.8 -1% | 98.2 -2% | 97.8 -2% | 98.4 -2% |
| AdobeRGB 1998 Coverage (%) | 84.7 | 69.9 -17% | 73.3 -13% | 70.5 -17% | 70.9 -16% | 74.4 -12% |
| Response Times | 21% | -35% | -19% | -42% | 46% | |
| Response Time Grey 50% / Grey 80% * (ms) | 13.6 ? | 11 ? 19% | 14.5 ? -7% | 12.4 ? 9% | 17 ? -25% | 3.39 ? 75% |
| Response Time Black / White * (ms) | 6.4 ? | 5 ? 22% | 10.4 ? -63% | 9.4 ? -47% | 10.1 ? -58% | 5.35 ? 16% |
| PWM Frequency (Hz) | 21620 ? | |||||
| Screen | -3% | 4% | 5% | 5% | -50% | |
| Brightness middle (cd/m²) | 511 | 520 2% | 405.7 -21% | 316 -38% | 308 -40% | 320 -37% |
| Brightness (cd/m²) | 498 | 494 -1% | 368 -26% | 301 -40% | 293 -41% | 316 -37% |
| Brightness Distribution (%) | 94 | 91 -3% | 87 -7% | 90 -4% | 90 -4% | 94 0% |
| Black Level * (cd/m²) | 0.36 | 0.39 -8% | 0.38 -6% | 0.28 22% | 0.23 36% | 0.21 42% |
| Contrast (:1) | 1419 | 1333 -6% | 1068 -25% | 1129 -20% | 1339 -6% | 1524 7% |
| Colorchecker dE 2000 * | 1.76 | 1.94 -10% | 1.65 6% | 1.54 12% | 1.47 16% | 4.55 -159% |
| Colorchecker dE 2000 max. * | 3.7 | 5.62 -52% | 4.2 -14% | 2.46 34% | 2.98 19% | 9.83 -166% |
| Colorchecker dE 2000 calibrated * | 1.56 | 0.74 53% | 0.53 66% | 1.21 22% | 1.02 35% | 1.51 3% |
| Greyscale dE 2000 * | 3 | 2.94 2% | 1.2 60% | 1.3 57% | 2.2 27% | 6.2 -107% |
| Gamma | 2.33 94% | 2.37 93% | 2.3 96% | 2.307 95% | 2.228 99% | 2.07 106% |
| CCT | 6341 103% | 6443 101% | 6453 101% | 6456 101% | 6228 104% | 6479 100% |
| Całkowita średnia (program / ustawienia) | 1% /
-2% | -15% /
-6% | -10% /
-3% | -18% /
-6% | -6% /
-29% |
* ... im mniej tym lepiej
Ponieważ 100% sRGB, 97,1% DCI P3 i 84,7% AdobeRGB są pokryte, nic nie stoi na przeszkodzie, aby edytować zdjęcia i filmy, które polegają na dokładnych kolorach. Żaden laptop do gier w naszym polu porównawczym nie może nawet zbliżyć się do tych liczb, z wyjątkiem przestrzeni kolorów sRGB.
Kolory i skala szarości są już skalibrowane i dlatego nie przekraczają limitu DeltaE 3, do którego ludzkie oko może wykryć odchylenia kolorów. Nasza kalibracja pozwoliła na dalszą poprawę tych wartości, bez widocznego odbicia kolorów. Nasz skalibrowany profil kolorów można pobrać ze strony tutaj.

Wyświetl czasy reakcji
| ↔ Czas reakcji od czerni do bieli | ||
|---|---|---|
| 6.4 ms ... wzrost ↗ i spadek ↘ łącznie | ↗ 2.2 ms wzrost | 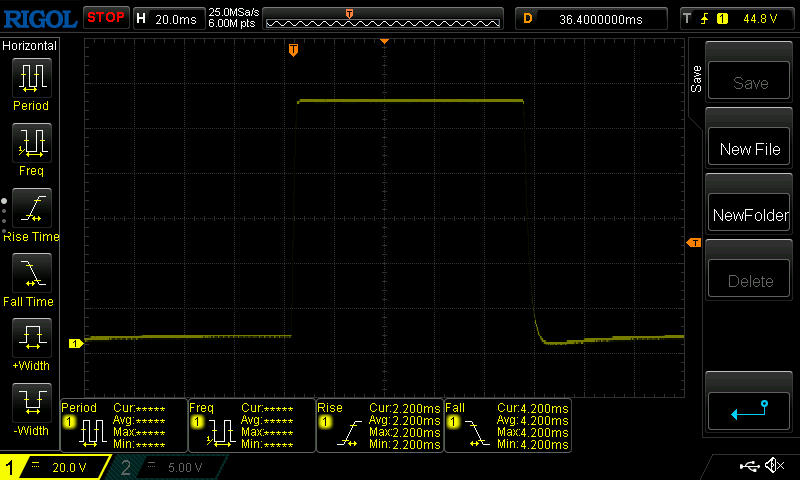 |
| ↘ 4.2 ms upadek | ||
| W naszych testach ekran wykazuje bardzo szybką reakcję i powinien bardzo dobrze nadawać się do szybkich gier. Dla porównania, wszystkie testowane urządzenia wahają się od 0.1 (minimum) do 240 (maksimum) ms. » 20 % wszystkich urządzeń jest lepszych. Oznacza to, że zmierzony czas reakcji jest lepszy od średniej wszystkich testowanych urządzeń (19.9 ms). | ||
| ↔ Czas reakcji 50% szarości do 80% szarości | ||
| 13.6 ms ... wzrost ↗ i spadek ↘ łącznie | ↗ 6.2 ms wzrost | 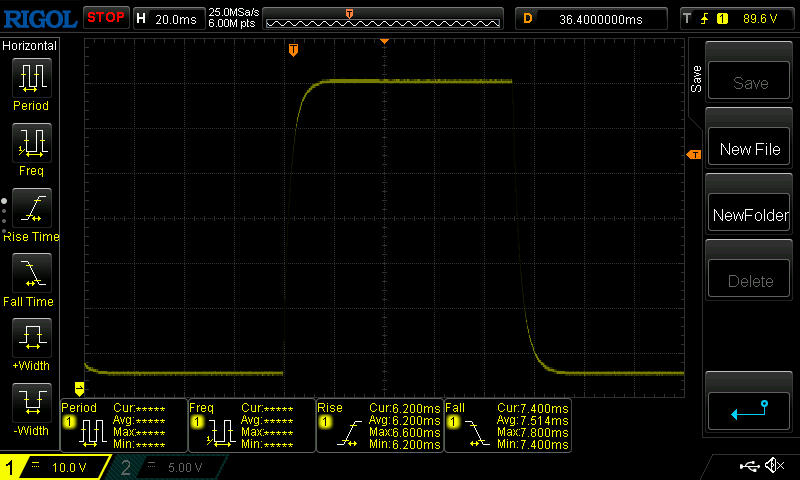 |
| ↘ 7.4 ms upadek | ||
| W naszych testach ekran wykazuje dobry współczynnik reakcji, ale może być zbyt wolny dla graczy rywalizujących ze sobą. Dla porównania, wszystkie testowane urządzenia wahają się od 0.165 (minimum) do 636 (maksimum) ms. » 27 % wszystkich urządzeń jest lepszych. Oznacza to, że zmierzony czas reakcji jest lepszy od średniej wszystkich testowanych urządzeń (31.1 ms). | ||
Migotanie ekranu / PWM (modulacja szerokości impulsu)
| Migotanie ekranu/nie wykryto PWM |  | ||
Dla porównania: 52 % wszystkich testowanych urządzeń nie używa PWM do przyciemniania wyświetlacza. Jeśli wykryto PWM, zmierzono średnio 7784 (minimum: 5 - maksimum: 343500) Hz. | |||
Na zewnątrz ekran jest czytelny zarówno w cieniu, jak i w miejscach półcienistych. W bezpośrednim świetle słonecznym nawet matowy wyświetlacz i 500 cd/m² nie zawsze pomagają.


Typowe dla paneli IPS kąty widzenia są stabilne, z góry, z dołu, a także z boku.

Wydajność: RTX 4060 osiąga maksymalną prędkość taktowania już przy mocy 100 W
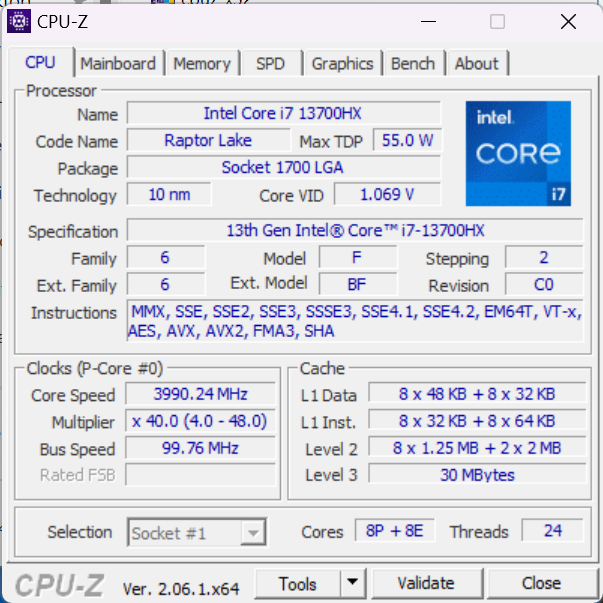
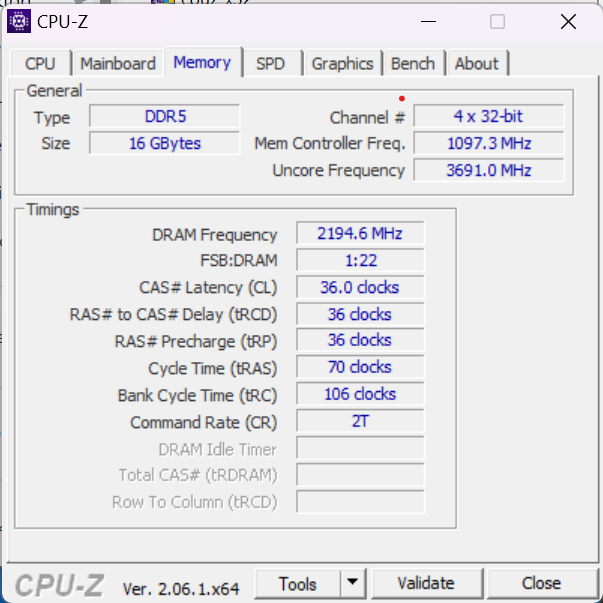
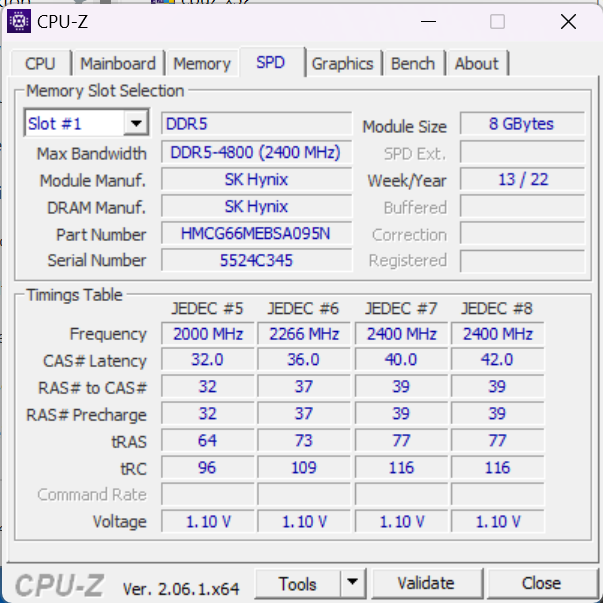
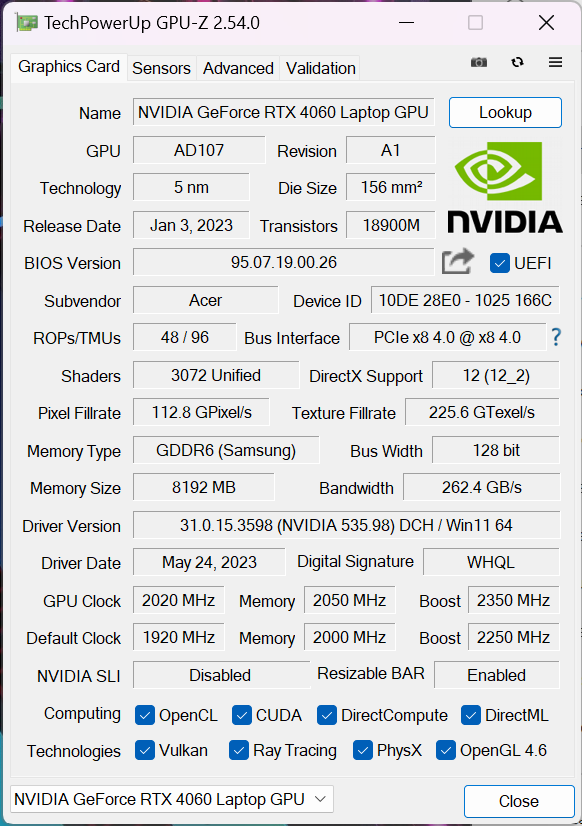
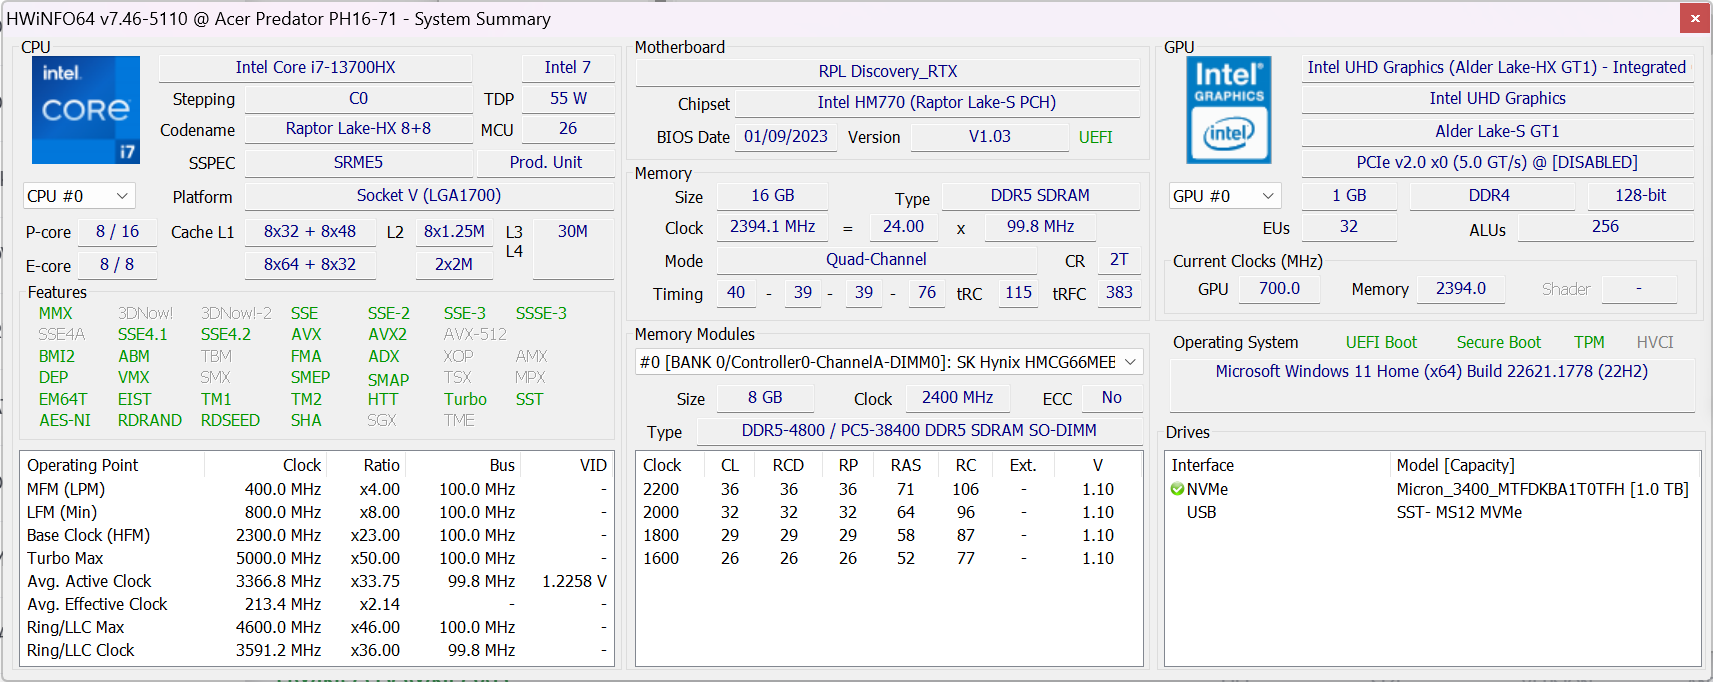
Nasza recenzowana konfiguracja Acer Predator Helios 16 posiada procesor Intel Core i7-13700HX(8 rdzeni P + 8 rdzeni E), 16 GB pamięci RAM DDR5 4800, dysk SSD o pojemności 1 TB (PCIe 4.0) oraz kartę graficzną Nvidia GeForce RTX 4060z Max TGP (140 W). Inne jednostki SKU są dostępne z Core i9-13900HX(8 rdzeni P + 16 rdzeni E), kartą graficznąRTX 4070 lub RTX 4080.
Rynkiem docelowym recenzowanego modelu są gracze, którzy nie muszą grać w aktualne gry ani przy najwyższej liczbie klatek na sekundę, ani w natywnej rozdzielczości QHD urządzenia. Inne zastosowania graficzne, takie jak edycja wideo 4K lub renderowanie 3D, są łatwo osiągalne dzięki temu modelowi.
Warunki testowe
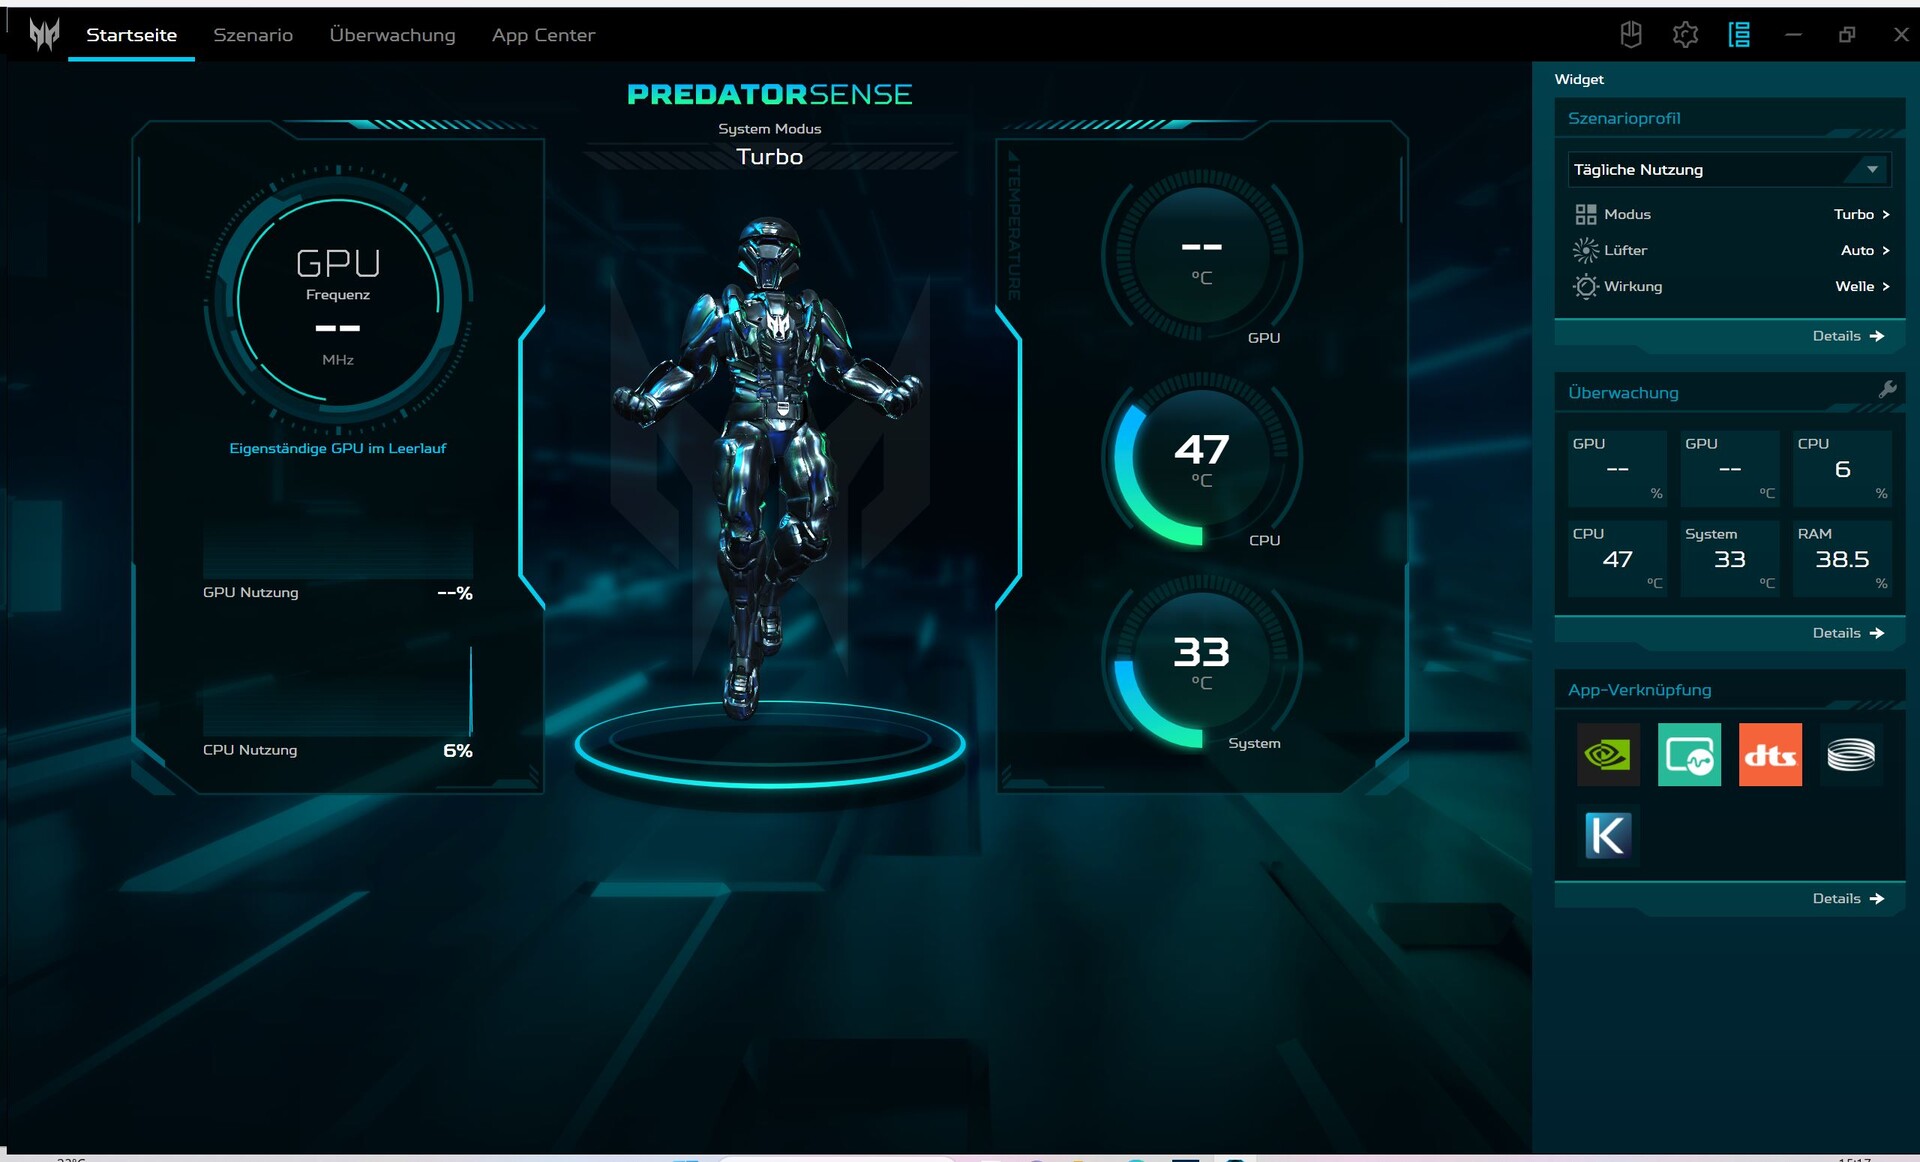
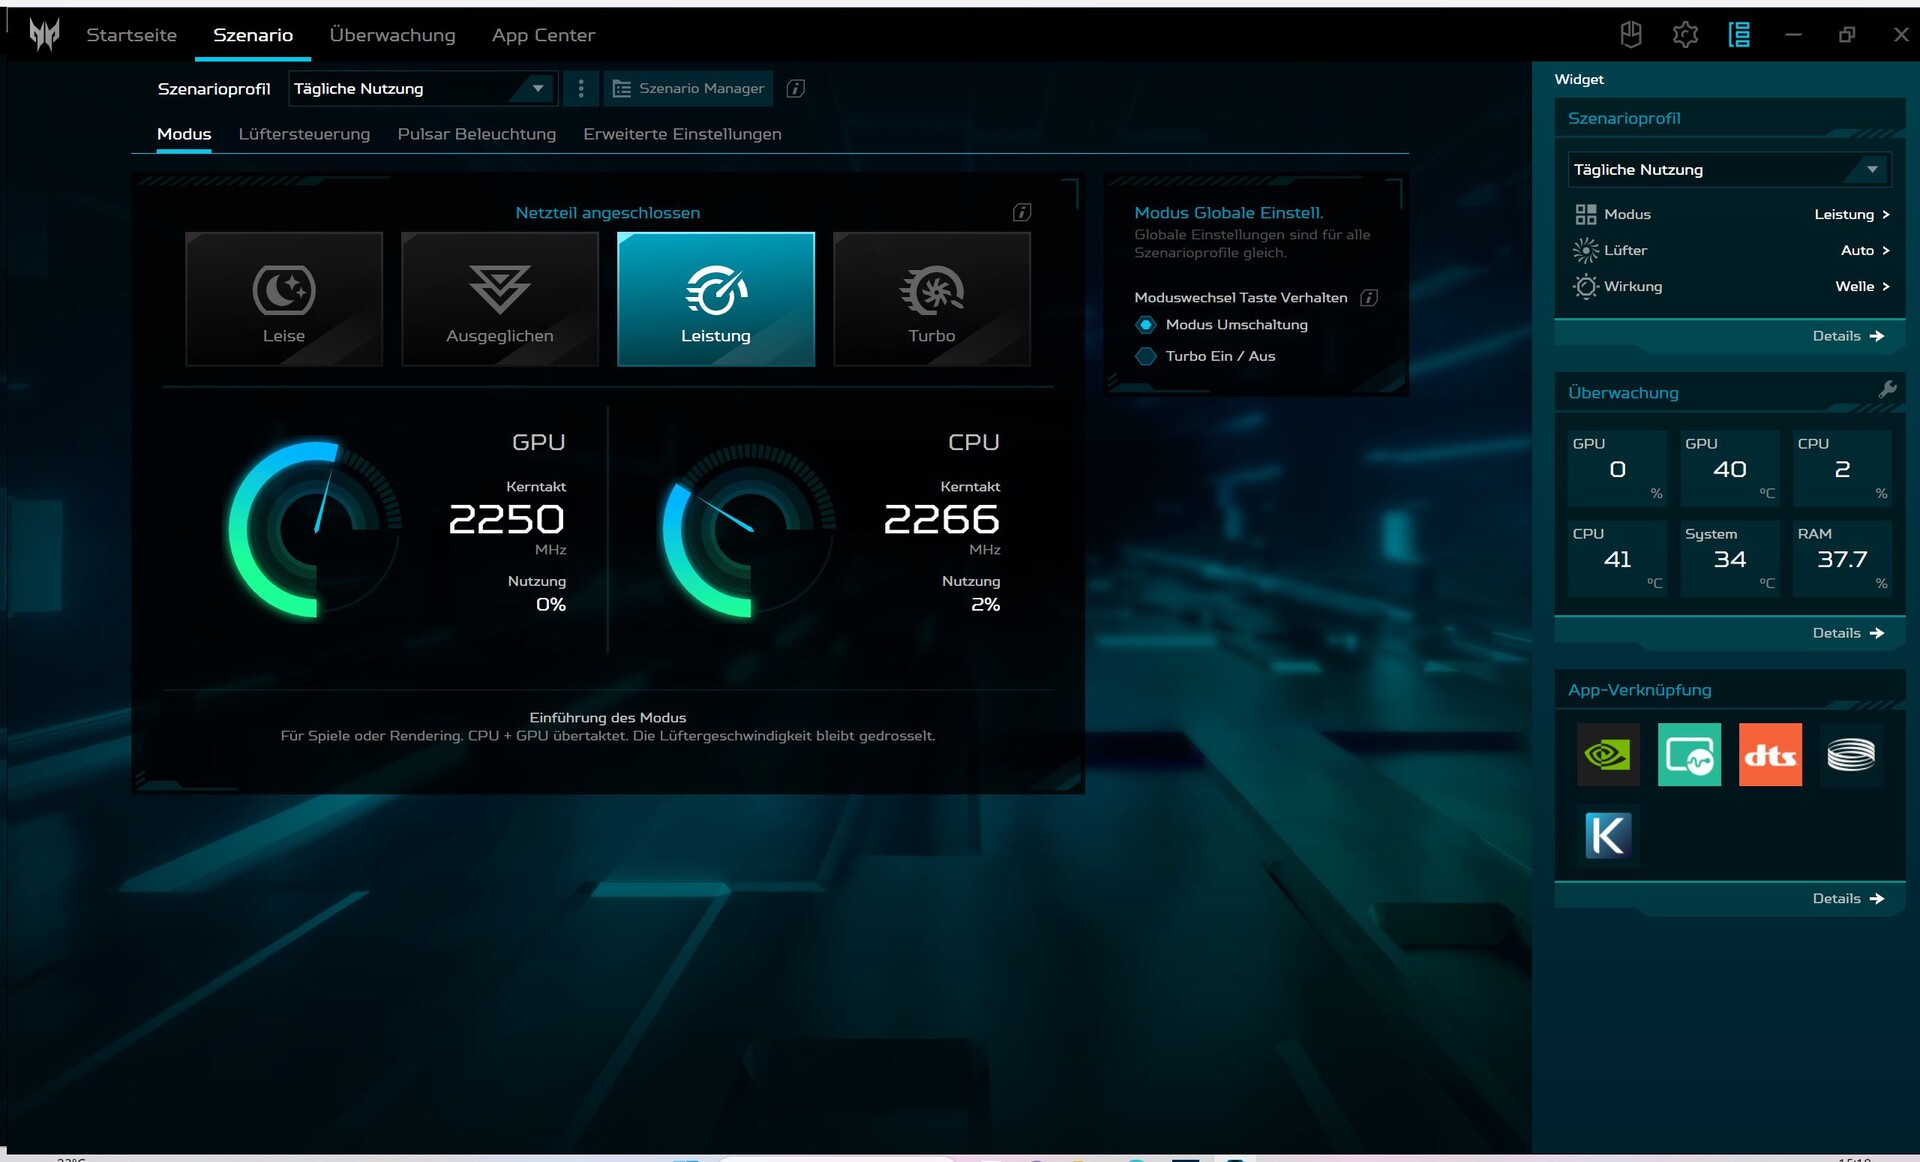
W oprogramowaniu Acer Control Center "PredatorSense" dostępne są cztery tryby wydajności, które można alternatywnie wybrać za pomocą przycisku po lewej stronie nad klawiaturą. Nasze testy wydajnościowe przeprowadziliśmy w trybie "Wydajność". Po odłączeniu od źródła zasilania, został on automatycznie przełączony na tryb "Zrównoważony". Tryb "Eco", który jest również dostępny tutaj, zmniejsza jasność ekranu, a wszystkie formy oświetlenia LED są wyłączone. Helios 16 musi być naładowany do co najmniej 40%, aby można było sterować trybami wydajności.
Poniższa tabela pokazuje, że w trybie "Balanced" traci się bardzo mało energii, a wentylatory pozostają znacznie cichsze, w rzeczywistości prawie przyjemnie ciche. W przeciwieństwie do tego, tryb "Turbo" jest nieznośnie głośny i dlatego jest przydatny tylko do długiego renderowania wideo lub czegoś podobnego.
| Scenariusz | Wentylatory Turbo + Max | Turbo | Wydajność | Zrównoważony | Cichy | Bateria |
|---|---|---|---|---|---|---|
| CPUPL2 | 157 W (1:05 min) | 157 W > 150 W (1 min) | 157 W > 140 W (~55 sek) | 157 W > 135 W (~55 sek) | 157 W > 120 W (~40 sek) | 25 W |
| CPU PL1 | 118 W | 115 W | 95 W | 85 W | 55 W | 25 W |
| GPU@Cyberpunk 2077 1.6 | 103 W | 100 W | 100 W | 90 W | 55 W | 37 W |
| GPU@FurMark | 138 W | 137 W | 130 W | 100 W | 60 W | 40 W |
| Wydajność (Cyperpunk 2077 1.6 @FHD/Ultra) | 96.2fps | 95.5fps | 93.2fps | 87.4fps | 65.8fps | 30fps |
Procesor
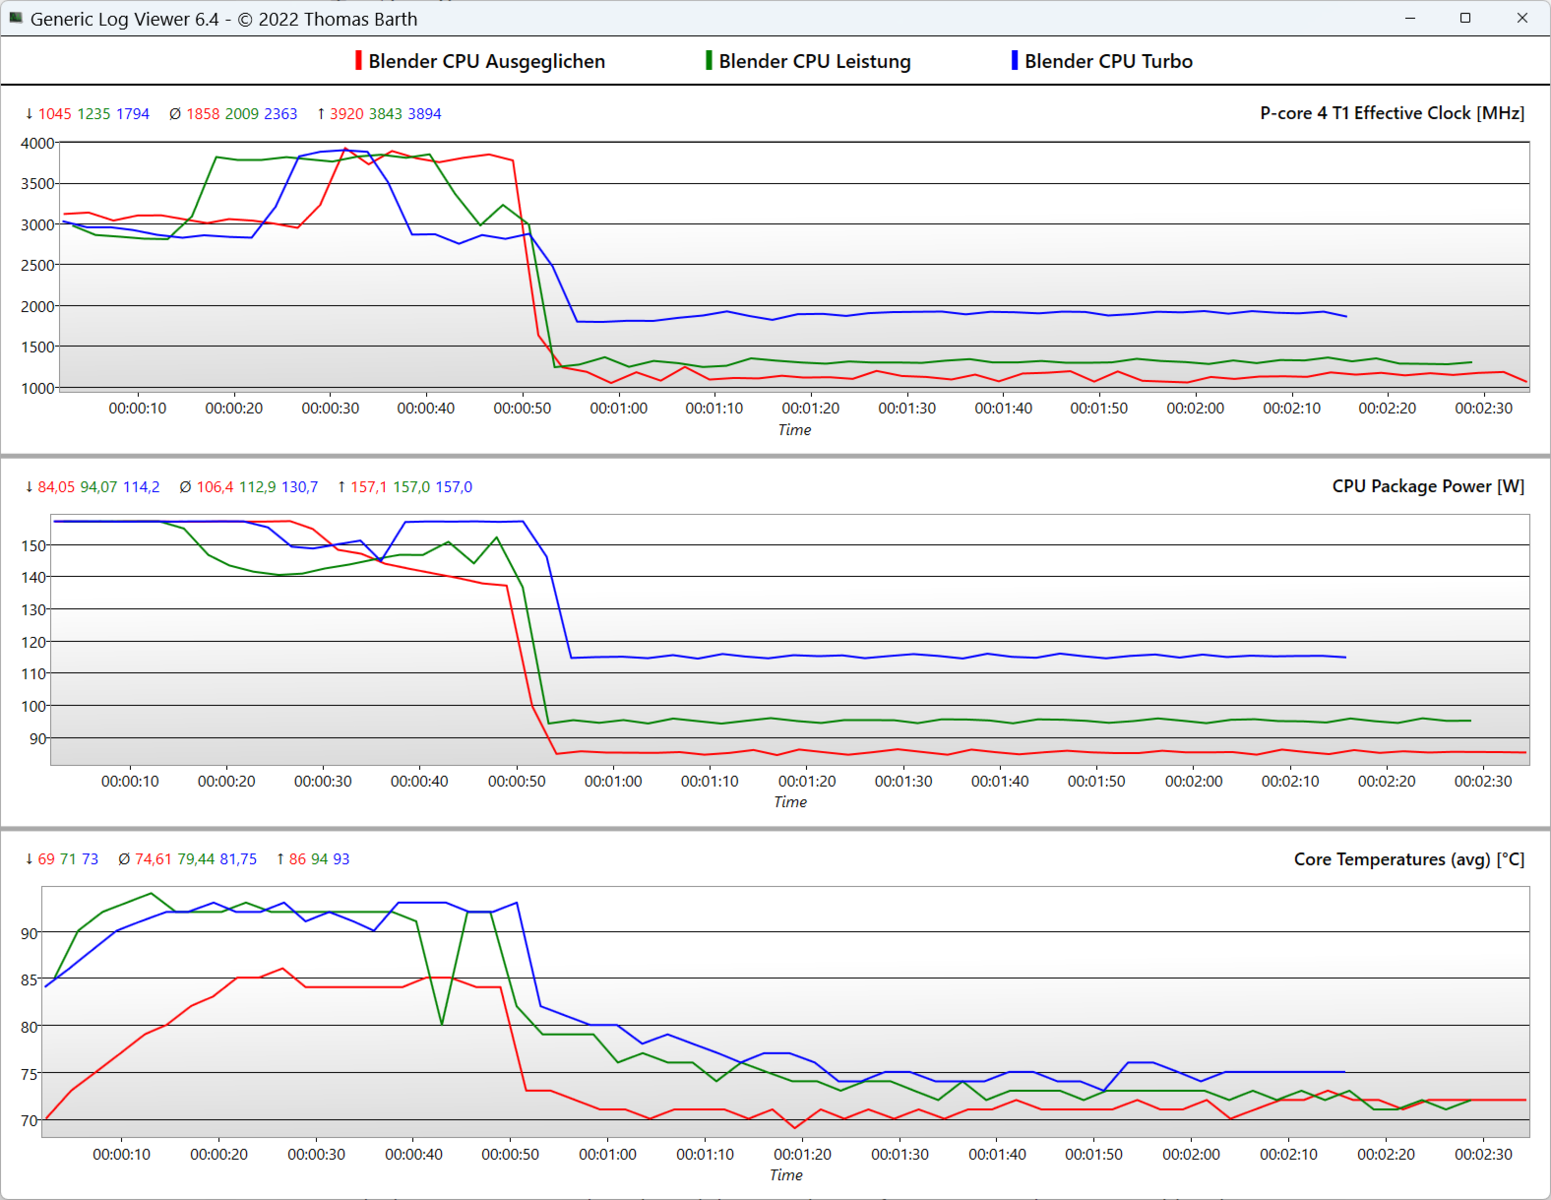
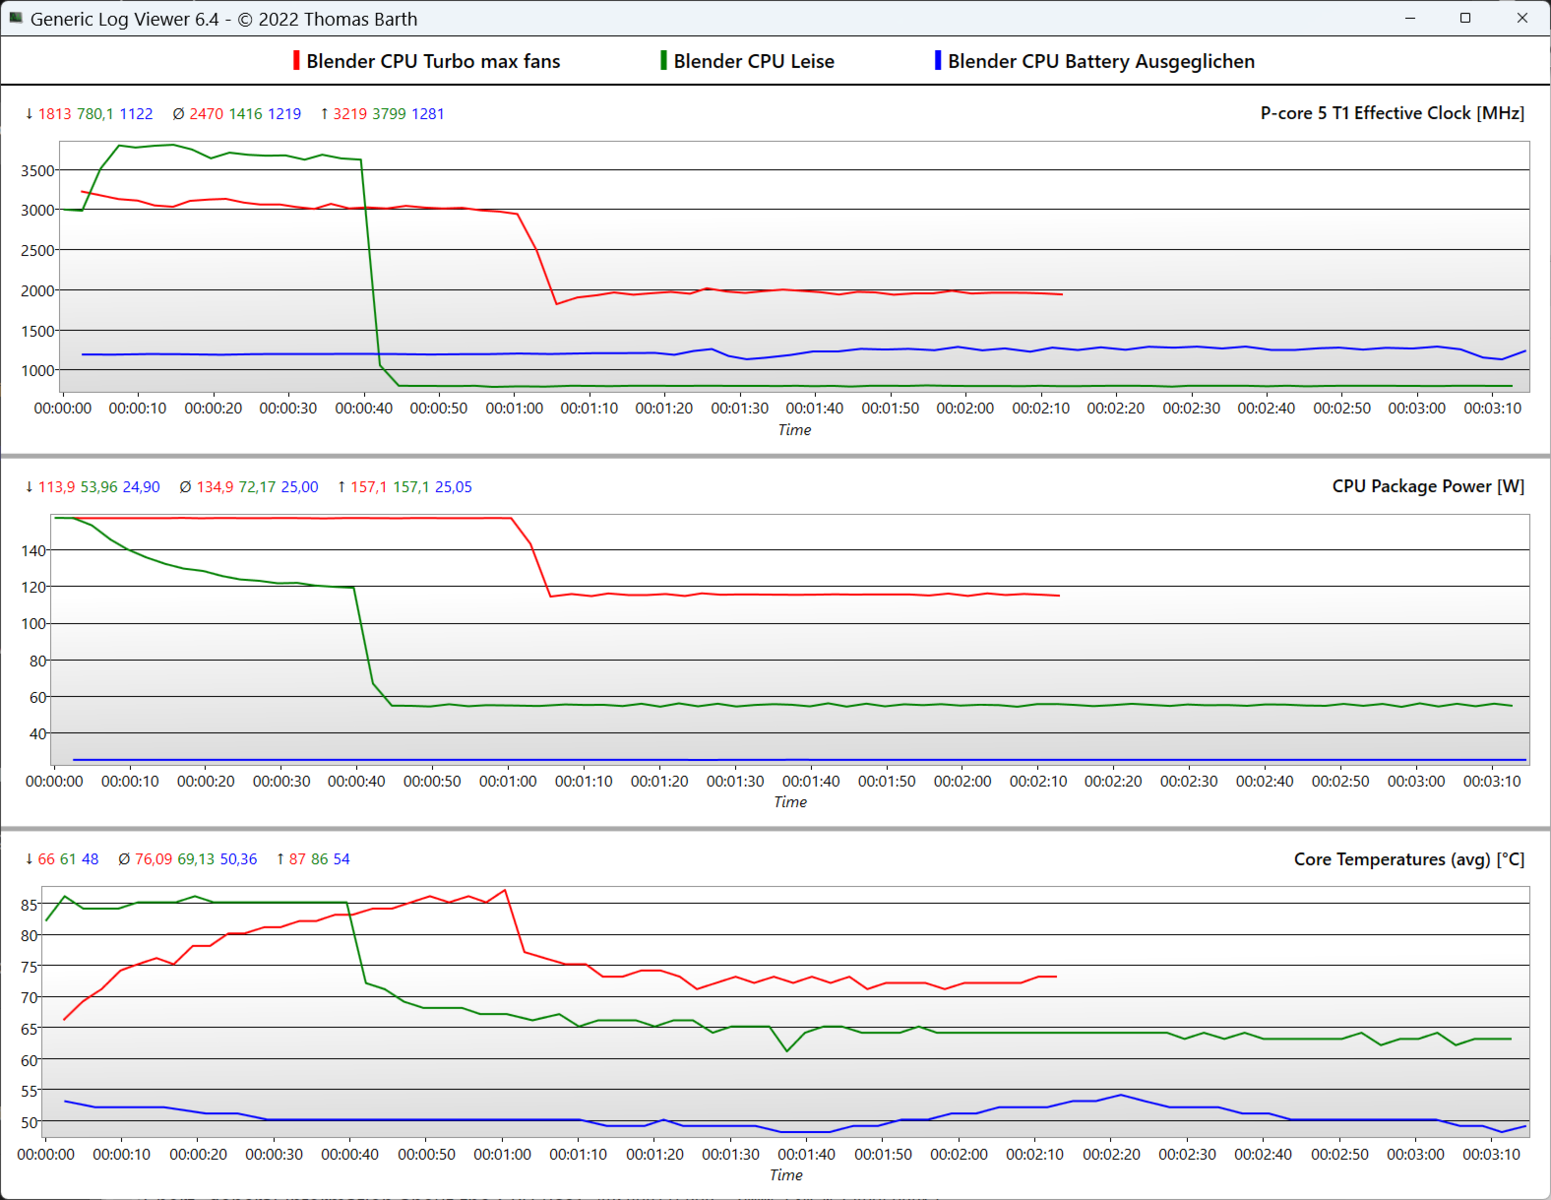
Intel Core i7-13700HXposiada 16 rdzeni i 24 wątki (8 rdzeni P + 8 rdzeni E), a także TDP na poziomie 55 watów. Turbo na poziomie 4,5 GHz nie jest w pełni wykorzystywane i w pierwszej minucie taktowanie rdzeni P wynosi od 3 GHz do 3,9 GHz, a następnie spada odpowiednio do 1,9 GHz (tryb Turbo) i 1,3 GHz (tryb Performance).
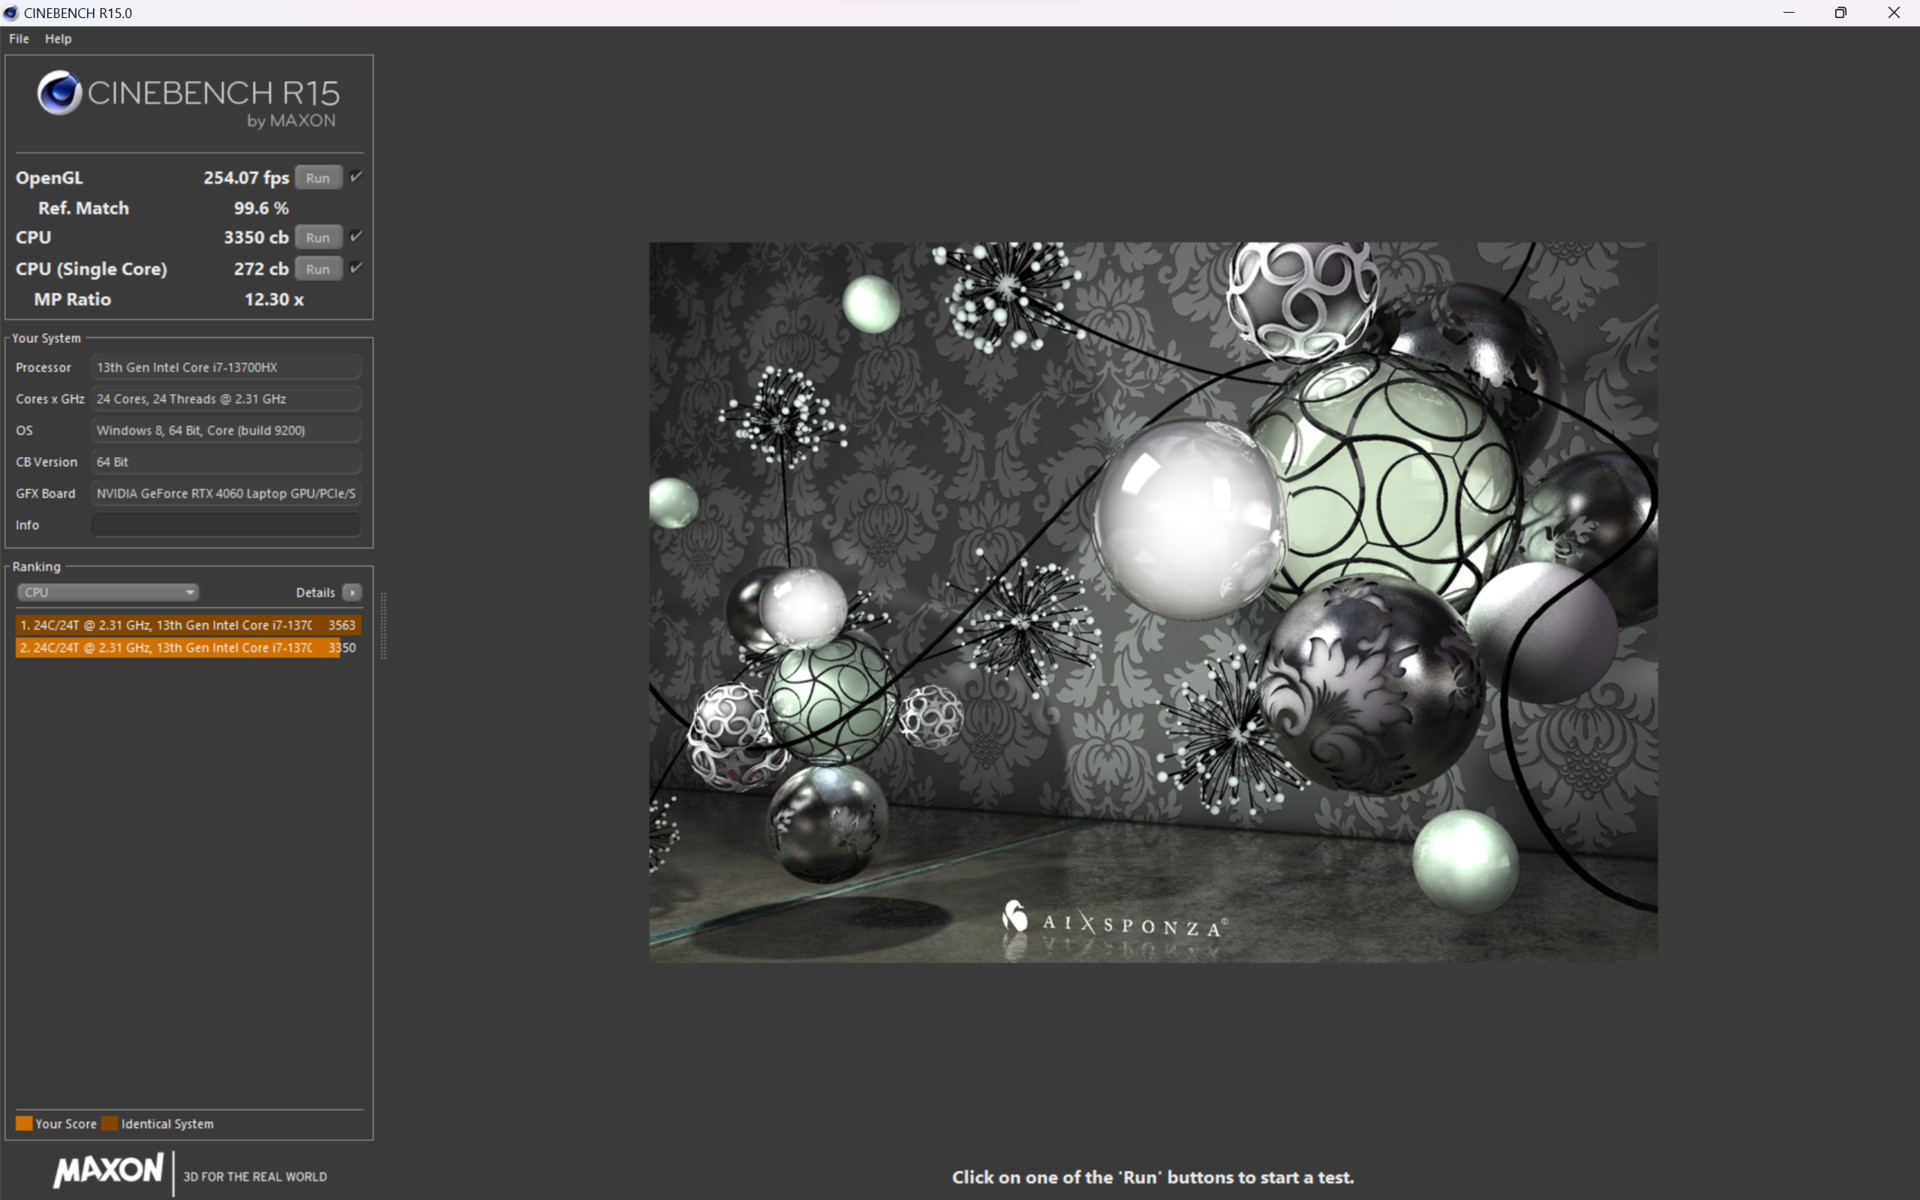
Wydajność wielordzeniowa odpowiada konkurentom z tym samym procesorem. 8-rdzeniowy AMD Ryzen 7 7735HS znaleziony w Acer Nitro 16 i Asus TUF Gaming A16 jest wyraźnie lepszy. Od piątego uruchomienia Cinebench R15 throttling wynosił ~15% i można go było prawie całkowicie uniknąć, aktywując głośny tryb "Turbo". Opcjonalnie dostępny Core i9-13900HX posiada dwa razy więcej rdzeni E i jest zazwyczaj o ~33% szybszy w zadaniach wielordzeniowych. W trybie bateryjnym sprawy wyglądają ponuro, ponieważ marny 25-watowy limit TDP oznacza spadek wydajności o prawie 65%.


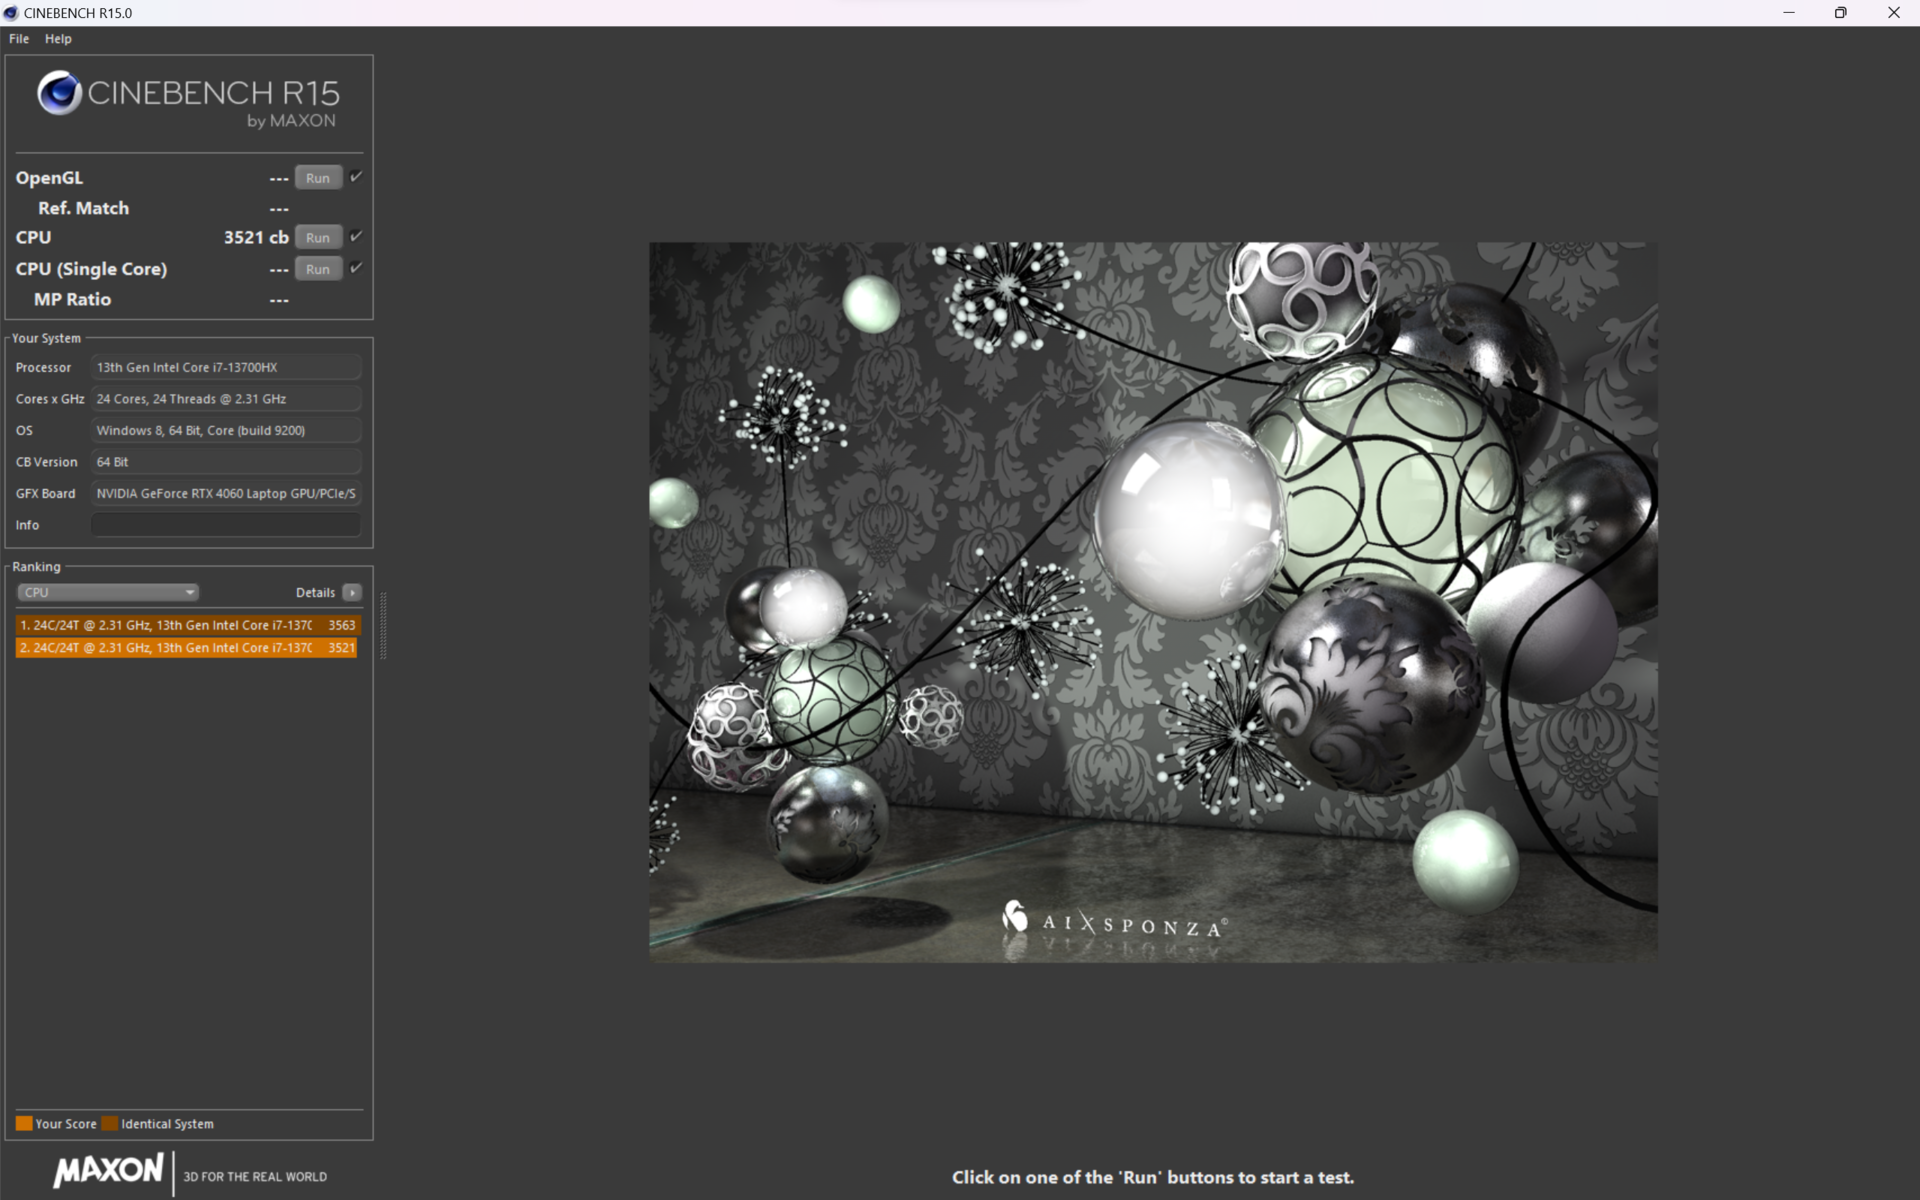
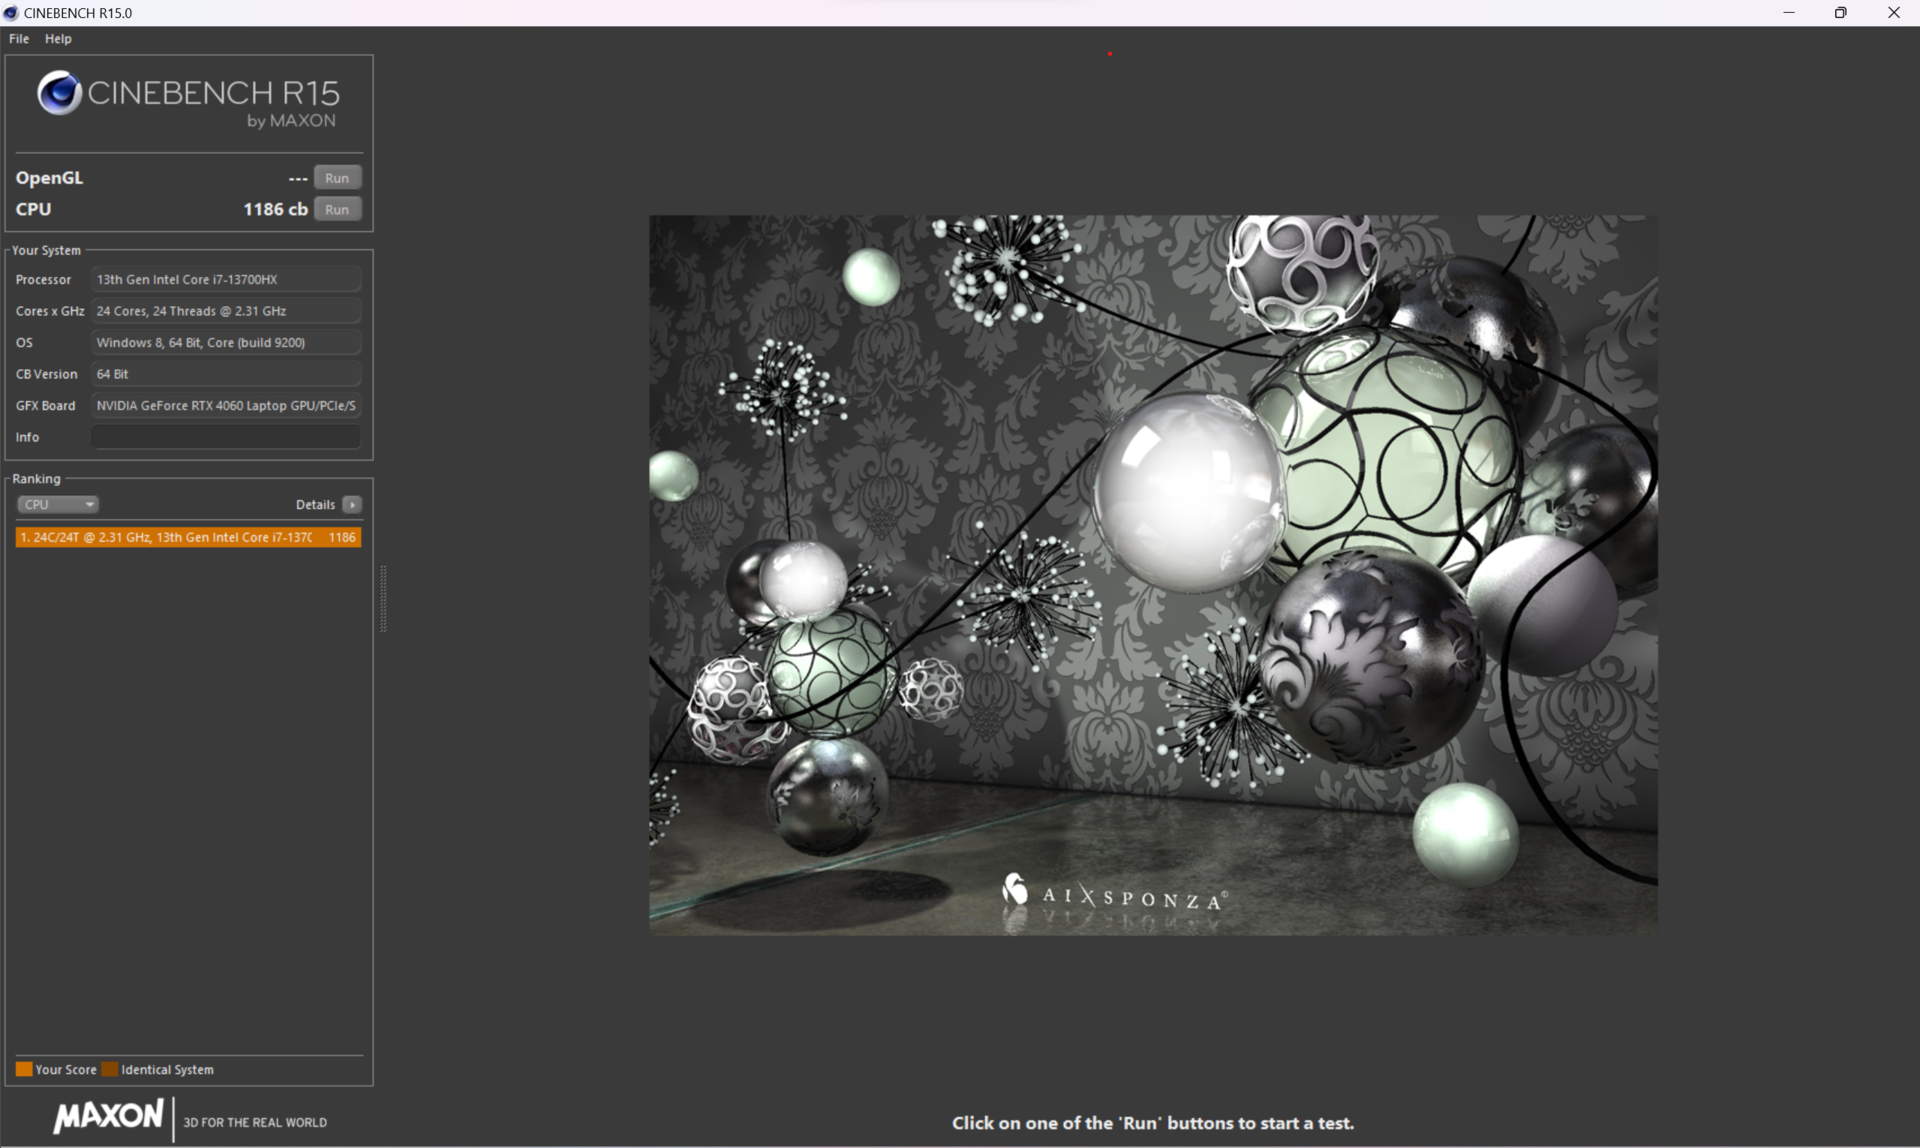
Cinebench R15 Multi Continuous Test
Cinebench R23: Multi Core | Single Core
Cinebench R20: CPU (Multi Core) | CPU (Single Core)
Cinebench R15: CPU Multi 64Bit | CPU Single 64Bit
Blender: v2.79 BMW27 CPU
7-Zip 18.03: 7z b 4 | 7z b 4 -mmt1
Geekbench 5.5: Multi-Core | Single-Core
HWBOT x265 Benchmark v2.2: 4k Preset
LibreOffice : 20 Documents To PDF
R Benchmark 2.5: Overall mean
| CPU Performance rating | |
| Średnia w klasie Gaming | |
| Acer Predator Helios 16 PH16-71-731Q | |
| Asus ROG Zephyrus M16 GU604VY-NM042X | |
| Aorus 15X ASF | |
| Dell G15 5530 | |
| Przeciętny Intel Core i7-13700HX | |
| Lenovo Legion Pro 5 16IRX8 | |
| Acer Predator Helios 300 (i7-12700H, RTX 3070 Ti) | |
| Acer Nitro 16 AN16-41 | |
| Asus TUF Gaming A16 FA617 | |
| Cinebench R23 / Multi Core | |
| Średnia w klasie Gaming (10488 - 40970, n=110, ostatnie 2 lata) | |
| Acer Predator Helios 16 PH16-71-731Q | |
| Dell G15 5530 | |
| Przeciętny Intel Core i7-13700HX (15558 - 22598, n=11) | |
| Aorus 15X ASF | |
| Lenovo Legion Pro 5 16IRX8 | |
| Asus ROG Zephyrus M16 GU604VY-NM042X | |
| Acer Predator Helios 300 (i7-12700H, RTX 3070 Ti) | |
| Acer Nitro 16 AN16-41 | |
| Asus TUF Gaming A16 FA617 | |
| Cinebench R23 / Single Core | |
| Średnia w klasie Gaming (1166 - 2356, n=110, ostatnie 2 lata) | |
| Asus ROG Zephyrus M16 GU604VY-NM042X | |
| Acer Predator Helios 16 PH16-71-731Q | |
| Aorus 15X ASF | |
| Dell G15 5530 | |
| Przeciętny Intel Core i7-13700HX (1666 - 1933, n=11) | |
| Acer Predator Helios 300 (i7-12700H, RTX 3070 Ti) | |
| Lenovo Legion Pro 5 16IRX8 | |
| Asus TUF Gaming A16 FA617 | |
| Acer Nitro 16 AN16-41 | |
| Cinebench R20 / CPU (Multi Core) | |
| Średnia w klasie Gaming (4029 - 16108, n=109, ostatnie 2 lata) | |
| Acer Predator Helios 16 PH16-71-731Q | |
| Dell G15 5530 | |
| Aorus 15X ASF | |
| Przeciętny Intel Core i7-13700HX (6160 - 8610, n=11) | |
| Asus ROG Zephyrus M16 GU604VY-NM042X | |
| Lenovo Legion Pro 5 16IRX8 | |
| Acer Predator Helios 300 (i7-12700H, RTX 3070 Ti) | |
| Acer Nitro 16 AN16-41 | |
| Asus TUF Gaming A16 FA617 | |
| Cinebench R20 / CPU (Single Core) | |
| Średnia w klasie Gaming (442 - 895, n=109, ostatnie 2 lata) | |
| Asus ROG Zephyrus M16 GU604VY-NM042X | |
| Acer Predator Helios 16 PH16-71-731Q | |
| Aorus 15X ASF | |
| Dell G15 5530 | |
| Przeciętny Intel Core i7-13700HX (644 - 740, n=11) | |
| Acer Predator Helios 300 (i7-12700H, RTX 3070 Ti) | |
| Lenovo Legion Pro 5 16IRX8 | |
| Asus TUF Gaming A16 FA617 | |
| Acer Nitro 16 AN16-41 | |
| Cinebench R15 / CPU Multi 64Bit | |
| Średnia w klasie Gaming (1578 - 6271, n=109, ostatnie 2 lata) | |
| Aorus 15X ASF | |
| Acer Predator Helios 16 PH16-71-731Q | |
| Acer Predator Helios 16 PH16-71-731Q | |
| Lenovo Legion Pro 5 16IRX8 | |
| Przeciętny Intel Core i7-13700HX (2548 - 3482, n=12) | |
| Dell G15 5530 | |
| Asus ROG Zephyrus M16 GU604VY-NM042X | |
| Acer Predator Helios 300 (i7-12700H, RTX 3070 Ti) | |
| Acer Nitro 16 AN16-41 | |
| Asus TUF Gaming A16 FA617 | |
| Cinebench R15 / CPU Single 64Bit | |
| Średnia w klasie Gaming (188.8 - 343, n=109, ostatnie 2 lata) | |
| Asus ROG Zephyrus M16 GU604VY-NM042X | |
| Aorus 15X ASF | |
| Dell G15 5530 | |
| Acer Predator Helios 16 PH16-71-731Q | |
| Przeciętny Intel Core i7-13700HX (243 - 279, n=11) | |
| Lenovo Legion Pro 5 16IRX8 | |
| Acer Predator Helios 300 (i7-12700H, RTX 3070 Ti) | |
| Asus TUF Gaming A16 FA617 | |
| Acer Nitro 16 AN16-41 | |
| Blender / v2.79 BMW27 CPU | |
| Asus TUF Gaming A16 FA617 | |
| Acer Nitro 16 AN16-41 | |
| Acer Predator Helios 300 (i7-12700H, RTX 3070 Ti) | |
| Aorus 15X ASF | |
| Asus ROG Zephyrus M16 GU604VY-NM042X | |
| Przeciętny Intel Core i7-13700HX (138 - 207, n=10) | |
| Dell G15 5530 | |
| Acer Predator Helios 16 PH16-71-731Q | |
| Średnia w klasie Gaming (80 - 330, n=107, ostatnie 2 lata) | |
| Lenovo Legion Pro 5 16IRX8 | |
| 7-Zip 18.03 / 7z b 4 | |
| Średnia w klasie Gaming (33491 - 148086, n=108, ostatnie 2 lata) | |
| Acer Predator Helios 16 PH16-71-731Q | |
| Asus ROG Zephyrus M16 GU604VY-NM042X | |
| Lenovo Legion Pro 5 16IRX8 | |
| Dell G15 5530 | |
| Przeciętny Intel Core i7-13700HX (58912 - 89294, n=11) | |
| Aorus 15X ASF | |
| Acer Predator Helios 300 (i7-12700H, RTX 3070 Ti) | |
| Asus TUF Gaming A16 FA617 | |
| Acer Nitro 16 AN16-41 | |
| 7-Zip 18.03 / 7z b 4 -mmt1 | |
| Aorus 15X ASF | |
| Średnia w klasie Gaming (4199 - 7436, n=108, ostatnie 2 lata) | |
| Asus ROG Zephyrus M16 GU604VY-NM042X | |
| Acer Predator Helios 16 PH16-71-731Q | |
| Przeciętny Intel Core i7-13700HX (5552 - 6409, n=11) | |
| Dell G15 5530 | |
| Asus TUF Gaming A16 FA617 | |
| Acer Predator Helios 300 (i7-12700H, RTX 3070 Ti) | |
| Lenovo Legion Pro 5 16IRX8 | |
| Acer Nitro 16 AN16-41 | |
| Geekbench 5.5 / Multi-Core | |
| Średnia w klasie Gaming (6460 - 27010, n=108, ostatnie 2 lata) | |
| Acer Predator Helios 16 PH16-71-731Q | |
| Asus ROG Zephyrus M16 GU604VY-NM042X | |
| Aorus 15X ASF | |
| Lenovo Legion Pro 5 16IRX8 | |
| Dell G15 5530 | |
| Przeciętny Intel Core i7-13700HX (10156 - 15850, n=12) | |
| Acer Predator Helios 300 (i7-12700H, RTX 3070 Ti) | |
| Asus TUF Gaming A16 FA617 | |
| Acer Nitro 16 AN16-41 | |
| Geekbench 5.5 / Single-Core | |
| Średnia w klasie Gaming (986 - 2474, n=108, ostatnie 2 lata) | |
| Asus ROG Zephyrus M16 GU604VY-NM042X | |
| Acer Predator Helios 16 PH16-71-731Q | |
| Aorus 15X ASF | |
| Dell G15 5530 | |
| Przeciętny Intel Core i7-13700HX (1666 - 1899, n=12) | |
| Lenovo Legion Pro 5 16IRX8 | |
| Acer Predator Helios 300 (i7-12700H, RTX 3070 Ti) | |
| Asus TUF Gaming A16 FA617 | |
| Acer Nitro 16 AN16-41 | |
| HWBOT x265 Benchmark v2.2 / 4k Preset | |
| Średnia w klasie Gaming (11.5 - 44.3, n=108, ostatnie 2 lata) | |
| Lenovo Legion Pro 5 16IRX8 | |
| Acer Predator Helios 16 PH16-71-731Q | |
| Dell G15 5530 | |
| Przeciętny Intel Core i7-13700HX (17.1 - 25.5, n=11) | |
| Asus ROG Zephyrus M16 GU604VY-NM042X | |
| Aorus 15X ASF | |
| Asus TUF Gaming A16 FA617 | |
| Acer Nitro 16 AN16-41 | |
| Acer Predator Helios 300 (i7-12700H, RTX 3070 Ti) | |
| LibreOffice / 20 Documents To PDF | |
| Acer Predator Helios 300 (i7-12700H, RTX 3070 Ti) | |
| Asus TUF Gaming A16 FA617 | |
| Acer Nitro 16 AN16-41 | |
| Asus ROG Zephyrus M16 GU604VY-NM042X | |
| Średnia w klasie Gaming (19 - 88.8, n=108, ostatnie 2 lata) | |
| Dell G15 5530 | |
| Przeciętny Intel Core i7-13700HX (36.5 - 52.9, n=11) | |
| Aorus 15X ASF | |
| Acer Predator Helios 16 PH16-71-731Q | |
| Lenovo Legion Pro 5 16IRX8 | |
| R Benchmark 2.5 / Overall mean | |
| Asus TUF Gaming A16 FA617 | |
| Acer Nitro 16 AN16-41 | |
| Lenovo Legion Pro 5 16IRX8 | |
| Przeciętny Intel Core i7-13700HX (0.4274 - 0.513, n=11) | |
| Acer Predator Helios 300 (i7-12700H, RTX 3070 Ti) | |
| Aorus 15X ASF | |
| Średnia w klasie Gaming (0.3439 - 0.759, n=109, ostatnie 2 lata) | |
| Acer Predator Helios 16 PH16-71-731Q | |
| Dell G15 5530 | |
| Asus ROG Zephyrus M16 GU604VY-NM042X | |
* ... im mniej tym lepiej
AIDA64: FP32 Ray-Trace | FPU Julia | CPU SHA3 | CPU Queen | FPU SinJulia | FPU Mandel | CPU AES | CPU ZLib | FP64 Ray-Trace | CPU PhotoWorxx
| Performance rating | |
| Średnia w klasie Gaming | |
| Acer Predator Helios 16 PH16-71-731Q | |
| Lenovo Legion Pro 5 16IRX8 | |
| Przeciętny Intel Core i7-13700HX | |
| Aorus 15X ASF | |
| Dell G15 5530 | |
| Acer Nitro 16 AN16-41 | |
| Asus TUF Gaming A16 FA617 | |
| AIDA64 / FP32 Ray-Trace | |
| Średnia w klasie Gaming (10227 - 85542, n=107, ostatnie 2 lata) | |
| Lenovo Legion Pro 5 16IRX8 | |
| Acer Predator Helios 16 PH16-71-731Q | |
| Przeciętny Intel Core i7-13700HX (14261 - 21999, n=11) | |
| Dell G15 5530 | |
| Aorus 15X ASF | |
| Acer Nitro 16 AN16-41 | |
| Asus TUF Gaming A16 FA617 | |
| AIDA64 / FPU Julia | |
| Średnia w klasie Gaming (51376 - 238426, n=107, ostatnie 2 lata) | |
| Acer Nitro 16 AN16-41 | |
| Lenovo Legion Pro 5 16IRX8 | |
| Asus TUF Gaming A16 FA617 | |
| Acer Predator Helios 16 PH16-71-731Q | |
| Przeciętny Intel Core i7-13700HX (74636 - 109364, n=11) | |
| Dell G15 5530 | |
| Aorus 15X ASF | |
| AIDA64 / CPU SHA3 | |
| Średnia w klasie Gaming (2180 - 9817, n=107, ostatnie 2 lata) | |
| Lenovo Legion Pro 5 16IRX8 | |
| Acer Predator Helios 16 PH16-71-731Q | |
| Dell G15 5530 | |
| Przeciętny Intel Core i7-13700HX (3359 - 5053, n=11) | |
| Aorus 15X ASF | |
| Asus TUF Gaming A16 FA617 | |
| Acer Nitro 16 AN16-41 | |
| AIDA64 / CPU Queen | |
| Średnia w klasie Gaming (49785 - 173351, n=98, ostatnie 2 lata) | |
| Acer Predator Helios 16 PH16-71-731Q | |
| Lenovo Legion Pro 5 16IRX8 | |
| Aorus 15X ASF | |
| Przeciętny Intel Core i7-13700HX (86532 - 114717, n=11) | |
| Acer Nitro 16 AN16-41 | |
| Dell G15 5530 | |
| Asus TUF Gaming A16 FA617 | |
| AIDA64 / FPU SinJulia | |
| Średnia w klasie Gaming (4424 - 33636, n=107, ostatnie 2 lata) | |
| Lenovo Legion Pro 5 16IRX8 | |
| Acer Nitro 16 AN16-41 | |
| Acer Predator Helios 16 PH16-71-731Q | |
| Asus TUF Gaming A16 FA617 | |
| Przeciętny Intel Core i7-13700HX (9290 - 13519, n=11) | |
| Aorus 15X ASF | |
| Dell G15 5530 | |
| AIDA64 / FPU Mandel | |
| Średnia w klasie Gaming (25115 - 128721, n=107, ostatnie 2 lata) | |
| Acer Nitro 16 AN16-41 | |
| Asus TUF Gaming A16 FA617 | |
| Lenovo Legion Pro 5 16IRX8 | |
| Acer Predator Helios 16 PH16-71-731Q | |
| Przeciętny Intel Core i7-13700HX (35751 - 53484, n=11) | |
| Dell G15 5530 | |
| Aorus 15X ASF | |
| AIDA64 / CPU AES | |
| Acer Predator Helios 16 PH16-71-731Q | |
| Aorus 15X ASF | |
| Przeciętny Intel Core i7-13700HX (67846 - 182575, n=11) | |
| Średnia w klasie Gaming (39258 - 247074, n=107, ostatnie 2 lata) | |
| Lenovo Legion Pro 5 16IRX8 | |
| Dell G15 5530 | |
| Asus TUF Gaming A16 FA617 | |
| Acer Nitro 16 AN16-41 | |
| AIDA64 / CPU ZLib | |
| Średnia w klasie Gaming (574 - 2531, n=107, ostatnie 2 lata) | |
| Acer Predator Helios 16 PH16-71-731Q | |
| Lenovo Legion Pro 5 16IRX8 | |
| Dell G15 5530 | |
| Przeciętny Intel Core i7-13700HX (981 - 1451, n=11) | |
| Aorus 15X ASF | |
| Acer Nitro 16 AN16-41 | |
| Asus TUF Gaming A16 FA617 | |
| AIDA64 / FP64 Ray-Trace | |
| Średnia w klasie Gaming (5509 - 45446, n=107, ostatnie 2 lata) | |
| Lenovo Legion Pro 5 16IRX8 | |
| Acer Predator Helios 16 PH16-71-731Q | |
| Przeciętny Intel Core i7-13700HX (7728 - 11837, n=11) | |
| Dell G15 5530 | |
| Aorus 15X ASF | |
| Acer Nitro 16 AN16-41 | |
| Asus TUF Gaming A16 FA617 | |
| AIDA64 / CPU PhotoWorxx | |
| Średnia w klasie Gaming (12271 - 89891, n=107, ostatnie 2 lata) | |
| Dell G15 5530 | |
| Lenovo Legion Pro 5 16IRX8 | |
| Acer Predator Helios 16 PH16-71-731Q | |
| Aorus 15X ASF | |
| Przeciętny Intel Core i7-13700HX (19678 - 42415, n=11) | |
| Asus TUF Gaming A16 FA617 | |
| Acer Nitro 16 AN16-41 | |
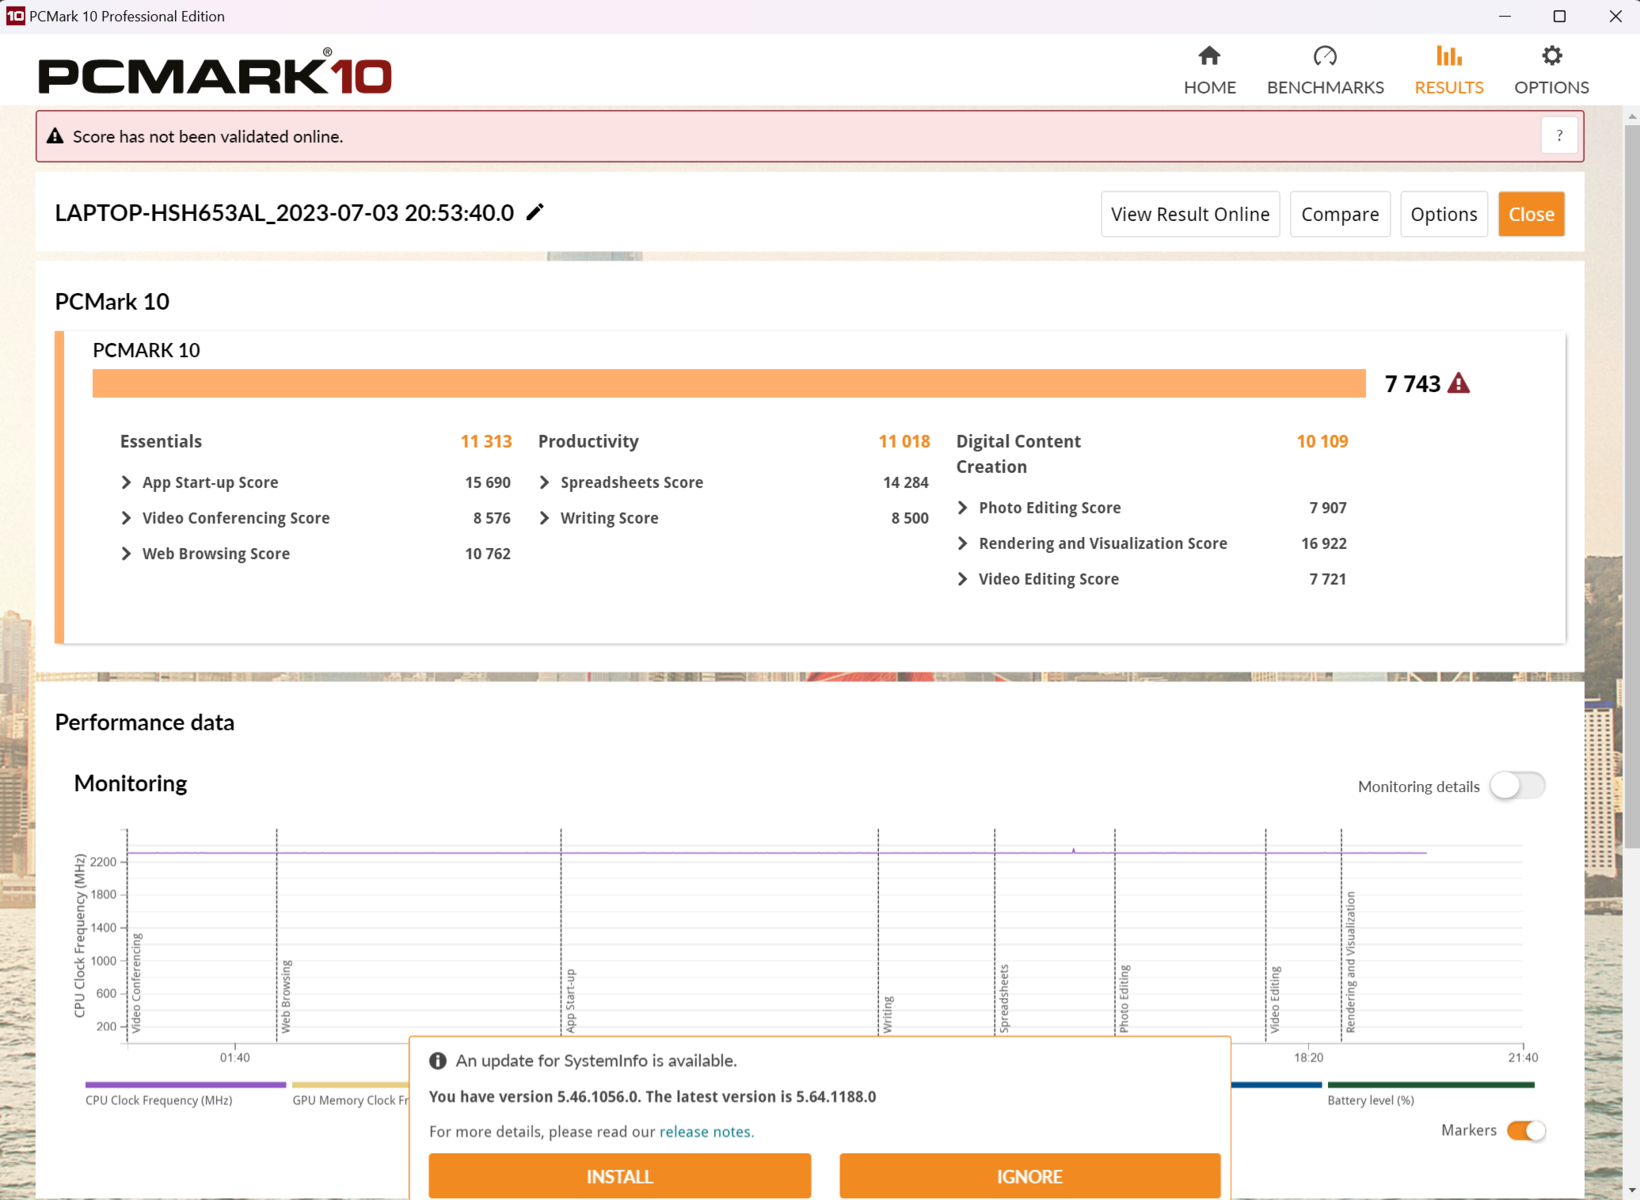
Wydajność systemu
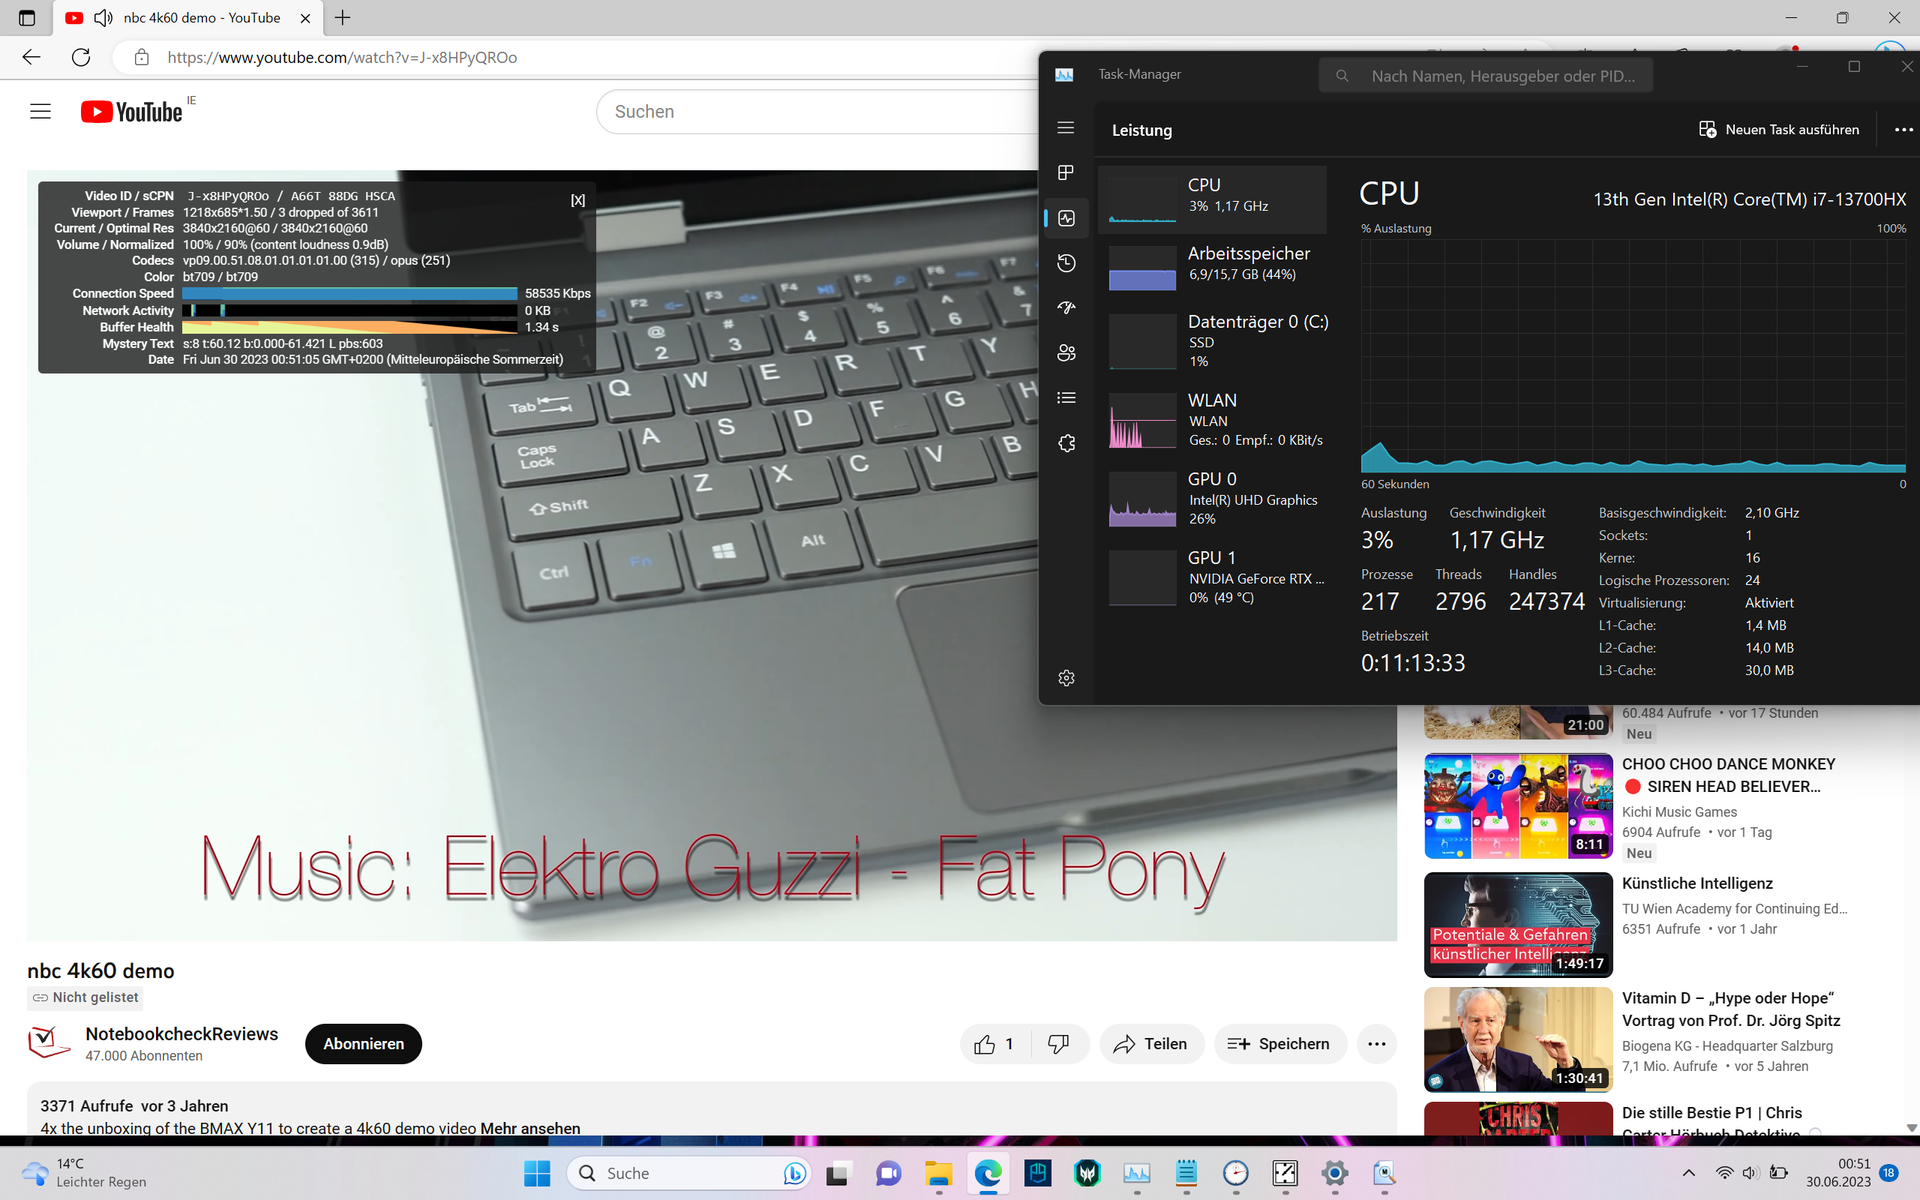
W codziennych zadaniach laptop Acer jest wyjątkowo responsywny. Surfowanie po Internecie podczas odtwarzania filmu 4K na YouTube nie sprawia, że system Intel-HX nawet się poci. Oznacza to, że w benchmarku PCMark 10 Predator Helios zajmuje pierwsze miejsce, a tuż za nim plasuje sięLenovo Legion Pro 5 16.
Podobnie, wydajność przeglądania stron internetowych, zilustrowana przez Mozilla Kraken 1.1 i WebXPRT, jest również na bardzo wysokim poziomie dzięki wysokiej wydajności jednordzeniowej.
CrossMark: Overall | Productivity | Creativity | Responsiveness
Mozilla Kraken 1.1: Total
Speedometer 2.0: Result 2.0
Octane V2: Total Score
Jetstream 2: 2.0 Total
WebXPRT 3: Overall
WebXPRT 4: Overall
| PCMark 10 / Score | |
| Średnia w klasie Gaming (5828 - 11574, n=94, ostatnie 2 lata) | |
| Acer Predator Helios 16 PH16-71-731Q | |
| Lenovo Legion Pro 5 16IRX8 | |
| Przeciętny Intel Core i7-13700HX, NVIDIA GeForce RTX 4060 Laptop GPU (6909 - 7743, n=5) | |
| Asus TUF Gaming A16 FA617 | |
| Acer Nitro 16 AN16-41 | |
| Aorus 15X ASF | |
| Dell G15 5530 | |
| PCMark 10 / Essentials | |
| Acer Predator Helios 16 PH16-71-731Q | |
| Dell G15 5530 | |
| Lenovo Legion Pro 5 16IRX8 | |
| Aorus 15X ASF | |
| Średnia w klasie Gaming (8810 - 12600, n=98, ostatnie 2 lata) | |
| Przeciętny Intel Core i7-13700HX, NVIDIA GeForce RTX 4060 Laptop GPU (9760 - 11313, n=5) | |
| Asus TUF Gaming A16 FA617 | |
| Acer Nitro 16 AN16-41 | |
| PCMark 10 / Productivity | |
| Acer Predator Helios 16 PH16-71-731Q | |
| Średnia w klasie Gaming (6845 - 18766, n=96, ostatnie 2 lata) | |
| Dell G15 5530 | |
| Przeciętny Intel Core i7-13700HX, NVIDIA GeForce RTX 4060 Laptop GPU (9131 - 11018, n=5) | |
| Aorus 15X ASF | |
| Asus TUF Gaming A16 FA617 | |
| Acer Nitro 16 AN16-41 | |
| Lenovo Legion Pro 5 16IRX8 | |
| PCMark 10 / Digital Content Creation | |
| Średnia w klasie Gaming (7602 - 19657, n=96, ostatnie 2 lata) | |
| Lenovo Legion Pro 5 16IRX8 | |
| Przeciętny Intel Core i7-13700HX, NVIDIA GeForce RTX 4060 Laptop GPU (9393 - 12434, n=5) | |
| Asus TUF Gaming A16 FA617 | |
| Acer Nitro 16 AN16-41 | |
| Acer Predator Helios 16 PH16-71-731Q | |
| Aorus 15X ASF | |
| Dell G15 5530 | |
| CrossMark / Overall | |
| Acer Predator Helios 16 PH16-71-731Q | |
| Aorus 15X ASF | |
| Średnia w klasie Gaming (1366 - 2409, n=96, ostatnie 2 lata) | |
| Przeciętny Intel Core i7-13700HX, NVIDIA GeForce RTX 4060 Laptop GPU (1663 - 2105, n=5) | |
| Dell G15 5530 | |
| Lenovo Legion Pro 5 16IRX8 | |
| Acer Nitro 16 AN16-41 | |
| CrossMark / Productivity | |
| Acer Predator Helios 16 PH16-71-731Q | |
| Aorus 15X ASF | |
| Średnia w klasie Gaming (1386 - 2254, n=96, ostatnie 2 lata) | |
| Przeciętny Intel Core i7-13700HX, NVIDIA GeForce RTX 4060 Laptop GPU (1618 - 1989, n=5) | |
| Dell G15 5530 | |
| Lenovo Legion Pro 5 16IRX8 | |
| Acer Nitro 16 AN16-41 | |
| CrossMark / Creativity | |
| Acer Predator Helios 16 PH16-71-731Q | |
| Średnia w klasie Gaming (1343 - 2729, n=96, ostatnie 2 lata) | |
| Aorus 15X ASF | |
| Dell G15 5530 | |
| Przeciętny Intel Core i7-13700HX, NVIDIA GeForce RTX 4060 Laptop GPU (1710 - 2274, n=5) | |
| Lenovo Legion Pro 5 16IRX8 | |
| Acer Nitro 16 AN16-41 | |
| CrossMark / Responsiveness | |
| Aorus 15X ASF | |
| Acer Predator Helios 16 PH16-71-731Q | |
| Średnia w klasie Gaming (1226 - 2334, n=96, ostatnie 2 lata) | |
| Przeciętny Intel Core i7-13700HX, NVIDIA GeForce RTX 4060 Laptop GPU (1269 - 1983, n=5) | |
| Lenovo Legion Pro 5 16IRX8 | |
| Dell G15 5530 | |
| Acer Nitro 16 AN16-41 | |
| Mozilla Kraken 1.1 / Total | |
| Asus TUF Gaming A16 FA617 | |
| Asus TUF Gaming A16 FA617 | |
| Acer Nitro 16 AN16-41 | |
| Lenovo Legion Pro 5 16IRX8 | |
| Przeciętny Intel Core i7-13700HX, NVIDIA GeForce RTX 4060 Laptop GPU (495 - 538, n=5) | |
| Dell G15 5530 | |
| Acer Predator Helios 16 PH16-71-731Q | |
| Aorus 15X ASF | |
| Średnia w klasie Gaming (391 - 590, n=104, ostatnie 2 lata) | |
| Speedometer 2.0 / Result 2.0 | |
| Średnia w klasie Gaming (29 - 686, n=28, ostatnie 2 lata) | |
| Acer Predator Helios 16 PH16-71-731Q | |
| Przeciętny Intel Core i7-13700HX, NVIDIA GeForce RTX 4060 Laptop GPU (300 - 343, n=3) | |
| Aorus 15X ASF | |
| Acer Nitro 16 AN16-41 | |
| Octane V2 / Total Score | |
| Średnia w klasie Gaming (89353 - 139447, n=29, ostatnie 2 lata) | |
| Aorus 15X ASF | |
| Acer Predator Helios 16 PH16-71-731Q | |
| Przeciętny Intel Core i7-13700HX, NVIDIA GeForce RTX 4060 Laptop GPU (86875 - 96413, n=3) | |
| Acer Nitro 16 AN16-41 | |
| Jetstream 2 / 2.0 Total | |
| Średnia w klasie Gaming (291 - 516, n=30, ostatnie 2 lata) | |
| Lenovo Legion Pro 5 16IRX8 | |
| Acer Predator Helios 16 PH16-71-731Q | |
| Aorus 15X ASF | |
| Przeciętny Intel Core i7-13700HX, NVIDIA GeForce RTX 4060 Laptop GPU (263 - 305, n=4) | |
| Acer Nitro 16 AN16-41 | |
| WebXPRT 3 / Overall | |
| Acer Predator Helios 16 PH16-71-731Q | |
| Aorus 15X ASF | |
| Średnia w klasie Gaming (242 - 532, n=99, ostatnie 2 lata) | |
| Asus TUF Gaming A16 FA617 | |
| Asus TUF Gaming A16 FA617 | |
| Dell G15 5530 | |
| Przeciętny Intel Core i7-13700HX, NVIDIA GeForce RTX 4060 Laptop GPU (238 - 336, n=4) | |
| Acer Nitro 16 AN16-41 | |
| Lenovo Legion Pro 5 16IRX8 | |
| WebXPRT 4 / Overall | |
| Średnia w klasie Gaming (176.4 - 354, n=99, ostatnie 2 lata) | |
| Acer Predator Helios 16 PH16-71-731Q | |
| Dell G15 5530 | |
| Aorus 15X ASF | |
| Przeciętny Intel Core i7-13700HX, NVIDIA GeForce RTX 4060 Laptop GPU (247 - 283, n=5) | |
| Lenovo Legion Pro 5 16IRX8 | |
| Asus TUF Gaming A16 FA617 | |
| Asus TUF Gaming A16 FA617 | |
| Acer Nitro 16 AN16-41 | |
* ... im mniej tym lepiej
| PCMark 10 Score | 7743 pkt. | |
Pomoc | ||
| AIDA64 / Memory Copy | |
| Średnia w klasie Gaming (21750 - 129946, n=107, ostatnie 2 lata) | |
| Dell G15 5530 | |
| Lenovo Legion Pro 5 16IRX8 | |
| Aorus 15X ASF | |
| Acer Predator Helios 16 PH16-71-731Q | |
| Przeciętny Intel Core i7-13700HX (36125 - 63990, n=11) | |
| Asus TUF Gaming A16 FA617 | |
| Acer Nitro 16 AN16-41 | |
| AIDA64 / Memory Read | |
| Średnia w klasie Gaming (22956 - 118858, n=107, ostatnie 2 lata) | |
| Dell G15 5530 | |
| Lenovo Legion Pro 5 16IRX8 | |
| Acer Predator Helios 16 PH16-71-731Q | |
| Aorus 15X ASF | |
| Przeciętny Intel Core i7-13700HX (36510 - 69729, n=11) | |
| Asus TUF Gaming A16 FA617 | |
| Acer Nitro 16 AN16-41 | |
| AIDA64 / Memory Write | |
| Acer Predator Helios 16 PH16-71-731Q | |
| Średnia w klasie Gaming (22297 - 135096, n=107, ostatnie 2 lata) | |
| Lenovo Legion Pro 5 16IRX8 | |
| Dell G15 5530 | |
| Przeciętny Intel Core i7-13700HX (33598 - 85675, n=11) | |
| Aorus 15X ASF | |
| Asus TUF Gaming A16 FA617 | |
| Acer Nitro 16 AN16-41 | |
| AIDA64 / Memory Latency | |
| Średnia w klasie Gaming (75.3 - 259, n=107, ostatnie 2 lata) | |
| Acer Nitro 16 AN16-41 | |
| Dell G15 5530 | |
| Przeciętny Intel Core i7-13700HX (81.5 - 97.9, n=11) | |
| Aorus 15X ASF | |
| Acer Predator Helios 16 PH16-71-731Q | |
| Asus TUF Gaming A16 FA617 | |
| Lenovo Legion Pro 5 16IRX8 | |
* ... im mniej tym lepiej
Opóźnienia DPC
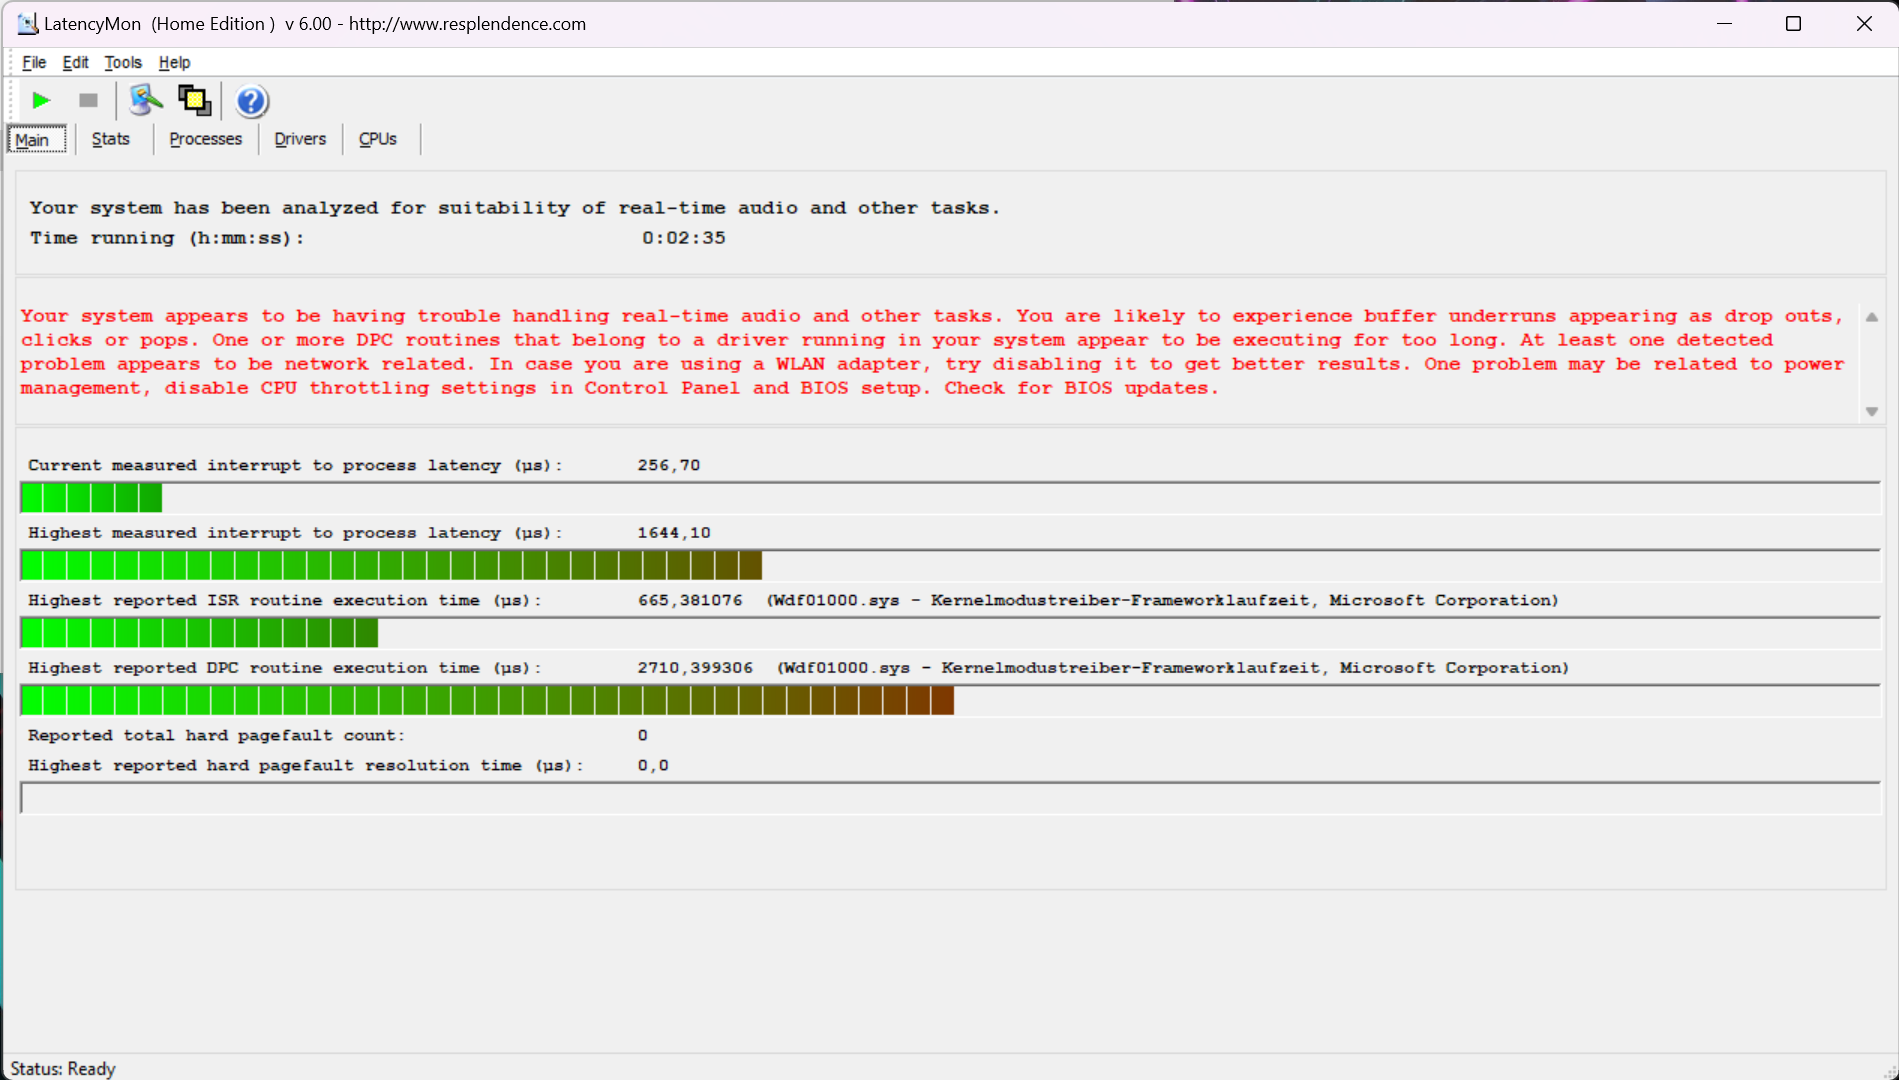
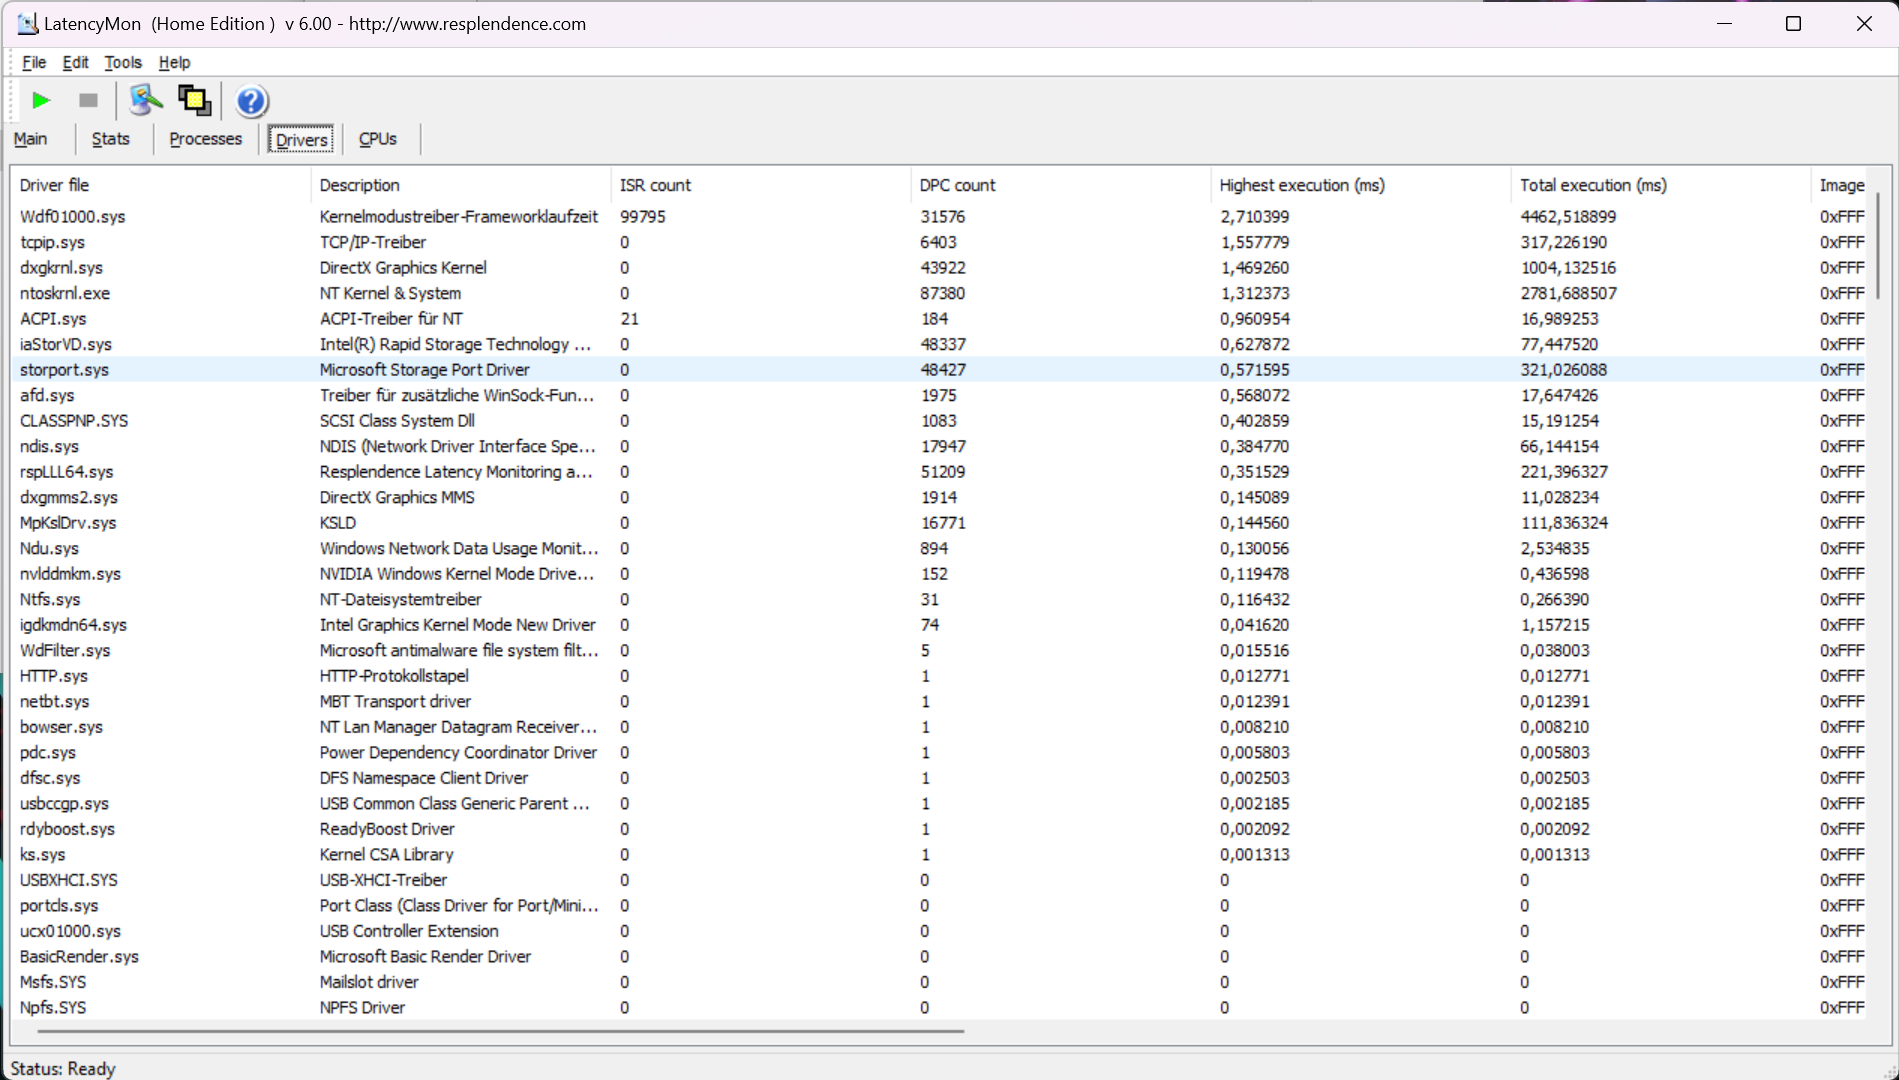
| DPC Latencies / LatencyMon - interrupt to process latency (max), Web, Youtube, Prime95 | |
| Dell G15 5530 | |
| Aorus 15X ASF | |
| Acer Predator Helios 16 PH16-71-731Q | |
| Acer Nitro 16 AN16-41 | |
| Lenovo Legion Pro 5 16IRX8 | |
| Asus TUF Gaming A16 FA617 | |
* ... im mniej tym lepiej
Pamięć masowa
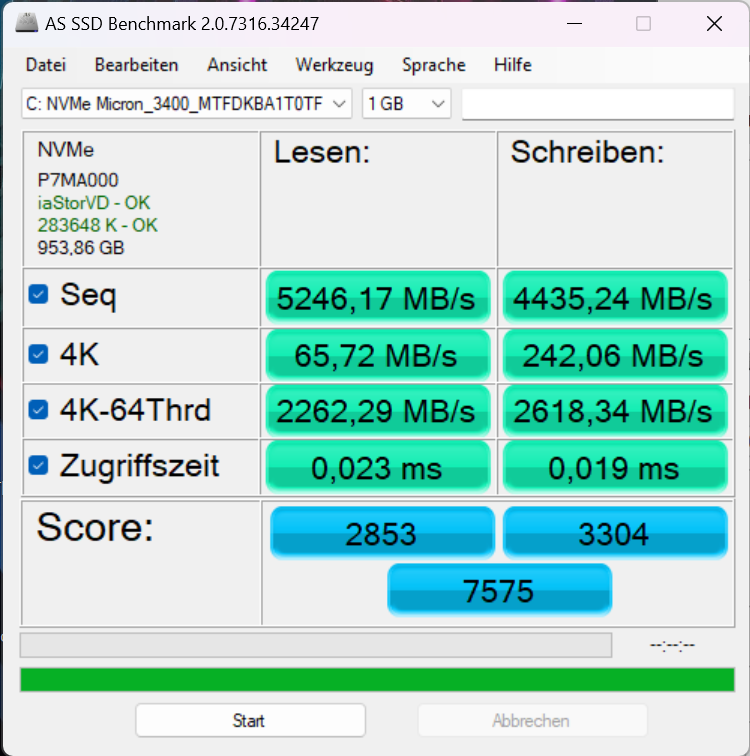
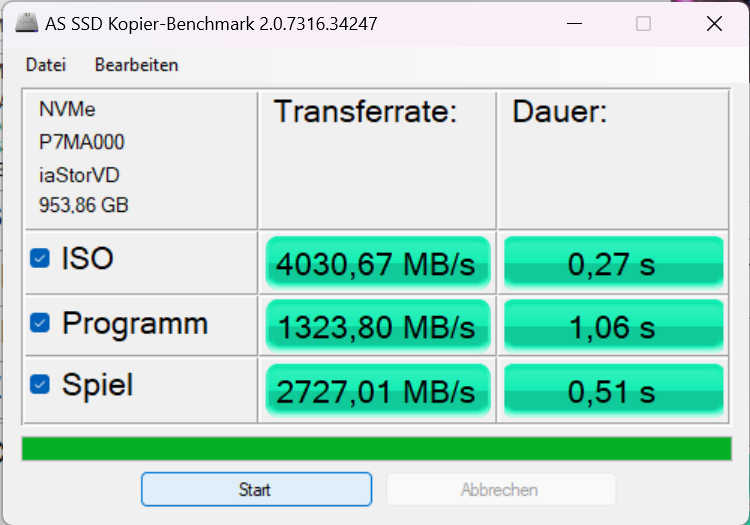
Zainstalowany dysk SSD PCIe 4.0 Micron 3400 może pomieścić 1 TB. Prędkość sekwencyjnego odczytu do 6 100 MB/s jest ponadprzeciętna. Jednak po krótkim czasie zaczyna się drastyczny throttling związany z temperaturą, który zmniejsza prędkość do jednej trzeciej pojemności. Throttling nie występuje w Micron 3400, który można znaleźć wAsus ROG Flow X16lubLenovo Legion 7ale ten sam problem został zgłoszony zarówno w HP ZBook Fury 16i ZBook Firefly 14.
SK Hynix PC801 w modeluLegion Pro 5 16może również utrzymać transfery do ~6000 MB/s, podczas gdy mały dysk SSD M.2 2242 znaleziony wDell G15 5530wyraźnie plasuje się w dolnej części stawki.
| Acer Predator Helios 16 PH16-71-731Q Micron 3400 1TB MTFDKBA1T0TFH | Acer Nitro 16 AN16-41 Samsung PM9A1 MZVL21T0HCLR | Lenovo Legion Pro 5 16IRX8 SK hynix PC801 HFS512GEJ9X115N | Aorus 15X ASF Gigabyte AG470S1TB-SI B10 | Asus TUF Gaming A16 FA617 Micron 2400 MTFDKBA1T0QFM | Dell G15 5530 SSTC CL4-3D512-Q11 | |
|---|---|---|---|---|---|---|
| AS SSD | -25% | -15% | -15% | -72% | -144% | |
| Seq Read (MB/s) | 5246.2 | 5185.49 -1% | 5856.12 12% | 4649.46 -11% | 3976.53 -24% | 2603.73 -50% |
| Seq Write (MB/s) | 4435.2 | 3900.46 -12% | 4750.28 7% | 3810.26 -14% | 3020.8 -32% | 494.63 -89% |
| 4K Read (MB/s) | 65.7 | 62.76 -4% | 77.12 17% | 100.75 53% | 49.25 -25% | 36.37 -45% |
| 4K Write (MB/s) | 242.1 | 137.9 -43% | 276.66 14% | 308.92 28% | 152.75 -37% | 188.64 -22% |
| 4K-64 Read (MB/s) | 2262.3 | 2593.07 15% | 2572.63 14% | 2964.13 31% | 1901.41 -16% | 932.26 -59% |
| 4K-64 Write (MB/s) | 2618.3 | 3195.33 22% | 3536.78 35% | 3103.89 19% | 1949.13 -26% | 276.64 -89% |
| Access Time Read * (ms) | 0.023 | 0.079 -243% | 0.044 -91% | 0.068 -196% | 0.05 -117% | 0.103 -348% |
| Access Time Write * (ms) | 0.019 | 0.029 -53% | 0.053 -179% | 0.012 37% | 0.105 -453% | 0.182 -858% |
| Score Read (Points) | 2853 | 3174 11% | 3235 13% | 3530 24% | 2348 -18% | 1229 -57% |
| Score Write (Points) | 3304 | 3723 13% | 4288 30% | 3794 15% | 2404 -27% | 515 -84% |
| Score Total (Points) | 7575 | 8452 12% | 9125 20% | 9097 20% | 5903 -22% | 2271 -70% |
| Copy ISO MB/s (MB/s) | 4030.7 | 3037.59 -25% | 566.62 -86% | 1039.04 -74% | 488.98 -88% | |
| Copy Program MB/s (MB/s) | 1323.8 | 968.9 -27% | 1098.38 -17% | 439.84 -67% | 296.26 -78% | |
| Copy Game MB/s (MB/s) | 2727 | 2239.37 -18% | 2670.4 -2% | 721.09 -74% | 452.22 -83% | |
| DiskSpd | -22% | -3% | 9% | -31% | -57% | |
| seq read (MB/s) | 3587 | 3520 -2% | 5346 49% | 3419 -5% | 2460 -31% | 2726 -24% |
| seq write (MB/s) | 4634 | 2220 -52% | 1495 -68% | 3270 -29% | 2991 -35% | 535 -88% |
| seq q8 t1 read (MB/s) | 6521 | 6661 2% | 7127 9% | 7018 8% | 4633 -29% | 2985 -54% |
| seq q8 t1 write (MB/s) | 4962 | 2216 -55% | 4903 -1% | 4398 -11% | 3415 -31% | 539 -89% |
| 4k q1 t1 read (MB/s) | 68.3 | 48.4 -29% | 65.9 -4% | 73.5 8% | 35.5 -48% | 34 -50% |
| 4k q1 t1 write (MB/s) | 249 | 159.6 -36% | 328 32% | 346 39% | 181.3 -27% | 224 -10% |
| 4k q32 t16 read (MB/s) | 2848 | 3311 16% | 2889 1% | 3552 25% | 2025 -29% | 1054 -63% |
| 4k q32 t16 write (MB/s) | 2670 | 2193 -18% | 1457 -45% | 3610 35% | 2291 -14% | 507 -81% |
| Całkowita średnia (program / ustawienia) | -24% /
-24% | -9% /
-11% | -3% /
-6% | -52% /
-55% | -101% /
-113% |
* ... im mniej tym lepiej
* ... im mniej tym lepiej
Continuous Performance Read: DiskSpd Read Loop, Queue Depth 8
Karta graficzna
Karta graficzna Nvidia Helios 16 GeForce RTX 4060 to układ średniej klasy z 8 GB pamięci VRAM, który ma maksymalne TGP wynoszące 140 watów (115 watów + 25 watów Dynamic Boost). Maksymalna częstotliwość taktowania 2,570 MHz jest jednak osiągana już przy 100 watów. Tylko test obciążeniowy FurMark był w stanie wydobyć ~140 watów z GPU. Dla kontrastu, podczas grania, GPU laptopa RTX 4060 nigdy nie pobiera więcej niż ~100 W.
Wydajność jest odpowiednio podobna do innych laptopów do gier z RTX 4060, takich jakLegion Pro 5 16i Dell G15 5530. Karta RTX 4070wAorus 15X również nie jest daleko. Wyniki benchmarków syntetycznych są o połowę niższe w trybie bateryjnym.
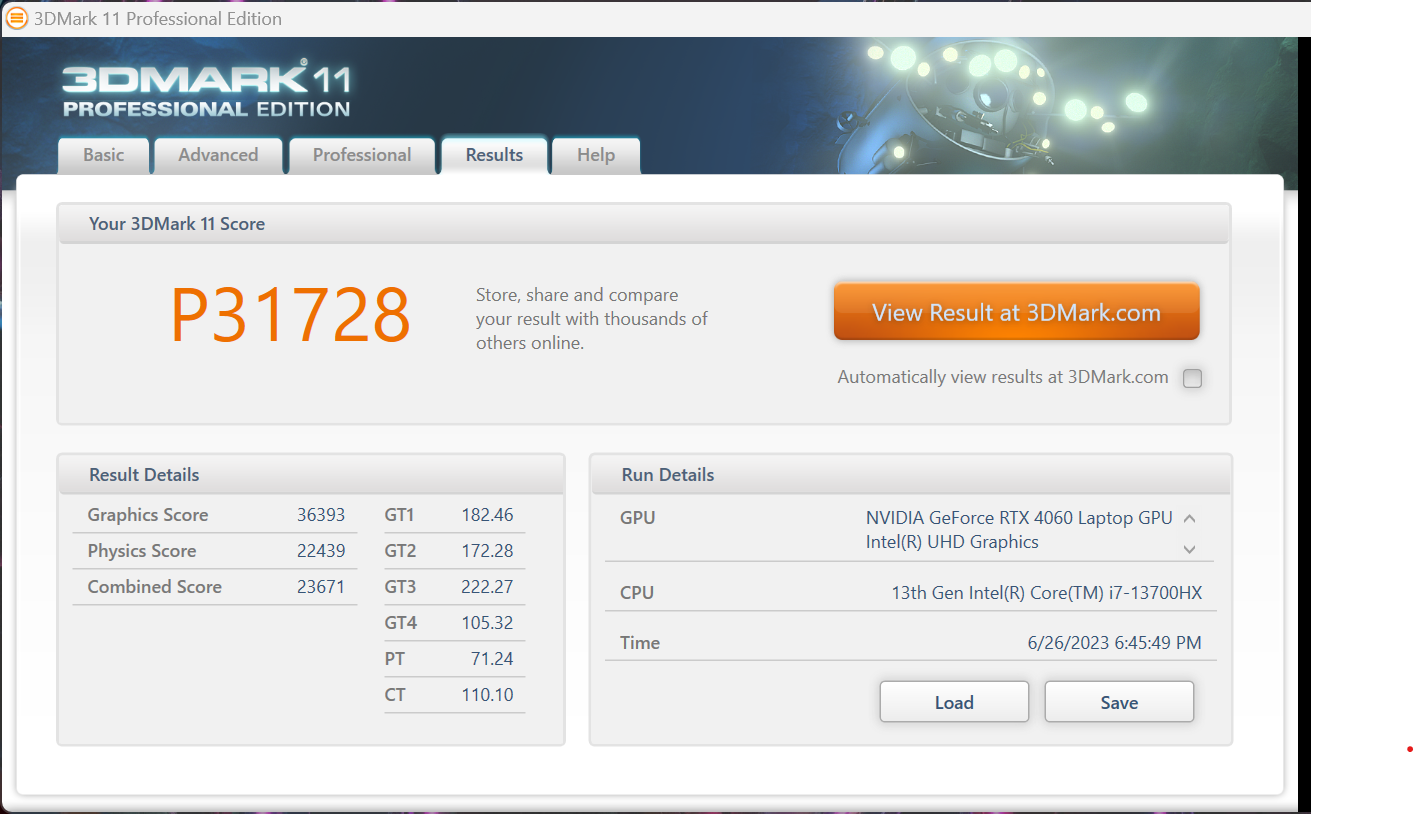

| 3DMark 11 Performance | 31728 pkt. | |
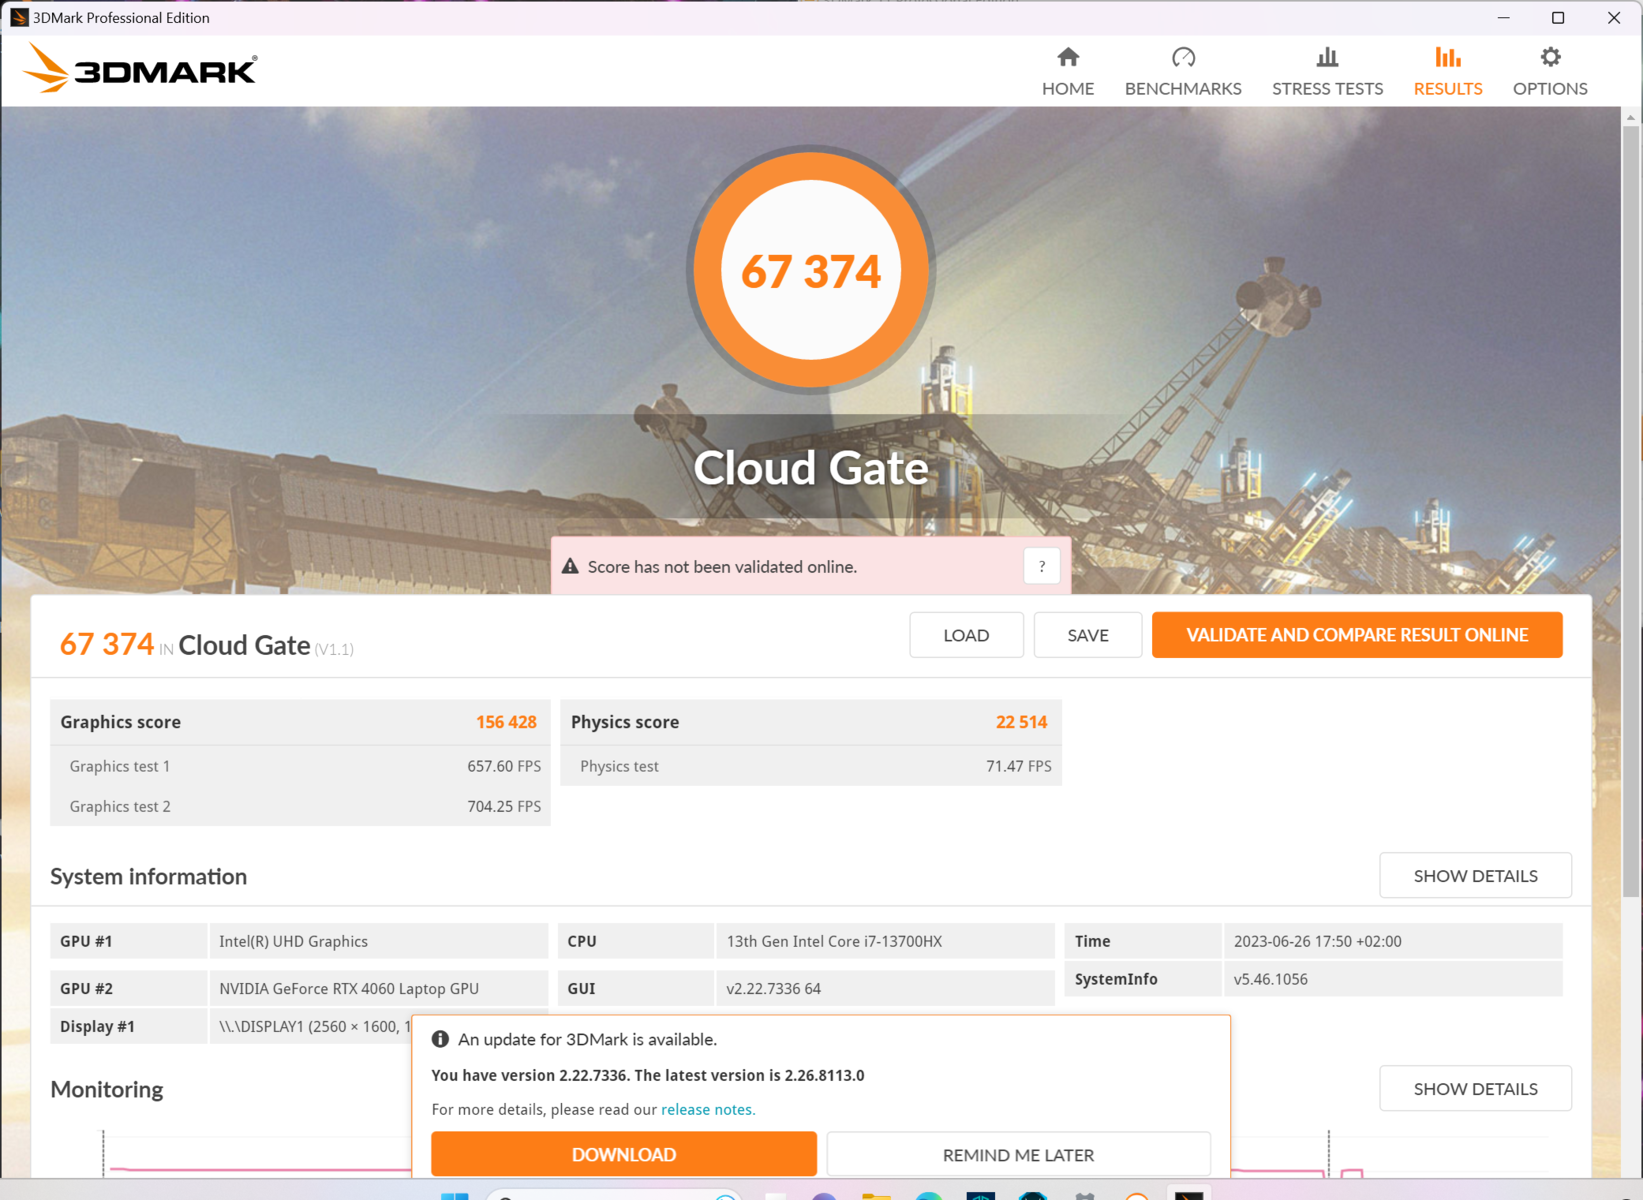
| 3DMark Cloud Gate Standard Score | 67374 pkt. | |
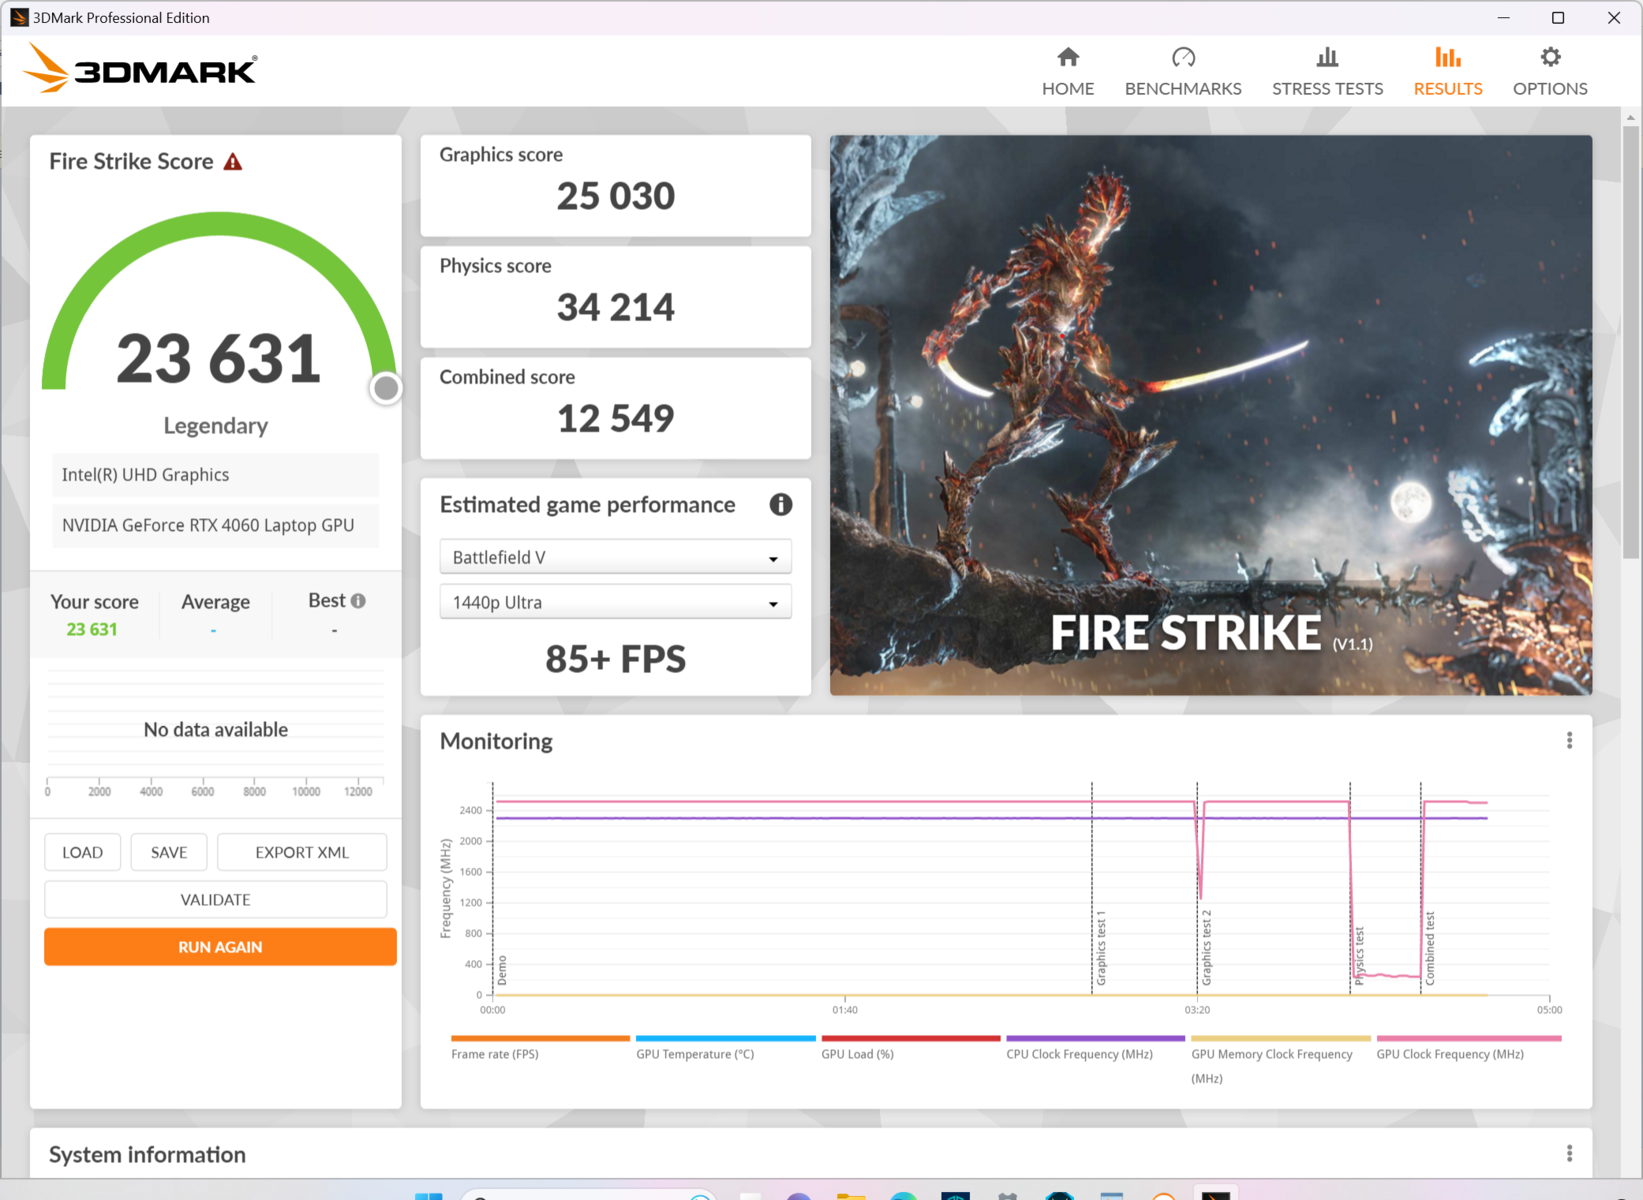
| 3DMark Fire Strike Score | 23631 pkt. | |
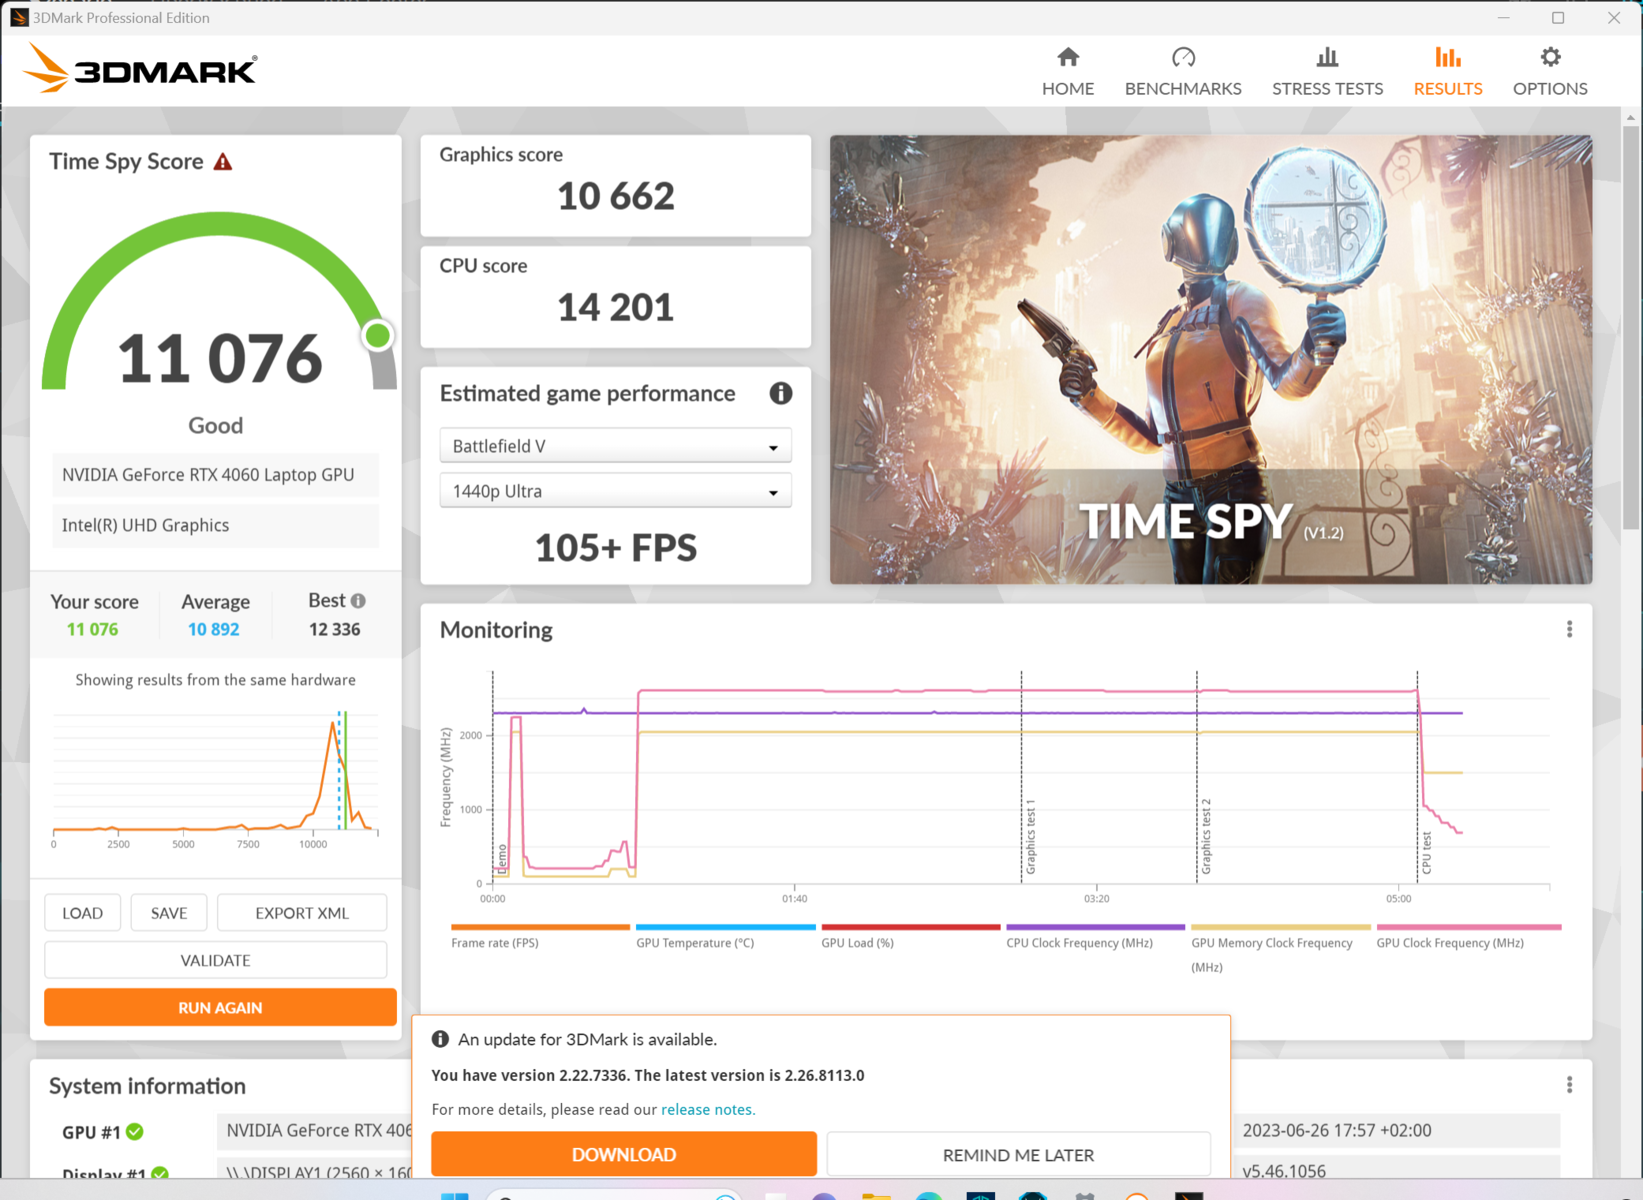
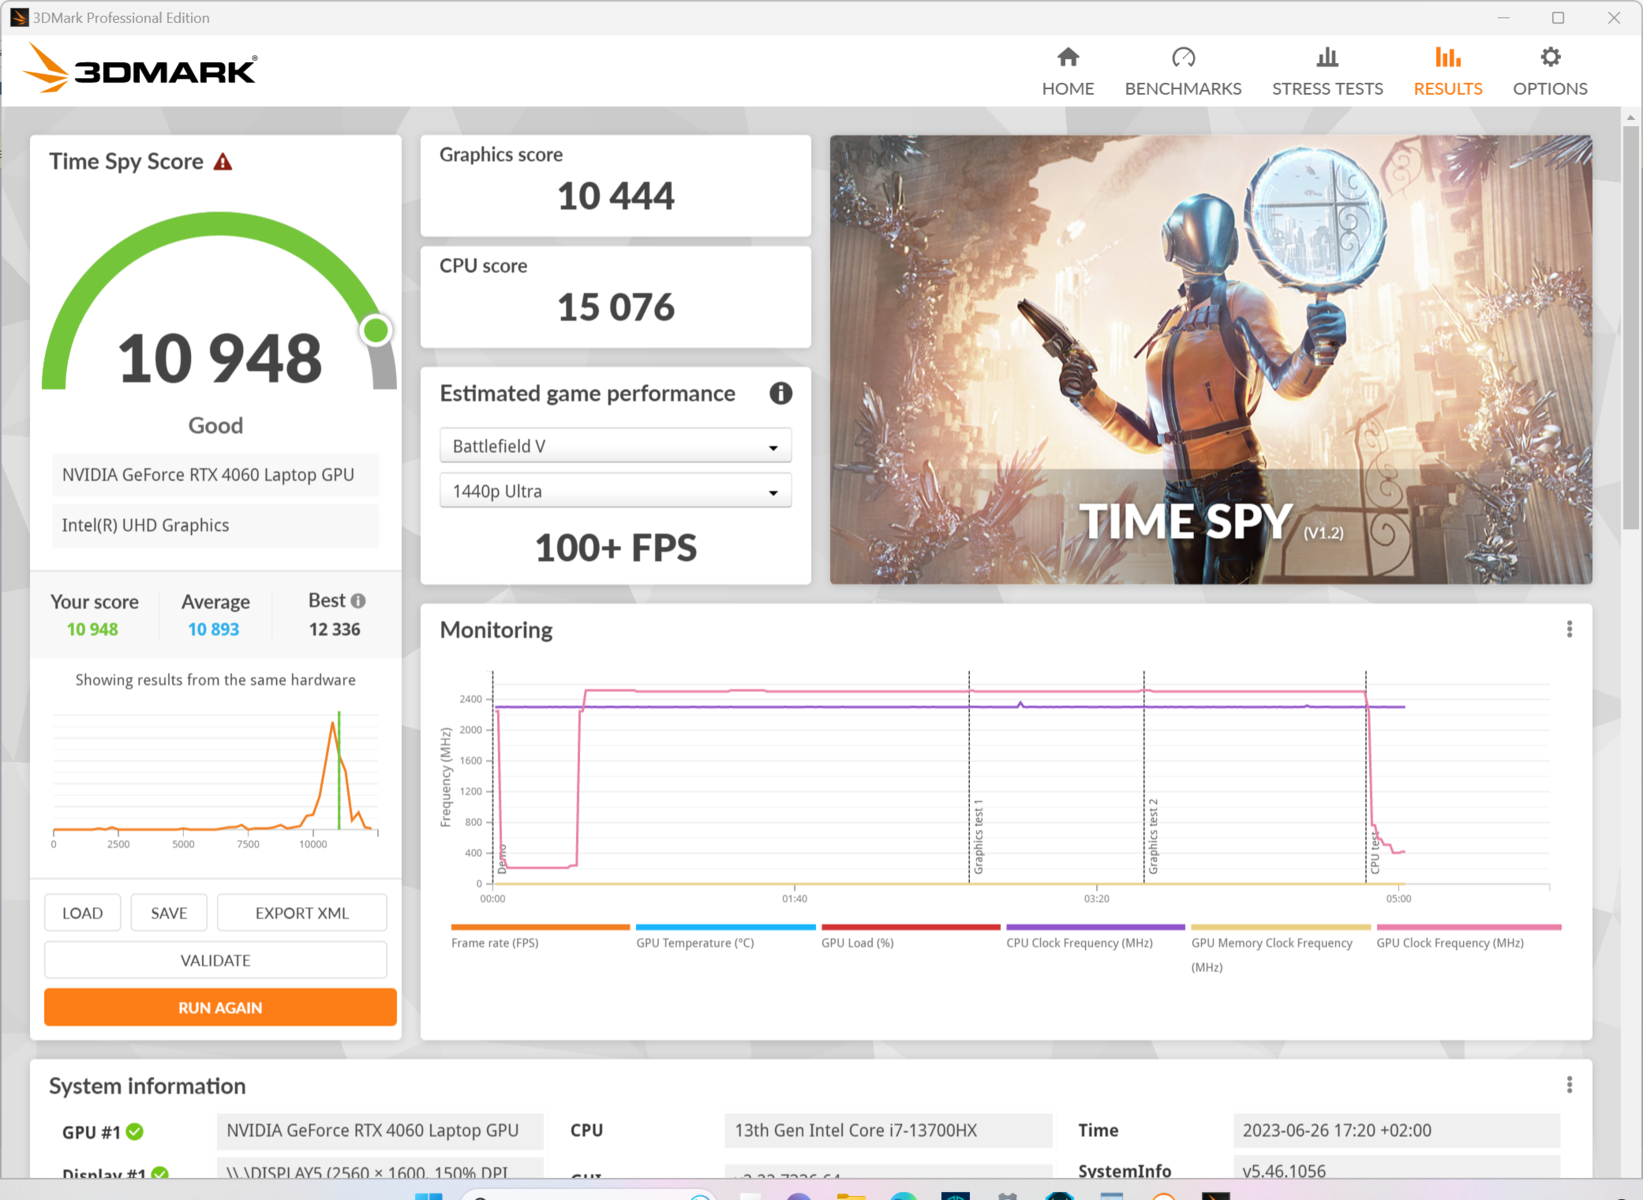
| 3DMark Time Spy Score | 10948 pkt. | |
Pomoc | ||
| Geekbench 6.0 - GPU OpenCL 6.0 | |
| Aorus 15X ASF | |
| Acer Nitro 16 AN16-41 | |
| Acer Predator Helios 16 PH16-71-731Q | |
| Dell G15 5530 | |
* ... im mniej tym lepiej
Wydajność w grach
W Cyberpunk 2077 @QHD/Ultra, Acer Predator Helios 16 był w stanie ścigać się na czele naszej konkurencji, nawet nieznacznie przed Legion Pro 5 16'sRTX 4070. Jednak w naszej ocenie wydajności wszystkie konkurencyjne urządzenia są połączone razem z RadeonemRX 7600Sznajdującym się w TUF Gaming A16nieznacznie słabnąc.
Przejście do trybu tylko dGPU skutkuje skromnym, 3-procentowym wzrostem wydajności. W połączeniu z trybem turbo wzrost ten wzrasta do 6%. Przy włączonym ray tracingu, w Cyberpunk 2077 1.6 Ultra/FHD nadal uzyskujemy 60 kl/s zamiast 93,2 kl/s. Z aktywowanym DLSS (zrównoważonym) - w tym przypadku bez ray tracingu - jest to 134,2 kl.
Zrównoważony tryb wydajności obniża liczbę klatek na sekundę do 87,4, co jest więcej niż akceptowalne, biorąc pod uwagę znacznie cichsze wentylatory. W trybie bateryjnym liczba klatek na sekundę spada o prawie 70% do 30 klatek na sekundę. Dzięki funkcji "DLSS Max Performance" możliwe jest ponowne podwojenie liczby klatek na sekundę, dzięki czemu niektóre nowe gry działają (i pozostają) stosunkowo płynnie w trybie baterii.
| Performance rating - Percent | |
| Średnia w klasie Gaming | |
| Aorus 15X ASF | |
| Dell G15 5530 | |
| Acer Predator Helios 300 (i7-12700H, RTX 3070 Ti) | |
| Acer Nitro 17 AN17-51-71ER | |
| Acer Predator Helios 16 PH16-71-731Q | |
| Acer Predator Triton 500 SE PT516-52s-70KX | |
| Acer Nitro 16 AN16-41 | |
| Asus TUF Gaming A16 FA617 | |
| The Witcher 3 - 1920x1080 Ultra Graphics & Postprocessing (HBAO+) | |
| Średnia w klasie Gaming (95 - 240, n=8, ostatnie 2 lata) | |
| Acer Predator Helios 300 (i7-12700H, RTX 3070 Ti) | |
| Aorus 15X ASF | |
| Acer Nitro 16 AN16-41 | |
| Acer Nitro 17 AN17-51-71ER | |
| Dell G15 5530 | |
| Acer Predator Triton 500 SE PT516-52s-70KX | |
| Acer Predator Helios 16 PH16-71-731Q | |
| Asus TUF Gaming A16 FA617 | |
| GTA V - 1920x1080 Highest AA:4xMSAA + FX AF:16x | |
| Średnia w klasie Gaming (48.3 - 186.9, n=100, ostatnie 2 lata) | |
| Aorus 15X ASF | |
| Acer Nitro 17 AN17-51-71ER | |
| Acer Predator Triton 500 SE PT516-52s-70KX | |
| Acer Predator Helios 300 (i7-12700H, RTX 3070 Ti) | |
| Acer Predator Helios 16 PH16-71-731Q | |
| Dell G15 5530 | |
| Acer Nitro 16 AN16-41 | |
| Asus TUF Gaming A16 FA617 | |
| Final Fantasy XV Benchmark - 1920x1080 High Quality | |
| Średnia w klasie Gaming (41 - 215, n=101, ostatnie 2 lata) | |
| Aorus 15X ASF | |
| Acer Predator Helios 300 (i7-12700H, RTX 3070 Ti) | |
| Acer Nitro 16 AN16-41 | |
| Acer Predator Triton 500 SE PT516-52s-70KX | |
| Acer Nitro 17 AN17-51-71ER | |
| Acer Predator Helios 16 PH16-71-731Q | |
| Dell G15 5530 | |
| Asus TUF Gaming A16 FA617 | |
| Strange Brigade - 1920x1080 ultra AA:ultra AF:16 | |
| Średnia w klasie Gaming (76.3 - 456, n=91, ostatnie 2 lata) | |
| Acer Predator Helios 300 (i7-12700H, RTX 3070 Ti) | |
| Aorus 15X ASF | |
| Acer Nitro 17 AN17-51-71ER | |
| Acer Nitro 16 AN16-41 | |
| Dell G15 5530 | |
| Acer Predator Helios 16 PH16-71-731Q | |
| Acer Predator Triton 500 SE PT516-52s-70KX | |
| Asus TUF Gaming A16 FA617 | |
| Dota 2 Reborn - 1920x1080 ultra (3/3) best looking | |
| Acer Predator Helios 16 PH16-71-731Q | |
| Średnia w klasie Gaming (84.8 - 248, n=110, ostatnie 2 lata) | |
| Aorus 15X ASF | |
| Dell G15 5530 | |
| Acer Predator Triton 500 SE PT516-52s-70KX | |
| Acer Nitro 17 AN17-51-71ER | |
| Acer Predator Helios 300 (i7-12700H, RTX 3070 Ti) | |
| Acer Nitro 16 AN16-41 | |
| Asus TUF Gaming A16 FA617 | |
| X-Plane 11.11 - 1920x1080 high (fps_test=3) | |
| Aorus 15X ASF | |
| Dell G15 5530 | |
| Acer Nitro 17 AN17-51-71ER | |
| Acer Predator Triton 500 SE PT516-52s-70KX | |
| Średnia w klasie Gaming (52.1 - 143.5, n=113, ostatnie 2 lata) | |
| Acer Predator Helios 16 PH16-71-731Q | |
| Acer Predator Helios 300 (i7-12700H, RTX 3070 Ti) | |
| Acer Nitro 16 AN16-41 | |
| Asus TUF Gaming A16 FA617 | |
Witcher 3 FPS diagram
| low | med. | high | ultra | QHD | |
|---|---|---|---|---|---|
| GTA V (2015) | 182.8 | 181.3 | 172.5 | 112.8 | 88.3 |
| The Witcher 3 (2015) | 466 | 331 | 181.3 | 102.1 | |
| Dota 2 Reborn (2015) | 189.6 | 171.8 | 159.2 | 153 | |
| Final Fantasy XV Benchmark (2018) | 226 | 150.3 | 100.1 | 72.4 | |
| X-Plane 11.11 (2018) | 136.2 | 123.2 | 95.4 | ||
| Strange Brigade (2018) | 434 | 272 | 215 | 185.2 | 123.5 |
| Shadow of the Tomb Raider (2018) | 141 | 93 | |||
| God of War (2022) | 134.4 | 112.3 | 89.4 | 64.6 | 53.3 |
| Cyberpunk 2077 1.6 (2022) | 132.5 | 126 | 114.9 | 93.2 | 58.6 |
| Tiny Tina's Wonderlands (2022) | 219 | 175.1 | 114.7 | 87.9 | 60 |
| F1 22 (2022) | 256 | 244 | 196.5 | 65.2 | 38 |
| Call of Duty Modern Warfare 2 2022 (2022) | 88 | 60 | |||
| Returnal (2023) | 84.4 | 77.9 | 72.6 | 67 | 59.4 |
Emisje: Acer Predator Helios 16 posiada wydajny system chłodzenia

Emisja hałasu
W trybie bezczynności, podczas surfowania po Internecie i wykonywania prostych zadań biurowych, Predator Helios 16 jest prawie zawsze przyjemnie cichy i, co oczywiste, w trybie cichym lub na zasilaniu bateryjnym.
Jeśli chodzi o czyste obciążenie procesora, osiągnięto 36,6 dB(A), ale nie było to zbyt irytujące. Podczas grania tryb wydajnościowy robi się bardzo głośny, osiągając 49 dB(A), co jest średnią dla laptopów do gier. W trybie turbo robi się nieznośnie głośno bez żadnej realnej wartości dodanej. Dla kontrastu, tryb zrównoważony osiąga prawie przyjemny hałas w tle, przy bardzo niewielkiej utracie wydajności. Wreszcie, tryb cichy jest przyjemny dla uszu przy spadkach o około 30% w aplikacjach 3D.
Jednak ładowanie naszego modelu testowego spowodowało wyraźnie słyszalny jęk.
Hałas
| luz |
| 24 / 24 / 32.32 dB |
| obciążenie |
| 36.66 / 49.49 dB |
 | ||
30 dB cichy 40 dB(A) słyszalny 50 dB(A) irytujący |
||
min: | ||
| Acer Predator Helios 16 PH16-71-731Q GeForce RTX 4060 Laptop GPU, i7-13700HX, Micron 3400 1TB MTFDKBA1T0TFH | Acer Nitro 16 AN16-41 GeForce RTX 4070 Laptop GPU, R7 7735HS, Samsung PM9A1 MZVL21T0HCLR | Lenovo Legion Pro 5 16IRX8 GeForce RTX 4060 Laptop GPU, i7-13700HX, SK hynix PC801 HFS512GEJ9X115N | Aorus 15X ASF GeForce RTX 4070 Laptop GPU, i7-13700HX, Gigabyte AG470S1TB-SI B10 | Asus TUF Gaming A16 FA617 Radeon RX 7600S, R7 7735HS, Micron 2400 MTFDKBA1T0QFM | Dell G15 5530 GeForce RTX 4060 Laptop GPU, i7-13650HX, SSTC CL4-3D512-Q11 | |
|---|---|---|---|---|---|---|
| Noise | -3% | 4% | -17% | -1% | 5% | |
| wyłączone / środowisko * (dB) | 24 | 25.7 -7% | 23 4% | 25 -4% | 24 -0% | 20.41 15% |
| Idle Minimum * (dB) | 24 | 25.7 -7% | 23.1 4% | 28 -17% | 24 -0% | 26.85 -12% |
| Idle Average * (dB) | 24 | 25.7 -7% | 23.1 4% | 29 -21% | 25 -4% | 26.85 -12% |
| Idle Maximum * (dB) | 32.32 | 26.3 19% | 26.6 18% | 36 -11% | 28 13% | 26.85 17% |
| Load Average * (dB) | 36.66 | 33.9 8% | 34.7 5% | 50 -36% | 42 -15% | 27.65 25% |
| Witcher 3 ultra * (dB) | 49.06 | 47.6 3% | 54 -10% | 50 -2% | 47.9 2% | |
| Load Maximum * (dB) | 49.49 | 62 -25% | 54.8 -11% | 58 -17% | 50 -1% | 47.86 3% |
* ... im mniej tym lepiej
Temperatura
Laptop Acer do gier pozostaje zadziwiająco chłodny, a podczas sesji gamingowych większość powierzchni nie osiąga nawet 40 °C. Ciepło koncentruje się tylko na wystającym układzie chłodzenia z tyłu, gdzie gorące punkty mogą osiągnąć 55 °C podczas grania. Tylko w połączonym teście obciążeniowym zmierzyliśmy gorący punkt o temperaturze 66 °C, chociaż nie zdarza się to podczas codziennego użytkowania. Użytkownicy w większości przypadków nigdy nie będą mieli kontaktu z tylną listwą, ale po umieszczeniu na kolanach, okazjonalny kontakt z urządzeniem będzie nieprzyjemny podczas grania.
(±) Maksymalna temperatura w górnej części wynosi 41 °C / 106 F, w porównaniu do średniej 40.4 °C / 105 F , począwszy od 21.2 do 68.8 °C dla klasy Gaming.
(-) Dno nagrzewa się maksymalnie do 66 °C / 151 F, w porównaniu do średniej 43.2 °C / 110 F
(±) W stanie bezczynności średnia temperatura górnej części wynosi 32.4 °C / 90 F, w porównaniu ze średnią temperaturą urządzenia wynoszącą 33.9 °C / ### class_avg_f### F.
(±) Podczas gry w Wiedźmina 3 średnia temperatura górnej części wynosi 33.1 °C / 92 F, w porównaniu do średniej temperatury urządzenia wynoszącej 33.9 °C / ## #class_avg_f### F.
(+) Podparcia dłoni i touchpad osiągają maksymalną temperaturę skóry (32 °C / 89.6 F) i dlatego nie są gorące.
(-) Średnia temperatura obszaru podparcia dłoni w podobnych urządzeniach wynosiła 28.8 °C / 83.8 F (-3.2 °C / -5.8 F).
| Acer Predator Helios 16 PH16-71-731Q Intel Core i7-13700HX, NVIDIA GeForce RTX 4060 Laptop GPU | Acer Nitro 16 AN16-41 AMD Ryzen 7 7735HS, NVIDIA GeForce RTX 4070 Laptop GPU | Lenovo Legion Pro 5 16IRX8 Intel Core i7-13700HX, NVIDIA GeForce RTX 4060 Laptop GPU | Aorus 15X ASF Intel Core i7-13700HX, NVIDIA GeForce RTX 4070 Laptop GPU | Asus TUF Gaming A16 FA617 AMD Ryzen 7 7735HS, AMD Radeon RX 7600S | Dell G15 5530 Intel Core i7-13650HX, NVIDIA GeForce RTX 4060 Laptop GPU | |
|---|---|---|---|---|---|---|
| Heat | 10% | 12% | 19% | -6% | -2% | |
| Maximum Upper Side * (°C) | 41 | 41.5 -1% | 42.8 -4% | 42 -2% | 54 -32% | 54 -32% |
| Maximum Bottom * (°C) | 66 | 51.8 22% | 50 24% | 51 23% | 47 29% | 62.2 6% |
| Idle Upper Side * (°C) | 36 | 31.6 12% | 29.6 18% | 27 25% | 40 -11% | 33.4 7% |
| Idle Bottom * (°C) | 37 | 34.5 7% | 34 8% | 26 30% | 40 -8% | 33.4 10% |
* ... im mniej tym lepiej
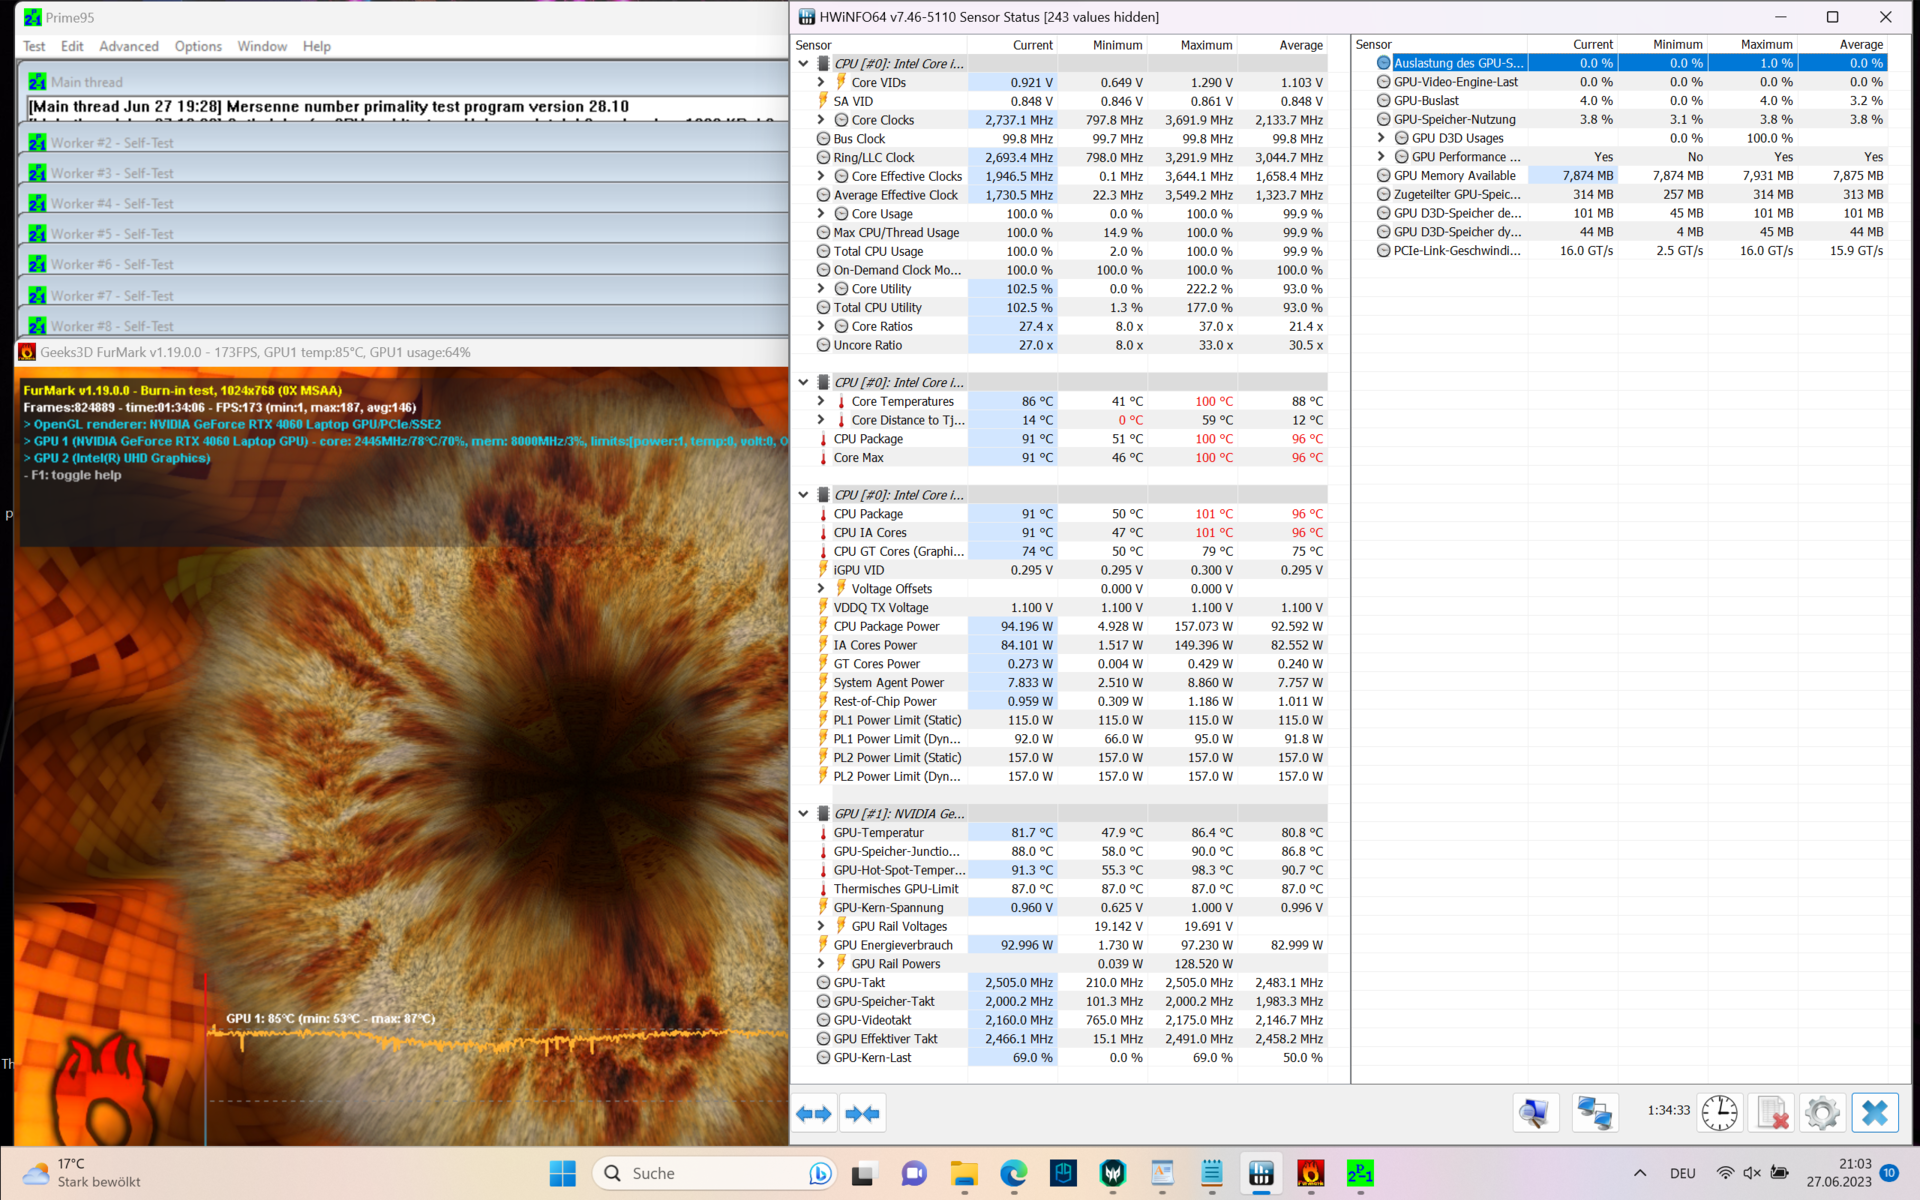
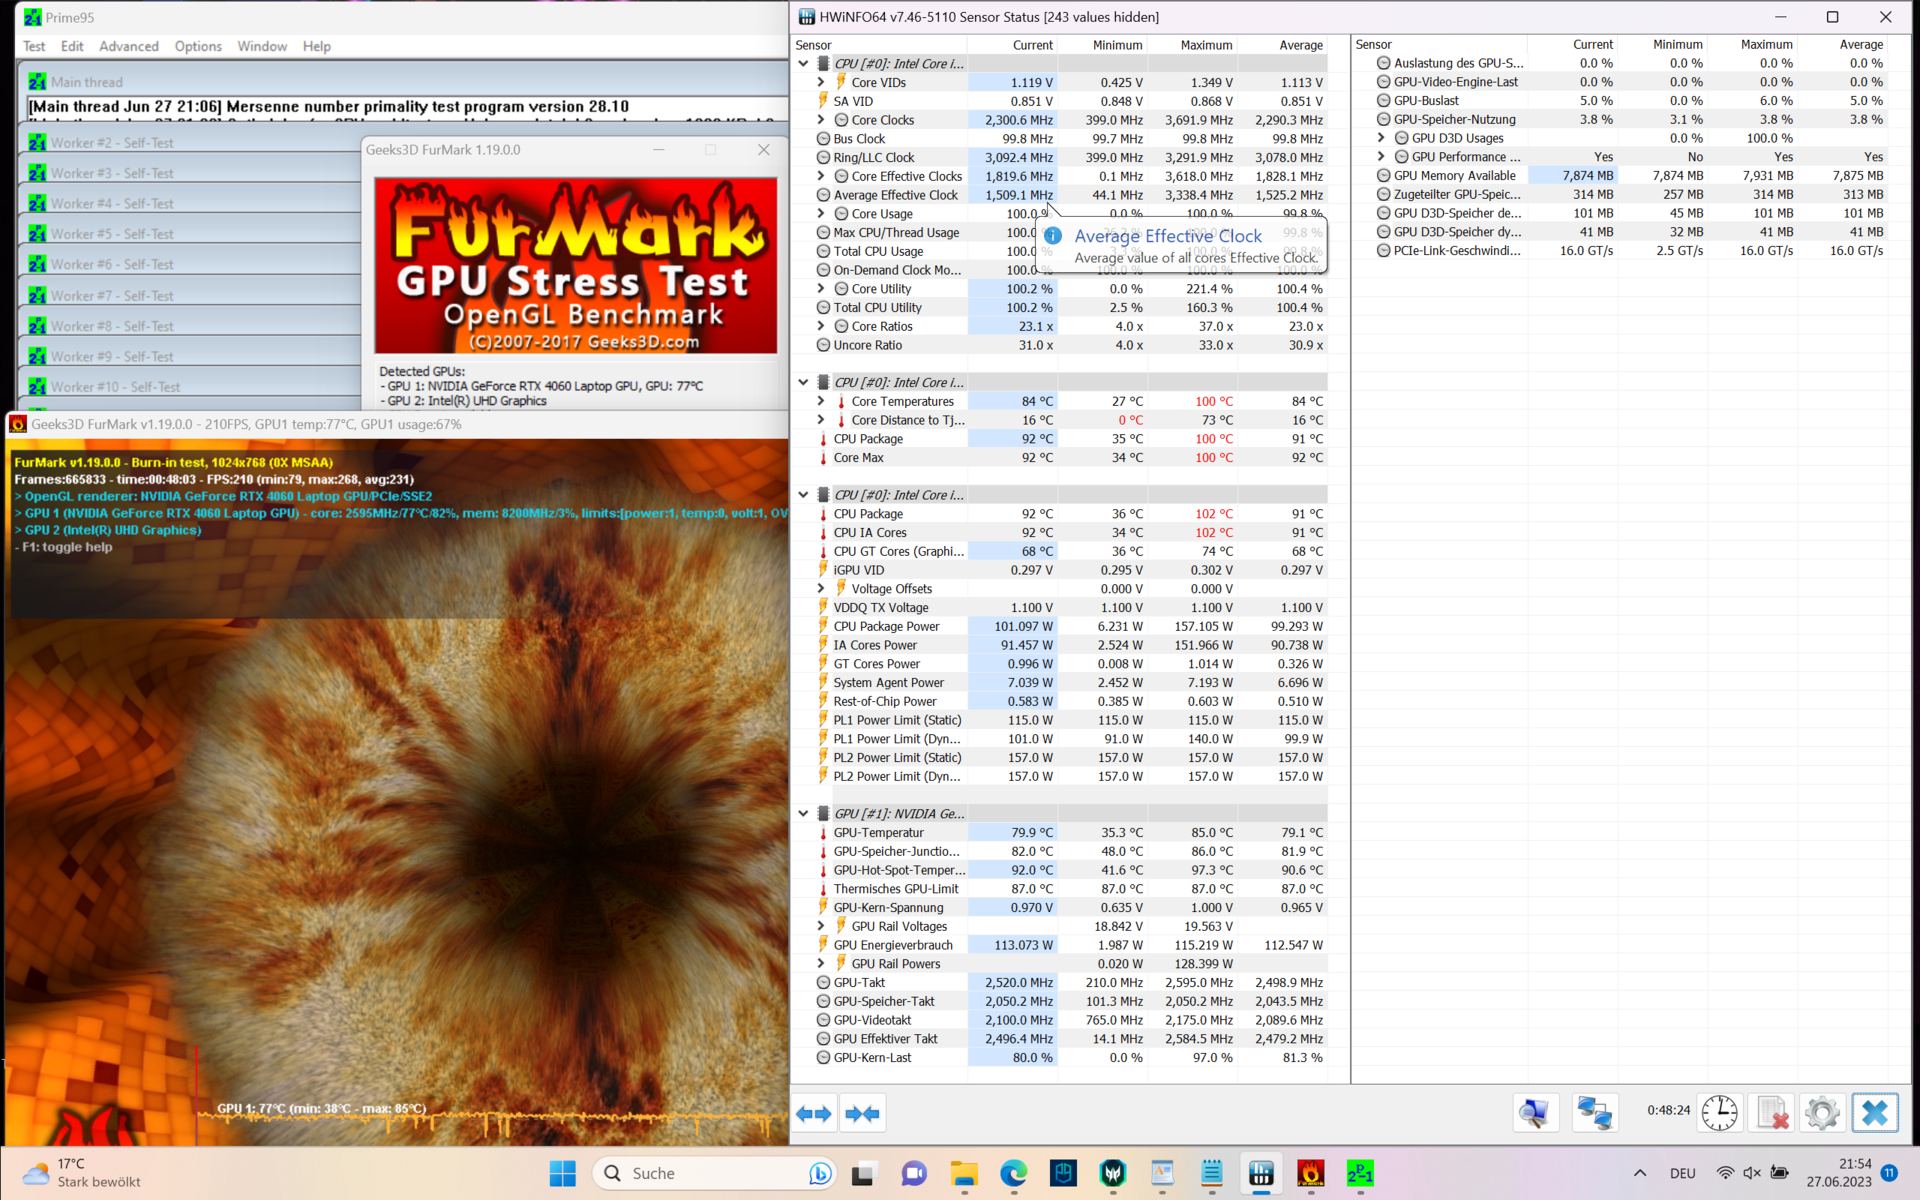
Test warunków skrajnych
W teście obciążeniowym (FurMark + Prime95) po minucie taktowanie rdzeni P spadło z 3,6 GHz do zaledwie 0,85 GHz, czyli znacznie poniżej bazowego taktowania 2,1 GHz. Po aktywacji trybu turbo i "maksymalnych wentylatorów", taktowanie spadło dopiero po 3 minutach (do ~1,1 GHz). Procesor nagrzewa się do 86 °C (i odpowiednio 83 °C) i stale pobiera 100 watów.
GPU mniej więcej utrzymuje swoje taktowanie na poziomie 2500-2600 MHz, nie nagrzewa się zbytnio (81 °C) i pobiera 115 W. W teście obciążeniowym Witcher 3 i w prawie wszystkich grach, kartaRTX 4060 potrzebuje tylko 100 W, aby osiągnąć maksymalną prędkość zegara. Jednak w modelach z kartąRTX 4080powinno to wyglądać inaczej.
W czystym teście obciążeniowym GPU (FurMark), procesor graficzny nadal prawie osiągał maksymalne taktowanie około 2430 MHz, pobierając 129 W i nagrzewając się do 76 °C. W trybie turbo + maksymalne wentylatory osiągnięto do 2625 MHz (lekkie podkręcenie), pobierając 136 watów (szczyt 139 watów), podczas gdy GPU pozostaje stosunkowo chłodny w temperaturze 71,5 °C.
Nawet podczas czystego stresu CPU, po minucie, rdzenie P taktują tylko z częstotliwością 0,92 GHz, ponieważ są ograniczone do 100 watów, chociaż procesor osiąga tylko 70 °C. System chłodzenia wyraźnie poradziłby sobie z czymś więcej. Po włączeniu trybu turbo + maksymalnych wentylatorów nadal jest to 1,45 GHz przy 115 W i 73 °C. Możliwość wyboru limitów PL byłaby rozsądna, zwłaszcza przy wyborze SKU z Core i9-13900HX.
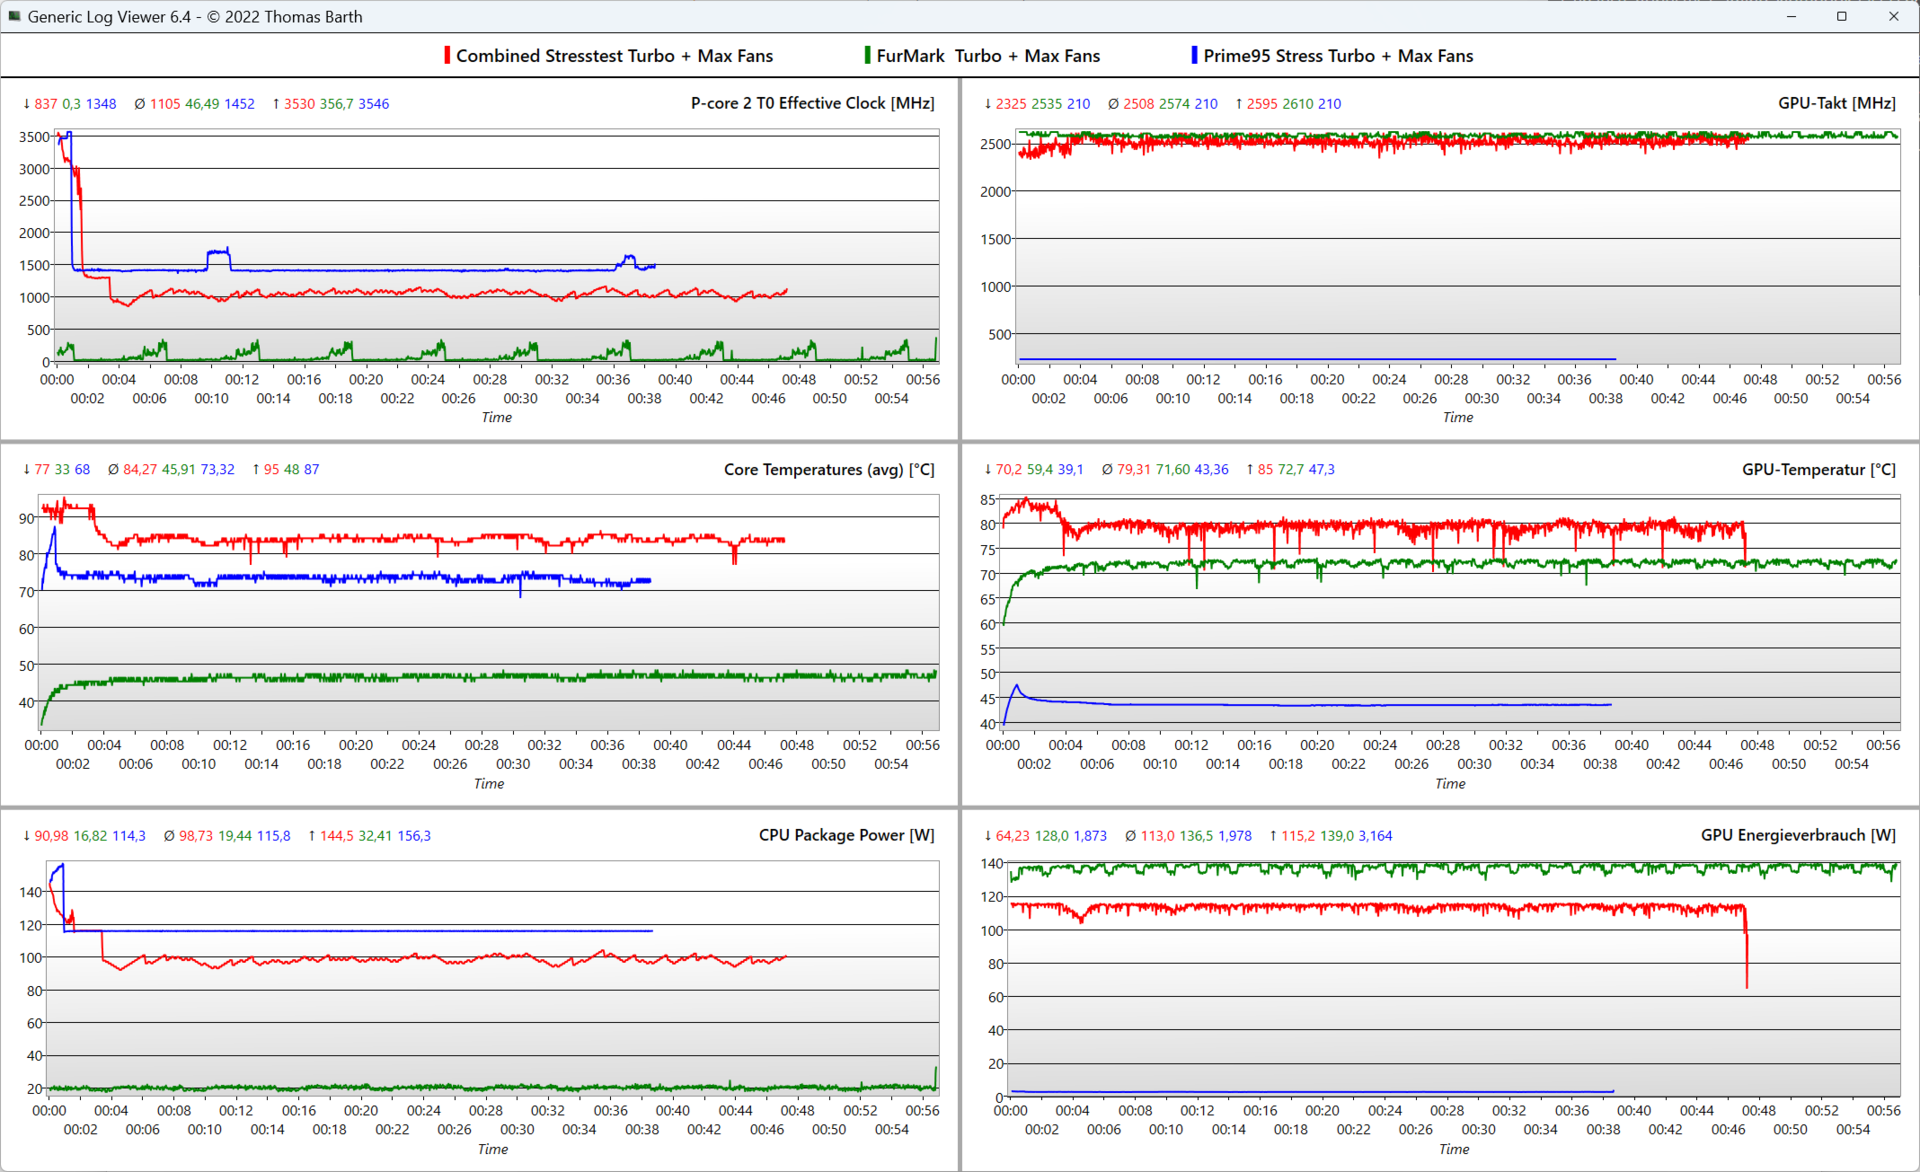
| @Tryb wydajności | Taktowanie rdzeni P/ E (GHz) | Taktowanie GPU (MHz) | Średnia temperatura CPU (°C) | Średnia temperatura GPU (°C) |
| Bezczynność systemu | 0,07 / 0,07 | - | 33 | 37 |
| Prime95Stress | 0,95 / 3,5 | 10 | 71 | 49 |
| Prime95+ FurMark | 0,85 / 3,4 | 2.500 | 86 | 81 |
| FurMarkStress | 0,55 / 0,02 | 2.450 | 54 | 76 |
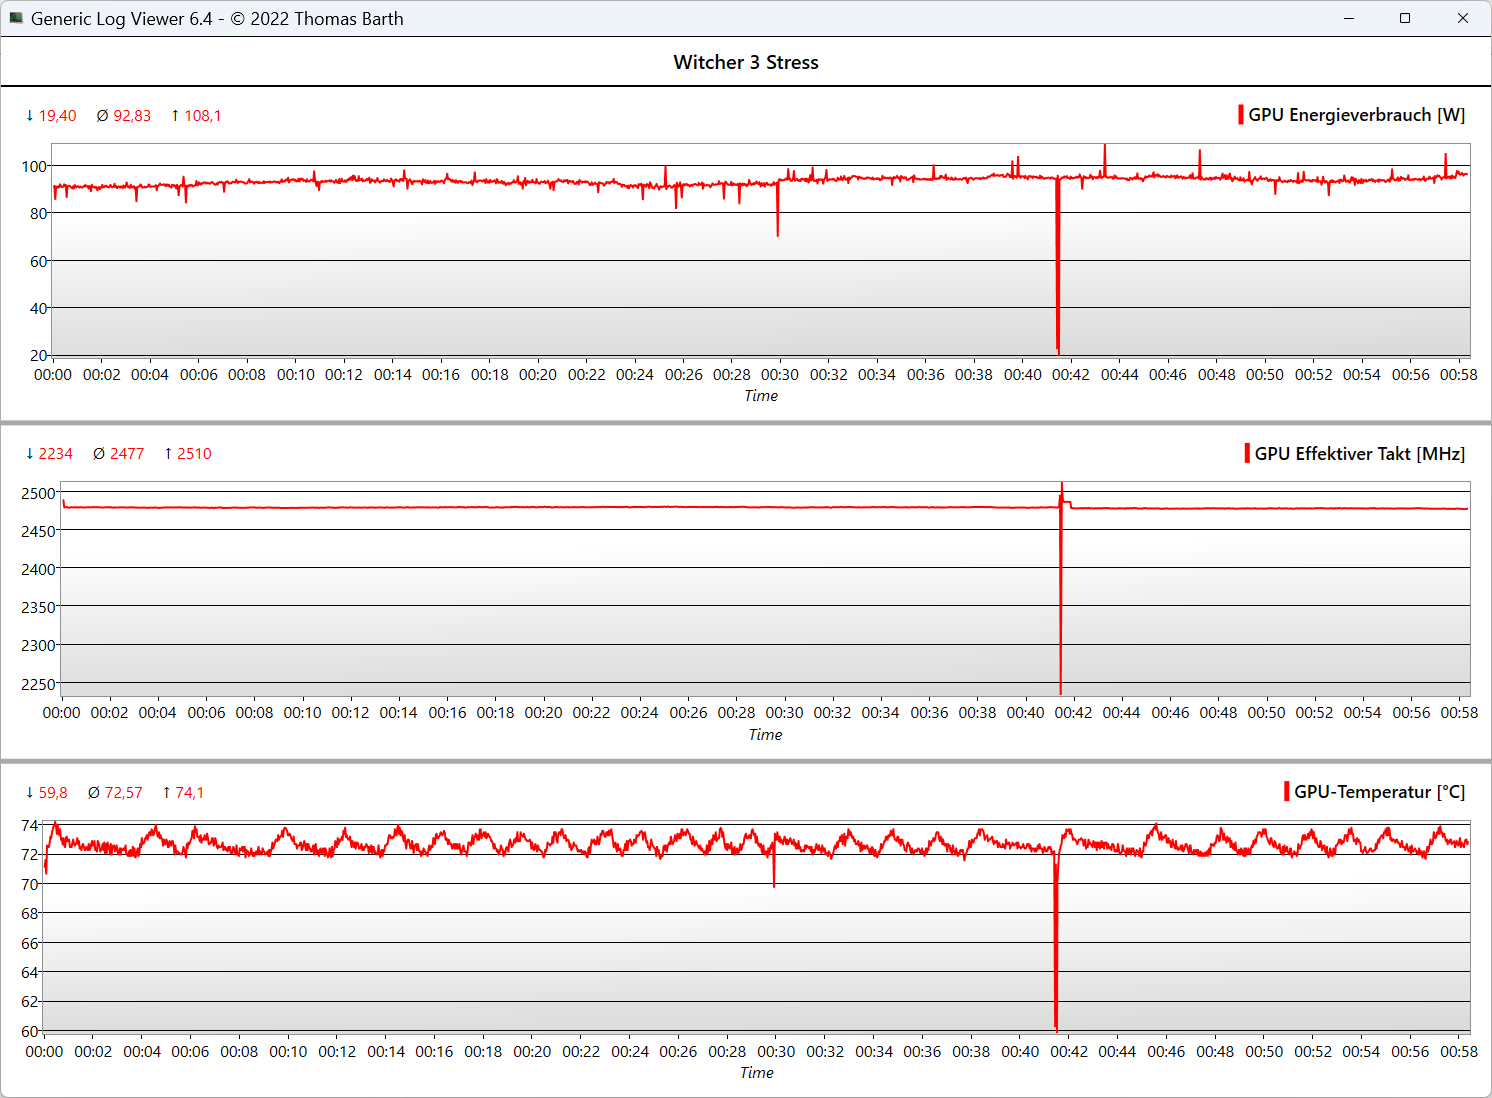
| Witcher 3 Stres | 1,6 / 0,02 | 2.475 | 61 | 73 |
Głośniki
Skierowane w dół 2-watowe głośniki stereo wytwarzają zrównoważone średnie i wysokie tony, ale basy są prawie całkowicie nieobecne, a maksymalna głośność 76,1 dB(A) jest raczej przeciętna. Laptopy do gier w naszym polu porównawczym nie radzą sobie lepiej.
Alternatywą może byćAsus ROG Strix G16, Lenovo Legion Pro 7oferuje lepszy dźwięk lub możesz użyć zestawu słuchawkowego lub systemu dźwiękowego przez gniazdo audio lub Bluetooth.
Acer Predator Helios 16 PH16-71-731Q analiza dźwięku
(±) | głośność głośnika jest średnia, ale dobra (76.12 dB)
Bas 100 - 315 Hz
(-) | prawie brak basu - średnio 15% niższa od mediany
(-) | bas nie jest liniowy (15% delta do poprzedniej częstotliwości)
Średnie 400 - 2000 Hz
(+) | zbalansowane środki średnie - tylko 2.5% od mediany
(+) | średnie są liniowe (5.9% delta do poprzedniej częstotliwości)
Wysokie 2–16 kHz
(+) | zrównoważone maksima - tylko 2.9% od mediany
(±) | liniowość wysokich wartości jest średnia (8.4% delta do poprzedniej częstotliwości)
Ogólnie 100 - 16.000 Hz
(+) | ogólny dźwięk jest liniowy (13.6% różnicy w stosunku do mediany)
W porównaniu do tej samej klasy
» 20% wszystkich testowanych urządzeń w tej klasie było lepszych, 7% podobnych, 73% gorszych
» Najlepszy miał deltę 6%, średnia wynosiła ###średnia###%, najgorsza wynosiła 132%
W porównaniu do wszystkich testowanych urządzeń
» 15% wszystkich testowanych urządzeń było lepszych, 4% podobnych, 82% gorszych
» Najlepszy miał deltę 4%, średnia wynosiła ###średnia###%, najgorsza wynosiła 134%
Lenovo Legion Pro 5 16IRX8 analiza dźwięku
(±) | głośność głośnika jest średnia, ale dobra (72.7 dB)
Bas 100 - 315 Hz
(-) | prawie brak basu - średnio 23.7% niższa od mediany
(±) | liniowość basu jest średnia (10.7% delta do poprzedniej częstotliwości)
Średnie 400 - 2000 Hz
(+) | zbalansowane środki średnie - tylko 3.8% od mediany
(±) | liniowość środka jest średnia (7.1% delta do poprzedniej częstotliwości)
Wysokie 2–16 kHz
(+) | zrównoważone maksima - tylko 3.7% od mediany
(+) | wzloty są liniowe (6.7% delta do poprzedniej częstotliwości)
Ogólnie 100 - 16.000 Hz
(±) | liniowość ogólnego dźwięku jest średnia (21.9% różnicy w stosunku do mediany)
W porównaniu do tej samej klasy
» 79% wszystkich testowanych urządzeń w tej klasie było lepszych, 6% podobnych, 16% gorszych
» Najlepszy miał deltę 6%, średnia wynosiła ###średnia###%, najgorsza wynosiła 132%
W porównaniu do wszystkich testowanych urządzeń
» 63% wszystkich testowanych urządzeń było lepszych, 7% podobnych, 31% gorszych
» Najlepszy miał deltę 4%, średnia wynosiła ###średnia###%, najgorsza wynosiła 134%
Zarządzanie energią: Wysokie zużycie energii w trybie bezczynności, krótsza żywotność baterii
Zużycie energii
Pobór mocy w stanie spoczynku na poziomie 20 W jest bardzo wysoki, nawet jak na system Intel HX, podczas gdy systemy AMD HS zapewniają najlepsze wyniki wśród konkurentów Acer.
175 watów podczas grania jest stosunkowo niskie, jednak prawie wszystkie laptopy RTX 4060 odnotowują tę wartość, ponieważ GPU osiąga maksymalną prędkość taktowania przy 100 watów. od 240 W do 276 W osiąga się tylko w codziennym (i nie typowym) teście obciążeniowym, który jest łatwo absorbowany przez 330-watowy zasilacz.
| wyłączony / stan wstrzymania | |
| luz | |
| obciążenie |
|
Legenda:
min: | |
| Acer Predator Helios 16 PH16-71-731Q i7-13700HX, GeForce RTX 4060 Laptop GPU, Micron 3400 1TB MTFDKBA1T0TFH, IPS-LED, 2560x1600, 16" | Acer Nitro 16 AN16-41 R7 7735HS, GeForce RTX 4070 Laptop GPU, Samsung PM9A1 MZVL21T0HCLR, IPS, 2560x1600, 16" | Lenovo Legion Pro 5 16IRX8 i7-13700HX, GeForce RTX 4060 Laptop GPU, SK hynix PC801 HFS512GEJ9X115N, IPS, 2560x1600, 16" | Aorus 15X ASF i7-13700HX, GeForce RTX 4070 Laptop GPU, Gigabyte AG470S1TB-SI B10, IPS, 2560x1440, 15.6" | Asus TUF Gaming A16 FA617 R7 7735HS, Radeon RX 7600S, Micron 2400 MTFDKBA1T0QFM, IPS-Level, 1920x1200, 16" | Dell G15 5530 i7-13650HX, GeForce RTX 4060 Laptop GPU, SSTC CL4-3D512-Q11, IPS, 1920x1080, 15.6" | Przeciętny NVIDIA GeForce RTX 4060 Laptop GPU | Średnia w klasie Gaming | |
|---|---|---|---|---|---|---|---|---|
| Power Consumption | 11% | -24% | 6% | 29% | 18% | 18% | 3% | |
| Idle Minimum * (Watt) | 15.9 | 11.6 27% | 24.5 -54% | 11 31% | 8 50% | 8.4 47% | 11.5 ? 28% | 13.2 ? 17% |
| Idle Average * (Watt) | 20.5 | 15.6 24% | 29.2 -42% | 16 22% | 11 46% | 14.98 27% | 16 ? 22% | 18.9 ? 8% |
| Idle Maximum * (Watt) | 20.9 | 16.5 21% | 34.3 -64% | 24 -15% | 16 23% | 15.56 26% | 20.3 ? 3% | 24.3 ? -16% |
| Load Average * (Watt) | 106 | 155 -46% | 98.7 7% | 104 2% | 97 8% | 96.8 9% | 92.9 ? 12% | 108.3 ? -2% |
| Witcher 3 ultra * (Watt) | 175 | 154.8 12% | 178.6 -2% | 185.4 -6% | 161.5 8% | 186 -6% | ||
| Load Maximum * (Watt) | 276 | 205 26% | 249.6 10% | 272 1% | 168 39% | 271.42 2% | 210 ? 24% | 254 ? 8% |
* ... im mniej tym lepiej
Power consumption Witcher 3 / stress test
Power consumption with an external monitor
Żywotność baterii
Przy jasności 150 cd/m² podczas surfowania po Internecie i zmiennej częstotliwości odświeżania od 120 do 240 Hz, czas pracy na baterii Heliosa 16 wynosi nieco ponad 5,5 godziny i jest mniej więcej średnią dla laptopów do gier. Systemy AMD, takie jakAcer Nitro 16iAsus TUF Gaming A16mają znacznie dłuższą żywotność, wynoszącą odpowiednio 9 i 12 godzin. Przy zaledwie 3,5 godzinachLegion Pro 5 16 plasuje się z tyłu.
Po pół godzinie bateria jest ponownie ładowana do 50%, a 100% zajmuje około 1,15 godziny. Możliwe jest również ładowanie laptopa przez USB-C, jednak jest to wolniejsze.
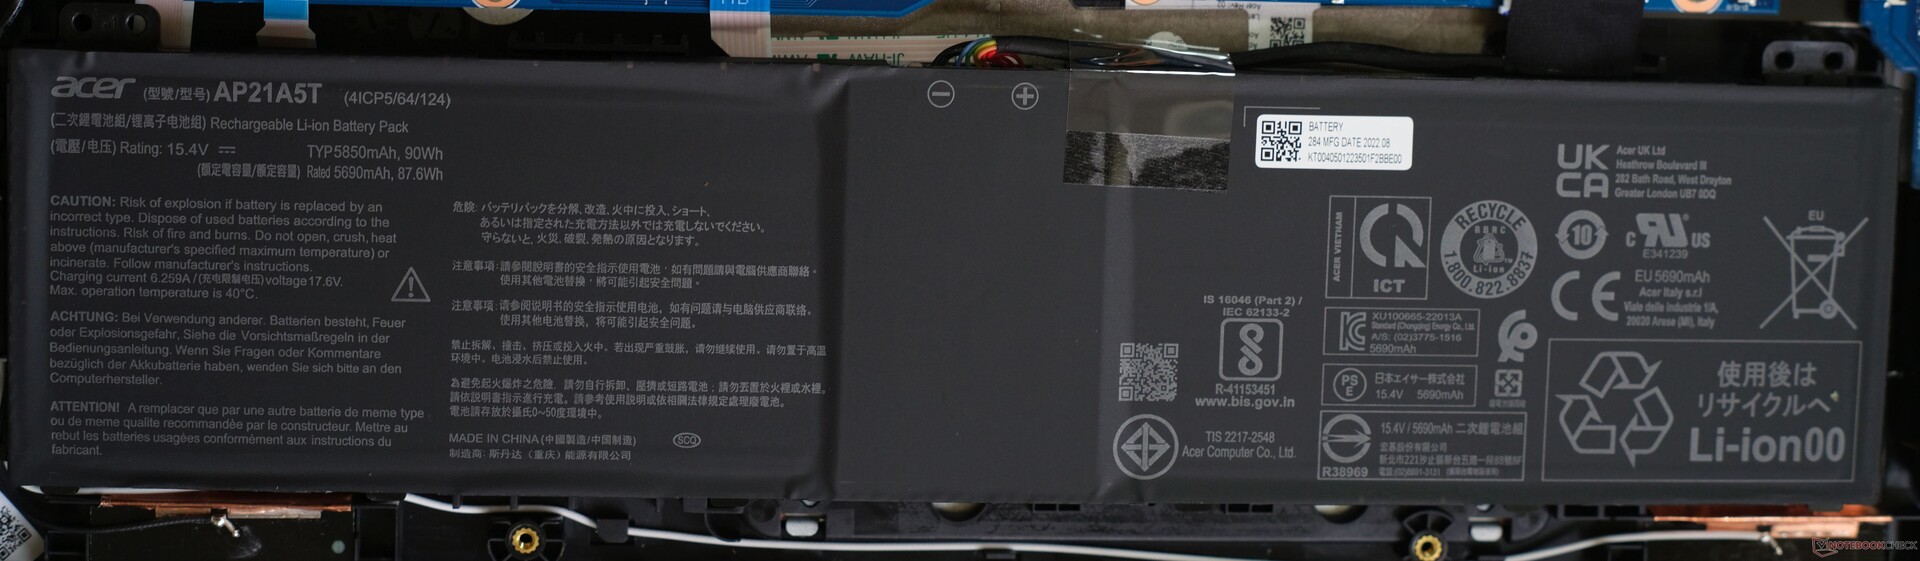
| Acer Predator Helios 16 PH16-71-731Q i7-13700HX, GeForce RTX 4060 Laptop GPU, 90 Wh | Acer Nitro 16 AN16-41 R7 7735HS, GeForce RTX 4070 Laptop GPU, 90 Wh | Lenovo Legion Pro 5 16IRX8 i7-13700HX, GeForce RTX 4060 Laptop GPU, 80 Wh | Aorus 15X ASF i7-13700HX, GeForce RTX 4070 Laptop GPU, 99 Wh | Asus TUF Gaming A16 FA617 R7 7735HS, Radeon RX 7600S, 90 Wh | Dell G15 5530 i7-13650HX, GeForce RTX 4060 Laptop GPU, 86 Wh | Średnia w klasie Gaming | |
|---|---|---|---|---|---|---|---|
| Czasy pracy | 65% | -46% | 48% | 58% | -9% | 32% | |
| H.264 (h) | 4.8 | 10.2 113% | 7.9 65% | 6.8 42% | 8.26 ? 72% | ||
| WiFi v1.3 (h) | 5.6 | 9 61% | 3.4 -39% | 8.2 46% | 12.1 116% | 6.5 16% | 7.04 ? 26% |
| Witcher 3 ultra (h) | 1.5 | 0.8 -47% | |||||
| Load (h) | 1.5 | 1.8 20% | 0.7 -53% | 2 33% | 1.5 0% | 0.8 -47% | 1.47 ? -2% |
| Reader / Idle (h) | 12.2 | 6.7 | 11.3 | 20.2 | 8.71 ? |
Za
Przeciw
Werdykt: Solidny laptop do gier RTX 4060 może być również cichy
Laptop do gier Acer Predator Helios 16 ma wiele mocnych stron, ale też kilka mniejszych kompromisów. Pozytywnie zaskoczył nas szybki wyświetlacz QHD o żywych kolorach i częstotliwości odświeżania 240 Hz z 97% DCI P3 i Dolby Vision, co oznacza, że nic nie stoi na przeszkodzie w wykonywaniu kreatywnej pracy.
W połączeniu z mocą procesora Intel HX i podobnie bardzo wydajną kartą graficznąRTX 4060otrzymujemy średniej klasy laptop do gier z wieloma elementami high-end.
Byliśmy również pod wrażeniem metalowej obudowy, mimo że klawiatura nieco się ugina. Same klawisze mogłyby mieć więcej sprzężenia zwrotnego, ale z drugiej strony podobało nam się szczególnie żywe kolory i energooszczędne podświetlenie klawiszy mini-LED. Niemniej jednak, czas pracy na baterii jest przeciętny i prawdopodobnie będzie jeszcze krótszy w przypadku korzystania z opcjonalnie dostępnego wyświetlacza mini-LED - zwłaszcza w połączeniu z najmocniejszym SKU (Core i9-13900HX + RTX 4080).
Wysoka wydajność, żywy wyświetlacz QHD 240 Hz oraz cisza i spokój podczas grania - wszystko to brzmi jak idealny przepis na laptop do gier i kreatywną stację roboczą. Musimy jednak zaakceptować pewne kompromisy.
Wydajny system chłodzenia pomaga utrzymać niskie temperatury wewnętrzne, zapewniając cichą i stabilną pracę, szczególnie w trybie zrównoważonym lub cichym. To, czego nam brakowało, to indywidualnie konfigurowalne limity mocy, aby popchnąć system chłodzenia do granic możliwości. Dławienie SSD związane z temperaturą wydaje się być skazą na ogólnie pozytywnym obrazie, z pozornie nadmiernym ograniczeniem procesora do 25 W w trybie baterii.
W swoim recenzenckim wariancie SKU laptop kosztuje obecnie odpowiednio 1900 USD i 1750 USD, ale od czasu do czasu można również kupić tańszy model za około 1450 USD z nieco mniej kolorowym wyświetlaczem 165 Hz. Jednak często można znaleźć jego głównego konkurenta, Lenovo Legion Pro 5 16 za około 1400 USD, przy czym urządzenie oferuje prawie takie same korzyści. Różnice można dostrzec tylko w szczegółach, takich jak brak Advanced Optimus, lepsza klawiatura i wyświetlacz QHD 165 Hz bez pokrycia DCI P3.
Dodatkowo, ciekawą opcją jest Asus ROG Strix G16, wyposażony w RTX 4060 i również kosztujący około 1800 USD. Ta inwestycja zapewni również lepsze głośniki, dłuższy czas pracy na baterii, klawiaturę z wyraźniejszym sprzężeniem zwrotnym i szybsze czasy reakcji wyświetlacza.
Cena i dostępność
Acer Predator Helios 16 o numerze modelu PH16-71-74UU (Core i7-13700HX, RTX 4060 i wyświetlacz 165 Hz) kosztuje obecnie 1650 USD na Amazon. Model mini-LED, w połączeniu z Core i9-13900HX i RTX 4080, jest obecnie niedostępny.
Acer Predator Helios 16 PH16-71-731Q
- 05/07/2023 v7 (old)
Marvin Gollor
Przezroczystość
Wyboru urządzeń do recenzji dokonuje nasza redakcja. Próbka testowa została udostępniona autorowi jako pożyczka od producenta lub sprzedawcy detalicznego na potrzeby tej recenzji. Pożyczkodawca nie miał wpływu na tę recenzję, producent nie otrzymał też kopii tej recenzji przed publikacją. Nie było obowiązku publikowania tej recenzji. Jako niezależna firma medialna, Notebookcheck nie podlega władzy producentów, sprzedawców detalicznych ani wydawców.
Tak testuje Notebookcheck
Każdego roku Notebookcheck niezależnie sprawdza setki laptopów i smartfonów, stosując standardowe procedury, aby zapewnić porównywalność wszystkich wyników. Od około 20 lat stale rozwijamy nasze metody badawcze, ustanawiając przy tym standardy branżowe. W naszych laboratoriach testowych doświadczeni technicy i redaktorzy korzystają z wysokiej jakości sprzętu pomiarowego. Testy te obejmują wieloetapowy proces walidacji. Nasz kompleksowy system ocen opiera się na setkach uzasadnionych pomiarów i benchmarków, co pozwala zachować obiektywizm.Price comparison

