Werdykt — Wyróżnia się niemal pod każdym względem
Kiedy pierwszy model OmniBook Ultra 14 zastąpił serię Spectre, chwaliliśmy jego wydajność i jakość, ale krytykowaliśmy wyświetlacz IPS o częstotliwości odświeżania 60 Hz oraz stosunkowo duże rozmiary. W 2026 roku model ten został całkowicie przeprojektowany – we wszystkich konfiguracjach zastosowano wyświetlacz OLED o częstotliwości odświeżania 120 Hz, a jego wygląd stał się znacznie bardziej elegancki, co ma zapewnić większą konkurencyjność w stosunku do alternatywnych rozwiązań, takich jak Dell XPS 14 lub Asus ExpertBook Ultra. Firma HP osiągnęła ogromny sukces dzięki niemal wszystkim wprowadzonym zmianom, a wzrost sztywności i jakości sprawia, że urządzenie to z łatwością może uchodzić za flagowy model z serii EliteBook.
Istnieją jednak pewne aspekty, które można by poprawić. Przede wszystkim zmodyfikowana klawiatura wydaje się zbędna, ponieważ klawiatury w dotychczasowych modelach EliteBook i OmniBook są pod innymi względami doskonałe lub przynajmniej więcej niż zadowalające. Cechy takie jak skok klawiszy, wyczucie i hałas niekoniecznie są lepsze w nowym OmniBooku, więc zmiana w odczuciu podczas pisania wydaje się wątpliwa.
Pod względem wydajności procesor Core Ultra X9 jest bardzo wydajny, ale w przypadku HP nie osiąga pełnego potencjału, ponieważ konkurencyjne modele z procesorem Core Ultra X7 mogą działać szybciej. Niestety producent nie oferuje żadnych konfiguracji z procesorem Core Ultra X7, co pozwoliłoby obniżyć ceny bez wpływu na wydajność. Pomijając te kilka niedociągnięć, model OmniBook Ultra 14 z 2026 roku nadal pozostaje jednym z najlepszych subnotebooków HP, o ile jest Pan w stanie zaakceptować wysoką cenę wywoławczą wynoszącą około 2500 USD. Alternatywnie, użytkownicy, którzy chcą nowego wyglądu i wyświetlacza, ale bez imponującego zintegrowanego procesora graficznego Arc B390, mogą zdecydować się na słabszą konfigurację z procesorem Core Ultra 7 za prawie połowę ceny.
Za
Przeciw
Cena i dostępność
Firma HP wprowadziła do sprzedaży model OmniBook Ultra 14 z procesorem Core Ultra X9, którego cena wynosi 2800 dolarów. Dostępna jest również wersja z procesorem Core Ultra 7 w cenie od 1300 do 1800 dolarów.
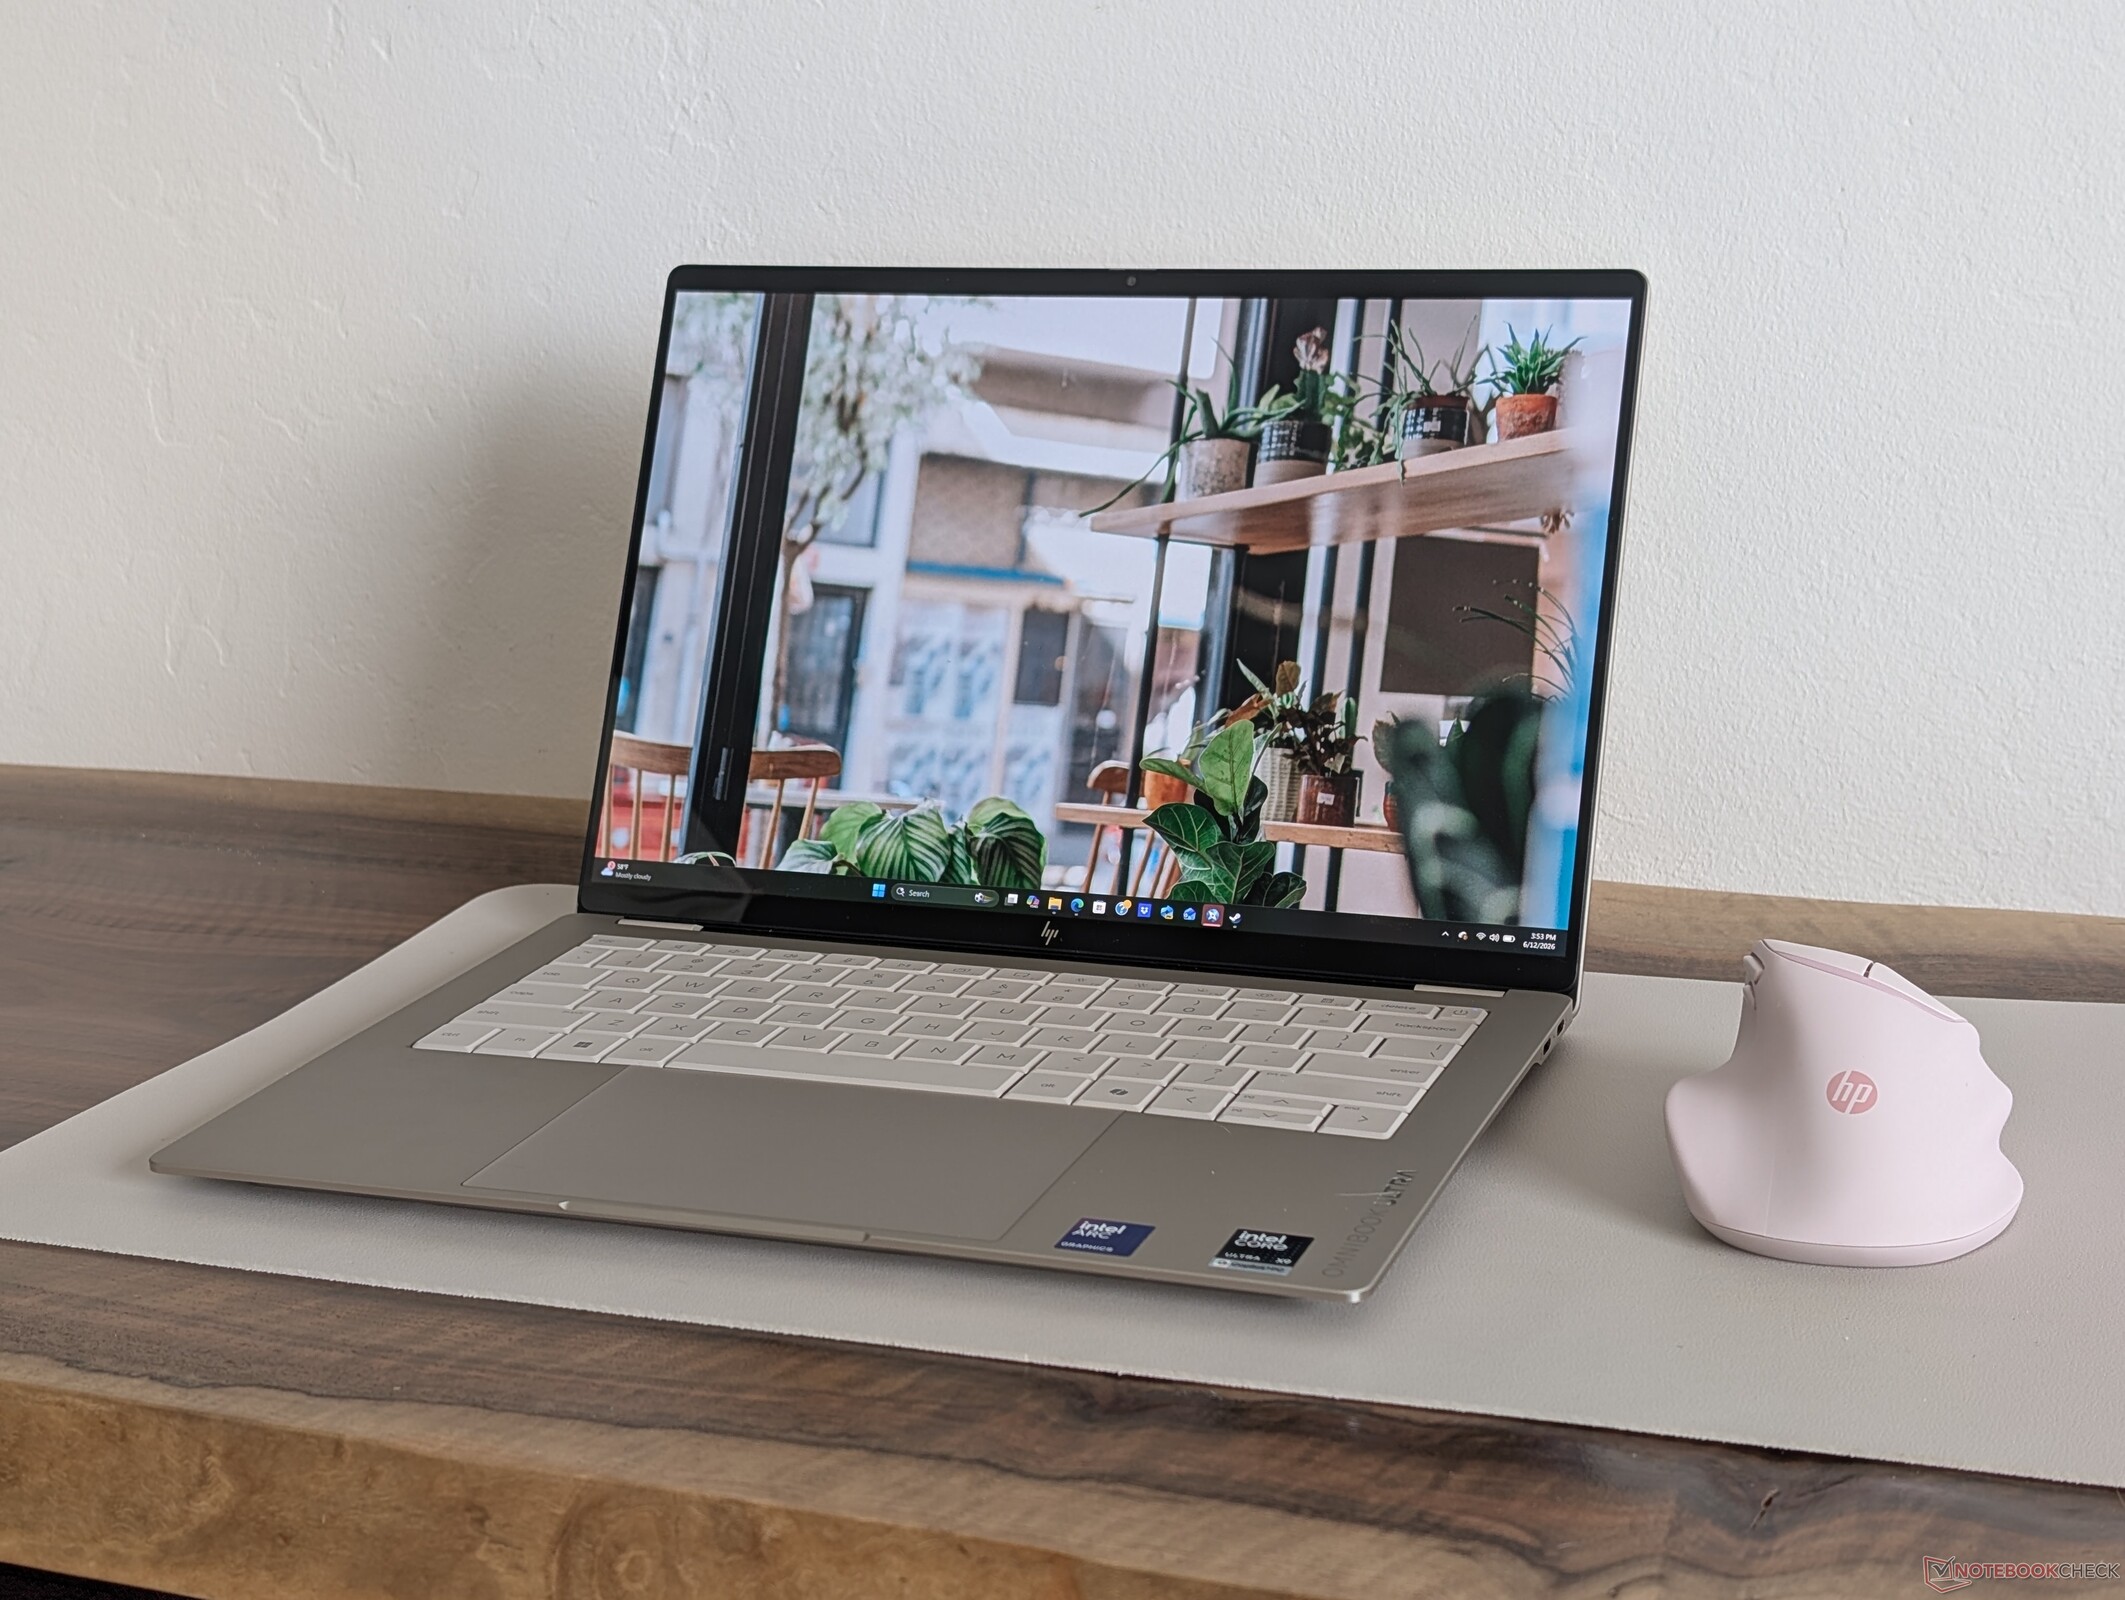
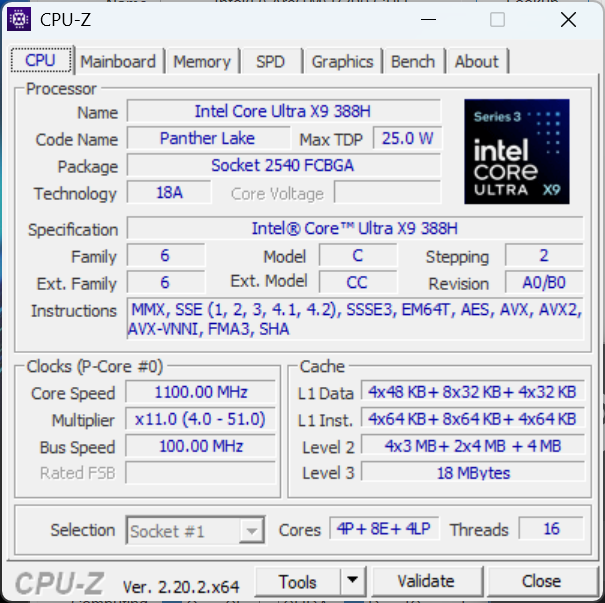
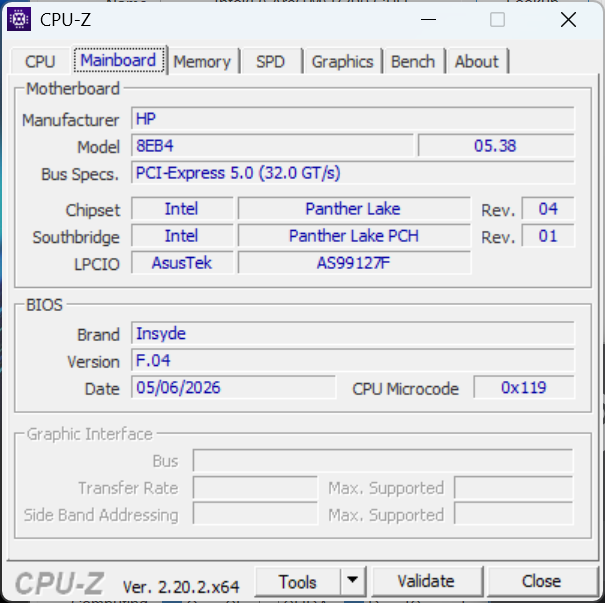
Zaprezentowany w styczniu model OmniBook Ultra 14 został w tym roku całkowicie odświeżony, zyskując zarówno nowe opcje procesorów, jak i nową obudowę. Użytkownicy mogą wybierać między procesorami Qualcomm Snapdragon X2 a Intel Panther Lake, a także jedną z trzech opcji kolorystycznych w zależności od konfiguracji.
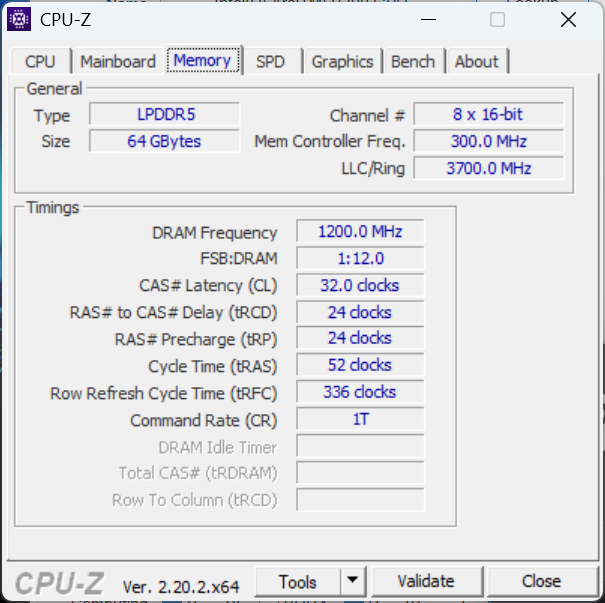
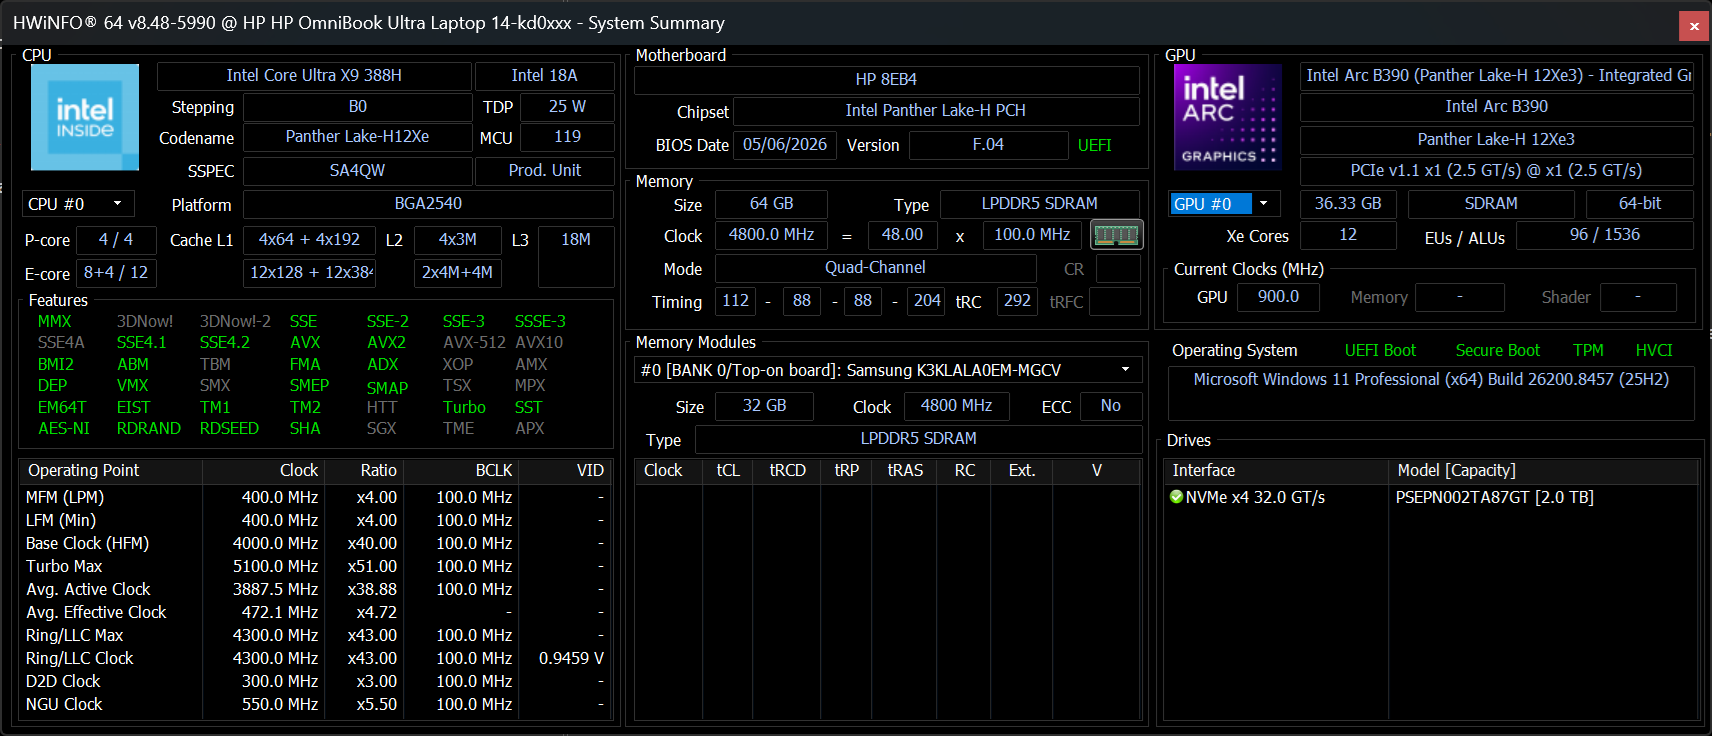
Nasz egzemplarz testowy to wersja z procesorem Intel z wyższej półki, wyposażona w procesor Core Ultra X9 388H, której cena wynosi około 2800 USD. Wolniejsza wersja z procesorem Core Ultra 7 368H jest dostępna za około połowę tej ceny, ale wszystkie opcje są wyposażone w ten sam ekran dotykowy OLED o rozdzielczości 1800p i częstotliwości odświeżania 120 Hz, w tym nawet modele z procesorem Qualcomm.
Konkurentami w tym segmencie są inne flagowe 14-calowe laptopy klasy prosumenckiej, takie jak Dell XPS 14, Asus ExpertBook Ultra, MSI Prestige 14 AIoraz Lenovo Yoga Slim 7 Ultra 14.
Więcej recenzji produktów HP:
Dane techniczne
Sprawa
Seria OmniBook skutecznie zastępuje serię Spectre , dlatego metalowa obudowa charakteryzuje się tymi samymi doskonałymi właściwościami, co jej poprzedniczka, w tym wysoką sztywnością oraz chropowatą powierzchnią zapobiegającą pozostawianiu odcisków palców. Nowa konstrukcja od razu wyróżnia się na tle starszego modelu z 2024 roku dzięki przeprojektowanej klawiaturze, zmienionym tylnym narożnikom oraz ostrzejszym, chromowanym wykończeniom wzdłuż krawędzi i narożników. Jest on również zauważalnie lżejszy i mniejszy od modelu 2024, co pokazuje poniższa tabela porównawcza.
Łączność
W najnowszym modelu OmniBooka zrezygnowano z portu USB-A, który był dostępny w niektórych starszych modelach.


Komunikacja
Kamera internetowa
W standardowym wyposażeniu znajduje się kamera internetowa o rozdzielczości 5 MP z funkcją podczerwieni i fizyczną przesłoną.


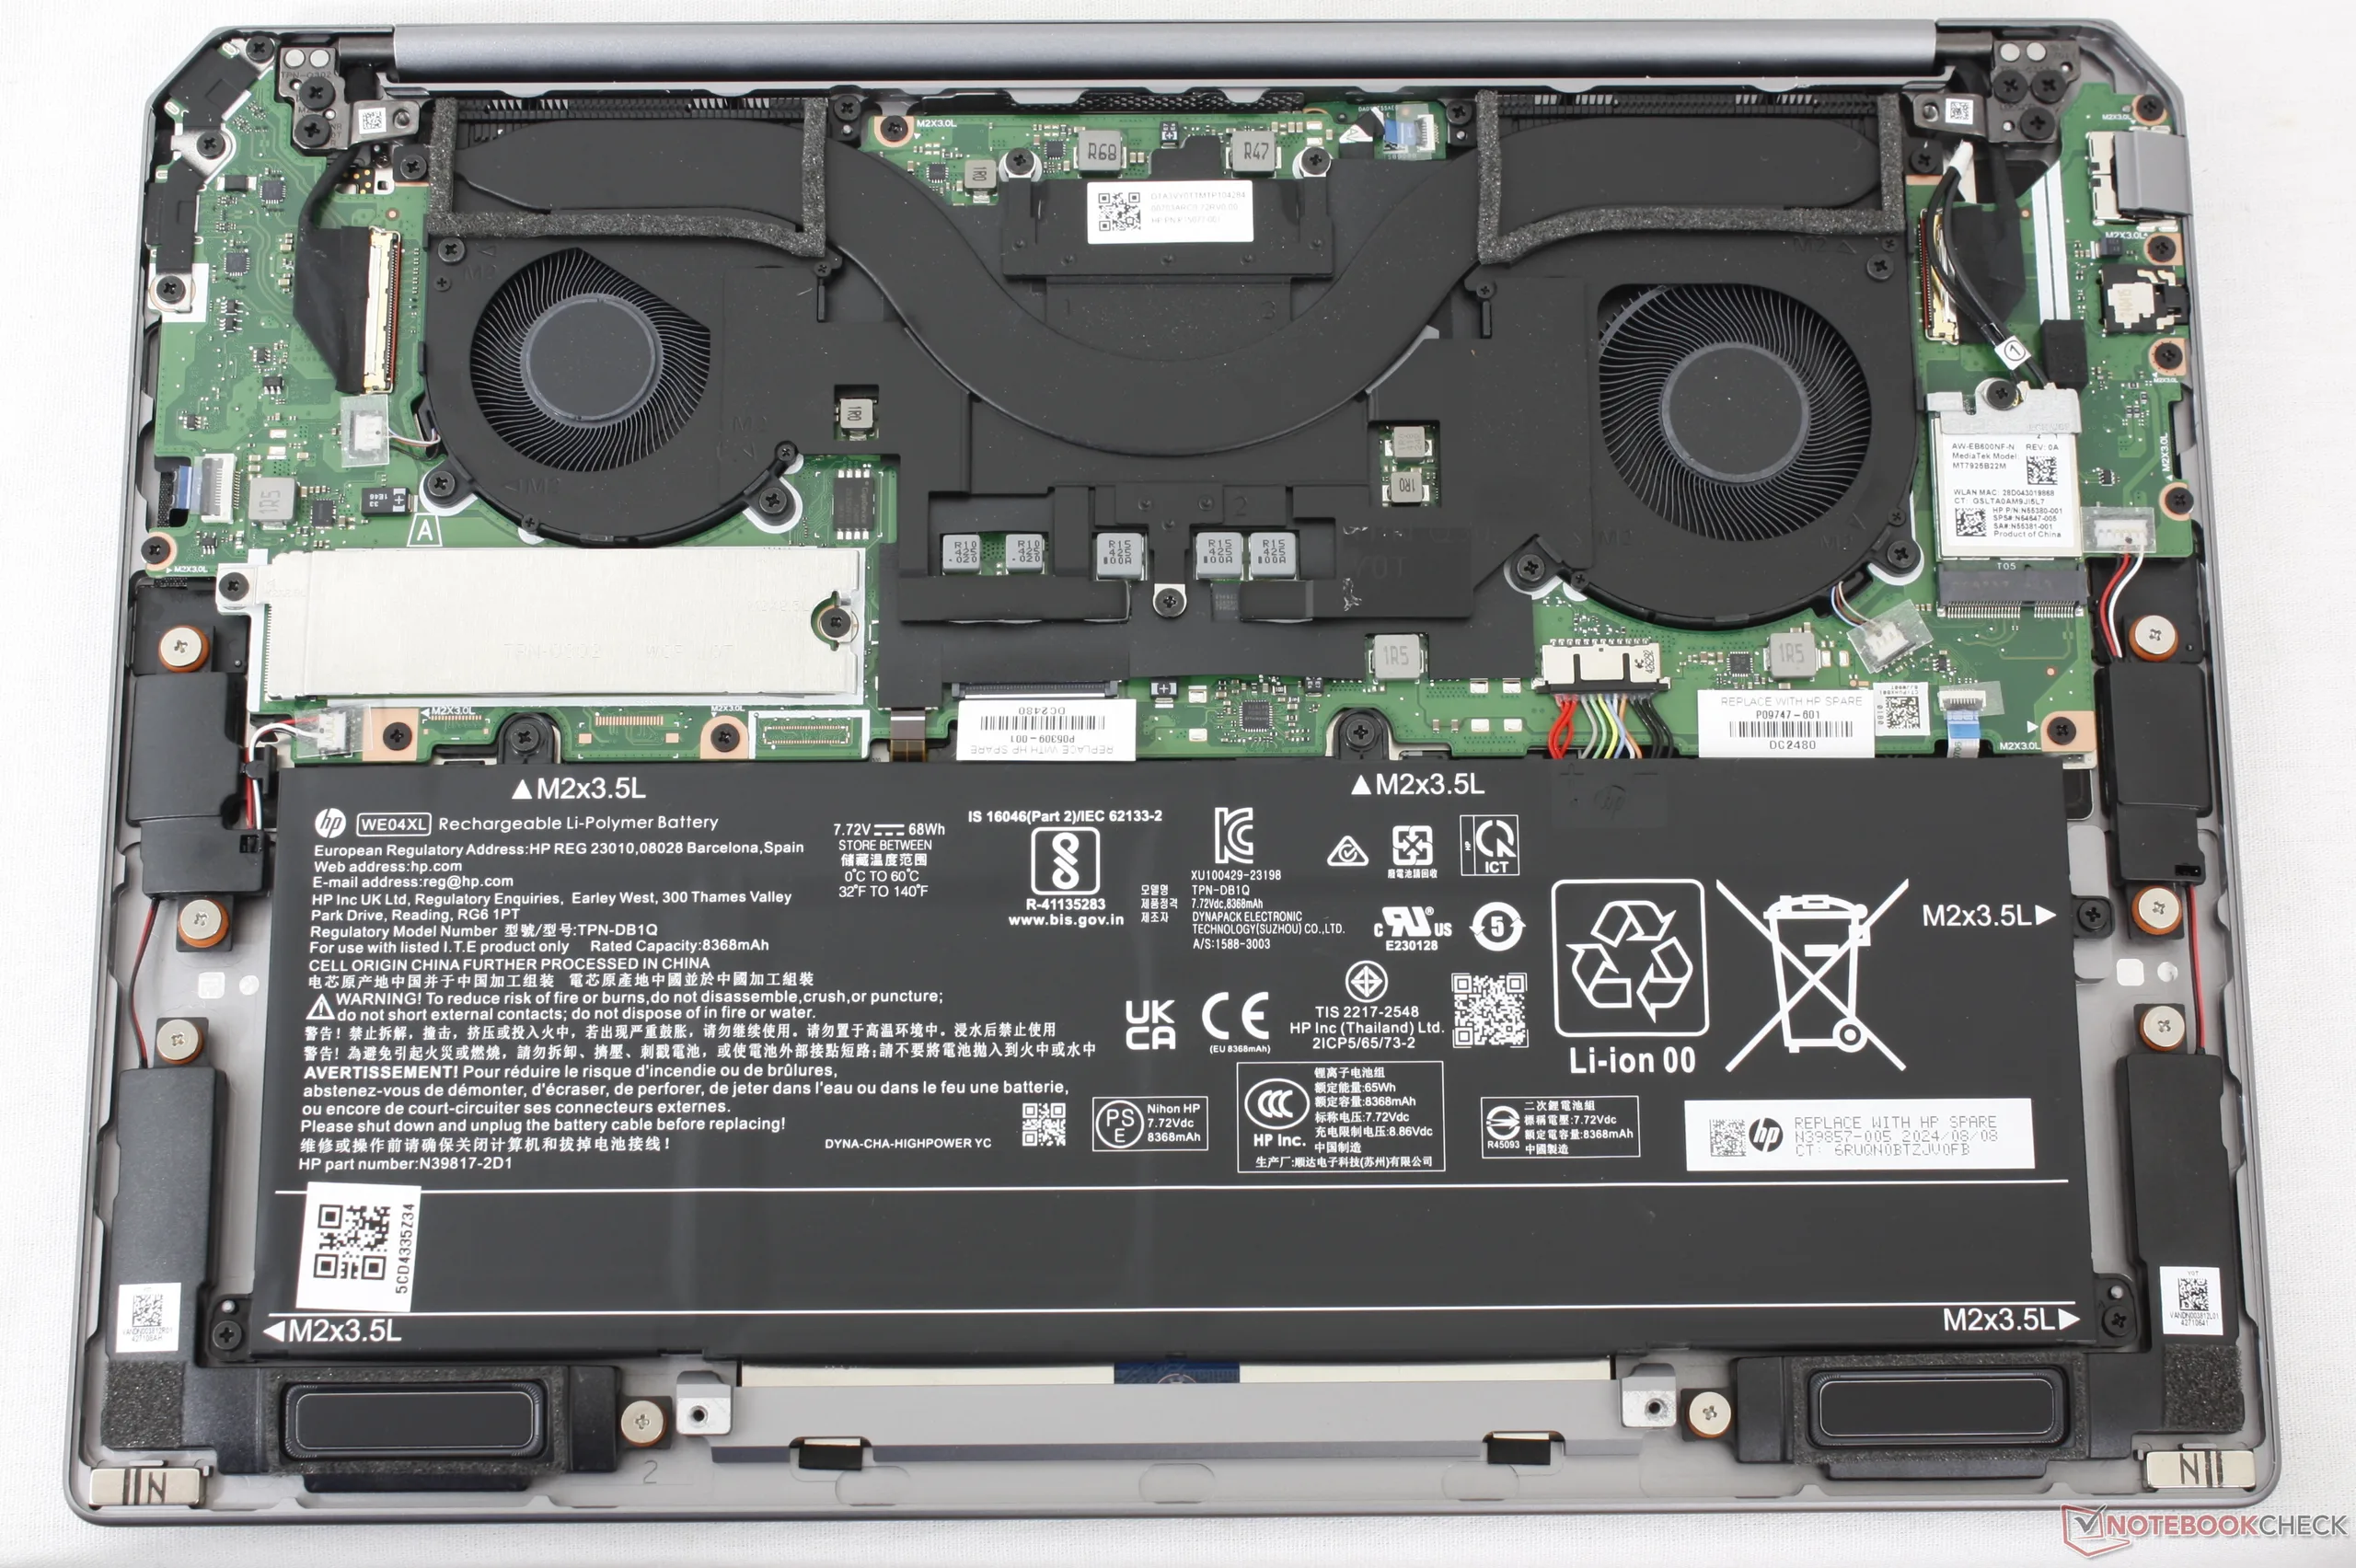
Konserwacja
Dno jest przymocowane za pomocą zaledwie czterech śrub krzyżakowych, co ułatwia serwisowanie. Niemniej jednak wymienić można jedynie dysk SSD M.2 2280, ponieważ moduły pamięci RAM i moduły WLAN są przylutowane.

Zrównoważony rozwój
Obudowa składa się w 80 procentach z metalu pochodzącego z recyklingu, a obudowy klawiatury i głośników – w ponad 40 procentach z tworzyw sztucznych pochodzących z recyklingu poużytkowego. Samo opakowanie nie zawiera żadnych tworzyw sztucznych.
Akcesoria i gwarancja
W zestawie nie ma żadnych dodatków poza zasilaczem sieciowym i dokumentacją. W przypadku zakupu w Stanach Zjednoczonych obowiązuje standardowa roczna gwarancja ograniczona.
Urządzenia wejściowe
Klawiatura
Klawiatura została przeprojektowana w stosunku do zeszłorocznego modelu, mimo że już wtedy była doskonała, charakteryzując się świetnym wyczuciem i skokiem klawiszy. Niestety, nowa klawiatura jest bardziej miękka, przez co wcale nie wydaje się być ulepszeniem.

Wyświetlacz
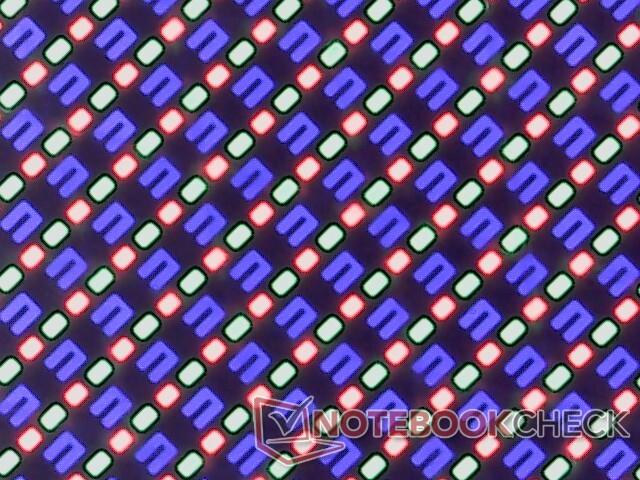
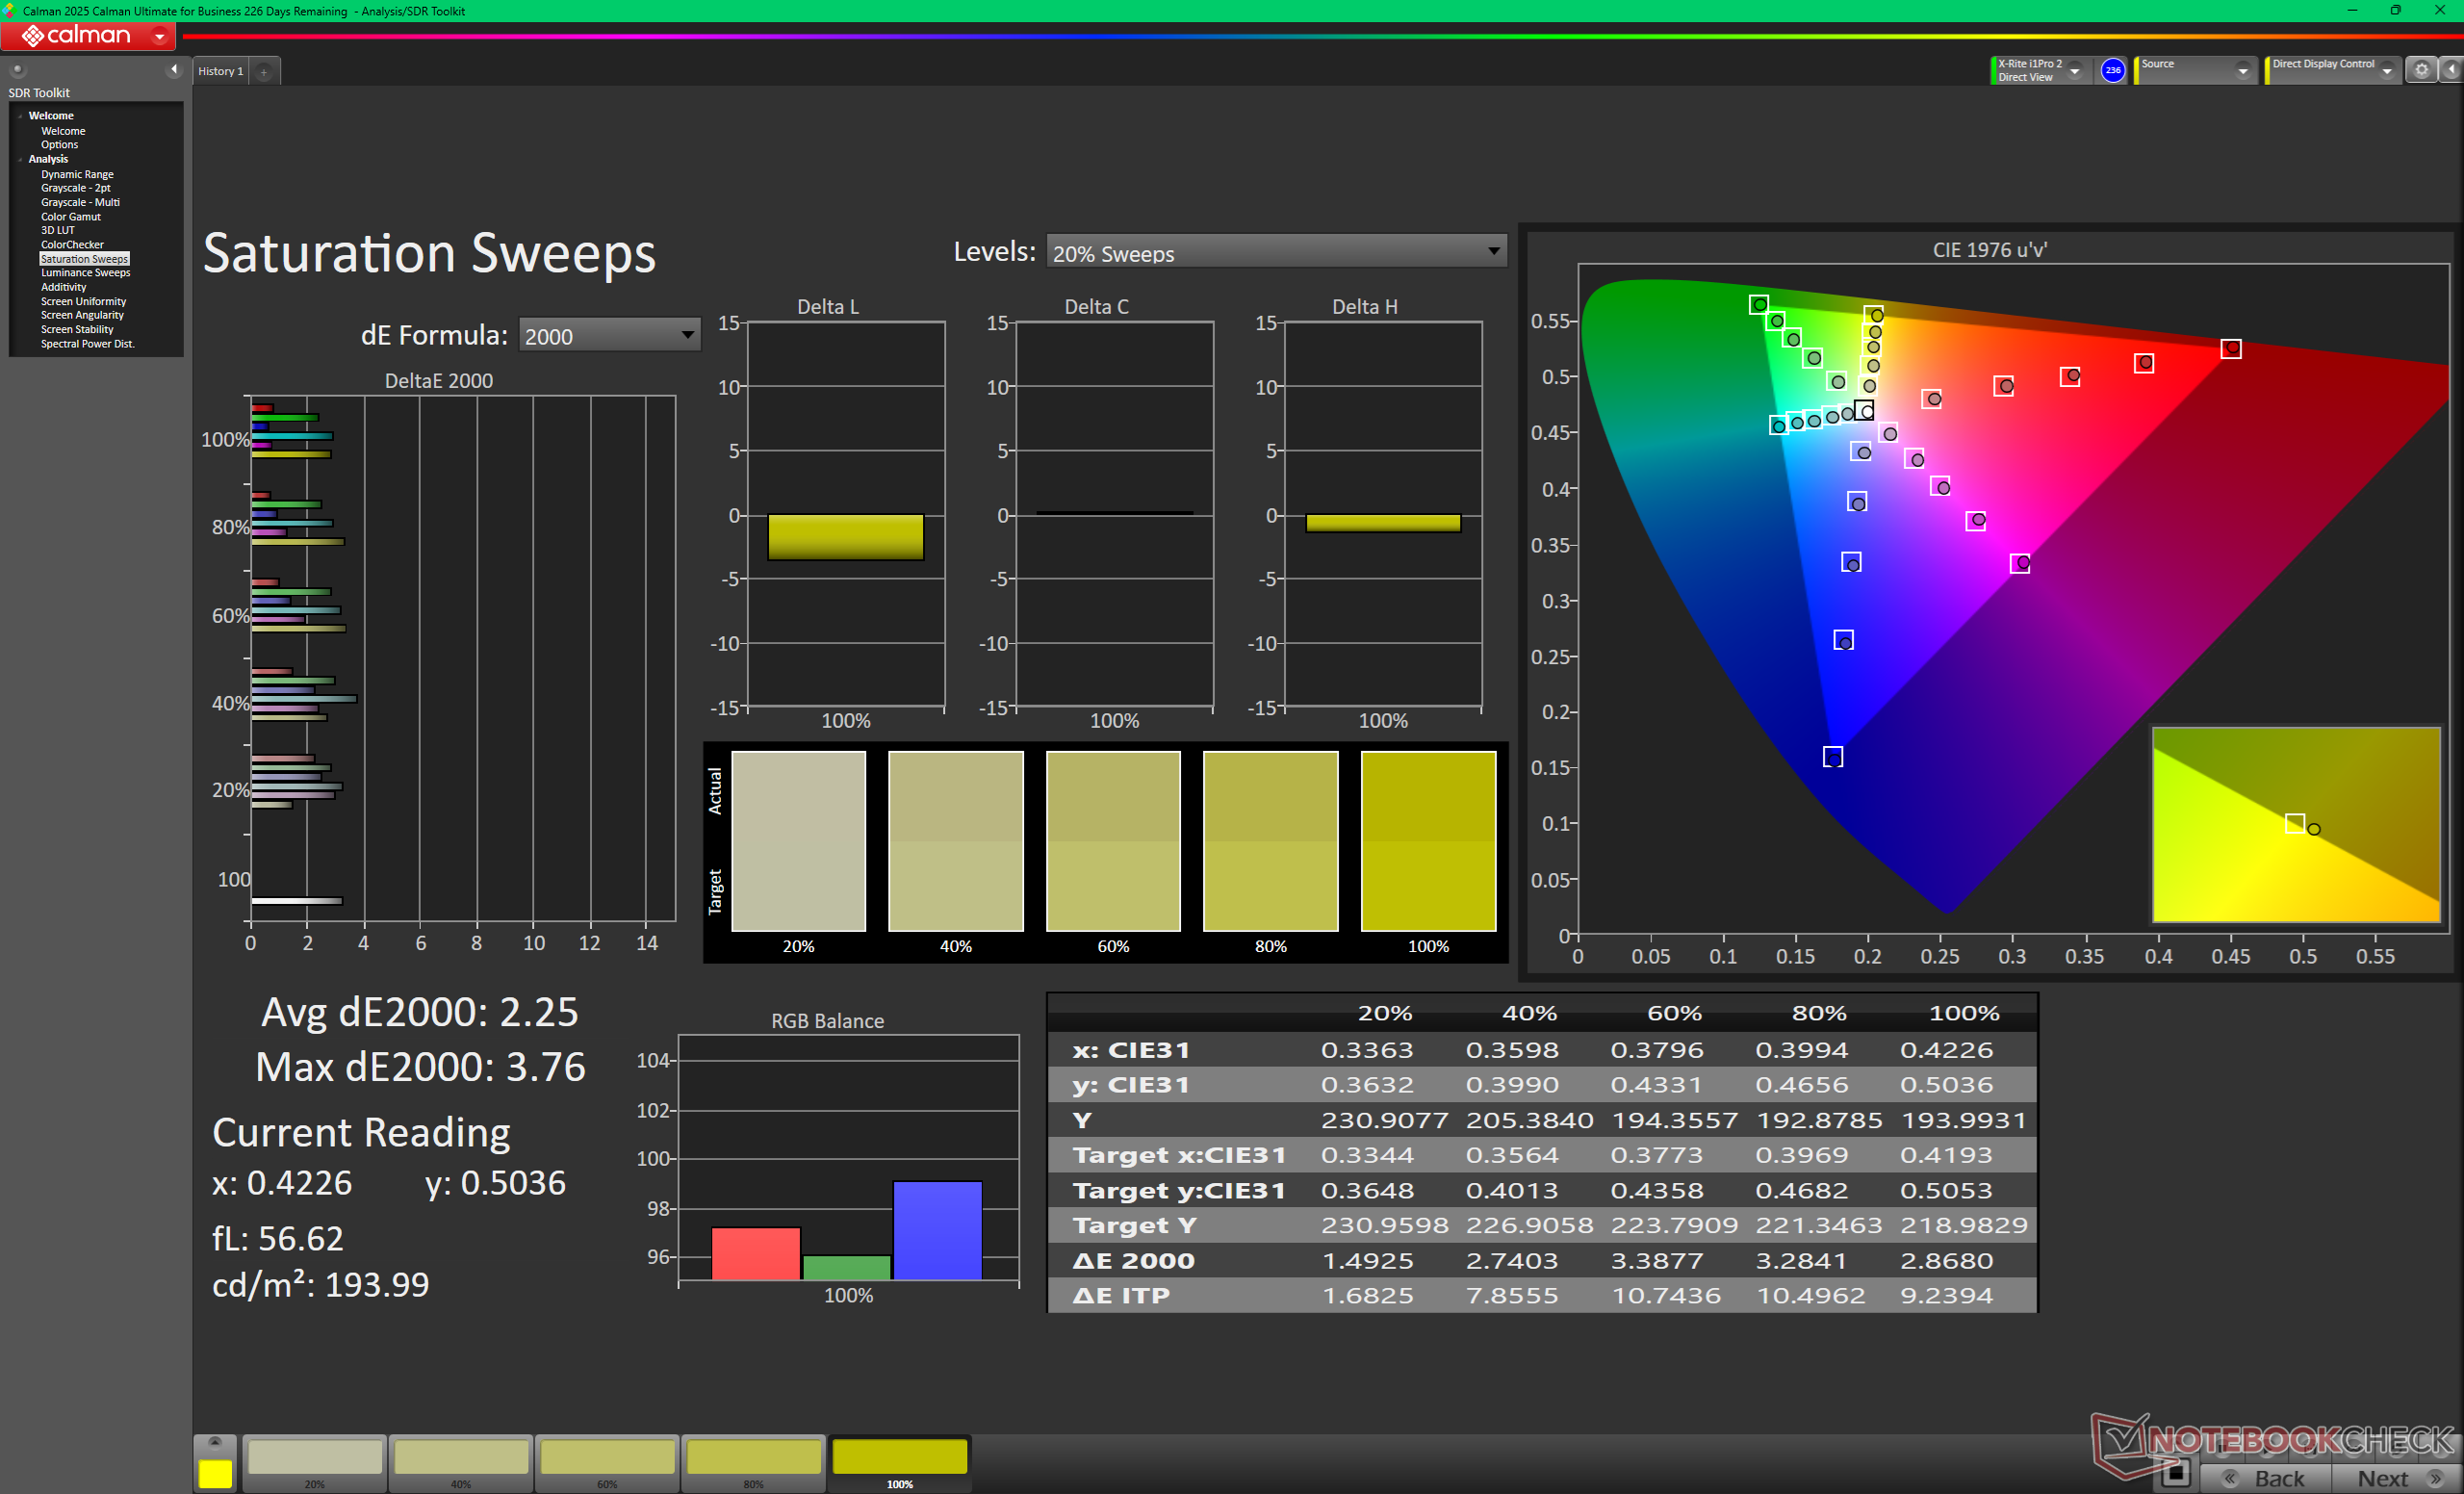
Wstępnie skalibrowany ekran dotykowy OLED rozwiązuje naszą główną uwagę dotyczącą modelu z 2024 roku: częstotliwość odświeżania. Dzięki częstotliwości 120 Hz system działa teraz niezwykle płynnie w porównaniu ze starszym panelem o częstotliwości 60 Hz. Poprawiono również inne aspekty, w tym przejście z technologii IPS na OLED, głębsze kolory i lepszą obsługę HDR oraz wyższą rozdzielczość natywną.
| |||||||||||||||||||||||||
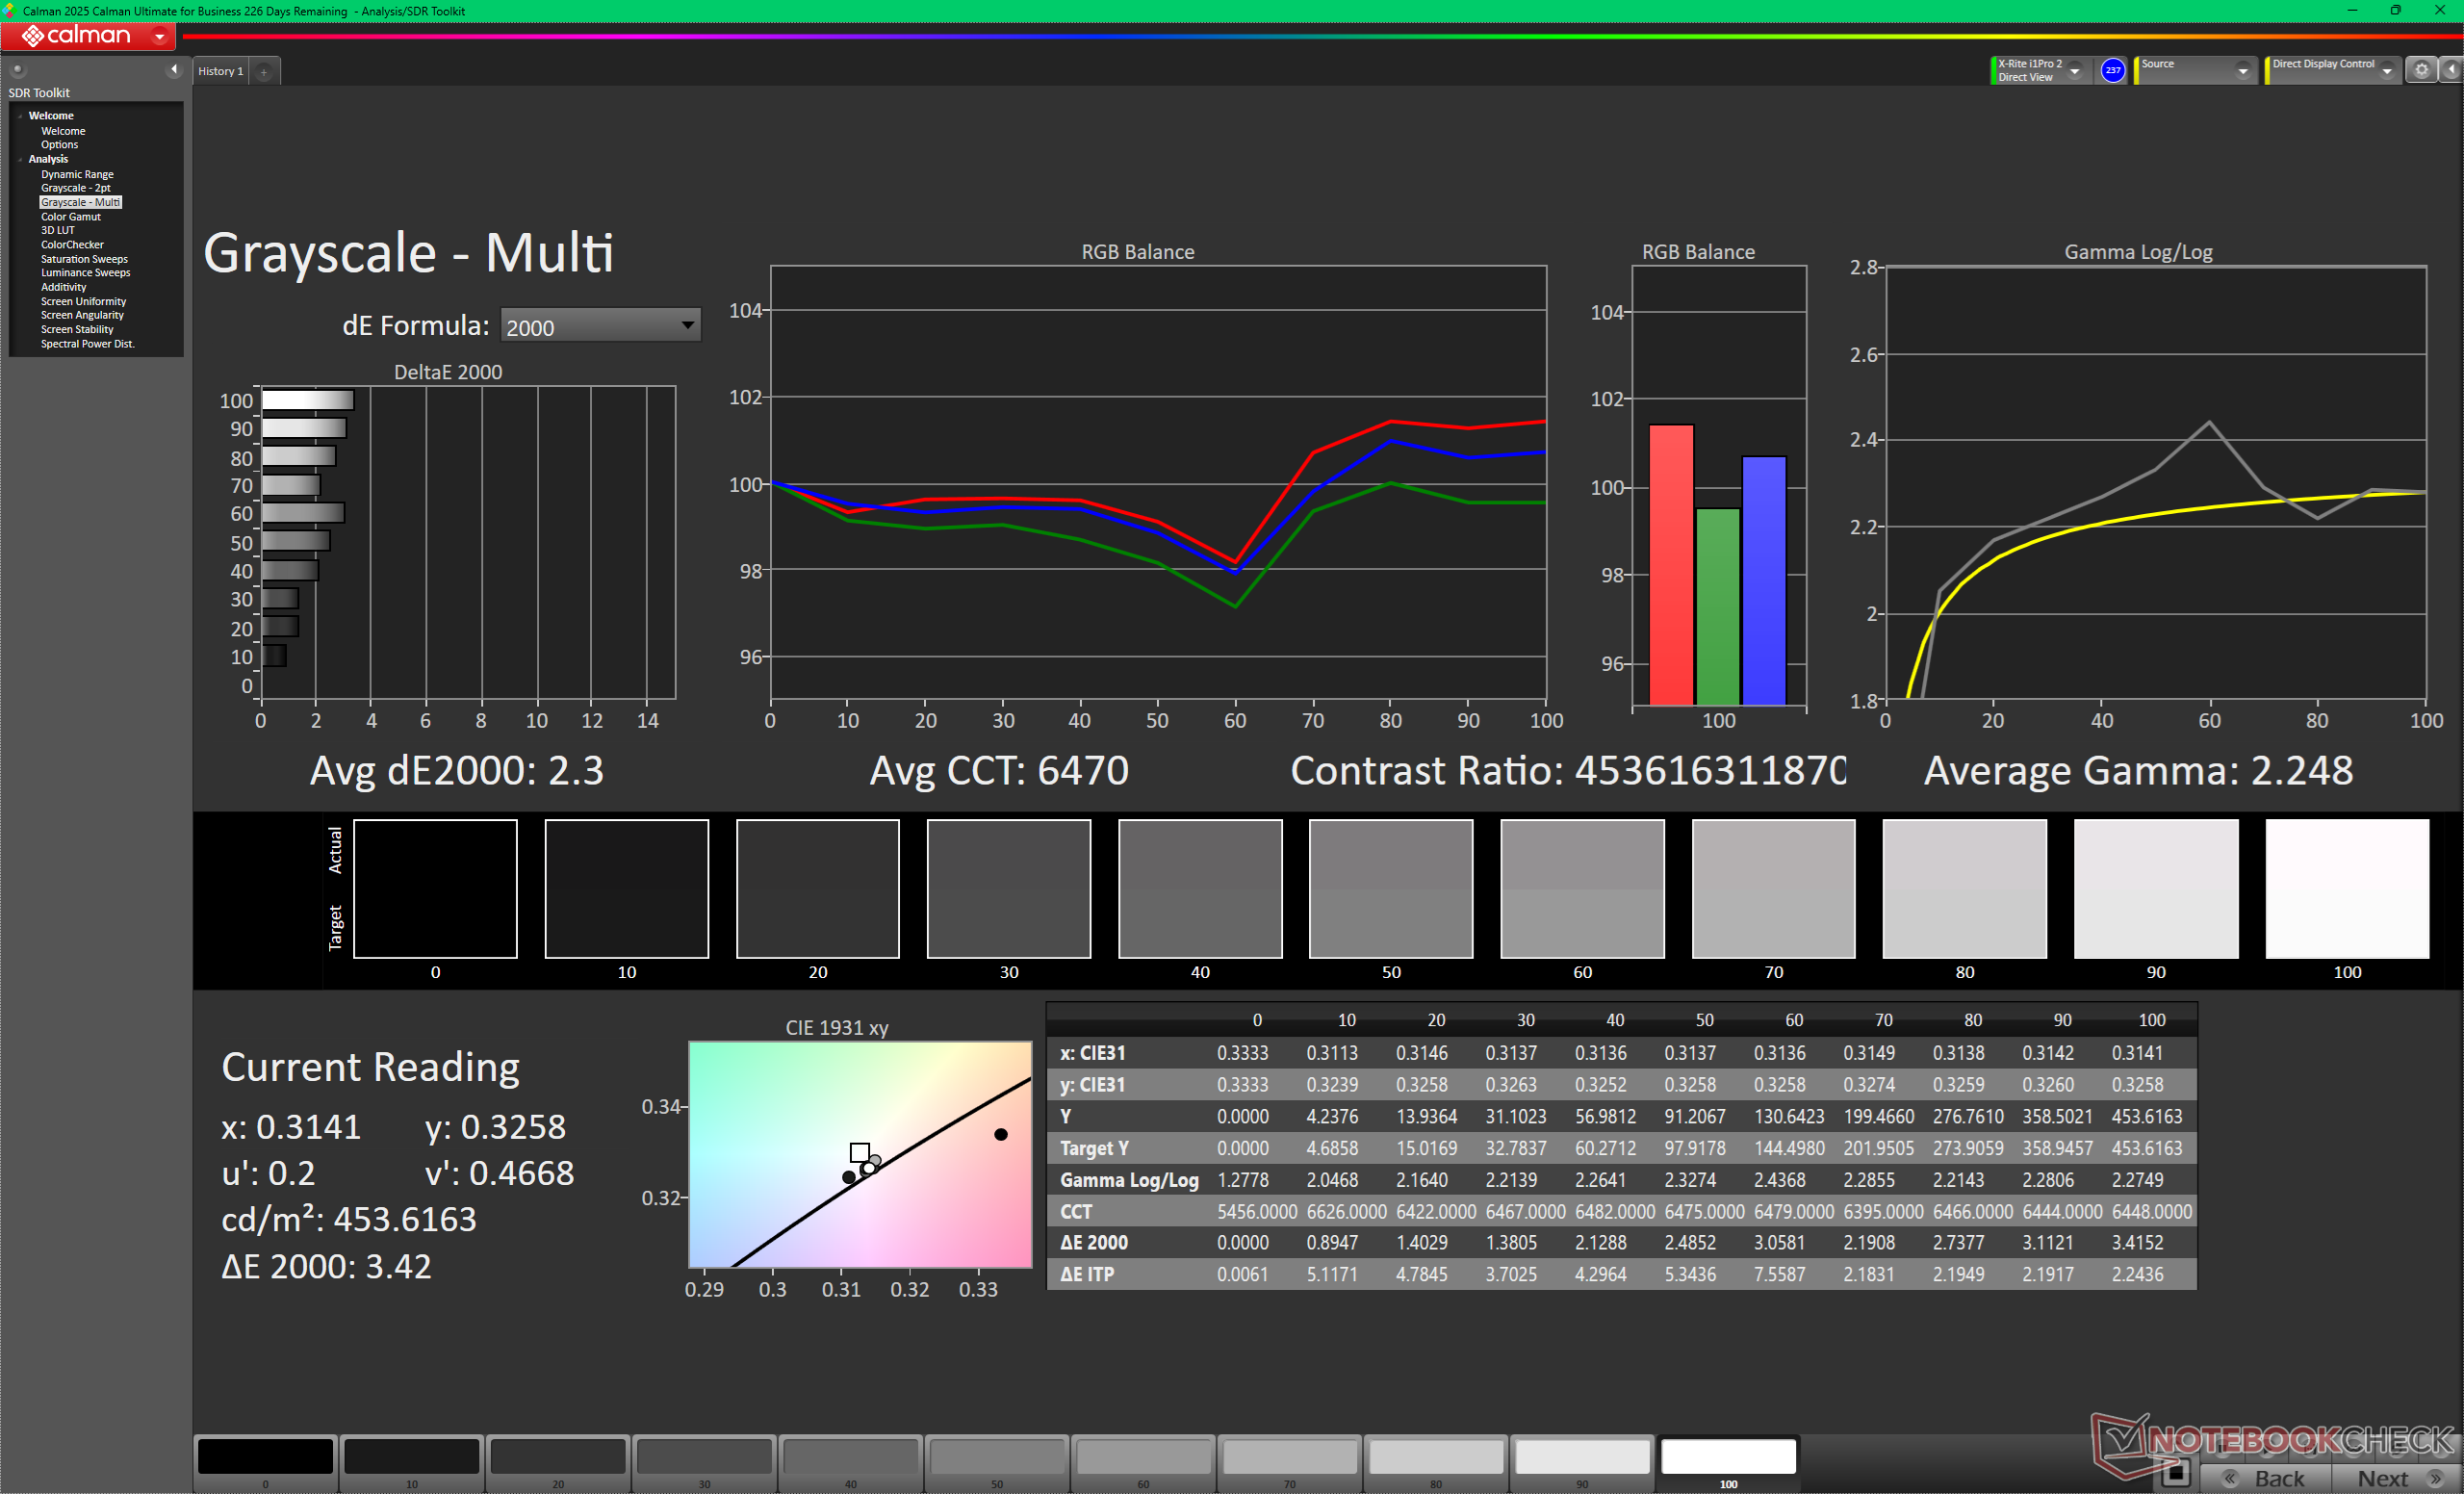
rozświetlenie: 99 %
na akumulatorze: 446 cd/m²
kontrast: ∞:1 (czerń: 0 cd/m²)
ΔE ColorChecker Calman: 1.76 | ∀{0.5-29.43 Ø4.71}
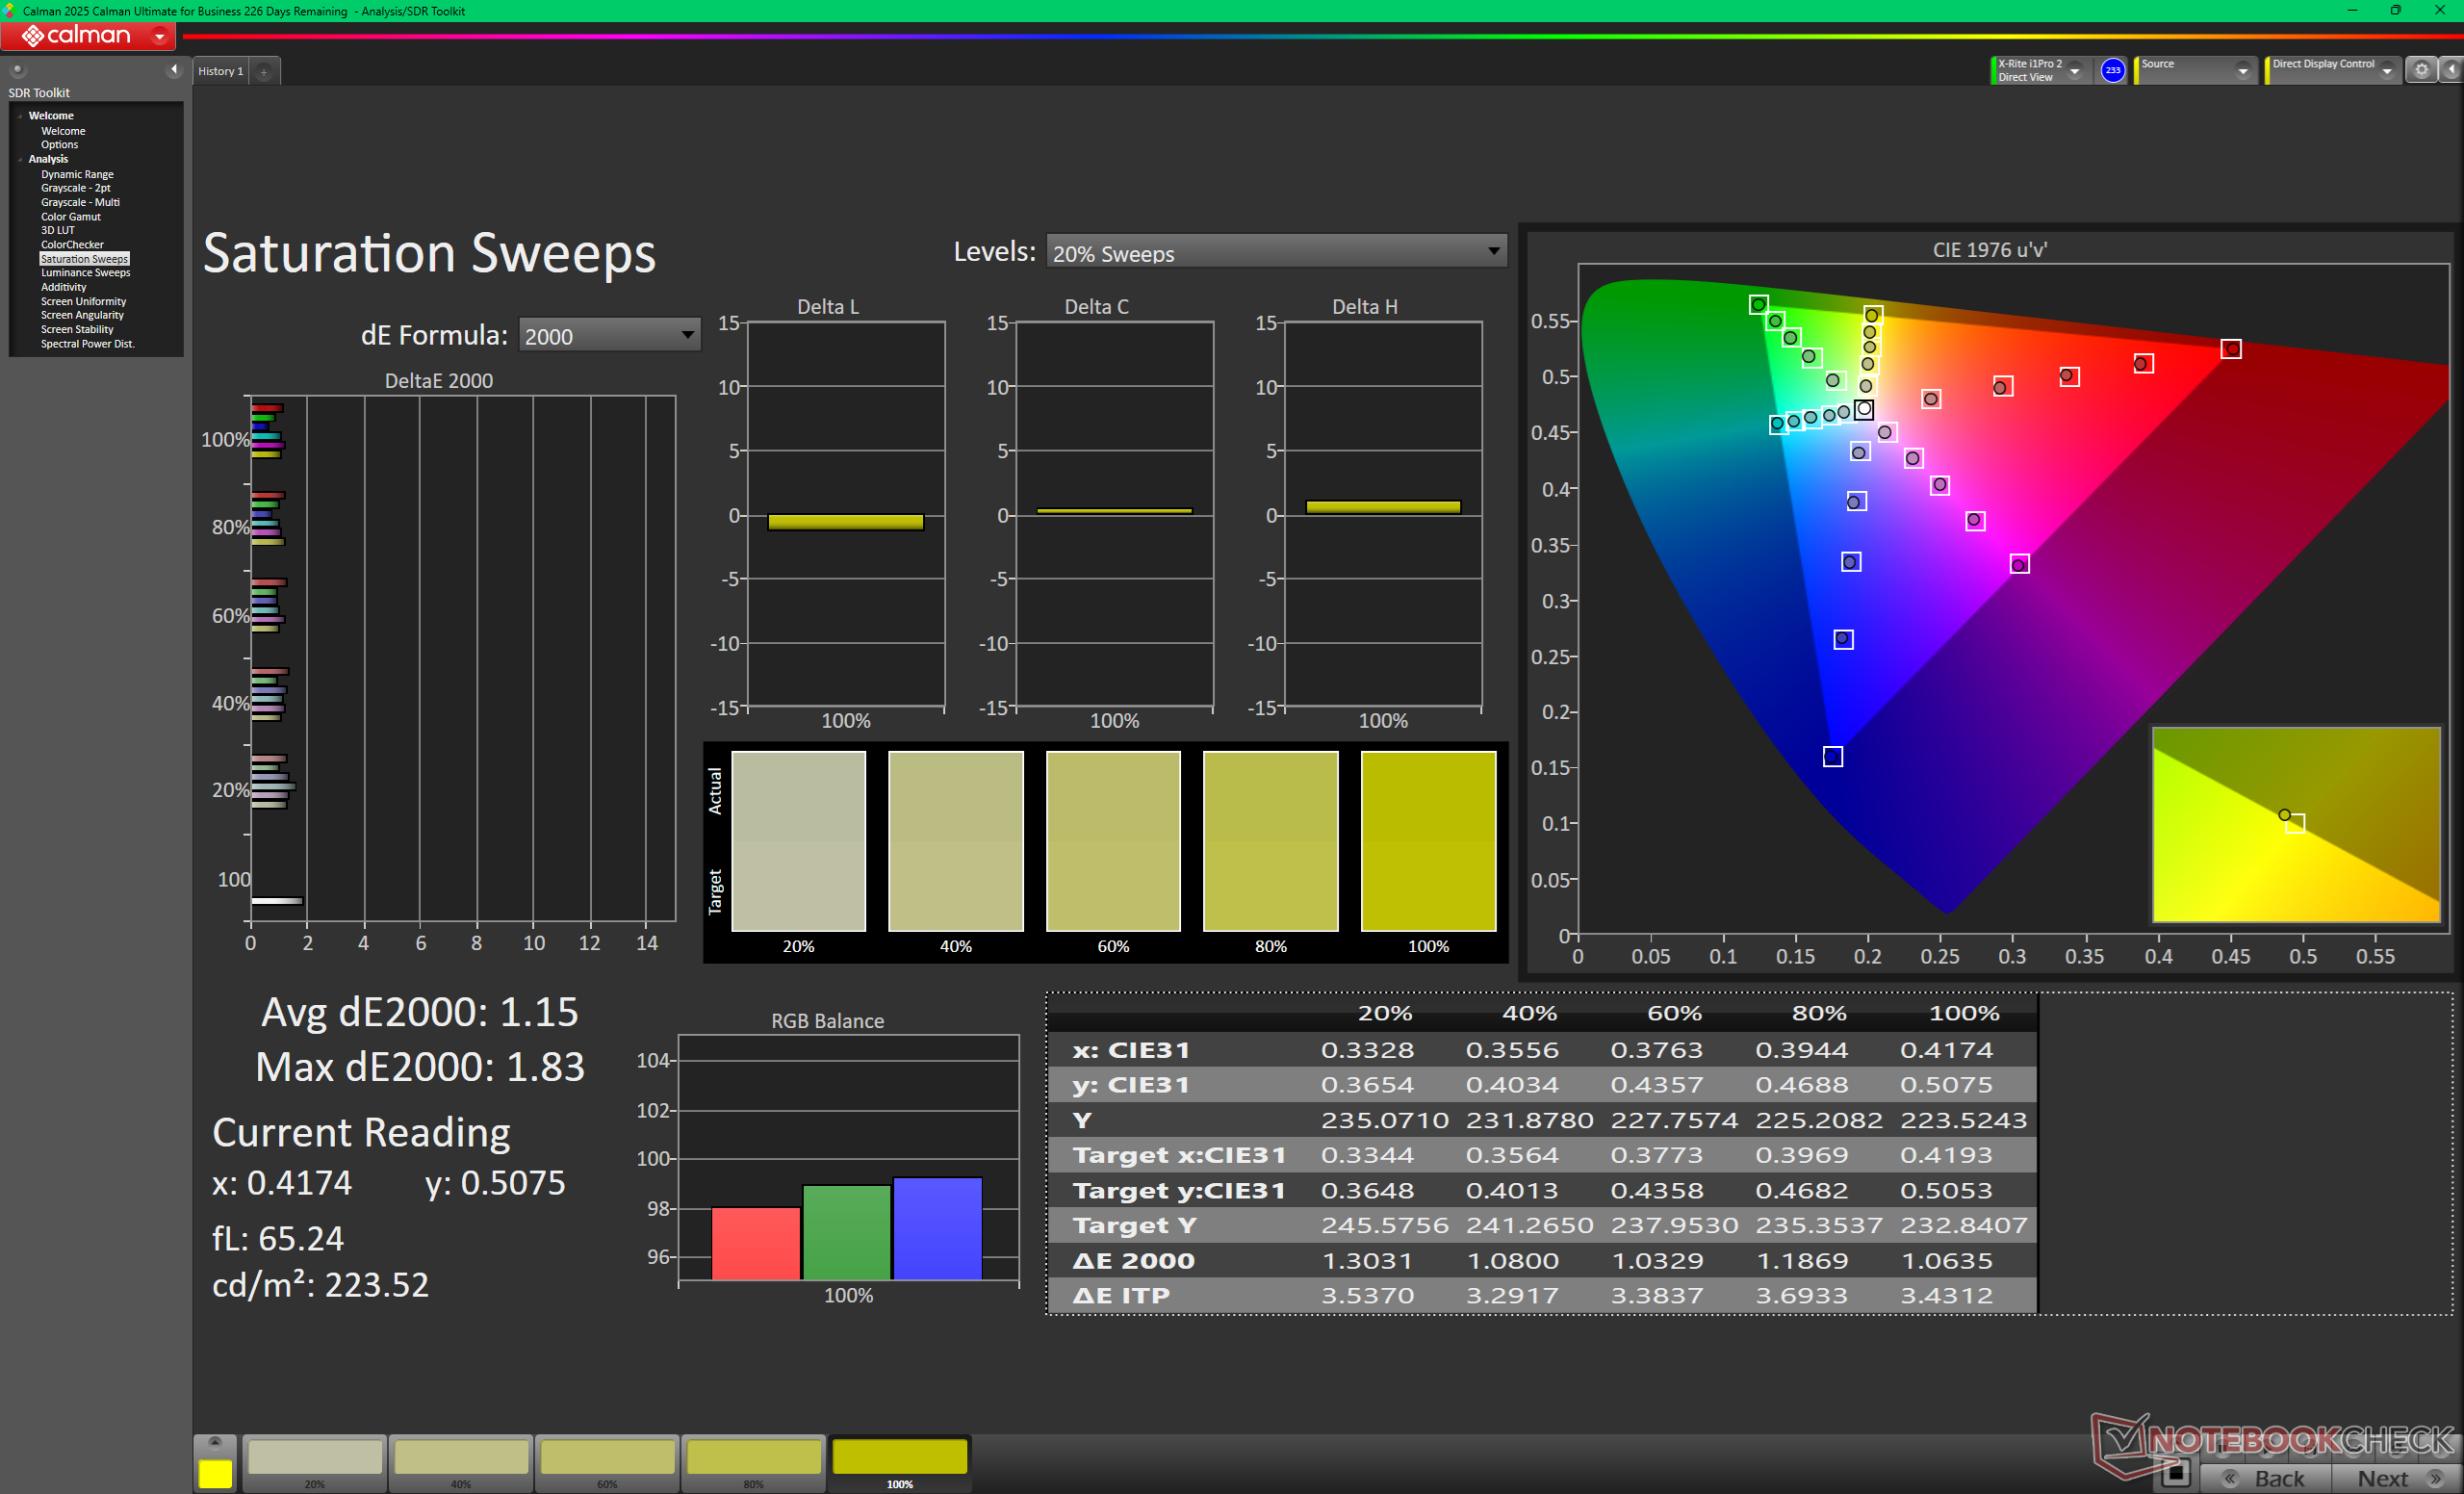
calibrated: 1.18
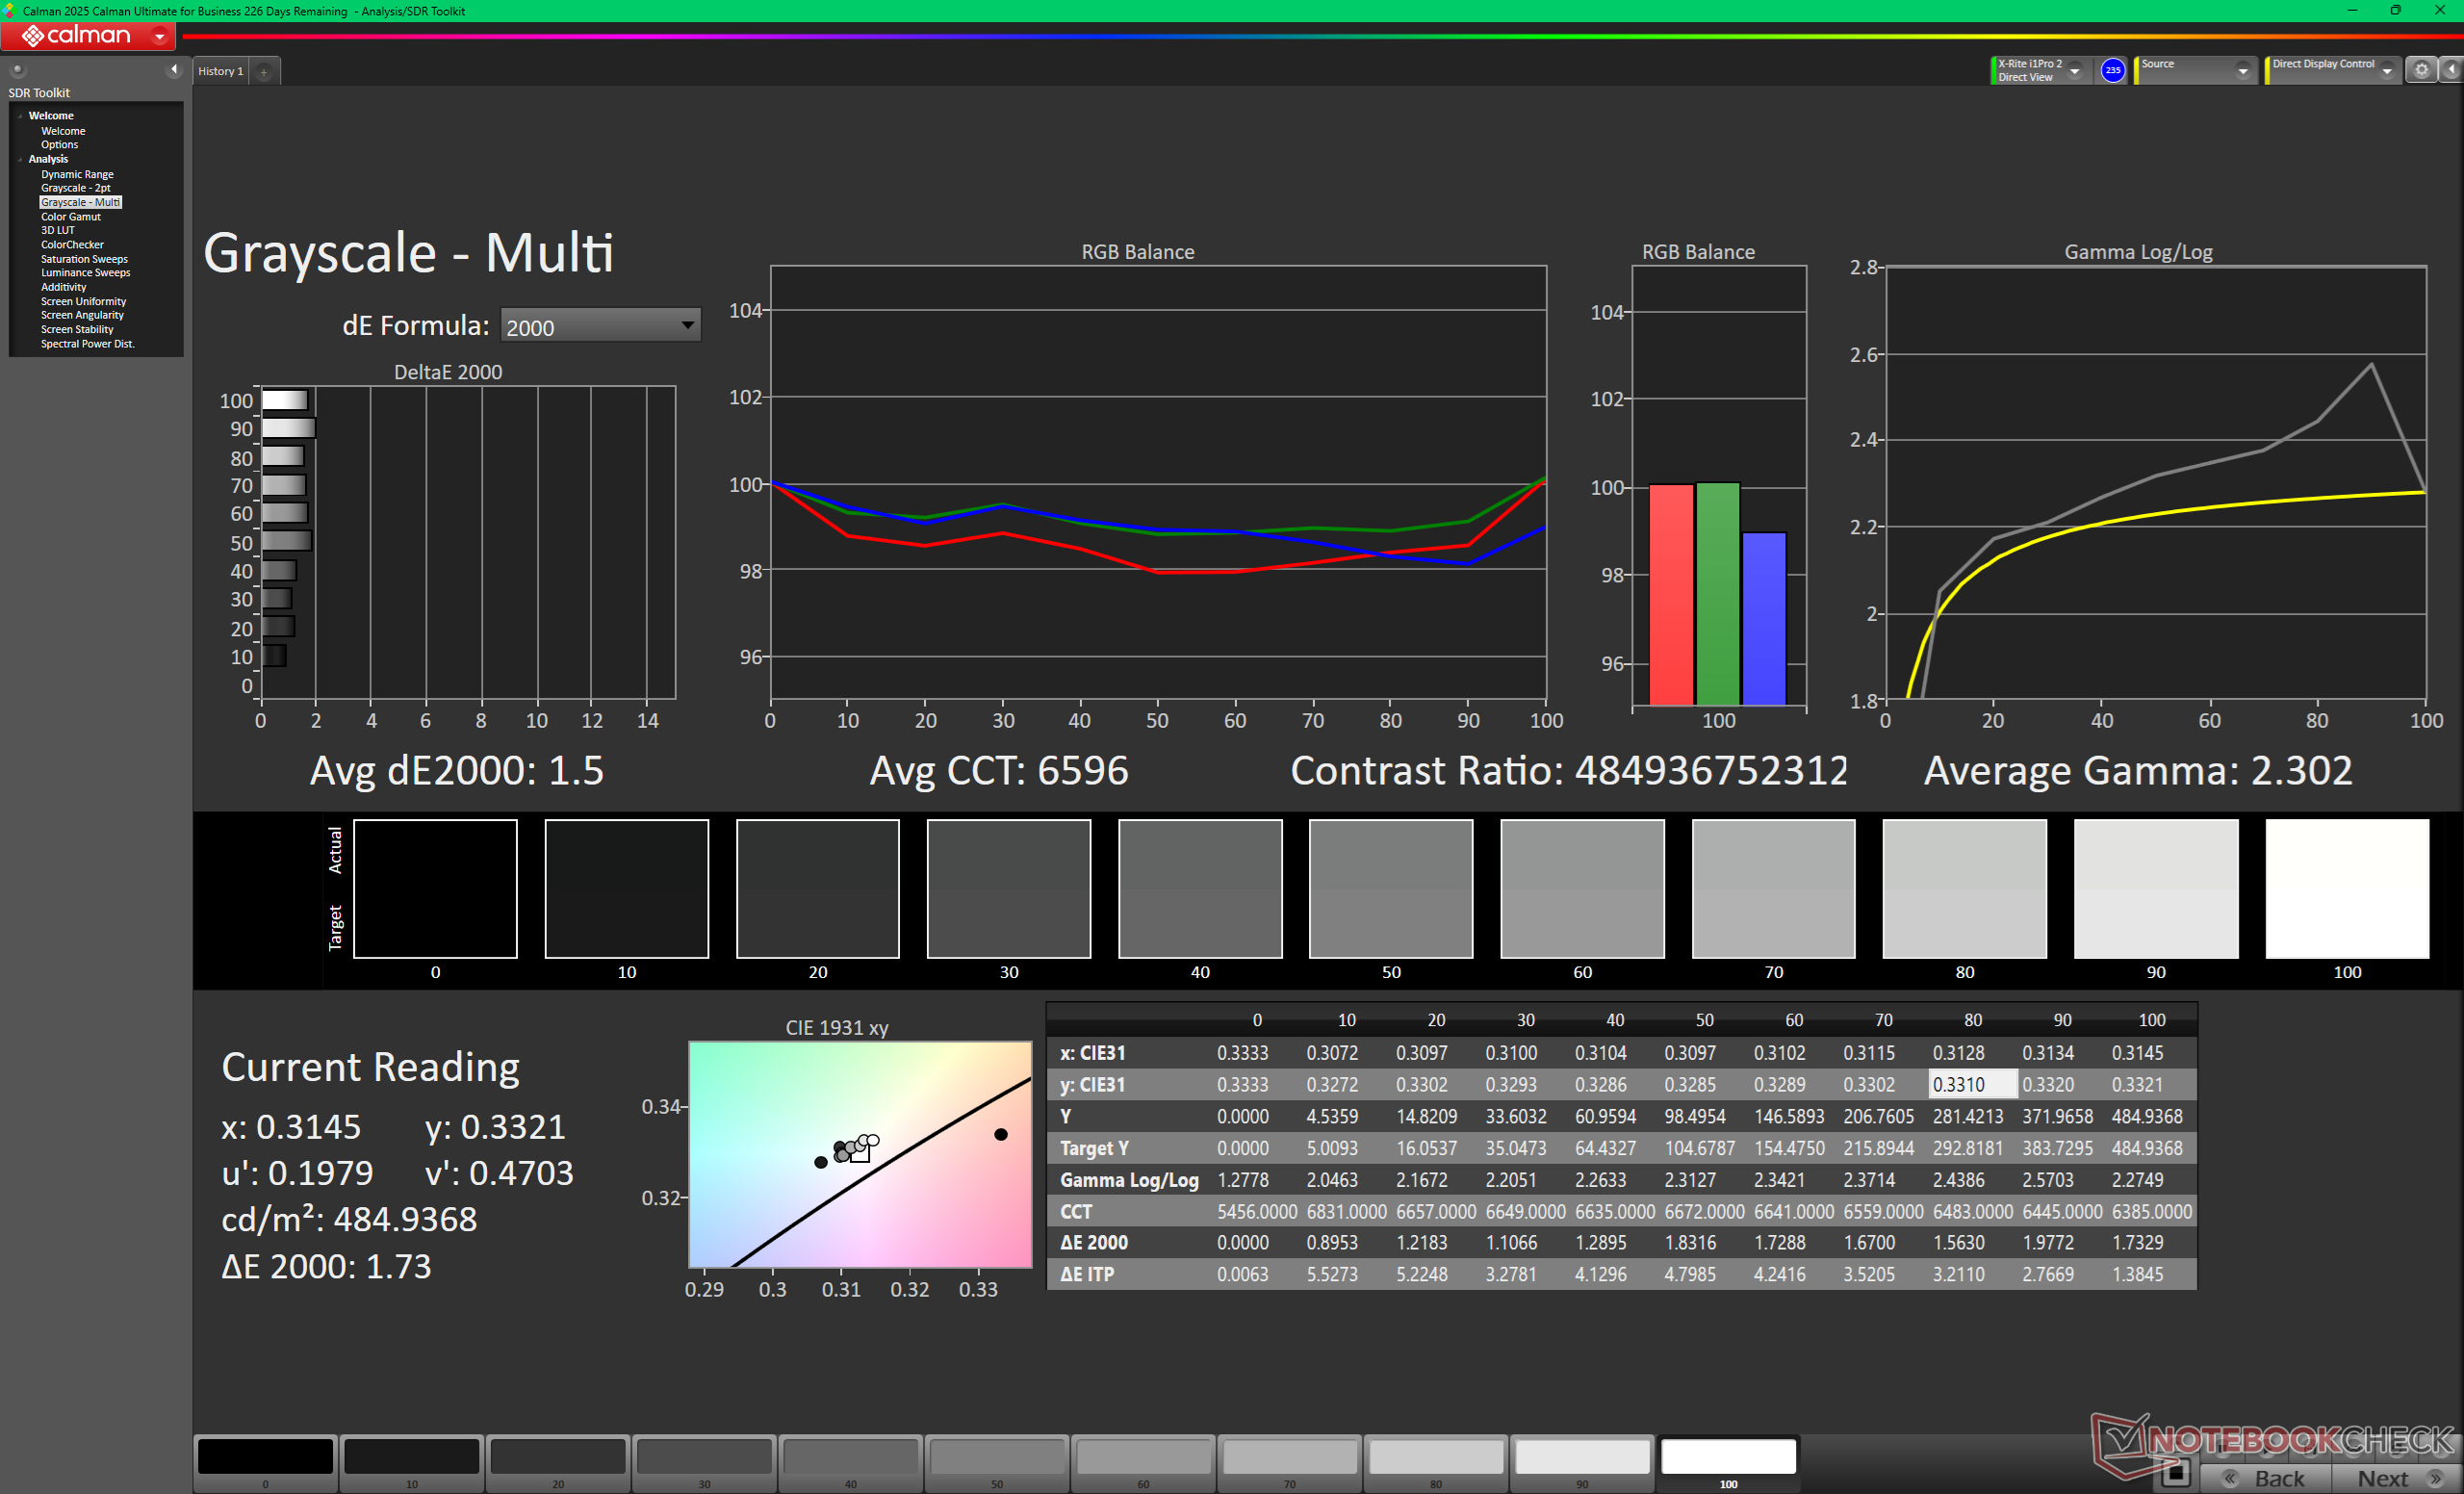
ΔE Greyscale Calman: 2.3 | ∀{0.09-98 Ø4.96}
92.3% AdobeRGB 1998 (Argyll 3D)
100% sRGB (Argyll 3D)
99.9% Display P3 (Argyll 3D)
Gamma: 2.25
CCT: 6470 K
| HP OmniBook Ultra 14 Core Ultra X9 Samsung SDC4215, OLED, 2880x1800, 14", 120 Hz | Lenovo Yoga Slim 7 Ultra 14IPH11 LEN140WQ+, OLED, 2880x1800, 14", 120 Hz | HP OmniBook Ultra Flip 14 Samsung SDC41AA, OLED, 2880x1800, 14", 120 Hz | Dell XPS 14 Core Ultra X7 358H LG Philips 140WT2, OLED, 2880x1800, 14", 120 Hz | MSI Prestige 14 Flip AI+ 2026 ATNA40KW05-0, OLED, 1920x1200, 14", 60 Hz | Asus ExpertBook Ultra B9406CAA Samsung ATNA40LE01-0, OLED, 2880x1800, 14", 120 Hz | |
|---|---|---|---|---|---|---|
| Display | -2% | 2% | 2% | -0% | -3% | |
| Display P3 Coverage (%) | 99.9 | 99.3 -1% | 99.8 0% | 99.7 0% | 100 0% | 96.2 -4% |
| sRGB Coverage (%) | 100 | 100 0% | 100 0% | 100 0% | 100 0% | 100 0% |
| AdobeRGB 1998 Coverage (%) | 92.3 | 87.7 -5% | 96.7 5% | 98.2 6% | 91.8 -1% | 86.7 -6% |
| Response Times | -39% | -32% | -21% | -95% | -3% | |
| Response Time Grey 50% / Grey 80% * (ms) | 0.58 ? | 0.64 ? -10% | 0.86 ? -48% | 0.75 ? -29% | 1.87 ? -222% | 0.71 ? -22% |
| Response Time Black / White * (ms) | 0.87 ? | 0.94 ? -8% | 1.01 ? -16% | 1.03 ? -18% | 1.53 ? -76% | 0.94 ? -8% |
| PWM Frequency (Hz) | 927.13 ? | 479.46 ? | 469 ? | 240.62 ? | 480 ? | 968.8 ? |
| PWM Amplitude * (%) | 25 | 50 -100% | 33.3 -33% | 29 -16% | 22 12% | 20 20% |
| Screen | 5% | 17% | 7% | 1% | 28% | |
| Brightness middle (cd/m²) | 446 | 470.7 6% | 363.9 -18% | 393.8 -12% | 292 -35% | 600.5 35% |
| Brightness (cd/m²) | 447 | 488 9% | 366 -18% | 389 -13% | 292 -35% | 612 37% |
| Brightness Distribution (%) | 99 | 94 -5% | 99 0% | 96 -3% | 98 -1% | 96 -3% |
| Black Level * (cd/m²) | 0.01 | |||||
| Colorchecker dE 2000 * | 1.76 | 2.21 -26% | 0.84 52% | 1.27 28% | 1.4 20% | 1.18 33% |
| Colorchecker dE 2000 max. * | 3.29 | 5.02 -53% | 2.72 17% | 3.35 -2% | 2.2 33% | 3.4 -3% |
| Colorchecker dE 2000 calibrated * | 1.18 | 0.82 31% | 0.82 31% | 0.71 40% | 0.73 38% | |
| Greyscale dE 2000 * | 2.3 | 0.6 74% | 1.1 52% | 2 13% | 1.7 26% | 1 57% |
| Gamma | 2.25 98% | 2.2 100% | 2.18 101% | 2.19 100% | 2.12 104% | 2.27 97% |
| CCT | 6470 100% | 6472 100% | 6330 103% | 6379 102% | 6510 100% | 6567 99% |
| Contrast (:1) | 29200 | |||||
| Całkowita średnia (program / ustawienia) | -12% /
-7% | -4% /
2% | -4% /
-0% | -31% /
-23% | 7% /
13% |
* ... im mniej tym lepiej


Wyświetl czasy reakcji
| ↔ Czas reakcji od czerni do bieli | ||
|---|---|---|
| 0.87 ms ... wzrost ↗ i spadek ↘ łącznie | ↗ 0.4 ms wzrost | 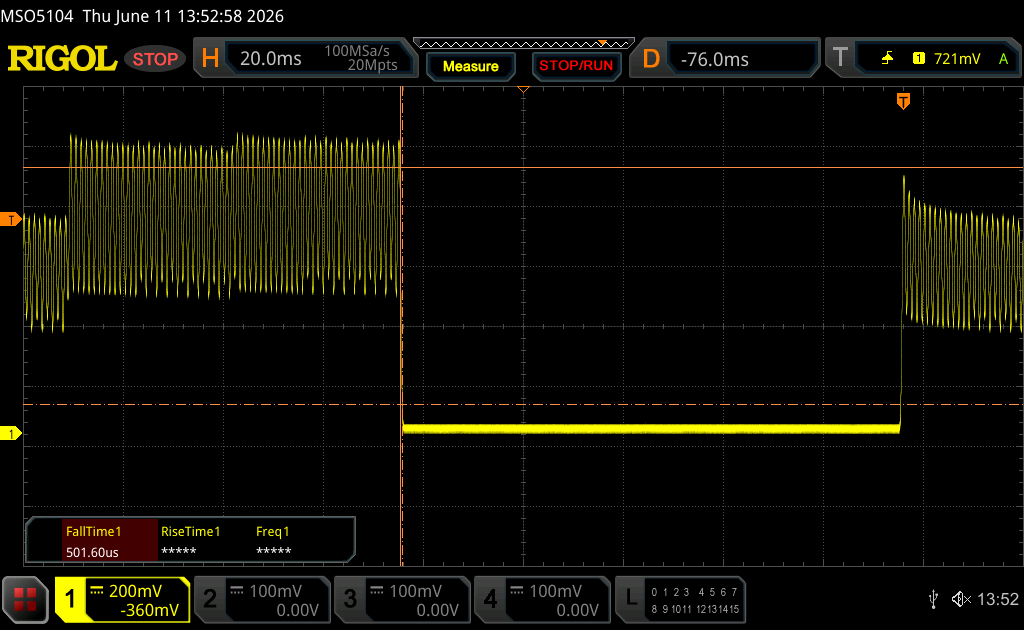 |
| ↘ 0.47 ms upadek | ||
| W naszych testach ekran wykazuje bardzo szybką reakcję i powinien bardzo dobrze nadawać się do szybkich gier. Dla porównania, wszystkie testowane urządzenia wahają się od 0.1 (minimum) do 240 (maksimum) ms. » 3 % wszystkich urządzeń jest lepszych. Oznacza to, że zmierzony czas reakcji jest lepszy od średniej wszystkich testowanych urządzeń (19.8 ms). | ||
| ↔ Czas reakcji 50% szarości do 80% szarości | ||
| 0.58 ms ... wzrost ↗ i spadek ↘ łącznie | ↗ 0.3 ms wzrost | 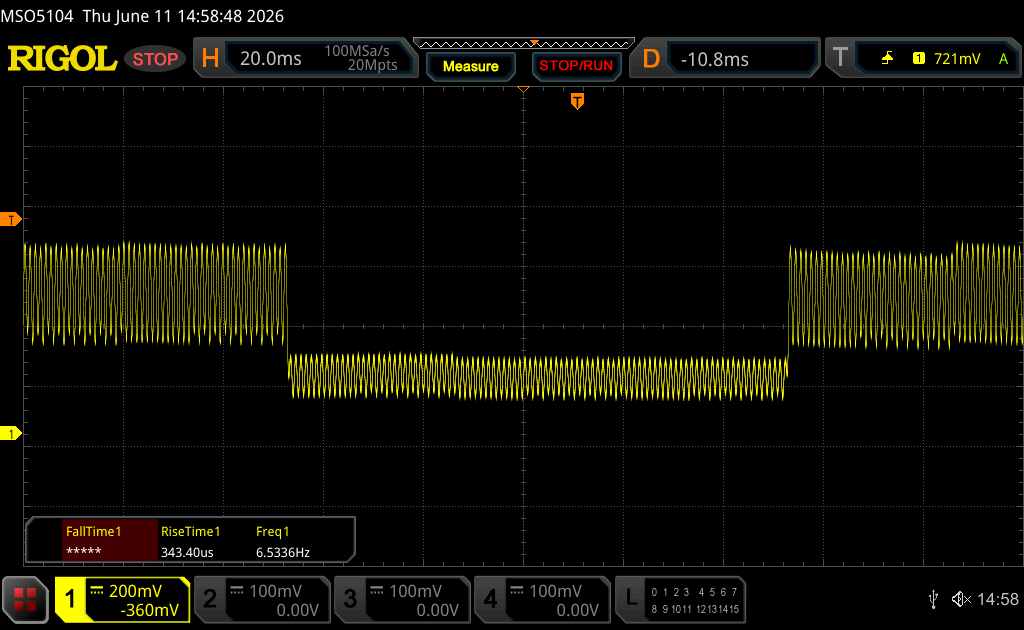 |
| ↘ 0.28 ms upadek | ||
| W naszych testach ekran wykazuje bardzo szybką reakcję i powinien bardzo dobrze nadawać się do szybkich gier. Dla porównania, wszystkie testowane urządzenia wahają się od 0.165 (minimum) do 636 (maksimum) ms. » 1 % wszystkich urządzeń jest lepszych. Oznacza to, że zmierzony czas reakcji jest lepszy od średniej wszystkich testowanych urządzeń (31 ms). | ||
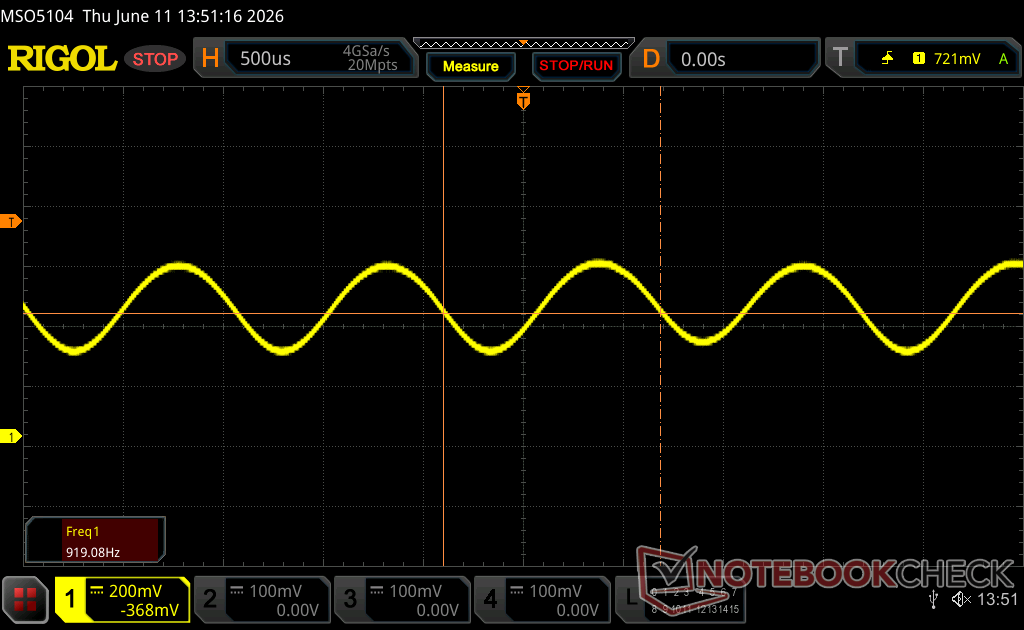
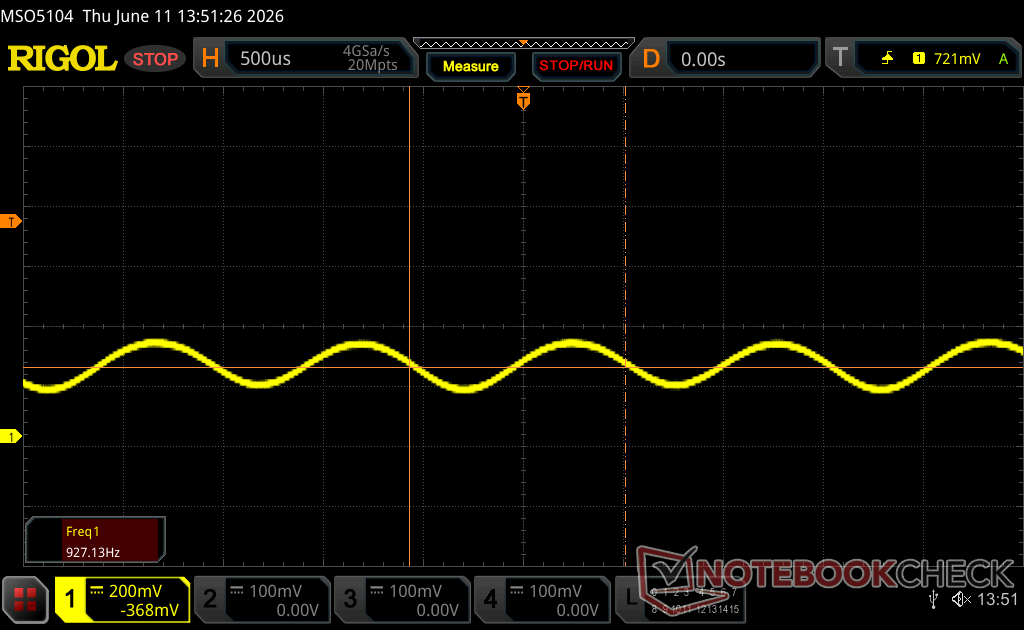
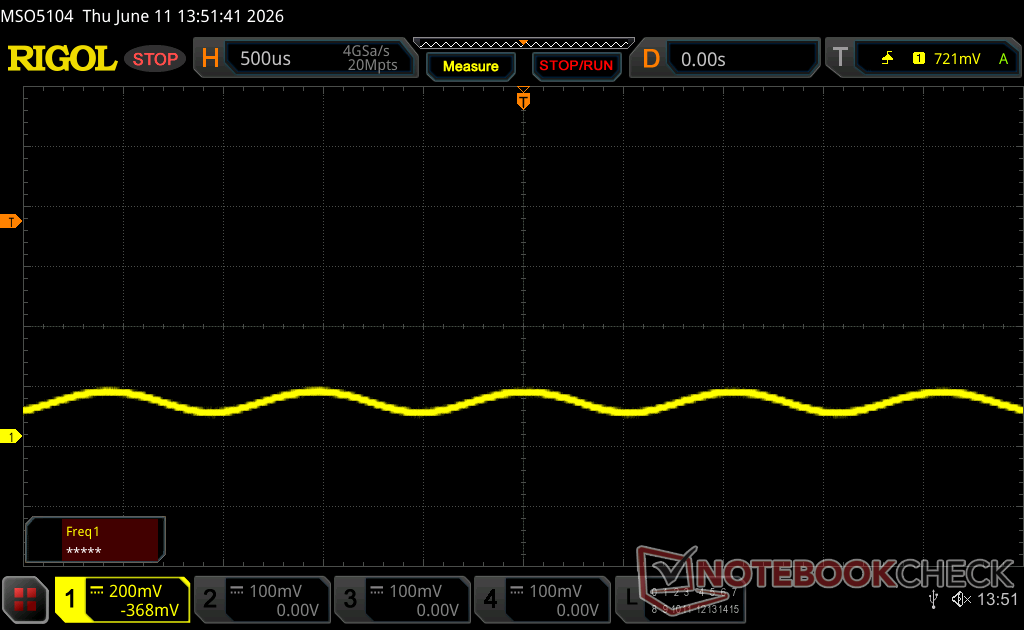
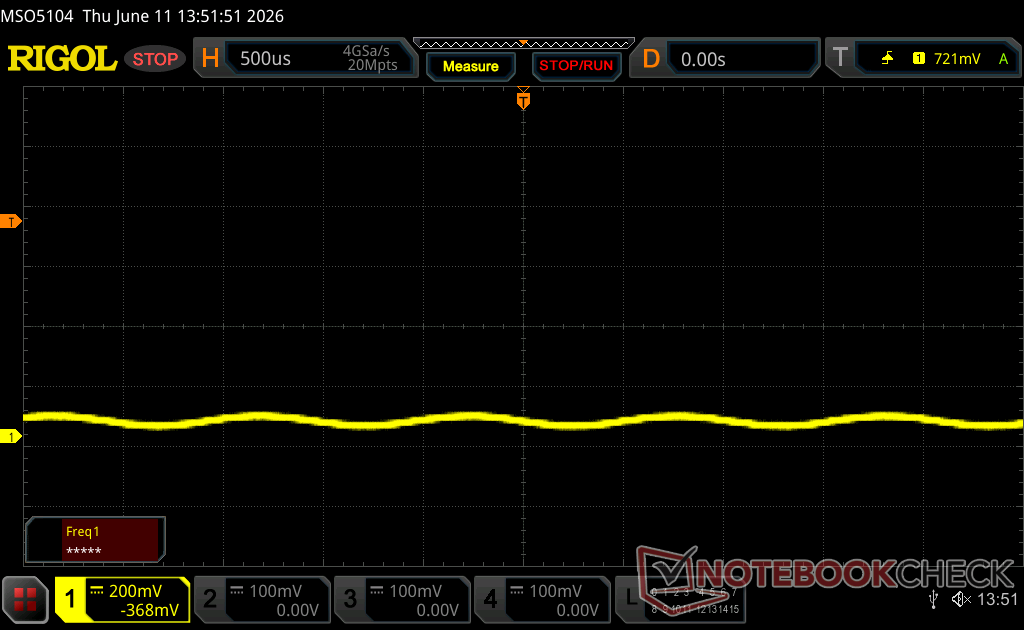
Migotanie ekranu / PWM (modulacja szerokości impulsu)
| Wykryto migotanie ekranu/wykryto PWM | 927.13 Hz Amplitude: 25 % | ≤ 100 % ustawienia jasności | 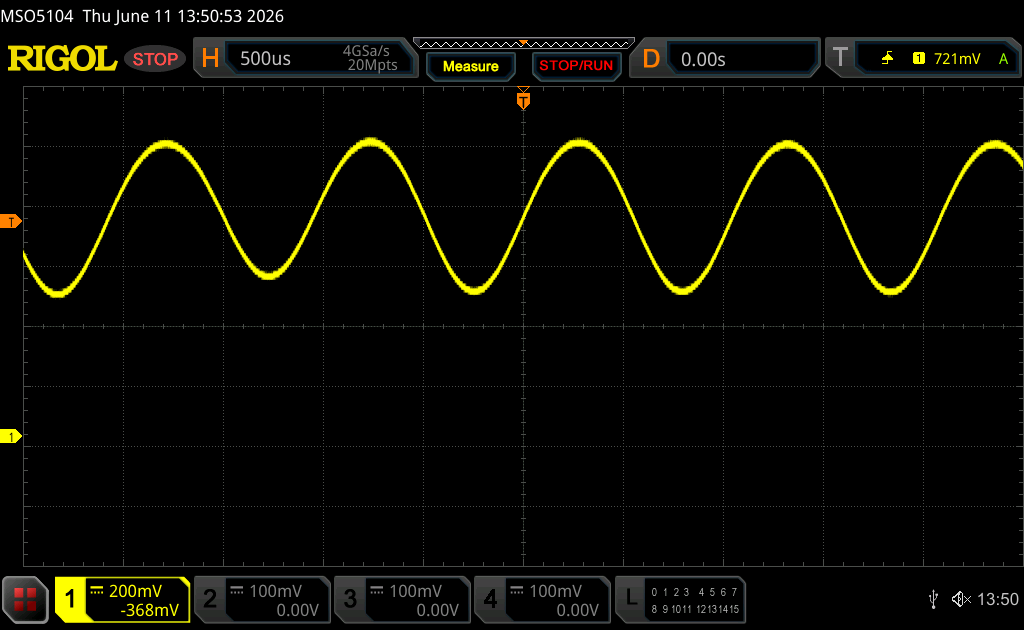 |
Podświetlenie wyświetlacza miga z częstotliwością 927.13 Hz (najgorszy przypadek, np. przy użyciu PWM) Wykryto migotanie przy ustawieniu jasności 100 % i poniżej. Powyżej tego ustawienia jasności nie powinno być żadnego migotania ani PWM. Częstotliwość 927.13 Hz jest dość wysoka, więc większość użytkowników wrażliwych na PWM nie powinna zauważyć żadnego migotania. Dla porównania: 52 % wszystkich testowanych urządzeń nie używa PWM do przyciemniania wyświetlacza. Jeśli wykryto PWM, zmierzono średnio 7757 (minimum: 5 - maksimum: 343500) Hz. | |||


Wydajność
Warunki testowania
Przed przeprowadzeniem poniższych testów porównawczych ustawiliśmy wbudowane oprogramowanie HP w trybie wydajnościowym.
Wydajność procesora
Model Core Ultra X9 388H w komputerze HP działa o około 5 do 10 procent wolniej niż oczekiwano. W rzeczywistości komputer Asus ExpertBook Ultra działa o około 10 procent szybciej, mimo że jest wyposażony w słabszy procesor Core Ultra X7 358H. Spadek wydajności można częściowo przypisać ograniczonemu potencjałowi funkcji Turbo Boost w modelu OmniBook Ultra 14; wydajność spadałaby z czasem o około 9 procent podczas ciągłego uruchamiania programu CineBench R15, co pokazuje poniższy wykres porównawczy.
Procesor Ryzen AI 9 HX 375 w modelu OmniBook z 2024 roku oferuje o około 20–25 procent wyższą wydajność wielowątkową.
Cinebench R15 – test wielopętlowy
Cinebench R23: Multi Core | Single Core
Cinebench R20: CPU (Multi Core) | CPU (Single Core)
Cinebench R15: CPU Multi 64Bit | CPU Single 64Bit
Blender: v2.79 BMW27 CPU
7-Zip 18.03: 7z b 4 | 7z b 4 -mmt1
Geekbench 6.7: Multi-Core | Single-Core
Geekbench 5.5: Multi-Core | Single-Core
HWBOT x265 Benchmark v2.2: 4k Preset
LibreOffice : 20 Documents To PDF
R Benchmark 2.5: Overall mean
* ... im mniej tym lepiej
AIDA64: FP32 Ray-Trace | FPU Julia | CPU SHA3 | CPU Queen | FPU SinJulia | FPU Mandel | CPU AES | CPU ZLib | FP64 Ray-Trace | CPU PhotoWorxx | CPU CheckMate
| Performance rating | |
| HP OmniBook Ultra 14 Core Ultra X9 -1! | |
| Dell XPS 14 Core Ultra X7 358H | |
| MSI Prestige 14 Flip AI+ 2026 -1! | |
| Przeciętny Intel Core Ultra X9 388H | |
| HP OmniBook Ultra Flip 14 -1! | |
| Lenovo Yoga Slim 7 Ultra 14IPH11 -1! | |
| Asus ExpertBook Ultra B9406CAA -1! | |
| AIDA64 / FP32 Ray-Trace | |
| HP OmniBook Ultra 14 Core Ultra X9 (v8.20.8100) | |
| MSI Prestige 14 Flip AI+ 2026 (v8.20.8100) | |
| Dell XPS 14 Core Ultra X7 358H (v8.20.8100) | |
| Przeciętny Intel Core Ultra X9 388H (12225 - 15651, n=2) | |
| HP OmniBook Ultra Flip 14 (v6.92.6600) | |
| Lenovo Yoga Slim 7 Ultra 14IPH11 (v8.20.8100) | |
| Asus ExpertBook Ultra B9406CAA (v6.92.6600) | |
| AIDA64 / FPU Julia | |
| HP OmniBook Ultra 14 Core Ultra X9 (v8.20.8100) | |
| MSI Prestige 14 Flip AI+ 2026 (v8.20.8100) | |
| Dell XPS 14 Core Ultra X7 358H (v8.20.8100) | |
| HP OmniBook Ultra Flip 14 (v6.92.6600) | |
| Lenovo Yoga Slim 7 Ultra 14IPH11 (v8.20.8100) | |
| Przeciętny Intel Core Ultra X9 388H (32079 - 82749, n=2) | |
| Asus ExpertBook Ultra B9406CAA (v6.92.6600) | |
| AIDA64 / CPU SHA3 | |
| Asus ExpertBook Ultra B9406CAA (v6.92.6600) | |
| Przeciętny Intel Core Ultra X9 388H (4178 - 4419, n=2) | |
| HP OmniBook Ultra 14 Core Ultra X9 (v8.20.8100) | |
| Dell XPS 14 Core Ultra X7 358H (v8.20.8100) | |
| MSI Prestige 14 Flip AI+ 2026 (v8.20.8100) | |
| Lenovo Yoga Slim 7 Ultra 14IPH11 (v8.20.8100) | |
| HP OmniBook Ultra Flip 14 (v6.92.6600) | |
| AIDA64 / CPU Queen | |
| Przeciętny Intel Core Ultra X9 388H (n=1) | |
| Dell XPS 14 Core Ultra X7 358H (v6.92.6600) | |
| Asus ExpertBook Ultra B9406CAA (v6.92.6600) | |
| HP OmniBook Ultra Flip 14 (v6.92.6600) | |
| AIDA64 / FPU SinJulia | |
| HP OmniBook Ultra 14 Core Ultra X9 (v8.20.8100) | |
| Dell XPS 14 Core Ultra X7 358H (v8.20.8100) | |
| MSI Prestige 14 Flip AI+ 2026 (v8.20.8100) | |
| Przeciętny Intel Core Ultra X9 388H (5099 - 7015, n=2) | |
| Asus ExpertBook Ultra B9406CAA (v6.92.6600) | |
| Lenovo Yoga Slim 7 Ultra 14IPH11 (v8.20.8100) | |
| HP OmniBook Ultra Flip 14 (v6.92.6600) | |
| AIDA64 / FPU Mandel | |
| HP OmniBook Ultra 14 Core Ultra X9 (v8.20.8100) | |
| MSI Prestige 14 Flip AI+ 2026 (v8.20.8100) | |
| Dell XPS 14 Core Ultra X7 358H (v8.20.8100) | |
| Lenovo Yoga Slim 7 Ultra 14IPH11 (v8.20.8100) | |
| HP OmniBook Ultra Flip 14 (v6.92.6600) | |
| Przeciętny Intel Core Ultra X9 388H (15864 - 44749, n=2) | |
| Asus ExpertBook Ultra B9406CAA (v6.92.6600) | |
| AIDA64 / CPU AES | |
| Dell XPS 14 Core Ultra X7 358H (v8.20.8100) | |
| HP OmniBook Ultra 14 Core Ultra X9 (v8.20.8100) | |
| MSI Prestige 14 Flip AI+ 2026 (v8.20.8100) | |
| HP OmniBook Ultra Flip 14 (v6.92.6600) | |
| Lenovo Yoga Slim 7 Ultra 14IPH11 (v8.20.8100) | |
| Przeciętny Intel Core Ultra X9 388H (5271 - 61890, n=2) | |
| Asus ExpertBook Ultra B9406CAA (v6.92.6600) | |
| AIDA64 / CPU ZLib | |
| Asus ExpertBook Ultra B9406CAA (v6.92.6600) | |
| Dell XPS 14 Core Ultra X7 358H (v8.20.8100) | |
| Przeciętny Intel Core Ultra X9 388H (984 - 1170, n=2) | |
| HP OmniBook Ultra 14 Core Ultra X9 (v8.20.8100) | |
| MSI Prestige 14 Flip AI+ 2026 (v8.20.8100) | |
| Lenovo Yoga Slim 7 Ultra 14IPH11 (v8.20.8100) | |
| HP OmniBook Ultra Flip 14 (v6.92.6600) | |
| AIDA64 / FP64 Ray-Trace | |
| HP OmniBook Ultra 14 Core Ultra X9 (v8.20.8100) | |
| MSI Prestige 14 Flip AI+ 2026 (v8.20.8100) | |
| Dell XPS 14 Core Ultra X7 358H (v8.20.8100) | |
| Przeciętny Intel Core Ultra X9 388H (6440 - 8317, n=2) | |
| HP OmniBook Ultra Flip 14 (v6.92.6600) | |
| Asus ExpertBook Ultra B9406CAA (v6.92.6600) | |
| Lenovo Yoga Slim 7 Ultra 14IPH11 (v8.20.8100) | |
| AIDA64 / CPU PhotoWorxx | |
| Dell XPS 14 Core Ultra X7 358H (v8.20.8100) | |
| HP OmniBook Ultra 14 Core Ultra X9 (v8.20.8100) | |
| MSI Prestige 14 Flip AI+ 2026 (v8.20.8100) | |
| Lenovo Yoga Slim 7 Ultra 14IPH11 (v8.20.8100) | |
| Przeciętny Intel Core Ultra X9 388H (33033 - 85600, n=2) | |
| HP OmniBook Ultra Flip 14 (v6.92.6600) | |
| Asus ExpertBook Ultra B9406CAA (v6.92.6600) | |
| AIDA64 / CPU CheckMate | |
| Dell XPS 14 Core Ultra X7 358H (v8.20.8100) | |
| MSI Prestige 14 Flip AI+ 2026 (v8.20.8100) | |
| HP OmniBook Ultra 14 Core Ultra X9 (v8.20.8100) | |
| Przeciętny Intel Core Ultra X9 388H (n=1) | |
| Lenovo Yoga Slim 7 Ultra 14IPH11 (v8.20.8100) | |
Wydajność systemu

PCMark 10: Score | Essentials | Productivity | Digital Content Creation
CrossMark: Overall | Productivity | Creativity | Responsiveness
WebXPRT 3: Overall
WebXPRT 4: Overall
Mozilla Kraken 1.1: Total
Geekbench AI: Single Precision GPU 1.7 | Half Precision GPU 1.7 | Quantized GPU 1.7
| Performance rating | |
| Przeciętny Intel Core Ultra X9 388H, Intel Arc B390 12 Xe3 Panther Lake iGPU | |
| HP OmniBook Ultra 14 Core Ultra X9 | |
| Dell XPS 14 Core Ultra X7 358H | |
| MSI Prestige 14 Flip AI+ 2026 -3! | |
| Asus ExpertBook Ultra B9406CAA | |
| Lenovo Yoga Slim 7 Ultra 14IPH11 | |
| HP OmniBook Ultra Flip 14 -3! | |
| PCMark 10 / Score | |
| Przeciętny Intel Core Ultra X9 388H, Intel Arc B390 12 Xe3 Panther Lake iGPU (9939 - 10123, n=2) | |
| HP OmniBook Ultra 14 Core Ultra X9 | |
| Dell XPS 14 Core Ultra X7 358H | |
| MSI Prestige 14 Flip AI+ 2026 | |
| Asus ExpertBook Ultra B9406CAA | |
| Lenovo Yoga Slim 7 Ultra 14IPH11 | |
| HP OmniBook Ultra Flip 14 | |
| PCMark 10 / Essentials | |
| HP OmniBook Ultra 14 Core Ultra X9 | |
| Przeciętny Intel Core Ultra X9 388H, Intel Arc B390 12 Xe3 Panther Lake iGPU (11094 - 11646, n=2) | |
| Dell XPS 14 Core Ultra X7 358H | |
| MSI Prestige 14 Flip AI+ 2026 | |
| Asus ExpertBook Ultra B9406CAA | |
| Lenovo Yoga Slim 7 Ultra 14IPH11 | |
| HP OmniBook Ultra Flip 14 | |
| PCMark 10 / Productivity | |
| Przeciętny Intel Core Ultra X9 388H, Intel Arc B390 12 Xe3 Panther Lake iGPU (16606 - 17914, n=2) | |
| Dell XPS 14 Core Ultra X7 358H | |
| MSI Prestige 14 Flip AI+ 2026 | |
| HP OmniBook Ultra 14 Core Ultra X9 | |
| Asus ExpertBook Ultra B9406CAA | |
| Lenovo Yoga Slim 7 Ultra 14IPH11 | |
| HP OmniBook Ultra Flip 14 | |
| PCMark 10 / Digital Content Creation | |
| Przeciętny Intel Core Ultra X9 388H, Intel Arc B390 12 Xe3 Panther Lake iGPU (13779 - 14164, n=2) | |
| Dell XPS 14 Core Ultra X7 358H | |
| HP OmniBook Ultra 14 Core Ultra X9 | |
| MSI Prestige 14 Flip AI+ 2026 | |
| Asus ExpertBook Ultra B9406CAA | |
| HP OmniBook Ultra Flip 14 | |
| Lenovo Yoga Slim 7 Ultra 14IPH11 | |
| CrossMark / Overall | |
| Przeciętny Intel Core Ultra X9 388H, Intel Arc B390 12 Xe3 Panther Lake iGPU (2048 - 2155, n=2) | |
| MSI Prestige 14 Flip AI+ 2026 | |
| HP OmniBook Ultra 14 Core Ultra X9 | |
| Dell XPS 14 Core Ultra X7 358H | |
| Asus ExpertBook Ultra B9406CAA | |
| Lenovo Yoga Slim 7 Ultra 14IPH11 | |
| HP OmniBook Ultra Flip 14 | |
| CrossMark / Productivity | |
| MSI Prestige 14 Flip AI+ 2026 | |
| Przeciętny Intel Core Ultra X9 388H, Intel Arc B390 12 Xe3 Panther Lake iGPU (1834 - 1942, n=2) | |
| HP OmniBook Ultra 14 Core Ultra X9 | |
| Lenovo Yoga Slim 7 Ultra 14IPH11 | |
| Dell XPS 14 Core Ultra X7 358H | |
| Asus ExpertBook Ultra B9406CAA | |
| HP OmniBook Ultra Flip 14 | |
| CrossMark / Creativity | |
| Przeciętny Intel Core Ultra X9 388H, Intel Arc B390 12 Xe3 Panther Lake iGPU (2390 - 2613, n=2) | |
| MSI Prestige 14 Flip AI+ 2026 | |
| Dell XPS 14 Core Ultra X7 358H | |
| HP OmniBook Ultra 14 Core Ultra X9 | |
| Asus ExpertBook Ultra B9406CAA | |
| Lenovo Yoga Slim 7 Ultra 14IPH11 | |
| HP OmniBook Ultra Flip 14 | |
| CrossMark / Responsiveness | |
| HP OmniBook Ultra 14 Core Ultra X9 | |
| Przeciętny Intel Core Ultra X9 388H, Intel Arc B390 12 Xe3 Panther Lake iGPU (1651 - 1797, n=2) | |
| MSI Prestige 14 Flip AI+ 2026 | |
| Asus ExpertBook Ultra B9406CAA | |
| Dell XPS 14 Core Ultra X7 358H | |
| Lenovo Yoga Slim 7 Ultra 14IPH11 | |
| HP OmniBook Ultra Flip 14 | |
| WebXPRT 3 / Overall | |
| HP OmniBook Ultra 14 Core Ultra X9 | |
| Przeciętny Intel Core Ultra X9 388H, Intel Arc B390 12 Xe3 Panther Lake iGPU (339 - 354, n=2) | |
| Dell XPS 14 Core Ultra X7 358H | |
| MSI Prestige 14 Flip AI+ 2026 | |
| Asus ExpertBook Ultra B9406CAA | |
| Lenovo Yoga Slim 7 Ultra 14IPH11 | |
| HP OmniBook Ultra Flip 14 | |
| WebXPRT 4 / Overall | |
| HP OmniBook Ultra 14 Core Ultra X9 | |
| Przeciętny Intel Core Ultra X9 388H, Intel Arc B390 12 Xe3 Panther Lake iGPU (314 - 318, n=2) | |
| Dell XPS 14 Core Ultra X7 358H | |
| MSI Prestige 14 Flip AI+ 2026 | |
| Asus ExpertBook Ultra B9406CAA | |
| Lenovo Yoga Slim 7 Ultra 14IPH11 | |
| HP OmniBook Ultra Flip 14 | |
| Mozilla Kraken 1.1 / Total | |
| HP OmniBook Ultra Flip 14 | |
| Lenovo Yoga Slim 7 Ultra 14IPH11 | |
| Asus ExpertBook Ultra B9406CAA | |
| MSI Prestige 14 Flip AI+ 2026 | |
| Dell XPS 14 Core Ultra X7 358H | |
| HP OmniBook Ultra 14 Core Ultra X9 | |
| Przeciętny Intel Core Ultra X9 388H, Intel Arc B390 12 Xe3 Panther Lake iGPU (430 - 431, n=2) | |
| Geekbench AI / Single Precision GPU 1.7 | |
| Asus ExpertBook Ultra B9406CAA | |
| Dell XPS 14 Core Ultra X7 358H | |
| HP OmniBook Ultra 14 Core Ultra X9 | |
| Przeciętny Intel Core Ultra X9 388H, Intel Arc B390 12 Xe3 Panther Lake iGPU (n=1) | |
| Lenovo Yoga Slim 7 Ultra 14IPH11 | |
| Geekbench AI / Half Precision GPU 1.7 | |
| Asus ExpertBook Ultra B9406CAA | |
| Dell XPS 14 Core Ultra X7 358H | |
| HP OmniBook Ultra 14 Core Ultra X9 | |
| Przeciętny Intel Core Ultra X9 388H, Intel Arc B390 12 Xe3 Panther Lake iGPU (n=1) | |
| Lenovo Yoga Slim 7 Ultra 14IPH11 | |
| Geekbench AI / Quantized GPU 1.7 | |
| Asus ExpertBook Ultra B9406CAA | |
| Dell XPS 14 Core Ultra X7 358H | |
| HP OmniBook Ultra 14 Core Ultra X9 | |
| Przeciętny Intel Core Ultra X9 388H, Intel Arc B390 12 Xe3 Panther Lake iGPU (n=1) | |
| Lenovo Yoga Slim 7 Ultra 14IPH11 | |
* ... im mniej tym lepiej
| PCMark 10 Score | 9939 pkt. | |
Pomoc | ||
| AIDA64 / Memory Copy | |
| Dell XPS 14 Core Ultra X7 358H | |
| HP OmniBook Ultra 14 Core Ultra X9 | |
| Przeciętny Intel Core Ultra X9 388H (129450 - 131023, n=2) | |
| MSI Prestige 14 Flip AI+ 2026 | |
| HP OmniBook Ultra Flip 14 | |
| Lenovo Yoga Slim 7 Ultra 14IPH11 | |
| AIDA64 / Memory Read | |
| Przeciętny Intel Core Ultra X9 388H (120487 - 131960, n=2) | |
| HP OmniBook Ultra 14 Core Ultra X9 | |
| Asus ExpertBook Ultra B9406CAA | |
| Dell XPS 14 Core Ultra X7 358H | |
| MSI Prestige 14 Flip AI+ 2026 | |
| HP OmniBook Ultra Flip 14 | |
| Lenovo Yoga Slim 7 Ultra 14IPH11 | |
| AIDA64 / Memory Write | |
| Przeciętny Intel Core Ultra X9 388H (135141 - 135182, n=2) | |
| HP OmniBook Ultra 14 Core Ultra X9 | |
| Dell XPS 14 Core Ultra X7 358H | |
| MSI Prestige 14 Flip AI+ 2026 | |
| Asus ExpertBook Ultra B9406CAA | |
| HP OmniBook Ultra Flip 14 | |
| Lenovo Yoga Slim 7 Ultra 14IPH11 | |
| AIDA64 / Memory Latency | |
| Lenovo Yoga Slim 7 Ultra 14IPH11 | |
| HP OmniBook Ultra Flip 14 | |
| MSI Prestige 14 Flip AI+ 2026 | |
| Dell XPS 14 Core Ultra X7 358H | |
| HP OmniBook Ultra 14 Core Ultra X9 | |
| Przeciętny Intel Core Ultra X9 388H (84 - 85, n=2) | |
* ... im mniej tym lepiej
Opóźnienie DPC


| DPC Latencies / LatencyMon - interrupt to process latency (max), Web, Youtube, Prime95 | |
| MSI Prestige 14 Flip AI+ 2026 | |
| HP OmniBook Ultra 14 Core Ultra X9 | |
| Lenovo Yoga Slim 7 Ultra 14IPH11 | |
| Dell XPS 14 Core Ultra X7 358H | |
| Asus ExpertBook Ultra B9406CAA | |
* ... im mniej tym lepiej
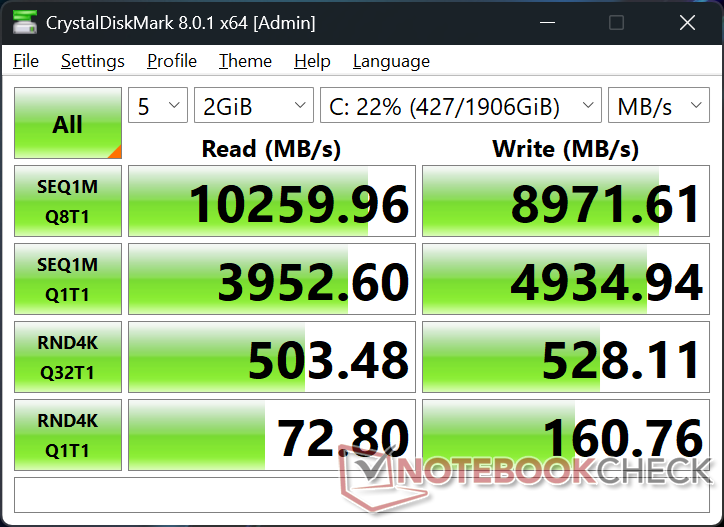
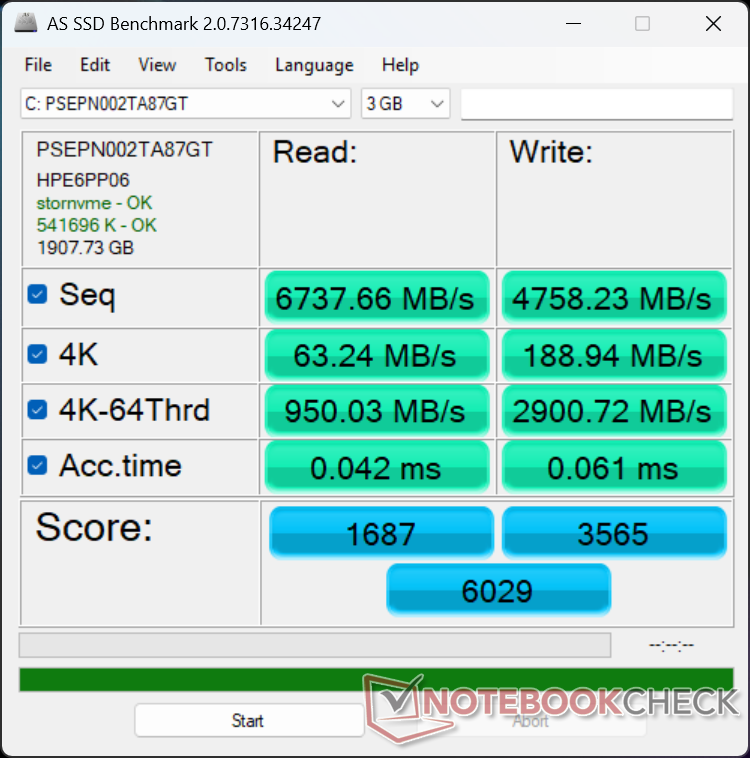
Urządzenia pamięci masowej
Karta M.2 2280 Phison PSEPN002TA87GT Dysk SSD PCIe 5.0 działa stabilnie z prędkością około 10 000 MB/s, podczas gdy dysk Samsung PMPA1 w komputerze OmniBook Ultra 14 Flip ulegałby spowolnieniu w tym samym teście obciążeniowym.

* ... im mniej tym lepiej
Ograniczanie przepustowości dysku: pętla odczytu DiskSpd, głębokość kolejki 8
Wydajność procesora graficznego
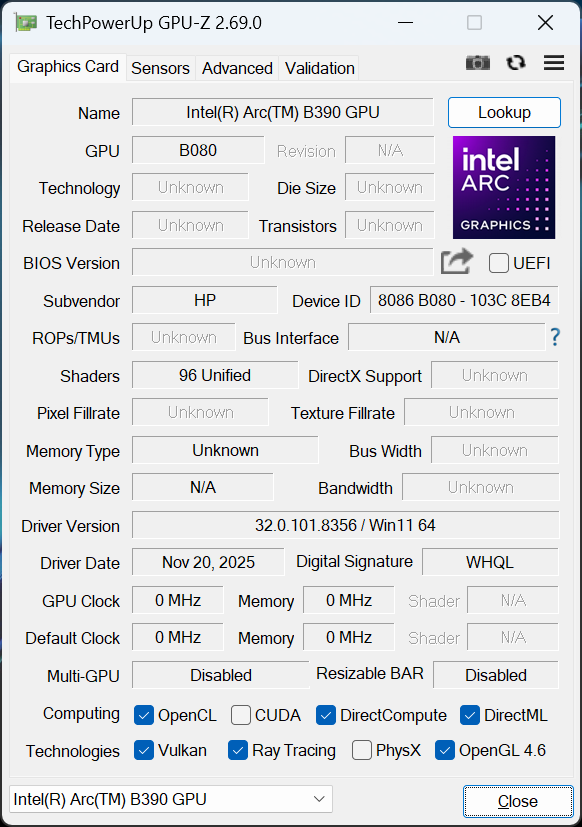
Chociaż sama wydajność procesora jest niższa niż w modelu OmniBook Ultra 14 z 2024 r. wyposażonym w procesor AMD, wydajność grafiki jest znacznie wyższa, co rekompensuje tę słabość procesora. Model Arc B390 działa nawet dwukrotnie szybciej niż Radeon 890M , co pozwala na płynne granie w nowoczesne, wymagające tytuły w rozdzielczości 1080p.
Liczba klatek na sekundę podczas grania niestety ulegała wahaniom, zamiast pozostawać stała. Na przykład podczas pracy w trybie bezczynności w grze Cyberpunk 2077 w rozdzielczości 1080p i ustawieniach Ultra liczba klatek na sekundę wahała się między 39 a 44 FPS, w porównaniu ze stałą wartością 28 FPS w modelu 2024 OmniBook Ultra 14.
Ogólna wydajność jest obniżona w trybie zrównoważonym lub podczas pracy na baterii, co pokazuje poniższa tabela wyników testu Fire Strike.
| Profil zasilania | Wynik grafiki | Wynik fizyki | Wynik łączny |
| Tryb wydajności | 16347 | 28159 | 4136 |
| Tryb zrównoważony | 13753 (-16%) | 23251 (-17%) | 3550 (-14%) |
| Zasilanie bateryjne | 15865 (-3%) | 24 559 (-13%) | 4451 (-8%) |
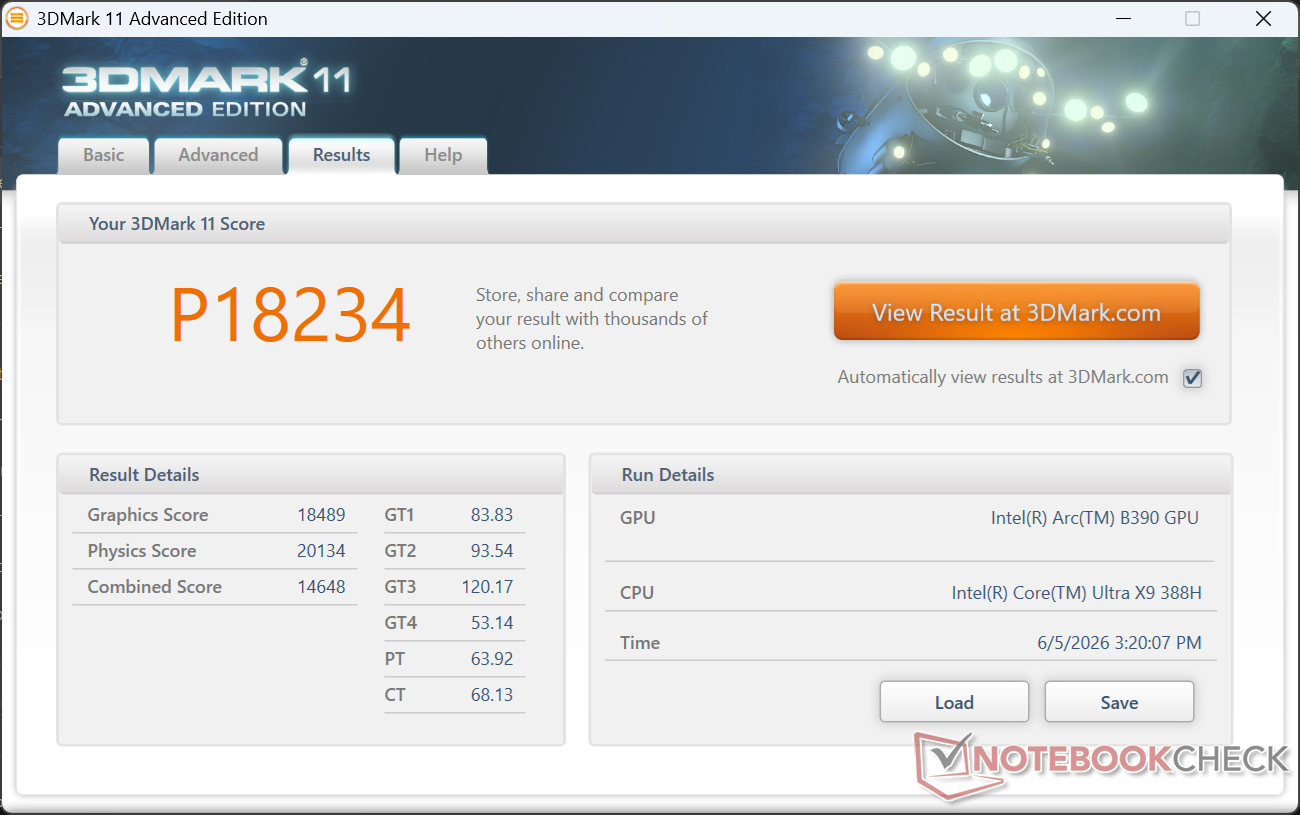


| 3DMark 11 Performance | 18234 pkt. | |
| 3DMark Cloud Gate Standard Score | 34003 pkt. | |
| 3DMark Fire Strike Score | 13265 pkt. | |
| 3DMark Time Spy Score | 6806 pkt. | |
Pomoc | ||
* ... im mniej tym lepiej
| Cyberpunk 2077 - 1920x1080 Ultra Preset (FSR off) | |
| Asus ExpertBook Ultra B9406CAA | |
| MSI Prestige 14 Flip AI+ 2026 | |
| HP OmniBook Ultra 14 Core Ultra X9 | |
| Dell XPS 14 Core Ultra X7 358H | |
| HP OmniBook Ultra Flip 14 | |
| Lenovo Yoga Slim 7 Ultra 14IPH11 | |
| Baldur's Gate 3 - 1920x1080 Ultra Preset AA:T | |
| HP OmniBook Ultra 14 Core Ultra X9 | |
| Asus ExpertBook Ultra B9406CAA | |
| Dell XPS 14 Core Ultra X7 358H | |
| MSI Prestige 14 Flip AI+ 2026 | |
| HP OmniBook Ultra Flip 14 | |
| Lenovo Yoga Slim 7 Ultra 14IPH11 | |
| GTA V - 1920x1080 Highest AA:4xMSAA + FX AF:16x | |
| Asus ExpertBook Ultra B9406CAA | |
| HP OmniBook Ultra 14 Core Ultra X9 | |
| MSI Prestige 14 Flip AI+ 2026 | |
| Dell XPS 14 Core Ultra X7 358H | |
| HP OmniBook Ultra Flip 14 | |
| Lenovo Yoga Slim 7 Ultra 14IPH11 | |
| Final Fantasy XV Benchmark - 1920x1080 High Quality | |
| Asus ExpertBook Ultra B9406CAA | |
| HP OmniBook Ultra 14 Core Ultra X9 | |
| Dell XPS 14 Core Ultra X7 358H | |
| MSI Prestige 14 Flip AI+ 2026 | |
| HP OmniBook Ultra Flip 14 | |
| Lenovo Yoga Slim 7 Ultra 14IPH11 | |
| Strange Brigade - 1920x1080 ultra AA:ultra AF:16 | |
| HP OmniBook Ultra 14 Core Ultra X9 | |
| Asus ExpertBook Ultra B9406CAA | |
| Dell XPS 14 Core Ultra X7 358H | |
| MSI Prestige 14 Flip AI+ 2026 | |
| HP OmniBook Ultra Flip 14 | |
| Lenovo Yoga Slim 7 Ultra 14IPH11 | |
| Dota 2 Reborn - 1920x1080 ultra (3/3) best looking | |
| Dell XPS 14 Core Ultra X7 358H | |
| Asus ExpertBook Ultra B9406CAA | |
| HP OmniBook Ultra 14 Core Ultra X9 | |
| MSI Prestige 14 Flip AI+ 2026 | |
| HP OmniBook Ultra Flip 14 | |
| Lenovo Yoga Slim 7 Ultra 14IPH11 | |
Wykres liczby klatek na sekundę w trybie Ultra w grze Cyberpunk 2077
| low | med. | high | ultra | |
|---|---|---|---|---|
| GTA V (2015) | 181.8 | 176.9 | 99.6 | 43.7 |
| Dota 2 Reborn (2015) | 110.8 | 84.5 | 99 | 97 |
| Final Fantasy XV Benchmark (2018) | 129.8 | 75.2 | 54.5 | |
| X-Plane 11.11 (2018) | 62 | 51.4 | 42.2 | |
| Strange Brigade (2018) | 335 | 137.5 | 114.9 | 101.3 |
| Baldur's Gate 3 (2023) | 72.2 | 61.3 | 54 | 53.5 |
| Cyberpunk 2077 (2023) | 74.2 | 60.1 | 51.9 | 44.9 |
| F1 24 (2024) | 141.8 | 131.9 | 101.4 | 35.6 |
Emisje
Hałas systemu
Hałas wentylatora osiągałby podobny poziom jak w poprzednich modelach, takich jak OmniBook Ultra 14 Flip lub oryginalny OmniBook Ultra 14 z 2024 r., więc najnowszy model nie jest technicznie głośniejszy ani cichszy. Jednak wentylatory przyspieszałyby szybciej w odpowiedzi na obciążenie, a tym samym szybciej osiągałyby maksymalną prędkość obrotową.
Hałas
| luz |
| 23.3 / 23.3 / 23.3 dB |
| obciążenie |
| 42.9 / 44.1 dB |
 | ||
30 dB cichy 40 dB(A) słyszalny 50 dB(A) irytujący |
||
min: | ||
| HP OmniBook Ultra 14 Core Ultra X9 Ultra X9 388H, Arc B390 Panther Lake iGPU | Lenovo Yoga Slim 7 Ultra 14IPH11 Ultra 7 355, Intel Graphics 4 Xe3 PTL | HP OmniBook Ultra Flip 14 Core Ultra 7 258V, Arc 140V | Dell XPS 14 Core Ultra X7 358H Ultra X7 358H, Arc B390 Panther Lake iGPU | MSI Prestige 14 Flip AI+ 2026 Ultra X7 358H, Arc B390 Panther Lake iGPU | Asus ExpertBook Ultra B9406CAA Ultra X7 358H, Arc B390 Panther Lake iGPU | |
|---|---|---|---|---|---|---|
| Noise | -4% | 9% | 3% | -3% | 5% | |
| wyłączone / środowisko * (dB) | 23.3 | 23.1 1% | 22.9 2% | 22.9 2% | 25.4 -9% | 22.9 2% |
| Idle Minimum * (dB) | 23.3 | 25.4 -9% | 23.2 -0% | 23.3 -0% | 25.4 -9% | 23.4 -0% |
| Idle Average * (dB) | 23.3 | 25.5 -9% | 23.2 -0% | 23.3 -0% | 25.4 -9% | 23.4 -0% |
| Idle Maximum * (dB) | 23.3 | 25.5 -9% | 23.2 -0% | 23.3 -0% | 25.4 -9% | 23.4 -0% |
| Load Average * (dB) | 42.9 | 44.4 -3% | 27.8 35% | 34 21% | 33.1 23% | 28.6 33% |
| Cyberpunk 2077 ultra * (dB) | 44.4 | 43.4 2% | 33.6 24% | 43.5 2% | 46.5 -5% | 42.8 4% |
| Load Maximum * (dB) | 44.1 | 45.5 -3% | 43.4 2% | 45.7 -4% | 46.5 -5% | 45.2 -2% |
* ... im mniej tym lepiej
Temperatura
Mimo wyższej wydajności, miejsca o najwyższej temperaturze powierzchni są zbliżone do tych, które odnotowaliśmy w przypadku modelu OmniBook Ultra 14 z 2024 roku.


(±) Maksymalna temperatura w górnej części wynosi 40.2 °C / 104 F, w porównaniu do średniej 35.9 °C / 97 F , począwszy od 21.4 do 59 °C dla klasy Subnotebook.
(±) Dno nagrzewa się maksymalnie do 44.2 °C / 112 F, w porównaniu do średniej 39.2 °C / 103 F
(+) W stanie bezczynności średnia temperatura górnej części wynosi 22.2 °C / 72 F, w porównaniu ze średnią temperaturą urządzenia wynoszącą 30.8 °C / ### class_avg_f### F.
(+) Podpórki pod nadgarstki i touchpad są chłodniejsze niż temperatura skóry i maksymalnie 30 °C / 86 F i dlatego są chłodne w dotyku.
(±) Średnia temperatura obszaru podparcia dłoni w podobnych urządzeniach wynosiła 28.2 °C / 82.8 F (-1.8 °C / -3.2 F).


| HP OmniBook Ultra 14 Core Ultra X9 Ultra X9 388H, Arc B390 Panther Lake iGPU | Lenovo Yoga Slim 7 Ultra 14IPH11 Ultra 7 355, Intel Graphics 4 Xe3 PTL | HP OmniBook Ultra Flip 14 Core Ultra 7 258V, Arc 140V | Dell XPS 14 Core Ultra X7 358H Ultra X7 358H, Arc B390 Panther Lake iGPU | MSI Prestige 14 Flip AI+ 2026 Ultra X7 358H, Arc B390 Panther Lake iGPU | Asus ExpertBook Ultra B9406CAA Ultra X7 358H, Arc B390 Panther Lake iGPU | |
|---|---|---|---|---|---|---|
| Heat | 9% | 0% | 2% | -9% | -1% | |
| Maximum Upper Side * (°C) | 40.2 | 33.6 16% | 35.8 11% | 34 15% | 47.1 -17% | 38.6 4% |
| Maximum Bottom * (°C) | 44.2 | 28.8 35% | 37.6 15% | 35.8 19% | 46.2 -5% | 38.4 13% |
| Idle Upper Side * (°C) | 22.8 | 25.2 -11% | 25.2 -11% | 25.6 -12% | 24.3 -7% | 24.6 -8% |
| Idle Bottom * (°C) | 23.4 | 24.6 -5% | 26.6 -14% | 26.4 -13% | 24.5 -5% | 26 -11% |
* ... im mniej tym lepiej
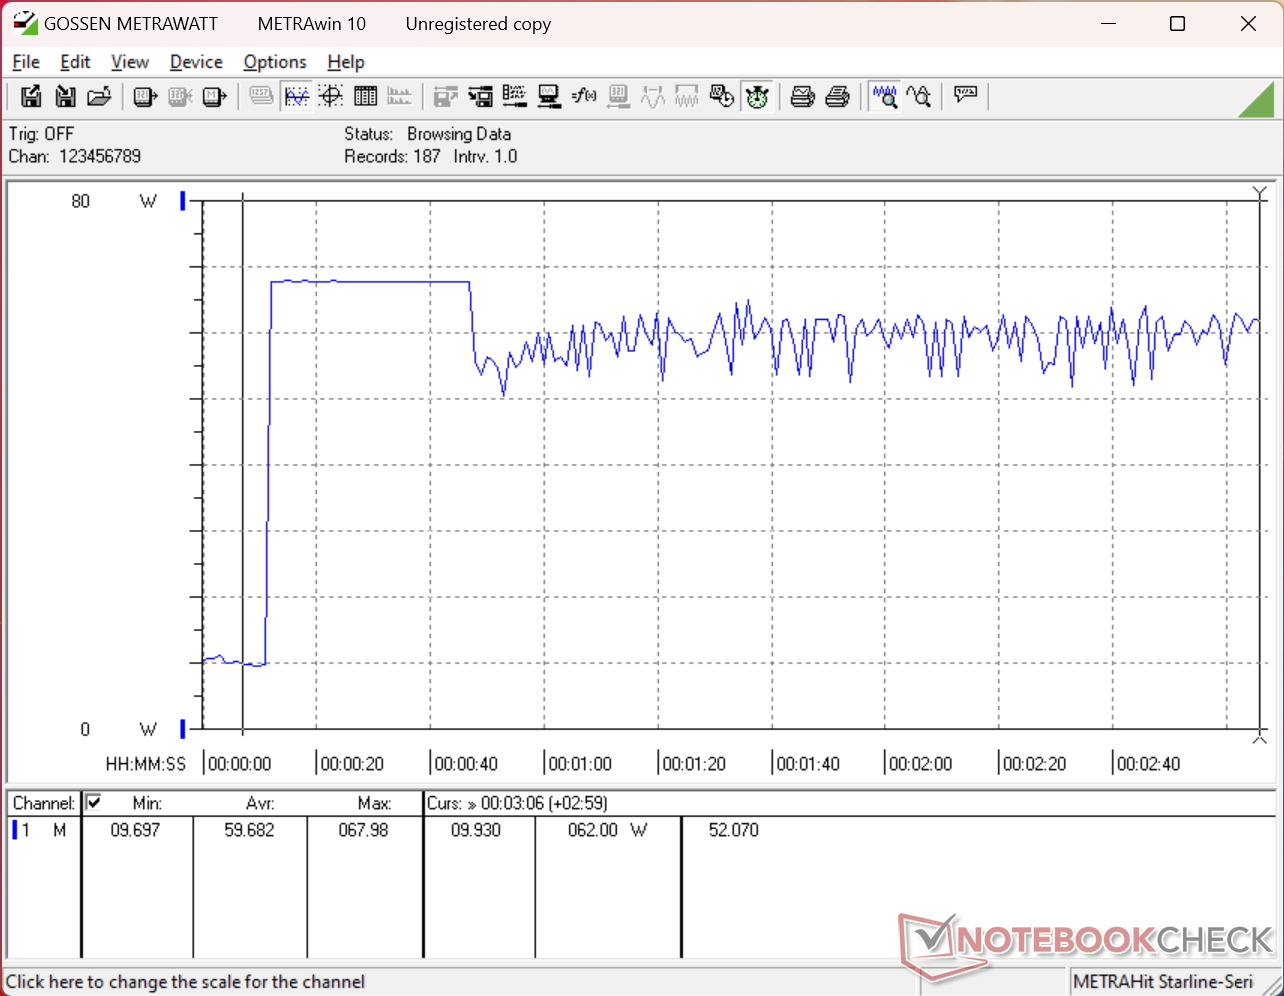
Test warunków skrajnych
Podczas uruchamiania testu obciążeniowego Prime95 częstotliwość procesora wzrastała do 2,9 GHz, pobór mocy do 43 W, a temperatura do 86°C, po czym około 30 sekund później spadała do 2,1 GHz, 26 W i 71°C, co sugeruje ograniczoną trwałość działania funkcji Turbo Boost. Nowy model XPS 14, który jest wyposażony w podobne procesory z serii Panther Lake, również stabilizował się na podobnych poziomach.
Częstotliwości taktowania procesora graficznego podczas uruchomienia gry Cyberpunk 2077 wahały się w przedziale od 1750 do 2200 MHz, nawet w trybie wydajnościowym, co koreluje z wahaniami liczby klatek na sekundę, o których mowa w sekcji dotyczącej wydajności procesora graficznego powyżej. Bardziej stabilne częstotliwości taktowania byłyby preferowane dla uzyskania bardziej stabilnej wydajności w grach, ponieważ wahania częstotliwości taktowania są rzadkością w innych laptopach.


| Średnia częstotliwość taktowania procesora (GHz) | Częstotliwość taktowania karty graficznej (MHz) | Średnia temperatura procesora (°C) | |
| Tryb bezczynności systemu | -- | -- | 61 |
| Obciążenie programem Prime95 | 2,0 | -- | 71 |
| Prime95 + FurMark Stress | 1,4–1,8 | 950–1450 | 66–72 |
| Cyberpunk 2077 Stress | 0,8 | 1750–2200 | 64–70 |
Prelegenci
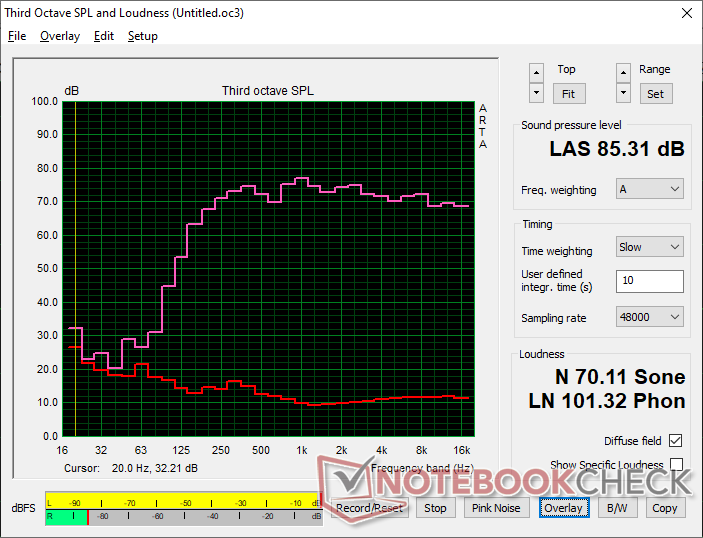
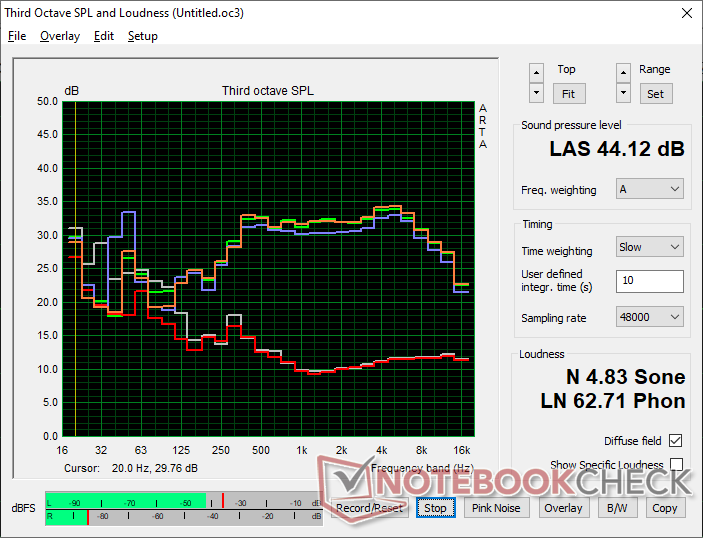
HP OmniBook Ultra 14 Core Ultra X9 analiza dźwięku
(+) | głośniki mogą odtwarzać stosunkowo głośno (85.3 dB)
Bas 100 - 315 Hz
(±) | zredukowany bas - średnio 10% niższy od mediany
(±) | liniowość basu jest średnia (11.6% delta do poprzedniej częstotliwości)
Średnie 400 - 2000 Hz
(+) | zbalansowane środki średnie - tylko 2.6% od mediany
(+) | średnie są liniowe (4% delta do poprzedniej częstotliwości)
Wysokie 2–16 kHz
(+) | zrównoważone maksima - tylko 1.3% od mediany
(+) | wzloty są liniowe (2.6% delta do poprzedniej częstotliwości)
Ogólnie 100 - 16.000 Hz
(+) | ogólny dźwięk jest liniowy (7.3% różnicy w stosunku do mediany)
W porównaniu do tej samej klasy
» 1% wszystkich testowanych urządzeń w tej klasie było lepszych, 1% podobnych, 98% gorszych
» Najlepszy miał deltę 5%, średnia wynosiła ###średnia###%, najgorsza wynosiła 53%
W porównaniu do wszystkich testowanych urządzeń
» 1% wszystkich testowanych urządzeń było lepszych, 0% podobnych, 99% gorszych
» Najlepszy miał deltę 4%, średnia wynosiła ###średnia###%, najgorsza wynosiła 134%
Apple MacBook Pro 16 2021 M1 Pro analiza dźwięku
(+) | głośniki mogą odtwarzać stosunkowo głośno (84.7 dB)
Bas 100 - 315 Hz
(+) | dobry bas - tylko 3.8% od mediany
(+) | bas jest liniowy (5.2% delta do poprzedniej częstotliwości)
Średnie 400 - 2000 Hz
(+) | zbalansowane środki średnie - tylko 1.3% od mediany
(+) | średnie są liniowe (2.1% delta do poprzedniej częstotliwości)
Wysokie 2–16 kHz
(+) | zrównoważone maksima - tylko 1.9% od mediany
(+) | wzloty są liniowe (2.7% delta do poprzedniej częstotliwości)
Ogólnie 100 - 16.000 Hz
(+) | ogólny dźwięk jest liniowy (4.6% różnicy w stosunku do mediany)
W porównaniu do tej samej klasy
» 0% wszystkich testowanych urządzeń w tej klasie było lepszych, 0% podobnych, 100% gorszych
» Najlepszy miał deltę 5%, średnia wynosiła ###średnia###%, najgorsza wynosiła 45%
W porównaniu do wszystkich testowanych urządzeń
» 0% wszystkich testowanych urządzeń było lepszych, 0% podobnych, 100% gorszych
» Najlepszy miał deltę 4%, średnia wynosiła ###średnia###%, najgorsza wynosiła 134%
Zarządzanie energią
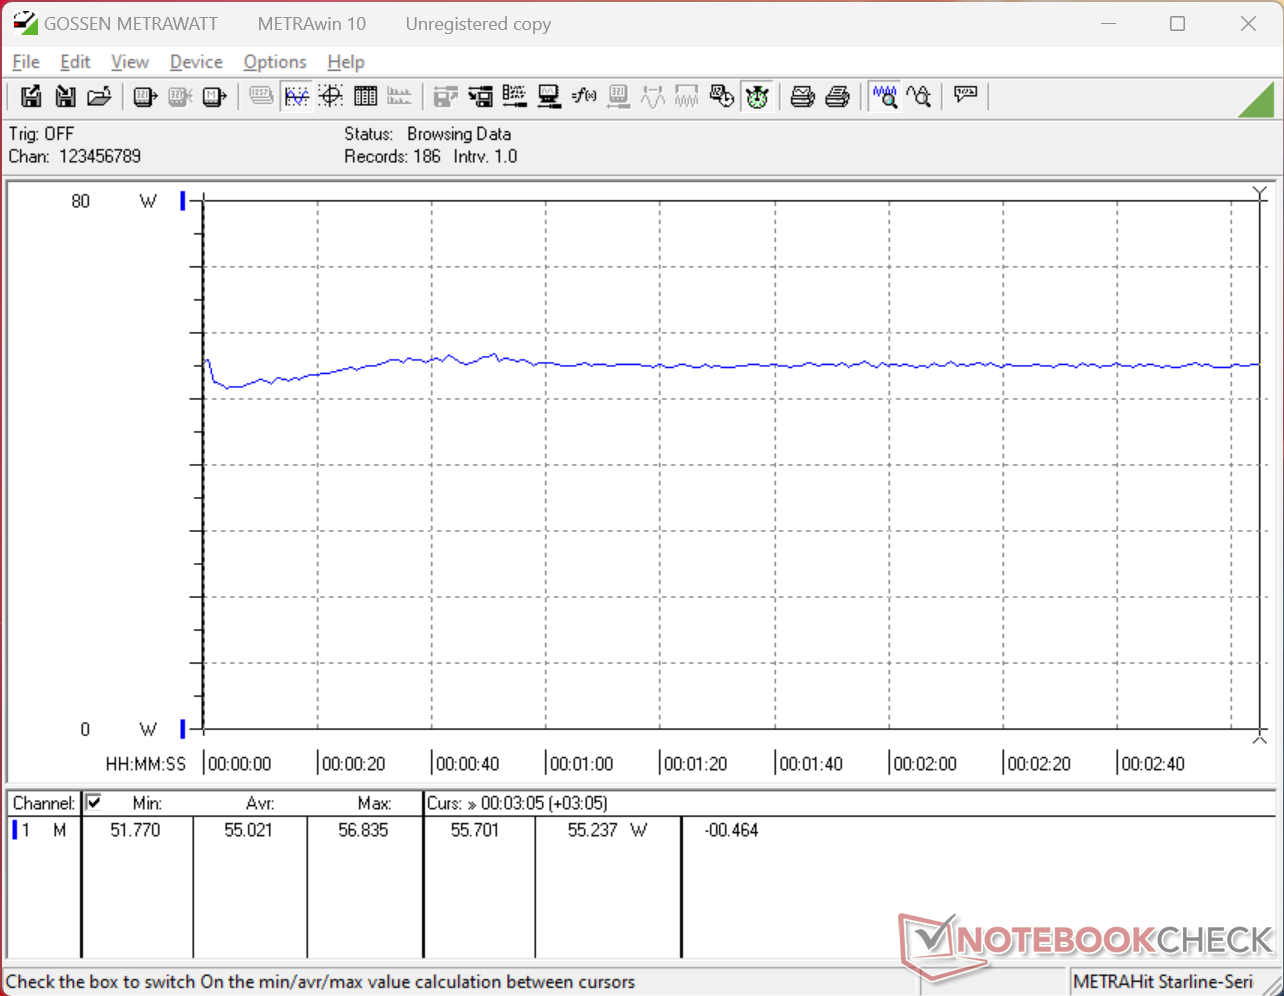
Zużycie energii
Zużycie energii pod obciążeniem jest tylko o kilka watów większe niż w przypadku OmniBook Ultra 14 Flip , przy czym zapewnia znacznie lepszą wydajność procesora i karty graficznej. Wzrost wydajności na wat jest ogromny przy przejściu z Lunar Lake na Panther Lake-X9.
Zasilacz sieciowy o mocy 65 W również został ulepszony – jest teraz mniejszy i bardziej przenośny niż poprzednio (6,5 x 3,2 x 3,2 cm w porównaniu z 9,8 x 5,4 x 2 cm).

| wyłączony / stan wstrzymania | |
| luz | |
| obciążenie |
|
Legenda:
min: | |
| HP OmniBook Ultra 14 Core Ultra X9 Ultra X9 388H, Arc B390 Panther Lake iGPU, , OLED, 2880x1800, 14" | Lenovo Yoga Slim 7 Ultra 14IPH11 Ultra 7 355, Intel Graphics 4 Xe3 PTL, SK hynix PVC10 HFS001TEM4X182N, OLED, 2880x1800, 14" | HP OmniBook Ultra Flip 14 Core Ultra 7 258V, Arc 140V, Samsung PM9A1 MZVL22T0HBLB, OLED, 2880x1800, 14" | Dell XPS 14 Core Ultra X7 358H Ultra X7 358H, Arc B390 Panther Lake iGPU, Samsung PM9C1b MZVL81T0HFLB-00BH1, OLED, 2880x1800, 14" | MSI Prestige 14 Flip AI+ 2026 Ultra X7 358H, Arc B390 Panther Lake iGPU, Phison 1 TB ESR01TBTCCZ-27J, OLED, 1920x1200, 14" | Asus ExpertBook Ultra B9406CAA Ultra X7 358H, Arc B390 Panther Lake iGPU, Samsung PM9E1 MZVLC2T0HBLD, OLED, 2880x1800, 14" | |
|---|---|---|---|---|---|---|
| Power Consumption | -11% | -5% | -12% | 3% | -2% | |
| Idle Minimum * (Watt) | 2.5 | 3.2 -28% | 3 -20% | 3.1 -24% | 2.8 -12% | 3.5 -40% |
| Idle Average * (Watt) | 5.1 | 3.9 24% | 4.4 14% | 3.6 29% | 4.2 18% | 4 22% |
| Idle Maximum * (Watt) | 5.8 | 12.3 -112% | 9.4 -62% | 10 -72% | 4.5 22% | 5.3 9% |
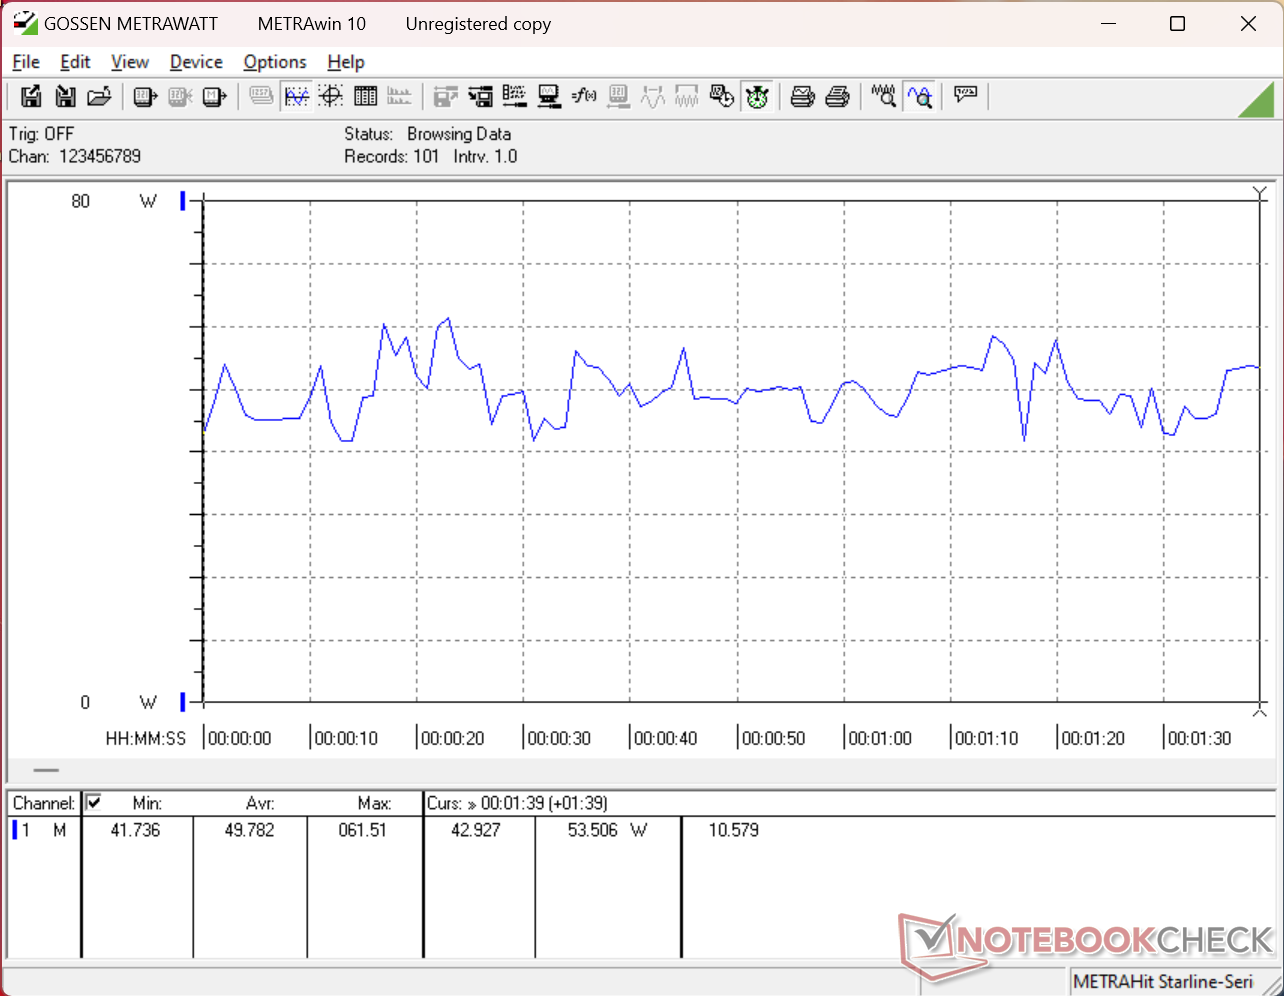
| Load Average * (Watt) | 49.8 | 36.5 27% | 42.3 15% | 39.2 21% | 48.9 2% | 43.7 12% |
| Cyberpunk 2077 ultra external monitor * (Watt) | 55.1 | 50.6 8% | 49.9 9% | 51.2 7% | 58.6 -6% | 61.4 -11% |
| Cyberpunk 2077 ultra * (Watt) | 55 | 51.1 7% | 51.1 7% | 51.4 7% | 59.9 -9% | 61.3 -11% |
| Load Maximum * (Watt) | 68 | 69 -1% | 65 4% | 101.4 -49% | 64 6% | 63.4 7% |
* ... im mniej tym lepiej
Zużycie energii w grze Cyberpunk / Test obciążeniowy
Zużycie energii przez monitor zewnętrzny
Żywotność baterii
| HP OmniBook Ultra 14 Core Ultra X9 Ultra X9 388H, Arc B390 Panther Lake iGPU, 70 Wh | Lenovo Yoga Slim 7 Ultra 14IPH11 Ultra 7 355, Intel Graphics 4 Xe3 PTL, 75 Wh | HP OmniBook Ultra Flip 14 Core Ultra 7 258V, Arc 140V, 64 Wh | Dell XPS 14 Core Ultra X7 358H Ultra X7 358H, Arc B390 Panther Lake iGPU, 70 Wh | MSI Prestige 14 Flip AI+ 2026 Ultra X7 358H, Arc B390 Panther Lake iGPU, 81 Wh | Asus ExpertBook Ultra B9406CAA Ultra X7 358H, Arc B390 Panther Lake iGPU, 70 Wh | |
|---|---|---|---|---|---|---|
| Czasy pracy | ||||||
| WiFi v1.3 (h) | 12.6 | 10.6 -16% | 14 11% | 16.8 33% | 19.6 56% | 16.1 28% |
Ocena serwisu Notebookcheck
Ten model, który można uznać za najlepszy laptop klasy prosumenckiej firmy HP przeznaczony do podróży, edycji, a nawet gier, jest jednocześnie jednym z najdroższych.
HP OmniBook Ultra 14 Core Ultra X9
- 12/06/2026 v8
Allen Ngo
 Total Sustainability Score:
 Porównanie potencjalnych konkurentów
Obraz | Model / recenzja | Cena | Waga | Wysokość | Ekran |
|---|---|---|---|---|---|
1. 87.9% 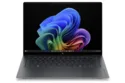 | HP OmniBook Ultra 14 Core Ultra X9 Intel Core Ultra X9 388H ⎘ Intel Arc B390 12 Xe3 Panther Lake iGPU ⎘ 32 GB Pamięć | Amazon: Cena katalogowa: 2800 USD | 1.3 kg | 10.7 mm | 14.00" 2880x1800 243 PPI OLED |
2. 84.9% 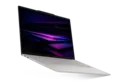 | Lenovo Yoga Slim 7 Ultra 14IPH11 Intel Core Ultra 7 355 ⎘ Intel Graphics 4 Xe3 Panther Lake iGPU ⎘ 32 GB Pamięć, 1024 GB SSD | Amazon: Cena katalogowa: 1700 USD | 978 g | 13.9 mm | 14.00" 2880x1800 243 PPI OLED |
3. 88.7% 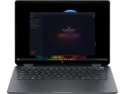 | HP OmniBook Ultra Flip 14 Intel Core Ultra 7 258V ⎘ Intel Arc Graphics 140V ⎘ 32 GB Pamięć, 2048 GB SSD | Amazon: Cena katalogowa: 1250 USD | 1.3 kg | 15 mm | 14.00" 2880x1800 243 PPI OLED |
4. 87.4% 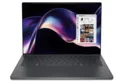 | Dell XPS 14 Core Ultra X7 358H Intel Core Ultra X7 358H ⎘ Intel Arc B390 12 Xe3 Panther Lake iGPU ⎘ 32 GB Pamięć, 1000 GB SSD | Amazon: 1. $1,599.99 Dell XPS 14 Premium Laptop D... 2. $2,399.99 Dell Premium 16 (Previously ... 3. $2,049.00 Dell XPS 14 9440 14.5" Noteb... Cena katalogowa: 2200 USD | 1.4 kg | 14.62 mm | 14.00" 2880x1800 243 PPI OLED |
5. 84.2% 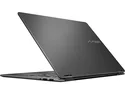 | MSI Prestige 14 Flip AI+ 2026 Intel Core Ultra X7 358H ⎘ Intel Arc B390 12 Xe3 Panther Lake iGPU ⎘ 32 GB Pamięć, 1000 GB SSD | Amazon: 1. $2,399.00 EXCaliberPC [2026] MSI Prest... 2. $1,470.00 msi Prestige A16 AI+ (2025) ... 3. $52.99 1pcs Laptop Cooling Fan Cool... Cena katalogowa: 1549€ | 1.4 kg | 13.9 mm | 14.00" 1920x1200 162 PPI OLED |
6. 87.6% 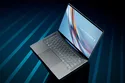 | Asus ExpertBook Ultra B9406CAA Intel Core Ultra X7 358H ⎘ Intel Arc B390 12 Xe3 Panther Lake iGPU ⎘ 32 GB Pamięć, 2048 GB SSD | Amazon: | 1.1 kg | 15.9 mm | 14.00" 2880x1800 243 PPI OLED |
Przezroczystość
Wyboru urządzeń do recenzji dokonuje nasza redakcja. Próbka testowa została udostępniona autorowi jako pożyczka od producenta lub sprzedawcy detalicznego na potrzeby tej recenzji. Pożyczkodawca nie miał wpływu na tę recenzję, producent nie otrzymał też kopii tej recenzji przed publikacją. Nie było obowiązku publikowania tej recenzji. Jako niezależna firma medialna, Notebookcheck nie podlega władzy producentów, sprzedawców detalicznych ani wydawców.
Tak testuje Notebookcheck
Każdego roku Notebookcheck niezależnie sprawdza setki laptopów i smartfonów, stosując standardowe procedury, aby zapewnić porównywalność wszystkich wyników. Od około 20 lat stale rozwijamy nasze metody badawcze, ustanawiając przy tym standardy branżowe. W naszych laboratoriach testowych doświadczeni technicy i redaktorzy korzystają z wysokiej jakości sprzętu pomiarowego. Testy te obejmują wieloetapowy proces walidacji. Nasz kompleksowy system ocen opiera się na setkach uzasadnionych pomiarów i benchmarków, co pozwala zachować obiektywizm.
