Asus TUF Gaming GeForce RTX 4070 Ti Super Review: AD103 mid-ranger, który rzuca wyzwanie RX 7900 XT i wypiera RTX 3090 Ti za 300 USD mniej

Nvidia wprowadziła na rynek rTX 4070 Ti Super wraz z modelem RTX 4070 Super i RTX 4080 Super podczas targów CES 2024. Wraz z tym odświeżeniem, RTX 4070 Ti Super stał się teraz procesorem graficznym AD103, co niesie ze sobą znaczną modernizację podsystemu pamięci wraz ze zwyczajowym wzrostem liczby rdzeni CUDA.
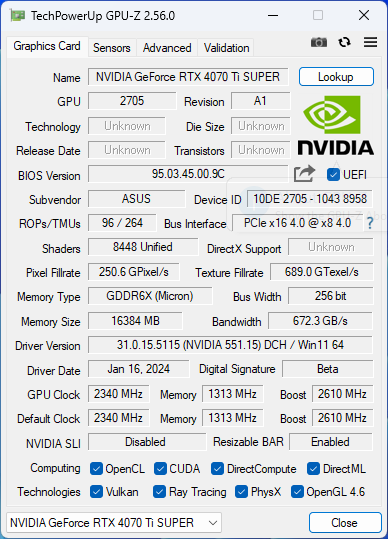
RTX 4070 Ti Super może pochwalić się teraz 8 448 rdzeniami CUDA, co stanowi 10% wzrost w porównaniu do 7 680 shaderów w oryginalnym RTX 4070 Ti. Przejście na krzem AD103 zapewnia karcie 16 GB pamięci GDDR6X z 256-bitową magistralą pamięci, która zapewnia przepustowość 672 GB/s.
Nvidia po raz kolejny zdecydowała się nie oferować wersji Founders Edition dla RTX 4070 Ti Super, ale istnieje wiele opcji do wyboru wśród ofert partnerów AiB. Większość partnerów AiB oferuje karty w sugerowanej cenie detalicznej 799 USD, oferując jednocześnie jednostki SKU z dodatkowymi udogodnieniami za dodatkową opłatą.
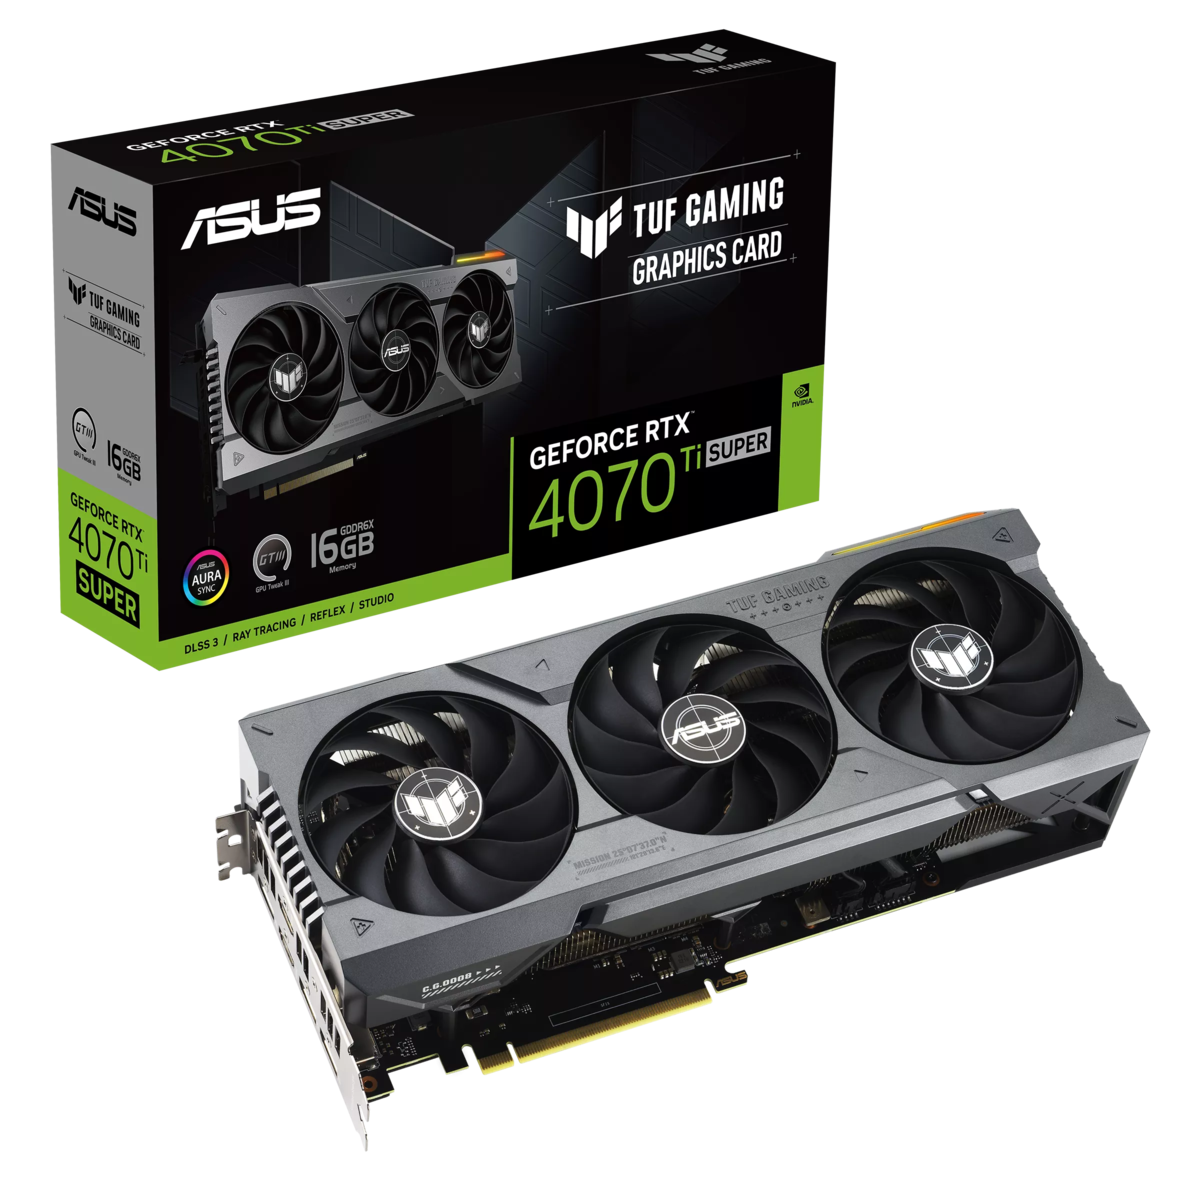
W związku z tym mamy teraz dla Państwa nową kartę Asus TUF Gaming GeForce RTX 4070 Ti Super. Karta ta jest dostępna w sprzedaży detalicznej za 799 USD lub 95 000 jenów w Indiach i jest objęta trzyletnią gwarancją. Asus oferuje również wariant OC tej karty, który w pełni zastępuje oryginał TUF Gaming GeForce RTX 4070 Ti OC który recenzowaliśmy w zeszłym roku.
W niniejszej recenzji przetestujemy kartę Asus TUF Gaming GeForce RTX 4070 Ti Super i sprawdzimy, czy ulepszenia sprzętowe przekładają się na wymierne korzyści w syntetycznych testach porównawczych i grach.
Porównanie Asus TUF Gaming RTX 4070 Ti Super z innymi układami GPU Nvidia
| Specyfikacja | RTX 4090 FE | RTX 4080 Super FE | RTX 4080 FE | AsusTUF RTX 4070 Ti Super | Asus TUF RTX 4070 Ti | RTX 4070 Super | ZotacRTX 4070 AMP Airo | KFA2RTX 4060 Ti EX | RTX 3090 Ti FE | RTX 3090 FE | RTX 3080 Ti FE | RTX 3070 Ti FE | RTX 3070 FE | Titan RTX |
|---|---|---|---|---|---|---|---|---|---|---|---|---|---|---|
| Chip | AD102 | AD103 | AD103 | AD103 | AD104 | AD104 | AD104 | AD106 | GA102 | GA102 | GA102 | GA104 | GA104 | TU102 |
| Proces FinFET | Niestandardowy 4N | Niestandardowy 4N | Niestandardowy 4N | Niestandardowy 4N | Niestandardowy 4N | Niestandardowy 4N | Niestandardowy 4N | Niestandardowy 4N | 8 nm | 8 nm | 8 nm | 8 nm | 8 nm | 12 nm |
| Rdzenie CUDA | 16 384 | 10 240 | 9 728 | 8448 | 7 680 | 7 168 | 5 888 | 4 352 | 10 752 | 10 496 | 10 240 | 6 144 | 5 888 | 4 608 |
| Jednostki tekstury | 512 | 320 | 304 | 264 | 240 | 224 | 184 | 136 | 336 | 328 | 320 | 192 | 184 | 288 |
| Rdzenie tensorowe | 512 4. gen. | 320 4. gen. | 304 4. gen. | 264 4. gen. | 240 4. gen. | 224 4. gen. | 184 4. gen. | 136 4. gen. | 336 3. gen. | 328 3. gen. | 320 3. gen. | 192 3. gen. | 184 3. gen. | 576 2. gen. |
| Rdzenie RT | 128 3. gen. | 80 3. gen. | 76 3. gen. | 66 3. gen. | 60 3. gen. | 56 3. gen. | 46 3. gen. | 34 3. gen. | 84 2. gen. | 82 2. gen. | 80 2. gen. | 48 2. gen. | 46 2. gen. | 72 |
| Zegar bazowy GPU | 2,235 MHz | 2,295 MHz | 2,205 MHz | 2,340 MHz | 2,310 MHz | 1,980 MHz | 1,920 MHz | 2,310 MHz | 1,560 MHz | 1,395 MHz | 1,365 MHz | 1,575 MHz | 1,500 MHz | 1,350 MHz |
| GPU Boost Clock | 2,520 MHz | 2,550 MHz | 2,505 MHz | 2,610 MHz | 2,760 MHz | 2,565 MHz | 2,535 MHz | 2,535 MHz | 1,860 MHz | 1,695 MHz | 1,665 MHz | 1,770 MHz | 1,750 MHz | 1,770 MHz |
| Magistrala pamięci | 384-bitowa | 256-bitowa | 256-bitowa | 256-bitowa | 192-bitowa | 192-bitowa | 192-bitowa | 128-bitowa | 384-bitowa | 384-bitowa | 384-bitowa | 256-bitowa | 256-bitowa | 384-bitowa |
| Przepustowość pamięci | 1 008 GB/s | 736,3 GB/s | 716,8 GB/s | 672GB/s | 504 GB/s | 504 GB/s | 504 GB/s | 288 GB/s | 1 008 GB/s | 936 GB/s | 912 GB/s | 608 GB/s | 448 GB/s | 672 GB/s |
| Pamięć wideo | 24 GB GDDR6X | 16 GB GDDR6X | 16 GB GDDR6X | 16 GB GDDR6X | 12 GB GDDR6X | 12 GB GDDR6X | 12 GB GDDR6X | 8 GB GDDR6 | 24 GB GDDR6X | 24 GB GDDR6X | 12 GB GDDR6X | 8 GB GDDR6X | 8 GB GDDR6 | 24 GB GDDR6 |
| Pobór mocy | 450 W | 320 W | 320 W | 285 W | 285 W | 220 W | 215 W | 160 W | 450 W | 350 W | 350 W | 290 W | 220 W | 280 W |
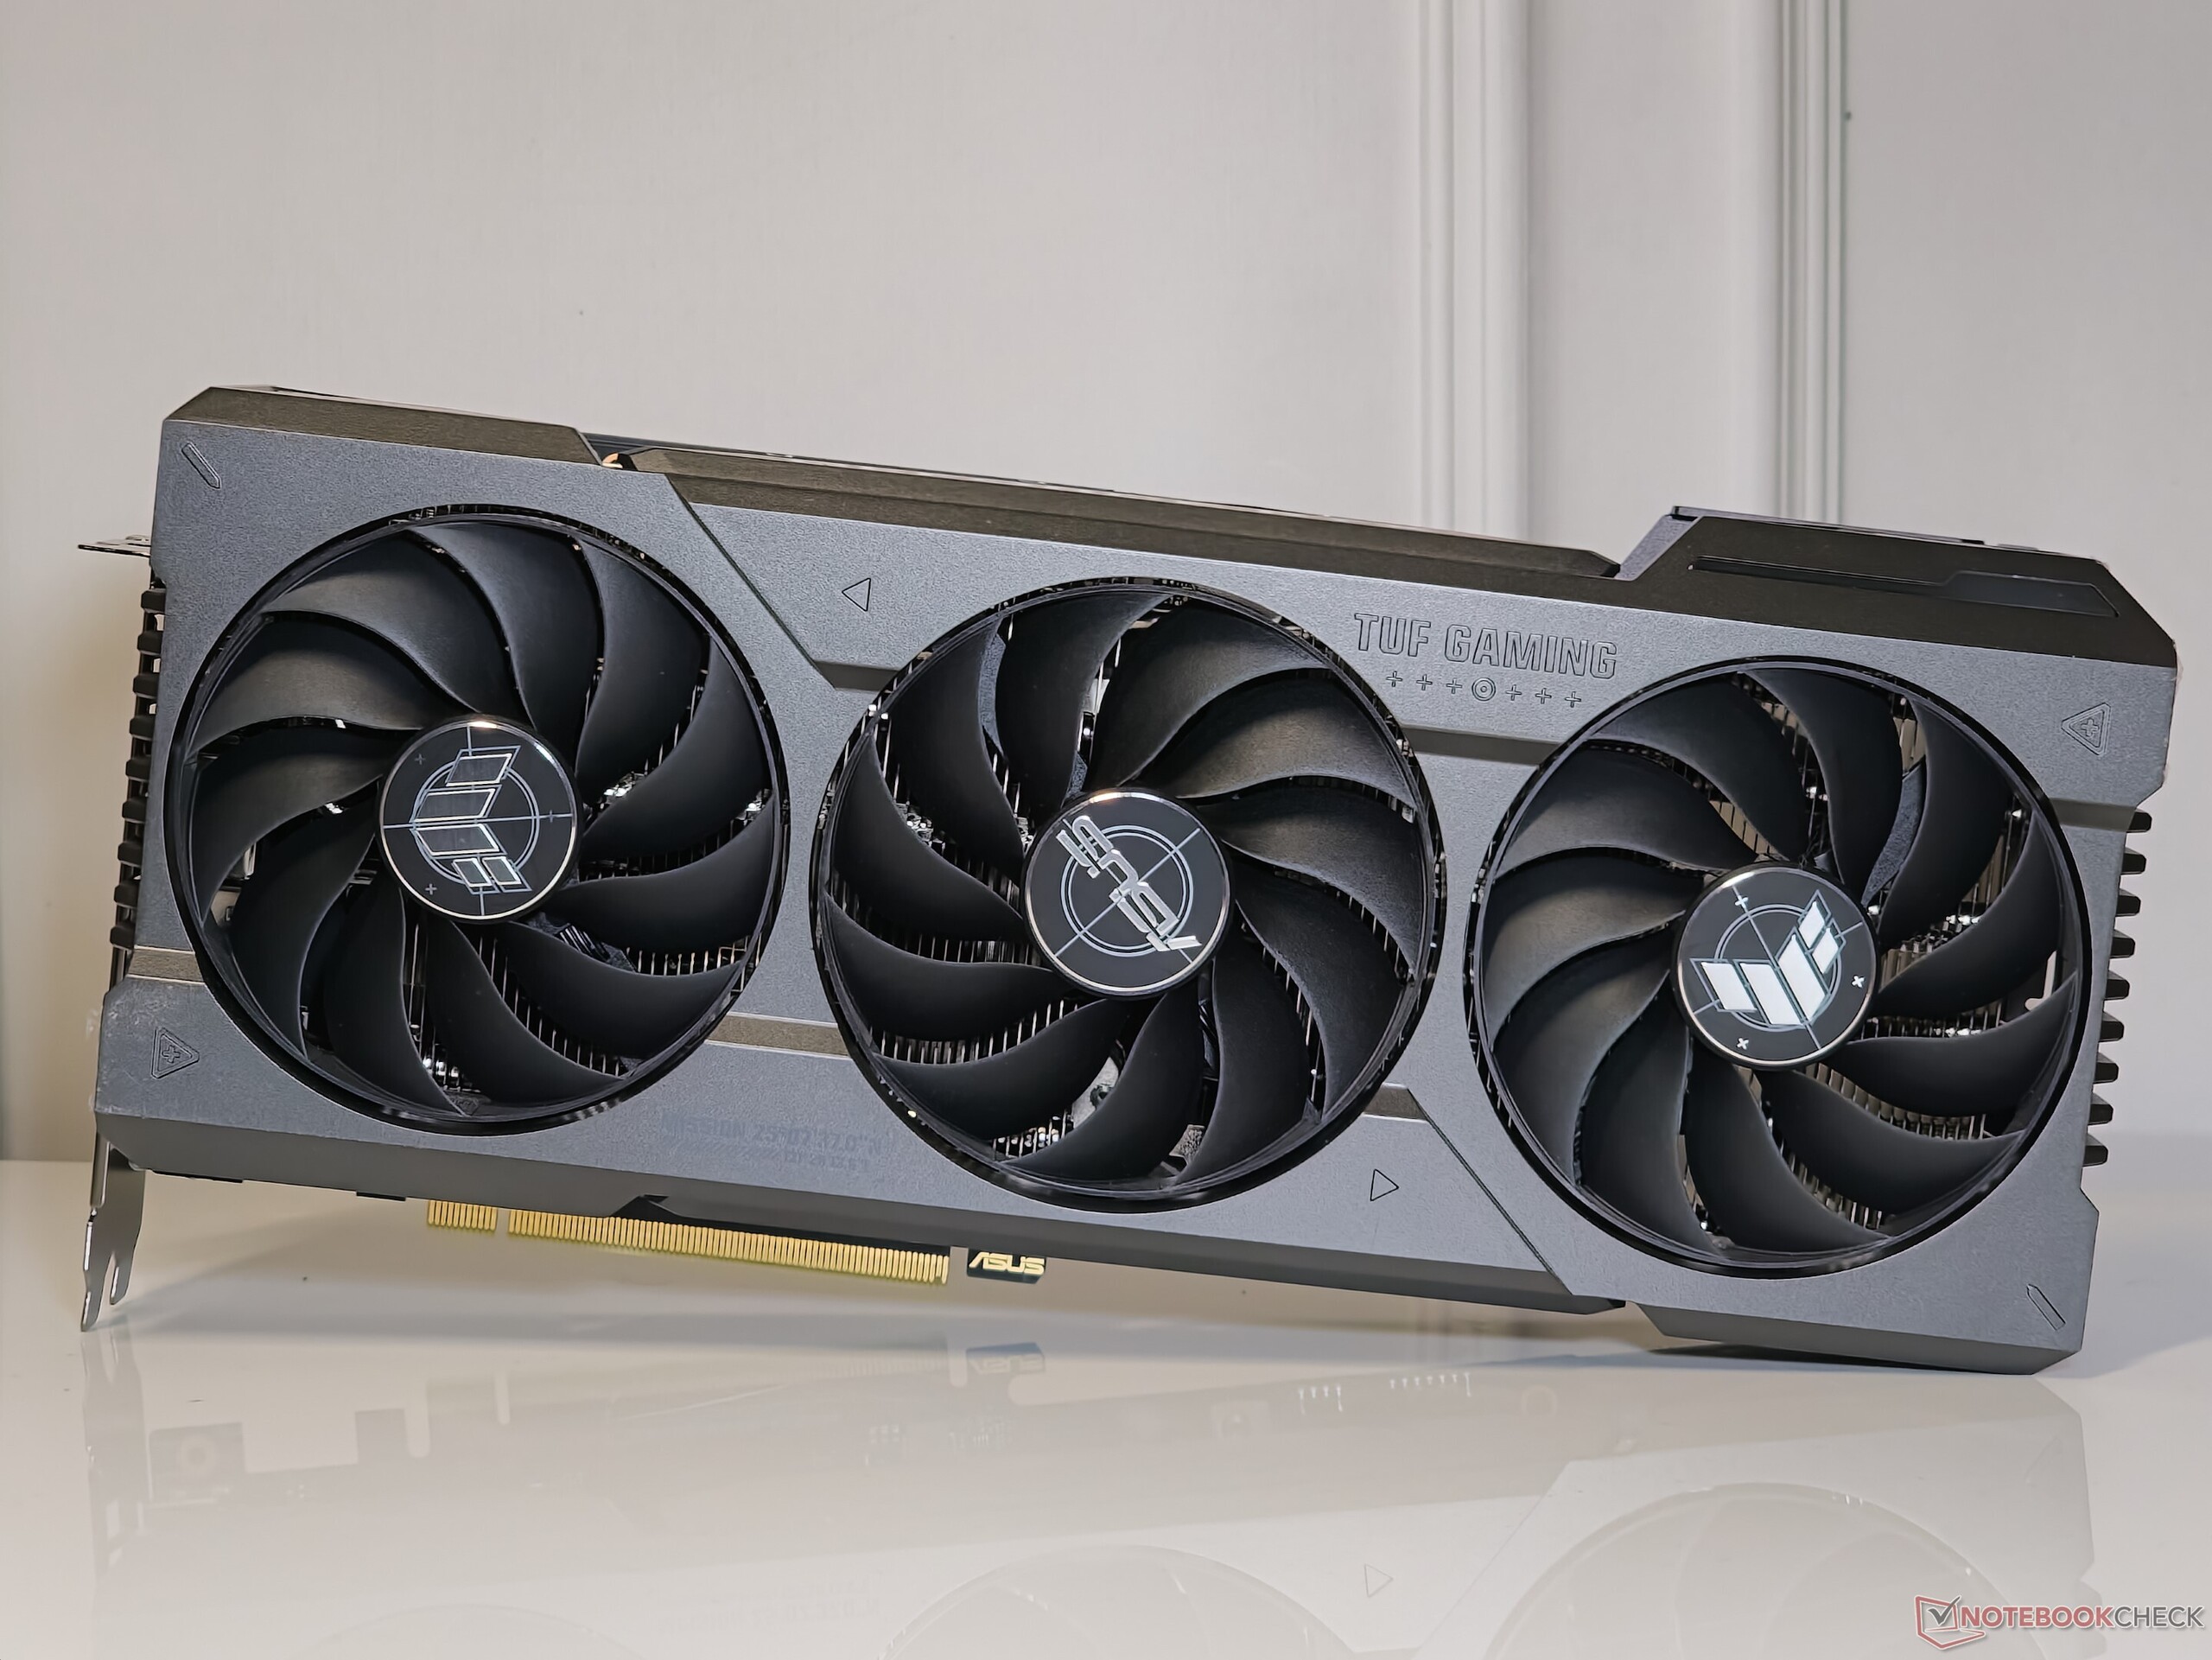
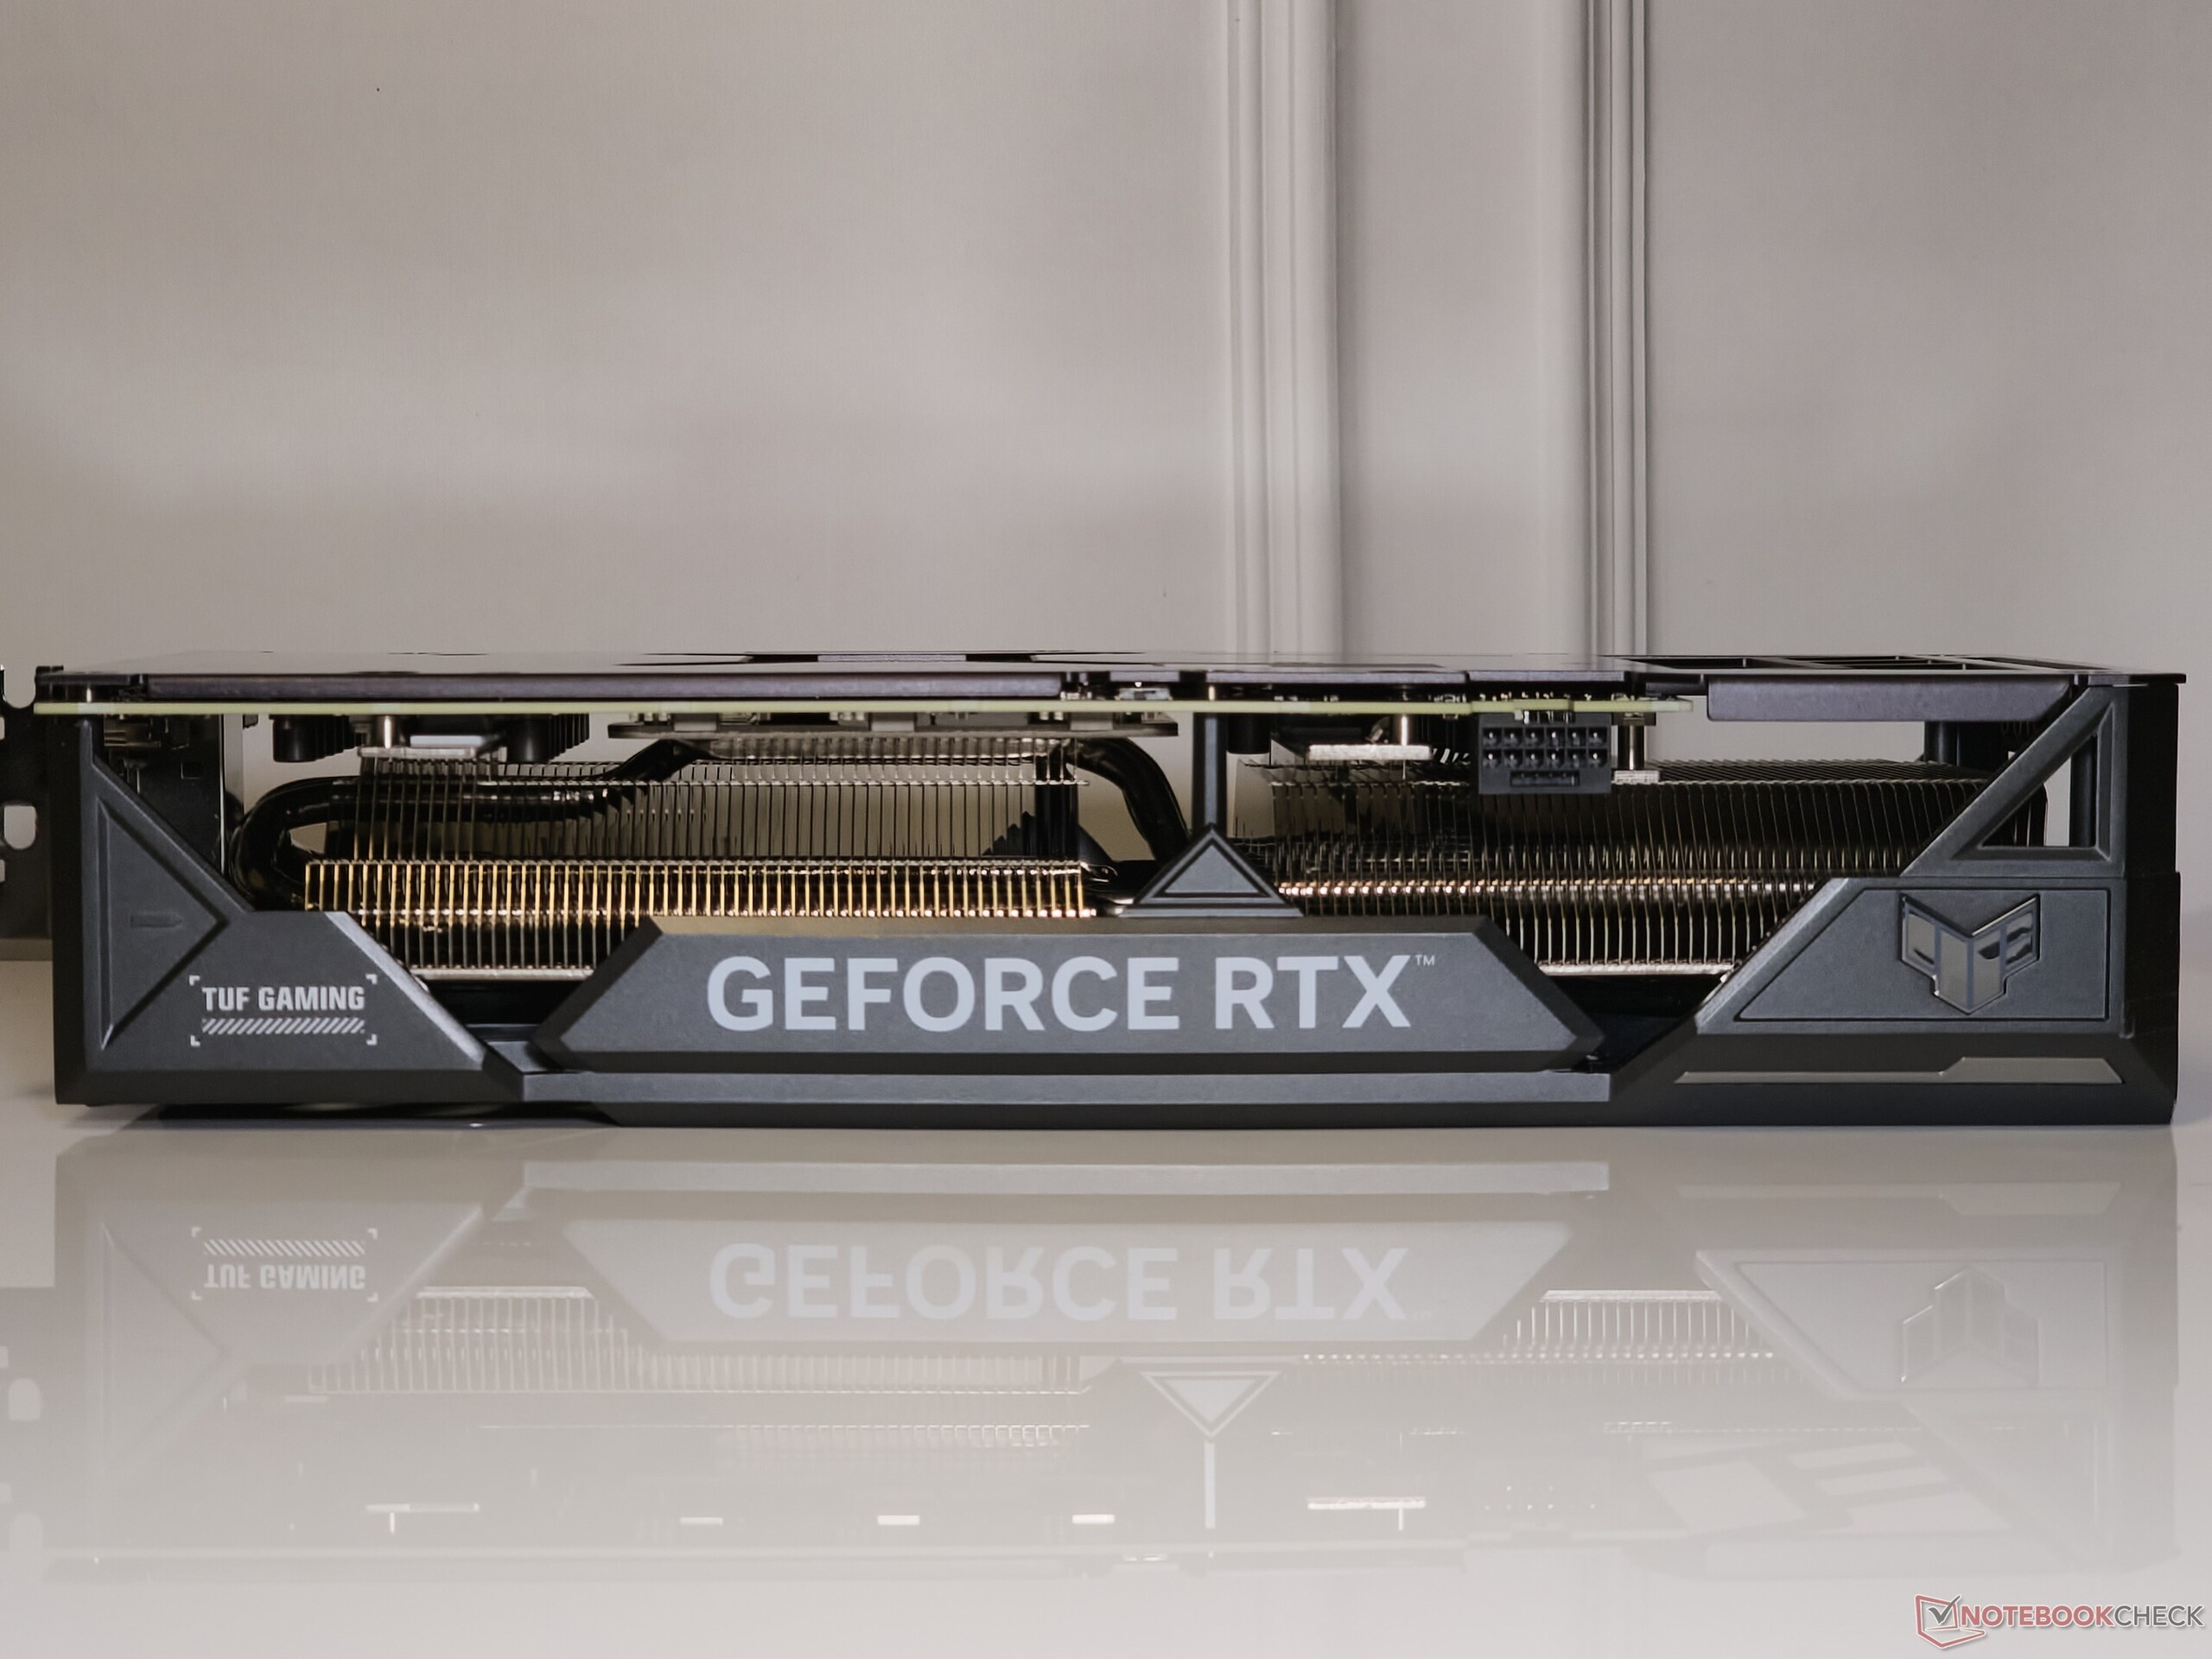
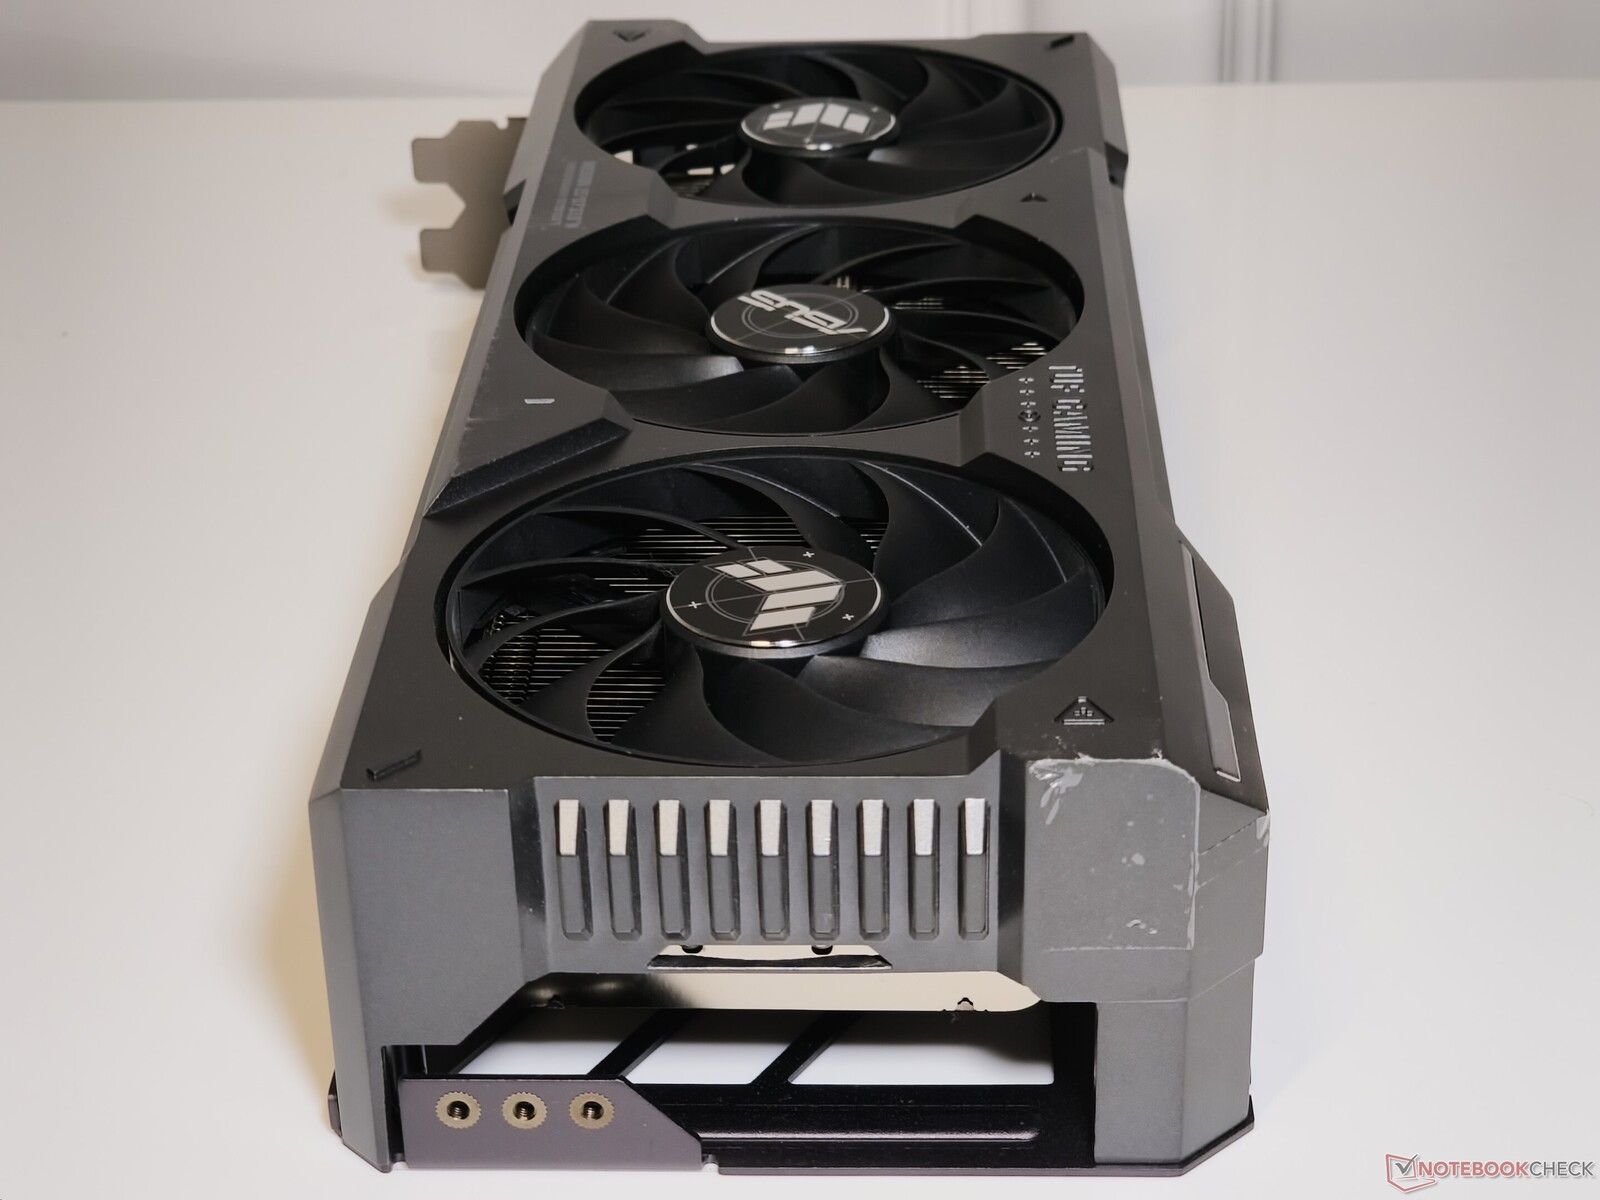
Asus TUF Gaming GeForce RTX 4070 Ti Super z bliska
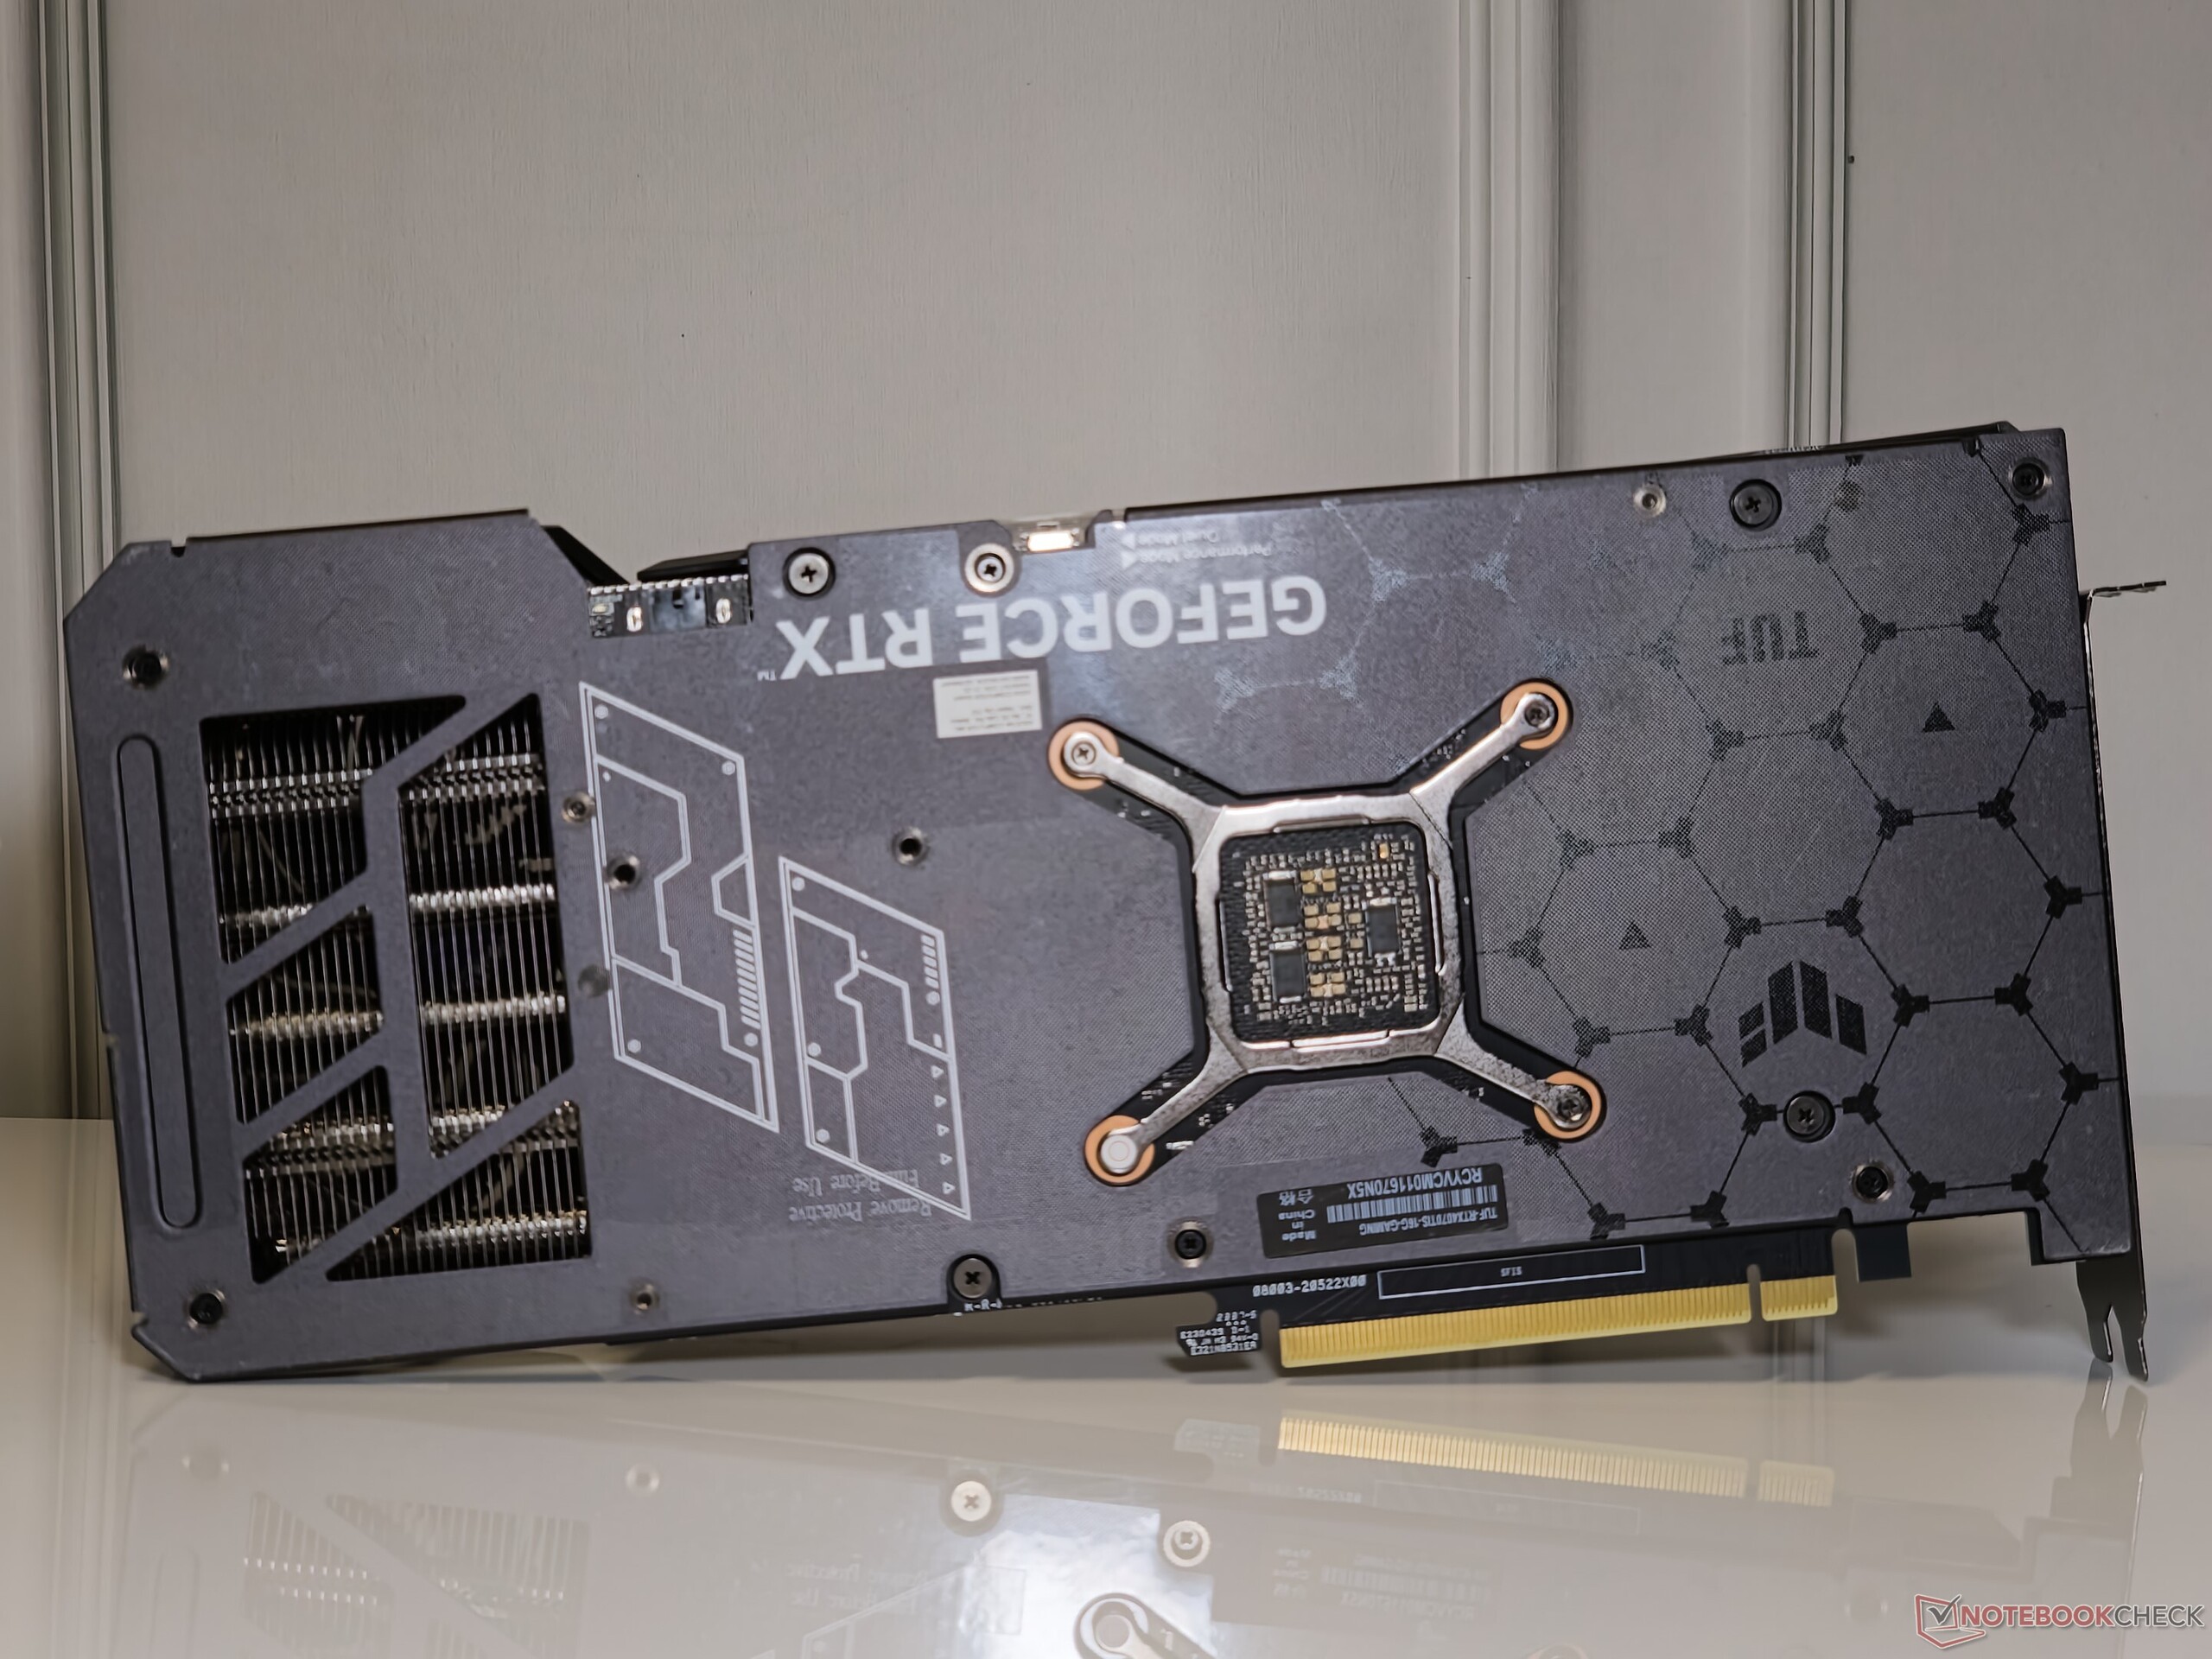
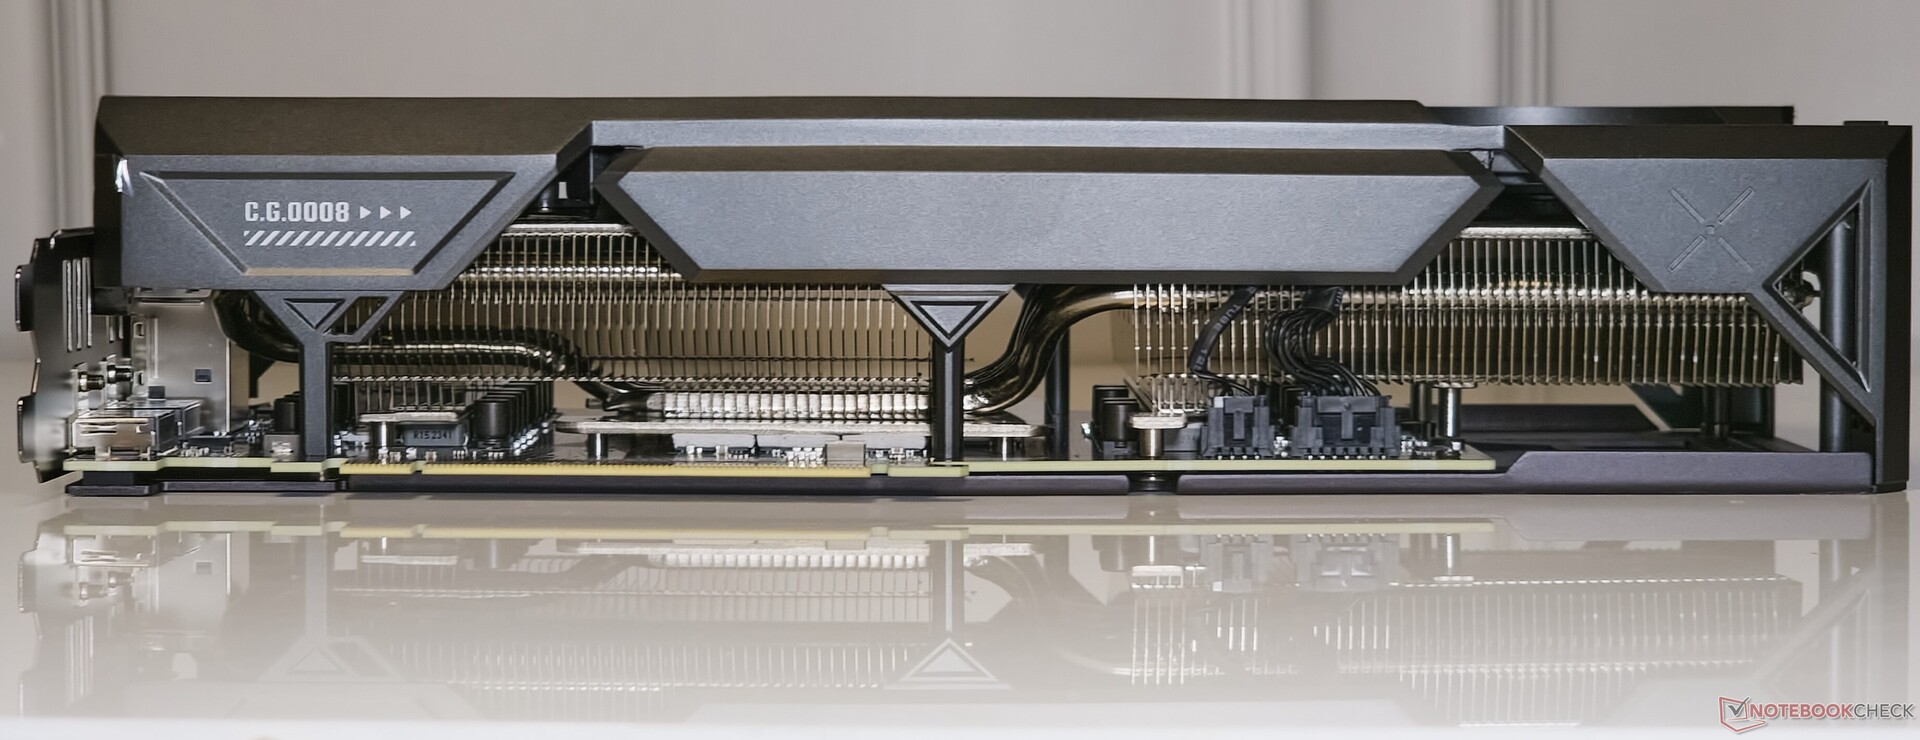
Karta TUF może być podstawową ofertą Asusa dla RTX 4070 Ti Super, ale jest zbudowana jak czołg. Karta posiada metalową osłonę, co jest rzadkością w ofertach innych niż premium. Metalowa płyta tylna zwiększa solidność i posiada wycięcia do wentylacji.
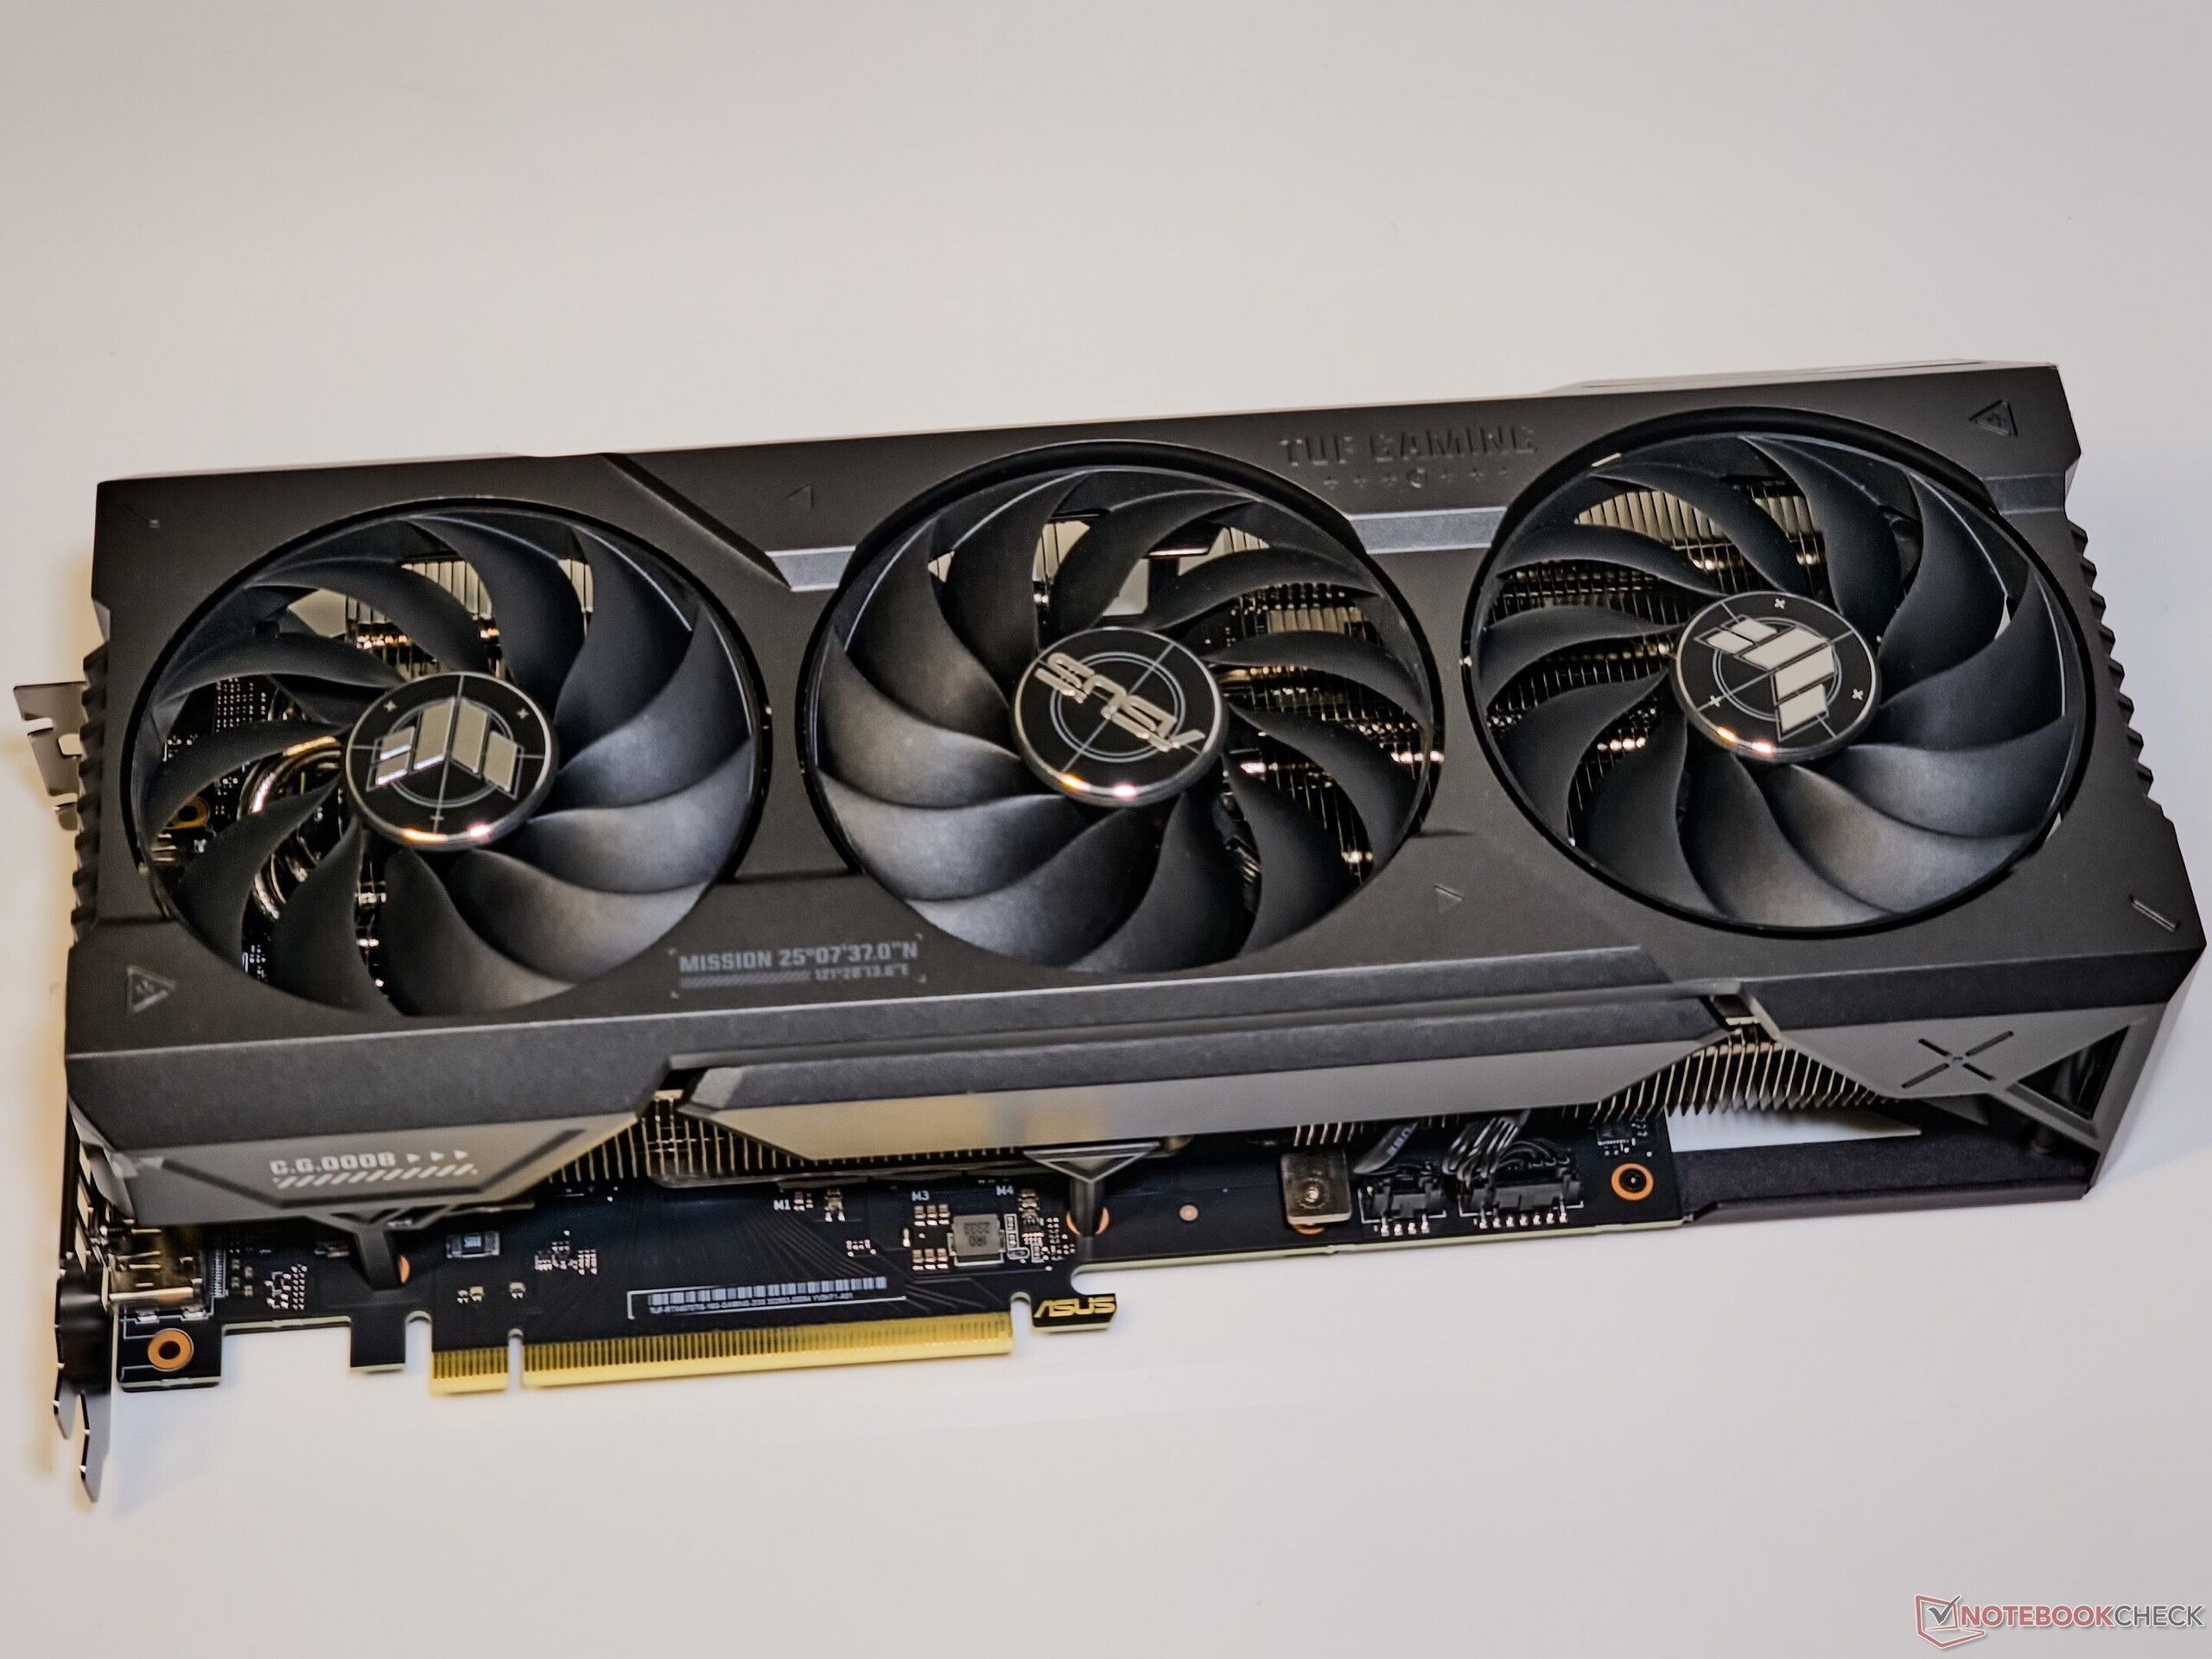
Przy wymiarach 305 x 138 x 65 mm, TUF Gaming GeForce RTX 4070 Ti Super nie stroni od zajmowania prawie 3,5 slotu na płycie. Jest to coś, o czym należy pamiętać, jeśli planują Państwo dodać inne karty rozszerzeń i mają Państwo płytę ATX lub mniejszą z blisko rozmieszczonymi slotami PCIe.
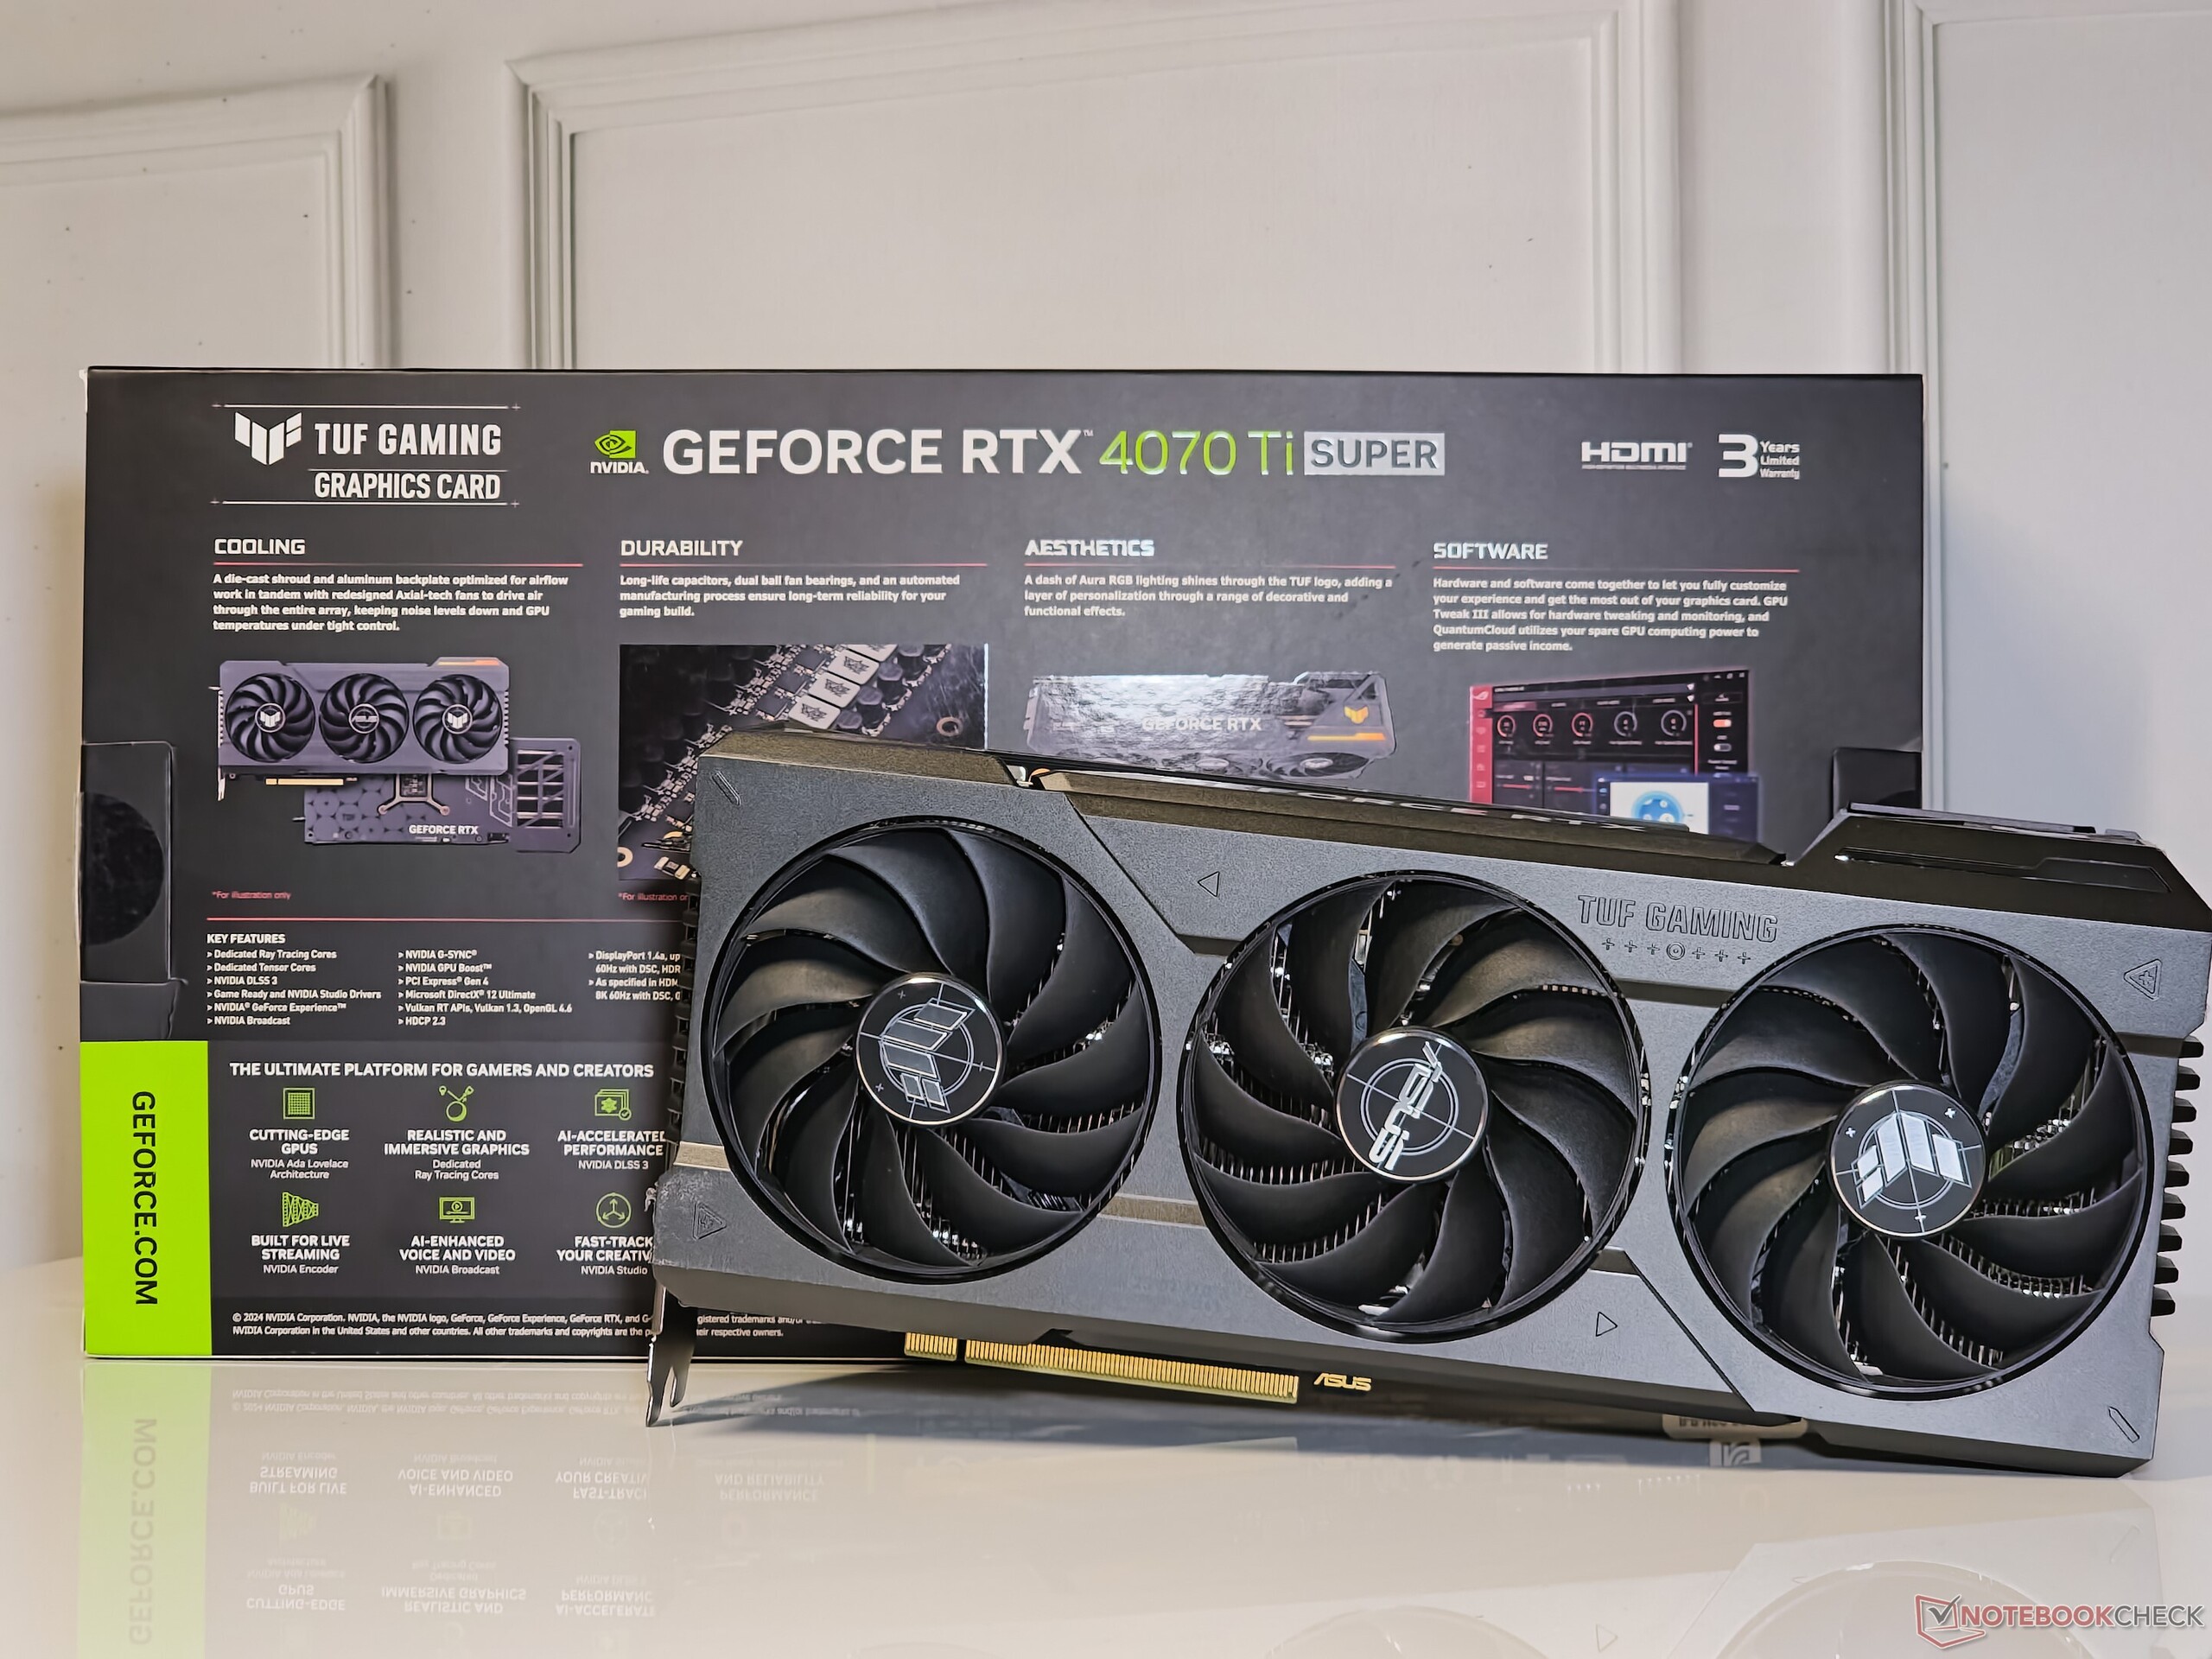
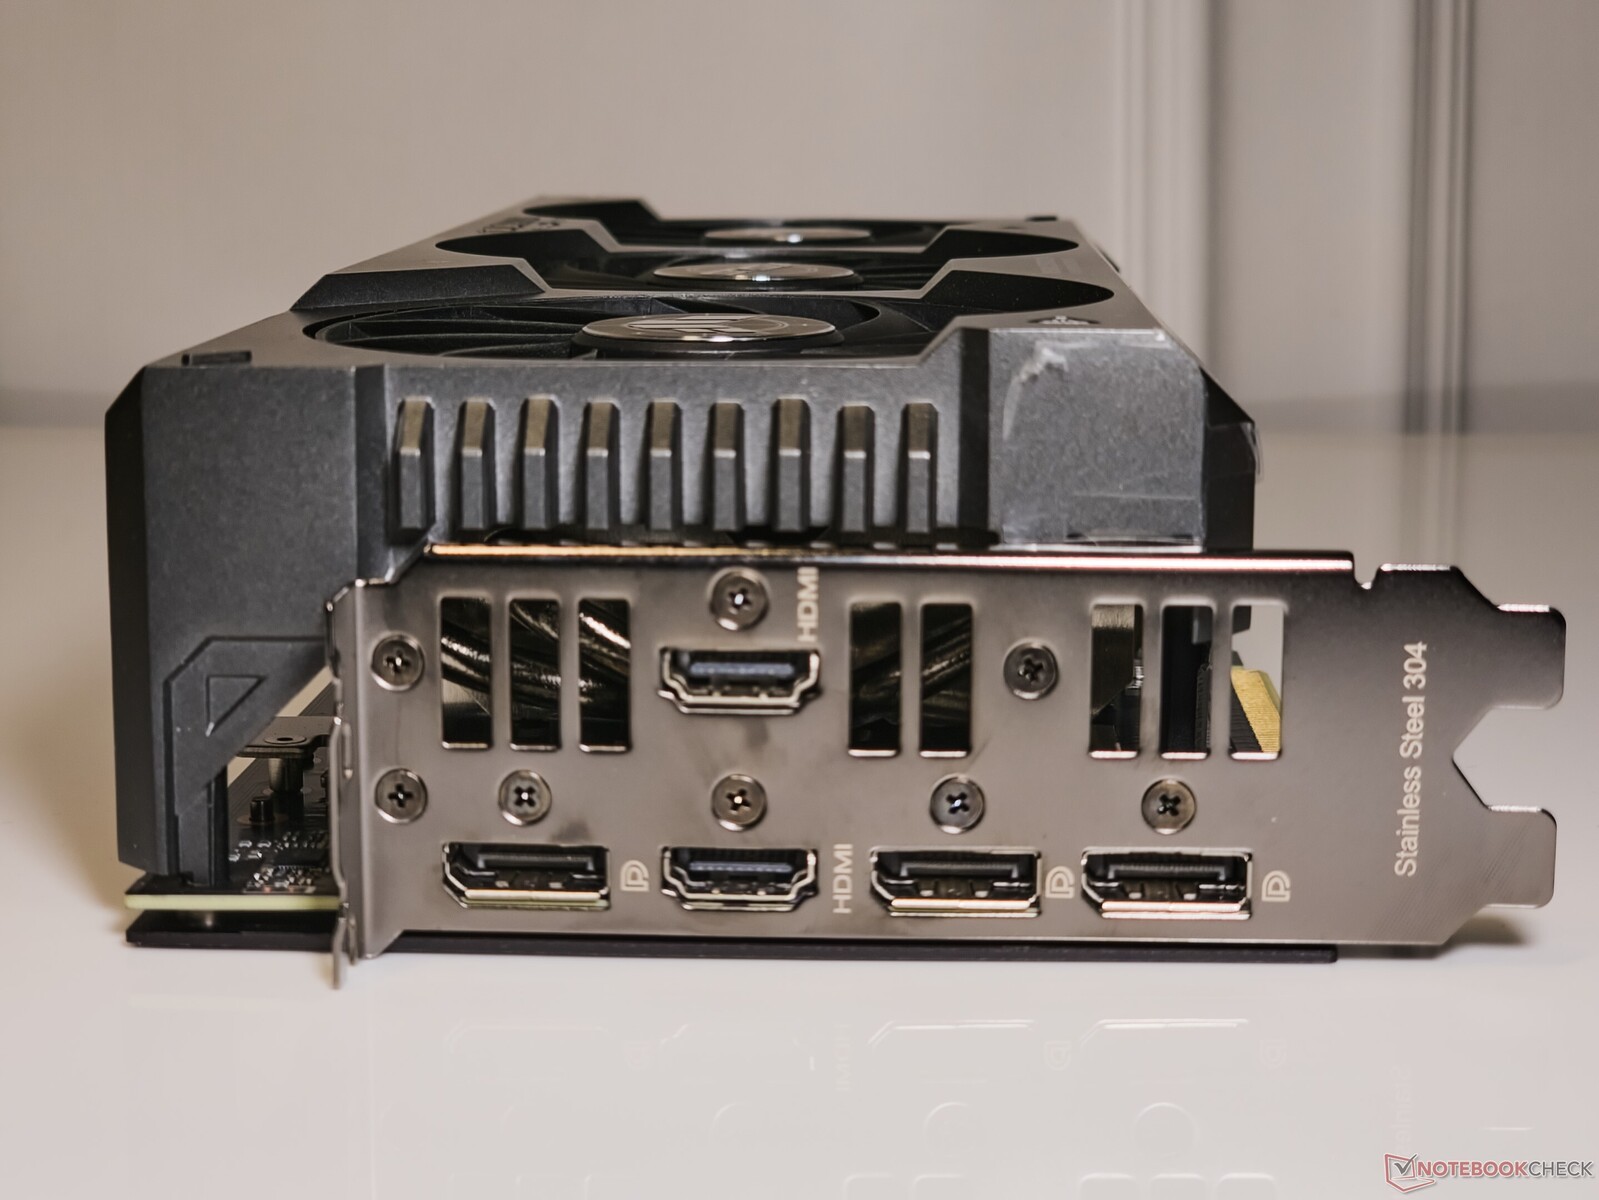
Podobnie jak większość innych kart Asusa, TUF Gaming GeForce RTX 4070 Ti Super jest również wyposażona w pięć portów, co nie zdarza się często w przypadku zdecydowanej większości kart.
Oprócz zwykłych 3 wyjść DisplayPort-1.4 i wyjścia HDMI 2.1a, Asus oferuje również dodatkowy port HDMI 2.1a, który może się przydać do podłączenia telewizora lub wyświetlaczy, które nie są wyposażone w DisplayPort.
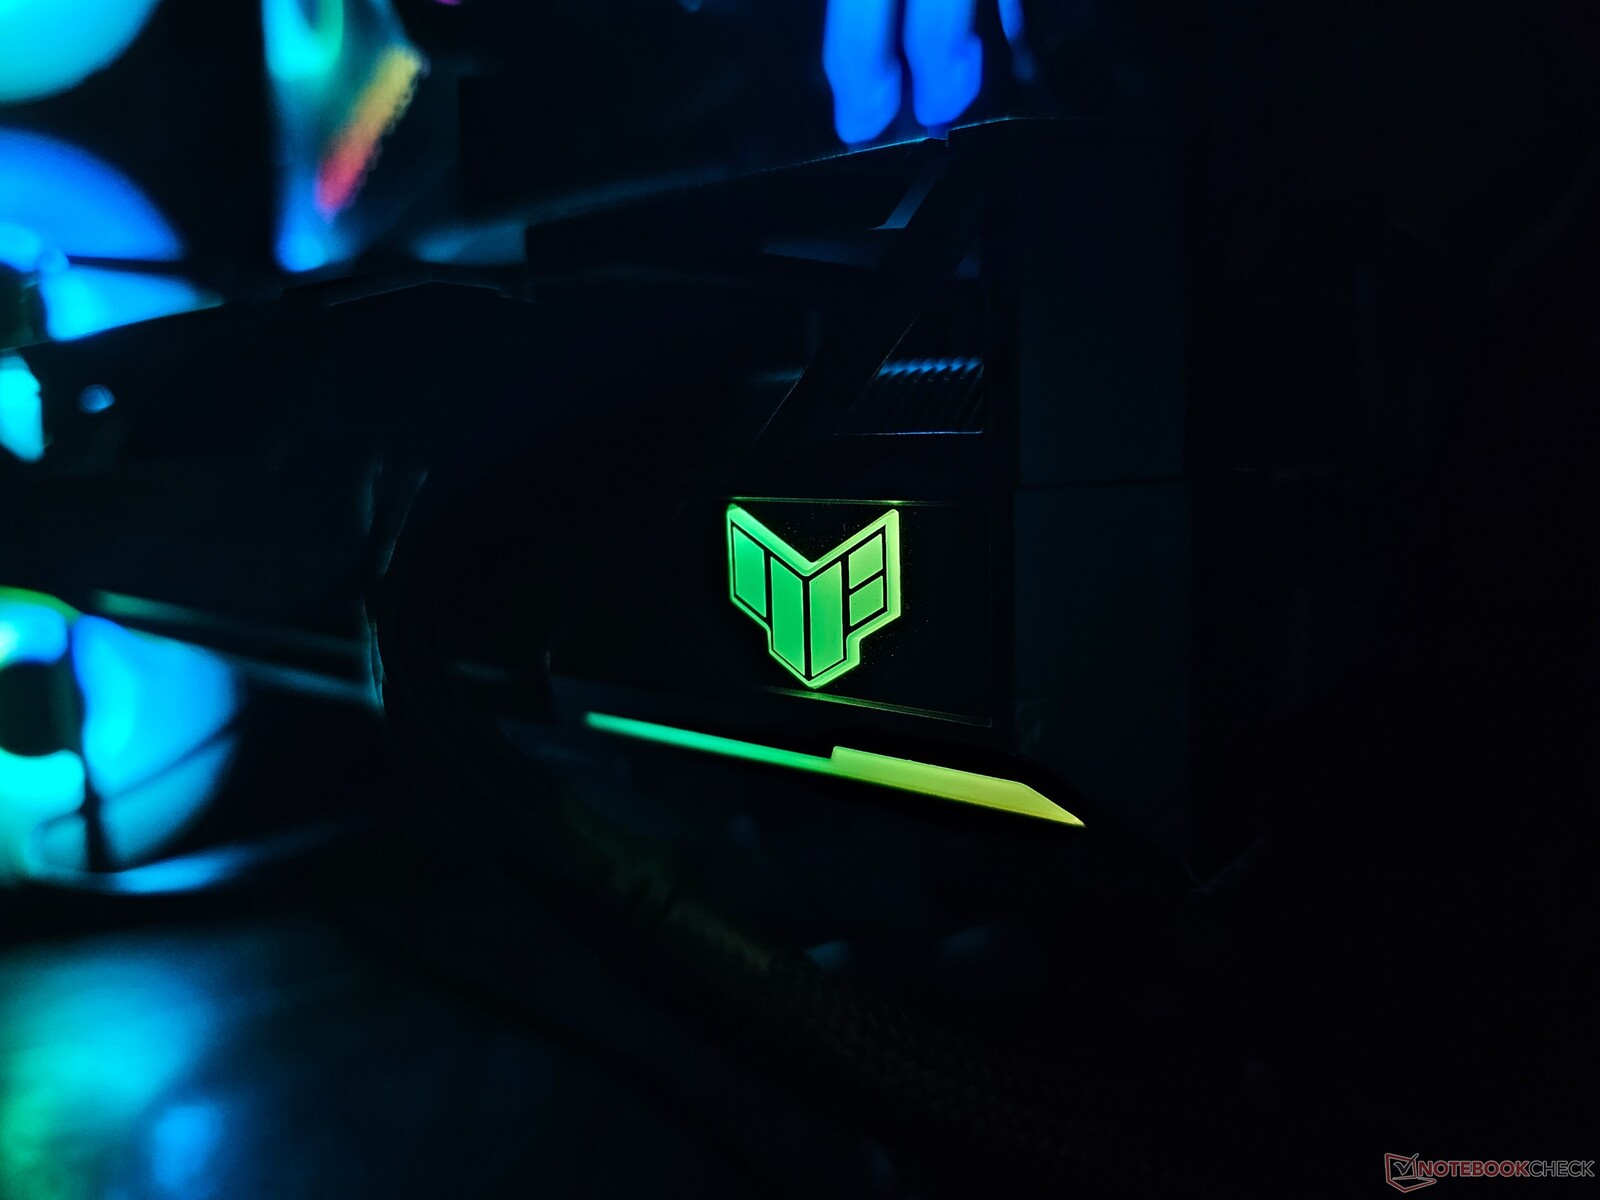
W przeciwieństwie do swoich odpowiedników Strix, karty TUF mają bardziej stonowane podświetlenie RGB. Jedynymi podświetlanymi obszarami są logo TUF i krótki pasek świetlny pod nim. Mimo to, oświetlenie jest skuteczne i można je dostosować za pomocą oprogramowania GPU Tweak III firmy Asus lub dowolnego narzędzia kompatybilnego z Aura Sync.
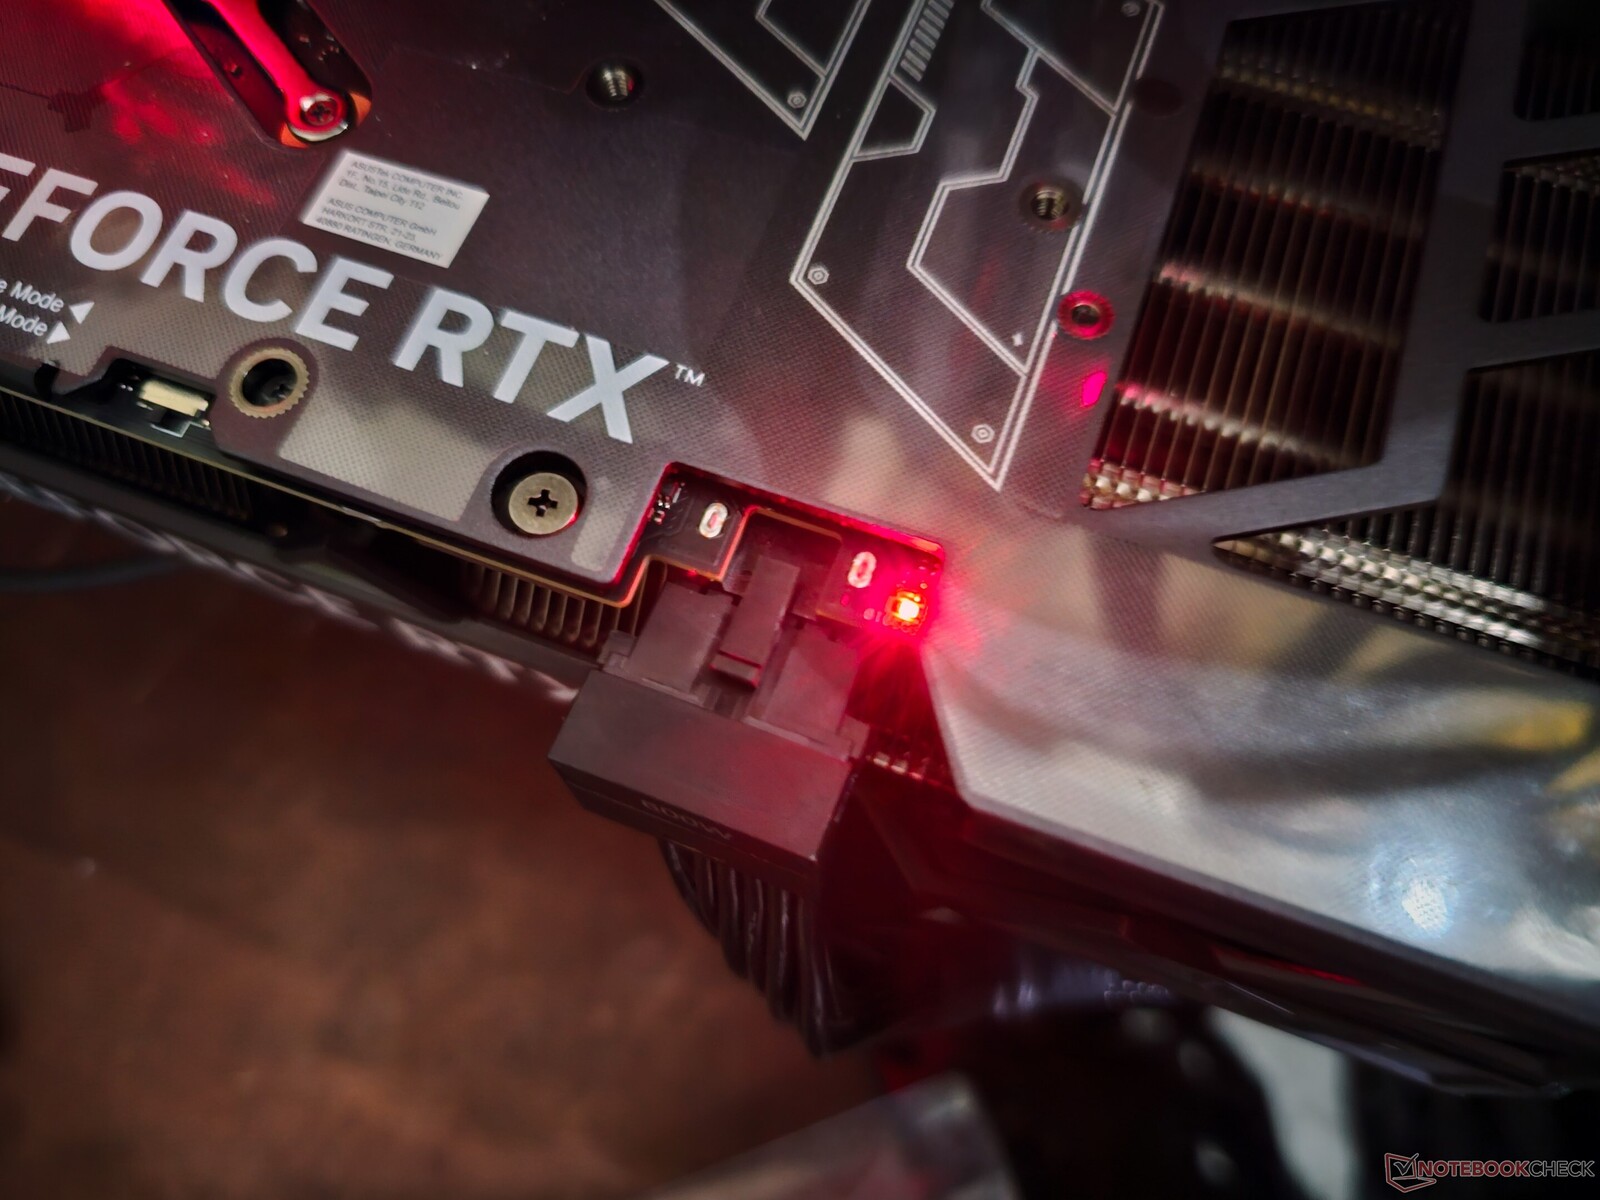
Za zasilanie odpowiada standardowe złącze 12VHPWR. Asus dostarcza w pudełku przejściówkę z 12VHPWR na 2x 8-pin, która idealnie pasuje do złącza.
Złącze zasilania posiada również przydatny czerwony wskaźnik LED, który świeci się, aby wskazać nieprawidłowe połączenie lub niewystarczające zasilanie. Niestety, wskaźnik świeci nawet podczas wyłączania systemu, co może potencjalnie dezorientować użytkowników.
Asus oferuje podwójny system BIOS, który można przełączać między trybami wydajności i ciszy. Przeprowadziliśmy wszystkie testy w trybie wydajności i użyliśmy trybu cichego do porównania poziomów hałasu wentylatorów.

Karty TUF są również dostarczane z przyzwoitym zestawem akcesoriów, który obejmuje:
- Karta kolekcjonerska TUF
- adapter zasilania 12VHPWR na 2x 8-pin
- Kartę z podziękowaniami
- Certyfikat TUF Gaming
- Skrócona instrukcja obsługi
- Informacje o gwarancji
- TUF Velcro hook and loop
- Uchwyt na GPU TUF z wbudowanym śrubokrętem
TUF Gaming GeForce RTX 4070 Ti Super ma znamionowy boost do 2610 MHz, co jest referencyjną specyfikacją Nvidii dla tego GPU. Jest to o 150 MHz mniej niż w przypadku oryginalnego RTX 4070 Ti non-Super, ale zegar bazowy został teraz zwiększony o 30 MHz do 2340 MHz.
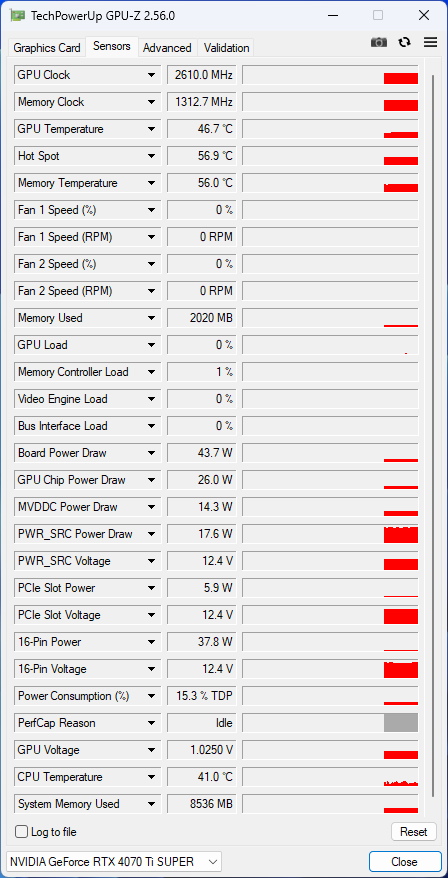
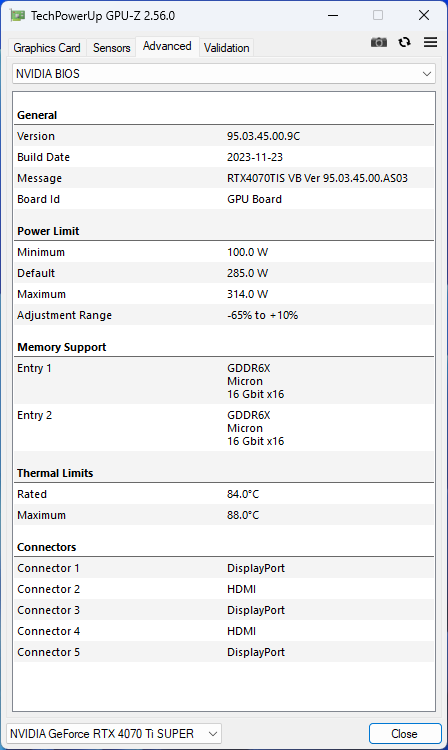
Pomimo zwiększenia przepustowości pamięci i liczby jednostek cieniujących, TUF Gaming GeForce RTX 4070 Ti Super działa przy TGP 285 W, podobnie jak RTX 4070 Ti.
Istnieje ograniczony potencjał zwiększenia wykorzystania mocy o 10% w celu zwiększenia TGP do 314 W.
Stanowisko testowe: RTX 4070 Ti Super i Core i9-13900K tworzą świetną parę
Nasz system testowy bazuje na procesorze Intel Core i9-13900K i platformie Z790. Obejmuje on następujące komponenty:
- Stanowisko testowe Cooler Master MasterFrame 700
- Intel Core i9-13900K z PL1=PL2
- Płyta główna Gigabyte Z790 Aorus Master
- Dysk SSD Gigabyte Aorus Gen4 2 TB NVMe
- Dysk SSD Sabrent Rocket 4 Plus Gen4 2 TB NVMe
- 2x 16 GB pamięci RAM Kingston Fury Renegade DDR5-6400 z timingami 32-39-39-80 przy 1,40 V
- Monitor Gigabyte M28U 4K 144 Hz
- Gigabyte Aorus Waterforce X II 360 Chłodnica AiO
- W pełni modularny zasilacz Cooler Master MVE Gold V2 1250 ATX 3.0
Zastosowano system Windows 11 23H2 z najnowszymi łatkami oraz sterownik Nvidia Game Ready Driver w wersji 551.15.
Chcielibyśmy podziękować firmie Cooler Master za dostarczenie stanowiska testowego i zasilacza, firmie Gigabyte za płytę główną, procesor, dysk SSD, cooler AiO i monitor, firmie Sabrent za dysk SSD oraz firmie Kingston za pamięci.
Syntetyczne testy porównawcze: Mocno umacnia swoją przewagę nad RTX 3090 Ti
W skumulowanych testach syntetycznych widzimy tylko 3% ogólną poprawę w przypadku TUF Gaming GeForce RTX 4070 Ti Super w porównaniu do RTX 4070 Ti i do 12% w porównaniu do RTX 4070 Super Founders Edition.
Indywidualnie, najlepsze zyski wynikają z benchmarków w wyższych rozdzielczościach. Przykładowo, 3DMark Fire Strike Ultra wykazuje 4% wzrost w porównaniu do średniej RTX 4070 Ti, podczas gdy testy Unigine Superposition 4K i 8K Optimized zwiększają tę różnicę do 11%.
RTX 4070 Ti Super jeszcze bardziej wyprzedza flagowy model Ampere RTX 3090 Ti o 5%, jednocześnie pozostając w tyle za AMD Radeon RX 7900 XT o ten sam margines.
3DMark 11: 1280x720 Performance GPU
3DMark: 1920x1080 Fire Strike Graphics | 3840x2160 Fire Strike Ultra Graphics | Fire Strike Extreme Graphics | 2560x1440 Time Spy Graphics
Unigine Heaven 4.0: Extreme Preset DX11 | Extreme Preset OpenGL
Unigine Valley 1.0: 1920x1080 Extreme HD DirectX AA:x8 | 1920x1080 Extreme HD Preset OpenGL AA:x8
Unigine Superposition: 1280x720 720p Low | 1920x1080 1080p Extreme | 3840x2160 4k Optimized | 7680x4320 8k Optimized
| Performance rating | |
| NVIDIA GeForce RTX 4090 Founders Edition | |
| AMD Radeon RX 7900 XTX | |
| NVIDIA GeForce RTX 4080 Founders Edition | |
| Średnia w klasie Desktop | |
| AMD Radeon RX 7900 XT | |
| Asus TUF Gaming GeForce RTX 4070 Ti Super | |
| Gigabyte Aorus GeForce RTX 4070 Ti Master | |
| Asus TUF Gaming GeForce RTX 4070 Ti | |
| Przeciętny NVIDIA GeForce RTX 4070 Ti | |
| Zotac Gaming GeForce RTX 3090 Ti AMP Extreme Holo | |
| Sapphire AMD Radeon RX 6950 XT Nitro+ Pure | |
| Gigabyte GeForce RTX 4070 Super Gaming OC 12G | |
| Przeciętny NVIDIA GeForce RTX 3090 | |
| Przeciętny NVIDIA GeForce RTX 3080 Ti | |
| NVIDIA GeForce RTX 4070 Super Founders Edition | |
| AMD Radeon RX 7800 XT | |
| AMD Radeon RX 6900 XT | |
| Zotac Gaming GeForce RTX 4070 AMP Airo | |
| AMD Radeon RX 6800 XT | |
| Przeciętny NVIDIA GeForce RTX 3080 | |
| KFA2 GeForce RTX 3070 Ti SG | |
| Sapphire Pulse Radeon RX 7700 XT | |
| Przeciętny NVIDIA Titan RTX | |
| Przeciętny NVIDIA GeForce RTX 3070 | |
| Przeciętny NVIDIA GeForce RTX 4060 Ti 8G | |
| KFA2 GeForce RTX 4060 Ti EX, 16GB GDDR6 | |
| XFX Speedster QICK 308 Radeon RX 7600 Black Edition | |
| KFA2 GeForce RTX 4060 1-Click-OC 2X | |
3DMark 11: 1280x720 Performance GPU
3DMark: 1920x1080 Fire Strike Graphics | 3840x2160 Fire Strike Ultra Graphics | Fire Strike Extreme Graphics | 2560x1440 Time Spy Graphics
Unigine Heaven 4.0: Extreme Preset DX11 | Extreme Preset OpenGL
Unigine Valley 1.0: 1920x1080 Extreme HD DirectX AA:x8 | 1920x1080 Extreme HD Preset OpenGL AA:x8
Unigine Superposition: 1280x720 720p Low | 1920x1080 1080p Extreme | 3840x2160 4k Optimized | 7680x4320 8k Optimized
| 3DMark 11 Performance | 54278 pkt. | |
| 3DMark Ice Storm Standard Score | 287297 pkt. | |
| 3DMark Cloud Gate Standard Score | 79438 pkt. | |
| 3DMark Fire Strike Score | 42631 pkt. | |
| 3DMark Fire Strike Extreme Score | 27105 pkt. | |
| 3DMark Time Spy Score | 23540 pkt. | |
Pomoc | ||
Wydajność obliczeniowa: Skala odpowiadająca zwiększonej liczbie rdzeni CUDA
Wpływ zwiększonej liczby rdzeni CUDA jest bardziej widoczny w testach obliczeniowych, takich jak V-Ray i Blender. W V-Ray 5, TUF Gaming GeForce RTX 4070 Ti Super osiąga imponujące 11% i 14% przewagi w benchmarkach CUDA i RTX w porównaniu do średniej RTX 4070 Ti. Karty AMD są w tych testach w oczywistej niekorzystnej sytuacji.
Tam, gdzie jednak błyszczą, to w testach LuxMark Sala GPU, gdzie nawet RX 6950 XT wykazuje dobrą przewagę nad RTX 4090 Founders Edition. Biorąc to pod uwagę, RTX 4070 Ti Super wykazuje przyzwoity wzrost o 11% zarówno w stosunku do TUF Gaming GeForce RTX 4070 Ti OC, jak i Aorus GeForce RTX 4070 Ti Master w LuxMark Room GPU.
TUF Gaming GeForce RTX 4070 Ti Super jest również w stanie ukończyć renderowanie Blendera 3.3 Classroom CUDA i Optix o 1,5 sekundy szybciej niż średnia RTX 4070 Ti.
V-Ray Benchmark Next 4.10: GPU
Blender: v3.3 Classroom CUDA | v3.3 Classroom OPTIX/RTX
LuxMark v2.0 64Bit: Room GPUs-only | Sala GPUs-only
ComputeMark v2.1: 1024x600 Normal, Score | 1024x600 Normal, QJuliaRayTrace | 1024x600 Normal, Mandel Scalar | 1024x600 Normal, Mandel Vector | 1024x600 Normal, Fluid 2DTexArr | 1024x600 Normal, Fluid 3DTex
| Blender / v3.3 Classroom CUDA | |
| KFA2 GeForce RTX 4060 1-Click-OC 2X (3.3.3) | |
| Przeciętny NVIDIA GeForce RTX 3070 (n=1) | |
| KFA2 GeForce RTX 3070 Ti SG (3.3.0) | |
| Przeciętny NVIDIA Titan RTX (n=1) | |
| Przeciętny NVIDIA GeForce RTX 4060 Ti 8G (n=1) | |
| Zotac Gaming GeForce RTX 4070 AMP Airo (3.3.3) | |
| Przeciętny NVIDIA GeForce RTX 3080 Ti (21 - 22, n=2) | |
| Przeciętny NVIDIA GeForce RTX 3090 (20 - 22, n=13) | |
| NVIDIA GeForce RTX 4070 Super Founders Edition (3.3.3) | |
| Gigabyte GeForce RTX 4070 Super Gaming OC 12G (3.3.3) | |
| Przeciętny NVIDIA GeForce RTX 4070 Ti (18 - 19, n=3) | |
| Średnia w klasie Desktop (8 - 54, n=31, ostatnie 2 lata) | |
| Gigabyte Aorus GeForce RTX 4070 Ti Master (3.3.2) | |
| Asus TUF Gaming GeForce RTX 4070 Ti Super (3.3.3) | |
| Blender / v3.3 Classroom OPTIX/RTX | |
| Przeciętny NVIDIA GeForce RTX 3070 (n=1) | |
| KFA2 GeForce RTX 4060 1-Click-OC 2X (3.3.3) | |
| Przeciętny NVIDIA Titan RTX (n=1) | |
| KFA2 GeForce RTX 3070 Ti SG (3.3.0) | |
| KFA2 GeForce RTX 4060 Ti EX, 16GB GDDR6 (3.3.3) | |
| Przeciętny NVIDIA GeForce RTX 4060 Ti 8G (17 - 18, n=3) | |
| Przeciętny NVIDIA GeForce RTX 3080 Ti (14 - 15, n=2) | |
| Zotac Gaming GeForce RTX 4070 AMP Airo (3.3.3) | |
| Przeciętny NVIDIA GeForce RTX 3090 (13 - 14, n=13) | |
| Asus TUF Gaming GeForce RTX 4070 Ti (3.3.2) | |
| Przeciętny NVIDIA GeForce RTX 4070 Ti (11 - 12, n=5) | |
| Gigabyte Aorus GeForce RTX 4070 Ti Master (3.3.2) | |
| NVIDIA GeForce RTX 4070 Super Founders Edition (3.3.3) | |
| Gigabyte GeForce RTX 4070 Super Gaming OC 12G (3.3.3) | |
| Średnia w klasie Desktop (5 - 19, n=30, ostatnie 2 lata) | |
| NVIDIA GeForce RTX 4080 Founders Edition (3.3.0) | |
| Asus TUF Gaming GeForce RTX 4070 Ti Super (3.3.3) | |
| NVIDIA GeForce RTX 4090 Founders Edition (3.3.0) | |
V-Ray Benchmark Next 4.10: GPU
Blender: v3.3 Classroom CUDA | v3.3 Classroom OPTIX/RTX
LuxMark v2.0 64Bit: Room GPUs-only | Sala GPUs-only
ComputeMark v2.1: 1024x600 Normal, Score | 1024x600 Normal, QJuliaRayTrace | 1024x600 Normal, Mandel Scalar | 1024x600 Normal, Mandel Vector | 1024x600 Normal, Fluid 2DTexArr | 1024x600 Normal, Fluid 3DTex
* ... im mniej tym lepiej
Wydajność w grach: Na równi z RTX 3090 Ti i RX 7900 XT w rozdzielczości QHD i 4K Ultra
W przeciwieństwie do testów syntetycznych, nie wszystkie gry skalują się zgodnie ze wzrostem liczby shaderów. W związku z tym widzimy tylko 4% wzrost w stosunku do przeciętnego RTX 4070 Ti non-Super w skumulowanej wydajności w grach QHD i 4K.
Gry takie jak The Witcher 3 i Shadow of the Tomb Raider wykazują do 5% wzrost w 4K Ultra z RTX 4070 Ti Super w porównaniu do średniej RTX 4070 Ti non-Super. Różnice zwiększają się do 8% w przypadku Borderlands 3 i do 11% w przypadku Final Fantasy XV w rozdzielczości 4K Ultra.
Stawia to RTX 4070 Ti Super w tej samej lidze co RTX 3090 Ti i Radeon RX 7900 XT, jeśli chodzi o gry, szczególnie w ustawieniach QHD i 4K Ultra.
Podobnie jak w przypadku RTX 4070 Super, Nvidia nadal oferuje RTX 4070 Ti Super dla graczy QHD. Podczas gdy karta ta z pewnością jest korzystna dla osób z wyświetlaczami QHD o wysokiej częstotliwości odświeżania, RTX 4070 Ti Super może wygodnie uruchomić sporą liczbę nowoczesnych i nieco starszych tytułów AAA w rozdzielczości 4K 60 lub wyższej.
Jednak niektóre z tych szczególnie obfitujących w tekstury, takie jak Cyberpunk 2077 Phantom Liberty, Alan Wake 2, Avatar: Frontiers of Pandora i tym podobne, będą wymagały pomocy w zakresie skalowania w celu uzyskania płynniejszej rozgrywki w rozdzielczości 4K Ultra.
Natywna wydajność ray tracingu
Wydajność ray tracingu w rozdzielczości 1080p Ultra jest równa lub tylko nieznacznie lepsza od RTX 4070 Ti, przy czym The Callisto Protocol wykazuje przyzwoity 9% wzrost.
RTX 4070 Ti Super ma przewagę w ray tracingu w rozdzielczości 4K Ultra, o czym świadczy 4% wzrost w Cyberpunk 2077 1.6 i 10% wzrost w Control.
Różnica staje się bardziej wyraźna w porównaniu z RTX 4070 Super Founders Edition. W tym przypadku RTX 4070 Ti Super wykazuje znaczną, 22-procentową przewagę w ray tracingu w grach Alan Wake 2 1080p i Cyberpunk 2077 Phantom Liberty 4K.
| low | med. | high | ultra | QHD | 4K DLSS | 4K | |
|---|---|---|---|---|---|---|---|
| GTA V (2015) | 187.6 | 187.6 | 187.4 | 160.1 | 155.3 | 182.1 | |
| The Witcher 3 (2015) | 558 | 430 | 210 | 159.3 | |||
| Dota 2 Reborn (2015) | 245 | 228 | 226 | 202 | 203 | ||
| Final Fantasy XV Benchmark (2018) | 235 | 235 | 209 | 168.8 | 98.9 | ||
| X-Plane 11.11 (2018) | 224 | 196.7 | 150 | 127.8 | |||
| Far Cry 5 (2018) | 203 | 197 | 188 | 187 | 119 | ||
| Strange Brigade (2018) | 568 | 467 | 442 | 407 | 306 | 161.9 | |
| Shadow of the Tomb Raider (2018) | 273 | 269 | 256 | 205 | 109.5 | ||
| Metro Exodus (2019) | 236 | 193.5 | 158.3 | 130.9 | 84.4 | ||
| Control (2019) | 226 | 196.9 | 130.3 | 78.9 | 66.4 | ||
| Borderlands 3 (2019) | 192.1 | 176.8 | 169.6 | 143.6 | 79.4 | ||
| Mafia Definitive Edition (2020) | 239 | 231 | 181 | 96.6 | |||
| Watch Dogs Legion (2020) | 171.2 | 159.3 | 144.2 | 115.9 | 68.6 | ||
| Far Cry 6 (2021) | 209 | 191 | 169 | 154 | 91 | ||
| Dying Light 2 (2022) | 213 | 162.2 | 121.5 | 63.7 | |||
| Cyberpunk 2077 1.6 (2022) | 196.9 | 195.9 | 172.3 | 157.5 | 103.6 | 49.7 | |
| Ghostwire Tokyo (2022) | 278 | 282 | 283 | 217 | 99.2 | ||
| F1 22 (2022) | 371 | 384 | 336 | 144.9 | 95.1 | 48.9 | |
| The Callisto Protocol (2022) | 210.62 | 202.94 | 149.39 | 114.82 | 70.04 | ||
| F1 23 (2023) | 385 | 402 | 363 | 138.2 | 90 | 77.4 | 45.1 |
| Baldur's Gate 3 (2023) | 246 | 223 | 218 | 157.8 | 133.9 | 117.2 | |
| Cyberpunk 2077 (2023) | 188.5 | 188.5 | 170.8 | 150.3 | 94.9 | 42.3 | |
| Assassin's Creed Mirage (2023) | 221 | 206 | 170 | 136 | 112 | 84 | |
| Alan Wake 2 (2023) | 124.7 | 114.4 | 82.5 | 63.7 | 44.7 | ||
| Call of Duty Modern Warfare 3 2023 (2023) | 227 | 184 | 179 | 133 | 112 | 84 | |
| Avatar Frontiers of Pandora (2023) | 163 | 141.8 | 113.2 | 76.6 | 68.9 | 39.8 |
Emisje: Niski poziom hałasu wentylatora, ale wyższe temperatury powierzchni pod obciążeniem
Asus TUF Gaming GeForce RTX 4070 Ti Super jest wyposażony w wentylatory osiowe z podwójnymi łożyskami kulkowymi, które mają zmniejszyć hałas i wydłużyć żywotność.
Miłym akcentem jest możliwość zdjęcia metalowej osłony w celu wyczyszczenia wentylatorów w razie potrzeby bez konieczności demontażu samej karty.
TUF Gaming GeForce RTX 4070 Ti Super wykorzystuje w sumie sześć rurek cieplnych do wydajnego odprowadzania ciepła z GPU, VRM i pamięci.
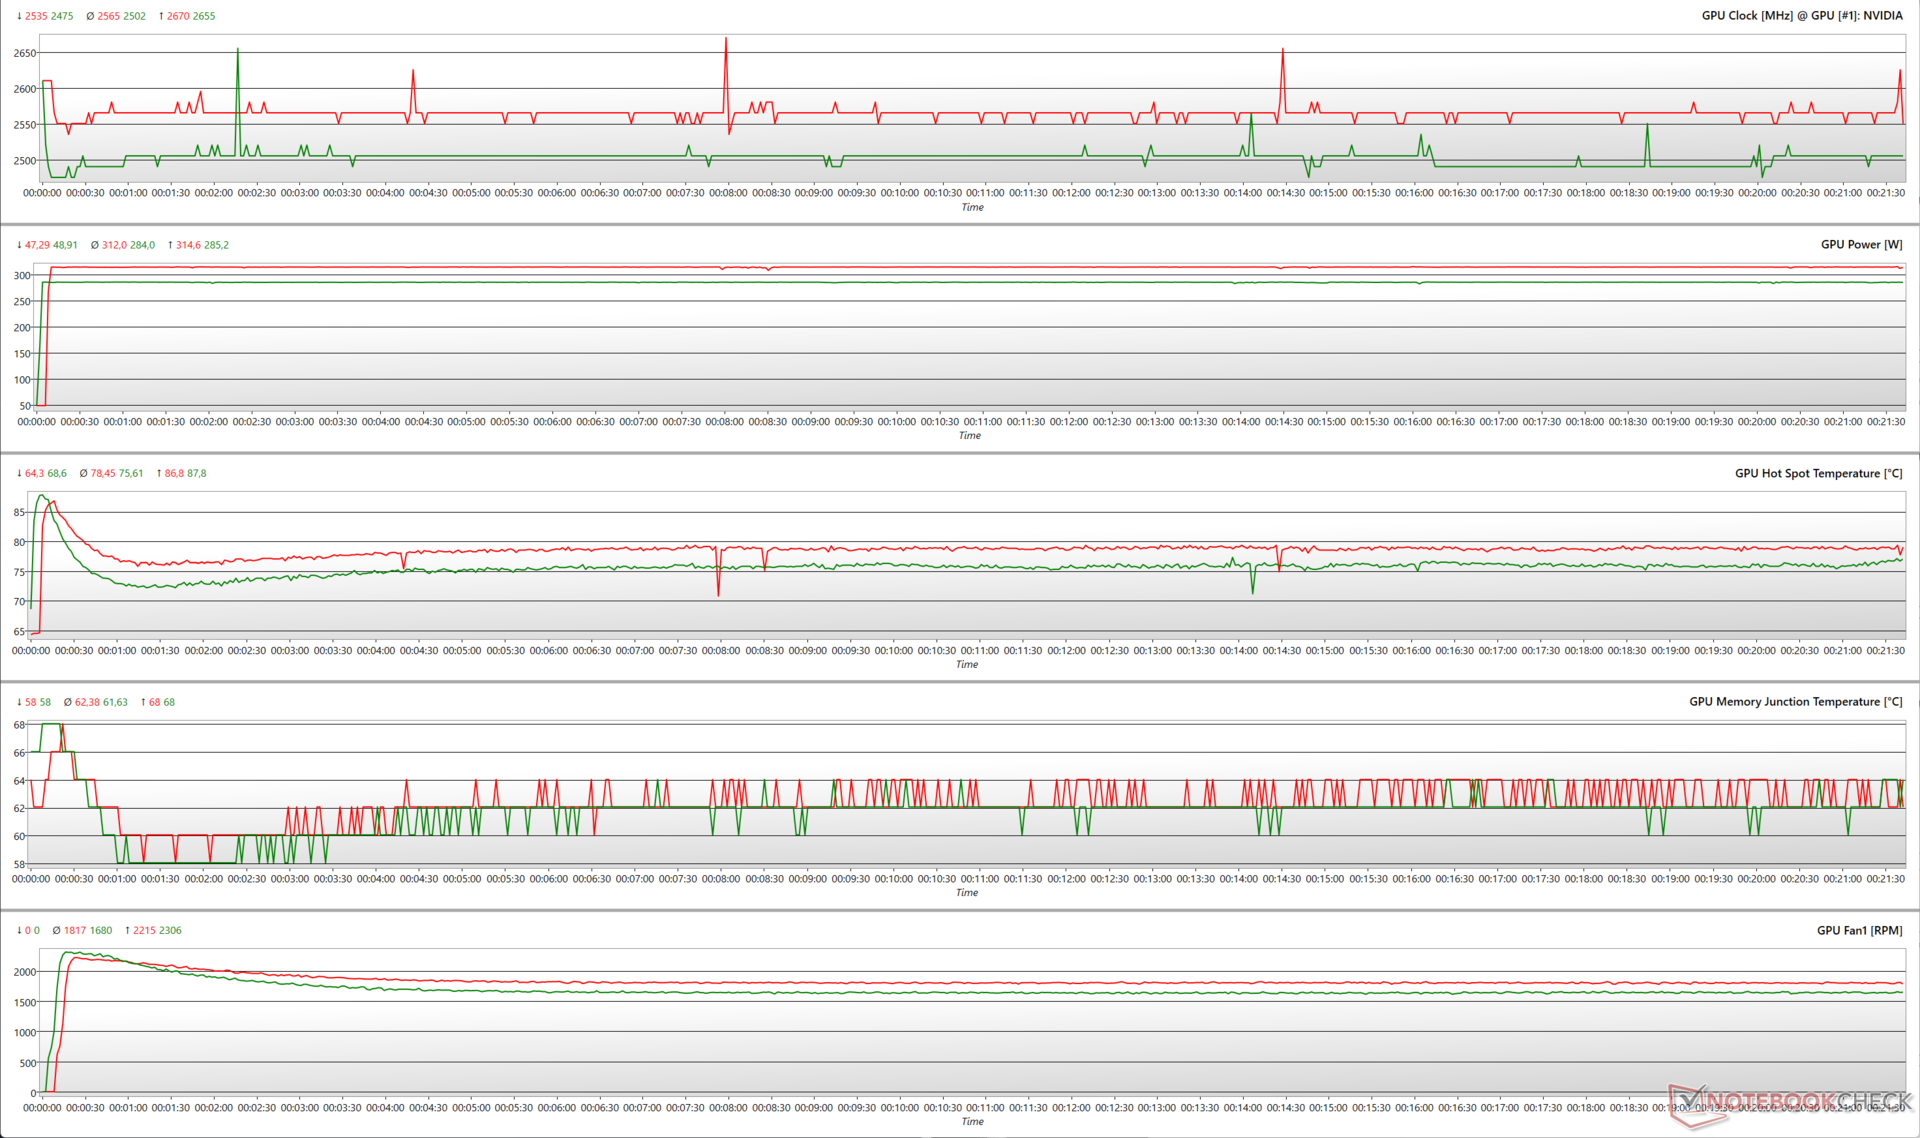
Testy warunków skrajnych
Przy 100% docelowej mocy (PT), karta TUF Gaming GeForce RTX 4070 Ti Super może zwiększyć taktowanie do 2655 MHz podczas testu FurMark w rozdzielczości 1280 x 720 bez AA, wykorzystując przy tym 285 W TGP.
Zwiększenie docelowej mocy do 110% powoduje, że karta osiąga taktowanie do 2670 MHz, zużywając przy tym prawie 315 W. Skutkuje to również nieco wyższą średnią temperaturą gorącego punktu wynoszącą ~78,5 °C i wyższą średnią prędkością wentylatora wynoszącą 1817 obr.
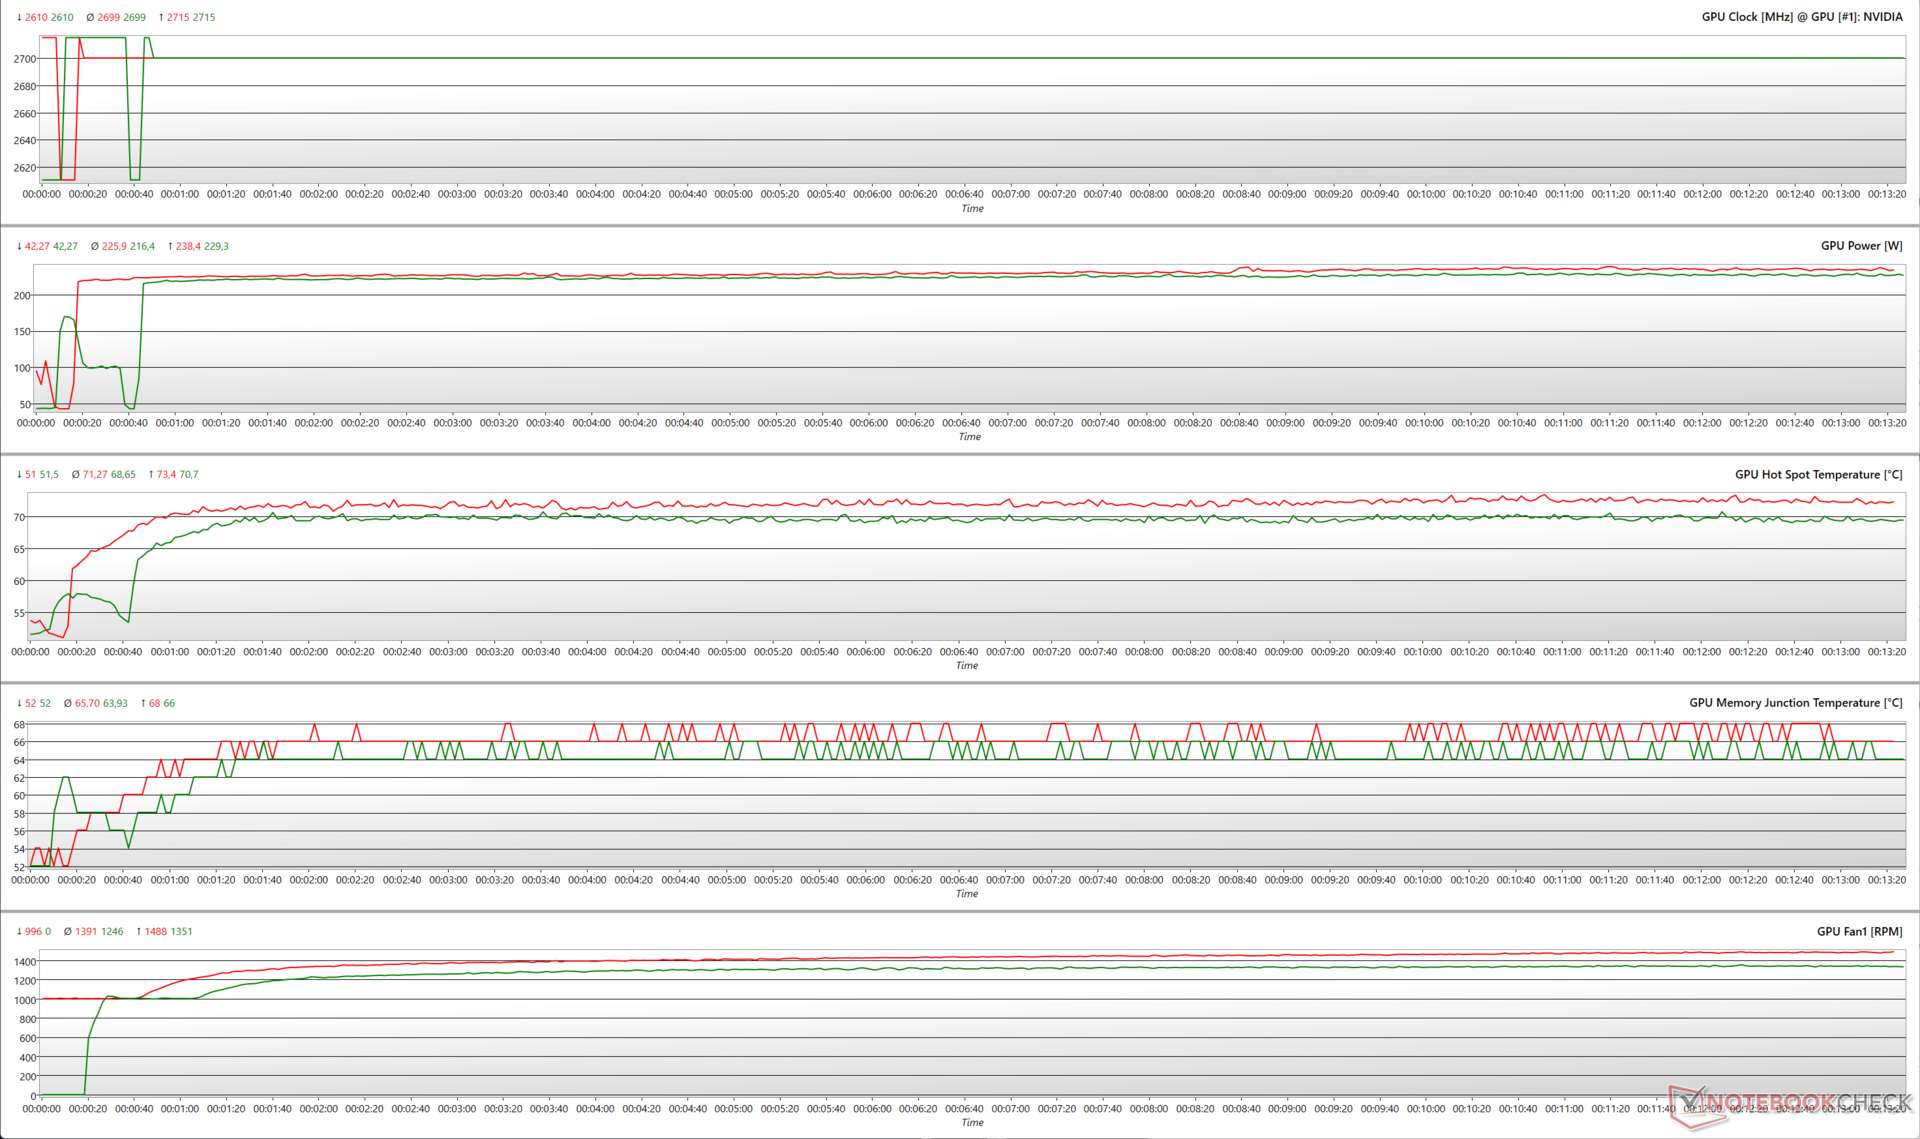
Podkręcanie z The Witcher 3 przy 1080p Ultra pokazuje podobny profil taktowania zarówno przy 100% PT, jak i 110% PT z maksymalnym podkręceniem do 2715 MHz. RTX 4070 Ti Super nie musi wykorzystywać całej dostępnej mocy 315 W, aby osiągnąć ten zegar - jest to zachowanie zgodne z innymi procesorami graficznymi Ada, które do tej pory sprawdziliśmy.
Średnia temperatura gorącego punktu GPU i średnie prędkości wentylatorów odnotowały jedynie nominalny wzrost o odpowiednio 3,8% i 11% przy 110% PT.
Wykres Witcher 3 FPS
Wygląda na to, że system chłodzenia Asusa wykonuje dobrą robotę, pomagając karcie TUF Gaming GeForce RTX 4070 Ti Super utrzymać stałą liczbę klatek na sekundę w grze The Witcher 3 zarówno w rozdzielczości 1080p Ultra, jak i 4K Ultra.
4K Ultra pokazuje początkowy spadek ze 109 do 101 klatek na sekundę, ale później karta radzi sobie z dość stałą liczbą klatek na sekundę.
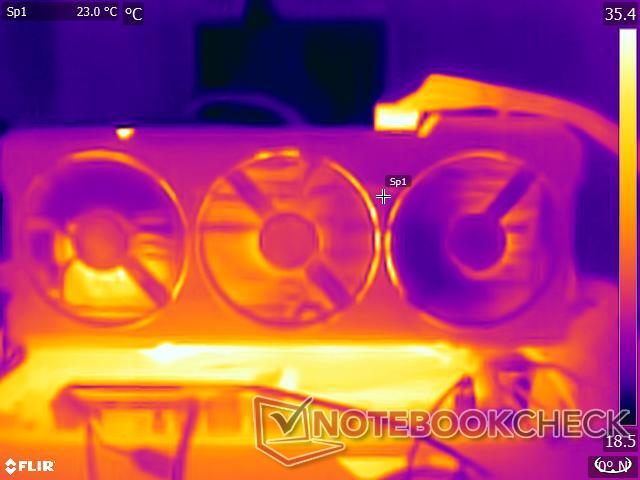
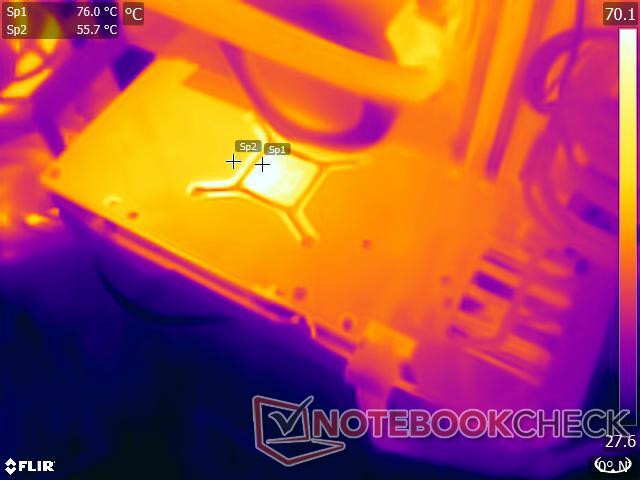
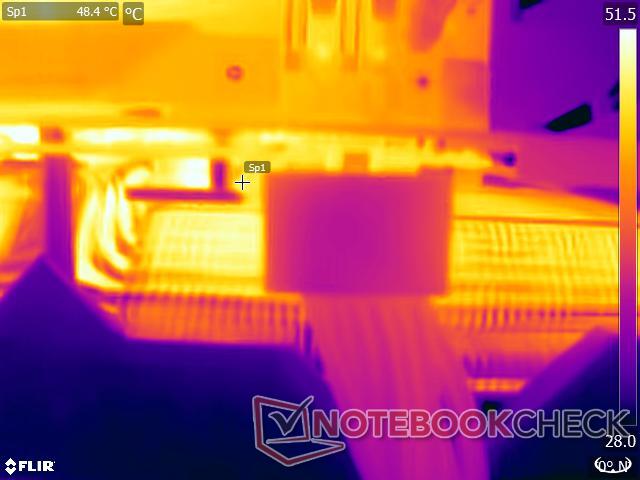
Temperatury powierzchni
Podczas gdy system chłodzenia jest w stanie zapewnić wydajność bez dławienia GPU, okazuje się, że TUF Gaming GeForce RTX 4070 Ti Super wykazuje stosunkowo wysokie temperatury powierzchniowe.
Przy temperaturze otoczenia wynoszącej 22 °C, metalowa osłona przednia nie nagrzewa się zbytnio, ale płyta tylna nagrzewa się do ~56 °C, podczas gdy obszar GPU może osiągnąć 76 °C. Obszar wokół złącza 12VHPWR pozostaje stosunkowo chłodny i wynosi 48,4 °C.

Poziomy hałasu
Implementacja potrójnego wentylatora Asusa generalnie zapewnia znośny poziom hałasu wentylatora, co widzieliśmy już wcześniej w przypadku TUF Gaming GeForce RTX 4070 Ti OC również.
Spośród trzech wentylatorów w TUF RTX 4070 Ti Super, dwa obracają się w kierunku przeciwnym do ruchu wskazówek zegara, podczas gdy środkowy wentylator obraca się zgodnie z ruchem wskazówek zegara. Asus zaimplementował całkowite zatrzymanie wentylatorów w stanie bezczynności, przy czym 55 °C jest progiem temperatury rdzenia przed uruchomieniem wentylatorów.
TUF Gaming RTX 4070 Ti Super umożliwia przełączanie między trybami Performance i Quiet VBIOS. Tryb cichy pozwala na zaostrzenie krzywych wentylatorów, a wszystkie inne parametry pozostają bez zmian. To powiedziawszy, nie ma zauważalnej różnicy między tymi trybami VBIOS dla wszystkich praktycznych celów.
Karta pozostawała poniżej 35 dB(A) we wszystkich obciążeniach FurMark i poniżej 30 dB(A) podczas stresu The Witcher 3 1080p Ultra. Maksymalny poziom ciśnienia akustycznego (SPL), jaki zarejestrowaliśmy, wyniósł 35,88 dB(A) w trybie Performance VBIOS przy 110% PT.
Jest to dobra poprawa w porównaniu do wcześniejszego TUF RTX 4070 Ti OC, który miał emisję bliską 46 dB(A) w obciążeniu FurMark. Proszę również zauważyć, że nasze pomiary SPL zostały wykonane na otwartym stanowisku testowym, co oznacza, że wentylatory powinny być praktycznie niesłyszalne w typowej obudowie ATX.
| Test obciążeniowy | Tryb VBIOS/ Docelowa moc | Hałas wentylatora dB(A) |
|---|---|---|
| FurMark 1280 x 720, bez AA | Wydajność / 100% | 33,71 |
| FurMark 1280 x 720, bez AA | Cisza / 100% | 33.05 |
| FurMark 1280 x 720, bez AA | Wydajność / 110% | 35.88 |
| FurMark 1280 x 720, bez AA | Cicha / 110% | 35.55 |
| Witcher 3 1080p Ultra | Wydajność / 100% | 28.40 |
| Witcher 3 1080p Ultra | Cicha / 100% | 27.77 |
| Witcher 3 1080p Ultra | Wydajność / 110% | 29.51 |
| Witcher 3 1080p Ultra | Ciche / 110% | 28.55 |
Zarządzanie energią: Oszczędniejszy pobór mocy niż RTX 4070 Ti
Pomimo wzrostu specyfikacji, TUF RTX 4070 Ti Super jest dość oszczędny, jeśli chodzi o zużycie energii i jest nawet bardziej ekonomiczny niż RTX 4070 Ti w testach zużycia energii FurMark i The Witcher 3. Pod względem efektywności energetycznej, TUF RTX 4070 Ti Super plasuje się tuż za RTX 4090 Founders Edition.
Jak to zwykle bywa w przypadku kart Nvidia Ada Lovelace, RTX 4070 Ti Super wykazuje podobny całkowity pobór mocy ze ściany zarówno przy 100%, jak i 110% docelowej mocy w teście The Witcher 3 w rozdzielczości 1080p Ultra. Jest to zgodne z naszymi obserwacjami z powyższego testu obciążeniowego.
Power Consumption: External monitor
| Power Consumption / FurMark 1.19 GPU Stress Test (external Monitor) | |
| NVIDIA GeForce RTX 4090 Founders Edition (133% PT OC, Idle: 81.25 W) | |
| NVIDIA GeForce RTX 4090 Founders Edition (100% PT, Idle: 81.25 W) | |
| Zotac Gaming GeForce RTX 3090 Ti AMP Extreme Holo (110% PT, Idle: 102 W) | |
| Zotac Gaming GeForce RTX 3090 Ti AMP Extreme Holo (100% PT; Quiet BIOS, Idle: 102 W) | |
| Zotac Gaming GeForce RTX 3090 Ti AMP Extreme Holo (100% PT; Amplify BIOS, Idle: 102 W) | |
| Sapphire AMD Radeon RX 6950 XT Nitro+ Pure | |
| AMD Radeon RX 7900 XTX (Idle: 86.5 W) | |
| AMD Radeon RX 7900 XT (Idle: 84.6 W) | |
| Przeciętny NVIDIA GeForce RTX 3080 (Idle: 492 - 505, n=2 W) | |
| KFA2 GeForce RTX 3070 Ti SG (Idle: 88.9 W) | |
| Przeciętny NVIDIA GeForce RTX 3090 (Idle: 281 - 551, n=9 W) | |
| NVIDIA GeForce RTX 4080 Founders Edition (110% PT, Idle: 78.45 W) | |
| NVIDIA GeForce RTX 4080 Founders Edition (100% PT, Idle: 78.45 W) | |
| Przeciętny NVIDIA GeForce RTX 3080 Ti (Idle: 427 - 513, n=3 W) | |
| AMD Radeon RX 6900 XT (Idle: 99.15 W) | |
| AMD Radeon RX 6800 XT (Idle: 99.5 W) | |
| Gigabyte Aorus GeForce RTX 4070 Ti Master (OC BIOS; 128% PT, Idle: 75.5 W) | |
| Gigabyte Aorus GeForce RTX 4070 Ti Master (OC BIOS; 100% PT, Idle: 75.5 W) | |
| Gigabyte Aorus GeForce RTX 4070 Ti Master (Silent BIOS; 100% PT, Idle: 75.5 W) | |
| Asus TUF Gaming GeForce RTX 4070 Ti (Perf BIOS / 110% PT, Idle: 75.4 W) | |
| Asus TUF Gaming GeForce RTX 4070 Ti (Quiet BIOS / 100% PT, Idle: 75.4 W) | |
| Asus TUF Gaming GeForce RTX 4070 Ti (Perf BIOS / 100% PT, Idle: 75.4 W) | |
| Asus TUF Gaming GeForce RTX 4070 Ti Super (110% PT, Perf. BIOS, Idle: 138 W) | |
| Asus TUF Gaming GeForce RTX 4070 Ti Super (100% PT, Perf. BIOS, Idle: 138 W) | |
| Przeciętny NVIDIA Titan RTX (Idle: n=1 W) | |
| Przeciętny NVIDIA GeForce RTX 4070 Ti (Idle: 400 - 451, n=9 W) | |
| Średnia w klasie Desktop (Idle: 70 - 743, n=38, ostatnie 2 lata W) | |
| Gigabyte GeForce RTX 4070 Super Gaming OC 12G (145% PT, BIOS OC, Idle: 122.6 W) | |
| Gigabyte GeForce RTX 4070 Super Gaming OC 12G (100% PT, BIOS OC, Idle: 122.6 W) | |
| AMD Radeon RX 7800 XT | |
| Sapphire Pulse Radeon RX 7700 XT | |
| NVIDIA GeForce RTX 4070 Super Founders Edition (109% PT, Idle: 114.9 W) | |
| NVIDIA GeForce RTX 4070 Super Founders Edition (100% PT, Idle: 114.9 W) | |
| Zotac Gaming GeForce RTX 4070 AMP Airo (120% PT, Idle: 94.4 W) | |
| Zotac Gaming GeForce RTX 4070 AMP Airo (100% PT, Idle: 94.4 W) | |
| Przeciętny NVIDIA GeForce RTX 3070 (Idle: 281 - 393, n=7 W) | |
| XFX Speedster QICK 308 Radeon RX 7600 Black Edition | |
| KFA2 GeForce RTX 4060 Ti EX, 16GB GDDR6 | |
| KFA2 GeForce RTX 4060 1-Click-OC 2X | |
| Power Consumption / The Witcher 3 ultra (external Monitor) | |
| Sapphire AMD Radeon RX 6950 XT Nitro+ Pure | |
| Zotac Gaming GeForce RTX 3090 Ti AMP Extreme Holo (110% PT, Idle: 102 W) | |
| Zotac Gaming GeForce RTX 3090 Ti AMP Extreme Holo (100% PT, Idle: 102 W) | |
| NVIDIA GeForce RTX 4090 Founders Edition (133% PT OC, Idle: 81.25 W) | |
| NVIDIA GeForce RTX 4090 Founders Edition (100% PT, Idle: 81.25 W) | |
| AMD Radeon RX 7900 XTX (Idle: 86.5 W) | |
| Przeciętny NVIDIA GeForce RTX 3090 (Idle: 464 - 597, n=18 W) | |
| Przeciętny NVIDIA GeForce RTX 3080 Ti (Idle: 490 - 528, n=3 W) | |
| AMD Radeon RX 6800 XT (Idle: 99.5 W) | |
| Przeciętny NVIDIA GeForce RTX 3080 (Idle: 498 - 505, n=2 W) | |
| AMD Radeon RX 6900 XT (Idle: 99.15 W) | |
| NVIDIA GeForce RTX 4080 Founders Edition (110% PT, Idle: 78.45 W) | |
| NVIDIA GeForce RTX 4080 Founders Edition (100% PT, Idle: 78.45 W) | |
| AMD Radeon RX 7900 XT (Idle: 84.6 W) | |
| KFA2 GeForce RTX 3070 Ti SG (Idle: 88.9 W) | |
| AMD Radeon RX 7800 XT | |
| Średnia w klasie Desktop (Idle: 69 - 692, n=44, ostatnie 2 lata W) | |
| Asus TUF Gaming GeForce RTX 4070 Ti (Perf BIOS / 110% PT, Idle: 75.4 W) | |
| Asus TUF Gaming GeForce RTX 4070 Ti (Perf BIOS / 100% PT, Idle: 75.4 W) | |
| Asus TUF Gaming GeForce RTX 4070 Ti (Quiet BIOS / 100% PT, Idle: 75.4 W) | |
| Przeciętny NVIDIA GeForce RTX 4070 Ti (Idle: 404 - 434, n=9 W) | |
| Gigabyte Aorus GeForce RTX 4070 Ti Master (Silent BIOS; 100% PT, Idle: 75.5 W) | |
| Gigabyte Aorus GeForce RTX 4070 Ti Master (OC BIOS; 128% PT, Idle: 75.5 W) | |
| Gigabyte Aorus GeForce RTX 4070 Ti Master (OC BIOS; 100% PT, Idle: 75.5 W) | |
| Przeciętny NVIDIA Titan RTX (Idle: 371 - 463, n=27 W) | |
| Przeciętny NVIDIA GeForce RTX 3070 (Idle: 317 - 550, n=5 W) | |
| Asus TUF Gaming GeForce RTX 4070 Ti Super (110% PT, Perf. BIOS, Idle: 138 W) | |
| Asus TUF Gaming GeForce RTX 4070 Ti Super (100% PT, Perf. BIOS, Idle: 138 W) | |
| Gigabyte GeForce RTX 4070 Super Gaming OC 12G (100% PT, BIOS OC, Idle: 122.6 W) | |
| Gigabyte GeForce RTX 4070 Super Gaming OC 12G (145% PT, BIOS OC, Idle: 122.6 W) | |
| Sapphire Pulse Radeon RX 7700 XT | |
| NVIDIA GeForce RTX 4070 Super Founders Edition (109% PT, Idle: 114.9 W) | |
| NVIDIA GeForce RTX 4070 Super Founders Edition (100% PT, Idle: 114.9 W) | |
| Zotac Gaming GeForce RTX 4070 AMP Airo (120% PT, Idle: 94.4 W) | |
| Zotac Gaming GeForce RTX 4070 AMP Airo (100% PT, Idle: 94.4 W) | |
| XFX Speedster QICK 308 Radeon RX 7600 Black Edition | |
| KFA2 GeForce RTX 4060 Ti EX, 16GB GDDR6 | |
| KFA2 GeForce RTX 4060 1-Click-OC 2X | |
| 1280x720 FurMark 1.19 GPU Stress Test (external Monitor) | |
| 1920x1080 The Witcher 3 ultra (external Monitor) | |
* ... im mniej tym lepiej
Za
Przeciw
Werdykt: Tym, czym powinien być oryginalny RTX 4070 Ti

RTX 4070 Ti Super zastępuje oryginalną kartę RTX 4070 Ti przy tej samej sugerowanej cenie detalicznej wynoszącej 799 USD. W przeciwieństwie do RTX 4070 Superktóry odnotowuje znaczny wzrost liczby shaderów o 21% w porównaniu do RTX 4070rTX 4070 Ti Super oferuje tylko 10% wzrost liczby rdzeni CUDA w porównaniu do RTX 4070 Ti, co może nie zawsze oferować wymierne korzyści w rzeczywistych scenariuszach gier.
Niemniej jednak, przejście na krzem AD103 oznacza, że RTX 4070 Ti Super jest teraz bardziej "kompletnym GPU średniej klasy", który dzieli stół z takimi układami jak RTX 4080 i RTX 4080 Super. Wynikającą z tego korzyścią jest szybszy 256-bitowy podsystem pamięci i 16 GB GDDR6X VRAM, których AD104 po prostu nie obsługuje.
Z kolei Asus TUF Gaming GeForce RTX 4070 Ti Super oferuje doskonałą jakość wykonania, dodatkowe porty i doskonałą wydajność w oparciu o specyfikacje referencyjne. Chociaż dostępna jest również wersja OC SKU, testowana podstawowa wersja SKU za 799 USD zapewnia wszystko, czego potrzeba, aby w pełni wykorzystać możliwości najnowszego uczestnika AD103.
Nowa płyta główna Asus TUF Gaming GeForce RTX 4070 Ti Super, oparta na architekturze AD103, doskonale radzi sobie z grami w rozdzielczości 1440p Ultra przy wysokiej liczbie klatek na sekundę, oferując jednocześnie przyzwoitą rozdzielczość 4K Ultra i możliwości obliczeniowe, dzięki czemu zasługuje na poważne rozważenie przy cenie wywoławczej wynoszącej 799 USD.
Asus wyposażył TUF Gaming GeForce RTX 4070 Ti Super w solidny system chłodzenia. Chociaż temperatury powierzchniowe wydają się być wyższe, chłodzenie z trzema wentylatorami i sześcioma ciepłowodami pozwala GPU AD103 pracować bez obaw o dławienie przy wysoce tolerowanym poziomie hałasu wentylatorów.
RTX 4070 Ti Super działa cuda w grach 1440p Ultra, ale szczerze mówiąc jest to przesada dla tej rozdzielczości. Jeśli są Państwo głównie graczami w rozdzielczości 1440p, którzy nie zajmują się zbytnio obciążeniami obliczeniowymi, mogą Państwo zaoszczędzić dobre 200 USD, wybierając zamiast tego RTX 4070 Super.
AMD Radeon RX 7900 XT karty takie jak XFX Speedster MERC310(740USD na Amazon) lub Asus TUF Gaming RX 7900 XT OC(880 USD na Amazon) są również opłacalnymi opcjami, zwłaszcza jeśli priorytetem jest sama wydajność rastrowania i są Państwo zadowoleni z skalowania FSR.
Biorąc to pod uwagę, TUF Gaming RTX 4070 Ti Super oferuje lepszą ogólną propozycję, biorąc pod uwagę jego wyższą wydajność ray tracingu i wsparcie dla generowania klatek DLSS 3 i rekonstrukcji promieni DLSS 3.5.
Interesujące, biorąc pod uwagę, że RTX 3090 Tiktórą ta karta z powodzeniem wypiera, kosztowała 2,5x więcej niż jej sugerowana cena detaliczna.
Cena i dostępność
Asus TUF Gaming GeForce RTX 4070 Ti Super można kupić w Best Buy US za 800 USD za wariant podstawowy, podczas gdy SKU OC kosztuje 850 USD.
W Indiach, TUF Gaming GeForce RTX 4070 Ti Super jest oficjalnie wyceniony na 95 000 jenów, przy czym rzeczywista cena zależy od dystrybutora. Amazon India oferuje obecnie edycję OC tej karty za 1 08 499 jenów.
Przezroczystość
Wyboru urządzeń do recenzji dokonuje nasza redakcja. Próbka testowa została udostępniona autorowi jako pożyczka od producenta lub sprzedawcy detalicznego na potrzeby tej recenzji. Pożyczkodawca nie miał wpływu na tę recenzję, producent nie otrzymał też kopii tej recenzji przed publikacją. Nie było obowiązku publikowania tej recenzji. Jako niezależna firma medialna, Notebookcheck nie podlega władzy producentów, sprzedawców detalicznych ani wydawców.
Tak testuje Notebookcheck
Każdego roku Notebookcheck niezależnie sprawdza setki laptopów i smartfonów, stosując standardowe procedury, aby zapewnić porównywalność wszystkich wyników. Od około 20 lat stale rozwijamy nasze metody badawcze, ustanawiając przy tym standardy branżowe. W naszych laboratoriach testowych doświadczeni technicy i redaktorzy korzystają z wysokiej jakości sprzętu pomiarowego. Testy te obejmują wieloetapowy proces walidacji. Nasz kompleksowy system ocen opiera się na setkach uzasadnionych pomiarów i benchmarków, co pozwala zachować obiektywizm.Price comparison

