Recenzja laptopa Lenovo ThinkPad P16 G1: Wydajna, zaprojektowana na nowo stacja robocza HX55
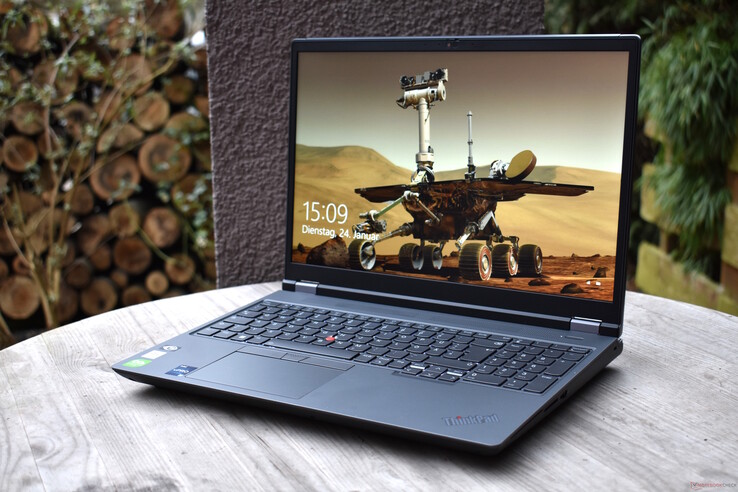
Od 2015 roku Lenovo posiada dwa modele w segmencie klasycznych, mobilnych stacji roboczych, gdzie nacisk kładzie się głównie na wydajność. Ostatnio modele te przeszły pod nazwę m.in.Lenovo ThinkPad P15 Gen 2oraz.Lenovo ThinkPad P17 Gen 2. Jak sama nazwa wskazuje, każde urządzenie było wyposażone w 15- i 17-calowy wyświetlacz. W 2022 roku Lenovo postanowiło zakończyć ten dualizm stacji roboczych i teraz oferują jedną pełnotłustą mobilną stację roboczą: Lenovo ThinkPad P16 Gen 1, która zastępuje oba poprzednie modele. W szczególności porównanie z jego bezpośrednimi konkurentami od Della i Asusa pokaże, jak dobrze wypada na tle podobnych urządzeń, gdzie wydajność mobilna jest priorytetem.
Potencjalni konkurenci w porównaniu
Ocena | Data | Model | Waga | Wysokość | Rozmiar | Rezolucja | Cena |
|---|---|---|---|---|---|---|---|
| 88.2 % v7 (old) | 02/2023 | Lenovo ThinkPad P16 G1 21D6001DMB i7-12850HX, RTX A2000 Laptop GPU | 3 kg | 30.23 mm | 16.00" | 2560x1600 | |
| 87.2 % v7 (old) | Lenovo ThinkPad P15 G2-20YQ001JGE i7-11800H, RTX A3000 Laptop GPU | 2.9 kg | 31.5 mm | 15.60" | 1920x1080 | ||
| 87.8 % v7 (old) | Lenovo ThinkPad P17 G2-20YU0025G i7-11800H, RTX A2000 Laptop GPU | 3.6 kg | 28.38 mm | 17.30" | 1920x1080 | ||
| 89.7 % v7 (old) | HP ZBook Fury 17 G8-4A6A9EA i9-11950H, RTX A3000 Laptop GPU | 2.9 kg | 27 mm | 17.30" | 3840x2160 | ||
| 88.4 % v7 (old) | 10/2022 | Dell Precision 7670 i7-12850HX, RTX A2000 Laptop GPU | 2.7 kg | 24.7 mm | 16.00" | 3840x2400 | |
| 89.6 % v7 (old) | 01/2023 | Asus ExpertBook B6 Flip B6602FC2 i9-12950HX, RTX A2000 Laptop GPU | 2.8 kg | 27.2 mm | 16.00" | 2560x1600 |
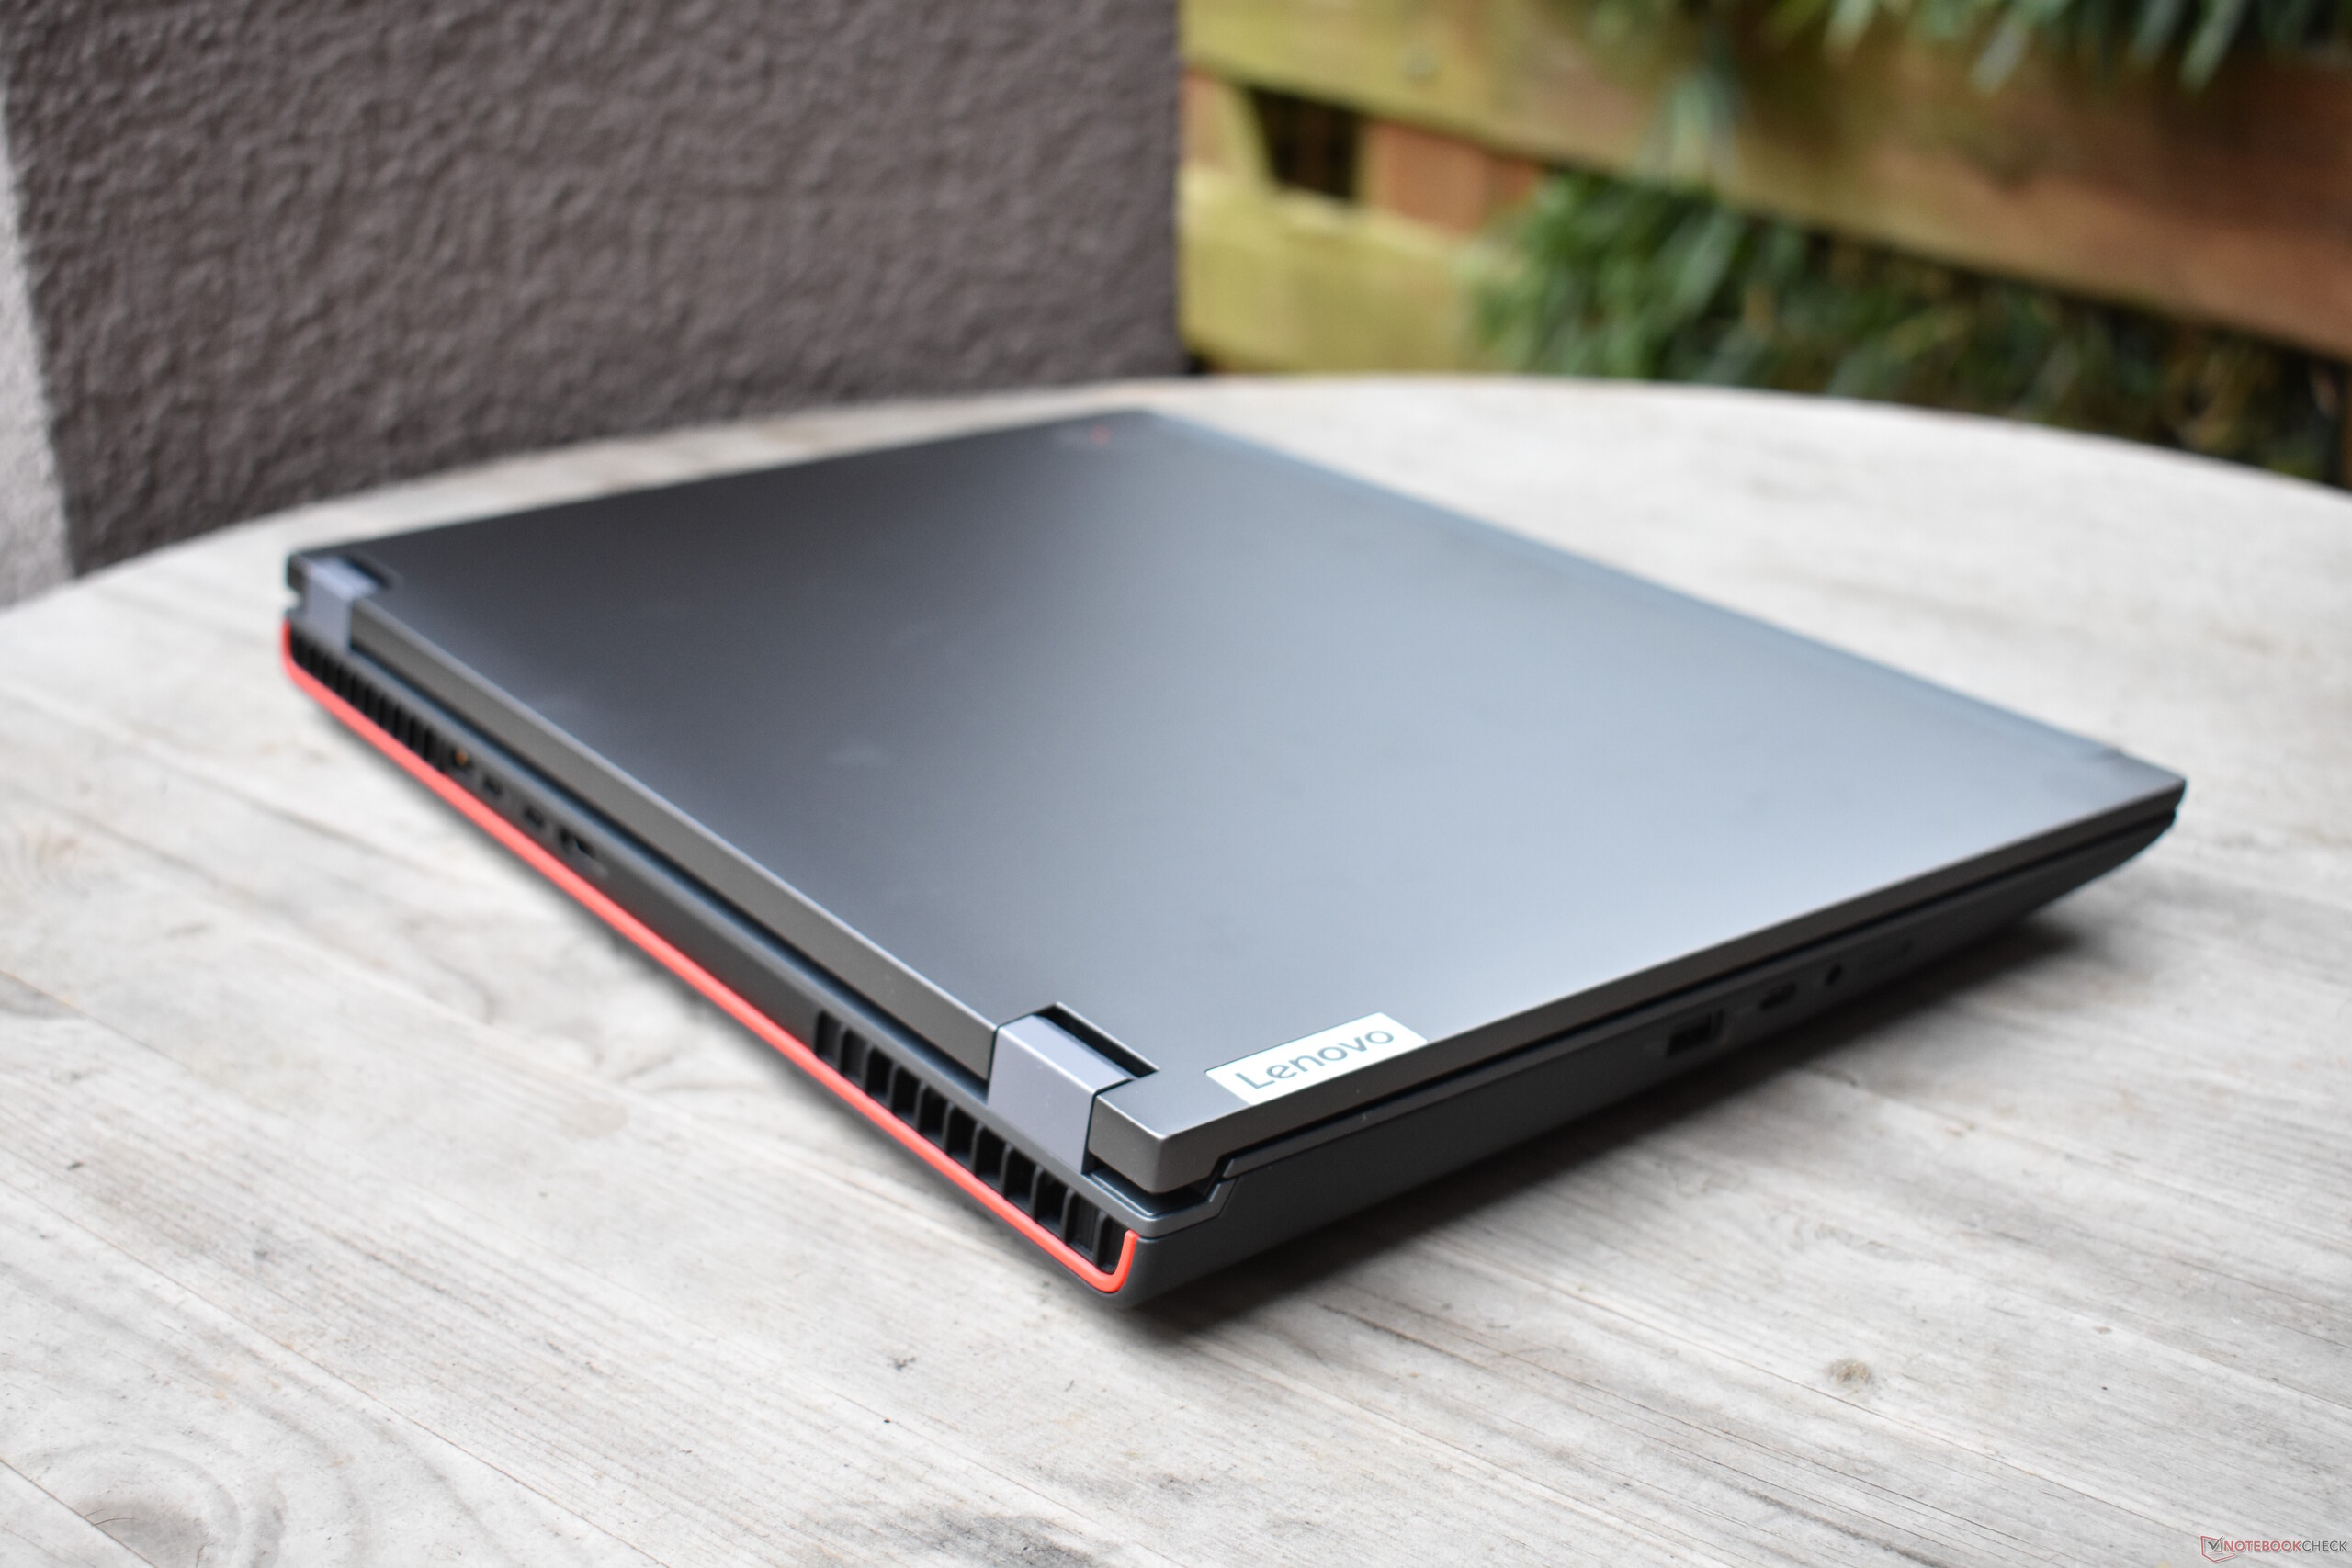
Obudowa: Szara, aluminiowa pokrywa z magnezową ramką
Od momentu powstania serii ThinkPad P, tj.P15oraz P17były najbardziej klasyczną reprezentacją wzornictwa ThinkPad. Ze swoimi pudełkowatymi, plastikowymi obudowami z magnezową ramką i klasycznym mechanizmem zawiasów na spodzie, były to laptopy ThinkPad, które najbardziej zbliżyły się do modeli takich jak klasycznyLenovo ThinkPad T60. Dla fanów ThinkPadów z pewnością pozytywna cecha, ale można było też uznać, że wzornictwo ma już za sobą datę sprzedaży - zwłaszcza jeśli chodzi o duże ramki wyświetlacza.
ThinkPad P16 zmienia wiele rzeczy. Podpórka pod nadgarstki, klawiatura i pokrywa wyświetlacza są w całości w kolorze "Storm Gray". Zaokrąglone krawędzie zapewniają nieco mniej pudełkowaty kształt. Jeśli chodzi o tył urządzenia, Lenovo pokazało, że chętnie eksperymentuje, gdyż obszar ten jest ozdobiony czerwonymi akcentami. P16 wygląda również bardziej nowocześnie niż jego poprzednik, gdyż ramki wyświetlacza są znacznie smuklejsze. Jednak jak na nowoczesne urządzenie, nadal są one stosunkowo duże, w szczególności w dolnej części wyświetlacza.
Jednostka bazowa wykonana jest z tworzywa sztucznego z włókna szklanego, które wzmocnione jest magnezową ramką; tak jak w przypadku poprzedników. Powierzchnie mają aksamitną powłokę, a szary plastik jest mniej podatny na odciski palców niż czarny plastik spotykany we wcześniejszych modelach ThinkPada. Podstawy nie można wykręcić, a jedynym słabym miejscem jest czytnik kart inteligentnych, gdzie oparcie dłoni lekko się ugina. Lenovo zdecydowało się na użycie aluminium do wykonania pokrywy LCD i podobnie jak ona otrzymała dodatkowe wzmocnienie w postaci magnezowej klatki. Stabilność pokrywy wyświetlacza jest znacznie lepsza w porównaniu z P15 i P17.
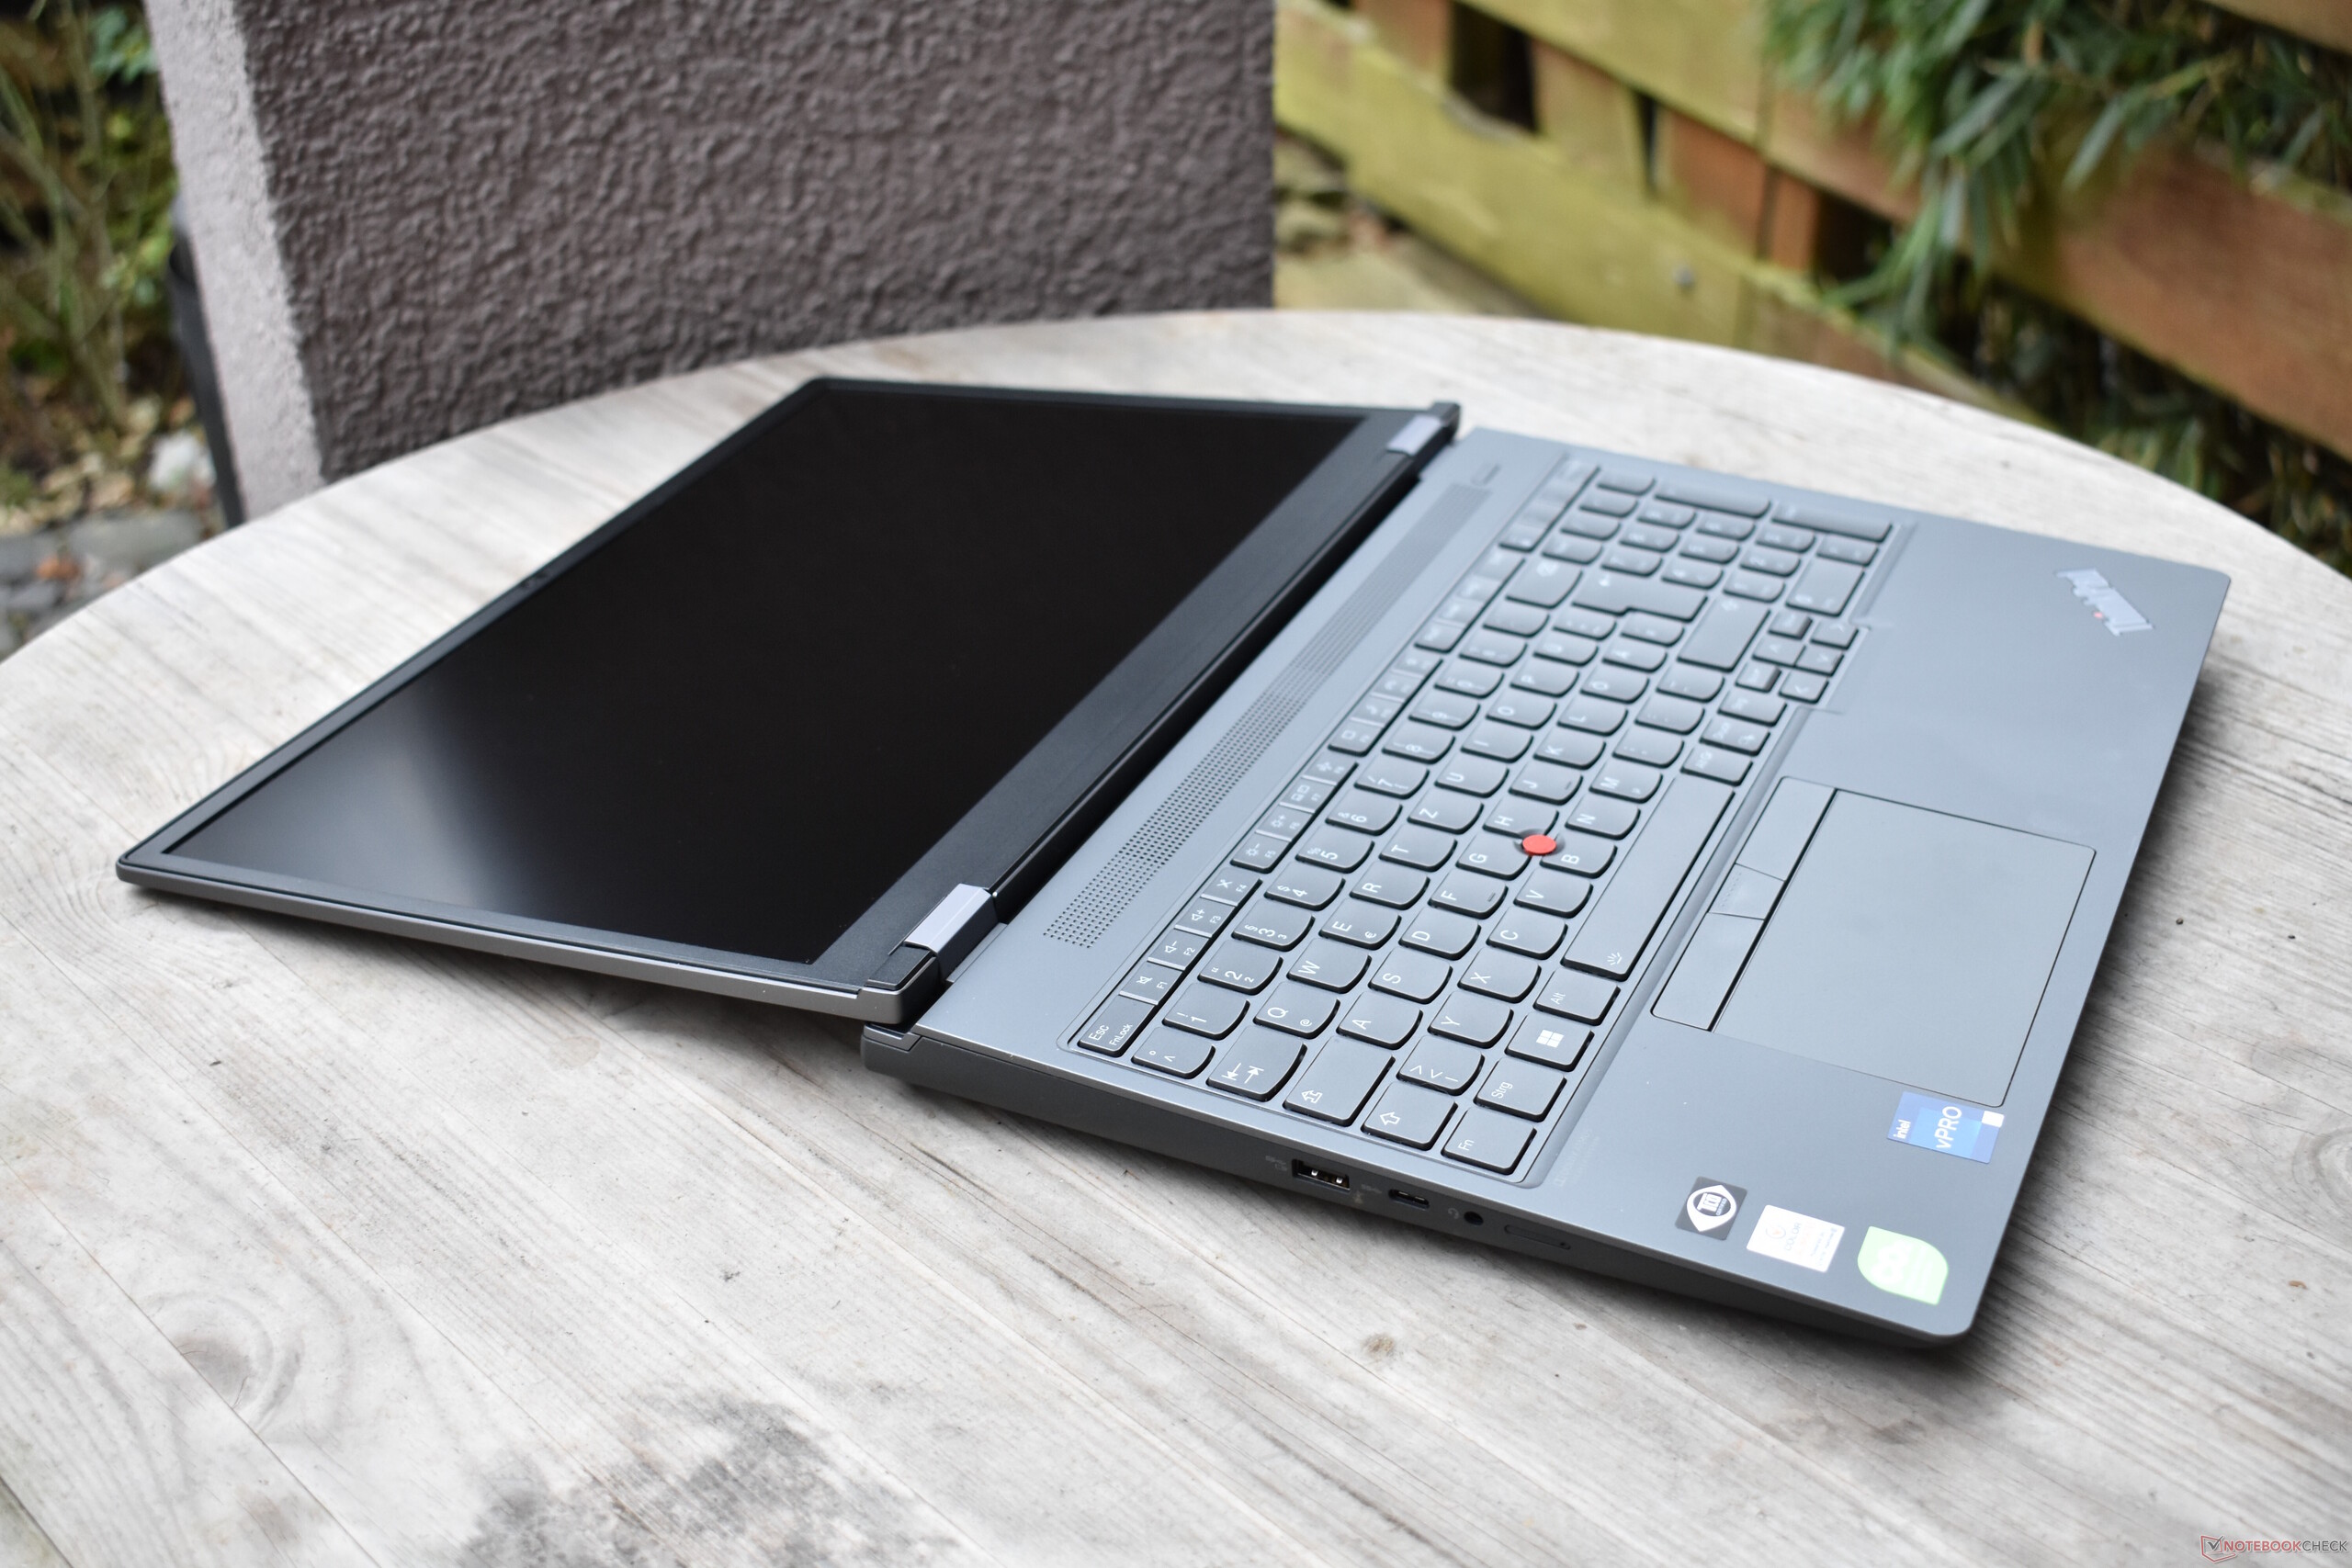
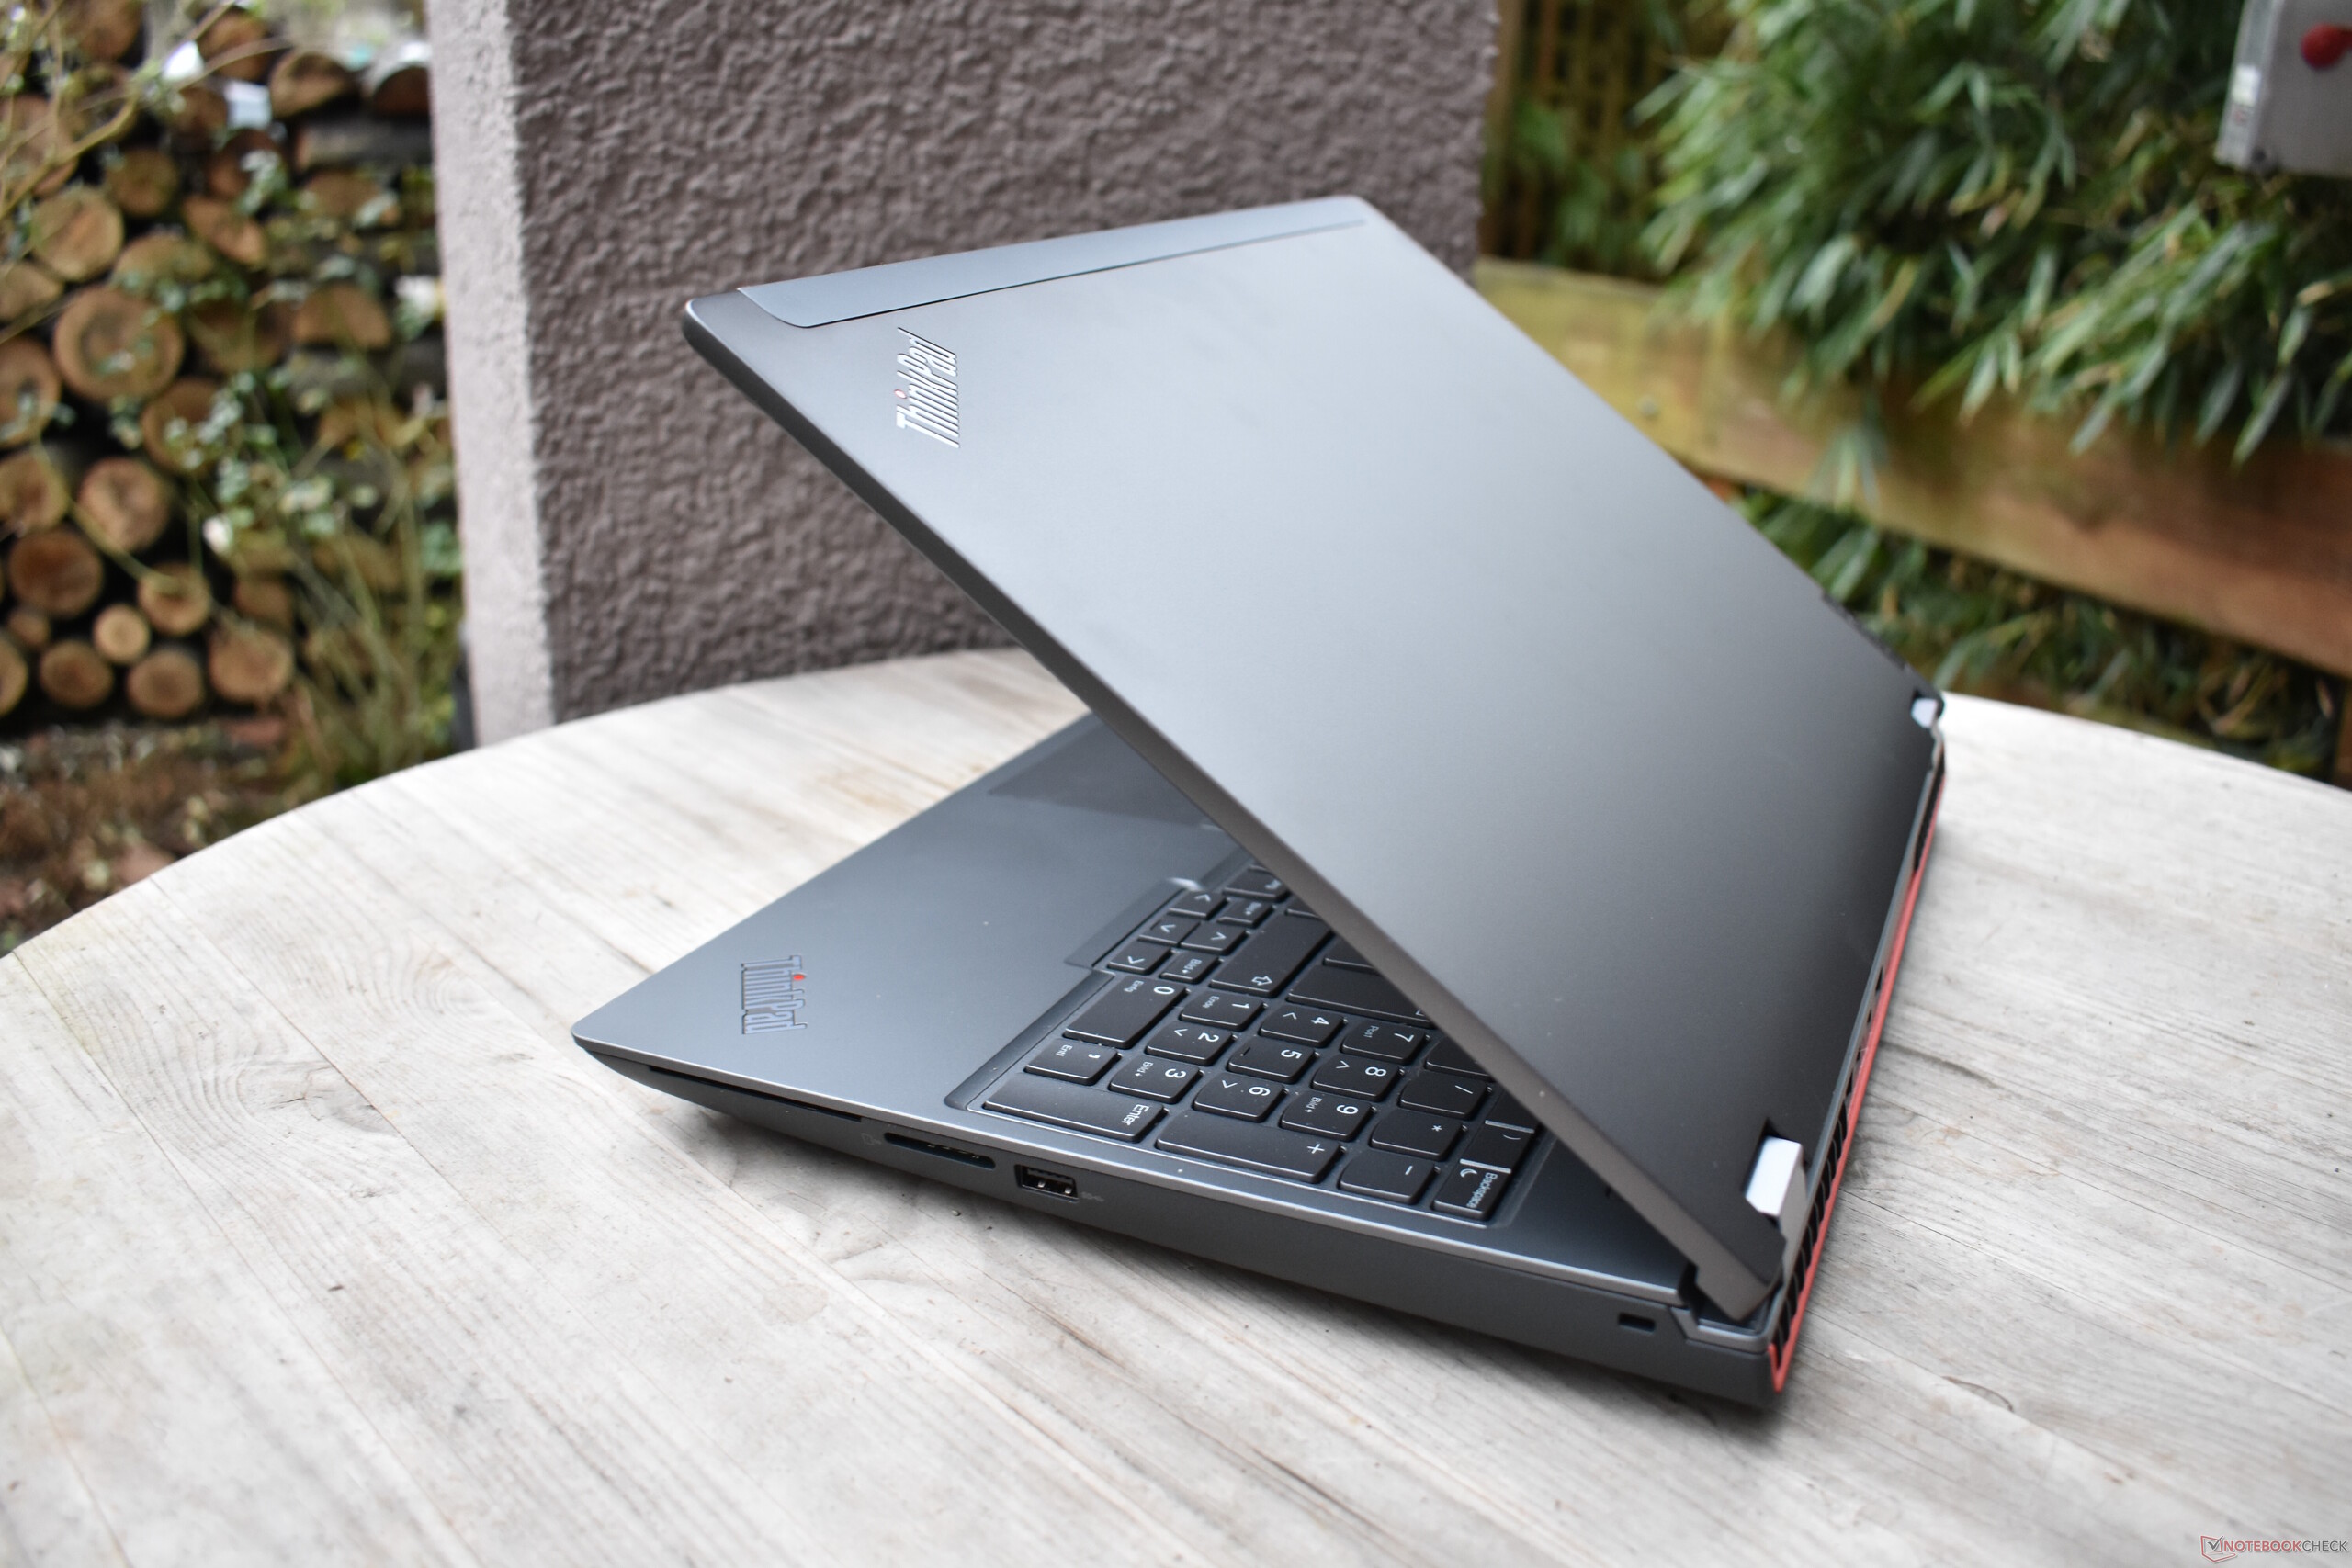
Duże, górne i dolne zawiasy, z wyróżniającymi się srebrnymi nakładkami, są praktycznie identyczne jak w tamtych modelach i utrzymują wyświetlacz solidnie na miejscu, bez żadnych oznak chwiania się. Wyświetlacz można otworzyć jedną ręką do kąta ponad 180 stopni.
Bardziej ThinkPad P15 G3 niż P17 G3: Pod względem rozmiarów i wagi Lenovo ThinkPad P16 G1 jest znacznie bliższy mniejszemu poprzednikowi niż większemu.
Precision Ciekawe jest też porównanie z Dell 7670: 16-calowa stacja robocza Della jest bardziej mobilna pod każdym względem, gdyż jest nie tylko mniejsza, ale także smuklejsza i lżejsza. Wraz z modelem Precision 7770 Dell nadal oferuje jeszcze większy i mocniejszy 17-calowy wariant LCD.
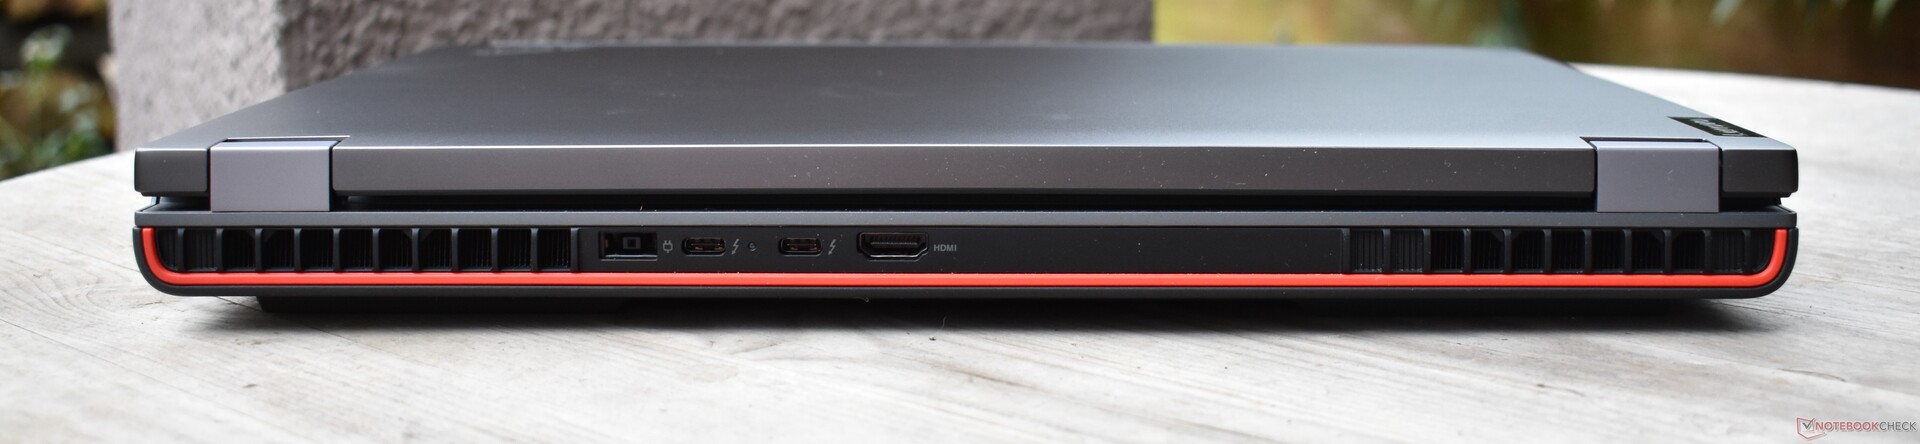
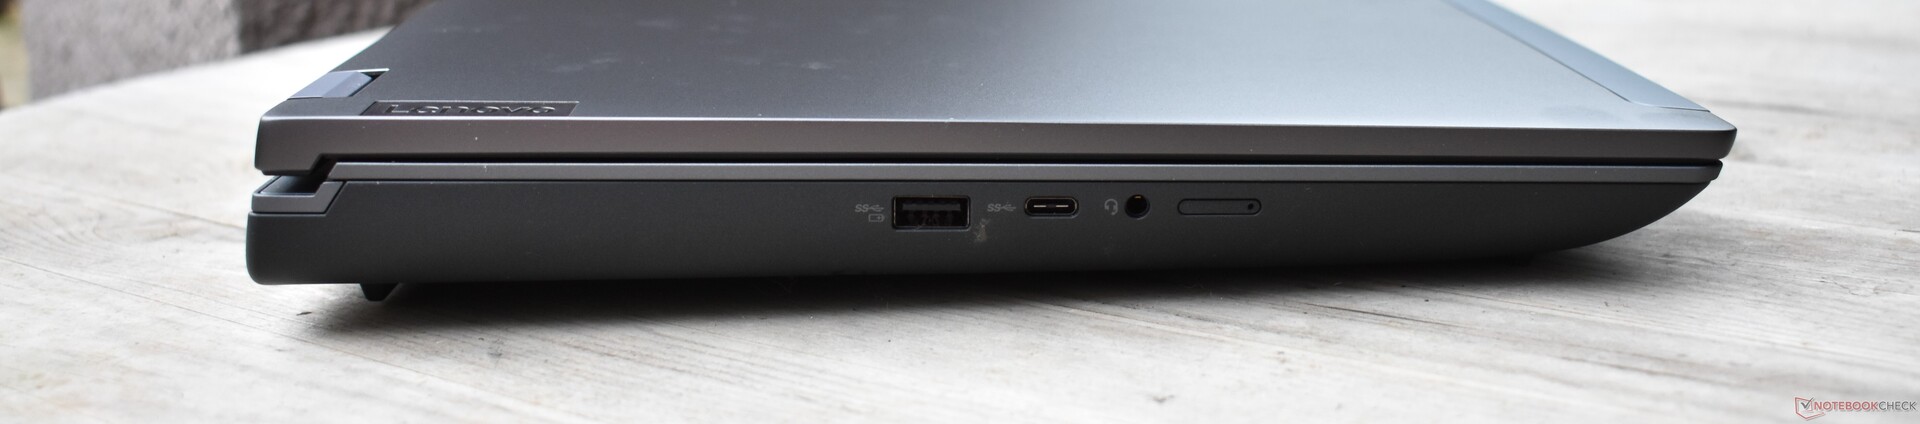
Właściwości: ThinkPad P16 bez RJ45
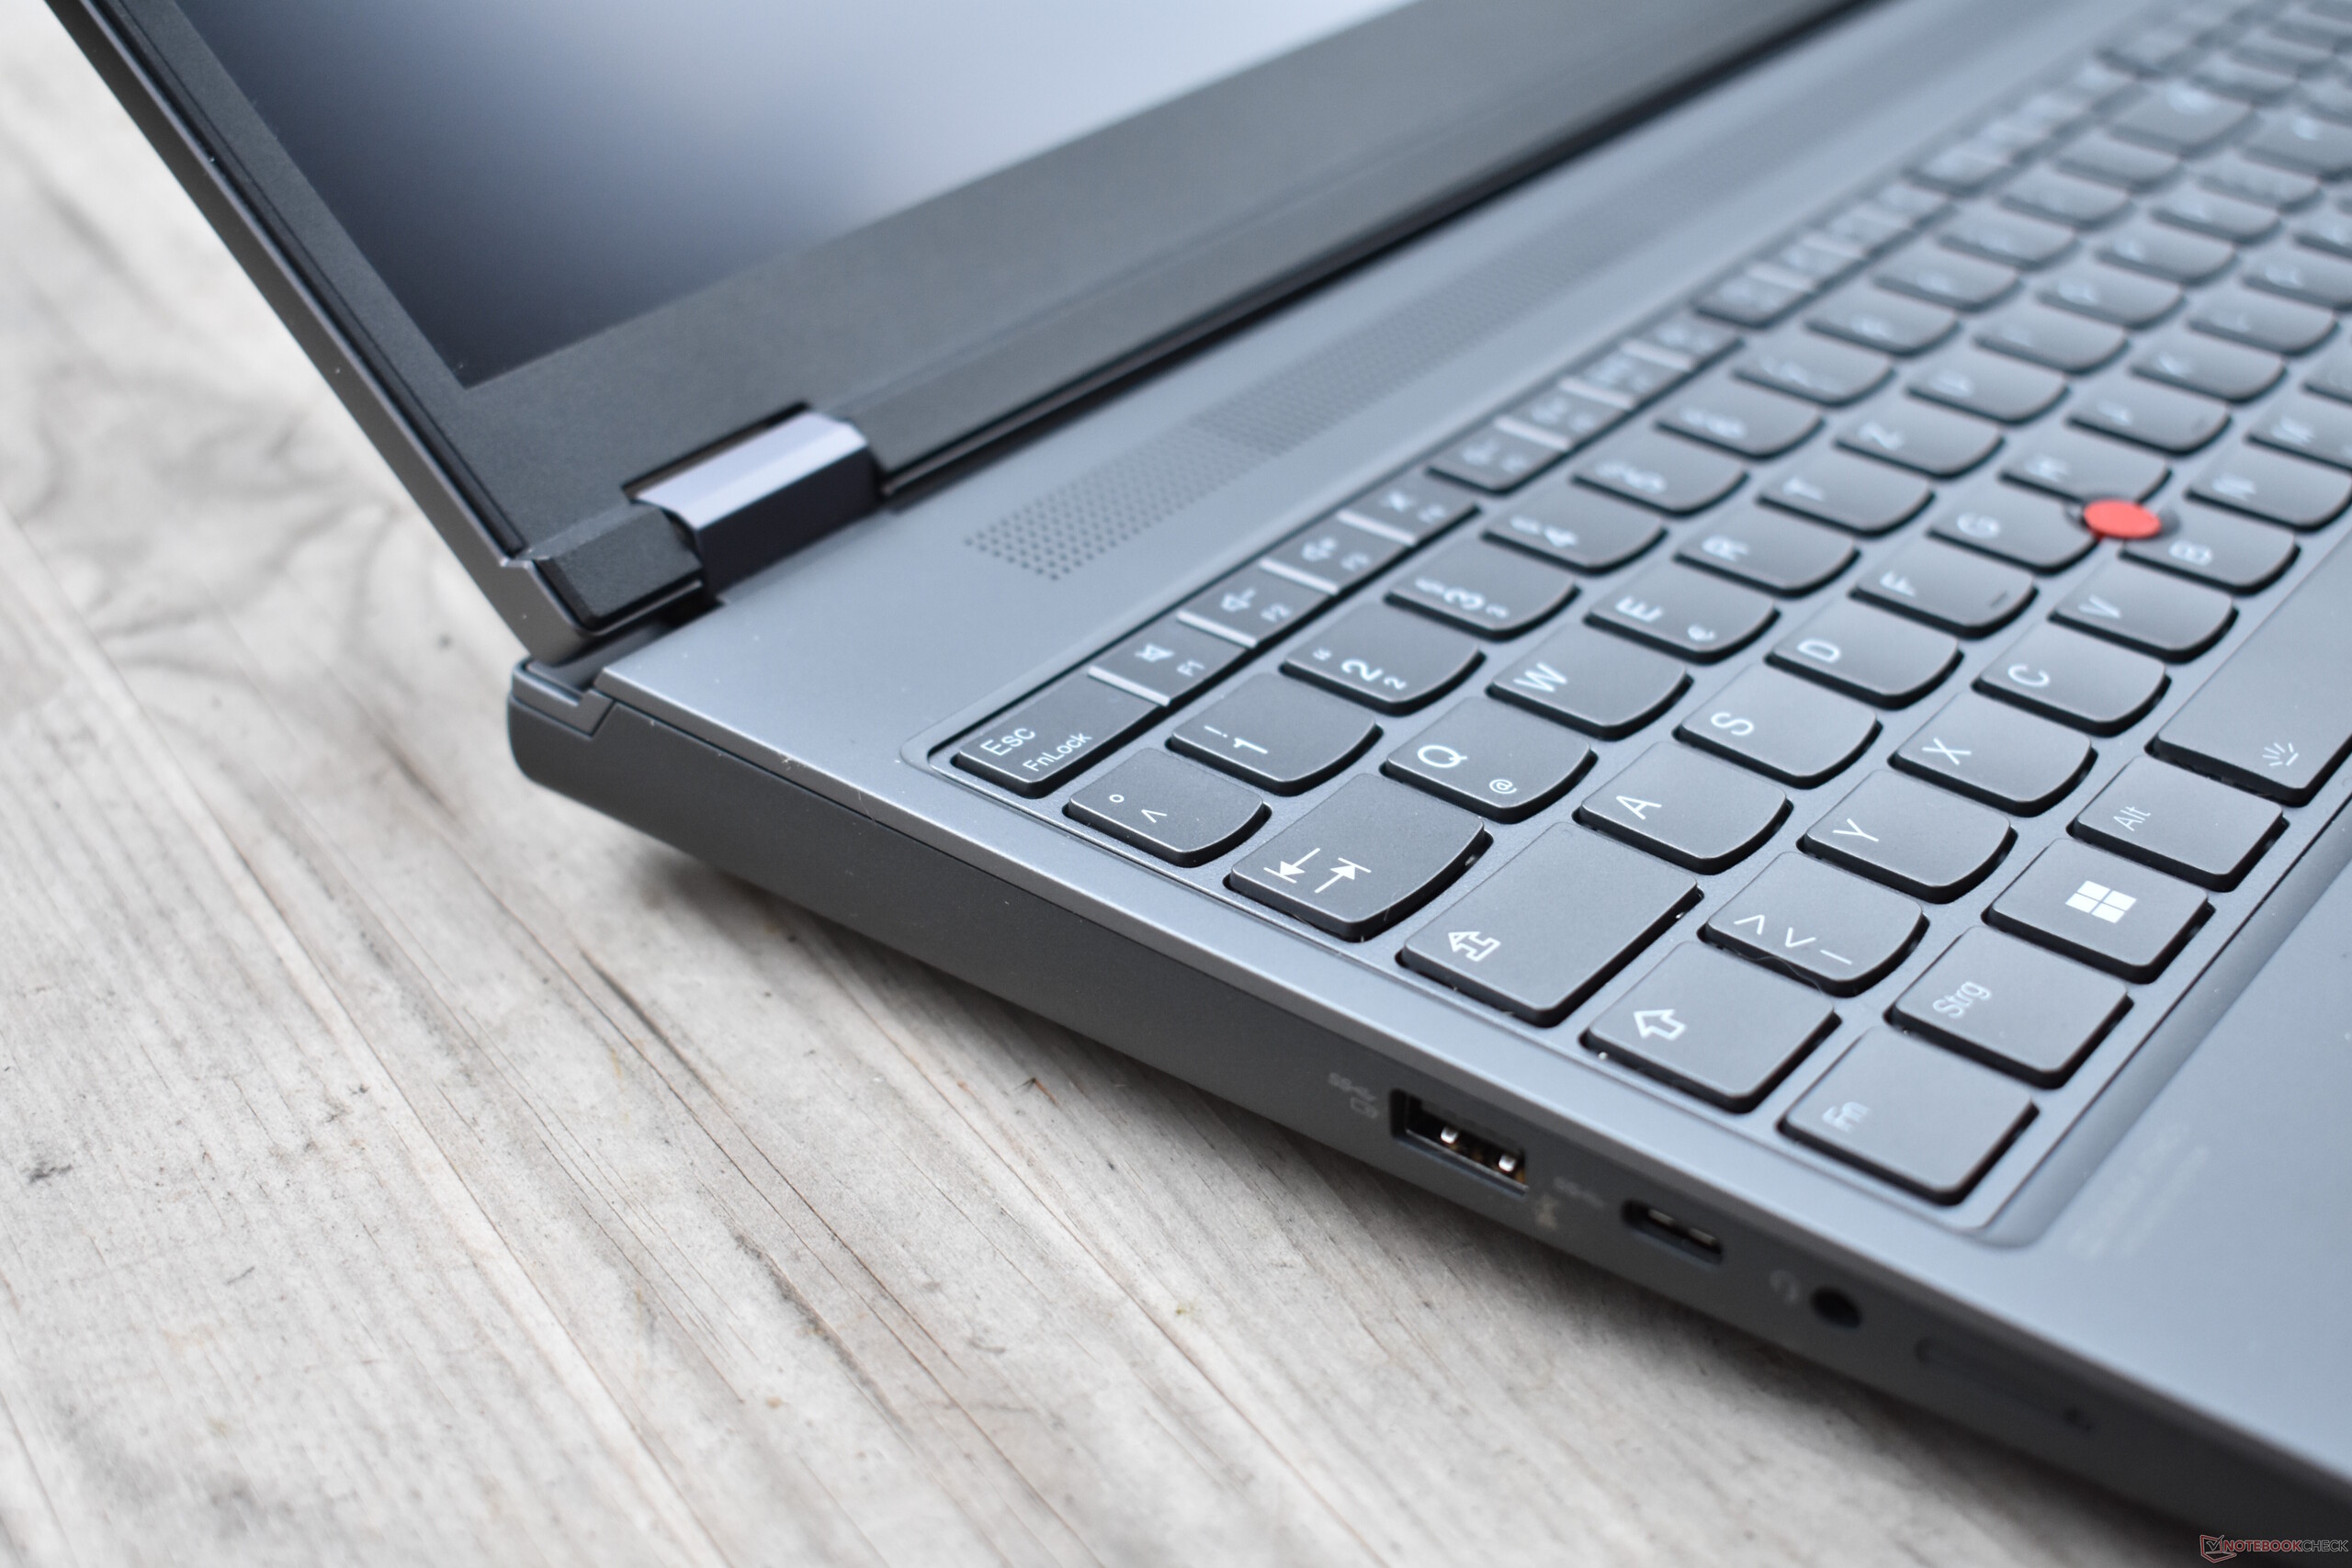
Lenovo odświeżyło design bez drastycznych zmian w opcjach łączności. Oprócz lokalizacji portów zmianie uległa tylko jedna: Zrezygnowano z funkcjonalności ethernetu RJ45. Do przewodowego korzystania z internetu służy stacja dokująca lub jeden z portów Thunderbolt.
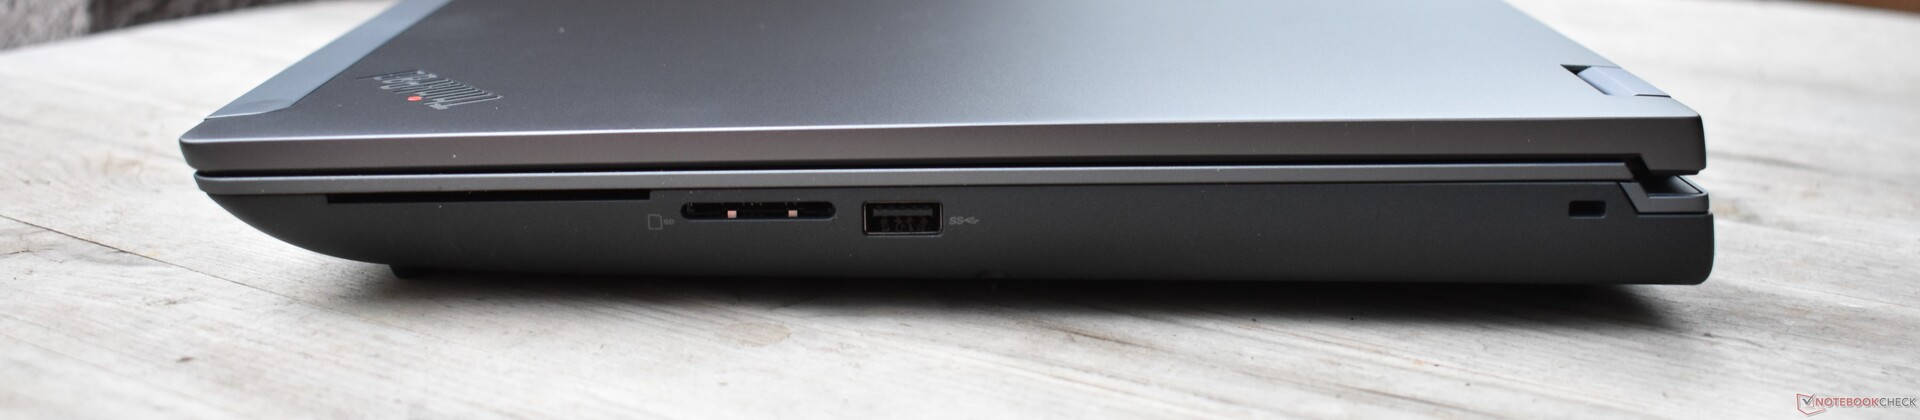
Czytnik kart SD
Wyniki benchmarków czytnika kart SD - które przetestowaliśmy z naszą referencyjną kartą AV Pro microSD 128 GB - są zaskakująco złe. Wyniki są znacznie poniżej średniej dla urządzenia klasy workstation, jak i jego własnego poprzednika.
| SD Card Reader | |
| average JPG Copy Test (av. of 3 runs) | |
| Lenovo ThinkPad P15 G2-20YQ001JGE (AV Pro V60) | |
| Dell Precision 7670 (Toshiba Exceria Pro SDXC 64 GB UHS-II) | |
| Lenovo ThinkPad P17 G2-20YU0025G (Toshiba Exceria Pro SDXC 64 GB UHS-II) | |
| Średnia w klasie Workstation (49.6 - 681, n=14, ostatnie 2 lata) | |
| HP ZBook Fury 17 G8-4A6A9EA (Angelbird AV Pro V60) | |
| Lenovo ThinkPad P16 G1 21D6001DMB (AV Pro V60) | |
| maximum AS SSD Seq Read Test (1GB) | |
| Średnia w klasie Workstation (87.6 - 1455, n=14, ostatnie 2 lata) | |
| Lenovo ThinkPad P15 G2-20YQ001JGE (AV Pro V60) | |
| Lenovo ThinkPad P17 G2-20YU0025G (Toshiba Exceria Pro SDXC 64 GB UHS-II) | |
| Dell Precision 7670 (Toshiba Exceria Pro SDXC 64 GB UHS-II) | |
| HP ZBook Fury 17 G8-4A6A9EA (Angelbird AV Pro V60) | |
| Lenovo ThinkPad P16 G1 21D6001DMB (AV Pro V60) | |
Komunikacja
Wydajność karty Intel AX211WiFi-6E jest lepsza od AX210 występującej w poprzednikach - modelach ThinkPad P15 i P17. Przede wszystkim dobrze wypada w dziedzinie odbioru, ale wysyłanie danych jest nieco wolniejsze i mniej stabilne.
Nasz model recenzencki nie posiadał modułu WWAN (4G LTE), ale może być w niego wyposażony.
| Networking | |
| Lenovo ThinkPad P16 G1 21D6001DMB | |
| iperf3 transmit AXE11000 | |
| iperf3 receive AXE11000 | |
| Lenovo ThinkPad P15 G2-20YQ001JGE | |
| iperf3 transmit AX12 | |
| iperf3 receive AX12 | |
| Lenovo ThinkPad P17 G2-20YU0025G | |
| iperf3 transmit AX12 | |
| iperf3 receive AX12 | |
| HP ZBook Fury 17 G8-4A6A9EA | |
| iperf3 transmit AX12 | |
| iperf3 receive AX12 | |
| Dell Precision 7670 | |
| iperf3 transmit AXE11000 6GHz | |
| iperf3 receive AXE11000 6GHz | |
| Asus ExpertBook B6 Flip B6602FC2 | |
| iperf3 transmit AXE11000 6GHz | |
| iperf3 receive AXE11000 6GHz | |
| iperf3 transmit AXE11000 | |
| iperf3 receive AXE11000 | |
Kamera internetowa
Ogólnie rzecz biorąc, kamera internetowa 1080p daje wyprane, rozmyte i zaszumione obrazy.


Bezpieczeństwo
Oprócz czytnika linii papilarnych wbudowanego w przycisk zasilania, Lenovo ThinkPad P16 2022 posiada kamerkę na podczerwień zgodną z Windows Hello. Ochronę może zapewnić blokada Kensington, jest też opcjonalny czytnik kart inteligentnych. Lenovo ThinkPad P16 posiada dedykowany układ TPM, a kamera internetowa posiada mechaniczną migawkę aparatu.
Akcesoria
Poza 170-watowym zasilaczem, w komplecie ze złączem Slim Tip, laptop jest pozbawiony dodatkowych akcesoriów. Najważniejszym opcjonalnym akcesorium powinna być stacja dokująca, taka jak ThinkPad Thunderbolt 4 Workstation dock
Konserwacja
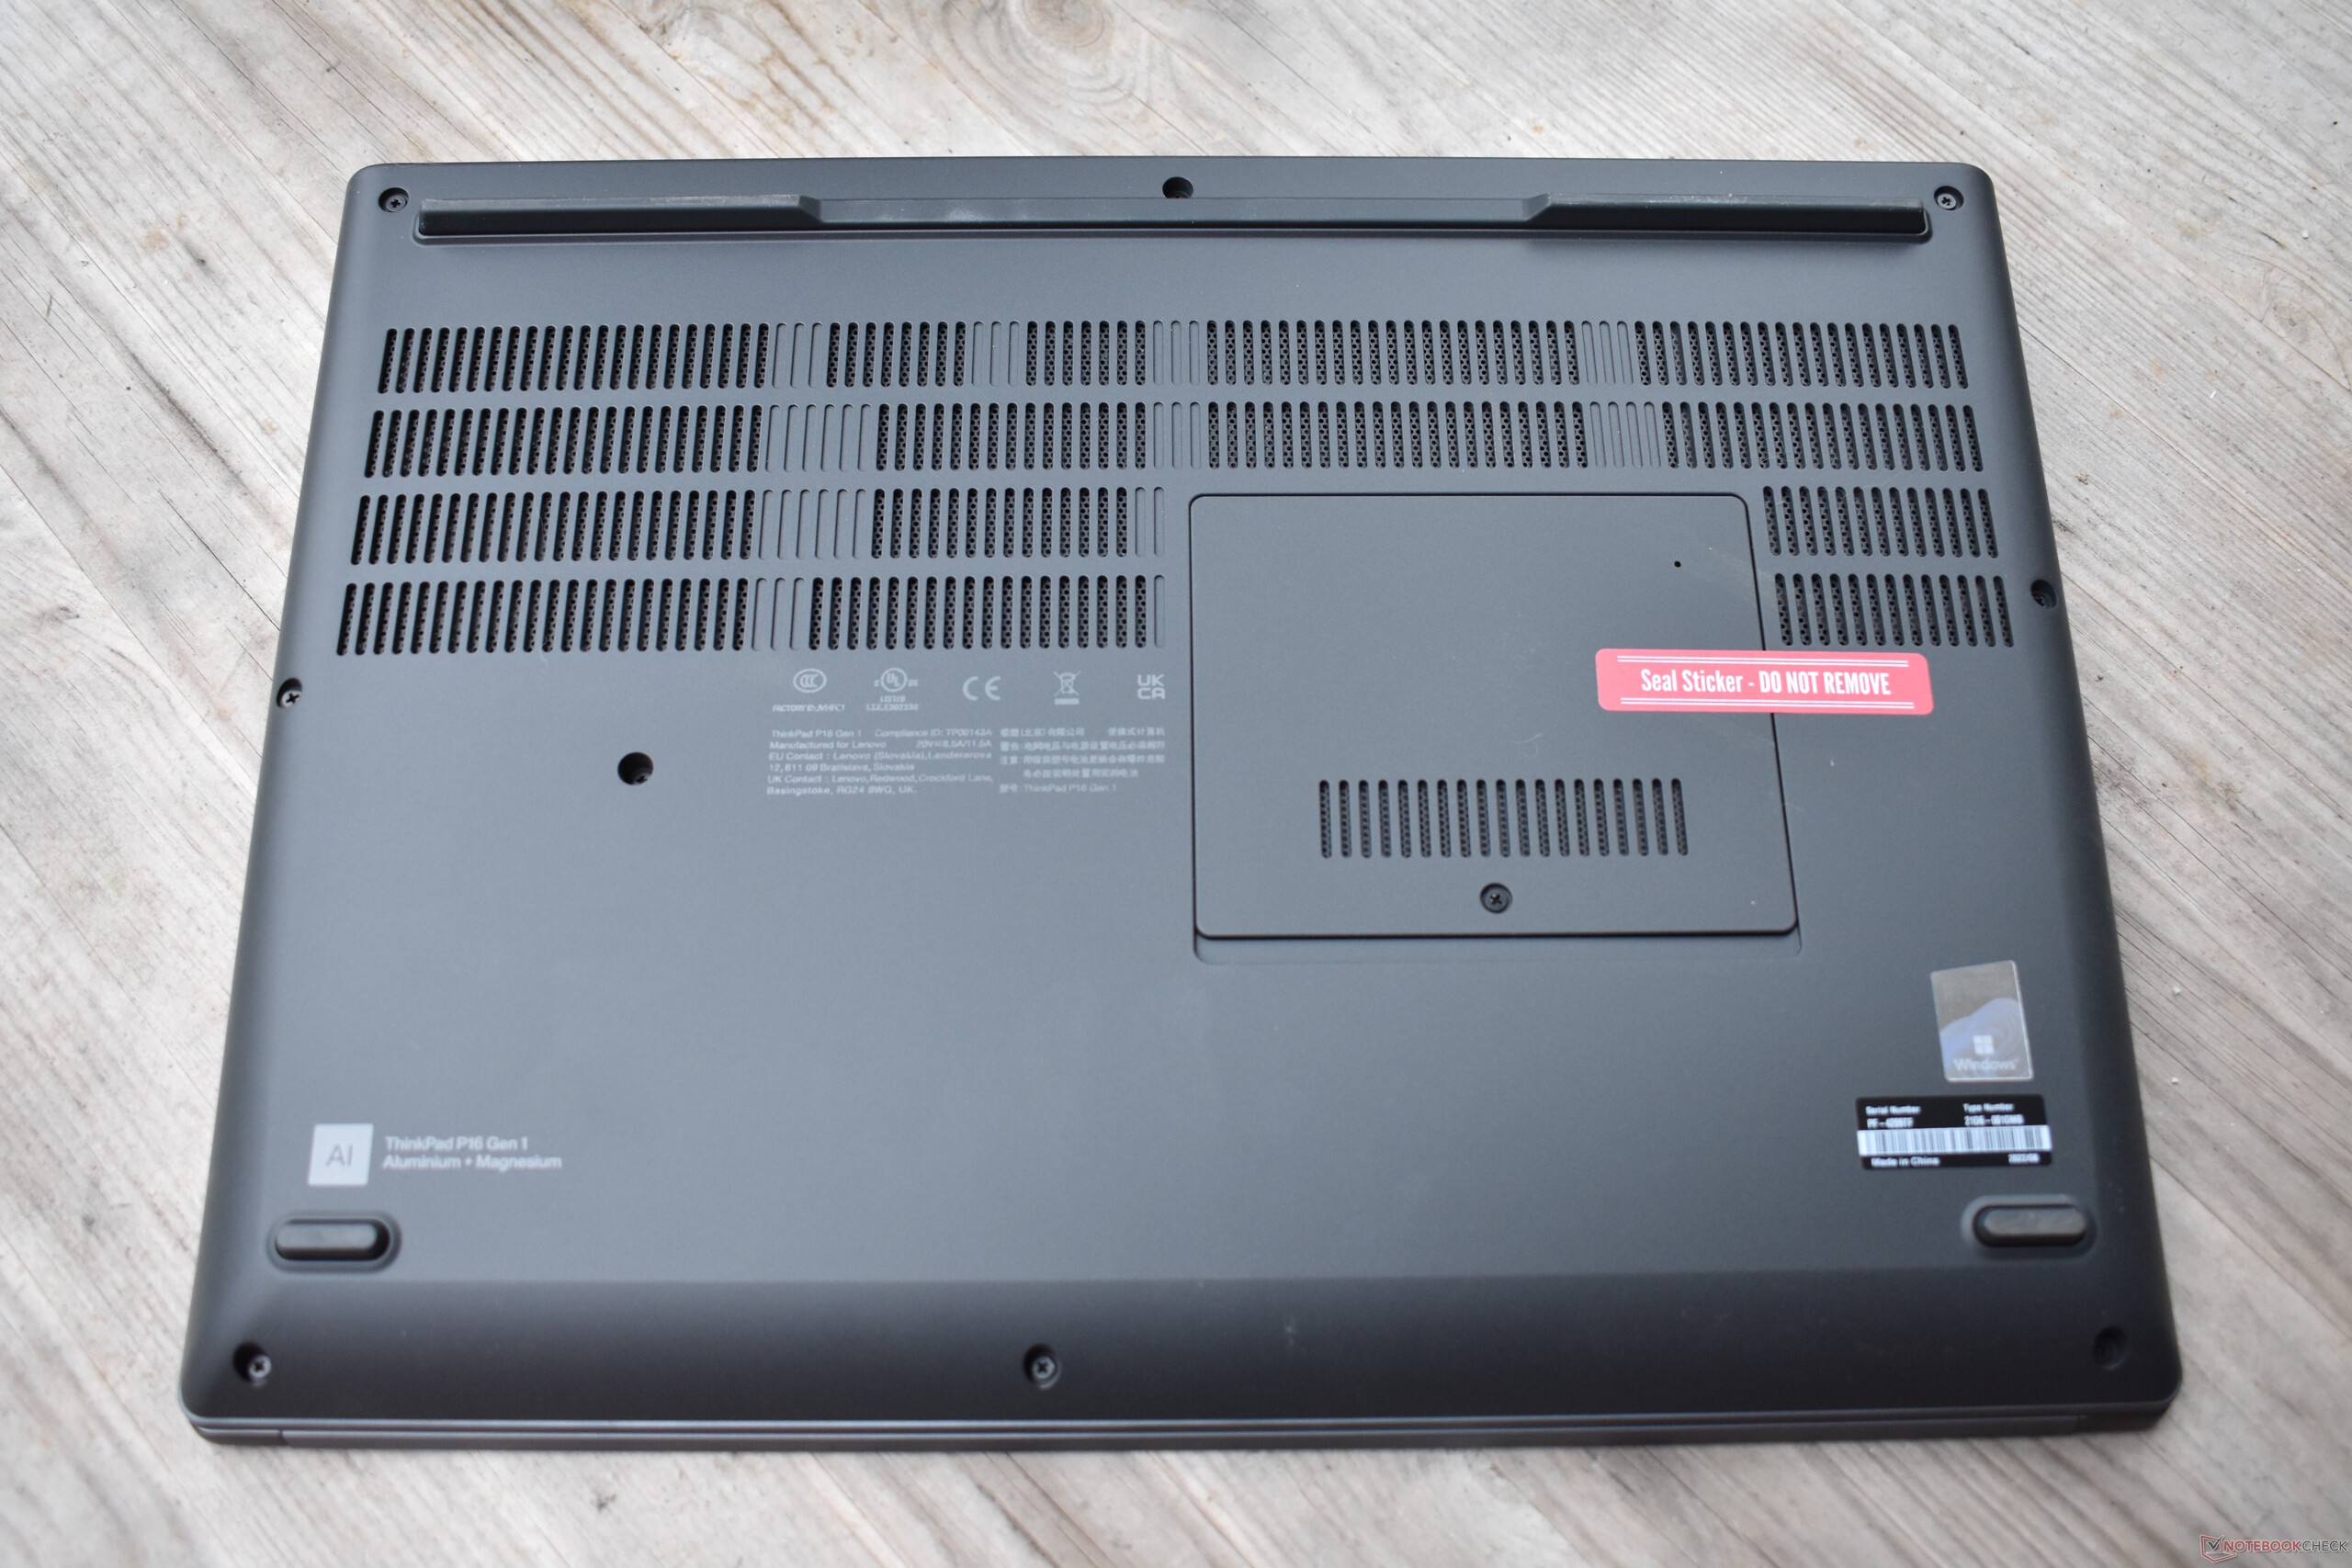
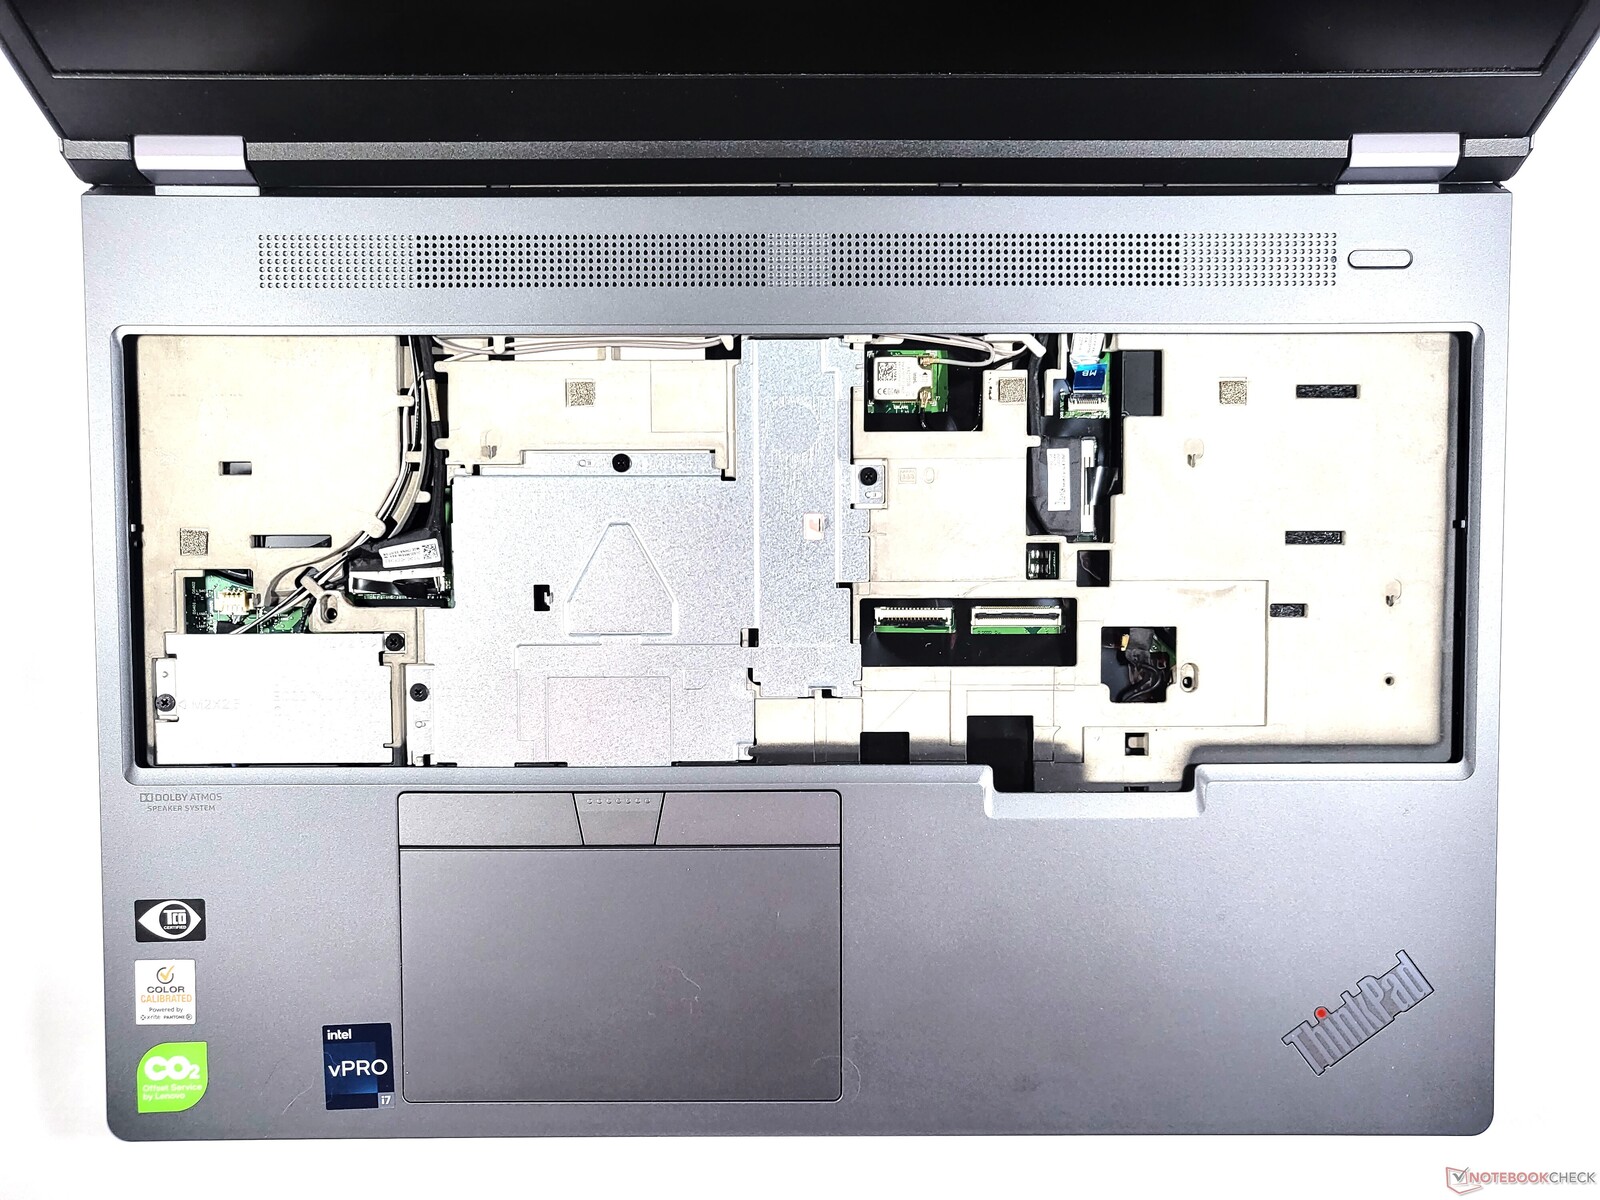
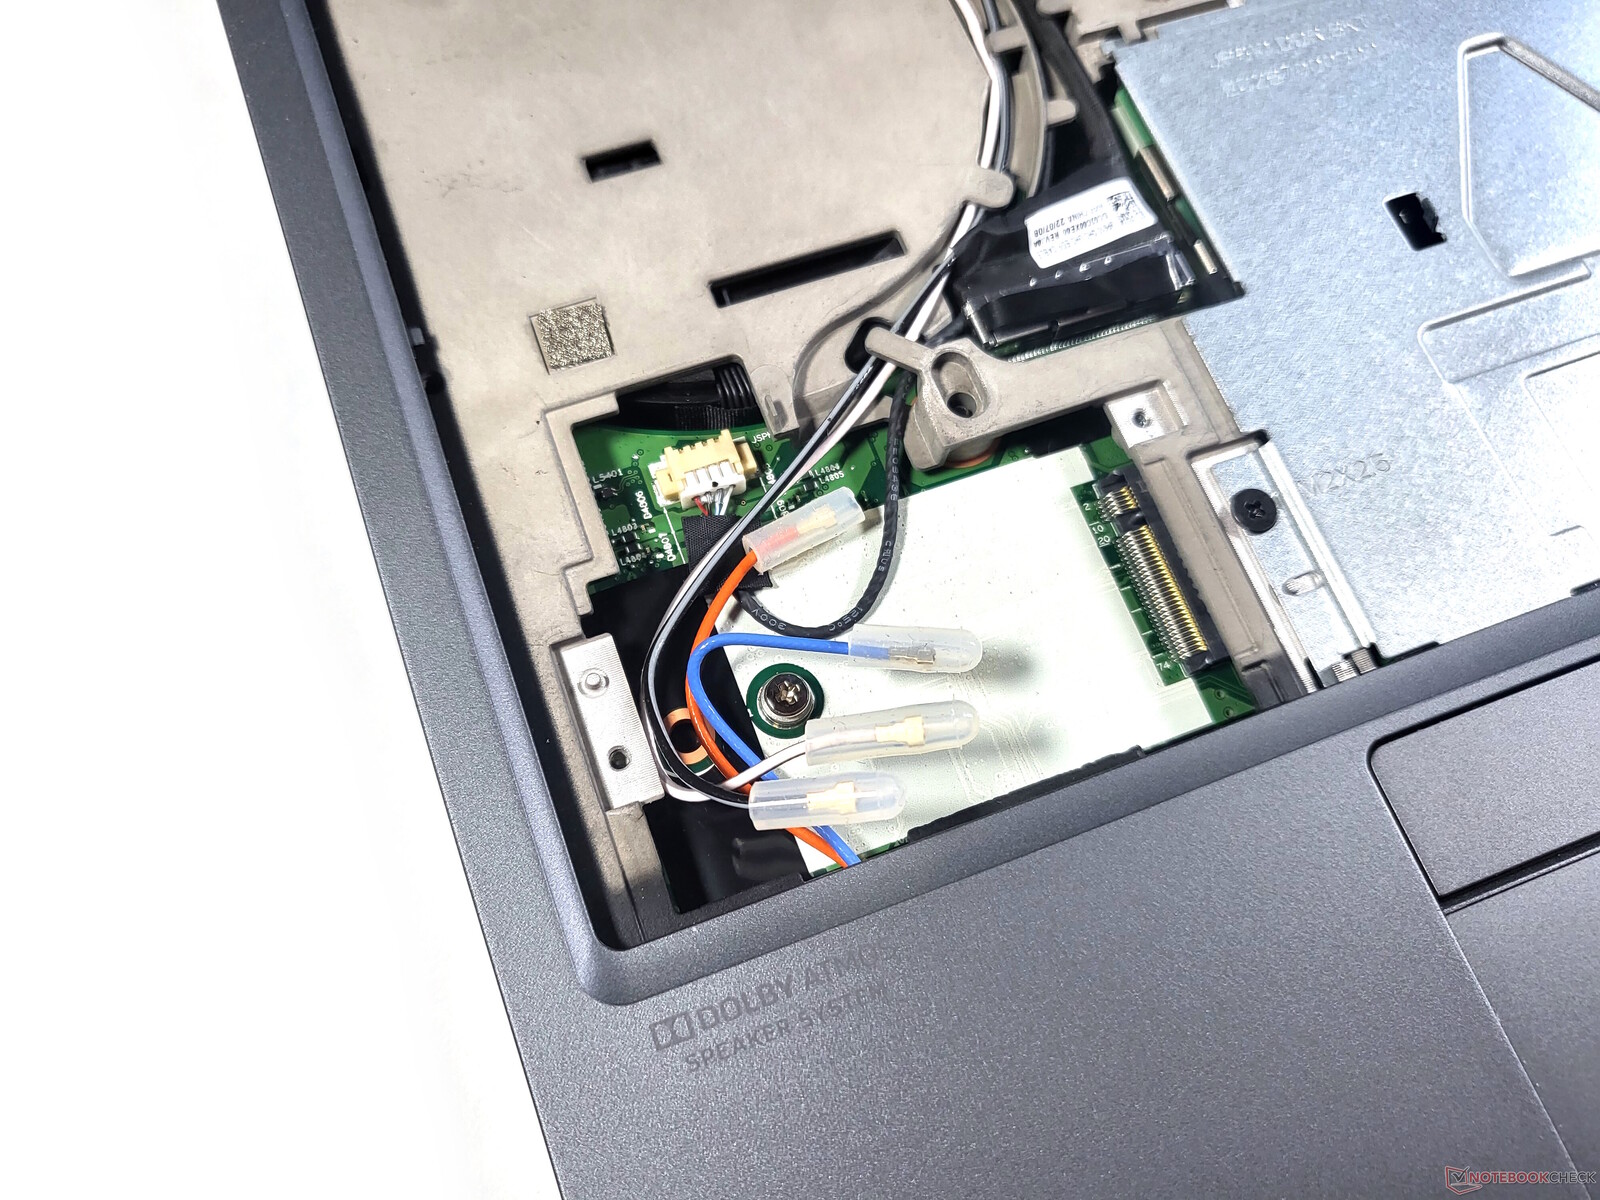
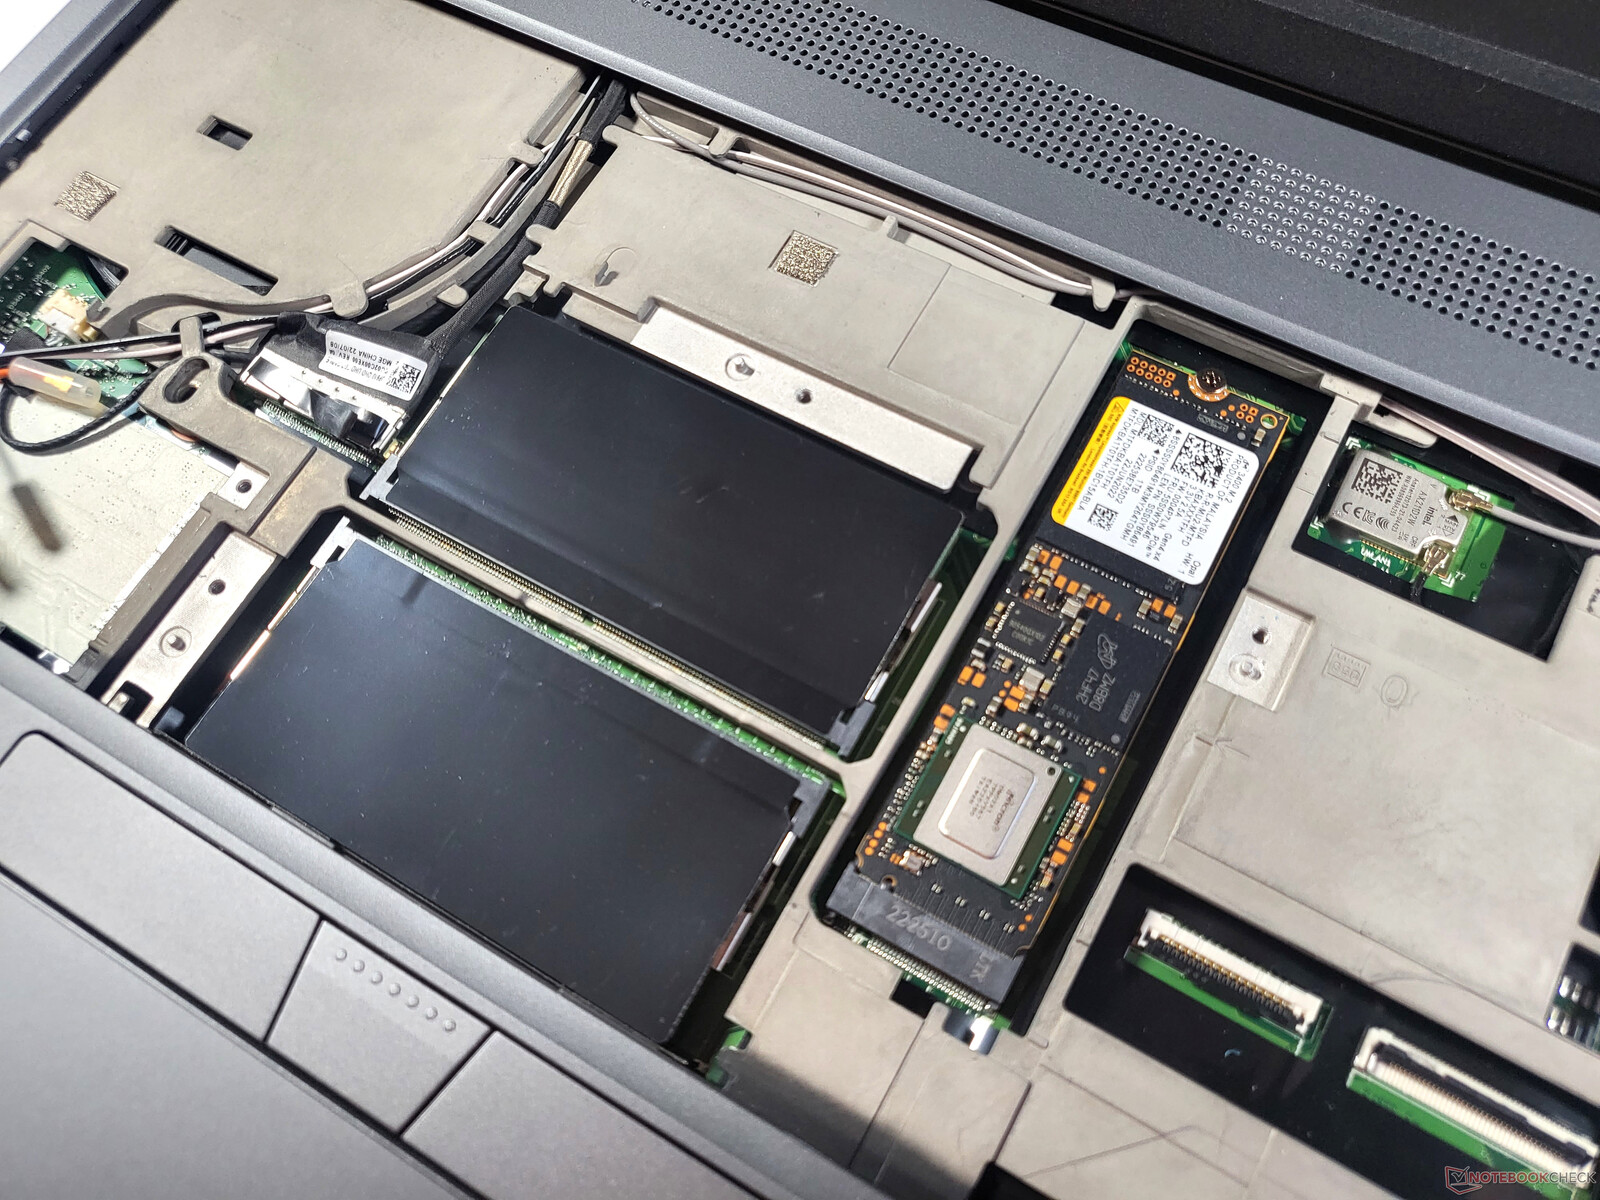
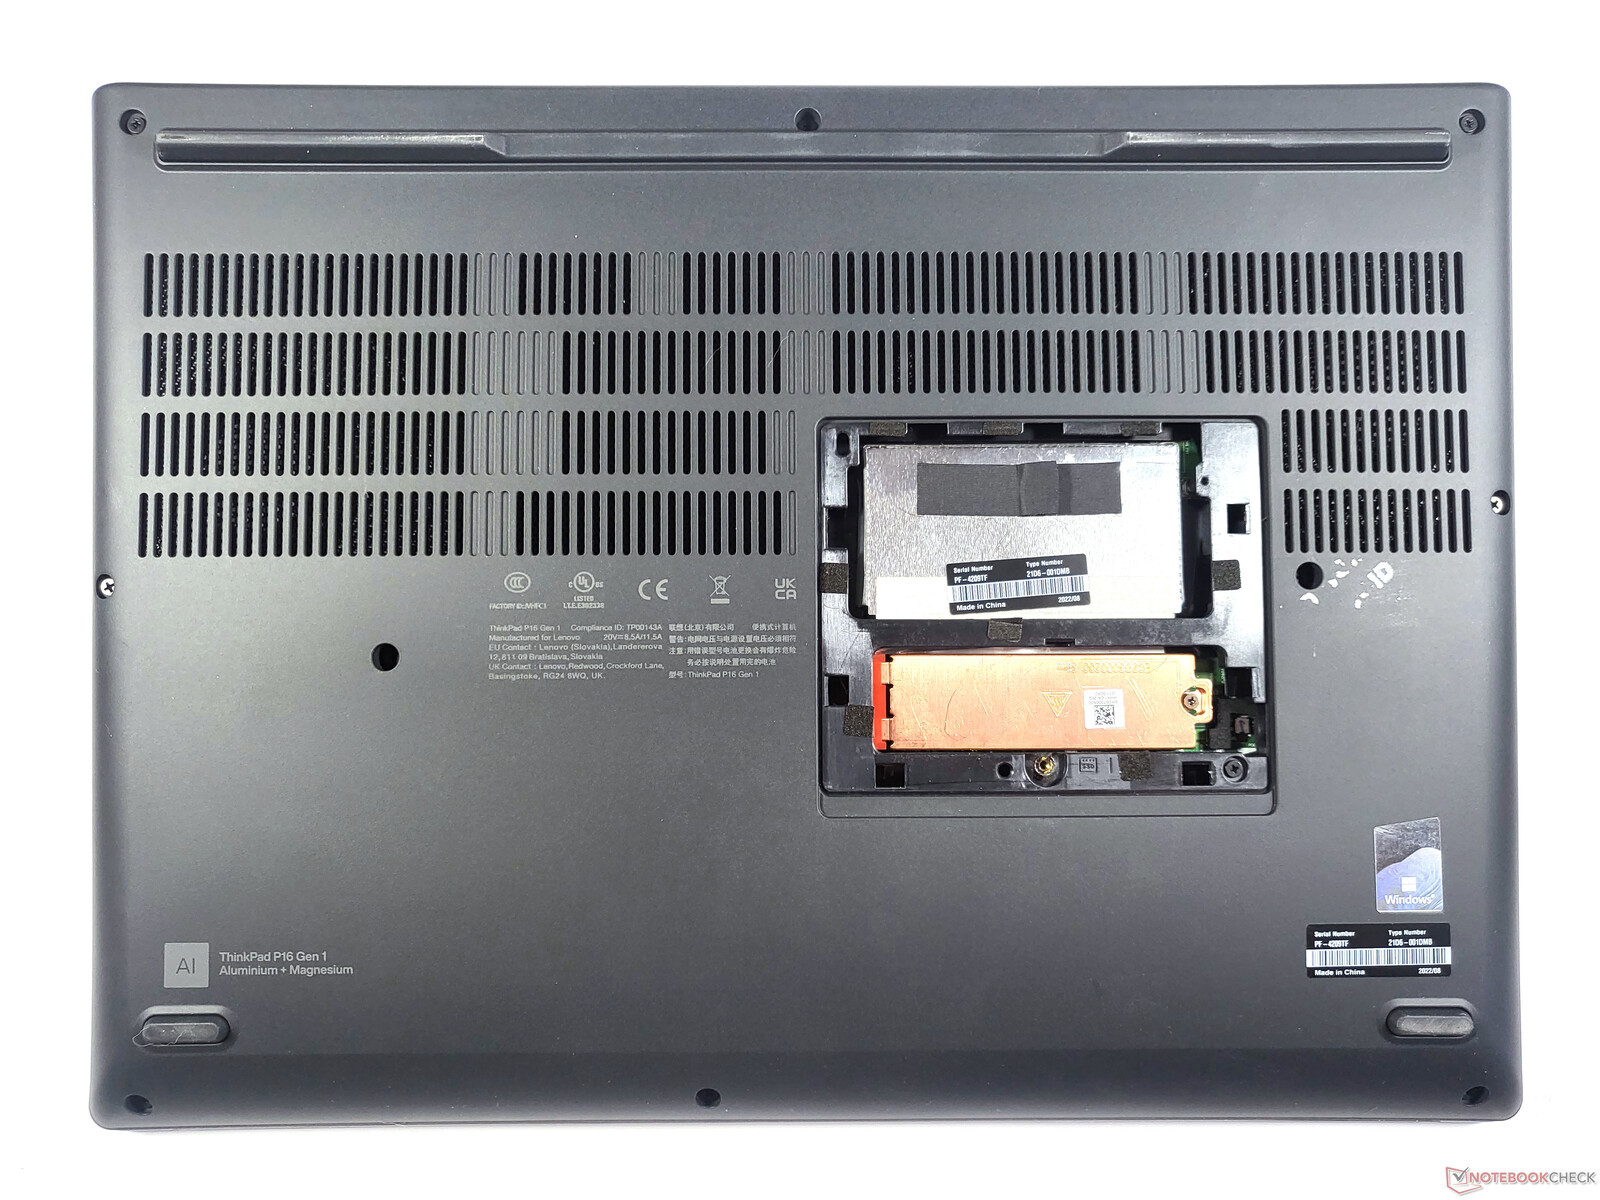
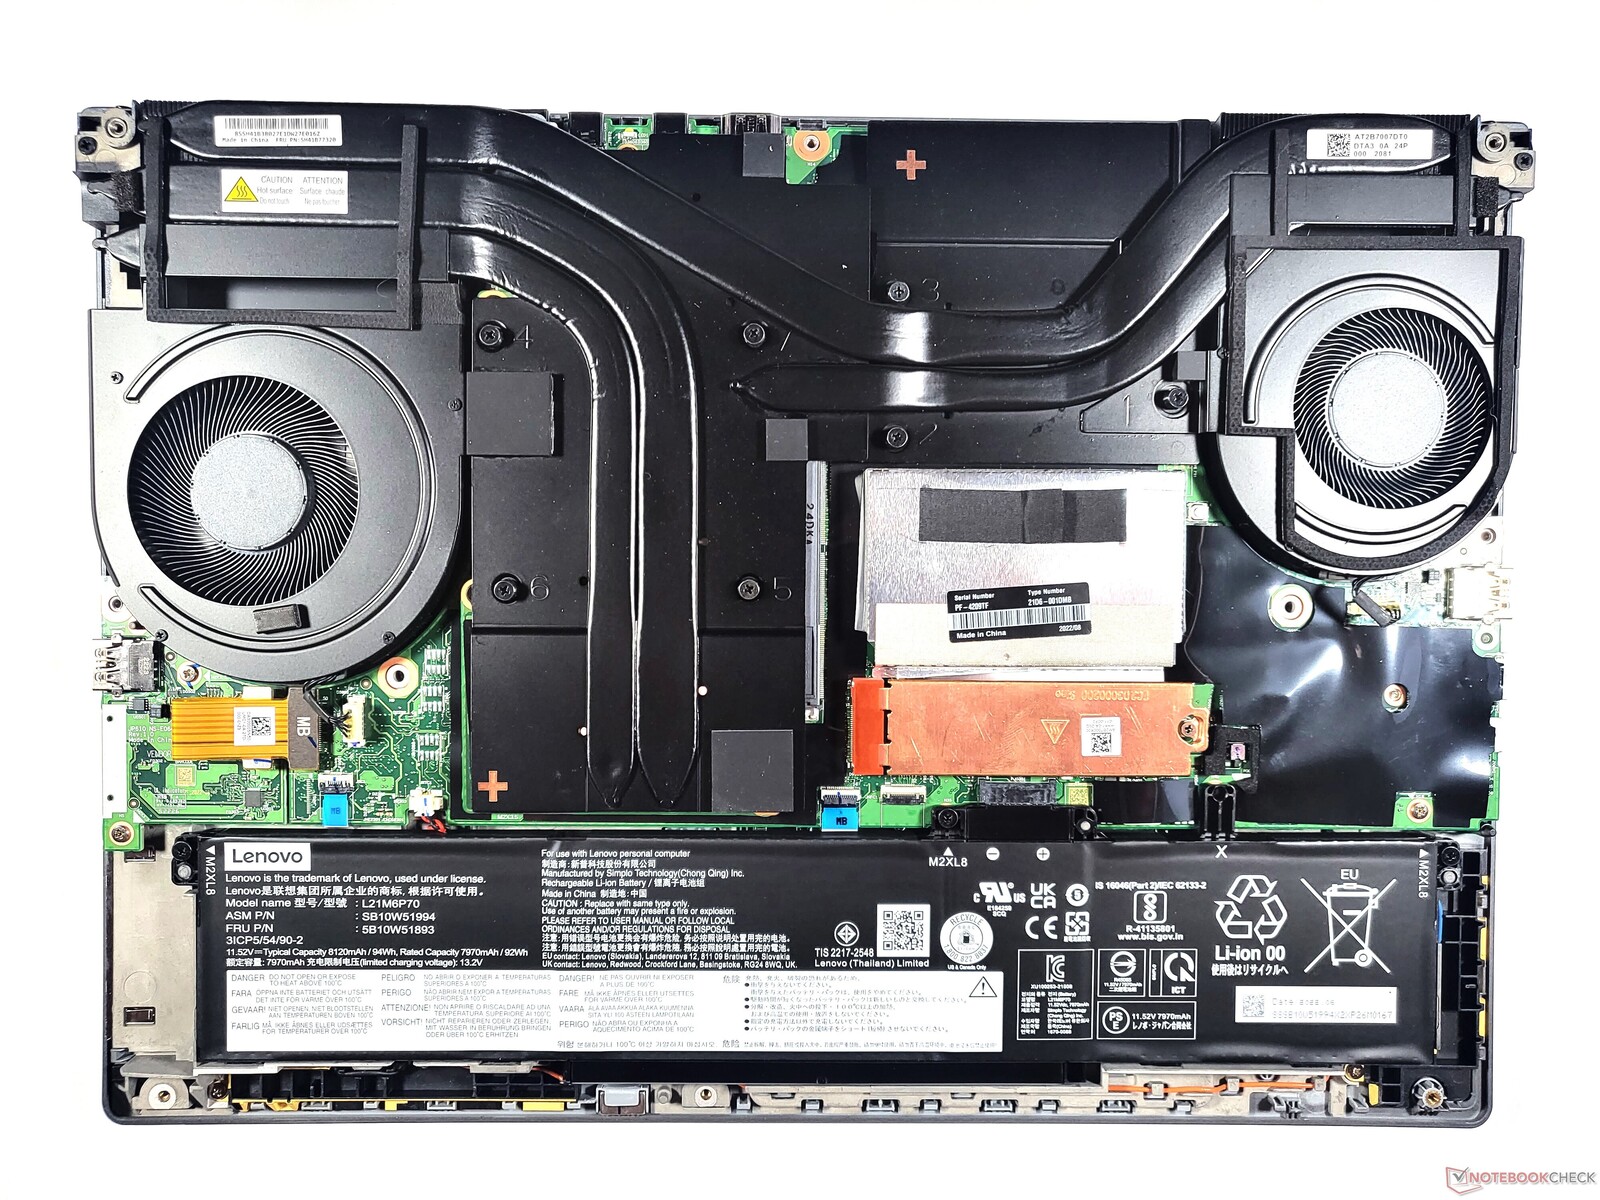
Lenovo bardzo ułatwiło dostęp do dwóch z czterech slotów RAM, gdyż należy zdjąć jedynie niewielką pokrywę na spodzie urządzenia. Tutaj również znajdziemy wolny slot M.2 2280. Nieco trudniejszy jest dostęp do pozostałych slotów RAM, drugiego slotu M.2, wlutowanego modułu WiFi, a także do slotu WWAN: w tym celu trzeba ustąpić miejsca klawiaturze. Ostatnia przeszkoda prezentuje się w postaci dwóch metalowych pokryw. W sumie na spodzie laptopa znajduje się jeszcze dziesięć dodatkowych śrubek krzyżowych zabezpieczonych plastikowymi haczykami. Po zdjęciu tej części uzyskuje się wyraźny widok na duży układ chłodzenia z łącznie dwoma wentylatorami oraz na wewnętrzny akumulator.
Wszystkie te czynności można wykonać bez utraty gwarancji. Dzięki podręcznikowi Hardware Maintenance Manual, Lenovo dostarczyło odpowiedni zestaw instrukcji
.
Gwarancja
Po wyjęciu z pudełka biznesowy laptop Lenovo ThinkPad P16 Gen 1 jest objęty 3-letnią gwarancją. Za dopłatą można ją również przedłużyć do pięciu lat. Nasze urządzenie recenzenckie posiada usługę Premier Support z obsługą na miejscu. Większość konfiguracji ThinkPada P16 wymaga jednak dodatkowej dopłaty, by móc cieszyć się tą funkcją. Klienci są uprawnieni do tych rozszerzonych opcji serwisowych tylko w Niemczech. Na arenie międzynarodowej dostępna jest gwarancja Bring In.
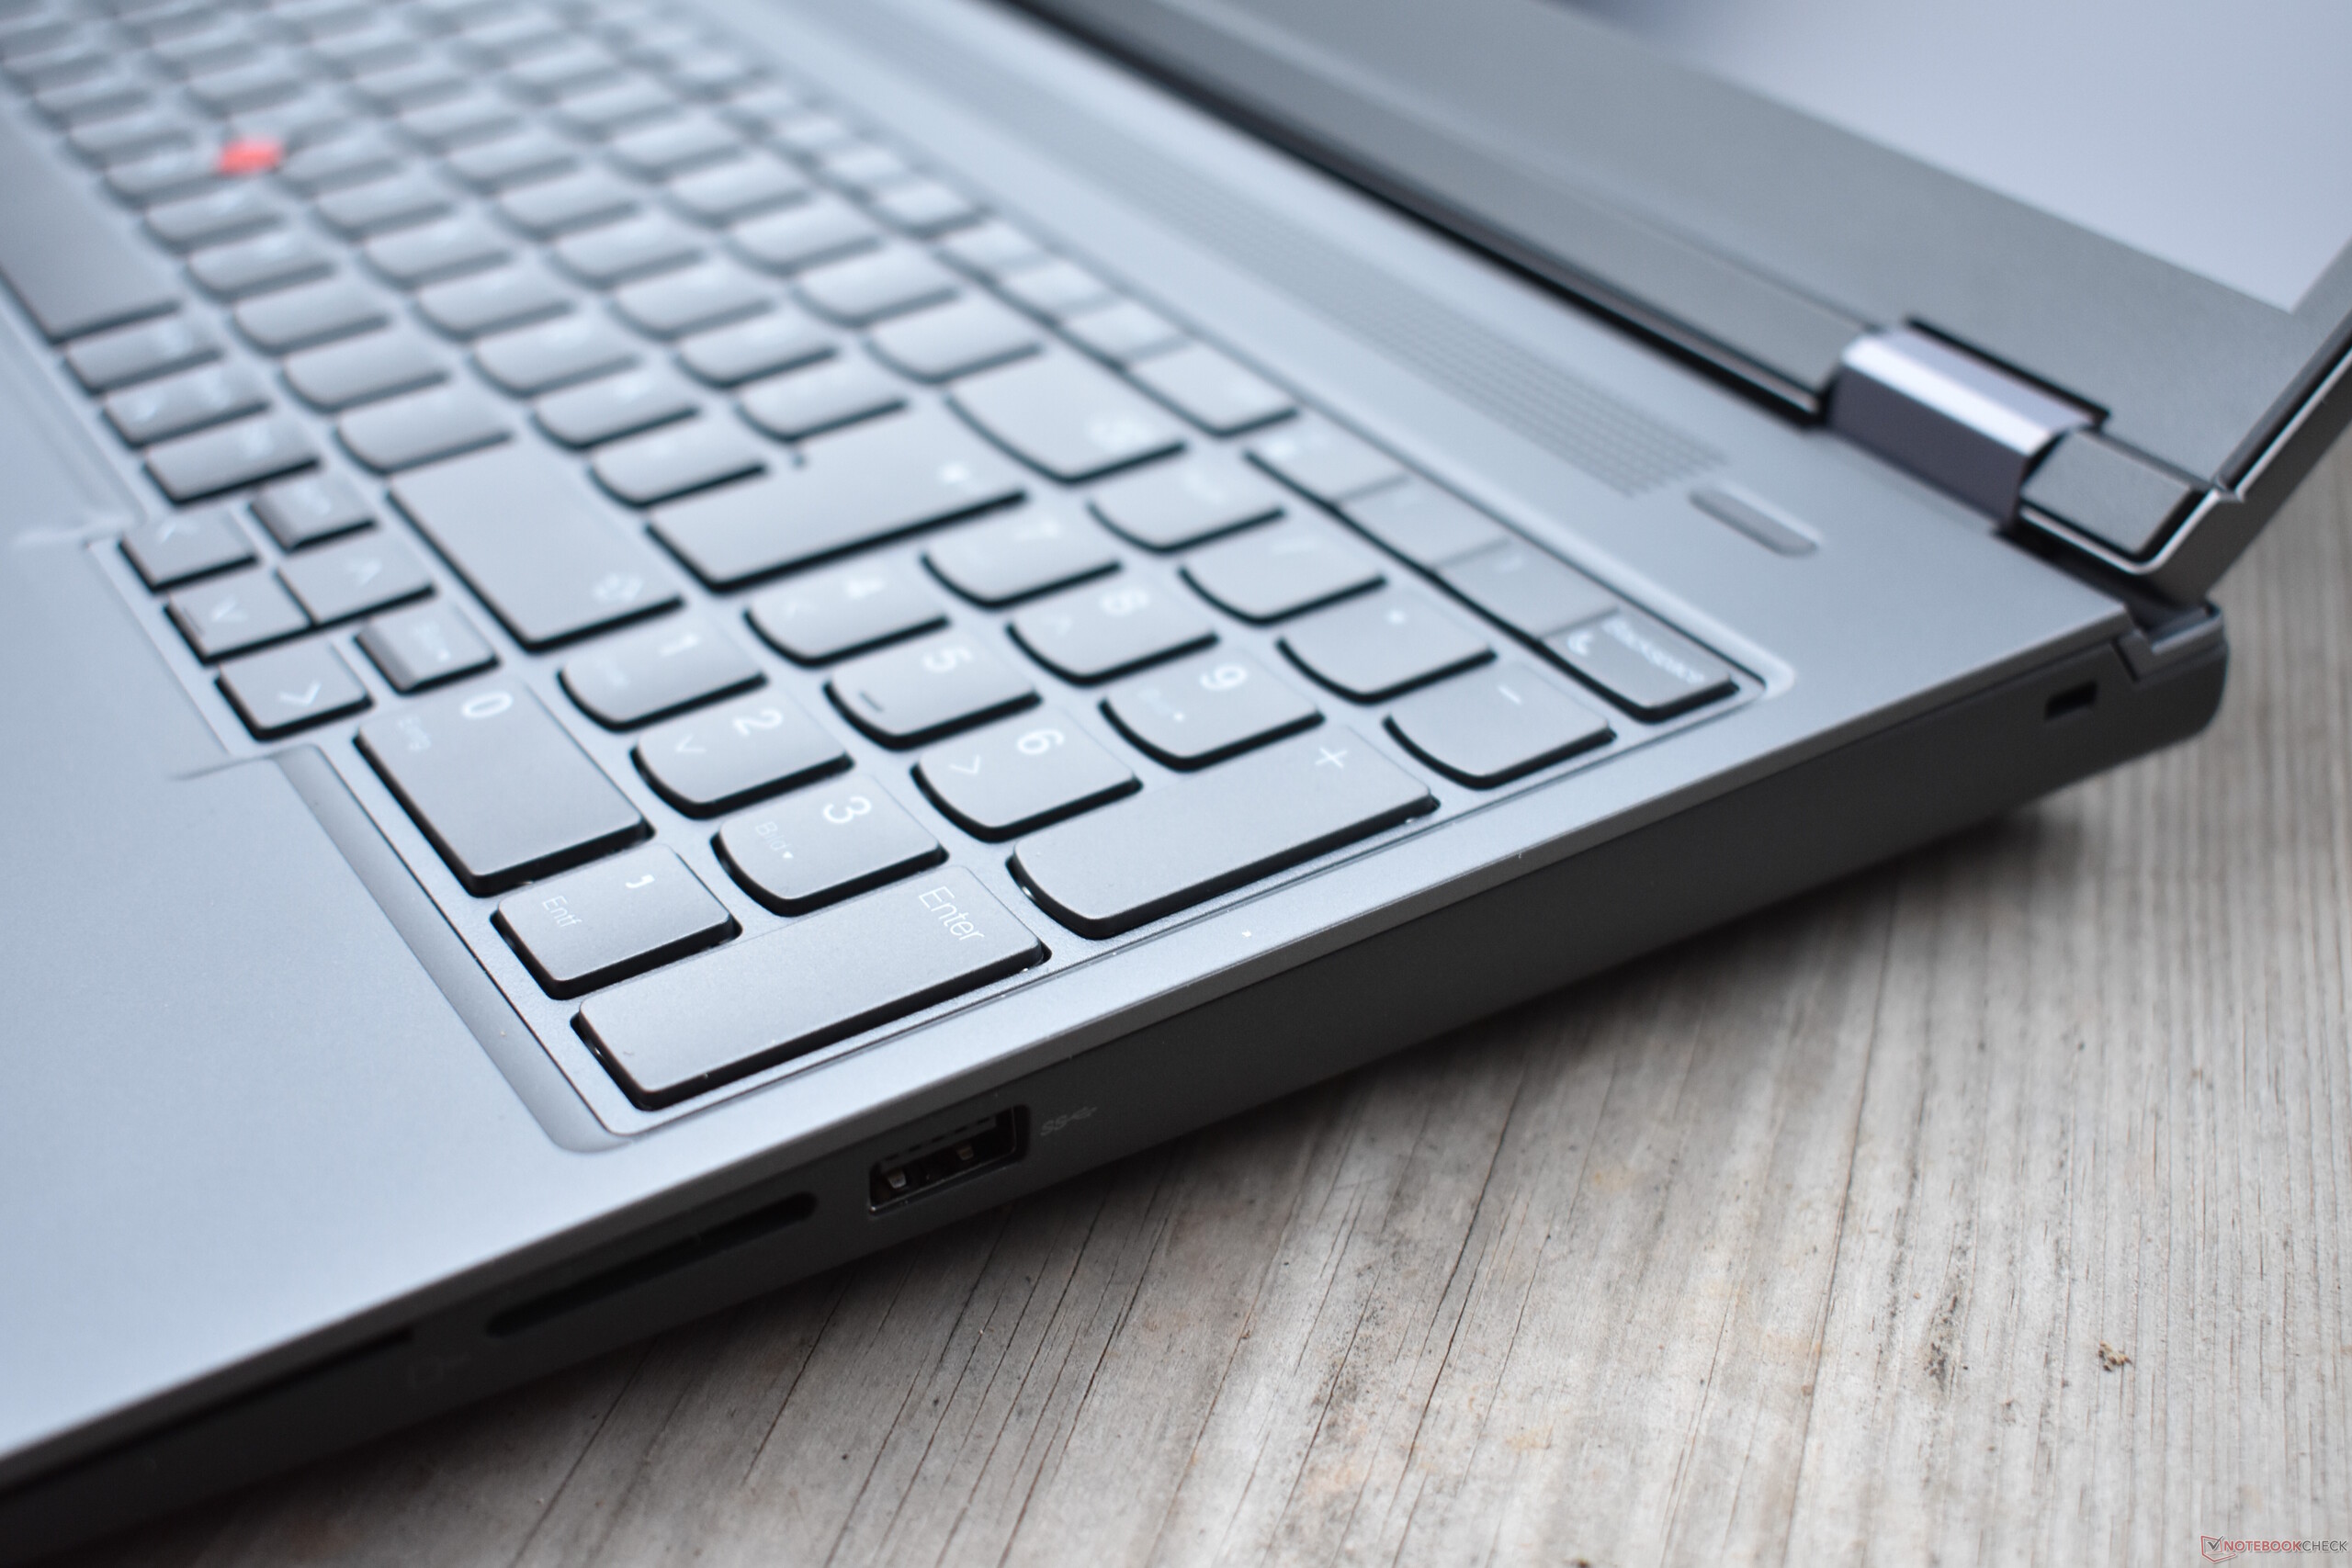
Urządzenia wejściowe: ThinkPad P ma teraz także skok klawiszy 1,5 mm
Klawiatura
Zaczynając od koloru, Lenovo całkowicie odnowiło klawiaturę ThinkPada P16. Klawiatura jest teraz cała w kolorze szarym, co naszym zdaniem nie wygląda tak dobrze, jak w przypadku Premium. O ile jest to stosunkowo mało znaczący punkt krytyki, o tyle decyzja o zmniejszeniu skoku klawiszy podświetlanej klawiatury z 1,8 do zaledwie 1,5 mm, jak również zmniejszona wysokość klawiszy, mają duże znaczenie: W efekcie klawiatura ThinkPada traci nieco ze specyficznego polotu, jaki miała wcześniej. Mimo to nadal mamy do czynienia z bardzo dobrą klawiaturą oferującą cudownie przyjemne wrażenia z pisania - choć teraz niewiele dzieli urządzenie Lenovo od konkurentów z HP i Della. Pozostaje zagadką, dlaczego samo Lenovo zdecydowało się na skrócenie skoku klawiszy w tak dużej i grubej stacji roboczej.
Lenovo nie wprowadziło żadnych zmian w układzie graficznym, gdzie wszystko jest jak dawniej. Jedna zmiana ma charakter optyczny, gdyż zewnętrzne klawisze są teraz kwadratowe zamiast zaokrąglonych. Ponieważ nie są to klawisze literowe, nie spowodowało to negatywnego wpływu na wrażenia z pisania. Podobnie jak w przypadku zaokrąglonych klawiszy, kwadratowe klawisze mają nieco wklęsły kształt.
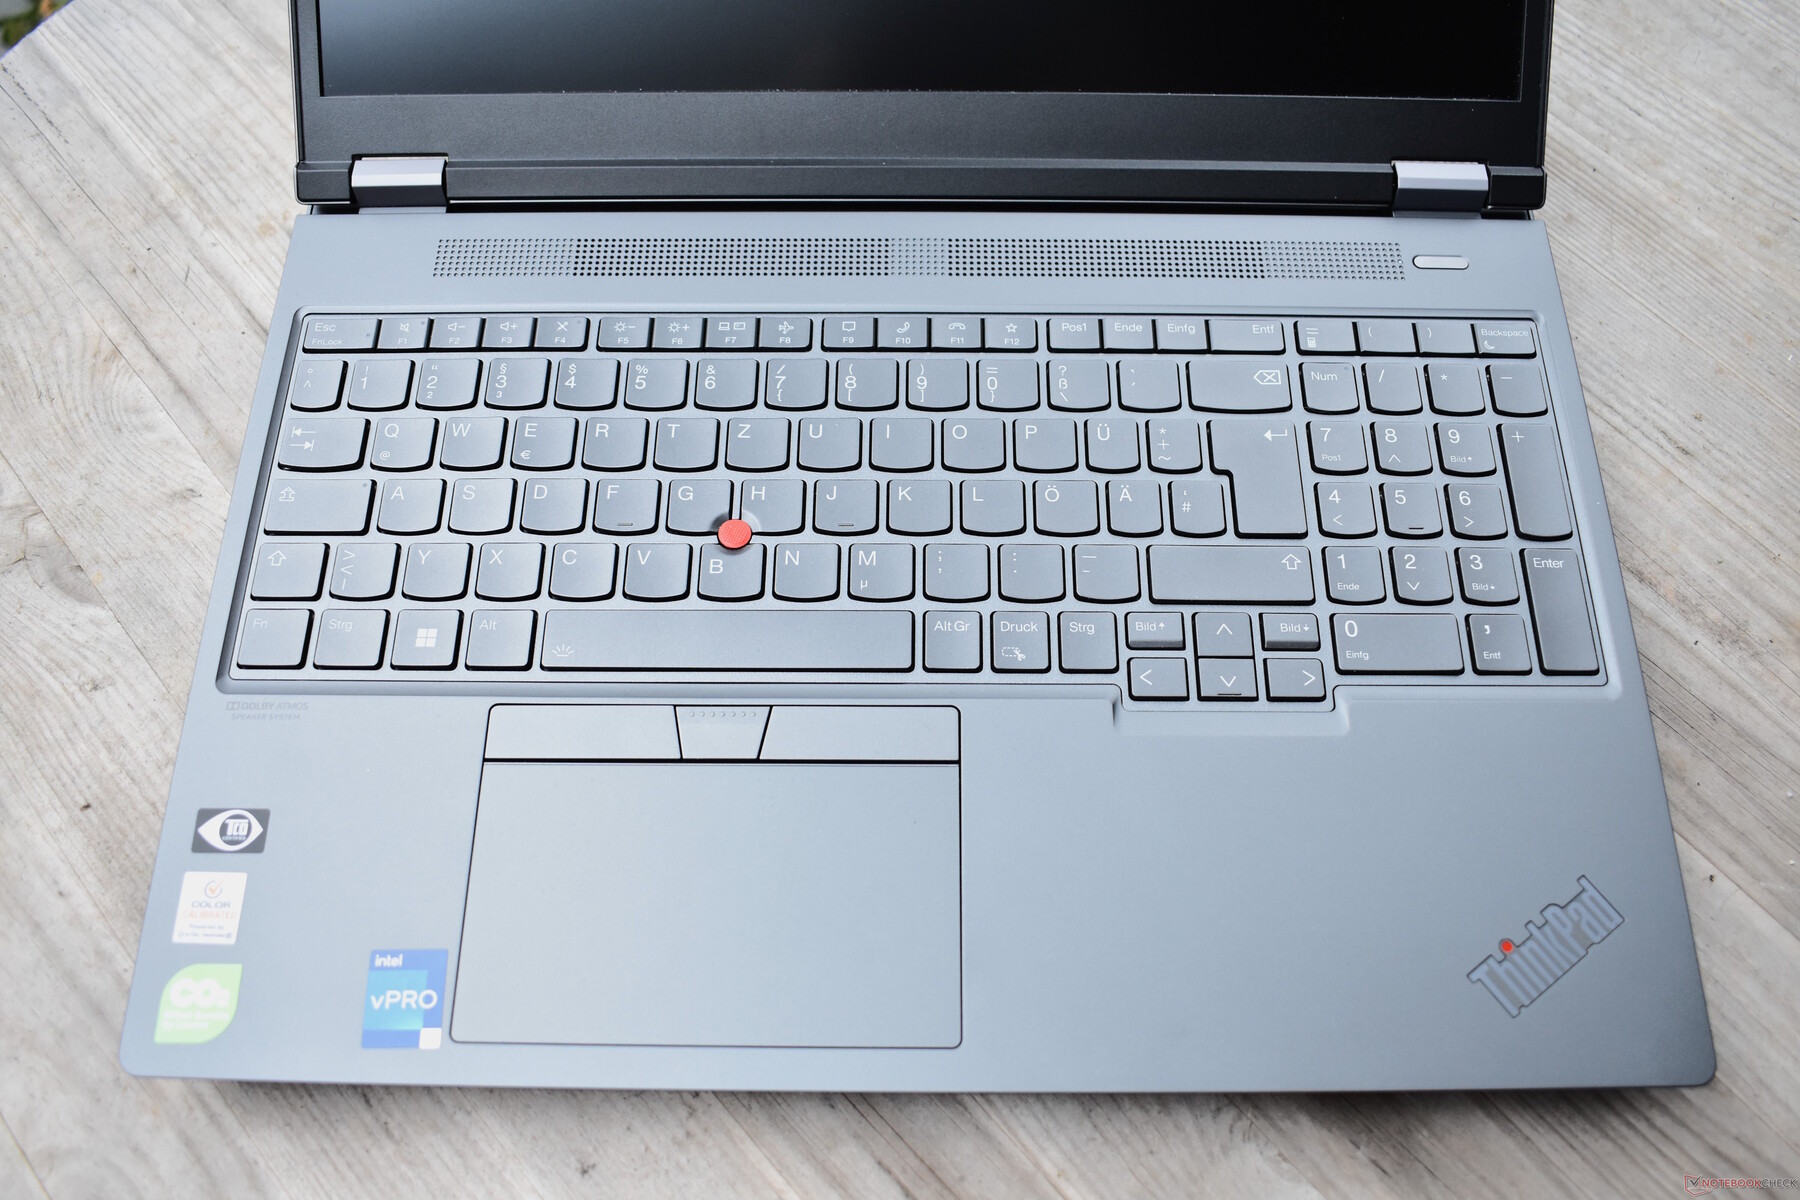
Touchpad i TrackPoint
Touchpad Lenovo ThinkPad P16 G1 wydaje się szerszy od poprzednich modeli i na szerokość urósł teraz do 11,5 cm. Powierzchnia jest wykonana z tworzywa sztucznego, które w dotyku jest jeszcze gładsze od poprzednika. Pod względem obsługi touchpad jest bardzo dobry i doskonale tłumaczy gesty multitouch. Jednak haptyczne sprzężenie zwrotne wypada blado w porównaniu z gładzikami wykonanymi ze szkła. Jako że mamy do czynienia z gładzikiem mechanicznym, możliwe jest stosowanie kliknięć tylko w dolnej części podkładki. Mechanizm klikania jest dość tępy, ale nie grzechocze i nie chwieje się.
TrackPoint nadal stanowi dobrą alternatywę dla touchpada, jeśli trzeba szybko przesuwać wskaźnik myszy podczas pisania. W porównaniu z poprzednikiem czerwony, zakończony gumą drążek wskazujący pozostał niezmieniony. Natomiast Lenovo przeprojektowało dedykowane klawisze TrackPoint, które wyglądają teraz bardziej nowocześnie, nie tracąc nic na użyteczności.
Wyświetlacz: Nowa opcja LCD WQXGA dla stacji roboczej Thinkpad
Jak to zwykle bywa w przypadku laptopów ThinkPad, Lenovo ThinkPad P16 2022 oferuje wybór różnych opcji wyświetlacza, które obejmują różne zastosowania i kategorie cenowe. To co je łączy to proporcje 16:10, a także fakt, że są to panele 16-calowe:
- WUXGA (1920 x 1200), IPS, 300 cd/m², 100 % sRGB, matowy
- WQXGA (2560 x 1600), IPS, 400 cd/m², 100 % sRGB, matowy
- WQUXGA (3840 x 2400), IPS, 600 cd/m², 100 % AdobeRGB, matowy
- WQUXGA (3840 x 2400), OLED, 400 cd/m², 100 % DCI-P3, antyrefleksyjny, wielodotykowy
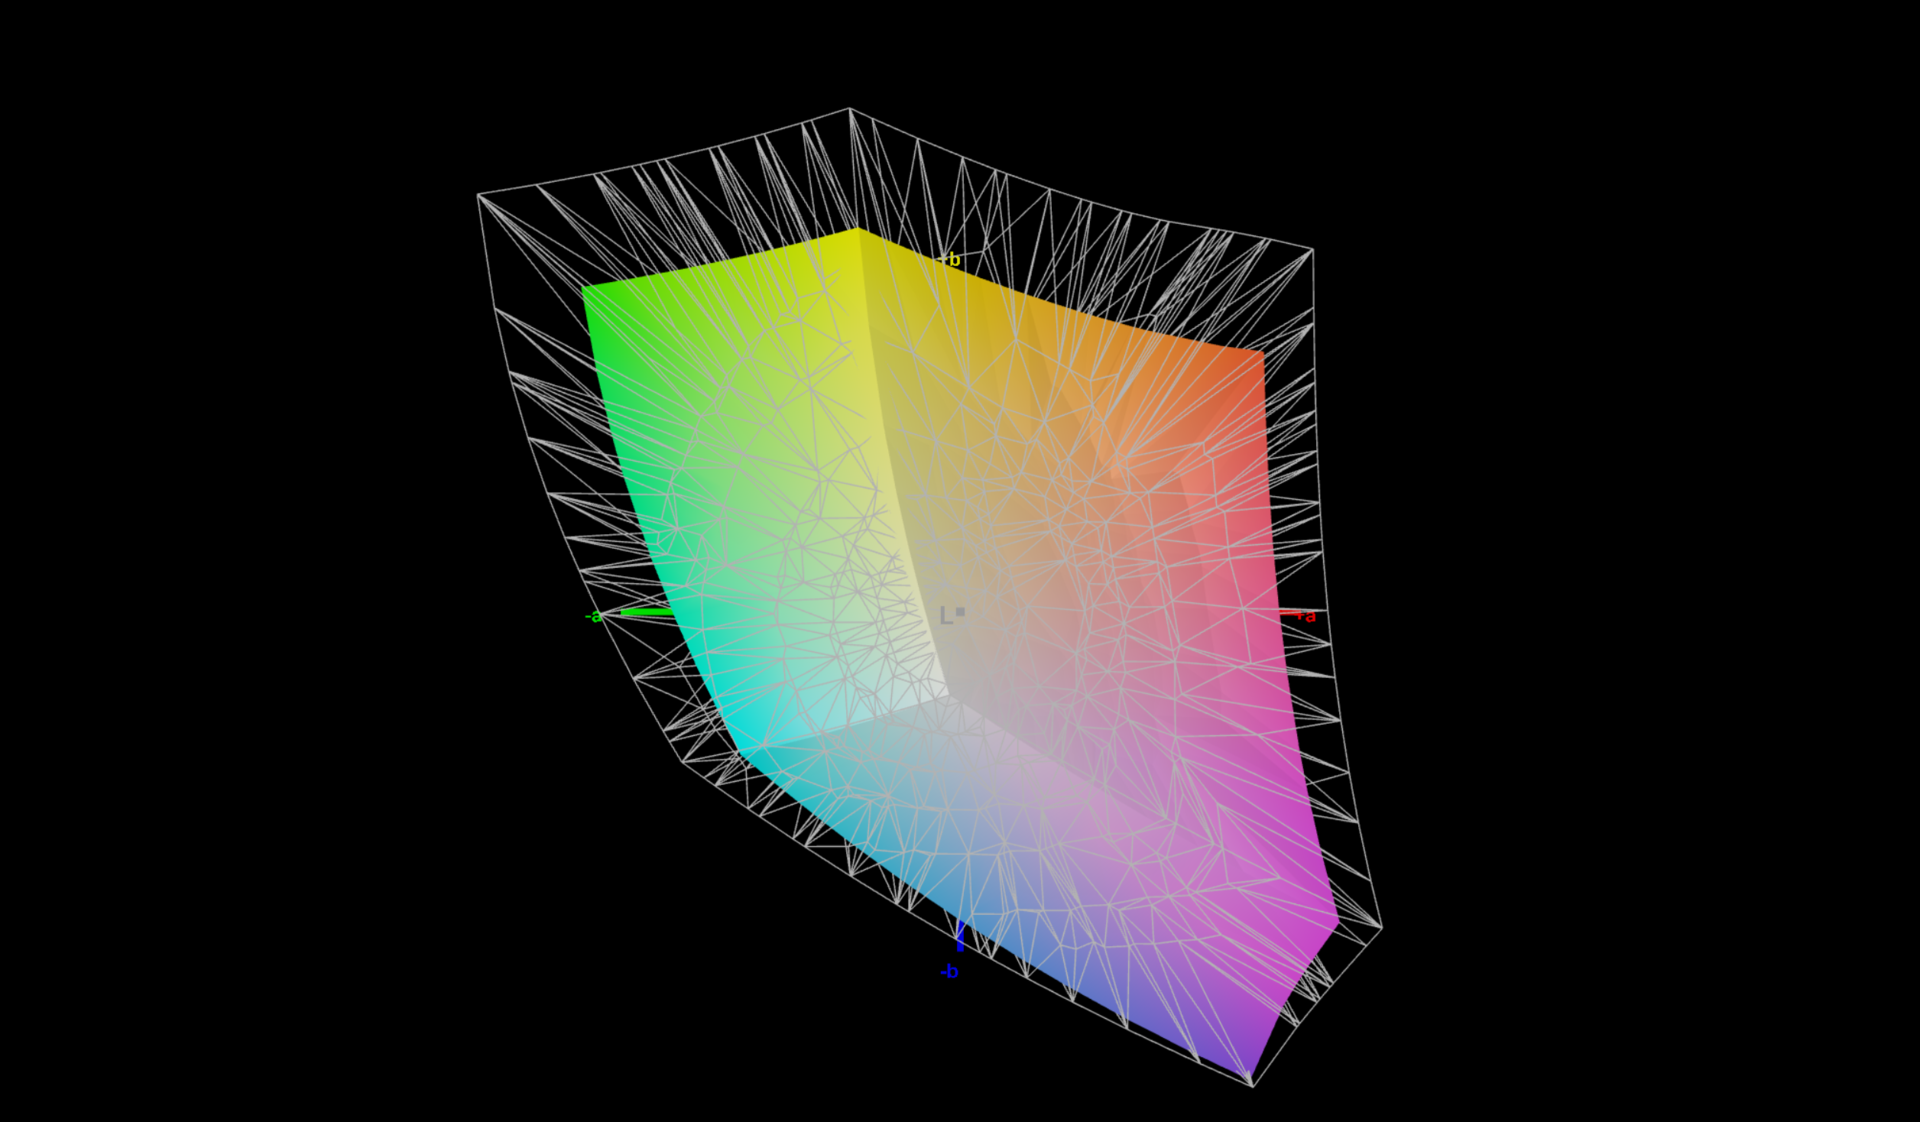
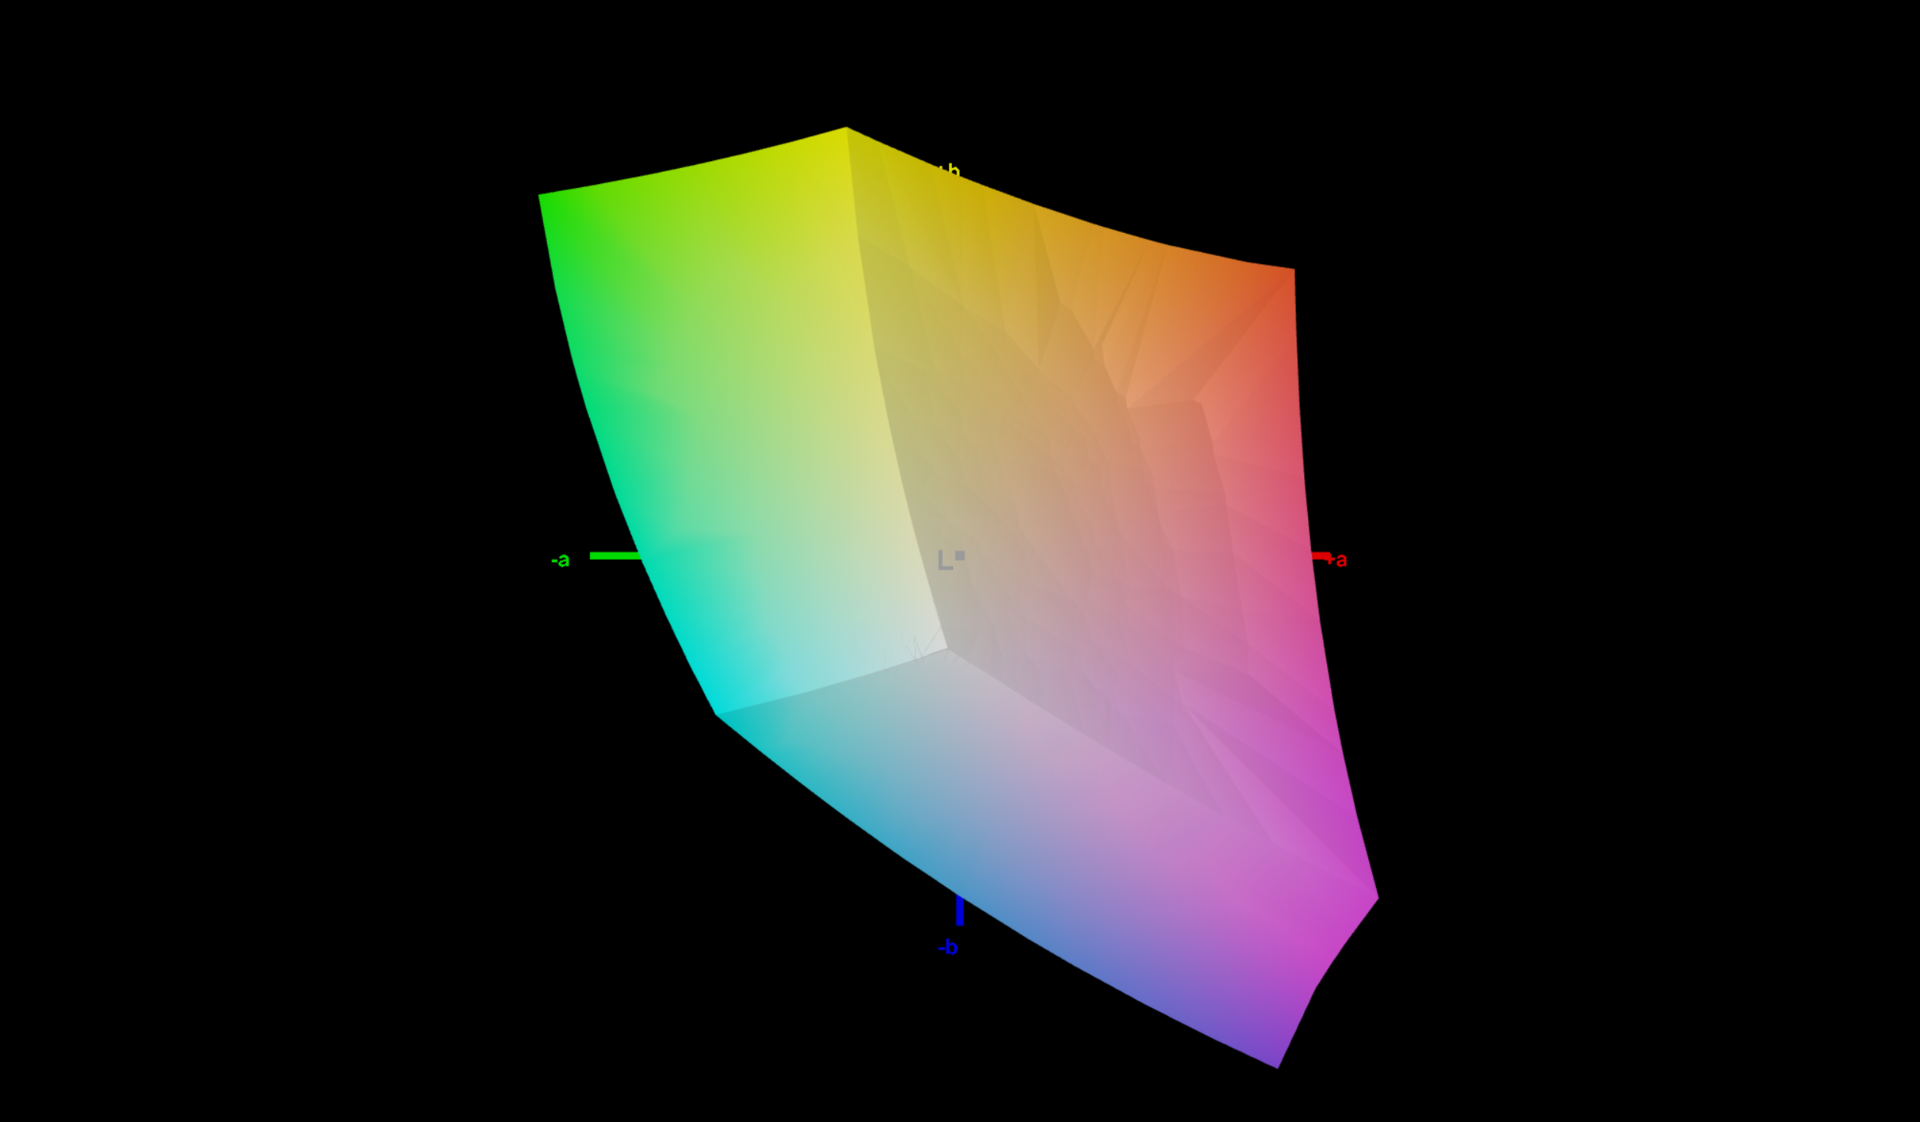
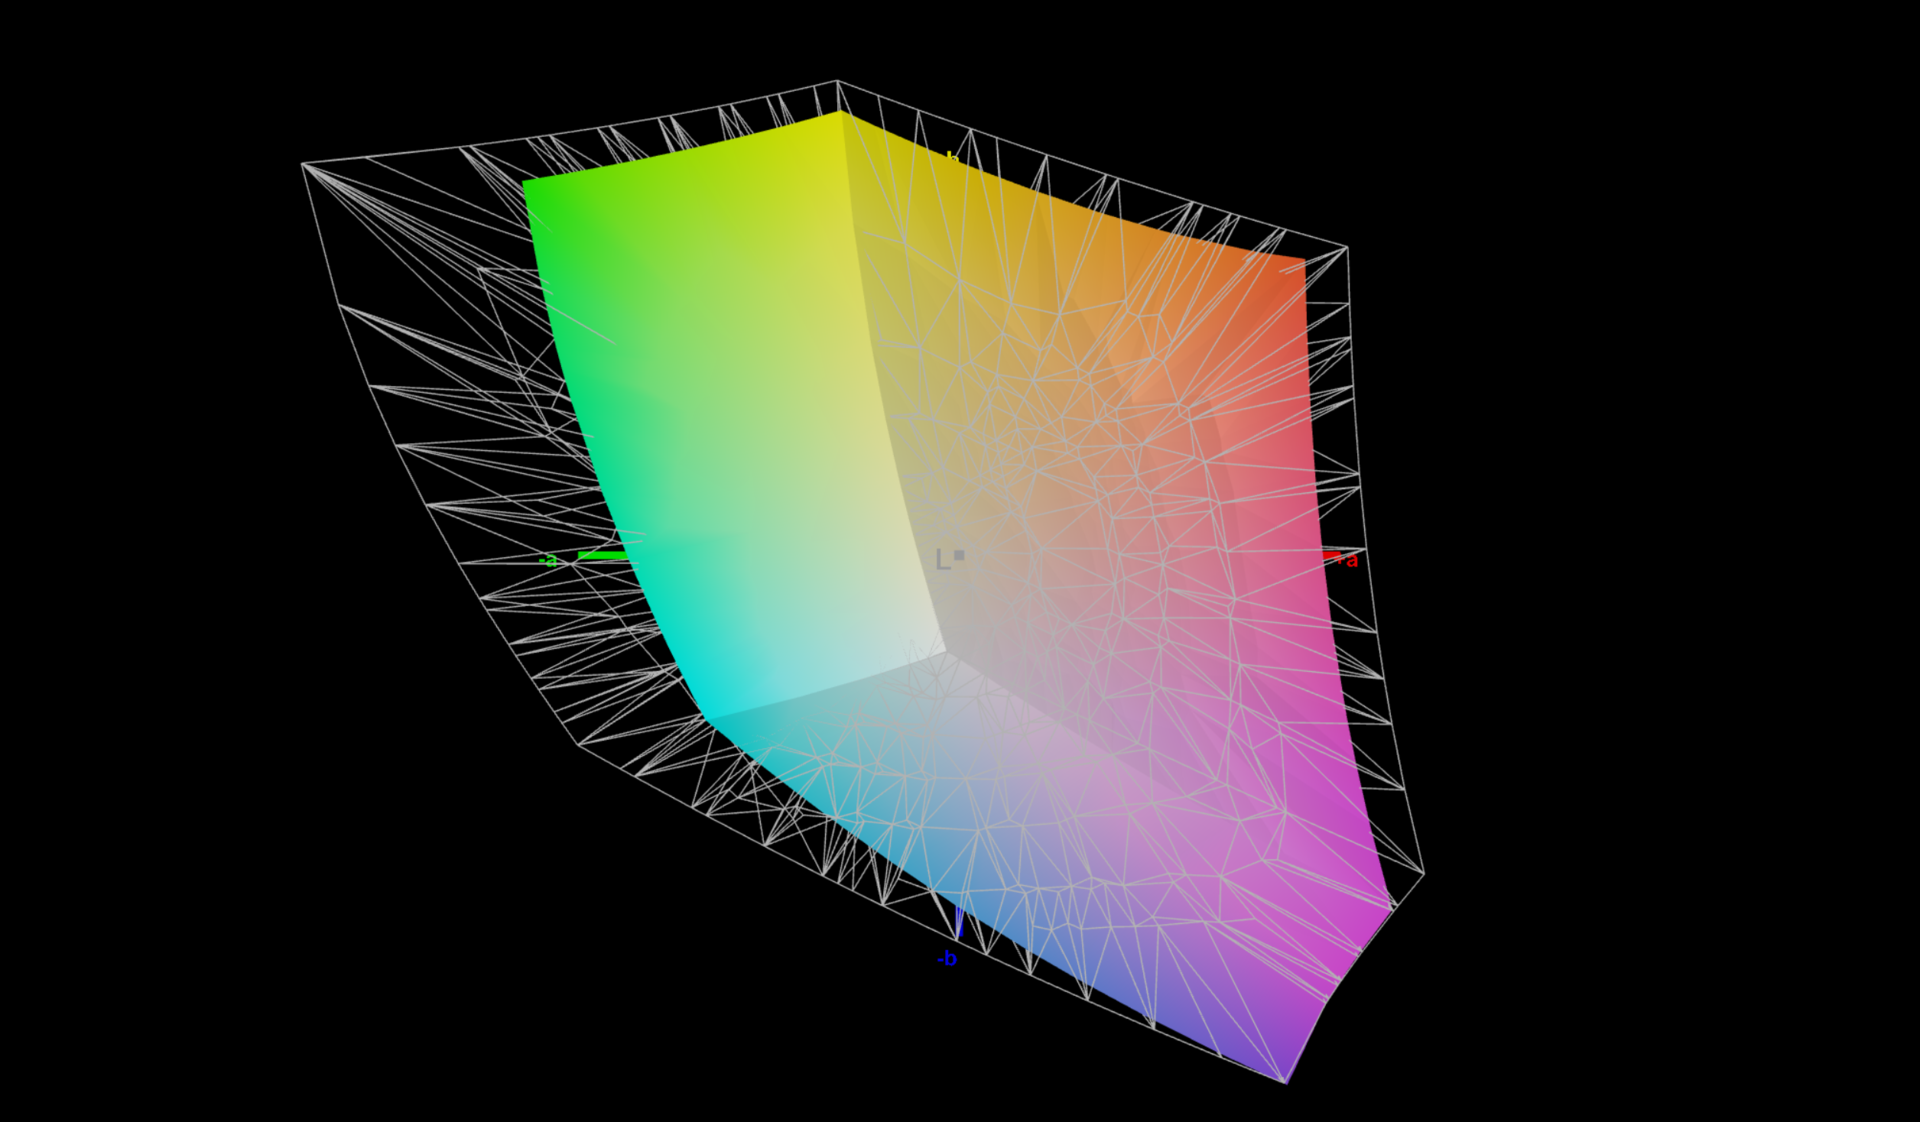
Średni poziom rozdzielczości 2,5K znaleziony w P16 jest nowością, gdyż P15 i P17 były dostępne tylko w proporcjach 16:9 z rozdzielczością Full-HD (1920 x 1080) lub 4K UHD (3840 x 2160). Wbudowany wyświetlacz WQXGA dostarcza reklamowane 400 cd/m² niemalże na przycisk, osiągając średnio 398 cd/m². W porównaniu z bezpośrednimi odpowiednikami plasuje go to w środku stawki. Wyświetlacz Asusa ExpertBook B6 Flip jest minimalnie jaśniejszy.
| |||||||||||||||||||||||||
rozświetlenie: 90 %
na akumulatorze: 424 cd/m²
kontrast: 1767:1 (czerń: 0.24 cd/m²)
ΔE ColorChecker Calman: 2.6 | ∀{0.5-29.43 Ø4.73}
calibrated: 0.8
ΔE Greyscale Calman: 4.1 | ∀{0.09-98 Ø4.97}
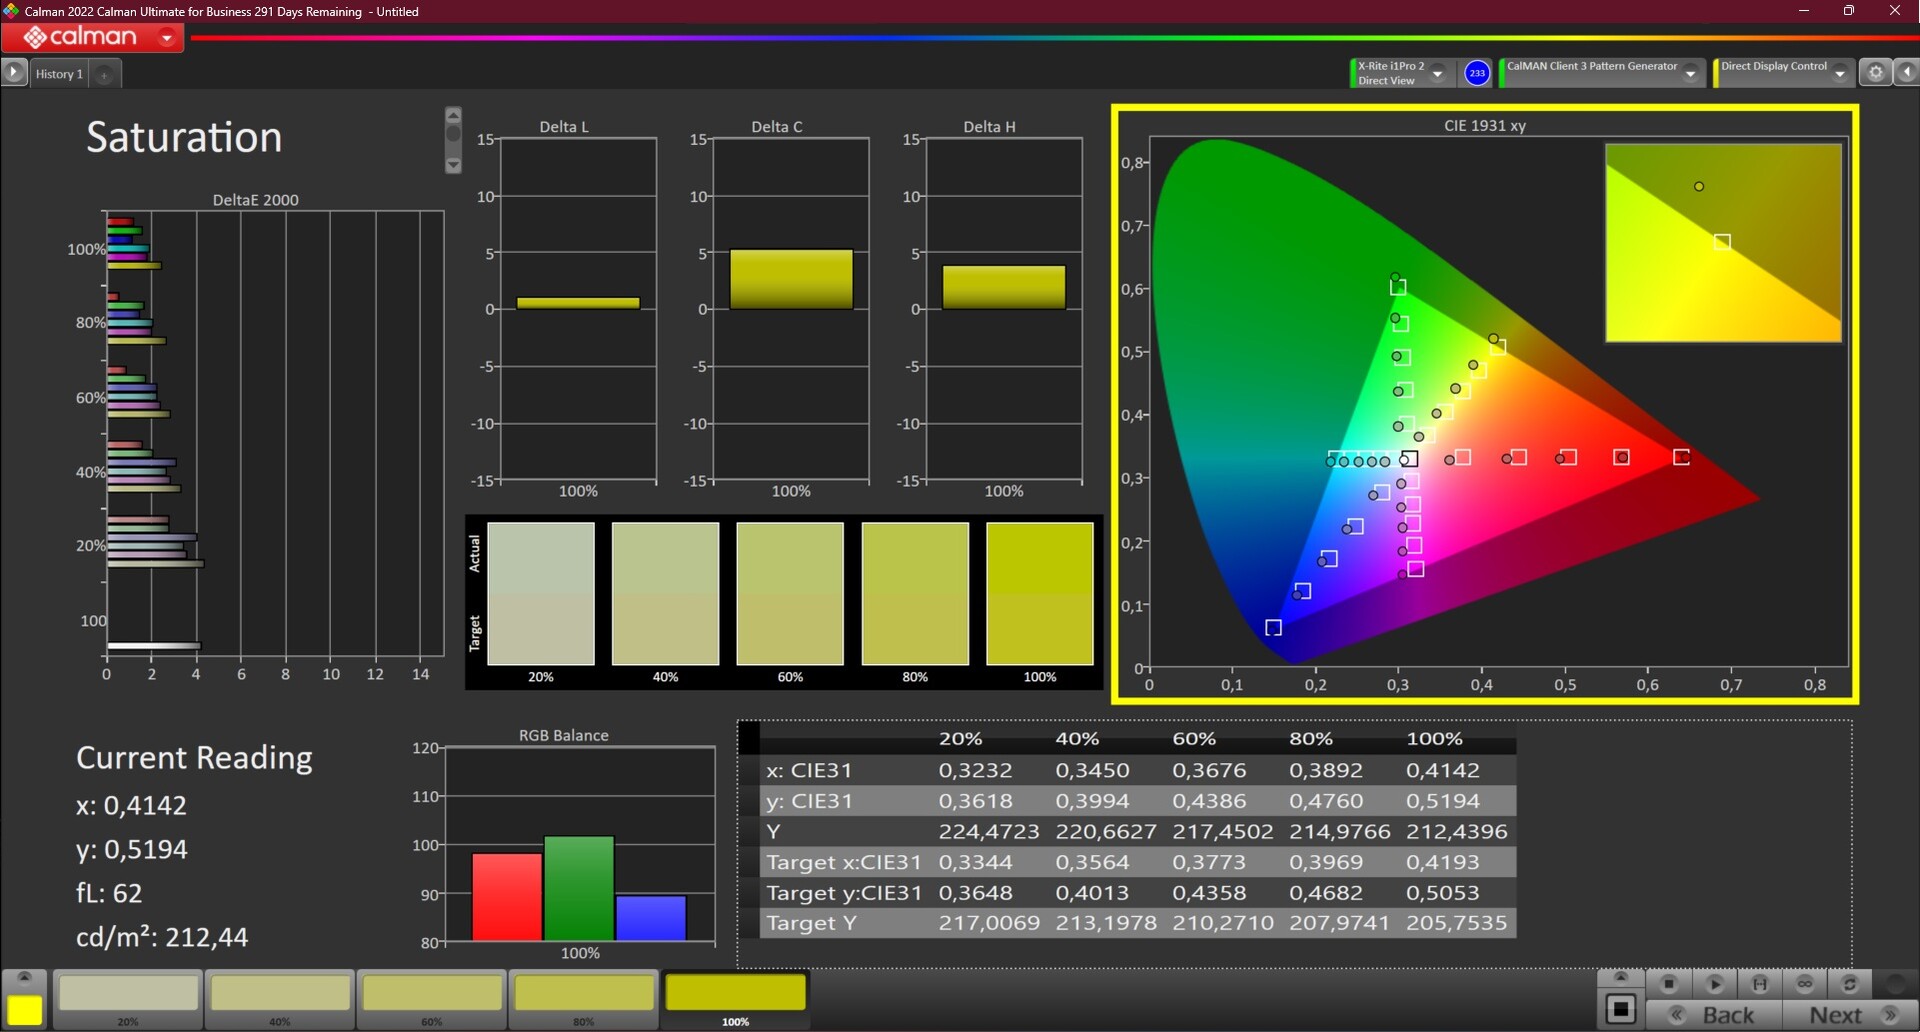
73.3% AdobeRGB 1998 (Argyll 3D)
100% sRGB (Argyll 3D)
71.5% Display P3 (Argyll 3D)
Gamma: 2.13
CCT: 7252 K
| Lenovo ThinkPad P16 G1 21D6001DMB NE160QDM-N63 , IPS LED, 2560x1600, 16" | Lenovo ThinkPad P15 G2-20YQ001JGE N156HCE_GN1, IPS, 1920x1080, 15.6" | Lenovo ThinkPad P17 G2-20YU0025G LP173WF4-SPF7, IPS LED, 1920x1080, 17.3" | HP ZBook Fury 17 G8-4A6A9EA AUOCD8C, IPS, 3840x2160, 17.3" | Dell Precision 7670 Samsung 160YV03, OLED, 3840x2400, 16" | Asus ExpertBook B6 Flip B6602FC2 AU Optronics Model: AUOE495, IPS, 2560x1600, 16" | |
|---|---|---|---|---|---|---|
| Display | -3% | -10% | 19% | 24% | 18% | |
| Display P3 Coverage (%) | 71.5 | 68.6 -4% | 67.9 -5% | 99.1 39% | 99.9 40% | 97.9 37% |
| sRGB Coverage (%) | 100 | 99.8 0% | 87.3 -13% | 100 0% | 100 0% | 99.89 0% |
| AdobeRGB 1998 Coverage (%) | 73.3 | 70.6 -4% | 63.9 -13% | 86.8 18% | 97.5 33% | 85.52 17% |
| Response Times | 20% | 6% | -41% | 94% | 20% | |
| Response Time Grey 50% / Grey 80% * (ms) | 37.7 ? | 37.6 ? -0% | 39.2 ? -4% | 67.6 ? -79% | 1.9 ? 95% | 36 ? 5% |
| Response Time Black / White * (ms) | 26.3 ? | 16 ? 39% | 22.4 ? 15% | 26.8 ? -2% | 2 ? 92% | 17 ? 35% |
| PWM Frequency (Hz) | 26040 ? | 59.5 ? | ||||
| Screen | -3% | -77% | 27% | -12% | -27% | |
| Brightness middle (cd/m²) | 424 | 498 17% | 361 -15% | 568 34% | 340.1 -20% | 440 4% |
| Brightness (cd/m²) | 398 | 490 23% | 334 -16% | 564 42% | 342 -14% | 418 5% |
| Brightness Distribution (%) | 90 | 95 6% | 87 -3% | 88 -2% | 98 9% | 82 -9% |
| Black Level * (cd/m²) | 0.24 | 0.39 -63% | 0.35 -46% | 0.33 -38% | 0.3 -25% | |
| Contrast (:1) | 1767 | 1277 -28% | 1031 -42% | 1721 -3% | 1467 -17% | |
| Colorchecker dE 2000 * | 2.6 | 2.1 19% | 5.4 -108% | 1 62% | 2.5 4% | 2.81 -8% |
| Colorchecker dE 2000 max. * | 4.9 | 5.6 -14% | 9.9 -102% | 2.4 51% | 8.19 -67% | 4.62 6% |
| Colorchecker dE 2000 calibrated * | 0.8 | 0.8 -0% | 3.2 -300% | 0.5 37% | 2.99 -274% | |
| Greyscale dE 2000 * | 4.1 | 3.4 17% | 6.5 -59% | 1.7 59% | 3.5 15% | 0.91 78% |
| Gamma | 2.13 103% | 2.32 95% | 2.23 99% | 2.18 101% | 2.12 104% | 2.2 100% |
| CCT | 7252 90% | 7162 91% | 7351 88% | 6461 101% | 6704 97% | 6600 98% |
| Całkowita średnia (program / ustawienia) | 5% /
1% | -27% /
-51% | 2% /
16% | 35% /
17% | 4% /
-10% |
* ... im mniej tym lepiej
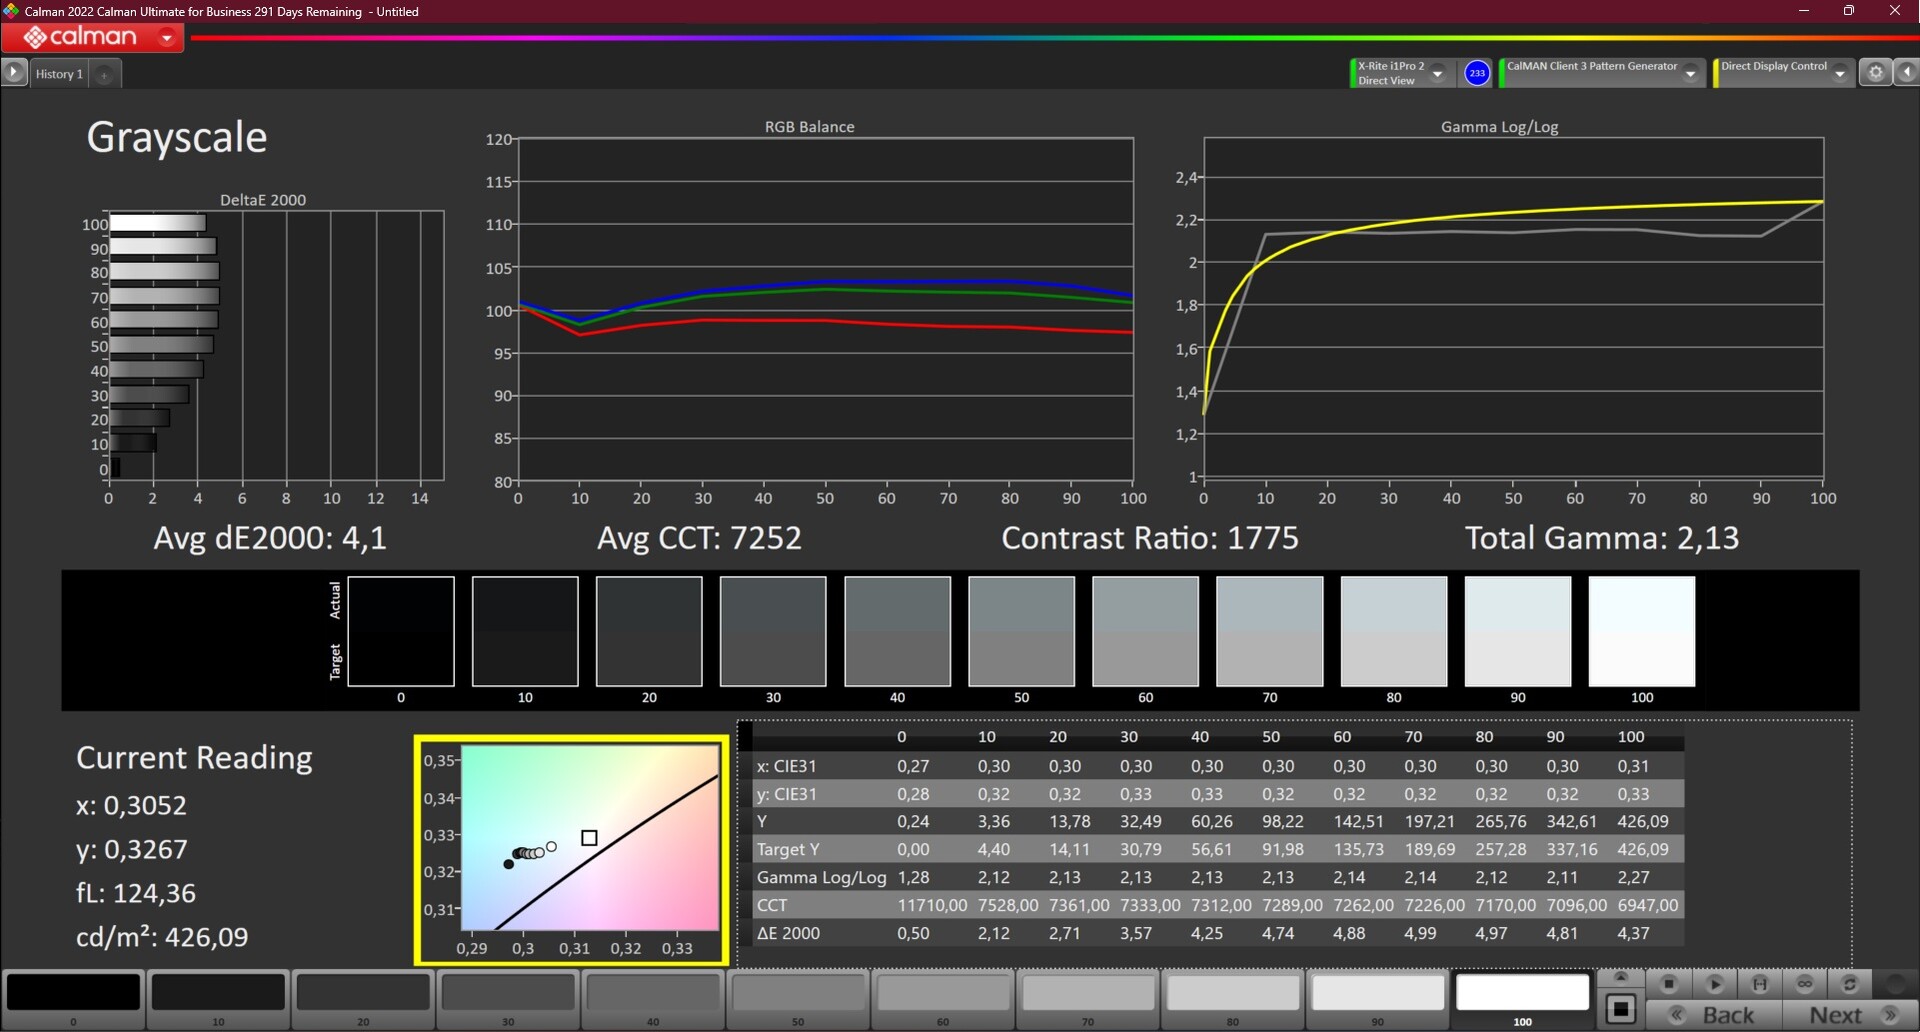
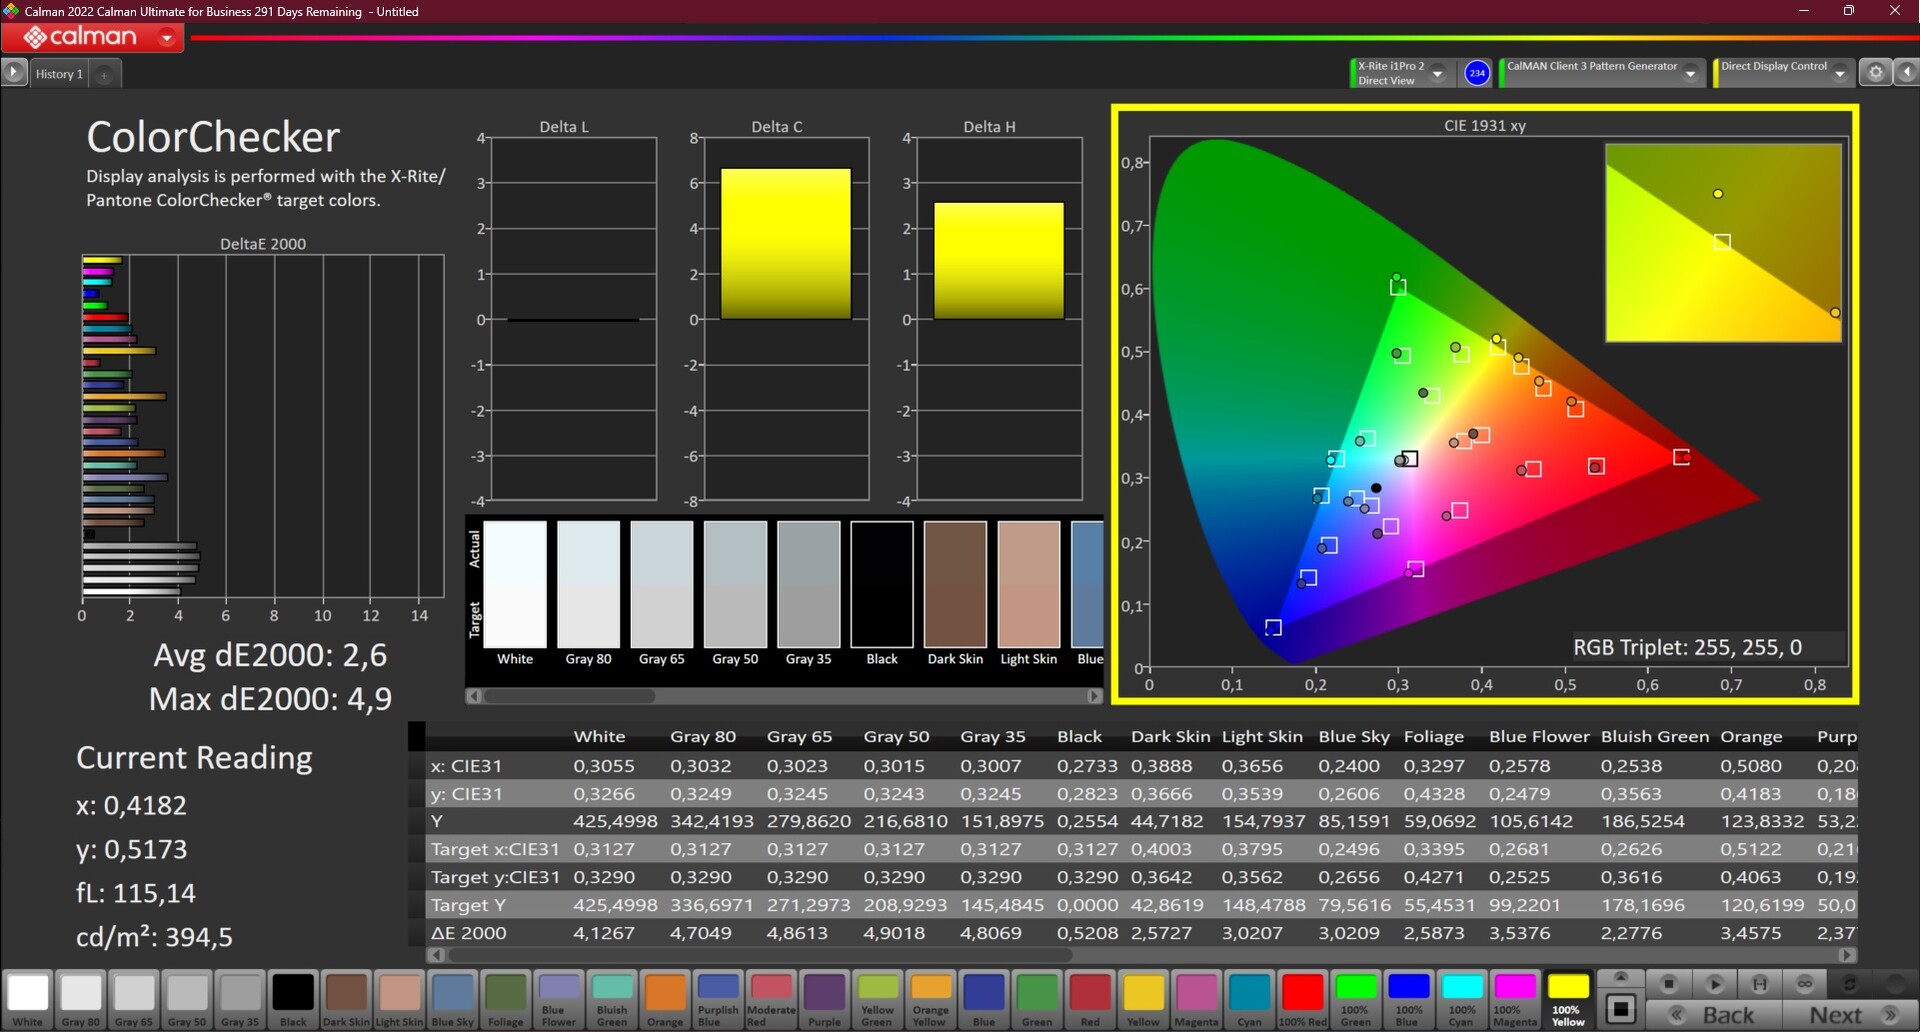
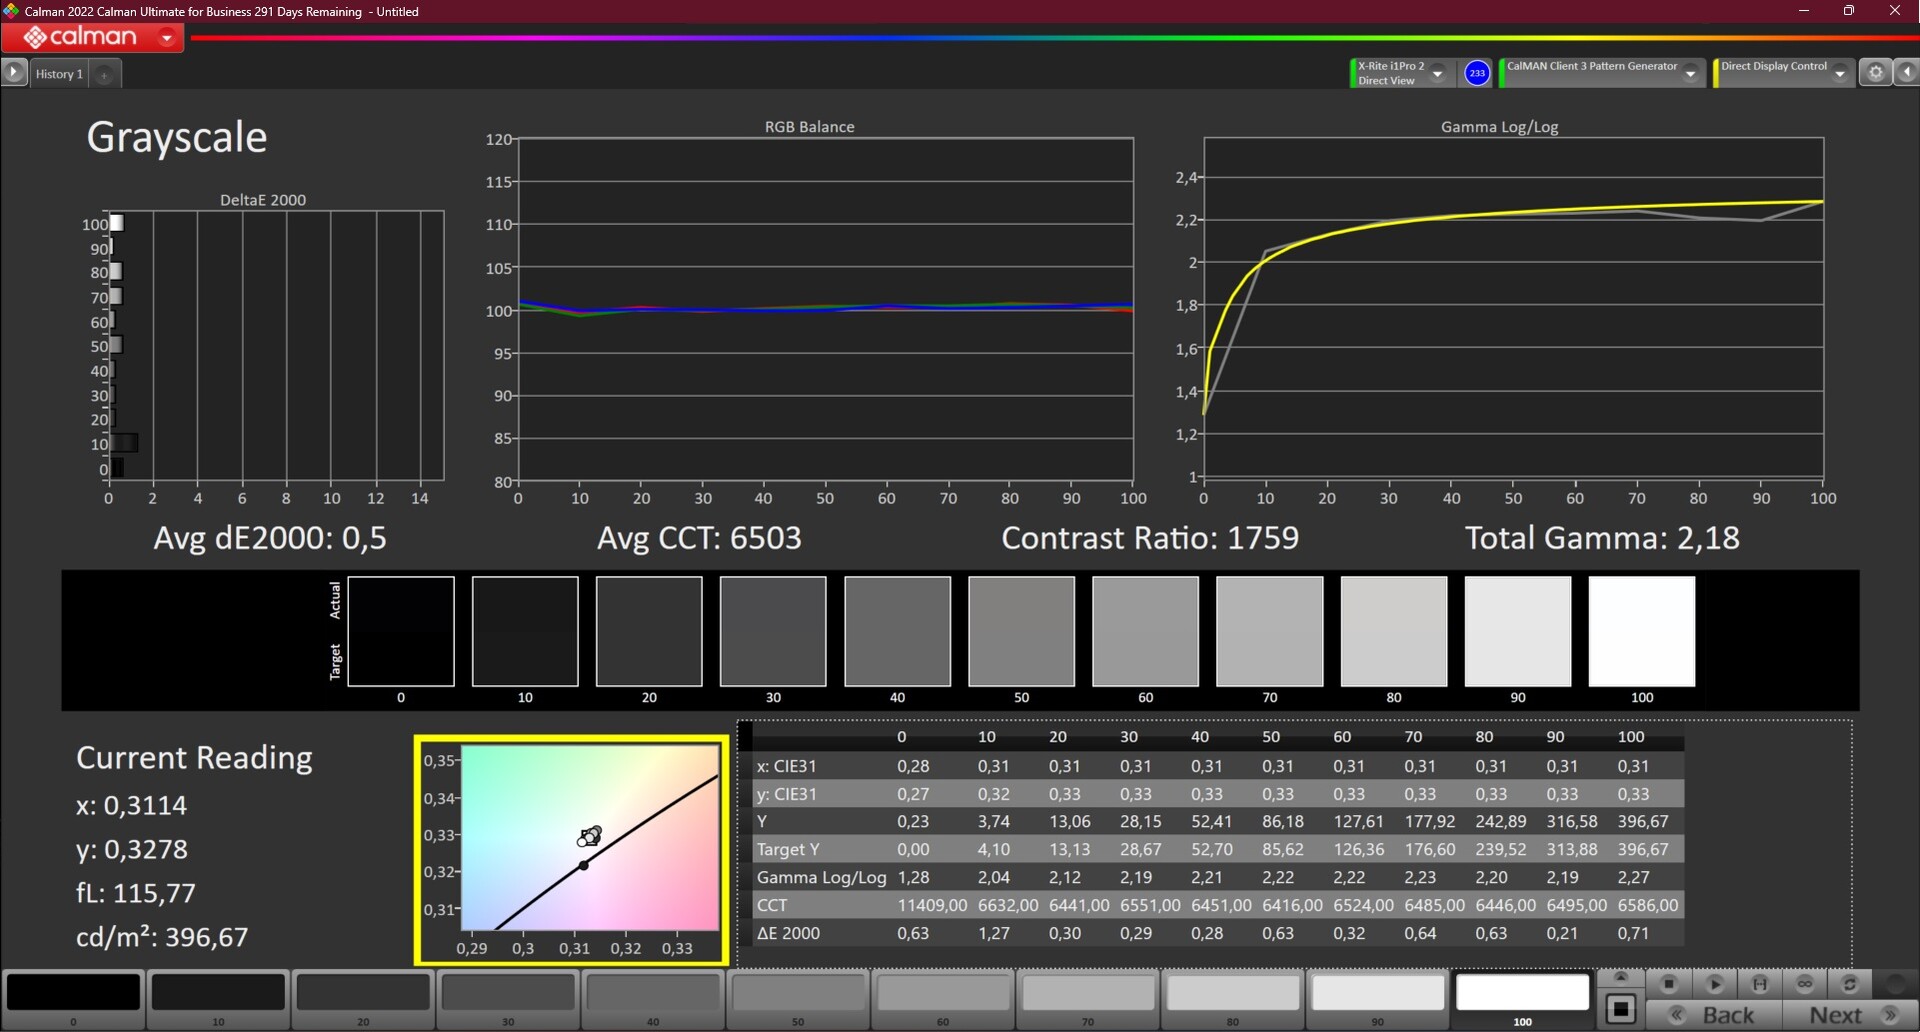
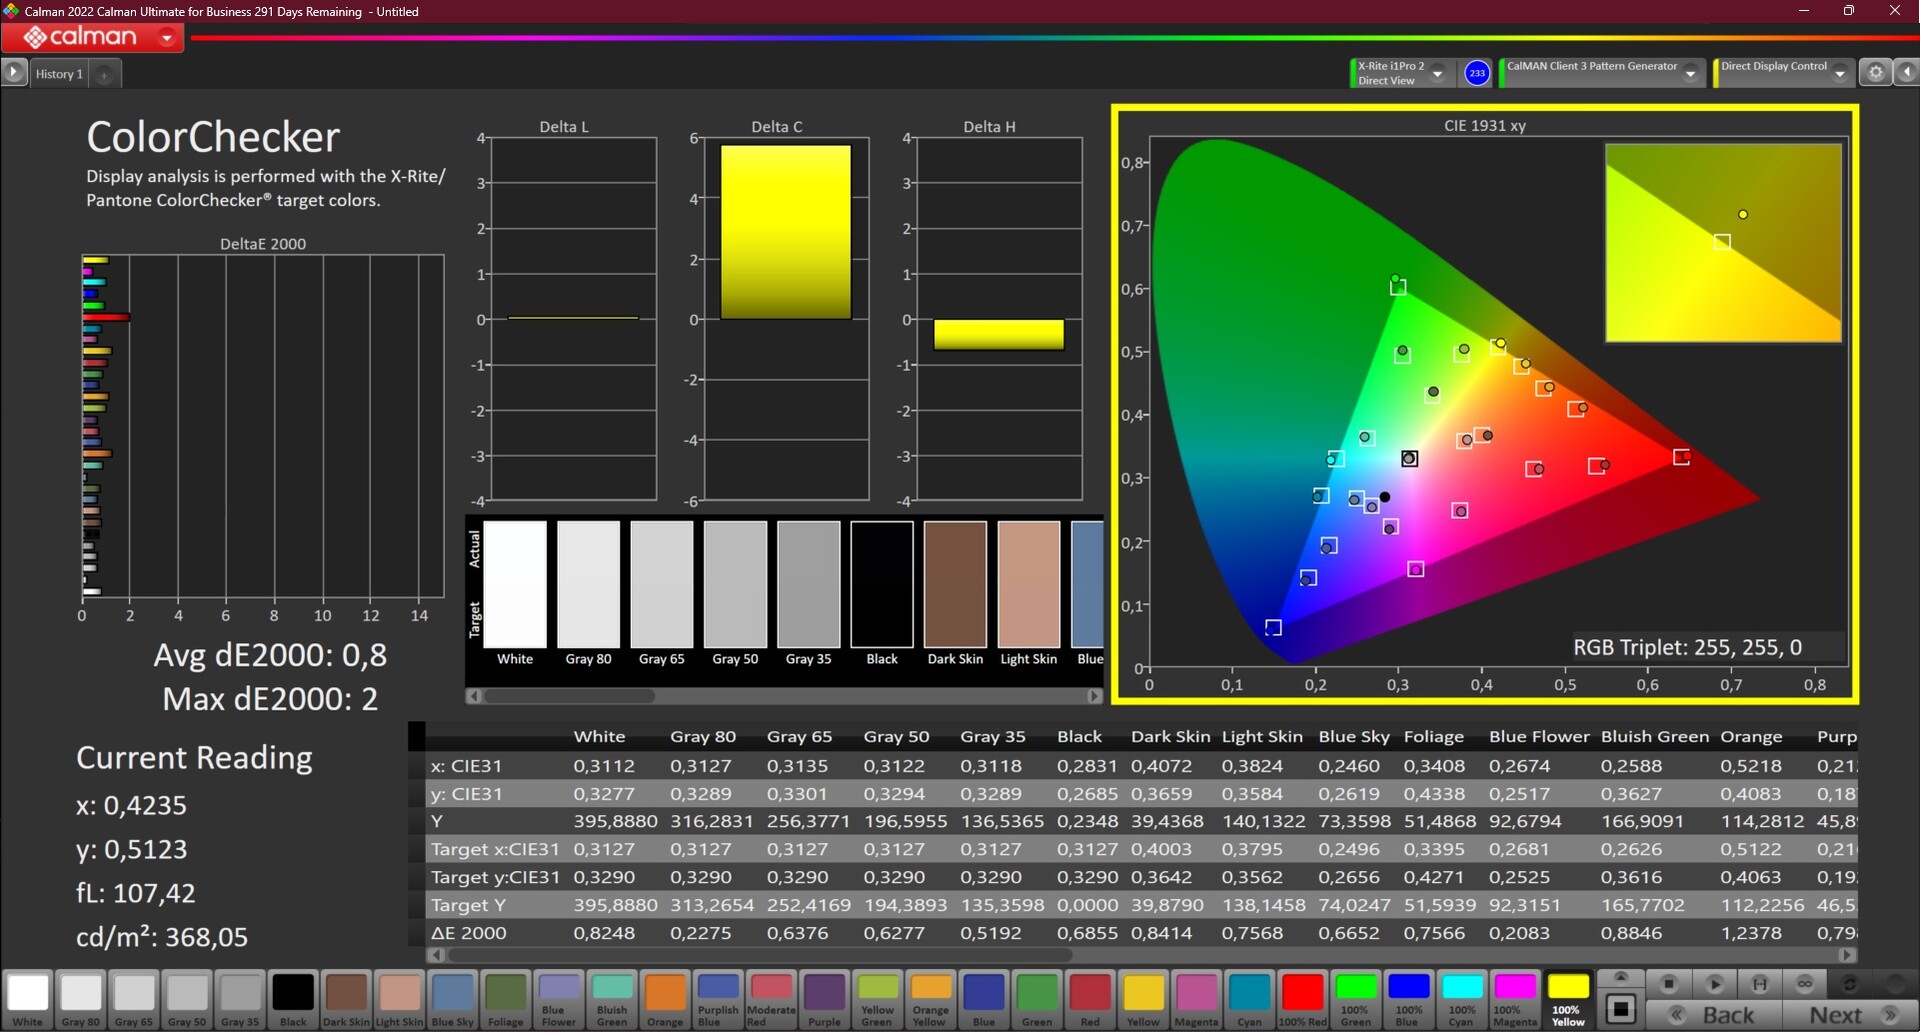
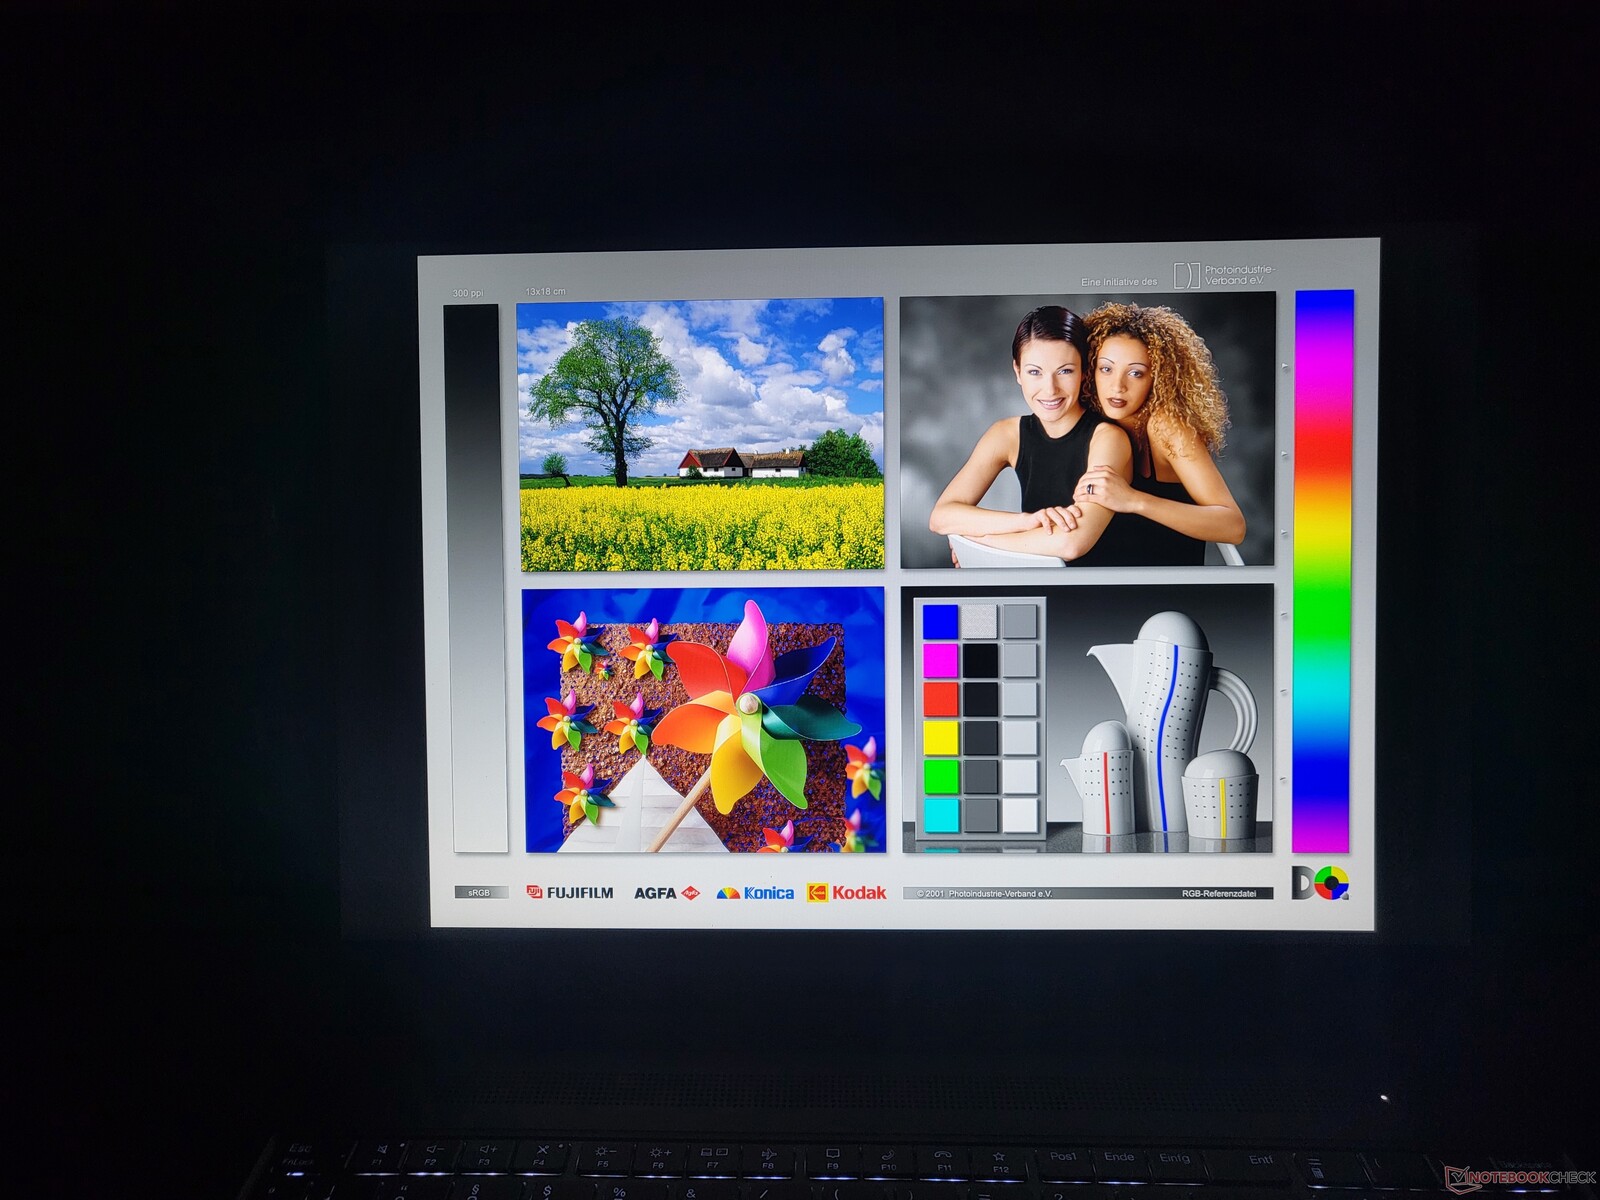
Po wyjęciu z pudełka kolory były ustawione nieco za chłodno, co mogliśmy zmierzyć za pomocą programu CalMan i kolorymetru X-Rite i1Pro 2. Kalibracja pomogła to skorygować, a także przyczyniła się do osiągnięcia doskonałej wartości DeltaE na poziomie 0,8. Jak zawsze, stworzony przez nas profil jest dostępny do pobrania, bez żadnych opłat.
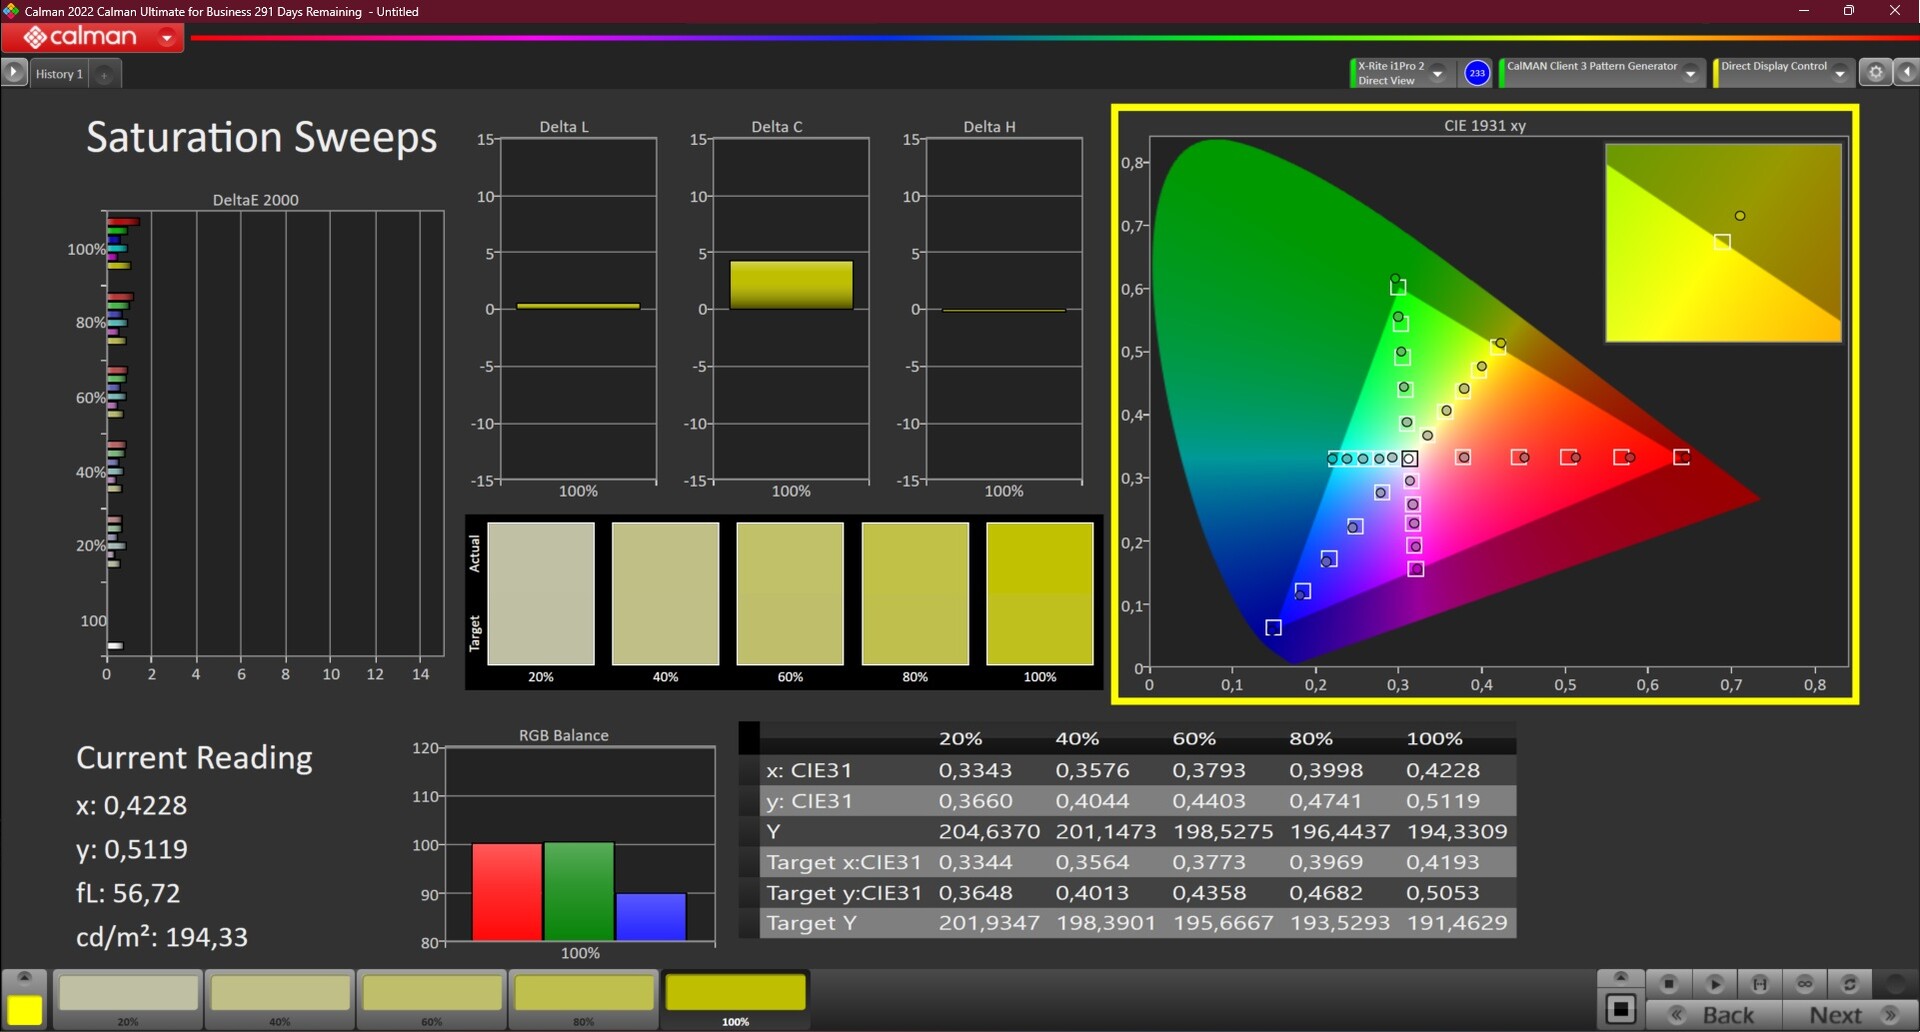
Po skalibrowaniu, monitor może być również używany do prostego przetwarzania obrazów, ponieważ całkowicie pokrywa przestrzeń kolorów sRGB. W przypadku większych przestrzeni barw należy wybrać jedną z opcji WQUXGA.
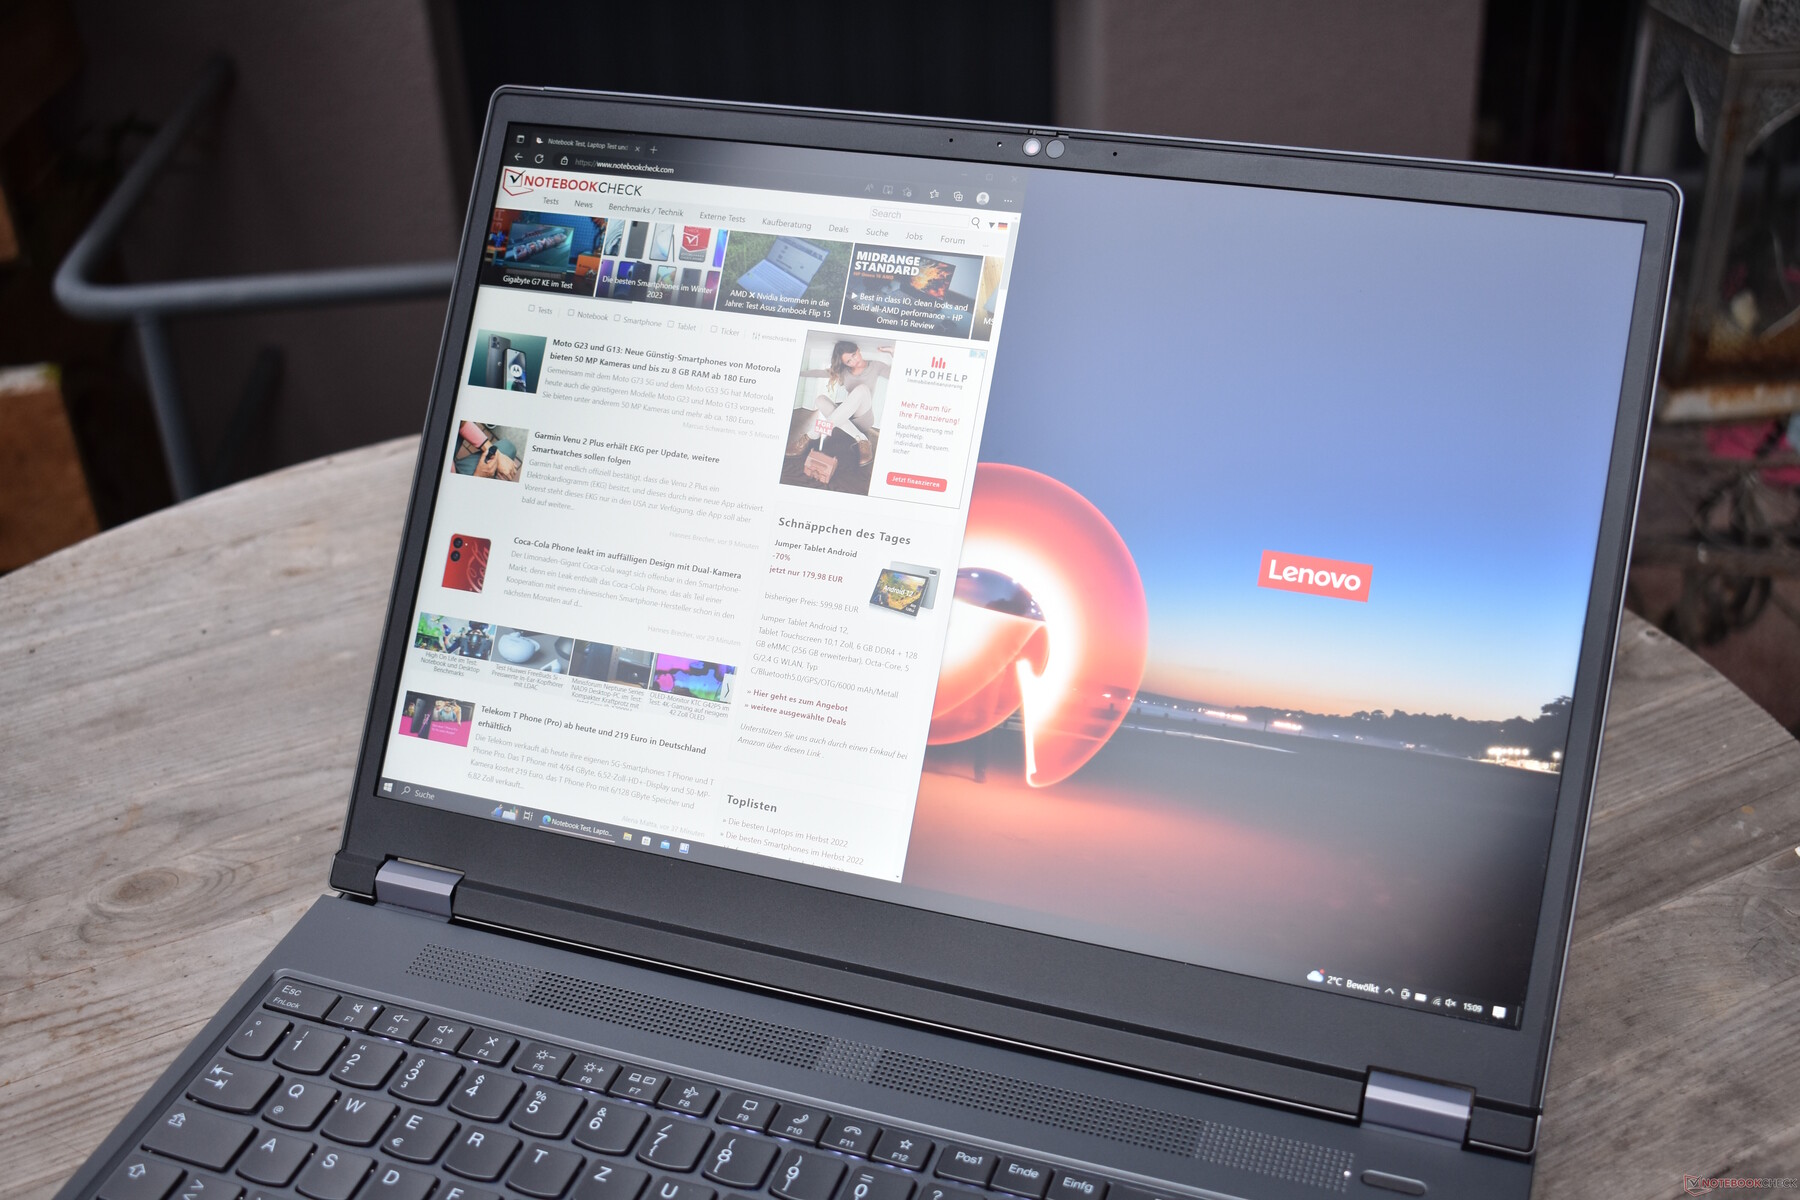
Na zewnątrz Lenovo ThinkPad P16 G1 radzi sobie bardzo dobrze dzięki matowemu wyświetlaczowi o dobrym poziomie jasności.
Wyświetl czasy reakcji
| ↔ Czas reakcji od czerni do bieli | ||
|---|---|---|
| 26.3 ms ... wzrost ↗ i spadek ↘ łącznie | ↗ 14 ms wzrost | 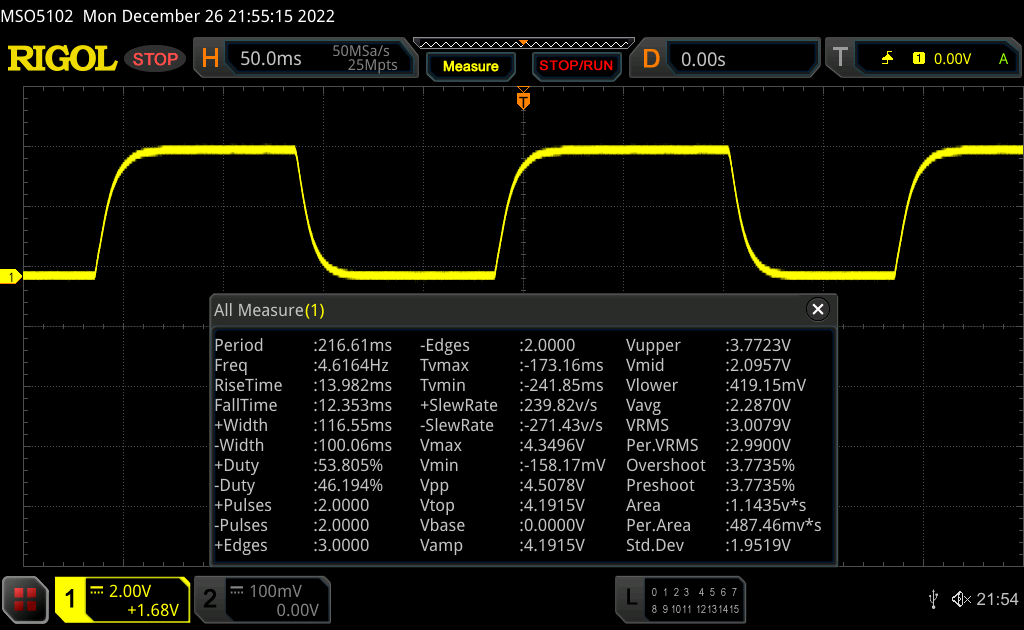 |
| ↘ 12.3 ms upadek | ||
| W naszych testach ekran wykazuje stosunkowo powolne tempo reakcji i może być zbyt wolny dla graczy. Dla porównania, wszystkie testowane urządzenia wahają się od 0.1 (minimum) do 240 (maksimum) ms. » 65 % wszystkich urządzeń jest lepszych. Oznacza to, że zmierzony czas reakcji jest gorszy od średniej wszystkich testowanych urządzeń (19.9 ms). | ||
| ↔ Czas reakcji 50% szarości do 80% szarości | ||
| 37.7 ms ... wzrost ↗ i spadek ↘ łącznie | ↗ 18.6 ms wzrost | 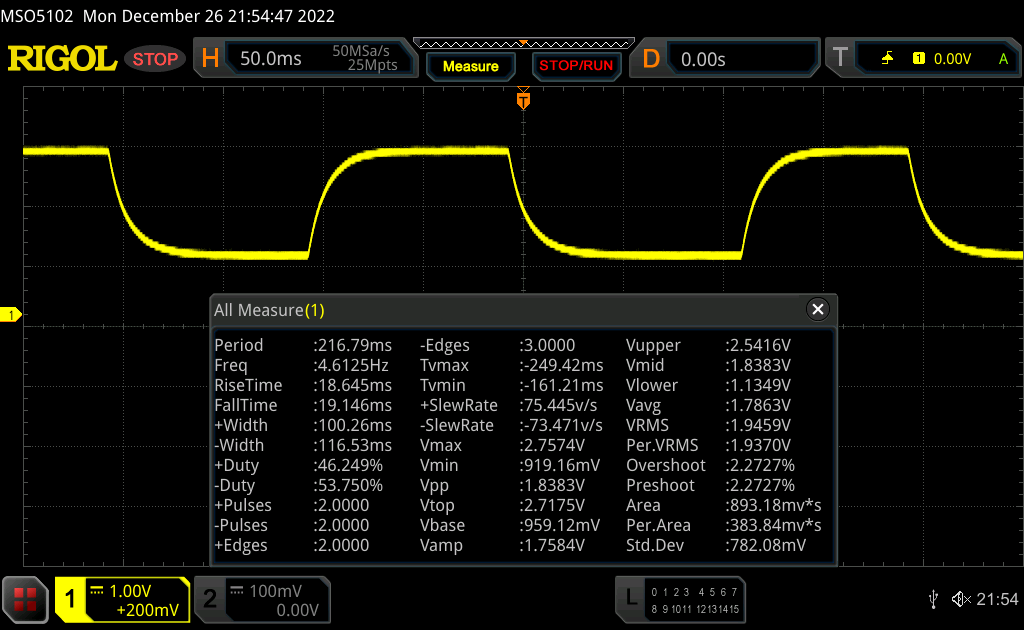 |
| ↘ 19.1 ms upadek | ||
| W naszych testach ekran wykazuje powolne tempo reakcji, co będzie niezadowalające dla graczy. Dla porównania, wszystkie testowane urządzenia wahają się od 0.165 (minimum) do 636 (maksimum) ms. » 55 % wszystkich urządzeń jest lepszych. Oznacza to, że zmierzony czas reakcji jest gorszy od średniej wszystkich testowanych urządzeń (31.1 ms). | ||
Migotanie ekranu / PWM (modulacja szerokości impulsu)
| Migotanie ekranu/nie wykryto PWM |  | ||
Dla porównania: 52 % wszystkich testowanych urządzeń nie używa PWM do przyciemniania wyświetlacza. Jeśli wykryto PWM, zmierzono średnio 7798 (minimum: 5 - maksimum: 343500) Hz. | |||
Wydajność: Mocny procesor Intela i dość słaby układ graficzny Nvidii
Lenovo oferuje model ThinkPad P16 G1 w wielu różnych konfiguracjach. Wszystkie zawierają procesor Intela z serii Alder Lake HX, a opcje to.Intel Core i5-12600HX, i7-12800HX, i7-12850HX, i9-12900HXjak równieżi9-12950HX. Niestety procesory Xeon nie są już dostępne i ich zadanie wykonują teraz procesory kończące się na 50. Jako że Lenovo nie lutuje swoich GPU, każdy z tych procesorów można skonfigurować z jednym z następujących układów graficznych: Intel ARC Pro A30M, Nvidia RTX A1000, RTX A2000, RTX A3000, RTX A4500 oraz RTX A5500.
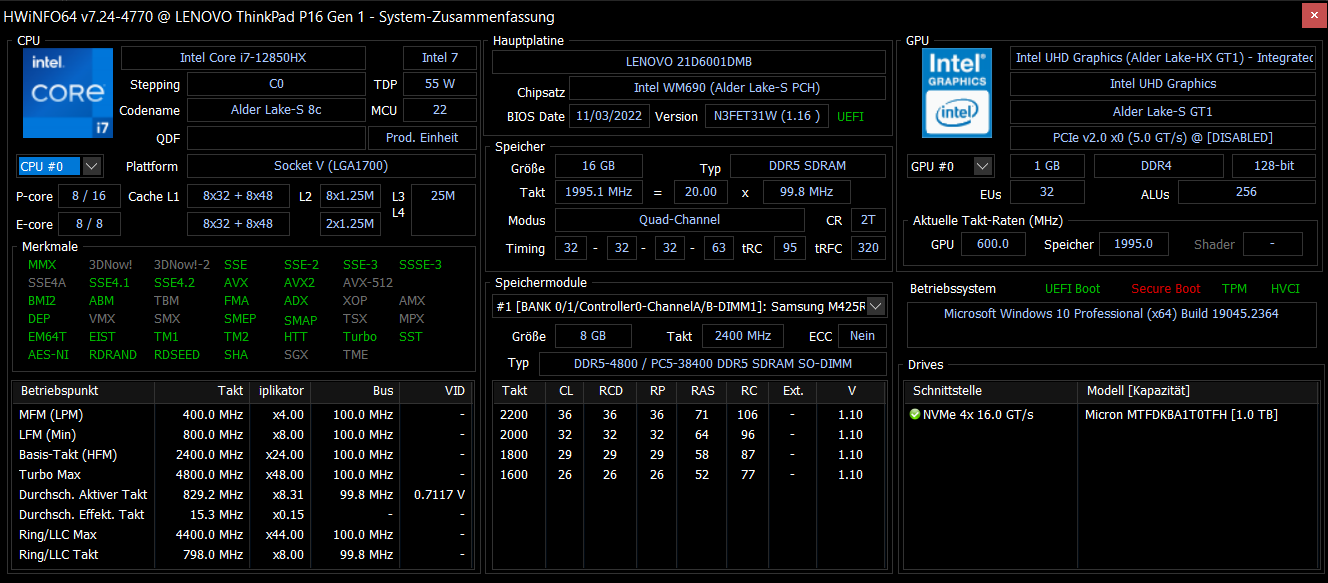
Możliwości nie kończą się tutaj, gdyż Lenovo ThinkPad P16 G1 posiada cztery gniazda pamięci RAM. To sprawia, że możliwe jest posiadanie do 128 GB pamięci RAM DDR5-3600, przy czym również ECC RAM jest dostępne dla procesorów z modelu 50. W sumie są dwa gniazda SSD i oba mogą przyjąć dyski SSD M.2 2280. Maksymalna pojemność pamięci masowej, jaką Lenovo sprzedaje w swoim laptopie ThinkPad, wynosi do ośmiu terabajtów i występuje w postaci dwóch 4-terabajtowych dysków SSD.
Warunki badania
Lenovo stosuje w ThinkPadach tryby zasilania właściwe dla systemu Windows. Przez krótki czas procesor może zużywać do 125 W, ale w dłuższym okresie jest ograniczony do 95 W. Jeśli zamiast trybu "Best Performance" wybrany zostanie tryb zasilania "Better Performance", zużycie wynosi na krótko 100 W, a przy ciągłym obciążeniu 80 W. W trybie "Większa wydajność baterii" ograniczenia są znacznie poważniejsze - turbo wynosi 70 watów, a stałe zużycie - 30 watów. Poza testem baterii WiFi, nasze testy zostały przeprowadzone w trybie "Best Performance".
Jedna szczególna cecha naszego urządzenia: Nadal jest wyposażony w system Windows 10 Pro. Dla większości testów nie jest to problem, ale ta starsza wersja systemu Windows była odpowiedzialna za bardzo niski wynik w Cinebench R15. Z tego powodu zrezygnowaliśmy z pętli Cinebench R15 z tym urządzeniem.
Procesor
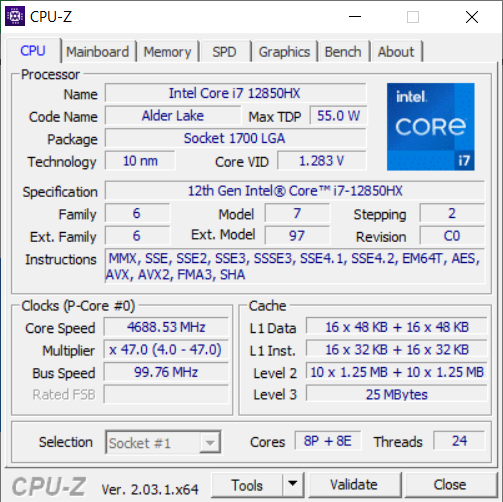
Na stronie .Intel Core i7-12850HXto procesor posiadający łącznie 16 rdzeni. Ponieważ architektura "Alder Lake" posiada asymetryczną strukturę, osiem z tych rdzeni to wydajne rdzenie P (2,1 do 4,8 GHz), a pozostałe osiem to wydajne rdzenie E (1,5 do 3,4 GHz). Dzięki hyperthreadingowi procesor posiada ponad 24 wątki. Jako członek serii HX55 typowe TDP oscyluje wokół 55 W. Szczegółowe porównanie z innymi obecnymi procesorami można znaleźć w naszym Lista procesorów.
Wydajność procesora w systemie jest znakomita i powyżej średniej dla tego procesora. ThinkPad P16 dość przekonująco pokonuje Dell Precision 7670. Jednak Asus ExpertBook B6 Flip jest szybszy dzięki zastosowaniu i9. Co ciekawe, X1 Extreme G5 jest prawie na równi z P16, choć ma tylko sześć rdzeni P. W porównaniu z modelami P15 G2 i P17 G2, wydajność procesora jest o około 31 do 35% lepsza
.W trybie akumulatorowym ThinkPad P16 uzyskał w Cinebench R23 wynik 14,844 pkt. Bez podłączonego zasilacza wydajność procesora jest o około 15 proc. niższa.
Cinebench R23 Multi Endurance Test
Cinebench R23: Multi Core | Single Core
Cinebench R20: CPU (Multi Core) | CPU (Single Core)
Cinebench R15: CPU Multi 64Bit | CPU Single 64Bit
Blender: v2.79 BMW27 CPU
7-Zip 18.03: 7z b 4 | 7z b 4 -mmt1
Geekbench 5.5: Multi-Core | Single-Core
HWBOT x265 Benchmark v2.2: 4k Preset
LibreOffice : 20 Documents To PDF
R Benchmark 2.5: Overall mean
| CPU Performance rating | |
| Średnia w klasie Workstation | |
| Asus ExpertBook B6 Flip B6602FC2 | |
| Lenovo ThinkPad P16 G1 21D6001DMB | |
| Lenovo ThinkPad X1 Extreme G5-21DE003RGE | |
| Przeciętny Intel Core i7-12850HX | |
| Dell Precision 7670 | |
| HP ZBook Fury 17 G8-4A6A9EA | |
| Lenovo ThinkPad Z16 G1 21D5S00T00 | |
| Lenovo ThinkPad P17 G2-20YU0025G | |
| Lenovo ThinkPad P15 G2-20YQ001JGE | |
| Cinebench R23 / Multi Core | |
| Średnia w klasie Workstation (14055 - 38520, n=25, ostatnie 2 lata) | |
| Asus ExpertBook B6 Flip B6602FC2 | |
| Lenovo ThinkPad X1 Extreme G5-21DE003RGE | |
| Lenovo ThinkPad P16 G1 21D6001DMB | |
| Przeciętny Intel Core i7-12850HX (15093 - 17510, n=2) | |
| Dell Precision 7670 | |
| HP ZBook Fury 17 G8-4A6A9EA | |
| Lenovo ThinkPad P17 G2-20YU0025G | |
| Lenovo ThinkPad Z16 G1 21D5S00T00 | |
| Lenovo ThinkPad P15 G2-20YQ001JGE | |
| Cinebench R23 / Single Core | |
| Średnia w klasie Workstation (1712 - 2228, n=25, ostatnie 2 lata) | |
| Asus ExpertBook B6 Flip B6602FC2 | |
| Lenovo ThinkPad P16 G1 21D6001DMB | |
| Lenovo ThinkPad X1 Extreme G5-21DE003RGE | |
| Przeciętny Intel Core i7-12850HX (1596 - 1845, n=2) | |
| HP ZBook Fury 17 G8-4A6A9EA | |
| Dell Precision 7670 | |
| Lenovo ThinkPad P17 G2-20YU0025G | |
| Lenovo ThinkPad P15 G2-20YQ001JGE | |
| Lenovo ThinkPad Z16 G1 21D5S00T00 | |
| Cinebench R20 / CPU (Multi Core) | |
| Średnia w klasie Workstation (5471 - 15043, n=25, ostatnie 2 lata) | |
| Asus ExpertBook B6 Flip B6602FC2 | |
| Lenovo ThinkPad X1 Extreme G5-21DE003RGE | |
| Lenovo ThinkPad P16 G1 21D6001DMB | |
| Przeciętny Intel Core i7-12850HX (6217 - 6764, n=2) | |
| Dell Precision 7670 | |
| Lenovo ThinkPad P17 G2-20YU0025G | |
| HP ZBook Fury 17 G8-4A6A9EA | |
| Lenovo ThinkPad Z16 G1 21D5S00T00 | |
| Lenovo ThinkPad P15 G2-20YQ001JGE | |
| Cinebench R20 / CPU (Single Core) | |
| Średnia w klasie Workstation (671 - 857, n=25, ostatnie 2 lata) | |
| Asus ExpertBook B6 Flip B6602FC2 | |
| Lenovo ThinkPad P16 G1 21D6001DMB | |
| Lenovo ThinkPad X1 Extreme G5-21DE003RGE | |
| Przeciętny Intel Core i7-12850HX (687 - 708, n=2) | |
| Dell Precision 7670 | |
| HP ZBook Fury 17 G8-4A6A9EA | |
| Lenovo ThinkPad Z16 G1 21D5S00T00 | |
| Lenovo ThinkPad P17 G2-20YU0025G | |
| Lenovo ThinkPad P15 G2-20YQ001JGE | |
| Cinebench R15 / CPU Multi 64Bit | |
| Średnia w klasie Workstation (2489 - 5810, n=25, ostatnie 2 lata) | |
| Asus ExpertBook B6 Flip B6602FC2 | |
| Lenovo ThinkPad P16 G1 21D6001DMB | |
| Lenovo ThinkPad X1 Extreme G5-21DE003RGE | |
| Przeciętny Intel Core i7-12850HX (2432 - 2926, n=2) | |
| Dell Precision 7670 | |
| Lenovo ThinkPad P17 G2-20YU0025G | |
| HP ZBook Fury 17 G8-4A6A9EA | |
| Lenovo ThinkPad Z16 G1 21D5S00T00 | |
| Lenovo ThinkPad P15 G2-20YQ001JGE | |
| Cinebench R15 / CPU Single 64Bit | |
| Średnia w klasie Workstation (191.4 - 328, n=25, ostatnie 2 lata) | |
| Asus ExpertBook B6 Flip B6602FC2 | |
| Lenovo ThinkPad P16 G1 21D6001DMB | |
| Przeciętny Intel Core i7-12850HX (253 - 268, n=2) | |
| Lenovo ThinkPad X1 Extreme G5-21DE003RGE | |
| Dell Precision 7670 | |
| HP ZBook Fury 17 G8-4A6A9EA | |
| Lenovo ThinkPad Z16 G1 21D5S00T00 | |
| Lenovo ThinkPad P17 G2-20YU0025G | |
| Lenovo ThinkPad P15 G2-20YQ001JGE | |
| Blender / v2.79 BMW27 CPU | |
| Lenovo ThinkPad P15 G2-20YQ001JGE | |
| Lenovo ThinkPad P17 G2-20YU0025G | |
| HP ZBook Fury 17 G8-4A6A9EA | |
| Lenovo ThinkPad Z16 G1 21D5S00T00 | |
| Dell Precision 7670 | |
| Przeciętny Intel Core i7-12850HX (181 - 205, n=2) | |
| Asus ExpertBook B6 Flip B6602FC2 | |
| Lenovo ThinkPad X1 Extreme G5-21DE003RGE | |
| Lenovo ThinkPad P16 G1 21D6001DMB | |
| Średnia w klasie Workstation (91 - 261, n=25, ostatnie 2 lata) | |
| 7-Zip 18.03 / 7z b 4 | |
| Średnia w klasie Workstation (54741 - 116969, n=25, ostatnie 2 lata) | |
| Asus ExpertBook B6 Flip B6602FC2 | |
| Lenovo ThinkPad P16 G1 21D6001DMB | |
| Lenovo ThinkPad X1 Extreme G5-21DE003RGE | |
| Przeciętny Intel Core i7-12850HX (53893 - 69464, n=2) | |
| Lenovo ThinkPad Z16 G1 21D5S00T00 | |
| Dell Precision 7670 | |
| HP ZBook Fury 17 G8-4A6A9EA | |
| Lenovo ThinkPad P15 G2-20YQ001JGE | |
| Lenovo ThinkPad P17 G2-20YU0025G | |
| 7-Zip 18.03 / 7z b 4 -mmt1 | |
| Asus ExpertBook B6 Flip B6602FC2 | |
| Średnia w klasie Workstation (5126 - 6960, n=25, ostatnie 2 lata) | |
| HP ZBook Fury 17 G8-4A6A9EA | |
| Lenovo ThinkPad P16 G1 21D6001DMB | |
| Lenovo ThinkPad X1 Extreme G5-21DE003RGE | |
| Przeciętny Intel Core i7-12850HX (5608 - 5916, n=2) | |
| Dell Precision 7670 | |
| Lenovo ThinkPad P15 G2-20YQ001JGE | |
| Lenovo ThinkPad P17 G2-20YU0025G | |
| Lenovo ThinkPad Z16 G1 21D5S00T00 | |
| Geekbench 5.5 / Multi-Core | |
| Średnia w klasie Workstation (11542 - 25554, n=25, ostatnie 2 lata) | |
| Asus ExpertBook B6 Flip B6602FC2 | |
| Lenovo ThinkPad P16 G1 21D6001DMB | |
| Przeciętny Intel Core i7-12850HX (11509 - 13095, n=2) | |
| Lenovo ThinkPad X1 Extreme G5-21DE003RGE | |
| Dell Precision 7670 | |
| Lenovo ThinkPad P15 G2-20YQ001JGE | |
| Lenovo ThinkPad Z16 G1 21D5S00T00 | |
| HP ZBook Fury 17 G8-4A6A9EA | |
| Lenovo ThinkPad P17 G2-20YU0025G | |
| Geekbench 5.5 / Single-Core | |
| Średnia w klasie Workstation (1781 - 2183, n=25, ostatnie 2 lata) | |
| Asus ExpertBook B6 Flip B6602FC2 | |
| Lenovo ThinkPad X1 Extreme G5-21DE003RGE | |
| Lenovo ThinkPad P16 G1 21D6001DMB | |
| Przeciętny Intel Core i7-12850HX (1777 - 1787, n=2) | |
| Dell Precision 7670 | |
| HP ZBook Fury 17 G8-4A6A9EA | |
| Lenovo ThinkPad P15 G2-20YQ001JGE | |
| Lenovo ThinkPad P17 G2-20YU0025G | |
| Lenovo ThinkPad Z16 G1 21D5S00T00 | |
| HWBOT x265 Benchmark v2.2 / 4k Preset | |
| Średnia w klasie Workstation (14.4 - 40.5, n=25, ostatnie 2 lata) | |
| Asus ExpertBook B6 Flip B6602FC2 | |
| Dell Precision 7670 | |
| Przeciętny Intel Core i7-12850HX (17.2 - 17.3, n=2) | |
| Lenovo ThinkPad P16 G1 21D6001DMB | |
| Lenovo ThinkPad X1 Extreme G5-21DE003RGE | |
| Lenovo ThinkPad Z16 G1 21D5S00T00 | |
| Lenovo ThinkPad P17 G2-20YU0025G | |
| HP ZBook Fury 17 G8-4A6A9EA | |
| Lenovo ThinkPad P15 G2-20YQ001JGE | |
| LibreOffice / 20 Documents To PDF | |
| HP ZBook Fury 17 G8-4A6A9EA | |
| Lenovo ThinkPad P17 G2-20YU0025G | |
| Lenovo ThinkPad Z16 G1 21D5S00T00 | |
| Dell Precision 7670 | |
| Lenovo ThinkPad P15 G2-20YQ001JGE | |
| Średnia w klasie Workstation (37.1 - 74.7, n=25, ostatnie 2 lata) | |
| Przeciętny Intel Core i7-12850HX (46.9 - 48.6, n=2) | |
| Lenovo ThinkPad P16 G1 21D6001DMB | |
| Asus ExpertBook B6 Flip B6602FC2 | |
| Lenovo ThinkPad X1 Extreme G5-21DE003RGE | |
| R Benchmark 2.5 / Overall mean | |
| Lenovo ThinkPad P17 G2-20YU0025G | |
| Lenovo ThinkPad P15 G2-20YQ001JGE | |
| HP ZBook Fury 17 G8-4A6A9EA | |
| Lenovo ThinkPad Z16 G1 21D5S00T00 | |
| Dell Precision 7670 | |
| Lenovo ThinkPad X1 Extreme G5-21DE003RGE | |
| Przeciętny Intel Core i7-12850HX (0.45 - 0.4698, n=2) | |
| Asus ExpertBook B6 Flip B6602FC2 | |
| Lenovo ThinkPad P16 G1 21D6001DMB | |
| Średnia w klasie Workstation (0.3825 - 0.603, n=25, ostatnie 2 lata) | |
* ... im mniej tym lepiej
AIDA64: FP32 Ray-Trace | FPU Julia | CPU SHA3 | CPU Queen | FPU SinJulia | FPU Mandel | CPU AES | CPU ZLib | FP64 Ray-Trace | CPU PhotoWorxx
| Performance rating | |
| Średnia w klasie Workstation | |
| Lenovo ThinkPad P16 G1 21D6001DMB | |
| Asus ExpertBook B6 Flip B6602FC2 | |
| Przeciętny Intel Core i7-12850HX | |
| HP ZBook Fury 17 G8-4A6A9EA | |
| Dell Precision 7670 | |
| AIDA64 / FP32 Ray-Trace | |
| Średnia w klasie Workstation (10658 - 61611, n=25, ostatnie 2 lata) | |
| Lenovo ThinkPad P16 G1 21D6001DMB | |
| Asus ExpertBook B6 Flip B6602FC2 | |
| HP ZBook Fury 17 G8-4A6A9EA | |
| Przeciętny Intel Core i7-12850HX (12983 - 16752, n=2) | |
| Dell Precision 7670 | |
| AIDA64 / FPU Julia | |
| Średnia w klasie Workstation (56664 - 186971, n=25, ostatnie 2 lata) | |
| Lenovo ThinkPad P16 G1 21D6001DMB | |
| Asus ExpertBook B6 Flip B6602FC2 | |
| Przeciętny Intel Core i7-12850HX (68219 - 87231, n=2) | |
| Dell Precision 7670 | |
| HP ZBook Fury 17 G8-4A6A9EA | |
| AIDA64 / CPU SHA3 | |
| Średnia w klasie Workstation (2608 - 8975, n=25, ostatnie 2 lata) | |
| HP ZBook Fury 17 G8-4A6A9EA | |
| Lenovo ThinkPad P16 G1 21D6001DMB | |
| Asus ExpertBook B6 Flip B6602FC2 | |
| Przeciętny Intel Core i7-12850HX (3098 - 3818, n=2) | |
| Dell Precision 7670 | |
| AIDA64 / CPU Queen | |
| Średnia w klasie Workstation (60778 - 144411, n=25, ostatnie 2 lata) | |
| Asus ExpertBook B6 Flip B6602FC2 | |
| HP ZBook Fury 17 G8-4A6A9EA | |
| Lenovo ThinkPad P16 G1 21D6001DMB | |
| Przeciętny Intel Core i7-12850HX (26716 - 95664, n=2) | |
| Dell Precision 7670 | |
| AIDA64 / FPU SinJulia | |
| Średnia w klasie Workstation (8165 - 29343, n=25, ostatnie 2 lata) | |
| Lenovo ThinkPad P16 G1 21D6001DMB | |
| Asus ExpertBook B6 Flip B6602FC2 | |
| Przeciętny Intel Core i7-12850HX (9869 - 11286, n=2) | |
| HP ZBook Fury 17 G8-4A6A9EA | |
| Dell Precision 7670 | |
| AIDA64 / FPU Mandel | |
| Średnia w klasie Workstation (27301 - 98153, n=25, ostatnie 2 lata) | |
| Lenovo ThinkPad P16 G1 21D6001DMB | |
| Asus ExpertBook B6 Flip B6602FC2 | |
| HP ZBook Fury 17 G8-4A6A9EA | |
| Przeciętny Intel Core i7-12850HX (34218 - 42580, n=2) | |
| Dell Precision 7670 | |
| AIDA64 / CPU AES | |
| Średnia w klasie Workstation (56077 - 187841, n=25, ostatnie 2 lata) | |
| HP ZBook Fury 17 G8-4A6A9EA | |
| Lenovo ThinkPad P16 G1 21D6001DMB | |
| Asus ExpertBook B6 Flip B6602FC2 | |
| Przeciętny Intel Core i7-12850HX (63362 - 80775, n=2) | |
| Dell Precision 7670 | |
| AIDA64 / CPU ZLib | |
| Średnia w klasie Workstation (742 - 2148, n=25, ostatnie 2 lata) | |
| Lenovo ThinkPad P16 G1 21D6001DMB | |
| Asus ExpertBook B6 Flip B6602FC2 | |
| Przeciętny Intel Core i7-12850HX (817 - 1102, n=2) | |
| Dell Precision 7670 | |
| HP ZBook Fury 17 G8-4A6A9EA | |
| AIDA64 / FP64 Ray-Trace | |
| Średnia w klasie Workstation (5580 - 32891, n=25, ostatnie 2 lata) | |
| Lenovo ThinkPad P16 G1 21D6001DMB | |
| Asus ExpertBook B6 Flip B6602FC2 | |
| HP ZBook Fury 17 G8-4A6A9EA | |
| Przeciętny Intel Core i7-12850HX (7671 - 9145, n=2) | |
| Dell Precision 7670 | |
| AIDA64 / CPU PhotoWorxx | |
| Średnia w klasie Workstation (37151 - 93684, n=25, ostatnie 2 lata) | |
| Dell Precision 7670 | |
| Przeciętny Intel Core i7-12850HX (33415 - 42035, n=2) | |
| Asus ExpertBook B6 Flip B6602FC2 | |
| Lenovo ThinkPad P16 G1 21D6001DMB | |
| HP ZBook Fury 17 G8-4A6A9EA | |
Wydajność systemu
Choć wyniki PCMark 10 są stosunkowo niższe, Lenovo ThinkPad P16 G1 oferuje bardzo dobrą wydajność w codziennym użytkowaniu - co jest logiczne, biorąc pod uwagę potężne podzespoły. Odpowiednio, CrossMark okazuje się znacznie lepszy.
CrossMark: Overall | Productivity | Creativity | Responsiveness
| PCMark 10 / Score | |
| Średnia w klasie Workstation (6436 - 10409, n=21, ostatnie 2 lata) | |
| Asus ExpertBook B6 Flip B6602FC2 | |
| Dell Precision 7670 | |
| Lenovo ThinkPad P15 G2-20YQ001JGE | |
| Przeciętny Intel Core i7-12850HX, NVIDIA RTX A2000 Laptop GPU (6226 - 6663, n=2) | |
| Lenovo ThinkPad P17 G2-20YU0025G | |
| Lenovo ThinkPad P16 G1 21D6001DMB | |
| HP ZBook Fury 17 G8-4A6A9EA | |
| PCMark 10 / Essentials | |
| Asus ExpertBook B6 Flip B6602FC2 | |
| Dell Precision 7670 | |
| Średnia w klasie Workstation (9622 - 11157, n=21, ostatnie 2 lata) | |
| Przeciętny Intel Core i7-12850HX, NVIDIA RTX A2000 Laptop GPU (10128 - 10555, n=2) | |
| Lenovo ThinkPad P15 G2-20YQ001JGE | |
| Lenovo ThinkPad P16 G1 21D6001DMB | |
| Lenovo ThinkPad P17 G2-20YU0025G | |
| HP ZBook Fury 17 G8-4A6A9EA | |
| PCMark 10 / Productivity | |
| Średnia w klasie Workstation (8789 - 20616, n=21, ostatnie 2 lata) | |
| Asus ExpertBook B6 Flip B6602FC2 | |
| Lenovo ThinkPad P16 G1 21D6001DMB | |
| Przeciętny Intel Core i7-12850HX, NVIDIA RTX A2000 Laptop GPU (9008 - 9349, n=2) | |
| Dell Precision 7670 | |
| Lenovo ThinkPad P15 G2-20YQ001JGE | |
| Lenovo ThinkPad P17 G2-20YU0025G | |
| HP ZBook Fury 17 G8-4A6A9EA | |
| PCMark 10 / Digital Content Creation | |
| Średnia w klasie Workstation (7744 - 15631, n=21, ostatnie 2 lata) | |
| HP ZBook Fury 17 G8-4A6A9EA | |
| Asus ExpertBook B6 Flip B6602FC2 | |
| Lenovo ThinkPad P15 G2-20YQ001JGE | |
| Lenovo ThinkPad P17 G2-20YU0025G | |
| Dell Precision 7670 | |
| Przeciętny Intel Core i7-12850HX, NVIDIA RTX A2000 Laptop GPU (6918 - 8443, n=2) | |
| Lenovo ThinkPad P16 G1 21D6001DMB | |
| CrossMark / Overall | |
| Asus ExpertBook B6 Flip B6602FC2 | |
| Średnia w klasie Workstation (1307 - 2267, n=24, ostatnie 2 lata) | |
| Lenovo ThinkPad P16 G1 21D6001DMB | |
| Przeciętny Intel Core i7-12850HX, NVIDIA RTX A2000 Laptop GPU (1509 - 1720, n=2) | |
| Dell Precision 7670 | |
| HP ZBook Fury 17 G8-4A6A9EA | |
| CrossMark / Productivity | |
| Asus ExpertBook B6 Flip B6602FC2 | |
| Średnia w klasie Workstation (1130 - 2122, n=24, ostatnie 2 lata) | |
| Lenovo ThinkPad P16 G1 21D6001DMB | |
| Przeciętny Intel Core i7-12850HX, NVIDIA RTX A2000 Laptop GPU (1445 - 1611, n=2) | |
| HP ZBook Fury 17 G8-4A6A9EA | |
| Dell Precision 7670 | |
| CrossMark / Creativity | |
| Średnia w klasie Workstation (1657 - 2725, n=24, ostatnie 2 lata) | |
| Asus ExpertBook B6 Flip B6602FC2 | |
| Lenovo ThinkPad P16 G1 21D6001DMB | |
| Przeciętny Intel Core i7-12850HX, NVIDIA RTX A2000 Laptop GPU (1682 - 1943, n=2) | |
| Dell Precision 7670 | |
| HP ZBook Fury 17 G8-4A6A9EA | |
| CrossMark / Responsiveness | |
| Asus ExpertBook B6 Flip B6602FC2 | |
| Średnia w klasie Workstation (993 - 2096, n=24, ostatnie 2 lata) | |
| Lenovo ThinkPad P16 G1 21D6001DMB | |
| Przeciętny Intel Core i7-12850HX, NVIDIA RTX A2000 Laptop GPU (1238 - 1454, n=2) | |
| Dell Precision 7670 | |
| HP ZBook Fury 17 G8-4A6A9EA | |
| PCMark 10 Score | 6226 pkt. | |
Pomoc | ||
| AIDA64 / Memory Copy | |
| Średnia w klasie Workstation (56003 - 164795, n=25, ostatnie 2 lata) | |
| Dell Precision 7670 | |
| Asus ExpertBook B6 Flip B6602FC2 | |
| Przeciętny Intel Core i7-12850HX (53840 - 62841, n=2) | |
| Lenovo ThinkPad P16 G1 21D6001DMB | |
| HP ZBook Fury 17 G8-4A6A9EA | |
| AIDA64 / Memory Read | |
| Średnia w klasie Workstation (55795 - 121563, n=25, ostatnie 2 lata) | |
| Dell Precision 7670 | |
| Przeciętny Intel Core i7-12850HX (58944 - 68747, n=2) | |
| Asus ExpertBook B6 Flip B6602FC2 | |
| Lenovo ThinkPad P16 G1 21D6001DMB | |
| HP ZBook Fury 17 G8-4A6A9EA | |
| AIDA64 / Memory Write | |
| Średnia w klasie Workstation (55663 - 214520, n=25, ostatnie 2 lata) | |
| Dell Precision 7670 | |
| Asus ExpertBook B6 Flip B6602FC2 | |
| Przeciętny Intel Core i7-12850HX (52160 - 64365, n=2) | |
| Lenovo ThinkPad P16 G1 21D6001DMB | |
| HP ZBook Fury 17 G8-4A6A9EA | |
| AIDA64 / Memory Latency | |
| Średnia w klasie Workstation (84.5 - 165.2, n=25, ostatnie 2 lata) | |
| Lenovo ThinkPad P16 G1 21D6001DMB | |
| Asus ExpertBook B6 Flip B6602FC2 | |
| Przeciętny Intel Core i7-12850HX (88.5 - 95.4, n=2) | |
| Dell Precision 7670 | |
| HP ZBook Fury 17 G8-4A6A9EA | |
| Lenovo ThinkPad P17 G2-20YU0025G | |
| Lenovo ThinkPad P15 G2-20YQ001JGE | |
* ... im mniej tym lepiej
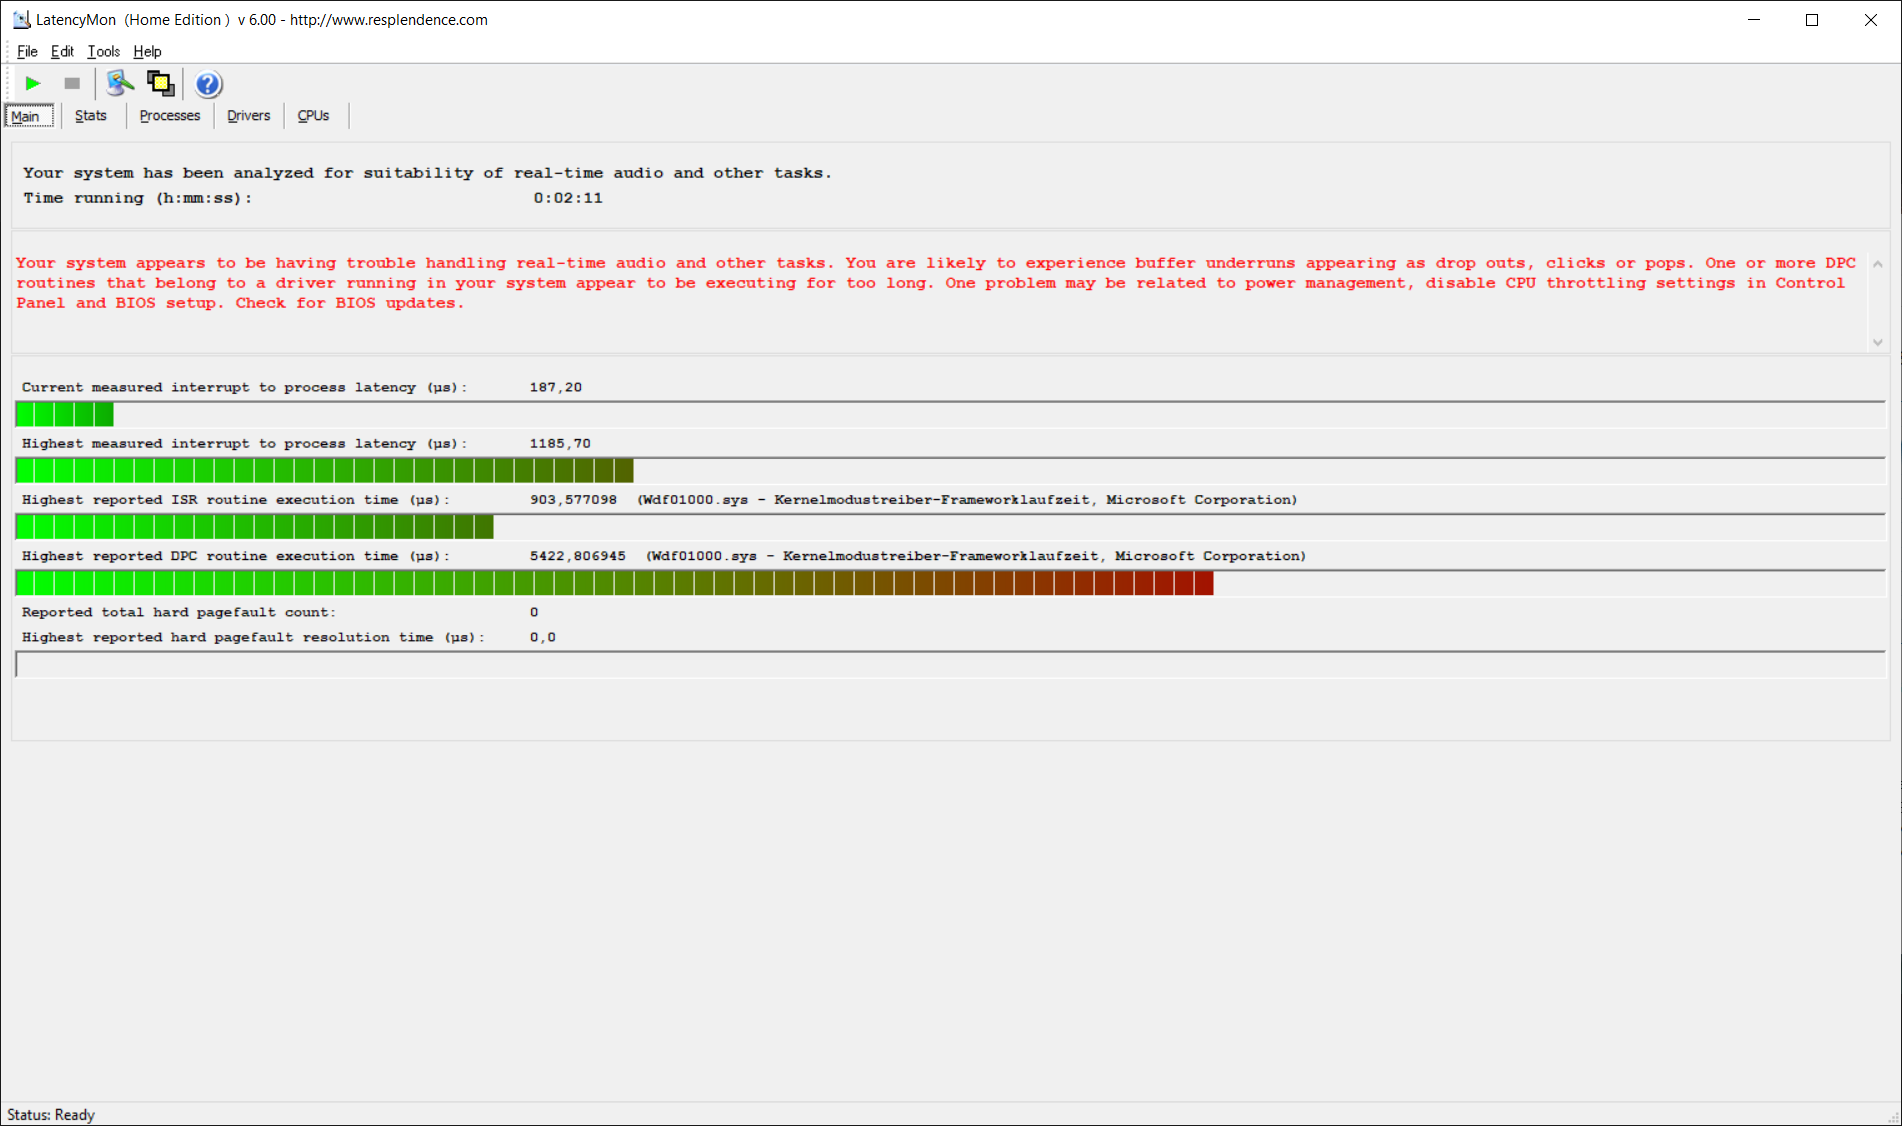
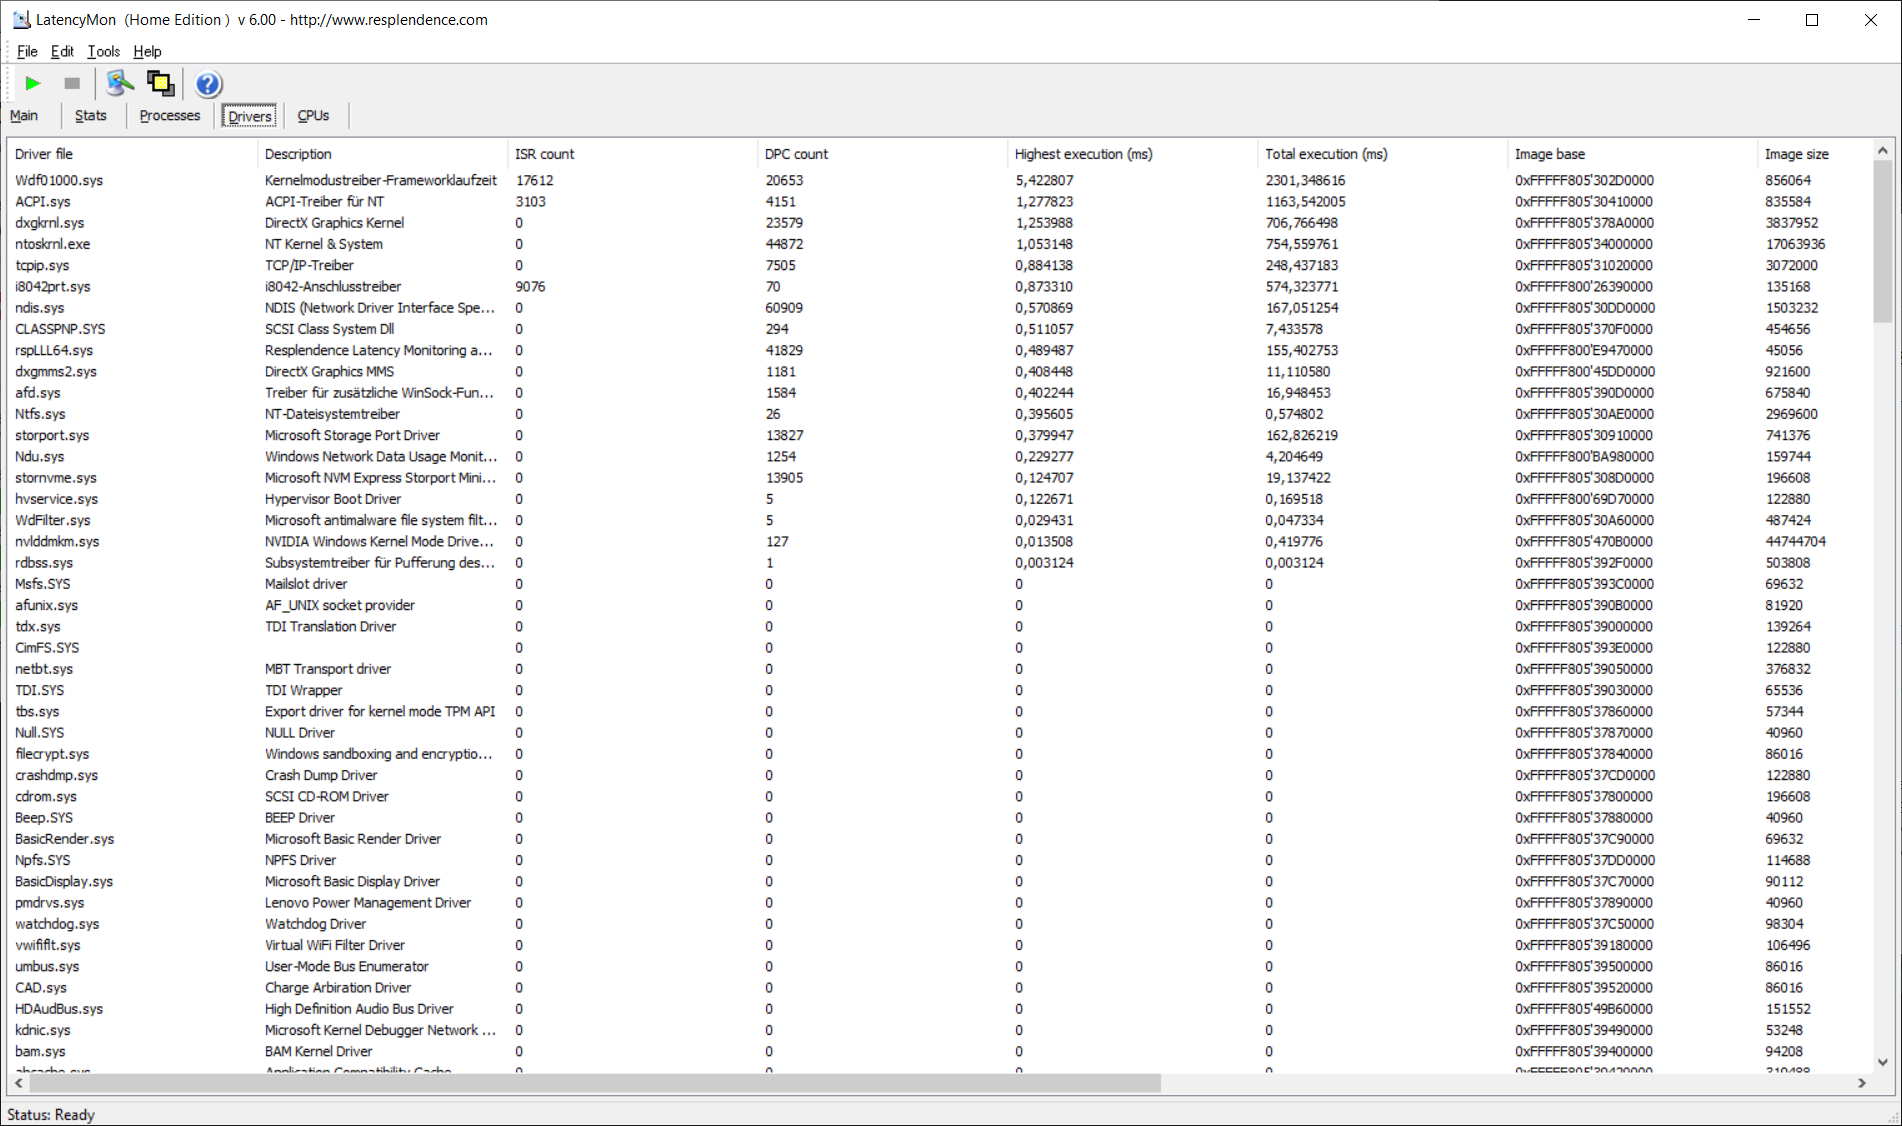
Opóźnienia DPC
Latencje DPC są znacznie niższe od poprzednika, ale nadal zbyt wysokie. Niemniej jednak w każdej chwili może się to zmienić za sprawą aktualizacji sterowników.
| DPC Latencies / LatencyMon - interrupt to process latency (max), Web, Youtube, Prime95 | |
| Lenovo ThinkPad P17 G2-20YU0025G | |
| Lenovo ThinkPad P15 G2-20YQ001JGE | |
| Asus ExpertBook B6 Flip B6602FC2 | |
| Dell Precision 7670 | |
| Lenovo ThinkPad P16 G1 21D6001DMB | |
| HP ZBook Studio 16 G9 62U04EA | |
* ... im mniej tym lepiej
Pamięć masowa
Dysk SSD w Lenovo ThinkPad P16 G1 pochodzi od firmy Micron, ma pojemność jednego terabajta i jest bardzo szybkim dyskiem SSD NVMe PCIe 4.0 w formacie M.2 2280. Dysk SSD jest wolniejszy od dysku SSD Samsunga znajdującego się w Asusie ExpertBook, ale szybszy od pozostałych konkurentów.

| Drive Performance rating - Percent | |
| Asus ExpertBook B6 Flip B6602FC2 | |
| Średnia w klasie Workstation | |
| Przeciętny Micron 3400 1TB MTFDKBA1T0TFH | |
| Lenovo ThinkPad P16 G1 21D6001DMB | |
| HP ZBook Studio 16 G9 62U04EA | |
| Dell Precision 7670 | |
| Lenovo ThinkPad P15 G2-20YQ001JGE | |
| Lenovo ThinkPad P17 G2-20YU0025G | |
* ... im mniej tym lepiej
Continuous Performance Read: DiskSpd Read Loop, Queue Depth 8
Karta graficzna
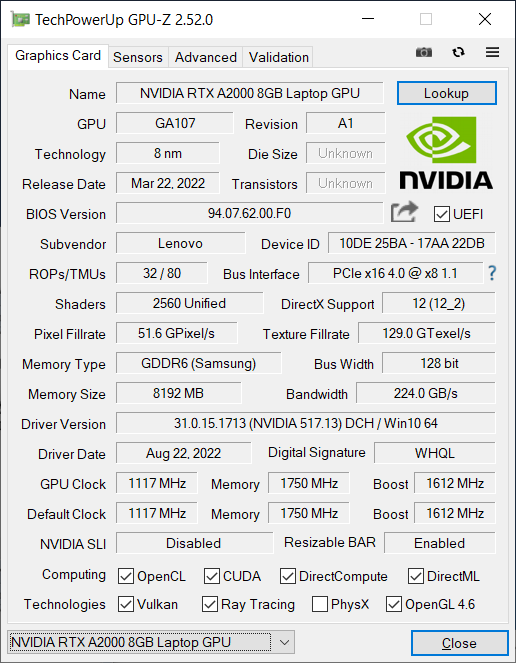
Na stronie .Nvidia RTX A2000 to procesor graficzny generacji Ampere z profesjonalnej serii RTX firmy Nvidia, znanej wcześniej jako "Quadro". 2560 jednostek cieniujących ma maksymalne taktowanie 1,678 GHz. Typowe TDP dla tego układu graficznego wynosi od 35 do 95 W; RTX A2000 ma 8 GB dedykowanej pamięci RAM podłączonej do 128-bitowej szyny pamięci. Strona .Lista GPUto doskonałe źródło porównań benchmarkowych z innymi układami graficznymi.
RTX A2000 w Lenovo ThinkPad P16 może zużywać do 60 watów, co czyni go jedną z podstawowych opcji z następnym najlepszym GPU, RTX A3000 zdolnym do zużywania do 115 watów. Zgodnie z ograniczonym zużyciem, wydajność RTX A2000 nie jest szczególnie wybitna. Ze wszystkich porównywanych stacji roboczych Lenovo ThinkPad P16 wypadł najgorzej, niezależnie od tego, czy w teście 3DMark, czy w specyficznym dla stacji roboczych benchmarku SPECviewperf. W szczególności.Dell Precision 7670jak również Asus ExpertBook B6 Flipwypadły lepiej dzięki prawie tym samym procesorom graficznym, które w tych laptopach mają TDP na poziomie odpowiednio 90 i 95 W.
Wynik ten znajduje odzwierciedlenie także w teście Blendera: W testach akceleracji GPU ThinkPad P16 G1 jest wolniejszy od konkurencji. W teście procesora Blendera jest jednak najszybszą mobilną stacją roboczą.
Podobnie jak w przypadku procesora, wydajność GPU jest ograniczona w trybie pracy na akumulatorze - w porównaniu z pracą na zasilaniu sieciowym wydajność spada o około 15 %.
| 3DMark Performance rating - Percent | |
| Średnia w klasie Workstation | |
| Lenovo ThinkPad P15 G2-20YQ001JGE | |
| Asus ExpertBook B6 Flip B6602FC2 | |
| Dell Precision 7670 | |
| Lenovo ThinkPad P17 G2-20YU0025G | |
| Przeciętny NVIDIA RTX A2000 Laptop GPU | |
| HP ZBook Studio 16 G9 62U04EA | |
| Lenovo ThinkPad P16 G1 21D6001DMB | |
| 3DMark 11 - 1280x720 Performance GPU | |
| Średnia w klasie Workstation (10888 - 69594, n=25, ostatnie 2 lata) | |
| Lenovo ThinkPad P15 G2-20YQ001JGE | |
| Asus ExpertBook B6 Flip B6602FC2 | |
| Dell Precision 7670 | |
| Lenovo ThinkPad P17 G2-20YU0025G | |
| HP ZBook Studio 16 G9 62U04EA | |
| Przeciętny NVIDIA RTX A2000 Laptop GPU (14831 - 19823, n=9) | |
| Lenovo ThinkPad P16 G1 21D6001DMB | |
| 3DMark | |
| 2560x1440 Time Spy Graphics | |
| Średnia w klasie Workstation (2725 - 24806, n=25, ostatnie 2 lata) | |
| Lenovo ThinkPad P15 G2-20YQ001JGE | |
| Asus ExpertBook B6 Flip B6602FC2 | |
| Dell Precision 7670 | |
| Lenovo ThinkPad P17 G2-20YU0025G | |
| Przeciętny NVIDIA RTX A2000 Laptop GPU (4228 - 6108, n=9) | |
| HP ZBook Studio 16 G9 62U04EA | |
| Lenovo ThinkPad P16 G1 21D6001DMB | |
| 1920x1080 Fire Strike Graphics | |
| Średnia w klasie Workstation (7578 - 52560, n=25, ostatnie 2 lata) | |
| Lenovo ThinkPad P15 G2-20YQ001JGE | |
| Asus ExpertBook B6 Flip B6602FC2 | |
| Lenovo ThinkPad P17 G2-20YU0025G | |
| Dell Precision 7670 | |
| Przeciętny NVIDIA RTX A2000 Laptop GPU (10415 - 15988, n=9) | |
| HP ZBook Studio 16 G9 62U04EA | |
| Lenovo ThinkPad P16 G1 21D6001DMB | |
| SPECviewperf Performance rating - Percent | |
| Średnia w klasie Workstation | |
| Lenovo ThinkPad P15 G2-20YQ001JGE | |
| Dell Precision 7670 -1! | |
| Asus ExpertBook B6 Flip B6602FC2 | |
| Lenovo ThinkPad P17 G2-20YU0025G | |
| Przeciętny NVIDIA RTX A2000 Laptop GPU | |
| HP ZBook Studio 16 G9 62U04EA | |
| Lenovo ThinkPad P16 G1 21D6001DMB | |
| 3DMark 11 Performance | 15998 pkt. | |
| 3DMark Cloud Gate Standard Score | 40815 pkt. | |
| 3DMark Fire Strike Score | 10381 pkt. | |
| 3DMark Time Spy Score | 5184 pkt. | |
Pomoc | ||
* ... im mniej tym lepiej
Wydajność w grach
Jako mobilna stacja robocza Lenovo ThinkPad P16 nie jest laptopem do gier. Można jednak korzystać z nowszych gier, choć nie w 4K. Podobnie jak w benchmarkach syntetycznych, bezpośrednia konkurencja jest szybsza od P16. Niskie TDP jest dodatkowo utrudnione przez fakt, że P16 nie udaje się utrzymać stałej wydajności GPU pod stałym obciążeniem.
| Performance rating - Percent | |
| Średnia w klasie Workstation | |
| Asus ExpertBook B6 Flip B6602FC2 | |
| Lenovo ThinkPad P15 G2-20YQ001JGE | |
| Dell Precision 7670 | |
| HP ZBook Fury 17 G8-4A6A9EA | |
| Lenovo ThinkPad P17 G2-20YU0025G | |
| Lenovo ThinkPad P16 G1 21D6001DMB | |
| The Witcher 3 - 1920x1080 Ultra Graphics & Postprocessing (HBAO+) | |
| Lenovo ThinkPad P15 G2-20YQ001JGE | |
| Asus ExpertBook B6 Flip B6602FC2 | |
| HP ZBook Fury 17 G8-4A6A9EA | |
| Dell Precision 7670 | |
| Średnia w klasie Workstation (26.3 - 91.7, n=3, ostatnie 2 lata) | |
| Lenovo ThinkPad P17 G2-20YU0025G | |
| Lenovo ThinkPad P16 G1 21D6001DMB | |
| Final Fantasy XV Benchmark - 1920x1080 High Quality | |
| Średnia w klasie Workstation (26.4 - 197.6, n=25, ostatnie 2 lata) | |
| Lenovo ThinkPad P15 G2-20YQ001JGE | |
| HP ZBook Fury 17 G8-4A6A9EA | |
| Asus ExpertBook B6 Flip B6602FC2 | |
| Dell Precision 7670 | |
| Lenovo ThinkPad P17 G2-20YU0025G | |
| Lenovo ThinkPad P16 G1 21D6001DMB | |
| Strange Brigade - 1920x1080 ultra AA:ultra AF:16 | |
| Średnia w klasie Workstation (54.5 - 418, n=19, ostatnie 2 lata) | |
| HP ZBook Fury 17 G8-4A6A9EA | |
| Lenovo ThinkPad P15 G2-20YQ001JGE | |
| Asus ExpertBook B6 Flip B6602FC2 | |
| Dell Precision 7670 | |
| Lenovo ThinkPad P17 G2-20YU0025G | |
| Lenovo ThinkPad P16 G1 21D6001DMB | |
| Dota 2 Reborn - 1920x1080 ultra (3/3) best looking | |
| Asus ExpertBook B6 Flip B6602FC2 | |
| Lenovo ThinkPad P16 G1 21D6001DMB | |
| Lenovo ThinkPad P15 G2-20YQ001JGE | |
| Średnia w klasie Workstation (50.7 - 178.4, n=25, ostatnie 2 lata) | |
| Dell Precision 7670 | |
| Lenovo ThinkPad P17 G2-20YU0025G | |
| HP ZBook Fury 17 G8-4A6A9EA | |
| X-Plane 11.11 - 1920x1080 high (fps_test=3) | |
| Asus ExpertBook B6 Flip B6602FC2 | |
| Lenovo ThinkPad P16 G1 21D6001DMB | |
| Dell Precision 7670 | |
| Lenovo ThinkPad P15 G2-20YQ001JGE | |
| Średnia w klasie Workstation (30.5 - 139.7, n=25, ostatnie 2 lata) | |
| Lenovo ThinkPad P17 G2-20YU0025G | |
| HP ZBook Fury 17 G8-4A6A9EA | |
Witcher 3 FPS diagram
| low | med. | high | ultra | QHD | |
|---|---|---|---|---|---|
| The Witcher 3 (2015) | 273 | 150.5 | 79.7 | 43.6 | |
| Dota 2 Reborn (2015) | 177.5 | 160.8 | 149.3 | 139.5 | |
| Final Fantasy XV Benchmark (2018) | 96.7 | 51.9 | 38.3 | 31.1 | |
| X-Plane 11.11 (2018) | 140.3 | 119.2 | 95.6 | ||
| Strange Brigade (2018) | 280 | 118.6 | 91.1 | 77.8 | 54.3 |
Emisje: Wentylator robi się głośny, ale laptop ThinkPad pozostaje chłodny
Emisja hałasu
W stanie bezczynności wentylatory Lenovo ThinkPad P16 są ciche. Przy 56,3 dB(a) pod obciążeniem potrafią być głośne - nawet głośniejsze od bezpośrednich odpowiedników laptopa. Nie dzieje się tak jednak w każdym zastosowaniu. W teście Witcher 3 wentylatory pracowały stosunkowo cicho, mierząc tylko 34,1 dB(a).
W laptopie Lenovo nie udało nam się wykryć żadnego wycieku cewek.
Hałas
| luz |
| 23.2 / 23.2 / 23.2 dB |
| obciążenie |
| 47.8 / 56.3 dB |
 | ||
30 dB cichy 40 dB(A) słyszalny 50 dB(A) irytujący |
||
min: | ||
| Lenovo ThinkPad P16 G1 21D6001DMB RTX A2000 Laptop GPU, i7-12850HX, Micron 3400 1TB MTFDKBA1T0TFH | Lenovo ThinkPad P15 G2-20YQ001JGE RTX A3000 Laptop GPU, i7-11800H, Kioxia XG7 KXG7AZNV512G | Lenovo ThinkPad P17 G2-20YU0025G RTX A2000 Laptop GPU, i7-11800H, Kioxia XG7 KXG7AZNV512G | HP ZBook Fury 17 G8-4A6A9EA RTX A3000 Laptop GPU, i9-11950H, Toshiba XG6 KXG60ZNV1T02 | Dell Precision 7670 RTX A2000 Laptop GPU, i7-12850HX, SK Hynix HFS001TEJ9X115N | Asus ExpertBook B6 Flip B6602FC2 RTX A2000 Laptop GPU, i9-12950HX, Samsung PM9A1 MZVL21T0HCLR | |
|---|---|---|---|---|---|---|
| Noise | -6% | -4% | -5% | -4% | -22% | |
| wyłączone / środowisko * (dB) | 23.2 | 24.3 -5% | 26.4 -14% | 24.5 -6% | 22.7 2% | 26 -12% |
| Idle Minimum * (dB) | 23.2 | 24.3 -5% | 26.4 -14% | 24.5 -6% | 22.9 1% | 32.4 -40% |
| Idle Average * (dB) | 23.2 | 24.3 -5% | 26.4 -14% | 24.5 -6% | 22.9 1% | 32.4 -40% |
| Idle Maximum * (dB) | 23.2 | 28.6 -23% | 26.4 -14% | 26.8 -16% | 24.5 -6% | 32.4 -40% |
| Load Average * (dB) | 47.8 | 47.5 1% | 38.1 20% | 41.8 13% | 48.7 -2% | 51.9 -9% |
| Witcher 3 ultra * (dB) | 34.1 | 38.1 -12% | 44.9 -32% | 45.2 -33% | ||
| Load Maximum * (dB) | 56.3 | 54.9 2% | 45 20% | 47.1 16% | 52.1 7% | 52.1 7% |
* ... im mniej tym lepiej
Temperatura
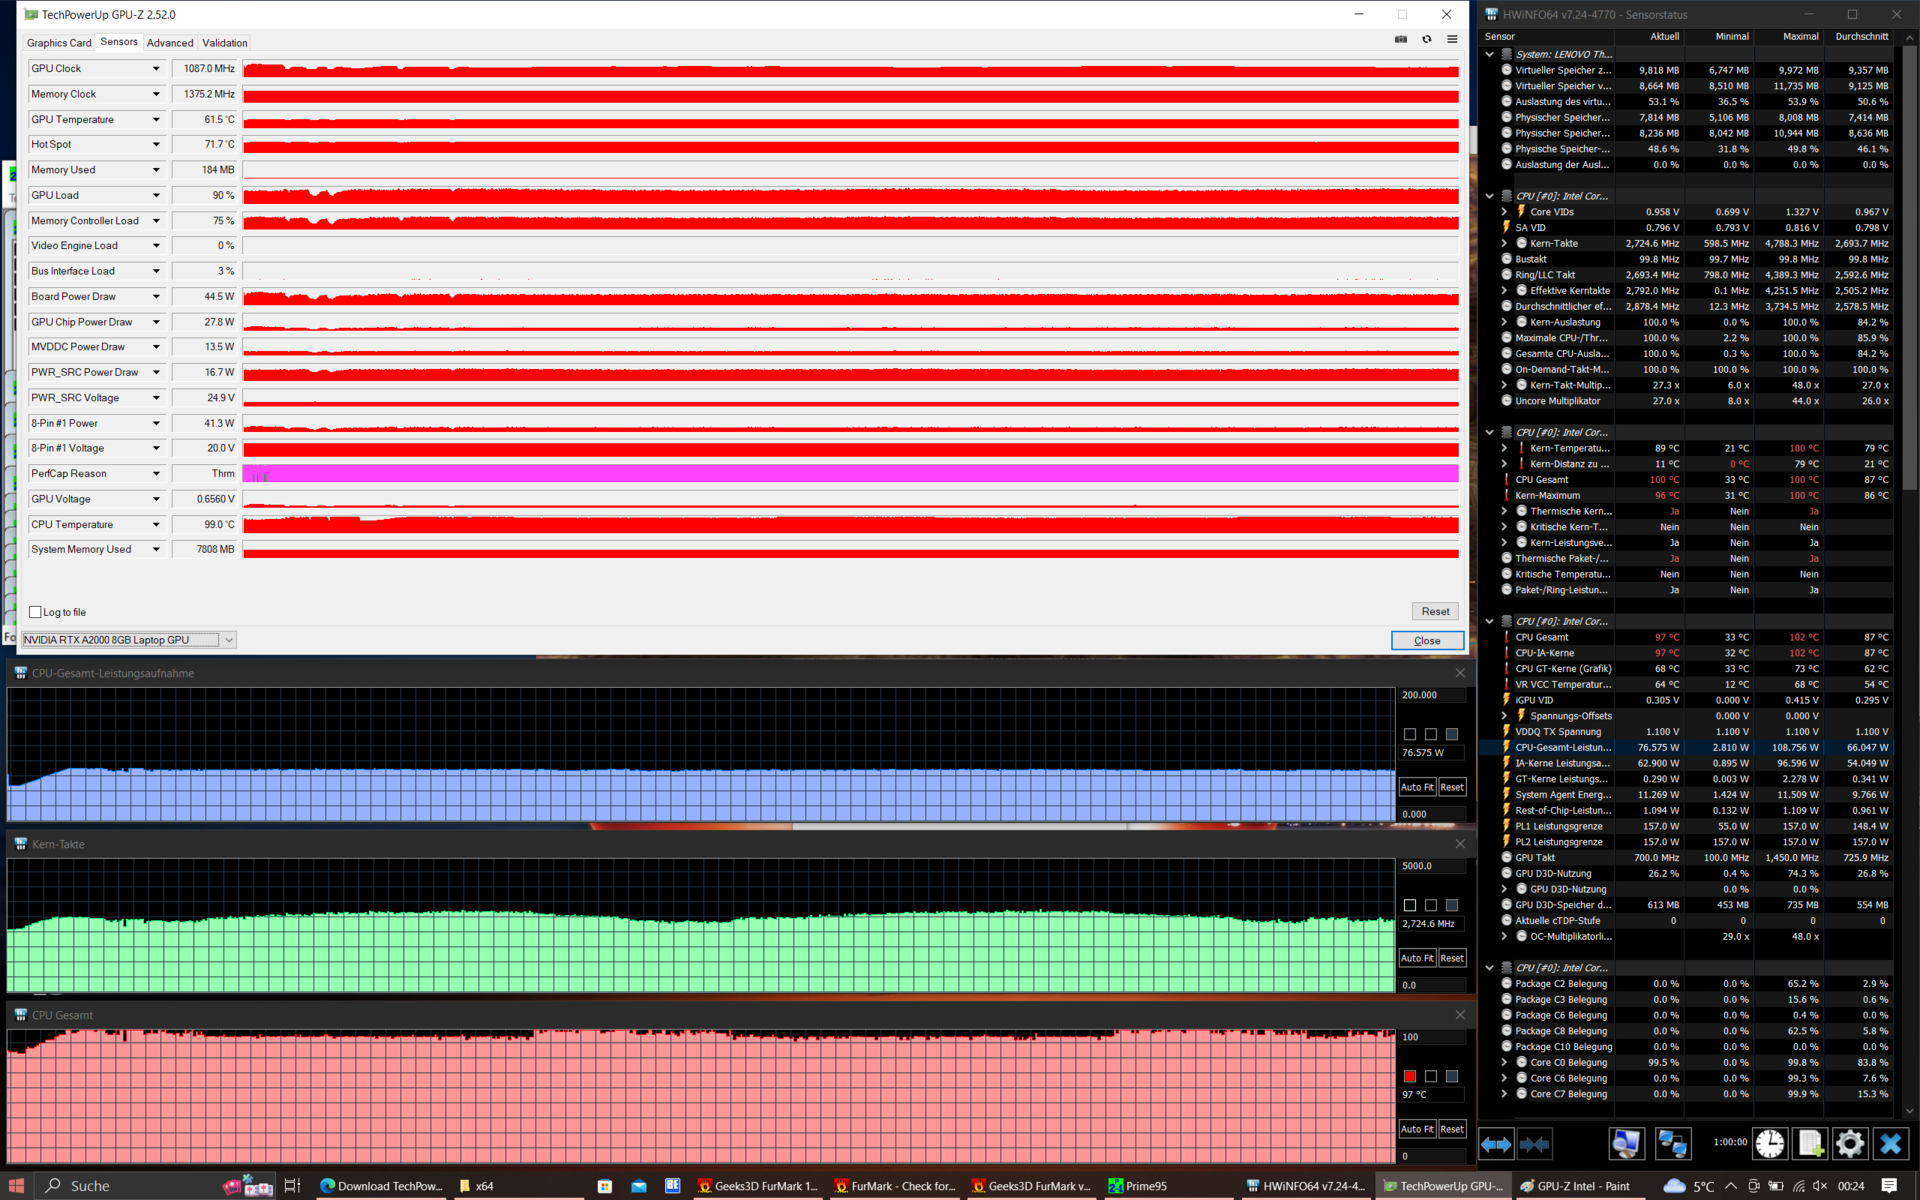
Przestronna obudowa z konstrukcją roll cage i komorą parową zapewnia stosunkowo równomierne rozprowadzanie ciepła odpadowego. W rezultacie oparcie dłoni w Lenovo ThinkPad P16 trochę się nagrzewa, ale maksymalne temperatury utrzymywały się w akceptowalnych granicach. W teście obciążeniowym temperatura punktu zapalnego wyniosła 43,1 stopnia i można to uznać za dobry wynik.
Choć procesor nie był dławiony podczas stress testu, spadła wydajność GPU: Po godzinie może on zużywać tylko 45 W zamiast 60.
(±) Maksymalna temperatura w górnej części wynosi 43.1 °C / 110 F, w porównaniu do średniej 38.2 °C / 101 F , począwszy od 22.2 do 69.8 °C dla klasy Workstation.
(+) Dno nagrzewa się maksymalnie do 39.9 °C / 104 F, w porównaniu do średniej 41.1 °C / 106 F
(+) W stanie bezczynności średnia temperatura górnej części wynosi 24.7 °C / 76 F, w porównaniu ze średnią temperaturą urządzenia wynoszącą 32 °C / ### class_avg_f### F.
(+) Podczas gry w Wiedźmina 3 średnia temperatura górnej części wynosi 31.2 °C / 88 F, w porównaniu do średniej temperatury urządzenia wynoszącej 32 °C / ## #class_avg_f### F.
(±) Podpórki pod nadgarstki i touchpad mogą się bardzo nagrzać w dotyku, maksymalnie do 36.7 °C / 98.1 F.
(-) Średnia temperatura obszaru podparcia dłoni w podobnych urządzeniach wynosiła 27.8 °C / 82 F (-8.9 °C / -16.1 F).
| Lenovo ThinkPad P16 G1 21D6001DMB Intel Core i7-12850HX, NVIDIA RTX A2000 Laptop GPU | Lenovo ThinkPad P15 G2-20YQ001JGE Intel Core i7-11800H, NVIDIA RTX A3000 Laptop GPU | Lenovo ThinkPad P17 G2-20YU0025G Intel Core i7-11800H, NVIDIA RTX A2000 Laptop GPU | HP ZBook Fury 17 G8-4A6A9EA Intel Core i9-11950H, NVIDIA RTX A3000 Laptop GPU | Dell Precision 7670 Intel Core i7-12850HX, NVIDIA RTX A2000 Laptop GPU | Asus ExpertBook B6 Flip B6602FC2 Intel Core i9-12950HX, NVIDIA RTX A2000 Laptop GPU | |
|---|---|---|---|---|---|---|
| Heat | -21% | -12% | -12% | -18% | -15% | |
| Maximum Upper Side * (°C) | 43.1 | 49.7 -15% | 49.6 -15% | 41.9 3% | 51 -18% | 48.4 -12% |
| Maximum Bottom * (°C) | 39.9 | 63.2 -58% | 52.1 -31% | 52.9 -33% | 45.8 -15% | 52.3 -31% |
| Idle Upper Side * (°C) | 26 | 27.1 -4% | 26 -0% | 28.2 -8% | 31.8 -22% | 27.8 -7% |
| Idle Bottom * (°C) | 27.6 | 29.8 -8% | 27.6 -0% | 30.7 -11% | 32.6 -18% | 30.3 -10% |
* ... im mniej tym lepiej
Mówcy
Głośniki stereo siedzą w górnej części klawiatury. W porównaniu z m.in.ThinkPad P15 G2, głośniki są ogólnie nieco cichsze, ale wytwarzają bardziej zrównoważony dźwięk z dodatkowymi basami. Choć jakość dźwięku jest dobra jak na laptop, nadal nie może się równać z zewnętrznym systemem dźwiękowym.
Lenovo ThinkPad P16 G1 21D6001DMB analiza dźwięku
(±) | głośność głośnika jest średnia, ale dobra (73.8 dB)
Bas 100 - 315 Hz
(±) | zredukowany bas - średnio 9.7% niższy od mediany
(±) | liniowość basu jest średnia (12.8% delta do poprzedniej częstotliwości)
Średnie 400 - 2000 Hz
(+) | zbalansowane środki średnie - tylko 2.9% od mediany
(+) | średnie są liniowe (6.3% delta do poprzedniej częstotliwości)
Wysokie 2–16 kHz
(+) | zrównoważone maksima - tylko 3.1% od mediany
(+) | wzloty są liniowe (4.3% delta do poprzedniej częstotliwości)
Ogólnie 100 - 16.000 Hz
(+) | ogólny dźwięk jest liniowy (13% różnicy w stosunku do mediany)
W porównaniu do tej samej klasy
» 22% wszystkich testowanych urządzeń w tej klasie było lepszych, 6% podobnych, 72% gorszych
» Najlepszy miał deltę 7%, średnia wynosiła ###średnia###%, najgorsza wynosiła 35%
W porównaniu do wszystkich testowanych urządzeń
» 13% wszystkich testowanych urządzeń było lepszych, 2% podobnych, 85% gorszych
» Najlepszy miał deltę 4%, średnia wynosiła ###średnia###%, najgorsza wynosiła 134%
Lenovo ThinkPad P15 G2-20YQ001JGE analiza dźwięku
(±) | głośność głośnika jest średnia, ale dobra (78 dB)
Bas 100 - 315 Hz
(-) | prawie brak basu - średnio 15.5% niższa od mediany
(±) | liniowość basu jest średnia (9.6% delta do poprzedniej częstotliwości)
Średnie 400 - 2000 Hz
(±) | wyższe średnie - średnio 7.5% wyższe niż mediana
(+) | średnie są liniowe (6.6% delta do poprzedniej częstotliwości)
Wysokie 2–16 kHz
(+) | zrównoważone maksima - tylko 2.4% od mediany
(+) | wzloty są liniowe (5.8% delta do poprzedniej częstotliwości)
Ogólnie 100 - 16.000 Hz
(±) | liniowość ogólnego dźwięku jest średnia (20.6% różnicy w stosunku do mediany)
W porównaniu do tej samej klasy
» 74% wszystkich testowanych urządzeń w tej klasie było lepszych, 6% podobnych, 21% gorszych
» Najlepszy miał deltę 7%, średnia wynosiła ###średnia###%, najgorsza wynosiła 35%
W porównaniu do wszystkich testowanych urządzeń
» 55% wszystkich testowanych urządzeń było lepszych, 8% podobnych, 37% gorszych
» Najlepszy miał deltę 4%, średnia wynosiła ###średnia###%, najgorsza wynosiła 134%
Zarządzanie energią: Układ GPU negatywnie wpływa na zarządzanie energią
Pobór mocy
Lenovo ThinkPad P16 działa wydajniej niż porównywalne urządzenia. Nawet w stanie bezczynności jest bardziej energooszczędny od konkurencji. Żeby jednak być sprawiedliwym, trzeba też powiedzieć, że podobne laptopy od HP i Della mają wyświetlacze 4K. Podobnie, mimo wyższej rozdzielczości WQXGA LCD, jest on wydajniejszy od P15 i P17 z ich panelami Full HD.
Zasilacz Slim Tip dostarcza 170 W - całkiem nieźle jak na maksymalne zużycie 168,9 W.
| wyłączony / stan wstrzymania | |
| luz | |
| obciążenie |
|
Legenda:
min: | |
| Lenovo ThinkPad P16 G1 21D6001DMB i7-12850HX, RTX A2000 Laptop GPU, Micron 3400 1TB MTFDKBA1T0TFH, IPS LED, 2560x1600, 16" | Lenovo ThinkPad P15 G2-20YQ001JGE i7-11800H, RTX A3000 Laptop GPU, Kioxia XG7 KXG7AZNV512G, IPS, 1920x1080, 15.6" | Lenovo ThinkPad P17 G2-20YU0025G i7-11800H, RTX A2000 Laptop GPU, Kioxia XG7 KXG7AZNV512G, IPS LED, 1920x1080, 17.3" | HP ZBook Fury 17 G8-4A6A9EA i9-11950H, RTX A3000 Laptop GPU, Toshiba XG6 KXG60ZNV1T02, IPS, 3840x2160, 17.3" | Dell Precision 7670 i7-12850HX, RTX A2000 Laptop GPU, SK Hynix HFS001TEJ9X115N, OLED, 3840x2400, 16" | Asus ExpertBook B6 Flip B6602FC2 i9-12950HX, RTX A2000 Laptop GPU, Samsung PM9A1 MZVL21T0HCLR, IPS, 2560x1600, 16" | Przeciętny NVIDIA RTX A2000 Laptop GPU | Średnia w klasie Workstation | |
|---|---|---|---|---|---|---|---|---|
| Power Consumption | -23% | -15% | -49% | -56% | -67% | -24% | -37% | |
| Idle Minimum * (Watt) | 5.1 | 6.3 -24% | 6.1 -20% | 7.6 -49% | 7.5 -47% | 10.5 -106% | 6.6 ? -29% | 8.94 ? -75% |
| Idle Average * (Watt) | 9.2 | 10.7 -16% | 10.9 -18% | 16.7 -82% | 9.5 -3% | 11.9 -29% | 11.8 ? -28% | 13.8 ? -50% |
| Idle Maximum * (Watt) | 9.9 | 11.6 -17% | 12.3 -24% | 17.5 -77% | 28.4 -187% | 18 -82% | 16.7 ? -69% | 17.5 ? -77% |
| Load Average * (Watt) | 124.1 | 99.3 20% | 106.3 14% | 117 6% | 139.1 -12% | 182 -47% | 116.3 ? 6% | 95 ? 23% |
| Witcher 3 ultra * (Watt) | 87.7 | 154 -76% | 124 -41% | 150 -71% | 134 -53% | 177.5 -102% | ||
| Load Maximum * (Watt) | 168.9 | 210 -24% | 168.9 -0% | 202 -20% | 220.8 -31% | 229 -36% | 171.2 ? -1% | 175.2 ? -4% |
* ... im mniej tym lepiej
Power consumption Witcher 3 / stress test
Power consumption with an external monitor
Żywotność baterii
Lenovo nie podjęło żadnych zmian w wewnętrznym 94-watowym akumulatorze litowo-polimerowym. W związku z tym czasy pracy na akumulatorze są na podobnym poziomie co u poprzedników i wynoszą około dziewięciu godzin w teście WiFi (jasność wyświetlacza 150 cd/m²). ThinkPad P16 ma jedną wyraźną przewagę nad m.in Dell Precision 7670który nie wytrzymuje prawie tak długo w teście WiFi ze względu na mniejszy, 83-watowy akumulator i wyświetlacz 4K.
| Lenovo ThinkPad P16 G1 21D6001DMB i7-12850HX, RTX A2000 Laptop GPU, 94 Wh | Lenovo ThinkPad P15 G2-20YQ001JGE i7-11800H, RTX A3000 Laptop GPU, 94 Wh | Lenovo ThinkPad P17 G2-20YU0025G i7-11800H, RTX A2000 Laptop GPU, 94 Wh | HP ZBook Fury 17 G8-4A6A9EA i9-11950H, RTX A3000 Laptop GPU, 94 Wh | Dell Precision 7670 i7-12850HX, RTX A2000 Laptop GPU, 83 Wh | Asus ExpertBook B6 Flip B6602FC2 i9-12950HX, RTX A2000 Laptop GPU, 90 Wh | Średnia w klasie Workstation | |
|---|---|---|---|---|---|---|---|
| Czasy pracy | -12% | -9% | -5% | -33% | -7% | -15% | |
| WiFi v1.3 (h) | 9.4 | 9.9 5% | 9.8 4% | 7.4 -21% | 5.9 -37% | 8.7 -7% | 8.53 ? -9% |
| Load (h) | 1.8 | 1.3 -28% | 1.4 -22% | 2 11% | 1.3 -28% | 1.7 -6% | 1.429 ? -21% |
Za
Przeciw
Werdykt: Nowa stacja robocza ThinkPad obnażona przez układ graficzny
Wprowadzając ThinkPad P16 Gen 1, Lenovo zrobiło duży krok od posiadania dwóch 15- i 17-calowych stacji roboczych do jednego 16-calowego modelu - to rzadkie, ale mile widziane uproszczenie linii. Jednocześnie Lenovo odważyło się wstrząsnąć dotychczasowym językiem wzornictwa serii ThinkPad P. W rezultacie powstała bardzo dobra stacja robocza, która jednak nie jest wolna od wad.
Jedną z mocnych stron laptopa Lenovo są bez wątpienia możliwości rozbudowy. Tylko tego typu stacje robocze mogą zaoferować aż cztery gniazda pamięci RAM. Urządzenie jest też wyposażone w funkcje i jest fabrycznie przygotowane do obsługi sieci WWAN. Brakuje nam jednak portu ethernetowego RJ45. Czy nowa konstrukcja jest optycznie lepsza, to kwestia gustu, ale nowa, wzmocniona metalem pokrywa wyświetlacza jest bez wątpienia bardzo solidna. Matowy wyświetlacz WQXGA imponuje wysoką jasnością, ale szkoda, że Lenovo nie oferuje panelu 165 Hz, który można znaleźć w modeluX1 Extreme Gen 5. Urządzenia wejściowe ThinkPada P16 są nadal bardzo dobre, ale zmniejszony skok klawiszy sprawia, że nie jest on na tym samym poziomie co jego poprzednik, ThinkPad P17.ThinkPad P17.
Jeśli chodzi o mobilne stacje robocze, kluczowa jest wydajność. Tutaj możemy zauważyć, że wydajność procesora została znacznie poprawiona. Nie dotyczy to jednak GPU: niepotrzebnie Lenovo pozostawiło RTX A2000 przy zużyciu zaledwie 60 W. Co dziwne, wentylatory nie pracują potężnie pod czystym obciążeniem CPU, więc z tego powodu wydajność laptopa pod obciążeniem jest dławiona. Mówiąc o wentylatorze: Pod trwałym obciążeniem aktywne chłodzenie pracuje bardzo głośno. Ma to jednak tę zaletę, że w niemal każdym obszarze ThinkPad P16 pozostaje znacznie chłodniejszy od swoich gorących poprzedników, modeli P15 i P17.
Potężna wydajność CPU, ale GPU pozostaje w tej wersji recenzenckiej ThinkPada P16 w tyle.
Podsumowując, nasz model recenzencki Lenovo ThinkPad P16 G1 jest doskonałym wyborem, gdy wymaga się od niego wykonywania zadań obciążających procesor. Jeżeli GPU jest ważne, należy powstrzymać się od zakupu wersji z RTX-A2000. Nie oznacza to jednak, że ThinkPad P16 z jednym z mocniejszych GPU cierpi na ten sam problem - nasza recenzja modelu Nvidia RTX A5500 jest już dostępna online.
Dla kogoś, kto szuka bardziej mobilnej stacji roboczej, ciekawą alternatywą może być Dell Precision 7670, o cieńszej, bardziej kompaktowej obudowie. Asus ExpertBook B6 Flip łączy moc stacji roboczej z konwertowalną konstrukcją i może być ciekawym wyborem dla użytkowników, którzy często pracują z rysikiem.
Cena i dostępność
Wysoka wydajność ma swoją cenę: ThinkPad P16 kosztuje co najmniej 2050 dolarów amerykańskich, a lepiej wyposażone modele osiągają cenę ponad 3500 dolarów amerykańskich. Podobne urządzenie do naszego modelu recenzenckiego kosztuje w serwisie Amazon około 2800 dolarów.
Lenovo ThinkPad P16 G1 21D6001DMB
- 27/01/2023 v7 (old)
Benjamin Herzig
Price comparison

