Recenzja Lenovo Legion Pro 7 16IRX8H: Wydajna potęga w postaci RTX 4080 z najwyższej półki

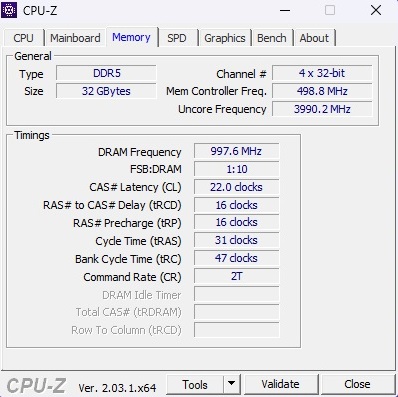
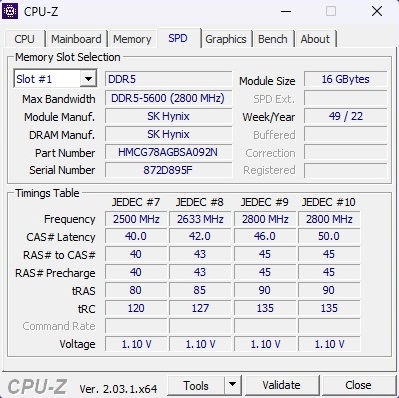
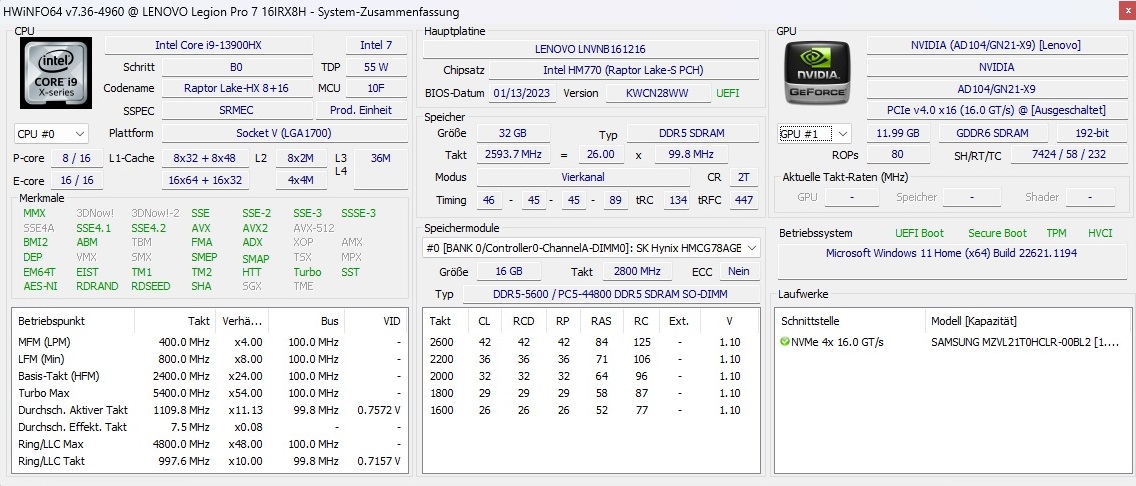
Z ceną detaliczną bliską 4000 euro Lenovo Legion Pro 7 16IRX8H, który mamy teraz do recenzji, nie może być tak naprawdę uznany za okazję. Jednak w tej cenie oferuje on m.in Core i9-13900HX, 32 GB pamięci DDR5-5600-RAM (2x 16 GB) oraz dysk SSD 1 TB PCIe Gen 4x4 NVMe M.2 2280.
Na stronie Procesor graficzny Nvidia GeForce RTX 4080 Laptopz 12 GB GDDR6 VRAM dba o wymagające zadania graficzne. Matowy wyświetlacz IPS w formacie 16:10 o rozdzielczości 2560 x 1600 pikseli pozwala osiągnąć 100% sRGB i 500 nitów szczytowej jasności. Lenovo oprócz AMD FreeSync wyposażyło panel 240 Hz w obsługę Nvidia G-Sync, co jest dobrym rozwiązaniem.
Jako system operacyjny do wyboru zainstalowany jest Windows 11 Home.
Podstawowym konkurentem Lenovo Legion 7 Pro jest jak na razie m.in.Razer Blade 16 Early 2023choć interesujące jest również to, jak laptop radzi sobie w porównaniu z poprzednią generacją. Dlatego uwzględniamy również Legion 7 SKU wyposażone w następujące kombinacje:Core i9-12900HXorazRTX 3080 Ti, Ryzen 9 5900HXorazRTX 3080, oraz Ryzen 9 6900HXoraz RX 6850M XT.
Potencjalni konkurenci w porównaniu
Ocena | Data | Model | Waga | Wysokość | Rozmiar | Rezolucja | Cena |
|---|---|---|---|---|---|---|---|
| 89.4 % v7 (old) | 02/2023 | Lenovo Legion Pro 7 16IRX8H i9-13900HX, GeForce RTX 4080 Laptop GPU | 2.7 kg | 26 mm | 16.00" | 2560x1600 | |
| 91.2 % v7 (old) | 02/2023 | Razer Blade 16 Early 2023 i9-13950HX, GeForce RTX 4080 Laptop GPU | 2.4 kg | 21.99 mm | 16.00" | 2560x1600 | |
| 88.9 % v7 (old) | 10/2022 | Lenovo Legion 7 16IAX7-82TD004SGE i9-12900HX, GeForce RTX 3080 Ti Laptop GPU | 2.6 kg | 20 mm | 16.00" | 2560x1600 | |
| 88.1 % v7 (old) | Lenovo Legion 7 16ACHg6 R9 5900HX, GeForce RTX 3080 Laptop GPU | 2.5 kg | 23.5 mm | 16.00" | 2560x1600 | ||
| 90.8 % v7 (old) | 10/2022 | Lenovo Legion 7 16ARHA7 R9 6900HX, Radeon RX 6850M XT | 2.6 kg | 19.4 mm | 16.00" | 2560x1600 |
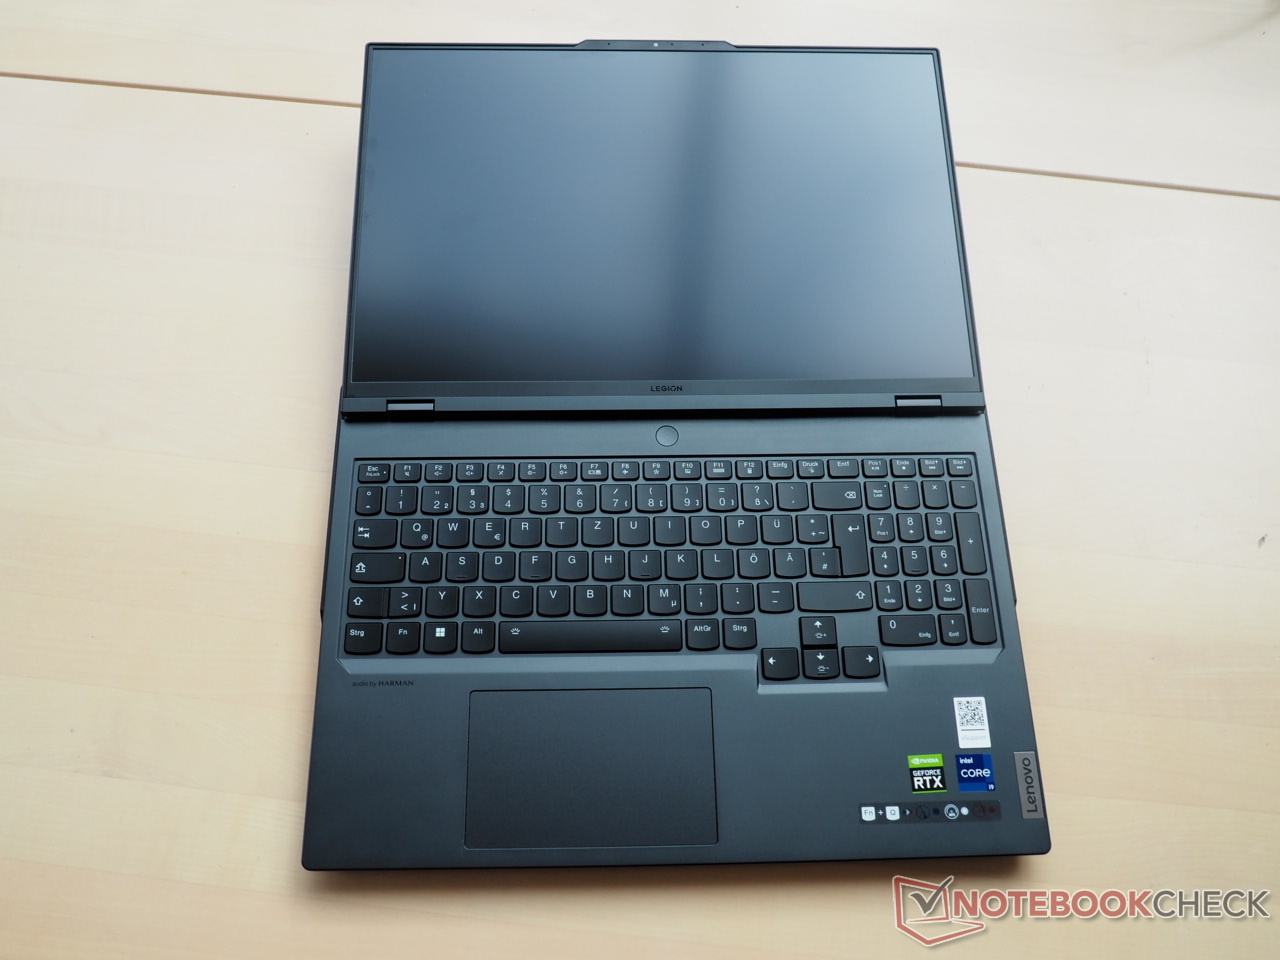
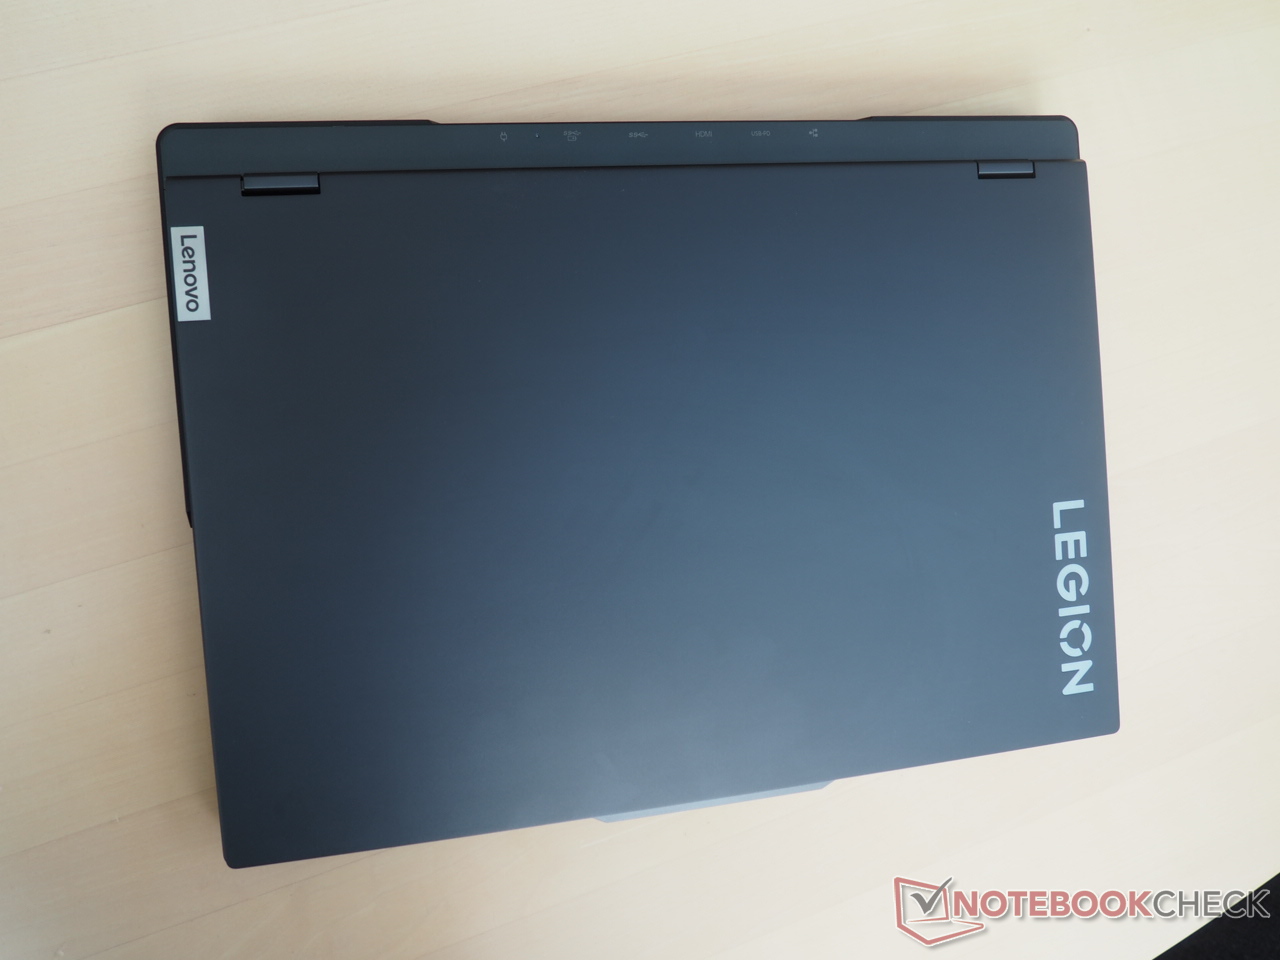
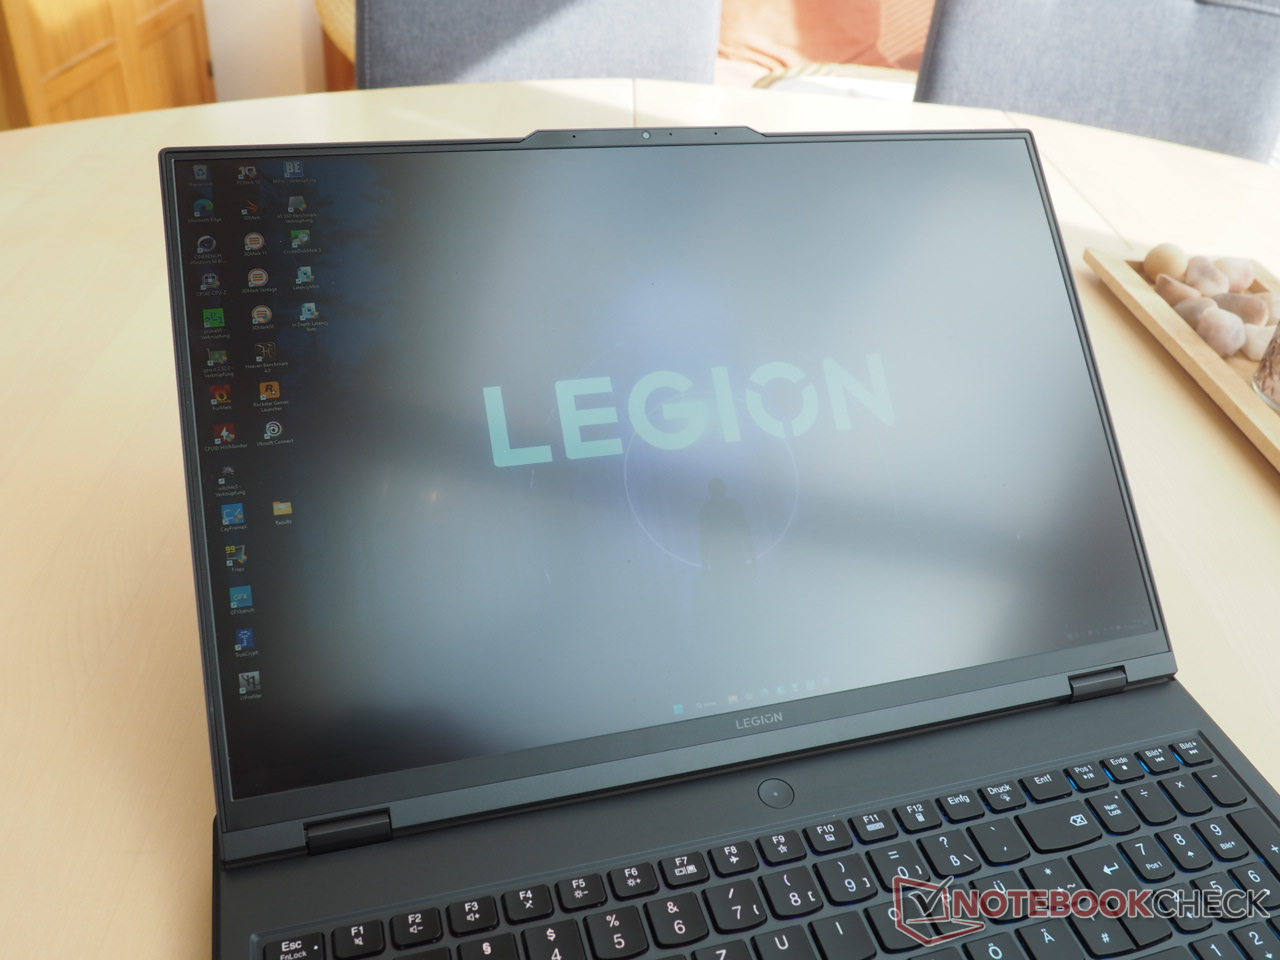
Obudowa: nie różni się zbytnio od poprzednika
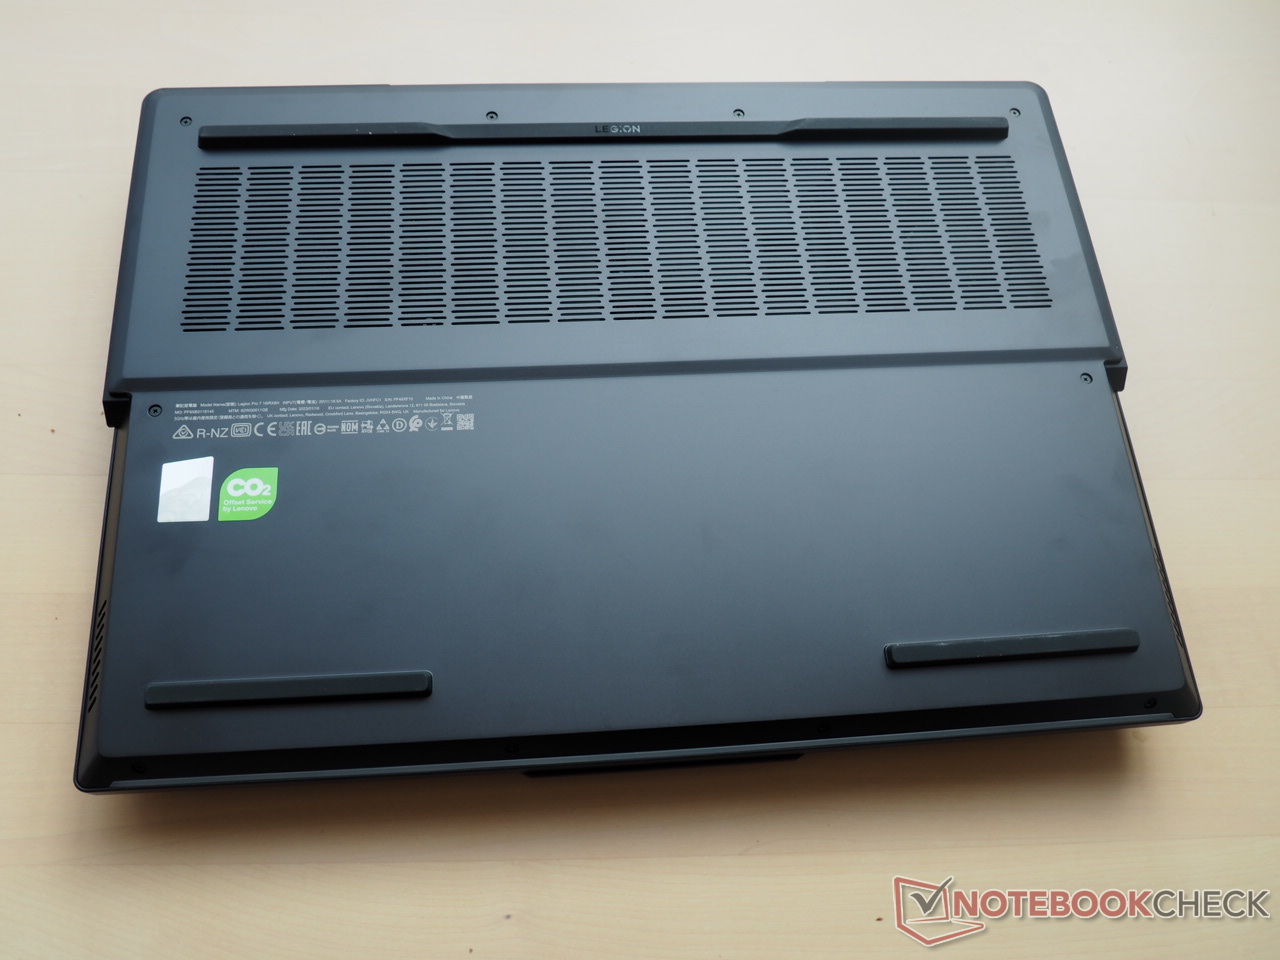
Konstrukcja obudowy jest dość podobna do poprzednika, tj Legion 7 16ARHA7z kilkoma drobnymi zmianami, takimi jak przeprojektowane boczne i tylne otwory wentylacyjne. Nawet z tymi zmianami konstrukcja obudowy pozostaje dobra. Stabilność i wytrzymałość zawiasów, które mogą się otworzyć na pełne 180°, jest również ponadprzeciętna w tej klasie.
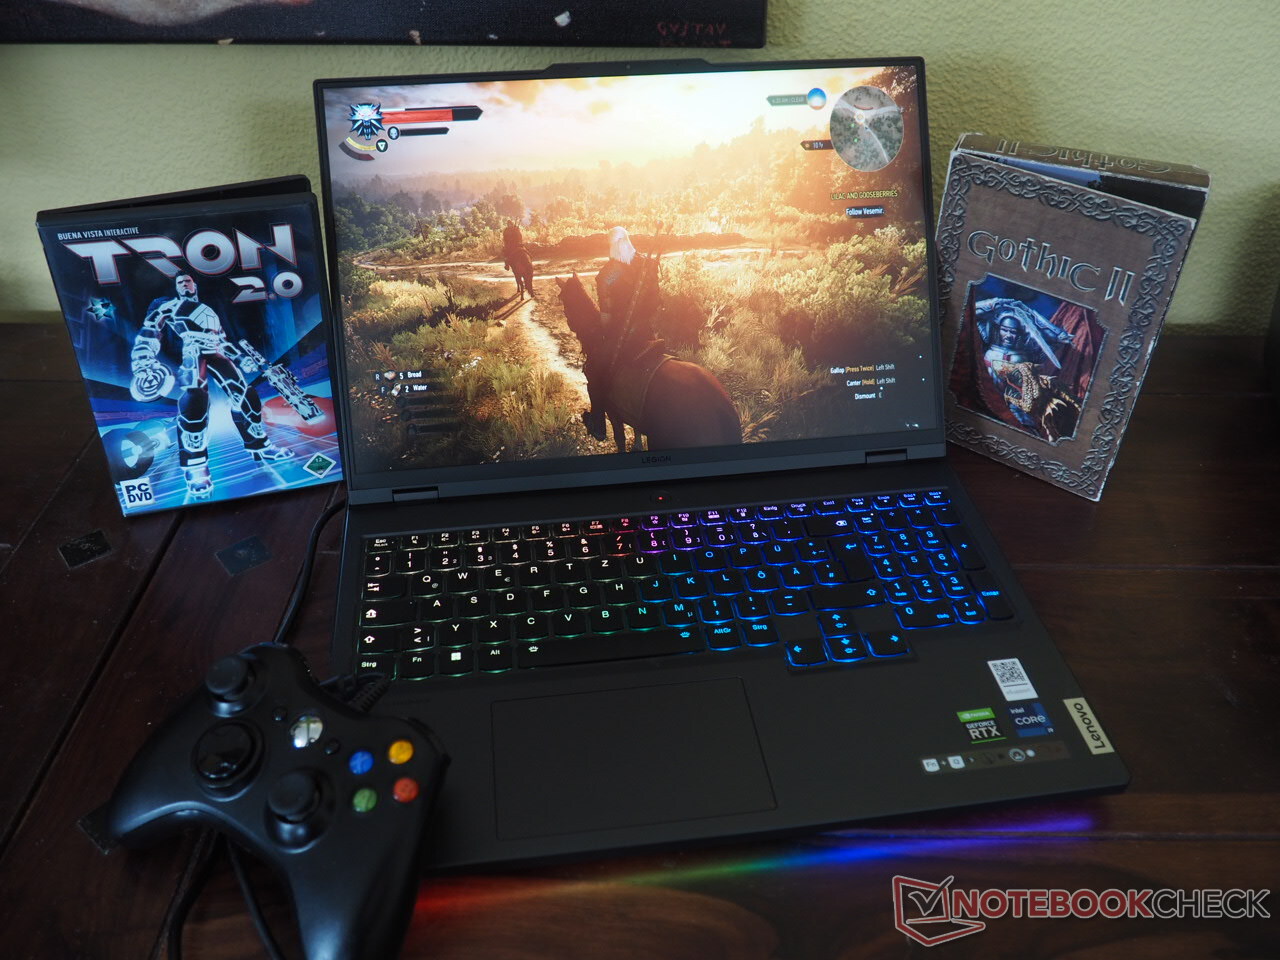
Ogólna jakość wykonania jest świetna. Zwłaszcza metalowa pokrywa wygląda klasycznie, ale szybko staje się magnesem na odciski palców. Wygląd urządzenia nie rzuca się w oczy, gdy jest wyłączone, z wyjątkiem oznaczenia Legion na pokrywie.
Podczas pracy jednak, dzięki klawiaturze z podświetleniem RGB i paskowi LED z przodu, Legion 7 Pro można natychmiast rozpoznać jako laptop do gier.
Przy wadze około 2,7 kg 16-calowy Legion 7 Pro ma tendencję do bycia jednym z cięższych laptopów w swojej kategorii (Razer Blade 16 waży 300 g mniej). Podobnie wysokość 2,6 cm to około 4 mm więcej niż w przypadku Blade 16, co teoretycznie powinno pomóc w lepszym chłodzeniu.
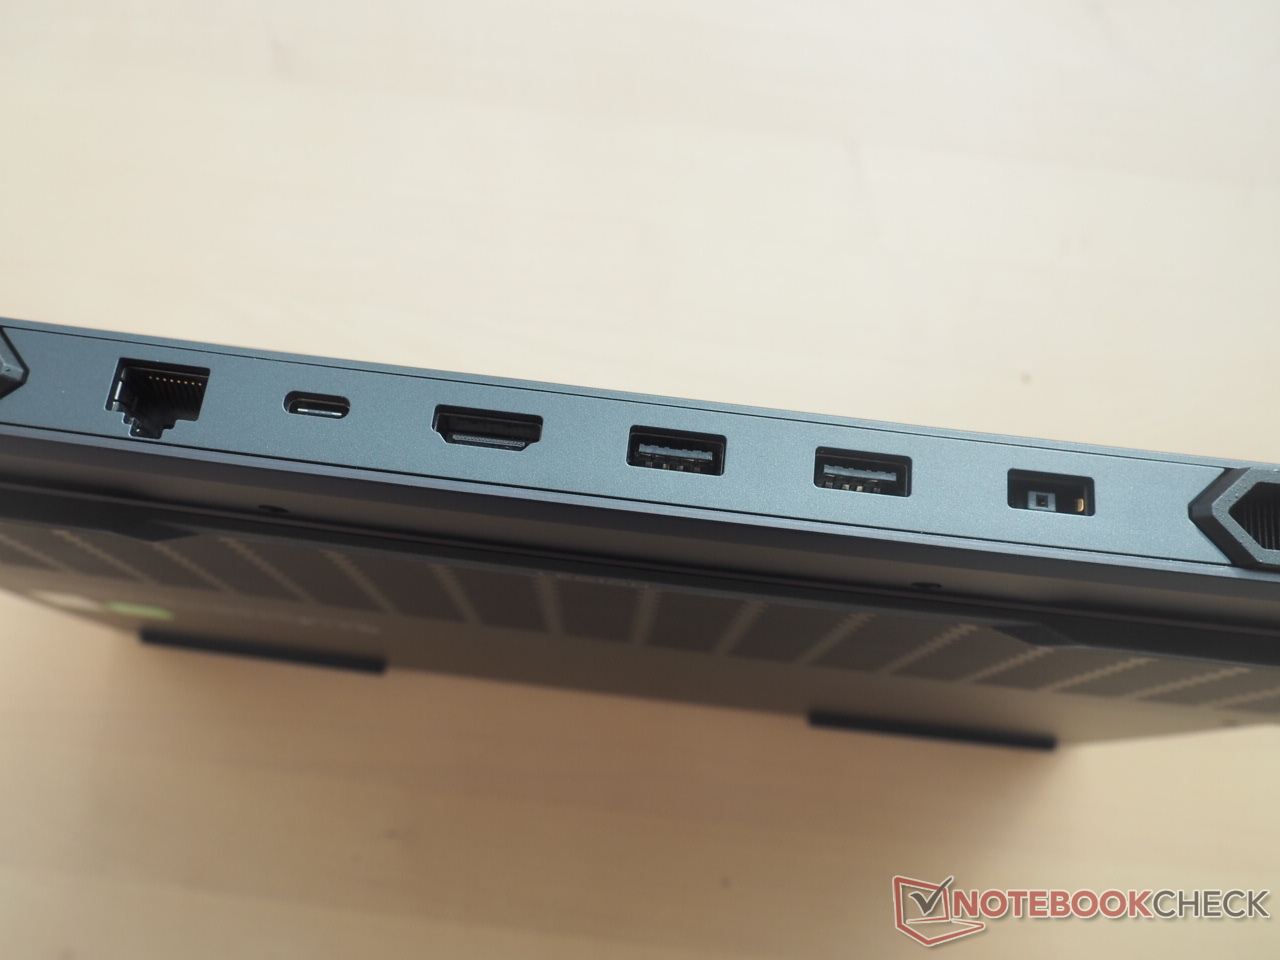
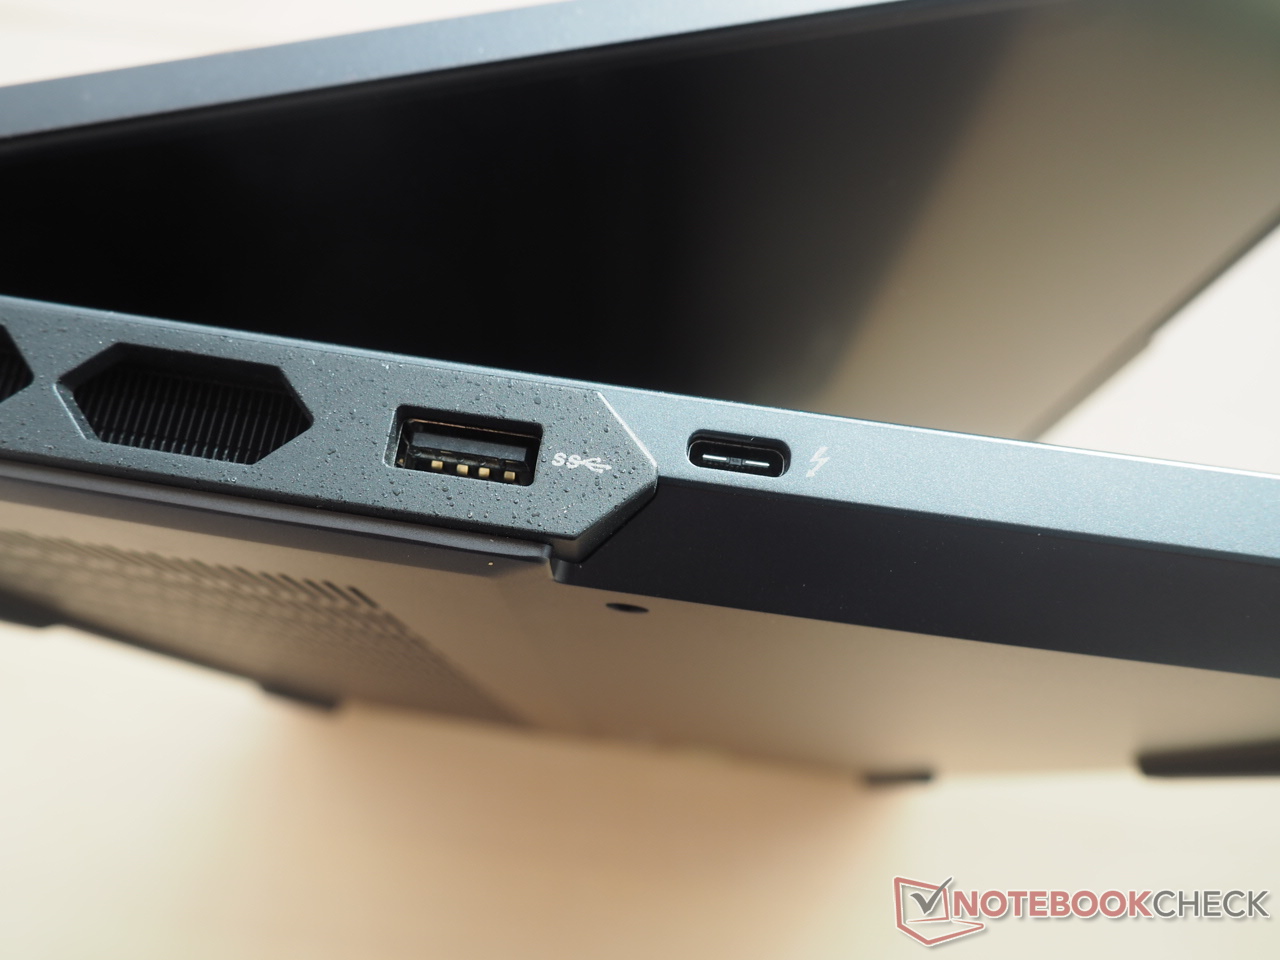
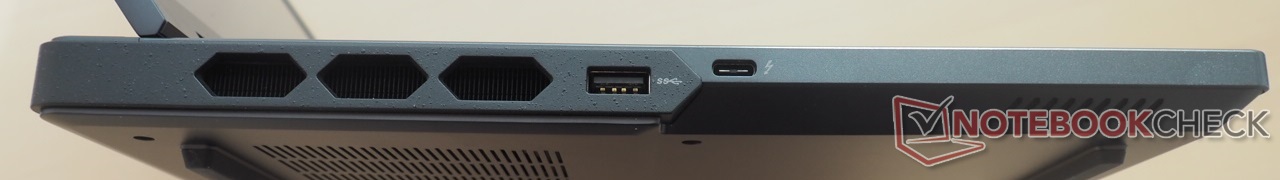
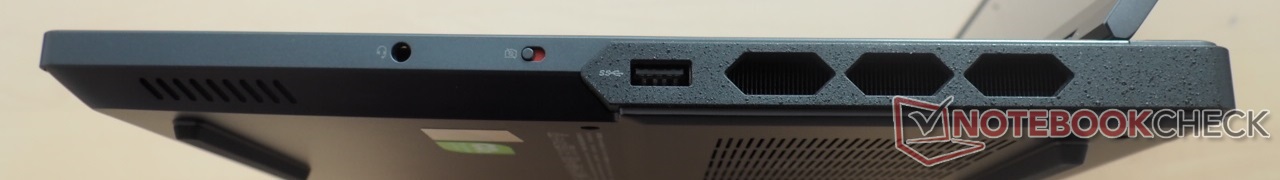
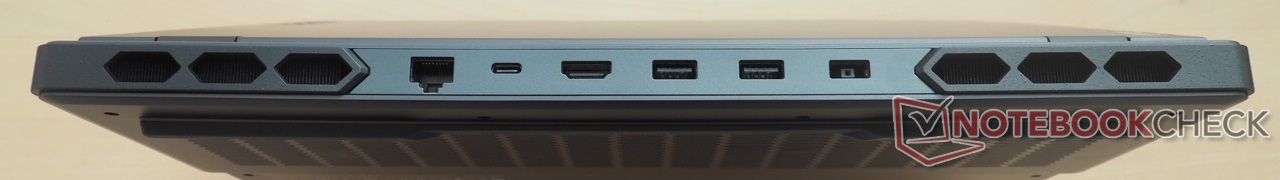
Łączność: Mnóstwo portów USB
Porty
Legion 7 Pro imponuje bogactwem portów. Łącznie dostępnych jest sześć portów USB (2x Type-C, 4x Type-A), co nie jest częstym zjawiskiem nawet w laptopach gamingowych z wyższej półki. Trzy zewnętrzne wyświetlacze można podłączyć dzięki obsłudze HDMI 2.1-out i DisplayPort-out na dwóch portach USB Type-C. Imponujące jest również dostarczanie mocy 140 W przez USB Type-C.
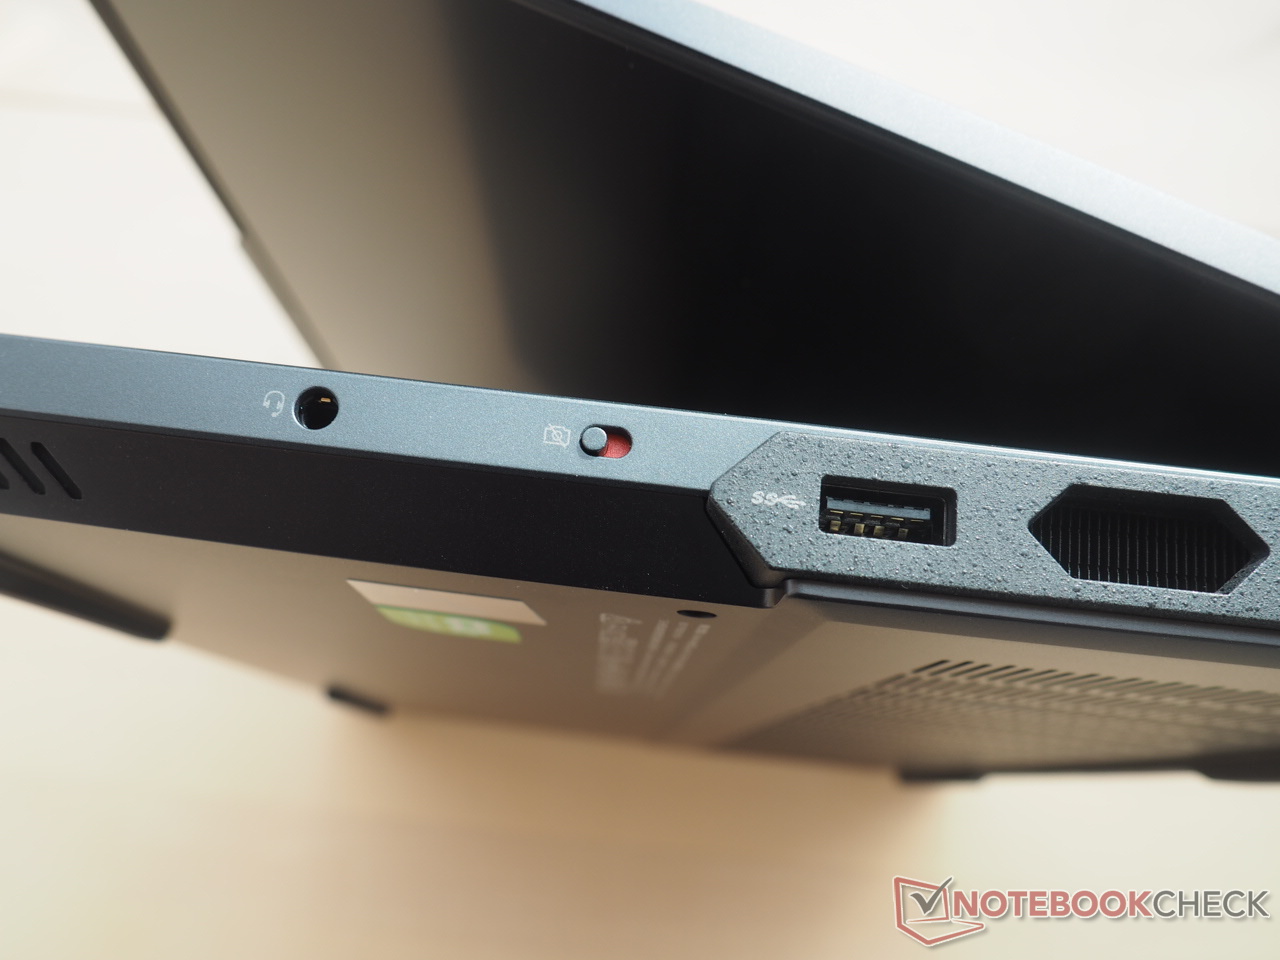
Port RJ-45, a także gniazdo audio uzupełniają wybór portów. Obecność fizycznego przełącznika migawki kamery internetowej na prawym boku to plus. Jedynym minusem w Legion 7 Pro jest brak czytnika kart.
Ponieważ większość portów znajduje się w tylnej części urządzenia, zarówno osoby lewo-, jak i praworęczne otrzymają swoje pieniądze podczas korzystania z przewodowej myszy do gier.
Komunikacja
Nie stwierdziliśmy żadnych rozbieżności w wydajności Wi-Fi. Legion Pro 7 osiągnął przepustowość 1600 Mb/s w odległości 1 m od naszego referencyjnego routera Asus ROG Rapture GT-AXE11000, co odpowiada bardzo dobrej transmisji i odbiorowi. Razer Blade 16 zadowala się przepustowością o kilka 100 Mb/s mniejszą.
Kamera internetowa
Jakość kamerki internetowej jest nieco powyżej przeciętnej. Kamerka o rozdzielczości 2 MP oferuje przyzwoitą ostrość obrazu i przechodnią dokładność kolorów, co jest akceptowalne jak na notebooka (standardy są tu niestety bardzo słabe).


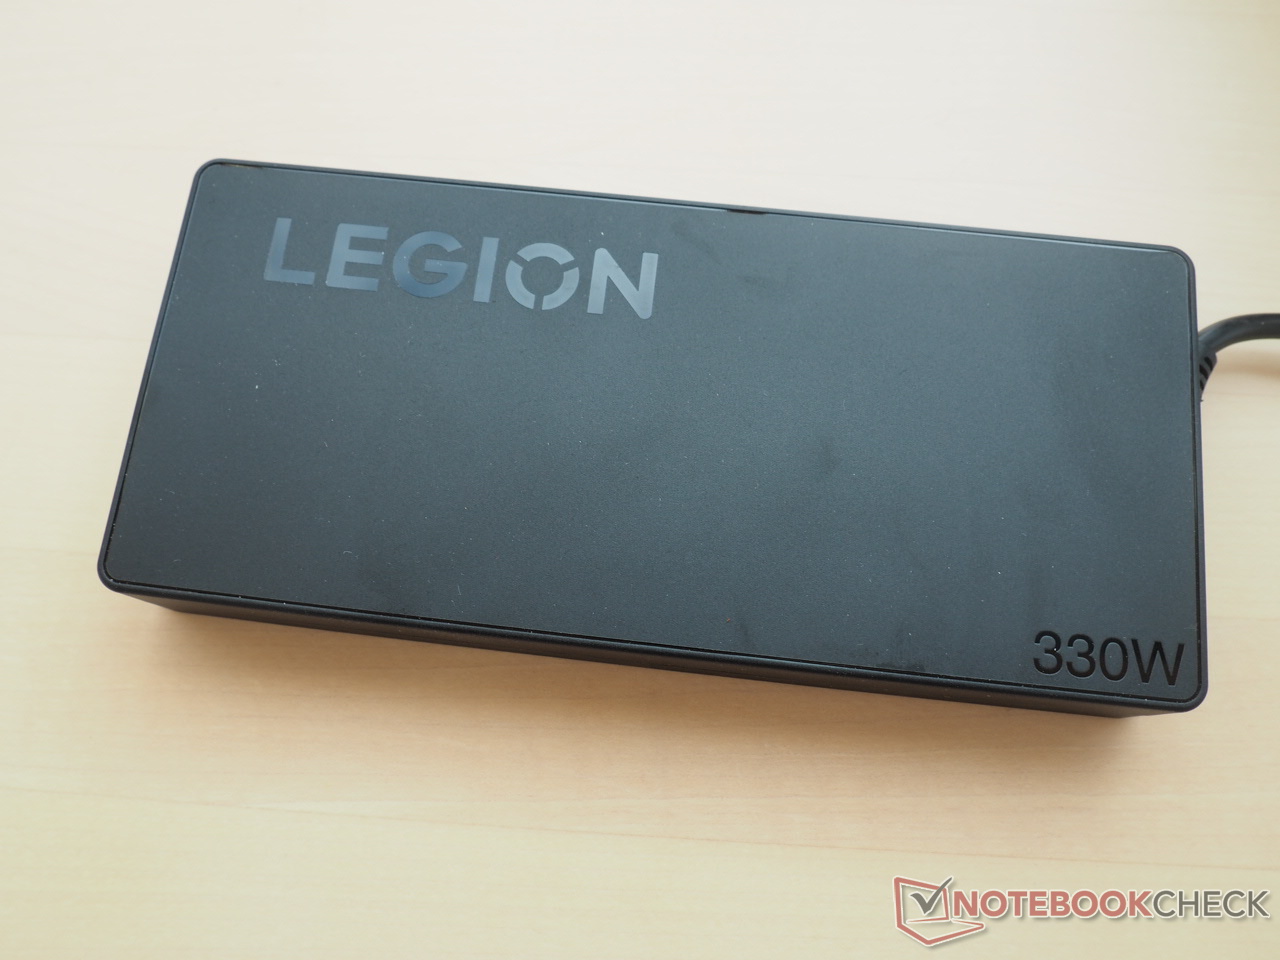
Akcesoria
W zakres dostawy wchodzi masywny, ważący 800 g zasilacz o wymiarach 18,5 x 8 x 2,5 cm, co jest zgodne z oczekiwaniami dla modelu o mocy 330 W. W standardzie jest kilka broszur informacyjnych.
Konserwacja
Lenovo mogło uczynić demontaż Legion 7 Pro bardziej przyjaznym dla klienta. Nawet po odkręceniu wszystkich śrubek obudowy płyta zasadnicza jest tak ciasna (zwłaszcza w tylnej części), że istnieje obawa o uszkodzenie obudowy przy użyciu zbyt dużej siły.
Z tego powodu oraz z racji tego, że jest to próbka detaliczna ze sklepu, nie próbowaliśmy otwierać laptopa dla bezpieczeństwa.
Gwarancja
Według informacji producenta w Niemczech, gwarancję Legion 7 Pro można przedłużyć do ponad trzech lat z Premium Care.
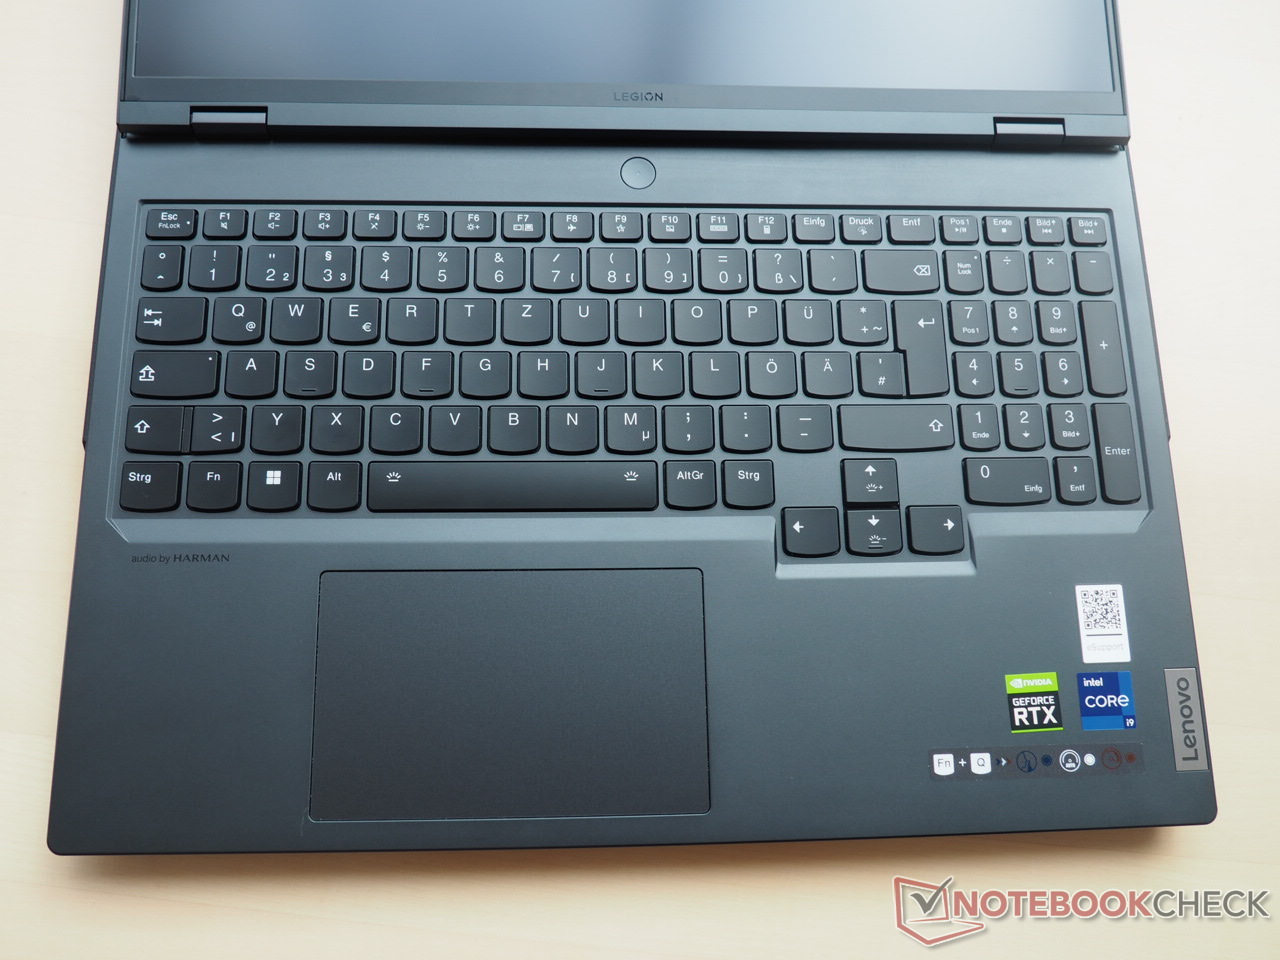
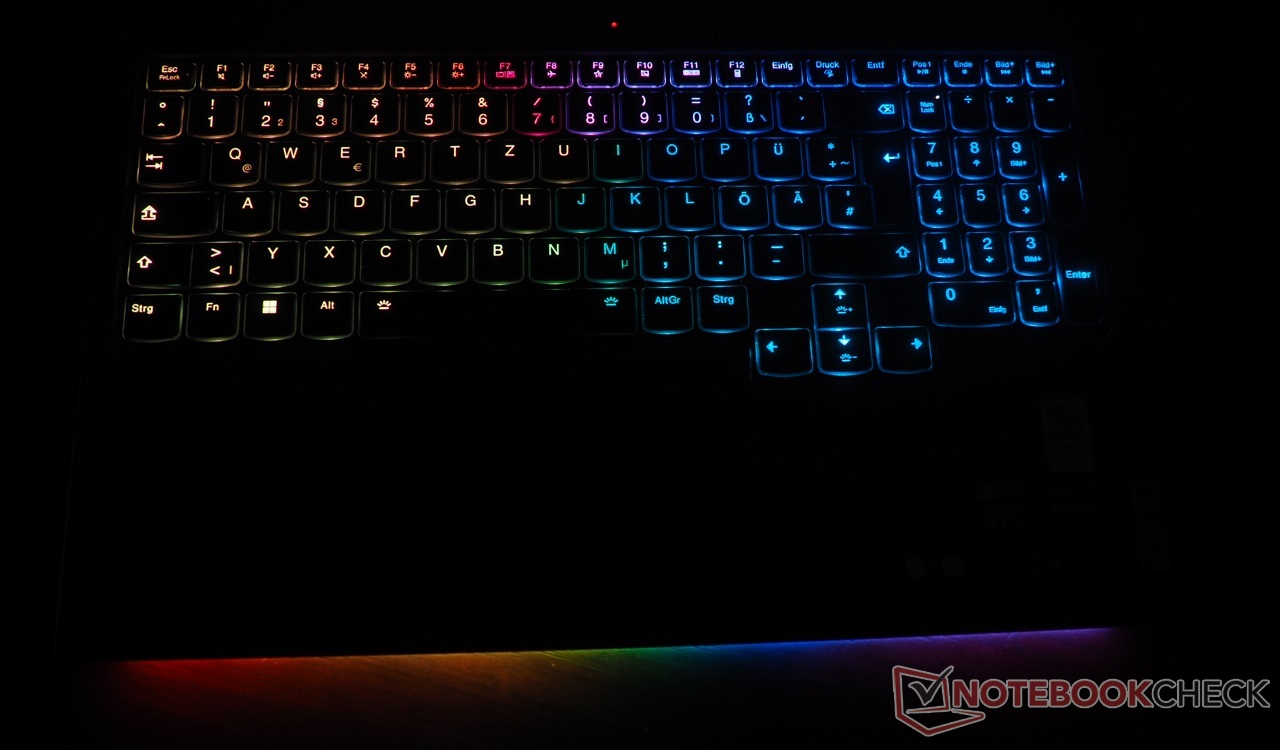
Urządzenia wejściowe: Niewiele miejsca na skargi
Klawiatura
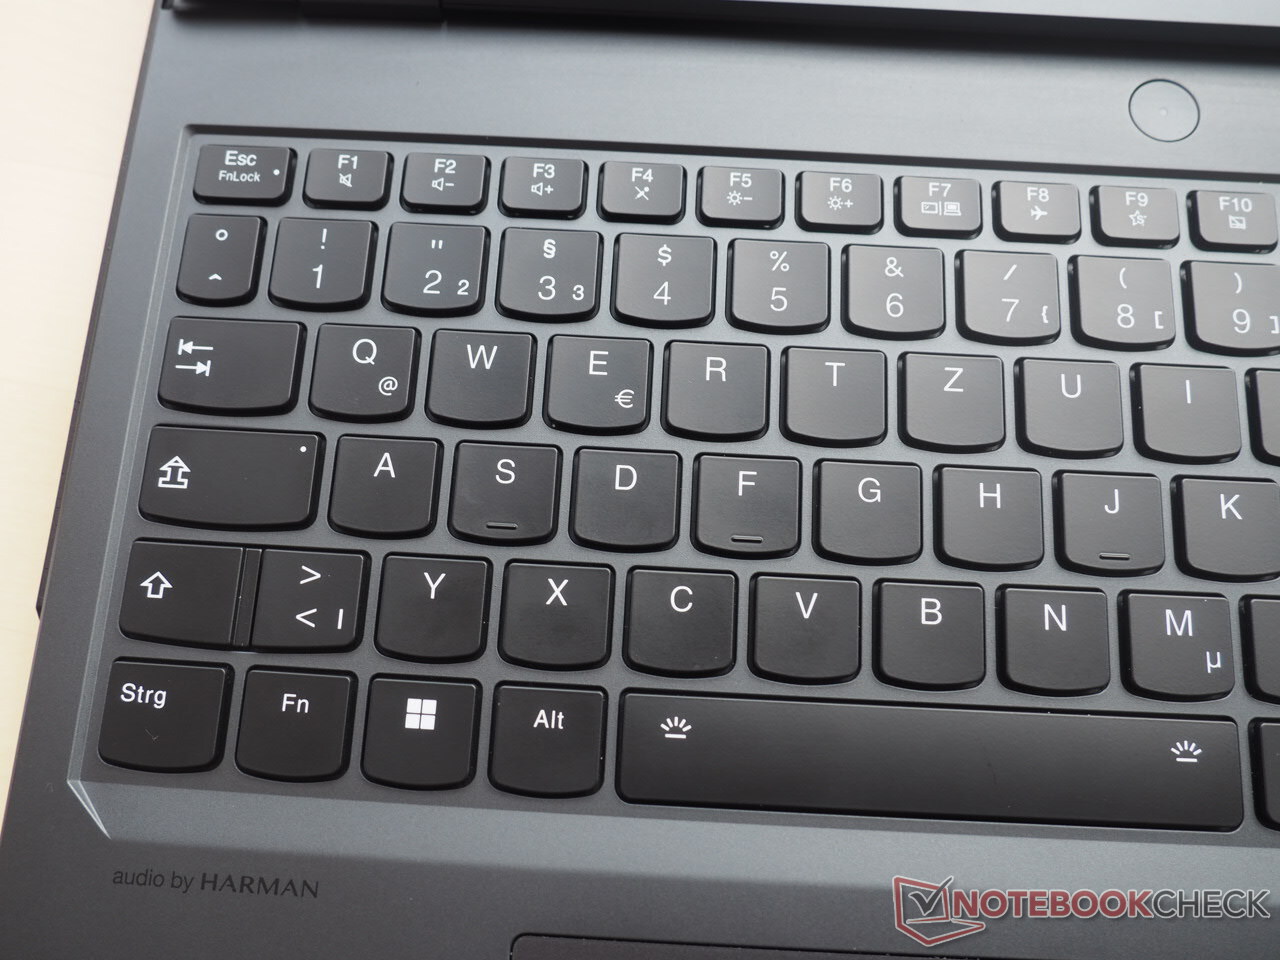
Klawiatura oferuje niewiele miejsca na reklamacje. Typowe dla Lenovo klawisze z zakrzywionymi dolnymi krawędziami zapewniają przyjemne pisanie po pewnym zapoznaniu się z nimi. Aktywacja i punkt nacisku są całkiem niezłe, choć nie zbliżają się do poziomu klawiatury mechanicznej.
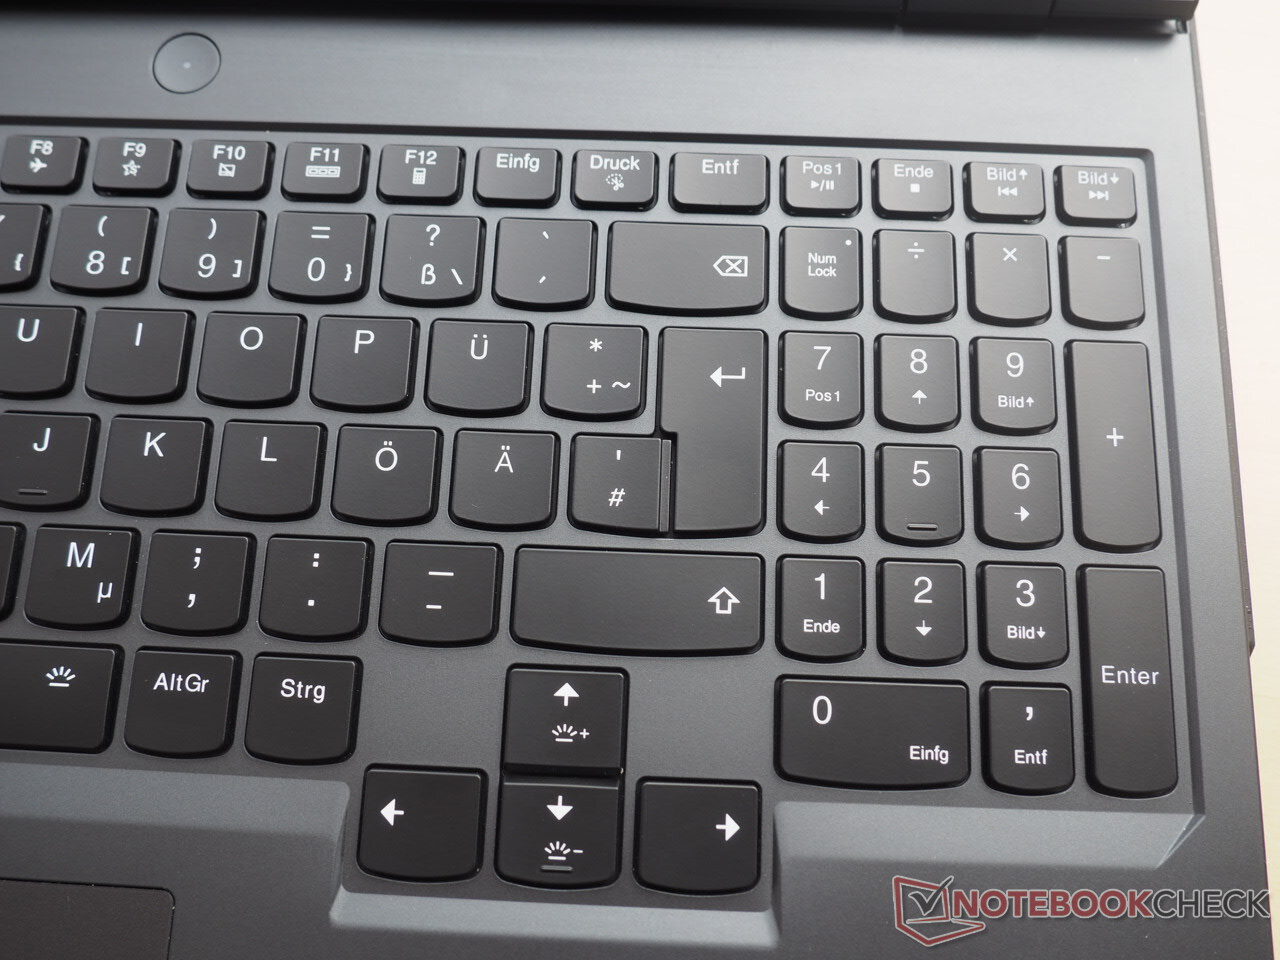
Układ klawiatury jest naszym zdaniem przekonujący. Osoby, które często korzystają z klawiszy strzałek, mogą liczyć na przyzwoite rozplanowanie. Dostępny jest także pełnowartościowy numpad. Dzięki wyraźnemu oznakowaniu klawiszy można wyłączyć podświetlenie w ciągu dnia. W przeciwnym razie podświetlenie oferuje użyteczną intensywność i kilka trybów regulacji.
Touchpad
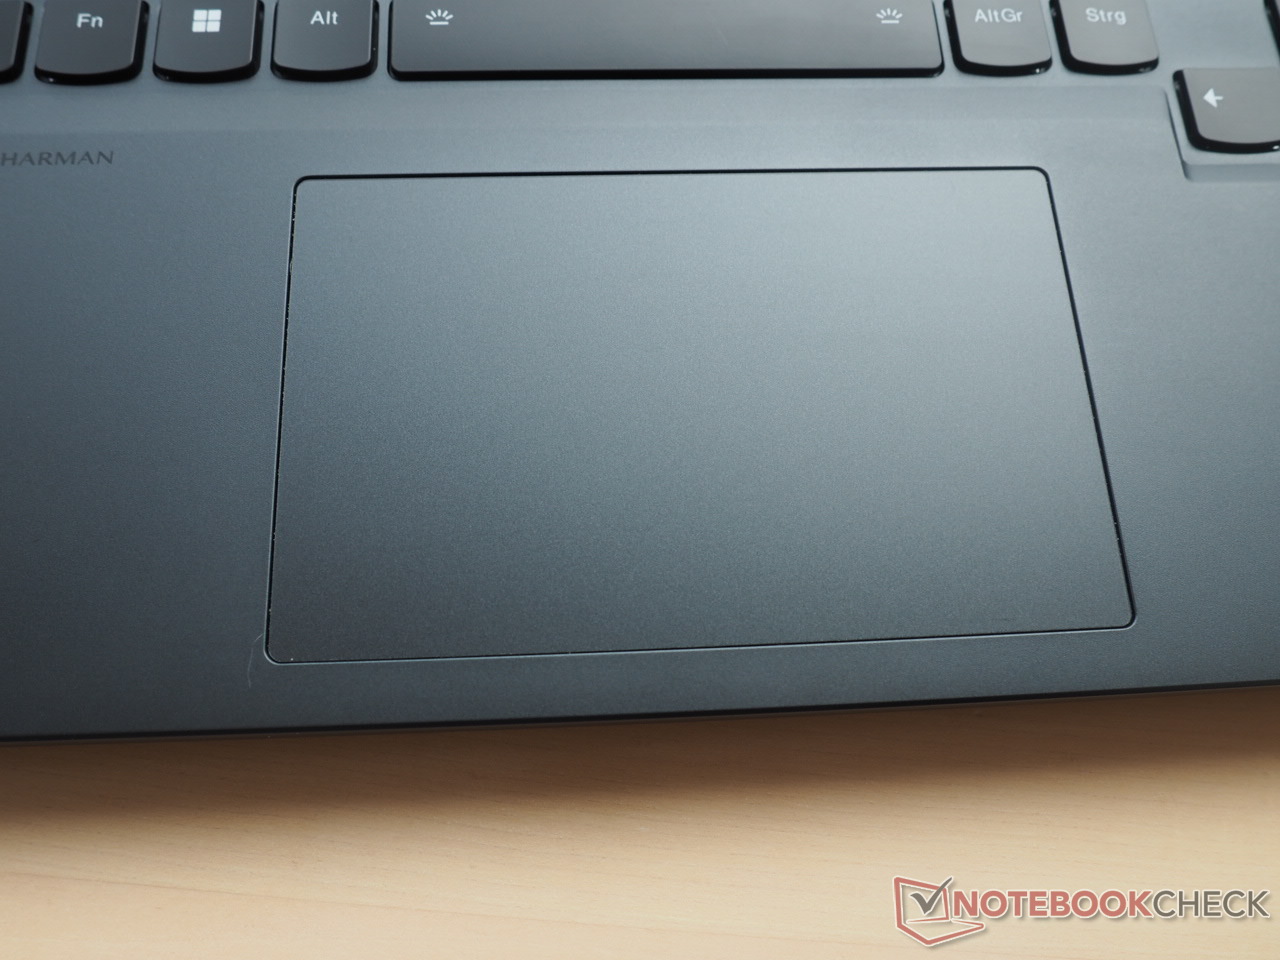
Gładki touchpad o wymiarach 12 x 7,5 cm wydaje się wystarczający dla 16-calowego urządzenia i jest umieszczony stosunkowo daleko po lewej stronie. Nie stwierdziliśmy żadnych problemów z precyzją i właściwościami ślizgowymi, co sprzyja płynnej pracy.
Obszary klikania w pobliżu spodu są bardzo stabilne i dają się łatwo uruchomić, ale brzmią dość głośno i rykoszetem.
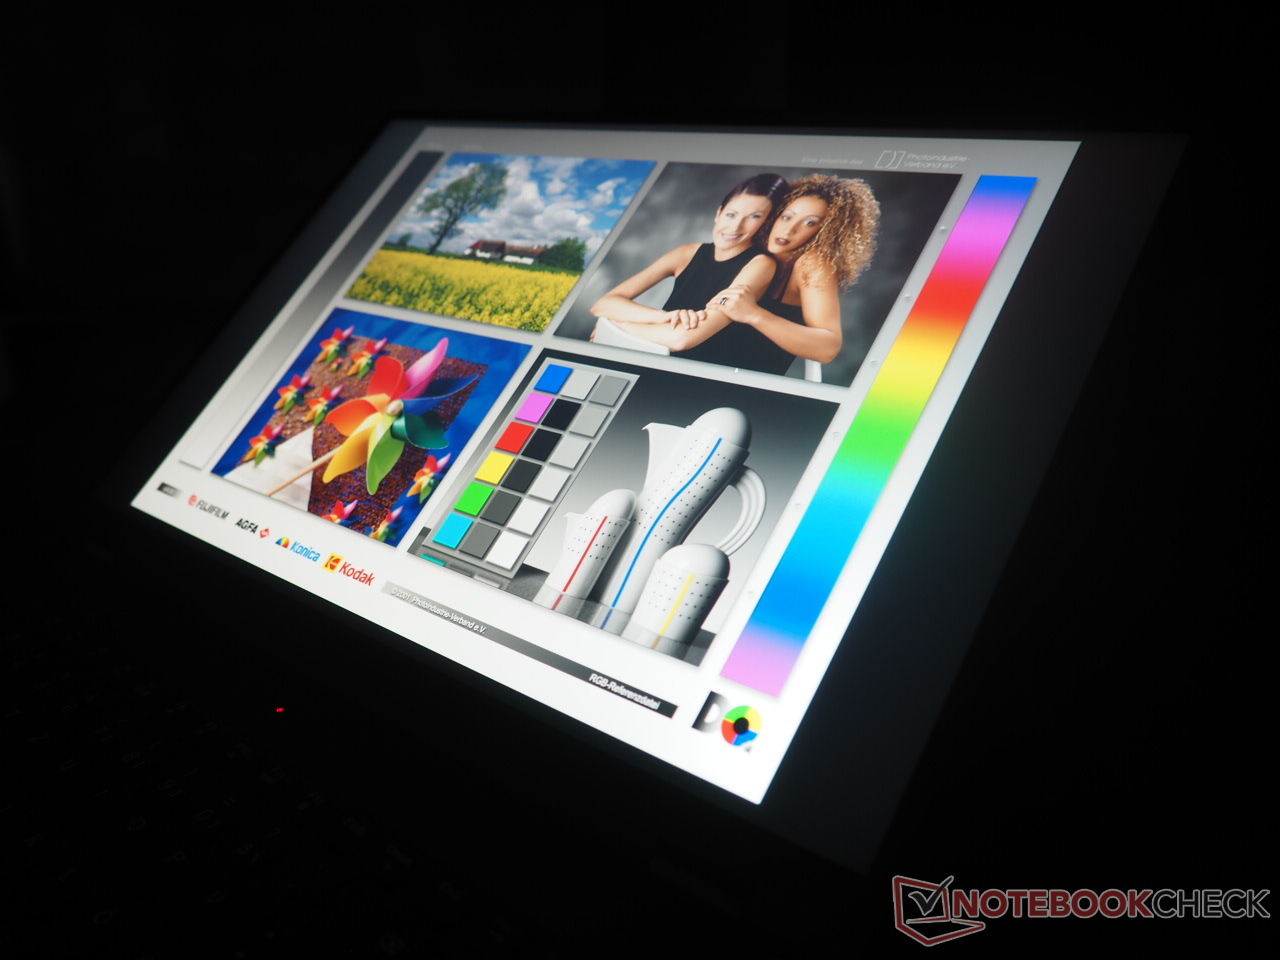
Wyświetlacz: panel 240 Hz z wysokim poziomem jasności i bez PWM
Panel WQXGA 240 Hz Legion 7 Pro oferuje wysoką średnią luminację 469 cd/m2, co powinno dobrze wróżyć do oglądania filmów na świeżym powietrzu. Konkurencja również oferuje jednak podobne poziomy jasności.
| |||||||||||||||||||||||||
rozświetlenie: 86 %
na akumulatorze: 511 cd/m²
kontrast: 1278:1 (czerń: 0.4 cd/m²)
ΔE ColorChecker Calman: 0.95 | ∀{0.5-29.43 Ø4.71}
calibrated: 0.91
ΔE Greyscale Calman: 0.6 | ∀{0.09-98 Ø4.96}
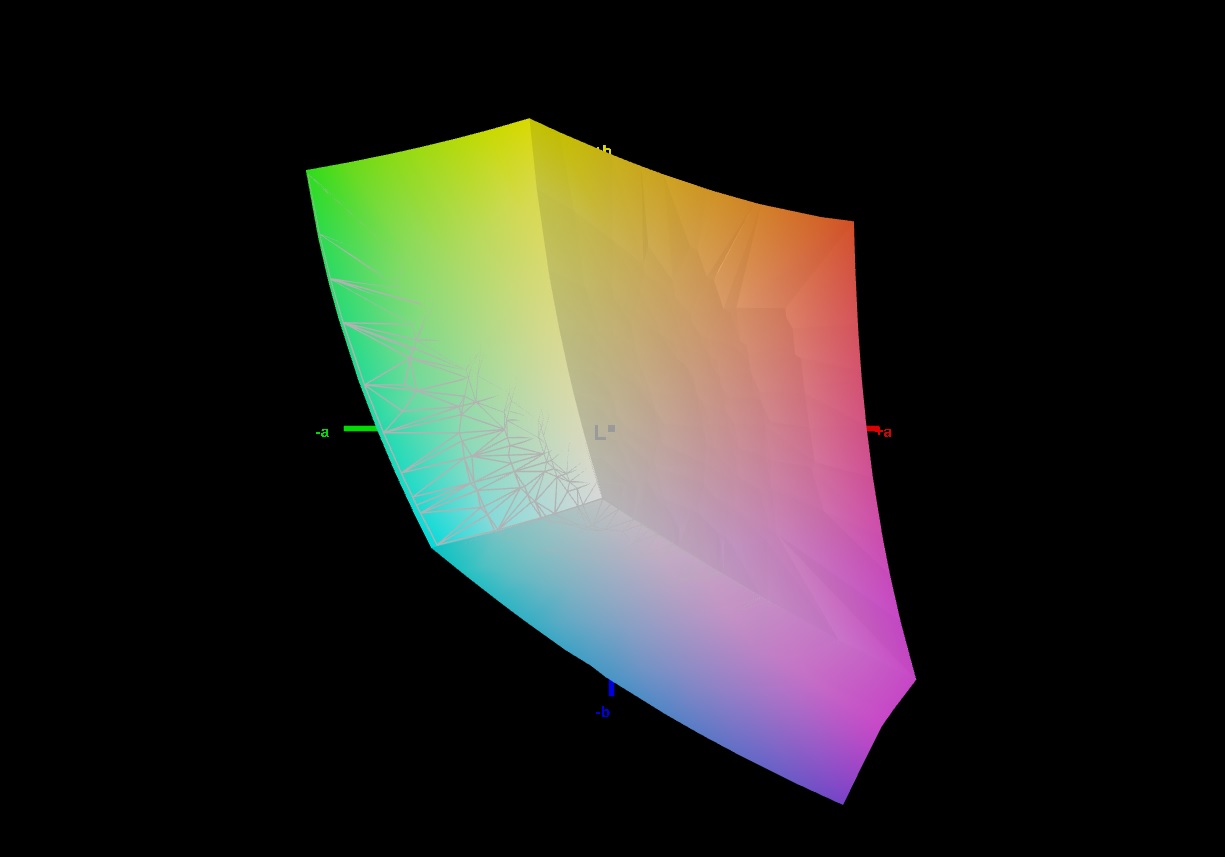
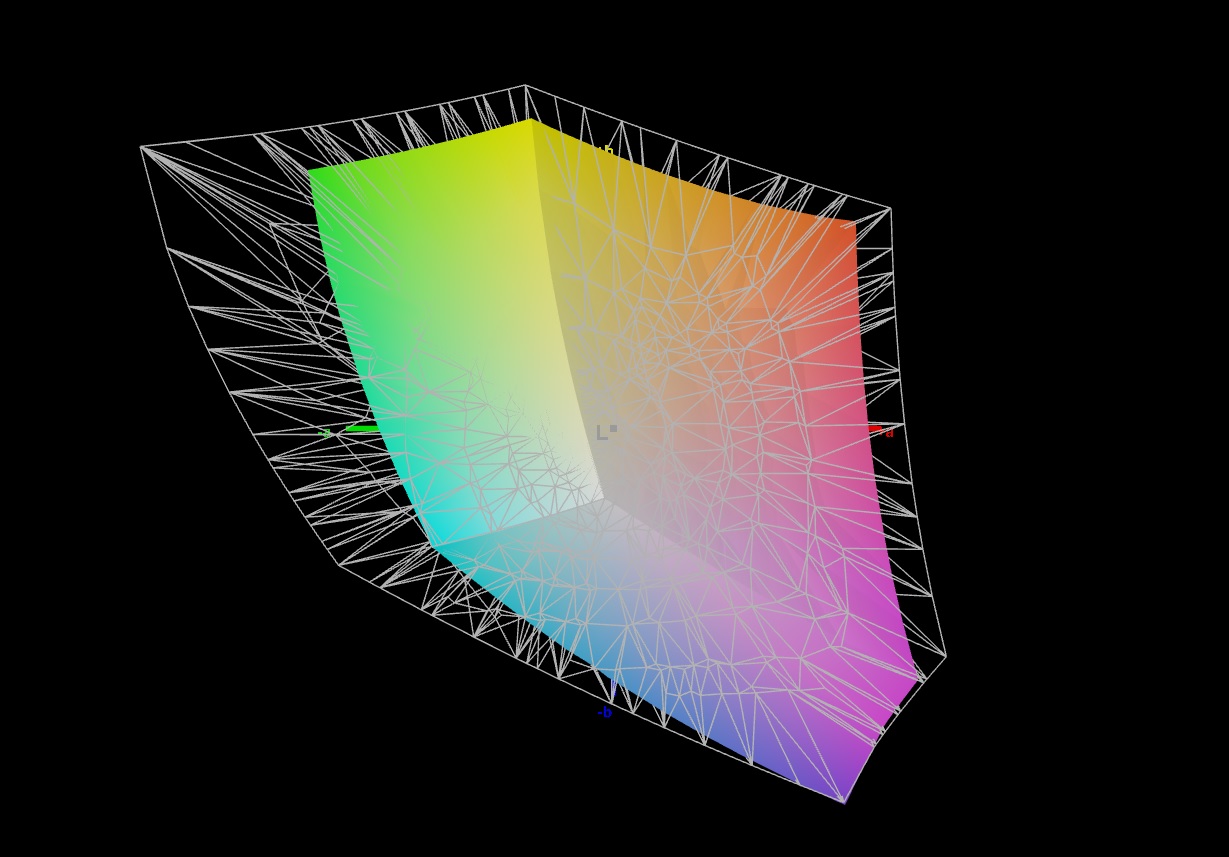
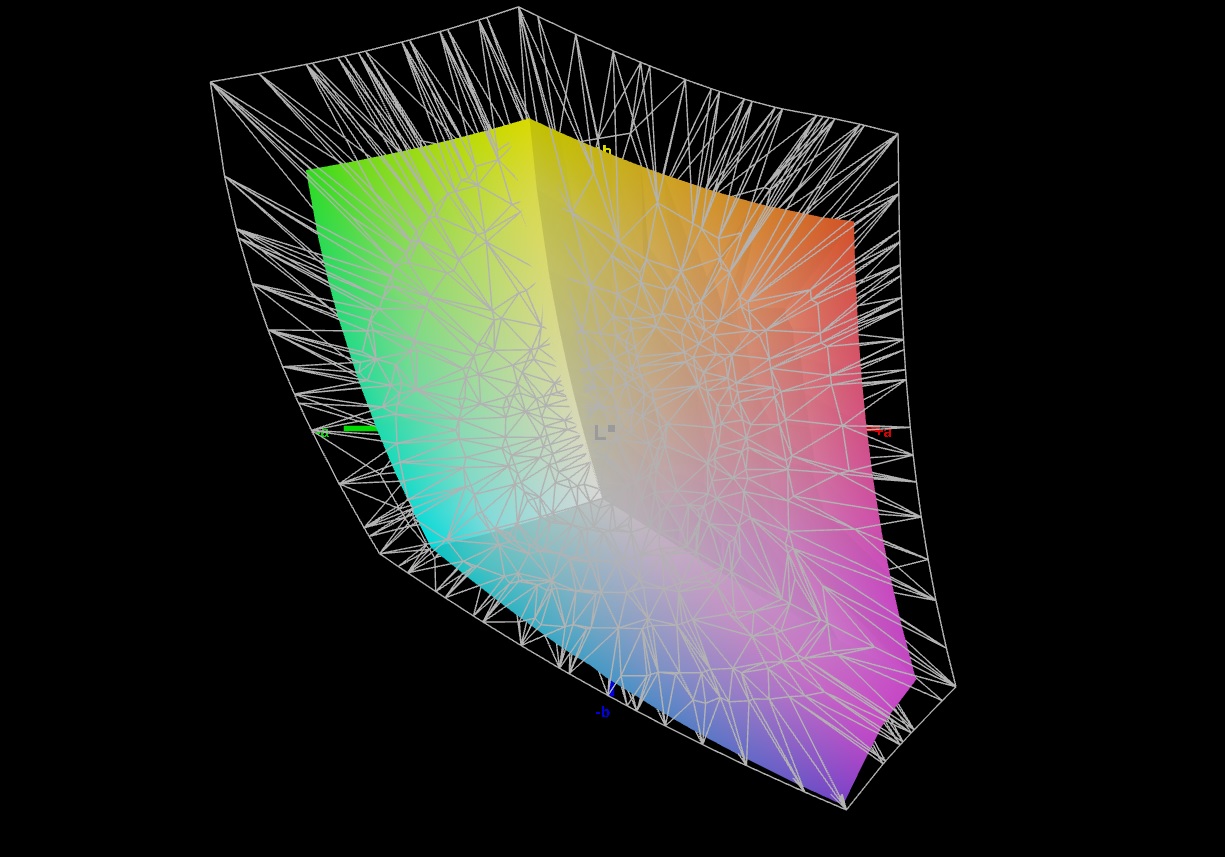
71.2% AdobeRGB 1998 (Argyll 3D)
99.7% sRGB (Argyll 3D)
69.1% Display P3 (Argyll 3D)
Gamma: 2.176
CCT: 6545 K
| Lenovo Legion Pro 7 16IRX8H MNG007DA2-3 (CSO1628), IPS, 2560x1600, 16" | Razer Blade 16 Early 2023 CSOT T3 MNG007DA4-1, IPS, 2560x1600, 16" | Lenovo Legion 7 16IAX7-82TD004SGE NE160QDM-NY1, IPS, 2560x1600, 16" | Lenovo Legion 7 16ACHg6 CSOT T3 MNG007DA1-1, IPS, 2560x1600, 16" | Lenovo Legion 7 16ARHA7 BOE CQ NE160QDM-NY1, IPS, 2560x1600, 16" | |
|---|---|---|---|---|---|
| Display | 23% | -1% | 1% | -7% | |
| Display P3 Coverage (%) | 69.1 | 98.5 43% | 69.3 0% | 70.3 2% | 63.7 -8% |
| sRGB Coverage (%) | 99.7 | 100 0% | 98.2 -2% | 99.4 0% | 95.3 -4% |
| AdobeRGB 1998 Coverage (%) | 71.2 | 89.7 26% | 70.8 -1% | 72.7 2% | 65.7 -8% |
| Response Times | -29% | 2% | -11% | -19% | |
| Response Time Grey 50% / Grey 80% * (ms) | 12.3 ? | 6.6 ? 46% | 12.6 ? -2% | 14 ? -14% | 9.2 ? 25% |
| Response Time Black / White * (ms) | 5.9 ? | 12 ? -103% | 5.6 ? 5% | 6.4 ? -8% | 9.6 ? -63% |
| PWM Frequency (Hz) | |||||
| Screen | -90% | -87% | -27% | -74% | |
| Brightness middle (cd/m²) | 511 | 456.8 -11% | 547 7% | 489 -4% | 478.8 -6% |
| Brightness (cd/m²) | 469 | 437 -7% | 523 12% | 469 0% | 477 2% |
| Brightness Distribution (%) | 86 | 83 -3% | 88 2% | 92 7% | 90 5% |
| Black Level * (cd/m²) | 0.4 | 0.35 13% | 0.44 -10% | 0.38 5% | 0.43 -8% |
| Contrast (:1) | 1278 | 1305 2% | 1243 -3% | 1287 1% | 1113 -13% |
| Colorchecker dE 2000 * | 0.95 | 3.7 -289% | 2.1 -121% | 1.45 -53% | 2.24 -136% |
| Colorchecker dE 2000 max. * | 2.07 | 6.42 -210% | 7 -238% | 2.16 -4% | 4.49 -117% |
| Colorchecker dE 2000 calibrated * | 0.91 | 0.66 27% | 0.9 1% | 1.16 -27% | 1.89 -108% |
| Greyscale dE 2000 * | 0.6 | 2.6 -333% | 3.2 -433% | 1.6 -167% | 2.3 -283% |
| Gamma | 2.176 101% | 2.3 96% | 2.23 99% | 2.197 100% | 2.25 98% |
| CCT | 6545 99% | 6108 106% | 6979 93% | 6377 102% | 6955 93% |
| Color Space (Percent of AdobeRGB 1998) (%) | 73 | ||||
| Color Space (Percent of sRGB) (%) | 94 | ||||
| Całkowita średnia (program / ustawienia) | -32% /
-57% | -29% /
-56% | -12% /
-19% | -33% /
-52% |
* ... im mniej tym lepiej
Współczynnik kontrastu 1 278:1 plasuje się na podobnych liniach co Blade 16. Flagowiec Razera oferuje jednak większe pokrycie palety barw. Legion Pro 7 radzi sobie w 100% z sRGB, ale wypada blado, jeśli chodzi o pokrycie Adobe RGB i Display P3.
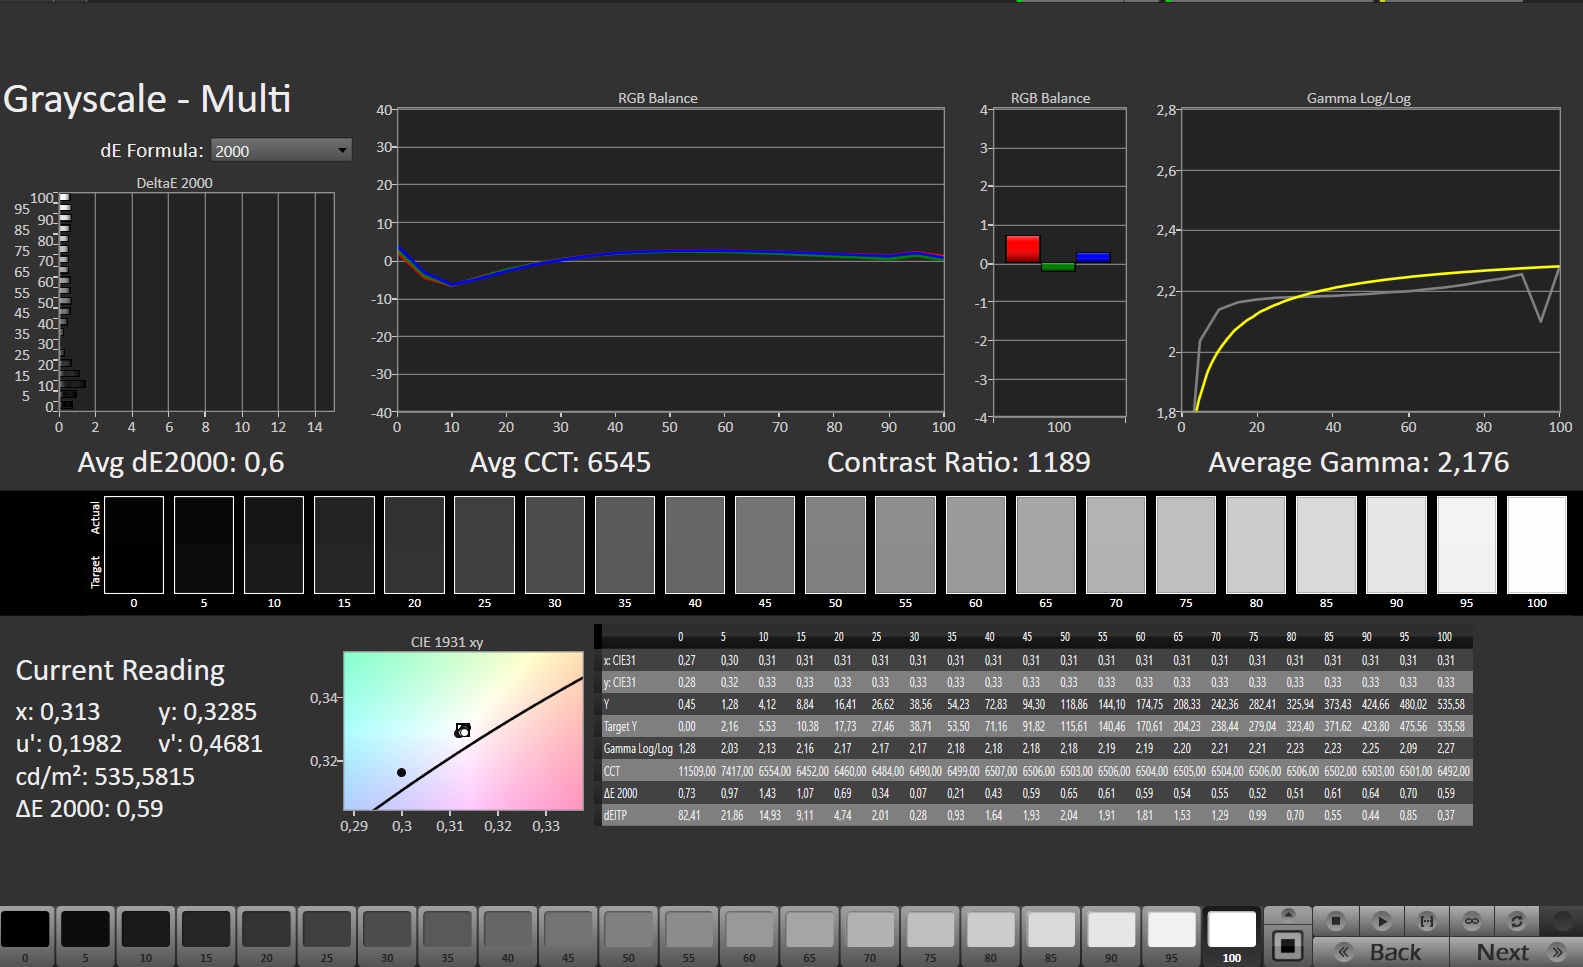
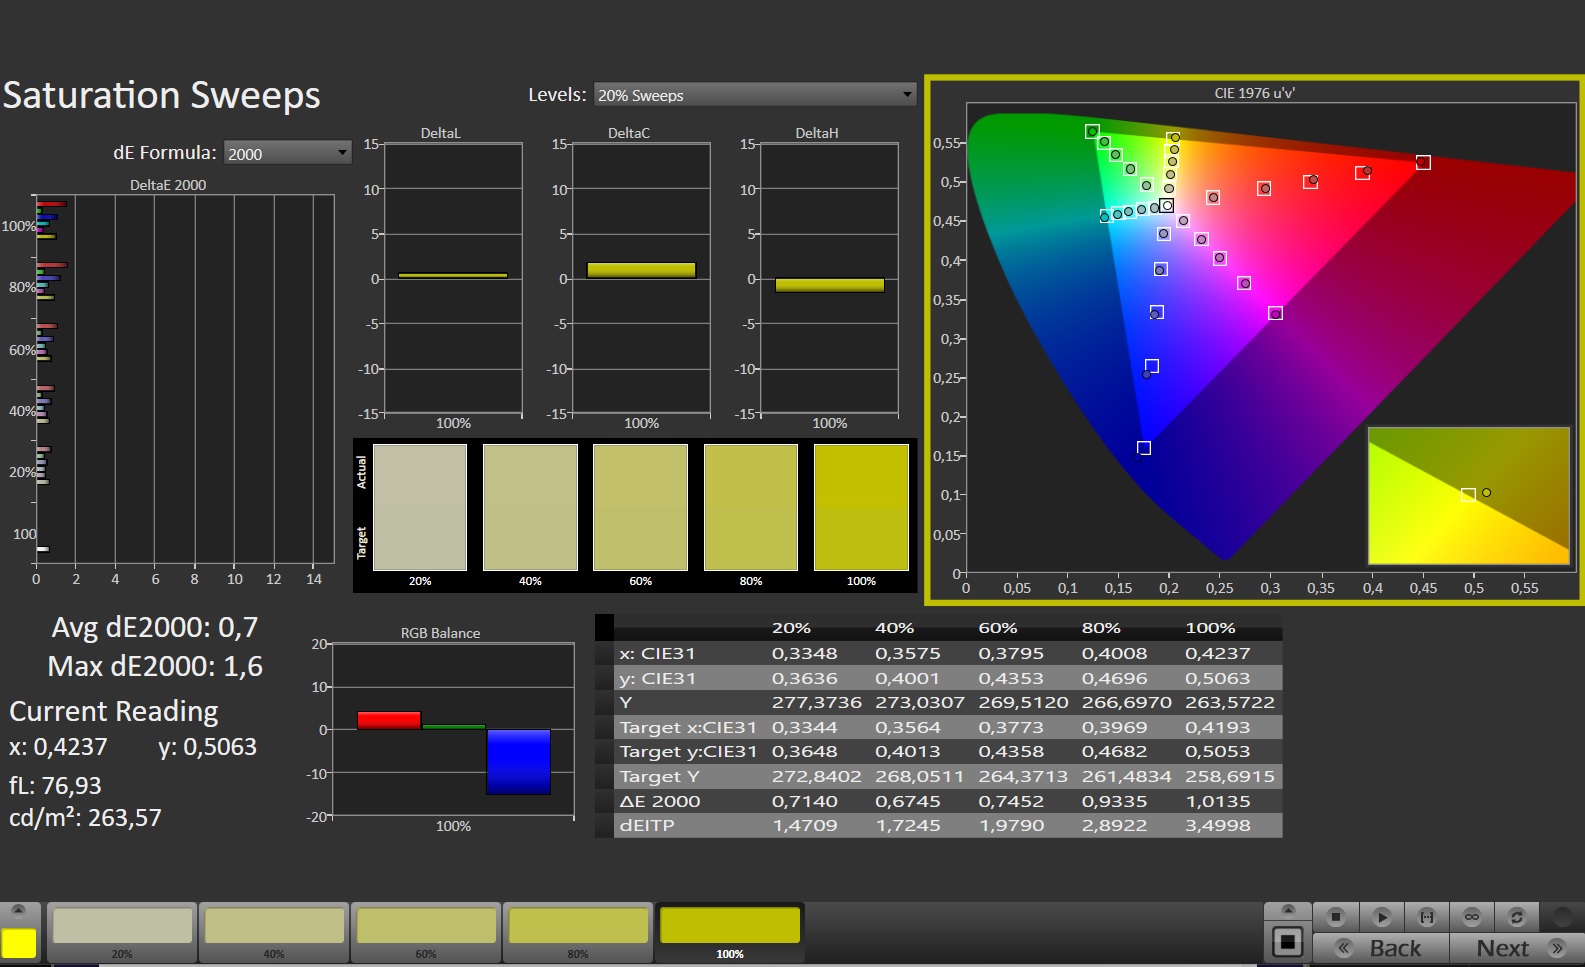
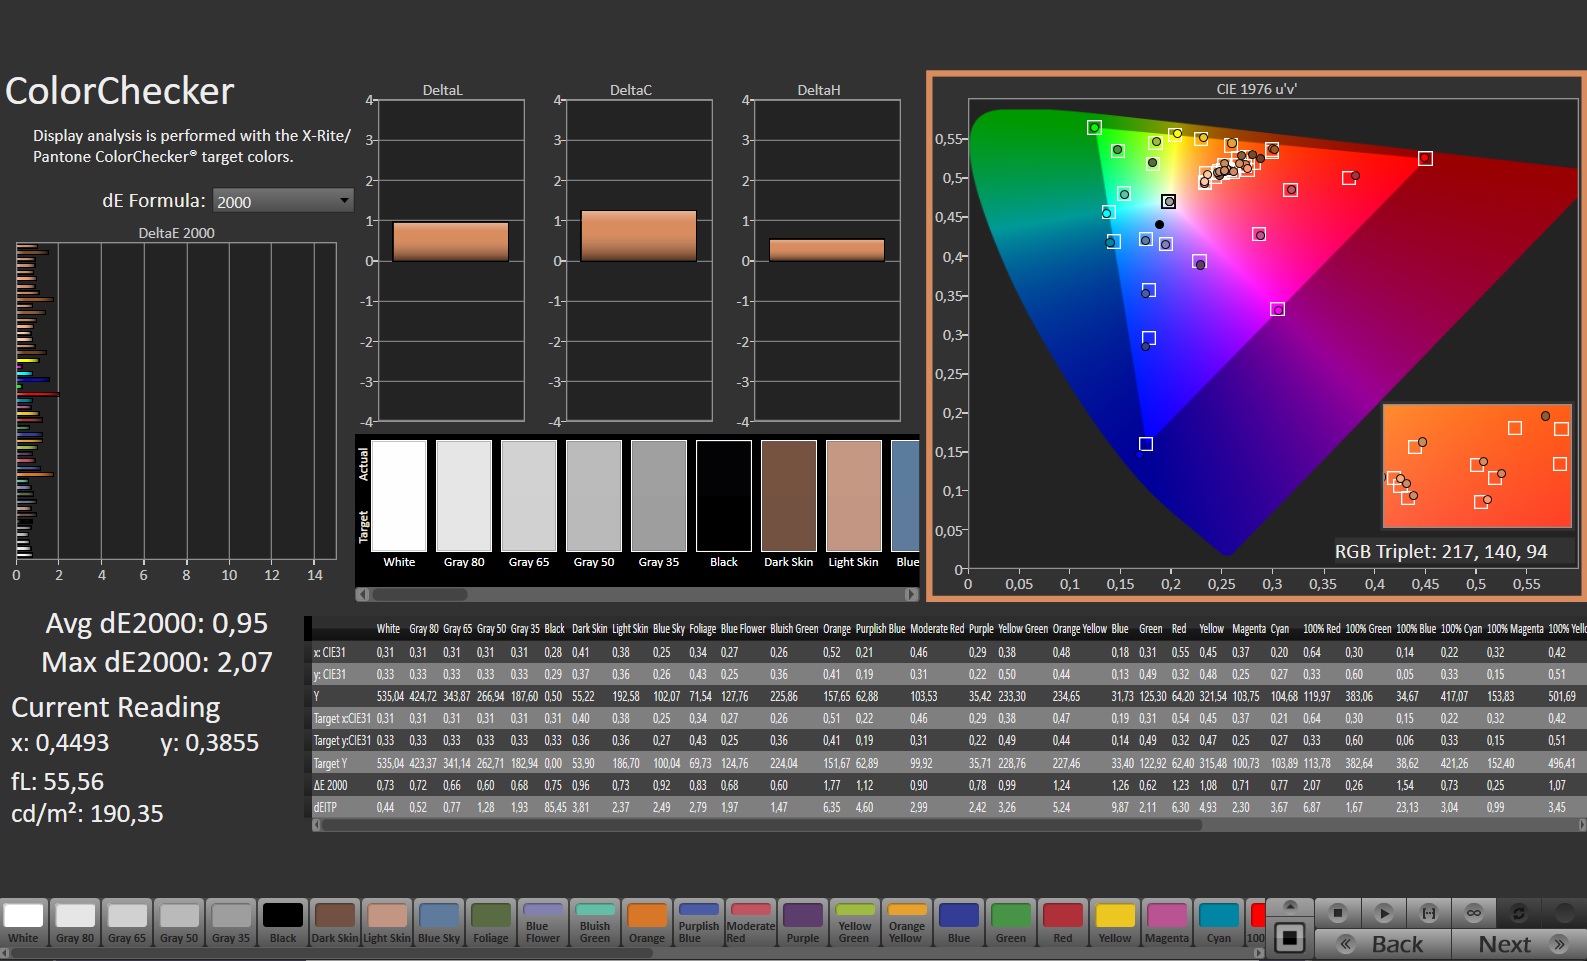
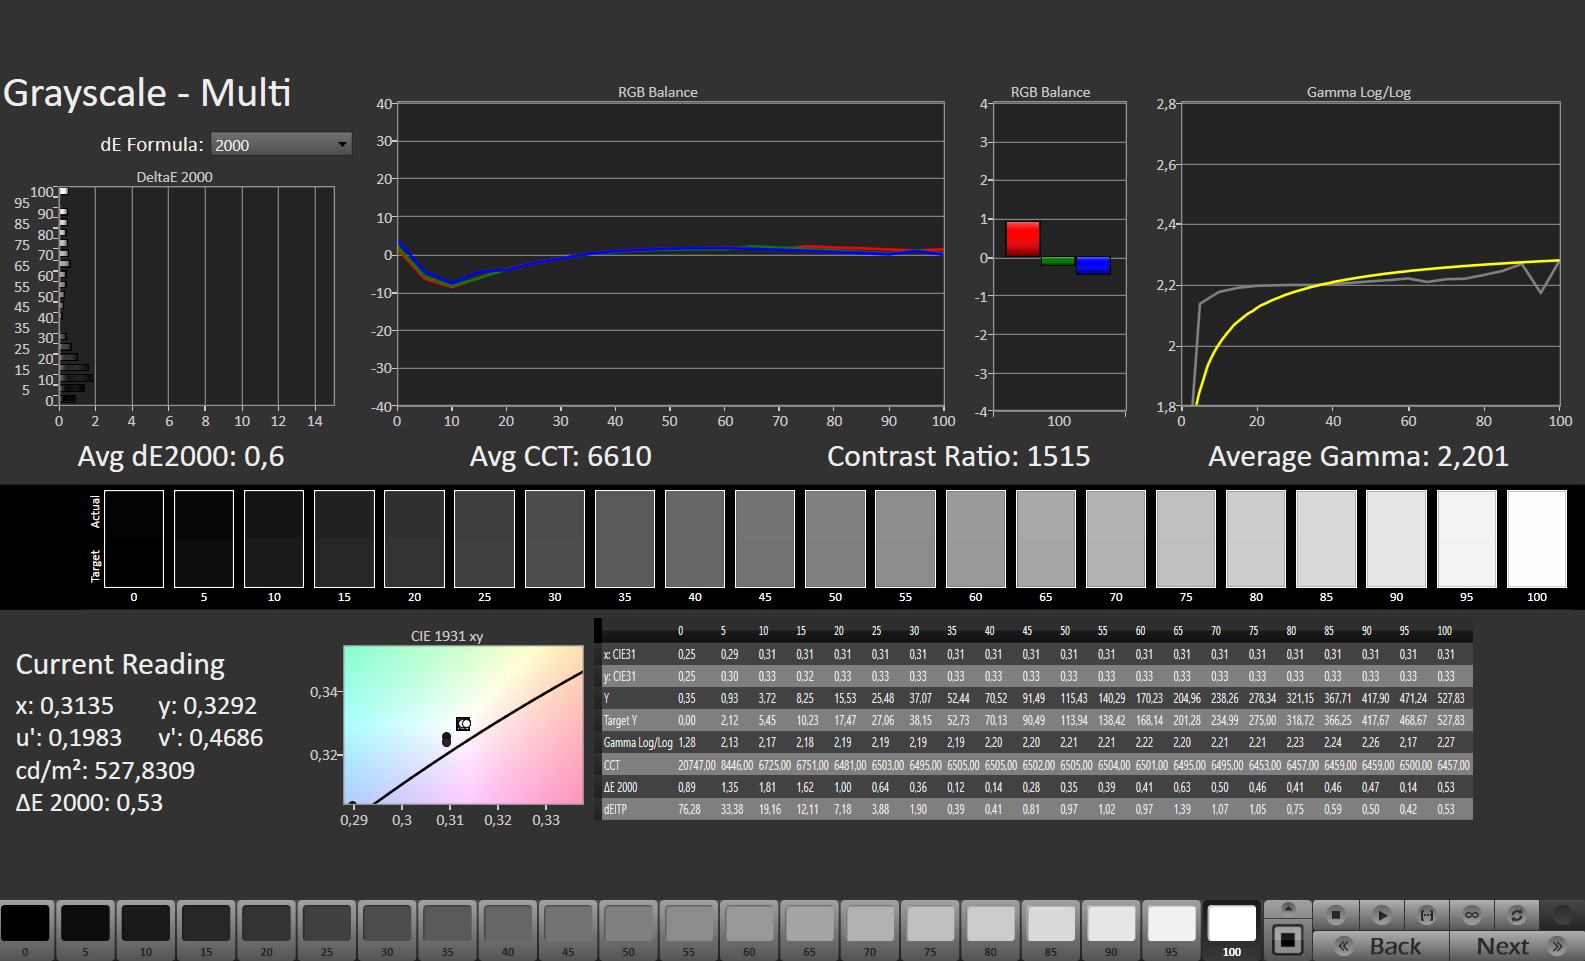
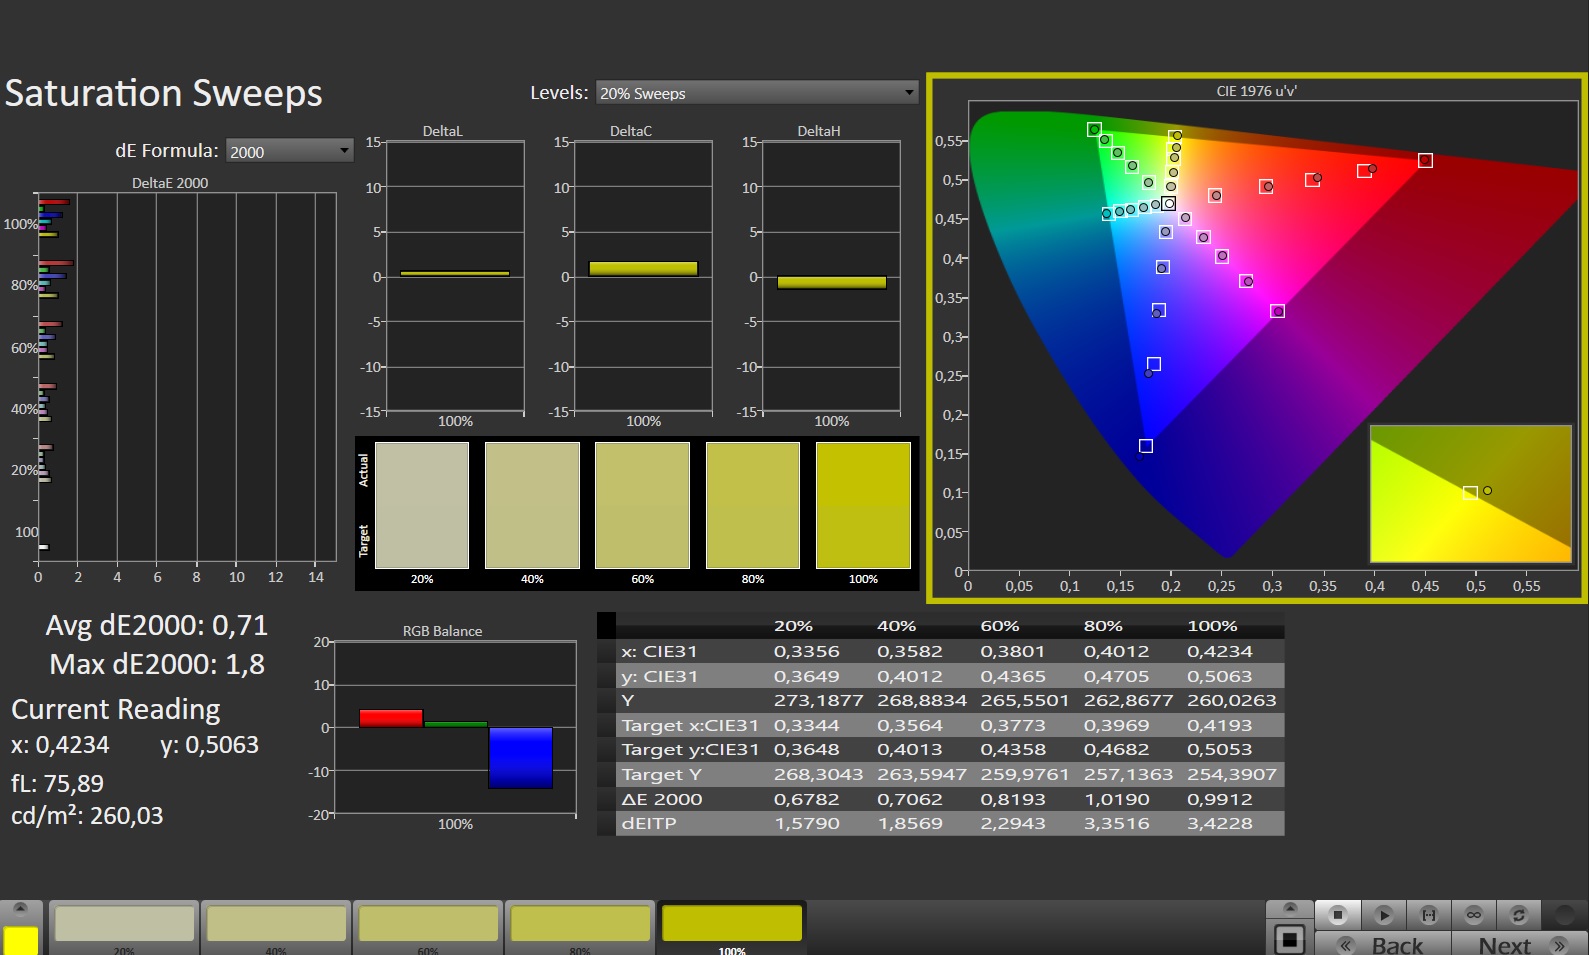

W związku z tym Legion Pro 7 oferuje doskonałą dokładność kolorów już po wyjęciu z pudełka dzięki kalibracji X-Rite Pantone.
Czasy reakcji (~6 ms od czerni do bieli) są na oczekiwanych liniach. Stabilność kątów widzenia zależy zwykle od poziomu IPS, wydaje się być stosunkowo dobra z pozycji skośnych.
Wyświetl czasy reakcji
| ↔ Czas reakcji od czerni do bieli | ||
|---|---|---|
| 5.9 ms ... wzrost ↗ i spadek ↘ łącznie | ↗ 2.2 ms wzrost | 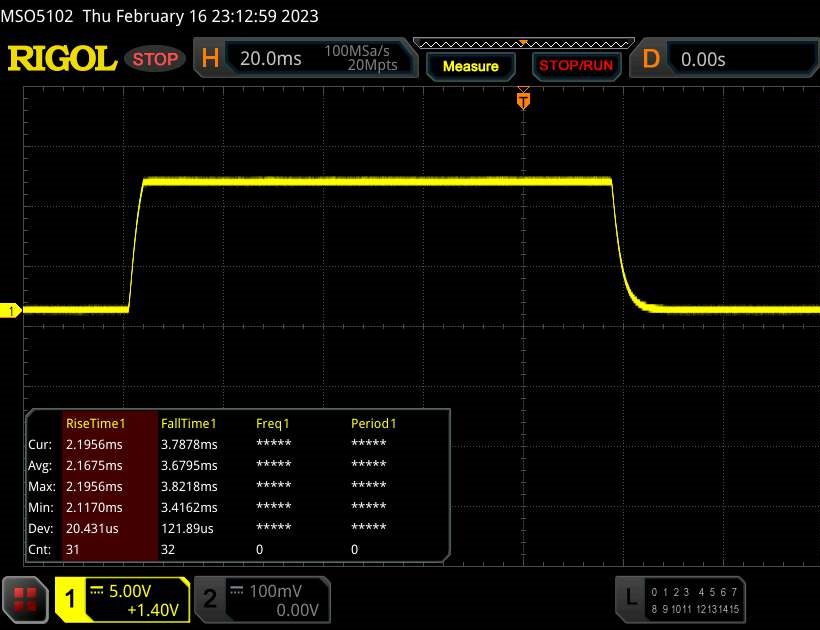 |
| ↘ 3.7 ms upadek | ||
| W naszych testach ekran wykazuje bardzo szybką reakcję i powinien bardzo dobrze nadawać się do szybkich gier. Dla porównania, wszystkie testowane urządzenia wahają się od 0.1 (minimum) do 240 (maksimum) ms. » 19 % wszystkich urządzeń jest lepszych. Oznacza to, że zmierzony czas reakcji jest lepszy od średniej wszystkich testowanych urządzeń (19.8 ms). | ||
| ↔ Czas reakcji 50% szarości do 80% szarości | ||
| 12.3 ms ... wzrost ↗ i spadek ↘ łącznie | ↗ 5.7 ms wzrost | 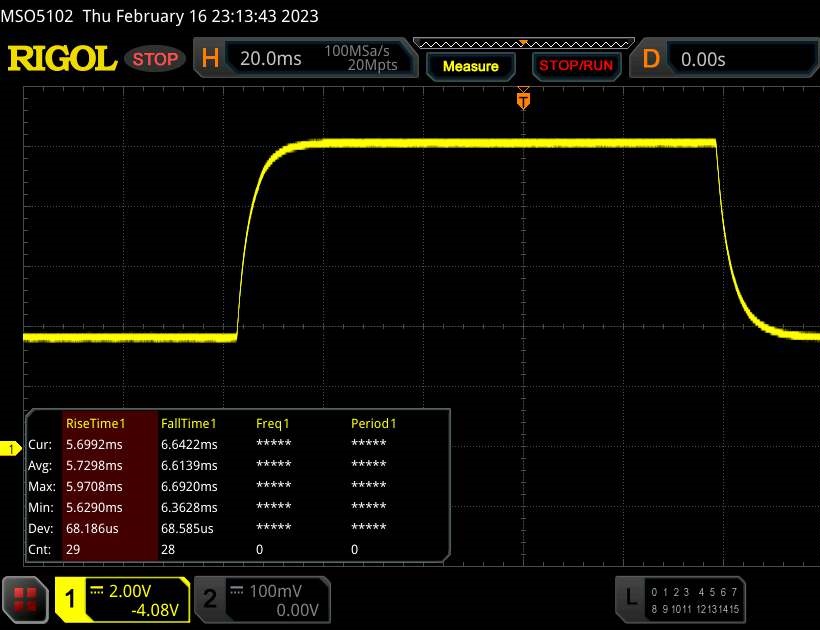 |
| ↘ 6.6 ms upadek | ||
| W naszych testach ekran wykazuje dobry współczynnik reakcji, ale może być zbyt wolny dla graczy rywalizujących ze sobą. Dla porównania, wszystkie testowane urządzenia wahają się od 0.165 (minimum) do 636 (maksimum) ms. » 26 % wszystkich urządzeń jest lepszych. Oznacza to, że zmierzony czas reakcji jest lepszy od średniej wszystkich testowanych urządzeń (31 ms). | ||
Migotanie ekranu / PWM (modulacja szerokości impulsu)
| Migotanie ekranu/nie wykryto PWM |  | ||
Dla porównania: 52 % wszystkich testowanych urządzeń nie używa PWM do przyciemniania wyświetlacza. Jeśli wykryto PWM, zmierzono średnio 7754 (minimum: 5 - maksimum: 343500) Hz. | |||
Wydajność: Core i9-13900HX i RTX 4080 na szczycie listy przebojów
Obecna konfiguracja umieszcza Lenovo Legion Pro 7 w kategorii absolutnego high-endu, co oznacza, że trzeba będzie odpowiednio wykaszleć grosze (mimo wszystko uważamy obecny poziom cen za wygórowany).
W każdym razie, ta konfiguracja oferuje wystarczająco dużo mocy, aby przepłynąć przez wszystkie rodzaje obciążeń roboczych przez wiele lat.
Warunki badania
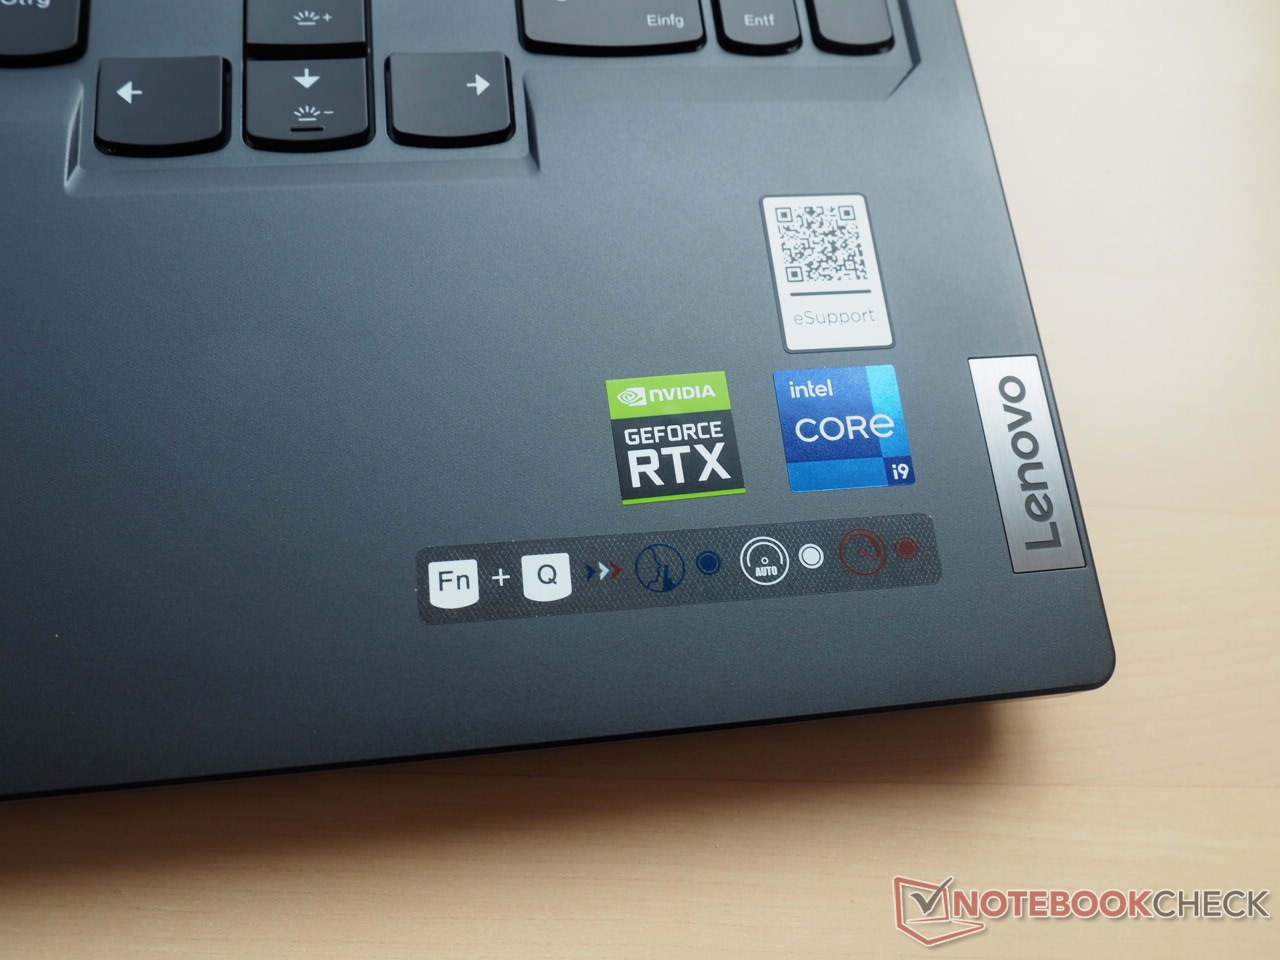
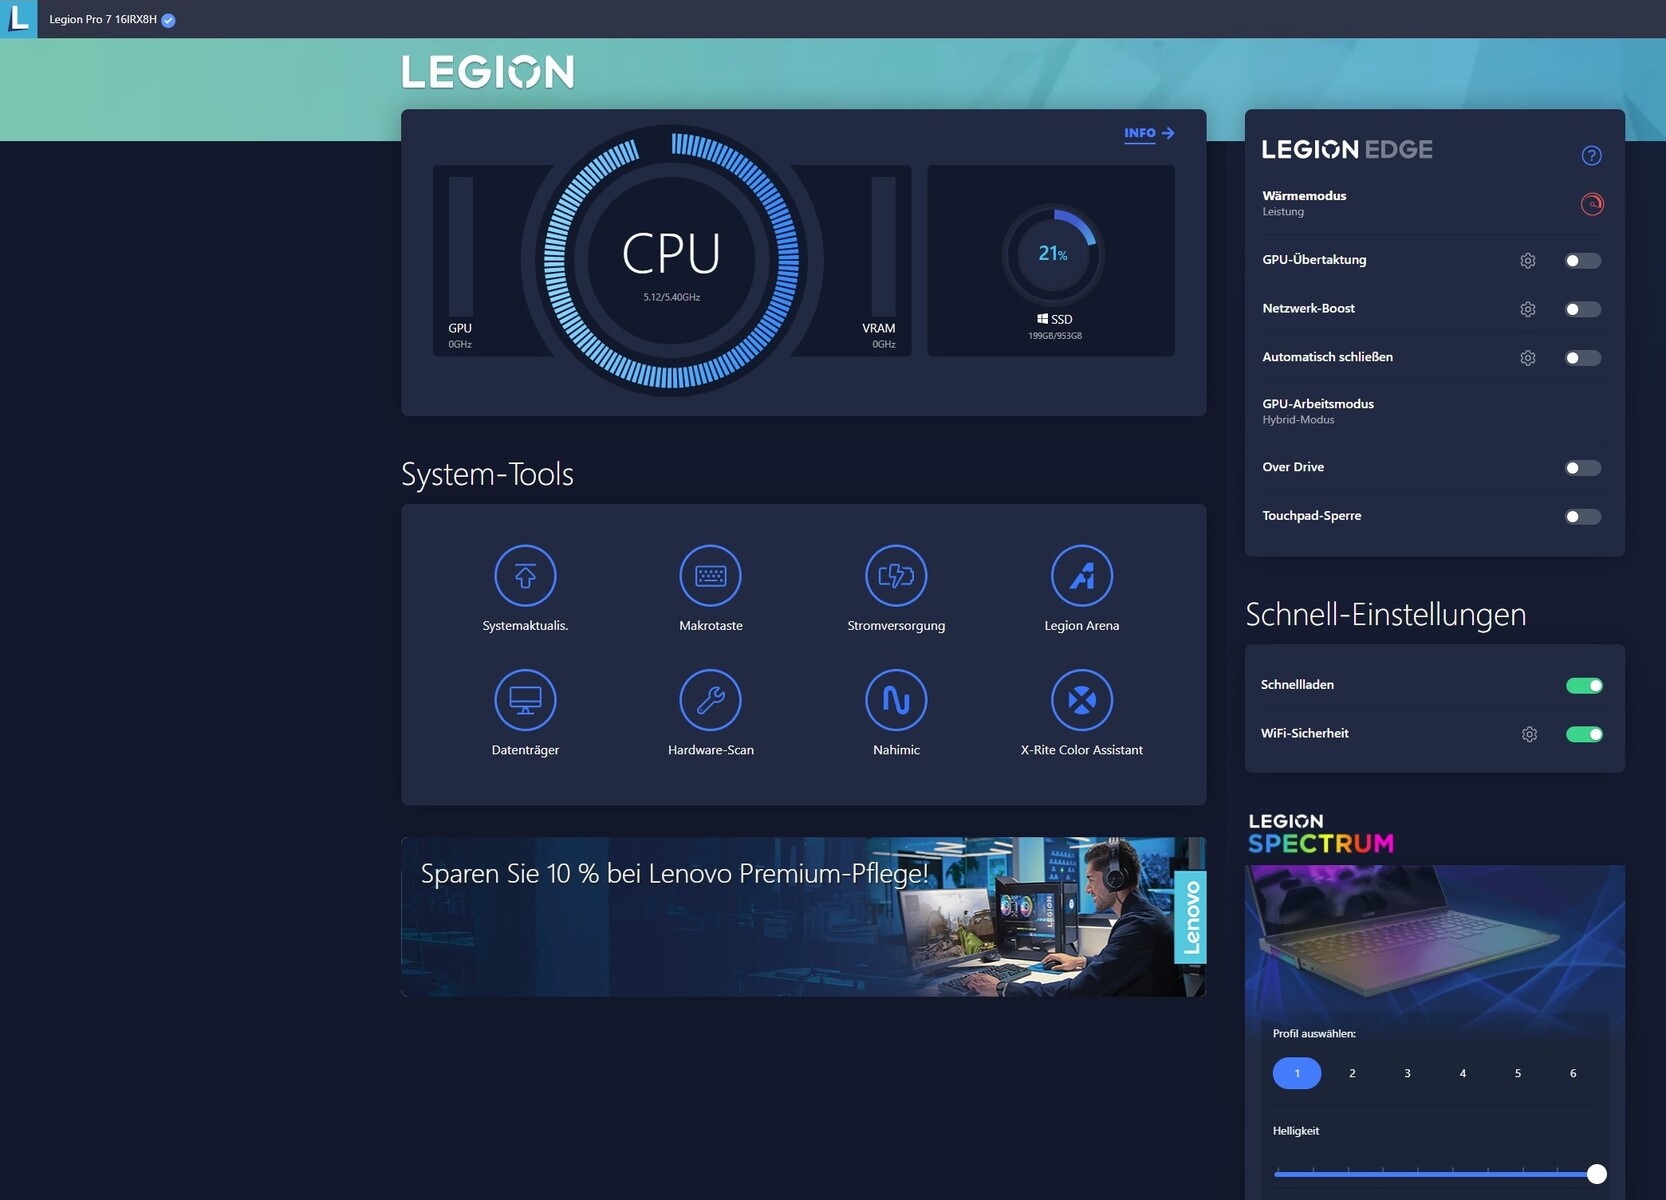
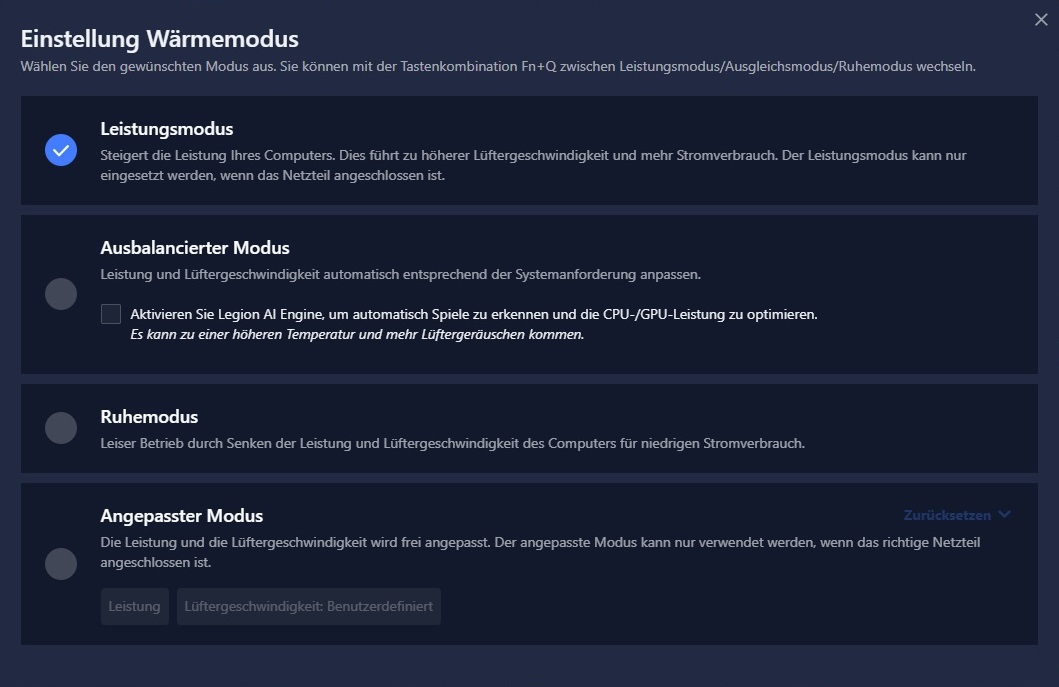
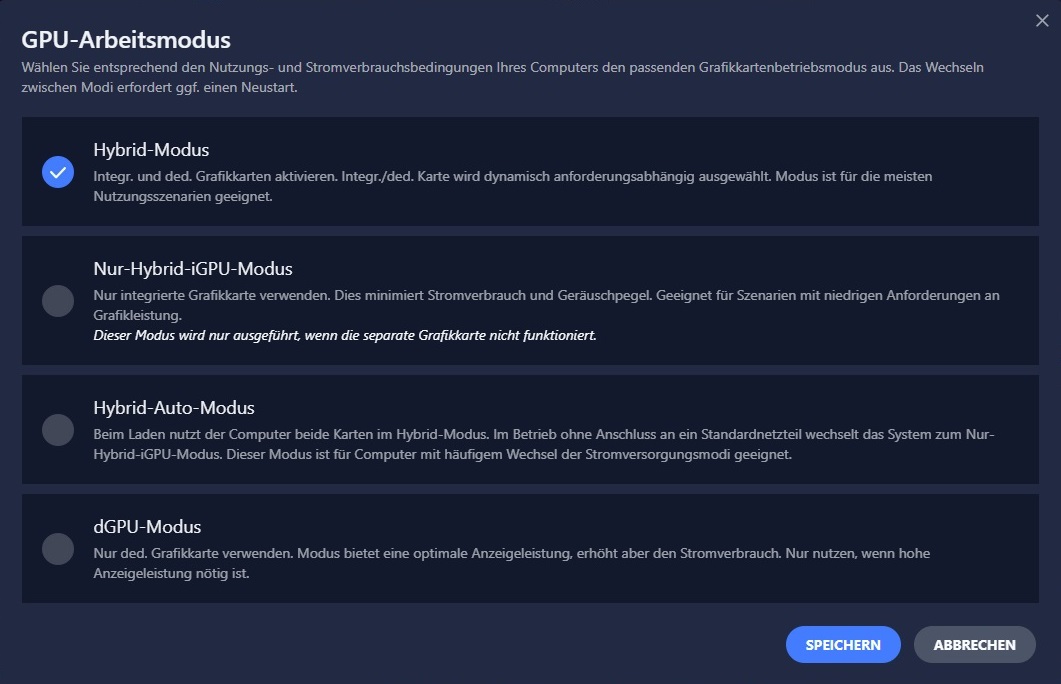
Preinstalowana jest aplikacja Lenovo Vantage, w ramach której można wybrać jeden z kilku trybów pracy wydajności i GPU. Tryby wydajności można również zmieniać za pomocą skrótu Fn + Q.
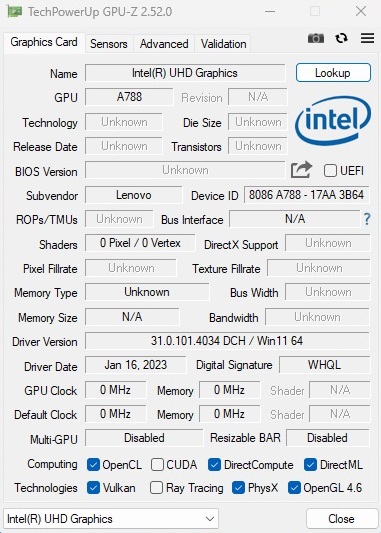
Do wszystkich naszych pomiarów wykorzystaliśmy tryb Performance wraz z aktywnym przełączaniem grafiki, który dynamicznie przełącza się między iGPU i dGPU. Dostępny jest również tryb czystego dGPU (sprawdź zrzuty ekranu poniżej).
Poniższa tabela ilustruje wpływ różnych trybów wydajności na wartości PL1/PL2 i hałas wentylatora.
| Silent | Balanced | Wydajność | |
| CPU PL1 (HWiNFO) | 55 W | 75 W | 130 W |
| CPU PL2 (HWiNFO) | 65 W | 119 W | 185 W |
| Hałas (The Witcher 3 ) | 39 dB(A) | 43 - 46 dB(A) | 49 - 55 dB(A) |
| Wydajność (The Witcher 3 ) | 40 fps (Locked) | 150 fps | 180 fps |
Prozessor
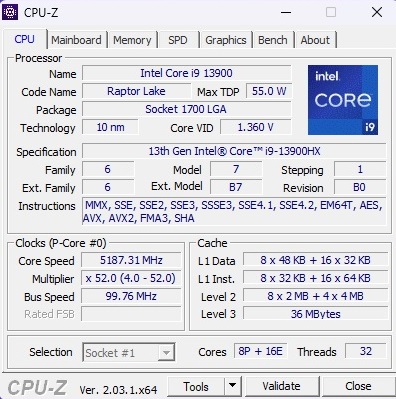
Na stronie Intel Core i9-13900HX to potwór wydajności. Ta 10 nm część oferuje osiem wydajnych rdzeni z zegarami od 2,2 GHz do 5,4 GHz i obsługą hyperthreadingu wraz z 16 wydajnymi rdzeniami taktowanymi zegarem od 1,6 GHz do 3,9 GHz bez hyperthreadingu, co daje łącznie 32 wątki równolegle.
Bujna 36 MB pamięci podręcznej L3 i TDP na poziomie 55 W dodatkowo potwierdzają, że Core i9-13900HX to potężny układ.
Cinebench R15 Multi Dauertest
| CPU Performance rating - Percent | |
| Lenovo Legion Pro 7 16IRX8H | |
| Przeciętny Intel Core i9-13900HX | |
| Razer Blade 16 Early 2023 | |
| Średnia w klasie Gaming | |
| Lenovo Legion 7 16IAX7-82TD004SGE | |
| Lenovo Legion 7 16ARHA7 | |
| Lenovo Legion 7 16ACHg6 | |
| Blender - v2.79 BMW27 CPU | |
| Lenovo Legion 7 16ACHg6 | |
| Lenovo Legion 7 16ARHA7 | |
| Średnia w klasie Gaming (79 - 330, n=104, ostatnie 2 lata) | |
| Lenovo Legion 7 16IAX7-82TD004SGE | |
| Przeciętny Intel Core i9-13900HX (101 - 153, n=22) | |
| Razer Blade 16 Early 2023 | |
| Lenovo Legion Pro 7 16IRX8H | |
| HWBOT x265 Benchmark v2.2 - 4k Preset | |
| Lenovo Legion Pro 7 16IRX8H | |
| Przeciętny Intel Core i9-13900HX (23.5 - 34.4, n=22) | |
| Średnia w klasie Gaming (11.5 - 44.4, n=105, ostatnie 2 lata) | |
| Razer Blade 16 Early 2023 | |
| Lenovo Legion 7 16IAX7-82TD004SGE | |
| Lenovo Legion 7 16ARHA7 | |
| Lenovo Legion 7 16ACHg6 | |
| LibreOffice - 20 Documents To PDF | |
| Lenovo Legion 7 16ARHA7 | |
| Lenovo Legion 7 16ACHg6 | |
| Średnia w klasie Gaming (33.2 - 88.8, n=105, ostatnie 2 lata) | |
| Razer Blade 16 Early 2023 | |
| Lenovo Legion Pro 7 16IRX8H | |
| Przeciętny Intel Core i9-13900HX (32.8 - 51.1, n=21) | |
| Lenovo Legion 7 16IAX7-82TD004SGE | |
| R Benchmark 2.5 - Overall mean | |
| Lenovo Legion 7 16ACHg6 | |
| Lenovo Legion 7 16ARHA7 | |
| Średnia w klasie Gaming (0.3439 - 0.759, n=106, ostatnie 2 lata) | |
| Lenovo Legion 7 16IAX7-82TD004SGE | |
| Razer Blade 16 Early 2023 | |
| Przeciętny Intel Core i9-13900HX (0.375 - 0.4564, n=22) | |
| Lenovo Legion Pro 7 16IRX8H | |
* ... im mniej tym lepiej
AIDA64: FP32 Ray-Trace | FPU Julia | CPU SHA3 | CPU Queen | FPU SinJulia | FPU Mandel | CPU AES | CPU ZLib | FP64 Ray-Trace | CPU PhotoWorxx
| Performance rating | |
| Lenovo Legion Pro 7 16IRX8H | |
| Średnia w klasie Gaming | |
| Przeciętny Intel Core i9-13900HX | |
| Razer Blade 16 Early 2023 | |
| Lenovo Legion 7 16ARHA7 | |
| Lenovo Legion 7 16IAX7-82TD004SGE | |
| Lenovo Legion 7 16ACHg6 | |
| AIDA64 / FP32 Ray-Trace | |
| Średnia w klasie Gaming (10227 - 85542, n=105, ostatnie 2 lata) | |
| Lenovo Legion Pro 7 16IRX8H | |
| Razer Blade 16 Early 2023 | |
| Razer Blade 16 Early 2023 | |
| Razer Blade 16 Early 2023 | |
| Przeciętny Intel Core i9-13900HX (17589 - 27615, n=22) | |
| Lenovo Legion 7 16ARHA7 | |
| Lenovo Legion 7 16ACHg6 | |
| Lenovo Legion 7 16IAX7-82TD004SGE | |
| AIDA64 / FPU Julia | |
| Średnia w klasie Gaming (51376 - 238426, n=105, ostatnie 2 lata) | |
| Lenovo Legion Pro 7 16IRX8H | |
| Razer Blade 16 Early 2023 | |
| Razer Blade 16 Early 2023 | |
| Razer Blade 16 Early 2023 | |
| Przeciętny Intel Core i9-13900HX (88686 - 137015, n=22) | |
| Lenovo Legion 7 16ARHA7 | |
| Lenovo Legion 7 16ACHg6 | |
| Lenovo Legion 7 16IAX7-82TD004SGE | |
| AIDA64 / CPU SHA3 | |
| Lenovo Legion Pro 7 16IRX8H | |
| Średnia w klasie Gaming (2180 - 10115, n=105, ostatnie 2 lata) | |
| Razer Blade 16 Early 2023 | |
| Razer Blade 16 Early 2023 | |
| Razer Blade 16 Early 2023 | |
| Przeciętny Intel Core i9-13900HX (4362 - 7029, n=22) | |
| Lenovo Legion 7 16IAX7-82TD004SGE | |
| Lenovo Legion 7 16ARHA7 | |
| Lenovo Legion 7 16ACHg6 | |
| AIDA64 / CPU Queen | |
| Razer Blade 16 Early 2023 | |
| Razer Blade 16 Early 2023 | |
| Lenovo Legion Pro 7 16IRX8H | |
| Przeciętny Intel Core i9-13900HX (125644 - 141385, n=22) | |
| Średnia w klasie Gaming (49785 - 173351, n=90, ostatnie 2 lata) | |
| Lenovo Legion 7 16ARHA7 | |
| Lenovo Legion 7 16ACHg6 | |
| Lenovo Legion 7 16IAX7-82TD004SGE | |
| AIDA64 / FPU SinJulia | |
| Razer Blade 16 Early 2023 | |
| Razer Blade 16 Early 2023 | |
| Razer Blade 16 Early 2023 | |
| Lenovo Legion Pro 7 16IRX8H | |
| Przeciętny Intel Core i9-13900HX (12334 - 17179, n=22) | |
| Średnia w klasie Gaming (4424 - 33636, n=105, ostatnie 2 lata) | |
| Lenovo Legion 7 16IAX7-82TD004SGE | |
| Lenovo Legion 7 16ARHA7 | |
| Lenovo Legion 7 16ACHg6 | |
| AIDA64 / FPU Mandel | |
| Średnia w klasie Gaming (25115 - 128721, n=105, ostatnie 2 lata) | |
| Lenovo Legion Pro 7 16IRX8H | |
| Razer Blade 16 Early 2023 | |
| Razer Blade 16 Early 2023 | |
| Razer Blade 16 Early 2023 | |
| Przeciętny Intel Core i9-13900HX (43850 - 69202, n=22) | |
| Lenovo Legion 7 16ARHA7 | |
| Lenovo Legion 7 16ACHg6 | |
| Lenovo Legion 7 16IAX7-82TD004SGE | |
| AIDA64 / CPU AES | |
| Razer Blade 16 Early 2023 | |
| Razer Blade 16 Early 2023 | |
| Razer Blade 16 Early 2023 | |
| Lenovo Legion 7 16ARHA7 | |
| Przeciętny Intel Core i9-13900HX (89413 - 237881, n=22) | |
| Lenovo Legion 7 16ACHg6 | |
| Lenovo Legion Pro 7 16IRX8H | |
| Lenovo Legion 7 16IAX7-82TD004SGE | |
| Średnia w klasie Gaming (39258 - 247074, n=105, ostatnie 2 lata) | |
| AIDA64 / CPU ZLib | |
| Lenovo Legion Pro 7 16IRX8H | |
| Razer Blade 16 Early 2023 | |
| Razer Blade 16 Early 2023 | |
| Razer Blade 16 Early 2023 | |
| Przeciętny Intel Core i9-13900HX (1284 - 1958, n=22) | |
| Średnia w klasie Gaming (574 - 2531, n=105, ostatnie 2 lata) | |
| Lenovo Legion 7 16IAX7-82TD004SGE | |
| Lenovo Legion 7 16ARHA7 | |
| Lenovo Legion 7 16ACHg6 | |
| AIDA64 / FP64 Ray-Trace | |
| Średnia w klasie Gaming (5509 - 45446, n=105, ostatnie 2 lata) | |
| Lenovo Legion Pro 7 16IRX8H | |
| Razer Blade 16 Early 2023 | |
| Razer Blade 16 Early 2023 | |
| Razer Blade 16 Early 2023 | |
| Przeciętny Intel Core i9-13900HX (9481 - 15279, n=22) | |
| Lenovo Legion 7 16ARHA7 | |
| Lenovo Legion 7 16ACHg6 | |
| Lenovo Legion 7 16IAX7-82TD004SGE | |
| AIDA64 / CPU PhotoWorxx | |
| Razer Blade 16 Early 2023 | |
| Razer Blade 16 Early 2023 | |
| Razer Blade 16 Early 2023 | |
| Lenovo Legion Pro 7 16IRX8H | |
| Przeciętny Intel Core i9-13900HX (42994 - 51994, n=22) | |
| Średnia w klasie Gaming (12271 - 89891, n=105, ostatnie 2 lata) | |
| Lenovo Legion 7 16IAX7-82TD004SGE | |
| Lenovo Legion 7 16ARHA7 | |
| Lenovo Legion 7 16ACHg6 | |
Wydajność systemu
Ogólna wydajność systemu idzie na łeb na szyję z Blade 16. Legion Pro 7 uzyskał 7 830 punktów w PCMark 10, co jest doskonałym wynikiem, przewyższającym o 11% średnią w klasie.
CrossMark: Overall | Productivity | Creativity | Responsiveness
| PCMark 10 / Score | |
| Lenovo Legion 7 16IAX7-82TD004SGE | |
| Średnia w klasie Gaming (5828 - 12414, n=93, ostatnie 2 lata) | |
| Przeciętny Intel Core i9-13900HX, NVIDIA GeForce RTX 4080 Laptop GPU (7609 - 8549, n=3) | |
| Razer Blade 16 Early 2023 | |
| Lenovo Legion Pro 7 16IRX8H | |
| Lenovo Legion 7 16ARHA7 | |
| Lenovo Legion 7 16ACHg6 | |
| PCMark 10 / Essentials | |
| Lenovo Legion Pro 7 16IRX8H | |
| Przeciętny Intel Core i9-13900HX, NVIDIA GeForce RTX 4080 Laptop GPU (10982 - 11824, n=3) | |
| Lenovo Legion 7 16IAX7-82TD004SGE | |
| Razer Blade 16 Early 2023 | |
| Średnia w klasie Gaming (8810 - 11935, n=97, ostatnie 2 lata) | |
| Lenovo Legion 7 16ARHA7 | |
| Lenovo Legion 7 16ACHg6 | |
| PCMark 10 / Productivity | |
| Średnia w klasie Gaming (6845 - 25323, n=95, ostatnie 2 lata) | |
| Lenovo Legion 7 16IAX7-82TD004SGE | |
| Lenovo Legion Pro 7 16IRX8H | |
| Przeciętny Intel Core i9-13900HX, NVIDIA GeForce RTX 4080 Laptop GPU (9976 - 10788, n=3) | |
| Lenovo Legion 7 16ACHg6 | |
| Lenovo Legion 7 16ARHA7 | |
| Razer Blade 16 Early 2023 | |
| PCMark 10 / Digital Content Creation | |
| Razer Blade 16 Early 2023 | |
| Lenovo Legion 7 16IAX7-82TD004SGE | |
| Średnia w klasie Gaming (7602 - 19954, n=95, ostatnie 2 lata) | |
| Przeciętny Intel Core i9-13900HX, NVIDIA GeForce RTX 4080 Laptop GPU (10135 - 14720, n=3) | |
| Lenovo Legion 7 16ARHA7 | |
| Lenovo Legion 7 16ACHg6 | |
| Lenovo Legion Pro 7 16IRX8H | |
| CrossMark / Overall | |
| Lenovo Legion 7 16IAX7-82TD004SGE | |
| Przeciętny Intel Core i9-13900HX, NVIDIA GeForce RTX 4080 Laptop GPU (1991 - 2194, n=2) | |
| Średnia w klasie Gaming (1366 - 2409, n=94, ostatnie 2 lata) | |
| Lenovo Legion 7 16ARHA7 | |
| Razer Blade 16 Early 2023 | |
| CrossMark / Productivity | |
| Lenovo Legion 7 16IAX7-82TD004SGE | |
| Przeciętny Intel Core i9-13900HX, NVIDIA GeForce RTX 4080 Laptop GPU (1828 - 2059, n=2) | |
| Średnia w klasie Gaming (1386 - 2254, n=94, ostatnie 2 lata) | |
| Lenovo Legion 7 16ARHA7 | |
| Razer Blade 16 Early 2023 | |
| CrossMark / Creativity | |
| Przeciętny Intel Core i9-13900HX, NVIDIA GeForce RTX 4080 Laptop GPU (2239 - 2411, n=2) | |
| Lenovo Legion 7 16IAX7-82TD004SGE | |
| Średnia w klasie Gaming (1343 - 2786, n=94, ostatnie 2 lata) | |
| Razer Blade 16 Early 2023 | |
| Lenovo Legion 7 16ARHA7 | |
| CrossMark / Responsiveness | |
| Lenovo Legion 7 16IAX7-82TD004SGE | |
| Przeciętny Intel Core i9-13900HX, NVIDIA GeForce RTX 4080 Laptop GPU (1808 - 1998, n=2) | |
| Średnia w klasie Gaming (1226 - 2334, n=94, ostatnie 2 lata) | |
| Razer Blade 16 Early 2023 | |
| Lenovo Legion 7 16ARHA7 | |
| PCMark 10 Score | 7830 pkt. | |
Pomoc | ||
| AIDA64 / Memory Copy | |
| Razer Blade 16 Early 2023 | |
| Razer Blade 16 Early 2023 | |
| Razer Blade 16 Early 2023 | |
| Lenovo Legion Pro 7 16IRX8H | |
| Przeciętny Intel Core i9-13900HX (67716 - 79193, n=22) | |
| Średnia w klasie Gaming (21750 - 129946, n=105, ostatnie 2 lata) | |
| Lenovo Legion 7 16IAX7-82TD004SGE | |
| Lenovo Legion 7 16ARHA7 | |
| Lenovo Legion 7 16ACHg6 | |
| AIDA64 / Memory Read | |
| Razer Blade 16 Early 2023 | |
| Razer Blade 16 Early 2023 | |
| Razer Blade 16 Early 2023 | |
| Lenovo Legion Pro 7 16IRX8H | |
| Przeciętny Intel Core i9-13900HX (73998 - 88462, n=22) | |
| Średnia w klasie Gaming (22956 - 118858, n=105, ostatnie 2 lata) | |
| Lenovo Legion 7 16IAX7-82TD004SGE | |
| Lenovo Legion 7 16ARHA7 | |
| Lenovo Legion 7 16ACHg6 | |
| AIDA64 / Memory Write | |
| Razer Blade 16 Early 2023 | |
| Razer Blade 16 Early 2023 | |
| Razer Blade 16 Early 2023 | |
| Średnia w klasie Gaming (22297 - 135096, n=105, ostatnie 2 lata) | |
| Przeciętny Intel Core i9-13900HX (65472 - 77045, n=22) | |
| Lenovo Legion Pro 7 16IRX8H | |
| Lenovo Legion 7 16IAX7-82TD004SGE | |
| Lenovo Legion 7 16ARHA7 | |
| Lenovo Legion 7 16ACHg6 | |
| AIDA64 / Memory Latency | |
| Średnia w klasie Gaming (75.3 - 259, n=105, ostatnie 2 lata) | |
| Razer Blade 16 Early 2023 | |
| Razer Blade 16 Early 2023 | |
| Razer Blade 16 Early 2023 | |
| Lenovo Legion 7 16IAX7-82TD004SGE | |
| Przeciętny Intel Core i9-13900HX (75.3 - 91.1, n=22) | |
| Lenovo Legion 7 16ARHA7 | |
| Lenovo Legion Pro 7 16IRX8H | |
| Lenovo Legion 7 16ACHg6 | |
* ... im mniej tym lepiej
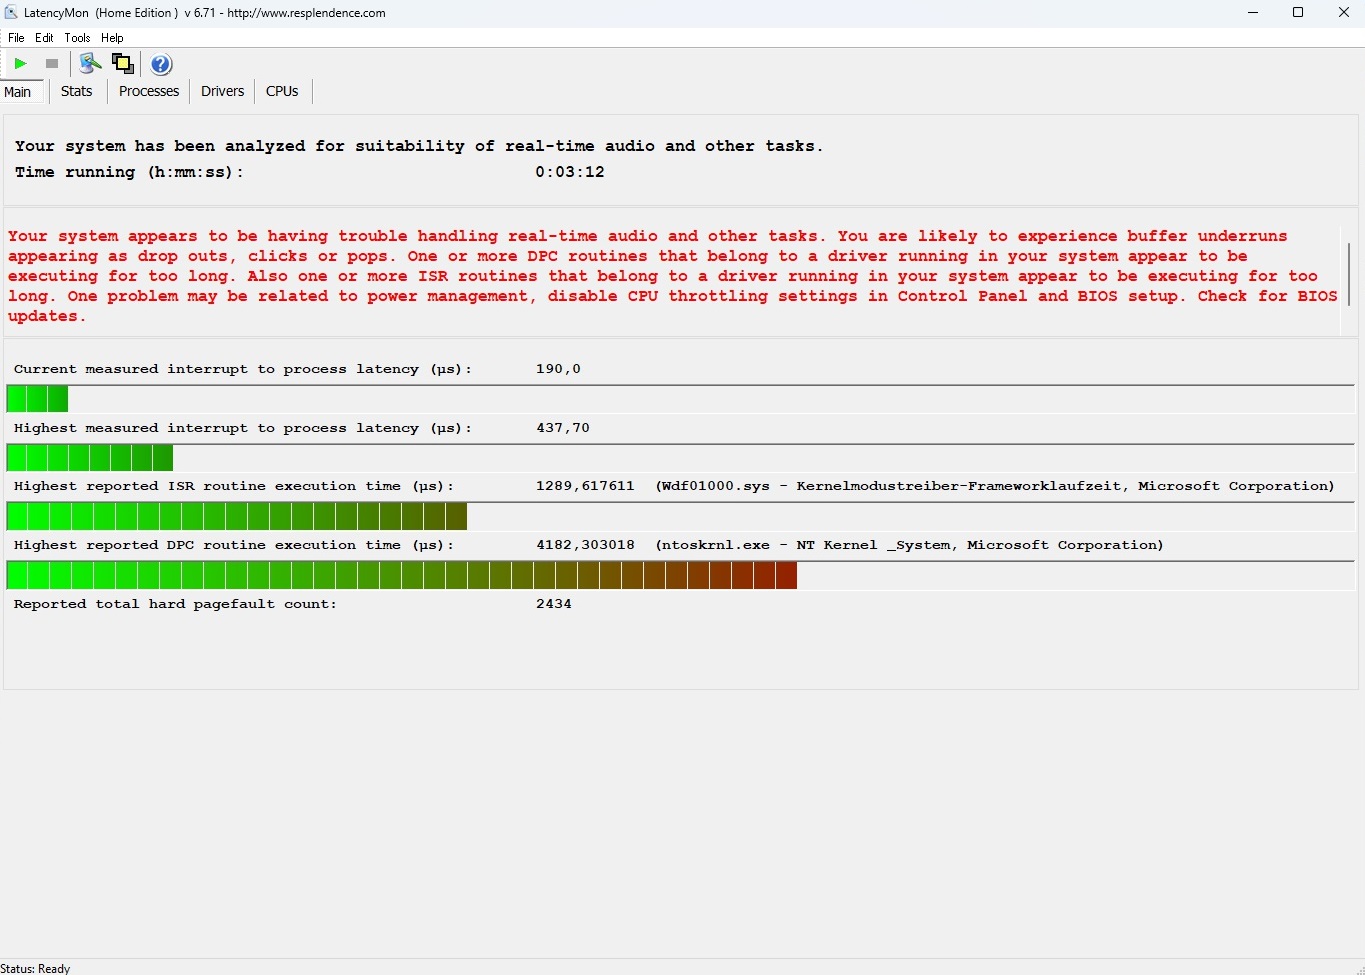
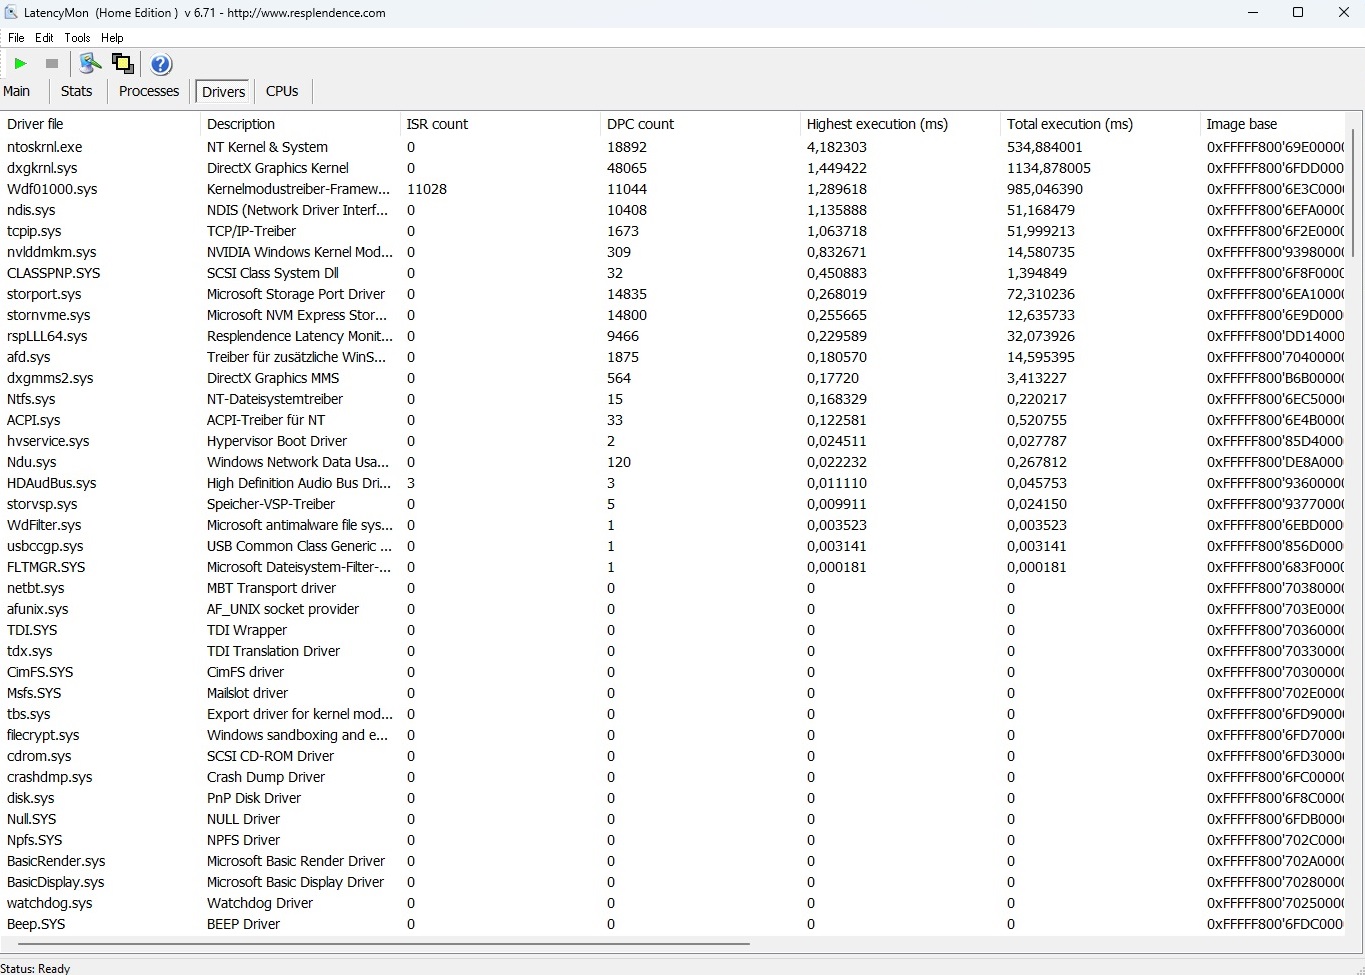
Opóźnienie DPC
Latencja DPC okazuje się po raz kolejny problematyczna, choć może to mieć znaczenie tylko dla niewielkiego podzbioru użytkowników. Według LatencyMon, Legion Pro 7 nie jest idealny do edycji audio w czasie rzeczywistym bez dalszego dostrajania.
| DPC Latencies / LatencyMon - interrupt to process latency (max), Web, Youtube, Prime95 | |
| Razer Blade 16 Early 2023 | |
| Lenovo Legion 7 16ARHA7 | |
| Lenovo Legion 7 16IAX7-82TD004SGE | |
| Lenovo Legion 7 16ACHg6 | |
| Lenovo Legion Pro 7 16IRX8H | |
* ... im mniej tym lepiej
Urządzenia do przechowywania danych
Legion Pro 7 ma dobre wyniki w dziale pamięci masowej. W naszym modelu testowym zastosowano szybki dysk SSD Samsung PM9A1 1 TB NVMe, który dobrze wypada w naszych benchmarkach. Dysk ten osiąga prędkość odczytu sekwencyjnego na poziomie około 5400 MB/s, a zapisu sekwencyjnego ponad 4000 MB/s.
Nasz test pętli DiskSpd wykazuje jednak silne wahania wydajności pod ciągłym obciążeniem. Konkurencja nie wydaje się być dotknięta tak silnym throttlingiem.

| Drive Performance rating - Percent | |
| Lenovo Legion Pro 7 16IRX8H | |
| Lenovo Legion 7 16IAX7-82TD004SGE | |
| Średnia w klasie Gaming | |
| Przeciętny Samsung PM9A1 MZVL21T0HCLR | |
| Razer Blade 16 Early 2023 | |
| Lenovo Legion 7 16ARHA7 | |
| Lenovo Legion 7 16ACHg6 | |
* ... im mniej tym lepiej
Disk Throttling: DiskSpd Read Loop, Queue Depth 8
Wydajność GPU
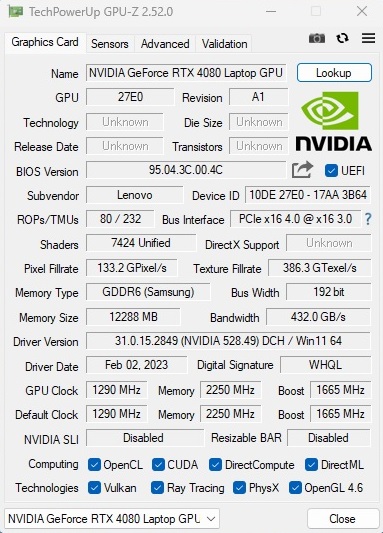
Przy maksymalnym TGP wynoszącym 175 W z uwzględnieniem Dynamic Boost RTX 4080 Laptop GPU jest prawdopodobnie najbardziej ekscytującym komponentem w Legion Pro 7 z perspektywy gracza. Specyfikacja tej 4 nm części z generacji Ada firmy Nvidia robi wrażenie na papierze.
Łącznie 7 424 rdzenie CUDA obiecują doskonałą wydajność. Jednak 12 GB pamięci VRAM GDDR6 na 192-bitowym interfejsie pamięci nie inspiruje zbytnio w 2023 roku - 16 GB pamięci VRAM byłoby bardziej trafne, biorąc pod uwagę wymagania dzisiejszych gier i wysoką cenę wywoławczą. Więcej informacji i analizę wydajności znajdziecie w naszym dedykowanym Analiza recenzji GPU Nvidia Ada RTX 40.
Pomimo braku szczególnie dużej ilości pamięci VRAM, karta graficzna RTX 4080 Laptop wyciera podłogę w stosunku do konkurencji AMD i swoich poprzedników. Biorąc pod uwagę wszystkie wyniki 3DMark, układ graficzny RTX 4080 Laptop jest o ponad 30% szybszy niż RTX 3080 Ti Laptop GPU i RX 6850M XT z poprzedniej generacji Legionów, które również działały przy wysokim TGP.
| 3DMark Performance rating - Percent | |
| Razer Blade 16 Early 2023 -1! | |
| Lenovo Legion Pro 7 16IRX8H | |
| Przeciętny NVIDIA GeForce RTX 4080 Laptop GPU | |
| Średnia w klasie Gaming | |
| Lenovo Legion 7 16IAX7-82TD004SGE -2! | |
| Lenovo Legion 7 16ARHA7 | |
| Lenovo Legion 7 16ACHg6 | |
| 3DMark 11 - 1280x720 Performance GPU | |
| Lenovo Legion Pro 7 16IRX8H | |
| Przeciętny NVIDIA GeForce RTX 4080 Laptop GPU (45199 - 63128, n=24) | |
| Razer Blade 16 Early 2023 | |
| Średnia w klasie Gaming (21841 - 80022, n=104, ostatnie 2 lata) | |
| Lenovo Legion 7 16IAX7-82TD004SGE | |
| Lenovo Legion 7 16ARHA7 | |
| Lenovo Legion 7 16ACHg6 | |
| 3DMark 06 Standard Score | 59578 pkt. | |
| 3DMark Vantage P Result | 111294 pkt. | |
| 3DMark 11 Performance | 44468 pkt. | |
| 3DMark Ice Storm Standard Score | 208555 pkt. | |
| 3DMark Cloud Gate Standard Score | 66531 pkt. | |
| 3DMark Fire Strike Score | 34434 pkt. | |
| 3DMark Time Spy Score | 17928 pkt. | |
Pomoc | ||
* ... im mniej tym lepiej
Wydajność w grach
W grach układ graficzny RTX 4080 Laptop ma jeszcze większą przewagę, co widać w skumulowanym rankingu wydajności, zwłaszcza w porównaniu z RTX 3080 Laptop GPU i RX 6850M XT. Procesor ma jednak wpływ na frameraty w rozdzielczości 1080p.
Bardziej miarodajne porównanie widać po aktywacji raytracingu oraz w rozdzielczościach QHD i 4K. Wybraliśmy nowoczesne tytuły, jak np Spider-Man "Miles Morales, Resident Evil "Villageoraz Strażnicy Galaxy aby zilustrować sprawność układu GPU RTX 4080 Laptop w wyższych rozdzielczościach i ustawieniach.
Średnio, układ GPU RTX 4080 Laptop jest w tych testach o około jedną trzecią szybszy niż układ GPU 175 RTX 3080 Ti Laptop i o około 60% szybszy niż układ GPU 165 W RTX 3080 Laptop.
Szczegółowe porównania wydajności są dostępne w naszym obszernym zestawieniu benchmarków gamingowych.
| Performance rating - Percent | |
| Razer Blade 16 Early 2023 | |
| Lenovo Legion Pro 7 16IRX8H | |
| Średnia w klasie Gaming | |
| Lenovo Legion 7 16IAX7-82TD004SGE | |
| Lenovo Legion 7 16ACHg6 | |
| Lenovo Legion 7 16ARHA7 | |
| The Witcher 3 - 1920x1080 Ultra Graphics & Postprocessing (HBAO+) | |
| Średnia w klasie Gaming (104.7 - 240, n=7, ostatnie 2 lata) | |
| Lenovo Legion Pro 7 16IRX8H | |
| Razer Blade 16 Early 2023 | |
| Lenovo Legion 7 16ARHA7 | |
| Lenovo Legion 7 16IAX7-82TD004SGE | |
| Lenovo Legion 7 16ACHg6 | |
| GTA V - 1920x1080 Highest AA:4xMSAA + FX AF:16x | |
| Lenovo Legion Pro 7 16IRX8H | |
| Razer Blade 16 Early 2023 | |
| Średnia w klasie Gaming (48.3 - 186.9, n=94, ostatnie 2 lata) | |
| Lenovo Legion 7 16IAX7-82TD004SGE | |
| Lenovo Legion 7 16ACHg6 | |
| Lenovo Legion 7 16ARHA7 | |
| Final Fantasy XV Benchmark - 1920x1080 High Quality | |
| Lenovo Legion Pro 7 16IRX8H | |
| Razer Blade 16 Early 2023 | |
| Średnia w klasie Gaming (41 - 215, n=95, ostatnie 2 lata) | |
| Lenovo Legion 7 16IAX7-82TD004SGE | |
| Lenovo Legion 7 16ARHA7 | |
| Lenovo Legion 7 16ACHg6 | |
| Strange Brigade - 1920x1080 ultra AA:ultra AF:16 | |
| Razer Blade 16 Early 2023 | |
| Lenovo Legion Pro 7 16IRX8H | |
| Średnia w klasie Gaming (76.3 - 458, n=87, ostatnie 2 lata) | |
| Lenovo Legion 7 16ARHA7 | |
| Lenovo Legion 7 16ACHg6 | |
| Lenovo Legion 7 16IAX7-82TD004SGE | |
| Dota 2 Reborn - 1920x1080 ultra (3/3) best looking | |
| Razer Blade 16 Early 2023 | |
| Lenovo Legion Pro 7 16IRX8H | |
| Lenovo Legion 7 16IAX7-82TD004SGE | |
| Średnia w klasie Gaming (84.8 - 248, n=107, ostatnie 2 lata) | |
| Lenovo Legion 7 16ACHg6 | |
| Lenovo Legion 7 16ARHA7 | |
| X-Plane 11.11 - 1920x1080 high (fps_test=3) | |
| Razer Blade 16 Early 2023 | |
| Lenovo Legion Pro 7 16IRX8H | |
| Lenovo Legion 7 16IAX7-82TD004SGE | |
| Średnia w klasie Gaming (55.5 - 143.5, n=109, ostatnie 2 lata) | |
| Lenovo Legion 7 16ACHg6 | |
| Lenovo Legion 7 16ARHA7 | |
| Spider-Man Miles Morales | |
| 1920x0180 Very High Preset + Ray-Tracing AA:T | |
| Lenovo Legion Pro 7 16IRX8H | |
| Przeciętny NVIDIA GeForce RTX 4080 Laptop GPU (n=1) | |
| MSI Raider GE76 12UHS @175 W TGP | |
| XMG Neo 15 @165 W TGP | |
| 2560x1440 Very High Preset AA:T | |
| Lenovo Legion Pro 7 16IRX8H | |
| Przeciętny NVIDIA GeForce RTX 4080 Laptop GPU (n=1) | |
| MSI Raider GE76 12UHS @175 W TGP | |
| XMG Neo 15 @165 W TGP | |
| 3840x2160 Very High Preset AA:T | |
| Lenovo Legion Pro 7 16IRX8H | |
| Przeciętny NVIDIA GeForce RTX 4080 Laptop GPU (n=1) | |
| MSI Raider GE76 12UHS @175 W TGP | |
| XMG Neo 15 @165 W TGP | |
| Resident Evil Village | |
| 1920x1080 Ray Tracing Preset | |
| Lenovo Legion Pro 7 16IRX8H | |
| Przeciętny NVIDIA GeForce RTX 4080 Laptop GPU (n=1) | |
| MSI GE76 Raider | |
| Lenovo Legion 7 16ACHg6 | |
| 2560x1440 Max Preset | |
| Lenovo Legion Pro 7 16IRX8H | |
| Przeciętny NVIDIA GeForce RTX 4080 Laptop GPU (n=1) | |
| MSI GE76 Raider | |
| Lenovo Legion 7 16ACHg6 | |
| 3840x2160 Max Preset | |
| Lenovo Legion Pro 7 16IRX8H | |
| Przeciętny NVIDIA GeForce RTX 4080 Laptop GPU (n=1) | |
| MSI GE76 Raider | |
| Guardians of the Galaxy | |
| 1920x1080 Ultra Preset + Ultra Ray-Tracing | |
| Lenovo Legion Pro 7 16IRX8H | |
| Przeciętny NVIDIA GeForce RTX 4080 Laptop GPU (n=1) | |
| MSI GE76 Raider | |
| XMG Neo 15 @165 W TGP | |
| 2560x1440 Ultra Preset | |
| Lenovo Legion Pro 7 16IRX8H | |
| Przeciętny NVIDIA GeForce RTX 4080 Laptop GPU (n=1) | |
| MSI GE76 Raider | |
| XMG Neo 15 @165 W TGP | |
| Lenovo Legion 7 16ARHA7 | |
| 3840x2160 Ultra Preset | |
| Lenovo Legion Pro 7 16IRX8H | |
| Przeciętny NVIDIA GeForce RTX 4080 Laptop GPU (n=1) | |
| MSI GE76 Raider | |
| XMG Neo 15 @165 W TGP | |
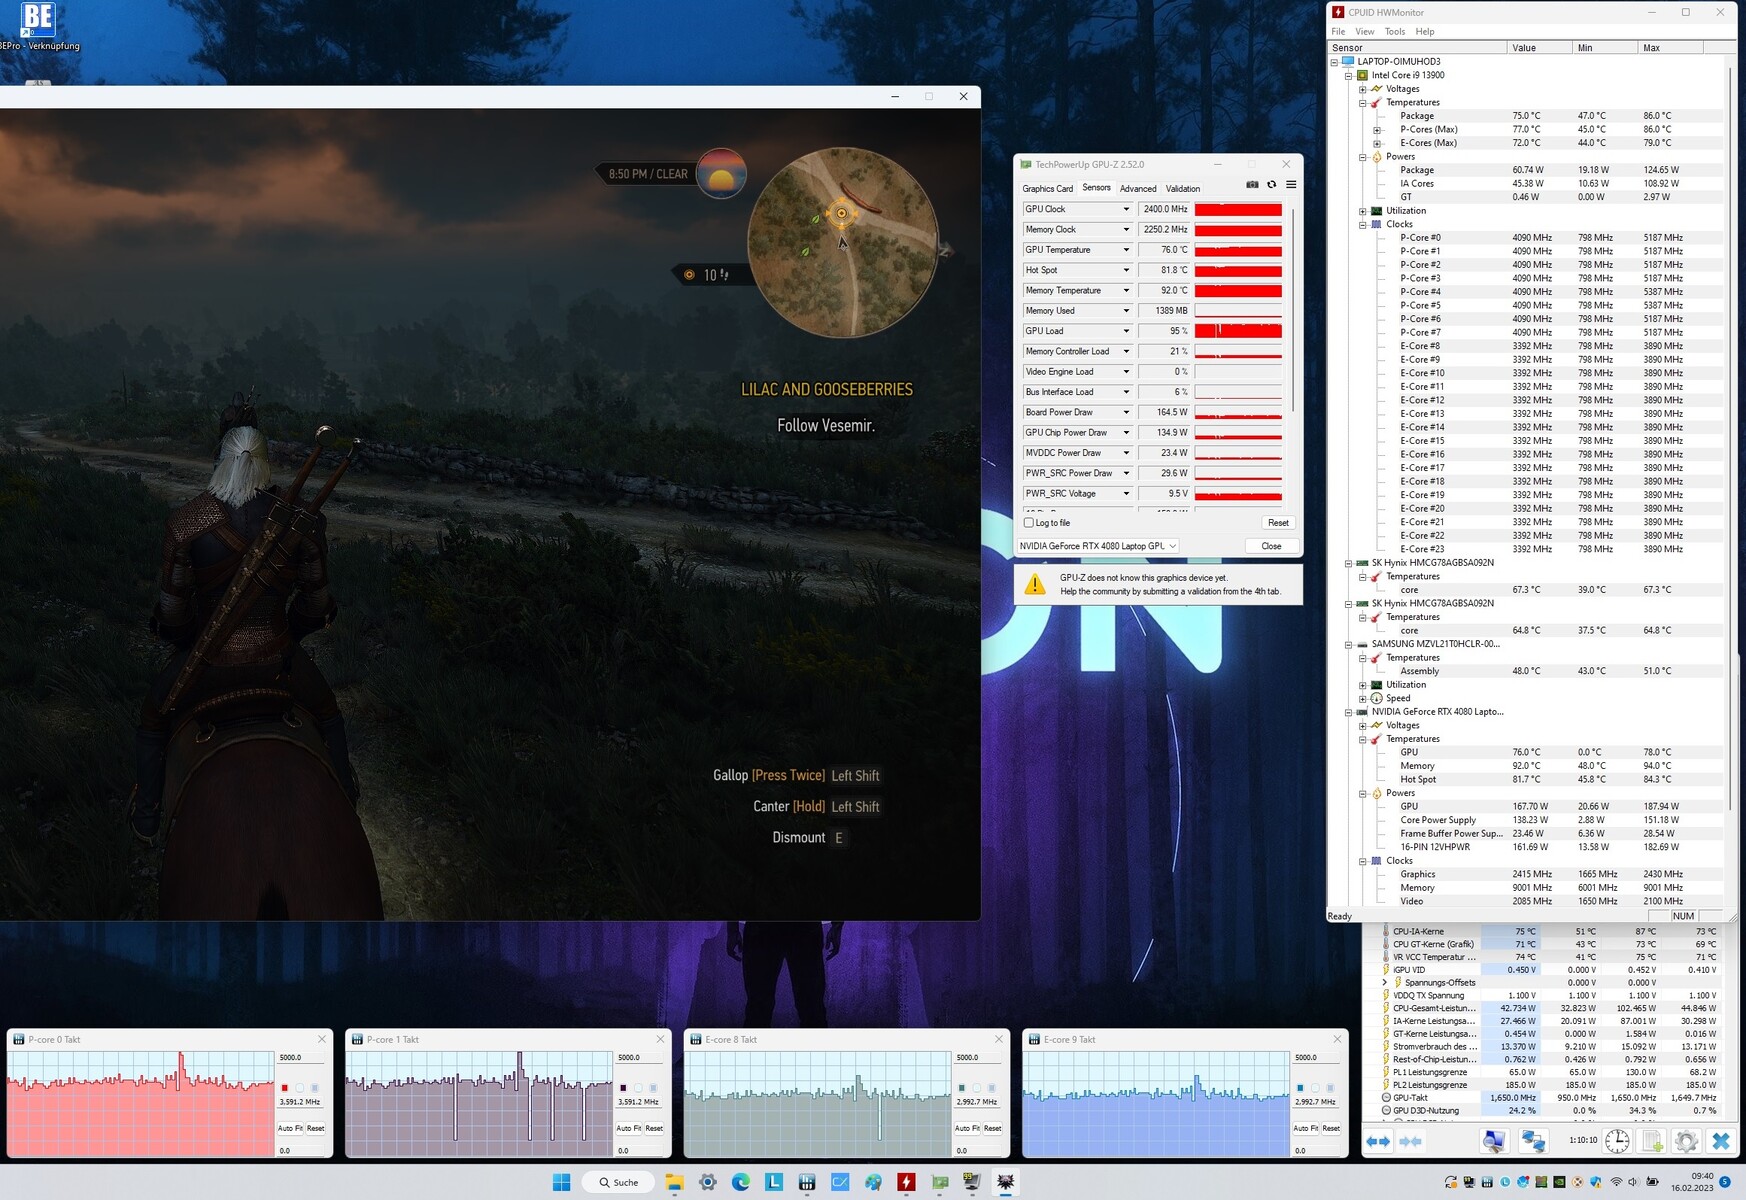
W przeciwieństwie do dysku SSD i - w mniejszym stopniu - CPU, GPU pozostaje stosunkowo stabilne w długim okresie czasu. Nie widzimy żadnych drastycznych spadków liczby klatek na sekundę ani niespójności w 60-minutowym stresie zThe Witcher 3w rozdzielczości 1080p Ultra.
The Witcher 3 FPS Chart
| low | med. | high | ultra | QHD | 4K | |
|---|---|---|---|---|---|---|
| GTA V (2015) | 187.6 | 185.1 | 145.5 | |||
| The Witcher 3 (2015) | 509 | 325 | 178 | |||
| Dota 2 Reborn (2015) | 206 | 194.4 | 179 | |||
| Final Fantasy XV Benchmark (2018) | 192.1 | 162.4 | ||||
| X-Plane 11.11 (2018) | 167.9 | 131.8 | ||||
| Far Cry 5 (2018) | 179 | 158 | 156 | |||
| Strange Brigade (2018) | 392 | 351 | 318 | |||
| Outriders (2021) | 157.7 | 151.1 | 149.9 | 130.5 | 72.3 | |
| Resident Evil Village (2021) | 239 | 239 | 239 | 193.7 | 100.5 | |
| Days Gone (2021) | 243 | 215 | 171.3 | 125.1 | 70.9 | |
| Deathloop (2021) | 130.5 | 129.4 | 123.5 | 112.8 | 60.7 | |
| Back 4 Blood (2021) | 345 | 295 | 276 | 188.4 | 112 | |
| Guardians of the Galaxy (2021) | 165 | 165 | 163 | 146 | 96 | |
| Riders Republic (2021) | 172 | 169 | 168 | 133 | 76 | |
| Farming Simulator 22 (2021) | 263 | 217 | 194.4 | 191.6 | 145.2 | |
| Halo Infinite (2021) | 239 | 209 | 197.5 | 150.7 | 88.6 | |
| God of War (2022) | 160.6 | 137.7 | 101.4 | 86.7 | 60 | |
| Rainbow Six Extraction (2022) | 278 | 272 | 221 | 172 | 88 | |
| Elden Ring (2022) | 59.9 | 59.8 | 59.8 | 59.6 | 59.3 | |
| Elex 2 (2022) | 118.7 | 118.7 | 118.5 | 114.5 | 63 | |
| Vampire Bloodhunt (2022) | 266 | 239 | 221 | 195.5 | 124.6 | |
| F1 22 (2022) | 247 | 222 | 101 | 72 | 38 | |
| The Quarry (2022) | 206 | 174.1 | 142 | 102.5 | 48.7 | |
| A Plague Tale Requiem (2022) | 110.9 | 97.7 | 86 | 63.4 | 36.1 | |
| Uncharted Legacy of Thieves Collection (2022) | 102.3 | 100.3 | 99.5 | 86.5 | 54.1 | |
| Call of Duty Modern Warfare 2 2022 (2022) | 182 | 149 | 140 | 104 | 67 | |
| Spider-Man Miles Morales (2022) | 115.2 | 103.3 | 101.3 | 94.8 | 68.5 | |
| Need for Speed Unbound (2022) | 101.2 | 94.7 | 83 | 79.7 | 63.6 | |
| High On Life (2023) | 214 | 162.8 | 148.4 | 100.6 | 42.6 | |
| The Witcher 3 v4 (2023) | 161.4 | 144 | 125.3 | 81.1 | 42.8 | |
| Dead Space Remake (2023) | 121.5 | 113.3 | 109.3 | 81.8 | 41.3 |
Emisje: Wyższa emisja temp. i hałasu w porównaniu do Blade 16
Szum systemu
Nic dziwnego, że oferowane komponenty z wyższej półki charakteryzują się wysoką emisją ciepła, a co za tym idzie - wysokim poziomem hałasu. Podczas gdy Legion Pro 7 jest jeszcze w miarę cichy w trybie bezczynności ze średnim poziomem ciśnienia akustycznego (SPL) 28 dB(A), w trybie Performance bez zestawu słuchawkowego robi się niepokojąco głośno - SPL wynosi od 49 do 55 dB(A).
Tryb zrównoważony, który nie powoduje dużego spadku wydajności, skutkuje bardziej znośnym SPL na poziomie 43 do 46 db(A). Razer Blade 16 pozostaje stosunkowo cichszy we wszystkich warunkach testu, pomimo mniejszej wysokości i wagi.
Hałas
| luz |
| 26 / 28 / 34 dB |
| obciążenie |
| 47 / 56 dB |
 | ||
30 dB cichy 40 dB(A) słyszalny 50 dB(A) irytujący |
||
min: | ||
| Lenovo Legion Pro 7 16IRX8H i9-13900HX, GeForce RTX 4080 Laptop GPU | Razer Blade 16 Early 2023 i9-13950HX, GeForce RTX 4080 Laptop GPU | Lenovo Legion 7 16IAX7-82TD004SGE i9-12900HX, GeForce RTX 3080 Ti Laptop GPU | Lenovo Legion 7 16ACHg6 R9 5900HX, GeForce RTX 3080 Laptop GPU | Lenovo Legion 7 16ARHA7 R9 6900HX, Radeon RX 6850M XT | |
|---|---|---|---|---|---|
| Noise | 14% | 3% | 3% | 16% | |
| wyłączone / środowisko * (dB) | 24 | 23 4% | 24.5 -2% | 26 -8% | 22.8 5% |
| Idle Minimum * (dB) | 26 | 23 12% | 24.5 6% | 26 -0% | 23 12% |
| Idle Average * (dB) | 28 | 23 18% | 30 -7% | 30 -7% | 23 18% |
| Idle Maximum * (dB) | 34 | 23.6 31% | 32.5 4% | 35 -3% | 23 32% |
| Load Average * (dB) | 47 | 39 17% | 43.9 7% | 40 15% | 26.8 43% |
| Witcher 3 ultra * (dB) | 55 | 51.6 6% | 48.8 11% | 46 16% | 54.3 1% |
| Load Maximum * (dB) | 56 | 51.3 8% | 54.2 3% | 50 11% | 54.2 3% |
* ... im mniej tym lepiej
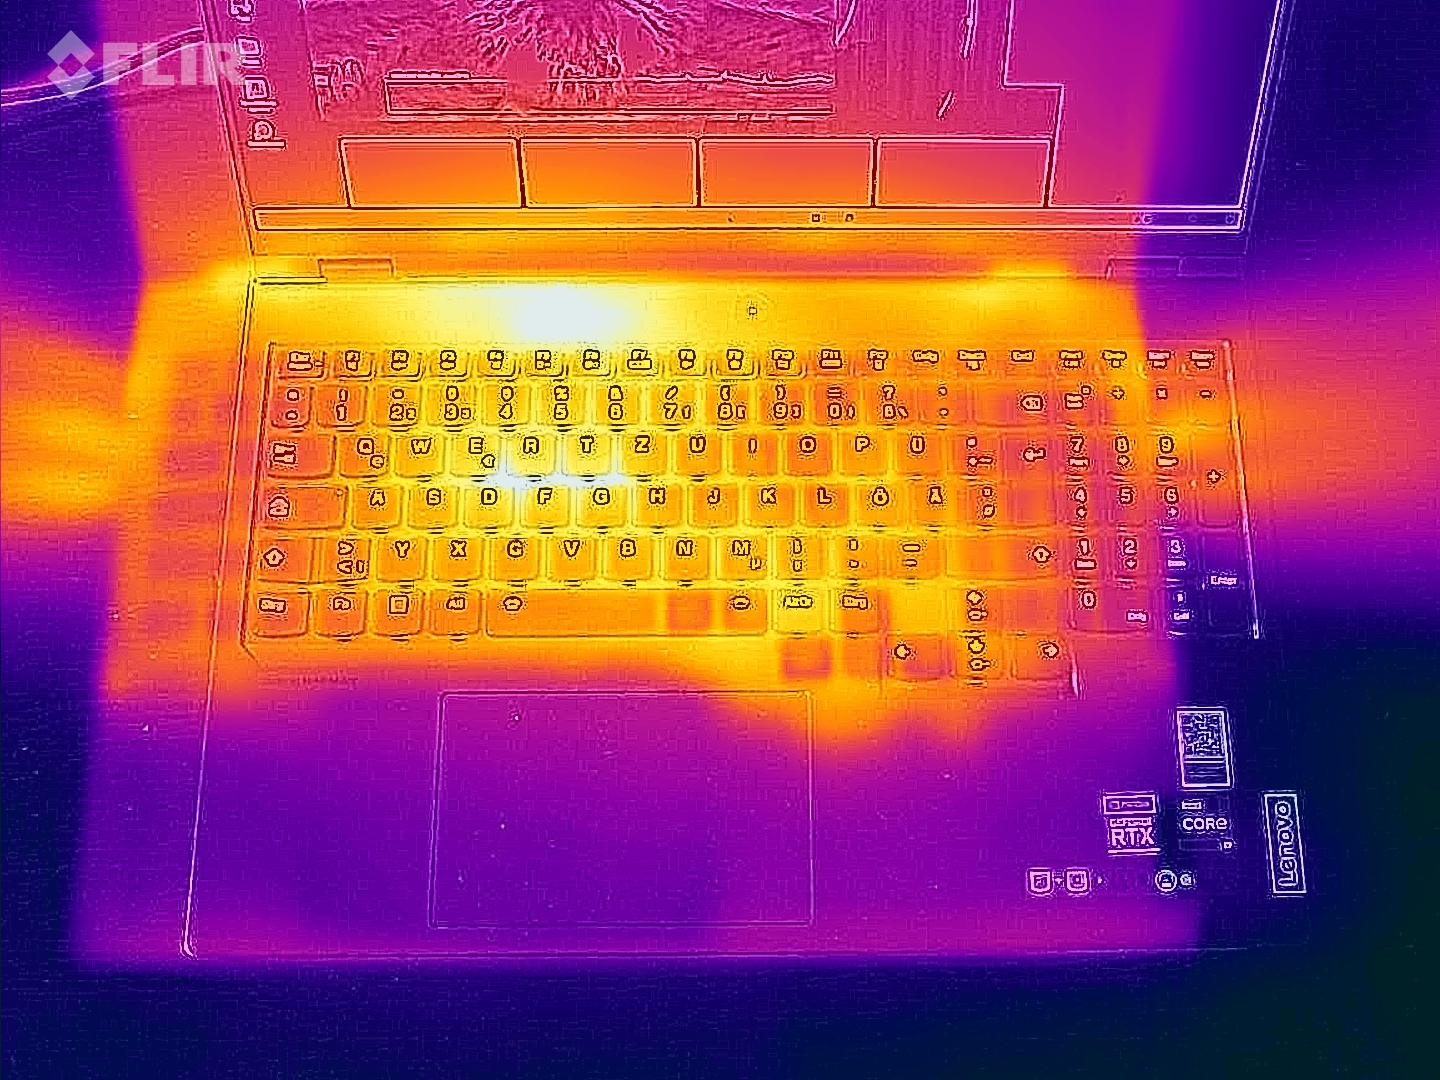
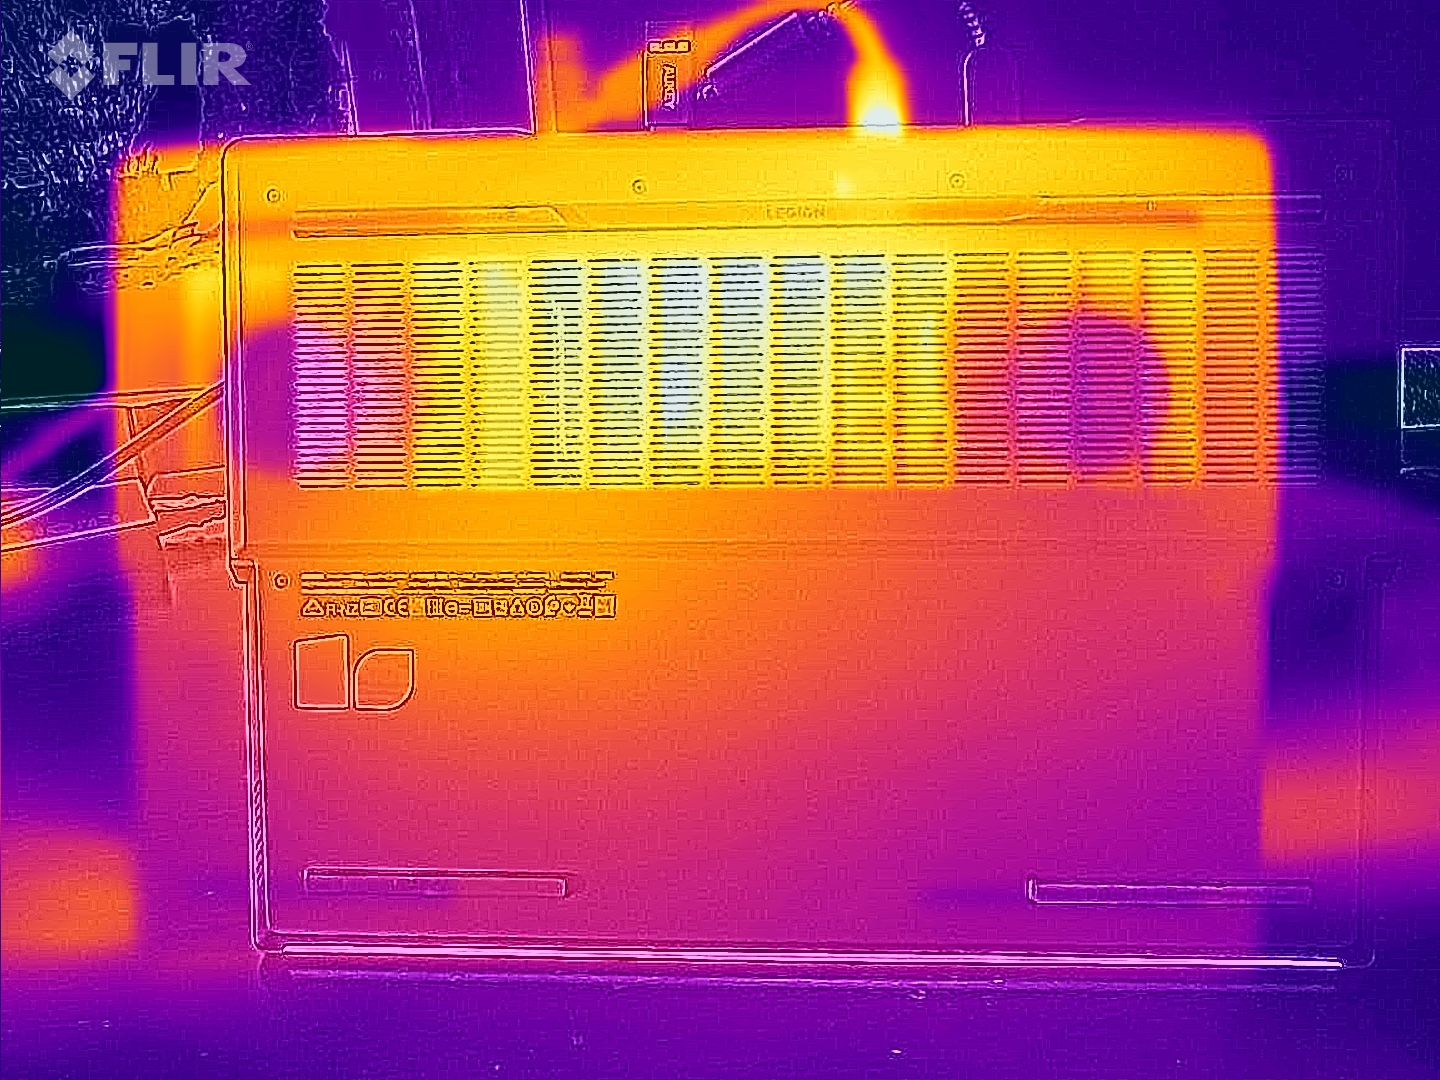
Temperatura
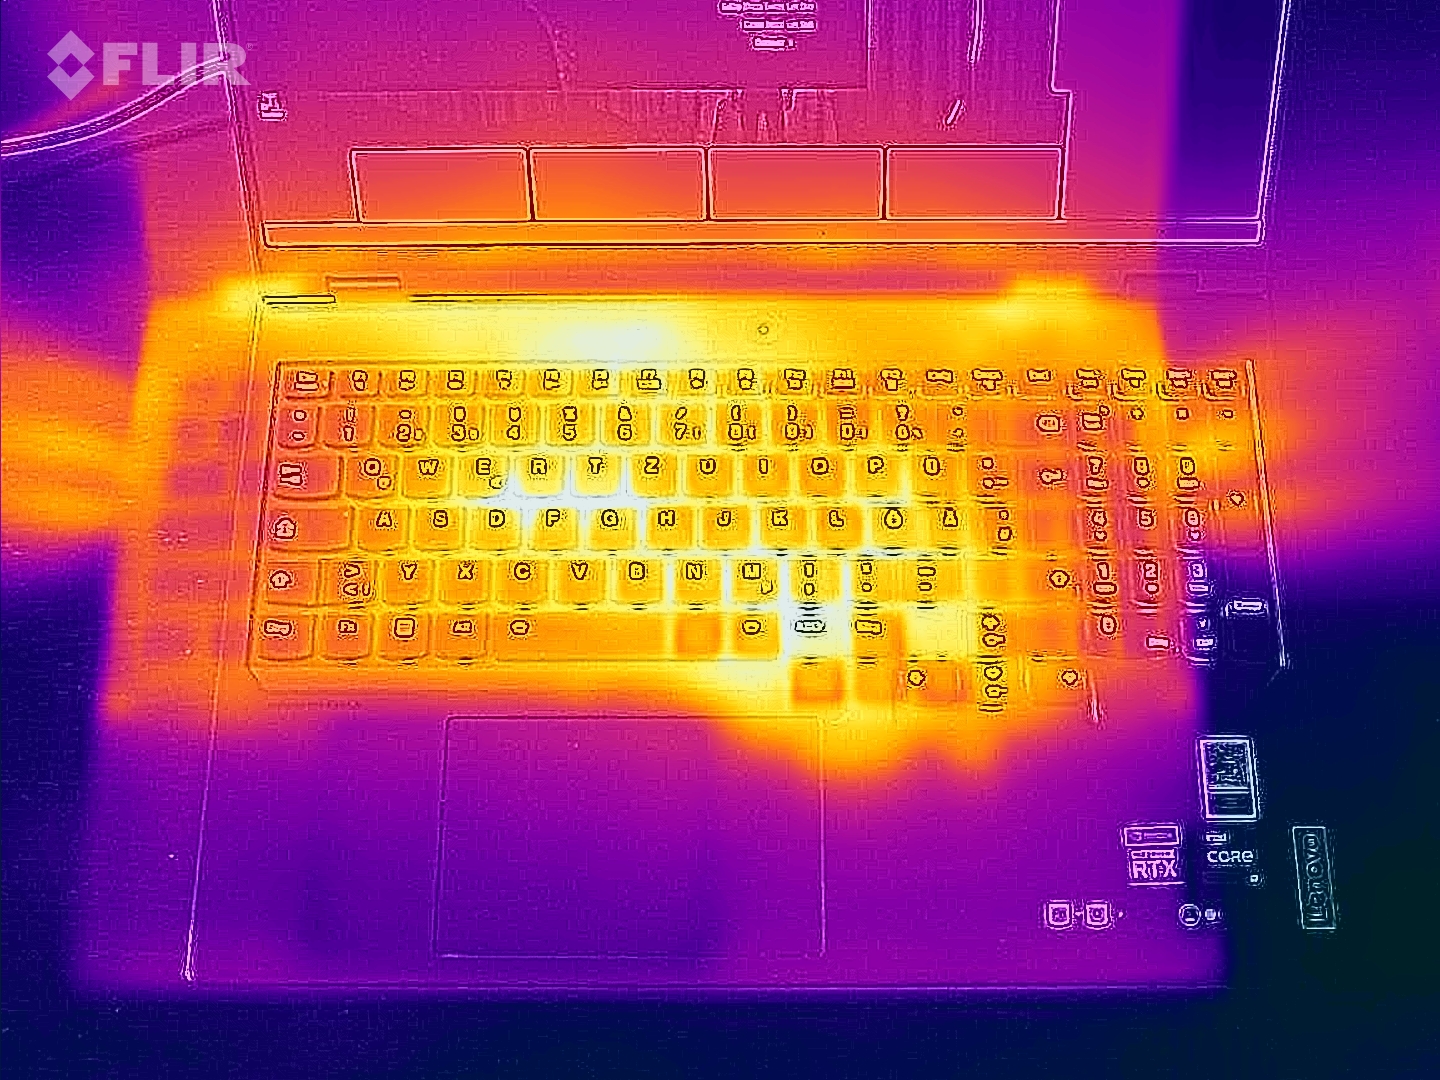
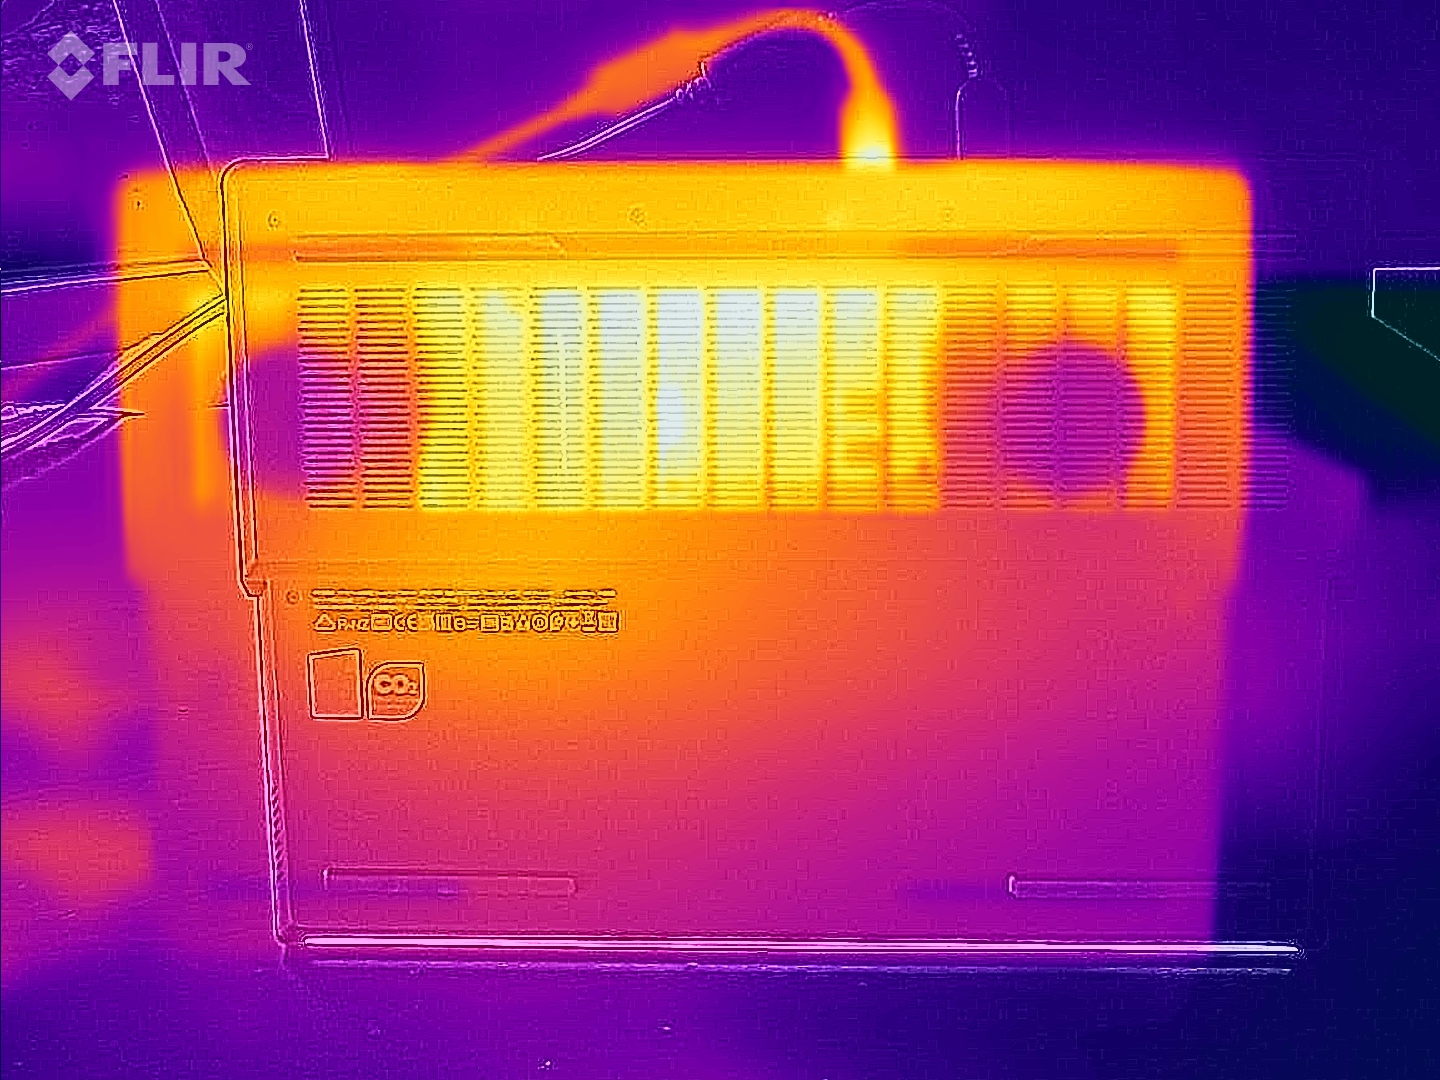
Podczas stresu z The Witcher 3 w 1080p Ultra, spód Legion Pro 7 przekracza w niektórych miejscach granicę 50 °C, co oznacza, że nie nadaje się on do grania na kolanach. W bezczynności wierzch rozgrzewa się do 40 °C, czyli stosunkowo wysoko.
Nawet jeśli chodzi o emisję ciepła, Razer Blade 16 wydaje się radzić sobie lepiej niż Legion Pro 7.
(-) Maksymalna temperatura w górnej części wynosi 48 °C / 118 F, w porównaniu do średniej 40.4 °C / 105 F , począwszy od 21.2 do 68.8 °C dla klasy Gaming.
(-) Dno nagrzewa się maksymalnie do 49 °C / 120 F, w porównaniu do średniej 43.2 °C / 110 F
(±) W stanie bezczynności średnia temperatura górnej części wynosi 32.7 °C / 91 F, w porównaniu ze średnią temperaturą urządzenia wynoszącą 33.9 °C / ### class_avg_f### F.
(-) Podczas gry w Wiedźmina 3 średnia temperatura górnej części wynosi 43.3 °C / 110 F, w porównaniu do średniej temperatury urządzenia wynoszącej 33.9 °C / ## #class_avg_f### F.
(-) Podpórki pod nadgarstki i touchpad mogą się bardzo nagrzać w dotyku, maksymalnie do 42 °C / 107.6 F.
(-) Średnia temperatura obszaru podparcia dłoni w podobnych urządzeniach wynosiła 28.8 °C / 83.8 F (-13.2 °C / -23.8 F).
| Lenovo Legion Pro 7 16IRX8H i9-13900HX, GeForce RTX 4080 Laptop GPU | Razer Blade 16 Early 2023 i9-13950HX, GeForce RTX 4080 Laptop GPU | Lenovo Legion 7 16IAX7-82TD004SGE i9-12900HX, GeForce RTX 3080 Ti Laptop GPU | Lenovo Legion 7 16ACHg6 R9 5900HX, GeForce RTX 3080 Laptop GPU | Lenovo Legion 7 16ARHA7 R9 6900HX, Radeon RX 6850M XT | |
|---|---|---|---|---|---|
| Heat | 16% | -5% | -5% | 13% | |
| Maximum Upper Side * (°C) | 48 | 40 17% | 44.4 7% | 51 -6% | 37.2 22% |
| Maximum Bottom * (°C) | 49 | 37.6 23% | 60.8 -24% | 52 -6% | 43 12% |
| Idle Upper Side * (°C) | 40 | 32.4 19% | 33.8 15% | 37 7% | 34 15% |
| Idle Bottom * (°C) | 33 | 31.4 5% | 38.8 -18% | 38 -15% | 32.8 1% |
* ... im mniej tym lepiej
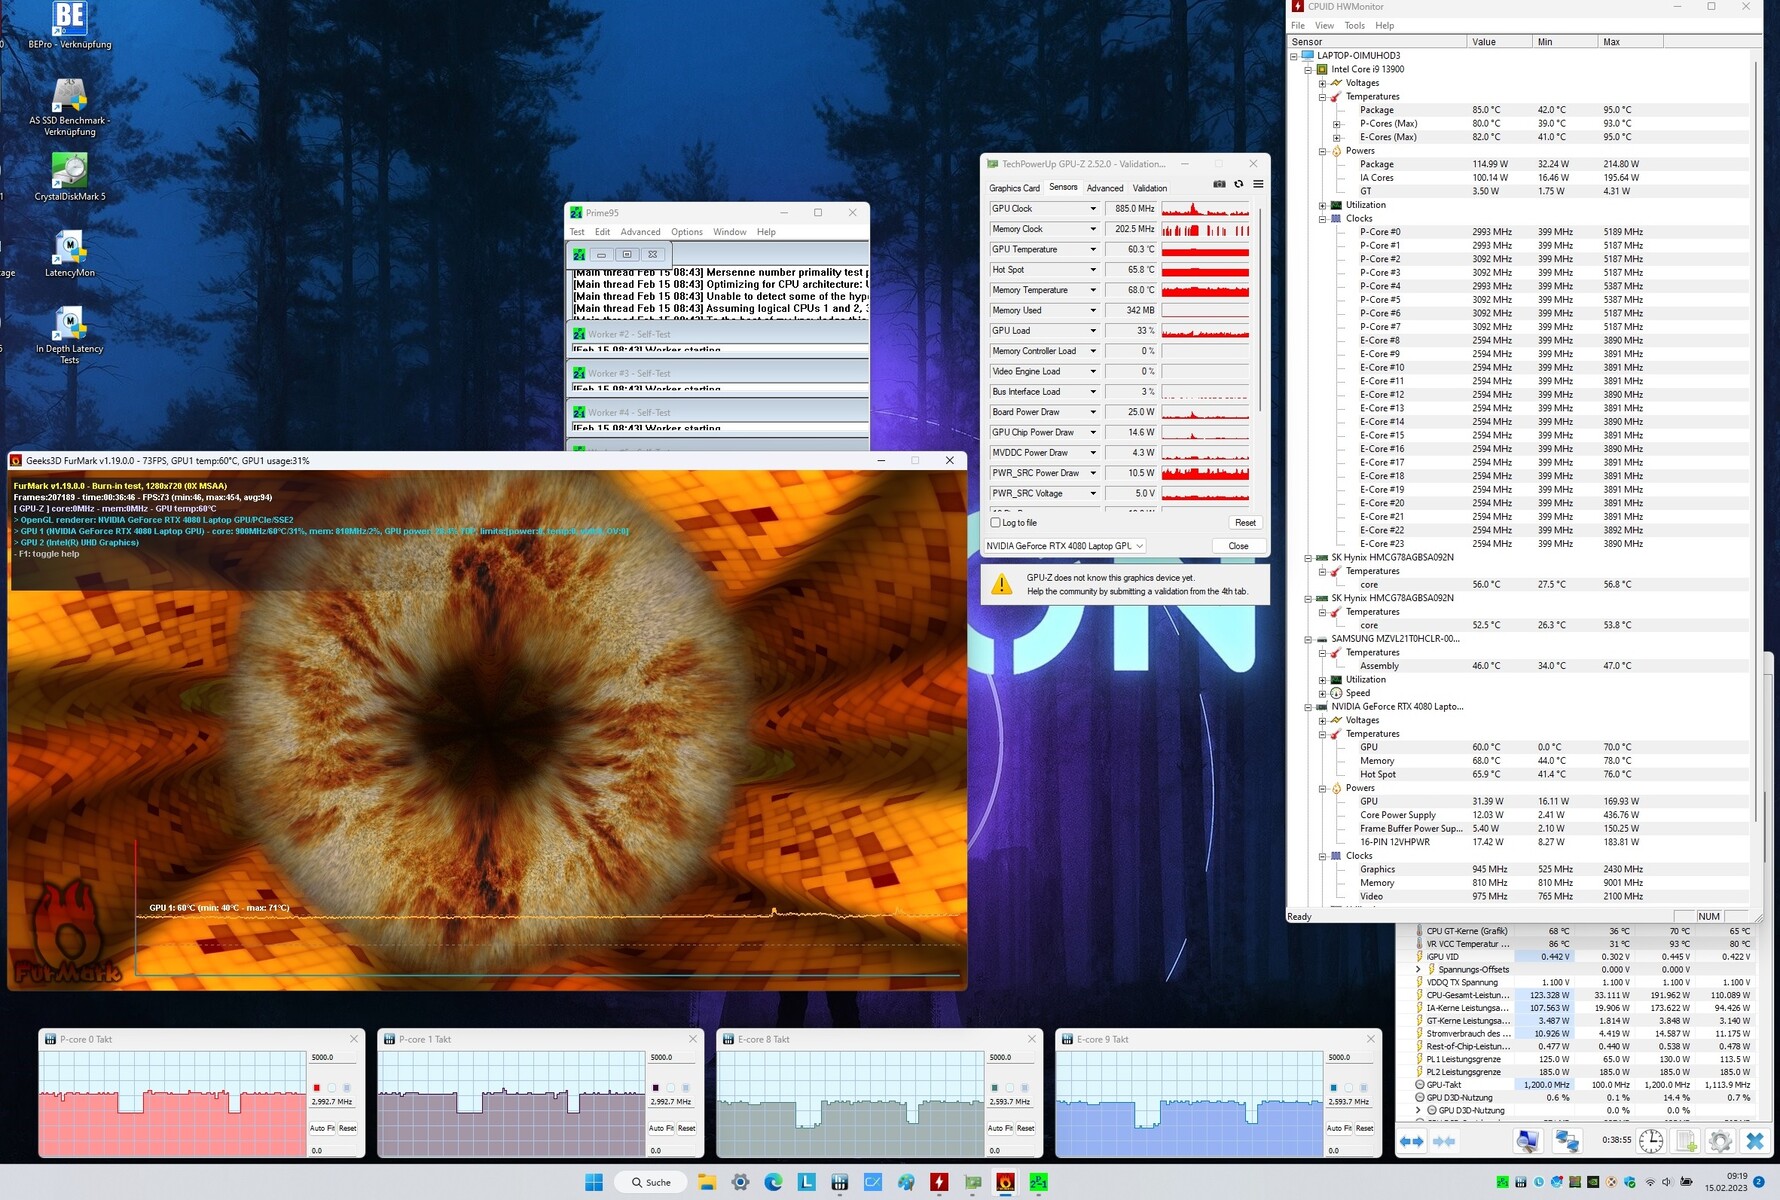
Test na stres
Połączony test obciążeniowy z FurMark i Prime95 nie jest zbyt pomocny, gdyż GPU wykazuje throttling. Podczas stresu The Witcher 3 CPU i GPU nagrzewają się do średnio 75°C, co nie jest problematyczne.
Mówcy
Cechą charakterystyczną Legion Pro 7 jest współpraca Lenovo z firmą Harman, która zaowocowała dobrze brzmiącymi głośnikami. Nasza analiza dźwięku nie wykazała żadnych rażących słabości w żadnym zakresie częstotliwości, co jest rzadkością w notebookach - Blade 16 musi się na przykład zadowolić słabszymi basami.
Zewnętrzne głośniki lub zestaw słuchawkowy nie są absolutnie konieczne, biorąc pod uwagę wysoki maksymalny poziom głośności 82 dB(A).
Lenovo Legion Pro 7 16IRX8H analiza dźwięku
(+) | głośniki mogą odtwarzać stosunkowo głośno (82 dB)
Bas 100 - 315 Hz
(±) | zredukowany bas - średnio 8.9% niższy od mediany
(+) | bas jest liniowy (6.4% delta do poprzedniej częstotliwości)
Średnie 400 - 2000 Hz
(+) | zbalansowane środki średnie - tylko 2.8% od mediany
(+) | średnie są liniowe (4.2% delta do poprzedniej częstotliwości)
Wysokie 2–16 kHz
(+) | zrównoważone maksima - tylko 2.5% od mediany
(+) | wzloty są liniowe (6% delta do poprzedniej częstotliwości)
Ogólnie 100 - 16.000 Hz
(+) | ogólny dźwięk jest liniowy (9.4% różnicy w stosunku do mediany)
W porównaniu do tej samej klasy
» 3% wszystkich testowanych urządzeń w tej klasie było lepszych, 2% podobnych, 95% gorszych
» Najlepszy miał deltę 6%, średnia wynosiła ###średnia###%, najgorsza wynosiła 132%
W porównaniu do wszystkich testowanych urządzeń
» 3% wszystkich testowanych urządzeń było lepszych, 1% podobnych, 96% gorszych
» Najlepszy miał deltę 4%, średnia wynosiła ###średnia###%, najgorsza wynosiła 134%
Razer Blade 16 Early 2023 analiza dźwięku
(+) | głośniki mogą odtwarzać stosunkowo głośno (88.2 dB)
Bas 100 - 315 Hz
(-) | prawie brak basu - średnio 16.4% niższa od mediany
(±) | liniowość basu jest średnia (10.8% delta do poprzedniej częstotliwości)
Średnie 400 - 2000 Hz
(+) | zbalansowane środki średnie - tylko 2.5% od mediany
(+) | średnie są liniowe (2.4% delta do poprzedniej częstotliwości)
Wysokie 2–16 kHz
(+) | zrównoważone maksima - tylko 4.9% od mediany
(±) | liniowość wysokich wartości jest średnia (7.9% delta do poprzedniej częstotliwości)
Ogólnie 100 - 16.000 Hz
(+) | ogólny dźwięk jest liniowy (12.6% różnicy w stosunku do mediany)
W porównaniu do tej samej klasy
» 16% wszystkich testowanych urządzeń w tej klasie było lepszych, 4% podobnych, 81% gorszych
» Najlepszy miał deltę 6%, średnia wynosiła ###średnia###%, najgorsza wynosiła 132%
W porównaniu do wszystkich testowanych urządzeń
» 11% wszystkich testowanych urządzeń było lepszych, 3% podobnych, 86% gorszych
» Najlepszy miał deltę 4%, średnia wynosiła ###średnia###%, najgorsza wynosiła 134%
Zarządzanie energią: Wysokie zużycie nawet w stanie spoczynku
Pobór mocy
Podobnie jak w przypadku wysokiej klasy laptopów do gier, Legion Pro 7 ma wysokie zapotrzebowanie na energię mimo przełączania grafiki nawet w trybie bezczynności. Zużycie od 18 do 32 W (wliczając krótkie skoki obciążenia) w stanie bezczynności sprawia, że Legion Pro 7 jest prawie o 20% powyżej średniej w klasie.
Odnotowujemy pobór 130 W ze ściany pod średnim obciążeniem (3DMark06) i 320 W w maksymalnym stresie. Podczas grania można się spodziewać, że zużycie dobije do około 260 W, czyli nieco więcej niż w przypadku Blade 16 (242 W).
| wyłączony / stan wstrzymania | |
| luz | |
| obciążenie |
|
Legenda:
min: | |
| Lenovo Legion Pro 7 16IRX8H i9-13900HX, GeForce RTX 4080 Laptop GPU | Razer Blade 16 Early 2023 i9-13950HX, GeForce RTX 4080 Laptop GPU | Lenovo Legion 7 16IAX7-82TD004SGE i9-12900HX, GeForce RTX 3080 Ti Laptop GPU | Lenovo Legion 7 16ACHg6 R9 5900HX, GeForce RTX 3080 Laptop GPU | Lenovo Legion 7 16ARHA7 R9 6900HX, Radeon RX 6850M XT | Średnia w klasie Gaming | |
|---|---|---|---|---|---|---|
| Power Consumption | -1% | 1% | -14% | 21% | 21% | |
| Idle Minimum * (Watt) | 18 | 15.2 16% | 19.2 -7% | 31 -72% | 9.9 45% | 13 ? 28% |
| Idle Average * (Watt) | 24 | 22.8 5% | 25.1 -5% | 33 -38% | 22 8% | 19 ? 21% |
| Idle Maximum * (Watt) | 32 | 49.8 -56% | 27.1 15% | 46 -44% | 23.1 28% | 24.6 ? 23% |
| Load Average * (Watt) | 130 | 121.2 7% | 132 -2% | 110 15% | 94.4 27% | 110.7 ? 15% |
| Witcher 3 ultra * (Watt) | 260 | 242 7% | 253 3% | 180 31% | 249 4% | |
| Load Maximum * (Watt) | 320 | 273.7 14% | 308.9 3% | 235 27% | 276 14% | 259 ? 19% |
* ... im mniej tym lepiej
Power consumption: The Witcher 3 / Stress test
Power consumption: External Monitor
Żywotność baterii
Lenovo wyposaża Legion Pro 7 w wydajny akumulator o pojemności 99 WHr, który może być tylko nieco przydatny ze względu na nieoptymalne zarządzanie energią. Możliwe jest uzyskanie do 6,5 godziny czasu pracy w stanie bezczynności, bez uruchomionego innego zadania i przy minimalnej jasności. Jest to skromny wynik w porównaniu z 9,5 godzinami Blade'a 16.
W codziennym użytkowaniu, takim jak przeglądanie internetu przez Wi-Fi przy obniżonej jasności 150 nitów, udało się uzyskać 5 godzin czasu pracy.
| Lenovo Legion Pro 7 16IRX8H i9-13900HX, GeForce RTX 4080 Laptop GPU, 99.9 Wh | Razer Blade 16 Early 2023 i9-13950HX, GeForce RTX 4080 Laptop GPU, 95.2 Wh | Lenovo Legion 7 16IAX7-82TD004SGE i9-12900HX, GeForce RTX 3080 Ti Laptop GPU, 99 Wh | Lenovo Legion 7 16ACHg6 R9 5900HX, GeForce RTX 3080 Laptop GPU, 80 Wh | Lenovo Legion 7 16ARHA7 R9 6900HX, Radeon RX 6850M XT, 99 Wh | Średnia w klasie Gaming | |
|---|---|---|---|---|---|---|
| Czasy pracy | 9% | -40% | 12% | 2% | 13% | |
| Reader / Idle (h) | 6.4 | 8.9 39% | 8.2 28% | 4.9 -23% | 8.27 ? 29% | |
| WiFi v1.3 (h) | 5.1 | 6.1 20% | 4.5 -12% | 6.8 33% | 7.3 43% | 7.11 ? 39% |
| Load (h) | 2.1 | 1.4 -33% | 0.7 -67% | 1.6 -24% | 1.8 -14% | 1.502 ? -28% |
| H.264 (h) | 5.1 | 6.8 | 8.32 ? | |||
| Witcher 3 ultra (h) | 0.9 |
Za
Przeciw
Werdykt: Imponująca moc dla graczy
Pasjonaci gier, którzy chcą grać w wymagające, nowoczesne tytuły z maksymalnymi detalami i nie mają nic przeciwko wydaniu moolah, znajdą Lenovo Legion 7 Pro 16IRX8H jako właściwy wybór.
Połączenie procesora Core i9-13900HX i GeForce RTX 4080 oferuje imponujący poziom wydajności, który z łatwością pozwala uzyskać 40, a nawet 60 fps w większości nowoczesnych gier w rozdzielczości 4K Ultra
Jasny, ostry i wierny kolorom wyświetlacz 16:10 QHD 240 Hz zapewnia wciągające wrażenia z oglądania. Sprzęt został umieszczony w stylowej obudowie, która sprawia wrażenie premium i dobrze wypada pod względem jakości wykonania i stabilności. Inne aspekty, takie jak jakość dźwięku, urządzenia wejściowe i łączność również wydają się być bliskie ideału.
Potencjalni nabywcy Lenovo Legion 7 Pro 16IRX8H będą musieli jednak pamiętać o wysokiej emisji. 16-calowy laptop dość mocno nagrzewa się pod obciążeniem, chyba że wybrany zostanie profil Silent - naszym zdaniem profil Balanced to najlepszy kompromis między wydajnością a emisją do codziennego użytku. Chętnie zobaczylibyśmy też dłuższe czasy pracy na baterii o pojemności 99 WHr.
Jednym z głównych konkurentów dla nowego Lenovo Legion 7 Pro jestRazer Blade 16który w rzeczywistości jest cichszy i chłodniejszy, a jednocześnie oferuje podobny poziom wydajności. Dodatkowo, Blade 16 jest nieco lżejszy i cieńszy w porównaniu z nim.
Mimo to Lenovo Legion 7 Pro 16IRX8H robi ogólne wrażenie i odpowiednio zasługuje na naszą ocenę "bardzo dobrą".
Ceny i dostępność
Testowany Lenovo Legion Pro 7 16IRX8H jest dostępny na stronie campuspoint.dew cenie 3 599 €. (RRP: 3 999 EURO).
Lenovo Legion Pro 7 16IRX8H
- 21/02/2023 v7 (old)
Florian Glaser
Przezroczystość
Wyboru urządzeń do recenzji dokonuje nasza redakcja. Próbka testowa została udostępniona autorowi jako pożyczka od producenta lub sprzedawcy detalicznego na potrzeby tej recenzji. Pożyczkodawca nie miał wpływu na tę recenzję, producent nie otrzymał też kopii tej recenzji przed publikacją. Nie było obowiązku publikowania tej recenzji. Jako niezależna firma medialna, Notebookcheck nie podlega władzy producentów, sprzedawców detalicznych ani wydawców.
Tak testuje Notebookcheck
Każdego roku Notebookcheck niezależnie sprawdza setki laptopów i smartfonów, stosując standardowe procedury, aby zapewnić porównywalność wszystkich wyników. Od około 20 lat stale rozwijamy nasze metody badawcze, ustanawiając przy tym standardy branżowe. W naszych laboratoriach testowych doświadczeni technicy i redaktorzy korzystają z wysokiej jakości sprzętu pomiarowego. Testy te obejmują wieloetapowy proces walidacji. Nasz kompleksowy system ocen opiera się na setkach uzasadnionych pomiarów i benchmarków, co pozwala zachować obiektywizm.Price comparison

