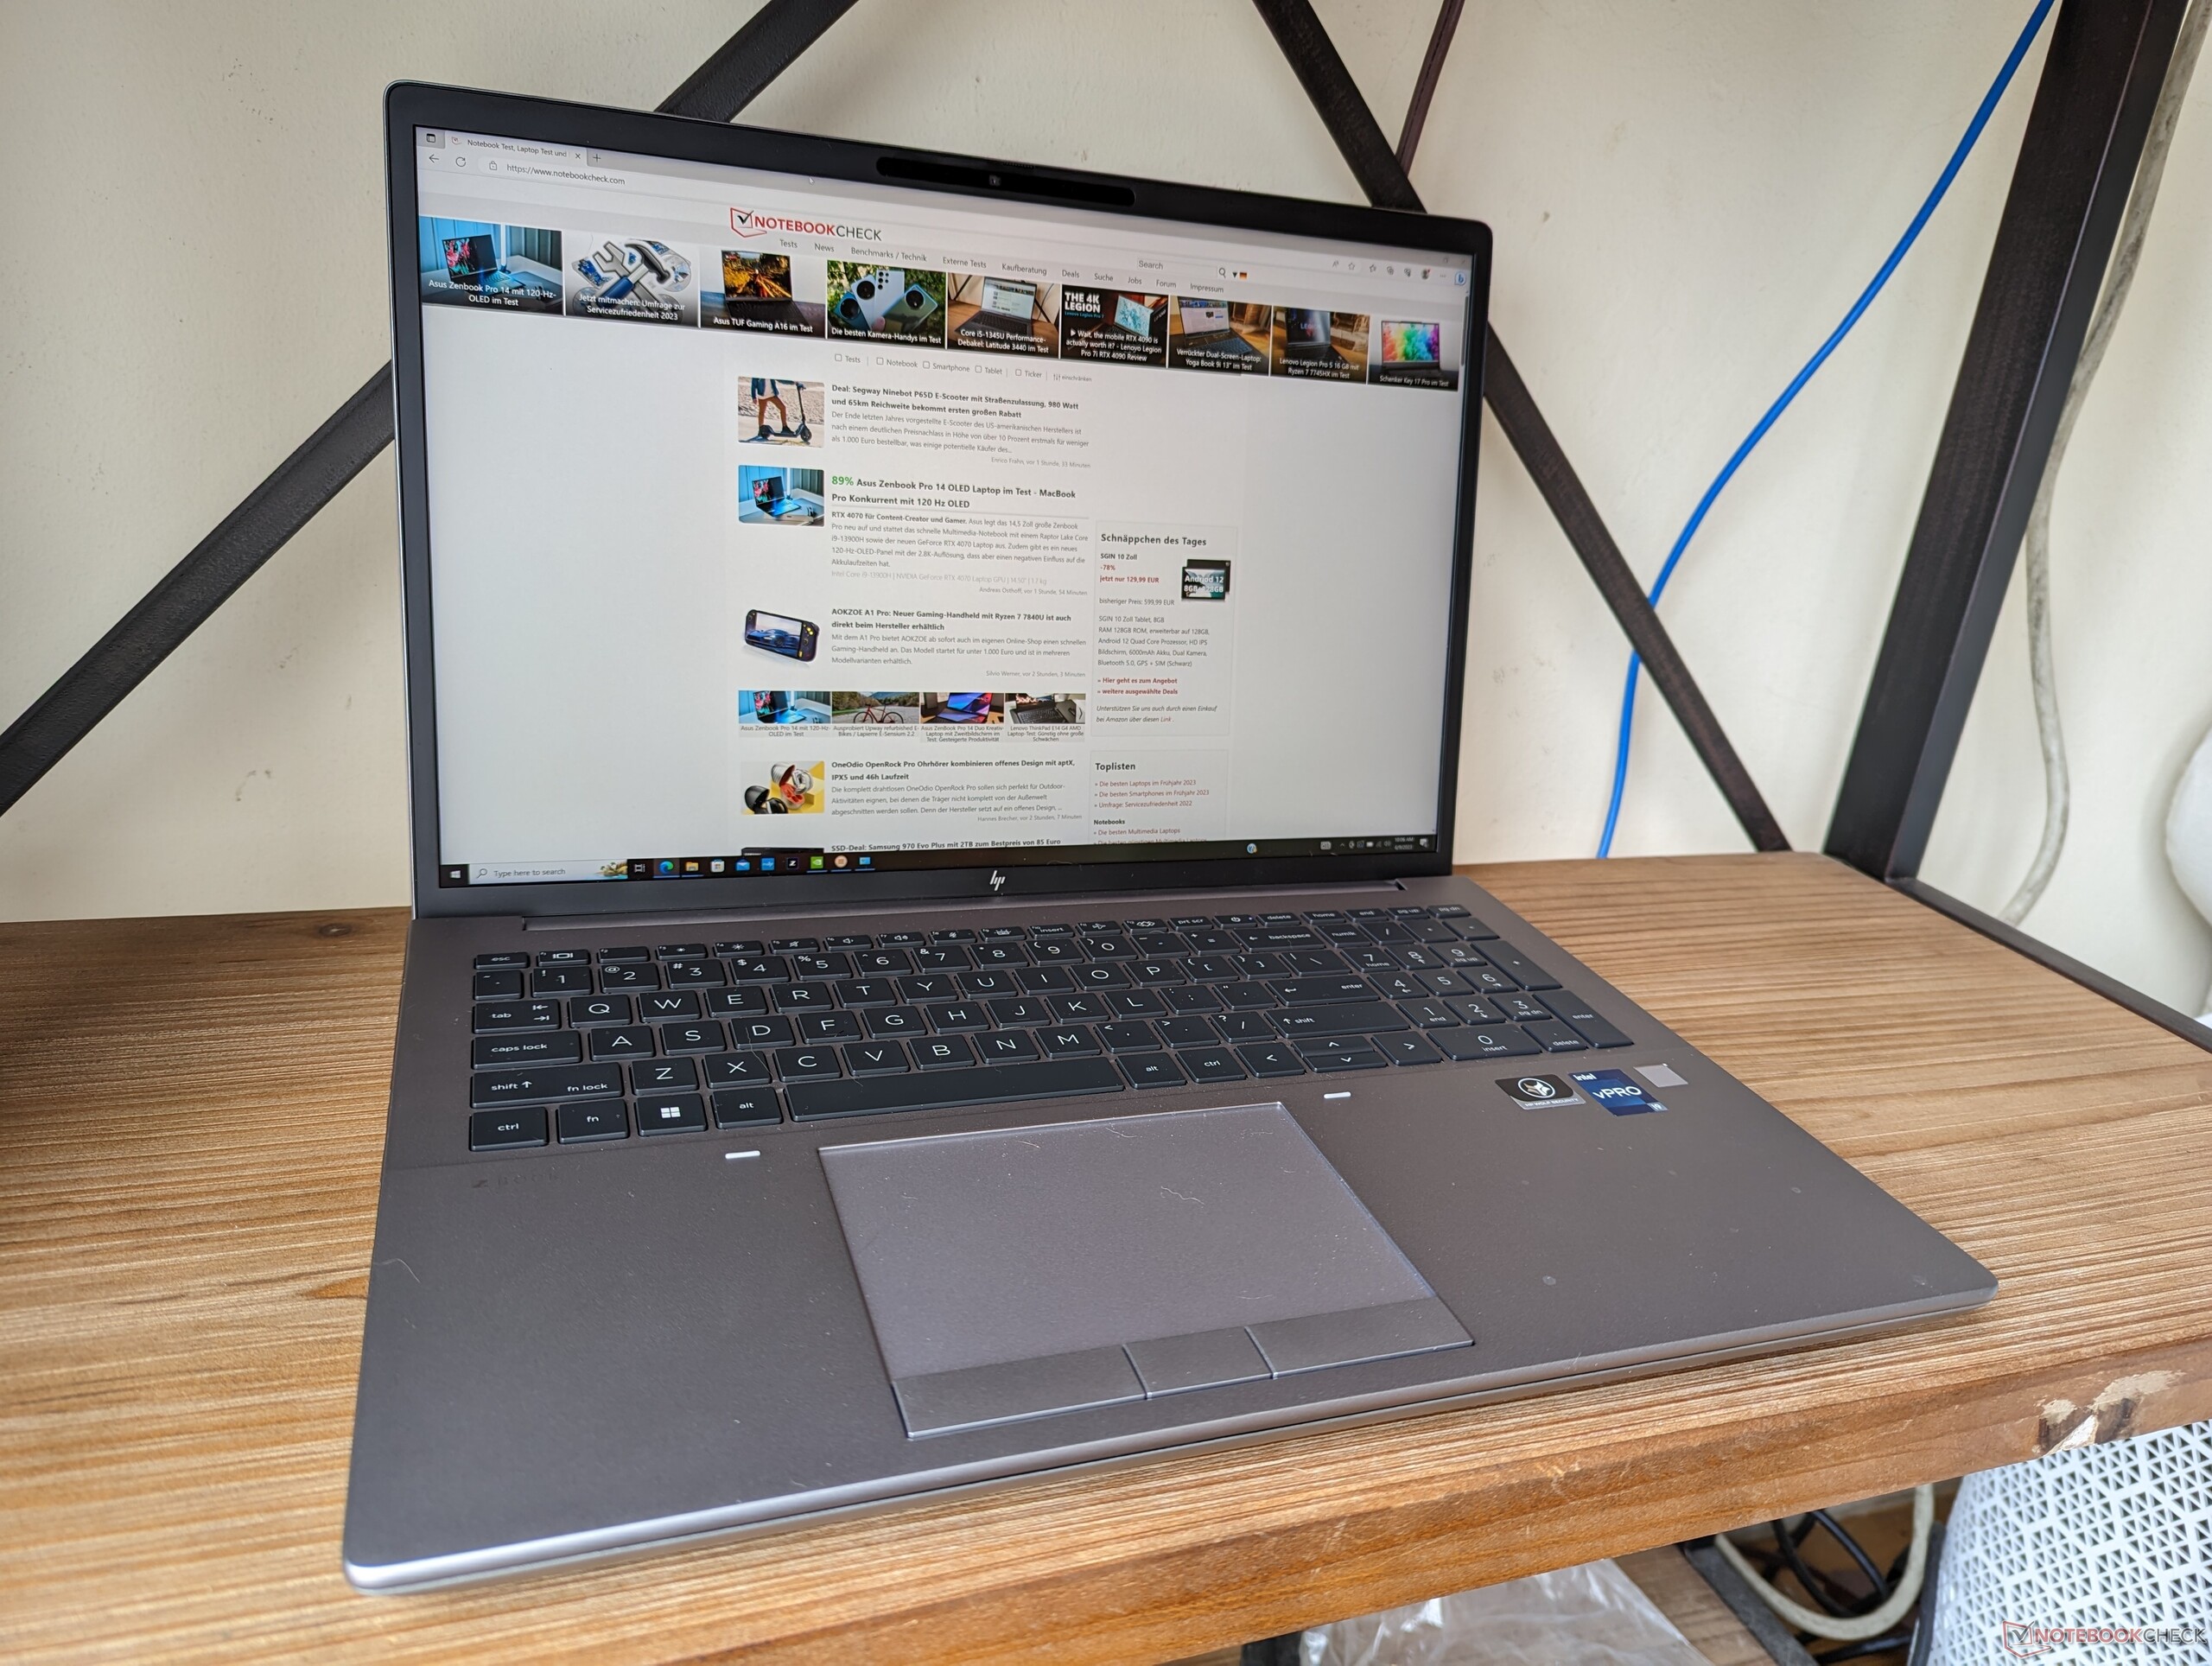
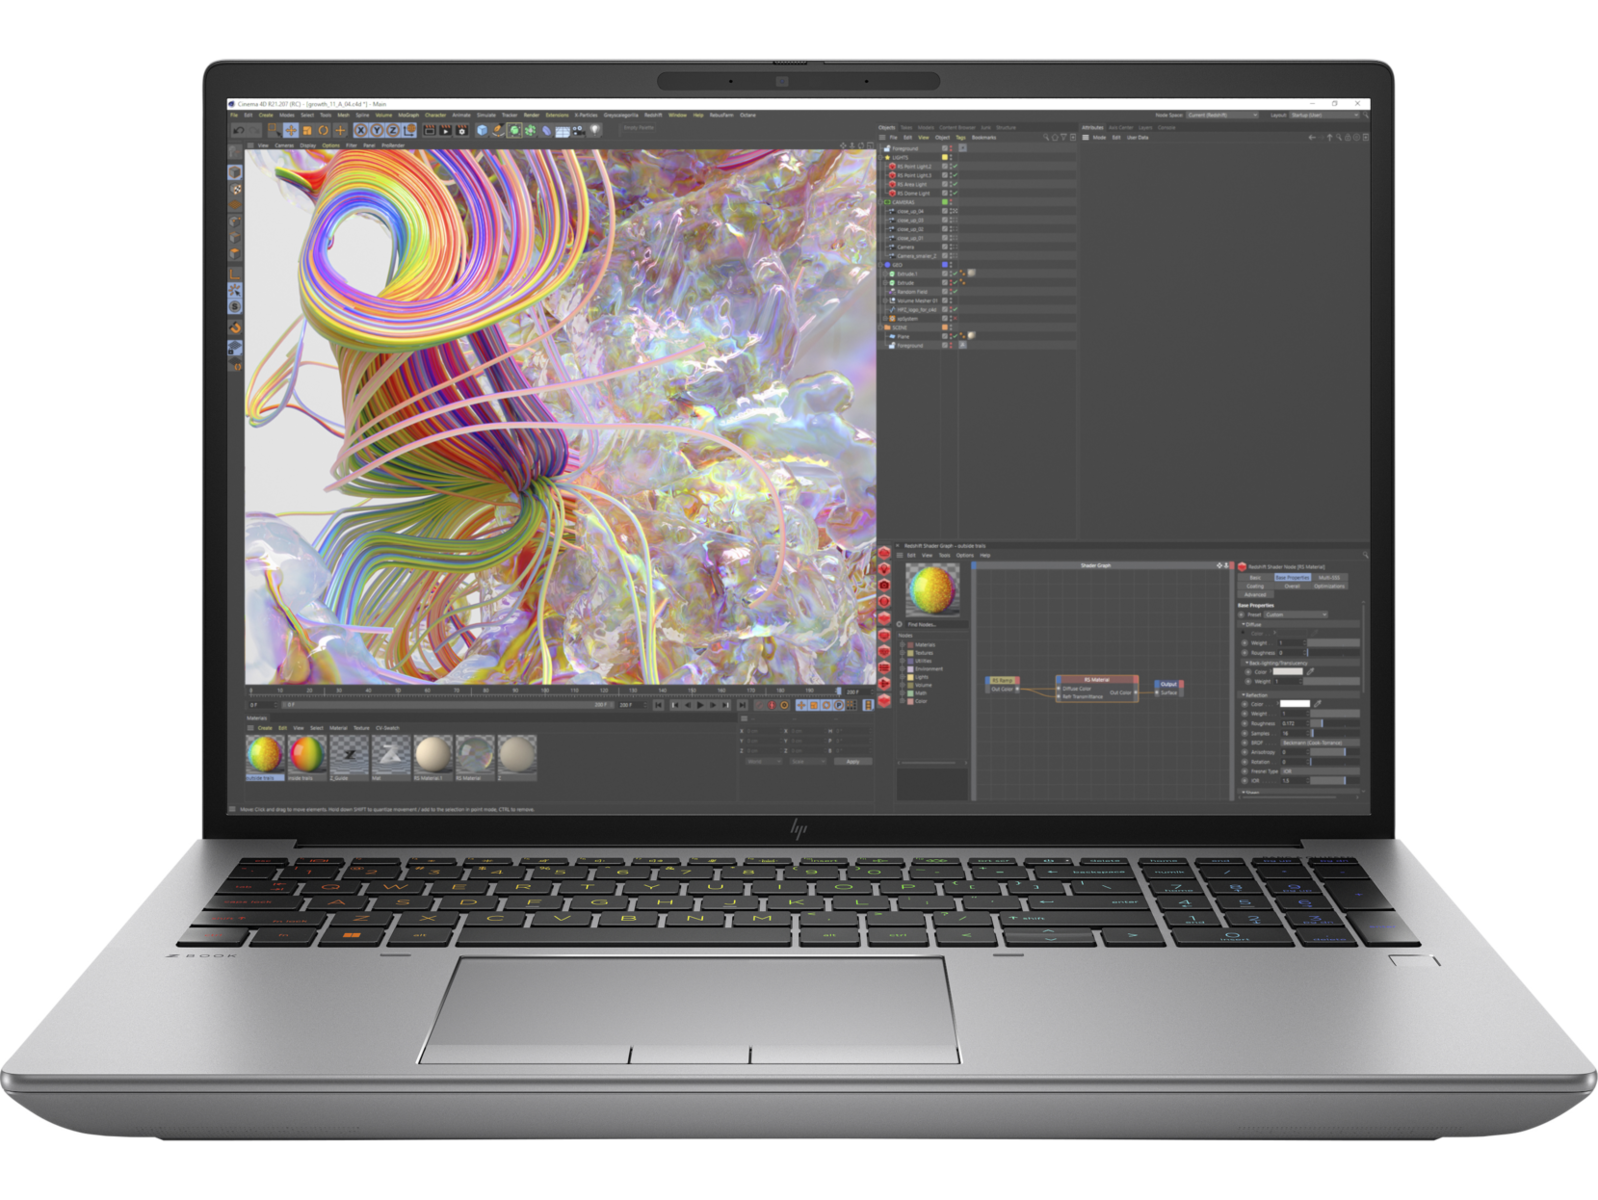
Recenzja stacji roboczej HP ZBook Fury 16 G9: Dell Precision 7670 i alternatywa dla ThinkPada P16 G1

Seria ZBook Fury jest domem dla najwydajniejszych mobilnych stacji roboczych HP, w przeciwieństwie do średniej klasy serii ZBook Studio Serii ZBook Studio i ultracienkiej ZBook Firefly.
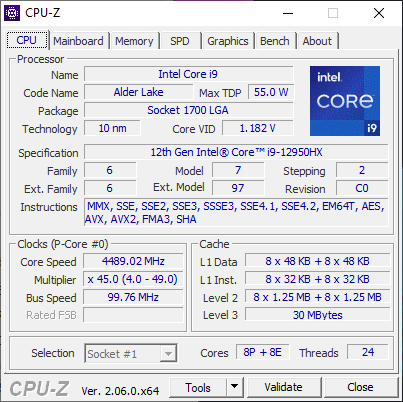
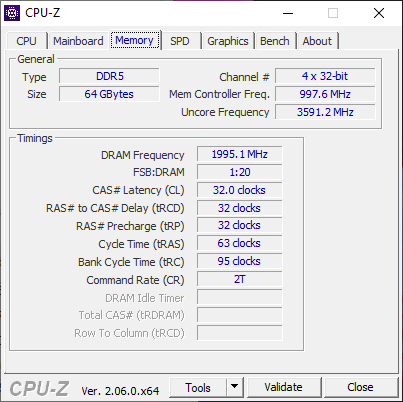
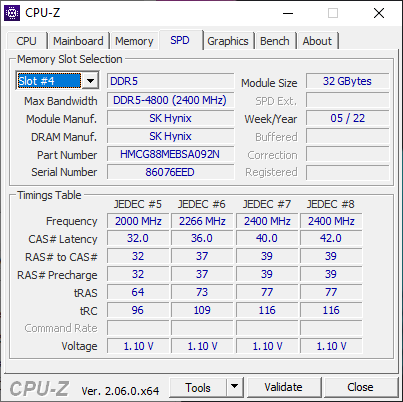
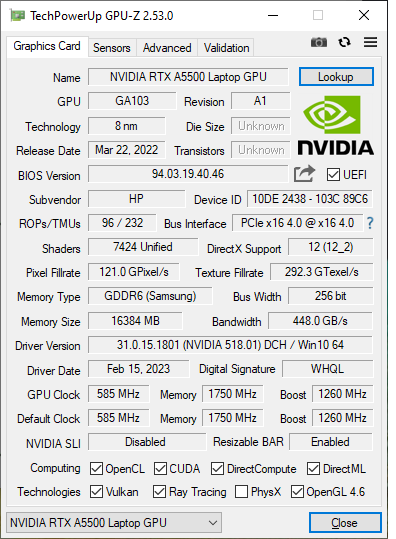
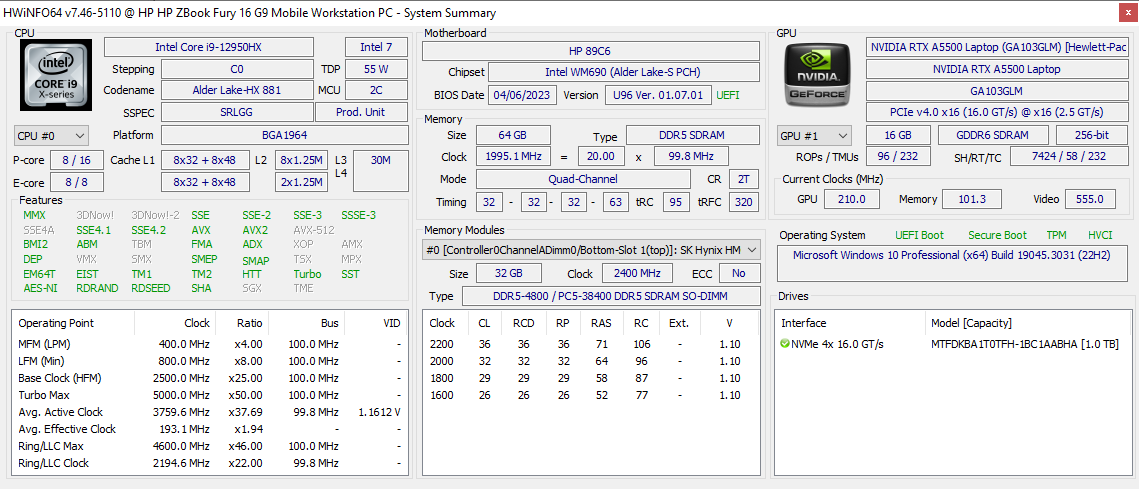
Nasza recenzowana jednostka to high-endowa konfiguracja Fury 16 G9 z procesorem 12. generacji Alder Lake-H Core i9-12950HX, GPU RTX A5500 Ampere, 64 GB pamięci RAM i wyświetlaczem IPS 3840 x 2400 w cenie detalicznej nieco ponad 4000 USD. Konfigurowalne opcje są ogromne z LTE, 5G, a nawet panelami OLED, jak wymieniono tutaj. Należy pamiętać, że ZBook Fury G10 z nowszymi opcjami Intel 13. generacji jest również dostępny, ale obudowa pozostaje identyczna z naszą Fury G9.
Alternatywy dla ZBook Fury 16 G9 obejmują inne flagowe 16-calowe mobilne stacje robocze, takie jak Dell Precision 7670, MSI CreatorPro Z16P, Asus ProArt StudioBook 16lub Lenovo ThinkPad P16 G1.
Więcej recenzji HP:
Potencjalni konkurenci w porównaniu
Ocena | Data | Model | Waga | Wysokość | Rozmiar | Rezolucja | Cena |
|---|---|---|---|---|---|---|---|
| 91 % v7 (old) | 06/2023 | HP ZBook Fury 16 G9 i9-12950HX, RTX A5500 Laptop GPU | 2.6 kg | 28.5 mm | 16.00" | 3840x2400 | |
| 90.1 % v7 (old) | 11/2022 | HP ZBook Studio 16 G9 62U04EA i7-12800H, RTX A2000 Laptop GPU | 1.8 kg | 19 mm | 16.00" | 3840x2400 | |
| 82.9 % v7 (old) | 10/2022 | HP ZBook Firefly 16 G9-6B897EA i7-1265U, T550 Laptop GPU | 2 kg | 19.2 mm | 16.00" | 1920x1200 | |
| 91 % v7 (old) | 02/2023 | Lenovo ThinkPad P16 G1 RTX A5500 i9-12950HX, RTX A5500 Laptop GPU | 3 kg | 30.23 mm | 16.00" | 3840x2400 | |
| 89.1 % v7 (old) | 12/2022 | Dell Precision 7000 7670 Performance i9-12950HX, RTX A5500 Laptop GPU | 2.8 kg | 25.95 mm | 16.00" | 3840x2400 | |
| 84.3 % v7 (old) | 11/2022 | MSI CreatorPro Z16P B12UKST i7-12700H, RTX A3000 Laptop GPU | 2.4 kg | 19 mm | 16.00" | 2560x1600 |
Etui - Classic ZBook
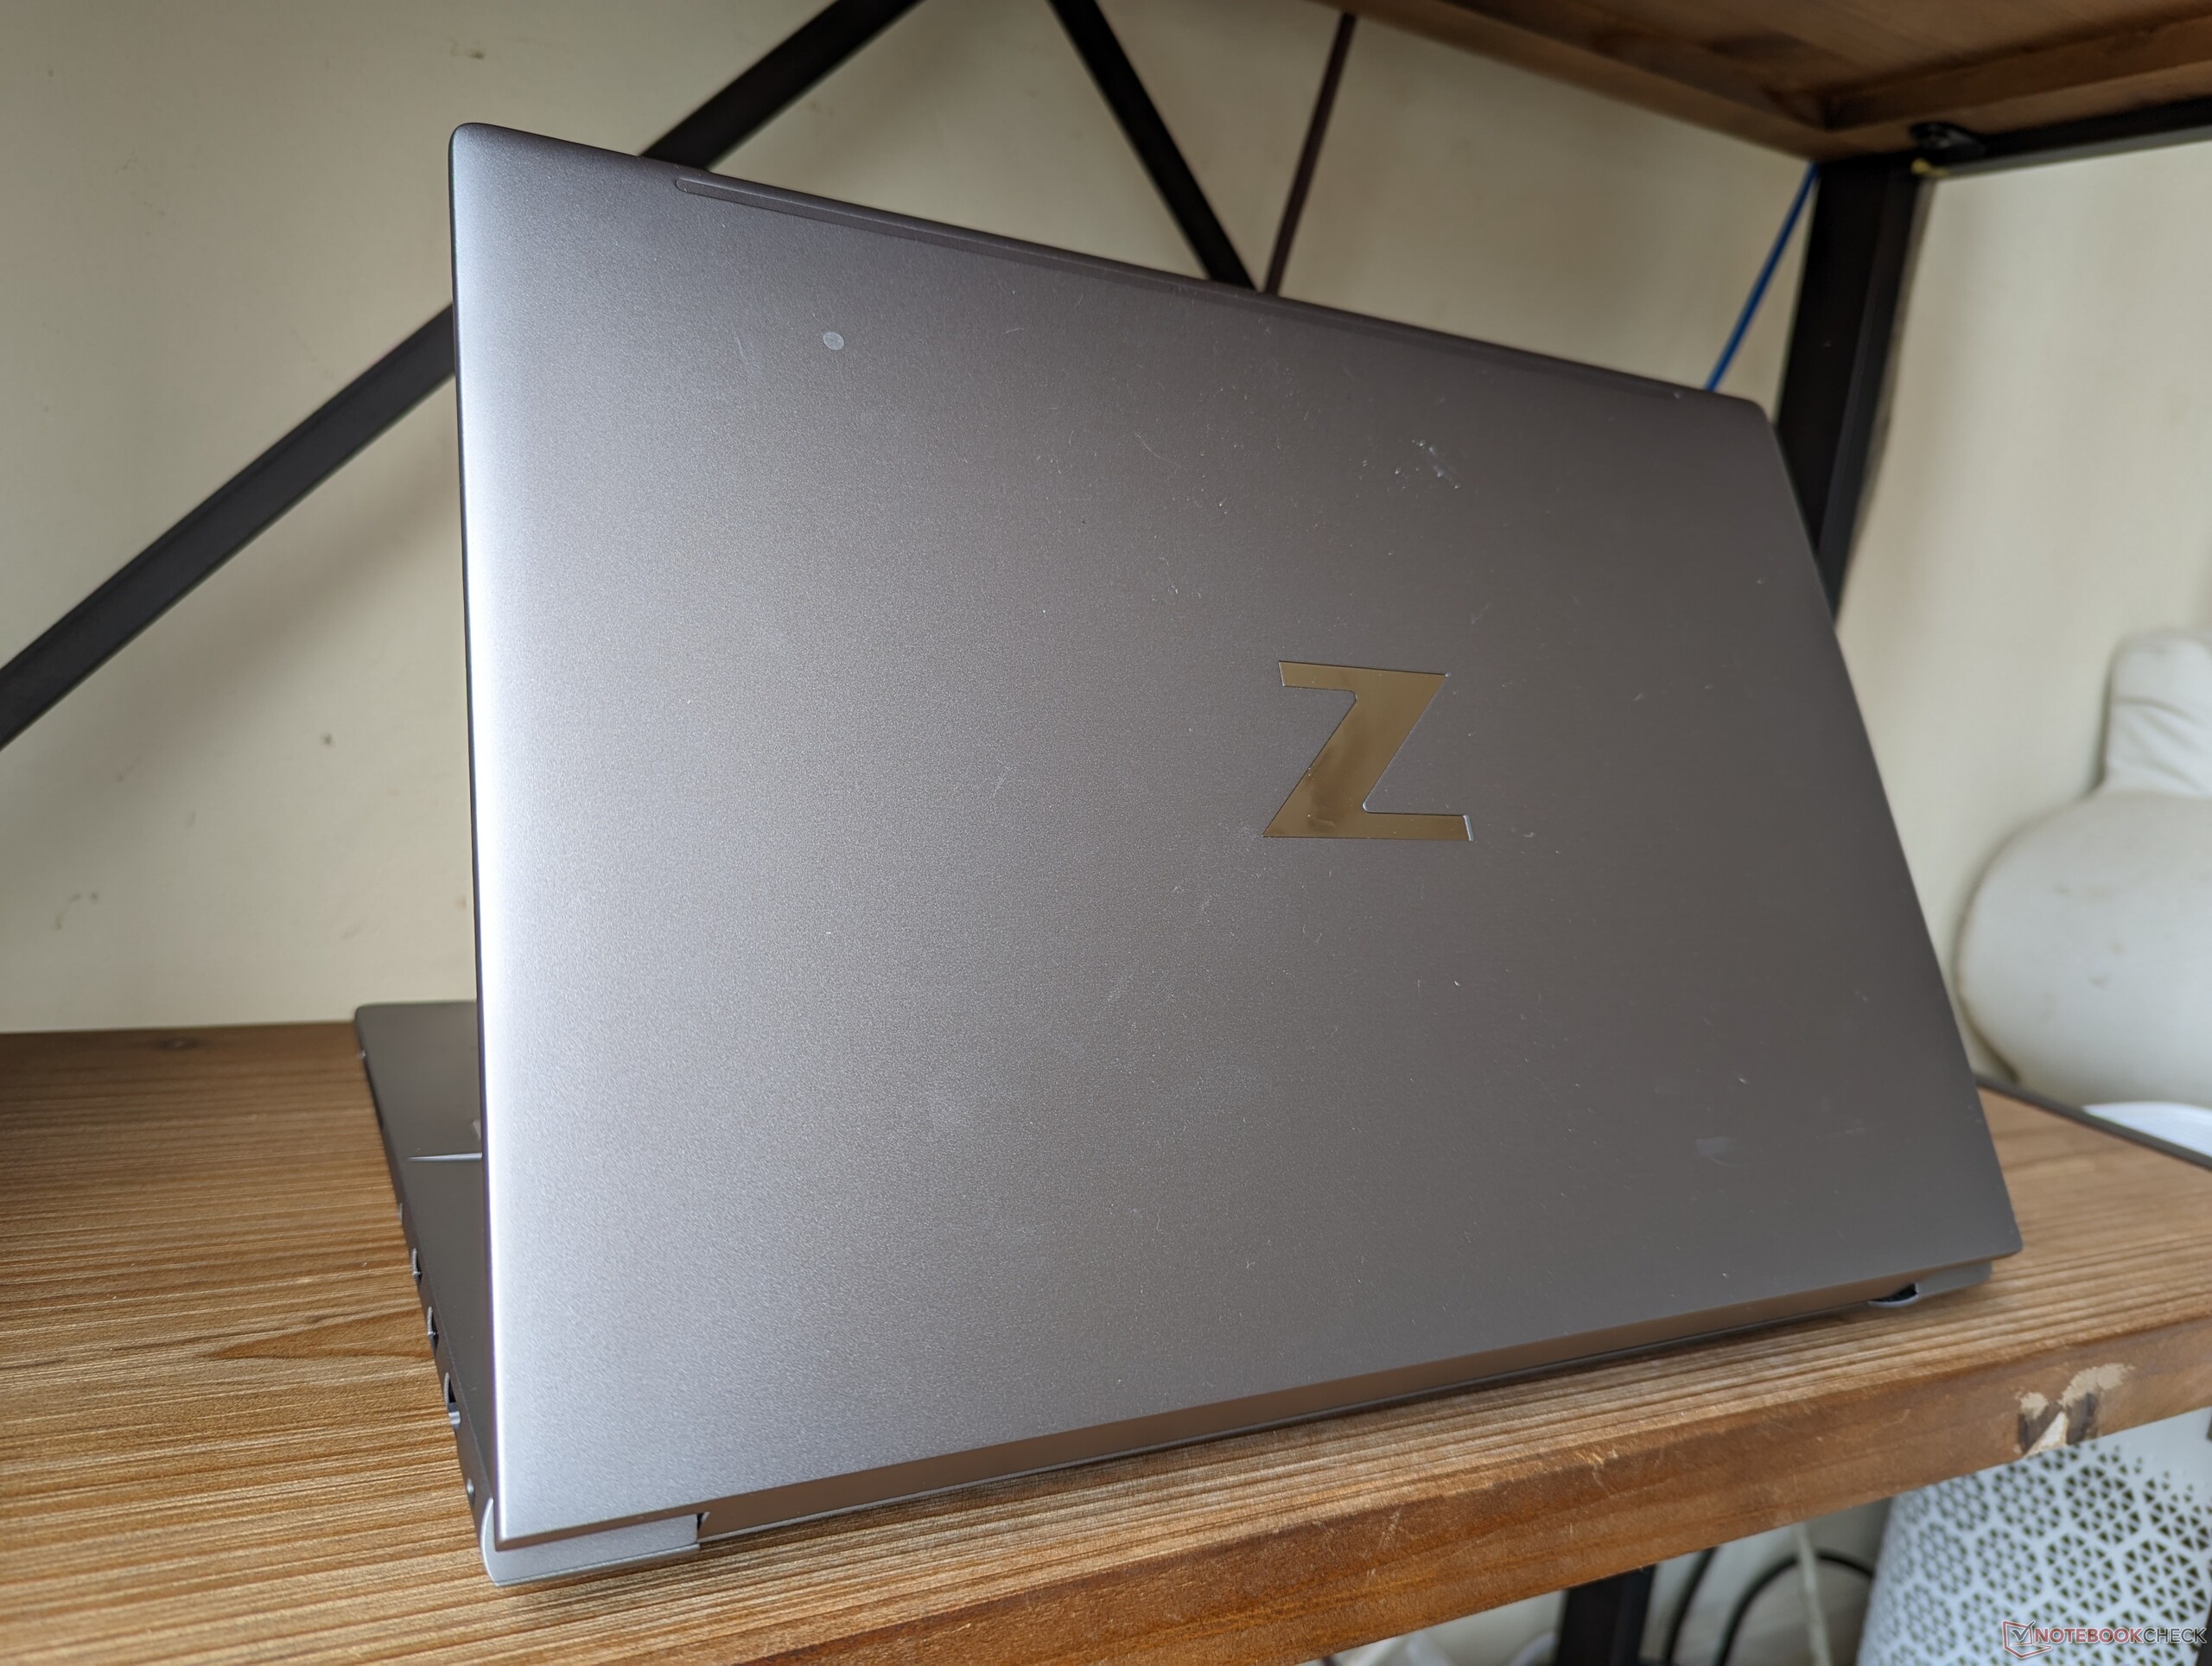
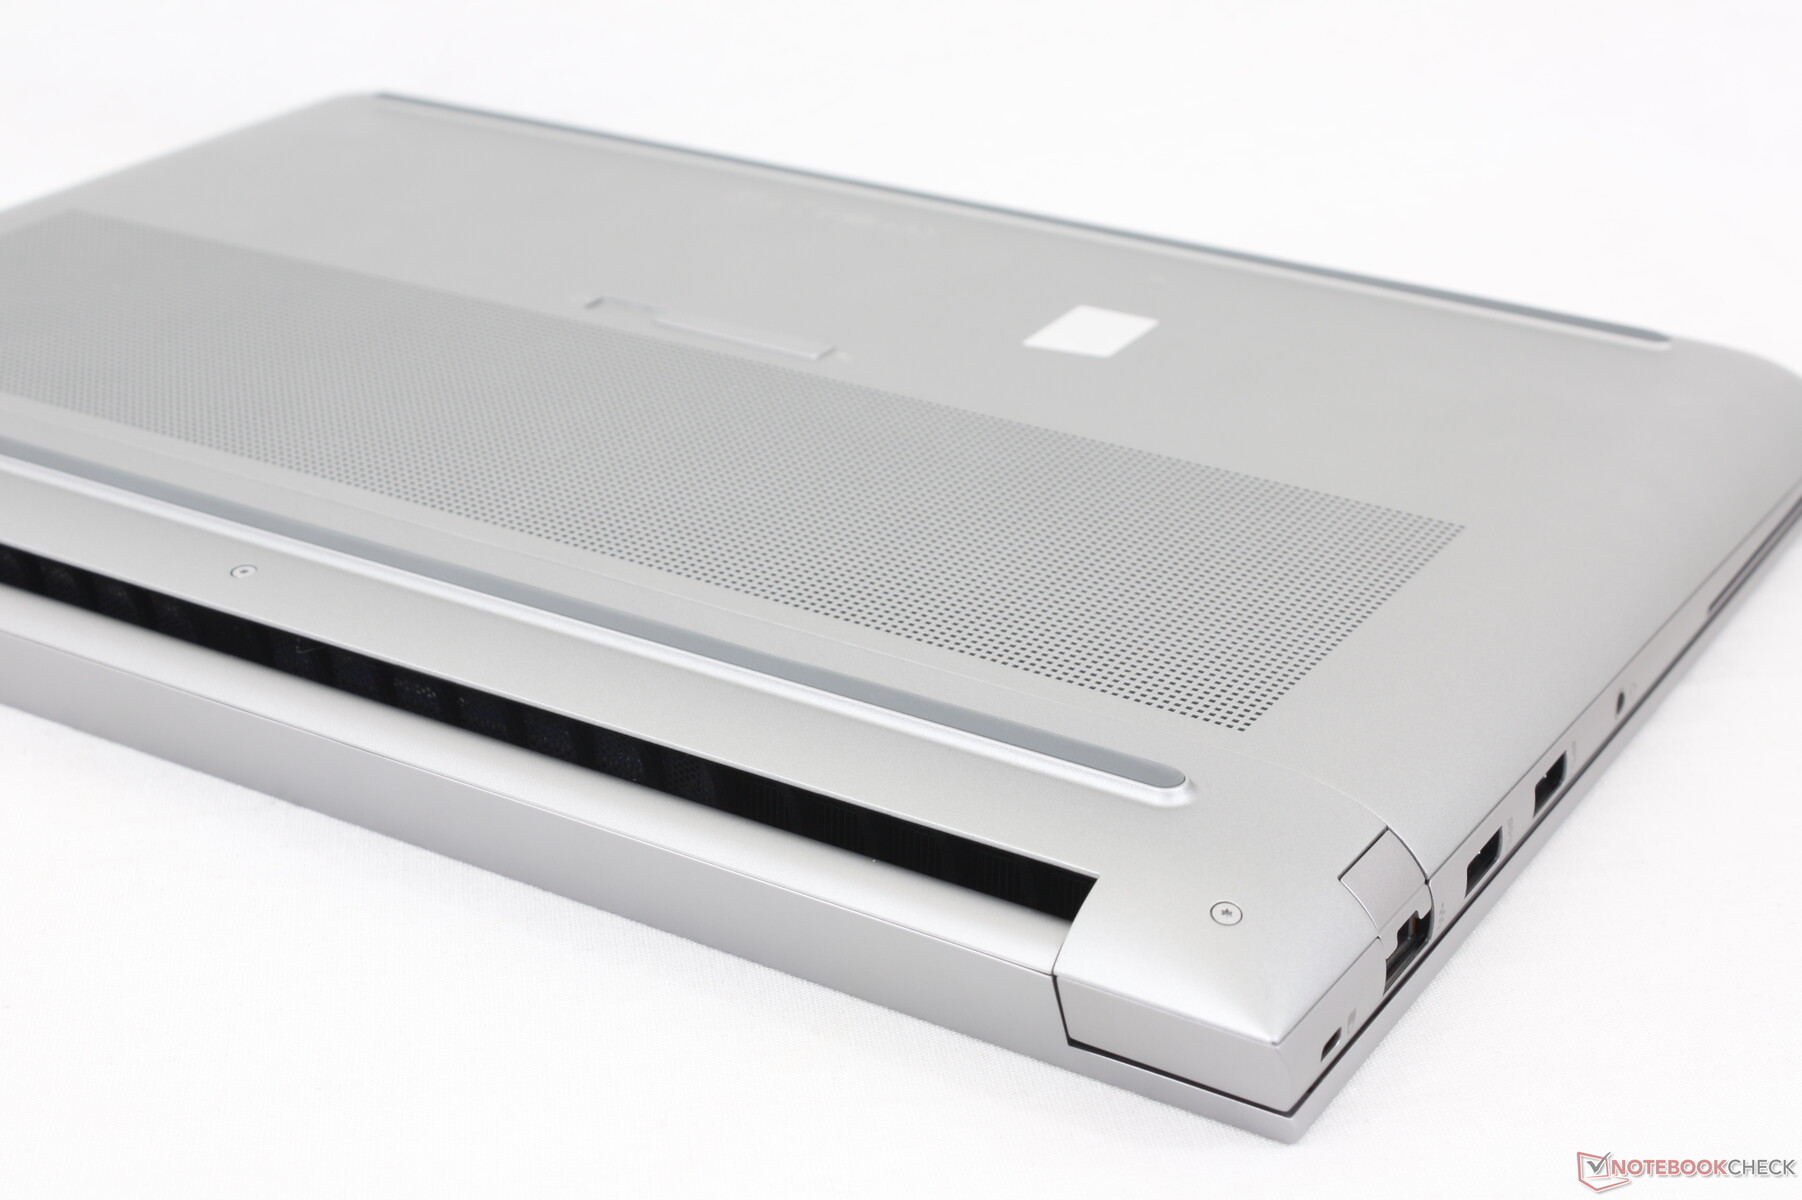
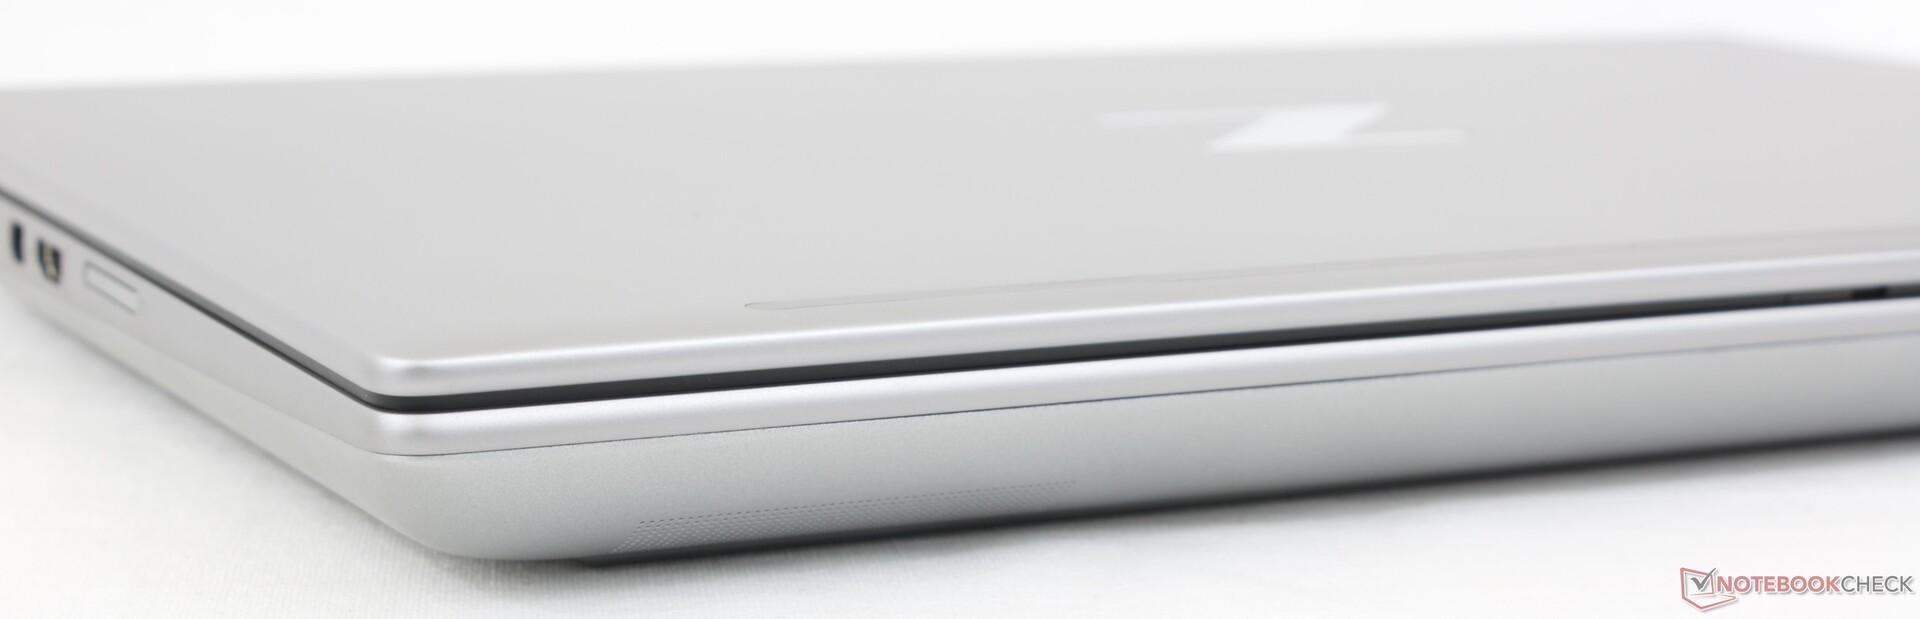
Obudowa składa się z tych samych materiałów ze stopu aluminium, z którymi właściciele ZBooków są już zaznajomieni. Skręcenia, wypaczenia i skrzypienia są minimalne i porównywalne z Precision 7670 co zapewnia dobre pierwsze wrażenie i brak problematycznych obszarów. Uginanie jest najbardziej zauważalne podczas wywierania nacisku na środek zewnętrznej pokrywy, gdzie znajduje się logo "Z", ale nie jest to powodem do jakichkolwiek długoterminowych obaw.
HP jest zauważalnie lżejszy niż zarównoThinkPad P16 G1 i Precision 7670, mimo że wszystkie mają podobne opcje procesora i karty graficznej. Odbywa się to jednak kosztem wydajności, co pokazują poniższe porównania benchmarków. Aby uzyskać coś bardziej przenośnego, użytkownicy mogą zamiast tego rozważyć znacznie cieńszy ZBook Firefly 16 G9 lub ZBook Studio 16 G9.
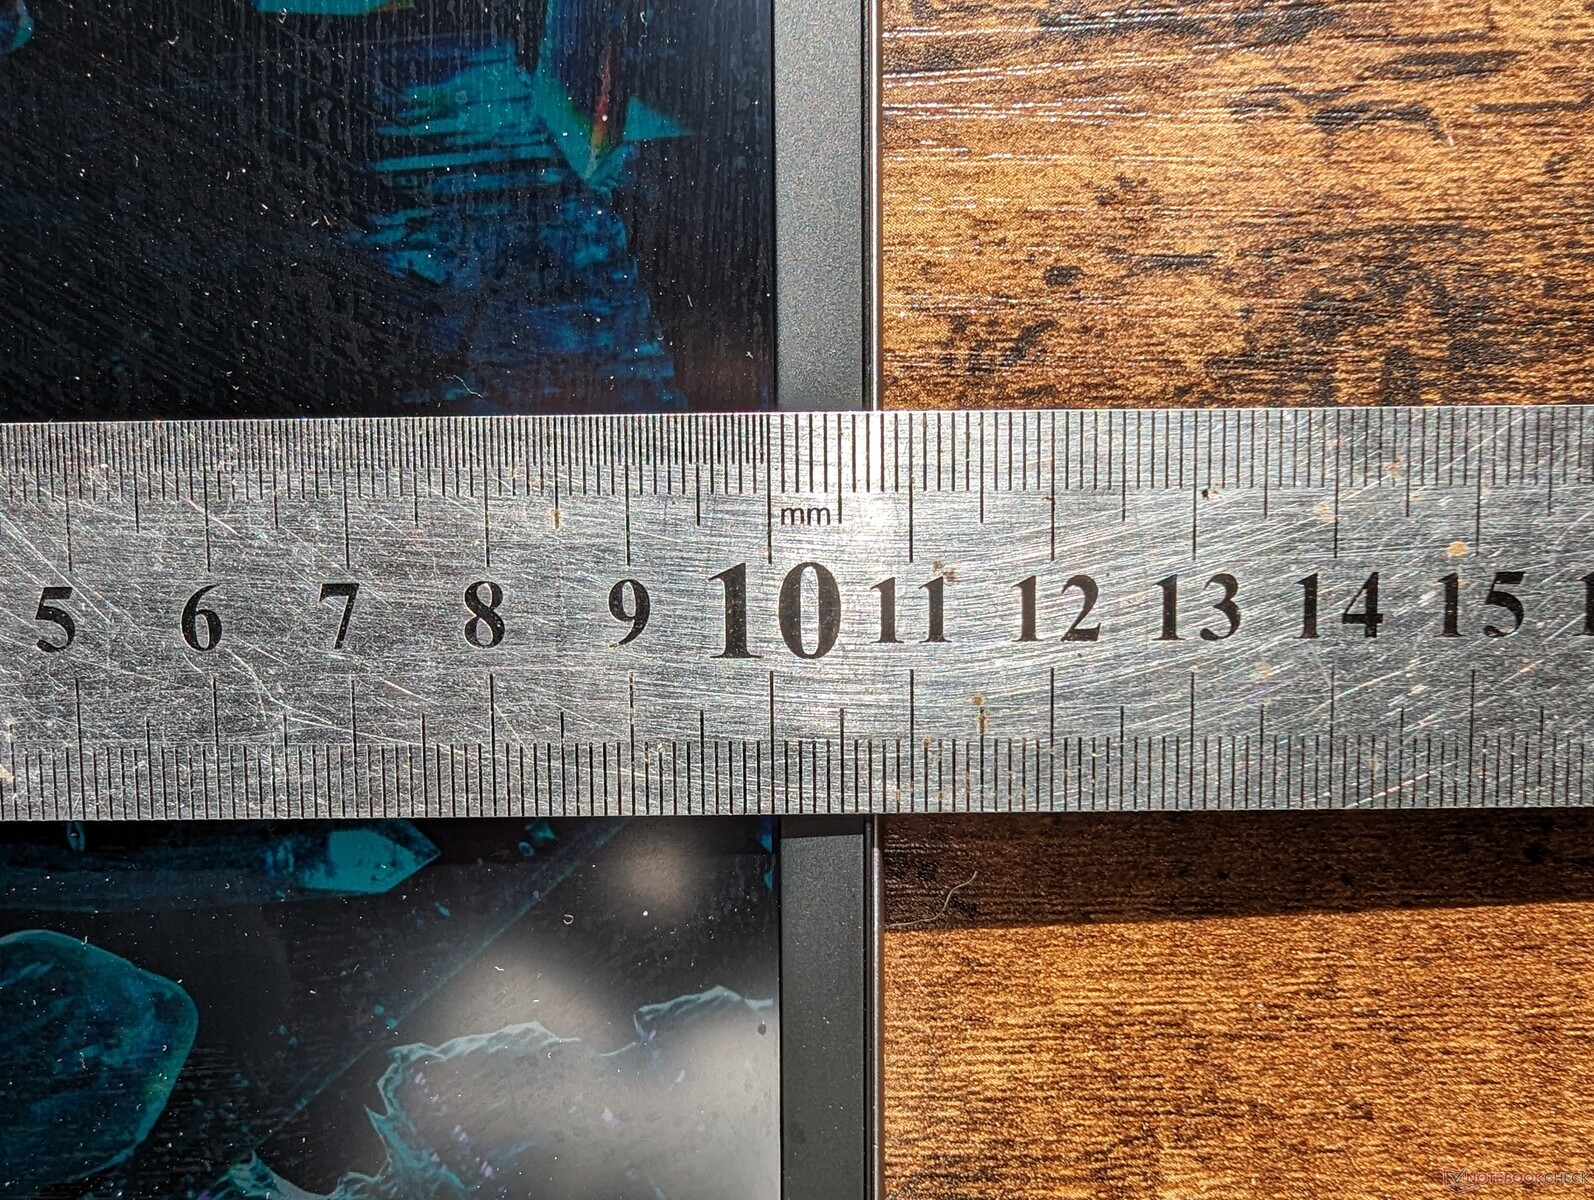
Dolna ramka Fury G9 jest zaskakująco wąska jak na stację roboczą, co przyczynia się do tego, że model ten jest krótszy niż większość innych 16-calowych alternatyw.
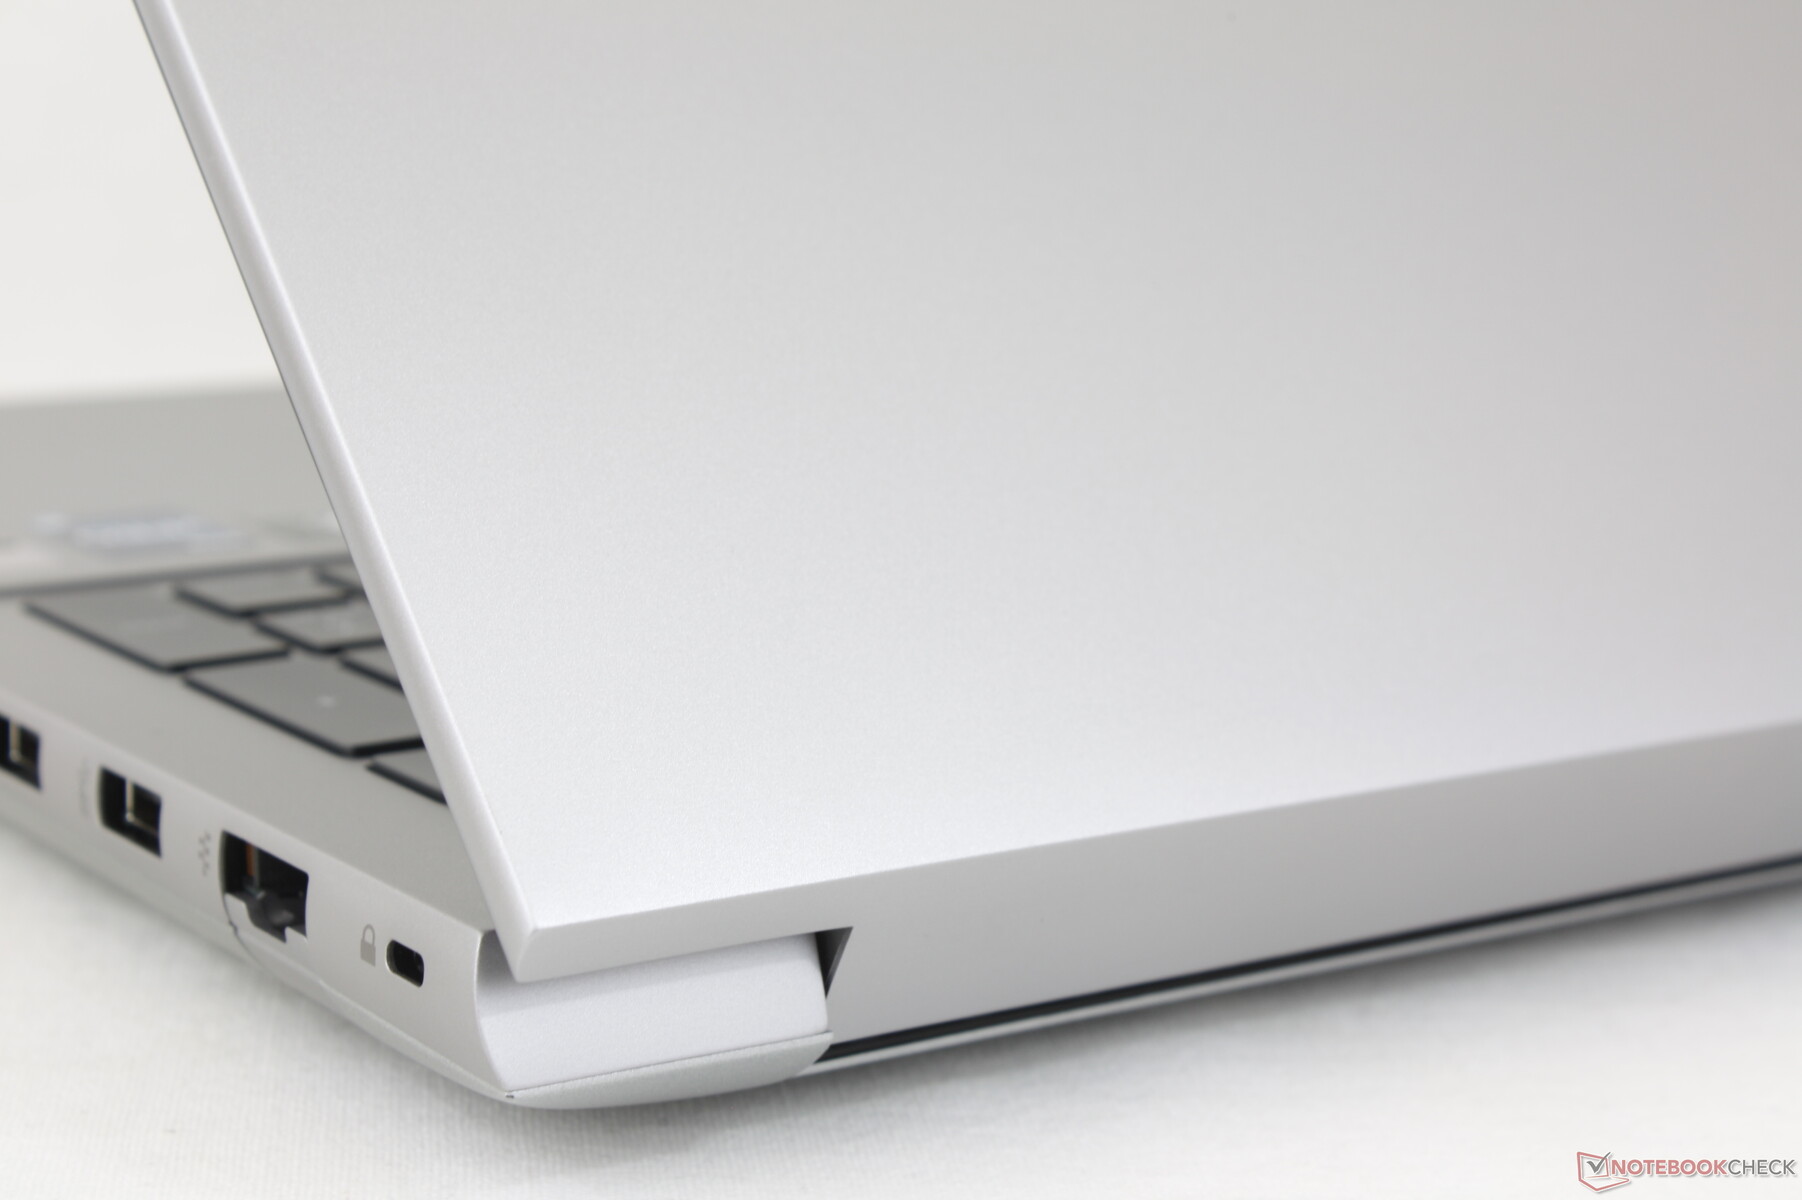
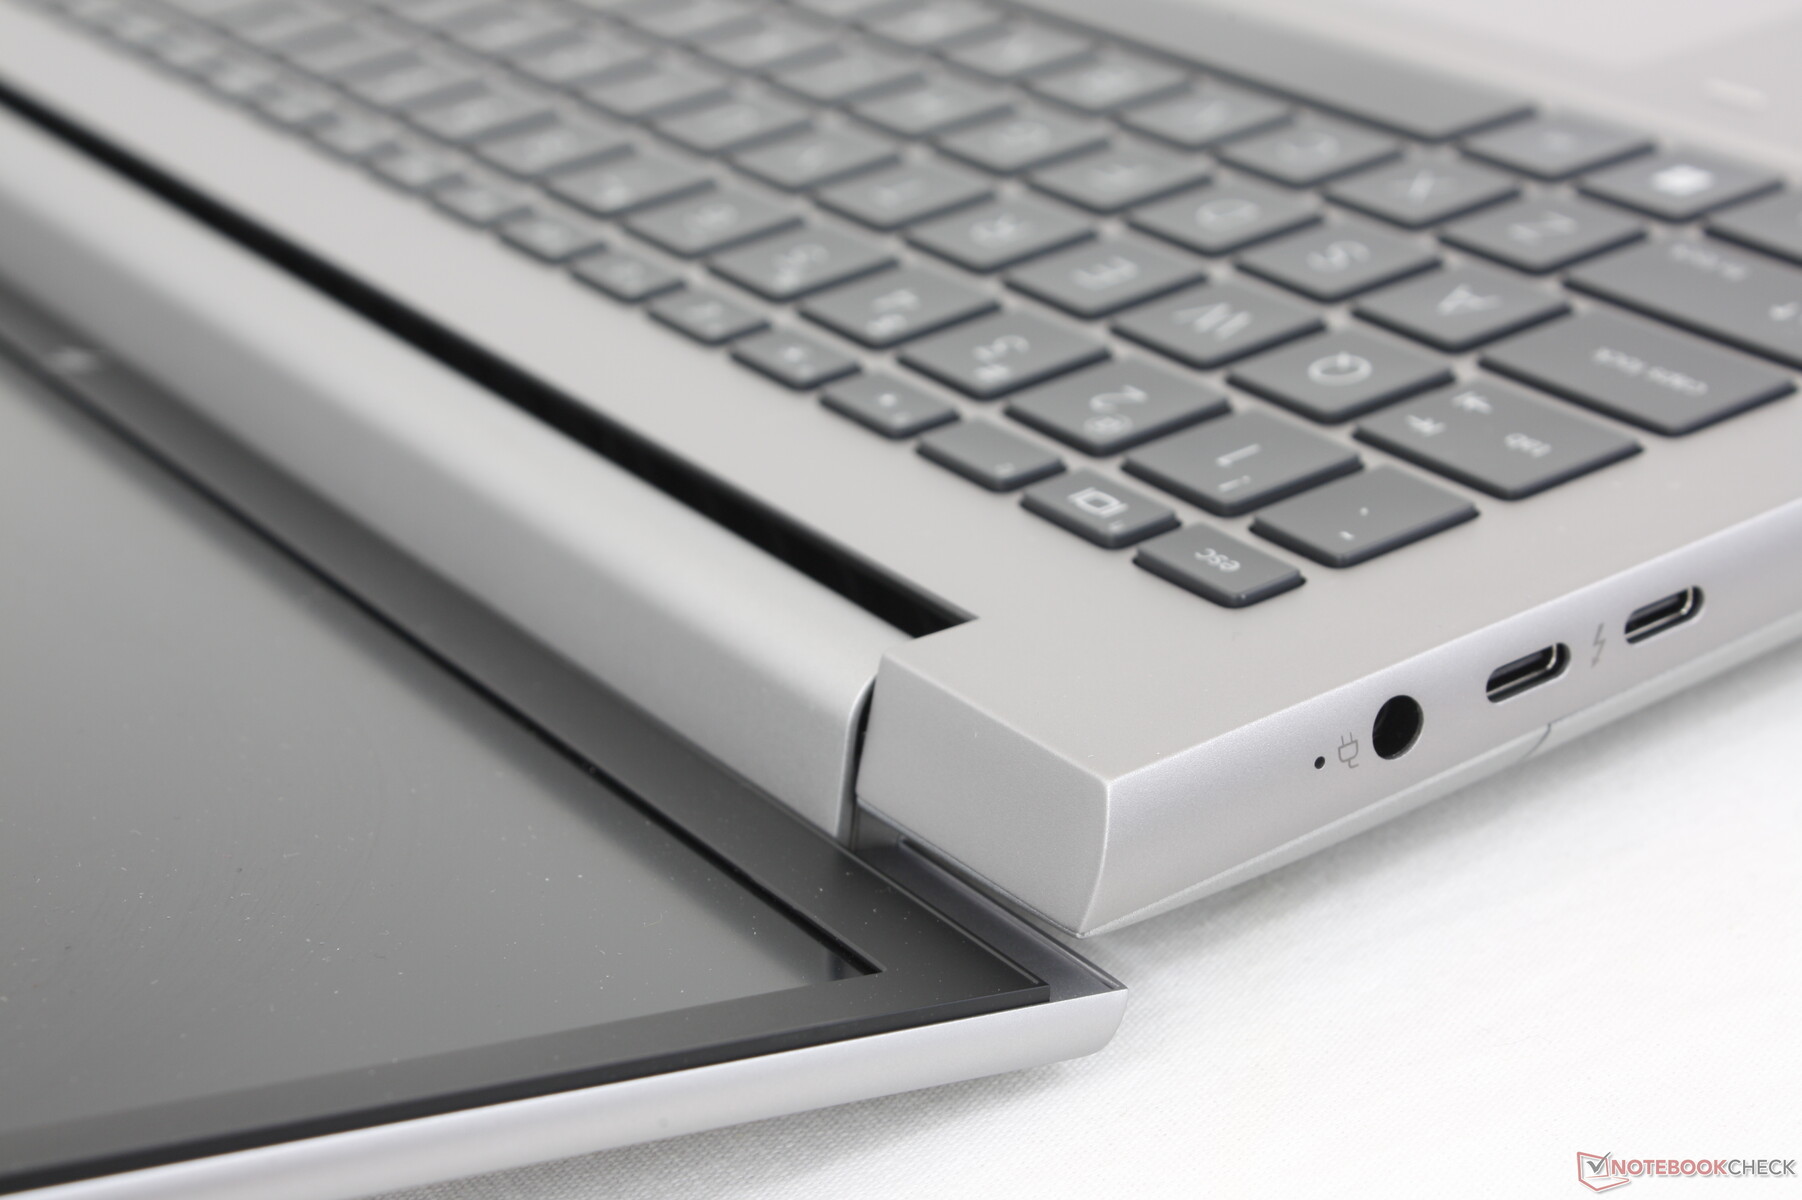
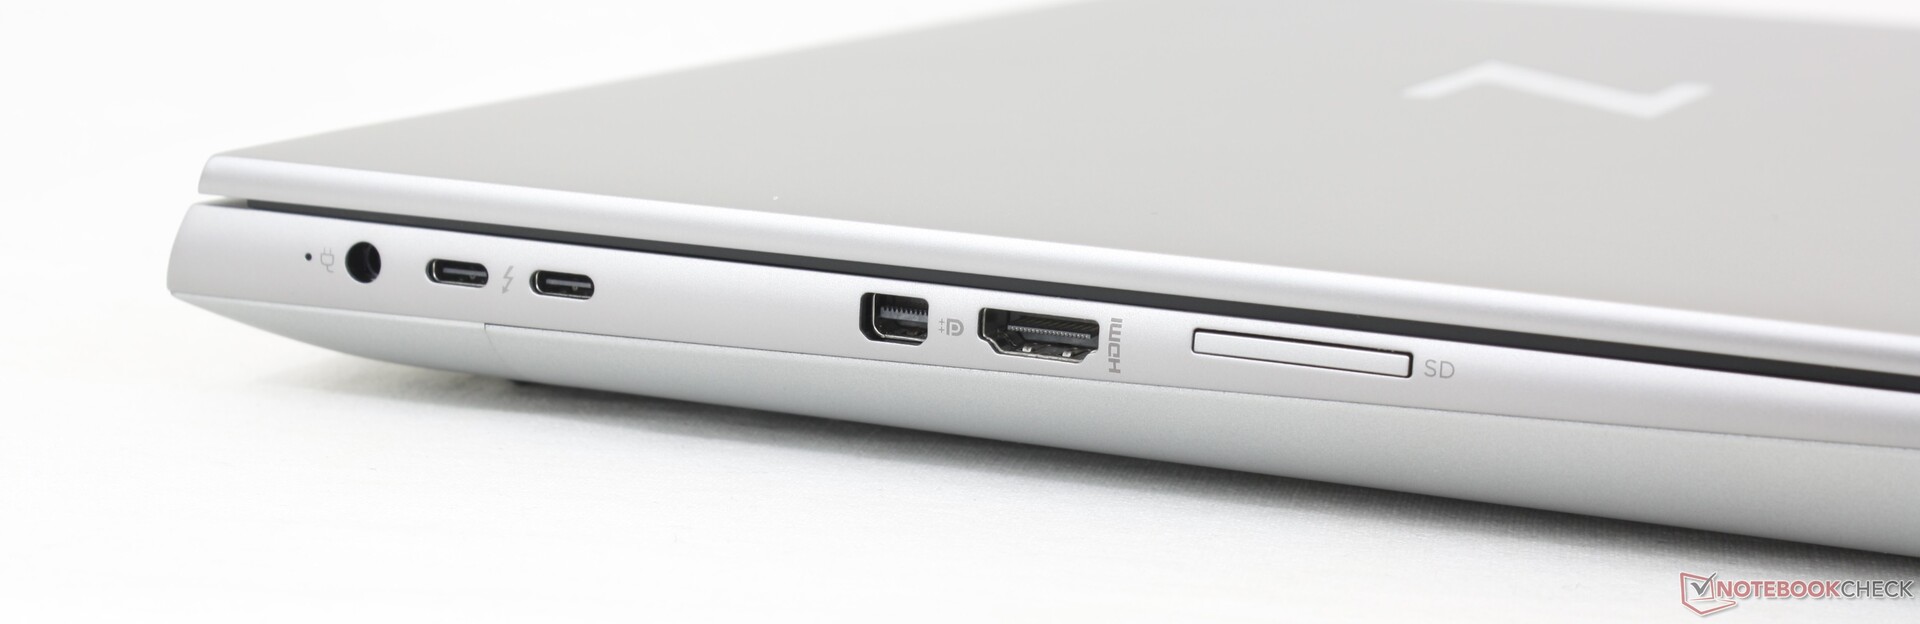
Łączność
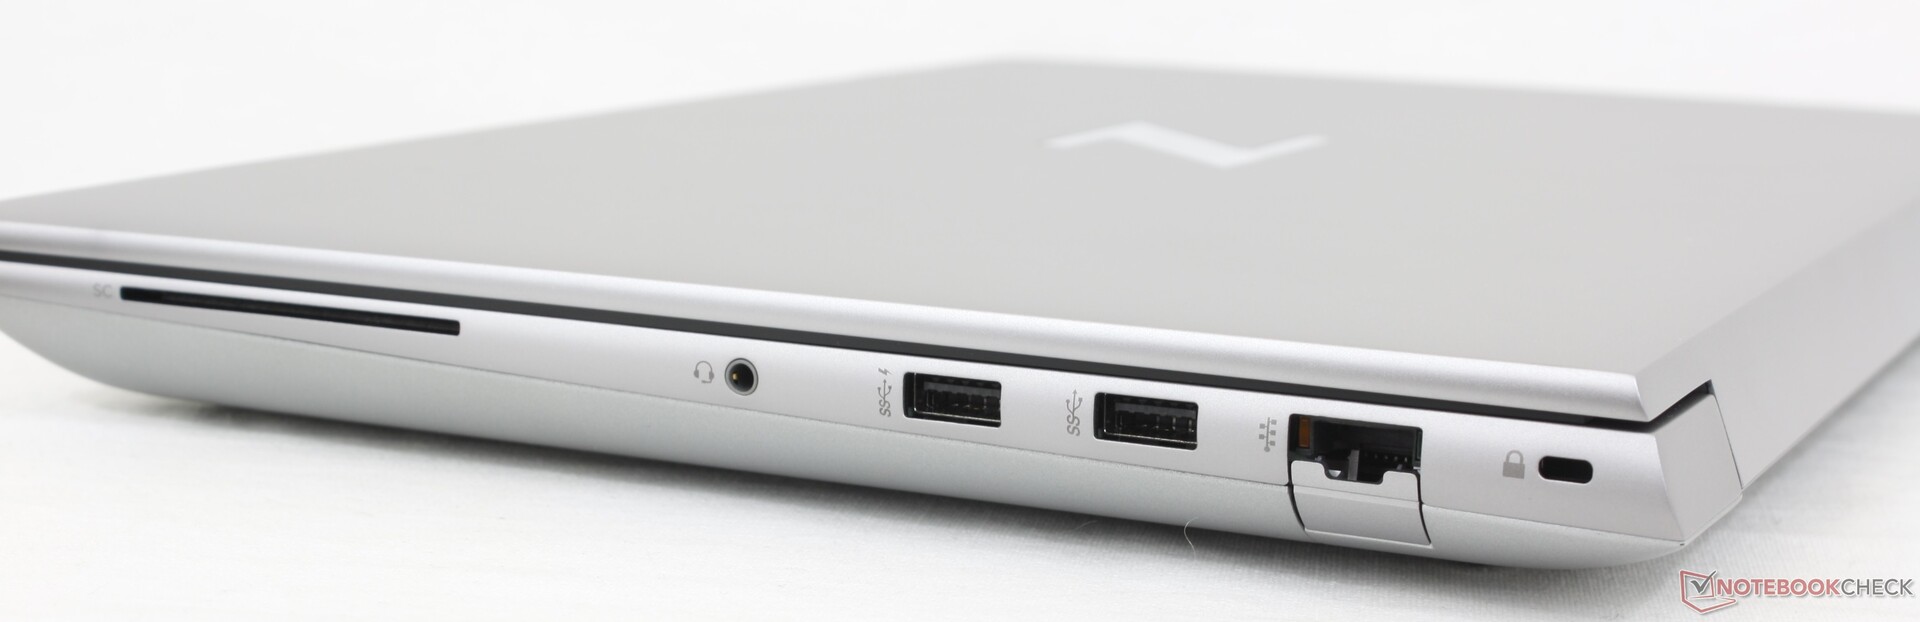
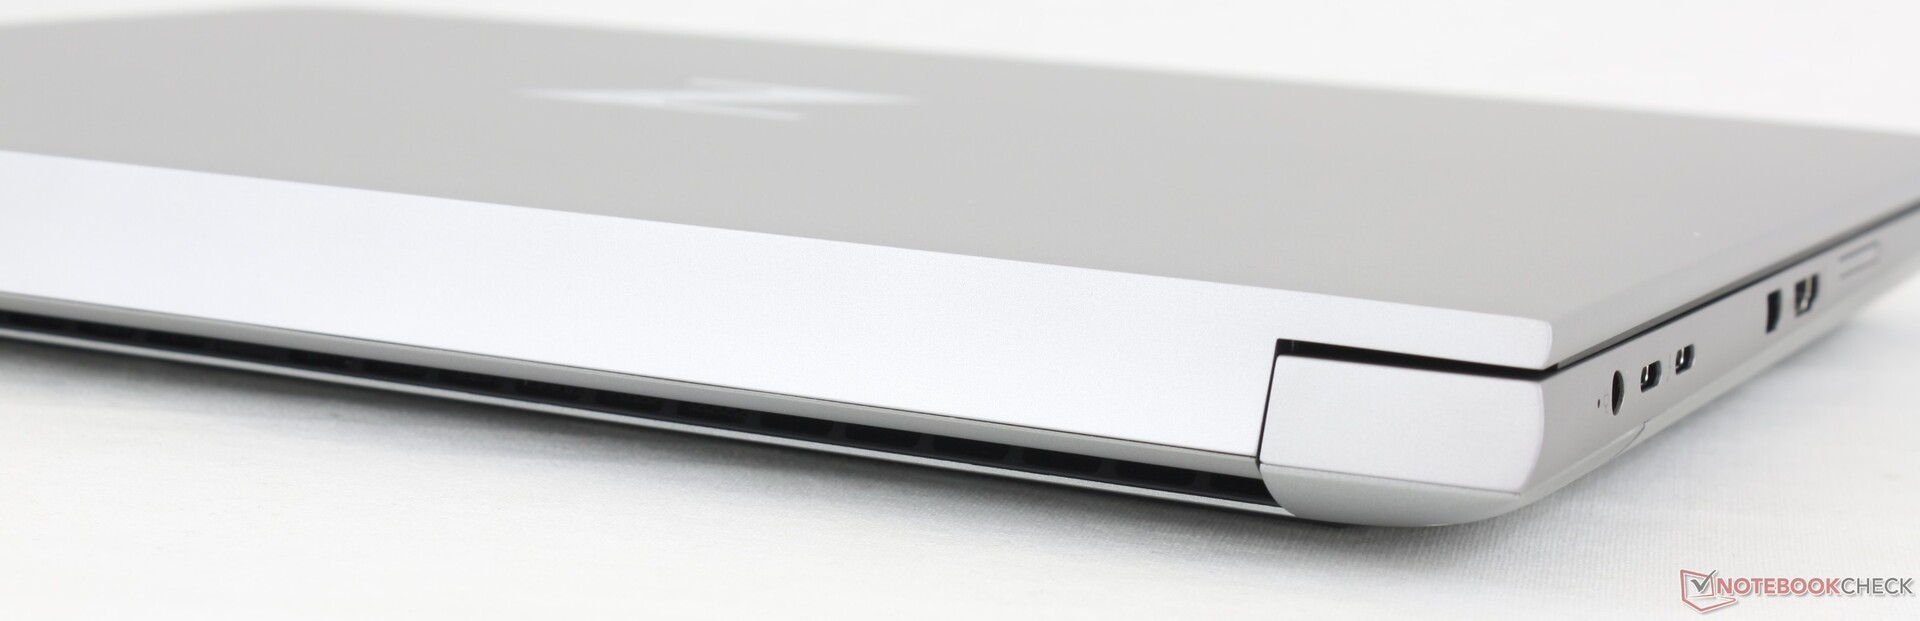
Nasz HP zawiera wszystkie porty, które można znaleźć na Precision 7670, ale ze zintegrowanym mini-DisplayPort zamiast trzeciego portu USB-C. W rzeczywistości jest to jedna z niewielu mobilnych stacji roboczych z opcją mini-DisplayPort.
Pozycjonowanie portów mogło być lepsze w odniesieniu do dwóch portów USB-C, ponieważ są one bardzo ciasno upakowane obok portu zasilacza sieciowego. Na przykład podłączenie niektórych adapterów lub kabli do jednego portu może potencjalnie zablokować dostęp do pozostałych dwóch portów.
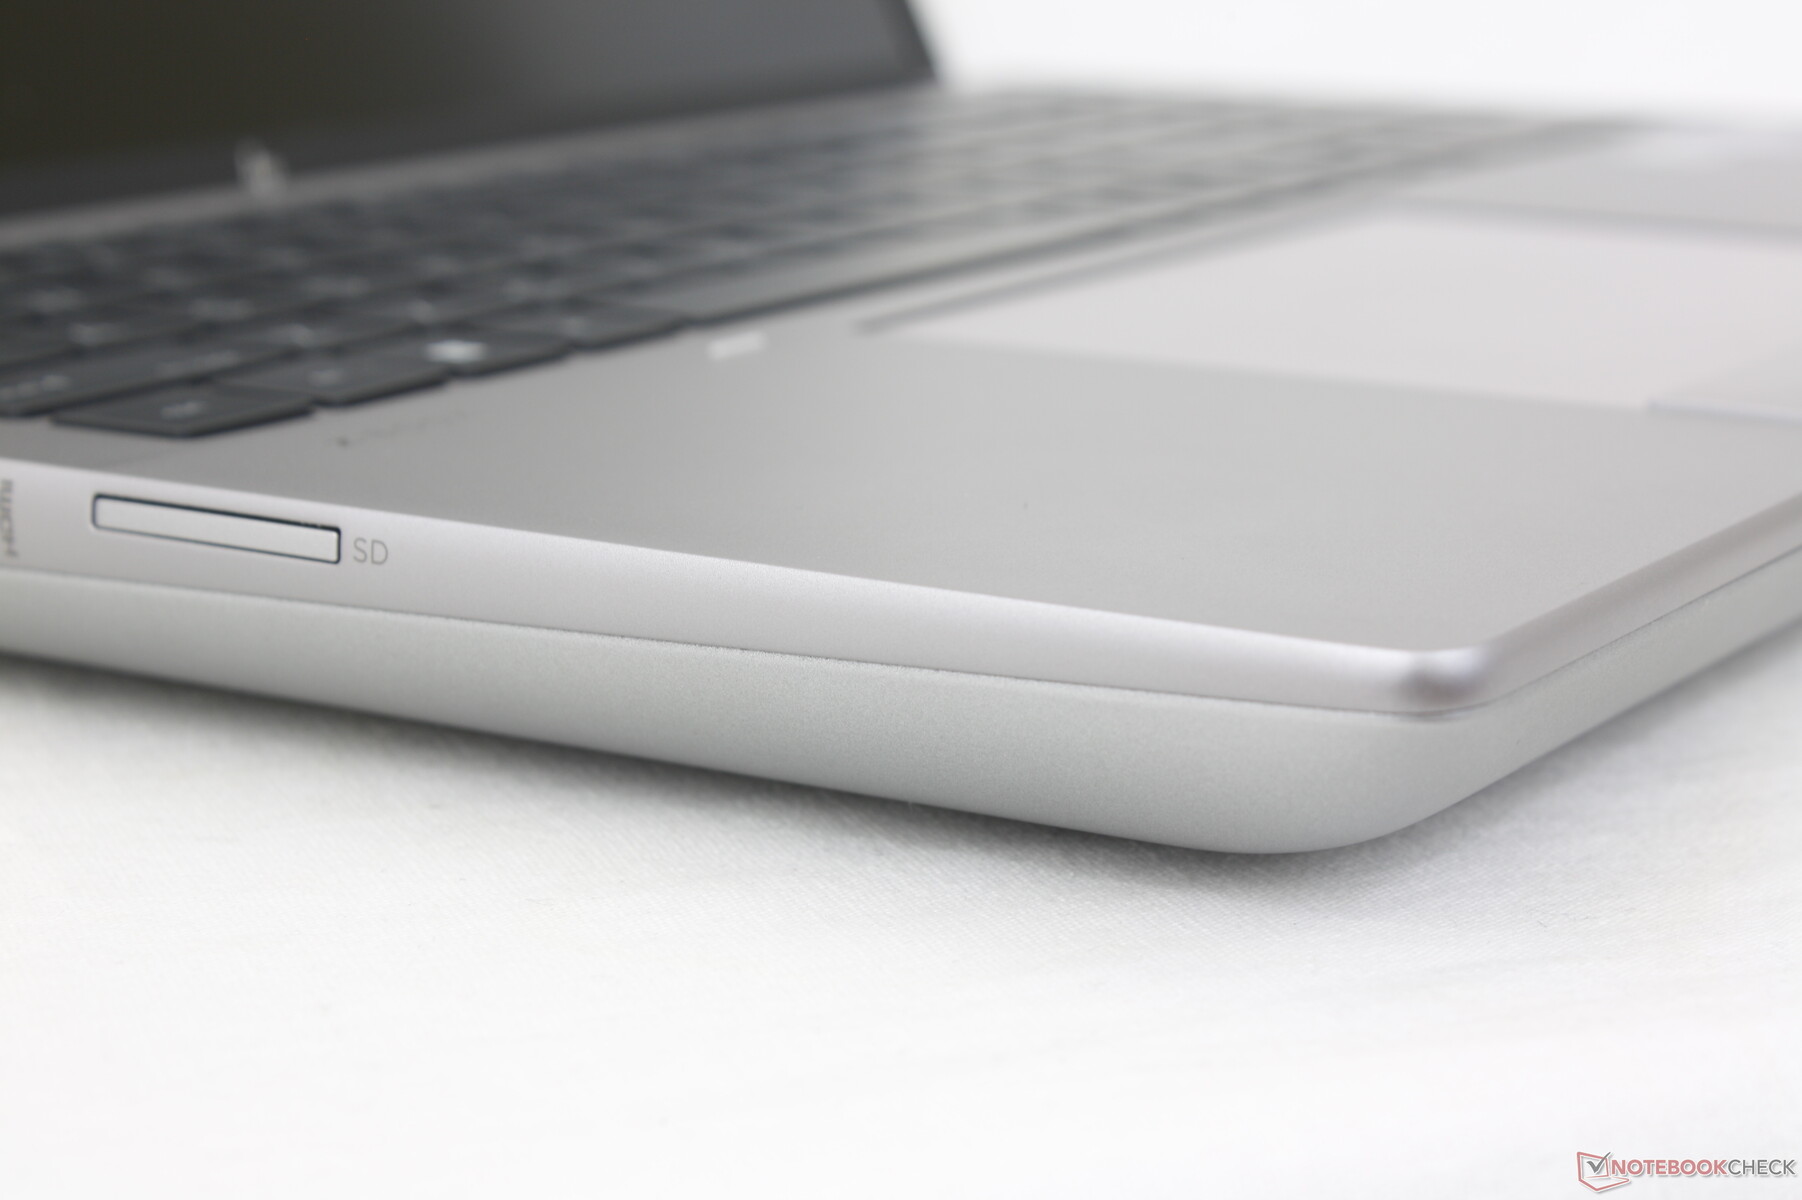
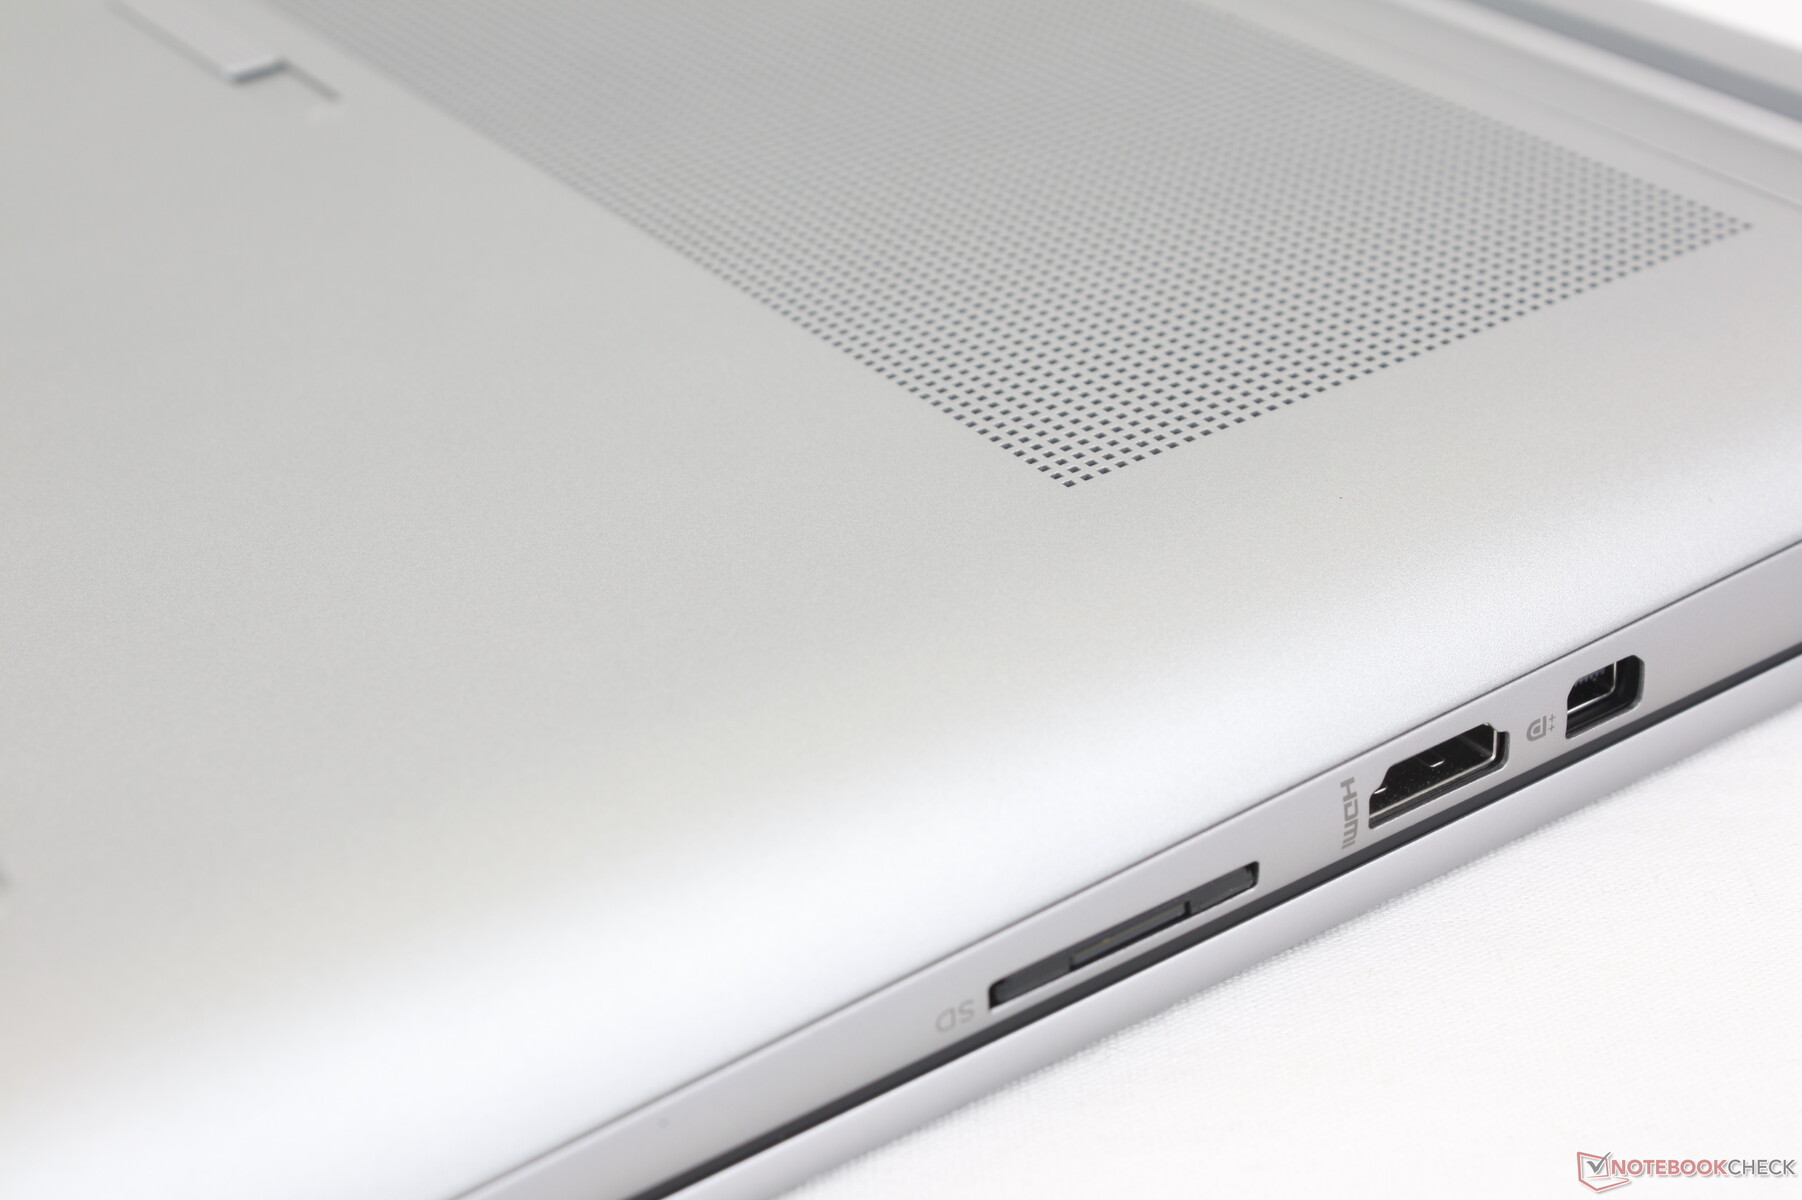
Czytnik kart SD
Szybkość transferu wynosi około 80 MB/s na naszej karcie testowej PNY EliteX-PRO60, mimo że karta jest w stanie przesyłać dane z prędkością do 280 MB/s. Dla porównania, zintegrowany czytnik SD w Precision 7670 jest ponad 2x szybszy. Użytkownicy, którzy polegają na kartach SD do przesyłania wideo i plików, mogą być rozczarowani Fury 16 G9 pod tym względem.
| SD Card Reader | |
| average JPG Copy Test (av. of 3 runs) | |
| Dell Precision 7000 7670 Performance (Toshiba Exceria Pro SDXC 64 GB UHS-II) | |
| MSI CreatorPro Z16P B12UKST (AV Pro V60) | |
| HP ZBook Fury 16 G9 (PNY EliteX-PRO60) | |
| Lenovo ThinkPad P16 G1 RTX A5500 (Toshiba Exceria Pro SDXC 64 GB UHS-II) | |
| HP ZBook Studio 16 G9 62U04EA (Angelbird AV PRO V60) | |
| maximum AS SSD Seq Read Test (1GB) | |
| Dell Precision 7000 7670 Performance (Toshiba Exceria Pro SDXC 64 GB UHS-II) | |
| HP ZBook Fury 16 G9 (PNY EliteX-PRO60) | |
| MSI CreatorPro Z16P B12UKST (AV Pro V60) | |
| Lenovo ThinkPad P16 G1 RTX A5500 (Toshiba Exceria Pro SDXC 64 GB UHS-II) | |
| HP ZBook Studio 16 G9 62U04EA (Angelbird AV PRO V60) | |
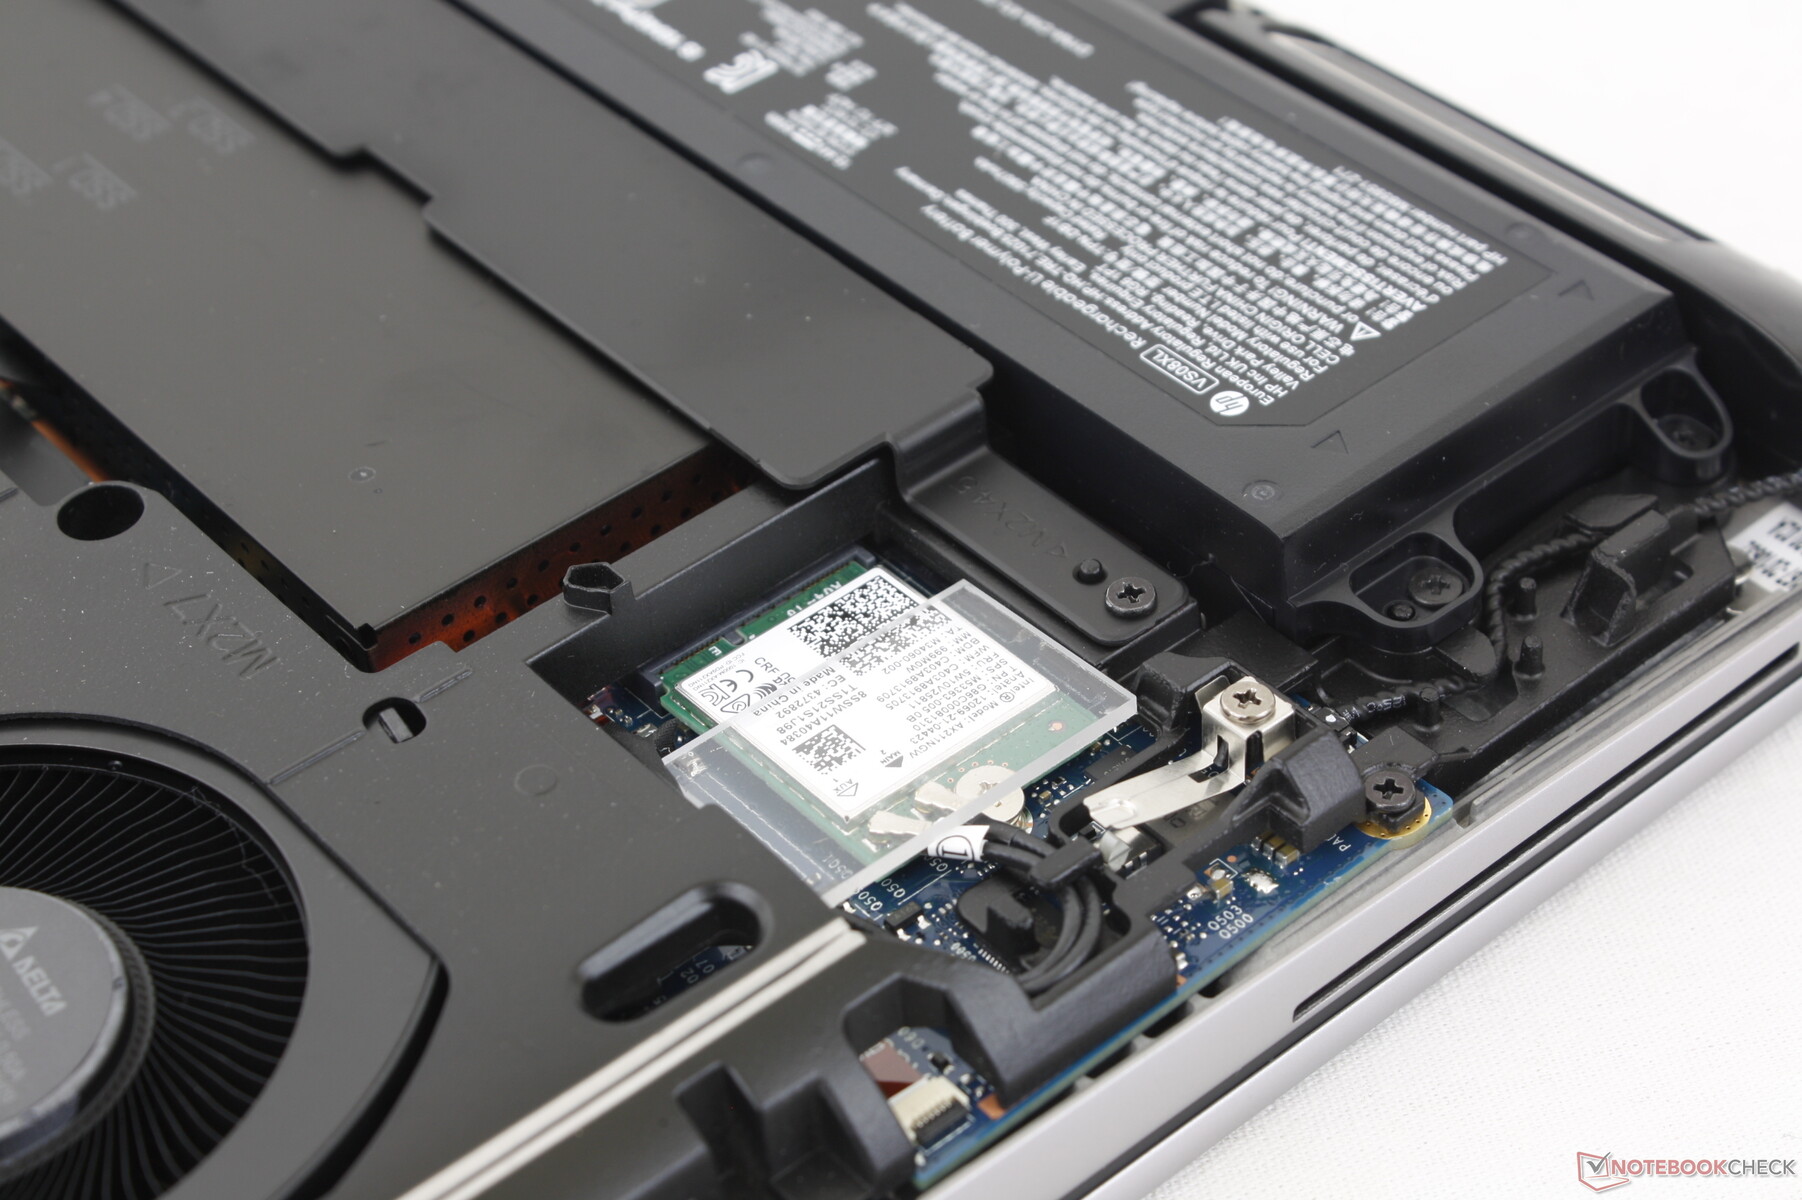
Komunikacja
Nasza jednostka z systemem Windows 10 jest wyposażona w układ Intel AX211 zapewniający łączność Wi-Fi 6E i Bluetooth 5.2. Niestety, Wi-Fi 6E jest wyłączone w systemie Windows 10, ponieważ Microsoft (idiotycznie) uczynił go wyłącznym dla systemu Windows 11. W związku z tym będziesz chciał skonfigurować system Windows 11, jeśli chcesz czerpać korzyści z Wi-Fi 6 GHz. Poza tym nie doświadczyliśmy żadnych problemów z wydajnością po sparowaniu z naszą zwykłą siecią Wi-Fi 6.
Kamera internetowa
ZBook Fury 16 G9 odziedziczył kamerę internetową 5 MP z najnowszego modelu Spectre i EliteBook. Jakość obrazu jest wyraźniejsza niż w większości innych laptopów, w których czujniki 1 MP i 2 MP są nadal powszechne, w tym w konkurencyjnych ThinkPad P16 i Precision 7670.
Przesuwana migawka i czujnik podczerwieni zapewniają odpowiednio prywatność i obsługę Hello.


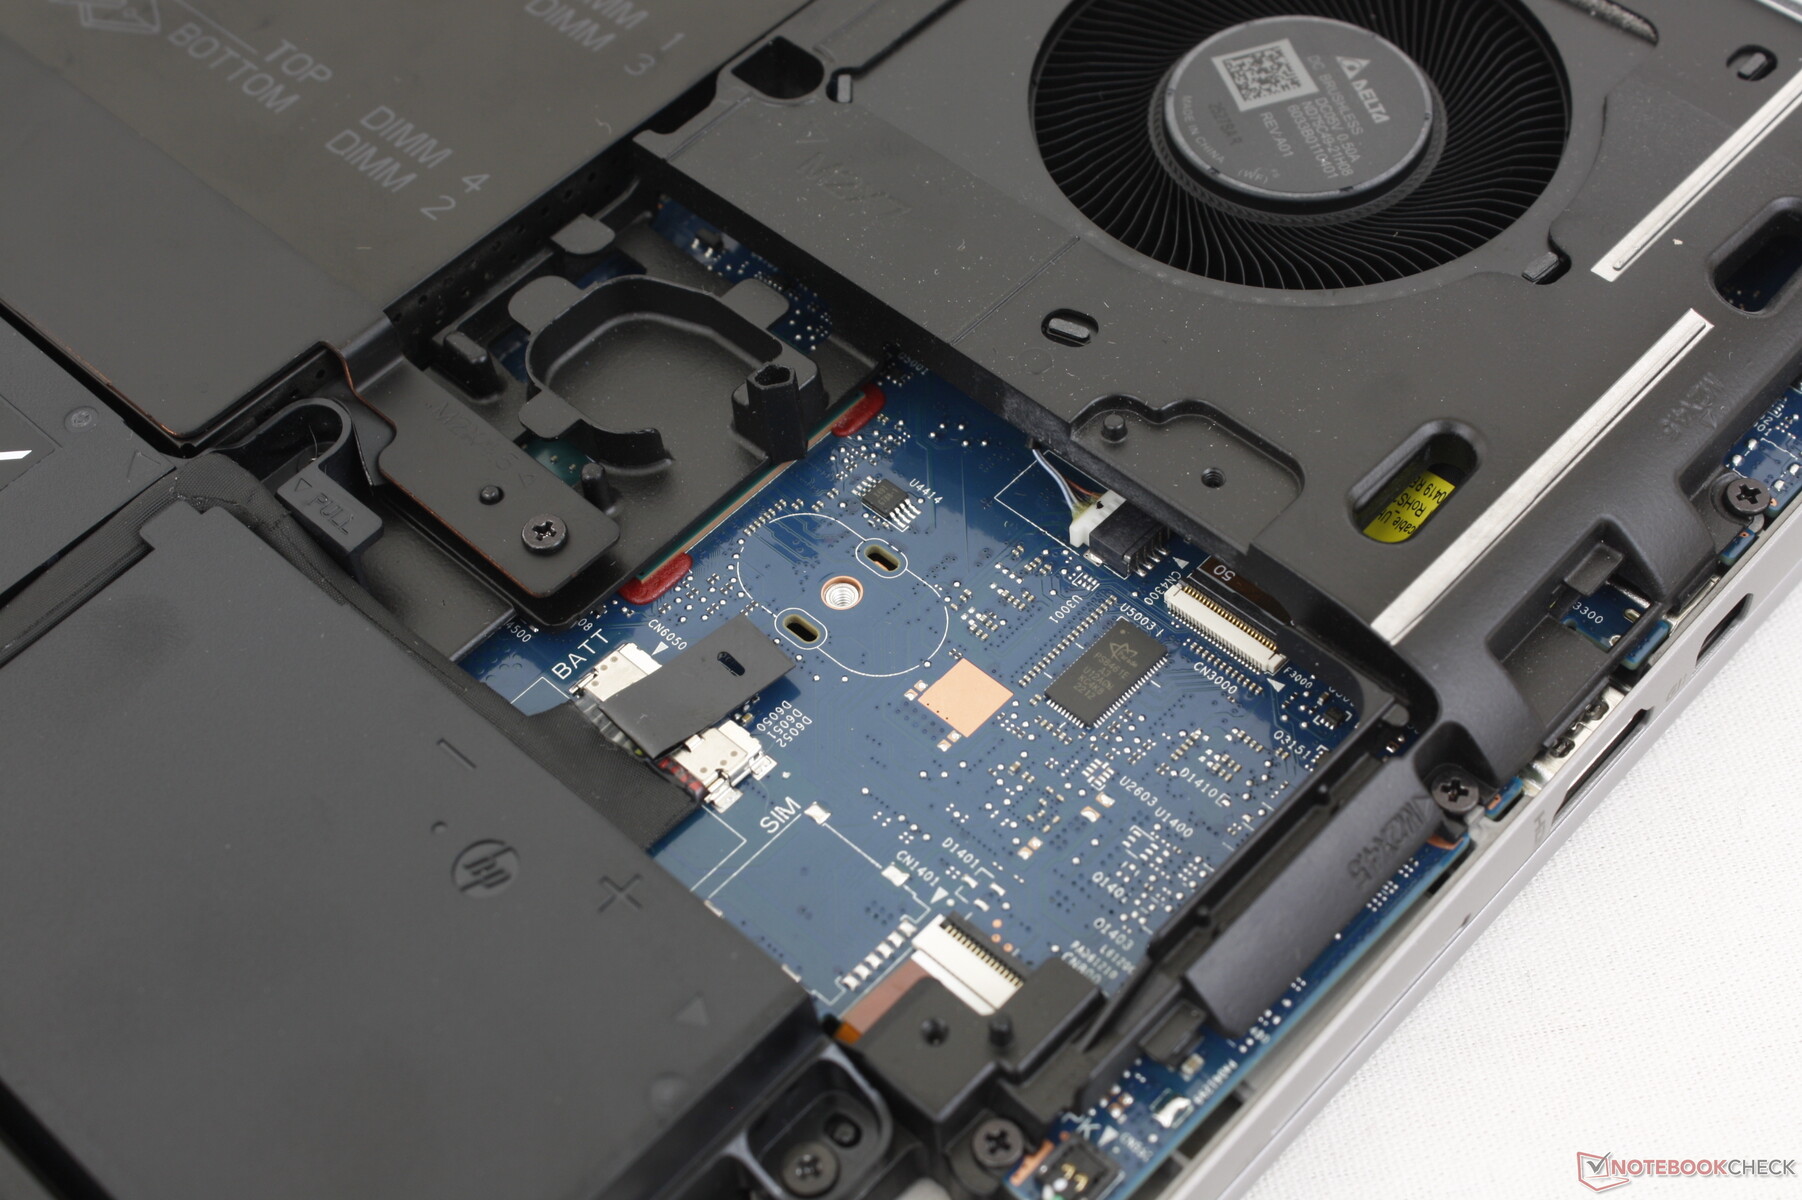
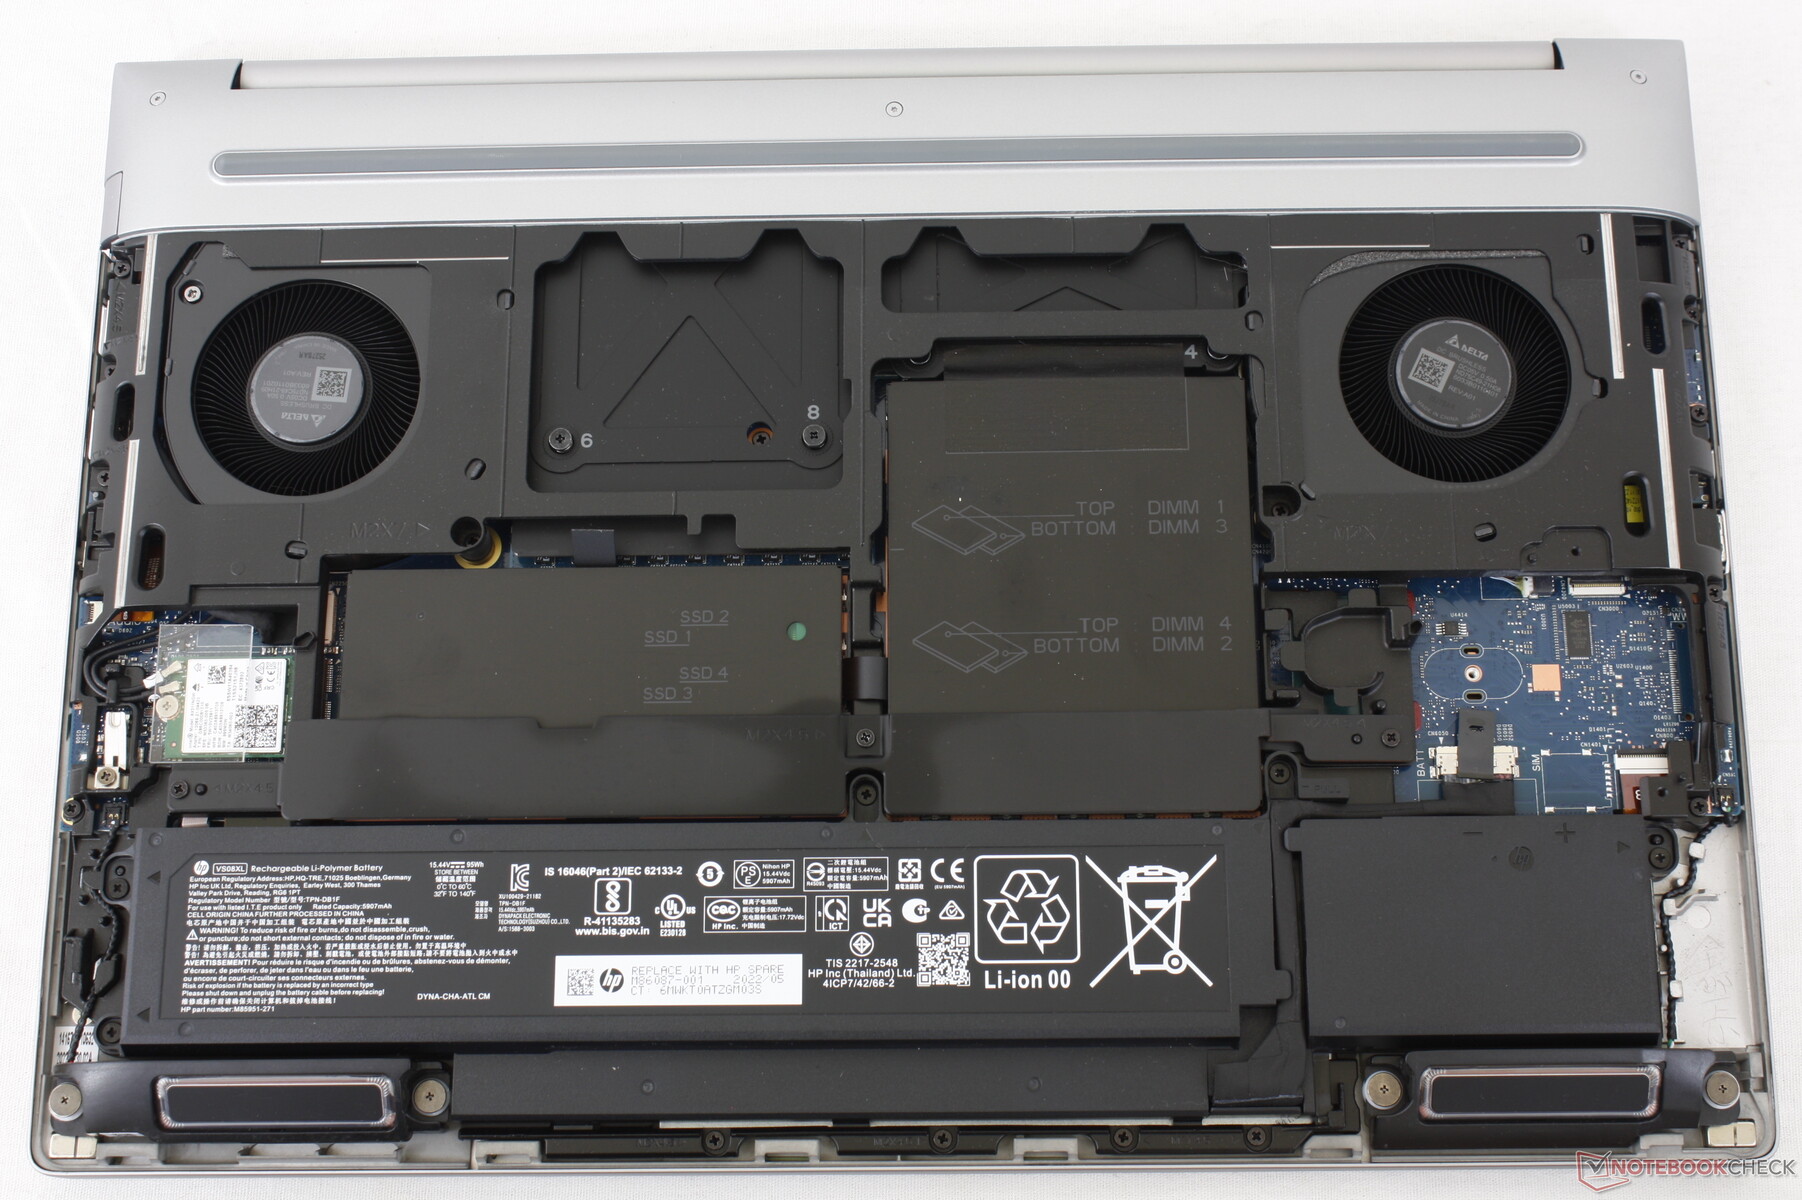
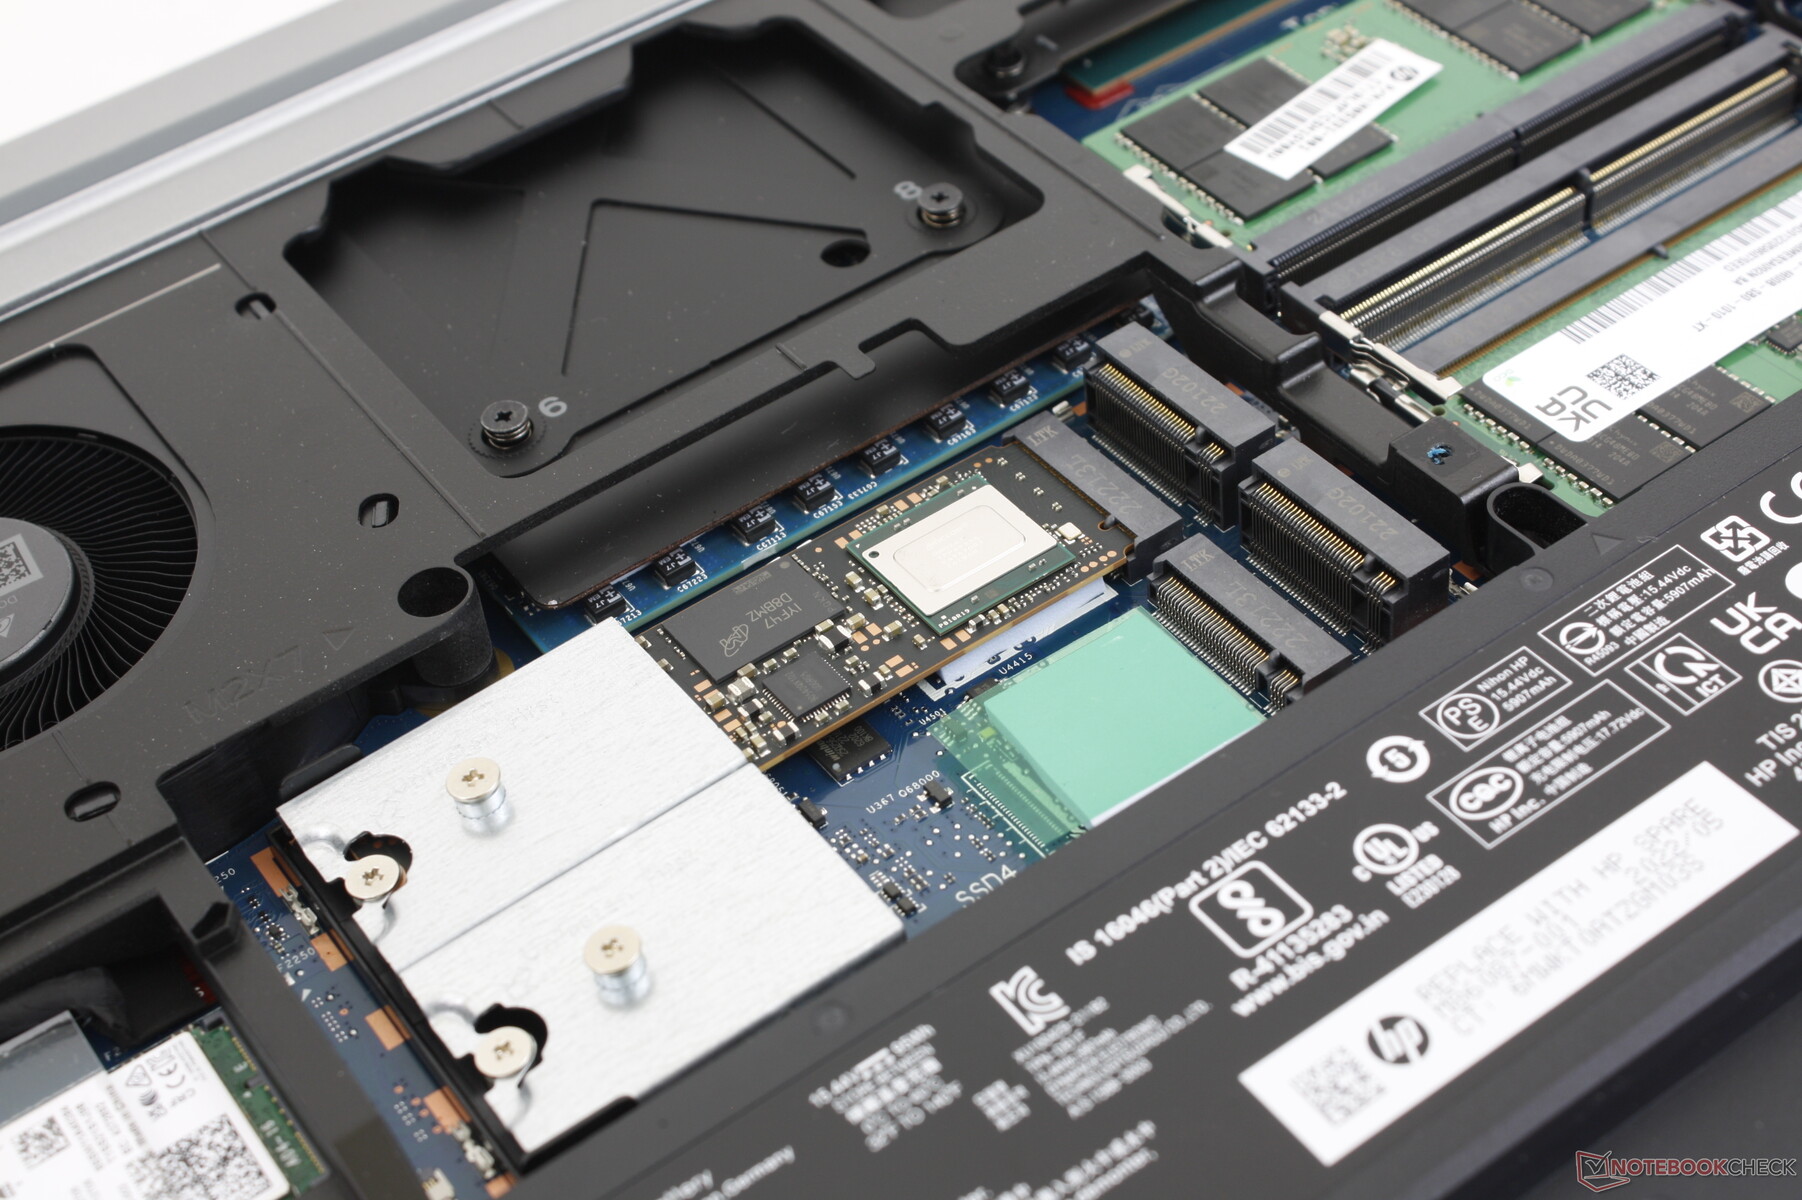
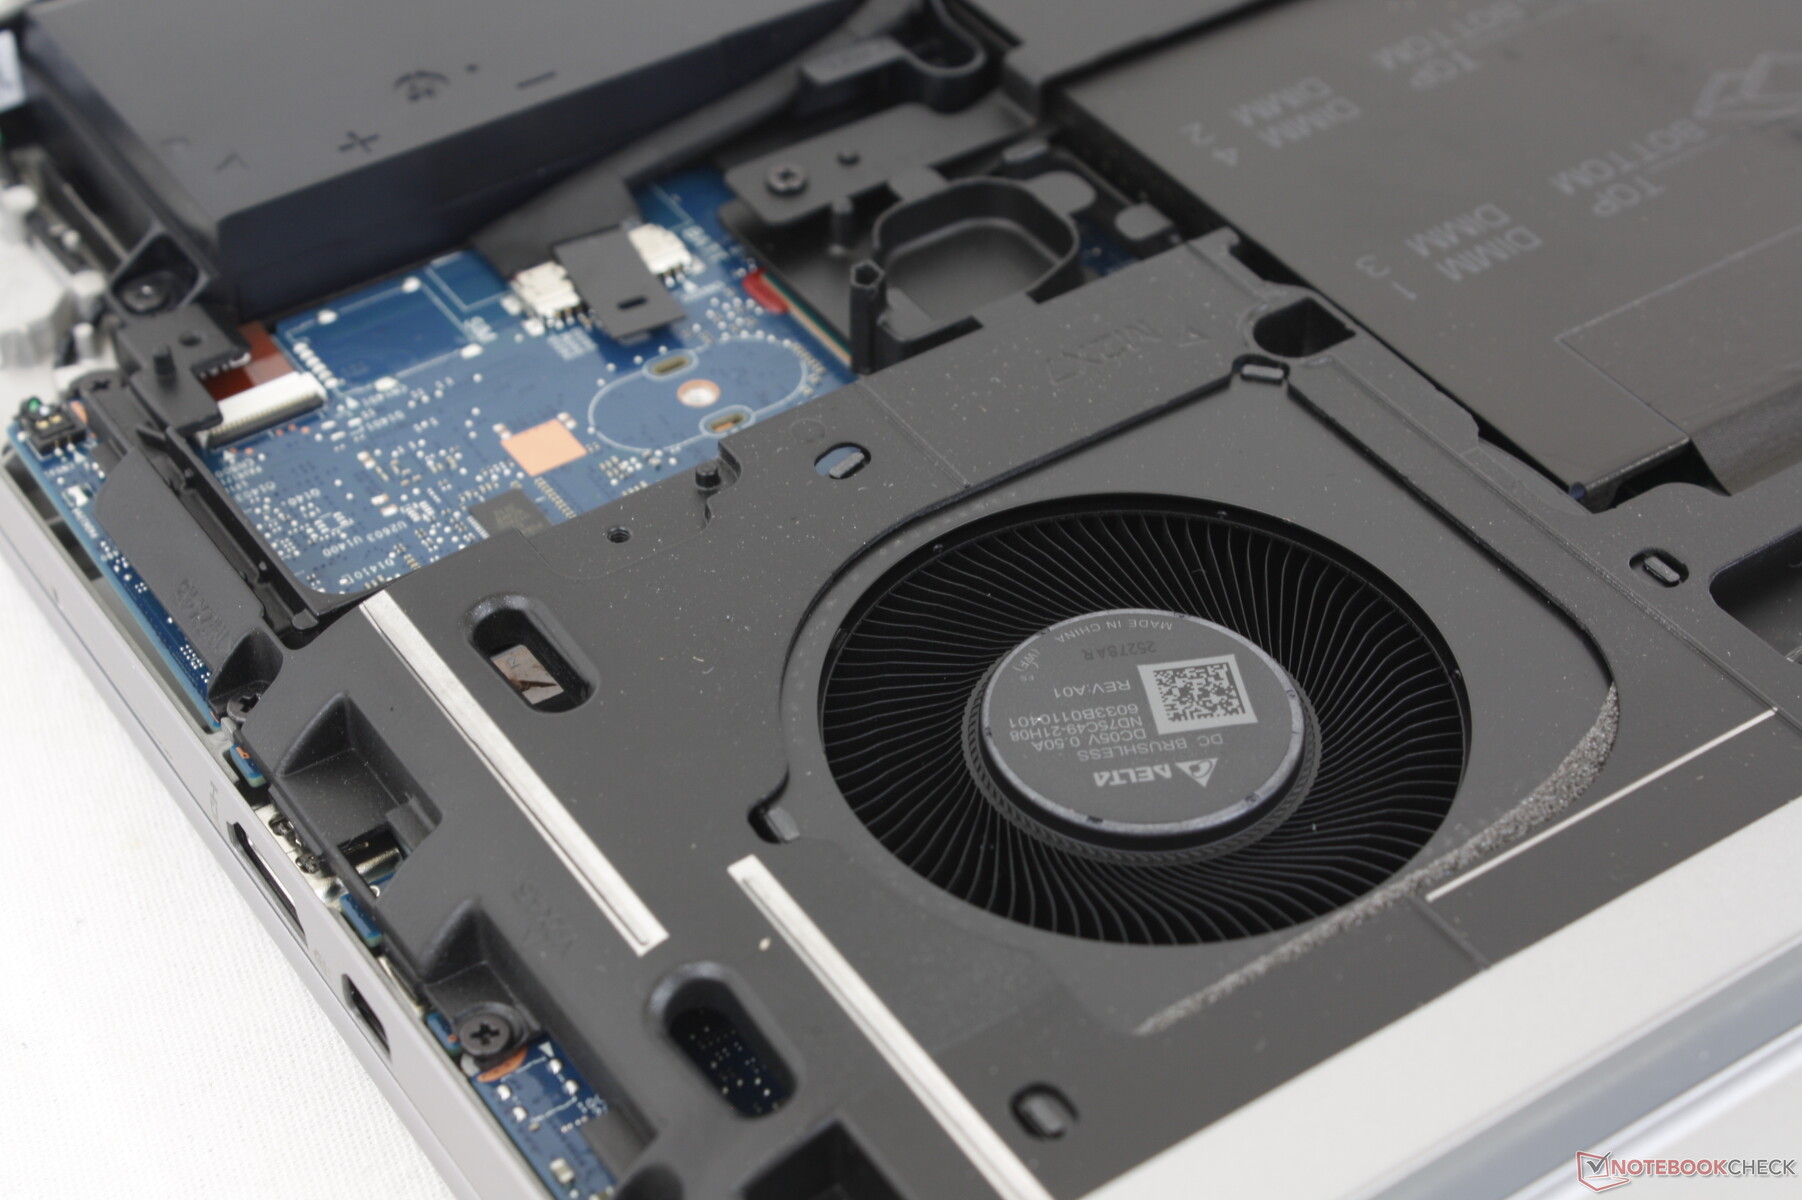
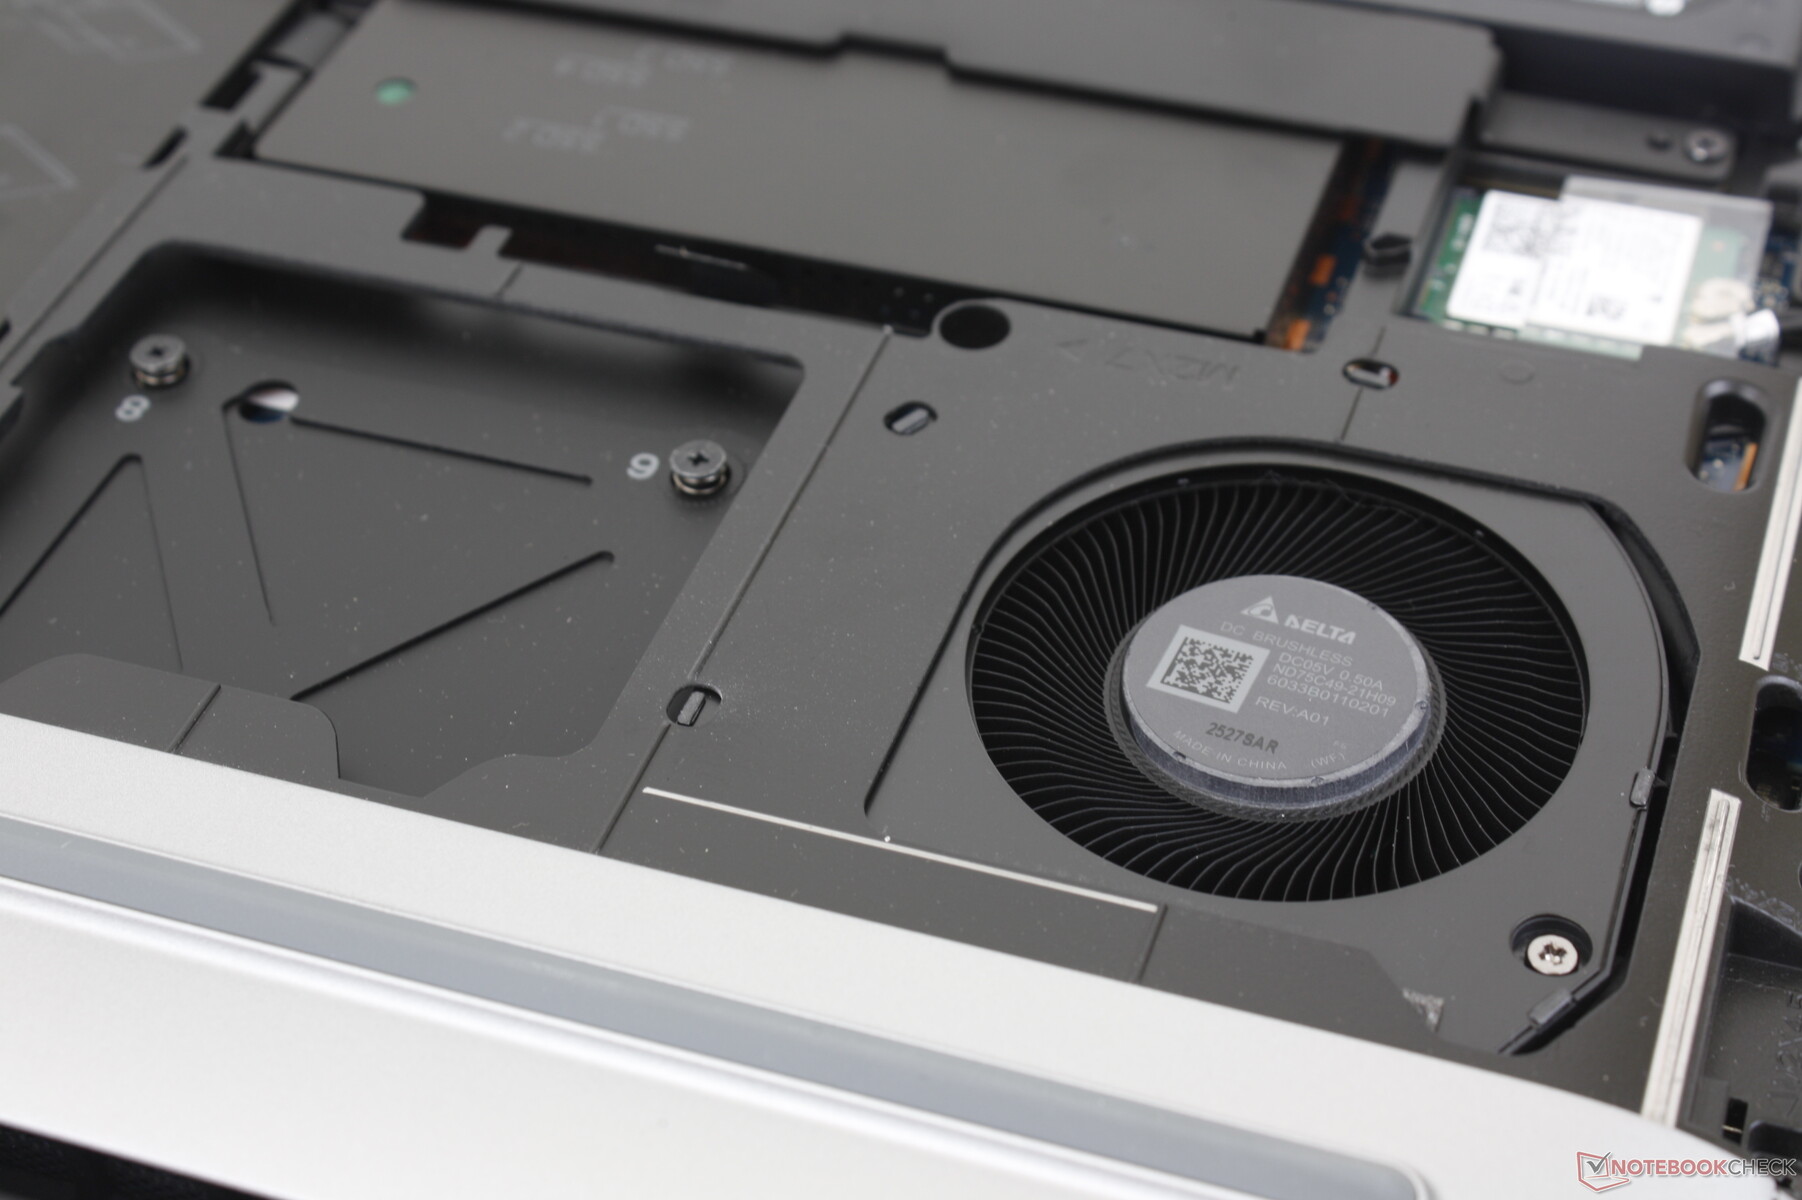
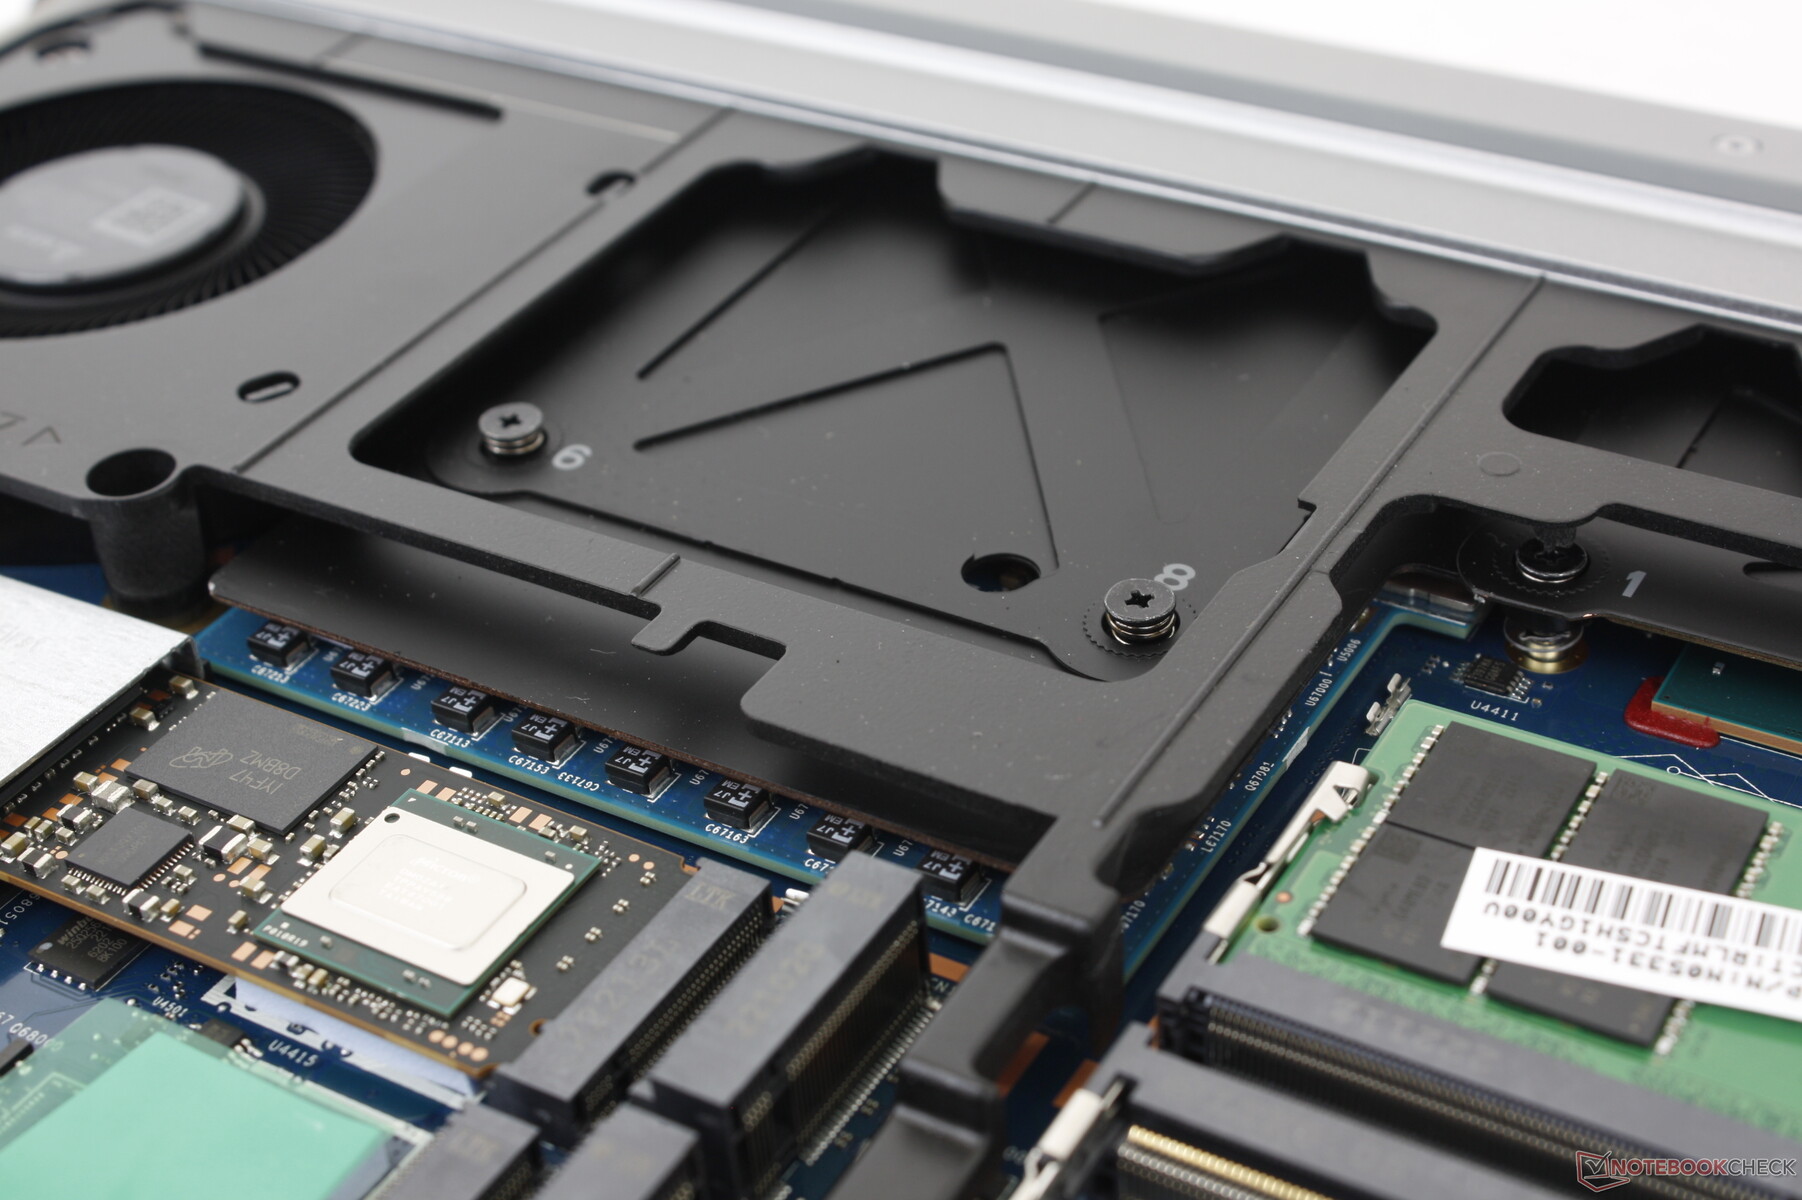
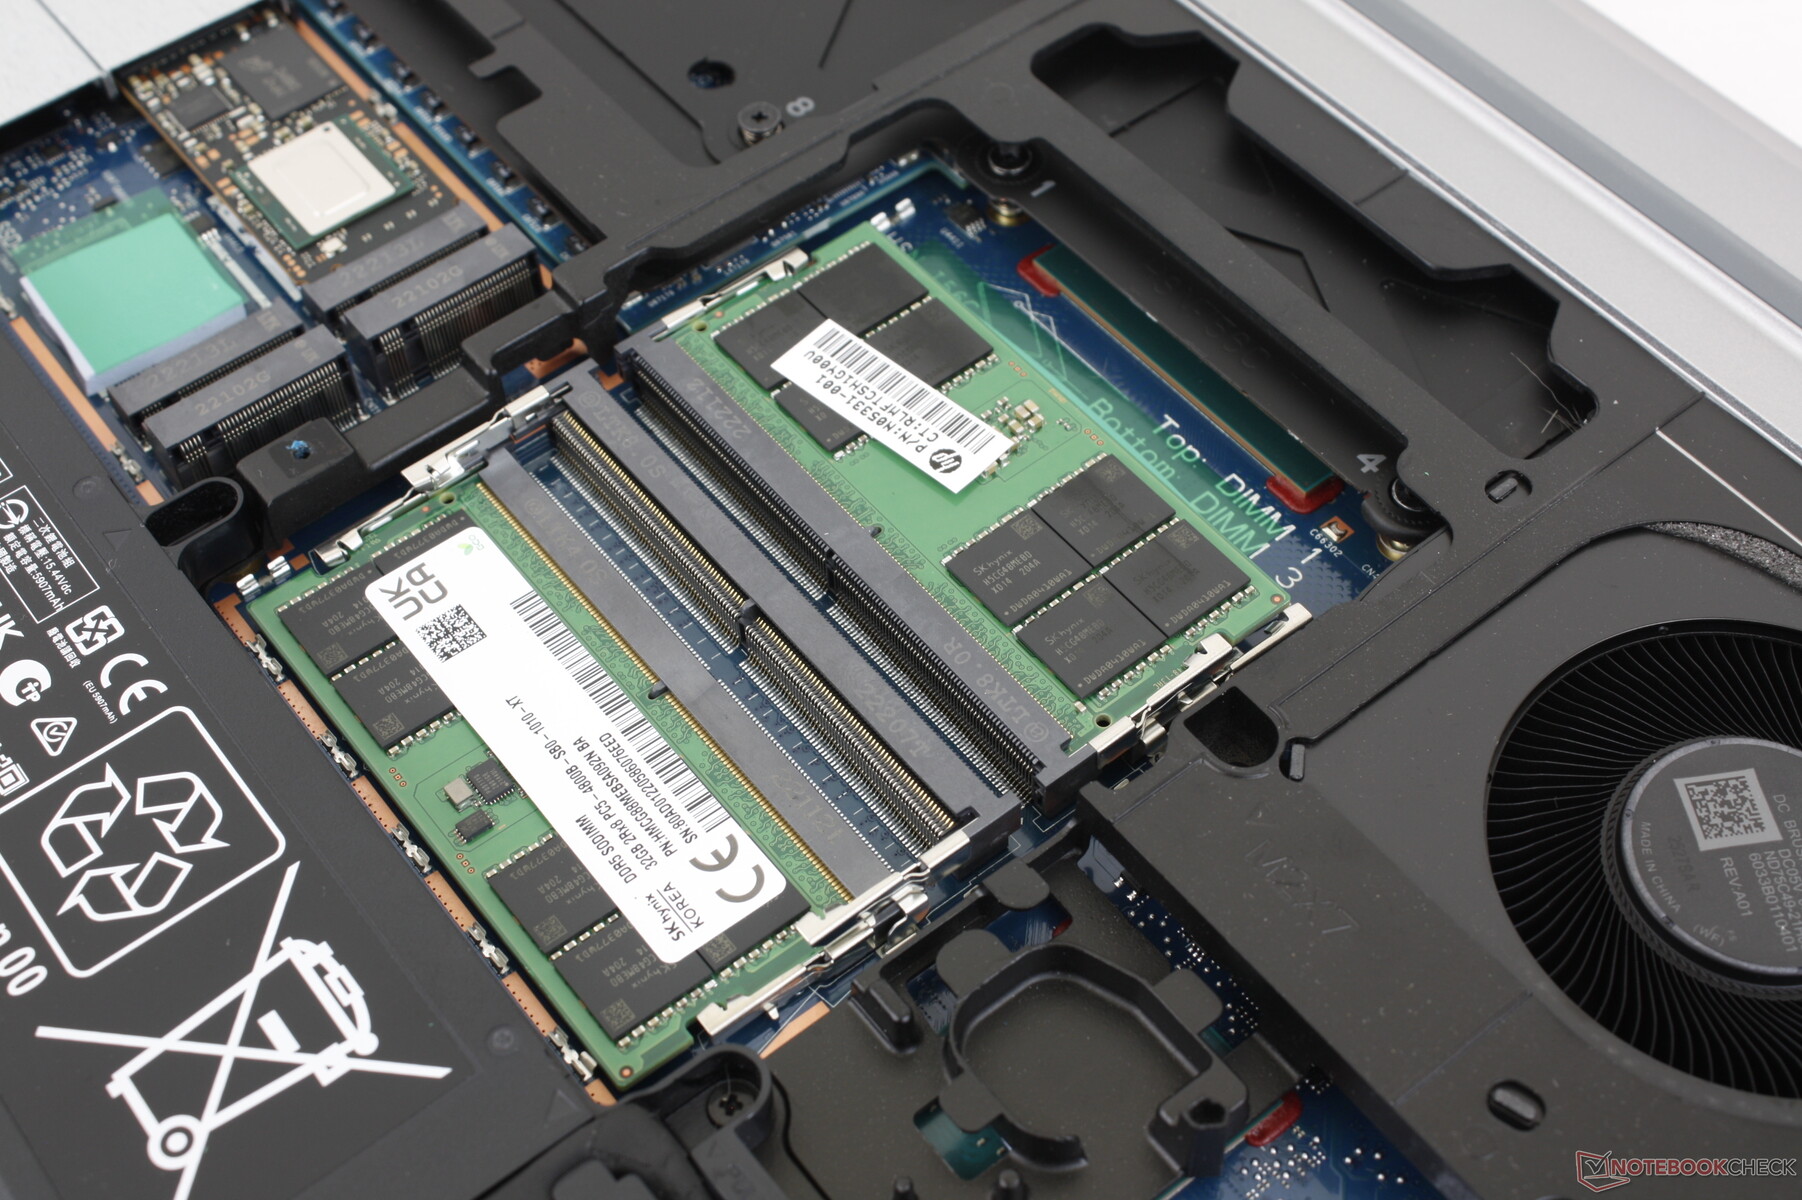
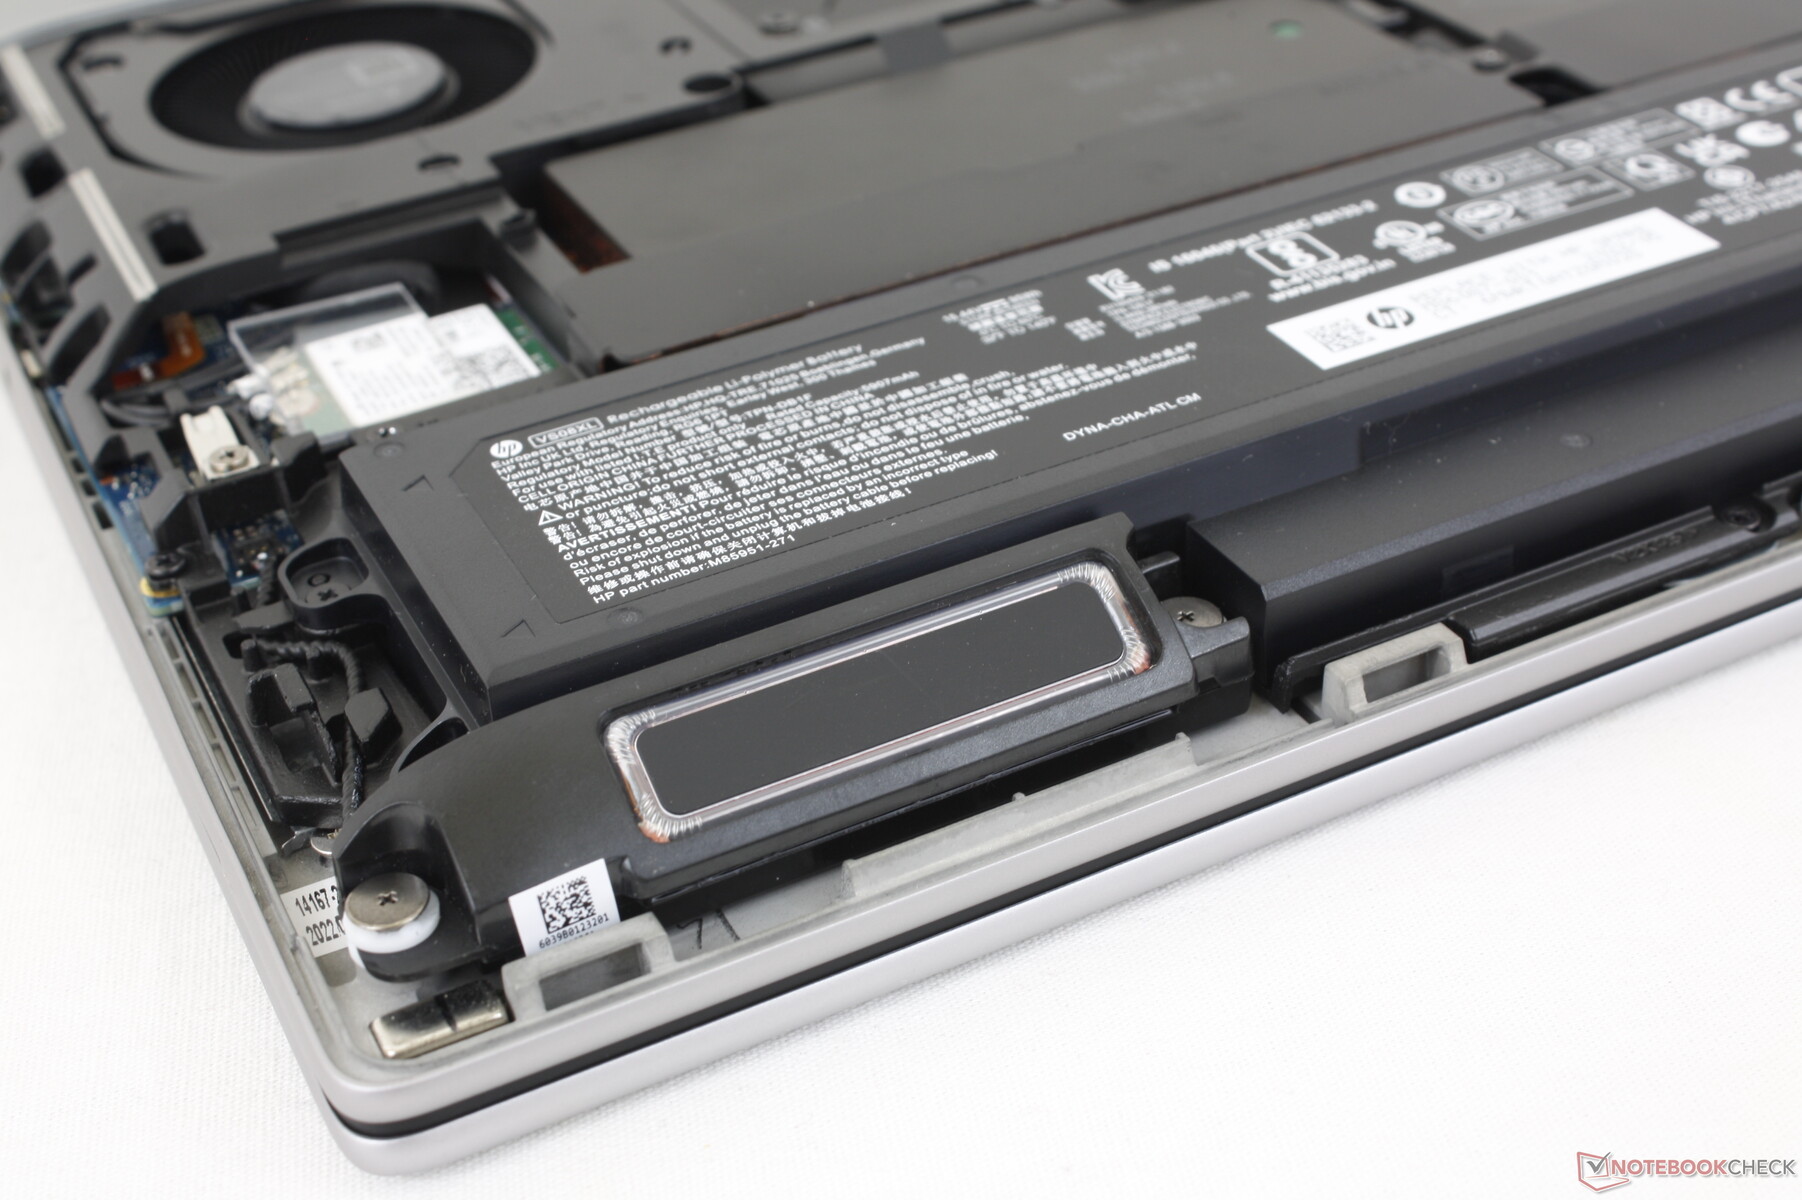
Konserwacja
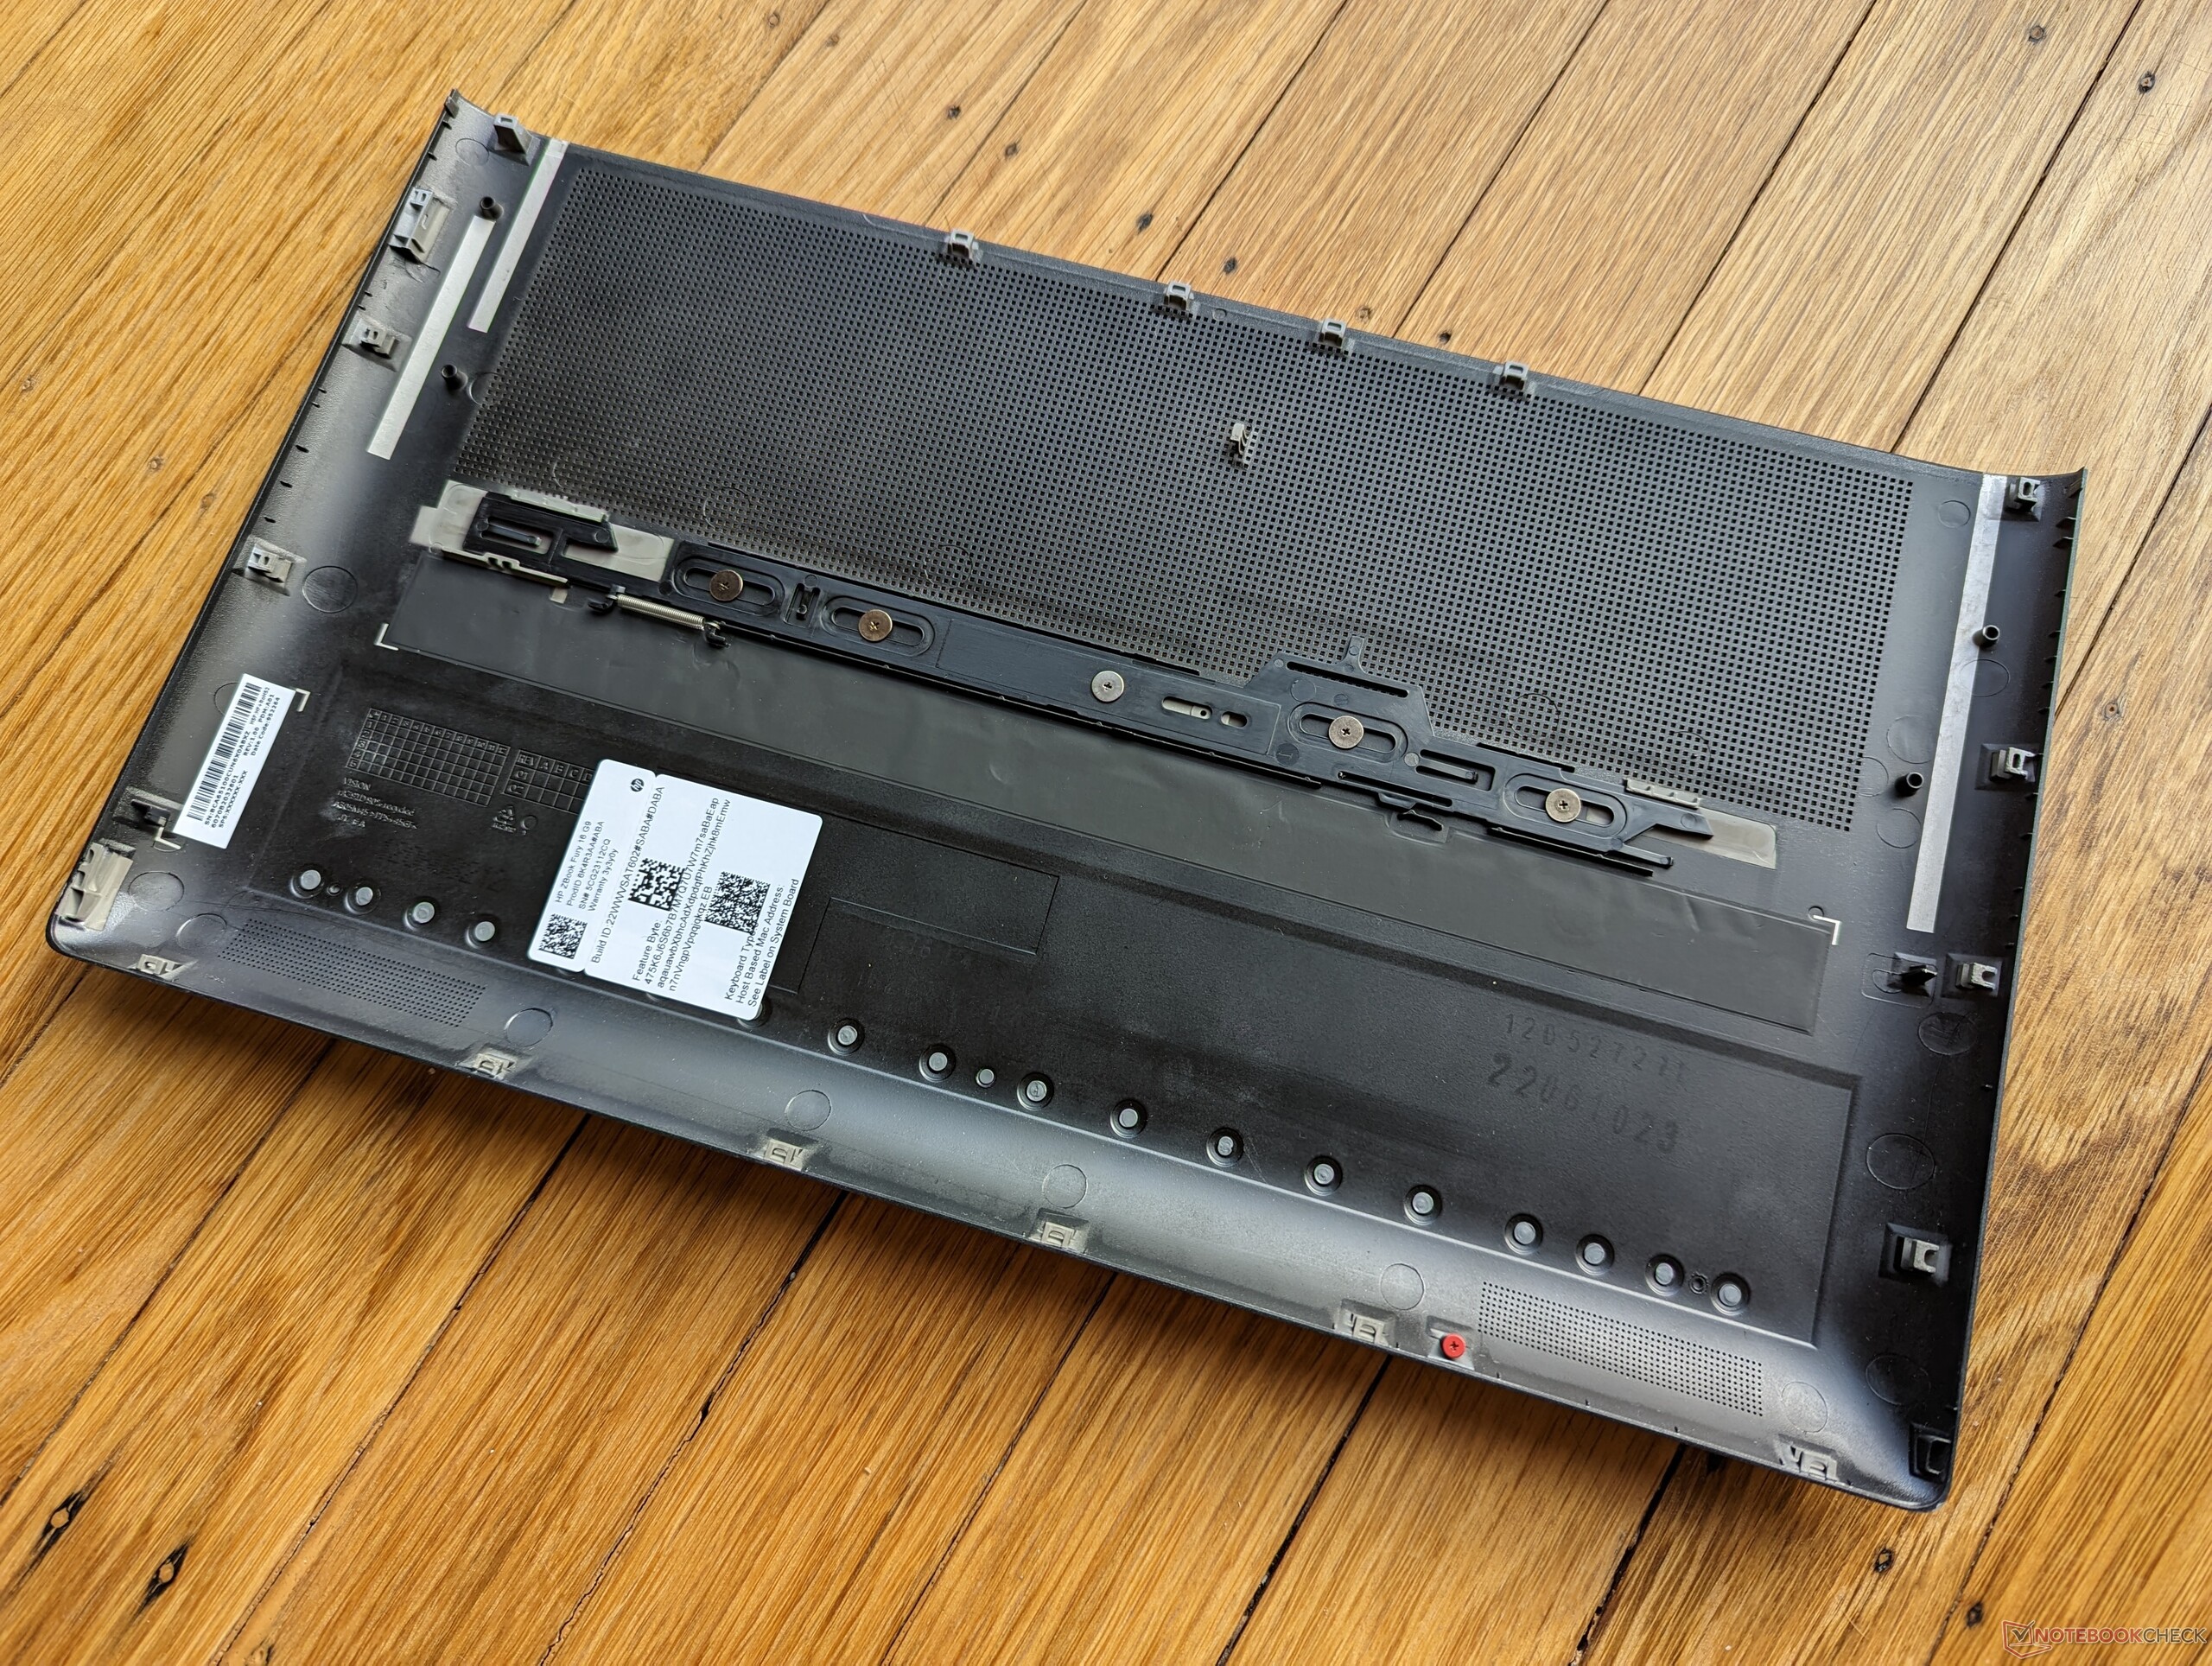
Dolny panel jest "beznarzędziowy", co oznacza, że można go łatwo zdjąć bez użycia narzędzi. Niestety, nadal wymagany jest śrubokręt, ponieważ zatoki pamięci masowej i gniazda SODIMM są chronione przez aluminiowe płytki. Model ten obsługuje do 4 dysków SSD M.2 2280 i 4 modułów pamięci RAM DDR5, co jest więcej niż to, co mogą zaoferować Precision 7670 i ThinkPad P16.
Akcesoria i gwarancja
W pudełku detalicznym nie ma żadnych dodatków poza zwykłym zasilaczem sieciowym i dokumentacją. Trzyletnia ograniczona gwarancja jest standardem w przypadku zakupu w USA.
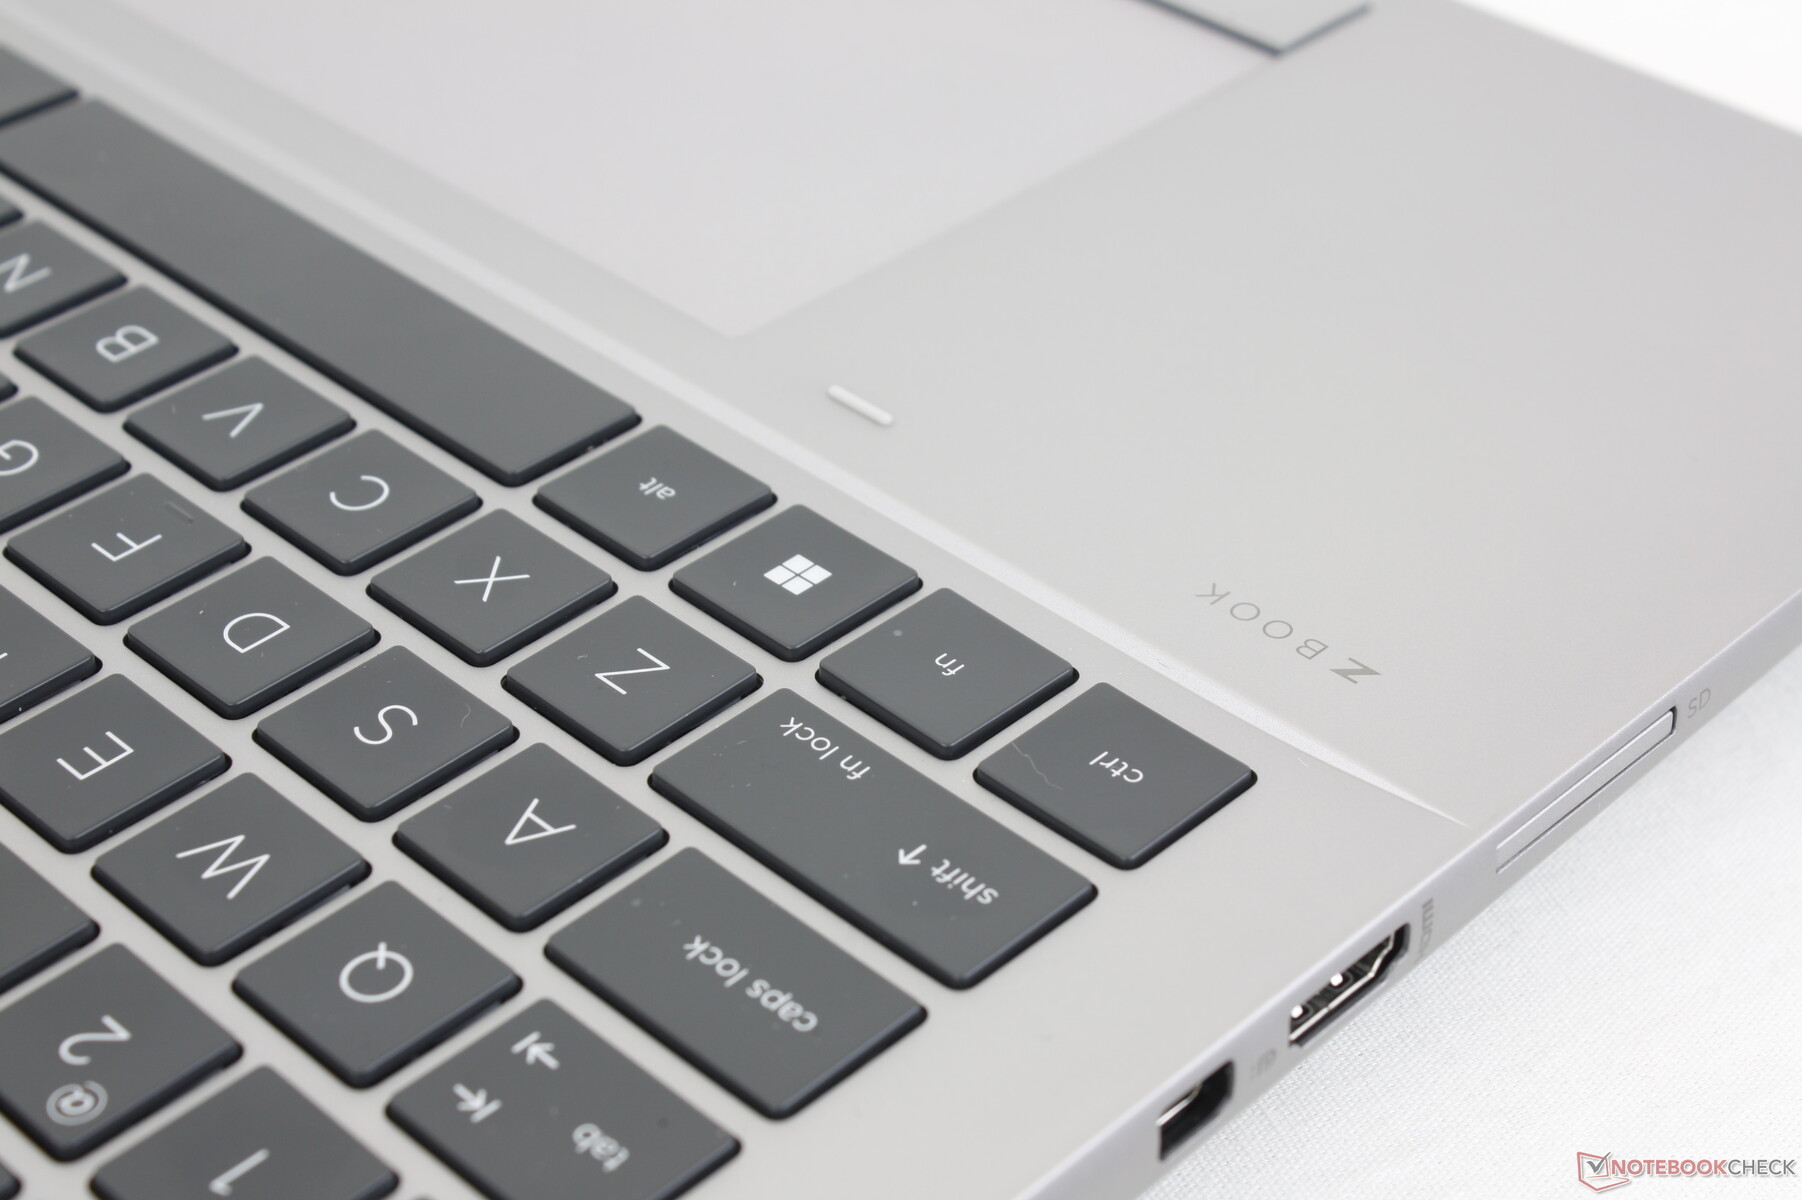
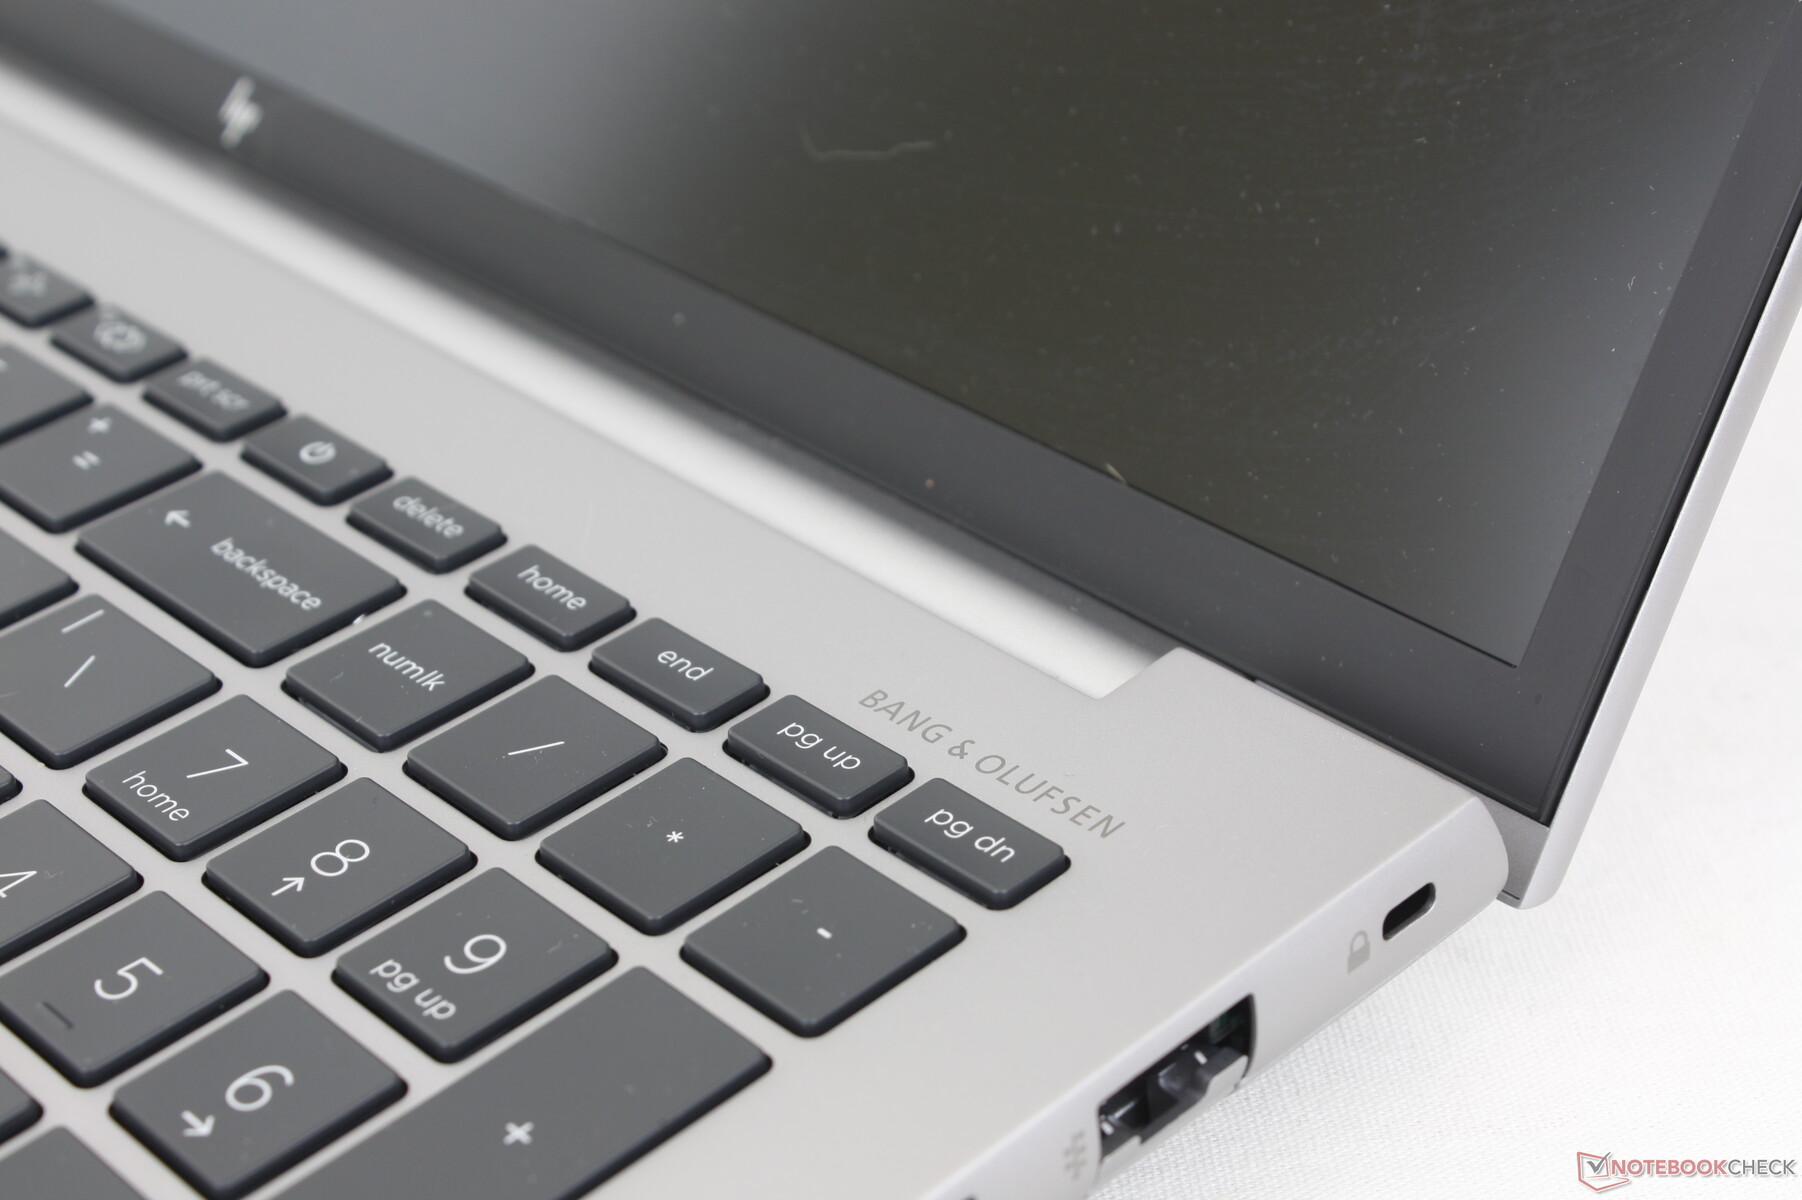
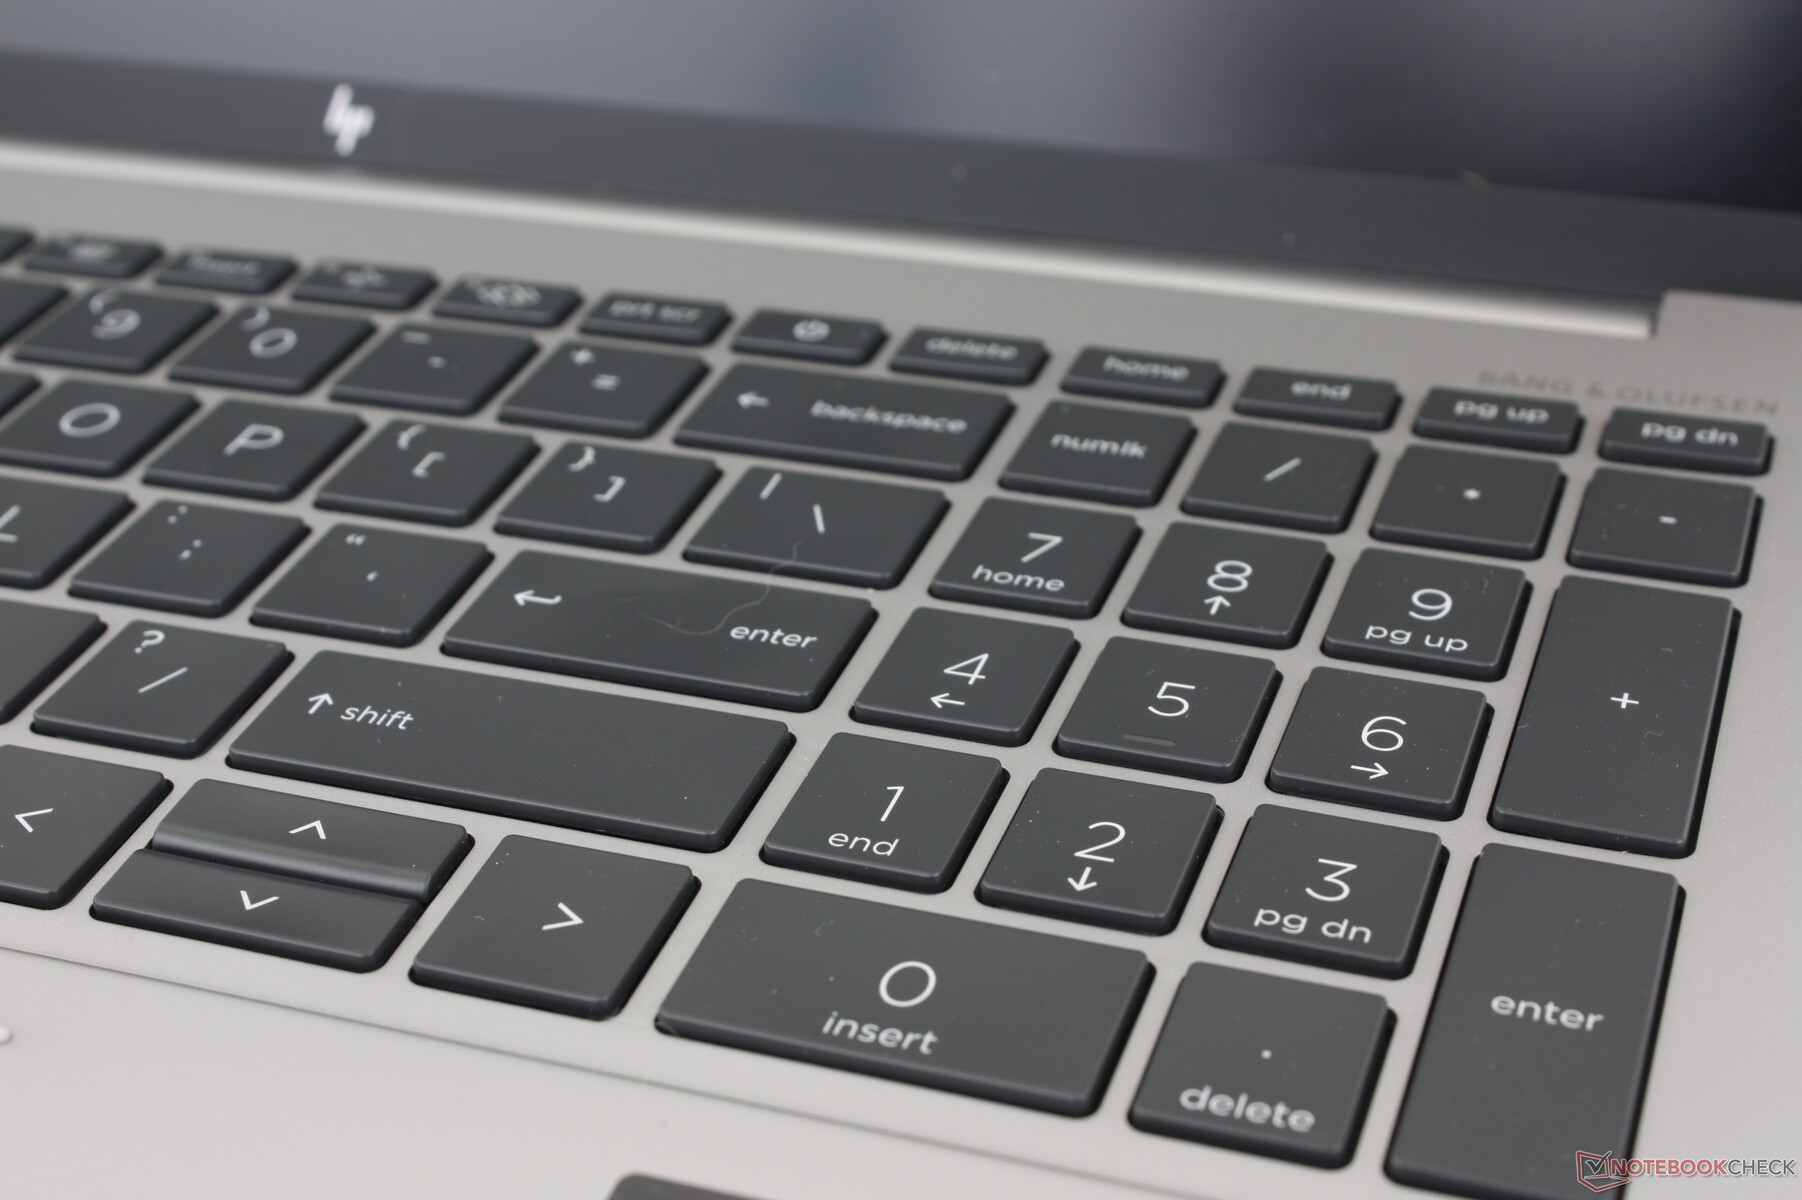
Urządzenia wejściowe - przestronne i wygodne
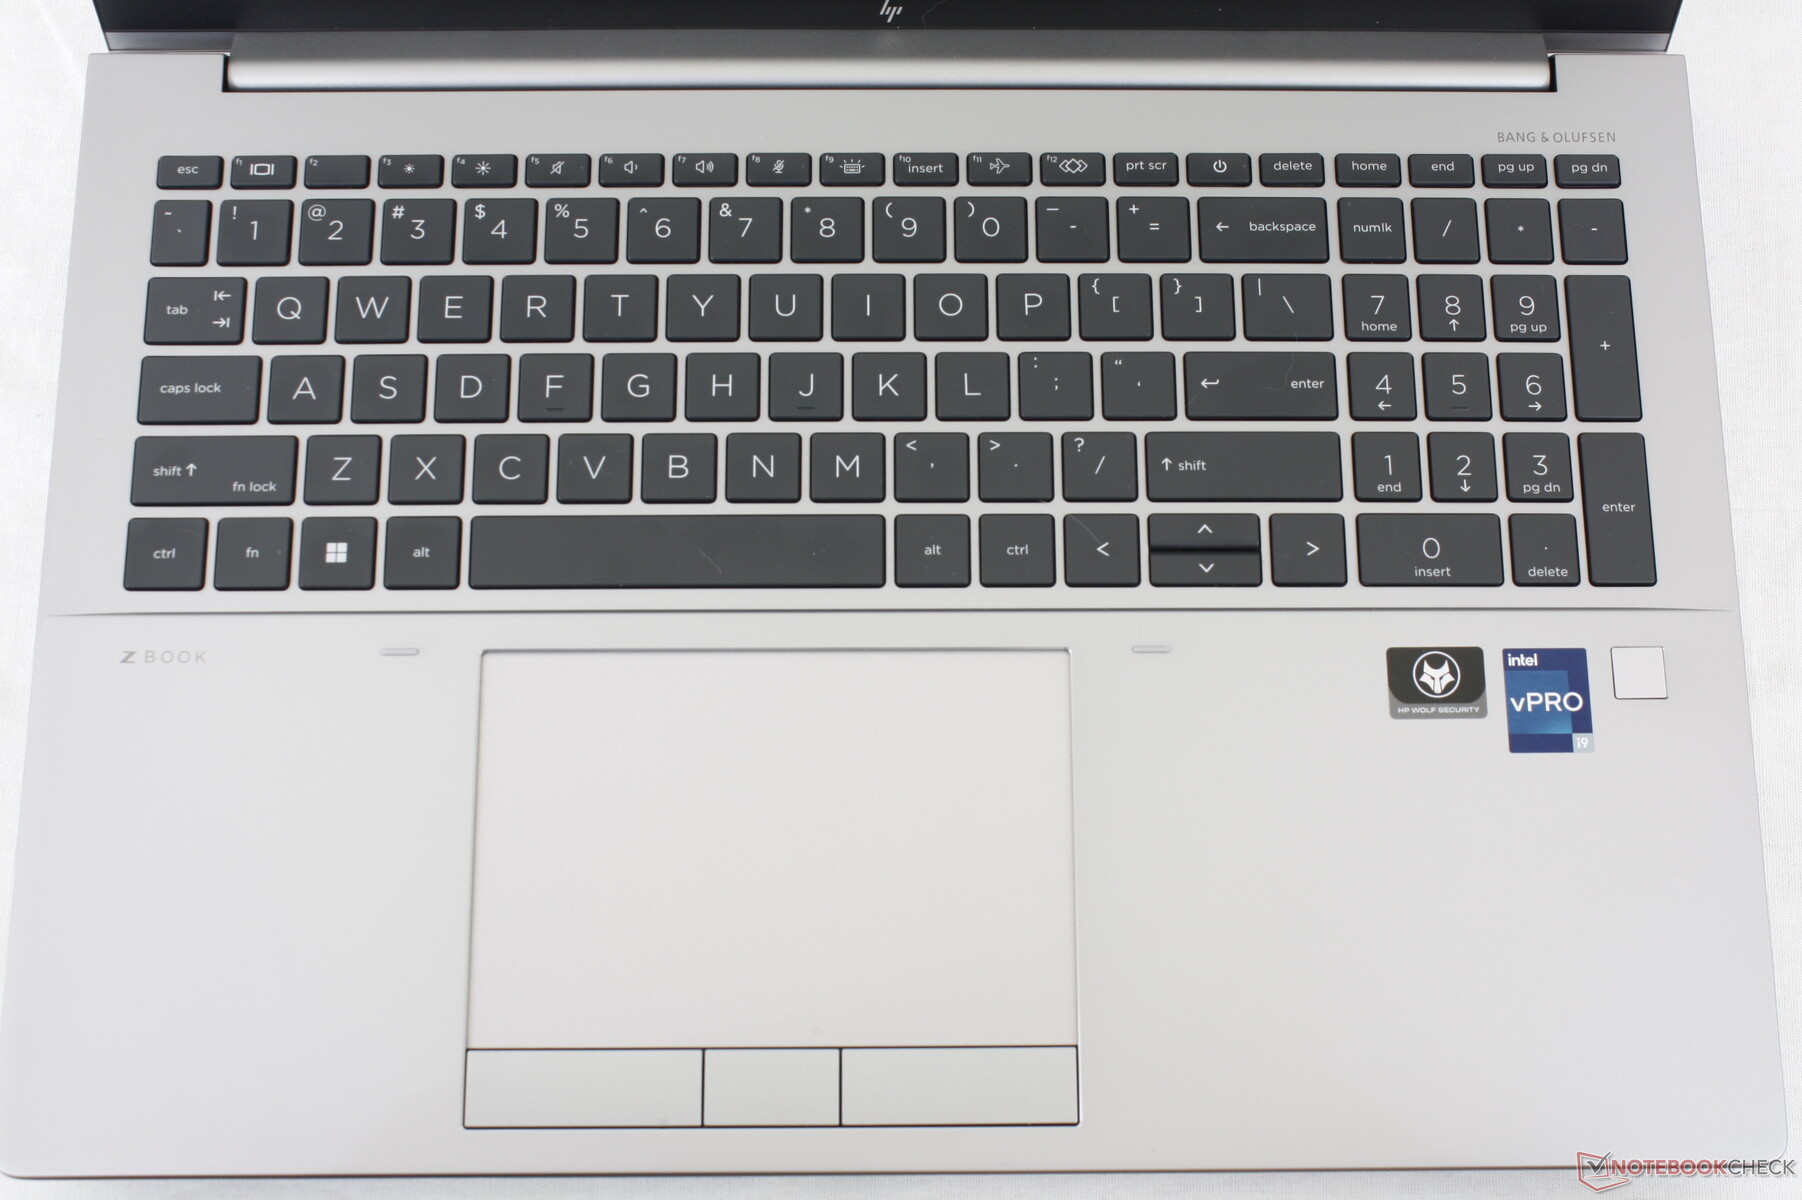
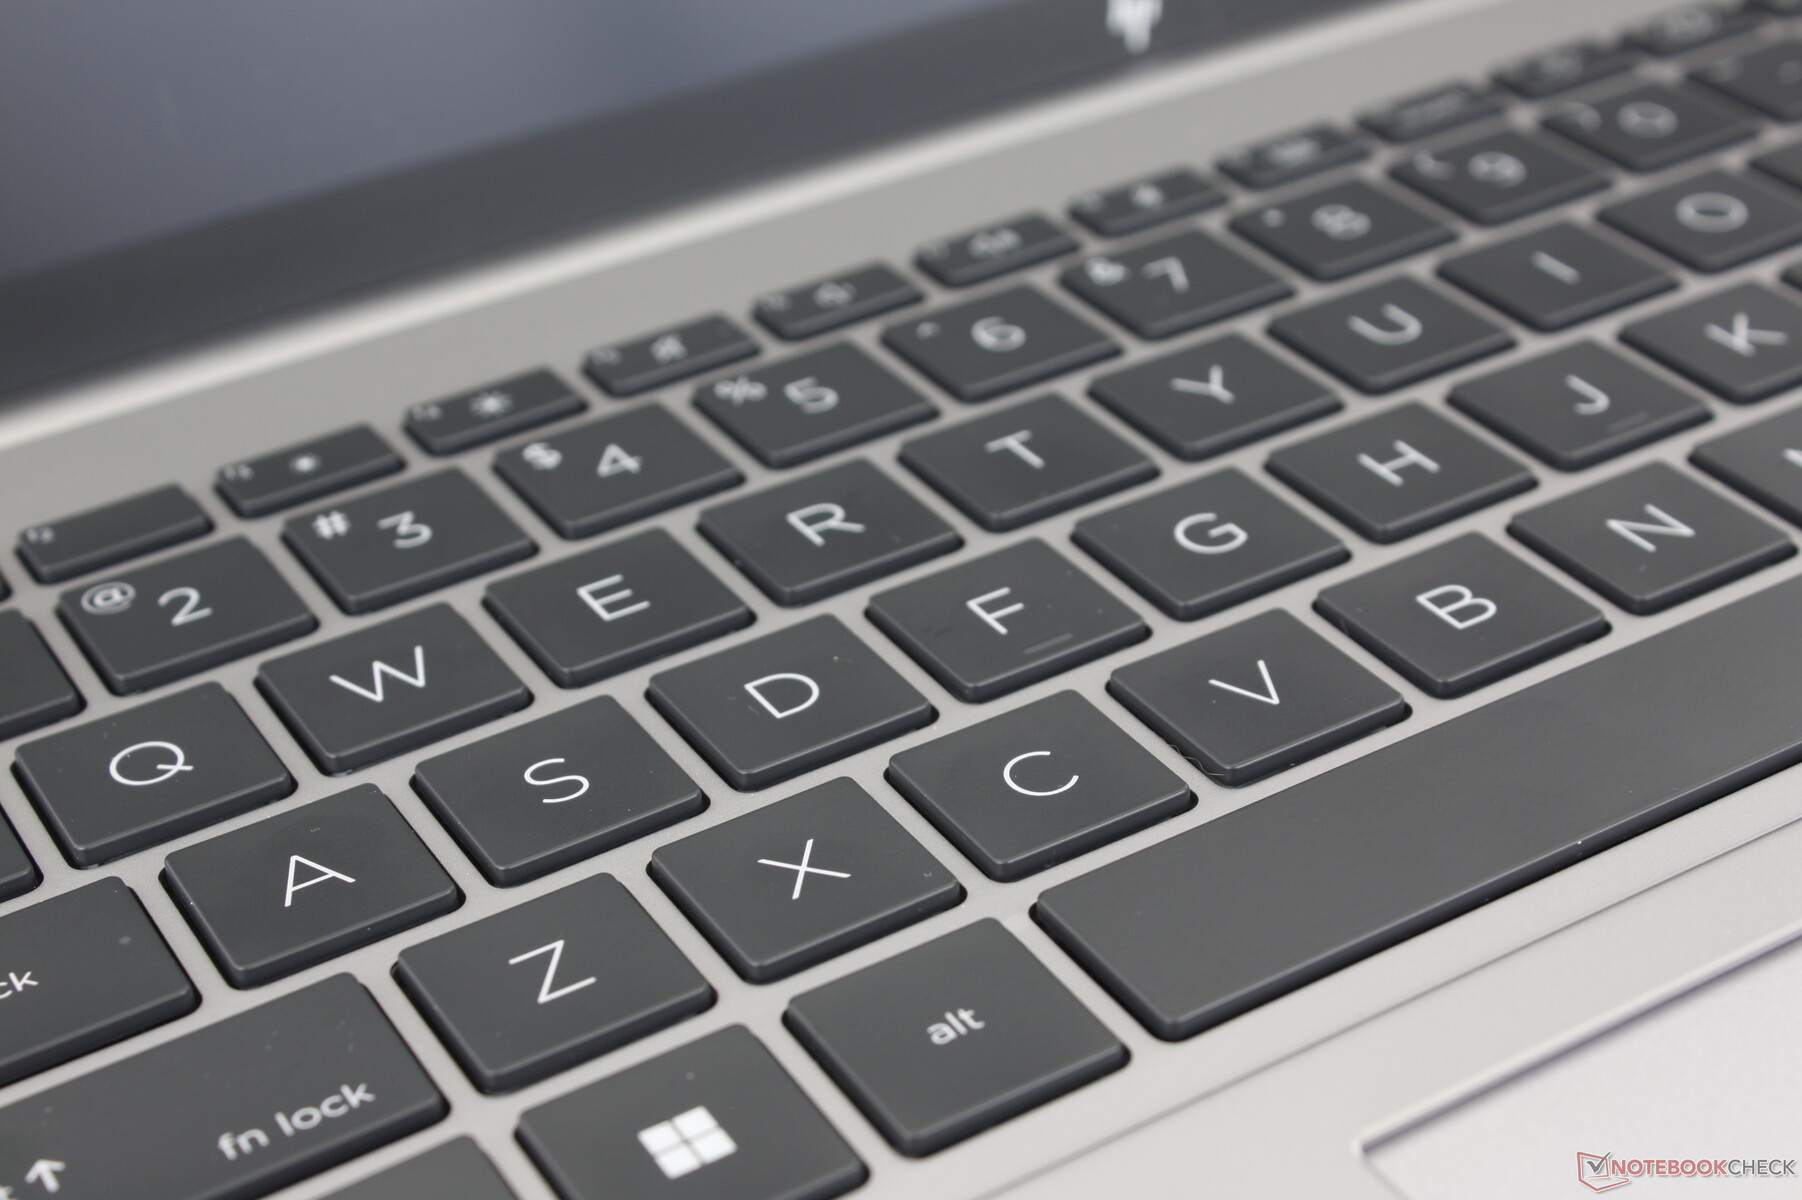
Klawiatura
Rodziny HP Spectre, EliteBook i ZBook mają jedne z najlepszych klawiatur w swoich kategoriach, jeśli chodzi o sprzężenie zwrotne i skok. Klawisze na Fury 16 G9 są twarde, co zapewnia satysfakcjonujące wrażenia podczas pisania. Stukot jest jednak głośniejszy niż w ThinkPadzie P16 G1 lub Precision 7670, zwłaszcza podczas naciskania klawiszy spacji lub Enter. Użytkownicy preferujący cichsze klawisze mogą chcieć najpierw wypróbować klawiaturę ZBook przed podjęciem decyzji.
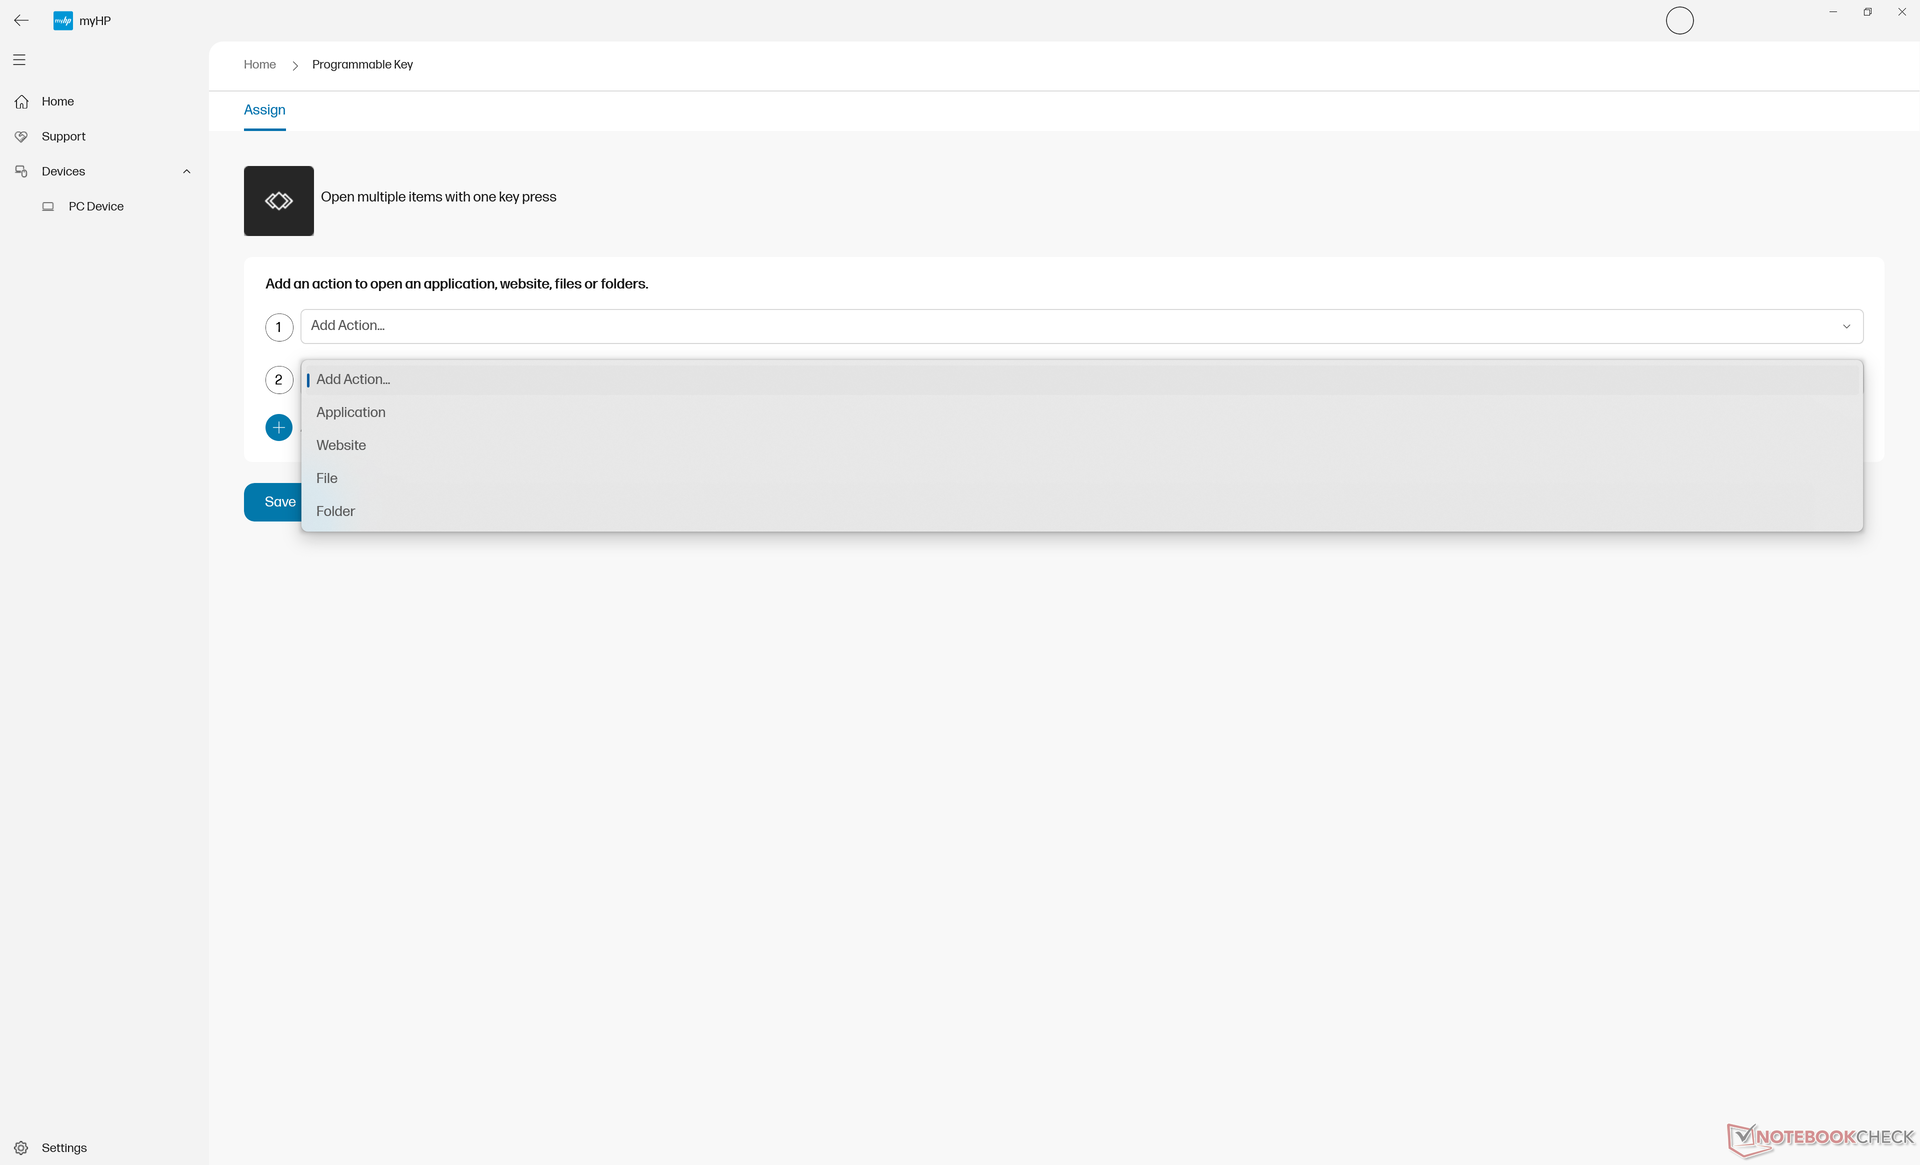
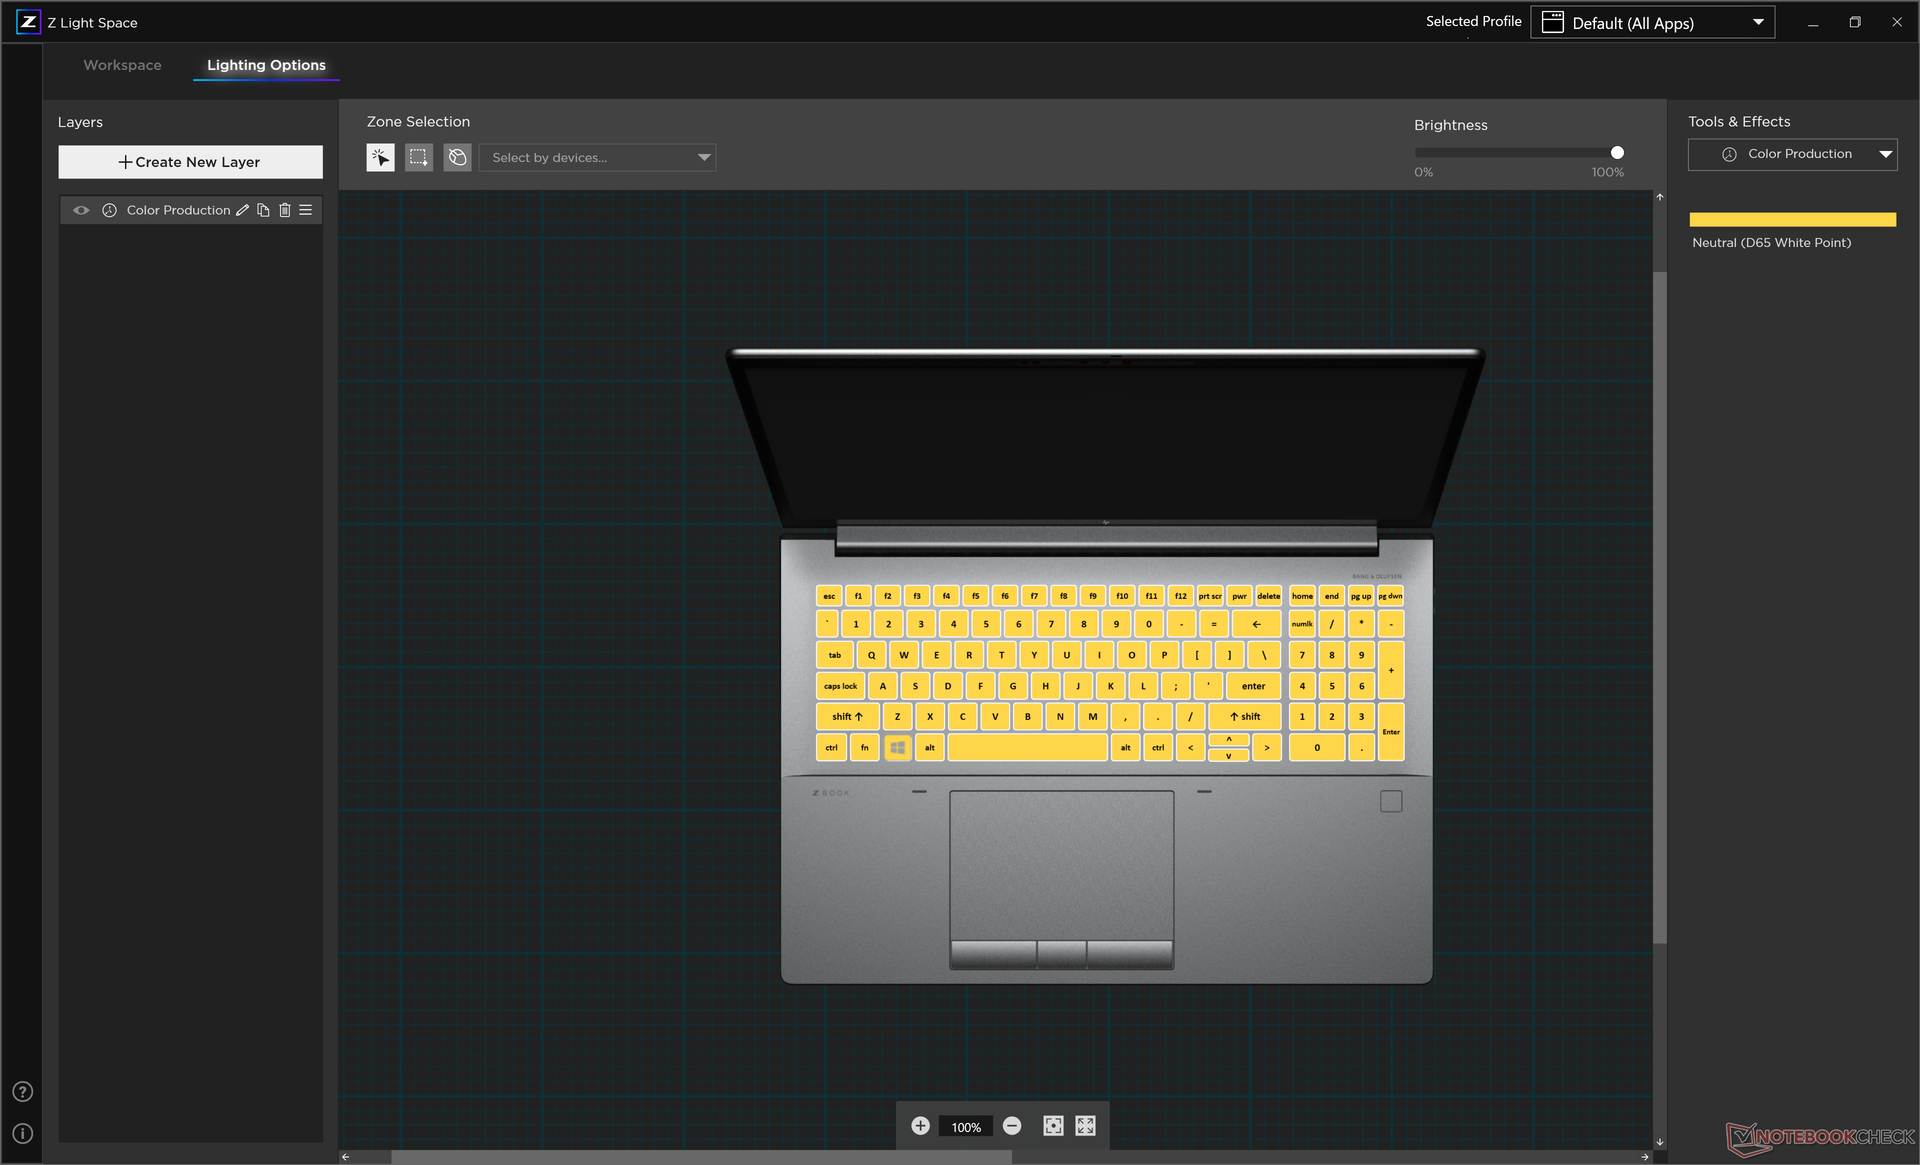
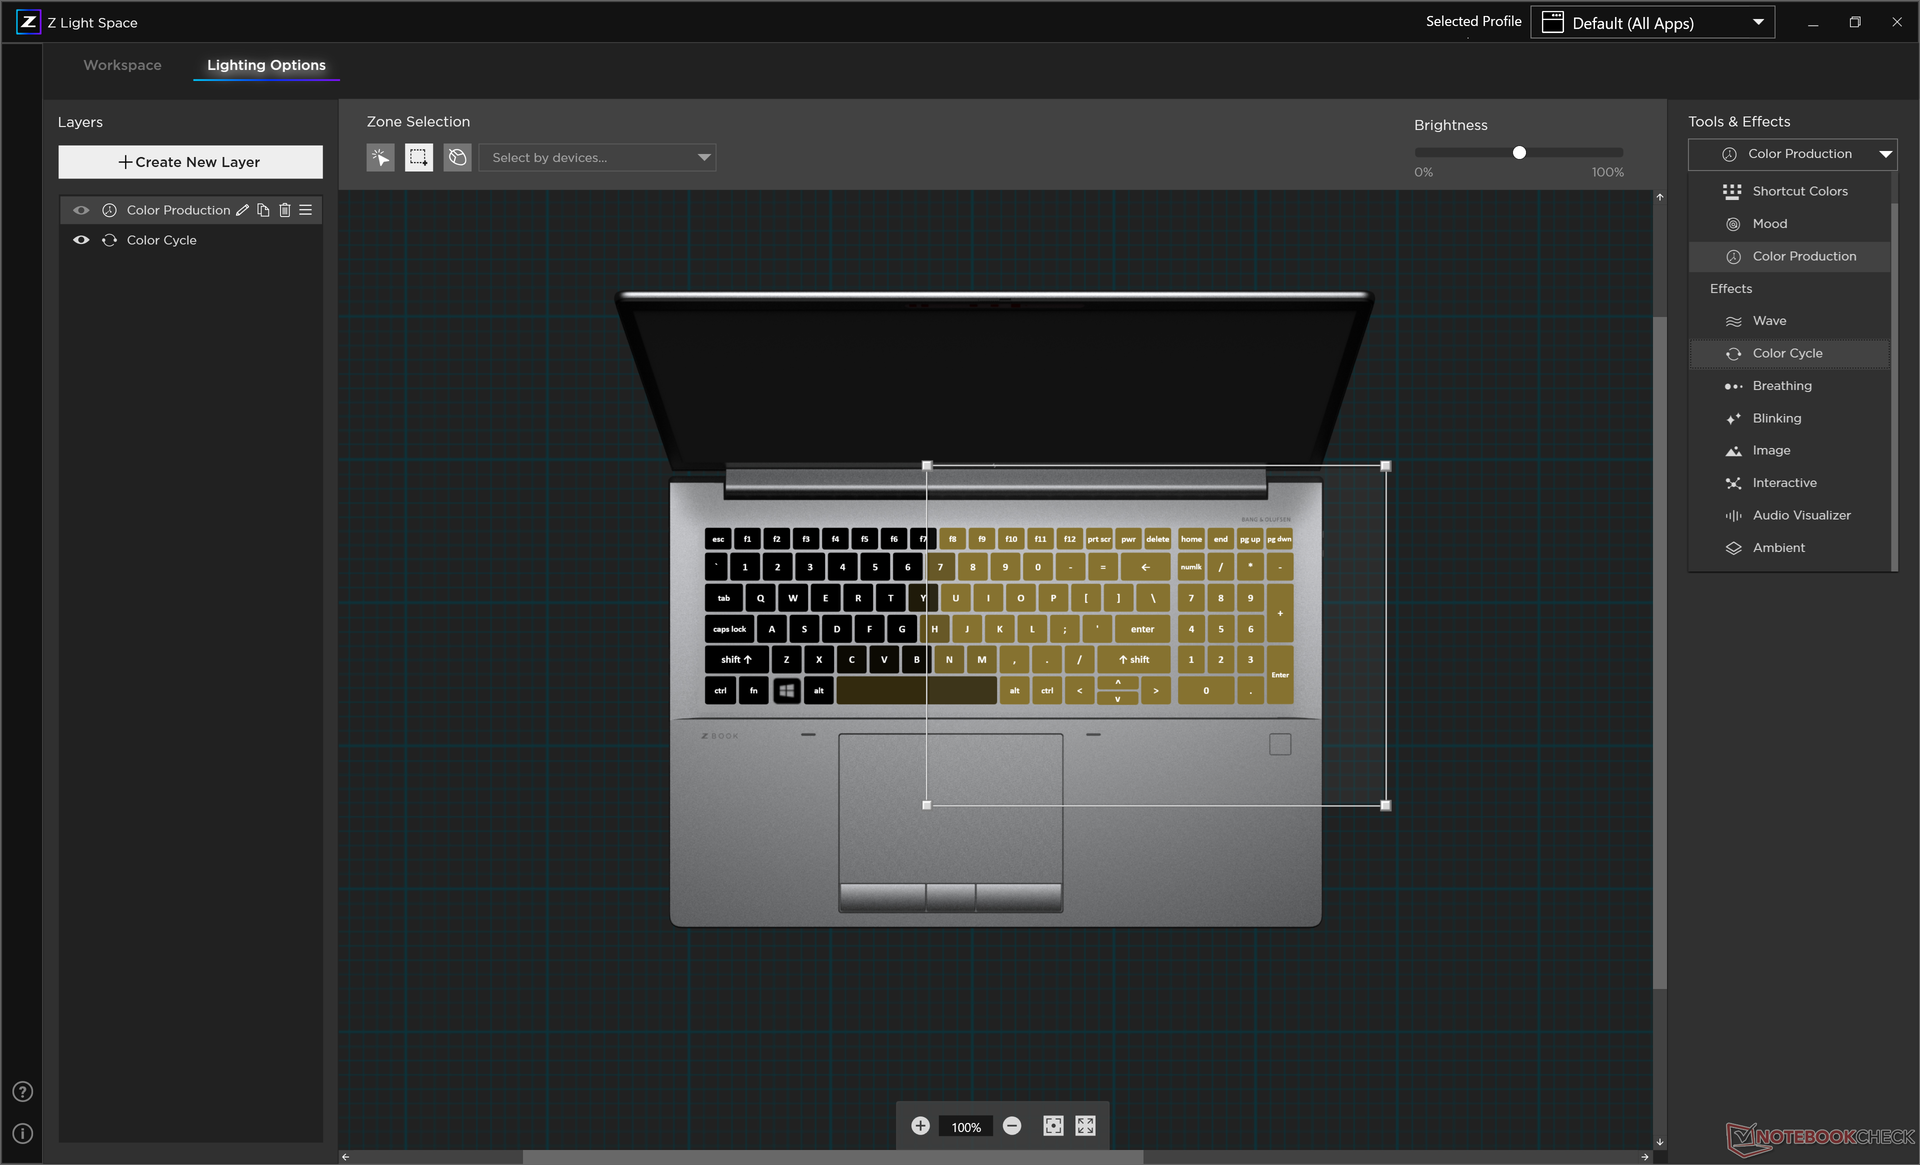
Godne uwagi funkcje klawiatury ZBook obejmują podświetlenie RGB każdego klawisza i pojedynczy programowalny / konfigurowalny klawisz. Większość innych stacji roboczych nie posiada jeszcze podobnych funkcji pomocniczych.
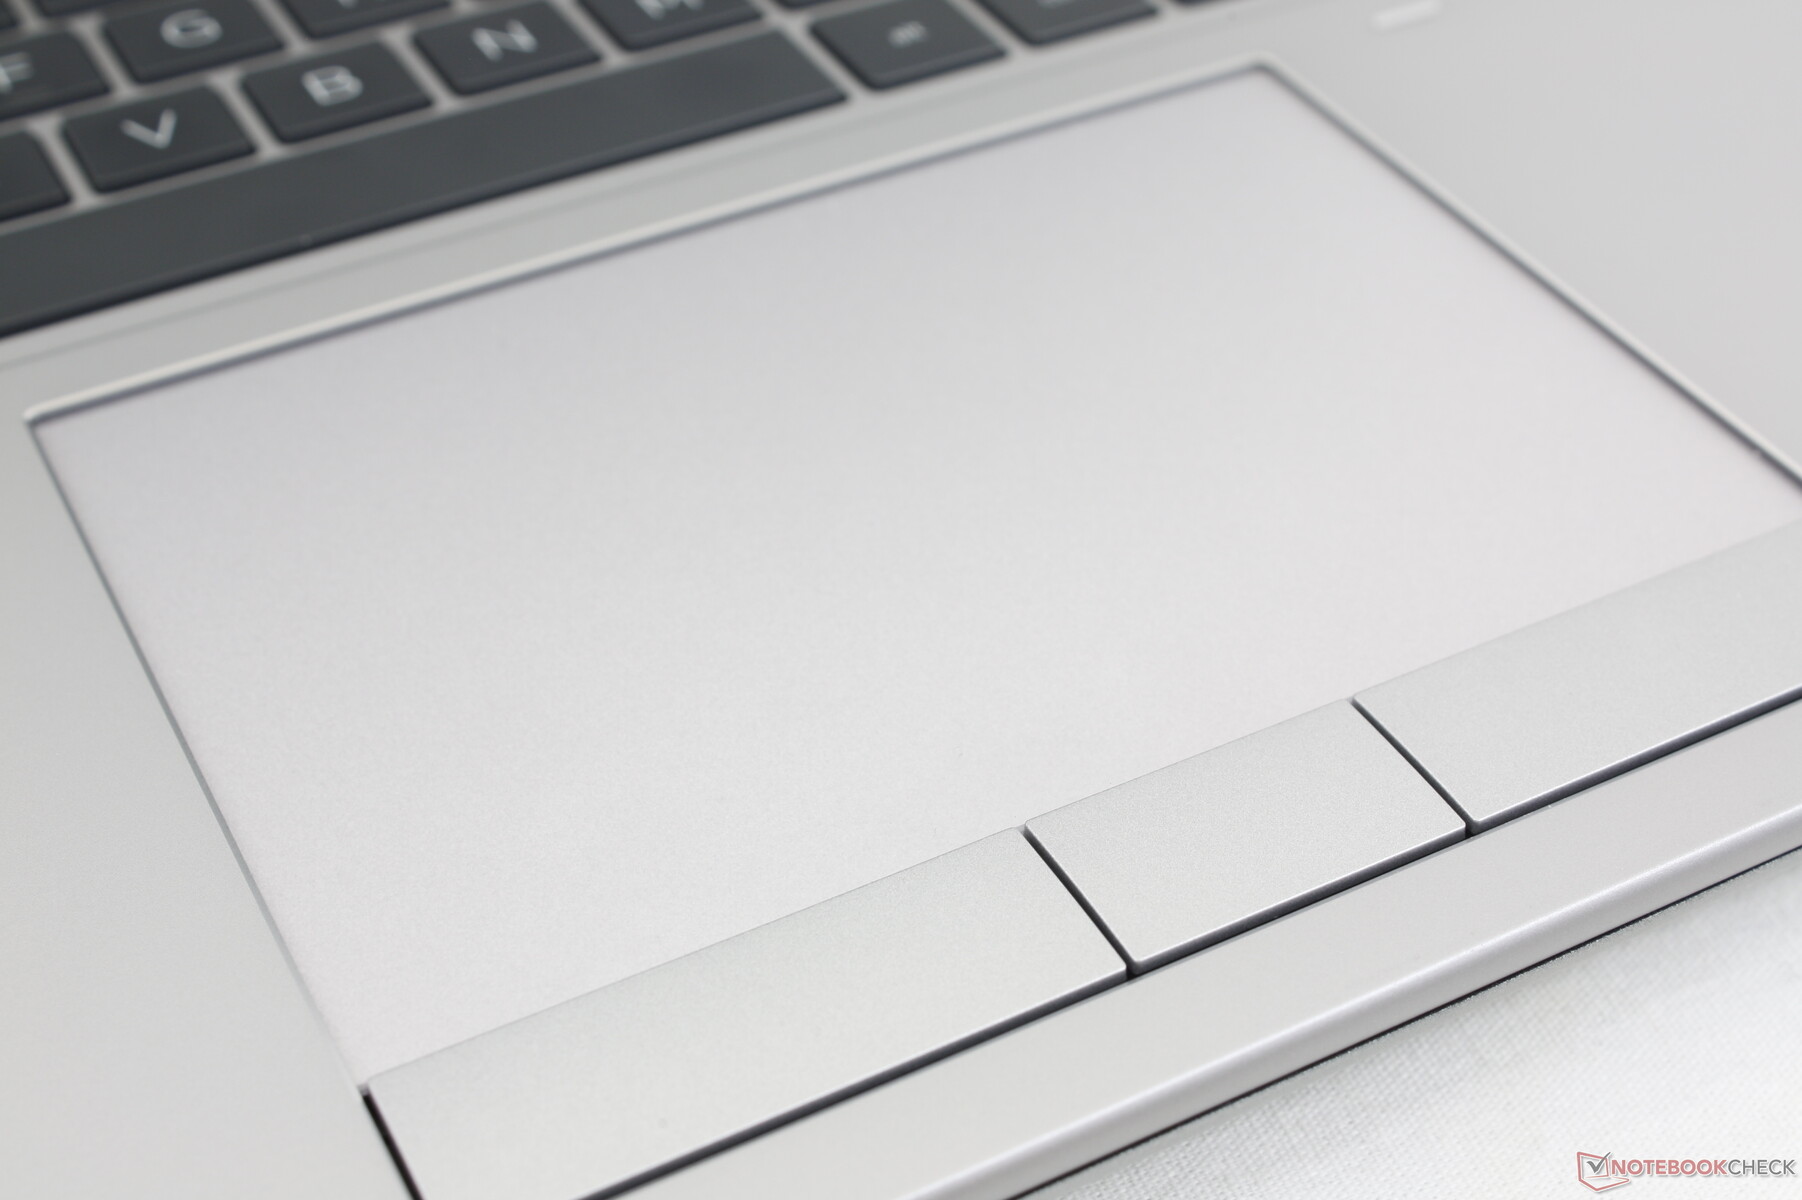
Touchpad
Touchpad jest jednym z najlepszych, jakich używaliśmy na jakimkolwiek laptopie, czy to stacji roboczej, czy innym. Nie tylko jest większy (12,4 x 8,3 cm) niż touchpady w ThinkPad P16 G1 (11,5 x 6,9 cm) lub Precision 7670 (11,5 x 8 cm), ale jego właściwości ślizgowe są płynne, zapewniając niezawodną kontrolę kursora przy dowolnej prędkości. Tymczasem dedykowane przyciski myszy mają większy skok niż w większości innych laptopów, zachowując jednocześnie satysfakcjonujące kliknięcie po naciśnięciu. Dla porównania, Precision 7670 nie posiada dedykowanych przycisków myszy na rzecz rozwiązania clickpad.
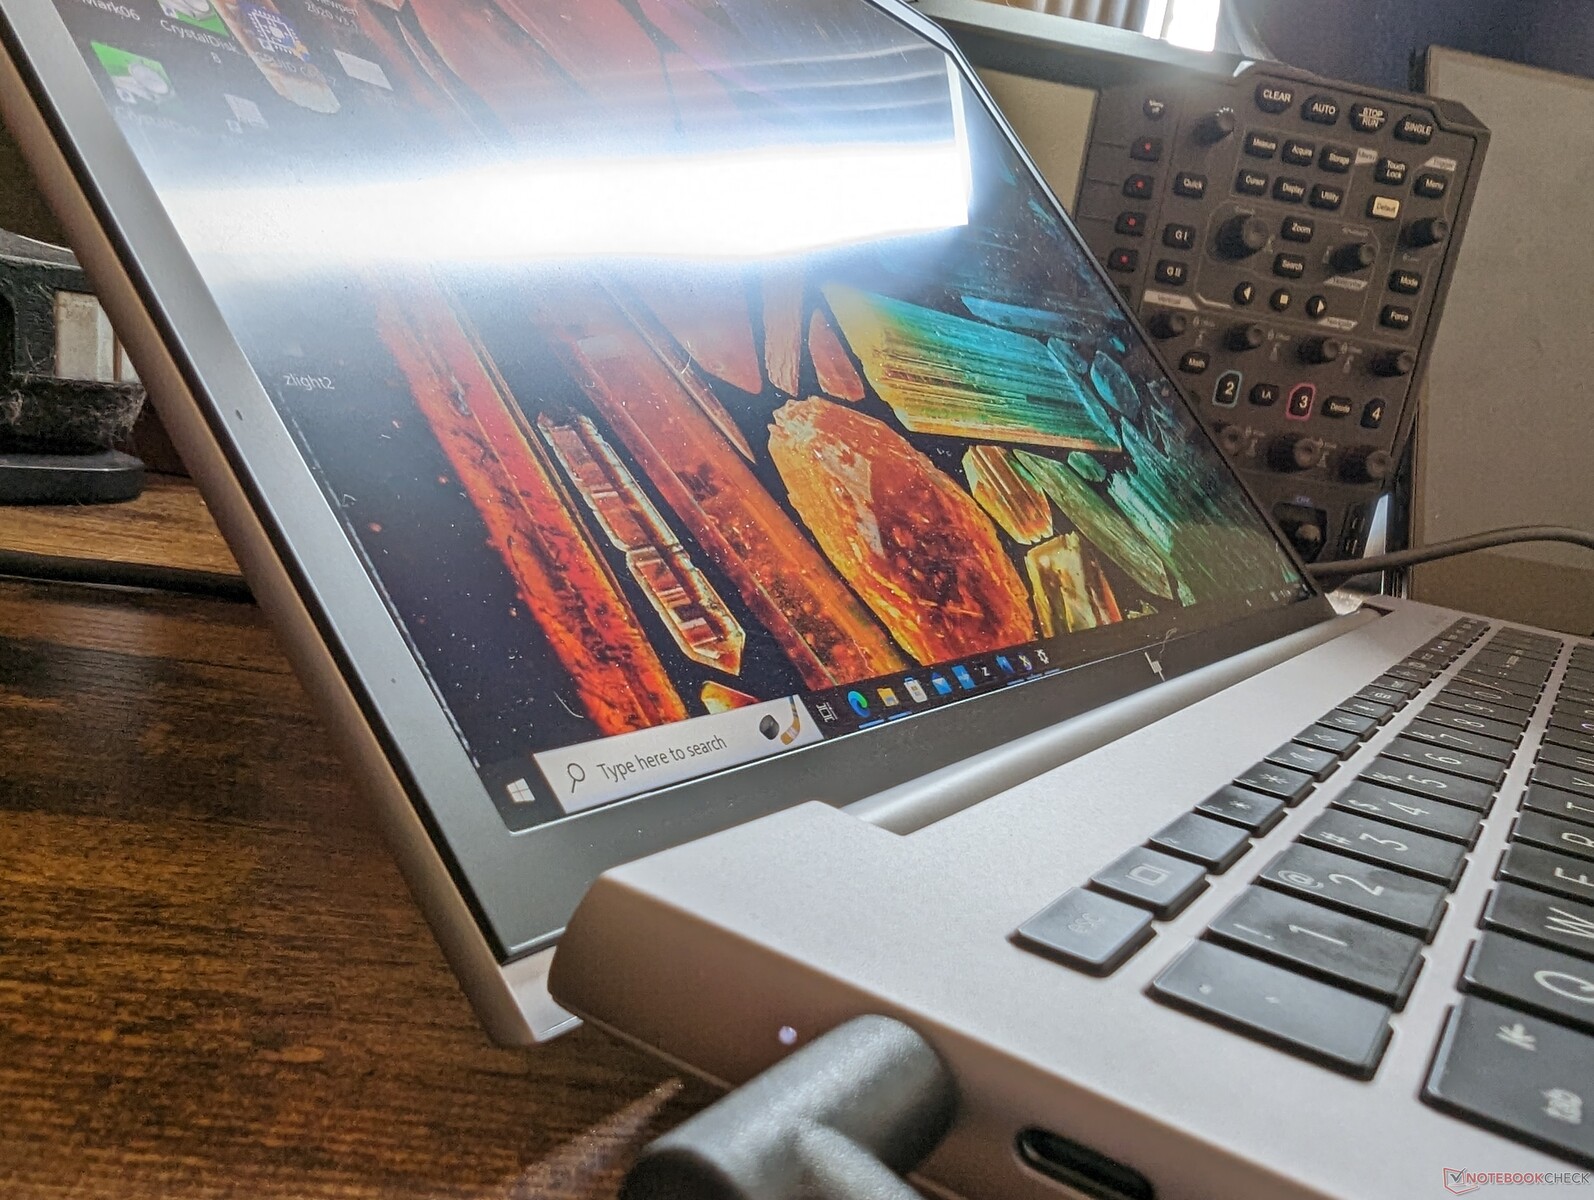
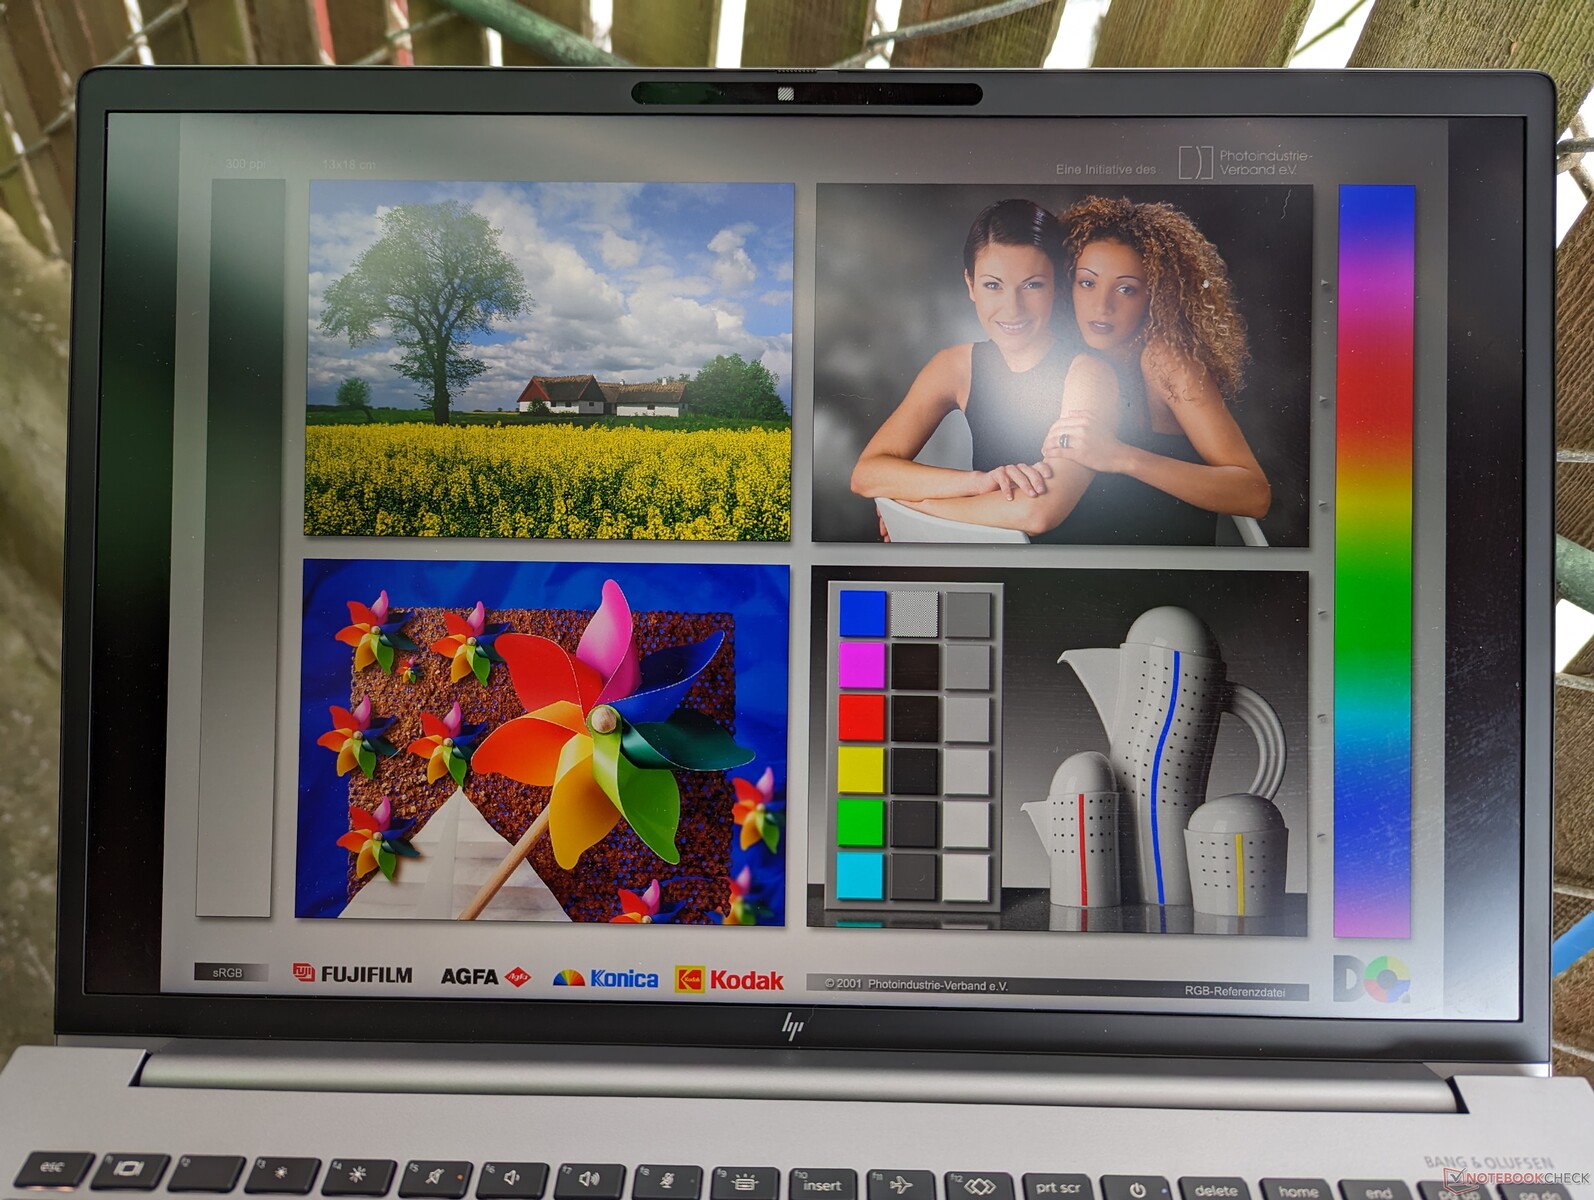
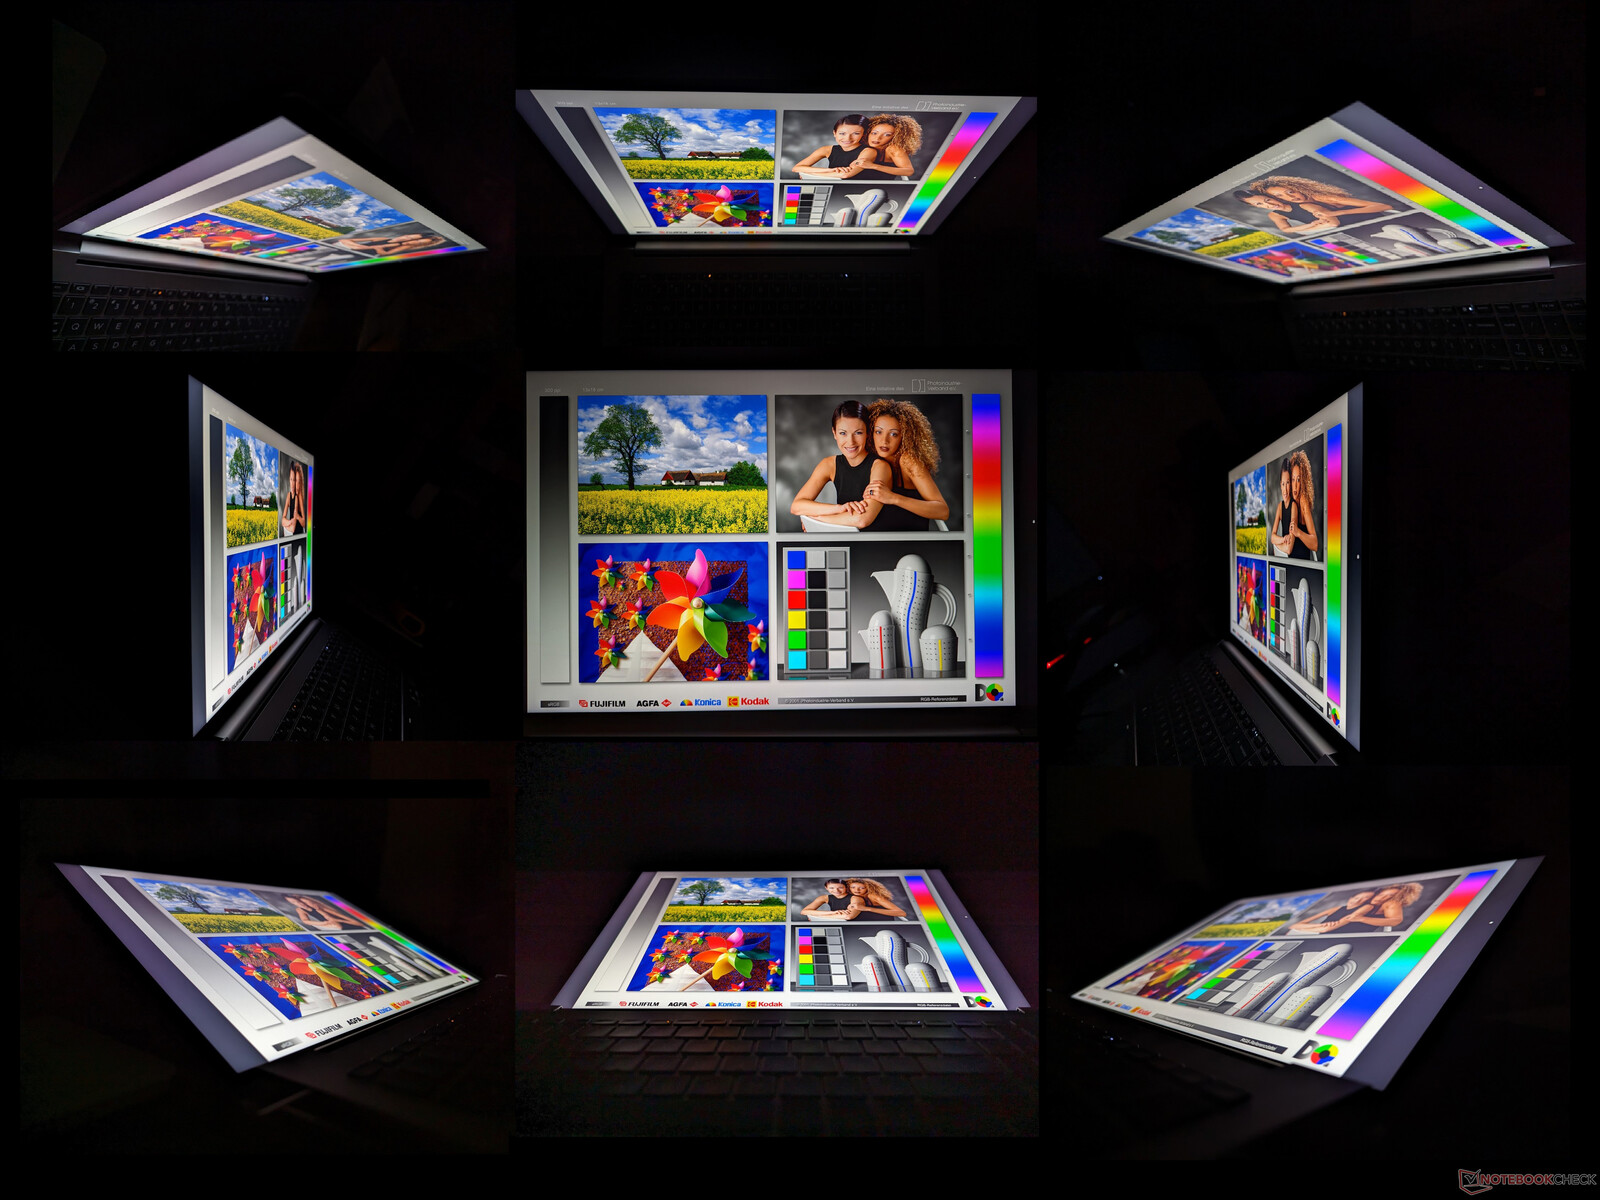
Wyświetlacz - doskonałe kolory i dobre czasy reakcji
HP stosuje te same opcje paneli BOE w wielu swoich 16-calowych laptopach. Model ZBook Studio 16 G9na przykład, wykorzystuje ten sam panel 4K 16:10, co nasz ZBook Fury 16 G9, czego przykładem są ich podobne atrybuty w poniższej tabeli.
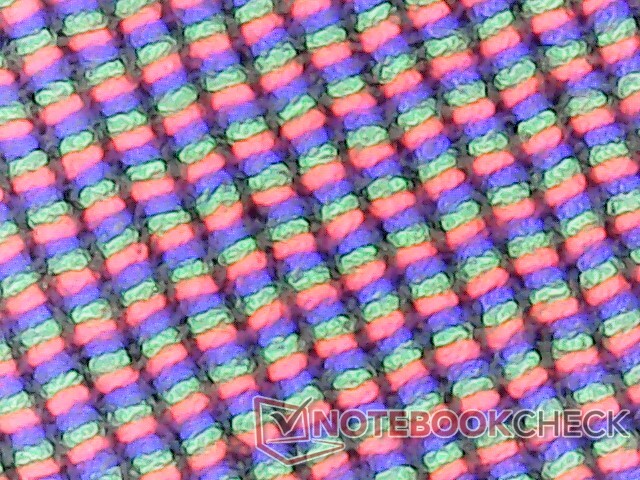
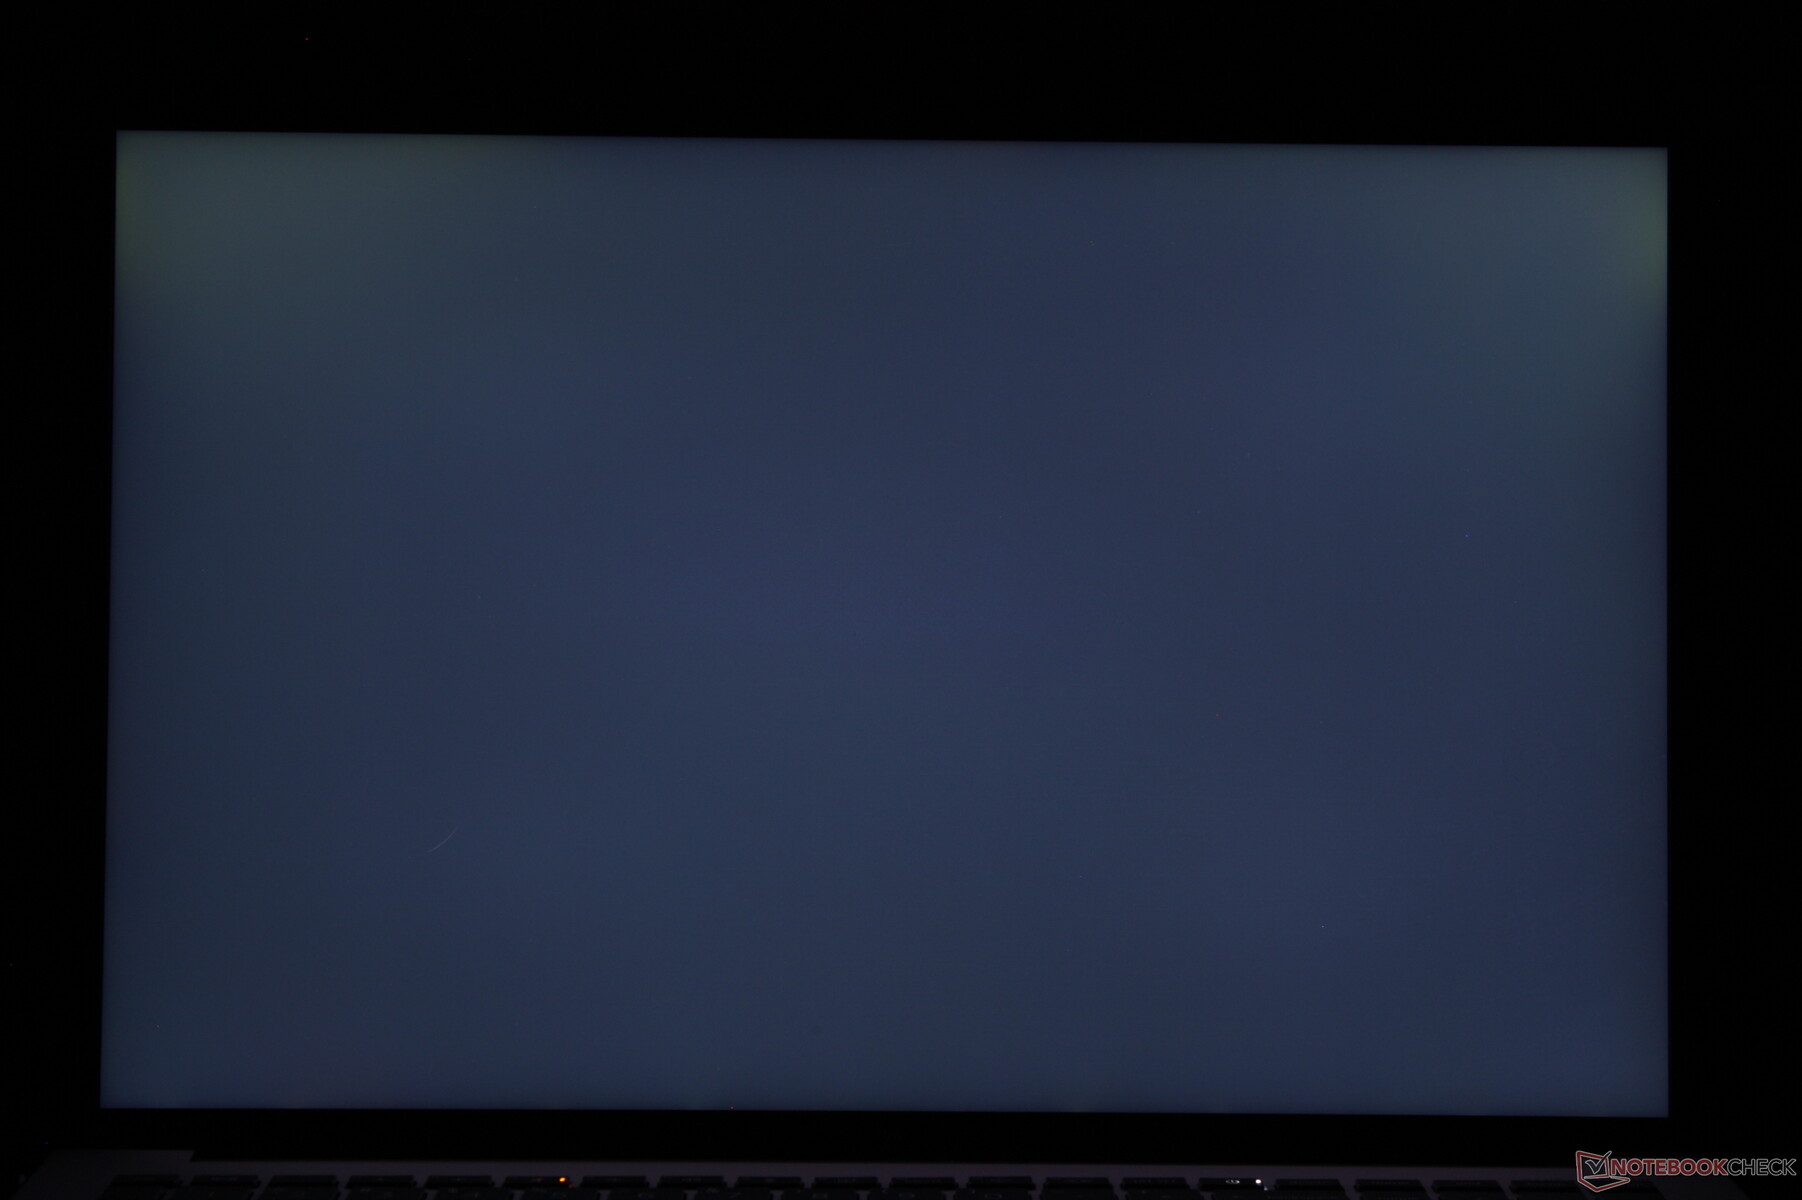
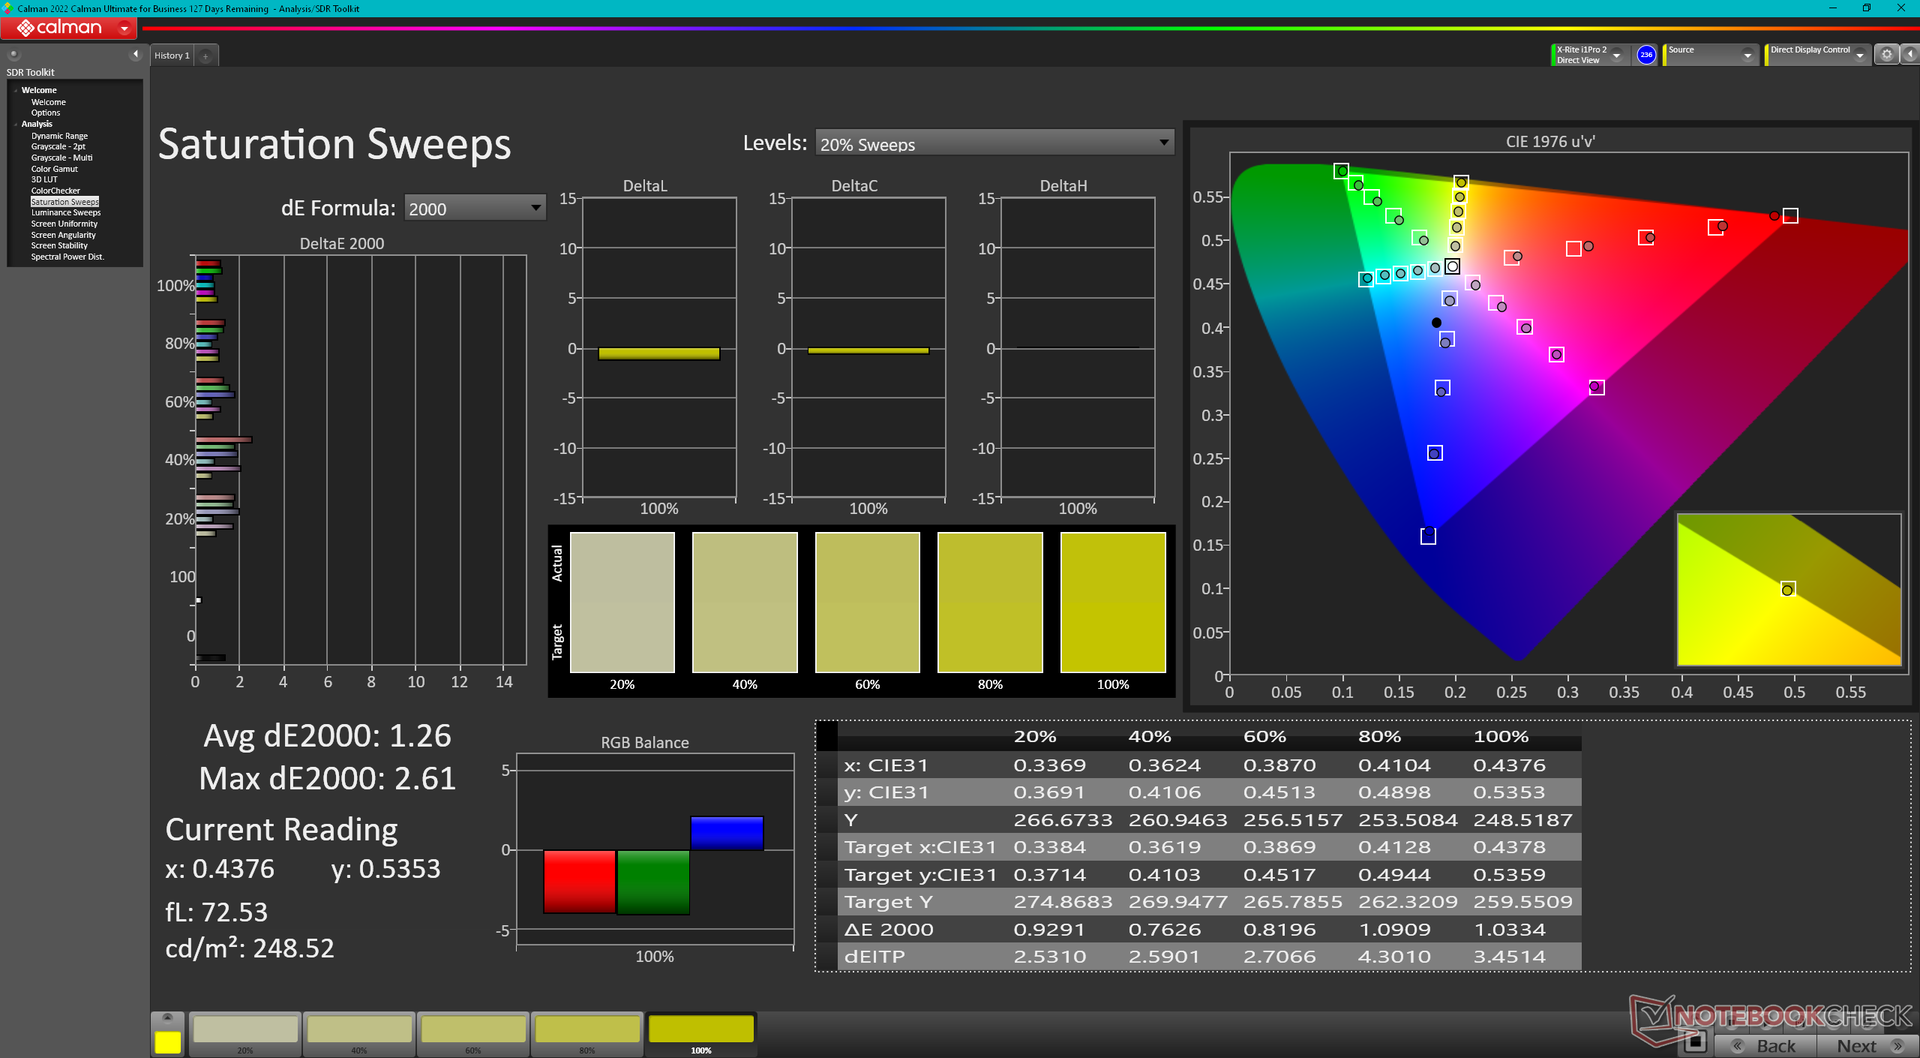
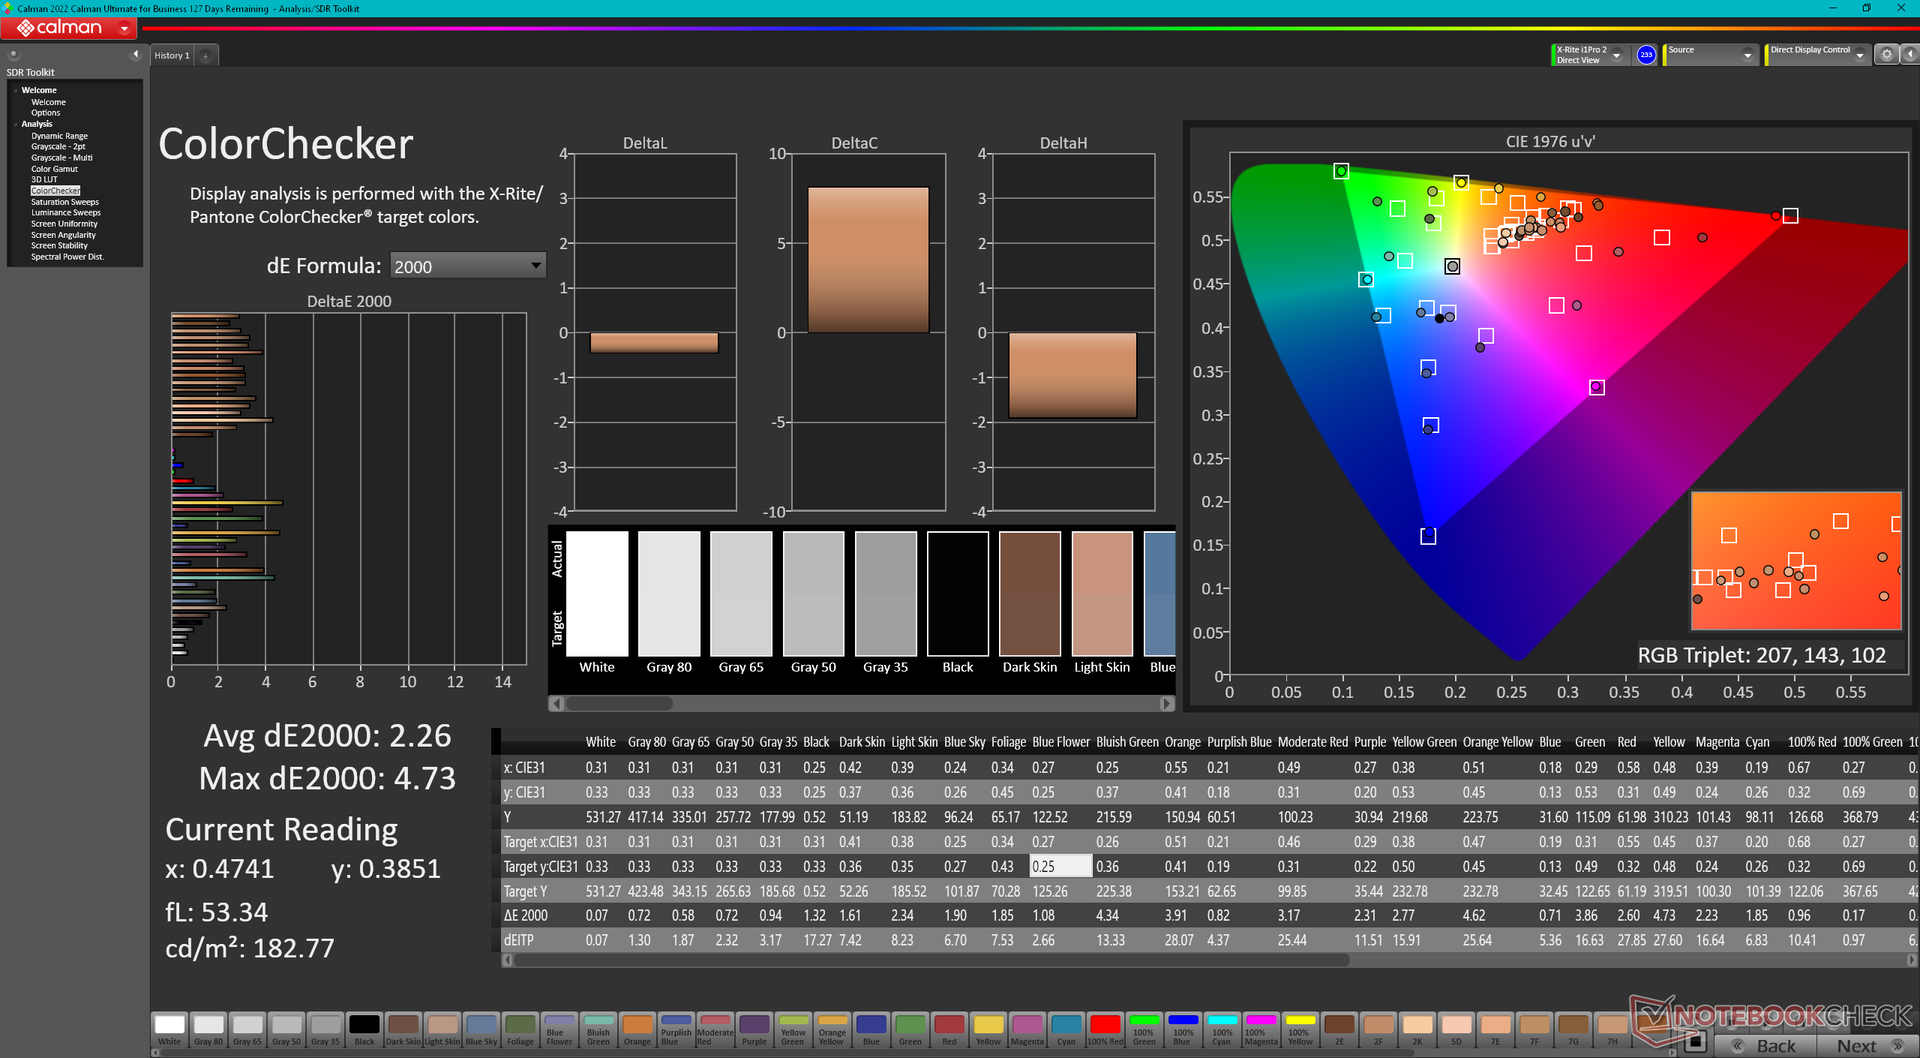
Nasz konkretny panel 4K IPS to wysokiej klasy oferta z szerokimi kolorami P3 i dobrym czasem reakcji czerni i bieli oraz szarości, dzięki czemu nadaje się zarówno do tworzenia treści, jak i do gier. Matowa nakładka nie jest jednak tak ostra jak błyszcząca alternatywa, a współczynnik kontrastu jest ograniczony do zaledwie ~1000:1. Na szczęście HP oferuje opcję OLED, która bezpośrednio rozwiązuje te dwa niedociągnięcia.
| |||||||||||||||||||||||||
rozświetlenie: 83 %
na akumulatorze: 451.7 cd/m²
kontrast: 931:1 (czerń: 0.57 cd/m²)
ΔE ColorChecker Calman: 2.26 | ∀{0.5-29.43 Ø4.73}
calibrated: 4.73
ΔE Greyscale Calman: 1 | ∀{0.09-98 Ø4.97}
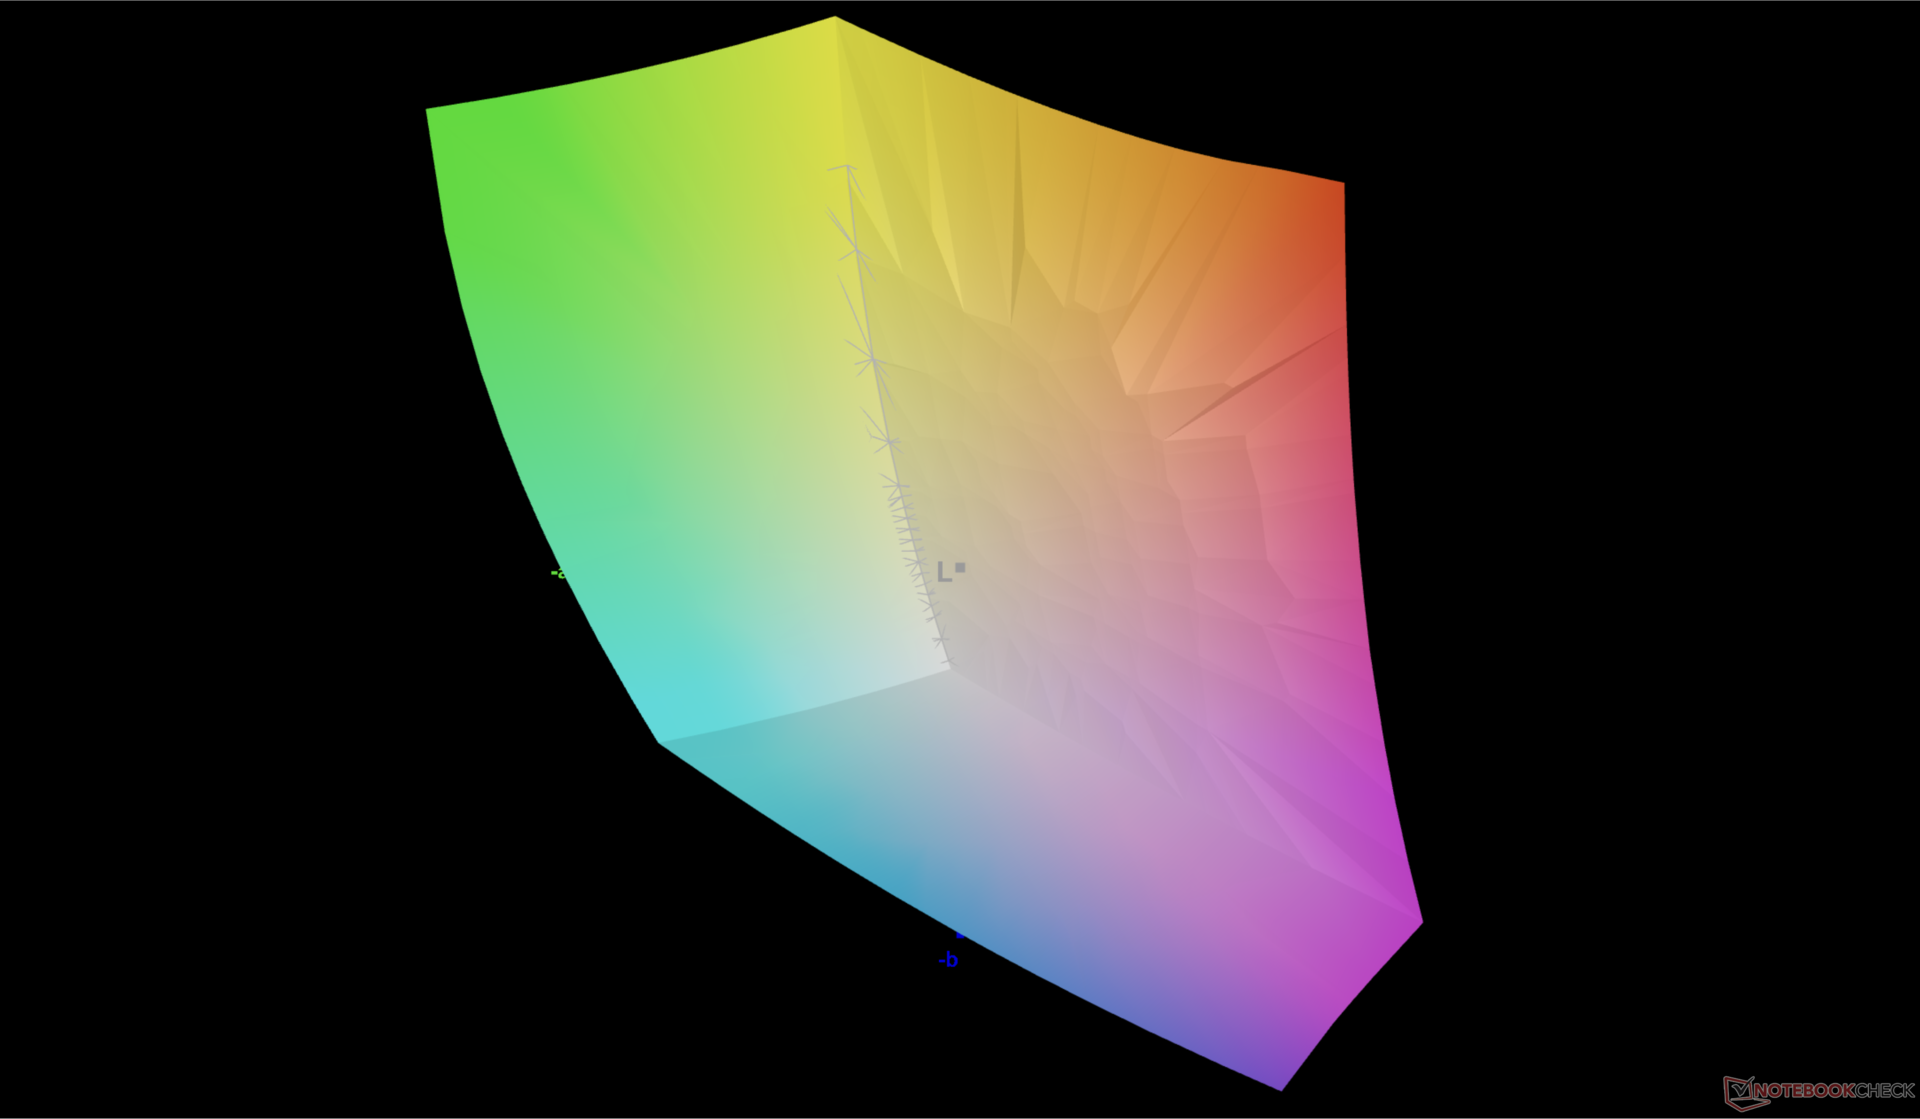
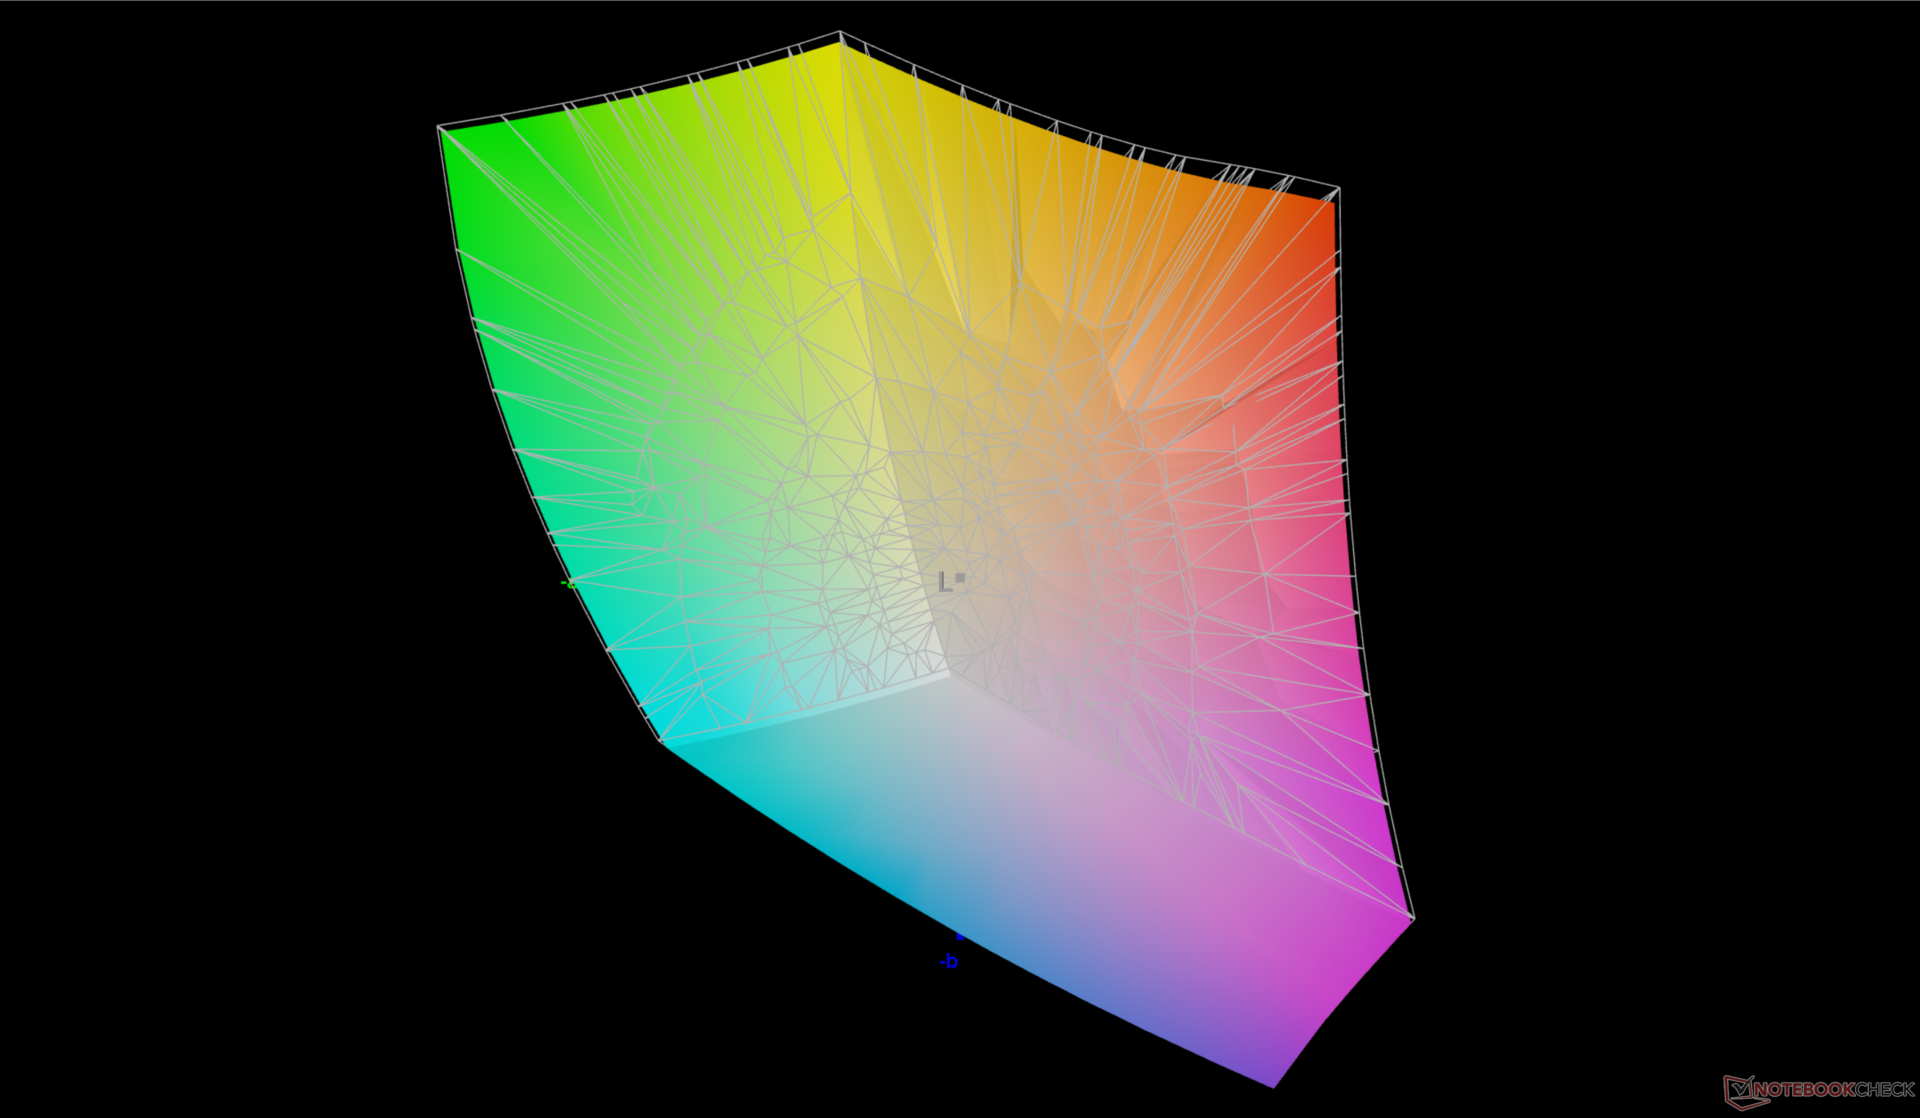
86.3% AdobeRGB 1998 (Argyll 3D)
99.9% sRGB (Argyll 3D)
97.4% Display P3 (Argyll 3D)
Gamma: 2.28
CCT: 6543 K
| HP ZBook Fury 16 G9 BOE0A52, IPS, 3840x2400, 16" | HP ZBook Studio 16 G9 62U04EA BOE0A52, IPS, 3840x2400, 16" | HP ZBook Firefly 16 G9-6B897EA BOE0A02, IPS, 1920x1200, 16" | Lenovo ThinkPad P16 G1 RTX A5500 LP160UQ1-SPB1, IPS, 3840x2400, 16" | Dell Precision 7000 7670 Performance Samsung 160YV03, OLED, 3840x2400, 16" | MSI CreatorPro Z16P B12UKST B160QAN02.N, IPS, 2560x1600, 16" | |
|---|---|---|---|---|---|---|
| Display | 0% | -18% | -2% | 6% | 0% | |
| Display P3 Coverage (%) | 97.4 | 97.5 0% | 68.1 -30% | 82.9 -15% | 99.9 3% | 97.6 0% |
| sRGB Coverage (%) | 99.9 | 99.9 0% | 96.1 -4% | 98.9 -1% | 100 0% | 99.9 0% |
| AdobeRGB 1998 Coverage (%) | 86.3 | 86.3 0% | 70 -19% | 95.9 11% | 98.1 14% | 87.4 1% |
| Response Times | 9% | -206% | -281% | 83% | 11% | |
| Response Time Grey 50% / Grey 80% * (ms) | 13.7 ? | 15.3 ? -12% | 52.8 ? -285% | 45.6 ? -233% | 1.84 ? 87% | 12.8 ? 7% |
| Response Time Black / White * (ms) | 8.6 ? | 6.1 ? 29% | 19.5 ? -127% | 36.8 ? -328% | 1.92 ? 78% | 7.4 ? 14% |
| PWM Frequency (Hz) | 59.52 ? | |||||
| Screen | 18% | -40% | -12% | -61% | 5% | |
| Brightness middle (cd/m²) | 530.5 | 554 4% | 526 -1% | 601.9 13% | 325.2 -39% | 407 -23% |
| Brightness (cd/m²) | 476 | 516 8% | 499 5% | 569 20% | 328 -31% | 388 -18% |
| Brightness Distribution (%) | 83 | 84 1% | 93 12% | 77 -7% | 97 17% | 88 6% |
| Black Level * (cd/m²) | 0.57 | 0.47 18% | 0.31 46% | 0.47 18% | 0.36 37% | |
| Contrast (:1) | 931 | 1179 27% | 1697 82% | 1281 38% | 1131 21% | |
| Colorchecker dE 2000 * | 2.26 | 1 56% | 3.6 -59% | 2.45 -8% | 4.59 -103% | 1.3 42% |
| Colorchecker dE 2000 calibrated * | 4.73 | 0.6 87% | 2.6 45% | 0.7 85% | ||
| Greyscale dE 2000 * | 1 | 1.6 -60% | 5.5 -450% | 2.6 -160% | 2.5 -150% | 2.1 -110% |
| Gamma | 2.28 96% | 2.29 96% | 2.02 109% | 2.3 96% | 2.1 105% | 2.26 97% |
| CCT | 6543 99% | 6458 101% | 6527 100% | 6805 96% | 6541 99% | 6437 101% |
| Colorchecker dE 2000 max. * | 2.4 | 6.6 | 4.46 | 7.65 | 2.5 | |
| Całkowita średnia (program / ustawienia) | 9% /
12% | -88% /
-60% | -98% /
-54% | 9% /
-12% | 5% /
5% |
* ... im mniej tym lepiej
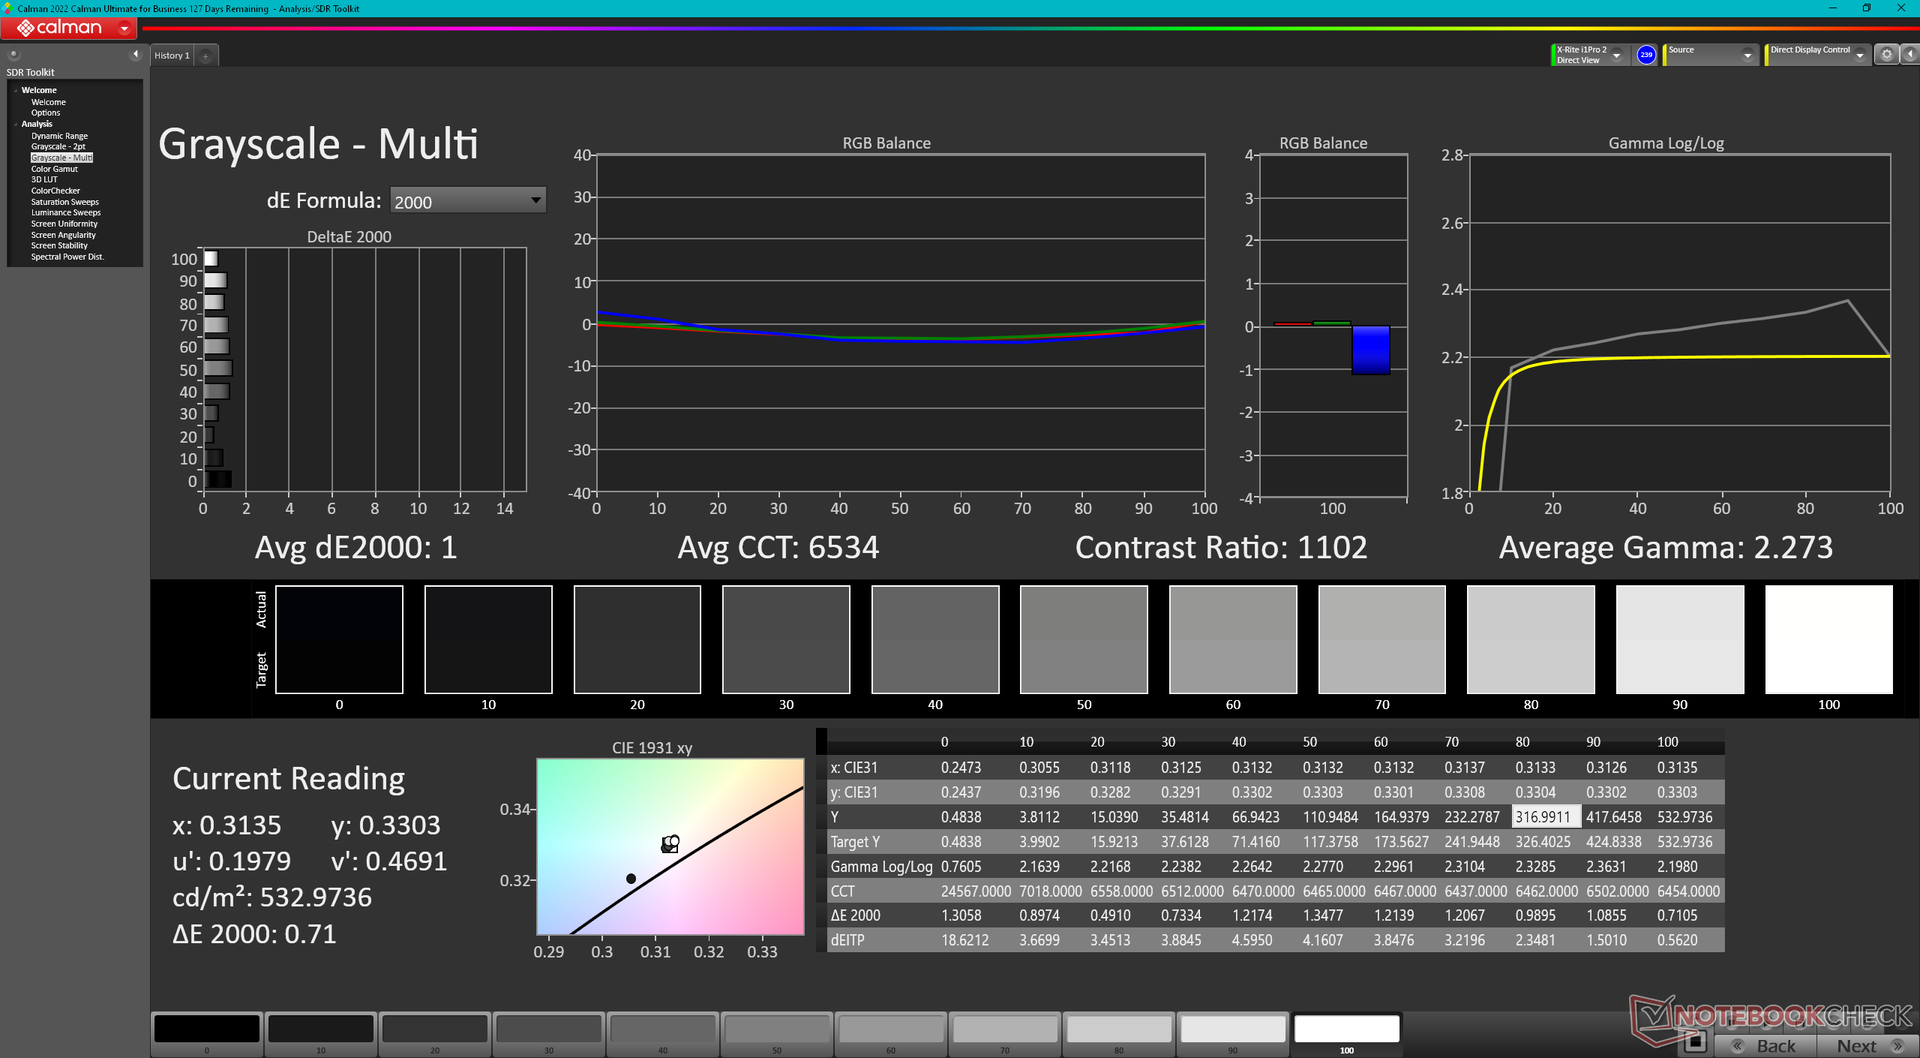
Wyświetlacz jest skalibrowany po wyjęciu z pudełka zgodnie ze standardem P3 ze średnimi wartościami DeltaE w skali szarości i koloru wynoszącymi odpowiednio zaledwie 1,0 i 2,26.
Wyświetl czasy reakcji
| ↔ Czas reakcji od czerni do bieli | ||
|---|---|---|
| 8.6 ms ... wzrost ↗ i spadek ↘ łącznie | ↗ 4.7 ms wzrost | 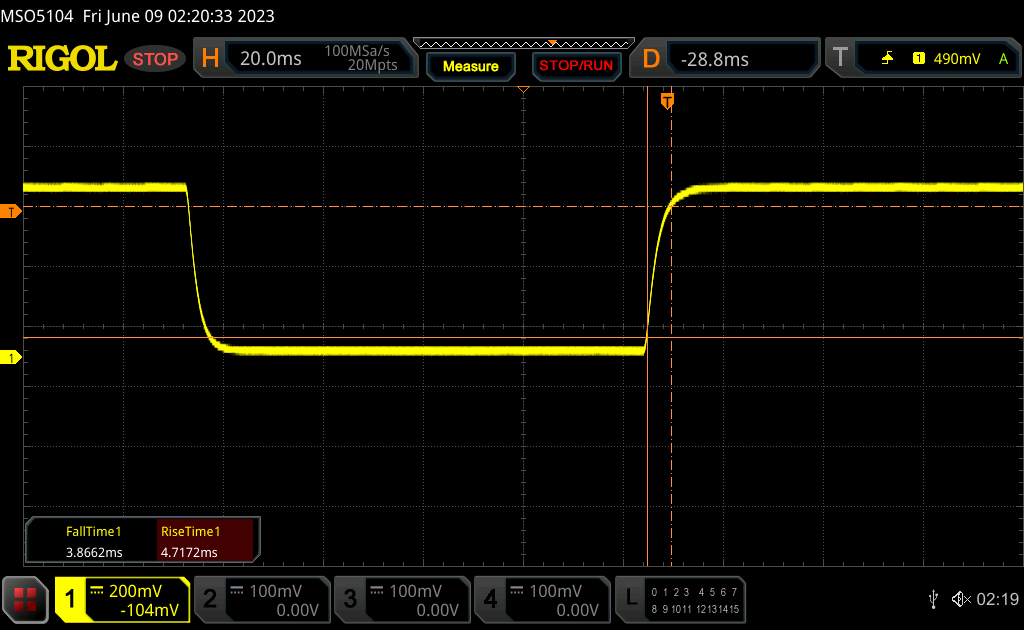 |
| ↘ 3.9 ms upadek | ||
| W naszych testach ekran wykazuje szybki czas reakcji i powinien nadawać się do gier. Dla porównania, wszystkie testowane urządzenia wahają się od 0.1 (minimum) do 240 (maksimum) ms. » 24 % wszystkich urządzeń jest lepszych. Oznacza to, że zmierzony czas reakcji jest lepszy od średniej wszystkich testowanych urządzeń (19.9 ms). | ||
| ↔ Czas reakcji 50% szarości do 80% szarości | ||
| 13.7 ms ... wzrost ↗ i spadek ↘ łącznie | ↗ 6.6 ms wzrost | 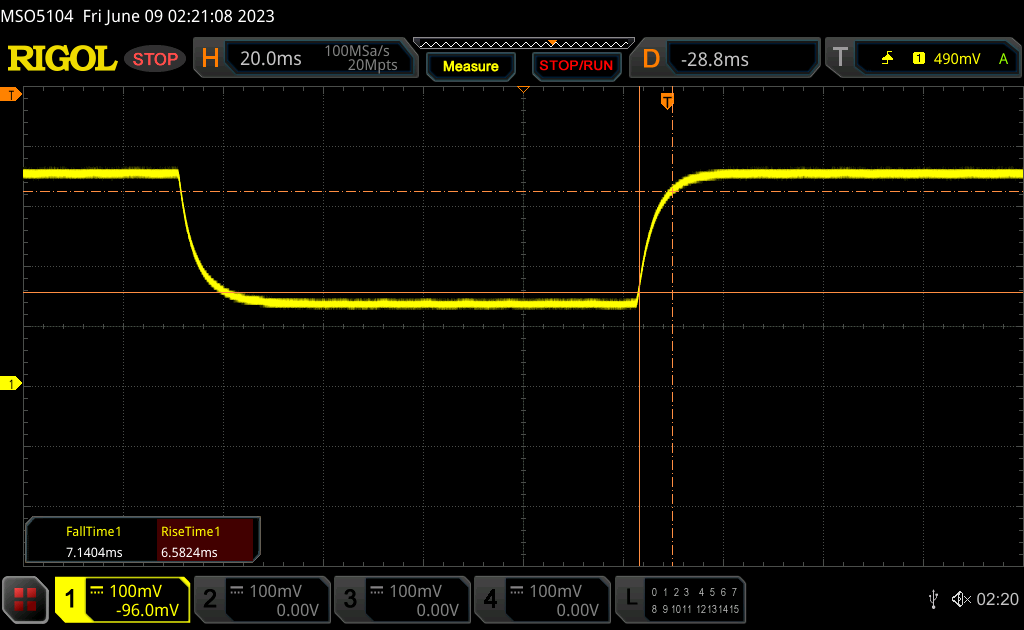 |
| ↘ 7.1 ms upadek | ||
| W naszych testach ekran wykazuje dobry współczynnik reakcji, ale może być zbyt wolny dla graczy rywalizujących ze sobą. Dla porównania, wszystkie testowane urządzenia wahają się od 0.165 (minimum) do 636 (maksimum) ms. » 27 % wszystkich urządzeń jest lepszych. Oznacza to, że zmierzony czas reakcji jest lepszy od średniej wszystkich testowanych urządzeń (31.1 ms). | ||
Migotanie ekranu / PWM (modulacja szerokości impulsu)
| Migotanie ekranu/nie wykryto PWM | 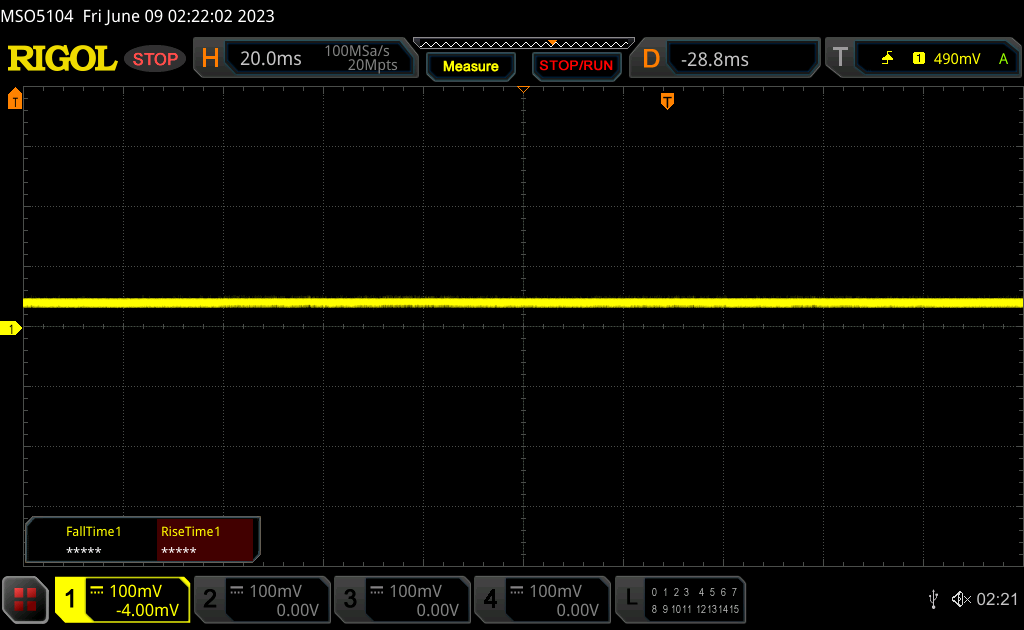 | ||
Dla porównania: 52 % wszystkich testowanych urządzeń nie używa PWM do przyciemniania wyświetlacza. Jeśli wykryto PWM, zmierzono średnio 7794 (minimum: 5 - maksimum: 343500) Hz. | |||
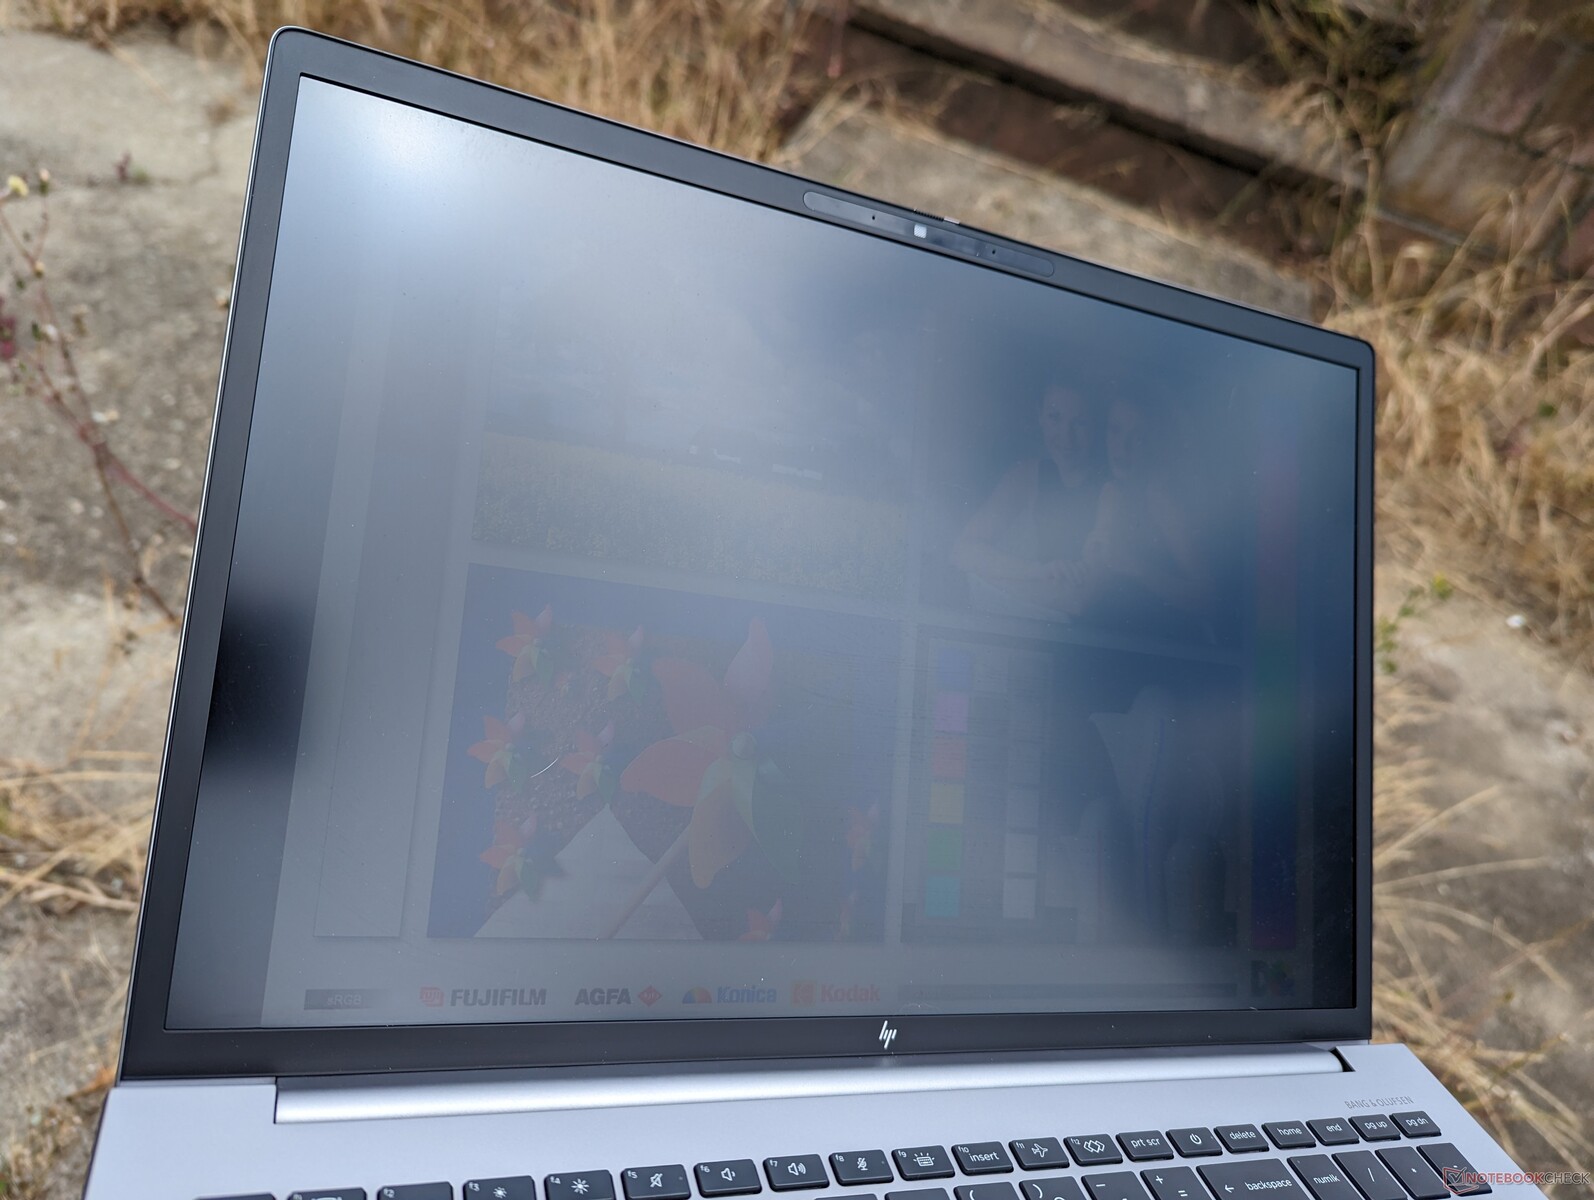
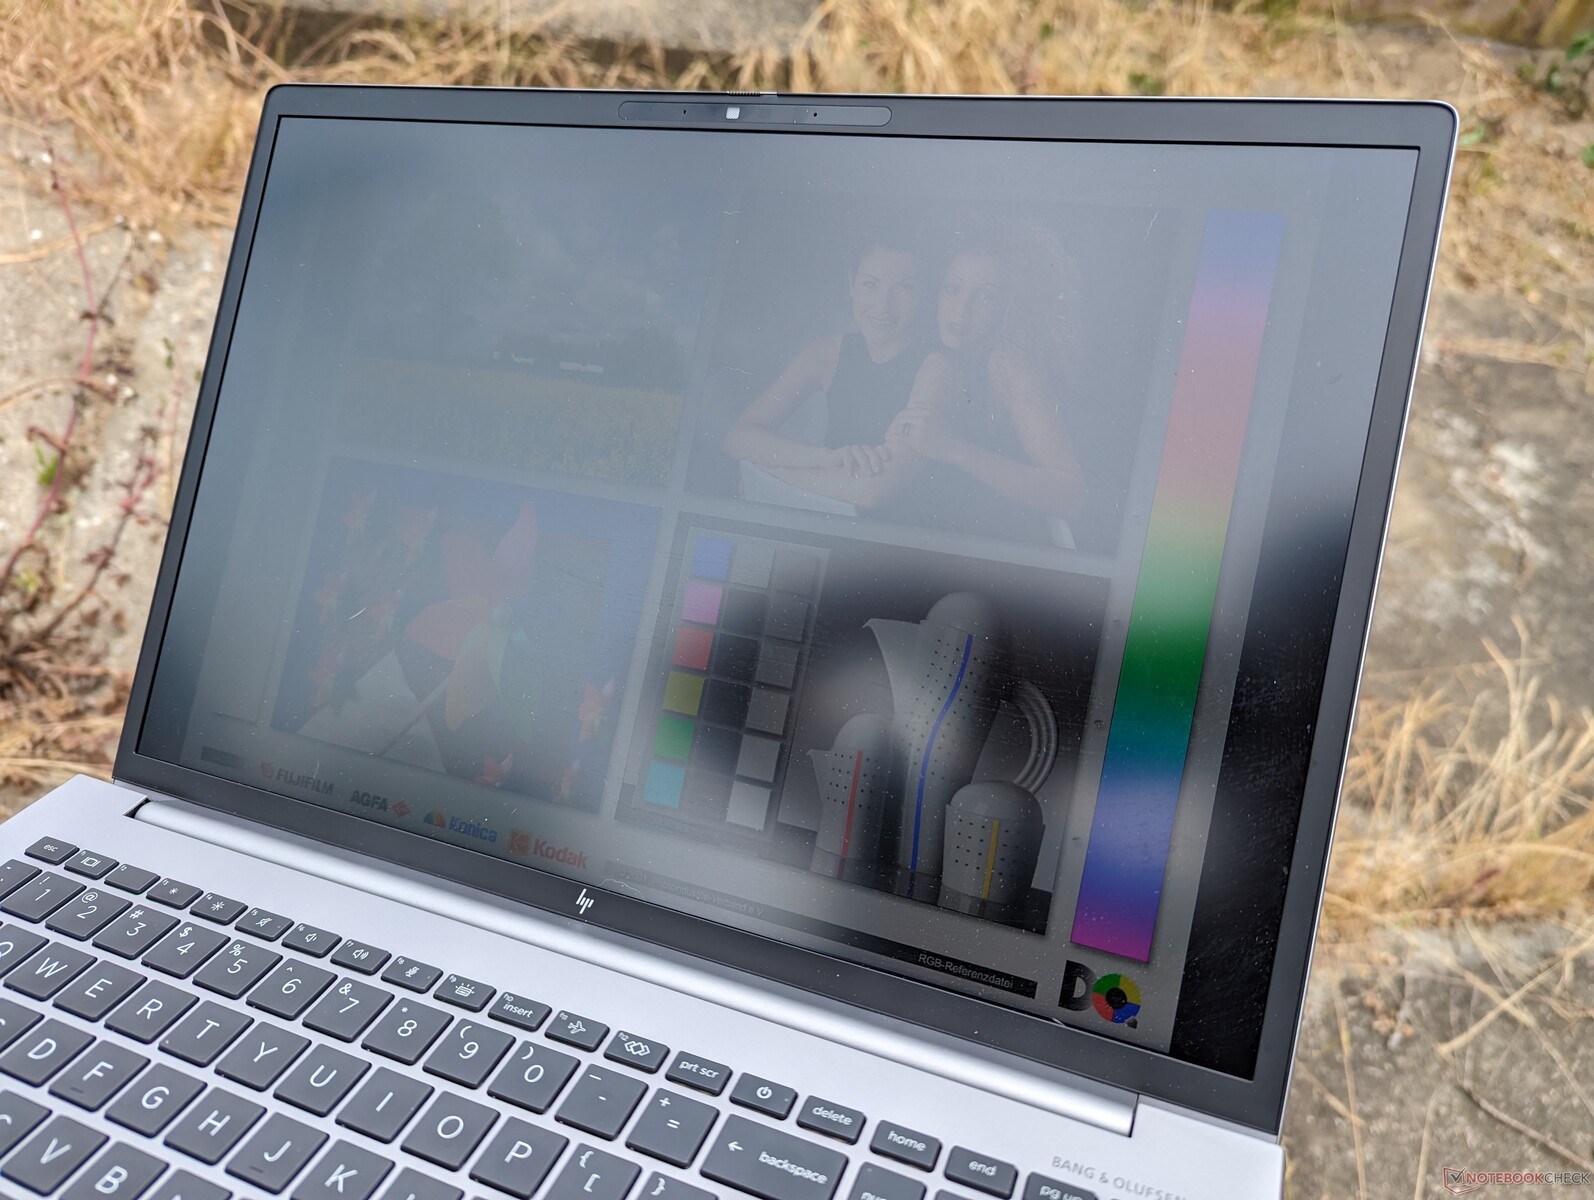
Widoczność na zewnątrz jest przyzwoita w cieniu i porównywalna z wieloma konsumenckimi Ultrabookami, ponieważ 400 nitów jest powszechnym celem. HP oferuje znacznie jaśniejszą opcję 1000 nitów, jeśli widoczność na zewnątrz jest priorytetem, ale panele są ograniczone do IPS i rozdzielczości tylko 1920 x 1200.
Warto zauważyć, że funkcja oszczędzania energii wyświetlacza jest domyślnie włączona, co oznacza, że maksymalna jasność wyświetlacza spadnie nawet o 80 nitów, jeśli będzie on działał na zasilaniu bateryjnym. Aby temu zapobiec, należy uruchomić Intel Graphics Command Center i przejść do podmenu System i Power, aby wyłączyć Display Power Savings.
Wydajność - 12. generacja Intel Alder Lake-H z Nvidia RTX Ampere
Warunki testowania
Przed uruchomieniem poniższych testów ustawiliśmy naszą jednostkę na tryb wydajności. HP nie oferuje żadnych dodatkowych profili zasilania poza standardowymi dla systemu Windows, a zaawansowane funkcje, takie jak Optimus 2.0 lub MUX, nie są obsługiwane.
Zaleca się, aby użytkownicy zapoznali się z MyHP i Z Light Space, aby uzyskać odpowiednio aktualizacje oprogramowania HP i ustawienia klawiatury RGB.
Procesor
Procesor 12. generacji Core i9-12950HX był jednym z najszybszych procesorów mobilnych dostępnych z obsługą technologii vPro i ECC aż do premiery 13. generacji Core i9-13950HX. Jeśli chodzi o opcje 13. generacji, niedawno rozpoczęła się wysyłka Fury 16 G10.
Procesor w naszym HP osiąga nieco gorsze wyniki o około 5 procent w porównaniu do przeciętnego laptopa w naszej bazie danych wyposażonego w ten sam procesor Core i9-12950HX. Co gorsza, procesor wydaje się dławić bardziej gwałtownie, gdy jest poddawany długim okresom stresu. Na przykład podczas uruchamiania CineBench R15 xT w pętli, wydajność spadłaby o około 20 procent po siódmej lub ósmej pętli. ThinkPad P16 G1 doświadcza płytszego stopnia dławienia procesora, co pokazuje poniższy wykres porównawczy
.Oczekuje się, że przejście na konfigurację Core i7-12850HX z naszego Core i9-12950HX wpłynie na wydajność zarówno jedno-, jak i wielowątkową o około 15 do 20 procent
.Cinebench R15 Multi Loop
Cinebench R23: Multi Core | Single Core
Cinebench R20: CPU (Multi Core) | CPU (Single Core)
Cinebench R15: CPU Multi 64Bit | CPU Single 64Bit
Blender: v2.79 BMW27 CPU
7-Zip 18.03: 7z b 4 | 7z b 4 -mmt1
Geekbench 5.5: Multi-Core | Single-Core
HWBOT x265 Benchmark v2.2: 4k Preset
LibreOffice : 20 Documents To PDF
R Benchmark 2.5: Overall mean
* ... im mniej tym lepiej
AIDA64: FP32 Ray-Trace | FPU Julia | CPU SHA3 | CPU Queen | FPU SinJulia | FPU Mandel | CPU AES | CPU ZLib | FP64 Ray-Trace | CPU PhotoWorxx
| Performance rating | |
| Przeciętny Intel Core i9-12950HX | |
| Lenovo ThinkPad P16 G1 RTX A5500 | |
| HP ZBook Fury 16 G9 | |
| MSI CreatorPro Z16P B12UKST | |
| HP ZBook Studio 16 G9 62U04EA | |
| Dell Precision 7000 7670 Performance | |
| HP ZBook Firefly 16 G9-6B897EA | |
| AIDA64 / FP32 Ray-Trace | |
| Lenovo ThinkPad P16 G1 RTX A5500 | |
| Przeciętny Intel Core i9-12950HX (15499 - 22868, n=7) | |
| HP ZBook Fury 16 G9 | |
| Dell Precision 7000 7670 Performance | |
| HP ZBook Studio 16 G9 62U04EA | |
| MSI CreatorPro Z16P B12UKST | |
| HP ZBook Firefly 16 G9-6B897EA | |
| AIDA64 / FPU Julia | |
| HP ZBook Fury 16 G9 | |
| Lenovo ThinkPad P16 G1 RTX A5500 | |
| Przeciętny Intel Core i9-12950HX (77846 - 115907, n=7) | |
| HP ZBook Studio 16 G9 62U04EA | |
| Dell Precision 7000 7670 Performance | |
| MSI CreatorPro Z16P B12UKST | |
| HP ZBook Firefly 16 G9-6B897EA | |
| AIDA64 / CPU SHA3 | |
| Lenovo ThinkPad P16 G1 RTX A5500 | |
| Przeciętny Intel Core i9-12950HX (3426 - 5069, n=7) | |
| HP ZBook Fury 16 G9 | |
| HP ZBook Studio 16 G9 62U04EA | |
| MSI CreatorPro Z16P B12UKST | |
| Dell Precision 7000 7670 Performance | |
| HP ZBook Firefly 16 G9-6B897EA | |
| AIDA64 / CPU Queen | |
| HP ZBook Studio 16 G9 62U04EA | |
| Przeciętny Intel Core i9-12950HX (102752 - 104726, n=7) | |
| Lenovo ThinkPad P16 G1 RTX A5500 | |
| Dell Precision 7000 7670 Performance | |
| HP ZBook Fury 16 G9 | |
| MSI CreatorPro Z16P B12UKST | |
| HP ZBook Firefly 16 G9-6B897EA | |
| AIDA64 / FPU SinJulia | |
| Lenovo ThinkPad P16 G1 RTX A5500 | |
| HP ZBook Fury 16 G9 | |
| Przeciętny Intel Core i9-12950HX (10134 - 12823, n=7) | |
| Dell Precision 7000 7670 Performance | |
| HP ZBook Studio 16 G9 62U04EA | |
| MSI CreatorPro Z16P B12UKST | |
| HP ZBook Firefly 16 G9-6B897EA | |
| AIDA64 / FPU Mandel | |
| HP ZBook Fury 16 G9 | |
| Lenovo ThinkPad P16 G1 RTX A5500 | |
| Przeciętny Intel Core i9-12950HX (37146 - 57340, n=7) | |
| HP ZBook Studio 16 G9 62U04EA | |
| Dell Precision 7000 7670 Performance | |
| MSI CreatorPro Z16P B12UKST | |
| HP ZBook Firefly 16 G9-6B897EA | |
| AIDA64 / CPU AES | |
| MSI CreatorPro Z16P B12UKST | |
| Przeciętny Intel Core i9-12950HX (72599 - 181128, n=7) | |
| HP ZBook Fury 16 G9 | |
| Lenovo ThinkPad P16 G1 RTX A5500 | |
| HP ZBook Studio 16 G9 62U04EA | |
| Dell Precision 7000 7670 Performance | |
| HP ZBook Firefly 16 G9-6B897EA | |
| AIDA64 / CPU ZLib | |
| Lenovo ThinkPad P16 G1 RTX A5500 | |
| HP ZBook Fury 16 G9 | |
| Przeciętny Intel Core i9-12950HX (996 - 1417, n=7) | |
| HP ZBook Studio 16 G9 62U04EA | |
| MSI CreatorPro Z16P B12UKST | |
| Dell Precision 7000 7670 Performance | |
| HP ZBook Firefly 16 G9-6B897EA | |
| AIDA64 / FP64 Ray-Trace | |
| Lenovo ThinkPad P16 G1 RTX A5500 | |
| Przeciętny Intel Core i9-12950HX (8455 - 12432, n=7) | |
| HP ZBook Fury 16 G9 | |
| HP ZBook Studio 16 G9 62U04EA | |
| Dell Precision 7000 7670 Performance | |
| MSI CreatorPro Z16P B12UKST | |
| HP ZBook Firefly 16 G9-6B897EA | |
| AIDA64 / CPU PhotoWorxx | |
| MSI CreatorPro Z16P B12UKST | |
| Dell Precision 7000 7670 Performance | |
| Przeciętny Intel Core i9-12950HX (35479 - 42655, n=7) | |
| Lenovo ThinkPad P16 G1 RTX A5500 | |
| HP ZBook Fury 16 G9 | |
| HP ZBook Studio 16 G9 62U04EA | |
| HP ZBook Firefly 16 G9-6B897EA | |
Wydajność systemu
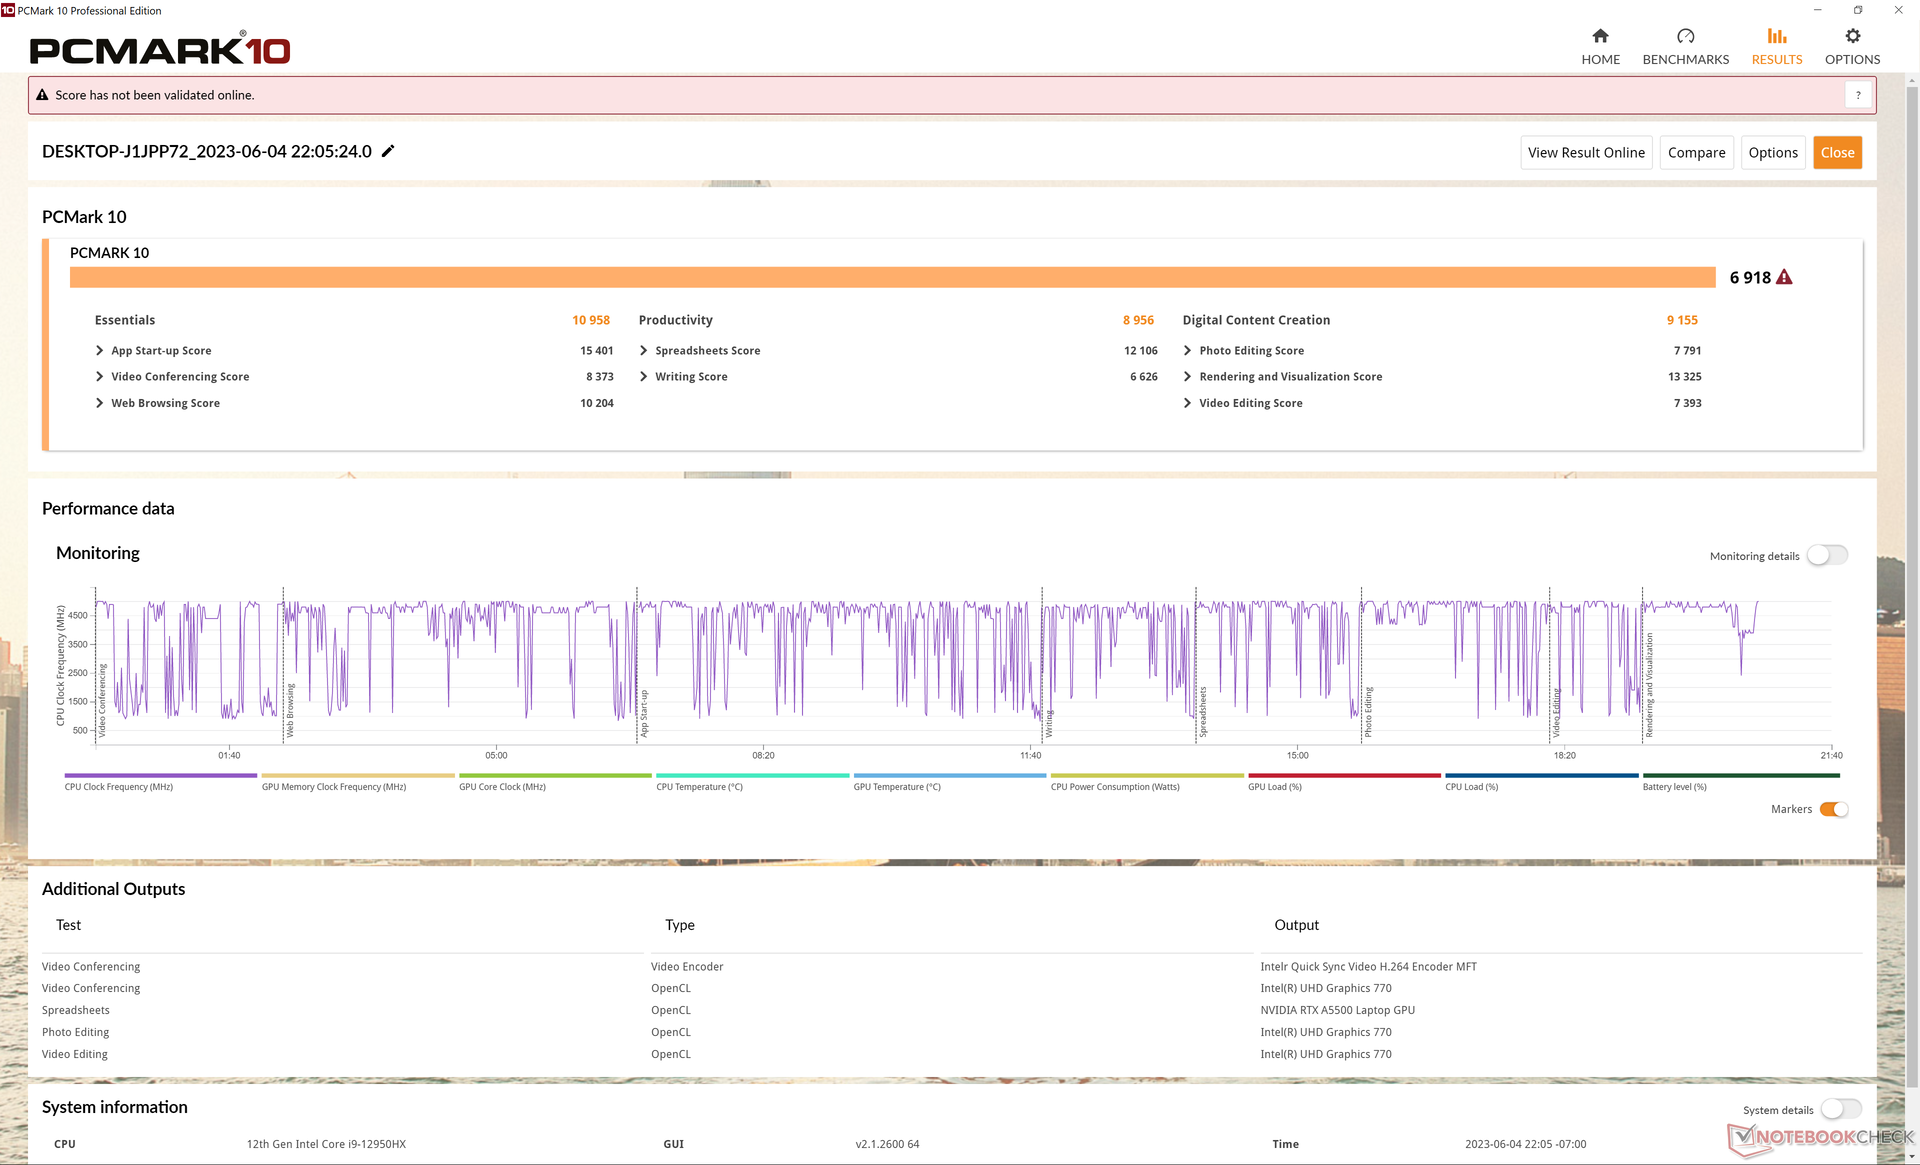
Wyniki PCMark są porównywalne zarówno z Dell Precision 7670, jak i Lenovo ThinkPad P16 G1. Warto zwrócić uwagę na znaczną przewagę nad mniejszym ZBook Firefly 16 G9 w podteście Digital Content Creation ze względu na szybszy procesor graficzny RTX A5500 w naszym Fury 16 G9.
CrossMark: Overall | Productivity | Creativity | Responsiveness
| PCMark 10 / Score | |
| Lenovo ThinkPad P16 G1 RTX A5500 | |
| MSI CreatorPro Z16P B12UKST | |
| Przeciętny Intel Core i9-12950HX, NVIDIA RTX A5500 Laptop GPU (6883 - 7236, n=3) | |
| HP ZBook Fury 16 G9 | |
| Dell Precision 7000 7670 Performance | |
| HP ZBook Studio 16 G9 62U04EA | |
| HP ZBook Firefly 16 G9-6B897EA | |
| PCMark 10 / Essentials | |
| Dell Precision 7000 7670 Performance | |
| Przeciętny Intel Core i9-12950HX, NVIDIA RTX A5500 Laptop GPU (10898 - 11465, n=3) | |
| HP ZBook Fury 16 G9 | |
| Lenovo ThinkPad P16 G1 RTX A5500 | |
| MSI CreatorPro Z16P B12UKST | |
| HP ZBook Firefly 16 G9-6B897EA | |
| HP ZBook Studio 16 G9 62U04EA | |
| PCMark 10 / Productivity | |
| Lenovo ThinkPad P16 G1 RTX A5500 | |
| MSI CreatorPro Z16P B12UKST | |
| HP ZBook Fury 16 G9 | |
| Przeciętny Intel Core i9-12950HX, NVIDIA RTX A5500 Laptop GPU (8054 - 9489, n=3) | |
| HP ZBook Firefly 16 G9-6B897EA | |
| Dell Precision 7000 7670 Performance | |
| HP ZBook Studio 16 G9 62U04EA | |
| PCMark 10 / Digital Content Creation | |
| Lenovo ThinkPad P16 G1 RTX A5500 | |
| MSI CreatorPro Z16P B12UKST | |
| Dell Precision 7000 7670 Performance | |
| Przeciętny Intel Core i9-12950HX, NVIDIA RTX A5500 Laptop GPU (9155 - 9944, n=3) | |
| HP ZBook Studio 16 G9 62U04EA | |
| HP ZBook Fury 16 G9 | |
| HP ZBook Firefly 16 G9-6B897EA | |
| CrossMark / Overall | |
| MSI CreatorPro Z16P B12UKST | |
| HP ZBook Fury 16 G9 | |
| Lenovo ThinkPad P16 G1 RTX A5500 | |
| Przeciętny Intel Core i9-12950HX, NVIDIA RTX A5500 Laptop GPU (1801 - 1889, n=3) | |
| HP ZBook Studio 16 G9 62U04EA | |
| Dell Precision 7000 7670 Performance | |
| HP ZBook Firefly 16 G9-6B897EA | |
| CrossMark / Productivity | |
| MSI CreatorPro Z16P B12UKST | |
| HP ZBook Fury 16 G9 | |
| Lenovo ThinkPad P16 G1 RTX A5500 | |
| Przeciętny Intel Core i9-12950HX, NVIDIA RTX A5500 Laptop GPU (1684 - 1785, n=3) | |
| HP ZBook Studio 16 G9 62U04EA | |
| Dell Precision 7000 7670 Performance | |
| HP ZBook Firefly 16 G9-6B897EA | |
| CrossMark / Creativity | |
| Lenovo ThinkPad P16 G1 RTX A5500 | |
| HP ZBook Fury 16 G9 | |
| Przeciętny Intel Core i9-12950HX, NVIDIA RTX A5500 Laptop GPU (2042 - 2192, n=3) | |
| HP ZBook Studio 16 G9 62U04EA | |
| MSI CreatorPro Z16P B12UKST | |
| Dell Precision 7000 7670 Performance | |
| HP ZBook Firefly 16 G9-6B897EA | |
| CrossMark / Responsiveness | |
| MSI CreatorPro Z16P B12UKST | |
| HP ZBook Fury 16 G9 | |
| HP ZBook Studio 16 G9 62U04EA | |
| Przeciętny Intel Core i9-12950HX, NVIDIA RTX A5500 Laptop GPU (1501 - 1585, n=3) | |
| Dell Precision 7000 7670 Performance | |
| Lenovo ThinkPad P16 G1 RTX A5500 | |
| HP ZBook Firefly 16 G9-6B897EA | |
| PCMark 10 Score | 6918 pkt. | |
Pomoc | ||
| AIDA64 / Memory Copy | |
| Dell Precision 7000 7670 Performance | |
| Przeciętny Intel Core i9-12950HX (59731 - 64732, n=7) | |
| Lenovo ThinkPad P16 G1 RTX A5500 | |
| MSI CreatorPro Z16P B12UKST | |
| HP ZBook Studio 16 G9 62U04EA | |
| HP ZBook Fury 16 G9 | |
| HP ZBook Firefly 16 G9-6B897EA | |
| AIDA64 / Memory Read | |
| Dell Precision 7000 7670 Performance | |
| Przeciętny Intel Core i9-12950HX (59744 - 70359, n=7) | |
| MSI CreatorPro Z16P B12UKST | |
| HP ZBook Studio 16 G9 62U04EA | |
| Lenovo ThinkPad P16 G1 RTX A5500 | |
| HP ZBook Fury 16 G9 | |
| HP ZBook Firefly 16 G9-6B897EA | |
| AIDA64 / Memory Write | |
| MSI CreatorPro Z16P B12UKST | |
| Dell Precision 7000 7670 Performance | |
| HP ZBook Studio 16 G9 62U04EA | |
| Przeciętny Intel Core i9-12950HX (57750 - 67899, n=7) | |
| HP ZBook Firefly 16 G9-6B897EA | |
| Lenovo ThinkPad P16 G1 RTX A5500 | |
| HP ZBook Fury 16 G9 | |
| AIDA64 / Memory Latency | |
| MSI CreatorPro Z16P B12UKST | |
| HP ZBook Fury 16 G9 | |
| Lenovo ThinkPad P16 G1 RTX A5500 | |
| HP ZBook Firefly 16 G9-6B897EA | |
| HP ZBook Studio 16 G9 62U04EA | |
| Przeciętny Intel Core i9-12950HX (84.5 - 92.2, n=7) | |
| Dell Precision 7000 7670 Performance | |
* ... im mniej tym lepiej
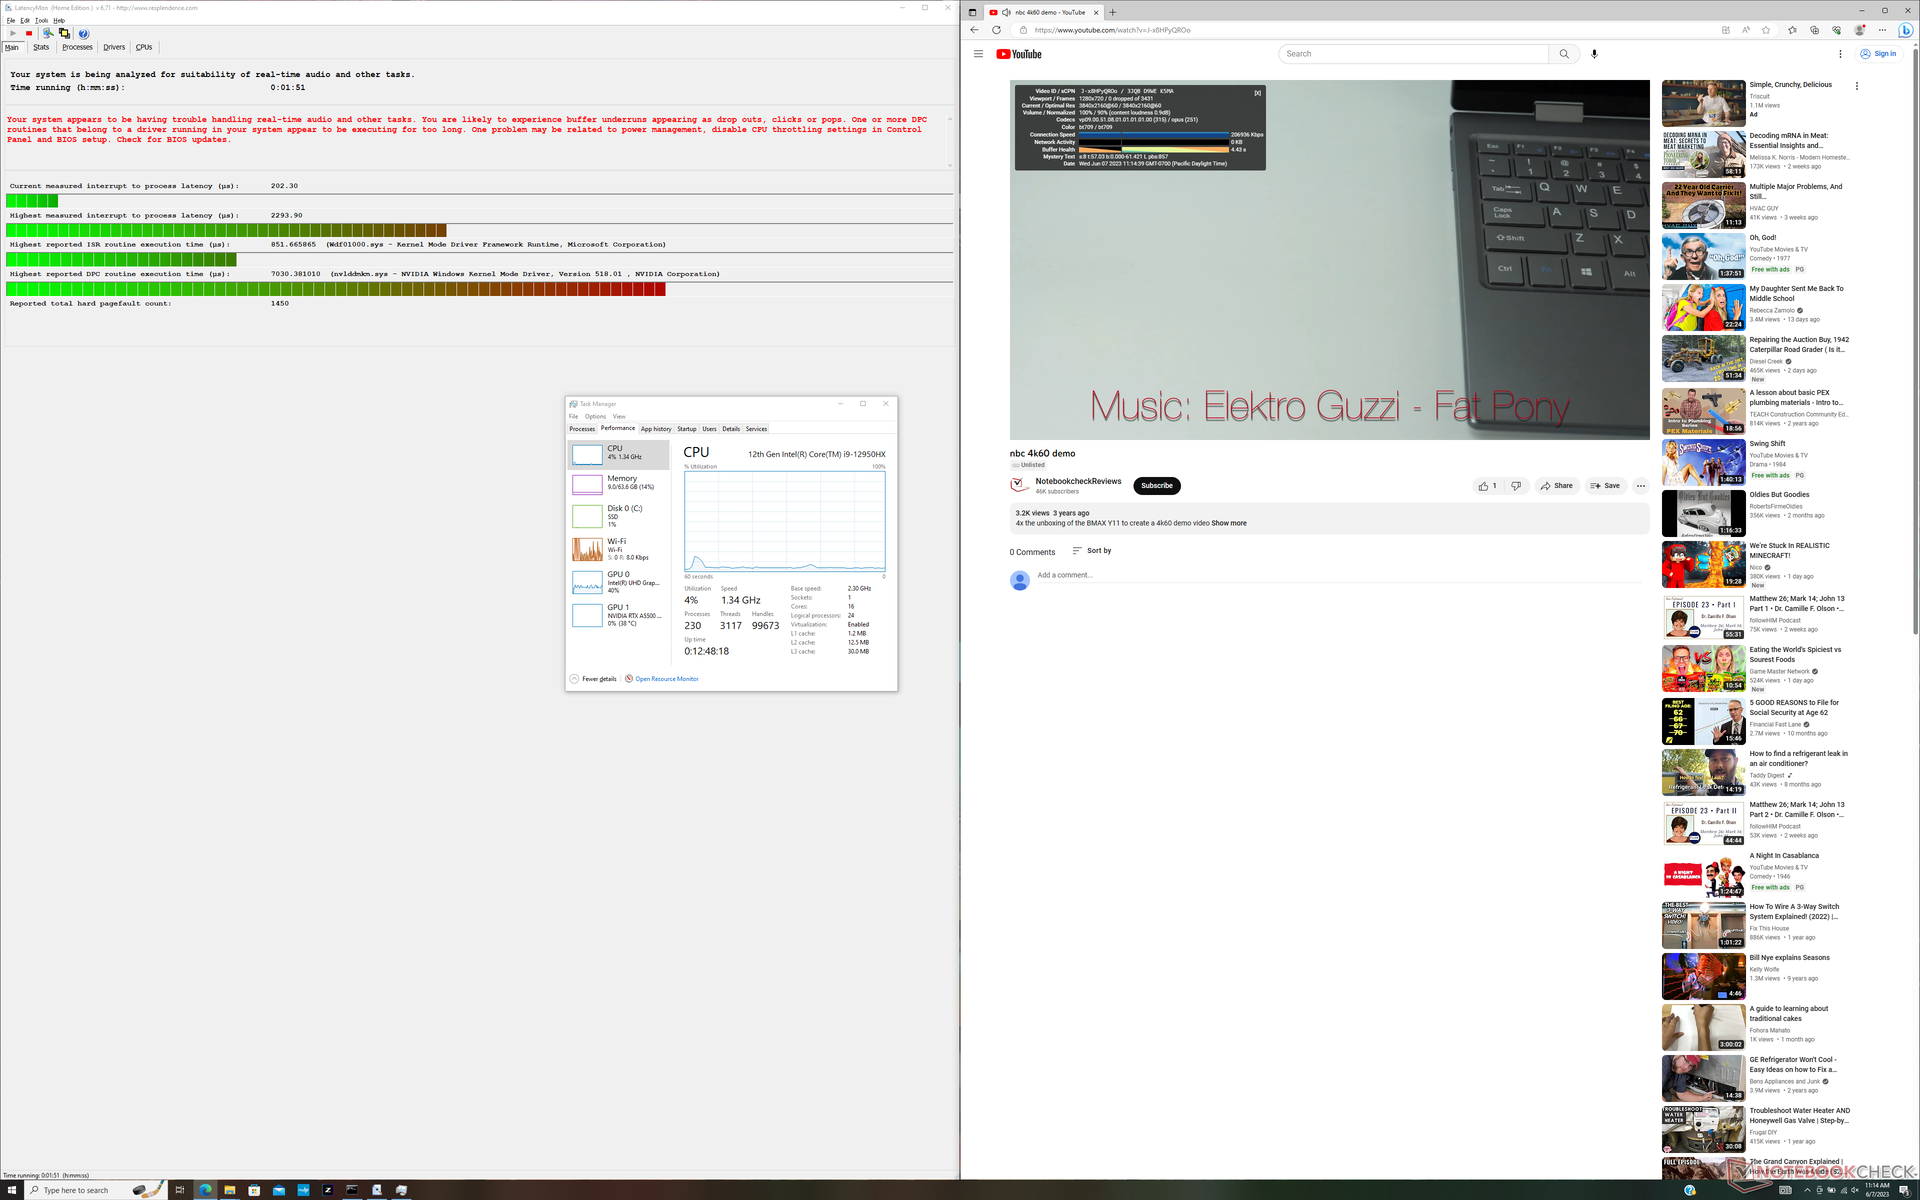
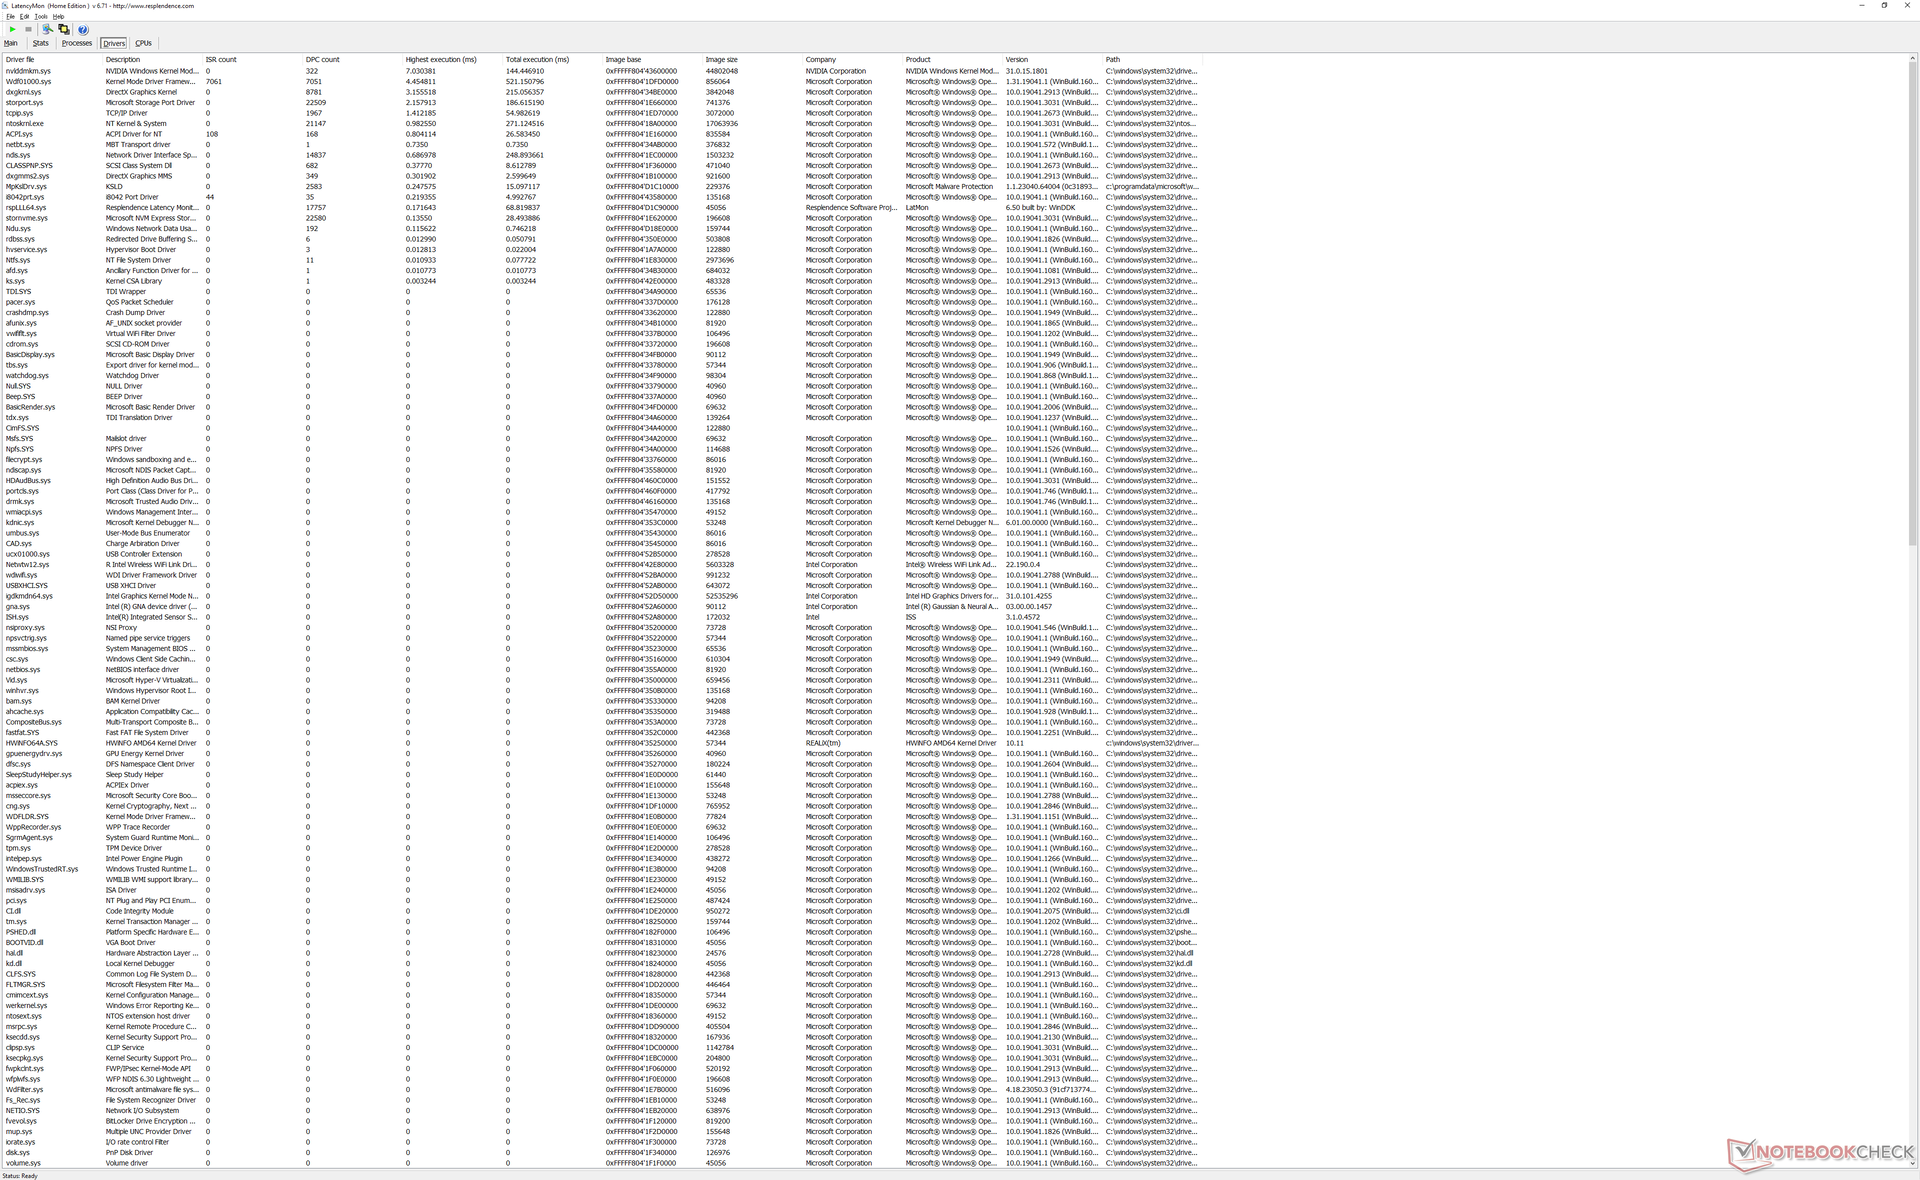
Opóźnienie DPC
LatencyMon ujawnia problemy z DPC podczas otwierania wielu kart przeglądarki na naszej stronie głównej. odtwarzanie wideo 4K przy 60 FPS jest poza tym idealne, z zerową liczbą utraconych klatek podczas testów.
| DPC Latencies / LatencyMon - interrupt to process latency (max), Web, Youtube, Prime95 | |
| HP ZBook Fury 16 G9 | |
| Dell Precision 7000 7670 Performance | |
| Lenovo ThinkPad P16 G1 RTX A5500 | |
| HP ZBook Studio 16 G9 62U04EA | |
| HP ZBook Firefly 16 G9-6B897EA | |
| MSI CreatorPro Z16P B12UKST | |
* ... im mniej tym lepiej
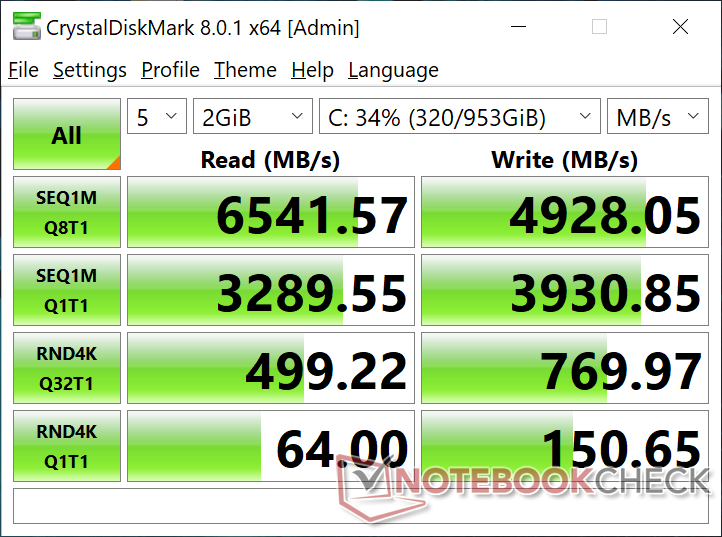
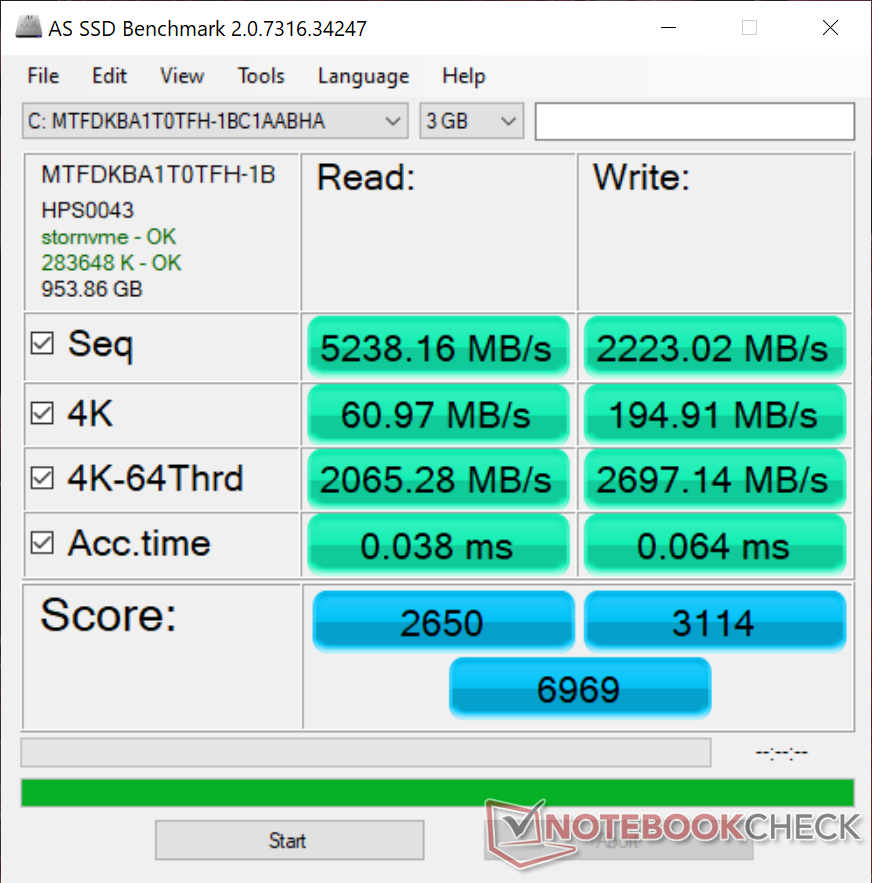
Urządzenia pamięci masowej - potencjalne ograniczenie wydajności
Nasza jednostka testowa jest dostarczana z tym samym dyskiem 1 TBMicron 3400 MTFDKBA1T0TFH SSD, który można znaleźć wLenovo ThinkPad X1 Extreme G5. Niestety, dysk SSD w naszym HP wydaje się cierpieć z powodu poważnych problemów z dławieniem wydajności, co pokazuje poniższy wykres porównawczy. Podczas uruchamiania DiskSpd w pętli, prędkość transferu czasami spadała z 6500 MB/s do nawet 1700 MB/s, podczas gdy ten sam dysk w Lenovo działał z prędkością 6500 MB/s w nieskończoność. Sugeruje to, że Fury 16 może mieć problemy z chłodzeniem dysków SSD. Wyniki nie uległy poprawie nawet po wielokrotnym powtórzeniu testów.

* ... im mniej tym lepiej
Disk Throttling: DiskSpd Read Loop, Queue Depth 8
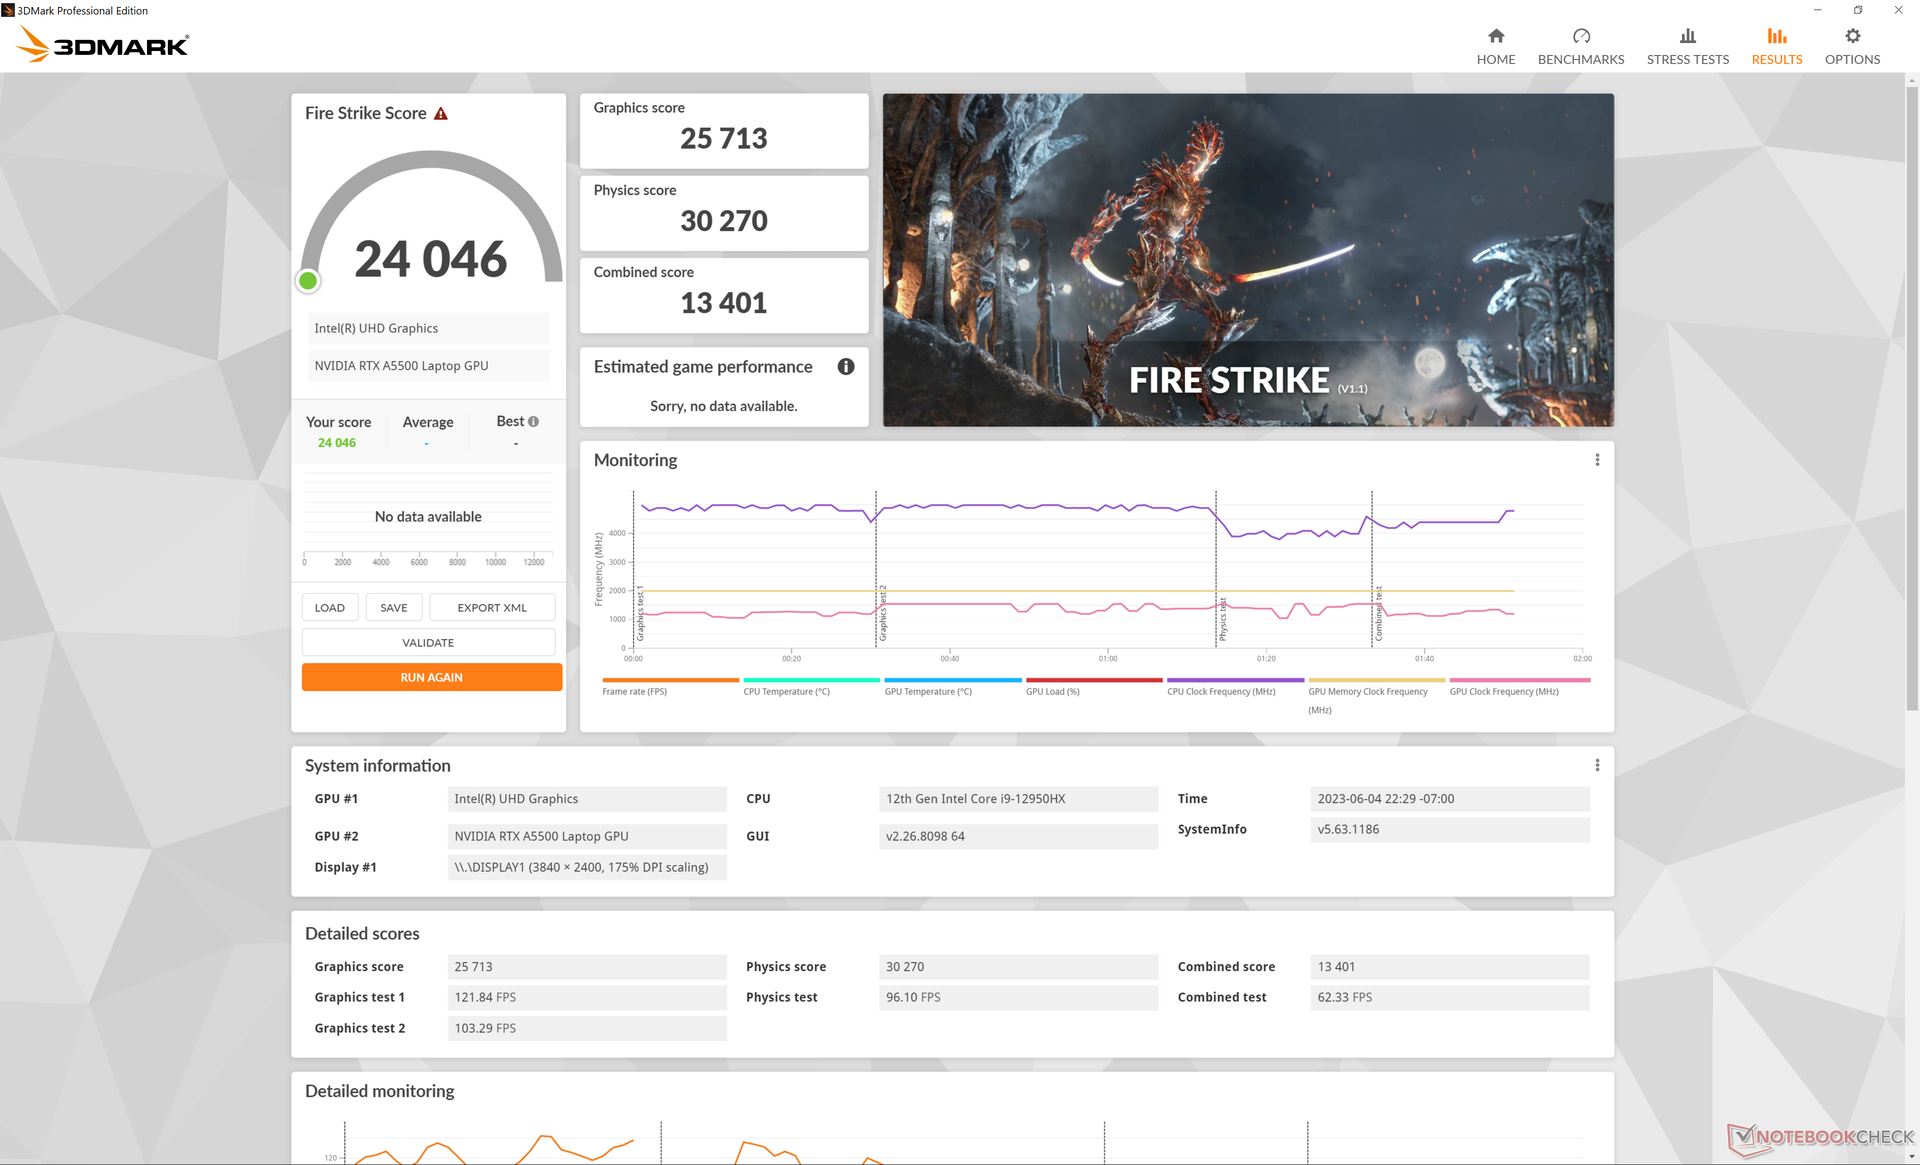
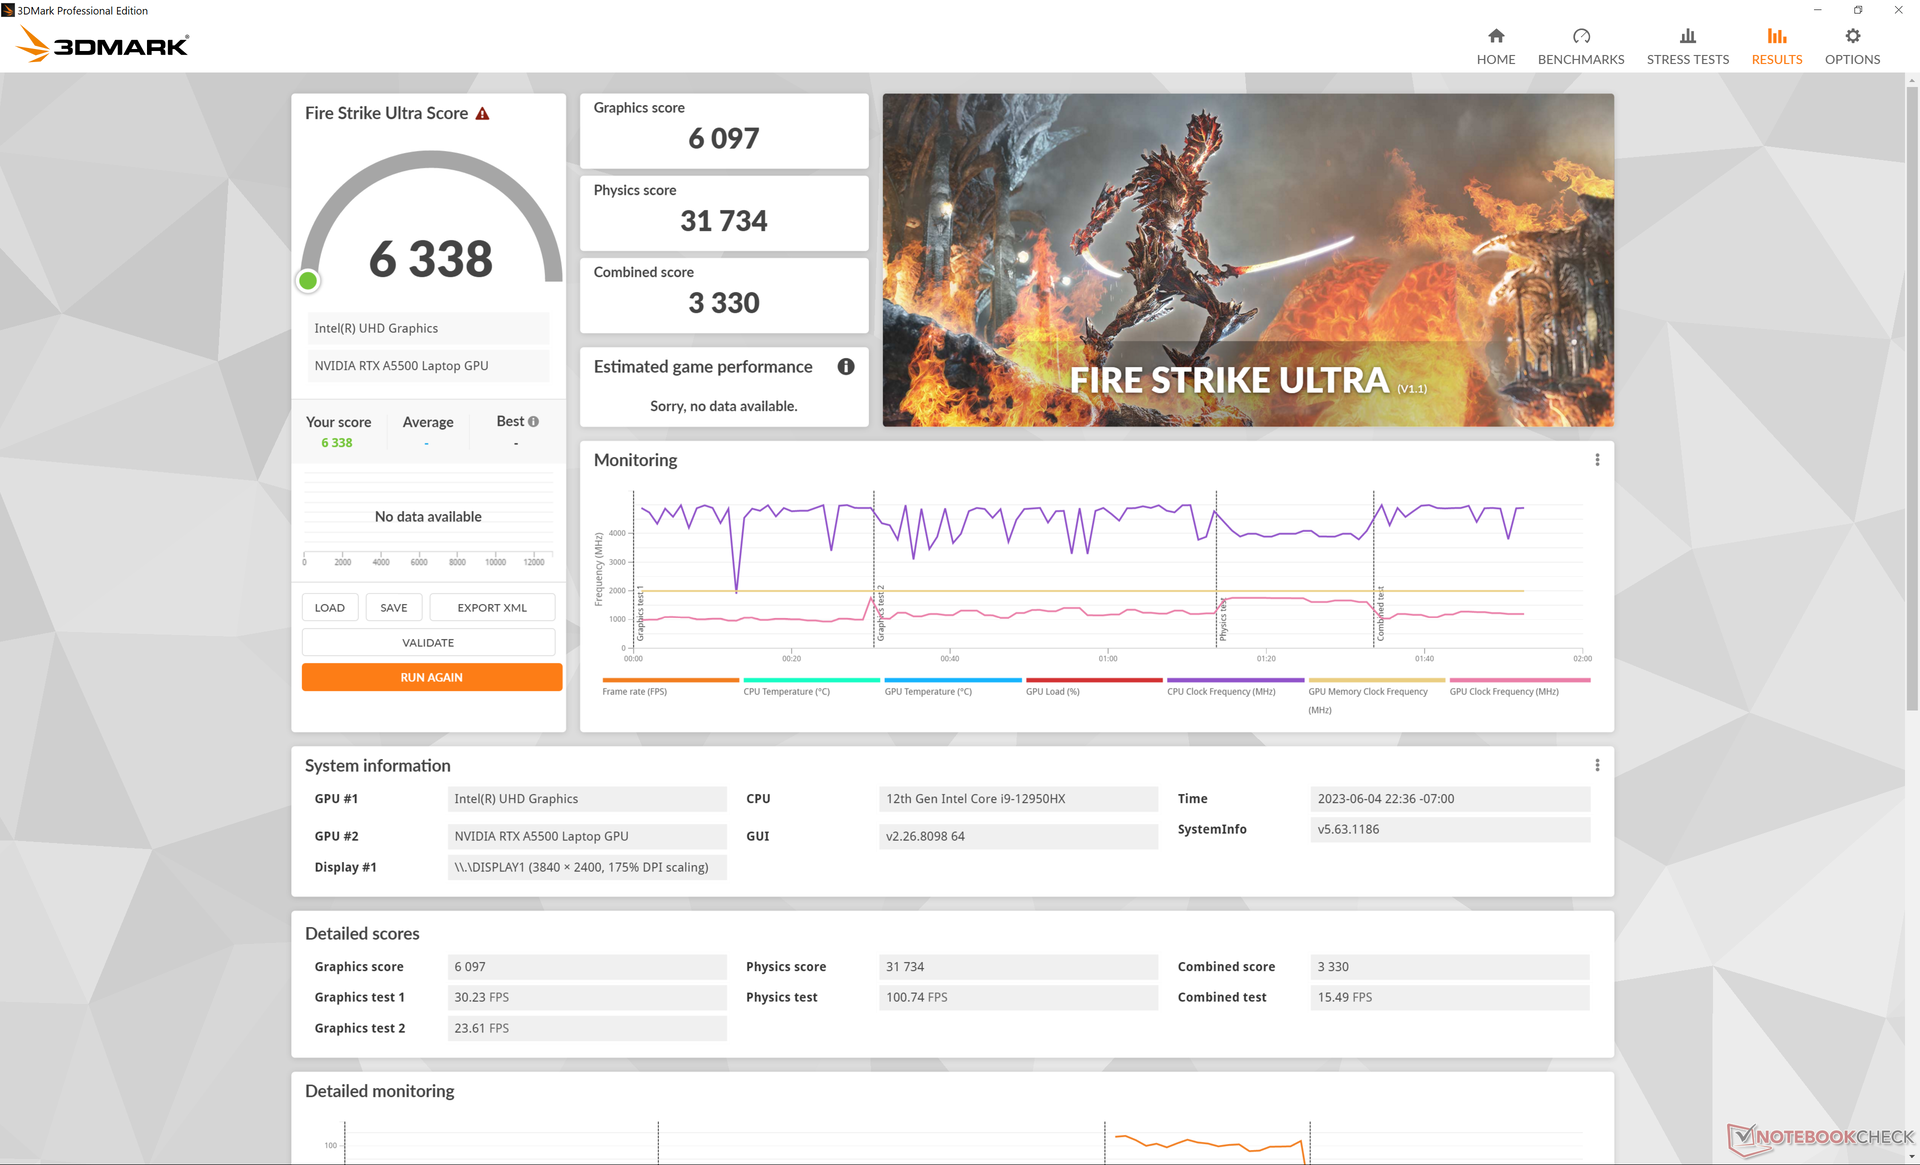
Wydajność GPU - 100 W TGP
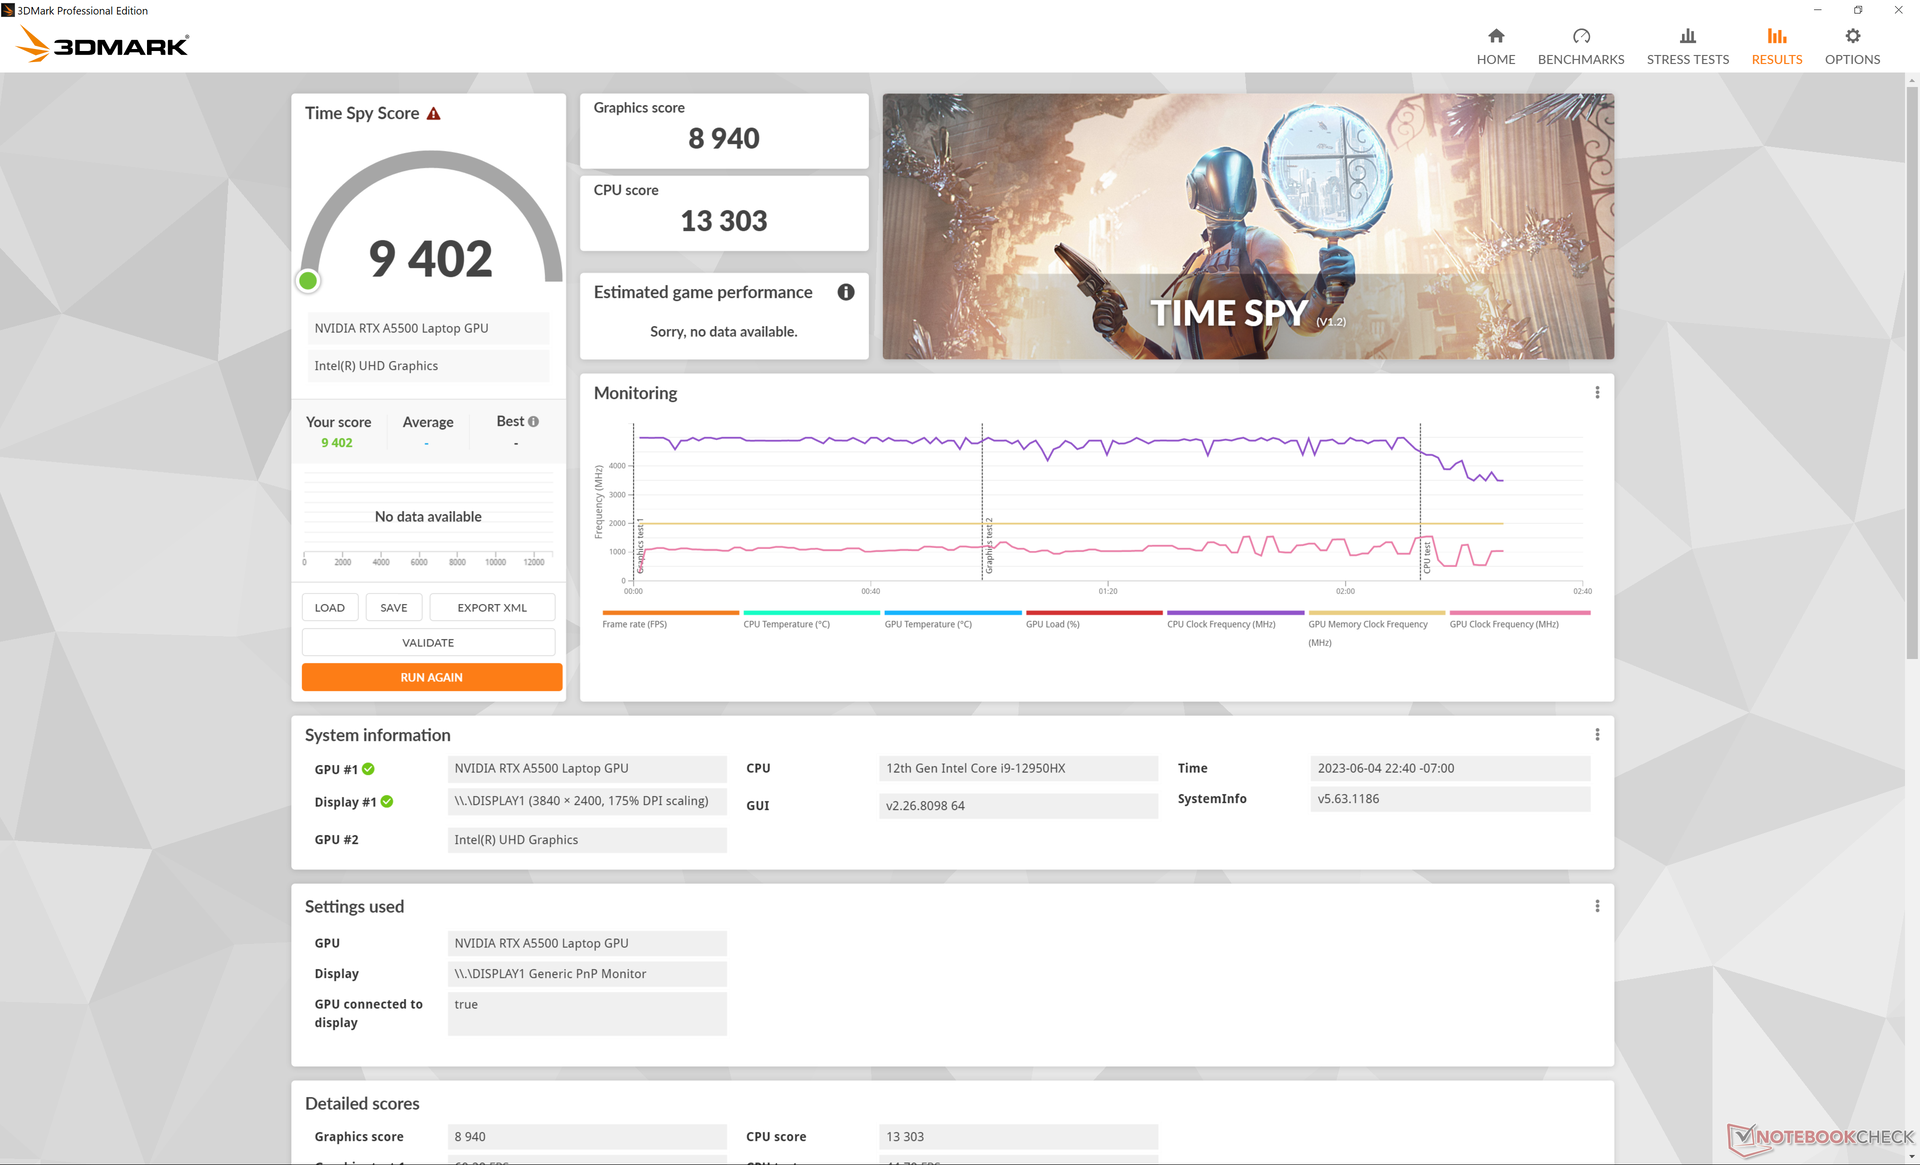
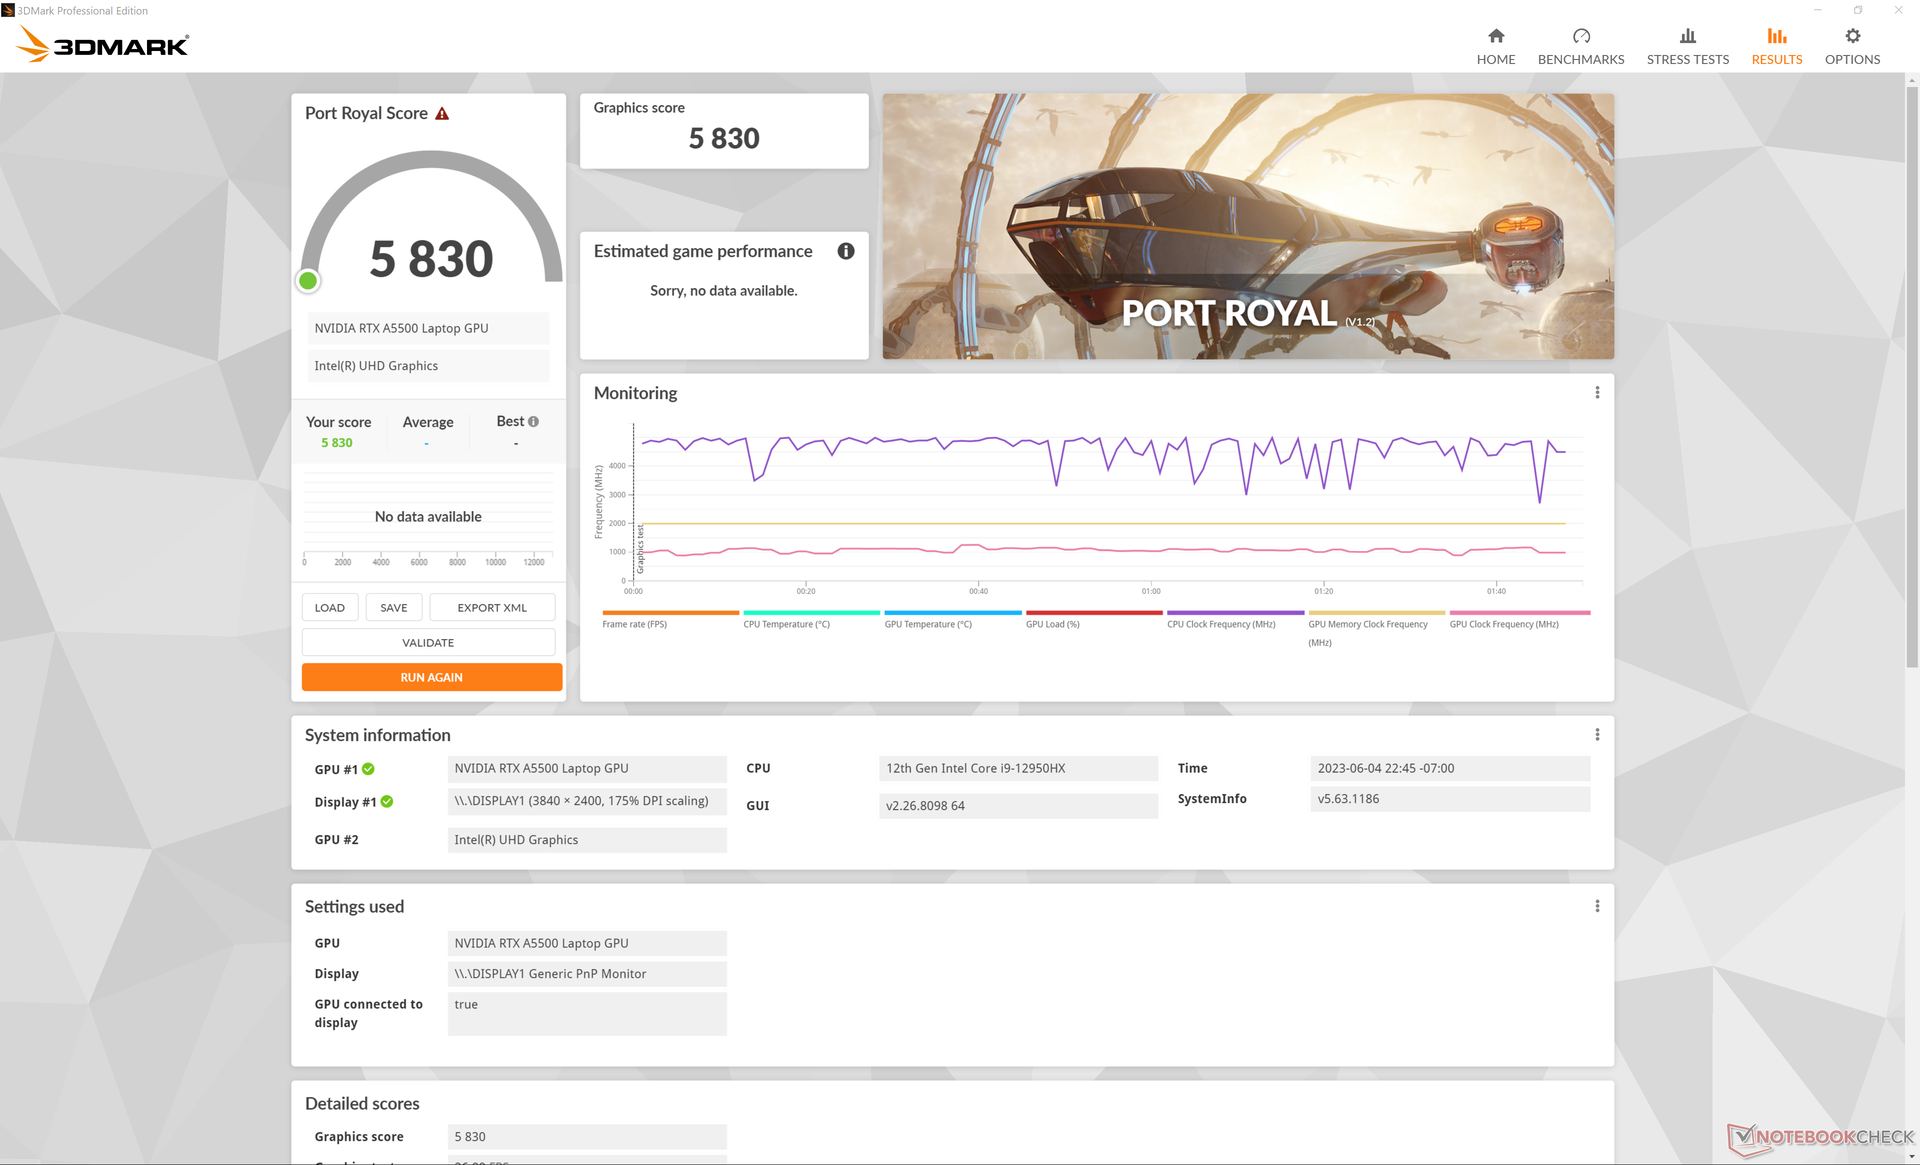
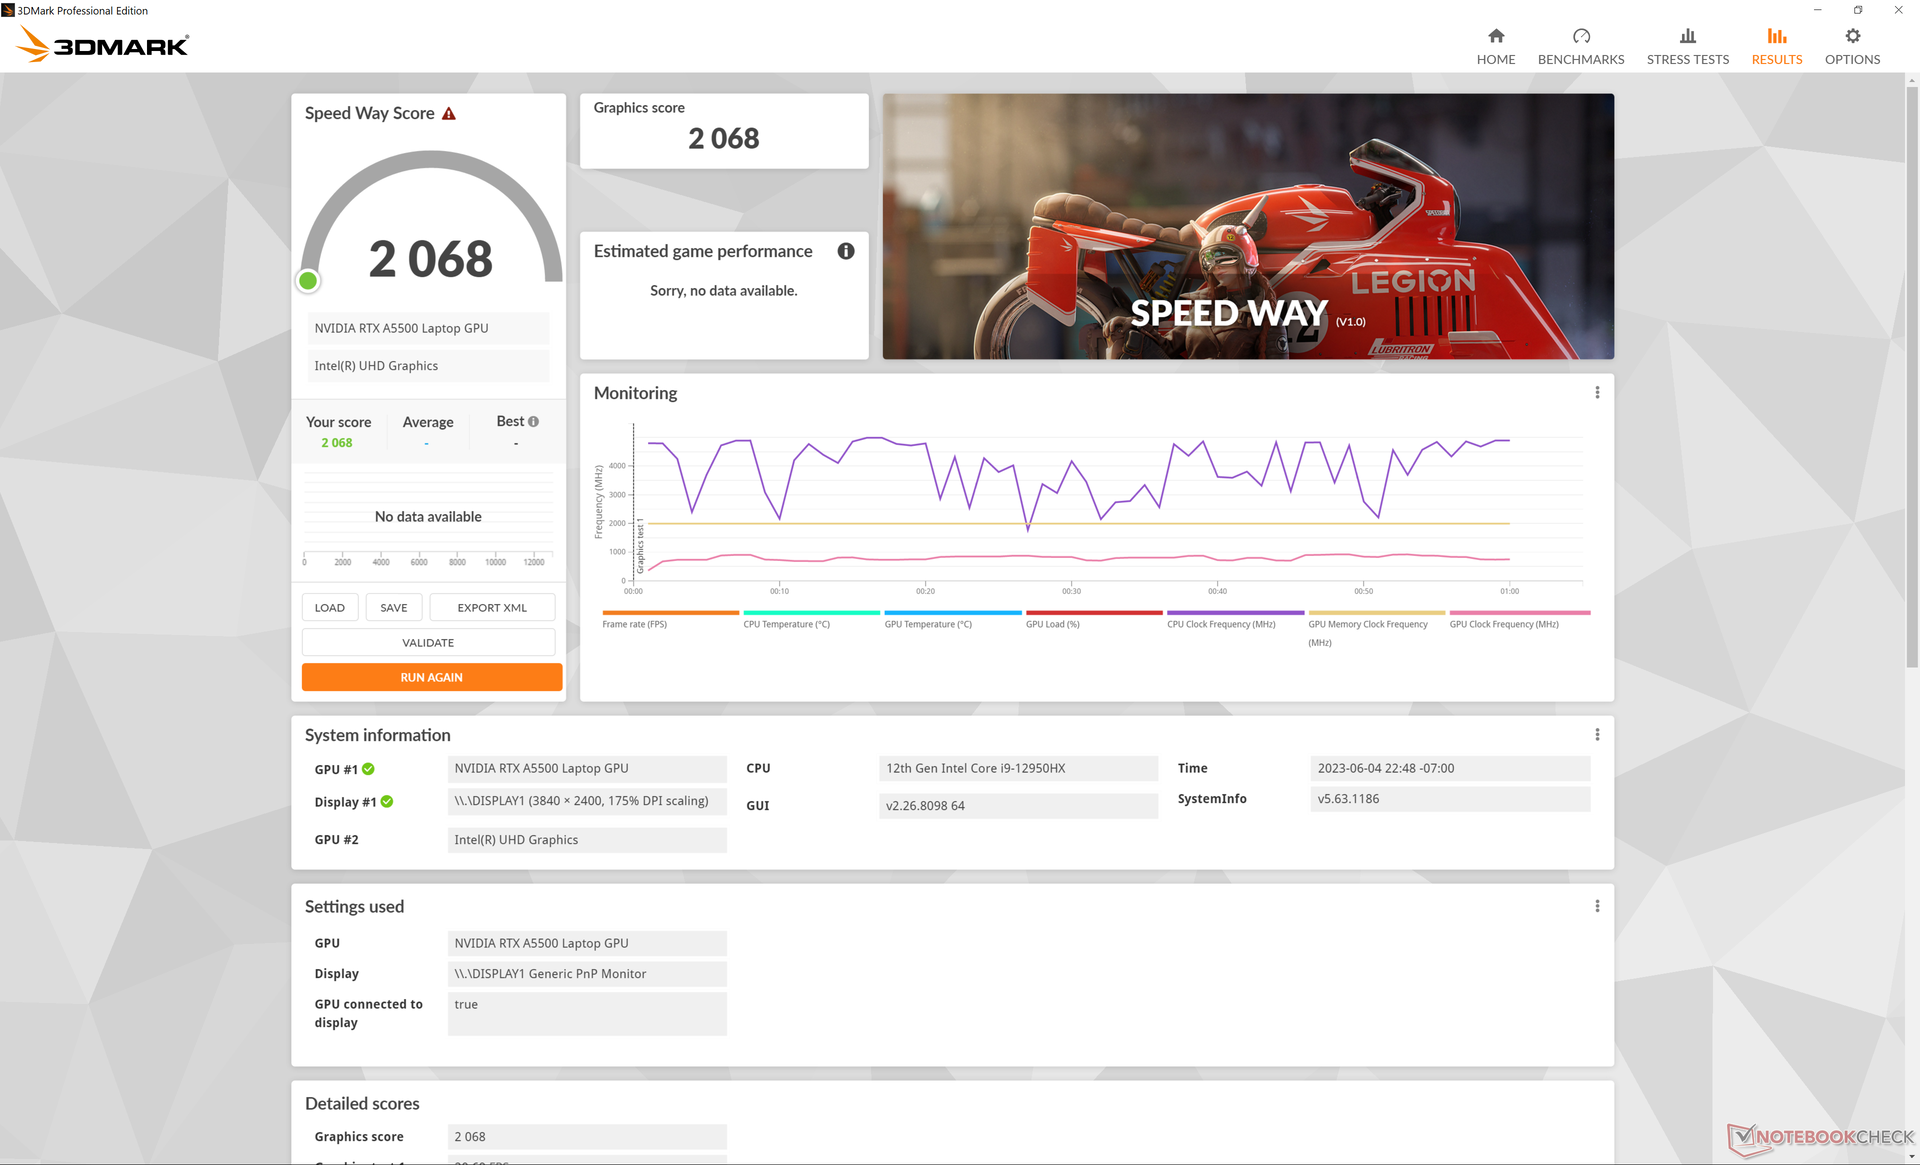
The RTX A5500 w naszym HP celuje w TGP na poziomie 100 W w porównaniu do 130 W i 135 W w ThinkPad P16 G1 i Precision 7670odpowiednio. W związku z tym wydajność graficzna powinna być nieco niższa na HP, mimo że wszystkie trzy systemy wykorzystują ten sam procesor graficzny RTX A5500. wyniki 3DMark i SpecViewPerf potwierdzają to, ponieważ nasz HP byłby konsekwentnie za modelami Dell i Lenovo nawet o 15 procent w niektórych przypadkach. Oczywiście nadal jest to bardzo szybka stacja robocza, ale nie jest to najszybsza dostępna opcja.
Przejście na RTX A3000 z naszej topowej konfiguracji RTX A5500 oczekuje się, że wydajność grafiki spadnie o 20 do 30 procent.
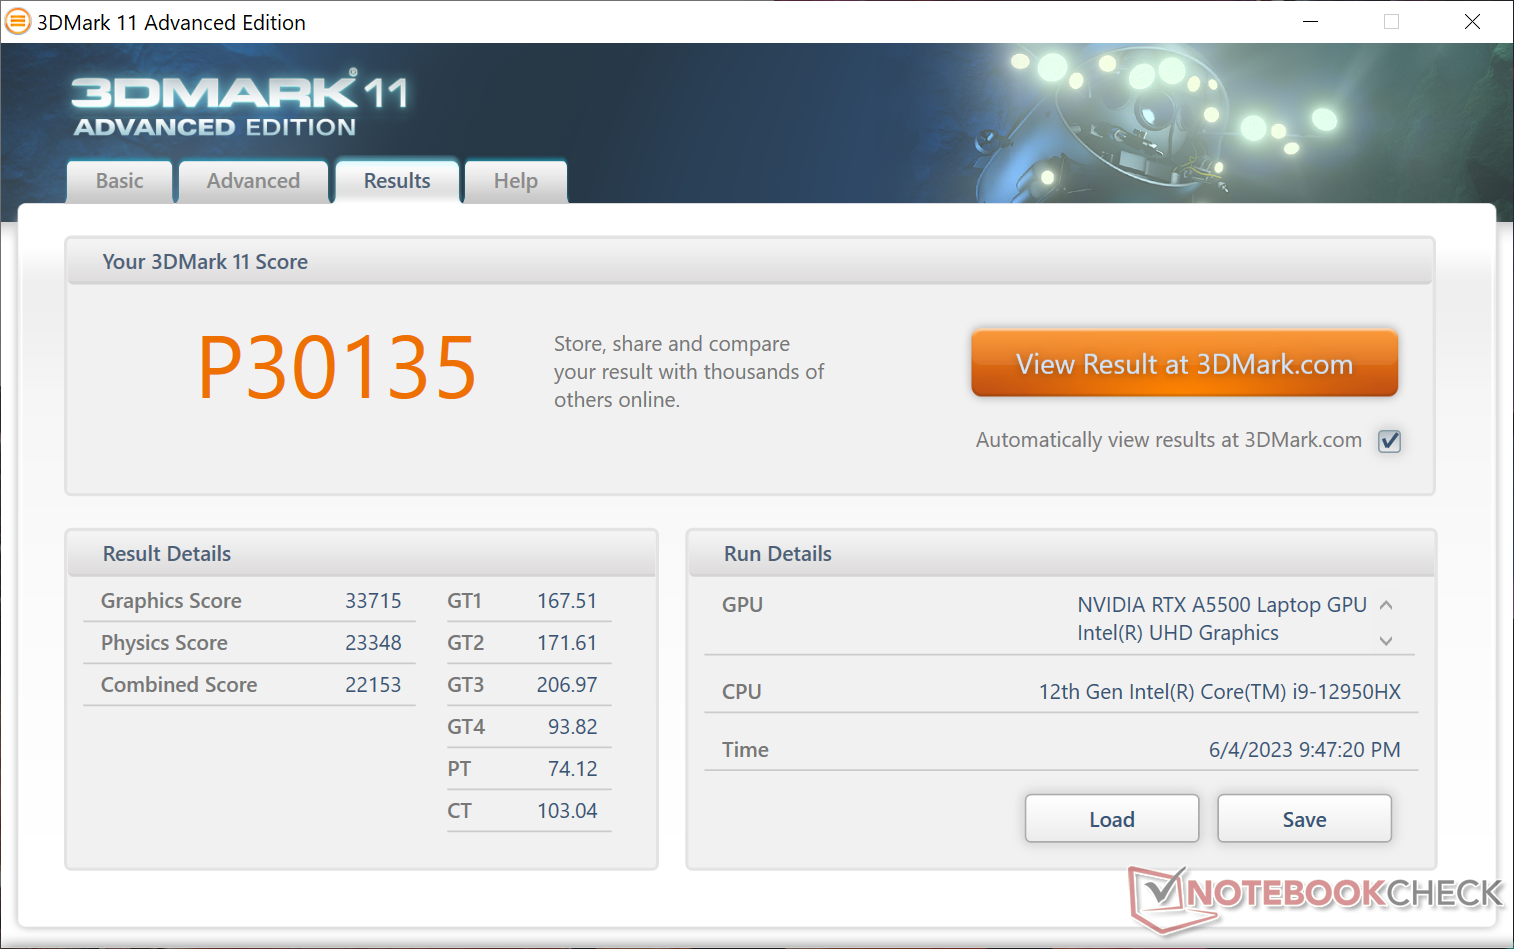
| 3DMark 11 Performance | 30135 pkt. | |
| 3DMark Fire Strike Score | 24046 pkt. | |
| 3DMark Time Spy Score | 9402 pkt. | |
Pomoc | ||
* ... im mniej tym lepiej
Wydajność w grach
Choć nie jest to GPU do gier, RTX A5500 jest więcej niż zdolny do grania w najnowsze tytuły w wysokich rozdzielczościach i ustawieniach. Użytkownicy mogą oczekiwać, że wydajność w grach będzie na równi z mobilnym GeForce RTX 4070.
| Tiny Tina's Wonderlands | |
| 1920x1080 Low Preset (DX12) | |
| Lenovo Legion Pro 5 16IRX8 | |
| HP ZBook Fury 16 G9 | |
| Przeciętny NVIDIA RTX A5500 Laptop GPU (n=1) | |
| Dell XPS 17 9730 RTX 4070 | |
| 1920x1080 Medium Preset (DX12) | |
| Lenovo Legion Pro 5 16IRX8 | |
| HP ZBook Fury 16 G9 | |
| Przeciętny NVIDIA RTX A5500 Laptop GPU (n=1) | |
| Dell XPS 17 9730 RTX 4070 | |
| 1920x1080 High Preset (DX12) | |
| Lenovo Legion Pro 5 16IRX8 | |
| HP ZBook Fury 16 G9 | |
| Przeciętny NVIDIA RTX A5500 Laptop GPU (n=1) | |
| Dell XPS 17 9730 RTX 4070 | |
| 1920x1080 Badass Preset (DX12) | |
| Asus Zephyrus Duo 16 GX650PY-NM006W | |
| Lenovo Legion Pro 5 16IRX8 | |
| HP ZBook Fury 16 G9 | |
| Przeciętny NVIDIA RTX A5500 Laptop GPU (n=1) | |
| Dell XPS 17 9730 RTX 4070 | |
| 2560x1440 Badass Preset (DX12) | |
| Asus Zephyrus Duo 16 GX650PY-NM006W | |
| Lenovo Legion Pro 5 16IRX8 | |
| HP ZBook Fury 16 G9 | |
| Przeciętny NVIDIA RTX A5500 Laptop GPU (n=1) | |
| Dell XPS 17 9730 RTX 4070 | |
| 3840x2160 Badass Preset (DX12) | |
| Lenovo Legion Pro 5 16IRX8 | |
| HP ZBook Fury 16 G9 | |
| Przeciętny NVIDIA RTX A5500 Laptop GPU (n=1) | |
| Dell XPS 17 9730 RTX 4070 | |
Witcher 3 FPS Chart
| low | med. | high | ultra | QHD | 4K | |
|---|---|---|---|---|---|---|
| GTA V (2015) | 185.4 | 182.7 | 170.7 | 118.5 | 97.5 | 97.1 |
| The Witcher 3 (2015) | 447 | 308.5 | 169.3 | 92.8 | 62.2 | |
| Dota 2 Reborn (2015) | 191.3 | 173.1 | 162.4 | 150.7 | 116.1 | |
| Final Fantasy XV Benchmark (2018) | 180.1 | 131.6 | 103.5 | 75.1 | 39.4 | |
| X-Plane 11.11 (2018) | 151.3 | 130.9 | 103.6 | 81.9 | ||
| Strange Brigade (2018) | 447 | 235 | 190.2 | 168.6 | 122 | 67.6 |
| Cyberpunk 2077 1.6 (2022) | 128.7 | 114.4 | 87.6 | 69.8 | 41.4 | 18.1 |
| Tiny Tina's Wonderlands (2022) | 193.7 | 158.6 | 109.5 | 87.5 | 57.9 | 29.6 |
| F1 22 (2022) | 224 | 209 | 170.2 | 60.9 | 37.2 | 17.6 |
| Returnal (2023) | 70 | 68 | 64 | 59 | 42 | 20 |
Emisje - cicha praca przy niskim obciążeniu
Hałas systemowy
Hałas wentylatora jest cichy podczas pracy z niewymagającymi obciążeniami. Zwykle waha się między 29 dB(A) a 35 dB(A) podczas niskich i średnich obciążeń, co jest ledwo słyszalne w większości środowisk biurowych.
Uruchamianie bardziej wymagających obciążeń, takich jak gry, może wywołać maksymalny hałas wentylatora nieco poniżej 50 dB(A), co jest zbliżone do tego, co zarejestrowaliśmy na ThinkPad P16 G1 lub Precision 7670. Niemniej jednakThinkPad P16 G1 jest w stanie pozostać cichszy przez dłuższy czas. Podczas uruchamiania 3DMark 06, na przykład, hałas wentylatora na naszym HP osiągnął poziom 36 dB(A) pod koniec pierwszej sceny benchmarku w porównaniu do zaledwie 29 dB(A) na Lenovo.
Hałas
| luz |
| 22.7 / 22.7 / 28.8 dB |
| obciążenie |
| 36.2 / 49.3 dB |
 | ||
30 dB cichy 40 dB(A) słyszalny 50 dB(A) irytujący |
||
min: | ||
| HP ZBook Fury 16 G9 RTX A5500 Laptop GPU, i9-12950HX, Micron 3400 1TB MTFDKBA1T0TFH | HP ZBook Studio 16 G9 62U04EA RTX A2000 Laptop GPU, i7-12800H, Micron 3400 1TB MTFDKBA1T0TFH | HP ZBook Firefly 16 G9-6B897EA T550 Laptop GPU, i7-1265U, Samsung PM9A1 MZVL21T0HCLR | Lenovo ThinkPad P16 G1 RTX A5500 RTX A5500 Laptop GPU, i9-12950HX, WDC PC SN810 2TB | Dell Precision 7000 7670 Performance RTX A5500 Laptop GPU, i9-12950HX | MSI CreatorPro Z16P B12UKST RTX A3000 Laptop GPU, i7-12700H, Samsung PM9A1 MZVL21T0HCLR | |
|---|---|---|---|---|---|---|
| Noise | -4% | 4% | 4% | -9% | -6% | |
| wyłączone / środowisko * (dB) | 22.6 | 24 -6% | 23.8 -5% | 23.1 -2% | 23.9 -6% | 24.1 -7% |
| Idle Minimum * (dB) | 22.7 | 24 -6% | 23.8 -5% | 23.1 -2% | 24 -6% | 27.1 -19% |
| Idle Average * (dB) | 22.7 | 27.7 -22% | 23.8 -5% | 23.1 -2% | 24 -6% | 27.1 -19% |
| Idle Maximum * (dB) | 28.8 | 27.7 4% | 23.8 17% | 23.1 20% | 38 -32% | 27.1 6% |
| Load Average * (dB) | 36.2 | 39.8 -10% | 39.4 -9% | 28.9 20% | 46.3 -28% | 42.9 -19% |
| Witcher 3 ultra * (dB) | 49.5 | 44.3 11% | 40.5 18% | 51.6 -4% | 41.9 15% | 44 11% |
| Load Maximum * (dB) | 49.3 | 47.7 3% | 41.4 16% | 51.4 -4% | 47.9 3% | 47 5% |
* ... im mniej tym lepiej
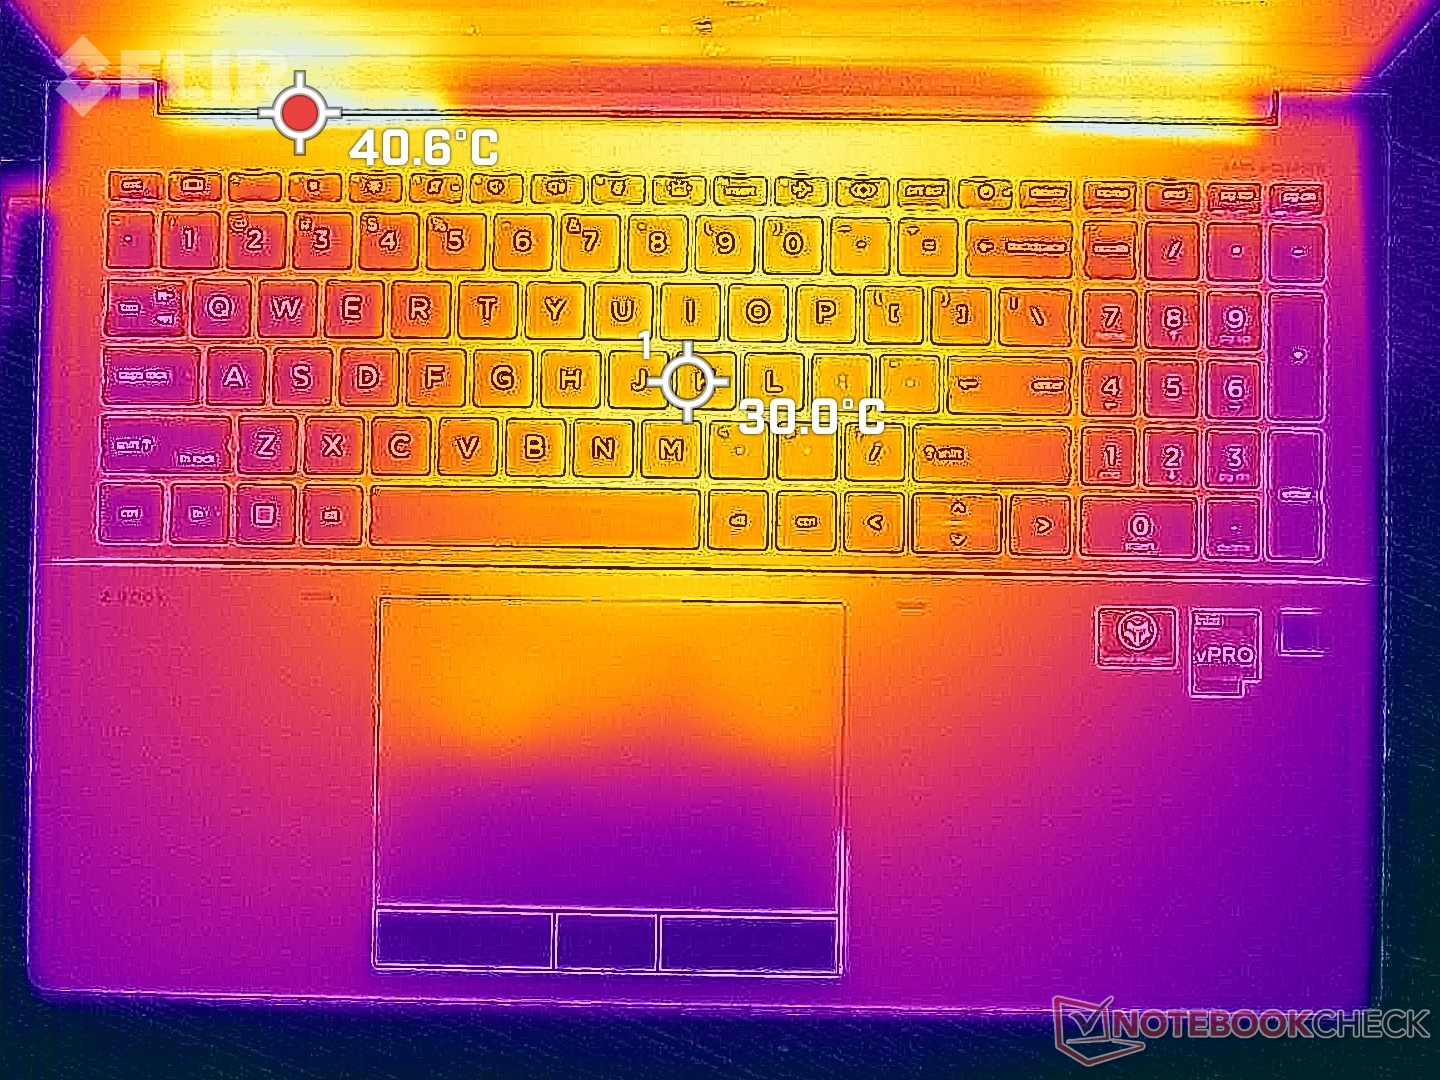
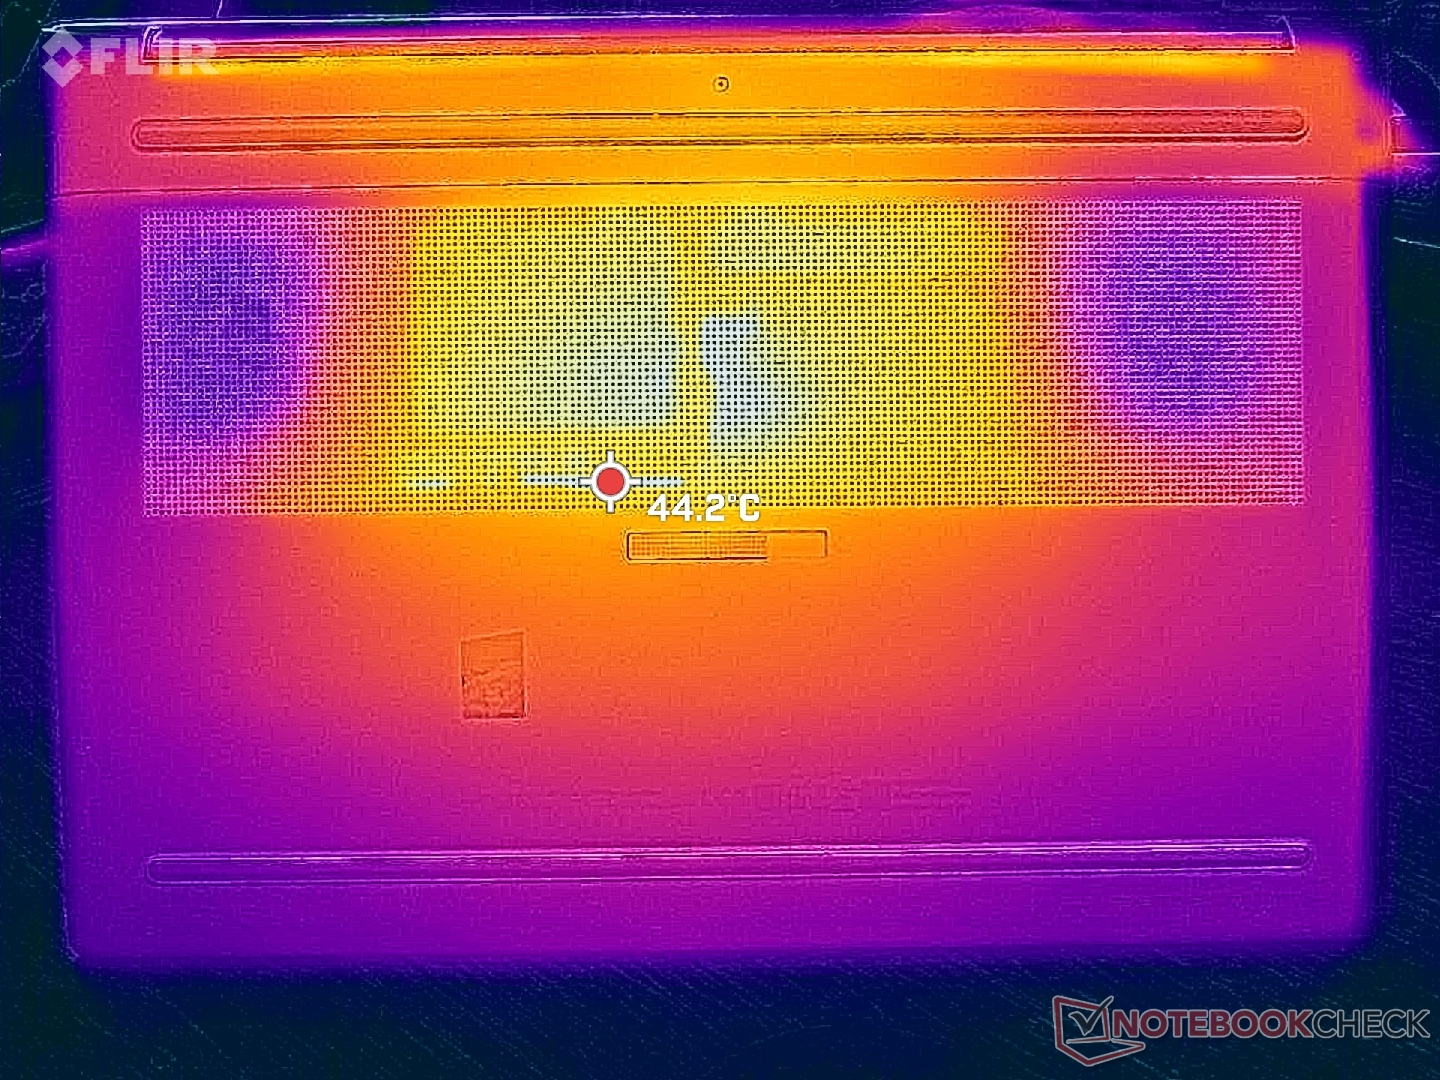
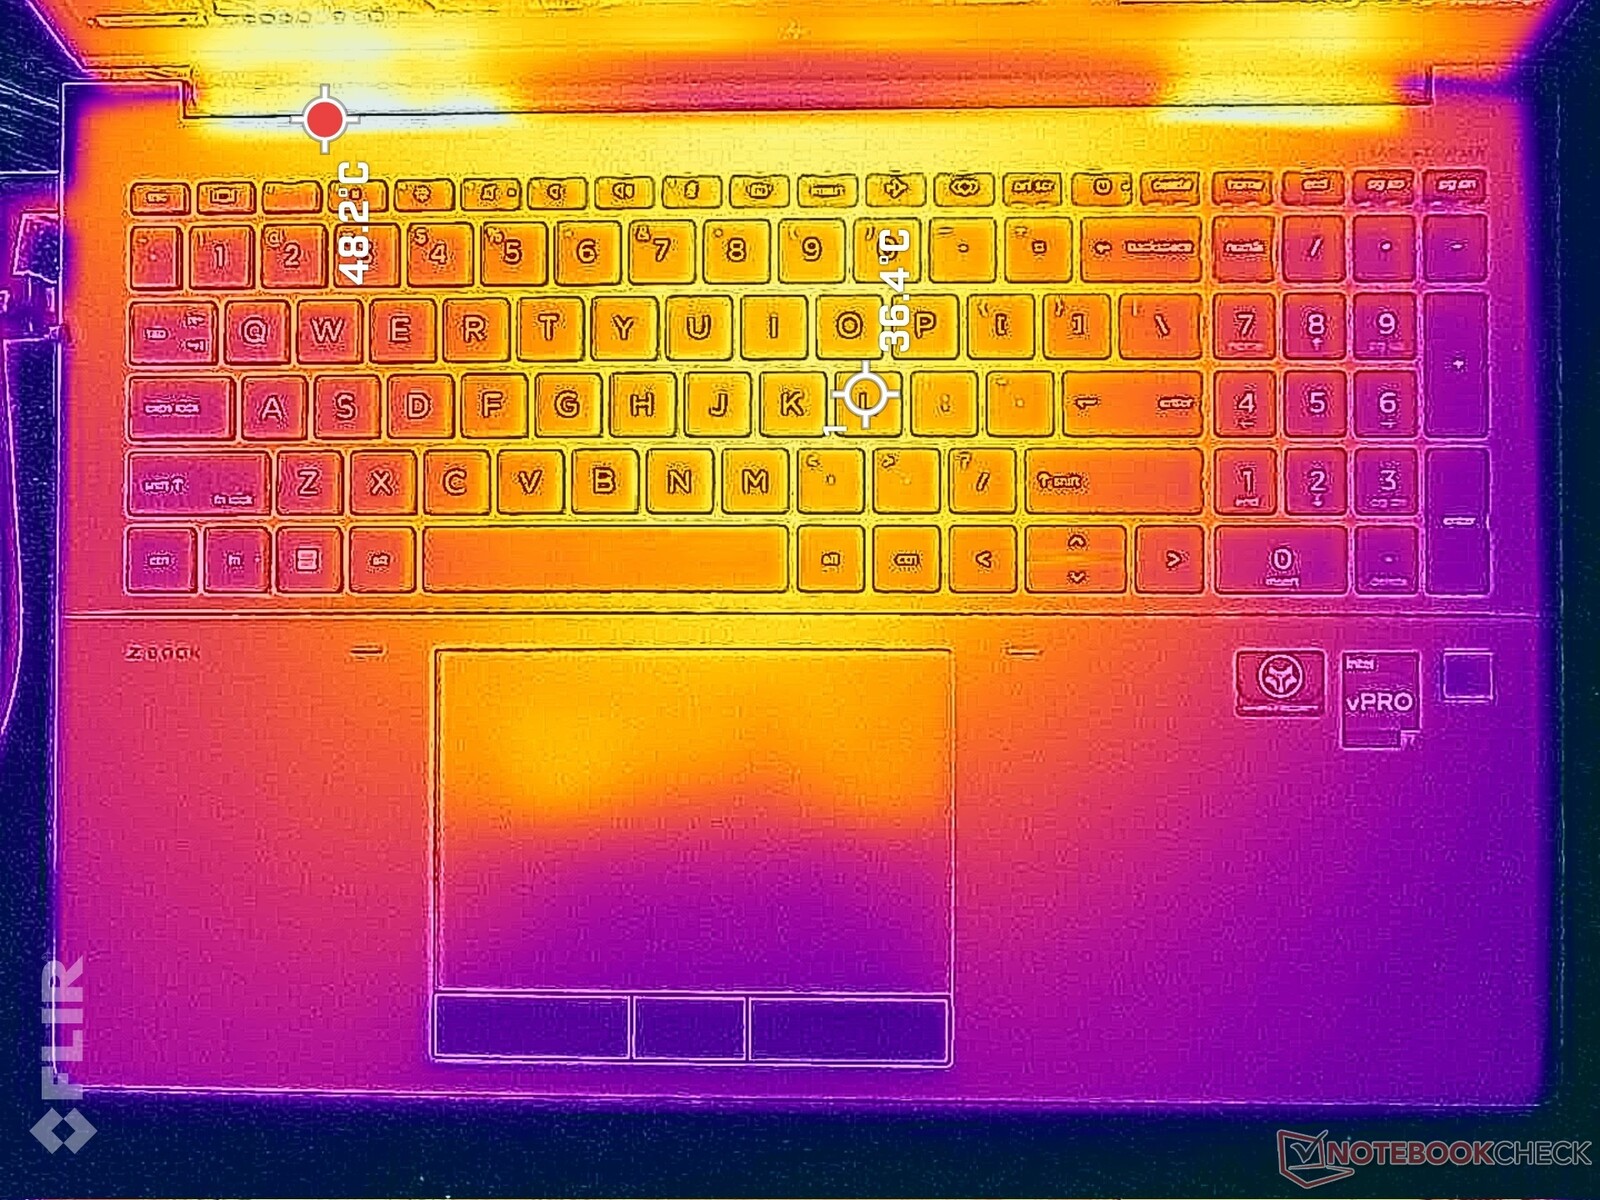
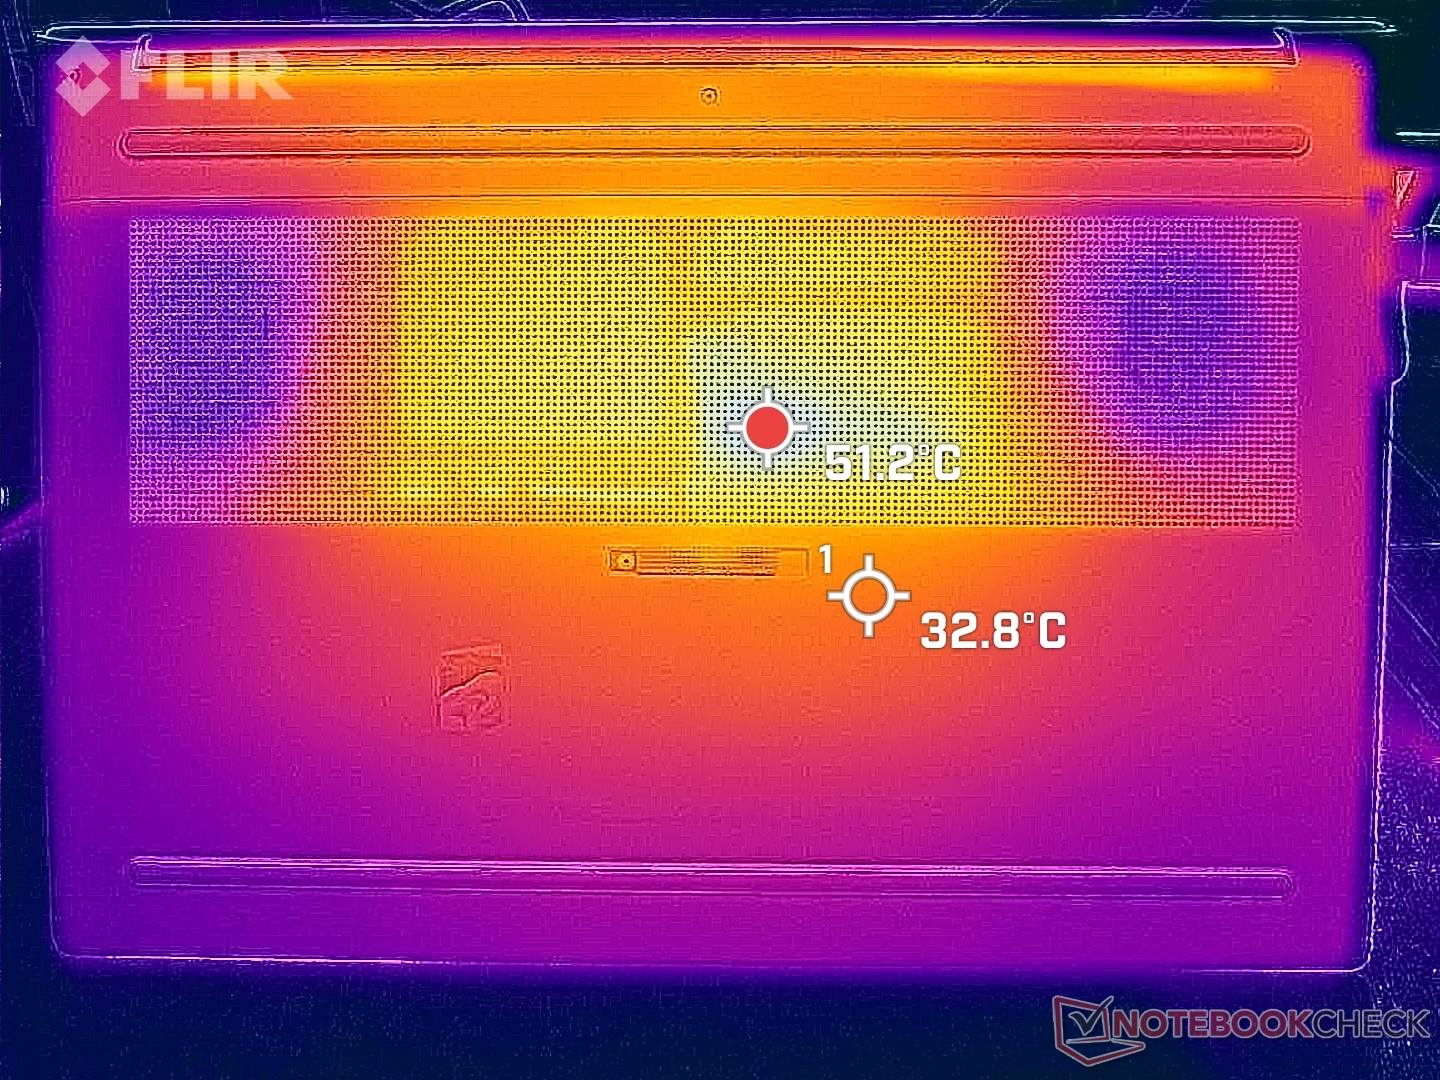
Temperatura - ciepłe podpórki pod nadgarstki pod obciążeniem
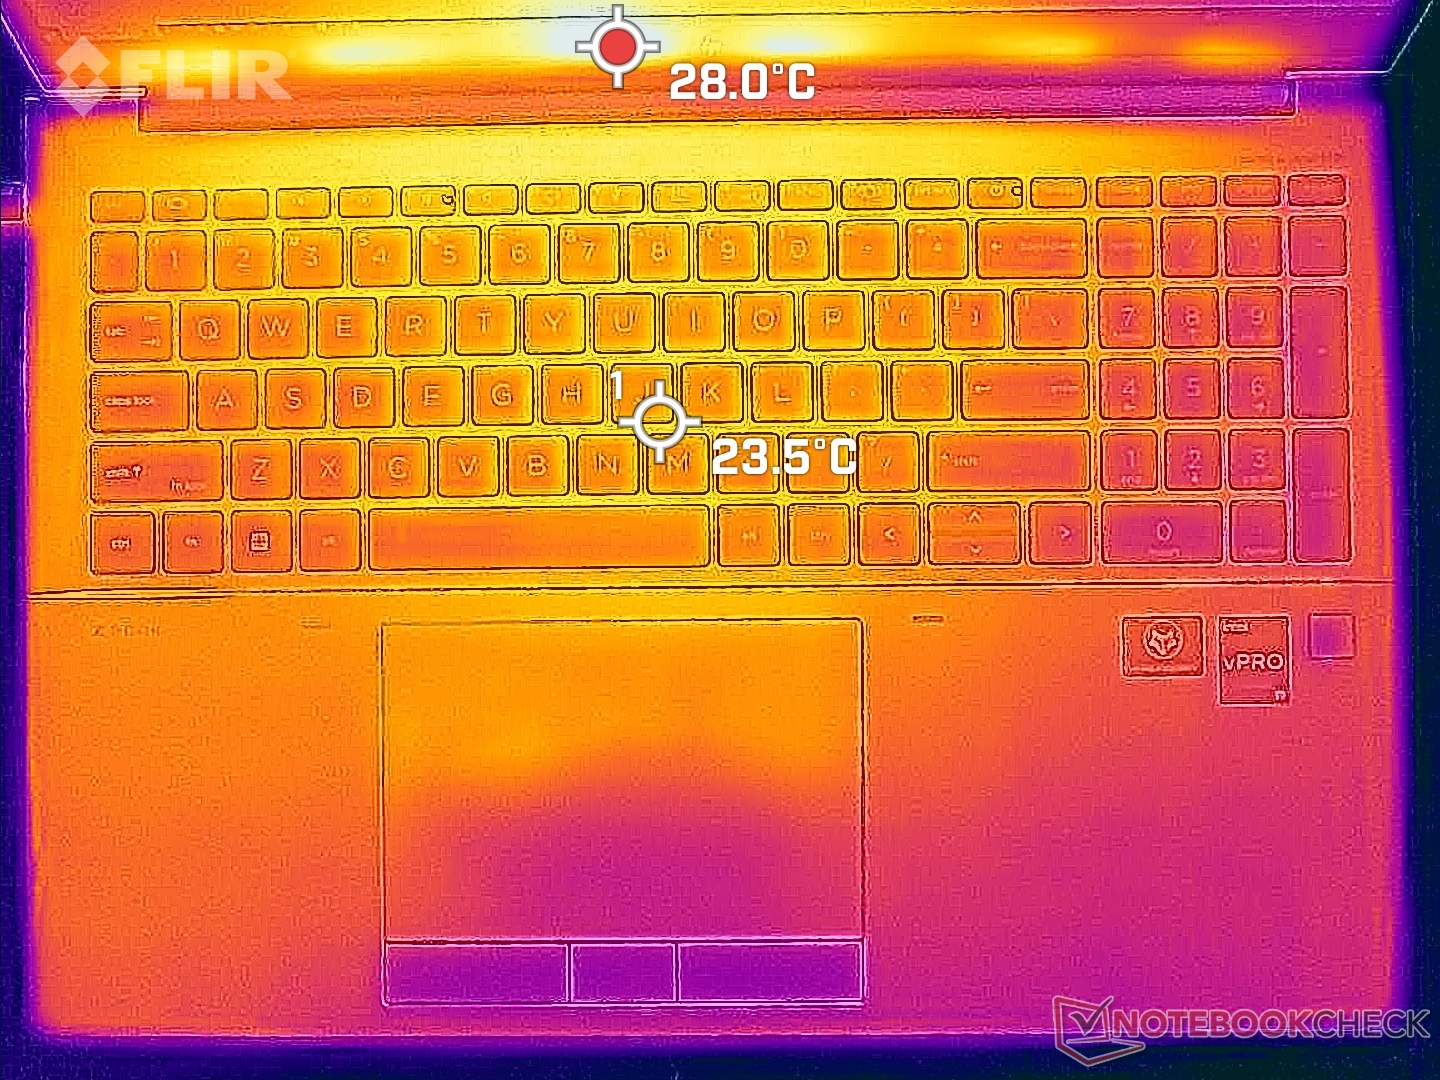
Temperatury powierzchni mają tendencję do bycia cieplejszymi w kierunku środka klawiatury, gdzie mogą osiągnąć ponad 36 C przy ekstremalnych obciążeniach przetwarzania. Rozwój temperatury jest bardziej symetryczny niż w Precision 7670 lub ThinkPad P16, ale touchpad i podpórki pod dłonie mogą stać się cieplejsze niż byśmy chcieli. Na przykład podczas pracy z wymagającymi obciążeniami touchpad w HP może osiągnąć ponad 35 ° C w porównaniu do 30 ° C lub niższej w wyżej wymienionych alternatywach Lenovo i Dell.
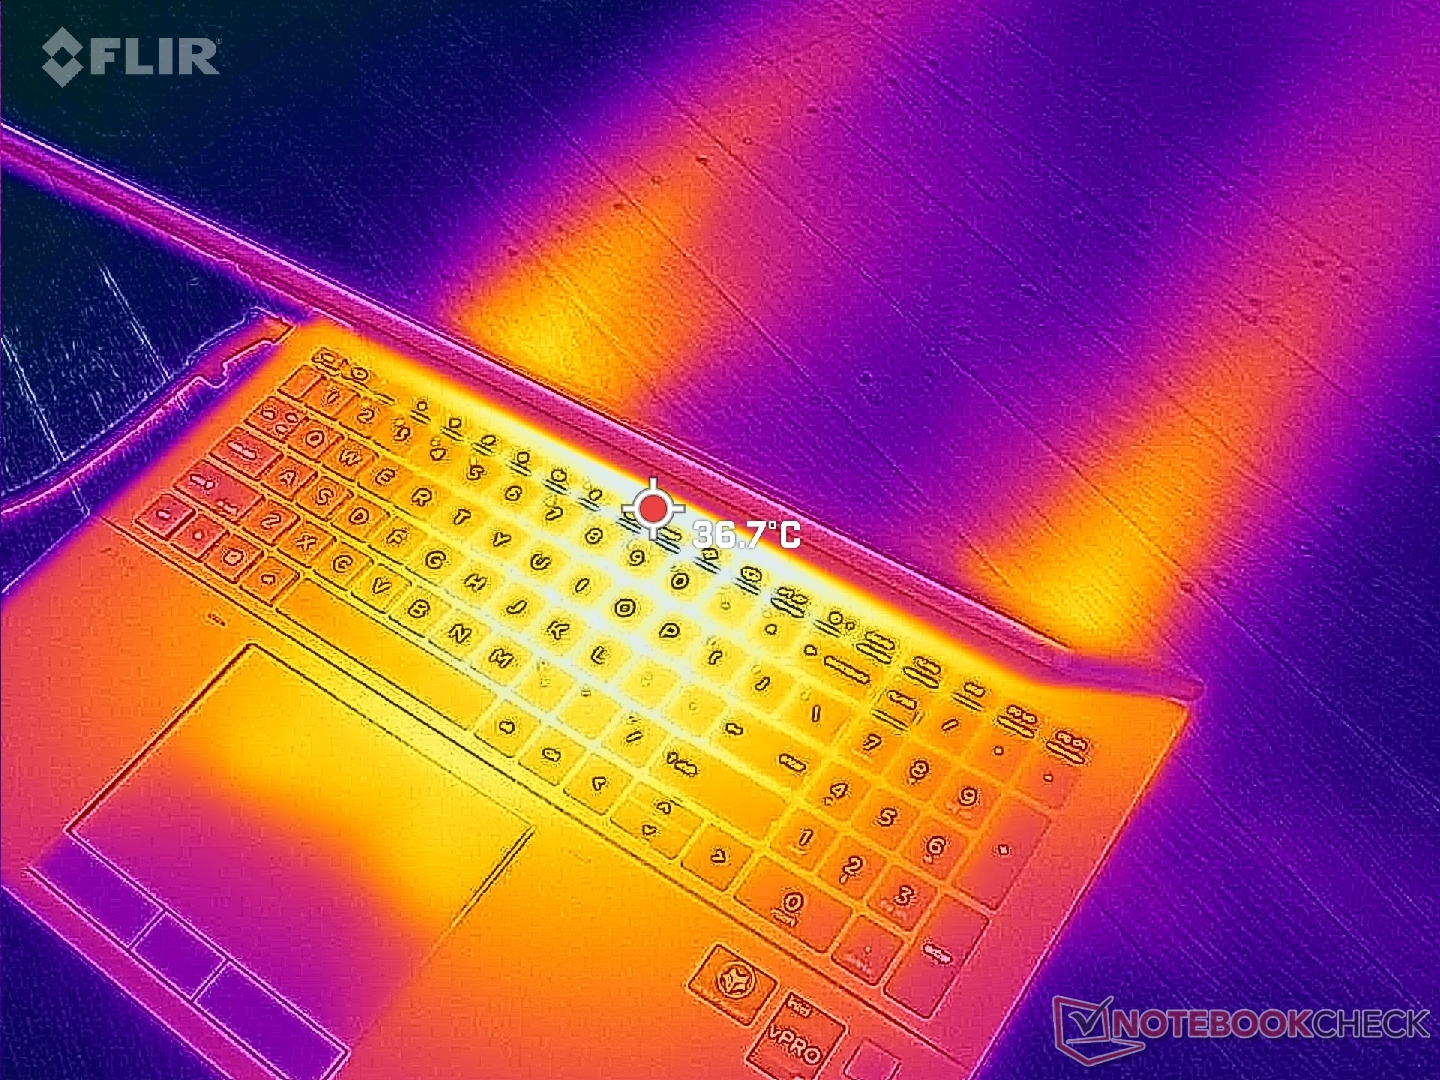
(±) Maksymalna temperatura w górnej części wynosi 43.2 °C / 110 F, w porównaniu do średniej 38.2 °C / 101 F , począwszy od 22.2 do 69.8 °C dla klasy Workstation.
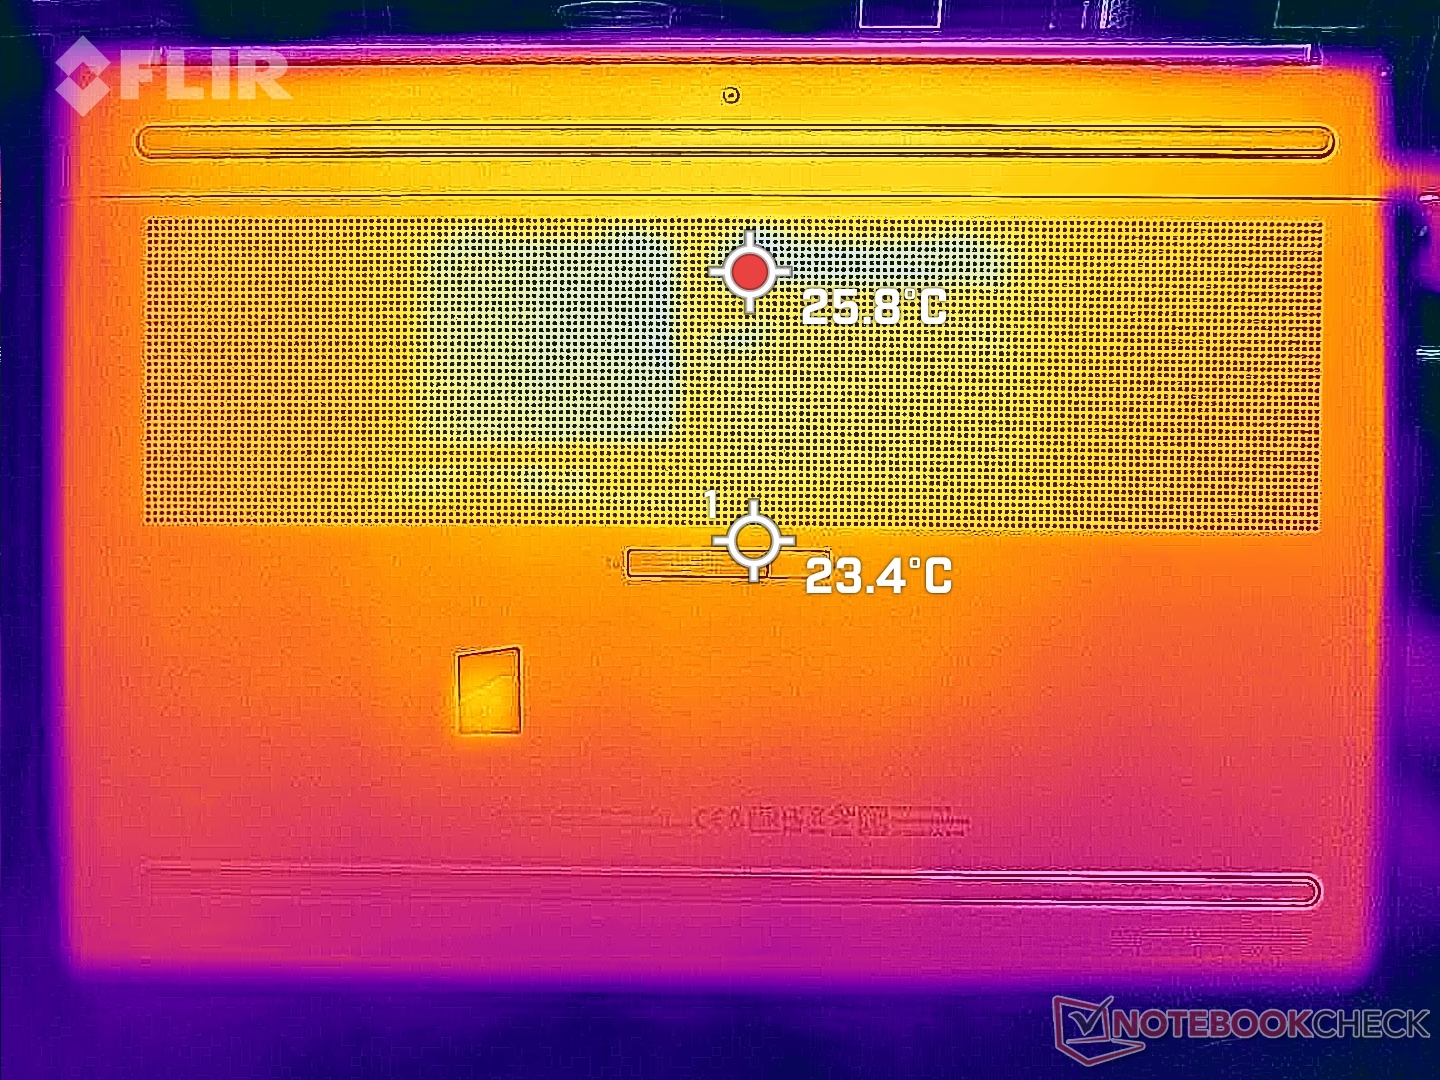
(-) Dno nagrzewa się maksymalnie do 50.4 °C / 123 F, w porównaniu do średniej 41.1 °C / 106 F
(+) W stanie bezczynności średnia temperatura górnej części wynosi 27.1 °C / 81 F, w porównaniu ze średnią temperaturą urządzenia wynoszącą 32 °C / ### class_avg_f### F.
(±) Podczas gry w Wiedźmina 3 średnia temperatura górnej części wynosi 34 °C / 93 F, w porównaniu do średniej temperatury urządzenia wynoszącej 32 °C / ## #class_avg_f### F.
(+) Podparcia dłoni i touchpad osiągają maksymalną temperaturę skóry (35.6 °C / 96.1 F) i dlatego nie są gorące.
(-) Średnia temperatura obszaru podparcia dłoni w podobnych urządzeniach wynosiła 27.8 °C / 82 F (-7.8 °C / -14.1 F).
| HP ZBook Fury 16 G9 Intel Core i9-12950HX, NVIDIA RTX A5500 Laptop GPU | HP ZBook Studio 16 G9 62U04EA Intel Core i7-12800H, NVIDIA RTX A2000 Laptop GPU | HP ZBook Firefly 16 G9-6B897EA Intel Core i7-1265U, NVIDIA T550 Laptop GPU | Lenovo ThinkPad P16 G1 RTX A5500 Intel Core i9-12950HX, NVIDIA RTX A5500 Laptop GPU | Dell Precision 7000 7670 Performance Intel Core i9-12950HX, NVIDIA RTX A5500 Laptop GPU | MSI CreatorPro Z16P B12UKST Intel Core i7-12700H, NVIDIA RTX A3000 Laptop GPU | |
|---|---|---|---|---|---|---|
| Heat | -1% | -4% | -12% | -15% | -12% | |
| Maximum Upper Side * (°C) | 43.2 | 38.7 10% | 42.1 3% | 44.8 -4% | 53 -23% | 56.3 -30% |
| Maximum Bottom * (°C) | 50.4 | 53.4 -6% | 48 5% | 49.8 1% | 43.2 14% | 68.3 -36% |
| Idle Upper Side * (°C) | 28.6 | 27.3 5% | 29.9 -5% | 30.6 -7% | 36.8 -29% | 25.2 12% |
| Idle Bottom * (°C) | 28.2 | 31.6 -12% | 32.9 -17% | 38.6 -37% | 33.8 -20% | 25.9 8% |
* ... im mniej tym lepiej
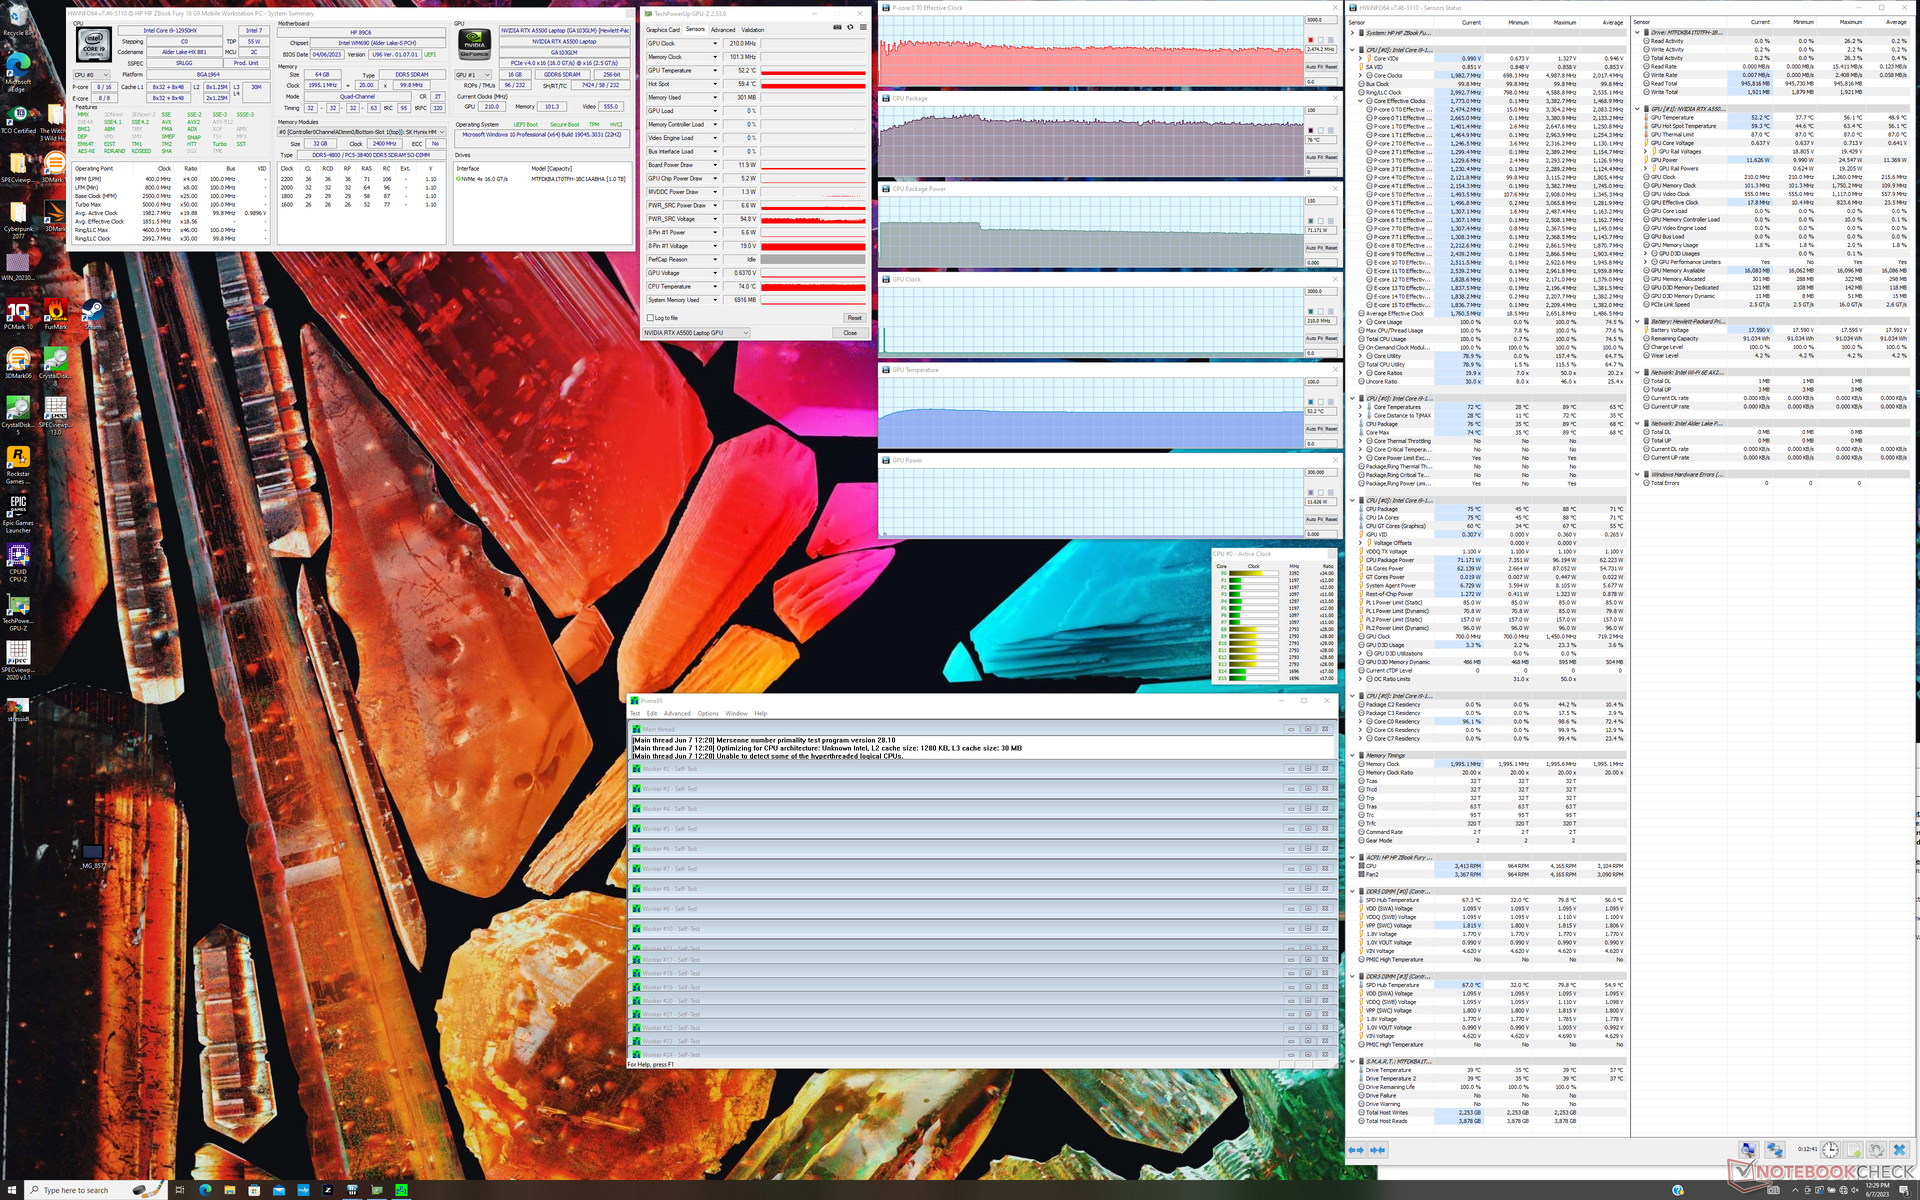
Test warunków skrajnych
Po uruchomieniu Prime95 w celu obciążenia procesora, częstotliwość taktowania i pobór mocy płyty wzrosły odpowiednio do 3,1 GHz i 96 W, trwając zaledwie kilka minut lub do momentu, gdy temperatura rdzenia osiągnęła 89 C. Następnie procesor spadał dalej, zanim ustabilizował się na poziomie 2,4 GHz, 76 C i 71 W. Powtarzając ten test na ThinkPad P16 G1 z dokładnie tym samym Core i9-12950HX Zaowocowałoby wyższą stabilną częstotliwością taktowania (3,0 GHz) i poborem mocy (81 W) kosztem znacznie wyższej temperatury rdzenia (100 C). HP przyjmuje bardziej powściągliwe podejście w tym względzie, co jest zgodne z naszymi wynikami CineBench powyżej.
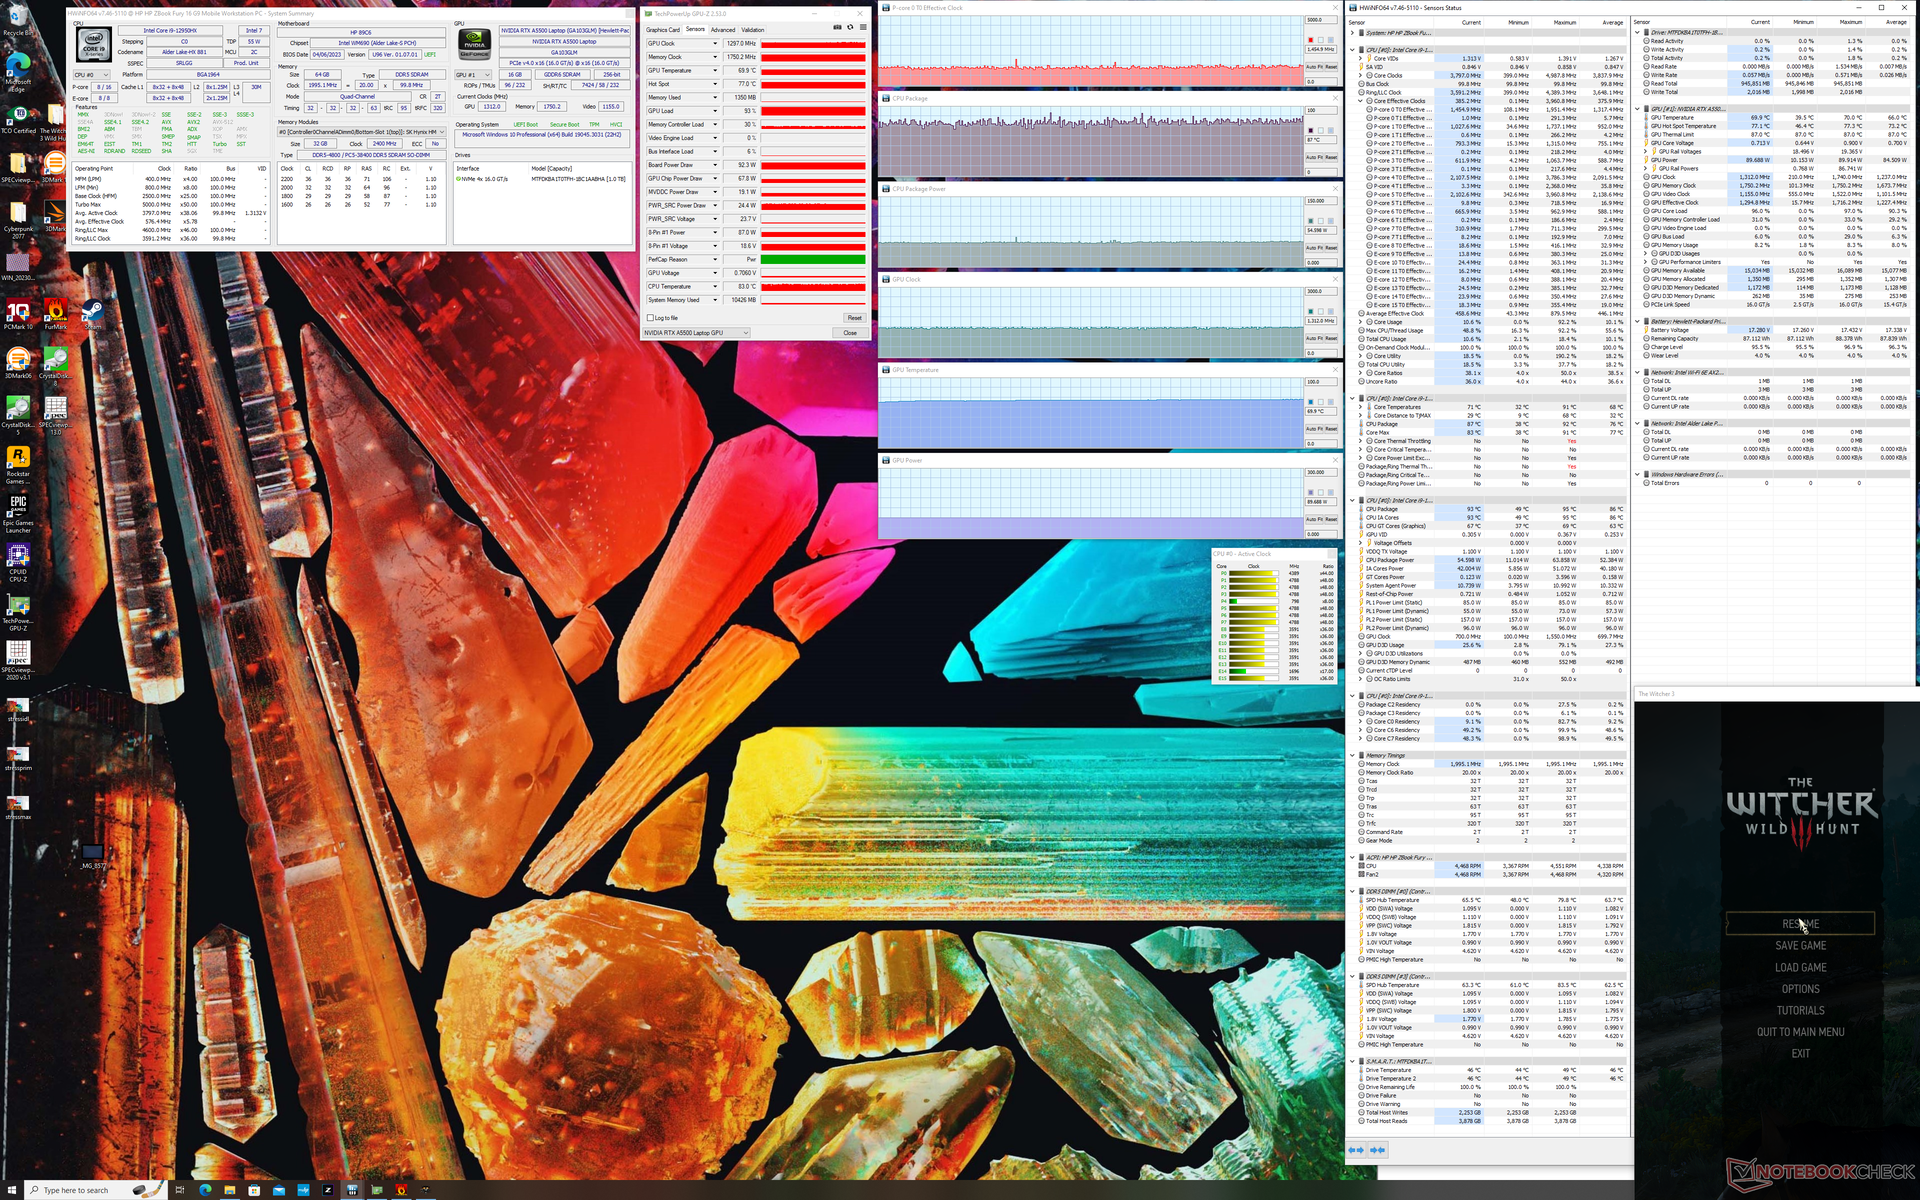
Uruchomienie Witcher 3 do reprezentowania wysokiego obciążenia graficznego spowodowałoby stabilną częstotliwość taktowania GPU, temperaturę i pobór mocy płyty odpowiednio 1297 MHz, 70 C i 92 W. Powtórzenie tego testu na ThinkPadzie P16 G1 zaowocowałoby wyższymi stabilnymi wartościami na całej płycie, wynoszącymi 1477 MHz, 78 C i 129 W. Taktowanie pamięci GPU byłoby również wyższe na ThinkPadzie.
Praca na zasilaniu bateryjnym ogranicza wydajność nawet w profilu Performance. Test Fire Strike na baterii zwróciłby wyniki fizyki i grafiki odpowiednio 22837 i 5625 punktów, w porównaniu do 30270 i 25713 punktów przy zasilaniu sieciowym.
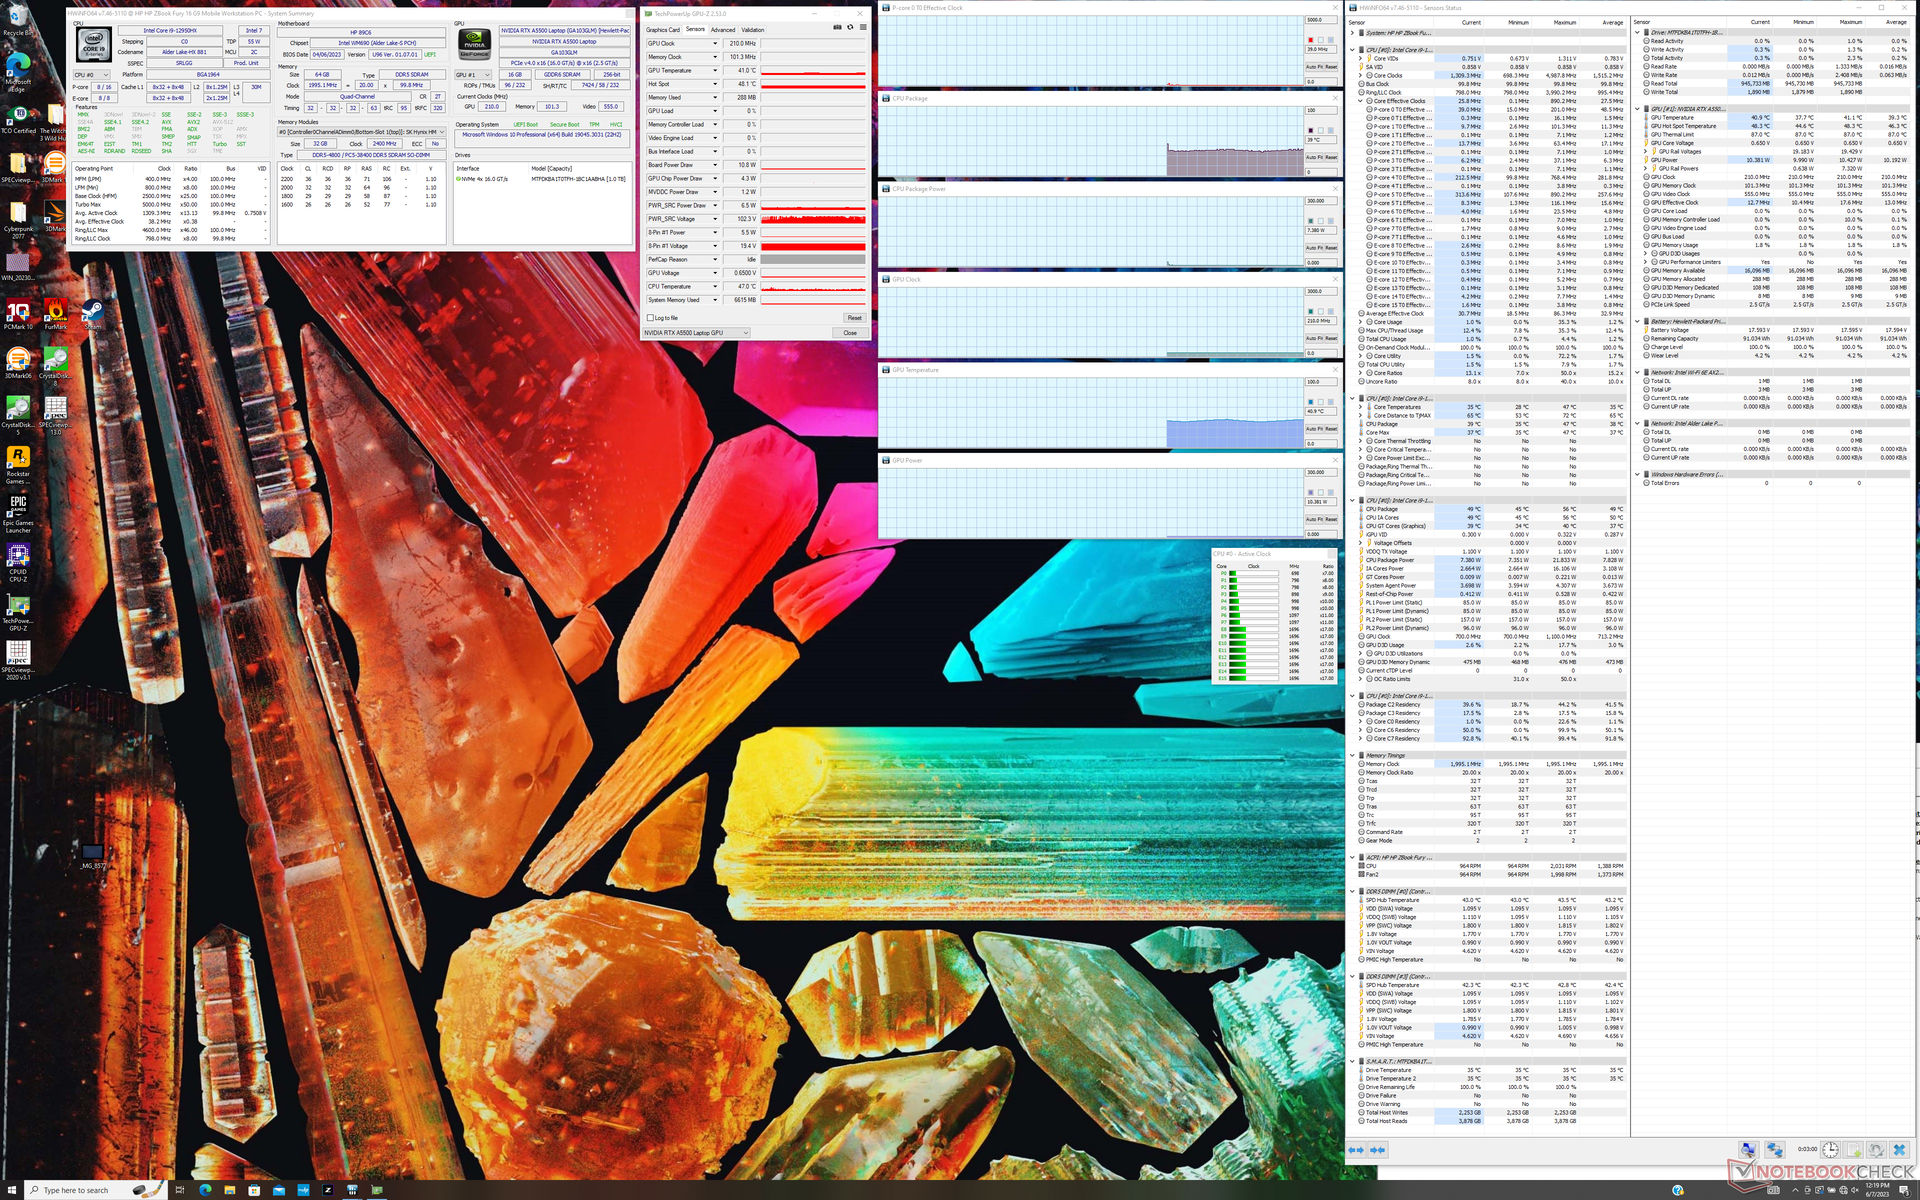
| Taktowanie CPU (GHz) | Taktowanie GPU (MHz) | Średnia temperatura CPU (°C) | Średnia temperatura GPU (°C) | |
| System w stanie spoczynku | -- | -- | 39 | 41 |
| Prime95Stress | 2.5 - 2.7 | -- | 76 | 52 |
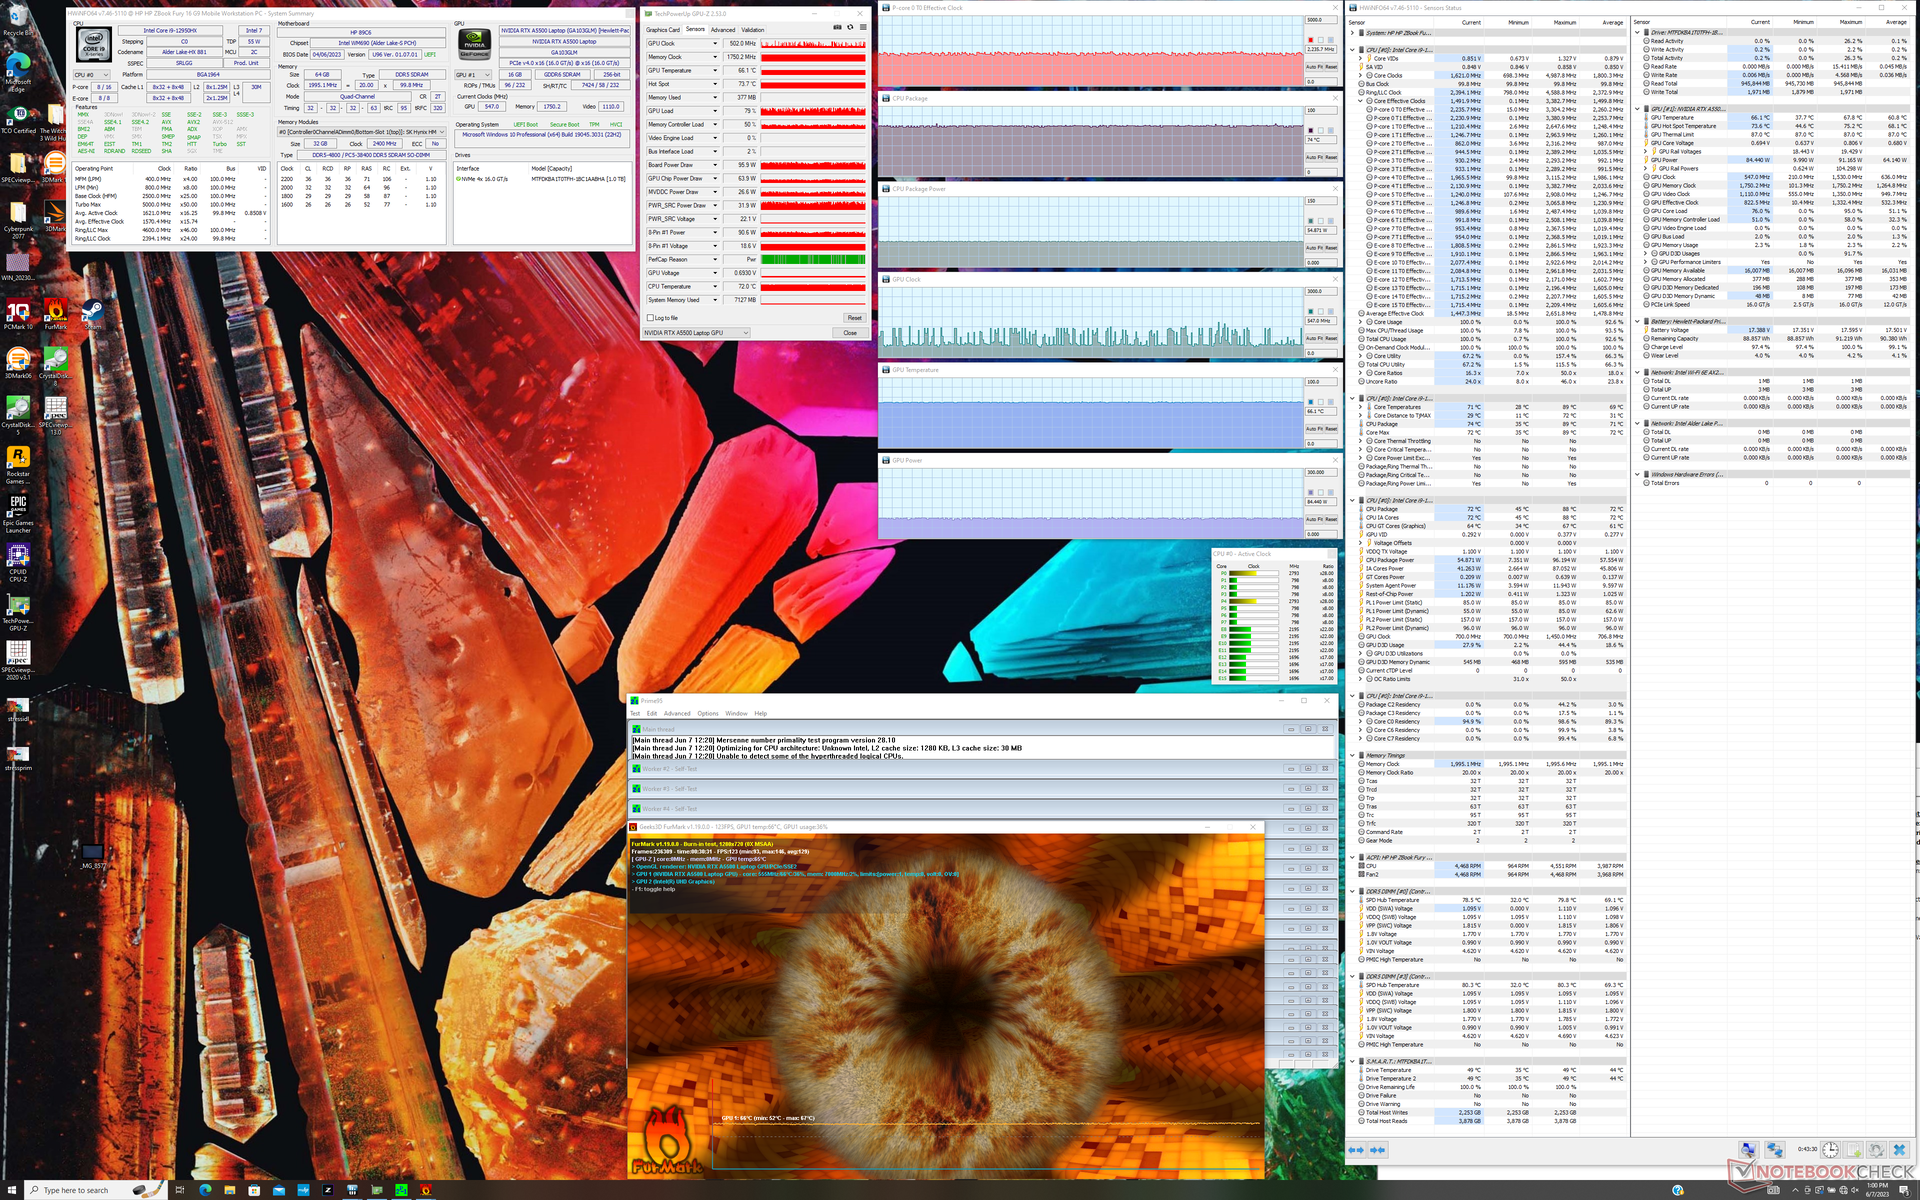
| Prime95+ FurMark Stress | 2.2 - 2.3 | 547 - 1200 | 74 | 66 |
| Witcher 3 Stres | ~1.4 | 1297 | 87 | 70 |
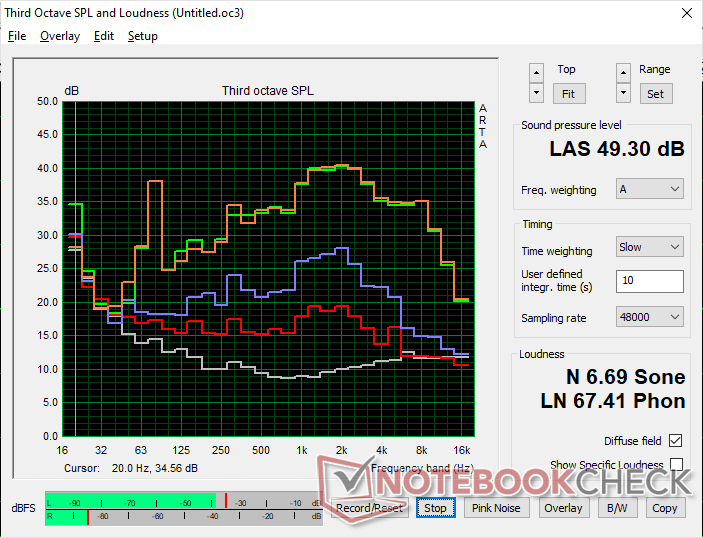
Głośniki
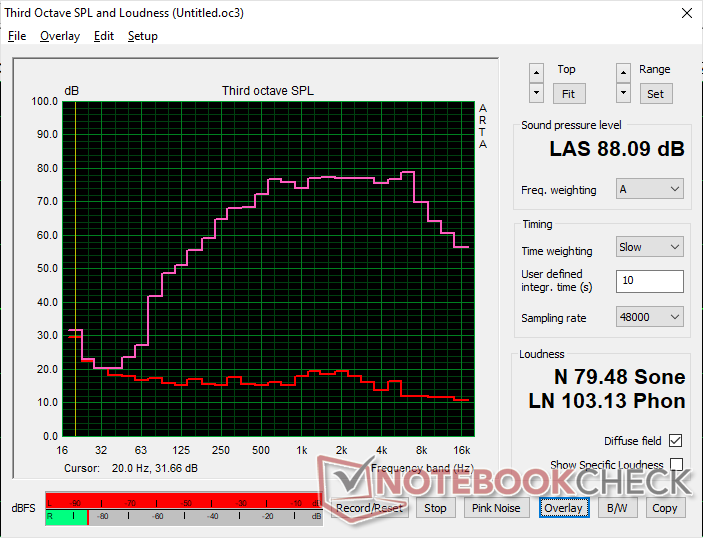
HP ZBook Fury 16 G9 analiza dźwięku
(+) | głośniki mogą odtwarzać stosunkowo głośno (88.1 dB)
Bas 100 - 315 Hz
(-) | prawie brak basu - średnio 16.1% niższa od mediany
(±) | liniowość basu jest średnia (7.5% delta do poprzedniej częstotliwości)
Średnie 400 - 2000 Hz
(+) | zbalansowane środki średnie - tylko 2.7% od mediany
(+) | średnie są liniowe (3.2% delta do poprzedniej częstotliwości)
Wysokie 2–16 kHz
(+) | zrównoważone maksima - tylko 4.2% od mediany
(+) | wzloty są liniowe (4.9% delta do poprzedniej częstotliwości)
Ogólnie 100 - 16.000 Hz
(+) | ogólny dźwięk jest liniowy (13.5% różnicy w stosunku do mediany)
W porównaniu do tej samej klasy
» 26% wszystkich testowanych urządzeń w tej klasie było lepszych, 5% podobnych, 70% gorszych
» Najlepszy miał deltę 7%, średnia wynosiła ###średnia###%, najgorsza wynosiła 35%
W porównaniu do wszystkich testowanych urządzeń
» 14% wszystkich testowanych urządzeń było lepszych, 4% podobnych, 82% gorszych
» Najlepszy miał deltę 4%, średnia wynosiła ###średnia###%, najgorsza wynosiła 134%
Apple MacBook Pro 16 2021 M1 Pro analiza dźwięku
(+) | głośniki mogą odtwarzać stosunkowo głośno (84.7 dB)
Bas 100 - 315 Hz
(+) | dobry bas - tylko 3.8% od mediany
(+) | bas jest liniowy (5.2% delta do poprzedniej częstotliwości)
Średnie 400 - 2000 Hz
(+) | zbalansowane środki średnie - tylko 1.3% od mediany
(+) | średnie są liniowe (2.1% delta do poprzedniej częstotliwości)
Wysokie 2–16 kHz
(+) | zrównoważone maksima - tylko 1.9% od mediany
(+) | wzloty są liniowe (2.7% delta do poprzedniej częstotliwości)
Ogólnie 100 - 16.000 Hz
(+) | ogólny dźwięk jest liniowy (4.6% różnicy w stosunku do mediany)
W porównaniu do tej samej klasy
» 0% wszystkich testowanych urządzeń w tej klasie było lepszych, 0% podobnych, 100% gorszych
» Najlepszy miał deltę 5%, średnia wynosiła ###średnia###%, najgorsza wynosiła 45%
W porównaniu do wszystkich testowanych urządzeń
» 0% wszystkich testowanych urządzeń było lepszych, 0% podobnych, 100% gorszych
» Najlepszy miał deltę 4%, średnia wynosiła ###średnia###%, najgorsza wynosiła 134%
Zarządzanie energią
Zużycie energii
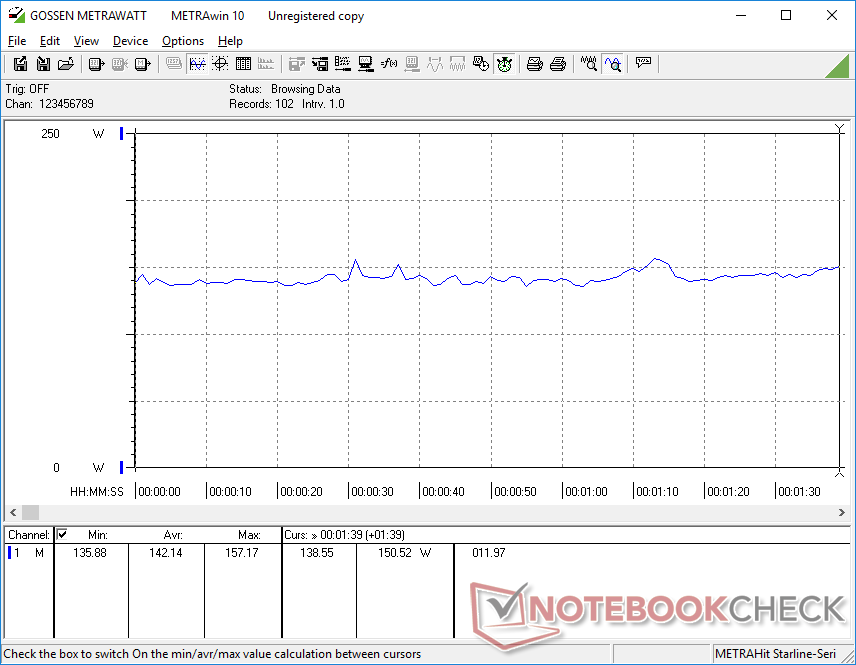
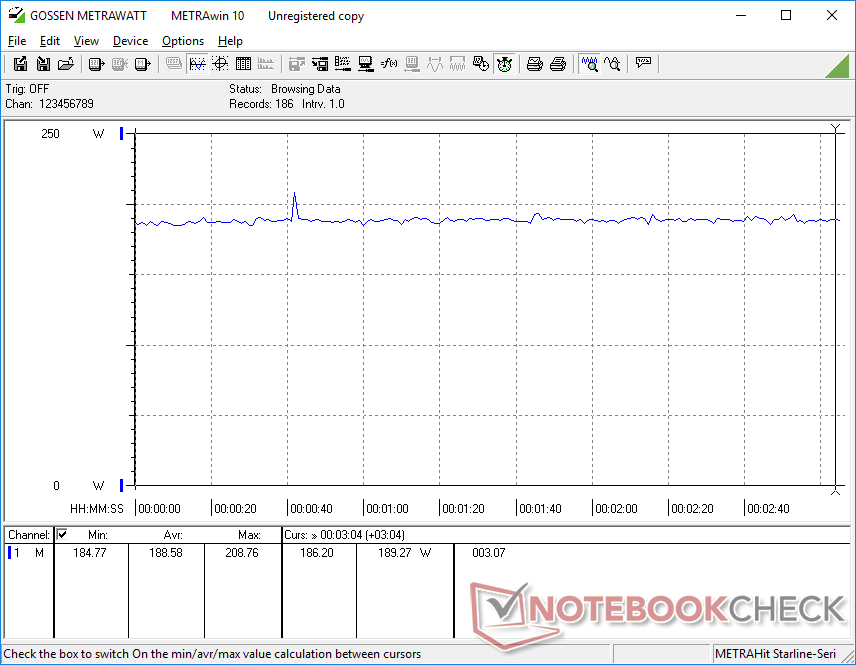
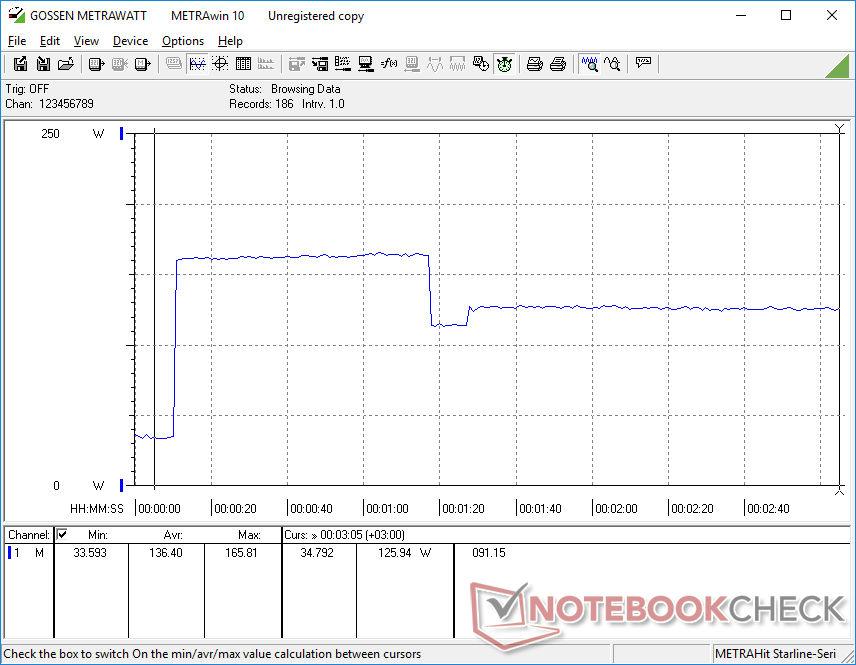
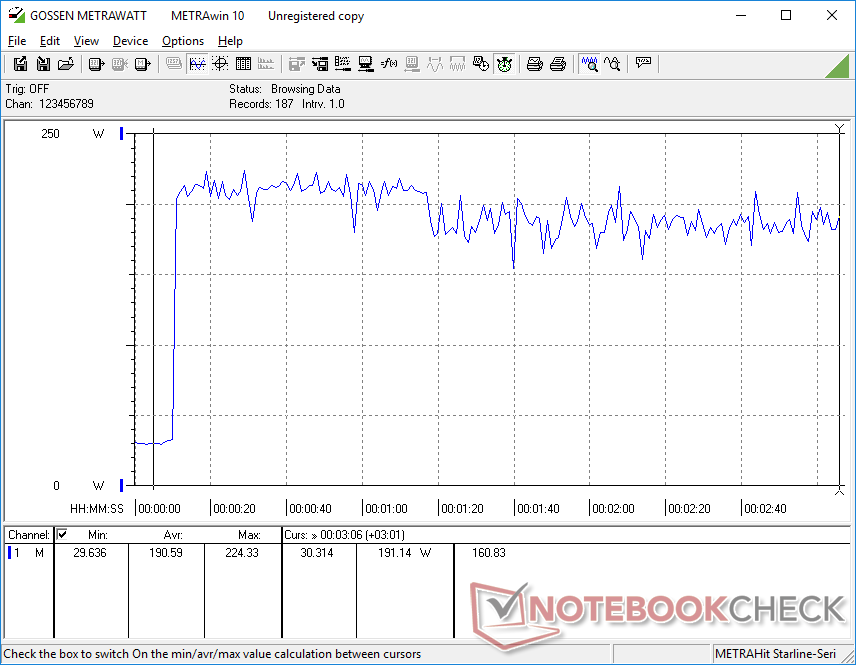
Zużycie energii jest stosunkowo wysokie. Na przykład praca na biegu jałowym na komputerze stacjonarnym zużywałaby nieco ponad 19 W, nawet przy włączonym profilu oszczędzania energii i minimalnym ustawieniu jasności, w porównaniu do odpowiednio 7 W lub 16 W w ThinkPad P16 G1 lub Precision 7670. Uruchamianie bardziej wymagających obciążeń, takich jak Witcher 3 zużyłoby 189 W lub prawie 30 W więcej niż na Precision 7670, mimo że Dell oferuje nieco wyższą wydajność graficzną.
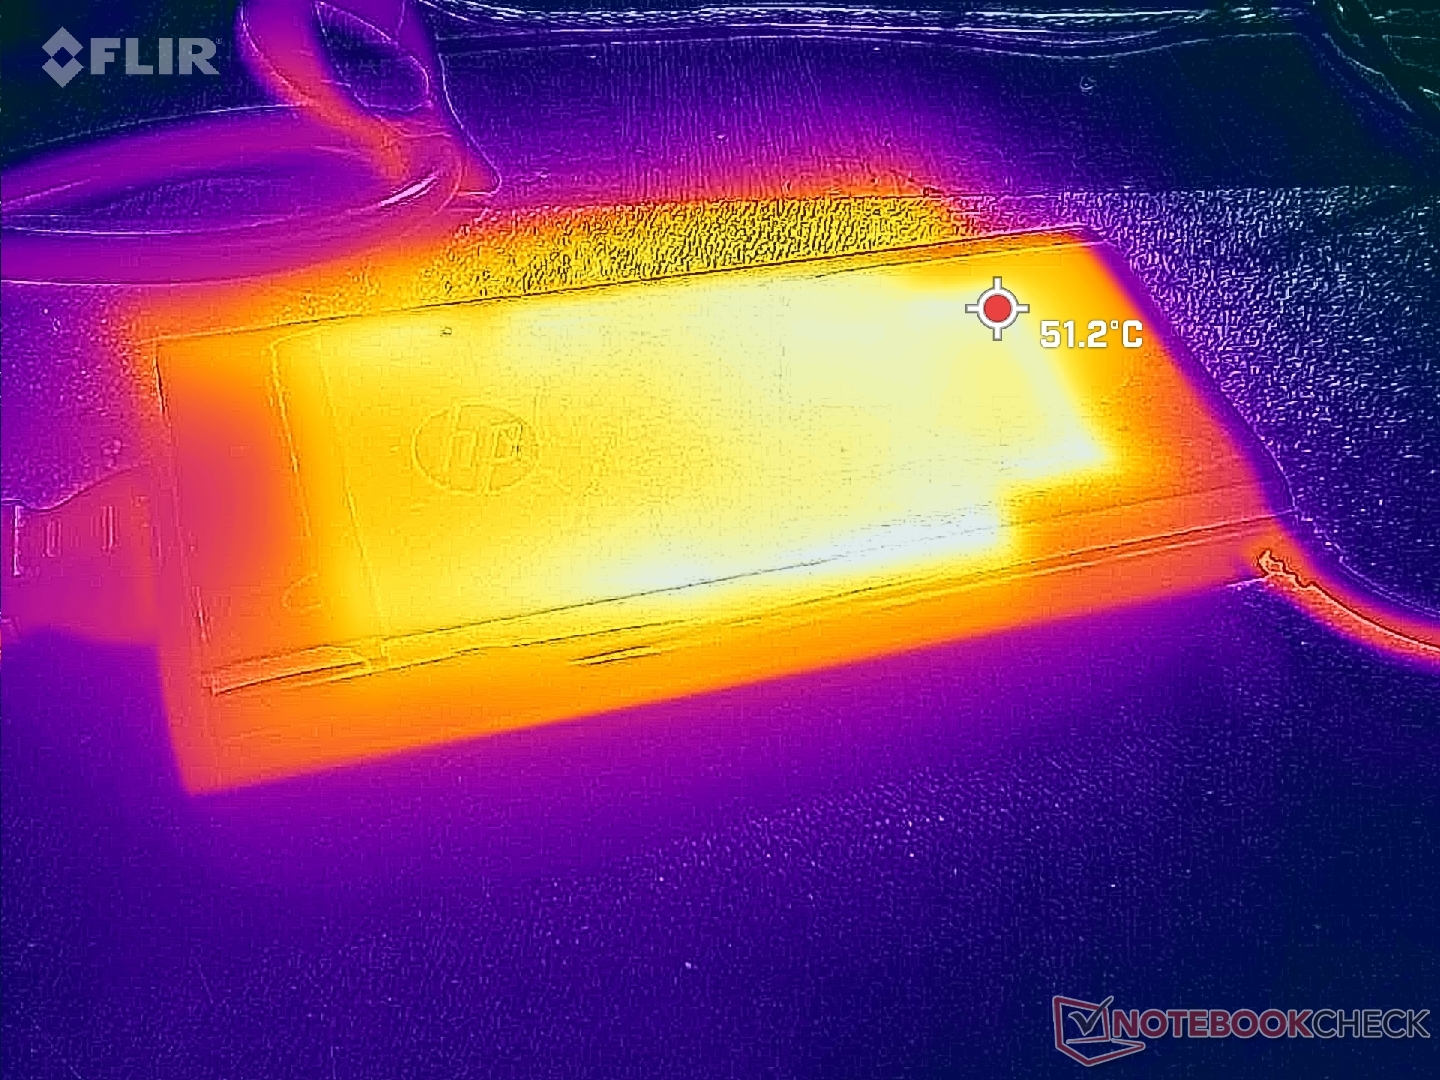
Jesteśmy w stanie zarejestrować tymczasowy maksymalny pobór 224 W ze średniej wielkości (~ 18 x 8,9 x 2,7 cm) zasilacza 230 W, gdy procesor i karta graficzna są wykorzystywane w 100 procentach. Ładowanie spowolniłoby zatem do indeksowania przy jednoczesnym uruchomieniu tak dużych obciążeń. Powtórzenie tego testu na Precision 7670 lub ThinkPad P16 G1 dałoby znacznie wyższe tymczasowe poziomy zużycia energii wynoszące około 300 W każdy, ponieważ mają one zarówno wyższe docelowe wartości TGP / TDP, jak i wyższe pułapy Turbo Boost.
| wyłączony / stan wstrzymania | |
| luz | |
| obciążenie |
|
Legenda:
min: | |
| HP ZBook Fury 16 G9 i9-12950HX, RTX A5500 Laptop GPU, Micron 3400 1TB MTFDKBA1T0TFH, IPS, 3840x2400, 16" | HP ZBook Studio 16 G9 62U04EA i7-12800H, RTX A2000 Laptop GPU, Micron 3400 1TB MTFDKBA1T0TFH, IPS, 3840x2400, 16" | HP ZBook Firefly 16 G9-6B897EA i7-1265U, T550 Laptop GPU, Samsung PM9A1 MZVL21T0HCLR, IPS, 1920x1200, 16" | Lenovo ThinkPad P16 G1 RTX A5500 i9-12950HX, RTX A5500 Laptop GPU, WDC PC SN810 2TB, IPS, 3840x2400, 16" | Dell Precision 7000 7670 Performance i9-12950HX, RTX A5500 Laptop GPU, , OLED, 3840x2400, 16" | MSI CreatorPro Z16P B12UKST i7-12700H, RTX A3000 Laptop GPU, Samsung PM9A1 MZVL21T0HCLR, IPS, 2560x1600, 16" | |
|---|---|---|---|---|---|---|
| Power Consumption | 40% | 71% | 10% | -8% | 35% | |
| Idle Minimum * (Watt) | 19.5 | 7.2 63% | 4.5 77% | 7.5 62% | 16.4 16% | 10.8 45% |
| Idle Average * (Watt) | 29 | 18.1 38% | 8 72% | 20.1 31% | 35.9 -24% | 16.3 44% |
| Idle Maximum * (Watt) | 40.7 | 18.5 55% | 8.7 79% | 40 2% | 47 -15% | 16.9 58% |
| Load Average * (Watt) | 142.1 | 112.8 21% | 48.3 66% | 137 4% | 147.1 -4% | 111.7 21% |
| Witcher 3 ultra * (Watt) | 188.6 | 106.7 43% | 45.3 76% | 208 -10% | 158.8 16% | 152.1 19% |
| Load Maximum * (Watt) | 224.4 | 186 17% | 94.7 58% | 285.9 -27% | 311 -39% | 177.4 21% |
* ... im mniej tym lepiej
Power Consumption Witcher 3 / Stresstest
Power Consumption external Monitor
Żywotność baterii - błędne czasy działania
6-godzinny czas pracy w sieci WLAN jest porównywalny doZBook Studio 16 G9 i ThinkPad P16 G1, a jednocześnie jest o ponad godzinę dłuższy niż w przypadku Precision 7670. Cieńszy ZBook Firefly 16 G9 może działać prawie dwa razy dłużej, ponieważ wykorzystuje wolniejszy procesor Core z serii U.
Ładowanie baterii o pojemności 95 Wh od stanu rozładowania do pełnej pojemności trwa nieco ponad godzinę przy użyciu dołączonego zasilacza sieciowego. System można również ładować za pomocą adapterów USB-C innych firm, ale kompatybilność nie jest gwarantowana w przypadku mniejszych pojemności. Na przykład podłączenie naszego 65 W adaptera USB-C do Fury 16 G9 spowodowałoby wyświetlenie wyskakującego okienka systemu Windows z informacją o niewystarczającej mocy do naładowania. Z drugiej strony, nasz zasilacz sieciowy USB-C o mocy 130 W naładowałby system bez żadnych problemów. Wydajność spada podczas ładowania przez USB-C, czego można było się spodziewać.
Co dziwne, czas pracy na baterii na biegu jałowym w trybie oszczędzania energii i przy najniższym ustawieniu jasności był krótszy niż w przypadku naszych zrównoważonych ustawień WLAN, nawet po wielu ponownych testach. Jest to prawdopodobnie błąd modelu wskazujący na słabe zarządzanie zasobami w tle lub błędne stany procesora związane z ustawieniami profilu zasilania systemu Windows.
| HP ZBook Fury 16 G9 i9-12950HX, RTX A5500 Laptop GPU, 95 Wh | HP ZBook Studio 16 G9 62U04EA i7-12800H, RTX A2000 Laptop GPU, 86 Wh | HP ZBook Firefly 16 G9-6B897EA i7-1265U, T550 Laptop GPU, 76 Wh | Lenovo ThinkPad P16 G1 RTX A5500 i9-12950HX, RTX A5500 Laptop GPU, 94 Wh | Dell Precision 7000 7670 Performance i9-12950HX, RTX A5500 Laptop GPU, 93 Wh | MSI CreatorPro Z16P B12UKST i7-12700H, RTX A3000 Laptop GPU, 90 Wh | |
|---|---|---|---|---|---|---|
| Czasy pracy | -2% | 92% | -3% | -22% | -3% | |
| Reader / Idle (h) | 5.3 | |||||
| WiFi v1.3 (h) | 6 | 6.3 5% | 13 117% | 5.8 -3% | 4.7 -22% | 5.8 -3% |
| Load (h) | 1.2 | 1.1 -8% | 2 67% | |||
| H.264 (h) | 8.5 | 18.4 |
Za
Przeciw
Werdykt - dobra wydajność, ale Lenovo i Dell robią to szybciej
ZBook Fury 16 G9 oferuje funkcje niedostępne w większości innych mobilnych stacji roboczych. Superjasny panel o jasności 1000 nitów, opcjonalny OLED, podświetlenie RGB każdego klawisza, dedykowany klawisz programowalny oraz obsługa do 4 dysków SSD i 4 modułów SODIMM to cechy, które entuzjaści mogą docenić. Tymczasem wygodna klawiatura i touchpad to coś, co chcielibyśmy, aby inni producenci mogli naśladować.
Główną wadą uniemożliwiającą natychmiastową rekomendację ZBook Fury 16 G9 jest jego bardziej stromy throttling wydajności w porównaniu do Lenovo ThinkPad P16 G1 lub Dell Precision 7670. Chociaż prawdą jest, że HP może obsługiwać 4 dyski wewnętrzne, wydajność tych dysków ma tendencję do dławienia się pod obciążeniem. Rozczarowujące jest również to, że RTX A5500 celuje w TGP o mocy zaledwie 100 W, podczas gdy wyżej wymienione modele Lenovo i Dell celują w ~130 W dla szybszej wydajności. Nawet procesor osiąga nieco gorsze wyniki w porównaniu do innych modeli z tą samą opcją procesora.
HP ZBook Fury 16 G9 jest lżejszy i bardziej bogaty w funkcje niż wiele innych 16-calowych stacji roboczych. Wydajność jest jednak nieco niższa ze względu na niższe docelowe wartości TGP i TDP oraz niewystarczające chłodzenie SSD.
Jeśli powyższe funkcje dodatkowe Cię nie interesują, lepiej zmaksymalizować wydajność, wybierając ThinkPad P16 G1 lub Precision 7670. Jeśli jednak nie masz nic przeciwko zmniejszeniu wydajności na rzecz tych funkcji, to warto rozważyć lżejszy HP Fury.
Cena i dostępność
HP wysyła teraz swojego ZBooka Fury 16 G 9 w cenie od 1490 USD za konfigurację podstawową do ponad 4000 USD za naszą konfigurację testową. Dostępny jest również model Fury 16 G10.
HP ZBook Fury 16 G9
- 09/06/2023 v7 (old)
Allen Ngo
Przezroczystość
Wyboru urządzeń do recenzji dokonuje nasza redakcja. Próbka testowa została udostępniona autorowi jako pożyczka od producenta lub sprzedawcy detalicznego na potrzeby tej recenzji. Pożyczkodawca nie miał wpływu na tę recenzję, producent nie otrzymał też kopii tej recenzji przed publikacją. Nie było obowiązku publikowania tej recenzji. Jako niezależna firma medialna, Notebookcheck nie podlega władzy producentów, sprzedawców detalicznych ani wydawców.
Tak testuje Notebookcheck
Każdego roku Notebookcheck niezależnie sprawdza setki laptopów i smartfonów, stosując standardowe procedury, aby zapewnić porównywalność wszystkich wyników. Od około 20 lat stale rozwijamy nasze metody badawcze, ustanawiając przy tym standardy branżowe. W naszych laboratoriach testowych doświadczeni technicy i redaktorzy korzystają z wysokiej jakości sprzętu pomiarowego. Testy te obejmują wieloetapowy proces walidacji. Nasz kompleksowy system ocen opiera się na setkach uzasadnionych pomiarów i benchmarków, co pozwala zachować obiektywizm.Price comparison

