Recenzja Asus ProArt StudioBook 16 H7600ZW: Ostateczna alternatywa MacBooka Pro dla twórców treści

Linia Asus ProArt jest skierowana do kreatywnych profesjonalistów, którzy potrzebują sprzętu z najwyższej półki, aby móc bez przeszkód pracować. ProArt StudioBook ma zastąpić MacBooka Pro dla twórców po stronie Windows i jest wyposażony w unikalne funkcje dostosowane do twórców w ruchu.
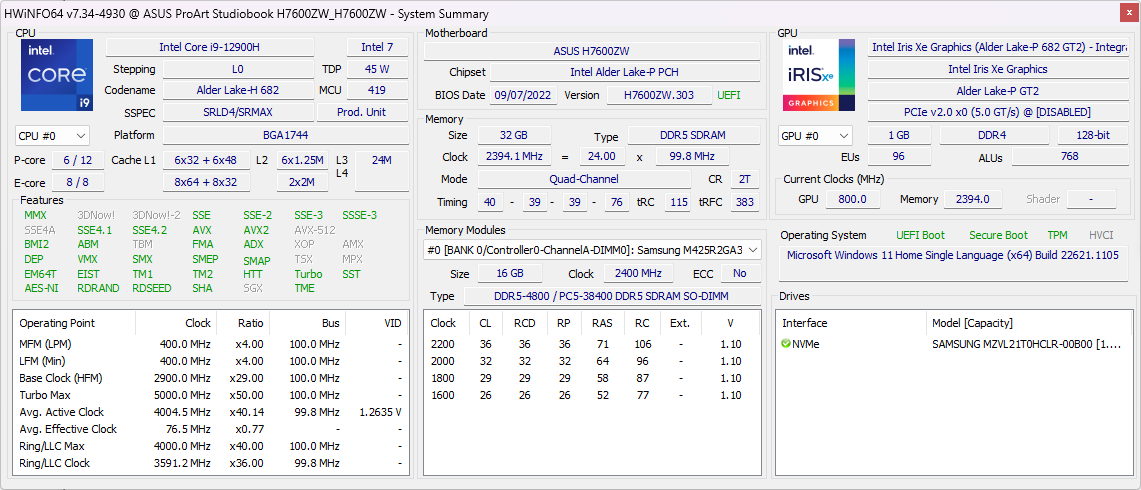
Wcześniej recenzowaliśmy ProArt StudioBook 16 Pro W7600 laptopa dla stacji roboczej wyposażonego w Intel Xeon W-11955M oraz Nvidia RTX A5000 Laptop GPU. Teraz mamy z nami ProArt StudioBook 16 H7600ZW wyposażony w Intel Core i9-12900H i Nvidia GeForce RTX 3070 Ti Laptop GPU.
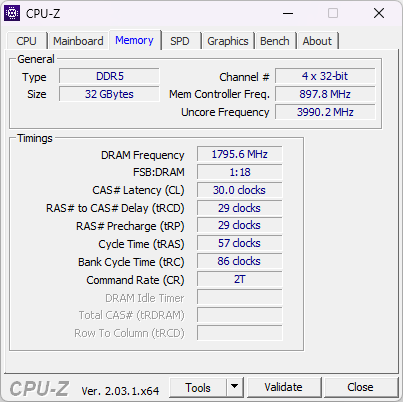
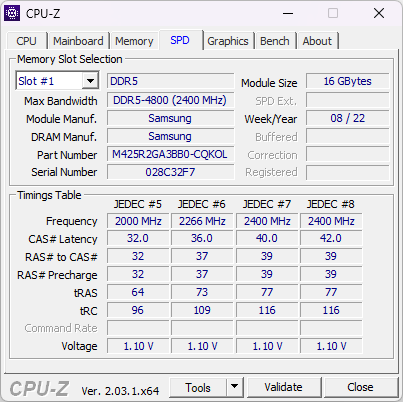
Nasz testowy egzemplarz wyposażony jest także w 32 GB pamięci RAM DDR5-4800, 16-calowy panel Samsung 4K OLED oraz 1 TB pamięci masowej PCIe. Asus wycenił obecnie tę konfigurację od ₹1 99 990 MRP lub od 2 699,99 USD w USA.
Niestety, Asus pominął opcje Ryzen 6000 lub Ryzen 7000 w serii ProArt. Jedynym obecnie dostępnym SKU opartym na Ryzenach jest ProArt StudioBook 16 OLED H5600 z Ryzen 9 5900HX oraz RTX 3070 Laptop GPU. Recenzja tego wariantu pojawi się niebawem.
Asus zaprezentował natomiast m.in.ProArt StudioBook 16 3D OLEDna targach CES 2023 z procesorem Intel 13. gen i modernizacją panelu 3D OLED, który mamy nadzieję zrecenzować w najbliższych tygodniach.
W tej recenzji poddajemy Asusa ProArt StudioBook 16 H7600ZW testowi i sprawdzamy, czy ten laptop rzeczywiście ma potencjał, by pozwolić na nieskrępowany przepływ kreatywności.
Potencjalni konkurenci w porównaniu
Ocena | Data | Model | Waga | Wysokość | Rozmiar | Rezolucja | Cena |
|---|---|---|---|---|---|---|---|
| 89 % v7 (old) | 02/2023 | Asus ProArt StudioBook 16 H7600ZW i9-12900H, GeForce RTX 3070 Ti Laptop GPU | 2.4 kg | 19.9 mm | 16.00" | 3840x2400 | |
| 83.8 % v7 (old) | 09/2022 | MSI Creator Z17 A12UGST-054 i9-12900H, GeForce RTX 3070 Ti Laptop GPU | 2.5 kg | 19 mm | 17.00" | 2560x1600 | |
| 83.7 % v7 (old) | MSI Creator Z16P B12UHST i9-12900H, GeForce RTX 3080 Ti Laptop GPU | 2.4 kg | 20.4 mm | 16.00" | 2560x1600 | ||
| 86.3 % v7 (old) | Asus ROG Strix Scar 15 G533ZW-LN106WS i9-12900H, GeForce RTX 3070 Ti Laptop GPU | 2.3 kg | 27.2 mm | 15.60" | 2560x1440 | ||
| 88.4 % v7 (old) | 12/2022 | Asus ZenBook Pro 16X OLED UX7602ZM-ME115W i9-12900H, GeForce RTX 3060 Laptop GPU | 2.4 kg | 19.5 mm | 16.00" | 3840x2400 | |
| 84.7 % v7 (old) | Gigabyte Aero 16 YE5 i9-12900HK, GeForce RTX 3080 Ti Laptop GPU | 2.3 kg | 22.4 mm | 16.00" | 3840x2400 | ||
| 87.9 % v7 (old) | 10/2022 | Lenovo ThinkBook 16p G3 ARH R9 6900HX, GeForce RTX 3060 Laptop GPU | 2.1 kg | 19.5 mm | 16.00" | 2560x1600 | |
| 88.2 % v7 (old) | Asus ROG Zephyrus Duo 16 GX650RX R9 6900HX, GeForce RTX 3080 Ti Laptop GPU | 2.6 kg | 20.5 mm | 16.00" | 3840x2400 | ||
| 93.2 % v7 (old) | Apple MacBook Pro 16 2021 M1 Pro M1 Pro, M1 Pro 16-Core GPU | 2.2 kg | 16.8 mm | 16.20" | 3456x2234 | ||
| 92.1 % v7 (old) | Apple MacBook Pro 14 2021 M1 Max 24-Core GPU M1 Max, M1 Max 24-Core GPU | 1.6 kg | 15.5 mm | 14.20" | 3024x1964 |
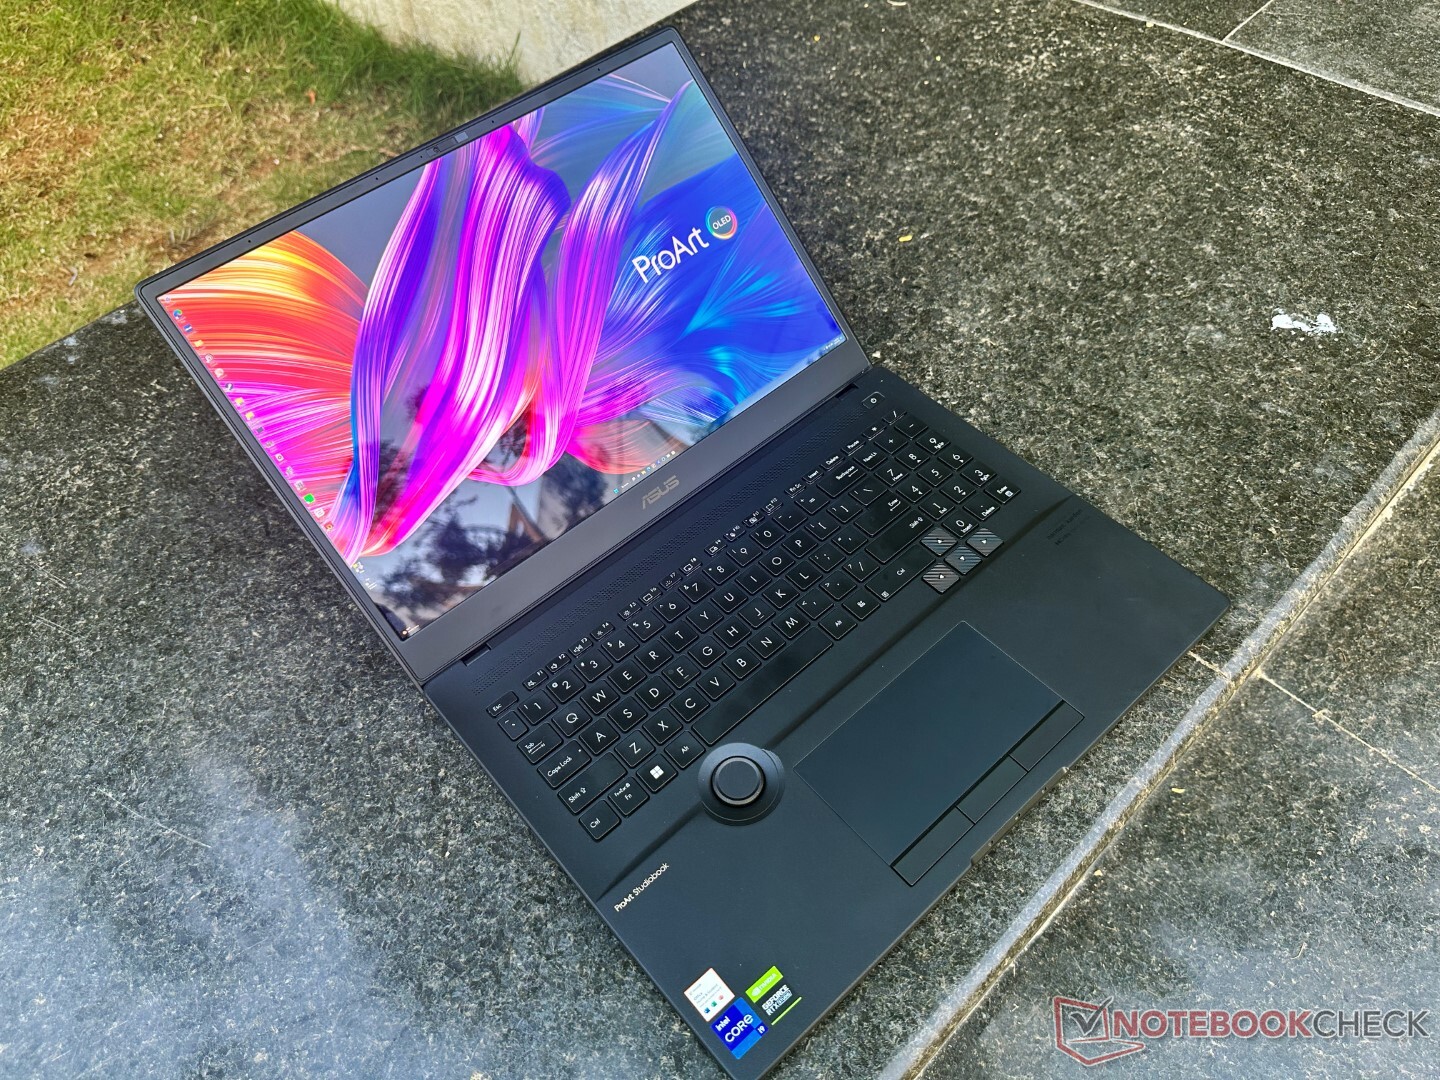
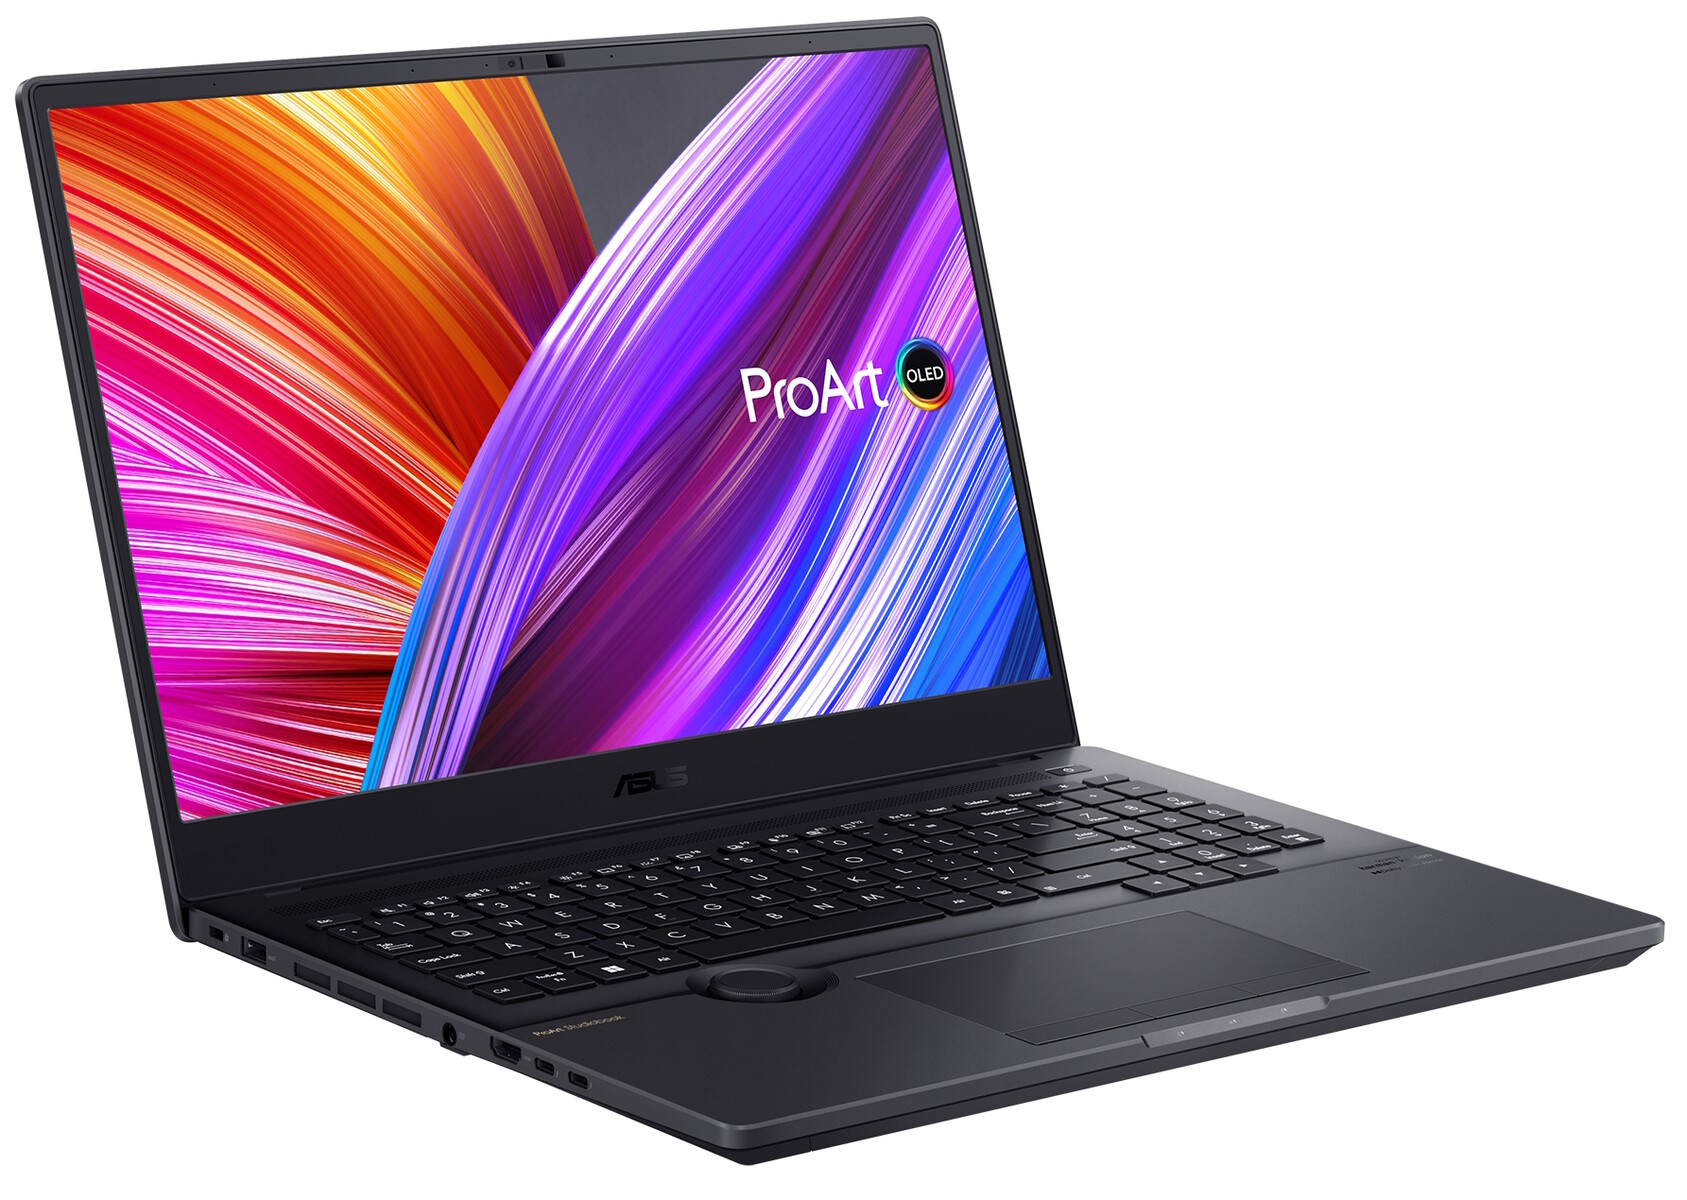
Obudowa: Budzący zaufanie stop aluminium
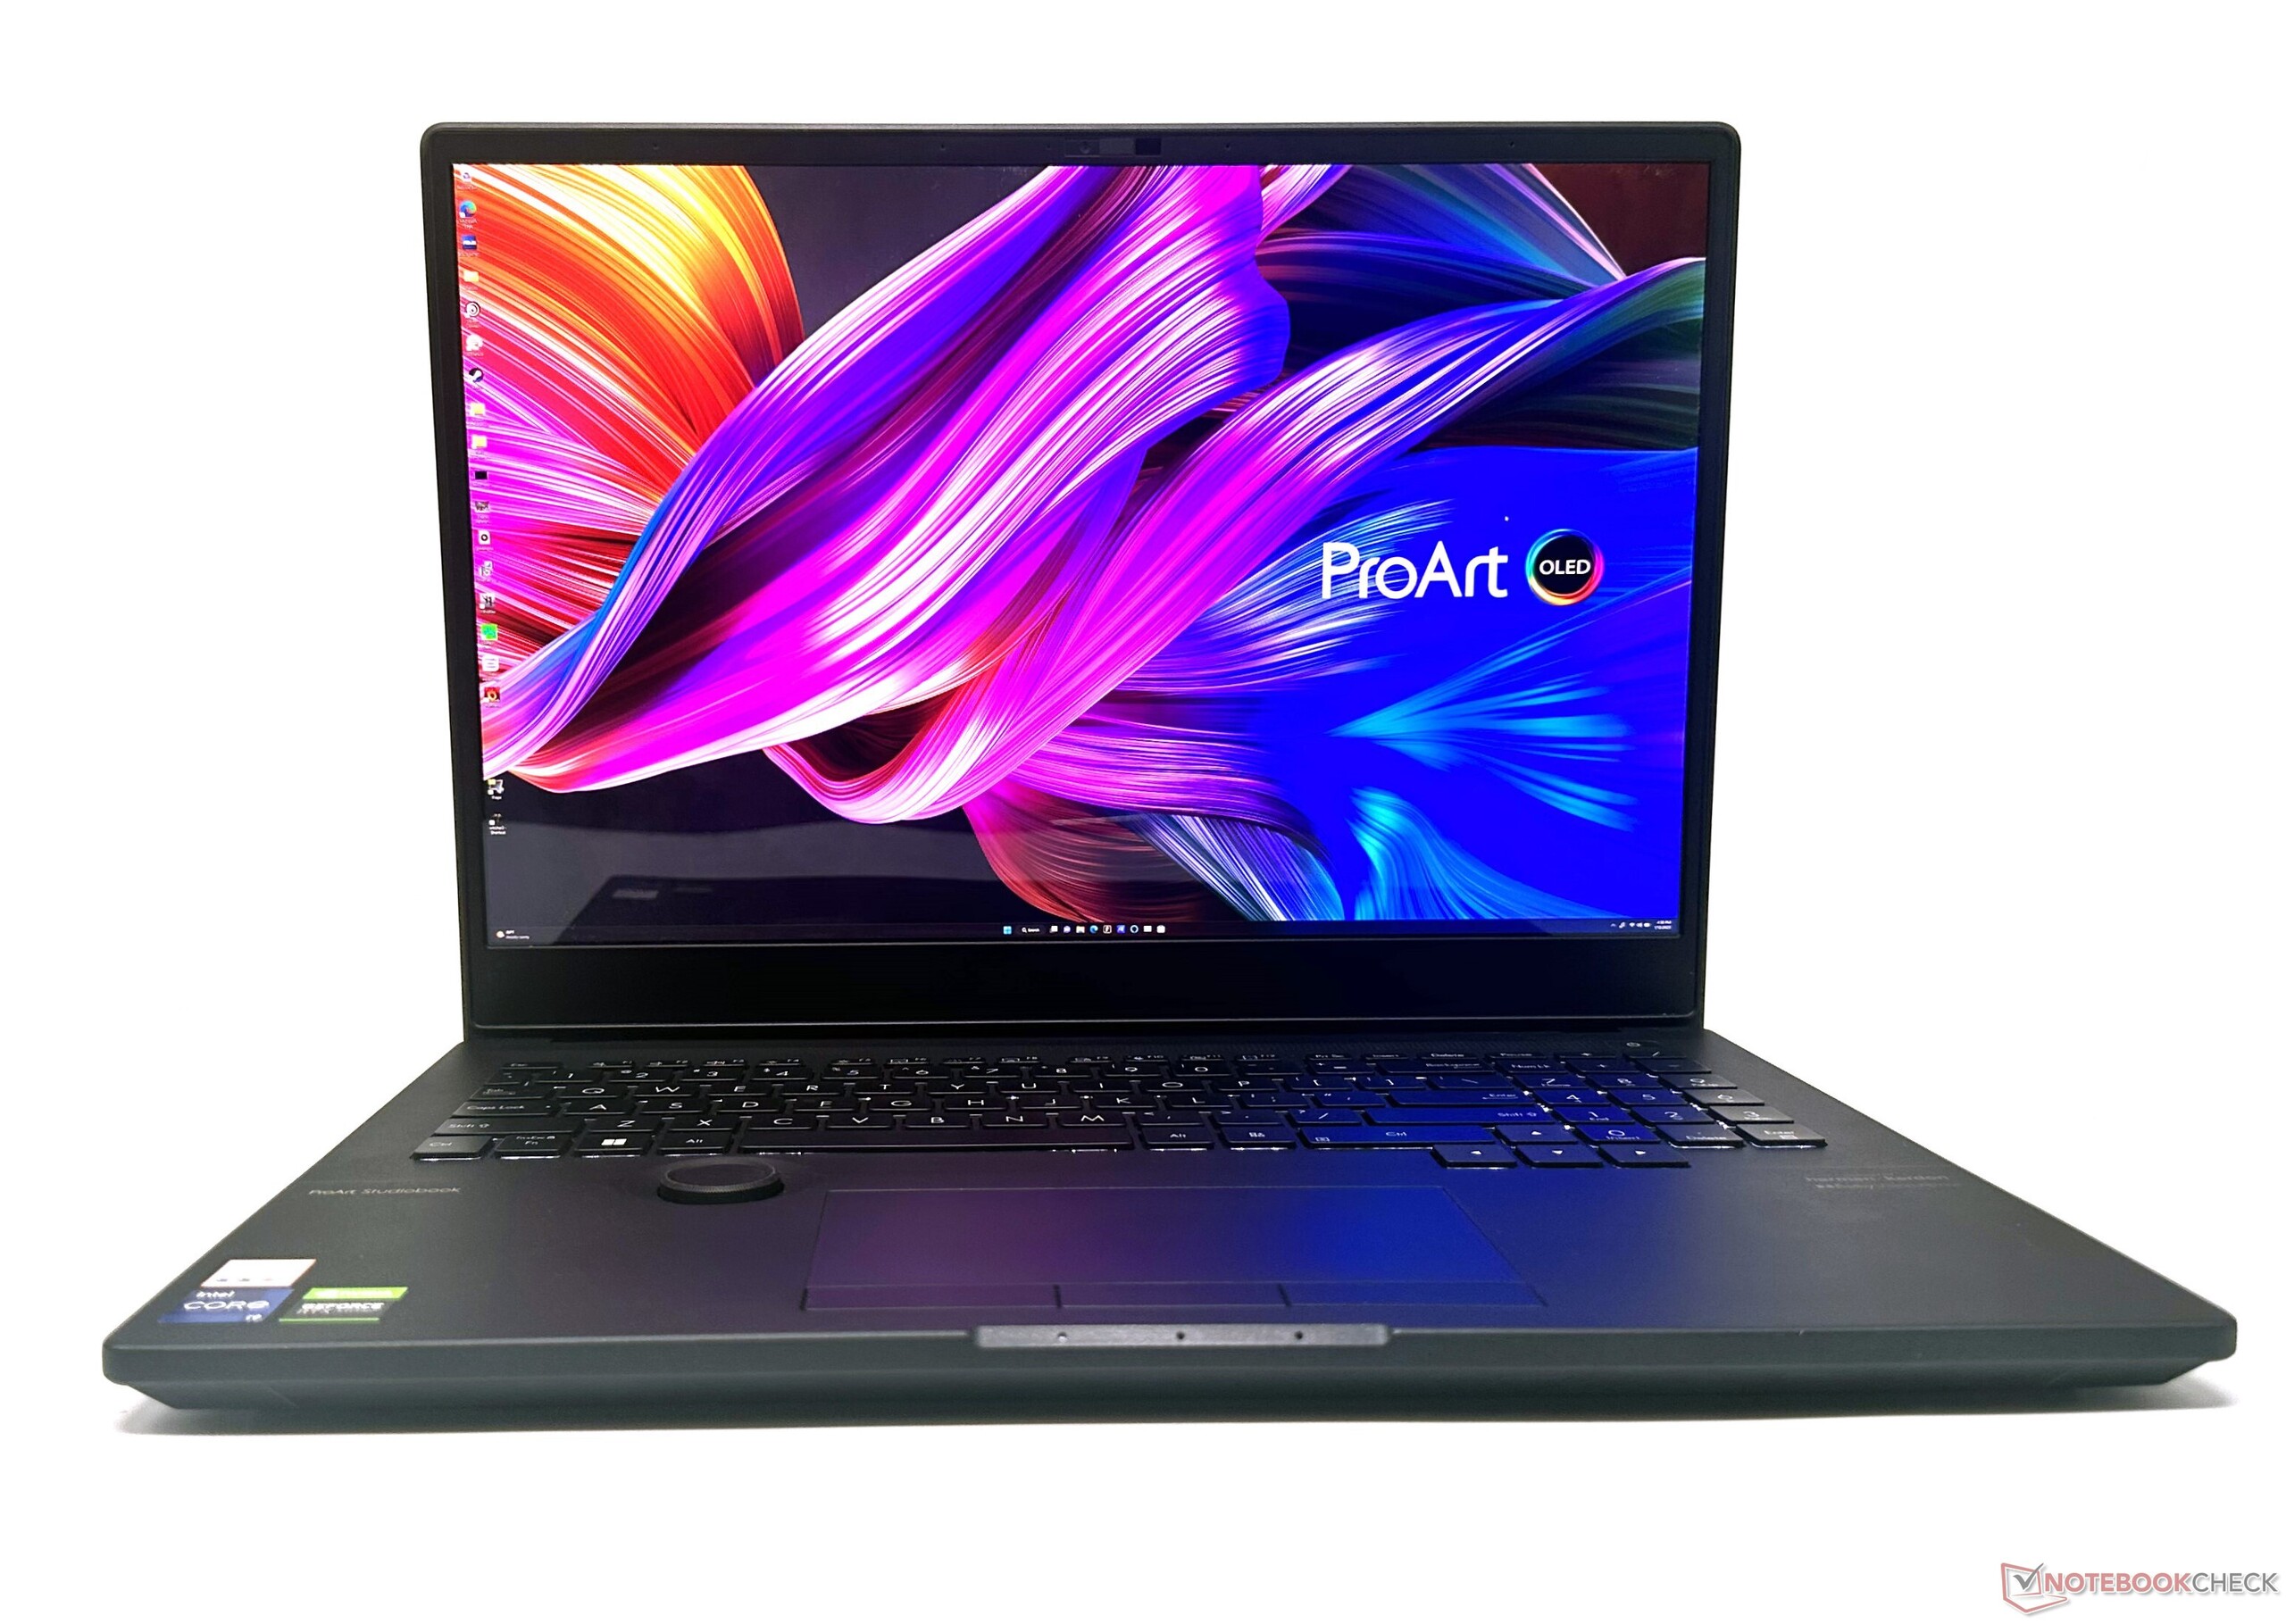
Obudowa i haptyka są dokładnie takie same jak w ProArt StudioBook 16 Pro W7600. Laptop jest dość ciężki, waży 2,4 kg, ale równomierne rozłożenie ciężaru na smukłej, 16-calowej obudowie o grubości 0,78 cala budzi zaufanie w codziennym użytkowaniu.
W szczególności podoba nam się podwyższona konstrukcja, która pozwala na wygodniejsze pisanie i swobodny przepływ powietrza. Nie ma ostrych krawędzi i nie doświadczyliśmy żadnych niepożądanych drgań wyświetlacza. Pokrywa jest również dość odporna na skręcanie. Pokrywę można otworzyć jednym palcem do 150° bez żadnych problemów ze stabilnością.
W górnej części klawiatury znajdują się otwory wentylacyjne. Sama płyta jest dobrze wykonana i nie ma wyczuwalnych ugięć. Na spodzie znajdują się trzy wskaźniki stanu: zasilania, akumulatora i aktywności dysku SSD.
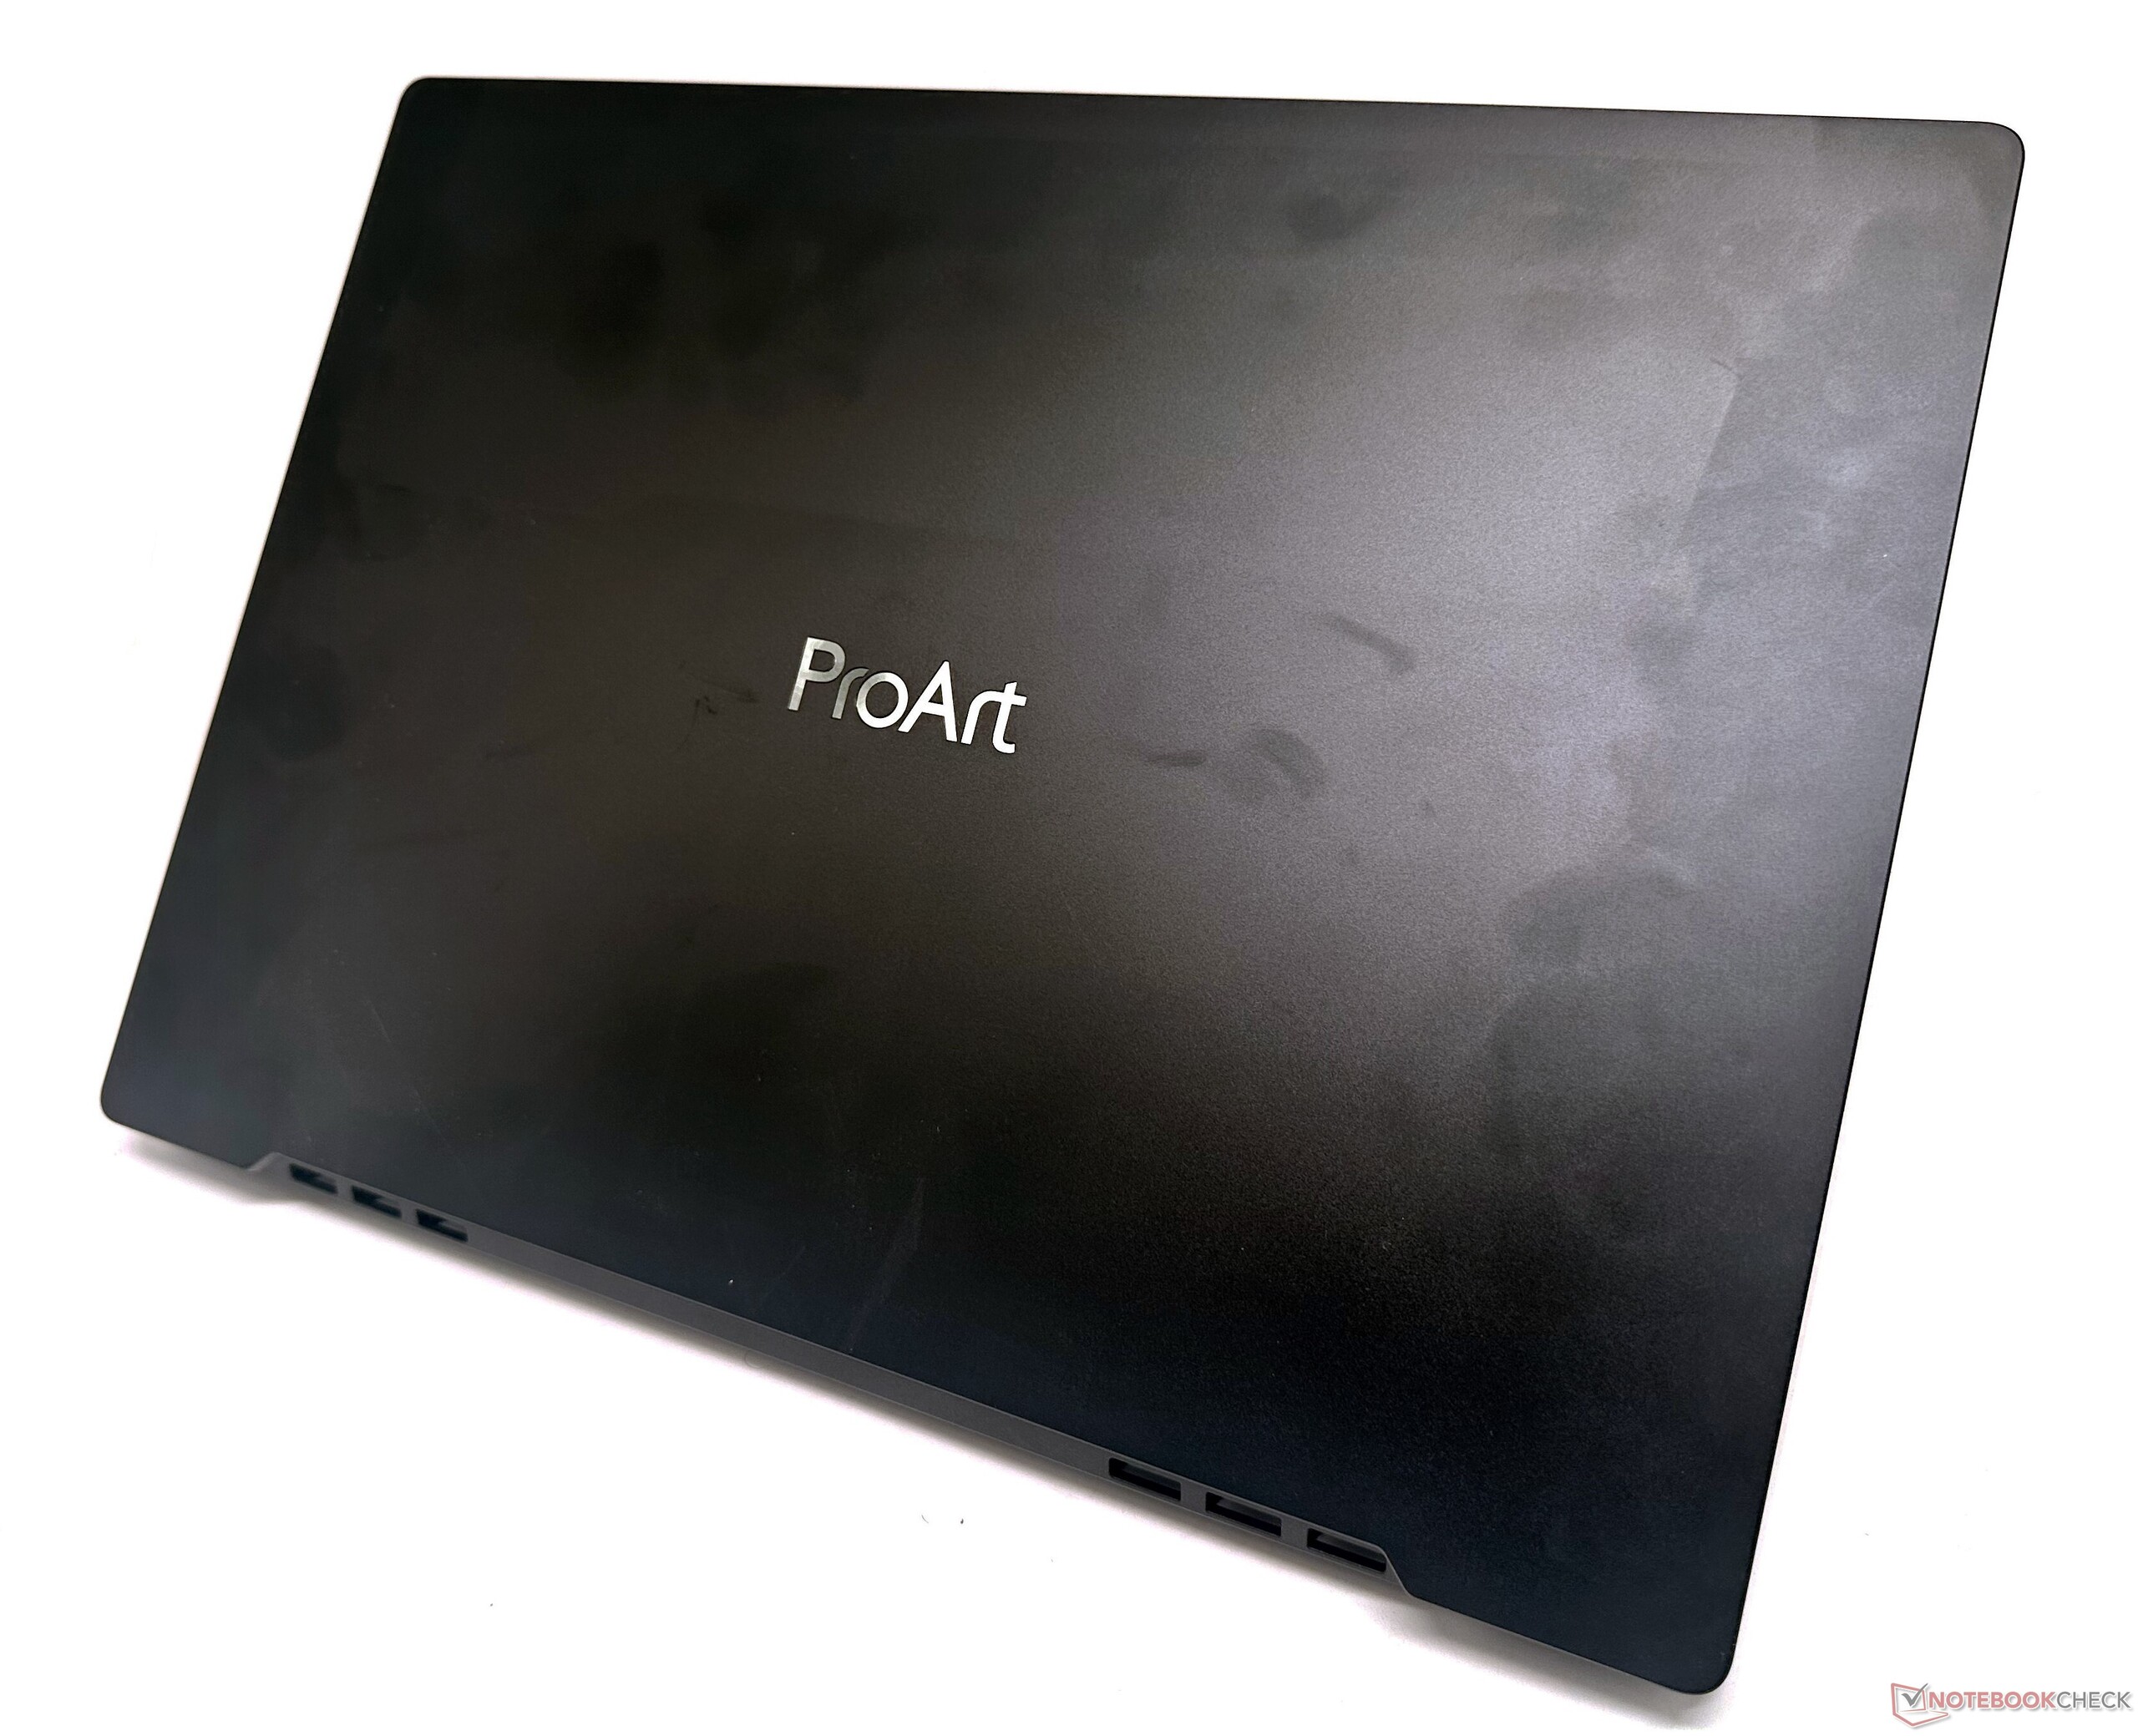
Asus twierdzi, że matowa pokrywa w kolorze Mineral Black posiada "zaawansowaną technologicznie nanopowłokę zapobiegającą powstawaniu odcisków palców". Choć odciski palców mogą nie być widoczne, pokrywa nie jest odporna na brud i nie jest oleofobiczna.
ProArt StudioBook 16 spełnia również kryteria MIL-STD-810H dotyczące trwałości i bez problemu wytrzymuje kaprysy pracy w plenerze.
Ogólnie rzecz biorąc, Asus ProArt StudioBook 16 może nie oddaje dokładnie wibracji MacBooka Pro, ale konstrukcja ze stopu aluminium jest zdecydowanie premium, minimalistyczna i dobrze współgra z ceną wywoławczą.
Łączność: Powolna, niespójna przepustowość Wi-Fi 6E
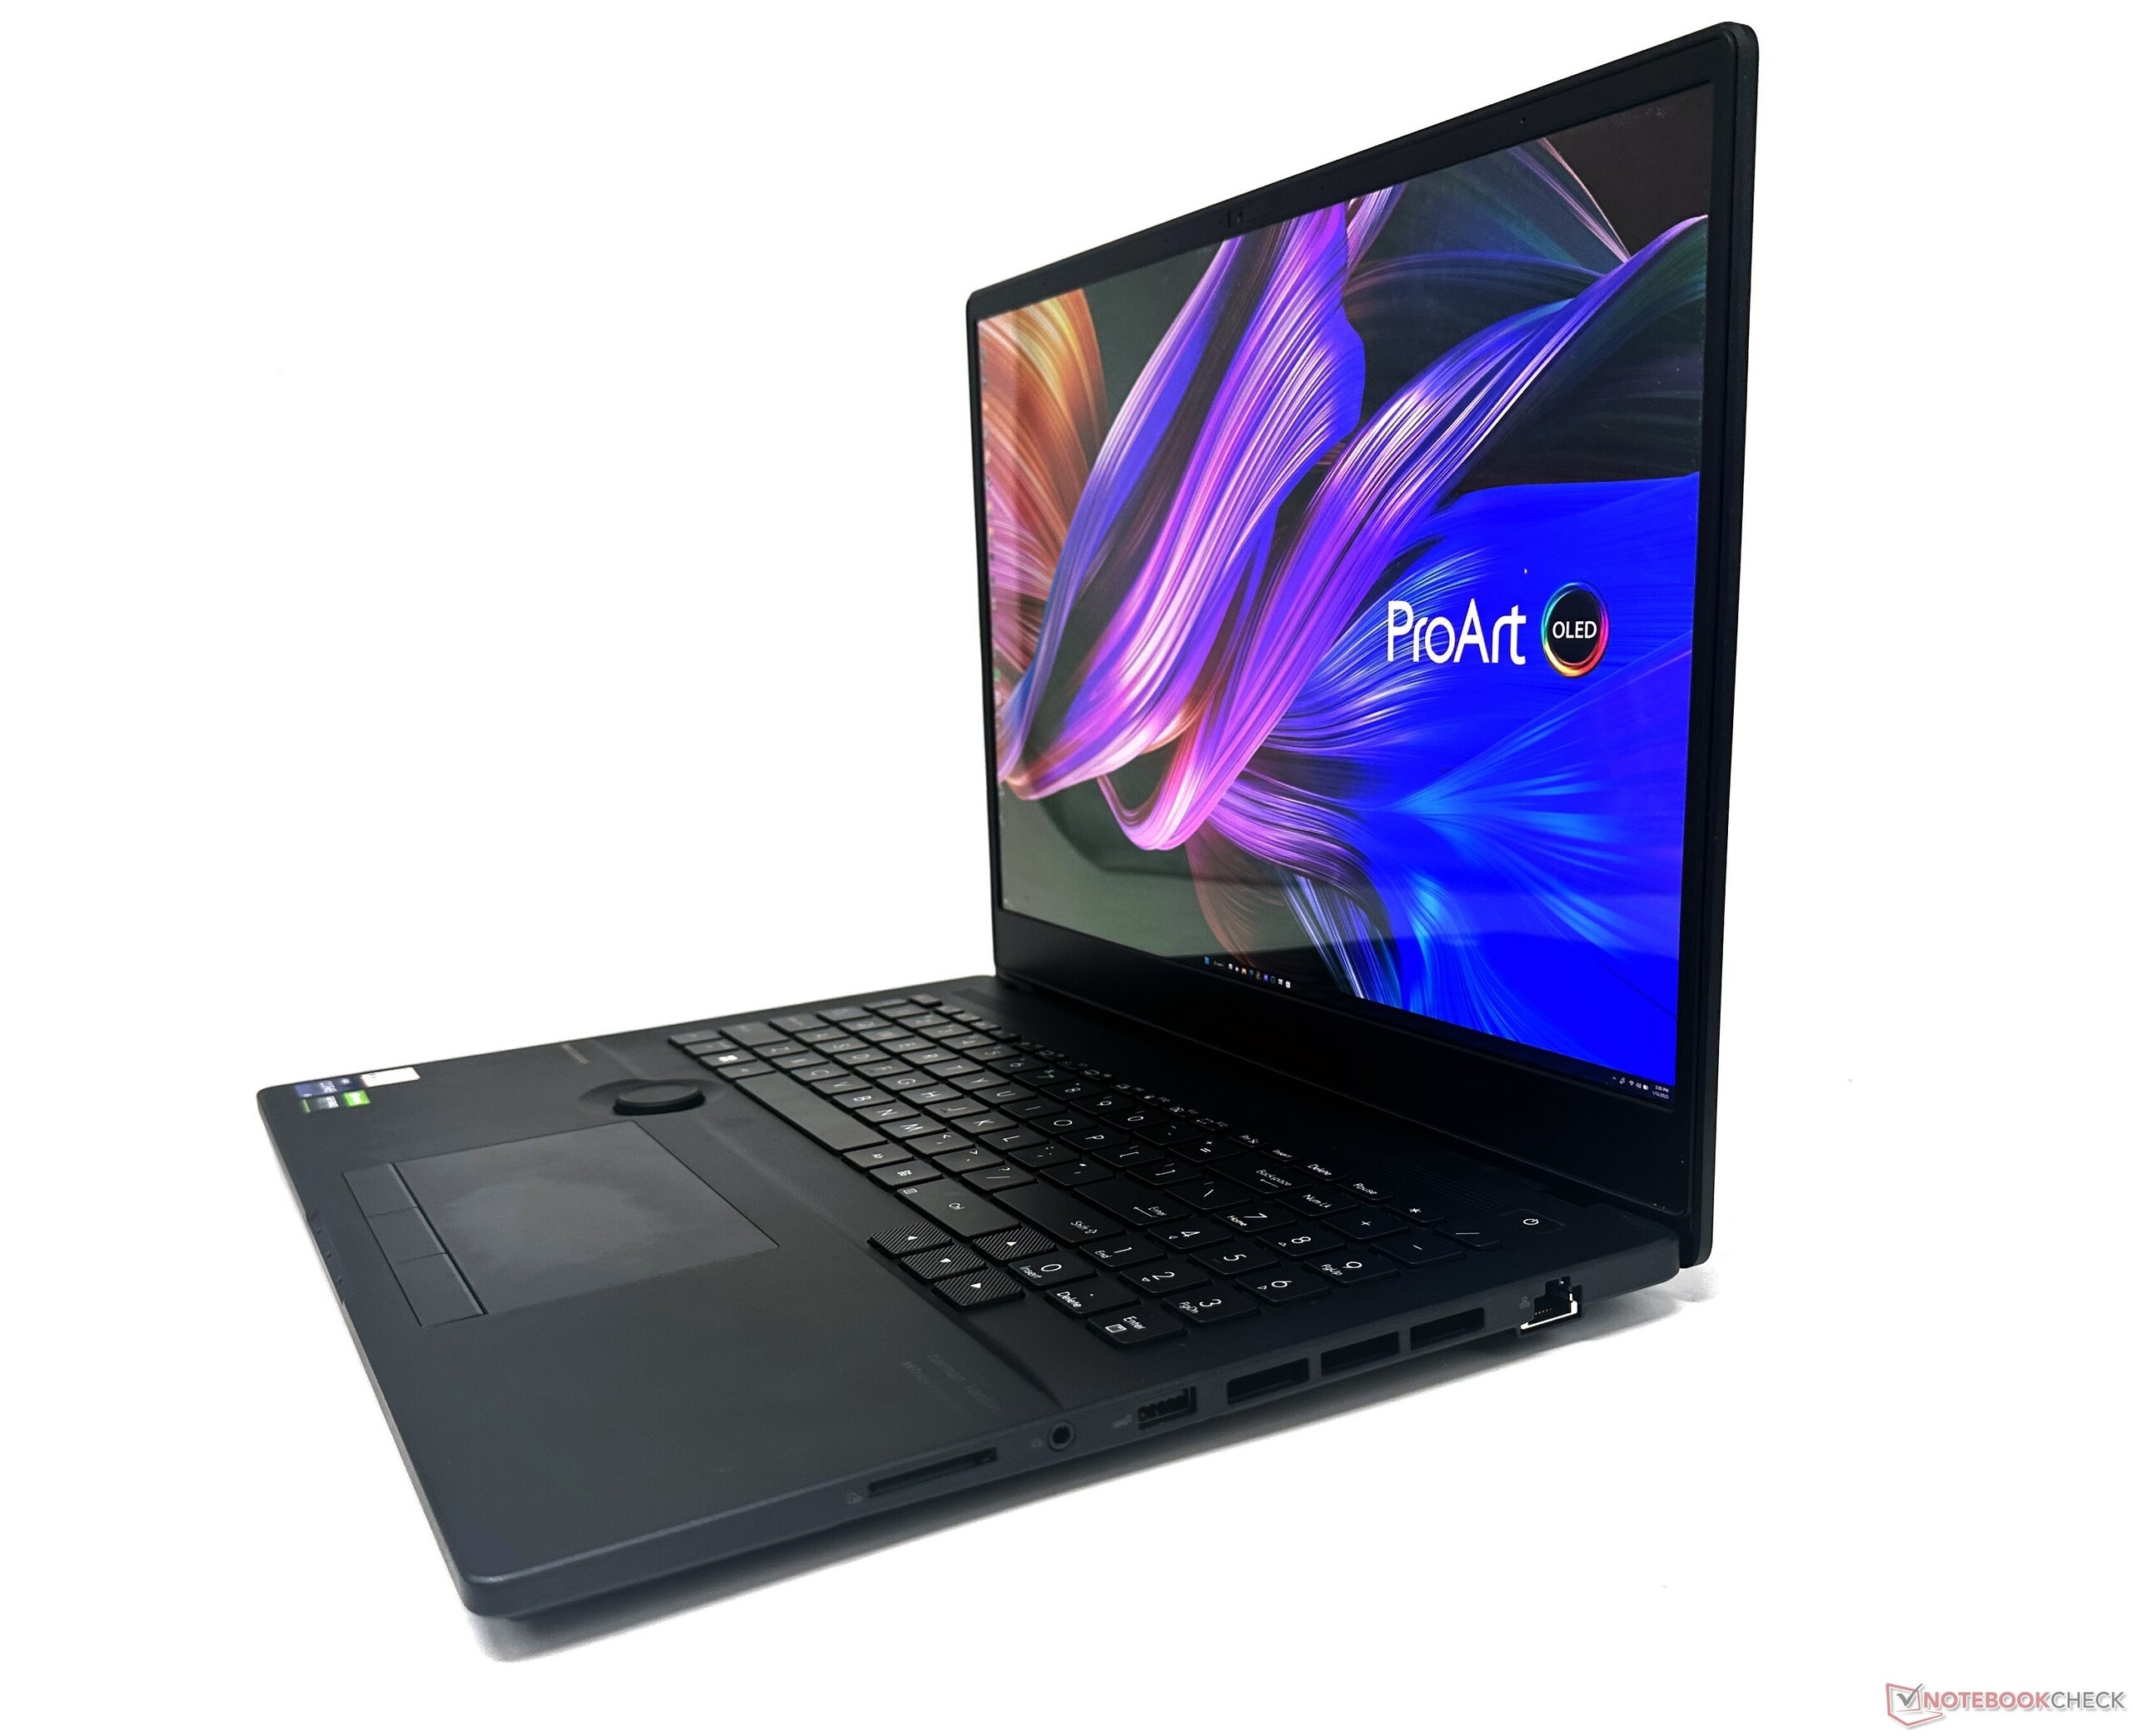
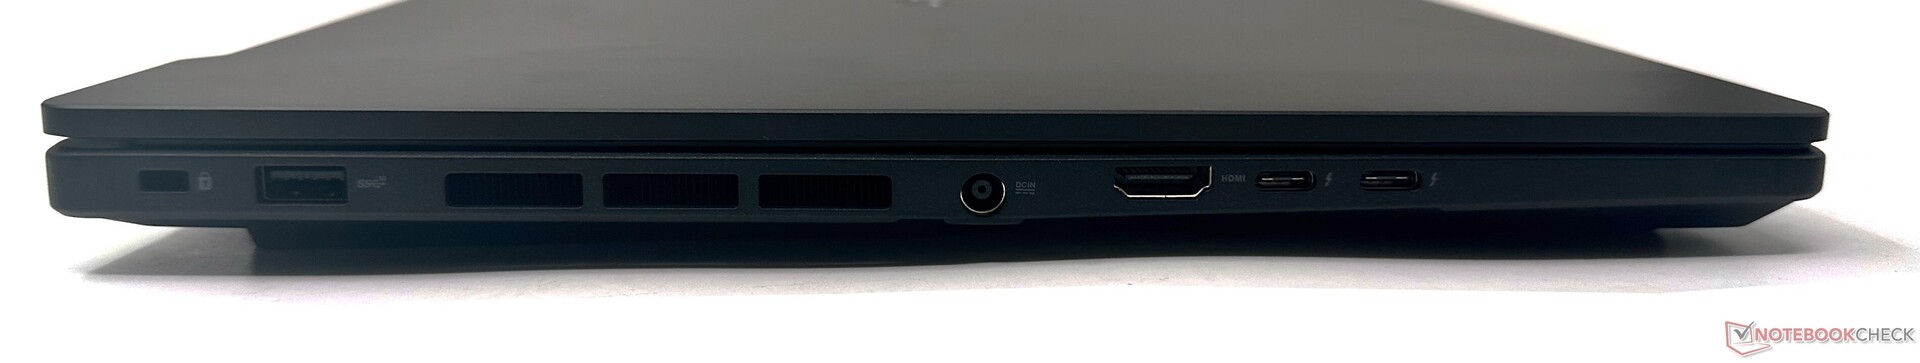
Wybór portów w Asusie ProArt StudioBook 16 jest przyzwoity, ale niezbyt rozbudowany. Asus całkowicie zrezygnował z portów USB 2.0. Zamiast tego dostajemy dwa porty USB 3.2 Gen2 Type-A, po jednym z każdej strony.
Z racji tego, że jest to platforma Intela, po lewej stronie znajduje się również kilka portów Thunderbolt 4. Dostępne jest także wyjście HDMI 2.1 oraz port LAN 2,5 Gb.
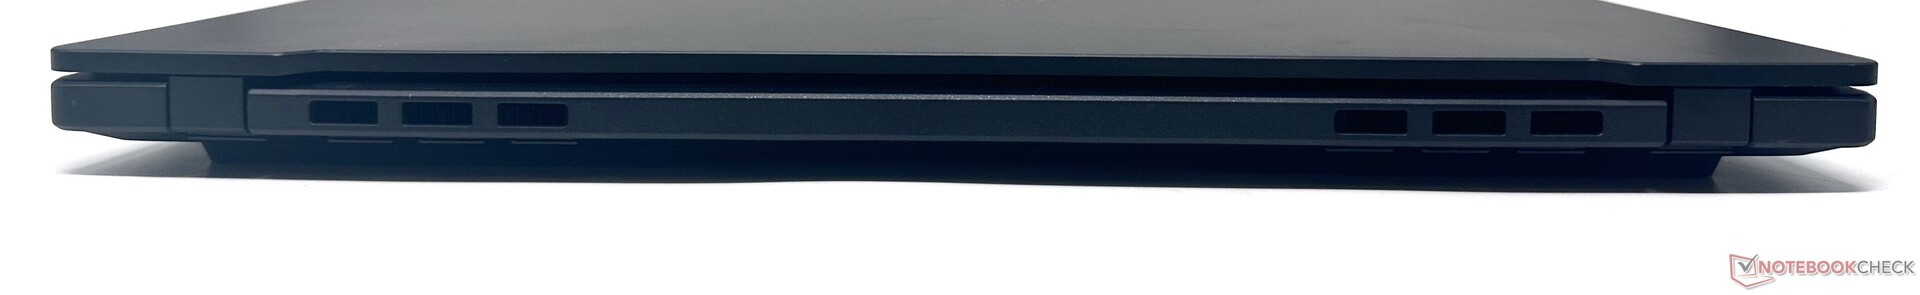
Tył nie oferuje żadnych możliwości podłączenia. Jako że jest to laptop skoncentrowany na twórcy, prawdopodobnie sensowniej byłoby umieścić porty Thunderbolt 4 z tyłu, zamiast upychać je oba po lewej stronie obudowy. Pomogłoby to uniknąć bałaganu w głównym obszarze roboczym z powodu stacji dokujących i innych tego typu akcesoriów.
Niemniej jednak nie stwierdziliśmy szczególnych utrudnień podczas podłączania wielu urządzeń peryferyjnych.
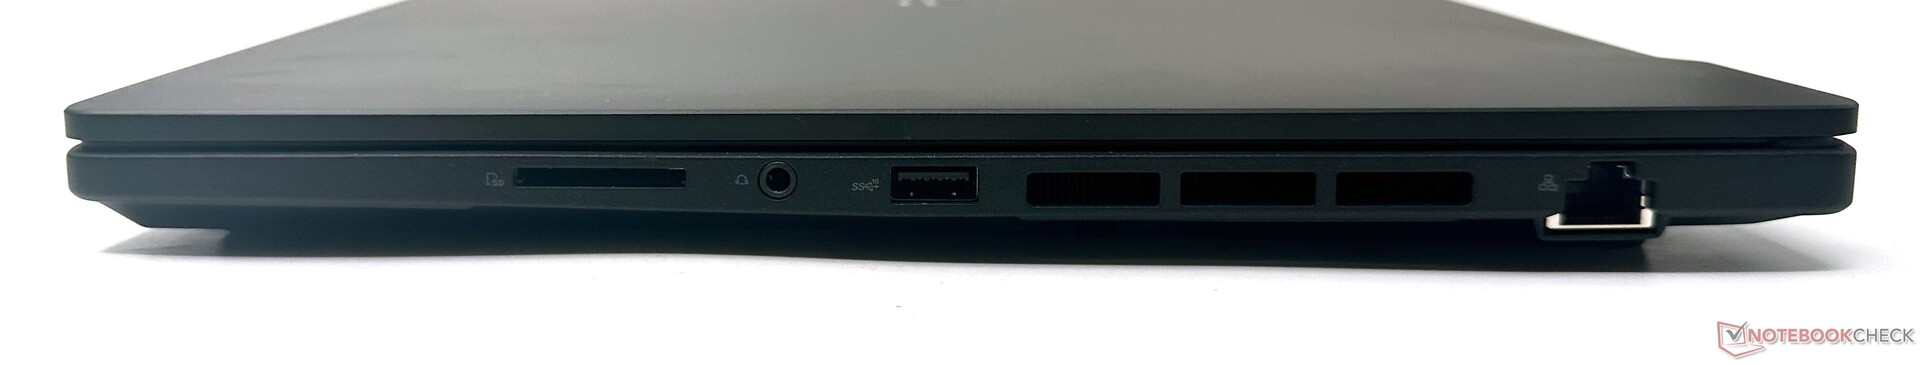
Czytnik kart SD
Asus wyposaża ProArt StudoBook 16 w czytnik kart SD Express 7.0. Czytnik kart oferuje przyzwoite prędkości transferu, które są bliskie średniej w klasie i są zbliżone do tych w Lenovo ThinkBook 16p Gen 3 oraz w Asus ZenBook Pro 16X OLED.
Nie jest to jednak najszybsza wydajność kart SD, jaką widzieliśmy - ta zasługa należy się m.in ROG Zephyrus Duo 16 oraz 2021 Apple MacBook Pro 16.
| SD Card Reader | |
| average JPG Copy Test (av. of 3 runs) | |
| Asus ROG Zephyrus Duo 16 GX650RX (AV PRO microSD 128 GB V60) | |
| Apple MacBook Pro 16 2021 M1 Pro (Angelbird AV Pro V60) | |
| Średnia w klasie Multimedia (23 - 531, n=44, ostatnie 2 lata) | |
| MSI Creator Z17 A12UGST-054 (AV Pro SD microSD 128 GB V60) | |
| MSI Creator Z16P B12UHST (AV PRO microSD 128 GB V60) | |
| Lenovo ThinkBook 16p G3 ARH (AV PRO microSD 128 GB V60) | |
| Asus ProArt StudioBook 16 H7600ZW (AV PRO microSD 128 GB V60) | |
| Asus ZenBook Pro 16X OLED UX7602ZM-ME115W (AV Pro SD microSD 128 GB V60) | |
| maximum AS SSD Seq Read Test (1GB) | |
| Średnia w klasie Multimedia (27.9 - 1455, n=43, ostatnie 2 lata) | |
| Asus ROG Zephyrus Duo 16 GX650RX (AV PRO microSD 128 GB V60) | |
| Lenovo ThinkBook 16p G3 ARH (AV PRO microSD 128 GB V60) | |
| Asus ProArt StudioBook 16 H7600ZW (AV PRO microSD 128 GB V60) | |
| Asus ZenBook Pro 16X OLED UX7602ZM-ME115W (AV Pro SD microSD 128 GB V60) | |
| MSI Creator Z17 A12UGST-054 (AV Pro SD microSD 128 GB V60) | |
Komunikacja
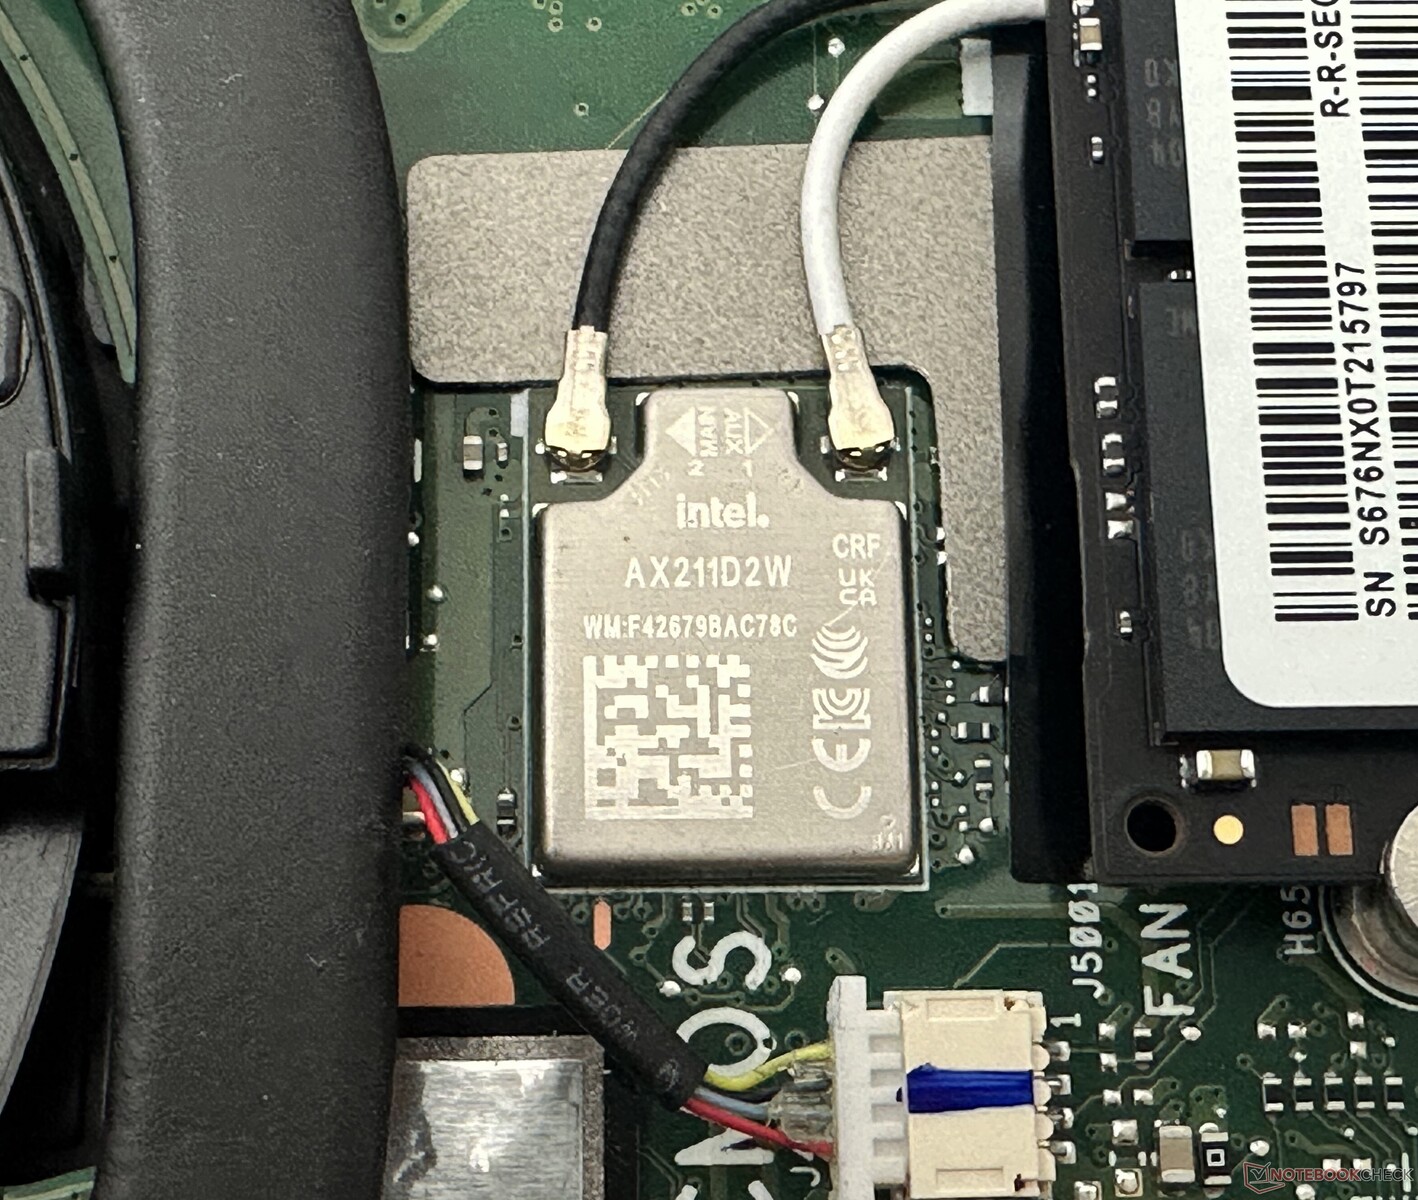
ProArt StudioBook 16 posiada kartę WLAN Intel Wi-Fi 6E AX211, która jest niestety przylutowana do płyty głównej. Sprawdziliśmy wydajność Wi-Fi w obu pasmach 5 GHz i 6 GHz z naszym referencyjnym routerem Asus ROG Rapture GT-AXE11000 w odległości 1 m od laptopa, bez innych podłączonych urządzeń i zakłóceń zewnętrznych.
Laptop wykazał się przyzwoitymi prędkościami transferu w spektrum 5 GHz, które generalnie dorównują konkurencji. Pasmo 6 GHz wypada jednak dość słabo, szczególnie w teście nadawania, z dużą niestabilnością. Stwierdziliśmy to nawet po wielokrotnych powtórzeniach.
Kamera internetowa
ProArt StudioBook 16 nie posiada dobrej jakości kamery internetowej. Jakość obrazu z dołączonej kamery 720p nie jest najlepsza.
Zdjęcia wykazują duże odchylenia kolorystyczne, brakuje im ostrości i szczegółowości, choć mogą się nadawać do prowadzenia wideorozmów, jeśli tylko jest odpowiednie oświetlenie otoczenia. Kamerkę można wyłączyć za pomocą skrótu na klawiszu F11.
Asus mógł z łatwością dostarczyć moduł 1080p zamiast tego za cenę wywoławczą.


Bezpieczeństwo
ProArt StudioBook 16 posiada fizyczną migawkę dla kamery internetowej i oferuje kamerkę na podczerwień do logowania opartego na Windows Hello. Nie ma czytnika linii papilarnych, ale są obecne układ TPM 2.0 i gniazdo blokady Kensington.
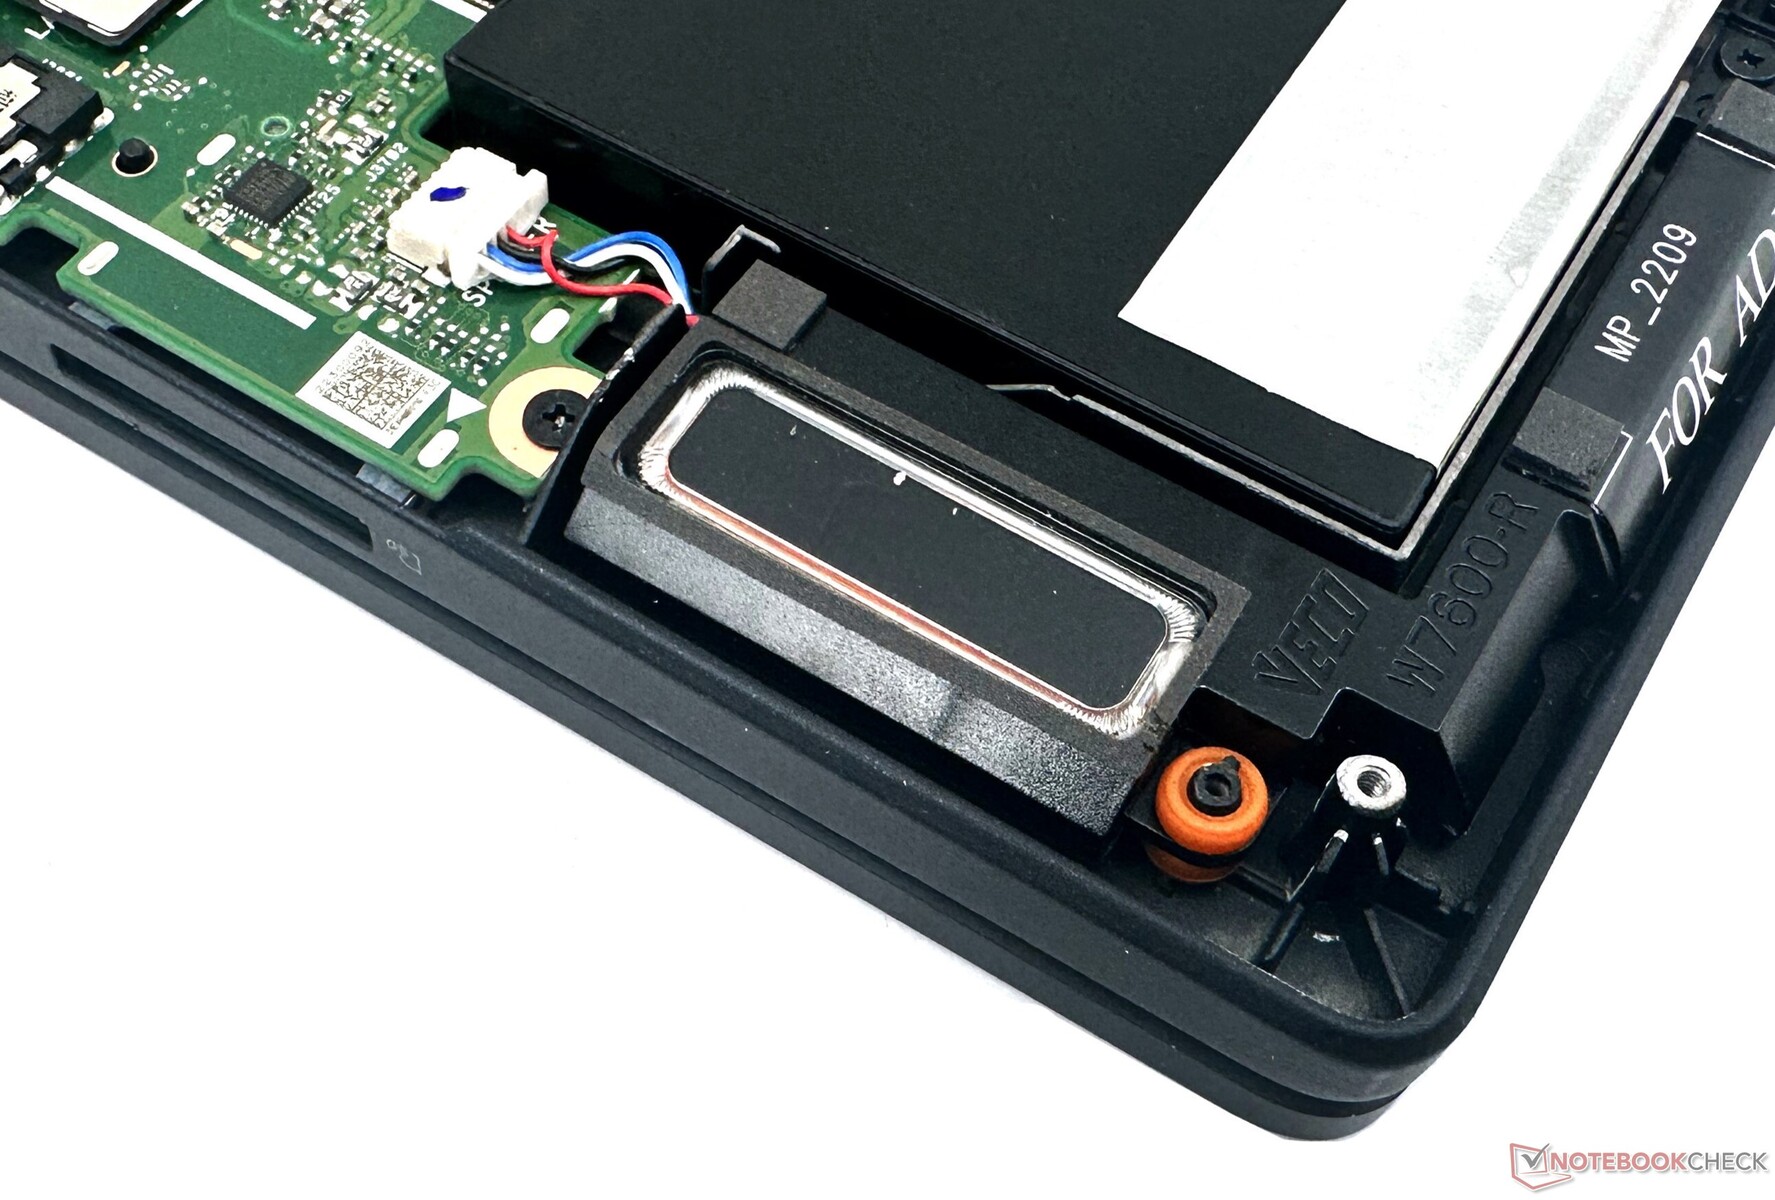
Konserwacja
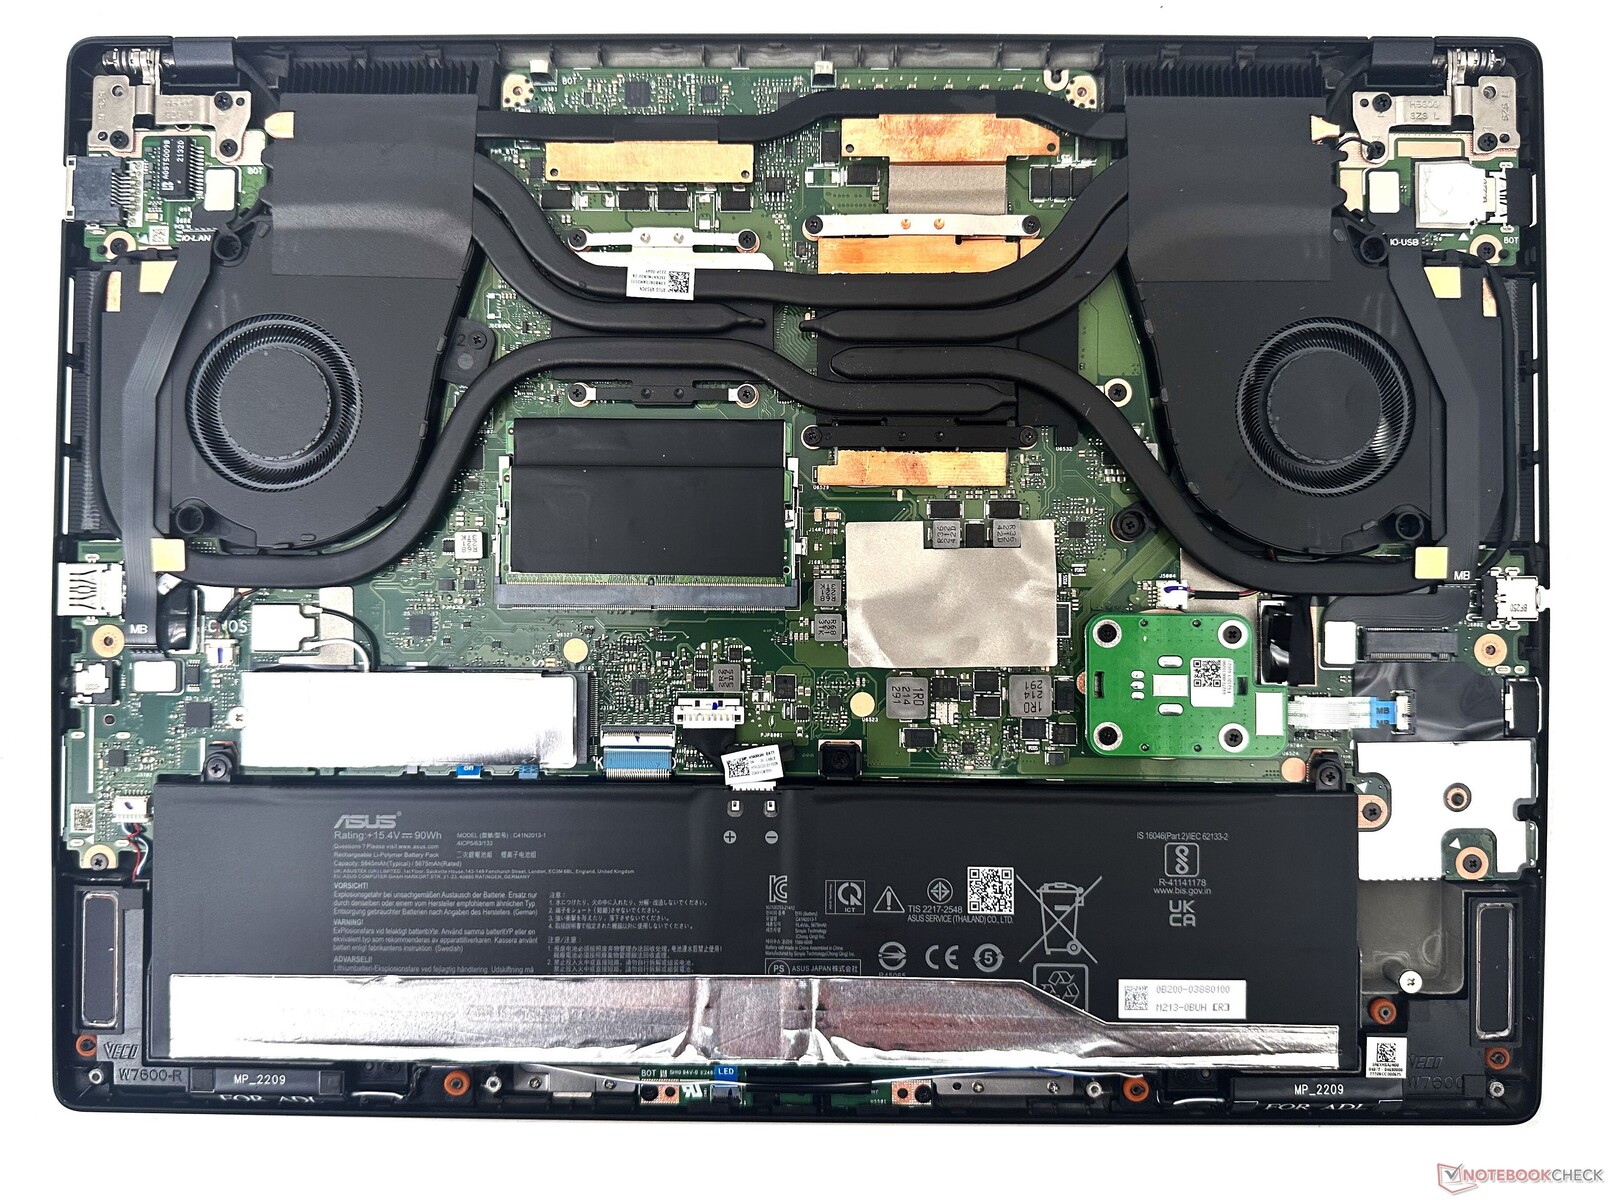
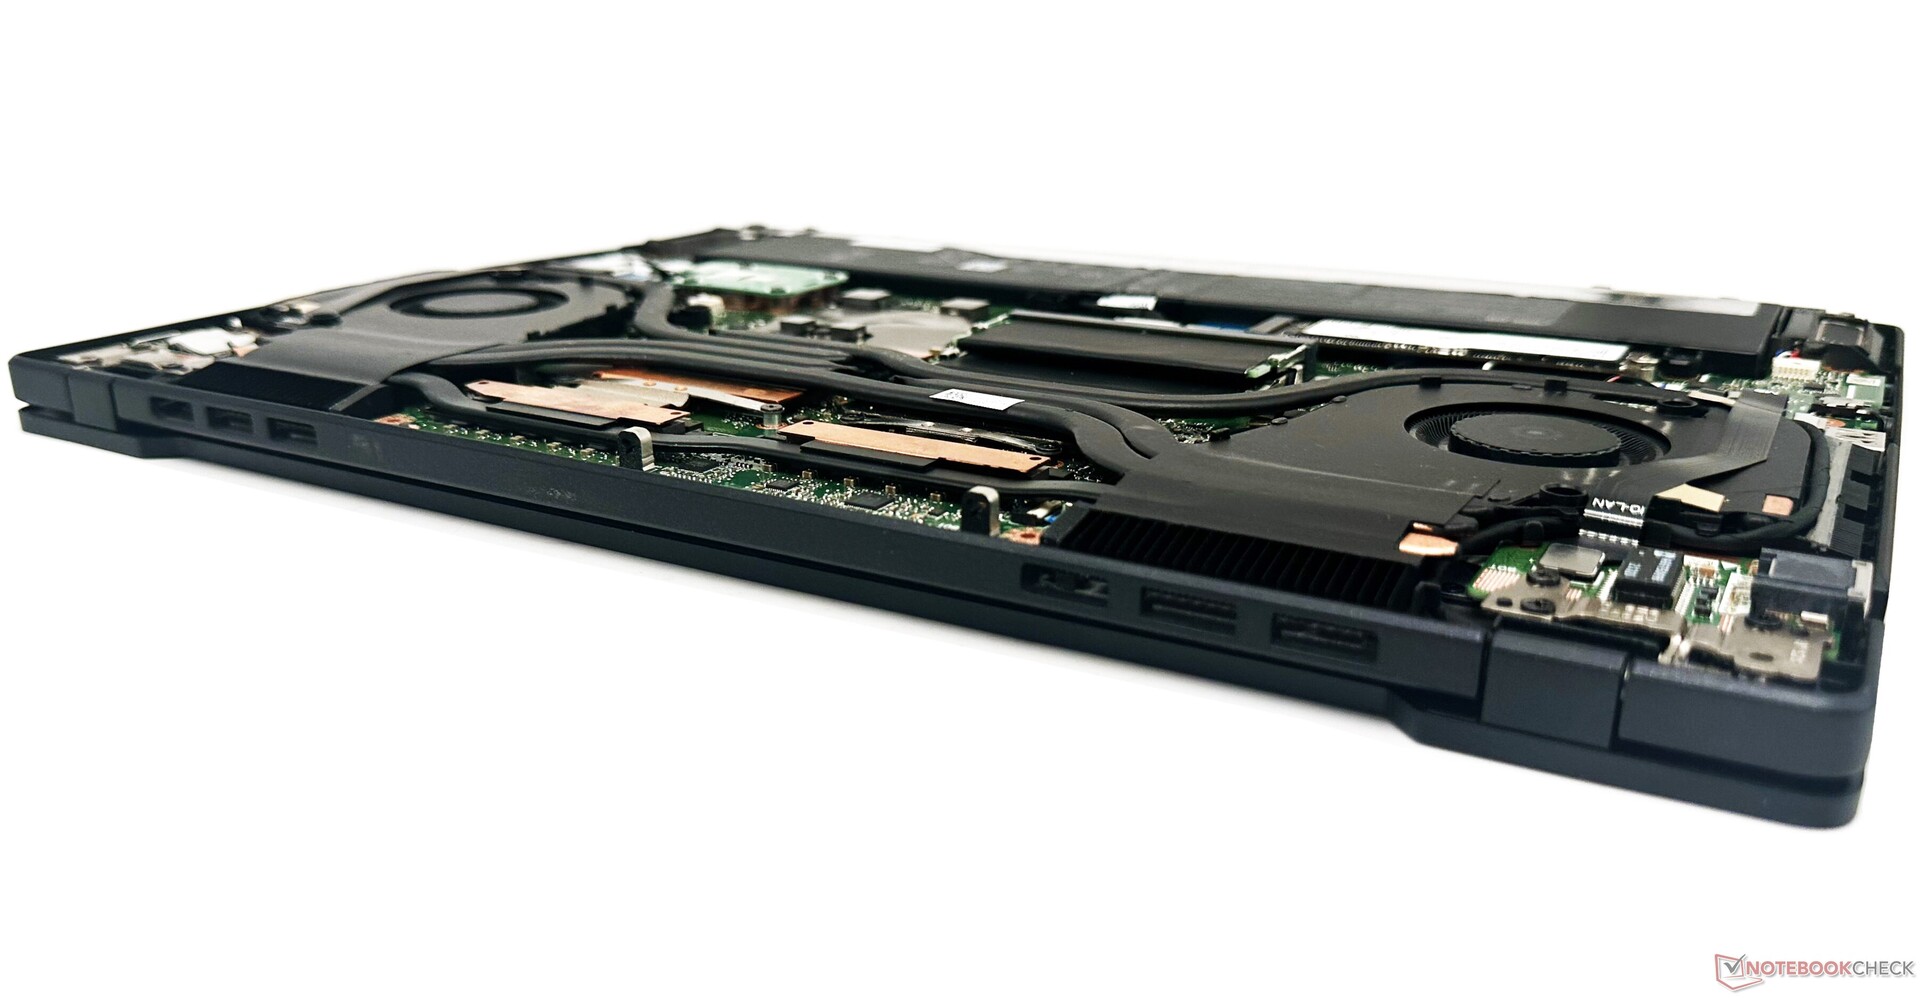
ProArt StudioBook 16 oferuje dobre możliwości serwisowania. Dostęp do wnętrza wymaga odkręcenia 13 śrub Torx T5 na tylnym panelu. Obszerna obudowa zapewnia dobrą separację między poszczególnymi komponentami.
Pamięć RAM i dysk SSD NVMe można wymieniać lub ulepszać, a kartę Wi-Fi można przylutować. W razie potrzeby można odkręcić baterię. Widzimy też osobną płytkę drukowaną dla Asus Dial.
Akcesoria i gwarancja
W pudełku znajdziemy zasilacz o mocy 240 W wraz z typowymi papierami. Dodatkowo Asus dostarcza utylitarny plecak przeznaczony dla kreatywnych w podróży.
Urządzenia wejściowe: Touchpad ma swój własny umysł
Klawiatura
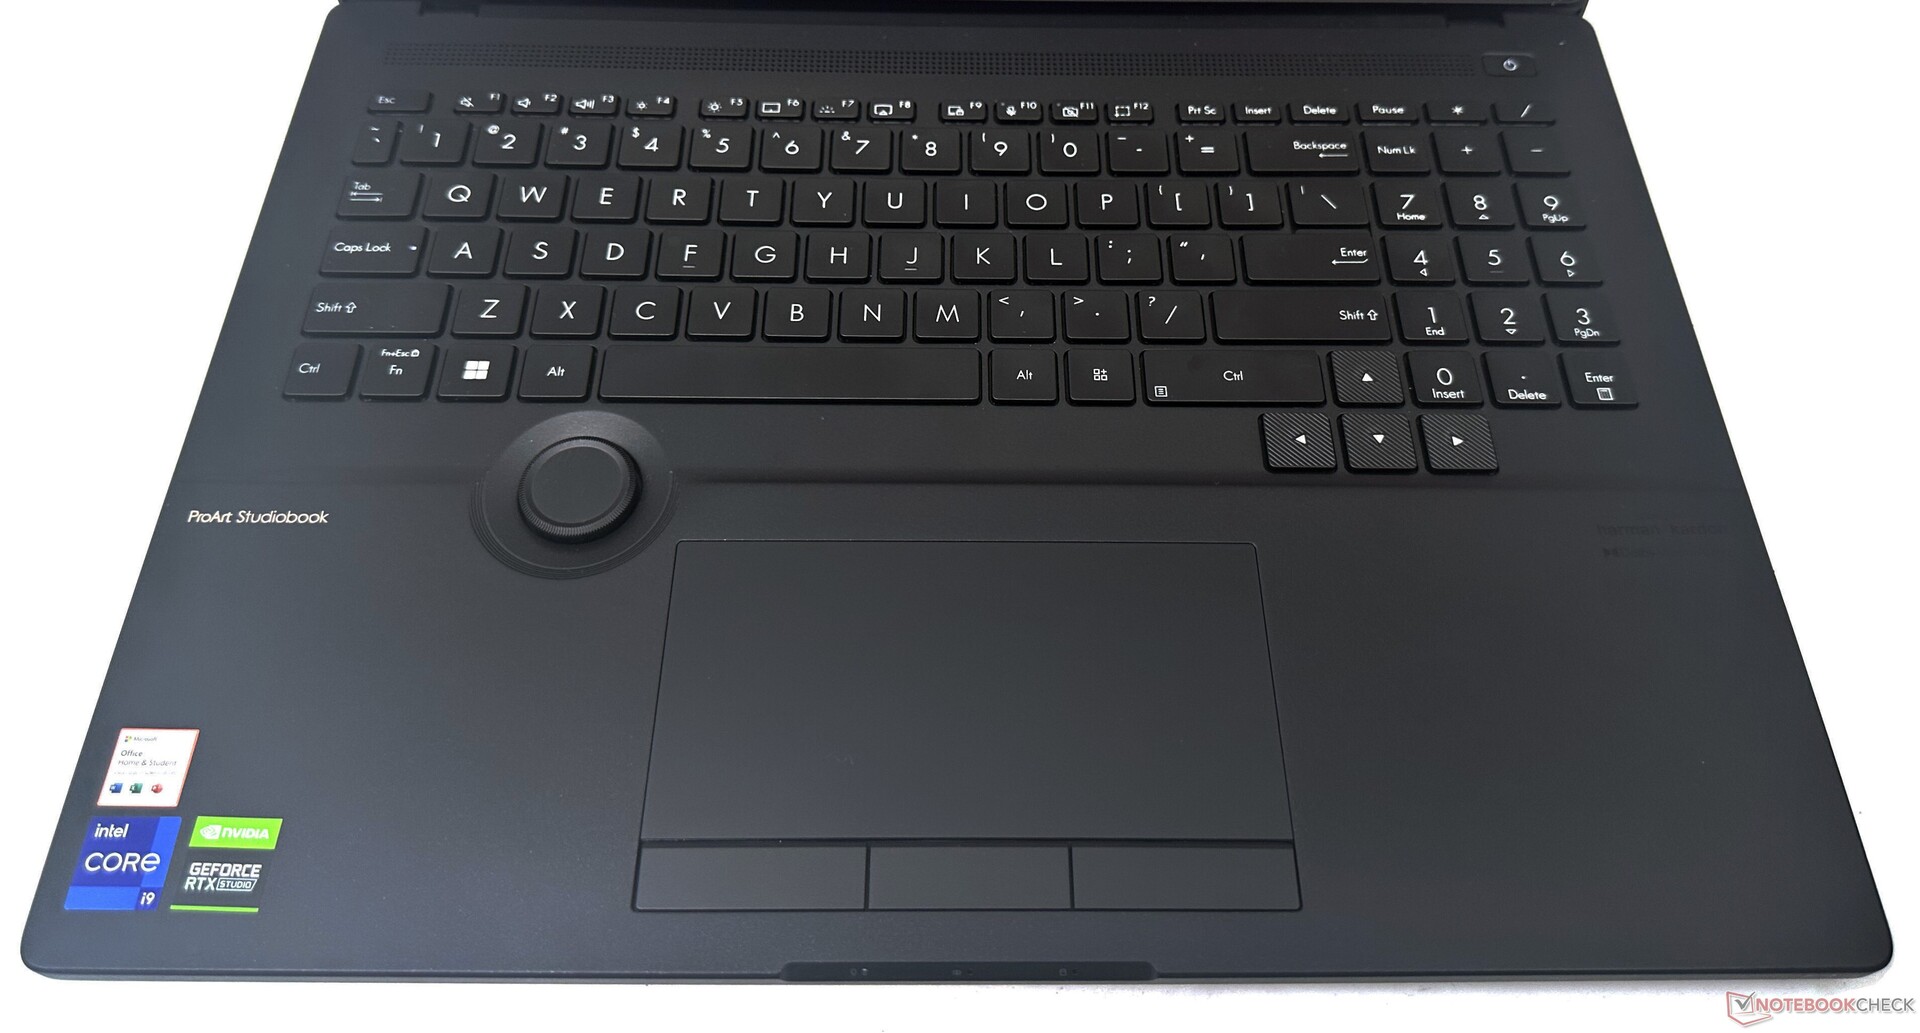
Pełnowymiarowa podświetlana klawiatura typu chiclet jest pojemna i ma odpowiednio duże klawisze strzałek. Odstęp między klawiszami wynoszący 1,4 mm sprawia, że pisanie jest dość wygodne, a sprzężenie zwrotne jest przyzwoite. W najwyższym rzędzie znajdują się skróty do najczęściej używanych funkcji, w tym do regulacji trzystopniowego podświetlenia.
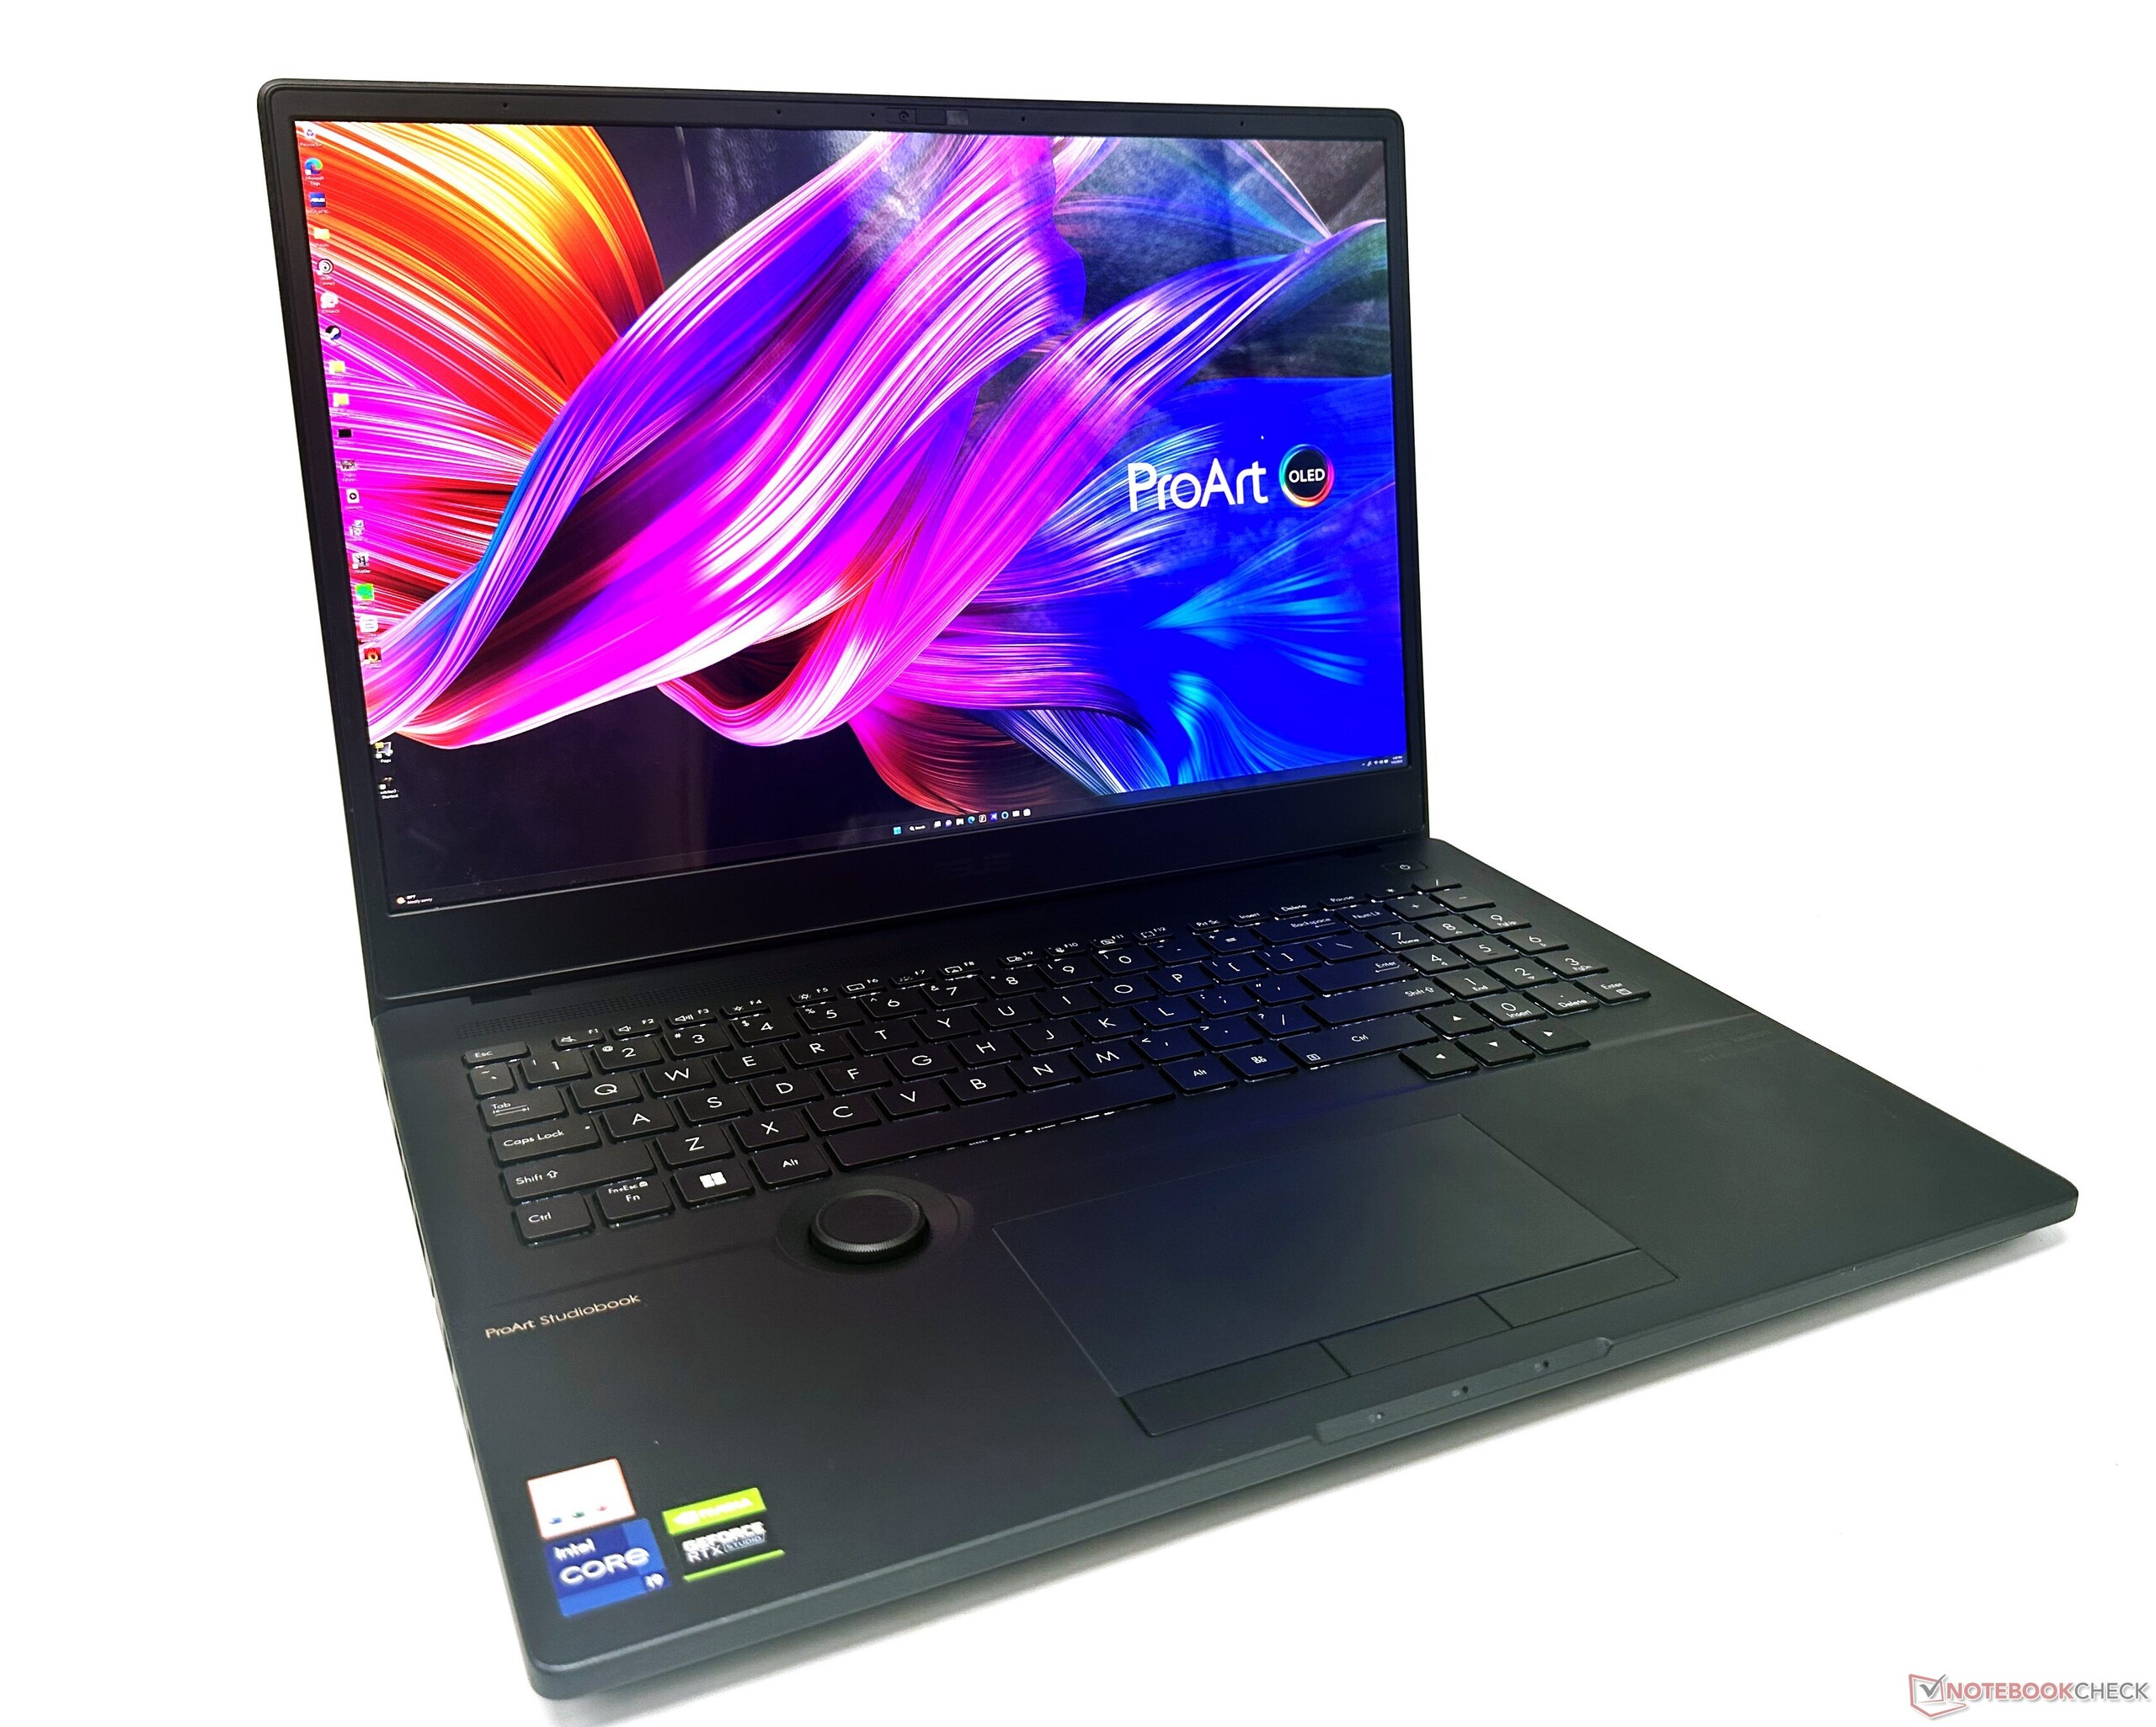
Asus Dial
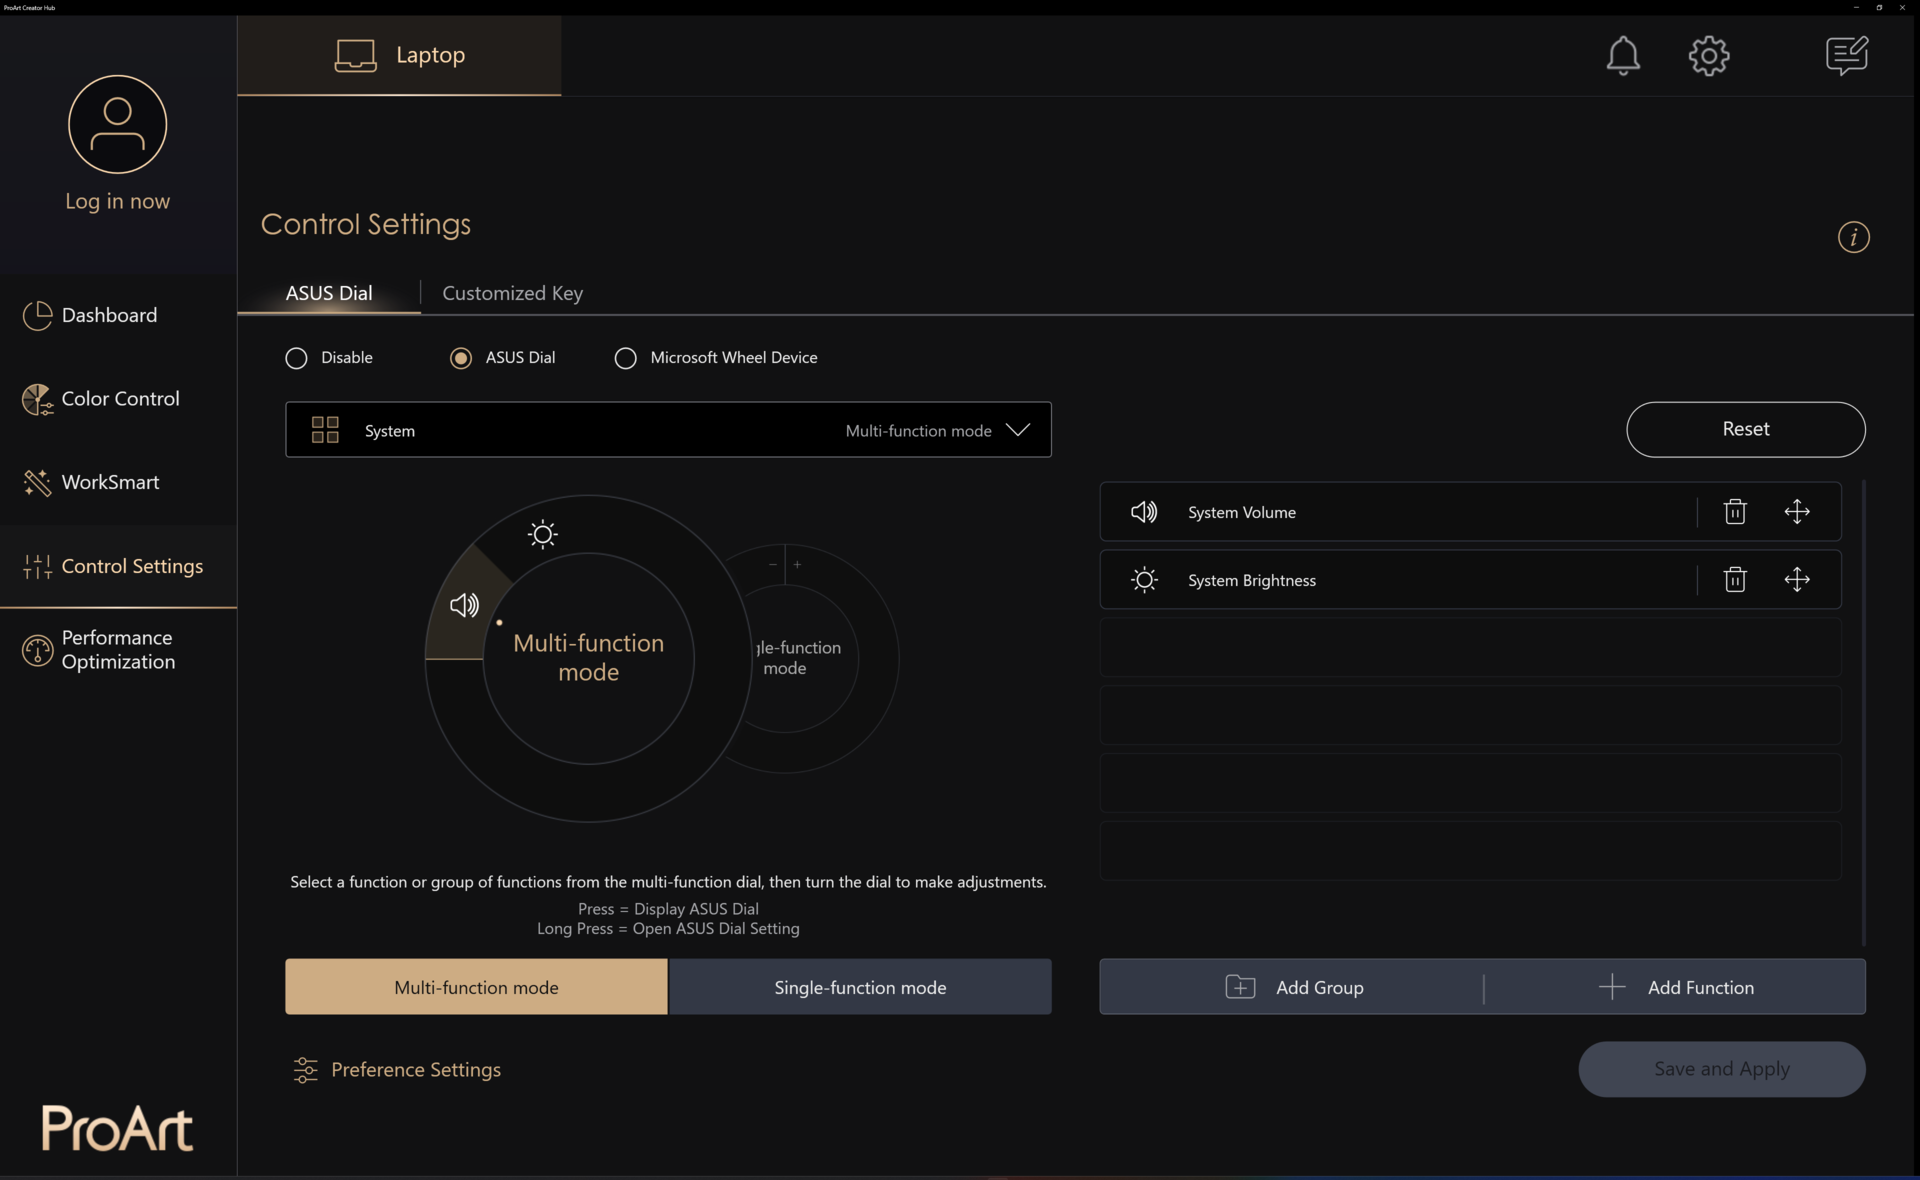
Asus Dial to wyróżniająca się cecha serii ProArt StudioBook. Dial daje twórcom analogowe poczucie pracy z ich aplikacjami.
Obecnie Asus oferuje kompatybilność z programami Adobe, takimi jak Photoshop, Illustrator, Lightroom Classic, Premiere Pro i After Effects.
Pokrętło współpracuje również z popularnymi funkcjami systemu Windows, takimi jak regulacja jasności i głośności. Inne funkcje Dial można dodać z poziomu ProArt Creator Hub.
W praktyce Asus Dial jest dość intuicyjny, ale może wymagać trochę czasu, aby przyzwyczaić się do dostępu do funkcji za pomocą pamięci mięśniowej. Pokrętło nie przeszkadza w pisaniu na klawiaturze czy korzystaniu z touchpada.
Touchpad
ProArt StudioBook 16 posiada szklany touchpad klasy premium, który jest w pełni kompatybilny z gestami Windows Precision Asus oferuje trzy fizyczne przyciski u podstawy touchpada, co w dzisiejszych czasach jest rzadkością, ale może być przydatne w aplikacjach kreatywnych do przesuwania lub obracania obiektów na scenie.
Sam touchpad nie klika, choć kliknięcia lewym przyciskiem są nadal rejestrowane jako stuknięcia. W naszym egzemplarzu testowym touchpad wydawał się jednak zbyt czuły. Powoduje to, że touchpad często błędnie rozpoznaje stuknięcie jako gest przeciągania i przytrzymywania. Zmiana czułości myszy w Panelu sterowania również nie pomogła.
To naturalne, że w normalnym użytkowaniu w touchpad uderza często więcej niż jeden palec. To natychmiast wyzwala gest przeciągania i przytrzymywania, czyniąc nawigację UI nieco nieintuicyjną. Przyciski fizyczne oferują nieco miękki, ale satysfakcjonujący klik.
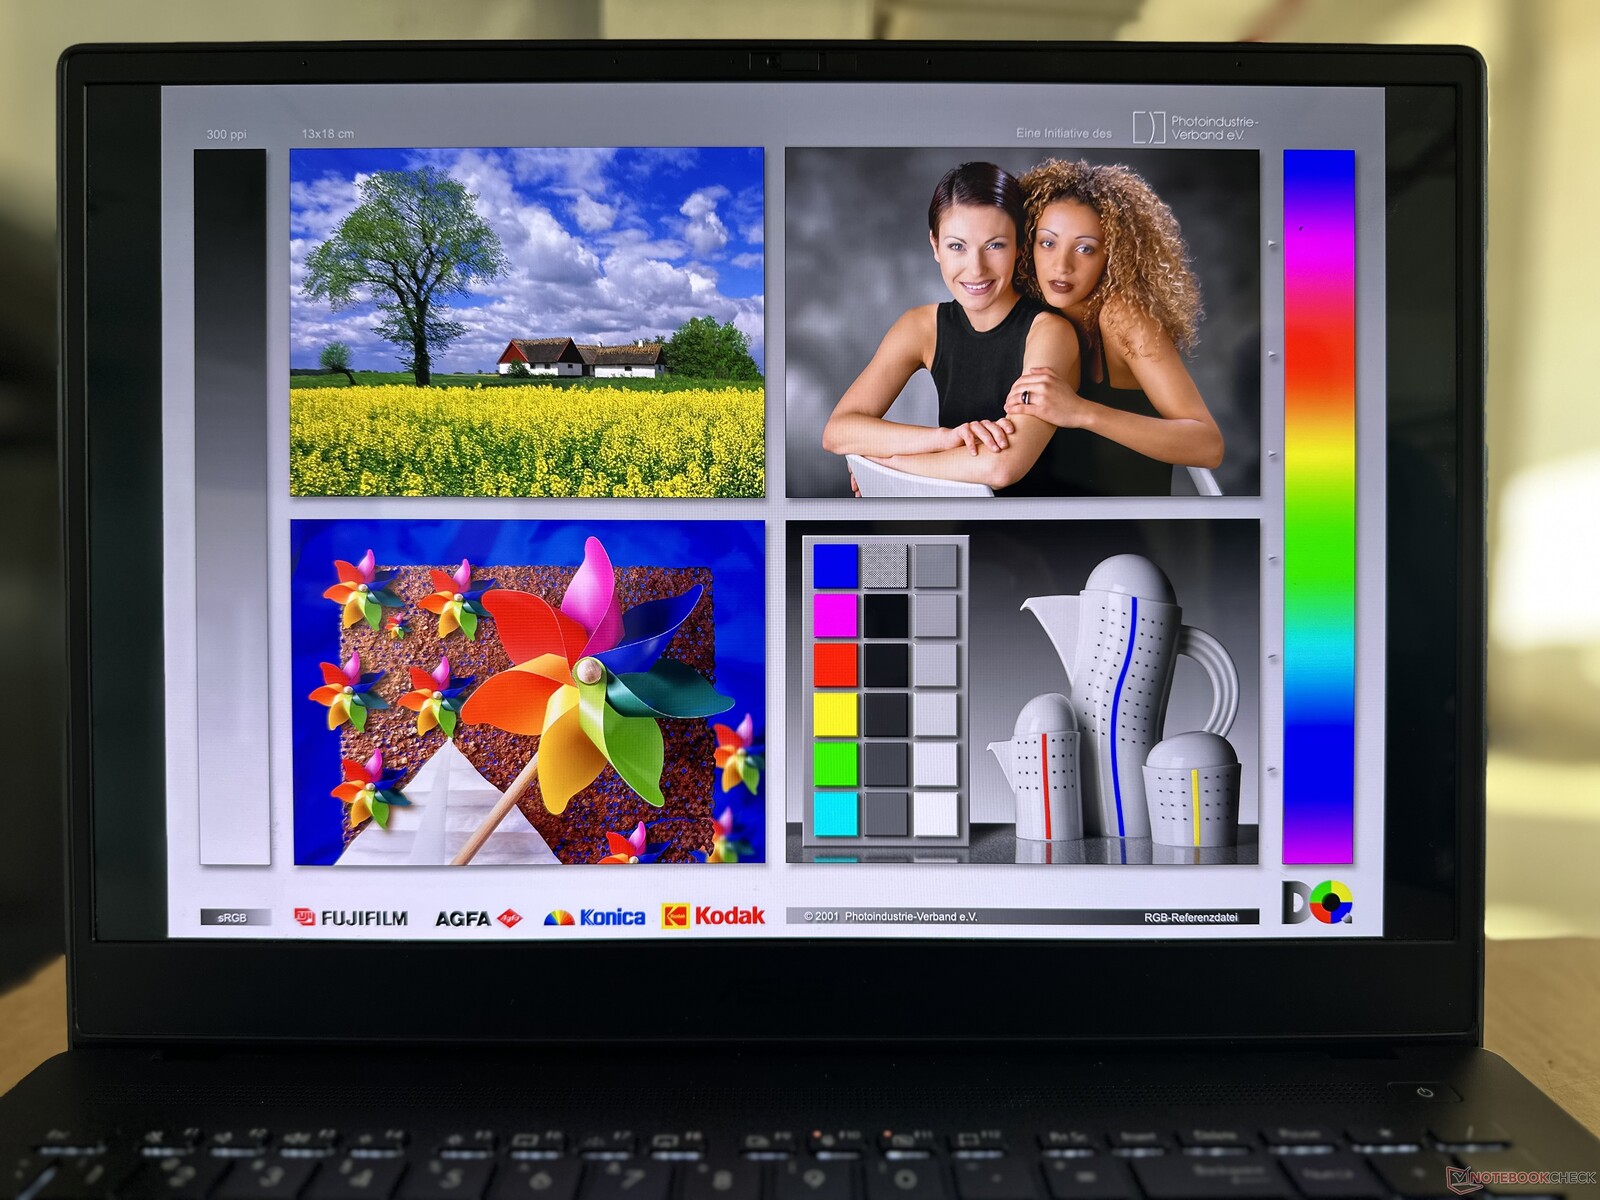
Wyświetlacz: 60 Hz panel Dolby Vision OELD z PWM
ProArt StudioBook 16 jest wyposażony w 16-calowy panel OLED o proporcjach 16:10 i rozdzielczości 4K (3840 x 2400) firmy Samsung. Asus zadowala się tylko panelem 60 Hz, ale nadrabia to w innych obszarach, co zobaczymy poniżej.
Układ subpikseli sugeruje matrycę S-Stripe RGB o ogólnym zagęszczeniu 283 PPI. Jako że jest to panel OLED, nie zaobserwowano bleedu podświetlenia.


Z racji tego, że jest to panel OLED, Samsung ATNA60YV02 oferuje równomierny rozkład jasności na poziomie 98% i w zasadzie nieskończony współczynnik kontrastu. Zmierzyliśmy średni poziom jasności SDR wynoszący 378 nitów.
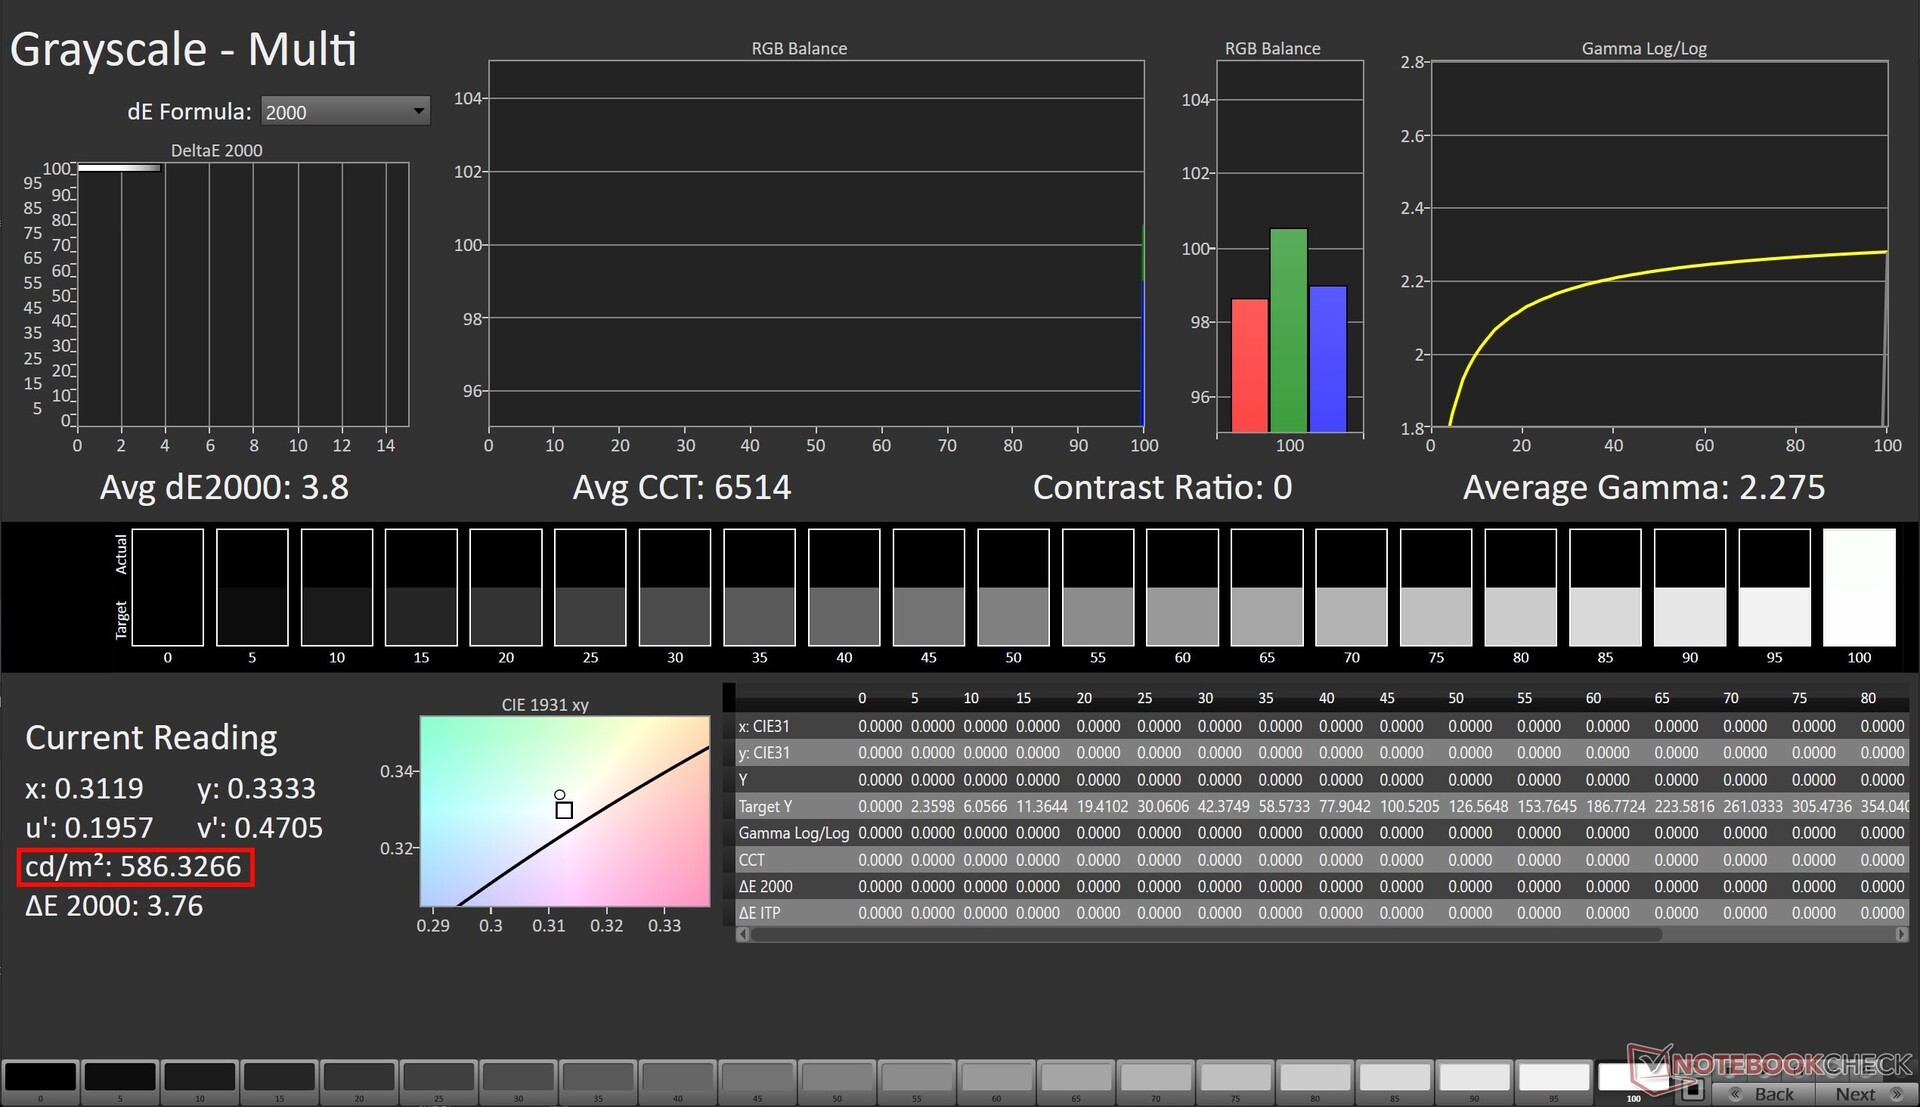
Według Asusa panel OLED ProArt StudioBook 16 posiada certyfikat VESA DisplayHDR True Black 600. Obsługiwana jest funkcja Dolby Vision HDR.
W naszych testach odnotowaliśmy szczytową jasność 586 nitów w trybie HDR przy obrazie w 100% białym.
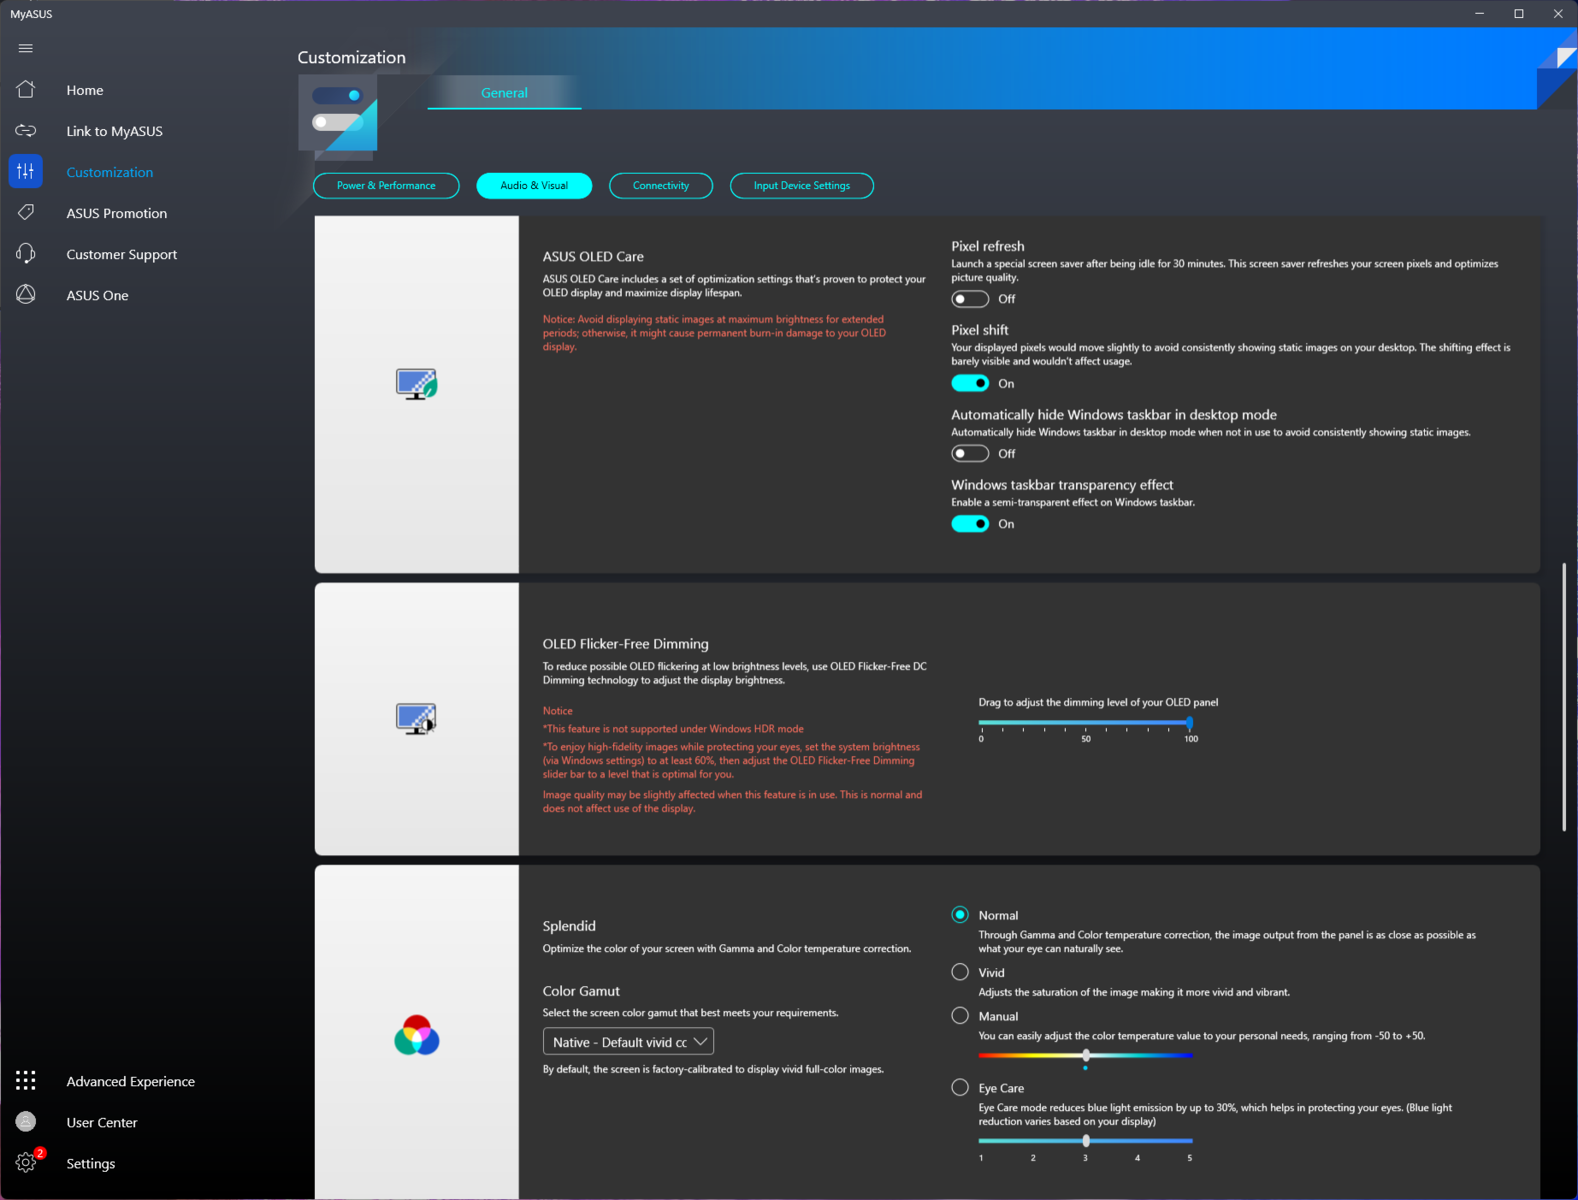
Aplikacja MyAsus oferuje opcje ustawienia odświeżania pikseli i przesunięcia pikseli, aby chronić OLED przed wypaleniem. Użytkownicy mogą również dostosować zakres DC Dimming, który ma być używany.
Użytkownik otrzymuje również możliwość wyboru pomiędzy różnymi profilami kolorów za pośrednictwem Splendid. Przeprowadziliśmy kalibrację wyświetlacza przy ustawieniu Normal.
| |||||||||||||||||||||||||
rozświetlenie: 98 %
na akumulatorze: 369 cd/m²
kontrast: ∞:1 (czerń: 0 cd/m²)
ΔE ColorChecker Calman: 2.97 | ∀{0.5-29.43 Ø4.72}
calibrated: 2.15
ΔE Greyscale Calman: 2.9 | ∀{0.09-98 Ø4.97}
96.5% AdobeRGB 1998 (Argyll 3D)
100% sRGB (Argyll 3D)
99.6% Display P3 (Argyll 3D)
Gamma: 2.13
CCT: 6636 K
| Asus ProArt StudioBook 16 H7600ZW Samsung ATNA60YV02, OLED, 3840x2400, 16" | MSI Creator Z16P B12UHST AUOD298, IPS True Pixel (~100% DCI-P3), 2560x1600, 16" | Asus ROG Strix Scar 15 G533ZW-LN106WS BOE CQ NE156QHM-NZ2, IPS-level, 2560x1440, 15.6" | Asus ZenBook Pro 16X OLED UX7602ZM-ME115W Samsung SDC415D, OLED, 3840x2400, 16" | Asus ROG Zephyrus Duo 16 GX650RX BOE NE160QAM-NX1, IPS-Level, 3840x2400, 16" | Apple MacBook Pro 16 2021 M1 Pro Liquid Retina XDR, Mini-LED, 3456x2234, 16.2" | |
|---|---|---|---|---|---|---|
| Display | -4% | -5% | -3% | -4% | -3% | |
| Display P3 Coverage (%) | 99.6 | 97.6 -2% | 96.2 -3% | 99.84 0% | 98 -2% | 99.1 -1% |
| sRGB Coverage (%) | 100 | 99.9 0% | 99.9 0% | 99.99 0% | 99.9 0% | 100 0% |
| AdobeRGB 1998 Coverage (%) | 96.5 | 86.8 -10% | 84.5 -12% | 88.9 -8% | 86.3 -11% | 88 -9% |
| Response Times | -321% | -165% | 32% | -372% | -1488% | |
| Response Time Grey 50% / Grey 80% * (ms) | 1.6 ? | 12.9 ? -706% | 7.86 ? -391% 4.21 ? -163% | 2 ? -25% | 14.6 ? -813% | 42.8 ? -2575% |
| Response Time Black / White * (ms) | 18.32 ? | 6.4 ? 65% | 7.5 ? 59% | 2 ? 89% | 5.6 ? 69% | 91.6 ? -400% |
| PWM Frequency (Hz) | 60 ? | 59 ? | 14880 | |||
| Screen | 12% | -14% | 6% | -10% | 30% | |
| Brightness middle (cd/m²) | 370 | 428 16% | 346 -6% | 346 -6% | 459 24% | 514 39% |
| Brightness (cd/m²) | 374 | 394 5% | 329 -12% | 354 -5% | 434 16% | 497 33% |
| Brightness Distribution (%) | 98 | 86 -12% | 91 -7% | 96 -2% | 88 -10% | 95 -3% |
| Black Level * (cd/m²) | 0.42 | 0.59 | 0.44 | 0.02 | ||
| Colorchecker dE 2000 * | 2.97 | 1.67 44% | 3.06 -3% | 2.28 23% | 2.97 -0% | 1.4 53% |
| Colorchecker dE 2000 max. * | 4.38 | 5.71 -30% | 5.81 -33% | 4.94 -13% | 8.13 -86% | 2.8 36% |
| Colorchecker dE 2000 calibrated * | 2.15 | 0.71 67% | 2.57 -20% | 2.16 -0% | 1.03 52% | |
| Greyscale dE 2000 * | 2.9 | 3.1 -7% | 1.64 43% | 4.9 -69% | 2.3 21% | |
| Gamma | 2.13 103% | 2.195 100% | 2.12 104% | 2.37 93% | 2.235 98% | 2.27 97% |
| CCT | 6636 98% | 6498 100% | 7021 93% | 6384 102% | 6775 96% | 6792 96% |
| Contrast (:1) | 1019 | 586 | 1043 | 25700 | ||
| Całkowita średnia (program / ustawienia) | -104% /
-48% | -61% /
-49% | 12% /
8% | -129% /
-69% | -487% /
-255% |
* ... im mniej tym lepiej
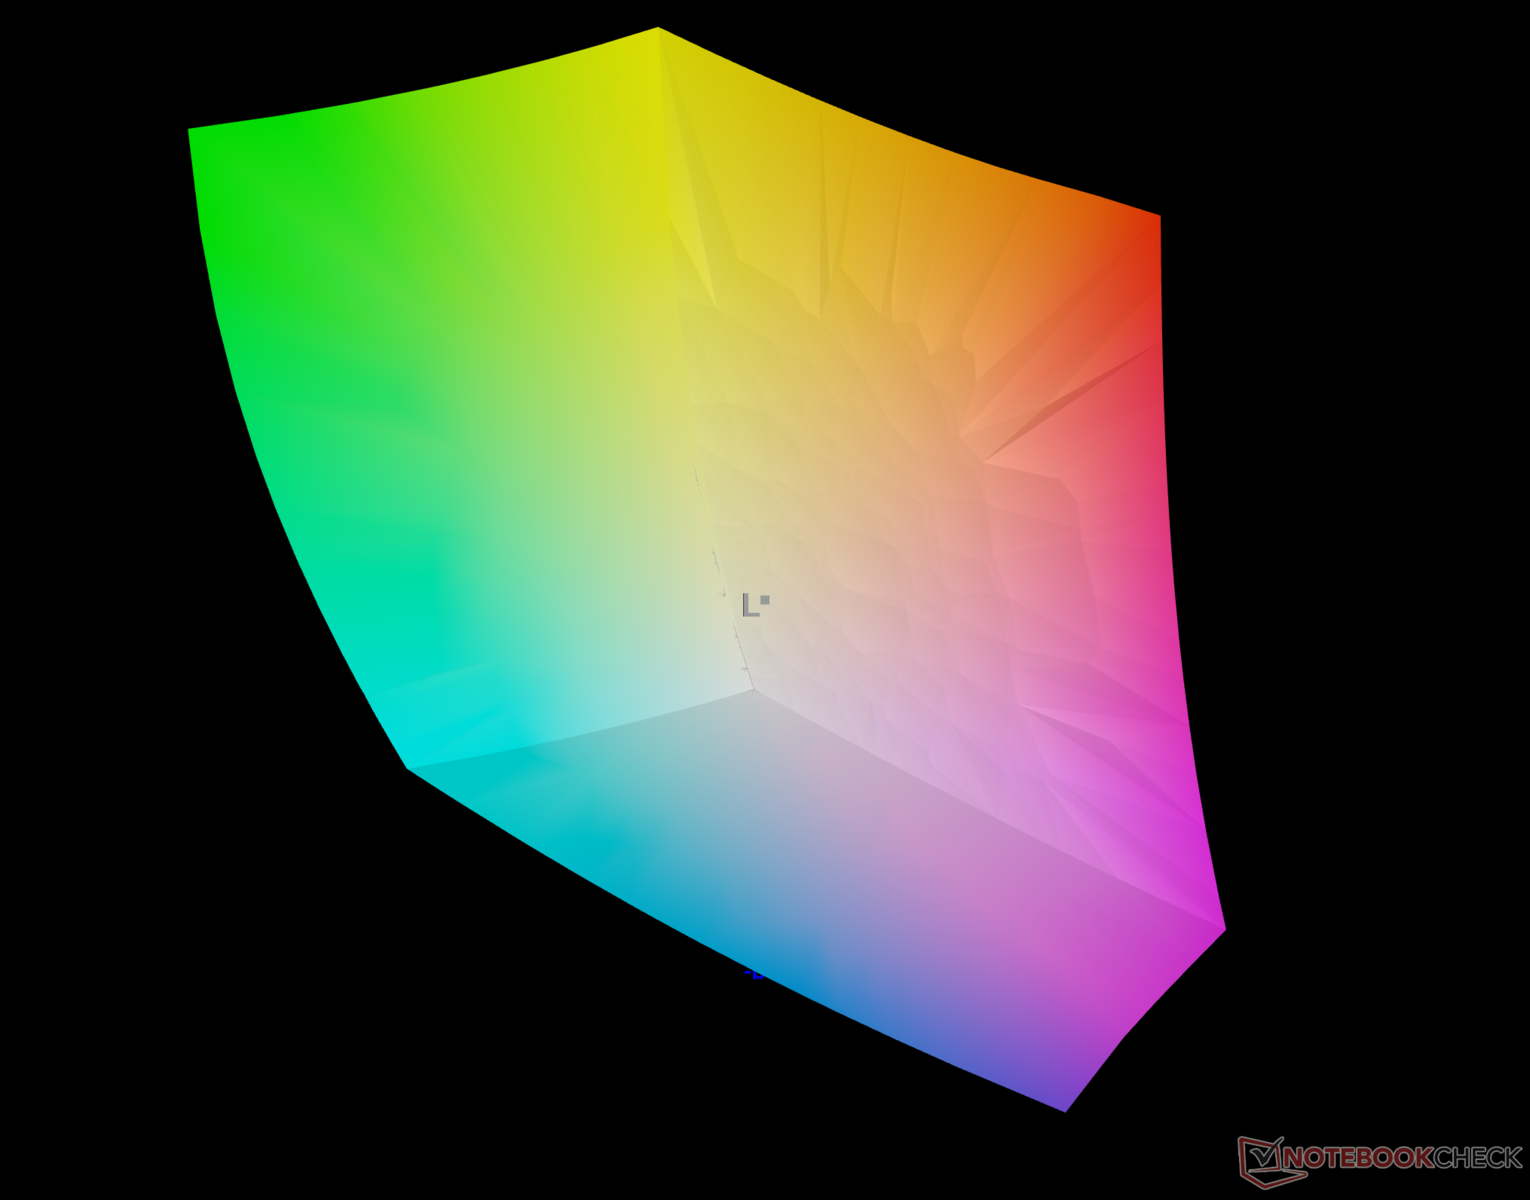
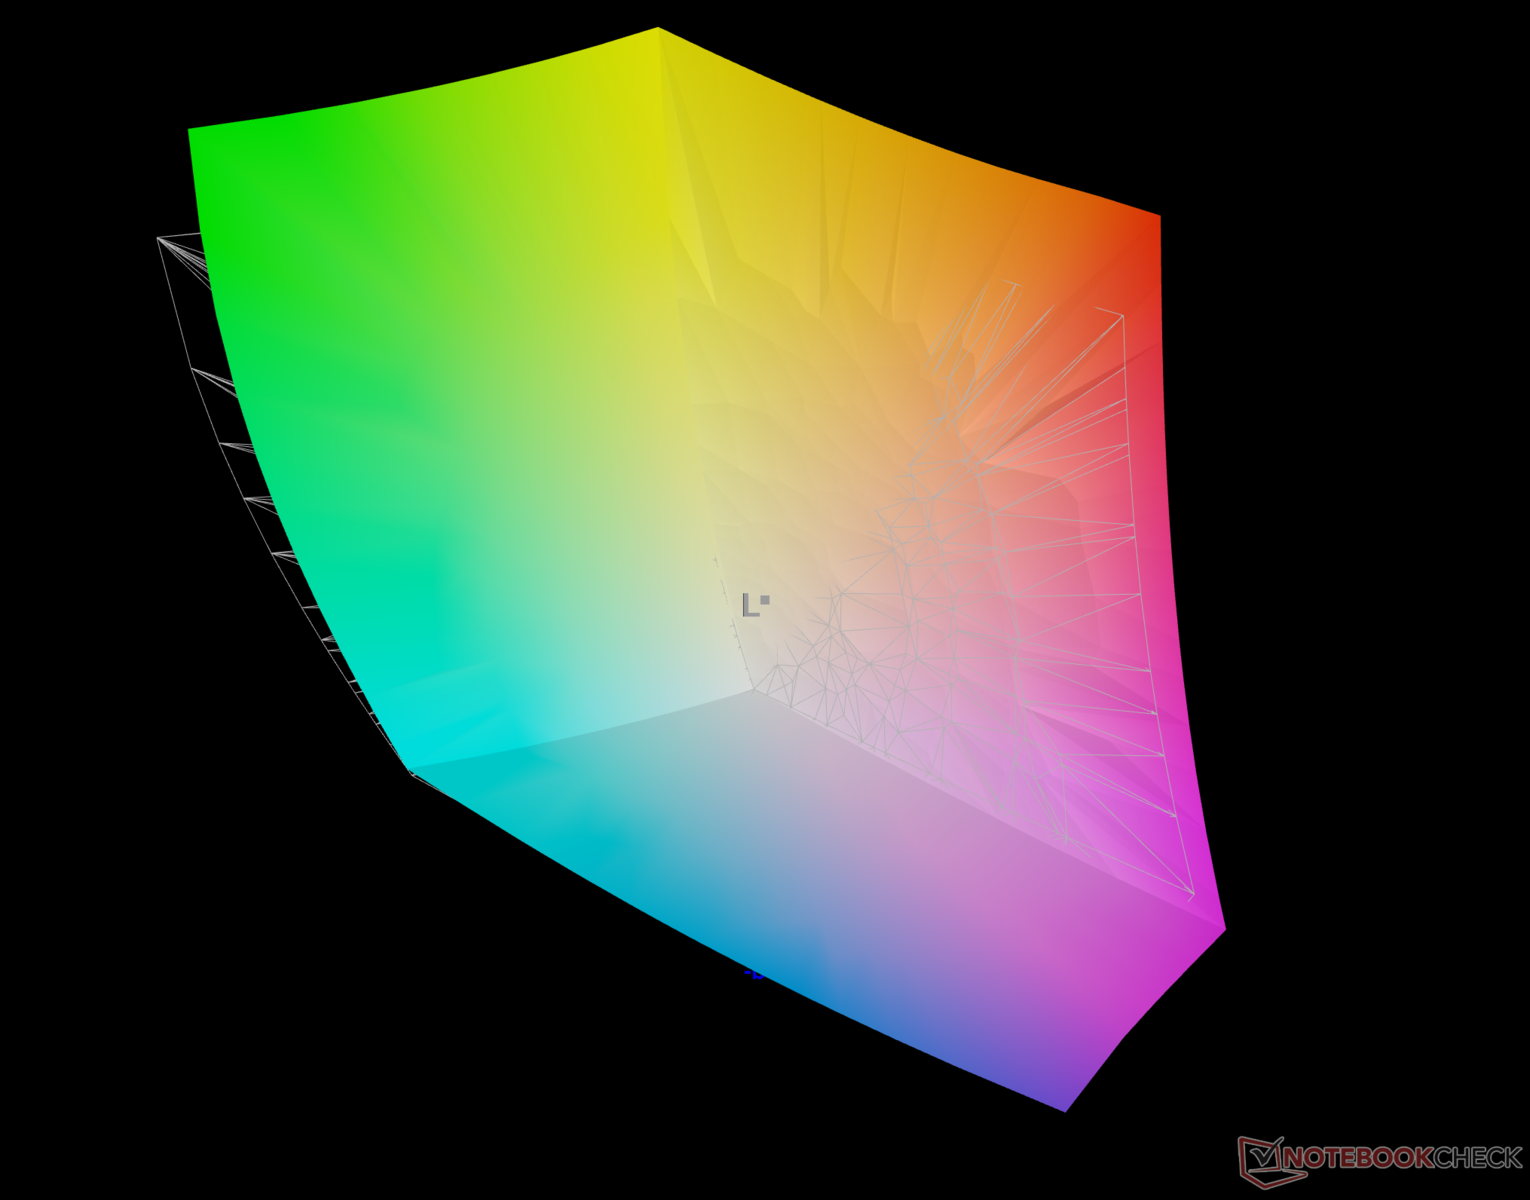
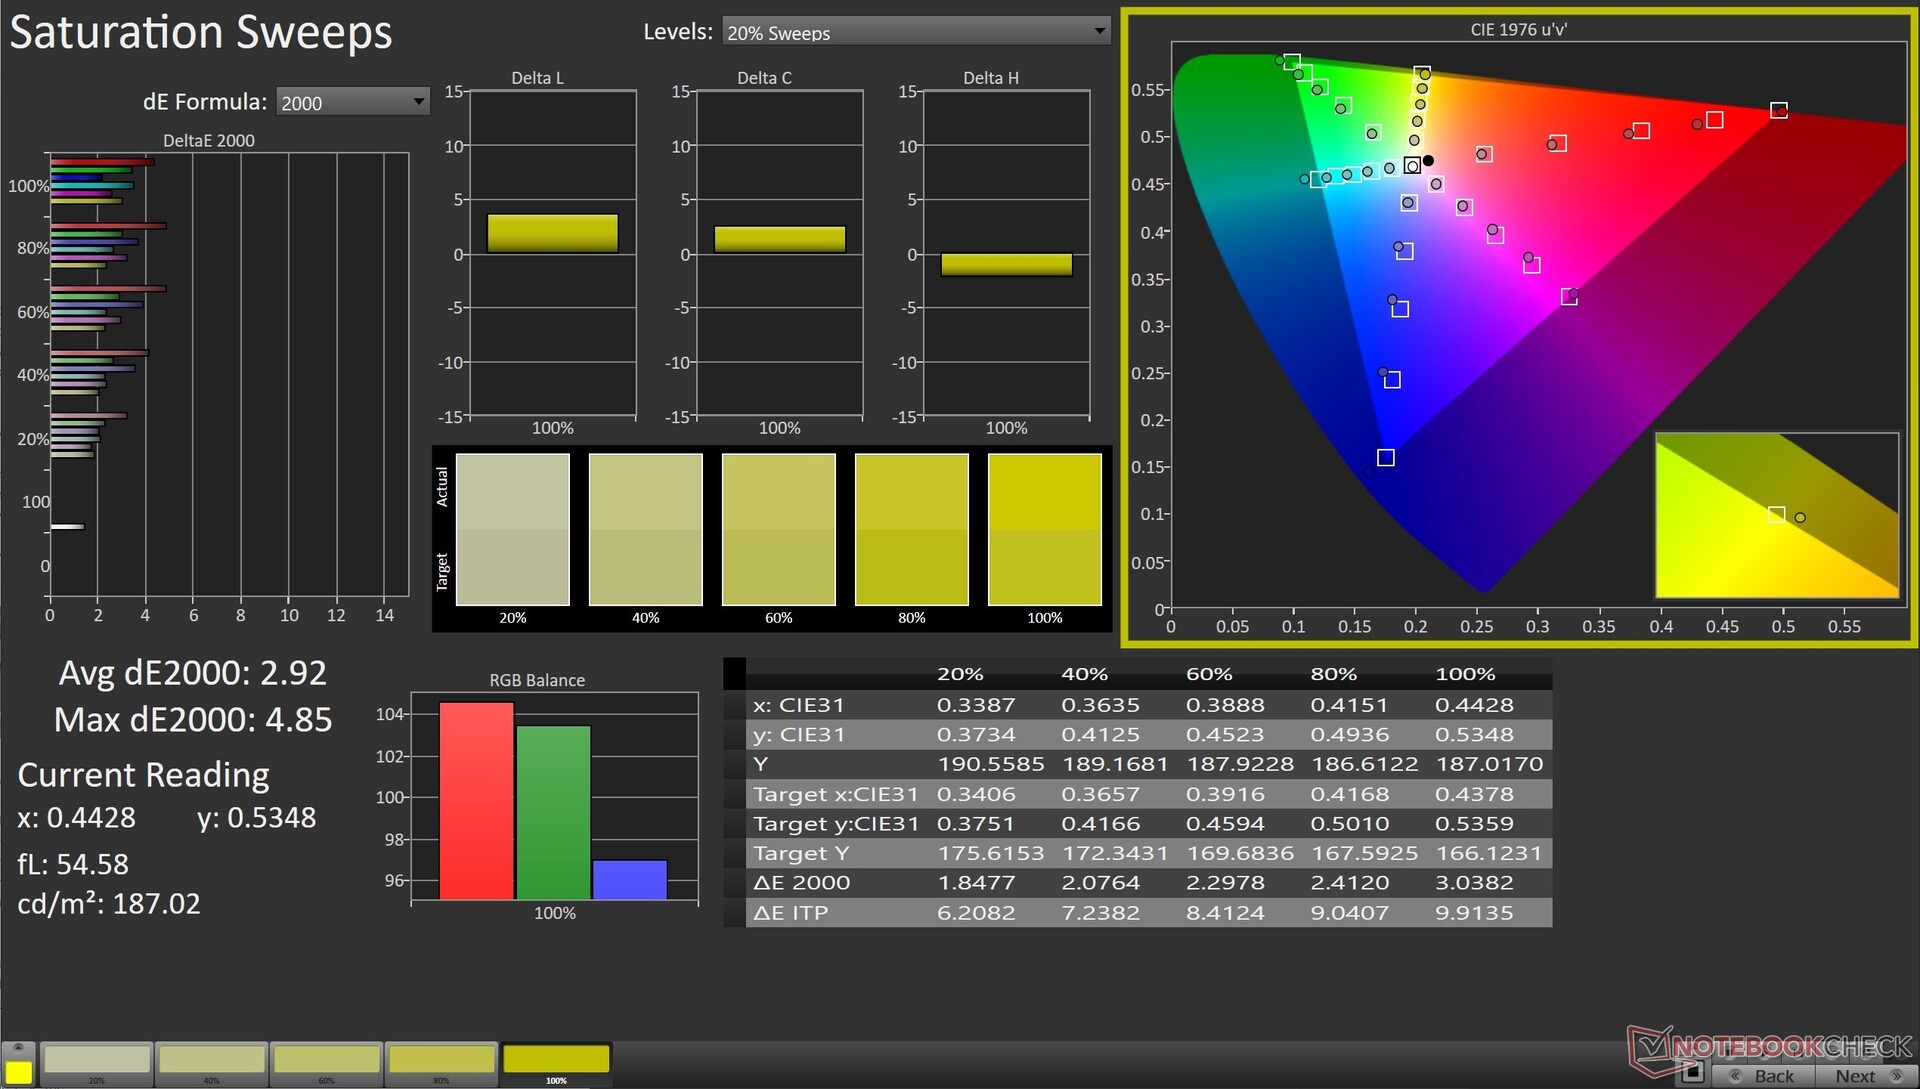
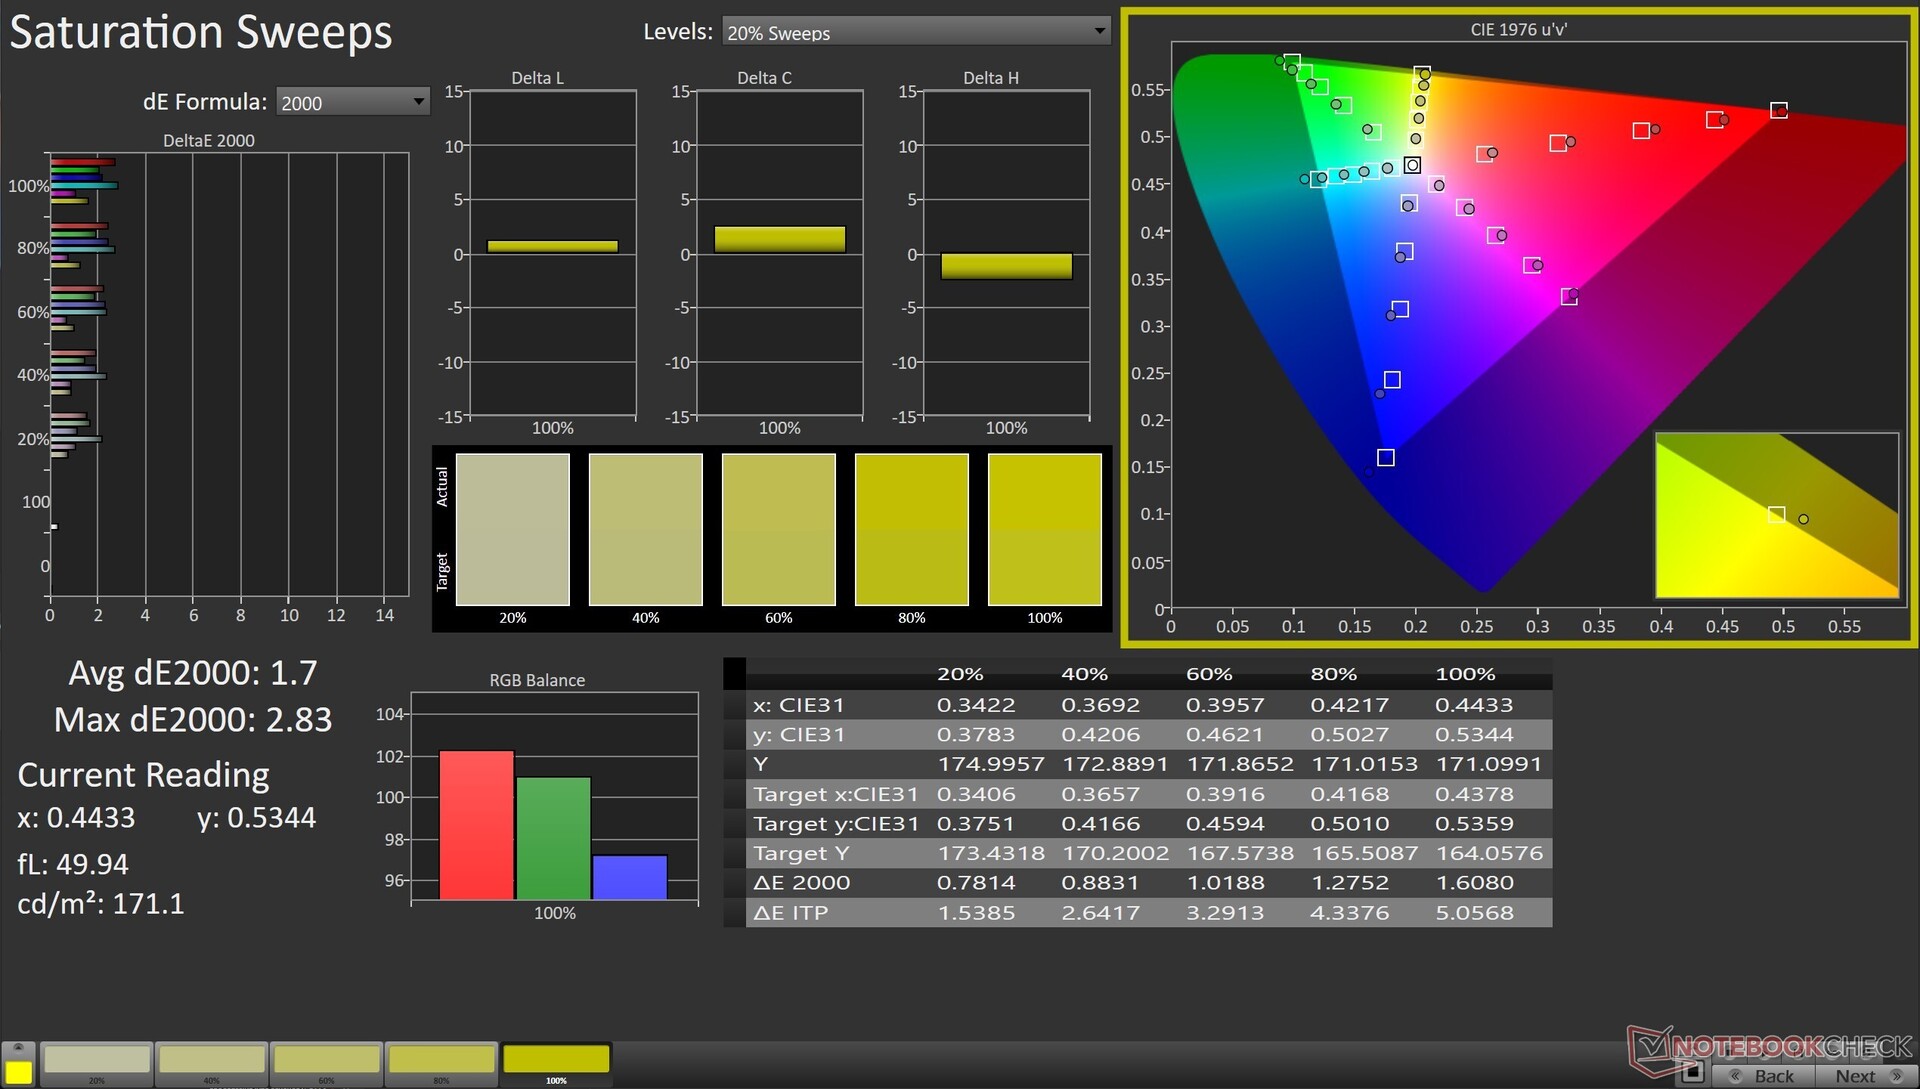
Asus reklamuje 100% pokrycie palety barw DCI-P3 dla panelu Samsung OLED, a nasze pomiary pokazują, że panel rzeczywiście jest w stanie w pełni pokryć przestrzeń barw sRGB i Display P3.
Pokrycie Adobe RGB jest również bardzo dobre i wynosi 96,5%, co sprawia, że ProArt StudioBook 16 doskonale nadaje się zarówno do tworzenia treści, jak i konsumpcji multimediów.

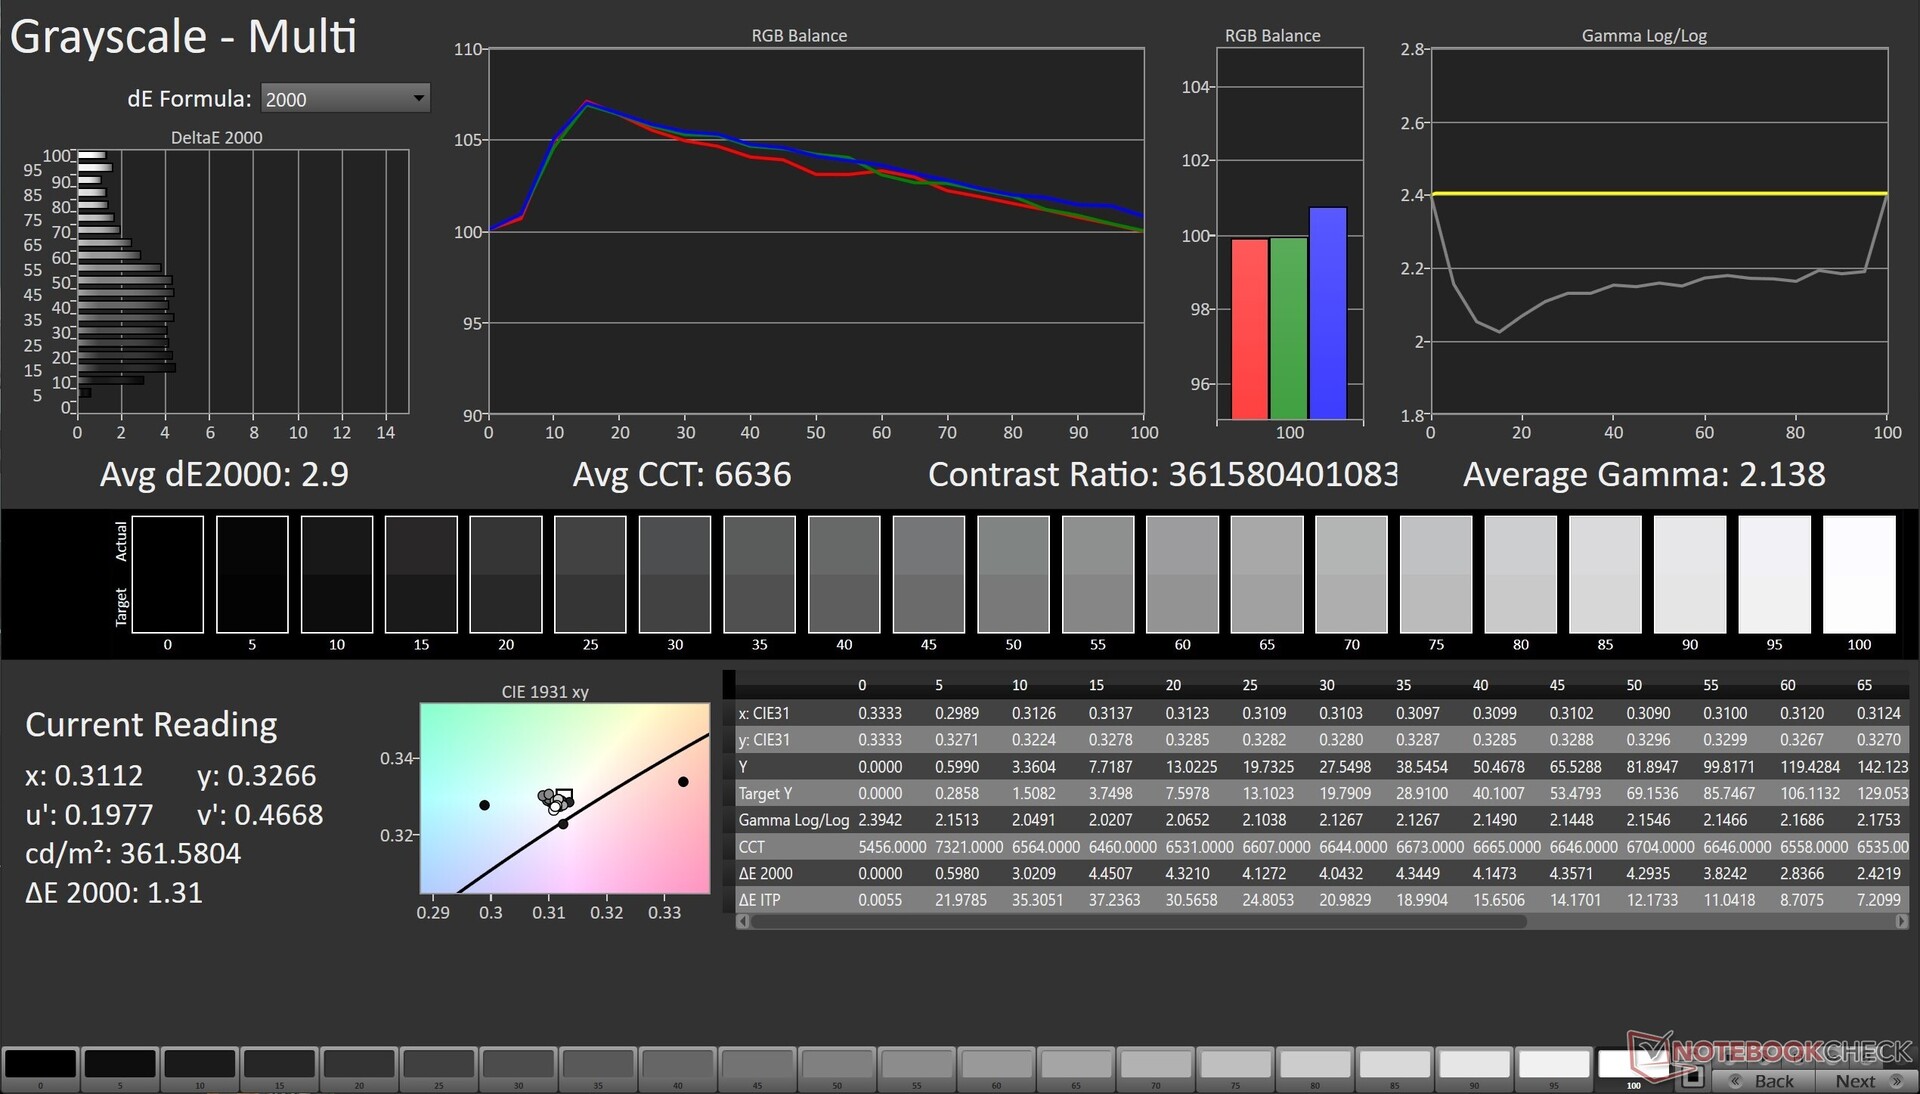
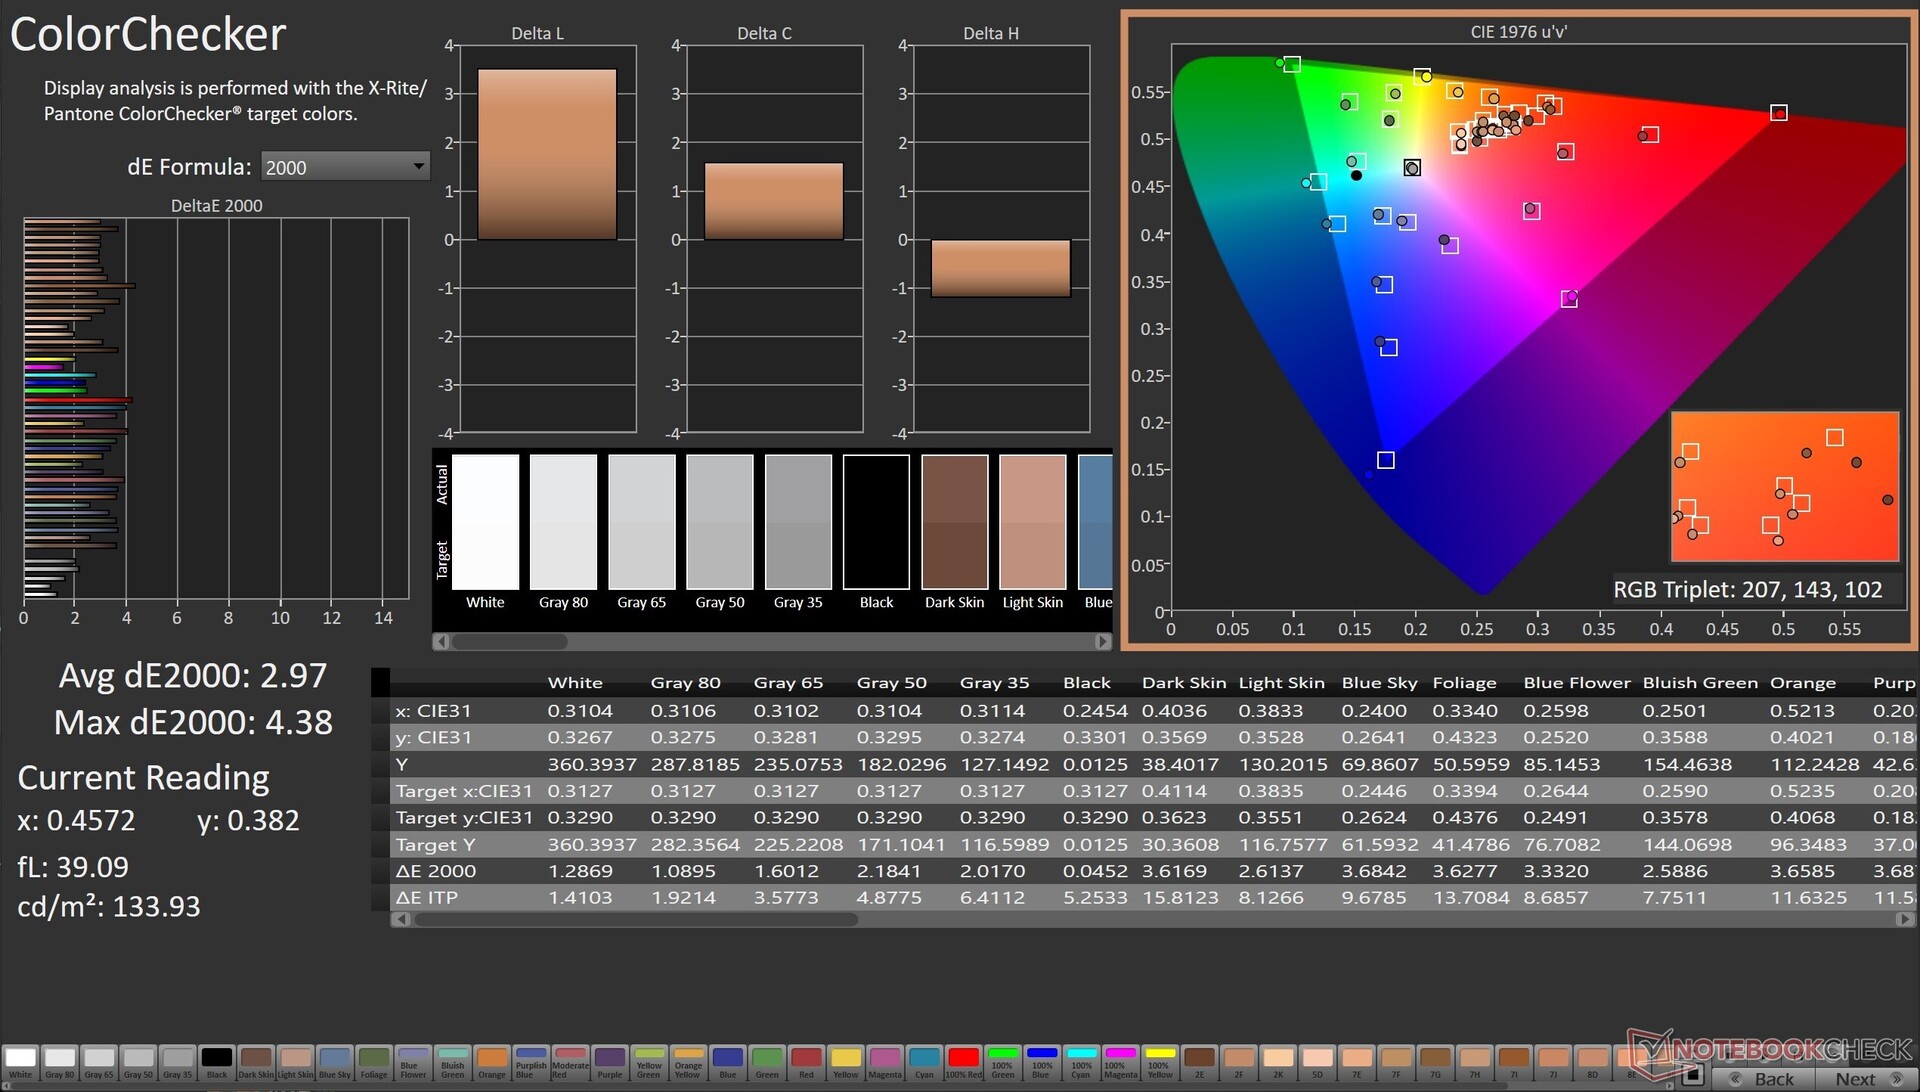
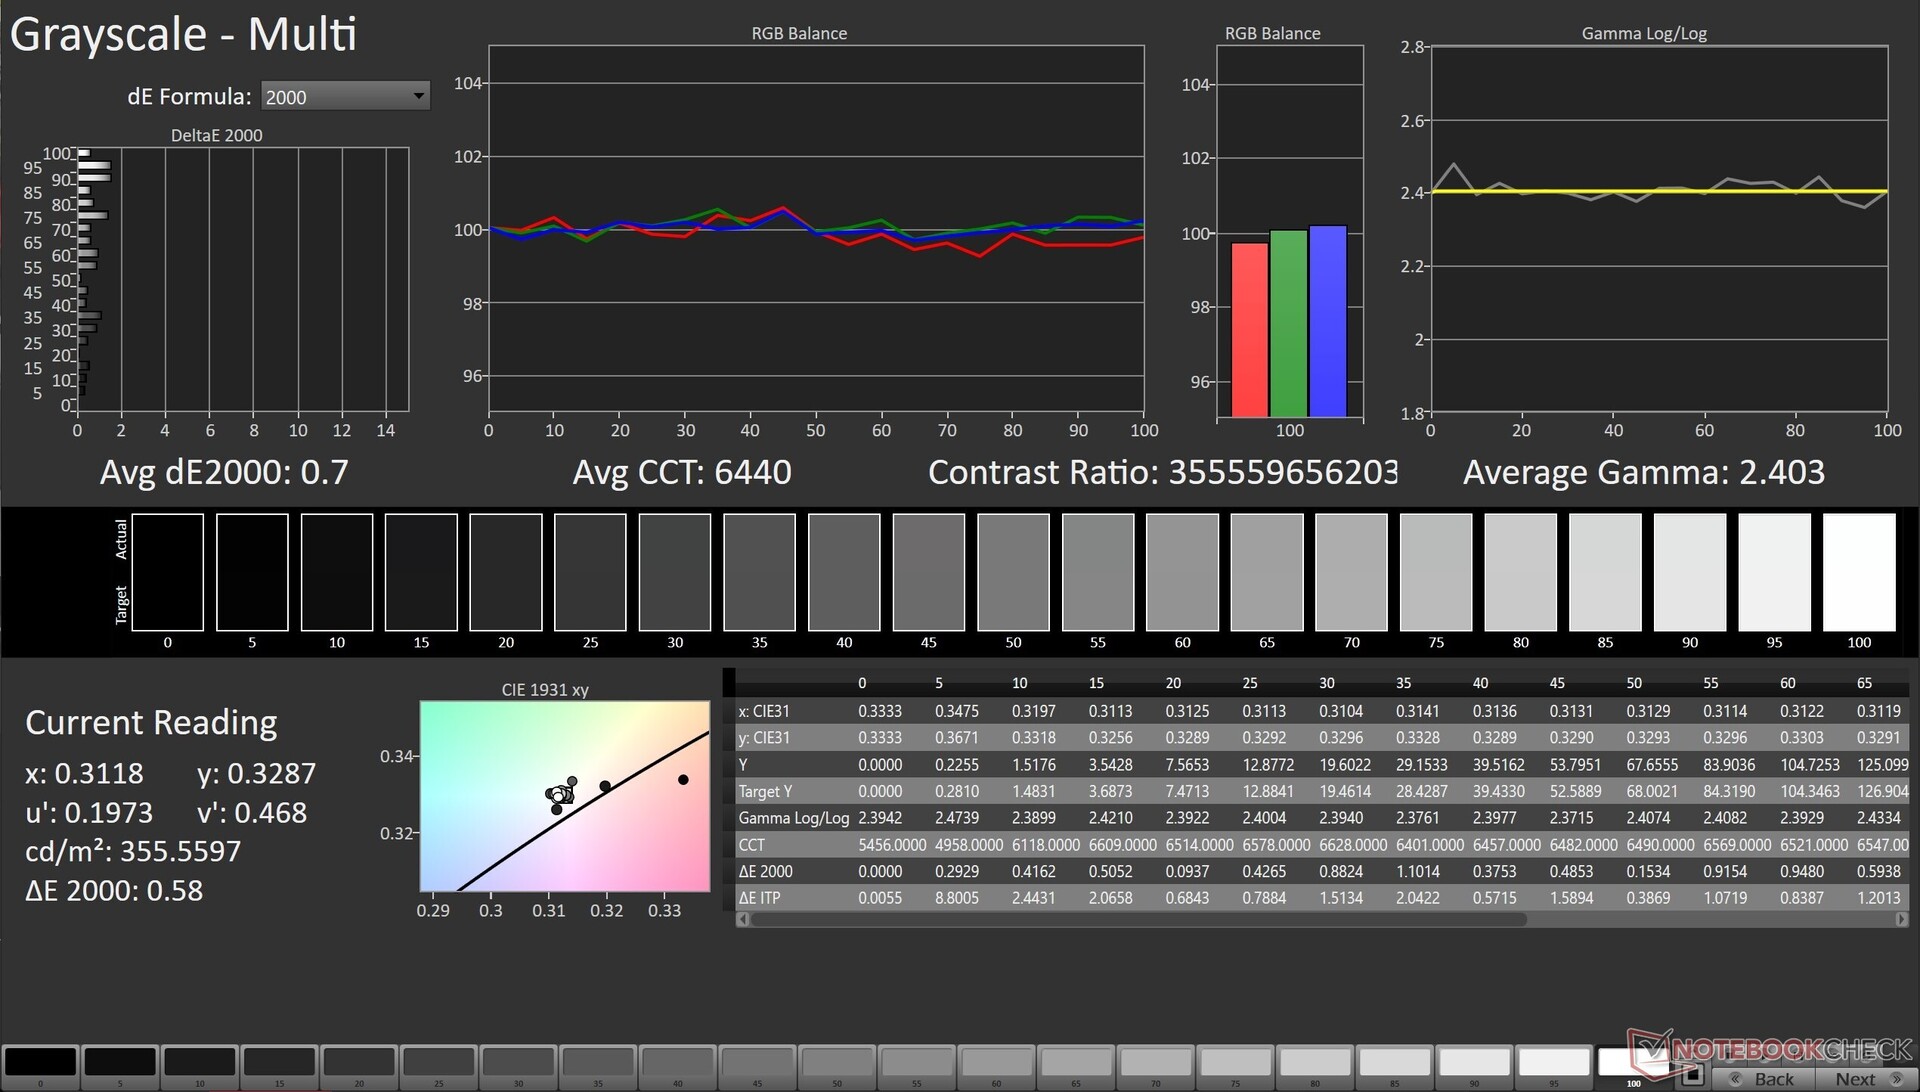
Wyświetlacz z walidacją PANTONE ma oferować średnią Delta E na poziomie 1,6 po wyjęciu z pudełka. Zmierzyliśmy jednak Delta Es na poziomie 2,9 i 2,97 w Grayscale i ColorChecker w profilu kolorów Normal.
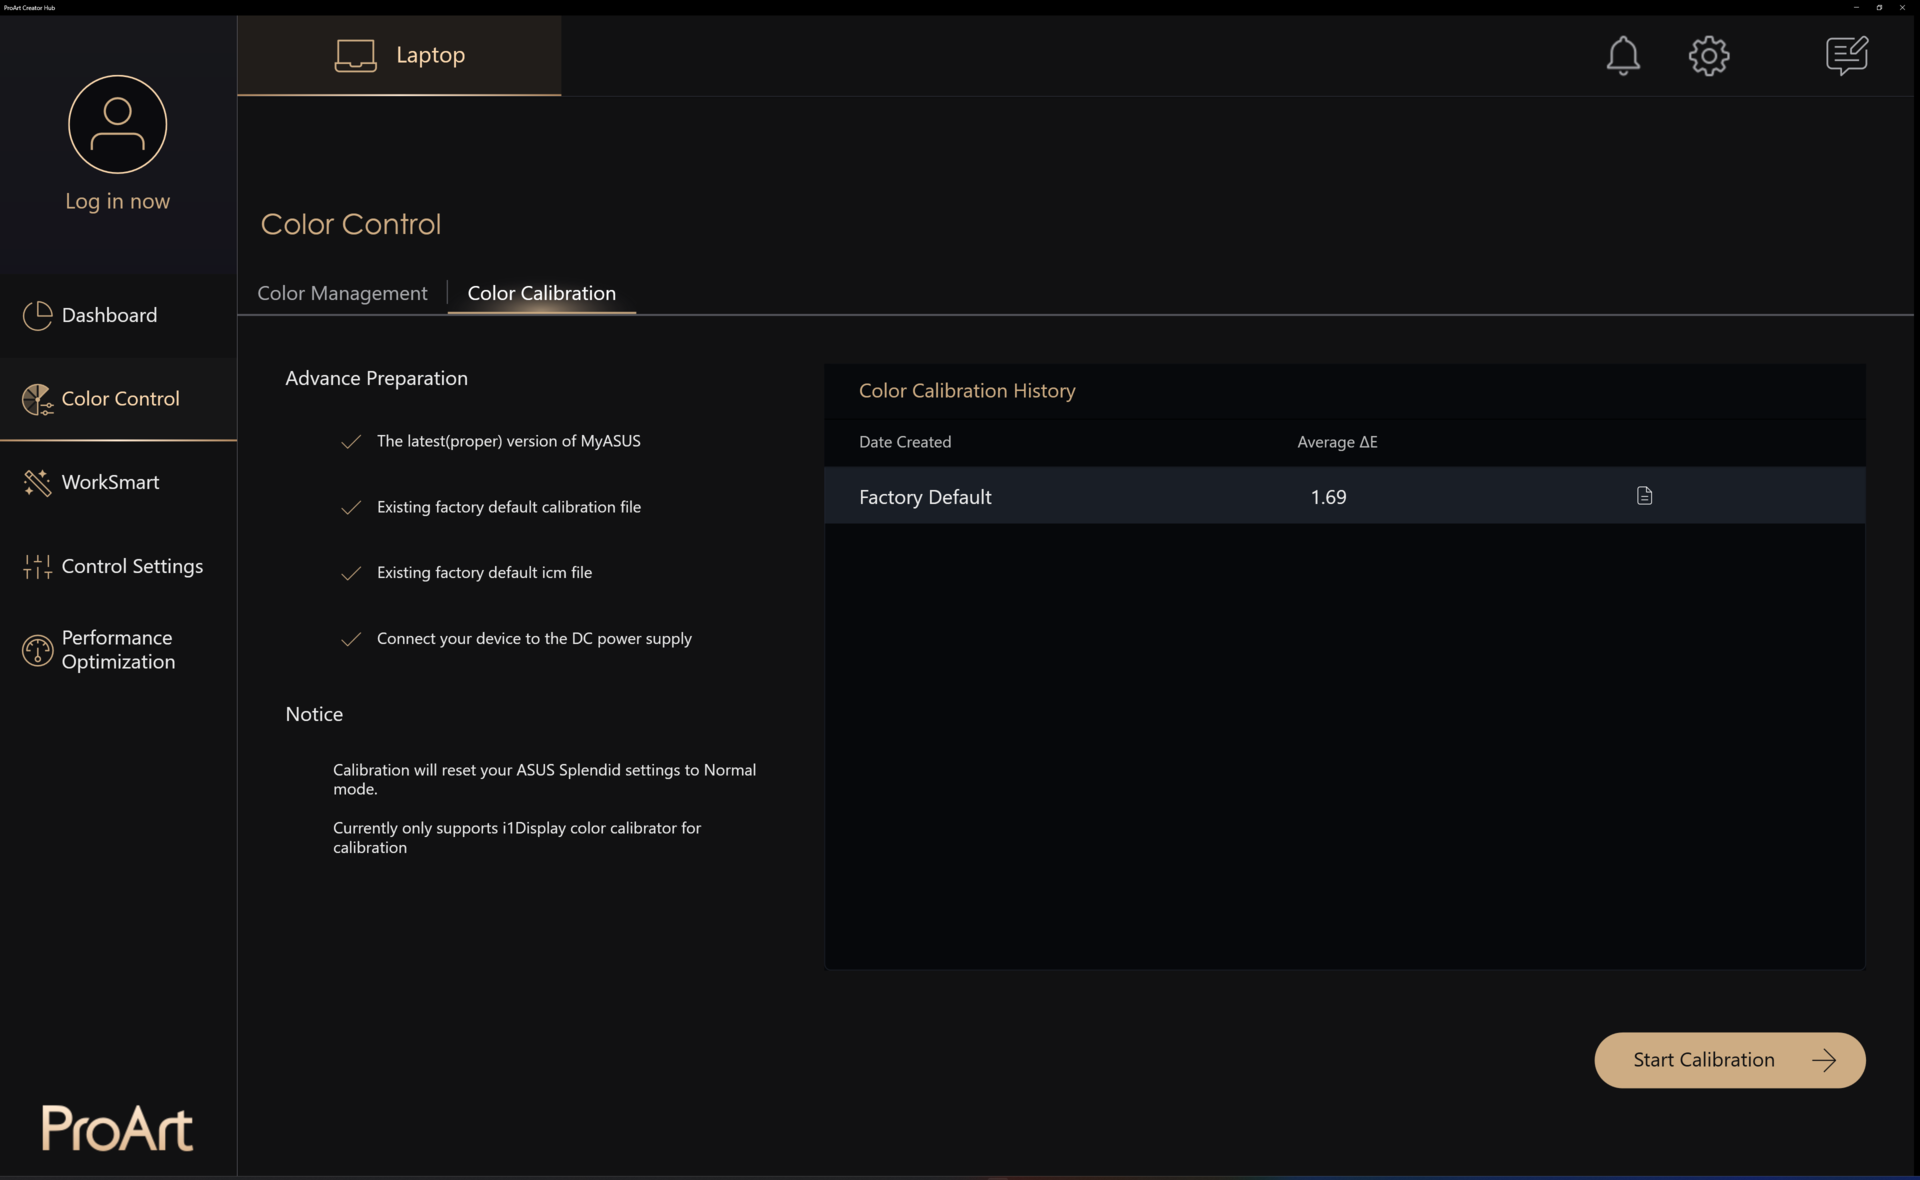
Asus oferuje również możliwość przeprowadzenia kalibracji wyświetlacza z poziomu aplikacji ProArt Creator Hub za pomocą kompatybilnego spektrofotometru.
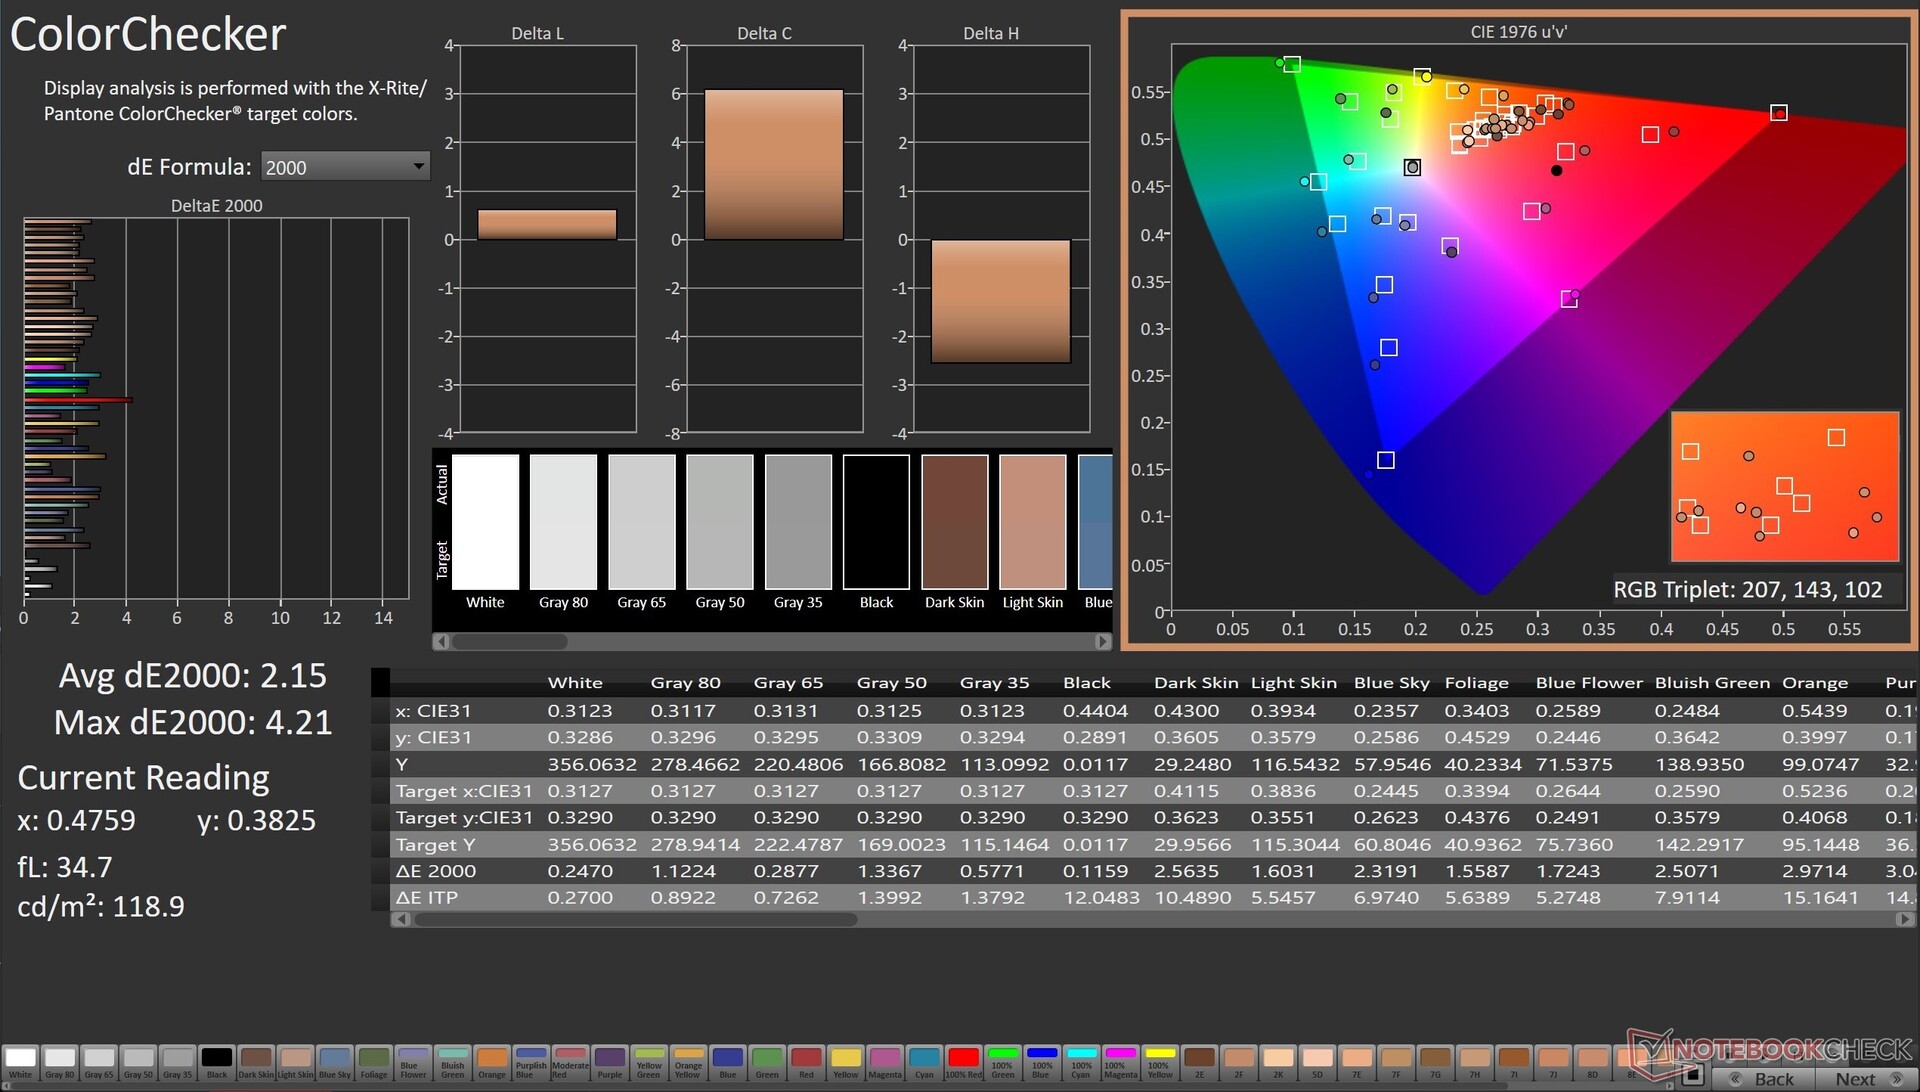
Dalsza kalibracja wyświetlacza w DCI-P3 przy użyciu spektrofotometru X-rite i1Basic Pro 3 i oprogramowania do kalibracji kolorów Calman Ultimate firmy Portrait Displays skutkuje znacznie poprawioną Delta E w skali szarości na poziomie zaledwie 0,7.
Delta E programu ColorChecker poprawia się nieco po kalibracji do 2,15. Wizualnie większość kolorów z wyjątkiem 100% czerwieni i odcieni niebieskiego wykazuje poprawę dokładności po kalibracji.
Skalibrowany plik ICC można pobrać z powyższego linku.
Wyświetl czasy reakcji
| ↔ Czas reakcji od czerni do bieli | ||
|---|---|---|
| 18.32 ms ... wzrost ↗ i spadek ↘ łącznie | ↗ 17.39 ms wzrost | 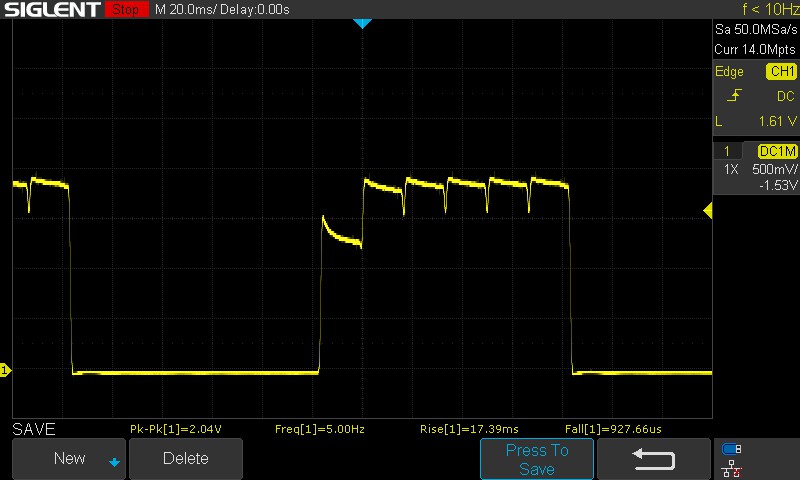 |
| ↘ 0.93 ms upadek | ||
| W naszych testach ekran wykazuje dobry współczynnik reakcji, ale może być zbyt wolny dla graczy rywalizujących ze sobą. Dla porównania, wszystkie testowane urządzenia wahają się od 0.1 (minimum) do 240 (maksimum) ms. » 41 % wszystkich urządzeń jest lepszych. Oznacza to, że zmierzony czas reakcji jest zbliżony do średniej wszystkich testowanych urządzeń (19.8 ms). | ||
| ↔ Czas reakcji 50% szarości do 80% szarości | ||
| 1.6 ms ... wzrost ↗ i spadek ↘ łącznie | ↗ 0.82 ms wzrost | 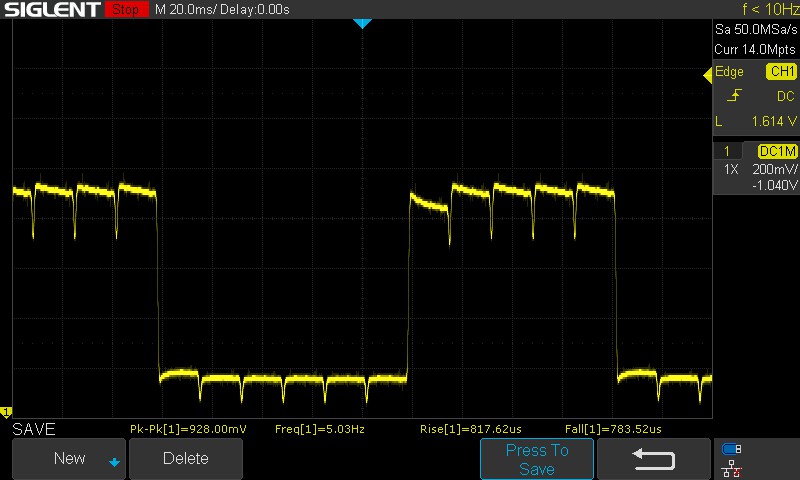 |
| ↘ 0.78 ms upadek | ||
| W naszych testach ekran wykazuje bardzo szybką reakcję i powinien bardzo dobrze nadawać się do szybkich gier. Dla porównania, wszystkie testowane urządzenia wahają się od 0.165 (minimum) do 636 (maksimum) ms. » 8 % wszystkich urządzeń jest lepszych. Oznacza to, że zmierzony czas reakcji jest lepszy od średniej wszystkich testowanych urządzeń (31 ms). | ||
Panel OLED oferuje doskonały czas reakcji od 50% szarości do 80% szarości na poziomie 1,6 ms. Przejście od 100% czerni do 100% bieli zajmuje jednak 18,32 ms. Powinno to być jeszcze w porządku w grach i na pewno nie jest problemem w przypadku przeznaczenia laptopa.
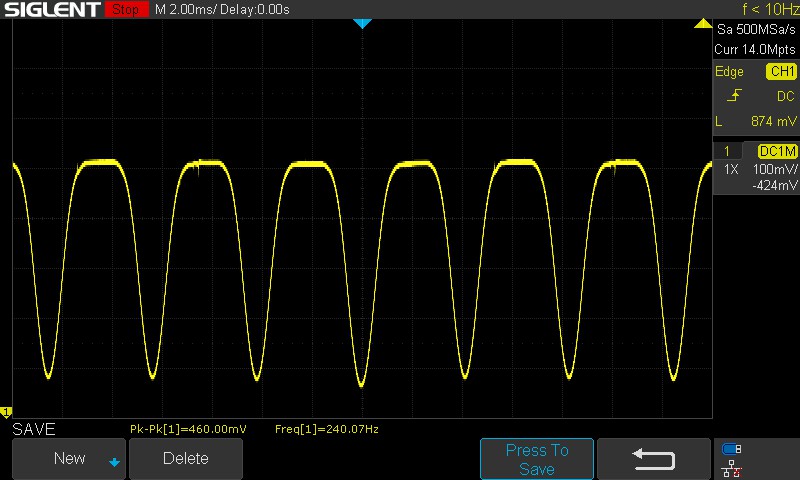
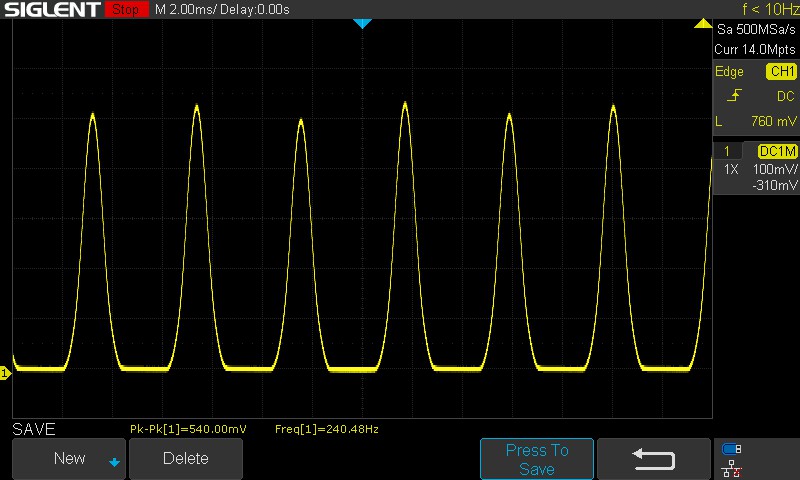
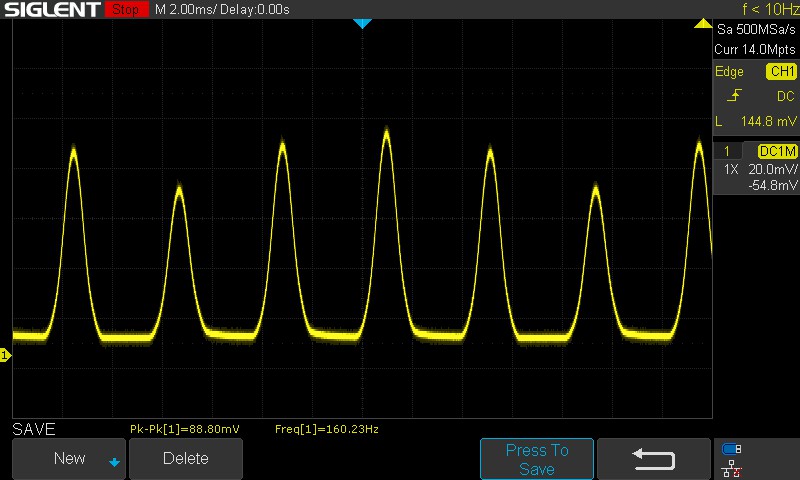
Migotanie ekranu / PWM (modulacja szerokości impulsu)
| Wykryto migotanie ekranu/wykryto PWM | 60 Hz | ≤ 100 % ustawienia jasności | 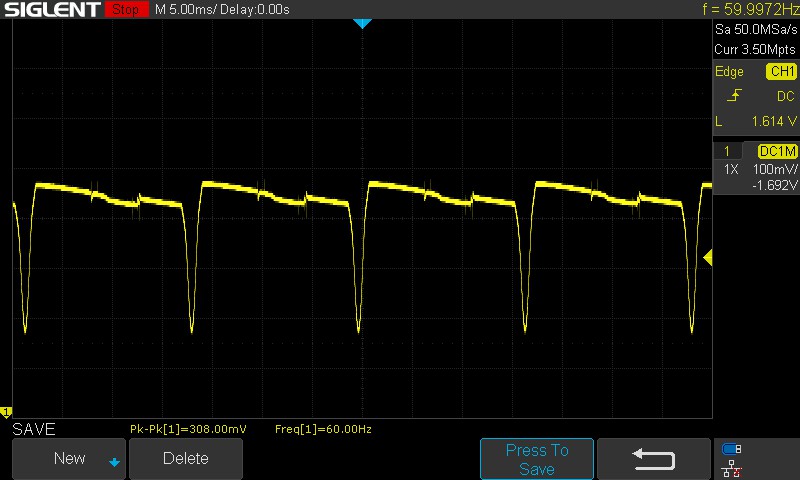 |
Podświetlenie wyświetlacza miga z częstotliwością 60 Hz (najgorszy przypadek, np. przy użyciu PWM) Wykryto migotanie przy ustawieniu jasności 100 % i poniżej. Powyżej tego ustawienia jasności nie powinno być żadnego migotania ani PWM. Częstotliwość 60 Hz jest bardzo niska, więc migotanie może powodować zmęczenie oczu i bóle głowy po dłuższym użytkowaniu. Dla porównania: 52 % wszystkich testowanych urządzeń nie używa PWM do przyciemniania wyświetlacza. Jeśli wykryto PWM, zmierzono średnio 7769 (minimum: 5 - maksimum: 343500) Hz. | |||
Asus wykorzystuje DC Dimming do regulacji intensywności podświetlenia. DC Dimming przy 60 Hz jest widoczny na poziomach jasności powyżej 51% do 100%. Poniżej 50% panel wykorzystuje PWM i migocze z częstotliwością 240 Hz. Zmniejsza się ona do 160 Hz, gdy suwak jasności Windows jest ustawiony na 0%.
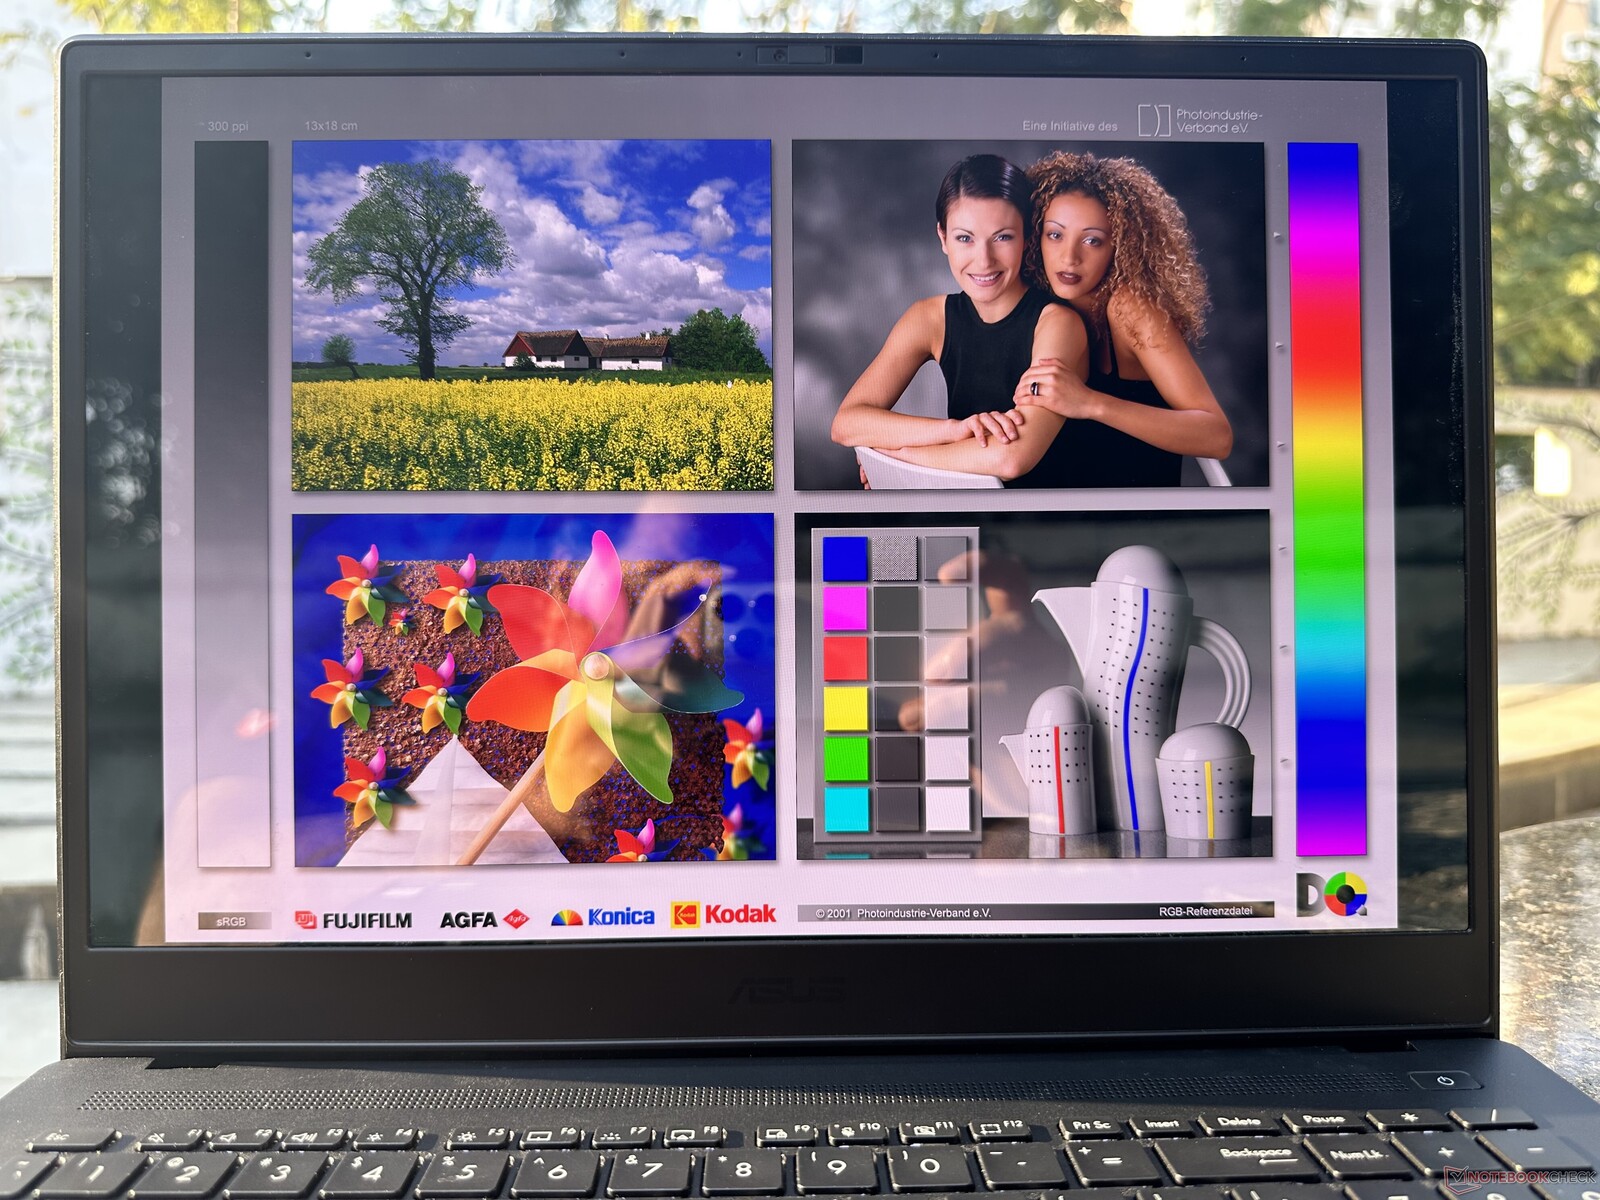
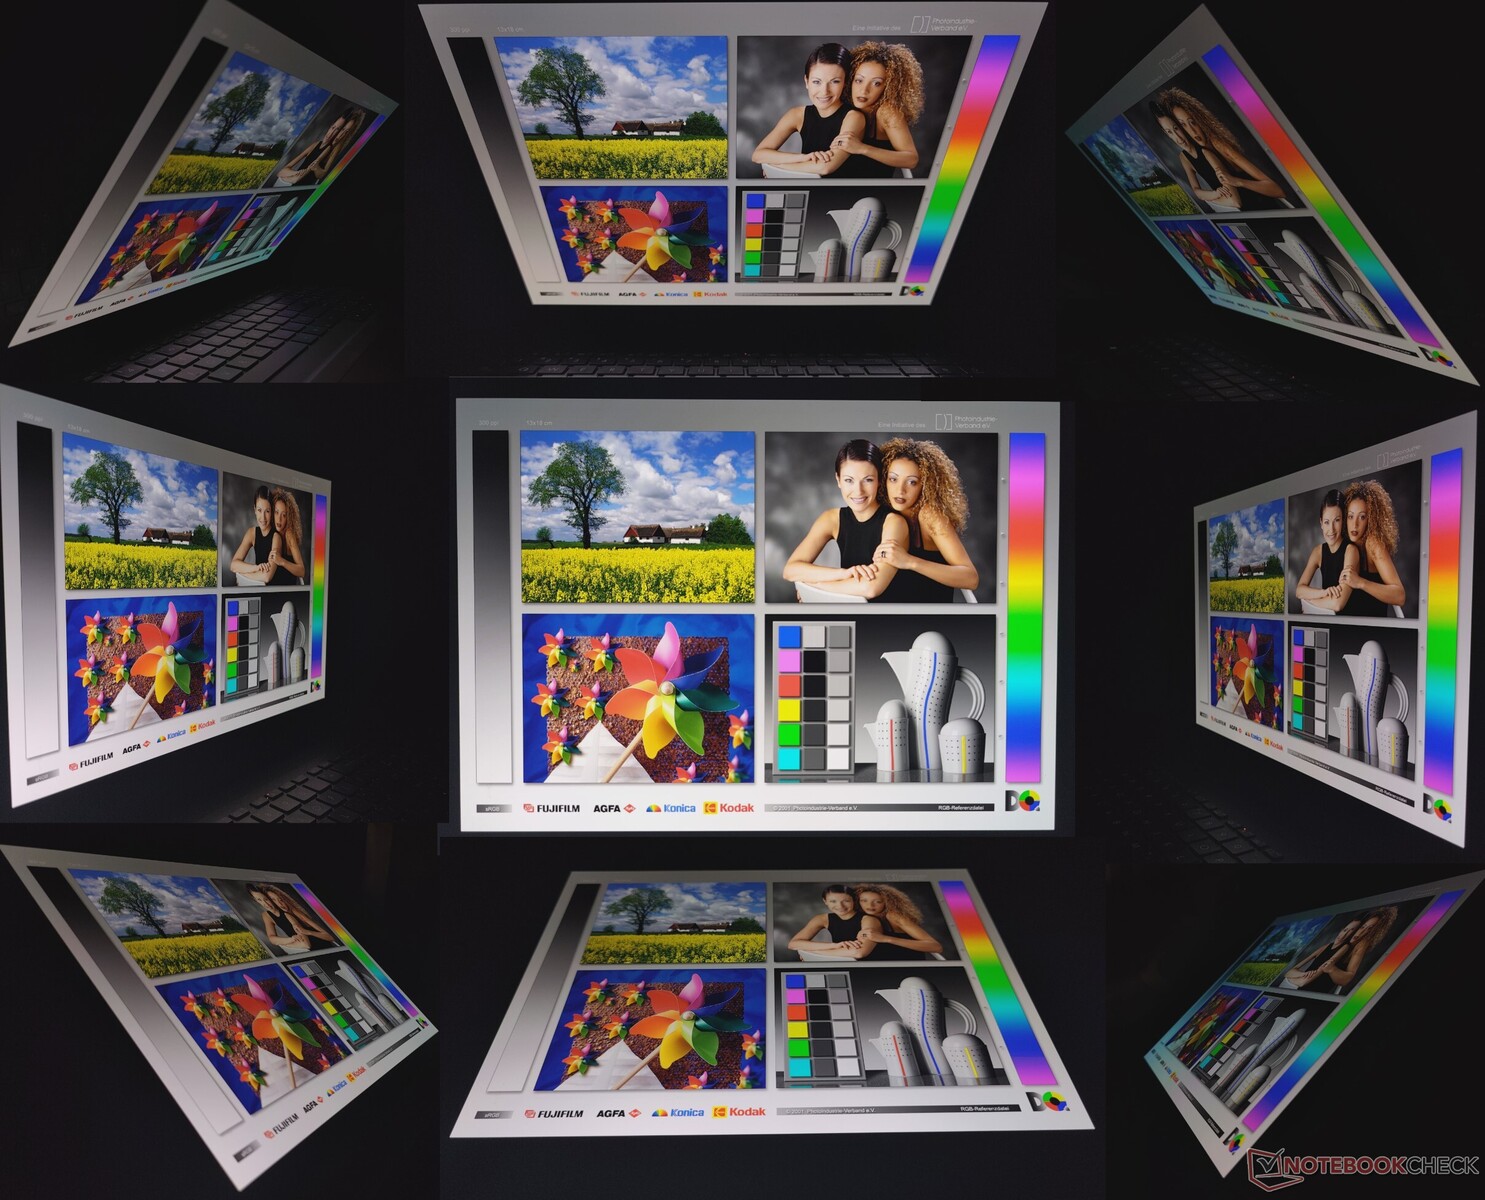
Jasny ekran zapewnia dobrą widoczność w świetle słonecznym. Kąty widzenia są względnie stabilne z wyjątkiem minimalnej utraty jasności na krańcach.
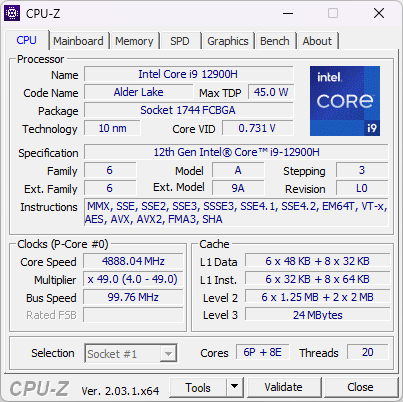
Wydajność: Połączenie Core i9-12900H i RTX 3070 Ti bez trzymanki
Nasz Asus ProArt StudioBook 16 jest napędzany przez Intel Core i9-12900H oraz procesor 115 W GPU Nvidia GeForce RTX 3070 Ti Laptop. Nabywcy mają również możliwość wyboru jednostek SKU wyposażonych w Core i7-12700H oraz GeForce RTX 3060 lub RTX 3080 Ti Laptop GPUwraz z opcjami pamięci DDR5-4800 z możliwością rozbudowy do 64 GB.
Warunki badania
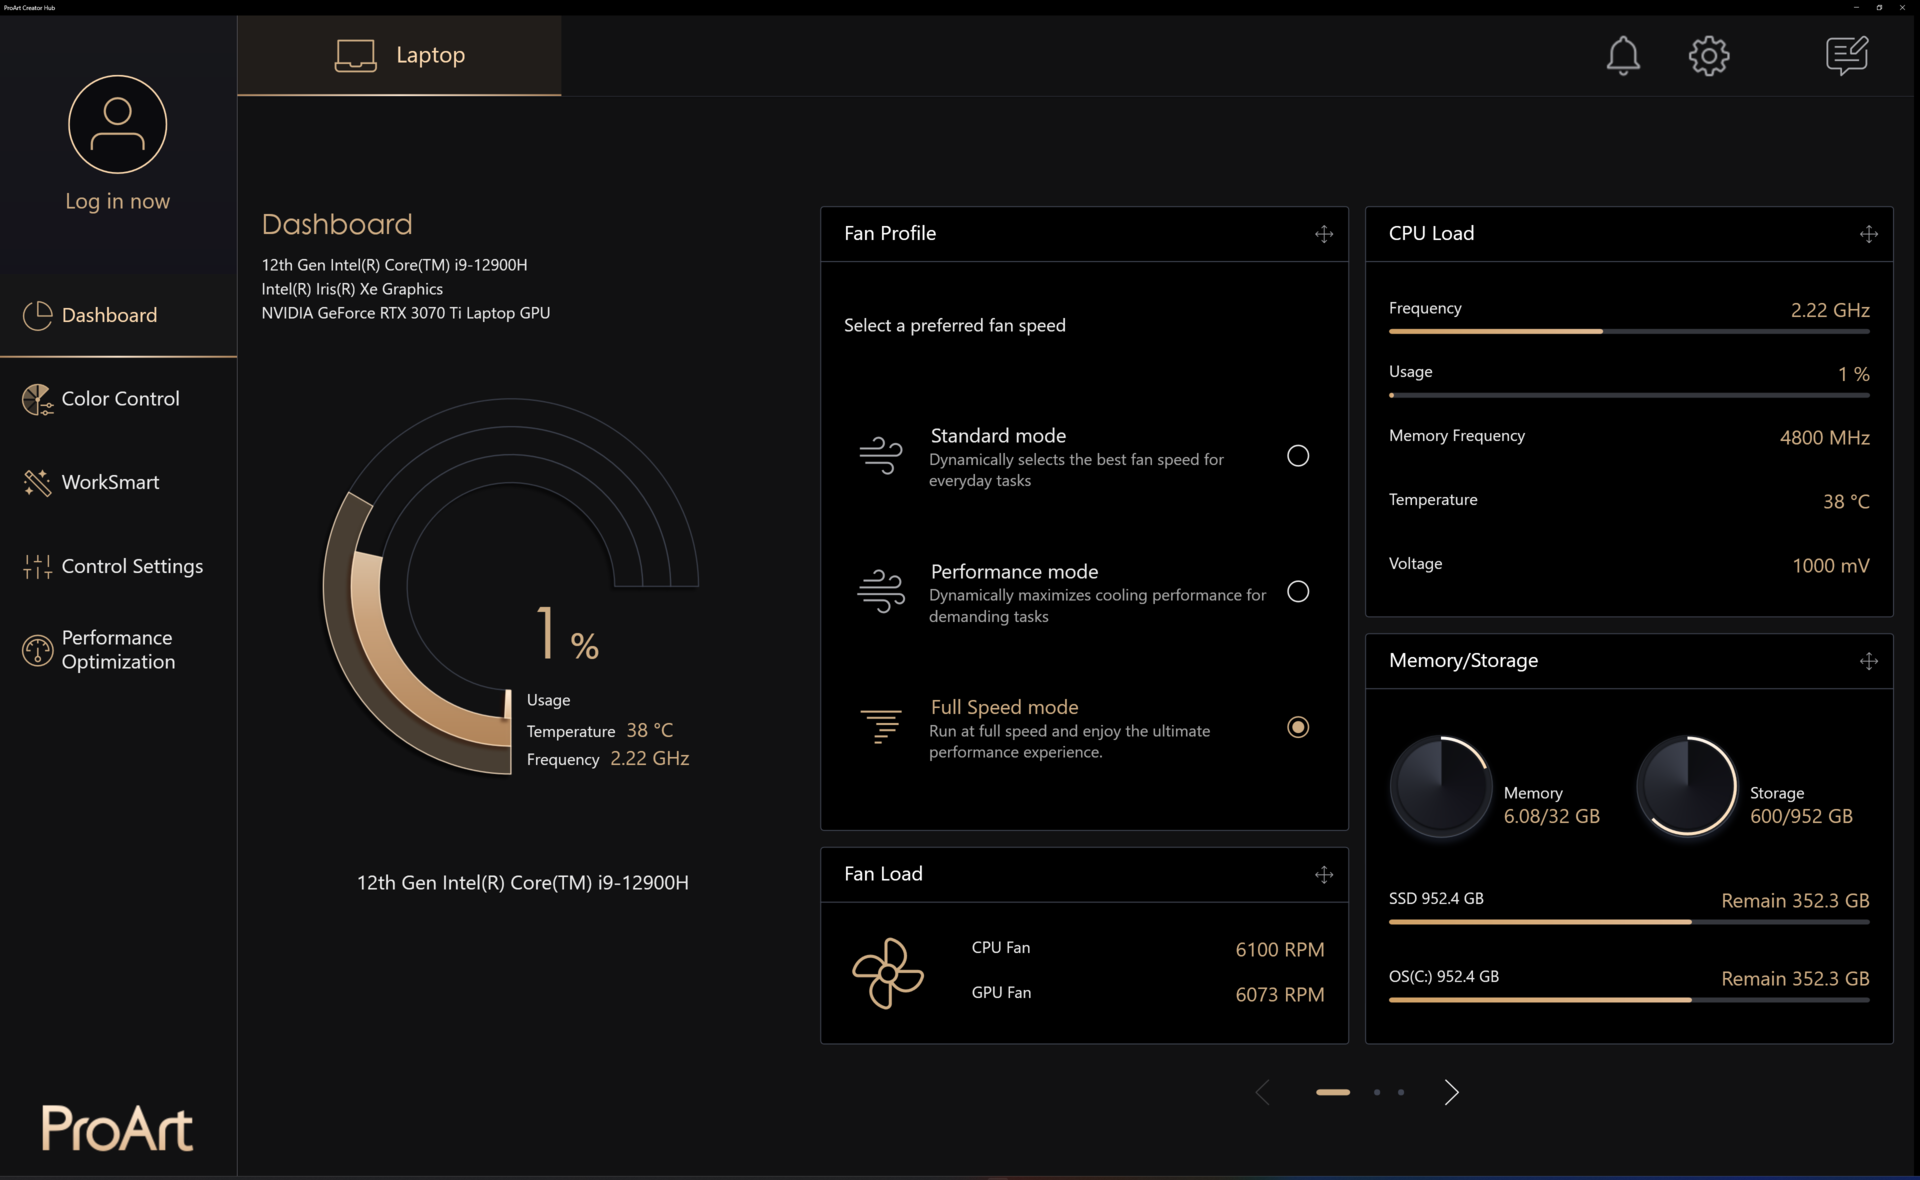
Ustawienia urządzenia są rozdzielone pomiędzy ProArt Creator Hub i aplikację MyAsus, co może być początkowo nieco mylące dla osób nowych w linii ProArt.
ProArt Creator Hub pozwala wybrać jeden z trzech dostępnych trybów wydajności, które wpływają na TDP Core i9-12900H zgodnie z poniższą tabelą.
Do wszystkich naszych testów użyliśmy trybu Full Speed, z wyjątkiem testów czasu pracy na baterii, które zostały przeprowadzone w trybie Standard.
| Tryb wydajności | PL1 (PBP) / Tau | PL2 (MTP) / Tau |
|---|---|---|
| Standard | 60 W / 56 s | 115 W / 2,44 ms |
| Performance | 110 W / 56 s | 115 W / 2,44 ms |
| Pełna prędkość | 110 W / 56 s | 115 W / 2,44 ms |
Procesor

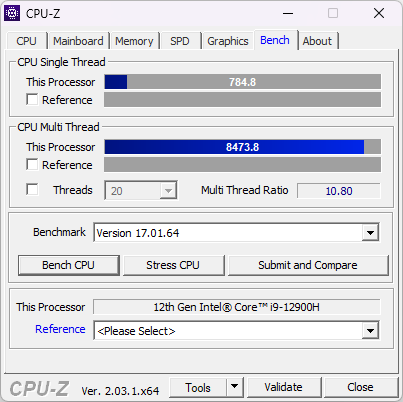
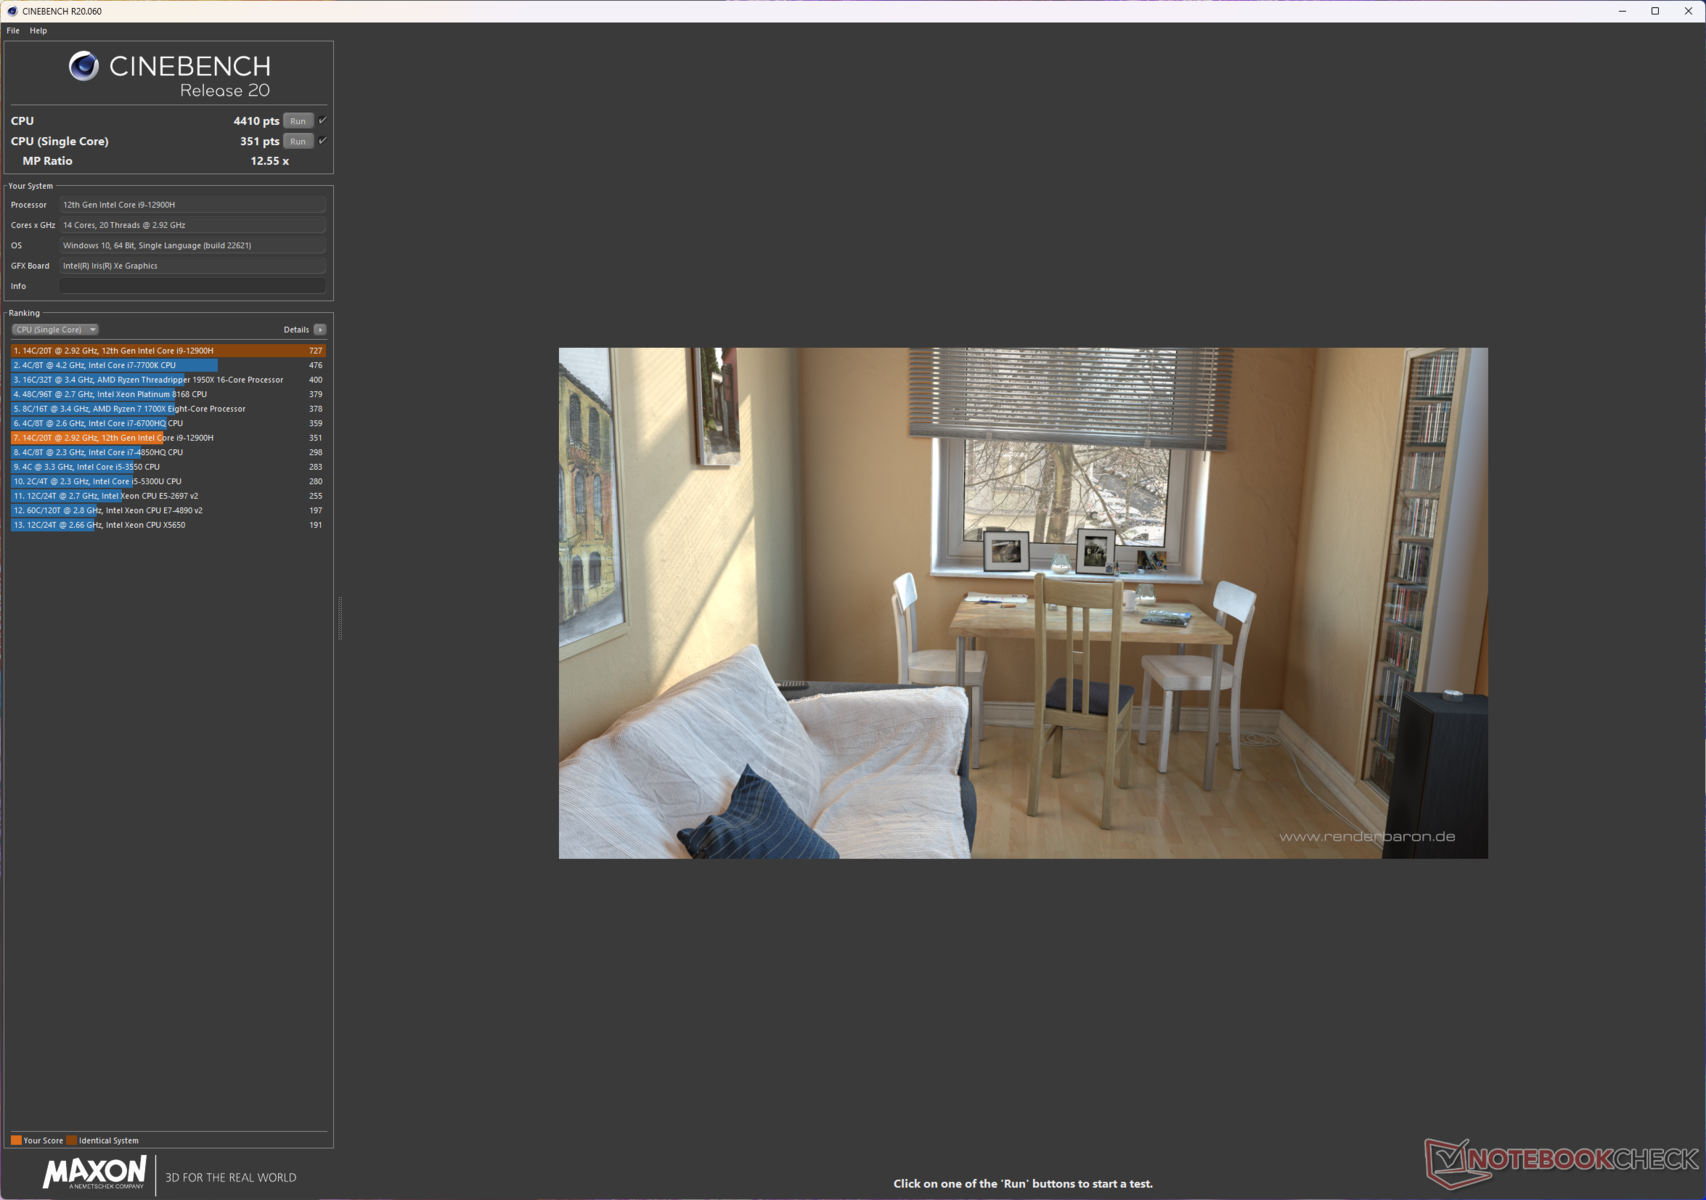
Procesor Intel Alder Lake-H Core i9-12900H posiada 14 rdzeni i 20 wątków z taktowaniem do 5 GHz. Implementacja chłodzenia przez Asusa wydaje się dość solidna, o czym świadczy nasz test pętli wielordzeniowej Cinebench R15, który nie wykazał żadnych zauważalnych oznak throttlingu.
ProArt StudioBook 16 przewodzi w rankingach ogólnej wydajności procesora, choć w porównaniu z konkurentami wyposażonymi w ten sam procesor ma marginalną przewagę. Wydajność pojedynczego rdzenia jest jednak mniejsza niż w przypadku 115 W PL2 MSI Creator Z16P160 W, Asus ROG Strix Scar 15135 W, oraz MSI Creator Z17120 W.
W porównaniu do Apple M1 Pro i M1 Max, Core i9-12900H w ProArt StudioBook 16 jest do 22% szybszy w trybie jednordzeniowym i 55% szybszy w trybie wielordzeniowym w Cinebench R23.
Cinebench R15 Multi Loop
Cinebench R23: Multi Core | Single Core
Cinebench R20: CPU (Multi Core) | CPU (Single Core)
Cinebench R15: CPU Multi 64Bit | CPU Single 64Bit
Blender: v2.79 BMW27 CPU
7-Zip 18.03: 7z b 4 | 7z b 4 -mmt1
Geekbench 5.5: Multi-Core | Single-Core
HWBOT x265 Benchmark v2.2: 4k Preset
LibreOffice : 20 Documents To PDF
R Benchmark 2.5: Overall mean
| CPU Performance rating | |
| Asus ProArt StudioBook 16 H7600ZW | |
| Asus ROG Strix Scar 15 G533ZW-LN106WS | |
| MSI Creator Z16P B12UHST | |
| Gigabyte Aero 16 YE5 | |
| Asus ZenBook Pro 16X OLED UX7602ZM-ME115W | |
| MSI Creator Z17 A12UGST-054 | |
| Średnia w klasie Multimedia | |
| Przeciętny Intel Core i9-12900H | |
| Asus ROG Zephyrus Duo 16 GX650RX | |
| Apple MacBook Pro 16 2021 M1 Pro -5! | |
| Apple MacBook Pro 14 2021 M1 Max 24-Core GPU -5! | |
| Lenovo ThinkBook 16p G3 ARH | |
| Cinebench R23 / Multi Core | |
| Asus ProArt StudioBook 16 H7600ZW | |
| Asus ROG Strix Scar 15 G533ZW-LN106WS | |
| MSI Creator Z16P B12UHST | |
| Gigabyte Aero 16 YE5 | |
| Asus ZenBook Pro 16X OLED UX7602ZM-ME115W | |
| Średnia w klasie Multimedia (4861 - 33362, n=81, ostatnie 2 lata) | |
| MSI Creator Z17 A12UGST-054 | |
| Przeciętny Intel Core i9-12900H (7359 - 19648, n=28) | |
| Asus ROG Zephyrus Duo 16 GX650RX | |
| Lenovo ThinkBook 16p G3 ARH | |
| Apple MacBook Pro 14 2021 M1 Max 24-Core GPU | |
| Apple MacBook Pro 16 2021 M1 Pro | |
| Cinebench R23 / Single Core | |
| Gigabyte Aero 16 YE5 | |
| Średnia w klasie Multimedia (1128 - 2459, n=73, ostatnie 2 lata) | |
| MSI Creator Z16P B12UHST | |
| Asus ROG Strix Scar 15 G533ZW-LN106WS | |
| MSI Creator Z17 A12UGST-054 | |
| Asus ProArt StudioBook 16 H7600ZW | |
| Przeciętny Intel Core i9-12900H (1634 - 1930, n=28) | |
| Asus ZenBook Pro 16X OLED UX7602ZM-ME115W | |
| Asus ROG Zephyrus Duo 16 GX650RX | |
| Lenovo ThinkBook 16p G3 ARH | |
| Apple MacBook Pro 16 2021 M1 Pro | |
| Apple MacBook Pro 14 2021 M1 Max 24-Core GPU | |
| Cinebench R20 / CPU (Multi Core) | |
| Asus ProArt StudioBook 16 H7600ZW | |
| Asus ROG Strix Scar 15 G533ZW-LN106WS | |
| MSI Creator Z16P B12UHST | |
| Gigabyte Aero 16 YE5 | |
| Średnia w klasie Multimedia (1887 - 12912, n=64, ostatnie 2 lata) | |
| MSI Creator Z17 A12UGST-054 | |
| Asus ZenBook Pro 16X OLED UX7602ZM-ME115W | |
| Przeciętny Intel Core i9-12900H (2681 - 7471, n=28) | |
| Asus ROG Zephyrus Duo 16 GX650RX | |
| Lenovo ThinkBook 16p G3 ARH | |
| Apple MacBook Pro 14 2021 M1 Max 24-Core GPU | |
| Apple MacBook Pro 16 2021 M1 Pro | |
| Cinebench R20 / CPU (Single Core) | |
| MSI Creator Z16P B12UHST | |
| Asus ProArt StudioBook 16 H7600ZW | |
| Asus ROG Strix Scar 15 G533ZW-LN106WS | |
| Średnia w klasie Multimedia (425 - 853, n=64, ostatnie 2 lata) | |
| MSI Creator Z17 A12UGST-054 | |
| Przeciętny Intel Core i9-12900H (624 - 738, n=28) | |
| Gigabyte Aero 16 YE5 | |
| Asus ZenBook Pro 16X OLED UX7602ZM-ME115W | |
| Lenovo ThinkBook 16p G3 ARH | |
| Asus ROG Zephyrus Duo 16 GX650RX | |
| Apple MacBook Pro 14 2021 M1 Max 24-Core GPU | |
| Apple MacBook Pro 16 2021 M1 Pro | |
| Cinebench R15 / CPU Multi 64Bit | |
| Asus ROG Strix Scar 15 G533ZW-LN106WS | |
| Asus ProArt StudioBook 16 H7600ZW | |
| MSI Creator Z16P B12UHST | |
| Gigabyte Aero 16 YE5 | |
| Asus ZenBook Pro 16X OLED UX7602ZM-ME115W | |
| MSI Creator Z17 A12UGST-054 | |
| Średnia w klasie Multimedia (856 - 5224, n=68, ostatnie 2 lata) | |
| Przeciętny Intel Core i9-12900H (1395 - 3077, n=28) | |
| Asus ROG Zephyrus Duo 16 GX650RX | |
| Lenovo ThinkBook 16p G3 ARH | |
| Apple MacBook Pro 16 2021 M1 Pro | |
| Apple MacBook Pro 14 2021 M1 Max 24-Core GPU | |
| Cinebench R15 / CPU Single 64Bit | |
| Średnia w klasie Multimedia (184.8 - 326, n=66, ostatnie 2 lata) | |
| Gigabyte Aero 16 YE5 | |
| Asus ProArt StudioBook 16 H7600ZW | |
| Asus ROG Strix Scar 15 G533ZW-LN106WS | |
| MSI Creator Z16P B12UHST | |
| Asus ZenBook Pro 16X OLED UX7602ZM-ME115W | |
| Asus ZenBook Pro 16X OLED UX7602ZM-ME115W | |
| Przeciętny Intel Core i9-12900H (235 - 277, n=29) | |
| MSI Creator Z17 A12UGST-054 | |
| Asus ROG Zephyrus Duo 16 GX650RX | |
| Lenovo ThinkBook 16p G3 ARH | |
| Apple MacBook Pro 14 2021 M1 Max 24-Core GPU | |
| Apple MacBook Pro 16 2021 M1 Pro | |
| Blender / v2.79 BMW27 CPU | |
| Średnia w klasie Multimedia (100 - 557, n=65, ostatnie 2 lata) | |
| Lenovo ThinkBook 16p G3 ARH | |
| Przeciętny Intel Core i9-12900H (160 - 451, n=28) | |
| Asus ROG Zephyrus Duo 16 GX650RX | |
| MSI Creator Z17 A12UGST-054 | |
| Gigabyte Aero 16 YE5 | |
| MSI Creator Z16P B12UHST | |
| Apple MacBook Pro 14 2021 M1 Max 24-Core GPU | |
| Asus ZenBook Pro 16X OLED UX7602ZM-ME115W | |
| Apple MacBook Pro 16 2021 M1 Pro | |
| Asus ROG Strix Scar 15 G533ZW-LN106WS | |
| Asus ProArt StudioBook 16 H7600ZW | |
| 7-Zip 18.03 / 7z b 4 | |
| Asus ProArt StudioBook 16 H7600ZW | |
| MSI Creator Z16P B12UHST | |
| Asus ZenBook Pro 16X OLED UX7602ZM-ME115W | |
| Gigabyte Aero 16 YE5 | |
| Asus ROG Strix Scar 15 G533ZW-LN106WS | |
| Asus ROG Zephyrus Duo 16 GX650RX | |
| MSI Creator Z17 A12UGST-054 | |
| Przeciętny Intel Core i9-12900H (34684 - 76677, n=28) | |
| Średnia w klasie Multimedia (26062 - 130368, n=62, ostatnie 2 lata) | |
| Lenovo ThinkBook 16p G3 ARH | |
| 7-Zip 18.03 / 7z b 4 -mmt1 | |
| Asus ProArt StudioBook 16 H7600ZW | |
| Gigabyte Aero 16 YE5 | |
| MSI Creator Z16P B12UHST | |
| Asus ROG Strix Scar 15 G533ZW-LN106WS | |
| Średnia w klasie Multimedia (3666 - 7545, n=63, ostatnie 2 lata) | |
| MSI Creator Z17 A12UGST-054 | |
| Przeciętny Intel Core i9-12900H (5302 - 6289, n=28) | |
| Asus ZenBook Pro 16X OLED UX7602ZM-ME115W | |
| Asus ROG Zephyrus Duo 16 GX650RX | |
| Lenovo ThinkBook 16p G3 ARH | |
| Geekbench 5.5 / Multi-Core | |
| MSI Creator Z16P B12UHST | |
| Asus ProArt StudioBook 16 H7600ZW | |
| Asus ROG Strix Scar 15 G533ZW-LN106WS | |
| Gigabyte Aero 16 YE5 | |
| Asus ZenBook Pro 16X OLED UX7602ZM-ME115W | |
| MSI Creator Z17 A12UGST-054 | |
| Średnia w klasie Multimedia (4652 - 20422, n=62, ostatnie 2 lata) | |
| Apple MacBook Pro 14 2021 M1 Max 24-Core GPU | |
| Apple MacBook Pro 16 2021 M1 Pro | |
| Przeciętny Intel Core i9-12900H (8519 - 14376, n=31) | |
| Asus ROG Zephyrus Duo 16 GX650RX | |
| Lenovo ThinkBook 16p G3 ARH | |
| Geekbench 5.5 / Single-Core | |
| Średnia w klasie Multimedia (805 - 2974, n=62, ostatnie 2 lata) | |
| MSI Creator Z16P B12UHST | |
| Asus ProArt StudioBook 16 H7600ZW | |
| Gigabyte Aero 16 YE5 | |
| MSI Creator Z17 A12UGST-054 | |
| Asus ROG Strix Scar 15 G533ZW-LN106WS | |
| Asus ZenBook Pro 16X OLED UX7602ZM-ME115W | |
| Przeciętny Intel Core i9-12900H (1631 - 1897, n=31) | |
| Apple MacBook Pro 16 2021 M1 Pro | |
| Apple MacBook Pro 14 2021 M1 Max 24-Core GPU | |
| Asus ROG Zephyrus Duo 16 GX650RX | |
| Lenovo ThinkBook 16p G3 ARH | |
| HWBOT x265 Benchmark v2.2 / 4k Preset | |
| Asus ProArt StudioBook 16 H7600ZW | |
| Asus ROG Strix Scar 15 G533ZW-LN106WS | |
| Asus ZenBook Pro 16X OLED UX7602ZM-ME115W | |
| MSI Creator Z16P B12UHST | |
| Średnia w klasie Multimedia (5.26 - 36.1, n=63, ostatnie 2 lata) | |
| Gigabyte Aero 16 YE5 | |
| Asus ROG Zephyrus Duo 16 GX650RX | |
| MSI Creator Z17 A12UGST-054 | |
| Przeciętny Intel Core i9-12900H (8.05 - 22.5, n=28) | |
| Lenovo ThinkBook 16p G3 ARH | |
| LibreOffice / 20 Documents To PDF | |
| Lenovo ThinkBook 16p G3 ARH | |
| Średnia w klasie Multimedia (23.9 - 146.7, n=64, ostatnie 2 lata) | |
| Asus ROG Zephyrus Duo 16 GX650RX | |
| Asus ProArt StudioBook 16 H7600ZW | |
| Przeciętny Intel Core i9-12900H (36.8 - 59.8, n=28) | |
| MSI Creator Z17 A12UGST-054 | |
| Asus ZenBook Pro 16X OLED UX7602ZM-ME115W | |
| Asus ROG Strix Scar 15 G533ZW-LN106WS | |
| Gigabyte Aero 16 YE5 | |
| MSI Creator Z16P B12UHST | |
| R Benchmark 2.5 / Overall mean | |
| Lenovo ThinkBook 16p G3 ARH | |
| Asus ROG Zephyrus Duo 16 GX650RX | |
| Średnia w klasie Multimedia (0.3604 - 0.947, n=63, ostatnie 2 lata) | |
| Przeciętny Intel Core i9-12900H (0.4218 - 0.506, n=28) | |
| MSI Creator Z17 A12UGST-054 | |
| Asus ZenBook Pro 16X OLED UX7602ZM-ME115W | |
| Asus ProArt StudioBook 16 H7600ZW | |
| MSI Creator Z16P B12UHST | |
| Asus ROG Strix Scar 15 G533ZW-LN106WS | |
| Gigabyte Aero 16 YE5 | |
* ... im mniej tym lepiej
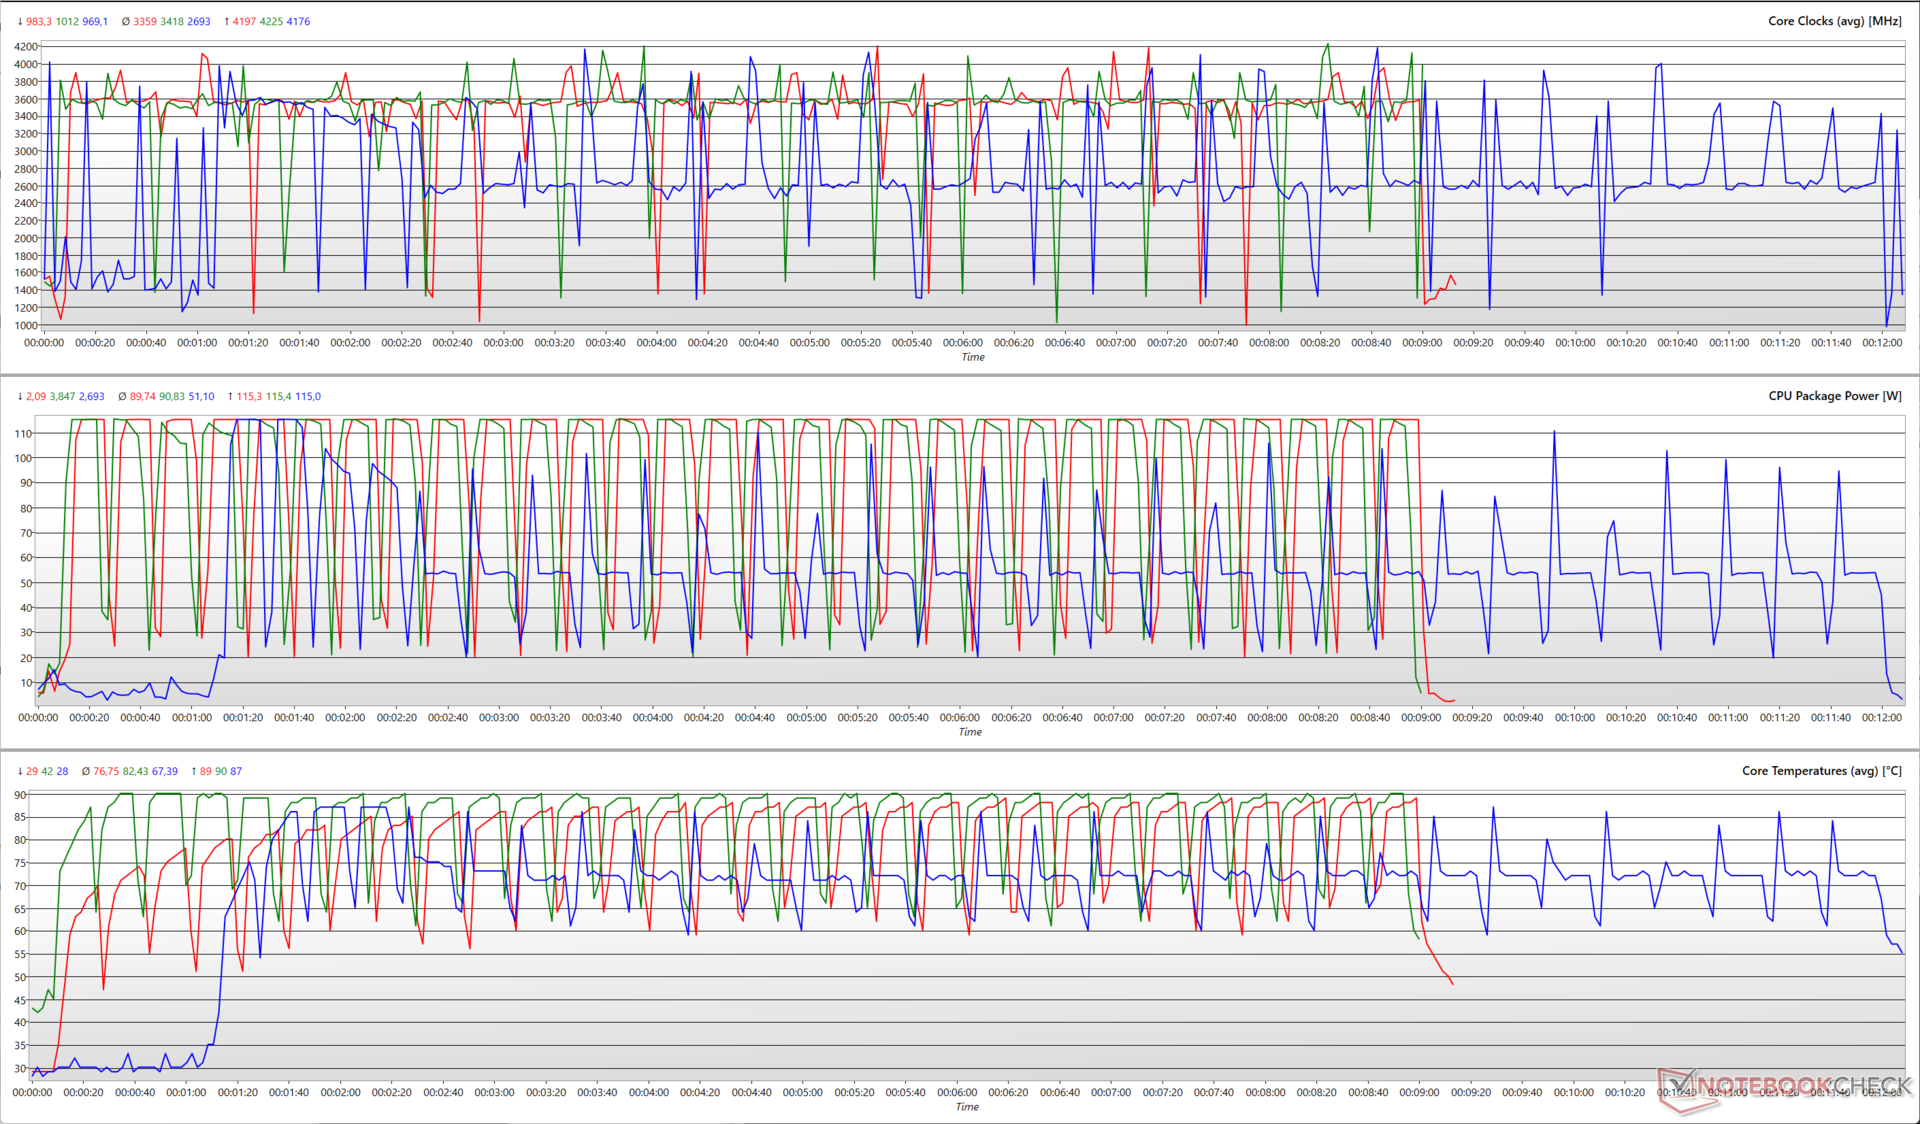
Poniższy wykres ilustruje jak zmieniają się różne parametry procesora podczas testu w pętli wielordzeniowej Cinebench R15. Widzimy, że wszystkie trzy tryby wydajności są w stanie osiągnąć maksymalne taktowanie, moc i limity temperatury.
Jednak tryb Standard oscyluje na niższym poziomie średniej mocy pakietu (51 W) w porównaniu z 90 W w pozostałych dwóch trybach. Skutkuje to niższymi średnimi zegarami rdzenia o około 2,7 GHz i niższymi temperaturami rdzenia w okolicach 67 °C.
Tryby Performance i Full Speed są mniej więcej takie same pod względem limitów mocy, ale ten drugi kręci wentylatory bez przerwy z maksymalną prędkością nawet w trybie jałowym. Dzięki temu średnie temperatury rdzenia w trybie Full Speed są o około 6 °C niższe w porównaniu z trybem Performance.
Wydajność może jednak ucierpieć przy zasilaniu z akumulatora. Wyniki testu Cinebench R20 spadają o 52% w trybie jednordzeniowym i o 40% w trybie wielordzeniowym podczas pracy na akumulatorze.
W przeciwieństwie do MacBooków Pros zasilanych krzemem Apple, które działają dość spójnie zarówno przy podłączeniu do prądu, jak i na zasilaniu bateryjnym, ProArt StudioBook 16, podobnie jak wszystkie nowoczesne urządzenia x86, może w pełni rozwinąć swoje możliwości tylko po podłączeniu do sieci
.
Zmniejszona wydajność na akumulatorze powinna jednak wystarczyć, by pomóc w kreatywnej pracy w podróży.
Ogólnie rzecz biorąc, ProArt StudioBook 16 oferuje wystarczającą moc procesora, by bez wysiłku przejść przez najbardziej wymagające procesy robocze.
AIDA64: FP32 Ray-Trace | FPU Julia | CPU SHA3 | CPU Queen | FPU SinJulia | FPU Mandel | CPU AES | CPU ZLib | FP64 Ray-Trace | CPU PhotoWorxx
| Performance rating | |
| Asus ProArt StudioBook 16 H7600ZW | |
| Asus ROG Zephyrus Duo 16 GX650RX | |
| Średnia w klasie Multimedia | |
| Lenovo ThinkBook 16p G3 ARH | |
| Asus ZenBook Pro 16X OLED UX7602ZM-ME115W | |
| Asus ROG Strix Scar 15 G533ZW-LN106WS | |
| MSI Creator Z16P B12UHST | |
| Przeciętny Intel Core i9-12900H | |
| Gigabyte Aero 16 YE5 | |
| MSI Creator Z17 A12UGST-054 | |
| AIDA64 / FP32 Ray-Trace | |
| Asus ProArt StudioBook 16 H7600ZW | |
| Średnia w klasie Multimedia (2214 - 50388, n=60, ostatnie 2 lata) | |
| Asus ROG Zephyrus Duo 16 GX650RX | |
| Lenovo ThinkBook 16p G3 ARH | |
| Asus ZenBook Pro 16X OLED UX7602ZM-ME115W | |
| Przeciętny Intel Core i9-12900H (4074 - 18289, n=29) | |
| Asus ROG Strix Scar 15 G533ZW-LN106WS | |
| MSI Creator Z16P B12UHST | |
| Gigabyte Aero 16 YE5 | |
| MSI Creator Z17 A12UGST-054 | |
| AIDA64 / FPU Julia | |
| Asus ROG Zephyrus Duo 16 GX650RX | |
| Lenovo ThinkBook 16p G3 ARH | |
| Asus ProArt StudioBook 16 H7600ZW | |
| Średnia w klasie Multimedia (12867 - 201874, n=61, ostatnie 2 lata) | |
| Asus ZenBook Pro 16X OLED UX7602ZM-ME115W | |
| Przeciętny Intel Core i9-12900H (22307 - 93236, n=29) | |
| Asus ROG Strix Scar 15 G533ZW-LN106WS | |
| MSI Creator Z16P B12UHST | |
| Gigabyte Aero 16 YE5 | |
| MSI Creator Z17 A12UGST-054 | |
| AIDA64 / CPU SHA3 | |
| Asus ProArt StudioBook 16 H7600ZW | |
| Średnia w klasie Multimedia (626 - 8623, n=61, ostatnie 2 lata) | |
| Asus ZenBook Pro 16X OLED UX7602ZM-ME115W | |
| Asus ROG Zephyrus Duo 16 GX650RX | |
| Asus ROG Strix Scar 15 G533ZW-LN106WS | |
| Lenovo ThinkBook 16p G3 ARH | |
| Przeciętny Intel Core i9-12900H (1378 - 4215, n=29) | |
| MSI Creator Z16P B12UHST | |
| Gigabyte Aero 16 YE5 | |
| MSI Creator Z17 A12UGST-054 | |
| AIDA64 / CPU Queen | |
| Asus ProArt StudioBook 16 H7600ZW | |
| Asus ZenBook Pro 16X OLED UX7602ZM-ME115W | |
| Gigabyte Aero 16 YE5 | |
| MSI Creator Z16P B12UHST | |
| MSI Creator Z17 A12UGST-054 | |
| Asus ROG Zephyrus Duo 16 GX650RX | |
| Asus ROG Strix Scar 15 G533ZW-LN106WS | |
| Lenovo ThinkBook 16p G3 ARH | |
| Przeciętny Intel Core i9-12900H (78172 - 111241, n=28) | |
| Średnia w klasie Multimedia (13483 - 181505, n=48, ostatnie 2 lata) | |
| AIDA64 / FPU SinJulia | |
| Lenovo ThinkBook 16p G3 ARH | |
| Asus ROG Zephyrus Duo 16 GX650RX | |
| Asus ProArt StudioBook 16 H7600ZW | |
| Asus ROG Strix Scar 15 G533ZW-LN106WS | |
| MSI Creator Z16P B12UHST | |
| Asus ZenBook Pro 16X OLED UX7602ZM-ME115W | |
| Gigabyte Aero 16 YE5 | |
| MSI Creator Z17 A12UGST-054 | |
| Przeciętny Intel Core i9-12900H (5709 - 10410, n=29) | |
| Średnia w klasie Multimedia (886 - 28794, n=61, ostatnie 2 lata) | |
| AIDA64 / FPU Mandel | |
| Asus ROG Zephyrus Duo 16 GX650RX | |
| Lenovo ThinkBook 16p G3 ARH | |
| Asus ProArt StudioBook 16 H7600ZW | |
| Średnia w klasie Multimedia (6395 - 105740, n=60, ostatnie 2 lata) | |
| Asus ZenBook Pro 16X OLED UX7602ZM-ME115W | |
| Przeciętny Intel Core i9-12900H (11257 - 45581, n=29) | |
| Asus ROG Strix Scar 15 G533ZW-LN106WS | |
| MSI Creator Z16P B12UHST | |
| Gigabyte Aero 16 YE5 | |
| MSI Creator Z17 A12UGST-054 | |
| AIDA64 / CPU AES | |
| Asus ProArt StudioBook 16 H7600ZW | |
| Asus ROG Zephyrus Duo 16 GX650RX | |
| Asus ROG Strix Scar 15 G533ZW-LN106WS | |
| MSI Creator Z16P B12UHST | |
| Gigabyte Aero 16 YE5 | |
| MSI Creator Z17 A12UGST-054 | |
| Przeciętny Intel Core i9-12900H (31935 - 151546, n=29) | |
| Asus ZenBook Pro 16X OLED UX7602ZM-ME115W | |
| Średnia w klasie Multimedia (8171 - 126790, n=61, ostatnie 2 lata) | |
| Lenovo ThinkBook 16p G3 ARH | |
| AIDA64 / CPU ZLib | |
| MSI Creator Z16P B12UHST | |
| Asus ROG Strix Scar 15 G533ZW-LN106WS | |
| Asus ProArt StudioBook 16 H7600ZW | |
| Asus ZenBook Pro 16X OLED UX7602ZM-ME115W | |
| Gigabyte Aero 16 YE5 | |
| Średnia w klasie Multimedia (143.8 - 2022, n=61, ostatnie 2 lata) | |
| MSI Creator Z17 A12UGST-054 | |
| Przeciętny Intel Core i9-12900H (449 - 1193, n=29) | |
| Asus ROG Zephyrus Duo 16 GX650RX | |
| Lenovo ThinkBook 16p G3 ARH | |
| AIDA64 / FP64 Ray-Trace | |
| Asus ProArt StudioBook 16 H7600ZW | |
| Średnia w klasie Multimedia (1014 - 26875, n=61, ostatnie 2 lata) | |
| Asus ROG Zephyrus Duo 16 GX650RX | |
| Lenovo ThinkBook 16p G3 ARH | |
| Asus ZenBook Pro 16X OLED UX7602ZM-ME115W | |
| Przeciętny Intel Core i9-12900H (2235 - 10511, n=29) | |
| Asus ROG Strix Scar 15 G533ZW-LN106WS | |
| MSI Creator Z16P B12UHST | |
| Gigabyte Aero 16 YE5 | |
| MSI Creator Z17 A12UGST-054 | |
| AIDA64 / CPU PhotoWorxx | |
| Średnia w klasie Multimedia (8187 - 88154, n=61, ostatnie 2 lata) | |
| Asus ZenBook Pro 16X OLED UX7602ZM-ME115W | |
| Asus ProArt StudioBook 16 H7600ZW | |
| MSI Creator Z16P B12UHST | |
| Asus ROG Strix Scar 15 G533ZW-LN106WS | |
| MSI Creator Z17 A12UGST-054 | |
| Gigabyte Aero 16 YE5 | |
| Przeciętny Intel Core i9-12900H (20960 - 48269, n=30) | |
| Asus ROG Zephyrus Duo 16 GX650RX | |
| Lenovo ThinkBook 16p G3 ARH | |
Sprawdź nasz dedykowany Intel Core i9-12900H aby uzyskać więcej informacji i porównać wydajność.
Wydajność systemu
ProArt StudioBook 16 nie stwarza problemów z codzienną wydajnością i szybkością reakcji systemu. Ogólne wyniki PCMark 10 są zgodne z oczekiwaniami dla tej konfiguracji.
W CrossMarku widać lekkie pogorszenie w porównaniu z Asusem ROG Strix Scar 15 i MSI Creator Z17, ale StudioBook 16 jest o 17% szybszy od M1 Max MacBook Pro 14 i 22% szybszy od M1 Pro MacBook Pro 16.
Affinity Photo 2 widzi jednak, że krzem Apple znacznie wyprzedza Core i9-12900H. ProArt StudioBook 16 wypada o 14% w połączonym teście CPU i aż o 55% w połączonym teście GPU w porównaniu z MacBookiem Pro 14 opartym na M1 Max.
CrossMark: Overall | Productivity | Creativity | Responsiveness
Affinity Photo 2: Combined (Multi CPU) | Combined (Single / Multi GPU)
| PCMark 10 / Score | |
| MSI Creator Z16P B12UHST | |
| Asus ProArt StudioBook 16 H7600ZW | |
| Asus ROG Strix Scar 15 G533ZW-LN106WS | |
| Gigabyte Aero 16 YE5 | |
| Przeciętny Intel Core i9-12900H, NVIDIA GeForce RTX 3070 Ti Laptop GPU (7087 - 8072, n=6) | |
| Średnia w klasie Multimedia (4325 - 10386, n=58, ostatnie 2 lata) | |
| Asus ZenBook Pro 16X OLED UX7602ZM-ME115W | |
| MSI Creator Z17 A12UGST-054 | |
| Lenovo ThinkBook 16p G3 ARH | |
| Asus ROG Zephyrus Duo 16 GX650RX | |
| PCMark 10 / Essentials | |
| Asus ProArt StudioBook 16 H7600ZW | |
| MSI Creator Z16P B12UHST | |
| Asus ZenBook Pro 16X OLED UX7602ZM-ME115W | |
| Gigabyte Aero 16 YE5 | |
| Przeciętny Intel Core i9-12900H, NVIDIA GeForce RTX 3070 Ti Laptop GPU (10266 - 11663, n=6) | |
| Asus ROG Strix Scar 15 G533ZW-LN106WS | |
| Średnia w klasie Multimedia (8025 - 11664, n=57, ostatnie 2 lata) | |
| MSI Creator Z17 A12UGST-054 | |
| Lenovo ThinkBook 16p G3 ARH | |
| Asus ROG Zephyrus Duo 16 GX650RX | |
| PCMark 10 / Productivity | |
| Średnia w klasie Multimedia (7323 - 18233, n=57, ostatnie 2 lata) | |
| MSI Creator Z16P B12UHST | |
| Asus ProArt StudioBook 16 H7600ZW | |
| Asus ROG Strix Scar 15 G533ZW-LN106WS | |
| Przeciętny Intel Core i9-12900H, NVIDIA GeForce RTX 3070 Ti Laptop GPU (9402 - 10742, n=6) | |
| Asus ZenBook Pro 16X OLED UX7602ZM-ME115W | |
| Gigabyte Aero 16 YE5 | |
| MSI Creator Z17 A12UGST-054 | |
| Lenovo ThinkBook 16p G3 ARH | |
| Asus ROG Zephyrus Duo 16 GX650RX | |
| PCMark 10 / Digital Content Creation | |
| Asus ROG Strix Scar 15 G533ZW-LN106WS | |
| Gigabyte Aero 16 YE5 | |
| MSI Creator Z16P B12UHST | |
| Asus ProArt StudioBook 16 H7600ZW | |
| Przeciętny Intel Core i9-12900H, NVIDIA GeForce RTX 3070 Ti Laptop GPU (10009 - 12541, n=6) | |
| Średnia w klasie Multimedia (3651 - 16240, n=57, ostatnie 2 lata) | |
| Asus ZenBook Pro 16X OLED UX7602ZM-ME115W | |
| MSI Creator Z17 A12UGST-054 | |
| Asus ROG Zephyrus Duo 16 GX650RX | |
| Lenovo ThinkBook 16p G3 ARH | |
| CrossMark / Overall | |
| Gigabyte Aero 16 YE5 | |
| Asus ROG Strix Scar 15 G533ZW-LN106WS | |
| MSI Creator Z17 A12UGST-054 | |
| Asus ProArt StudioBook 16 H7600ZW | |
| Przeciętny Intel Core i9-12900H, NVIDIA GeForce RTX 3070 Ti Laptop GPU (1664 - 2044, n=6) | |
| Średnia w klasie Multimedia (866 - 2728, n=67, ostatnie 2 lata) | |
| Asus ZenBook Pro 16X OLED UX7602ZM-ME115W | |
| Asus ROG Zephyrus Duo 16 GX650RX | |
| Apple MacBook Pro 14 2021 M1 Max 24-Core GPU | |
| Apple MacBook Pro 16 2021 M1 Pro | |
| Lenovo ThinkBook 16p G3 ARH | |
| CrossMark / Productivity | |
| Gigabyte Aero 16 YE5 | |
| Asus ROG Strix Scar 15 G533ZW-LN106WS | |
| MSI Creator Z17 A12UGST-054 | |
| Asus ProArt StudioBook 16 H7600ZW | |
| Przeciętny Intel Core i9-12900H, NVIDIA GeForce RTX 3070 Ti Laptop GPU (1591 - 1968, n=6) | |
| Średnia w klasie Multimedia (931 - 2489, n=67, ostatnie 2 lata) | |
| Asus ROG Zephyrus Duo 16 GX650RX | |
| Asus ZenBook Pro 16X OLED UX7602ZM-ME115W | |
| Lenovo ThinkBook 16p G3 ARH | |
| Apple MacBook Pro 14 2021 M1 Max 24-Core GPU | |
| Apple MacBook Pro 16 2021 M1 Pro | |
| CrossMark / Creativity | |
| Gigabyte Aero 16 YE5 | |
| Apple MacBook Pro 14 2021 M1 Max 24-Core GPU | |
| MSI Creator Z17 A12UGST-054 | |
| Średnia w klasie Multimedia (907 - 3465, n=67, ostatnie 2 lata) | |
| Asus ROG Strix Scar 15 G533ZW-LN106WS | |
| Asus ProArt StudioBook 16 H7600ZW | |
| Apple MacBook Pro 16 2021 M1 Pro | |
| Asus ZenBook Pro 16X OLED UX7602ZM-ME115W | |
| Przeciętny Intel Core i9-12900H, NVIDIA GeForce RTX 3070 Ti Laptop GPU (1797 - 2148, n=6) | |
| Asus ROG Zephyrus Duo 16 GX650RX | |
| Lenovo ThinkBook 16p G3 ARH | |
| CrossMark / Responsiveness | |
| Gigabyte Aero 16 YE5 | |
| Asus ROG Strix Scar 15 G533ZW-LN106WS | |
| MSI Creator Z17 A12UGST-054 | |
| Przeciętny Intel Core i9-12900H, NVIDIA GeForce RTX 3070 Ti Laptop GPU (1514 - 2069, n=6) | |
| Asus ROG Zephyrus Duo 16 GX650RX | |
| Asus ProArt StudioBook 16 H7600ZW | |
| Średnia w klasie Multimedia (605 - 2024, n=67, ostatnie 2 lata) | |
| Asus ZenBook Pro 16X OLED UX7602ZM-ME115W | |
| Lenovo ThinkBook 16p G3 ARH | |
| Apple MacBook Pro 14 2021 M1 Max 24-Core GPU | |
| Apple MacBook Pro 16 2021 M1 Pro | |
| Affinity Photo 2 / Combined (Multi CPU) | |
| Apple MacBook Pro 16 2021 M1 Pro | |
| Apple MacBook Pro 14 2021 M1 Max 24-Core GPU | |
| Asus ProArt StudioBook 16 H7600ZW | |
| Przeciętny Intel Core i9-12900H, NVIDIA GeForce RTX 3070 Ti Laptop GPU (n=1) | |
| Affinity Photo 2 / Combined (Single / Multi GPU) | |
| Apple MacBook Pro 14 2021 M1 Max 24-Core GPU | |
| Apple MacBook Pro 16 2021 M1 Pro | |
| Asus ProArt StudioBook 16 H7600ZW | |
| Przeciętny Intel Core i9-12900H, NVIDIA GeForce RTX 3070 Ti Laptop GPU (n=1) | |
| PCMark 8 Home Score Accelerated v2 | 5440 pkt. | |
| PCMark 8 Work Score Accelerated v2 | 5380 pkt. | |
| PCMark 10 Score | 8072 pkt. | |
Pomoc | ||
| AIDA64 / Memory Copy | |
| Średnia w klasie Multimedia (11299 - 132135, n=61, ostatnie 2 lata) | |
| Asus ZenBook Pro 16X OLED UX7602ZM-ME115W | |
| MSI Creator Z16P B12UHST | |
| Gigabyte Aero 16 YE5 | |
| Asus ProArt StudioBook 16 H7600ZW | |
| MSI Creator Z17 A12UGST-054 | |
| Asus ROG Strix Scar 15 G533ZW-LN106WS | |
| Przeciętny Intel Core i9-12900H (34438 - 74264, n=29) | |
| Asus ROG Zephyrus Duo 16 GX650RX | |
| Lenovo ThinkBook 16p G3 ARH | |
| AIDA64 / Memory Read | |
| Średnia w klasie Multimedia (11624 - 174586, n=61, ostatnie 2 lata) | |
| Asus ZenBook Pro 16X OLED UX7602ZM-ME115W | |
| MSI Creator Z16P B12UHST | |
| Asus ProArt StudioBook 16 H7600ZW | |
| Gigabyte Aero 16 YE5 | |
| MSI Creator Z17 A12UGST-054 | |
| Asus ROG Strix Scar 15 G533ZW-LN106WS | |
| Przeciętny Intel Core i9-12900H (36365 - 74642, n=29) | |
| Asus ROG Zephyrus Duo 16 GX650RX | |
| Lenovo ThinkBook 16p G3 ARH | |
| AIDA64 / Memory Write | |
| Średnia w klasie Multimedia (11755 - 134998, n=61, ostatnie 2 lata) | |
| Asus ROG Strix Scar 15 G533ZW-LN106WS | |
| MSI Creator Z16P B12UHST | |
| MSI Creator Z17 A12UGST-054 | |
| Asus ProArt StudioBook 16 H7600ZW | |
| Asus ZenBook Pro 16X OLED UX7602ZM-ME115W | |
| Gigabyte Aero 16 YE5 | |
| Przeciętny Intel Core i9-12900H (32276 - 67858, n=29) | |
| Asus ROG Zephyrus Duo 16 GX650RX | |
| Lenovo ThinkBook 16p G3 ARH | |
| AIDA64 / Memory Latency | |
| Średnia w klasie Multimedia (7 - 535, n=60, ostatnie 2 lata) | |
| Lenovo ThinkBook 16p G3 ARH | |
| Asus ZenBook Pro 16X OLED UX7602ZM-ME115W | |
| Asus ROG Strix Scar 15 G533ZW-LN106WS | |
| MSI Creator Z16P B12UHST | |
| MSI Creator Z17 A12UGST-054 | |
| Asus ROG Zephyrus Duo 16 GX650RX | |
| Gigabyte Aero 16 YE5 | |
| Asus ProArt StudioBook 16 H7600ZW | |
| Przeciętny Intel Core i9-12900H (74.7 - 118.1, n=28) | |
* ... im mniej tym lepiej
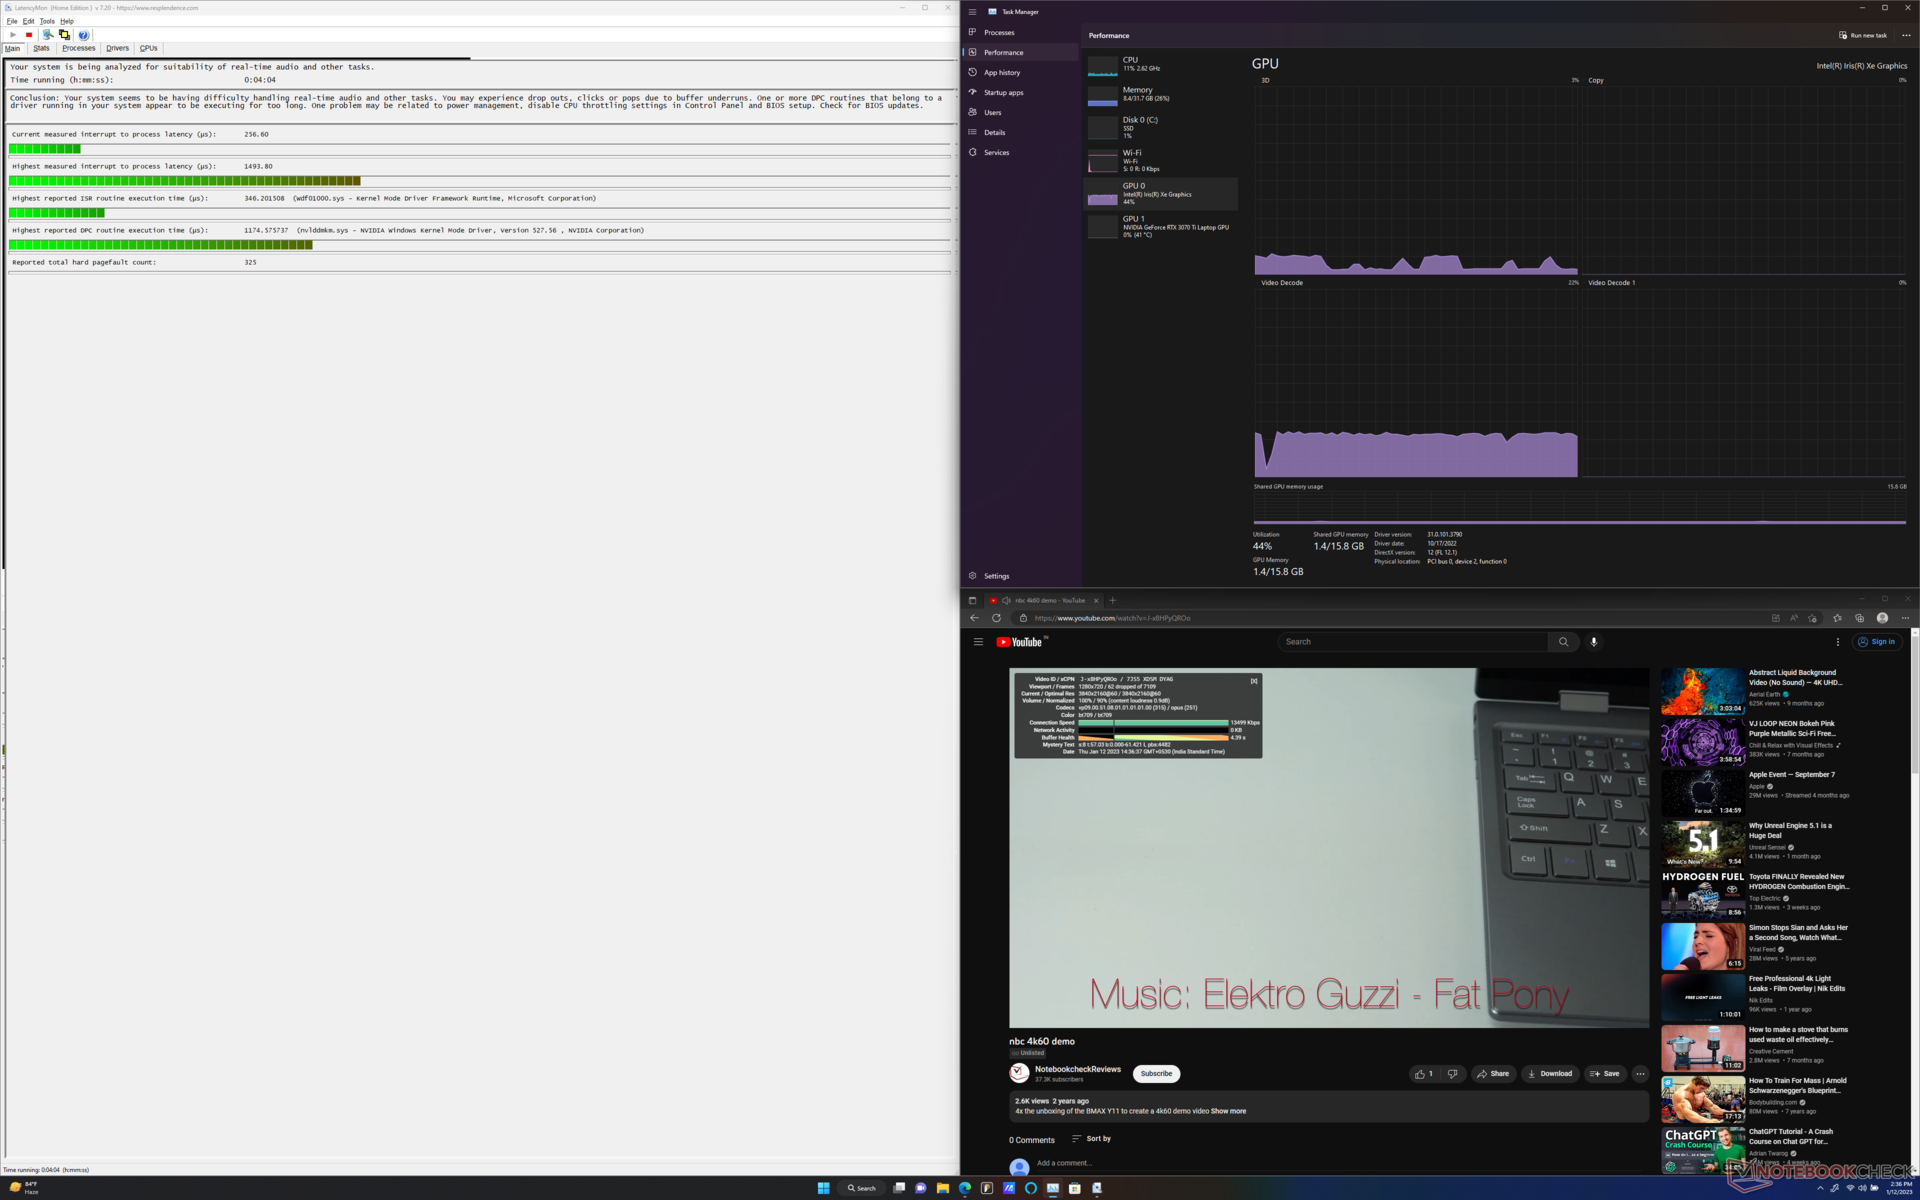
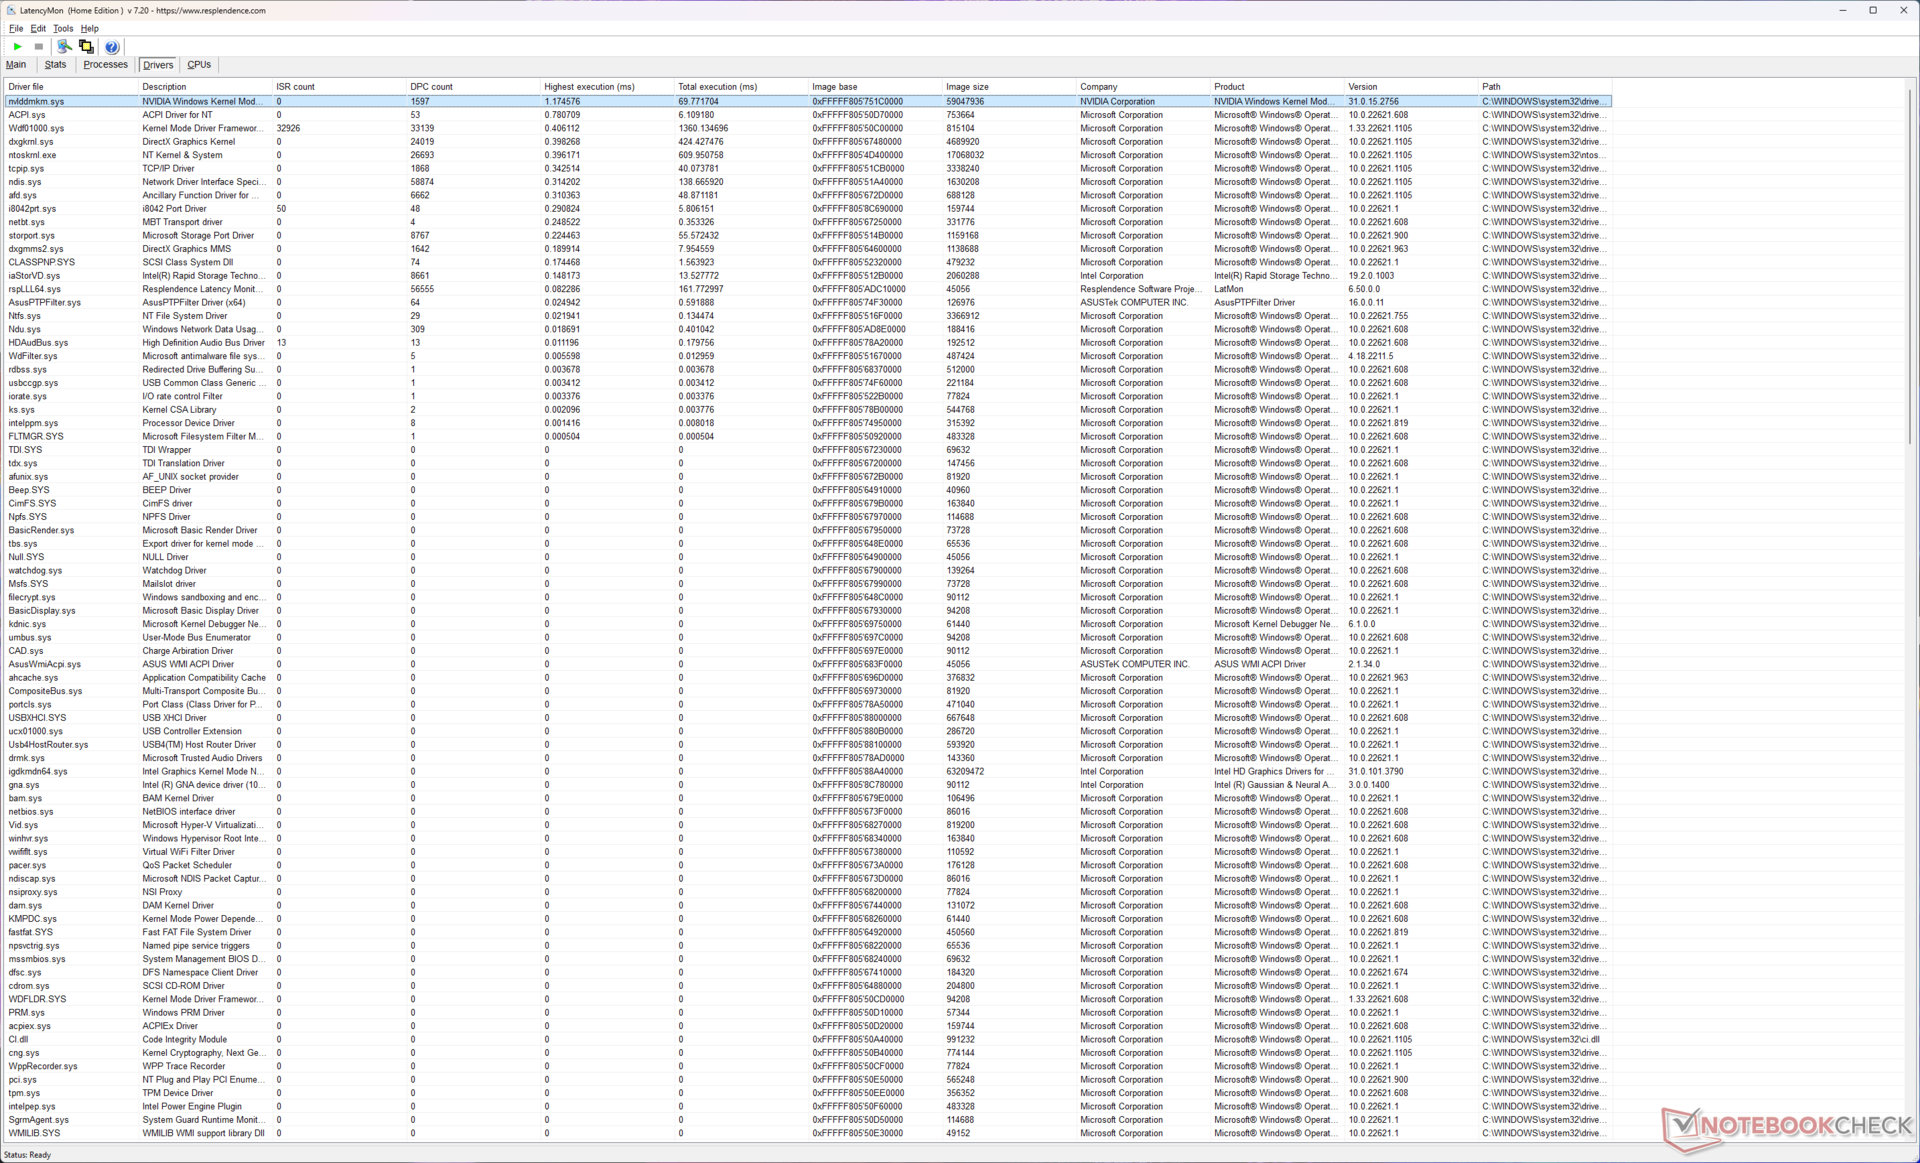
Opóźnienie DPC
Zmierzyliśmy najwyższą latencję między przerwaniami a procesami na poziomie 1493,8 µs, co jest wartością wyższą dla laptopa skoncentrowanego na twórcach treści. Wydaje się, że przyczyną zwiększonego opóźnienia jest sterownik systemowy trybu jądra Nvidii.
| DPC Latencies / LatencyMon - interrupt to process latency (max), Web, Youtube, Prime95 | |
| Lenovo ThinkBook 16p G3 ARH | |
| MSI Creator Z17 A12UGST-054 | |
| Asus ProArt StudioBook 16 H7600ZW | |
| Asus ROG Strix Scar 15 G533ZW-LN106WS | |
| MSI Creator Z16P B12UHST | |
| Gigabyte Aero 16 YE5 | |
| Asus ROG Zephyrus Duo 16 GX650RX | |
| Asus ZenBook Pro 16X OLED UX7602ZM-ME115W | |
* ... im mniej tym lepiej
Nasz Ranking Latencji DPCstrona zawiera więcej porównań opóźnień w recenzowanych urządzeniach.
Urządzenia do przechowywania danych
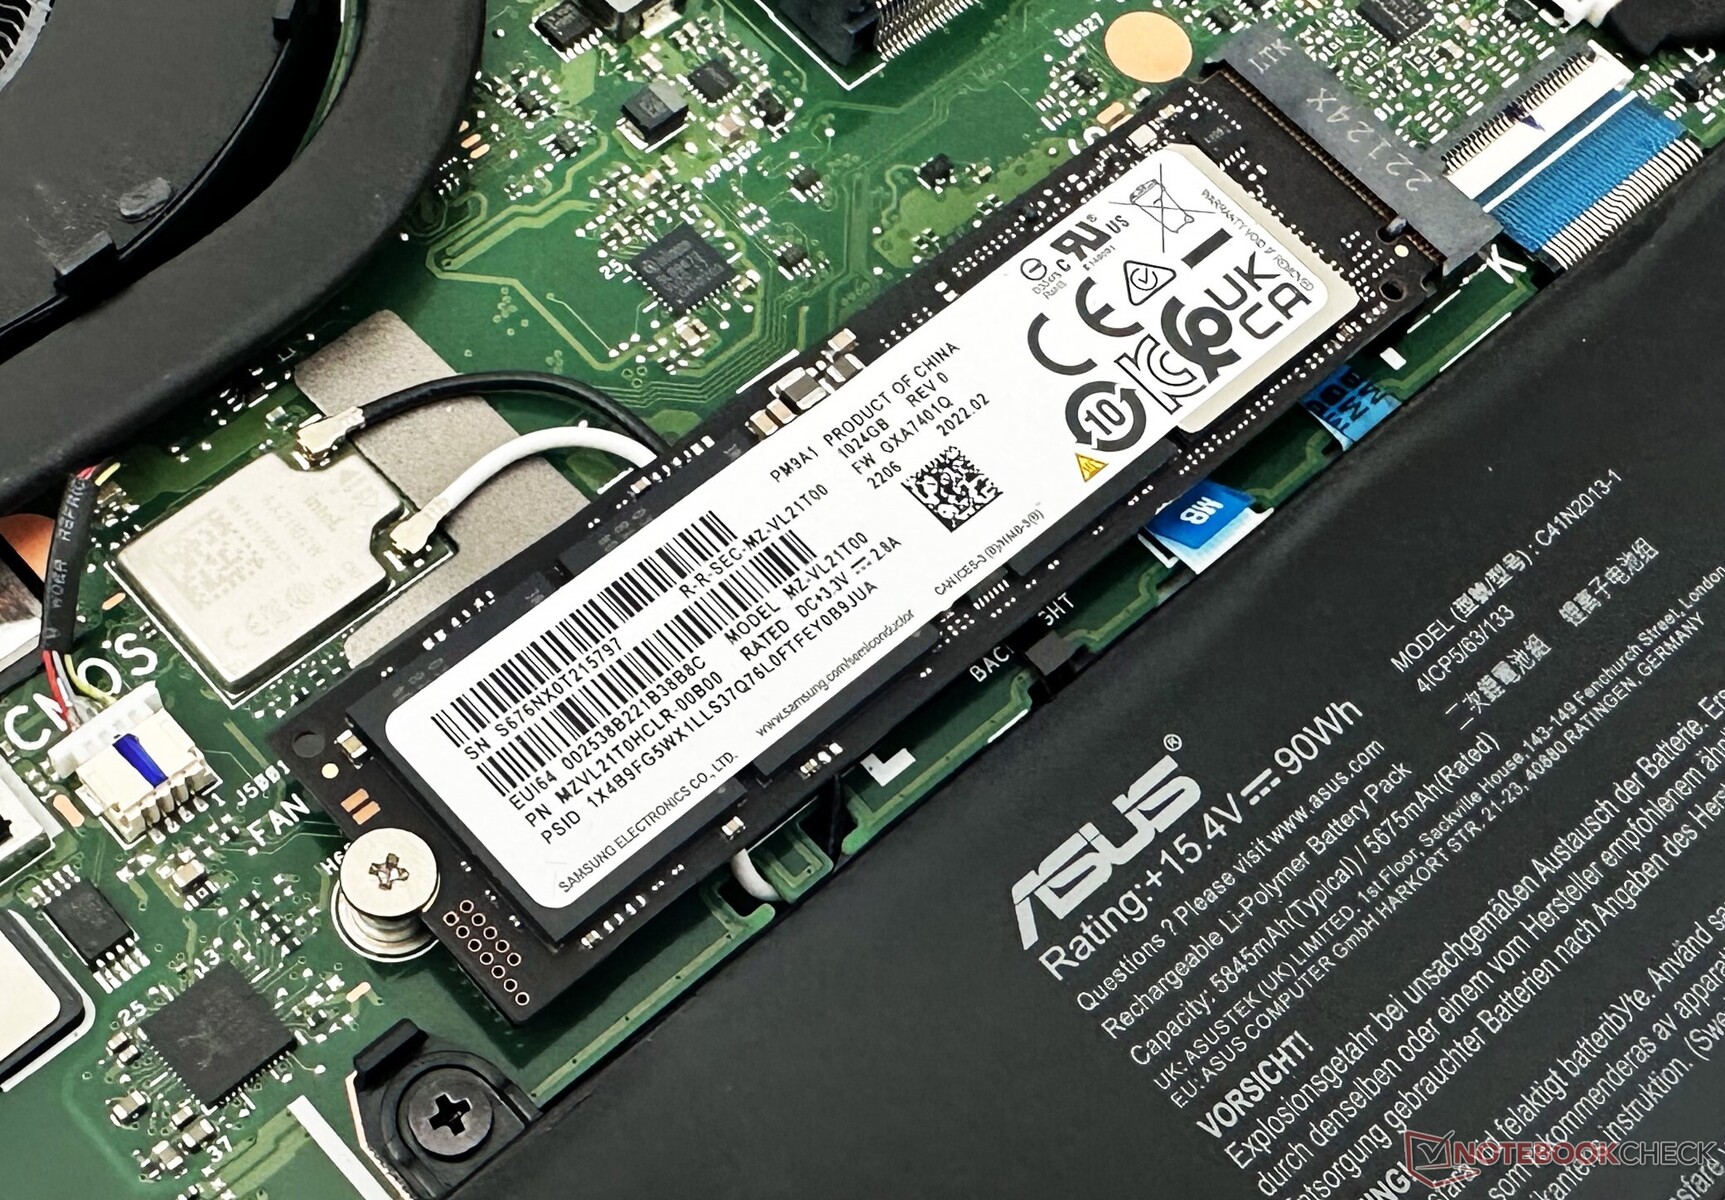
Dołączony do zestawu dysk Samsung PM9A1 1 TB NVMe SSD wypada przyzwoicie w ogólnych benchmarkach dyskowych, ale pozostaje w tyle za swoimi 2 TB kuzynami znalezionymi w ROG Strix Scar 15 i Creator Z16P. Nadal jest o 10% szybszy od tego samego dysku znajdującego się w Asusie ZenBook Pro 16X OLED.
Dysk SSD jest zamknięty w aluminiowej obwolucie, a tylna ścianka ma także wyściółkę termiczną. Dysk dławi się jednak dotkliwie w naszym teście pętli odczytu DiskSpd przy głębokości kolejki wynoszącej 8.
Dostępne jest zapasowe gniazdo M.2 2280, które umożliwia dodanie kolejnego dysku NVMe. Nie ma jednak zatoki na dysk 2,5-calowy.

| Drive Performance rating - Percent | |
| Gigabyte Aero 16 YE5 | |
| Asus ROG Strix Scar 15 G533ZW-LN106WS | |
| MSI Creator Z16P B12UHST | |
| Asus ROG Zephyrus Duo 16 GX650RX | |
| Przeciętny Samsung PM9A1 MZVL21T0HCLR | |
| MSI Creator Z17 A12UGST-054 | |
| Asus ProArt StudioBook 16 H7600ZW | |
| Asus ZenBook Pro 16X OLED UX7602ZM-ME115W | |
| Średnia w klasie Multimedia | |
| Lenovo ThinkBook 16p G3 ARH | |
* ... im mniej tym lepiej
Disk Throttling: DiskSpd Read Loop, Queue Depth 8
Zapoznaj się z naszymi Benchmarki SSD i HDD aby uzyskać więcej informacji na temat porównań pamięci masowej.
Wydajność GPU
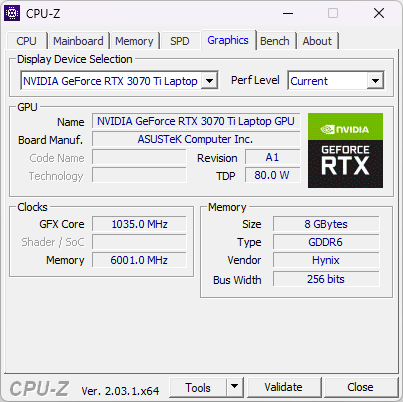
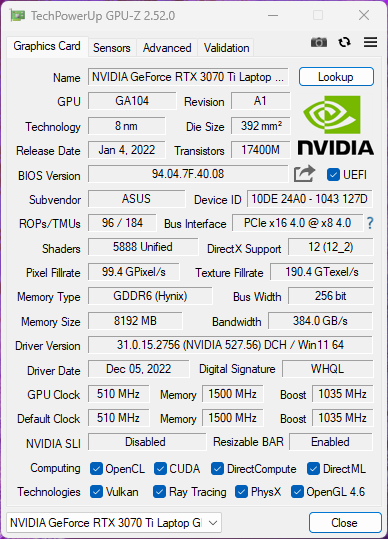
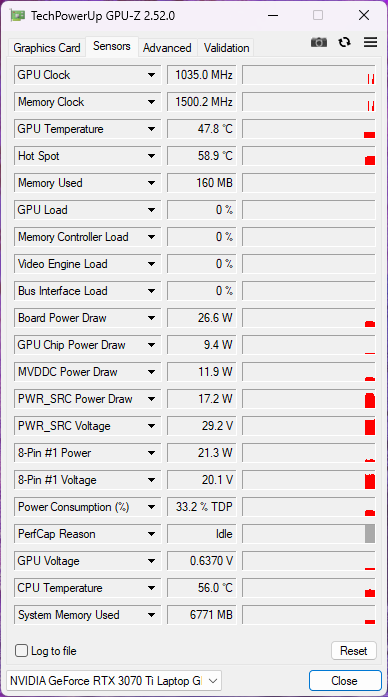
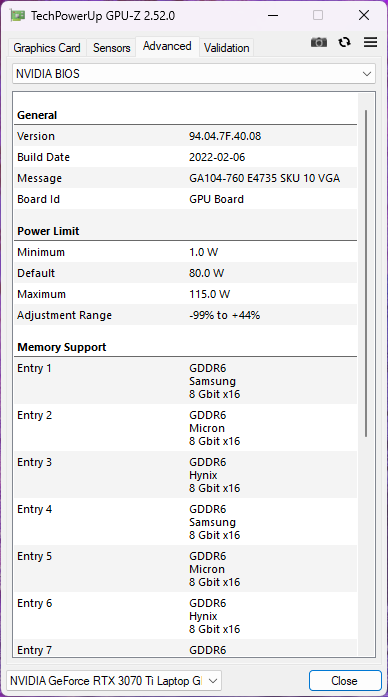
Nasza jednostka ProArt StudioBook 16 została wyposażona w 115 W Nvidia GeForce RTX 3070 Ti Laptop GPU z 8 GB pamięci VRAM GDDR6. Asus nie podaje wartości Dynamic Boost dla tego GPU. Laptop korzysta domyślnie ze sterowników Nvidia Studio Drivers.
Niższe TGP oznacza, że ProArt StudioBook 16 jest o 15% wolniejszy w ogólnej wydajności w 3DMarku w porównaniu z ROG Strix Scar 15, który wykorzystuje 150 W RTX 3070 Ti. Wciąż jednak jest o 8% szybszy od 105 W RTX 3080 Ti Laptop GPU w Gigabyte Aero 16 YE5.
| 3DMark Performance rating - Percent | |
| Asus ROG Strix Scar 15 G533ZW-LN106WS | |
| Przeciętny NVIDIA GeForce RTX 3070 Ti Laptop GPU | |
| Asus ROG Zephyrus Duo 16 GX650RX | |
| MSI Creator Z17 A12UGST-054 | |
| Asus ProArt StudioBook 16 H7600ZW | |
| MSI Creator Z16P B12UHST | |
| Gigabyte Aero 16 YE5 | |
| Asus ZenBook Pro 16X OLED UX7602ZM-ME115W | |
| Lenovo ThinkBook 16p G3 ARH | |
| Średnia w klasie Multimedia | |
| 3DMark 11 - 1280x720 Performance GPU | |
| Asus ROG Zephyrus Duo 16 GX650RX | |
| Asus ROG Strix Scar 15 G533ZW-LN106WS | |
| Asus ProArt StudioBook 16 H7600ZW | |
| Przeciętny NVIDIA GeForce RTX 3070 Ti Laptop GPU (13799 - 42569, n=36) | |
| Gigabyte Aero 16 YE5 | |
| MSI Creator Z17 A12UGST-054 | |
| Asus ZenBook Pro 16X OLED UX7602ZM-ME115W | |
| Lenovo ThinkBook 16p G3 ARH | |
| Średnia w klasie Multimedia (3749 - 60002, n=62, ostatnie 2 lata) | |
| MSI Creator Z16P B12UHST | |
| 3DMark 11 Performance | 32806 pkt. | |
| 3DMark Ice Storm Standard Score | 75692 pkt. | |
| 3DMark Cloud Gate Standard Score | 49147 pkt. | |
| 3DMark Fire Strike Score | 23989 pkt. | |
| 3DMark Fire Strike Extreme Score | 12966 pkt. | |
| 3DMark Time Spy Score | 10673 pkt. | |
Pomoc | ||
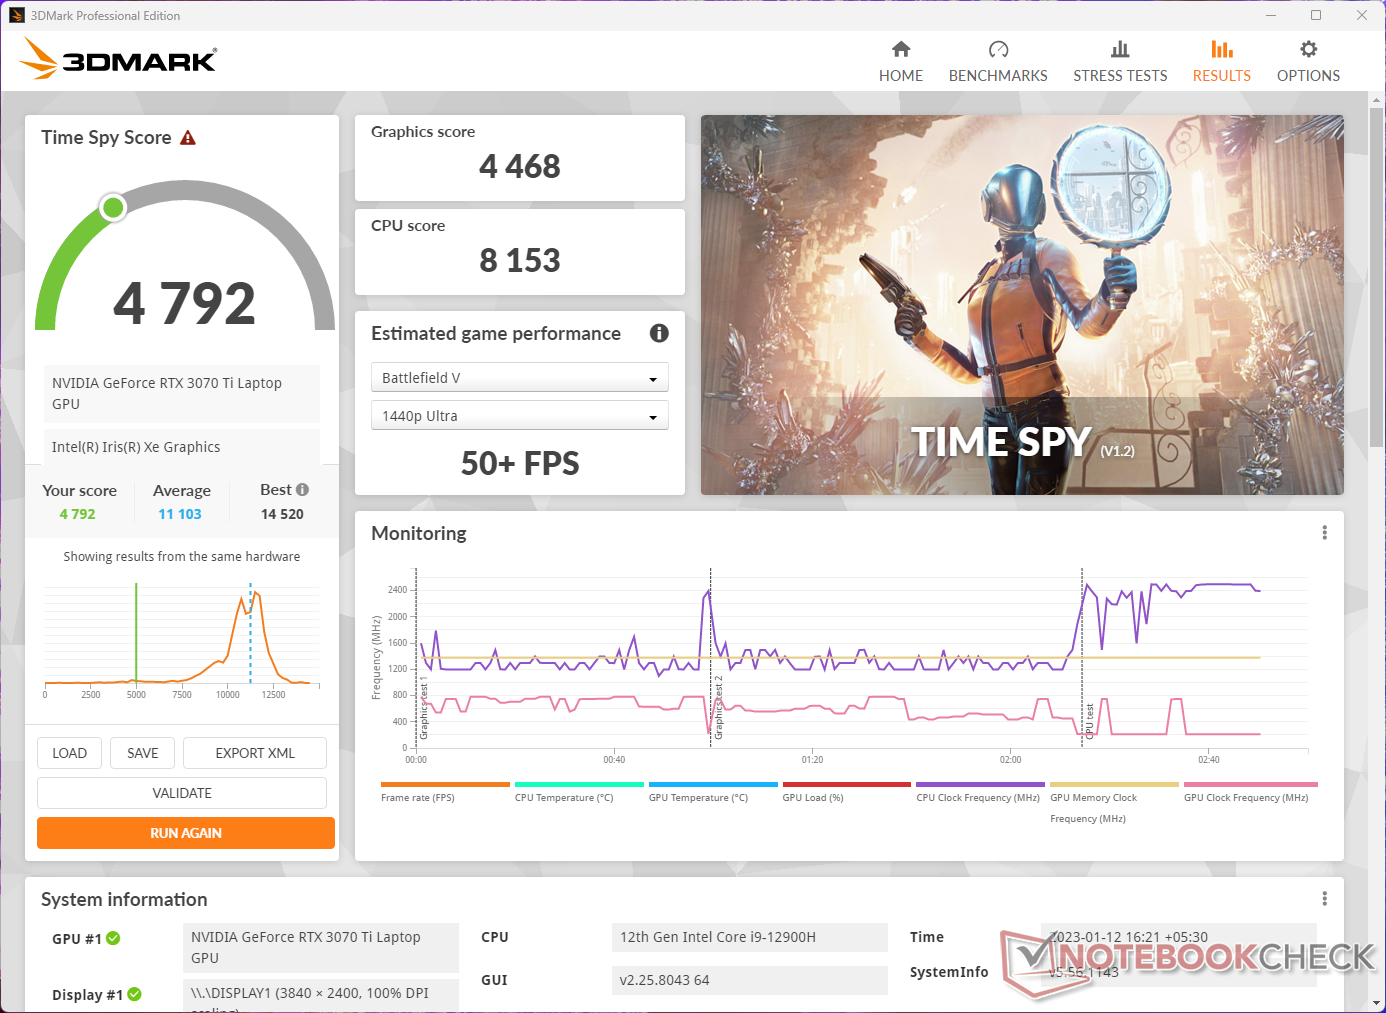
wyniki 3DMark Time Spy spadają o 56% na baterii. Według benchmarku, powinno to nadal umożliwić rozgrywkę w 50+ fps w 1440p w Battlefield V.
W porównaniu z laptopami opartymi na RTX 3060, RTX 3070 Ti w StudioBook 16 wykazuje znaczną przewagę w testach Blendera - przyp. tłum RTX 3060 Laptop GPU jest do 23% i 35% wolniejszy odpowiednio w testach Blender Optix i CUDA.
* ... im mniej tym lepiej
Wydajność w grach
Asus nie reklamuje ProArt StudioBook 16 jako laptopa do gier, ale dostarczony sprzęt jest z pewnością zdolny do uruchamiania nowoczesnych gier w przyzwoitych framerate'ach. Łączna wydajność w grach jest taka, jak można się spodziewać w przypadku urządzenia o takiej konfiguracji, ale i tak jest o około 9% szybsza ogólnie w porównaniu z MSI Creator Z17.
Nawet trąci niektóre z laptopów napędzanych RTX 3080 Ti- w porównaniu o zauważalny margines. Należy jednak pamiętać, że to wnioskowanie jest ważne tylko w 1080p, gdzie wydajność w grach jest bardziej ograniczona przez procesor.
| Performance rating - Percent | |
| Asus ProArt StudioBook 16 H7600ZW | |
| Asus ROG Strix Scar 15 G533ZW-LN106WS -1! | |
| MSI Creator Z17 A12UGST-054 | |
| Gigabyte Aero 16 YE5 | |
| Asus ROG Zephyrus Duo 16 GX650RX | |
| MSI Creator Z16P B12UHST | |
| Asus ZenBook Pro 16X OLED UX7602ZM-ME115W | |
| Lenovo ThinkBook 16p G3 ARH | |
| Średnia w klasie Multimedia | |
| The Witcher 3 - 1920x1080 Ultra Graphics & Postprocessing (HBAO+) | |
| Asus ROG Zephyrus Duo 16 GX650RX | |
| Asus ROG Strix Scar 15 G533ZW-LN106WS | |
| Asus ProArt StudioBook 16 H7600ZW | |
| Gigabyte Aero 16 YE5 | |
| MSI Creator Z17 A12UGST-054 | |
| Lenovo ThinkBook 16p G3 ARH | |
| Asus ZenBook Pro 16X OLED UX7602ZM-ME115W | |
| MSI Creator Z16P B12UHST | |
| Średnia w klasie Multimedia (11 - 121, n=13, ostatnie 2 lata) | |
| GTA V - 1920x1080 Highest AA:4xMSAA + FX AF:16x | |
| Asus ROG Strix Scar 15 G533ZW-LN106WS | |
| Asus ProArt StudioBook 16 H7600ZW | |
| MSI Creator Z17 A12UGST-054 | |
| Gigabyte Aero 16 YE5 | |
| Asus ROG Zephyrus Duo 16 GX650RX | |
| Asus ZenBook Pro 16X OLED UX7602ZM-ME115W | |
| MSI Creator Z16P B12UHST | |
| Lenovo ThinkBook 16p G3 ARH | |
| Średnia w klasie Multimedia (7.92 - 141.6, n=63, ostatnie 2 lata) | |
| Final Fantasy XV Benchmark - 1920x1080 High Quality | |
| Asus ROG Zephyrus Duo 16 GX650RX | |
| Asus ProArt StudioBook 16 H7600ZW | |
| Asus ROG Strix Scar 15 G533ZW-LN106WS | |
| MSI Creator Z16P B12UHST | |
| Gigabyte Aero 16 YE5 | |
| MSI Creator Z17 A12UGST-054 | |
| Asus ZenBook Pro 16X OLED UX7602ZM-ME115W | |
| Lenovo ThinkBook 16p G3 ARH | |
| Średnia w klasie Multimedia (7.61 - 144.4, n=66, ostatnie 2 lata) | |
| Strange Brigade - 1920x1080 ultra AA:ultra AF:16 | |
| Asus ROG Strix Scar 15 G533ZW-LN106WS | |
| Asus ProArt StudioBook 16 H7600ZW | |
| Asus ROG Zephyrus Duo 16 GX650RX | |
| MSI Creator Z17 A12UGST-054 | |
| MSI Creator Z16P B12UHST | |
| Gigabyte Aero 16 YE5 | |
| Asus ZenBook Pro 16X OLED UX7602ZM-ME115W | |
| Lenovo ThinkBook 16p G3 ARH | |
| Średnia w klasie Multimedia (13.3 - 303, n=66, ostatnie 2 lata) | |
| Dota 2 Reborn - 1920x1080 ultra (3/3) best looking | |
| Gigabyte Aero 16 YE5 | |
| Asus ProArt StudioBook 16 H7600ZW | |
| MSI Creator Z17 A12UGST-054 | |
| Asus ROG Strix Scar 15 G533ZW-LN106WS | |
| MSI Creator Z16P B12UHST | |
| Asus ZenBook Pro 16X OLED UX7602ZM-ME115W | |
| Asus ROG Zephyrus Duo 16 GX650RX | |
| Lenovo ThinkBook 16p G3 ARH | |
| Średnia w klasie Multimedia (29 - 179.9, n=68, ostatnie 2 lata) | |
| X-Plane 11.11 - 1920x1080 high (fps_test=3) | |
| Asus ProArt StudioBook 16 H7600ZW | |
| Gigabyte Aero 16 YE5 | |
| MSI Creator Z17 A12UGST-054 | |
| MSI Creator Z16P B12UHST | |
| Asus ZenBook Pro 16X OLED UX7602ZM-ME115W | |
| Asus ROG Zephyrus Duo 16 GX650RX | |
| Lenovo ThinkBook 16p G3 ARH | |
| Średnia w klasie Multimedia (16.9 - 141.1, n=62, ostatnie 2 lata) | |
W wyższych rozdzielczościach i w ray tracingu zalety procesora graficznego RTX 3080 Ti Laptop stają się wyraźnie widoczne. Jednak w większości przypadków, jeśli chodzi o wydajność rastrową, różnica między tymi dwoma GPU mieści się w granicach 10%.
| The Witcher 3 | |
| 3840x2160 High Graphics & Postprocessing (Nvidia HairWorks Off) | |
| Asus ROG Zephyrus Duo 16 GX650RX | |
| Asus ROG Strix Scar 15 G533ZW-LN106WS | |
| Przeciętny NVIDIA GeForce RTX 3070 Ti Laptop GPU (73.2 - 78, n=2) | |
| Asus ProArt StudioBook 16 H7600ZW | |
| Średnia w klasie Multimedia (61 - 71, n=2, ostatnie 2 lata) | |
| Gigabyte Aero 16 YE5 | |
| Asus ZenBook Pro 16X OLED UX7602ZM-ME115W | |
| 3840x2160 Ultra Graphics & Postprocessing (HBAO+) | |
| Asus ROG Zephyrus Duo 16 GX650RX | |
| Asus ROG Strix Scar 15 G533ZW-LN106WS | |
| Przeciętny NVIDIA GeForce RTX 3070 Ti Laptop GPU (48.4 - 52.3, n=2) | |
| Asus ProArt StudioBook 16 H7600ZW | |
| Gigabyte Aero 16 YE5 | |
| Far Cry 5 | |
| 2560x1440 Ultra Preset AA:T | |
| Asus ROG Strix Scar 15 G533ZW-LN106WS | |
| Asus ROG Zephyrus Duo 16 GX650RX | |
| Asus ProArt StudioBook 16 H7600ZW | |
| MSI Creator Z16P B12UHST | |
| Przeciętny NVIDIA GeForce RTX 3070 Ti Laptop GPU (77 - 111, n=15) | |
| MSI Creator Z17 A12UGST-054 | |
| Średnia w klasie Multimedia (45 - 106, n=4, ostatnie 2 lata) | |
| Gigabyte Aero 16 YE5 | |
| Asus ZenBook Pro 16X OLED UX7602ZM-ME115W | |
| 3840x2160 Ultra Preset AA:T | |
| Asus ROG Strix Scar 15 G533ZW-LN106WS | |
| Asus ROG Zephyrus Duo 16 GX650RX | |
| Przeciętny NVIDIA GeForce RTX 3070 Ti Laptop GPU (57 - 61, n=2) | |
| Asus ProArt StudioBook 16 H7600ZW | |
| Średnia w klasie Multimedia (54 - 59, n=2, ostatnie 2 lata) | |
| Gigabyte Aero 16 YE5 | |
| Asus ZenBook Pro 16X OLED UX7602ZM-ME115W | |
| Cyberpunk 2077 1.6 | |
| 1920x1080 Ray Tracing Ultra Preset (DLSS off) | |
| Gigabyte Aero 16 YE5 | |
| Asus ROG Zephyrus Duo 16 GX650RX | |
| Przeciętny NVIDIA GeForce RTX 3070 Ti Laptop GPU (27.9 - 63, n=7) | |
| Asus ProArt StudioBook 16 H7600ZW | |
| Asus ROG Strix Scar 15 G533ZW-LN106WS | |
| 2560x1440 Ultra Preset | |
| Asus ROG Zephyrus Duo 16 GX650RX | |
| Asus ProArt StudioBook 16 H7600ZW | |
| Przeciętny NVIDIA GeForce RTX 3070 Ti Laptop GPU (40 - 62, n=10) | |
| Asus ROG Strix Scar 15 G533ZW-LN106WS | |
| Gigabyte Aero 16 YE5 | |
| Lenovo ThinkBook 16p G3 ARH | |
| 3840x2160 Ultra Preset | |
| Asus ProArt StudioBook 16 H7600ZW | |
| Przeciętny NVIDIA GeForce RTX 3070 Ti Laptop GPU (24.6 - 28.1, n=2) | |
| Asus ROG Zephyrus Duo 16 GX650RX | |
| Asus ROG Strix Scar 15 G533ZW-LN106WS | |
| Gigabyte Aero 16 YE5 | |
| 1920x1080 Ultra Preset | |
| Asus ROG Zephyrus Duo 16 GX650RX | |
| Asus ProArt StudioBook 16 H7600ZW | |
| Przeciętny NVIDIA GeForce RTX 3070 Ti Laptop GPU (48.5 - 104, n=13) | |
| Asus ROG Strix Scar 15 G533ZW-LN106WS | |
| Gigabyte Aero 16 YE5 | |
| Lenovo ThinkBook 16p G3 ARH | |
| Final Fantasy XV Benchmark | |
| 2560x1440 High Quality | |
| Asus ROG Zephyrus Duo 16 GX650RX | |
| Asus ProArt StudioBook 16 H7600ZW | |
| Przeciętny NVIDIA GeForce RTX 3070 Ti Laptop GPU (57.9 - 93, n=24) | |
| Asus ROG Strix Scar 15 G533ZW-LN106WS | |
| Średnia w klasie Multimedia (18.4 - 129.9, n=25, ostatnie 2 lata) | |
| MSI Creator Z16P B12UHST | |
| Gigabyte Aero 16 YE5 | |
| MSI Creator Z17 A12UGST-054 | |
| Asus ZenBook Pro 16X OLED UX7602ZM-ME115W | |
| Lenovo ThinkBook 16p G3 ARH | |
| 3840x2160 High Quality | |
| Średnia w klasie Multimedia (42 - 83.4, n=4, ostatnie 2 lata) | |
| Asus ROG Zephyrus Duo 16 GX650RX | |
| Asus ProArt StudioBook 16 H7600ZW | |
| Asus ROG Strix Scar 15 G533ZW-LN106WS | |
| Przeciętny NVIDIA GeForce RTX 3070 Ti Laptop GPU (39.6 - 46.6, n=5) | |
| Gigabyte Aero 16 YE5 | |
| Asus ZenBook Pro 16X OLED UX7602ZM-ME115W | |
| X-Plane 11.11 - 3840x2160 high (fps_test=3) | |
| Przeciętny NVIDIA GeForce RTX 3070 Ti Laptop GPU (91.3 - 102, n=3) | |
| Asus ProArt StudioBook 16 H7600ZW | |
| Gigabyte Aero 16 YE5 | |
| Średnia w klasie Multimedia (63.4 - 114.7, n=4, ostatnie 2 lata) | |
| Asus ZenBook Pro 16X OLED UX7602ZM-ME115W | |
| Asus ROG Zephyrus Duo 16 GX650RX | |
Wykres Witcher 3 FPS
Dzięki doskonałemu chłodzeniu Asusa, nie widzimy żadnych odczuwalnych spadków klatek podczas stresu z The Witcher 3 w 1080p Ultra.
| low | med. | high | ultra | QHD | 4K | |
|---|---|---|---|---|---|---|
| GTA V (2015) | 187.2 | 186.4 | 181.9 | 122.2 | 97.6 | 92.1 |
| The Witcher 3 (2015) | 428 | 316 | 195.9 | 105.6 | 73.2 | |
| Dota 2 Reborn (2015) | 190.6 | 174.7 | 165.6 | 159.2 | 122.6 | |
| Final Fantasy XV Benchmark (2018) | 211 | 140.1 | 106.9 | 81.1 | 46.2 | |
| X-Plane 11.11 (2018) | 155 | 136.1 | 108.4 | 91.3 | ||
| Far Cry 5 (2018) | 182 | 154 | 145 | 137 | 104 | 57 |
| Strange Brigade (2018) | 460 | 257 | 209 | 183.8 | 136.9 | 74.4 |
| F1 2021 (2021) | 371 | 252 | 208 | 119.8 | 93.5 | 53.5 |
| Cyberpunk 2077 1.6 (2022) | 124.5 | 100.3 | 87.4 | 81.3 | 51 | 28.1 |
Emisje: Mniej niż 35 dB(A) hałasu wentylatora w profilu standardowym
Szum systemu
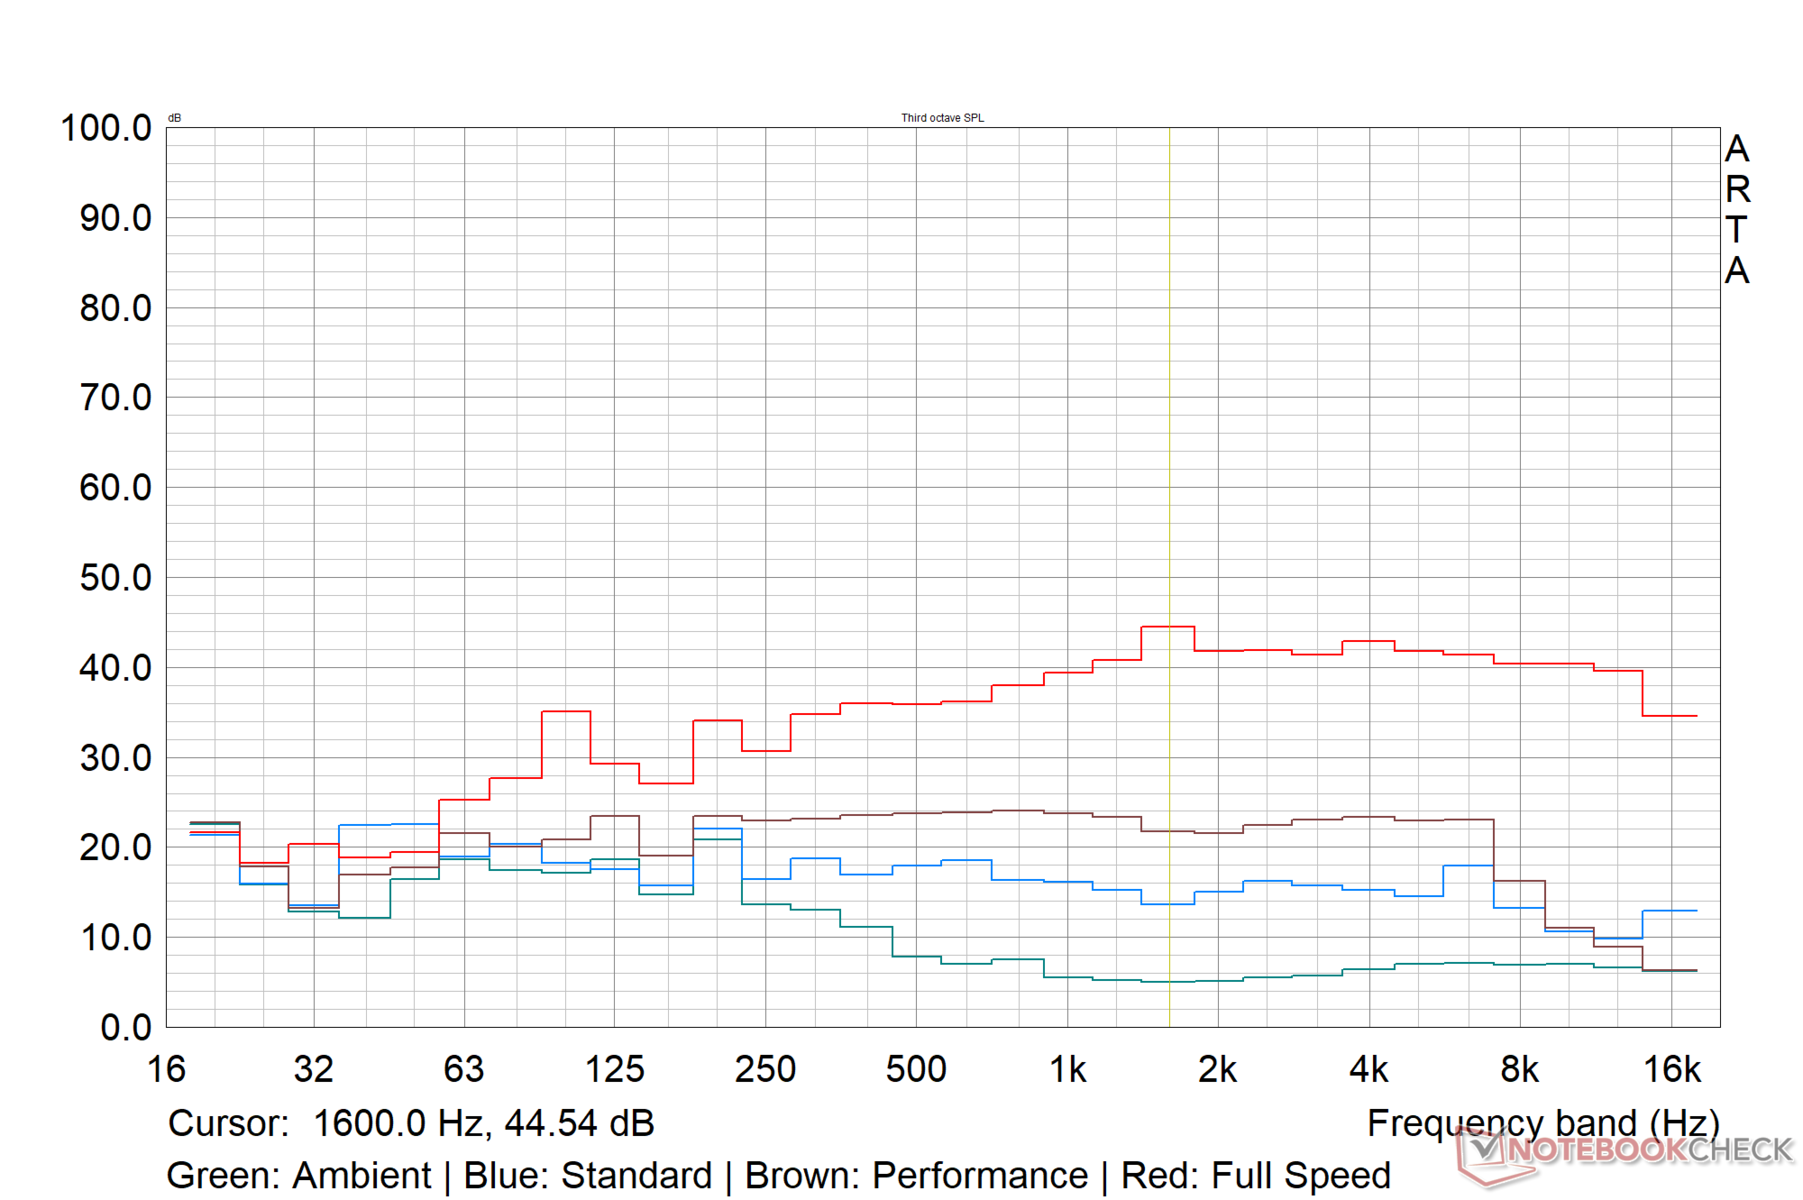
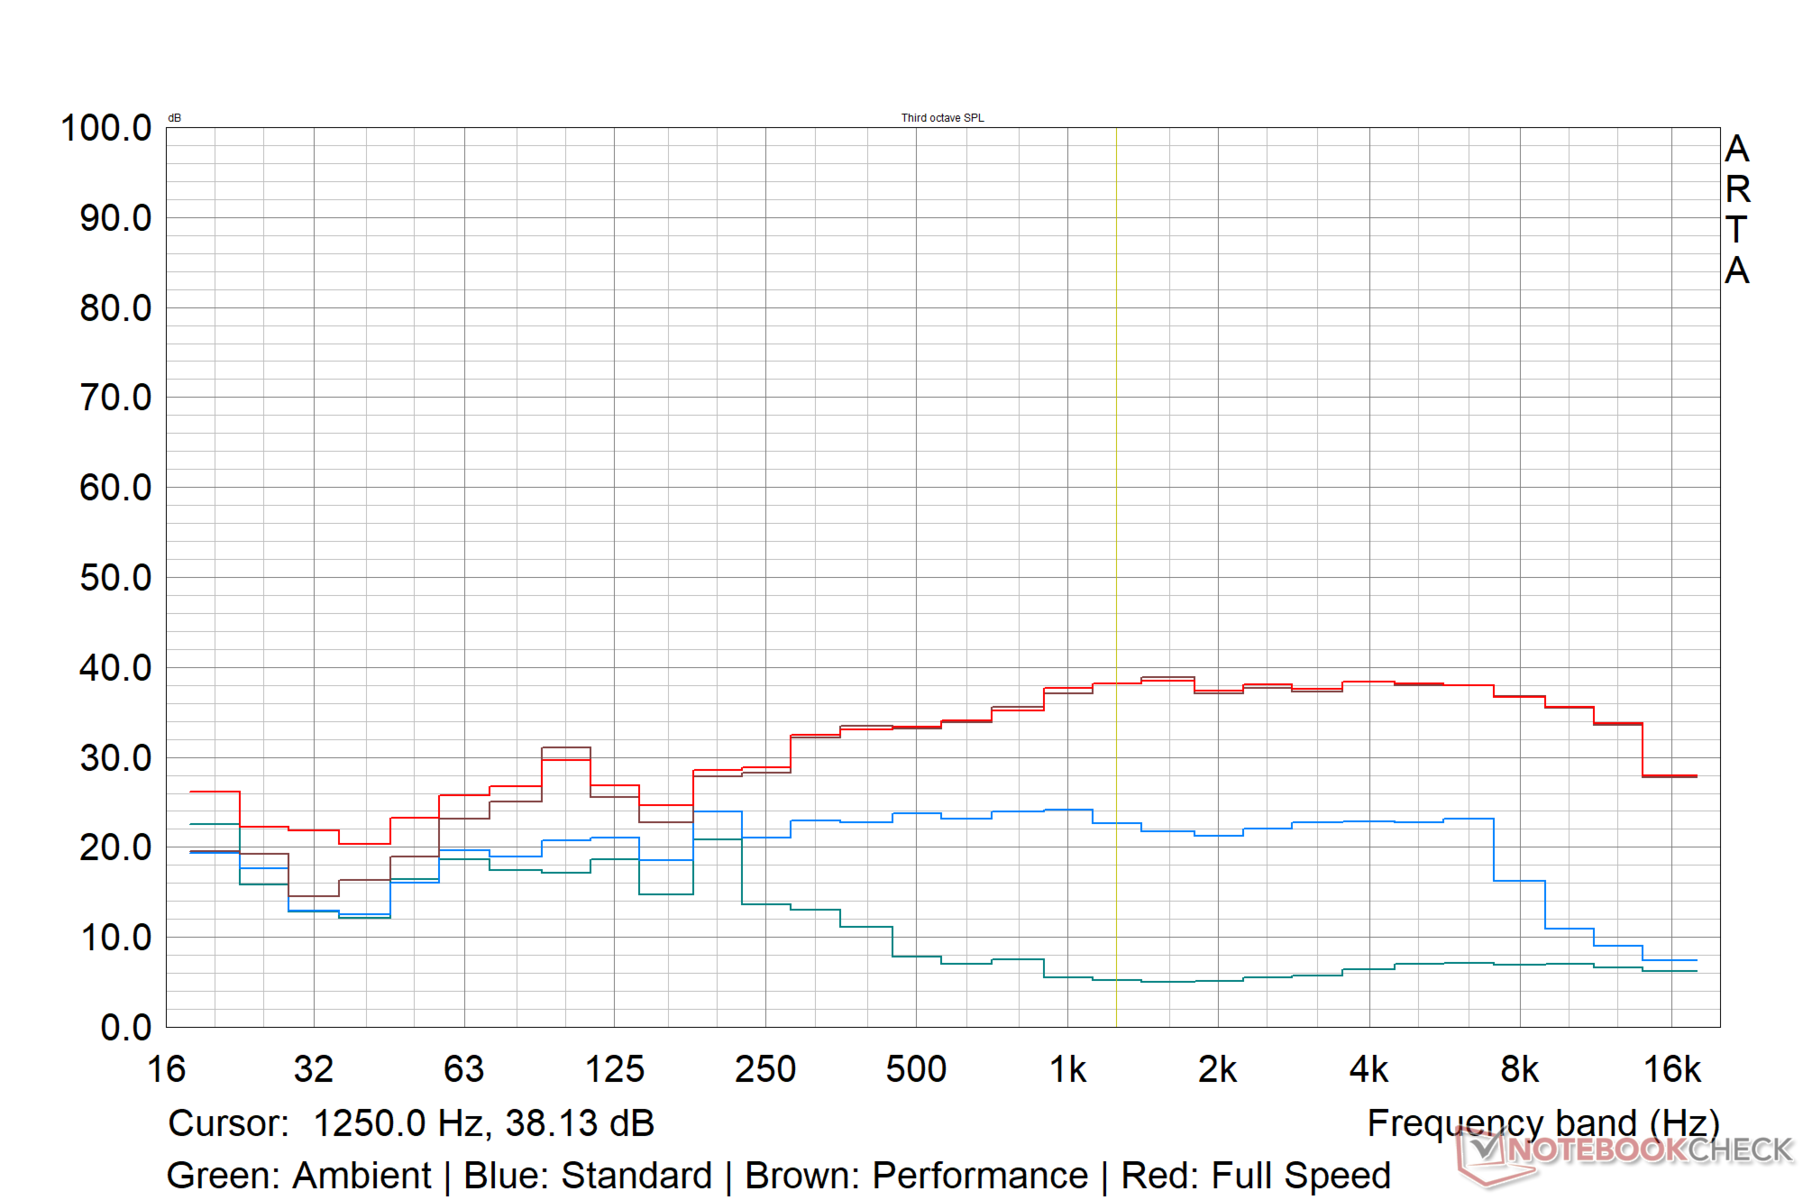
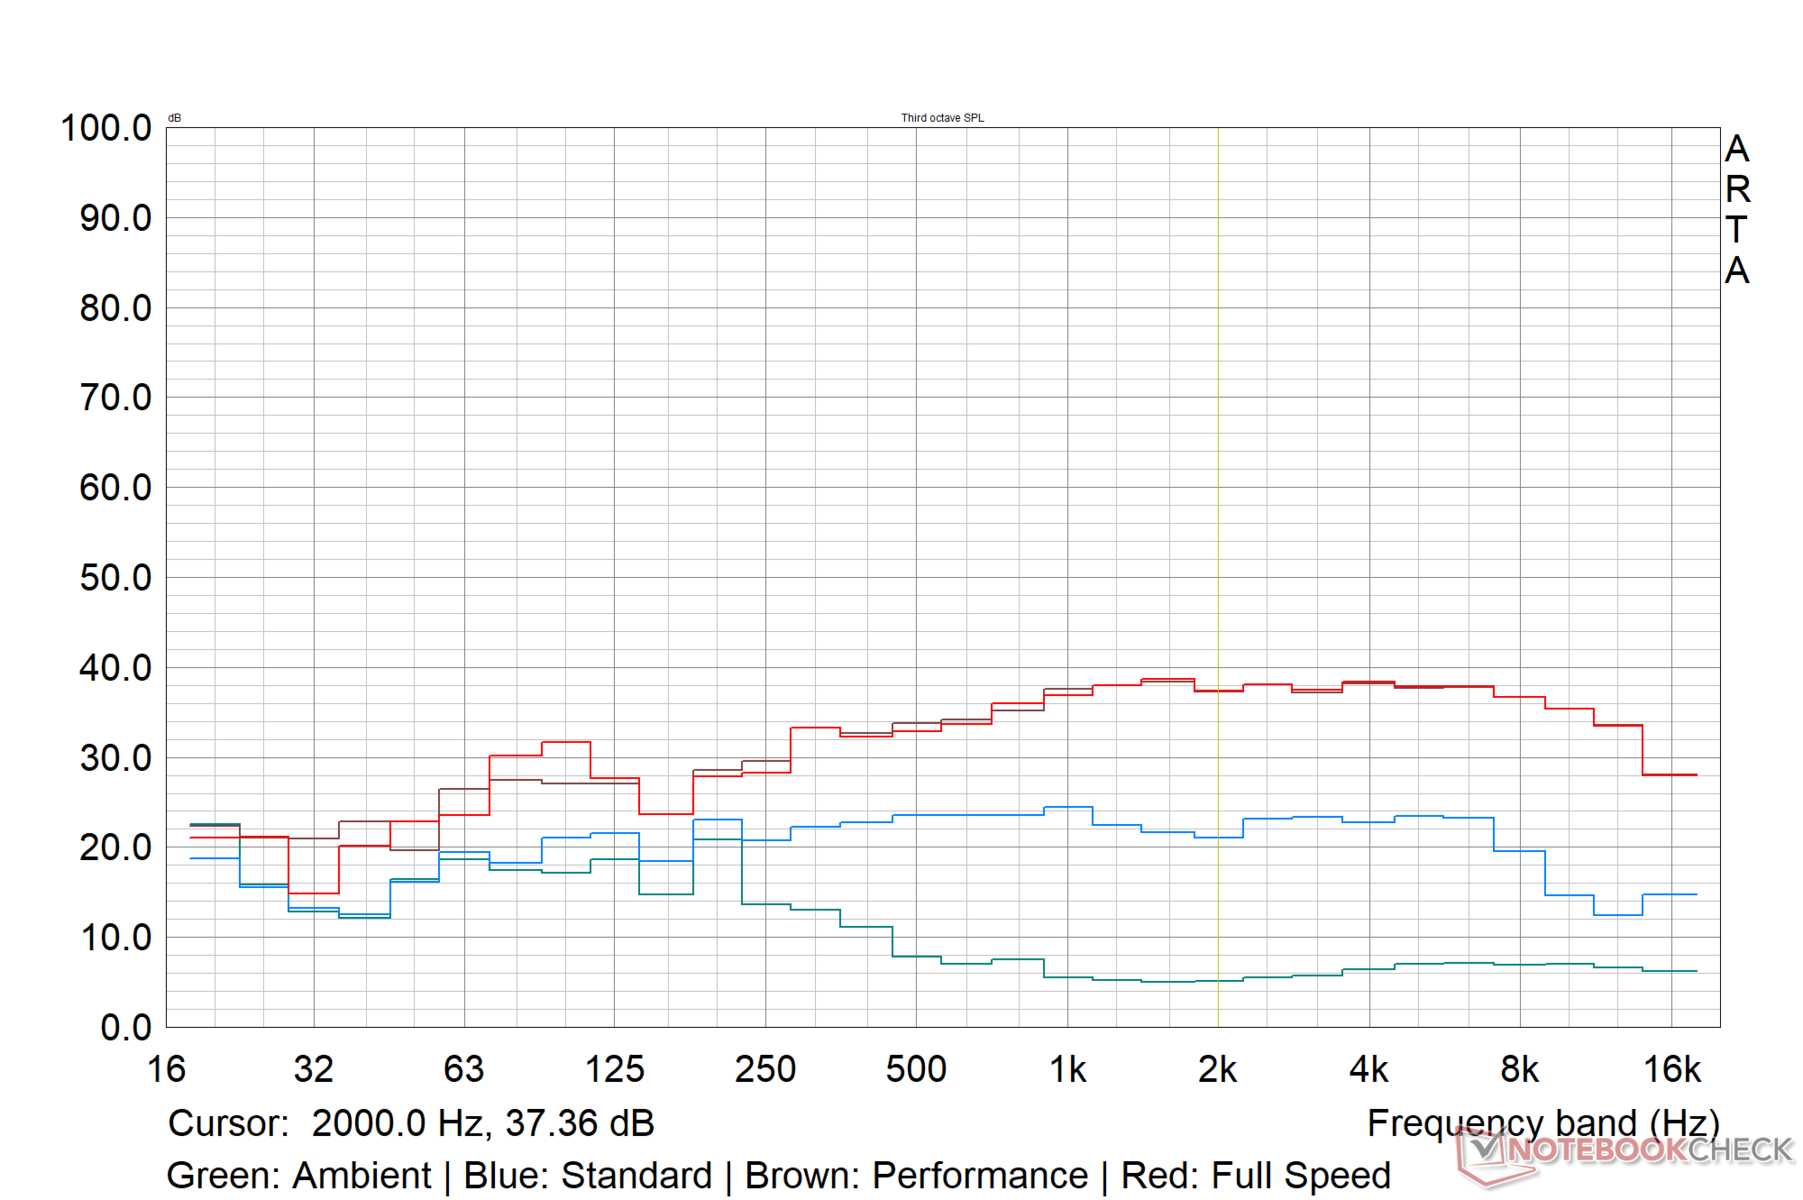
Przy ustawieniu pełnej prędkości poziom ciśnienia akustycznego (SPL) szumu wentylatora wynosi od 50 dB(A) do 53 dB(A) nawet w stanie bezczynności. Dlatego też użyliśmy trybu Performance do bardziej realistycznej oceny poziomów hałasu StudioBook 16.
Zanotowaliśmy 49 dB(A) SPL podczas uruchamiania The Witcher 3 w 1080p Ultra i w połączonym stresie Prime95 i FurMark.
Asus twierdzi, że poziom hałasu w trybie Standard wynosi <40 dB(A) i uznaliśmy to za prawdę. Maksymalny poziom hałasu pozostaje poniżej 35 dB(A) w profilu Standard we wszystkich warunkach testowych.
Choć profil Standard można ogólnie polecić do nieintensywnego użytkowania, nie uzyskamy tu maksymalnej wydajności - w tym trybie zaobserwowaliśmy 24% spadek wydajności w wielordzeniowym wyniku Cinebench R15.
| Ustawienie wydajności | Idle dB(A) | Load average dB(A) | Load maximum dB(A) | The Witcher 3 dB(A) |
|---|---|---|---|---|
| Standard | 19.54 | 27.84 | 34.31 | 34.60 |
| Wydajność | 20.07 | 34.53 | 49.21 | 49.14 |
| Pełna prędkość | 53,26 | 53,24 | 49,32 | 49,20 |
Hałas
| luz |
| 20.07 / 20.07 / 20.07 dB |
| obciążenie |
| 34.53 / 49.21 dB |
 | ||
30 dB cichy 40 dB(A) słyszalny 50 dB(A) irytujący |
||
min: | ||
| Asus ProArt StudioBook 16 H7600ZW i9-12900H, GeForce RTX 3070 Ti Laptop GPU | MSI Creator Z17 A12UGST-054 i9-12900H, GeForce RTX 3070 Ti Laptop GPU | Asus ROG Strix Scar 15 G533ZW-LN106WS i9-12900H, GeForce RTX 3070 Ti Laptop GPU | Asus ROG Zephyrus Duo 16 GX650RX R9 6900HX, GeForce RTX 3080 Ti Laptop GPU | Apple MacBook Pro 14 2021 M1 Max 24-Core GPU M1 Max, M1 Max 24-Core GPU | |
|---|---|---|---|---|---|
| Noise | -41% | -58% | -23% | -9% | |
| wyłączone / środowisko * (dB) | 19.55 | 26 -33% | 26.86 -37% | 26 -33% | 24.8 -27% |
| Idle Minimum * (dB) | 20.07 | 31.8 -58% | 39.07 -95% | 26 -30% | 24.8 -24% |
| Idle Average * (dB) | 20.07 | 31.8 -58% | 39.07 -95% | 27 -35% | 24.8 -24% |
| Idle Maximum * (dB) | 20.07 | 31.8 -58% | 39.07 -95% | 29 -44% | 24.8 -24% |
| Load Average * (dB) | 34.53 | 53.9 -56% | 53.34 -54% | 41 -19% | 30.4 12% |
| Witcher 3 ultra * (dB) | 49.1 | 53.9 -10% | 56.6 -15% | 48 2% | 35.8 27% |
| Load Maximum * (dB) | 49.21 | 54.9 -12% | 56.6 -15% | 50 -2% | 49.5 -1% |
* ... im mniej tym lepiej
Temperatura
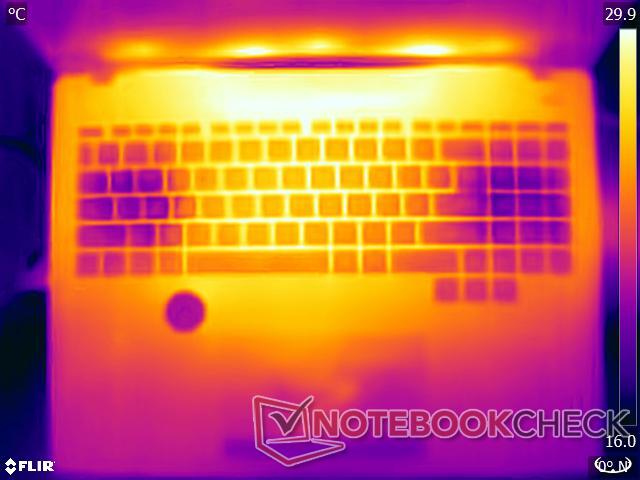
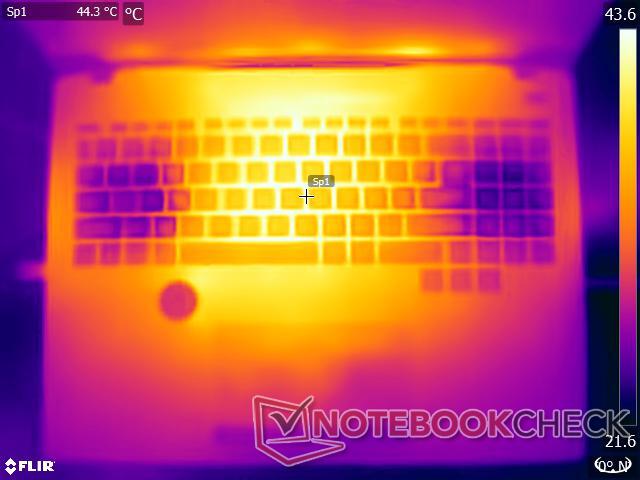
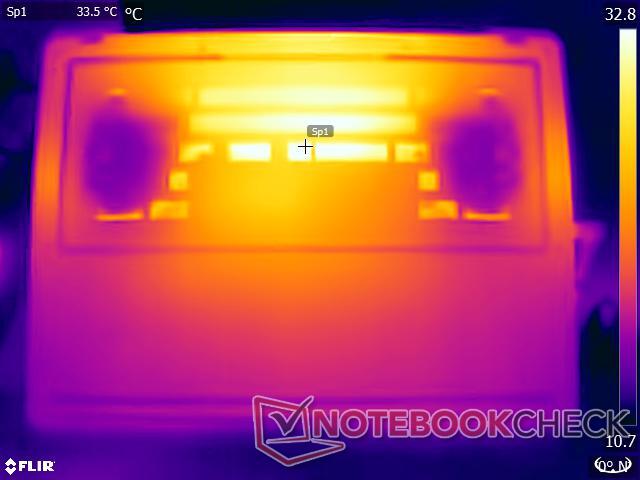
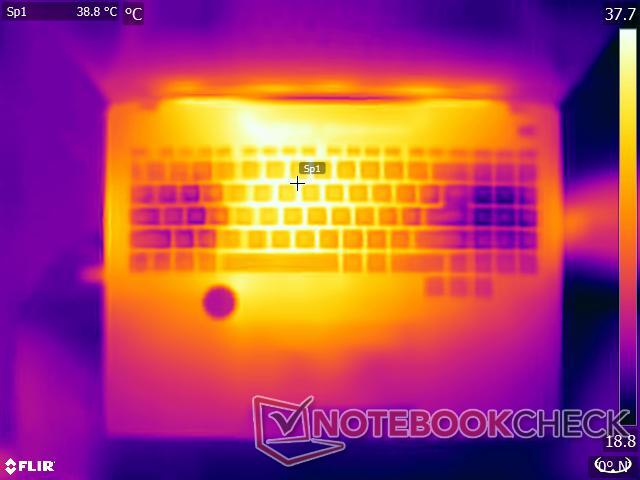
Tryb Full Speed zapewnia tolerowane temperatury powierzchni pod obciążeniem dzięki ciągłej pracy wentylatora z maksymalną prędkością. Wyższe temperatury powierzchni pod obciążeniem są zwykle skoncentrowane w okolicach górnej i środkowej lewej części obudowy.
Pod połączonym obciążeniem Prime95 i FurMark średnie temperatury górnej i dolnej części obudowy oscylują w granicach 41°C. Na stronie Witcher 3 w rozdzielczości 1080p Ultra średnie temperatury powierzchni są stosunkowo niższe i wynoszą około 34°C.
Touchpad i obszar oparcia dłoni nagrzewają się pod maksymalnym obciążeniem, ale poza tym pozostają względnie chłodne podczas testu obciążeniowego Witcher 3.
(±) Maksymalna temperatura w górnej części wynosi 41.6 °C / 107 F, w porównaniu do średniej 36.8 °C / 98 F , począwszy od 21 do 71 °C dla klasy Multimedia.
(±) Dno nagrzewa się maksymalnie do 41.4 °C / 107 F, w porównaniu do średniej 39.1 °C / 102 F
(+) W stanie bezczynności średnia temperatura górnej części wynosi 29.5 °C / 85 F, w porównaniu ze średnią temperaturą urządzenia wynoszącą 31.3 °C / ### class_avg_f### F.
(±) Podczas gry w Wiedźmina 3 średnia temperatura górnej części wynosi 34.2 °C / 94 F, w porównaniu do średniej temperatury urządzenia wynoszącej 31.3 °C / ## #class_avg_f### F.
(+) Podparcia dłoni i touchpad osiągają maksymalną temperaturę skóry (35.6 °C / 96.1 F) i dlatego nie są gorące.
(-) Średnia temperatura obszaru podparcia dłoni w podobnych urządzeniach wynosiła 28.7 °C / 83.7 F (-6.9 °C / -12.4 F).
Choć nasze testy obciążeniowe przedstawiają ekstremalne scenariusze, dla bezpieczeństwa osobistego zalecamy korzystanie z ProArt StudioBook 16 na kolanach tylko podczas uruchamiania nieintensywnych obciążeń w ustawieniu Standard.


| Asus ProArt StudioBook 16 H7600ZW Intel Core i9-12900H, NVIDIA GeForce RTX 3070 Ti Laptop GPU | MSI Creator Z17 A12UGST-054 Intel Core i9-12900H, NVIDIA GeForce RTX 3070 Ti Laptop GPU | Asus ROG Strix Scar 15 G533ZW-LN106WS Intel Core i9-12900H, NVIDIA GeForce RTX 3070 Ti Laptop GPU | Asus ROG Zephyrus Duo 16 GX650RX AMD Ryzen 9 6900HX, NVIDIA GeForce RTX 3080 Ti Laptop GPU | Apple MacBook Pro 14 2021 M1 Max 24-Core GPU Apple M1 Max, Apple M1 Max 24-Core GPU | |
|---|---|---|---|---|---|
| Heat | -28% | -19% | -12% | 5% | |
| Maximum Upper Side * (°C) | 41.6 | 63.9 -54% | 42.6 -2% | 45 -8% | 49.2 -18% |
| Maximum Bottom * (°C) | 41.4 | 68 -64% | 50.2 -21% | 50 -21% | 44.1 -7% |
| Idle Upper Side * (°C) | 31.8 | 28.3 11% | 36.2 -14% | 33 -4% | 23.5 26% |
| Idle Bottom * (°C) | 29.2 | 30.2 -3% | 40.2 -38% | 33 -13% | 23.6 19% |
* ... im mniej tym lepiej
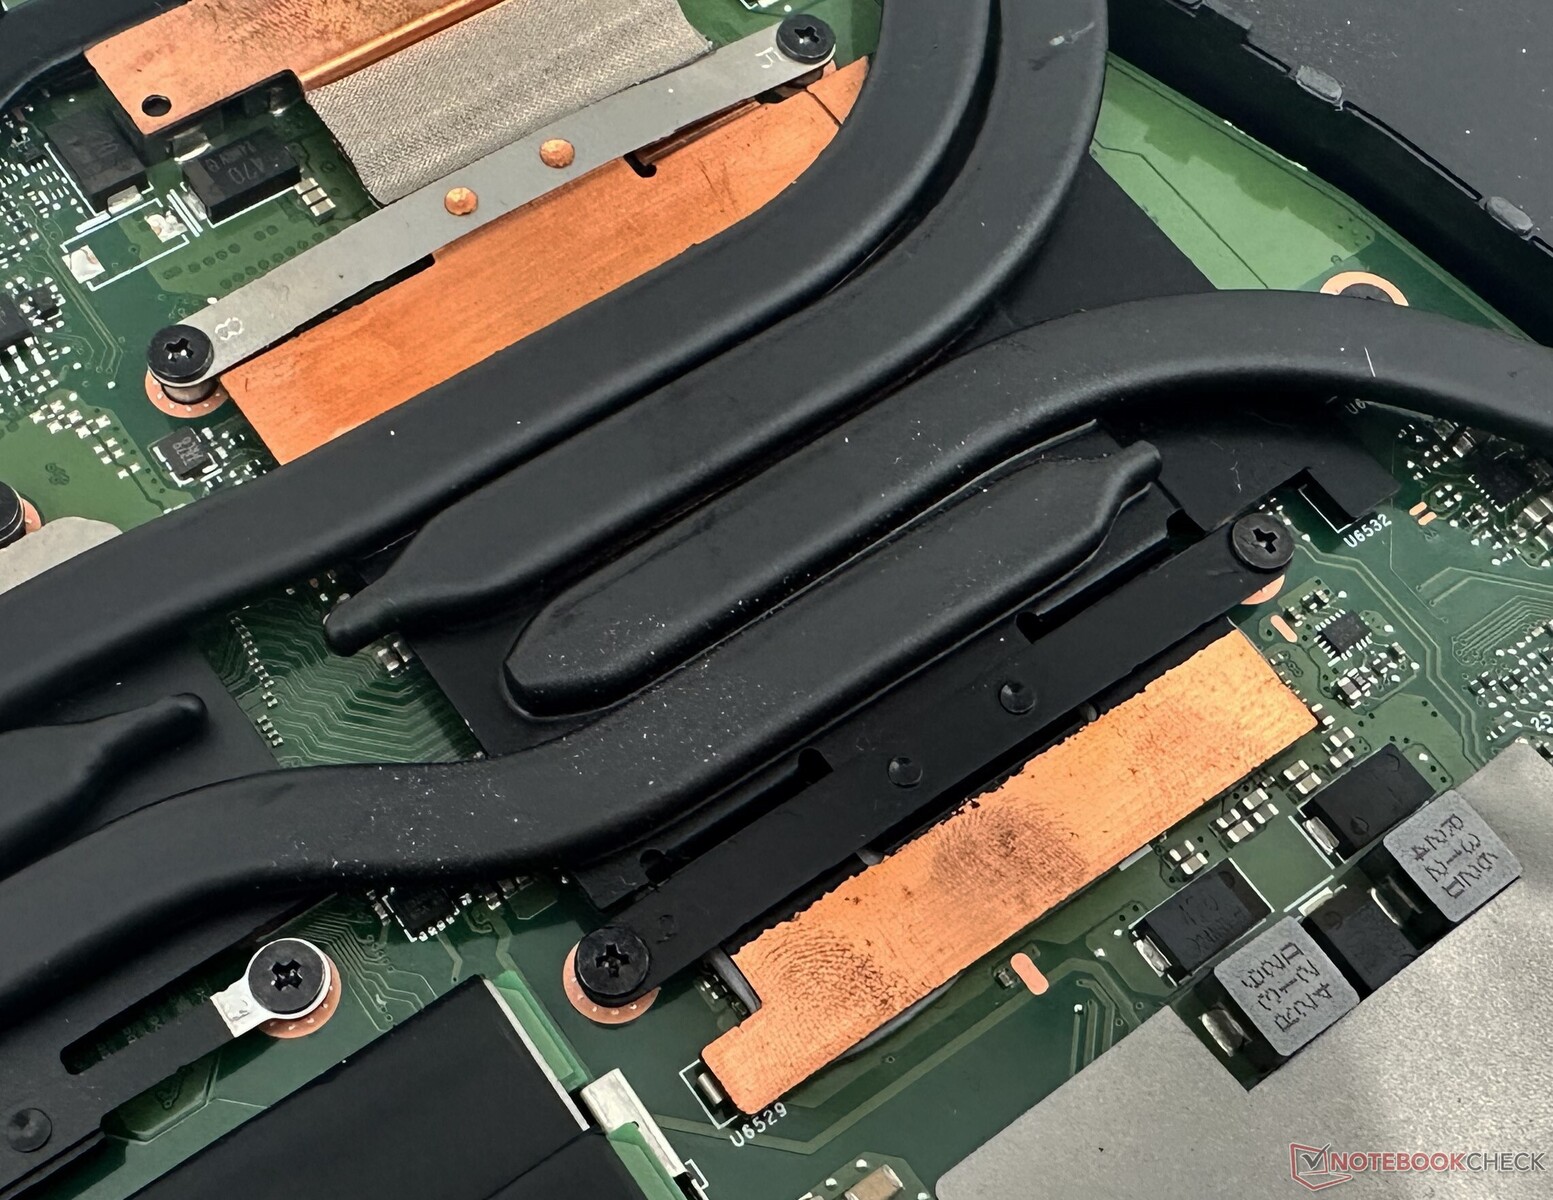
Stress Test
Asus zastosował system chłodzenia z dwoma wentylatorami, sześcioma ciepłowodami i interfejsem ciekłego metalu dla procesora, aby zapewnić chłodne działanie ProArt StudioBook 16.
Podczas uruchamiania Prime95 w miejscu dużych FFT, Core i9-12900H osiągnął 4,2 GHz, przy czym temperatura rdzenia osiągnęła 91°C, a moc pakietu wyniosła 115 W.
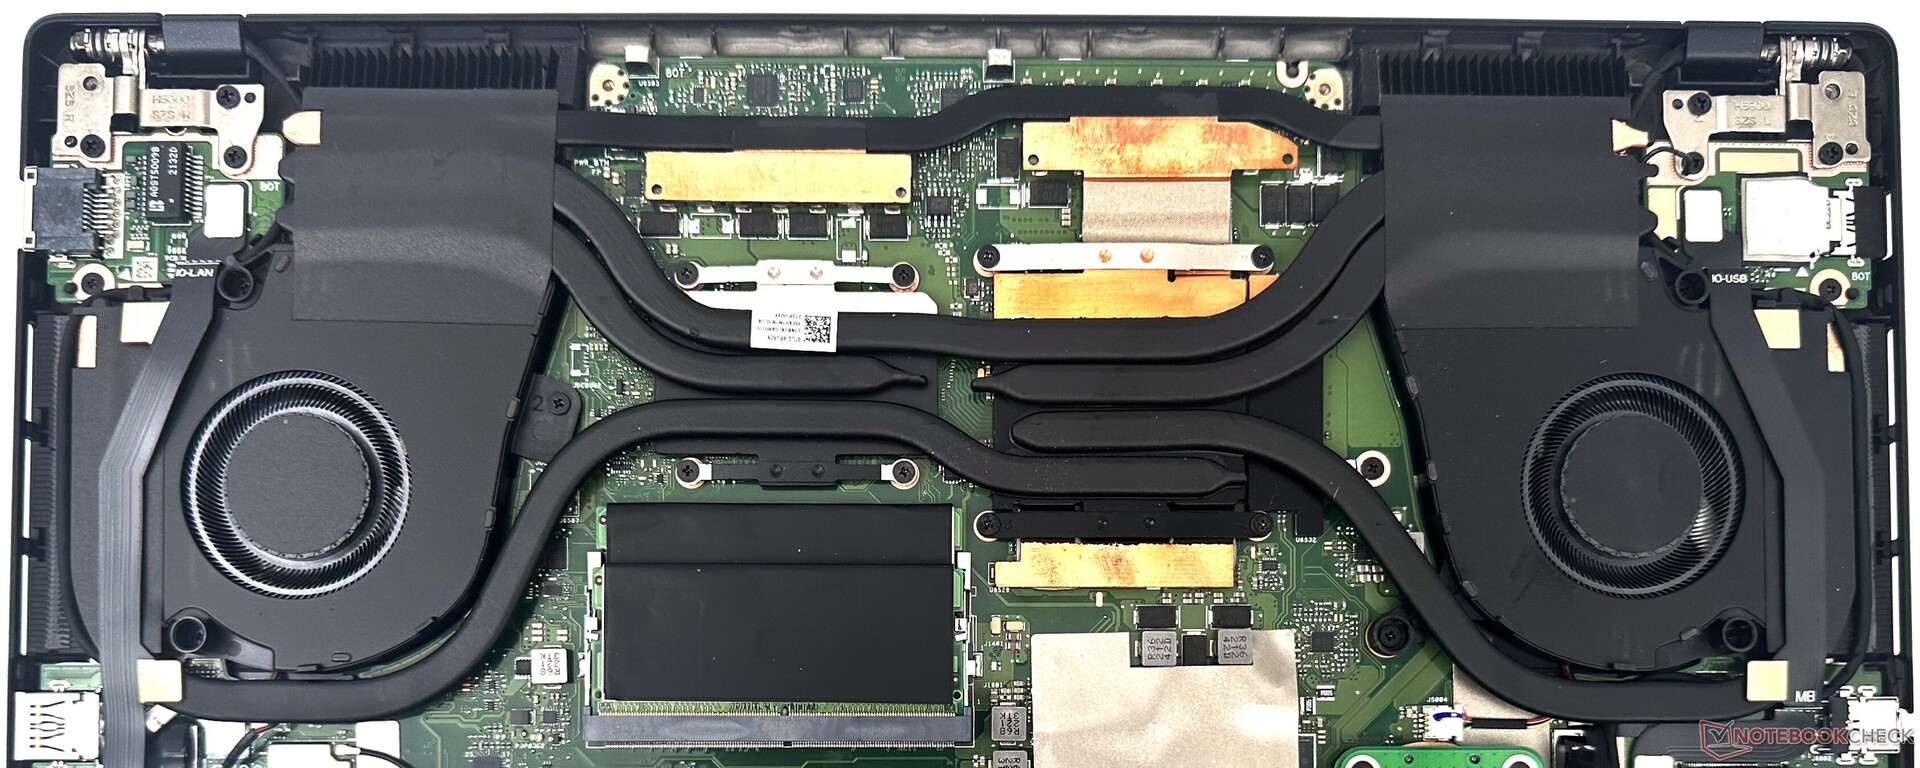
Po dodaniu do mieszanki FurMark średnie taktowanie CPU spadło do 2,09 GHz, co dało miejsce dla układu graficznego RTX 3070 Ti Laptop, który osiągnął maksimum do 1635 MHz. Zarówno CPU, jak i GPU są w stanie zbliżyć się do swoich docelowych 115 W mocy, choć chwilowo. Średnia moc pakietu Core i9-12900H zostaje zredukowana do 52 W, by umożliwić RTX 3070 Ti zużycie 91 W.
Strona Witcher 3 w 1080p Ultra prezentuje bardziej realistyczne warunki obciążenia. Tutaj średnie taktowanie CPU oscyluje wokół granicy 2,5 GHz, ale procesor graficzny jest w stanie konsekwentnie pracować z taktowaniem podwyższonym, osiągając maksymalny poziom 113 W TGP w całym przebiegu.
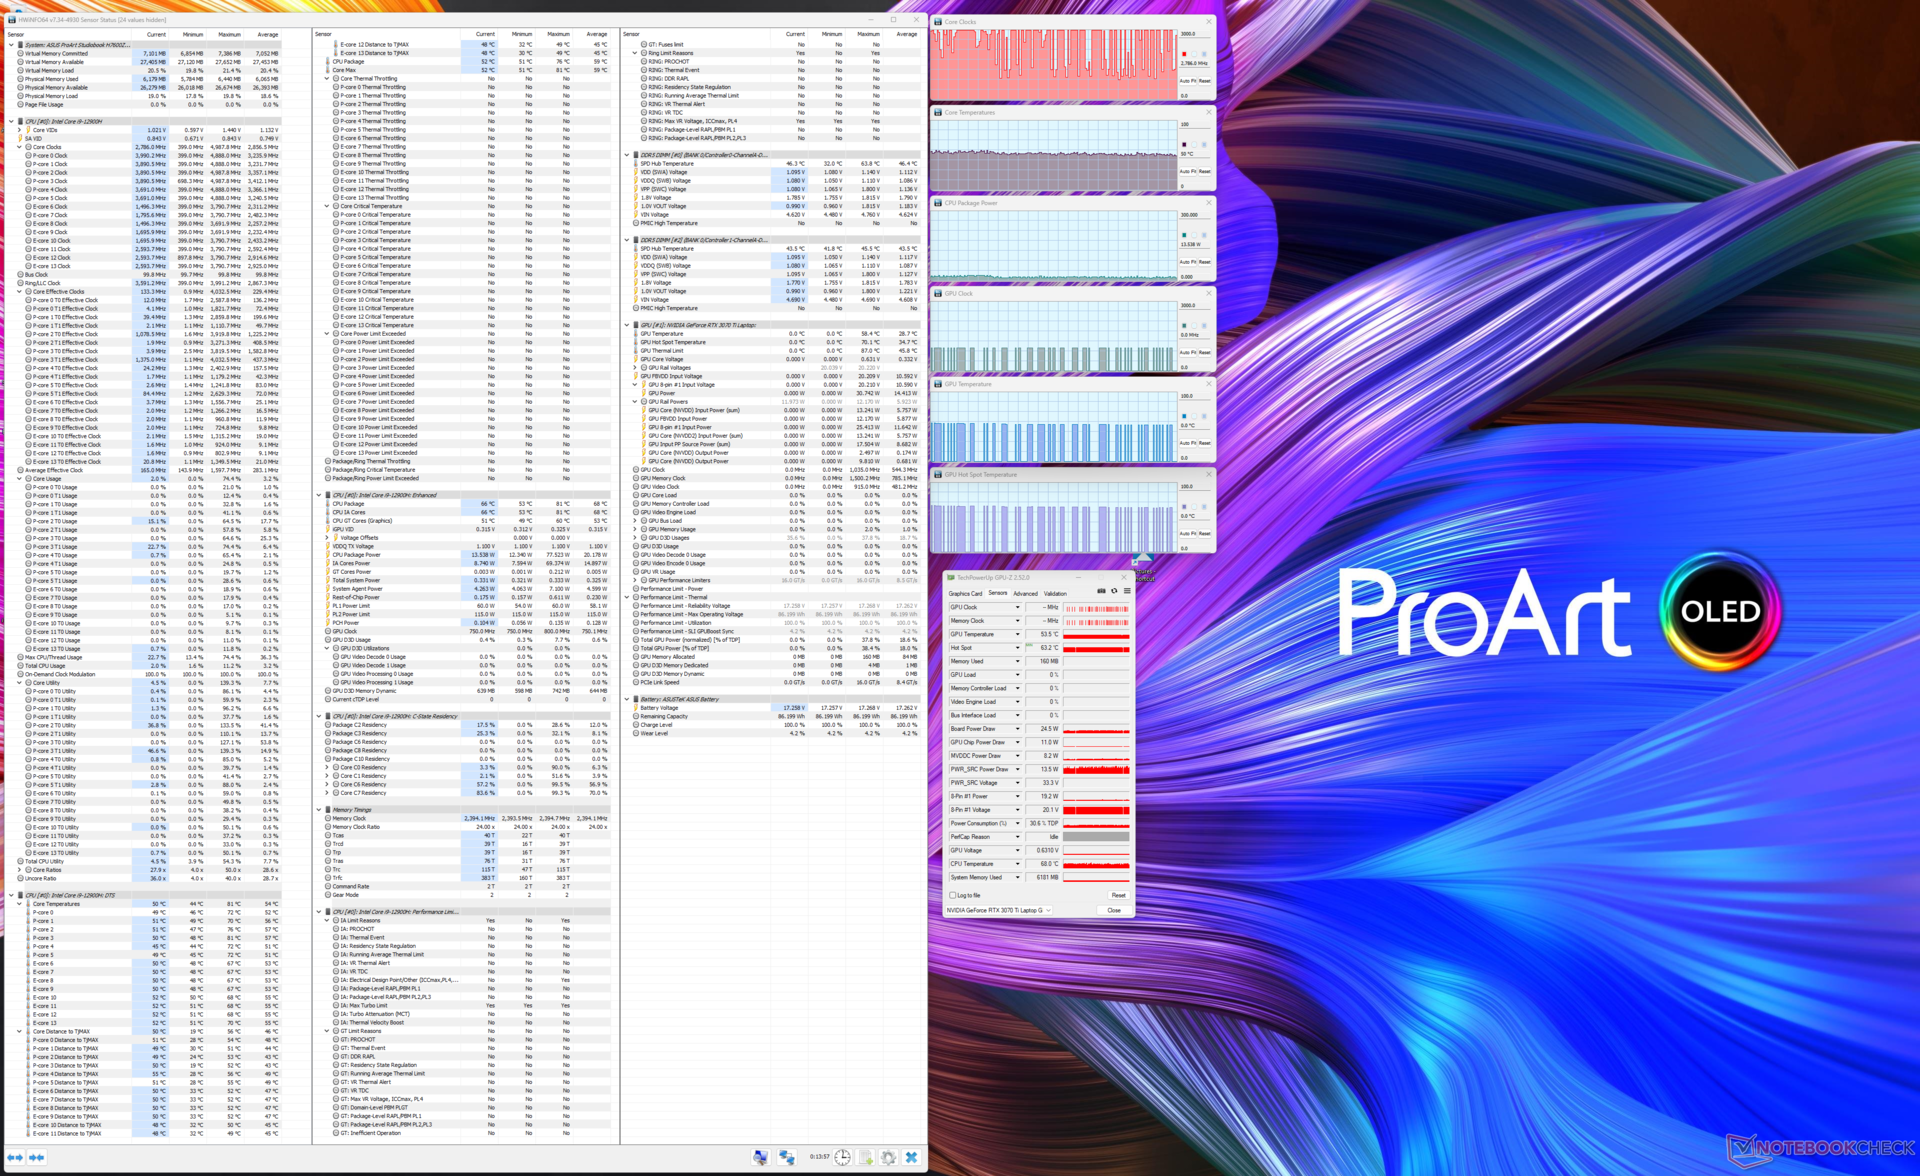
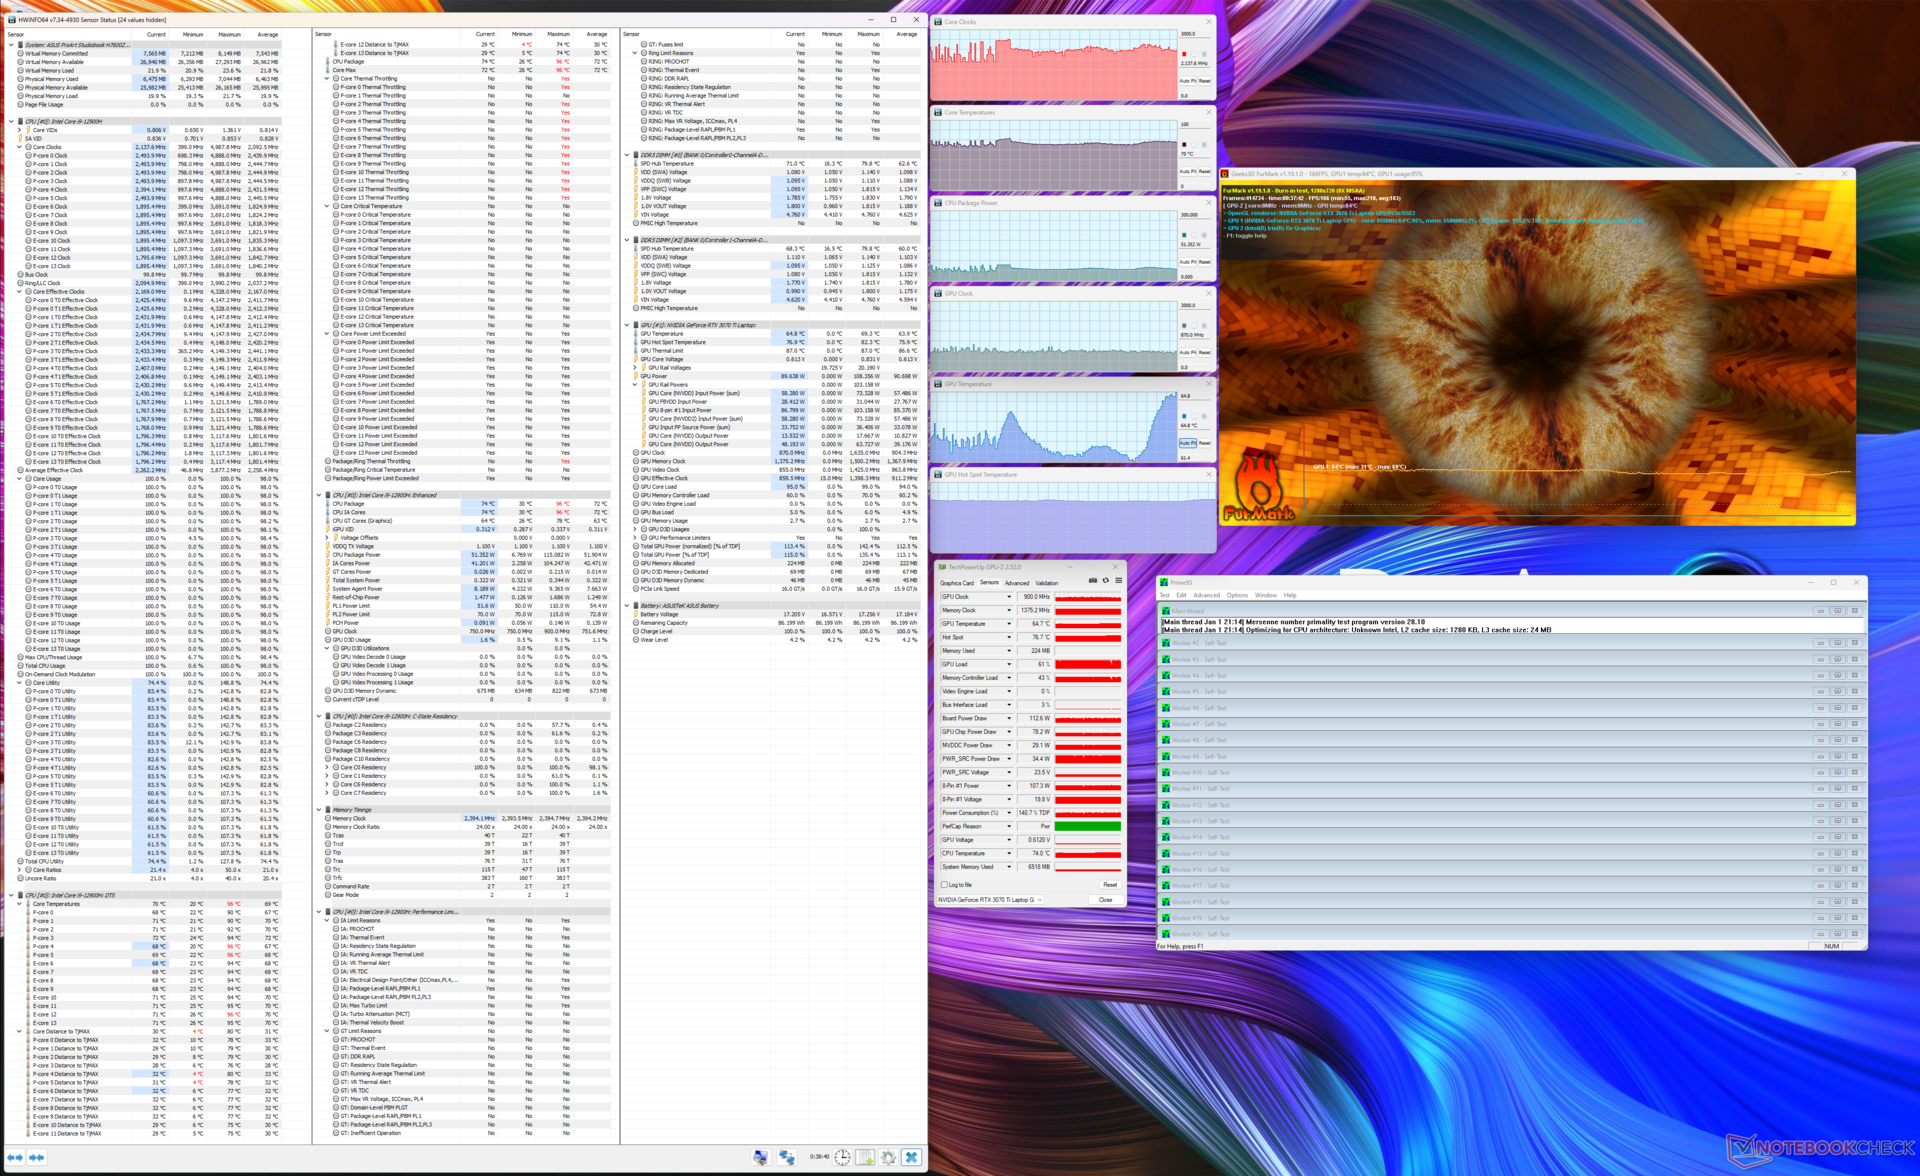
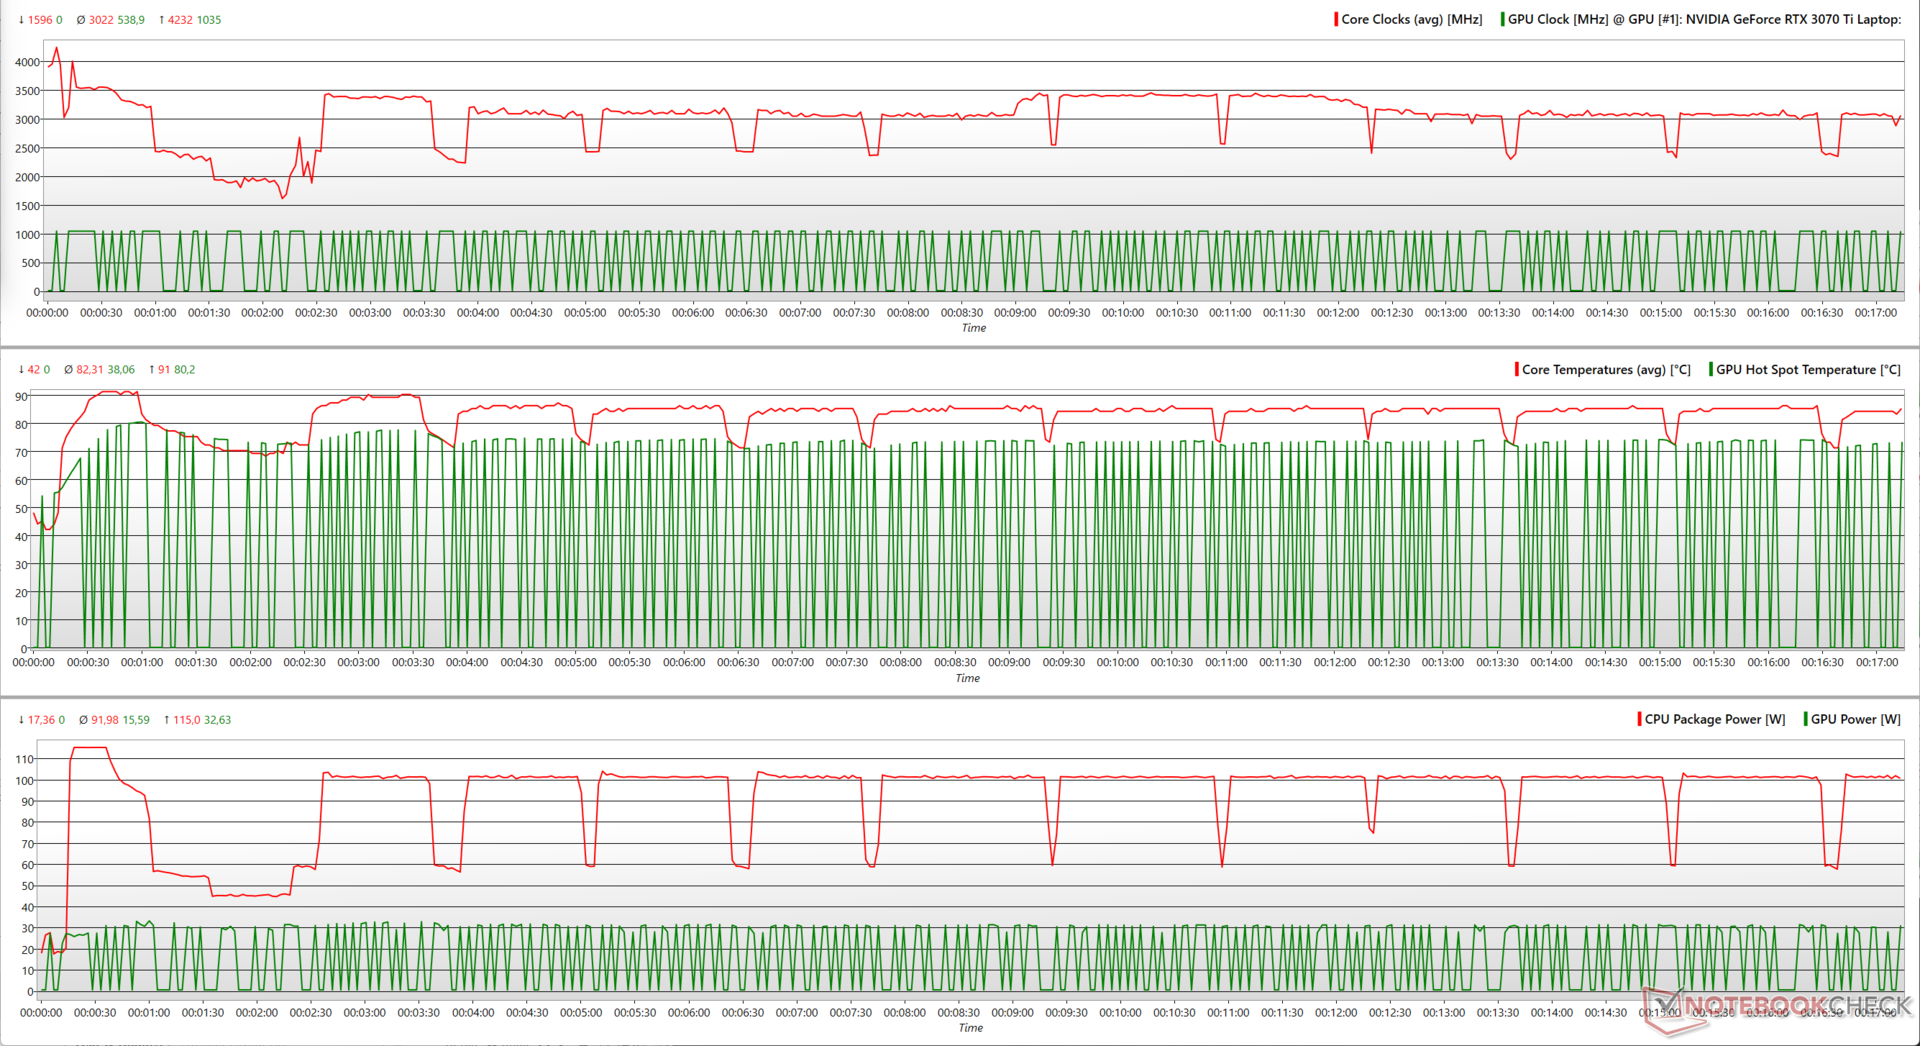
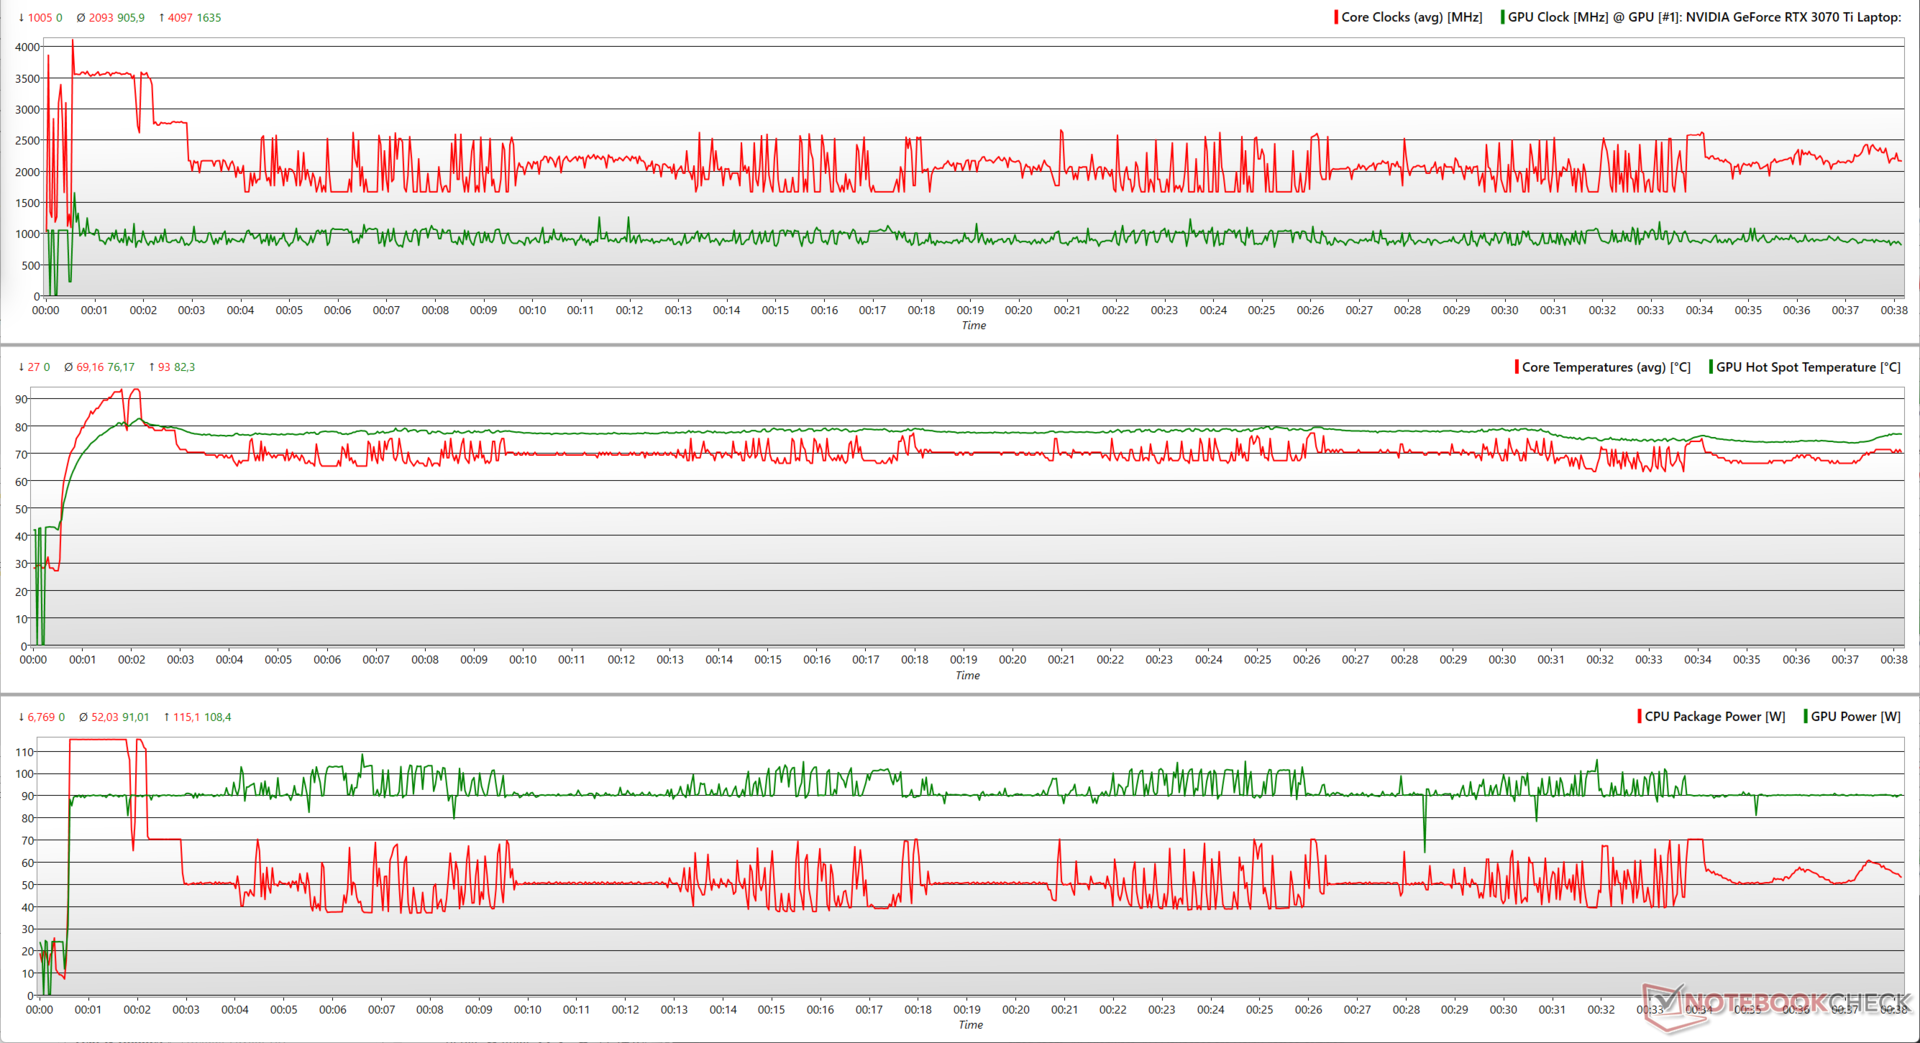
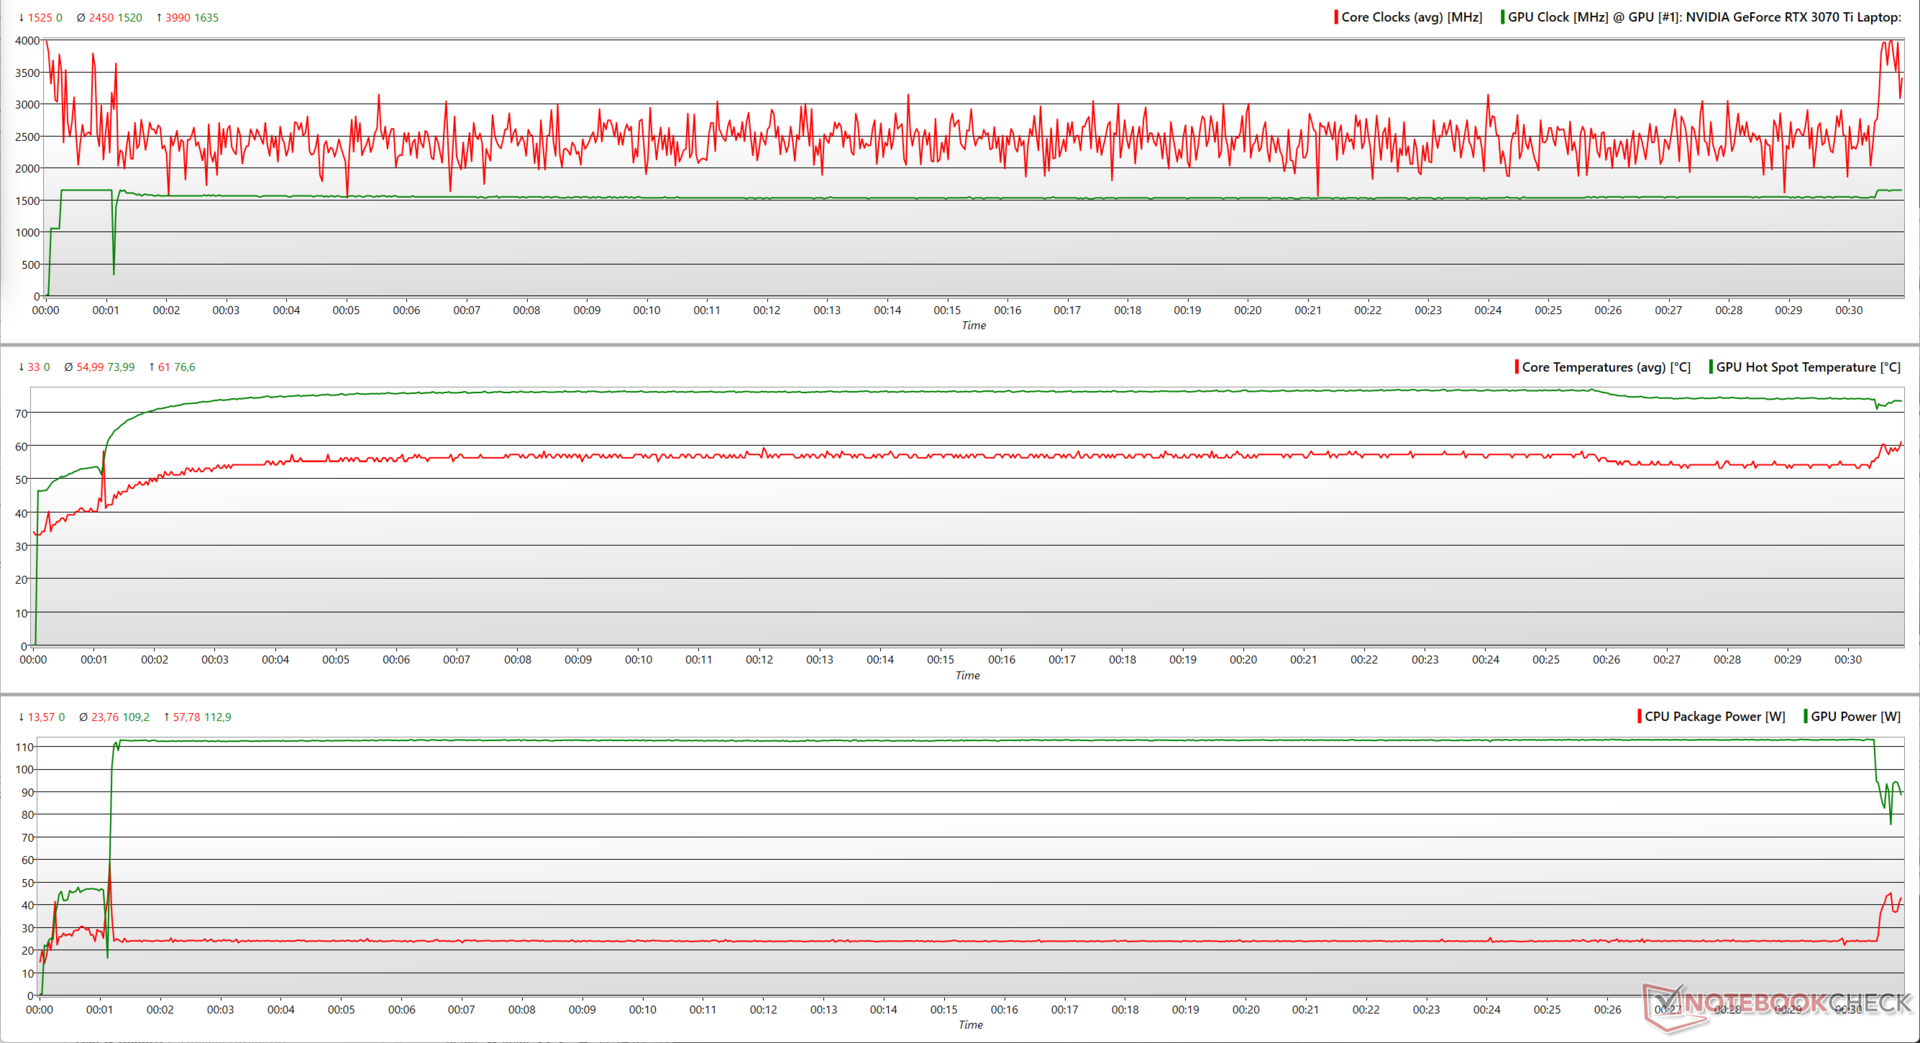
| Test obciążeniowy | Zegar CPU (GHz) | Zegar GPU (MHz) | Średnia temperatura CPU (°C) | Średnia temperatura GPU (°C) |
| System Idle | 2.79 | - | 54 | 28.7 |
| Prime95 | 3.03 | - | 82 | 30.9 |
| Prime95 + FurMark | 2,13 | 900 | 69 | 63,9 |
| The Witcher 3 | 3.78 | 1.635 | 55 | 61.6 |
Mówcy
Asus wyposażył ProArt StudioBook 16 w pokładowe głośniki stereo z funkcją Smart Amp z certyfikatem Harman Kardon. Podsystem audio obsługuje również Dolby Atmos oraz przetwornik DAC ESS Sabre z certyfikatem Hi-Res Audio do napędzania słuchawek o wysokiej impedancji.
Głośność szczytowa na poziomie 80,06 dB(A) jest odpowiednia dla przeciętnej wielkości pomieszczenia. Obserwujemy zredukowany, ale wciąż liniowy bas oraz dobre średnie i wysokie tony. Subiektywnie rzecz biorąc, głośniki pokładowe są w porządku do swobodnego słuchania.
Dla osób pragnących większej wierności dźwięku dostępne są gniazdo audio 3,5 mm oraz Bluetooth 5.0.
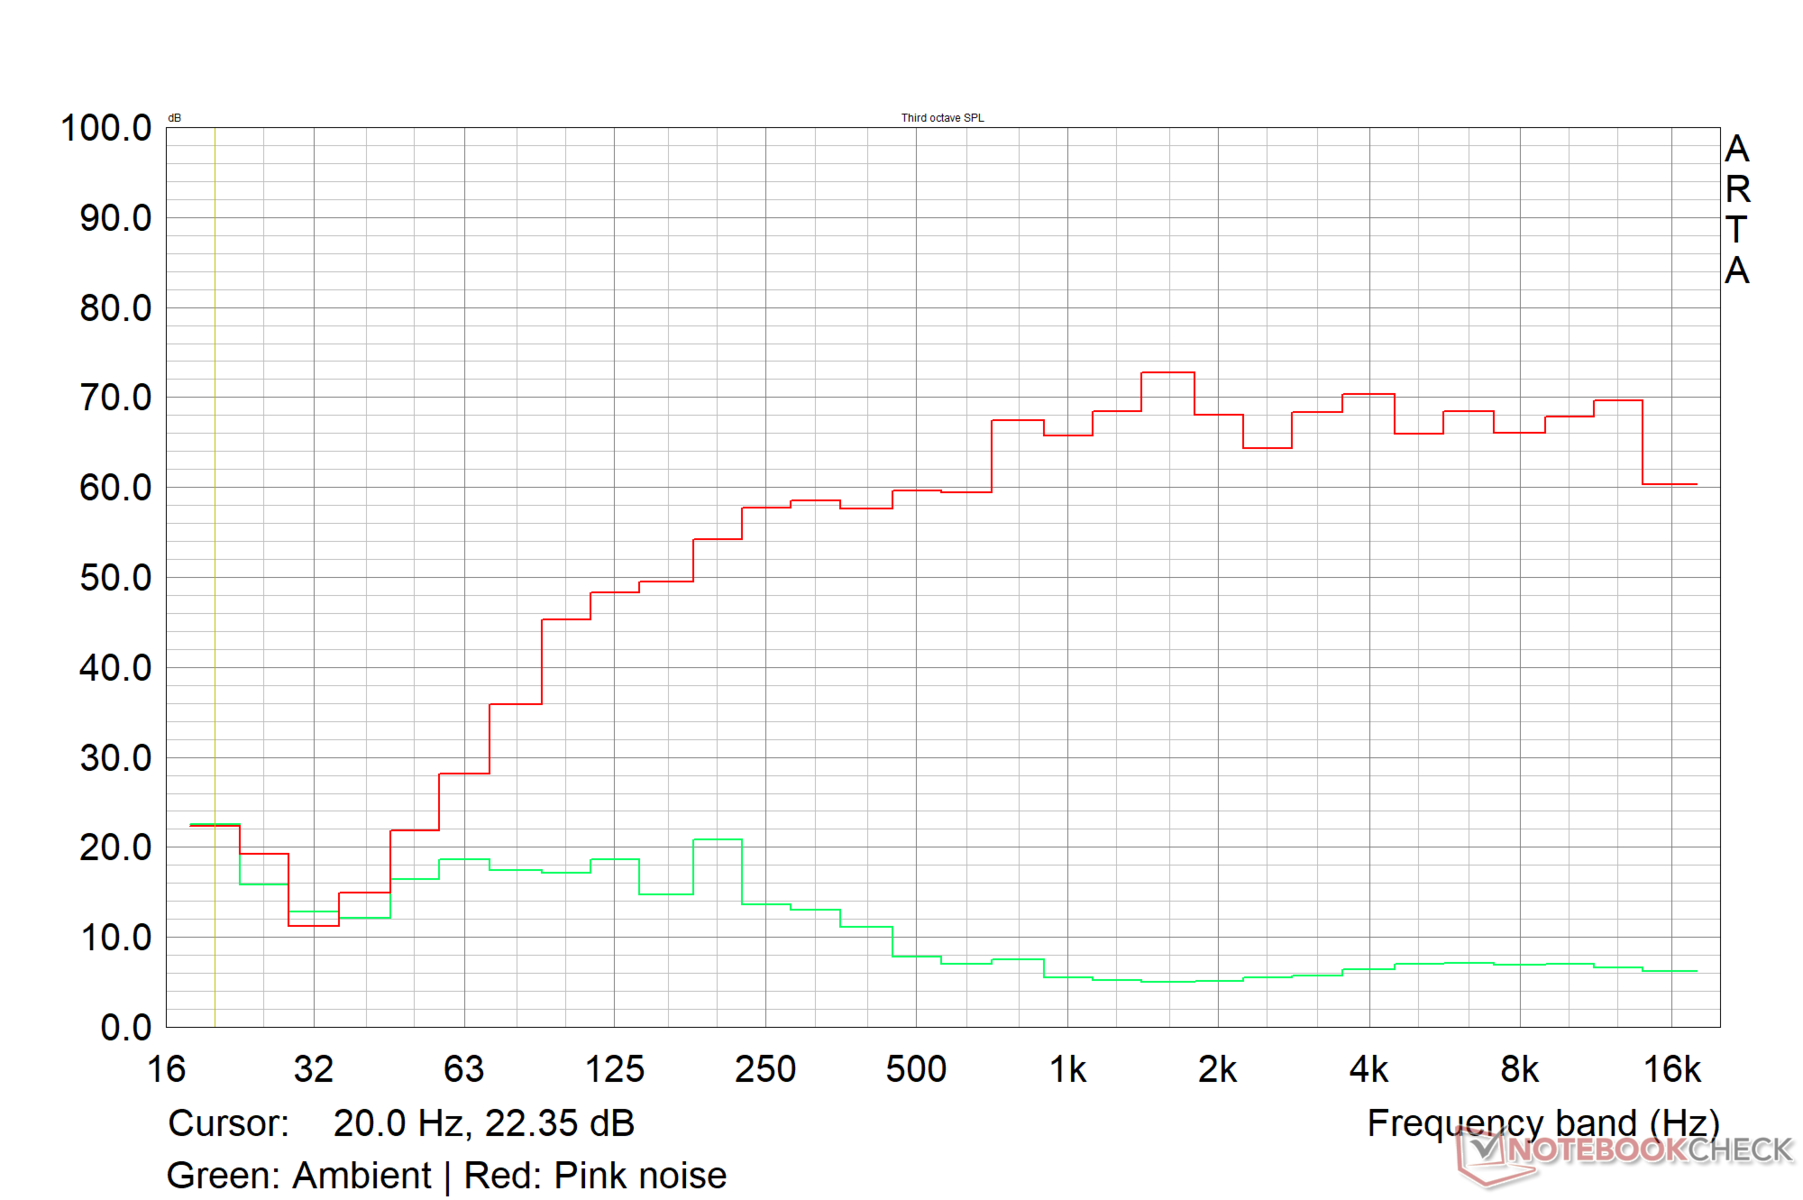
Asus ProArt StudioBook 16 H7600ZW analiza dźwięku
(±) | głośność głośnika jest średnia, ale dobra (80.1 dB)
Bas 100 - 315 Hz
(±) | zredukowany bas - średnio 13.5% niższy od mediany
(+) | bas jest liniowy (6.4% delta do poprzedniej częstotliwości)
Średnie 400 - 2000 Hz
(+) | zbalansowane środki średnie - tylko 4.3% od mediany
(+) | średnie są liniowe (5.2% delta do poprzedniej częstotliwości)
Wysokie 2–16 kHz
(+) | zrównoważone maksima - tylko 2% od mediany
(+) | wzloty są liniowe (5.1% delta do poprzedniej częstotliwości)
Ogólnie 100 - 16.000 Hz
(+) | ogólny dźwięk jest liniowy (11.6% różnicy w stosunku do mediany)
W porównaniu do tej samej klasy
» 19% wszystkich testowanych urządzeń w tej klasie było lepszych, 4% podobnych, 78% gorszych
» Najlepszy miał deltę 5%, średnia wynosiła ###średnia###%, najgorsza wynosiła 45%
W porównaniu do wszystkich testowanych urządzeń
» 8% wszystkich testowanych urządzeń było lepszych, 2% podobnych, 90% gorszych
» Najlepszy miał deltę 4%, średnia wynosiła ###średnia###%, najgorsza wynosiła 134%
Apple MacBook Pro 16 2021 M1 Pro analiza dźwięku
(+) | głośniki mogą odtwarzać stosunkowo głośno (84.7 dB)
Bas 100 - 315 Hz
(+) | dobry bas - tylko 3.8% od mediany
(+) | bas jest liniowy (5.2% delta do poprzedniej częstotliwości)
Średnie 400 - 2000 Hz
(+) | zbalansowane środki średnie - tylko 1.3% od mediany
(+) | średnie są liniowe (2.1% delta do poprzedniej częstotliwości)
Wysokie 2–16 kHz
(+) | zrównoważone maksima - tylko 1.9% od mediany
(+) | wzloty są liniowe (2.7% delta do poprzedniej częstotliwości)
Ogólnie 100 - 16.000 Hz
(+) | ogólny dźwięk jest liniowy (4.6% różnicy w stosunku do mediany)
W porównaniu do tej samej klasy
» 0% wszystkich testowanych urządzeń w tej klasie było lepszych, 0% podobnych, 100% gorszych
» Najlepszy miał deltę 5%, średnia wynosiła ###średnia###%, najgorsza wynosiła 45%
W porównaniu do wszystkich testowanych urządzeń
» 0% wszystkich testowanych urządzeń było lepszych, 0% podobnych, 100% gorszych
» Najlepszy miał deltę 4%, średnia wynosiła ###średnia###%, najgorsza wynosiła 134%
Zarządzanie energią: Maksymalna moc 240 W pod obciążeniem
Pobór mocy
Zanotowaliśmy maksymalny pobór mocy 241 W pod obciążeniem, więc dołączony do zestawu adapter 240 W powinien w zupełności wystarczyć do zasilenia ProArt StudioBook 16 przez najbardziej wymagające zadania. Pobór mocy ze ściany przypomina schemat, który widzieliśmy wcześniej podczas testów obciążeniowych.
Mimo to ProArt StudioBook 16 nie cierpi na wysoki pobór w stanie spoczynku, jak ma to miejsce w przypadku MSI Creator Z17. ROG Strix Scar 15 jest bardziej oszczędny w idle, ale zużycie pod obciążeniem jest wyższe niż StudioBook 16.
Nic dziwnego, że Apple MacBook Pro 14 z M1 Max wypada w tym porównaniu jako najbardziej oszczędny w zużyciu energii.
| wyłączony / stan wstrzymania | |
| luz | |
| obciążenie |
|
Legenda:
min: | |
| Asus ProArt StudioBook 16 H7600ZW i9-12900H, GeForce RTX 3070 Ti Laptop GPU, OLED, 3840x2400, 16" | MSI Creator Z17 A12UGST-054 i9-12900H, GeForce RTX 3070 Ti Laptop GPU, IPS, 2560x1600, 17" | Asus ROG Strix Scar 15 G533ZW-LN106WS i9-12900H, GeForce RTX 3070 Ti Laptop GPU, IPS-level, 2560x1440, 15.6" | Lenovo ThinkBook 16p G3 ARH R9 6900HX, GeForce RTX 3060 Laptop GPU, IPS, 2560x1600, 16" | Apple MacBook Pro 14 2021 M1 Max 24-Core GPU M1 Max, M1 Max 24-Core GPU, Mini-LED, 3024x1964, 14.2" | Przeciętny NVIDIA GeForce RTX 3070 Ti Laptop GPU | Średnia w klasie Multimedia | |
|---|---|---|---|---|---|---|---|
| Power Consumption | -70% | 9% | 16% | 52% | -10% | 49% | |
| Idle Minimum * (Watt) | 12.6 | 34.6 -175% | 7.56 40% | 10.3 18% | 3.2 75% | 14.2 ? -13% | 5.64 ? 55% |
| Idle Average * (Watt) | 17.41 | 43 -147% | 13.5 22% | 16 8% | 12.6 28% | 19.9 ? -14% | 10 ? 43% |
| Idle Maximum * (Watt) | 23.12 | 44.9 -94% | 16.87 27% | 24 -4% | 13 44% | 26.2 ? -13% | 12.2 ? 47% |
| Load Average * (Watt) | 117.5 | 145 -23% | 128.9 -10% | 85.4 27% | 57.9 51% | 125.8 ? -7% | 64.8 ? 45% |
| Witcher 3 ultra * (Watt) | 172.6 | 152.4 12% | 196.2 -14% | 132.2 23% | 76.3 56% | ||
| Load Maximum * (Watt) | 241.36 | 220 9% | 274.86 -14% | 181.9 25% | 97.7 60% | 248 ? -3% | 111.7 ? 54% |
* ... im mniej tym lepiej
Power Consumption: The Witcher 3 / Stress test
Power Consumption: External monitor
Czas pracy na baterii
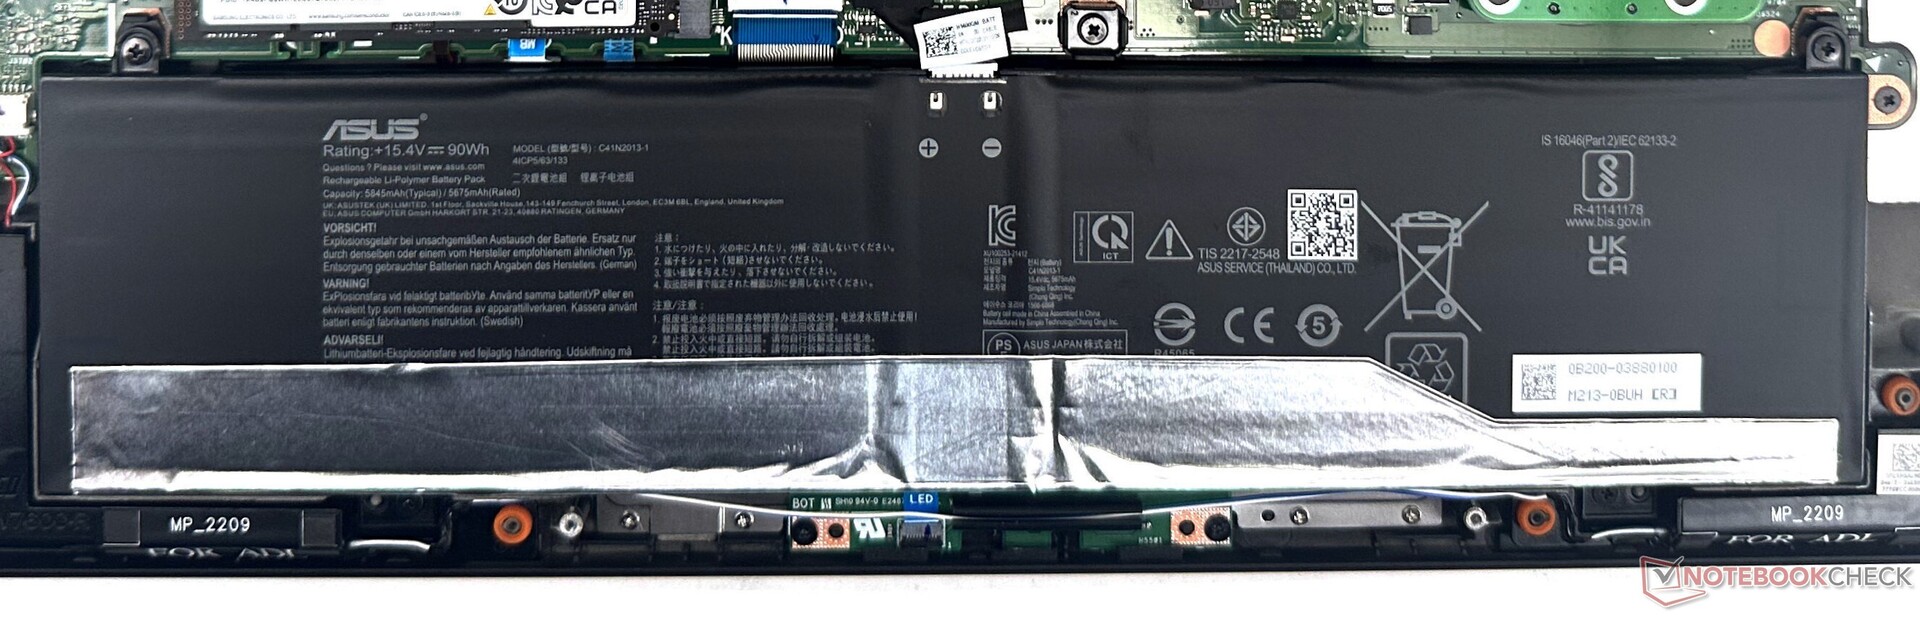
Choć ProArt StudioBook 16 nie może się równać z MacBookiem Pro, jeśli chodzi o czasy pracy na akumulatorze, pakiet Li-ion o pojemności 90 WHr zapewnia przyzwoitą trwałość w trasie, zanim trzeba będzie sięgnąć po ładowarkę. Wszystkie testy akumulatora zostały przeprowadzone w trybie standardowym.
Asus reklamuje 10-godzinny czas pracy na akumulatorze podczas odtwarzania wideo, a w teście pętli wideo H.264 1080p przy 150 nitach zabrakło nam zaledwie 9:45. MacBook Pro 14 z M1 Max oferuje o 54% dłuższy czas pracy w naszym standardowym teście Wi-Fi przy jasności ekranu 150 nitów.
W razie potrzeby można odkręcić i wymienić akumulator.
| Asus ProArt StudioBook 16 H7600ZW i9-12900H, GeForce RTX 3070 Ti Laptop GPU, 90 Wh | MSI Creator Z17 A12UGST-054 i9-12900H, GeForce RTX 3070 Ti Laptop GPU, 90 Wh | Asus ROG Strix Scar 15 G533ZW-LN106WS i9-12900H, GeForce RTX 3070 Ti Laptop GPU, 90 Wh | Lenovo ThinkBook 16p G3 ARH R9 6900HX, GeForce RTX 3060 Laptop GPU, 71 Wh | Apple MacBook Pro 14 2021 M1 Max 24-Core GPU M1 Max, M1 Max 24-Core GPU, 69.9 Wh | Średnia w klasie Multimedia | |
|---|---|---|---|---|---|---|
| Czasy pracy | 25% | -2% | -13% | 40% | 72% | |
| H.264 (h) | 9.7 | 5.5 -43% | 8.5 -12% | 12.1 25% | 16.4 ? 69% | |
| WiFi v1.3 (h) | 7.5 | 5.5 -27% | 8.4 12% | 6.5 -13% | 11.6 55% | 12 ? 60% |
| Witcher 3 ultra (h) | 1.3 | 1.2 -8% | ||||
| Load (h) | 0.9 | 2.2 144% | 0.9 0% | 1.675 ? 86% |
Za
Przeciw
Werdykt: Prawie idealny do tworzenia treści mobilnych
Asus ProArt StudioBook 16 stara się wyróżnić spośród rosnącej liczby laptopów przeznaczonych dla twórców i udaje mu się to całkiem przekonująco.
Wzornictwo ProArt StudioBook jest minimalistyczne, ale emanuje klasą. Obudowa jest dobrze zbudowana, pokrywę można otworzyć jednym palcem, a wyświetlacz ma bardzo cienkie ramki, dzięki czemu można się w nim zanurzyć.
Dostosowywalne pokrętło Asus Dial może okazać się niezwykle przydatne w obsługiwanych aplikacjach dla tych, którzy chcą mieć wygodny analogowy sposób wprowadzania danych.
Asus zastosował w StudioBook 16 wysokiej jakości panel OLED firmy Samsung. Nie może się on pochwalić wysoką częstotliwością odświeżania, ale dokładność kolorów i niemal stuprocentowe pokrycie przestrzeni barw sRGB, Adobe RGB i Display P3 będą mile widziane przez twórców. Wyświetlacz cierpi z powodu PWM przy niskich poziomach jasności, ale zastosowanie DC Dimming przy jasności powyżej 50% powinno być nadal przyjazne dla oczu.
Asus ProArt StudioBook 16 oferuje niemal wszystko, czego twórcy treści oczekiwaliby od laptopa w tej cenie. Dzięki wydajnemu procesorowi Core i9-12900H i procesorowi graficznemu RTX 3070 Ti Laptop wraz z jasnym, żywym panelem OLED i wygodą, jaką zapewnia Asus Dial, ProArt StudioBook 16 ma potencjał, by odwieść Cię od MacBooka Pro.
Wydajność dzięki kombinacji Core i9-12900H i RTX 3070 Ti Laptop GPU nie sprawia żadnych niespodzianek. W rzeczywistości nawet wyprzedza swoich konkurentów, takich jak MSI Creator Z17 i Ryzen 9 6900HX-powered Asus ROG Zephyrus Duo 16 i Lenovo ThinkBook 16p G3, przynajmniej pod względem wydajności procesora
.Procesor graficzny RTX 3070 Ti Laptop jest świetny do gier w QHD i powinien być więcej niż wystarczający do zapewnienia wystarczającej ilości soków dla aplikacji do tworzenia treści, zwłaszcza ze sterownikami Nvidia Studio.
Asus wyraźnie celuje w tłum MacBook Pro, a ProArt StudioBook 16 znacznie wyprzedza konkurencję z Cupertino, jeśli chodzi o surową wydajność. Mimo to MacBooki oparte na krzemie Apple mają przewagę architektoniczną pod względem wydajności z dala od ściany i czasu pracy na baterii.
Ponadto, jak widać w benchmarku Affinity Photo 2, aplikacje zoptymalizowane specjalnie dla krzemu Apple mogą wykazywać znacznie lepszą wydajność niż ich wersje x86.
Asus ProArt StudioBook 16 nie jest jednak pozbawiony kilku niedociągnięć. Wydajności Wi-Fi przydałoby się trochę stabilności i dodać przepustowość w paśmie 6 GHz 6E. Wydajność kart SD również może być znacznie lepsza, biorąc pod uwagę docelową grupę odbiorców.
Trzyprzyciskowy touchpad jest jednym z najlepszych, jakie można dostać w laptopie z Windows, ale wymaga jeszcze dopracowania pod względem czułości. Akumulator o pojemności 90 Whr oferuje ponadprzeciętne czasy pracy, ale to tylko w warunkach testowych.
Podsumowując, Asus ProArt StudioBook 16 łączy formę i funkcjonalność z równie dobrą wydajnością, co czyni go zdecydowanie wartym rozważenia dla twórców treści, jeśli cena nie stanowi dla nich bariery.
Ceny i dostępność
Testowana konfiguracja Asus ProArt StudioBook 16 H7600 z procesorem Core i9-12900H i kartą graficzną RTX 3070 Ti Laptop jest dostępny w cenie ₹2,49,990 (~3,015 USD) na Amazon India.
W USA ProArt StudioBook 16 z procesorem Core i7-12700H, GPU RTX 3070 Ti Laptop, 16 GB RAM i 2 TB NVMe storage można mieć za 2 549 USD na Amazon US i za około 2 699,99 USD ze strony Best Buy.
Kupujący mogą również zdecydować się na ProArt StudioBook 16 SKU featuring the Nvidia RTX A3000 Laptop GPU za 2 971 USD na stronie Amazon US.
Asus ProArt StudioBook 16 H7600ZW
- 25/02/2023 v7 (old)
Vaidyanathan Subramaniam
Przezroczystość
Wyboru urządzeń do recenzji dokonuje nasza redakcja. Próbka testowa została udostępniona autorowi jako pożyczka od producenta lub sprzedawcy detalicznego na potrzeby tej recenzji. Pożyczkodawca nie miał wpływu na tę recenzję, producent nie otrzymał też kopii tej recenzji przed publikacją. Nie było obowiązku publikowania tej recenzji. Jako niezależna firma medialna, Notebookcheck nie podlega władzy producentów, sprzedawców detalicznych ani wydawców.
Tak testuje Notebookcheck
Każdego roku Notebookcheck niezależnie sprawdza setki laptopów i smartfonów, stosując standardowe procedury, aby zapewnić porównywalność wszystkich wyników. Od około 20 lat stale rozwijamy nasze metody badawcze, ustanawiając przy tym standardy branżowe. W naszych laboratoriach testowych doświadczeni technicy i redaktorzy korzystają z wysokiej jakości sprzętu pomiarowego. Testy te obejmują wieloetapowy proces walidacji. Nasz kompleksowy system ocen opiera się na setkach uzasadnionych pomiarów i benchmarków, co pozwala zachować obiektywizm.Price comparison

