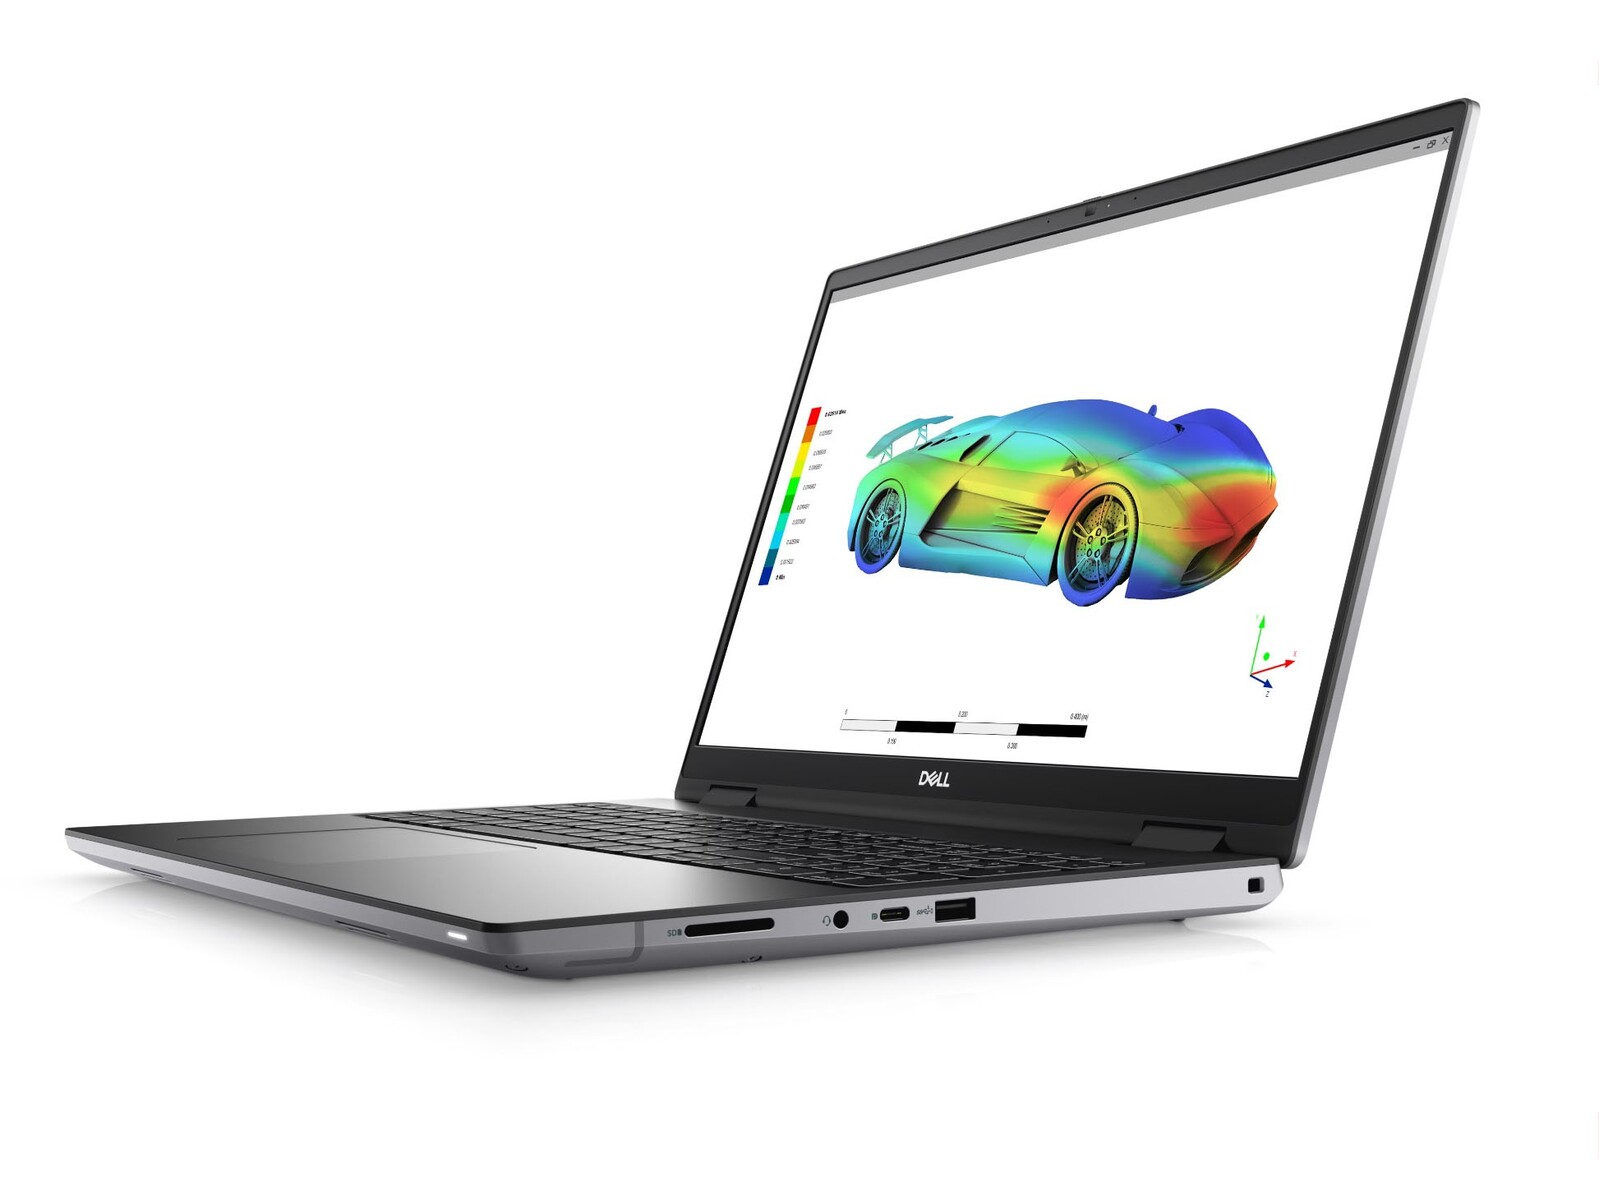
Debiut Nvidia RTX A5500: Recenzja stacji roboczej Dell Precision 7670 Performance
Dell podejmuje spore ryzyko ze swoją nową serią Precision 7670. Jest to nie tylko pierwszy produkcyjny laptop wykorzystujący CAMMale sama seria składa się z cieńszego modelu i mocniejszego grubszego modelu (zwanego "Performance" lub "Ultimate") w zależności od konfiguracji. Cieńszy model recenzowaliśmy w zeszłym miesiącu, więc teraz przyjrzymy się grubszemu modelowi.
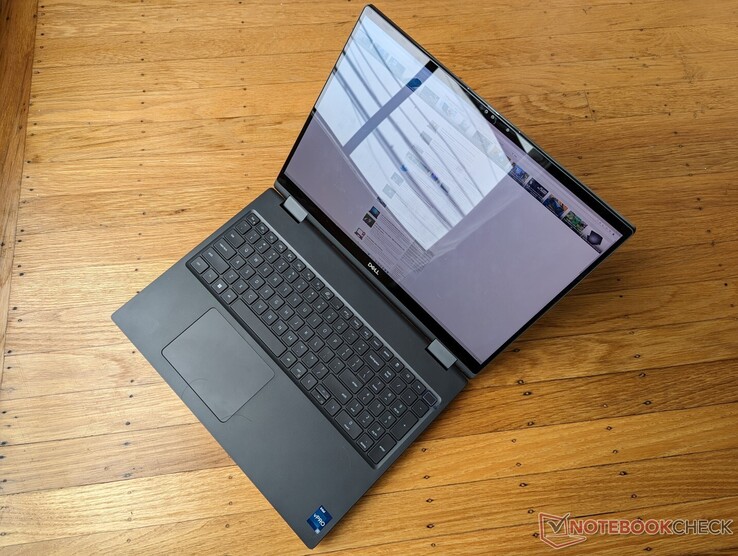
Poza niewielkimi różnicami w wysokości Z, oba modele mają dokładnie taką samą konstrukcję obudowy i funkcje. Polecamy sprawdzić naszą istniejącą recenzję cieńszego modelu Precision 7670 aby dowiedzieć się więcej o cechach fizycznych tej serii.
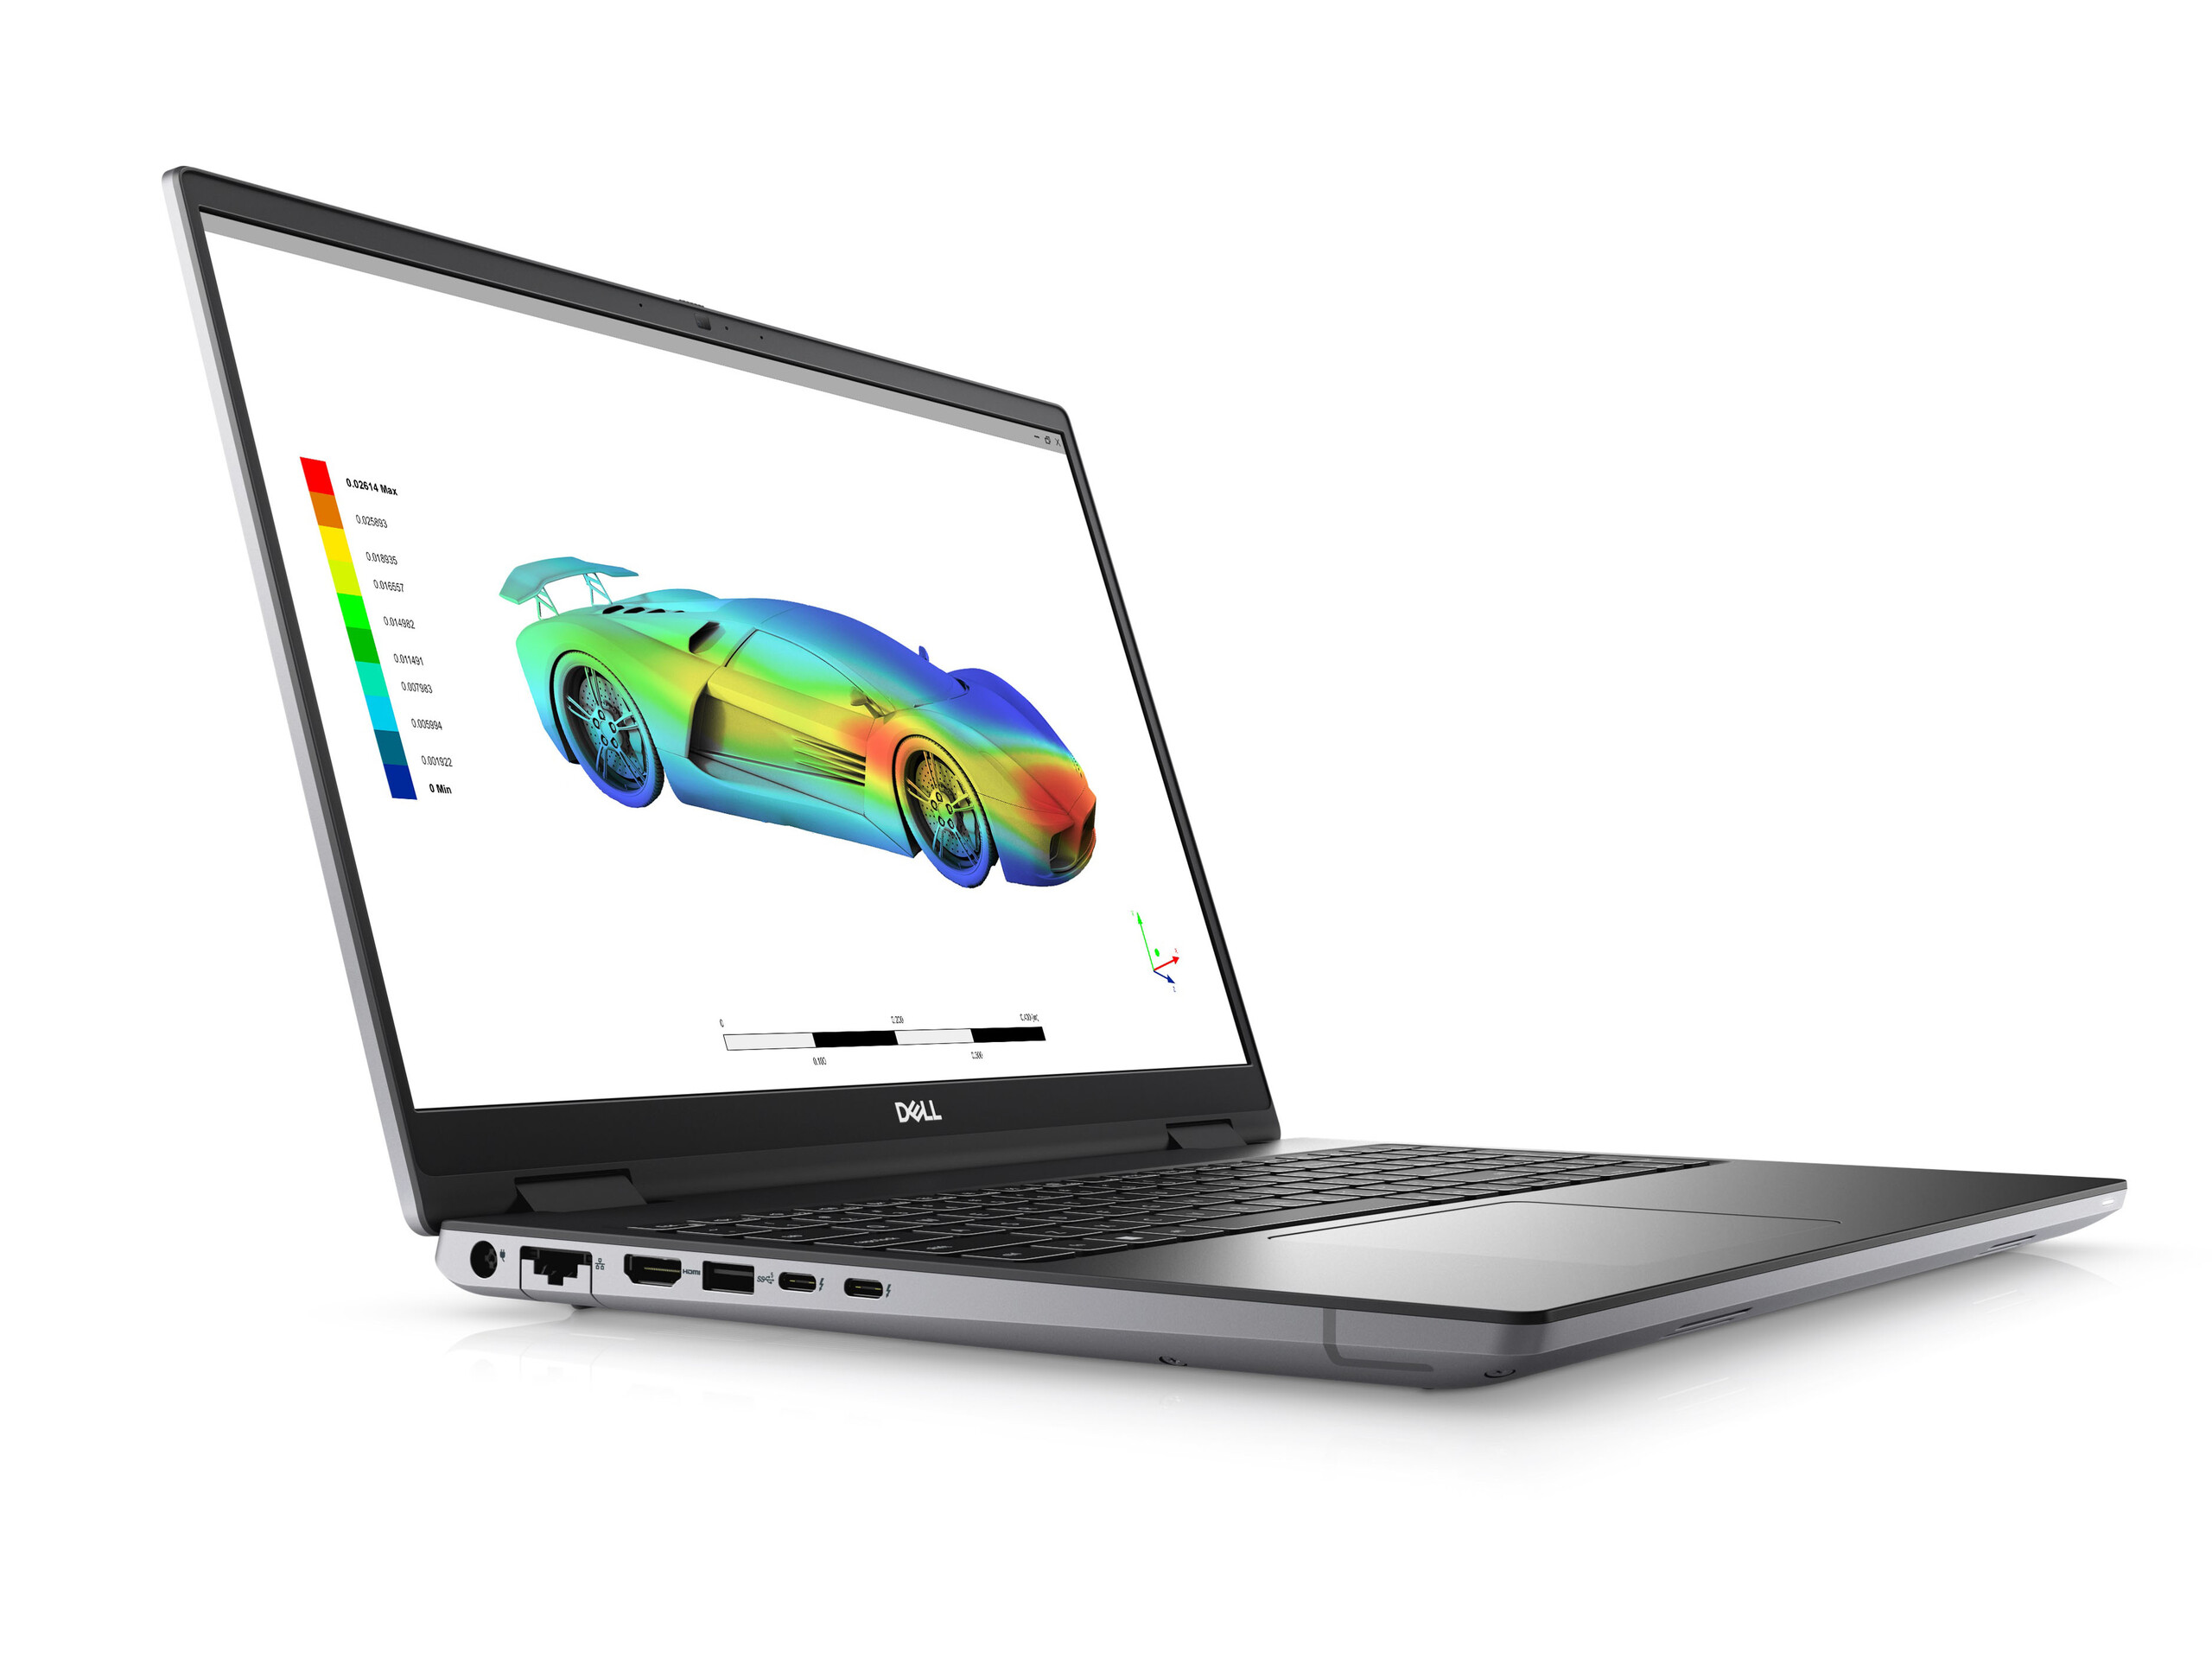
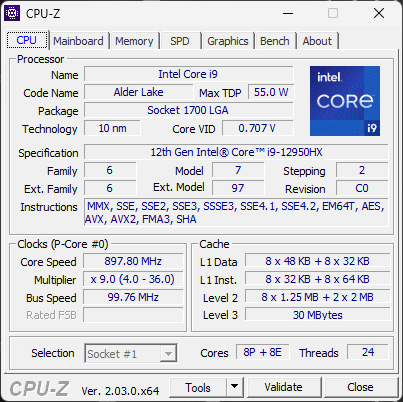
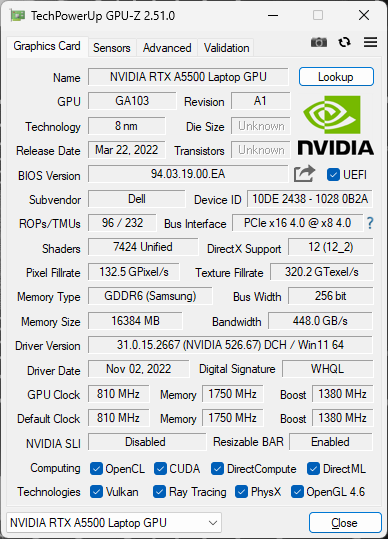
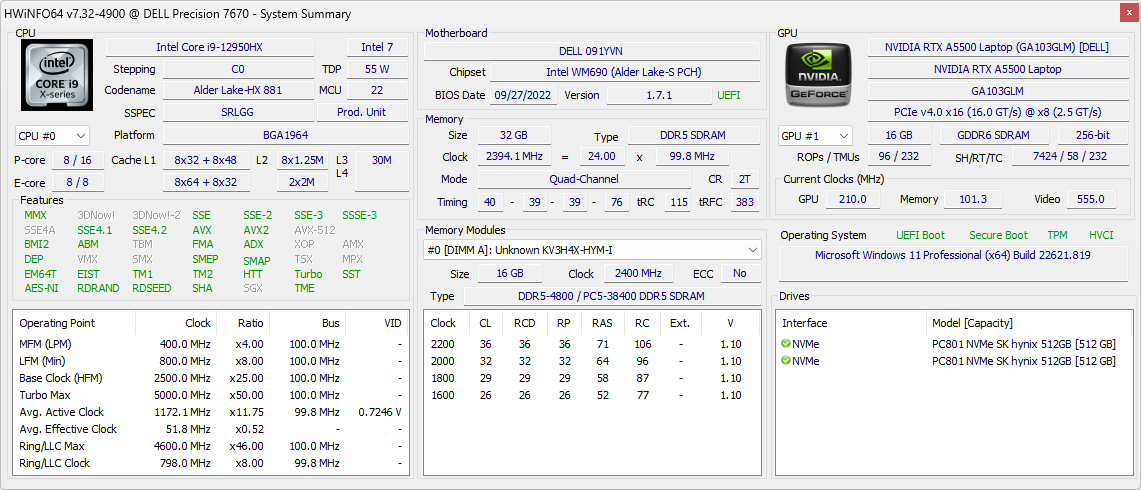
Nasz konkretny egzemplarz recenzencki to najwyższa konfiguracja z procesorem Core i9-12950HX, GPU RTX A5500 i ekranem dotykowym OLED 2400p 16:10 za około 7000 USD. Mniejsze SKU schodzą do Core i7-12850HX lub RTX A4500, ale wszystkie opcje są wyposażone w ten sam ekran dotykowy IPS o rozdzielczości 2400p. Z kolei cieńszy Precision 7670 może zejść tylko do GPU RTX A2000.
Konkurenci w tej przestrzeni obejmują inne 16-calowe mobilne stacje robocze, jak np.MSI CreatorPro Z16P,HP ZBook Studio 16lubLenovo ThinkPad P1 G4.
Więcej recenzji Della:
Potencjalni konkurenci w porównaniu
Ocena | Data | Model | Waga | Wysokość | Rozmiar | Rezolucja | Cena |
|---|---|---|---|---|---|---|---|
| 89.1 % v7 (old) | 12/2022 | Dell Precision 7000 7670 Performance i9-12950HX, RTX A5500 Laptop GPU | 2.8 kg | 25.95 mm | 16.00" | 3840x2400 | |
| 84.3 % v7 (old) | 11/2022 | MSI CreatorPro Z16P B12UKST i7-12700H, RTX A3000 Laptop GPU | 2.4 kg | 19 mm | 16.00" | 2560x1600 | |
| 90.1 % v7 (old) | 11/2022 | HP ZBook Studio 16 G9 62U04EA i7-12800H, RTX A2000 Laptop GPU | 1.8 kg | 19 mm | 16.00" | 3840x2400 | |
| 82.9 % v7 (old) | 10/2022 | HP ZBook Firefly 16 G9-6B897EA i7-1265U, T550 Laptop GPU | 2 kg | 19.2 mm | 16.00" | 1920x1200 | |
| 89.3 % v7 (old) | Lenovo ThinkPad P1 G4-20Y4Z9DVUS i7-11800H, T1200 Laptop GPU | 1.8 kg | 17.7 mm | 16.00" | 2560x1600 | ||
| 88.4 % v7 (old) | 10/2022 | Dell Precision 7670 i7-12850HX, RTX A2000 Laptop GPU | 2.7 kg | 24.7 mm | 16.00" | 3840x2400 |
Sprawa
Długość i szerokość są identyczne jak w przypadku zwykłego, smuklejszego Precision 7670, natomiast grubość i waga zostały podniesione odpowiednio o około 1,3 mm i 100 g. W praktyce trudno zauważyć te różnice, gdyż zwykły Precision 7670 jest już jedną z grubszych i cięższych mobilnych stacji roboczych.
Czytnik kart SD
| SD Card Reader | |
| average JPG Copy Test (av. of 3 runs) | |
| Lenovo ThinkPad P1 G4-20Y4Z9DVUS (Angelbird AV Pro V60) | |
| Dell Precision 7670 (Toshiba Exceria Pro SDXC 64 GB UHS-II) | |
| Dell Precision 7000 7670 Performance (Toshiba Exceria Pro SDXC 64 GB UHS-II) | |
| MSI CreatorPro Z16P B12UKST (AV Pro V60) | |
| HP ZBook Studio 16 G9 62U04EA (Angelbird AV PRO V60) | |
| maximum AS SSD Seq Read Test (1GB) | |
| Dell Precision 7670 (Toshiba Exceria Pro SDXC 64 GB UHS-II) | |
| Dell Precision 7000 7670 Performance (Toshiba Exceria Pro SDXC 64 GB UHS-II) | |
| Lenovo ThinkPad P1 G4-20Y4Z9DVUS (Angelbird AV Pro V60) | |
| MSI CreatorPro Z16P B12UKST (AV Pro V60) | |
| HP ZBook Studio 16 G9 62U04EA (Angelbird AV PRO V60) | |
Komunikacja
Chociaż Intel AX211 jest obecny we wszystkich modelach Precision 7670, wydajność jest wolniejsza niż oczekiwaliśmy na naszym konkretnym urządzeniu testowym. Średnia prędkość transmisji wynosi tylko 891 Mbps po sparowaniu z naszą siecią 6 Ghz, w porównaniu z prawie dwukrotnie większą prędkością w MSI CreatorPro Z16P lub HP ZBook Firefly 16 G9 każdy z nich posiada ten sam moduł AX211. Powtórzyliśmy ten test sześć razy w dwa różne dni, by się upewnić, ale wyniki nie uległy poprawie.
| Networking | |
| iperf3 transmit AX12 | |
| Lenovo ThinkPad P1 G4-20Y4Z9DVUS | |
| iperf3 receive AX12 | |
| Lenovo ThinkPad P1 G4-20Y4Z9DVUS | |
| iperf3 receive AXE11000 6GHz | |
| MSI CreatorPro Z16P B12UKST | |
| HP ZBook Studio 16 G9 62U04EA | |
| HP ZBook Firefly 16 G9-6B897EA | |
| Dell Precision 7000 7670 Performance | |
| Dell Precision 7670 | |
| iperf3 receive AXE11000 | |
| Dell Precision 7000 7670 Performance | |
| iperf3 transmit AXE11000 | |
| Dell Precision 7000 7670 Performance | |
| iperf3 transmit AXE11000 6GHz | |
| MSI CreatorPro Z16P B12UKST | |
| HP ZBook Firefly 16 G9-6B897EA | |
| HP ZBook Studio 16 G9 62U04EA | |
| Dell Precision 7670 | |
| Dell Precision 7000 7670 Performance | |
Kamera internetowa


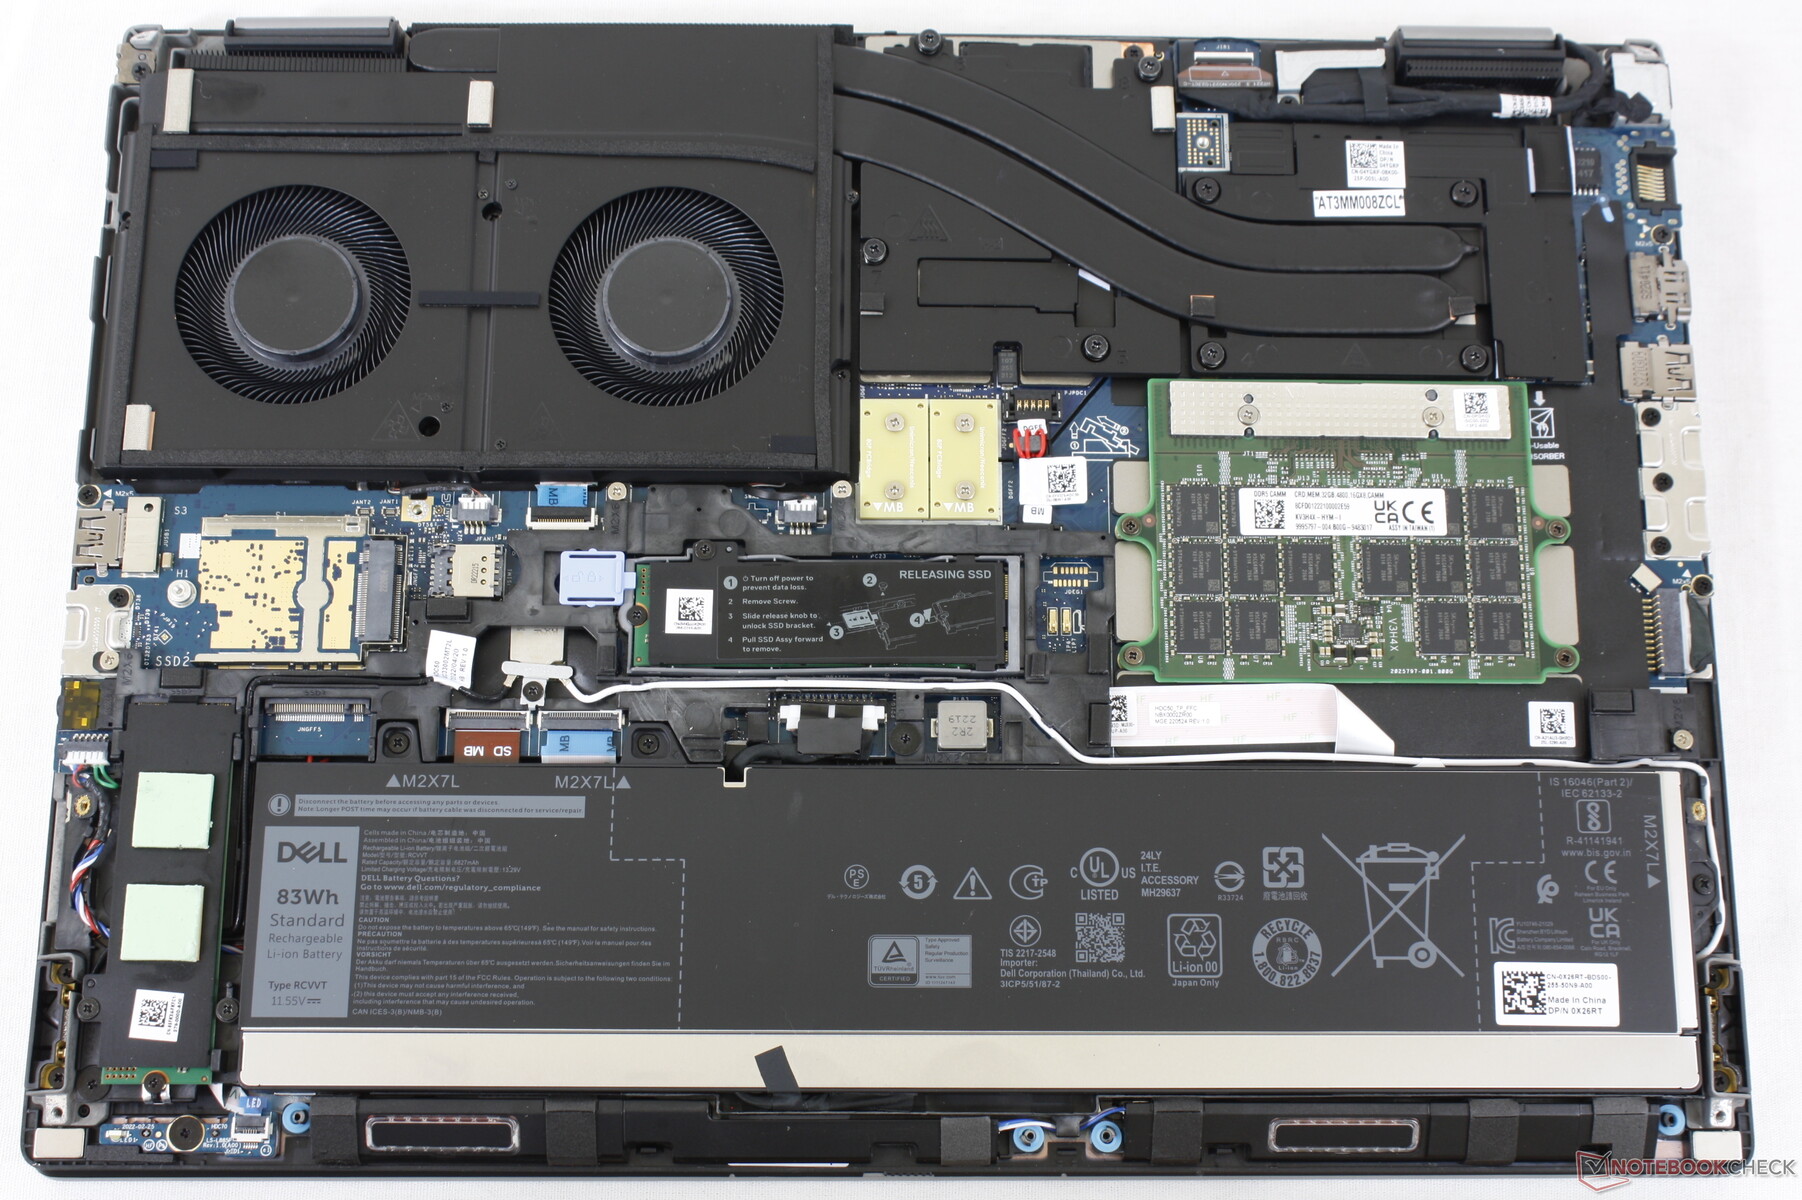
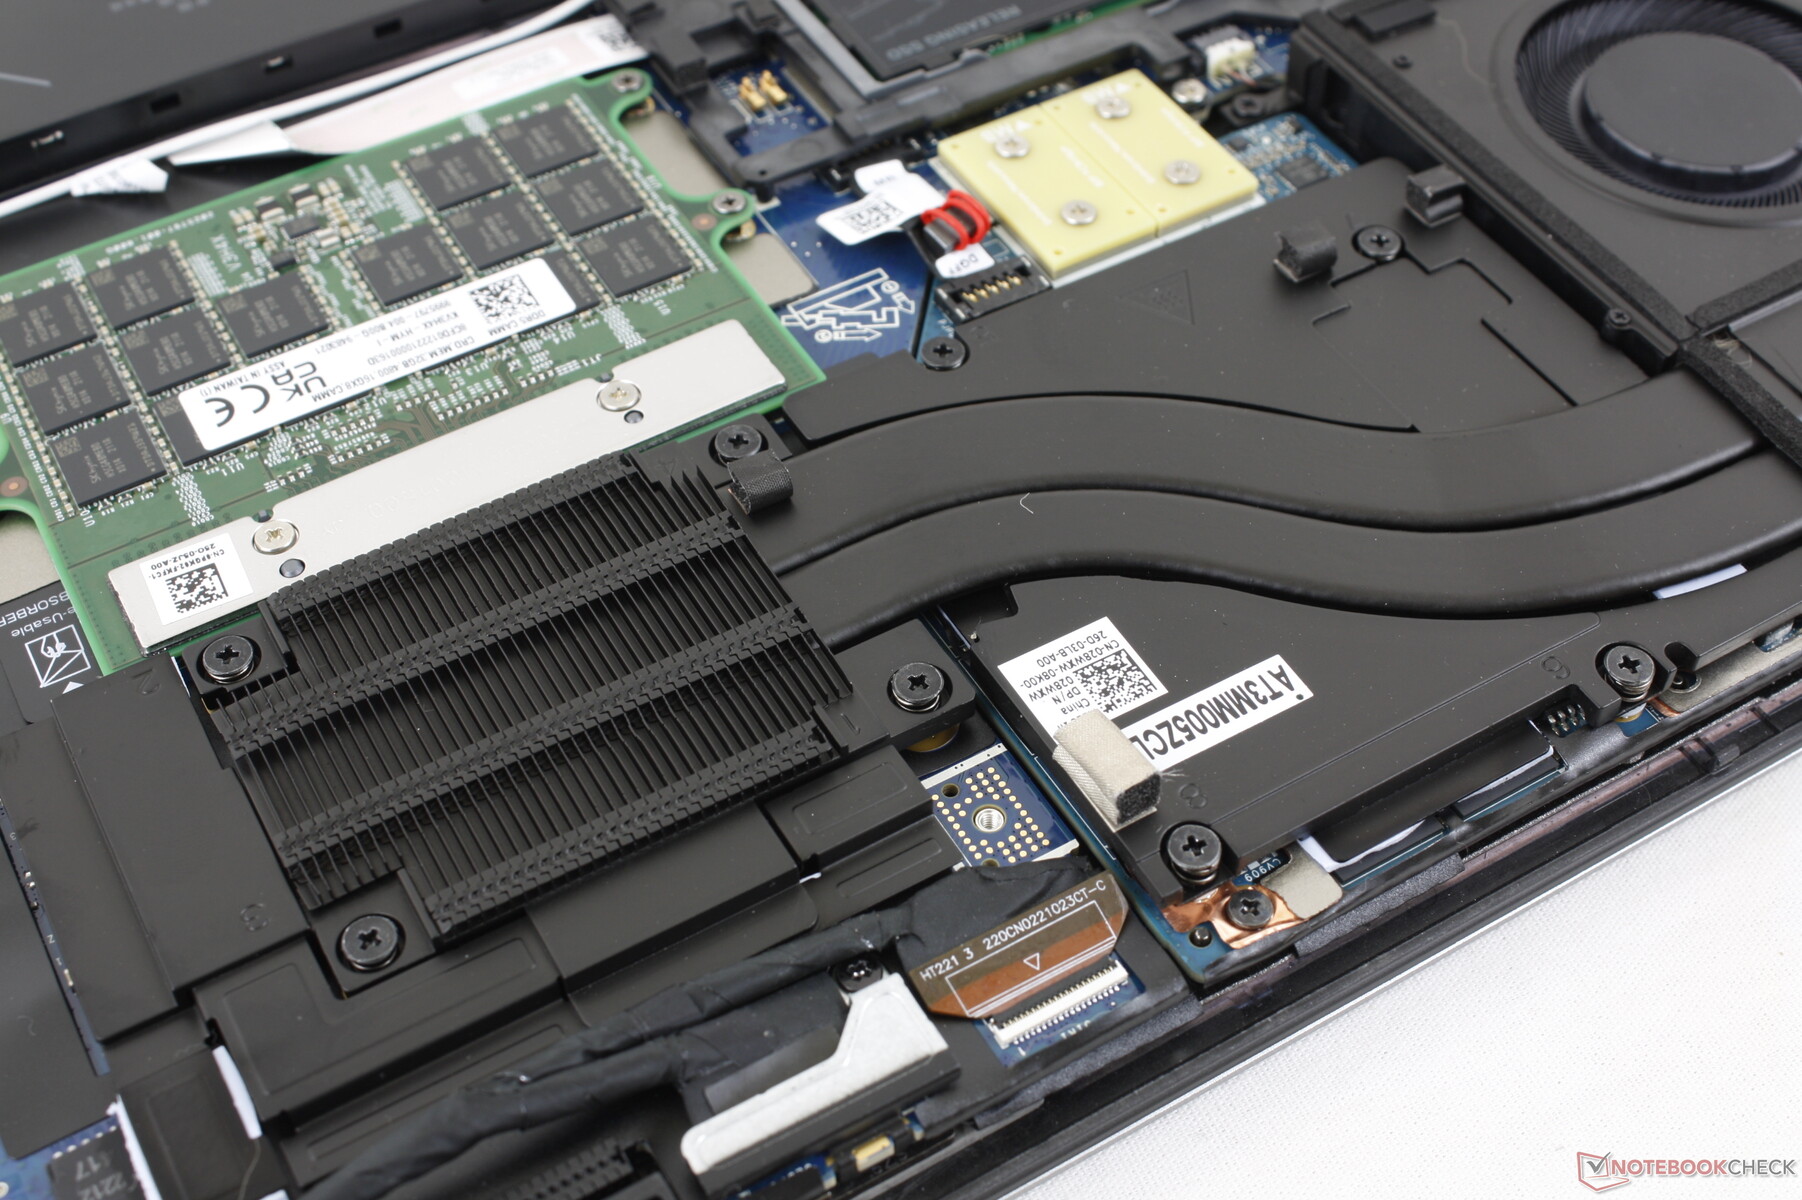
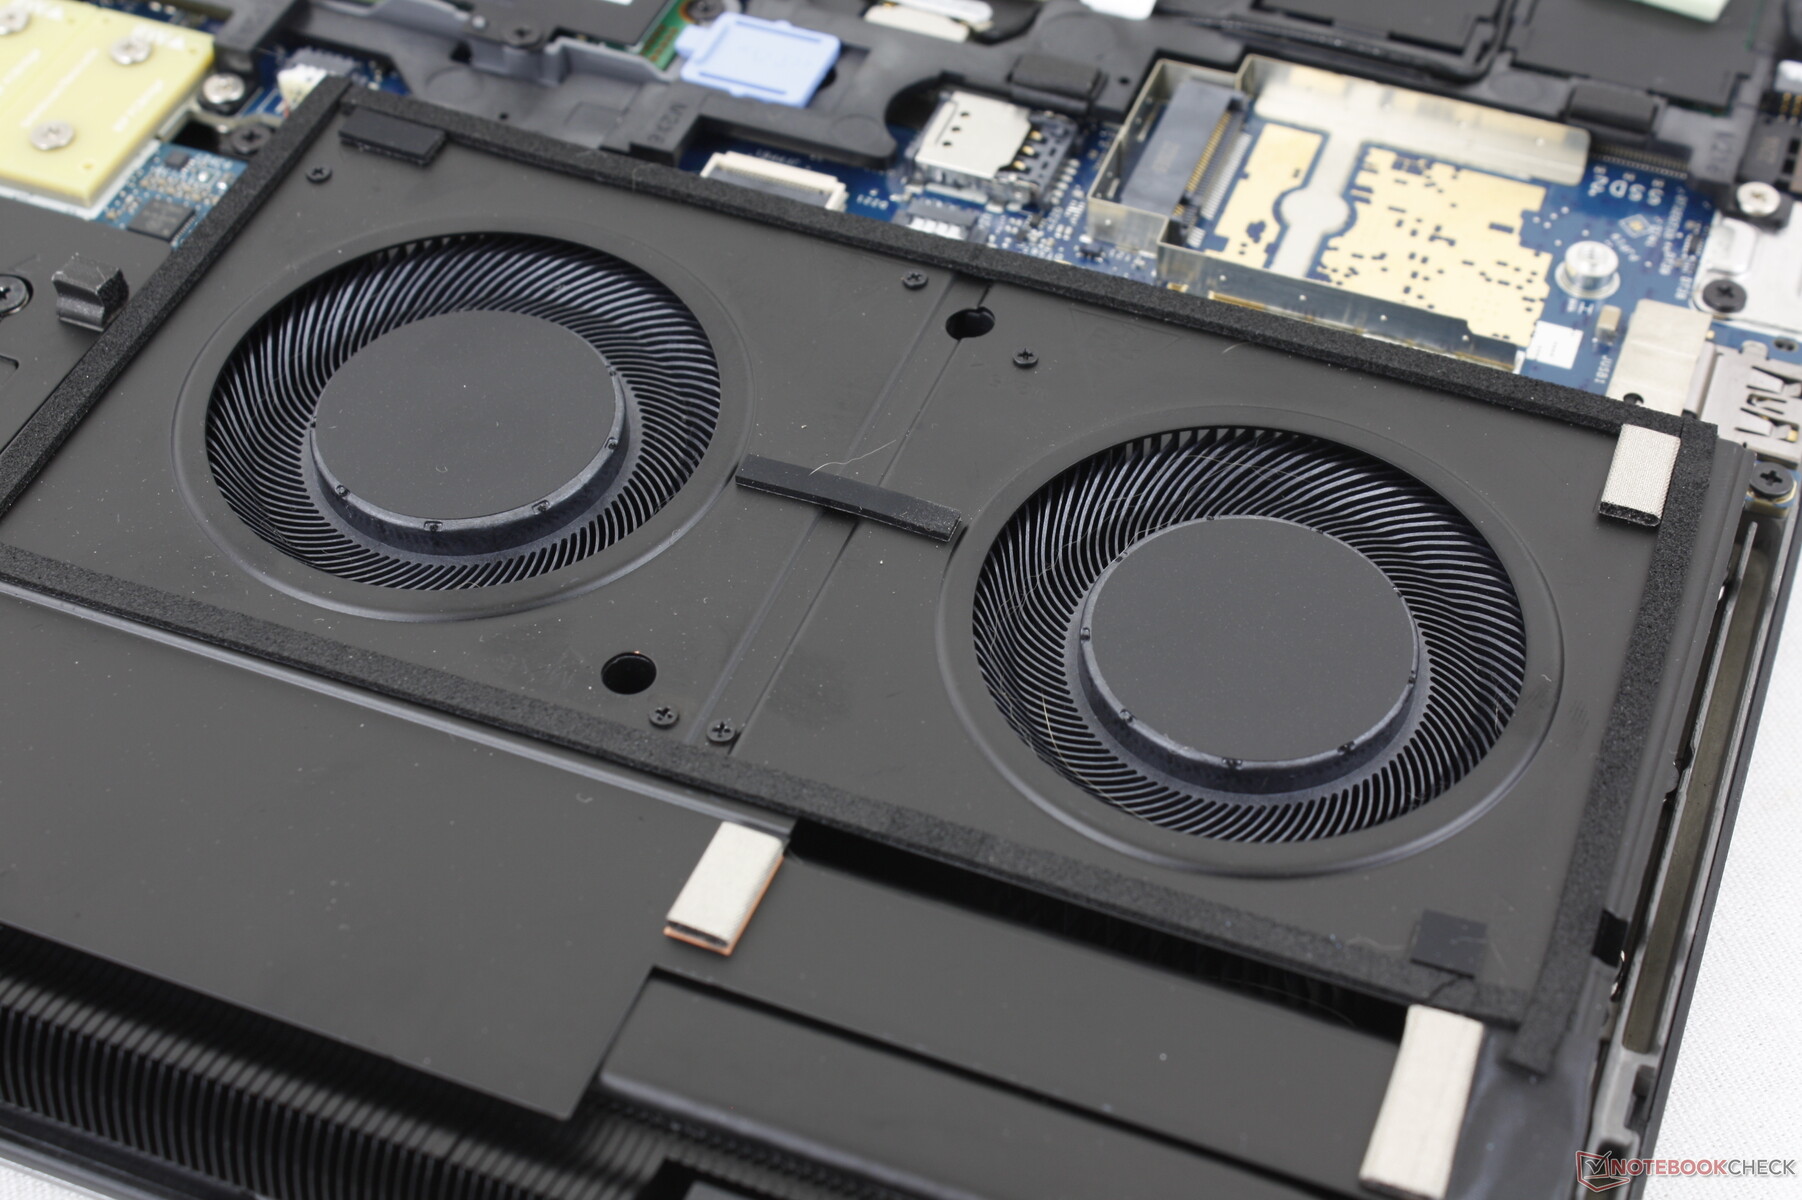
Konserwacja
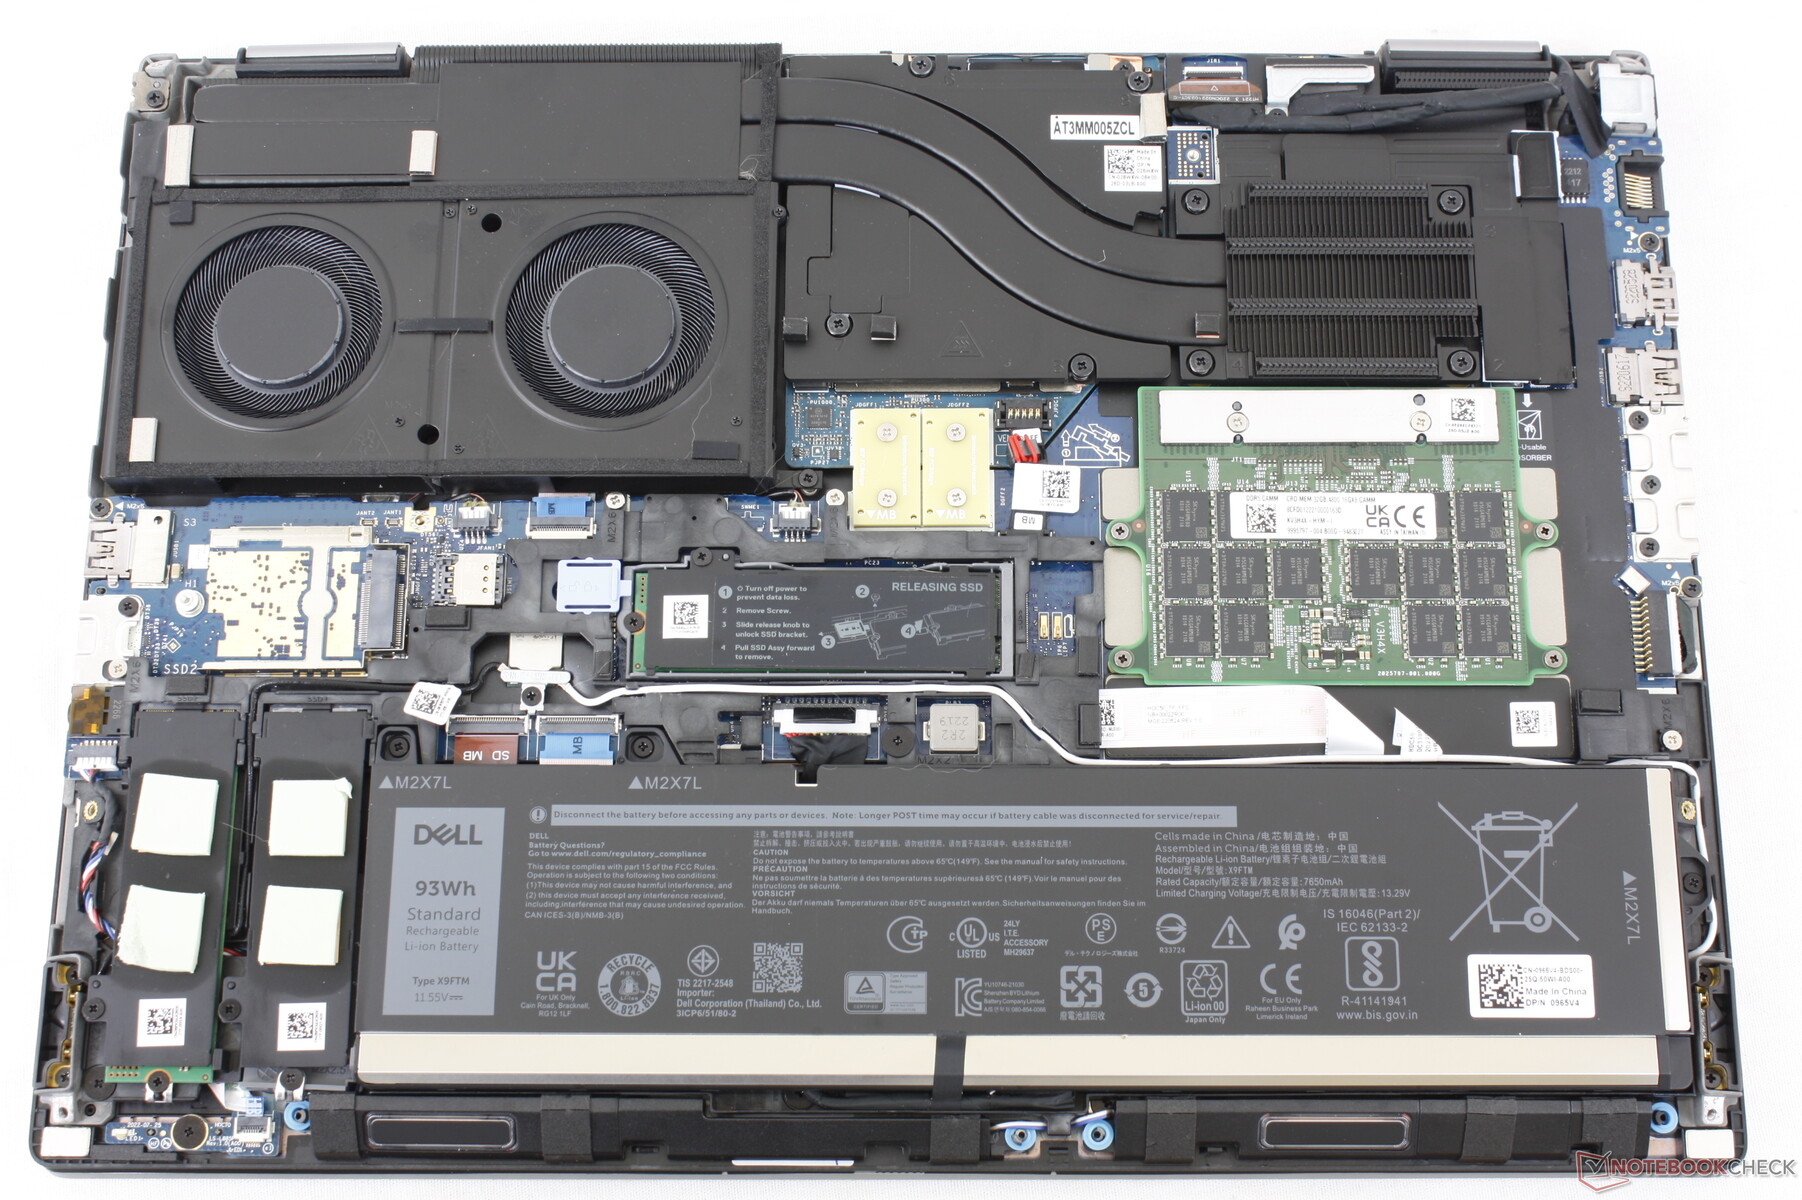
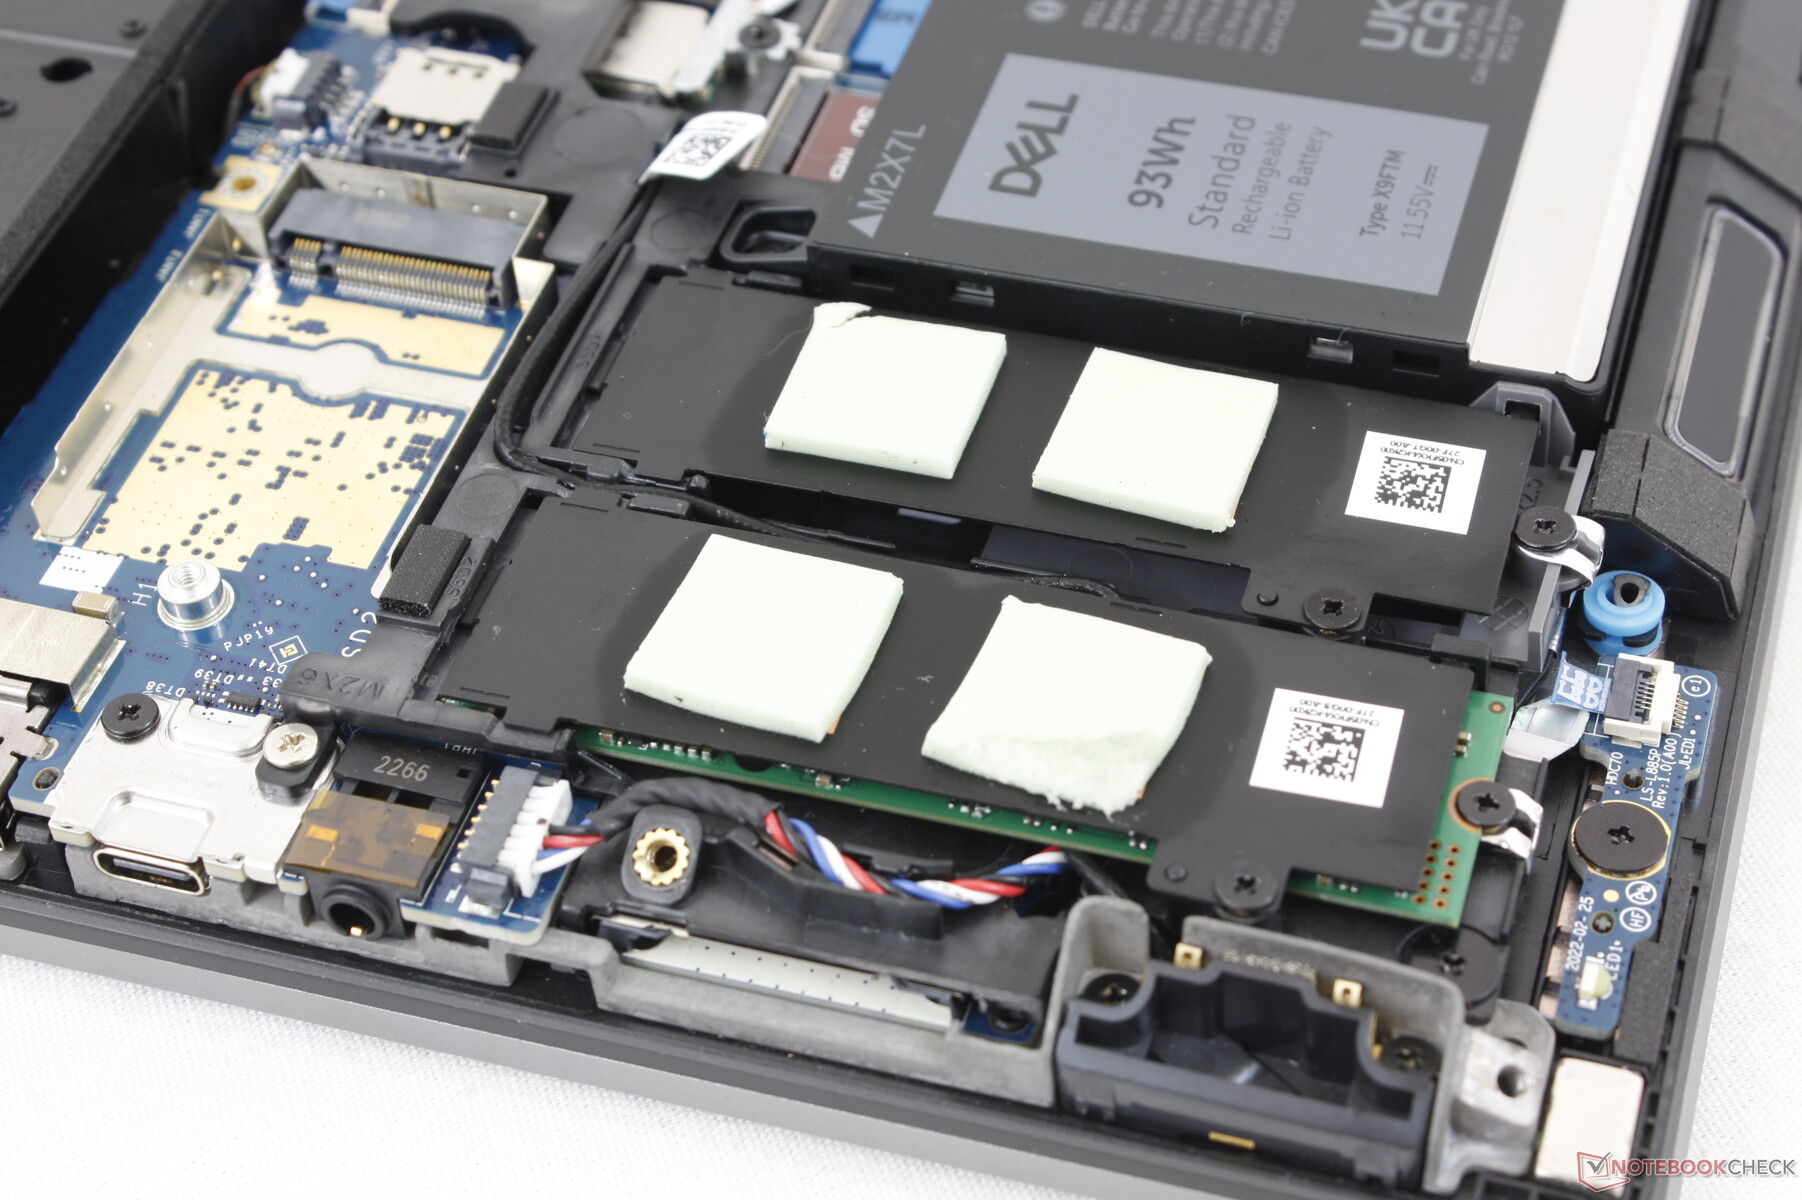
Dolny panel jest zabezpieczony sześcioma śrubkami Philipsa, co ułatwia serwisowanie. Układ wewnętrzny jest podobny do smuklejszego Precision 7670, z wyjątkiem różnic w pojemności akumulatora, liczbie dostępnych zatok pamięci masowej i obecności małego radiatora.
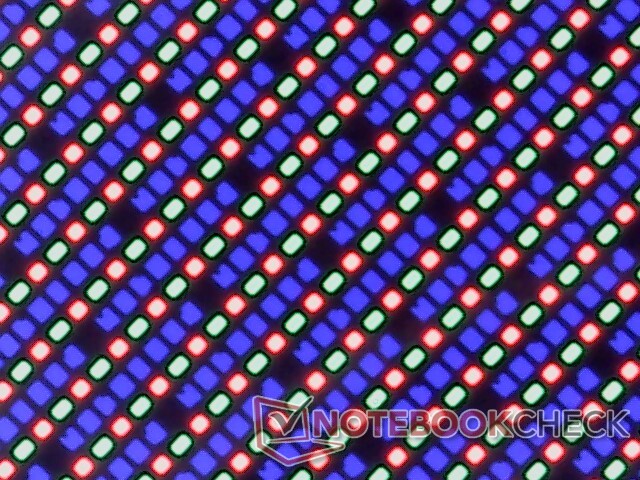
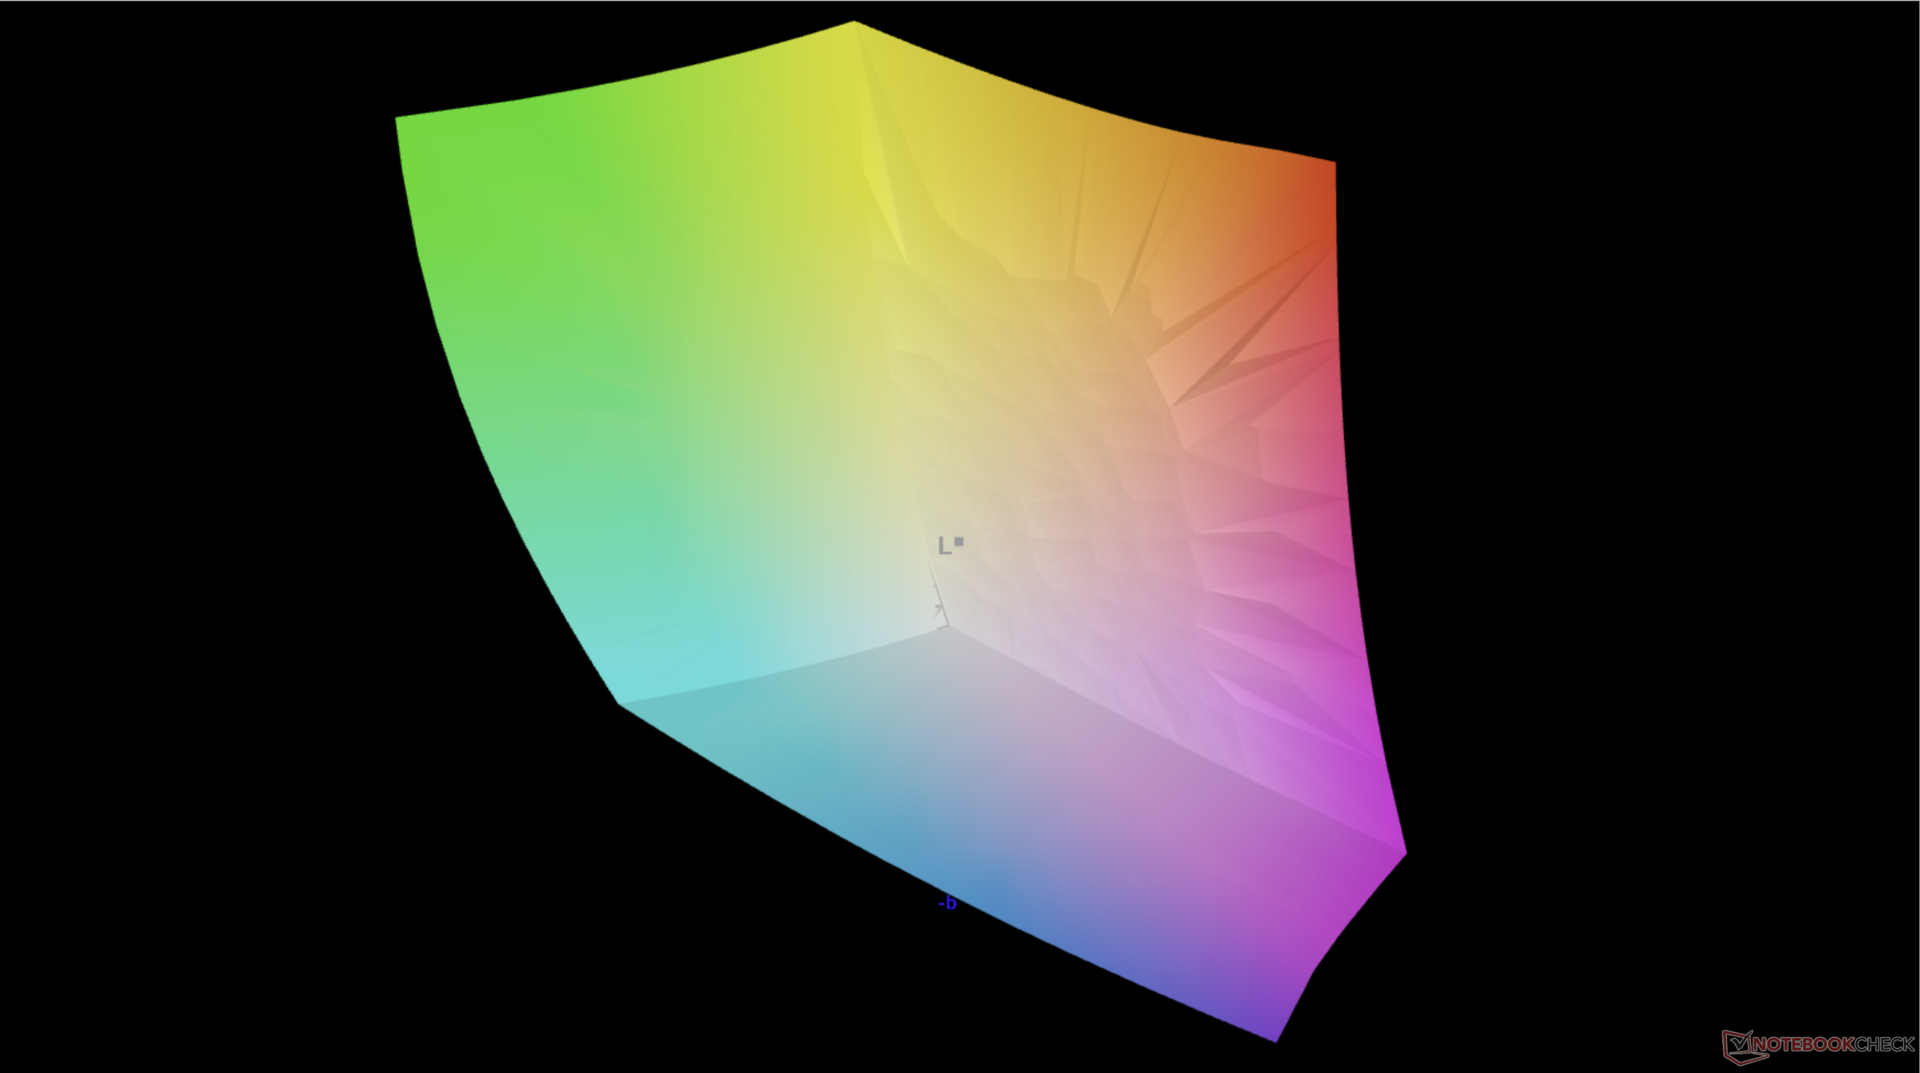
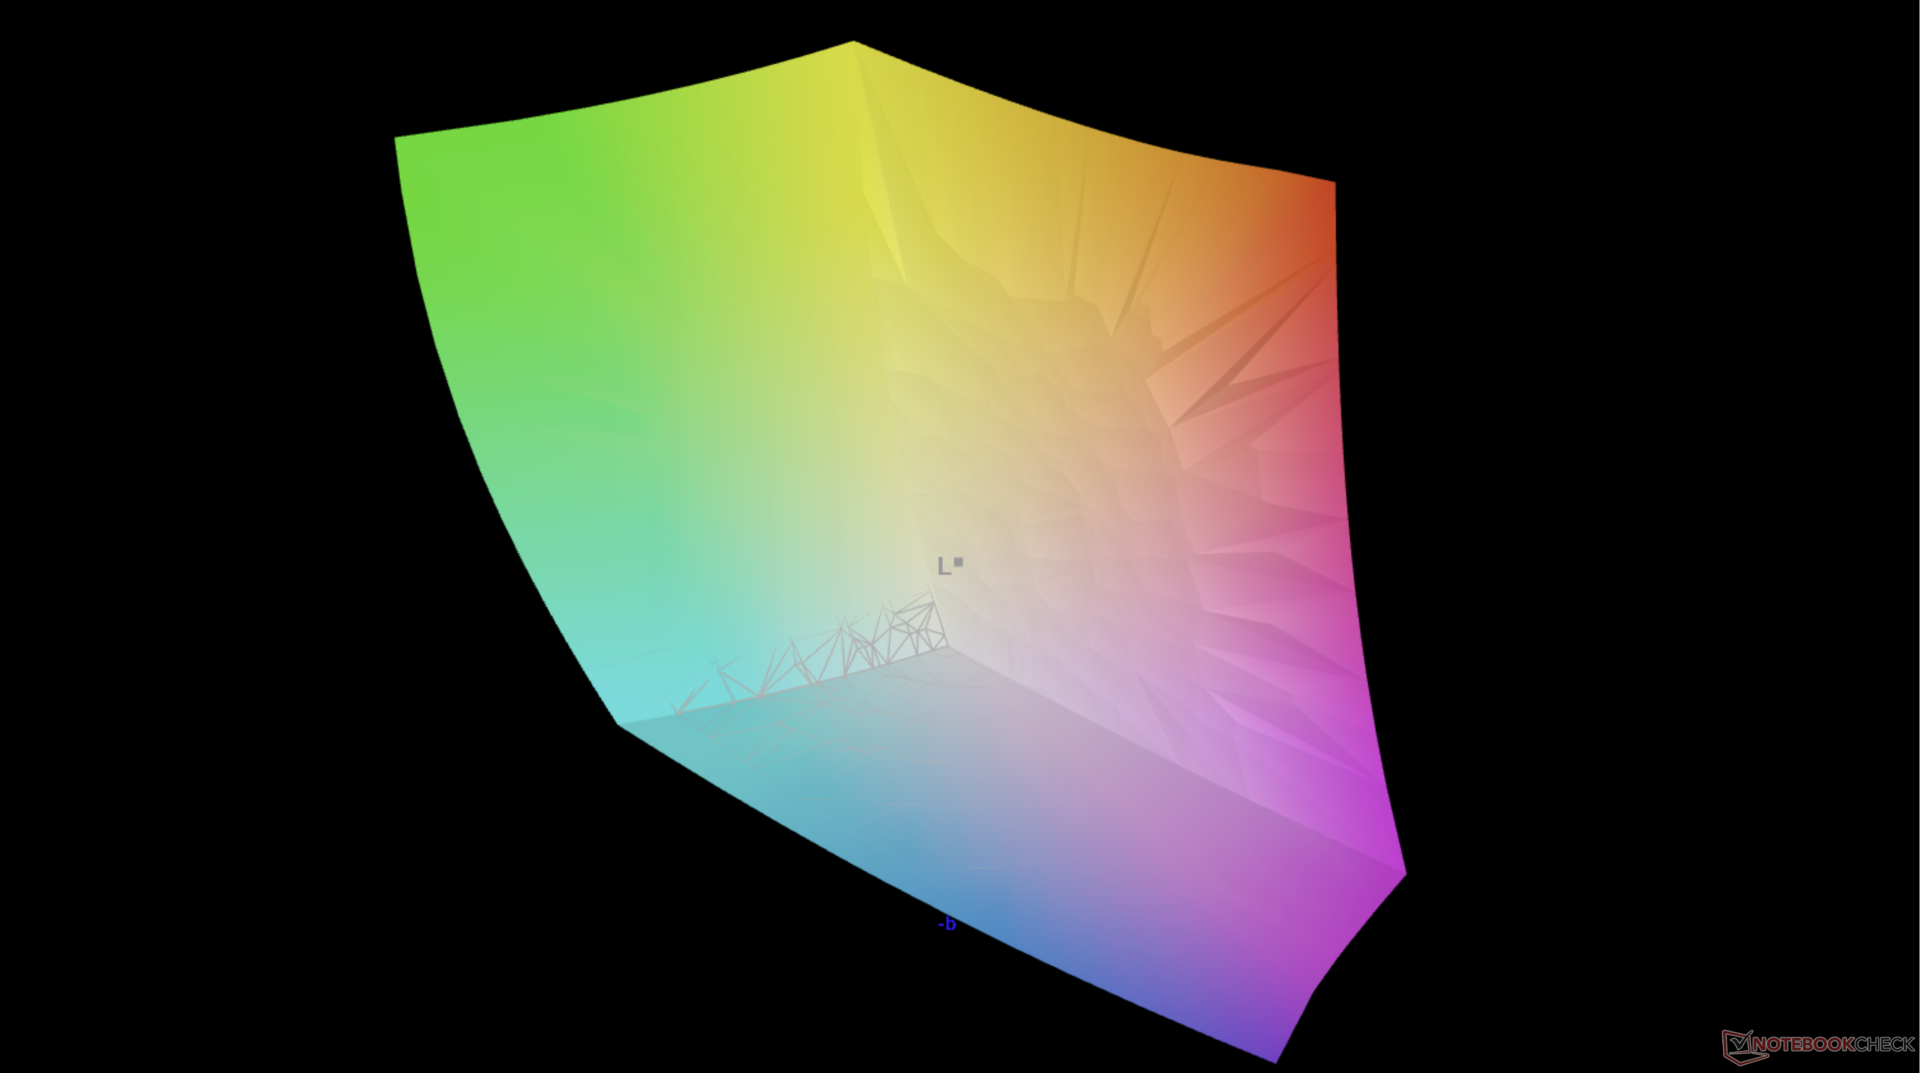
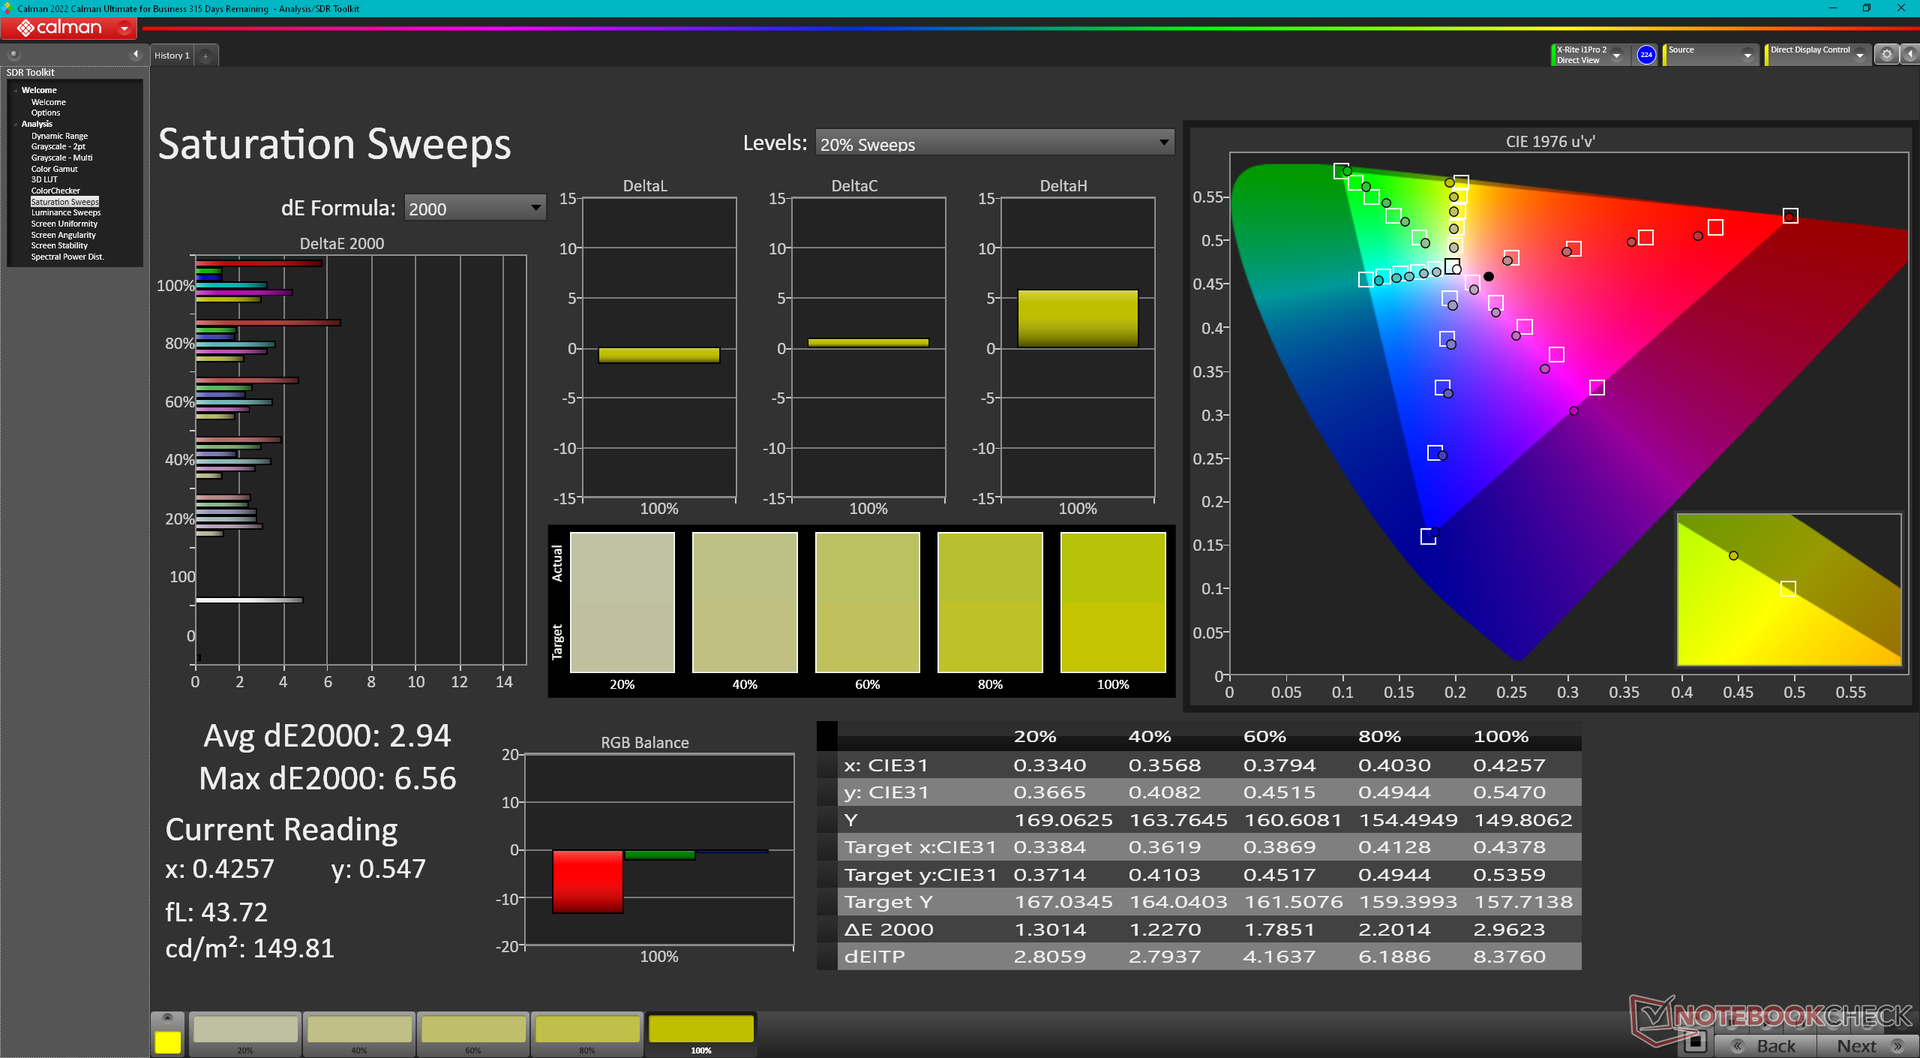
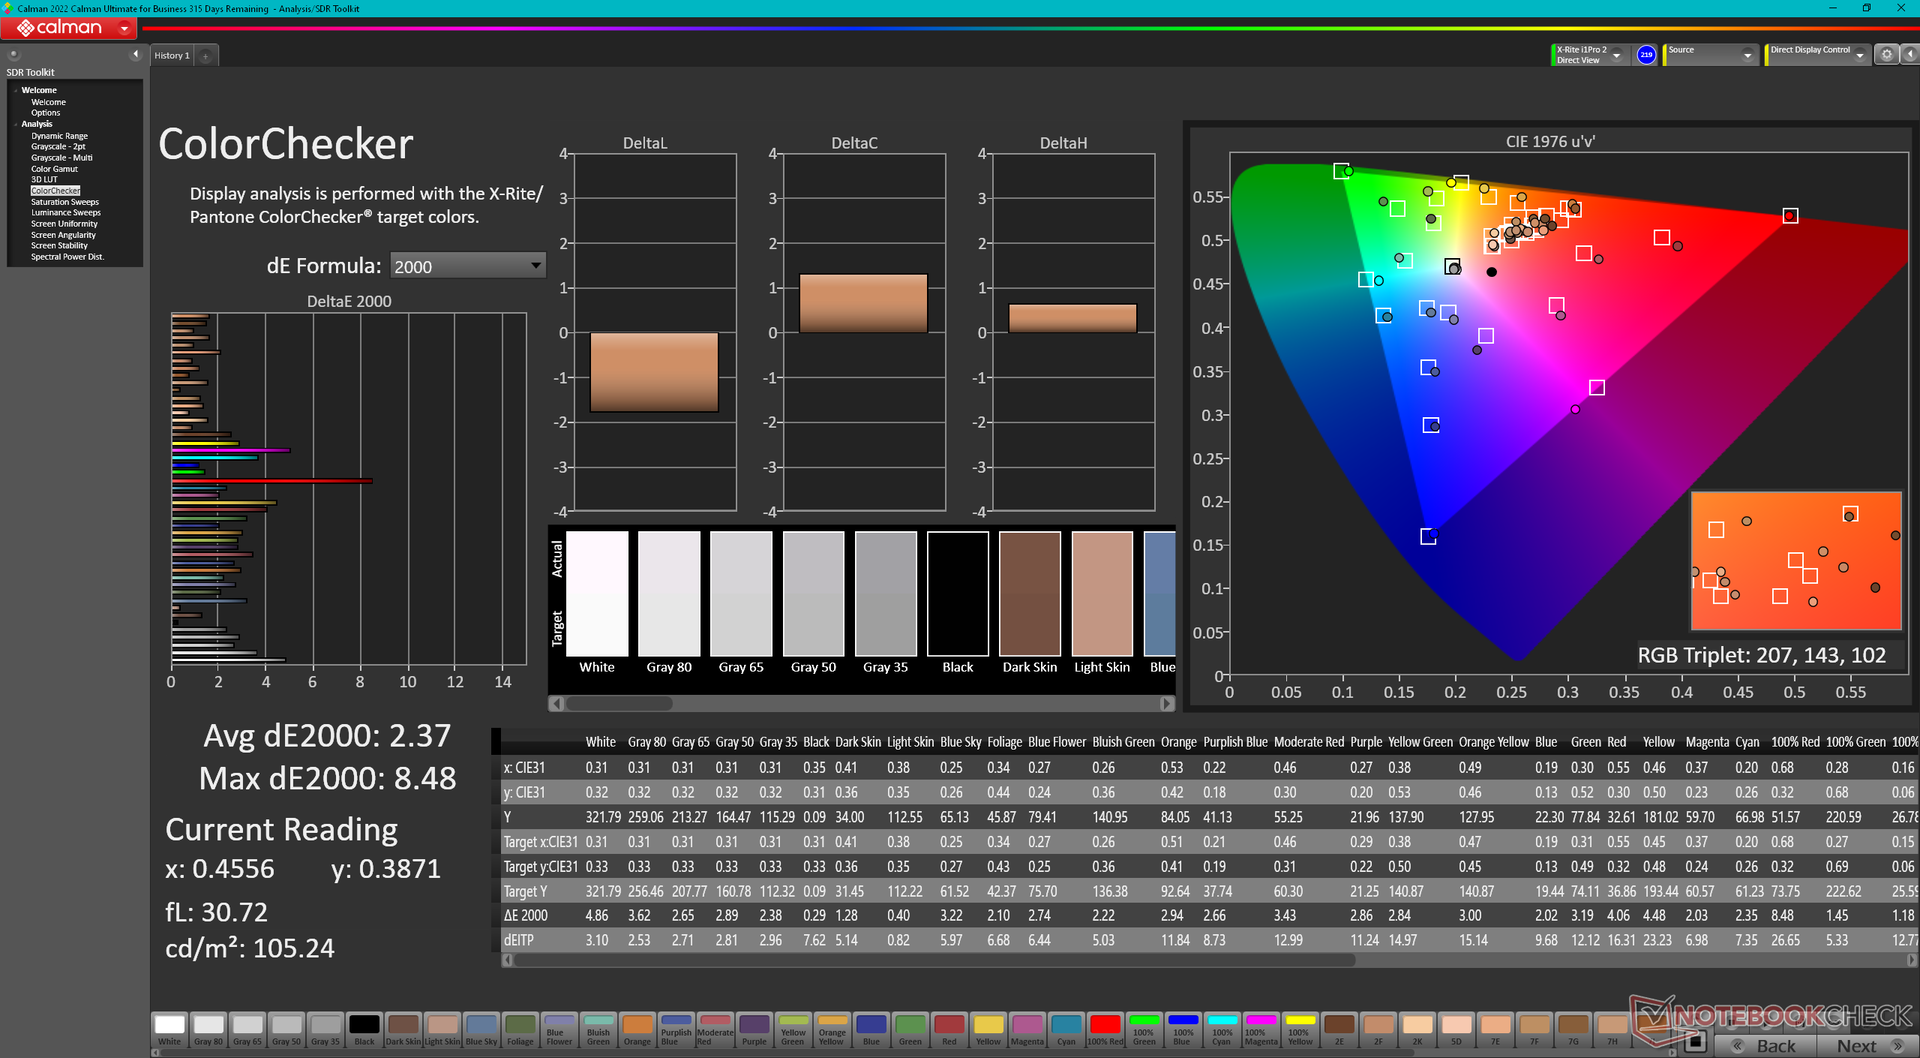
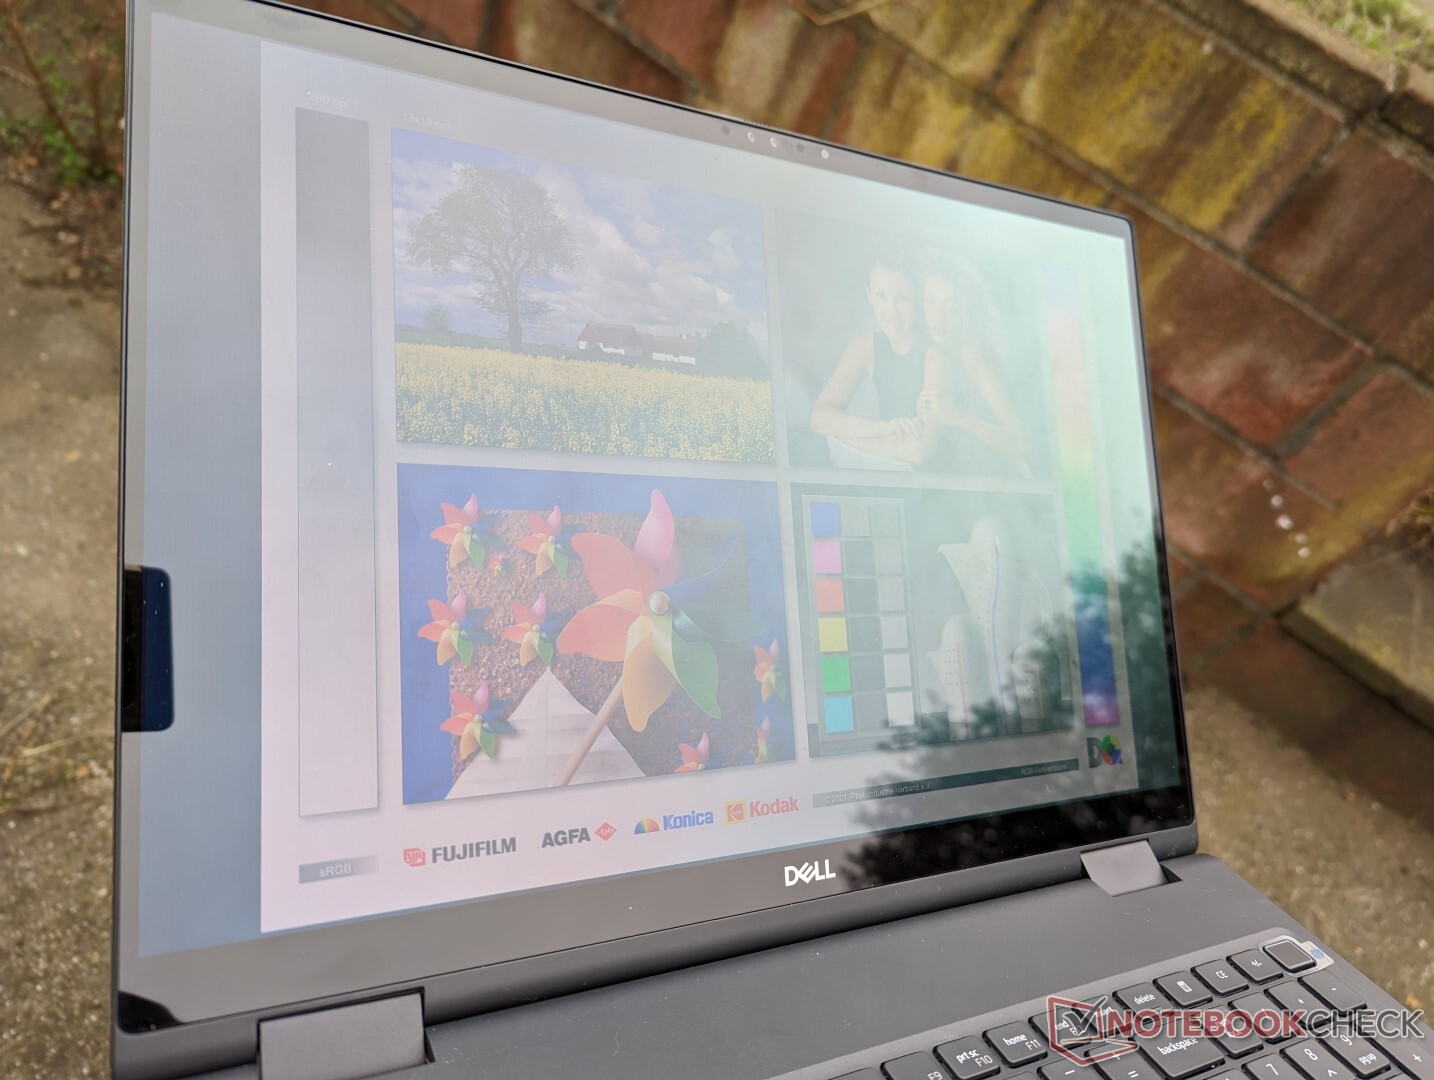
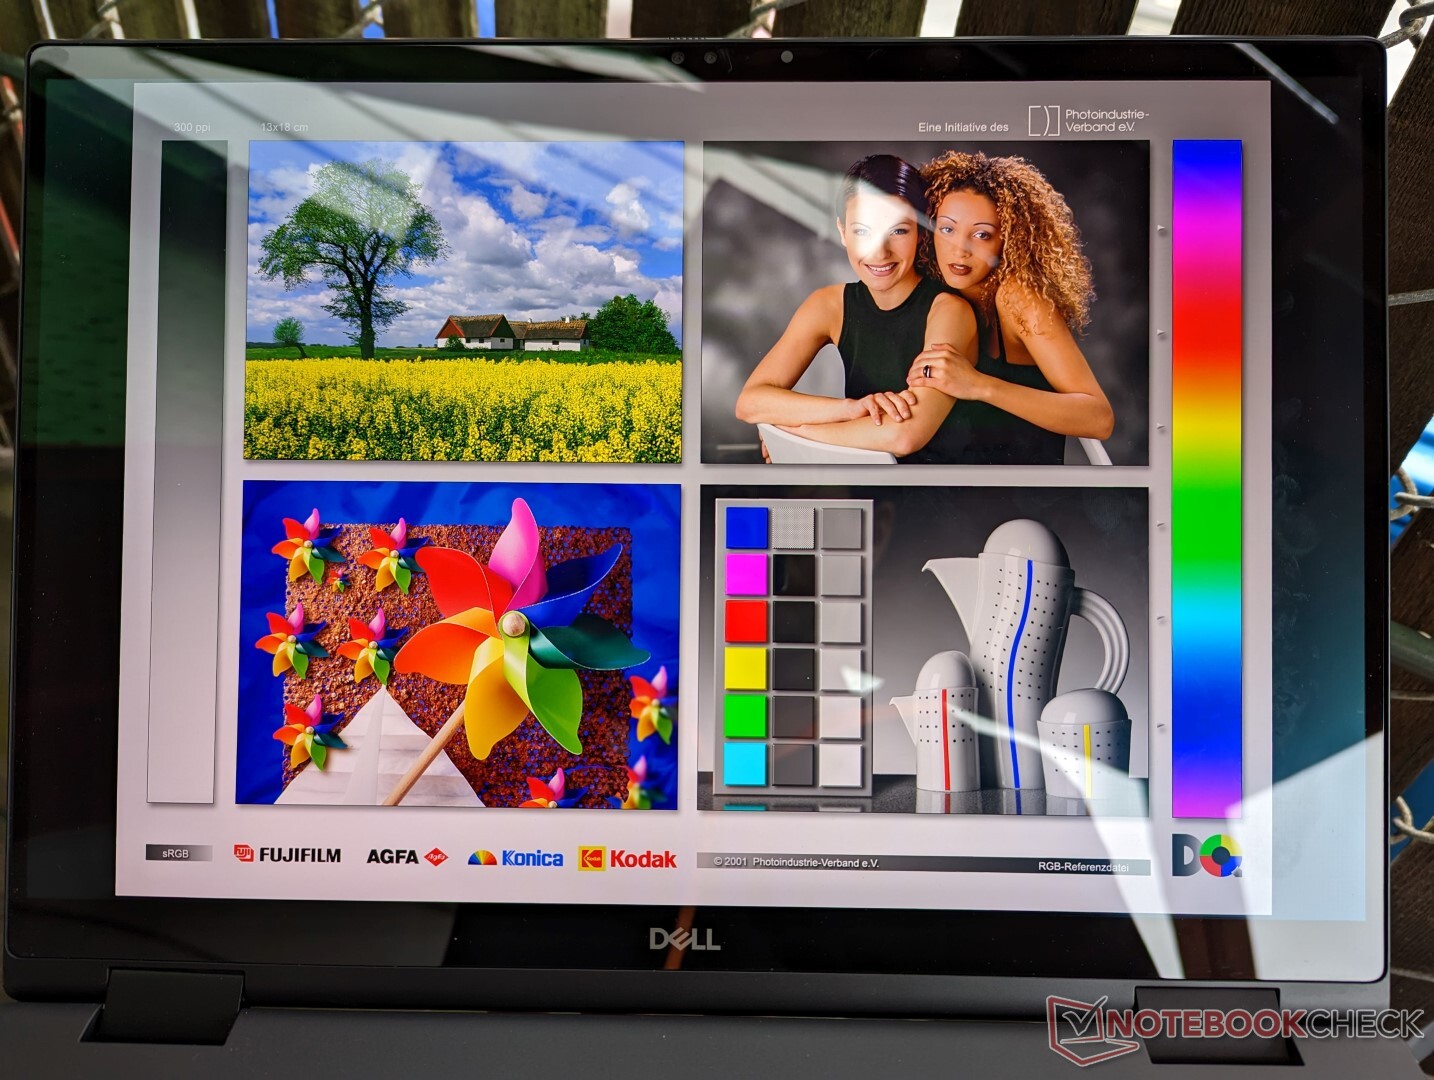
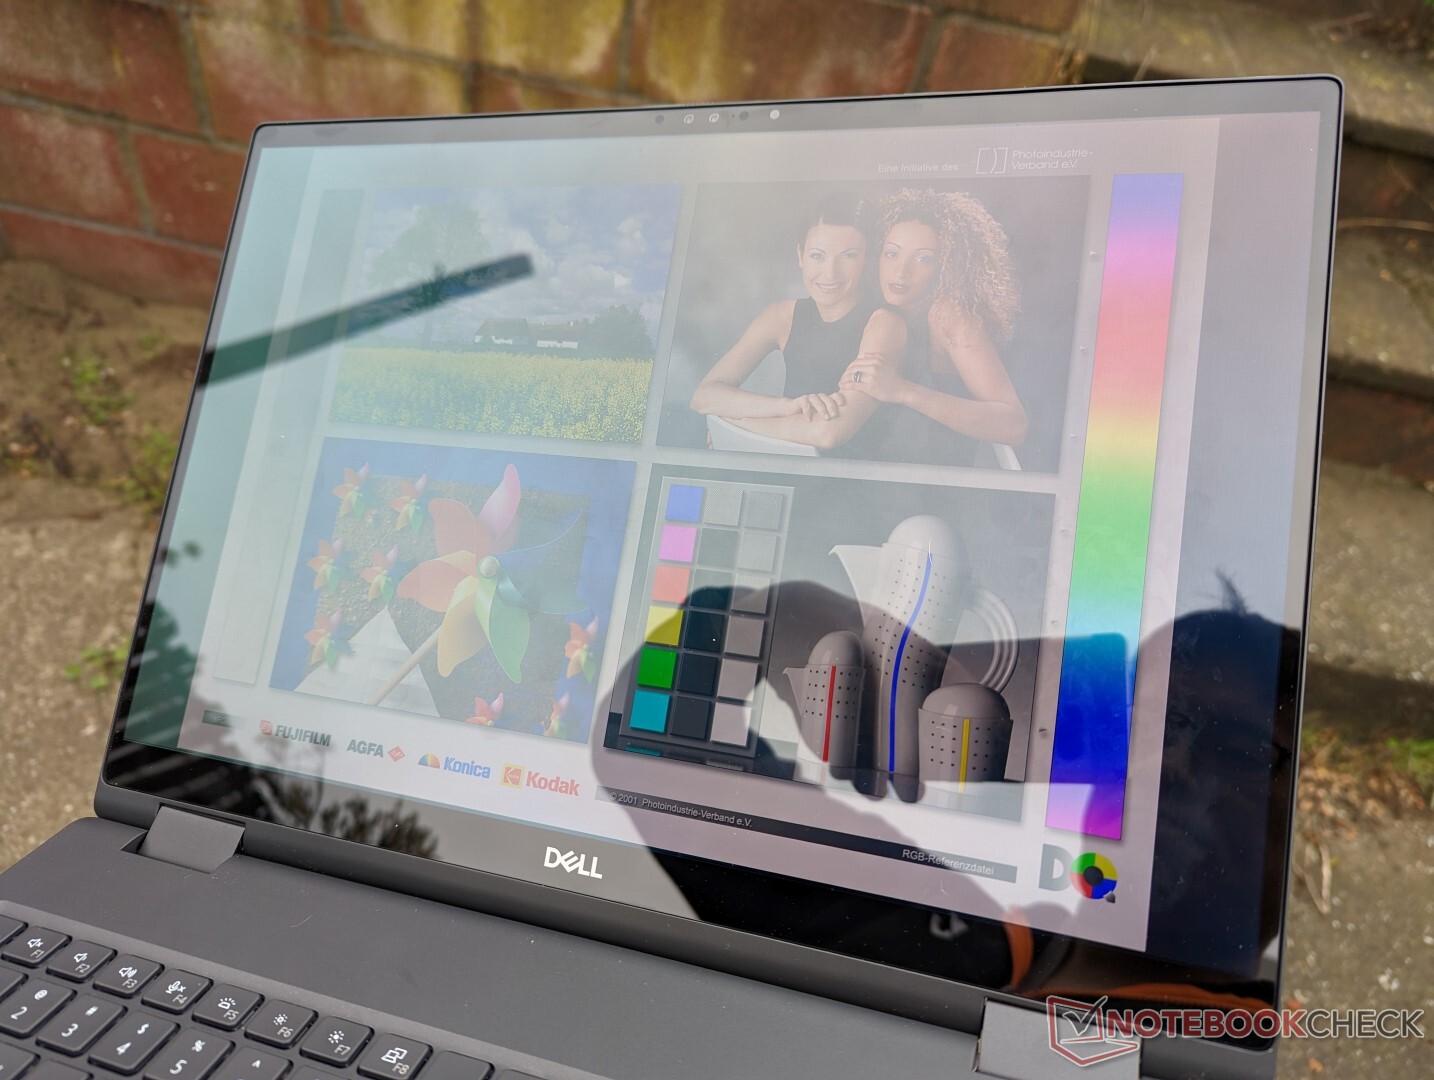
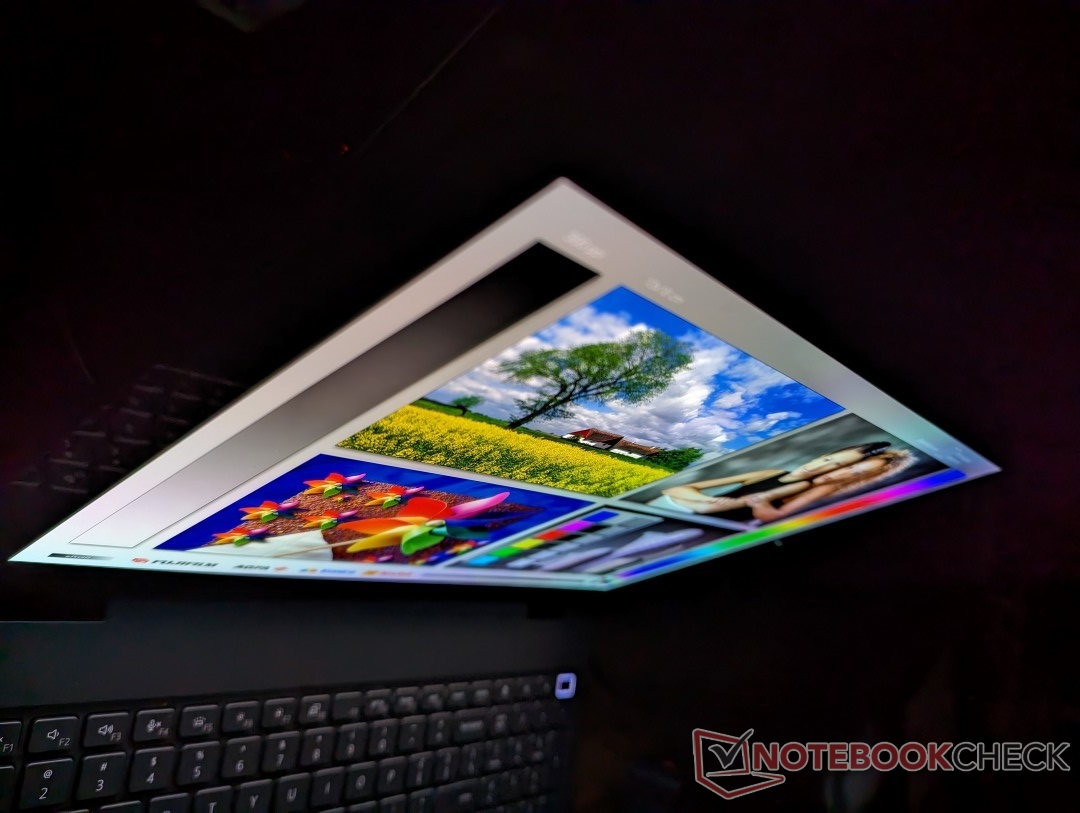
Wyświetl
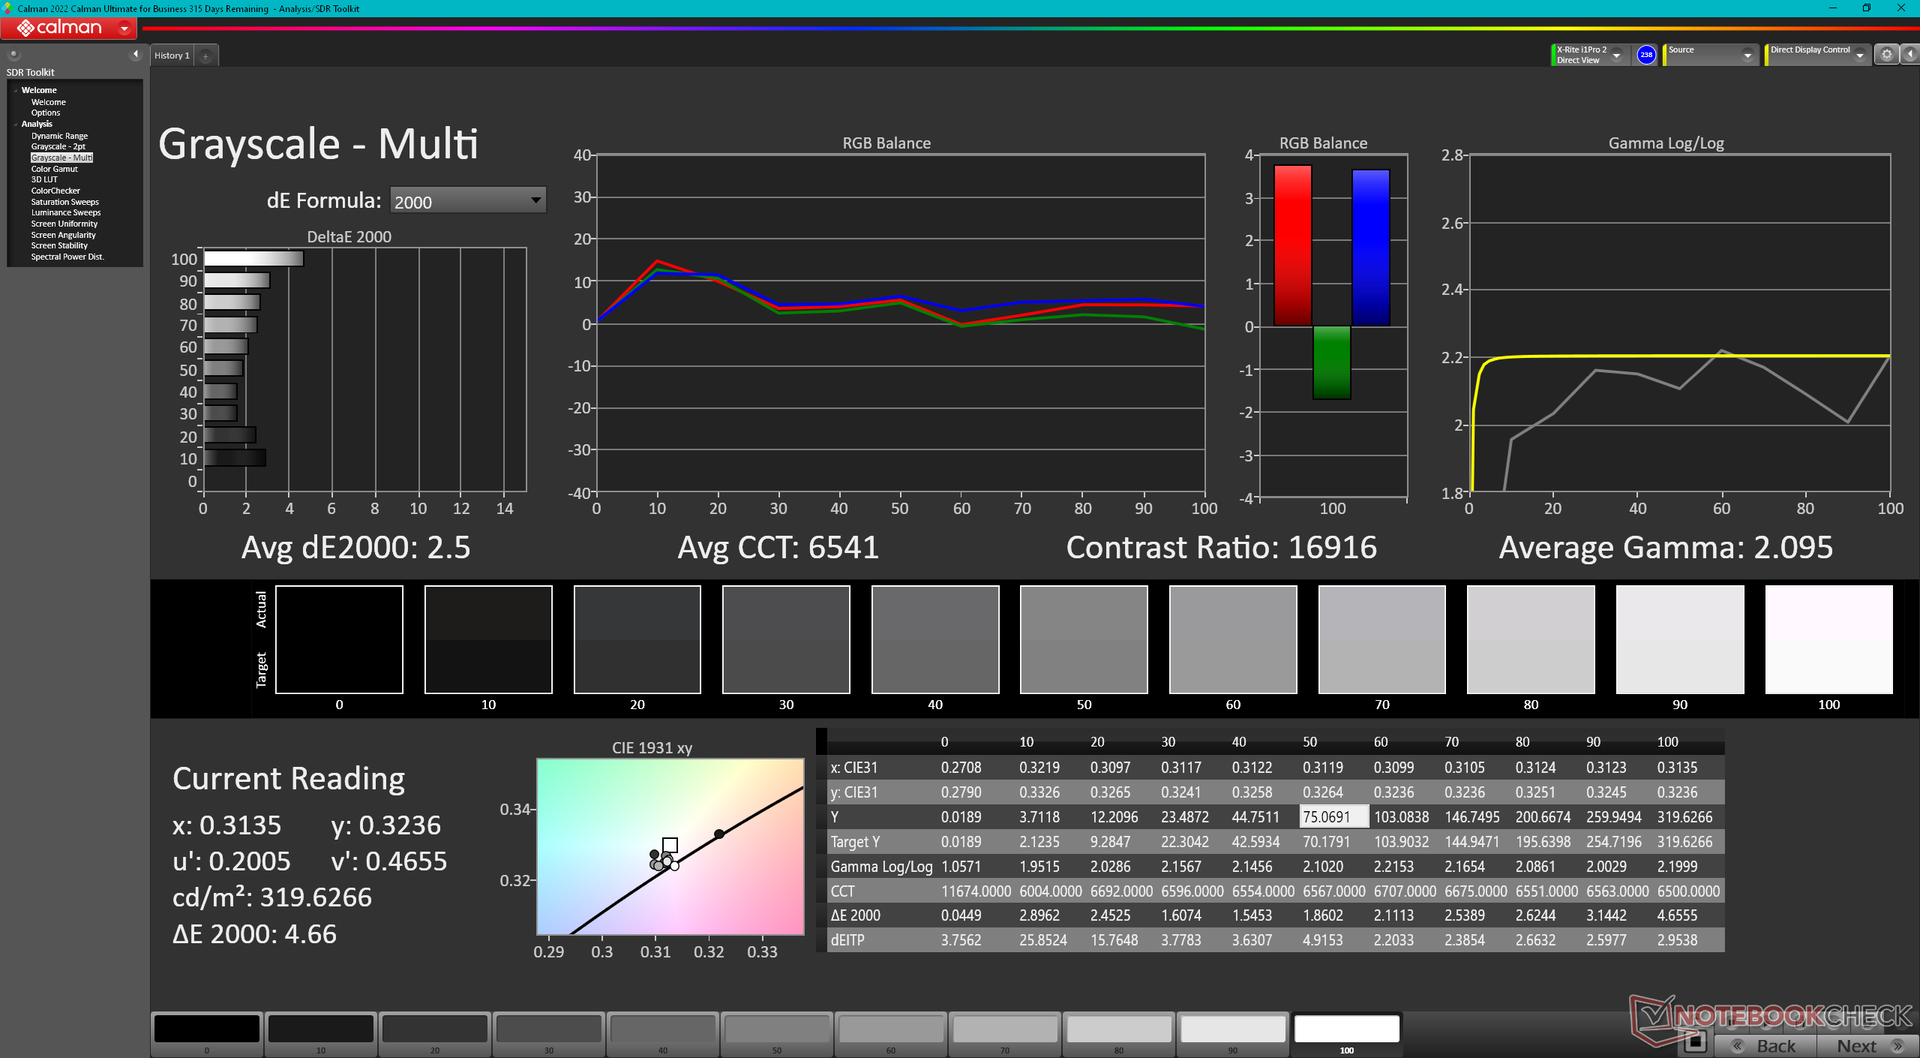
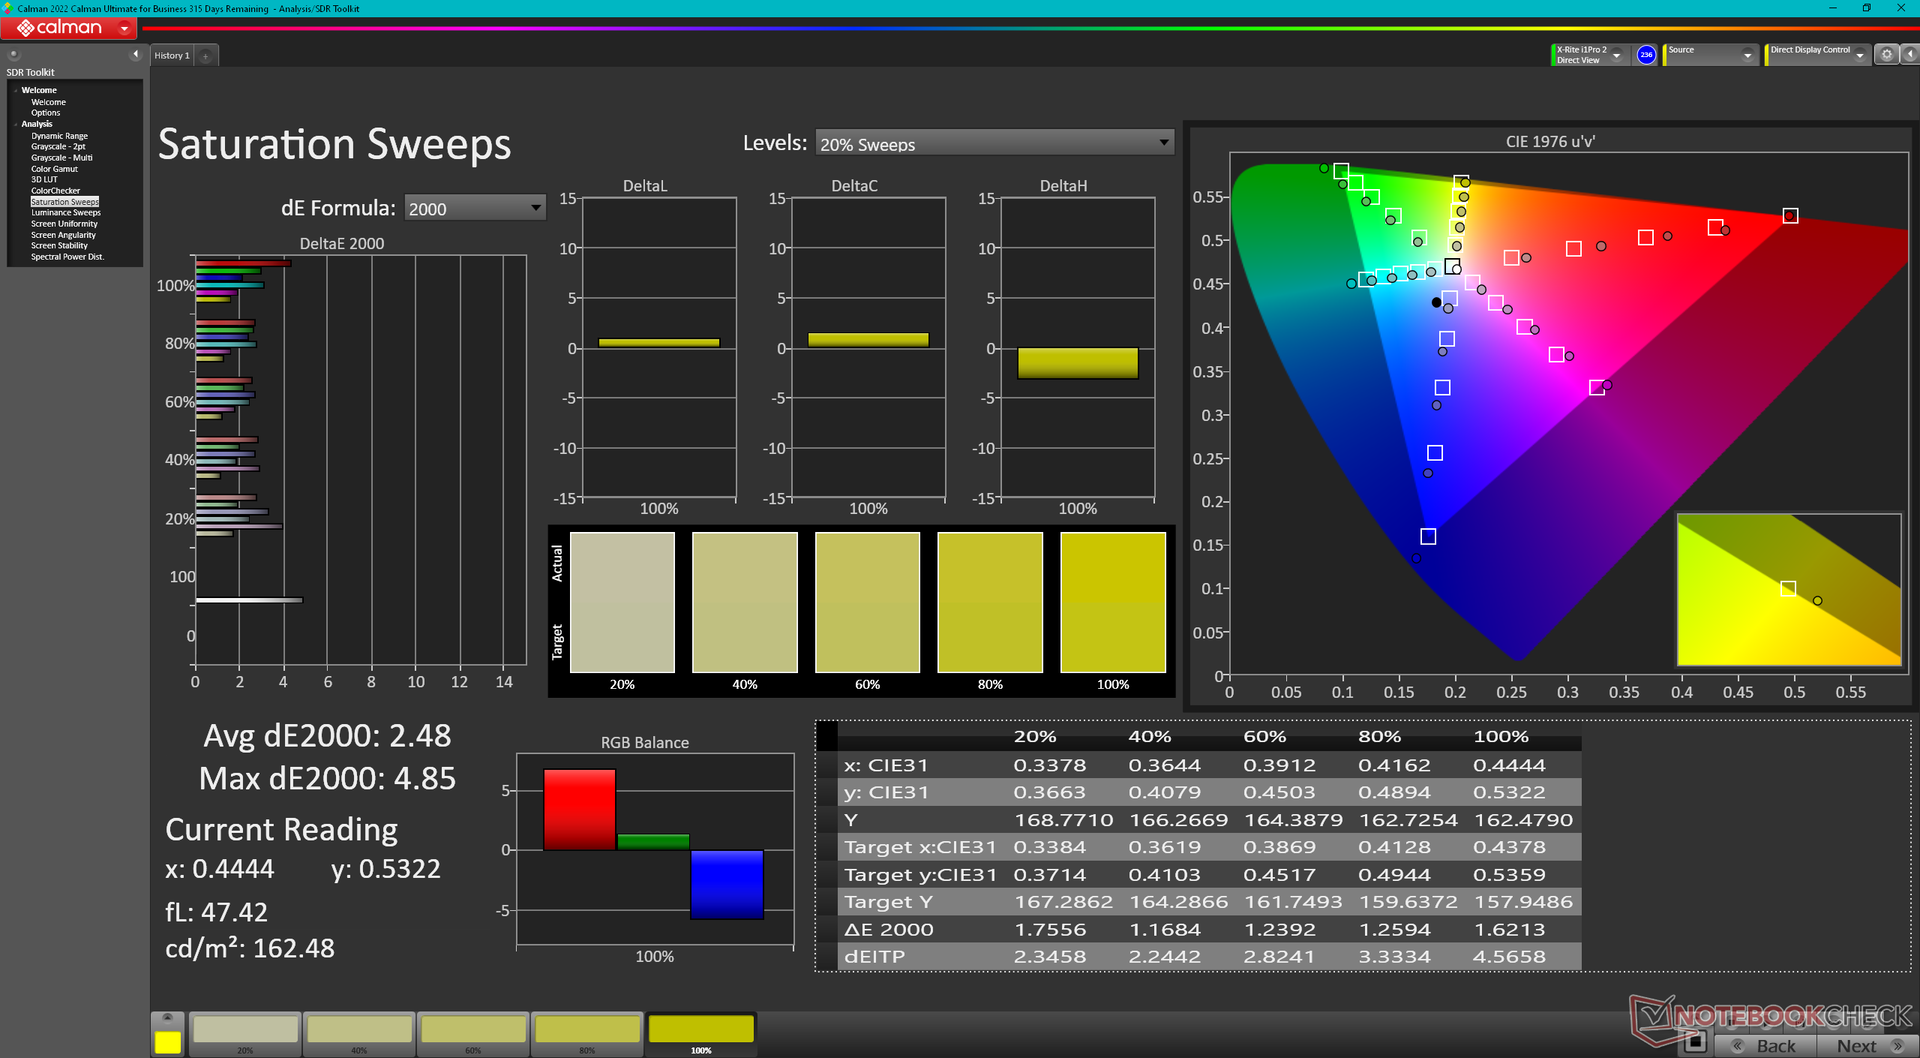
Opcje wyświetlania są identyczne jak te dostępne w cieńszym Precision 7670. W naszym egzemplarzu testowym zastosowano ten sam panel OLED Samsung 160YV03 obiecujący pełne kolory P3.
| |||||||||||||||||||||||||
rozświetlenie: 97 %
na akumulatorze: 325.2 cd/m²
kontrast: ∞:1 (czerń: 0 cd/m²)
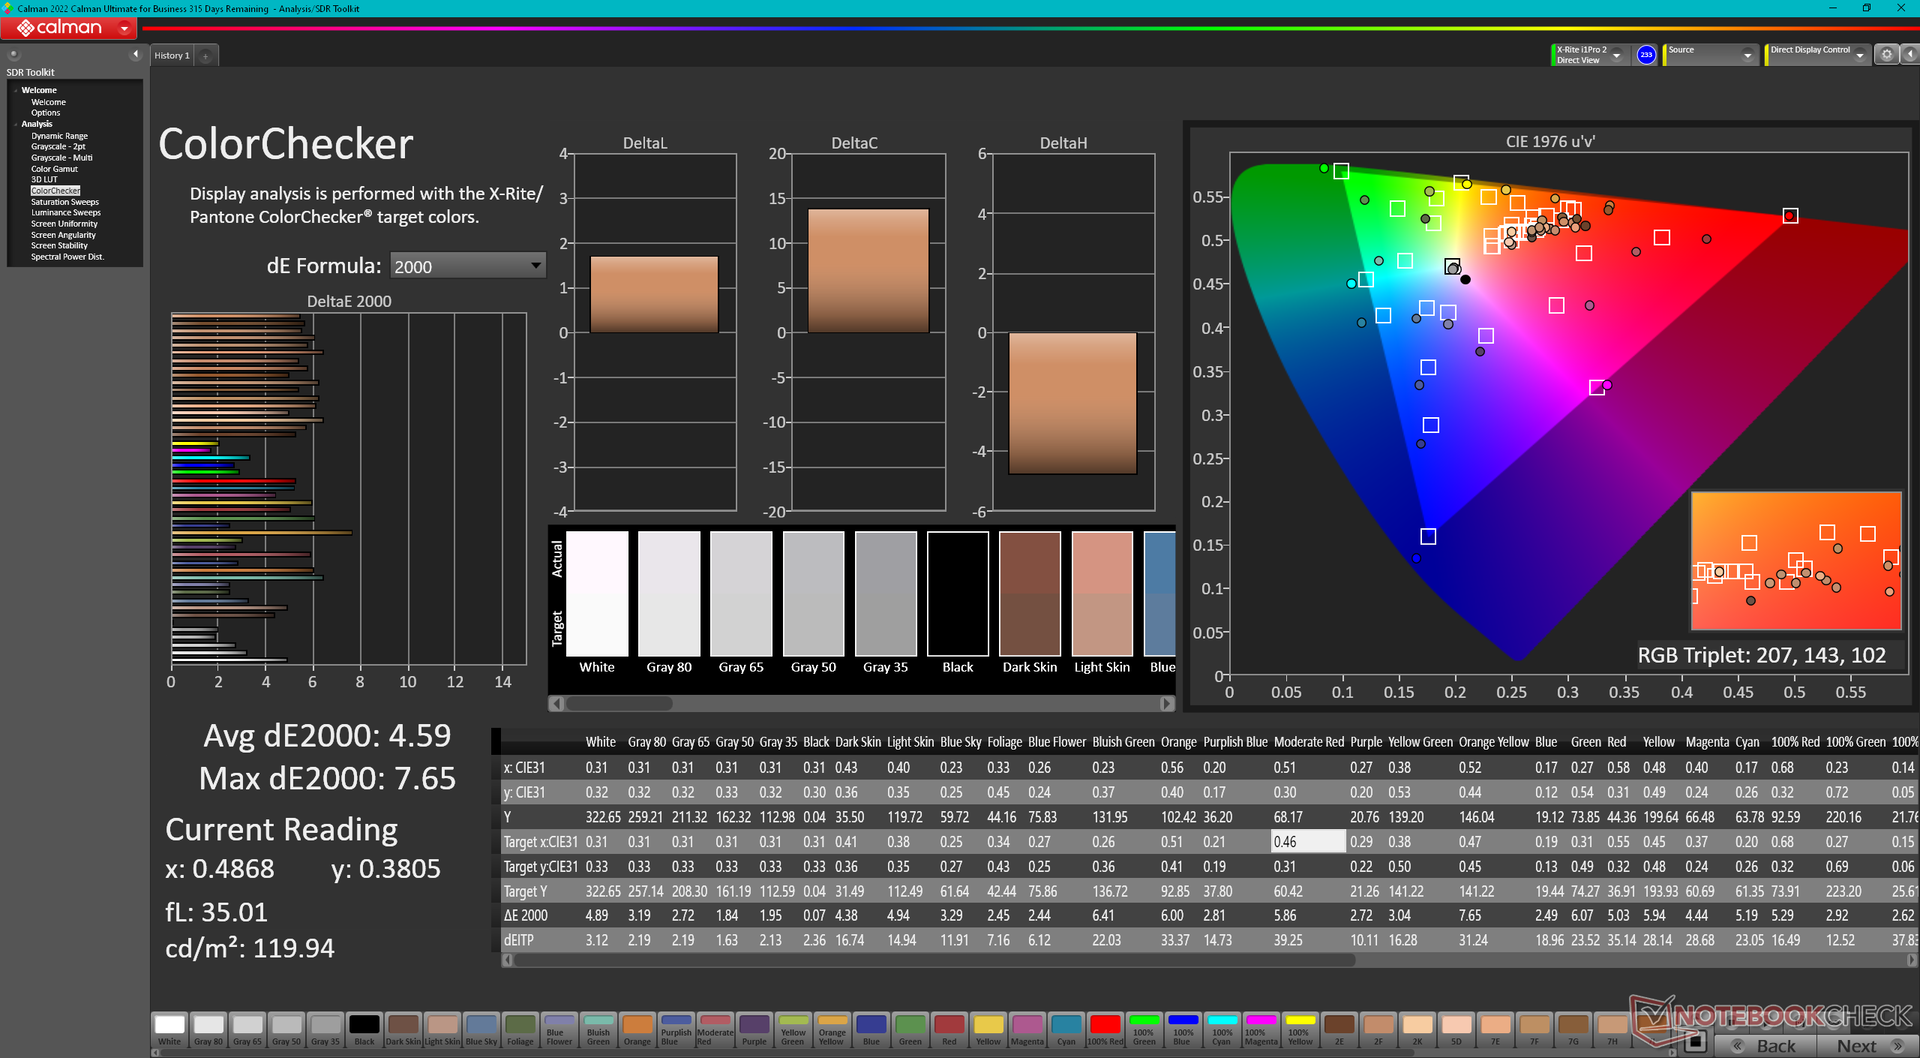
ΔE ColorChecker Calman: 4.59 | ∀{0.5-29.43 Ø4.71}
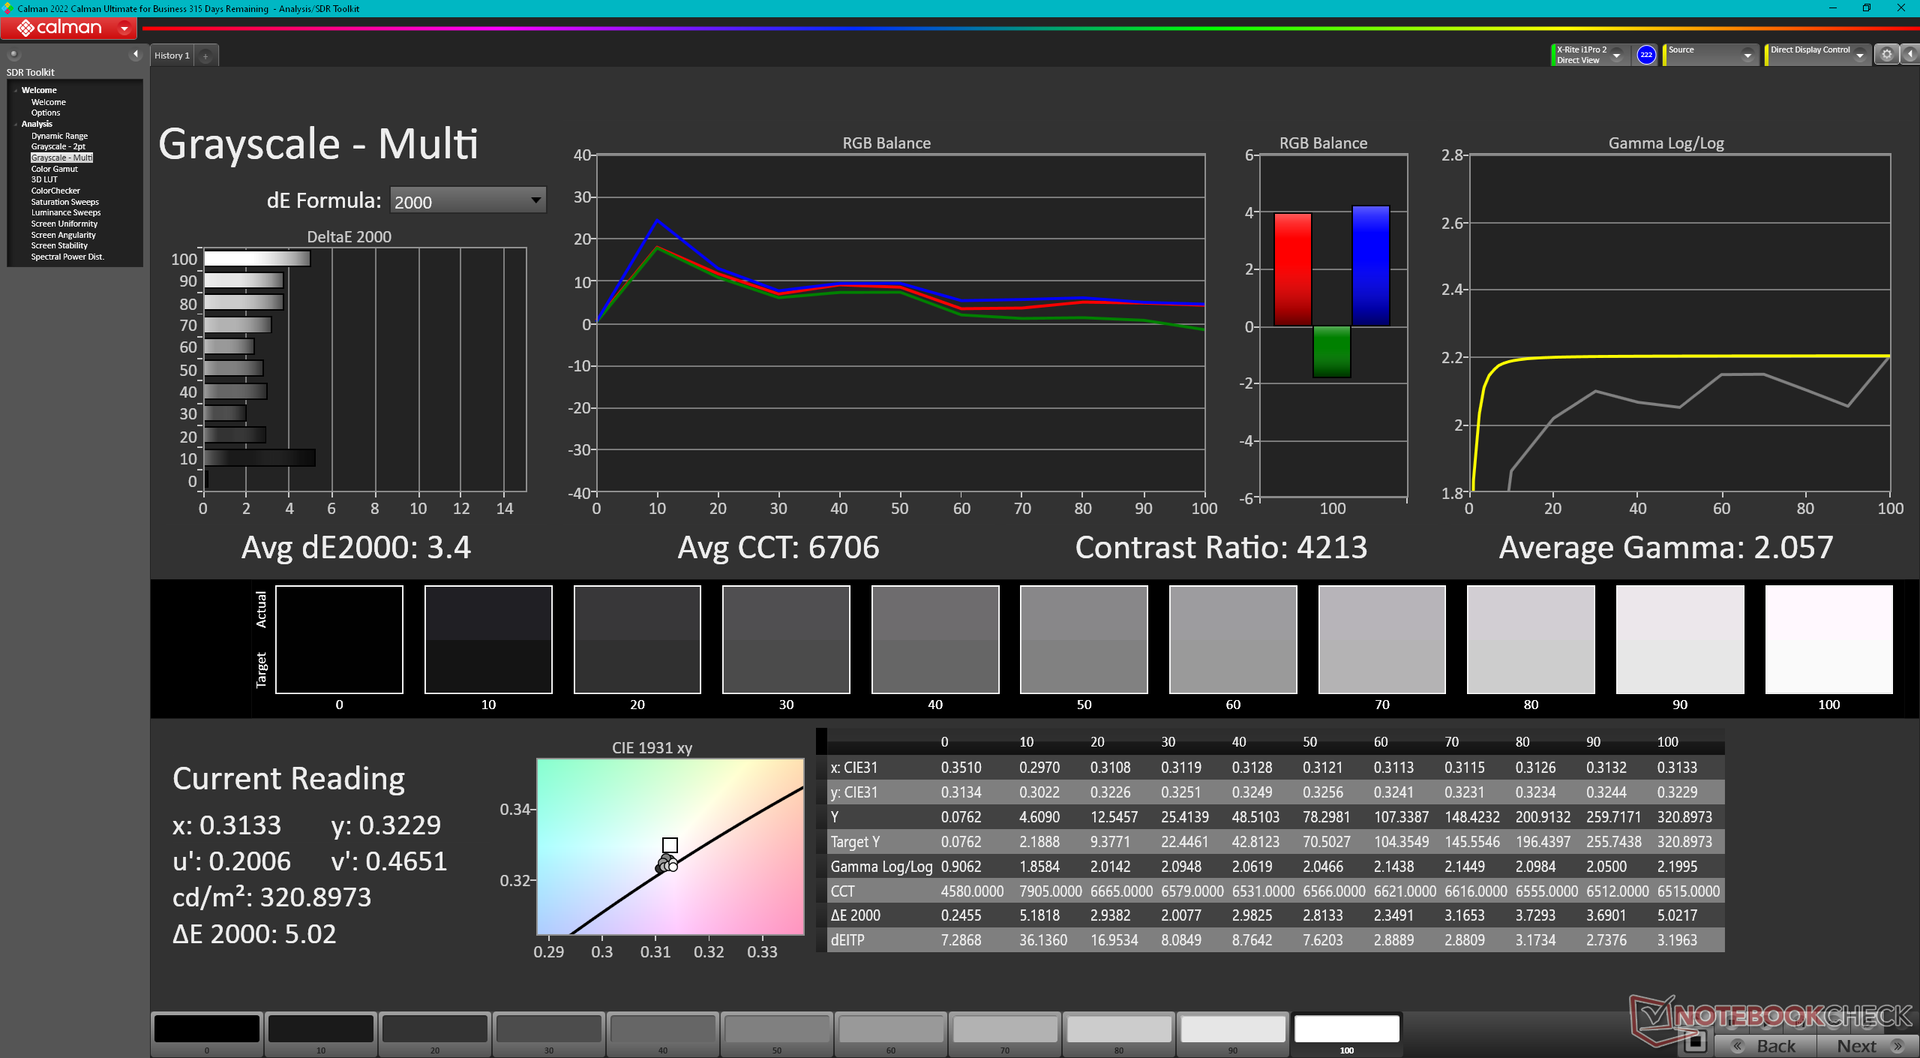
ΔE Greyscale Calman: 2.5 | ∀{0.09-98 Ø4.96}
98.1% AdobeRGB 1998 (Argyll 3D)
100% sRGB (Argyll 3D)
99.9% Display P3 (Argyll 3D)
Gamma: 2.1
CCT: 6541 K
| Dell Precision 7000 7670 Performance Samsung 160YV03, OLED, 3840x2400, 16" | MSI CreatorPro Z16P B12UKST B160QAN02.N, IPS, 2560x1600, 16" | HP ZBook Studio 16 G9 62U04EA BOE0A52, IPS, 3840x2400, 16" | HP ZBook Firefly 16 G9-6B897EA BOE0A02, IPS, 1920x1200, 16" | Lenovo ThinkPad P1 G4-20Y4Z9DVUS NE160QDM-N63, IPS, 2560x1600, 16" | Dell Precision 7670 Samsung 160YV03, OLED, 3840x2400, 16" | |
|---|---|---|---|---|---|---|
| Display | -4% | -5% | -22% | -17% | -0% | |
| Display P3 Coverage (%) | 99.9 | 97.6 -2% | 97.5 -2% | 68.1 -32% | 72.7 -27% | 99.9 0% |
| sRGB Coverage (%) | 100 | 99.9 0% | 99.9 0% | 96.1 -4% | 99.3 -1% | 100 0% |
| AdobeRGB 1998 Coverage (%) | 98.1 | 87.4 -11% | 86.3 -12% | 70 -29% | 74.7 -24% | 97.5 -1% |
| Response Times | -441% | -475% | -1843% | -1550% | -4% | |
| Response Time Grey 50% / Grey 80% * (ms) | 1.84 ? | 12.8 ? -596% | 15.3 ? -732% | 52.8 ? -2770% | 40.8 -2117% | 1.9 ? -3% |
| Response Time Black / White * (ms) | 1.92 ? | 7.4 ? -285% | 6.1 ? -218% | 19.5 ? -916% | 20.8 -983% | 2 ? -4% |
| PWM Frequency (Hz) | 59.52 ? | 59.5 ? | ||||
| Screen | 32% | 50% | 4% | 7% | 2% | |
| Brightness middle (cd/m²) | 325.2 | 407 25% | 554 70% | 526 62% | 441 36% | 340.1 5% |
| Brightness (cd/m²) | 328 | 388 18% | 516 57% | 499 52% | 420 28% | 342 4% |
| Brightness Distribution (%) | 97 | 88 -9% | 84 -13% | 93 -4% | 90 -7% | 98 1% |
| Black Level * (cd/m²) | 0.36 | 0.47 | 0.31 | 0.27 | ||
| Colorchecker dE 2000 * | 4.59 | 1.3 72% | 1 78% | 3.6 22% | 2.6 43% | 2.5 46% |
| Colorchecker dE 2000 max. * | 7.65 | 2.5 67% | 2.4 69% | 6.6 14% | 6 22% | 8.19 -7% |
| Greyscale dE 2000 * | 2.5 | 2.1 16% | 1.6 36% | 5.5 -120% | 4.5 -80% | 3.5 -40% |
| Gamma | 2.1 105% | 2.26 97% | 2.29 96% | 2.02 109% | 2.18 101% | 2.12 104% |
| CCT | 6541 99% | 6437 101% | 6458 101% | 6527 100% | 6623 98% | 6704 97% |
| Contrast (:1) | 1131 | 1179 | 1697 | 1633 | ||
| Colorchecker dE 2000 calibrated * | 0.7 | 0.6 | 2.6 | 1.2 | ||
| Całkowita średnia (program / ustawienia) | -138% /
-64% | -143% /
-61% | -620% /
-339% | -520% /
-283% | -1% /
0% |
* ... im mniej tym lepiej
Wyświetl czasy reakcji
| ↔ Czas reakcji od czerni do bieli | ||
|---|---|---|
| 1.92 ms ... wzrost ↗ i spadek ↘ łącznie | ↗ 0.92 ms wzrost | 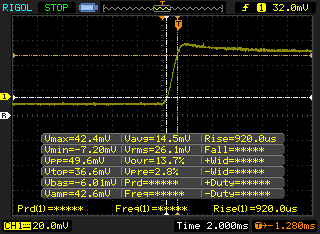 |
| ↘ 1 ms upadek | ||
| W naszych testach ekran wykazuje bardzo szybką reakcję i powinien bardzo dobrze nadawać się do szybkich gier. Dla porównania, wszystkie testowane urządzenia wahają się od 0.1 (minimum) do 240 (maksimum) ms. » 11 % wszystkich urządzeń jest lepszych. Oznacza to, że zmierzony czas reakcji jest lepszy od średniej wszystkich testowanych urządzeń (19.8 ms). | ||
| ↔ Czas reakcji 50% szarości do 80% szarości | ||
| 1.84 ms ... wzrost ↗ i spadek ↘ łącznie | ↗ 0.92 ms wzrost | 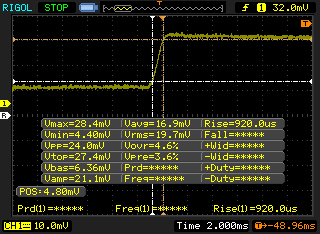 |
| ↘ 0.92 ms upadek | ||
| W naszych testach ekran wykazuje bardzo szybką reakcję i powinien bardzo dobrze nadawać się do szybkich gier. Dla porównania, wszystkie testowane urządzenia wahają się od 0.165 (minimum) do 636 (maksimum) ms. » 9 % wszystkich urządzeń jest lepszych. Oznacza to, że zmierzony czas reakcji jest lepszy od średniej wszystkich testowanych urządzeń (31 ms). | ||
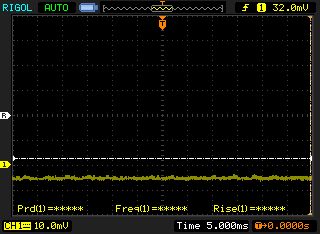
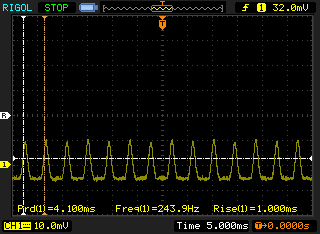
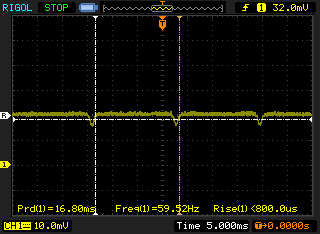
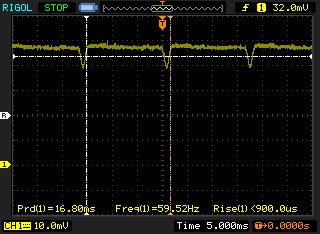
Migotanie ekranu / PWM (modulacja szerokości impulsu)
| Wykryto migotanie ekranu/wykryto PWM | 59.52 Hz | ≤ 100 % ustawienia jasności | 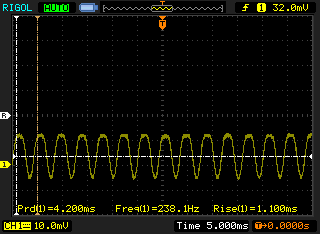 |
Podświetlenie wyświetlacza miga z częstotliwością 59.52 Hz (najgorszy przypadek, np. przy użyciu PWM) Wykryto migotanie przy ustawieniu jasności 100 % i poniżej. Powyżej tego ustawienia jasności nie powinno być żadnego migotania ani PWM. Częstotliwość 59.52 Hz jest bardzo niska, więc migotanie może powodować zmęczenie oczu i bóle głowy po dłuższym użytkowaniu. Dla porównania: 52 % wszystkich testowanych urządzeń nie używa PWM do przyciemniania wyświetlacza. Jeśli wykryto PWM, zmierzono średnio 7757 (minimum: 5 - maksimum: 343500) Hz. | |||
Migotanie jest obecne na wszystkich ustawieniach jasności, jak w przypadku większości paneli OLED. Udało nam się zarejestrować częstotliwość 238,1 Hz od 0 do 57 procent jasności i 59,5 Hz od 58 procent do maksimum.

Wydajność
Warunki badania
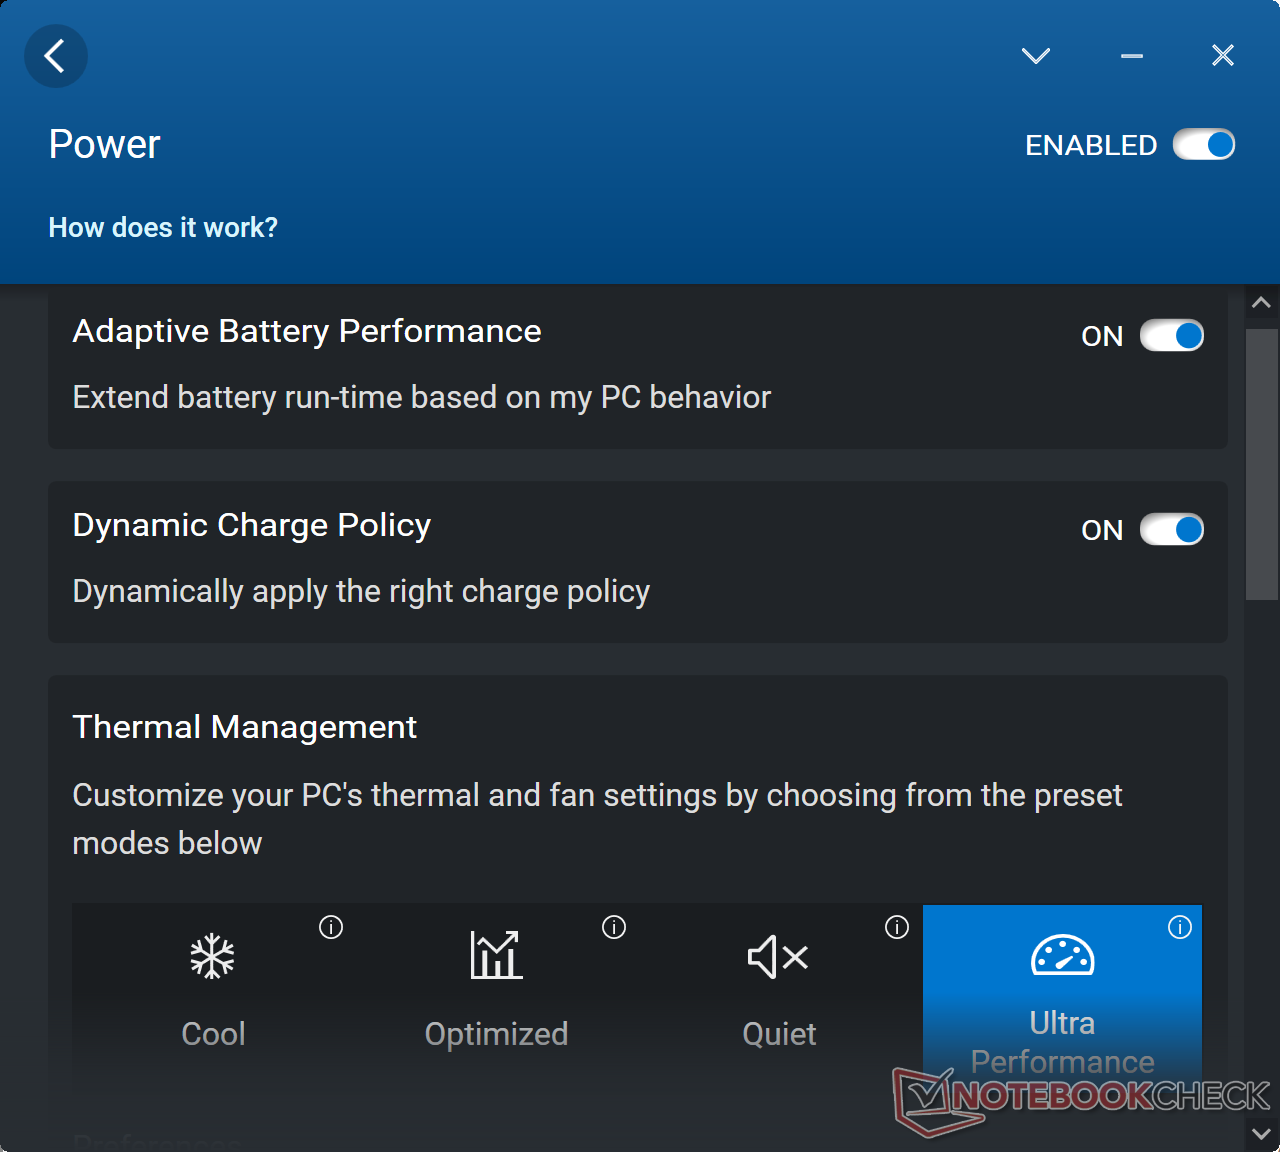
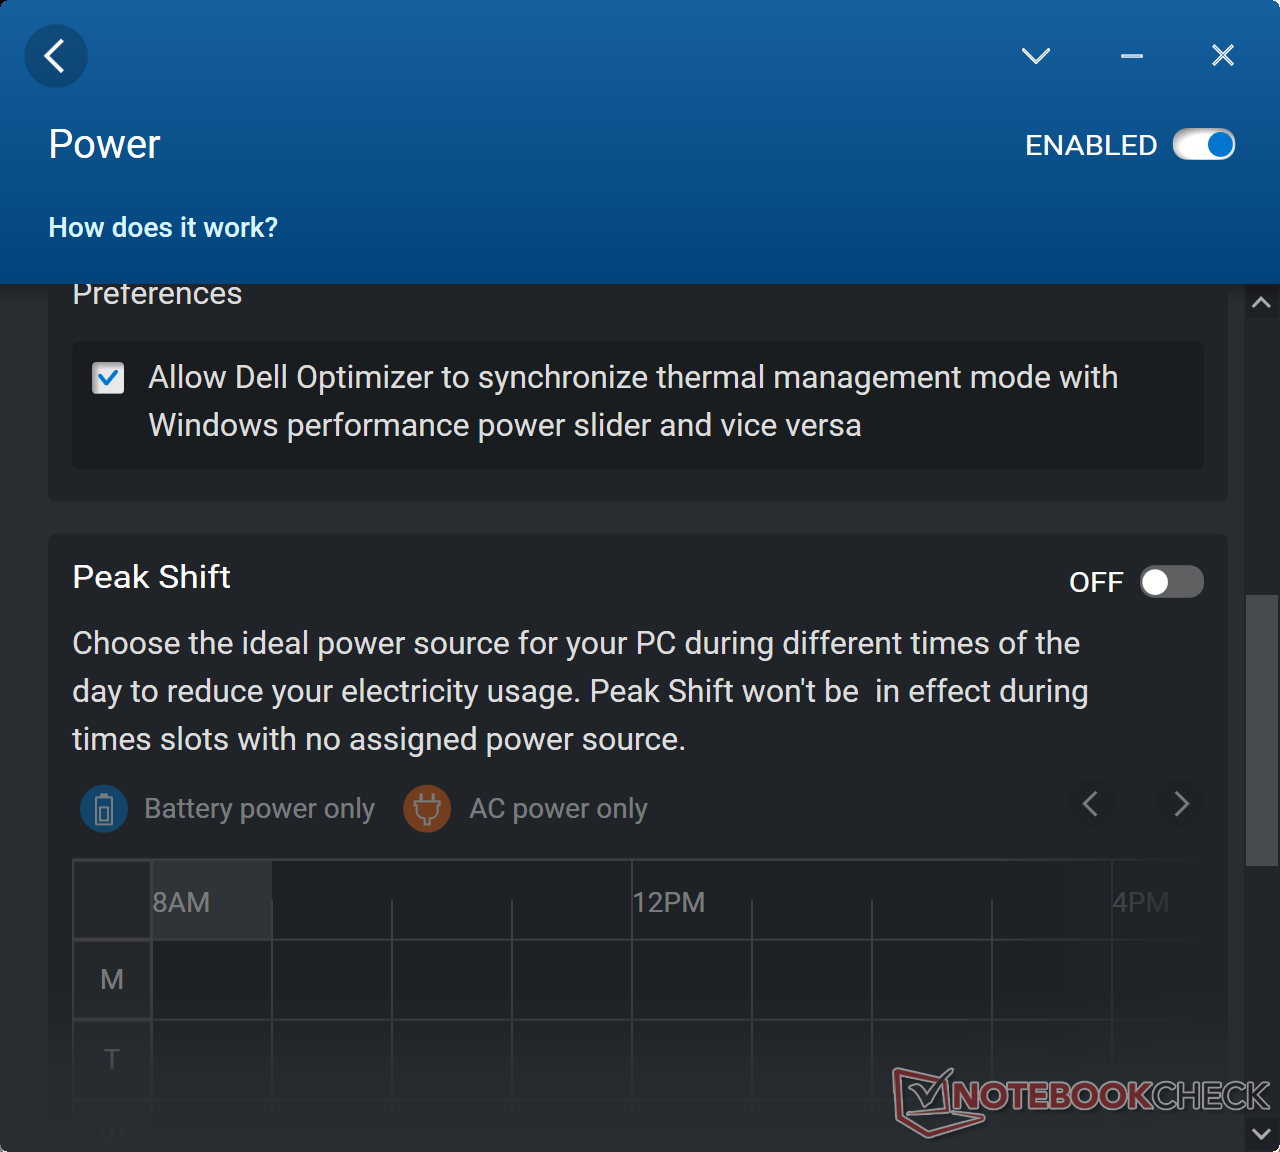
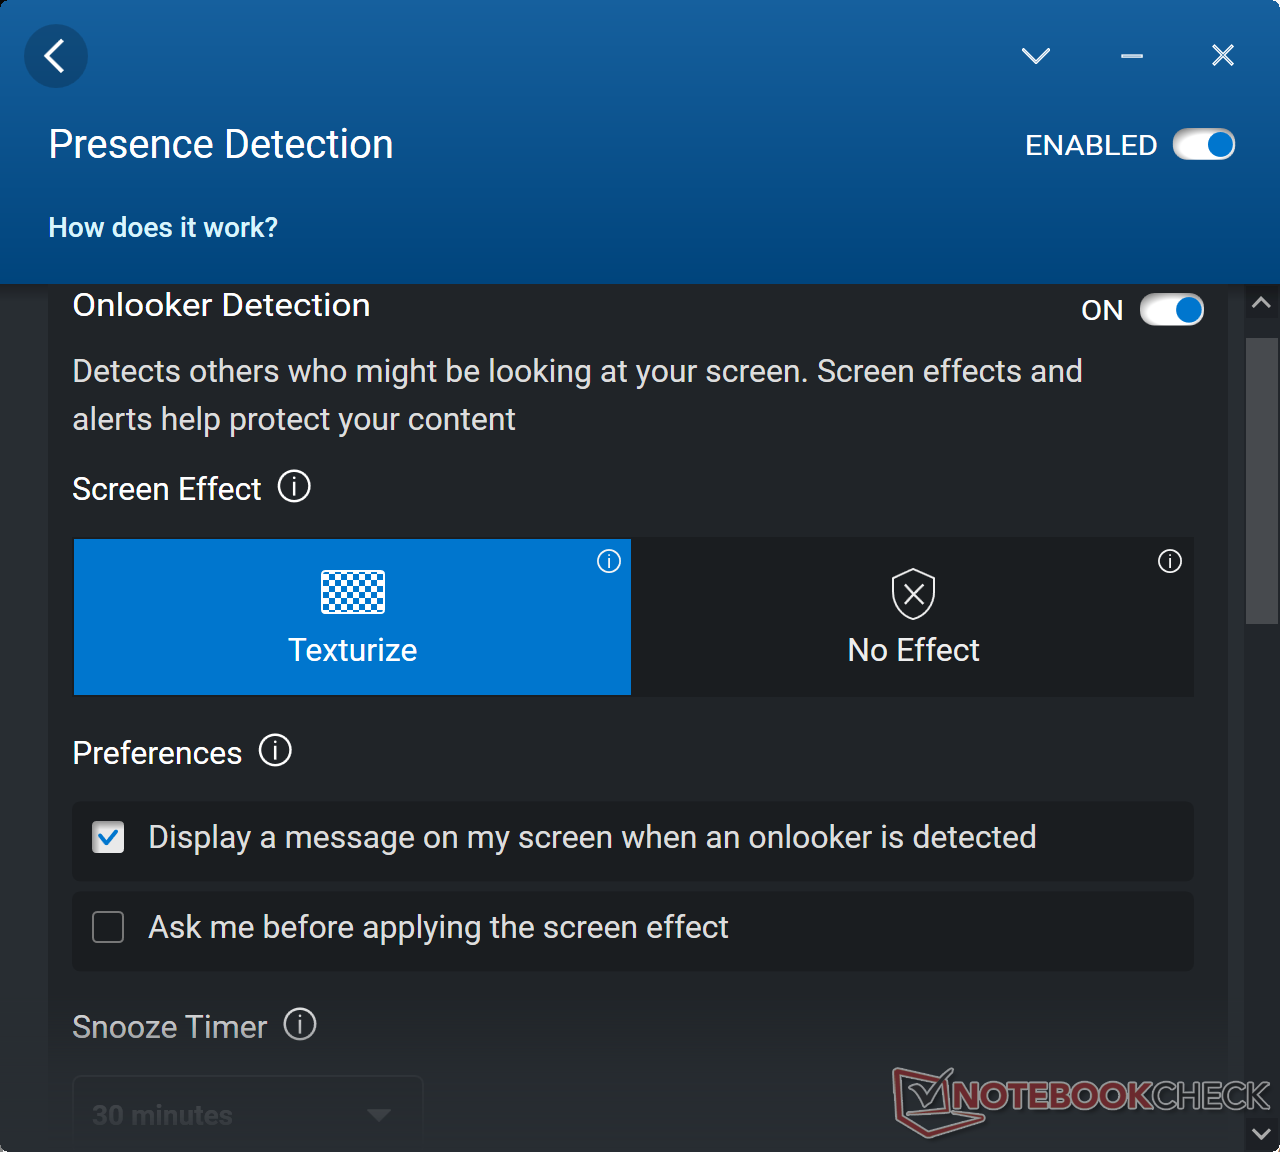
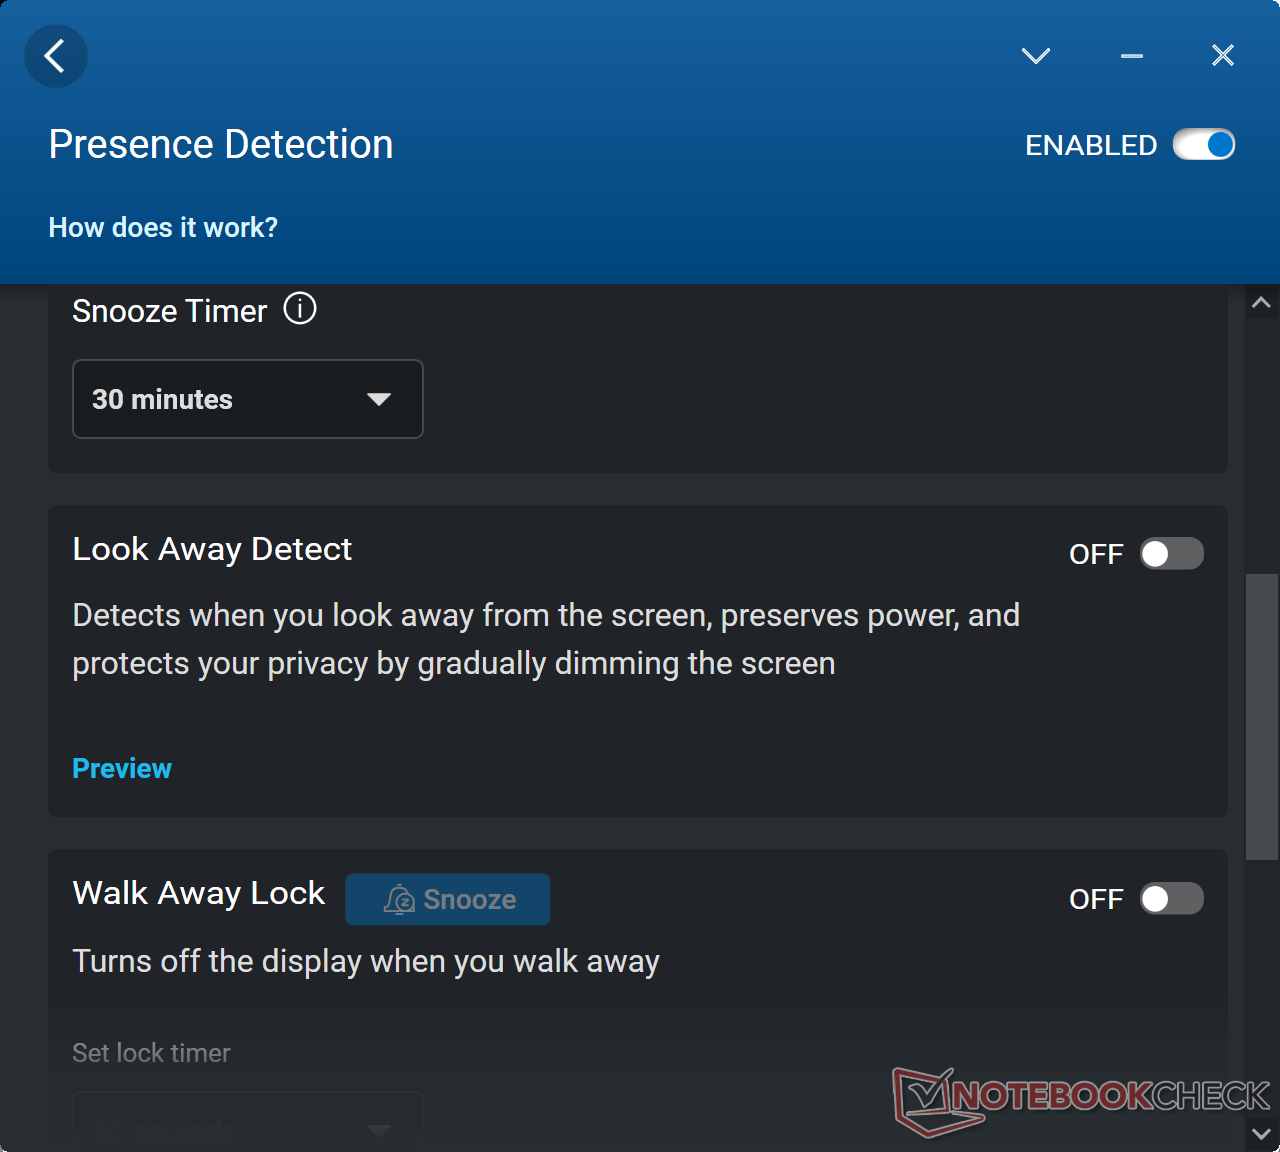
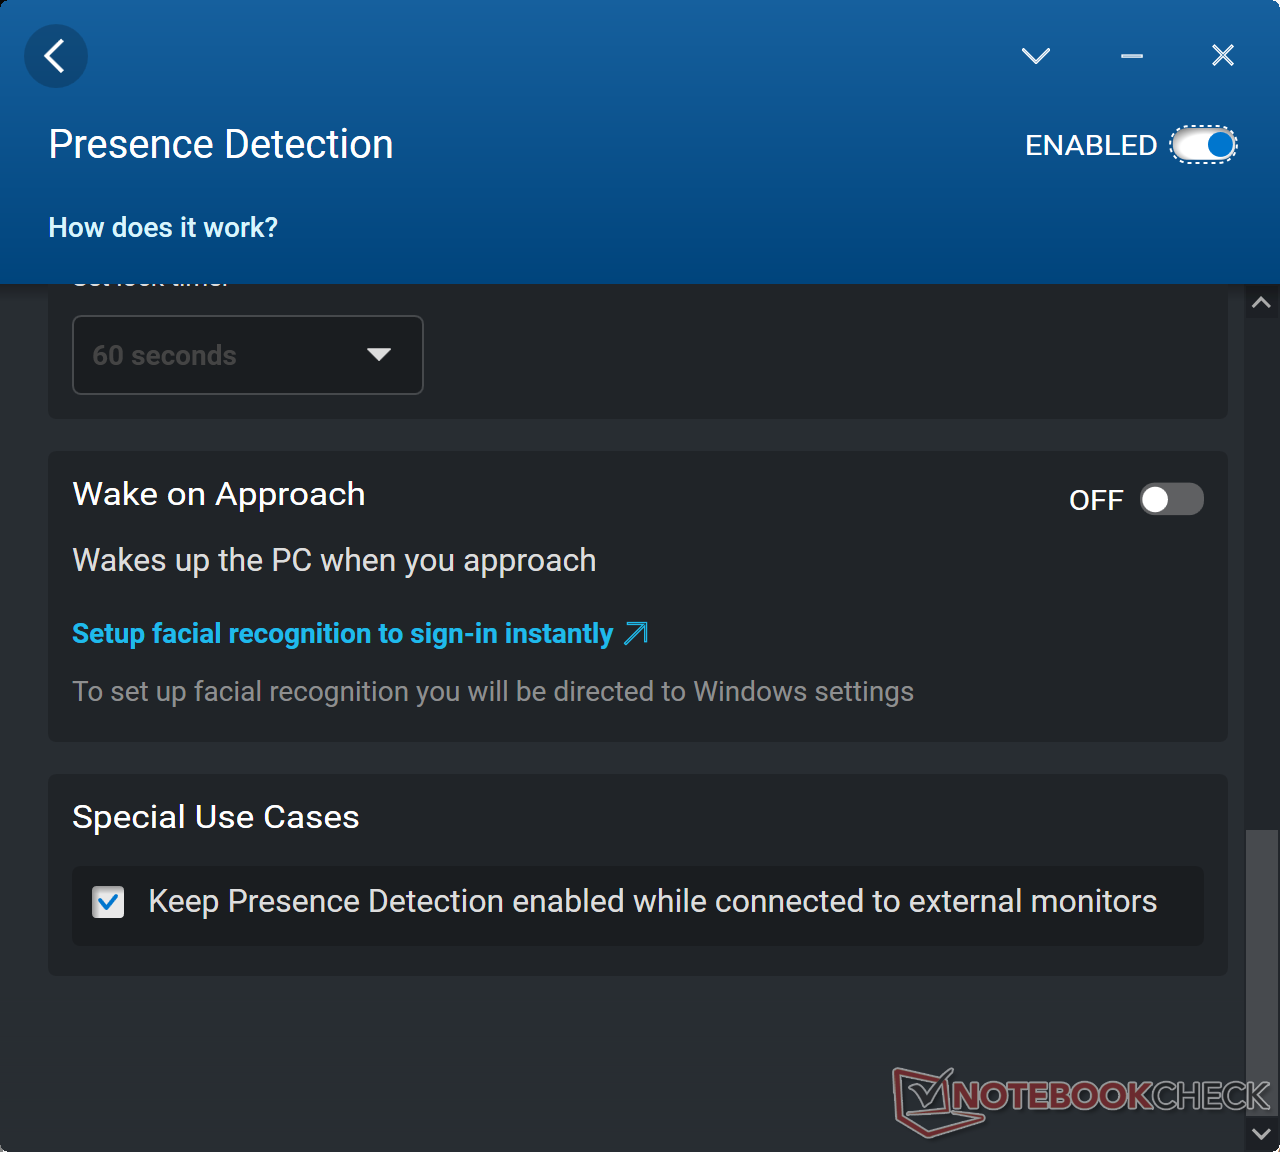
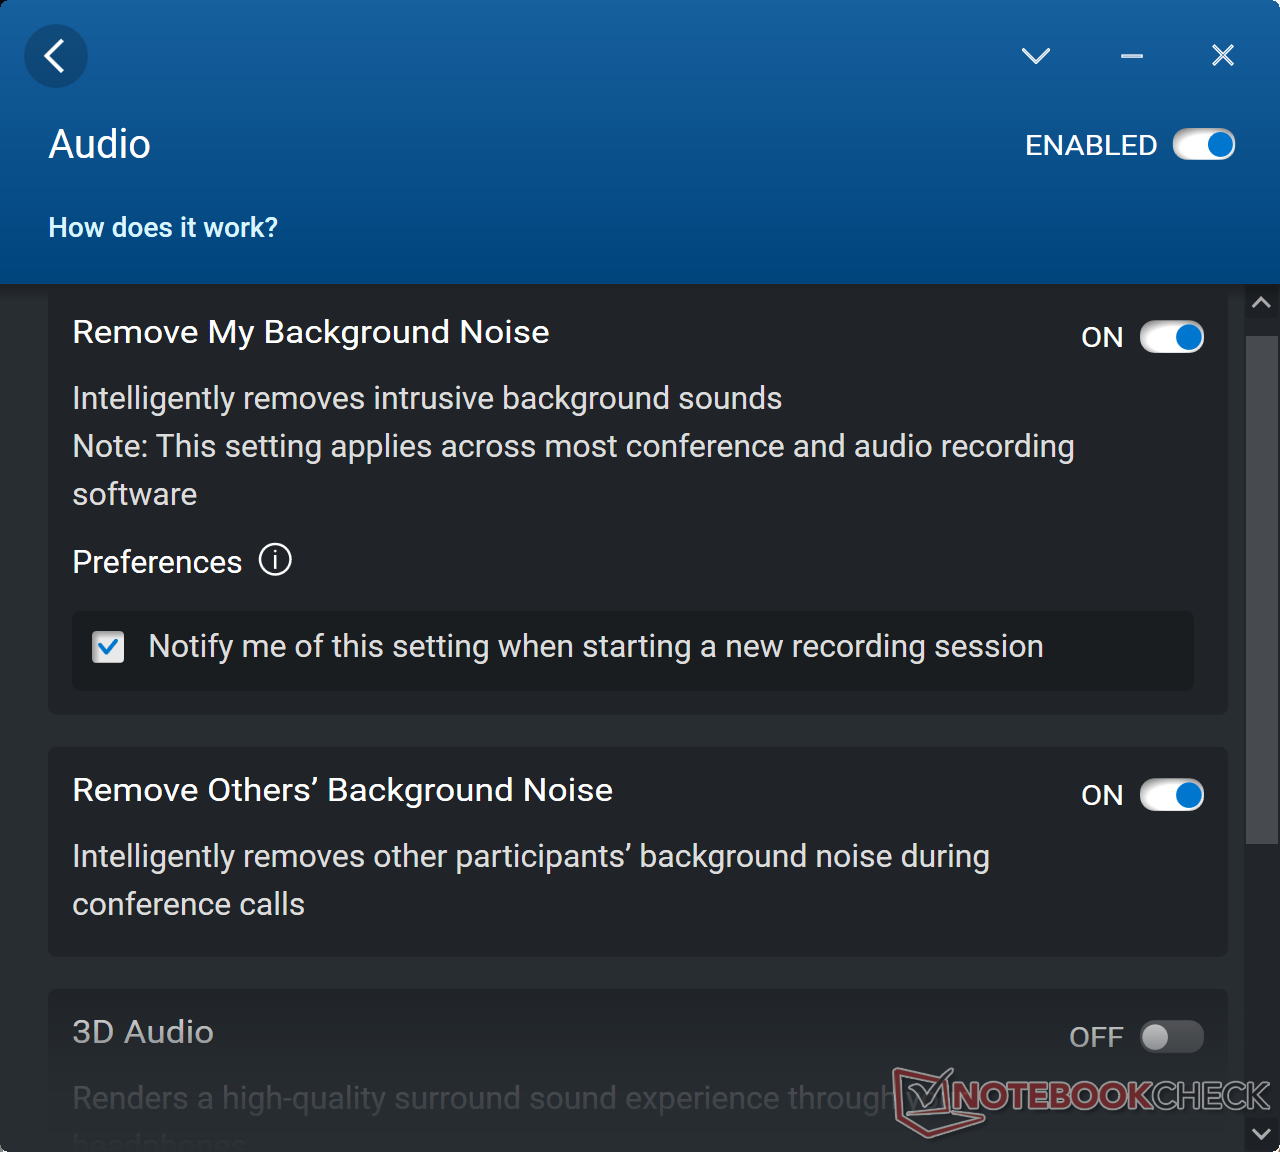
Przed przeprowadzeniem poniższych testów wydajnościowych ustawiliśmy nasz komputer w trybie Ultra Performance za pomocą oprogramowania Dell Optimizer, a procesor graficzny w trybie grafiki dyskretnej. Zaleca się, by właściciele zapoznali się z programem Optimizer, ponieważ jest to centrum kontroli wielu specyficznych funkcji laptopa, w tym wykrywania obecności i zachowania podczas ładowania
W oprogramowaniu ani w BIOS-ie nie znajdziemy żadnego przełącznika MUX.
Procesor
Wydajność wielowątkowa jest tylko o około 8 do 14 procent szybsza niż w przypadkuCore i7-12850HX w naszym smuklejszym Precision 7670. Wąski margines nie jest niespodziewany, ale bardziej zaskakującym aspektem jest nieco słaba trwałość Turbo Boost naszegoCore i9-12950HX. Podczas pracy w pętli CineBench R15 xT wydajność spadała o około 17% w czasie, zamiast pozostawać na stałym poziomie przez cały czas. Deficyt wydajności jest podobny do tego, co zaobserwowaliśmy na zwykłym Precision 7670 pomimo grubszego profilu naszego modelu Performance.
Cinebench R15 Multi Loop
Cinebench R23: Multi Core | Single Core
Cinebench R15: CPU Multi 64Bit | CPU Single 64Bit
Blender: v2.79 BMW27 CPU
7-Zip 18.03: 7z b 4 | 7z b 4 -mmt1
Geekbench 5.5: Multi-Core | Single-Core
HWBOT x265 Benchmark v2.2: 4k Preset
LibreOffice : 20 Documents To PDF
R Benchmark 2.5: Overall mean
| Cinebench R20 / CPU (Multi Core) | |
| Przeciętny Intel Core i9-12950HX (6625 - 8777, n=7) | |
| MSI CreatorPro Z16P B12UKST | |
| Dell Precision 7000 7670 Performance | |
| HP ZBook Studio 16 G9 62U04EA | |
| Dell Precision 7670 | |
| Lenovo ThinkPad P1 G4-20Y4Z9DVUS | |
| HP ZBook Firefly 16 G9-6B897EA | |
| Cinebench R20 / CPU (Single Core) | |
| Przeciętny Intel Core i9-12950HX (703 - 741, n=7) | |
| HP ZBook Studio 16 G9 62U04EA | |
| Dell Precision 7000 7670 Performance | |
| Dell Precision 7670 | |
| MSI CreatorPro Z16P B12UKST | |
| Lenovo ThinkPad P1 G4-20Y4Z9DVUS | |
| HP ZBook Firefly 16 G9-6B897EA | |
| Cinebench R23 / Multi Core | |
| Przeciętny Intel Core i9-12950HX (16277 - 23113, n=7) | |
| MSI CreatorPro Z16P B12UKST | |
| HP ZBook Studio 16 G9 62U04EA | |
| Dell Precision 7000 7670 Performance | |
| Dell Precision 7670 | |
| Lenovo ThinkPad P1 G4-20Y4Z9DVUS | |
| HP ZBook Firefly 16 G9-6B897EA | |
| Cinebench R23 / Single Core | |
| HP ZBook Studio 16 G9 62U04EA | |
| Przeciętny Intel Core i9-12950HX (1465 - 1922, n=7) | |
| MSI CreatorPro Z16P B12UKST | |
| Dell Precision 7670 | |
| Lenovo ThinkPad P1 G4-20Y4Z9DVUS | |
| Dell Precision 7000 7670 Performance | |
| HP ZBook Firefly 16 G9-6B897EA | |
| Cinebench R15 / CPU Multi 64Bit | |
| Przeciętny Intel Core i9-12950HX (2464 - 3530, n=7) | |
| Dell Precision 7000 7670 Performance | |
| HP ZBook Studio 16 G9 62U04EA | |
| Dell Precision 7670 | |
| MSI CreatorPro Z16P B12UKST | |
| Lenovo ThinkPad P1 G4-20Y4Z9DVUS | |
| HP ZBook Firefly 16 G9-6B897EA | |
| Cinebench R15 / CPU Single 64Bit | |
| HP ZBook Studio 16 G9 62U04EA | |
| Dell Precision 7000 7670 Performance | |
| Przeciętny Intel Core i9-12950HX (167 - 276, n=7) | |
| Dell Precision 7670 | |
| MSI CreatorPro Z16P B12UKST | |
| Lenovo ThinkPad P1 G4-20Y4Z9DVUS | |
| HP ZBook Firefly 16 G9-6B897EA | |
| Blender / v2.79 BMW27 CPU | |
| HP ZBook Firefly 16 G9-6B897EA | |
| Lenovo ThinkPad P1 G4-20Y4Z9DVUS | |
| Dell Precision 7670 | |
| MSI CreatorPro Z16P B12UKST | |
| Dell Precision 7000 7670 Performance | |
| HP ZBook Studio 16 G9 62U04EA | |
| Przeciętny Intel Core i9-12950HX (138 - 193, n=7) | |
| 7-Zip 18.03 / 7z b 4 | |
| Przeciętny Intel Core i9-12950HX (65637 - 85019, n=7) | |
| HP ZBook Studio 16 G9 62U04EA | |
| MSI CreatorPro Z16P B12UKST | |
| Dell Precision 7000 7670 Performance | |
| Dell Precision 7670 | |
| Lenovo ThinkPad P1 G4-20Y4Z9DVUS | |
| HP ZBook Firefly 16 G9-6B897EA | |
| 7-Zip 18.03 / 7z b 4 -mmt1 | |
| Przeciętny Intel Core i9-12950HX (6022 - 6318, n=7) | |
| Dell Precision 7000 7670 Performance | |
| HP ZBook Studio 16 G9 62U04EA | |
| MSI CreatorPro Z16P B12UKST | |
| Dell Precision 7670 | |
| Lenovo ThinkPad P1 G4-20Y4Z9DVUS | |
| HP ZBook Firefly 16 G9-6B897EA | |
| Geekbench 5.5 / Multi-Core | |
| Przeciętny Intel Core i9-12950HX (14028 - 16009, n=7) | |
| Dell Precision 7000 7670 Performance | |
| HP ZBook Studio 16 G9 62U04EA | |
| MSI CreatorPro Z16P B12UKST | |
| Dell Precision 7670 | |
| Lenovo ThinkPad P1 G4-20Y4Z9DVUS | |
| HP ZBook Firefly 16 G9-6B897EA | |
| Geekbench 5.5 / Single-Core | |
| Dell Precision 7000 7670 Performance | |
| Przeciętny Intel Core i9-12950HX (1847 - 1945, n=7) | |
| HP ZBook Studio 16 G9 62U04EA | |
| HP ZBook Firefly 16 G9-6B897EA | |
| MSI CreatorPro Z16P B12UKST | |
| Dell Precision 7670 | |
| Lenovo ThinkPad P1 G4-20Y4Z9DVUS | |
| HWBOT x265 Benchmark v2.2 / 4k Preset | |
| Przeciętny Intel Core i9-12950HX (18.6 - 26.5, n=7) | |
| HP ZBook Studio 16 G9 62U04EA | |
| MSI CreatorPro Z16P B12UKST | |
| Dell Precision 7000 7670 Performance | |
| Dell Precision 7670 | |
| Lenovo ThinkPad P1 G4-20Y4Z9DVUS | |
| HP ZBook Firefly 16 G9-6B897EA | |
| LibreOffice / 20 Documents To PDF | |
| HP ZBook Firefly 16 G9-6B897EA | |
| Lenovo ThinkPad P1 G4-20Y4Z9DVUS | |
| Dell Precision 7670 | |
| Dell Precision 7000 7670 Performance | |
| HP ZBook Studio 16 G9 62U04EA | |
| Przeciętny Intel Core i9-12950HX (34.7 - 45.4, n=7) | |
| MSI CreatorPro Z16P B12UKST | |
| R Benchmark 2.5 / Overall mean | |
| Lenovo ThinkPad P1 G4-20Y4Z9DVUS | |
| HP ZBook Firefly 16 G9-6B897EA | |
| Dell Precision 7670 | |
| MSI CreatorPro Z16P B12UKST | |
| Dell Precision 7000 7670 Performance | |
| HP ZBook Studio 16 G9 62U04EA | |
| Przeciętny Intel Core i9-12950HX (0.4251 - 0.4515, n=7) | |
* ... im mniej tym lepiej
AIDA64: FP32 Ray-Trace | FPU Julia | CPU SHA3 | CPU Queen | FPU SinJulia | FPU Mandel | CPU AES | CPU ZLib | FP64 Ray-Trace | CPU PhotoWorxx
| Performance rating | |
| Przeciętny Intel Core i9-12950HX | |
| MSI CreatorPro Z16P B12UKST | |
| HP ZBook Studio 16 G9 62U04EA | |
| Dell Precision 7000 7670 Performance | |
| Lenovo ThinkPad P1 G4-20Y4Z9DVUS | |
| Dell Precision 7670 | |
| HP ZBook Firefly 16 G9-6B897EA | |
| AIDA64 / FP32 Ray-Trace | |
| Przeciętny Intel Core i9-12950HX (15499 - 22868, n=7) | |
| Dell Precision 7000 7670 Performance | |
| Lenovo ThinkPad P1 G4-20Y4Z9DVUS | |
| HP ZBook Studio 16 G9 62U04EA | |
| MSI CreatorPro Z16P B12UKST | |
| Dell Precision 7670 | |
| HP ZBook Firefly 16 G9-6B897EA | |
| AIDA64 / FPU Julia | |
| Przeciętny Intel Core i9-12950HX (77846 - 115907, n=7) | |
| HP ZBook Studio 16 G9 62U04EA | |
| Dell Precision 7000 7670 Performance | |
| MSI CreatorPro Z16P B12UKST | |
| Dell Precision 7670 | |
| Lenovo ThinkPad P1 G4-20Y4Z9DVUS | |
| HP ZBook Firefly 16 G9-6B897EA | |
| AIDA64 / CPU SHA3 | |
| Lenovo ThinkPad P1 G4-20Y4Z9DVUS | |
| Przeciętny Intel Core i9-12950HX (3426 - 5069, n=7) | |
| HP ZBook Studio 16 G9 62U04EA | |
| MSI CreatorPro Z16P B12UKST | |
| Dell Precision 7000 7670 Performance | |
| Dell Precision 7670 | |
| HP ZBook Firefly 16 G9-6B897EA | |
| AIDA64 / CPU Queen | |
| HP ZBook Studio 16 G9 62U04EA | |
| Przeciętny Intel Core i9-12950HX (102752 - 104726, n=7) | |
| Dell Precision 7000 7670 Performance | |
| MSI CreatorPro Z16P B12UKST | |
| Lenovo ThinkPad P1 G4-20Y4Z9DVUS | |
| HP ZBook Firefly 16 G9-6B897EA | |
| Dell Precision 7670 | |
| AIDA64 / FPU SinJulia | |
| Przeciętny Intel Core i9-12950HX (10134 - 12823, n=7) | |
| Dell Precision 7000 7670 Performance | |
| Dell Precision 7670 | |
| Lenovo ThinkPad P1 G4-20Y4Z9DVUS | |
| HP ZBook Studio 16 G9 62U04EA | |
| MSI CreatorPro Z16P B12UKST | |
| HP ZBook Firefly 16 G9-6B897EA | |
| AIDA64 / FPU Mandel | |
| Przeciętny Intel Core i9-12950HX (37146 - 57340, n=7) | |
| HP ZBook Studio 16 G9 62U04EA | |
| Lenovo ThinkPad P1 G4-20Y4Z9DVUS | |
| Dell Precision 7000 7670 Performance | |
| MSI CreatorPro Z16P B12UKST | |
| Dell Precision 7670 | |
| HP ZBook Firefly 16 G9-6B897EA | |
| AIDA64 / CPU AES | |
| MSI CreatorPro Z16P B12UKST | |
| Przeciętny Intel Core i9-12950HX (72599 - 181128, n=7) | |
| Lenovo ThinkPad P1 G4-20Y4Z9DVUS | |
| HP ZBook Studio 16 G9 62U04EA | |
| Dell Precision 7000 7670 Performance | |
| Dell Precision 7670 | |
| HP ZBook Firefly 16 G9-6B897EA | |
| AIDA64 / CPU ZLib | |
| Przeciętny Intel Core i9-12950HX (996 - 1417, n=7) | |
| HP ZBook Studio 16 G9 62U04EA | |
| MSI CreatorPro Z16P B12UKST | |
| Dell Precision 7000 7670 Performance | |
| Dell Precision 7670 | |
| Lenovo ThinkPad P1 G4-20Y4Z9DVUS | |
| HP ZBook Firefly 16 G9-6B897EA | |
| AIDA64 / FP64 Ray-Trace | |
| Przeciętny Intel Core i9-12950HX (8455 - 12432, n=7) | |
| HP ZBook Studio 16 G9 62U04EA | |
| Dell Precision 7000 7670 Performance | |
| Lenovo ThinkPad P1 G4-20Y4Z9DVUS | |
| MSI CreatorPro Z16P B12UKST | |
| Dell Precision 7670 | |
| HP ZBook Firefly 16 G9-6B897EA | |
| AIDA64 / CPU PhotoWorxx | |
| MSI CreatorPro Z16P B12UKST | |
| Dell Precision 7000 7670 Performance | |
| Dell Precision 7670 | |
| Przeciętny Intel Core i9-12950HX (35479 - 42655, n=7) | |
| HP ZBook Studio 16 G9 62U04EA | |
| HP ZBook Firefly 16 G9-6B897EA | |
| Lenovo ThinkPad P1 G4-20Y4Z9DVUS | |
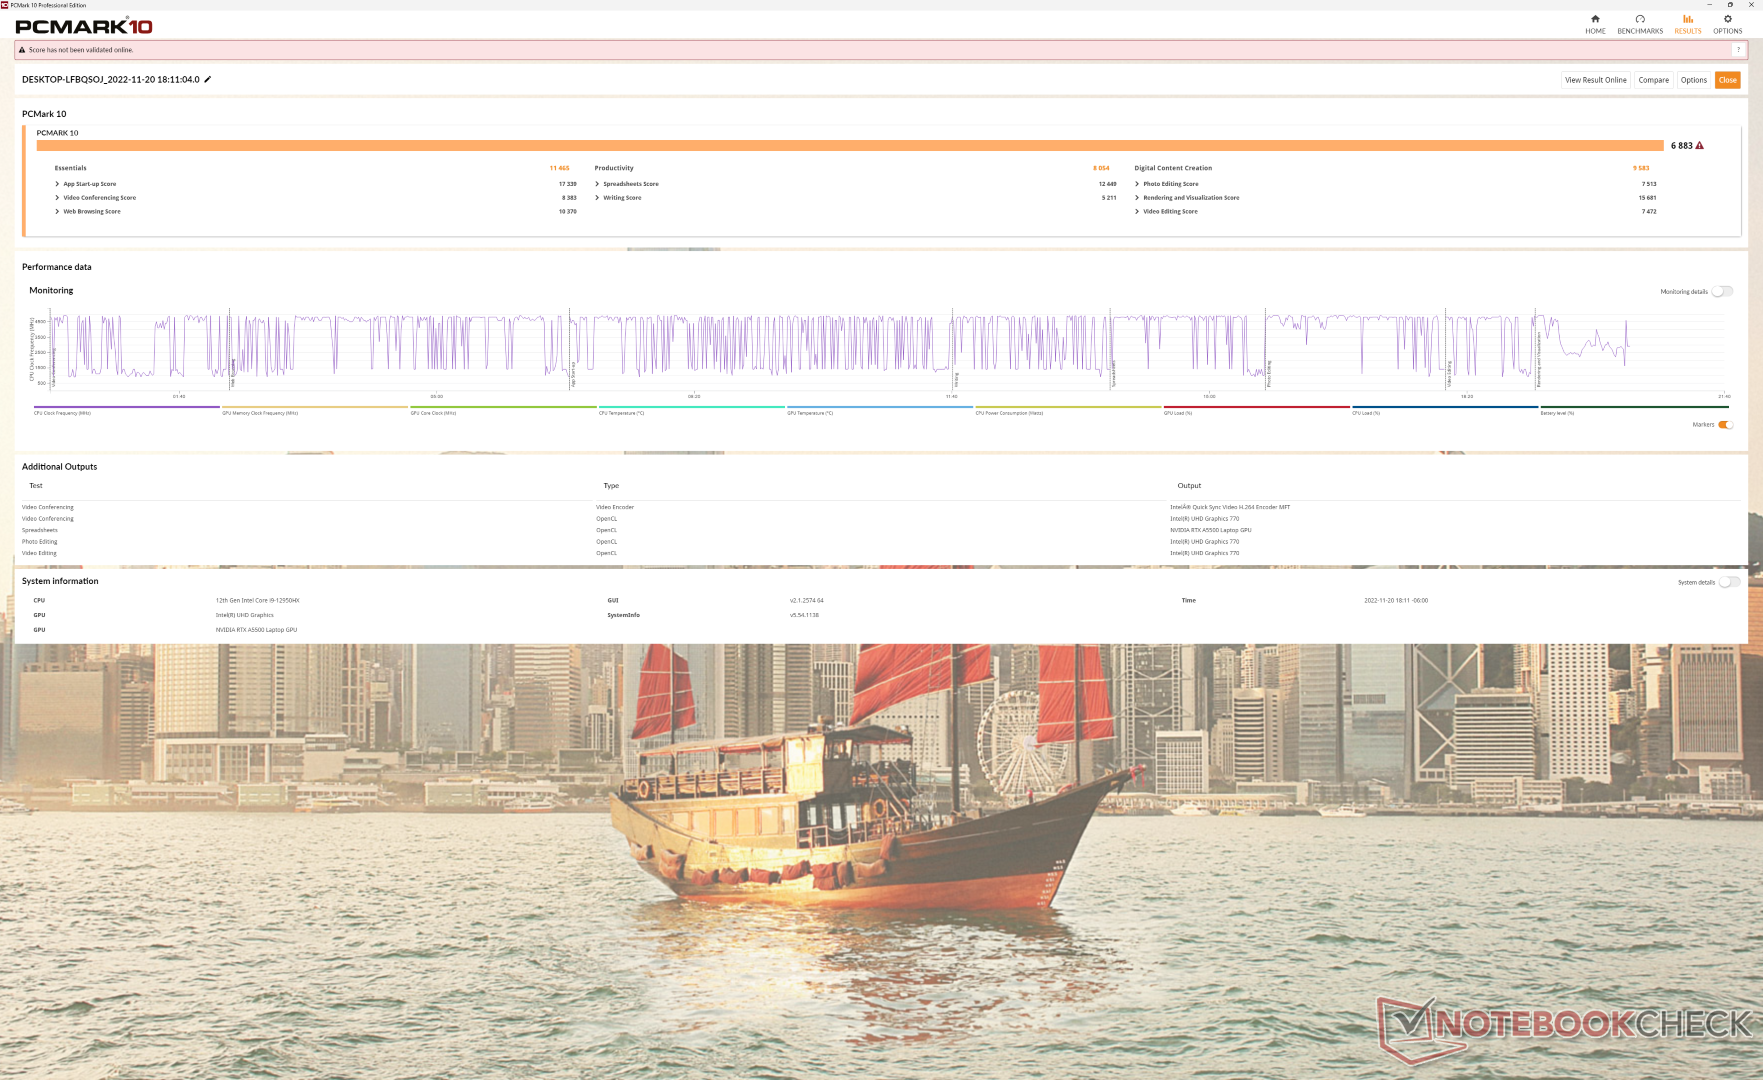
Wydajność systemu
Wyniki PCMark są porównywalne z dostępnymi obecnie mobilnymi stacjami roboczymi z wyższej półki, m.in.HP ZBook Fury 15 G8.
CrossMark: Overall | Productivity | Creativity | Responsiveness
| PCMark 10 / Score | |
| MSI CreatorPro Z16P B12UKST | |
| MSI WE76 11UM-456 | |
| Przeciętny Intel Core i9-12950HX, NVIDIA RTX A5500 Laptop GPU (6883 - 7236, n=3) | |
| Dell Precision 7000 7670 Performance | |
| Dell Precision 7670 | |
| HP ZBook Studio 16 G9 62U04EA | |
| Lenovo ThinkPad P1 G4-20Y4Z9DVUS | |
| HP ZBook Firefly 16 G9-6B897EA | |
| PCMark 10 / Essentials | |
| Dell Precision 7000 7670 Performance | |
| Przeciętny Intel Core i9-12950HX, NVIDIA RTX A5500 Laptop GPU (10898 - 11465, n=3) | |
| MSI CreatorPro Z16P B12UKST | |
| Dell Precision 7670 | |
| HP ZBook Firefly 16 G9-6B897EA | |
| Lenovo ThinkPad P1 G4-20Y4Z9DVUS | |
| MSI WE76 11UM-456 | |
| HP ZBook Studio 16 G9 62U04EA | |
| PCMark 10 / Productivity | |
| MSI WE76 11UM-456 | |
| MSI CreatorPro Z16P B12UKST | |
| Dell Precision 7670 | |
| Przeciętny Intel Core i9-12950HX, NVIDIA RTX A5500 Laptop GPU (8054 - 9489, n=3) | |
| HP ZBook Firefly 16 G9-6B897EA | |
| Lenovo ThinkPad P1 G4-20Y4Z9DVUS | |
| Dell Precision 7000 7670 Performance | |
| HP ZBook Studio 16 G9 62U04EA | |
| PCMark 10 / Digital Content Creation | |
| MSI WE76 11UM-456 | |
| MSI CreatorPro Z16P B12UKST | |
| Dell Precision 7000 7670 Performance | |
| Przeciętny Intel Core i9-12950HX, NVIDIA RTX A5500 Laptop GPU (9155 - 9944, n=3) | |
| HP ZBook Studio 16 G9 62U04EA | |
| Dell Precision 7670 | |
| Lenovo ThinkPad P1 G4-20Y4Z9DVUS | |
| HP ZBook Firefly 16 G9-6B897EA | |
| CrossMark / Overall | |
| MSI CreatorPro Z16P B12UKST | |
| Przeciętny Intel Core i9-12950HX, NVIDIA RTX A5500 Laptop GPU (1801 - 1889, n=3) | |
| HP ZBook Studio 16 G9 62U04EA | |
| Dell Precision 7000 7670 Performance | |
| MSI WE76 11UM-456 | |
| HP ZBook Firefly 16 G9-6B897EA | |
| Lenovo ThinkPad P1 G4-20Y4Z9DVUS | |
| Dell Precision 7670 | |
| CrossMark / Productivity | |
| MSI CreatorPro Z16P B12UKST | |
| Przeciętny Intel Core i9-12950HX, NVIDIA RTX A5500 Laptop GPU (1684 - 1785, n=3) | |
| HP ZBook Studio 16 G9 62U04EA | |
| Dell Precision 7000 7670 Performance | |
| MSI WE76 11UM-456 | |
| HP ZBook Firefly 16 G9-6B897EA | |
| Lenovo ThinkPad P1 G4-20Y4Z9DVUS | |
| Dell Precision 7670 | |
| CrossMark / Creativity | |
| Przeciętny Intel Core i9-12950HX, NVIDIA RTX A5500 Laptop GPU (2042 - 2192, n=3) | |
| HP ZBook Studio 16 G9 62U04EA | |
| MSI CreatorPro Z16P B12UKST | |
| Dell Precision 7000 7670 Performance | |
| MSI WE76 11UM-456 | |
| HP ZBook Firefly 16 G9-6B897EA | |
| Dell Precision 7670 | |
| Lenovo ThinkPad P1 G4-20Y4Z9DVUS | |
| CrossMark / Responsiveness | |
| MSI CreatorPro Z16P B12UKST | |
| HP ZBook Studio 16 G9 62U04EA | |
| Przeciętny Intel Core i9-12950HX, NVIDIA RTX A5500 Laptop GPU (1501 - 1585, n=3) | |
| Dell Precision 7000 7670 Performance | |
| MSI WE76 11UM-456 | |
| HP ZBook Firefly 16 G9-6B897EA | |
| Lenovo ThinkPad P1 G4-20Y4Z9DVUS | |
| Dell Precision 7670 | |
| PCMark 10 Score | 6883 pkt. | |
Pomoc | ||
| AIDA64 / Memory Copy | |
| Dell Precision 7000 7670 Performance | |
| Przeciętny Intel Core i9-12950HX (59731 - 64732, n=7) | |
| Dell Precision 7670 | |
| MSI CreatorPro Z16P B12UKST | |
| HP ZBook Studio 16 G9 62U04EA | |
| HP ZBook Firefly 16 G9-6B897EA | |
| Lenovo ThinkPad P1 G4-20Y4Z9DVUS | |
| AIDA64 / Memory Read | |
| Dell Precision 7670 | |
| Dell Precision 7000 7670 Performance | |
| Przeciętny Intel Core i9-12950HX (59744 - 70359, n=7) | |
| MSI CreatorPro Z16P B12UKST | |
| HP ZBook Studio 16 G9 62U04EA | |
| HP ZBook Firefly 16 G9-6B897EA | |
| Lenovo ThinkPad P1 G4-20Y4Z9DVUS | |
| AIDA64 / Memory Write | |
| MSI CreatorPro Z16P B12UKST | |
| Dell Precision 7000 7670 Performance | |
| HP ZBook Studio 16 G9 62U04EA | |
| Dell Precision 7670 | |
| Przeciętny Intel Core i9-12950HX (57750 - 67899, n=7) | |
| HP ZBook Firefly 16 G9-6B897EA | |
| Lenovo ThinkPad P1 G4-20Y4Z9DVUS | |
| AIDA64 / Memory Latency | |
| MSI CreatorPro Z16P B12UKST | |
| HP ZBook Firefly 16 G9-6B897EA | |
| HP ZBook Studio 16 G9 62U04EA | |
| Dell Precision 7670 | |
| Przeciętny Intel Core i9-12950HX (84.5 - 92.2, n=7) | |
| Dell Precision 7000 7670 Performance | |
| Lenovo ThinkPad P1 G4-20Y4Z9DVUS | |
* ... im mniej tym lepiej
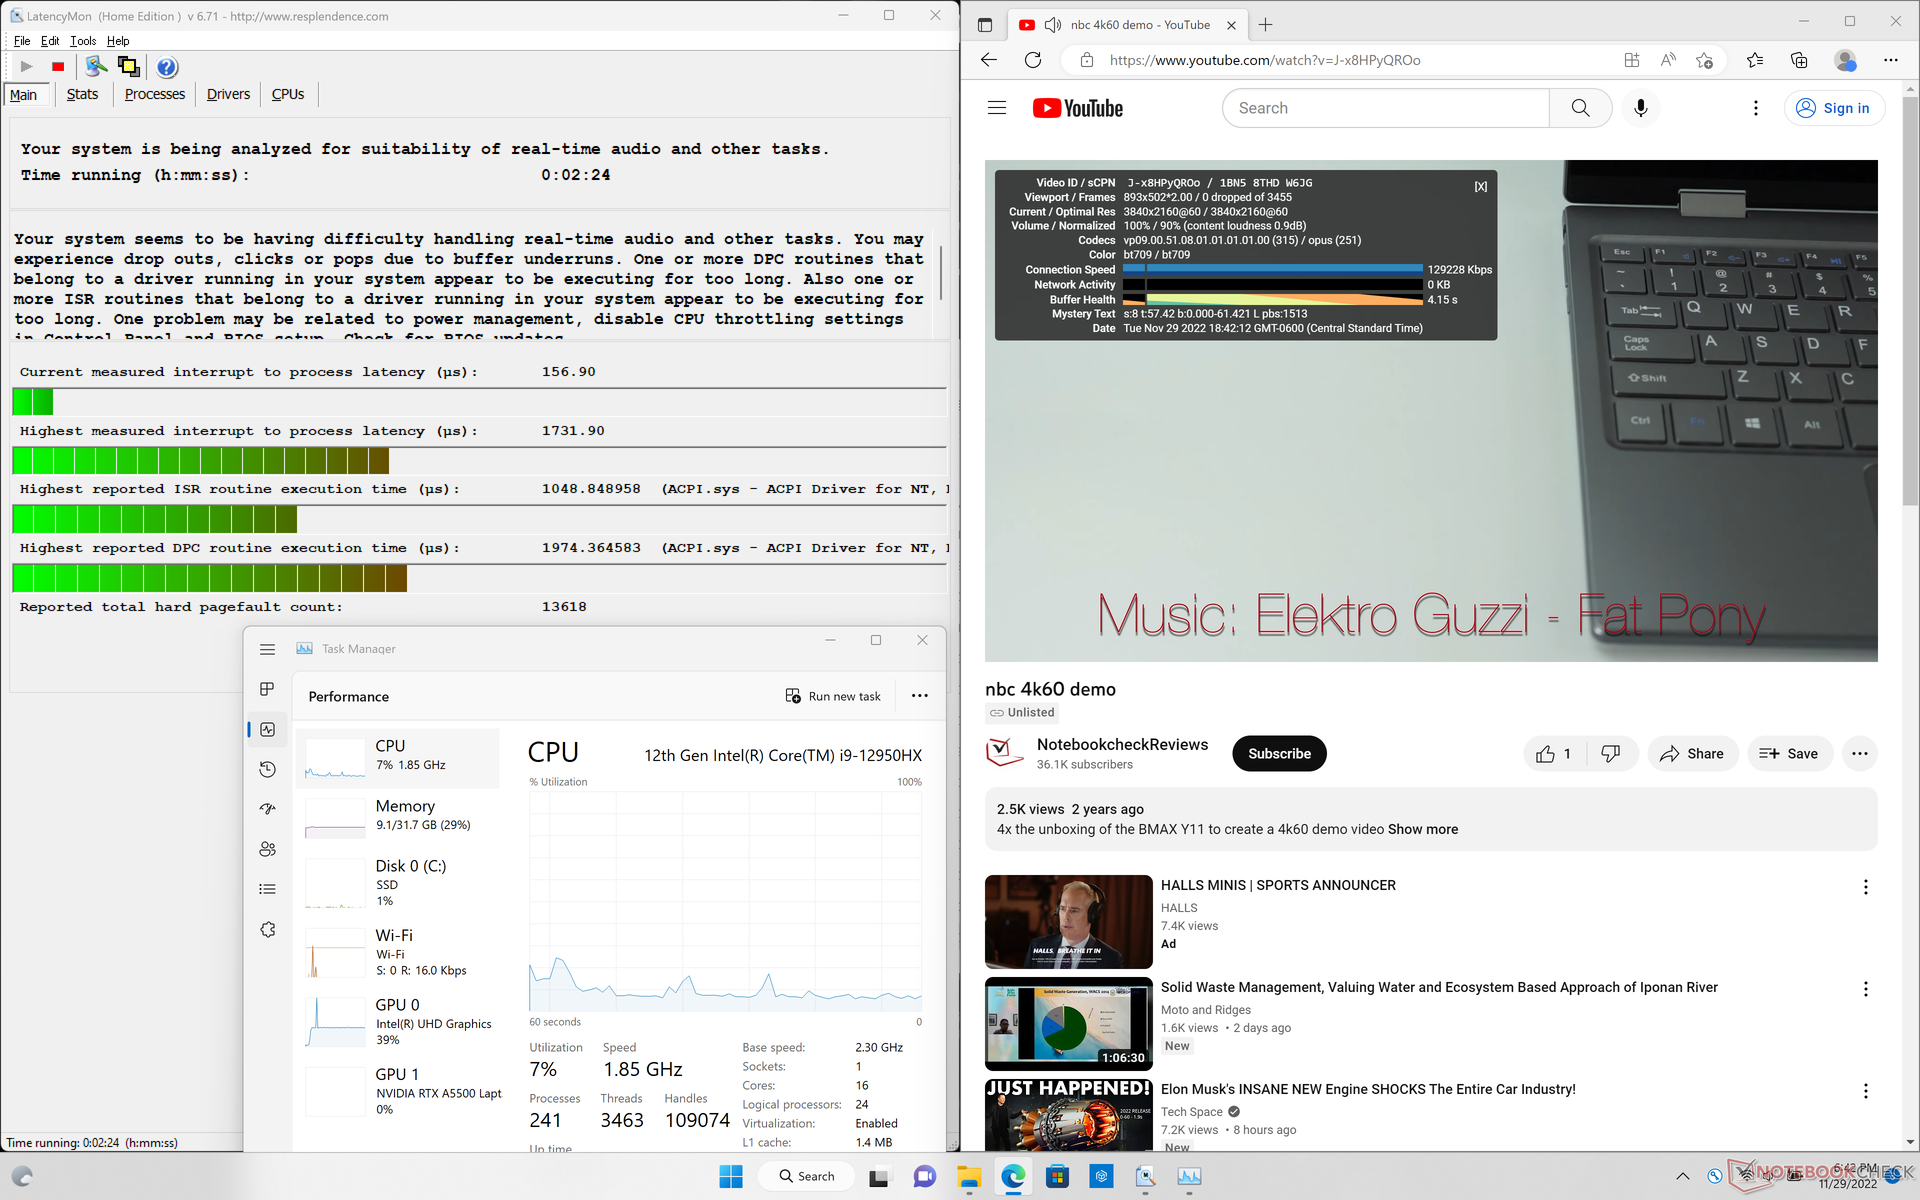
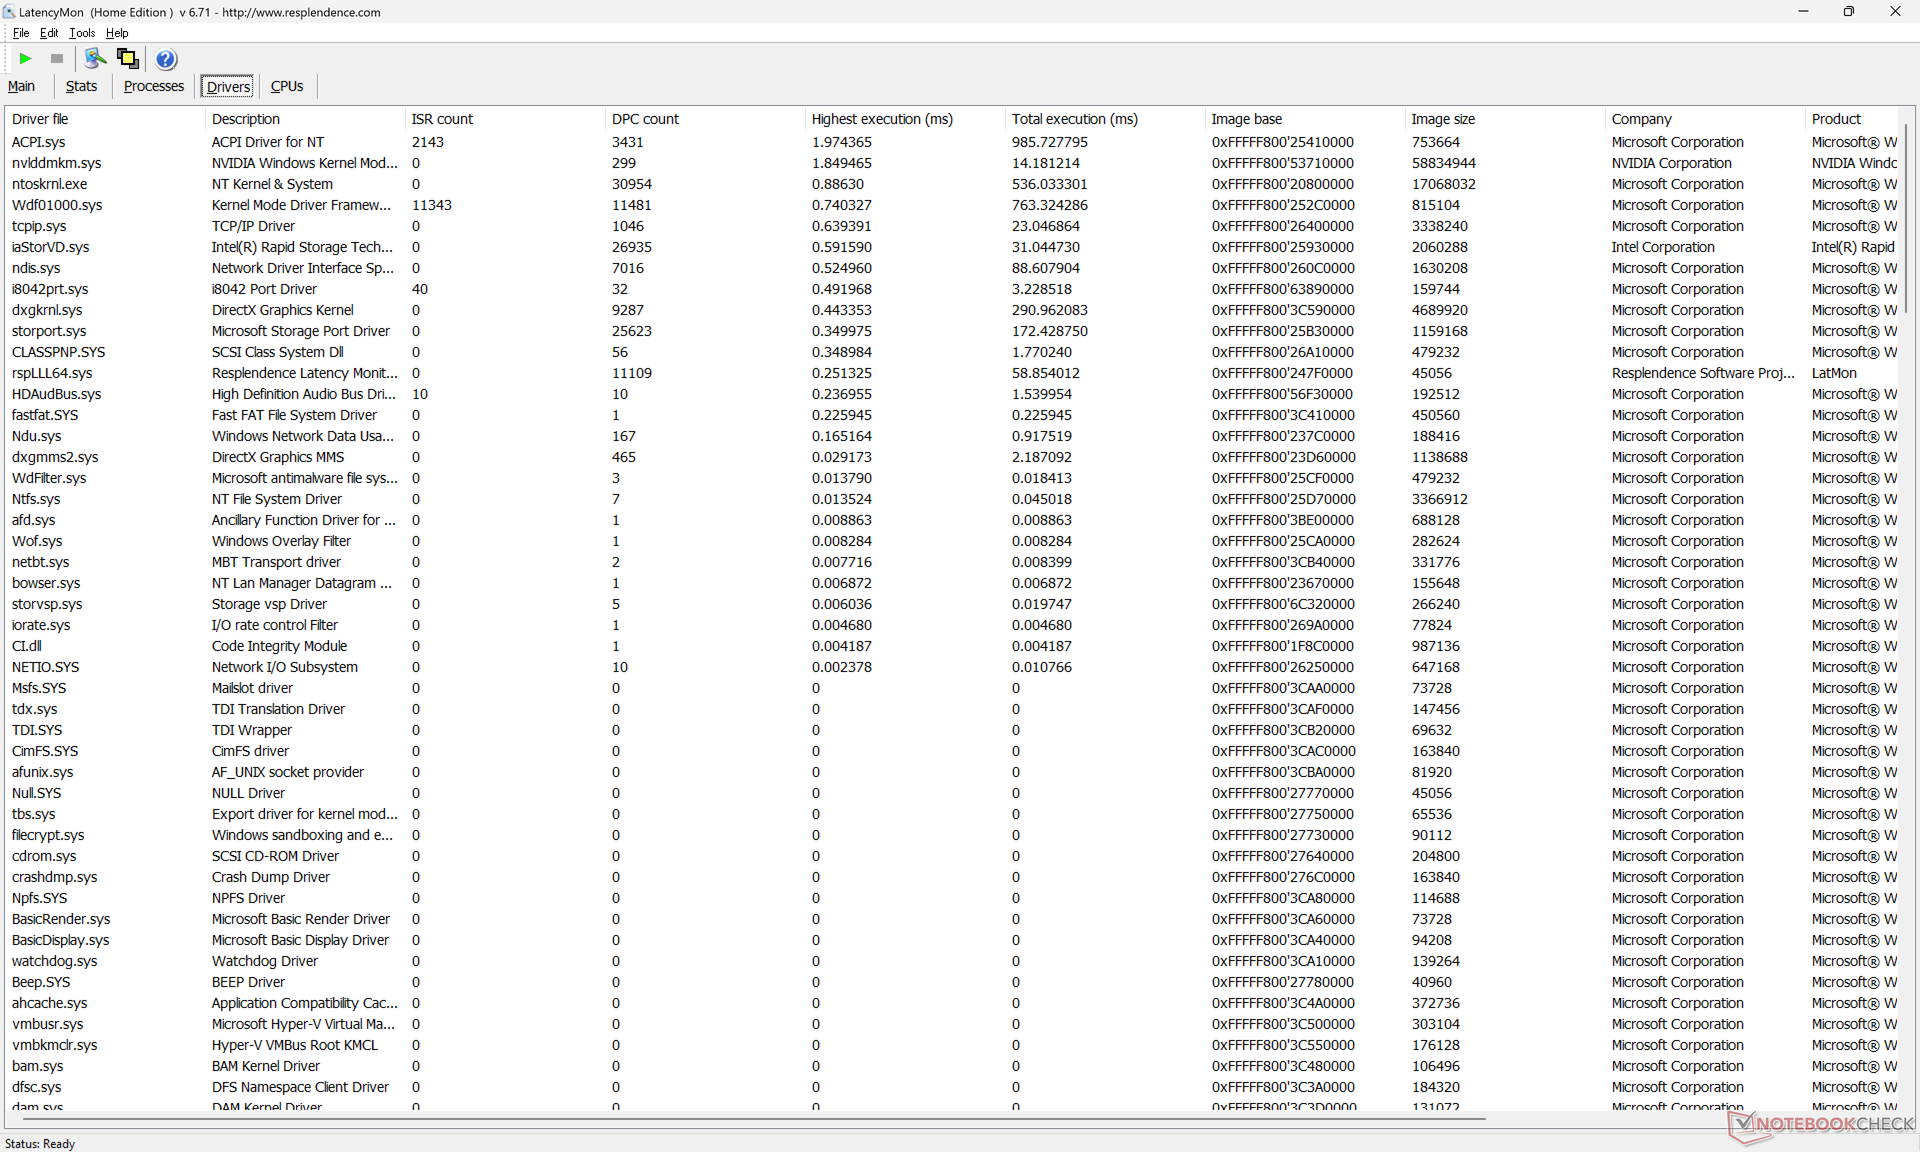
Opóźnienie DPC
LatencyMon ujawnia problemy z DPC podczas otwierania wielu kart przeglądarki na naszej stronie głównej, nawet po kilku ponownych testach. odtwarzanie wideo 4K przy 60 FPS jest poza tym płynne i bez żadnych spadków klatek.
| DPC Latencies / LatencyMon - interrupt to process latency (max), Web, Youtube, Prime95 | |
| Dell Precision 7000 7670 Performance | |
| Lenovo ThinkPad P1 G4-20Y4Z9DVUS | |
| Dell Precision 7670 | |
| HP ZBook Studio 16 G9 62U04EA | |
| HP ZBook Firefly 16 G9-6B897EA | |
| MSI CreatorPro Z16P B12UKST | |
* ... im mniej tym lepiej
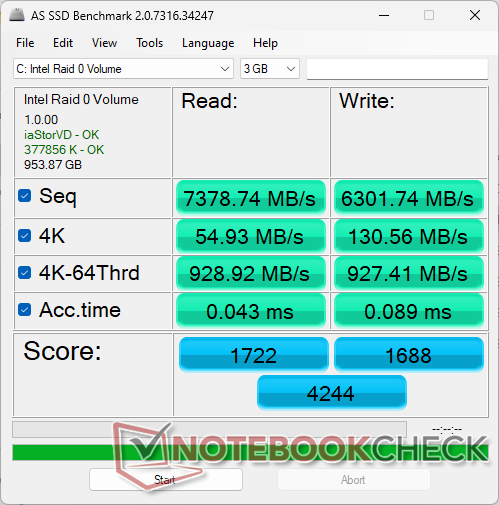
Urządzenia do przechowywania danych
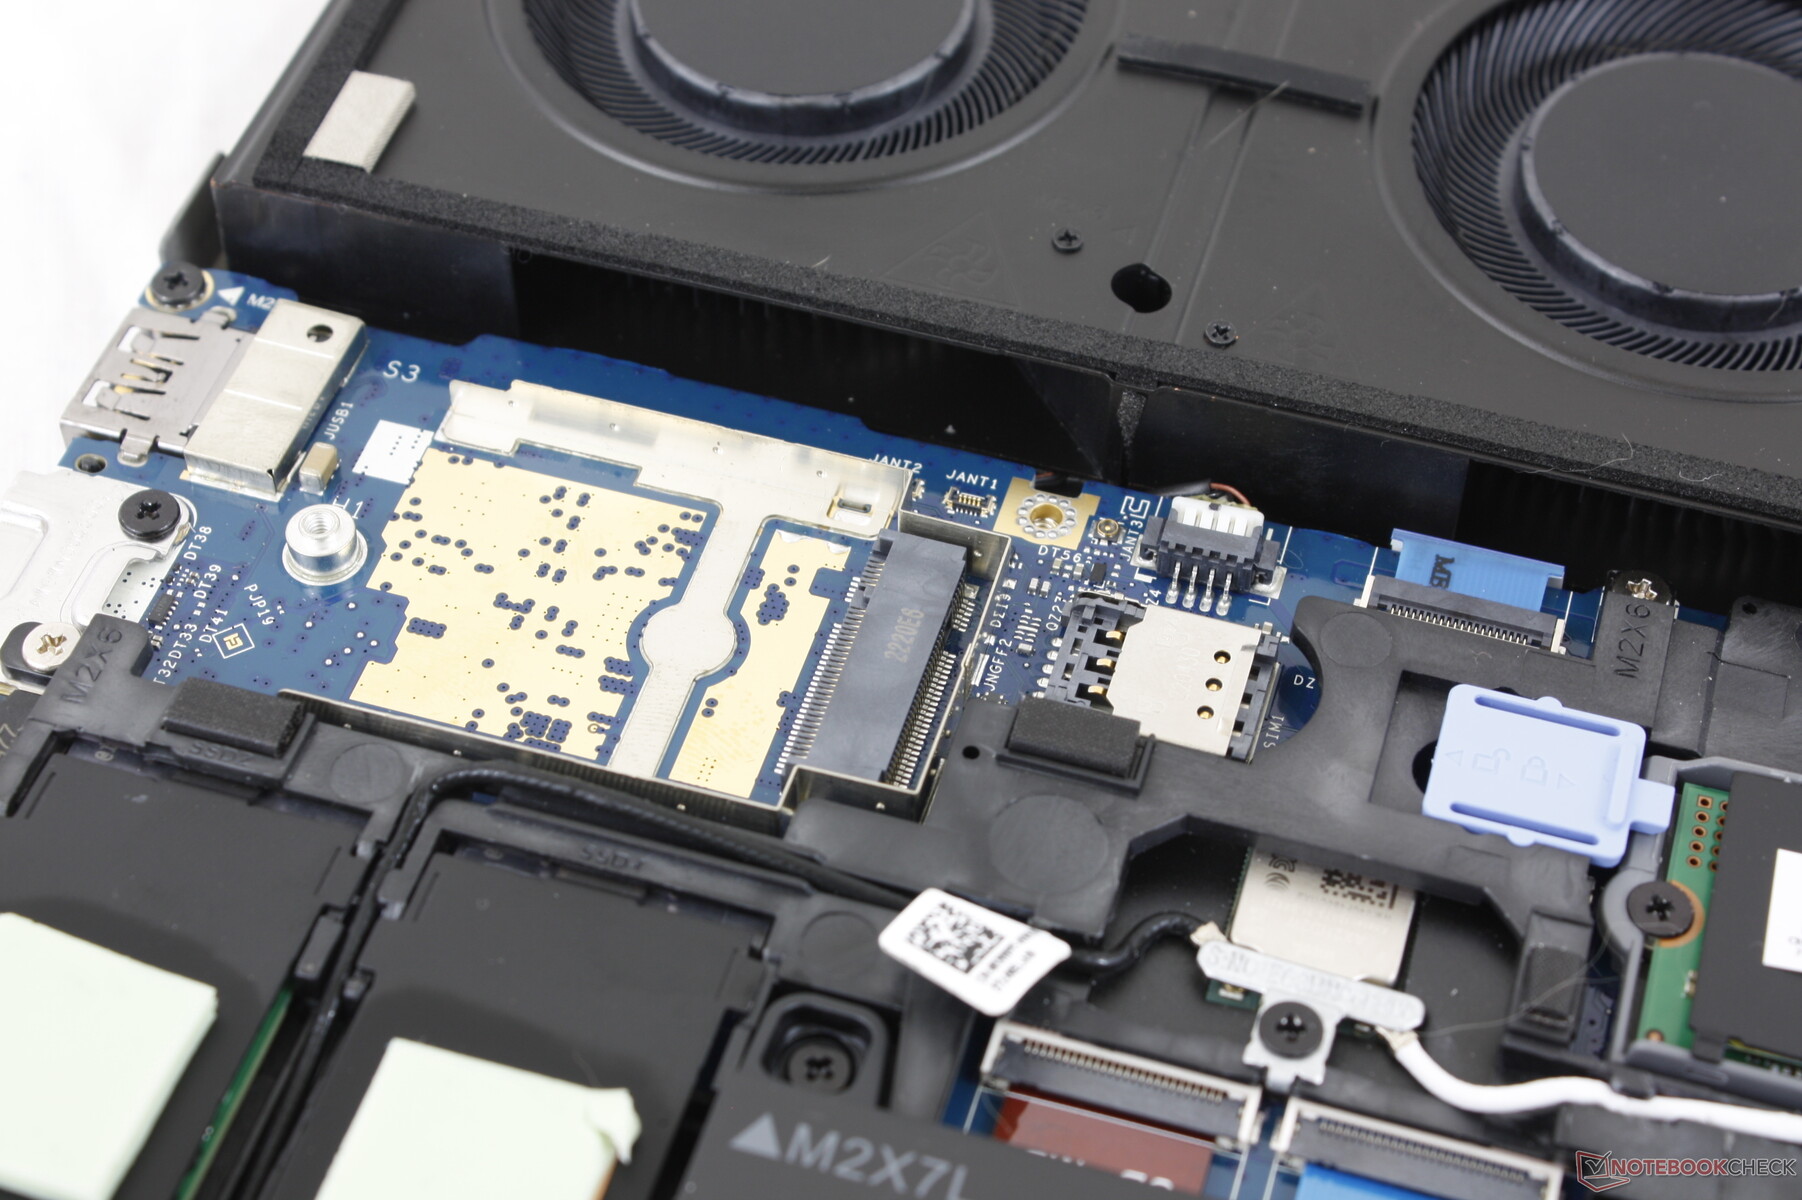
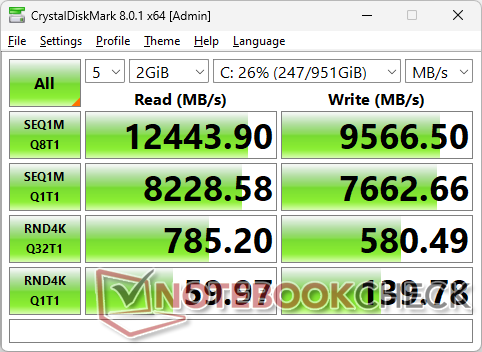
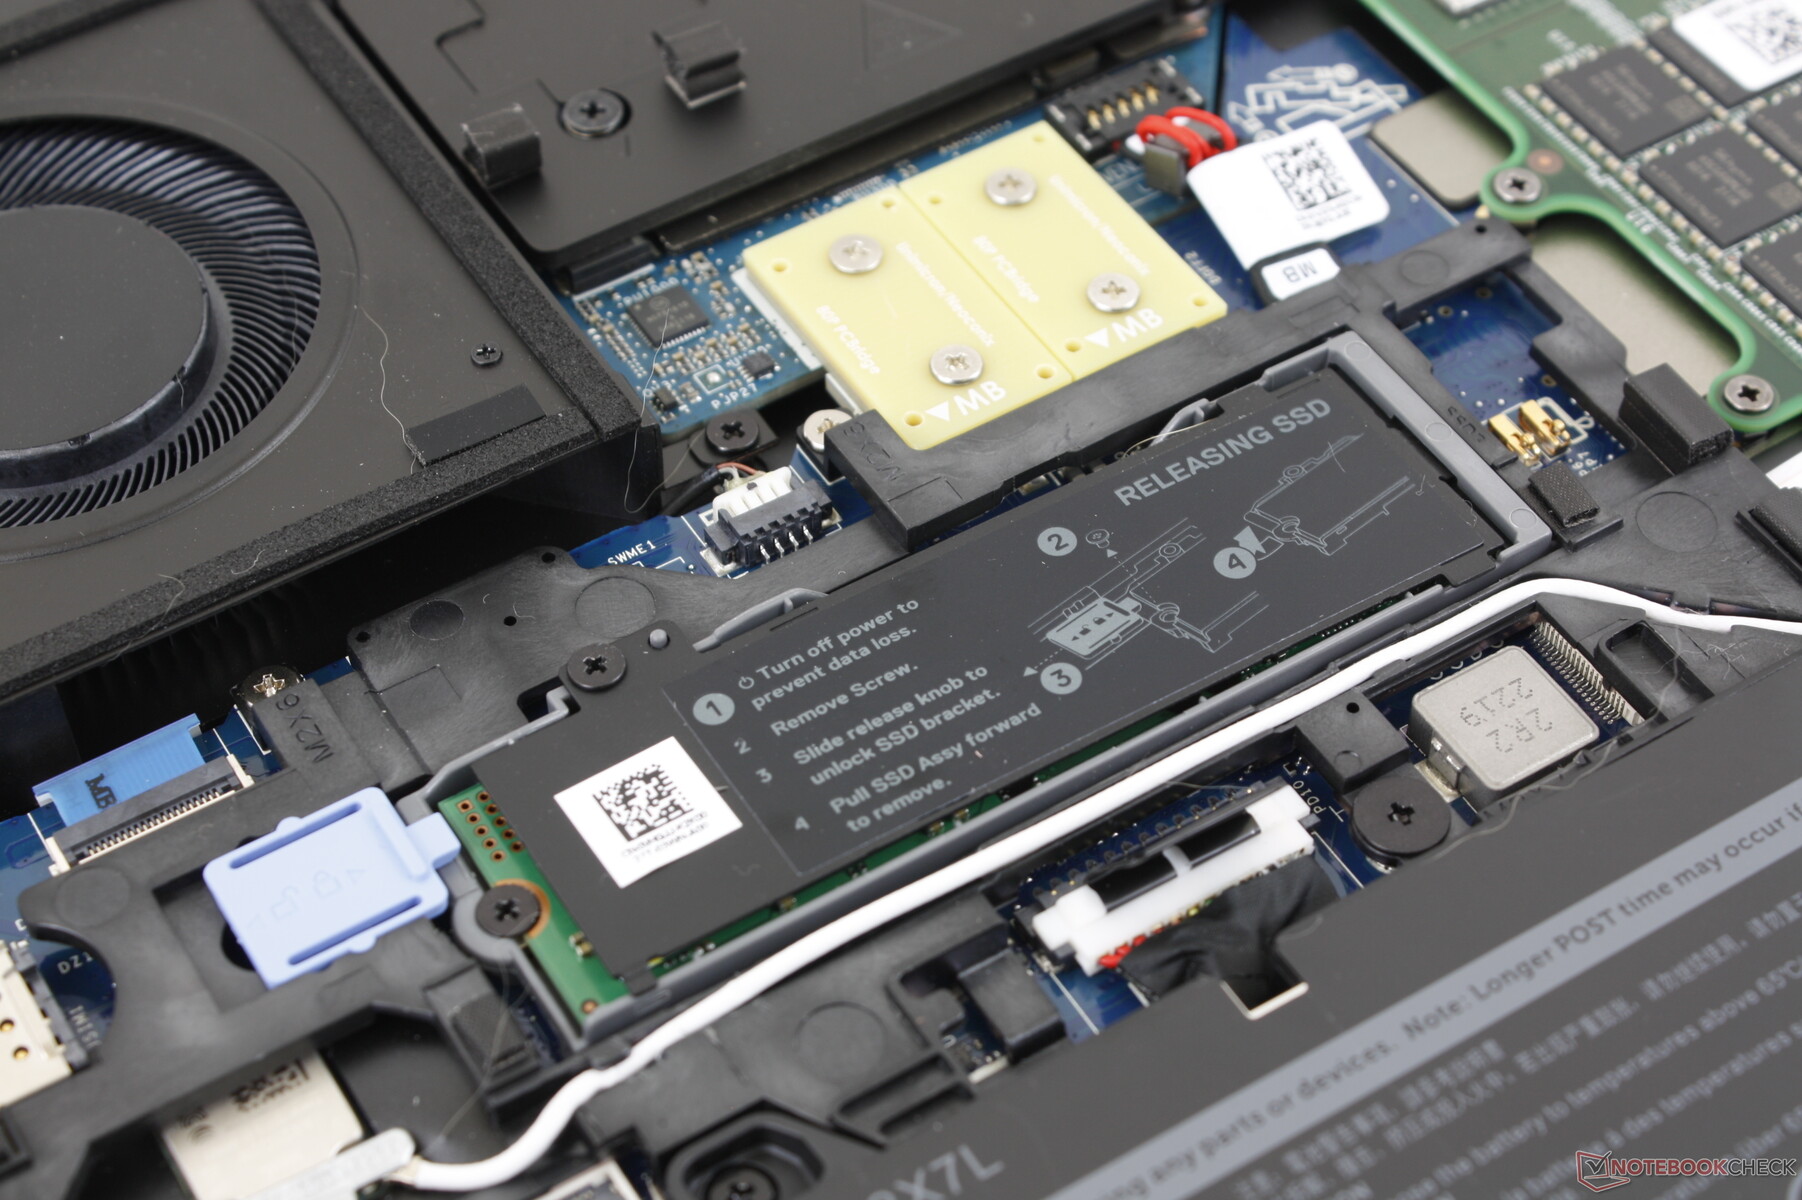
Użytkownicy mogą zainstalować do trzech dysków SSD PCIe4 x4 NVMe M.2 2280 zamiast tylko dwóch w smuklejszym zwykłym modelu. Na stronie dwa dyski SK Hynix PC801 w naszym egzemplarzu zostały zainstalowane w konfiguracji RAID 0, co zapewnia szalenie wysokie rzeczywiste sekwencyjne prędkości odczytu i zapisu, wynoszące odpowiednio około 13000 MB/s i 10000 MB/s. Każde gniazdo SSD posiada własny rozpraszacz ciepła i podkładkę termiczną do odprowadzania ciepła.

| Drive Performance rating - Percent | |
| MSI CreatorPro Z16P B12UKST -8! | |
| Dell Precision 7670 | |
| Dell Precision 7000 7670 Performance | |
| HP ZBook Studio 16 G9 62U04EA | |
| Lenovo ThinkPad P1 G4-20Y4Z9DVUS | |
| HP ZBook Firefly 16 G9-6B897EA | |
| Global Average -3 | |
* ... im mniej tym lepiej
Disk Throttling: DiskSpd Read Loop, Queue Depth 8
Wydajność GPU
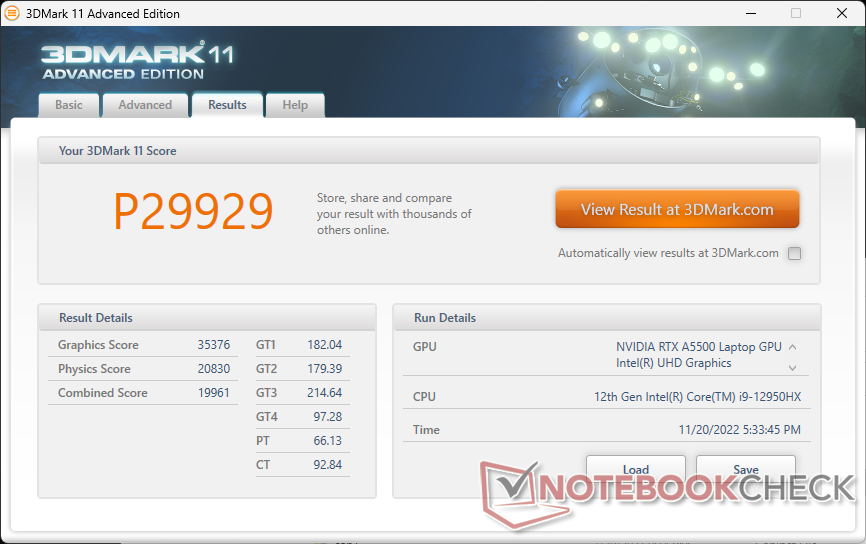
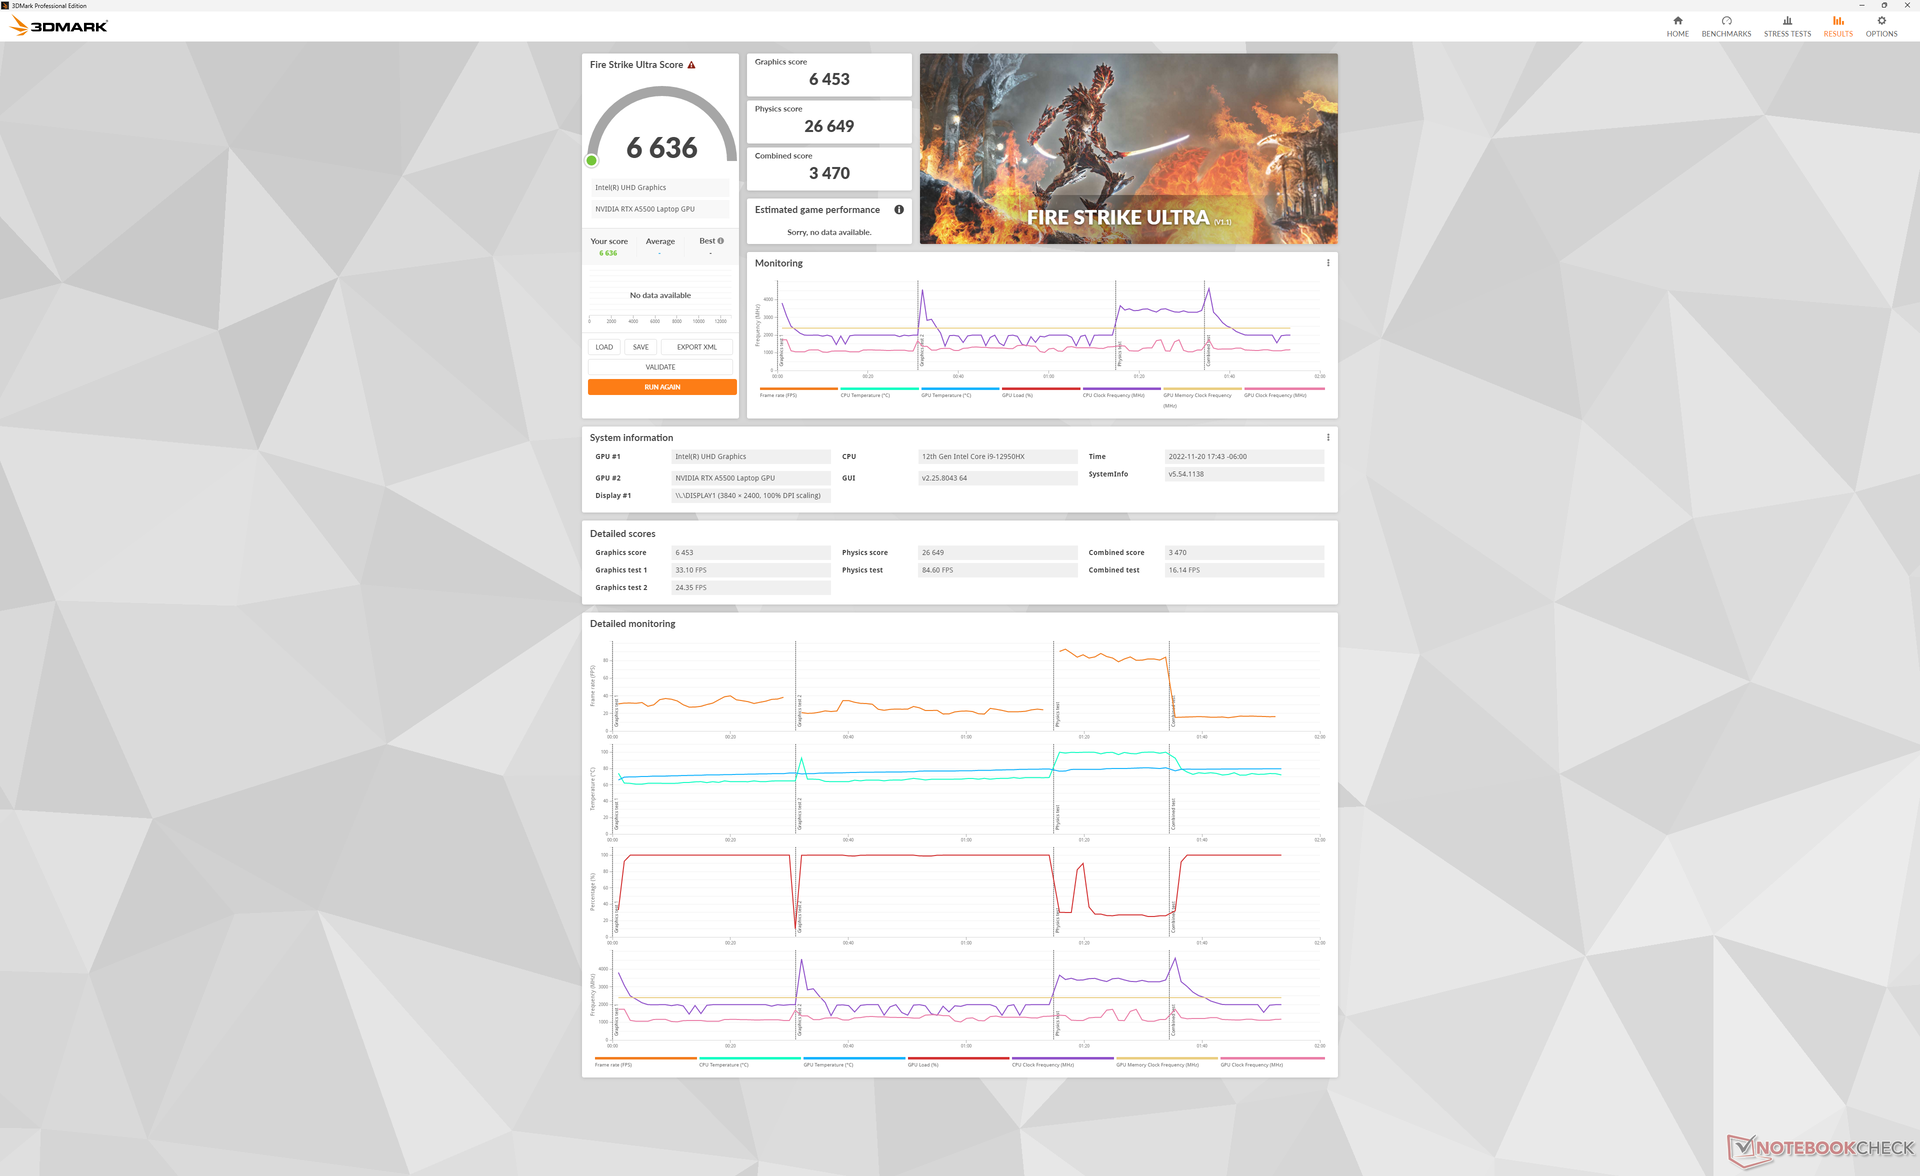
Na stronie RTX A5500 jest o około 60 do 80 procent szybszy niż RTX A2000 w smuklejszym Precision 7670 aby być jedną z najszybszych mobilnych stacji roboczych obecnie na rynku. Nie jest jednak dużo lepszy od mającego już dwa lata Quadro RTX 5000 w Acer ConceptD 9 Pro lub Asus ProArt StudioBook Pro X, jednak nawet pod względem wydajności w ray-tracingu. Na stronie RTX A5000 w większym 17,3-calowym MSI WE76 przewyższa naszego RTX A5500 w większości benchmarków.
| 3DMark 11 - 1280x720 Performance GPU | |
| MSI WE76 11UM-456 | |
| Średnia w klasie Workstation (12535 - 69594, n=23, ostatnie 2 lata) | |
| Dell Precision 7000 7670 Performance | |
| Acer ConceptD 9 Pro | |
| Dell Precision 7550 | |
| MSI CreatorPro Z16P B12UKST | |
| HP ZBook Fury 17 G7 119W5EA | |
| Dell Precision 7670 | |
| HP ZBook Studio 16 G9 62U04EA | |
| HP ZBook Studio G7 | |
| Lenovo ThinkPad P1 G4-20Y4Z9DVUS | |
| Lenovo ThinkPad P15 Gen1-20ST000DGE | |
| Dell Precision 3000 3551 | |
| Lenovo ThinkPad P15s Gen1-20T4000JGE | |
| SPECviewperf 13 | |
| Solidworks (sw-04) | |
| Acer ConceptD 9 Pro | |
| Dell Precision 7000 7670 Performance | |
| Średnia w klasie Workstation (147.5 - 230, n=10, ostatnie 2 lata) | |
| MSI WE76 11UM-456 | |
| Dell Precision 7670 | |
| MSI CreatorPro Z16P B12UKST | |
| Dell Precision 7550 | |
| Lenovo ThinkPad P1 G4-20Y4Z9DVUS | |
| HP ZBook Studio G7 | |
| HP ZBook Studio 16 G9 62U04EA | |
| HP ZBook Fury 17 G7 119W5EA | |
| Lenovo ThinkPad P15 Gen1-20ST000DGE | |
| Dell Precision 3000 3551 | |
| Lenovo ThinkPad P15s Gen1-20T4000JGE | |
| Siemens NX (snx-03) | |
| Średnia w klasie Workstation (331 - 879, n=10, ostatnie 2 lata) | |
| Acer ConceptD 9 Pro | |
| Dell Precision 7000 7670 Performance | |
| MSI WE76 11UM-456 | |
| Dell Precision 7550 | |
| MSI CreatorPro Z16P B12UKST | |
| HP ZBook Fury 17 G7 119W5EA | |
| Dell Precision 7670 | |
| HP ZBook Studio G7 | |
| HP ZBook Studio 16 G9 62U04EA | |
| Lenovo ThinkPad P1 G4-20Y4Z9DVUS | |
| Lenovo ThinkPad P15 Gen1-20ST000DGE | |
| Dell Precision 3000 3551 | |
| Lenovo ThinkPad P15s Gen1-20T4000JGE | |
| Showcase (showcase-02) | |
| Średnia w klasie Workstation (85.3 - 319, n=10, ostatnie 2 lata) | |
| Dell Precision 7000 7670 Performance | |
| MSI WE76 11UM-456 | |
| Acer ConceptD 9 Pro | |
| MSI CreatorPro Z16P B12UKST | |
| Dell Precision 7550 | |
| HP ZBook Fury 17 G7 119W5EA | |
| Dell Precision 7670 | |
| HP ZBook Studio G7 | |
| HP ZBook Studio 16 G9 62U04EA | |
| Lenovo ThinkPad P1 G4-20Y4Z9DVUS | |
| Lenovo ThinkPad P15 Gen1-20ST000DGE | |
| Dell Precision 3000 3551 | |
| Lenovo ThinkPad P15s Gen1-20T4000JGE | |
| Medical (medical-02) | |
| Średnia w klasie Workstation (169.9 - 363, n=10, ostatnie 2 lata) | |
| Acer ConceptD 9 Pro | |
| Dell Precision 7000 7670 Performance | |
| MSI WE76 11UM-456 | |
| MSI CreatorPro Z16P B12UKST | |
| Dell Precision 7550 | |
| HP ZBook Fury 17 G7 119W5EA | |
| Dell Precision 7670 | |
| HP ZBook Studio G7 | |
| HP ZBook Studio 16 G9 62U04EA | |
| Lenovo ThinkPad P1 G4-20Y4Z9DVUS | |
| Lenovo ThinkPad P15 Gen1-20ST000DGE | |
| Dell Precision 3000 3551 | |
| Lenovo ThinkPad P15s Gen1-20T4000JGE | |
| Maya (maya-05) | |
| Średnia w klasie Workstation (287 - 448, n=5, ostatnie 2 lata) | |
| Acer ConceptD 9 Pro | |
| Dell Precision 7000 7670 Performance | |
| MSI WE76 11UM-456 | |
| MSI CreatorPro Z16P B12UKST | |
| Dell Precision 7550 | |
| Dell Precision 7670 | |
| HP ZBook Fury 17 G7 119W5EA | |
| HP ZBook Studio G7 | |
| HP ZBook Studio 16 G9 62U04EA | |
| Lenovo ThinkPad P1 G4-20Y4Z9DVUS | |
| Lenovo ThinkPad P15 Gen1-20ST000DGE | |
| Dell Precision 3000 3551 | |
| Lenovo ThinkPad P15s Gen1-20T4000JGE | |
| Energy (energy-02) | |
| Średnia w klasie Workstation (49.5 - 174.7, n=10, ostatnie 2 lata) | |
| MSI WE76 11UM-456 | |
| Dell Precision 7000 7670 Performance | |
| Acer ConceptD 9 Pro | |
| MSI CreatorPro Z16P B12UKST | |
| Dell Precision 7550 | |
| Dell Precision 7670 | |
| HP ZBook Fury 17 G7 119W5EA | |
| HP ZBook Studio 16 G9 62U04EA | |
| HP ZBook Studio G7 | |
| Lenovo ThinkPad P1 G4-20Y4Z9DVUS | |
| Lenovo ThinkPad P15 Gen1-20ST000DGE | |
| Dell Precision 3000 3551 | |
| Lenovo ThinkPad P15s Gen1-20T4000JGE | |
| Creo (creo-02) | |
| Średnia w klasie Workstation (262 - 589, n=10, ostatnie 2 lata) | |
| Acer ConceptD 9 Pro | |
| Dell Precision 7000 7670 Performance | |
| MSI WE76 11UM-456 | |
| MSI CreatorPro Z16P B12UKST | |
| Dell Precision 7550 | |
| HP ZBook Studio G7 | |
| HP ZBook Fury 17 G7 119W5EA | |
| HP ZBook Studio 16 G9 62U04EA | |
| Lenovo ThinkPad P1 G4-20Y4Z9DVUS | |
| Lenovo ThinkPad P15 Gen1-20ST000DGE | |
| Dell Precision 3000 3551 | |
| Lenovo ThinkPad P15s Gen1-20T4000JGE | |
| Catia (catia-05) | |
| Średnia w klasie Workstation (301 - 552, n=10, ostatnie 2 lata) | |
| Dell Precision 7000 7670 Performance | |
| Acer ConceptD 9 Pro | |
| MSI WE76 11UM-456 | |
| MSI CreatorPro Z16P B12UKST | |
| Dell Precision 7550 | |
| Dell Precision 7670 | |
| HP ZBook Studio G7 | |
| HP ZBook Studio 16 G9 62U04EA | |
| HP ZBook Fury 17 G7 119W5EA | |
| Lenovo ThinkPad P1 G4-20Y4Z9DVUS | |
| Lenovo ThinkPad P15 Gen1-20ST000DGE | |
| Dell Precision 3000 3551 | |
| Lenovo ThinkPad P15s Gen1-20T4000JGE | |
| 3DMark 11 Performance | 29929 pkt. | |
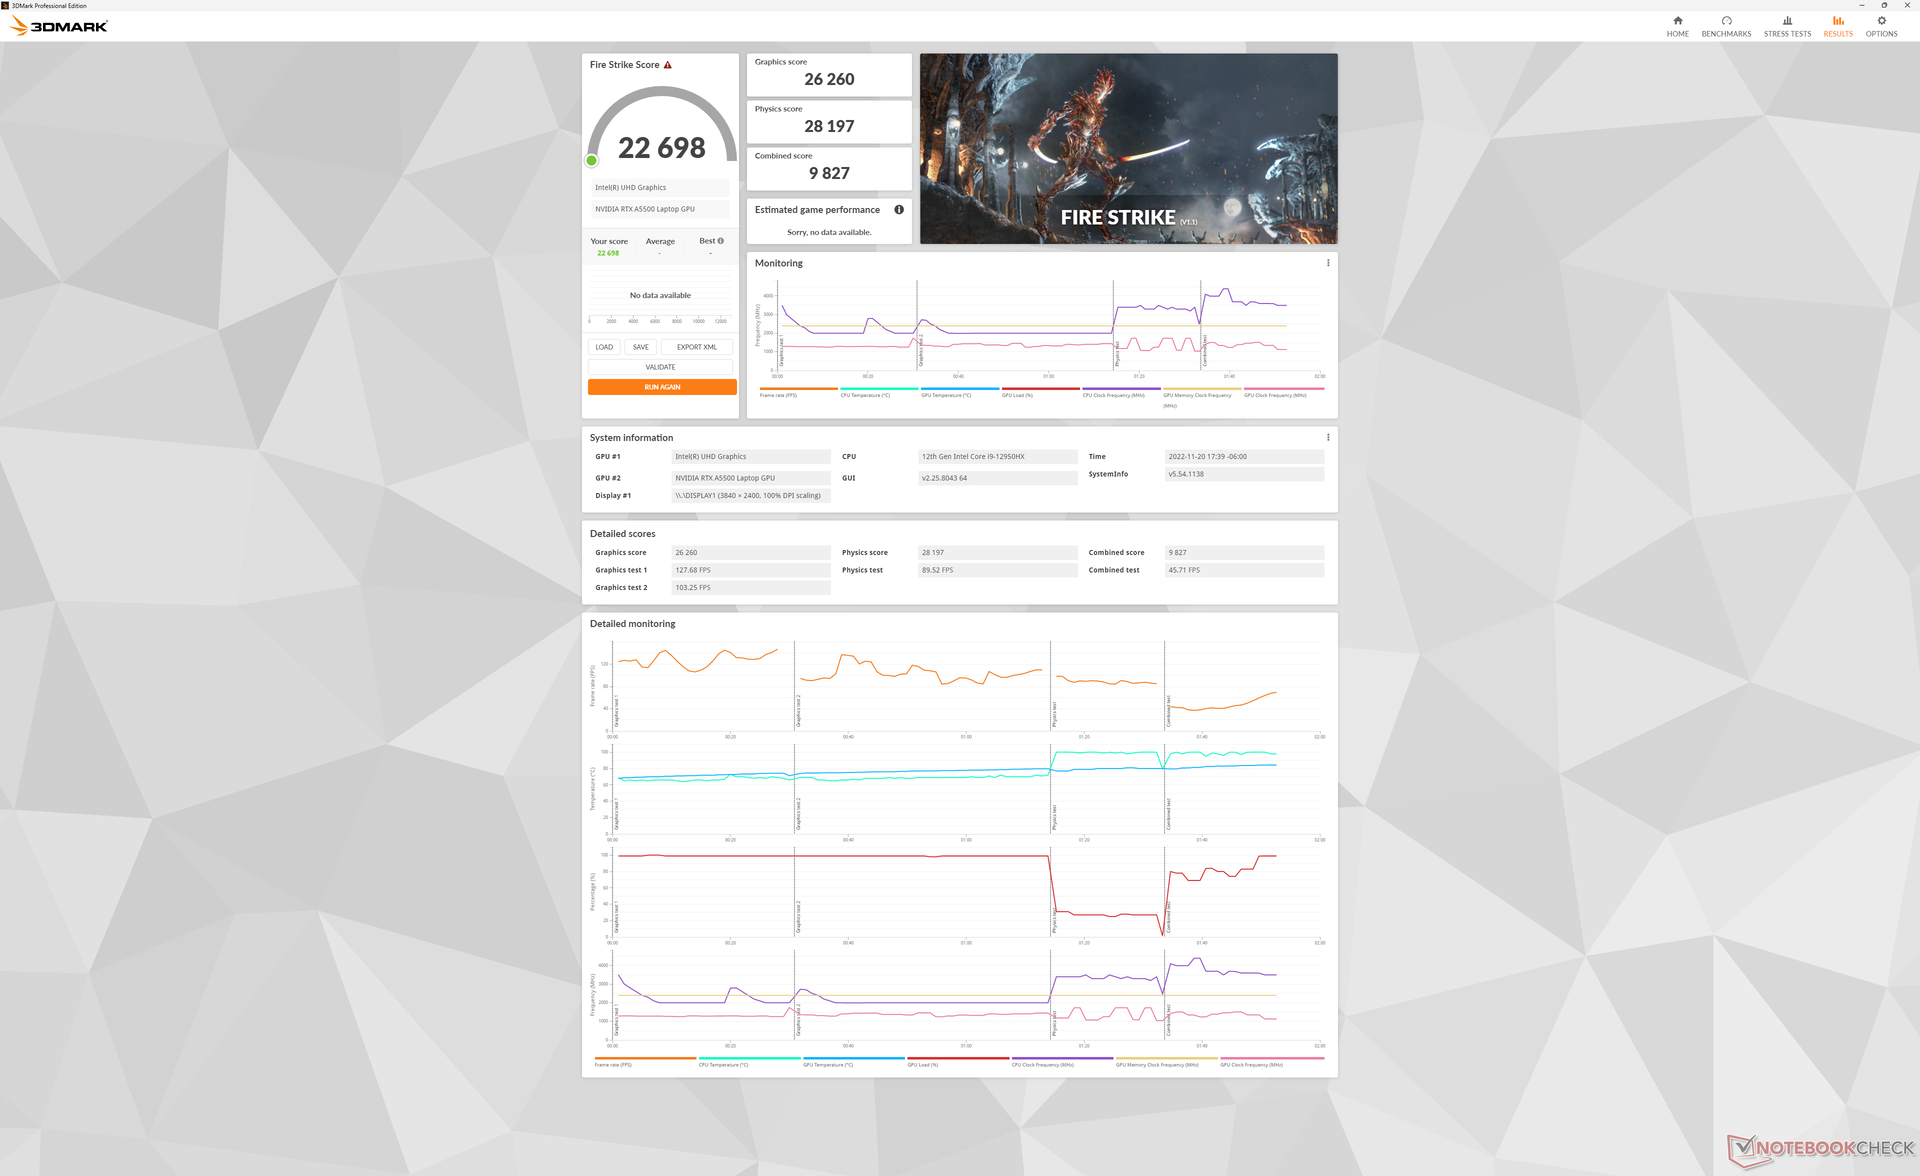
| 3DMark Fire Strike Score | 22698 pkt. | |
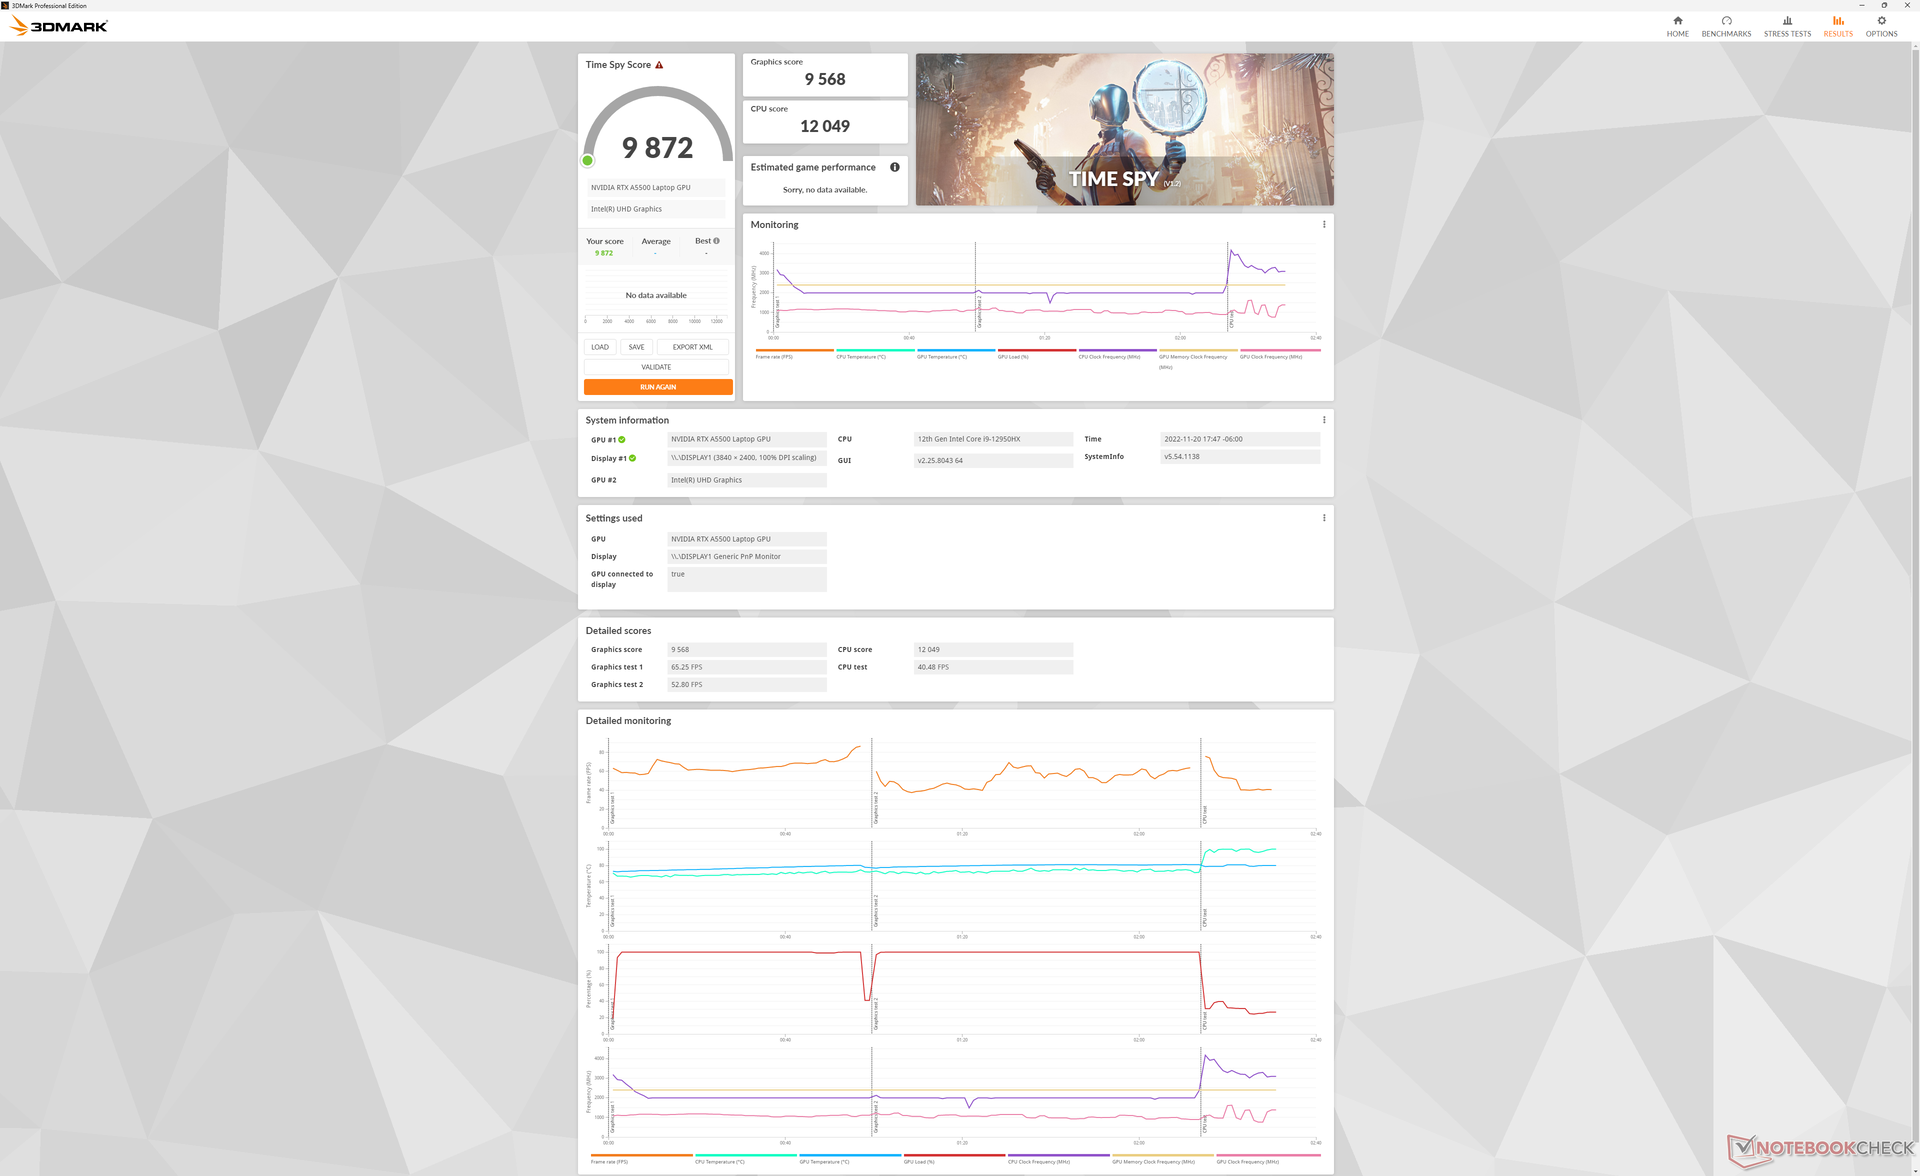
| 3DMark Time Spy Score | 9872 pkt. | |
Pomoc | ||
* ... im mniej tym lepiej
| Performance rating - Percent | |
| Dell Precision 7000 7670 Performance | |
| MSI CreatorPro Z16P B12UKST | |
| Dell Precision 7670 | |
| HP ZBook Studio 16 G9 62U04EA | |
| Lenovo ThinkPad P1 G4-20Y4Z9DVUS -2! | |
| HP ZBook Firefly 16 G9-6B897EA | |
| The Witcher 3 - 1920x1080 Ultra Graphics & Postprocessing (HBAO+) | |
| Dell Precision 7000 7670 Performance | |
| MSI CreatorPro Z16P B12UKST | |
| Dell Precision 7670 | |
| HP ZBook Studio 16 G9 62U04EA | |
| Lenovo ThinkPad P1 G4-20Y4Z9DVUS | |
| HP ZBook Firefly 16 G9-6B897EA | |
| GTA V - 1920x1080 Highest AA:4xMSAA + FX AF:16x | |
| Dell Precision 7000 7670 Performance | |
| MSI CreatorPro Z16P B12UKST | |
| Dell Precision 7670 | |
| HP ZBook Studio 16 G9 62U04EA | |
| HP ZBook Firefly 16 G9-6B897EA | |
| Final Fantasy XV Benchmark - 1920x1080 High Quality | |
| Dell Precision 7000 7670 Performance | |
| MSI CreatorPro Z16P B12UKST | |
| Dell Precision 7670 | |
| HP ZBook Studio 16 G9 62U04EA | |
| Lenovo ThinkPad P1 G4-20Y4Z9DVUS | |
| HP ZBook Firefly 16 G9-6B897EA | |
| Strange Brigade - 1920x1080 ultra AA:ultra AF:16 | |
| Dell Precision 7000 7670 Performance | |
| MSI CreatorPro Z16P B12UKST | |
| Dell Precision 7670 | |
| HP ZBook Studio 16 G9 62U04EA | |
| HP ZBook Firefly 16 G9-6B897EA | |
| Dota 2 Reborn - 1920x1080 ultra (3/3) best looking | |
| Dell Precision 7000 7670 Performance | |
| HP ZBook Studio 16 G9 62U04EA | |
| MSI CreatorPro Z16P B12UKST | |
| Dell Precision 7670 | |
| Lenovo ThinkPad P1 G4-20Y4Z9DVUS | |
| HP ZBook Firefly 16 G9-6B897EA | |
| X-Plane 11.11 - 1920x1080 high (fps_test=3) | |
| Dell Precision 7000 7670 Performance | |
| MSI CreatorPro Z16P B12UKST | |
| HP ZBook Studio 16 G9 62U04EA | |
| Dell Precision 7670 | |
| Lenovo ThinkPad P1 G4-20Y4Z9DVUS | |
| HP ZBook Firefly 16 G9-6B897EA | |
| The Witcher 3 | |
| 1024x768 Low Graphics & Postprocessing | |
| Dell Precision 7000 7670 Performance | |
| MSI CreatorPro Z16P B12UKST | |
| Acer ConceptD 9 Pro | |
| MSI WE76 11UM-456 | |
| Dell Precision 7550 | |
| Dell Precision 7670 | |
| HP ZBook Studio 16 G9 62U04EA | |
| HP ZBook Studio G7 | |
| HP ZBook Fury 17 G7 119W5EA | |
| Lenovo ThinkPad P1 G4-20Y4Z9DVUS | |
| Lenovo ThinkPad P15 Gen1-20ST000DGE | |
| Dell Precision 3000 3551 | |
| Lenovo ThinkPad P15s Gen1-20T4000JGE | |
| 1366x768 Medium Graphics & Postprocessing | |
| Acer ConceptD 9 Pro | |
| Dell Precision 7000 7670 Performance | |
| MSI WE76 11UM-456 | |
| MSI CreatorPro Z16P B12UKST | |
| Dell Precision 7550 | |
| HP ZBook Studio 16 G9 62U04EA | |
| Dell Precision 7670 | |
| HP ZBook Studio G7 | |
| HP ZBook Fury 17 G7 119W5EA | |
| Lenovo ThinkPad P1 G4-20Y4Z9DVUS | |
| Lenovo ThinkPad P15 Gen1-20ST000DGE | |
| Dell Precision 3000 3551 | |
| Lenovo ThinkPad P15s Gen1-20T4000JGE | |
| 1920x1080 High Graphics & Postprocessing (Nvidia HairWorks Off) | |
| Dell Precision 7000 7670 Performance | |
| Acer ConceptD 9 Pro | |
| MSI WE76 11UM-456 | |
| MSI CreatorPro Z16P B12UKST | |
| Dell Precision 7550 | |
| HP ZBook Fury 17 G7 119W5EA | |
| Dell Precision 7670 | |
| HP ZBook Studio 16 G9 62U04EA | |
| HP ZBook Studio G7 | |
| Lenovo ThinkPad P1 G4-20Y4Z9DVUS | |
| Lenovo ThinkPad P15 Gen1-20ST000DGE | |
| Dell Precision 3000 3551 | |
| Lenovo ThinkPad P15s Gen1-20T4000JGE | |
| 1920x1080 Ultra Graphics & Postprocessing (HBAO+) | |
| Acer ConceptD 9 Pro | |
| Dell Precision 7000 7670 Performance | |
| MSI WE76 11UM-456 | |
| Dell Precision 7550 | |
| HP ZBook Fury 17 G7 119W5EA | |
| MSI CreatorPro Z16P B12UKST | |
| Dell Precision 7670 | |
| HP ZBook Studio G7 | |
| HP ZBook Studio 16 G9 62U04EA | |
| Lenovo ThinkPad P1 G4-20Y4Z9DVUS | |
| Lenovo ThinkPad P15 Gen1-20ST000DGE | |
| Dell Precision 3000 3551 | |
| Cyberpunk 2077 1.6 | |
| 1920x1080 Low Preset | |
| Dell Precision 7000 7670 Performance | |
| Dell Precision 7670 | |
| MSI CreatorPro Z16P B12UKST | |
| HP ZBook Studio 16 G9 62U04EA | |
| 1920x1080 Medium Preset | |
| Dell Precision 7000 7670 Performance | |
| MSI CreatorPro Z16P B12UKST | |
| Dell Precision 7670 | |
| HP ZBook Studio 16 G9 62U04EA | |
| 1920x1080 High Preset | |
| Dell Precision 7000 7670 Performance | |
| Dell Precision 7670 | |
| MSI CreatorPro Z16P B12UKST | |
| HP ZBook Studio 16 G9 62U04EA | |
| 1920x1080 Ultra Preset | |
| Dell Precision 7000 7670 Performance | |
| Dell Precision 7670 | |
| MSI CreatorPro Z16P B12UKST | |
| HP ZBook Studio 16 G9 62U04EA | |
| 2560x1440 Ultra Preset | |
| Dell Precision 7000 7670 Performance | |
| Dell Precision 7670 | |
| MSI CreatorPro Z16P B12UKST | |
| HP ZBook Studio 16 G9 62U04EA | |
| 3840x2160 Ultra Preset | |
| Dell Precision 7000 7670 Performance | |
Podczas pracy na biegu jałowym Witcher 3 przez godzinę, udało nam się zarejestrować ogromne spadki liczby klatek na sekundę po około 10 minutach testu, co pokazuje poniższy wykres. Sugeruje to słabe priorytetyzowanie programów lub przerywanie działań w tle, które mogą potencjalnie zakłócić działanie głównego programu w centrum uwagi.
Witcher 3 FPS Chart
| low | med. | high | ultra | QHD | 4K | |
|---|---|---|---|---|---|---|
| GTA V (2015) | 183.4 | 178.1 | 166.2 | 102.6 | 99.2 | |
| The Witcher 3 (2015) | 421.2 | 306.8 | 205.4 | 101.5 | 62.5 | |
| Dota 2 Reborn (2015) | 193.3 | 171.3 | 161.8 | 152.9 | 131.4 | |
| Final Fantasy XV Benchmark (2018) | 170.1 | 138.9 | 107.8 | 78.9 | 43.5 | |
| X-Plane 11.11 (2018) | 146.2 | 134.3 | 107.8 | 92.7 | ||
| Strange Brigade (2018) | 377 | 244 | 200 | 177.9 | 129.3 | |
| Metro Exodus (2019) | 171 | 125.8 | 95.3 | 75.7 | 58.5 | 31.3 |
| Borderlands 3 (2019) | 162.9 | 135.4 | 110.4 | 89.3 | 62.7 | 30.2 |
| Gears Tactics (2020) | 314.1 | 189.7 | 139.2 | 110.1 | 77.1 | 34.9 |
| Horizon Zero Dawn (2020) | 139 | 130 | 111 | 101 | 89 | 42 |
| Watch Dogs Legion (2020) | 119 | 98 | 93 | 77 | 58 | 30 |
| Dirt 5 (2020) | 167.6 | 130 | 114.8 | 92.2 | 71.9 | 39.8 |
| Hitman 3 (2021) | 229 | 186.6 | 179.9 | 161.4 | 104.6 | 43.8 |
| Far Cry 6 (2021) | 132 | 115 | 104 | 95 | 79 | 42 |
| Guardians of the Galaxy (2021) | 142 | 124 | 137 | 134 | 104 | 49 |
| God of War (2022) | 128.9 | 119.6 | 105.6 | 79 | 62.2 | 35.6 |
| Cyberpunk 2077 1.6 (2022) | 93.9 | 80.2 | 79.3 | 75.7 | 45.3 | 17.8 |
| F1 22 (2022) | 190.8 | 188.2 | 163.1 | 66.4 | 40.8 | 18.8 |
Emisje
Szum systemu
Wentylatory w modelu Precision 7670 Performance mają tendencję do częstszego pulsowania niż wentylatory w smuklejszym modelu Precision 7670, prawdopodobnie z powodu wyższego pułapu Turbo Boost procesora Core i9-12950HX w porównaniu z Core i7-12850HX. Nie powinno to jednak stanowić problemu, kiedy profil zasilania jest ustawiony na tryb zrównoważony lub cichy
Ogólny hałas wentylatorów jest generalnie cichszy od tego, co odnotowaliśmy na smuklejszym Precision 7670. Obciążenia w grach ustabilizowałyby się w zakresie 42 do 47 dB(A) w porównaniu z 45 do 49 dB(A) w mniejszym modelu. Przy 100-procentowym obciążeniu CPU i GPU udało nam się osiągnąć maksymalnie 48 dB(A).
Hałas
| luz |
| 24 / 24 / 38 dB |
| obciążenie |
| 46.3 / 47.9 dB |
 | ||
30 dB cichy 40 dB(A) słyszalny 50 dB(A) irytujący |
||
min: | ||
| Dell Precision 7000 7670 Performance RTX A5500 Laptop GPU, i9-12950HX | MSI CreatorPro Z16P B12UKST RTX A3000 Laptop GPU, i7-12700H, Samsung PM9A1 MZVL21T0HCLR | HP ZBook Studio 16 G9 62U04EA RTX A2000 Laptop GPU, i7-12800H, Micron 3400 1TB MTFDKBA1T0TFH | HP ZBook Firefly 16 G9-6B897EA T550 Laptop GPU, i7-1265U, Samsung PM9A1 MZVL21T0HCLR | Lenovo ThinkPad P1 G4-20Y4Z9DVUS T1200 Laptop GPU, i7-11800H, Samsung PM9A1 MZVL2512HCJQ | Dell Precision 7670 RTX A2000 Laptop GPU, i7-12850HX, SK Hynix HFS001TEJ9X115N | |
|---|---|---|---|---|---|---|
| Noise | 1% | 3% | 10% | 2% | 4% | |
| wyłączone / środowisko * (dB) | 23.9 | 24.1 -1% | 24 -0% | 23.8 -0% | 24.3 -2% | 22.7 5% |
| Idle Minimum * (dB) | 24 | 27.1 -13% | 24 -0% | 23.8 1% | 24.3 -1% | 22.9 5% |
| Idle Average * (dB) | 24 | 27.1 -13% | 27.7 -15% | 23.8 1% | 24.3 -1% | 22.9 5% |
| Idle Maximum * (dB) | 38 | 27.1 29% | 27.7 27% | 23.8 37% | 26.6 30% | 24.5 36% |
| Load Average * (dB) | 46.3 | 42.9 7% | 39.8 14% | 39.4 15% | 46.8 -1% | 48.7 -5% |
| Witcher 3 ultra * (dB) | 41.9 | 44 -5% | 44.3 -6% | 40.5 3% | 46.8 -12% | 45.2 -8% |
| Load Maximum * (dB) | 47.9 | 47 2% | 47.7 -0% | 41.4 14% | 46.8 2% | 52.1 -9% |
* ... im mniej tym lepiej
Temperatura
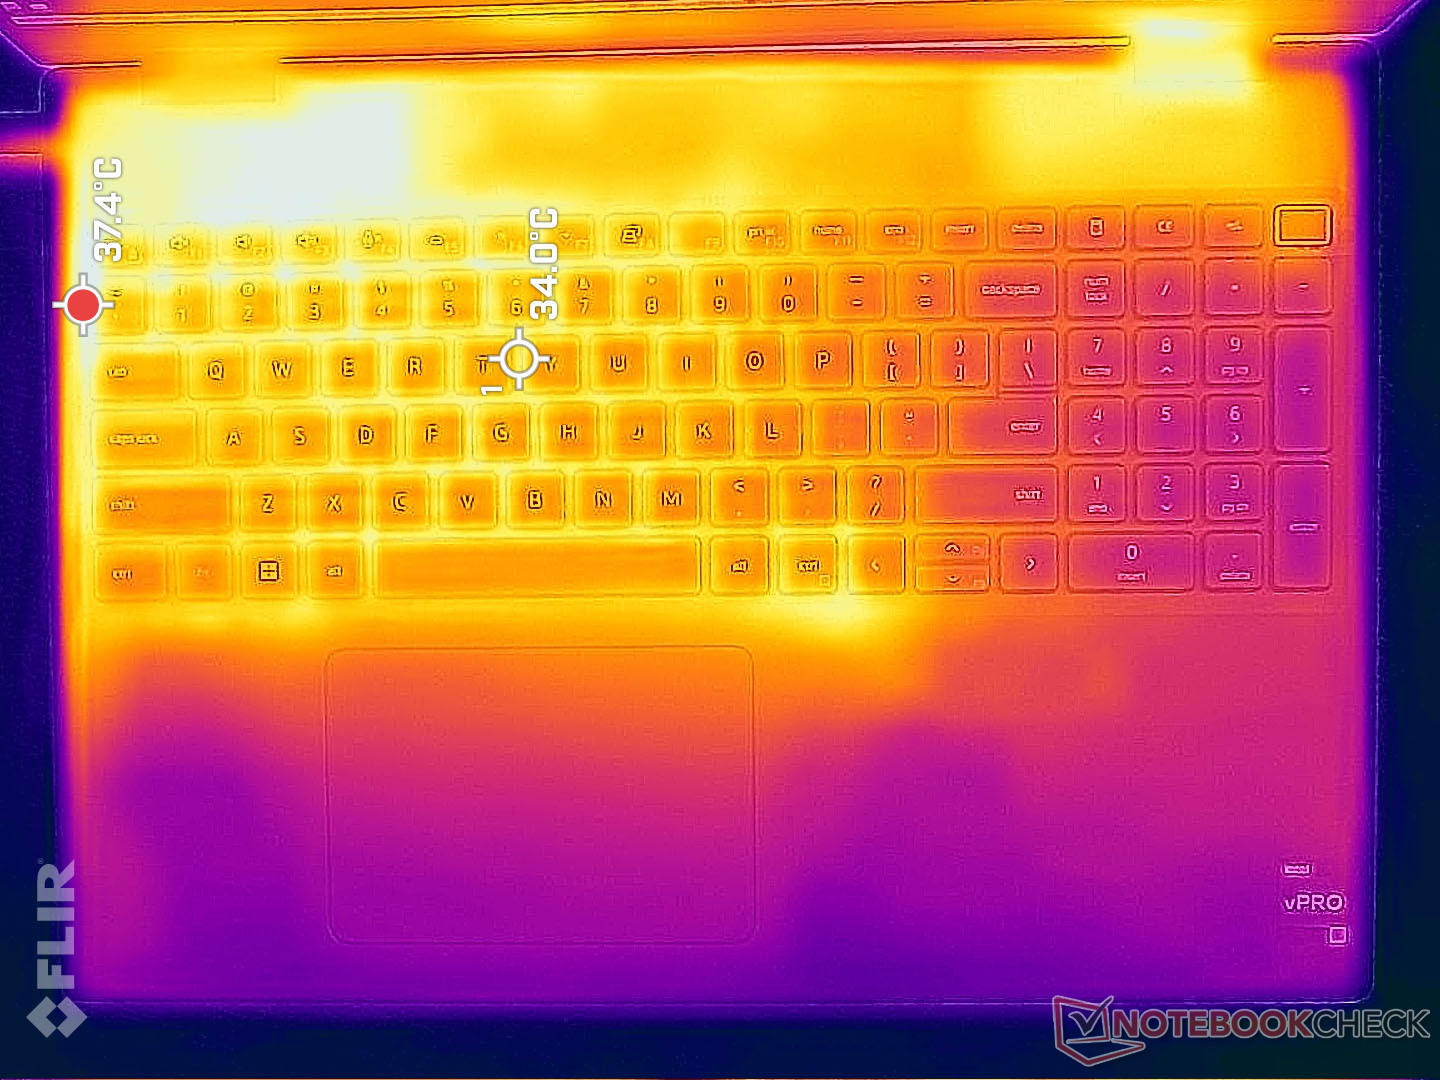
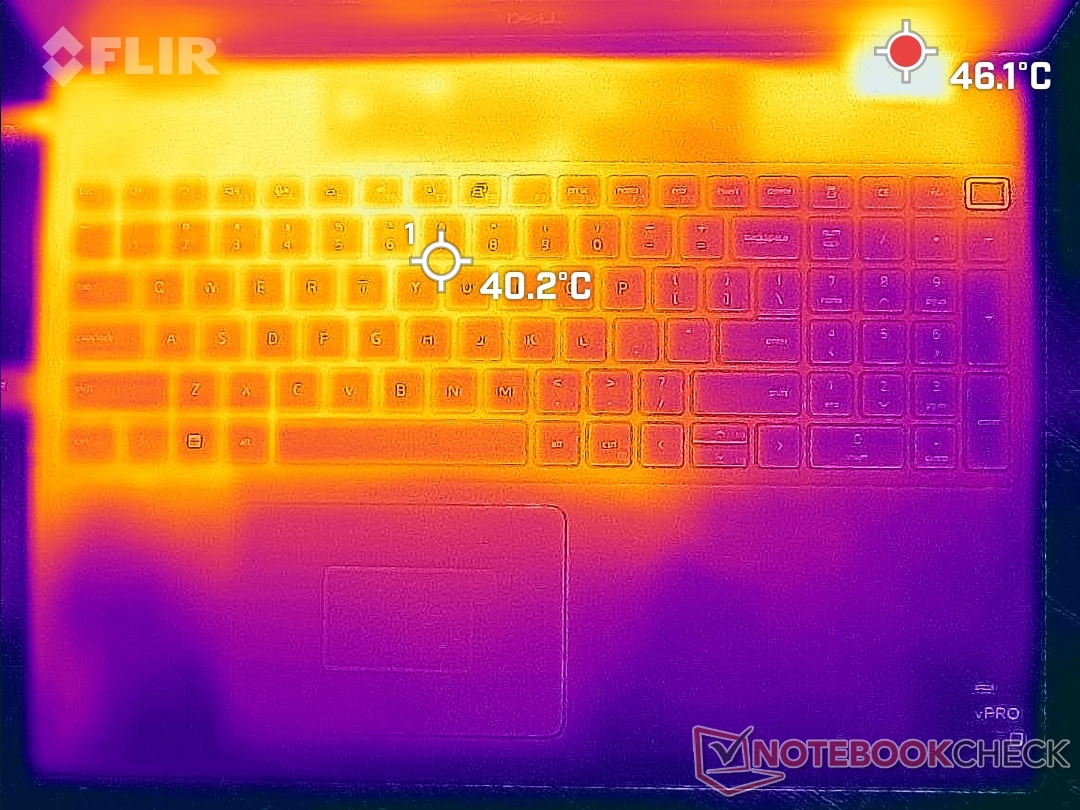
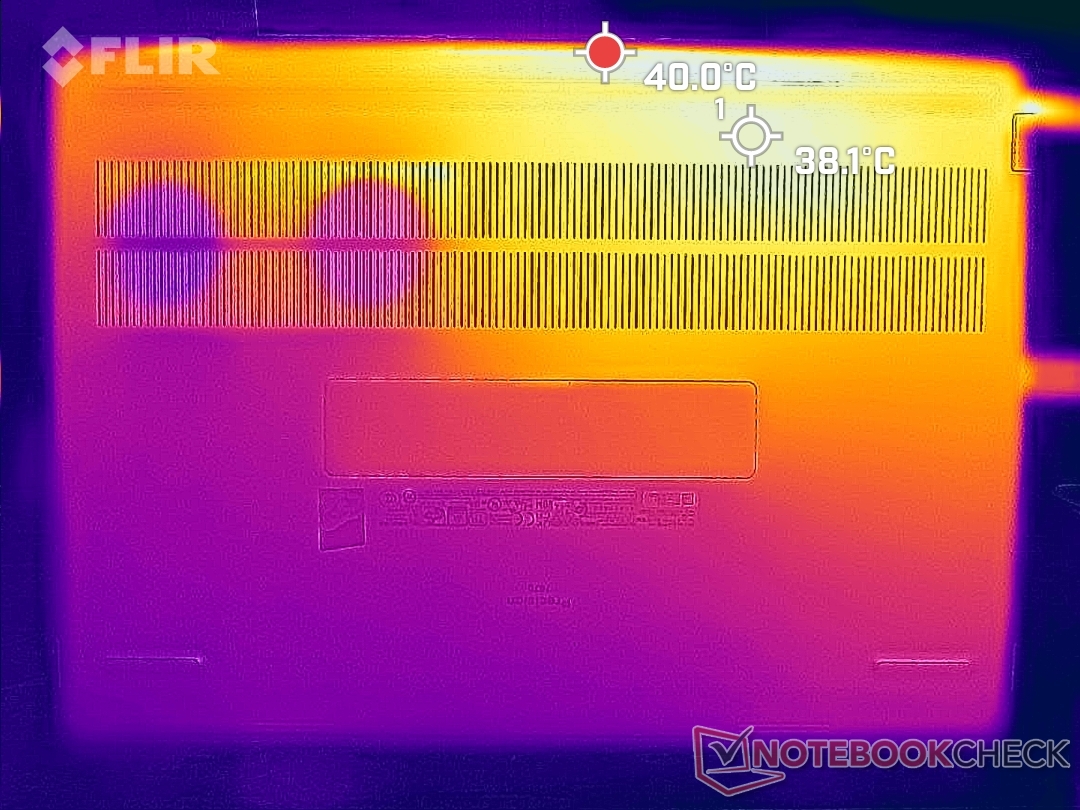
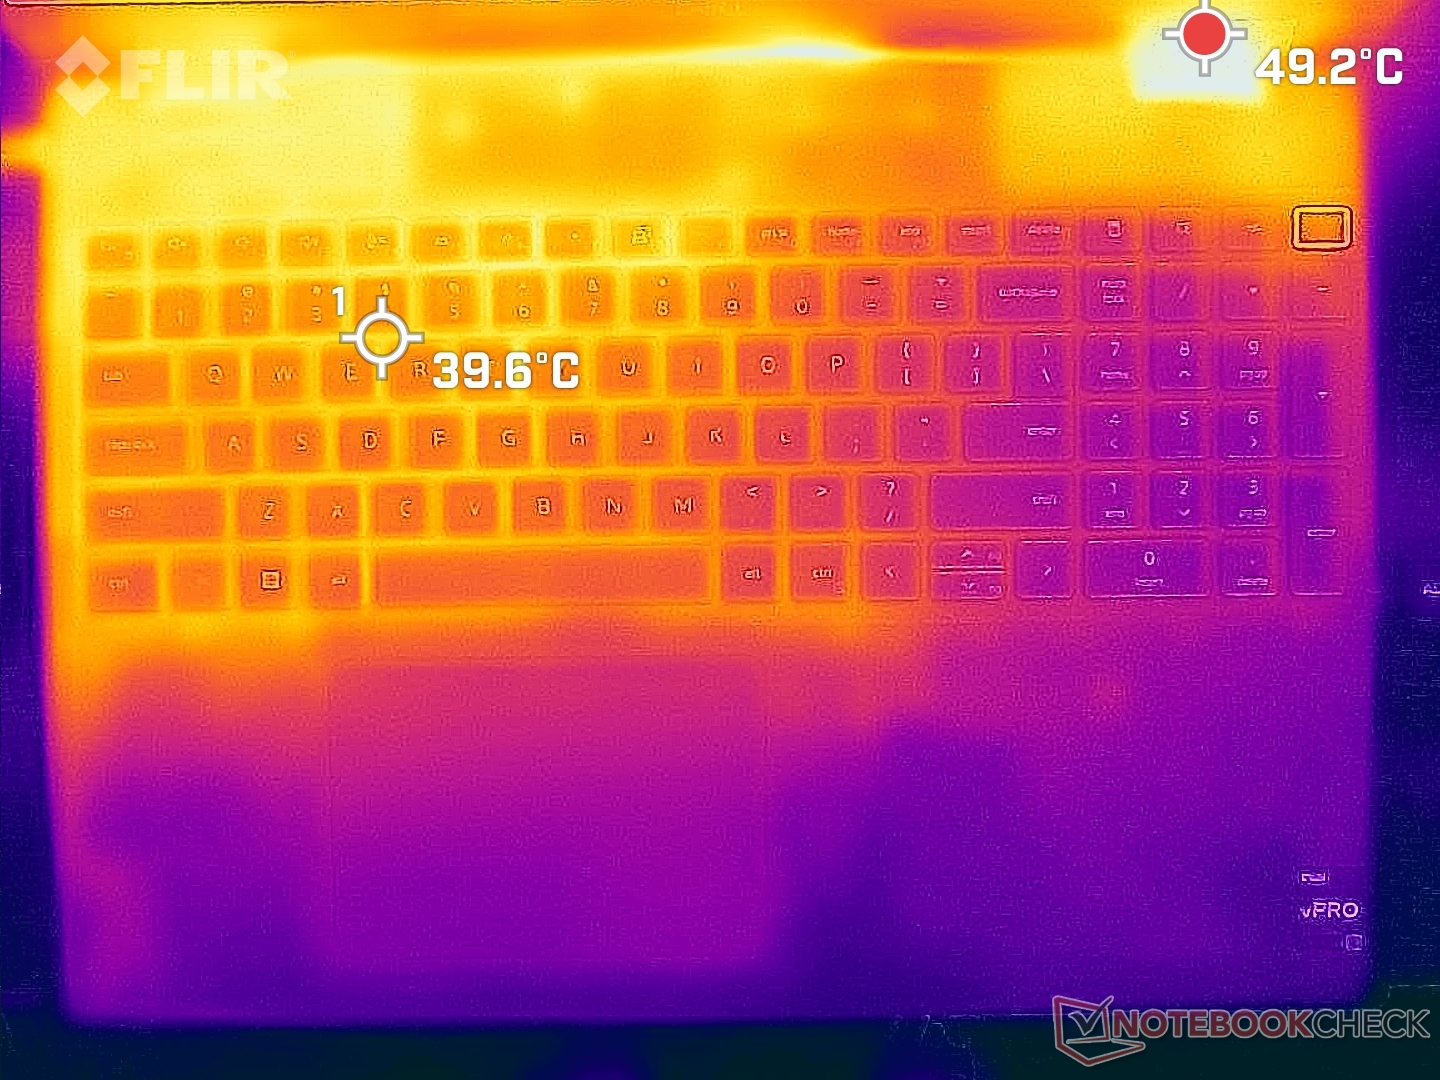
Temperatury powierzchni są rzeczywiście nieco cieplejsze od tego, co odnotowaliśmy na zwykłym Precision 7670. Gorące punkty na klawiaturze i z tyłu podczas uruchamiania wymagających obciążeń, takich jak gry przez dłuższy czas, mogą osiągnąć około 40 C każdy w porównaniu do 35 C na cieńszym zwykłym modelu. Wyniki te są zgodne z naszymi pomiarami temperatury rdzenia w następnej sekcji poniżej, gdzie nasz CPU i GPU ustabilizowałyby się w cieplejszych temperaturach.
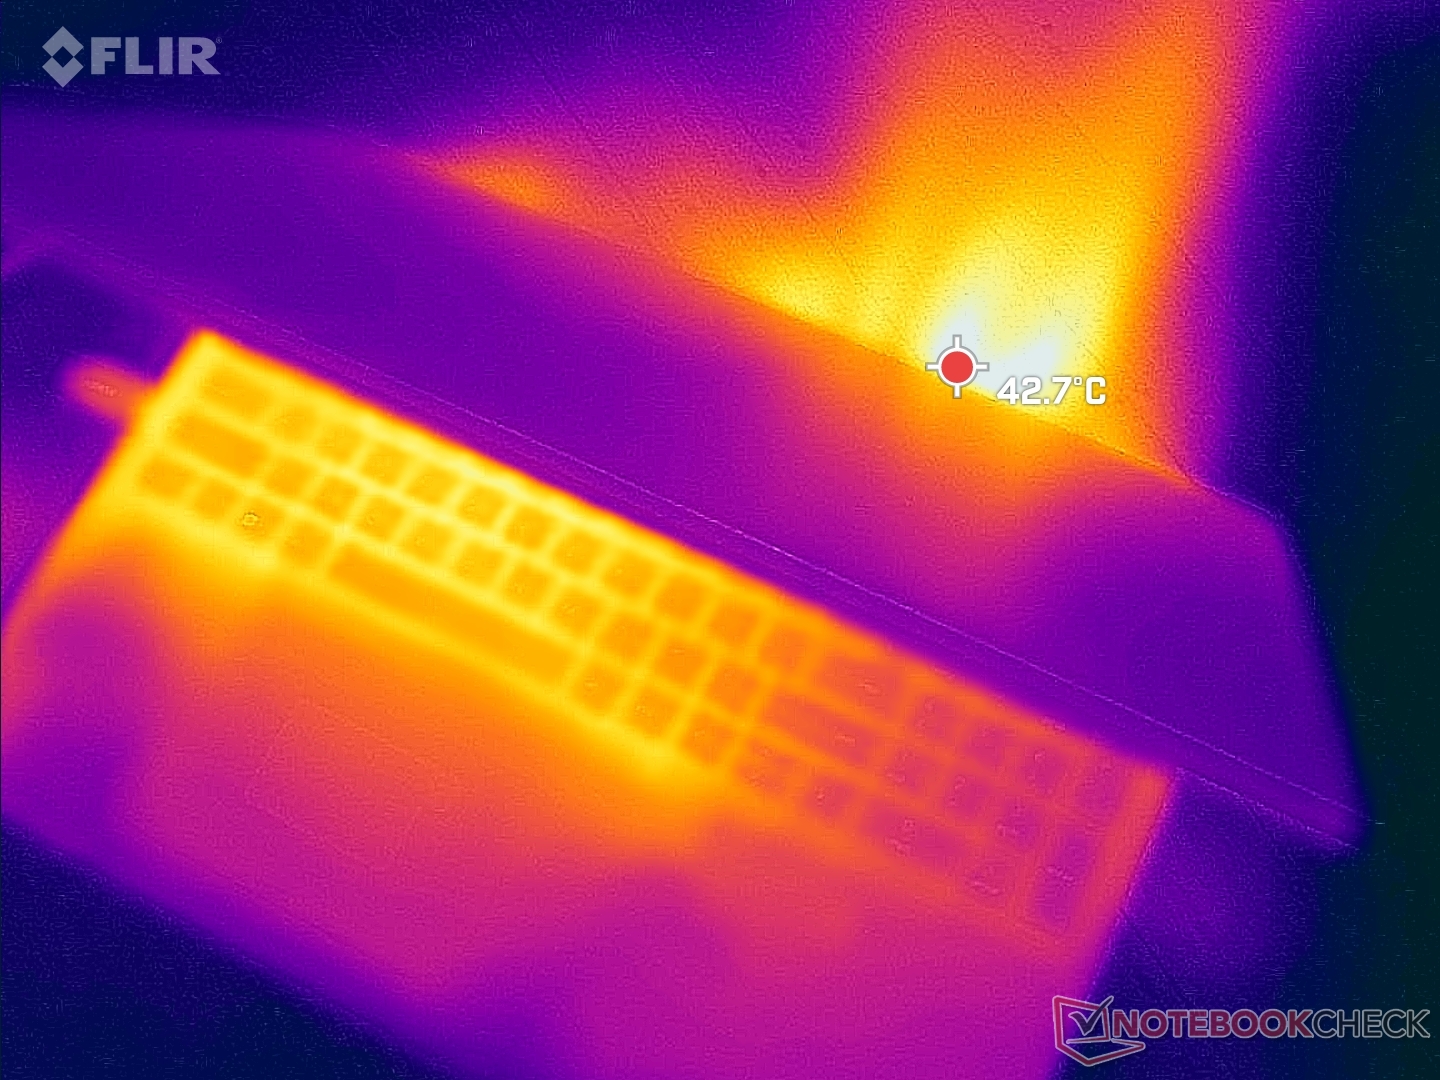
(-) Maksymalna temperatura w górnej części wynosi 53 °C / 127 F, w porównaniu do średniej 38.2 °C / 101 F , począwszy od 22.2 do 69.8 °C dla klasy Workstation.
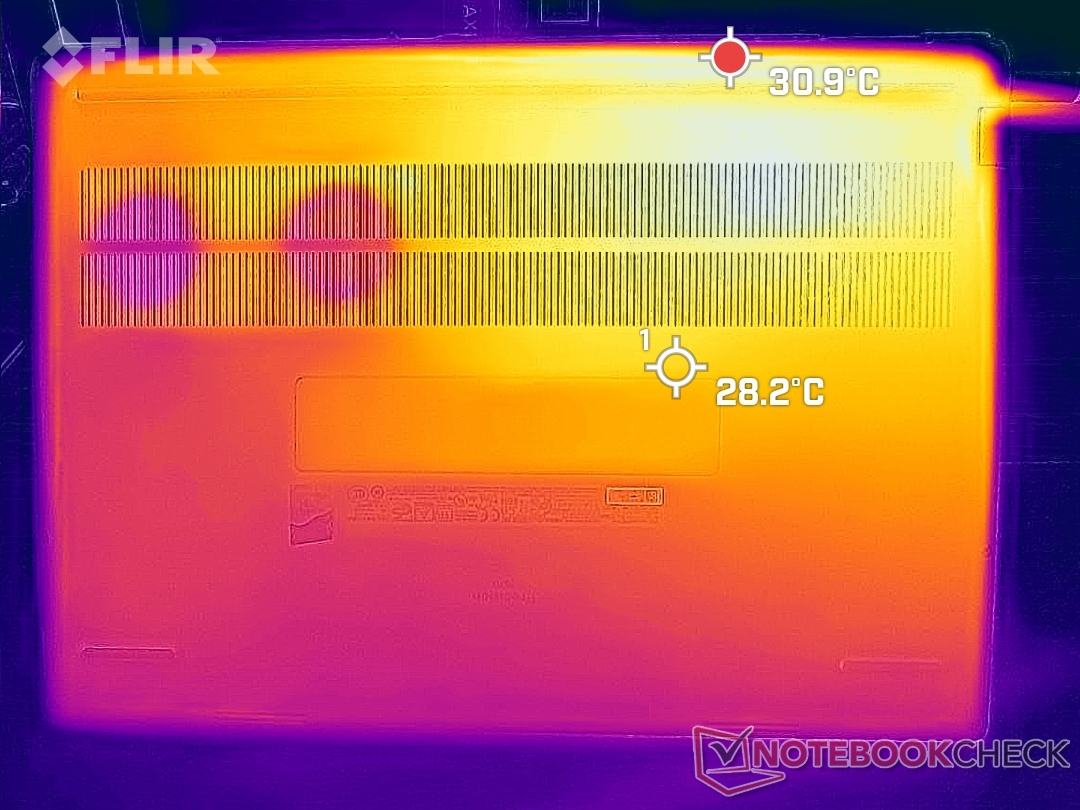
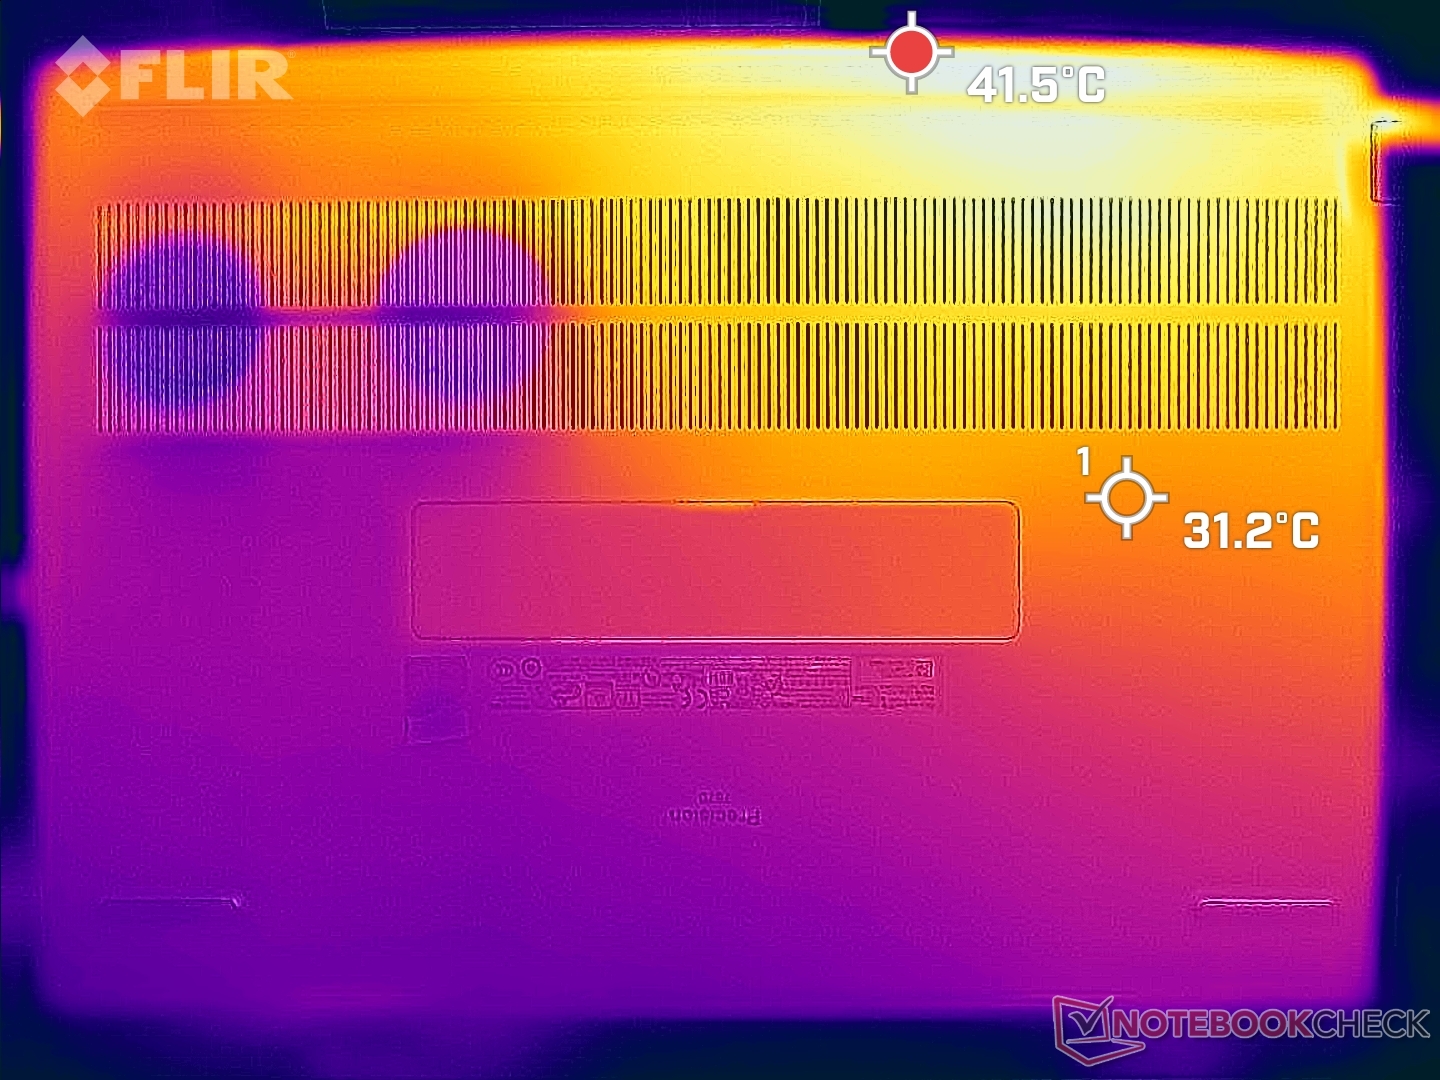
(±) Dno nagrzewa się maksymalnie do 43.2 °C / 110 F, w porównaniu do średniej 41.1 °C / 106 F
(+) W stanie bezczynności średnia temperatura górnej części wynosi 31.8 °C / 89 F, w porównaniu ze średnią temperaturą urządzenia wynoszącą 32 °C / ### class_avg_f### F.
(±) Podczas gry w Wiedźmina 3 średnia temperatura górnej części wynosi 37 °C / 99 F, w porównaniu do średniej temperatury urządzenia wynoszącej 32 °C / ## #class_avg_f### F.
(+) Podpórki pod nadgarstki i touchpad są chłodniejsze niż temperatura skóry i maksymalnie 30.6 °C / 87.1 F i dlatego są chłodne w dotyku.
(-) Średnia temperatura obszaru podparcia dłoni w podobnych urządzeniach wynosiła 27.8 °C / 82 F (-2.8 °C / -5.1 F).
| Dell Precision 7000 7670 Performance Intel Core i9-12950HX, NVIDIA RTX A5500 Laptop GPU | MSI CreatorPro Z16P B12UKST Intel Core i7-12700H, NVIDIA RTX A3000 Laptop GPU | HP ZBook Studio 16 G9 62U04EA Intel Core i7-12800H, NVIDIA RTX A2000 Laptop GPU | HP ZBook Firefly 16 G9-6B897EA Intel Core i7-1265U, NVIDIA T550 Laptop GPU | Lenovo ThinkPad P1 G4-20Y4Z9DVUS Intel Core i7-11800H, NVIDIA T1200 Laptop GPU | Dell Precision 7670 Intel Core i7-12850HX, NVIDIA RTX A2000 Laptop GPU | |
|---|---|---|---|---|---|---|
| Heat | -2% | 9% | 8% | 7% | 4% | |
| Maximum Upper Side * (°C) | 53 | 56.3 -6% | 38.7 27% | 42.1 21% | 49.9 6% | 51 4% |
| Maximum Bottom * (°C) | 43.2 | 68.3 -58% | 53.4 -24% | 48 -11% | 56.7 -31% | 45.8 -6% |
| Idle Upper Side * (°C) | 36.8 | 25.2 32% | 27.3 26% | 29.9 19% | 25.5 31% | 31.8 14% |
| Idle Bottom * (°C) | 33.8 | 25.9 23% | 31.6 7% | 32.9 3% | 26.2 22% | 32.6 4% |
* ... im mniej tym lepiej
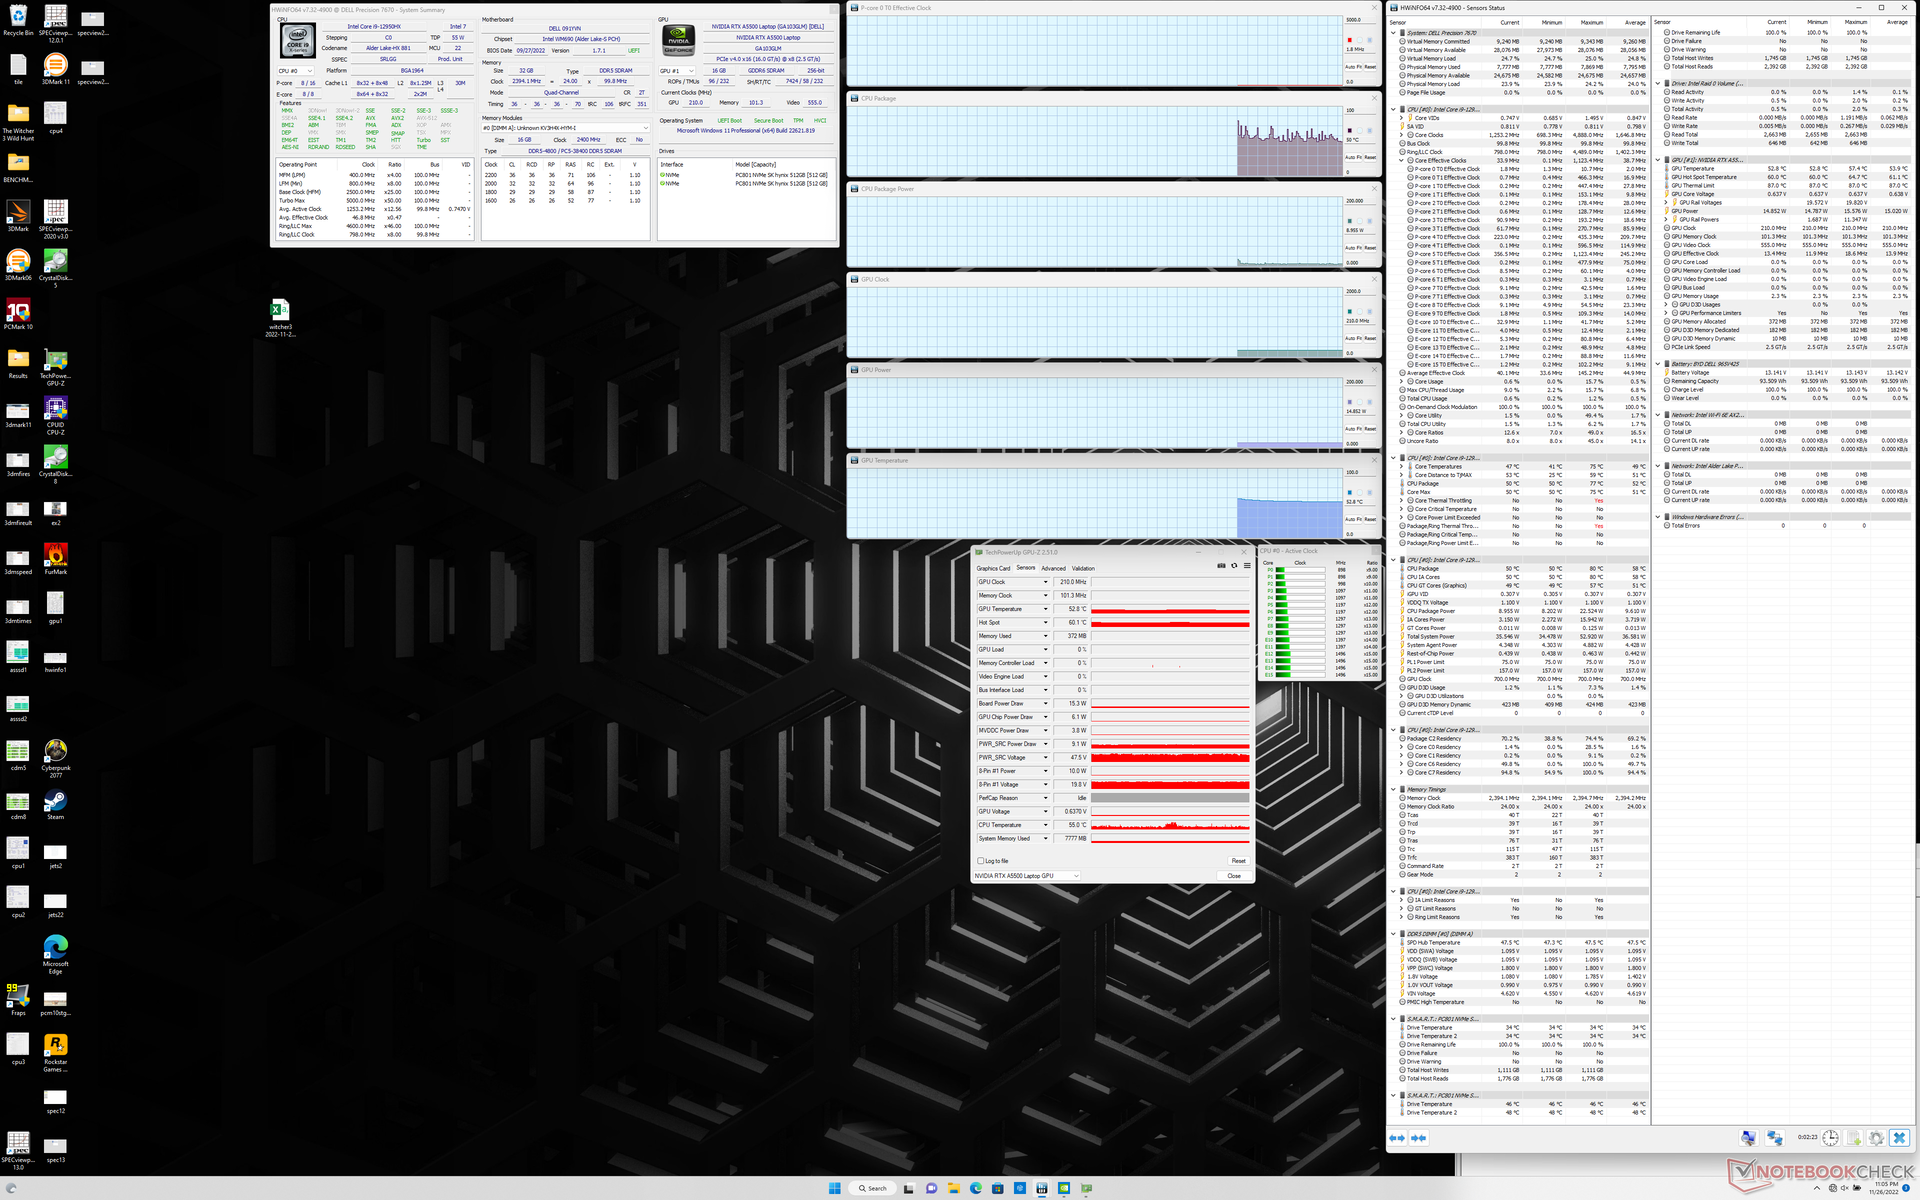
Stress Test
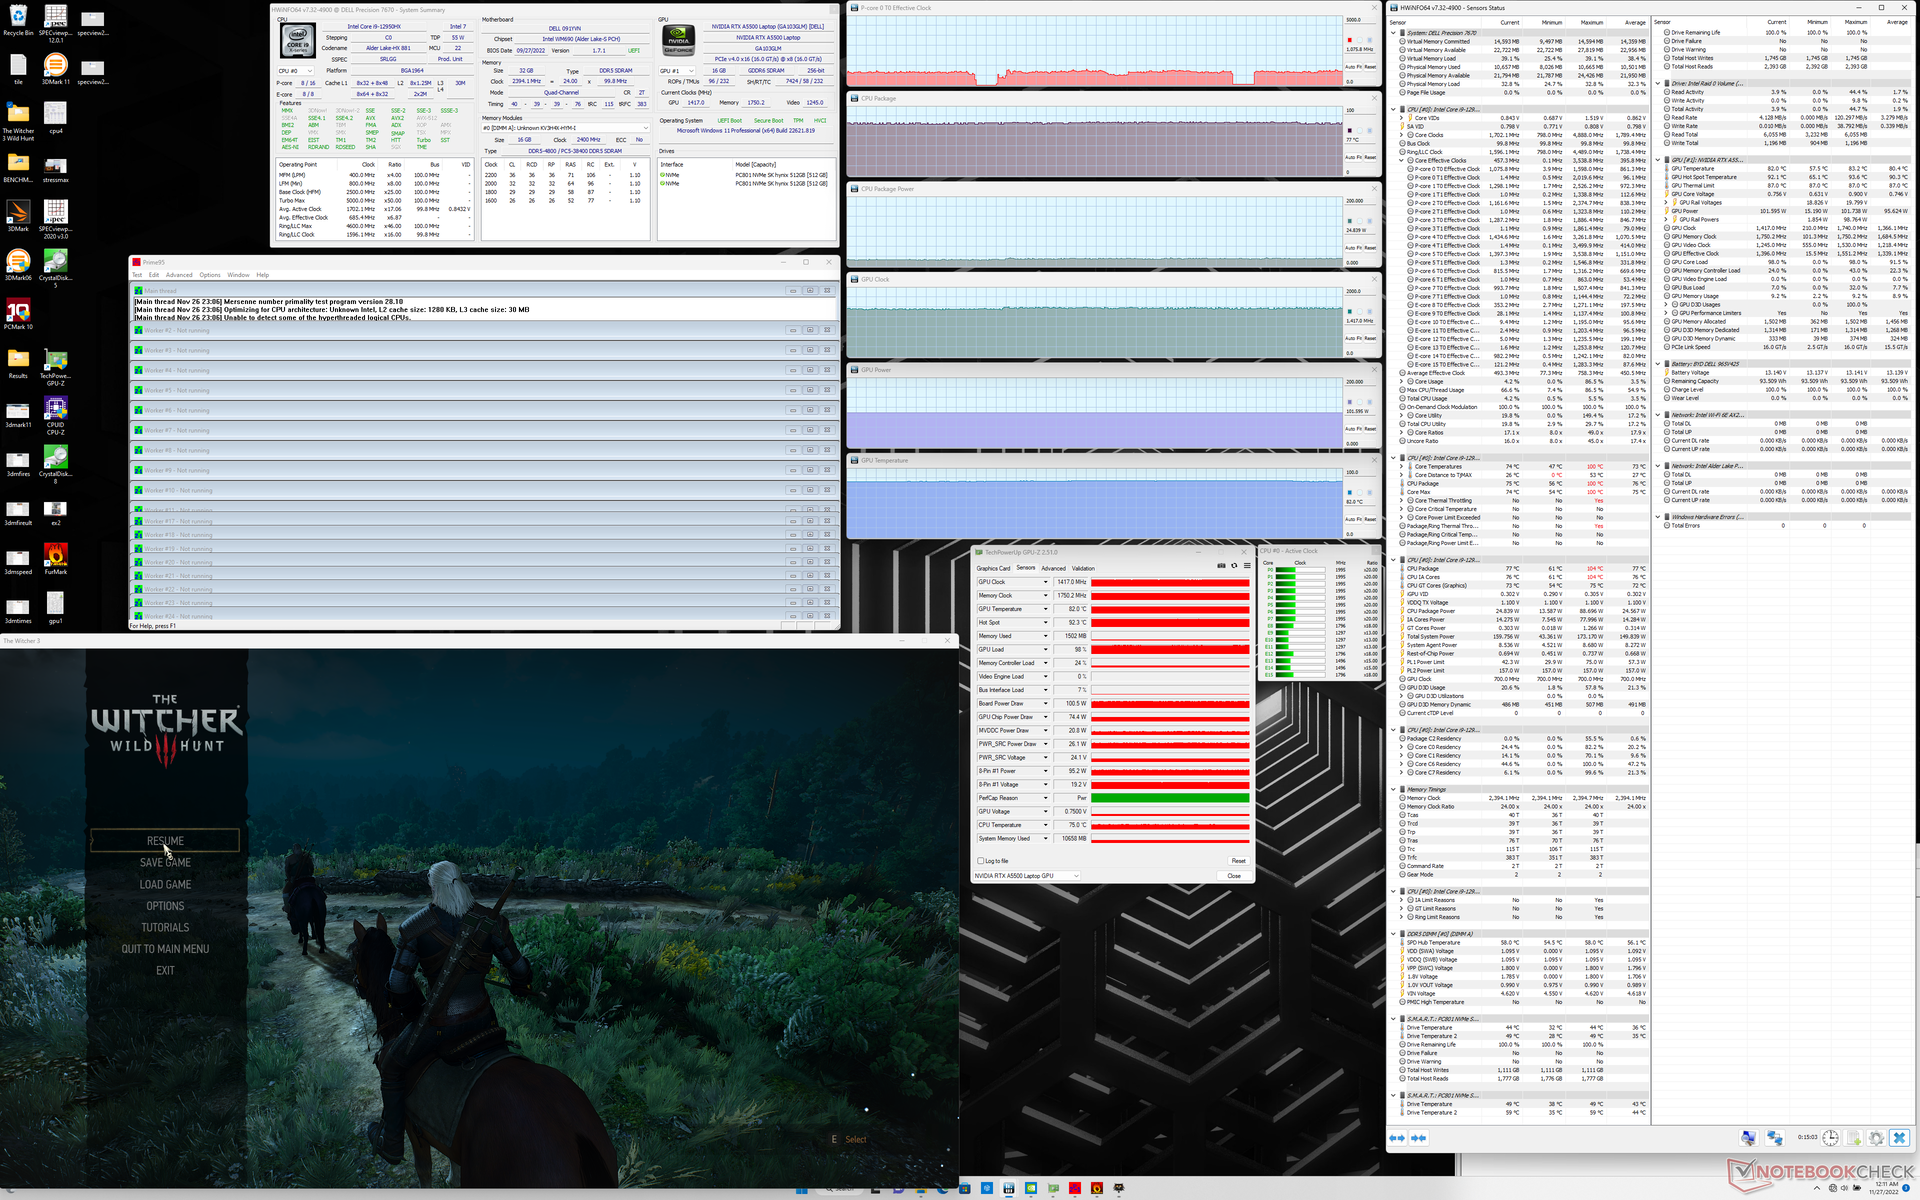
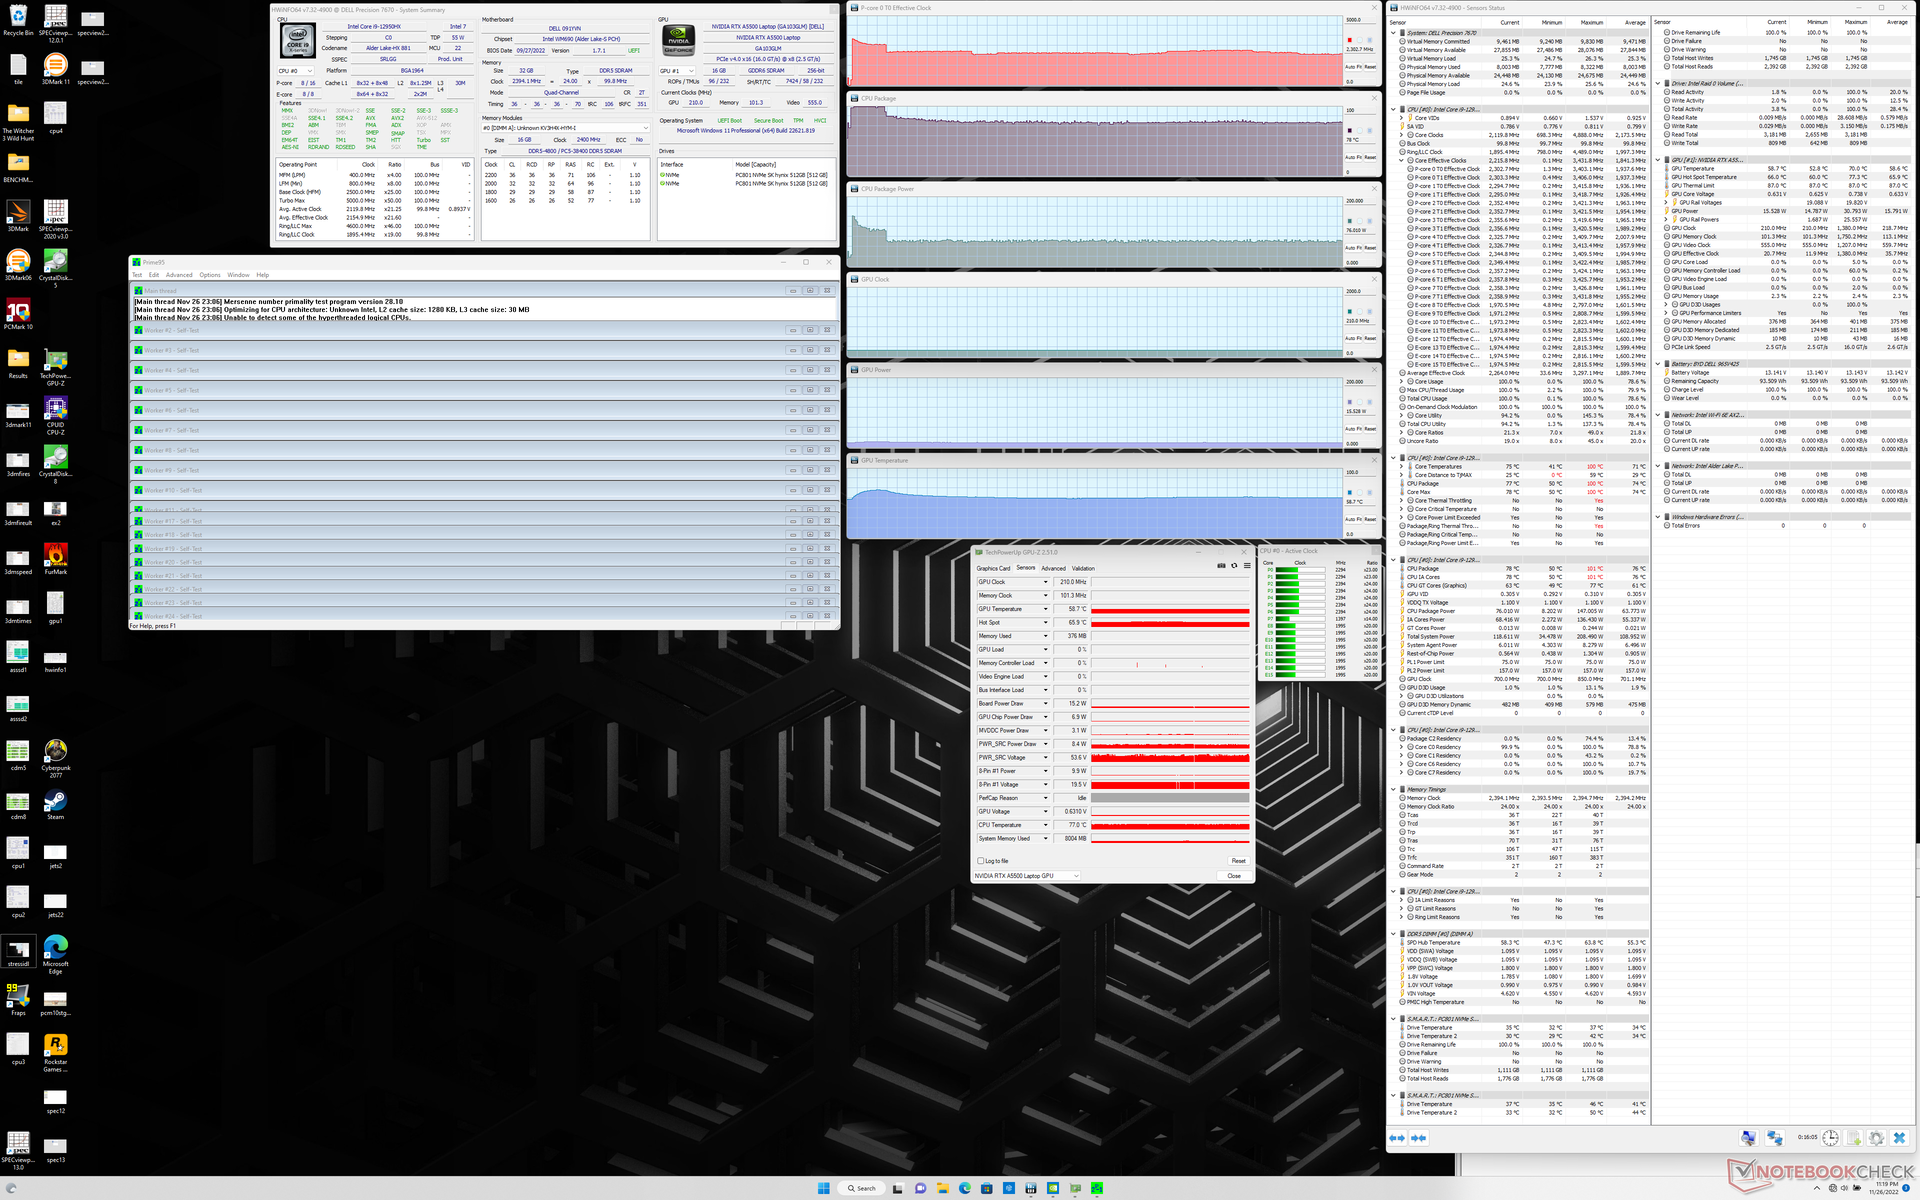
Podczas uruchomienia Prime95, aby obciążyć procesor, częstotliwość taktowania i temperatura skoczyłyby niemal natychmiast do 3,4 GHz i 99 C, odpowiednio, przy wysokim poborze mocy procesora 147 W. Tak wysoka temperatura nie jest zrównoważona, więc częstotliwość taktowania i temperatura szybko spadłyby do bardziej stabilnych 2,3 GHz i 78 C, odpowiednio, przy końcowym poborze mocy procesora 76 W. Stały, znaczący spadek potencjału Turbo Boost pasuje do naszych wyników testu CineBench R15 xT, gdzie wyniki spadałyby powoli, zanim ustabilizowałyby się z czasem.
Temperatury CPU i GPU podczas pracy Witcher 3 ustabilizowałyby się na poziomie odpowiednio 77 C i 82 C, w porównaniu do 70 C i 80 C na zwykłym, cieńszym Precision 7670.
Wydajność jest ograniczona w przypadku pracy na baterii. Fire Strike na baterii zwróciłby wyniki Fizyki i Grafiki, odpowiednio 18901 i 9254 punktów, w porównaniu do 28197 i 26260 punktów przy zasilaniu z sieci.
| ZegarCPU (GHz) | Zegar GPU (MHz) | Średnia temperatura CPU (°C) | Średnia temperatura GPU (°C) | |
| System w stanie bezczynności | -- | -- | 50 | 53 |
| Prime95 Stress | 2.3 | -- | 78 | 59 |
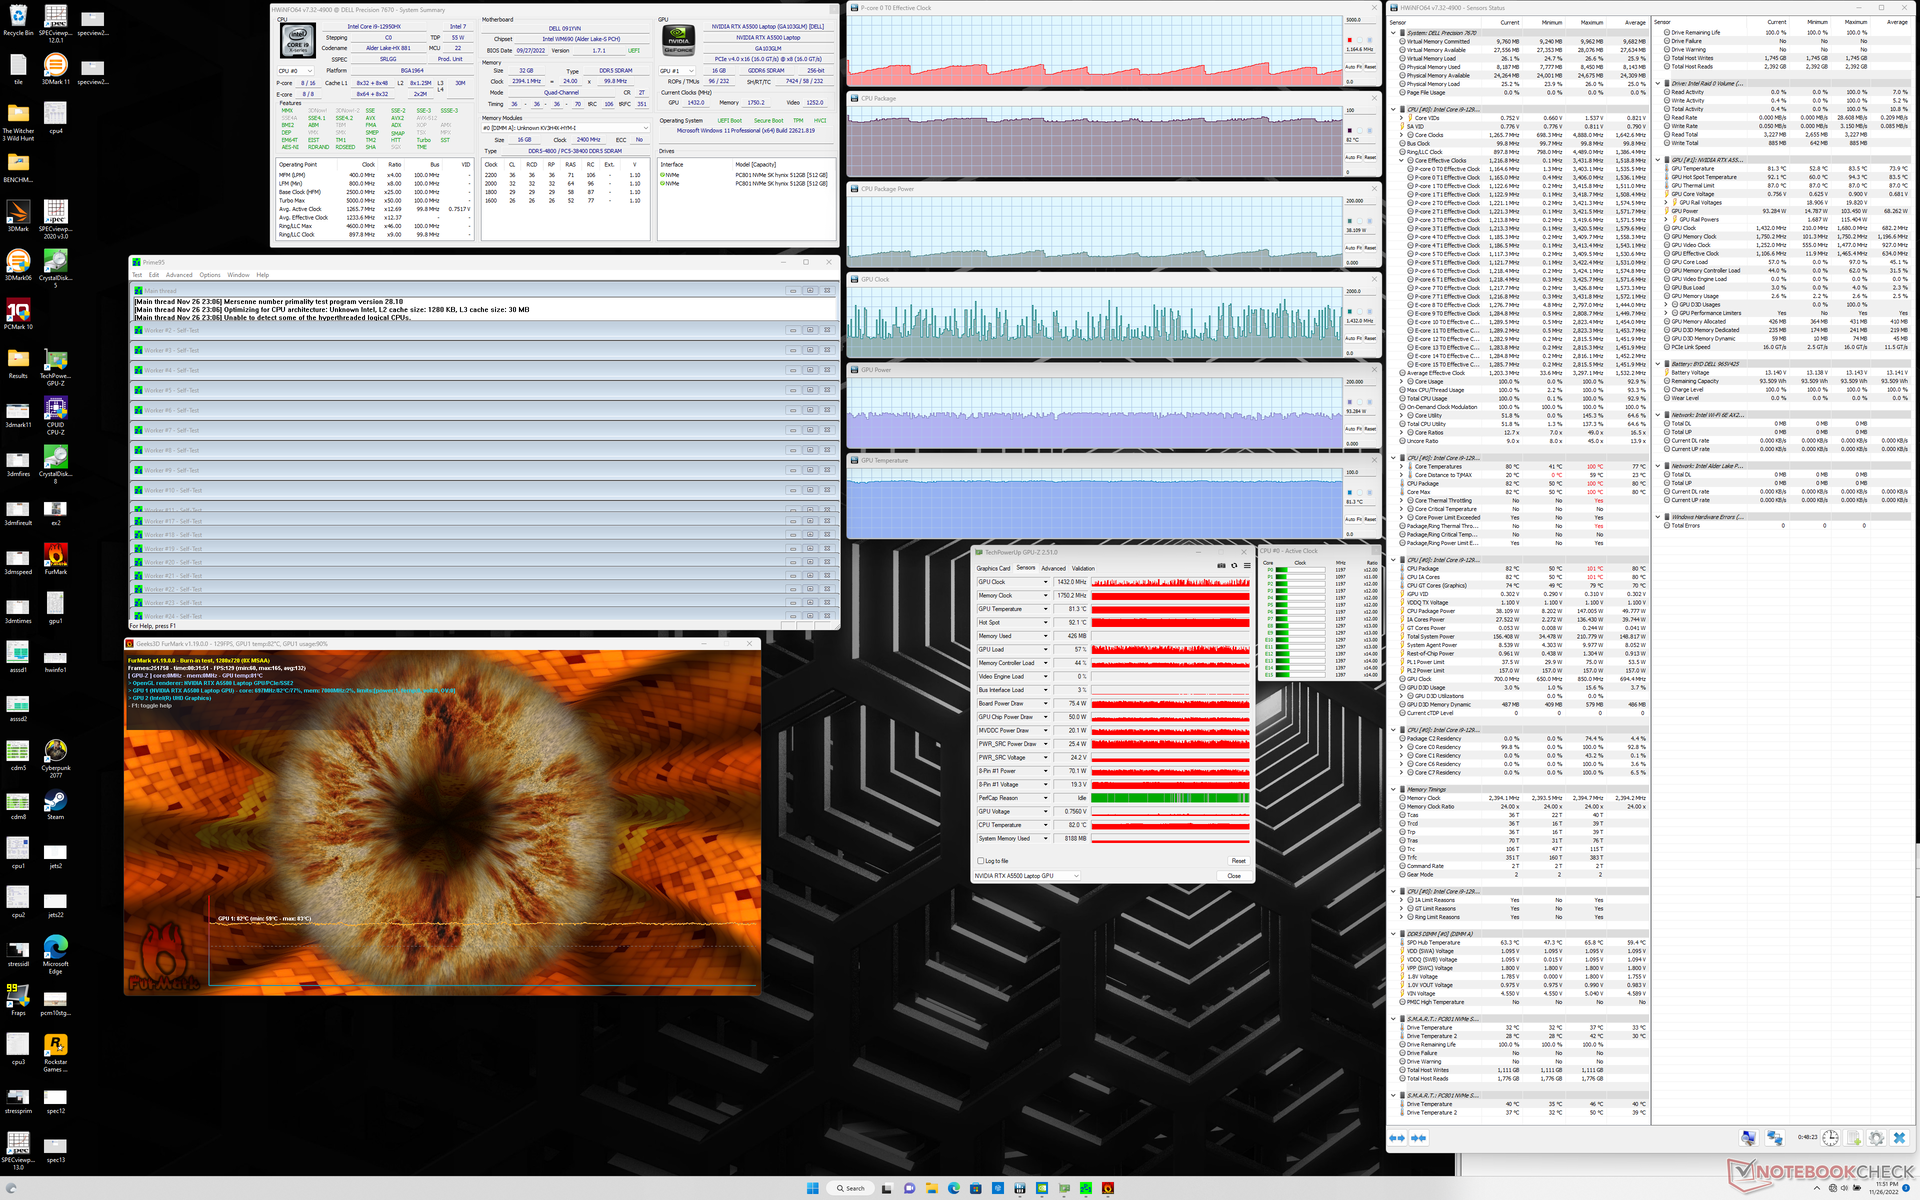
| Prime95 + FurMark Stress | 0,8 - 1,4 | 500 - 1555 | 79 - 83 | 81 |
| Witcher 3 Stress | 1.1 | 1417 | 77 | 82 |
Mówcy
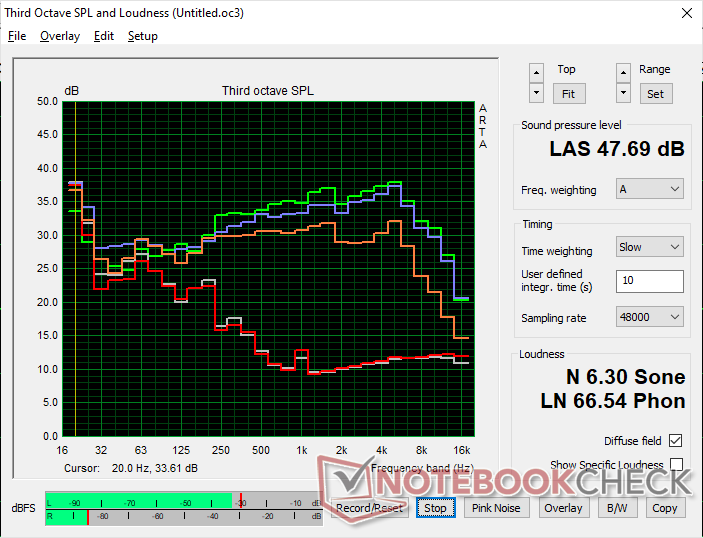
Sprawdź brzmienie wbudowanych głośników (dźwięk, szum, basy, maksymalna głośność,...) w różnych gatunkach muzycznych / telefonii, porównaj w ramach kategorii urządzenia, funkcje specjalne (oprogramowanie),... Jak można podłączyć zewnętrzne urządzenia audio? W razie potrzeby przetestuj interfejsy dźwiękowe. Przeanalizuj wykres szumu różowego.
Krótka recenzja:Głośnik analityczny. około 250 znaków
Dell Precision 7000 7670 Performance analiza dźwięku
(+) | głośniki mogą odtwarzać stosunkowo głośno (91.1 dB)
Bas 100 - 315 Hz
(-) | prawie brak basu - średnio 15.1% niższa od mediany
(±) | liniowość basu jest średnia (7.1% delta do poprzedniej częstotliwości)
Średnie 400 - 2000 Hz
(+) | zbalansowane środki średnie - tylko 2.9% od mediany
(+) | średnie są liniowe (3.7% delta do poprzedniej częstotliwości)
Wysokie 2–16 kHz
(+) | zrównoważone maksima - tylko 3.5% od mediany
(+) | wzloty są liniowe (1.6% delta do poprzedniej częstotliwości)
Ogólnie 100 - 16.000 Hz
(+) | ogólny dźwięk jest liniowy (10.4% różnicy w stosunku do mediany)
W porównaniu do tej samej klasy
» 6% wszystkich testowanych urządzeń w tej klasie było lepszych, 6% podobnych, 88% gorszych
» Najlepszy miał deltę 7%, średnia wynosiła ###średnia###%, najgorsza wynosiła 35%
W porównaniu do wszystkich testowanych urządzeń
» 5% wszystkich testowanych urządzeń było lepszych, 1% podobnych, 93% gorszych
» Najlepszy miał deltę 4%, średnia wynosiła ###średnia###%, najgorsza wynosiła 134%
Apple MacBook Pro 16 2021 M1 Pro analiza dźwięku
(+) | głośniki mogą odtwarzać stosunkowo głośno (84.7 dB)
Bas 100 - 315 Hz
(+) | dobry bas - tylko 3.8% od mediany
(+) | bas jest liniowy (5.2% delta do poprzedniej częstotliwości)
Średnie 400 - 2000 Hz
(+) | zbalansowane środki średnie - tylko 1.3% od mediany
(+) | średnie są liniowe (2.1% delta do poprzedniej częstotliwości)
Wysokie 2–16 kHz
(+) | zrównoważone maksima - tylko 1.9% od mediany
(+) | wzloty są liniowe (2.7% delta do poprzedniej częstotliwości)
Ogólnie 100 - 16.000 Hz
(+) | ogólny dźwięk jest liniowy (4.6% różnicy w stosunku do mediany)
W porównaniu do tej samej klasy
» 0% wszystkich testowanych urządzeń w tej klasie było lepszych, 0% podobnych, 100% gorszych
» Najlepszy miał deltę 5%, średnia wynosiła ###średnia###%, najgorsza wynosiła 45%
W porównaniu do wszystkich testowanych urządzeń
» 0% wszystkich testowanych urządzeń było lepszych, 0% podobnych, 100% gorszych
» Najlepszy miał deltę 4%, średnia wynosiła ###średnia###%, najgorsza wynosiła 134%
Zarządzanie energią
Pobór mocy
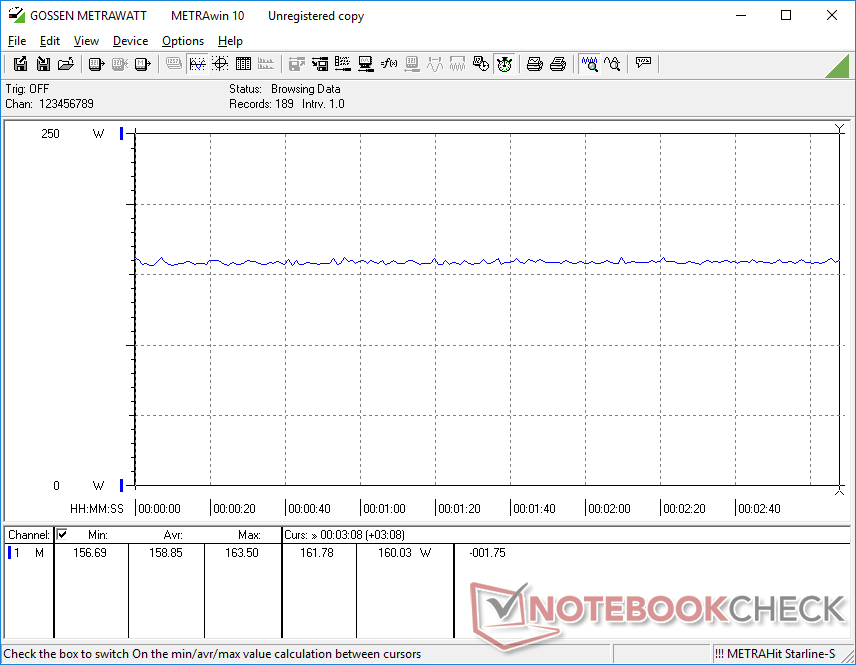
Już zwykły Precision 7670 jest maszyną wymagającą dużej ilości energii, a Precision 7670 Performance jest jeszcze bardziej. W stanie spoczynku na pulpicie zużywa od 16 do 47 W, zależnie od poziomu jasności, profilu zasilania i kolorów OLED na ekranie. Dla porównania, większość innych stacji roboczych pobiera zazwyczaj około 15 W
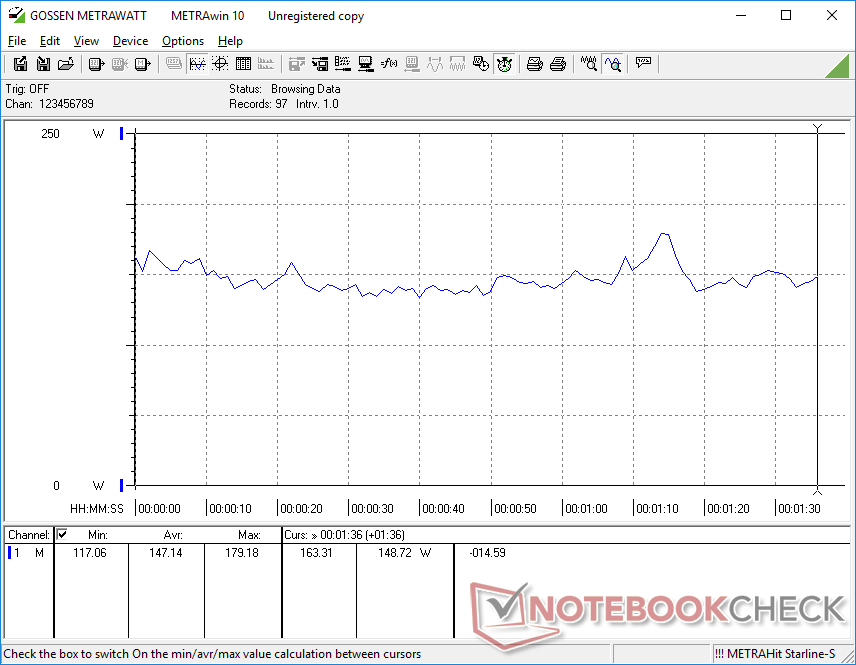
W przypadku wymagających obciążeń, takich jak gry, nasze urządzenie pobierało około 159 W w porównaniu do 134 W w przypadku zwykłego Precision 7670. 19-procentowy wzrost zużycia energii jest stosunkowo niewielki, biorąc pod uwagę 70-80-procentowy wzrost potencjału graficznego w stosunku do Quadro A2000
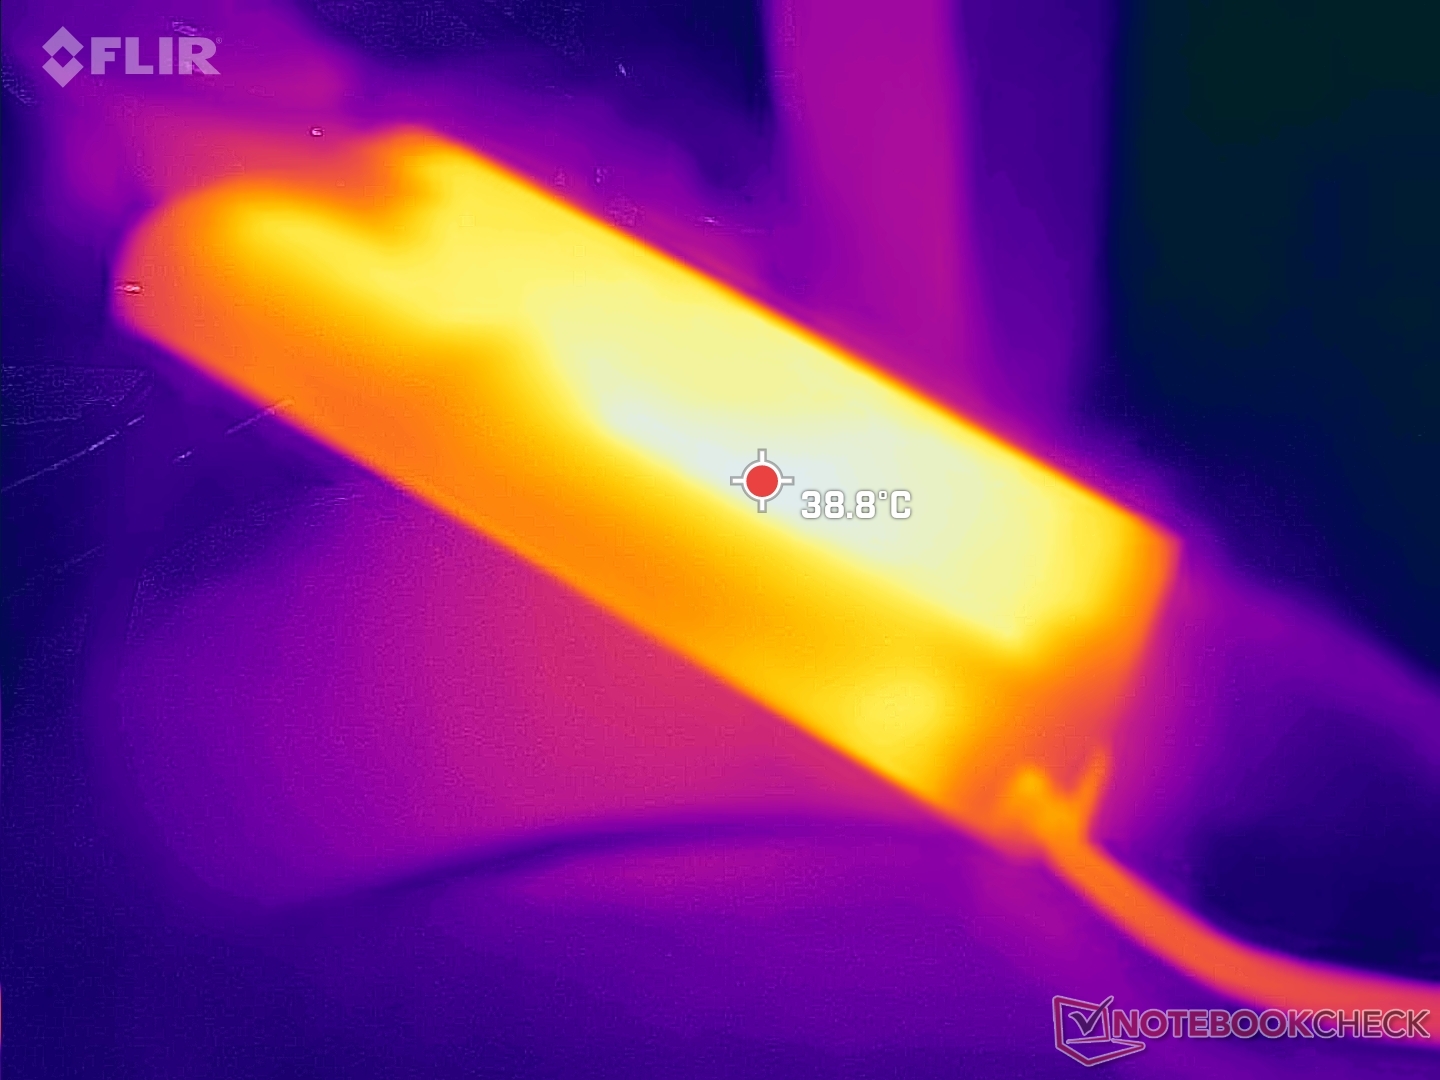
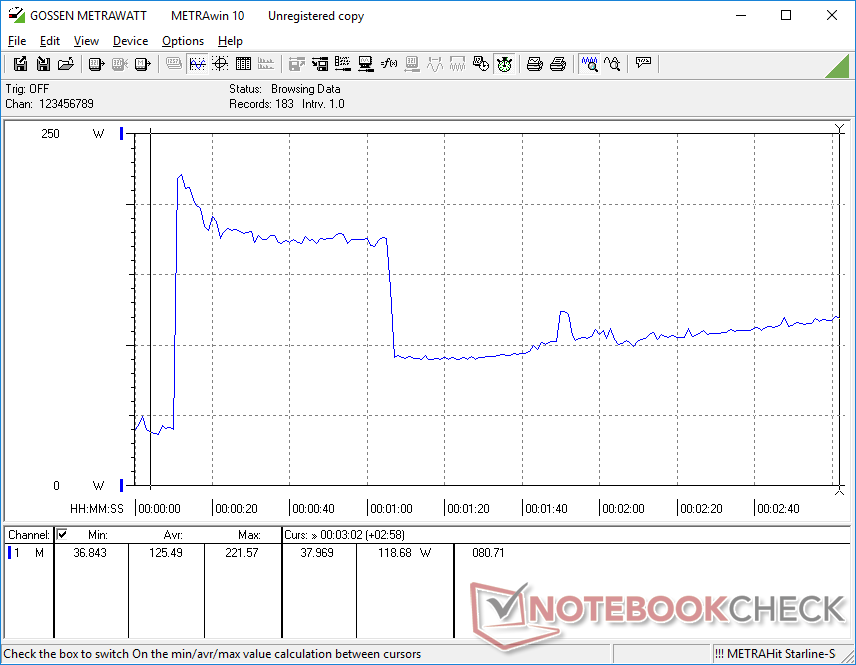
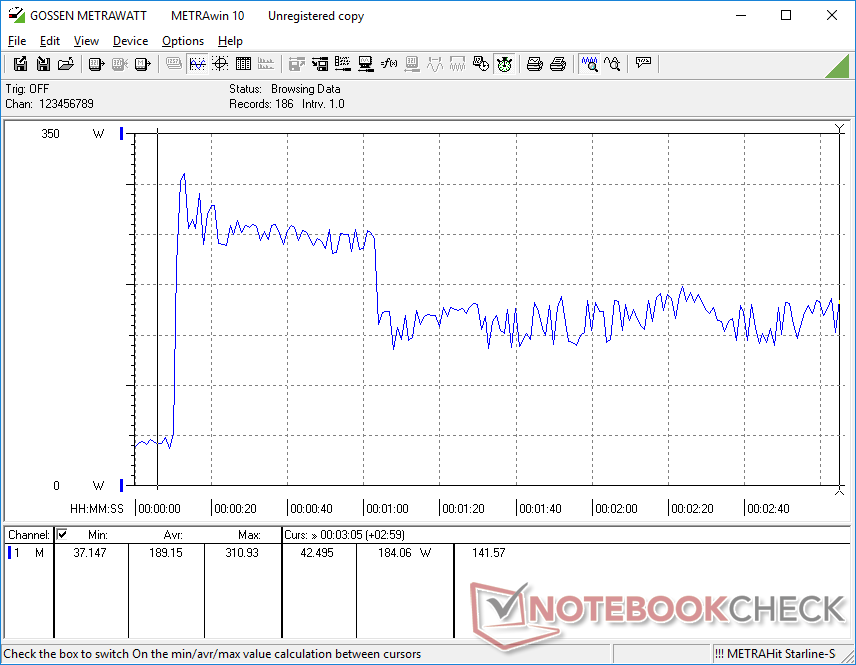
W zestawie znajduje się średniej wielkości (~15,2 x 7,8 x 2,3 cm) zasilacz sieciowy o mocy 240 W, podczas gdy zwykły Precision 7670 dostarczany jest z mniejszym zasilaczem o mocy 180 W. Udało nam się zarejestrować chwilowy maksymalny pobór mocy 311 W z zasilacza, gdy zarówno CPU, jak i GPU są wykorzystywane w 100%, co widać na poniższych zrzutach ekranu. Sugeruje to zarówno ograniczoną wydajność Turbo Boost, jak i potencjalnie niedostateczną moc zasilacza, biorąc pod uwagę, jak wymagający może być układ wewnętrzny.
| wyłączony / stan wstrzymania | |
| luz | |
| obciążenie |
|
Legenda:
min: | |
| Dell Precision 7000 7670 Performance i9-12950HX, RTX A5500 Laptop GPU, , OLED, 3840x2400, 16" | MSI CreatorPro Z16P B12UKST i7-12700H, RTX A3000 Laptop GPU, Samsung PM9A1 MZVL21T0HCLR, IPS, 2560x1600, 16" | HP ZBook Studio 16 G9 62U04EA i7-12800H, RTX A2000 Laptop GPU, Micron 3400 1TB MTFDKBA1T0TFH, IPS, 3840x2400, 16" | HP ZBook Firefly 16 G9-6B897EA i7-1265U, T550 Laptop GPU, Samsung PM9A1 MZVL21T0HCLR, IPS, 1920x1200, 16" | Lenovo ThinkPad P1 G4-20Y4Z9DVUS i7-11800H, T1200 Laptop GPU, Samsung PM9A1 MZVL2512HCJQ, IPS, 2560x1600, 16" | Dell Precision 7670 i7-12850HX, RTX A2000 Laptop GPU, SK Hynix HFS001TEJ9X115N, OLED, 3840x2400, 16" | MSI WE76 11UM-456 i9-11980HK, RTX A5000 Laptop GPU, Samsung PM9A1 MZVL22T0HBLB, IPS, 3840x2160, 17.3" | |
|---|---|---|---|---|---|---|---|
| Power Consumption | 37% | 44% | 73% | 48% | 36% | 19% | |
| Idle Minimum * (Watt) | 16.4 | 10.8 34% | 7.2 56% | 4.5 73% | 9.9 40% | 7.5 54% | 10.5 36% |
| Idle Average * (Watt) | 35.9 | 16.3 55% | 18.1 50% | 8 78% | 13.9 61% | 9.5 74% | 18.6 48% |
| Idle Maximum * (Watt) | 47 | 16.9 64% | 18.5 61% | 8.7 81% | 14.6 69% | 28.4 40% | 20 57% |
| Load Average * (Watt) | 147.1 | 111.7 24% | 112.8 23% | 48.3 67% | 95 35% | 139.1 5% | 132.4 10% |
| Witcher 3 ultra * (Watt) | 158.8 | 152.1 4% | 106.7 33% | 45.3 71% | 98.9 38% | 134 16% | 232 -46% |
| Load Maximum * (Watt) | 311 | 177.4 43% | 186 40% | 94.7 70% | 170.8 45% | 220.8 29% | 281.6 9% |
* ... im mniej tym lepiej
Power Consumption Witcher 3 / Stresstest
Power Consumption external Monitor
Czas pracy na baterii
Pojemność baterii jest tym razem nieco większa i wynosi 93 Wh w porównaniu z 83 Wh w smuklejszym modelu Precision 7670. Mimo to czas pracy w sieci WLAN jest krótszy o prawie godzinę w naszym modelu Performance ze względu na bardziej wydajny układ wewnętrzny.
Ładowanie od pustej do pełnej pojemności trwa powoli około 2,5 godziny.
| Dell Precision 7000 7670 Performance i9-12950HX, RTX A5500 Laptop GPU, 93 Wh | MSI CreatorPro Z16P B12UKST i7-12700H, RTX A3000 Laptop GPU, 90 Wh | HP ZBook Studio 16 G9 62U04EA i7-12800H, RTX A2000 Laptop GPU, 86 Wh | HP ZBook Firefly 16 G9-6B897EA i7-1265U, T550 Laptop GPU, 76 Wh | Lenovo ThinkPad P1 G4-20Y4Z9DVUS i7-11800H, T1200 Laptop GPU, 90 Wh | Dell Precision 7670 i7-12850HX, RTX A2000 Laptop GPU, 83 Wh | |
|---|---|---|---|---|---|---|
| Czasy pracy | 23% | 34% | 177% | 87% | 26% | |
| WiFi v1.3 (h) | 4.7 | 5.8 23% | 6.3 34% | 13 177% | 8.8 87% | 5.9 26% |
| H.264 (h) | 8.5 | 18.4 | ||||
| Load (h) | 1.1 | 2 | 1.3 | |||
| Reader / Idle (h) | 7.9 |
Za
Przeciw
Werdykt
Precision 7670 Performance jest tylko nieznacznie grubszy i cięższy od standardowej Precision 7670ale oferuje o około 10 procent i 80 procent wyższą wydajność CPU i GPU niż standardowy model, jeśli jest skonfigurowany z najwyższymi opcjami procesora. Jeżeli nie zamierzasz wykorzystywać w szczególności zalet procesora graficznego, nie ma większego powodu, by kupować model Performance zamiast modelu standardowego, ponieważ inne zalety są stosunkowo niewielkie.
Płyta główna Precision 7670 Performance spełnia oczekiwania, jeśli chodzi o opcje i funkcje procesora klasy high-end. Niemniej jednak ograniczony potencjał Turbo Boost, wysokie temperatury rdzenia i problemy z opóźnieniami DPC są nieco rozczarowujące.
W kwestii ogólnej wydajności można jeszcze wiele poprawić. Mimo że jest to grubszy model Performance, temperatury rdzeni nie są wcale lepsze, niż w modelu standardowym. W konsekwencji Turbo Boost trwa znacznie krócej niż przewidywano, co może nie spodobać się docelowej grupie entuzjastów. Wysokie opóźnienia DPC, nierówna wydajność WiFi, wysoki pobór mocy na biegu jałowym i niewymiarowy zasilacz AC to kolejne problemy, które nie powinny mieć miejsca w profesjonalnej stacji roboczej, takiej jak ta.
Cena i dostępność
Dell prowadzi już sprzedaż Precision 7670 Performance w cenie od 5300 USD za podstawową konfigurację do ponad 7000 USD w konfiguracji z tym samym procesorem i układem graficznym, co nasz testowy egzemplarz.
Dell Precision 7000 7670 Performance
- 03/12/2022 v7 (old)
Allen Ngo
Price comparison

