Recenzja stacji roboczej Dell Precision 5470: Debiut Nvidia RTX A1000
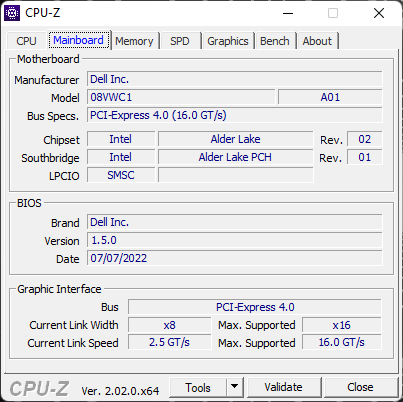
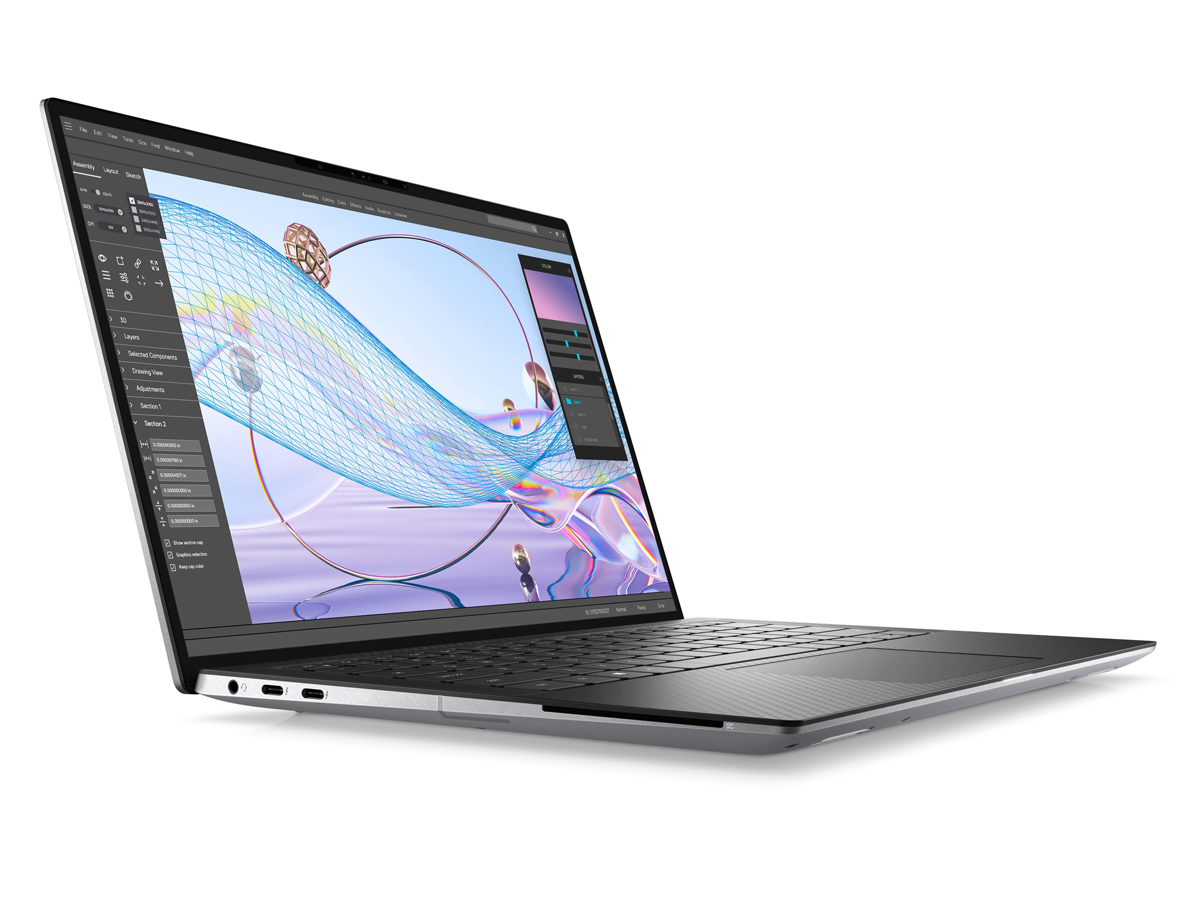
Model Precision 5470 to jak dotąd najmniejsza mobilna stacja robocza firmy Dell. Podobnie jak inspirowany XPS 17 Precision 5750 i XPS 15 Precision 556014-calowy Precision 5470 jest inspirowany wyglądem i konstrukcją XPS 13 9300/9310. Jeśli w przeszłości miałeś do czynienia z systemem XPS, to Precision 5470 powinien wyglądać i czuć się bardzo znajomo.
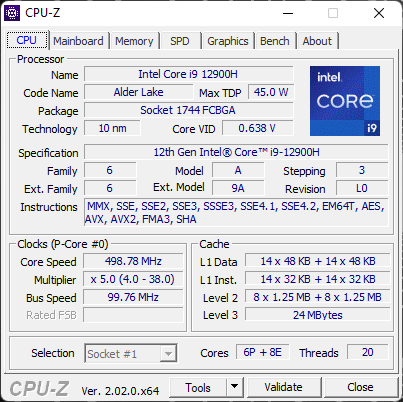
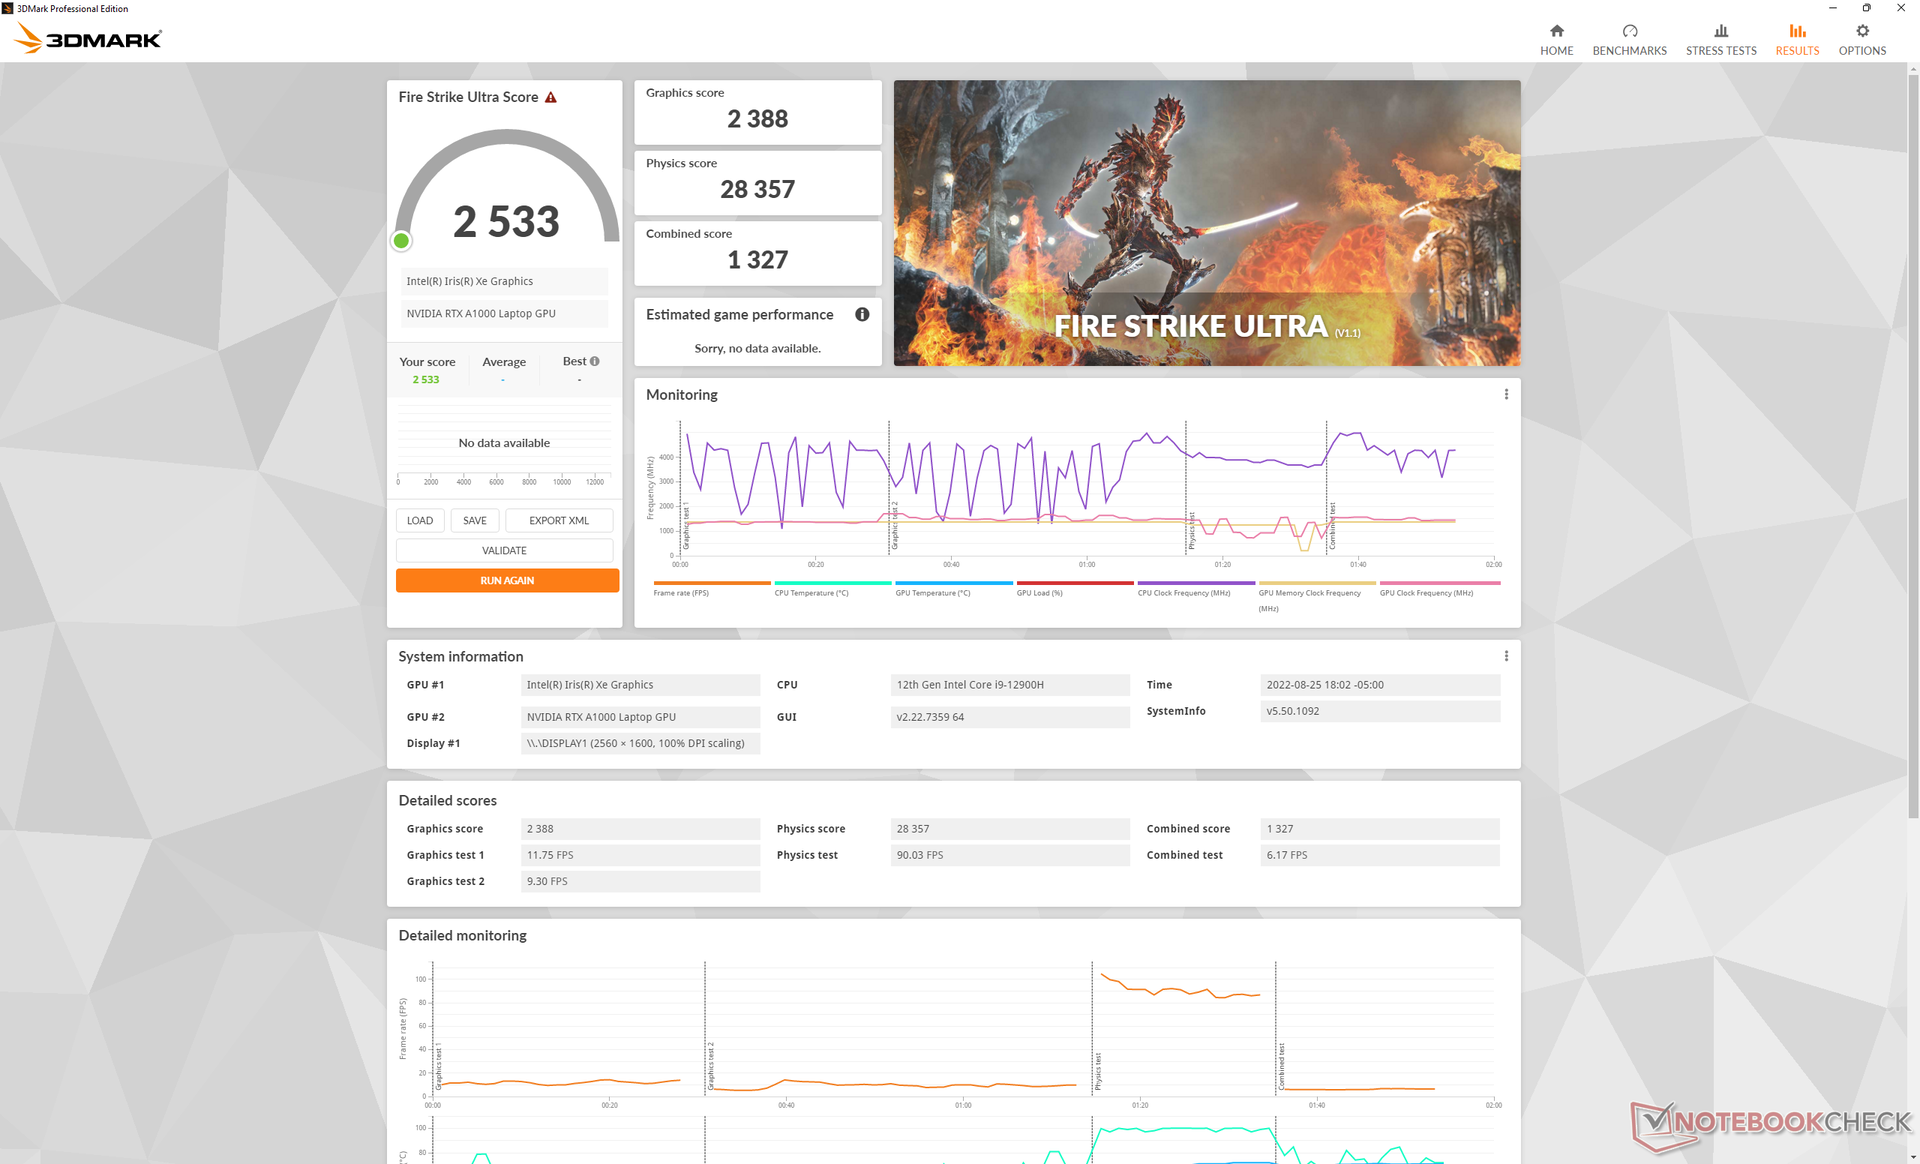
Dwa czynniki wyróżniające model Precision 5470 to procesor Core 12. generacji serii H oraz opcjonalny układ graficzny Nvidia RTX A1000, zapewniający ogromną moc obliczeniową, biorąc pod uwagę 14-calową obudowę. Nasz egzemplarz recenzencki wyposażony jest w procesor Core i9-12900H, układ graficzny A1000 i błyszczący ekran dotykowy 1600p w cenie około 3000 USD. Inne jednostki SKU z procesorami od i5-12500H do i7-12800H, zintegrowaną grafiką Iris Xe i matowym ekranem 1200p są również dostępne w niższych cenach.
Bezpośrednimi konkurentami są inne wysokiej klasy 14-calowe mobilne stacje robocze, jak np HP ZBook Firefly 14 lub Lenovo ThinkPad P14s. Ta kategoria wielkości jest wciąż nowa, jeśli chodzi o stacje robocze, dlatego porównamy Precision 5470 z kilkoma większymi modelami, jak np ThinkPad P15 G2 lub własny Precision 5560 firmy Dell.
Więcej recenzji Della:
Potential Competitors in Comparison
Ocena | Data | Model | Waga | Wysokość | Rozmiar | Rezolucja | Cena |
|---|---|---|---|---|---|---|---|
| 87.6 % v7 (old) | 10/2022 | Dell Precision 5000 5470 i9-12900H, RTX A1000 Laptop GPU | 1.6 kg | 18.95 mm | 14.00" | 2560x1600 | |
| 86.2 % v7 (old) | Lenovo ThinkPad P15v G2 21A9000XGE i7-11800H, T1200 Laptop GPU | 2.3 kg | 22.7 mm | 15.60" | 1920x1080 | ||
| 88.3 % v7 (old) | Dell Precision 5000 5560 i7-11850H, RTX A2000 Laptop GPU | 2 kg | 18 mm | 15.60" | 3840x2400 | ||
| 85.2 % v7 (old) | Lenovo ThinkPad P14s G2 AMD R7 PRO 5850U, Vega 8 | 1.5 kg | 17.9 mm | 14.00" | 3840x2160 | ||
| 85.2 % v7 (old) | HP ZBook Firefly 14 G8 2C9Q2EA i7-1165G7, T500 Laptop GPU | 1.4 kg | 17.9 mm | 14.00" | 1920x1080 | ||
| 82.4 % v7 (old) | HP ZBook Firefly 14 G7 i7-10610U, Quadro P520 | 1.4 kg | 17.9 mm | 14.00" | 1920x1080 |
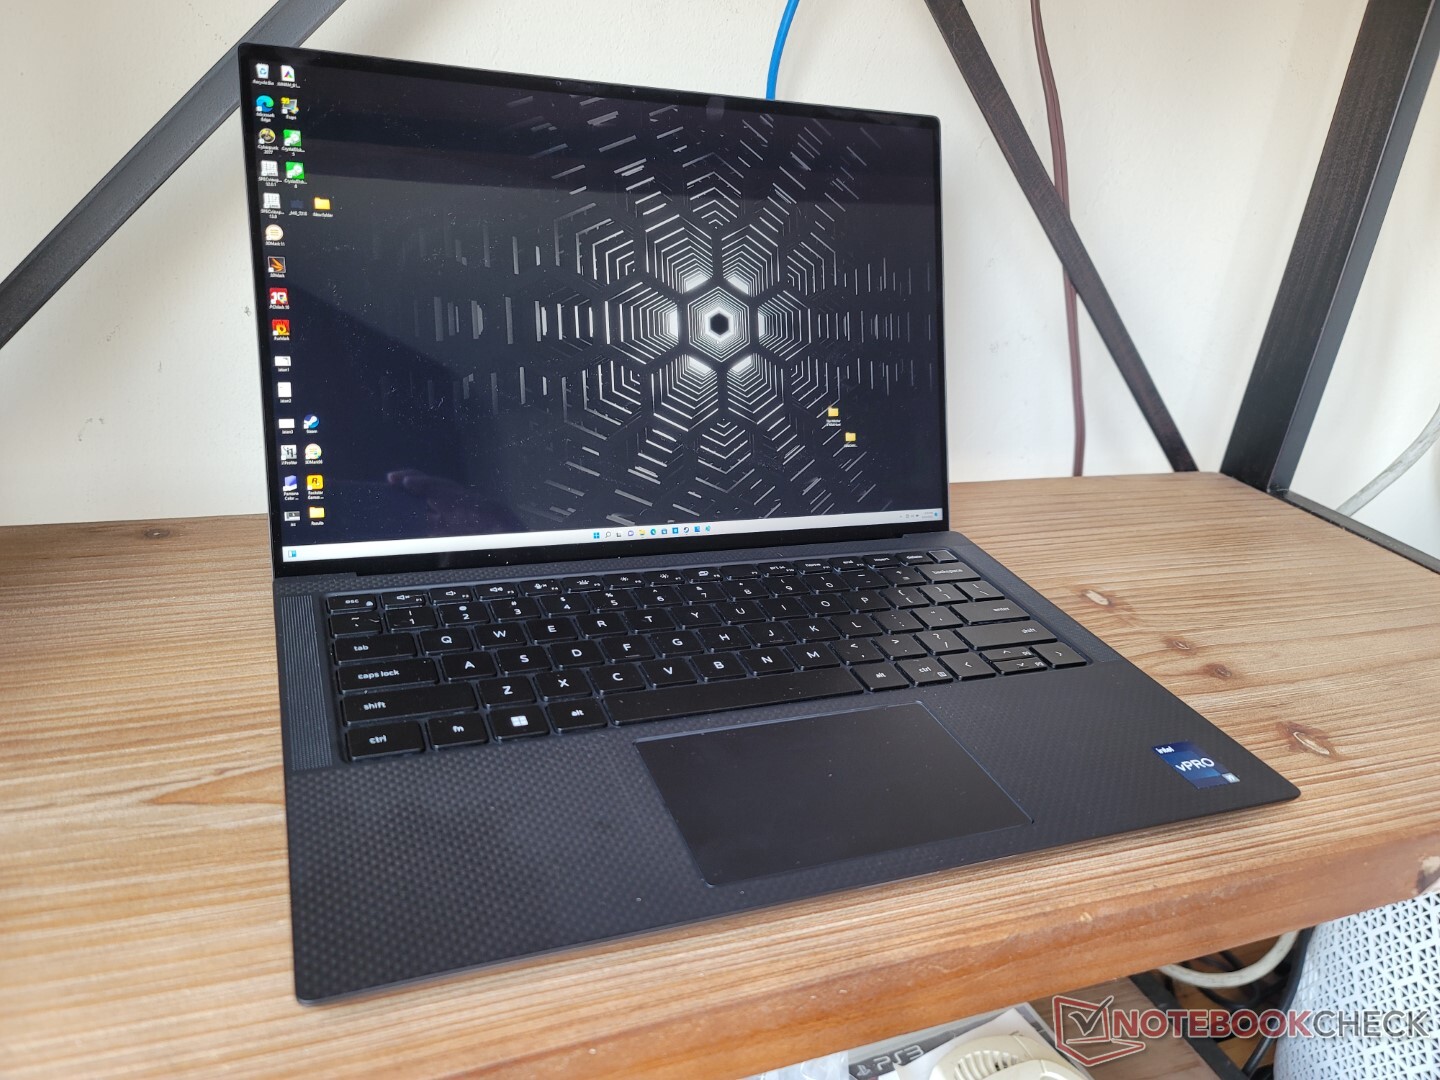
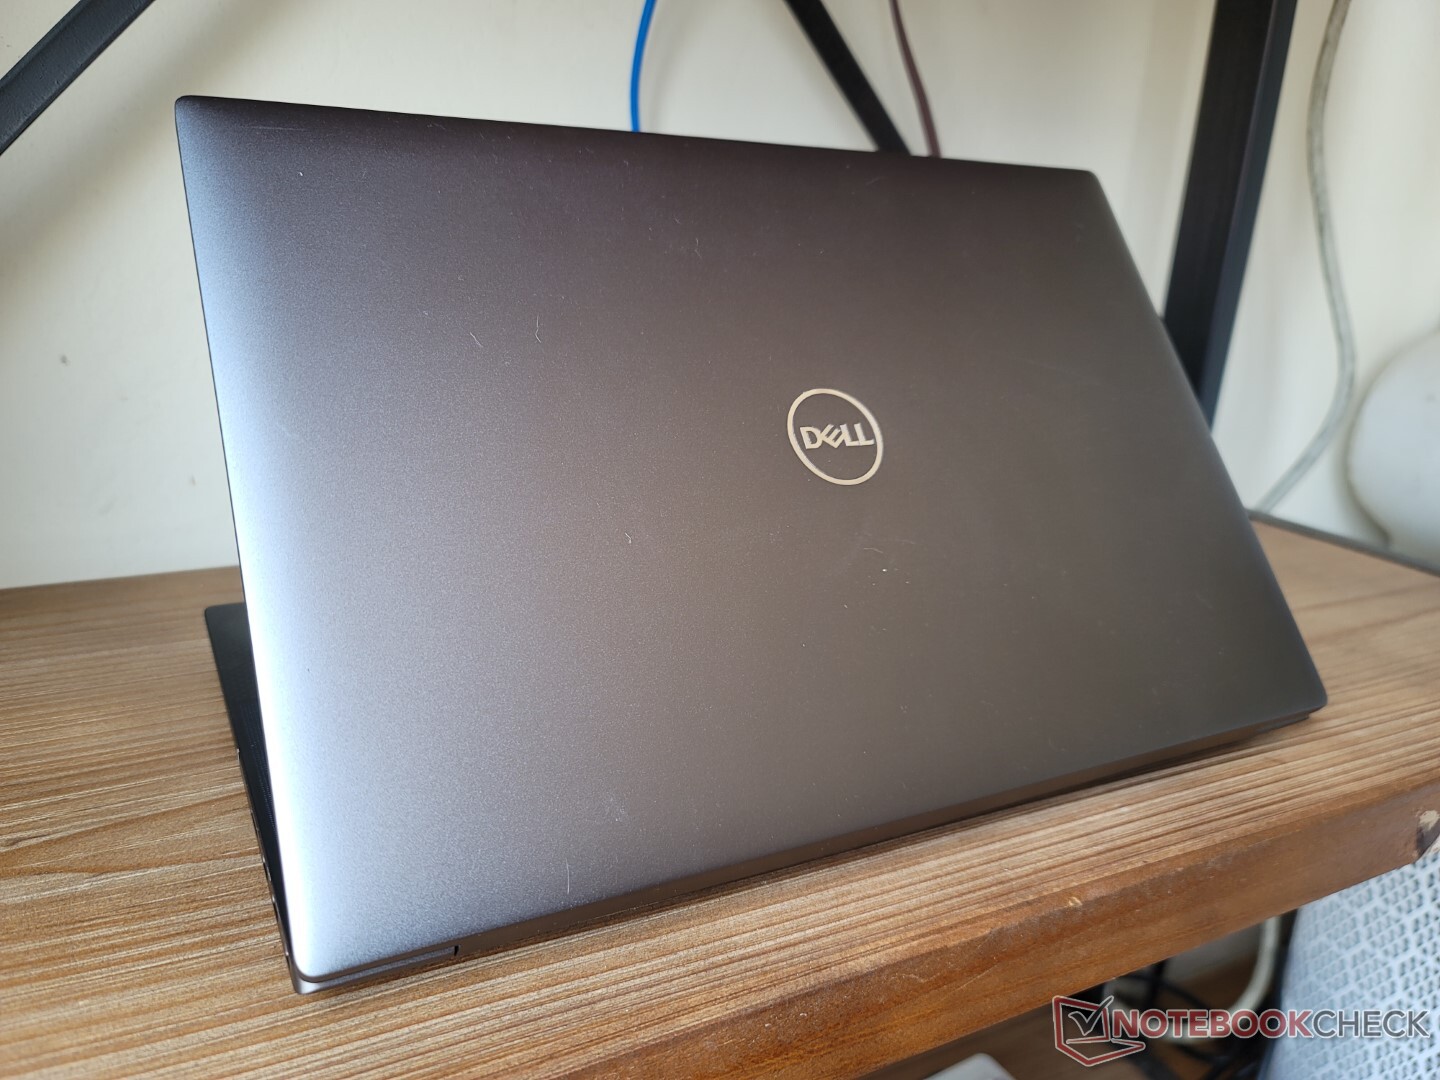
Obudowa - XPS Look And Feel
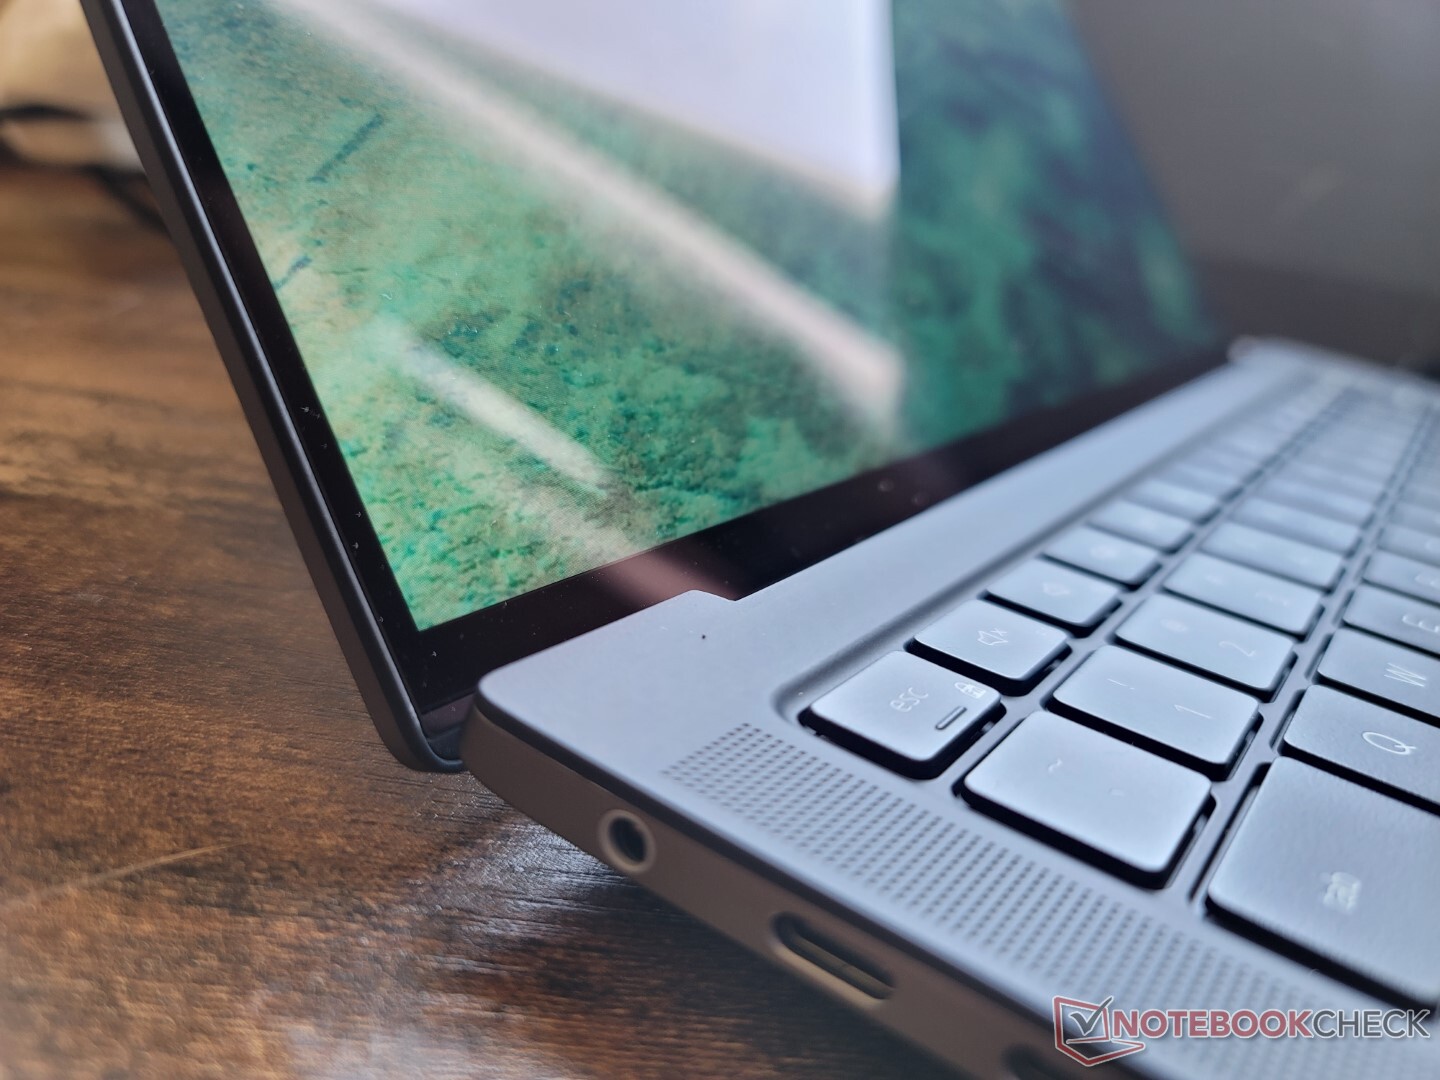
W chwili pisania tego tekstu nie ma jeszcze XPS-a 14, ale Precision 5470 jest w zasadzie jego prekursorem. Mieści się wygodnie pomiędzy klasycznym 13-calowym XPS 13 a 15-calowym XPS 15 a jednocześnie wykorzystuje tę samą szarą powłokę ze stopu magnezu i pokład z włókna węglowego, które stały się standardem w modelach XPS.
Jakość obudowy jest doskonała, a przy próbach wykręcania i wyginania jej powierzchni pojawiają się tylko drobne trzeszczenia i odkształcenia. Z pewnością sprawia wrażenie mocniejszej i bardziej profesjonalnej niż nowy XPS 13 9320 konstrukcja. Niemniej jednak zawiasy mogłyby być sztywniejsze, by dać lepsze poczucie długowieczności.
14-calowy Precision 5470 jest większy i cięższy od 13-calowego XPS 13 9300 o zauważalne marginesy. Jest nawet nieco grubszy od XPS-a 15, a jednocześnie wagowo bliższy XPS-owi 15 niż XPS-owi 13. Mimo to jest bardzo kompaktowy w swojej klasie, zwłaszcza jeśli chodzi o powierzchnię podstawy w porównaniu z HP Firefly 14 G8 czy ThinkPadem P14s.
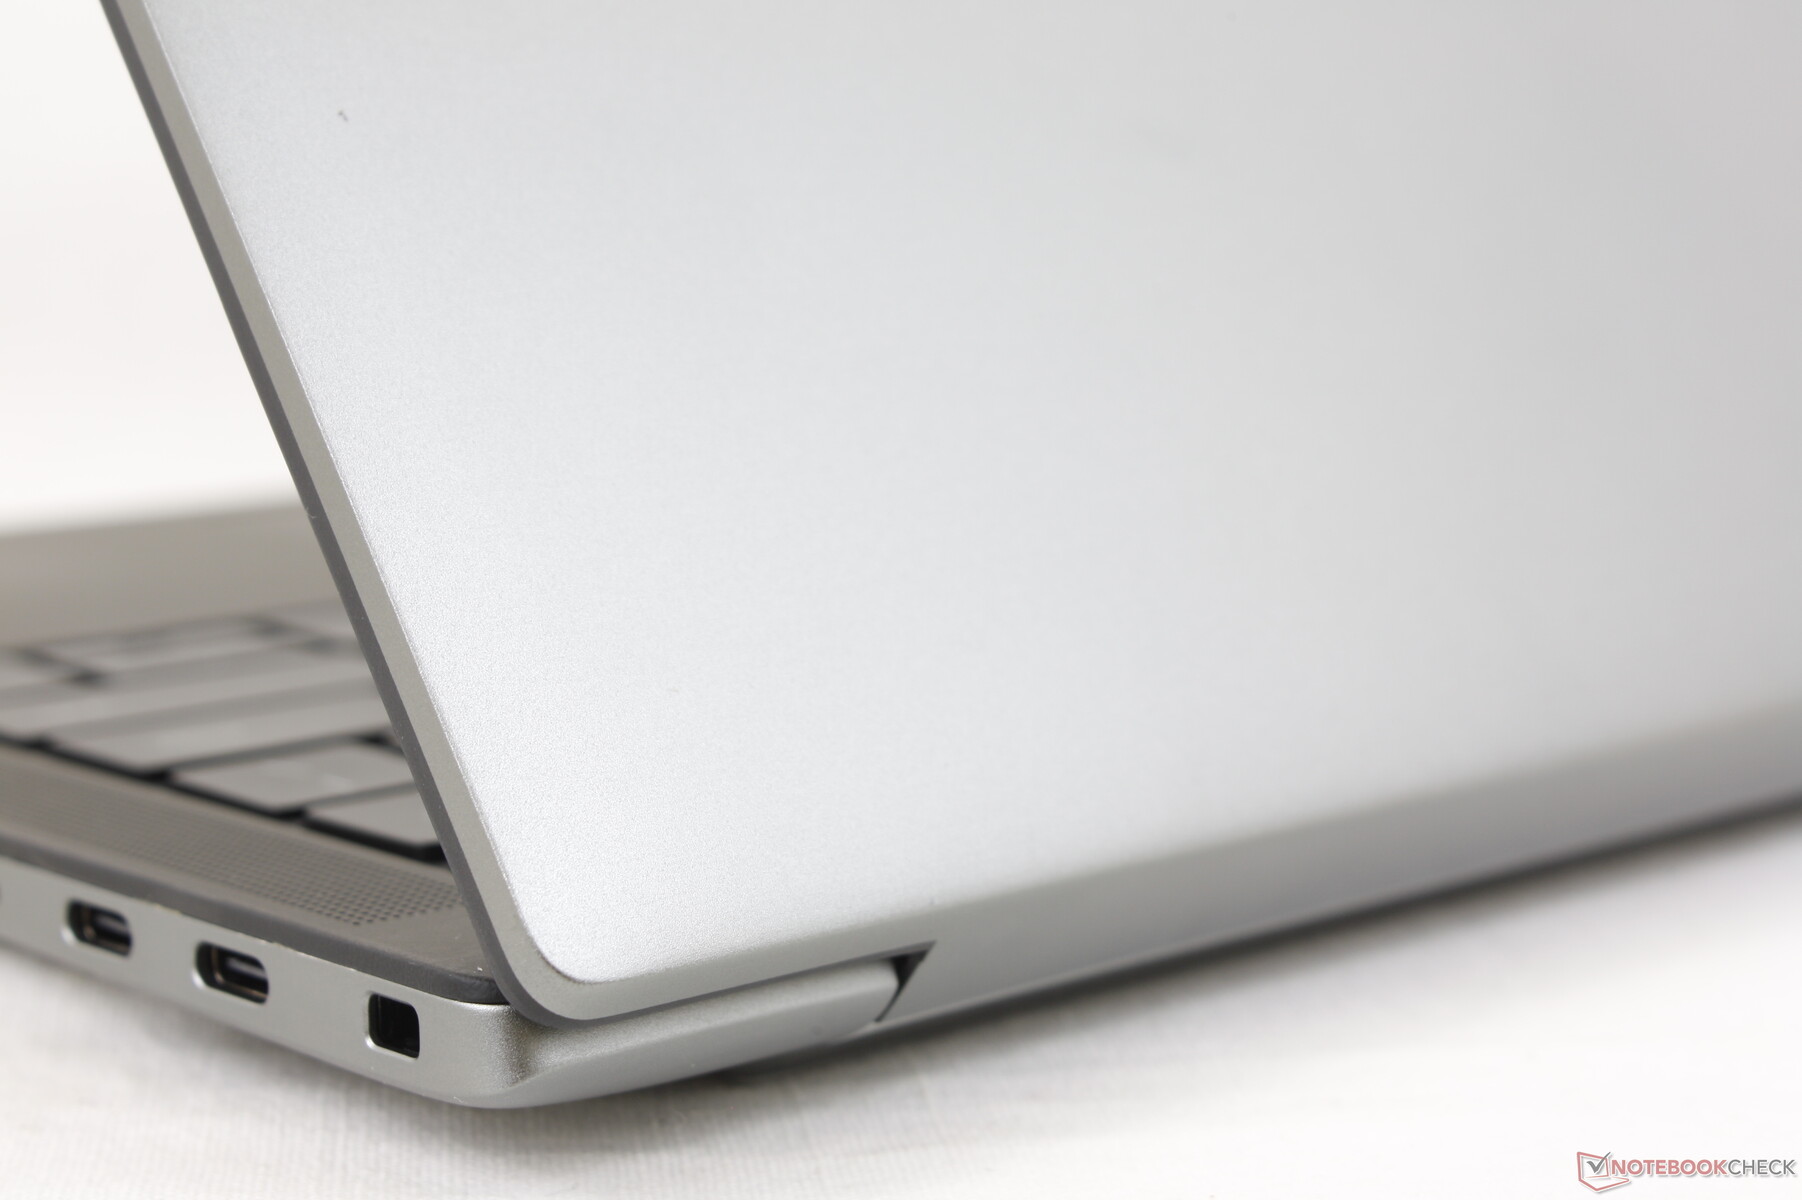
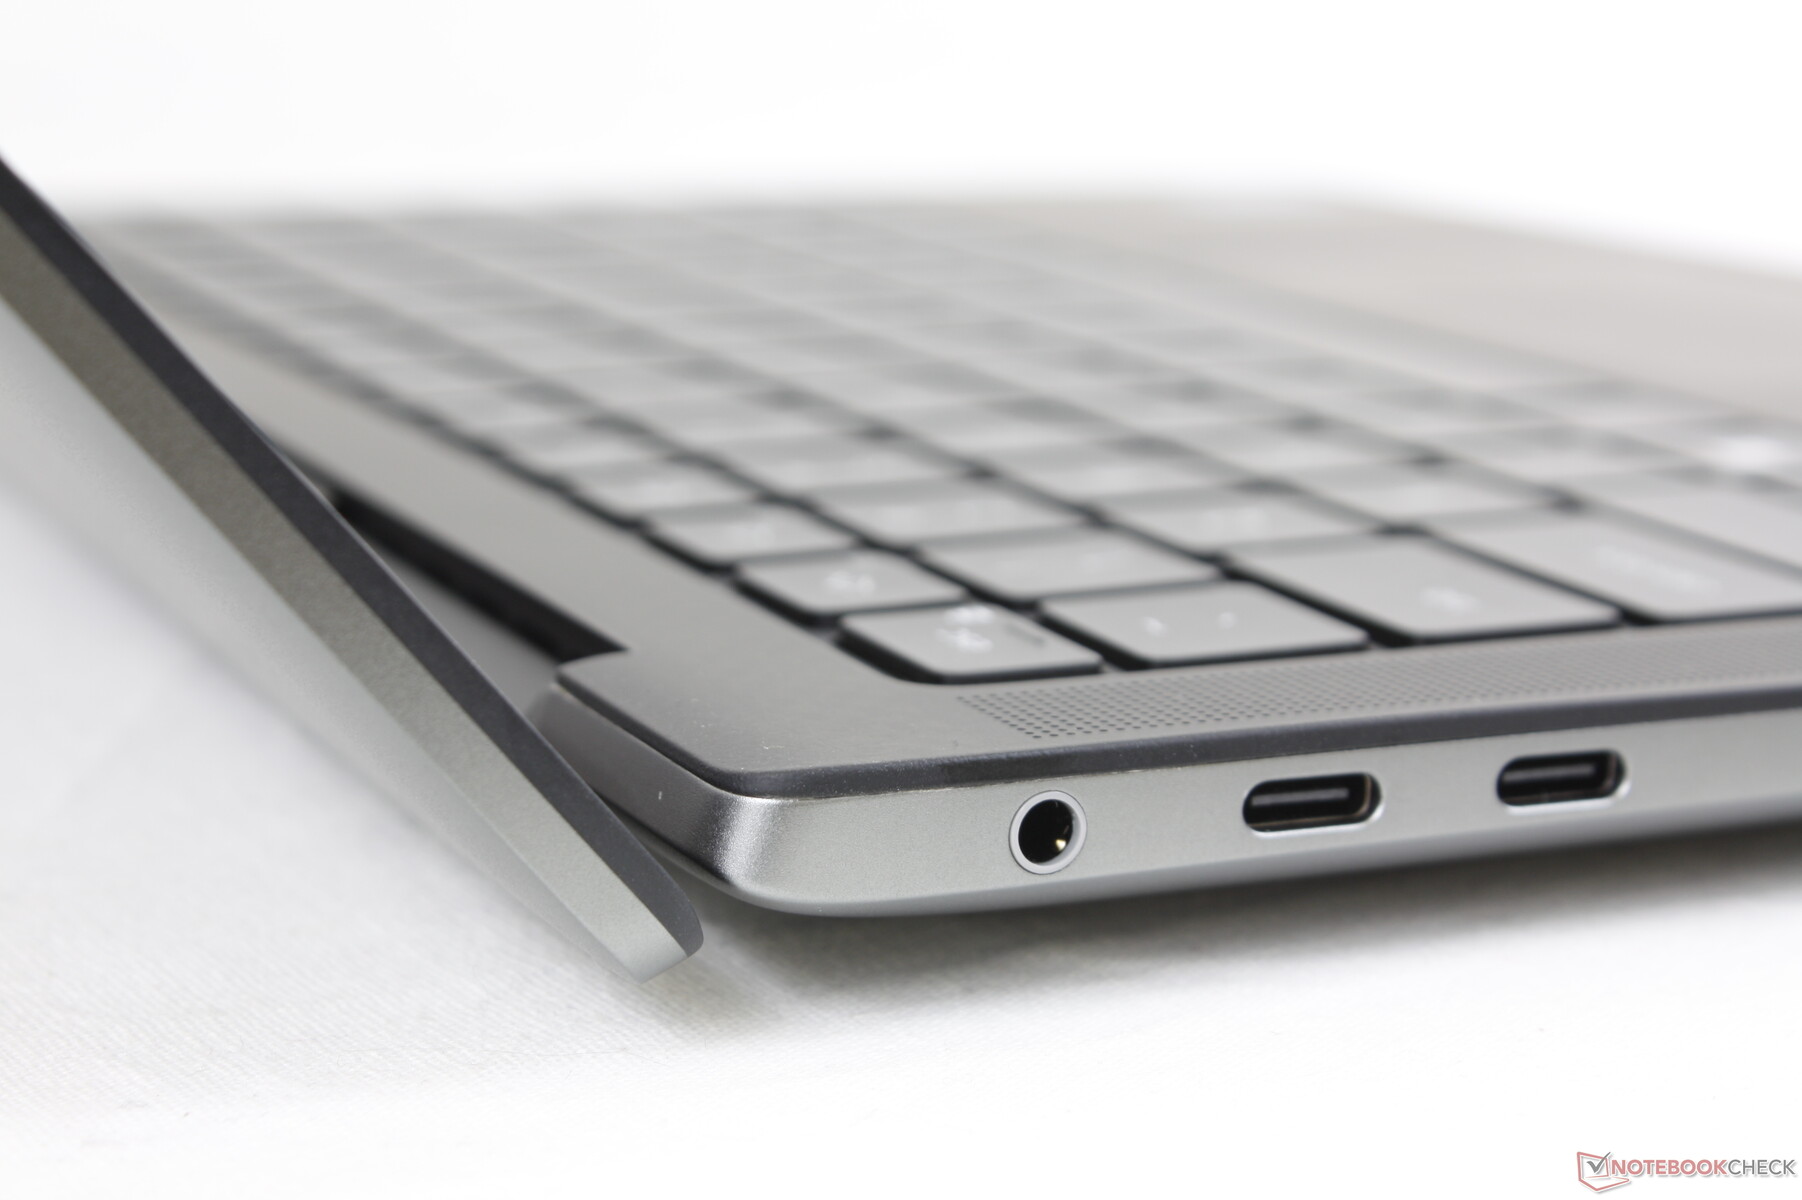
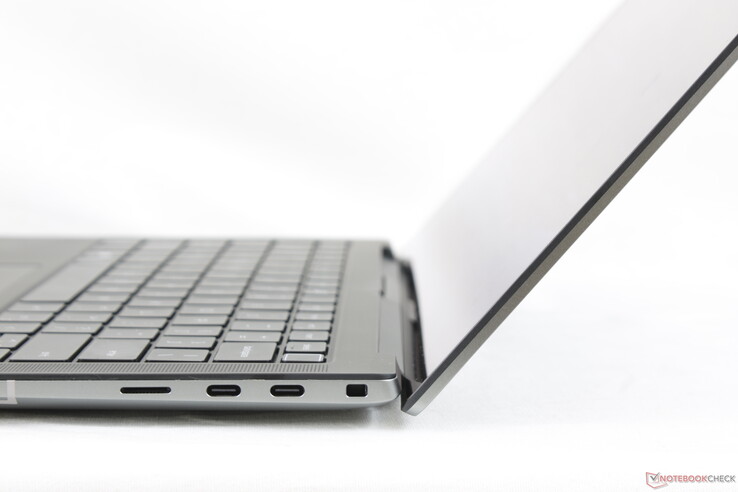
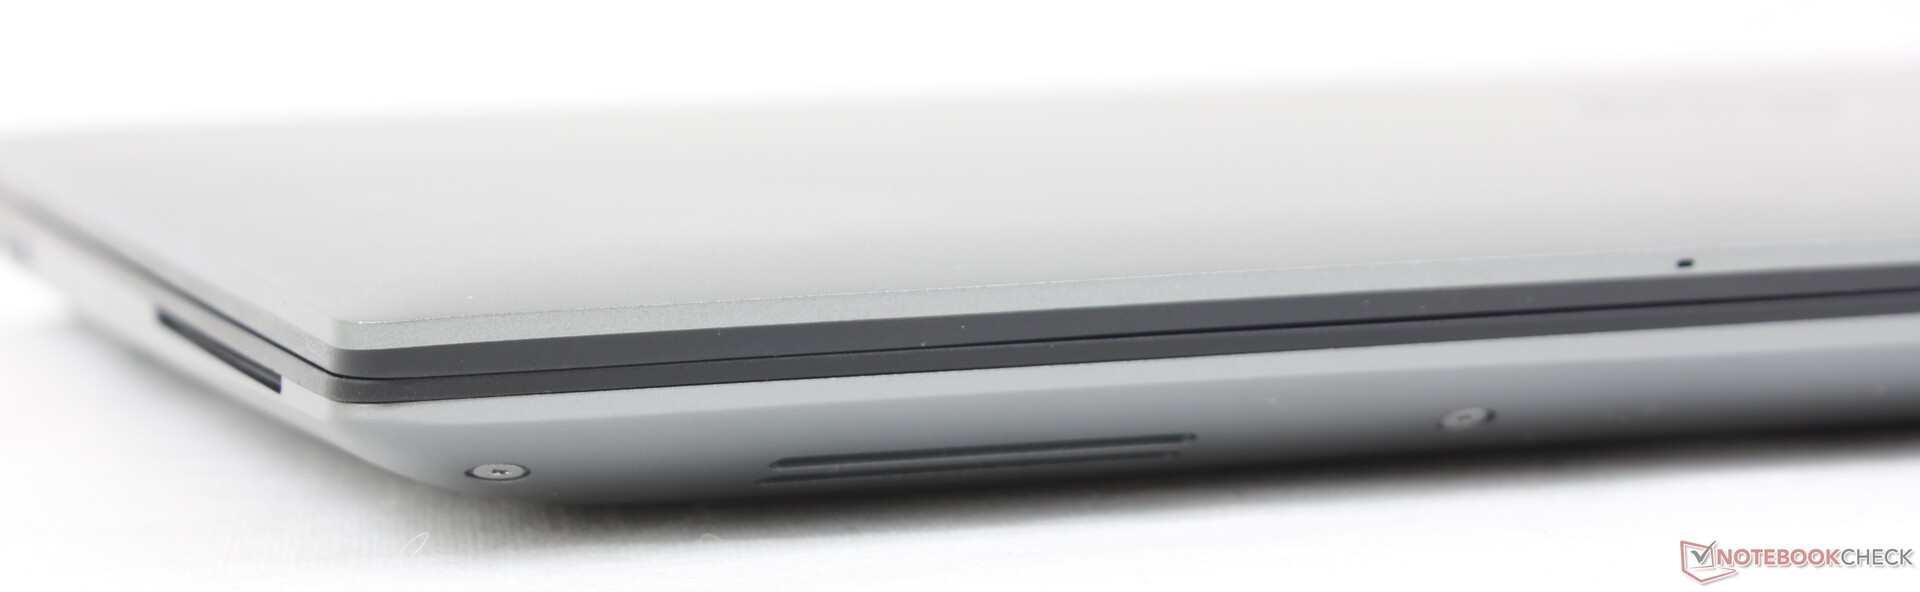
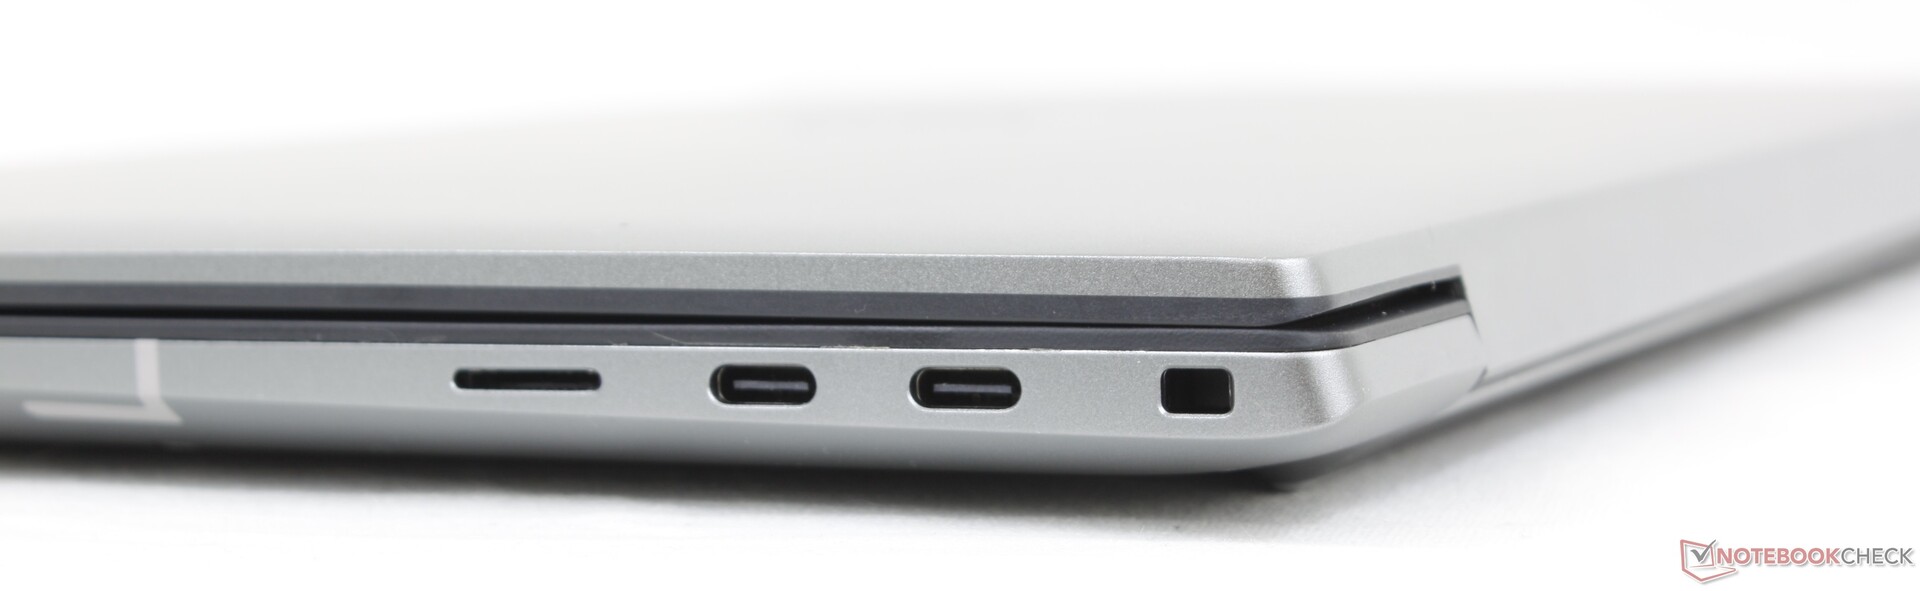
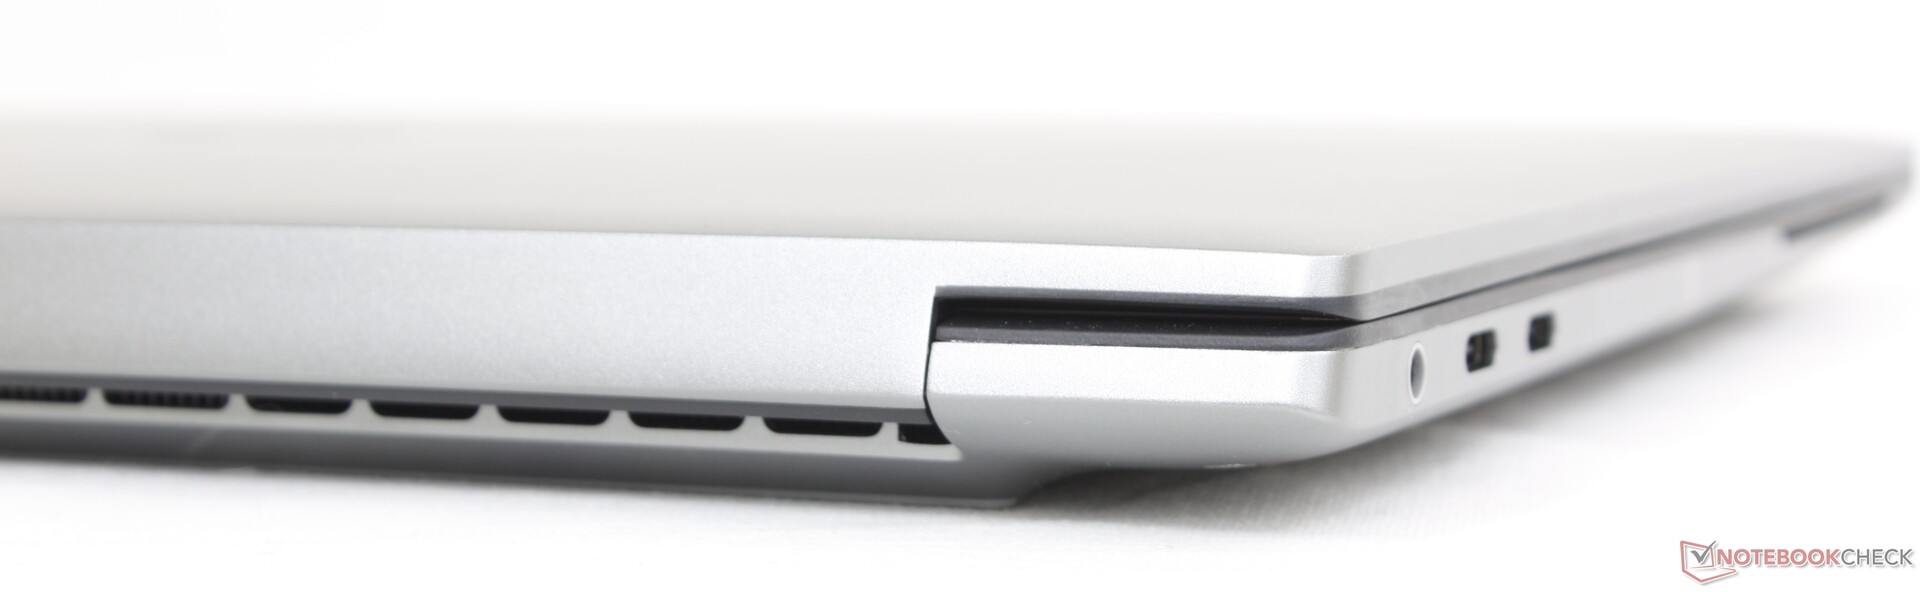
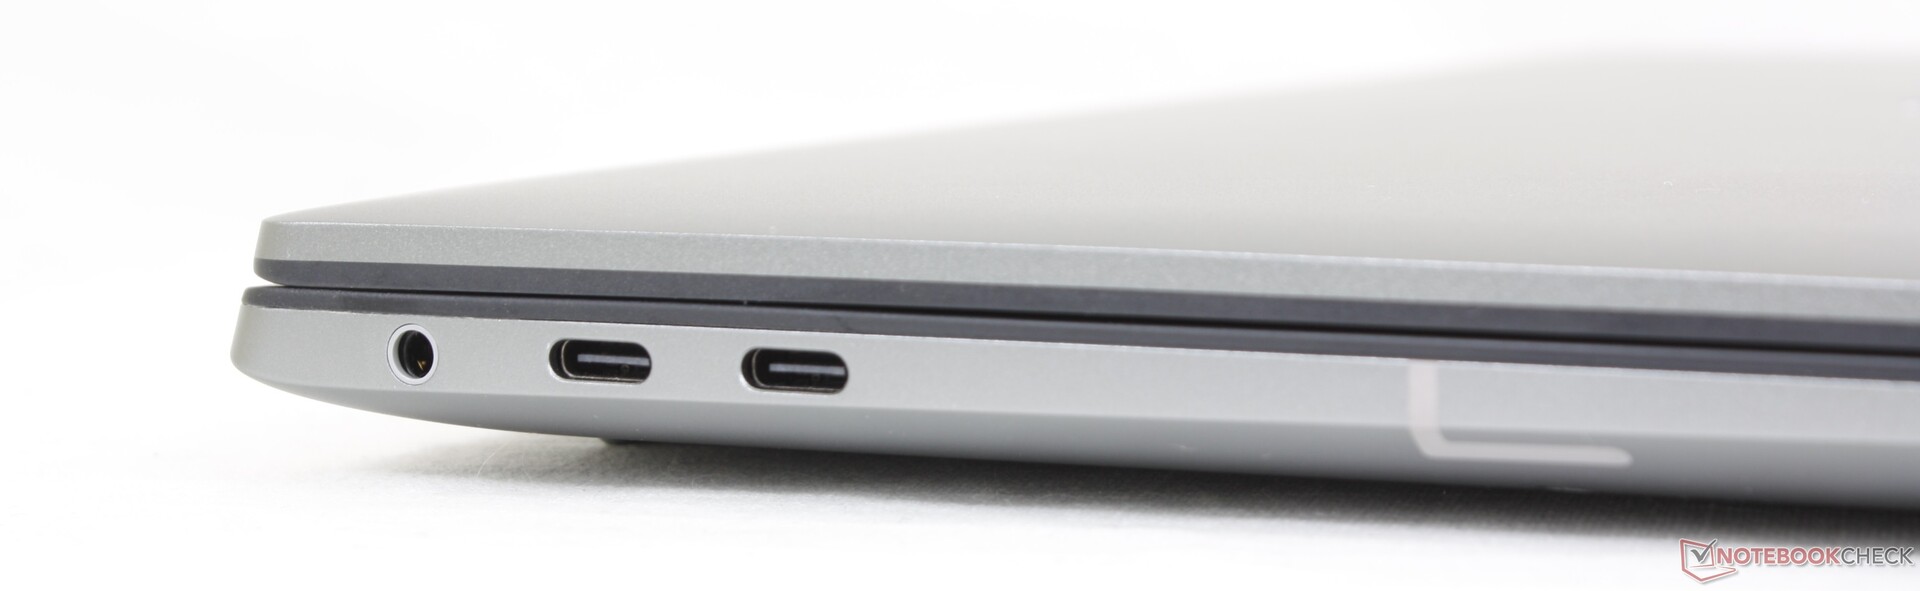
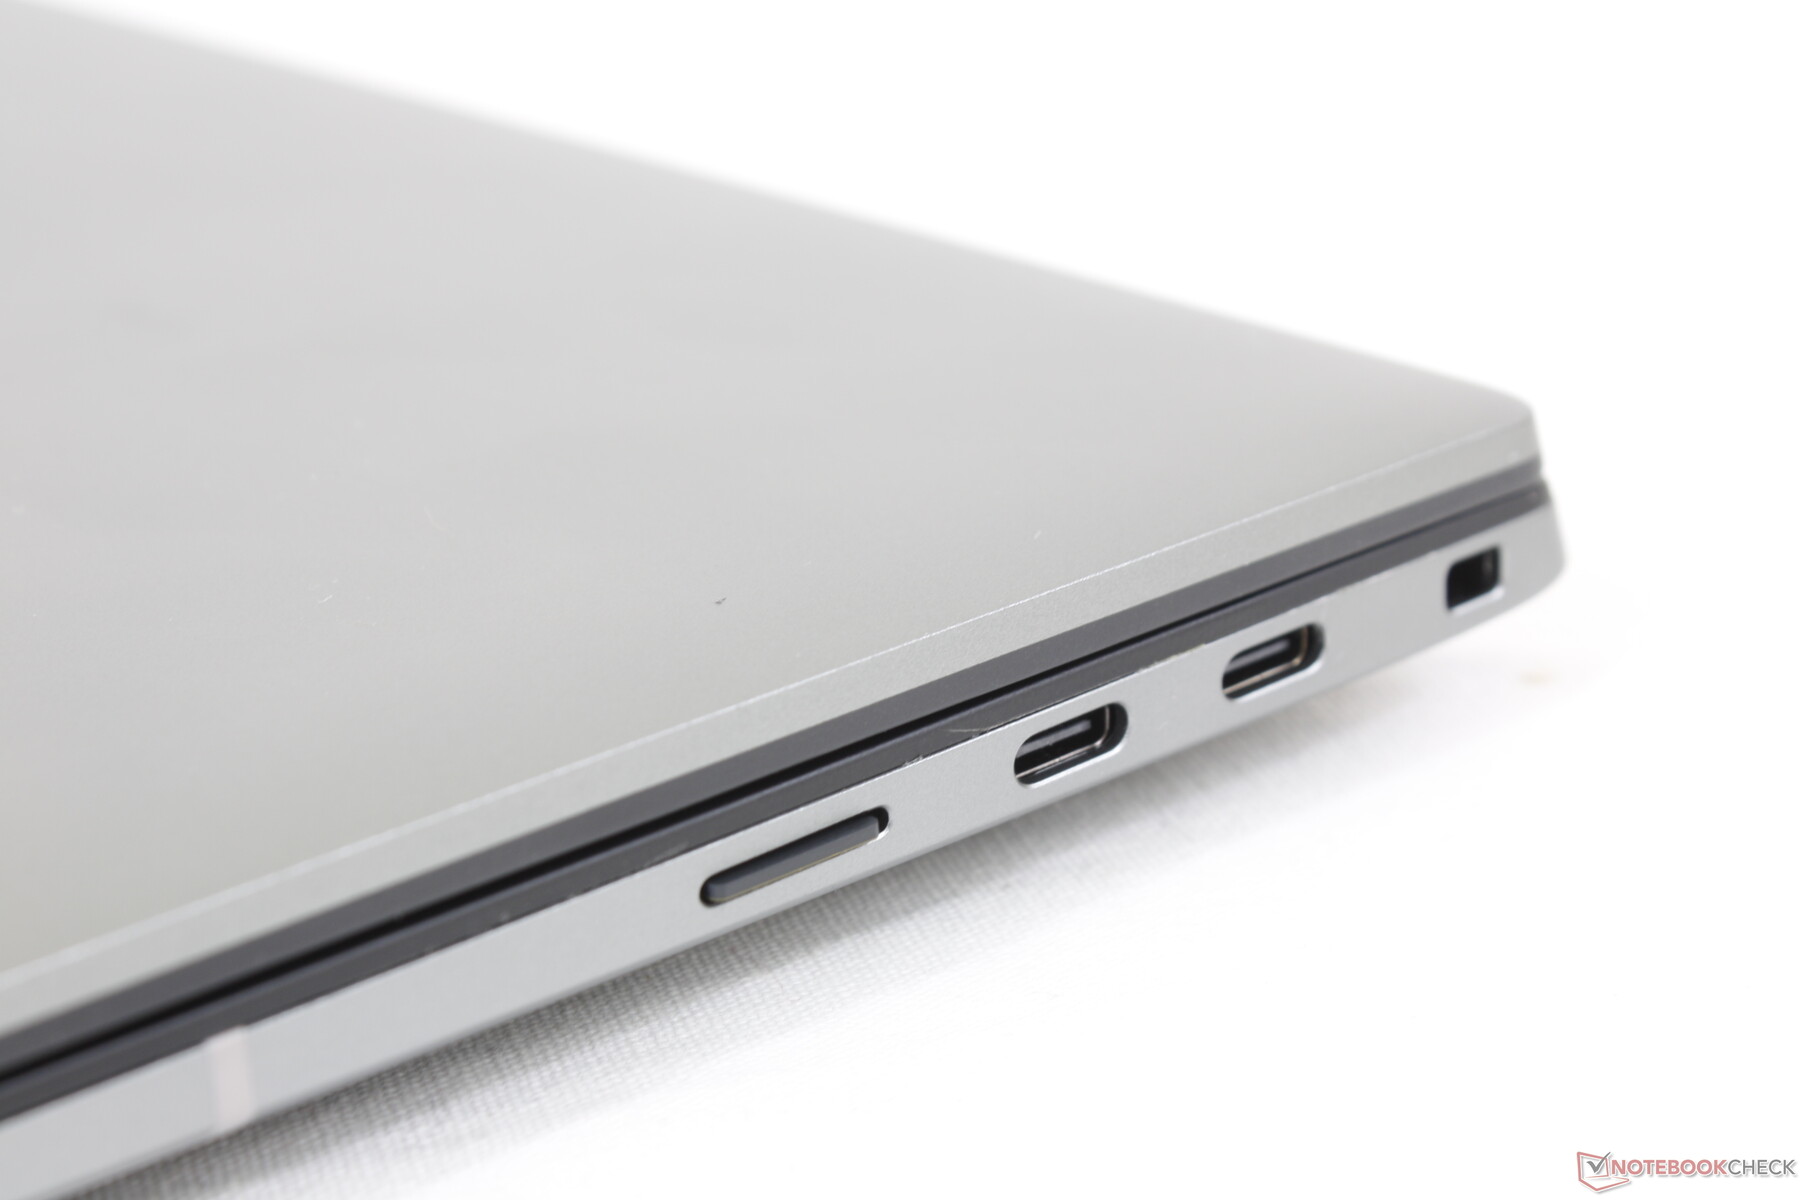
Łączność - Tylko USB-C
Opcje portów są ograniczone tylko do USB-C, podczas gdy większość stacji roboczych ma znacznie szerszy wybór. Precision posiadacze 5470 będą więc musieli polegać na adapterach lub stacjach dokujących przy podłączaniu większości urządzeń.
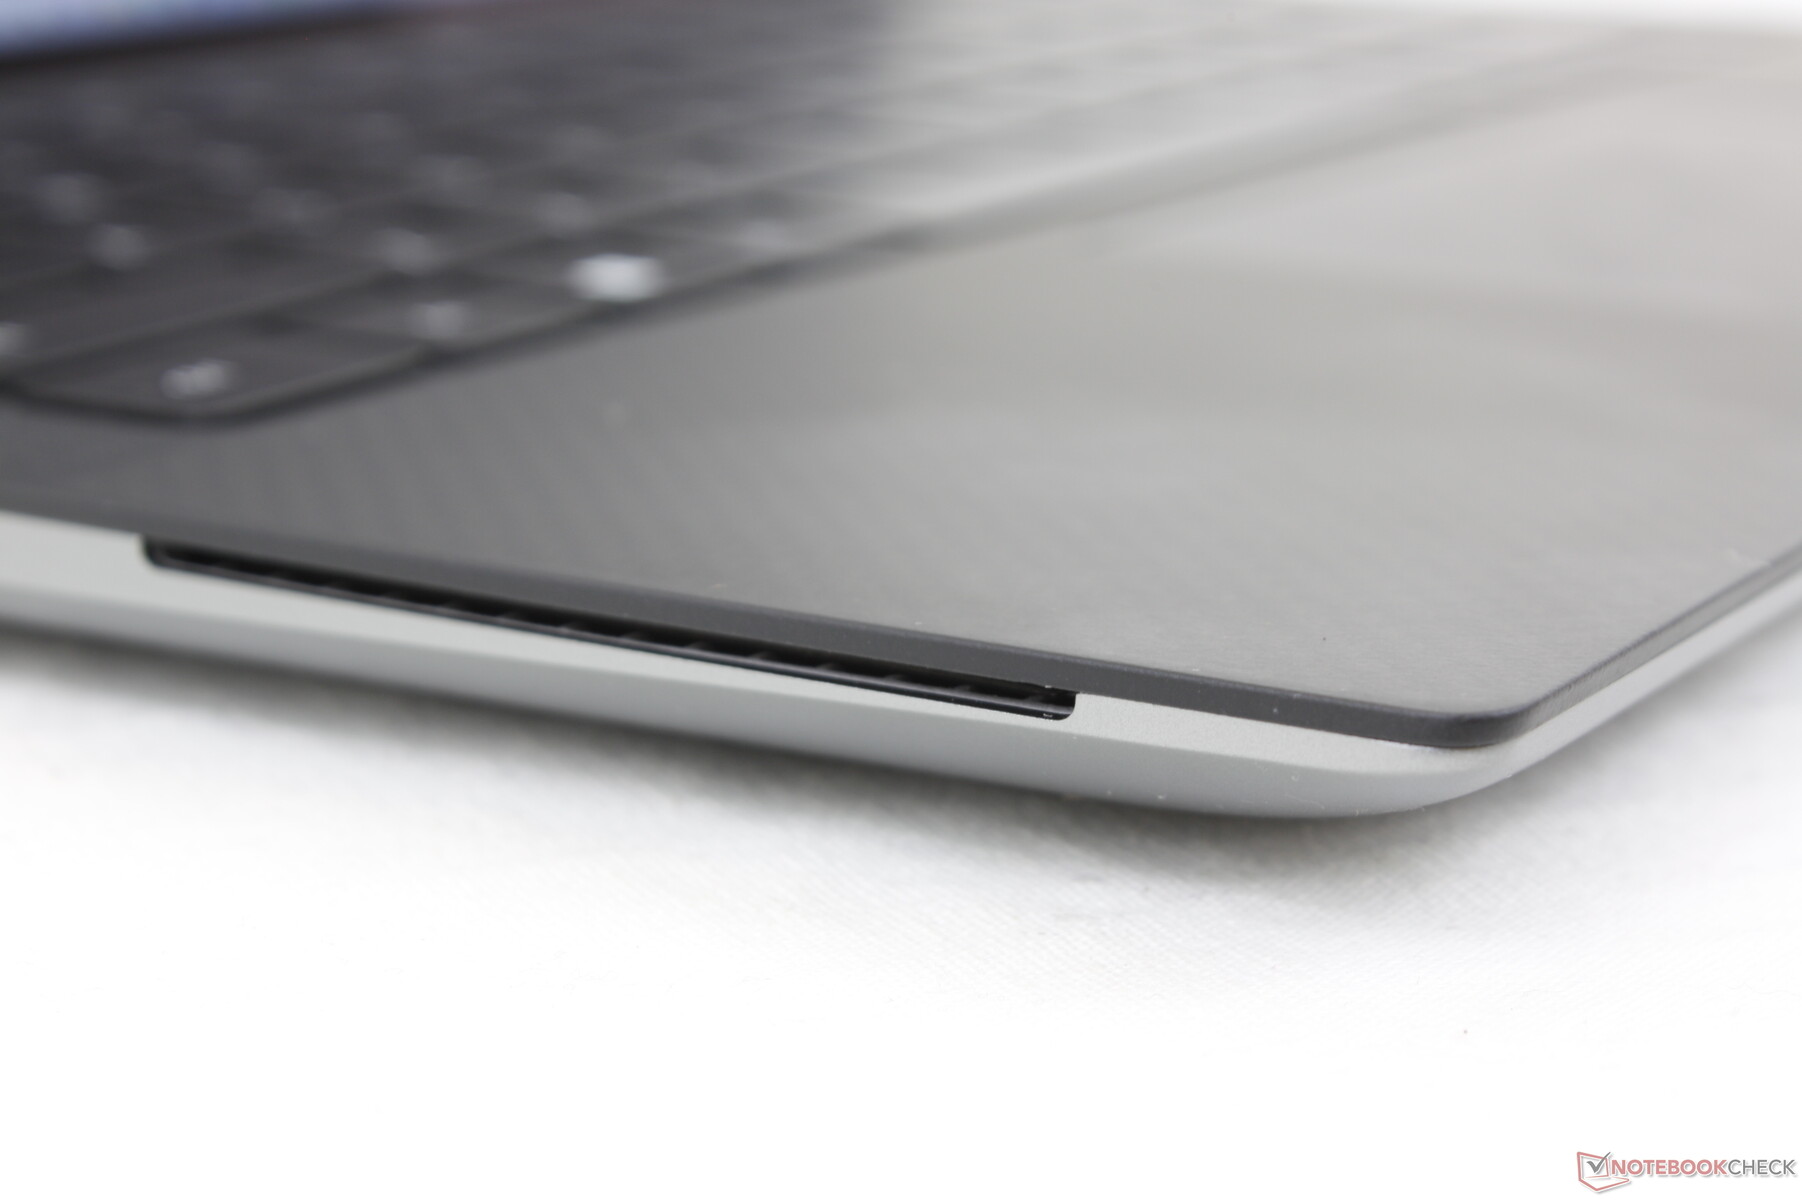
Czytnik kart SD
Transfery ze zintegrowanego czytnika kart są bardzo szybkie i wynoszą prawie 230 MB/s z naszej karty testowej UHS-II. W zależności od wielkości plików rzeczywiste prędkości transferu mogą być jednak niższe. Przenoszenie 1 GB zdjęć (~4 MB każde) jest wolniejsze i trwa około 13 sekund.
| SD Card Reader | |
| average JPG Copy Test (av. of 3 runs) | |
| Dell Precision 5000 5560 (AV Pro V60) | |
| Lenovo ThinkPad P15v G2 21A9000XGE | |
| Dell Precision 5000 5470 (AV Pro V60) | |
| Lenovo ThinkPad P14s G2 AMD (AV PRO V60) | |
| maximum AS SSD Seq Read Test (1GB) | |
| Lenovo ThinkPad P15v G2 21A9000XGE | |
| Dell Precision 5000 5470 (AV Pro V60) | |
| Dell Precision 5000 5560 (AV Pro V60) | |
| Lenovo ThinkPad P14s G2 AMD (AV PRO V60) | |
Komunikacja
Standardem dla łączności Wi-Fi 6E i Bluetooth 5.2 jest układ Intel AX211. Choć nie doświadczyliśmy żadnych zauważalnych problemów, prędkości transmisji były wolniejsze i bardziej zmienne niż oczekiwaliśmy.
| Networking | |
| iperf3 transmit AX12 | |
| Lenovo ThinkPad P15v G2 21A9000XGE | |
| HP ZBook Firefly 14 G8 2C9Q2EA | |
| HP ZBook Firefly 14 G7 | |
| Dell Precision 5000 5560 | |
| Lenovo ThinkPad P14s G2 AMD | |
| iperf3 receive AX12 | |
| HP ZBook Firefly 14 G8 2C9Q2EA | |
| Lenovo ThinkPad P15v G2 21A9000XGE | |
| Dell Precision 5000 5560 | |
| HP ZBook Firefly 14 G7 | |
| Lenovo ThinkPad P14s G2 AMD | |
| iperf3 receive AXE11000 6GHz | |
| Dell Precision 5000 5470 | |
| iperf3 transmit AXE11000 6GHz | |
| Dell Precision 5000 5470 | |
Kamera internetowa
Kamera internetowa jest ograniczona do zaledwie 1 MP lub 720p, podczas gdy większość innych laptopów przeszła już na 2 MP lub nawet 5 MP, jak w przypadku wielu wysokiej klasy laptopów HP wielu high-endowych laptopów HP. Jakość obrazu jest mętna, podobnie jak w przypadku kamery internetowej w serii XPS 13
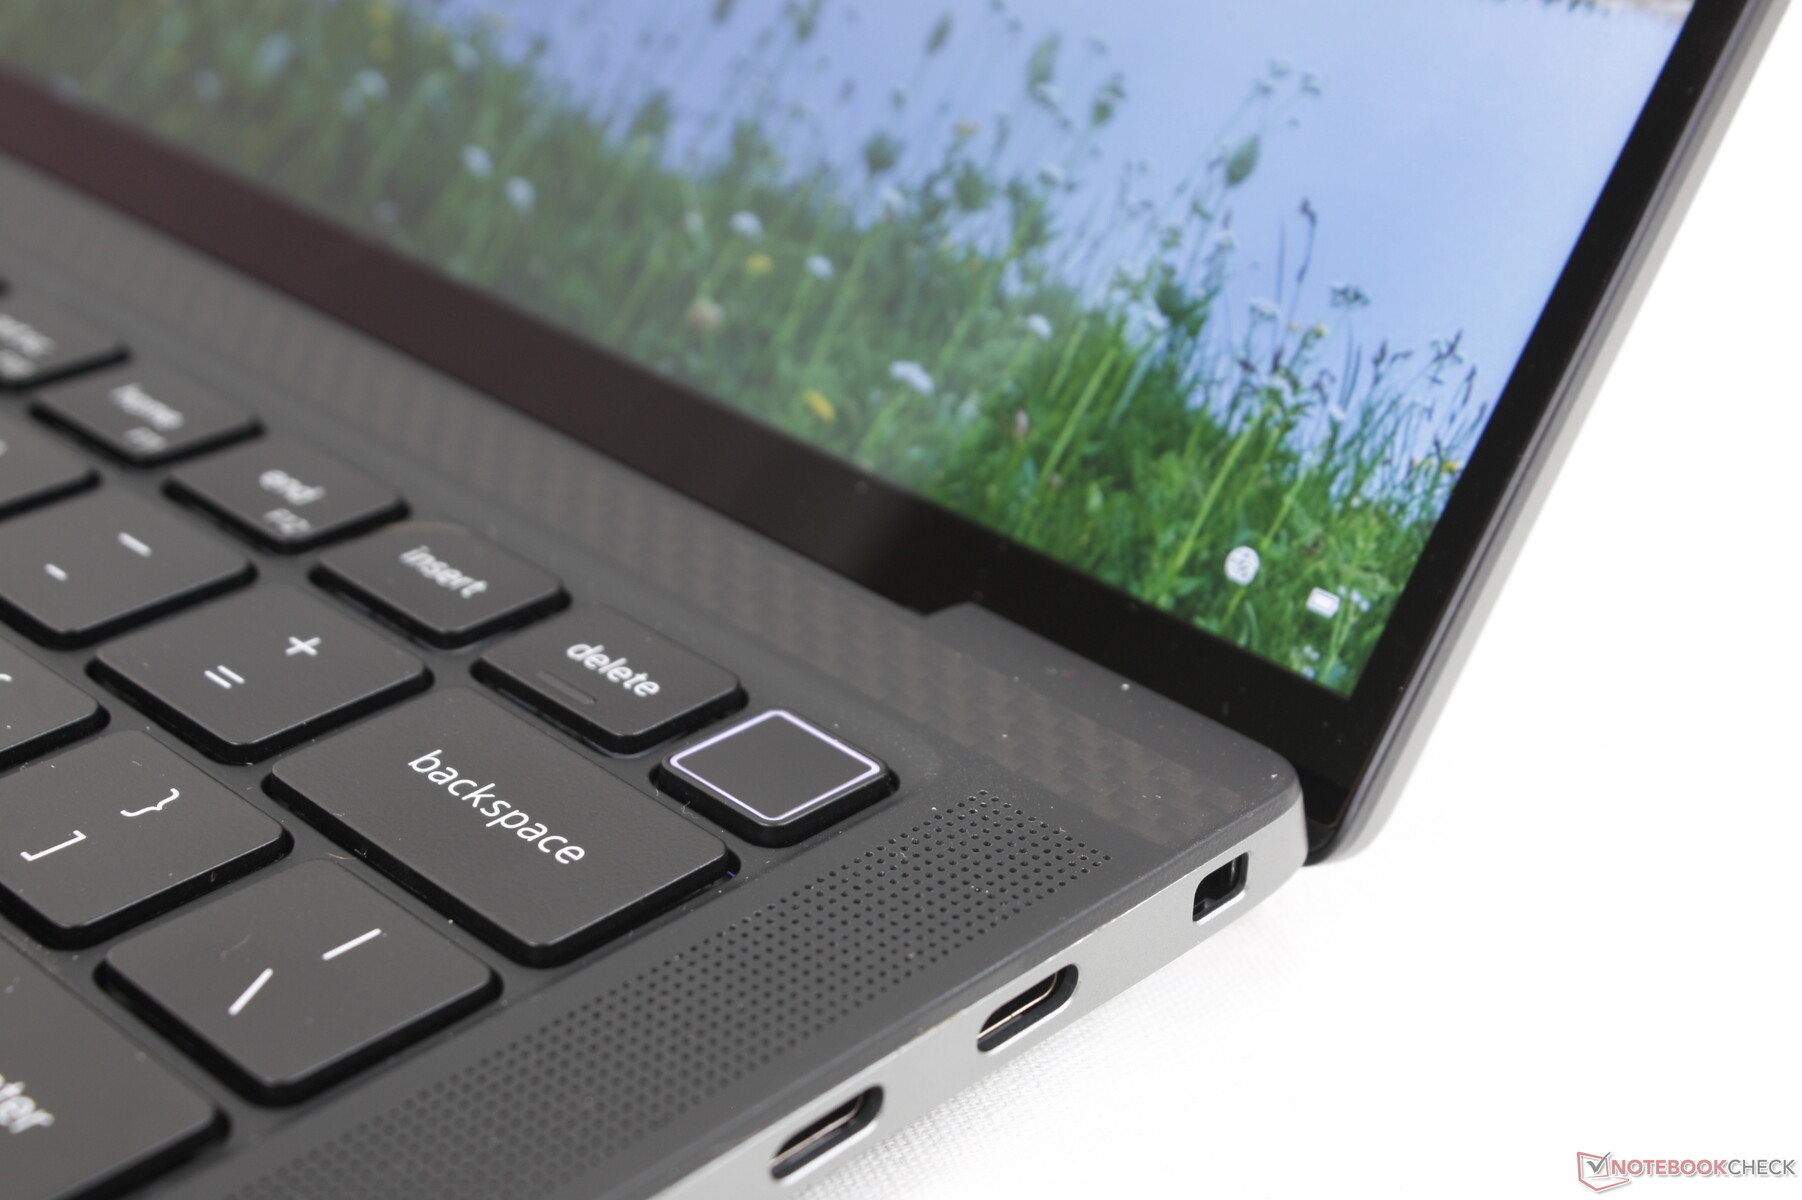
IR jest obecny dla wsparcia Hello, ale nie ma migawki kamery internetowej dla prywatności.


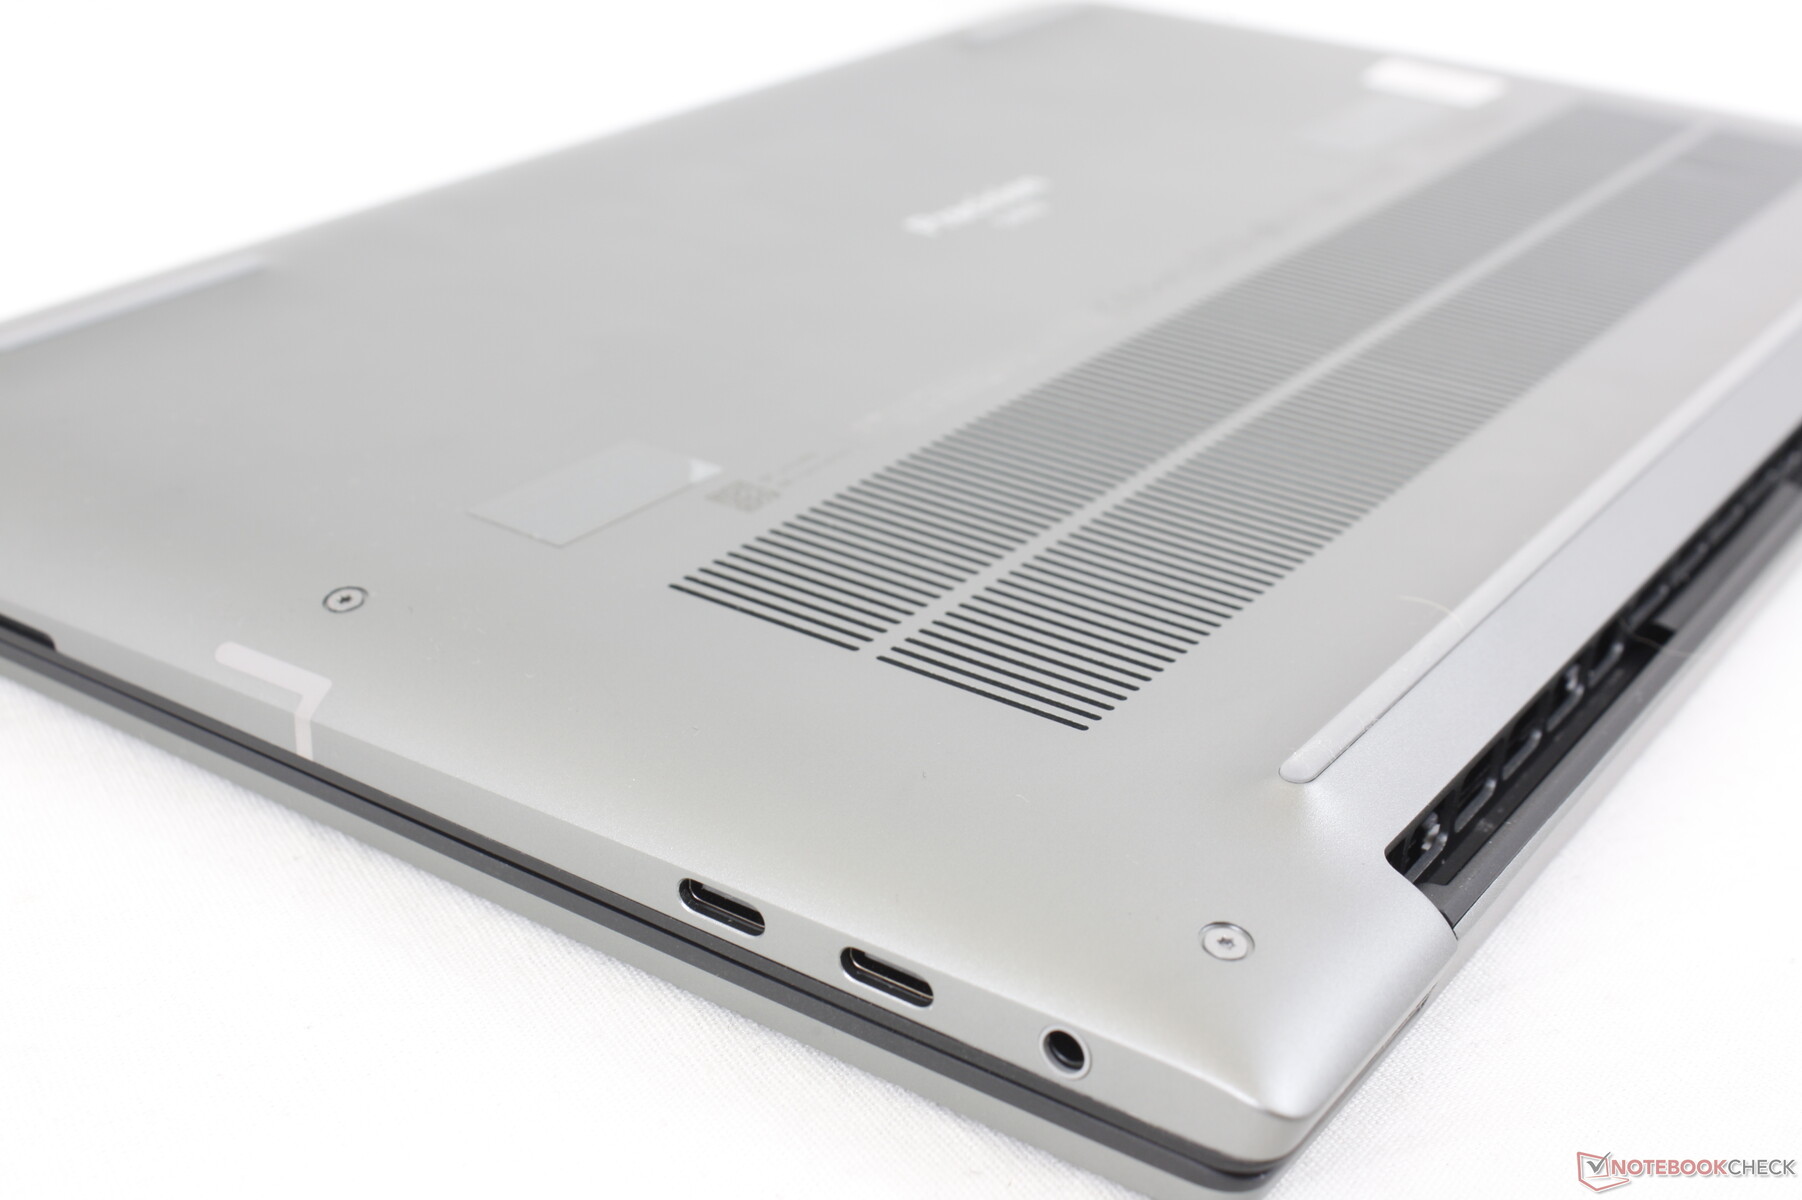
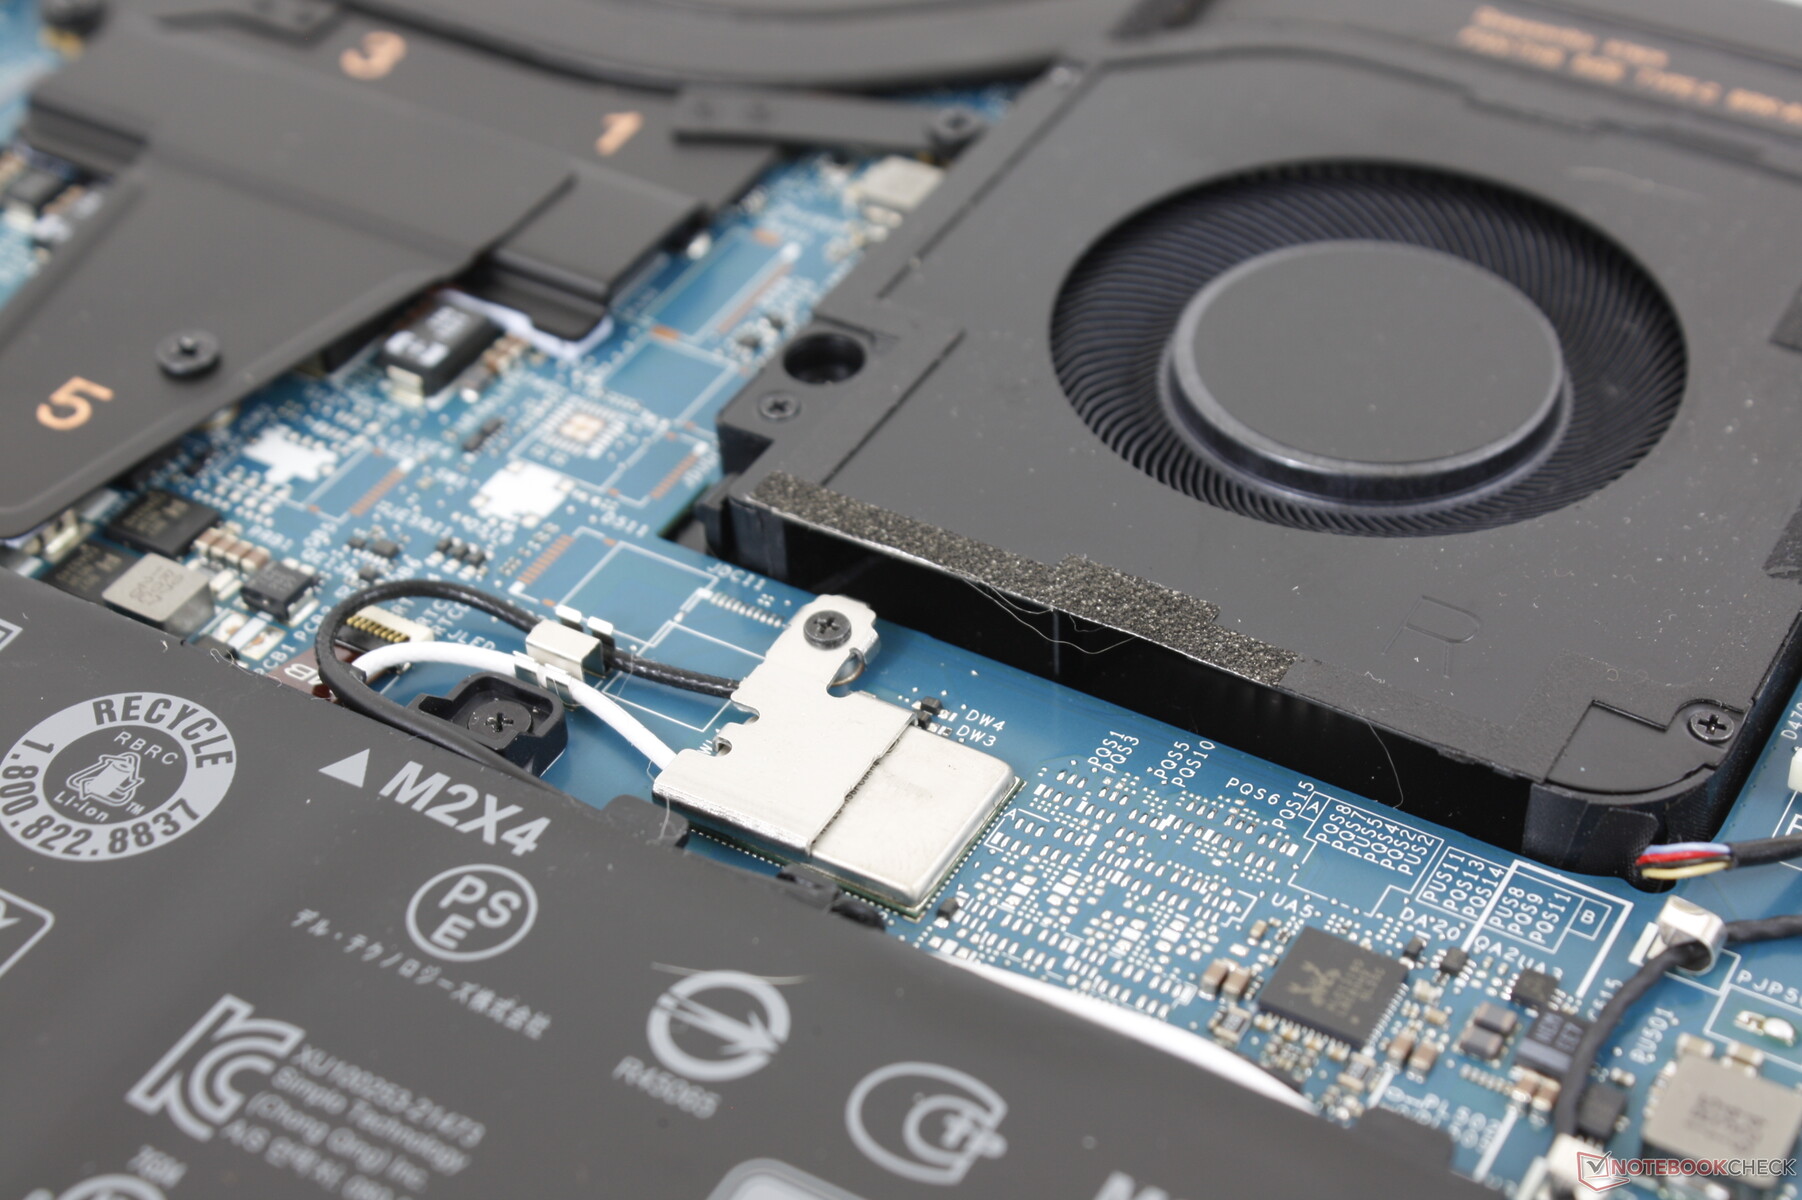
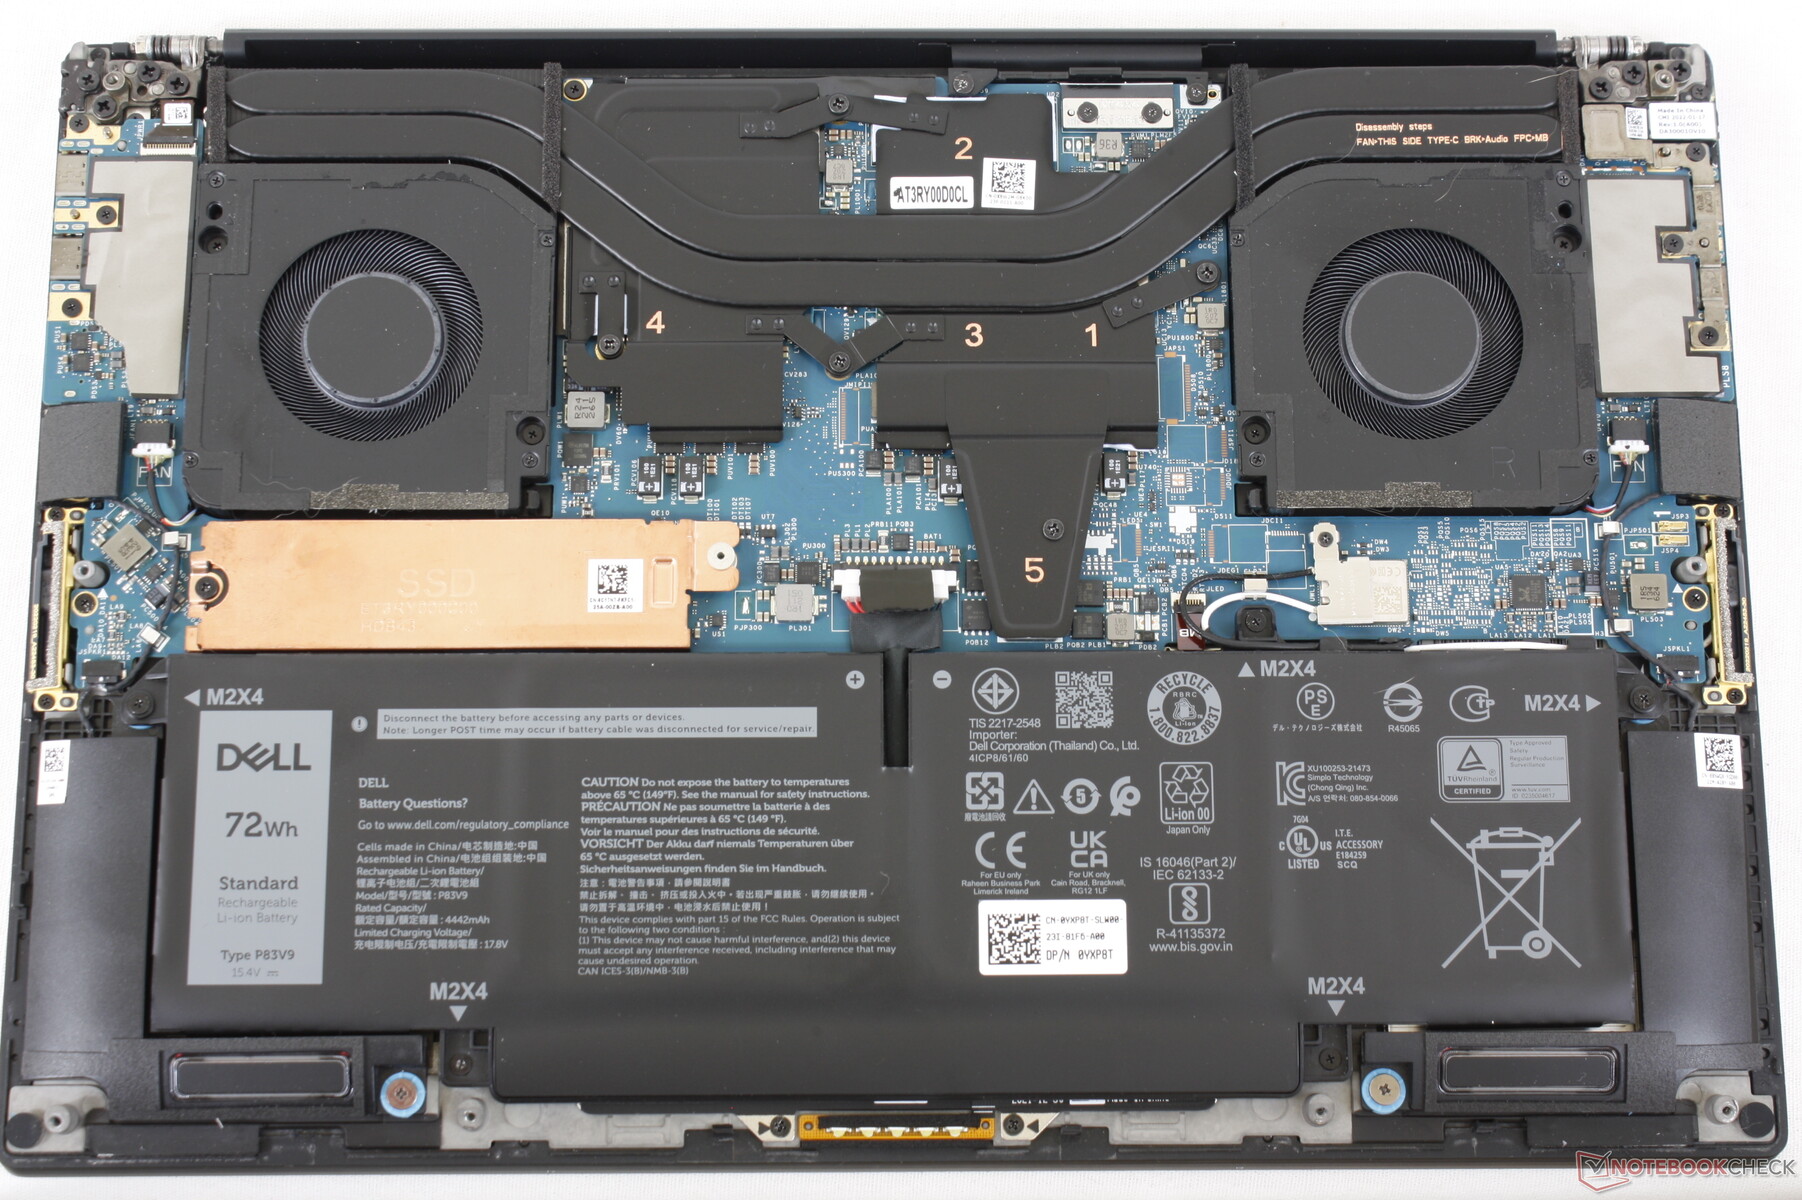
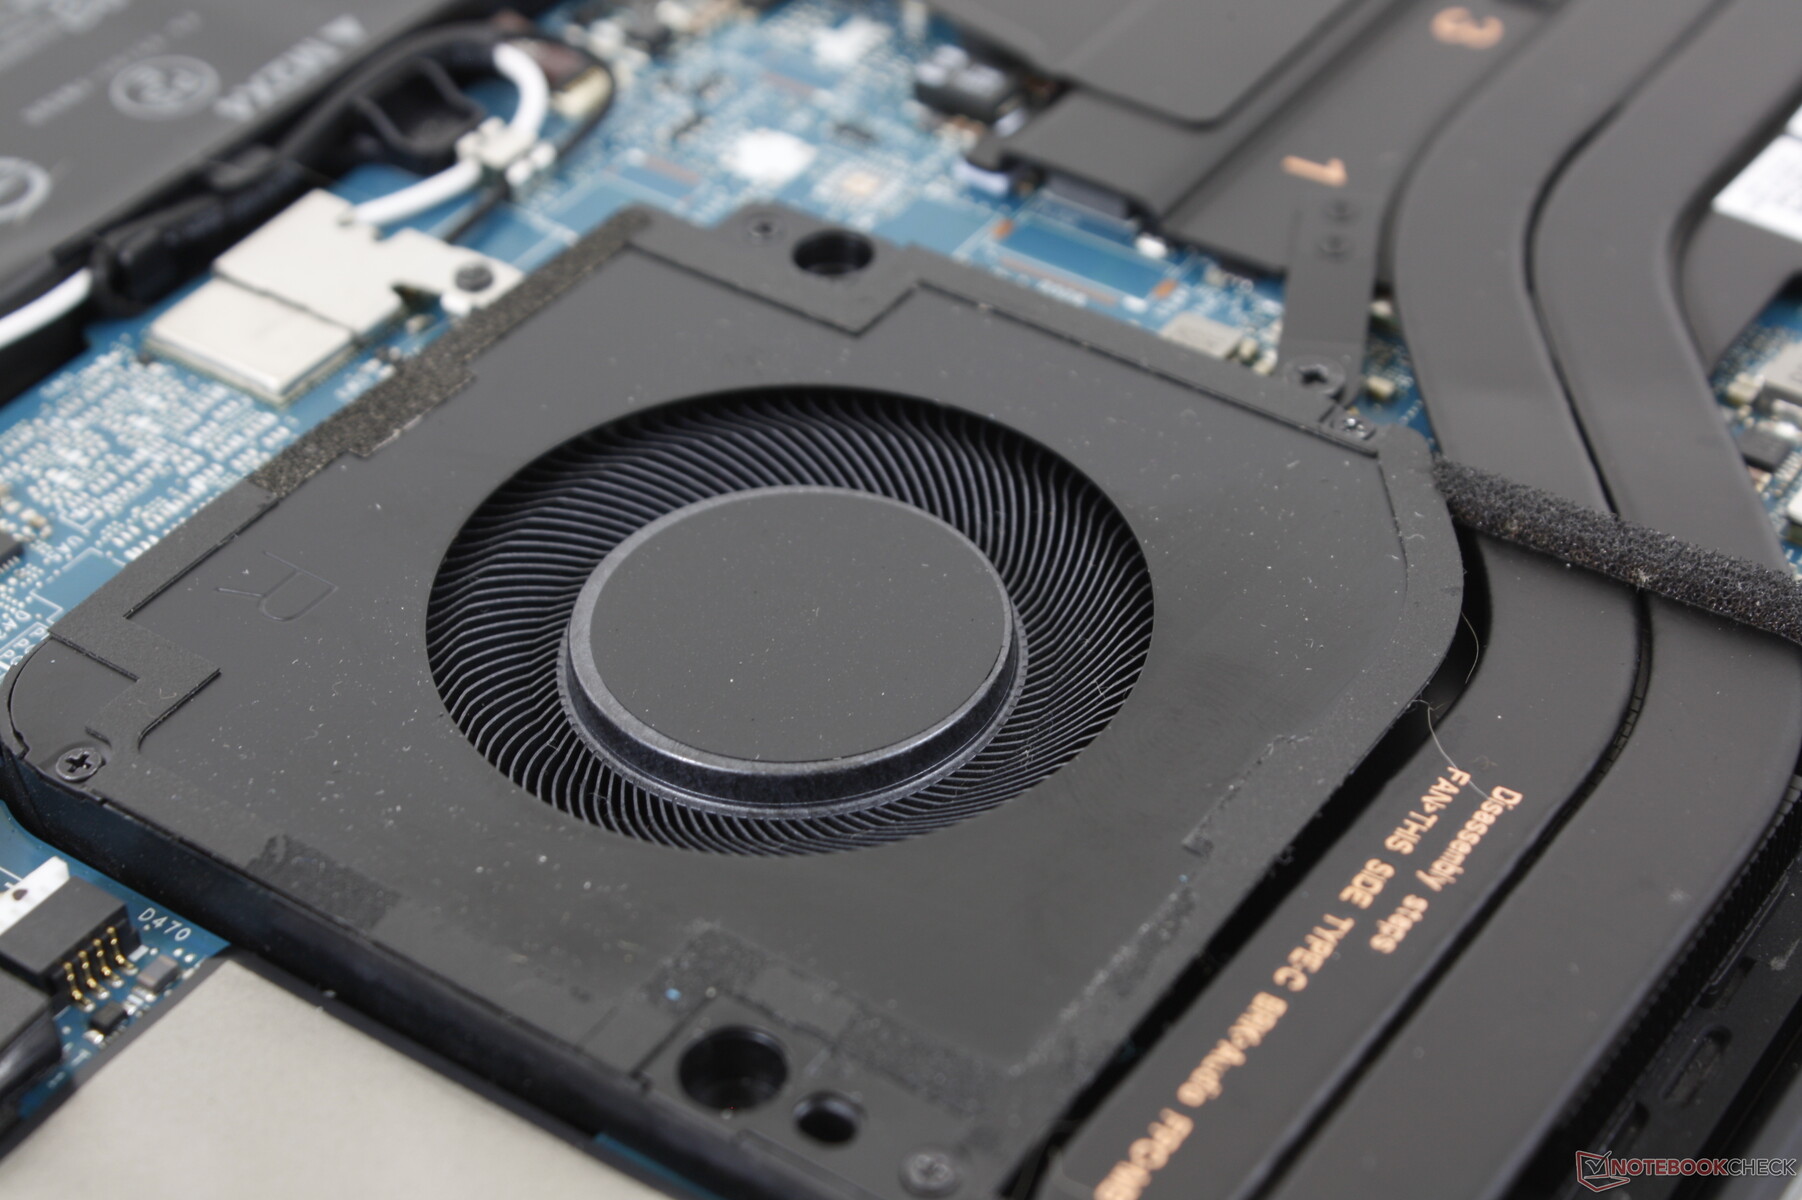
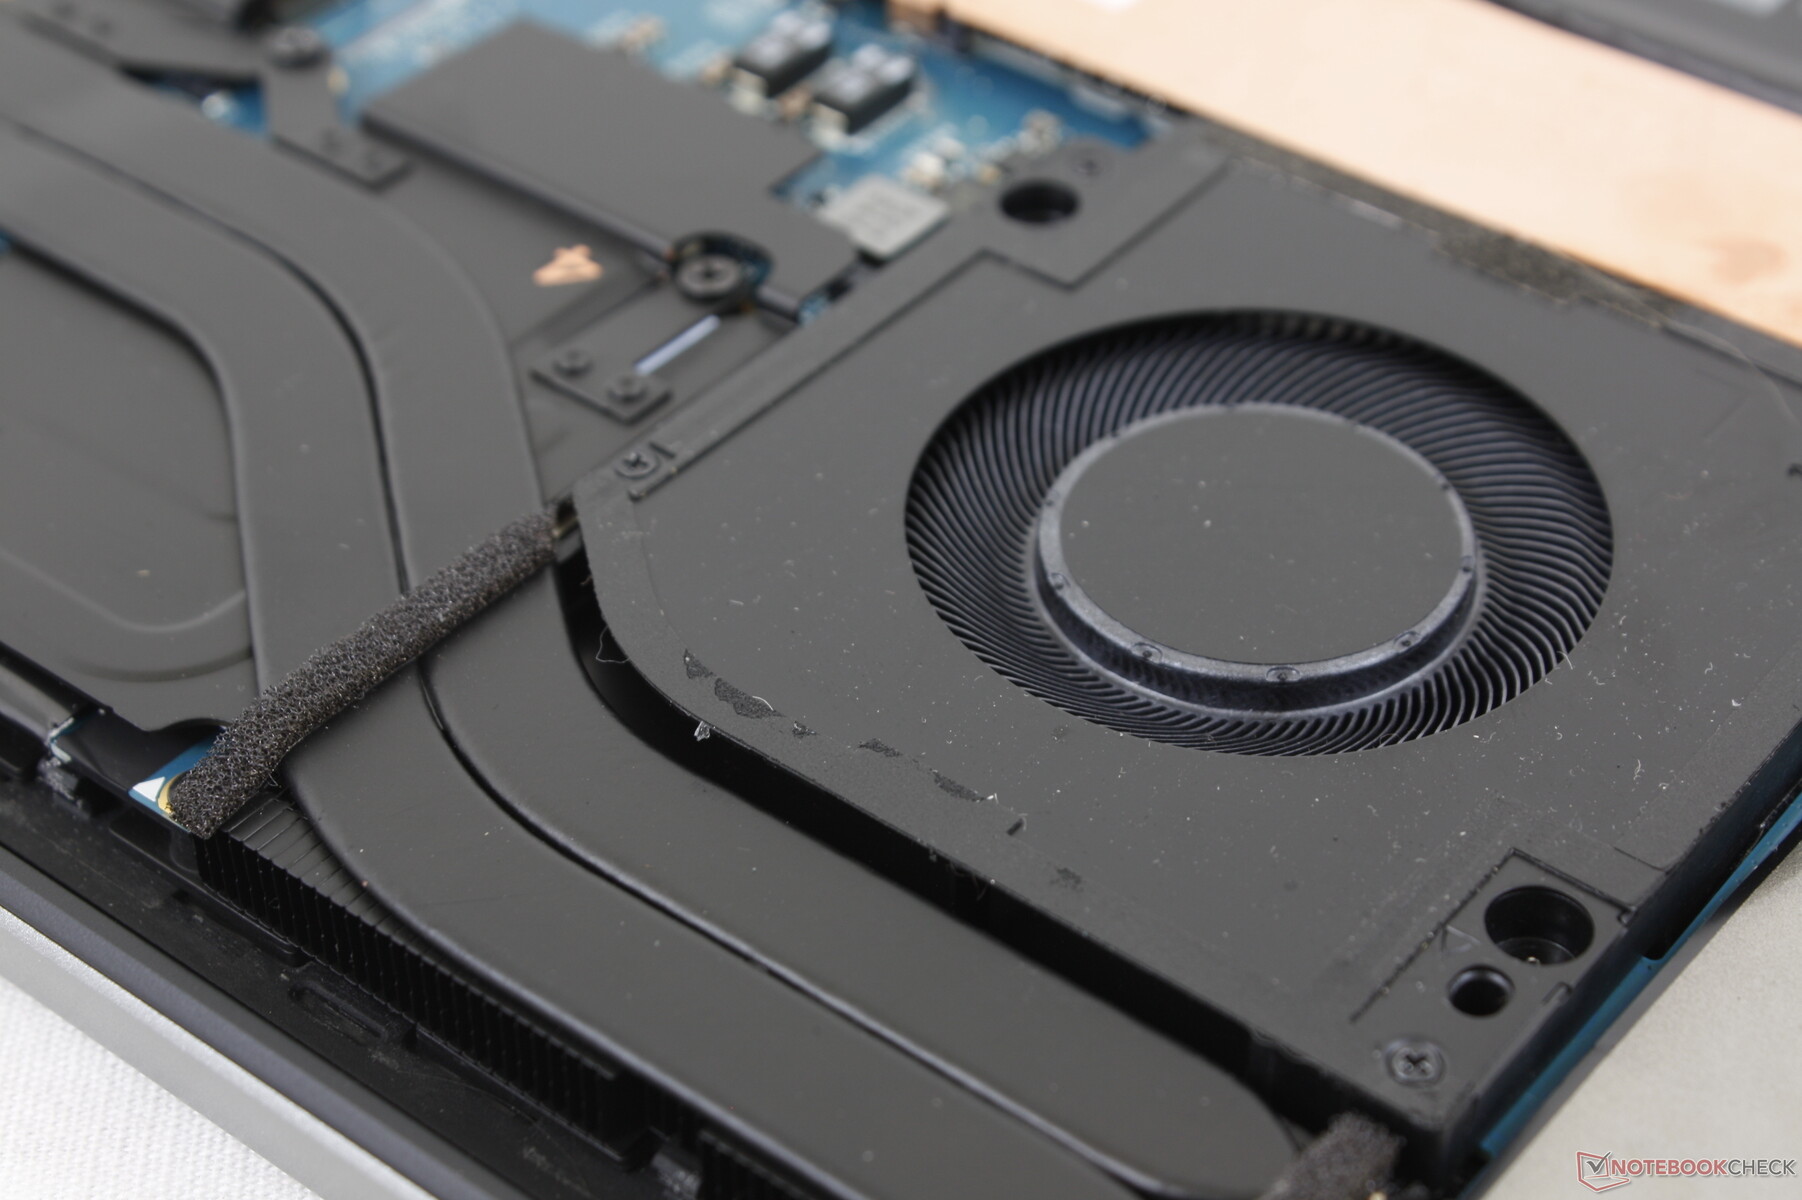
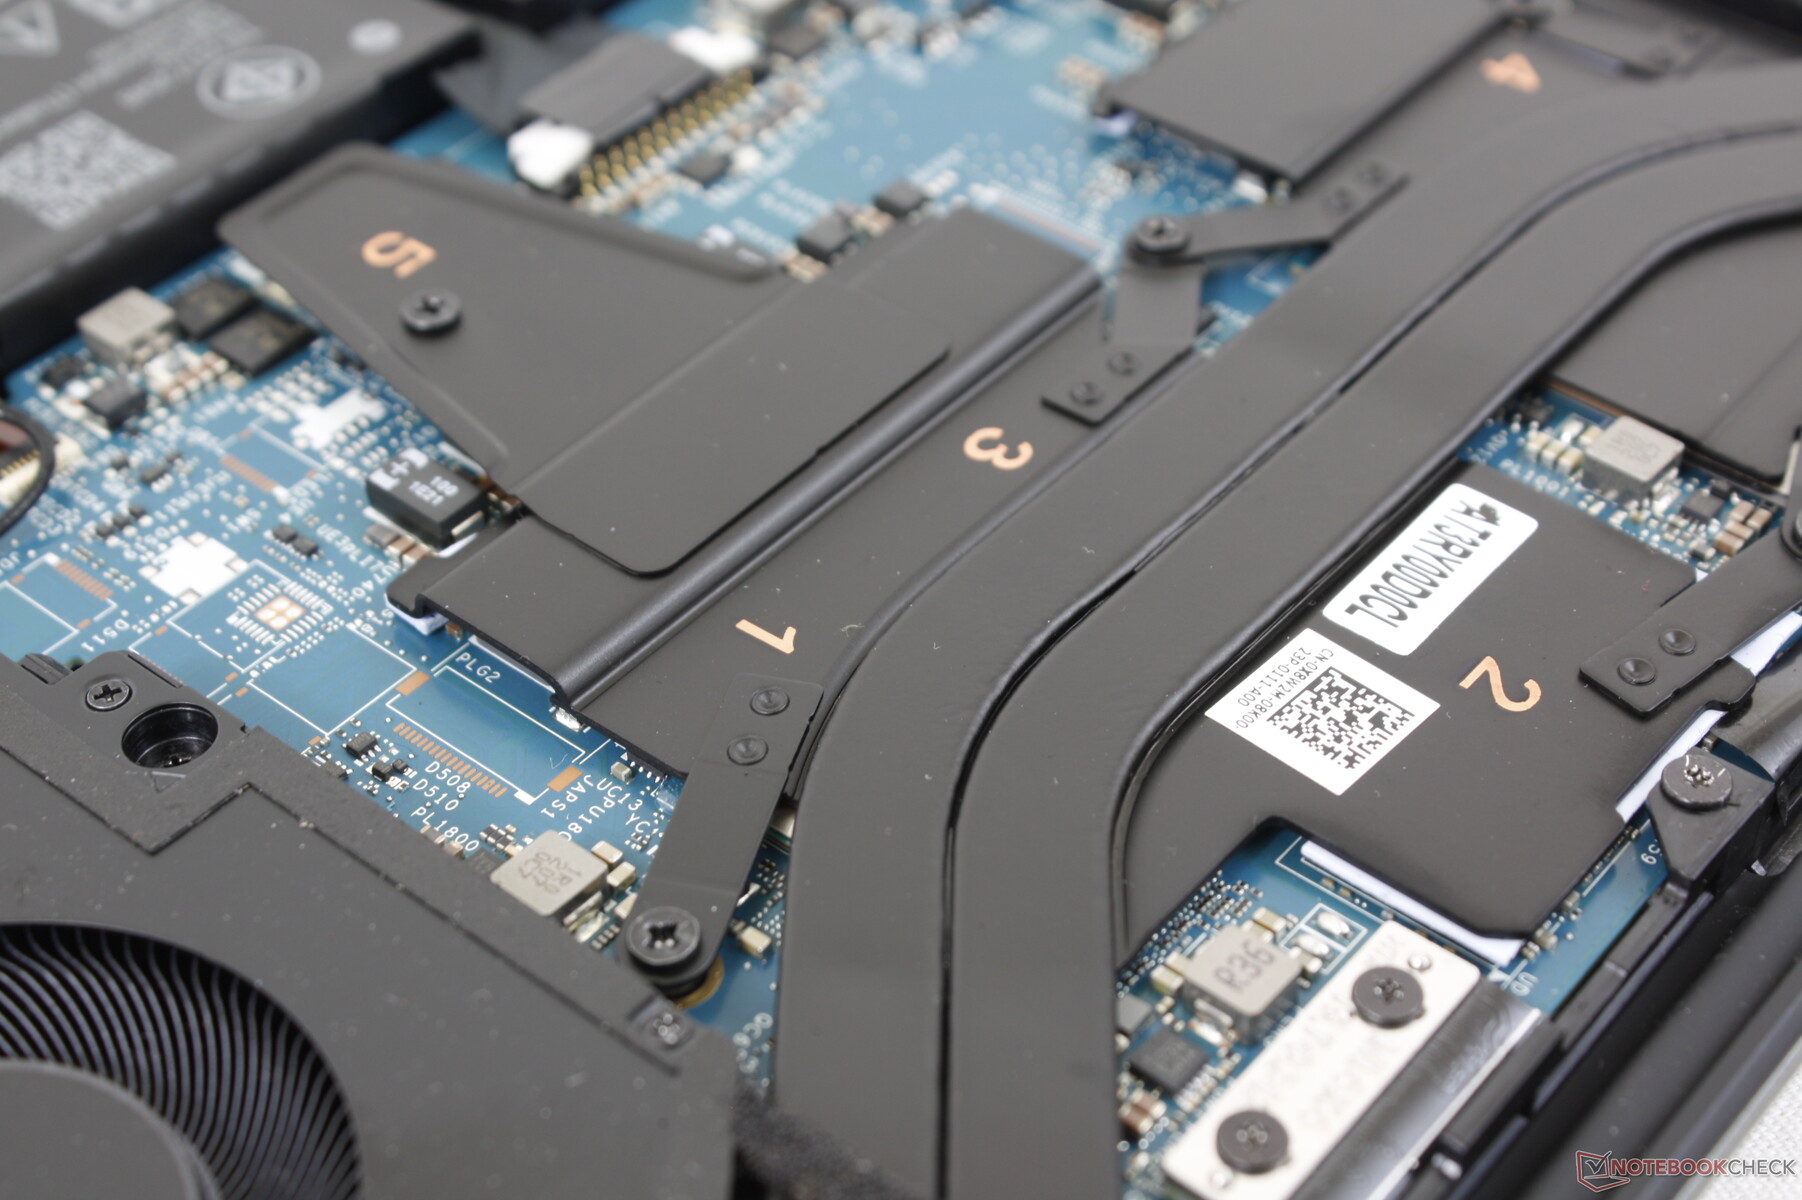
Konserwacja
Dolny panel jest zabezpieczony ośmioma śrubkami T5 Torx, co ułatwia jego demontaż. Nie ma jednak zbyt wielu możliwości modernizacji, gdyż moduły RAM i WLAN są wlutowane.
Gwarancja
Podstawowa gwarancja wynosi w USA tylko 12 miesięcy, zamiast 36-miesięcznego okresu, jakiego przyszło nam oczekiwać od większości mobilnych stacji roboczych i wysokiej klasy laptopów profesjonalnych.
Urządzenia wejściowe
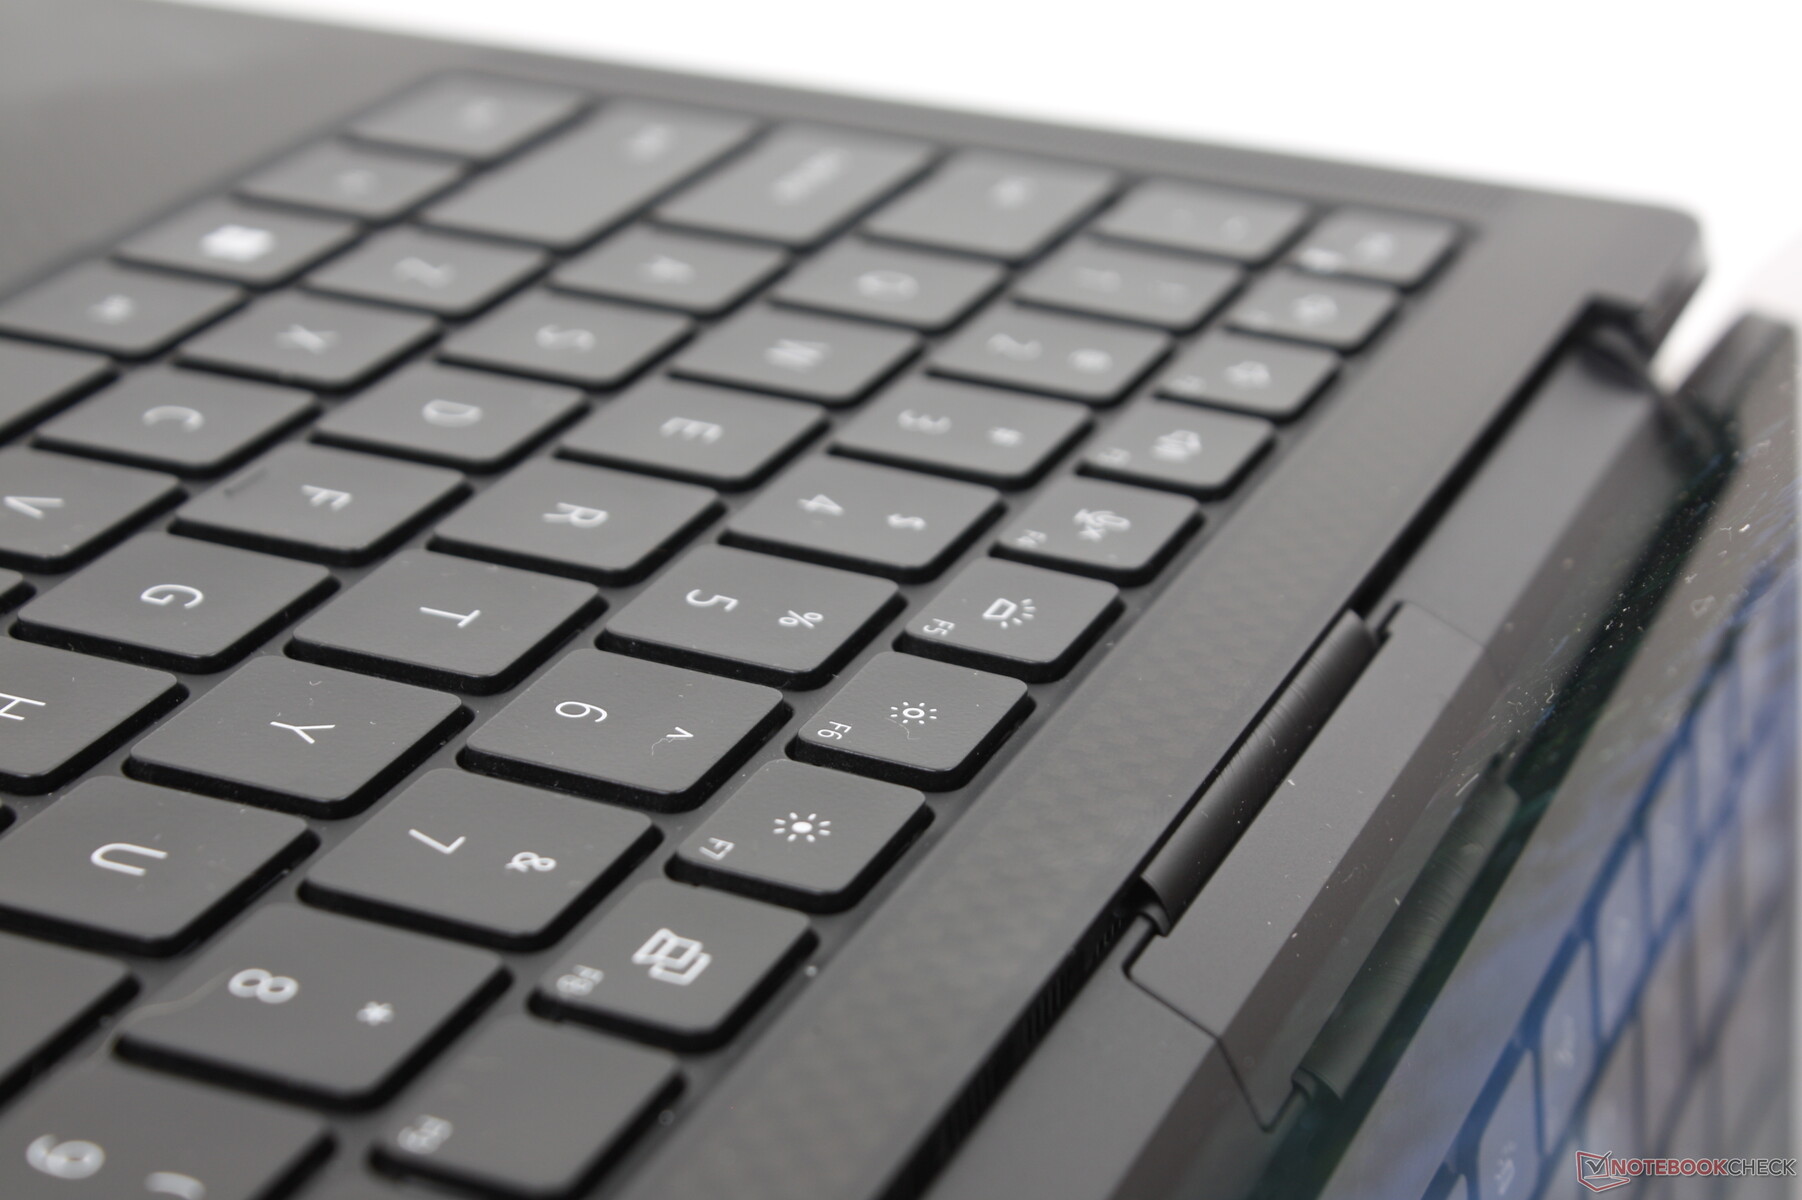
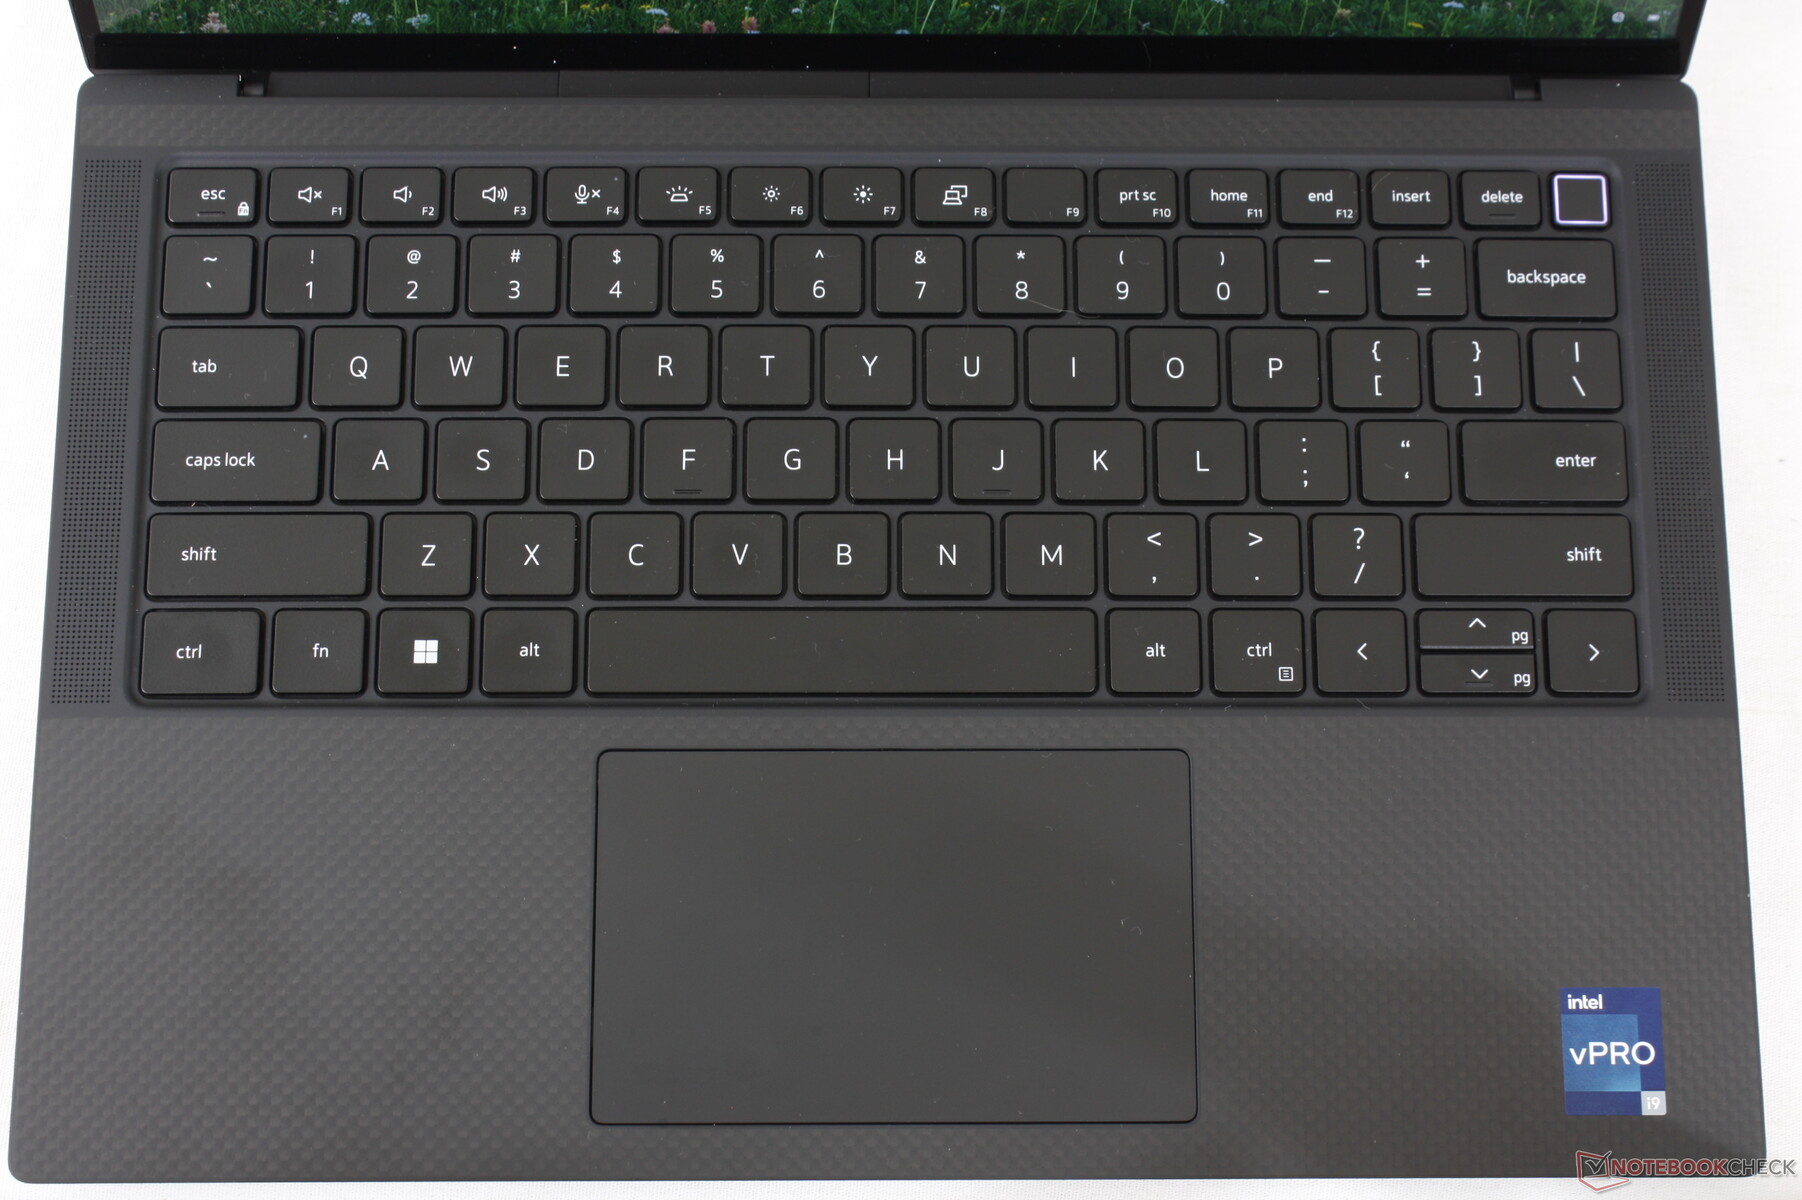
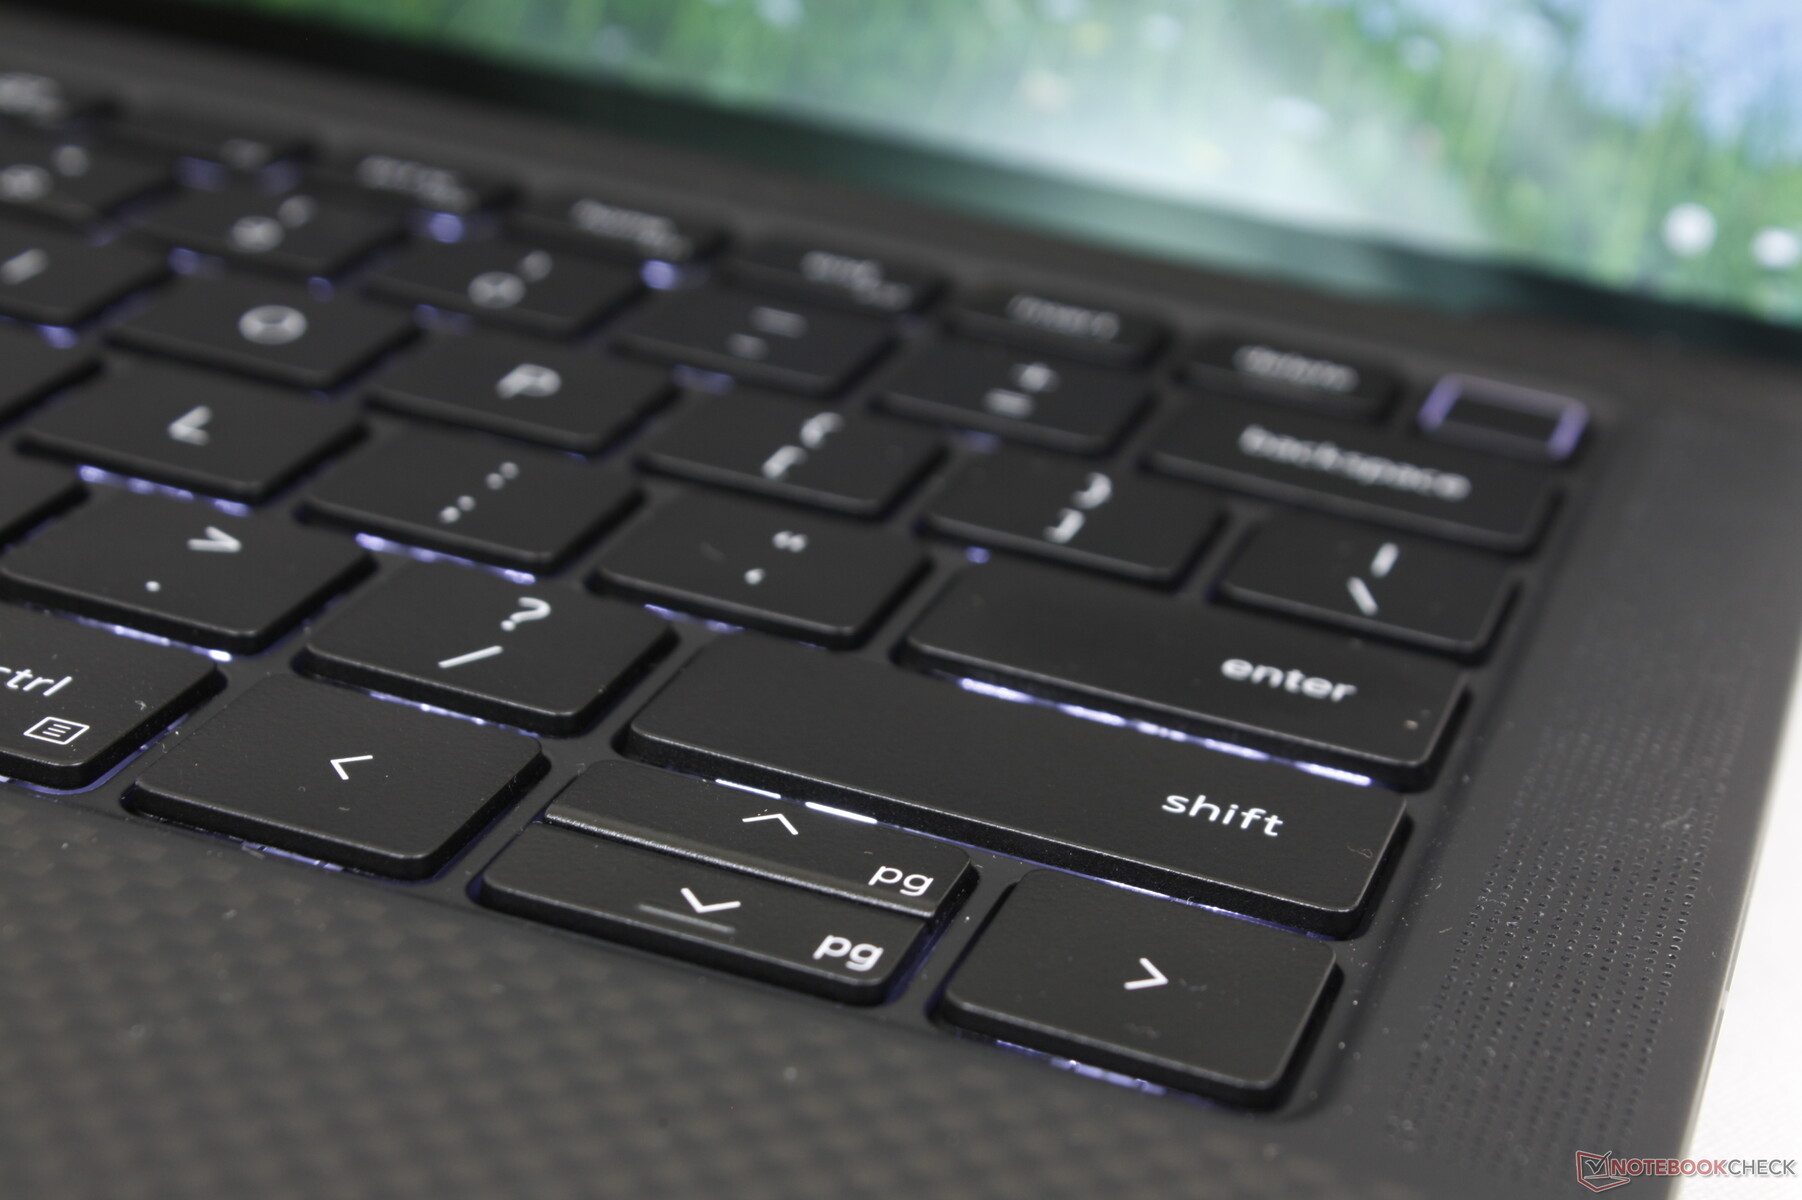
Klawiatura
Model ten dziedziczy klawiaturę, jaką można znaleźć w starszych XPS 13 9300 lub 9310. Jeśli pisałeś już na XPS 13, będziesz wiedział, czego się spodziewać po Precision 5470. Sprzężenie zwrotne klawiszy jest jednolite z umiarkowanym skokiem, ale klawisze w HP EliteBook lub serii Firefly mają tendencję do ostrzejszego lub wyraźniejszego naciskania.
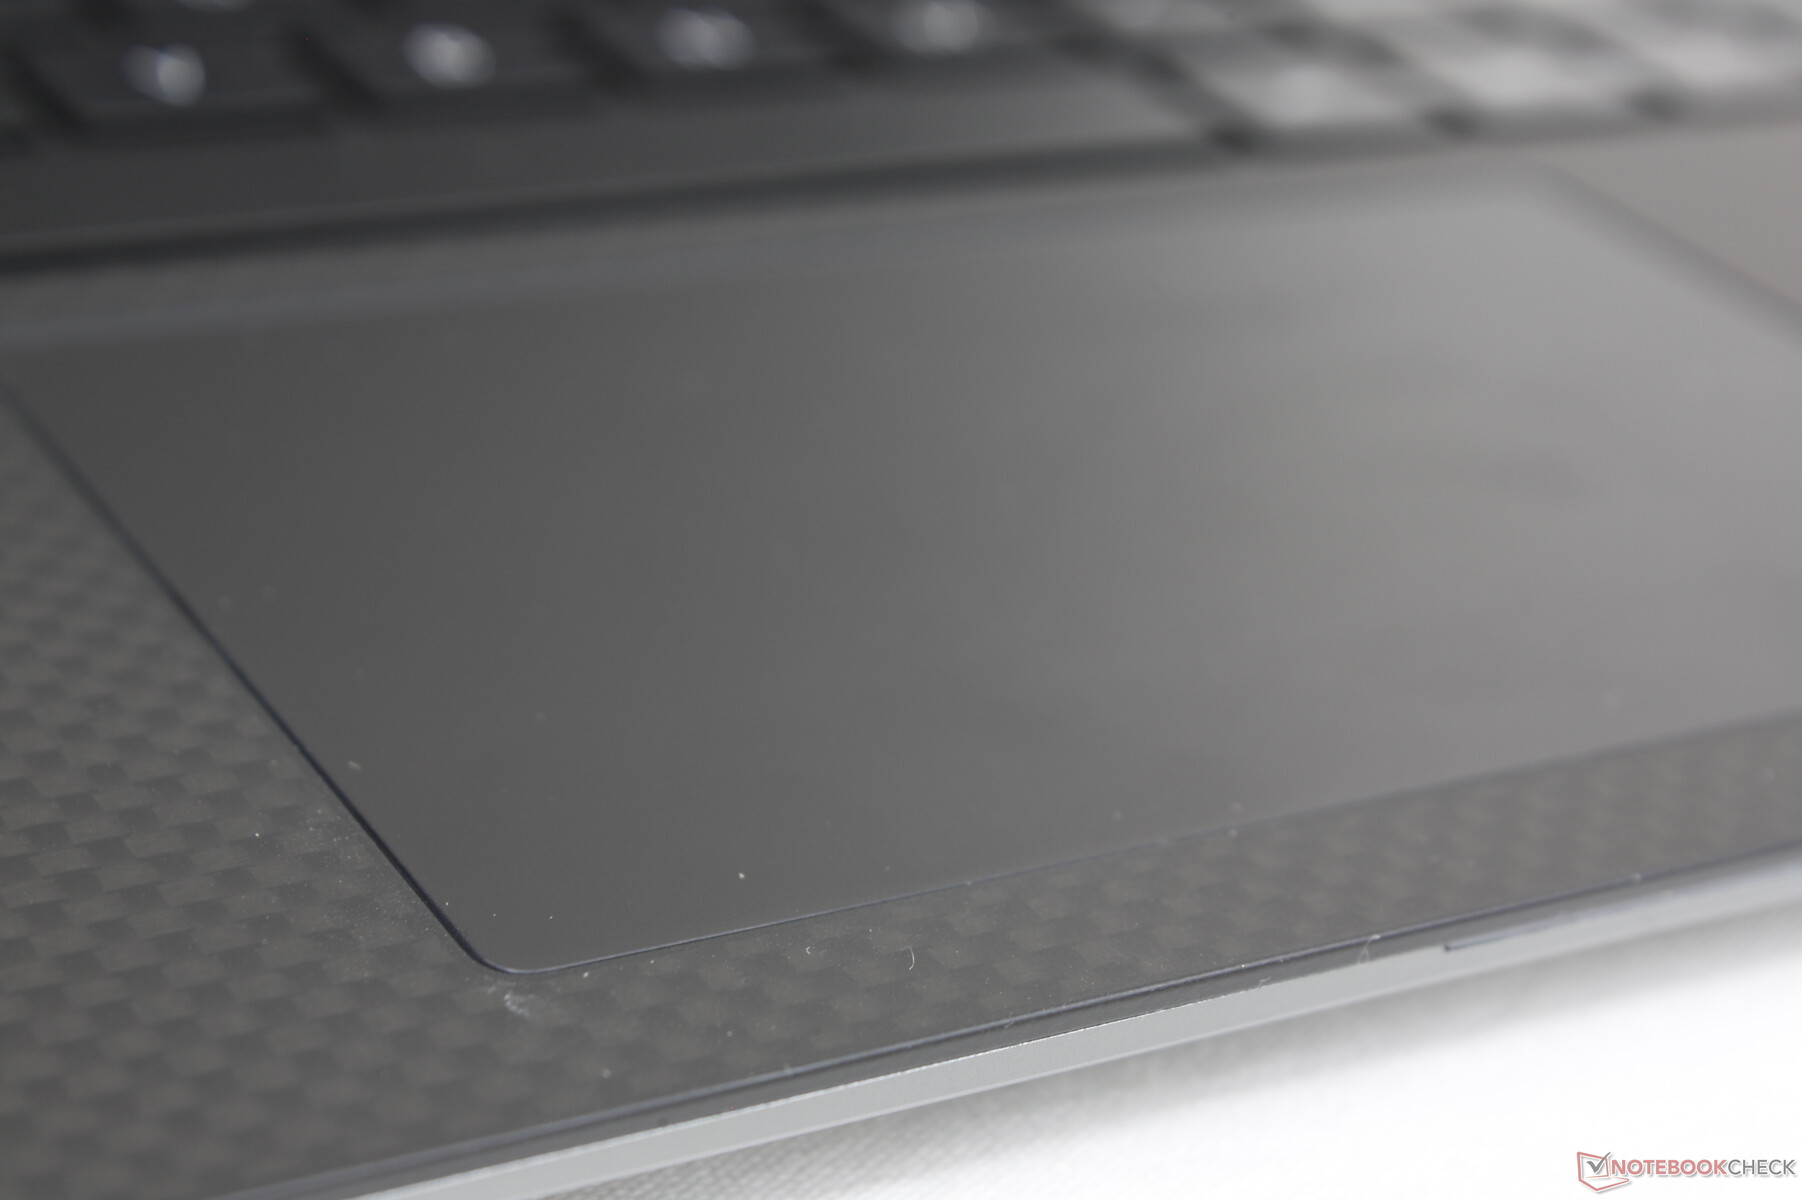
Touchpad
Powierzchnia płytki dotykowej jest mniej więcej taka sama, jak w XPS 13 9300 (10,8 x 6,7 cm vs. 11,2 x 6,5 cm). Przyczepność jest gładka i tylko nieco lepka przy mniejszych prędkościach, co zapewnia lepszą precyzję w razie potrzeby. Sprzężenie zwrotne podczas klikania na płytce jest stosunkowo miękkie i płytkie, ale z dużo cichszym klekotem niż w większości innych laptopów.

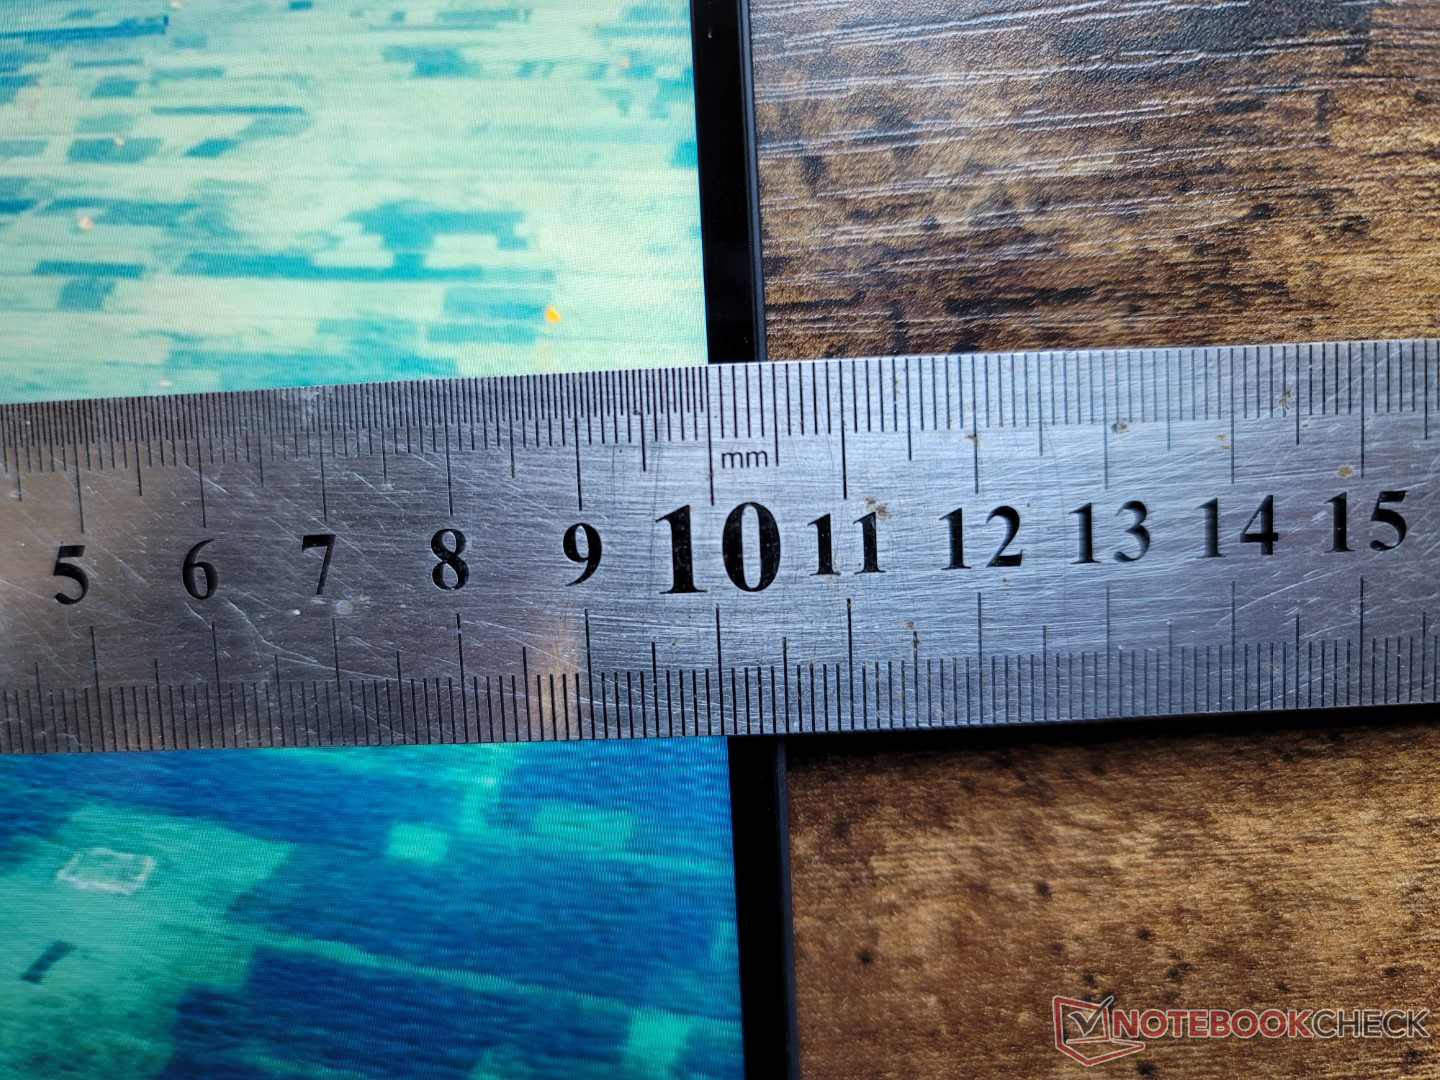
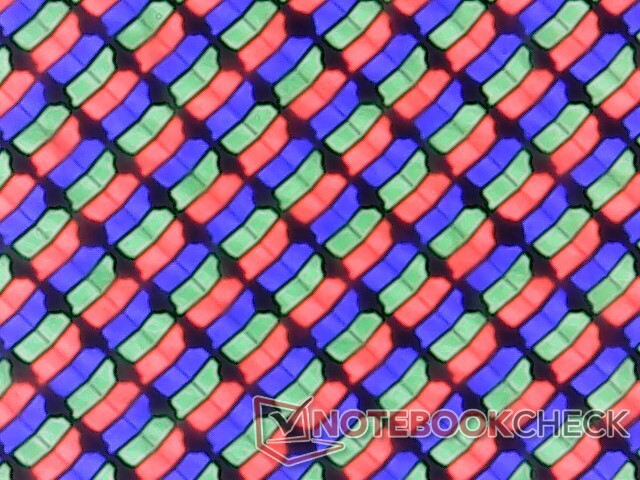
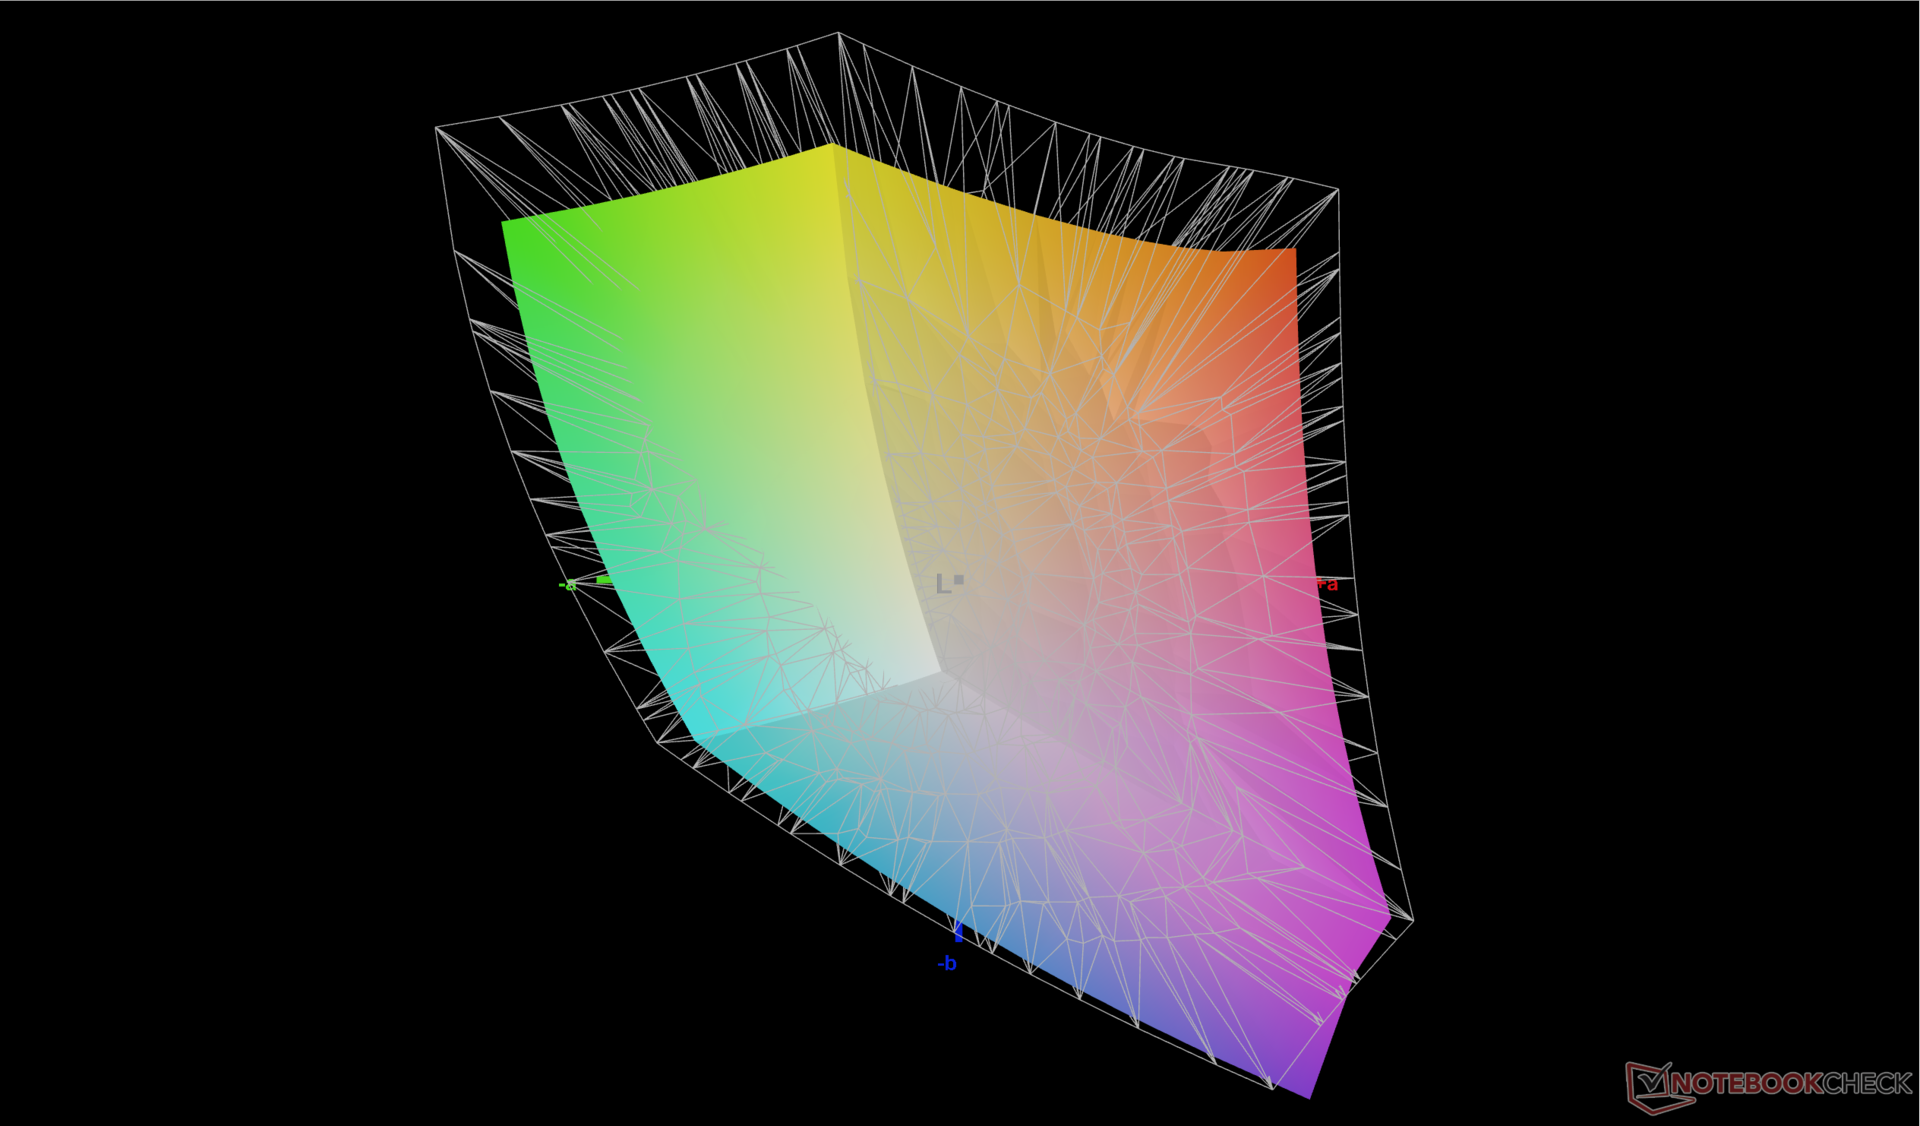
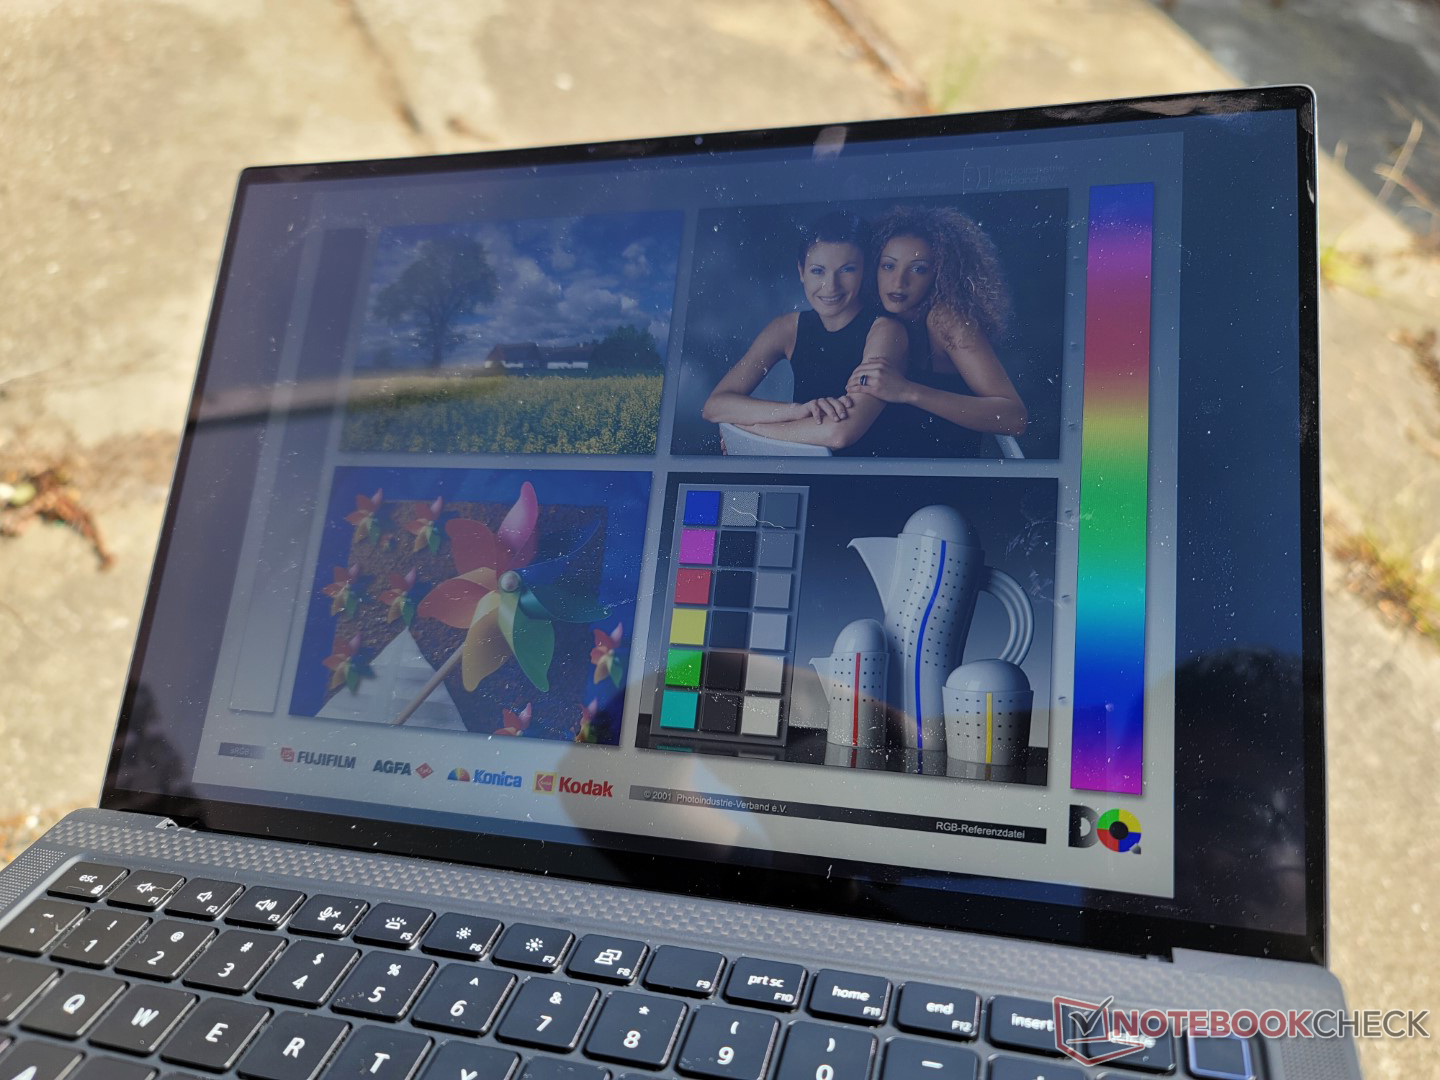
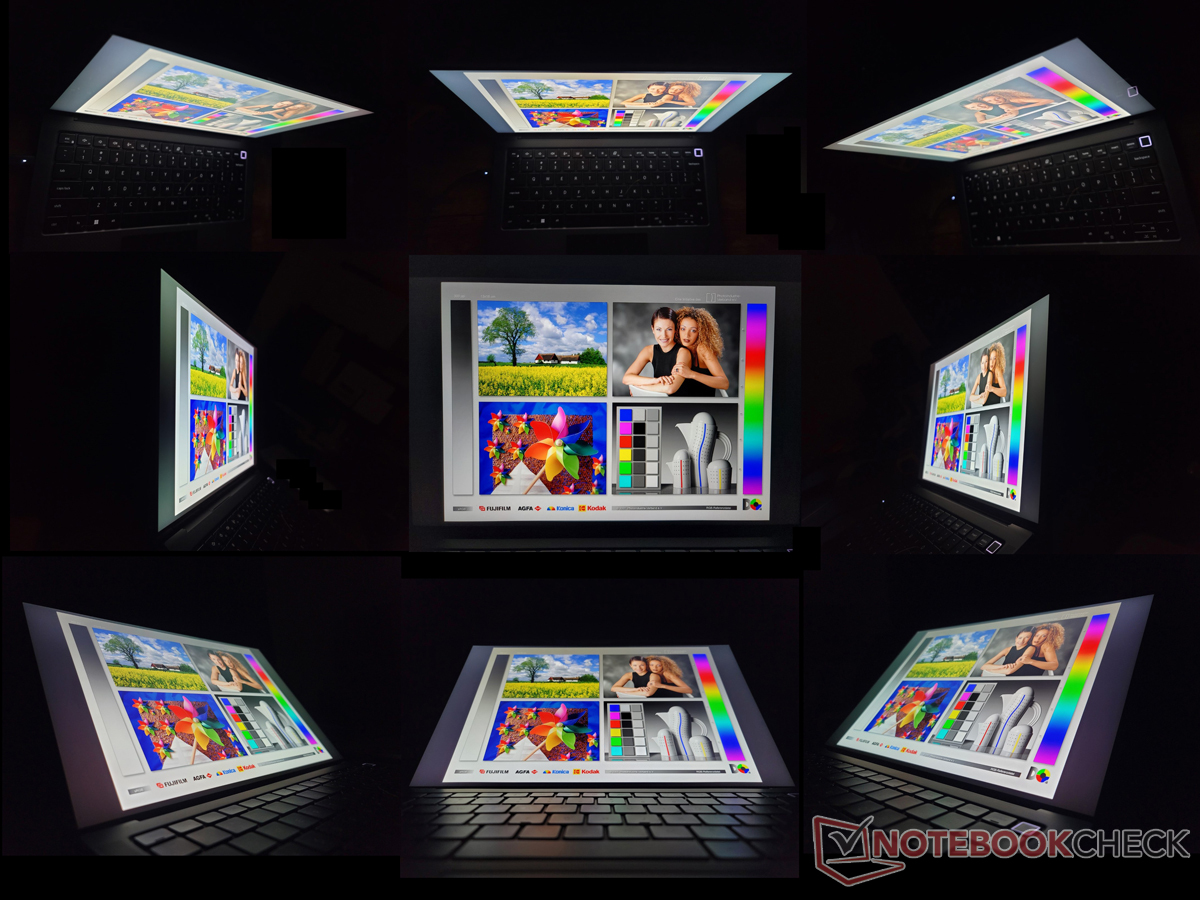
Wyświetlacz - identyczny jak w przypadku Latitude 9430 2-in-1
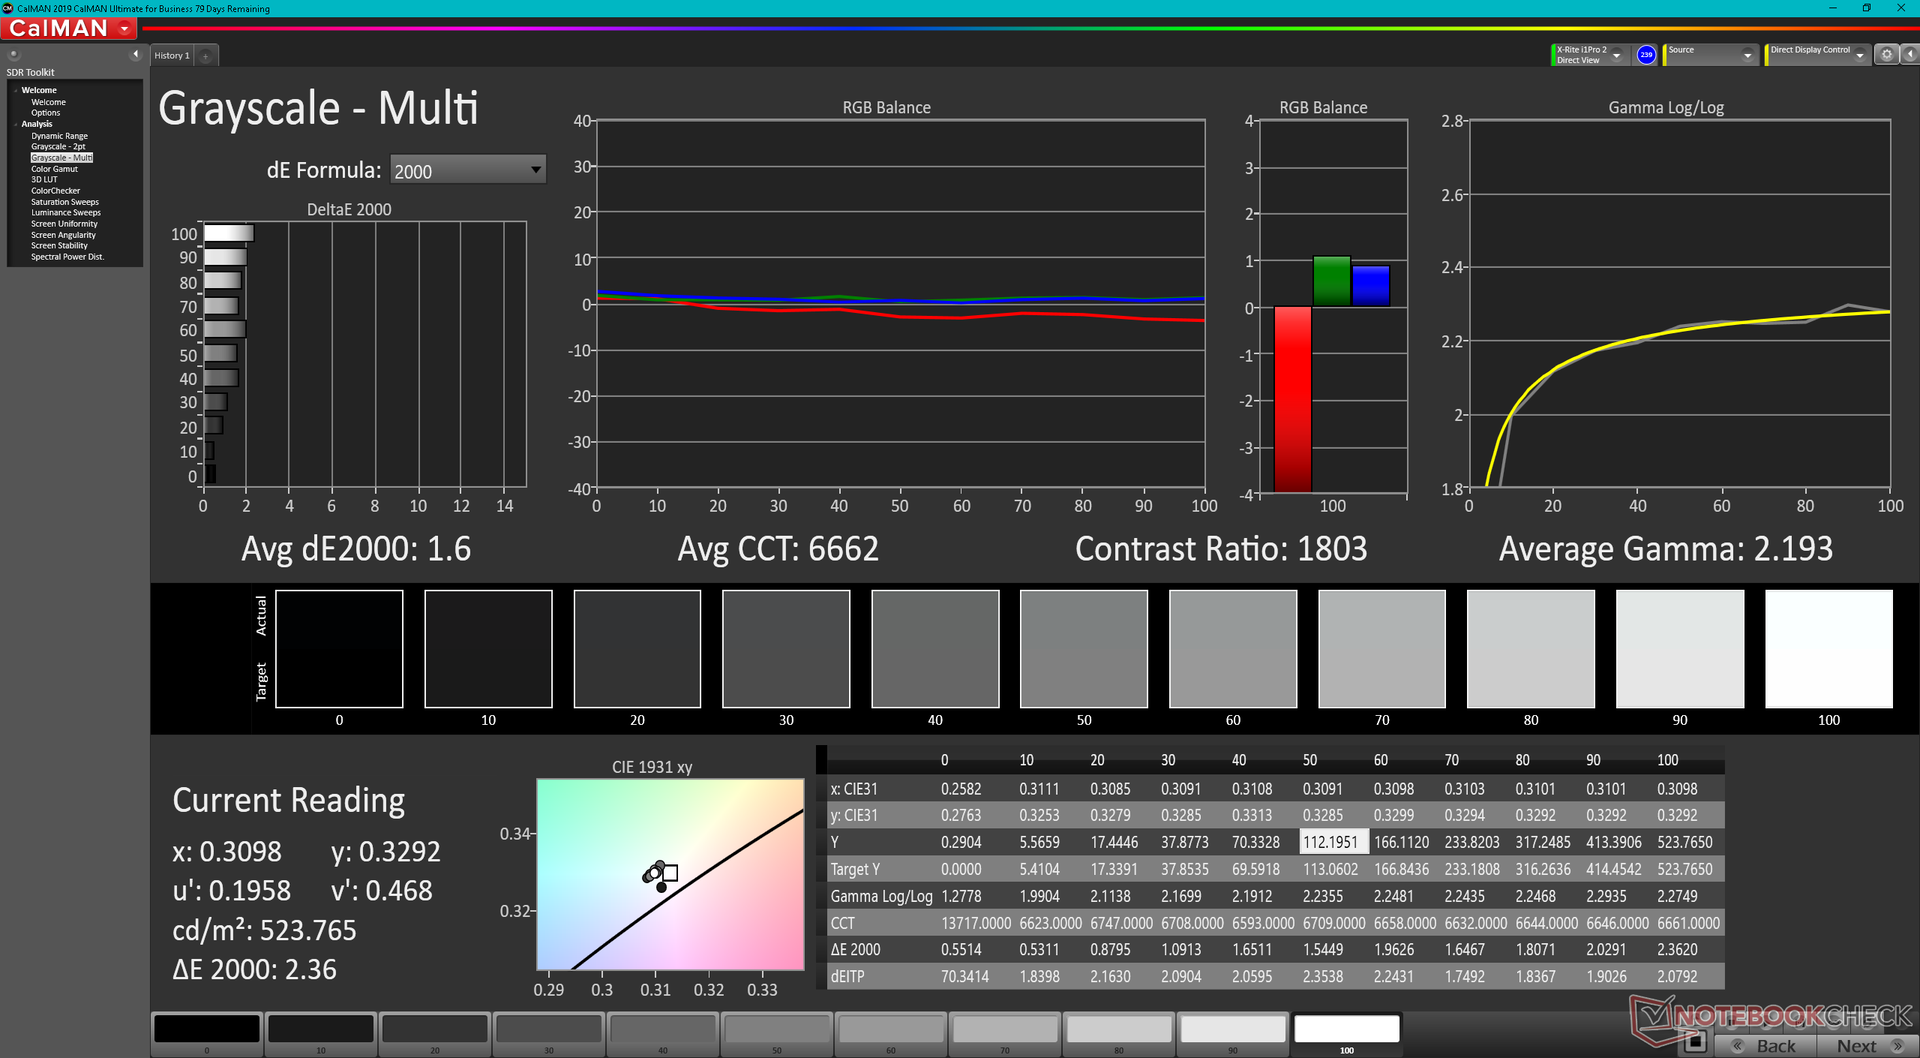
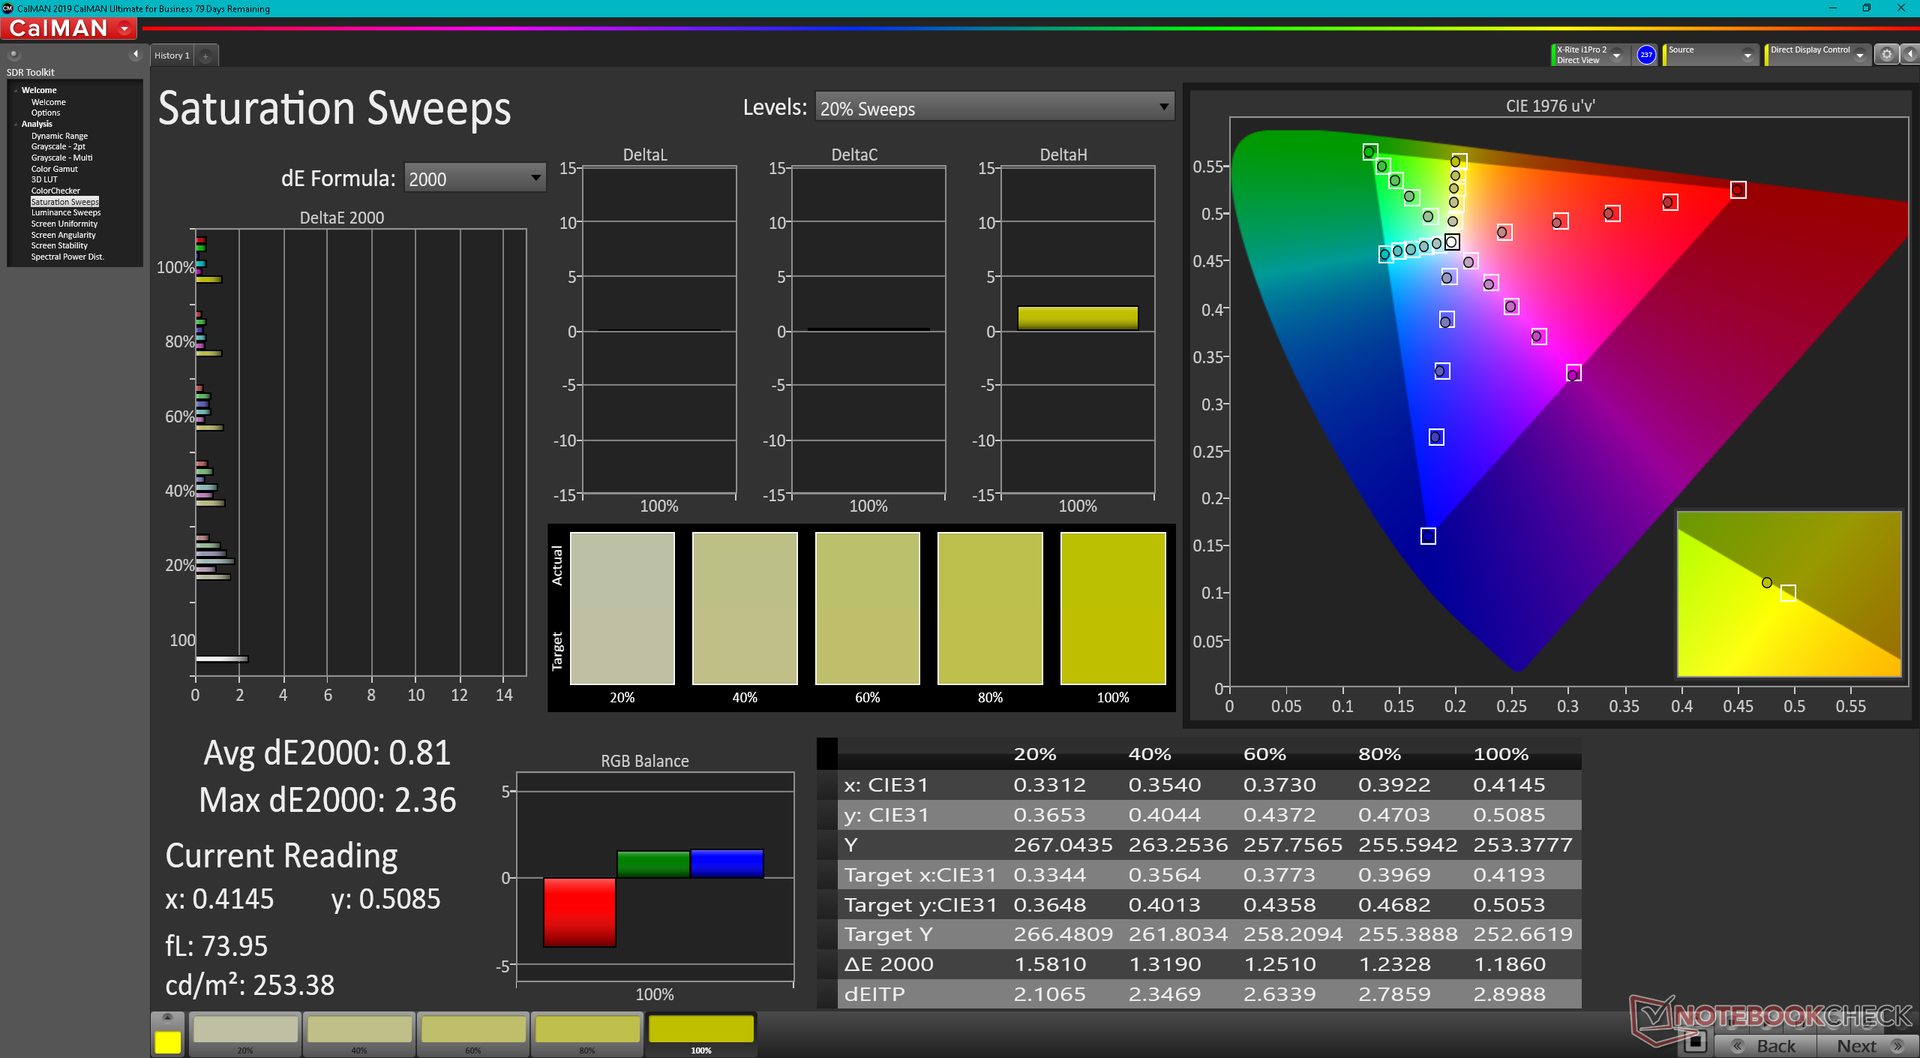
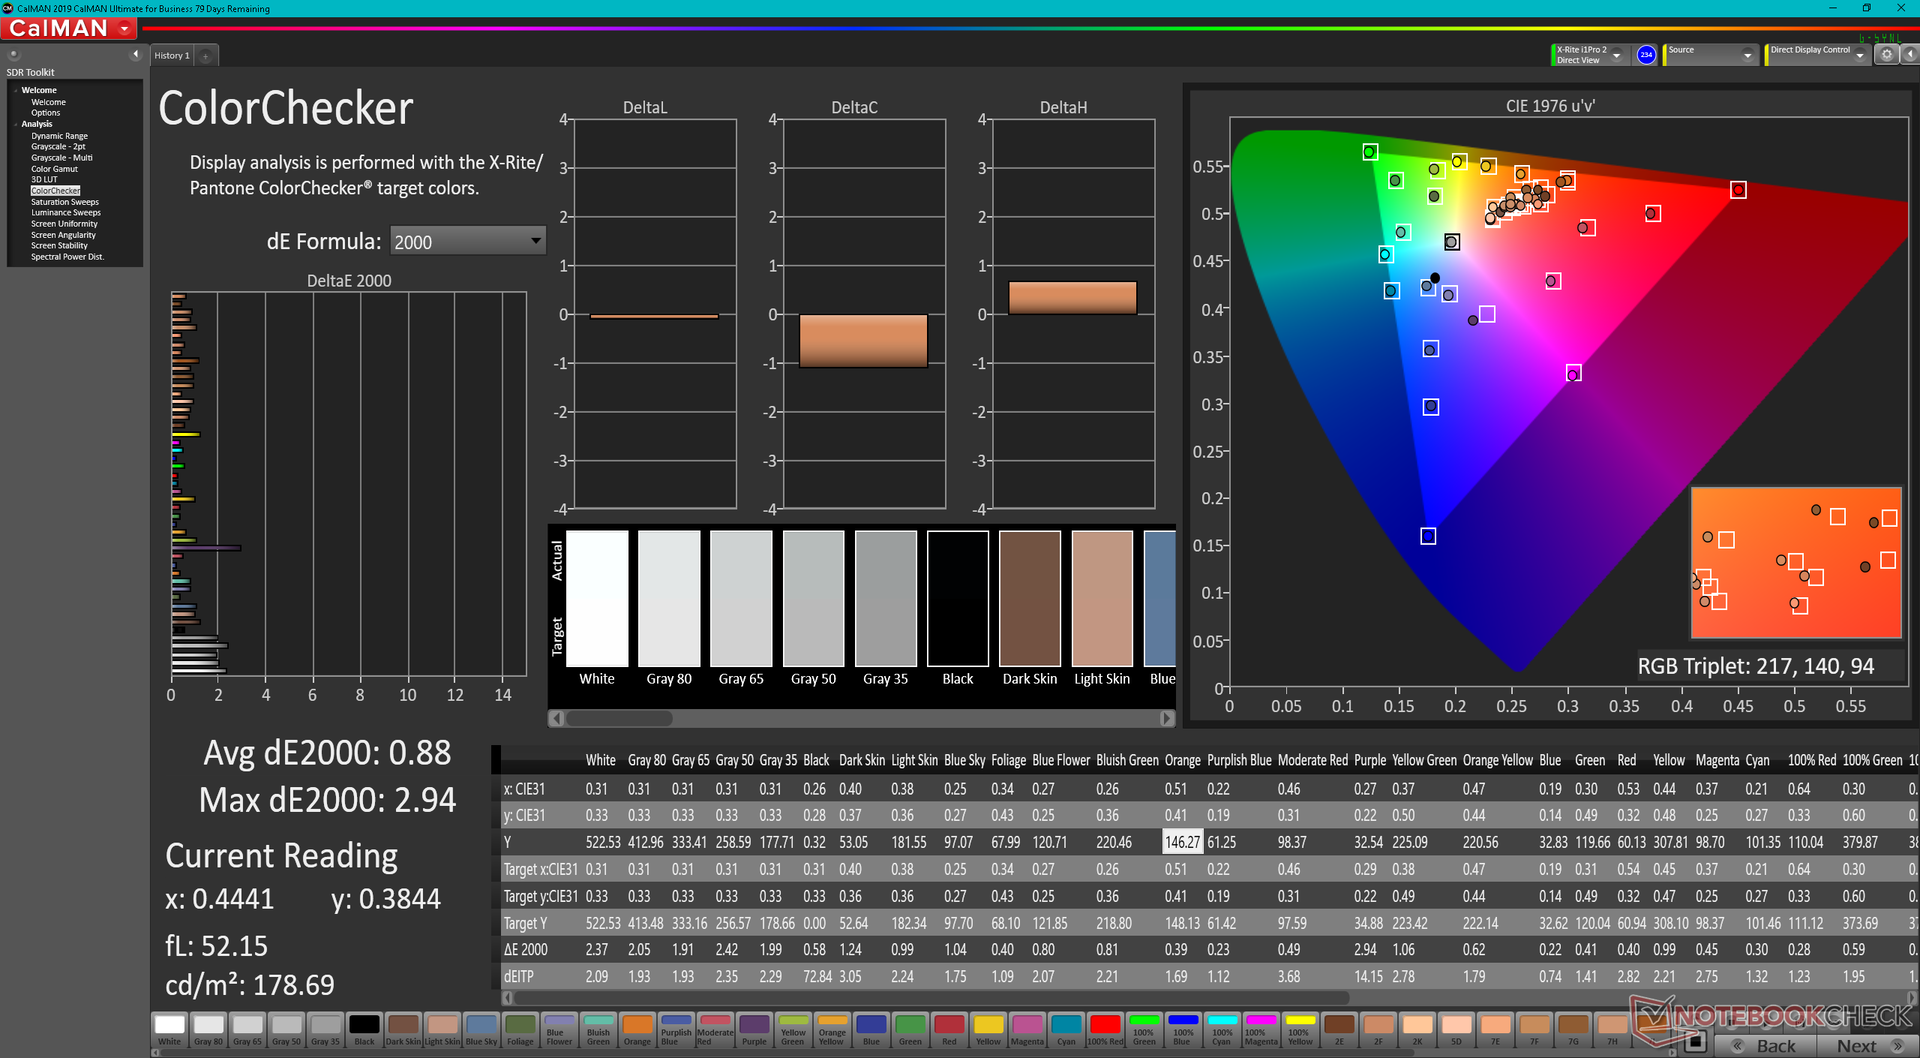
W modelu Precision 5470 zastosowano ten sam wysokiej jakości ekran dotykowy AU Optronics B140QAN IPS, który można znaleźć w modelu Latitude 9430 2-in-1. Dlatego oba modele mają podobne czasy reakcji w czerni i bieli, gamut, współczynnik kontrastu, a nawet ogólną jasność. Wyświetlacz ten jest doskonały dla użytkowników, którzy chcą pełnego pokrycia sRGB i stosunkowo głębokich poziomów czerni, ale niestety cierpi na zauważalny ghosting, który może być problemem w przypadku aplikacji obejmujących szybko poruszającą się grafikę lub wideo.
Nie ma ekranów OLED, kolorów AdobeRGB lub P3 ani opcji wyższej częstotliwości odświeżania do wyboru, co oznacza, że użytkownicy są ograniczeni do matrycy IPS i częstotliwości 60 Hz we wszystkich bieżących konfiguracjach.
| |||||||||||||||||||||||||
rozświetlenie: 94 %
na akumulatorze: 537 cd/m²
kontrast: 1627:1 (czerń: 0.33 cd/m²)
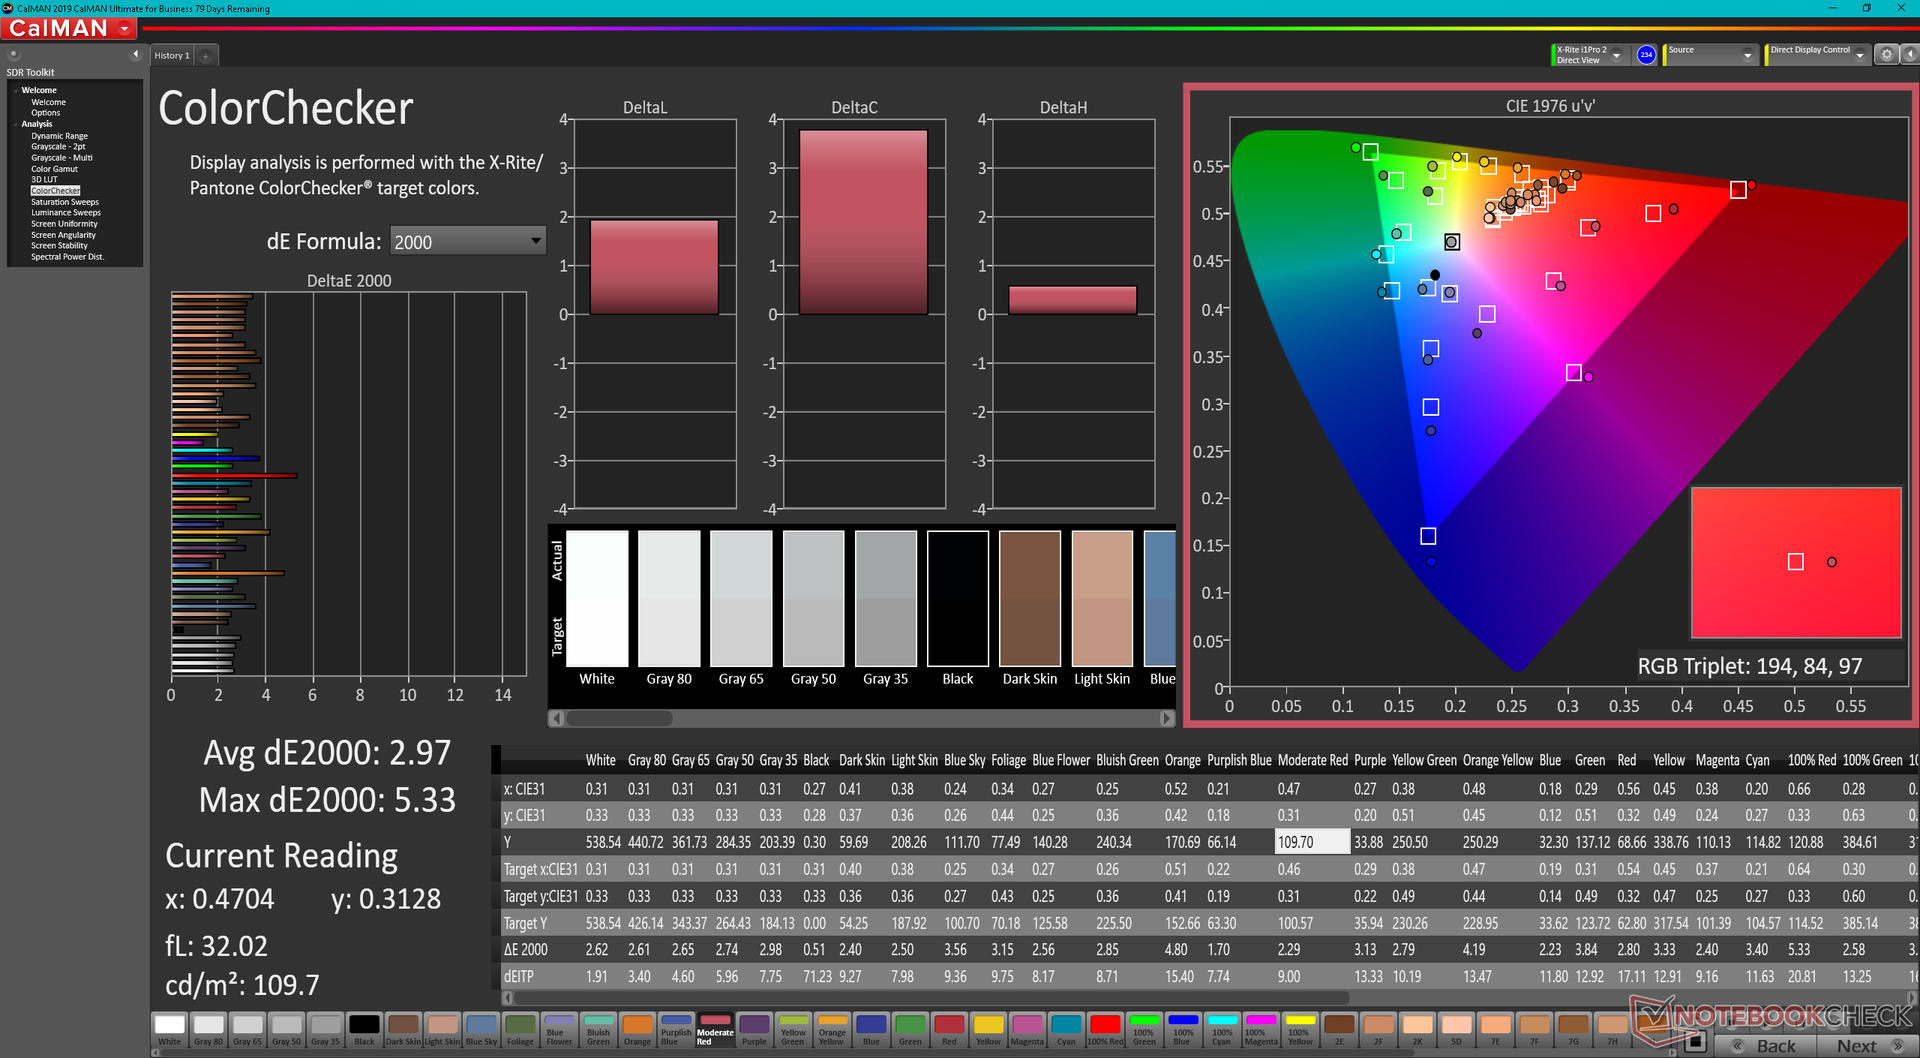
ΔE ColorChecker Calman: 2.97 | ∀{0.5-29.43 Ø4.71}
calibrated: 0.88
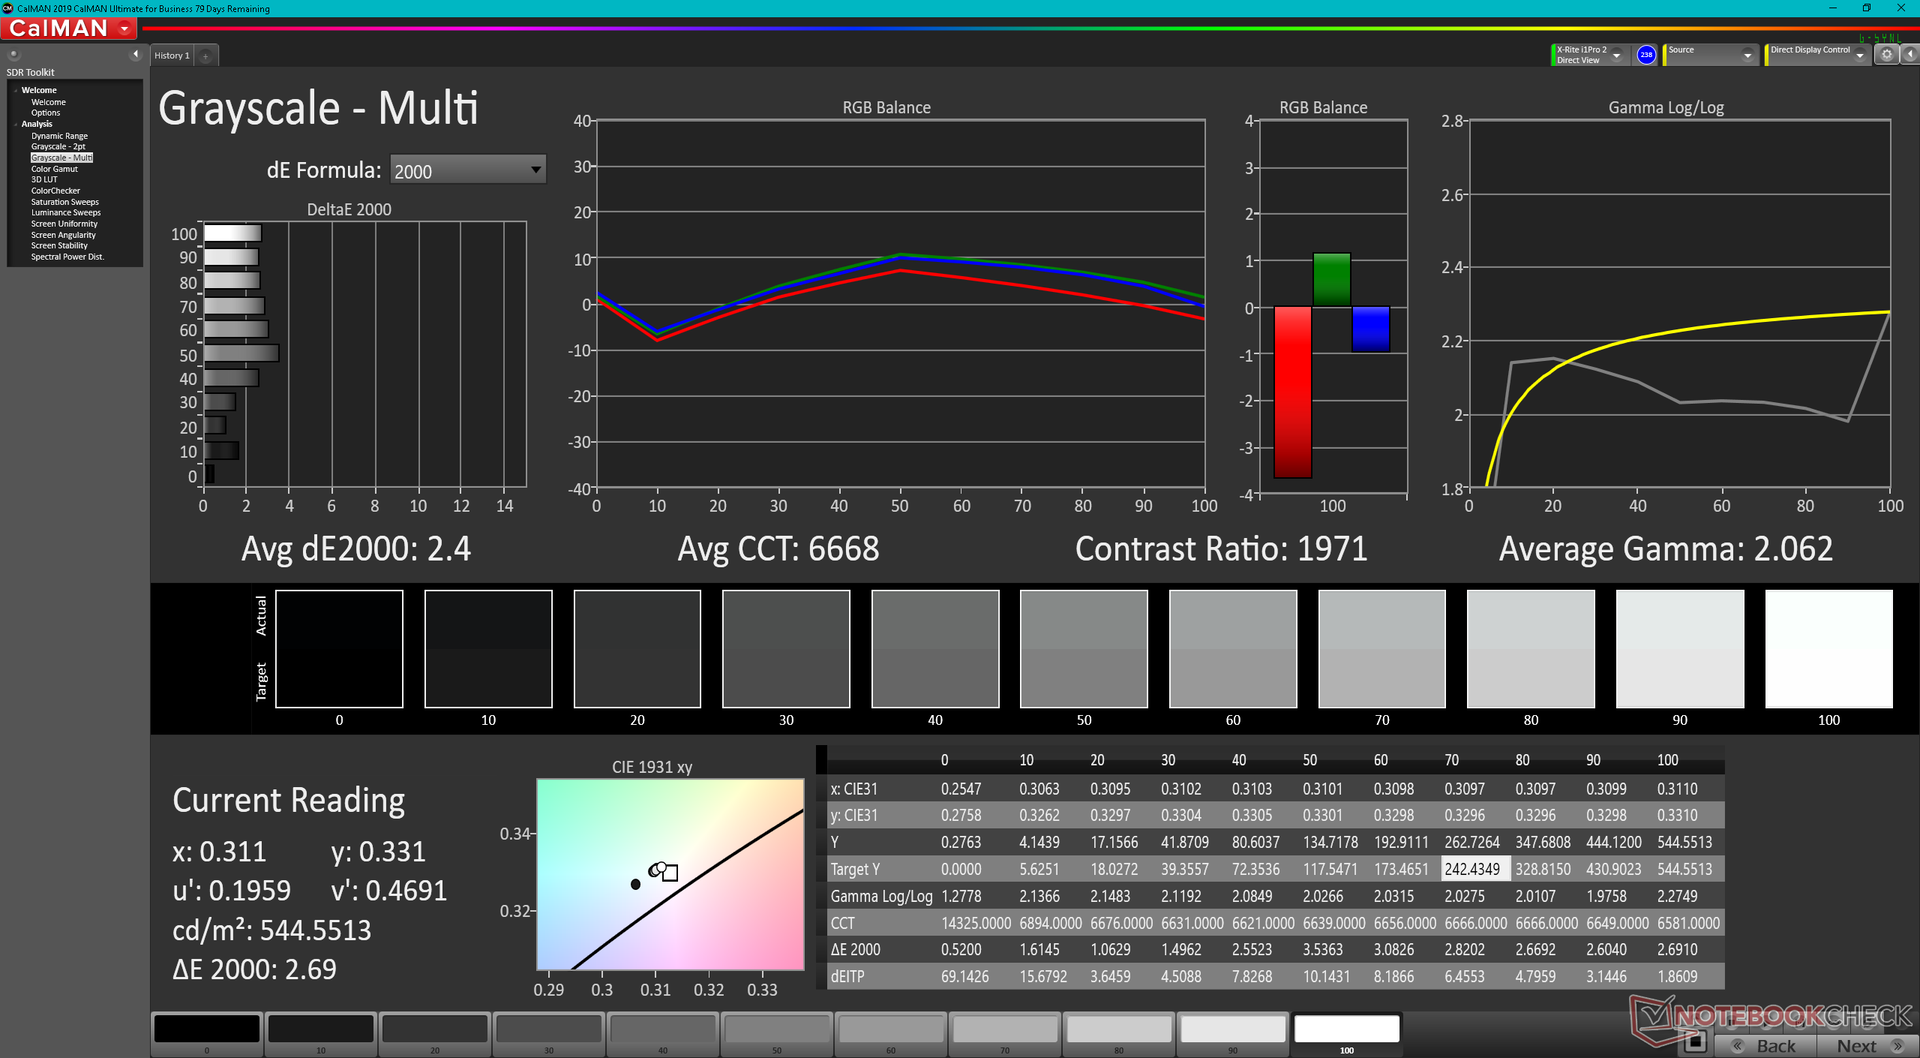
ΔE Greyscale Calman: 2.4 | ∀{0.09-98 Ø4.96}
78.7% AdobeRGB 1998 (Argyll 3D)
100% sRGB (Argyll 3D)
79.3% Display P3 (Argyll 3D)
Gamma: 2.06
CCT: 6668 K
| Dell Precision 5000 5470 AU Optronics B140QAN, IPS, 2560x1600, 14" | Lenovo ThinkPad P15v G2 21A9000XGE N156HCA-EAC, IPS LED, 1920x1080, 15.6" | Dell Precision 5000 5560 Sharp LQ156R1, IPS, 3840x2400, 15.6" | Lenovo ThinkPad P14s G2 AMD MNE001EA1-5, IPS LED, 3840x2160, 14" | HP ZBook Firefly 14 G8 2C9Q2EA AU Optronics AUO068B, IPS, 1920x1080, 14" | HP ZBook Firefly 14 G7 InfoVision IVO8C78 (X140NVFC R0), IPS, 1920x1080, 14" | |
|---|---|---|---|---|---|---|
| Display | -41% | 16% | 10% | -7% | -4% | |
| Display P3 Coverage (%) | 79.3 | 43.7 -45% | 94.9 20% | 96.8 22% | 70 -12% | 73.8 -7% |
| sRGB Coverage (%) | 100 | 65.1 -35% | 100 0% | 99.9 0% | 99.5 0% | 99 -1% |
| AdobeRGB 1998 Coverage (%) | 78.7 | 45.3 -42% | 100 27% | 85.8 9% | 71.4 -9% | 75.5 -4% |
| Response Times | 11% | 8% | 8% | -7% | -19% | |
| Response Time Grey 50% / Grey 80% * (ms) | 52.4 ? | 48 ? 8% | 47.2 ? 10% | 52 ? 1% | 64.4 ? -23% | 54.8 ? -5% |
| Response Time Black / White * (ms) | 32.4 ? | 28 ? 14% | 30.4 ? 6% | 28 ? 14% | 29.2 ? 10% | 43.2 ? -33% |
| PWM Frequency (Hz) | 284.1 ? | |||||
| Screen | -116% | -24% | -19% | -10% | -27% | |
| Brightness middle (cd/m²) | 537 | 305 -43% | 501.5 -7% | 512 -5% | 461 -14% | 934 74% |
| Brightness (cd/m²) | 518 | 281 -46% | 467 -10% | 487 -6% | 439 -15% | 937 81% |
| Brightness Distribution (%) | 94 | 88 -6% | 83 -12% | 90 -4% | 89 -5% | 87 -7% |
| Black Level * (cd/m²) | 0.33 | 0.32 3% | 0.44 -33% | 0.35 -6% | 0.24 27% | 0.37 -12% |
| Contrast (:1) | 1627 | 953 -41% | 1140 -30% | 1463 -10% | 1921 18% | 2524 55% |
| Colorchecker dE 2000 * | 2.97 | 5.9 -99% | 4.73 -59% | 3.1 -4% | 2.6 12% | 4.7 -58% |
| Colorchecker dE 2000 max. * | 5.33 | 20.1 -277% | 8.45 -59% | 8.4 -58% | 5.8 -9% | 10.5 -97% |
| Colorchecker dE 2000 calibrated * | 0.88 | 4.5 -411% | 0.51 42% | 0.4 55% | 1.1 -25% | 1.6 -82% |
| Greyscale dE 2000 * | 2.4 | 5.3 -121% | 3.6 -50% | 5.5 -129% | 4.4 -83% | 7.1 -196% |
| Gamma | 2.06 107% | 2.1 105% | 2.08 106% | 2.22 99% | 2.29 96% | 2.31 95% |
| CCT | 6668 97% | 6307 103% | 6447 101% | 6373 102% | 6478 100% | 6348 102% |
| Color Space (Percent of AdobeRGB 1998) (%) | 65.2 | 68.5 | ||||
| Color Space (Percent of sRGB) (%) | 99.4 | 98.9 | ||||
| Całkowita średnia (program / ustawienia) | -49% /
-82% | 0% /
-11% | -0% /
-9% | -8% /
-9% | -17% /
-21% |
* ... im mniej tym lepiej
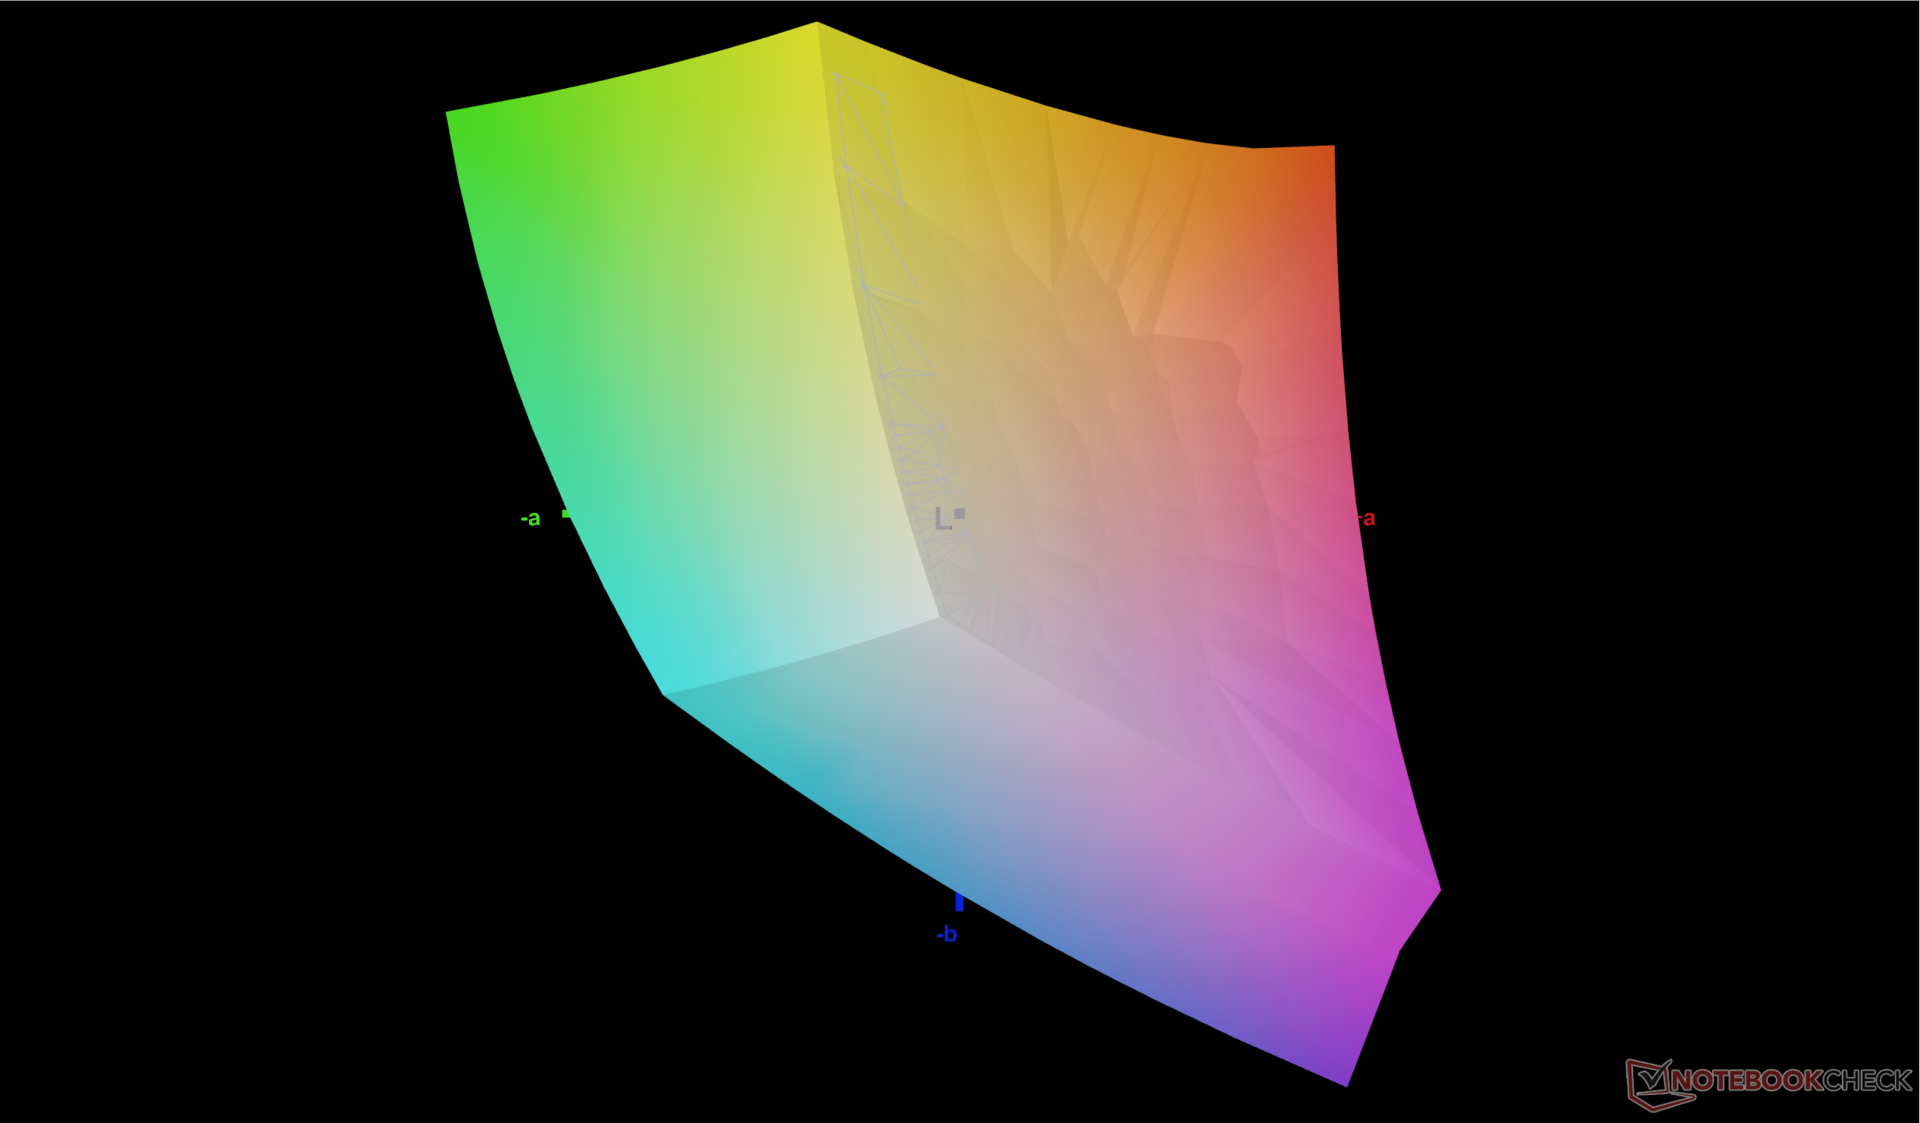
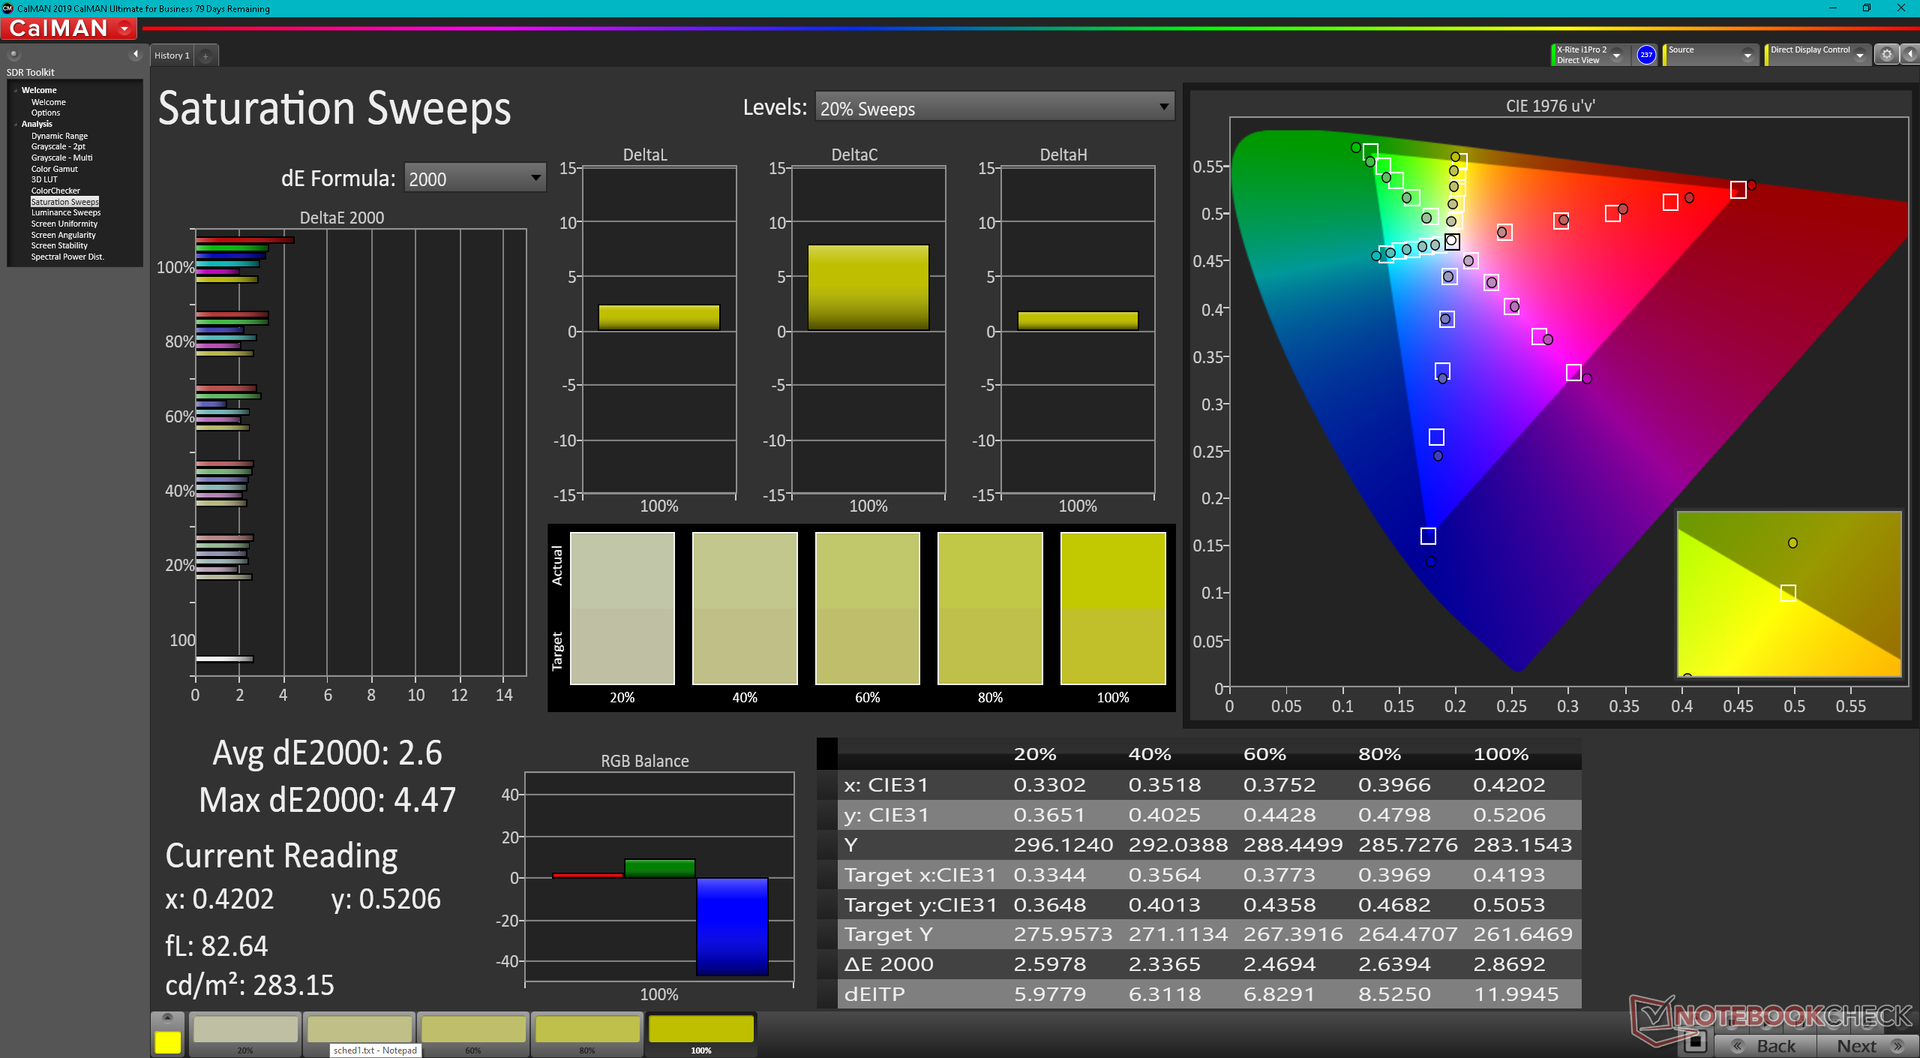
Wyświetlacz jest dobrze skalibrowany pod kątem standardu sRGB, a średnie wartości DeltaE dla skali szarości i koloru wynoszą odpowiednio 2,4 i 2,97. Przy pomocy kolorymetru X-Rite udało nam się jeszcze bardziej poprawić te wartości do <2 każda, co pokazują nasze wyniki CalMan poniżej.
Wyświetl czasy reakcji
| ↔ Czas reakcji od czerni do bieli | ||
|---|---|---|
| 32.4 ms ... wzrost ↗ i spadek ↘ łącznie | ↗ 15.6 ms wzrost | 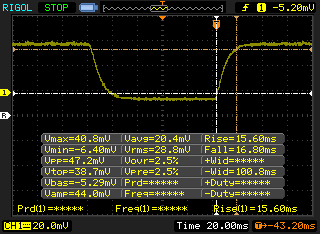 |
| ↘ 16.8 ms upadek | ||
| W naszych testach ekran wykazuje powolne tempo reakcji, co będzie niezadowalające dla graczy. Dla porównania, wszystkie testowane urządzenia wahają się od 0.1 (minimum) do 240 (maksimum) ms. » 88 % wszystkich urządzeń jest lepszych. Oznacza to, że zmierzony czas reakcji jest gorszy od średniej wszystkich testowanych urządzeń (19.8 ms). | ||
| ↔ Czas reakcji 50% szarości do 80% szarości | ||
| 52.4 ms ... wzrost ↗ i spadek ↘ łącznie | ↗ 24.4 ms wzrost | 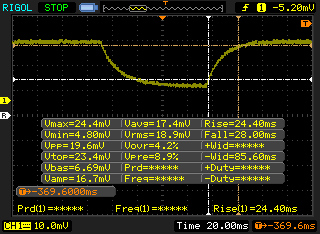 |
| ↘ 28 ms upadek | ||
| W naszych testach ekran wykazuje powolne tempo reakcji, co będzie niezadowalające dla graczy. Dla porównania, wszystkie testowane urządzenia wahają się od 0.165 (minimum) do 636 (maksimum) ms. » 89 % wszystkich urządzeń jest lepszych. Oznacza to, że zmierzony czas reakcji jest gorszy od średniej wszystkich testowanych urządzeń (31 ms). | ||
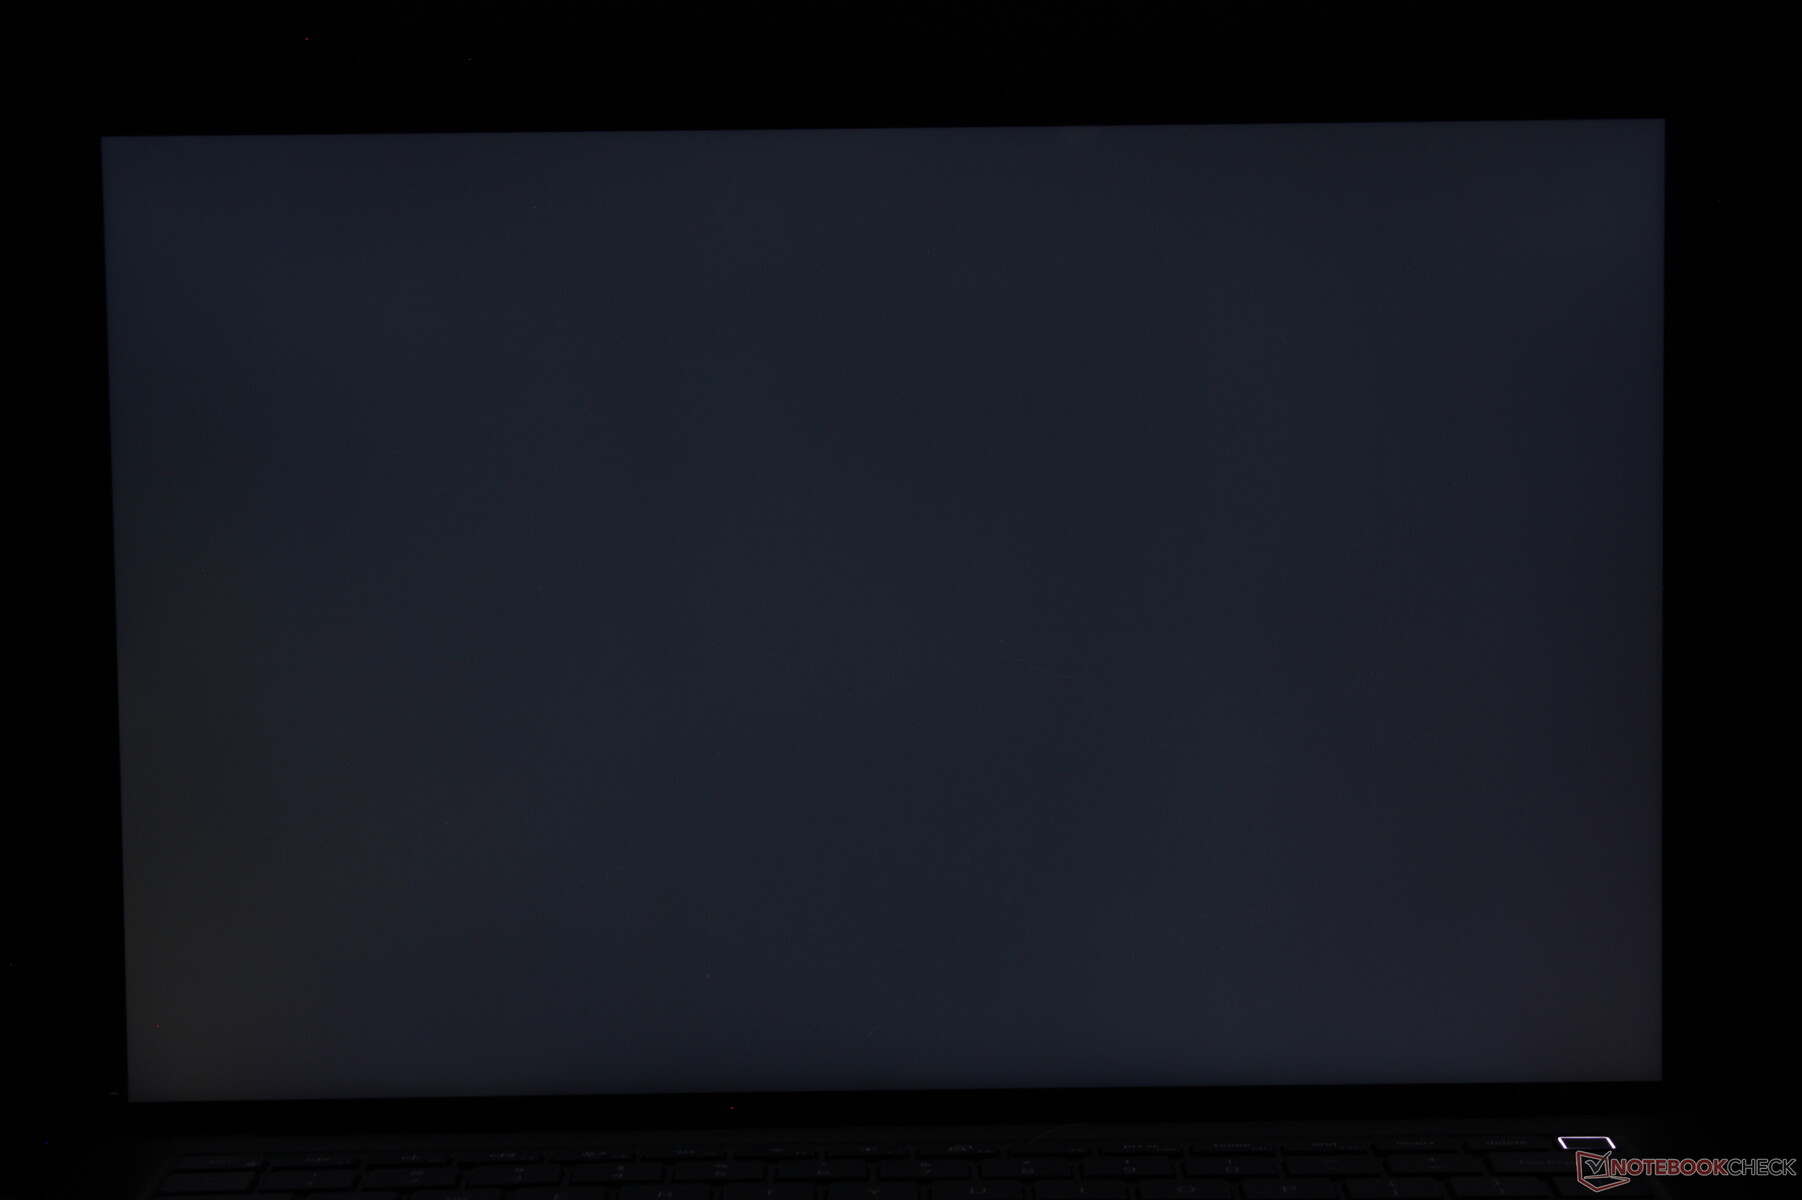
Migotanie ekranu / PWM (modulacja szerokości impulsu)
| Migotanie ekranu/nie wykryto PWM | 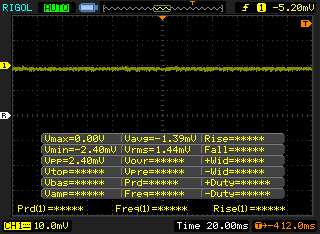 | ||
Dla porównania: 52 % wszystkich testowanych urządzeń nie używa PWM do przyciemniania wyświetlacza. Jeśli wykryto PWM, zmierzono średnio 7754 (minimum: 5 - maksimum: 343500) Hz. | |||
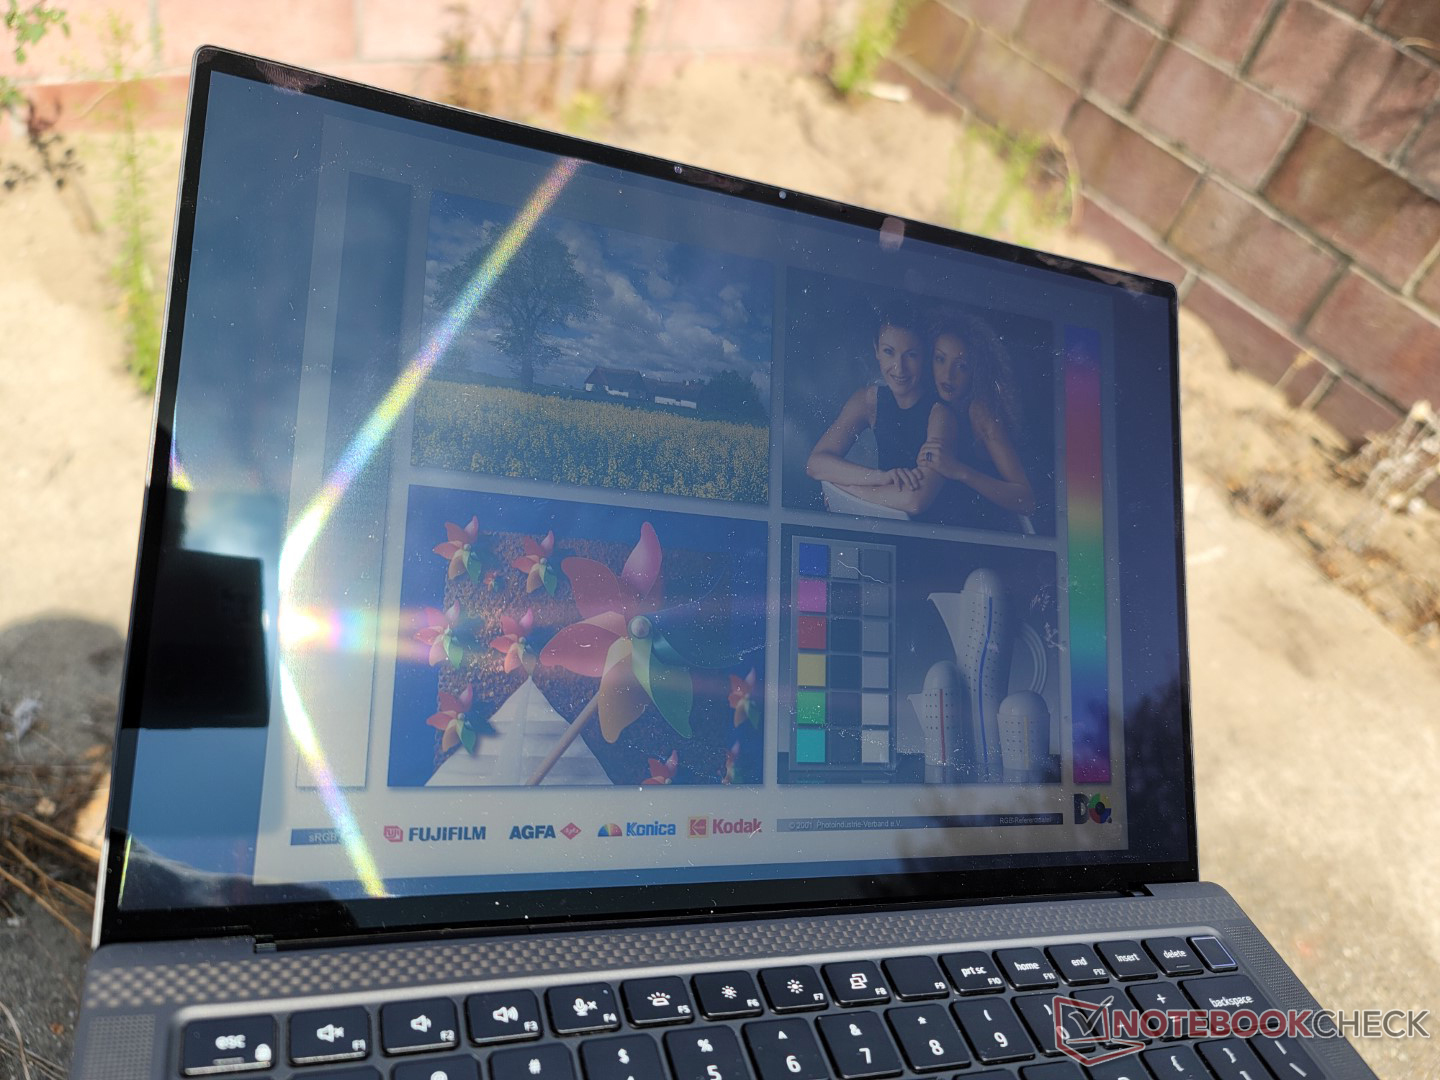
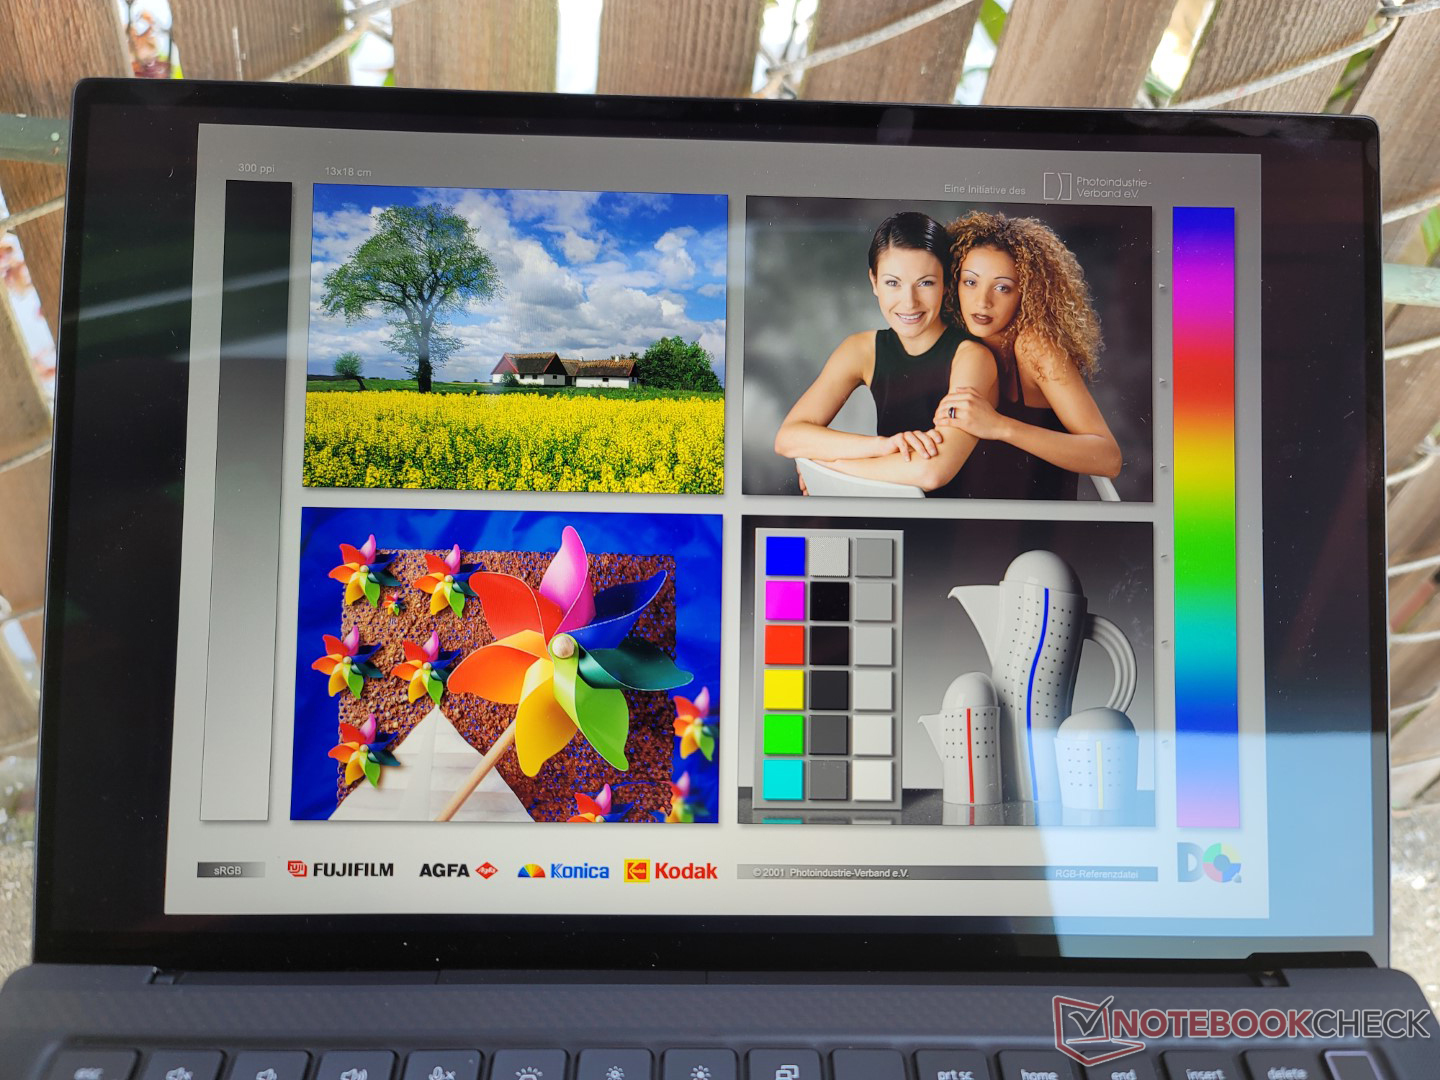
Wyświetlacz jest jaśniejszy niż w większości konsumenckich Ultrabooków, co zapewnia lepszą widoczność na zewnątrz. Niemniej jednak wiele modeli HP EliteBook lub ZBooków oferują opcje paneli 1000-nitowych dla znacznie łatwiejszego przebywania na zewnątrz. Dell nie zaoferował jeszcze podobnych opcji jasności dla swojej serii Precision.
Wydajność - procesor Core i9 serii H i dyskretny układ graficzny
Warunki badania
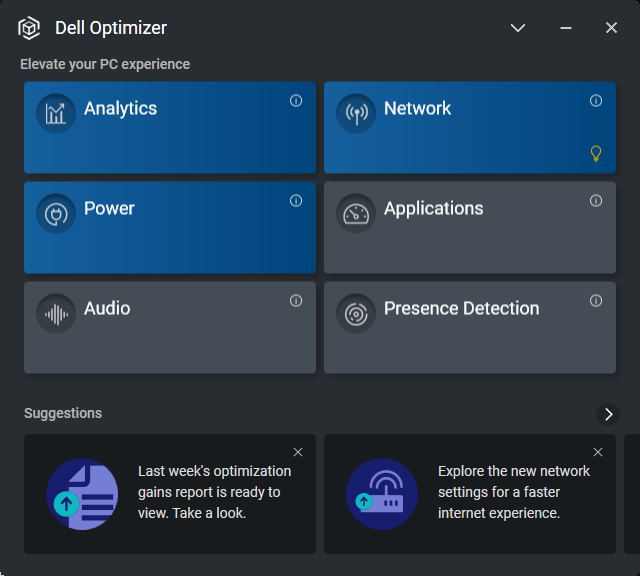
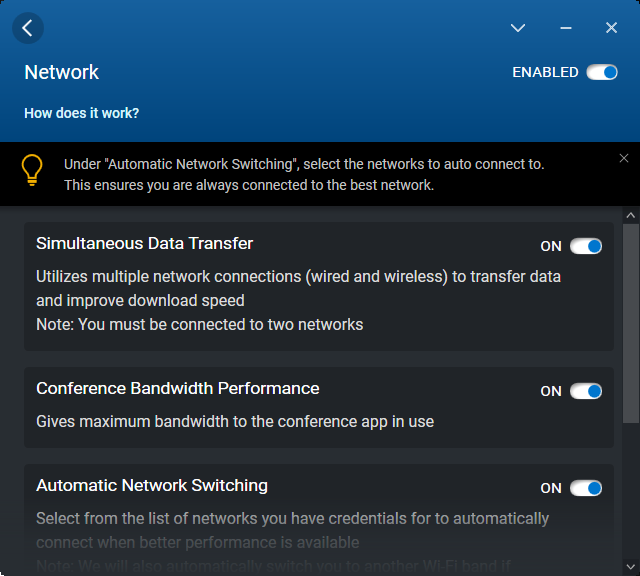
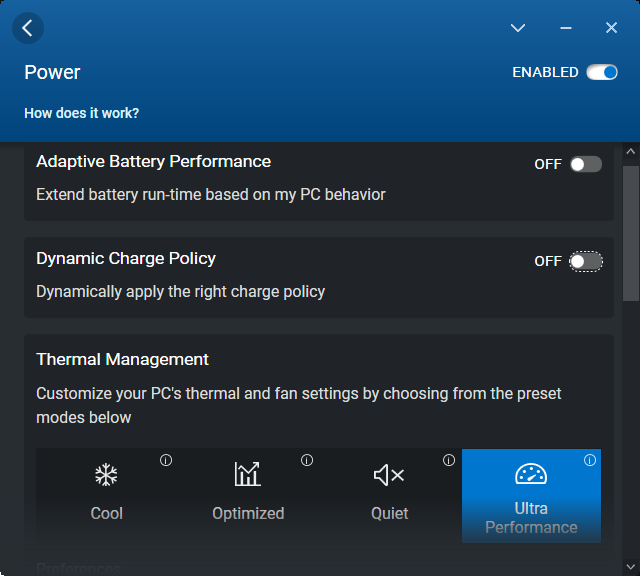
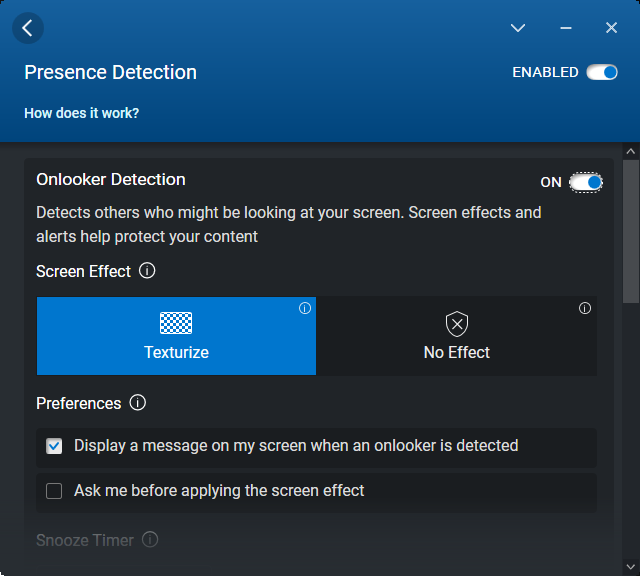
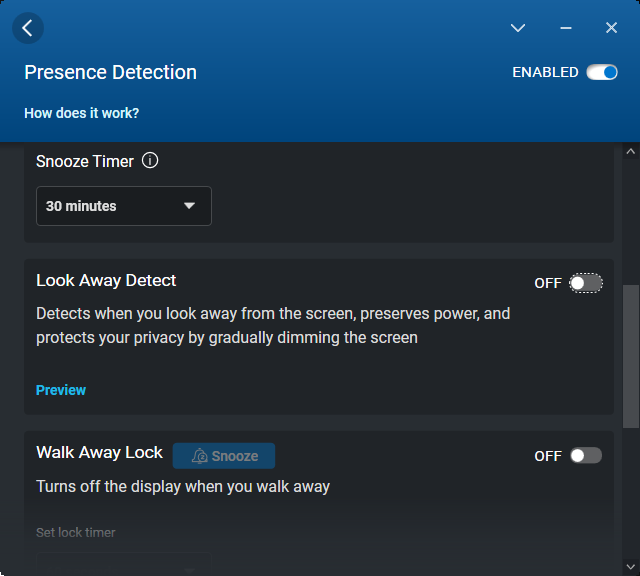
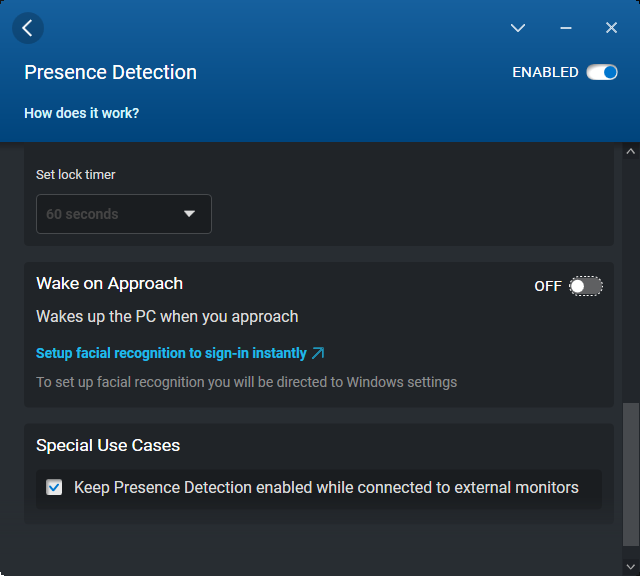
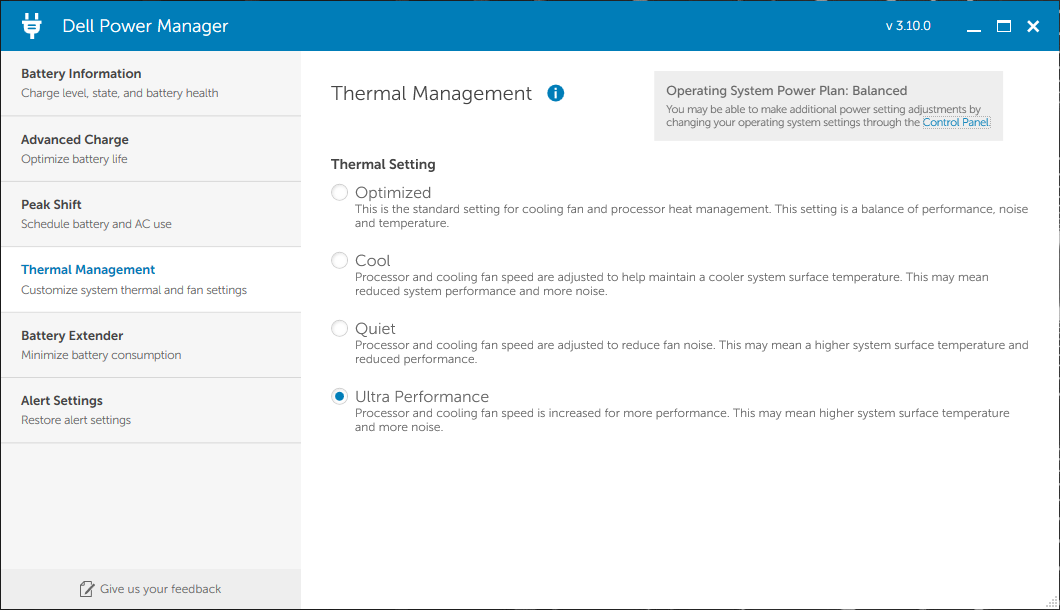
Przed uruchomieniem poniższych benchmarków ustawiliśmy nasz egzemplarz w trybie Ultra Performance za pomocą oprogramowania Dell Optimizer. Włączyliśmy też dyskretny układ graficzny Nvidii za pośrednictwem panelu sterowania Nvidii. Warto zauważyć, że te same ustawienia zasilania można skonfigurować za pomocą programu Dell Power Manager lub Dell Optimizer. Na szczęście zmiana profilu zasilania w jednym programie powoduje automatyczną zmianę ustawień w drugim.
Procesor
Wydajność procesora to mieszanka. W porównaniu z innymi 14-calowymi laptopami biznesowymi lub stacjami roboczymi Precision 5470 oferuje znacznie wyższą wydajność, która dorównuje nawet większym stacjom roboczym, takim jak MSI WE76 lub HP ZBook Fury 17 G8. Jest to w zasadzie procesor zaprojektowany dla grubszych laptopów ściśniętych w 14-calowej obudowie. W porównaniu do innych laptopów z tym samym Core i9-12900H CPU, procesor w naszym Precision jest jednak wolniejszy średnio o około 15 do 20 procent.
Kolejną wadą procesora jest jego niestabilne taktowanie. Podczas uruchamiania CineBench R15 xT w pętli wyniki wahały się na przykład między 1500 a 2100 pkt. Dla porównania, takie wahania nie wystąpiłyby w tym samym teście na HP ZBook Fury 17 G8 lub MSI Creator Z17, z których każdy posiada procesor klasy Core i9.
Cinebench R15 Multi Loop
Cinebench R23: Multi Core | Single Core
Cinebench R15: CPU Multi 64Bit | CPU Single 64Bit
Blender: v2.79 BMW27 CPU
7-Zip 18.03: 7z b 4 | 7z b 4 -mmt1
Geekbench 5.5: Multi-Core | Single-Core
HWBOT x265 Benchmark v2.2: 4k Preset
LibreOffice : 20 Documents To PDF
R Benchmark 2.5: Overall mean
| Cinebench R20 / CPU (Multi Core) | |
| Przeciętny Intel Core i9-12900H (2681 - 7471, n=28) | |
| HP ZBook Fury 17 G8-4A6A9EA | |
| Dell Precision 5000 5470 | |
| MSI WE76 11UM-456 | |
| HP ZBook Power 15 G8 313S5EA | |
| Asus ProArt StudioBook 16 W7600H5A-2BL2 | |
| Dell Precision 5000 5560 | |
| HP ZBook Fury 17 G7 119W5EA | |
| Lenovo ThinkPad P15v G2 21A9000XGE | |
| Lenovo ThinkPad P14s G2 AMD | |
| Acer ConceptD 9 Pro | |
| Lenovo ThinkPad P14s Gen2-20VX000GGE | |
| HP ZBook Firefly 14 G8 2C9Q2EA | |
| HP ZBook Firefly 14 G7 | |
| Cinebench R20 / CPU (Single Core) | |
| Przeciętny Intel Core i9-12900H (624 - 738, n=28) | |
| Dell Precision 5000 5470 | |
| HP ZBook Fury 17 G8-4A6A9EA | |
| MSI WE76 11UM-456 | |
| HP ZBook Power 15 G8 313S5EA | |
| Dell Precision 5000 5560 | |
| HP ZBook Firefly 14 G8 2C9Q2EA | |
| Lenovo ThinkPad P15v G2 21A9000XGE | |
| Asus ProArt StudioBook 16 W7600H5A-2BL2 | |
| Lenovo ThinkPad P14s G2 AMD | |
| Lenovo ThinkPad P14s Gen2-20VX000GGE | |
| Acer ConceptD 9 Pro | |
| HP ZBook Fury 17 G7 119W5EA | |
| HP ZBook Firefly 14 G7 | |
| Cinebench R23 / Multi Core | |
| Przeciętny Intel Core i9-12900H (7359 - 19648, n=28) | |
| MSI WE76 11UM-456 | |
| HP ZBook Fury 17 G8-4A6A9EA | |
| Dell Precision 5000 5470 | |
| HP ZBook Power 15 G8 313S5EA | |
| Asus ProArt StudioBook 16 W7600H5A-2BL2 | |
| Lenovo ThinkPad P15v G2 21A9000XGE | |
| Dell Precision 5000 5560 | |
| Lenovo ThinkPad P14s G2 AMD | |
| HP ZBook Fury 17 G7 119W5EA | |
| Lenovo ThinkPad P14s Gen2-20VX000GGE | |
| HP ZBook Firefly 14 G7 | |
| Cinebench R23 / Single Core | |
| Przeciętny Intel Core i9-12900H (1634 - 1930, n=28) | |
| Dell Precision 5000 5470 | |
| HP ZBook Fury 17 G8-4A6A9EA | |
| MSI WE76 11UM-456 | |
| HP ZBook Power 15 G8 313S5EA | |
| Dell Precision 5000 5560 | |
| Lenovo ThinkPad P14s Gen2-20VX000GGE | |
| Asus ProArt StudioBook 16 W7600H5A-2BL2 | |
| Lenovo ThinkPad P14s G2 AMD | |
| HP ZBook Fury 17 G7 119W5EA | |
| HP ZBook Firefly 14 G7 | |
| Cinebench R15 / CPU Multi 64Bit | |
| Przeciętny Intel Core i9-12900H (1395 - 3077, n=28) | |
| Dell Precision 5000 5470 | |
| MSI WE76 11UM-456 | |
| HP ZBook Fury 17 G8-4A6A9EA | |
| HP ZBook Power 15 G8 313S5EA | |
| HP ZBook Power 15 G8 313S5EA | |
| Asus ProArt StudioBook 16 W7600H5A-2BL2 | |
| Lenovo ThinkPad P15v G2 21A9000XGE | |
| Acer ConceptD 9 Pro | |
| Dell Precision 5000 5560 | |
| Lenovo ThinkPad P14s G2 AMD | |
| HP ZBook Fury 17 G7 119W5EA | |
| Lenovo ThinkPad P14s Gen2-20VX000GGE | |
| HP ZBook Firefly 14 G8 2C9Q2EA | |
| HP ZBook Firefly 14 G7 | |
| Cinebench R15 / CPU Single 64Bit | |
| Przeciętny Intel Core i9-12900H (235 - 277, n=29) | |
| HP ZBook Fury 17 G8-4A6A9EA | |
| Dell Precision 5000 5470 | |
| MSI WE76 11UM-456 | |
| Dell Precision 5000 5560 | |
| HP ZBook Power 15 G8 313S5EA | |
| Asus ProArt StudioBook 16 W7600H5A-2BL2 | |
| HP ZBook Firefly 14 G8 2C9Q2EA | |
| Lenovo ThinkPad P14s G2 AMD | |
| Lenovo ThinkPad P15v G2 21A9000XGE | |
| Lenovo ThinkPad P14s Gen2-20VX000GGE | |
| HP ZBook Fury 17 G7 119W5EA | |
| Acer ConceptD 9 Pro | |
| HP ZBook Firefly 14 G7 | |
| Blender / v2.79 BMW27 CPU | |
| HP ZBook Firefly 14 G7 | |
| Lenovo ThinkPad P14s Gen2-20VX000GGE | |
| HP ZBook Firefly 14 G8 2C9Q2EA | |
| Lenovo ThinkPad P14s G2 AMD | |
| Lenovo ThinkPad P15v G2 21A9000XGE | |
| Dell Precision 5000 5560 | |
| HP ZBook Fury 17 G7 119W5EA | |
| Asus ProArt StudioBook 16 W7600H5A-2BL2 | |
| HP ZBook Power 15 G8 313S5EA | |
| Dell Precision 5000 5470 | |
| HP ZBook Fury 17 G8-4A6A9EA | |
| Przeciętny Intel Core i9-12900H (160 - 451, n=28) | |
| 7-Zip 18.03 / 7z b 4 | |
| Przeciętny Intel Core i9-12900H (34684 - 76677, n=28) | |
| MSI WE76 11UM-456 | |
| Dell Precision 5000 5470 | |
| HP ZBook Fury 17 G8-4A6A9EA | |
| HP ZBook Power 15 G8 313S5EA | |
| Asus ProArt StudioBook 16 W7600H5A-2BL2 | |
| Lenovo ThinkPad P14s G2 AMD | |
| Dell Precision 5000 5560 | |
| HP ZBook Fury 17 G7 119W5EA | |
| Acer ConceptD 9 Pro | |
| Lenovo ThinkPad P15v G2 21A9000XGE | |
| HP ZBook Firefly 14 G8 2C9Q2EA | |
| Lenovo ThinkPad P14s Gen2-20VX000GGE | |
| HP ZBook Firefly 14 G7 | |
| 7-Zip 18.03 / 7z b 4 -mmt1 | |
| HP ZBook Fury 17 G8-4A6A9EA | |
| Przeciętny Intel Core i9-12900H (5302 - 6289, n=28) | |
| Dell Precision 5000 5560 | |
| MSI WE76 11UM-456 | |
| HP ZBook Power 15 G8 313S5EA | |
| HP ZBook Fury 17 G7 119W5EA | |
| Lenovo ThinkPad P14s Gen2-20VX000GGE | |
| Dell Precision 5000 5470 | |
| Acer ConceptD 9 Pro | |
| HP ZBook Firefly 14 G8 2C9Q2EA | |
| Lenovo ThinkPad P14s G2 AMD | |
| Lenovo ThinkPad P15v G2 21A9000XGE | |
| Asus ProArt StudioBook 16 W7600H5A-2BL2 | |
| HP ZBook Firefly 14 G7 | |
| Geekbench 5.5 / Multi-Core | |
| Dell Precision 5000 5470 | |
| Przeciętny Intel Core i9-12900H (8519 - 14376, n=31) | |
| MSI WE76 11UM-456 | |
| Asus ProArt StudioBook 16 W7600H5A-2BL2 | |
| HP ZBook Fury 17 G8-4A6A9EA | |
| HP ZBook Power 15 G8 313S5EA | |
| Acer ConceptD 9 Pro | |
| Lenovo ThinkPad P14s G2 AMD | |
| HP ZBook Fury 17 G7 119W5EA | |
| Lenovo ThinkPad P15v G2 21A9000XGE | |
| Lenovo ThinkPad P14s Gen2-20VX000GGE | |
| HP ZBook Firefly 14 G8 2C9Q2EA | |
| HP ZBook Firefly 14 G7 | |
| Geekbench 5.5 / Single-Core | |
| Dell Precision 5000 5470 | |
| Przeciętny Intel Core i9-12900H (1631 - 1897, n=31) | |
| MSI WE76 11UM-456 | |
| Lenovo ThinkPad P14s Gen2-20VX000GGE | |
| HP ZBook Fury 17 G8-4A6A9EA | |
| HP ZBook Firefly 14 G8 2C9Q2EA | |
| HP ZBook Power 15 G8 313S5EA | |
| Asus ProArt StudioBook 16 W7600H5A-2BL2 | |
| Lenovo ThinkPad P15v G2 21A9000XGE | |
| Lenovo ThinkPad P14s G2 AMD | |
| HP ZBook Fury 17 G7 119W5EA | |
| Acer ConceptD 9 Pro | |
| HP ZBook Firefly 14 G7 | |
| HWBOT x265 Benchmark v2.2 / 4k Preset | |
| Przeciętny Intel Core i9-12900H (8.05 - 22.5, n=28) | |
| MSI WE76 11UM-456 | |
| HP ZBook Fury 17 G8-4A6A9EA | |
| HP ZBook Power 15 G8 313S5EA | |
| Asus ProArt StudioBook 16 W7600H5A-2BL2 | |
| Dell Precision 5000 5470 | |
| Dell Precision 5000 5560 | |
| Lenovo ThinkPad P14s G2 AMD | |
| Lenovo ThinkPad P15v G2 21A9000XGE | |
| HP ZBook Fury 17 G7 119W5EA | |
| Lenovo ThinkPad P14s Gen2-20VX000GGE | |
| HP ZBook Firefly 14 G8 2C9Q2EA | |
| HP ZBook Firefly 14 G7 | |
| LibreOffice / 20 Documents To PDF | |
| HP ZBook Firefly 14 G7 | |
| Acer ConceptD 9 Pro | |
| HP ZBook Fury 17 G7 119W5EA | |
| Lenovo ThinkPad P15v G2 21A9000XGE | |
| HP ZBook Fury 17 G8-4A6A9EA | |
| HP ZBook Firefly 14 G8 2C9Q2EA | |
| Lenovo ThinkPad P14s G2 AMD | |
| Dell Precision 5000 5560 | |
| MSI WE76 11UM-456 | |
| Dell Precision 5000 5470 | |
| HP ZBook Power 15 G8 313S5EA | |
| Przeciętny Intel Core i9-12900H (36.8 - 59.8, n=28) | |
| Lenovo ThinkPad P14s Gen2-20VX000GGE | |
| Asus ProArt StudioBook 16 W7600H5A-2BL2 | |
| R Benchmark 2.5 / Overall mean | |
| HP ZBook Firefly 14 G7 | |
| HP ZBook Power 15 G8 313S5EA | |
| Lenovo ThinkPad P15v G2 21A9000XGE | |
| HP ZBook Fury 17 G7 119W5EA | |
| Asus ProArt StudioBook 16 W7600H5A-2BL2 | |
| HP ZBook Firefly 14 G8 2C9Q2EA | |
| Lenovo ThinkPad P14s Gen2-20VX000GGE | |
| MSI WE76 11UM-456 | |
| Lenovo ThinkPad P14s G2 AMD | |
| Dell Precision 5000 5560 | |
| HP ZBook Fury 17 G8-4A6A9EA | |
| Dell Precision 5000 5470 | |
| Przeciętny Intel Core i9-12900H (0.4218 - 0.506, n=28) | |
Cinebench R23: Multi Core | Single Core
Cinebench R15: CPU Multi 64Bit | CPU Single 64Bit
Blender: v2.79 BMW27 CPU
7-Zip 18.03: 7z b 4 | 7z b 4 -mmt1
Geekbench 5.5: Multi-Core | Single-Core
HWBOT x265 Benchmark v2.2: 4k Preset
LibreOffice : 20 Documents To PDF
R Benchmark 2.5: Overall mean
* ... im mniej tym lepiej
AIDA64: FP32 Ray-Trace | FPU Julia | CPU SHA3 | CPU Queen | FPU SinJulia | FPU Mandel | CPU AES | CPU ZLib | FP64 Ray-Trace | CPU PhotoWorxx
| Performance rating | |
| Przeciętny Intel Core i9-12900H | |
| Dell Precision 5000 5470 | |
| Lenovo ThinkPad P14s G2 AMD | |
| Lenovo ThinkPad P15v G2 21A9000XGE | |
| HP ZBook Firefly 14 G8 2C9Q2EA | |
| HP ZBook Firefly 14 G7 | |
| AIDA64 / FP32 Ray-Trace | |
| Dell Precision 5000 5470 | |
| Lenovo ThinkPad P15v G2 21A9000XGE | |
| Przeciętny Intel Core i9-12900H (4074 - 18289, n=29) | |
| Lenovo ThinkPad P14s G2 AMD | |
| HP ZBook Firefly 14 G8 2C9Q2EA | |
| HP ZBook Firefly 14 G7 | |
| AIDA64 / FPU Julia | |
| Lenovo ThinkPad P14s G2 AMD | |
| Dell Precision 5000 5470 | |
| Przeciętny Intel Core i9-12900H (22307 - 93236, n=29) | |
| Lenovo ThinkPad P15v G2 21A9000XGE | |
| HP ZBook Firefly 14 G8 2C9Q2EA | |
| HP ZBook Firefly 14 G7 | |
| AIDA64 / CPU SHA3 | |
| Lenovo ThinkPad P15v G2 21A9000XGE | |
| Przeciętny Intel Core i9-12900H (1378 - 4215, n=29) | |
| Dell Precision 5000 5470 | |
| Lenovo ThinkPad P14s G2 AMD | |
| HP ZBook Firefly 14 G8 2C9Q2EA | |
| HP ZBook Firefly 14 G7 | |
| AIDA64 / CPU Queen | |
| Dell Precision 5000 5470 | |
| Przeciętny Intel Core i9-12900H (78172 - 111241, n=28) | |
| Lenovo ThinkPad P15v G2 21A9000XGE | |
| Lenovo ThinkPad P14s G2 AMD | |
| HP ZBook Firefly 14 G7 | |
| HP ZBook Firefly 14 G8 2C9Q2EA | |
| AIDA64 / FPU SinJulia | |
| Lenovo ThinkPad P14s G2 AMD | |
| Przeciętny Intel Core i9-12900H (5709 - 10410, n=29) | |
| Lenovo ThinkPad P15v G2 21A9000XGE | |
| Dell Precision 5000 5470 | |
| HP ZBook Firefly 14 G8 2C9Q2EA | |
| HP ZBook Firefly 14 G7 | |
| AIDA64 / FPU Mandel | |
| Lenovo ThinkPad P14s G2 AMD | |
| Dell Precision 5000 5470 | |
| Lenovo ThinkPad P15v G2 21A9000XGE | |
| Przeciętny Intel Core i9-12900H (11257 - 45581, n=29) | |
| HP ZBook Firefly 14 G8 2C9Q2EA | |
| HP ZBook Firefly 14 G7 | |
| AIDA64 / CPU AES | |
| Lenovo ThinkPad P14s G2 AMD | |
| Przeciętny Intel Core i9-12900H (31935 - 151546, n=29) | |
| Lenovo ThinkPad P15v G2 21A9000XGE | |
| HP ZBook Firefly 14 G8 2C9Q2EA | |
| Dell Precision 5000 5470 | |
| HP ZBook Firefly 14 G7 | |
| AIDA64 / CPU ZLib | |
| Przeciętny Intel Core i9-12900H (449 - 1193, n=29) | |
| Lenovo ThinkPad P15v G2 21A9000XGE | |
| Lenovo ThinkPad P14s G2 AMD | |
| Dell Precision 5000 5470 | |
| HP ZBook Firefly 14 G8 2C9Q2EA | |
| HP ZBook Firefly 14 G7 | |
| AIDA64 / FP64 Ray-Trace | |
| Dell Precision 5000 5470 | |
| Lenovo ThinkPad P15v G2 21A9000XGE | |
| Przeciętny Intel Core i9-12900H (2235 - 10511, n=29) | |
| Lenovo ThinkPad P14s G2 AMD | |
| HP ZBook Firefly 14 G8 2C9Q2EA | |
| HP ZBook Firefly 14 G7 | |
| AIDA64 / CPU PhotoWorxx | |
| Dell Precision 5000 5470 | |
| Przeciętny Intel Core i9-12900H (20960 - 48269, n=30) | |
| HP ZBook Firefly 14 G8 2C9Q2EA | |
| HP ZBook Firefly 14 G7 | |
| Lenovo ThinkPad P14s G2 AMD | |
| Lenovo ThinkPad P15v G2 21A9000XGE | |
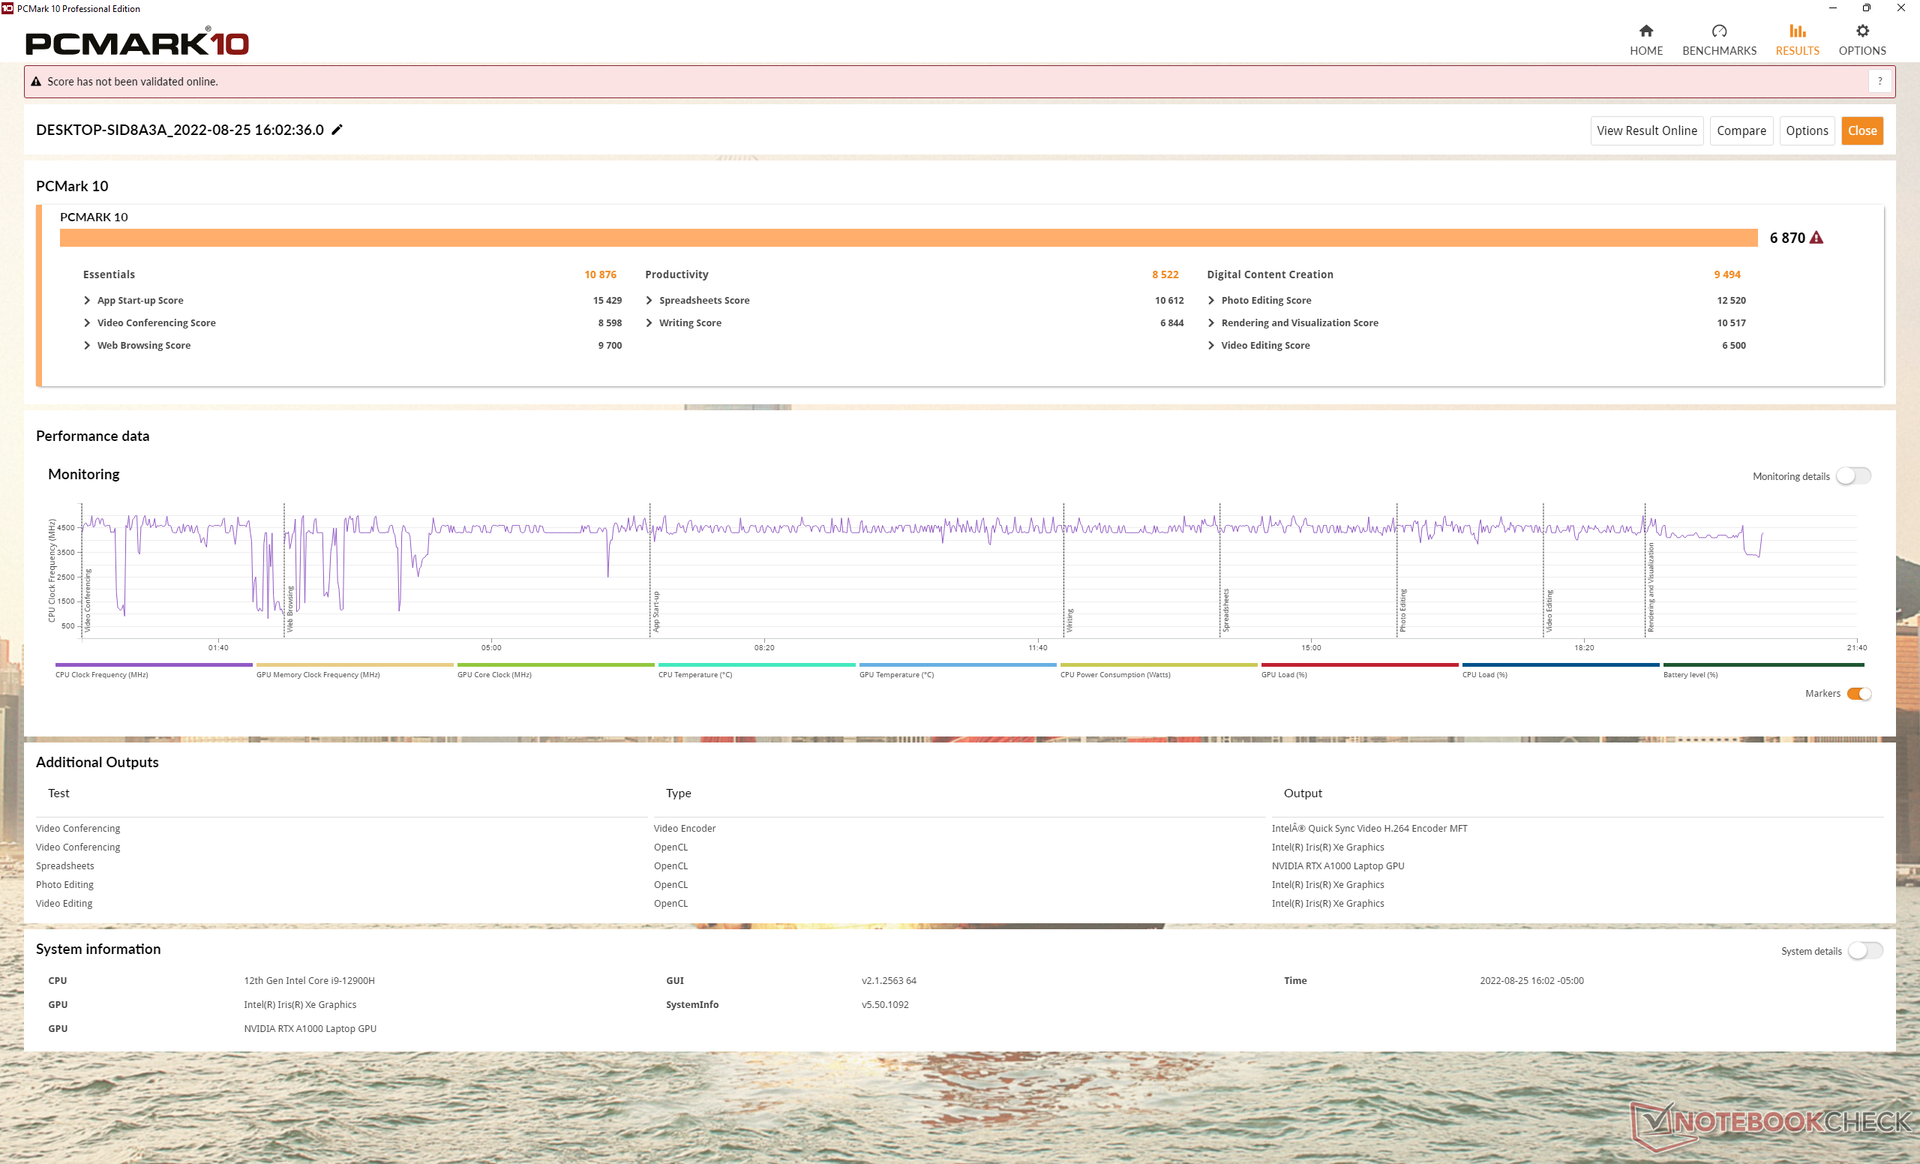
Wydajność systemu
Wyniki PCMark 10 są wyższe od oczekiwanych w porównaniu z innymi mobilnymi stacjami roboczymi. Przypisujemy to procesorowi Core i9 12. generacji serii H i dyskowi SSD PCIe4 x4, które są stosunkowo rzadkimi opcjami w 14-calowej stacji roboczej.
CrossMark: Overall | Productivity | Creativity | Responsiveness
| PCMark 10 / Score | |
| Dell Precision 5000 5470 | |
| Przeciętny Intel Core i9-12900H, NVIDIA RTX A1000 Laptop GPU (n=1) | |
| Dell Precision 5000 5560 | |
| Lenovo ThinkPad P15v G2 21A9000XGE | |
| Lenovo ThinkPad P14s G2 AMD | |
| HP ZBook Firefly 14 G8 2C9Q2EA | |
| HP ZBook Firefly 14 G7 | |
| PCMark 10 / Essentials | |
| Dell Precision 5000 5470 | |
| Przeciętny Intel Core i9-12900H, NVIDIA RTX A1000 Laptop GPU (n=1) | |
| Dell Precision 5000 5560 | |
| Lenovo ThinkPad P15v G2 21A9000XGE | |
| Lenovo ThinkPad P14s G2 AMD | |
| HP ZBook Firefly 14 G8 2C9Q2EA | |
| HP ZBook Firefly 14 G7 | |
| PCMark 10 / Productivity | |
| Dell Precision 5000 5560 | |
| Lenovo ThinkPad P14s G2 AMD | |
| Dell Precision 5000 5470 | |
| Przeciętny Intel Core i9-12900H, NVIDIA RTX A1000 Laptop GPU (n=1) | |
| HP ZBook Firefly 14 G8 2C9Q2EA | |
| Lenovo ThinkPad P15v G2 21A9000XGE | |
| HP ZBook Firefly 14 G7 | |
| PCMark 10 / Digital Content Creation | |
| Dell Precision 5000 5470 | |
| Przeciętny Intel Core i9-12900H, NVIDIA RTX A1000 Laptop GPU (n=1) | |
| Dell Precision 5000 5560 | |
| Lenovo ThinkPad P15v G2 21A9000XGE | |
| Lenovo ThinkPad P14s G2 AMD | |
| HP ZBook Firefly 14 G8 2C9Q2EA | |
| HP ZBook Firefly 14 G7 | |
| CrossMark / Overall | |
| Dell Precision 5000 5470 | |
| Przeciętny Intel Core i9-12900H, NVIDIA RTX A1000 Laptop GPU (n=1) | |
| Lenovo ThinkPad P15v G2 21A9000XGE | |
| CrossMark / Productivity | |
| Dell Precision 5000 5470 | |
| Przeciętny Intel Core i9-12900H, NVIDIA RTX A1000 Laptop GPU (n=1) | |
| Lenovo ThinkPad P15v G2 21A9000XGE | |
| CrossMark / Creativity | |
| Dell Precision 5000 5470 | |
| Przeciętny Intel Core i9-12900H, NVIDIA RTX A1000 Laptop GPU (n=1) | |
| Lenovo ThinkPad P15v G2 21A9000XGE | |
| CrossMark / Responsiveness | |
| Dell Precision 5000 5470 | |
| Przeciętny Intel Core i9-12900H, NVIDIA RTX A1000 Laptop GPU (n=1) | |
| Lenovo ThinkPad P15v G2 21A9000XGE | |
| PCMark 10 Score | 6870 pkt. | |
Pomoc | ||
| AIDA64 / Memory Copy | |
| Dell Precision 5000 5470 | |
| Przeciętny Intel Core i9-12900H (34438 - 74264, n=29) | |
| Lenovo ThinkPad P14s G2 AMD | |
| HP ZBook Firefly 14 G8 2C9Q2EA | |
| HP ZBook Firefly 14 G7 | |
| Lenovo ThinkPad P15v G2 21A9000XGE | |
| AIDA64 / Memory Read | |
| Dell Precision 5000 5470 | |
| Przeciętny Intel Core i9-12900H (36365 - 74642, n=29) | |
| Lenovo ThinkPad P14s G2 AMD | |
| HP ZBook Firefly 14 G8 2C9Q2EA | |
| HP ZBook Firefly 14 G7 | |
| Lenovo ThinkPad P15v G2 21A9000XGE | |
| AIDA64 / Memory Write | |
| Dell Precision 5000 5470 | |
| Przeciętny Intel Core i9-12900H (32276 - 67858, n=29) | |
| HP ZBook Firefly 14 G8 2C9Q2EA | |
| Lenovo ThinkPad P14s G2 AMD | |
| HP ZBook Firefly 14 G7 | |
| Lenovo ThinkPad P15v G2 21A9000XGE | |
| AIDA64 / Memory Latency | |
| Dell Precision 5000 5470 | |
| Lenovo ThinkPad P14s G2 AMD | |
| Lenovo ThinkPad P15v G2 21A9000XGE | |
| Przeciętny Intel Core i9-12900H (74.7 - 118.1, n=28) | |
| HP ZBook Firefly 14 G7 | |
| HP ZBook Firefly 14 G8 2C9Q2EA | |
* ... im mniej tym lepiej
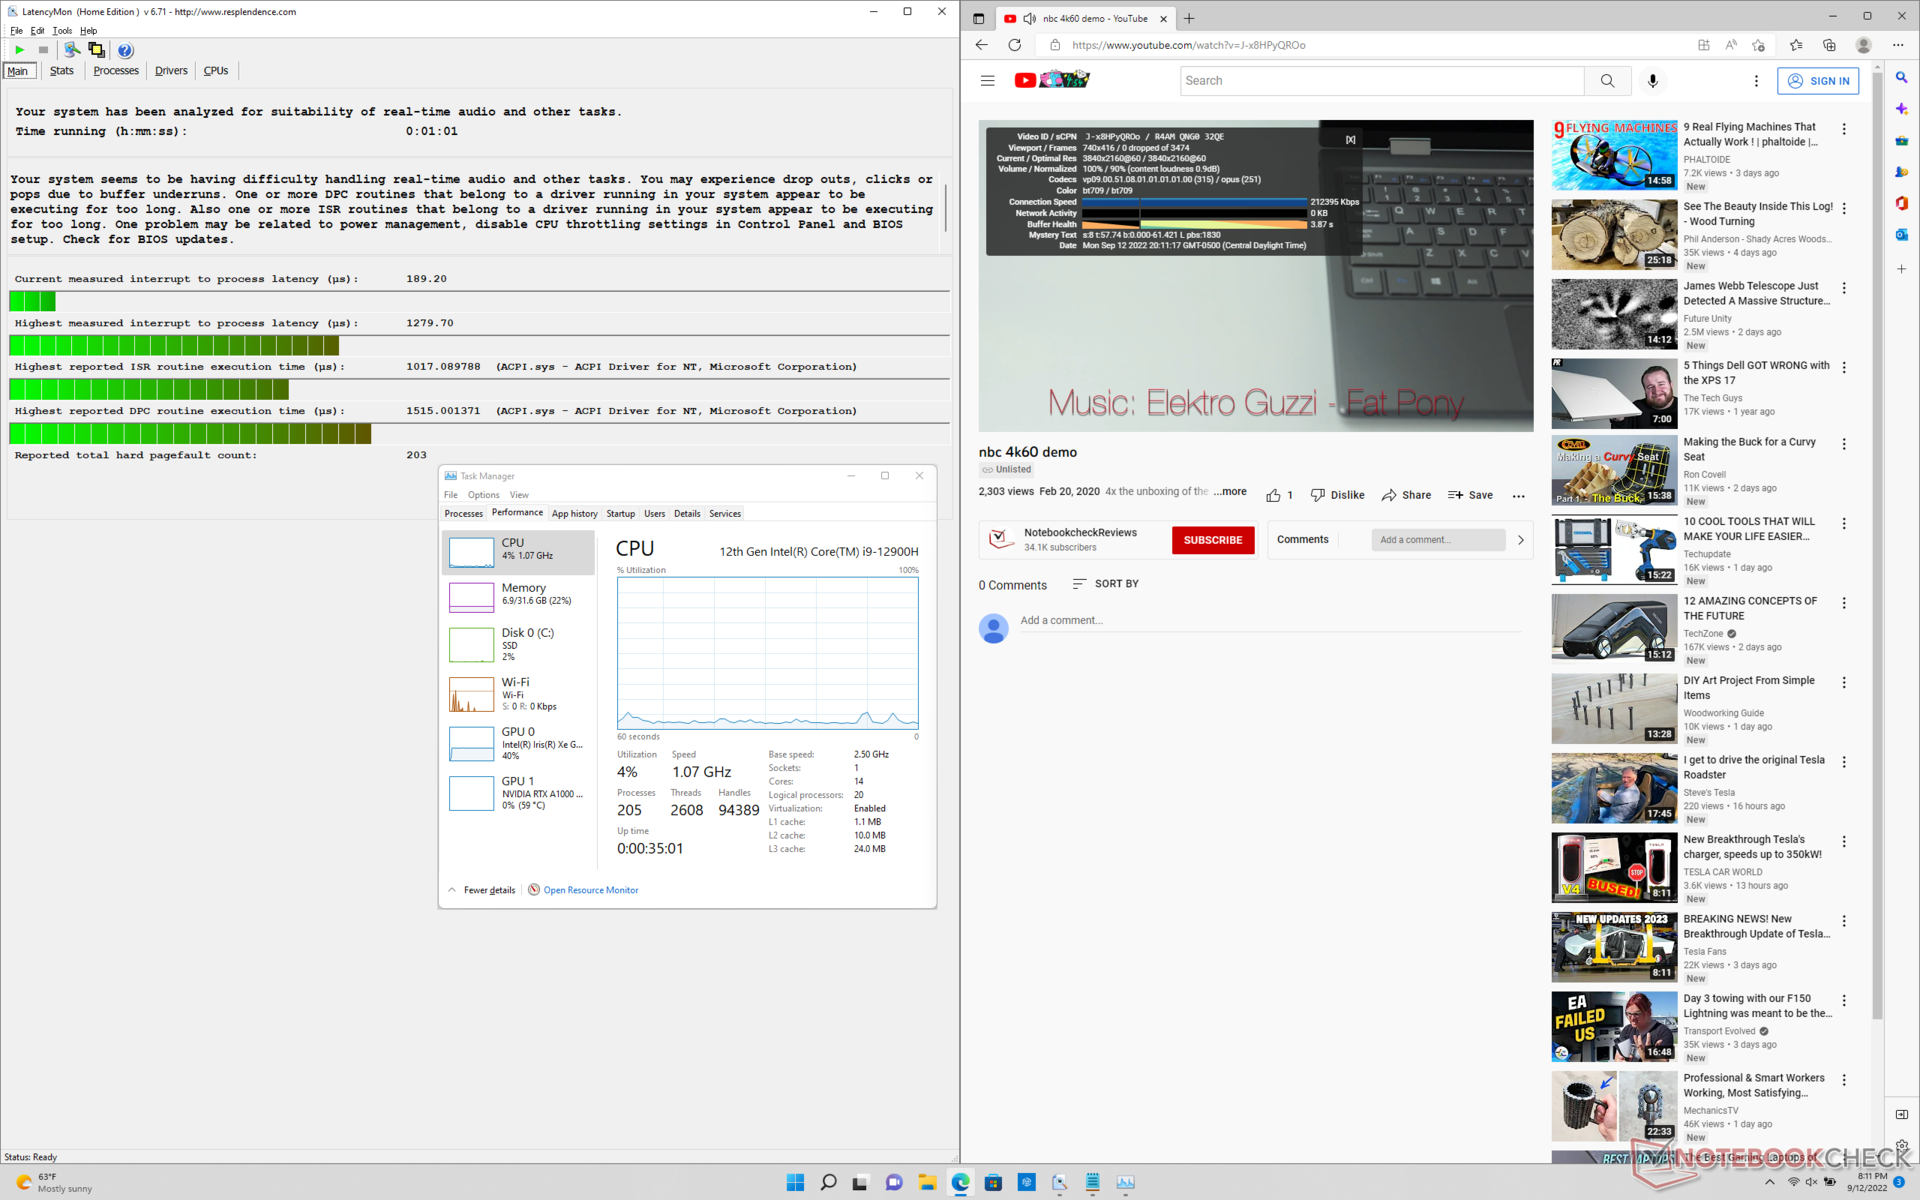
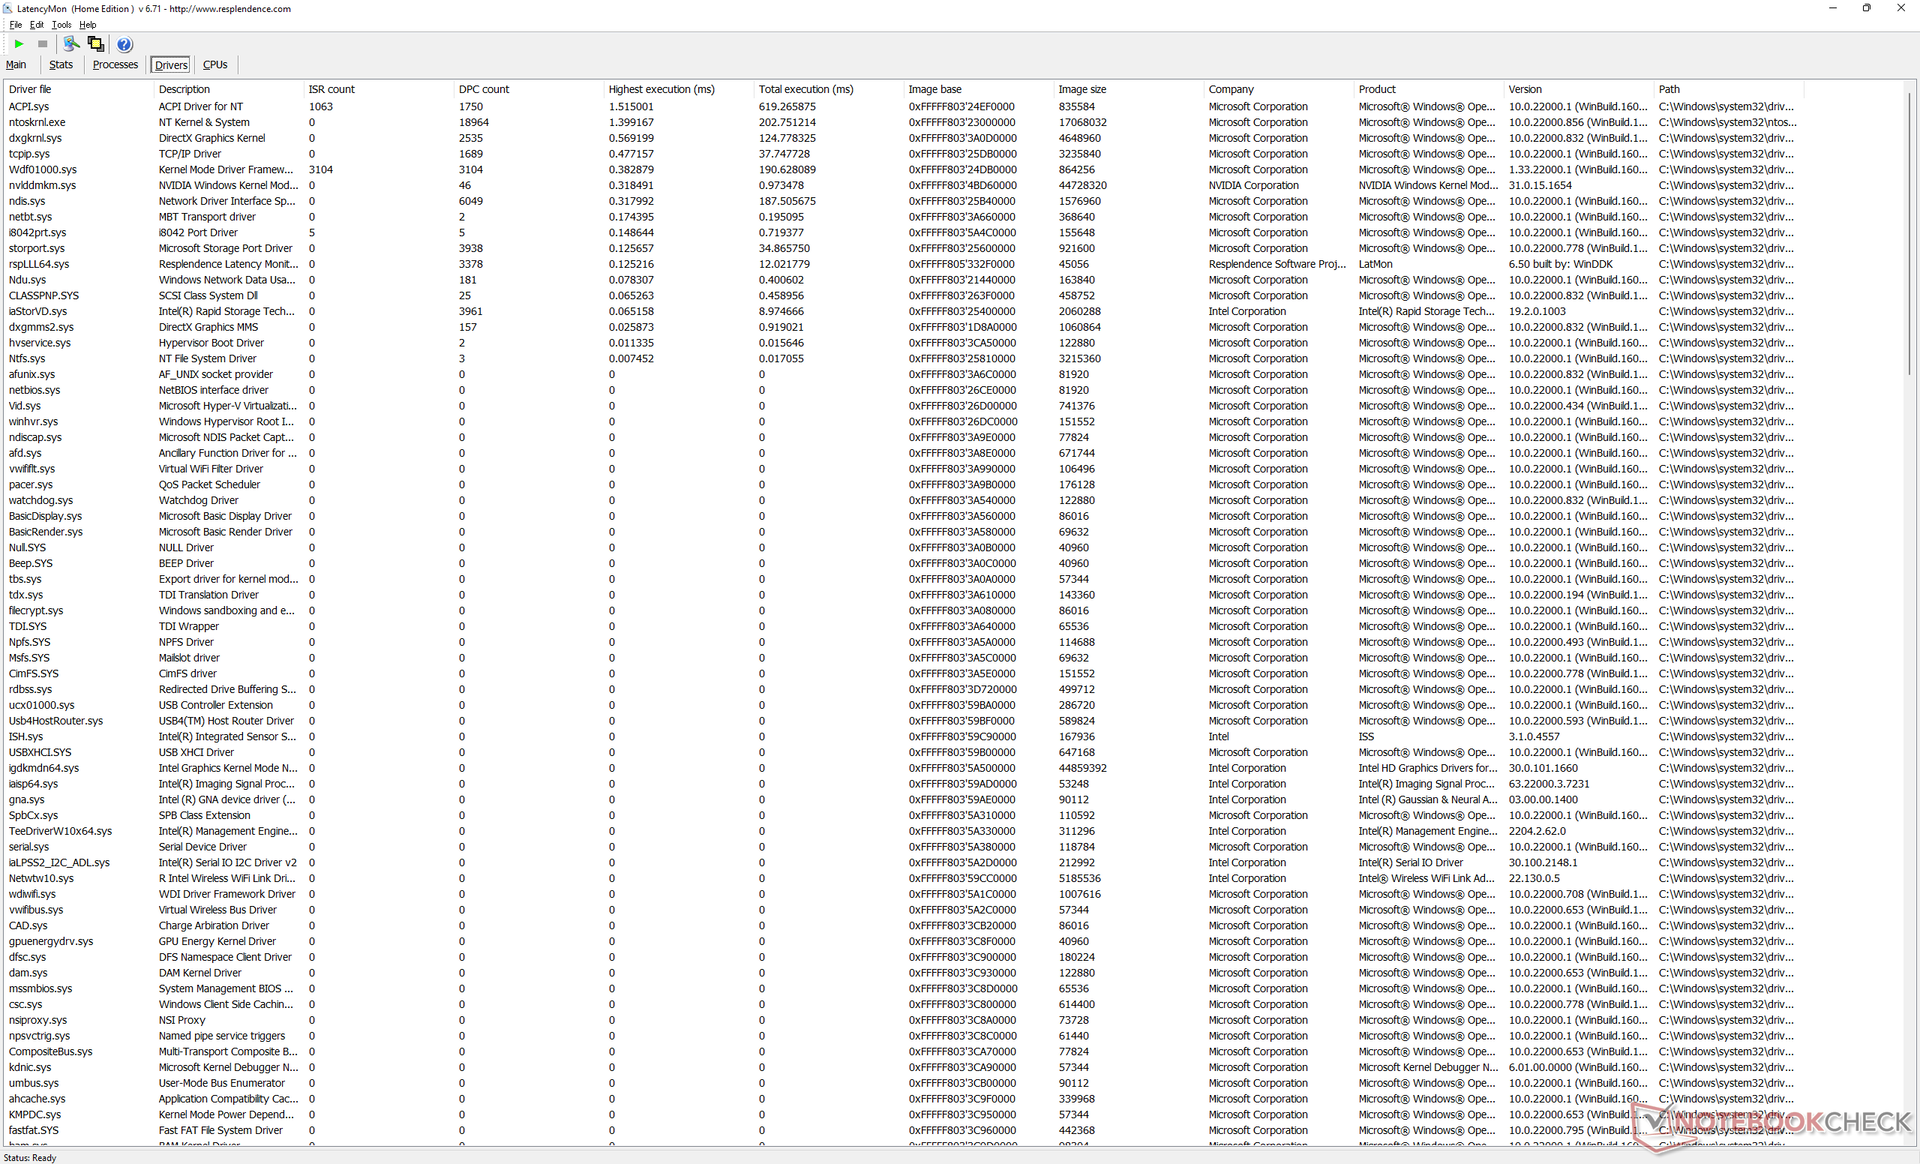
Opóźnienie DPC
LatencyMon ujawnia lekkie problemy z DPC podczas otwierania wielu kart przeglądarki na naszej stronie głównej, co jest nieco rozczarowujące na stacji roboczej. odtwarzanie w rozdzielczości 4K przy 60 FPS jest poza tym perfekcyjne i nie odnotowaliśmy żadnych spadków klatek podczas naszego minutowego testu wideo.
| DPC Latencies / LatencyMon - interrupt to process latency (max), Web, Youtube, Prime95 | |
| Lenovo ThinkPad P15v G2 21A9000XGE | |
| HP ZBook Firefly 14 G8 2C9Q2EA | |
| Lenovo ThinkPad P14s G2 AMD | |
| HP ZBook Firefly 14 G7 | |
| Dell Precision 5000 5470 | |
| Dell Precision 5000 5560 | |
* ... im mniej tym lepiej
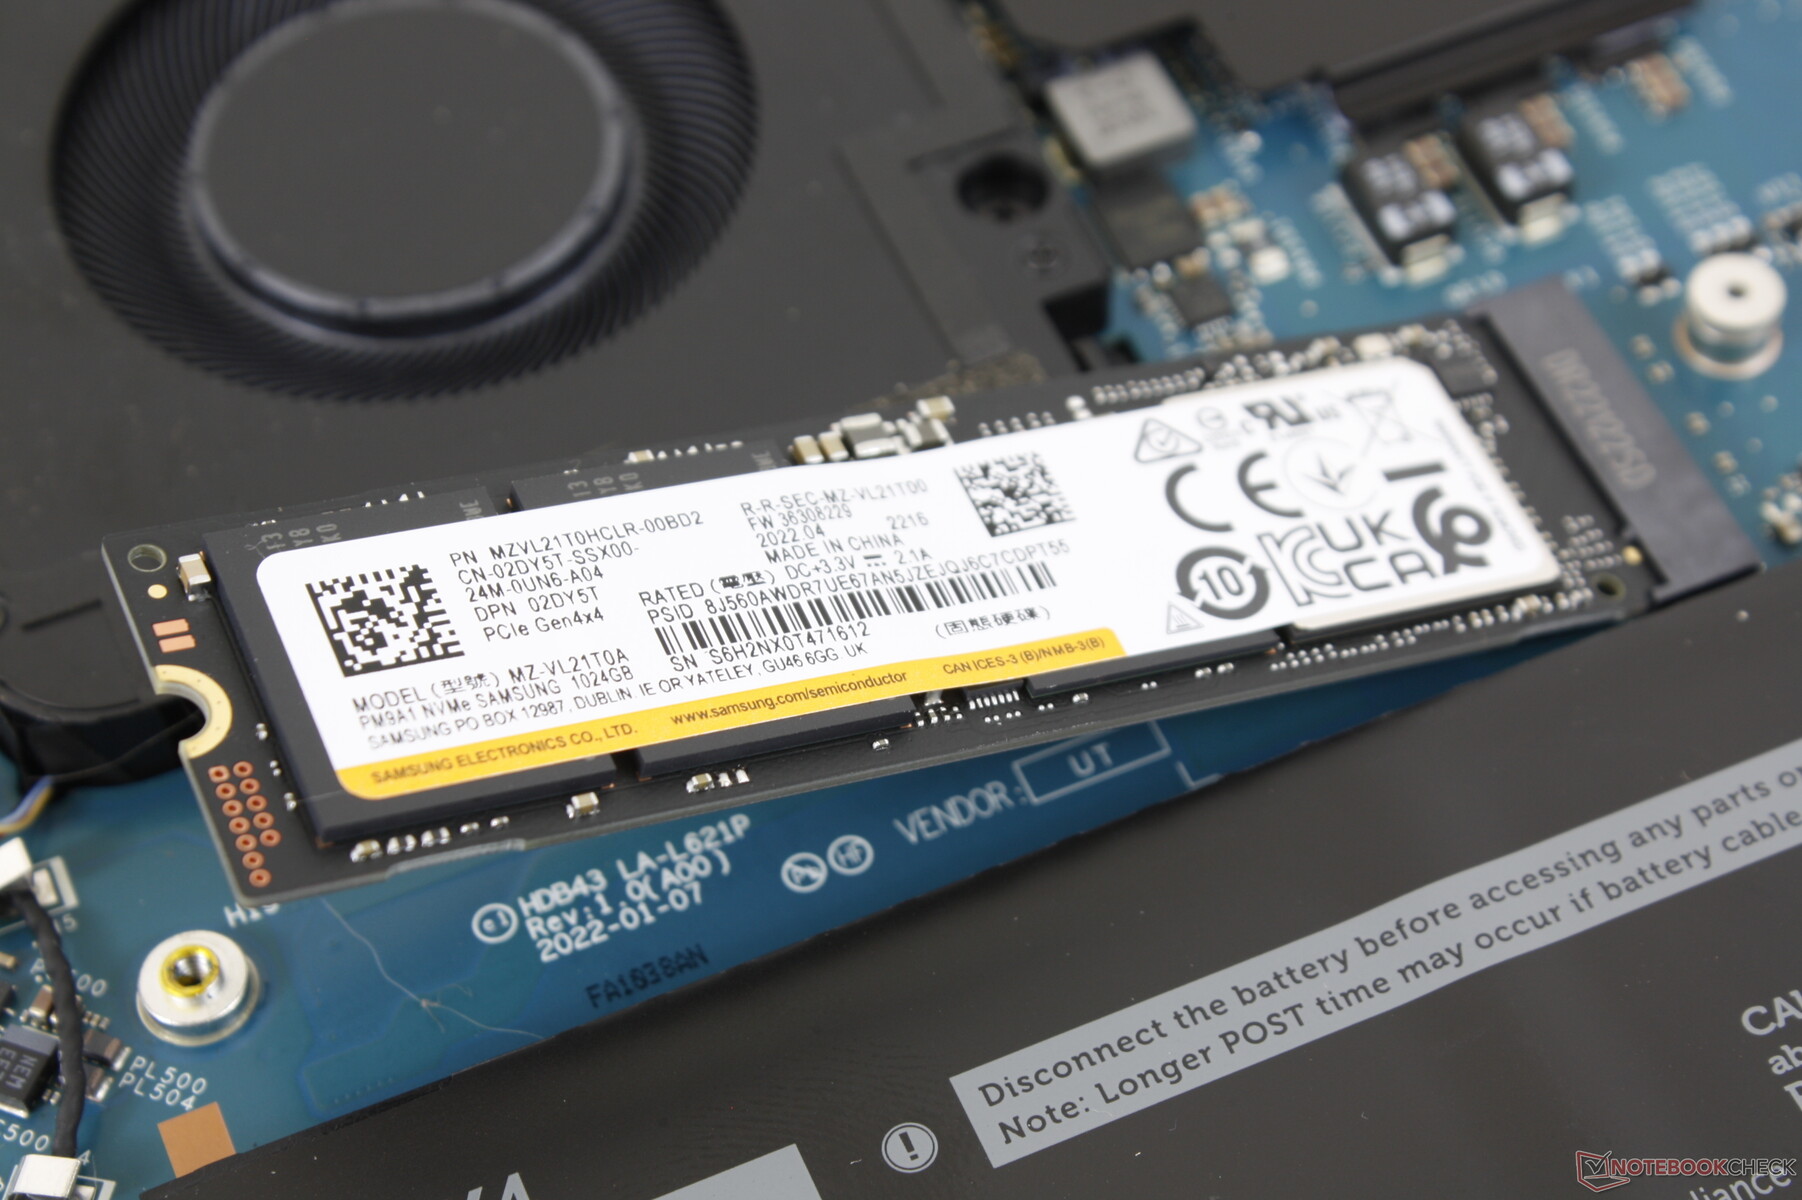
Urządzenia do przechowywania danych
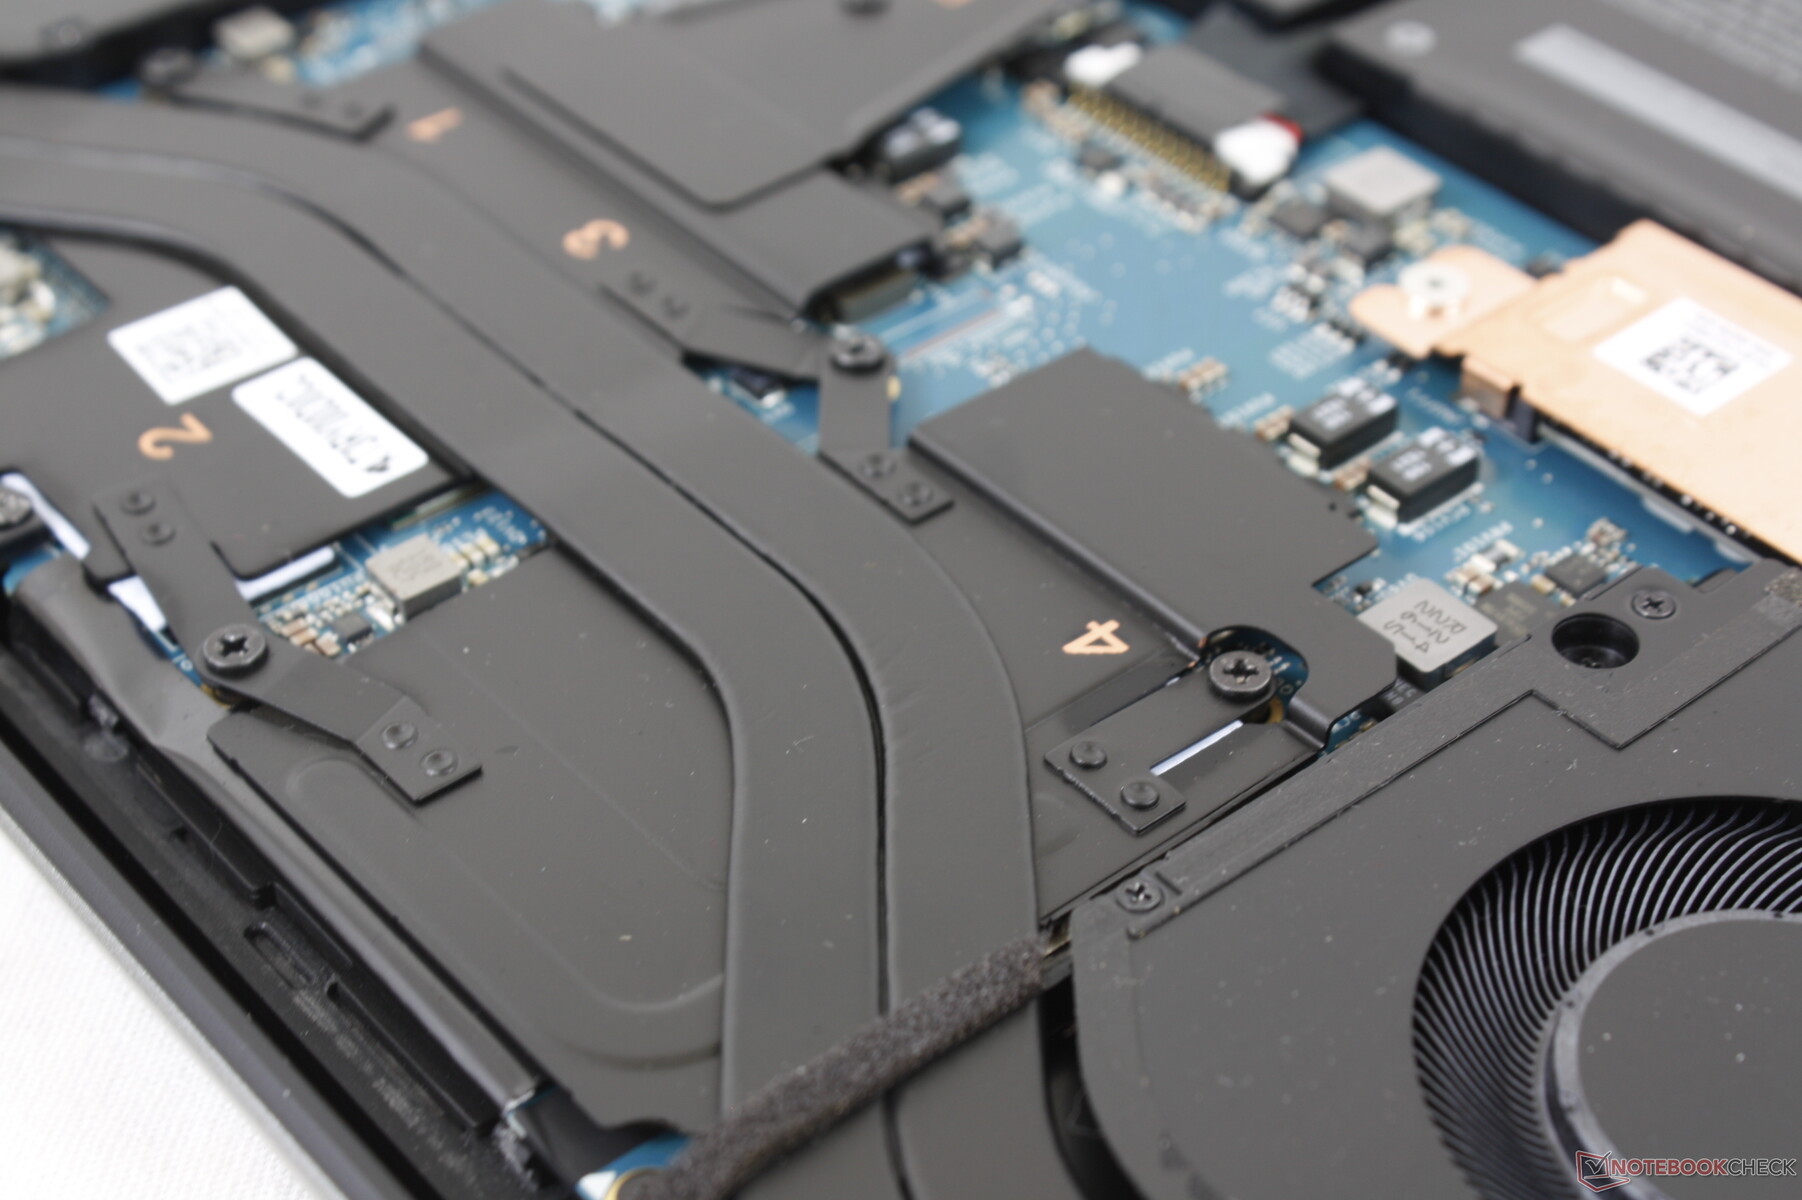
Dell oferuje opcje pamięci masowej PCIe3 lub PCIe4 o pojemności od 256 GB do 4 TB z opcjonalnym samoszyfrowaniem. PCIe4 Samsung PM9A1 w naszym teście posiada własny miedziany rozpraszacz ciepła, który zapewnia lepszą wydajność niż w laptopach bez rozpraszacza ciepła SSD, takich jak Latitude 7330.

| Drive Performance rating - Percent | |
| Dell Precision 5000 5560 | |
| Dell Precision 5000 5470 | |
| Lenovo ThinkPad P14s G2 AMD | |
| HP ZBook Firefly 14 G8 2C9Q2EA | |
| HP ZBook Firefly 14 G7 | |
| Lenovo ThinkPad P15v G2 21A9000XGE | |
| DiskSpd | |
| seq read | |
| Dell Precision 5000 5470 | |
| Dell Precision 5000 5560 | |
| Lenovo ThinkPad P15v G2 21A9000XGE | |
| HP ZBook Firefly 14 G7 | |
| HP ZBook Firefly 14 G8 2C9Q2EA | |
| Lenovo ThinkPad P14s G2 AMD | |
| seq write | |
| Dell Precision 5000 5470 | |
| Dell Precision 5000 5560 | |
| HP ZBook Firefly 14 G7 | |
| Lenovo ThinkPad P15v G2 21A9000XGE | |
| HP ZBook Firefly 14 G8 2C9Q2EA | |
| Lenovo ThinkPad P14s G2 AMD | |
| seq q8 t1 read | |
| Dell Precision 5000 5560 | |
| Dell Precision 5000 5470 | |
| Lenovo ThinkPad P14s G2 AMD | |
| HP ZBook Firefly 14 G8 2C9Q2EA | |
| Lenovo ThinkPad P15v G2 21A9000XGE | |
| HP ZBook Firefly 14 G7 | |
| seq q8 t1 write | |
| Dell Precision 5000 5470 | |
| Dell Precision 5000 5560 | |
| Lenovo ThinkPad P14s G2 AMD | |
| HP ZBook Firefly 14 G8 2C9Q2EA | |
| HP ZBook Firefly 14 G7 | |
| Lenovo ThinkPad P15v G2 21A9000XGE | |
| 4k q1 t1 read | |
| Dell Precision 5000 5560 | |
| Dell Precision 5000 5470 | |
| Lenovo ThinkPad P14s G2 AMD | |
| HP ZBook Firefly 14 G8 2C9Q2EA | |
| HP ZBook Firefly 14 G7 | |
| Lenovo ThinkPad P15v G2 21A9000XGE | |
| 4k q1 t1 write | |
| Dell Precision 5000 5560 | |
| Dell Precision 5000 5470 | |
| HP ZBook Firefly 14 G8 2C9Q2EA | |
| HP ZBook Firefly 14 G7 | |
| Lenovo ThinkPad P14s G2 AMD | |
| Lenovo ThinkPad P15v G2 21A9000XGE | |
| 4k q32 t16 read | |
| HP ZBook Firefly 14 G8 2C9Q2EA | |
| Lenovo ThinkPad P14s G2 AMD | |
| HP ZBook Firefly 14 G7 | |
| Lenovo ThinkPad P15v G2 21A9000XGE | |
| Dell Precision 5000 5560 | |
| Dell Precision 5000 5470 | |
| 4k q32 t16 write | |
| HP ZBook Firefly 14 G8 2C9Q2EA | |
| Lenovo ThinkPad P14s G2 AMD | |
| HP ZBook Firefly 14 G7 | |
| Dell Precision 5000 5470 | |
| Dell Precision 5000 5560 | |
| Lenovo ThinkPad P15v G2 21A9000XGE | |
| AS SSD | |
| Score Total | |
| Dell Precision 5000 5560 | |
| Dell Precision 5000 5470 | |
| Lenovo ThinkPad P14s G2 AMD | |
| HP ZBook Firefly 14 G8 2C9Q2EA | |
| Lenovo ThinkPad P15v G2 21A9000XGE | |
| HP ZBook Firefly 14 G7 | |
| Score Read | |
| Dell Precision 5000 5560 | |
| Dell Precision 5000 5470 | |
| HP ZBook Firefly 14 G8 2C9Q2EA | |
| HP ZBook Firefly 14 G7 | |
| Lenovo ThinkPad P14s G2 AMD | |
| Lenovo ThinkPad P15v G2 21A9000XGE | |
| Score Write | |
| Dell Precision 5000 5470 | |
| Dell Precision 5000 5560 | |
| Lenovo ThinkPad P14s G2 AMD | |
| HP ZBook Firefly 14 G8 2C9Q2EA | |
| Lenovo ThinkPad P15v G2 21A9000XGE | |
| HP ZBook Firefly 14 G7 | |
| Seq Read | |
| Dell Precision 5000 5560 | |
| Dell Precision 5000 5470 | |
| Lenovo ThinkPad P14s G2 AMD | |
| Lenovo ThinkPad P15v G2 21A9000XGE | |
| HP ZBook Firefly 14 G8 2C9Q2EA | |
| HP ZBook Firefly 14 G7 | |
| Seq Write | |
| Dell Precision 5000 5470 | |
| Dell Precision 5000 5560 | |
| Lenovo ThinkPad P14s G2 AMD | |
| Lenovo ThinkPad P15v G2 21A9000XGE | |
| HP ZBook Firefly 14 G8 2C9Q2EA | |
| HP ZBook Firefly 14 G7 | |
| 4K Read | |
| Dell Precision 5000 5560 | |
| Dell Precision 5000 5470 | |
| HP ZBook Firefly 14 G8 2C9Q2EA | |
| Lenovo ThinkPad P14s G2 AMD | |
| HP ZBook Firefly 14 G7 | |
| Lenovo ThinkPad P15v G2 21A9000XGE | |
| 4K Write | |
| Dell Precision 5000 5560 | |
| Dell Precision 5000 5470 | |
| HP ZBook Firefly 14 G7 | |
| HP ZBook Firefly 14 G8 2C9Q2EA | |
| Lenovo ThinkPad P14s G2 AMD | |
| Lenovo ThinkPad P15v G2 21A9000XGE | |
| 4K-64 Read | |
| Dell Precision 5000 5560 | |
| HP ZBook Firefly 14 G8 2C9Q2EA | |
| HP ZBook Firefly 14 G7 | |
| Lenovo ThinkPad P14s G2 AMD | |
| Lenovo ThinkPad P15v G2 21A9000XGE | |
| Dell Precision 5000 5470 | |
| 4K-64 Write | |
| Dell Precision 5000 5470 | |
| Dell Precision 5000 5560 | |
| Lenovo ThinkPad P14s G2 AMD | |
| HP ZBook Firefly 14 G8 2C9Q2EA | |
| Lenovo ThinkPad P15v G2 21A9000XGE | |
| HP ZBook Firefly 14 G7 | |
| Access Time Read | |
| Lenovo ThinkPad P15v G2 21A9000XGE | |
| HP ZBook Firefly 14 G8 2C9Q2EA | |
| HP ZBook Firefly 14 G7 | |
| Lenovo ThinkPad P14s G2 AMD | |
| Dell Precision 5000 5470 | |
| Dell Precision 5000 5560 | |
| Access Time Write | |
| Dell Precision 5000 5470 | |
| Dell Precision 5000 5560 | |
| Lenovo ThinkPad P15v G2 21A9000XGE | |
| HP ZBook Firefly 14 G8 2C9Q2EA | |
| HP ZBook Firefly 14 G7 | |
| Lenovo ThinkPad P14s G2 AMD | |
* ... im mniej tym lepiej
Disk Throttling: DiskSpd Read Loop, Queue Depth 8
Wydajność GPU - grafika RTX A1000 o mocy 40 W
Ogólna wydajność grafiki jest o około 10 do 20 procent szybsza niż w przypadku zeszłorocznegoNVIDIA T1200. Przede wszystkim jednak RTX A1000 jest tylko o 10 do 15 procent wolniejszy od RTX A2000 na stronie Precision 5560, z wyjątkiem aplikacji ray-tracingowych, gdzie A2000 może być ponad 2x szybszy. Jeśli Twoje obciążenia robocze obejmują efekty ray tracingu, to RTX A1000 jest tym, którego należy unikać.
Uruchomienie trybu Balanced zamiast trybu Ultra Performance zmniejsza wydajność procesora o około 33%, podczas gdy wydajność GPU jest mniejsza.
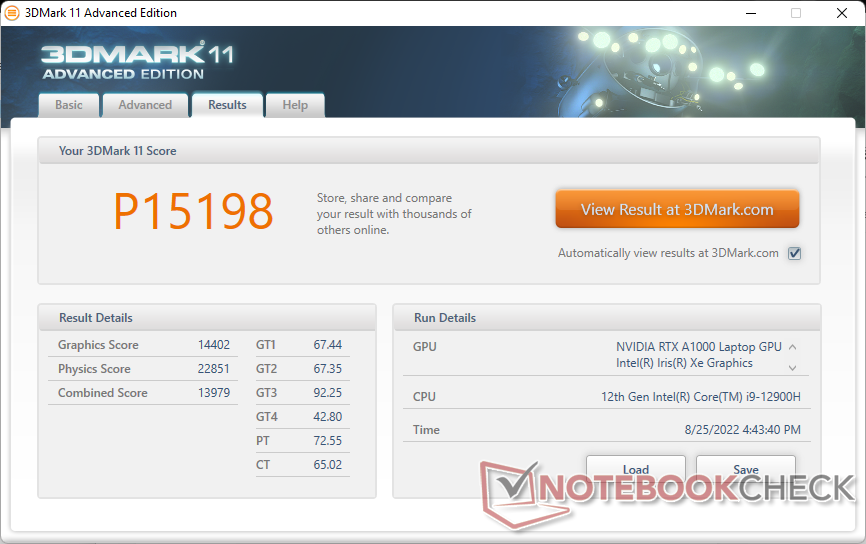

| 3DMark 11 - 1280x720 Performance GPU | |
| HP ZBook Fury 17 G8-4A6A9EA | |
| HP ZBook Fury 17 G7 119W5EA | |
| Dell G15 5510 | |
| Dell Precision 5000 5560 | |
| Przeciętny NVIDIA RTX A1000 Laptop GPU (14402 - 15867, n=2) | |
| Dell Precision 5000 5470 | |
| Lenovo ThinkPad P1 G4-20Y4Z9DVUS | |
| Lenovo ThinkPad P15v G2 21A9000XGE | |
| HP ZBook Power 15 G8 313S5EA | |
| HP ZBook Firefly 15 G8 2C9R7EA | |
| Dell Precision 3000 3551 | |
| Lenovo ThinkPad P15s Gen1-20T4000JGE | |
| 3DMark | |
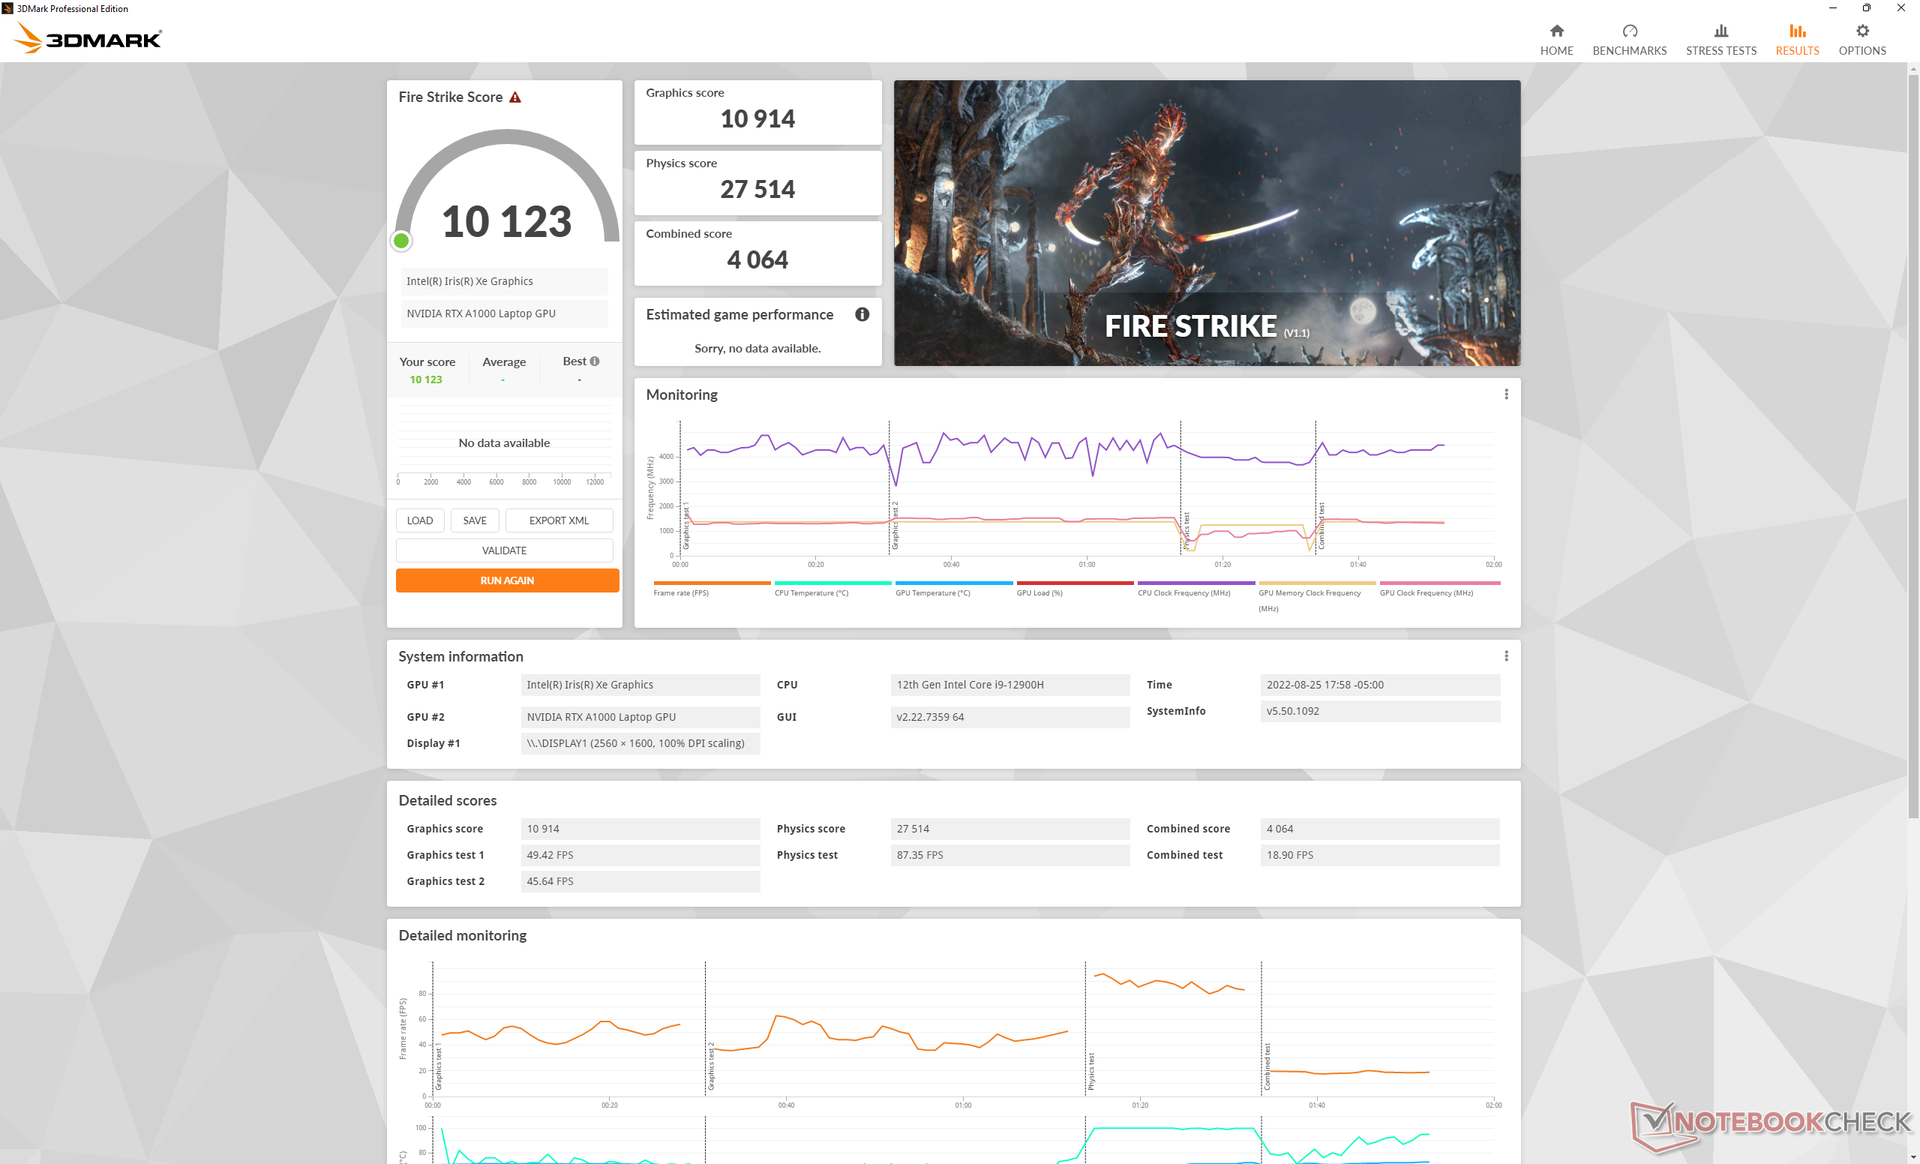
| 1920x1080 Fire Strike Graphics | |
| HP ZBook Fury 17 G7 119W5EA | |
| HP ZBook Fury 17 G8-4A6A9EA | |
| Dell G15 5510 | |
| Dell Precision 5000 5560 | |
| Przeciętny NVIDIA RTX A1000 Laptop GPU (10914 - 11728, n=2) | |
| Dell Precision 5000 5470 | |
| Lenovo ThinkPad P1 G4-20Y4Z9DVUS | |
| Lenovo ThinkPad P15v G2 21A9000XGE | |
| HP ZBook Power 15 G8 313S5EA | |
| HP ZBook Firefly 15 G8 2C9R7EA | |
| Dell Precision 3000 3551 | |
| Lenovo ThinkPad P15s Gen1-20T4000JGE | |
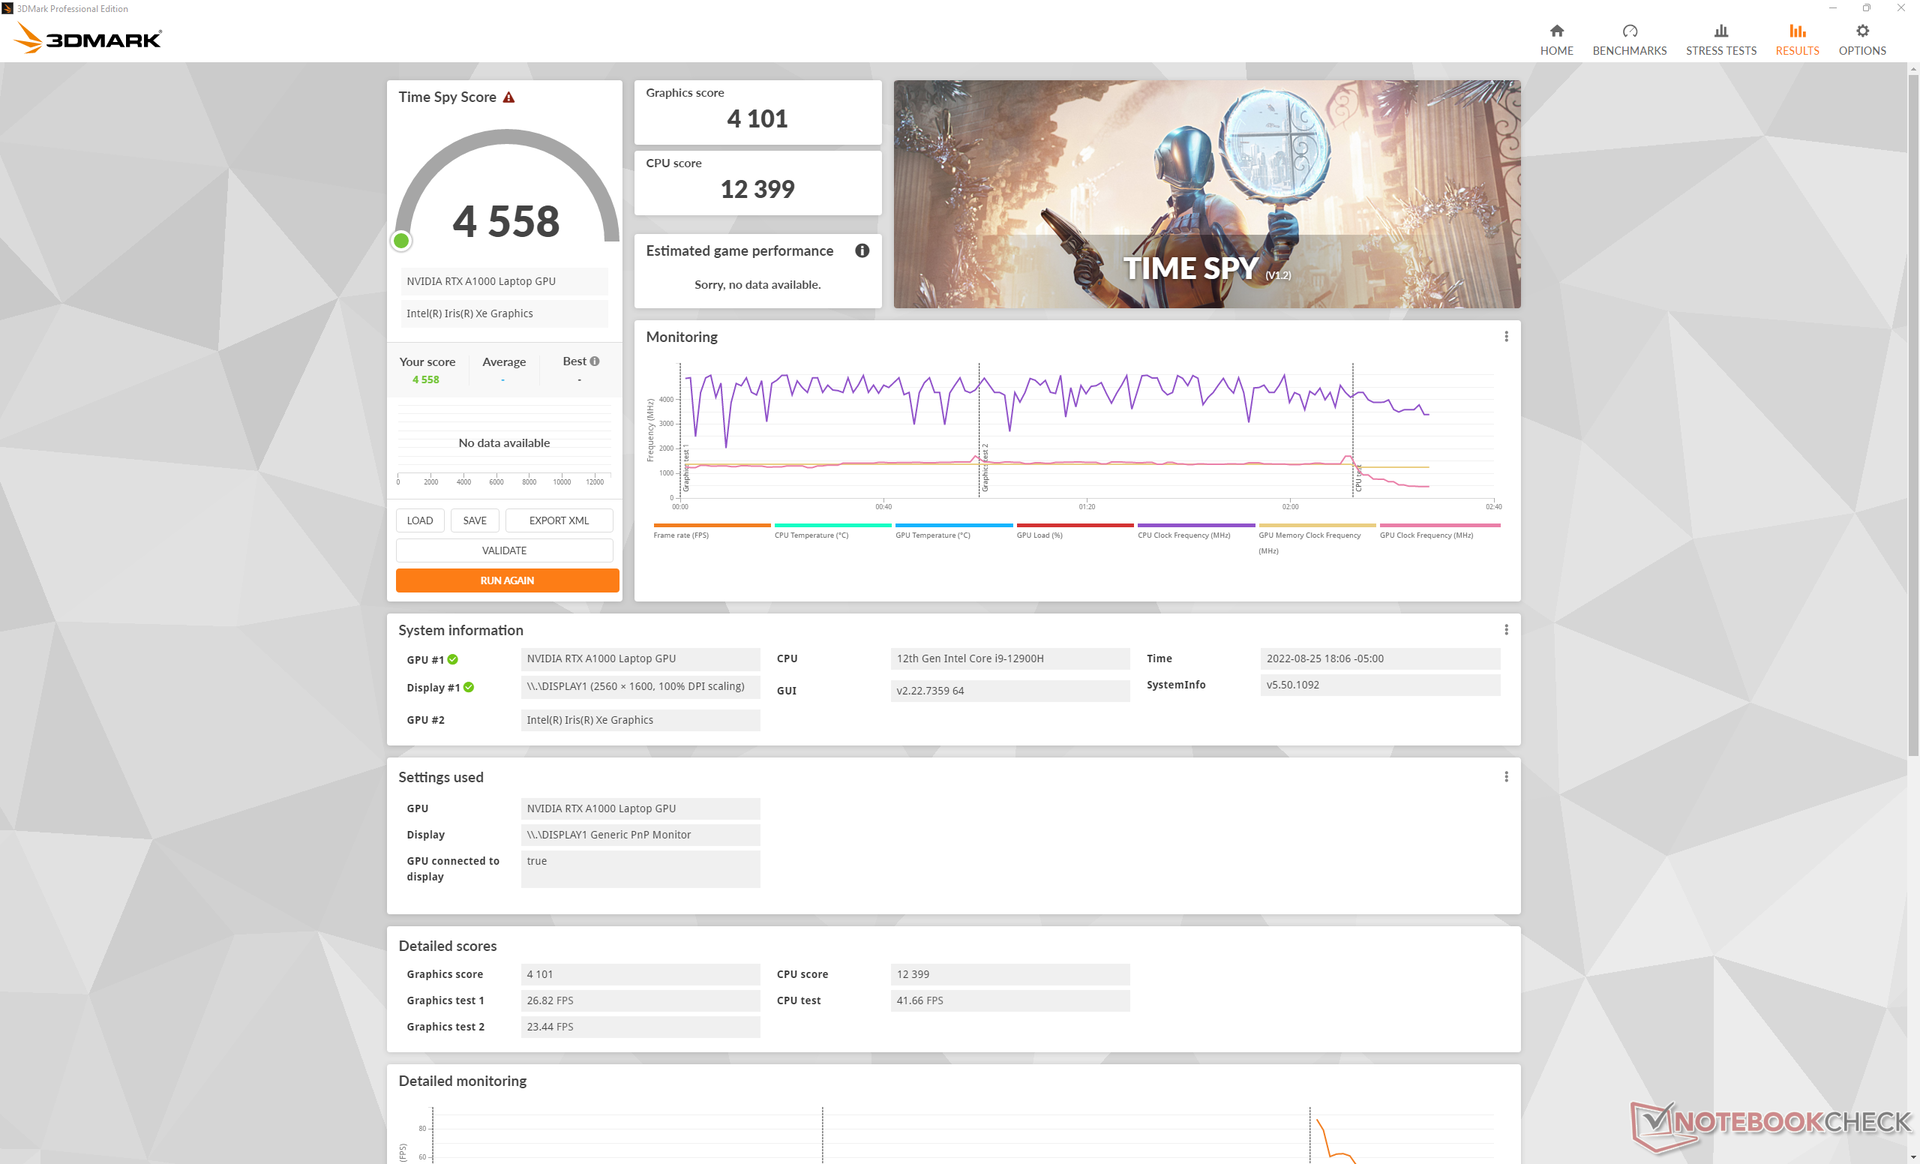
| 2560x1440 Time Spy Graphics | |
| HP ZBook Fury 17 G7 119W5EA | |
| HP ZBook Fury 17 G8-4A6A9EA | |
| Dell G15 5510 | |
| Dell Precision 5000 5560 | |
| Przeciętny NVIDIA RTX A1000 Laptop GPU (4101 - 4410, n=2) | |
| Dell Precision 5000 5470 | |
| Lenovo ThinkPad P1 G4-20Y4Z9DVUS | |
| Lenovo ThinkPad P15v G2 21A9000XGE | |
| HP ZBook Power 15 G8 313S5EA | |
| HP ZBook Firefly 15 G8 2C9R7EA | |
| Dell Precision 3000 3551 | |
| Lenovo ThinkPad P15s Gen1-20T4000JGE | |
| 2560x1440 Port Royal Graphics | |
| HP ZBook Fury 17 G8-4A6A9EA | |
| Przeciętny NVIDIA RTX A1000 Laptop GPU (304 - 2649, n=2) | |
| Dell Precision 5000 5560 | |
| Dell G15 5510 | |
| Dell Precision 5000 5470 | |
| SPECviewperf 2020 | |
| 1920x1080 3ds Max (3dsmax-07) | |
| HP ZBook Fury 17 G8-4A6A9EA | |
| HP ZBook Fury 17 G7 119W5EA | |
| Dell Precision 5000 5560 | |
| Przeciętny NVIDIA RTX A1000 Laptop GPU (54.4 - 55.4, n=2) | |
| Dell Precision 5000 5470 | |
| Lenovo ThinkPad P1 G4-20Y4Z9DVUS | |
| Lenovo ThinkPad P15v G2 21A9000XGE | |
| HP ZBook Power 15 G8 313S5EA | |
| HP ZBook Firefly 15 G8 2C9R7EA | |
| Lenovo ThinkPad P15s Gen1-20T4000JGE | |
| 1920x1080 CATIA (catia-06) | |
| HP ZBook Fury 17 G8-4A6A9EA | |
| HP ZBook Fury 17 G7 119W5EA | |
| Dell Precision 5000 5560 | |
| Przeciętny NVIDIA RTX A1000 Laptop GPU (47.4 - 52.2, n=2) | |
| Dell Precision 5000 5470 | |
| Lenovo ThinkPad P1 G4-20Y4Z9DVUS | |
| Lenovo ThinkPad P15v G2 21A9000XGE | |
| HP ZBook Power 15 G8 313S5EA | |
| HP ZBook Firefly 15 G8 2C9R7EA | |
| Lenovo ThinkPad P15s Gen1-20T4000JGE | |
| 1920x1080 Creo (creo-03) | |
| HP ZBook Fury 17 G8-4A6A9EA | |
| Dell Precision 5000 5560 | |
| Przeciętny NVIDIA RTX A1000 Laptop GPU (87.2 - 90.9, n=2) | |
| HP ZBook Fury 17 G7 119W5EA | |
| Dell Precision 5000 5470 | |
| Lenovo ThinkPad P1 G4-20Y4Z9DVUS | |
| Lenovo ThinkPad P15v G2 21A9000XGE | |
| HP ZBook Power 15 G8 313S5EA | |
| HP ZBook Firefly 15 G8 2C9R7EA | |
| Lenovo ThinkPad P15s Gen1-20T4000JGE | |
| 1920x1080 Energy (energy-03) | |
| HP ZBook Fury 17 G8-4A6A9EA | |
| HP ZBook Fury 17 G7 119W5EA | |
| Dell Precision 5000 5560 | |
| Przeciętny NVIDIA RTX A1000 Laptop GPU (23.8 - 30.3, n=2) | |
| Dell Precision 5000 5470 | |
| Lenovo ThinkPad P1 G4-20Y4Z9DVUS | |
| Lenovo ThinkPad P15v G2 21A9000XGE | |
| HP ZBook Power 15 G8 313S5EA | |
| HP ZBook Firefly 15 G8 2C9R7EA | |
| Lenovo ThinkPad P15s Gen1-20T4000JGE | |
| 1920x1080 Maya (maya-06) | |
| HP ZBook Fury 17 G8-4A6A9EA | |
| Dell Precision 5000 5560 | |
| Przeciętny NVIDIA RTX A1000 Laptop GPU (189.6 - 202, n=2) | |
| Dell Precision 5000 5470 | |
| HP ZBook Fury 17 G7 119W5EA | |
| Lenovo ThinkPad P1 G4-20Y4Z9DVUS | |
| Lenovo ThinkPad P15v G2 21A9000XGE | |
| HP ZBook Power 15 G8 313S5EA | |
| HP ZBook Firefly 15 G8 2C9R7EA | |
| Lenovo ThinkPad P15s Gen1-20T4000JGE | |
| 1920x1080 Medical (medical-03) | |
| HP ZBook Fury 17 G8-4A6A9EA | |
| Przeciętny NVIDIA RTX A1000 Laptop GPU (30.3 - 57.3, n=2) | |
| HP ZBook Fury 17 G7 119W5EA | |
| Dell Precision 5000 5560 | |
| Dell Precision 5000 5470 | |
| Lenovo ThinkPad P1 G4-20Y4Z9DVUS | |
| Lenovo ThinkPad P15v G2 21A9000XGE | |
| HP ZBook Power 15 G8 313S5EA | |
| HP ZBook Firefly 15 G8 2C9R7EA | |
| Lenovo ThinkPad P15s Gen1-20T4000JGE | |
| 1920x1080 Siemens NX (snx-04) | |
| HP ZBook Fury 17 G8-4A6A9EA | |
| Przeciętny NVIDIA RTX A1000 Laptop GPU (174.1 - 194.8, n=2) | |
| HP ZBook Fury 17 G7 119W5EA | |
| Dell Precision 5000 5560 | |
| Dell Precision 5000 5470 | |
| Lenovo ThinkPad P1 G4-20Y4Z9DVUS | |
| Lenovo ThinkPad P15v G2 21A9000XGE | |
| HP ZBook Power 15 G8 313S5EA | |
| HP ZBook Firefly 15 G8 2C9R7EA | |
| Lenovo ThinkPad P15s Gen1-20T4000JGE | |
| 1920x1080 Solidworks (solidworks-05) | |
| HP ZBook Fury 17 G8-4A6A9EA | |
| HP ZBook Fury 17 G7 119W5EA | |
| Dell Precision 5000 5560 | |
| Przeciętny NVIDIA RTX A1000 Laptop GPU (108.5 - 113.7, n=2) | |
| Dell Precision 5000 5470 | |
| Lenovo ThinkPad P1 G4-20Y4Z9DVUS | |
| Lenovo ThinkPad P15v G2 21A9000XGE | |
| HP ZBook Power 15 G8 313S5EA | |
| HP ZBook Firefly 15 G8 2C9R7EA | |
| Lenovo ThinkPad P15s Gen1-20T4000JGE | |
| SPECviewperf 13 | |
| 3ds Max (3dsmax-06) | |
| HP ZBook Fury 17 G8-4A6A9EA | |
| Dell Precision 5000 5560 | |
| HP ZBook Fury 17 G7 119W5EA | |
| Przeciętny NVIDIA RTX A1000 Laptop GPU (123.7 - 127.8, n=2) | |
| Dell Precision 5000 5470 | |
| Lenovo ThinkPad P1 G4-20Y4Z9DVUS | |
| Lenovo ThinkPad P15v G2 21A9000XGE | |
| HP ZBook Power 15 G8 313S5EA | |
| HP ZBook Firefly 15 G8 2C9R7EA | |
| Dell Precision 3000 3551 | |
| Lenovo ThinkPad P15s Gen1-20T4000JGE | |
| Catia (catia-05) | |
| HP ZBook Fury 17 G8-4A6A9EA | |
| Przeciętny NVIDIA RTX A1000 Laptop GPU (184.4 - 218, n=2) | |
| Dell Precision 5000 5560 | |
| Dell Precision 5000 5470 | |
| HP ZBook Fury 17 G7 119W5EA | |
| Lenovo ThinkPad P1 G4-20Y4Z9DVUS | |
| Lenovo ThinkPad P15v G2 21A9000XGE | |
| HP ZBook Power 15 G8 313S5EA | |
| HP ZBook Firefly 15 G8 2C9R7EA | |
| Dell Precision 3000 3551 | |
| Lenovo ThinkPad P15s Gen1-20T4000JGE | |
| Creo (creo-02) | |
| HP ZBook Fury 17 G8-4A6A9EA | |
| HP ZBook Fury 17 G7 119W5EA | |
| Dell Precision 5000 5560 | |
| Przeciętny NVIDIA RTX A1000 Laptop GPU (155.7 - 164.8, n=2) | |
| Dell Precision 5000 5470 | |
| Lenovo ThinkPad P1 G4-20Y4Z9DVUS | |
| Lenovo ThinkPad P15v G2 21A9000XGE | |
| HP ZBook Power 15 G8 313S5EA | |
| HP ZBook Firefly 15 G8 2C9R7EA | |
| Dell Precision 3000 3551 | |
| Lenovo ThinkPad P15s Gen1-20T4000JGE | |
| Energy (energy-02) | |
| HP ZBook Fury 17 G8-4A6A9EA | |
| HP ZBook Fury 17 G7 119W5EA | |
| Dell Precision 5000 5560 | |
| Przeciętny NVIDIA RTX A1000 Laptop GPU (25.1 - 30.3, n=2) | |
| Dell Precision 5000 5470 | |
| Lenovo ThinkPad P1 G4-20Y4Z9DVUS | |
| Lenovo ThinkPad P15v G2 21A9000XGE | |
| HP ZBook Power 15 G8 313S5EA | |
| HP ZBook Firefly 15 G8 2C9R7EA | |
| Dell Precision 3000 3551 | |
| Lenovo ThinkPad P15s Gen1-20T4000JGE | |
| Maya (maya-05) | |
| HP ZBook Fury 17 G8-4A6A9EA | |
| Przeciętny NVIDIA RTX A1000 Laptop GPU (161.7 - 169, n=2) | |
| HP ZBook Fury 17 G7 119W5EA | |
| Dell Precision 5000 5560 | |
| Dell Precision 5000 5470 | |
| Lenovo ThinkPad P1 G4-20Y4Z9DVUS | |
| Lenovo ThinkPad P15v G2 21A9000XGE | |
| HP ZBook Power 15 G8 313S5EA | |
| Dell Precision 3000 3551 | |
| HP ZBook Firefly 15 G8 2C9R7EA | |
| Lenovo ThinkPad P15s Gen1-20T4000JGE | |
| Medical (medical-02) | |
| HP ZBook Fury 17 G8-4A6A9EA | |
| Przeciętny NVIDIA RTX A1000 Laptop GPU (62.1 - 105.5, n=2) | |
| HP ZBook Fury 17 G7 119W5EA | |
| Dell Precision 5000 5560 | |
| Dell Precision 5000 5470 | |
| Lenovo ThinkPad P1 G4-20Y4Z9DVUS | |
| Lenovo ThinkPad P15v G2 21A9000XGE | |
| HP ZBook Power 15 G8 313S5EA | |
| HP ZBook Firefly 15 G8 2C9R7EA | |
| Dell Precision 3000 3551 | |
| Lenovo ThinkPad P15s Gen1-20T4000JGE | |
| Showcase (showcase-02) | |
| HP ZBook Fury 17 G7 119W5EA | |
| HP ZBook Fury 17 G8-4A6A9EA | |
| Dell Precision 5000 5560 | |
| Dell Precision 5000 5470 | |
| Przeciętny NVIDIA RTX A1000 Laptop GPU (55.7 - 57.9, n=2) | |
| Lenovo ThinkPad P1 G4-20Y4Z9DVUS | |
| Lenovo ThinkPad P15v G2 21A9000XGE | |
| HP ZBook Power 15 G8 313S5EA | |
| Dell Precision 3000 3551 | |
| HP ZBook Firefly 15 G8 2C9R7EA | |
| Lenovo ThinkPad P15s Gen1-20T4000JGE | |
| Siemens NX (snx-03) | |
| HP ZBook Fury 17 G8-4A6A9EA | |
| HP ZBook Fury 17 G7 119W5EA | |
| Przeciętny NVIDIA RTX A1000 Laptop GPU (185.1 - 195.8, n=2) | |
| Dell Precision 5000 5470 | |
| Dell Precision 5000 5560 | |
| Lenovo ThinkPad P1 G4-20Y4Z9DVUS | |
| Lenovo ThinkPad P15v G2 21A9000XGE | |
| HP ZBook Power 15 G8 313S5EA | |
| HP ZBook Firefly 15 G8 2C9R7EA | |
| Dell Precision 3000 3551 | |
| Lenovo ThinkPad P15s Gen1-20T4000JGE | |
| Solidworks (sw-04) | |
| HP ZBook Fury 17 G8-4A6A9EA | |
| Przeciętny NVIDIA RTX A1000 Laptop GPU (134.9 - 147.9, n=2) | |
| Dell Precision 5000 5560 | |
| Dell Precision 5000 5470 | |
| Lenovo ThinkPad P1 G4-20Y4Z9DVUS | |
| Lenovo ThinkPad P15v G2 21A9000XGE | |
| HP ZBook Fury 17 G7 119W5EA | |
| HP ZBook Power 15 G8 313S5EA | |
| HP ZBook Firefly 15 G8 2C9R7EA | |
| Dell Precision 3000 3551 | |
| Lenovo ThinkPad P15s Gen1-20T4000JGE | |
| SPECviewperf 12 | |
| 1900x1060 Catia (catia-04) | |
| Dell Precision 5000 5560 | |
| Dell Precision 5000 5470 | |
| Przeciętny NVIDIA RTX A1000 Laptop GPU (n=1) | |
| Dell Precision 3000 3551 | |
| 1900x1060 Creo (creo-01) | |
| Dell Precision 5000 5560 | |
| Przeciętny NVIDIA RTX A1000 Laptop GPU (n=1) | |
| Dell Precision 5000 5470 | |
| Dell Precision 3000 3551 | |
| 1900x1060 Energy (energy-01) | |
| Dell Precision 5000 5560 | |
| Dell Precision 5000 5470 | |
| Przeciętny NVIDIA RTX A1000 Laptop GPU (n=1) | |
| Dell Precision 3000 3551 | |
| 1900x1060 Maya (maya-04) | |
| Dell Precision 5000 5560 | |
| Przeciętny NVIDIA RTX A1000 Laptop GPU (n=1) | |
| Dell Precision 5000 5470 | |
| Dell Precision 3000 3551 | |
| 1900x1060 Medical (medical-01) | |
| Dell Precision 5000 5560 | |
| Dell Precision 5000 5470 | |
| Przeciętny NVIDIA RTX A1000 Laptop GPU (n=1) | |
| Dell Precision 3000 3551 | |
| 1900x1060 Showcase (showcase-01) | |
| Dell Precision 5000 5560 | |
| Dell Precision 5000 5470 | |
| Przeciętny NVIDIA RTX A1000 Laptop GPU (n=1) | |
| Dell Precision 3000 3551 | |
| 1900x1060 Siemens NX (snx-02) | |
| Dell Precision 5000 5470 | |
| Przeciętny NVIDIA RTX A1000 Laptop GPU (n=1) | |
| Dell Precision 5000 5560 | |
| Dell Precision 3000 3551 | |
| 1900x1060 Solidworks (sw-03) | |
| Dell Precision 5000 5560 | |
| Dell Precision 5000 5470 | |
| Przeciętny NVIDIA RTX A1000 Laptop GPU (n=1) | |
| Dell Precision 3000 3551 | |
| 3DMark 11 Performance | 15198 pkt. | |
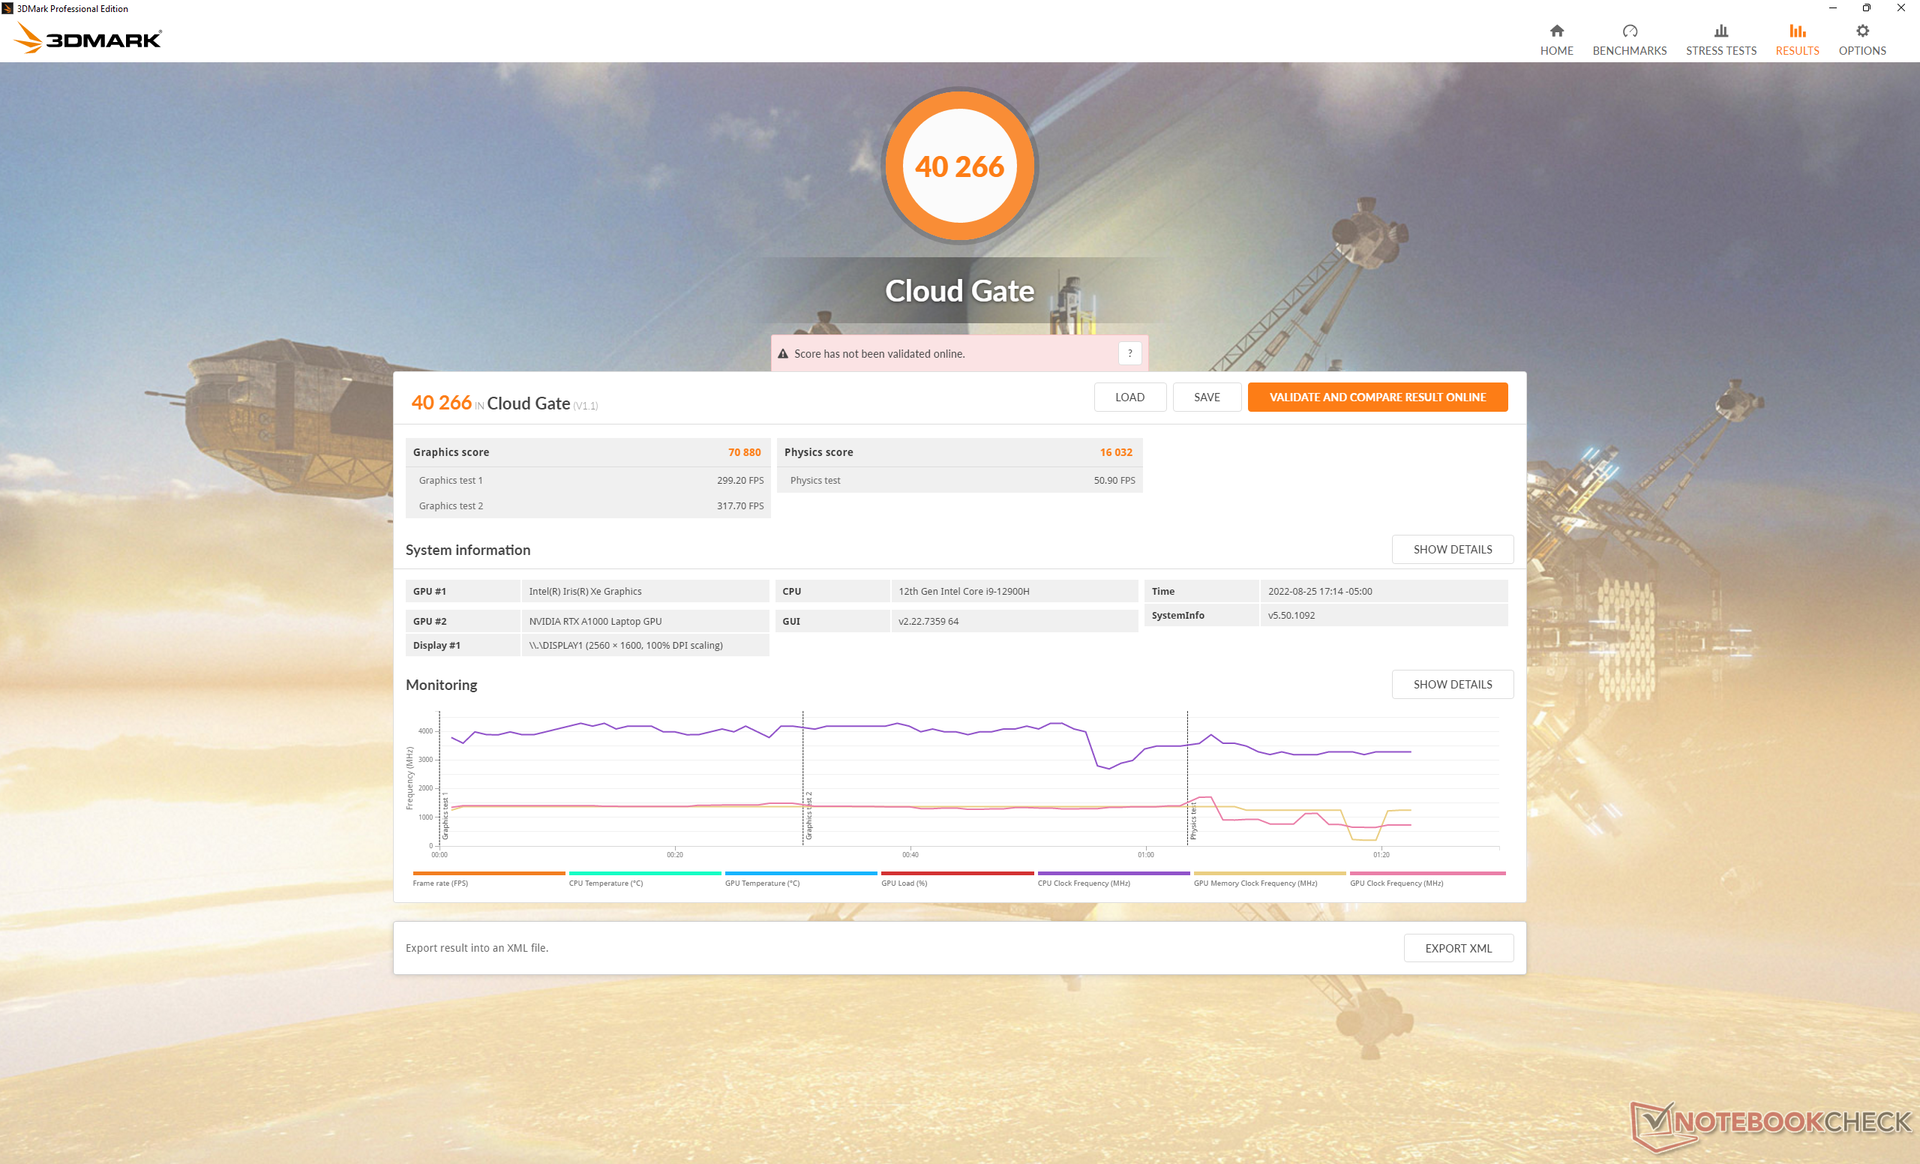
| 3DMark Cloud Gate Standard Score | 40266 pkt. | |
| 3DMark Fire Strike Score | 10123 pkt. | |
| 3DMark Time Spy Score | 4558 pkt. | |
Pomoc | ||
| The Witcher 3 | |
| 1024x768 Low Graphics & Postprocessing | |
| HP ZBook Fury 17 G8-4A6A9EA | |
| Dell Precision 5000 5560 | |
| Przeciętny NVIDIA RTX A1000 Laptop GPU (244 - 257, n=2) | |
| Dell Precision 5000 5470 | |
| HP ZBook Fury 17 G7 119W5EA | |
| Lenovo ThinkPad P1 G4-20Y4Z9DVUS | |
| HP ZBook Power 15 G8 313S5EA | |
| Dell Precision 3000 3551 | |
| Lenovo ThinkPad P15s Gen1-20T4000JGE | |
| 1366x768 Medium Graphics & Postprocessing | |
| HP ZBook Fury 17 G7 119W5EA | |
| HP ZBook Fury 17 G8-4A6A9EA | |
| Przeciętny NVIDIA RTX A1000 Laptop GPU (147.5 - 165, n=2) | |
| Dell Precision 5000 5560 | |
| Dell Precision 5000 5470 | |
| Lenovo ThinkPad P1 G4-20Y4Z9DVUS | |
| HP ZBook Power 15 G8 313S5EA | |
| Dell Precision 3000 3551 | |
| Lenovo ThinkPad P15s Gen1-20T4000JGE | |
| 1920x1080 High Graphics & Postprocessing (Nvidia HairWorks Off) | |
| HP ZBook Fury 17 G7 119W5EA | |
| HP ZBook Fury 17 G8-4A6A9EA | |
| Dell Precision 5000 5560 | |
| Przeciętny NVIDIA RTX A1000 Laptop GPU (82.1 - 87, n=2) | |
| Dell Precision 5000 5470 | |
| Lenovo ThinkPad P1 G4-20Y4Z9DVUS | |
| Lenovo ThinkPad P15v G2 21A9000XGE | |
| HP ZBook Power 15 G8 313S5EA | |
| Dell Precision 3000 3551 | |
| Lenovo ThinkPad P15s Gen1-20T4000JGE | |
| 1920x1080 Ultra Graphics & Postprocessing (HBAO+) | |
| HP ZBook Fury 17 G7 119W5EA | |
| HP ZBook Fury 17 G8-4A6A9EA | |
| Dell Precision 5000 5560 | |
| Przeciętny NVIDIA RTX A1000 Laptop GPU (42.7 - 43.2, n=2) | |
| Dell Precision 5000 5470 | |
| Lenovo ThinkPad P1 G4-20Y4Z9DVUS | |
| Lenovo ThinkPad P15v G2 21A9000XGE | |
| HP ZBook Power 15 G8 313S5EA | |
| HP ZBook Firefly 15 G8 2C9R7EA | |
| Dell Precision 3000 3551 | |
| GTA V | |
| 1024x768 Lowest Settings possible | |
| Dell Precision 5000 5560 | |
| Lenovo ThinkPad P15v G2 21A9000XGE | |
| Dell Precision 5000 5470 | |
| Przeciętny NVIDIA RTX A1000 Laptop GPU (n=1) | |
| HP ZBook Fury 17 G8-4A6A9EA | |
| HP ZBook Power 15 G8 313S5EA | |
| 1920x1080 Lowest Settings possible | |
| Dell Precision 5000 5560 | |
| Dell Precision 5000 5470 | |
| Przeciętny NVIDIA RTX A1000 Laptop GPU (n=1) | |
| 1366x768 Normal/Off AF:4x | |
| Dell Precision 5000 5560 | |
| Przeciętny NVIDIA RTX A1000 Laptop GPU (159.8 - 168.2, n=2) | |
| Dell Precision 5000 5470 | |
| Lenovo ThinkPad P15v G2 21A9000XGE | |
| HP ZBook Fury 17 G8-4A6A9EA | |
| HP ZBook Power 15 G8 313S5EA | |
| 1920x1080 Normal/Off AF:4x | |
| Dell Precision 5000 5560 | |
| Dell Precision 5000 5470 | |
| Przeciętny NVIDIA RTX A1000 Laptop GPU (n=1) | |
| HP ZBook Fury 17 G8-4A6A9EA | |
| HP ZBook Power 15 G8 313S5EA | |
| 1920x1080 High/On (Advanced Graphics Off) AA:2xMSAA + FX AF:8x | |
| Przeciętny NVIDIA RTX A1000 Laptop GPU (113.7 - 129.4, n=2) | |
| Dell Precision 5000 5470 | |
| Dell Precision 5000 5560 | |
| HP ZBook Fury 17 G8-4A6A9EA | |
| Lenovo ThinkPad P15v G2 21A9000XGE | |
| HP ZBook Power 15 G8 313S5EA | |
| 1920x1080 Highest AA:4xMSAA + FX AF:16x | |
| HP ZBook Fury 17 G8-4A6A9EA | |
| Przeciętny NVIDIA RTX A1000 Laptop GPU (58.9 - 62.7, n=2) | |
| Dell Precision 5000 5470 | |
| Dell Precision 5000 5560 | |
| Lenovo ThinkPad P15v G2 21A9000XGE | |
| HP ZBook Power 15 G8 313S5EA | |
| Dota 2 Reborn | |
| 1280x720 min (0/3) fastest | |
| Dell Precision 5000 5560 | |
| Dell Precision 5000 5470 | |
| Lenovo ThinkPad P1 G4-20Y4Z9DVUS | |
| Dell Precision 3000 3551 | |
| HP ZBook Fury 17 G8-4A6A9EA | |
| Przeciętny NVIDIA RTX A1000 Laptop GPU (139.4 - 160.8, n=2) | |
| HP ZBook Power 15 G8 313S5EA | |
| Lenovo ThinkPad P15s Gen1-20T4000JGE | |
| HP ZBook Firefly 15 G8 2C9R7EA | |
| Lenovo ThinkPad P15v G2 21A9000XGE | |
| HP ZBook Fury 17 G7 119W5EA | |
| 1366x768 med (1/3) | |
| Dell Precision 5000 5560 | |
| Dell Precision 5000 5470 | |
| Dell Precision 3000 3551 | |
| Przeciętny NVIDIA RTX A1000 Laptop GPU (128.7 - 147.9, n=2) | |
| Lenovo ThinkPad P1 G4-20Y4Z9DVUS | |
| HP ZBook Fury 17 G8-4A6A9EA | |
| HP ZBook Power 15 G8 313S5EA | |
| Lenovo ThinkPad P15s Gen1-20T4000JGE | |
| HP ZBook Firefly 15 G8 2C9R7EA | |
| Lenovo ThinkPad P15v G2 21A9000XGE | |
| HP ZBook Fury 17 G7 119W5EA | |
| 1920x1080 high (2/3) | |
| Dell Precision 5000 5560 | |
| Lenovo ThinkPad P1 G4-20Y4Z9DVUS | |
| HP ZBook Fury 17 G8-4A6A9EA | |
| Przeciętny NVIDIA RTX A1000 Laptop GPU (112.3 - 125, n=2) | |
| HP ZBook Power 15 G8 313S5EA | |
| Dell Precision 5000 5470 | |
| Lenovo ThinkPad P15v G2 21A9000XGE | |
| HP ZBook Fury 17 G7 119W5EA | |
| HP ZBook Firefly 15 G8 2C9R7EA | |
| Dell Precision 3000 3551 | |
| Lenovo ThinkPad P15s Gen1-20T4000JGE | |
| 1920x1080 ultra (3/3) best looking | |
| Dell Precision 5000 5470 | |
| Przeciętny NVIDIA RTX A1000 Laptop GPU (118.2 - 132.1, n=2) | |
| Dell Precision 5000 5560 | |
| Lenovo ThinkPad P1 G4-20Y4Z9DVUS | |
| HP ZBook Fury 17 G8-4A6A9EA | |
| HP ZBook Power 15 G8 313S5EA | |
| HP ZBook Fury 17 G7 119W5EA | |
| Lenovo ThinkPad P15v G2 21A9000XGE | |
| HP ZBook Firefly 15 G8 2C9R7EA | |
| Dell Precision 3000 3551 | |
| Lenovo ThinkPad P15s Gen1-20T4000JGE | |
| Final Fantasy XV Benchmark | |
| 1280x720 Lite Quality | |
| HP ZBook Fury 17 G8-4A6A9EA | |
| HP ZBook Fury 17 G7 119W5EA | |
| Przeciętny NVIDIA RTX A1000 Laptop GPU (105.3 - 129.2, n=2) | |
| Dell Precision 5000 5470 | |
| Lenovo ThinkPad P1 G4-20Y4Z9DVUS | |
| Lenovo ThinkPad P15v G2 21A9000XGE | |
| Dell Precision 5000 5560 | |
| HP ZBook Power 15 G8 313S5EA | |
| Dell Precision 3000 3551 | |
| 1920x1080 Standard Quality | |
| HP ZBook Fury 17 G8-4A6A9EA | |
| HP ZBook Fury 17 G7 119W5EA | |
| Przeciętny NVIDIA RTX A1000 Laptop GPU (59.1 - 67.9, n=2) | |
| Dell Precision 5000 5560 | |
| Dell Precision 5000 5470 | |
| Lenovo ThinkPad P1 G4-20Y4Z9DVUS | |
| Lenovo ThinkPad P15v G2 21A9000XGE | |
| HP ZBook Power 15 G8 313S5EA | |
| Dell Precision 3000 3551 | |
| 1920x1080 High Quality | |
| HP ZBook Fury 17 G7 119W5EA | |
| HP ZBook Fury 17 G8-4A6A9EA | |
| Dell Precision 5000 5560 | |
| Przeciętny NVIDIA RTX A1000 Laptop GPU (43 - 48.3, n=2) | |
| Dell Precision 5000 5470 | |
| Lenovo ThinkPad P1 G4-20Y4Z9DVUS | |
| Lenovo ThinkPad P15v G2 21A9000XGE | |
| HP ZBook Power 15 G8 313S5EA | |
| Dell Precision 3000 3551 | |
| X-Plane 11.11 | |
| 1280x720 low (fps_test=1) | |
| Dell Precision 5000 5470 | |
| Dell Precision 5000 5560 | |
| Przeciętny NVIDIA RTX A1000 Laptop GPU (99.8 - 118.7, n=2) | |
| Lenovo ThinkPad P1 G4-20Y4Z9DVUS | |
| HP ZBook Power 15 G8 313S5EA | |
| Dell Precision 3000 3551 | |
| HP ZBook Fury 17 G8-4A6A9EA | |
| Lenovo ThinkPad P15v G2 21A9000XGE | |
| HP ZBook Fury 17 G7 119W5EA | |
| HP ZBook Firefly 15 G8 2C9R7EA | |
| Lenovo ThinkPad P15s Gen1-20T4000JGE | |
| 1920x1080 med (fps_test=2) | |
| Dell Precision 5000 5470 | |
| Lenovo ThinkPad P1 G4-20Y4Z9DVUS | |
| HP ZBook Power 15 G8 313S5EA | |
| Przeciętny NVIDIA RTX A1000 Laptop GPU (88.6 - 94.8, n=2) | |
| Dell Precision 5000 5560 | |
| HP ZBook Fury 17 G8-4A6A9EA | |
| HP ZBook Fury 17 G7 119W5EA | |
| Lenovo ThinkPad P15v G2 21A9000XGE | |
| Dell Precision 3000 3551 | |
| HP ZBook Firefly 15 G8 2C9R7EA | |
| Lenovo ThinkPad P15s Gen1-20T4000JGE | |
| 1920x1080 high (fps_test=3) | |
| HP ZBook Power 15 G8 313S5EA | |
| Dell Precision 5000 5470 | |
| Lenovo ThinkPad P1 G4-20Y4Z9DVUS | |
| Dell Precision 5000 5560 | |
| Przeciętny NVIDIA RTX A1000 Laptop GPU (71.9 - 76.3, n=2) | |
| HP ZBook Fury 17 G8-4A6A9EA | |
| HP ZBook Fury 17 G7 119W5EA | |
| Lenovo ThinkPad P15v G2 21A9000XGE | |
| Dell Precision 3000 3551 | |
| HP ZBook Firefly 15 G8 2C9R7EA | |
| Lenovo ThinkPad P15s Gen1-20T4000JGE | |
| Strange Brigade | |
| 1280x720 lowest AF:1 | |
| HP ZBook Fury 17 G8-4A6A9EA | |
| Przeciętny NVIDIA RTX A1000 Laptop GPU (242 - 261, n=2) | |
| Dell Precision 5000 5560 | |
| Dell Precision 5000 5470 | |
| Lenovo ThinkPad P15v G2 21A9000XGE | |
| HP ZBook Power 15 G8 313S5EA | |
| 1920x1080 medium AA:medium AF:4 | |
| HP ZBook Fury 17 G8-4A6A9EA | |
| Przeciętny NVIDIA RTX A1000 Laptop GPU (106.2 - 111.4, n=2) | |
| Dell Precision 5000 5470 | |
| Lenovo ThinkPad P15v G2 21A9000XGE | |
| HP ZBook Power 15 G8 313S5EA | |
| 1920x1080 high AA:high AF:8 | |
| HP ZBook Fury 17 G8-4A6A9EA | |
| Przeciętny NVIDIA RTX A1000 Laptop GPU (84.7 - 90.2, n=2) | |
| Dell Precision 5000 5470 | |
| Lenovo ThinkPad P15v G2 21A9000XGE | |
| HP ZBook Power 15 G8 313S5EA | |
| 1920x1080 ultra AA:ultra AF:16 | |
| HP ZBook Fury 17 G8-4A6A9EA | |
| Przeciętny NVIDIA RTX A1000 Laptop GPU (72.8 - 78.4, n=2) | |
| Dell Precision 5000 5470 | |
| Lenovo ThinkPad P15v G2 21A9000XGE | |
| HP ZBook Power 15 G8 313S5EA | |
| Cyberpunk 2077 1.6 | |
| 1920x1080 Low Preset | |
| Dell Precision 5000 5470 | |
| Przeciętny NVIDIA RTX A1000 Laptop GPU (n=1) | |
| 1920x1080 Medium Preset | |
| Dell Precision 5000 5470 | |
| Przeciętny NVIDIA RTX A1000 Laptop GPU (n=1) | |
| 1920x1080 High Preset | |
| Dell Precision 5000 5470 | |
| Przeciętny NVIDIA RTX A1000 Laptop GPU (n=1) | |
| 1920x1080 Ultra Preset | |
| Dell Precision 5000 5470 | |
| Przeciętny NVIDIA RTX A1000 Laptop GPU (n=1) | |
Witcher 3 FPS Chart
| low | med. | high | ultra | QHD | |
|---|---|---|---|---|---|
| GTA V (2015) | 168 | 159.8 | 113.7 | 58.9 | |
| The Witcher 3 (2015) | 244.1 | 147.5 | 82.1 | 42.7 | |
| Dota 2 Reborn (2015) | 160.8 | 147.9 | 112.3 | 132.1 | |
| Final Fantasy XV Benchmark (2018) | 105.3 | 59.1 | 43 | ||
| X-Plane 11.11 (2018) | 118.7 | 94.8 | 76.3 | ||
| Strange Brigade (2018) | 242 | 106.2 | 84.7 | 72.8 | |
| Metro Exodus (2019) | 111 | 53.3 | 39.3 | 31.2 | 23.6 |
| Borderlands 3 (2019) | 110.4 | 68.4 | 42.6 | 31.3 | 18.8 |
| Gears Tactics (2020) | 161.5 | 106.5 | 63.9 | 46.8 | 31.1 |
| Horizon Zero Dawn (2020) | 82 | 68 | 58 | 48 | 38 |
| Watch Dogs Legion (2020) | 75 | 62 | 54 | 26 | 17 |
| Dirt 5 (2020) | 135 | 62.4 | 48.5 | 37.2 | 25.8 |
| Assassin´s Creed Valhalla (2020) | 103 | 50 | 33 | 25 | 22 |
| Hitman 3 (2021) | 171.9 | 83.7 | 71.3 | 66.1 | 41 |
| F1 2021 (2021) | 195 | 127 | 103 | 54 | 34 |
| Far Cry 6 (2021) | 103 | 64 | 54 | ||
| Guardians of the Galaxy (2021) | 92 | 64 | 64 | 61 | 37 |
| God of War (2022) | 60.2 | 49.1 | 40.9 | 25.8 | 20.5 |
| Cyberpunk 2077 1.6 (2022) | 61.3 | 50.4 | 36.7 | 29 | |
| F1 22 (2022) | 112 | 107 | 76 | 22 | 13 |
Emisje
Hałas systemu - głośny pod obciążeniem
Model Precision 5470 pracuje głośniej niż większy Precision 5560 kiedy jest pod obciążeniem. Na przykład uruchomienie strony Witcher 3 na przykład praca w trybie Ultra Performance powoduje szum wentylatora o natężeniu nieco poniżej 49 dB(A) w porównaniu z zaledwie 40 dB(A) w 15,6-calowej stacji roboczej Precision. W rzeczywistości Precision 5470 jest z łatwością jedną z najgłośniejszych stacji roboczych w swojej małej, 14-calowej kategorii.
System staje się cichszy o 40,3 dB(A), kiedy pracuje pod dużym obciążeniem w trybie Balanced zamiast w trybie Ultra Performance. Stracisz trochę na wydajności procesora, ale cichsze wentylatory mogą być warte kompromisu w zależności od środowiska.
Wewnętrzne wentylatory będą okresowo pulsować bez powodu, jeśli ustawisz tryb Ultra Performance, nawet jeśli komputer będzie stał bezczynnie. Tryb zrównoważony lub cichy jest zalecany w przypadku niewymagających aplikacji.
Hałas
| luz |
| 23.3 / 23.3 / 23.3 dB |
| obciążenie |
| 48.5 / 50.4 dB |
 | ||
30 dB cichy 40 dB(A) słyszalny 50 dB(A) irytujący |
||
min: | ||
| Dell Precision 5000 5470 RTX A1000 Laptop GPU, i9-12900H, Samsung PM9A1 MZVL21T0HCLR | Lenovo ThinkPad P15v G2 21A9000XGE T1200 Laptop GPU, i7-11800H, Toshiba XG6 KXG6AZNV512G | Dell Precision 5000 5560 RTX A2000 Laptop GPU, i7-11850H, Samsung PM9A1 MZVL22T0HBLB | Lenovo ThinkPad P14s G2 AMD Vega 8, R7 PRO 5850U, SK Hynix PC711 1TB HFS001TDE9X081N | HP ZBook Firefly 14 G8 2C9Q2EA T500 Laptop GPU, i7-1165G7, Toshiba XG6 KXG60ZNV1T02 | HP ZBook Firefly 14 G7 Quadro P520, i7-10610U, Toshiba XG6 KXG60ZNV512G | |
|---|---|---|---|---|---|---|
| Noise | 3% | 11% | 8% | -4% | -4% | |
| wyłączone / środowisko * (dB) | 23 | 25.21 -10% | 23.4 -2% | 24.04 -5% | 28.7 -25% | 29.7 -29% |
| Idle Minimum * (dB) | 23.3 | 25.21 -8% | 23.6 -1% | 24.04 -3% | 28.7 -23% | 29.7 -27% |
| Idle Average * (dB) | 23.3 | 25.21 -8% | 23.6 -1% | 24.04 -3% | 28.7 -23% | 29.7 -27% |
| Idle Maximum * (dB) | 23.3 | 25.21 -8% | 23.6 -1% | 24.04 -3% | 28.7 -23% | 30.4 -30% |
| Load Average * (dB) | 48.5 | 39.09 19% | 25.8 47% | 28.19 42% | 34 30% | 33.1 32% |
| Witcher 3 ultra * (dB) | 48.6 | 36.6 25% | 40.1 17% | 40.1 17% | 35.3 27% | |
| Load Maximum * (dB) | 50.4 | 43.53 14% | 41.4 18% | 40.77 19% | 40.1 20% | 37.9 25% |
* ... im mniej tym lepiej
Temperatura
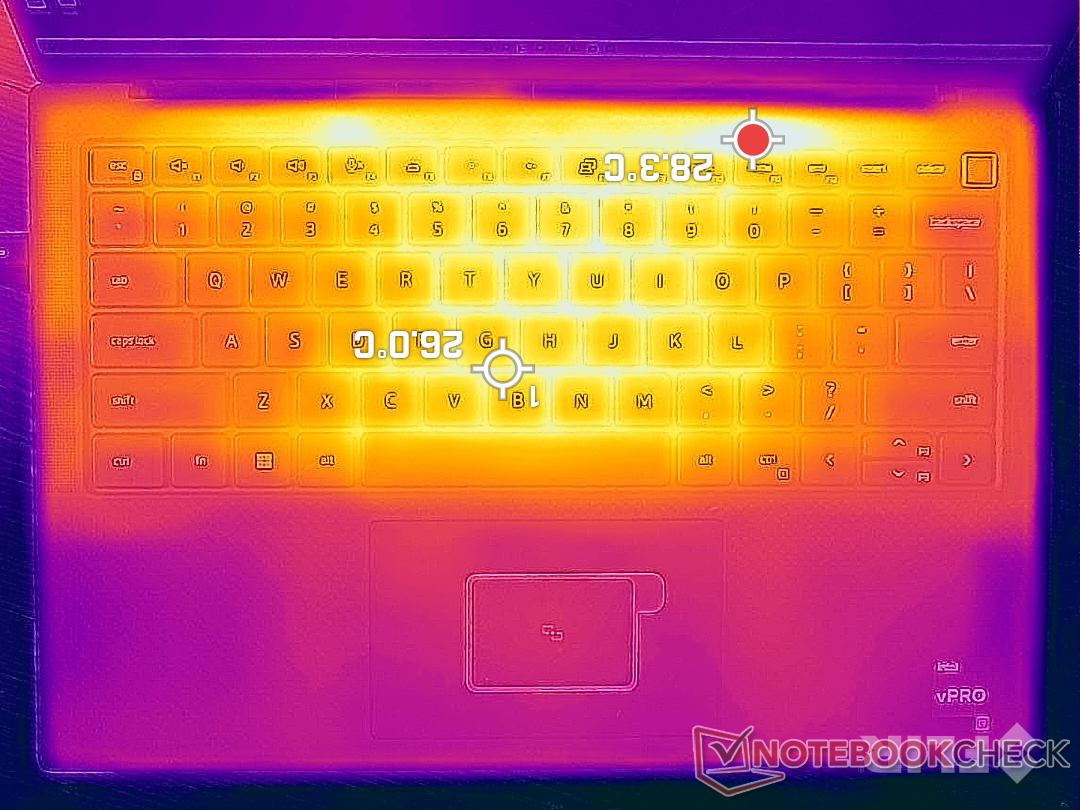
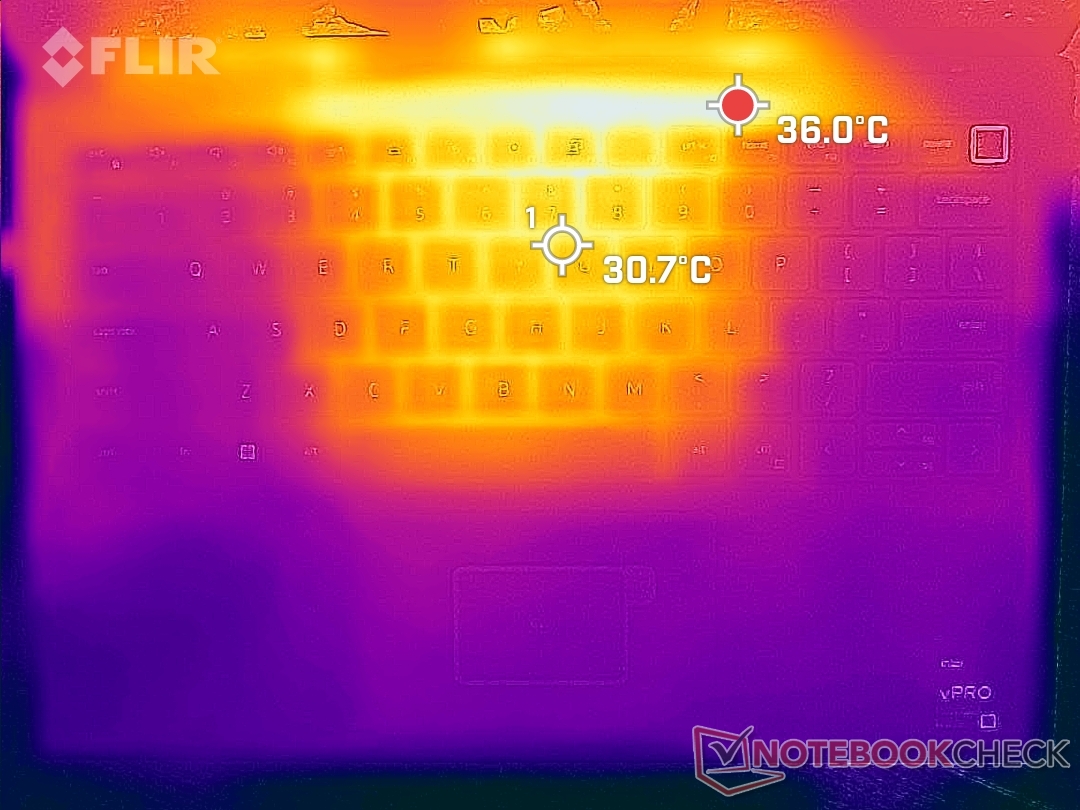
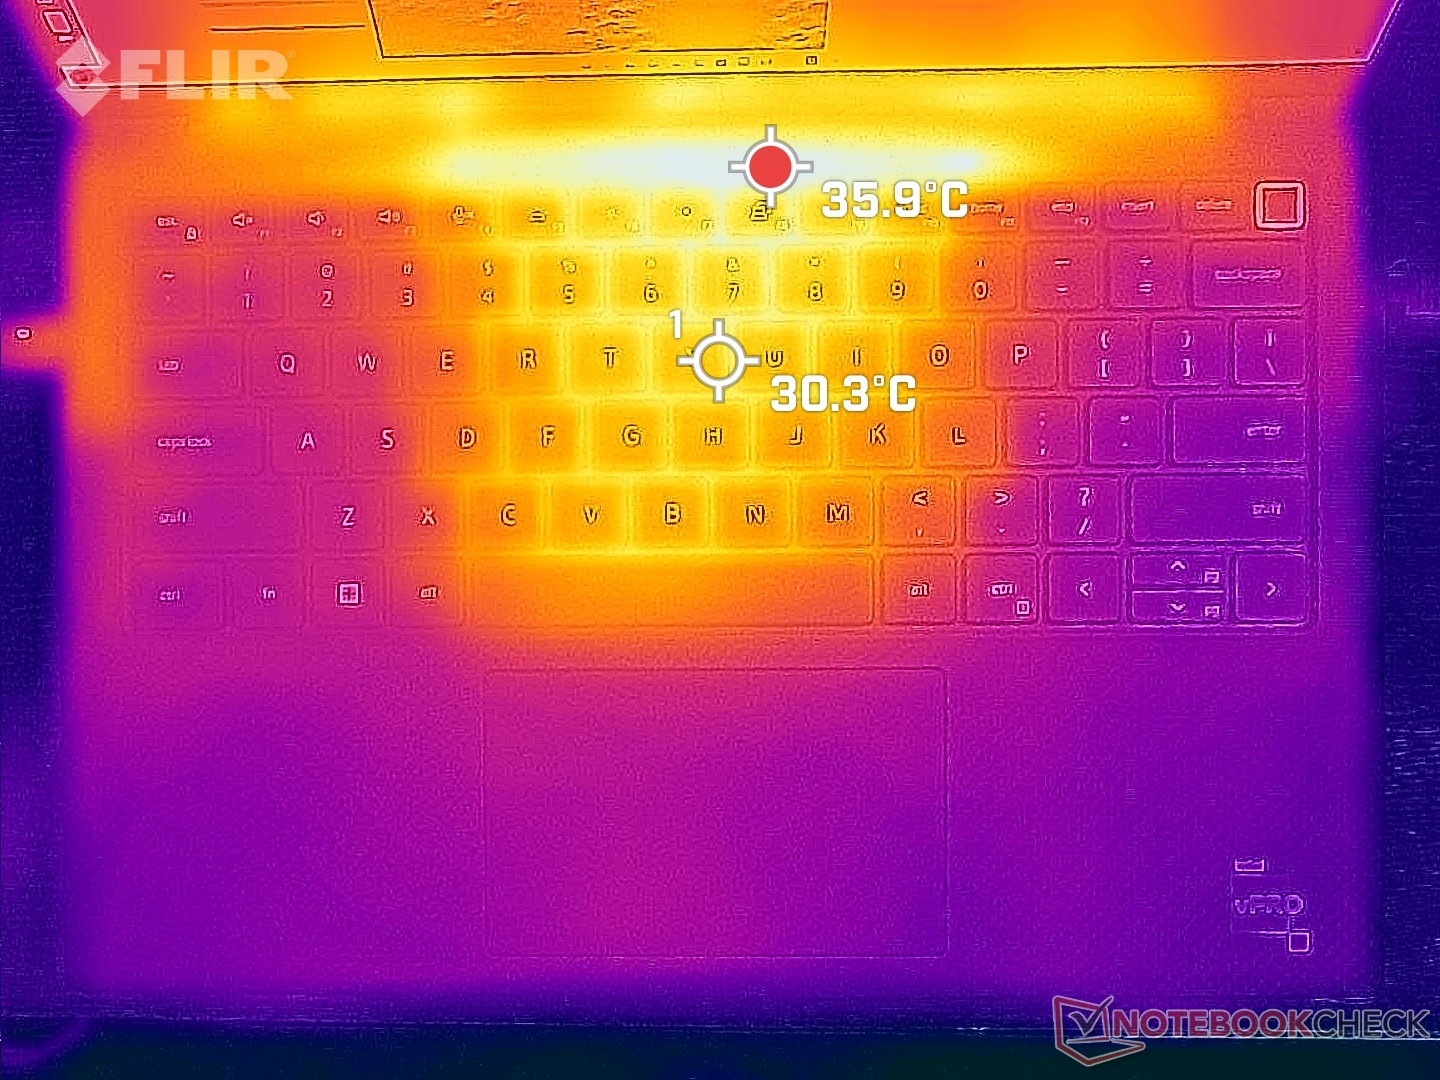
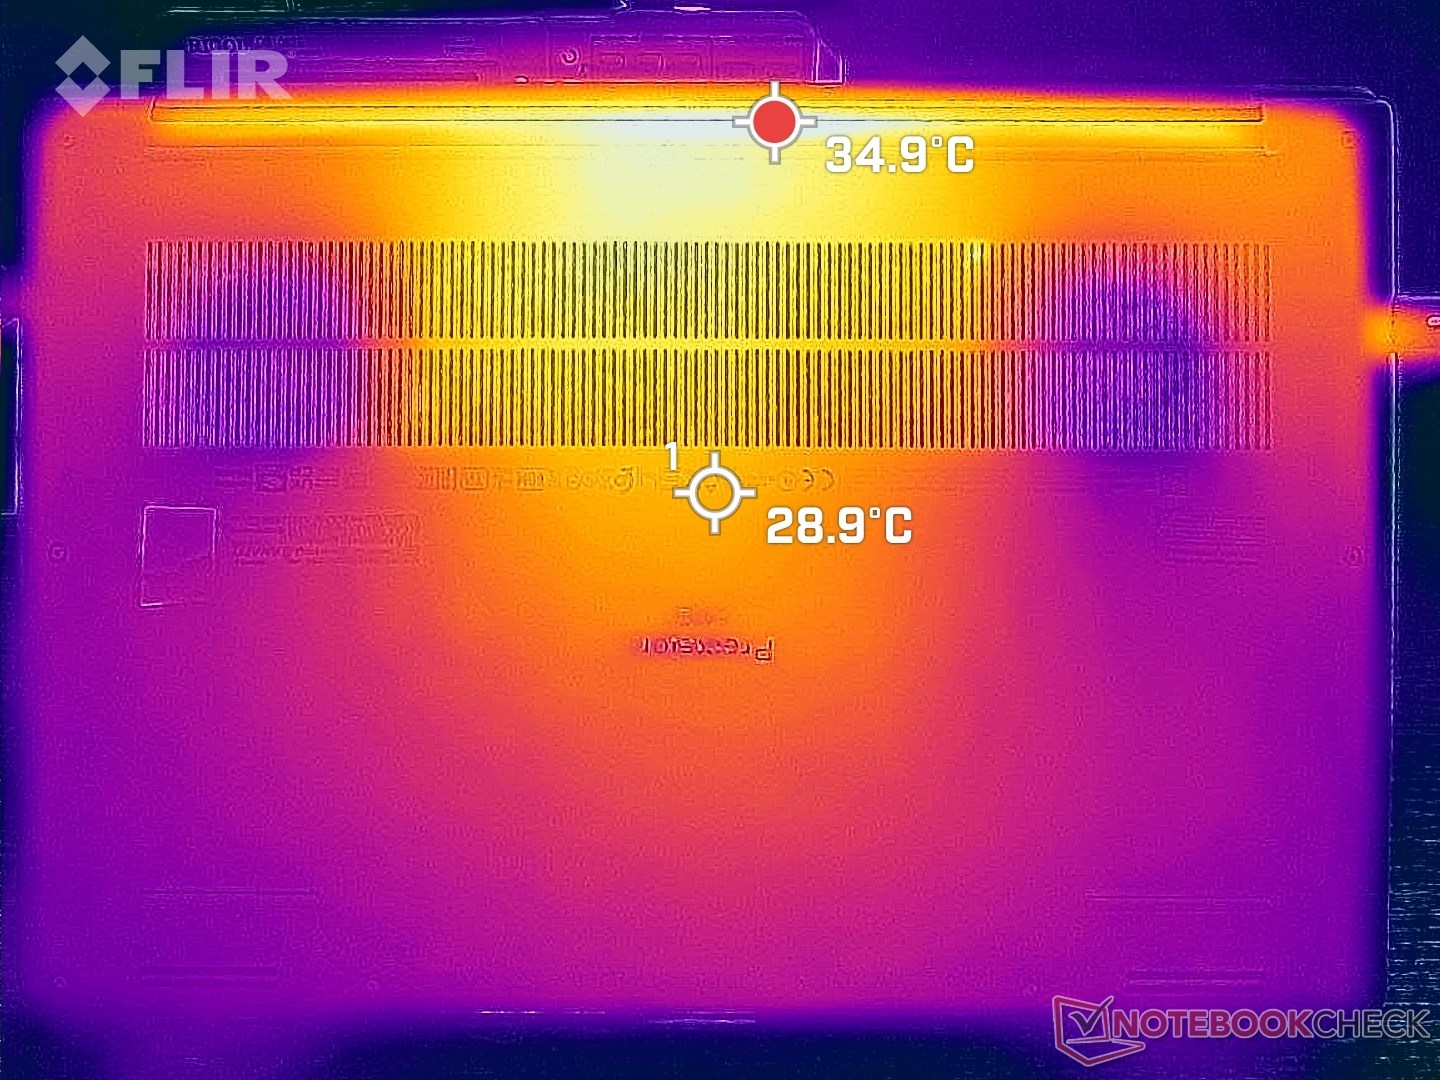
Temperatury powierzchni są chłodniejsze niż można się było spodziewać, biorąc pod uwagę procesor klasy Core H, dyskretny układ graficzny Nvidii i niewielki rozmiar obudowy. Alternatywne 14-calowe stacje robocze, takie jak ZBook Firefly 14 G8 czy ThinkPad P14s G2, wyposażone są w wolniejsze procesory, a mimo to mogą być znacznie cieplejsze - temperatury w gorących punktach sięgają 49 stopni Celsjusza, podczas gdy na naszej stronie Precision było to tylko 42 stopnie Celsjusza. Mimo to środek klawiatury może się dość mocno nagrzać do 42°C.
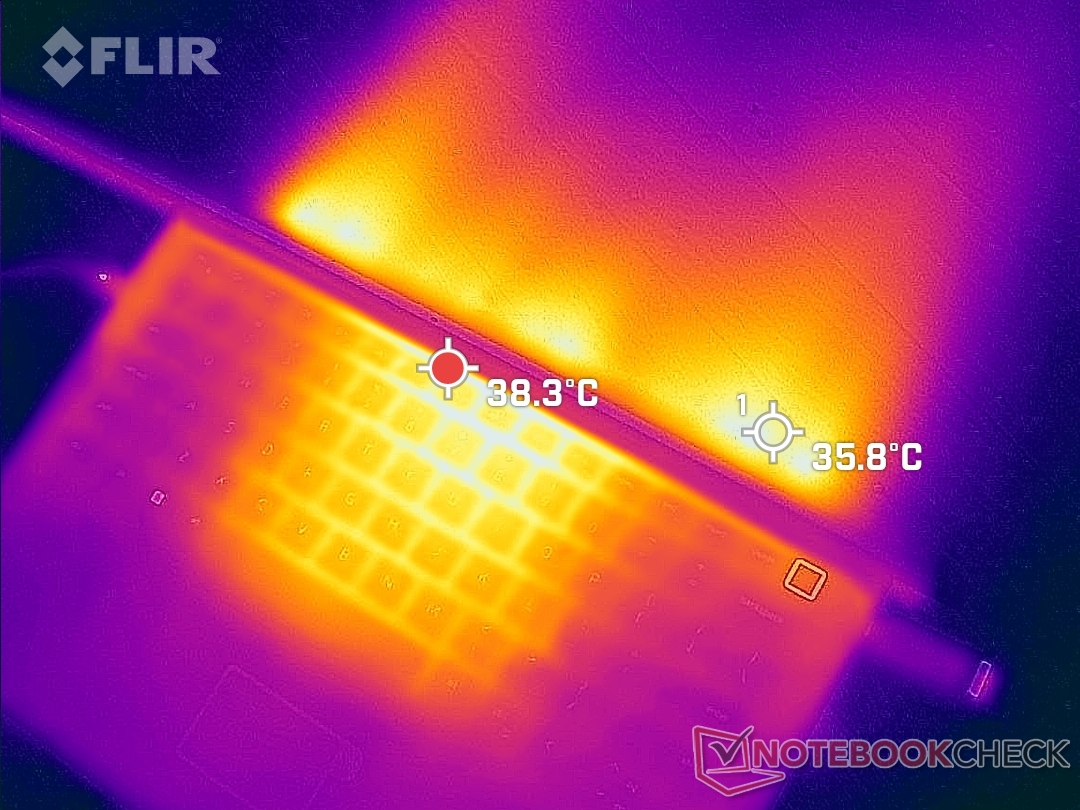
(±) Maksymalna temperatura w górnej części wynosi 41.8 °C / 107 F, w porównaniu do średniej 38.2 °C / 101 F , począwszy od 22.2 do 69.8 °C dla klasy Workstation.
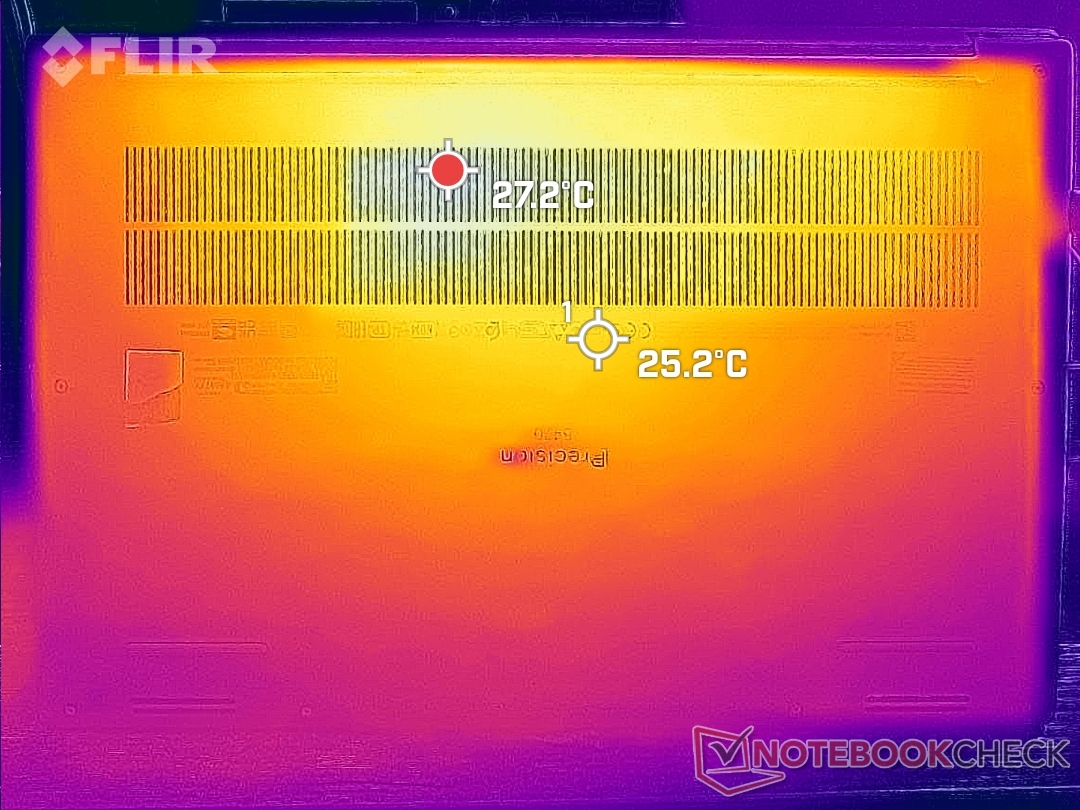
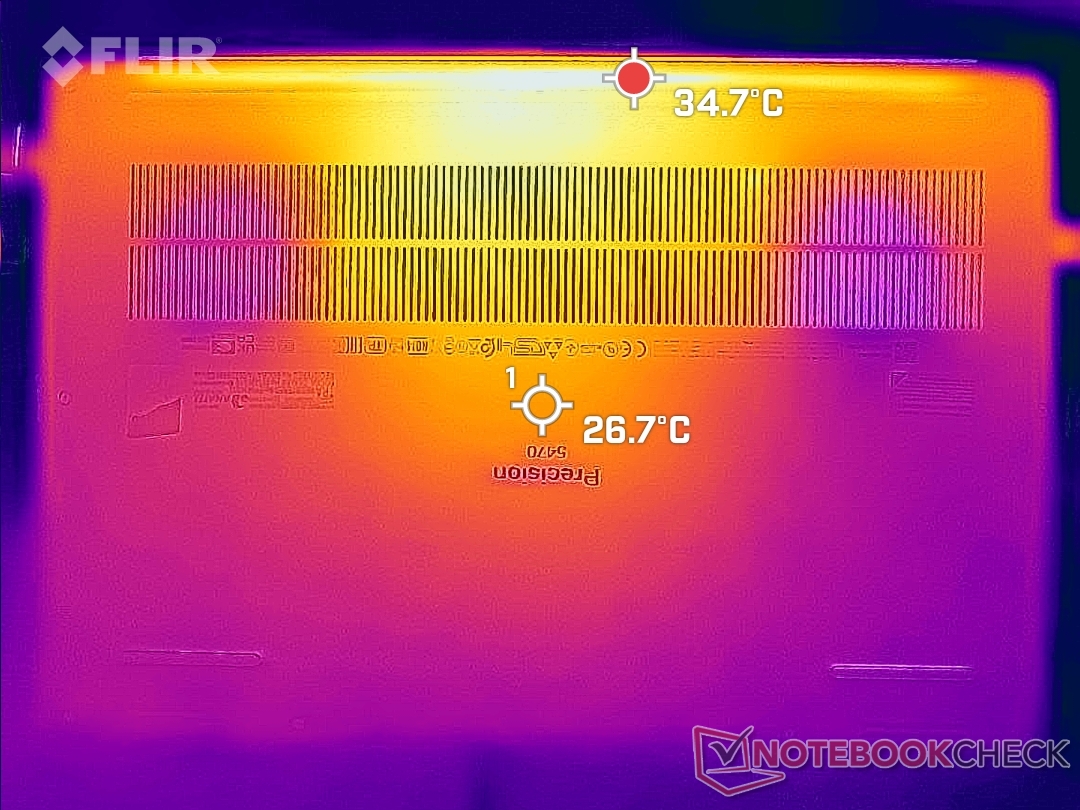
(+) Dno nagrzewa się maksymalnie do 36 °C / 97 F, w porównaniu do średniej 41.1 °C / 106 F
(+) W stanie bezczynności średnia temperatura górnej części wynosi 31 °C / 88 F, w porównaniu ze średnią temperaturą urządzenia wynoszącą 32 °C / ### class_avg_f### F.
(±) Podczas gry w Wiedźmina 3 średnia temperatura górnej części wynosi 32.2 °C / 90 F, w porównaniu do średniej temperatury urządzenia wynoszącej 32 °C / ## #class_avg_f### F.
(+) Podpórki pod nadgarstki i touchpad są chłodniejsze niż temperatura skóry i maksymalnie 27.6 °C / 81.7 F i dlatego są chłodne w dotyku.
(±) Średnia temperatura obszaru podparcia dłoni w podobnych urządzeniach wynosiła 27.8 °C / 82 F (+0.2 °C / 0.3 F).
| Dell Precision 5000 5470 Intel Core i9-12900H, NVIDIA RTX A1000 Laptop GPU | Lenovo ThinkPad P15v G2 21A9000XGE Intel Core i7-11800H, NVIDIA T1200 Laptop GPU | Dell Precision 5000 5560 Intel Core i7-11850H, NVIDIA RTX A2000 Laptop GPU | Lenovo ThinkPad P14s G2 AMD AMD Ryzen 7 PRO 5850U, AMD Radeon RX Vega 8 (Ryzen 4000/5000) | HP ZBook Firefly 14 G8 2C9Q2EA Intel Core i7-1165G7, NVIDIA T500 Laptop GPU | HP ZBook Firefly 14 G7 Intel Core i7-10610U, NVIDIA Quadro P520 | |
|---|---|---|---|---|---|---|
| Heat | -9% | -10% | 1% | 5% | -7% | |
| Maximum Upper Side * (°C) | 41.8 | 53.8 -29% | 48.2 -15% | 42.8 -2% | 42.6 -2% | 52.3 -25% |
| Maximum Bottom * (°C) | 36 | 52.1 -45% | 42.6 -18% | 47.5 -32% | 49.4 -37% | 60.9 -69% |
| Idle Upper Side * (°C) | 34.6 | 27.6 20% | 34.8 -1% | 27 22% | 24.2 30% | 23.1 33% |
| Idle Bottom * (°C) | 33.6 | 27.7 18% | 35.2 -5% | 28.3 16% | 24.6 27% | 23 32% |
* ... im mniej tym lepiej
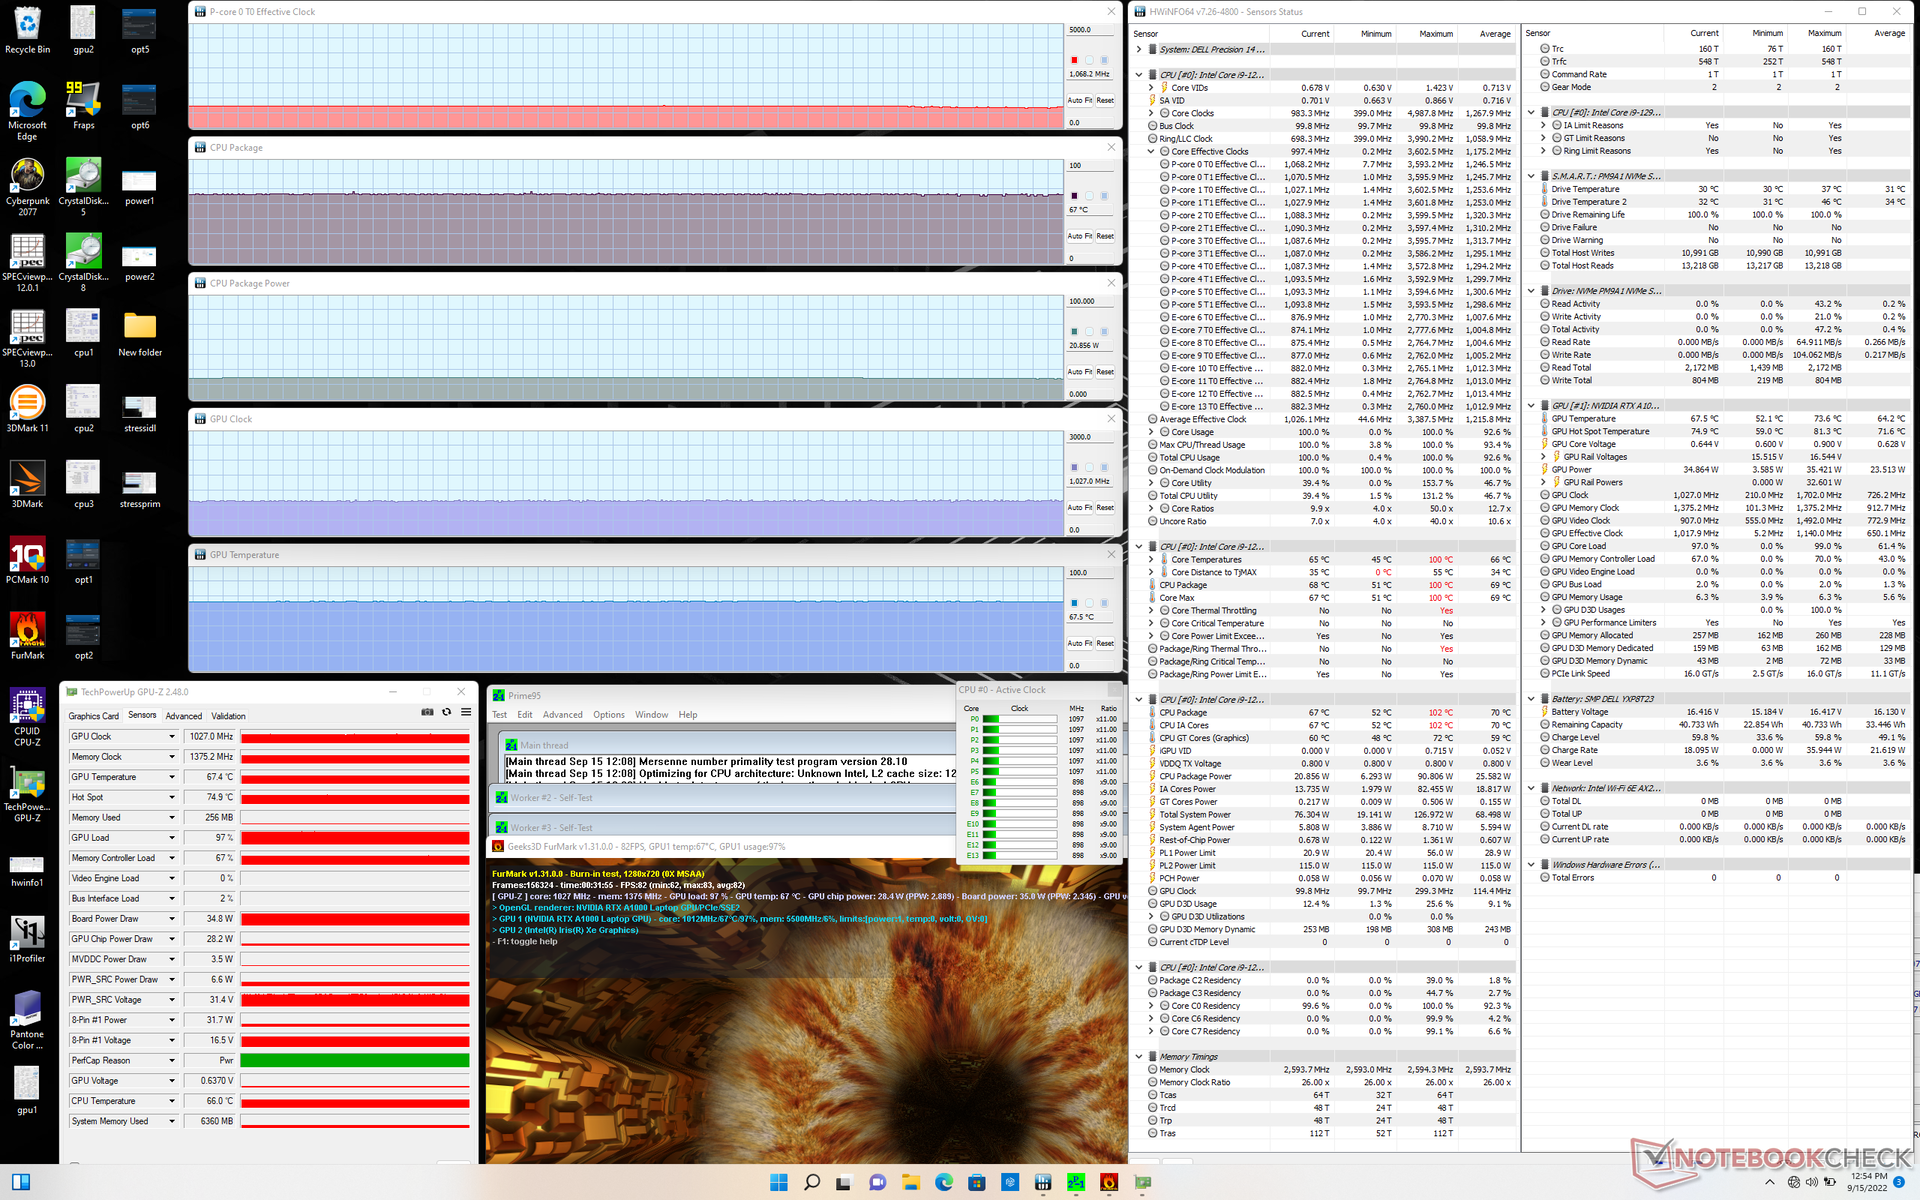
Stress Test - cykliczne zwiększanie częstotliwości taktowania procesora
Uruchomienie Prime95 powodowało skokowe zwiększenie częstotliwości taktowania CPU, poboru mocy na płycie oraz temperatury rdzenia do 3,6 GHz, 91 W i 101 C, odpowiednio. Po kilku sekundach jednak częstotliwość taktowania, pobór mocy i temperatura zaczynały się zmieniać w zakresie od 1,0 do 2,4 GHz, 20 do 50 W i 61 do 82 C. To cykliczne zachowanie pasuje do wyników naszego testu CineBency R15 xT, który pokazał, że Precision 5470 nie jest w stanie utrzymać stałego taktowania Turbo Boost przez dłuższy czas. Wykorzystanie pełnego potencjału procesora Core i9-12900H w tak małej obudowie pozostaje mrzonką.
Podczas pracy Witcher 3 w celu odwzorowania wysokiego obciążenia procesor i układ graficzny ustabilizowałyby się na poziomie odpowiednio 82 i 71 stopni Celsjusza, w porównaniu z 69 i 75 stopniami Celsjusza na Precision 5560.
Praca na zasilaniu akumulatorowym ogranicza wydajność procesora. Test Fire Strike na zasilaniu akumulatorowym przyniósłby wyniki z dziedziny fizyki i grafiki na poziomie odpowiednio 21067 i 10542 pkt. w porównaniu z 27514 i 10914 pkt. na zasilaniu sieciowym.
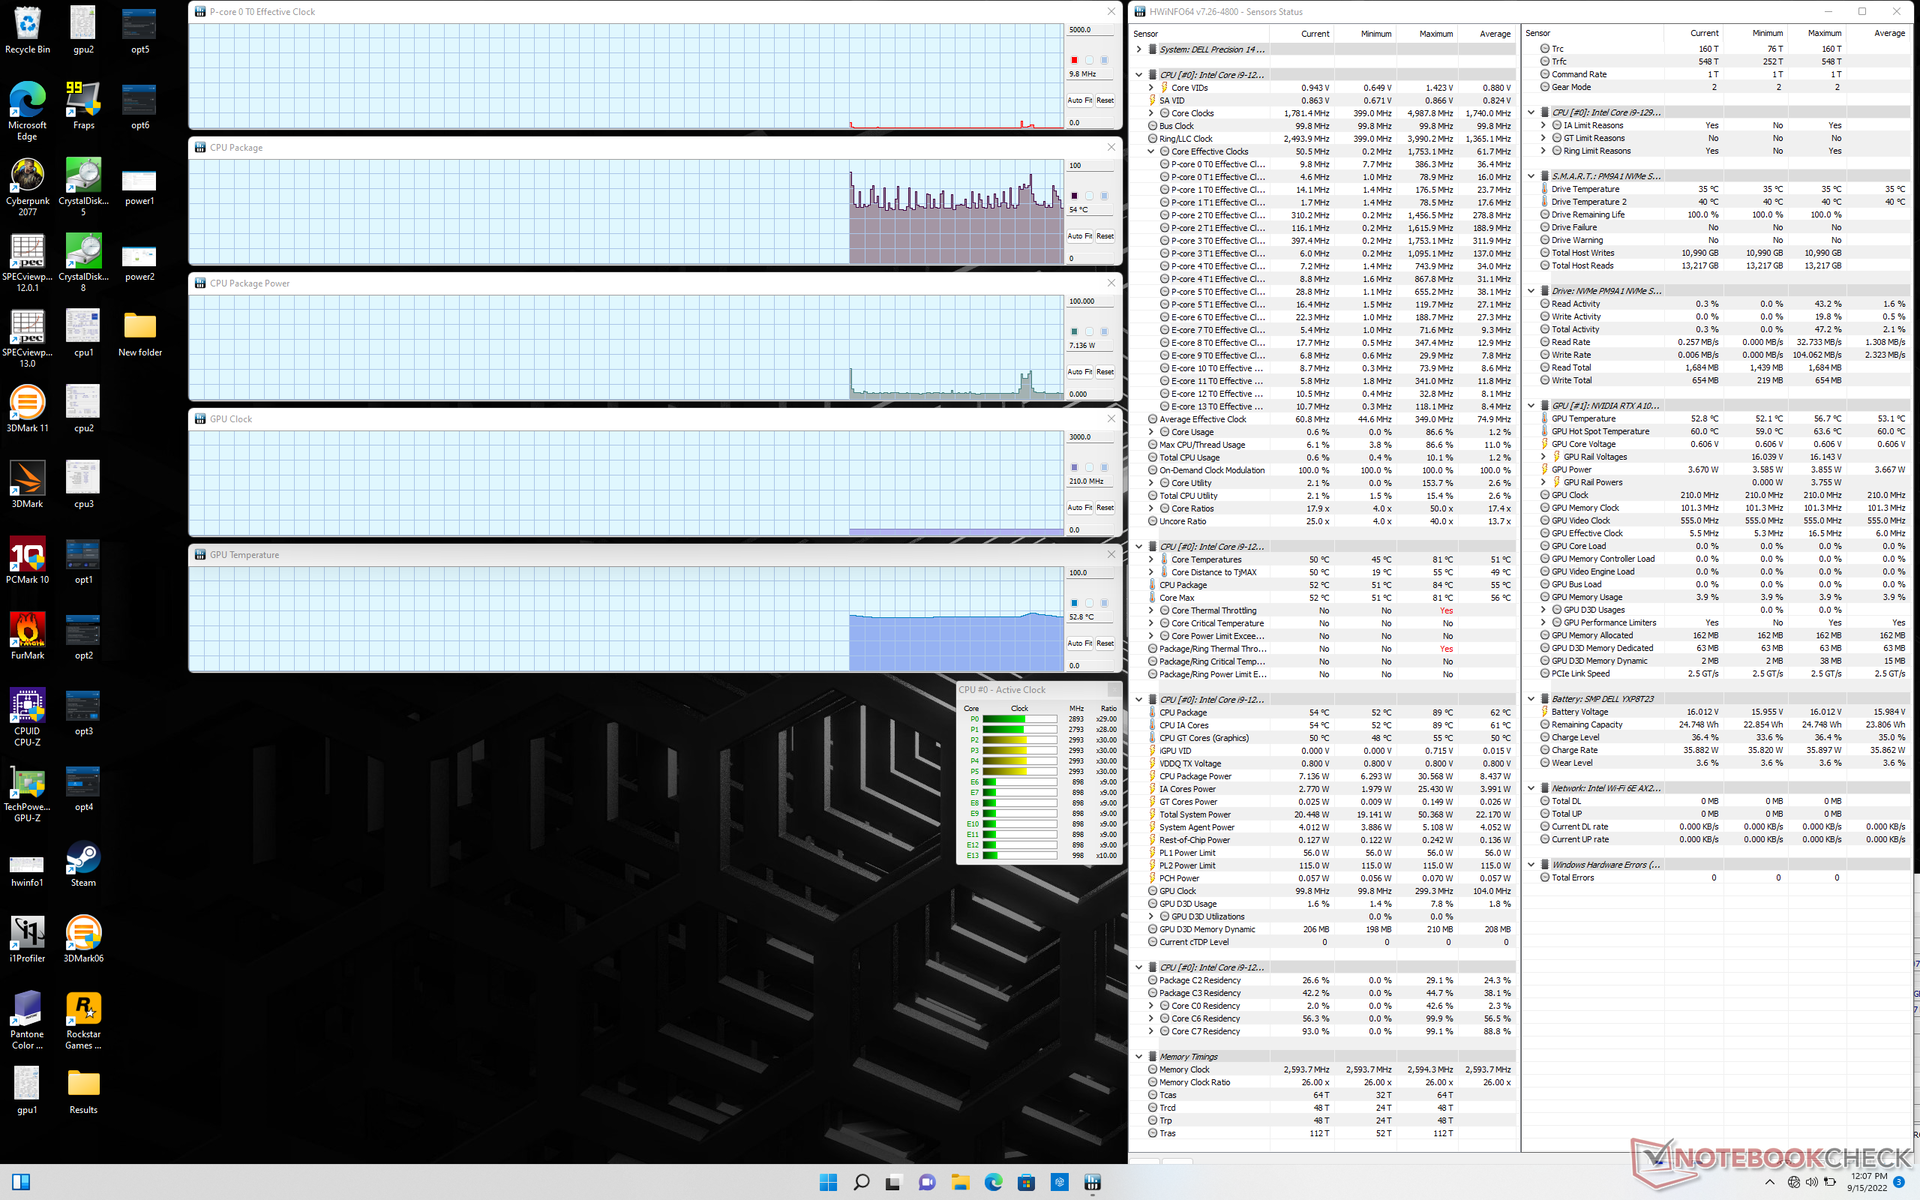
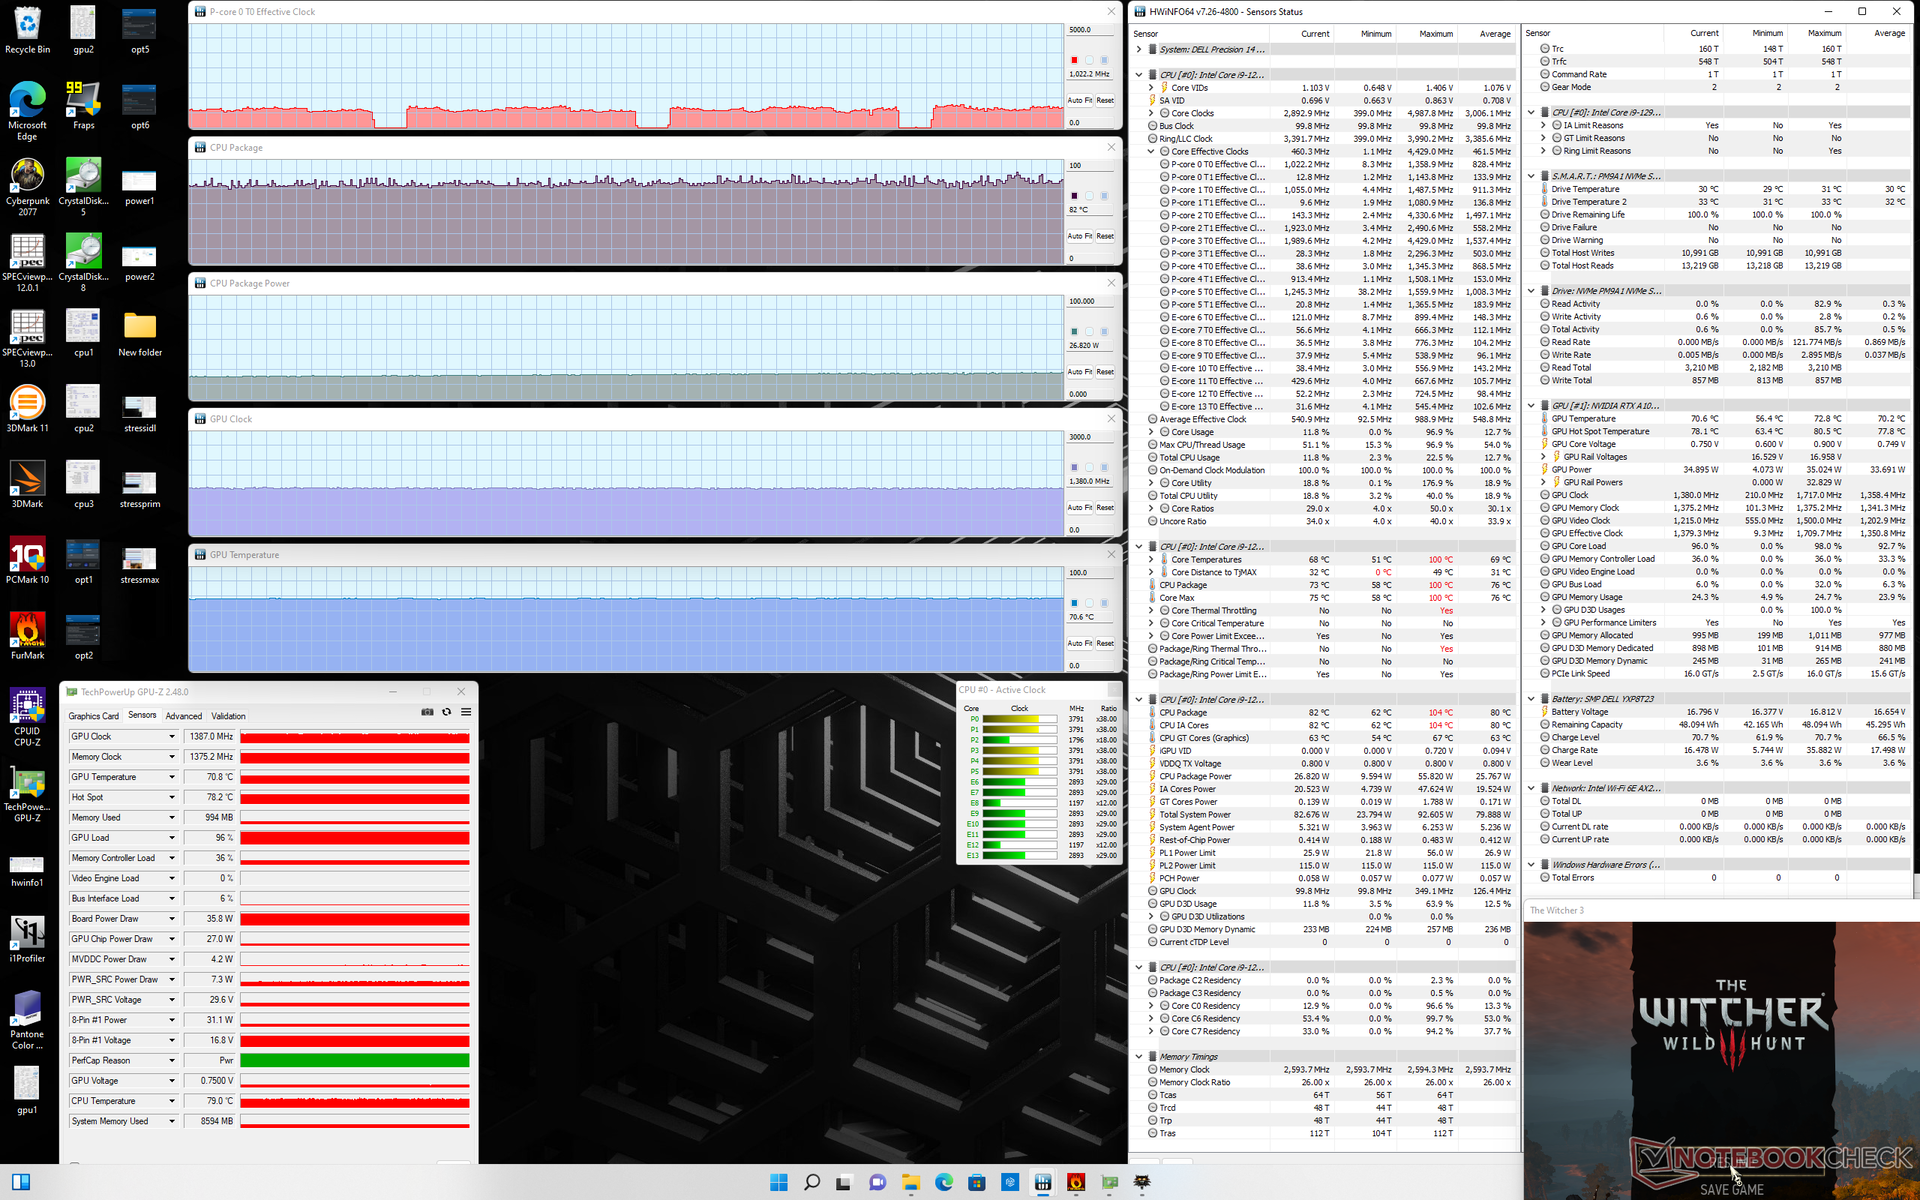
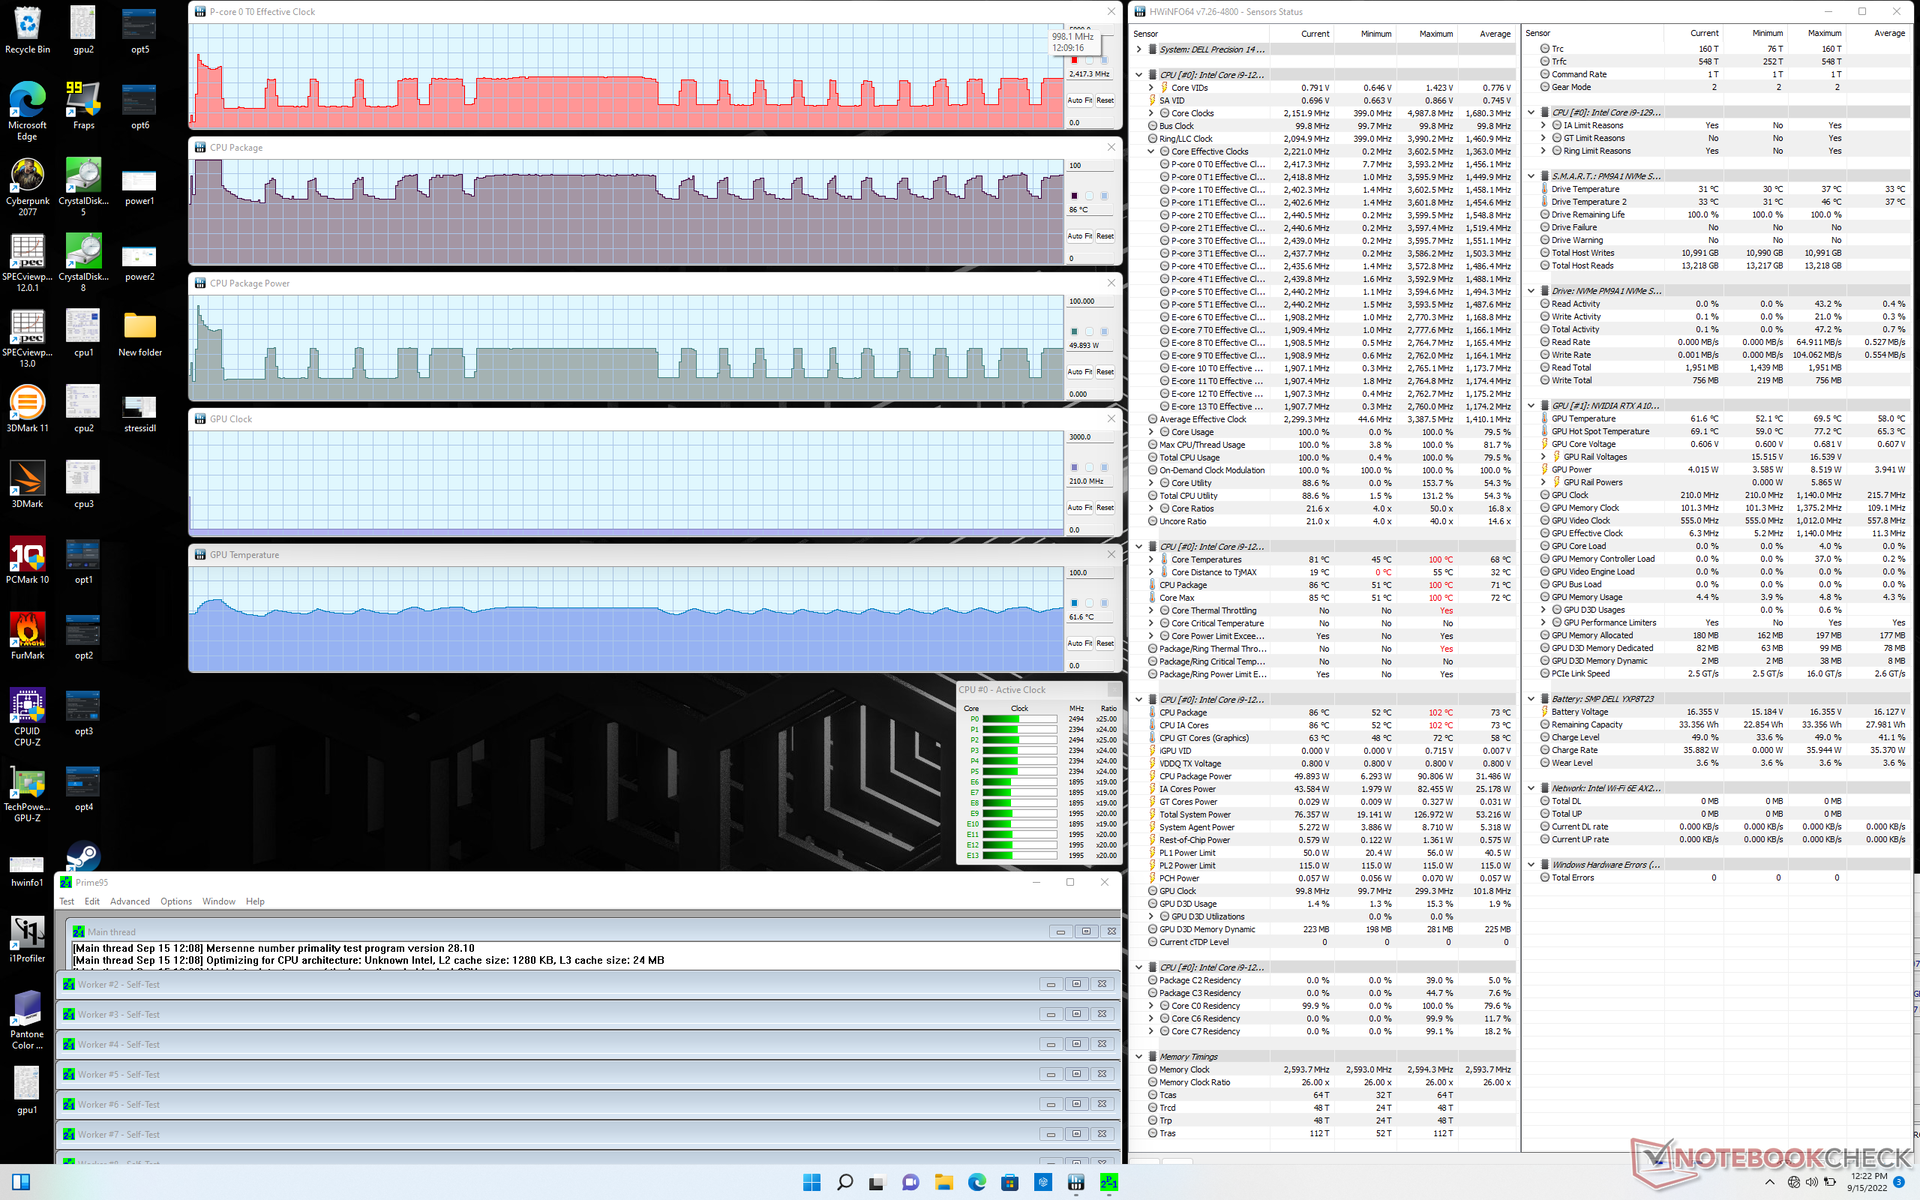
| ZegarCPU (GHz) | Zegar GPU (MHz) | Średnia temperatura CPU (°C) | Średnia temperatura GPU (°C) | |
| System w stanie bezczynności | -- | -- | 54 | 53 |
| Prime95 Stress | 1.0 - 2.4 | -- | 61 - 80 | ~61 |
| Prime95 + FurMark Stress | 1.1 | 1027 | 67 | 68 |
| Witcher 3 Stress | 1.0 | 1387 | 82 | 71 |
Mówcy
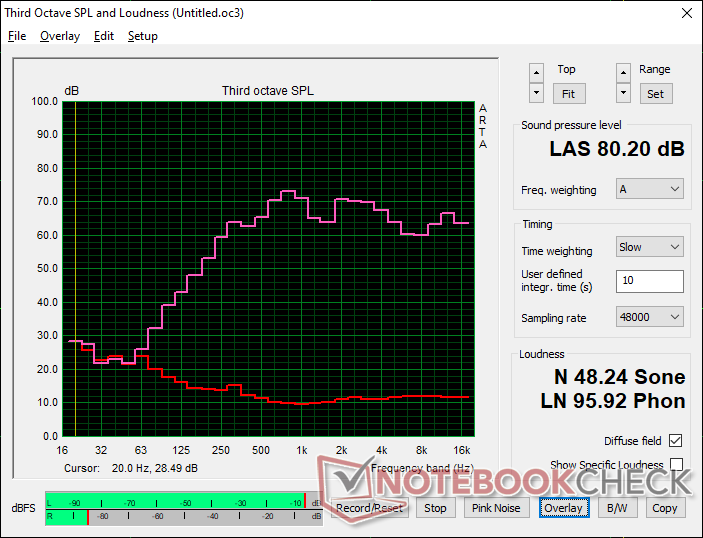
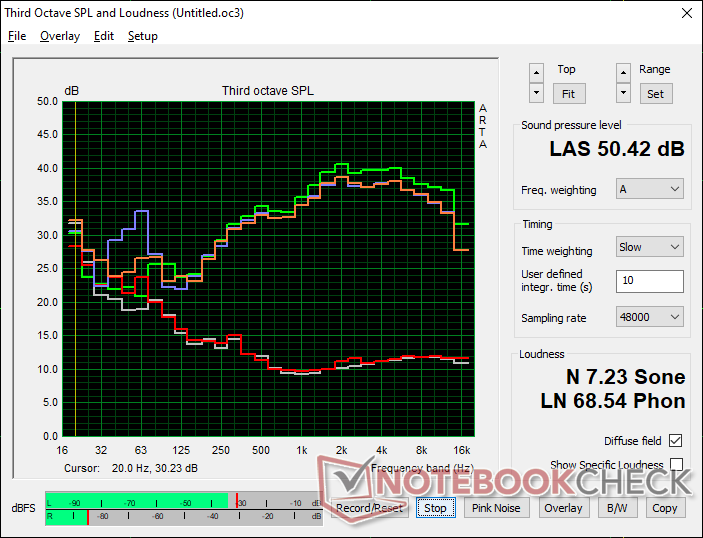
Dell Precision 5000 5470 analiza dźwięku
(±) | głośność głośnika jest średnia, ale dobra (80.2 dB)
Bas 100 - 315 Hz
(±) | zredukowany bas - średnio 12.9% niższy od mediany
(±) | liniowość basu jest średnia (10.1% delta do poprzedniej częstotliwości)
Średnie 400 - 2000 Hz
(+) | zbalansowane środki średnie - tylko 4.2% od mediany
(+) | średnie są liniowe (6.5% delta do poprzedniej częstotliwości)
Wysokie 2–16 kHz
(+) | zrównoważone maksima - tylko 3.4% od mediany
(+) | wzloty są liniowe (3.9% delta do poprzedniej częstotliwości)
Ogólnie 100 - 16.000 Hz
(+) | ogólny dźwięk jest liniowy (12.9% różnicy w stosunku do mediany)
W porównaniu do tej samej klasy
» 21% wszystkich testowanych urządzeń w tej klasie było lepszych, 6% podobnych, 72% gorszych
» Najlepszy miał deltę 7%, średnia wynosiła ###średnia###%, najgorsza wynosiła 35%
W porównaniu do wszystkich testowanych urządzeń
» 12% wszystkich testowanych urządzeń było lepszych, 3% podobnych, 85% gorszych
» Najlepszy miał deltę 4%, średnia wynosiła ###średnia###%, najgorsza wynosiła 134%
Apple MacBook Pro 16 2021 M1 Pro analiza dźwięku
(+) | głośniki mogą odtwarzać stosunkowo głośno (84.7 dB)
Bas 100 - 315 Hz
(+) | dobry bas - tylko 3.8% od mediany
(+) | bas jest liniowy (5.2% delta do poprzedniej częstotliwości)
Średnie 400 - 2000 Hz
(+) | zbalansowane środki średnie - tylko 1.3% od mediany
(+) | średnie są liniowe (2.1% delta do poprzedniej częstotliwości)
Wysokie 2–16 kHz
(+) | zrównoważone maksima - tylko 1.9% od mediany
(+) | wzloty są liniowe (2.7% delta do poprzedniej częstotliwości)
Ogólnie 100 - 16.000 Hz
(+) | ogólny dźwięk jest liniowy (4.6% różnicy w stosunku do mediany)
W porównaniu do tej samej klasy
» 0% wszystkich testowanych urządzeń w tej klasie było lepszych, 0% podobnych, 100% gorszych
» Najlepszy miał deltę 5%, średnia wynosiła ###średnia###%, najgorsza wynosiła 45%
W porównaniu do wszystkich testowanych urządzeń
» 0% wszystkich testowanych urządzeń było lepszych, 0% podobnych, 100% gorszych
» Najlepszy miał deltę 4%, średnia wynosiła ###średnia###%, najgorsza wynosiła 134%
Zarządzanie energią
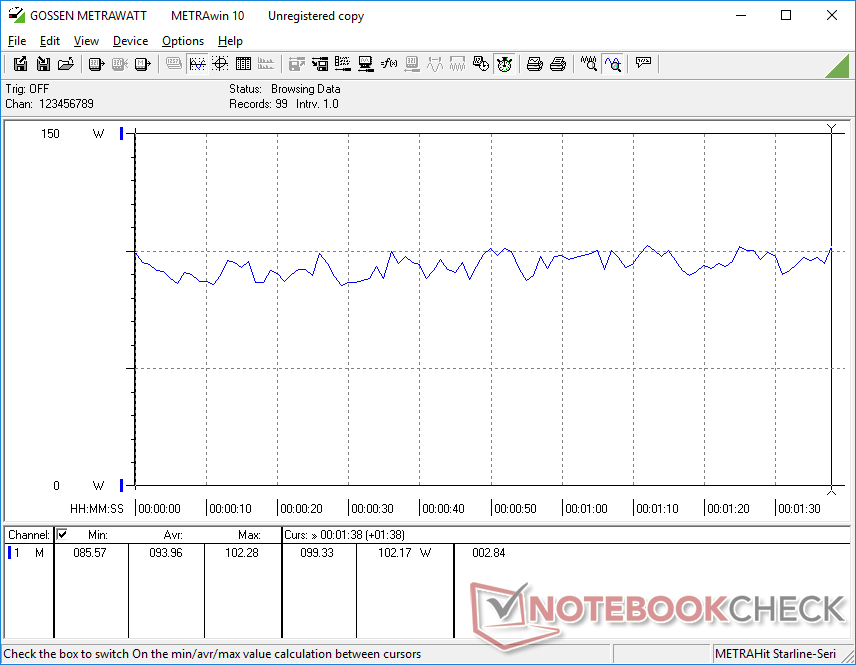
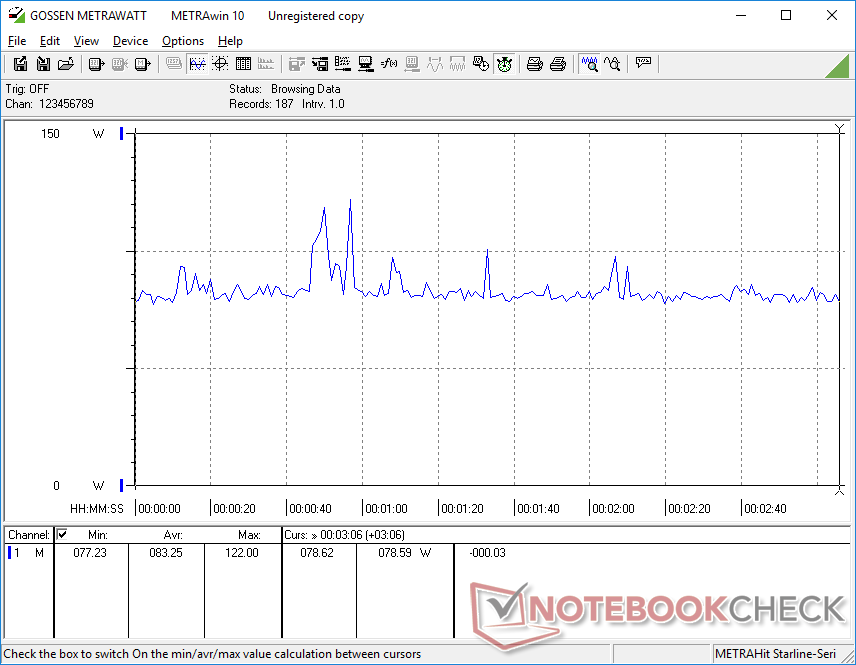
Pobór mocy - wymagająca mała maszyna
Praca na biegu jałowym na pulpicie przy najniższym ustawieniu jasności i profilu zasilania wymaga zaledwie 4,3 W, natomiast maksymalne ustawienie jasności i profil zasilania z aktywnym dGPU wymaga prawie 19 W. Jednak przy bardziej wymagających obciążeniach, takich jak gry, system staje się równie wymagający jak większy Precision 5560 z szybszym procesorem graficznym RTX A2000, ale wolniejszym procesorem i7-11850H. System jest ogólnie bardziej wymagający niż inne 14-calowe stacje robocze, czego należy się spodziewać po jego szybszym sprzęcie wewnętrznym
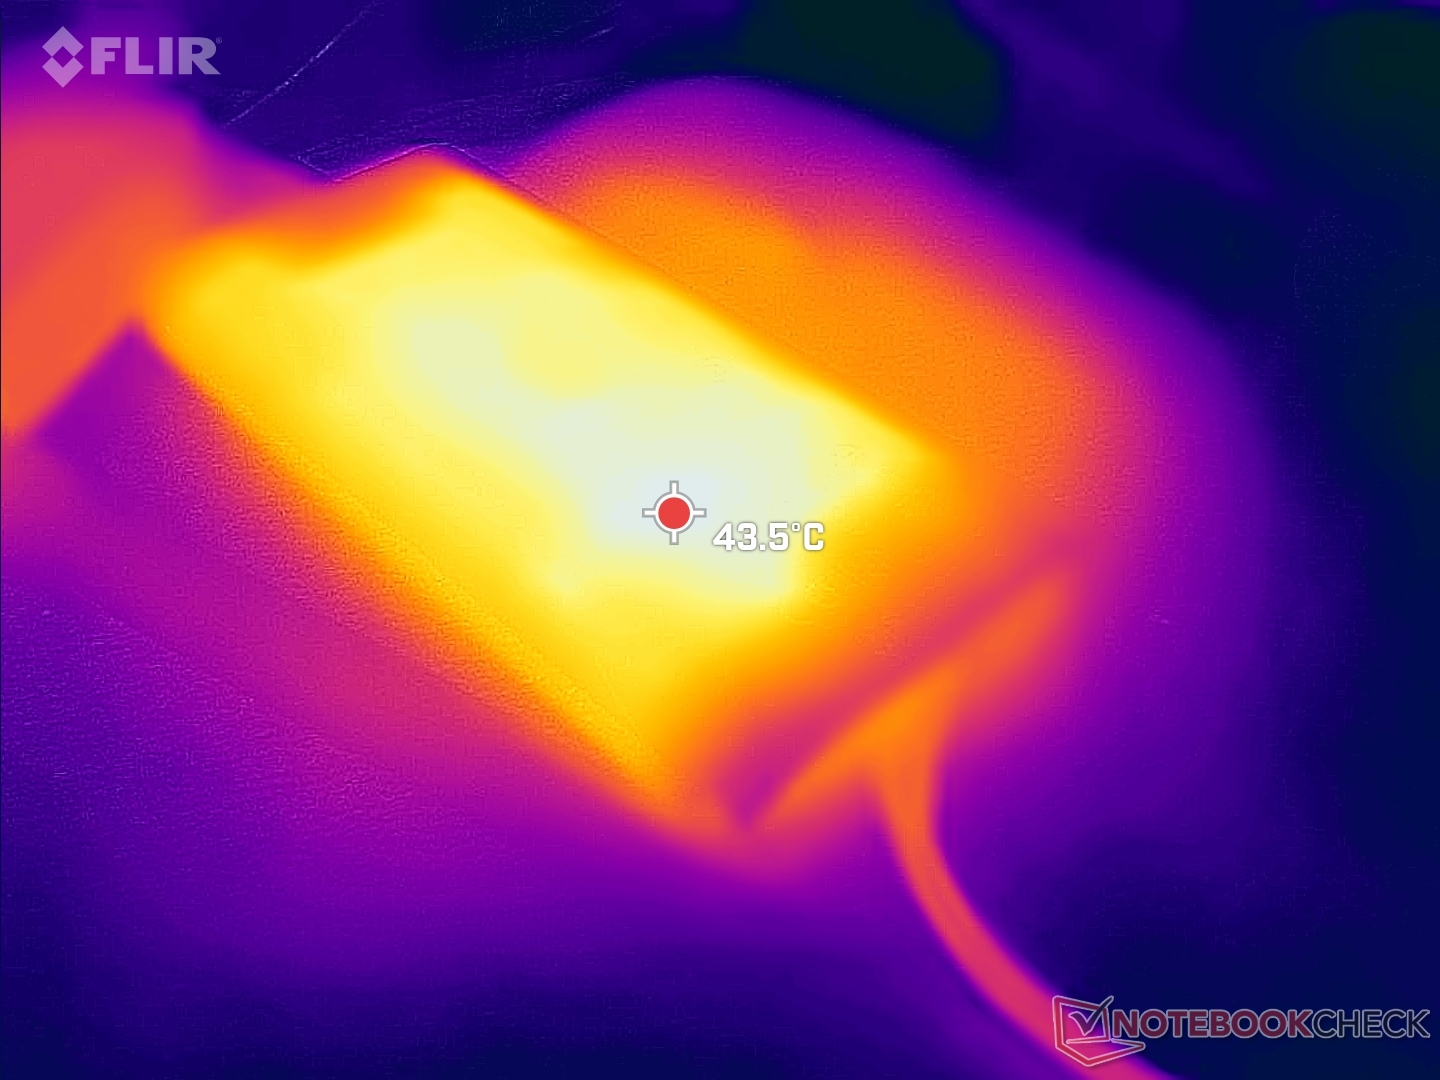
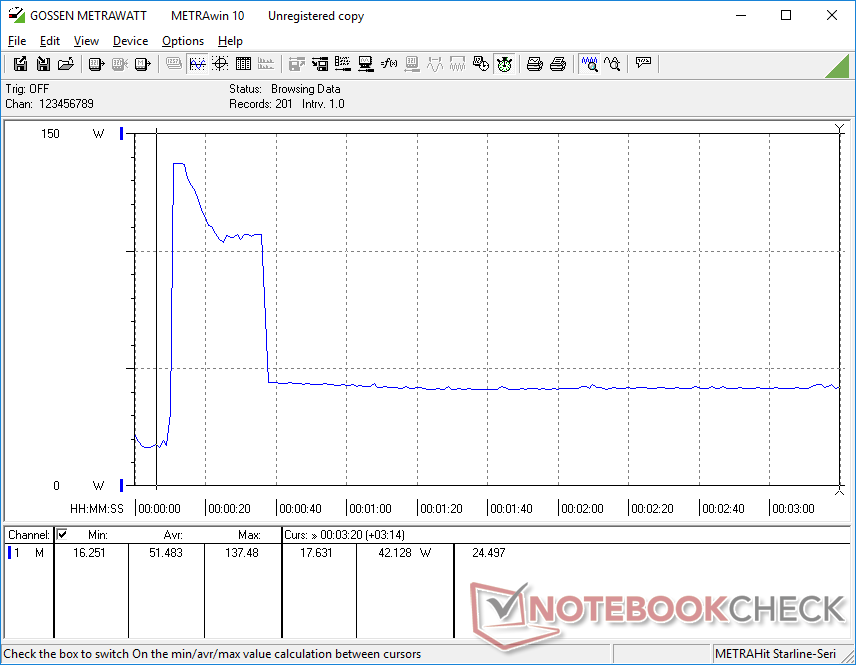
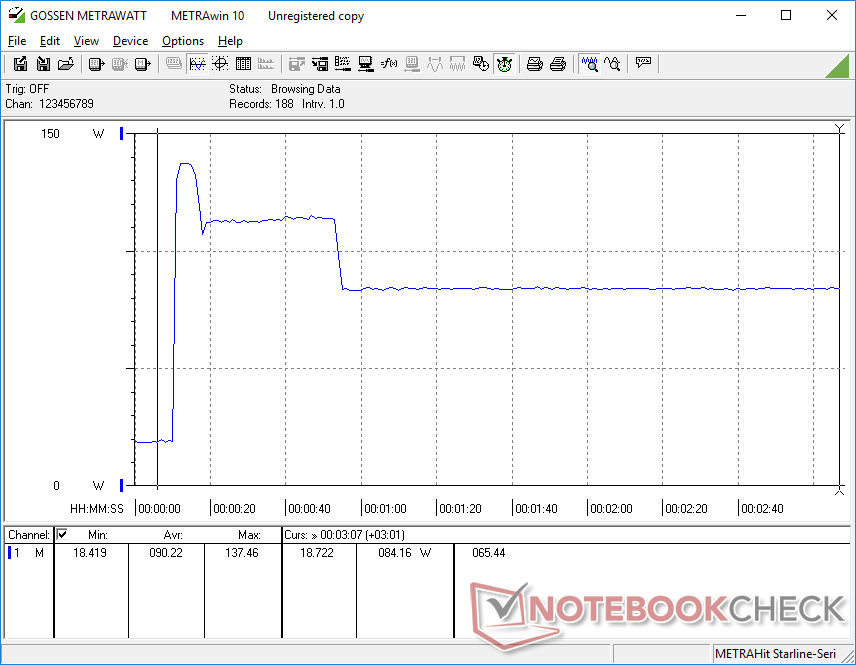
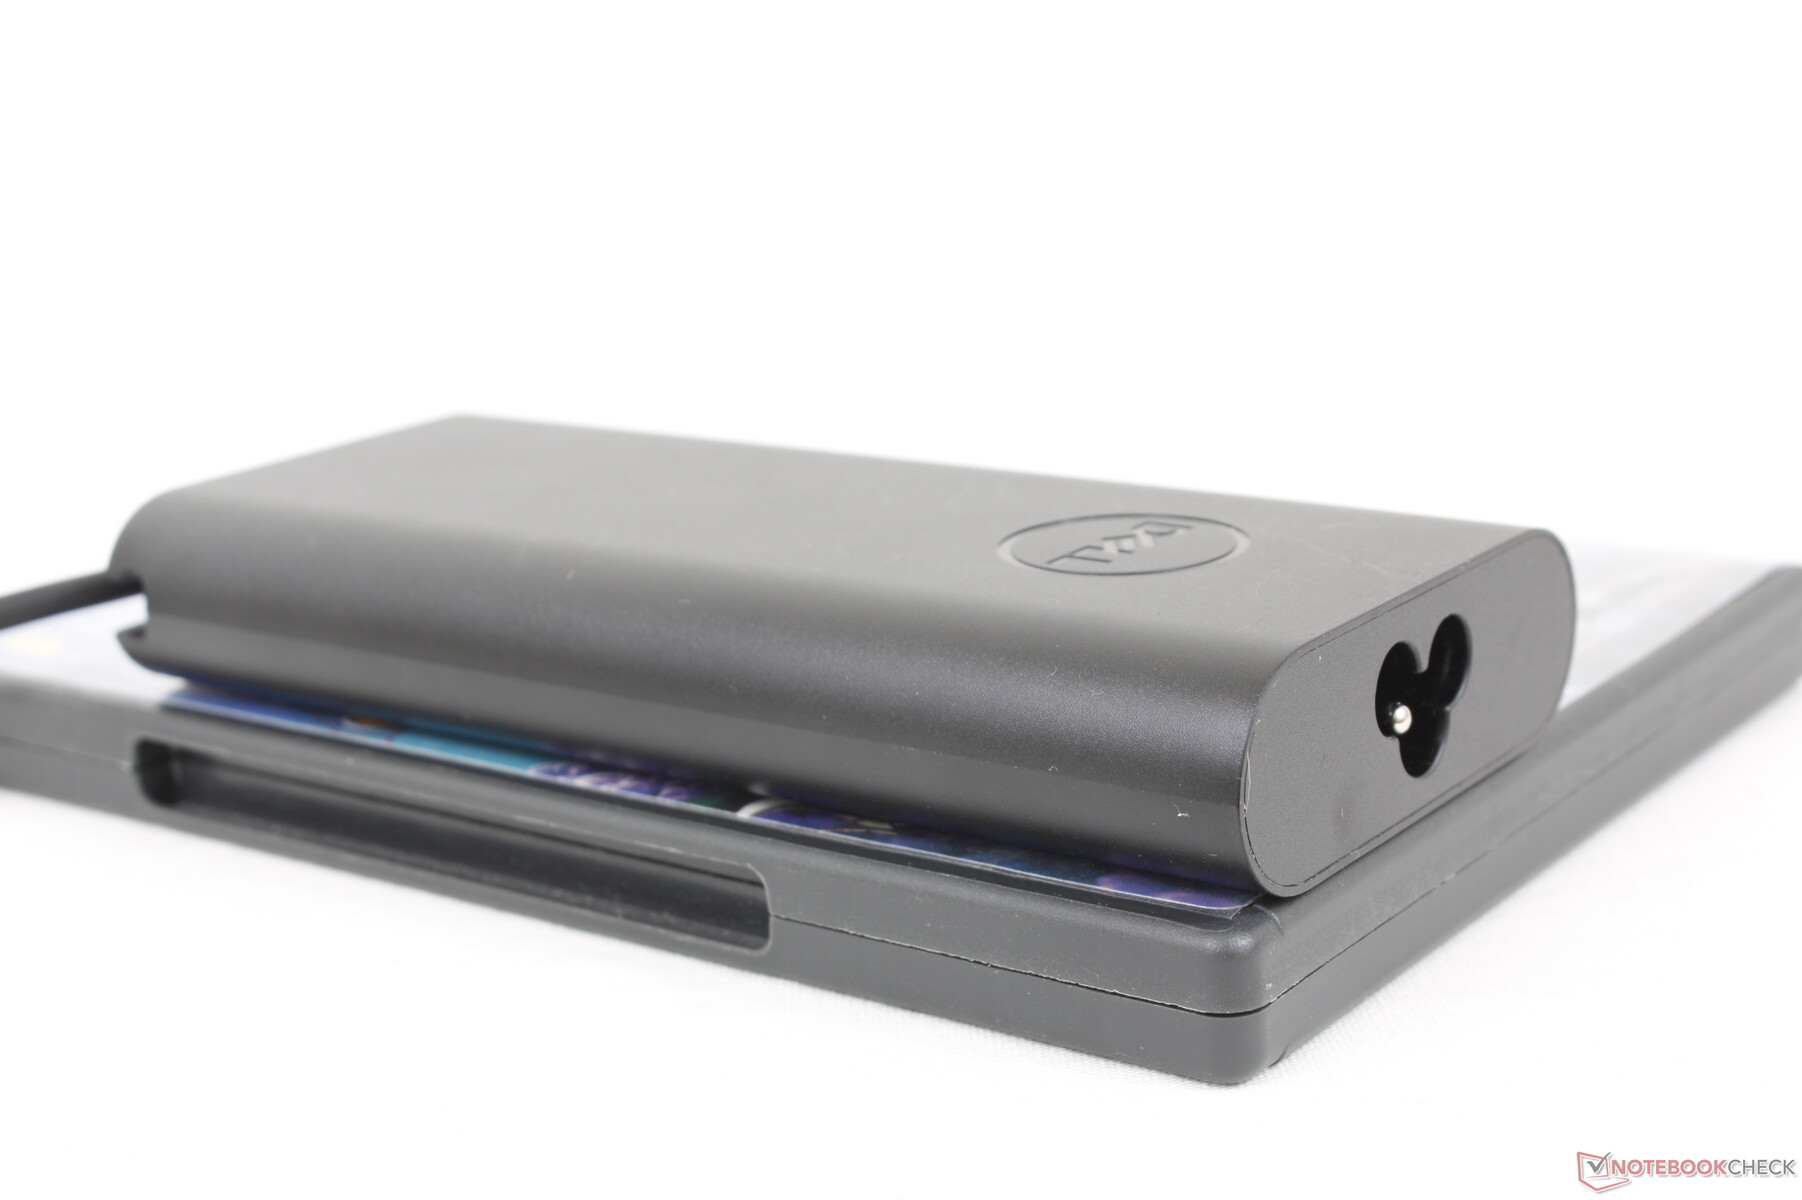
Jesteśmy w stanie odnotować maksymalny pobór prawie 138 W z małego-średniego (~14,3 x 6,5 x 2,2 cm) adaptera USB-C AC 130 W podczas uruchomienia Prim95. Ten wskaźnik jest tylko chwilowy, co pokazują poniższe zrzuty ekranu, ze względu na ograniczenia termiczne rozwiązania chłodzącego. Kształt krzywej poboru mocy ściśle odpowiada naszym obserwacjom dotyczącym częstotliwości taktowania i poboru mocy przez płytę główną.
Zauważ, że jednostki GPU bez dyskretnego układu graficznego RTX A1000 będą dostarczane z mniejszym adapterem USB-C o mocy 90 W zamiast większego 130 W.
| wyłączony / stan wstrzymania | |
| luz | |
| obciążenie |
|
Legenda:
min: | |
| Dell Precision 5000 5470 i9-12900H, RTX A1000 Laptop GPU, Samsung PM9A1 MZVL21T0HCLR, IPS, 2560x1600, 14" | Lenovo ThinkPad P15v G2 21A9000XGE i7-11800H, T1200 Laptop GPU, Toshiba XG6 KXG6AZNV512G, IPS LED, 1920x1080, 15.6" | Dell Precision 5000 5560 i7-11850H, RTX A2000 Laptop GPU, Samsung PM9A1 MZVL22T0HBLB, IPS, 3840x2400, 15.6" | Lenovo ThinkPad P14s G2 AMD R7 PRO 5850U, Vega 8, SK Hynix PC711 1TB HFS001TDE9X081N, IPS LED, 3840x2160, 14" | HP ZBook Firefly 14 G8 2C9Q2EA i7-1165G7, T500 Laptop GPU, Toshiba XG6 KXG60ZNV1T02, IPS, 1920x1080, 14" | HP ZBook Firefly 14 G7 i7-10610U, Quadro P520, Toshiba XG6 KXG60ZNV512G, IPS, 1920x1080, 14" | |
|---|---|---|---|---|---|---|
| Power Consumption | 1% | -22% | 35% | 40% | 30% | |
| Idle Minimum * (Watt) | 4.3 | 5.96 -39% | 6.2 -44% | 4.49 -4% | 3.1 28% | 3.3 23% |
| Idle Average * (Watt) | 8.9 | 8.37 6% | 13.9 -56% | 9.62 -8% | 4.7 47% | 9.3 -4% |
| Idle Maximum * (Watt) | 18.9 | 9.05 52% | 23.8 -26% | 10.24 46% | 8.6 54% | 12.1 36% |
| Load Average * (Watt) | 94 | 91.82 2% | 95.7 -2% | 31.56 66% | 64.8 31% | 59.4 37% |
| Witcher 3 ultra * (Watt) | 83.2 | 102 -23% | 87 -5% | 43.7 47% | 59.6 28% | 52.7 37% |
| Load Maximum * (Watt) | 137.5 | 126.38 8% | 132.6 4% | 52.37 62% | 68.5 50% | 69.4 50% |
* ... im mniej tym lepiej
Power Consumption Witcher 3 / Stresstest
Power Consumption external Monitor
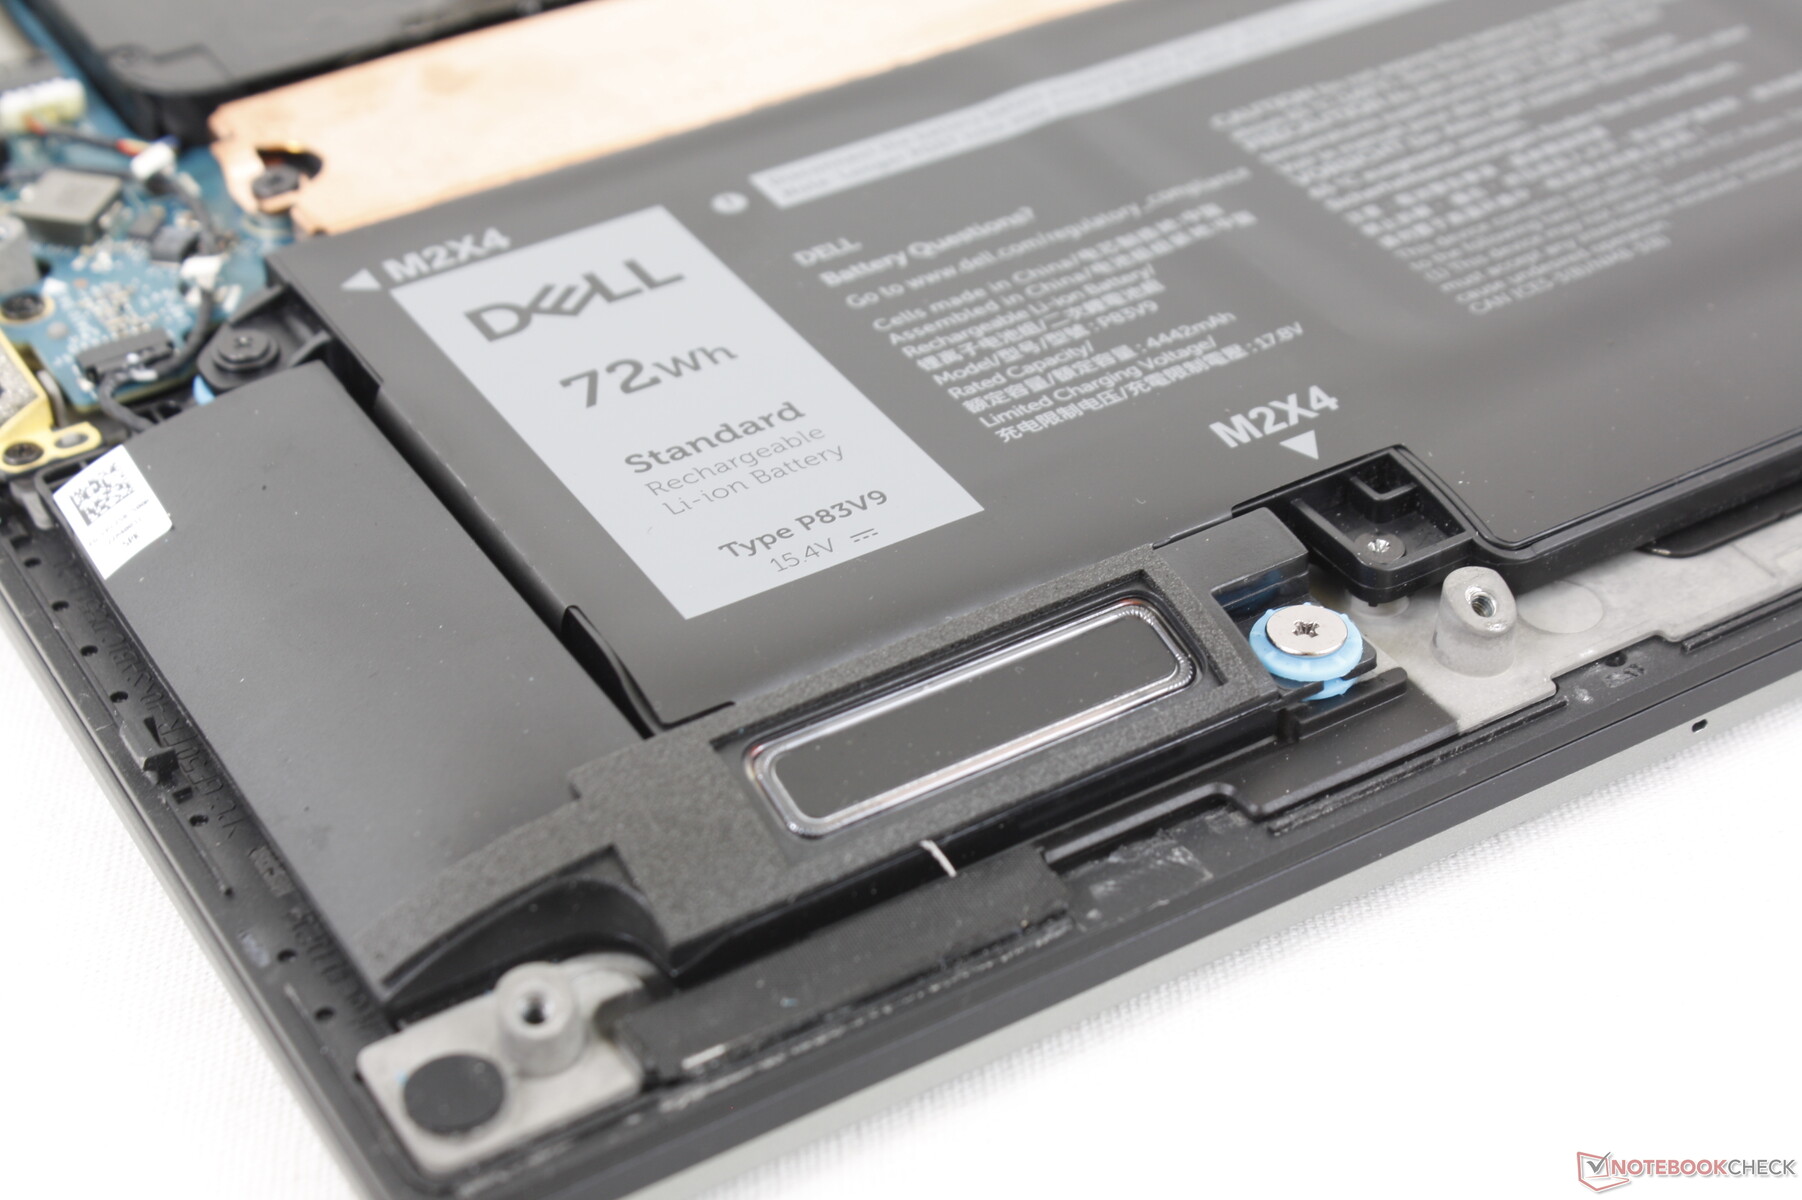
Czas pracy na baterii
Pojemność akumulatora jest stosunkowo duża jak na ultracienki laptop 14-calowy i wynosi 72 Wh. Czas pracy w sieci WLAN trwa nieco ponad 9,5 h na pełnym ładowaniu, co jest o kilka godzin krótsze od tego, co odnotowaliśmy w wolniejszym, zasilanym procesorem Core U laptopie HP ZBook Firefly 14 G8.
Ładowanie od pustego do pełnego trwa około 2 godzin.
| Dell Precision 5000 5470 i9-12900H, RTX A1000 Laptop GPU, 72 Wh | Lenovo ThinkPad P15v G2 21A9000XGE i7-11800H, T1200 Laptop GPU, 68 Wh | Dell Precision 5000 5560 i7-11850H, RTX A2000 Laptop GPU, 86 Wh | Lenovo ThinkPad P14s G2 AMD R7 PRO 5850U, Vega 8, 50 Wh | HP ZBook Firefly 14 G8 2C9Q2EA i7-1165G7, T500 Laptop GPU, 53 Wh | HP ZBook Firefly 14 G7 i7-10610U, Quadro P520, 53 Wh | |
|---|---|---|---|---|---|---|
| Czasy pracy | -8% | 4% | 7% | 162% | 21% | |
| Reader / Idle (h) | 14.7 | 17.2 17% | 12 -18% | |||
| WiFi v1.3 (h) | 9.6 | 7.5 -22% | 6.3 -34% | 8.3 -14% | 12.8 33% | 10.1 5% |
| Load (h) | 1.1 | 0.9 -18% | 1.8 64% | 1.4 27% | 4.3 291% | 1.5 36% |
| H.264 (h) | 8 | 10.6 | 12.5 |
Za
Przeciw
Werdykt - Uber Powerful bez Uber Size
Model Precision 5470 można najlepiej opisać jako cienką i lekką stację roboczą z procesorem grubego i ciężkiego laptopa do gier. Nie znajdziesz innej tak kompaktowej 14-calowej stacji roboczej z tym samym procesorem Core i9-12900H, a nawet dyskretnym układem graficznym Nvidia RTX, co ten Dell. Jeśli zależy Ci na maksymalnej wydajności przy zachowaniu jak najmniejszej wagi i rozmiarów, to Precision 5470 może być wart rozważenia.
Precision
5470 jest szybszy i bardziej wydajny niż wskazywałby na to jego niewielki rozmiar. Jest to model stacji roboczej, który warto nabyć, jeśli chce się utrzymać jak najwyższą wydajność w małej, 14-calowej obudowie.
Niestety, jeśli chodzi o wydajność, system ten jest nieco zbyt ambitny. Jego Core i9-12900H wypada słabo w porównaniu z innymi laptopami z tym samym procesorem. Jest on jednak szybki w porównaniu zinnych 14-calowych stacji roboczych, ale zdecydowanie mógłby być szybszy. Mamy obawy co do tego, na ile jednostka SKU Core i9-12900HK może być faktycznie lepsza od naszego Core i9-12900H, biorąc pod uwagę niepożądane wahania częstotliwości taktowania podczas naszej recenzji. Tymczasem RTX A1000 wykazuje słaby potencjał ray tracingu, mimo że w nazwie ma RTX, podobnie jak nasze obserwacje z GeForce RTX 3050, na którym bazuje A1000.
Wymagający procesor 12 gen serii H jest bezpośrednio odpowiedzialny za stosunkowo głośny hałas wentylatora i wysoki pobór mocy Precision 5470. Może on wyglądać i sprawiać wrażenie 14-calowego laptopa, ale momentami zdecydowanie brzmi jak laptop do gier. Wada ta jest powszechna w przypadku małych laptopów o wysokiej wydajności.
Cena i dostępność
Model Precision 5470 jest już powszechnie dostępny u sprzedawców internetowych, takich jak Newegg lub Amazon aczkolwiek tylko w ograniczonych konfiguracjach FHD w cenie od 2000 do 2300 USD. Użytkownicy mogą zamiast tego zakupić bezpośrednio od firmy Dell którzy będą mieli do wyboru więcej opcji konfiguracyjnych.
Dell Precision 5000 5470
- 16/09/2022 v7 (old)
Allen Ngo
Price comparison

