Recenzja Dell G15 5530: Realna alternatywa dla Alienware teraz z Raptor Lake-HX

Seria Dell G ma na celu zapewnienie sprawności Alienware tym, którzy wolą nie płacić przez zęby za wydajny laptop do gier. Podczas targów MWC 2023 firma Dell zaprezentowała odświeżone serie G15 i G16 z opcjami GPU Intel Raptor Lake-HX i Nvidia GeForce RTX 40.
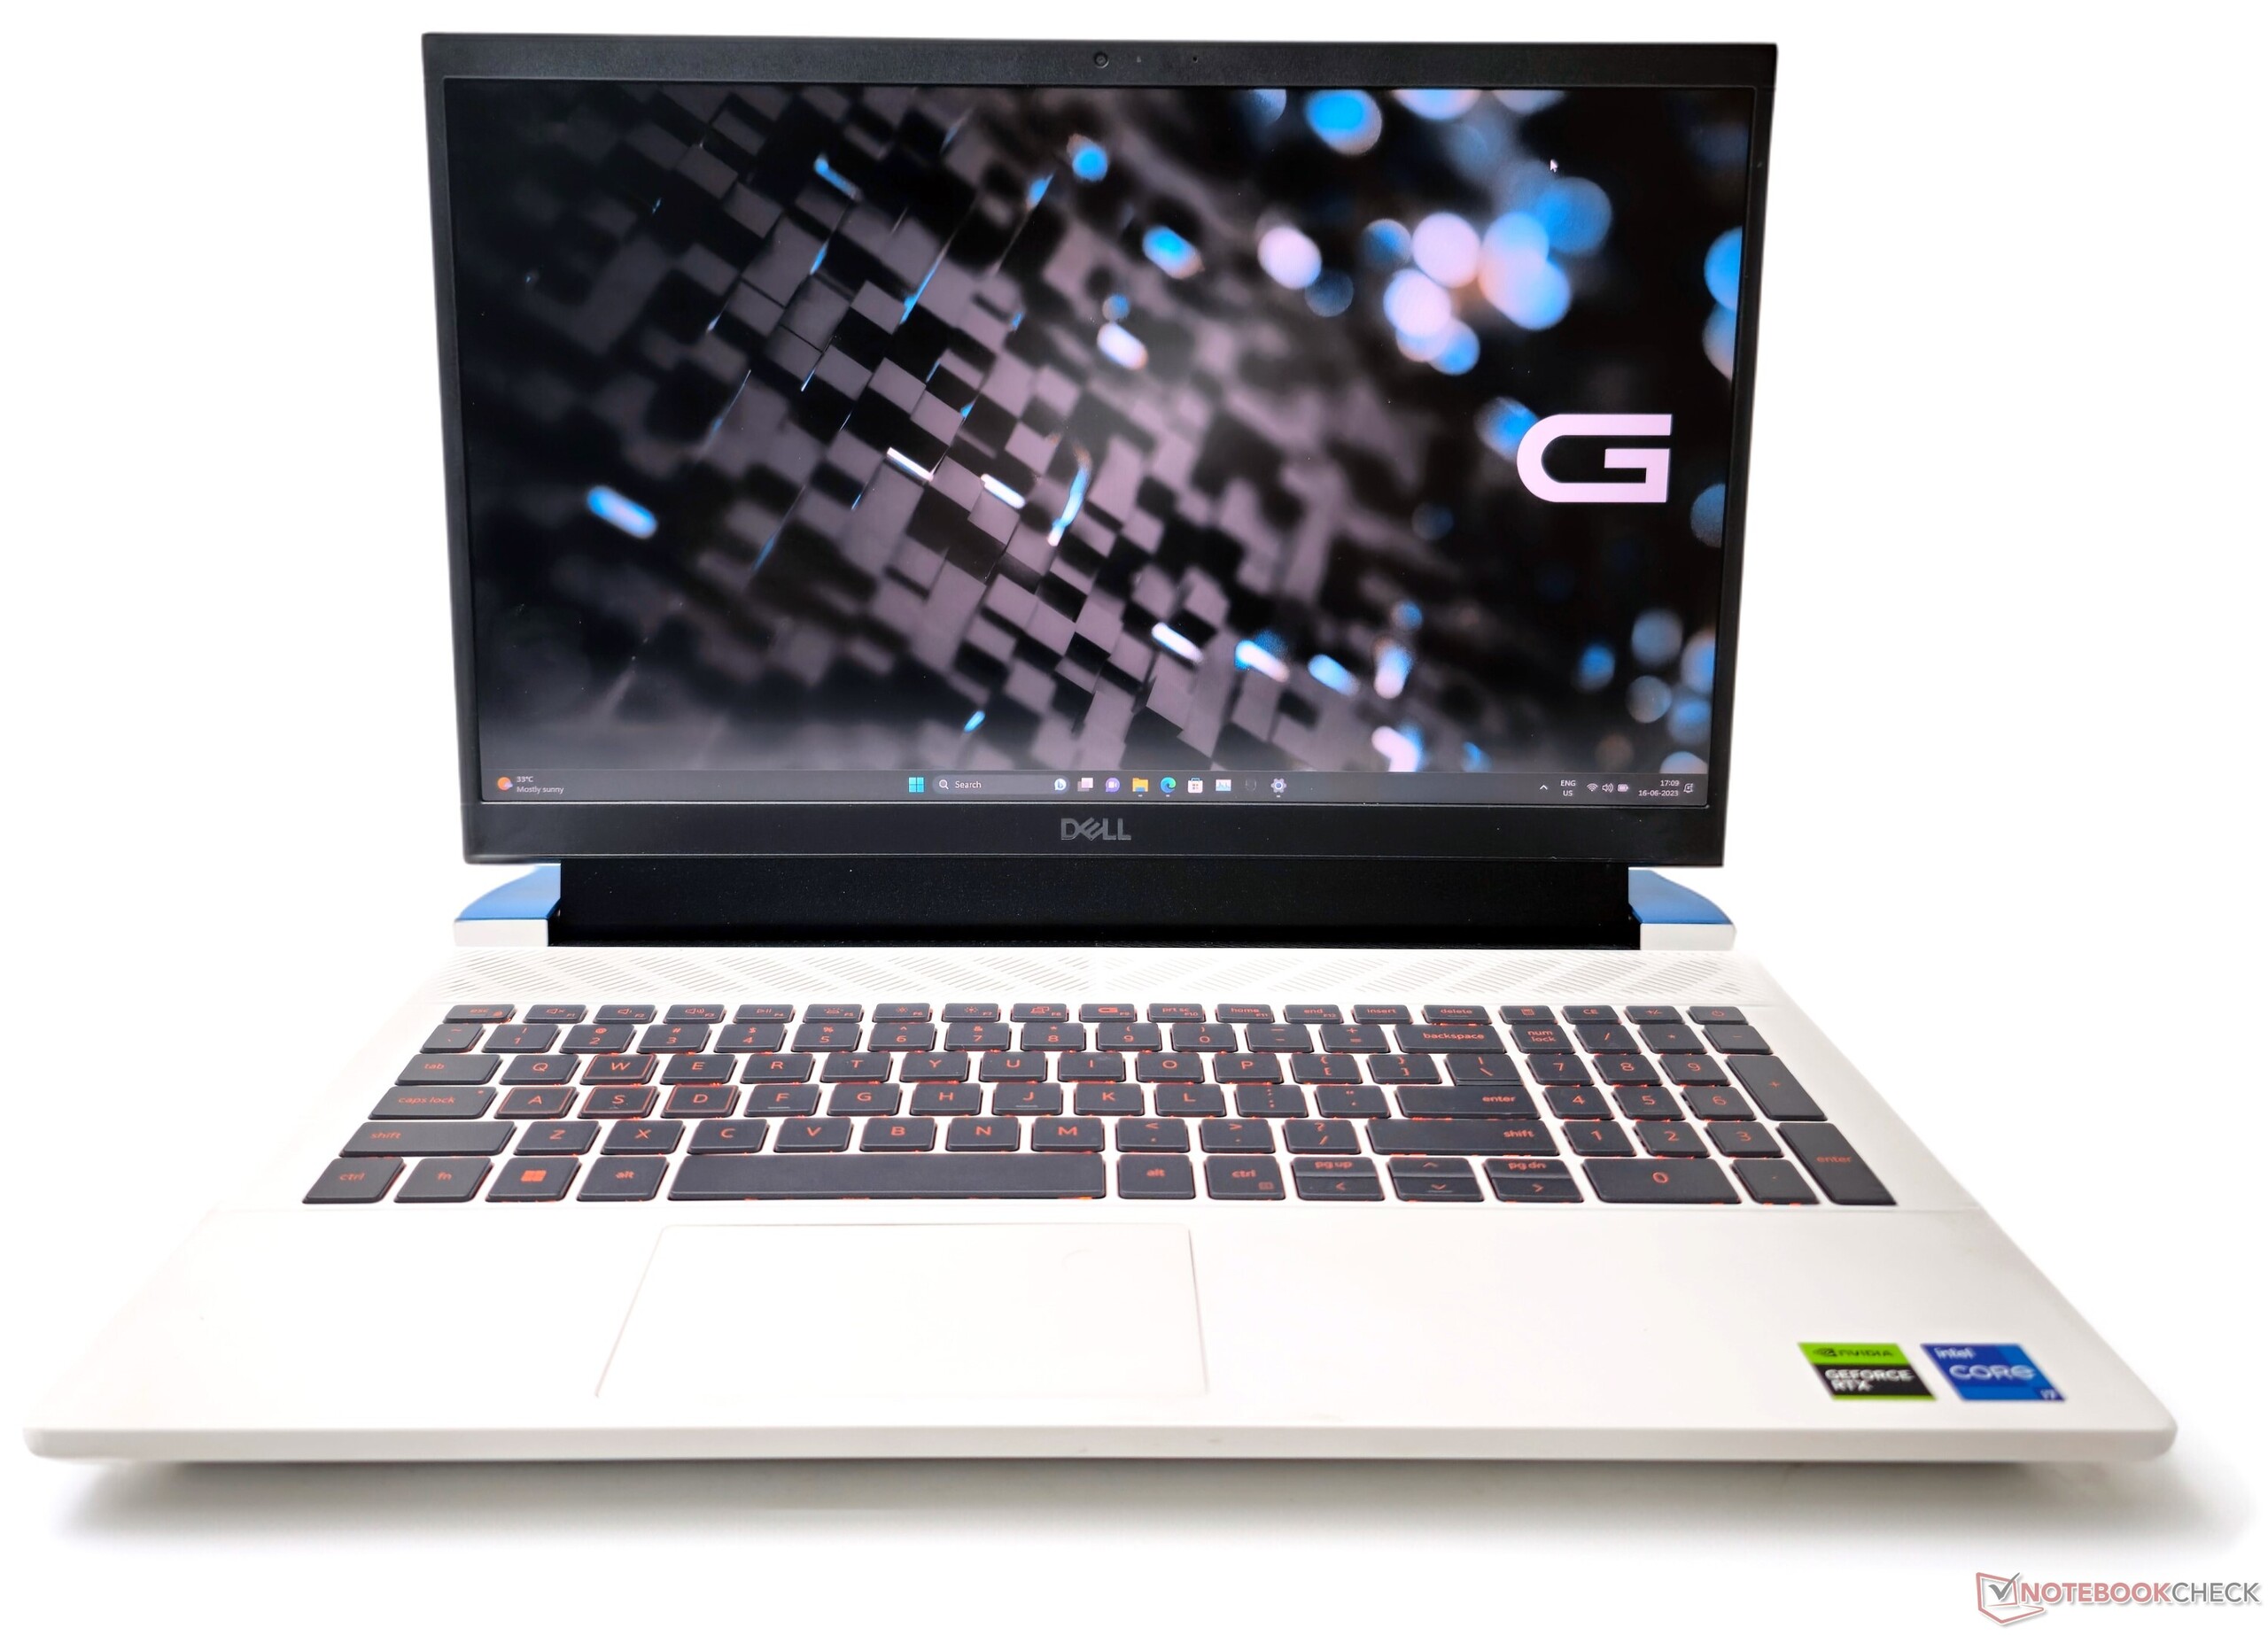
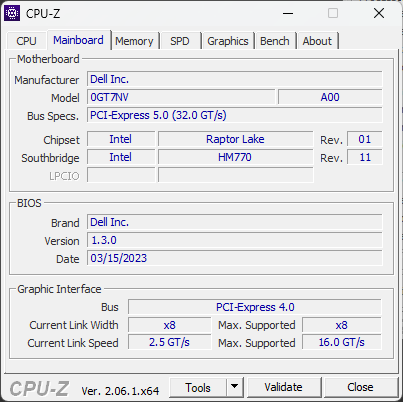
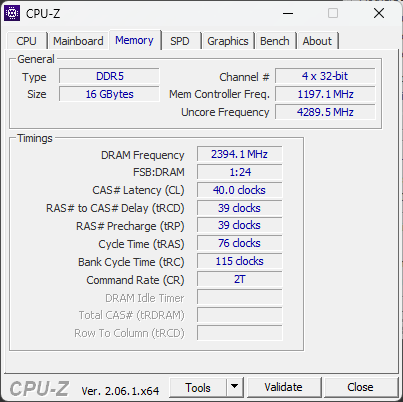
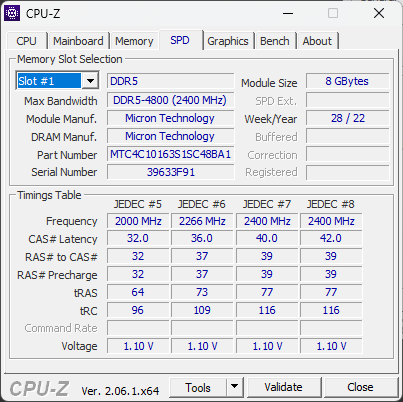
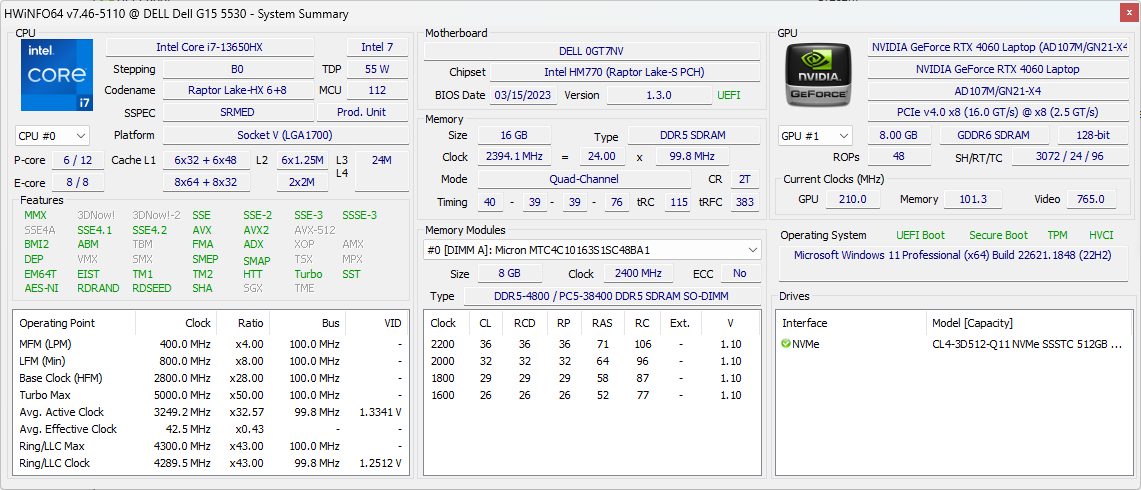
Mamy teraz z nami Dell G15 5530 z topową konfiguracją wyposażoną w Intel Core i7-13650HX, Nvidia GeForce RTX 4060 Laptop GPU16 GB pamięci RAM DDR5-4800, 512 GB NVMe SSD i 15,6-calowy wyświetlacz FHD G-Sync 165 Hz.
W tej recenzji bierzemy Dell G15 5530 na przejażdżkę i sprawdzamy, jak dobrze wypada w porównaniu z konkurencją za cenę wywoławczą 1 58 990 jenów (1 449 euro lub 1659,99 USD).
Potencjalni konkurenci w porównaniu
Ocena | Data | Model | Waga | Wysokość | Rozmiar | Rezolucja | Cena |
|---|---|---|---|---|---|---|---|
| 84.2 % v7 (old) | 06/2023 | Dell G15 5530 i7-13650HX, GeForce RTX 4060 Laptop GPU | 3 kg | 26.95 mm | 15.60" | 1920x1080 | |
| 87.4 % v7 (old) | 03/2023 | Asus ROG Strix G18 G814JI i7-13650HX, GeForce RTX 4070 Laptop GPU | 3 kg | 31 mm | 18.00" | 2560x1600 | |
| 87.9 % v7 (old) | 05/2023 | Lenovo Legion Pro 5 16IRX8 i7-13700HX, GeForce RTX 4060 Laptop GPU | 2.5 kg | 26.8 mm | 16.00" | 2560x1600 | |
| 89.7 % v7 (old) | 06/2023 | Asus ROG Flow X16 GV601V i9-13900H, GeForce RTX 4060 Laptop GPU | 2.1 kg | 19.4 mm | 16.00" | 2560x1600 | |
| 82.1 % v7 (old) | 02/2023 | MSI Katana 17 B13VFK i7-13620H, GeForce RTX 4060 Laptop GPU | 2.8 kg | 25.2 mm | 17.30" | 1920x1080 | |
| 86.9 % v7 (old) | 06/2023 | Asus TUF Gaming A16 FA617XS R9 7940HS, Radeon RX 7600S | 2.2 kg | 22.1 mm | 16.00" | 1920x1200 | |
| 88.4 % v7 (old) | 04/2023 | Asus ROG Strix G17 G713PI R9 7945HX, GeForce RTX 4070 Laptop GPU | 2.8 kg | 30.7 mm | 17.30" | 2560x1440 | |
| 89 % v7 (old) | 04/2023 | Medion Erazer Major X20 i9-13900HX, GeForce RTX 4070 Laptop GPU | 2.4 kg | 29 mm | 16.00" | 2560x1600 |
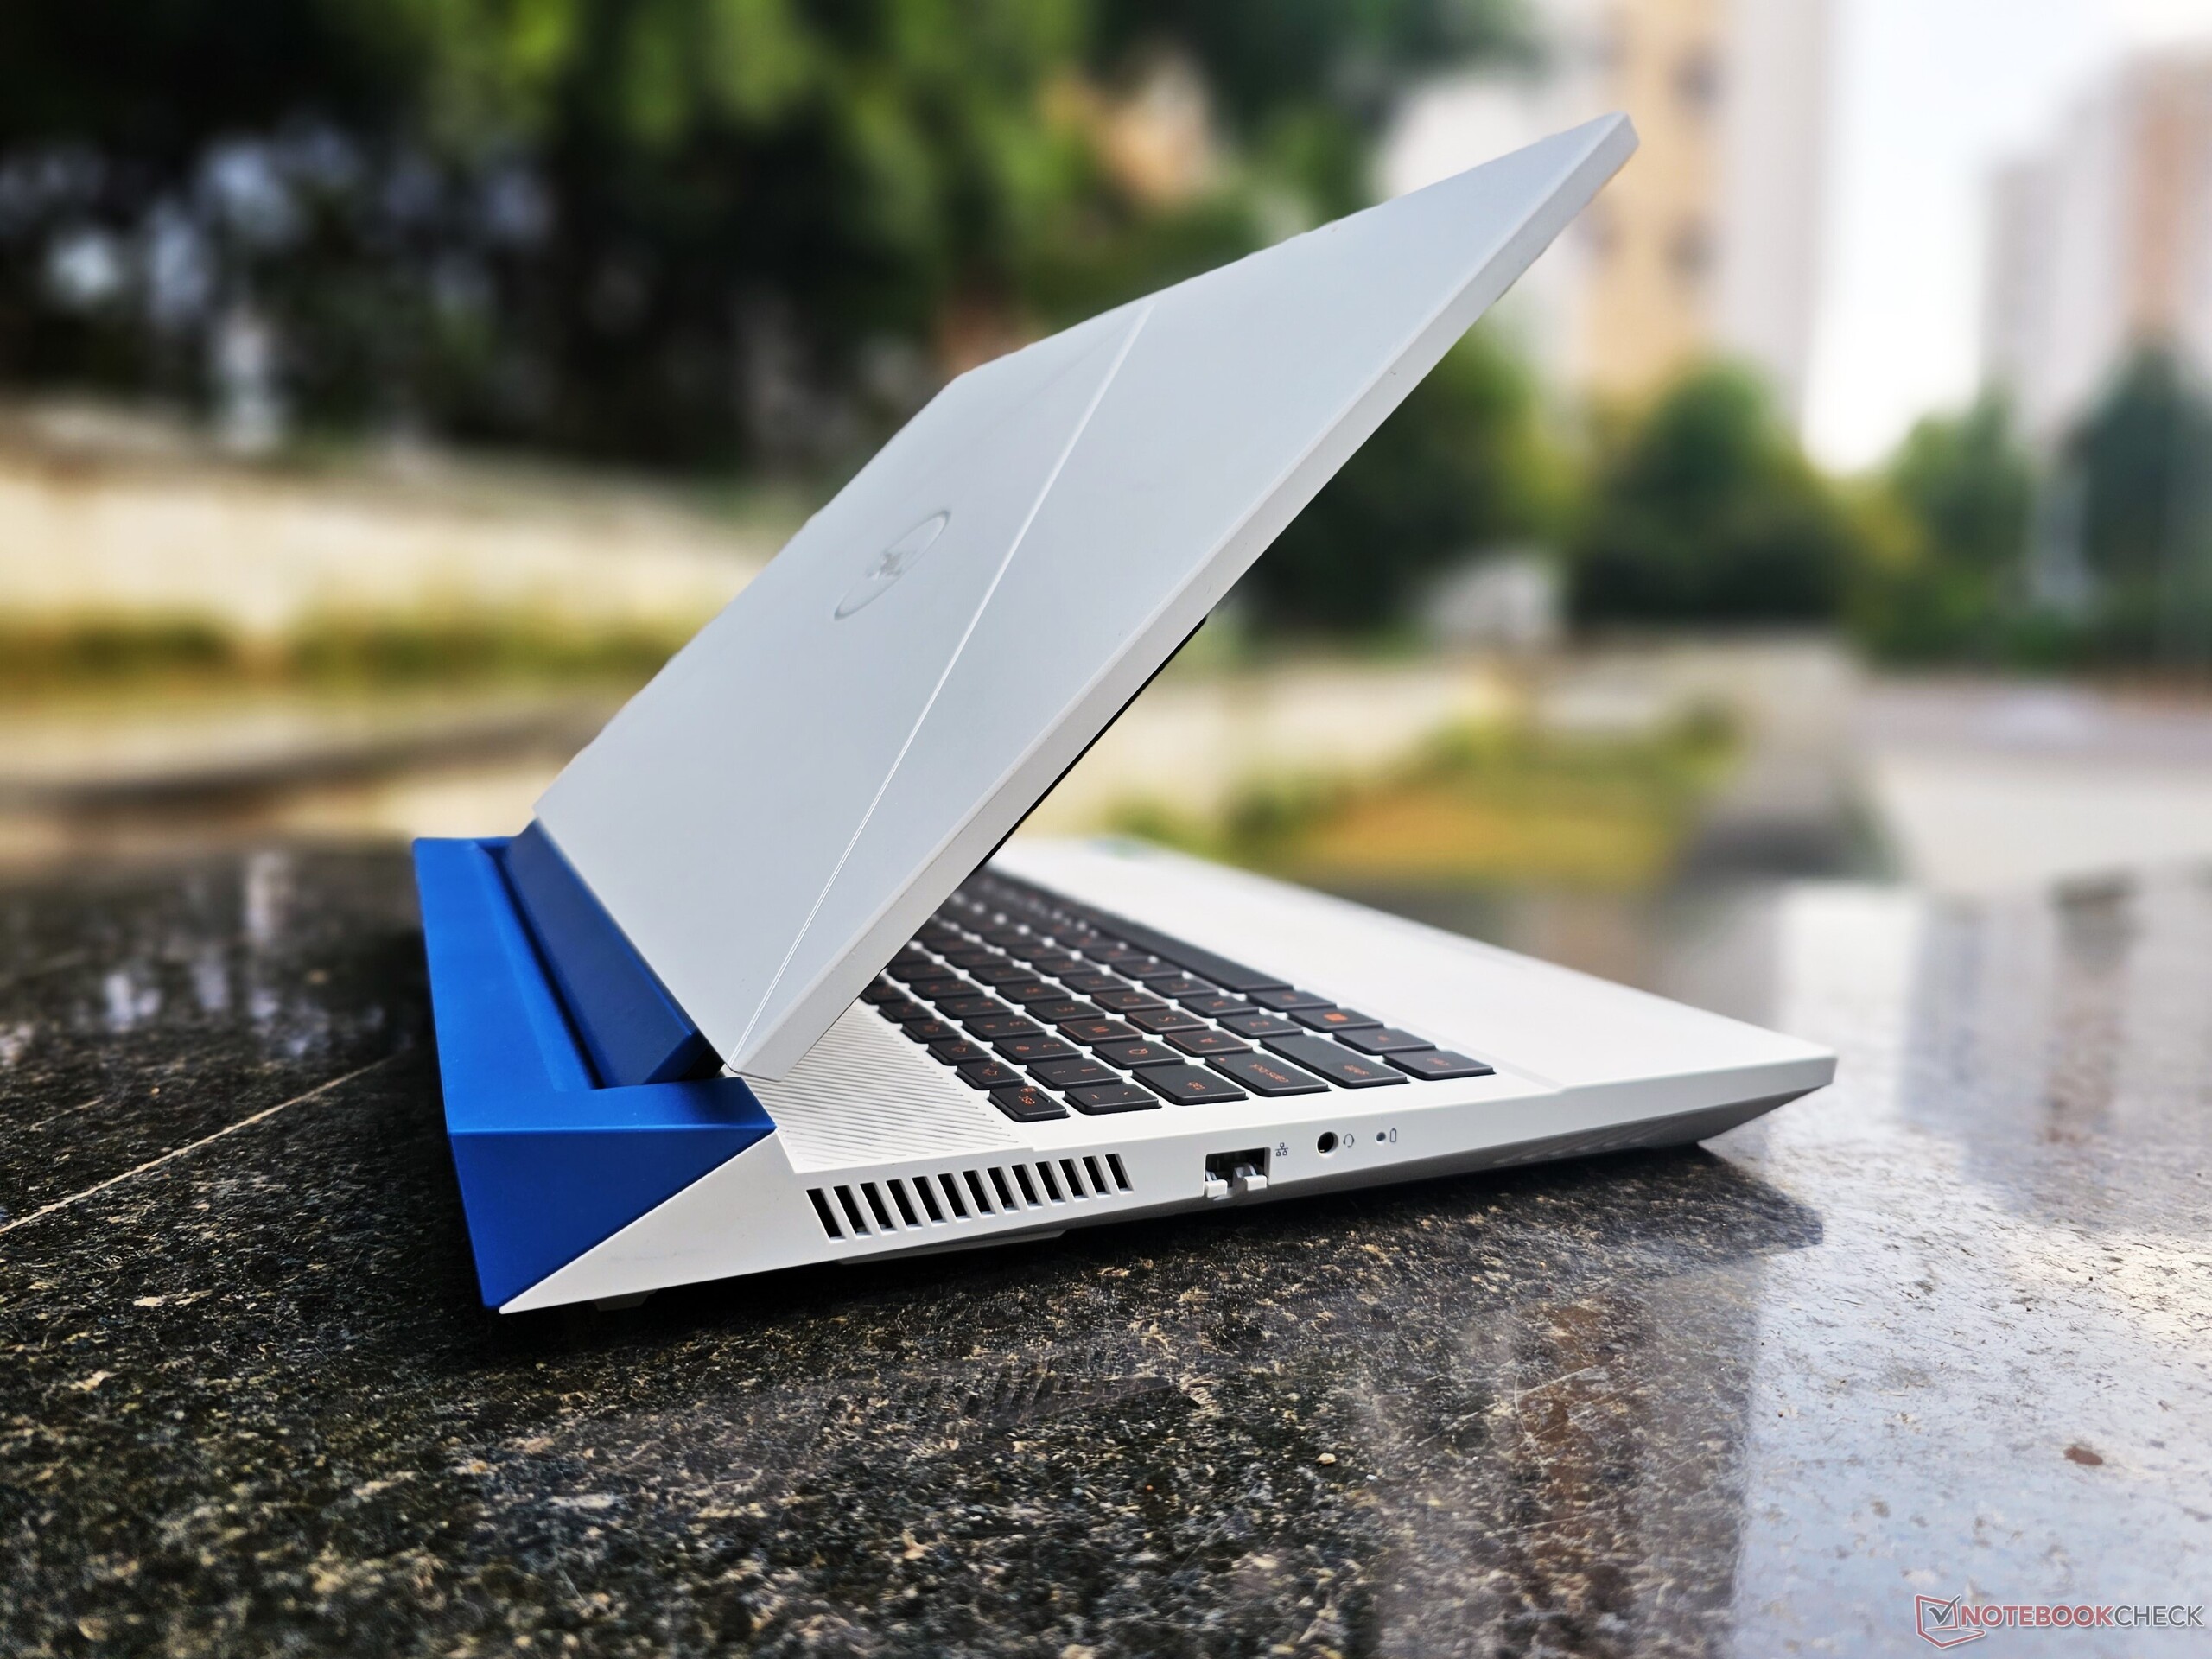
Obudowa: Plastikowa, ciężka obudowa z nieporęcznym zasilaczem
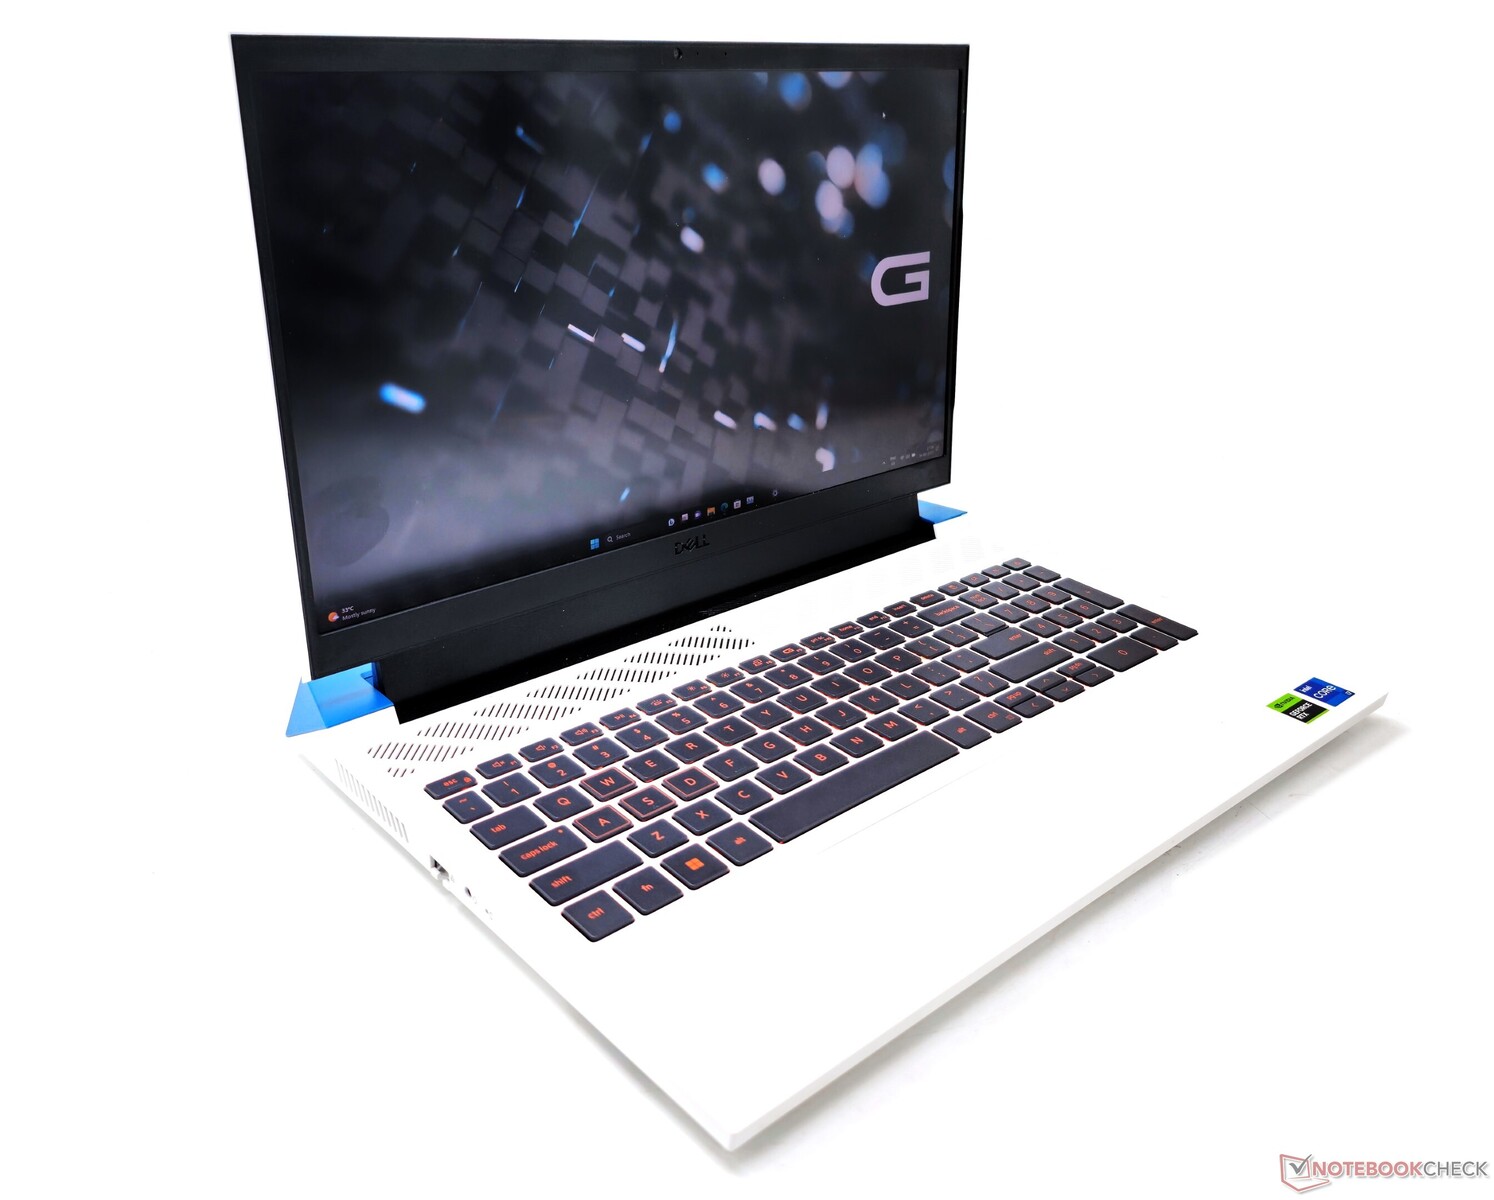
Wygląda na to, że tym razem Dell ograniczył pizzazz RGB, w przeciwieństwie do tego, co widzieliśmy wcześniej zG15 5520i G15 5521 Special Edition. Obudowa 5530 jest mniej więcej identyczna z obudową G15 5510.
Nasza jednostka G15 5530 to wariant Quantum White z półką termiczną Deep Space Blue. Dodatkowo, Dell oferuje dwa alternatywne warianty kolorystyczne dla tego modelu: Dark Shadow Gray z czarną półką termiczną i Pop Purple z półką termiczną Neo Mint.
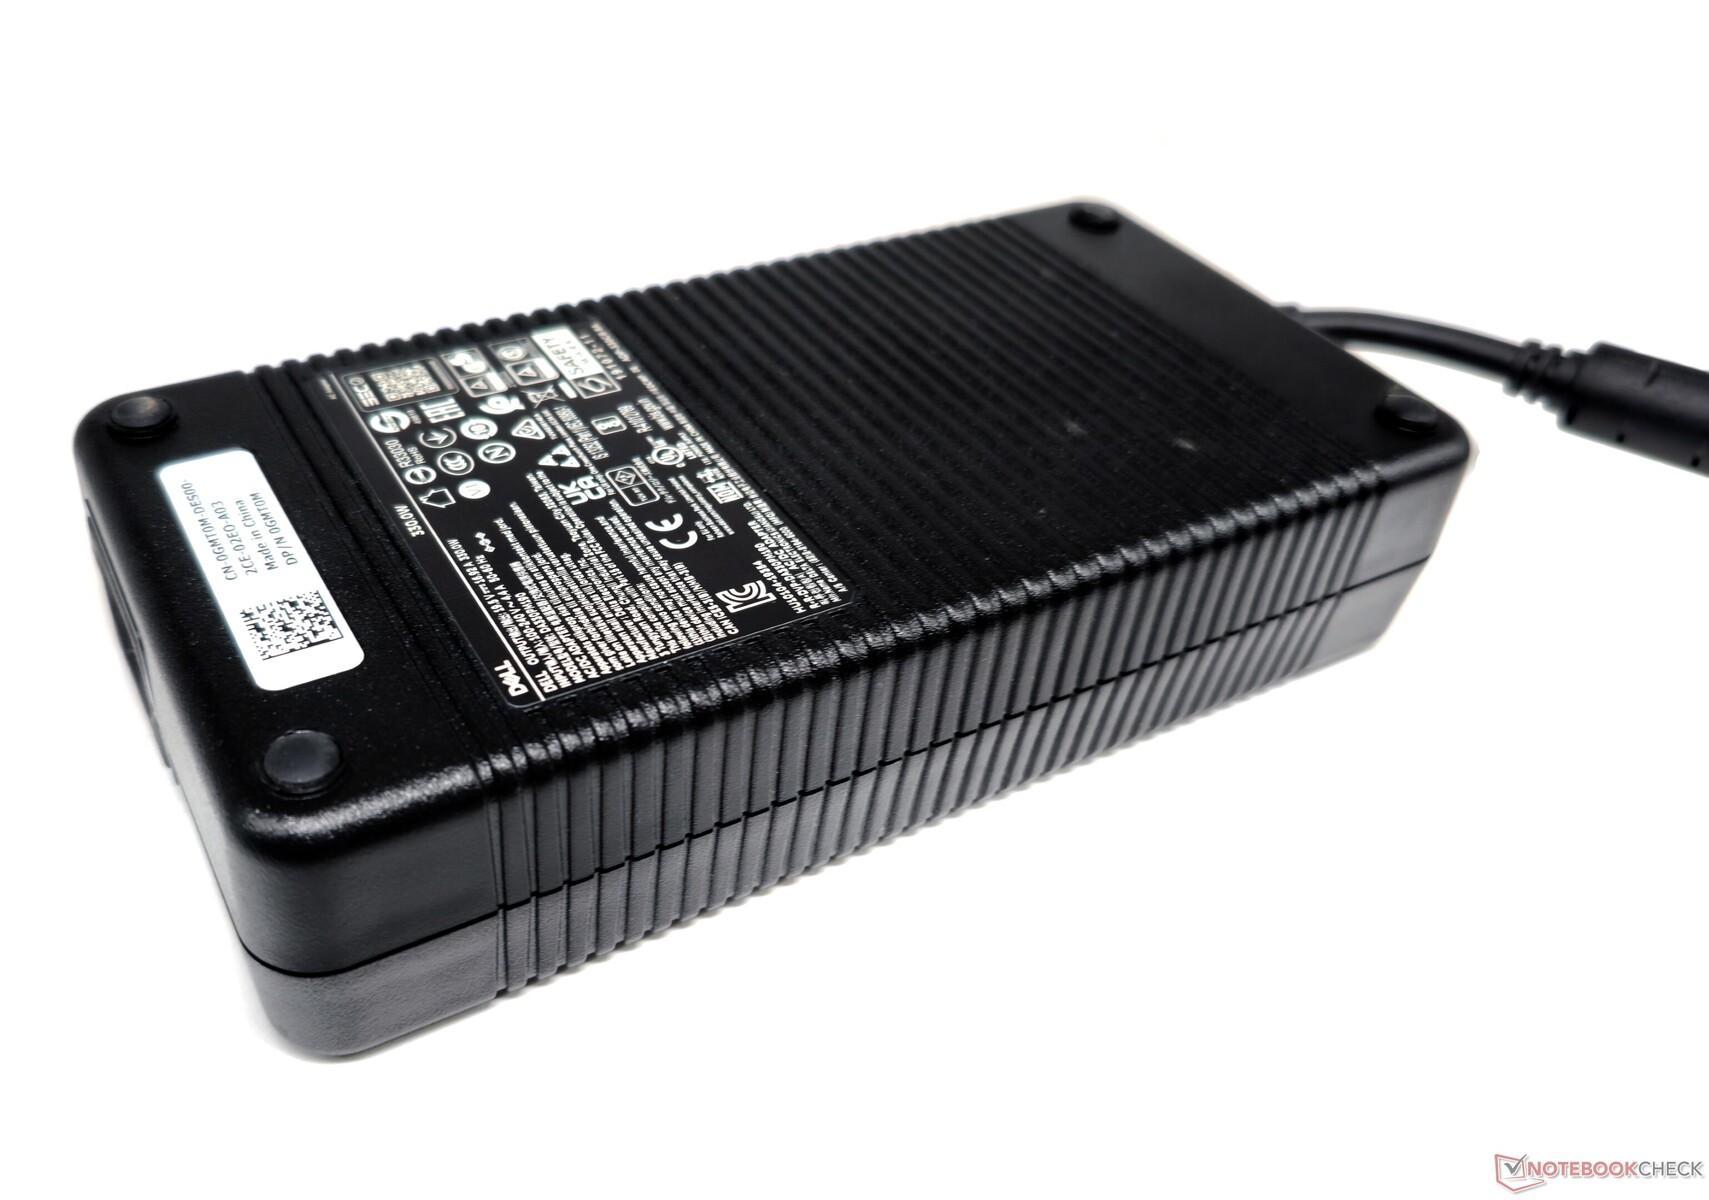
Laptop G15 5530 ma plastikową obudowę, która waży prawie 3 kg, co jest jego główną wadą. Do tego dochodzi również 1,34 kg zasilacz o mocy 330 W, więc gracze mogą spodziewać się niezłego treningu podczas noszenia tego laptopa.
Zawiasy w naszym egzemplarzu były nieco sztywne, ale pokrywę można otworzyć jednym palcem z pewnym wysiłkiem. Chociaż pokrywa łatwo ugina się przy minimalnej sile, pozostaje stabilna bez chybotania podczas normalnego użytkowania.
Ogólna konstrukcja obudowy nie zaskakuje, ale ostre rogi i duża waga mogą nie każdemu przypaść do gustu.

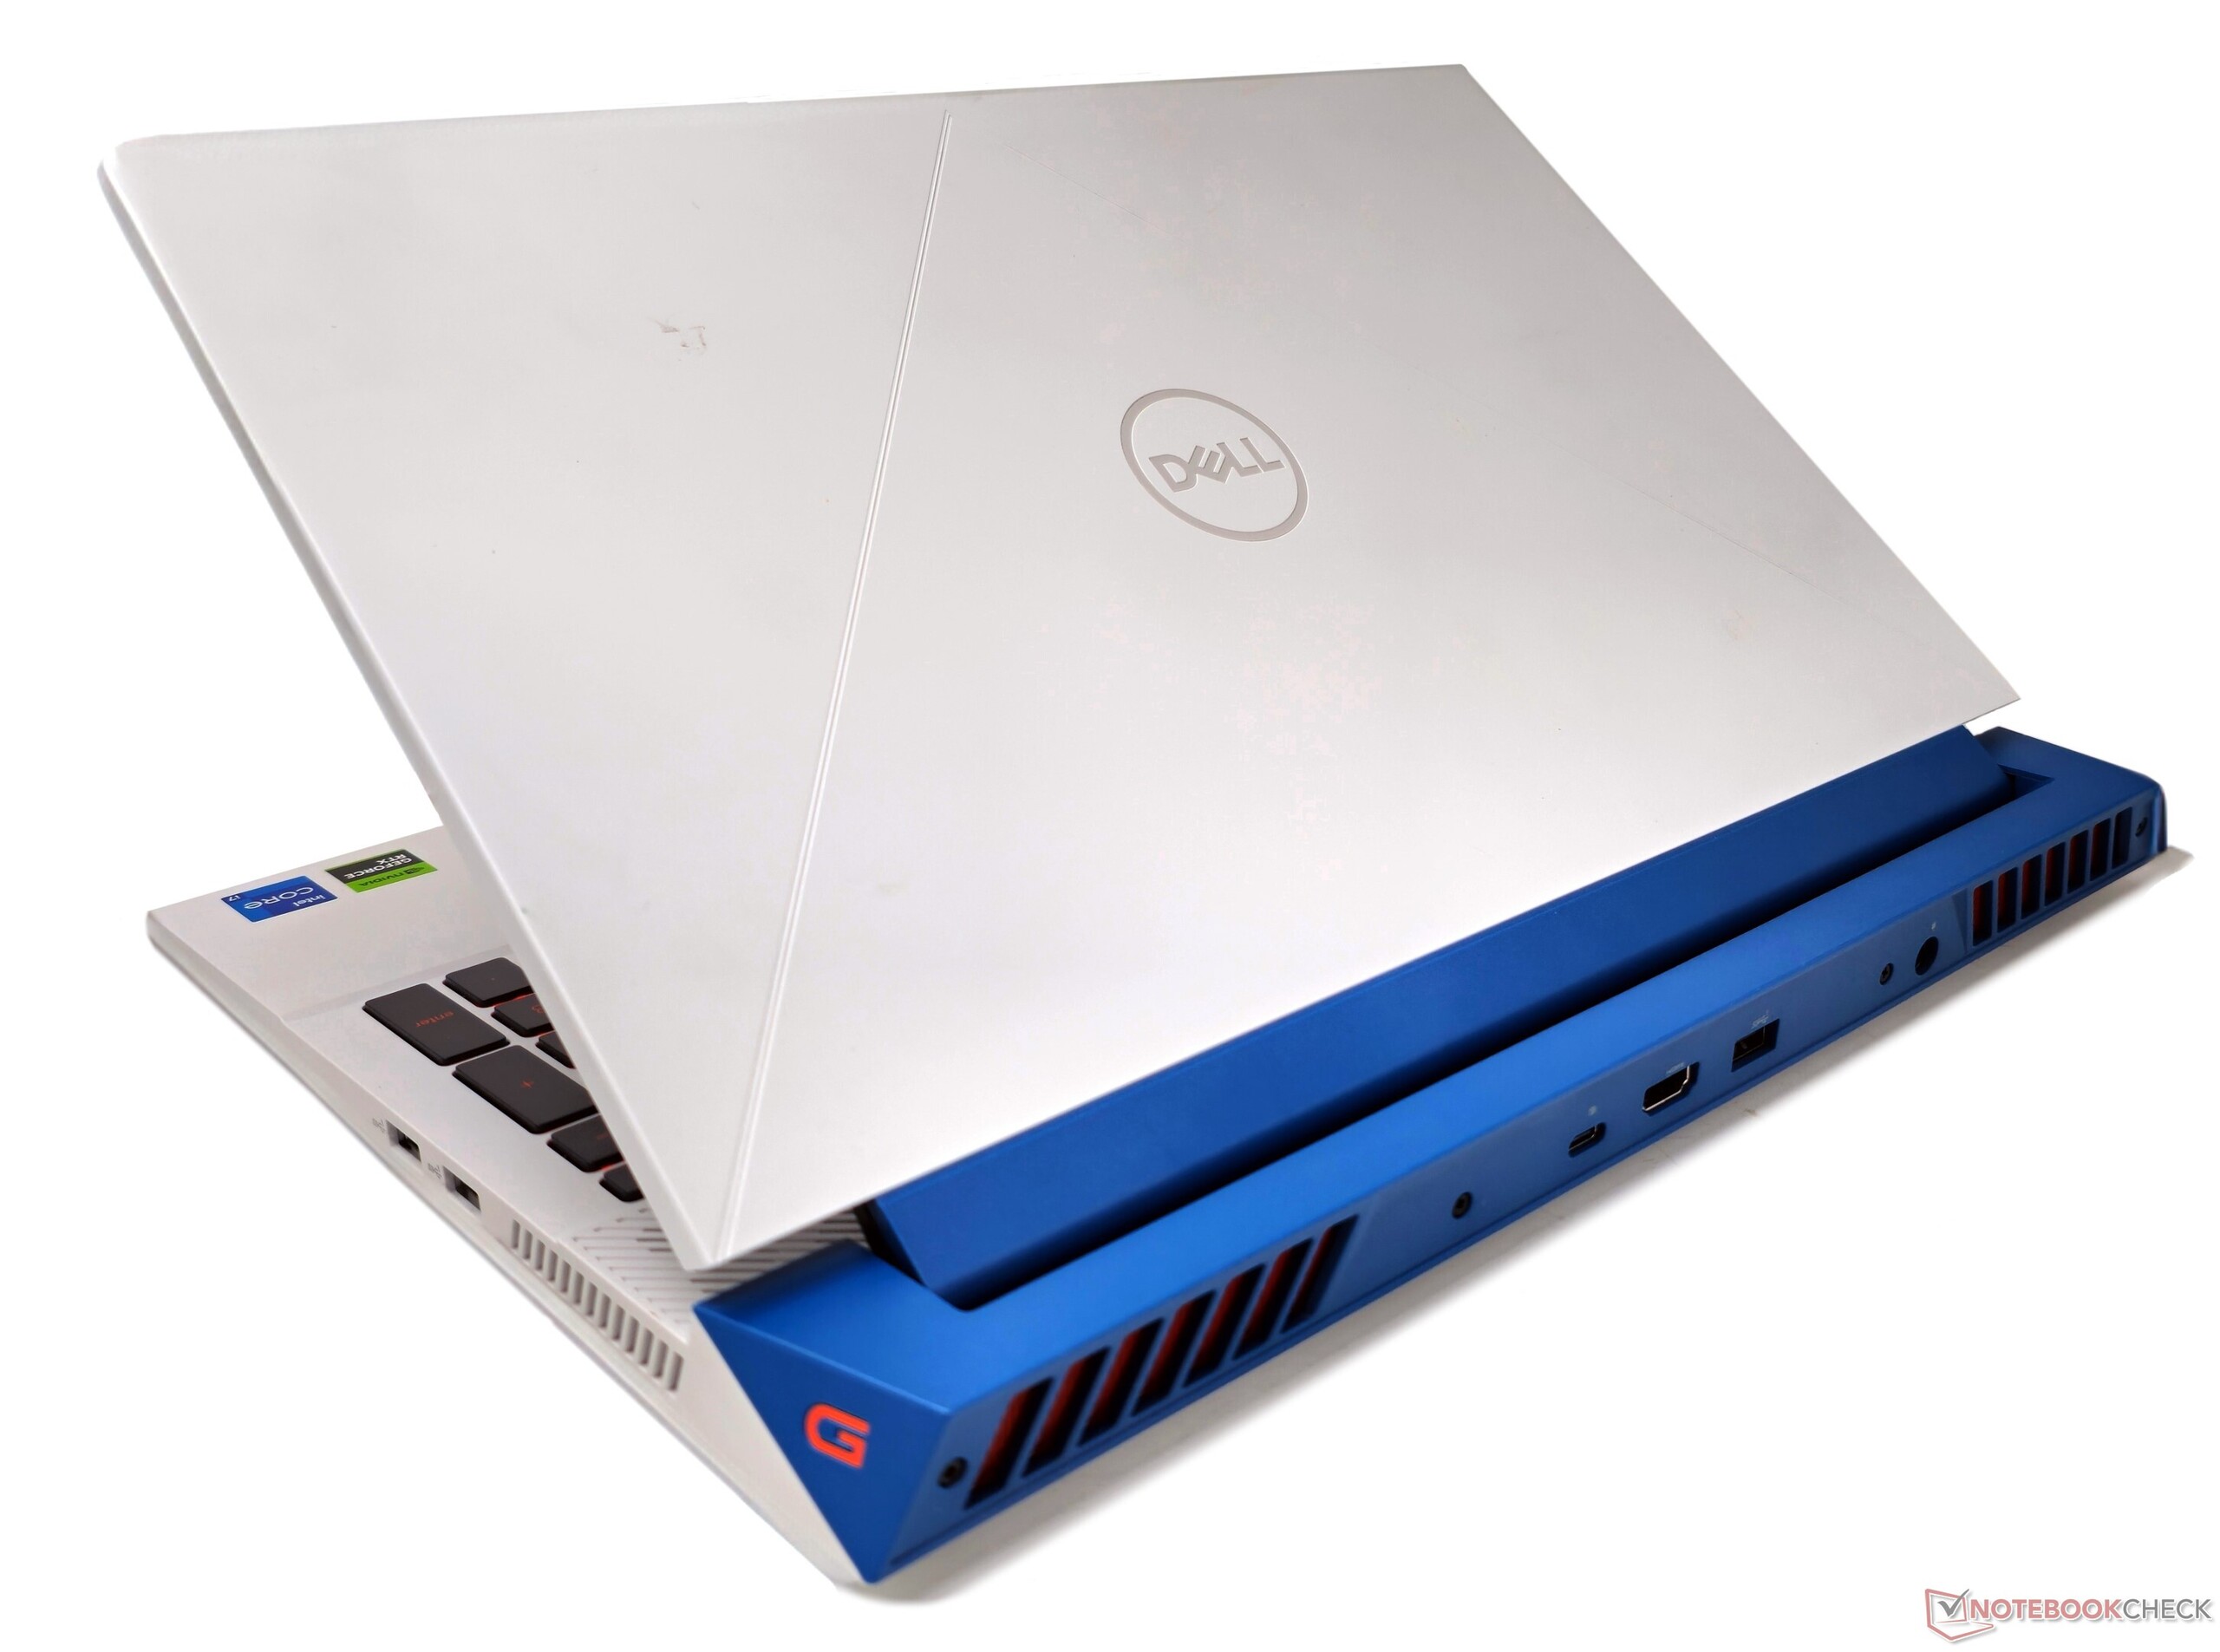

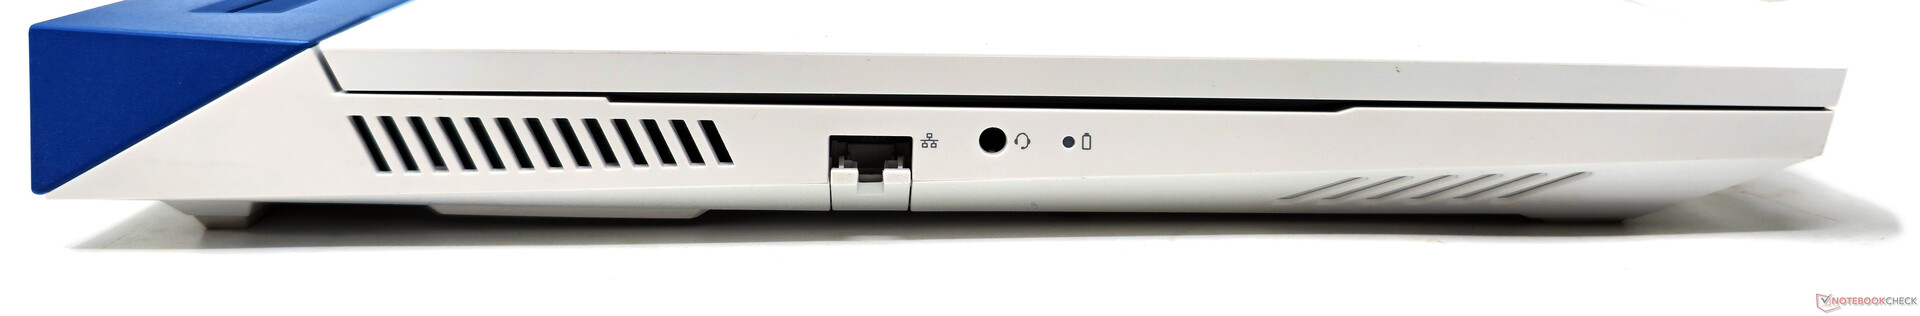
Łączność: Nieidealny rozkład portów dla graczy
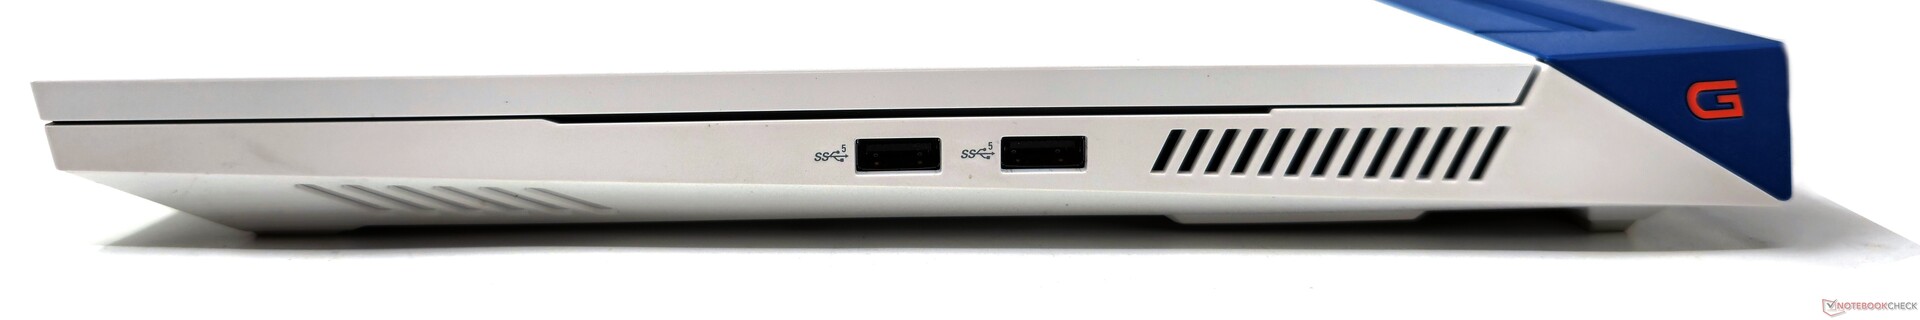
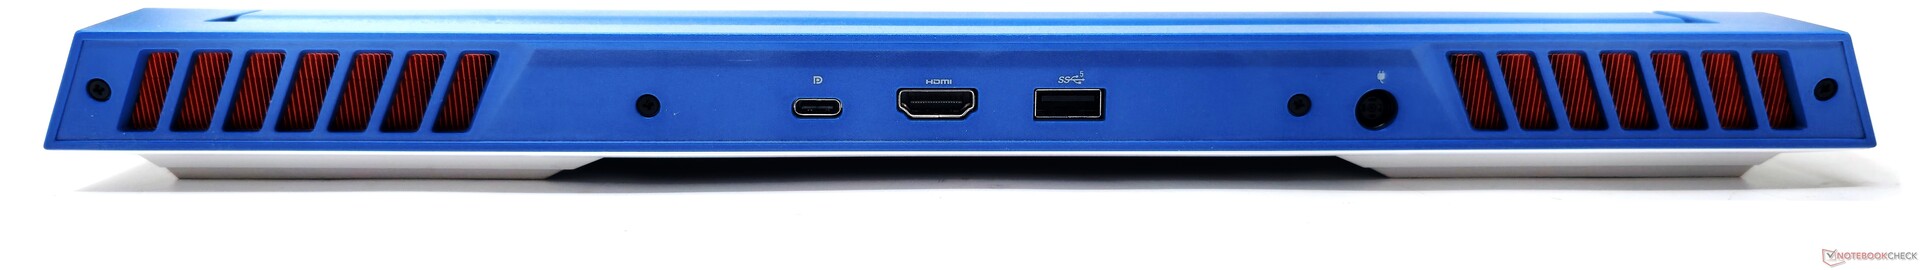
Rozmieszczenie portów w G15 5530 nie jest idealne. Tylko port LAN i gniazdo słuchawkowe znajdują się po lewej stronie, podczas gdy po prawej stronie znajdują się dwa porty USB 3.2 Gen1 Type-A. Pozostałe porty znajdują się z tyłu.
Brak portów USB po lewej stronie może być irytujący dla połączeń peryferyjnych, zwłaszcza dla graczy korzystających z myszy przewodowej.
Co więcej, jedyny port USB typu C oferuje funkcję DisplayPort-out, ale brakuje mu funkcji Power Delivery. W rezultacie laptop nie może być ładowany bez użycia nieporęcznego zasilacza.
Komunikacja
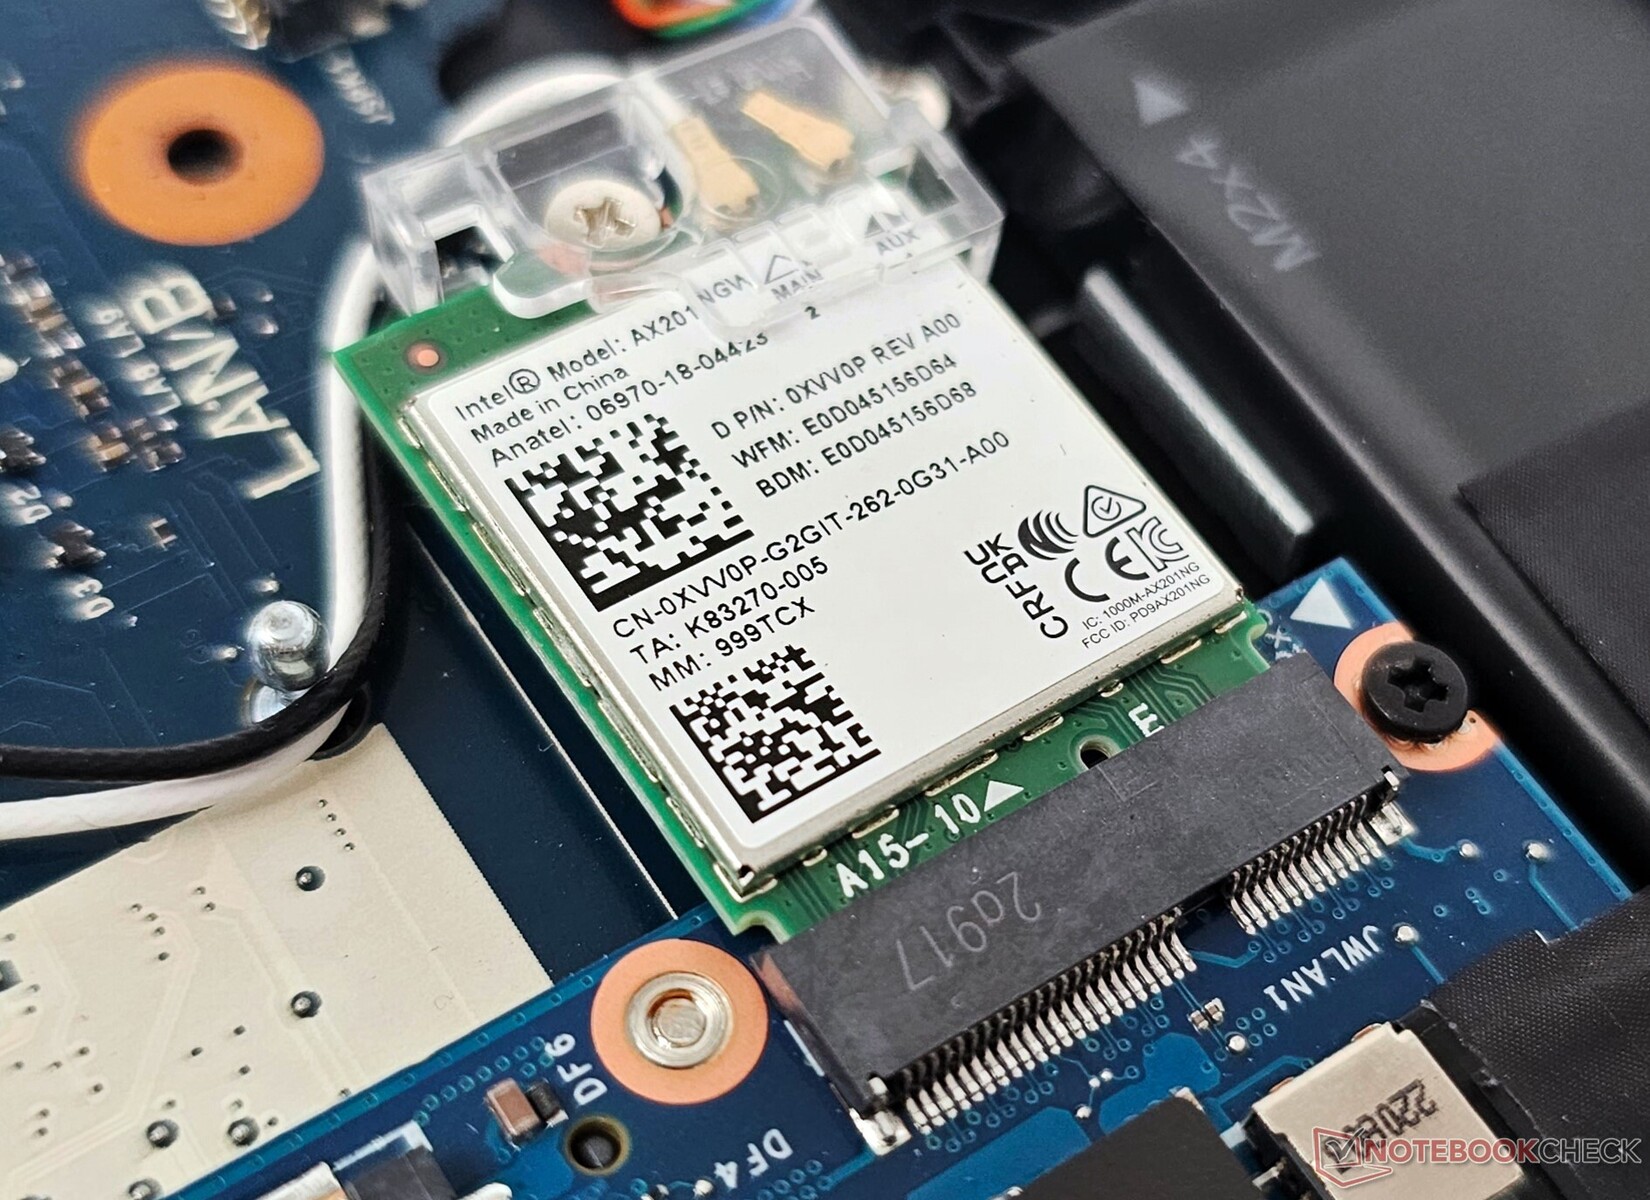
Mimo że karta Intel AX201 WLAN w G15 5530 nie obsługuje Wi-Fi 6E, okazało się, że jej implementacja w G15 5530 nadal zapewnia doskonałą przepustowość.
Nasze testy, przeprowadzone z referencyjnym routerem Asus ROG Rapture GT-AXE11000, wykazały względnie stabilną wydajność, gdy laptop znajdował się w odległości 1 m od routera z wyraźną linią wzroku i bez zakłóceń zewnętrznych.
Kamera internetowa
Jakość obrazu z kamery internetowej 720p nie jest niczym, o czym można by pisać w domu, z dużymi odchyleniami kolorów (szczególnie w przypadku odcieni niebieskiego) oraz brakiem ogólnej ostrości i wyrazistości.


Bezpieczeństwo
Poza modułem TPM 2.0, G15 5530 nie oferuje żadnych dodatkowych funkcji bezpieczeństwa ani logowania biometrycznego.
Akcesoria i gwarancja
W pudełku nie ma żadnych akcesoriów poza zasilaczem 330 W i zwykłą dokumentacją.
W Indiach Dell standardowo zapewnia roczną pomoc techniczną w zakresie sprzętu i oprogramowania.
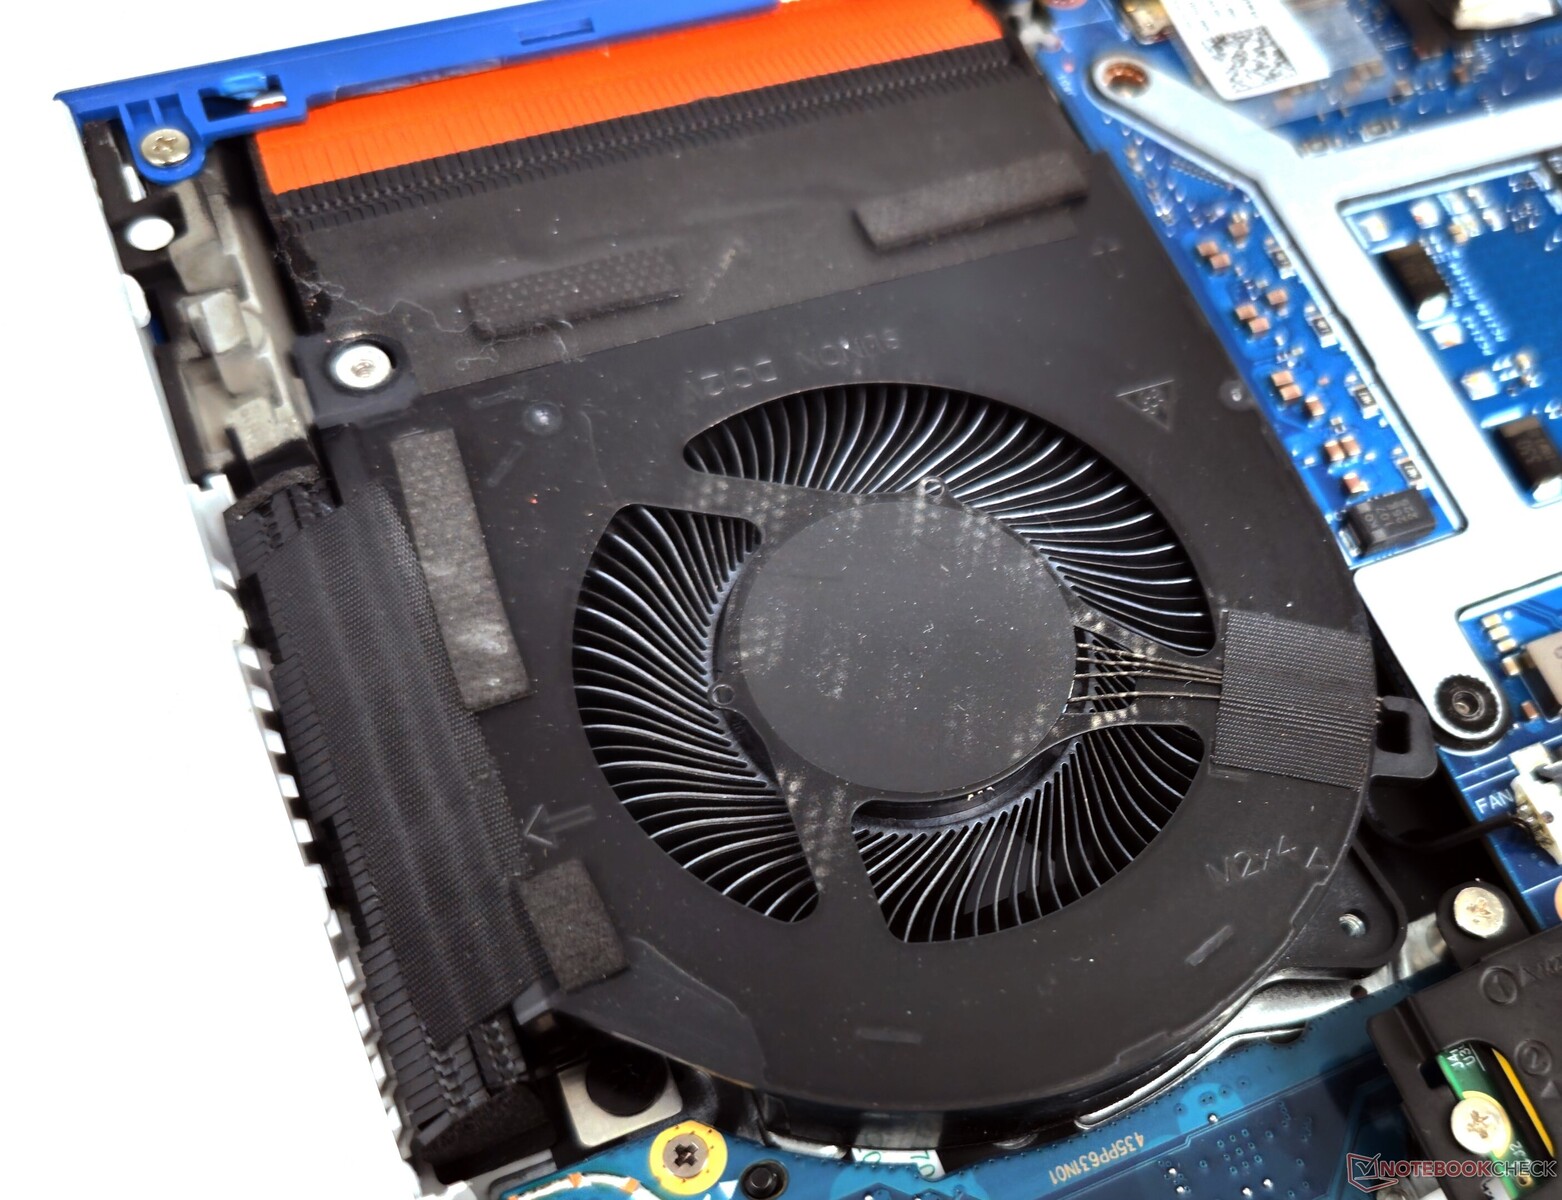
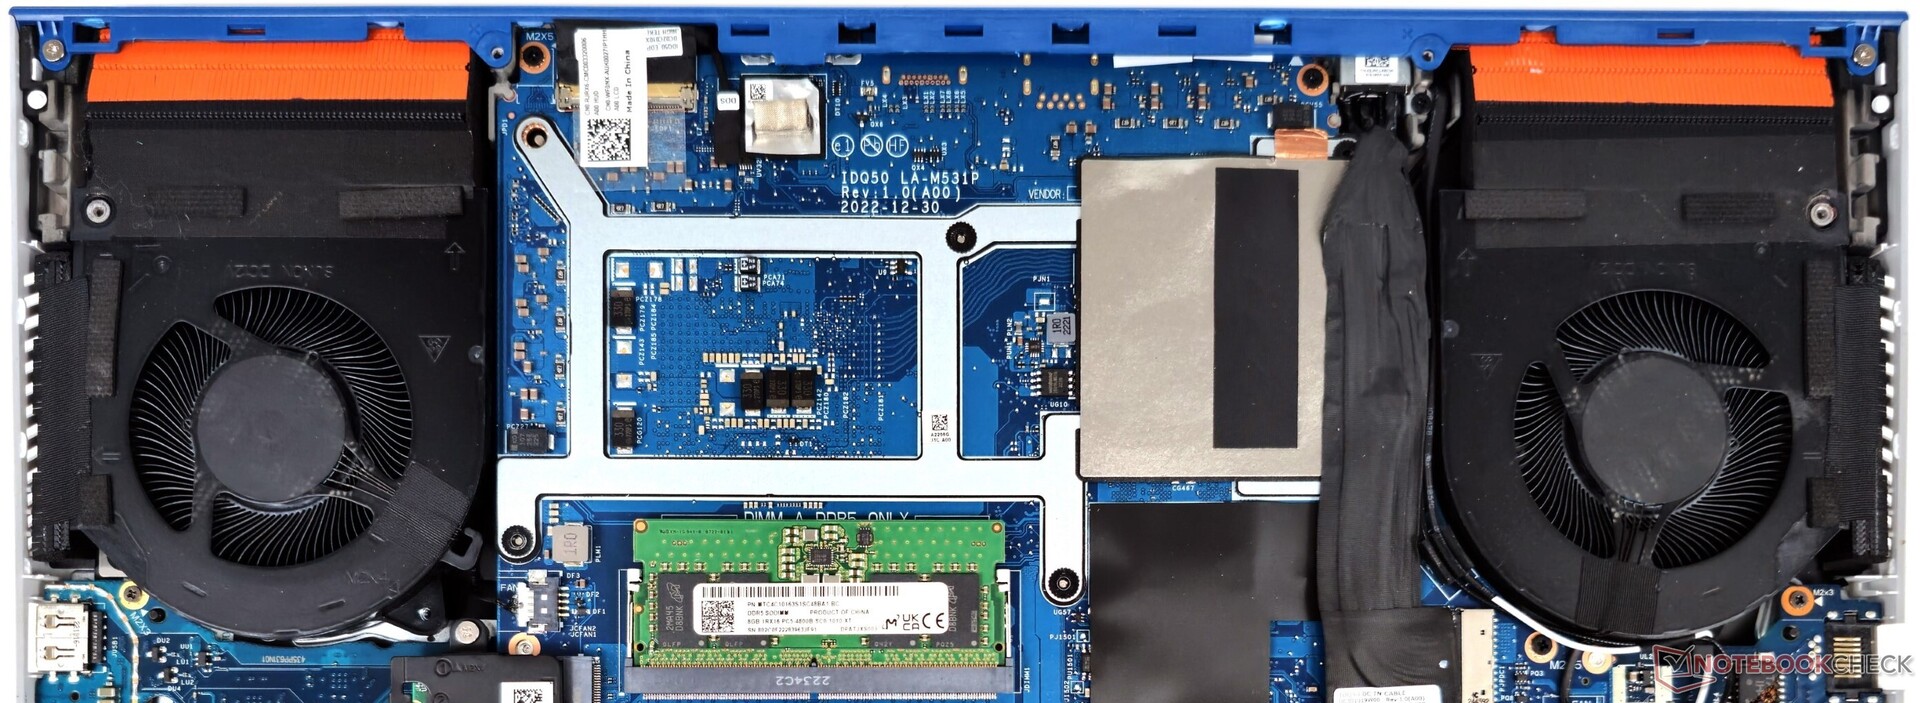
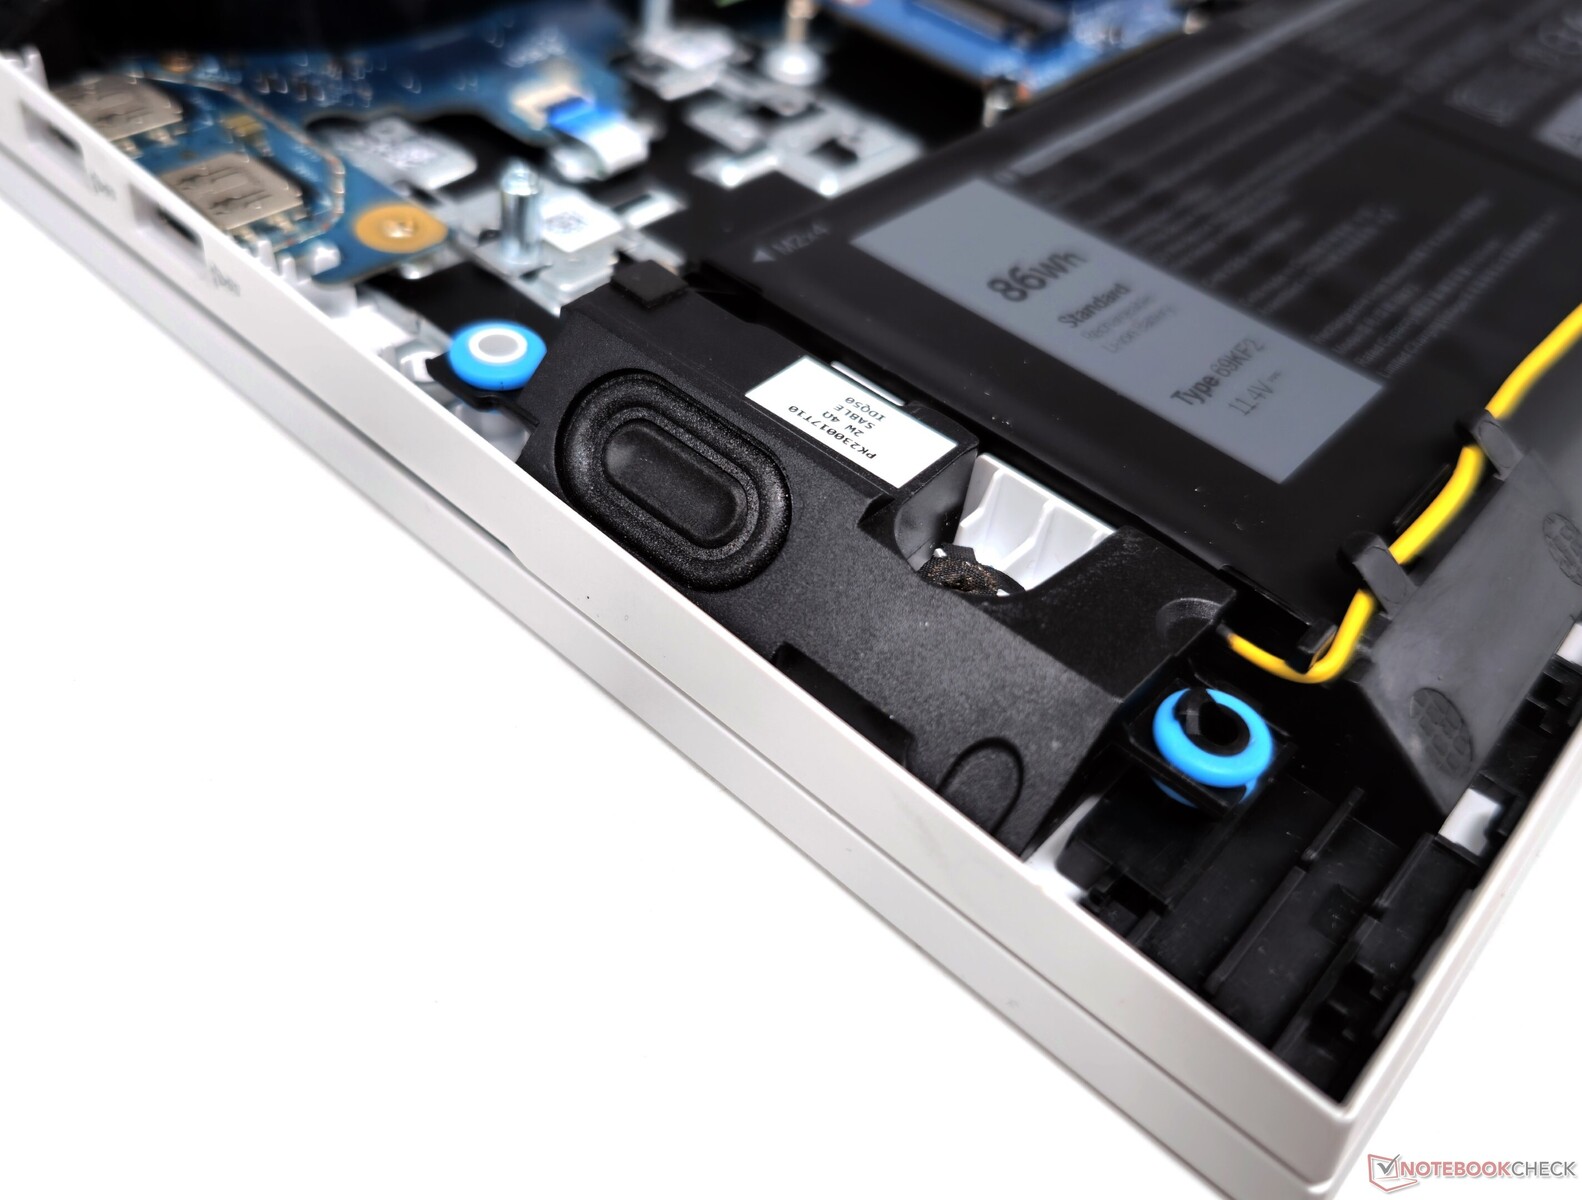
Konserwacja
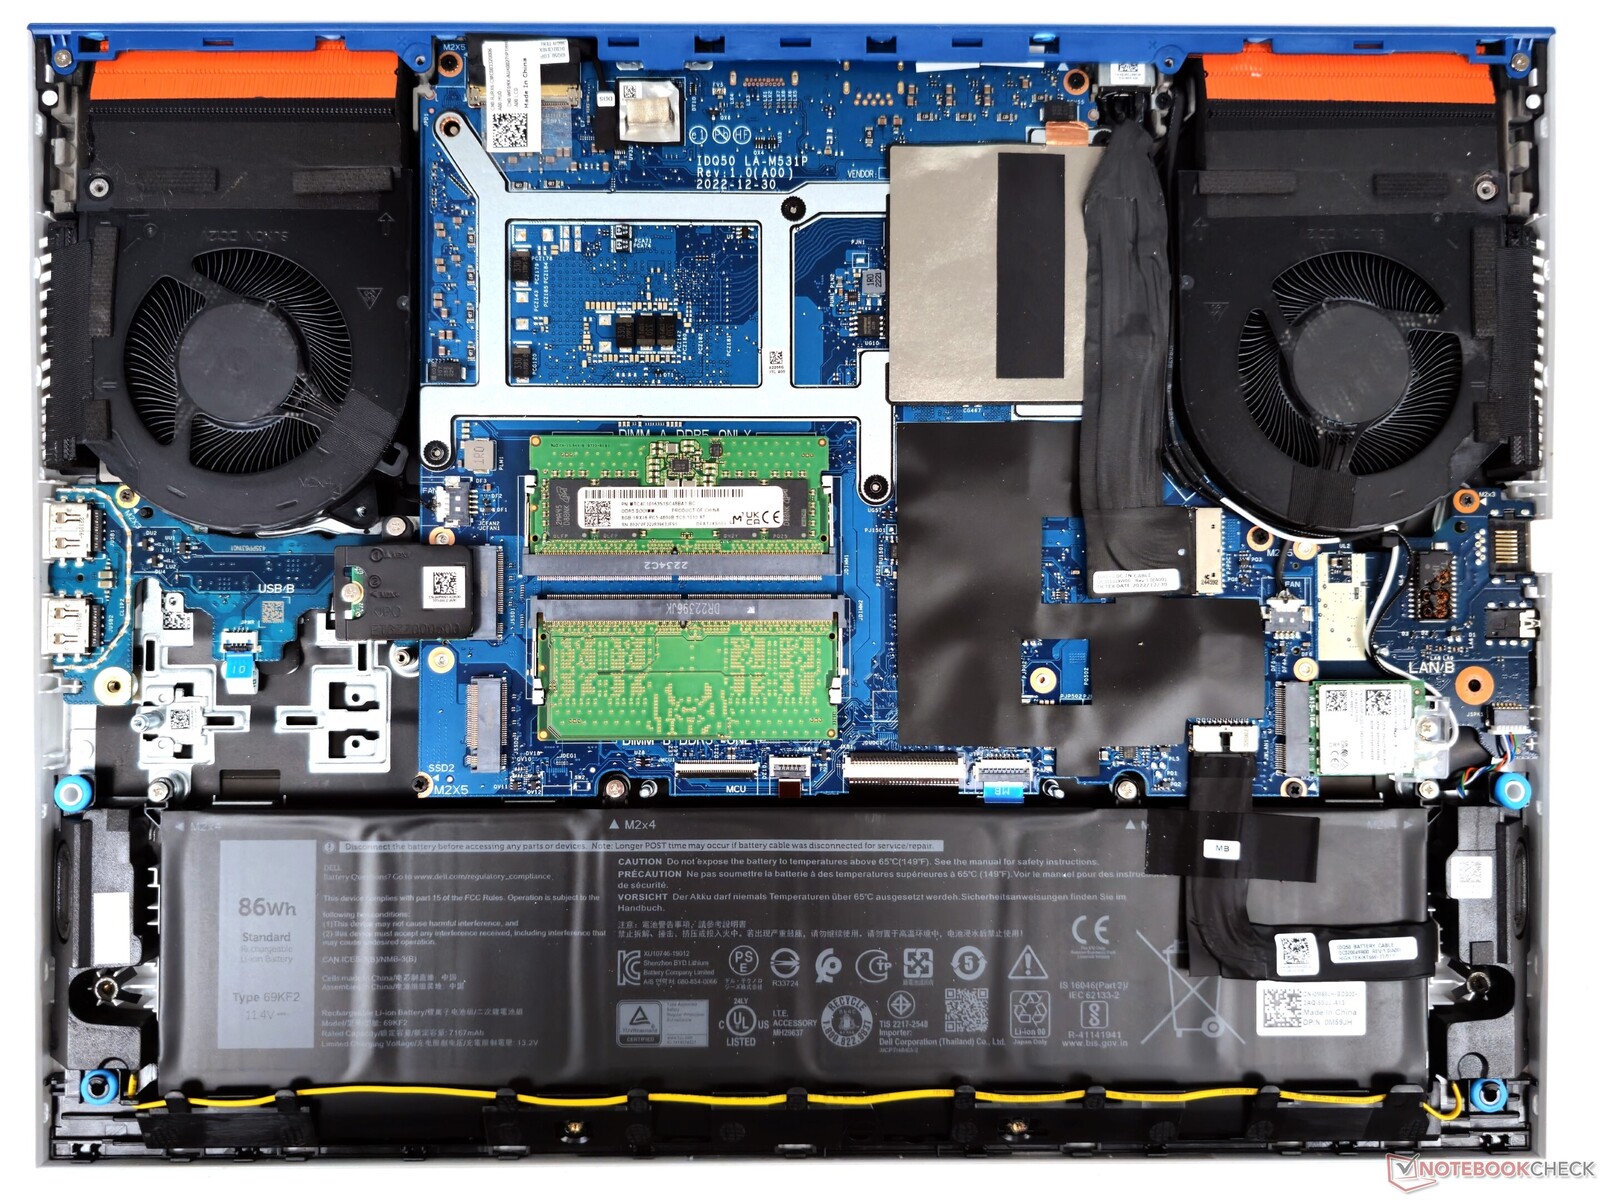
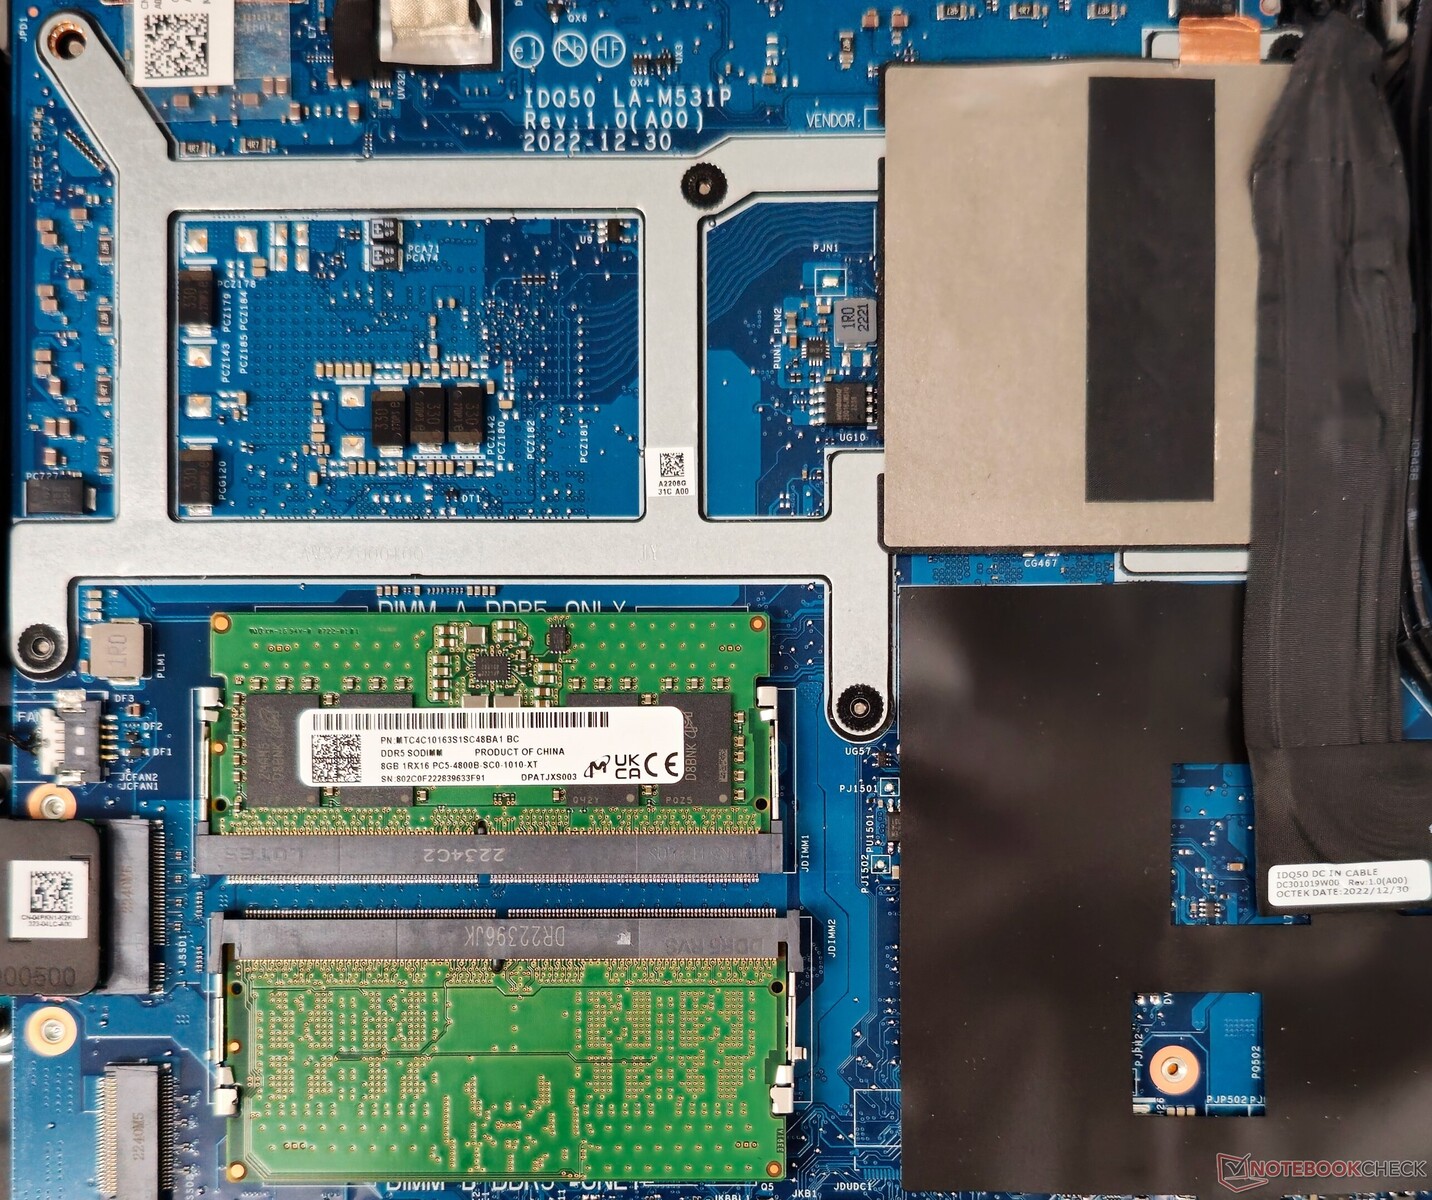
Tylny panel G15 5530 można łatwo otworzyć po odkręceniu 10 śrub PH00. System chłodzenia znajduje się na spodzie płyty głównej. Sieć WLAN, dysk SSD i pamięć RAM DDR5 można rozbudować.
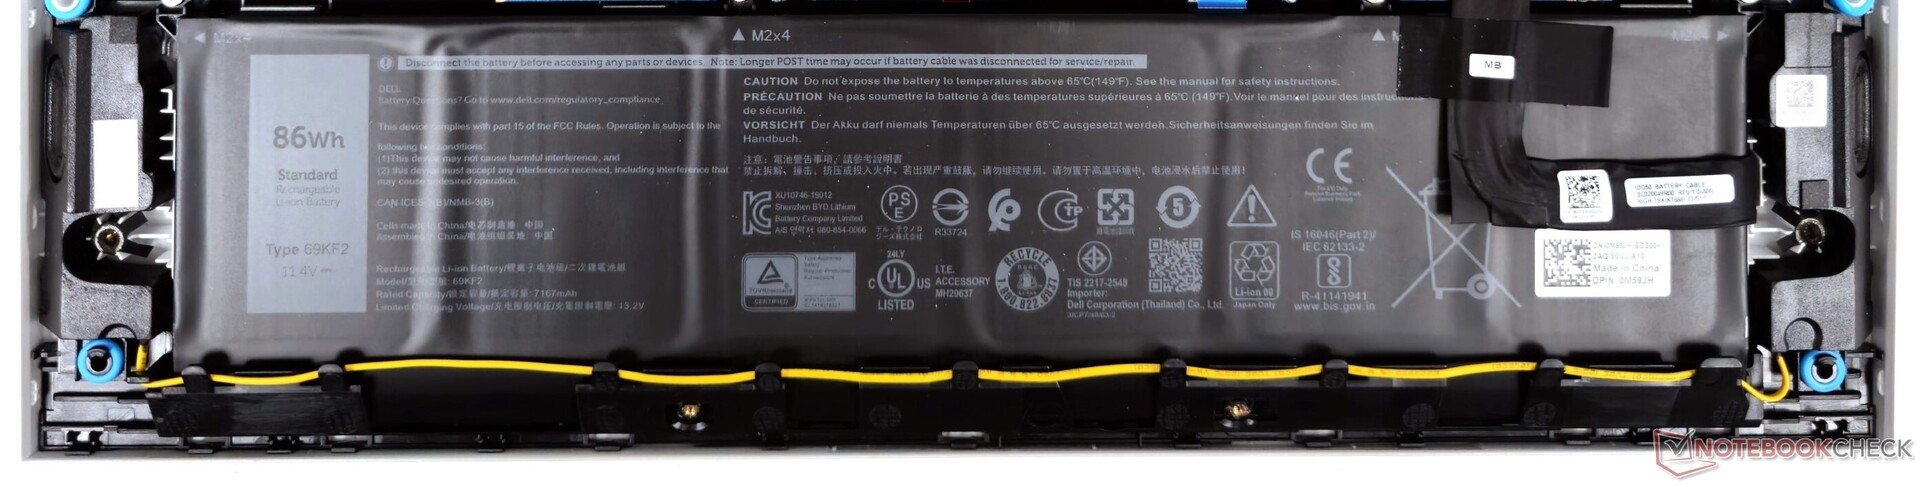
Dell wykorzystuje niekonwencjonalne gniazda M.2 2242 (M-key) do przechowywania danych. Użytkownicy powinni wziąć to pod uwagę podczas dodawania lub wymiany dysków NVMe. Baterię można w razie potrzeby odkręcić i wymienić.
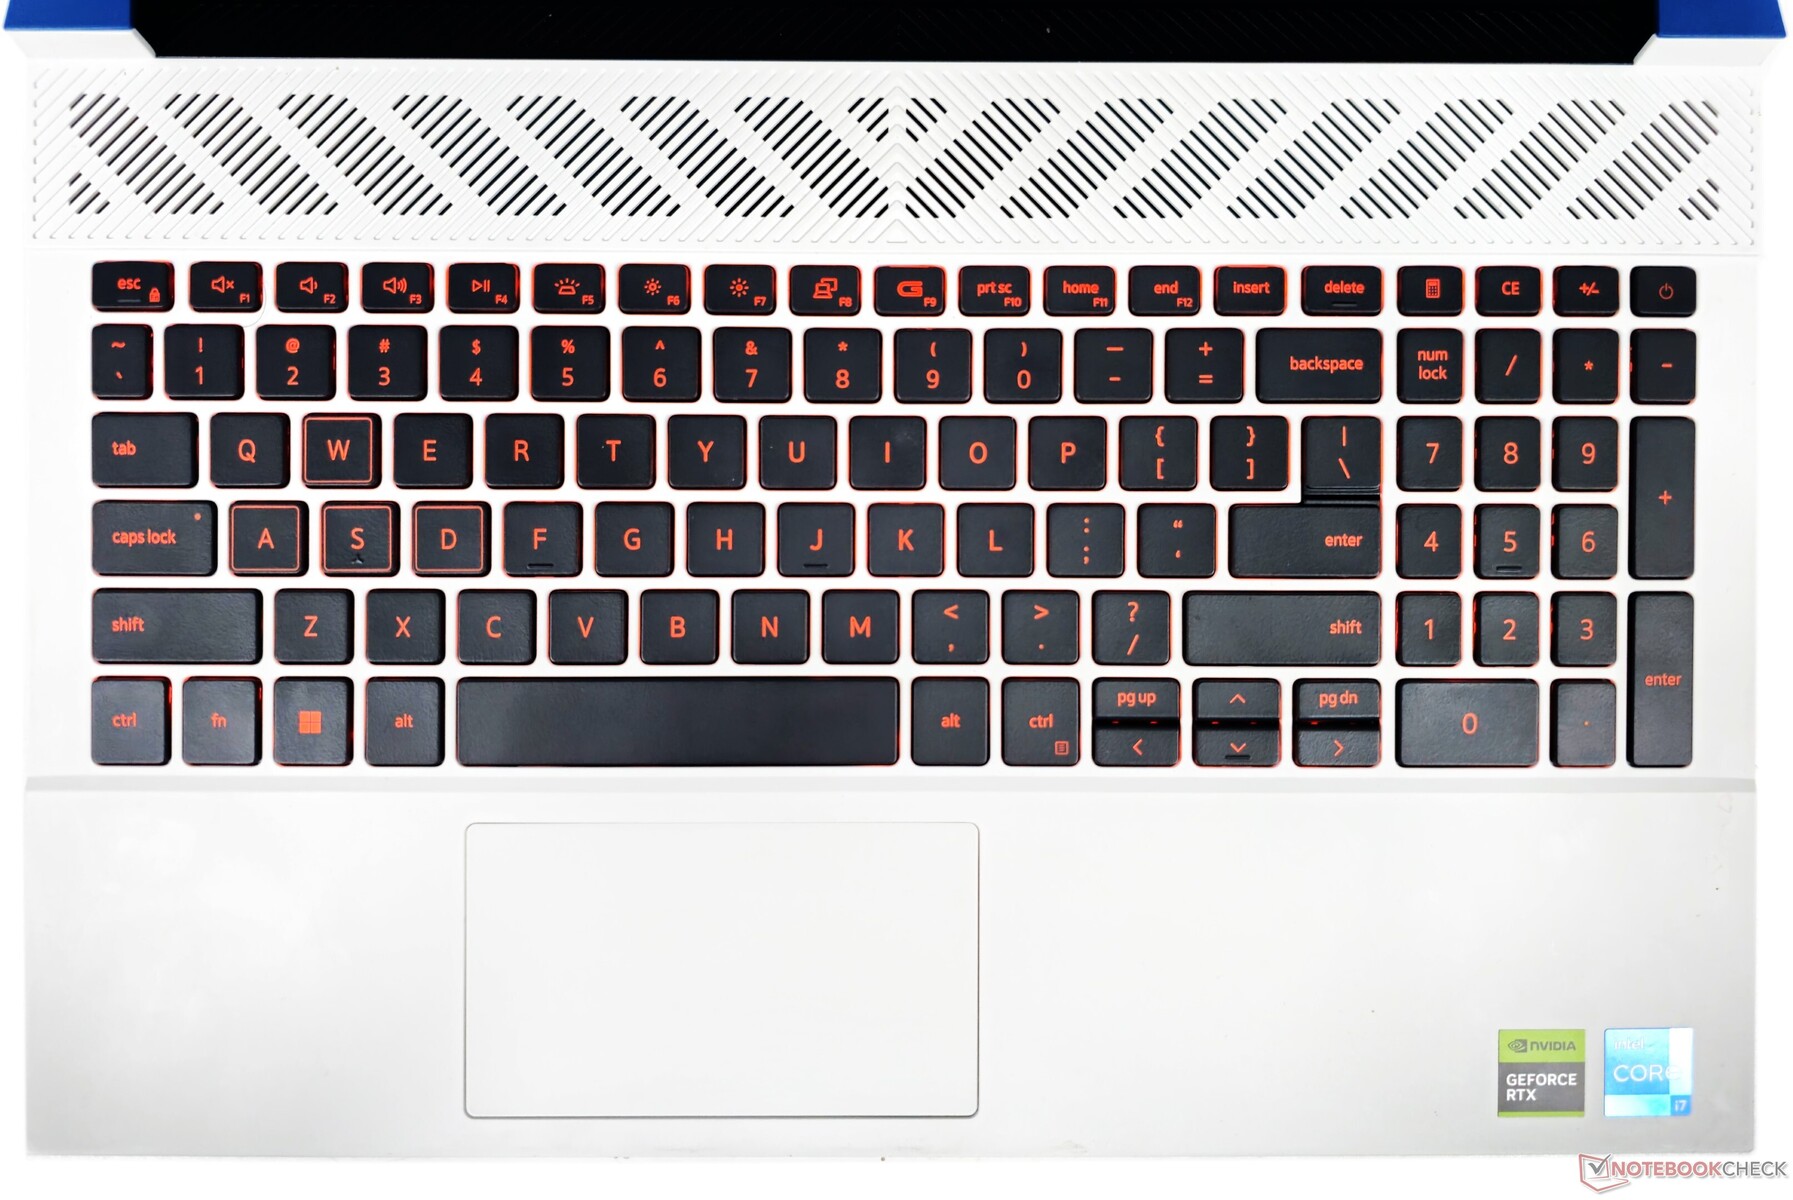
Urządzenia wejściowe: Płaskie klawisze o niewielkim skoku i ciasny touchpad
Klawiatura
Klawiatura w G15 5530 ma minimalne ugięcie i posiada płaskie, równomiernie rozmieszczone klawisze, które oferują nieco płytki skok. Obejmuje ona klawiaturę numeryczną wraz ze skrótami kalkulatora dla wygody. Układ ten powoduje jednak, że klawisze Page Up i Page Down są stłoczone razem z małymi klawiszami strzałek.
Według firmy Dell, klawiatura G15 5530 jest wyposażona w 4-strefowe podświetlenie RGB. Jednak w naszym egzemplarzu obecne były tylko pomarańczowe diody LED z dwustopniową regulacją jasności. Ponadto klawiatura nie została rozpoznana w Alienware Command Center, co ogranicza opcje dostosowywania.
Klawisz F9 zawiera skrót Game Shift, umożliwiający natychmiastowe przełączenie na maksymalną wydajność i prędkość wentylatora w razie potrzeby.
Touchpad
Touchpad o wymiarach 6 cm x 10,5 cm wydaje się ciasny w porównaniu do innych laptopów z serii 2023. To powiedziawszy, oferuje płynne przesuwanie, obsługuje gesty Windows Precision i jest responsywny nawet w rogach.
Kliknięcia mogą być czasami głośne, co może być drobną irytacją dla tych, którzy wolą cichsze wprowadzanie danych.
Urządzenia wejściowe G15 nie są złe same w sobie, ale użytkownicy z pewnością mogą skorzystać z zewnętrznej klawiatury i myszy.
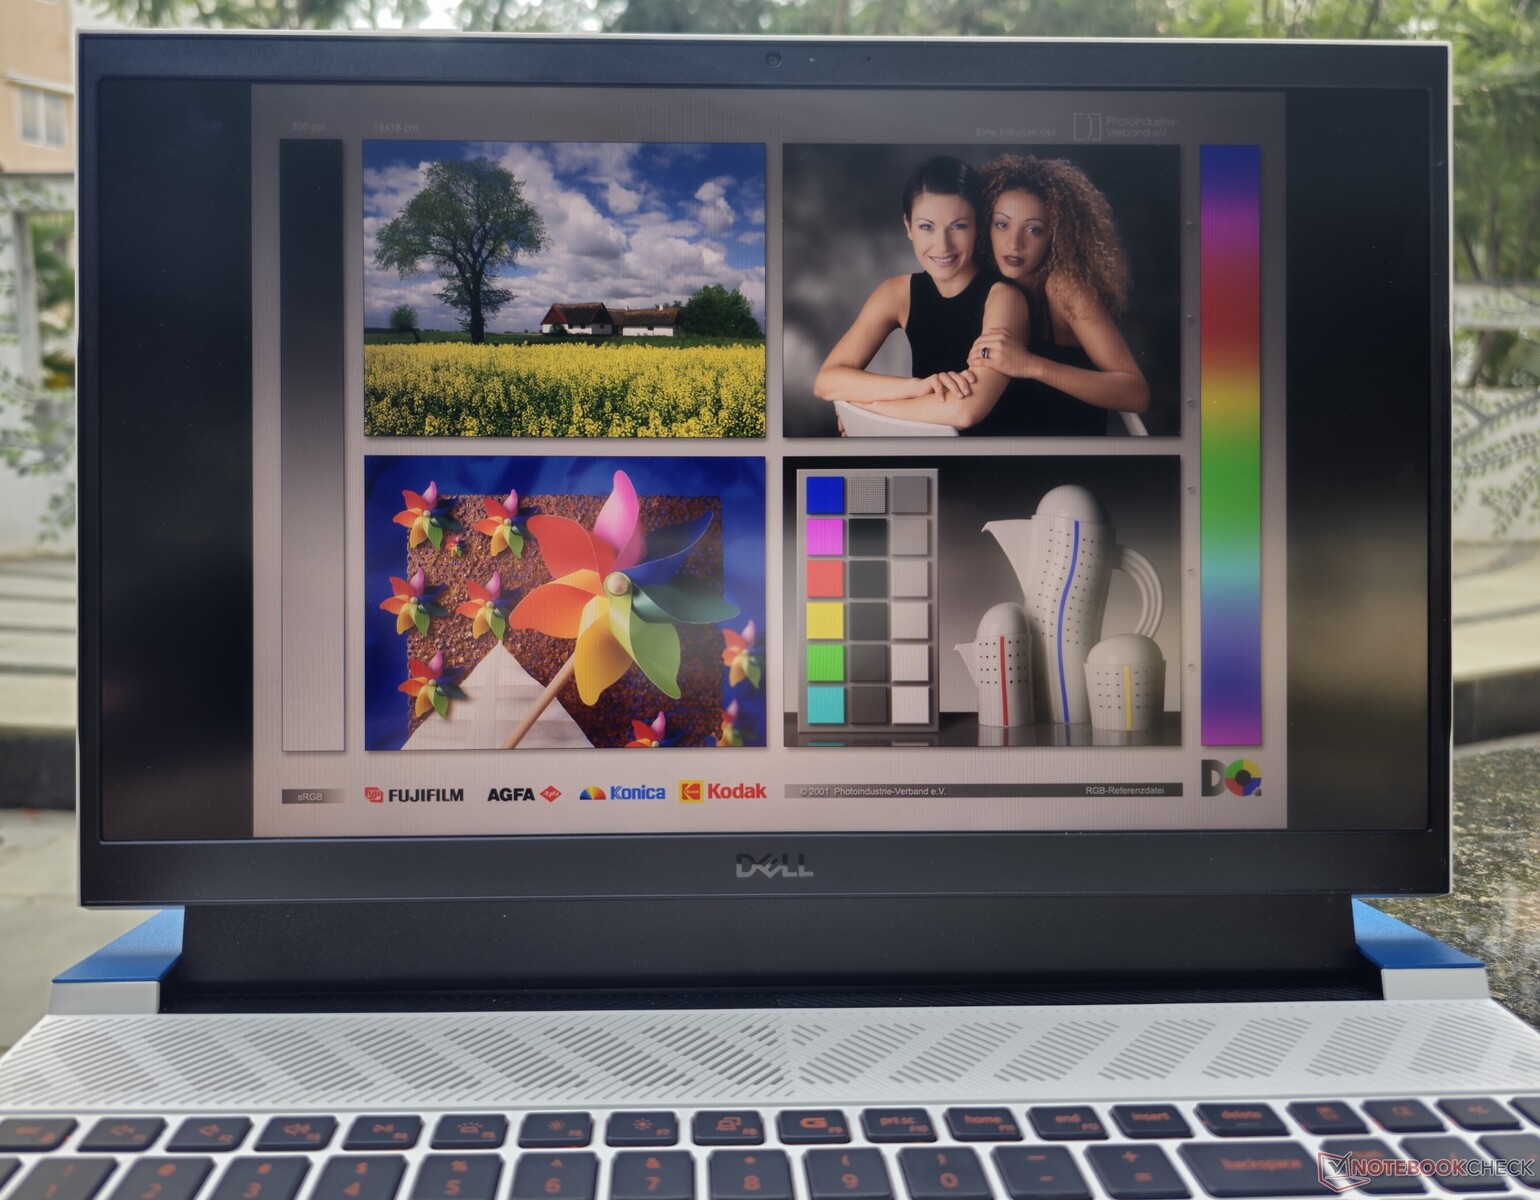
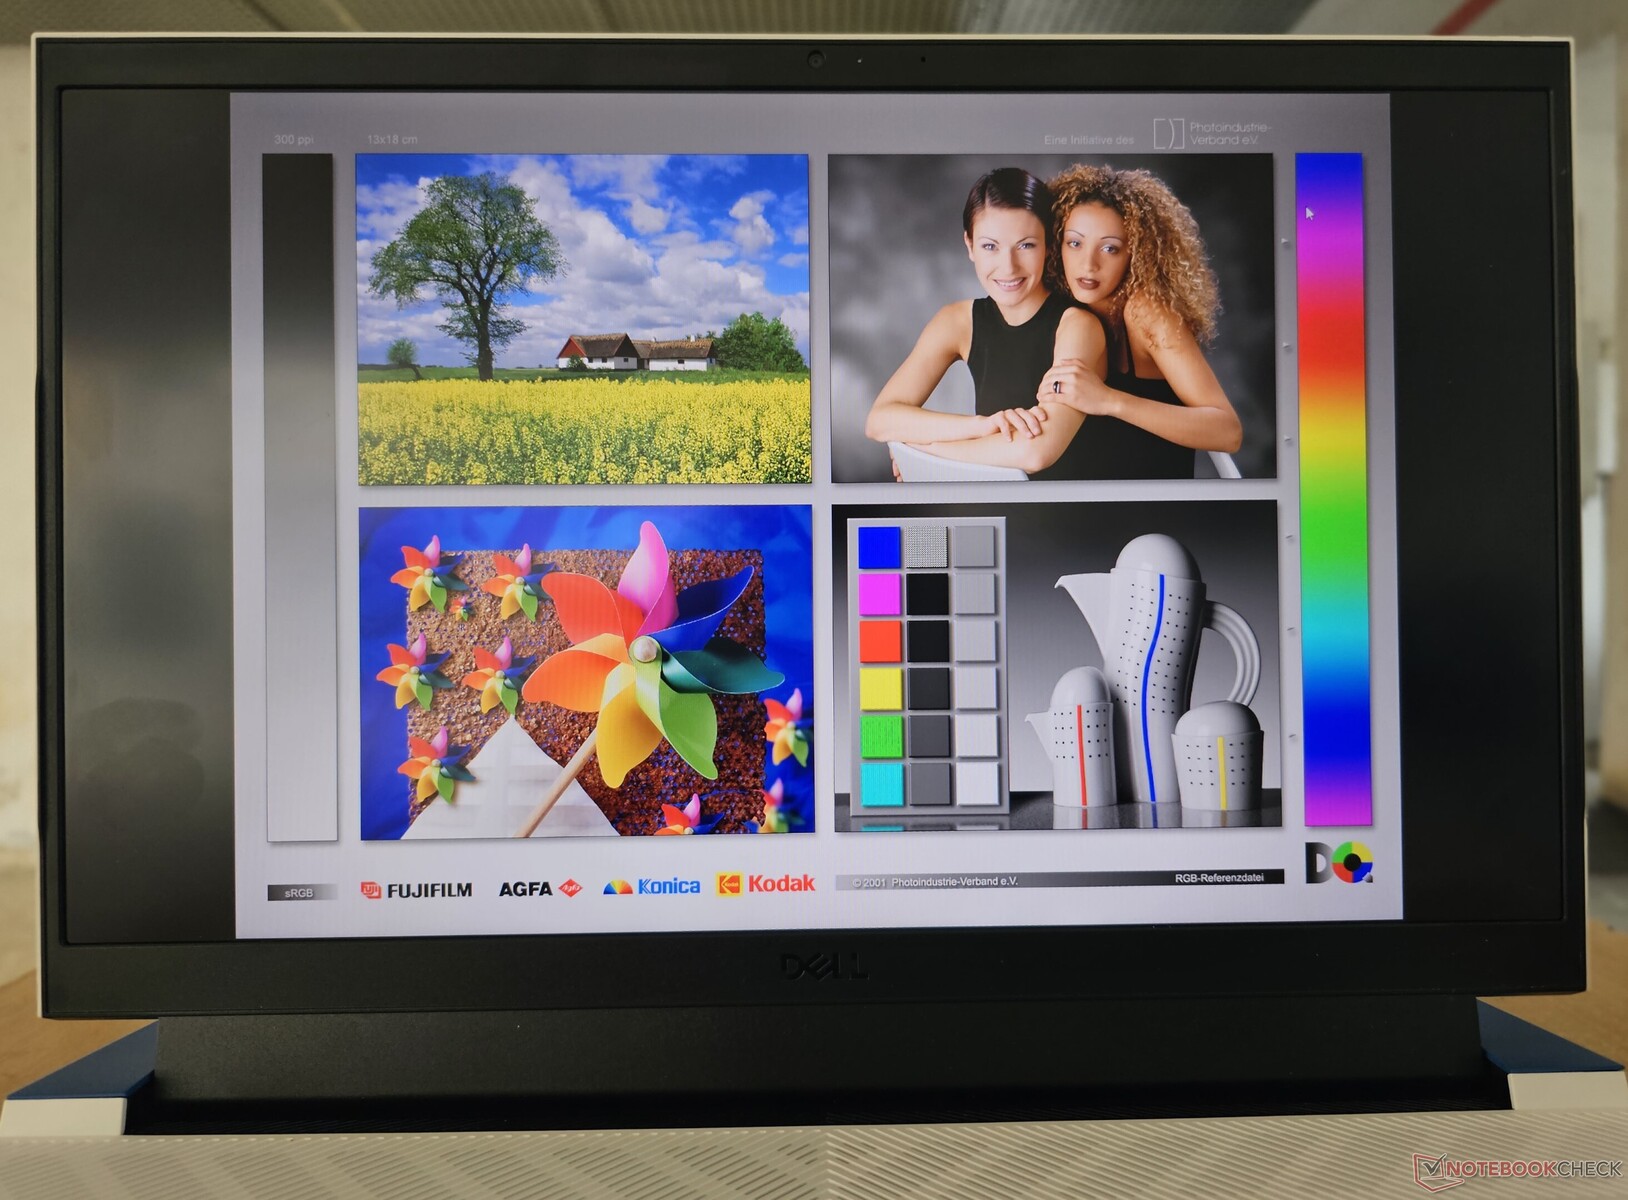
Wyświetlacz: panel 165 Hz 1080p z funkcją overdrive
Dell wyposażył G15 w panel AUO IPS 1080p, który oferuje częstotliwość odświeżania 165 Hz z G-Sync. Widzimy znaczne krwawienie w rogach, co jest typowe dla ekranów IPS.
Rozkład jasności jest dość równomierny na poziomie 94%, a współczynnik kontrastu wynosi przyzwoite 1524:1, co powinno zapewnić dobre wrażenia wizualne w grach.


| |||||||||||||||||||||||||
rozświetlenie: 94 %
na akumulatorze: 321 cd/m²
kontrast: 1524:1 (czerń: 0.21 cd/m²)
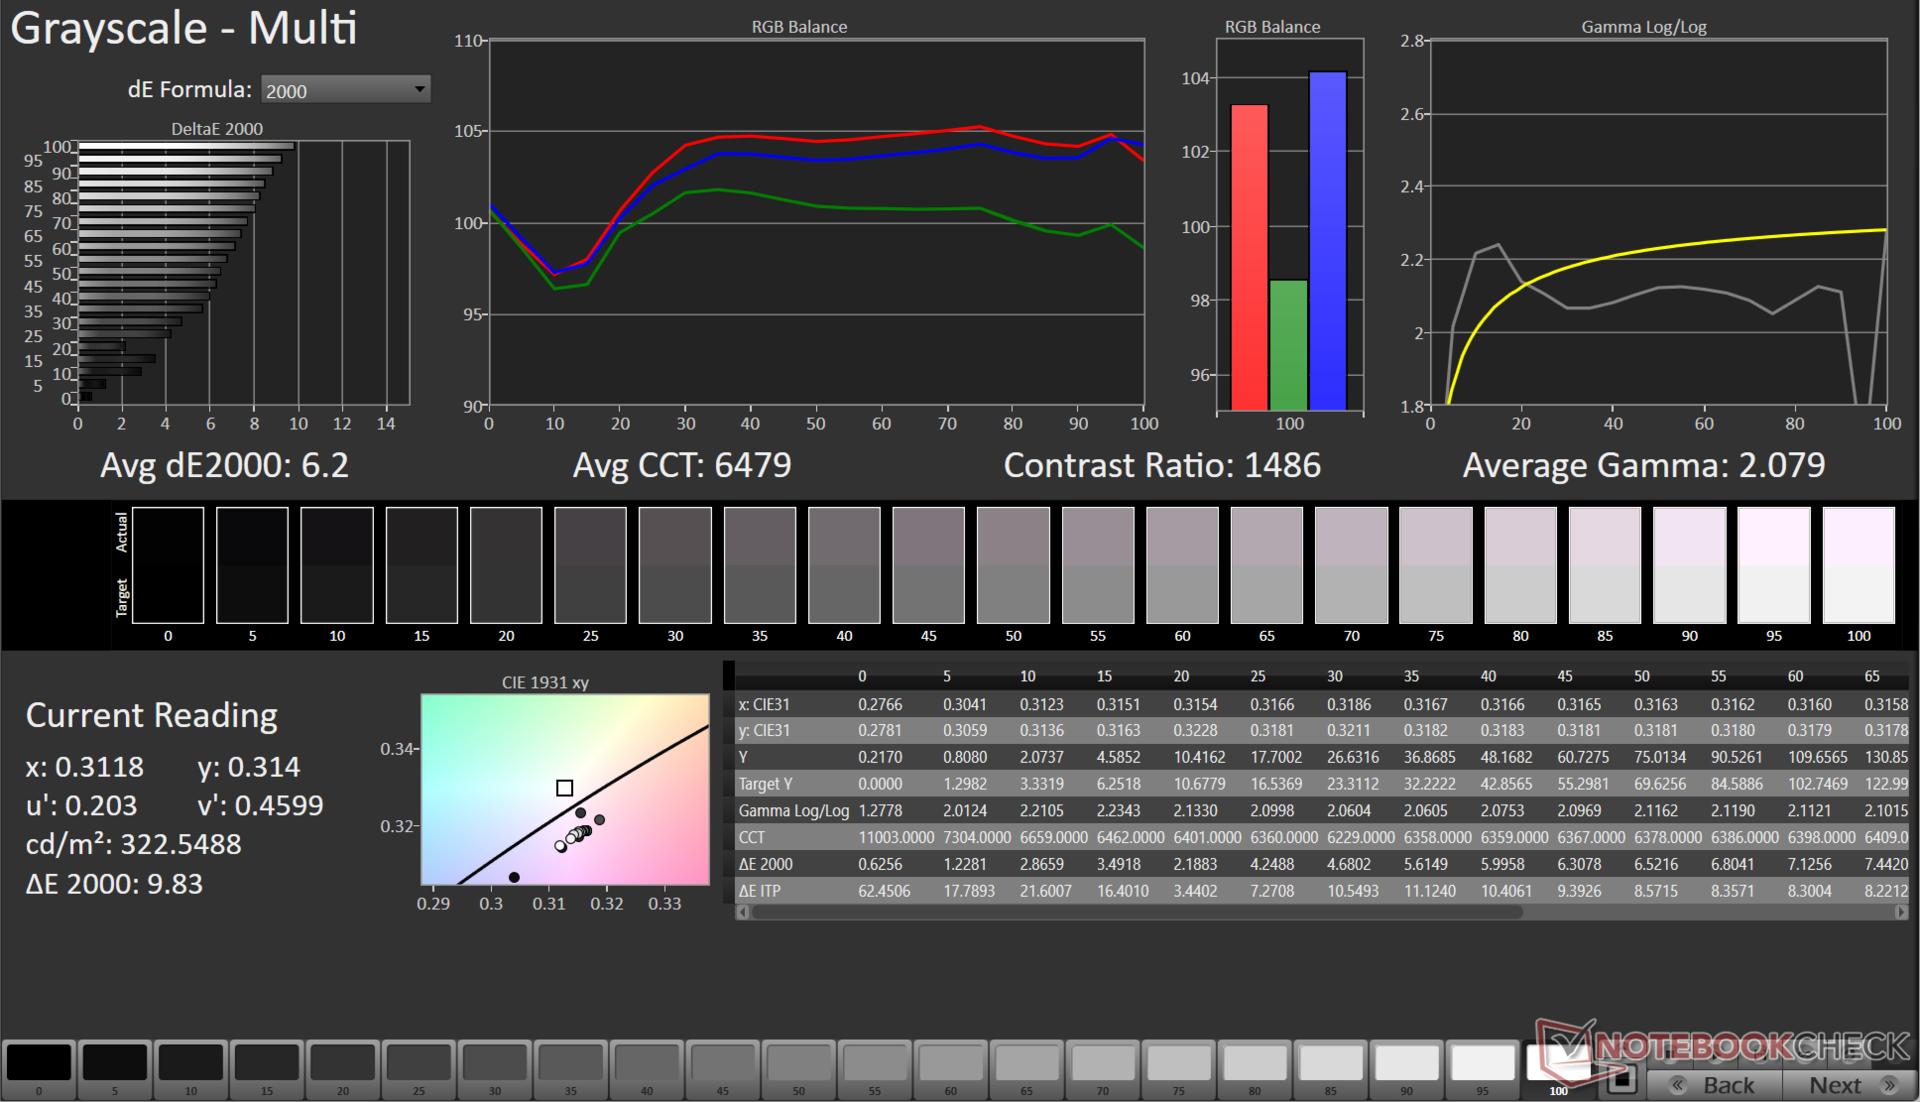
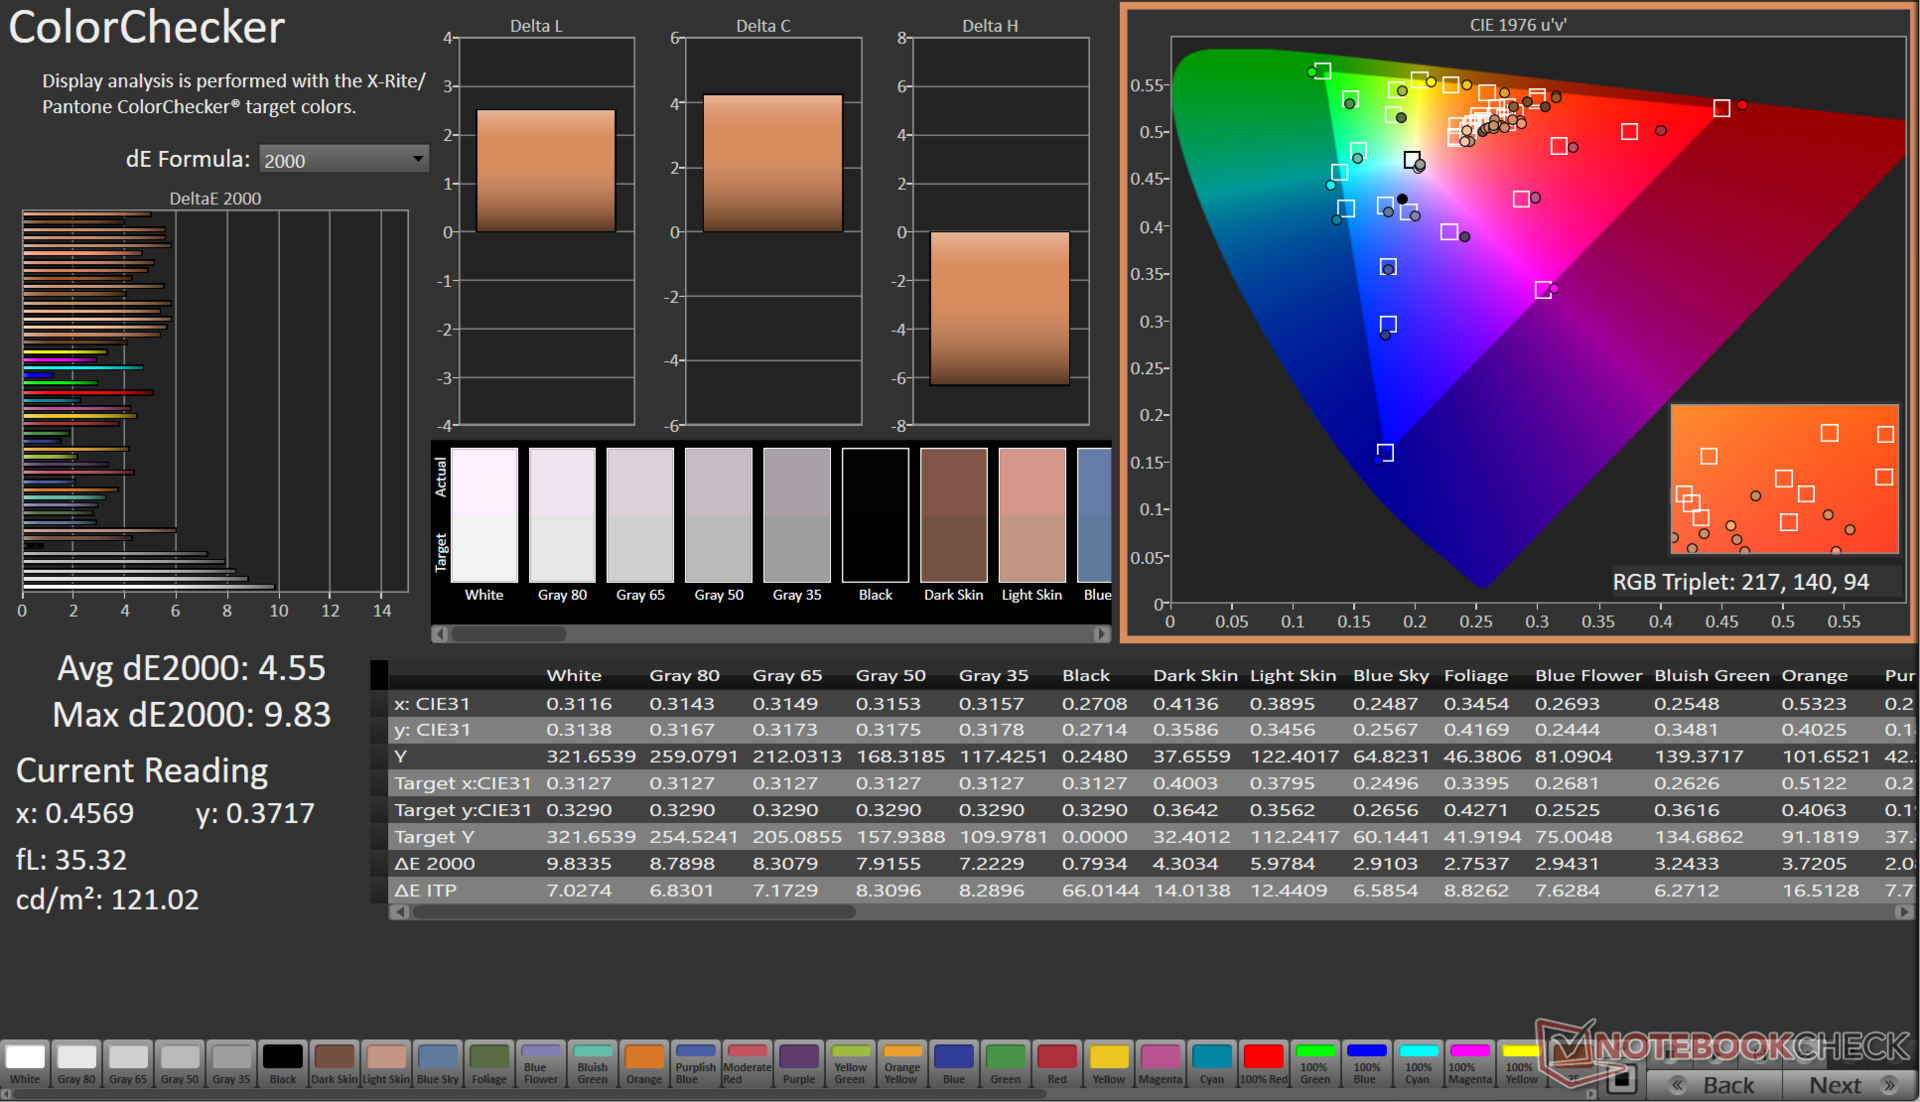
ΔE ColorChecker Calman: 4.55 | ∀{0.5-29.43 Ø4.71}
calibrated: 1.51
ΔE Greyscale Calman: 6.2 | ∀{0.09-98 Ø4.96}
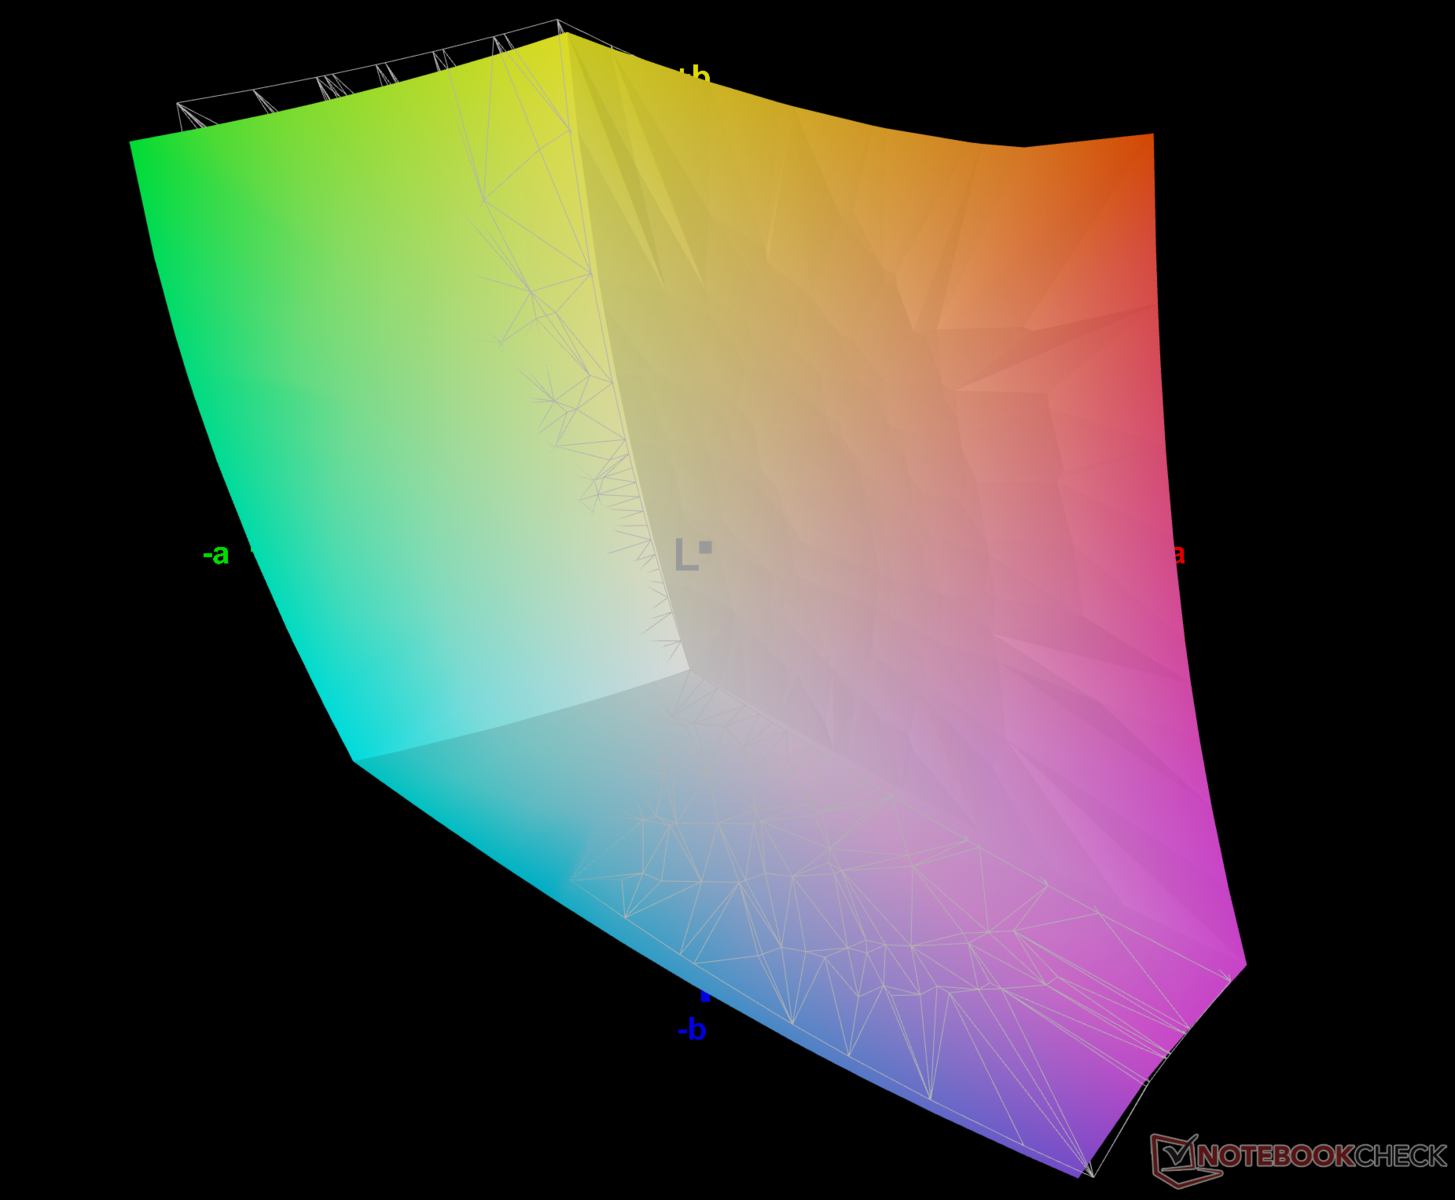
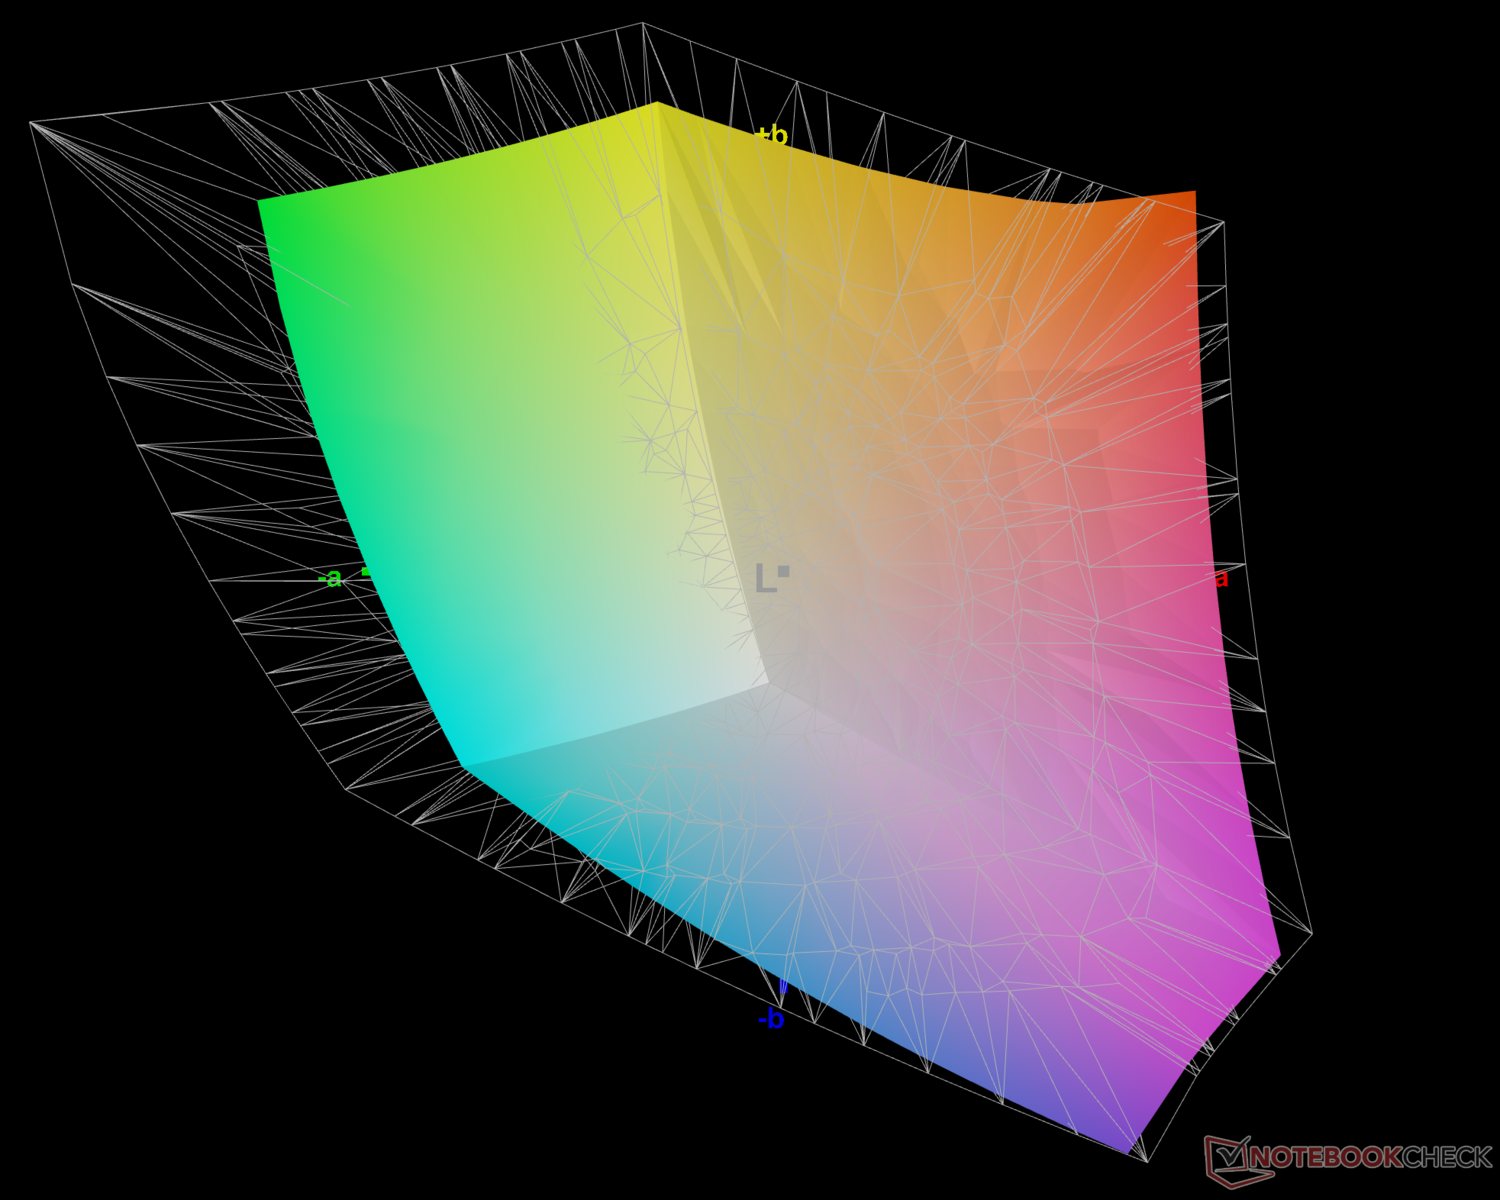
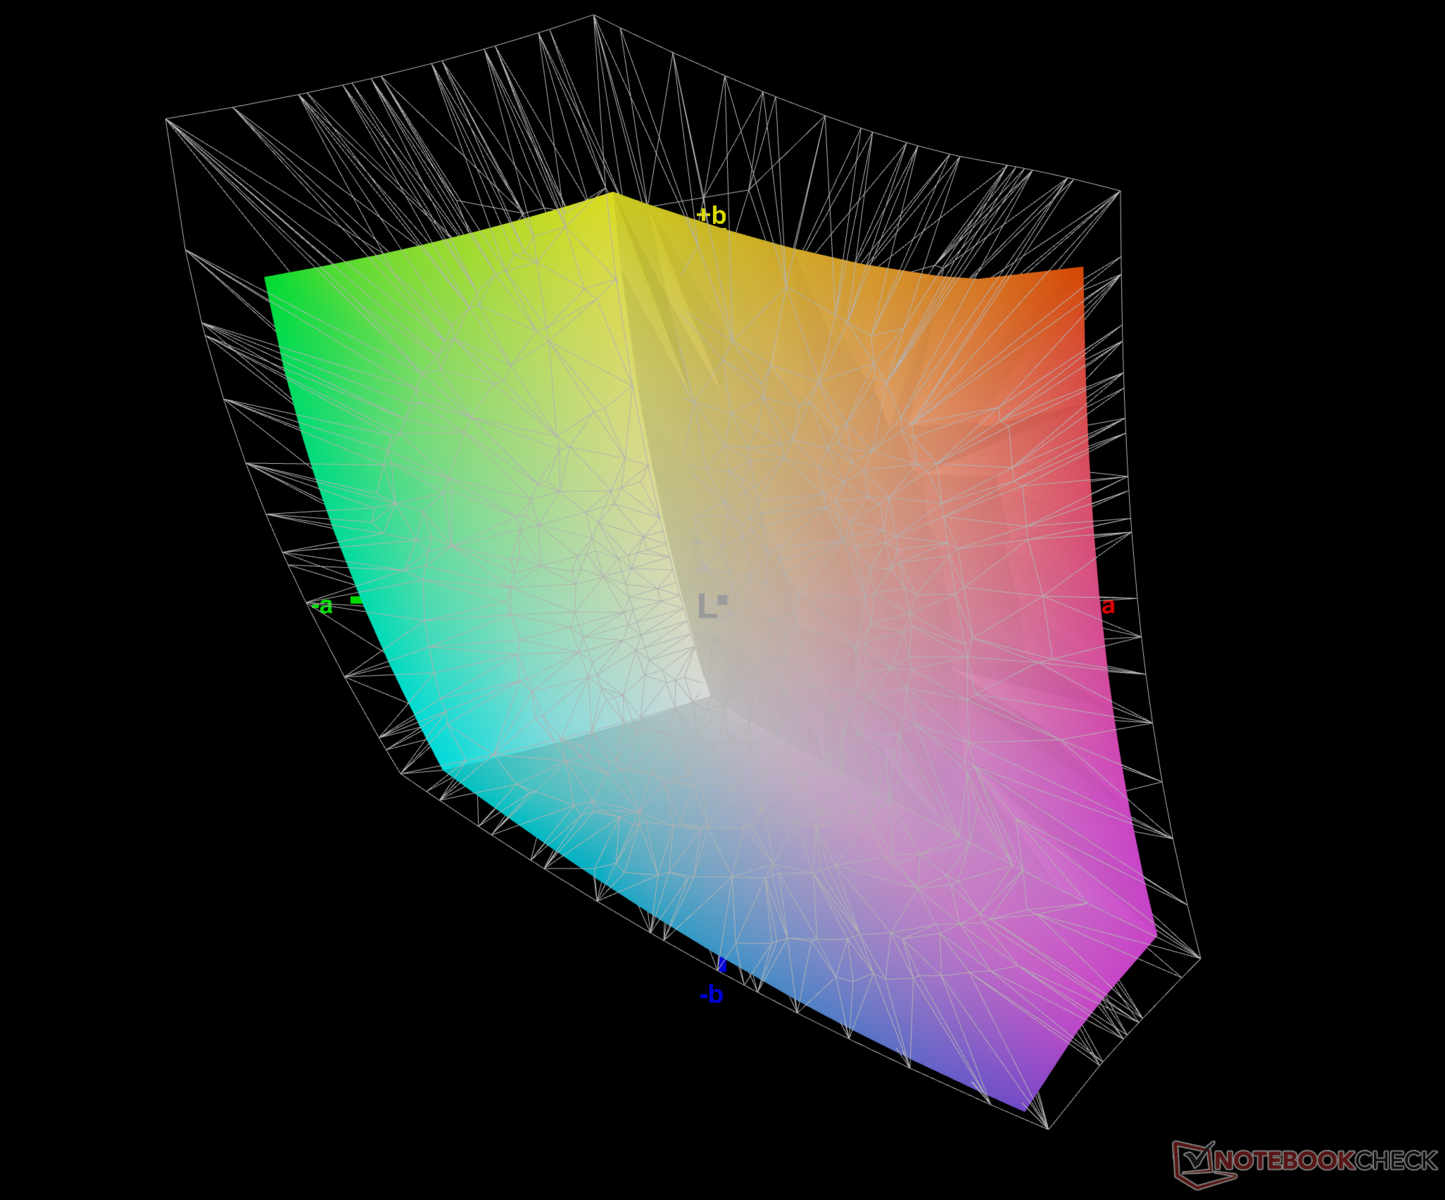
74.4% AdobeRGB 1998 (Argyll 3D)
98.4% sRGB (Argyll 3D)
73.1% Display P3 (Argyll 3D)
Gamma: 2.07
CCT: 6479 K
| Dell G15 5530 AUO B156HAN, IPS, 1920x1080, 15.6" | Asus ROG Strix G18 G814JI NE180QDM-NZ2 (BOE0B35), IPS, 2560x1600, 18" | Lenovo Legion Pro 5 16IRX8 AU Optronics B160QAN03.1, IPS, 2560x1600, 16" | Asus ROG Flow X16 GV601V TMX1603 (TL160ADMP03-0), IPS, 2560x1600, 16" | MSI Katana 17 B13VFK B173HAN04.9, IPS LED, 1920x1080, 17.3" | Asus TUF Gaming A16 FA617XS BOE NE160WUM-NX2, IPS, 1920x1200, 16" | Asus ROG Strix G17 G713PI BOE0B69, IPS, 2560x1440, 17.3" | Medion Erazer Major X20 BOE CQ NE160QDM-NZ1, IPS, 2560x1600, 16" | |
|---|---|---|---|---|---|---|---|---|
| Display | 17% | -1% | 16% | -42% | -4% | 17% | -3% | |
| Display P3 Coverage (%) | 73.1 | 98.1 34% | 71.2 -3% | 96.61 32% | 40.8 -44% | 69.3 -5% | 98.3 34% | 69.4 -5% |
| sRGB Coverage (%) | 98.4 | 99.9 2% | 98.8 0% | 99.92 2% | 61 -38% | 97.3 -1% | 100 2% | 98 0% |
| AdobeRGB 1998 Coverage (%) | 74.4 | 85.6 15% | 73.3 -1% | 84.63 14% | 42.2 -43% | 70.7 -5% | 85.9 15% | 70.9 -5% |
| Response Times | -67% | -211% | -27% | -630% | -224% | -59% | -161% | |
| Response Time Grey 50% / Grey 80% * (ms) | 3.39 ? | 5.6 ? -65% | 14.5 ? -328% | 3.8 ? -12% | 33 ? -873% | 15.6 ? -360% | 5.3 ? -56% | 13.1 ? -286% |
| Response Time Black / White * (ms) | 5.35 ? | 9 ? -68% | 10.4 ? -94% | 7.6 ? -42% | 26 ? -386% | 10 ? -87% | 8.6 ? -61% | 7.3 ? -36% |
| PWM Frequency (Hz) | 21620 ? | |||||||
| Screen | 14% | 21% | 21% | -32% | 21% | 17% | 12% | |
| Brightness middle (cd/m²) | 320 | 471 47% | 405.7 27% | 486 52% | 267 -17% | 301 -6% | 327 2% | 374 17% |
| Brightness (cd/m²) | 316 | 422 34% | 368 16% | 469 48% | 256 -19% | 294 -7% | 320 1% | 357 13% |
| Brightness Distribution (%) | 94 | 83 -12% | 87 -7% | 91 -3% | 93 -1% | 94 0% | 89 -5% | 92 -2% |
| Black Level * (cd/m²) | 0.21 | 0.47 -124% | 0.38 -81% | 0.39 -86% | 0.21 -0% | 0.21 -0% | 0.38 -81% | 0.33 -57% |
| Contrast (:1) | 1524 | 1002 -34% | 1068 -30% | 1246 -18% | 1271 -17% | 1433 -6% | 861 -44% | 1133 -26% |
| Colorchecker dE 2000 * | 4.55 | 2.05 55% | 1.65 64% | 2.27 50% | 4.7 -3% | 1.79 61% | 1.01 78% | 2.43 47% |
| Colorchecker dE 2000 max. * | 9.83 | 4.15 58% | 4.2 57% | 5.73 42% | 20.4 -108% | 3.48 65% | 4.01 59% | 3.97 60% |
| Colorchecker dE 2000 calibrated * | 1.51 | 0.8 47% | 0.53 65% | 0.6 60% | 4.5 -198% | 1.2 21% | 0.41 73% | 1.4 7% |
| Greyscale dE 2000 * | 6.2 | 2.8 55% | 1.2 81% | 3.36 46% | 1.5 76% | 2.5 60% | 1.6 74% | 3.1 50% |
| Gamma | 2.07 106% | 2.204 100% | 2.3 96% | 2.46 89% | 2.12 104% | 2.265 97% | 2.168 101% | 2.191 100% |
| CCT | 6479 100% | 7122 91% | 6453 101% | 6625 98% | 6552 99% | 6157 106% | 6659 98% | 6194 105% |
| Całkowita średnia (program / ustawienia) | -12% /
3% | -64% /
-17% | 3% /
13% | -235% /
-119% | -69% /
-19% | -8% /
7% | -51% /
-16% |
* ... im mniej tym lepiej
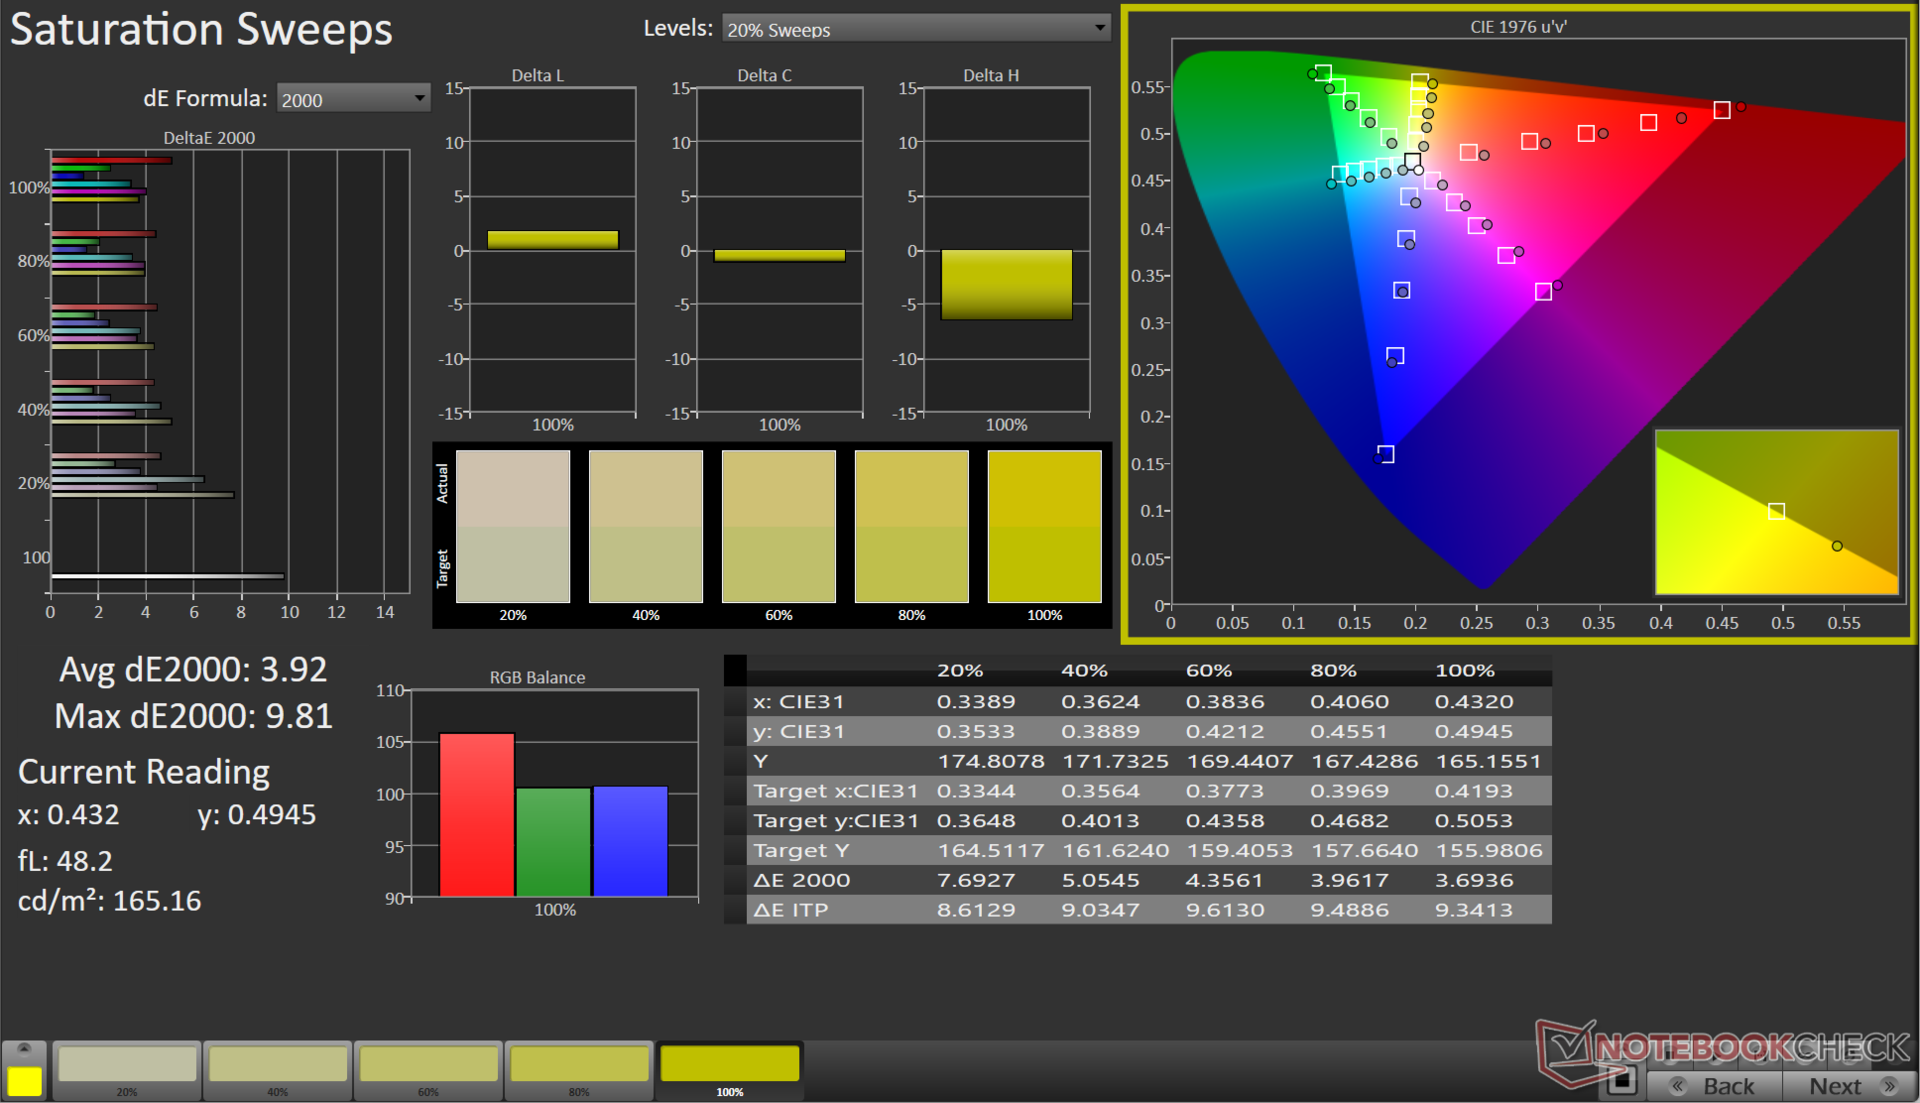
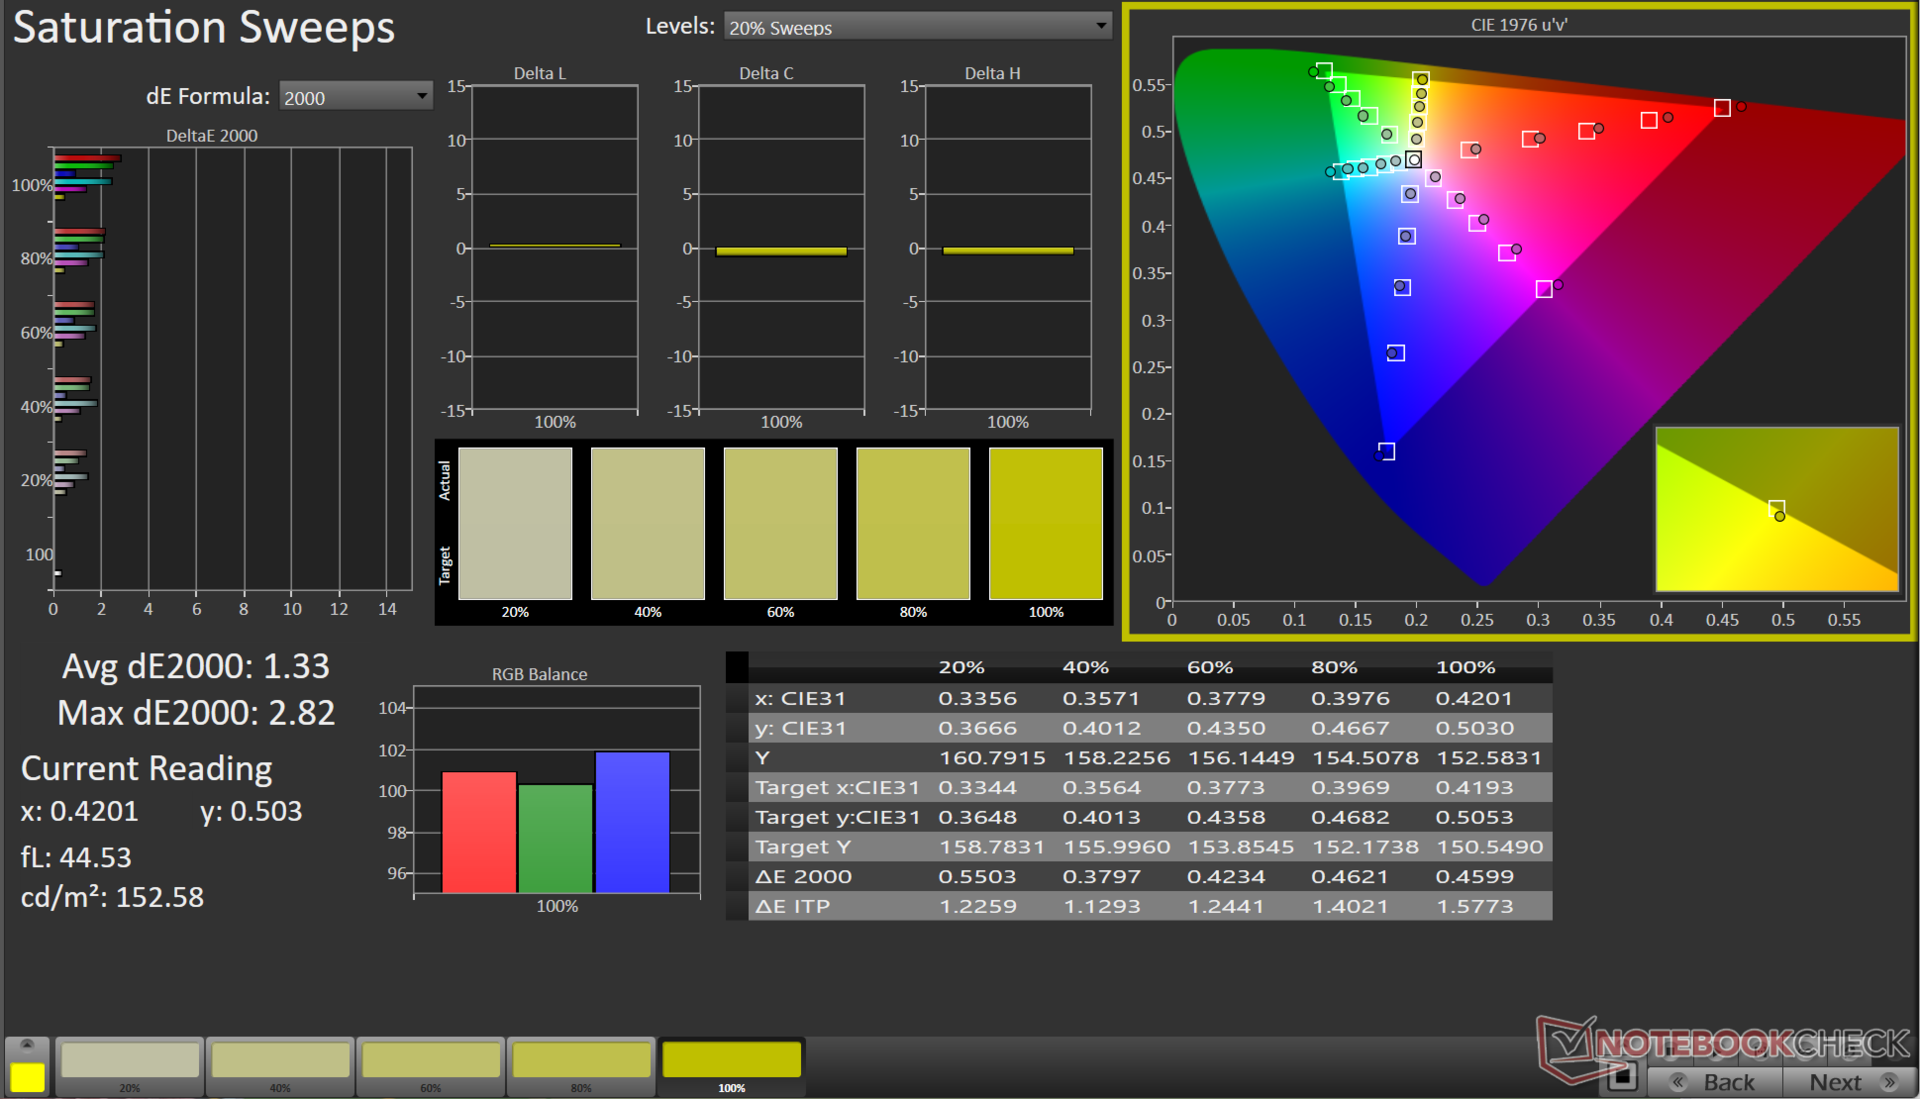
Wyświetlacz pokrywa prawie całą gamę kolorów sRGB z przyzwoitą wydajnością w przestrzeniach kolorów Adobe RGB i Display P3, co powinno być odpowiednie do gier i wykonywania podstawowych edycji.
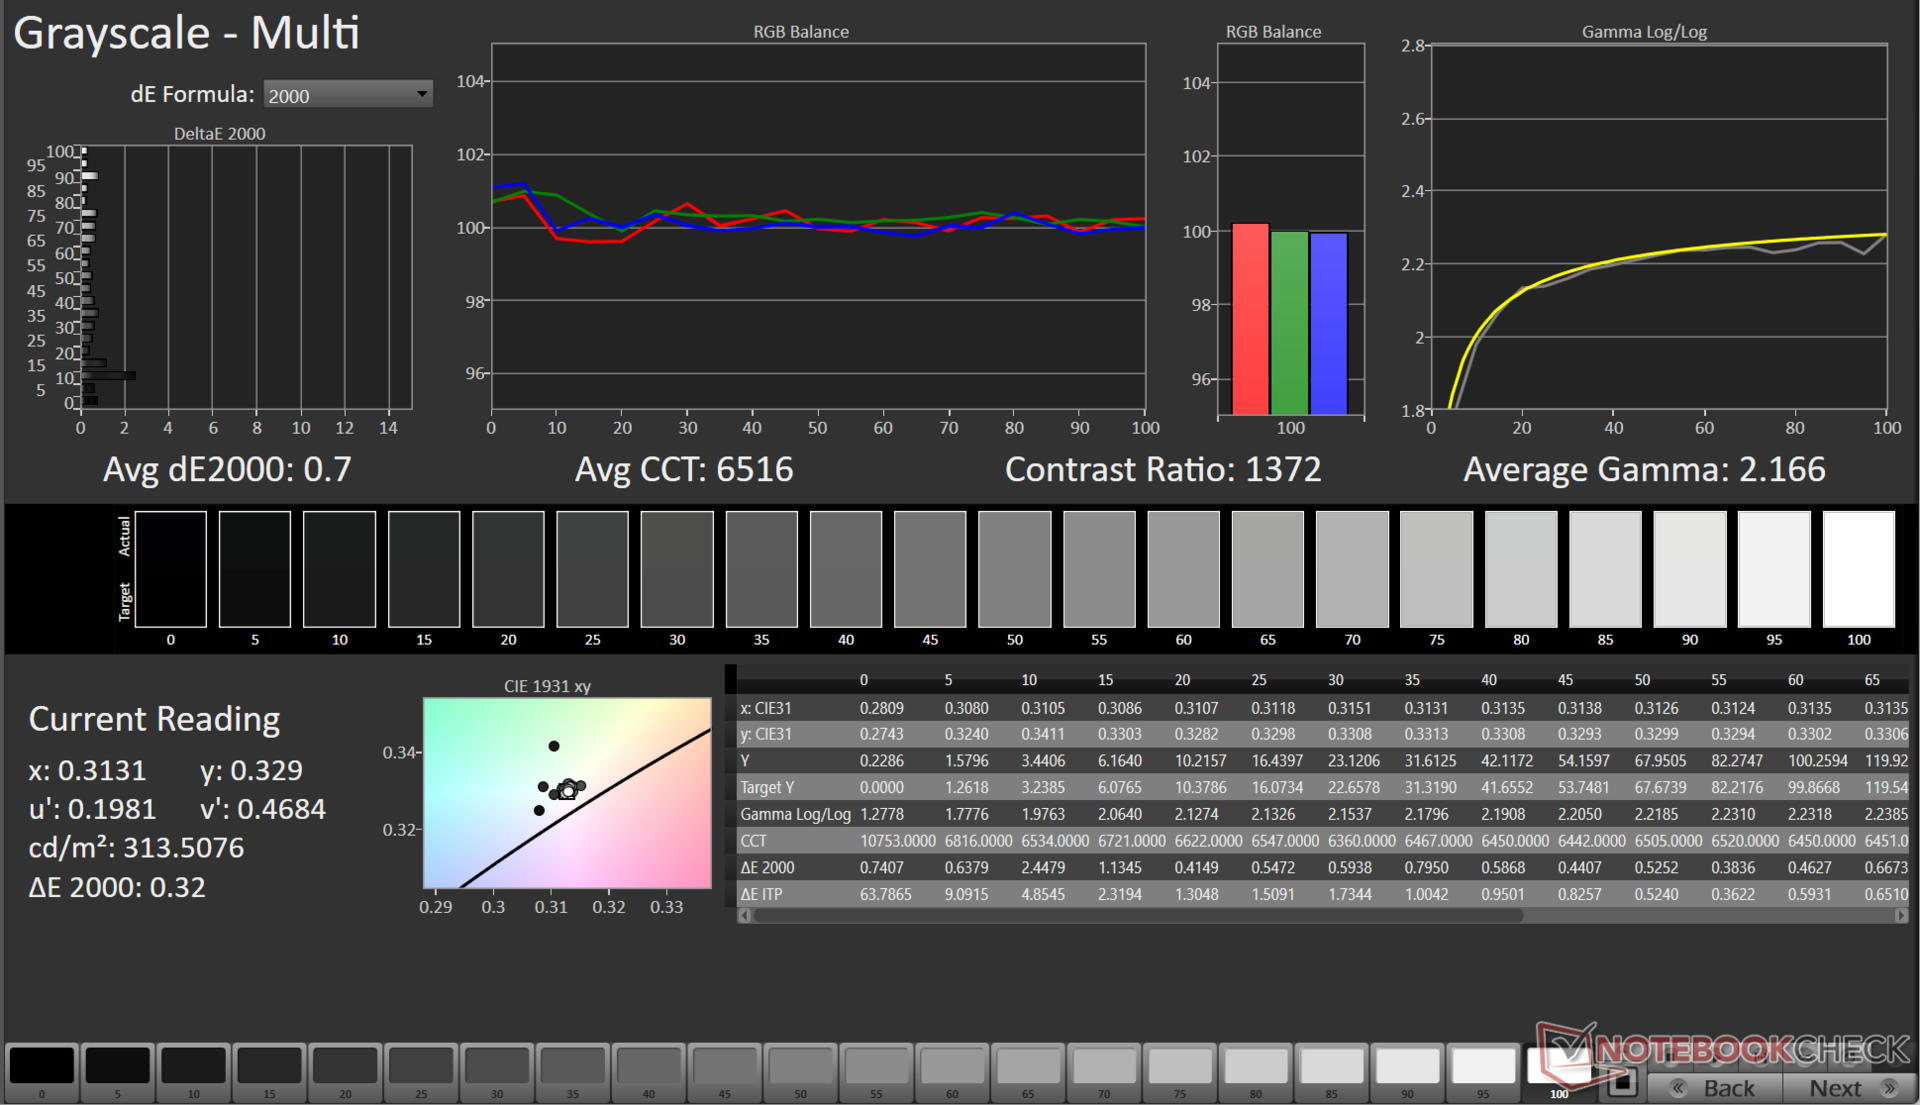
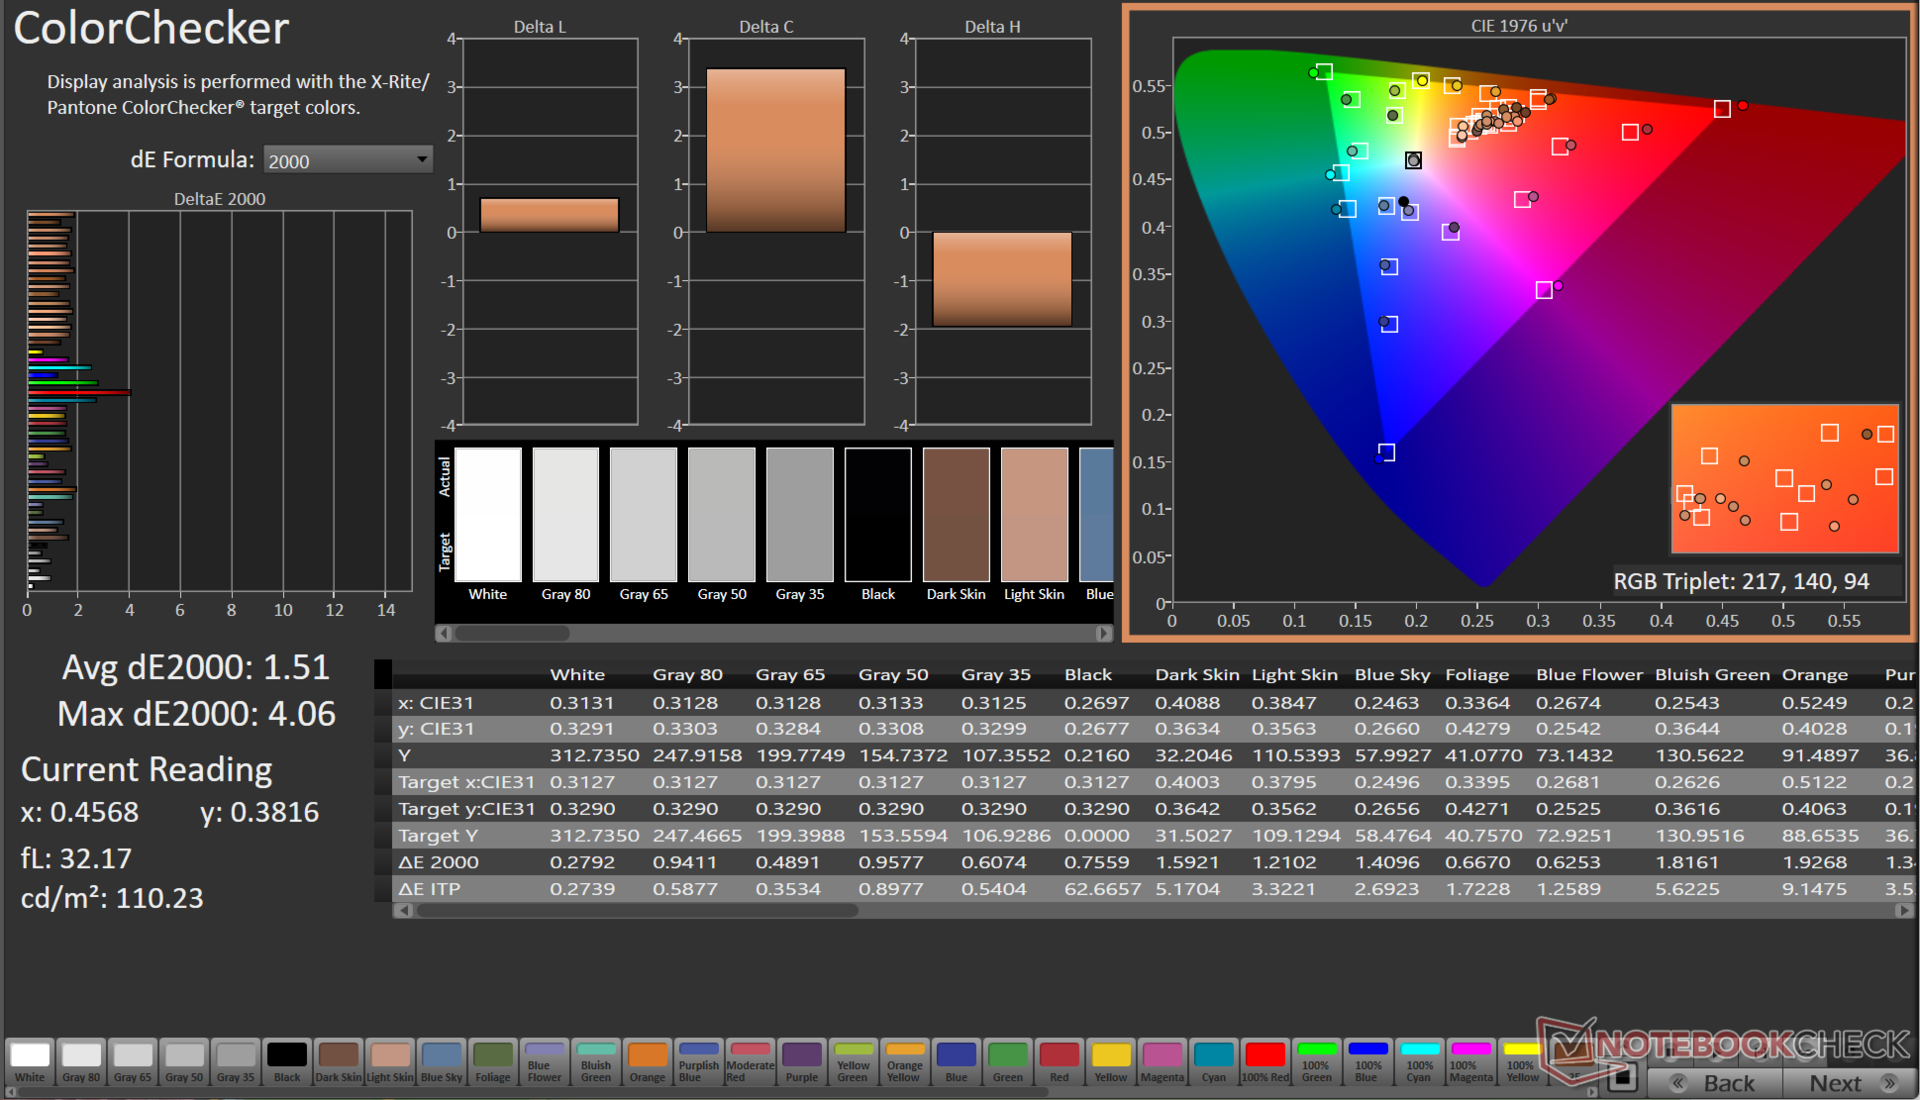
Dokładność kolorów G15 po wyjęciu z pudełka wykazuje zauważalne odchylenia. Byliśmy jednak w stanie osiągnąć radykalną poprawę dzięki naszej procedurze kalibracji przy użyciu spektrofotometru X-Rite i1Basic Pro 3 i oprogramowania do kalibracji kolorów Calman Ultimate firmy Portrait Display.
Średnia Delta E 2000 w skali szarości mogła zostać zredukowana do 0,7, podczas gdy średnia Delta E 2000 w ColorChecker poprawiła się do 1,51.
Skalibrowany plik ICC można pobrać z linku powyżej.
Wyświetl czasy reakcji
| ↔ Czas reakcji od czerni do bieli | ||
|---|---|---|
| 5.35 ms ... wzrost ↗ i spadek ↘ łącznie | ↗ 2.34 ms wzrost | 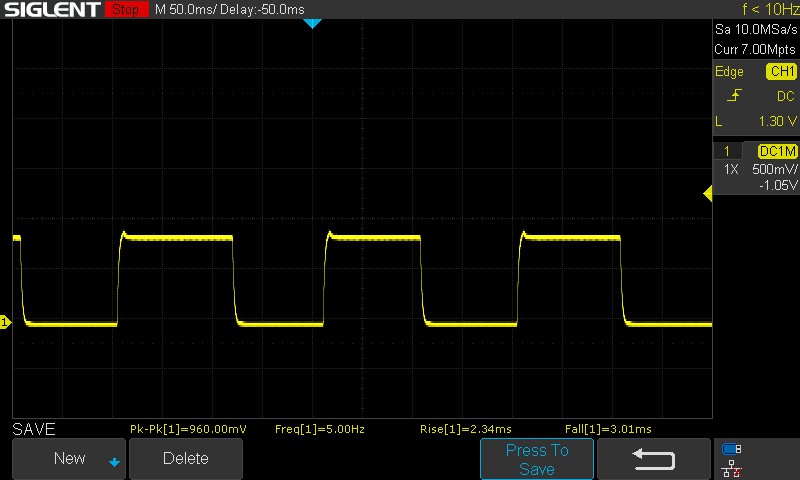 |
| ↘ 3.01 ms upadek | ||
| W naszych testach ekran wykazuje bardzo szybką reakcję i powinien bardzo dobrze nadawać się do szybkich gier. Dla porównania, wszystkie testowane urządzenia wahają się od 0.1 (minimum) do 240 (maksimum) ms. » 18 % wszystkich urządzeń jest lepszych. Oznacza to, że zmierzony czas reakcji jest lepszy od średniej wszystkich testowanych urządzeń (19.8 ms). | ||
| ↔ Czas reakcji 50% szarości do 80% szarości | ||
| 3.39 ms ... wzrost ↗ i spadek ↘ łącznie | ↗ 1.4 ms wzrost | 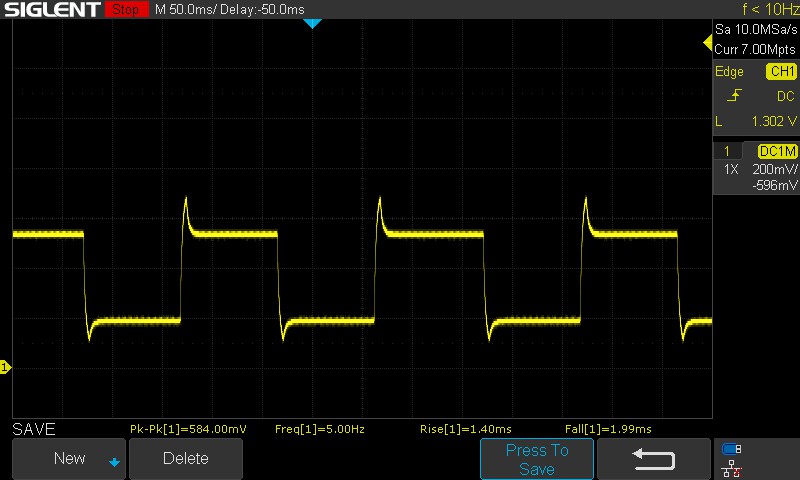 |
| ↘ 1.99 ms upadek | ||
| W naszych testach ekran wykazuje bardzo szybką reakcję i powinien bardzo dobrze nadawać się do szybkich gier. Dla porównania, wszystkie testowane urządzenia wahają się od 0.165 (minimum) do 636 (maksimum) ms. » 14 % wszystkich urządzeń jest lepszych. Oznacza to, że zmierzony czas reakcji jest lepszy od średniej wszystkich testowanych urządzeń (31 ms). | ||
Migotanie ekranu / PWM (modulacja szerokości impulsu)
| Wykryto migotanie ekranu/wykryto PWM | 21620 Hz | ≤ 100 % ustawienia jasności | 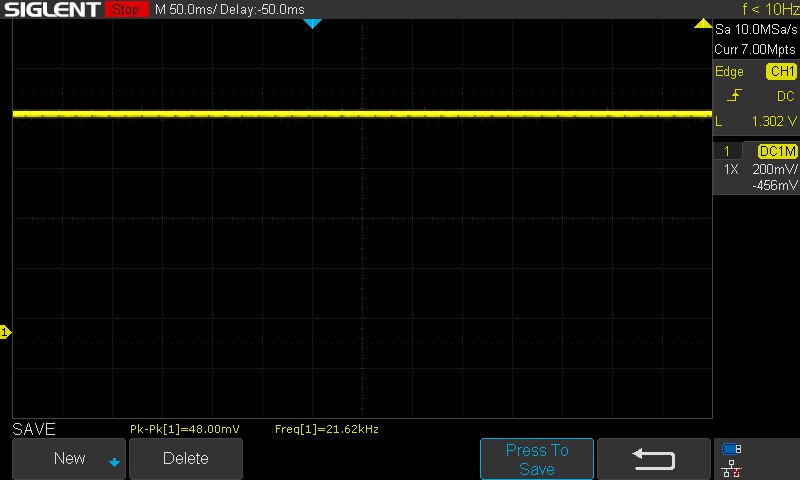 |
Podświetlenie wyświetlacza miga z częstotliwością 21620 Hz (najgorszy przypadek, np. przy użyciu PWM) Wykryto migotanie przy ustawieniu jasności 100 % i poniżej. Powyżej tego ustawienia jasności nie powinno być żadnego migotania ani PWM. Częstotliwość 21620 Hz jest dość wysoka, więc większość użytkowników wrażliwych na PWM nie powinna zauważyć żadnego migotania. Dla porównania: 52 % wszystkich testowanych urządzeń nie używa PWM do przyciemniania wyświetlacza. Jeśli wykryto PWM, zmierzono średnio 7747 (minimum: 5 - maksimum: 343500) Hz. | |||
Panel G15 wykorzystuje overdrive, aby osiągnąć niższe czasy reakcji. Warto zauważyć, że nie ma opcji dezaktywacji overdrive panelu za pośrednictwem Alienware Command Center.
Chociaż panel nie wykorzystuje PWM do regulacji jasności, nadal wykazuje migotanie. Jest jednak mało prawdopodobne, aby spowodowało to znaczne zmęczenie oczu lub dyskomfort dla większości użytkowników ze względu na wysoką częstotliwość.
Aby uzyskać więcej informacji, zapoznaj się z naszym artykułem "Dlaczego PWM to taki ból głowy". Ponadto Tabela rankingowa PWM zawiera przegląd zmierzonych częstotliwości PWM we wszystkich dotychczas przetestowanych urządzeniach.
Oglądanie na zewnątrz nie stanowi większego problemu, o ile na ekran nie pada bezpośrednie światło słoneczne. Kąty widzenia są szerokie i stosunkowo stabilne, z wyjątkiem pewnej zauważalnej utraty jasności w skrajnych przypadkach.

Wydajność: Zgodnie z oczekiwaniami dla kombinacji Core i7-13650HX i RTX 4060
Nasza jednostka Dell G15 5530 jest zasilana przez Intel Core i7-13650HX iNvidia GeForce RTX 4060 GPU do laptopów. W zależności od regionu, nabywcy mogą również skonfigurować ten laptop z Core i5-13450HX i kartą graficzną RTX 3050 6 GB lub RTX 4050 GPU.
Należy pamiętać, że opcja RTX 3050 jest dostępna tylko w połączeniu z procesorem Core i5-13450HX.
Warunki testowania
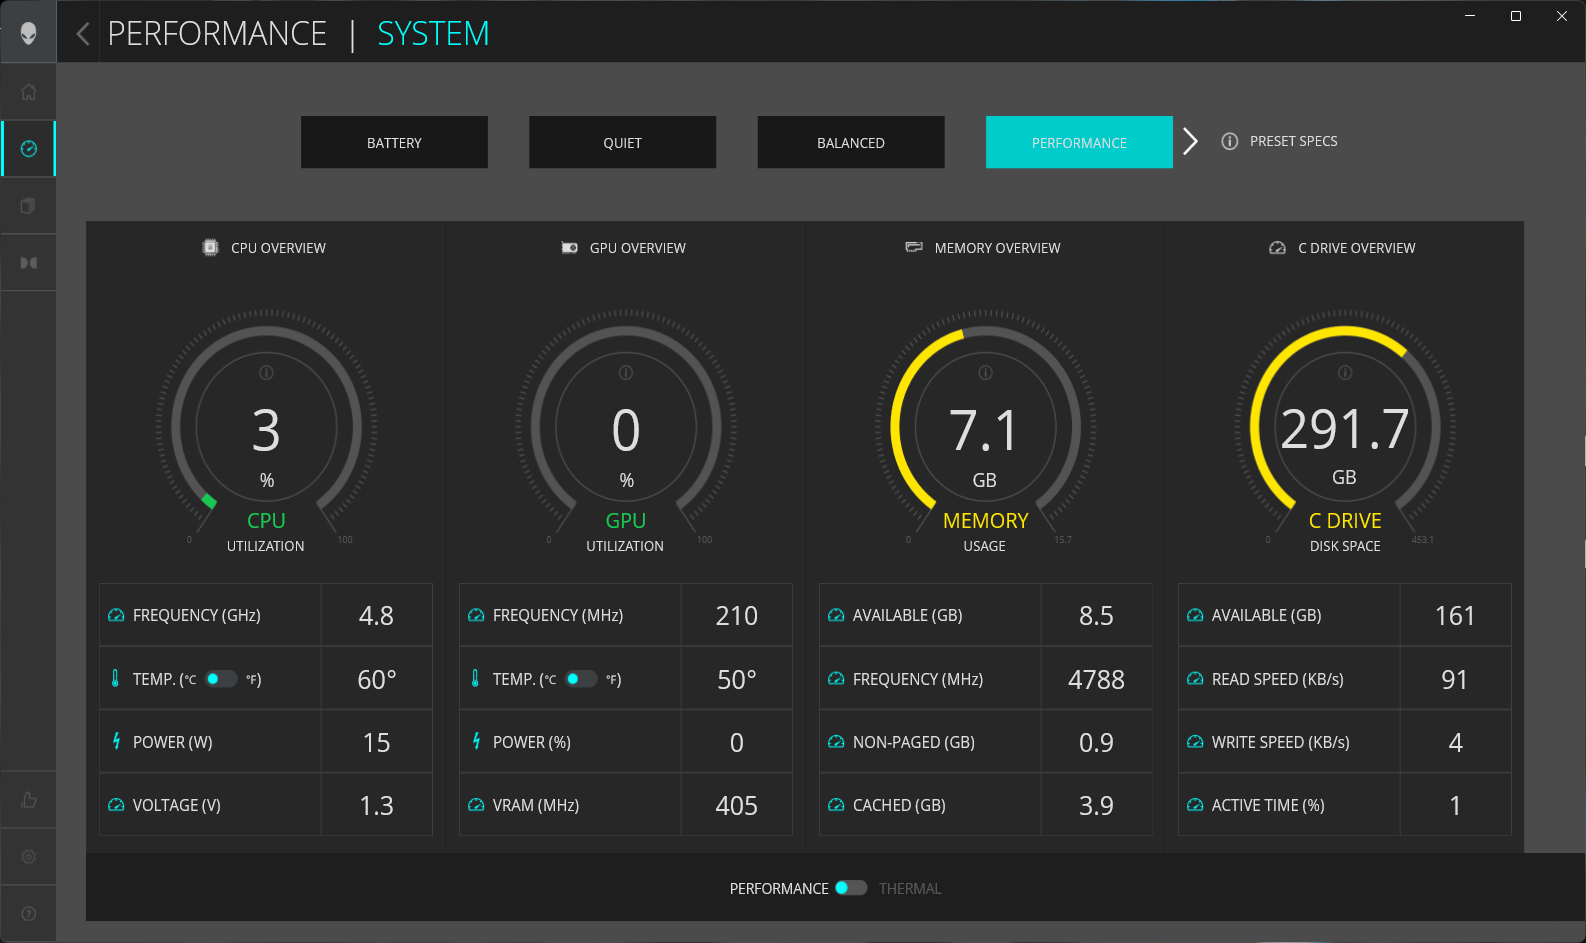
Alienware Command Center zapewnia cztery predefiniowane ustawienia wydajności do wyboru, ale pozwala także użytkownikom tworzyć i dostosowywać własne profile.
Wykorzystaliśmy tryb wydajności dla wszystkich testów porównawczych i testów, z wyjątkiem oceny żywotności baterii, dla której użyliśmy profilu baterii.
Poniższa tabela ilustruje różnice w podstawowej mocy procesora (PBP) i maksymalnej mocy Turbo (MTP) dla każdego scenariusza:
| Tryb wydajności | PL1 (PBP) / Tau | PL2 (MTP) / Tau | PL4 |
|---|---|---|---|
| Bateria | 55 W / 56 s | 157 W / 2,44 ms | 242 W |
| Cichy | 55 W / 56 s | 157 W / 2,44 ms | 242 W |
| Zrównoważony | 157 W / 56 s | 157 W / 2,44 ms | 242 W |
| Wydajność | 191 W / 56 s | 191 W / 2,44 ms | 242 W |
Procesor
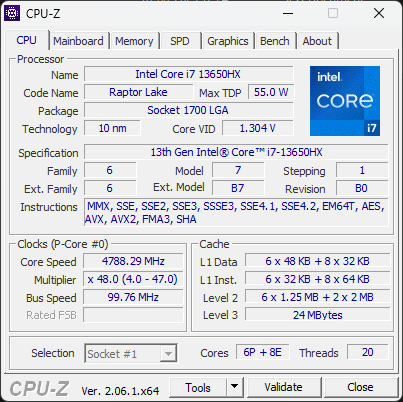
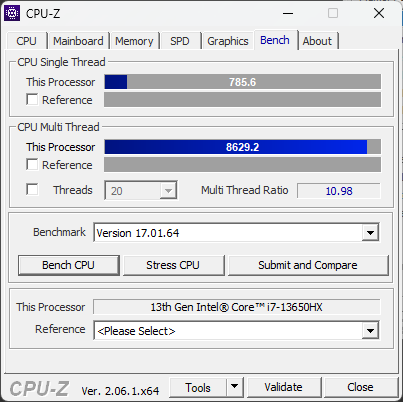
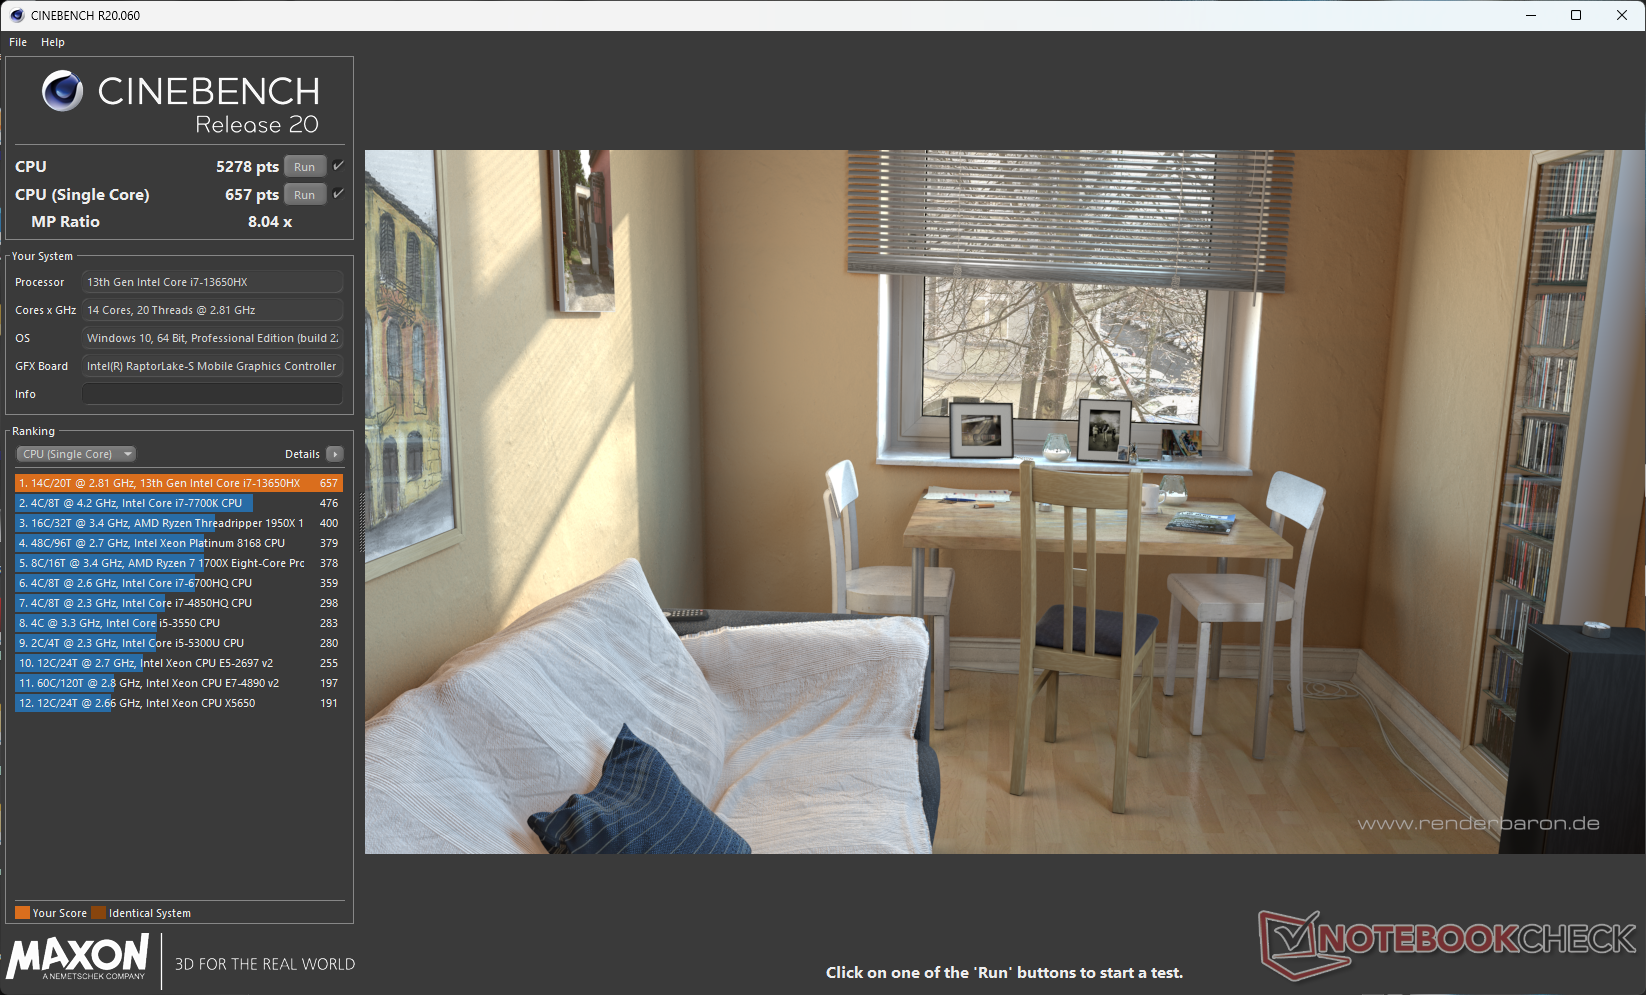
Intel Core i7-13650HX to 14-rdzeniowa, 20-wątkowa część Raptor Lake-HX, która oferuje jednordzeniowe przyspieszenie do 4,9 GHz na rdzeniach P.
W teście wielordzeniowej pętli Cinebench R15, G15 5530 zaczyna na równi z Asus ROG Strix G18, który wykorzystuje ten sam procesor. Jednak w połowie testu obserwujemy lekkie dławienie. Poza tym ogólna wydajność procesora jest niemal identyczna w obu modelach.
Core i7-13650HX w G15 5530 oferuje dobrą przewagę w testach wielordzeniowych nad Ryzen 9 7940HS w Asus TUF Gaming A16, ale ten ostatni udaje się utrzymać w uderzającej odległości w skumulowanej wydajności ze względu na wysokie zyski z pojedynczego rdzenia
.Cinebench R15 Multi Loop
Cinebench R23: Multi Core | Single Core
Cinebench R20: CPU (Multi Core) | CPU (Single Core)
Cinebench R15: CPU Multi 64Bit | CPU Single 64Bit
Blender: v2.79 BMW27 CPU
7-Zip 18.03: 7z b 4 | 7z b 4 -mmt1
Geekbench 5.5: Multi-Core | Single-Core
HWBOT x265 Benchmark v2.2: 4k Preset
LibreOffice : 20 Documents To PDF
R Benchmark 2.5: Overall mean
| CPU Performance rating | |
| Asus ROG Strix G17 G713PI | |
| Medion Erazer Major X20 | |
| Średnia w klasie Gaming | |
| Asus ROG Flow X16 GV601V | |
| Dell G15 5530 | |
| Asus ROG Strix G18 G814JI | |
| Lenovo Legion Pro 5 16IRX8 | |
| Przeciętny Intel Core i7-13650HX | |
| Asus TUF Gaming A16 FA617XS | |
| MSI Katana 17 B13VFK | |
| Cinebench R23 / Multi Core | |
| Asus ROG Strix G17 G713PI | |
| Medion Erazer Major X20 | |
| Średnia w klasie Gaming (10488 - 42661, n=107, ostatnie 2 lata) | |
| Asus ROG Strix G18 G814JI | |
| Dell G15 5530 | |
| Przeciętny Intel Core i7-13650HX (18744 - 21006, n=6) | |
| Lenovo Legion Pro 5 16IRX8 | |
| Asus ROG Flow X16 GV601V | |
| Asus TUF Gaming A16 FA617XS | |
| MSI Katana 17 B13VFK | |
| Cinebench R23 / Single Core | |
| Medion Erazer Major X20 | |
| Asus ROG Flow X16 GV601V | |
| Średnia w klasie Gaming (1166 - 2415, n=107, ostatnie 2 lata) | |
| Asus ROG Strix G18 G814JI | |
| Asus ROG Strix G17 G713PI | |
| Dell G15 5530 | |
| Przeciętny Intel Core i7-13650HX (1693 - 1903, n=6) | |
| MSI Katana 17 B13VFK | |
| Asus TUF Gaming A16 FA617XS | |
| Lenovo Legion Pro 5 16IRX8 | |
| Cinebench R20 / CPU (Multi Core) | |
| Medion Erazer Major X20 | |
| Średnia w klasie Gaming (4029 - 16433, n=106, ostatnie 2 lata) | |
| Asus ROG Strix G17 G713PI | |
| Dell G15 5530 | |
| Asus ROG Strix G18 G814JI | |
| Przeciętny Intel Core i7-13650HX (7197 - 8021, n=5) | |
| Asus ROG Flow X16 GV601V | |
| Lenovo Legion Pro 5 16IRX8 | |
| Asus TUF Gaming A16 FA617XS | |
| MSI Katana 17 B13VFK | |
| Cinebench R20 / CPU (Single Core) | |
| Średnia w klasie Gaming (442 - 913, n=106, ostatnie 2 lata) | |
| Medion Erazer Major X20 | |
| Asus ROG Flow X16 GV601V | |
| Asus ROG Strix G18 G814JI | |
| Przeciętny Intel Core i7-13650HX (700 - 728, n=5) | |
| Asus ROG Strix G17 G713PI | |
| Dell G15 5530 | |
| Asus TUF Gaming A16 FA617XS | |
| MSI Katana 17 B13VFK | |
| Lenovo Legion Pro 5 16IRX8 | |
| Cinebench R15 / CPU Multi 64Bit | |
| Asus ROG Strix G17 G713PI | |
| Medion Erazer Major X20 | |
| Średnia w klasie Gaming (1578 - 6330, n=105, ostatnie 2 lata) | |
| Lenovo Legion Pro 5 16IRX8 | |
| Dell G15 5530 | |
| Asus ROG Strix G18 G814JI | |
| Asus ROG Flow X16 GV601V | |
| Przeciętny Intel Core i7-13650HX (2864 - 3147, n=5) | |
| Asus TUF Gaming A16 FA617XS | |
| MSI Katana 17 B13VFK | |
| Cinebench R15 / CPU Single 64Bit | |
| Medion Erazer Major X20 | |
| Średnia w klasie Gaming (188.8 - 350, n=106, ostatnie 2 lata) | |
| Asus ROG Strix G17 G713PI | |
| Asus ROG Flow X16 GV601V | |
| Asus TUF Gaming A16 FA617XS | |
| Asus ROG Strix G18 G814JI | |
| Dell G15 5530 | |
| Przeciętny Intel Core i7-13650HX (256 - 275, n=5) | |
| Lenovo Legion Pro 5 16IRX8 | |
| MSI Katana 17 B13VFK | |
| Blender / v2.79 BMW27 CPU | |
| MSI Katana 17 B13VFK | |
| Asus TUF Gaming A16 FA617XS | |
| Asus ROG Flow X16 GV601V | |
| Przeciętny Intel Core i7-13650HX (158 - 226, n=5) | |
| Dell G15 5530 | |
| Asus ROG Strix G18 G814JI | |
| Lenovo Legion Pro 5 16IRX8 | |
| Średnia w klasie Gaming (79 - 330, n=104, ostatnie 2 lata) | |
| Medion Erazer Major X20 | |
| Asus ROG Strix G17 G713PI | |
| 7-Zip 18.03 / 7z b 4 | |
| Asus ROG Strix G17 G713PI | |
| Medion Erazer Major X20 | |
| Średnia w klasie Gaming (33491 - 148086, n=105, ostatnie 2 lata) | |
| Asus ROG Strix G18 G814JI | |
| Lenovo Legion Pro 5 16IRX8 | |
| Dell G15 5530 | |
| Przeciętny Intel Core i7-13650HX (73927 - 80057, n=5) | |
| Asus ROG Flow X16 GV601V | |
| Asus TUF Gaming A16 FA617XS | |
| MSI Katana 17 B13VFK | |
| 7-Zip 18.03 / 7z b 4 -mmt1 | |
| Asus ROG Strix G17 G713PI | |
| Medion Erazer Major X20 | |
| Asus TUF Gaming A16 FA617XS | |
| Średnia w klasie Gaming (4199 - 7436, n=105, ostatnie 2 lata) | |
| Asus ROG Flow X16 GV601V | |
| Asus ROG Strix G18 G814JI | |
| Przeciętny Intel Core i7-13650HX (5828 - 6125, n=5) | |
| Dell G15 5530 | |
| MSI Katana 17 B13VFK | |
| Lenovo Legion Pro 5 16IRX8 | |
| Geekbench 5.5 / Multi-Core | |
| Medion Erazer Major X20 | |
| Asus ROG Strix G17 G713PI | |
| Średnia w klasie Gaming (6460 - 28263, n=105, ostatnie 2 lata) | |
| Asus ROG Strix G18 G814JI | |
| Lenovo Legion Pro 5 16IRX8 | |
| Dell G15 5530 | |
| Asus ROG Flow X16 GV601V | |
| Przeciętny Intel Core i7-13650HX (12509 - 14778, n=5) | |
| Asus TUF Gaming A16 FA617XS | |
| MSI Katana 17 B13VFK | |
| Geekbench 5.5 / Single-Core | |
| Średnia w klasie Gaming (986 - 2474, n=105, ostatnie 2 lata) | |
| Asus ROG Strix G17 G713PI | |
| Medion Erazer Major X20 | |
| Asus TUF Gaming A16 FA617XS | |
| Asus ROG Flow X16 GV601V | |
| Dell G15 5530 | |
| Przeciętny Intel Core i7-13650HX (1810 - 1866, n=5) | |
| Asus ROG Strix G18 G814JI | |
| MSI Katana 17 B13VFK | |
| Lenovo Legion Pro 5 16IRX8 | |
| HWBOT x265 Benchmark v2.2 / 4k Preset | |
| Asus ROG Strix G17 G713PI | |
| Medion Erazer Major X20 | |
| Średnia w klasie Gaming (11.5 - 44.4, n=105, ostatnie 2 lata) | |
| Lenovo Legion Pro 5 16IRX8 | |
| Asus ROG Strix G18 G814JI | |
| Dell G15 5530 | |
| Asus ROG Flow X16 GV601V | |
| Przeciętny Intel Core i7-13650HX (18.9 - 23.6, n=5) | |
| Asus TUF Gaming A16 FA617XS | |
| MSI Katana 17 B13VFK | |
| LibreOffice / 20 Documents To PDF | |
| Asus ROG Strix G18 G814JI | |
| MSI Katana 17 B13VFK | |
| Średnia w klasie Gaming (33.2 - 88.8, n=105, ostatnie 2 lata) | |
| Przeciętny Intel Core i7-13650HX (38.9 - 58.8, n=5) | |
| Dell G15 5530 | |
| Asus ROG Strix G17 G713PI | |
| Medion Erazer Major X20 | |
| Asus TUF Gaming A16 FA617XS | |
| Asus ROG Flow X16 GV601V | |
| Lenovo Legion Pro 5 16IRX8 | |
| R Benchmark 2.5 / Overall mean | |
| Lenovo Legion Pro 5 16IRX8 | |
| MSI Katana 17 B13VFK | |
| Asus ROG Strix G18 G814JI | |
| Przeciętny Intel Core i7-13650HX (0.4217 - 0.4461, n=6) | |
| Średnia w klasie Gaming (0.3439 - 0.759, n=106, ostatnie 2 lata) | |
| Dell G15 5530 | |
| Asus TUF Gaming A16 FA617XS | |
| Asus ROG Flow X16 GV601V | |
| Asus ROG Strix G17 G713PI | |
| Medion Erazer Major X20 | |
* ... im mniej tym lepiej
Poniższy wykres ilustruje, jak różne parametry procesora zmieniają się w każdym trybie wydajności podczas wielordzeniowej pętli Cinebench R15.
Tryby Performance i Balanced wykazują podobne średnie taktowanie boost w okolicach 3,6 GHz, podczas gdy tryb Quiet zadowala się średnim taktowaniem boost na poziomie zaledwie 2,6 GHz.
Tryb Balanced jest o około 9 W bardziej ekonomiczny niż Performance pod względem szczytowego poboru mocy pakietu CPU. Temperatury rdzenia są jednak mniej więcej identyczne w obu ustawieniach.
Warto zauważyć, że podczas gdy tryb cichy zużywa średnio około 50,5 W mocy pakietu, powoduje on również spadek wydajności o 23%.
Na zasilaniu bateryjnym wydajność jednordzeniowa Cinebench R20 spadła tylko o 7%. Jednak wynik wielordzeniowy spada o 34%.
AIDA64: FP32 Ray-Trace | FPU Julia | CPU SHA3 | CPU Queen | FPU SinJulia | FPU Mandel | CPU AES | CPU ZLib | FP64 Ray-Trace | CPU PhotoWorxx
| Performance rating | |
| Asus ROG Strix G17 G713PI | |
| Średnia w klasie Gaming | |
| Medion Erazer Major X20 | |
| Asus TUF Gaming A16 FA617XS | |
| Lenovo Legion Pro 5 16IRX8 | |
| Asus ROG Strix G18 G814JI | |
| Dell G15 5530 | |
| Przeciętny Intel Core i7-13650HX | |
| Asus ROG Flow X16 GV601V | |
| MSI Katana 17 B13VFK | |
| AIDA64 / FP32 Ray-Trace | |
| Asus ROG Strix G17 G713PI | |
| Średnia w klasie Gaming (10227 - 85542, n=105, ostatnie 2 lata) | |
| Asus TUF Gaming A16 FA617XS | |
| Medion Erazer Major X20 | |
| Lenovo Legion Pro 5 16IRX8 | |
| Asus ROG Strix G18 G814JI | |
| Dell G15 5530 | |
| Przeciętny Intel Core i7-13650HX (13404 - 20012, n=5) | |
| MSI Katana 17 B13VFK | |
| Asus ROG Flow X16 GV601V | |
| AIDA64 / FPU Julia | |
| Asus ROG Strix G17 G713PI | |
| Średnia w klasie Gaming (51376 - 238426, n=105, ostatnie 2 lata) | |
| Medion Erazer Major X20 | |
| Asus TUF Gaming A16 FA617XS | |
| Lenovo Legion Pro 5 16IRX8 | |
| Asus ROG Strix G18 G814JI | |
| Dell G15 5530 | |
| Przeciętny Intel Core i7-13650HX (68241 - 97317, n=5) | |
| Asus ROG Flow X16 GV601V | |
| MSI Katana 17 B13VFK | |
| AIDA64 / CPU SHA3 | |
| Asus ROG Strix G17 G713PI | |
| Średnia w klasie Gaming (2180 - 10115, n=105, ostatnie 2 lata) | |
| Medion Erazer Major X20 | |
| Lenovo Legion Pro 5 16IRX8 | |
| Asus TUF Gaming A16 FA617XS | |
| Asus ROG Strix G18 G814JI | |
| Dell G15 5530 | |
| Asus ROG Flow X16 GV601V | |
| Przeciętny Intel Core i7-13650HX (3127 - 4487, n=5) | |
| MSI Katana 17 B13VFK | |
| AIDA64 / CPU Queen | |
| Asus ROG Strix G17 G713PI | |
| Medion Erazer Major X20 | |
| Asus TUF Gaming A16 FA617XS | |
| Średnia w klasie Gaming (49785 - 173351, n=90, ostatnie 2 lata) | |
| Lenovo Legion Pro 5 16IRX8 | |
| Asus ROG Flow X16 GV601V | |
| Asus ROG Strix G18 G814JI | |
| Przeciętny Intel Core i7-13650HX (108627 - 110589, n=5) | |
| Dell G15 5530 | |
| MSI Katana 17 B13VFK | |
| AIDA64 / FPU SinJulia | |
| Asus ROG Strix G17 G713PI | |
| Asus TUF Gaming A16 FA617XS | |
| Medion Erazer Major X20 | |
| Średnia w klasie Gaming (4424 - 33636, n=105, ostatnie 2 lata) | |
| Lenovo Legion Pro 5 16IRX8 | |
| Asus ROG Flow X16 GV601V | |
| Dell G15 5530 | |
| Asus ROG Strix G18 G814JI | |
| Przeciętny Intel Core i7-13650HX (9134 - 10887, n=5) | |
| MSI Katana 17 B13VFK | |
| AIDA64 / FPU Mandel | |
| Asus ROG Strix G17 G713PI | |
| Średnia w klasie Gaming (25115 - 128721, n=105, ostatnie 2 lata) | |
| Asus TUF Gaming A16 FA617XS | |
| Medion Erazer Major X20 | |
| Lenovo Legion Pro 5 16IRX8 | |
| Asus ROG Strix G18 G814JI | |
| Dell G15 5530 | |
| Przeciętny Intel Core i7-13650HX (33391 - 48323, n=5) | |
| Asus ROG Flow X16 GV601V | |
| MSI Katana 17 B13VFK | |
| AIDA64 / CPU AES | |
| Asus ROG Strix G17 G713PI | |
| Medion Erazer Major X20 | |
| Średnia w klasie Gaming (39258 - 247074, n=105, ostatnie 2 lata) | |
| Lenovo Legion Pro 5 16IRX8 | |
| Asus TUF Gaming A16 FA617XS | |
| Dell G15 5530 | |
| Asus ROG Strix G18 G814JI | |
| Asus ROG Flow X16 GV601V | |
| Przeciętny Intel Core i7-13650HX (64436 - 85343, n=5) | |
| MSI Katana 17 B13VFK | |
| AIDA64 / CPU ZLib | |
| Asus ROG Strix G17 G713PI | |
| Medion Erazer Major X20 | |
| Średnia w klasie Gaming (574 - 2531, n=105, ostatnie 2 lata) | |
| Lenovo Legion Pro 5 16IRX8 | |
| Dell G15 5530 | |
| Asus ROG Strix G18 G814JI | |
| Przeciętny Intel Core i7-13650HX (1136 - 1285, n=5) | |
| Asus ROG Flow X16 GV601V | |
| Asus TUF Gaming A16 FA617XS | |
| MSI Katana 17 B13VFK | |
| AIDA64 / FP64 Ray-Trace | |
| Asus ROG Strix G17 G713PI | |
| Średnia w klasie Gaming (5509 - 45446, n=105, ostatnie 2 lata) | |
| Asus TUF Gaming A16 FA617XS | |
| Medion Erazer Major X20 | |
| Lenovo Legion Pro 5 16IRX8 | |
| Asus ROG Strix G18 G814JI | |
| Dell G15 5530 | |
| Przeciętny Intel Core i7-13650HX (7270 - 10900, n=5) | |
| Asus ROG Flow X16 GV601V | |
| MSI Katana 17 B13VFK | |
| AIDA64 / CPU PhotoWorxx | |
| Średnia w klasie Gaming (12271 - 89891, n=105, ostatnie 2 lata) | |
| Medion Erazer Major X20 | |
| Asus ROG Strix G18 G814JI | |
| Przeciętny Intel Core i7-13650HX (36170 - 43289, n=5) | |
| Asus ROG Flow X16 GV601V | |
| Dell G15 5530 | |
| Lenovo Legion Pro 5 16IRX8 | |
| MSI Katana 17 B13VFK | |
| Asus ROG Strix G17 G713PI | |
| Asus TUF Gaming A16 FA617XS | |
Nasz dedykowany Intel Core i7-13650HX zawiera więcej informacji i porównania wydajności.
Wydajność systemu
G15 5530 osiąga niższy ogólny wynik PCMark 10 w porównaniu do konkurencji, ale nie napotkaliśmy żadnych czkawek w obliczeniach ogólnego przeznaczenia.
Karta MSI Katana 17 z procesorem Core i7-13620H udało się nieznacznie wyprzedzić G15 5530 w PCMark 10 i ogólnych wynikach CrossMark.
CrossMark: Overall | Productivity | Creativity | Responsiveness
AIDA64: Memory Copy | Memory Read | Memory Write | Memory Latency
| PCMark 10 / Score | |
| Średnia w klasie Gaming (5828 - 12414, n=93, ostatnie 2 lata) | |
| Asus TUF Gaming A16 FA617XS | |
| Asus ROG Flow X16 GV601V | |
| Lenovo Legion Pro 5 16IRX8 | |
| Medion Erazer Major X20 | |
| Asus ROG Strix G17 G713PI | |
| Przeciętny Intel Core i7-13650HX, NVIDIA GeForce RTX 4060 Laptop GPU (6984 - 7613, n=3) | |
| MSI Katana 17 B13VFK | |
| Dell G15 5530 | |
| Asus ROG Strix G18 G814JI | |
| PCMark 10 / Essentials | |
| Medion Erazer Major X20 | |
| Asus ROG Flow X16 GV601V | |
| Asus ROG Strix G17 G713PI | |
| Dell G15 5530 | |
| Lenovo Legion Pro 5 16IRX8 | |
| Asus TUF Gaming A16 FA617XS | |
| MSI Katana 17 B13VFK | |
| Średnia w klasie Gaming (8810 - 11935, n=97, ostatnie 2 lata) | |
| Przeciętny Intel Core i7-13650HX, NVIDIA GeForce RTX 4060 Laptop GPU (9532 - 11151, n=3) | |
| Asus ROG Strix G18 G814JI | |
| PCMark 10 / Productivity | |
| Średnia w klasie Gaming (6845 - 25323, n=95, ostatnie 2 lata) | |
| Asus ROG Strix G17 G713PI | |
| Asus TUF Gaming A16 FA617XS | |
| Asus ROG Flow X16 GV601V | |
| Przeciętny Intel Core i7-13650HX, NVIDIA GeForce RTX 4060 Laptop GPU (9961 - 10204, n=3) | |
| Dell G15 5530 | |
| Medion Erazer Major X20 | |
| MSI Katana 17 B13VFK | |
| Lenovo Legion Pro 5 16IRX8 | |
| Asus ROG Strix G18 G814JI | |
| PCMark 10 / Digital Content Creation | |
| Średnia w klasie Gaming (7602 - 19954, n=95, ostatnie 2 lata) | |
| Lenovo Legion Pro 5 16IRX8 | |
| Asus TUF Gaming A16 FA617XS | |
| Asus ROG Flow X16 GV601V | |
| Przeciętny Intel Core i7-13650HX, NVIDIA GeForce RTX 4060 Laptop GPU (8323 - 11686, n=3) | |
| Medion Erazer Major X20 | |
| MSI Katana 17 B13VFK | |
| Asus ROG Strix G17 G713PI | |
| Dell G15 5530 | |
| Asus ROG Strix G18 G814JI | |
| CrossMark / Overall | |
| Asus ROG Strix G17 G713PI | |
| Średnia w klasie Gaming (1366 - 2409, n=94, ostatnie 2 lata) | |
| Asus ROG Flow X16 GV601V | |
| Przeciętny Intel Core i7-13650HX, NVIDIA GeForce RTX 4060 Laptop GPU (1839 - 1951, n=3) | |
| MSI Katana 17 B13VFK | |
| Medion Erazer Major X20 | |
| Dell G15 5530 | |
| Asus TUF Gaming A16 FA617XS | |
| Lenovo Legion Pro 5 16IRX8 | |
| CrossMark / Productivity | |
| Asus ROG Strix G17 G713PI | |
| Asus ROG Flow X16 GV601V | |
| Średnia w klasie Gaming (1386 - 2254, n=94, ostatnie 2 lata) | |
| Przeciętny Intel Core i7-13650HX, NVIDIA GeForce RTX 4060 Laptop GPU (1730 - 1864, n=3) | |
| MSI Katana 17 B13VFK | |
| Dell G15 5530 | |
| Asus TUF Gaming A16 FA617XS | |
| Medion Erazer Major X20 | |
| Lenovo Legion Pro 5 16IRX8 | |
| CrossMark / Creativity | |
| Asus ROG Strix G17 G713PI | |
| Średnia w klasie Gaming (1343 - 2786, n=94, ostatnie 2 lata) | |
| Asus ROG Flow X16 GV601V | |
| Medion Erazer Major X20 | |
| Dell G15 5530 | |
| Przeciętny Intel Core i7-13650HX, NVIDIA GeForce RTX 4060 Laptop GPU (2020 - 2063, n=3) | |
| MSI Katana 17 B13VFK | |
| Asus TUF Gaming A16 FA617XS | |
| Lenovo Legion Pro 5 16IRX8 | |
| CrossMark / Responsiveness | |
| MSI Katana 17 B13VFK | |
| Przeciętny Intel Core i7-13650HX, NVIDIA GeForce RTX 4060 Laptop GPU (1544 - 1907, n=3) | |
| Średnia w klasie Gaming (1226 - 2334, n=94, ostatnie 2 lata) | |
| Asus ROG Flow X16 GV601V | |
| Asus ROG Strix G17 G713PI | |
| Lenovo Legion Pro 5 16IRX8 | |
| Medion Erazer Major X20 | |
| Dell G15 5530 | |
| Asus TUF Gaming A16 FA617XS | |
| AIDA64 / Memory Copy | |
| Średnia w klasie Gaming (21750 - 129946, n=105, ostatnie 2 lata) | |
| Medion Erazer Major X20 | |
| Asus ROG Strix G18 G814JI | |
| Asus ROG Flow X16 GV601V | |
| Asus TUF Gaming A16 FA617XS | |
| Przeciętny Intel Core i7-13650HX, NVIDIA GeForce RTX 4060 Laptop GPU (59266 - 59896, n=3) | |
| Dell G15 5530 | |
| Lenovo Legion Pro 5 16IRX8 | |
| MSI Katana 17 B13VFK | |
| Asus ROG Strix G17 G713PI | |
| AIDA64 / Memory Read | |
| Średnia w klasie Gaming (22956 - 118858, n=105, ostatnie 2 lata) | |
| Medion Erazer Major X20 | |
| Asus ROG Strix G18 G814JI | |
| Asus ROG Flow X16 GV601V | |
| Przeciętny Intel Core i7-13650HX, NVIDIA GeForce RTX 4060 Laptop GPU (67305 - 68612, n=3) | |
| Dell G15 5530 | |
| Lenovo Legion Pro 5 16IRX8 | |
| MSI Katana 17 B13VFK | |
| Asus TUF Gaming A16 FA617XS | |
| Asus ROG Strix G17 G713PI | |
| AIDA64 / Memory Write | |
| Średnia w klasie Gaming (22297 - 135096, n=105, ostatnie 2 lata) | |
| Asus TUF Gaming A16 FA617XS | |
| Lenovo Legion Pro 5 16IRX8 | |
| Medion Erazer Major X20 | |
| Asus ROG Flow X16 GV601V | |
| Asus ROG Strix G18 G814JI | |
| Dell G15 5530 | |
| Przeciętny Intel Core i7-13650HX, NVIDIA GeForce RTX 4060 Laptop GPU (58028 - 60298, n=3) | |
| Asus ROG Strix G17 G713PI | |
| MSI Katana 17 B13VFK | |
| AIDA64 / Memory Latency | |
| Średnia w klasie Gaming (75.3 - 259, n=105, ostatnie 2 lata) | |
| MSI Katana 17 B13VFK | |
| Asus ROG Flow X16 GV601V | |
| Dell G15 5530 | |
| Medion Erazer Major X20 | |
| Przeciętny Intel Core i7-13650HX, NVIDIA GeForce RTX 4060 Laptop GPU (90.4 - 90.8, n=3) | |
| Asus TUF Gaming A16 FA617XS | |
| Asus ROG Strix G17 G713PI | |
| Asus ROG Strix G18 G814JI | |
| Lenovo Legion Pro 5 16IRX8 | |
* ... im mniej tym lepiej
| PCMark 8 Home Score Accelerated v2 | 4748 pkt. | |
| PCMark 8 Work Score Accelerated v2 | 6712 pkt. | |
| PCMark 10 Score | 6984 pkt. | |
Pomoc | ||
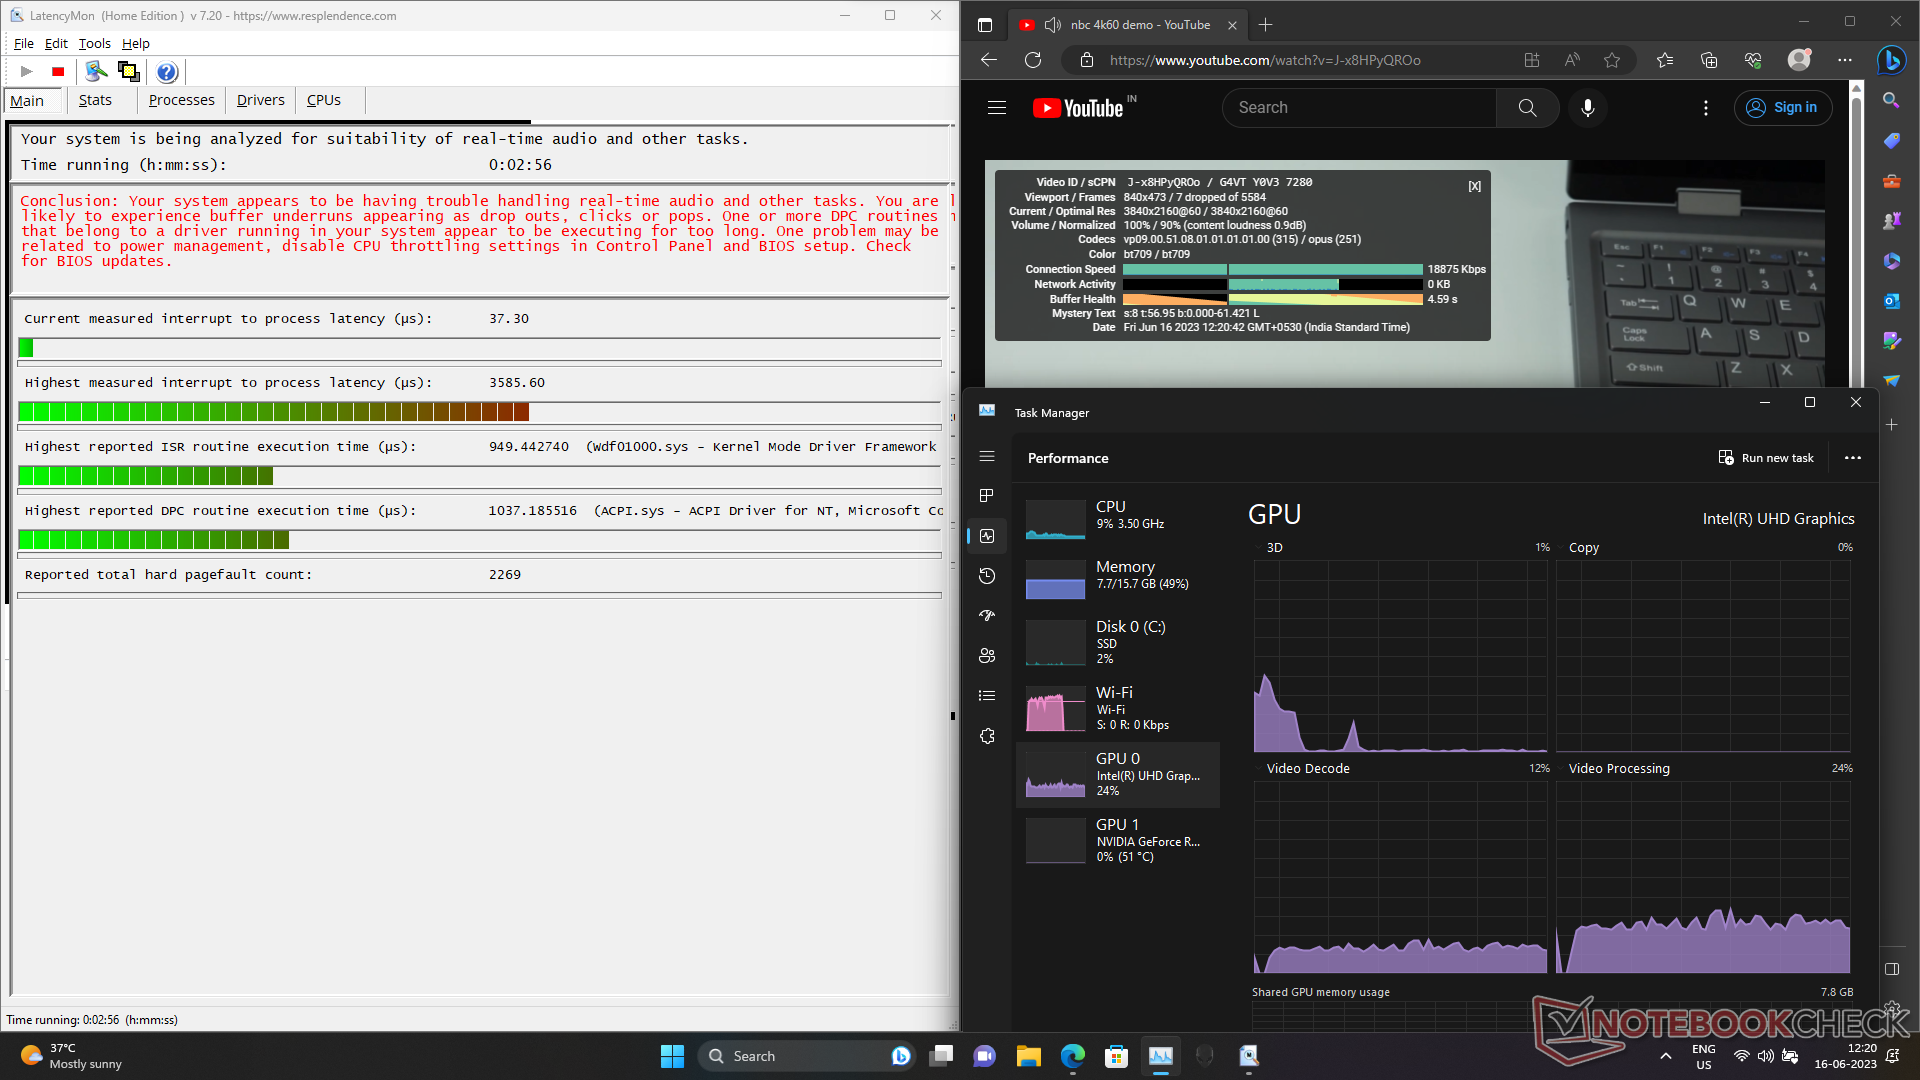
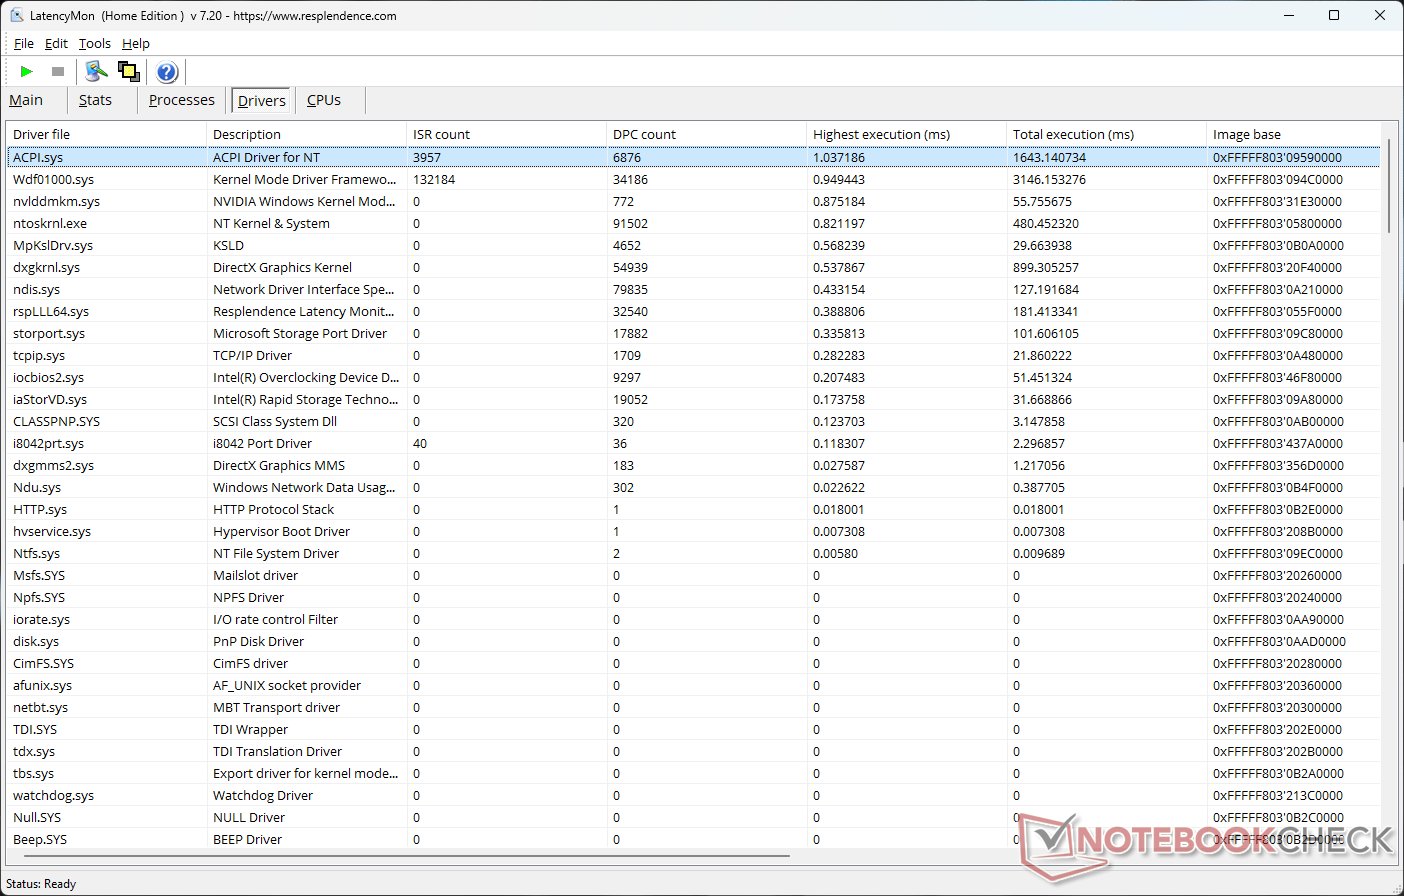
Opóźnienie DPC
G15 5530 cierpi na wysokie opóźnienie między przerwaniem a procesem wynoszące 3585,6 µs z powodu długiego czasu wykonywania sterownika ACPI.sys.
| DPC Latencies / LatencyMon - interrupt to process latency (max), Web, Youtube, Prime95 | |
| Dell G15 5530 | |
| MSI Katana 17 B13VFK | |
| Medion Erazer Major X20 | |
| Asus ROG Strix G17 G713PI | |
| Asus ROG Flow X16 GV601V | |
| Asus TUF Gaming A16 FA617XS | |
| Asus ROG Strix G18 G814JI | |
| Lenovo Legion Pro 5 16IRX8 | |
* ... im mniej tym lepiej
Urządzenia pamięci masowej
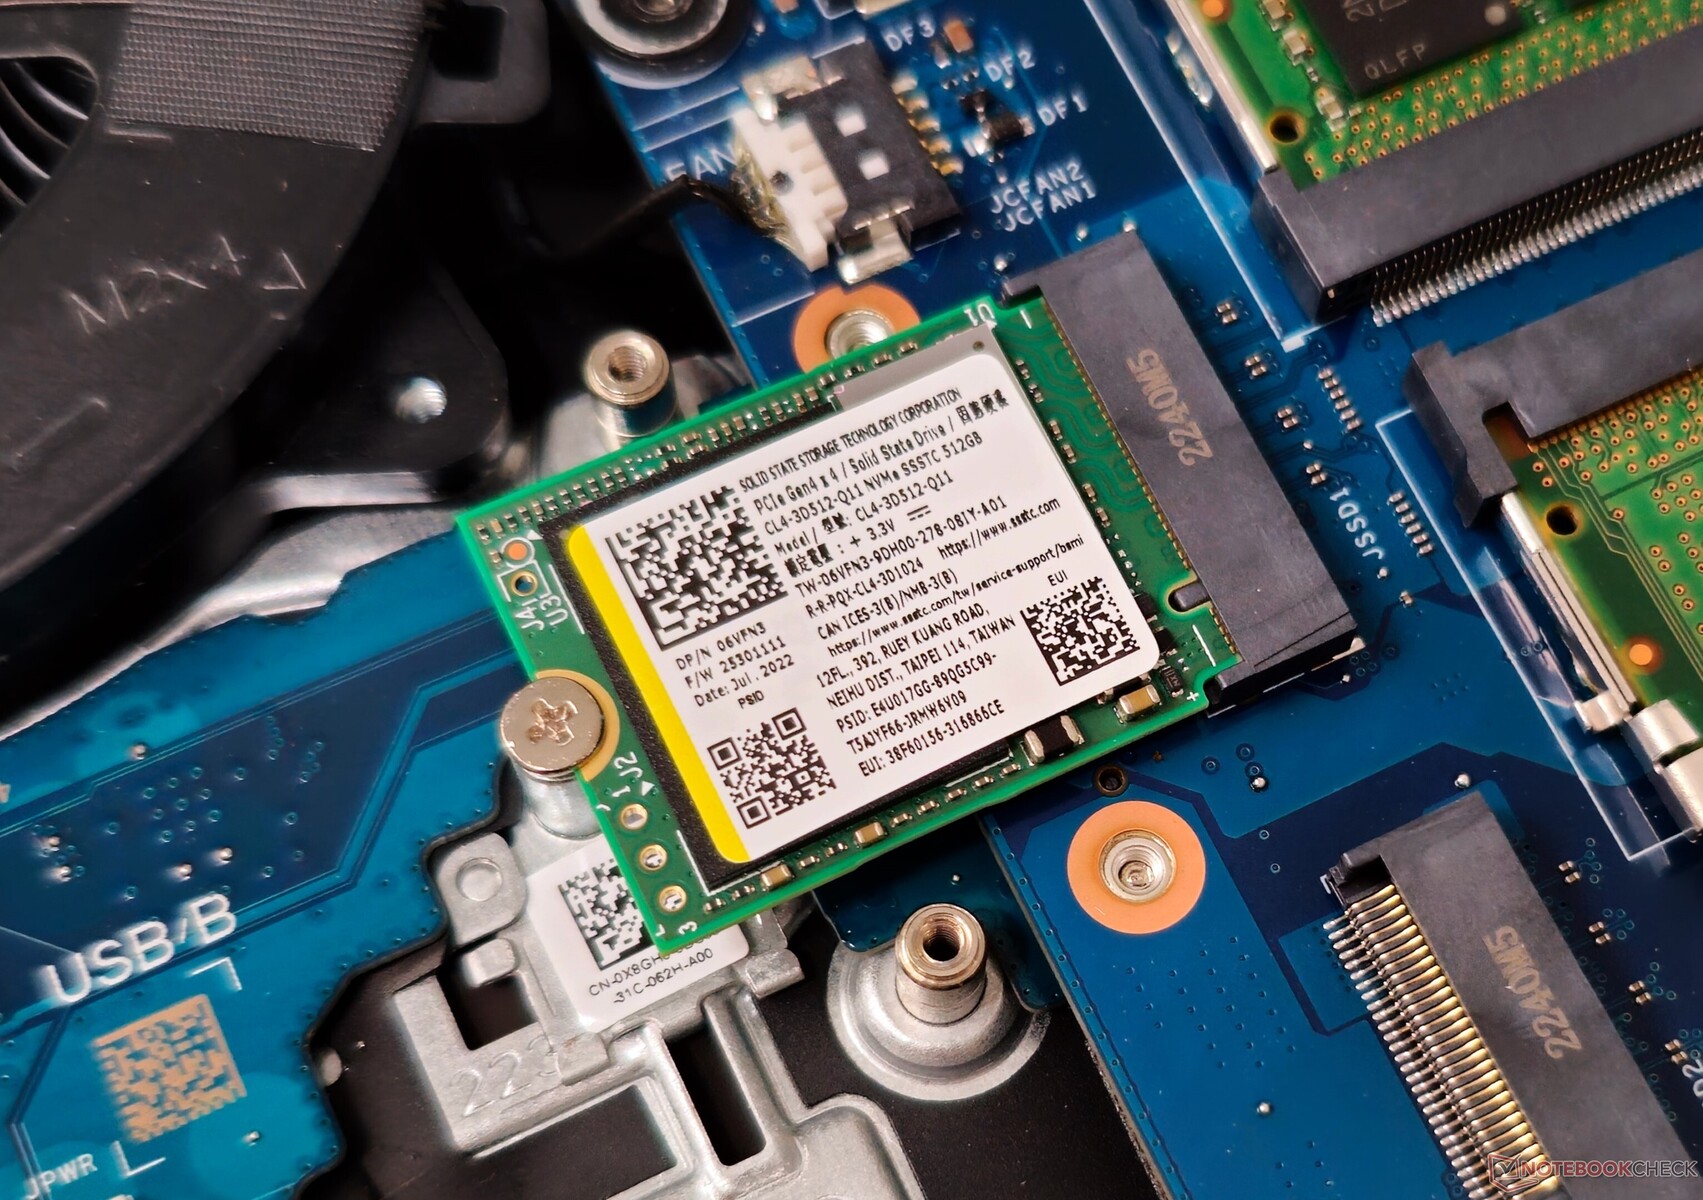
Dell oferuje dwa gniazda M.2 2242 na dyski pamięci masowej zamiast bardziej wszechobecnej odmiany M.2 2280.
Użytkownicy powinni zaktualizować dysk, jeśli zamierzają zainstalować dużą liczbę gier, ponieważ obraz fabryczny zapewnia tylko 398 GB wolnego miejsca z 512 GB pojemności.
Przy sekwencyjnym odczycie poniżej 3000 MB/s i sekwencyjnym zapisie około 500 MB/s, wydajność SSTC CL4 jest daleka od imponującej.
Nie ma możliwości rozszerzenia pamięci masowej za pomocą 2,5-calowych dysków SATA.

* ... im mniej tym lepiej
Dysk SSD oferuje trwały odczyt przy głębokości kolejki wynoszącej 8, ale dopiero po drastycznym spadku wydajności w 10. przebiegu.
Disk Throttling: DiskSpd Read Loop, Queue Depth 8
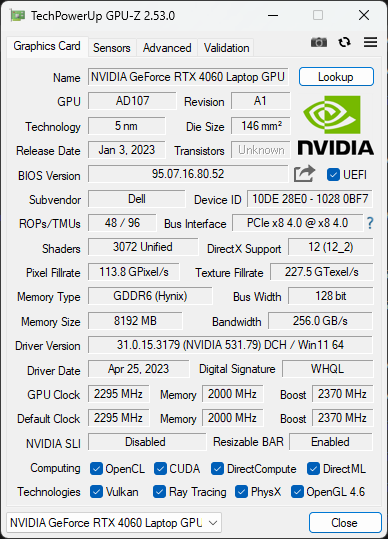
Wydajność GPU
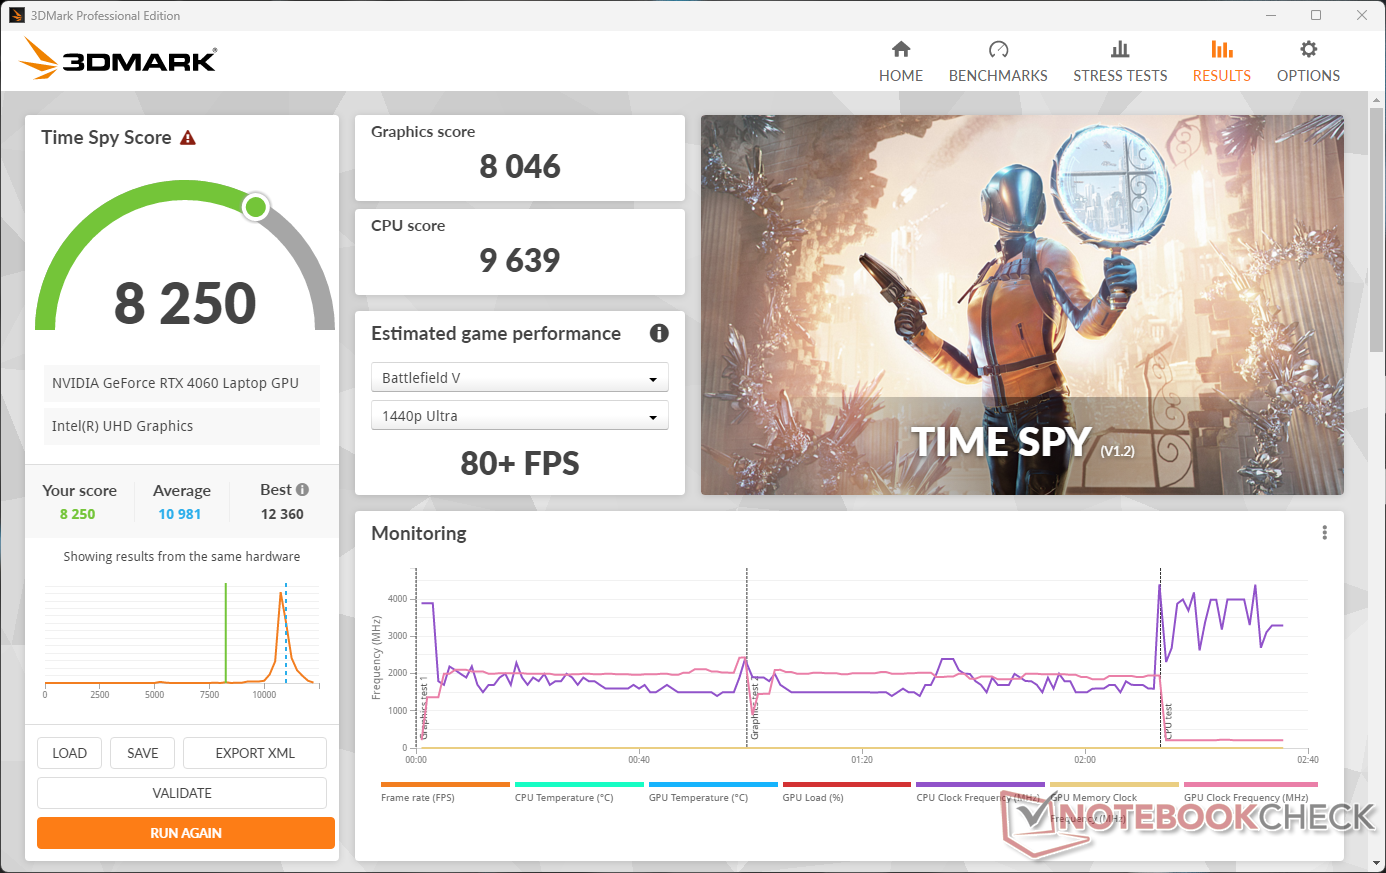
Procesor graficzny 140 W Nvidia GeForce RTX 4060 Laptop osiąga oczekiwane wyniki w skumulowanych testach 3DMark. Co ciekawe, MSI Katana 17 z 105 W RTX 4060 ma niewielką przewagę wydajnościową nad innymi laptopami z RTX 4060 w porównaniu.
Z drugiej strony, G15 5530 rekompensuje tę różnicę wydajności w testach Blendera.
wynik 3DMark Time Spy Wynik grafiki spada o 24% na zasilaniu bateryjnym.
| 3DMark 11 Performance | 32321 pkt. | |
| 3DMark Ice Storm Standard Score | 242288 pkt. | |
| 3DMark Cloud Gate Standard Score | 66116 pkt. | |
| 3DMark Fire Strike Score | 24323 pkt. | |
| 3DMark Fire Strike Extreme Score | 12237 pkt. | |
| 3DMark Time Spy Score | 11007 pkt. | |
Pomoc | ||
| Blender / v3.3 Classroom OPTIX/RTX | |
| MSI Katana 17 B13VFK | |
| Asus ROG Strix G18 G814JI | |
| Przeciętny NVIDIA GeForce RTX 4060 Laptop GPU (19 - 28, n=53) | |
| Asus ROG Flow X16 GV601V | |
| Lenovo Legion Pro 5 16IRX8 | |
| Dell G15 5530 | |
| Asus ROG Strix G17 G713PI | |
| Medion Erazer Major X20 | |
| Średnia w klasie Gaming (9 - 32, n=106, ostatnie 2 lata) | |
| Blender / v3.3 Classroom CUDA | |
| MSI Katana 17 B13VFK | |
| Przeciętny NVIDIA GeForce RTX 4060 Laptop GPU (39 - 53, n=53) | |
| Asus ROG Flow X16 GV601V | |
| Dell G15 5530 | |
| Lenovo Legion Pro 5 16IRX8 | |
| Asus ROG Strix G18 G814JI | |
| Asus ROG Strix G17 G713PI | |
| Medion Erazer Major X20 | |
| Średnia w klasie Gaming (15 - 228, n=106, ostatnie 2 lata) | |
| Blender / v3.3 Classroom CPU | |
| MSI Katana 17 B13VFK | |
| Asus ROG Flow X16 GV601V | |
| Przeciętny NVIDIA GeForce RTX 4060 Laptop GPU (189 - 452, n=53) | |
| Asus TUF Gaming A16 FA617XS | |
| Dell G15 5530 | |
| Asus ROG Strix G18 G814JI | |
| Lenovo Legion Pro 5 16IRX8 | |
| Średnia w klasie Gaming (122 - 565, n=102, ostatnie 2 lata) | |
| Medion Erazer Major X20 | |
| Asus ROG Strix G17 G713PI | |
* ... im mniej tym lepiej
Wydajność w grach
Procesor graficzny RTX 4060 do laptopów jest w stanie osiągnąć trzycyfrową liczbę klatek na sekundę (fps) w stosunkowo starszych grach przy ustawieniach 1080p Ultra. Nawet w nowszych grach może on konsekwentnie dostarczać liczbę klatek na sekundę znacznie powyżej 60 fps w rozdzielczości 1080p Ultra.
Użytkownikom zainteresowanym graniem w wyższych rozdzielczościach przy użyciu zewnętrznego monitora, włączenie funkcji Nvidia DLSS (Deep Learning Super Sampling) lub AMD FSR (FidelityFX Super Resolution) w obsługiwanych tytułach może zapewnić znaczny wzrost liczby klatek na sekundę.
| The Witcher 3 - 1920x1080 Ultra Graphics & Postprocessing (HBAO+) | |
| Średnia w klasie Gaming (104.7 - 240, n=6, ostatnie 2 lata) | |
| Medion Erazer Major X20 | |
| Asus ROG Strix G17 G713PI | |
| Asus ROG Strix G18 G814JI | |
| Lenovo Legion Pro 5 16IRX8 | |
| Asus ROG Flow X16 GV601V | |
| MSI Katana 17 B13VFK | |
| Dell G15 5530 | |
| Asus TUF Gaming A16 FA617XS | |
| Cyberpunk 2077 1.6 | |
| 1920x1080 High Preset | |
| Lenovo Legion Pro 5 16IRX8 | |
| Dell G15 5530 | |
| Asus ROG Strix G17 G713PI | |
| Asus ROG Flow X16 GV601V | |
| Przeciętny NVIDIA GeForce RTX 4060 Laptop GPU (63.5 - 114.9, n=16) | |
| 1920x1080 Ultra Preset | |
| Lenovo Legion Pro 5 16IRX8 | |
| Asus ROG Strix G17 G713PI | |
| Dell G15 5530 | |
| Asus ROG Flow X16 GV601V | |
| Przeciętny NVIDIA GeForce RTX 4060 Laptop GPU (57.9 - 93.2, n=18) | |
| MSI Katana 17 B13VFK | |
| 1920x1080 Ray Tracing Ultra Preset (DLSS off) | |
| Przeciętny NVIDIA GeForce RTX 4060 Laptop GPU (25.6 - 60, n=6) | |
| Dell G15 5530 | |
| Asus ROG Flow X16 GV601V | |
| MSI Katana 17 B13VFK | |
Wykres Witcher 3 FPS
System chłodzenia G15 5530 wydaje się być całkiem skuteczny, o czym świadczy stosunkowo stabilna liczba klatek na sekundę widoczna poniżej Teście Witcher 3 teście obciążeniowym.
| low | med. | high | ultra | |
|---|---|---|---|---|
| GTA V (2015) | 182.6 | 175.3 | 172.8 | 111.8 |
| The Witcher 3 (2015) | 407 | 335 | 205 | 104.6 |
| Dota 2 Reborn (2015) | 179.9 | 163.8 | 154.9 | 144.8 |
| Final Fantasy XV Benchmark (2018) | 212 | 137.3 | 100.1 | |
| X-Plane 11.11 (2018) | 160.1 | 146.8 | 115.6 | |
| Far Cry 5 (2018) | 168 | 152 | 146 | 139 |
| Strange Brigade (2018) | 467 | 281 | 222 | 189.6 |
| Cyberpunk 2077 1.6 (2022) | 123.2 | 99.4 | 86.1 | 80 |
| F1 22 (2022) | 244 | 235 | 177.7 | 66.1 |
Sprawdź naszą dedykowaną stronę GPU Nvidia GeForce RTX 4060 do laptopów aby uzyskać więcej porównań wydajności.
Emisje: Pod wpływem stresu robi się ciepło
Hałas systemowy
Pod obciążeniem, G15 może generować hałas na poziomie nieco poniżej 50 dB(A). Co ciekawe, tryb Quiet wytwarza wyższy poziom ciśnienia akustycznego (SPL) w porównaniu do trybów Balanced i Performance, nawet przy niewielkim obciążeniu 3DMark 06. Niemniej jednak, maksymalny hałas wentylatora pozostaje poniżej 40 dB(A) w tym profilu.
Nie zaobserwowano większych spadków wydajności w różnych profilach podczas testów z The Witcher 3 w rozdzielczości 1080p Ultra.
Hałas
| luz |
| 26.85 / 26.85 / 26.85 dB |
| obciążenie |
| 27.65 / 47.86 dB |
 | ||
30 dB cichy 40 dB(A) słyszalny 50 dB(A) irytujący |
||
min: | ||
Jak wspomniano wcześniej, tryb cichy może wykazywać pewne ograniczenia w wydajności procesora, ale nadal powinien zapewniać zadowalającą liczbę klatek na sekundę przy jednoczesnym utrzymaniu hałasu wentylatora na akceptowalnym poziomie.
| Tryb wydajności | Bezczynność dB(A) | Średnie obciążenie dB(A) | Maksymalne obciążenie dB(A) | Witcher 3 1080p Ultra dB(A) |
|---|---|---|---|---|
| Bateria | 20,90 | 32,60 | 33,21 | 44,36 / 104 kl |
| Cichy | 20.74 | 32.95 | 37.68 | 37.63 / 99 fps |
| Zrównoważony | 20.80 | 26.40 | 45.97 | 45.92 / 104 fps |
| Wydajność | 26,85 | 27,65 | 47,86 | 47,86 / 105 fps |
| Dell G15 5530 Intel Core i7-13650HX, GeForce RTX 4060 Laptop GPU | Asus ROG Strix G18 G814JI Intel Core i7-13650HX, GeForce RTX 4070 Laptop GPU | Lenovo Legion Pro 5 16IRX8 Intel Core i7-13700HX, GeForce RTX 4060 Laptop GPU | Asus ROG Flow X16 GV601V Intel Core i9-13900H, GeForce RTX 4060 Laptop GPU | MSI Katana 17 B13VFK Intel Core i7-13620H, GeForce RTX 4060 Laptop GPU | Asus TUF Gaming A16 FA617XS AMD Ryzen 9 7940HS, Radeon RX 7600S | Asus ROG Strix G17 G713PI AMD Ryzen 9 7945HX, GeForce RTX 4070 Laptop GPU | Medion Erazer Major X20 Intel Core i9-13900HX, GeForce RTX 4070 Laptop GPU | |
|---|---|---|---|---|---|---|---|---|
| Noise | -10% | -3% | -4% | -24% | -13% | -14% | -21% | |
| wyłączone / środowisko * (dB) | 20.41 | 25 -22% | 23 -13% | 24 -18% | 24.5 -20% | 25 -22% | 25 -22% | 24 -18% |
| Idle Minimum * (dB) | 26.85 | 26 3% | 23.1 14% | 24 11% | 24.5 9% | 25 7% | 26 3% | 25 7% |
| Idle Average * (dB) | 26.85 | 28 -4% | 23.1 14% | 24 11% | 24.5 9% | 26 3% | 29 -8% | 29 -8% |
| Idle Maximum * (dB) | 26.85 | 29 -8% | 26.6 1% | 24 11% | 40 -49% | 28 -4% | 30 -12% | 31 -15% |
| Load Average * (dB) | 27.65 | 41 -48% | 34.7 -25% | 36.71 -33% | 48.3 -75% | 43 -56% | 46 -66% | 50 -81% |
| Witcher 3 ultra * (dB) | 47.9 | 44 8% | 47.6 1% | 50.92 -6% | 56 -17% | 51 -6% | 46 4% | 53 -11% |
| Load Maximum * (dB) | 47.86 | 46 4% | 54.8 -15% | 50.92 -6% | 59.1 -23% | 53 -11% | 47 2% | 57 -19% |
* ... im mniej tym lepiej
Temperatura
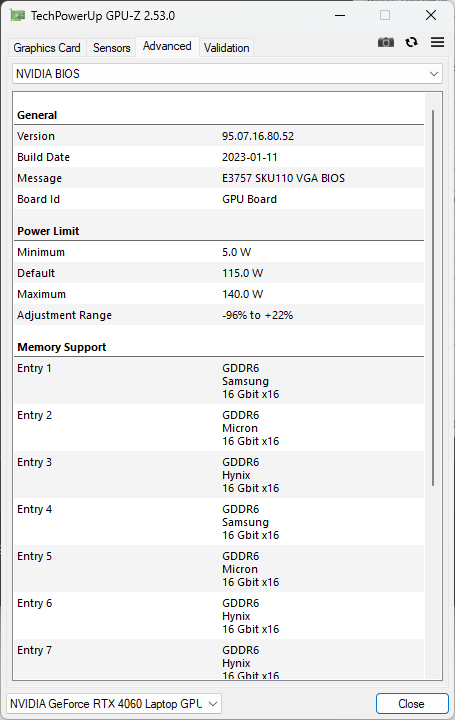
Według firmy Dell, jednostki SKU G15 5530 wyposażone w RTX 4050 i nowsze wykorzystują system chłodzenia z komorą parową wraz z materiałem interfejsu termicznego Element 31, podobnie jak ich kuzyni Alienware.
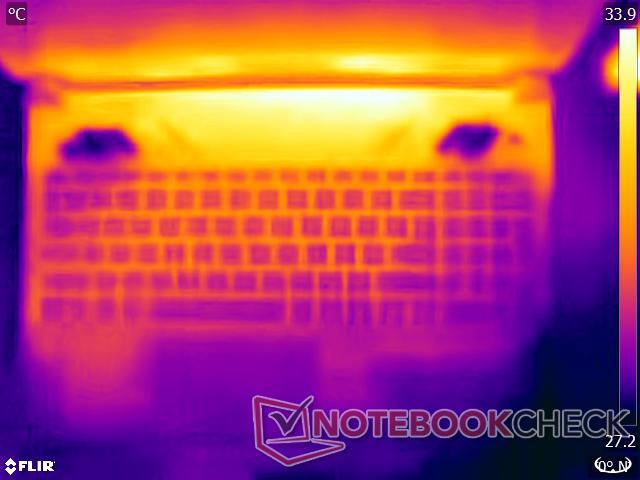
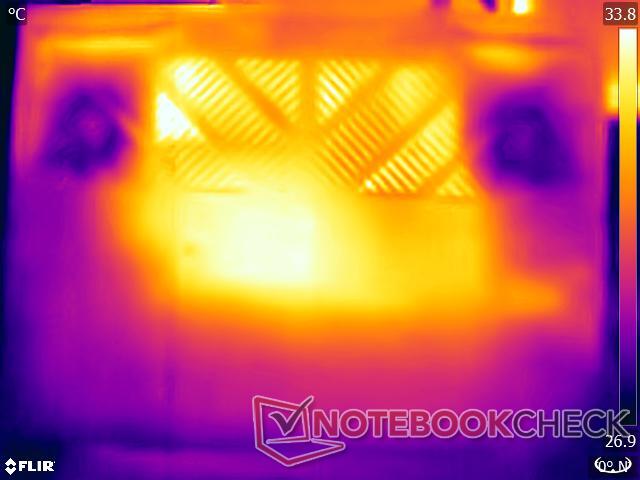
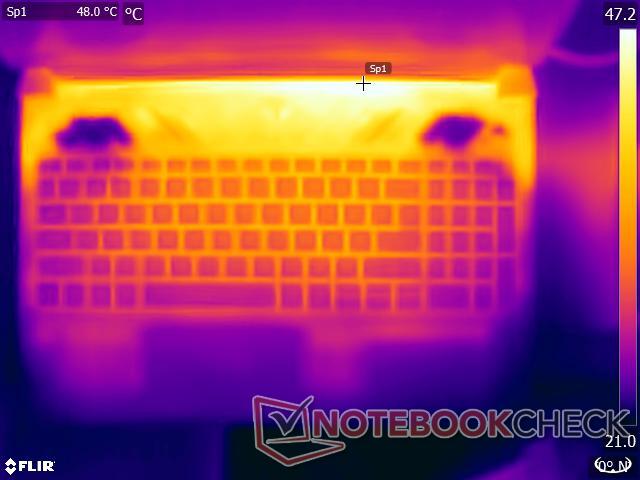
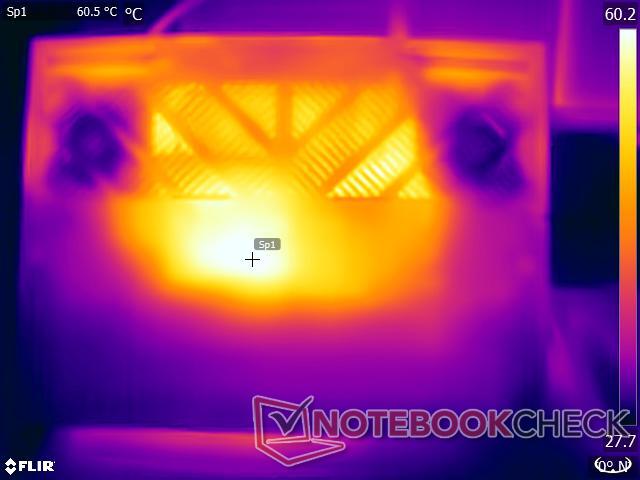
Pomimo obecności komory parowej, obserwujemy wysokie temperatury powierzchni pod obciążeniem. Podpórki pod nadgarstki i obszary touchpada pozostają jednak stosunkowo chłodne.
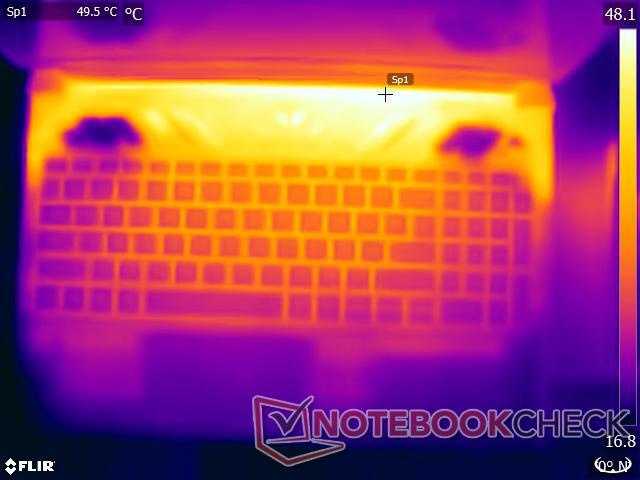
(-) Maksymalna temperatura w górnej części wynosi 54 °C / 129 F, w porównaniu do średniej 40.4 °C / 105 F , począwszy od 21.2 do 68.8 °C dla klasy Gaming.
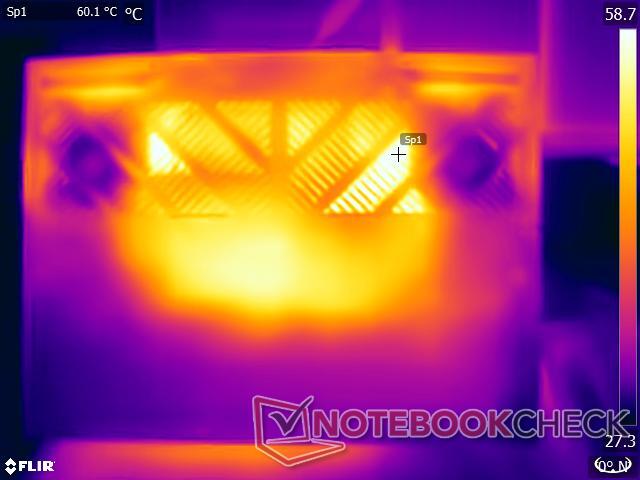
(-) Dno nagrzewa się maksymalnie do 62.2 °C / 144 F, w porównaniu do średniej 43.2 °C / 110 F
(+) W stanie bezczynności średnia temperatura górnej części wynosi 31 °C / 88 F, w porównaniu ze średnią temperaturą urządzenia wynoszącą 33.9 °C / ### class_avg_f### F.
(-) Podczas gry w Wiedźmina 3 średnia temperatura górnej części wynosi 41.9 °C / 107 F, w porównaniu do średniej temperatury urządzenia wynoszącej 33.9 °C / ## #class_avg_f### F.
(+) Podparcia dłoni i touchpad osiągają maksymalną temperaturę skóry (34.4 °C / 93.9 F) i dlatego nie są gorące.
(-) Średnia temperatura obszaru podparcia dłoni w podobnych urządzeniach wynosiła 28.8 °C / 83.8 F (-5.6 °C / -10.1 F).
| Dell G15 5530 Intel Core i7-13650HX, NVIDIA GeForce RTX 4060 Laptop GPU | Asus ROG Strix G18 G814JI Intel Core i7-13650HX, NVIDIA GeForce RTX 4070 Laptop GPU | Lenovo Legion Pro 5 16IRX8 Intel Core i7-13700HX, NVIDIA GeForce RTX 4060 Laptop GPU | Asus ROG Flow X16 GV601V Intel Core i9-13900H, NVIDIA GeForce RTX 4060 Laptop GPU | MSI Katana 17 B13VFK Intel Core i7-13620H, NVIDIA GeForce RTX 4060 Laptop GPU | Asus TUF Gaming A16 FA617XS AMD Ryzen 9 7940HS, AMD Radeon RX 7600S | Asus ROG Strix G17 G713PI AMD Ryzen 9 7945HX, NVIDIA GeForce RTX 4070 Laptop GPU | Medion Erazer Major X20 Intel Core i9-13900HX, NVIDIA GeForce RTX 4070 Laptop GPU | |
|---|---|---|---|---|---|---|---|---|
| Heat | 16% | 13% | 11% | 13% | 11% | 14% | 3% | |
| Maximum Upper Side * (°C) | 54 | 45 17% | 42.8 21% | 46 15% | 41.6 23% | 53 2% | 42 22% | 46 15% |
| Maximum Bottom * (°C) | 62.2 | 47 24% | 50 20% | 41 34% | 43.1 31% | 48 23% | 41 34% | 49 21% |
| Idle Upper Side * (°C) | 33.4 | 28 16% | 29.6 11% | 36 -8% | 32 4% | 30 10% | 33 1% | 37 -11% |
| Idle Bottom * (°C) | 33.4 | 31 7% | 34 -2% | 33 1% | 35.8 -7% | 30 10% | 34 -2% | 38 -14% |
* ... im mniej tym lepiej
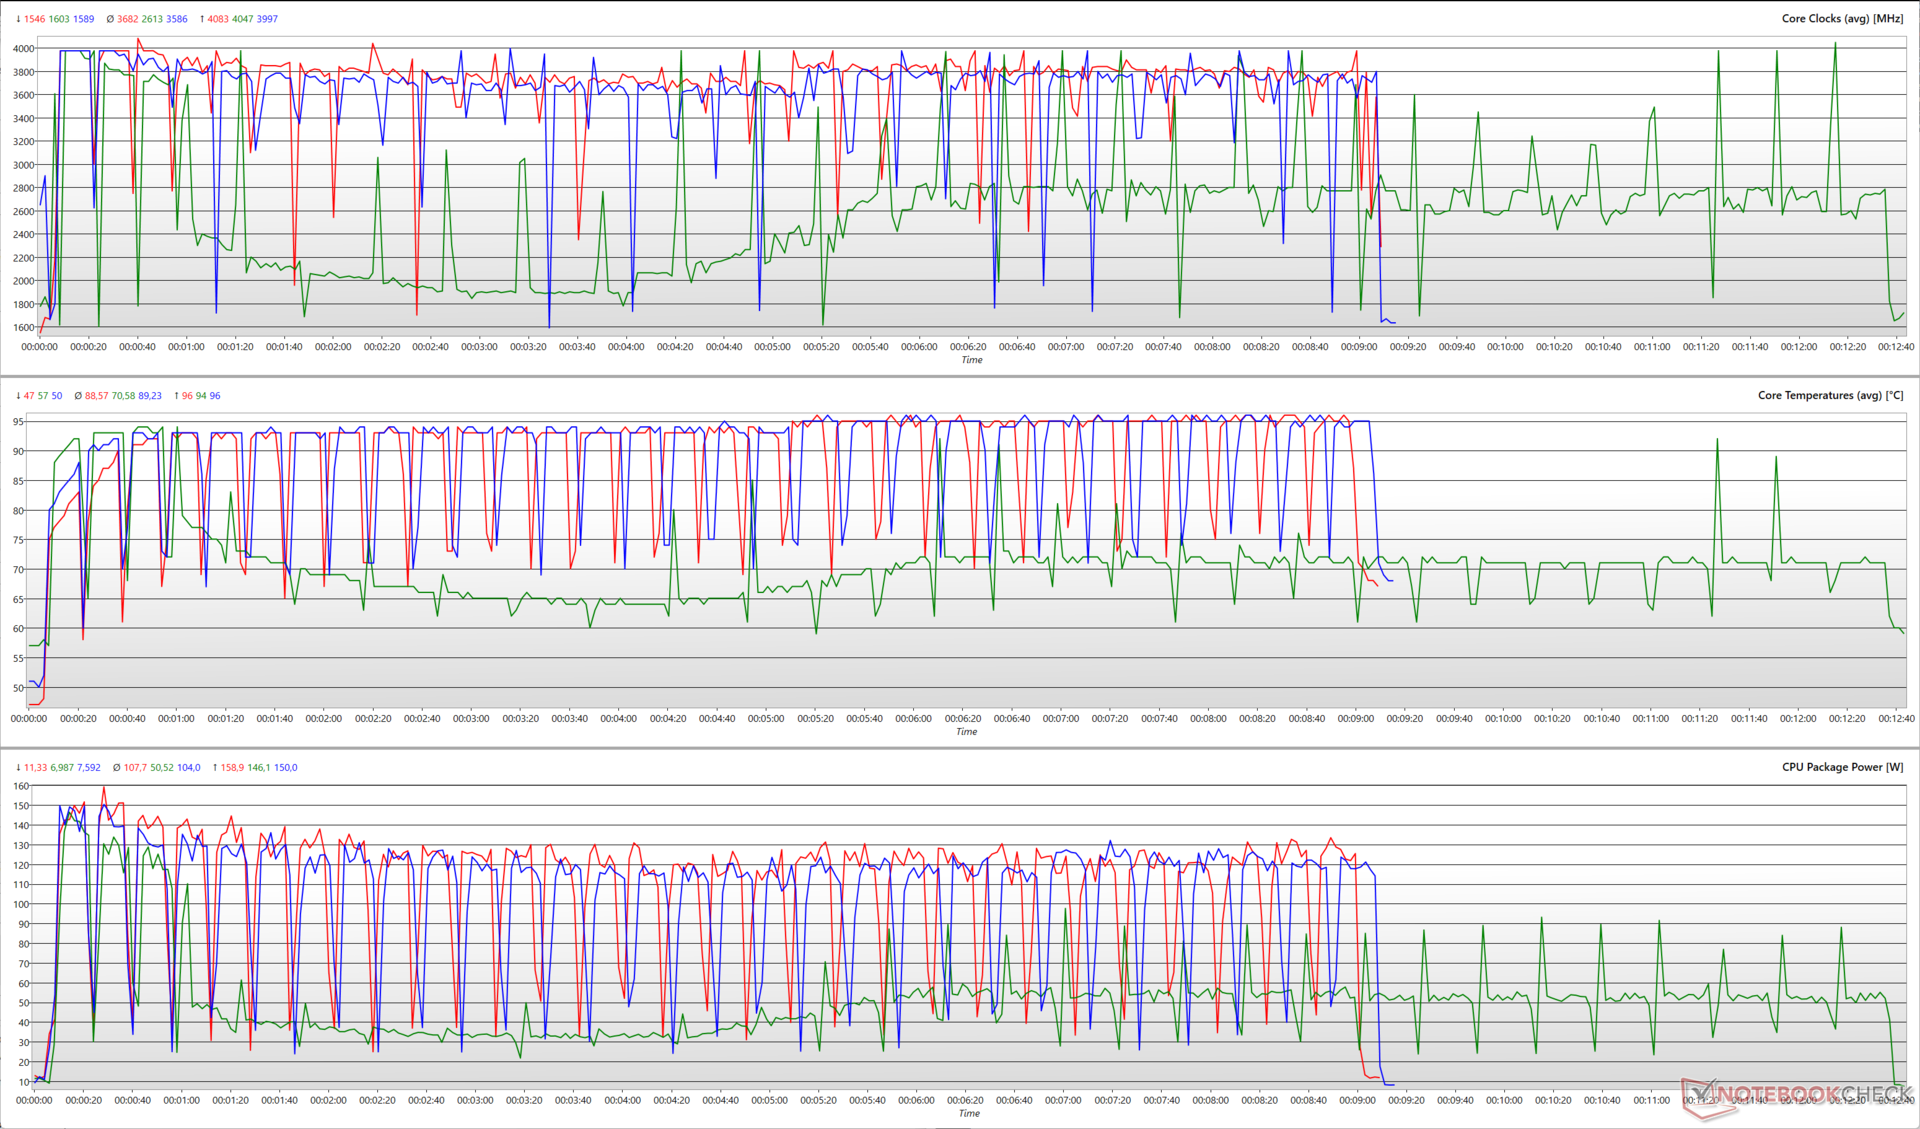
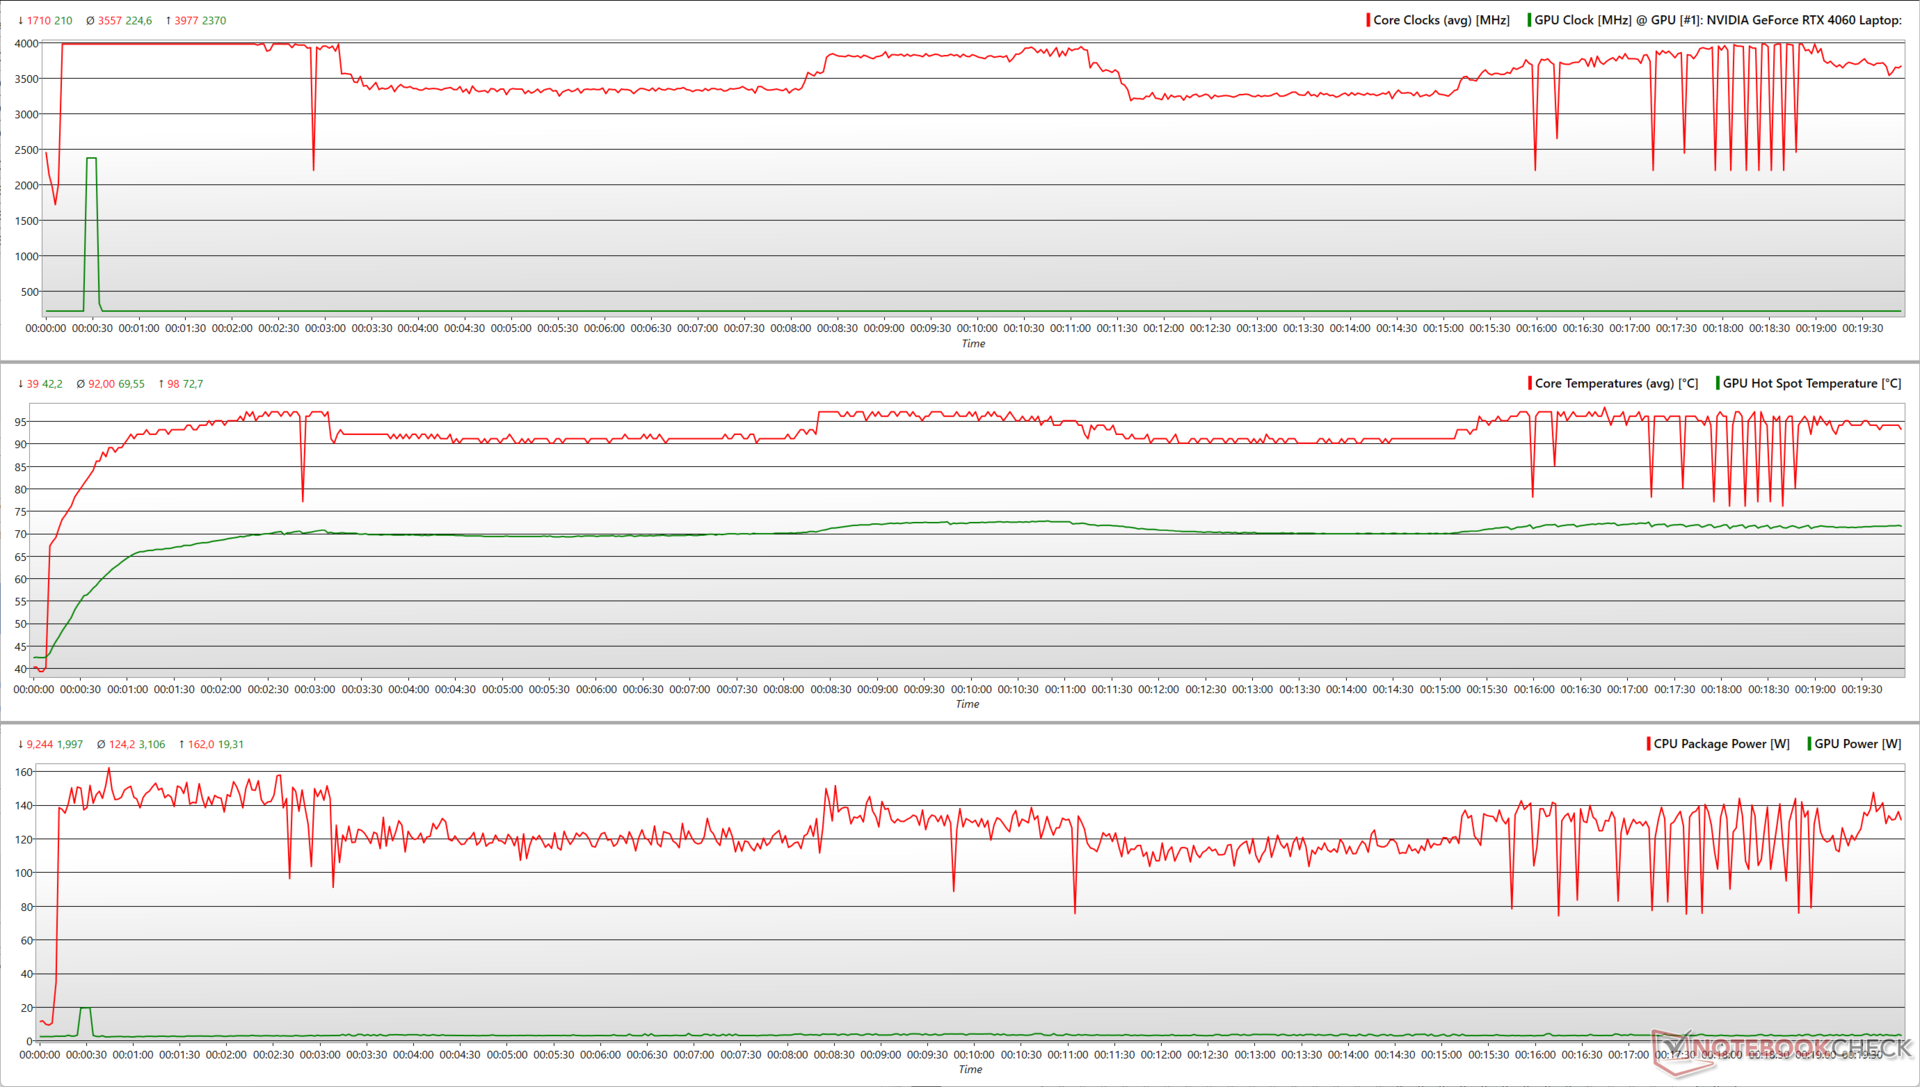
Test warunków skrajnych
Podczas testów obciążeniowych przy użyciu dużych FFT w Prime95, Core i7-13650HX osiąga szczytową moc pakietu 162 W i osiąga maksymalną częstotliwość doładowania prawie 4 GHz. Jednak tak wysoki pobór mocy i częstotliwość nie utrzymują się, a procesor osiąga średnią moc pakietu 124 W przez cały test warunków skrajnych.
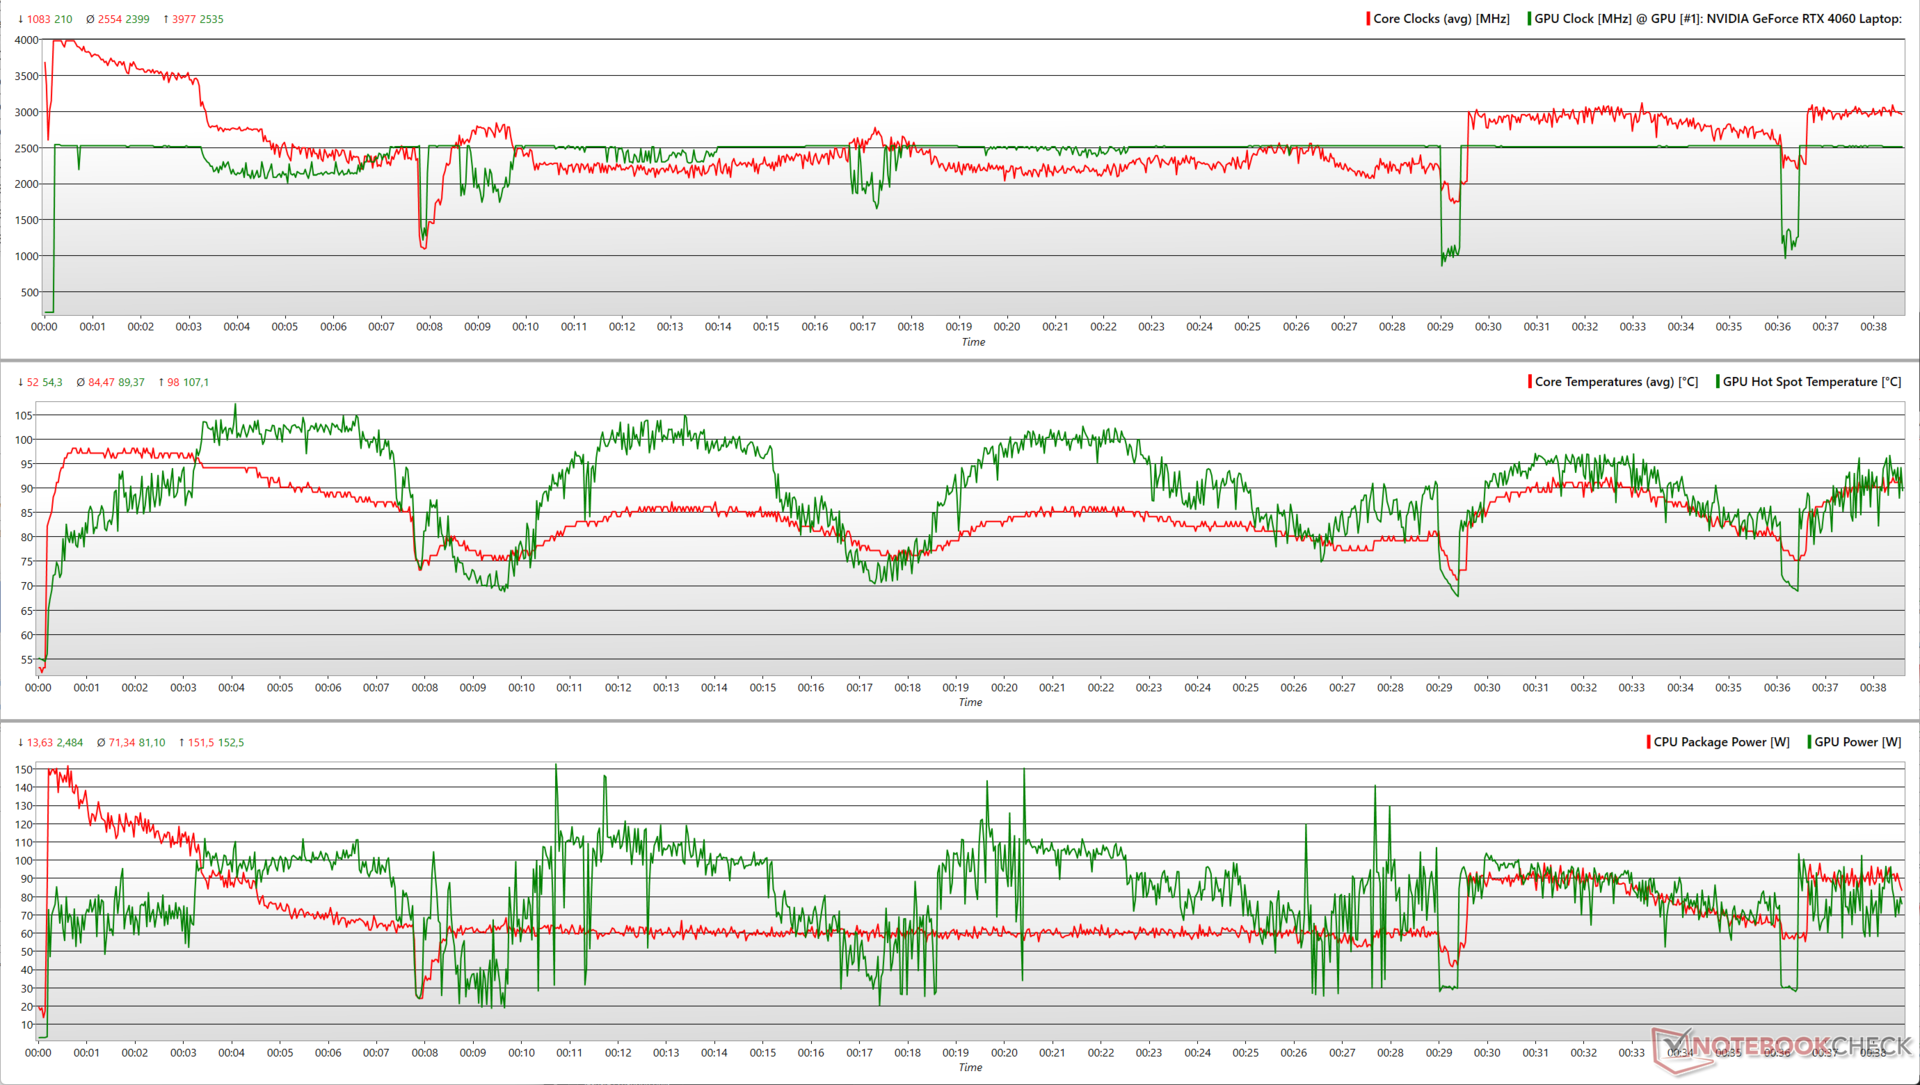
Po wprowadzeniu FurMark, GPU RTX 4060 osiąga szczytowy pobór mocy na poziomie 152,5 W przy częstotliwości taktowania 2535 MHz. Ostatecznie zarówno CPU, jak i GPU ustabilizowały się na średnim poborze mocy wynoszącym odpowiednio 71 W (taktowanie 2,5 GHz) i 81 W (taktowanie 2399 MHz).
| Test obciążeniowy | Taktowanie CPU (GHz) | Taktowanie GPU (MHz) | Średnia temperatura CPU (°C) | Średnia temperatura GPU (°C) |
| Bezczynność systemu | 1,6 | 210 | 39 | 36,3 |
| Prime95 | 3.7 | 210 | 92 | 61.3 |
| Prime95 + FurMark | 3.05 | 2,505 | 84.5 | 89.3 |
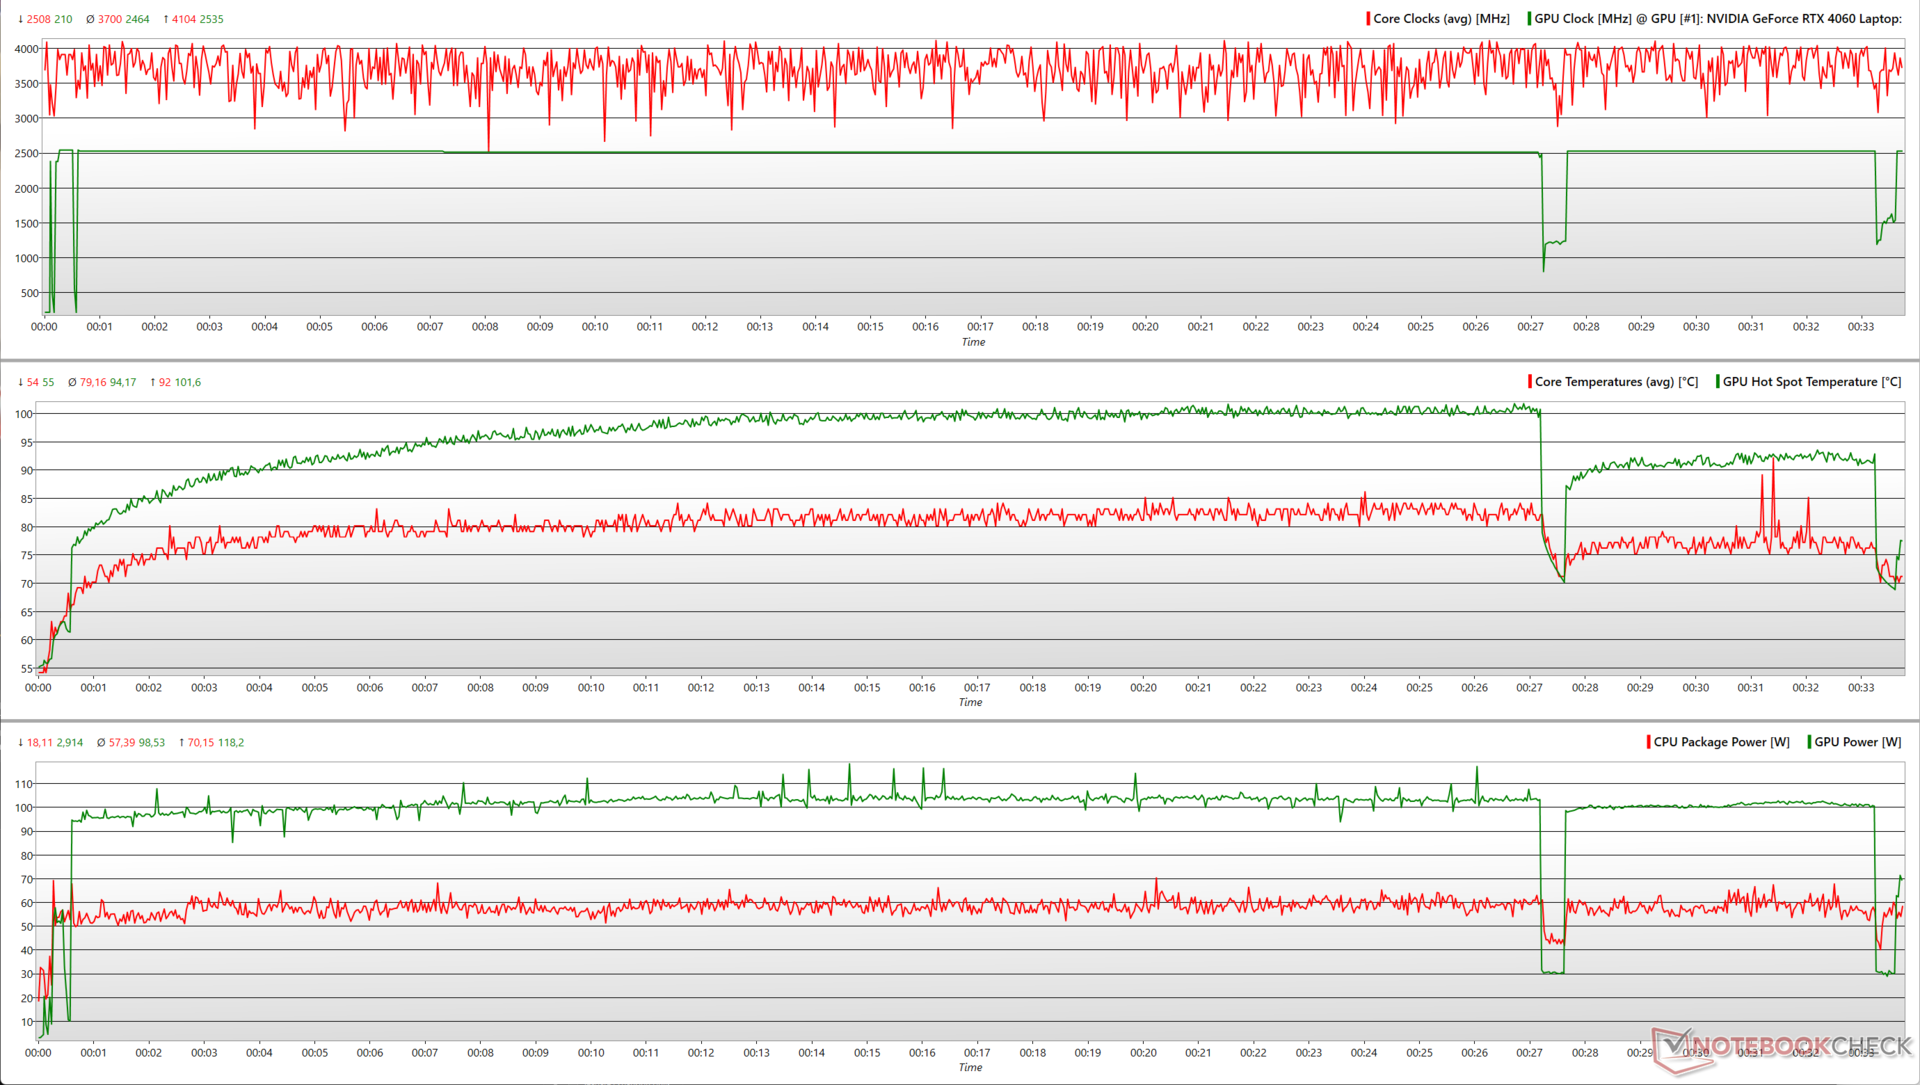
| The Witcher 3 1080p Ultra | 4 | 1,485 | 79 | 94 |
Procesor i karta graficzna wykazują bardziej przewidywalną reakcję podczas testów obciążeniowych z grą The Witcher 3 w rozdzielczości 1080p Ultra. Osiągają one szczytowe taktowania odpowiednio 4,1 GHz i 2535 MHz, przy czym CPU zużywa maksymalnie 70 W, a GPU maksymalnie 118 W. W okolicach 30. minuty testu następuje krótki spadek wskaźników CPU i GPU, ale szybko wracają one do pierwotnych prędkości zegara.
Głośniki
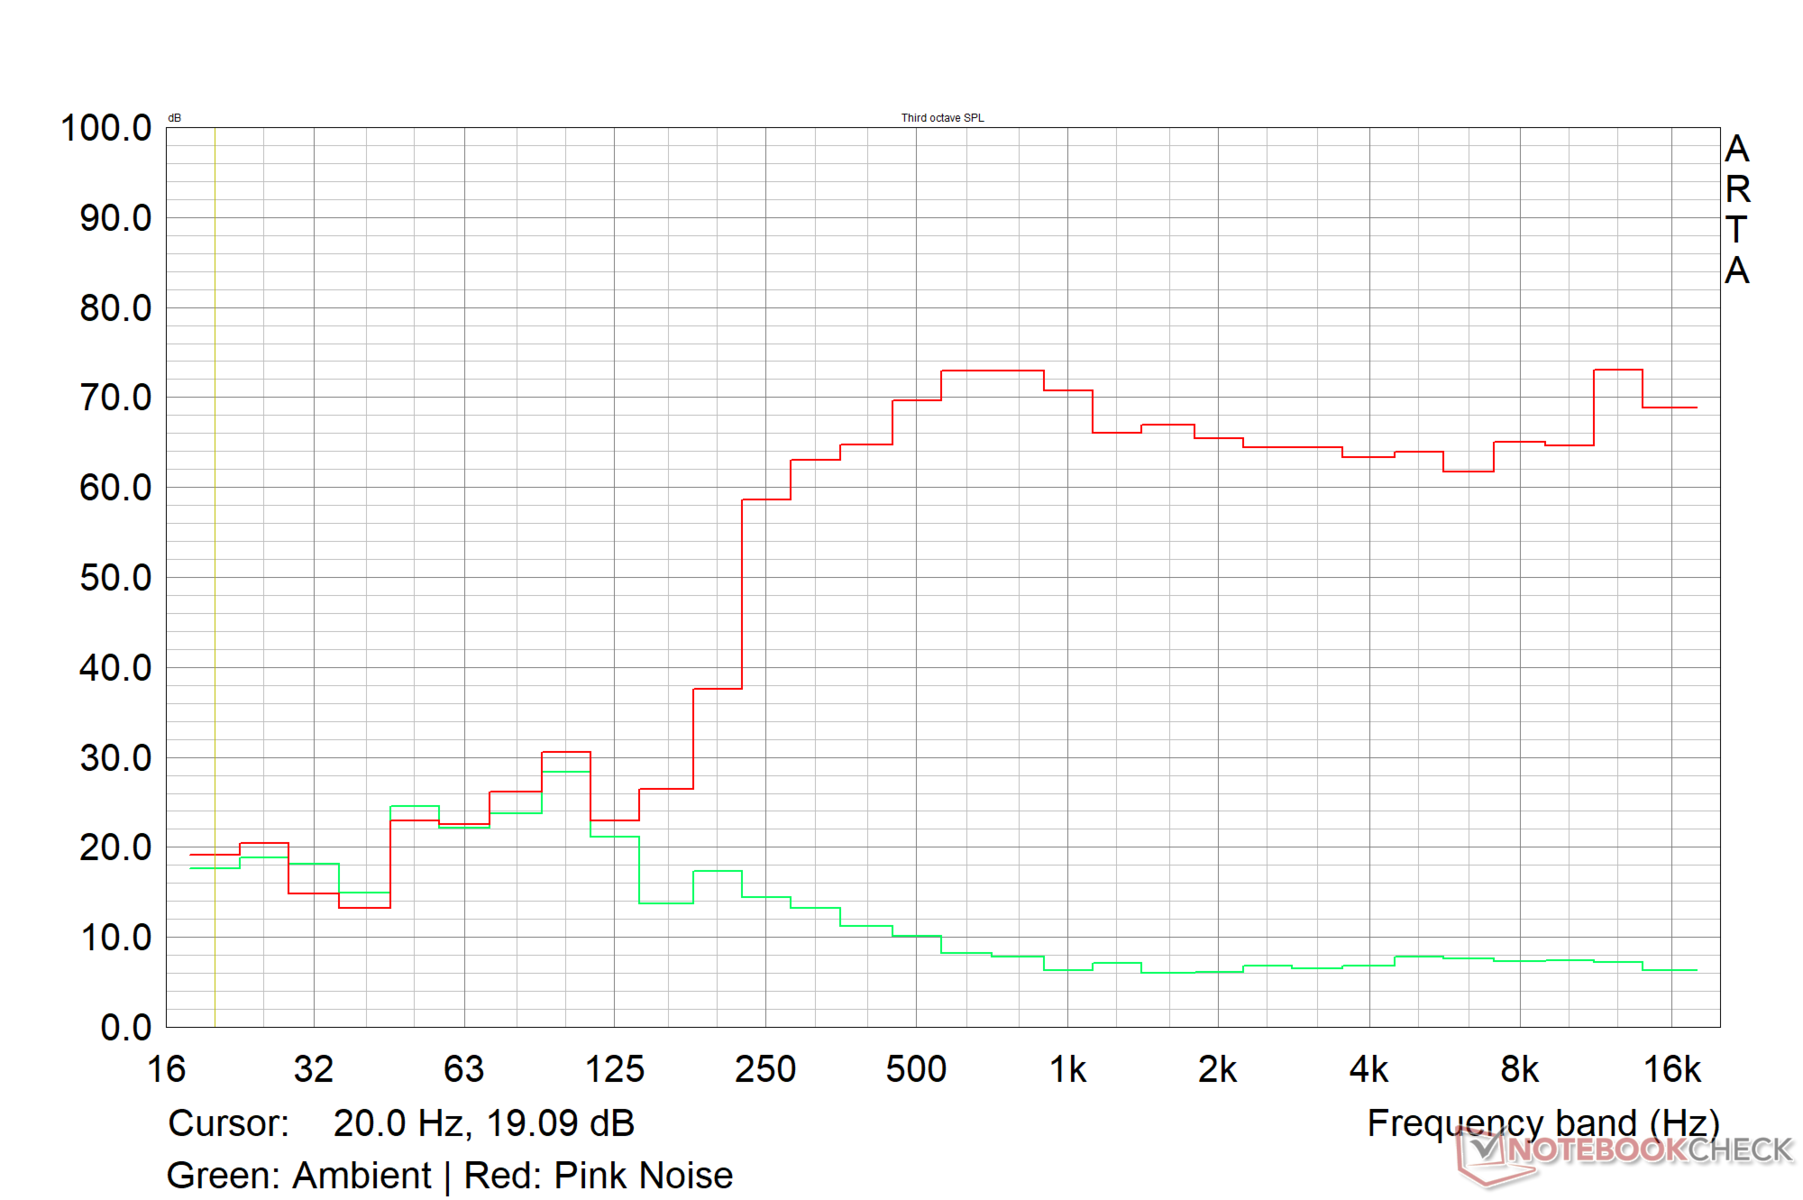
Głośniki G15 są dość głośne na poziomie 79,6 dB(A). Wydaje się jednak, że Dell mógł skuteczniej wykorzystać dużą obudowę, aby zapewnić mocniejsze basy. Z drugiej strony, średnie i wysokie tony są dobrze odtwarzane.
Jakość dźwięku jest zadowalająca, ale użytkownicy mogą uzyskać lepsze wrażenia dźwiękowe, podłączając zewnętrzne urządzenia audio przez gniazdo audio 3,5 mm lub przez Bluetooth.
Dell G15 5530 analiza dźwięku
(±) | głośność głośnika jest średnia, ale dobra (79.6 dB)
Bas 100 - 315 Hz
(-) | prawie brak basu - średnio 24.7% niższa od mediany
(-) | bas nie jest liniowy (15.2% delta do poprzedniej częstotliwości)
Średnie 400 - 2000 Hz
(+) | zbalansowane środki średnie - tylko 4.1% od mediany
(+) | średnie są liniowe (4.2% delta do poprzedniej częstotliwości)
Wysokie 2–16 kHz
(+) | zrównoważone maksima - tylko 0.8% od mediany
(+) | wzloty są liniowe (2.2% delta do poprzedniej częstotliwości)
Ogólnie 100 - 16.000 Hz
(±) | liniowość ogólnego dźwięku jest średnia (16.3% różnicy w stosunku do mediany)
W porównaniu do tej samej klasy
» 41% wszystkich testowanych urządzeń w tej klasie było lepszych, 6% podobnych, 53% gorszych
» Najlepszy miał deltę 6%, średnia wynosiła ###średnia###%, najgorsza wynosiła 132%
W porównaniu do wszystkich testowanych urządzeń
» 27% wszystkich testowanych urządzeń było lepszych, 6% podobnych, 68% gorszych
» Najlepszy miał deltę 4%, średnia wynosiła ###średnia###%, najgorsza wynosiła 134%
Apple MacBook Pro 16 2021 M1 Pro analiza dźwięku
(+) | głośniki mogą odtwarzać stosunkowo głośno (84.7 dB)
Bas 100 - 315 Hz
(+) | dobry bas - tylko 3.8% od mediany
(+) | bas jest liniowy (5.2% delta do poprzedniej częstotliwości)
Średnie 400 - 2000 Hz
(+) | zbalansowane środki średnie - tylko 1.3% od mediany
(+) | średnie są liniowe (2.1% delta do poprzedniej częstotliwości)
Wysokie 2–16 kHz
(+) | zrównoważone maksima - tylko 1.9% od mediany
(+) | wzloty są liniowe (2.7% delta do poprzedniej częstotliwości)
Ogólnie 100 - 16.000 Hz
(+) | ogólny dźwięk jest liniowy (4.6% różnicy w stosunku do mediany)
W porównaniu do tej samej klasy
» 0% wszystkich testowanych urządzeń w tej klasie było lepszych, 0% podobnych, 100% gorszych
» Najlepszy miał deltę 5%, średnia wynosiła ###średnia###%, najgorsza wynosiła 45%
W porównaniu do wszystkich testowanych urządzeń
» 0% wszystkich testowanych urządzeń było lepszych, 0% podobnych, 100% gorszych
» Najlepszy miał deltę 4%, średnia wynosiła ###średnia###%, najgorsza wynosiła 134%
Zarządzanie energią: Niezbyt oszczędny pod obciążeniem
Zużycie energii
Podczas gdy G15 5530 wykazuje dość efektywne zużycie energii w stanie spoczynku, zużywa więcej energii pod obciążeniem w porównaniu do ROG Strix G18 wyposażonego w RTX 4070.
The Lenovo Legion Pro 5 16wyposażony w procesor Core i7-13700HX i RTX 4060, pokazuje odwrócenie ról z nieco niższym zużyciem energii pod obciążeniem niż G15 5530, ale wyższym poborem mocy w stanie bezczynności.
Dostarczony w zestawie potężny zasilacz o mocy 330 W jest w stanie zapewnić G15 odpowiednie zasilanie nawet w stresie.
| wyłączony / stan wstrzymania | |
| luz | |
| obciążenie |
|
Legenda:
min: | |
| Dell G15 5530 i7-13650HX, GeForce RTX 4060 Laptop GPU, IPS, 1920x1080, 15.6" | Asus ROG Strix G18 G814JI i7-13650HX, GeForce RTX 4070 Laptop GPU, IPS, 2560x1600, 18" | Lenovo Legion Pro 5 16IRX8 i7-13700HX, GeForce RTX 4060 Laptop GPU, IPS, 2560x1600, 16" | Asus ROG Flow X16 GV601V i9-13900H, GeForce RTX 4060 Laptop GPU, IPS, 2560x1600, 16" | MSI Katana 17 B13VFK i7-13620H, GeForce RTX 4060 Laptop GPU, IPS LED, 1920x1080, 17.3" | Asus TUF Gaming A16 FA617XS R9 7940HS, Radeon RX 7600S, IPS, 1920x1200, 16" | Asus ROG Strix G17 G713PI R9 7945HX, GeForce RTX 4070 Laptop GPU, IPS, 2560x1440, 17.3" | Medion Erazer Major X20 i9-13900HX, GeForce RTX 4070 Laptop GPU, IPS, 2560x1600, 16" | Przeciętny NVIDIA GeForce RTX 4060 Laptop GPU | Średnia w klasie Gaming | |
|---|---|---|---|---|---|---|---|---|---|---|
| Power Consumption | -10% | -66% | 1% | 1% | 19% | -35% | -26% | -9% | -29% | |
| Idle Minimum * (Watt) | 8.4 | 8 5% | 24.5 -192% | 9.6 -14% | 12.2 -45% | 7 17% | 15 -79% | 12 -43% | 11.5 ? -37% | 13 ? -55% |
| Idle Average * (Watt) | 14.98 | 15 -0% | 29.2 -95% | 16 -7% | 14.9 1% | 10 33% | 20 -34% | 16 -7% | 16 ? -7% | 18.7 ? -25% |
| Idle Maximum * (Watt) | 15.56 | 26 -67% | 34.3 -120% | 16.9 -9% | 15.8 -2% | 15 4% | 29 -86% | 26 -67% | 20.3 ? -30% | 24.3 ? -56% |
| Load Average * (Watt) | 96.8 | 102 -5% | 98.7 -2% | 104 -7% | 85.22 12% | 86 11% | 121 -25% | 115 -19% | 92.9 ? 4% | 110.2 ? -14% |
| Witcher 3 ultra * (Watt) | 186 | 178.6 4% | 178.6 4% | 142 24% | 151.1 19% | 160.6 14% | 179.8 3% | 191.6 -3% | ||
| Load Maximum * (Watt) | 271.42 | 267 2% | 249.6 8% | 214 21% | 212.8 22% | 172 37% | 246 9% | 319 -18% | 210 ? 23% | 258 ? 5% |
* ... im mniej tym lepiej
Power Consumption: The Witcher 3 / Stress test
Power Consumption: External monitor
Żywotność baterii
G15 przełącza się na profil zasilania bateryjnego po odłączeniu od zasilania. Częstotliwość odświeżania nie zmniejsza się jednak automatycznie do 60 Hz.
Bateria o pojemności 86 Whr zapewnia przyzwoite czasy pracy, o ile laptop nie jest mocno obciążony. Na przykład, podczas odtwarzania wideo 1080p przy 150 nitach, bateria może wytrzymać prawie 7 godzin. Jednak podczas grania na tym samym poziomie jasności bateria wytrzymuje zaledwie godzinę.
| Dell G15 5530 Intel Core i7-13650HX, GeForce RTX 4060 Laptop GPU, 86 Wh | Asus ROG Strix G18 G814JI Intel Core i7-13650HX, GeForce RTX 4070 Laptop GPU, 90 Wh | Lenovo Legion Pro 5 16IRX8 Intel Core i7-13700HX, GeForce RTX 4060 Laptop GPU, 80 Wh | Asus ROG Flow X16 GV601V Intel Core i9-13900H, GeForce RTX 4060 Laptop GPU, 90 Wh | MSI Katana 17 B13VFK Intel Core i7-13620H, GeForce RTX 4060 Laptop GPU, 53.5 Wh | Asus TUF Gaming A16 FA617XS AMD Ryzen 9 7940HS, Radeon RX 7600S, 90 Wh | Asus ROG Strix G17 G713PI AMD Ryzen 9 7945HX, GeForce RTX 4070 Laptop GPU, 90 Wh | Medion Erazer Major X20 Intel Core i9-13900HX, GeForce RTX 4070 Laptop GPU, 62.3 Wh | Średnia w klasie Gaming | |
|---|---|---|---|---|---|---|---|---|---|
| Czasy pracy | 38% | -31% | 47% | -15% | 62% | -8% | 7% | 41% | |
| H.264 (h) | 6.8 | 8.9 31% | 12.4 82% | 2.8 -59% | 4.2 -38% | 8.64 ? 27% | |||
| WiFi v1.3 (h) | 6.5 | 8.1 25% | 3.4 -48% | 7.9 22% | 2.9 -55% | 12.4 91% | 4.3 -34% | 3.9 -40% | 7.11 ? 9% |
| Witcher 3 ultra (h) | 0.8 | 1.1 38% | |||||||
| Load (h) | 0.8 | 1.2 50% | 0.7 -13% | 1.5 88% | 1 25% | 0.9 13% | 1 25% | 1.6 100% | 1.502 ? 88% |
| Reader / Idle (h) | 11.7 | 6.7 | 20.3 | 5.8 | 8.71 ? |
Za
Przeciw
Werdykt: stara się zrobić to dobrze bez rozbijania banku
Odświeżony Dell G15 5530 wnosi moc desktopowej klasy Intel Raptor Lake-HX do ciężkiej, ale modnej obudowy uzupełnionej o nieporęczny zasilacz.
G15 5530 ma wiele zalet. Otrzymujesz dobrą przepustowość Wi-Fi i szybki panel IPS 1080p z przyzwoitym odwzorowaniem kolorów. Konserwacja i aktualizacje są łatwe, pod warunkiem, że nie przeszkadza ci niekonwencjonalne gniazdo M.2 2242 SSD.
Jeśli chodzi o wydajność, połączenie procesora Core i7-13650HX i 140 W karty graficznej Nvidia GeForce RTX 4060 Laptop zapewnia wysoką wydajność w grach 1080p Ultra, z potencjałem do wyższych rozdzielczości przy użyciu DLSS lub FSR. W przeważającej części, G15 5530 wypada równie dobrze, coLenovo Legion Pro 5 16 z procesorem Core i7-13700HX.
Dell G15 5530 zapewnia wysoką wydajność, łatwe aktualizacje i jest niedrogą alternatywą dla swoich braci Alienware, o ile można przeoczyć jego masę i żyć z niektórymi kompromisami."
Istnieje jednak kilka nieuniknionych kompromisów, których trzeba dokonać. Rozmieszczenie portów nie jest zbyt idealne, pamięć masowa jest powolna, nie ma zasilania USB, a kamera internetowa rozczarowuje jak na urządzenie z 2023 roku. Temperatury powierzchni i zużycie energii pod obciążeniem są również wyższe dla tej konfiguracji. Nawet Asus ROG Strix G17 z AMD Ryzen 9 7945HX i RTX 4070 zużywa mniej energii pod obciążeniem.
Podsumowując, Dell G15 5530 stara się jak najlepiej zrównoważyć moc i cenę, i zdecydowanie zasługuje na uwagę, jeśli szukasz laptopa do gier w okolicach 1,50,000 ₹ (1400 USD).
Cena i dostępność
Dell G15 5530 można skonfigurować i zakupić bezpośrednio w sklepach internetowych Dell India i sklepach internetowych Dell US. G15 5530 z RTX 4060 jest również wymieniony na Amazon US.
Amazon India ma wersję RTX 4050 o nieznanej dostępności. Dell G15 5530 z Core i7-13650HX, RTX 4050 i dyskiem SSD 1 TB można kupić w Best Buy za 1150 USD.
Dell G15 5530
- 25/06/2023 v7 (old)
Vaidyanathan Subramaniam
Przezroczystość
Wyboru urządzeń do recenzji dokonuje nasza redakcja. Próbka testowa została udostępniona autorowi jako pożyczka od producenta lub sprzedawcy detalicznego na potrzeby tej recenzji. Pożyczkodawca nie miał wpływu na tę recenzję, producent nie otrzymał też kopii tej recenzji przed publikacją. Nie było obowiązku publikowania tej recenzji. Jako niezależna firma medialna, Notebookcheck nie podlega władzy producentów, sprzedawców detalicznych ani wydawców.
Tak testuje Notebookcheck
Każdego roku Notebookcheck niezależnie sprawdza setki laptopów i smartfonów, stosując standardowe procedury, aby zapewnić porównywalność wszystkich wyników. Od około 20 lat stale rozwijamy nasze metody badawcze, ustanawiając przy tym standardy branżowe. W naszych laboratoriach testowych doświadczeni technicy i redaktorzy korzystają z wysokiej jakości sprzętu pomiarowego. Testy te obejmują wieloetapowy proces walidacji. Nasz kompleksowy system ocen opiera się na setkach uzasadnionych pomiarów i benchmarków, co pozwala zachować obiektywizm.Price comparison

