Recenzja stacji roboczej Lenovo ThinkPad P16 G1 RTX A5500: Szybsza niż Dell Precision 7670
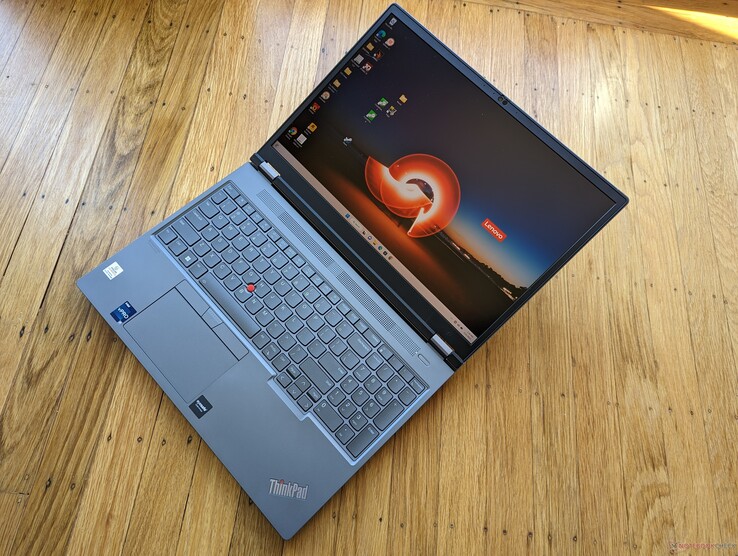
ThinkPad P16 G1 to nowa generacja 16-calowych stacji roboczych ThinkPad zaprojektowana, aby przewyższyć istniejącą 16-calową serię ThinkPad P1. Przenosi jedne z najszybszych obecnie dostępnych mobilnych procesorów i procesorów graficznych dla stacji roboczych, odpowiednio do Core i9-12950HX i RTX A5500, aby być jedną z najszybszych mobilnych stacji roboczych na rynku. Nasz egzemplarz w konfiguracji sprzedaje się za około 9000 USD. Oczywiście dostępne są również tańsze SKU z wolniejszą zintegrowaną grafiką UHD lub Intel ARC Pro A30M, których ceny początkowe wynoszą zamiast tego 3400 USD.
Model ten konkuruje bezpośrednio z innymi mobilnymi stacjami roboczymi klasy high-end i niektórymi laptopami z Nvidia Studio, takimi jak Dell Precision 7670, Asus ProArt StudioBook Pro 16, MSI CreatorPro Z16P, czy HP ZBook Studio 16 G9. Zobacz naszą pełną recenzję na temat konfiguracji ThinkPad P16 G1 RTX A2000, aby dowiedzieć się więcej o obudowie i innych cechach fizycznych tego modelu. W tej recenzji skupimy się na tym, czego użytkownicy mogą oczekiwać od ThinkPada P16 G1 pod względem wydajności w przypadku konfiguracji z opcjami procesora i karty graficznej z najwyższej półki.
Więcej recenzji Lenovo:
Potencjalni konkurenci w porównaniu
Ocena | Data | Model | Waga | Wysokość | Rozmiar | Rezolucja | Cena |
|---|---|---|---|---|---|---|---|
| 91 % v7 (old) | 02/2023 | Lenovo ThinkPad P16 G1 RTX A5500 i9-12950HX, RTX A5500 Laptop GPU | 3 kg | 30.23 mm | 16.00" | 3840x2400 | |
v (old) | Asus ProArt StudioBook 16 W7600H5A-2BL2 W-11955M, RTX A5000 Laptop GPU | 2.4 kg | 21.4 mm | 16.00" | 3840x2400 | ||
| 89.1 % v7 (old) | 12/2022 | Dell Precision 7000 7670 Performance i9-12950HX, RTX A5500 Laptop GPU | 2.8 kg | 25.95 mm | 16.00" | 3840x2400 | |
| 88.2 % v7 (old) | 02/2023 | Lenovo ThinkPad P16 G1 21D6001DMB i7-12850HX, RTX A2000 Laptop GPU | 3 kg | 30.23 mm | 16.00" | 2560x1600 | |
| 84.3 % v7 (old) | 11/2022 | MSI CreatorPro Z16P B12UKST i7-12700H, RTX A3000 Laptop GPU | 2.4 kg | 19 mm | 16.00" | 2560x1600 | |
| 90.1 % v7 (old) | 11/2022 | HP ZBook Studio 16 G9 62U04EA i7-12800H, RTX A2000 Laptop GPU | 1.8 kg | 19 mm | 16.00" | 3840x2400 |
Sprawa
Czytnik kart SD
Zintegrowany czytnik kart oferuje zaledwie przeciętne prędkości transferu. Przeniesienie 1 GB zdjęć z naszej testowej karty UHS-II na pulpit zajmuje około 14 sekund w porównaniu z mniej niż połową tego czasu w przypadku Precision 7670. Jak na wysokiej klasy mobilną stację roboczą, taką jak nasz ThinkPad P1, oczekiwaliśmy nieco więcej.
| SD Card Reader | |
| average JPG Copy Test (av. of 3 runs) | |
| Dell Precision 7000 7670 Performance (Toshiba Exceria Pro SDXC 64 GB UHS-II) | |
| MSI CreatorPro Z16P B12UKST (AV Pro V60) | |
| Lenovo ThinkPad P16 G1 RTX A5500 (Toshiba Exceria Pro SDXC 64 GB UHS-II) | |
| HP ZBook Studio 16 G9 62U04EA (Angelbird AV PRO V60) | |
| Asus ProArt StudioBook 16 W7600H5A-2BL2 (AV Pro SD microSD 128 GB V60) | |
| Lenovo ThinkPad P16 G1 21D6001DMB (AV Pro V60) | |
| maximum AS SSD Seq Read Test (1GB) | |
| Dell Precision 7000 7670 Performance (Toshiba Exceria Pro SDXC 64 GB UHS-II) | |
| Asus ProArt StudioBook 16 W7600H5A-2BL2 (AV Pro SD microSD 128 GB V60) | |
| MSI CreatorPro Z16P B12UKST (AV Pro V60) | |
| Lenovo ThinkPad P16 G1 RTX A5500 (Toshiba Exceria Pro SDXC 64 GB UHS-II) | |
| HP ZBook Studio 16 G9 62U04EA (Angelbird AV PRO V60) | |
| Lenovo ThinkPad P16 G1 21D6001DMB (AV Pro V60) | |
Komunikacja
| Networking | |
| iperf3 transmit AX12 | |
| Asus ProArt StudioBook 16 W7600H5A-2BL2 | |
| iperf3 receive AX12 | |
| Asus ProArt StudioBook 16 W7600H5A-2BL2 | |
| iperf3 receive AXE11000 6GHz | |
| MSI CreatorPro Z16P B12UKST | |
| HP ZBook Studio 16 G9 62U04EA | |
| Dell Precision 7000 7670 Performance | |
| Lenovo ThinkPad P16 G1 RTX A5500 | |
| iperf3 receive AXE11000 | |
| Lenovo ThinkPad P16 G1 21D6001DMB | |
| Lenovo ThinkPad P16 G1 RTX A5500 | |
| Dell Precision 7000 7670 Performance | |
| iperf3 transmit AXE11000 | |
| Lenovo ThinkPad P16 G1 RTX A5500 | |
| Lenovo ThinkPad P16 G1 21D6001DMB | |
| Dell Precision 7000 7670 Performance | |
| iperf3 transmit AXE11000 6GHz | |
| MSI CreatorPro Z16P B12UKST | |
| HP ZBook Studio 16 G9 62U04EA | |
| Lenovo ThinkPad P16 G1 RTX A5500 | |
| Dell Precision 7000 7670 Performance | |
Kamera internetowa


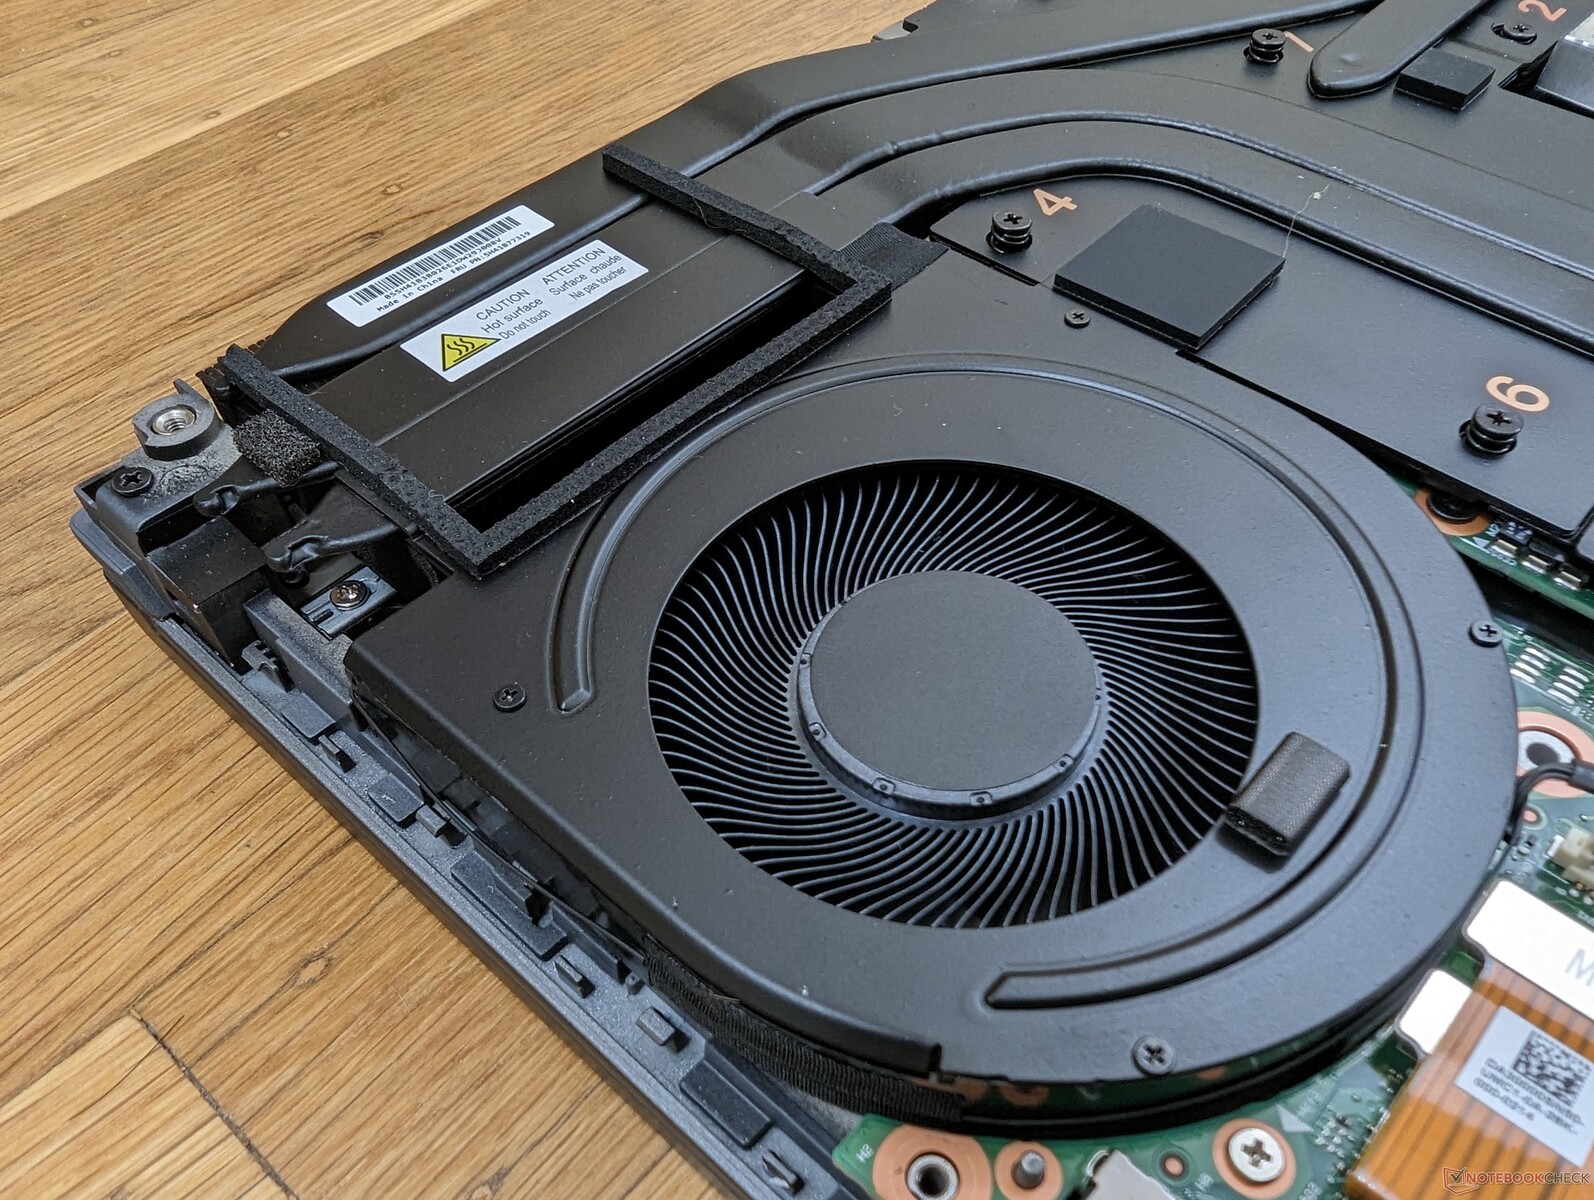
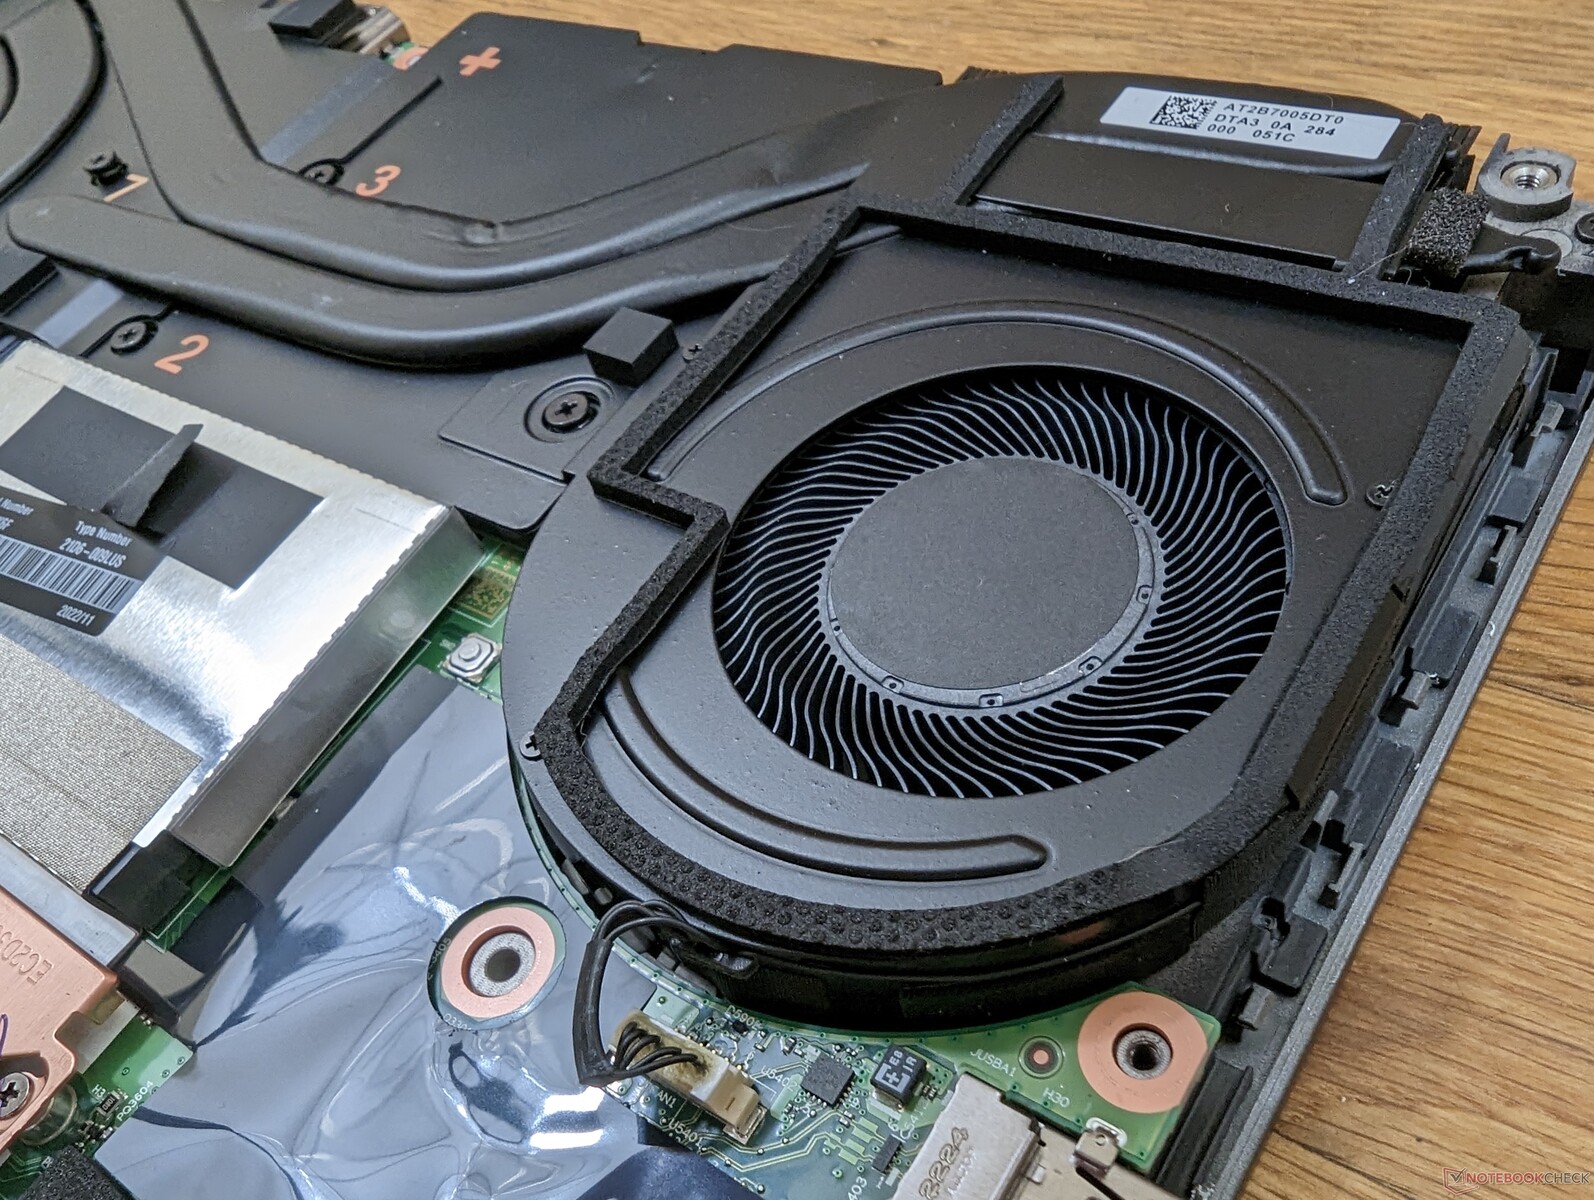
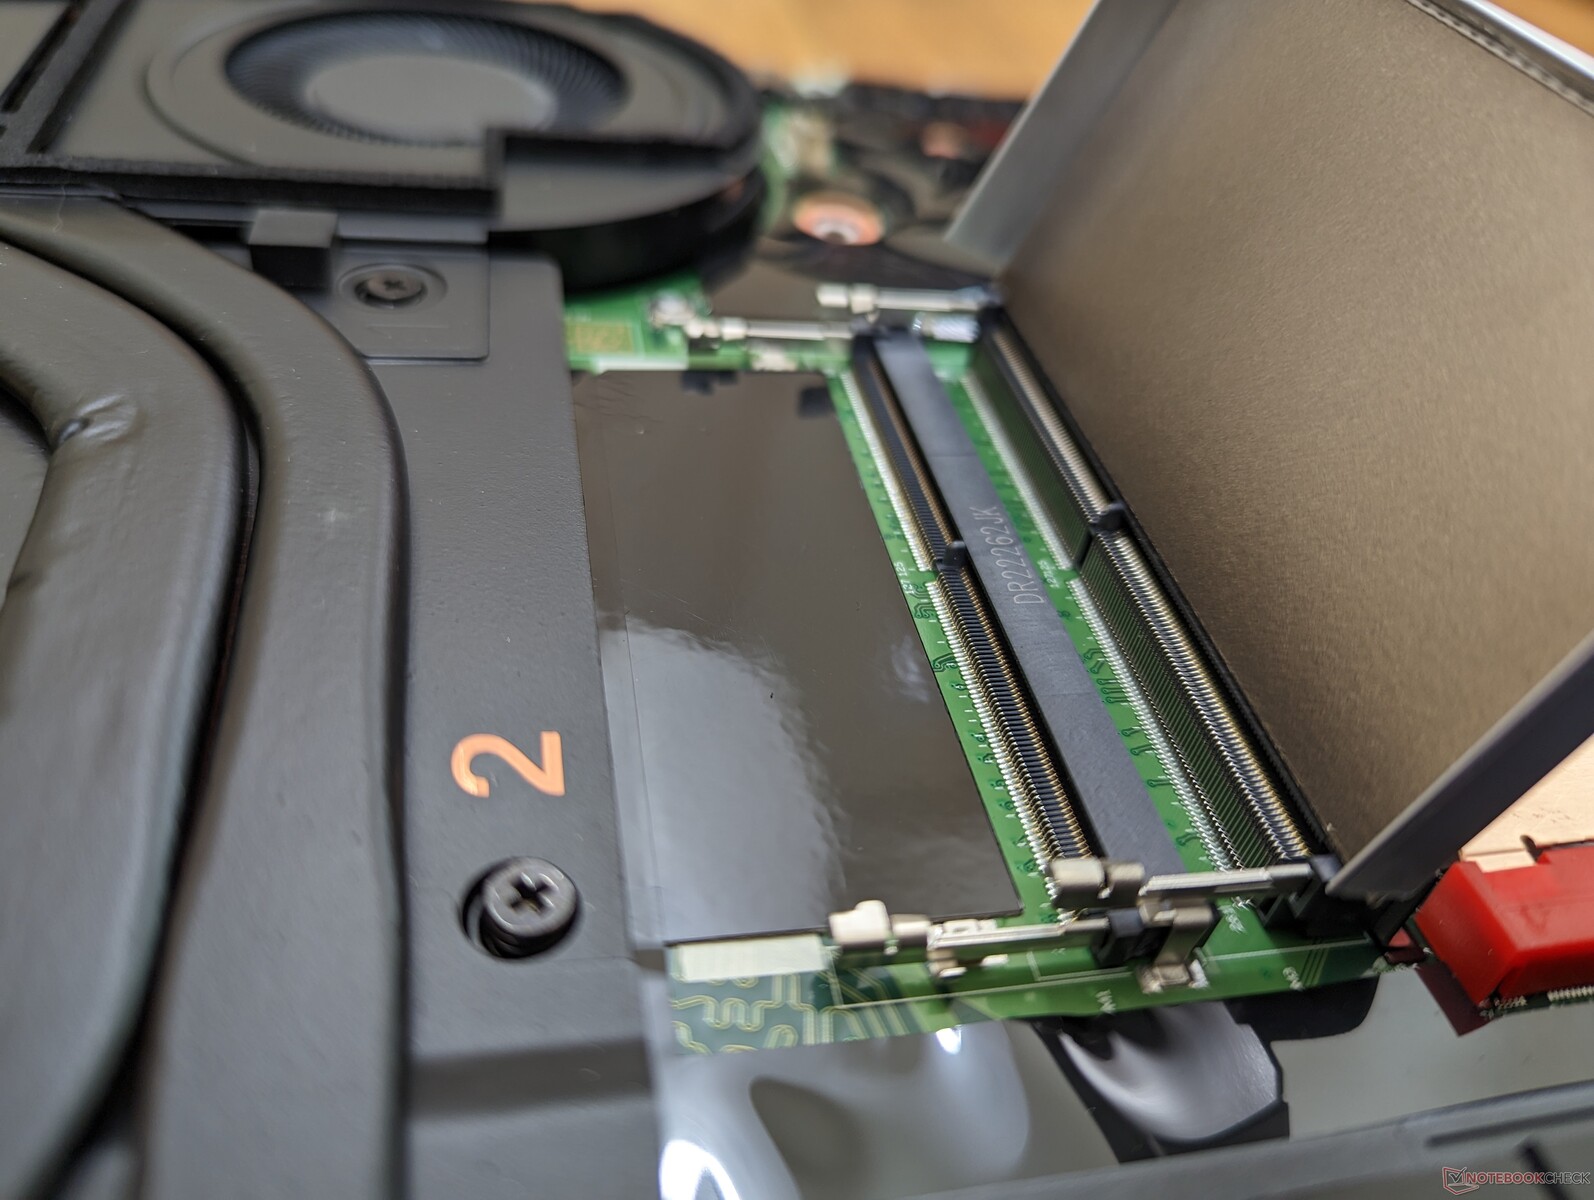
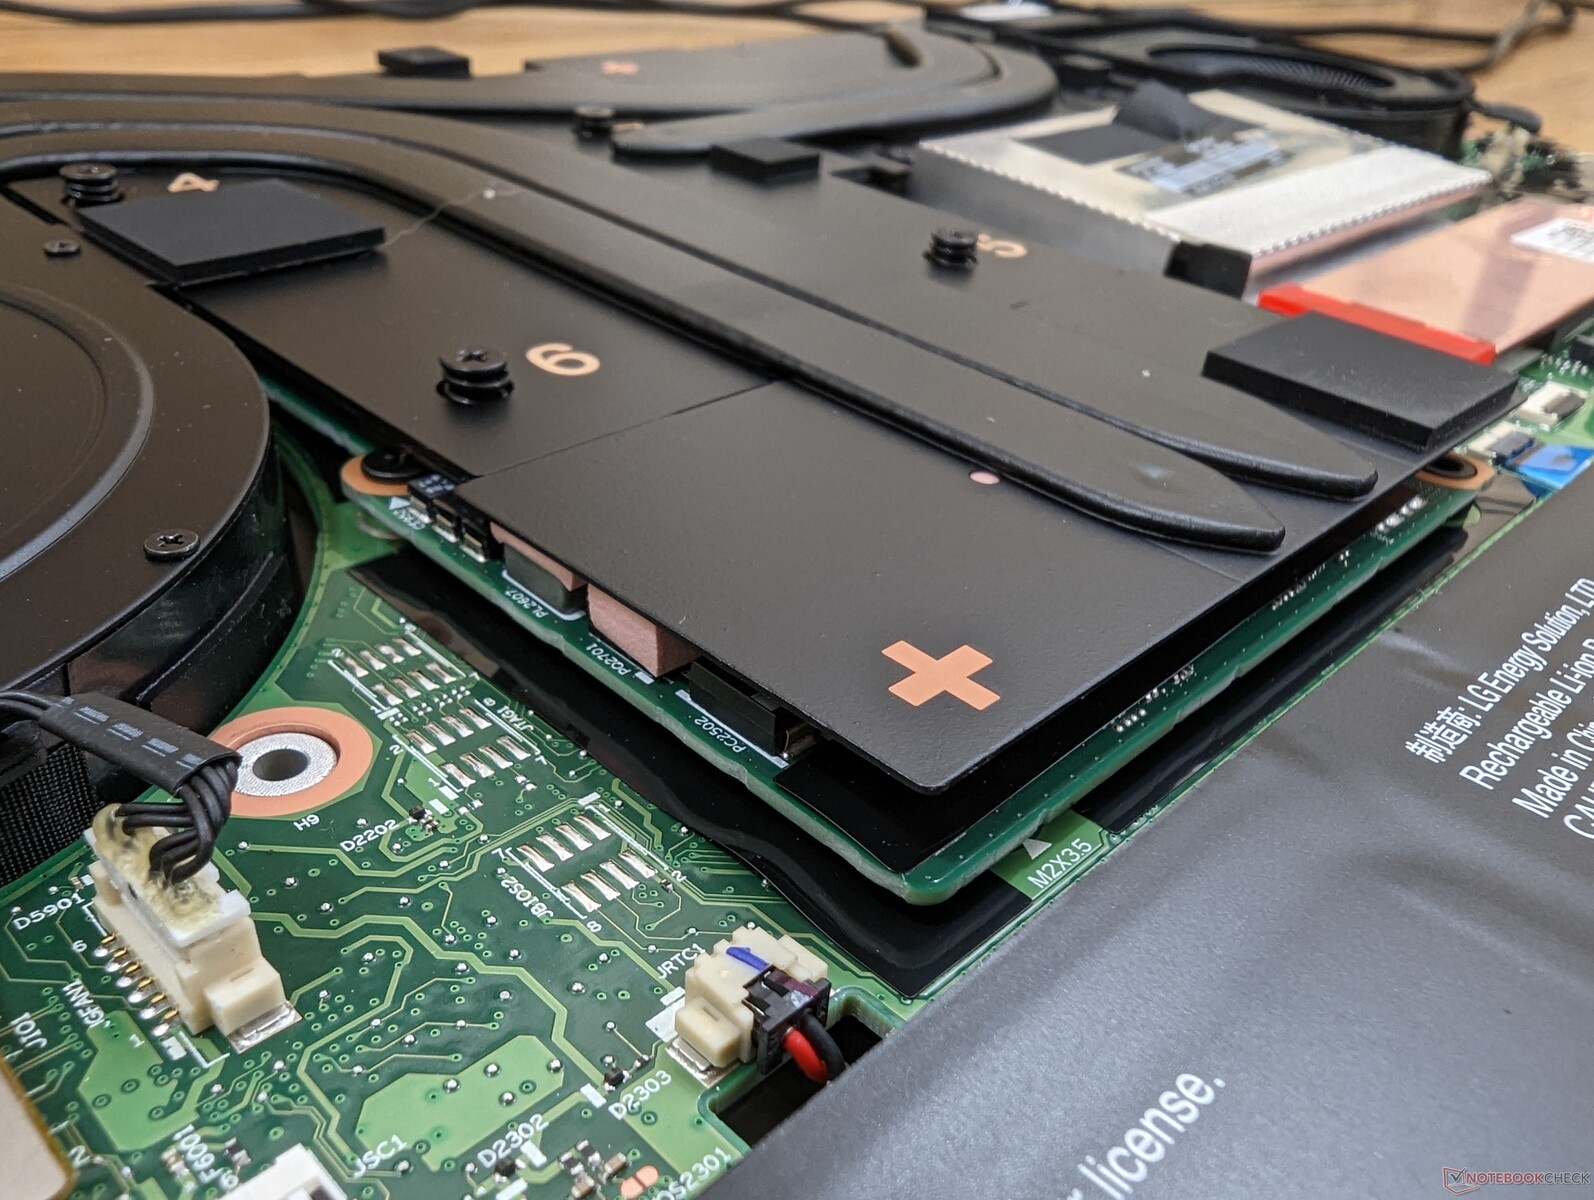
Konserwacja
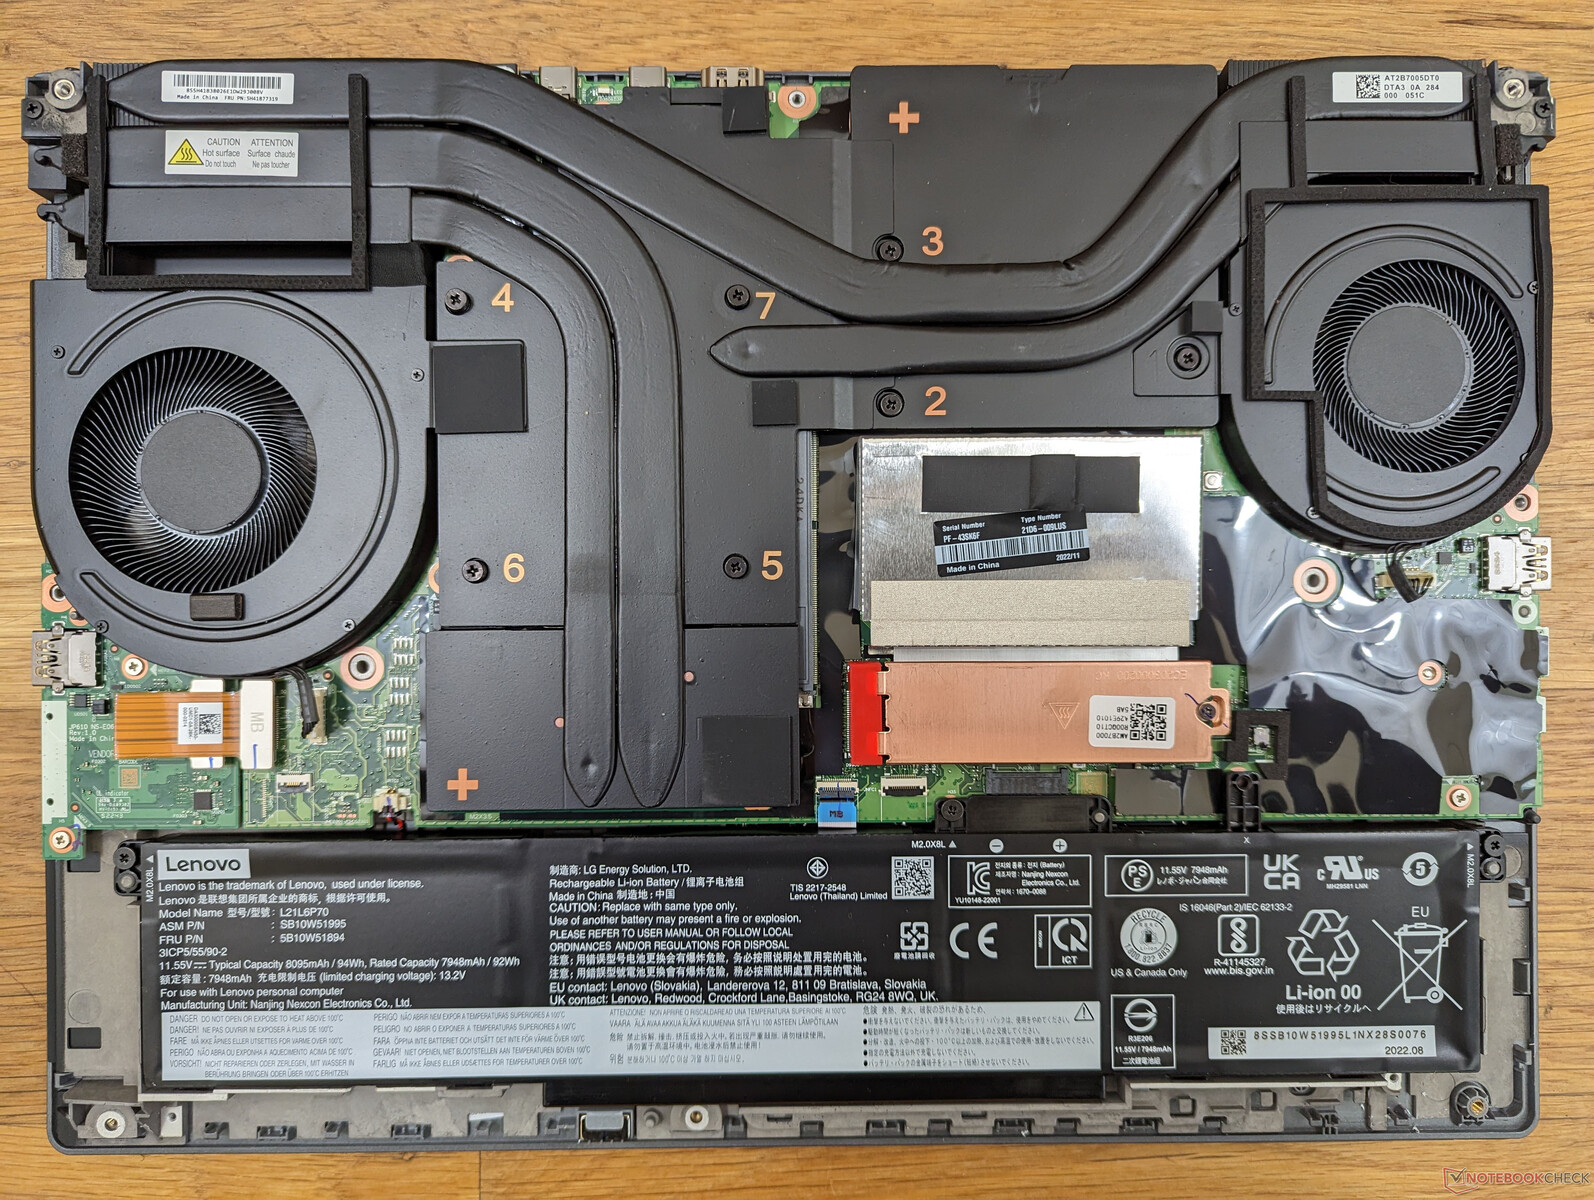
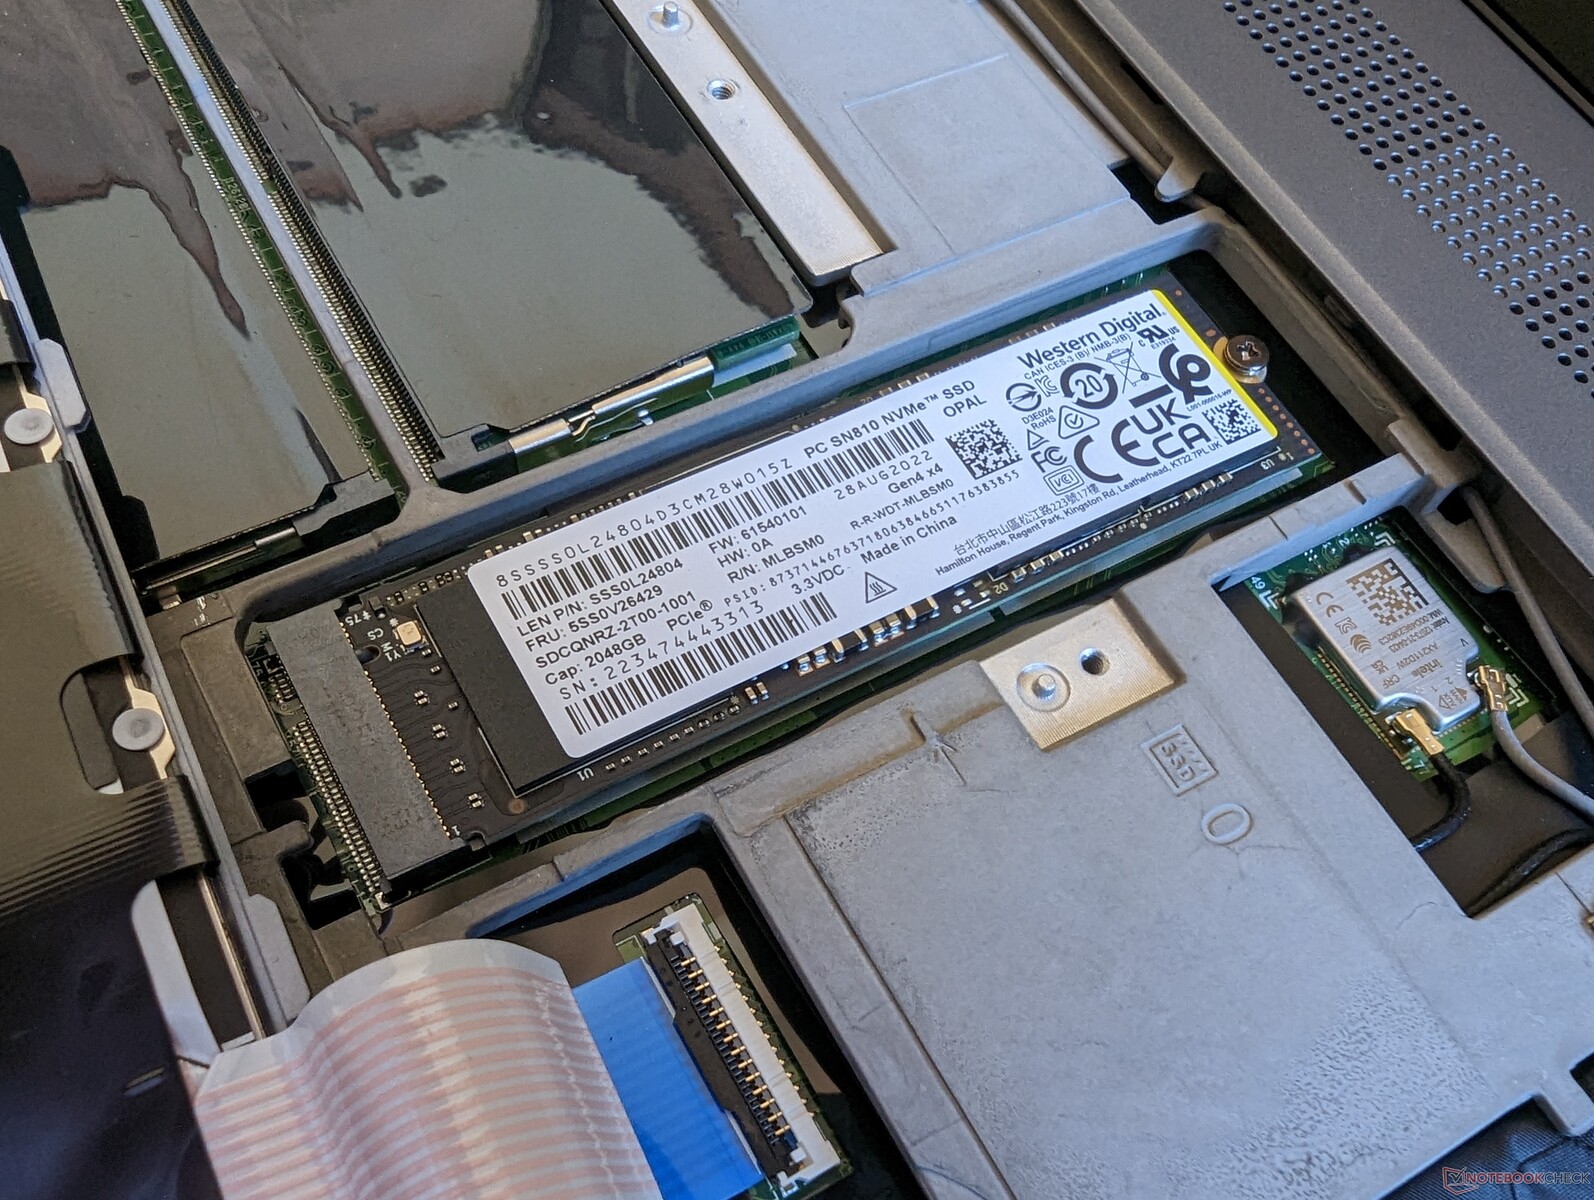
Dolny panel jest zabezpieczony 12 śrubkami Philipsa. Aby uzyskać dostęp do modułu WAN, podstawowego gniazda M.2 SSD oraz dwóch z czterech gniazd SODIMM, należy zdjąć klawiaturę. Lenovo posiada oficjalny podręcznik konserwacji https://download.lenovo.com/pccbbs/mobiles_pdf/p16_gen1_hmm_en.pdf dla użytkowników końcowych.
Co ciekawe, ThinkPad P16 G1 jest jednym z niewielu laptopów dostarczanych z wymiennym procesorem graficznym. Wymienianie karty graficznej w laptopie nie jest zazwyczaj zalecane, chyba że w celach serwisowych lub wymiany.
Akcesoria i gwarancja
W pudełku nie ma żadnych dodatków poza zasilaczem sieciowym i dokumentacją.
Obowiązuje roczna ograniczona gwarancja, podczas gdy Dell Precision 7670 ma w standardzie trzy lata. W razie potrzeby Lenovo oferuje jednak serwis na miejscu podczas rocznego okresu gwarancji.
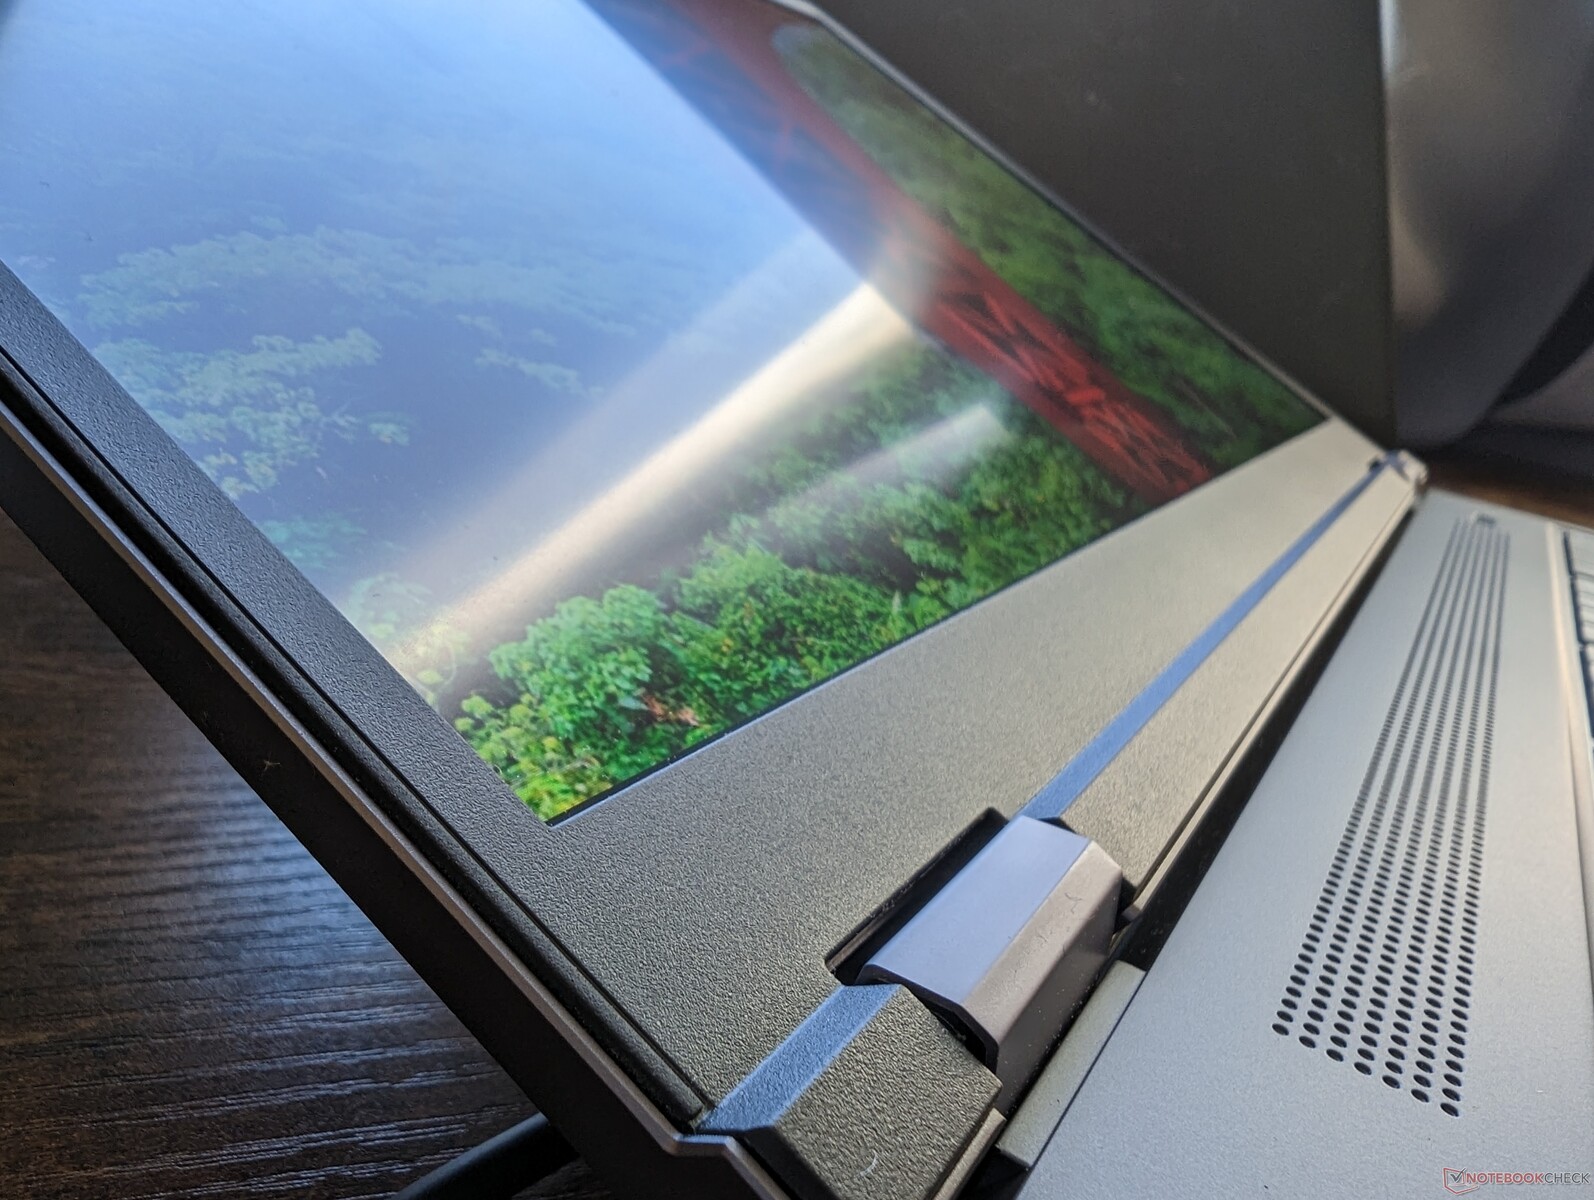
Wyświetl
Lenovo oferuje cztery różne opcje wyświetlaczy 60 Hz, z których wszystkie są skalibrowane fabrycznie Pantone z przyciemnianiem DC. Nasze pomiary poniżej odzwierciedlają tylko pogrubioną opcję, podczas gdy nasz drugi egzemplarz z GPU RTX A2000 jest wyposażony w opcję 1600p.
- 1920 x 1200, bez dotyku, IPS, 300 nitów, matowy, 100% sRGB
- 2560 x 1600, bez dotyku, IPS, 400 nitów, matowy, 100% sRGB
- 3840 x 2400, bezdotykowy, IPS, 600 nitów, matowy, 100% AdobeRGB
- 3840 x 2400, dotyk, OLED, 400 nitów, błyszczący, 100% DCI-P3
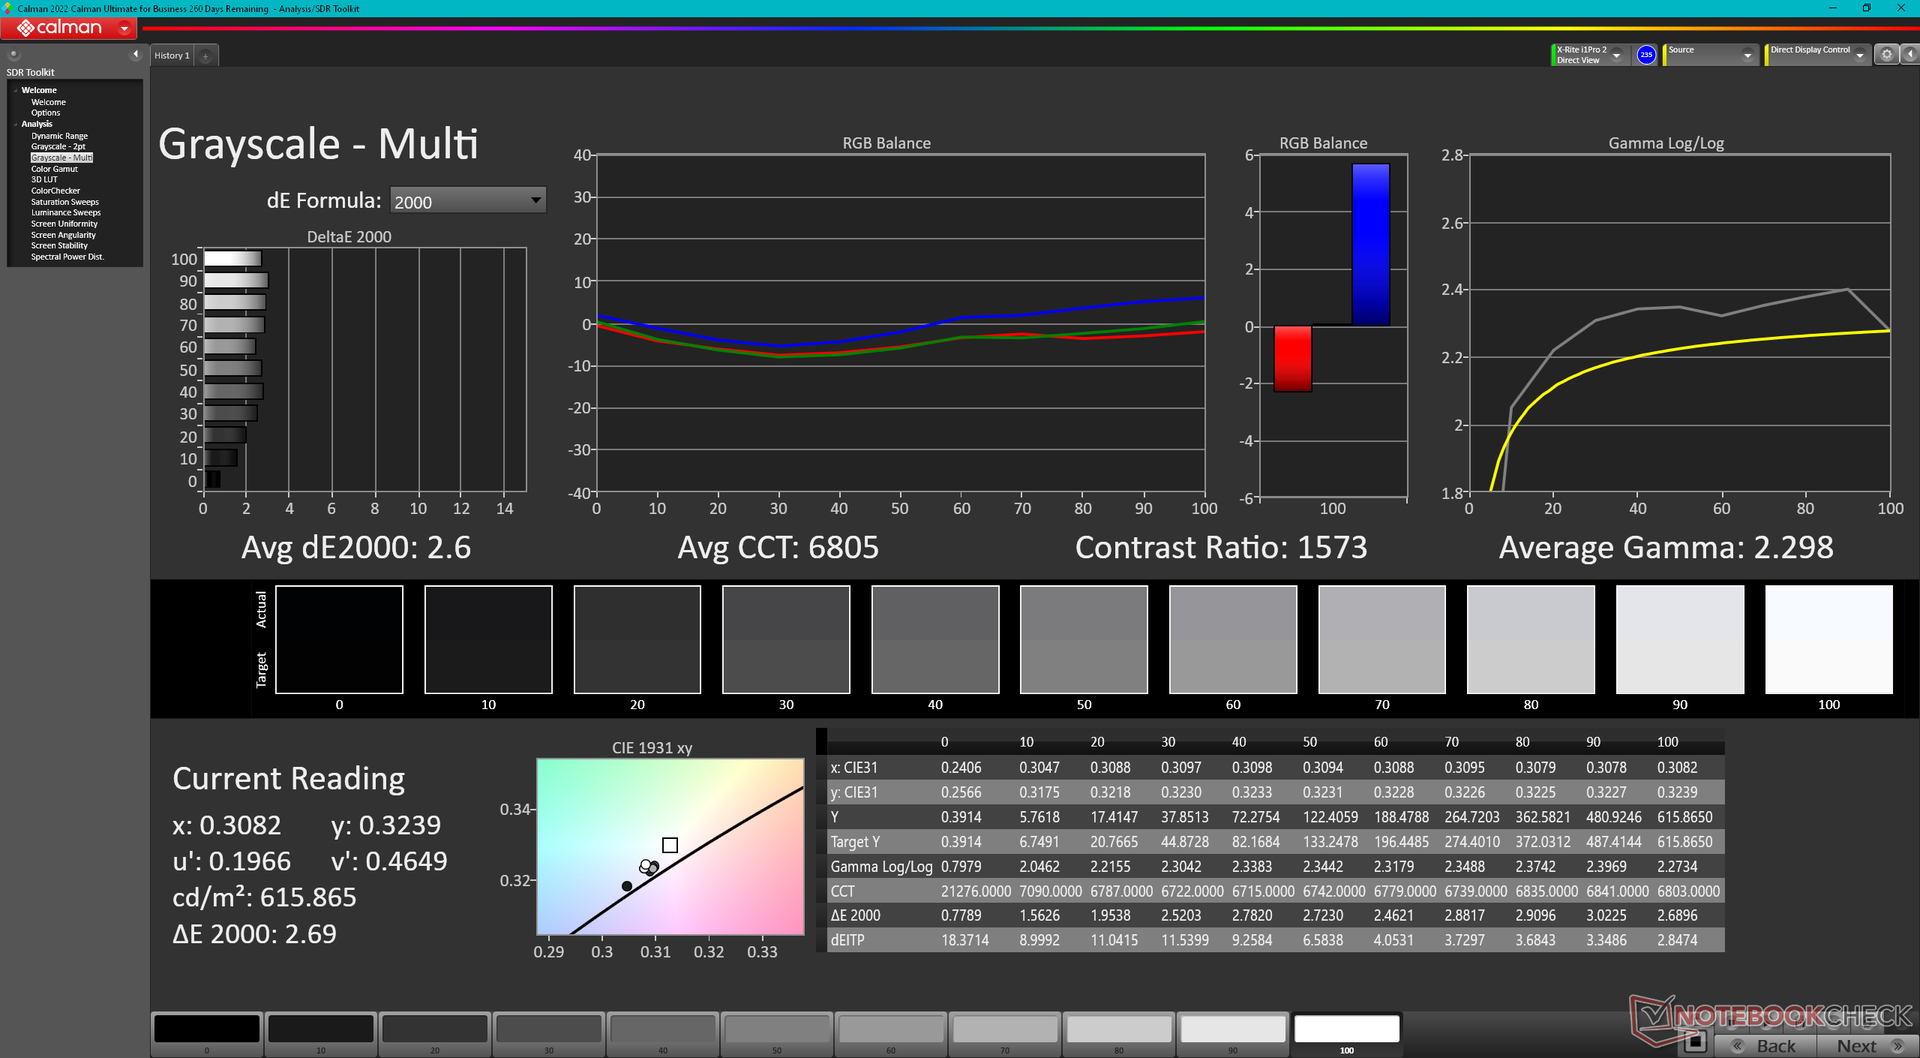
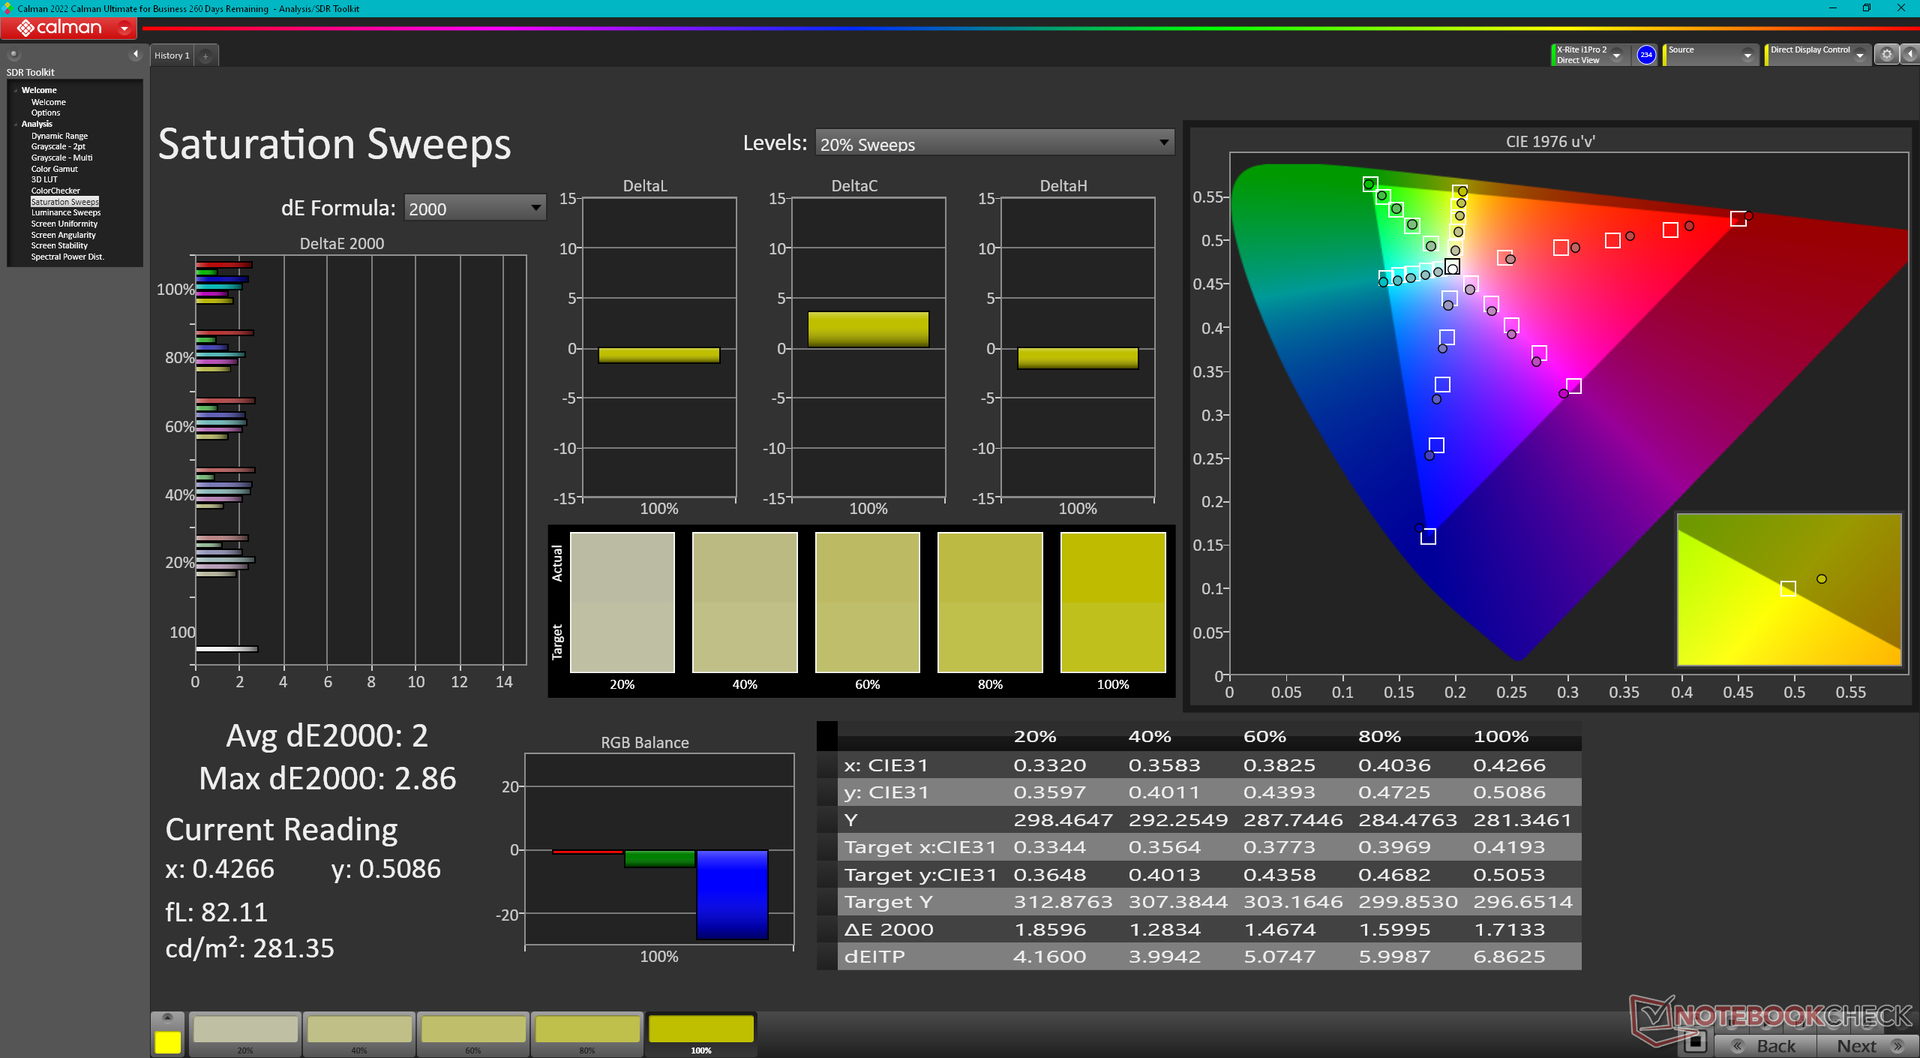
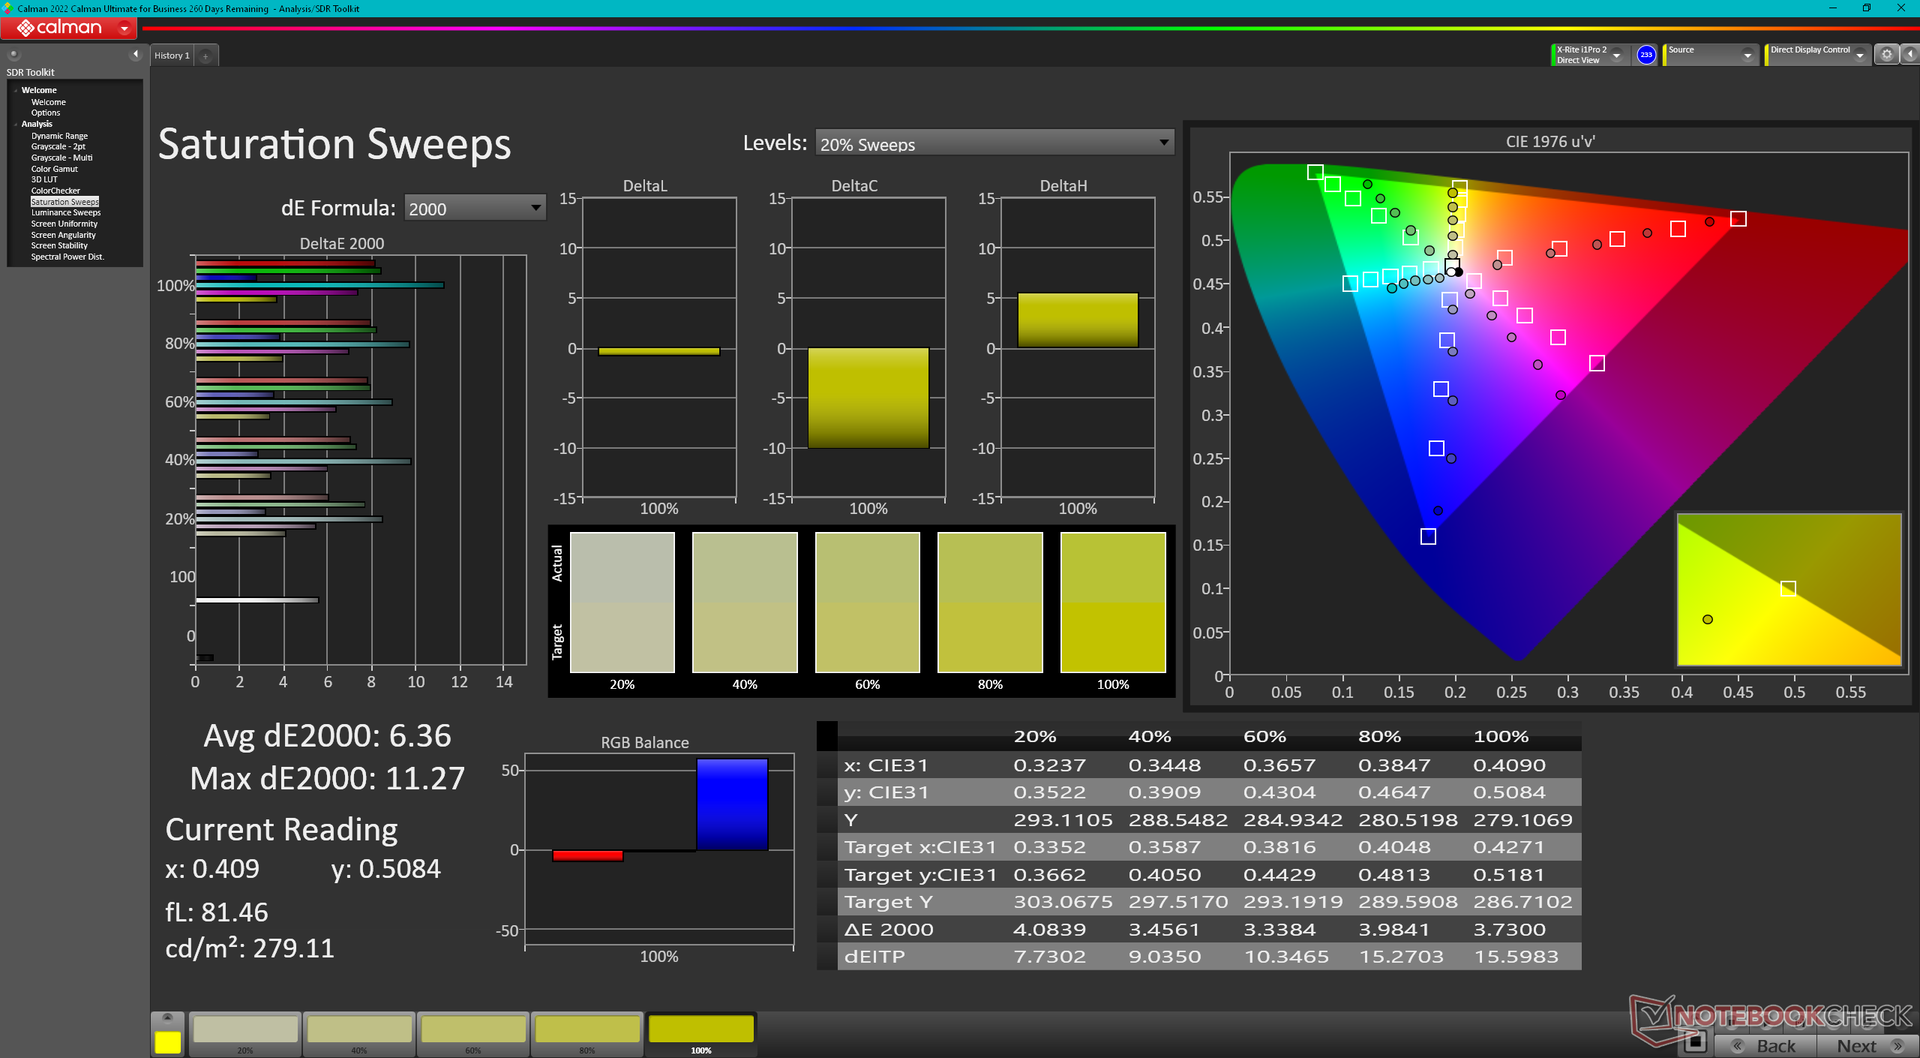
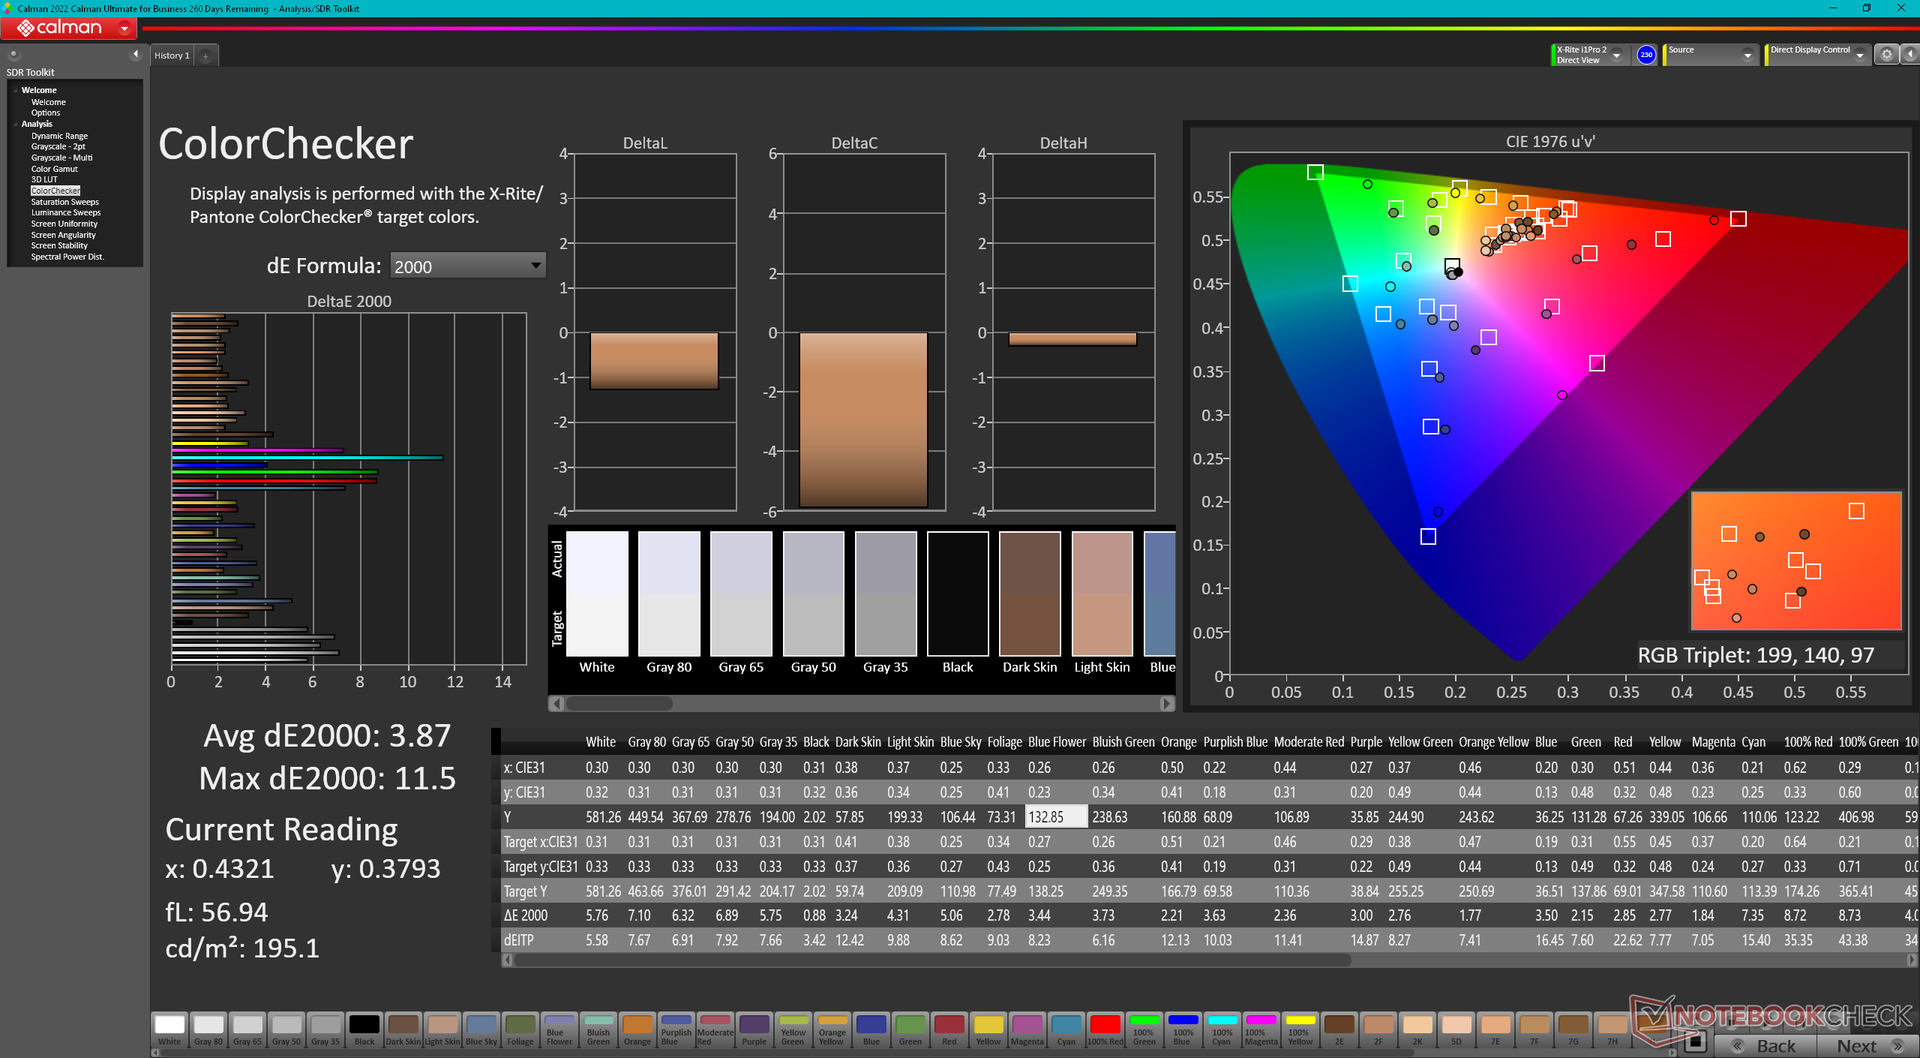
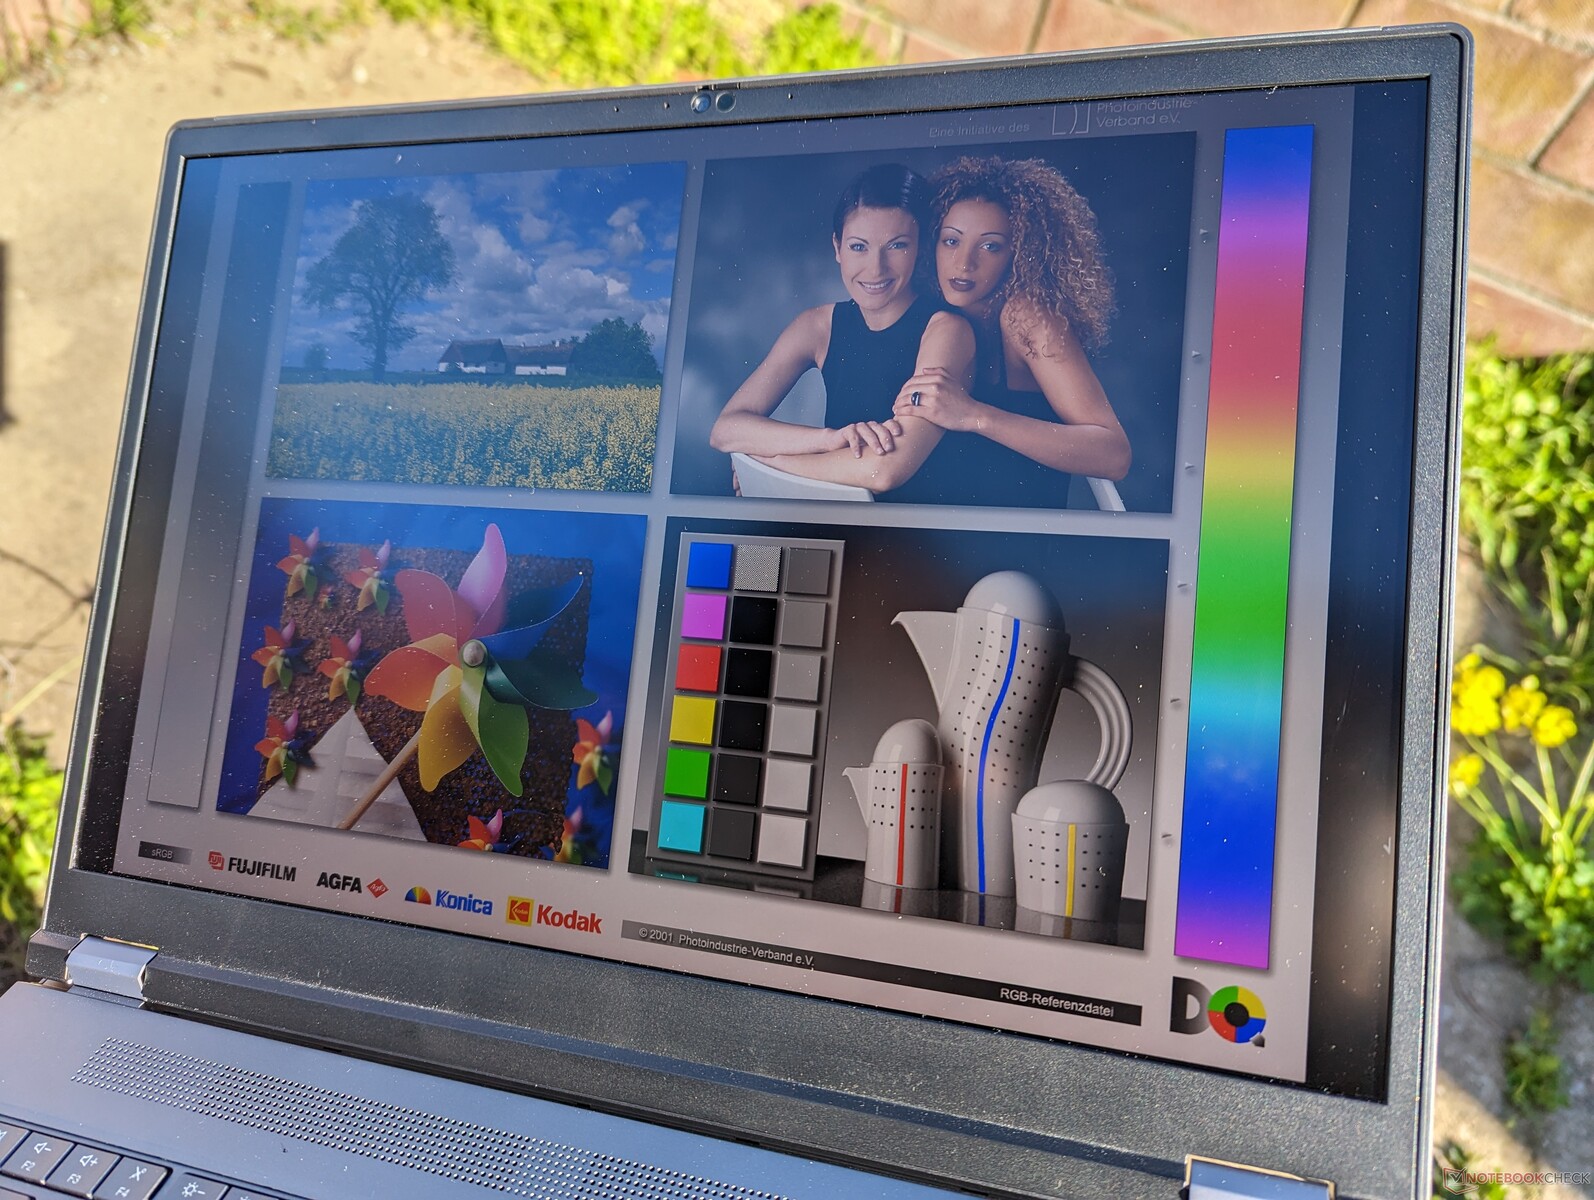
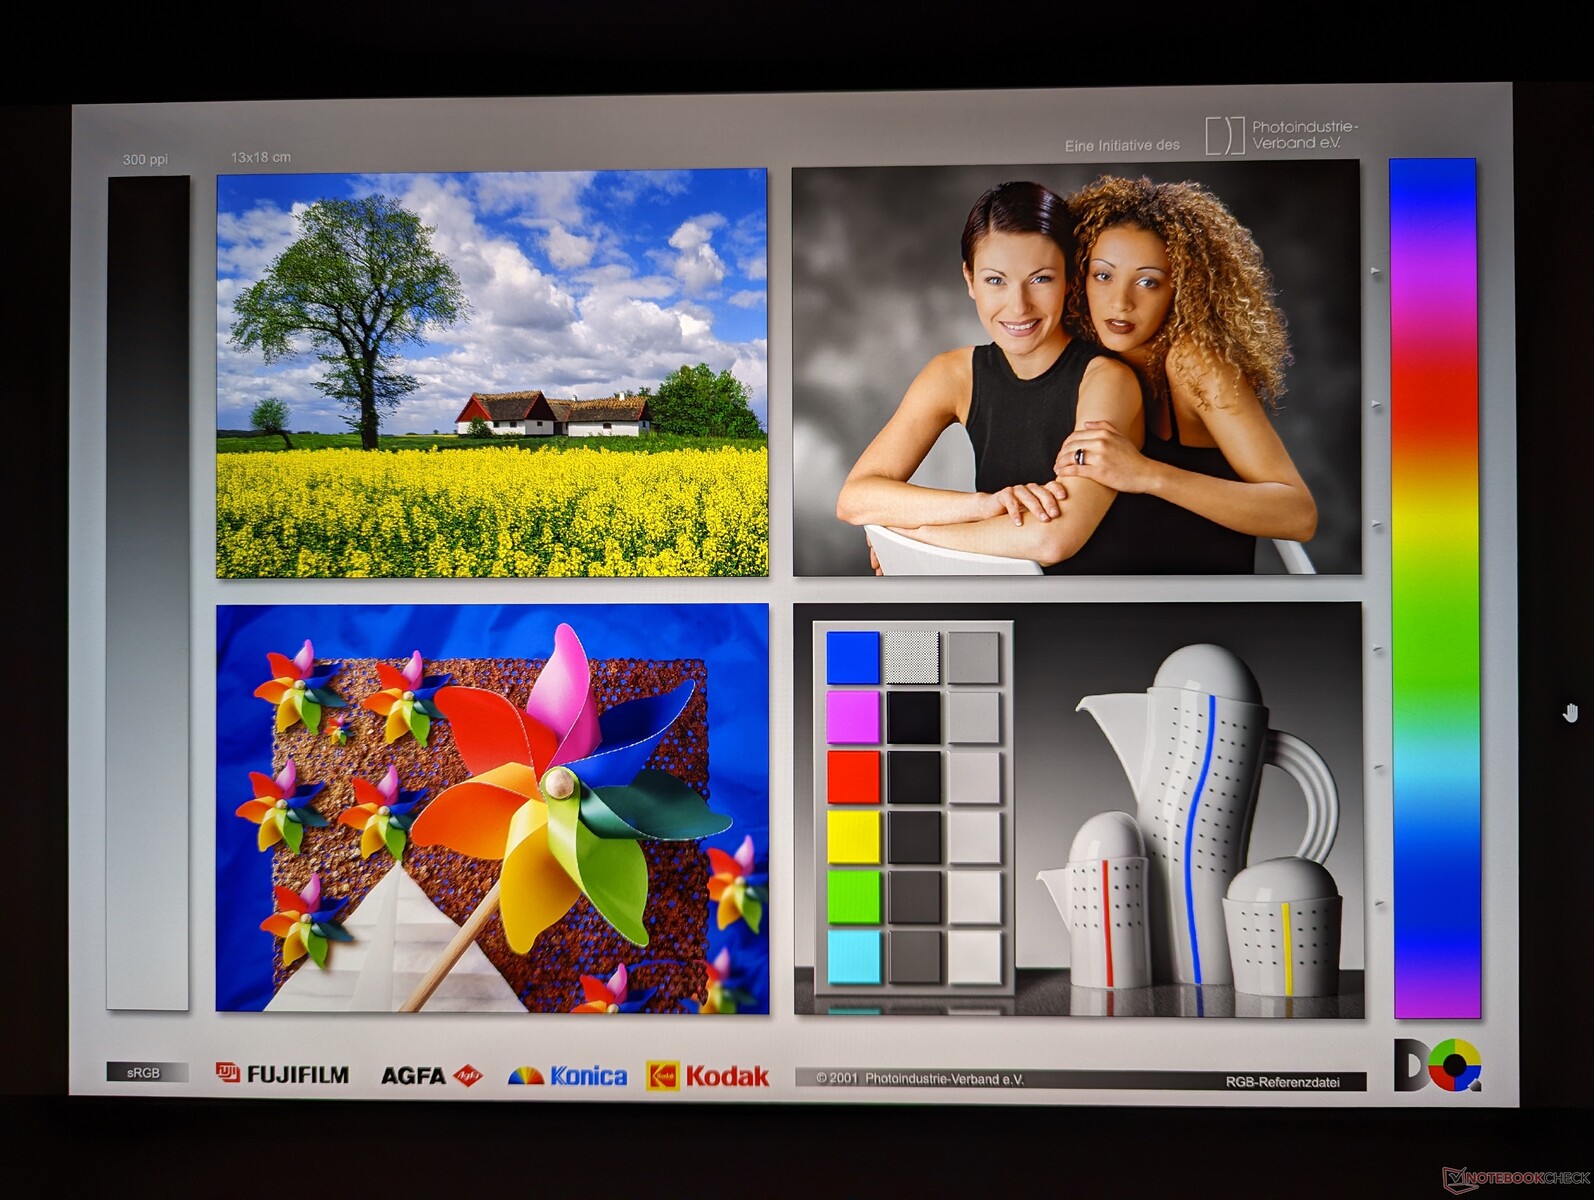
Nasze niezależne pomiary mogą potwierdzić pełne pokrycie AdobeRGB i jasność 600 nitów. Rozkład jasności jest jednak tylko przeciętny, mimo docelowych 600-nitów. Na przykład lewy górny kwadrant naszego wyświetlacza jest o 29 procent jaśniejszy od prawego dolnego kwadrantu (642 nity vs. 497 nitów). Wybór panelu OLED poprawiłby rozkład jasności, ale spodziewaliśmy się czegoś lepszego po naszym panelu IPS, biorąc pod uwagę cenę wywoławczą ThinkPada P1 G1.
Warto zauważyć, że Lenovo wykorzystuje ten sam panel LP160UQ1-SPB1 IPS w ThinkPadzie P1 G1 w innych 16-calowych modelach ThinkPadów, m.in.ThinkPad P1 G4 orazThinkPad X1 Extreme G4.


| |||||||||||||||||||||||||
rozświetlenie: 77 %
na akumulatorze: 601.9 cd/m²
kontrast: 1281:1 (czerń: 0.47 cd/m²)
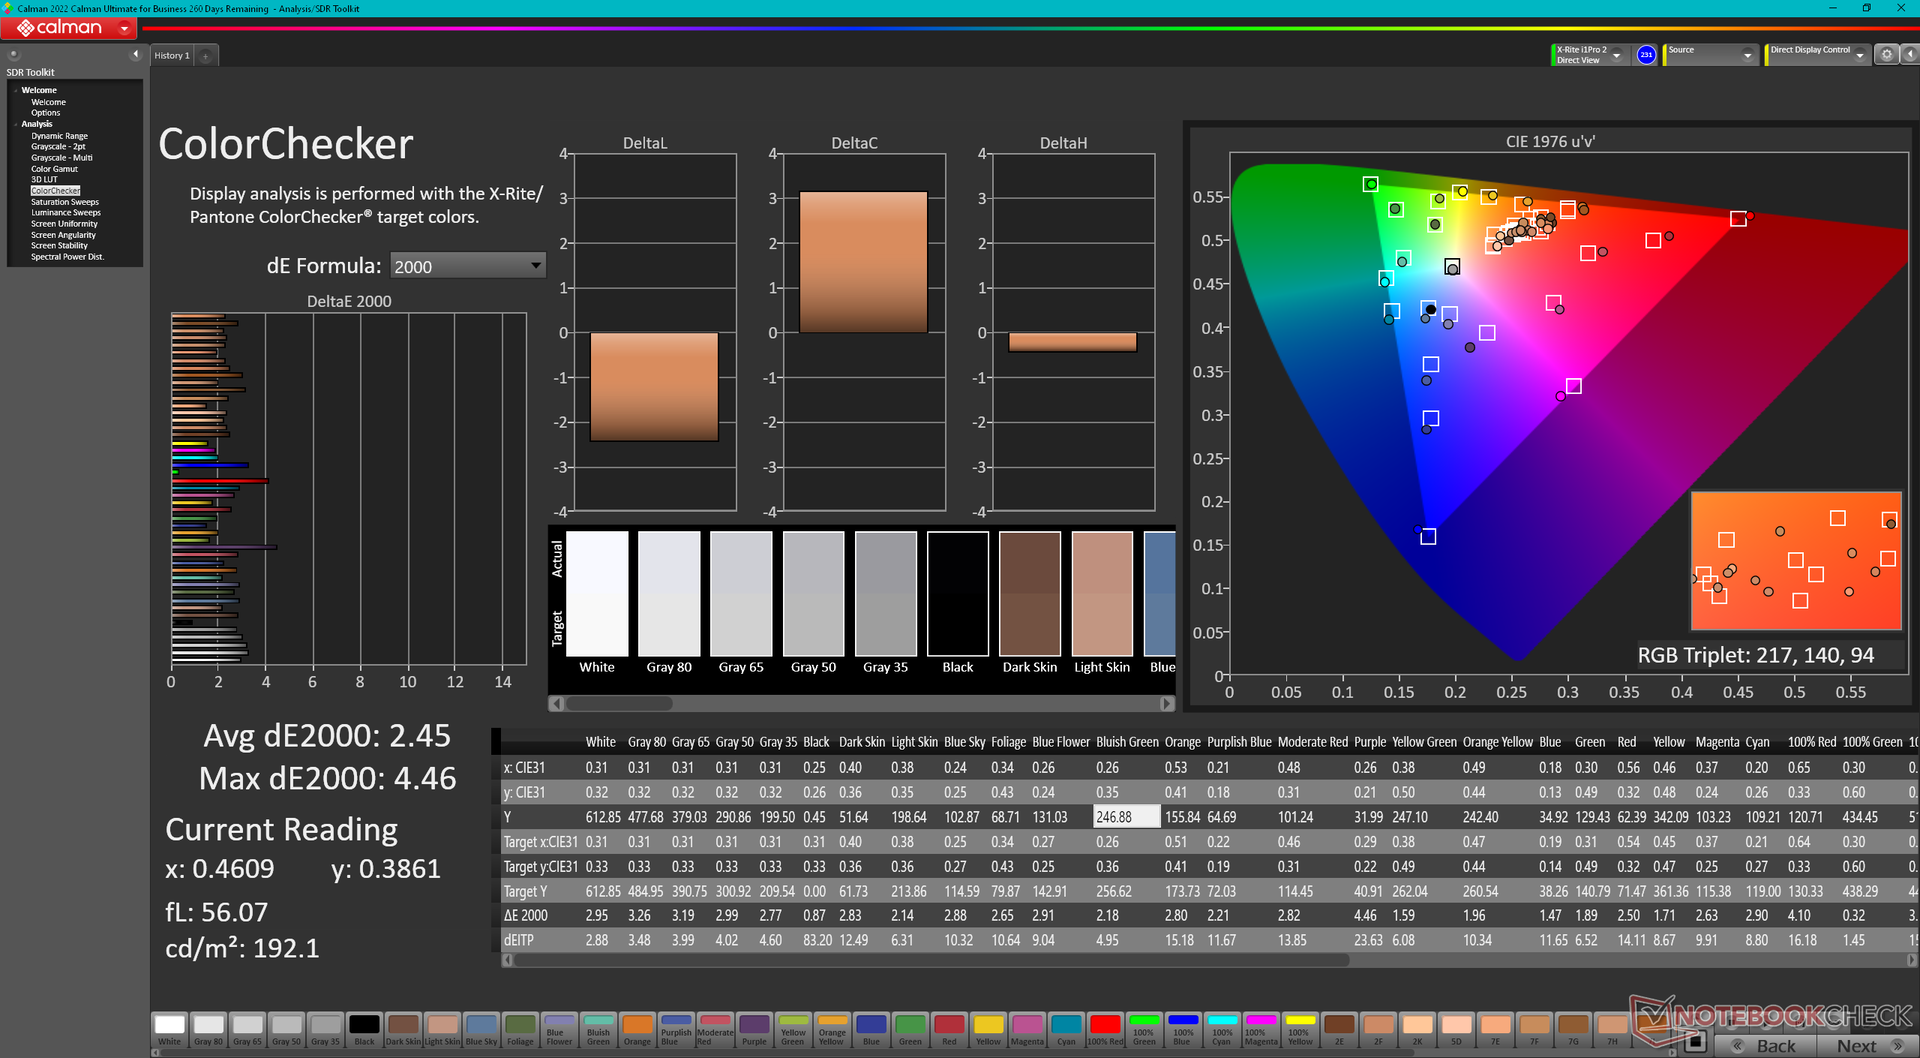
ΔE ColorChecker Calman: 2.45 | ∀{0.5-29.43 Ø4.73}
ΔE Greyscale Calman: 2.6 | ∀{0.09-98 Ø4.97}
95.9% AdobeRGB 1998 (Argyll 3D)
98.9% sRGB (Argyll 3D)
82.9% Display P3 (Argyll 3D)
Gamma: 2.3
CCT: 6805 K
| Lenovo ThinkPad P16 G1 RTX A5500 LP160UQ1-SPB1, IPS, 3840x2400, 16" | Asus ProArt StudioBook 16 W7600H5A-2BL2 ATNA60YV02-0, OLED, 3840x2400, 16" | Dell Precision 7000 7670 Performance Samsung 160YV03, OLED, 3840x2400, 16" | Lenovo ThinkPad P16 G1 21D6001DMB NE160QDM-N63 , IPS LED, 2560x1600, 16" | MSI CreatorPro Z16P B12UKST B160QAN02.N, IPS, 2560x1600, 16" | HP ZBook Studio 16 G9 62U04EA BOE0A52, IPS, 3840x2400, 16" | |
|---|---|---|---|---|---|---|
| Display | 8% | 8% | -12% | 3% | 3% | |
| Display P3 Coverage (%) | 82.9 | 99.9 21% | 99.9 21% | 71.5 -14% | 97.6 18% | 97.5 18% |
| sRGB Coverage (%) | 98.9 | 100 1% | 100 1% | 100 1% | 99.9 1% | 99.9 1% |
| AdobeRGB 1998 Coverage (%) | 95.9 | 98.6 3% | 98.1 2% | 73.3 -24% | 87.4 -9% | 86.3 -10% |
| Response Times | 96% | 96% | 23% | 76% | 75% | |
| Response Time Grey 50% / Grey 80% * (ms) | 45.6 ? | 2 ? 96% | 1.84 ? 96% | 37.7 ? 17% | 12.8 ? 72% | 15.3 ? 66% |
| Response Time Black / White * (ms) | 36.8 ? | 2 ? 95% | 1.92 ? 95% | 26.3 ? 29% | 7.4 ? 80% | 6.1 ? 83% |
| PWM Frequency (Hz) | 240 ? | 59.52 ? | ||||
| Screen | -2% | -36% | -4% | 9% | 16% | |
| Brightness middle (cd/m²) | 601.9 | 353 -41% | 325.2 -46% | 424 -30% | 407 -32% | 554 -8% |
| Brightness (cd/m²) | 569 | 360 -37% | 328 -42% | 398 -30% | 388 -32% | 516 -9% |
| Brightness Distribution (%) | 77 | 96 25% | 97 26% | 90 17% | 88 14% | 84 9% |
| Black Level * (cd/m²) | 0.47 | 0.24 49% | 0.36 23% | 0.47 -0% | ||
| Contrast (:1) | 1281 | 1767 38% | 1131 -12% | 1179 -8% | ||
| Colorchecker dE 2000 * | 2.45 | 2.45 -0% | 4.59 -87% | 2.6 -6% | 1.3 47% | 1 59% |
| Colorchecker dE 2000 max. * | 4.46 | 3.75 16% | 7.65 -72% | 4.9 -10% | 2.5 44% | 2.4 46% |
| Greyscale dE 2000 * | 2.6 | 1.88 28% | 2.5 4% | 4.1 -58% | 2.1 19% | 1.6 38% |
| Gamma | 2.3 96% | 2.31 95% | 2.1 105% | 2.13 103% | 2.26 97% | 2.29 96% |
| CCT | 6805 96% | 6441 101% | 6541 99% | 7252 90% | 6437 101% | 6458 101% |
| Colorchecker dE 2000 calibrated * | 2.77 | 0.8 | 0.7 | 0.6 | ||
| Całkowita średnia (program / ustawienia) | 34% /
19% | 23% /
-0% | 2% /
-2% | 29% /
18% | 31% /
22% |
* ... im mniej tym lepiej
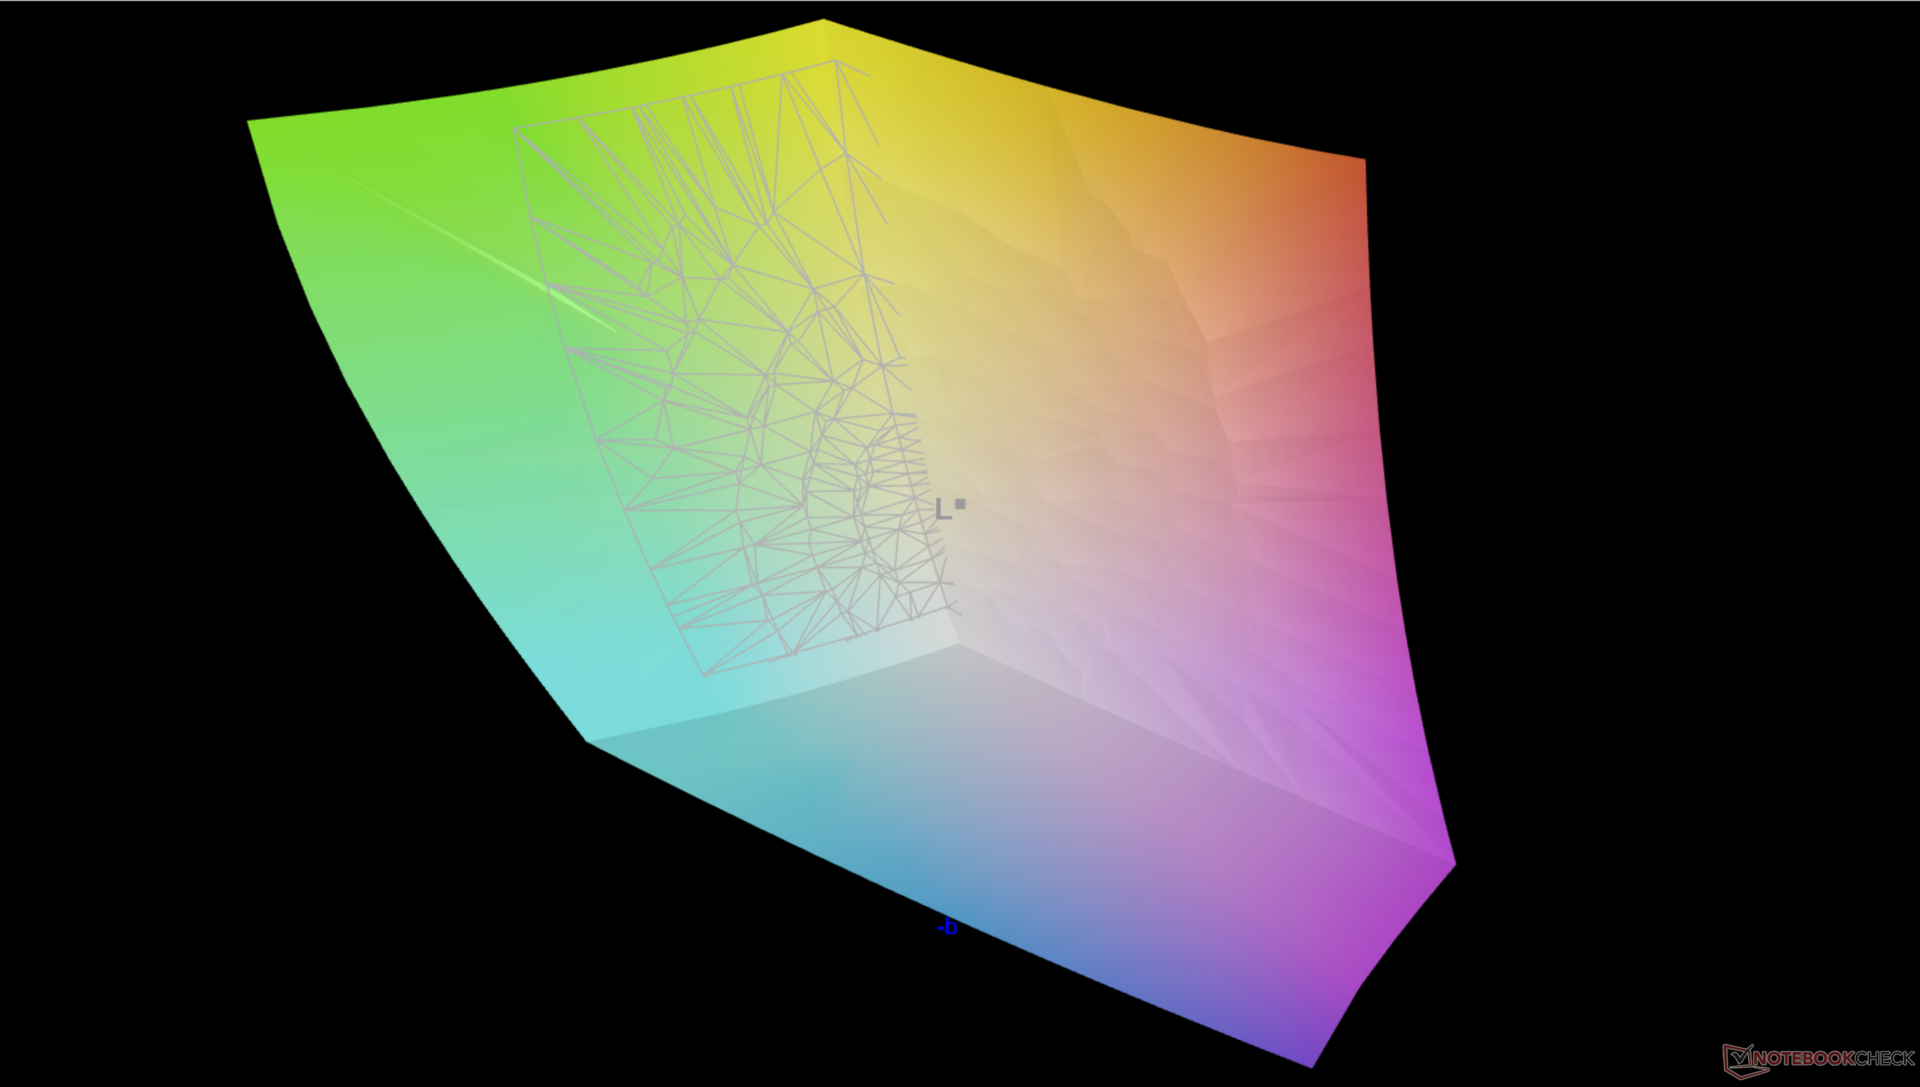
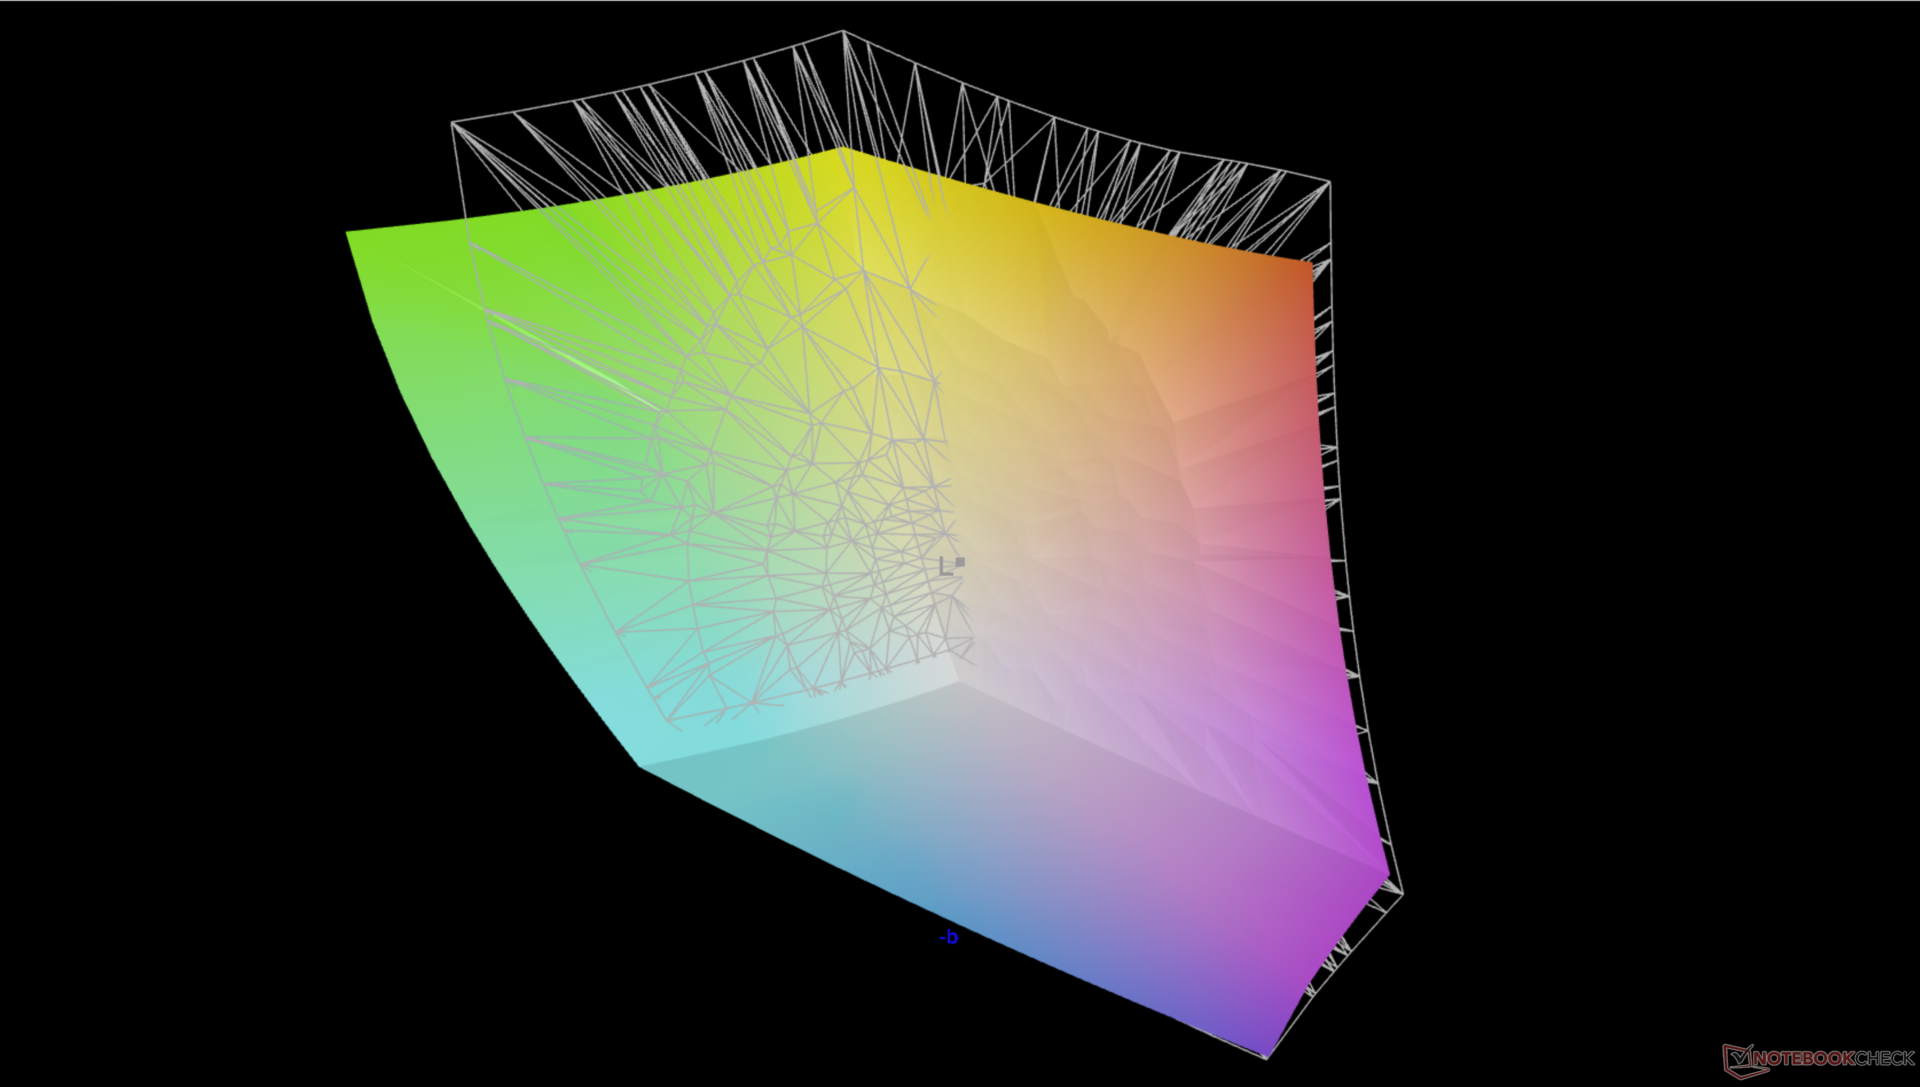
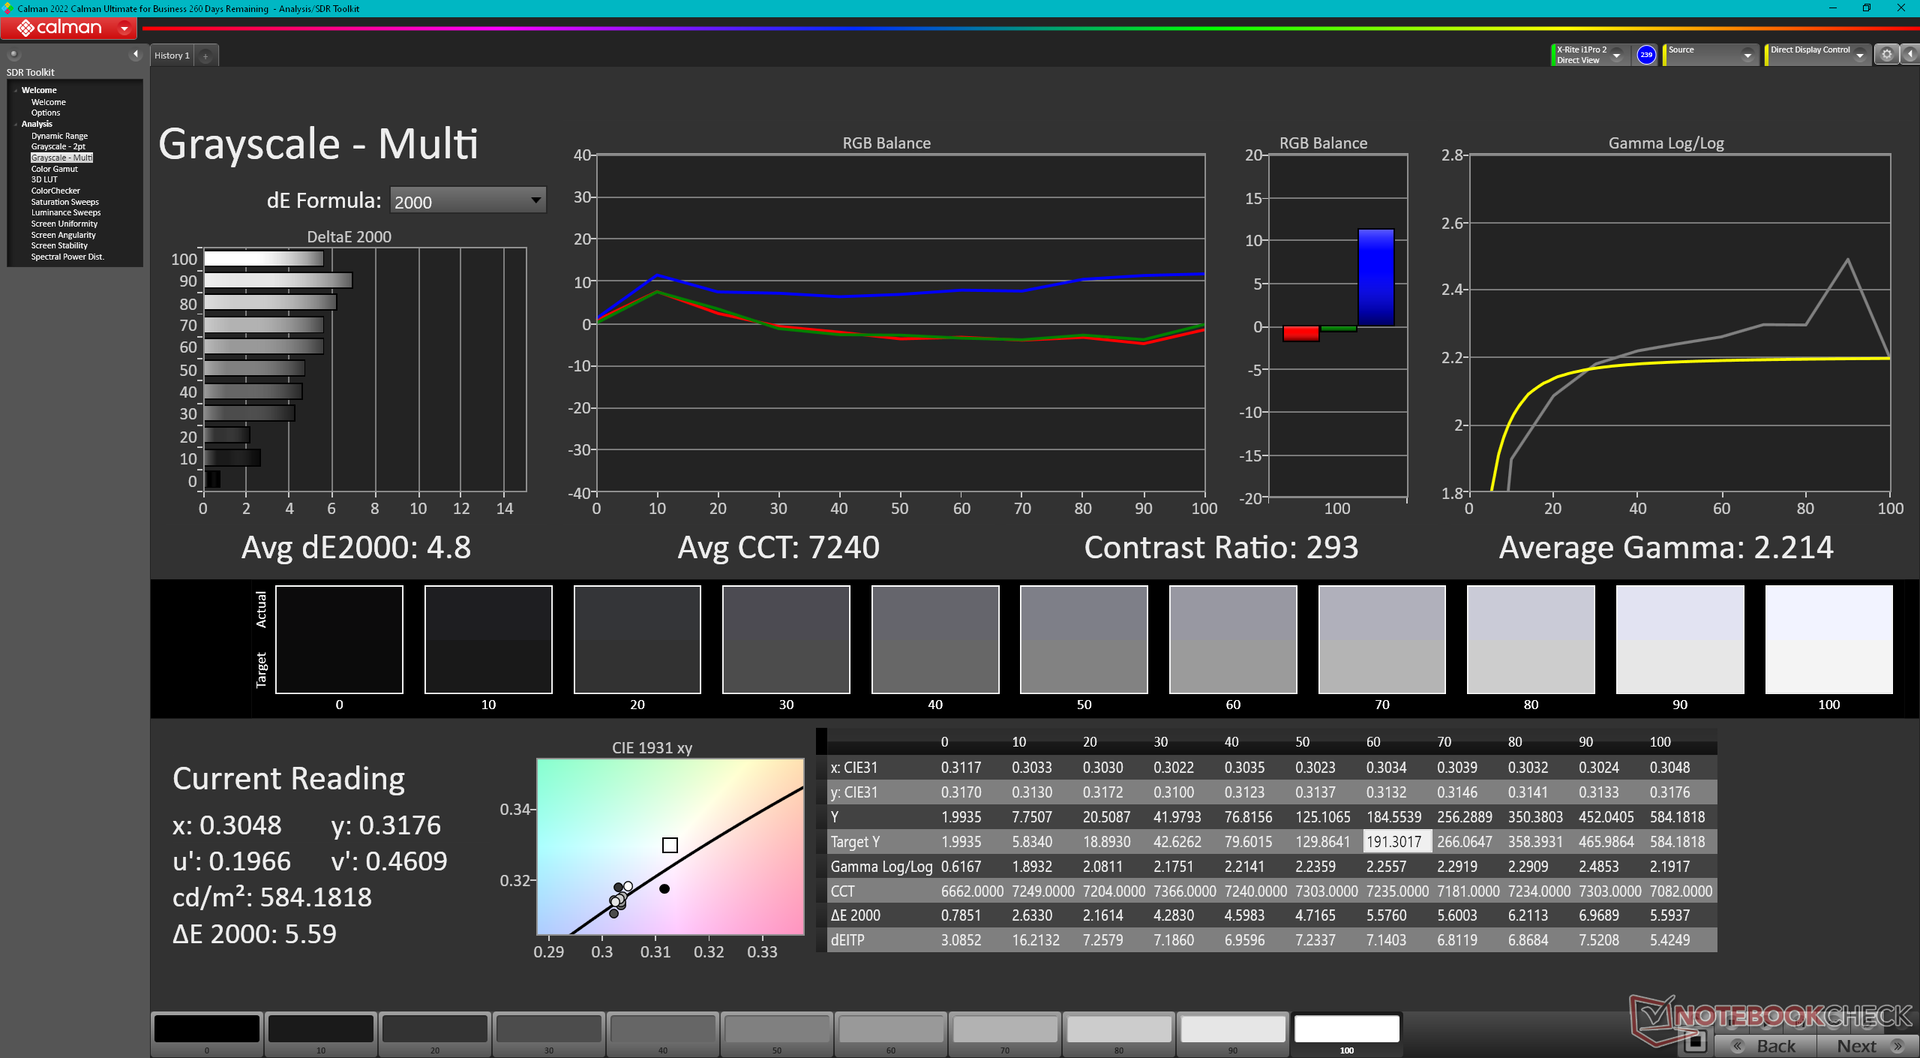
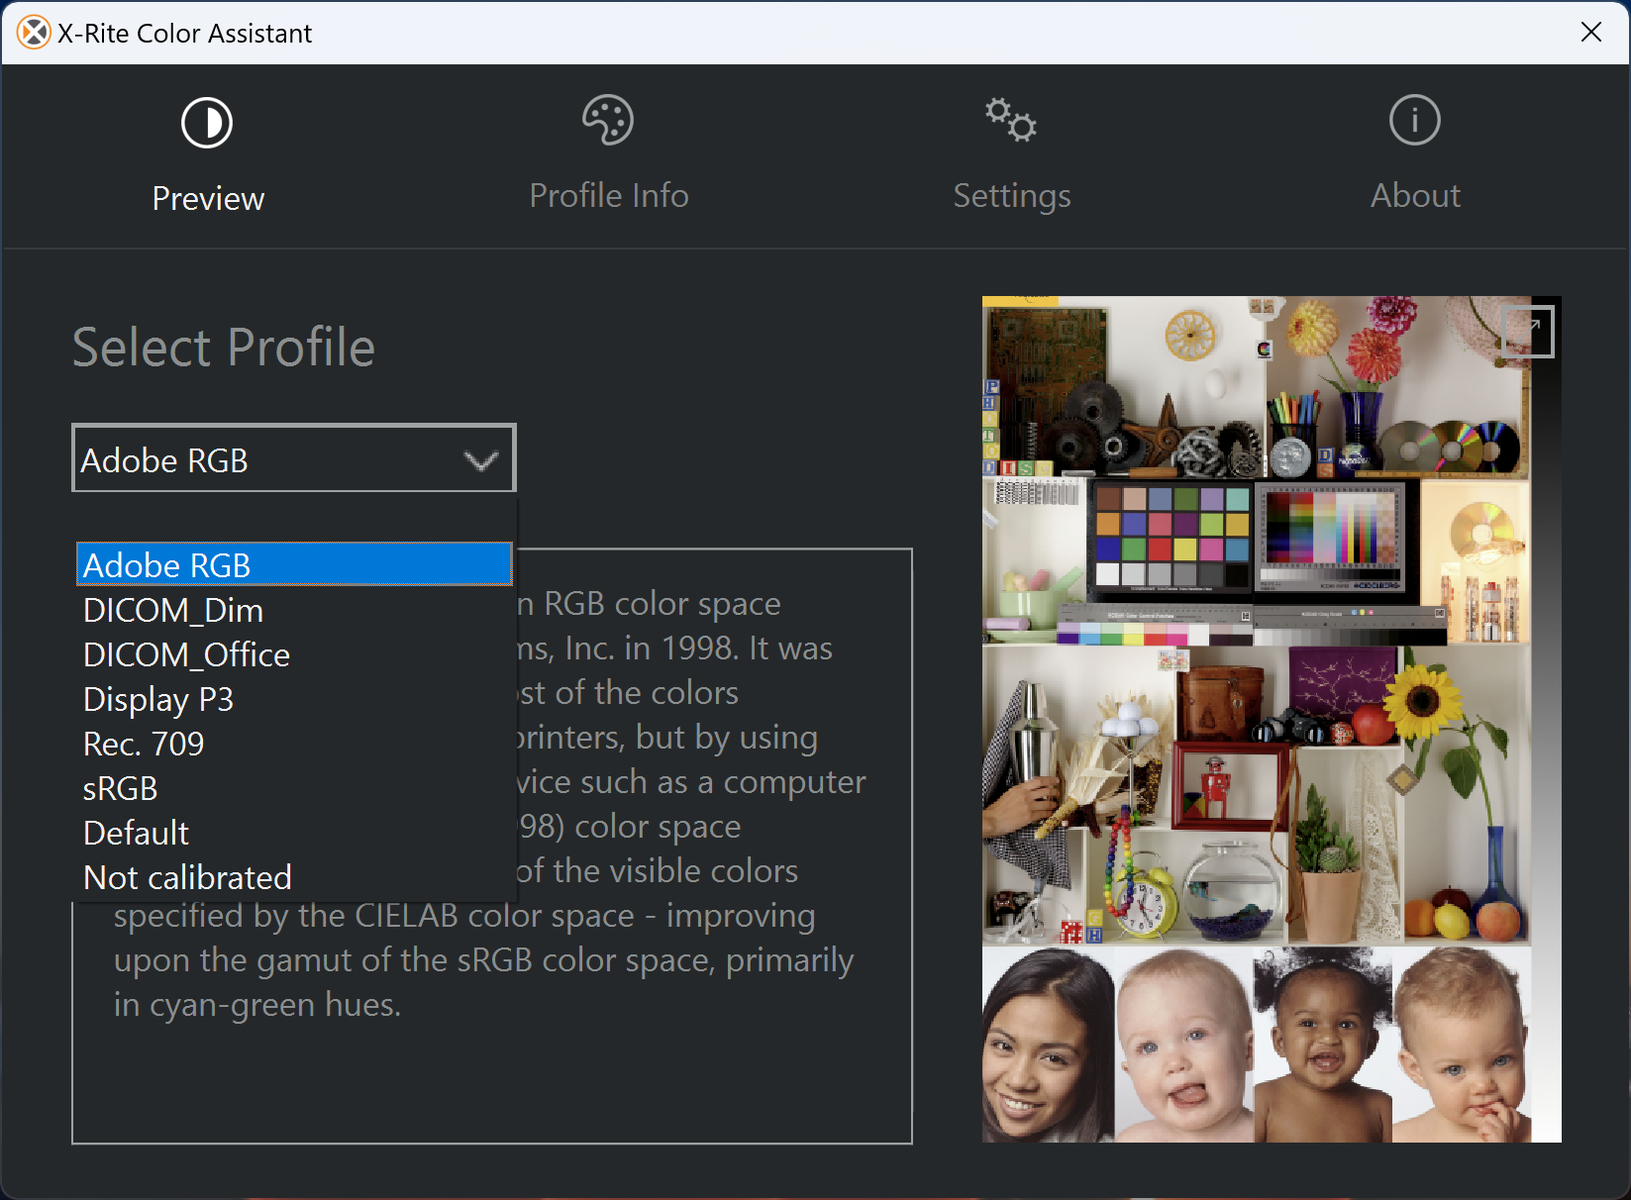
Profil kolorów można zmienić za pomocą preinstalowanego oprogramowania X-Rite Color Assistant. Wydaje się ono być obecnie zabugowane, ponieważ kolory nie są tak dokładne jak powinny być po wyjęciu z pudełka, pomimo pełnego pokrycia AdobeRGB przez nasz panel. Przykładowo, przy ustawieniu w trybie sRGB, średnie wartości deltaE dla skali szarości i kolorów wyniosłyby odpowiednio 2,6 i 2,45, w porównaniu do 4,8 i 3,87 przy ustawieniu w trybie AdobeRGB.
Wyświetl czasy reakcji
| ↔ Czas reakcji od czerni do bieli | ||
|---|---|---|
| 36.8 ms ... wzrost ↗ i spadek ↘ łącznie | ↗ 19.6 ms wzrost | 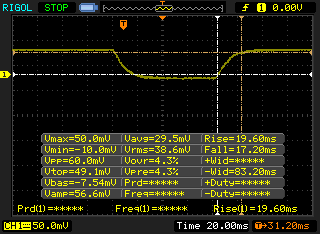 |
| ↘ 17.2 ms upadek | ||
| W naszych testach ekran wykazuje powolne tempo reakcji, co będzie niezadowalające dla graczy. Dla porównania, wszystkie testowane urządzenia wahają się od 0.1 (minimum) do 240 (maksimum) ms. » 95 % wszystkich urządzeń jest lepszych. Oznacza to, że zmierzony czas reakcji jest gorszy od średniej wszystkich testowanych urządzeń (19.9 ms). | ||
| ↔ Czas reakcji 50% szarości do 80% szarości | ||
| 45.6 ms ... wzrost ↗ i spadek ↘ łącznie | ↗ 21.2 ms wzrost | 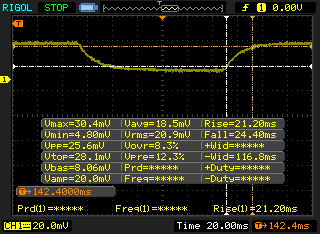 |
| ↘ 24.4 ms upadek | ||
| W naszych testach ekran wykazuje powolne tempo reakcji, co będzie niezadowalające dla graczy. Dla porównania, wszystkie testowane urządzenia wahają się od 0.165 (minimum) do 636 (maksimum) ms. » 78 % wszystkich urządzeń jest lepszych. Oznacza to, że zmierzony czas reakcji jest gorszy od średniej wszystkich testowanych urządzeń (31.1 ms). | ||
Migotanie ekranu / PWM (modulacja szerokości impulsu)
| Migotanie ekranu/nie wykryto PWM | 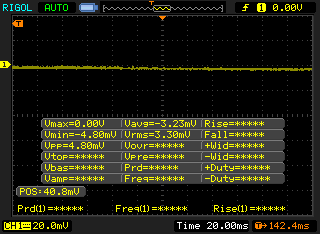 | ||
Dla porównania: 52 % wszystkich testowanych urządzeń nie używa PWM do przyciemniania wyświetlacza. Jeśli wykryto PWM, zmierzono średnio 7794 (minimum: 5 - maksimum: 343500) Hz. | |||
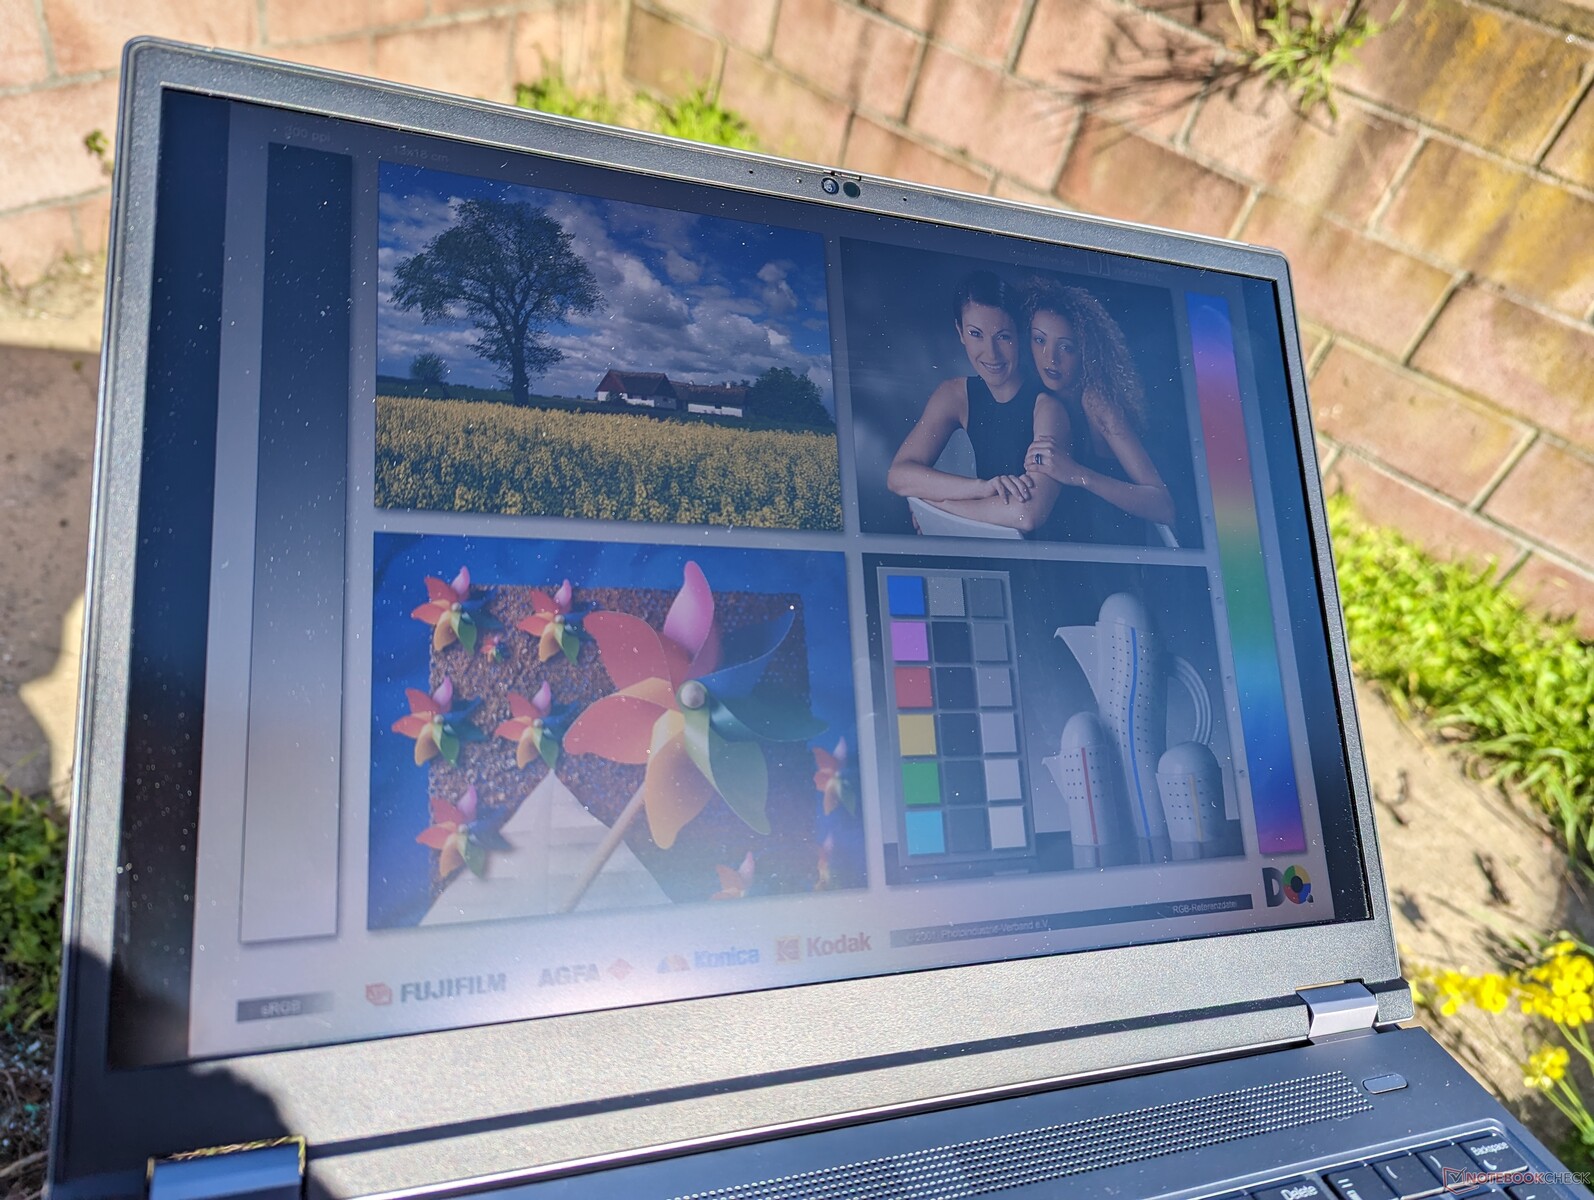
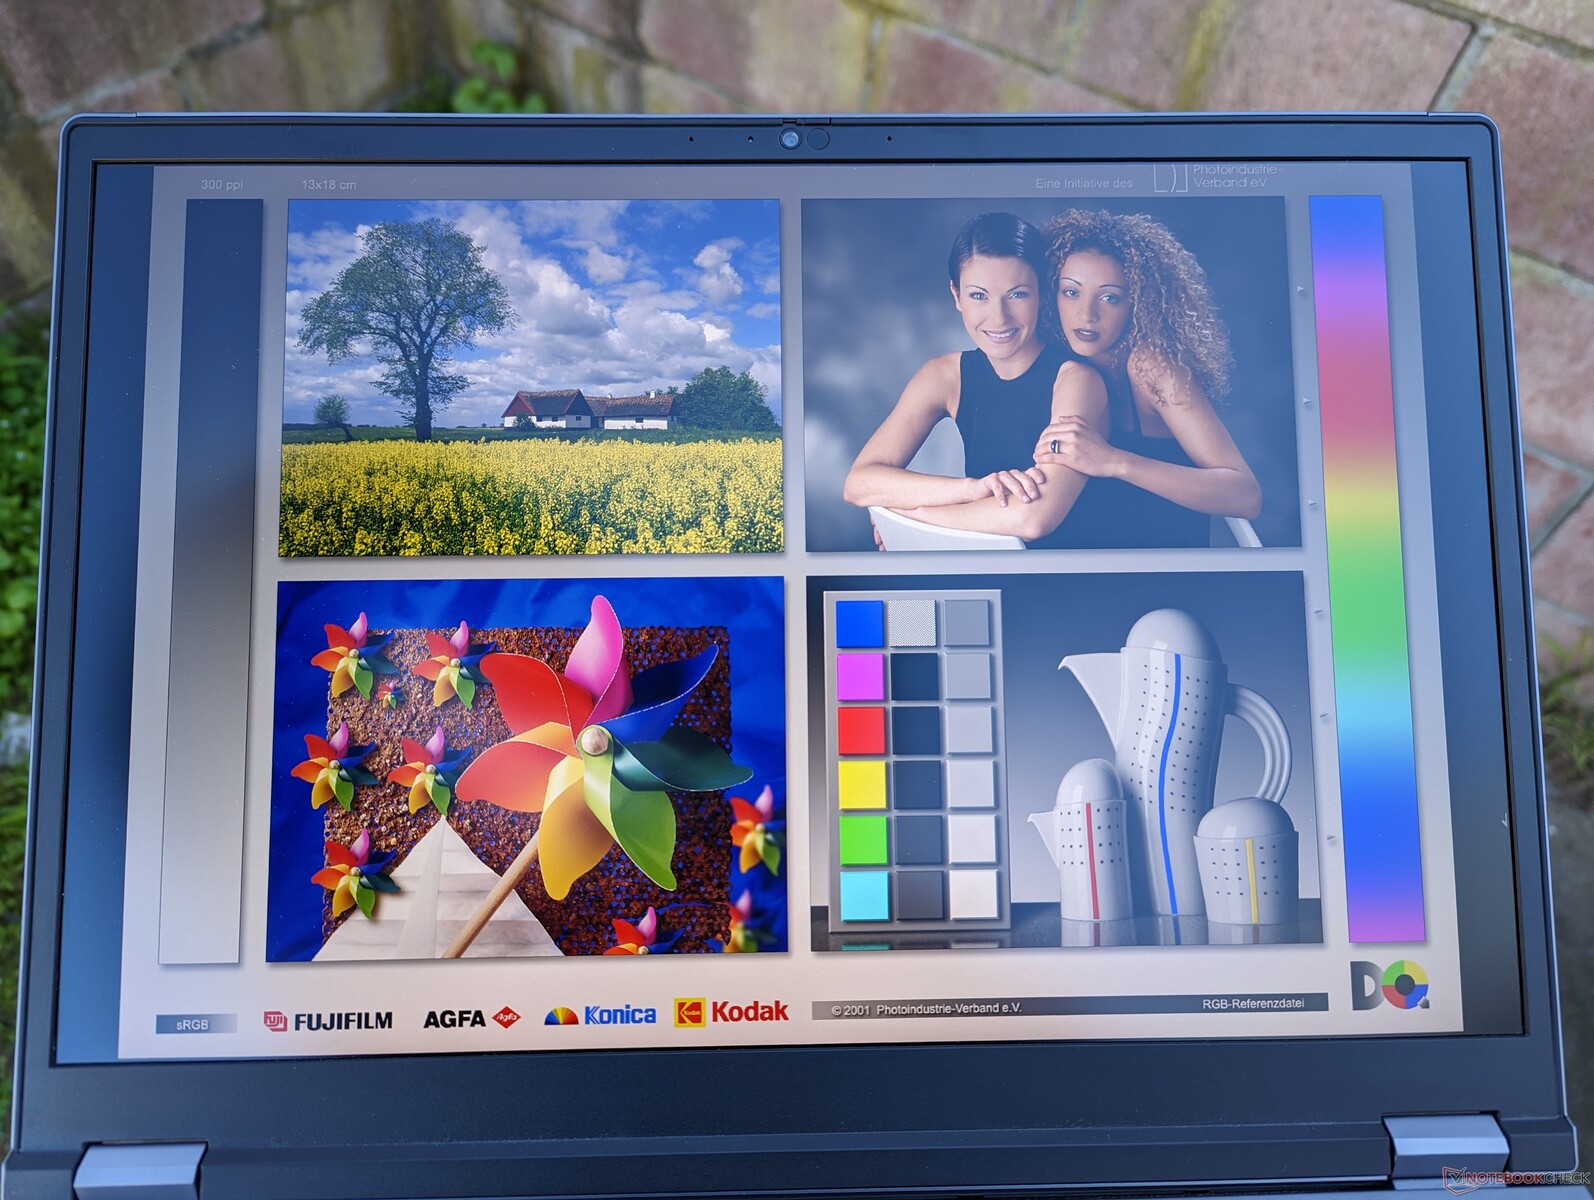
Widoczność na zewnątrz jest przyzwoita, gdyż wyświetlacz jest jaśniejszy, niż w większości innych laptopów, gdzie częściej spotykany jest zakres od 300 do 400 nitów. Nadal jednak zaleca się pracę w cieniu, kiedy tylko jest to możliwe, gdyż bezpośrednie światło słoneczne pogarsza jakość obrazu i kolory.
Wydajność
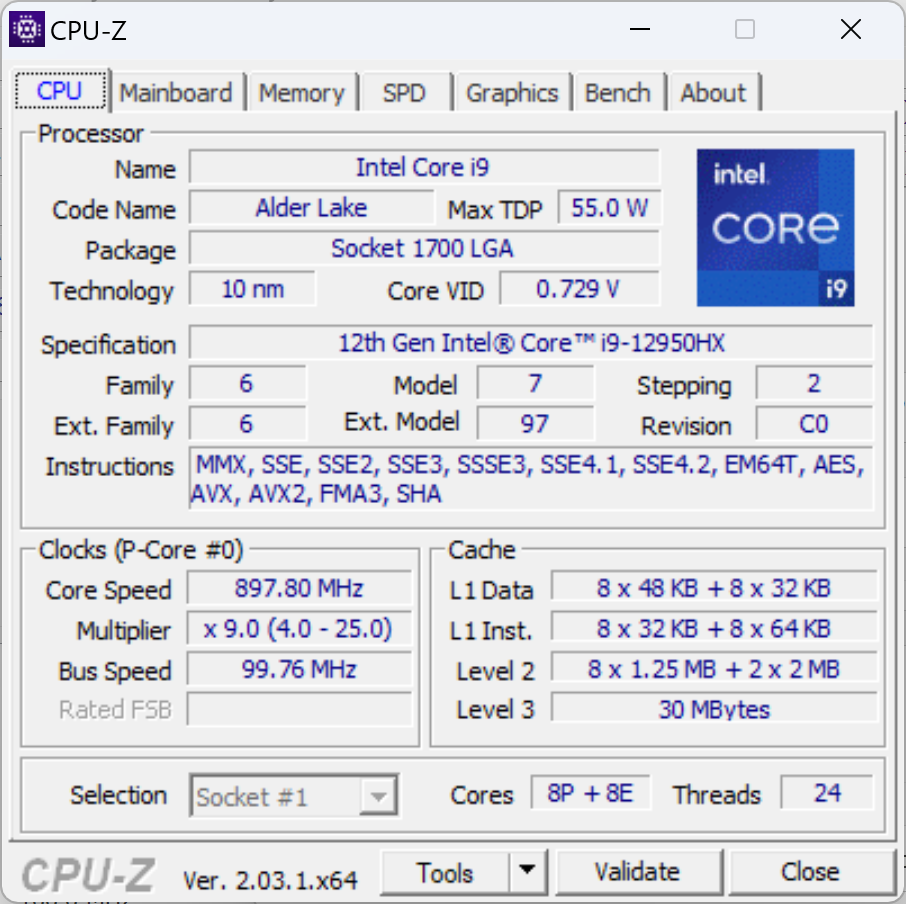
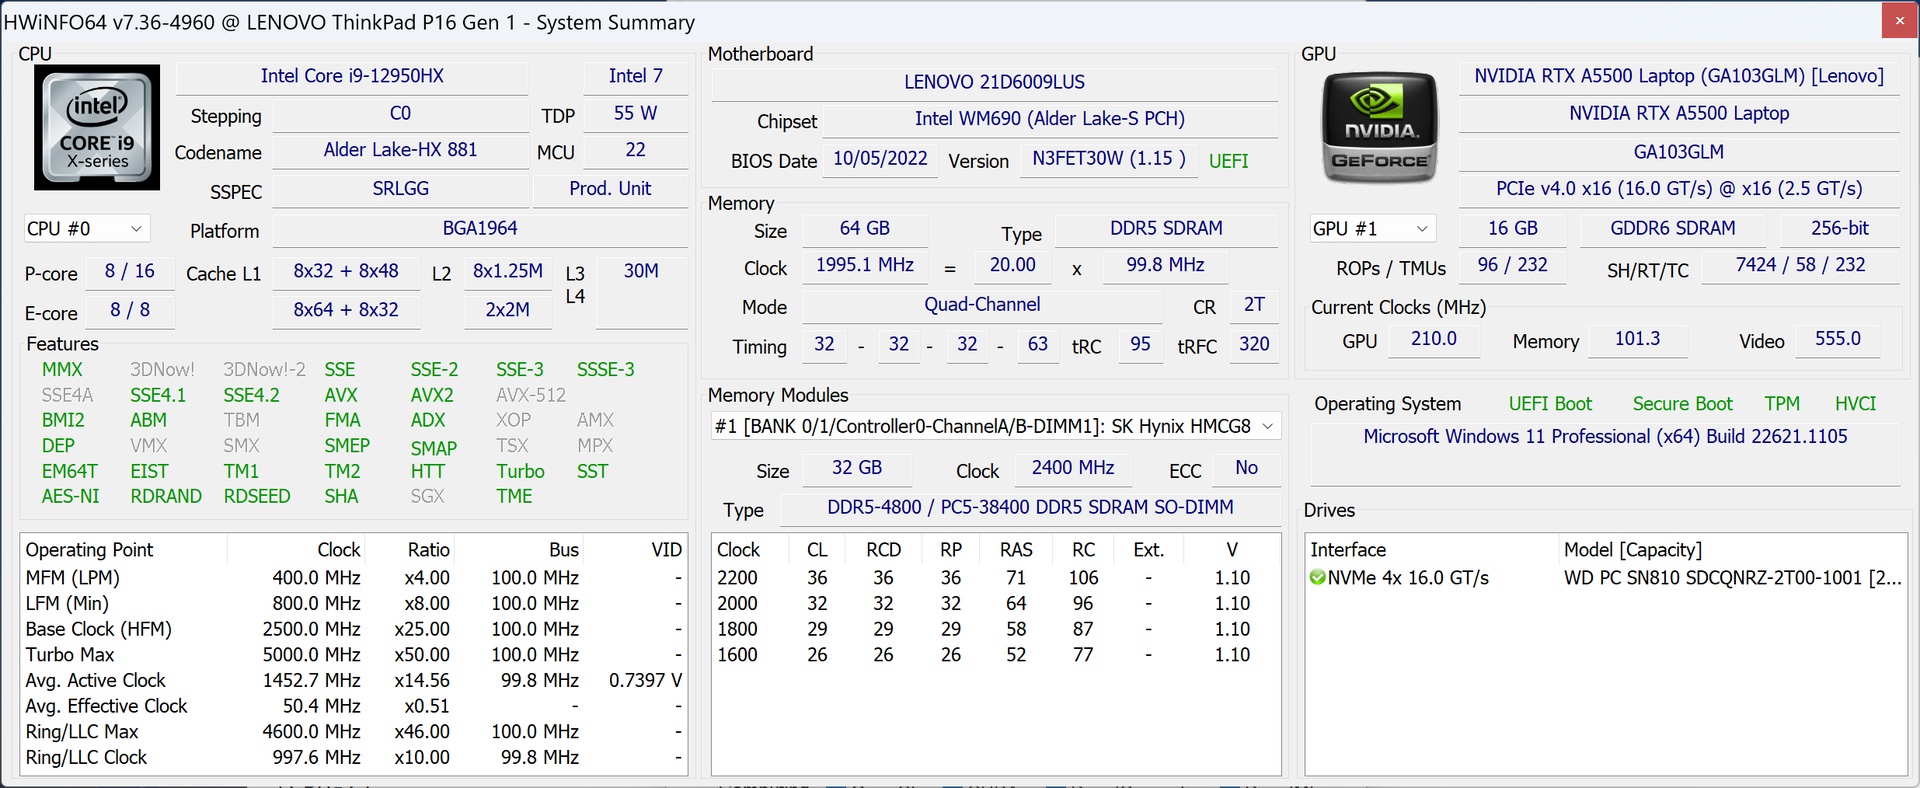
Warunki badania
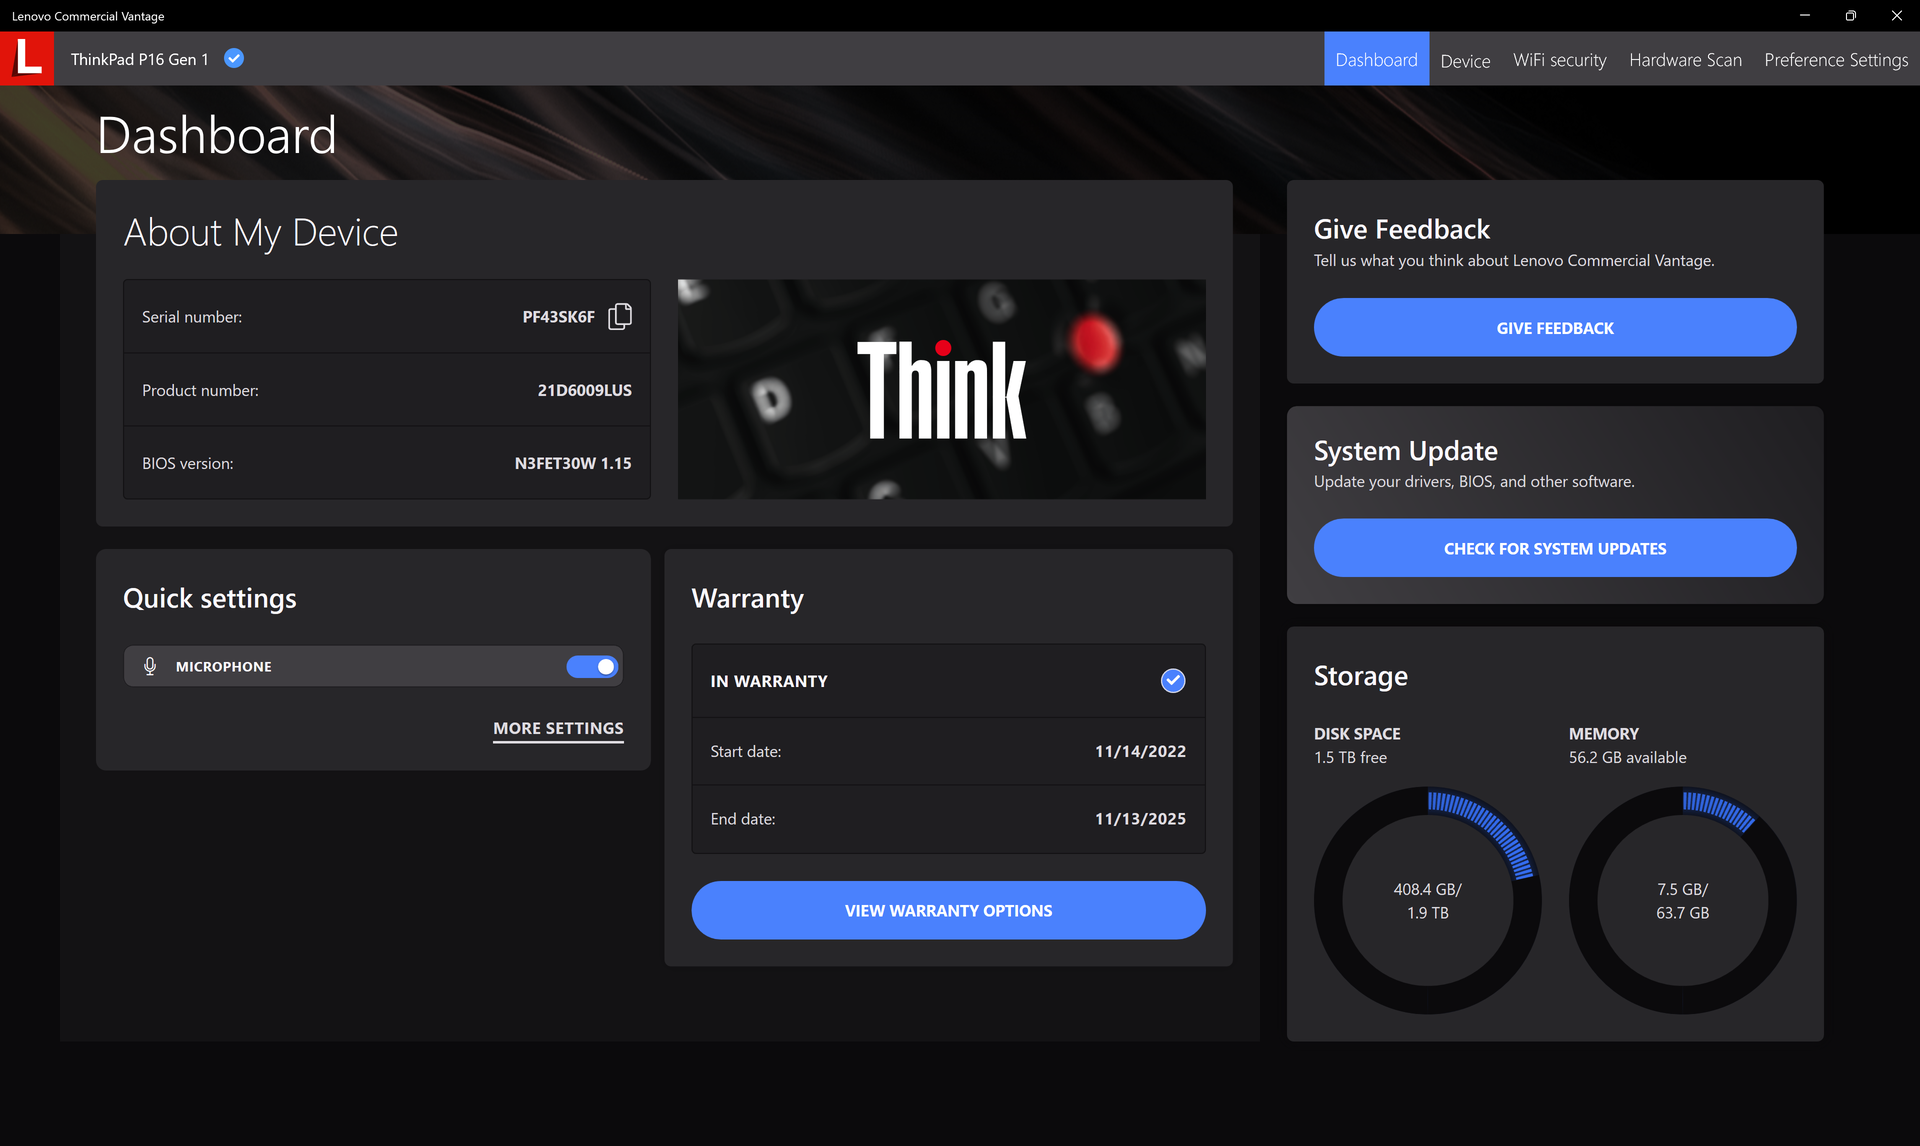
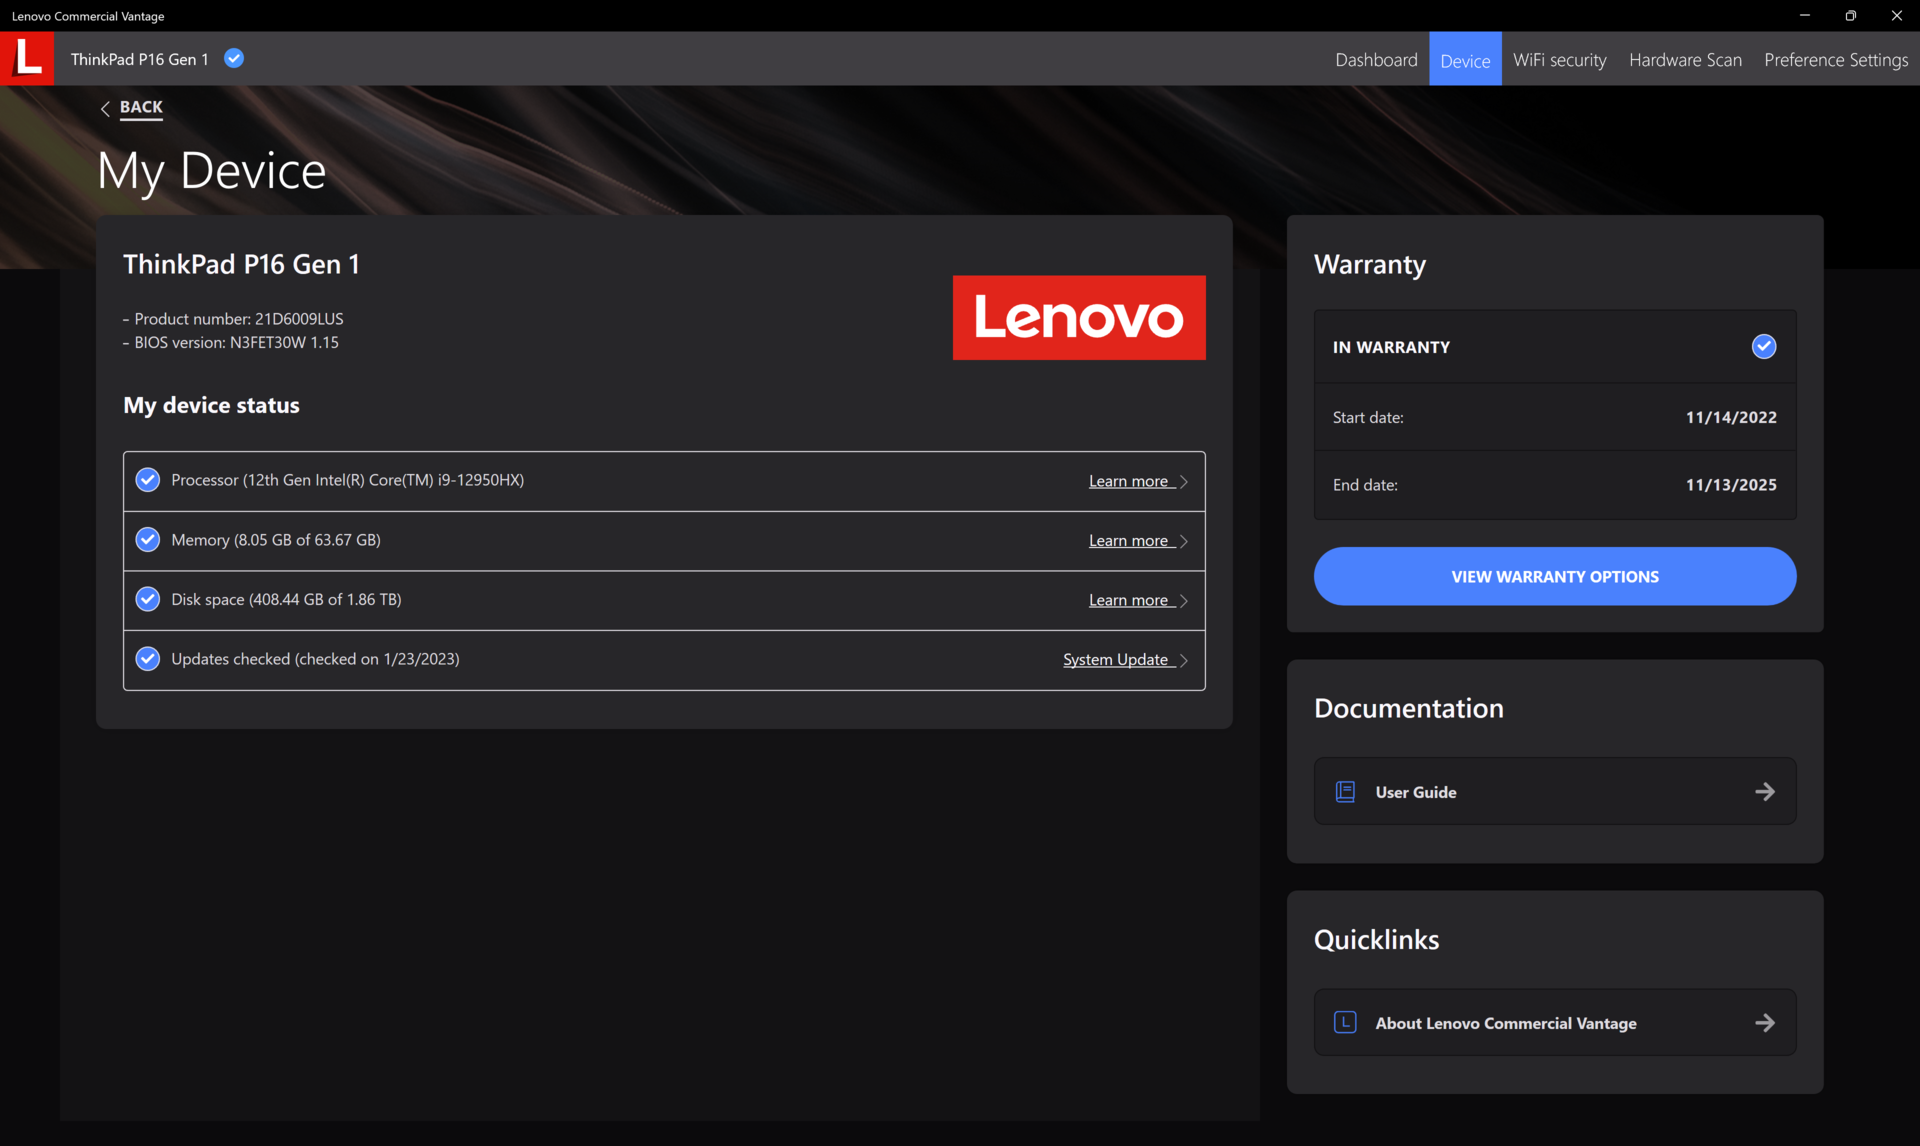
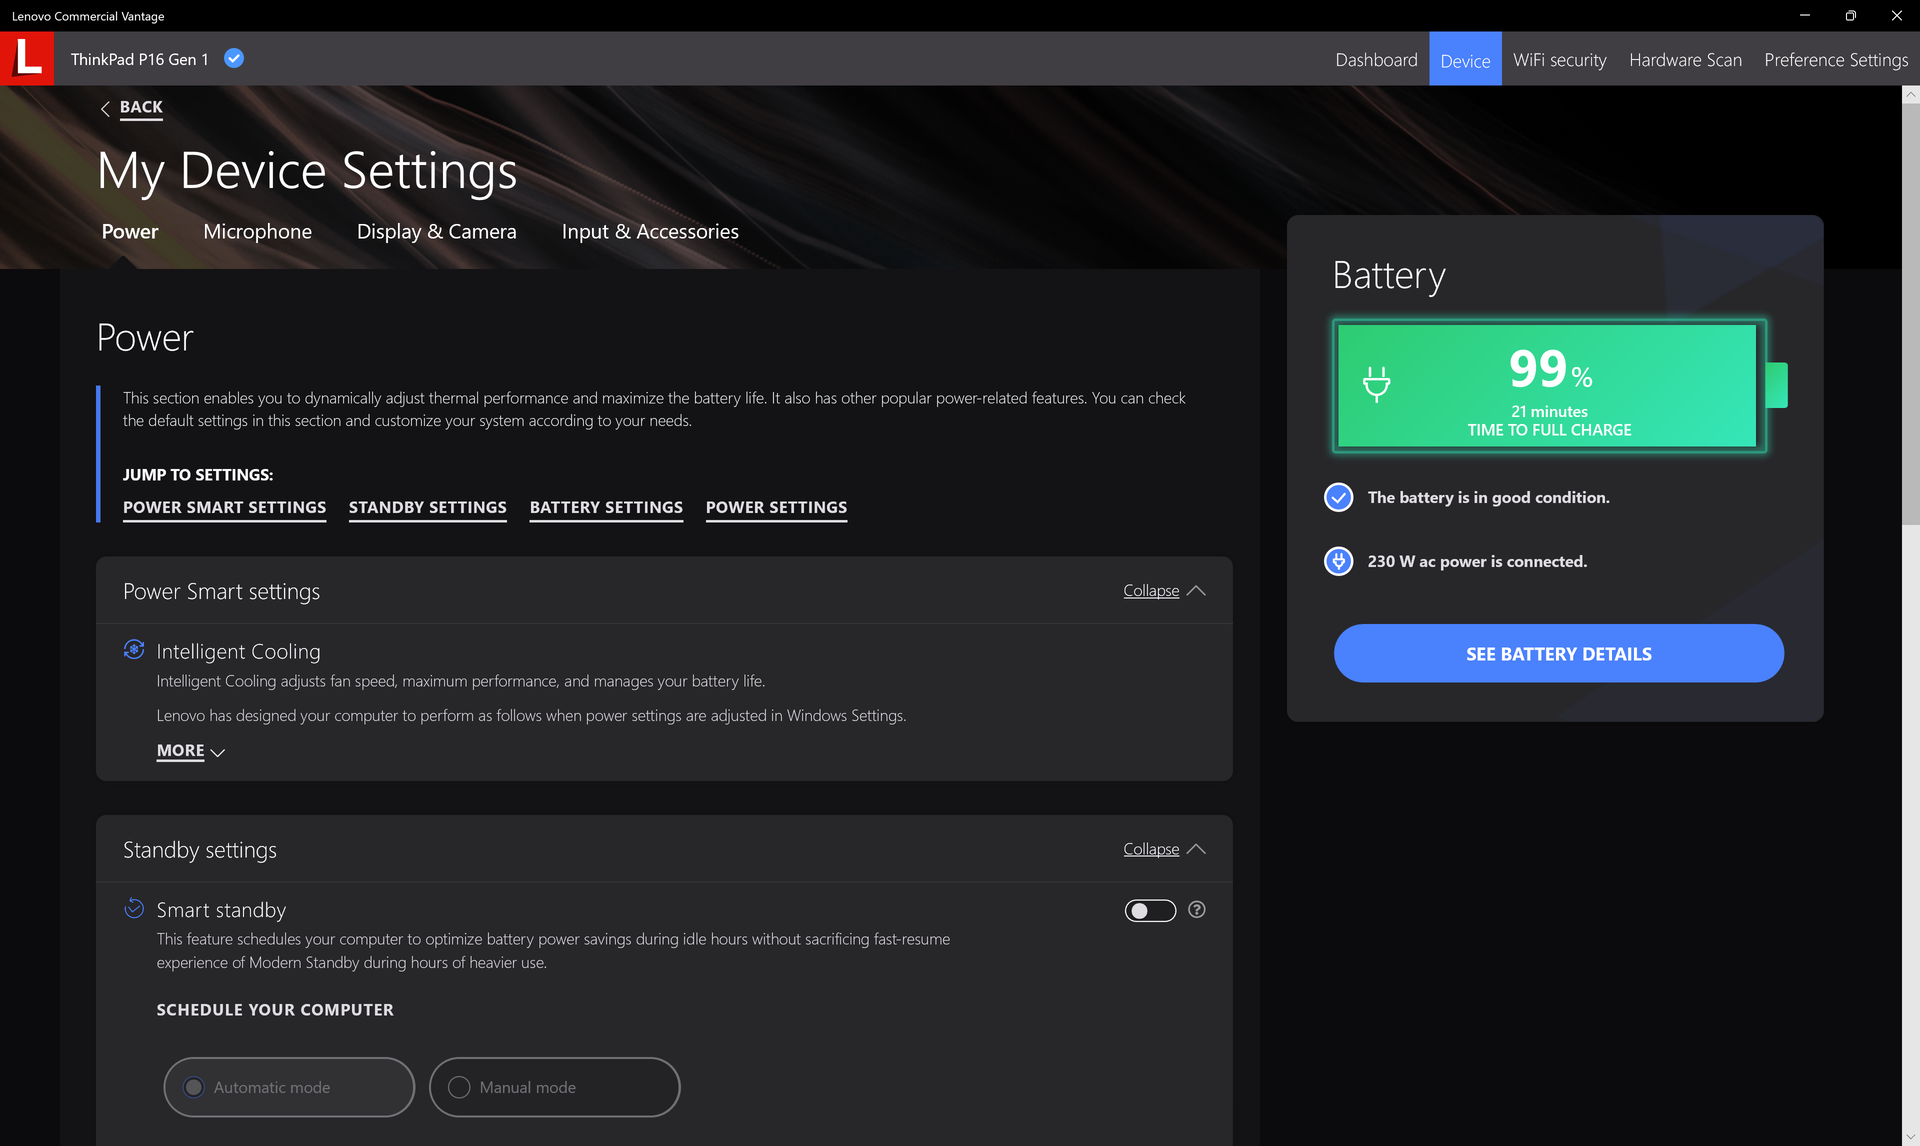
Przed przeprowadzeniem poniższych testów wydajnościowych ustawiliśmy nasz komputer w trybie Performance i dGPU, odpowiednio przez system Windows i panel sterowania Nvidia. Zaleca się, aby użytkownicy zapoznali się z preinstalowanym oprogramowaniem Lenovo Vantage, ponieważ jest ono centralnym punktem aktualizacji BIOS-u, funkcji, statusu gwarancji i innych informacji.
Nie ma opcji procesorów Xeon, więc pamięć RAM ECC nie jest obsługiwana. Stan ECC dla GPU można jednak włączyć lub wyłączyć za pośrednictwem panelu sterowania Nvidii.
Procesor
Surowa wydajność wielowątkowa jest o około 10 procent szybsza niż w przypadku Core i9-12900H w konkurencyjnym MSI CreatorPro Z16P. Modernizacja zCore i7-12850HX do naszej konfiguracji Core i9-12950HX zwiększy wydajność o 15 procent. Być może najbardziej zauważalne jest to, że Precision 7670 jest o około 15 do 20 procent wolniejszy, mimo że posiada ten sam procesor Core i9-12950HX, co nasze Lenovo.
Stabilność Turbo Boost jest dobra, ale nie idealna. Na przykład w pętli CineBench R15 xT oryginalny wynik 3141 punktów spadłby z czasem do ~2830 punktów, co oznacza spadek wydajności o 10 procent.
Cinebench R15 Multi Loop
Cinebench R23: Multi Core | Single Core
Cinebench R20: CPU (Multi Core) | CPU (Single Core)
Cinebench R15: CPU Multi 64Bit | CPU Single 64Bit
Blender: v2.79 BMW27 CPU
7-Zip 18.03: 7z b 4 | 7z b 4 -mmt1
Geekbench 5.5: Multi-Core | Single-Core
HWBOT x265 Benchmark v2.2: 4k Preset
LibreOffice : 20 Documents To PDF
R Benchmark 2.5: Overall mean
| CPU Performance rating | |
| Intel NUC13 Raptor Canyon | |
| Lenovo Legion 7 16IAX7-82TD004SGE | |
| Lenovo ThinkPad P16 G1 RTX A5500 | |
| Przeciętny Intel Core i9-12950HX | |
| MSI Creator Z16P B12UHST | |
| Lenovo ThinkPad P16 G1 21D6001DMB | |
| HP ZBook Studio 16 G9 62U04EA | |
| Dell Precision 7000 7670 Performance | |
| MSI CreatorPro Z16P B12UKST | |
| Dell Precision 5000 5470 | |
| MSI WE76 11UM-456 -1! | |
| HP ZBook Studio 15 G8 | |
| Asus ProArt StudioBook 16 W7600H5A-2BL2 | |
| HP ZBook Fury 15 G8 -2! | |
| HP ZBook Studio G7 | |
| Cinebench R23 / Multi Core | |
| Intel NUC13 Raptor Canyon | |
| Lenovo Legion 7 16IAX7-82TD004SGE | |
| Lenovo ThinkPad P16 G1 RTX A5500 | |
| Przeciętny Intel Core i9-12950HX (16277 - 23113, n=7) | |
| MSI Creator Z16P B12UHST | |
| Lenovo ThinkPad P16 G1 21D6001DMB | |
| MSI CreatorPro Z16P B12UKST | |
| HP ZBook Studio 16 G9 62U04EA | |
| Dell Precision 7000 7670 Performance | |
| MSI WE76 11UM-456 | |
| Dell Precision 5000 5470 | |
| HP ZBook Fury 15 G8 | |
| HP ZBook Studio 15 G8 | |
| Asus ProArt StudioBook 16 W7600H5A-2BL2 | |
| HP ZBook Studio G7 | |
| Cinebench R23 / Single Core | |
| Intel NUC13 Raptor Canyon | |
| Lenovo Legion 7 16IAX7-82TD004SGE | |
| MSI Creator Z16P B12UHST | |
| Lenovo ThinkPad P16 G1 RTX A5500 | |
| HP ZBook Studio 16 G9 62U04EA | |
| Lenovo ThinkPad P16 G1 21D6001DMB | |
| Przeciętny Intel Core i9-12950HX (1465 - 1922, n=7) | |
| Dell Precision 5000 5470 | |
| MSI CreatorPro Z16P B12UKST | |
| MSI WE76 11UM-456 | |
| HP ZBook Fury 15 G8 | |
| HP ZBook Studio 15 G8 | |
| Asus ProArt StudioBook 16 W7600H5A-2BL2 | |
| Dell Precision 7000 7670 Performance | |
| HP ZBook Studio G7 | |
| Cinebench R20 / CPU (Multi Core) | |
| Intel NUC13 Raptor Canyon | |
| Lenovo Legion 7 16IAX7-82TD004SGE | |
| Lenovo ThinkPad P16 G1 RTX A5500 | |
| Przeciętny Intel Core i9-12950HX (6625 - 8777, n=7) | |
| MSI Creator Z16P B12UHST | |
| Lenovo ThinkPad P16 G1 21D6001DMB | |
| MSI CreatorPro Z16P B12UKST | |
| Dell Precision 7000 7670 Performance | |
| HP ZBook Studio 16 G9 62U04EA | |
| HP ZBook Fury 15 G8 | |
| HP ZBook Studio 15 G8 | |
| Dell Precision 5000 5470 | |
| MSI WE76 11UM-456 | |
| Asus ProArt StudioBook 16 W7600H5A-2BL2 | |
| HP ZBook Studio G7 | |
| Cinebench R20 / CPU (Single Core) | |
| Intel NUC13 Raptor Canyon | |
| Lenovo Legion 7 16IAX7-82TD004SGE | |
| MSI Creator Z16P B12UHST | |
| Przeciętny Intel Core i9-12950HX (703 - 741, n=7) | |
| Lenovo ThinkPad P16 G1 RTX A5500 | |
| HP ZBook Studio 16 G9 62U04EA | |
| Lenovo ThinkPad P16 G1 21D6001DMB | |
| Dell Precision 7000 7670 Performance | |
| Dell Precision 5000 5470 | |
| MSI CreatorPro Z16P B12UKST | |
| MSI WE76 11UM-456 | |
| HP ZBook Fury 15 G8 | |
| HP ZBook Studio 15 G8 | |
| Asus ProArt StudioBook 16 W7600H5A-2BL2 | |
| HP ZBook Studio G7 | |
| Cinebench R15 / CPU Multi 64Bit | |
| Intel NUC13 Raptor Canyon | |
| Lenovo Legion 7 16IAX7-82TD004SGE | |
| Lenovo ThinkPad P16 G1 RTX A5500 | |
| Przeciętny Intel Core i9-12950HX (2464 - 3530, n=7) | |
| Lenovo ThinkPad P16 G1 21D6001DMB | |
| MSI Creator Z16P B12UHST | |
| Dell Precision 7000 7670 Performance | |
| HP ZBook Studio 16 G9 62U04EA | |
| Dell Precision 5000 5470 | |
| MSI CreatorPro Z16P B12UKST | |
| MSI WE76 11UM-456 | |
| Asus ProArt StudioBook 16 W7600H5A-2BL2 | |
| HP ZBook Studio 15 G8 | |
| HP ZBook Fury 15 G8 | |
| HP ZBook Studio G7 | |
| Cinebench R15 / CPU Single 64Bit | |
| Intel NUC13 Raptor Canyon | |
| Lenovo Legion 7 16IAX7-82TD004SGE | |
| MSI Creator Z16P B12UHST | |
| Lenovo ThinkPad P16 G1 RTX A5500 | |
| HP ZBook Studio 16 G9 62U04EA | |
| Lenovo ThinkPad P16 G1 21D6001DMB | |
| Dell Precision 7000 7670 Performance | |
| Przeciętny Intel Core i9-12950HX (167 - 276, n=7) | |
| Dell Precision 5000 5470 | |
| MSI WE76 11UM-456 | |
| HP ZBook Fury 15 G8 | |
| MSI CreatorPro Z16P B12UKST | |
| HP ZBook Studio 15 G8 | |
| Asus ProArt StudioBook 16 W7600H5A-2BL2 | |
| HP ZBook Studio G7 | |
| Blender / v2.79 BMW27 CPU | |
| HP ZBook Studio G7 | |
| Asus ProArt StudioBook 16 W7600H5A-2BL2 | |
| HP ZBook Fury 15 G8 | |
| HP ZBook Studio 15 G8 | |
| Dell Precision 5000 5470 | |
| MSI CreatorPro Z16P B12UKST | |
| Dell Precision 7000 7670 Performance | |
| HP ZBook Studio 16 G9 62U04EA | |
| MSI Creator Z16P B12UHST | |
| Lenovo ThinkPad P16 G1 21D6001DMB | |
| Przeciętny Intel Core i9-12950HX (138 - 193, n=7) | |
| Lenovo ThinkPad P16 G1 RTX A5500 | |
| Lenovo Legion 7 16IAX7-82TD004SGE | |
| Intel NUC13 Raptor Canyon | |
| 7-Zip 18.03 / 7z b 4 | |
| Intel NUC13 Raptor Canyon | |
| Lenovo Legion 7 16IAX7-82TD004SGE | |
| Lenovo ThinkPad P16 G1 RTX A5500 | |
| Przeciętny Intel Core i9-12950HX (65637 - 85019, n=7) | |
| MSI Creator Z16P B12UHST | |
| Lenovo ThinkPad P16 G1 21D6001DMB | |
| HP ZBook Studio 16 G9 62U04EA | |
| MSI CreatorPro Z16P B12UKST | |
| Dell Precision 7000 7670 Performance | |
| MSI WE76 11UM-456 | |
| Dell Precision 5000 5470 | |
| HP ZBook Fury 15 G8 | |
| HP ZBook Studio 15 G8 | |
| Asus ProArt StudioBook 16 W7600H5A-2BL2 | |
| HP ZBook Studio G7 | |
| 7-Zip 18.03 / 7z b 4 -mmt1 | |
| Intel NUC13 Raptor Canyon | |
| Lenovo Legion 7 16IAX7-82TD004SGE | |
| Przeciętny Intel Core i9-12950HX (6022 - 6318, n=7) | |
| Lenovo ThinkPad P16 G1 RTX A5500 | |
| MSI Creator Z16P B12UHST | |
| Dell Precision 7000 7670 Performance | |
| HP ZBook Studio 16 G9 62U04EA | |
| Lenovo ThinkPad P16 G1 21D6001DMB | |
| HP ZBook Studio 15 G8 | |
| MSI CreatorPro Z16P B12UKST | |
| HP ZBook Fury 15 G8 | |
| MSI WE76 11UM-456 | |
| HP ZBook Studio G7 | |
| Dell Precision 5000 5470 | |
| Asus ProArt StudioBook 16 W7600H5A-2BL2 | |
| Geekbench 5.5 / Multi-Core | |
| Intel NUC13 Raptor Canyon | |
| Lenovo Legion 7 16IAX7-82TD004SGE | |
| Lenovo ThinkPad P16 G1 RTX A5500 | |
| Przeciętny Intel Core i9-12950HX (14028 - 16009, n=7) | |
| MSI Creator Z16P B12UHST | |
| Dell Precision 7000 7670 Performance | |
| Lenovo ThinkPad P16 G1 21D6001DMB | |
| HP ZBook Studio 16 G9 62U04EA | |
| Dell Precision 5000 5470 | |
| MSI CreatorPro Z16P B12UKST | |
| MSI WE76 11UM-456 | |
| Asus ProArt StudioBook 16 W7600H5A-2BL2 | |
| HP ZBook Studio G7 | |
| HP ZBook Studio 15 G8 | |
| Geekbench 5.5 / Single-Core | |
| Intel NUC13 Raptor Canyon | |
| Lenovo ThinkPad P16 G1 RTX A5500 | |
| Dell Precision 7000 7670 Performance | |
| Przeciętny Intel Core i9-12950HX (1847 - 1945, n=7) | |
| MSI Creator Z16P B12UHST | |
| Lenovo Legion 7 16IAX7-82TD004SGE | |
| HP ZBook Studio 16 G9 62U04EA | |
| Dell Precision 5000 5470 | |
| MSI CreatorPro Z16P B12UKST | |
| Lenovo ThinkPad P16 G1 21D6001DMB | |
| HP ZBook Studio 15 G8 | |
| MSI WE76 11UM-456 | |
| Asus ProArt StudioBook 16 W7600H5A-2BL2 | |
| HP ZBook Studio G7 | |
| HWBOT x265 Benchmark v2.2 / 4k Preset | |
| Intel NUC13 Raptor Canyon | |
| Lenovo Legion 7 16IAX7-82TD004SGE | |
| Lenovo ThinkPad P16 G1 RTX A5500 | |
| Przeciętny Intel Core i9-12950HX (18.6 - 26.5, n=7) | |
| HP ZBook Studio 16 G9 62U04EA | |
| MSI CreatorPro Z16P B12UKST | |
| MSI Creator Z16P B12UHST | |
| Dell Precision 7000 7670 Performance | |
| Lenovo ThinkPad P16 G1 21D6001DMB | |
| MSI WE76 11UM-456 | |
| HP ZBook Studio 15 G8 | |
| HP ZBook Fury 15 G8 | |
| Asus ProArt StudioBook 16 W7600H5A-2BL2 | |
| Dell Precision 5000 5470 | |
| HP ZBook Studio G7 | |
| LibreOffice / 20 Documents To PDF | |
| HP ZBook Studio G7 | |
| HP ZBook Fury 15 G8 | |
| HP ZBook Studio 15 G8 | |
| MSI WE76 11UM-456 | |
| Lenovo ThinkPad P16 G1 21D6001DMB | |
| Dell Precision 5000 5470 | |
| Dell Precision 7000 7670 Performance | |
| HP ZBook Studio 16 G9 62U04EA | |
| Intel NUC13 Raptor Canyon | |
| Przeciętny Intel Core i9-12950HX (34.7 - 45.4, n=7) | |
| Lenovo ThinkPad P16 G1 RTX A5500 | |
| MSI Creator Z16P B12UHST | |
| MSI CreatorPro Z16P B12UKST | |
| Lenovo Legion 7 16IAX7-82TD004SGE | |
| Asus ProArt StudioBook 16 W7600H5A-2BL2 | |
| R Benchmark 2.5 / Overall mean | |
| Asus ProArt StudioBook 16 W7600H5A-2BL2 | |
| HP ZBook Studio G7 | |
| HP ZBook Studio 15 G8 | |
| MSI WE76 11UM-456 | |
| HP ZBook Fury 15 G8 | |
| Dell Precision 5000 5470 | |
| MSI CreatorPro Z16P B12UKST | |
| Lenovo ThinkPad P16 G1 21D6001DMB | |
| Dell Precision 7000 7670 Performance | |
| HP ZBook Studio 16 G9 62U04EA | |
| Lenovo ThinkPad P16 G1 RTX A5500 | |
| Przeciętny Intel Core i9-12950HX (0.4251 - 0.4515, n=7) | |
| MSI Creator Z16P B12UHST | |
| Lenovo Legion 7 16IAX7-82TD004SGE | |
| Intel NUC13 Raptor Canyon | |
Cinebench R23: Multi Core | Single Core
Cinebench R20: CPU (Multi Core) | CPU (Single Core)
Cinebench R15: CPU Multi 64Bit | CPU Single 64Bit
Blender: v2.79 BMW27 CPU
7-Zip 18.03: 7z b 4 | 7z b 4 -mmt1
Geekbench 5.5: Multi-Core | Single-Core
HWBOT x265 Benchmark v2.2: 4k Preset
LibreOffice : 20 Documents To PDF
R Benchmark 2.5: Overall mean
* ... im mniej tym lepiej
AIDA64: FP32 Ray-Trace | FPU Julia | CPU SHA3 | CPU Queen | FPU SinJulia | FPU Mandel | CPU AES | CPU ZLib | FP64 Ray-Trace | CPU PhotoWorxx
| Performance rating | |
| Przeciętny Intel Core i9-12950HX | |
| Lenovo ThinkPad P16 G1 RTX A5500 | |
| Lenovo ThinkPad P16 G1 21D6001DMB | |
| MSI CreatorPro Z16P B12UKST | |
| HP ZBook Studio 16 G9 62U04EA | |
| Dell Precision 7000 7670 Performance | |
| Asus ProArt StudioBook 16 W7600H5A-2BL2 -9! | |
| AIDA64 / FP32 Ray-Trace | |
| Lenovo ThinkPad P16 G1 RTX A5500 | |
| Przeciętny Intel Core i9-12950HX (15499 - 22868, n=7) | |
| Lenovo ThinkPad P16 G1 21D6001DMB | |
| Dell Precision 7000 7670 Performance | |
| HP ZBook Studio 16 G9 62U04EA | |
| MSI CreatorPro Z16P B12UKST | |
| AIDA64 / FPU Julia | |
| Lenovo ThinkPad P16 G1 RTX A5500 | |
| Przeciętny Intel Core i9-12950HX (77846 - 115907, n=7) | |
| Lenovo ThinkPad P16 G1 21D6001DMB | |
| HP ZBook Studio 16 G9 62U04EA | |
| Dell Precision 7000 7670 Performance | |
| MSI CreatorPro Z16P B12UKST | |
| AIDA64 / CPU SHA3 | |
| Lenovo ThinkPad P16 G1 RTX A5500 | |
| Przeciętny Intel Core i9-12950HX (3426 - 5069, n=7) | |
| Lenovo ThinkPad P16 G1 21D6001DMB | |
| HP ZBook Studio 16 G9 62U04EA | |
| MSI CreatorPro Z16P B12UKST | |
| Dell Precision 7000 7670 Performance | |
| AIDA64 / CPU Queen | |
| HP ZBook Studio 16 G9 62U04EA | |
| Przeciętny Intel Core i9-12950HX (102752 - 104726, n=7) | |
| Lenovo ThinkPad P16 G1 RTX A5500 | |
| Dell Precision 7000 7670 Performance | |
| MSI CreatorPro Z16P B12UKST | |
| Lenovo ThinkPad P16 G1 21D6001DMB | |
| AIDA64 / FPU SinJulia | |
| Lenovo ThinkPad P16 G1 RTX A5500 | |
| Przeciętny Intel Core i9-12950HX (10134 - 12823, n=7) | |
| Lenovo ThinkPad P16 G1 21D6001DMB | |
| Dell Precision 7000 7670 Performance | |
| HP ZBook Studio 16 G9 62U04EA | |
| MSI CreatorPro Z16P B12UKST | |
| AIDA64 / FPU Mandel | |
| Lenovo ThinkPad P16 G1 RTX A5500 | |
| Przeciętny Intel Core i9-12950HX (37146 - 57340, n=7) | |
| Lenovo ThinkPad P16 G1 21D6001DMB | |
| HP ZBook Studio 16 G9 62U04EA | |
| Dell Precision 7000 7670 Performance | |
| MSI CreatorPro Z16P B12UKST | |
| AIDA64 / CPU AES | |
| MSI CreatorPro Z16P B12UKST | |
| Przeciętny Intel Core i9-12950HX (72599 - 181128, n=7) | |
| Lenovo ThinkPad P16 G1 RTX A5500 | |
| Lenovo ThinkPad P16 G1 21D6001DMB | |
| HP ZBook Studio 16 G9 62U04EA | |
| Dell Precision 7000 7670 Performance | |
| AIDA64 / CPU ZLib | |
| Lenovo ThinkPad P16 G1 RTX A5500 | |
| Przeciętny Intel Core i9-12950HX (996 - 1417, n=7) | |
| Lenovo ThinkPad P16 G1 21D6001DMB | |
| HP ZBook Studio 16 G9 62U04EA | |
| MSI CreatorPro Z16P B12UKST | |
| Dell Precision 7000 7670 Performance | |
| Asus ProArt StudioBook 16 W7600H5A-2BL2 | |
| Asus ProArt StudioBook 16 W7600H5A-2BL2 | |
| AIDA64 / FP64 Ray-Trace | |
| Lenovo ThinkPad P16 G1 RTX A5500 | |
| Przeciętny Intel Core i9-12950HX (8455 - 12432, n=7) | |
| Lenovo ThinkPad P16 G1 21D6001DMB | |
| HP ZBook Studio 16 G9 62U04EA | |
| Dell Precision 7000 7670 Performance | |
| MSI CreatorPro Z16P B12UKST | |
| AIDA64 / CPU PhotoWorxx | |
| MSI CreatorPro Z16P B12UKST | |
| Dell Precision 7000 7670 Performance | |
| Przeciętny Intel Core i9-12950HX (35479 - 42655, n=7) | |
| Lenovo ThinkPad P16 G1 RTX A5500 | |
| HP ZBook Studio 16 G9 62U04EA | |
| Lenovo ThinkPad P16 G1 21D6001DMB | |
Wydajność systemu
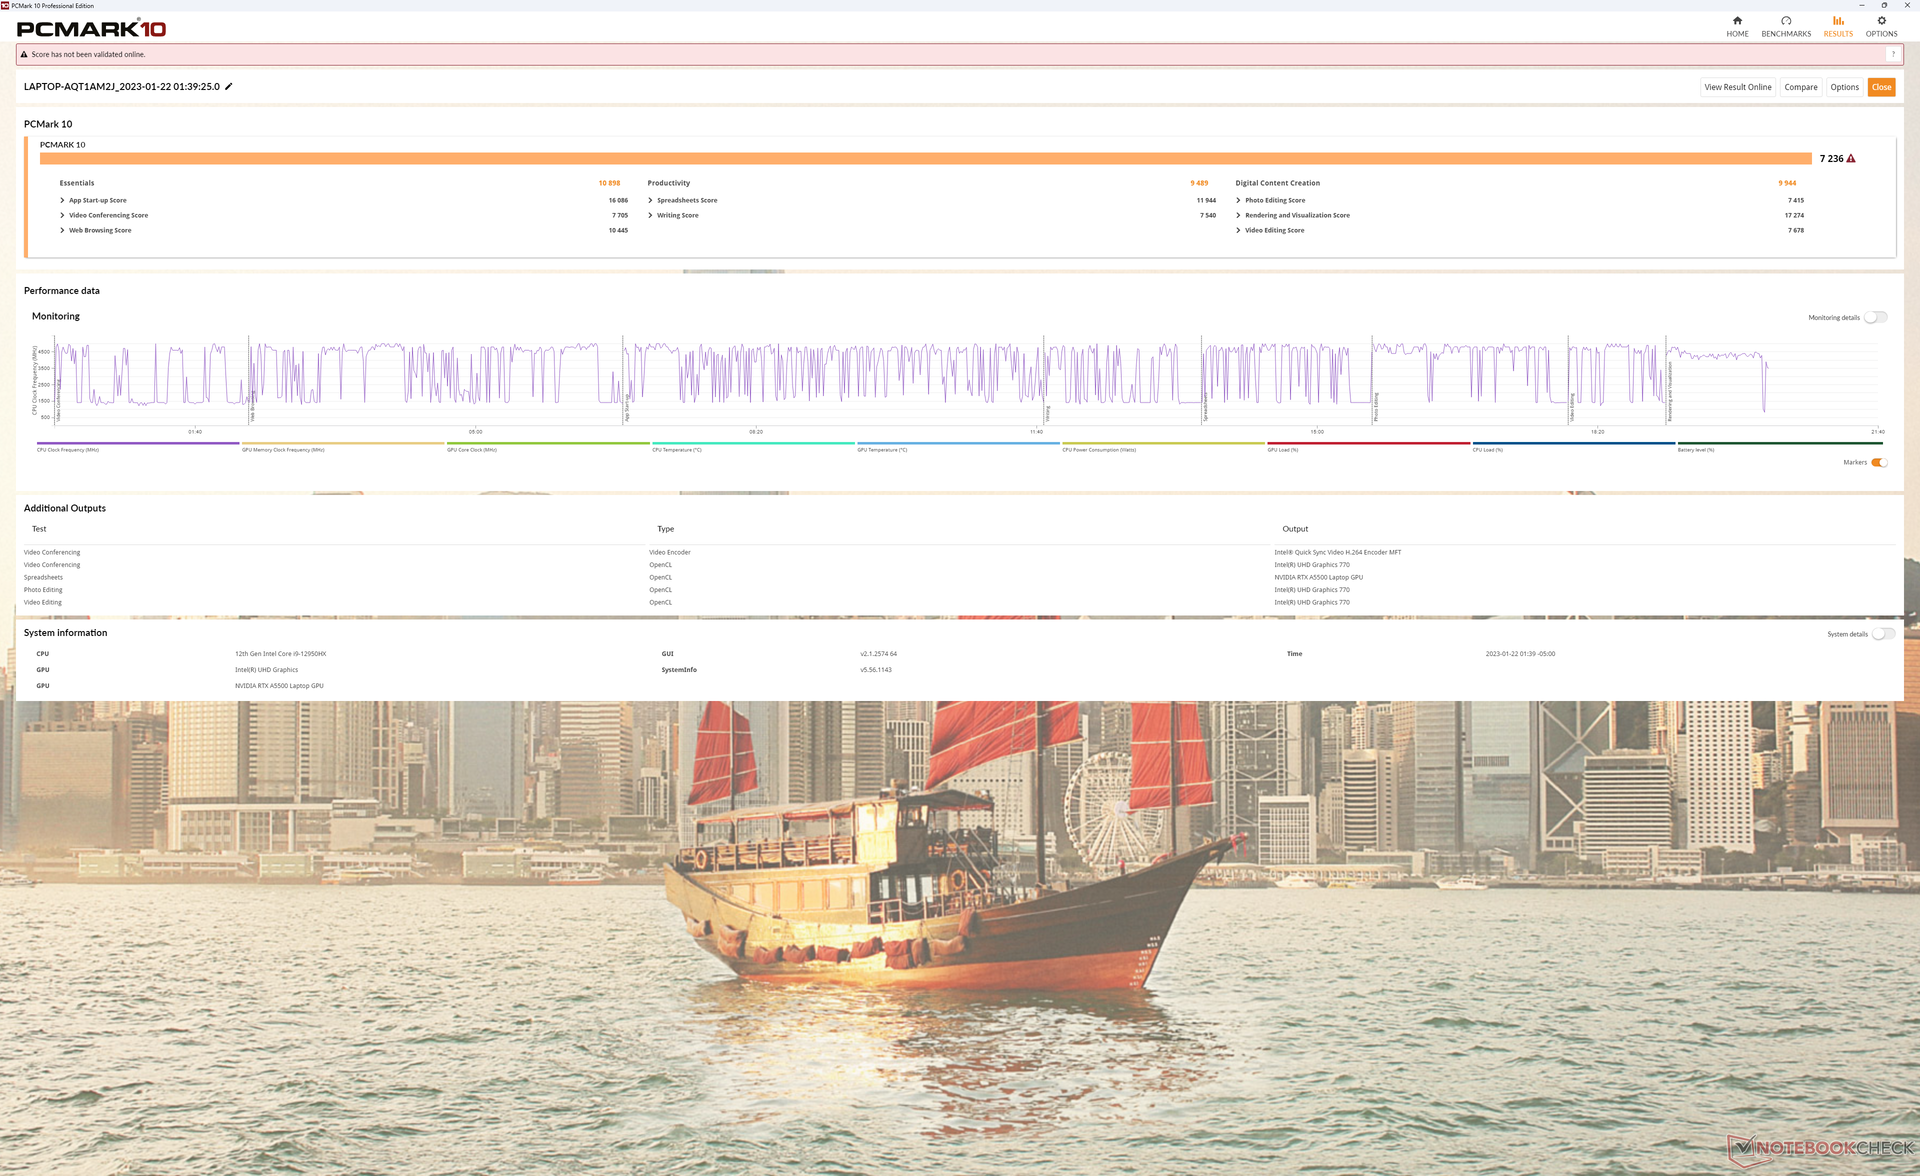
Wyniki PCMark są jednymi z najwyższych, jakie widzieliśmy na jakiejkolwiek mobilnej stacji roboczej. Nasz system wyprzedza nawet Dell Precision 7670 który posiada te same opcje CPU i GPU co ThinkPad P16 G1.
CrossMark: Overall | Productivity | Creativity | Responsiveness
| PCMark 10 / Score | |
| Lenovo ThinkPad P16 G1 RTX A5500 | |
| MSI CreatorPro Z16P B12UKST | |
| Przeciętny Intel Core i9-12950HX, NVIDIA RTX A5500 Laptop GPU (6883 - 7236, n=3) | |
| Asus ProArt StudioBook 16 W7600H5A-2BL2 | |
| Dell Precision 7000 7670 Performance | |
| HP ZBook Studio 16 G9 62U04EA | |
| Lenovo ThinkPad P16 G1 21D6001DMB | |
| PCMark 10 / Essentials | |
| Dell Precision 7000 7670 Performance | |
| Przeciętny Intel Core i9-12950HX, NVIDIA RTX A5500 Laptop GPU (10898 - 11465, n=3) | |
| Lenovo ThinkPad P16 G1 RTX A5500 | |
| MSI CreatorPro Z16P B12UKST | |
| Asus ProArt StudioBook 16 W7600H5A-2BL2 | |
| Lenovo ThinkPad P16 G1 21D6001DMB | |
| HP ZBook Studio 16 G9 62U04EA | |
| PCMark 10 / Productivity | |
| Lenovo ThinkPad P16 G1 RTX A5500 | |
| MSI CreatorPro Z16P B12UKST | |
| Lenovo ThinkPad P16 G1 21D6001DMB | |
| Asus ProArt StudioBook 16 W7600H5A-2BL2 | |
| Przeciętny Intel Core i9-12950HX, NVIDIA RTX A5500 Laptop GPU (8054 - 9489, n=3) | |
| Dell Precision 7000 7670 Performance | |
| HP ZBook Studio 16 G9 62U04EA | |
| PCMark 10 / Digital Content Creation | |
| Asus ProArt StudioBook 16 W7600H5A-2BL2 | |
| Lenovo ThinkPad P16 G1 RTX A5500 | |
| MSI CreatorPro Z16P B12UKST | |
| Dell Precision 7000 7670 Performance | |
| Przeciętny Intel Core i9-12950HX, NVIDIA RTX A5500 Laptop GPU (9155 - 9944, n=3) | |
| HP ZBook Studio 16 G9 62U04EA | |
| Lenovo ThinkPad P16 G1 21D6001DMB | |
| CrossMark / Overall | |
| MSI CreatorPro Z16P B12UKST | |
| Lenovo ThinkPad P16 G1 RTX A5500 | |
| Przeciętny Intel Core i9-12950HX, NVIDIA RTX A5500 Laptop GPU (1801 - 1889, n=3) | |
| HP ZBook Studio 16 G9 62U04EA | |
| Dell Precision 7000 7670 Performance | |
| Lenovo ThinkPad P16 G1 21D6001DMB | |
| CrossMark / Productivity | |
| MSI CreatorPro Z16P B12UKST | |
| Lenovo ThinkPad P16 G1 RTX A5500 | |
| Przeciętny Intel Core i9-12950HX, NVIDIA RTX A5500 Laptop GPU (1684 - 1785, n=3) | |
| HP ZBook Studio 16 G9 62U04EA | |
| Dell Precision 7000 7670 Performance | |
| Lenovo ThinkPad P16 G1 21D6001DMB | |
| CrossMark / Creativity | |
| Lenovo ThinkPad P16 G1 RTX A5500 | |
| Przeciętny Intel Core i9-12950HX, NVIDIA RTX A5500 Laptop GPU (2042 - 2192, n=3) | |
| HP ZBook Studio 16 G9 62U04EA | |
| MSI CreatorPro Z16P B12UKST | |
| Dell Precision 7000 7670 Performance | |
| Lenovo ThinkPad P16 G1 21D6001DMB | |
| CrossMark / Responsiveness | |
| MSI CreatorPro Z16P B12UKST | |
| HP ZBook Studio 16 G9 62U04EA | |
| Przeciętny Intel Core i9-12950HX, NVIDIA RTX A5500 Laptop GPU (1501 - 1585, n=3) | |
| Dell Precision 7000 7670 Performance | |
| Lenovo ThinkPad P16 G1 RTX A5500 | |
| Lenovo ThinkPad P16 G1 21D6001DMB | |
| PCMark 10 Score | 7236 pkt. | |
Pomoc | ||
| AIDA64 / Memory Copy | |
| Dell Precision 7000 7670 Performance | |
| Przeciętny Intel Core i9-12950HX (59731 - 64732, n=7) | |
| Lenovo ThinkPad P16 G1 RTX A5500 | |
| MSI CreatorPro Z16P B12UKST | |
| HP ZBook Studio 16 G9 62U04EA | |
| Lenovo ThinkPad P16 G1 21D6001DMB | |
| AIDA64 / Memory Read | |
| Dell Precision 7000 7670 Performance | |
| Przeciętny Intel Core i9-12950HX (59744 - 70359, n=7) | |
| MSI CreatorPro Z16P B12UKST | |
| HP ZBook Studio 16 G9 62U04EA | |
| Lenovo ThinkPad P16 G1 RTX A5500 | |
| Lenovo ThinkPad P16 G1 21D6001DMB | |
| AIDA64 / Memory Write | |
| MSI CreatorPro Z16P B12UKST | |
| Dell Precision 7000 7670 Performance | |
| HP ZBook Studio 16 G9 62U04EA | |
| Przeciętny Intel Core i9-12950HX (57750 - 67899, n=7) | |
| Lenovo ThinkPad P16 G1 RTX A5500 | |
| Lenovo ThinkPad P16 G1 21D6001DMB | |
| AIDA64 / Memory Latency | |
| Lenovo ThinkPad P16 G1 21D6001DMB | |
| MSI CreatorPro Z16P B12UKST | |
| Lenovo ThinkPad P16 G1 RTX A5500 | |
| HP ZBook Studio 16 G9 62U04EA | |
| Przeciętny Intel Core i9-12950HX (84.5 - 92.2, n=7) | |
| Dell Precision 7000 7670 Performance | |
| Asus ProArt StudioBook 16 W7600H5A-2BL2 | |
| Asus ProArt StudioBook 16 W7600H5A-2BL2 | |
* ... im mniej tym lepiej
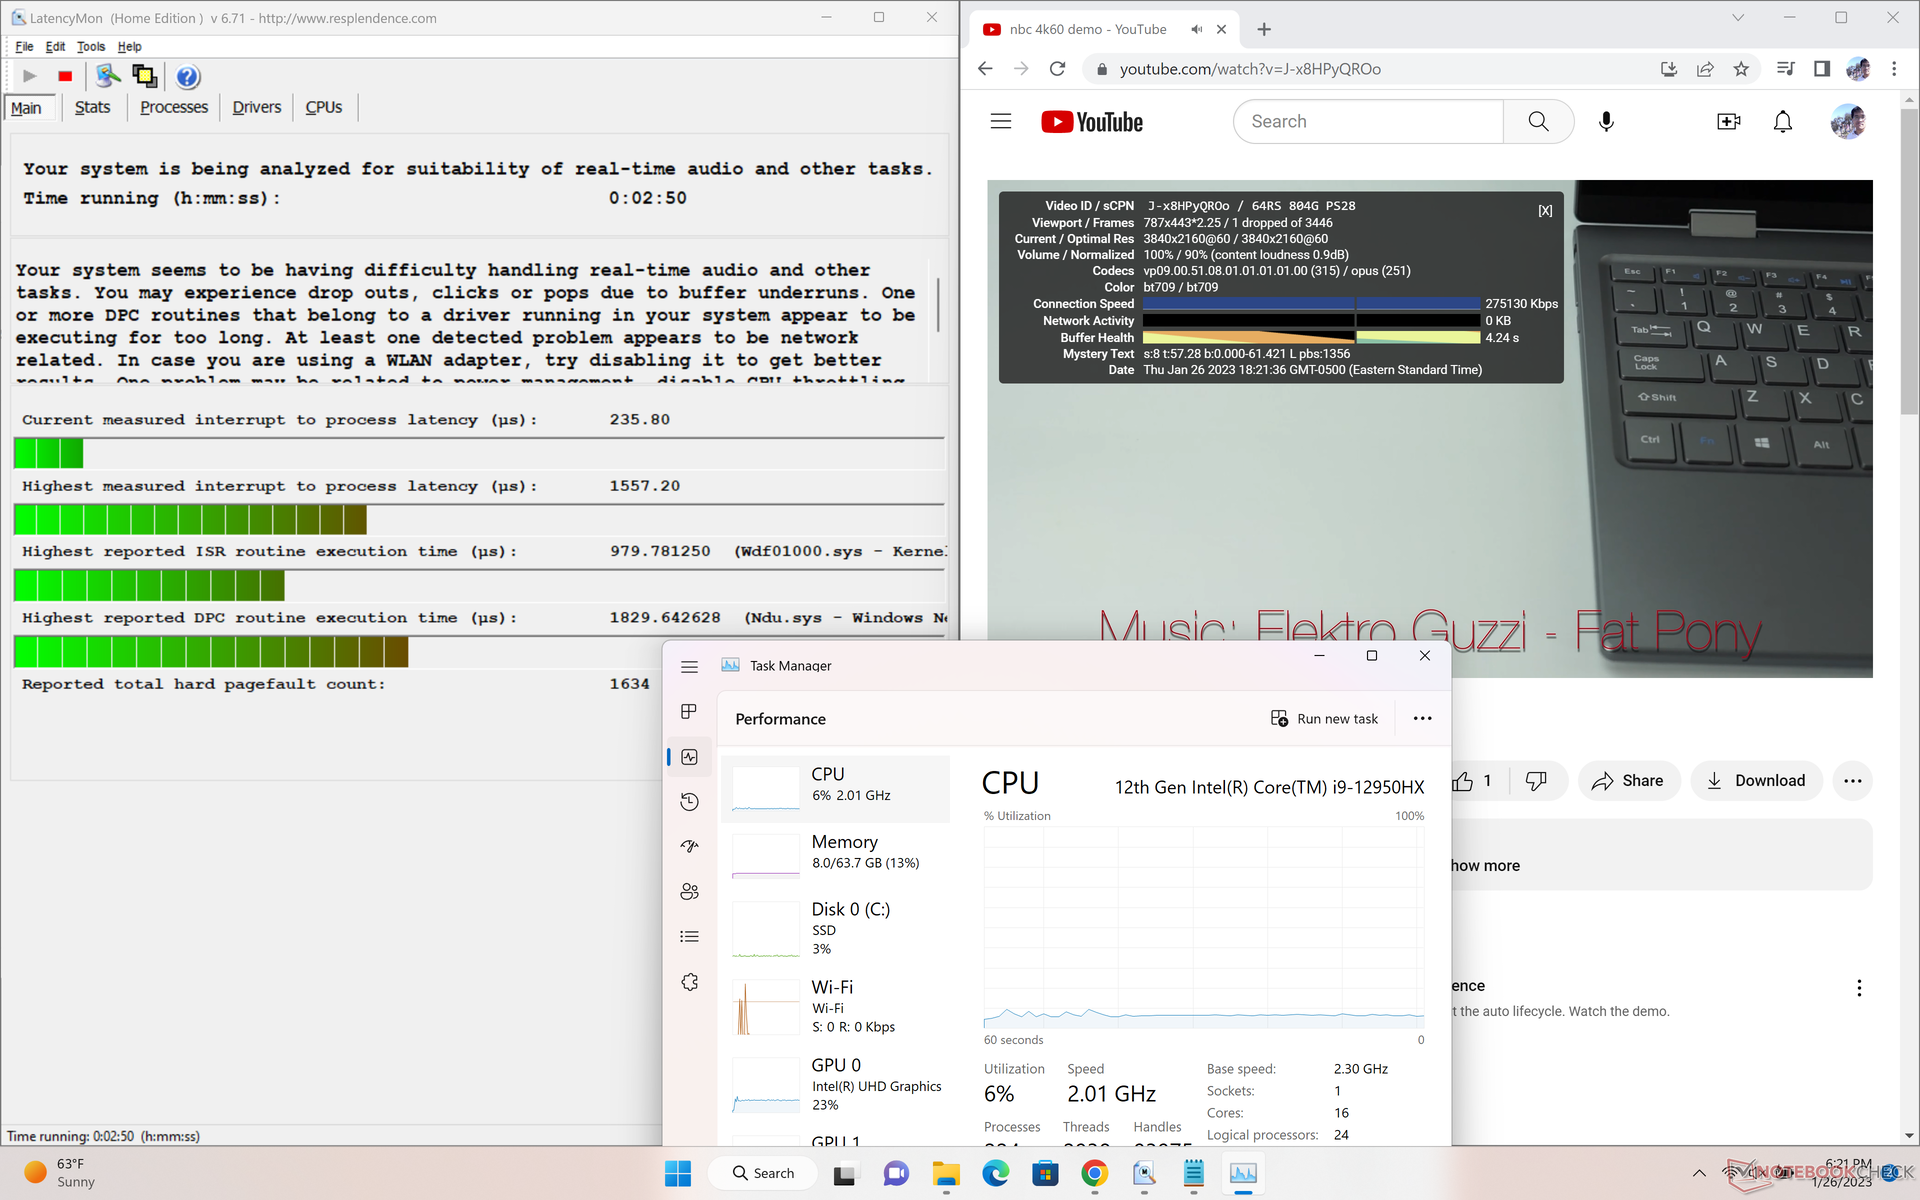
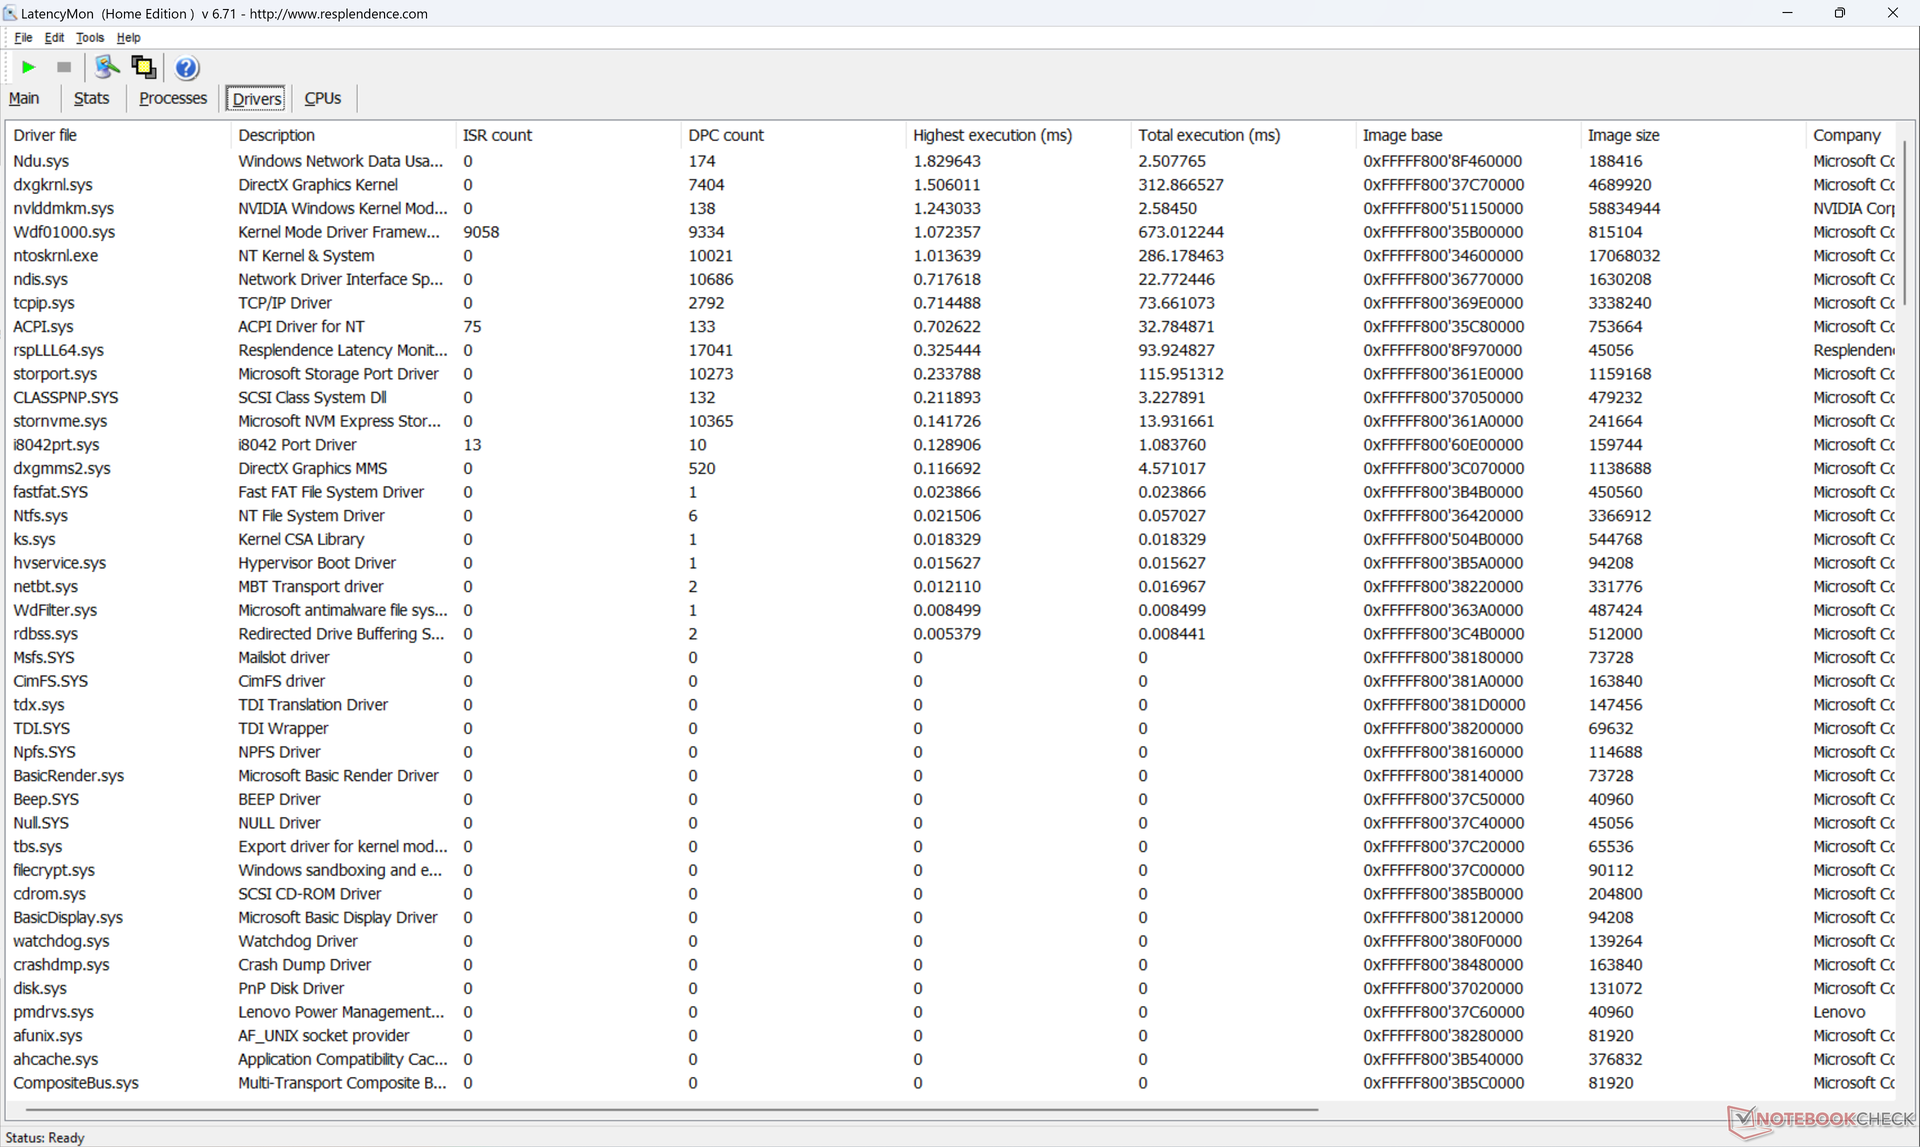
Opóźnienie DPC
LatencyMon ujawnia drobne problemy z DPC podczas otwierania wielu kart przeglądarki na naszej stronie głównej, co jest rozczarowujące dla stacji roboczej. odtwarzanie wideo 4K przy 60 FPS jest poza tym znakomite - w naszym teście pojawiła się tylko jedna klatka.
| DPC Latencies / LatencyMon - interrupt to process latency (max), Web, Youtube, Prime95 | |
| Dell Precision 7000 7670 Performance | |
| Lenovo ThinkPad P16 G1 RTX A5500 | |
| Asus ProArt StudioBook 16 W7600H5A-2BL2 | |
| Lenovo ThinkPad P16 G1 21D6001DMB | |
| HP ZBook Studio 16 G9 62U04EA | |
| MSI CreatorPro Z16P B12UKST | |
* ... im mniej tym lepiej
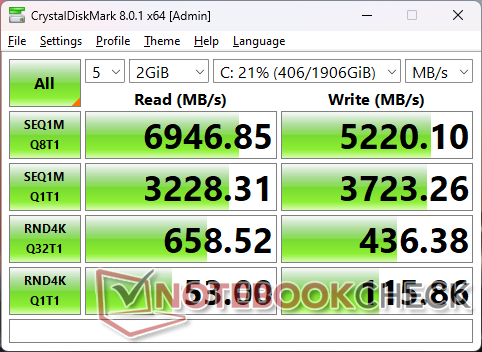
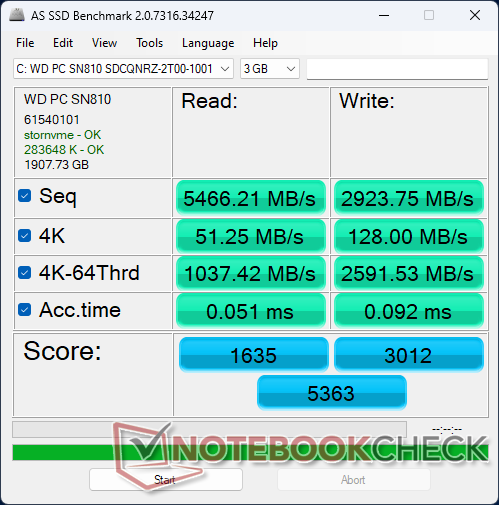
Urządzenia do przechowywania danych
Podczas gdy nasza konfiguracja A2000 jest wyposażona w dysk SSD Micron 3400, nasza konfiguracja A5500 jest wyposażona w dysk WD SN10 WD SN810 OPAL SSD. Sekwencyjne prędkości odczytu i zapisu są porównywalne między nimi, ale nasz dysk WD wydaje się mieć problemy z utrzymaniem maksymalnych prędkości transferu po około 5 minutach stresu, jak pokazuje nasz wykres porównawczy poniżej.

| Drive Performance rating - Percent | |
| MSI CreatorPro Z16P B12UKST -8! | |
| Lenovo ThinkPad P16 G1 21D6001DMB | |
| HP ZBook Studio 16 G9 62U04EA | |
| Dell Precision 7000 7670 Performance | |
| Lenovo ThinkPad P16 G1 RTX A5500 | |
| Asus ProArt StudioBook 16 W7600H5A-2BL2 | |
* ... im mniej tym lepiej
Disk Throttling: DiskSpd Read Loop, Queue Depth 8
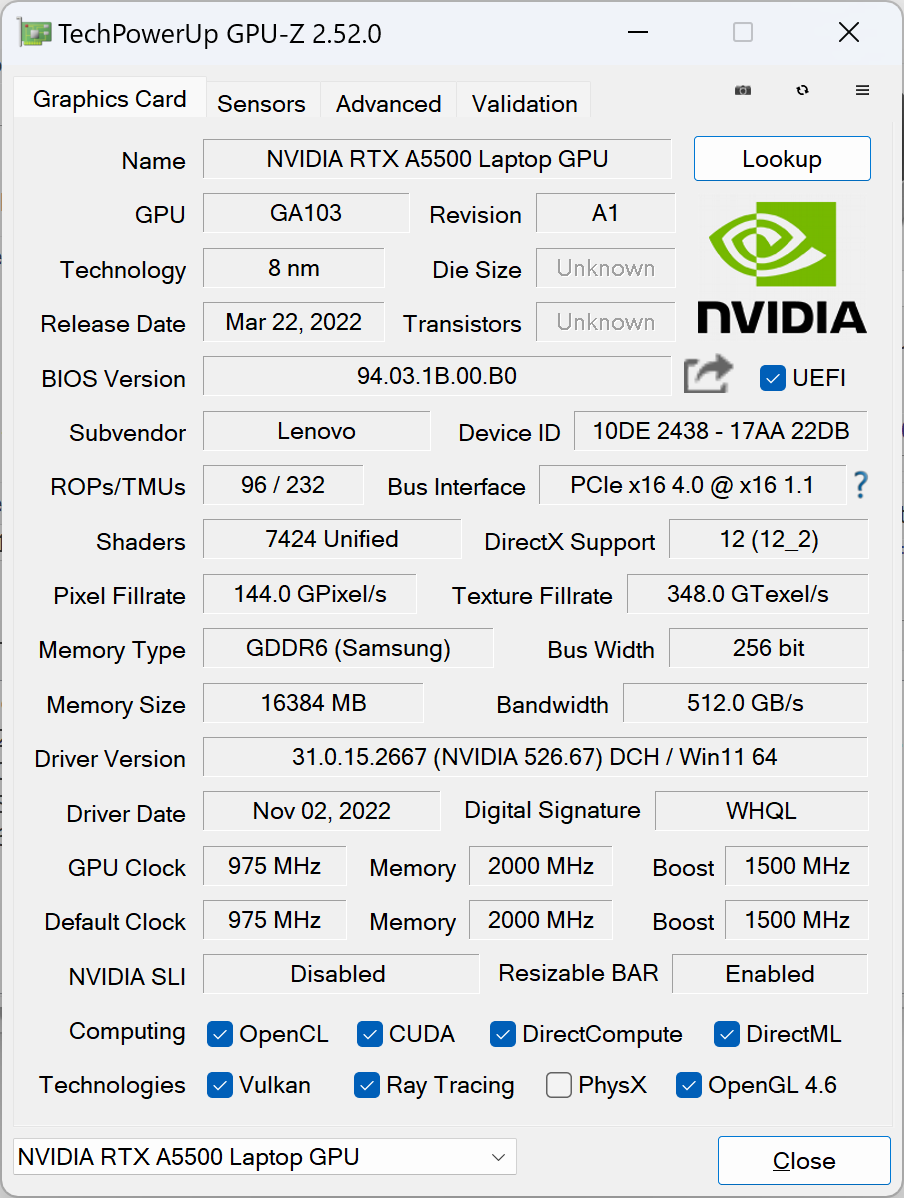
Wydajność GPU
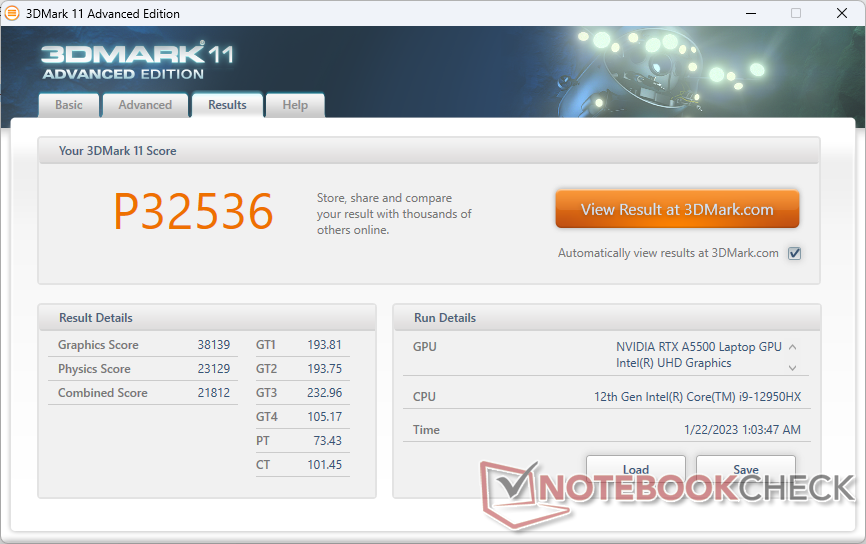
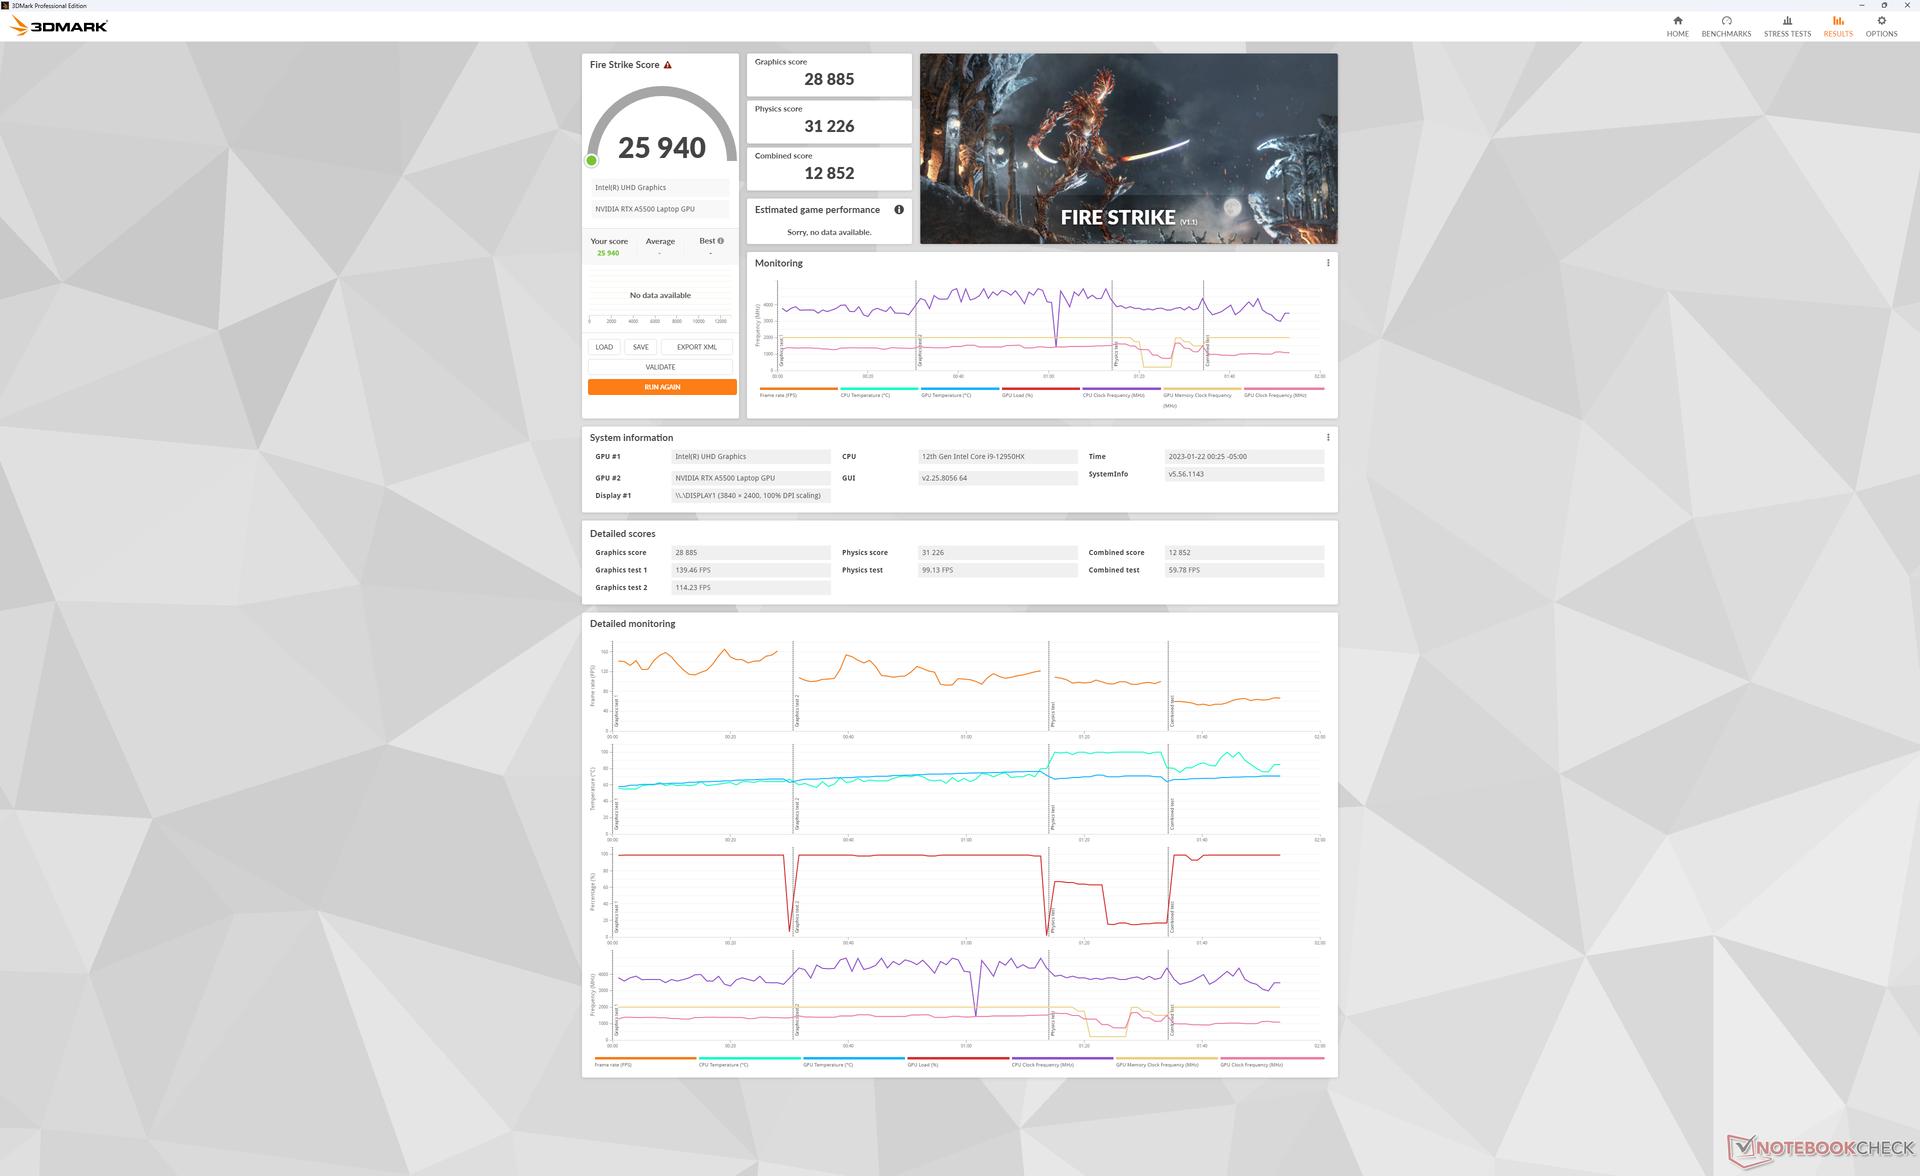
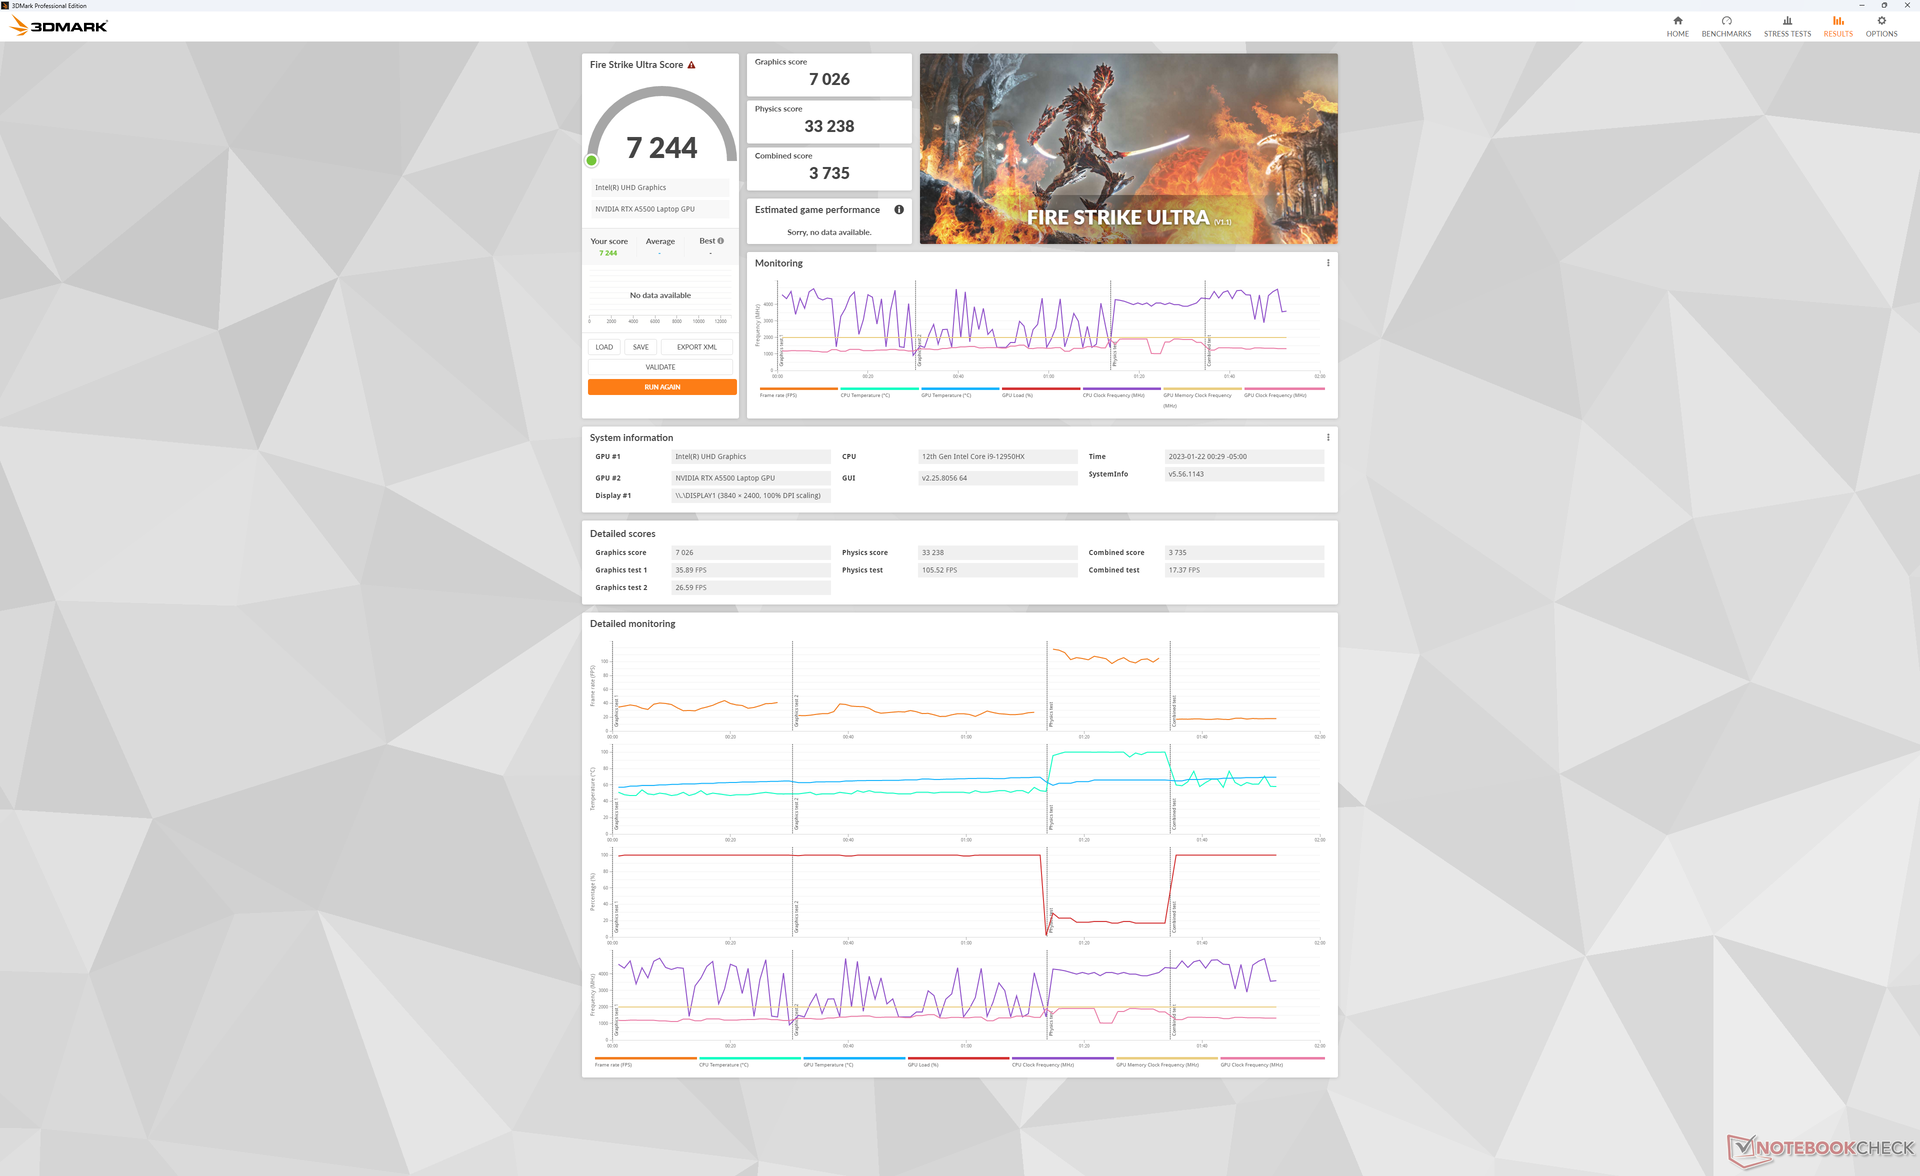
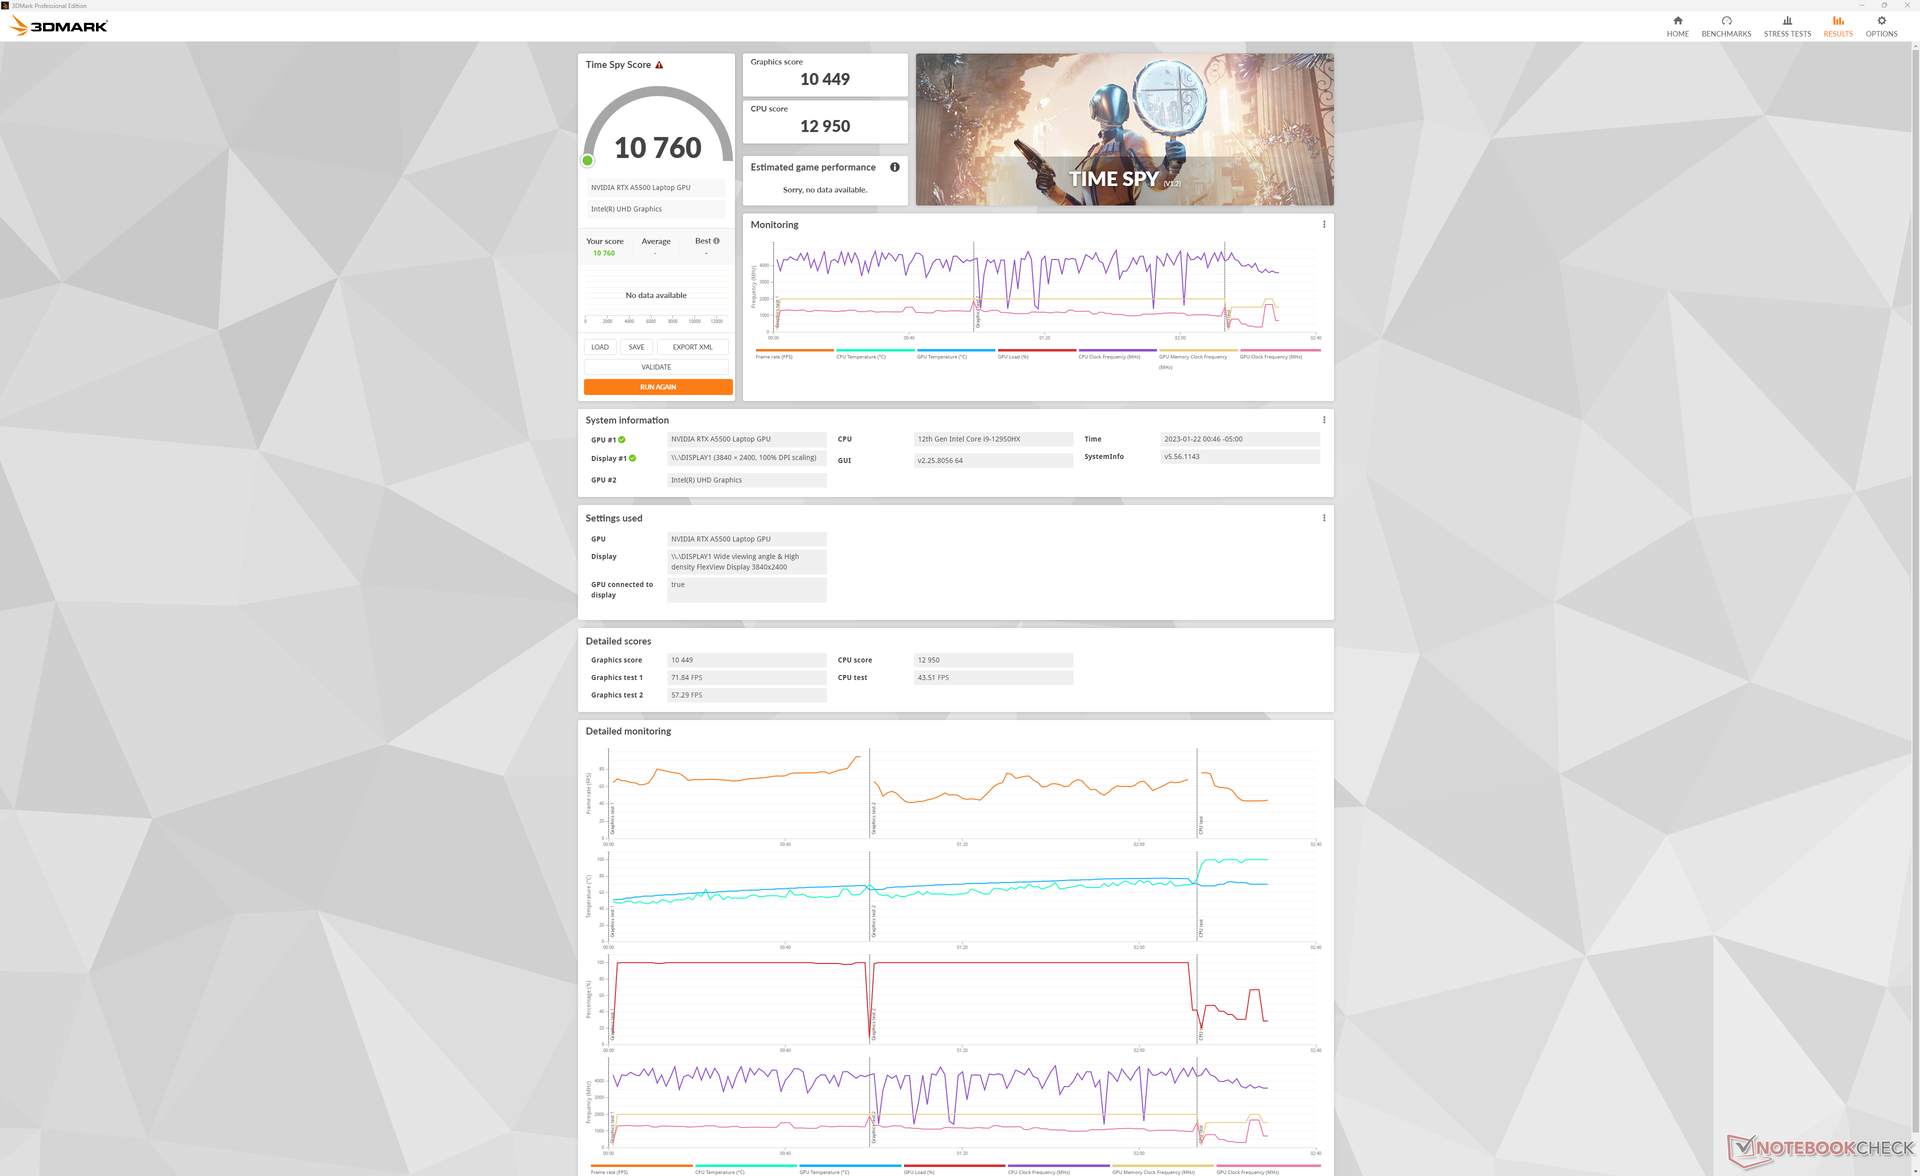
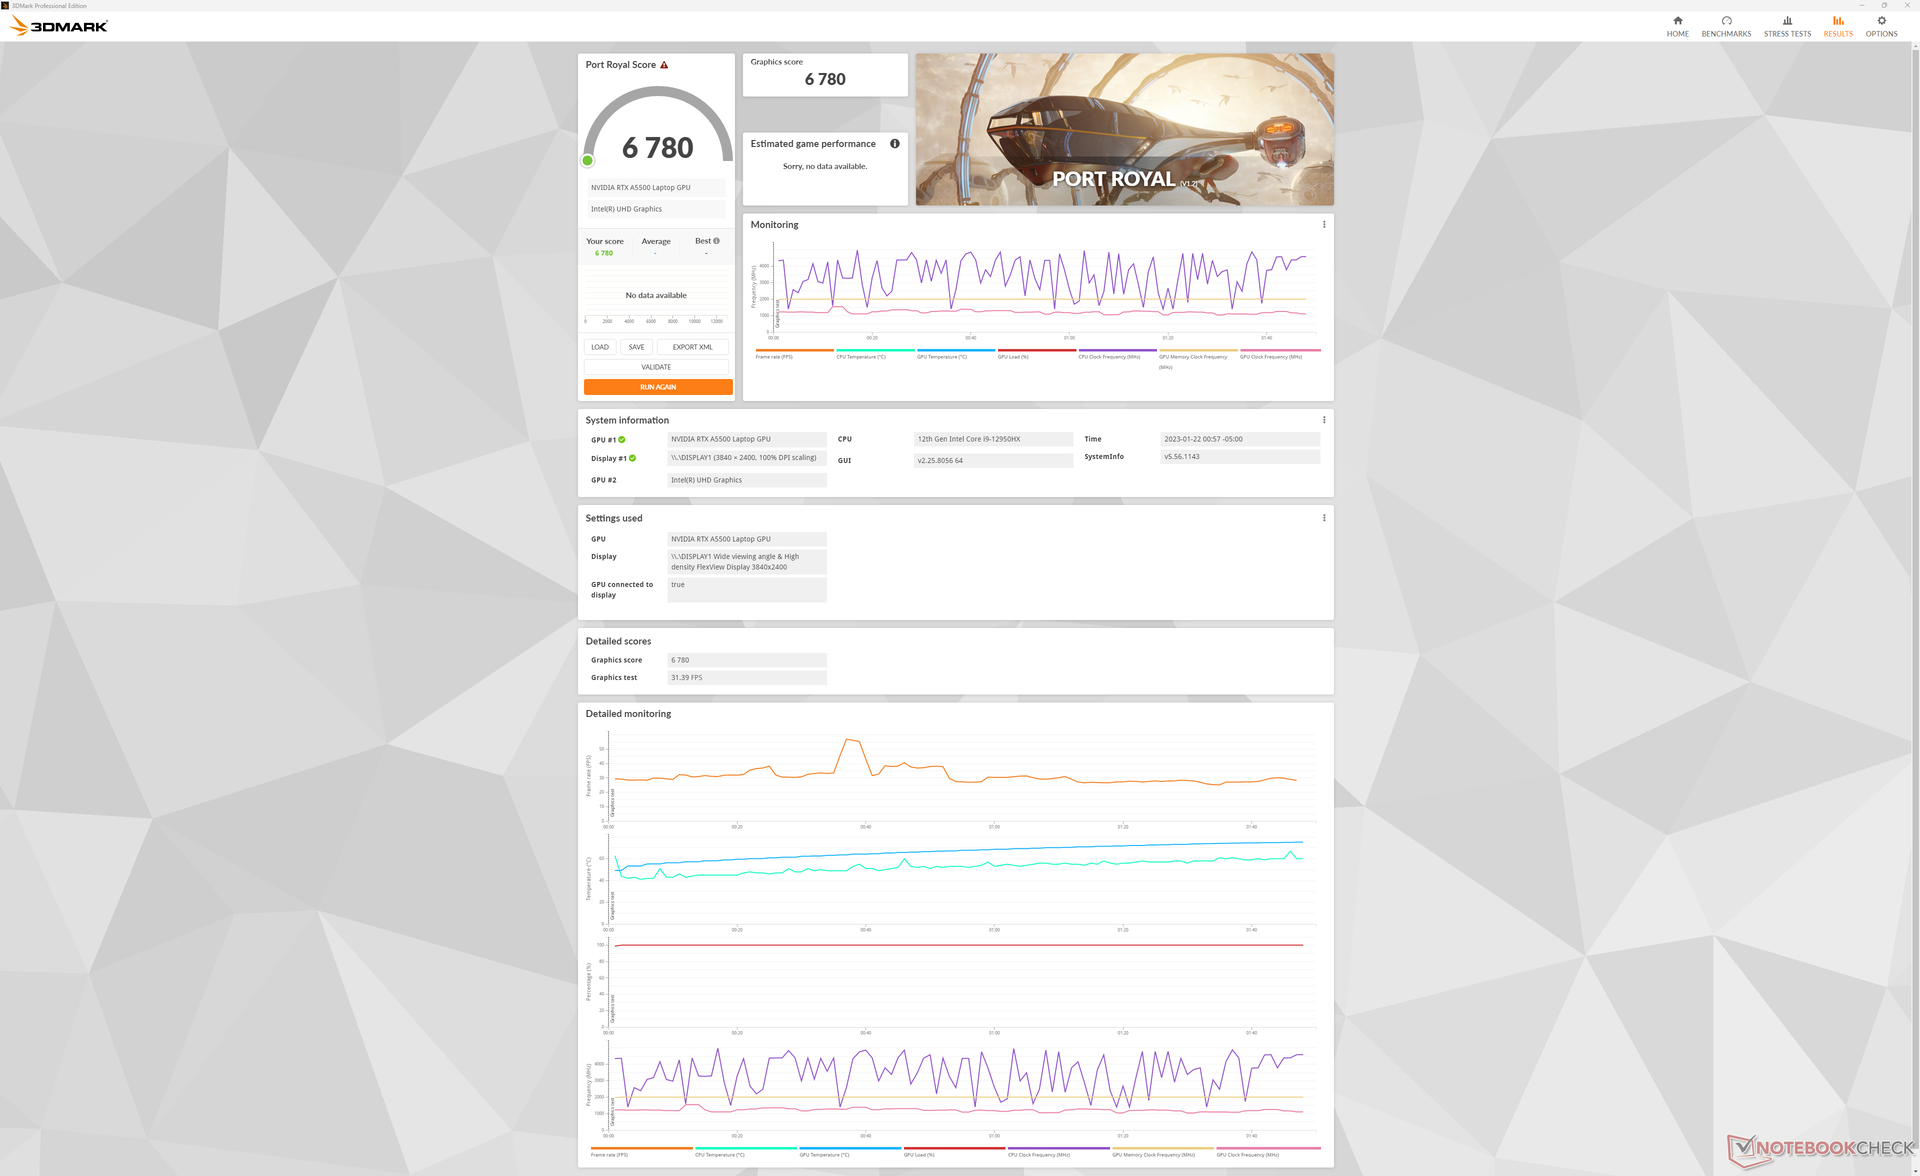
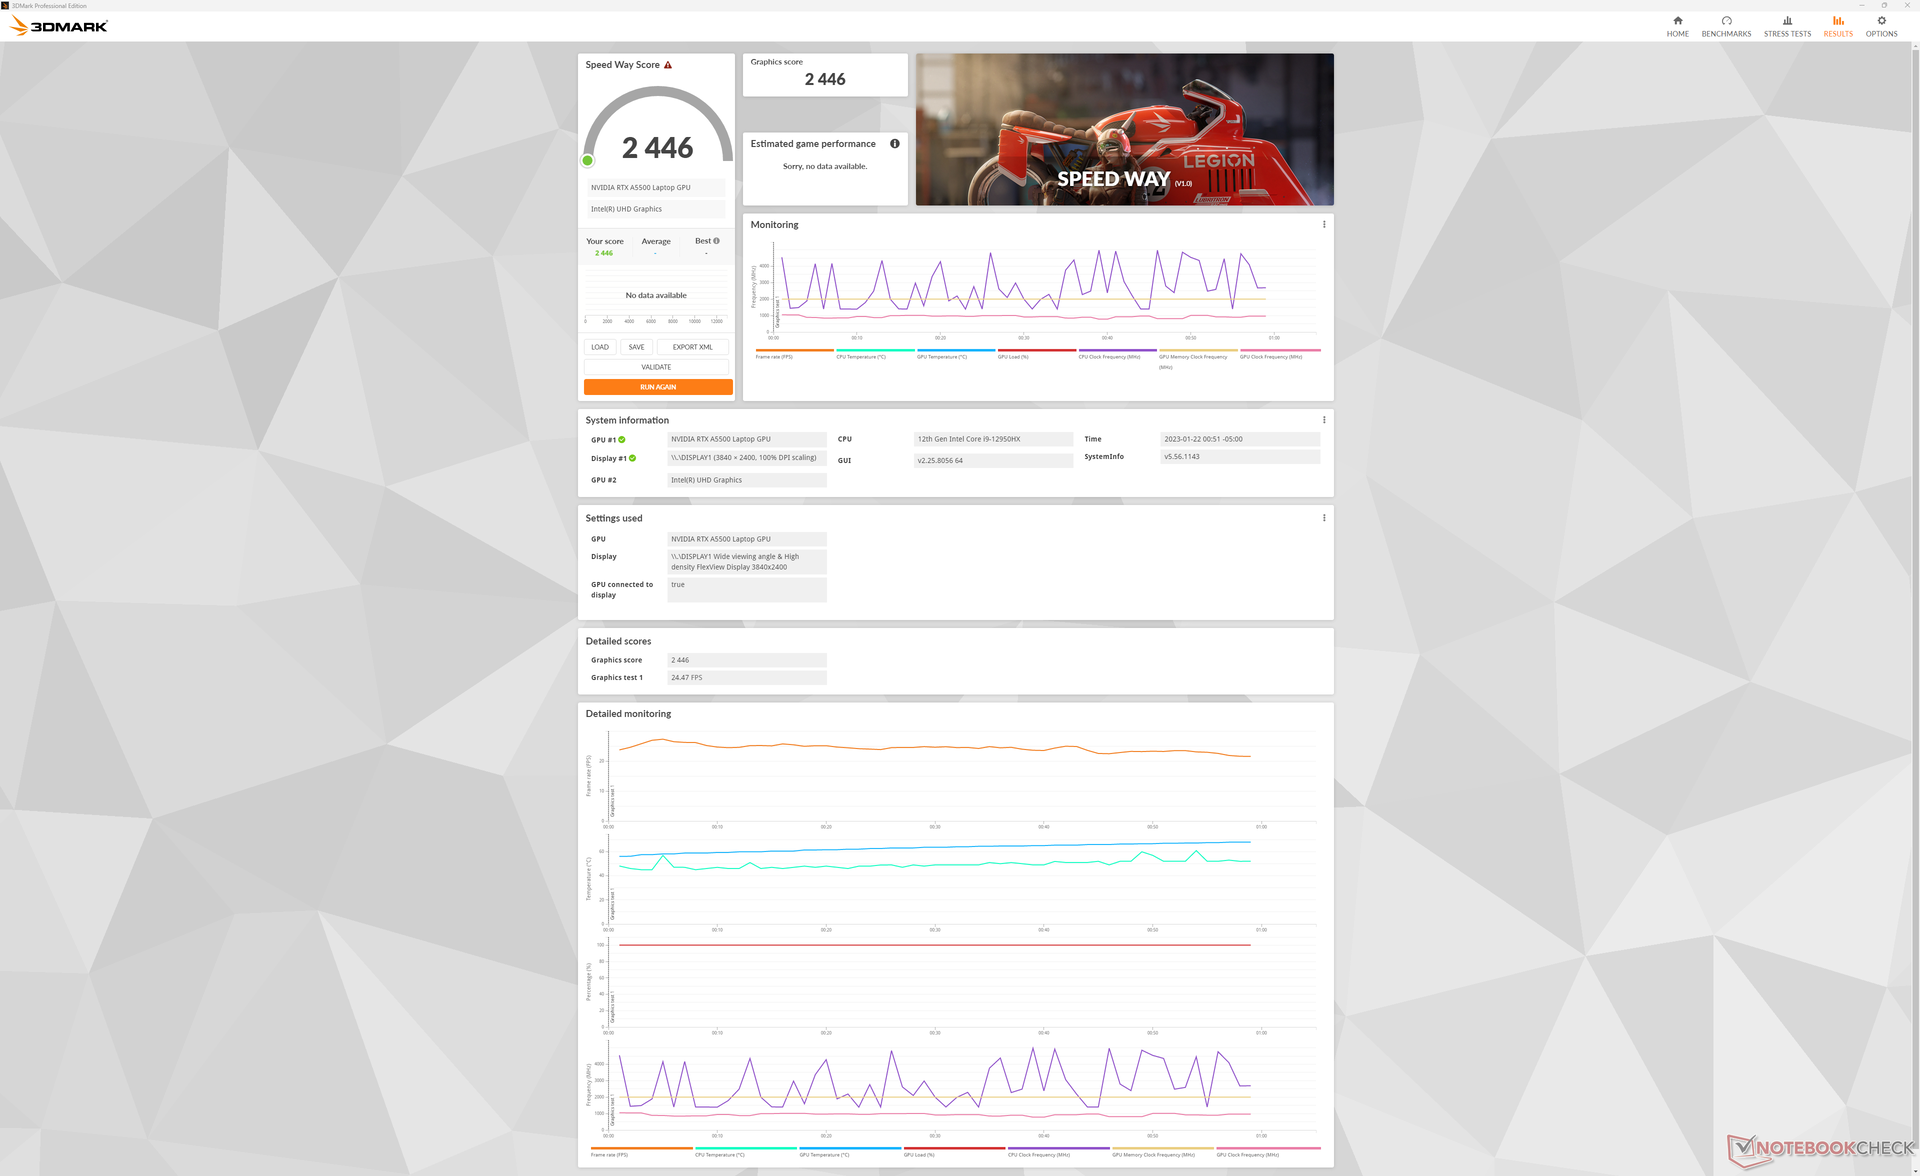
Na stronie RTX A5500 w naszym Lenovo działa około 10 procent szybciej niż ten sam procesor graficzny w konkurencyjnym Precision 7670. Dzieje się tak pomimo faktu, że według panelu kontrolnego Nvidii procesor graficzny w Dellu ma moc 135 W TGP, a w Lenovo 130 W TGP. Przechodząc do niższej klasy RTX A2000 SKU obniży wydajność grafiki nawet o 50-65%.
| 3DMark Performance rating - Percent | |
| Lenovo Legion 7 16IAX7-82TD004SGE -34! | |
| Lenovo ThinkPad P16 G1 RTX A5500 | |
| Dell Precision 7000 7670 Performance -1! | |
| Przeciętny NVIDIA RTX A5500 Laptop GPU | |
| Asus ProArt StudioBook 16 W7600H5A-2BL2 -19! | |
| MSI WE76 11UM-456 -9! | |
| HP ZBook Fury 15 G8 -1! | |
| MSI CreatorPro Z16P B12UKST -17! | |
| HP ZBook Studio 15 G8 -17! | |
| HP ZBook Studio G7 -17! | |
| HP ZBook Studio 16 G9 62U04EA -9! | |
| Dell Precision 5000 5470 -9! | |
| Lenovo ThinkPad P16 G1 21D6001DMB -17! | |
| 3DMark 11 - 1280x720 Performance GPU | |
| Lenovo Legion 7 16IAX7-82TD004SGE | |
| MSI WE76 11UM-456 | |
| Lenovo ThinkPad P16 G1 RTX A5500 | |
| Przeciętny NVIDIA RTX A5500 Laptop GPU (33715 - 38139, n=3) | |
| Dell Precision 7000 7670 Performance | |
| HP ZBook Fury 15 G8 | |
| HP ZBook Studio 15 G8 | |
| MSI CreatorPro Z16P B12UKST | |
| HP ZBook Studio 16 G9 62U04EA | |
| HP ZBook Studio G7 | |
| Lenovo ThinkPad P16 G1 21D6001DMB | |
| Dell Precision 5000 5470 | |
| 3DMark 11 Performance | 32536 pkt. | |
| 3DMark Cloud Gate Standard Score | 54323 pkt. | |
| 3DMark Fire Strike Score | 25940 pkt. | |
| 3DMark Time Spy Score | 10760 pkt. | |
Pomoc | ||
* ... im mniej tym lepiej
Witcher 3 FPS Chart
| low | med. | high | ultra | QHD | 4K | |
|---|---|---|---|---|---|---|
| GTA V (2015) | 185.9 | 183.4 | 177.7 | 124.4 | 103.5 | |
| The Witcher 3 (2015) | 489.4 | 329.9 | 211.8 | 110.4 | 63.7 | |
| Dota 2 Reborn (2015) | 194.3 | 174.5 | 166.1 | 156.3 | 132.8 | |
| Final Fantasy XV Benchmark (2018) | 212 | 142.5 | 113.1 | 83.5 | 45.4 | |
| X-Plane 11.11 (2018) | 155.8 | 137.6 | 108.8 | 93.7 | ||
| Strange Brigade (2018) | 442 | 264 | 223 | 197.7 | 138.6 | |
| Cyberpunk 2077 1.6 (2022) | 132.3 | 117.7 | 96.1 | 80.7 | 47 | 20.4 |
Emisje
Szum systemu
W domyślnym trybie zrównoważonym wentylatory pozostawały ciche przez dłuższy czas, niż można by się spodziewać, pomimo obecności w środku wydajnych procesorów. Na przykład w programie 3DMark 06 pod koniec pierwszej sceny benchmarku nos wentylatorów osiągał zaledwie 28 dB(A). Wystarczyło kilka uruchomień, aby wentylatory zaczęły pracować z głośniejszymi obrotami, dochodzącymi do 40 dB(A).
W przypadku bardziej wymagających obciążeń w trybie Performance hałas wentylatorów osiągnął poziom nieco ponad 50 dB(A) i był zauważalnie głośniejszy od konkurencyjnych stacji roboczych, w tym Precision 7670, co pokazuje poniższa tabela. Oczywiście te alternatywne rozwiązania są również wolniejsze od naszej konfiguracji Lenovo.
Hałas
| luz |
| 23.1 / 23.1 / 23.1 dB |
| obciążenie |
| 28.9 / 51.4 dB |
 | ||
30 dB cichy 40 dB(A) słyszalny 50 dB(A) irytujący |
||
min: | ||
| Lenovo ThinkPad P16 G1 RTX A5500 RTX A5500 Laptop GPU, i9-12950HX, WDC PC SN810 2TB | Asus ProArt StudioBook 16 W7600H5A-2BL2 RTX A5000 Laptop GPU, W-11955M, 2x Micron 2300 2TB MTFDHBA2T0TDV (RAID 0) | Dell Precision 7000 7670 Performance RTX A5500 Laptop GPU, i9-12950HX | Lenovo ThinkPad P16 G1 21D6001DMB RTX A2000 Laptop GPU, i7-12850HX, Micron 3400 1TB MTFDKBA1T0TFH | MSI CreatorPro Z16P B12UKST RTX A3000 Laptop GPU, i7-12700H, Samsung PM9A1 MZVL21T0HCLR | HP ZBook Studio 16 G9 62U04EA RTX A2000 Laptop GPU, i7-12800H, Micron 3400 1TB MTFDKBA1T0TFH | |
|---|---|---|---|---|---|---|
| Noise | -14% | -16% | -6% | -11% | -9% | |
| wyłączone / środowisko * (dB) | 23.1 | 26 -13% | 23.9 -3% | 23.2 -0% | 24.1 -4% | 24 -4% |
| Idle Minimum * (dB) | 23.1 | 26 -13% | 24 -4% | 23.2 -0% | 27.1 -17% | 24 -4% |
| Idle Average * (dB) | 23.1 | 26 -13% | 24 -4% | 23.2 -0% | 27.1 -17% | 27.7 -20% |
| Idle Maximum * (dB) | 23.1 | 26.5 -15% | 38 -65% | 23.2 -0% | 27.1 -17% | 27.7 -20% |
| Load Average * (dB) | 28.9 | 42 -45% | 46.3 -60% | 47.8 -65% | 42.9 -48% | 39.8 -38% |
| Witcher 3 ultra * (dB) | 51.6 | 41.9 19% | 34.1 34% | 44 15% | 44.3 14% | |
| Load Maximum * (dB) | 51.4 | 43 16% | 47.9 7% | 56.3 -10% | 47 9% | 47.7 7% |
* ... im mniej tym lepiej
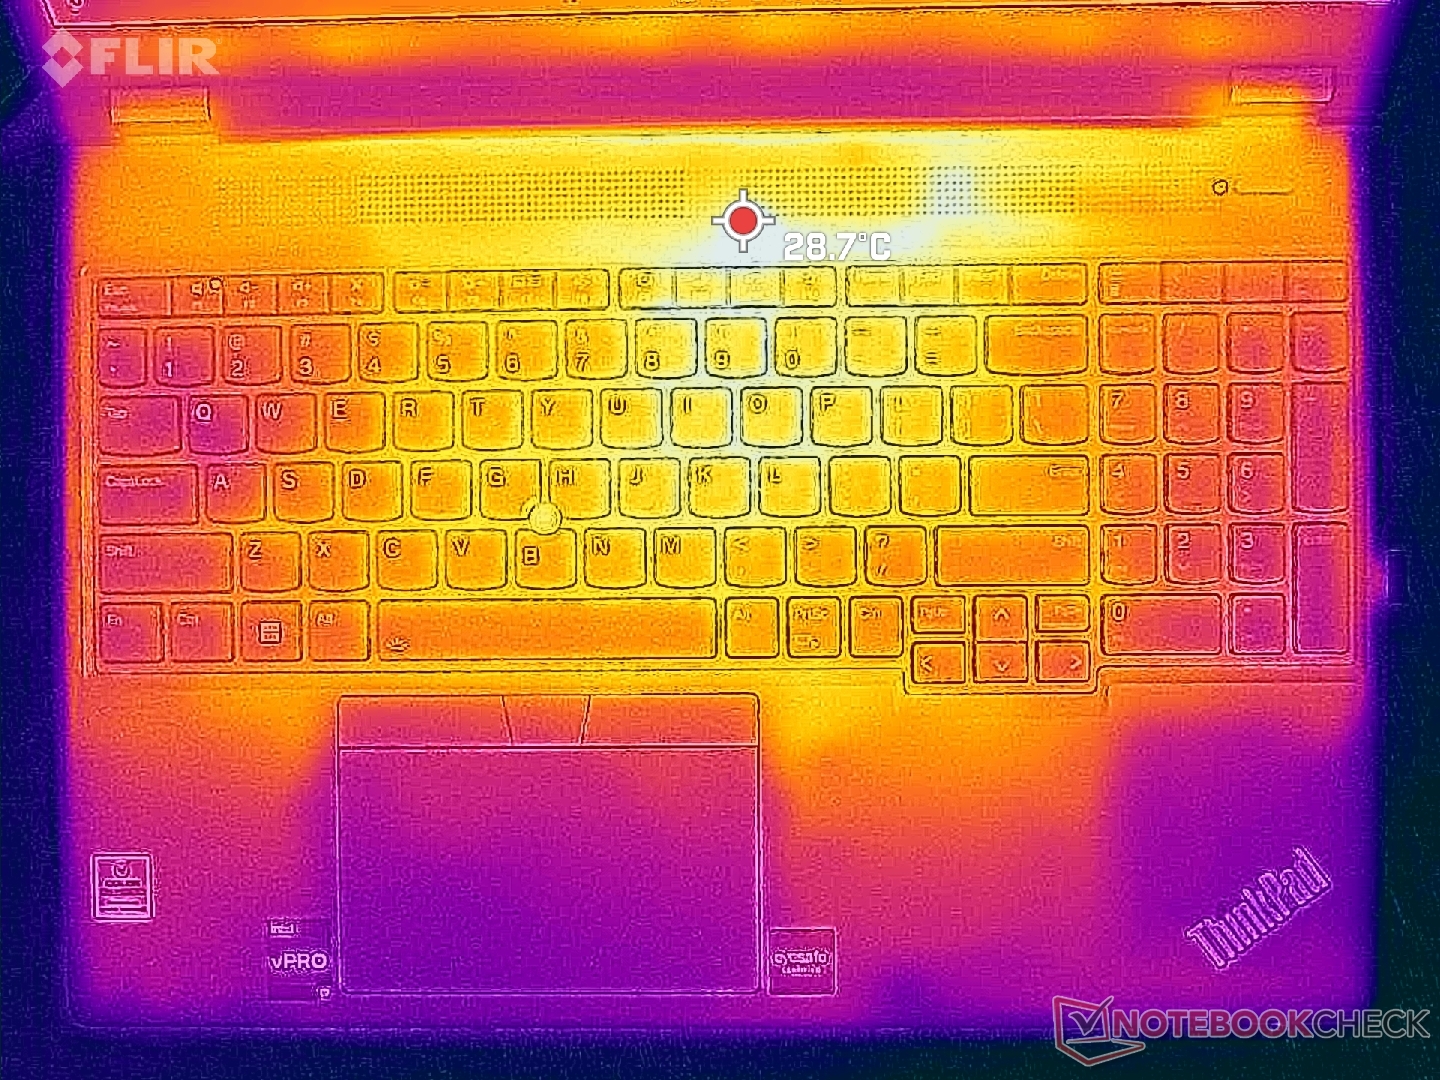
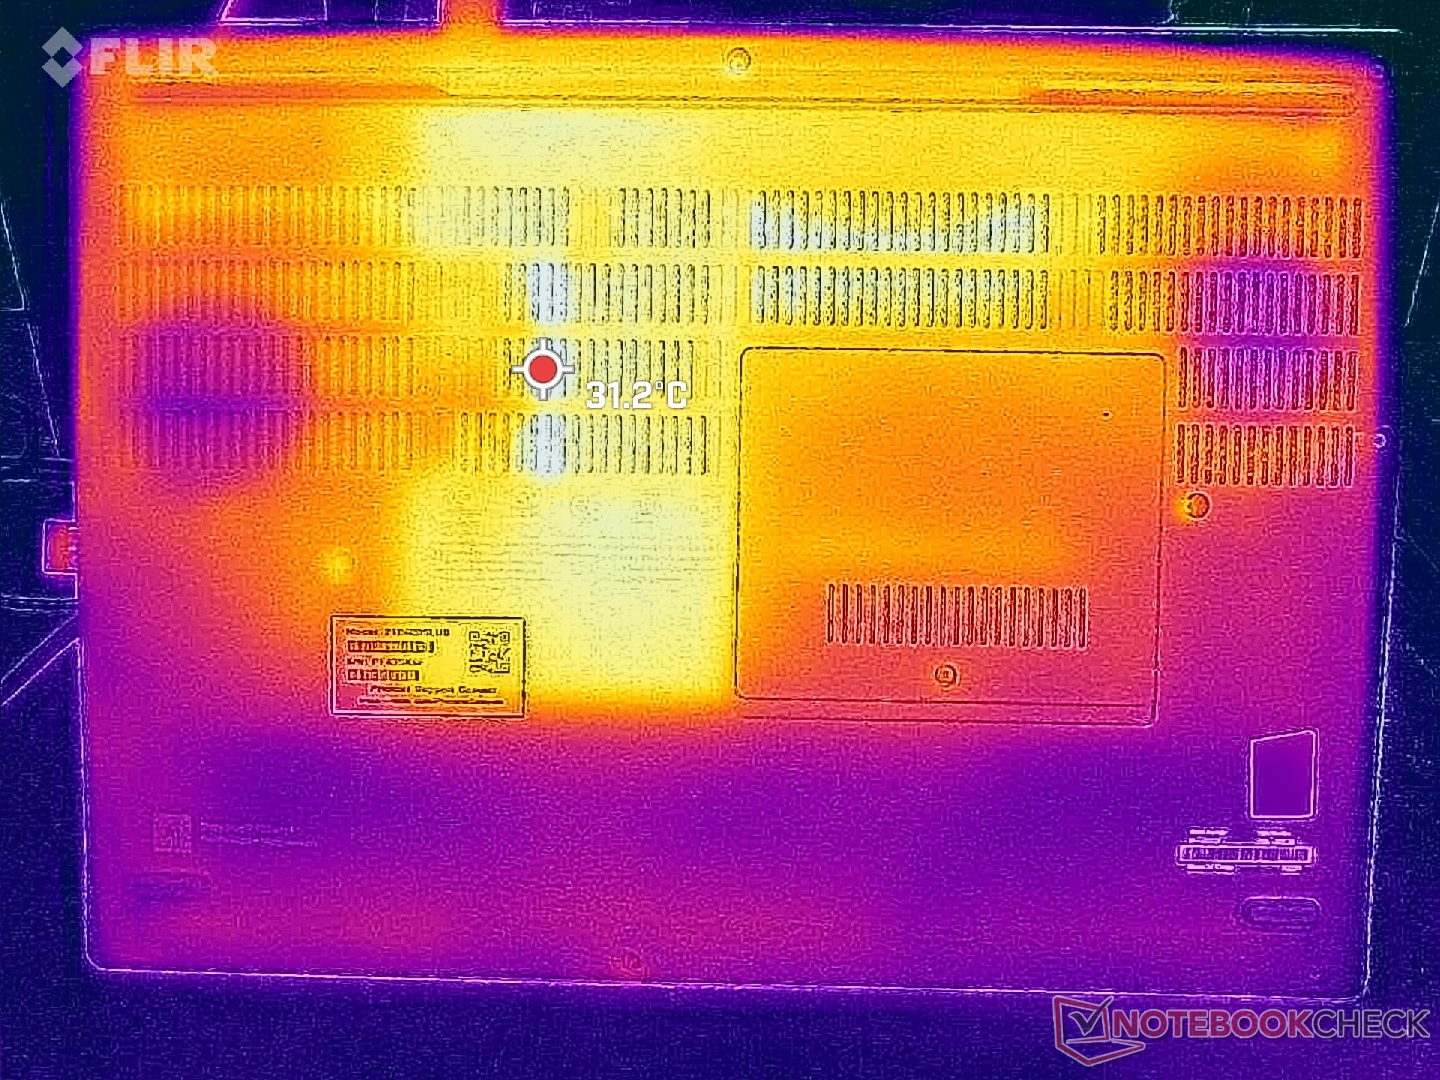
Temperatura
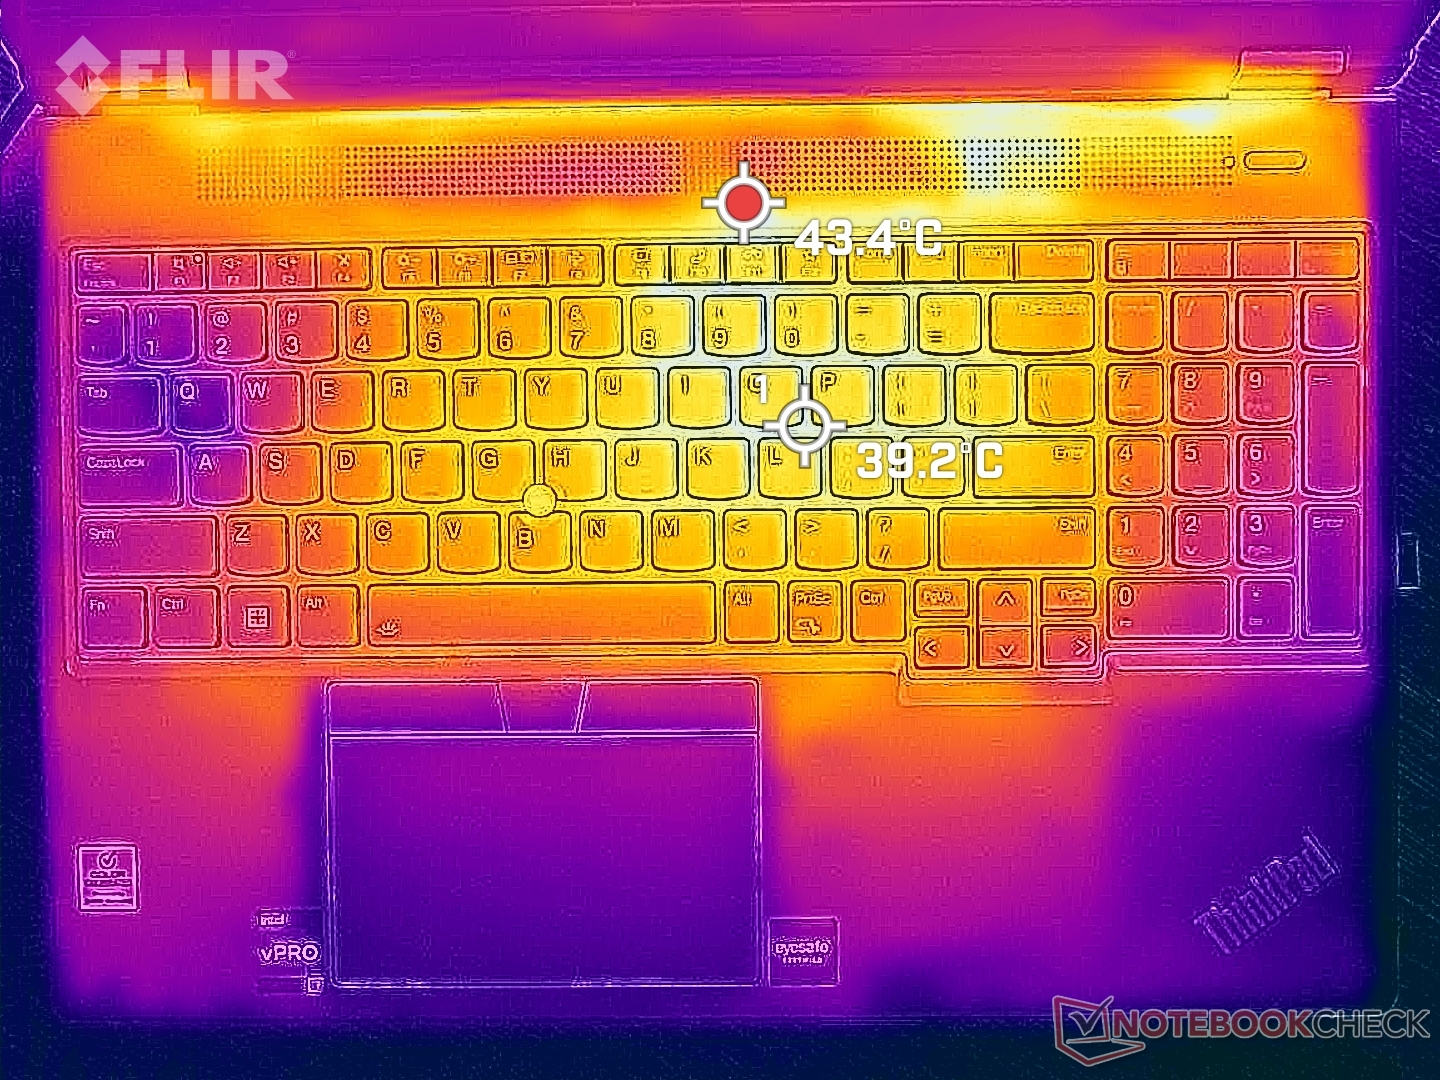
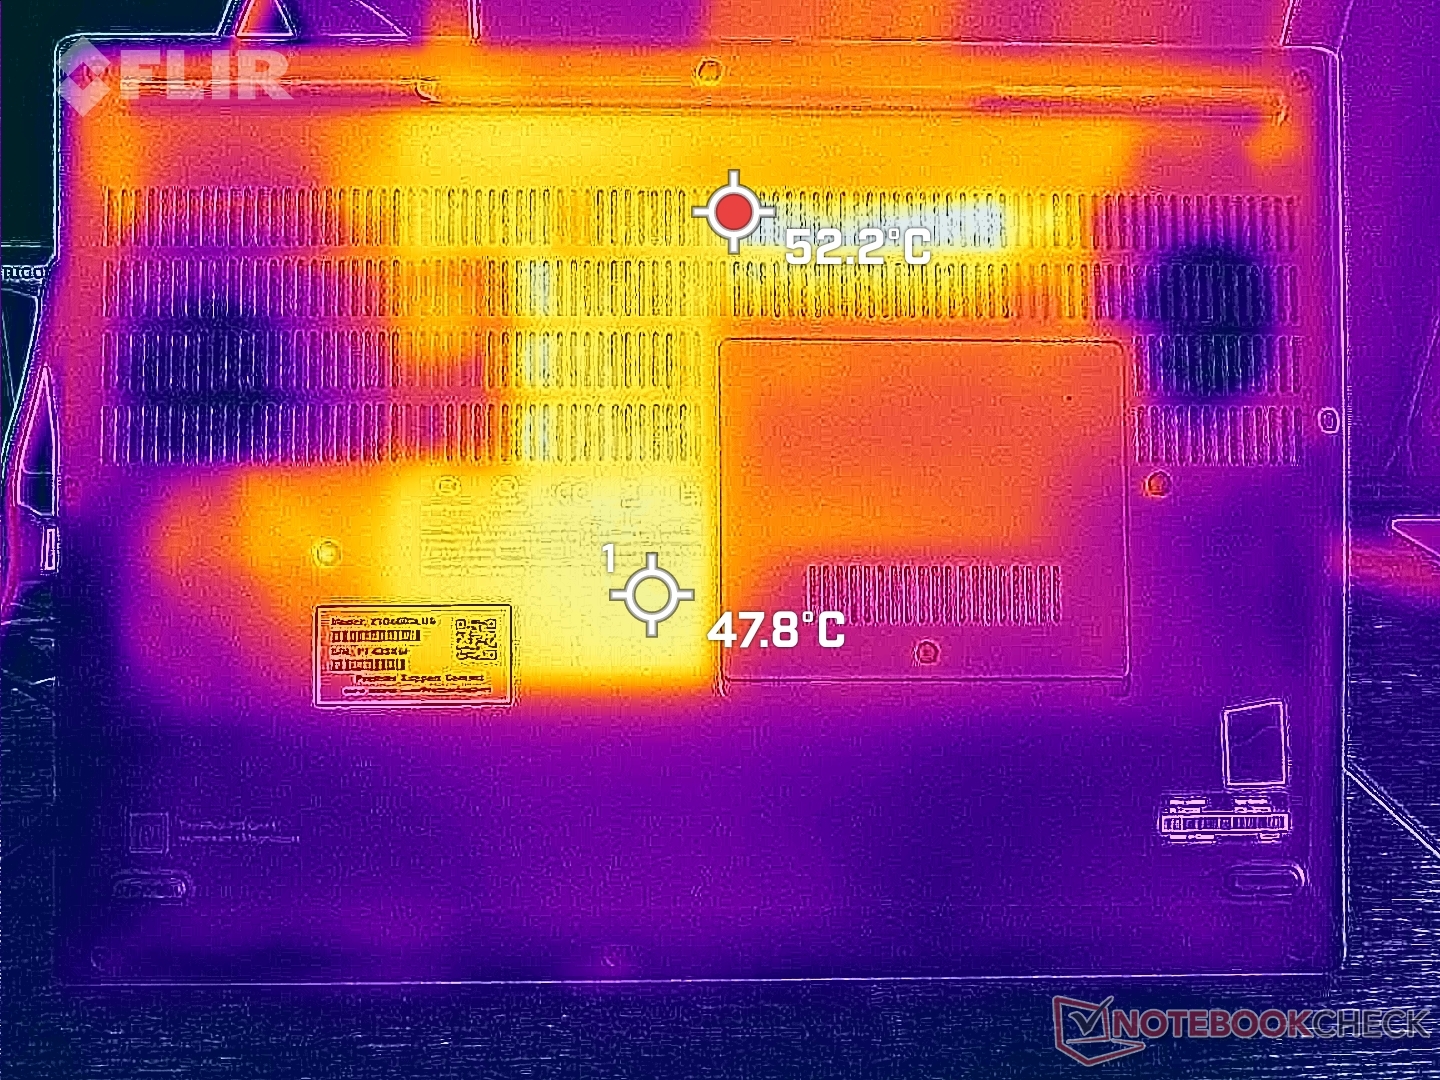
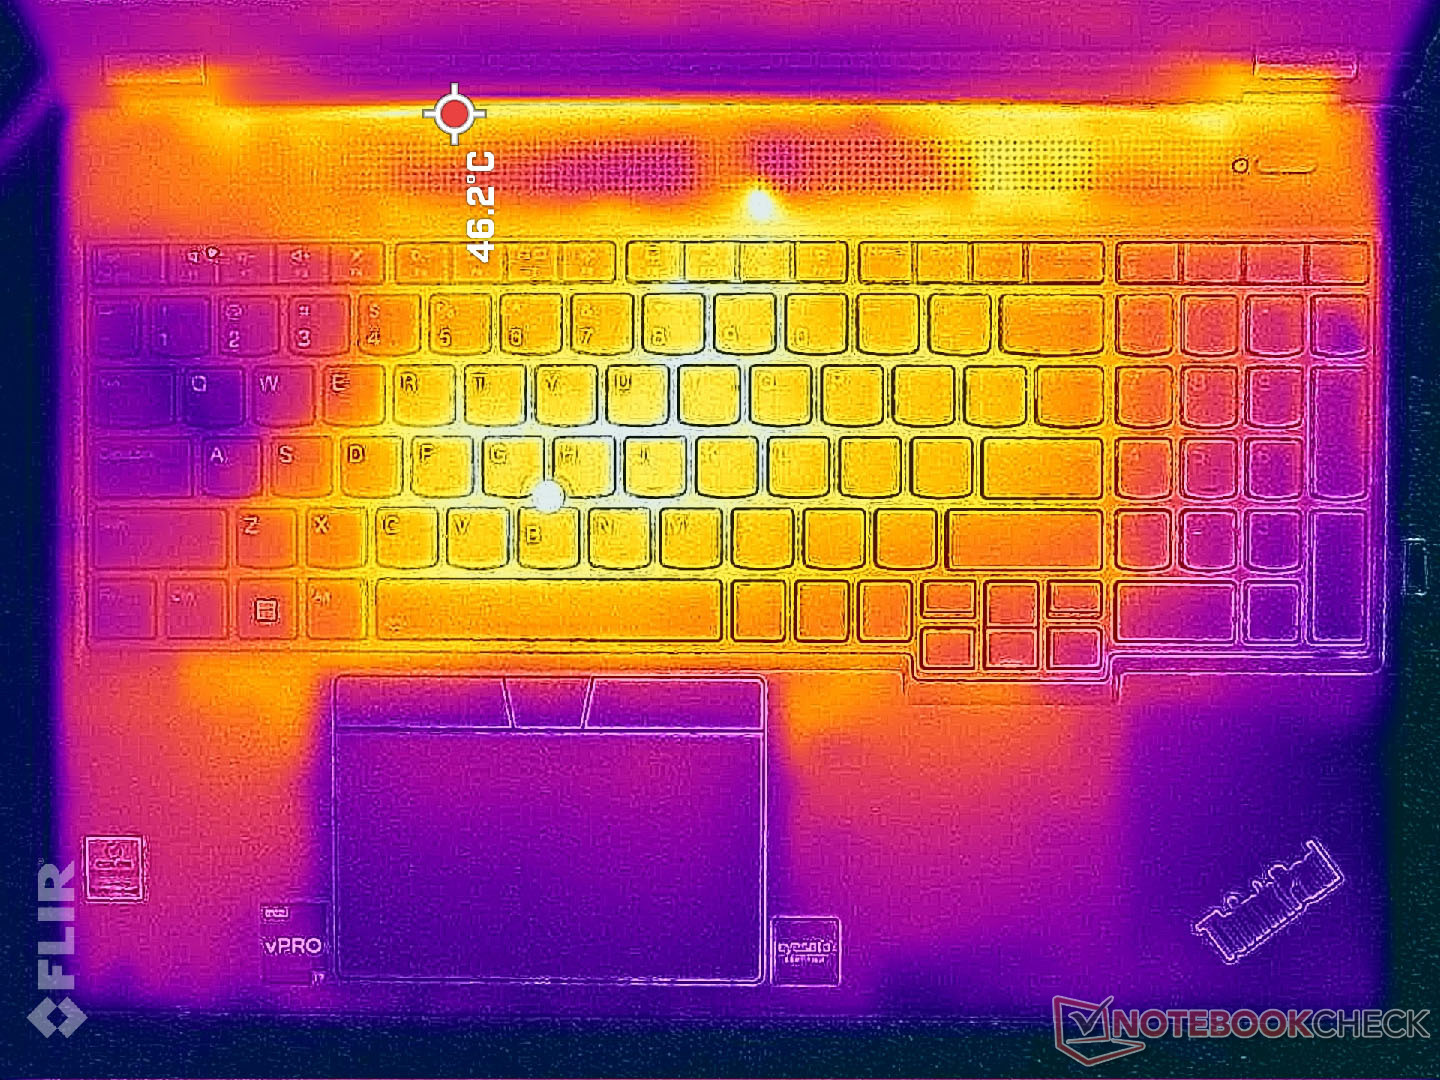
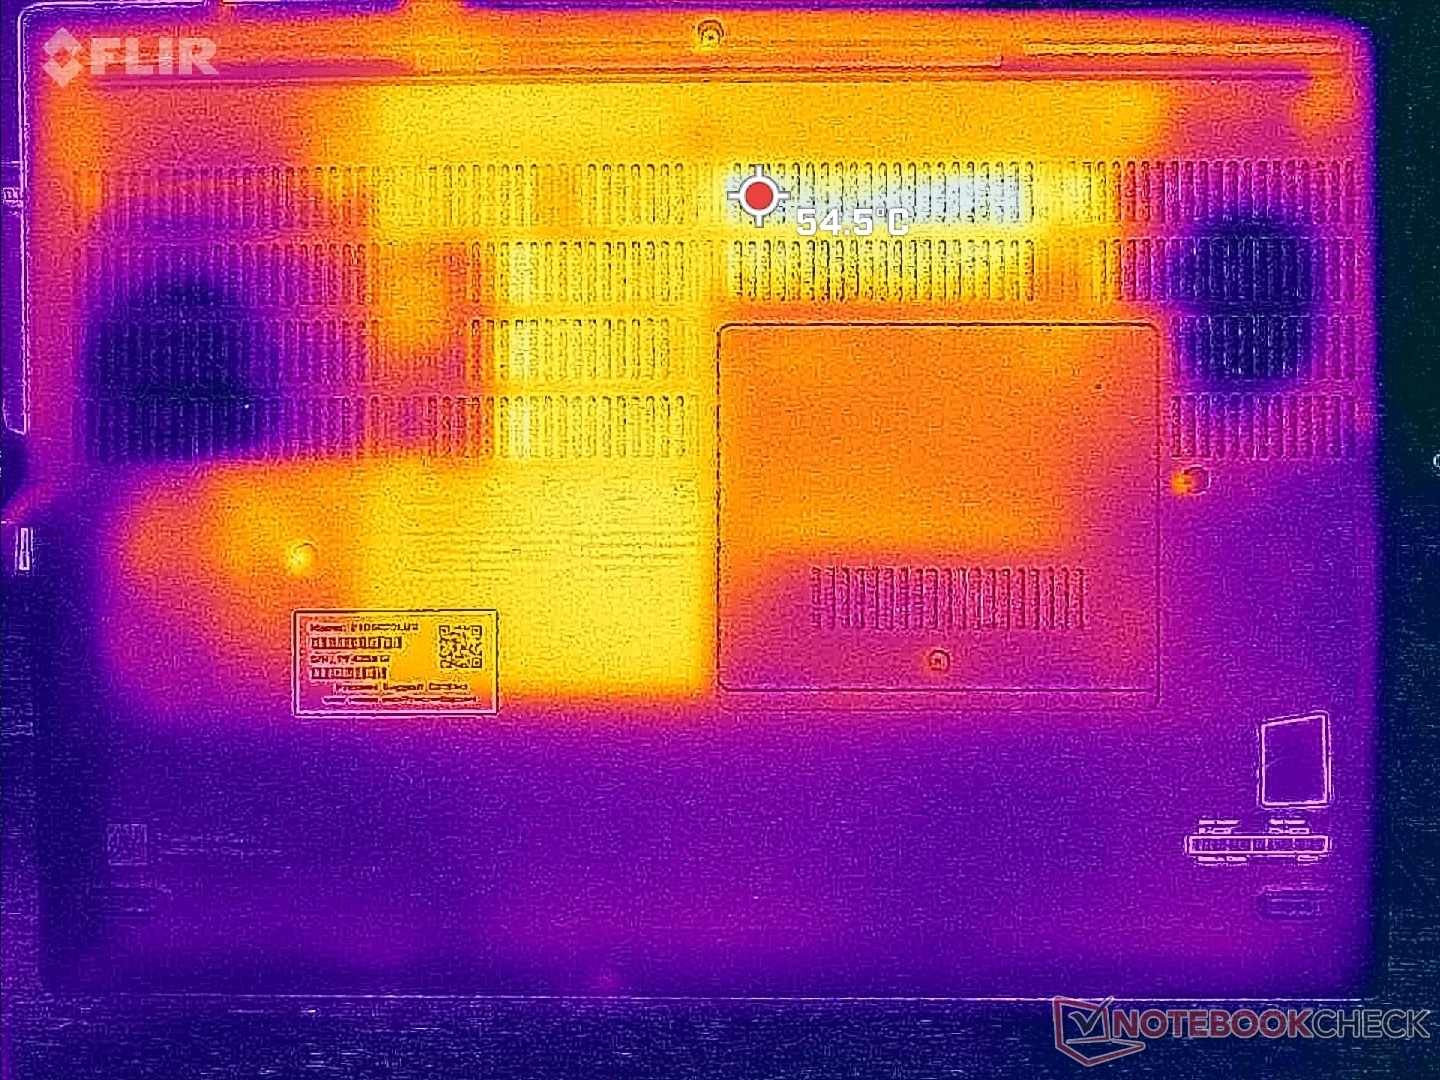
Temperatury powierzchni są cieplejsze od oczekiwanych nawet w stanie spoczynku na pulpicie bez uruchomionych aplikacji. Na przykład spód może być tak ciepły, jak 37 C, w porównaniu z 31 C na Precision 7670. Przy większym obciążeniu te same gorące punkty na Lenovo mogą osiągnąć 49 C lub cieplej, podczas gdy środek klawiatury może osiągnąć 40 C. Temperatury skóry mogą czuć się niekomfortowo, jeśli laptop jest na kolanach zamiast na stole.
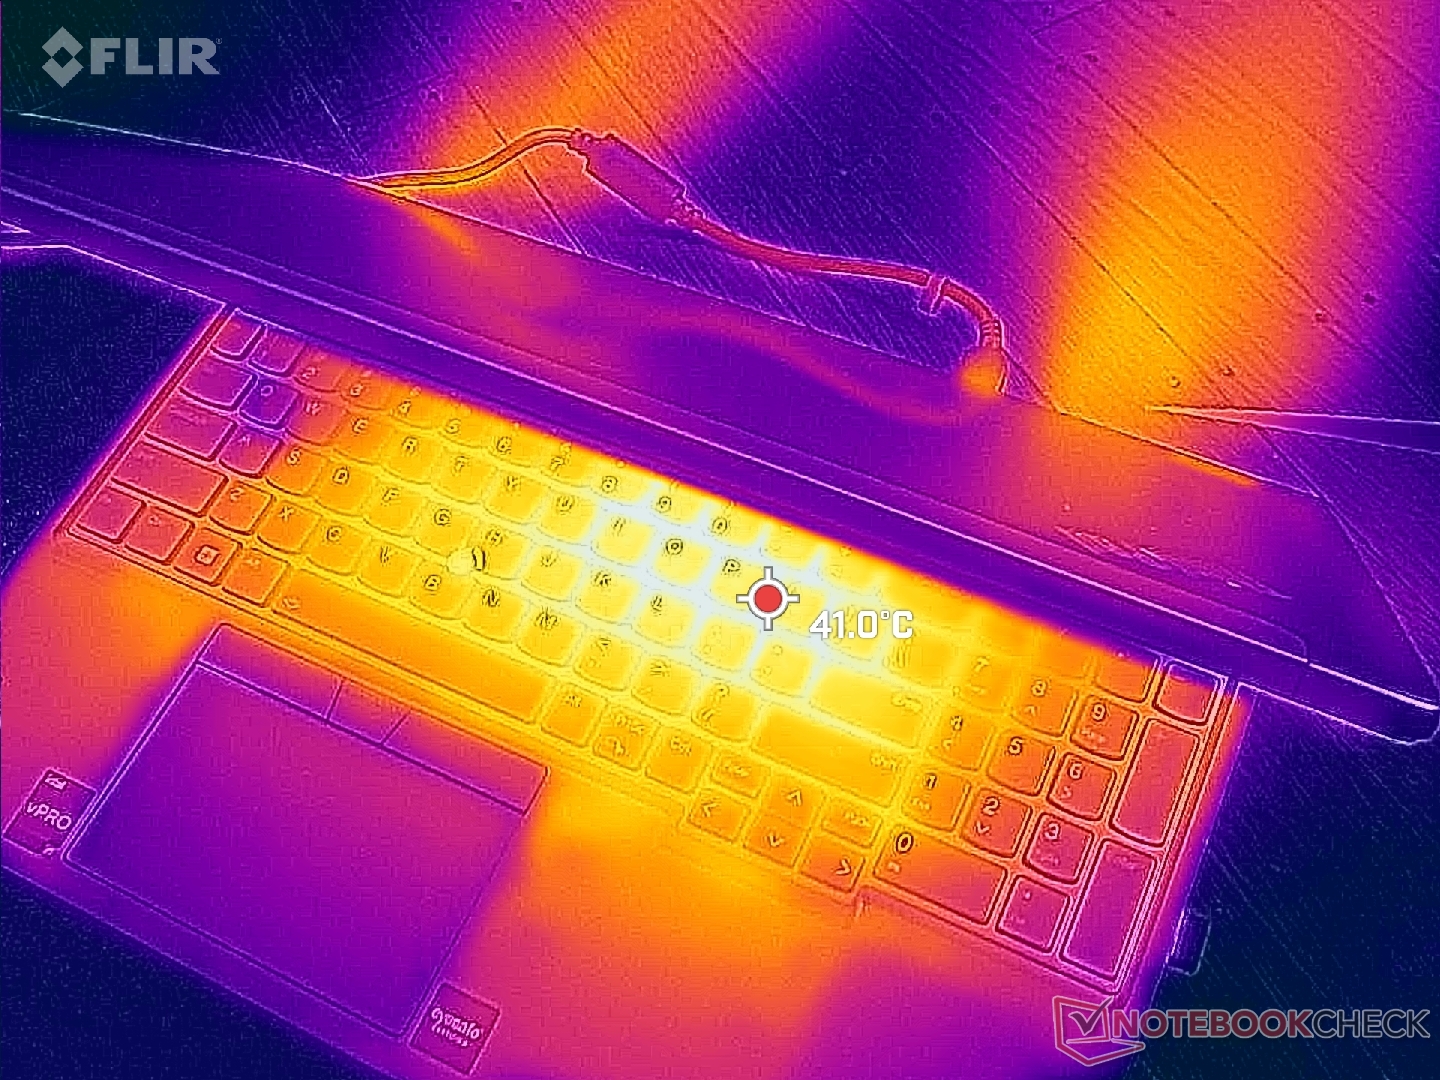
(±) Maksymalna temperatura w górnej części wynosi 44.8 °C / 113 F, w porównaniu do średniej 38.2 °C / 101 F , począwszy od 22.2 do 69.8 °C dla klasy Workstation.
(-) Dno nagrzewa się maksymalnie do 49.8 °C / 122 F, w porównaniu do średniej 41.1 °C / 106 F
(+) W stanie bezczynności średnia temperatura górnej części wynosi 28.6 °C / 83 F, w porównaniu ze średnią temperaturą urządzenia wynoszącą 32 °C / ### class_avg_f### F.
(±) Podczas gry w Wiedźmina 3 średnia temperatura górnej części wynosi 36.4 °C / 98 F, w porównaniu do średniej temperatury urządzenia wynoszącej 32 °C / ## #class_avg_f### F.
(+) Podparcia dłoni i touchpad osiągają maksymalną temperaturę skóry (32.4 °C / 90.3 F) i dlatego nie są gorące.
(-) Średnia temperatura obszaru podparcia dłoni w podobnych urządzeniach wynosiła 27.8 °C / 82 F (-4.6 °C / -8.3 F).
| Lenovo ThinkPad P16 G1 RTX A5500 Intel Core i9-12950HX, NVIDIA RTX A5500 Laptop GPU | Asus ProArt StudioBook 16 W7600H5A-2BL2 Intel Xeon W-11955M, NVIDIA RTX A5000 Laptop GPU | Dell Precision 7000 7670 Performance Intel Core i9-12950HX, NVIDIA RTX A5500 Laptop GPU | Lenovo ThinkPad P16 G1 21D6001DMB Intel Core i7-12850HX, NVIDIA RTX A2000 Laptop GPU | MSI CreatorPro Z16P B12UKST Intel Core i7-12700H, NVIDIA RTX A3000 Laptop GPU | HP ZBook Studio 16 G9 62U04EA Intel Core i7-12800H, NVIDIA RTX A2000 Laptop GPU | |
|---|---|---|---|---|---|---|
| Heat | -1% | -3% | 17% | -3% | 9% | |
| Maximum Upper Side * (°C) | 44.8 | 45.7 -2% | 53 -18% | 43.1 4% | 56.3 -26% | 38.7 14% |
| Maximum Bottom * (°C) | 49.8 | 48.3 3% | 43.2 13% | 39.9 20% | 68.3 -37% | 53.4 -7% |
| Idle Upper Side * (°C) | 30.6 | 35.3 -15% | 36.8 -20% | 26 15% | 25.2 18% | 27.3 11% |
| Idle Bottom * (°C) | 38.6 | 34.4 11% | 33.8 12% | 27.6 28% | 25.9 33% | 31.6 18% |
* ... im mniej tym lepiej
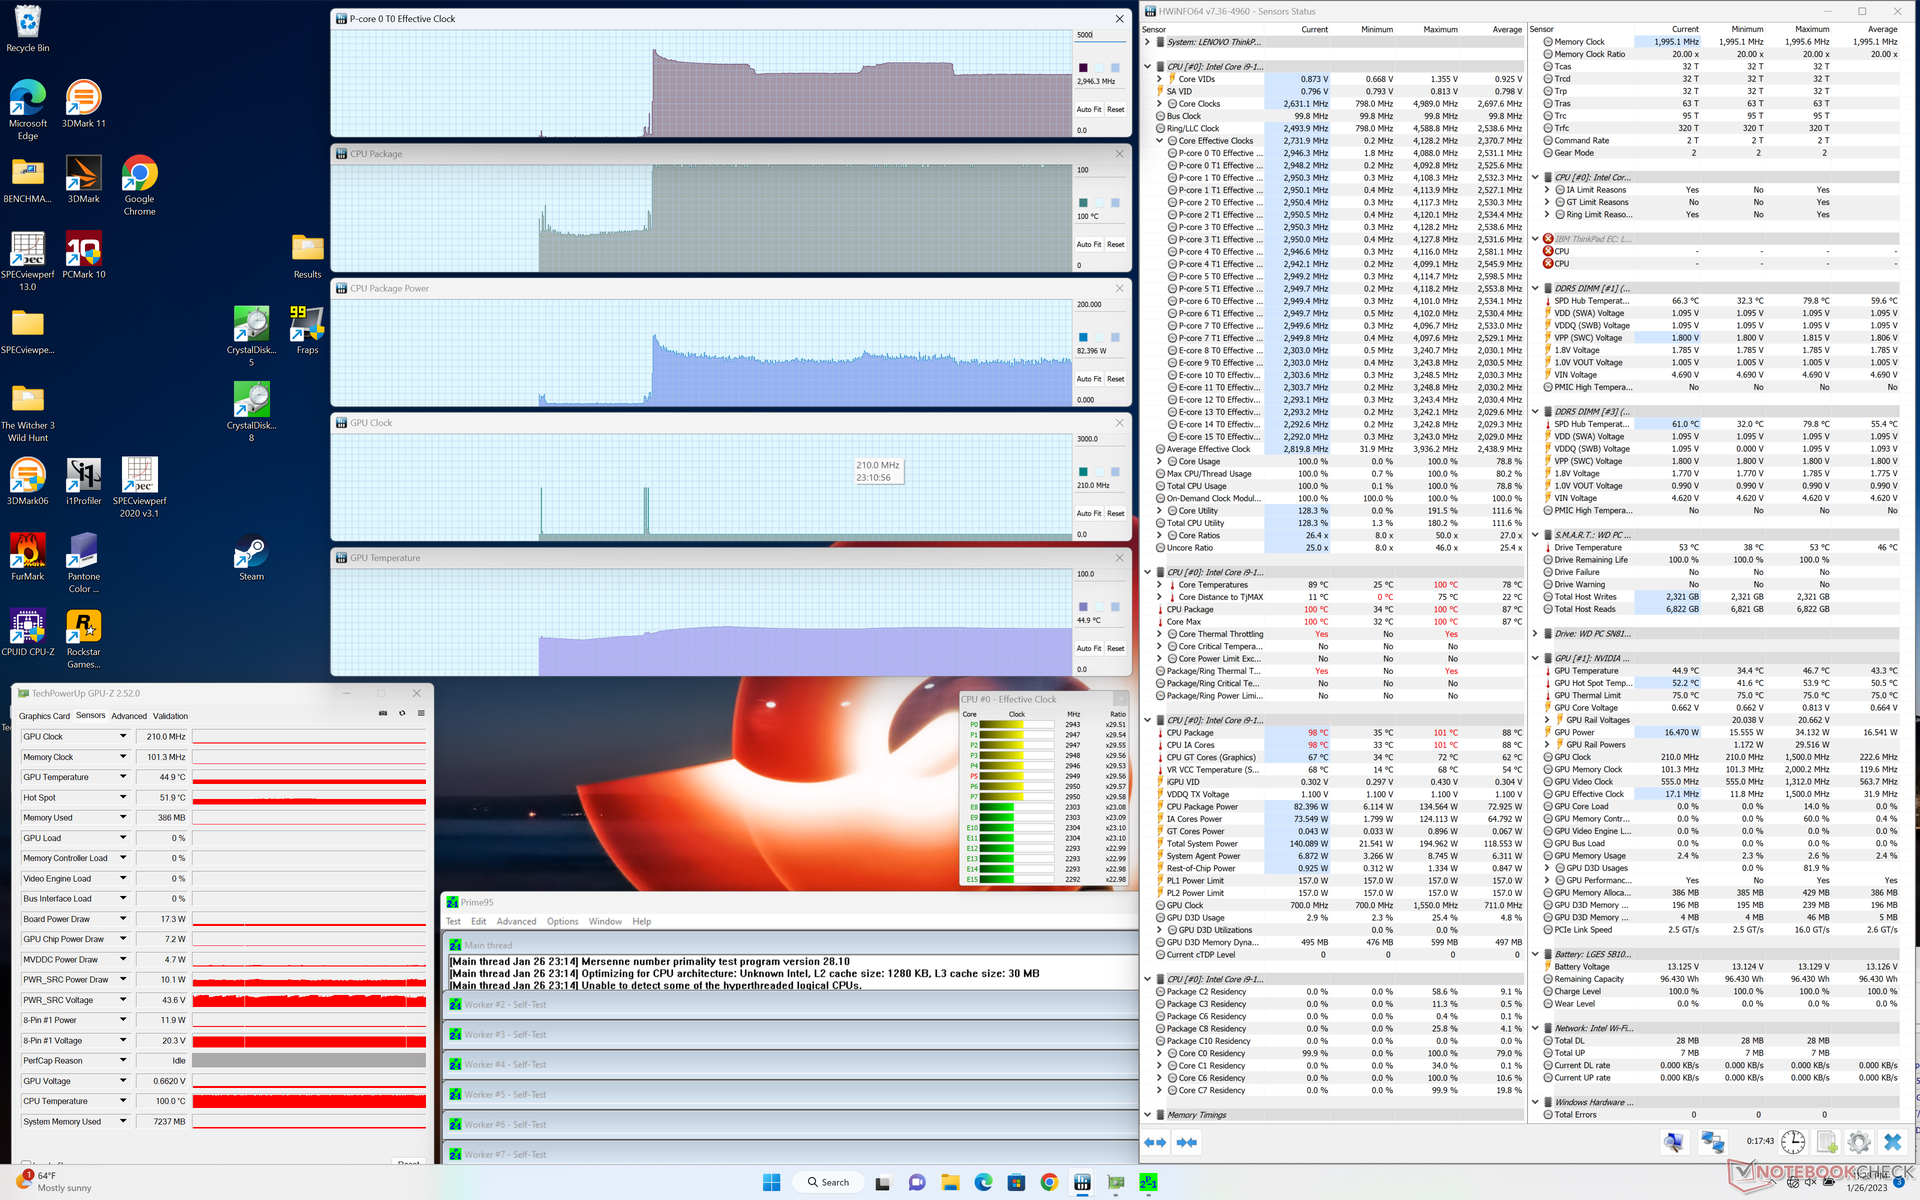
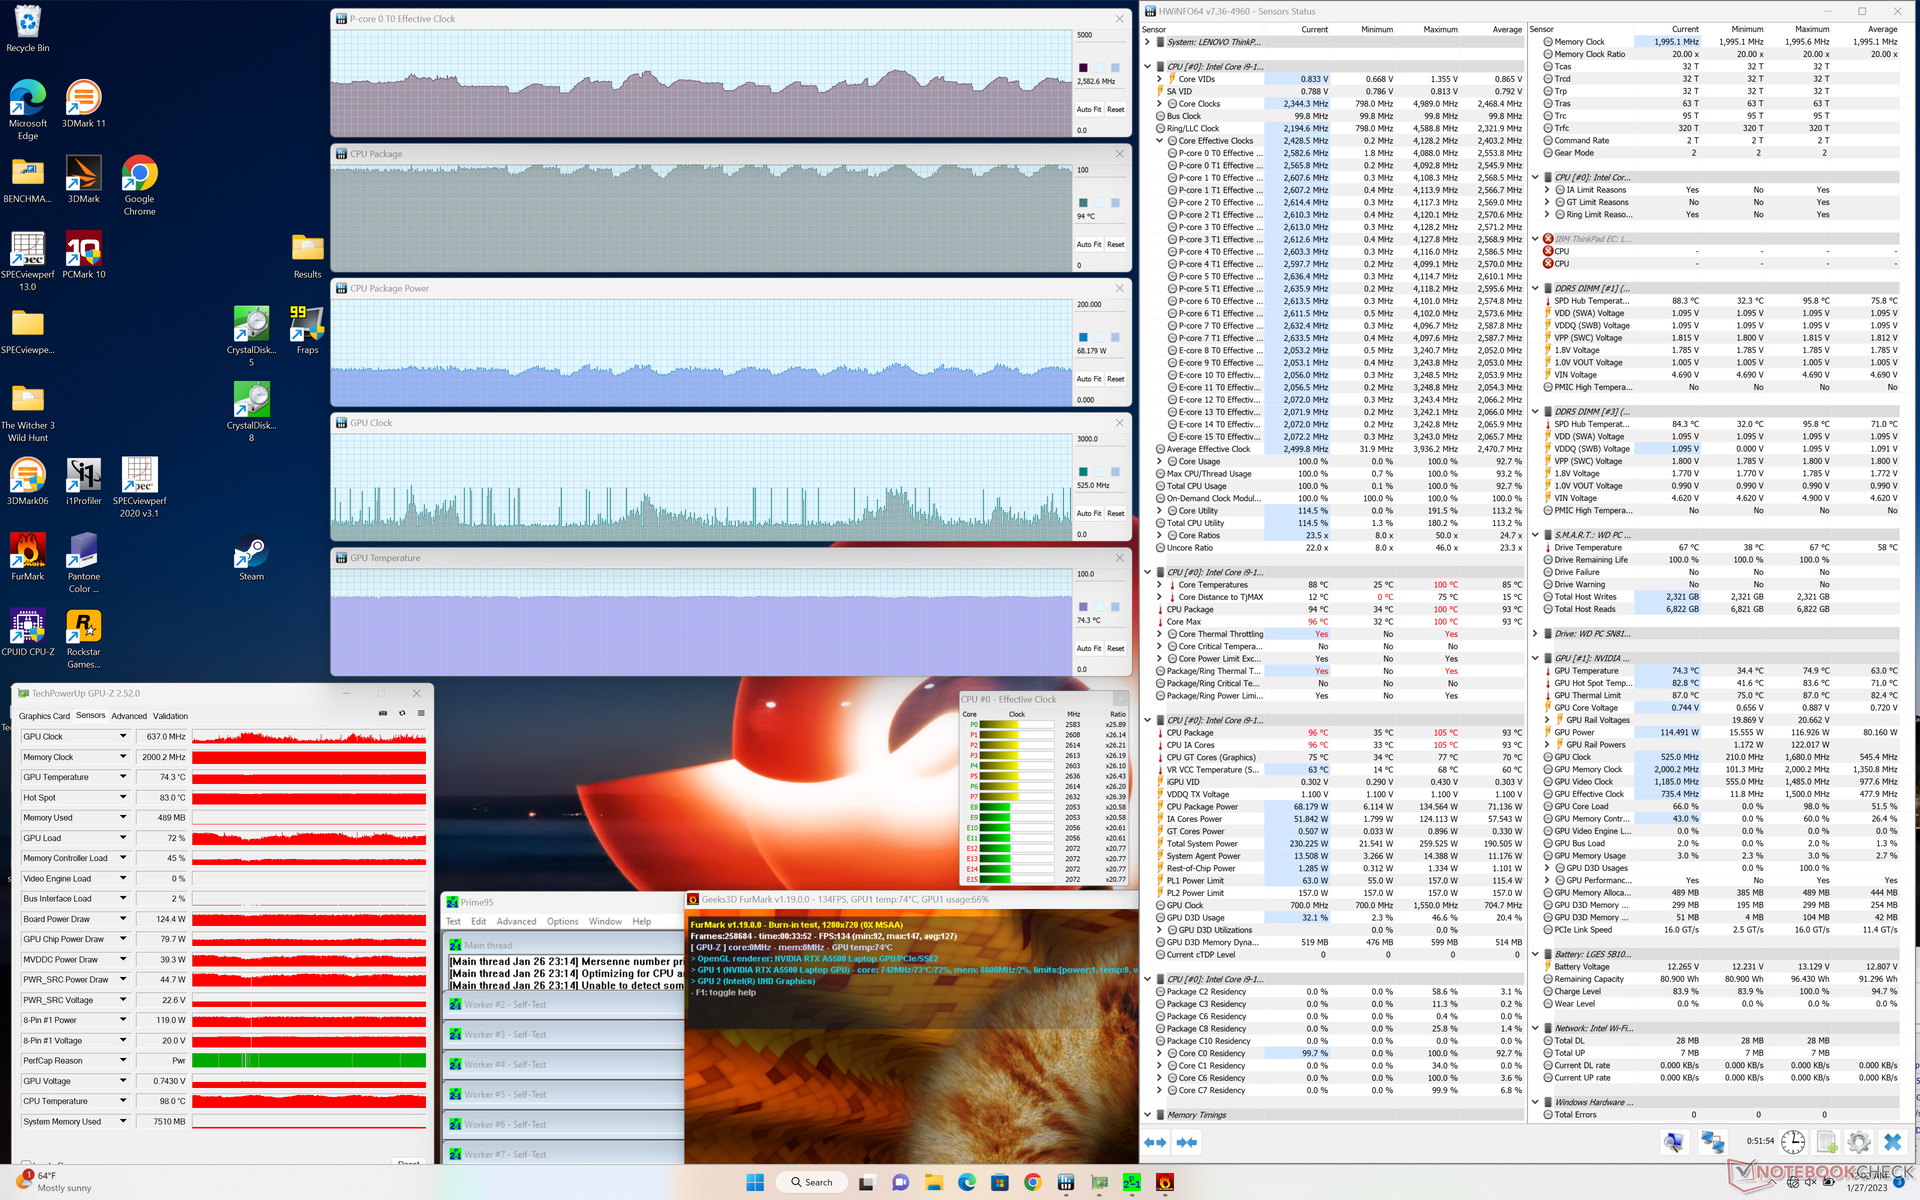
Stress Test
System zdecydowanie daje się we znaki, kiedy procesory są pod dużym obciążeniem. Na przykład podczas uruchomienia Prime95 częstotliwość taktowania procesora i pobór mocy na płycie głównej wzrosły odpowiednio do 4,1 GHz i 135 W. Niestety temperatura rdzenia wzrosła do 100 C niemal natychmiast, więc szybko spadła, aby zapobiec jeszcze większemu ociepleniu. Niestety temperatura rdzenia wzrosła niemal natychmiast do 100 C, więc częstotliwość taktowania szybko spadła, aby zapobiec jeszcze większej temperaturze. Procesor ostatecznie ustabilizował się na poziomie 3 GHz, 82 W i 100 C, co oznacza, że przekracza granice możliwości chłodzenia ThinkPada P16 G1. Powtórzenie tego testu na komputerze Precision 7670 wyposażonym w ten sam procesor dałoby wolniejszą stabilną częstotliwość taktowania 2,3 GHz i chłodniejszą temperaturę rdzenia 78 C.
Podczas pracy Witcher 3 przy wysokim obciążeniu częstotliwość taktowania GPU, taktowanie pamięci i temperatura ustabilizowałyby się odpowiednio na poziomie 1477 MHz, 2000 MHz i 78 C, w porównaniu z 1417 MHz, 1750 MHz i 82 C na Precision 7670 w podobnych warunkach. Pobór mocy na pokładzie byłby również wyższy w przypadku Lenovo - 129 W w porównaniu z zaledwie 100 W w przypadku Della, co wyjaśniałoby wspomnianą wyżej przewagę wydajności GPU.
Praca na zasilaniu akumulatorowym ogranicza wydajność. Test Fire Strike na akumulatorze przyniósłby wyniki z fizyki i grafiki na poziomie odpowiednio 18903 i 12395 pkt. w porównaniu z 31226 i 28885 pkt. na zasilaniu sieciowym.
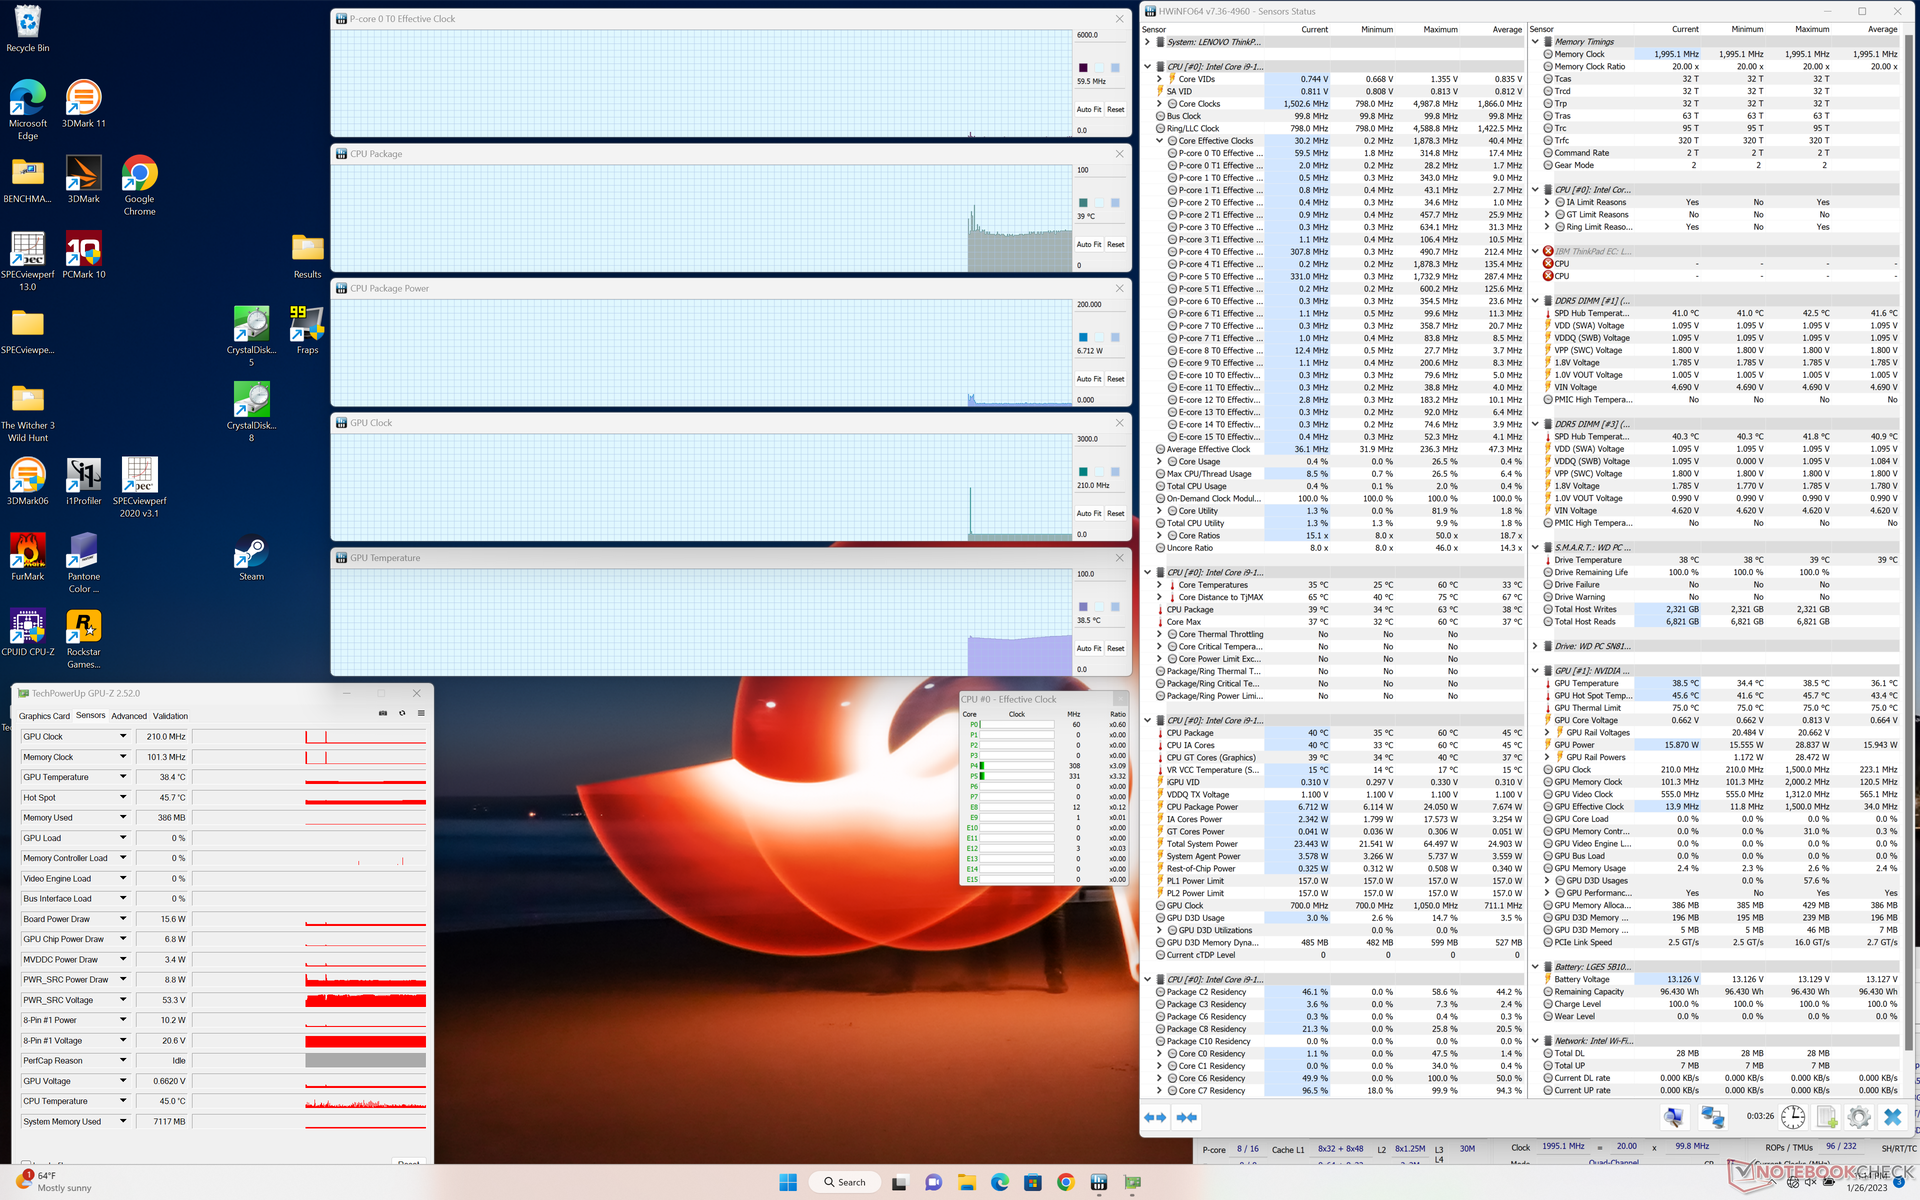
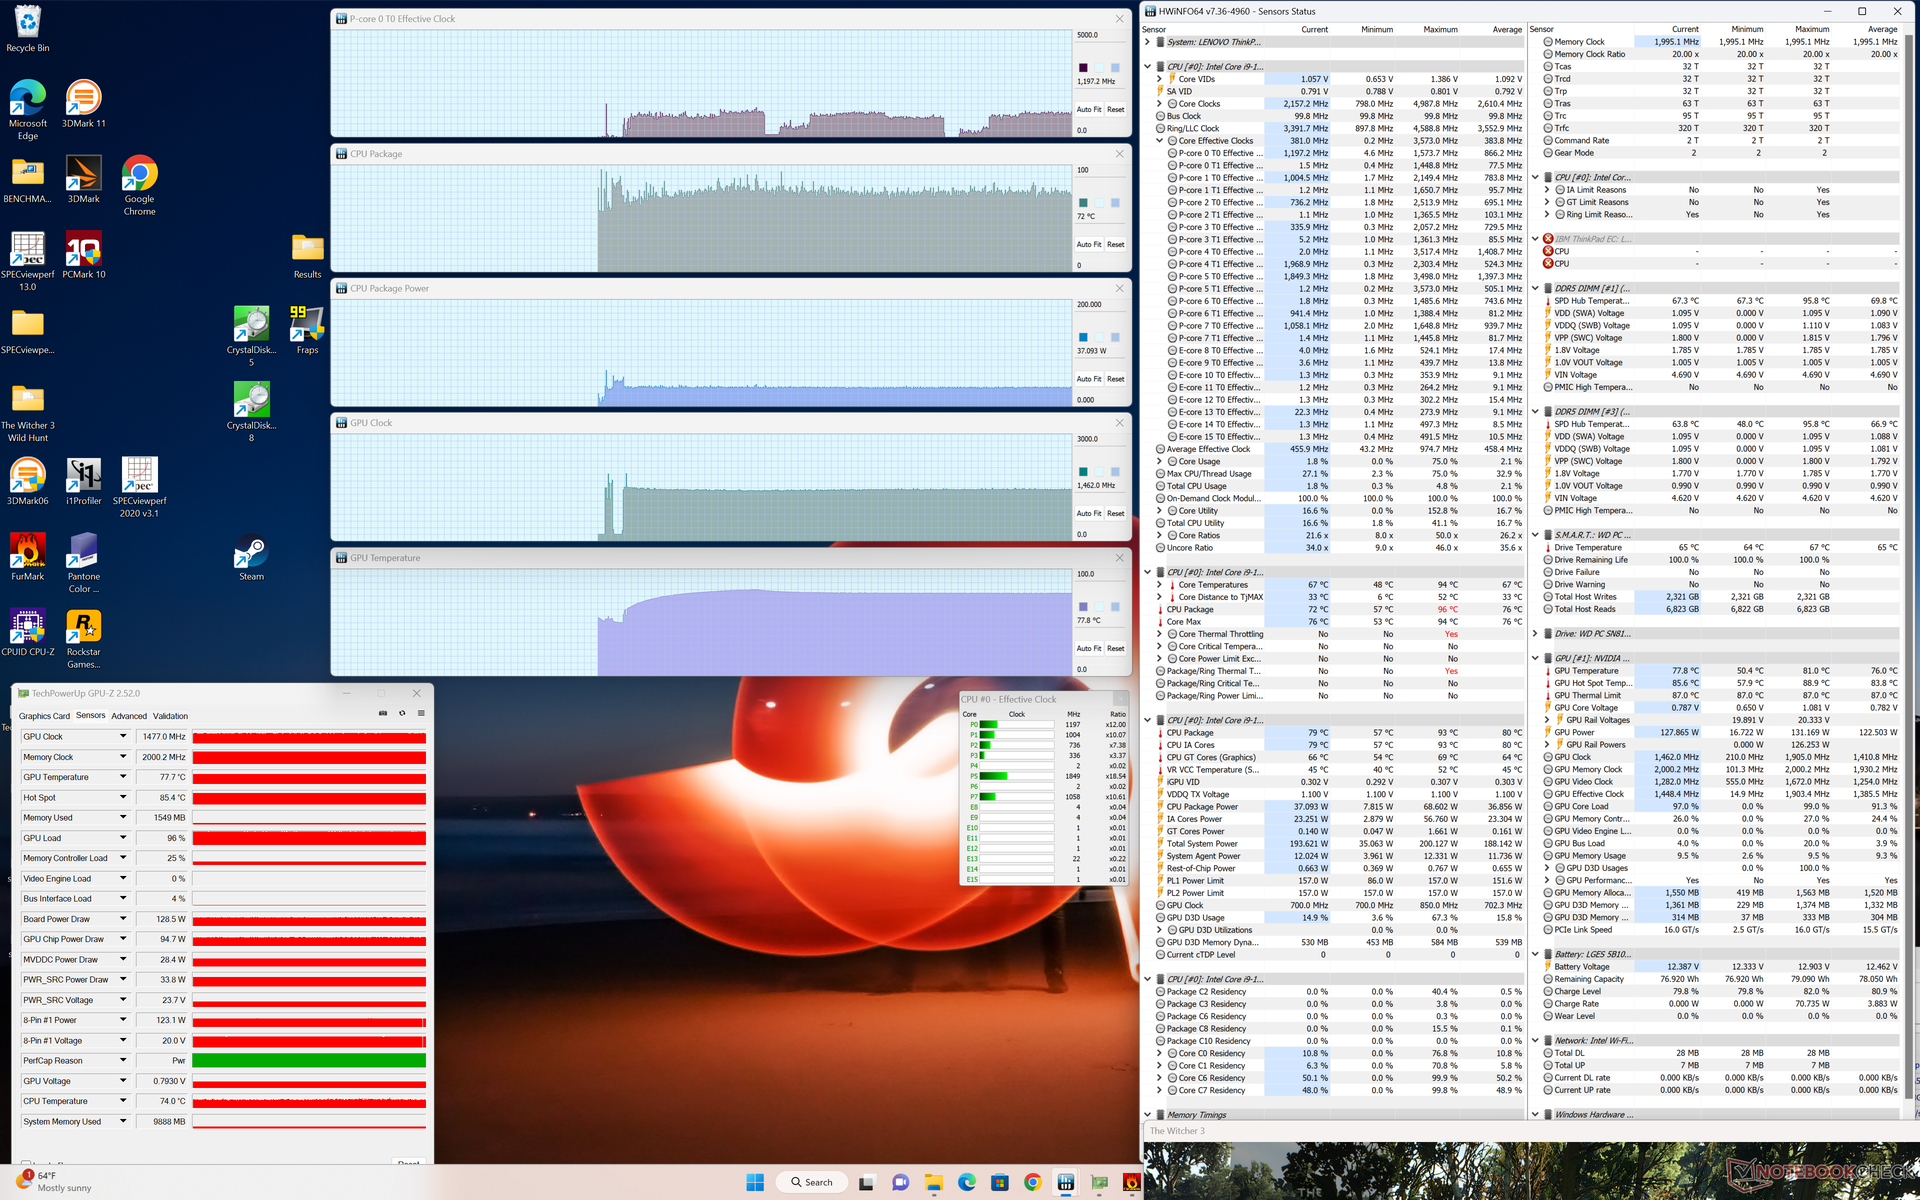
| ZegarCPU (GHz) | Zegar GPU (MHz) | Średnia temperatura CPU (°C) | Średnia temperatura GPU (°C) | |
| System Idle | -- | -- | 39 | 39 |
| Prime95 Stress | 3.0 | -- | 100 | 45 |
| Prime95 + FurMark Stress | 2.1 - 2.8 | ~500 - 1550 | 88 - 100 | 75 |
| Witcher 3 Stress | ~1.2 | 1477 | 72 | 78 |
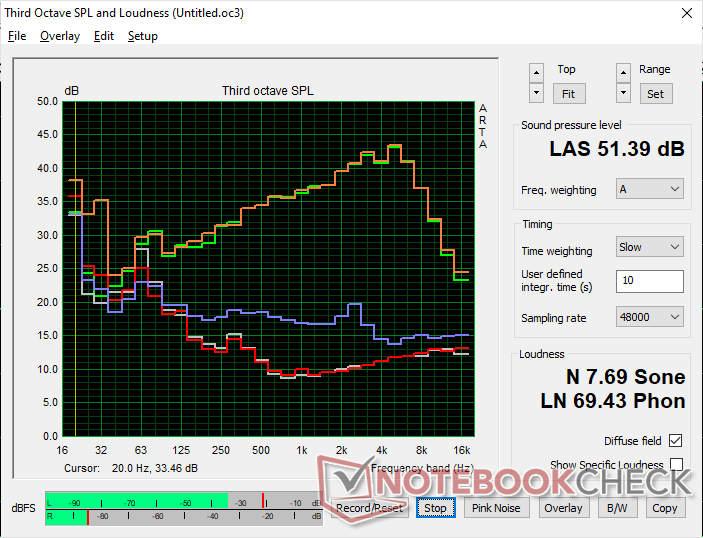
Mówcy
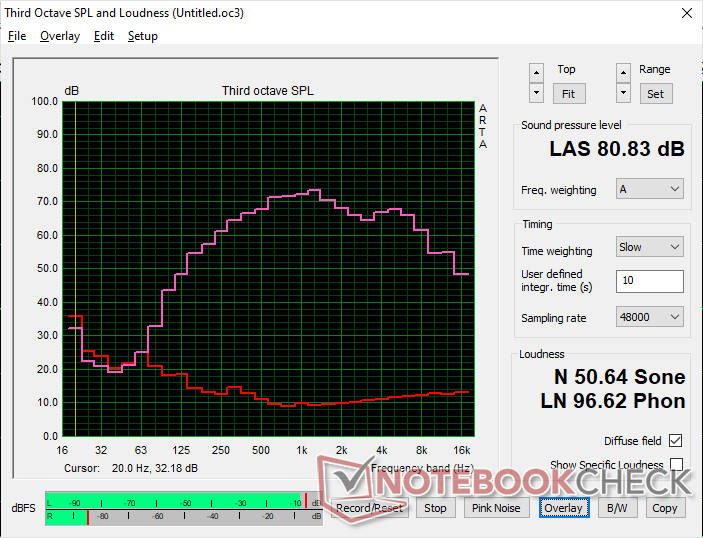
Lenovo ThinkPad P16 G1 RTX A5500 analiza dźwięku
(±) | głośność głośnika jest średnia, ale dobra (80.8 dB)
Bas 100 - 315 Hz
(±) | zredukowany bas - średnio 11.1% niższy od mediany
(±) | liniowość basu jest średnia (9.7% delta do poprzedniej częstotliwości)
Średnie 400 - 2000 Hz
(+) | zbalansowane środki średnie - tylko 4.1% od mediany
(+) | średnie są liniowe (3.3% delta do poprzedniej częstotliwości)
Wysokie 2–16 kHz
(+) | zrównoważone maksima - tylko 2.9% od mediany
(+) | wzloty są liniowe (5.2% delta do poprzedniej częstotliwości)
Ogólnie 100 - 16.000 Hz
(+) | ogólny dźwięk jest liniowy (13.2% różnicy w stosunku do mediany)
W porównaniu do tej samej klasy
» 23% wszystkich testowanych urządzeń w tej klasie było lepszych, 6% podobnych, 71% gorszych
» Najlepszy miał deltę 7%, średnia wynosiła ###średnia###%, najgorsza wynosiła 35%
W porównaniu do wszystkich testowanych urządzeń
» 13% wszystkich testowanych urządzeń było lepszych, 3% podobnych, 84% gorszych
» Najlepszy miał deltę 4%, średnia wynosiła ###średnia###%, najgorsza wynosiła 134%
Apple MacBook Pro 16 2021 M1 Pro analiza dźwięku
(+) | głośniki mogą odtwarzać stosunkowo głośno (84.7 dB)
Bas 100 - 315 Hz
(+) | dobry bas - tylko 3.8% od mediany
(+) | bas jest liniowy (5.2% delta do poprzedniej częstotliwości)
Średnie 400 - 2000 Hz
(+) | zbalansowane środki średnie - tylko 1.3% od mediany
(+) | średnie są liniowe (2.1% delta do poprzedniej częstotliwości)
Wysokie 2–16 kHz
(+) | zrównoważone maksima - tylko 1.9% od mediany
(+) | wzloty są liniowe (2.7% delta do poprzedniej częstotliwości)
Ogólnie 100 - 16.000 Hz
(+) | ogólny dźwięk jest liniowy (4.6% różnicy w stosunku do mediany)
W porównaniu do tej samej klasy
» 0% wszystkich testowanych urządzeń w tej klasie było lepszych, 0% podobnych, 100% gorszych
» Najlepszy miał deltę 5%, średnia wynosiła ###średnia###%, najgorsza wynosiła 45%
W porównaniu do wszystkich testowanych urządzeń
» 0% wszystkich testowanych urządzeń było lepszych, 0% podobnych, 100% gorszych
» Najlepszy miał deltę 4%, średnia wynosiła ###średnia###%, najgorsza wynosiła 134%
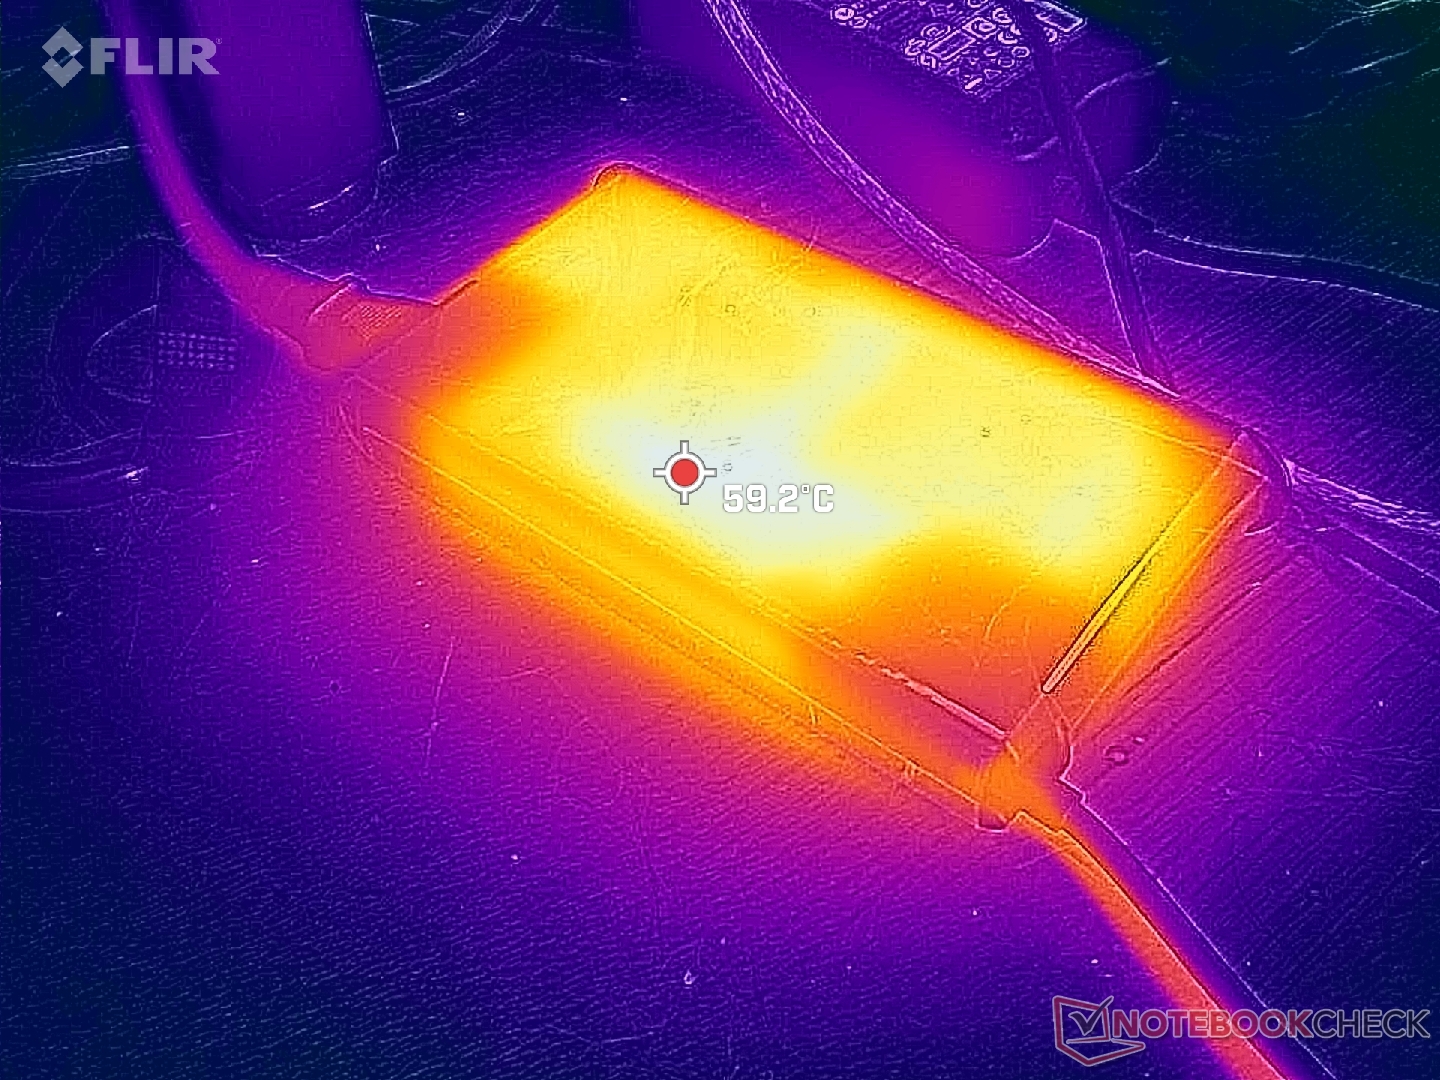
Zarządzanie energią
Pobór mocy
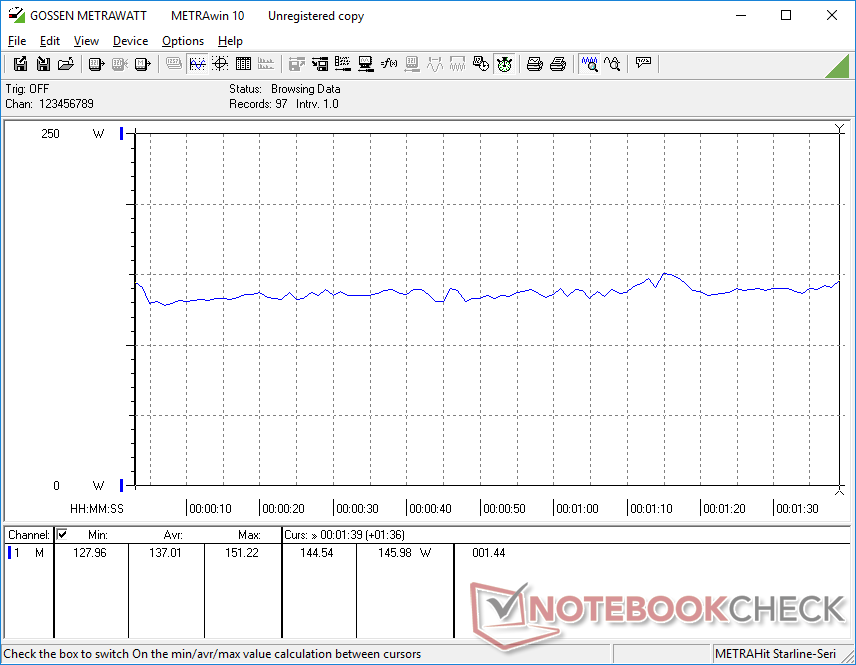
Pobór mocy na biegu jałowym jest niższy niż w przypadku Precision 7670 o kilka watów, prawdopodobnie z powodu bardziej wymagającego panelu OLED w tym ostatnim. Przy większym obciążeniu, np Witcher 3zużycie energii jest jednak zauważalnie wyższe w Lenovo niż w Dellu (208 W vs. 159 W). Wyższy pobór mocy zbiega się z wyższą wydajnością CPU i GPU w konkurencyjnym modelu Dell, co pokazały nasze powyższe benchmarki.
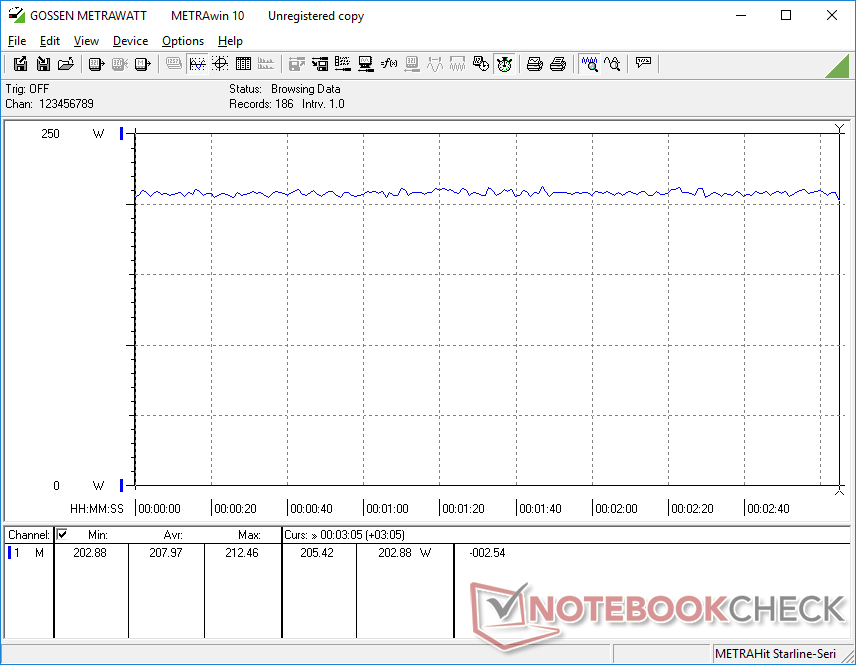
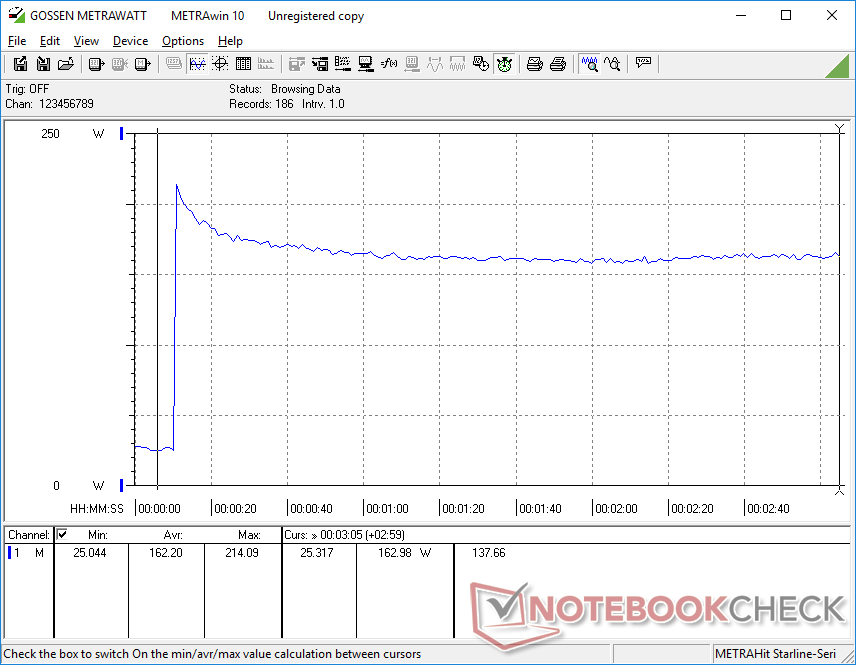
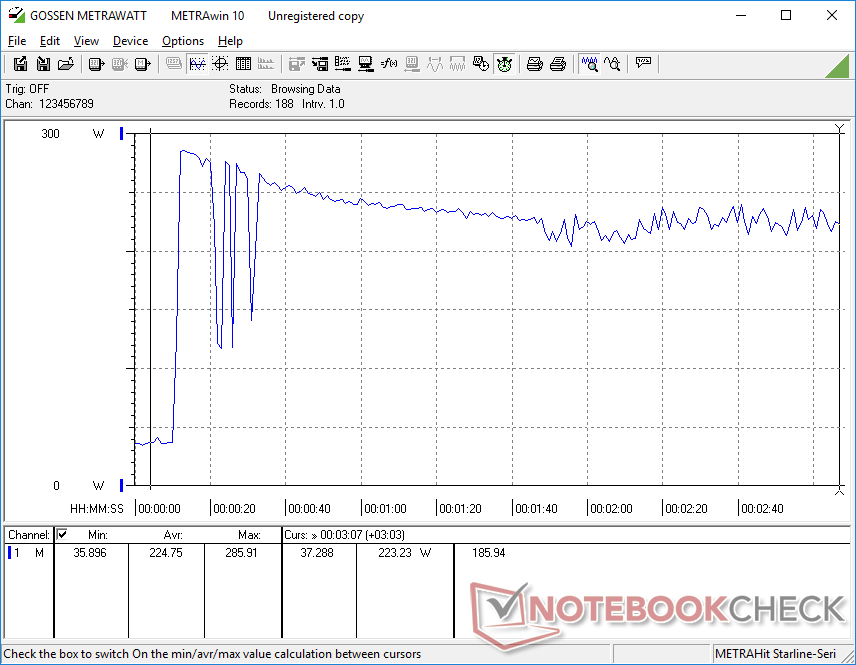
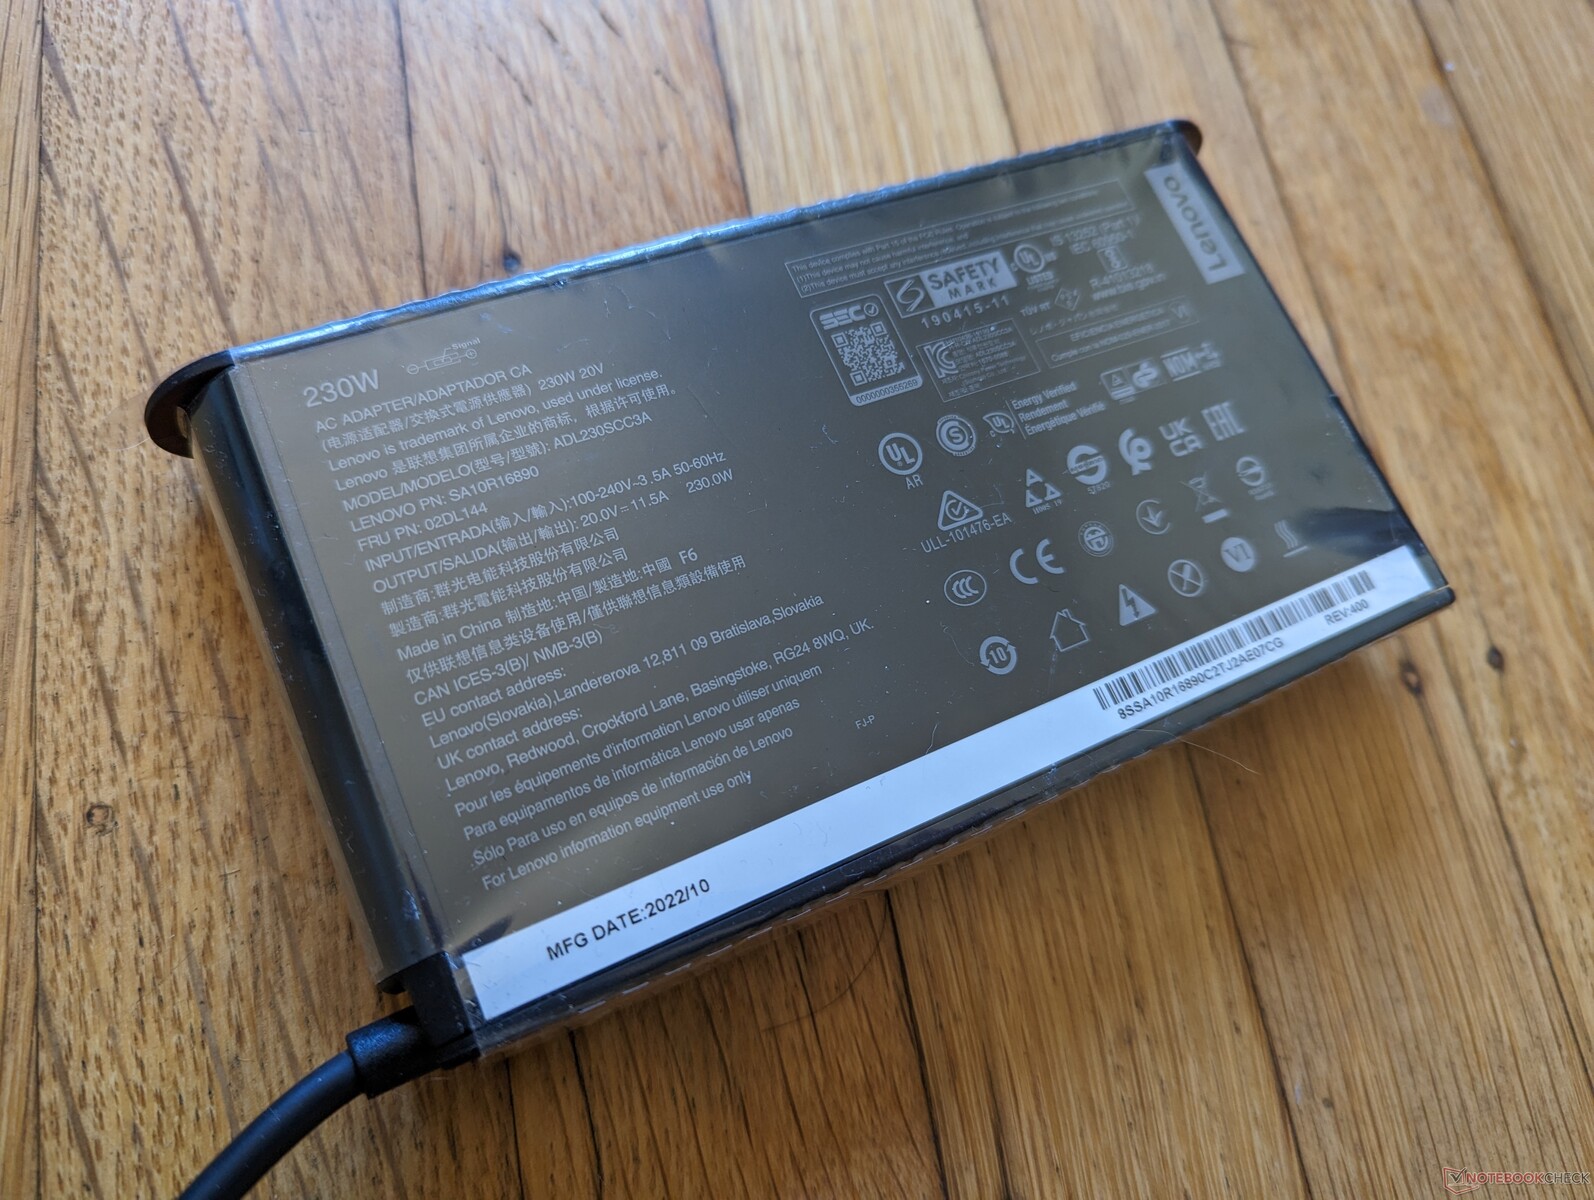
Choć użytkownicy mogą docenić dodatkową wydajność, nasz w pełni obciążony Lenovo jest znacznie bardziej wymagający niż większość innych mobilnych stacji roboczych. W rzeczywistości, średniej wielkości (~15 x 8,6 x 2,6 cm) zasilacz AC o mocy 230 W może nie wystarczyć do zasilenia maszyny, gdy CPU i GPU są mocno obciążone. Udało nam się zmierzyć chwilowy maksymalny pobór 286 W z zasilacza 230 W, zanim ostatecznie spadnie on i ustabilizuje się na poziomie około 223 W. Spodziewajcie się zatem, że podczas pracy pod dużym obciążeniem tempo ładowania akumulatora będzie wolne lub nawet ujemne. Podczas pracy Witcher 3 na przykład przez 90 minut, zaobserwowaliśmy spadek poziomu baterii ze 100 procent do 87 procent. Podobne zachowanie zaobserwowaliśmy na starszym XPS 17 lub Precision 5750. Szkoda, że Lenovo nie oferuje w kasie opcji zasilacza AC o mocy wyższej niż 230 W.
Konfiguracja z niższej klasy RTX A2000 obniżyłaby zużycie o około połowę. W tym przypadku zasilacz AC o mocy 230 W byłby wystarczający.
| wyłączony / stan wstrzymania | |
| luz | |
| obciążenie |
|
Legenda:
min: | |
| Lenovo ThinkPad P16 G1 RTX A5500 i9-12950HX, RTX A5500 Laptop GPU, WDC PC SN810 2TB, IPS, 3840x2400, 16" | Asus ProArt StudioBook 16 W7600H5A-2BL2 W-11955M, RTX A5000 Laptop GPU, 2x Micron 2300 2TB MTFDHBA2T0TDV (RAID 0), OLED, 3840x2400, 16" | Dell Precision 7000 7670 Performance i9-12950HX, RTX A5500 Laptop GPU, , OLED, 3840x2400, 16" | Lenovo ThinkPad P16 G1 21D6001DMB i7-12850HX, RTX A2000 Laptop GPU, Micron 3400 1TB MTFDKBA1T0TFH, IPS LED, 2560x1600, 16" | MSI CreatorPro Z16P B12UKST i7-12700H, RTX A3000 Laptop GPU, Samsung PM9A1 MZVL21T0HCLR, IPS, 2560x1600, 16" | HP ZBook Studio 16 G9 62U04EA i7-12800H, RTX A2000 Laptop GPU, Micron 3400 1TB MTFDKBA1T0TFH, IPS, 3840x2400, 16" | |
|---|---|---|---|---|---|---|
| Power Consumption | 14% | -35% | 45% | 19% | 28% | |
| Idle Minimum * (Watt) | 7.5 | 12.4 -65% | 16.4 -119% | 5.1 32% | 10.8 -44% | 7.2 4% |
| Idle Average * (Watt) | 20.1 | 16.5 18% | 35.9 -79% | 9.2 54% | 16.3 19% | 18.1 10% |
| Idle Maximum * (Watt) | 40 | 25 37% | 47 -18% | 9.9 75% | 16.9 58% | 18.5 54% |
| Load Average * (Watt) | 137 | 132 4% | 147.1 -7% | 124.1 9% | 111.7 18% | 112.8 18% |
| Witcher 3 ultra * (Watt) | 208 | 132 37% | 158.8 24% | 87.7 58% | 152.1 27% | 106.7 49% |
| Load Maximum * (Watt) | 285.9 | 134 53% | 311 -9% | 168.9 41% | 177.4 38% | 186 35% |
* ... im mniej tym lepiej
Power Consumption Witcher 3 / Stresstest
Power Consumption external Monitor
Czas pracy na baterii
Czas pracy jest o kilka godzin krótszy niż w przypadku naszego mniejszego modelu RTX A2000 SKU, co daje łącznie nieco poniżej 6 godzin przy ustawieniu profilu zasilania Balanced.
Ładowanie od pustego do pełnego trwa około 2 godzin. Szacowany przez Lenovo czas ładowania nie jest jednak tak dokładny, ponieważ Vantage może pokazać, że na początku będzie to nawet 4 godziny, zanim automatycznie się przekalibruje. Należy pamiętać, że szybkość ładowania będzie znacznie wolniejsza w przypadku uruchamiania wymagających aplikacji, jak wspomniano powyżej.
System nie może być ładowany przez USB-C.
| Lenovo ThinkPad P16 G1 RTX A5500 i9-12950HX, RTX A5500 Laptop GPU, 94 Wh | Asus ProArt StudioBook 16 W7600H5A-2BL2 W-11955M, RTX A5000 Laptop GPU, 90 Wh | Dell Precision 7000 7670 Performance i9-12950HX, RTX A5500 Laptop GPU, 93 Wh | Lenovo ThinkPad P16 G1 21D6001DMB i7-12850HX, RTX A2000 Laptop GPU, 94 Wh | MSI CreatorPro Z16P B12UKST i7-12700H, RTX A3000 Laptop GPU, 90 Wh | HP ZBook Studio 16 G9 62U04EA i7-12800H, RTX A2000 Laptop GPU, 86 Wh | |
|---|---|---|---|---|---|---|
| Czasy pracy | -14% | -19% | 62% | 0% | 9% | |
| WiFi v1.3 (h) | 5.8 | 5 -14% | 4.7 -19% | 9.4 62% | 5.8 0% | 6.3 9% |
| H.264 (h) | 1.8 | 8.5 | ||||
| Witcher 3 ultra (h) | 1.6 | |||||
| Load (h) | 1.8 | 1.1 |
Za
Przeciw
Werdykt - Zasilacz sieciowy o mocy 230 W nie jest wystarczający
Z perspektywy czysto wydajnościowej ThinkPad P16 G1 jest jedną z najszybszych mobilnych stacji roboczych dostępnych obecnie bez względu na rozmiar ekranu. Jego procesor Core i9-12950HX i karta graficzna RTX A5500 nieznacznie, ale konsekwentnie przewyższają model Precision 7670 nawet jeśli model Della jest wyposażony w podobne opcje procesora.
Są dwie kluczowe wady, które mamy nadzieję, że Lenovo może rozwiązać w przyszłych iteracjach. Po pierwsze, temperatury procesora są znacznie cieplejsze od przeciętnych podczas pracy pod wymagającymi obciążeniami. Wysokie temperatury nie są oczywiście niespodziewane, ale 100 stopni Celsjusza to po prostu zbyt wysoka temperatura, by można ją było uznać za komfortową, kiedy ten sam procesor we wspomnianym modelu Della w podobnych warunkach ledwie przekroczyłby granicę 80 stopni Celsjusza. Wysoka temperatura to być może cena, jaką trzeba zapłacić za nieco szybszą wydajność.
Po drugie, zasilacz 230 W poci się, próbując zasilić ponad 100-watowy CPU i 130-watowy GPU. Zmagania można zaobserwować podczas pracy z wymagającymi obciążeniami, ponieważ szybkość ładowania systemu znacznie spada, a w niektórych scenariuszach może nawet dojść do wyczerpania baterii. Kiedy jesteśmy w stanie zmierzyć szczytowy pobór mocy 285 W z zasilacza sieciowego o mocy 230 W, to wyraźnie widać, że mamy tu do czynienia z wąskim gardłem. Większy zasilacz 280 W lub 330 W byłby bardziej odpowiedni, biorąc pod uwagę nasz poziom konfiguracji.
ThinkPad P16 Gen 1 maksymalizuje wydajność, nawet jeśli oznacza to wyższy pobór mocy i wyższe temperatury rdzenia. Zasilacz 230 W może być jednak zbyt konserwatywny, biorąc pod uwagę bardzo wymagające procesory w naszej topowej konfiguracji.
Ogólna wysoka wydajność systemu jest jednak niezaprzeczalna pomimo wysokich temperatur i niewystarczającej mocy 230 W. Pamiętaj o wyłączeniu wszelkich wymagających aplikacji, aby uzyskać przyzwoitą prędkość ładowania.
Cena i dostępność
ThinkPad P16 G1 jest już dostępny w sprzedaży w sklepach Best Buy i Amazon w niższych konfiguracjach, których ceny zaczynają się odpowiednio od 2570 USD lub 3850 USD. Zalecamy zakup bezpośrednio od Lenovo, ponieważ mają oni w magazynie najbardziej konfigurowalne opcje.
Lenovo ThinkPad P16 G1 RTX A5500
- 06/02/2023 v7 (old)
Allen Ngo
Przezroczystość
Wyboru urządzeń do recenzji dokonuje nasza redakcja. Próbka testowa została udostępniona autorowi jako pożyczka od producenta lub sprzedawcy detalicznego na potrzeby tej recenzji. Pożyczkodawca nie miał wpływu na tę recenzję, producent nie otrzymał też kopii tej recenzji przed publikacją. Nie było obowiązku publikowania tej recenzji. Jako niezależna firma medialna, Notebookcheck nie podlega władzy producentów, sprzedawców detalicznych ani wydawców.
Tak testuje Notebookcheck
Każdego roku Notebookcheck niezależnie sprawdza setki laptopów i smartfonów, stosując standardowe procedury, aby zapewnić porównywalność wszystkich wyników. Od około 20 lat stale rozwijamy nasze metody badawcze, ustanawiając przy tym standardy branżowe. W naszych laboratoriach testowych doświadczeni technicy i redaktorzy korzystają z wysokiej jakości sprzętu pomiarowego. Testy te obejmują wieloetapowy proces walidacji. Nasz kompleksowy system ocen opiera się na setkach uzasadnionych pomiarów i benchmarków, co pozwala zachować obiektywizm.Price comparison

